|
|
NVIDIA GeForce RTX 4090 Founders Edition
Intel Core i9-13900K, NVIDIA GeForce RTX 4090 |
170.7 (154min, 154.59P1) fps +102% |
Media della classe Desktop
(29.2 - 235, n=44, ultimi 2 anni) | |
NVIDIA GeForce RTX 4080 Founders Edition
Intel Core i9-13900K, NVIDIA GeForce RTX 4080 |
128 (113min, 114.12P1) fps +51% |
AMD Radeon RX 7900 XTX
AMD Ryzen 9 7950X, AMD Radeon RX 7900 XTX |
125.8 (9.5min, 66.1P0.1, 94.8P1) fps +49% |
AMD Radeon RX 7900 XT
AMD Ryzen 9 7950X, AMD Radeon RX 7900 XT |
109.4 (57.5min, 60.1P0.1, 86.2P1) fps +29% |
Zotac Gaming GeForce RTX 3090 Ti AMP Extreme Holo
AMD Ryzen 7 5800X3D, NVIDIA GeForce RTX 3090 Ti |
107.5 (97min, 97.56P1) fps +27% |
Asus TUF Gaming GeForce RTX 4070 Ti
Intel Core i9-13900K, NVIDIA GeForce RTX 4070 Ti |
98.3 (88min, 88.56P1) fps +16% |
Media NVIDIA GeForce RTX 4070 Ti
(92.4 - 98.3, n=4) | |
Media NVIDIA GeForce RTX 3080 Ti
(93.1 - 96.4, n=4) | |
Gigabyte Aorus GeForce RTX 4070 Ti Master
Intel Core i9-13900K, NVIDIA GeForce RTX 4070 Ti |
94.4 (86min, 86.46P1) fps +12% |
Media NVIDIA GeForce RTX 3090
(85.4 - 98.5, n=10) | |
Sapphire AMD Radeon RX 6950 XT Nitro+ Pure
AMD Ryzen 9 5900X, AMD Radeon RX 6950 XT |
92.3 (10.8min, 48.8P0.1, 54.2P1) fps +9% |
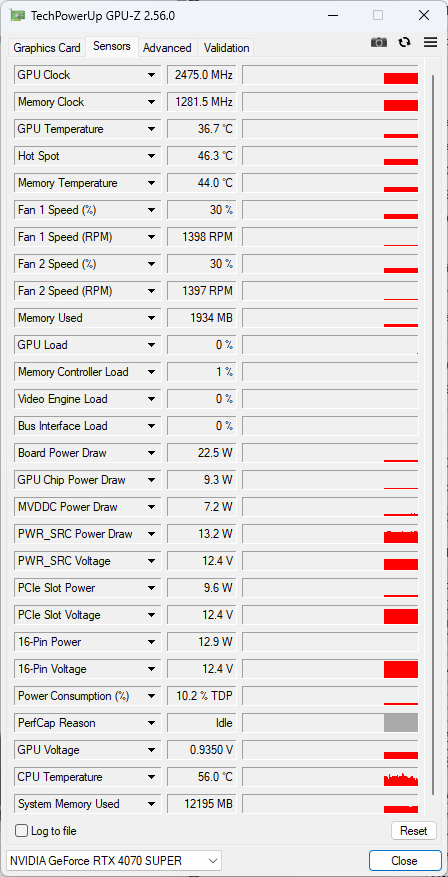
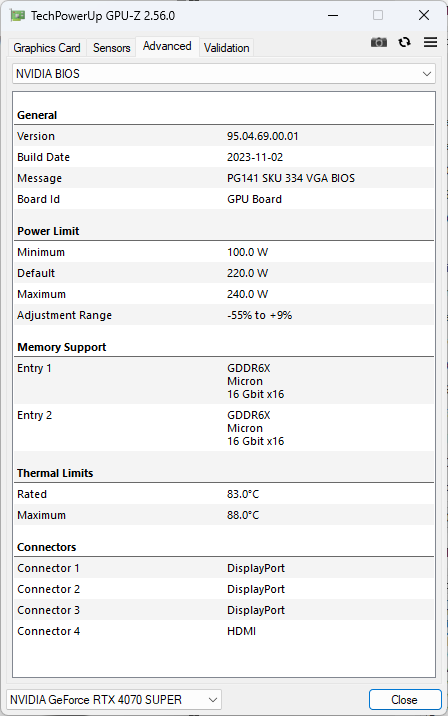
NVIDIA GeForce RTX 4070 Super Founders Edition
Intel Core i9-13900K, NVIDIA GeForce RTX 4070 SUPER | |
Media NVIDIA GeForce RTX 3080
(78 - 85.7, n=2) | |
AMD Radeon RX 7800 XT
AMD Ryzen 9 7950X, AMD Radeon RX 7800 XT | |
Zotac Gaming GeForce RTX 4070 AMP Airo
Intel Core i9-13900K, NVIDIA GeForce RTX 4070 |
77.1 (69min, 69P1) fps -9% |
AMD Radeon RX 6900 XT
AMD Ryzen 9 5950X, AMD Radeon RX 6900 XT |
76.6 (70min, 70P1) fps -9% |
Media NVIDIA Titan RTX
(n=1) | |
Sapphire Pulse Radeon RX 7700 XT
AMD Ryzen 9 7950X, AMD Radeon RX 7700 XT |
64.4 (33min, 33.3P0.1, 56.3P1) fps -24% |
Media NVIDIA GeForce RTX 3070
(59 - 60.3, n=2) | |
Media NVIDIA GeForce RTX 4060 Ti 8G
(53.9 - 54.3, n=3) | |
KFA2 GeForce RTX 4060 Ti EX, 16GB GDDR6
AMD Ryzen 9 7950X, NVIDIA GeForce RTX 4060 Ti 16G | |
XFX Speedster QICK 308 Radeon RX 7600 Black Edition
AMD Ryzen 9 7950X, AMD Radeon RX 7600 | |
KFA2 GeForce RTX 4060 1-Click-OC 2X
AMD Ryzen 9 7950X, NVIDIA GeForce RTX 4060 | |
|
NVIDIA GeForce RTX 4090 Founders Edition
Intel Core i9-13900K, NVIDIA GeForce RTX 4090 |
274 (243min, 244.12P1) fps +112% |
Media della classe Desktop
(41.7 - 388, n=44, ultimi 2 anni) | |
NVIDIA GeForce RTX 4080 Founders Edition
Intel Core i9-13900K, NVIDIA GeForce RTX 4080 |
204 (183min, 183.55P1) fps +58% |
Zotac Gaming GeForce RTX 3090 Ti AMP Extreme Holo
AMD Ryzen 7 5800X3D, NVIDIA GeForce RTX 3090 Ti |
172.9 (152min, 152.57P1) fps +34% |
AMD Radeon RX 7900 XTX
AMD Ryzen 9 7950X, AMD Radeon RX 7900 XTX |
163.8 (49.6min, 112P0.1, 134.1P1) fps +27% |
AMD Radeon RX 7900 XT
AMD Ryzen 9 7950X, AMD Radeon RX 7900 XT |
158.5 (83.2min, 111.2P0.1, 122.8P1) fps +22% |
Media NVIDIA GeForce RTX 3080 Ti
(149 - 156.8, n=4) | |
Media NVIDIA GeForce RTX 3090
(128 - 160.2, n=14) | |
Asus TUF Gaming GeForce RTX 4070 Ti
Intel Core i9-13900K, NVIDIA GeForce RTX 4070 Ti |
151.9 (137min, 138.12P1) fps +17% |
Gigabyte Aorus GeForce RTX 4070 Ti Master
Intel Core i9-13900K, NVIDIA GeForce RTX 4070 Ti |
148.7 (130min, 130.59P1) fps +15% |
Media NVIDIA GeForce RTX 4070 Ti
(143 - 151.9, n=4) | |
Sapphire AMD Radeon RX 6950 XT Nitro+ Pure
AMD Ryzen 9 5900X, AMD Radeon RX 6950 XT |
139.7 (10.4min, 105.6P0.1, 118.6P1) fps +8% |
NVIDIA GeForce RTX 4070 Super Founders Edition
Intel Core i9-13900K, NVIDIA GeForce RTX 4070 SUPER |
129.4 (117min, 117.31P1) fps |
AMD Radeon RX 6900 XT
AMD Ryzen 9 5950X, AMD Radeon RX 6900 XT |
122 (105min, 105P1) fps -6% |
Zotac Gaming GeForce RTX 4070 AMP Airo
Intel Core i9-13900K, NVIDIA GeForce RTX 4070 |
116.9 (102min, 102P1) fps -10% |
Media NVIDIA GeForce RTX 3080
(114 - 115, n=2) | |
AMD Radeon RX 7800 XT
AMD Ryzen 9 7950X, AMD Radeon RX 7800 XT | |
AMD Radeon RX 6800 XT
AMD Ryzen 9 5950X, AMD Radeon RX 6800 XT | |
Media NVIDIA Titan RTX
(94 - 107.1, n=28) | |
Media NVIDIA GeForce RTX 3070
(84 - 93.9, n=5) | |
Sapphire Pulse Radeon RX 7700 XT
AMD Ryzen 9 7950X, AMD Radeon RX 7700 XT |
88.7 (73.3min, 74.7P0.1, 79.4P1) fps -31% |
Media NVIDIA GeForce RTX 4060 Ti 8G
(78.5 - 80.4, n=3) | |
KFA2 GeForce RTX 4060 Ti EX, 16GB GDDR6
AMD Ryzen 9 7950X, NVIDIA GeForce RTX 4060 Ti 16G | |
KFA2 GeForce RTX 4060 1-Click-OC 2X
AMD Ryzen 9 7950X, NVIDIA GeForce RTX 4060 | |
XFX Speedster QICK 308 Radeon RX 7600 Black Edition
AMD Ryzen 9 7950X, AMD Radeon RX 7600 | |
|
NVIDIA GeForce RTX 4090 Founders Edition
Intel Core i9-13900K, NVIDIA GeForce RTX 4090 |
297 (271min, 271P1) fps +55% |
AMD Radeon RX 7900 XTX
AMD Ryzen 9 7950X, AMD Radeon RX 7900 XTX |
297 (41.3min, 167.7P0.1, 245P1) fps +55% |
AMD Radeon RX 7900 XT
AMD Ryzen 9 7950X, AMD Radeon RX 7900 XT |
265 (104.1min, 151.5P0.1, 214P1) fps +38% |
NVIDIA GeForce RTX 4080 Founders Edition
Intel Core i9-13900K, NVIDIA GeForce RTX 4080 |
254 (227min, 227P1) fps +32% |
Media della classe Desktop
(7.8 - 369, n=48, ultimi 2 anni) | |
Asus TUF Gaming GeForce RTX 4070 Ti
Intel Core i9-13900K, NVIDIA GeForce RTX 4070 Ti |
230 (207min, 208.68P1) fps +20% |
Media NVIDIA GeForce RTX 4070 Ti
(217 - 230, n=5) | |
Gigabyte Aorus GeForce RTX 4070 Ti Master
Intel Core i9-13900K, NVIDIA GeForce RTX 4070 Ti |
220 (199min, 199.56P1) fps +15% |
Sapphire AMD Radeon RX 6950 XT Nitro+ Pure
AMD Ryzen 9 5900X, AMD Radeon RX 6950 XT |
205 (10.2min, 109.8P0.1, 161.2P1) fps +7% |
Zotac Gaming GeForce RTX 3090 Ti AMP Extreme Holo
AMD Ryzen 7 5800X3D, NVIDIA GeForce RTX 3090 Ti (110% PT) |
196.3 (192min, 193P1) fps +2% |
Zotac Gaming GeForce RTX 3090 Ti AMP Extreme Holo
AMD Ryzen 7 5800X3D, NVIDIA GeForce RTX 3090 Ti (100% PT) |
193.4 (173min, 173.56P1) fps +1% |
NVIDIA GeForce RTX 4070 Super Founders Edition
Intel Core i9-13900K, NVIDIA GeForce RTX 4070 SUPER |
191.9 (175min, 175P1) fps |
AMD Radeon RX 7800 XT
AMD Ryzen 9 7950X, AMD Radeon RX 7800 XT | |
Media NVIDIA GeForce RTX 3090
(160 - 192.6, n=18) | |
Media NVIDIA GeForce RTX 3080 Ti
(174 - 184.6, n=4) | |
Zotac Gaming GeForce RTX 4070 AMP Airo
Intel Core i9-13900K, NVIDIA GeForce RTX 4070 |
168.6 (150min, 150.7P1) fps -12% |
Sapphire Pulse Radeon RX 7700 XT
AMD Ryzen 9 7950X, AMD Radeon RX 7700 XT |
168.3 (89min, 96.5P0.1, 143.7P1) fps -12% |
AMD Radeon RX 6900 XT
AMD Ryzen 9 5950X, AMD Radeon RX 6900 XT | |
AMD Radeon RX 6800 XT
AMD Ryzen 9 5950X, AMD Radeon RX 6800 XT | |
Media NVIDIA GeForce RTX 3080
(145 - 152, n=2) | |
Media NVIDIA GeForce RTX 4060 Ti 8G
(134.1 - 140.6, n=4) | |
Media NVIDIA Titan RTX
(124 - 150, n=28) | |
KFA2 GeForce RTX 4060 Ti EX, 16GB GDDR6
AMD Ryzen 9 7950X, NVIDIA GeForce RTX 4060 Ti 16G | |
XFX Speedster QICK 308 Radeon RX 7600 Black Edition
AMD Ryzen 9 7950X, AMD Radeon RX 7600 | |
KFA2 GeForce RTX 4060 1-Click-OC 2X
AMD Ryzen 9 7950X, NVIDIA GeForce RTX 4060 | |
Media NVIDIA GeForce RTX 3070
(52.8 - 132.2, n=7) | |
|
|
NVIDIA GeForce RTX 4090 Founders Edition
Intel Core i9-13900K, NVIDIA GeForce RTX 4090 | |
Media della classe Desktop
(101.4 - 166.6, n=12, ultimi 2 anni) | |
NVIDIA GeForce RTX 4080 Founders Edition
Intel Core i9-13900K, NVIDIA GeForce RTX 4080 |
105.7 (67.17min) fps +45% |
AMD Radeon RX 7900 XTX
AMD Ryzen 9 7950X, AMD Radeon RX 7900 XTX |
103.5 (66.43min) fps +42% |
AMD Radeon RX 7900 XT
AMD Ryzen 9 7950X, AMD Radeon RX 7900 XT | |
Gigabyte Aorus GeForce RTX 4070 Ti Master
Intel Core i9-13900K, NVIDIA GeForce RTX 4070 Ti | |
Asus TUF Gaming GeForce RTX 4070 Ti
Intel Core i9-13900K, NVIDIA GeForce RTX 4070 Ti | |
Zotac Gaming GeForce RTX 3090 Ti AMP Extreme Holo
AMD Ryzen 7 5800X3D, NVIDIA GeForce RTX 3090 Ti | |
Media NVIDIA GeForce RTX 4070 Ti
(81.2 - 85, n=4) | |
Media NVIDIA GeForce RTX 3080 Ti
(74.2 - 77.1, n=4) | |
Sapphire AMD Radeon RX 6950 XT Nitro+ Pure
AMD Ryzen 9 5900X, AMD Radeon RX 6950 XT | |
Media NVIDIA GeForce RTX 3090
(70.6 - 77.3, n=12) | |
NVIDIA GeForce RTX 4070 Super Founders Edition
Intel Core i9-13900K, NVIDIA GeForce RTX 4070 SUPER | |
AMD Radeon RX 6900 XT
AMD Ryzen 9 5950X, AMD Radeon RX 6900 XT | |
AMD Radeon RX 7800 XT
AMD Ryzen 9 7950X, AMD Radeon RX 7800 XT | |
Zotac Gaming GeForce RTX 4070 AMP Airo
Intel Core i9-13900K, NVIDIA GeForce RTX 4070 | |
Media NVIDIA GeForce RTX 3080
(64.1 - 65.9, n=2) | |
Sapphire Pulse Radeon RX 7700 XT
AMD Ryzen 9 7950X, AMD Radeon RX 7700 XT | |
AMD Radeon RX 6800 XT
AMD Ryzen 9 5950X, AMD Radeon RX 6800 XT | |
Media NVIDIA Titan RTX
(51.3 - 57.9, n=27) | |
Media NVIDIA GeForce RTX 3070
(48.3 - 49.7, n=5) | |
Media NVIDIA GeForce RTX 4060 Ti 8G
(48.4 - 49.3, n=3) | |
KFA2 GeForce RTX 4060 Ti EX, 16GB GDDR6
AMD Ryzen 9 7950X, NVIDIA GeForce RTX 4060 Ti 16G | |
KFA2 GeForce RTX 4060 1-Click-OC 2X
AMD Ryzen 9 7950X, NVIDIA GeForce RTX 4060 | |
XFX Speedster QICK 308 Radeon RX 7600 Black Edition
AMD Ryzen 9 7950X, AMD Radeon RX 7600 | |
|
Media della classe Desktop
(152.7 - 202, n=13, ultimi 2 anni) | |
NVIDIA GeForce RTX 4090 Founders Edition
Intel Core i9-13900K, NVIDIA GeForce RTX 4090 | |
NVIDIA GeForce RTX 4080 Founders Edition
Intel Core i9-13900K, NVIDIA GeForce RTX 4080 |
155.1 (77.58min) fps +34% |
AMD Radeon RX 7900 XTX
AMD Ryzen 9 7950X, AMD Radeon RX 7900 XTX |
154.5 (90.83min) fps +33% |
AMD Radeon RX 7900 XT
AMD Ryzen 9 7950X, AMD Radeon RX 7900 XT | |
Gigabyte Aorus GeForce RTX 4070 Ti Master
Intel Core i9-13900K, NVIDIA GeForce RTX 4070 Ti | |
Asus TUF Gaming GeForce RTX 4070 Ti
Intel Core i9-13900K, NVIDIA GeForce RTX 4070 Ti |
132.1 (72.92min) fps +14% |
Media NVIDIA GeForce RTX 4070 Ti
(126.7 - 132.3, n=4) | |
Zotac Gaming GeForce RTX 3090 Ti AMP Extreme Holo
AMD Ryzen 7 5800X3D, NVIDIA GeForce RTX 3090 Ti | |
NVIDIA GeForce RTX 4070 Super Founders Edition
Intel Core i9-13900K, NVIDIA GeForce RTX 4070 SUPER | |
Sapphire AMD Radeon RX 6950 XT Nitro+ Pure
AMD Ryzen 9 5900X, AMD Radeon RX 6950 XT | |
Media NVIDIA GeForce RTX 3080 Ti
(110 - 118, n=4) | |
Media NVIDIA GeForce RTX 3090
(102 - 118.2, n=12) | |
Zotac Gaming GeForce RTX 4070 AMP Airo
Intel Core i9-13900K, NVIDIA GeForce RTX 4070 |
103.8 (60.52min) fps -11% |
AMD Radeon RX 7800 XT
AMD Ryzen 9 7950X, AMD Radeon RX 7800 XT |
102.6 (62.24min) fps -12% |
AMD Radeon RX 6900 XT
AMD Ryzen 9 5950X, AMD Radeon RX 6900 XT | |
Media NVIDIA GeForce RTX 3080
(92.2 - 97.4, n=2) | |
AMD Radeon RX 6800 XT
AMD Ryzen 9 5950X, AMD Radeon RX 6800 XT | |
Sapphire Pulse Radeon RX 7700 XT
AMD Ryzen 9 7950X, AMD Radeon RX 7700 XT | |
Media NVIDIA Titan RTX
(69 - 92.9, n=26) | |
Media NVIDIA GeForce RTX 4060 Ti 8G
(78.9 - 80.1, n=3) | |
KFA2 GeForce RTX 4060 Ti EX, 16GB GDDR6
AMD Ryzen 9 7950X, NVIDIA GeForce RTX 4060 Ti 16G | |
Media NVIDIA GeForce RTX 3070
(74.4 - 78.3, n=5) | |
XFX Speedster QICK 308 Radeon RX 7600 Black Edition
AMD Ryzen 9 7950X, AMD Radeon RX 7600 | |
KFA2 GeForce RTX 4060 1-Click-OC 2X
AMD Ryzen 9 7950X, NVIDIA GeForce RTX 4060 | |
|
NVIDIA GeForce RTX 4090 Founders Edition
Intel Core i9-13900K, NVIDIA GeForce RTX 4090 |
191.2 (84.99min) fps +32% |
Media della classe Desktop
(6.41 - 226, n=14, ultimi 2 anni) | |
AMD Radeon RX 7900 XTX
AMD Ryzen 9 7950X, AMD Radeon RX 7900 XTX |
183.5 (102.51min) fps +27% |
NVIDIA GeForce RTX 4080 Founders Edition
Intel Core i9-13900K, NVIDIA GeForce RTX 4080 | |
AMD Radeon RX 7900 XT
AMD Ryzen 9 7950X, AMD Radeon RX 7900 XT |
164.6 (92.11min) fps +14% |
Asus TUF Gaming GeForce RTX 4070 Ti
Intel Core i9-13900K, NVIDIA GeForce RTX 4070 Ti |
161.4 (78.05min) fps +11% |
Gigabyte Aorus GeForce RTX 4070 Ti Master
Intel Core i9-13900K, NVIDIA GeForce RTX 4070 Ti |
161.2 (77.88min) fps +11% |
Media NVIDIA GeForce RTX 4070 Ti
(155.6 - 161.4, n=4) | |
Zotac Gaming GeForce RTX 3090 Ti AMP Extreme Holo
AMD Ryzen 7 5800X3D, NVIDIA GeForce RTX 3090 Ti | |
NVIDIA GeForce RTX 4070 Super Founders Edition
Intel Core i9-13900K, NVIDIA GeForce RTX 4070 SUPER | |
Sapphire AMD Radeon RX 6950 XT Nitro+ Pure
AMD Ryzen 9 5900X, AMD Radeon RX 6950 XT | |
Media NVIDIA GeForce RTX 3080 Ti
(131 - 144.2, n=5) | |
Media NVIDIA GeForce RTX 3090
(108 - 145, n=12) | |
Zotac Gaming GeForce RTX 4070 AMP Airo
Intel Core i9-13900K, NVIDIA GeForce RTX 4070 |
129.4 (68.29min) fps -11% |
AMD Radeon RX 7800 XT
AMD Ryzen 9 7950X, AMD Radeon RX 7800 XT |
128.5 (73.66min) fps -11% |
AMD Radeon RX 6900 XT
AMD Ryzen 9 5950X, AMD Radeon RX 6900 XT | |
AMD Radeon RX 6800 XT
AMD Ryzen 9 5950X, AMD Radeon RX 6800 XT | |
Sapphire Pulse Radeon RX 7700 XT
AMD Ryzen 9 7950X, AMD Radeon RX 7700 XT |
113.9 (65.05min) fps -21% |
Media NVIDIA GeForce RTX 3080
(111 - 116, n=2) | |
Media NVIDIA Titan RTX
(73 - 116, n=27) | |
Media NVIDIA GeForce RTX 4060 Ti 8G
(100.6 - 101.8, n=3) | |
KFA2 GeForce RTX 4060 Ti EX, 16GB GDDR6
AMD Ryzen 9 7950X, NVIDIA GeForce RTX 4060 Ti 16G | |
Media NVIDIA GeForce RTX 3070
(91.3 - 97.7, n=5) | |
XFX Speedster QICK 308 Radeon RX 7600 Black Edition
AMD Ryzen 9 7950X, AMD Radeon RX 7600 | |
KFA2 GeForce RTX 4060 1-Click-OC 2X
AMD Ryzen 9 7950X, NVIDIA GeForce RTX 4060 | |
|
|
NVIDIA GeForce RTX 4090 Founders Edition
Intel Core i9-13900K, NVIDIA GeForce RTX 4090 |
107.7 (83.4min, 85.3P0.1, 91.1P1) fps +88% |
AMD Radeon RX 7900 XTX
AMD Ryzen 9 7950X, AMD Radeon RX 7900 XTX |
89.4 (46.8min, 48.3P0.1, 52.1P1) fps +56% |
NVIDIA GeForce RTX 4080 Founders Edition
Intel Core i9-13900K, NVIDIA GeForce RTX 4080 |
82.6 (15.4min, 68.7P0.1, 71.9P1) fps +44% |
AMD Radeon RX 7900 XT
AMD Ryzen 9 7950X, AMD Radeon RX 7900 XT |
75.8 (40.1min, 41.7P0.1, 43.6P1) fps +32% |
Zotac Gaming GeForce RTX 3090 Ti AMP Extreme Holo
AMD Ryzen 7 5800X3D, NVIDIA GeForce RTX 3090 Ti |
73.9 (46.2min, 53.2P0.1, 62.6P1) fps +29% |
Media NVIDIA GeForce RTX 4070 Ti
(63.8 - 66.2, n=4) | |
Asus TUF Gaming GeForce RTX 4070 Ti
Intel Core i9-13900K, NVIDIA GeForce RTX 4070 Ti |
64.9 (50min, 51.9P0.1, 56.5P1) fps +13% |
Gigabyte Aorus GeForce RTX 4070 Ti Master
Intel Core i9-13900K, NVIDIA GeForce RTX 4070 Ti |
64.9 (26.4min, 32.6P0.1, 55.9P1) fps +13% |
Sapphire AMD Radeon RX 6950 XT Nitro+ Pure
AMD Ryzen 9 5900X, AMD Radeon RX 6950 XT |
64.8 (33.1min, 33.6P0.1, 36.3P1) fps +13% |
Media NVIDIA GeForce RTX 3080 Ti
(63.9 - 64.9, n=3) | |
Media NVIDIA GeForce RTX 3090
(61.3 - 66, n=5) | |
AMD Radeon RX 7800 XT
AMD Ryzen 9 7950X, AMD Radeon RX 7800 XT |
58.2 (30.4min, 30.9P0.1, 32.7P1) fps +1% |
NVIDIA GeForce RTX 4070 Super Founders Edition
Intel Core i9-13900K, NVIDIA GeForce RTX 4070 SUPER |
57.4 (47.8min, 47.9P0.1, 50.2P1) fps |
Media NVIDIA GeForce RTX 3080
(56.2 - 56.7, n=2) | |
AMD Radeon RX 6900 XT
AMD Ryzen 9 5950X, AMD Radeon RX 6900 XT |
54.7 (39.8min, 41.7P0.1, 44.9P1) fps -5% |
AMD Radeon RX 6900 XT
AMD Ryzen 9 5950X, AMD Radeon RX 6900 XT (SAM ENABLED) |
53.9 (36.6min, 41.7P0.1, 43.5P1) fps -6% |
AMD Radeon RX 6800 XT
AMD Ryzen 9 5950X, AMD Radeon RX 6800 XT | |
Zotac Gaming GeForce RTX 4070 AMP Airo
Intel Core i9-13900K, NVIDIA GeForce RTX 4070 |
50.2 (29.1min, 30P0.1, 37.6P1) fps -13% |
Media NVIDIA Titan RTX
(45.2 - 47.3, n=3) | |
Sapphire Pulse Radeon RX 7700 XT
AMD Ryzen 9 7950X, AMD Radeon RX 7700 XT |
46.4 (24.9min, 25.5P0.1, 26.2P1) fps -19% |
Media NVIDIA GeForce RTX 3070
(40.6 - 42.3, n=3) | |
KFA2 GeForce RTX 4060 Ti EX, 16GB GDDR6
AMD Ryzen 9 7950X, NVIDIA GeForce RTX 4060 Ti 16G |
36 (19.1min, 24.7P0.1, 31.1P1) fps -37% |
Media NVIDIA GeForce RTX 4060 Ti 8G
(34.3 - 37.3, n=3) | |
XFX Speedster QICK 308 Radeon RX 7600 Black Edition
AMD Ryzen 9 7950X, AMD Radeon RX 7600 |
31.3 (17.1min, 17.1P0.1, 17.6P1) fps -45% |
KFA2 GeForce RTX 4060 1-Click-OC 2X
AMD Ryzen 9 7950X, NVIDIA GeForce RTX 4060 |
28.4 (20.2min, 21.3P0.1, 24.9P1) fps -51% |
|
NVIDIA GeForce RTX 4090 Founders Edition
Intel Core i9-13900K, NVIDIA GeForce RTX 4090 |
201 (84.1min, 146.6P0.1, 159P1) fps +79% |
AMD Radeon RX 7900 XTX
AMD Ryzen 9 7950X, AMD Radeon RX 7900 XTX |
184.9 (66.6min, 105.1P0.1, 121.7P1) fps +64% |
NVIDIA GeForce RTX 4080 Founders Edition
Intel Core i9-13900K, NVIDIA GeForce RTX 4080 |
164.2 (59.2min, 121.2P0.1, 135.5P1) fps +46% |
AMD Radeon RX 7900 XT
AMD Ryzen 9 7950X, AMD Radeon RX 7900 XT |
156.4 (53.3min, 89.4P0.1, 95.9P1) fps +39% |
Zotac Gaming GeForce RTX 3090 Ti AMP Extreme Holo
AMD Ryzen 7 5800X3D, NVIDIA GeForce RTX 3090 Ti |
142.5 (51.8min, 81.9P0.1, 115.5P1) fps +27% |
Sapphire AMD Radeon RX 6950 XT Nitro+ Pure
AMD Ryzen 9 5900X, AMD Radeon RX 6950 XT |
133.5 (73.5min, 75.3P0.1, 83.4P1) fps +19% |
Asus TUF Gaming GeForce RTX 4070 Ti
Intel Core i9-13900K, NVIDIA GeForce RTX 4070 Ti |
130.6 (59min, 74P0.1, 107.3P1) fps +16% |
Gigabyte Aorus GeForce RTX 4070 Ti Master
Intel Core i9-13900K, NVIDIA GeForce RTX 4070 Ti |
130.6 (24.9min, 47.8P0.1, 108.8P1) fps +16% |
Media NVIDIA GeForce RTX 3080 Ti
(122 - 125.5, n=3) | |
Media NVIDIA GeForce RTX 4070 Ti
(100 - 130.6, n=4) | |
Media NVIDIA GeForce RTX 3090
(115.8 - 123.7, n=5) | |
AMD Radeon RX 7800 XT
AMD Ryzen 9 7950X, AMD Radeon RX 7800 XT |
120.3 (60.2min, 62.9P0.1, 68.1P1) fps +7% |
AMD Radeon RX 6900 XT
AMD Ryzen 9 5950X, AMD Radeon RX 6900 XT |
113 (71.5min, 73.2P0.1, 79.6P1) fps 0% |
AMD Radeon RX 6900 XT
AMD Ryzen 9 5950X, AMD Radeon RX 6900 XT (SAM ENABLED) |
113 (68min, 71.3P0.1, 81.1P1) fps 0% |
NVIDIA GeForce RTX 4070 Super Founders Edition
Intel Core i9-13900K, NVIDIA GeForce RTX 4070 SUPER |
112.6 (83.1min, 89.4P0.1, 94.5P1) fps |
AMD Radeon RX 6800 XT
AMD Ryzen 9 5950X, AMD Radeon RX 6800 XT | |
Media NVIDIA GeForce RTX 3080
(105 - 106, n=2) | |
Zotac Gaming GeForce RTX 4070 AMP Airo
Intel Core i9-13900K, NVIDIA GeForce RTX 4070 |
101.8 (15.7min, 26.9P0.1, 84P1) fps -10% |
Sapphire Pulse Radeon RX 7700 XT
AMD Ryzen 9 7950X, AMD Radeon RX 7700 XT |
96.1 (51.5min, 52P0.1, 55P1) fps -15% |
Media NVIDIA Titan RTX
(89 - 93.6, n=3) | |
Media NVIDIA GeForce RTX 3070
(79.8 - 82.5, n=3) | |
Media NVIDIA GeForce RTX 4060 Ti 8G
(69.2 - 75.3, n=3) | |
KFA2 GeForce RTX 4060 Ti EX, 16GB GDDR6
AMD Ryzen 9 7950X, NVIDIA GeForce RTX 4060 Ti 16G |
73.1 (43.1min, 53.6P0.1, 62.7P1) fps -35% |
XFX Speedster QICK 308 Radeon RX 7600 Black Edition
AMD Ryzen 9 7950X, AMD Radeon RX 7600 |
63.6 (33.4min, 34.3P0.1, 36.6P1) fps -44% |
KFA2 GeForce RTX 4060 1-Click-OC 2X
AMD Ryzen 9 7950X, NVIDIA GeForce RTX 4060 |
58.4 (38.3min, 43.3P0.1, 50.2P1) fps -48% |
|
AMD Radeon RX 7900 XTX
AMD Ryzen 9 7950X, AMD Radeon RX 7900 XTX |
240 (18.1min, 136.2P0.1, 151.8P1) fps +39% |
NVIDIA GeForce RTX 4090 Founders Edition
Intel Core i9-13900K, NVIDIA GeForce RTX 4090 |
238 (14.4min, 62.9P0.1, 153.8P1) fps +38% |
NVIDIA GeForce RTX 4080 Founders Edition
Intel Core i9-13900K, NVIDIA GeForce RTX 4080 |
233 (7.49min, 27.2P0.1, 156.1P1) fps +35% |
AMD Radeon RX 7900 XT
AMD Ryzen 9 7950X, AMD Radeon RX 7900 XT |
233 (67.8min, 133.8P0.1, 152.6P1) fps +35% |
Zotac Gaming GeForce RTX 3090 Ti AMP Extreme Holo
AMD Ryzen 7 5800X3D, NVIDIA GeForce RTX 3090 Ti |
209 (55.6min, 119.8P0.1, 162.7P1) fps +21% |
Sapphire AMD Radeon RX 6950 XT Nitro+ Pure
AMD Ryzen 9 5900X, AMD Radeon RX 6950 XT |
205 (45.2min, 129.1P0.1, 150.8P1) fps +19% |
Asus TUF Gaming GeForce RTX 4070 Ti
Intel Core i9-13900K, NVIDIA GeForce RTX 4070 Ti |
202 (88min, 151.4P0.1, 165P1) fps +17% |
Gigabyte Aorus GeForce RTX 4070 Ti Master
Intel Core i9-13900K, NVIDIA GeForce RTX 4070 Ti |
201 (51.3min, 64.4P0.1, 157.9P1) fps +16% |
Media NVIDIA GeForce RTX 4070 Ti
(196.6 - 202, n=4) | |
AMD Radeon RX 7800 XT
AMD Ryzen 9 7950X, AMD Radeon RX 7800 XT |
190.1 (56.5min, 107.1P0.1, 118.1P1) fps +10% |
Media NVIDIA GeForce RTX 3080 Ti
(181 - 190.7, n=3) | |
Media NVIDIA GeForce RTX 3090
(172.2 - 189.2, n=5) | |
AMD Radeon RX 6900 XT
AMD Ryzen 9 5950X, AMD Radeon RX 6900 XT |
175 (56.8min, 96P0.1, 112P1) fps +1% |
AMD Radeon RX 6900 XT
AMD Ryzen 9 5950X, AMD Radeon RX 6900 XT (SAM ENABLED) |
174 (54min, 99P0.1, 112P1) fps +1% |
NVIDIA GeForce RTX 4070 Super Founders Edition
Intel Core i9-13900K, NVIDIA GeForce RTX 4070 SUPER |
172.7 (52.1min, 129.1P0.1, 139.6P1) fps |
AMD Radeon RX 6800 XT
AMD Ryzen 9 5950X, AMD Radeon RX 6800 XT | |
Zotac Gaming GeForce RTX 4070 AMP Airo
Intel Core i9-13900K, NVIDIA GeForce RTX 4070 |
159.5 (24.5min, 120.5P0.1, 131P1) fps -8% |
Sapphire Pulse Radeon RX 7700 XT
AMD Ryzen 9 7950X, AMD Radeon RX 7700 XT |
156.1 (52.1min, 85.6P0.1, 89.5P1) fps -10% |
Media NVIDIA GeForce RTX 3080
(151 - 155, n=2) | |
Media NVIDIA Titan RTX
(135 - 141.9, n=3) | |
Media NVIDIA GeForce RTX 3070
(117 - 124.9, n=3) | |
Media NVIDIA GeForce RTX 4060 Ti 8G
(115.7 - 120.2, n=3) | |
KFA2 GeForce RTX 4060 Ti EX, 16GB GDDR6
AMD Ryzen 9 7950X, NVIDIA GeForce RTX 4060 Ti 16G |
113.3 (49.6min, 62.7P0.1, 94.3P1) fps -34% |
XFX Speedster QICK 308 Radeon RX 7600 Black Edition
AMD Ryzen 9 7950X, AMD Radeon RX 7600 |
100.3 (52.4min, 55.2P0.1, 57.3P1) fps -42% |
KFA2 GeForce RTX 4060 1-Click-OC 2X
AMD Ryzen 9 7950X, NVIDIA GeForce RTX 4060 |
92.6 (60min, 71.7P0.1, 78.5P1) fps -46% |
|
|
NVIDIA GeForce RTX 4090 Founders Edition
Intel Core i9-13900K, NVIDIA GeForce RTX 4090 | |
Media della classe Desktop
(76.7 - 168, n=13, ultimi 2 anni) | |
NVIDIA GeForce RTX 4080 Founders Edition
Intel Core i9-13900K, NVIDIA GeForce RTX 4080 | |
AMD Radeon RX 7900 XTX
AMD Ryzen 9 7950X, AMD Radeon RX 7900 XTX | |
Zotac Gaming GeForce RTX 3090 Ti AMP Extreme Holo
AMD Ryzen 7 5800X3D, NVIDIA GeForce RTX 3090 Ti | |
Gigabyte Aorus GeForce RTX 4070 Ti Master
Intel Core i9-13900K, NVIDIA GeForce RTX 4070 Ti | |
AMD Radeon RX 7900 XT
AMD Ryzen 9 7950X, AMD Radeon RX 7900 XT | |
Asus TUF Gaming GeForce RTX 4070 Ti
Intel Core i9-13900K, NVIDIA GeForce RTX 4070 Ti | |
Media NVIDIA GeForce RTX 4070 Ti
(71.9 - 74.9, n=4) | |
Media NVIDIA GeForce RTX 3090
(68 - 75.3, n=13) | |
Media NVIDIA GeForce RTX 3080 Ti
(71.2 - 74, n=4) | |
NVIDIA GeForce RTX 4070 Super Founders Edition
Intel Core i9-13900K, NVIDIA GeForce RTX 4070 SUPER | |
Media NVIDIA GeForce RTX 3080
(61.5 - 61.9, n=2) | |
Sapphire AMD Radeon RX 6950 XT Nitro+ Pure
AMD Ryzen 9 5900X, AMD Radeon RX 6950 XT | |
AMD Radeon RX 6900 XT
AMD Ryzen 9 5950X, AMD Radeon RX 6900 XT (SAM ENABLED) | |
AMD Radeon RX 6900 XT
AMD Ryzen 9 5950X, AMD Radeon RX 6900 XT | |
Zotac Gaming GeForce RTX 4070 AMP Airo
Intel Core i9-13900K, NVIDIA GeForce RTX 4070 | |
AMD Radeon RX 7800 XT
AMD Ryzen 9 7950X, AMD Radeon RX 7800 XT | |
AMD Radeon RX 6800 XT
AMD Ryzen 9 5950X, AMD Radeon RX 6800 XT | |
Sapphire Pulse Radeon RX 7700 XT
AMD Ryzen 9 7950X, AMD Radeon RX 7700 XT | |
Media NVIDIA Titan RTX
(46 - 52.8, n=29) | |
Media NVIDIA GeForce RTX 3070
(42.7 - 46.3, n=5) | |
Media NVIDIA GeForce RTX 4060 Ti 8G
(43.1 - 43.7, n=3) | |
KFA2 GeForce RTX 4060 Ti EX, 16GB GDDR6
AMD Ryzen 9 7950X, NVIDIA GeForce RTX 4060 Ti 16G | |
XFX Speedster QICK 308 Radeon RX 7600 Black Edition
AMD Ryzen 9 7950X, AMD Radeon RX 7600 | |
KFA2 GeForce RTX 4060 1-Click-OC 2X
AMD Ryzen 9 7950X, NVIDIA GeForce RTX 4060 | |
|
NVIDIA GeForce RTX 4090 Founders Edition
Intel Core i9-13900K, NVIDIA GeForce RTX 4090 | |
Media della classe Desktop
(129.5 - 223, n=13, ultimi 2 anni) | |
NVIDIA GeForce RTX 4080 Founders Edition
Intel Core i9-13900K, NVIDIA GeForce RTX 4080 | |
AMD Radeon RX 7900 XTX
AMD Ryzen 9 7950X, AMD Radeon RX 7900 XTX | |
Zotac Gaming GeForce RTX 3090 Ti AMP Extreme Holo
AMD Ryzen 7 5800X3D, NVIDIA GeForce RTX 3090 Ti | |
Gigabyte Aorus GeForce RTX 4070 Ti Master
Intel Core i9-13900K, NVIDIA GeForce RTX 4070 Ti | |
Asus TUF Gaming GeForce RTX 4070 Ti
Intel Core i9-13900K, NVIDIA GeForce RTX 4070 Ti | |
Media NVIDIA GeForce RTX 4070 Ti
(134.3 - 142, n=4) | |
AMD Radeon RX 7900 XT
AMD Ryzen 9 7950X, AMD Radeon RX 7900 XT | |
NVIDIA GeForce RTX 4070 Super Founders Edition
Intel Core i9-13900K, NVIDIA GeForce RTX 4070 SUPER | |
Media NVIDIA GeForce RTX 3080 Ti
(114 - 130.2, n=4) | |
Media NVIDIA GeForce RTX 3090
(105 - 131.6, n=13) | |
Zotac Gaming GeForce RTX 4070 AMP Airo
Intel Core i9-13900K, NVIDIA GeForce RTX 4070 | |
Sapphire AMD Radeon RX 6950 XT Nitro+ Pure
AMD Ryzen 9 5900X, AMD Radeon RX 6950 XT | |
AMD Radeon RX 6900 XT
AMD Ryzen 9 5950X, AMD Radeon RX 6900 XT (SAM ENABLED) | |
AMD Radeon RX 6900 XT
AMD Ryzen 9 5950X, AMD Radeon RX 6900 XT | |
AMD Radeon RX 7800 XT
AMD Ryzen 9 7950X, AMD Radeon RX 7800 XT | |
Media NVIDIA GeForce RTX 3080
(95.7 - 103, n=2) | |
AMD Radeon RX 6800 XT
AMD Ryzen 9 5950X, AMD Radeon RX 6800 XT | |
Sapphire Pulse Radeon RX 7700 XT
AMD Ryzen 9 7950X, AMD Radeon RX 7700 XT | |
Media NVIDIA Titan RTX
(74 - 93.1, n=29) | |
Media NVIDIA GeForce RTX 4060 Ti 8G
(83.9 - 85.2, n=3) | |
KFA2 GeForce RTX 4060 Ti EX, 16GB GDDR6
AMD Ryzen 9 7950X, NVIDIA GeForce RTX 4060 Ti 16G | |
Media NVIDIA GeForce RTX 3070
(75.1 - 82.9, n=5) | |
XFX Speedster QICK 308 Radeon RX 7600 Black Edition
AMD Ryzen 9 7950X, AMD Radeon RX 7600 | |
KFA2 GeForce RTX 4060 1-Click-OC 2X
AMD Ryzen 9 7950X, NVIDIA GeForce RTX 4060 | |
|
NVIDIA GeForce RTX 4090 Founders Edition
Intel Core i9-13900K, NVIDIA GeForce RTX 4090 | |
NVIDIA GeForce RTX 4080 Founders Edition
Intel Core i9-13900K, NVIDIA GeForce RTX 4080 | |
Asus TUF Gaming GeForce RTX 4070 Ti
Intel Core i9-13900K, NVIDIA GeForce RTX 4070 Ti | |
Gigabyte Aorus GeForce RTX 4070 Ti Master
Intel Core i9-13900K, NVIDIA GeForce RTX 4070 Ti | |
AMD Radeon RX 7900 XTX
AMD Ryzen 9 7950X, AMD Radeon RX 7900 XTX | |
Media NVIDIA GeForce RTX 4070 Ti
(171.4 - 186.9, n=4) | |
Zotac Gaming GeForce RTX 3090 Ti AMP Extreme Holo
AMD Ryzen 7 5800X3D, NVIDIA GeForce RTX 3090 Ti | |
AMD Radeon RX 7900 XT
AMD Ryzen 9 7950X, AMD Radeon RX 7900 XT | |
Media della classe Desktop
(6.4 - 248, n=14, ultimi 2 anni) | |
NVIDIA GeForce RTX 4070 Super Founders Edition
Intel Core i9-13900K, NVIDIA GeForce RTX 4070 SUPER | |
Zotac Gaming GeForce RTX 4070 AMP Airo
Intel Core i9-13900K, NVIDIA GeForce RTX 4070 | |
Media NVIDIA GeForce RTX 3080 Ti
(129 - 164.9, n=4) | |
Media NVIDIA GeForce RTX 3090
(117 - 170.1, n=13) | |
AMD Radeon RX 7800 XT
AMD Ryzen 9 7950X, AMD Radeon RX 7800 XT | |
AMD Radeon RX 6900 XT
AMD Ryzen 9 5950X, AMD Radeon RX 6900 XT (SAM ENABLED) | |
AMD Radeon RX 6900 XT
AMD Ryzen 9 5950X, AMD Radeon RX 6900 XT | |
Sapphire AMD Radeon RX 6950 XT Nitro+ Pure
AMD Ryzen 9 5900X, AMD Radeon RX 6950 XT | |
Sapphire Pulse Radeon RX 7700 XT
AMD Ryzen 9 7950X, AMD Radeon RX 7700 XT | |
Media NVIDIA GeForce RTX 3080
(117 - 128, n=2) | |
Media NVIDIA GeForce RTX 4060 Ti 8G
(121.5 - 123.5, n=3) | |
AMD Radeon RX 6800 XT
AMD Ryzen 9 5950X, AMD Radeon RX 6800 XT | |
KFA2 GeForce RTX 4060 Ti EX, 16GB GDDR6
AMD Ryzen 9 7950X, NVIDIA GeForce RTX 4060 Ti 16G | |
Media NVIDIA Titan RTX
(77.2 - 128.7, n=29) | |
Media NVIDIA GeForce RTX 3070
(95.3 - 108.9, n=5) | |
XFX Speedster QICK 308 Radeon RX 7600 Black Edition
AMD Ryzen 9 7950X, AMD Radeon RX 7600 | |
KFA2 GeForce RTX 4060 1-Click-OC 2X
AMD Ryzen 9 7950X, NVIDIA GeForce RTX 4060 | |
|
|
Media della classe Desktop
(177.2 - 239, n=13, ultimi 2 anni) | |
NVIDIA GeForce RTX 4090 Founders Edition
Intel Core i9-13900K, NVIDIA GeForce RTX 4090 | |
NVIDIA GeForce RTX 4080 Founders Edition
Intel Core i9-13900K, NVIDIA GeForce RTX 4080 | |
AMD Radeon RX 7900 XTX
AMD Ryzen 9 7950X, AMD Radeon RX 7900 XTX | |
AMD Radeon RX 7900 XT
AMD Ryzen 9 7950X, AMD Radeon RX 7900 XT | |
Zotac Gaming GeForce RTX 3090 Ti AMP Extreme Holo
AMD Ryzen 7 5800X3D, NVIDIA GeForce RTX 3090 Ti | |
Gigabyte Aorus GeForce RTX 4070 Ti Master
Intel Core i9-13900K, NVIDIA GeForce RTX 4070 Ti | |
Asus TUF Gaming GeForce RTX 4070 Ti
Intel Core i9-13900K, NVIDIA GeForce RTX 4070 Ti | |
Media NVIDIA GeForce RTX 4070 Ti
(102.7 - 104.9, n=4) | |
Sapphire AMD Radeon RX 6950 XT Nitro+ Pure
AMD Ryzen 9 5900X, AMD Radeon RX 6950 XT | |
Media NVIDIA GeForce RTX 3090
(89.3 - 99.7, n=12) | |
Media NVIDIA GeForce RTX 3080 Ti
(93 - 98.6, n=3) | |
NVIDIA GeForce RTX 4070 Super Founders Edition
Intel Core i9-13900K, NVIDIA GeForce RTX 4070 SUPER | |
AMD Radeon RX 6900 XT
AMD Ryzen 9 5950X, AMD Radeon RX 6900 XT (SAM ENABLED) | |
AMD Radeon RX 6900 XT
AMD Ryzen 9 5950X, AMD Radeon RX 6900 XT | |
Media NVIDIA GeForce RTX 3080
(83.9 - 87.9, n=2) | |
Zotac Gaming GeForce RTX 4070 AMP Airo
Intel Core i9-13900K, NVIDIA GeForce RTX 4070 | |
AMD Radeon RX 7800 XT
AMD Ryzen 9 7950X, AMD Radeon RX 7800 XT | |
AMD Radeon RX 6800 XT
AMD Ryzen 9 5950X, AMD Radeon RX 6800 XT | |
Media NVIDIA Titan RTX
(59 - 71.1, n=24) | |
Sapphire Pulse Radeon RX 7700 XT
AMD Ryzen 9 7950X, AMD Radeon RX 7700 XT | |
Media NVIDIA GeForce RTX 3070
(61 - 63.5, n=4) | |
KFA2 GeForce RTX 4060 Ti EX, 16GB GDDR6
AMD Ryzen 9 7950X, NVIDIA GeForce RTX 4060 Ti 16G | |
Media NVIDIA GeForce RTX 4060 Ti 8G
(58.1 - 58.7, n=3) | |
KFA2 GeForce RTX 4060 1-Click-OC 2X
AMD Ryzen 9 7950X, NVIDIA GeForce RTX 4060 | |
XFX Speedster QICK 308 Radeon RX 7600 Black Edition
AMD Ryzen 9 7950X, AMD Radeon RX 7600 | |
|
NVIDIA GeForce RTX 4090 Founders Edition
Intel Core i9-13900K, NVIDIA GeForce RTX 4090 | |
Media della classe Desktop
(223 - 356, n=13, ultimi 2 anni) | |
NVIDIA GeForce RTX 4080 Founders Edition
Intel Core i9-13900K, NVIDIA GeForce RTX 4080 | |
AMD Radeon RX 7900 XTX
AMD Ryzen 9 7950X, AMD Radeon RX 7900 XTX | |
Gigabyte Aorus GeForce RTX 4070 Ti Master
Intel Core i9-13900K, NVIDIA GeForce RTX 4070 Ti | |
AMD Radeon RX 7900 XT
AMD Ryzen 9 7950X, AMD Radeon RX 7900 XT | |
Asus TUF Gaming GeForce RTX 4070 Ti
Intel Core i9-13900K, NVIDIA GeForce RTX 4070 Ti | |
Media NVIDIA GeForce RTX 4070 Ti
(195.9 - 204, n=4) | |
Zotac Gaming GeForce RTX 3090 Ti AMP Extreme Holo
AMD Ryzen 7 5800X3D, NVIDIA GeForce RTX 3090 Ti | |
Sapphire AMD Radeon RX 6950 XT Nitro+ Pure
AMD Ryzen 9 5900X, AMD Radeon RX 6950 XT | |
Media NVIDIA GeForce RTX 3090
(137 - 172.3, n=12) | |
NVIDIA GeForce RTX 4070 Super Founders Edition
Intel Core i9-13900K, NVIDIA GeForce RTX 4070 SUPER | |
Media NVIDIA GeForce RTX 3080 Ti
(157 - 173.3, n=3) | |
AMD Radeon RX 6900 XT
AMD Ryzen 9 5950X, AMD Radeon RX 6900 XT (SAM ENABLED) | |
AMD Radeon RX 6900 XT
AMD Ryzen 9 5950X, AMD Radeon RX 6900 XT | |
Zotac Gaming GeForce RTX 4070 AMP Airo
Intel Core i9-13900K, NVIDIA GeForce RTX 4070 | |
AMD Radeon RX 7800 XT
AMD Ryzen 9 7950X, AMD Radeon RX 7800 XT | |
Media NVIDIA GeForce RTX 3080
(147 - 152, n=2) | |
AMD Radeon RX 6800 XT
AMD Ryzen 9 5950X, AMD Radeon RX 6800 XT | |
Sapphire Pulse Radeon RX 7700 XT
AMD Ryzen 9 7950X, AMD Radeon RX 7700 XT | |
Media NVIDIA GeForce RTX 4060 Ti 8G
(119.3 - 121.2, n=3) | |
KFA2 GeForce RTX 4060 Ti EX, 16GB GDDR6
AMD Ryzen 9 7950X, NVIDIA GeForce RTX 4060 Ti 16G | |
Media NVIDIA Titan RTX
(98 - 128, n=23) | |
Media NVIDIA GeForce RTX 3070
(108 - 116, n=4) | |
KFA2 GeForce RTX 4060 1-Click-OC 2X
AMD Ryzen 9 7950X, NVIDIA GeForce RTX 4060 | |
XFX Speedster QICK 308 Radeon RX 7600 Black Edition
AMD Ryzen 9 7950X, AMD Radeon RX 7600 | |
|
NVIDIA GeForce RTX 4090 Founders Edition
Intel Core i9-13900K, NVIDIA GeForce RTX 4090 | |
NVIDIA GeForce RTX 4080 Founders Edition
Intel Core i9-13900K, NVIDIA GeForce RTX 4080 | |
AMD Radeon RX 7900 XTX
AMD Ryzen 9 7950X, AMD Radeon RX 7900 XTX | |
AMD Radeon RX 7900 XT
AMD Ryzen 9 7950X, AMD Radeon RX 7900 XT | |
Asus TUF Gaming GeForce RTX 4070 Ti
Intel Core i9-13900K, NVIDIA GeForce RTX 4070 Ti | |
Gigabyte Aorus GeForce RTX 4070 Ti Master
Intel Core i9-13900K, NVIDIA GeForce RTX 4070 Ti | |
Media della classe Desktop
(9.4 - 387, n=14, ultimi 2 anni) | |
Media NVIDIA GeForce RTX 4070 Ti
(263 - 280, n=4) | |
Zotac Gaming GeForce RTX 3090 Ti AMP Extreme Holo
AMD Ryzen 7 5800X3D, NVIDIA GeForce RTX 3090 Ti | |
NVIDIA GeForce RTX 4070 Super Founders Edition
Intel Core i9-13900K, NVIDIA GeForce RTX 4070 SUPER | |
Zotac Gaming GeForce RTX 4070 AMP Airo
Intel Core i9-13900K, NVIDIA GeForce RTX 4070 | |
Sapphire AMD Radeon RX 6950 XT Nitro+ Pure
AMD Ryzen 9 5900X, AMD Radeon RX 6950 XT | |
AMD Radeon RX 7800 XT
AMD Ryzen 9 7950X, AMD Radeon RX 7800 XT | |
Media NVIDIA GeForce RTX 3080 Ti
(178 - 238, n=3) | |
Media NVIDIA GeForce RTX 3090
(145 - 240, n=14) | |
AMD Radeon RX 6900 XT
AMD Ryzen 9 5950X, AMD Radeon RX 6900 XT | |
AMD Radeon RX 6900 XT
AMD Ryzen 9 5950X, AMD Radeon RX 6900 XT (SAM ENABLED) | |
Sapphire Pulse Radeon RX 7700 XT
AMD Ryzen 9 7950X, AMD Radeon RX 7700 XT | |
AMD Radeon RX 6800 XT
AMD Ryzen 9 5950X, AMD Radeon RX 6800 XT | |
KFA2 GeForce RTX 4060 Ti EX, 16GB GDDR6
AMD Ryzen 9 7950X, NVIDIA GeForce RTX 4060 Ti 16G | |
Media NVIDIA GeForce RTX 4060 Ti 8G
(181.6 - 184, n=3) | |
Media NVIDIA GeForce RTX 3080
(177 - 185, n=2) | |
Media NVIDIA GeForce RTX 3070
(138 - 160, n=4) | |
Media NVIDIA Titan RTX
(106 - 178.8, n=24) | |
KFA2 GeForce RTX 4060 1-Click-OC 2X
AMD Ryzen 9 7950X, NVIDIA GeForce RTX 4060 | |
XFX Speedster QICK 308 Radeon RX 7600 Black Edition
AMD Ryzen 9 7950X, AMD Radeon RX 7600 | |
|
|
NVIDIA GeForce RTX 4090 Founders Edition
Intel Core i9-13900K, NVIDIA GeForce RTX 4090 |
160.2 (42.5min, 66.5P0.1, 122.8P1) fps +99% |
NVIDIA GeForce RTX 4080 Founders Edition
Intel Core i9-13900K, NVIDIA GeForce RTX 4080 |
115.6 (34.7min, 70.3P0.1, 99.3P1) fps +44% |
Zotac Gaming GeForce RTX 3090 Ti AMP Extreme Holo
AMD Ryzen 7 5800X3D, NVIDIA GeForce RTX 3090 Ti |
99.2 (29.7min, 56P0.1, 77.1P1) fps +23% |
Asus TUF Gaming GeForce RTX 4070 Ti
Intel Core i9-13900K, NVIDIA GeForce RTX 4070 Ti |
88.9 (34.4min, 62P0.1, 77.4P1) fps +10% |
Media NVIDIA GeForce RTX 4070 Ti
(88.2 - 88.9, n=2) | |
Gigabyte Aorus GeForce RTX 4070 Ti Master
Intel Core i9-13900K, NVIDIA GeForce RTX 4070 Ti |
88.2 (38min, 50P0.1, 75.9P1) fps +10% |
Media NVIDIA GeForce RTX 3090
(84.5 - 89.1, n=2) | |
Media NVIDIA GeForce RTX 3080 Ti
(n=1) | |
NVIDIA GeForce RTX 4070 Super Founders Edition
Intel Core i9-13900K, NVIDIA GeForce RTX 4070 SUPER |
80.5 (17.6min, 28.5P0.1, 67.4P1) fps |
Sapphire AMD Radeon RX 6950 XT Nitro+ Pure
AMD Ryzen 9 5900X, AMD Radeon RX 6950 XT |
80.4 (44.2min, 56.8P0.1, 70.5P1) fps 0% |
Media NVIDIA GeForce RTX 3080
(78.1 - 78.2, n=2) | |
Zotac Gaming GeForce RTX 4070 AMP Airo
Intel Core i9-13900K, NVIDIA GeForce RTX 4070 |
72.3 (32.3min, 50.2P0.1, 64.6P1) fps -10% |
AMD Radeon RX 6900 XT
AMD Ryzen 9 5950X, AMD Radeon RX 6900 XT |
67 (32.3min, 41.7P0.1, 44.7P1) fps -17% |
Media NVIDIA Titan RTX
(n=1) | |
AMD Radeon RX 6800 XT
AMD Ryzen 9 5950X, AMD Radeon RX 6800 XT |
62.6 (28min, 37.6P0.1, 49.2P1) fps -22% |
Media NVIDIA GeForce RTX 3070
(55.2 - 56.6, n=2) | |
|
NVIDIA GeForce RTX 4090 Founders Edition
Intel Core i9-13900K, NVIDIA GeForce RTX 4090 |
238 (71.6min, 84.3P0.1, 162.7P1) fps +52% |
NVIDIA GeForce RTX 4080 Founders Edition
Intel Core i9-13900K, NVIDIA GeForce RTX 4080 |
214 (100.6min, 149.1P0.1, 172.3P1) fps +36% |
Gigabyte Aorus GeForce RTX 4070 Ti Master
Intel Core i9-13900K, NVIDIA GeForce RTX 4070 Ti |
175.5 (51.6min, 61P0.1, 140.4P1) fps +12% |
Zotac Gaming GeForce RTX 3090 Ti AMP Extreme Holo
AMD Ryzen 7 5800X3D, NVIDIA GeForce RTX 3090 Ti |
173.9 (73.1min, 101.4P0.1, 134.6P1) fps +11% |
Media NVIDIA GeForce RTX 4070 Ti
(171.9 - 175.5, n=2) | |
Asus TUF Gaming GeForce RTX 4070 Ti
Intel Core i9-13900K, NVIDIA GeForce RTX 4070 Ti |
171.9 (100min, 119.6P0.1, 144.6P1) fps +10% |
NVIDIA GeForce RTX 4070 Super Founders Edition
Intel Core i9-13900K, NVIDIA GeForce RTX 4070 SUPER |
156.8 (45.5min, 105.1P0.1, 131P1) fps |
Sapphire AMD Radeon RX 6950 XT Nitro+ Pure
AMD Ryzen 9 5900X, AMD Radeon RX 6950 XT |
156.2 (30min, 87.3P0.1, 114P1) fps 0% |
Media NVIDIA GeForce RTX 3090
(142.3 - 149, n=2) | |
Media NVIDIA GeForce RTX 3080 Ti
(n=1) | |
Zotac Gaming GeForce RTX 4070 AMP Airo
Intel Core i9-13900K, NVIDIA GeForce RTX 4070 |
141.1 (38.7min, 98.7P0.1, 118.6P1) fps -10% |
Media NVIDIA GeForce RTX 3080
(127 - 137, n=2) | |
AMD Radeon RX 6900 XT
AMD Ryzen 9 5950X, AMD Radeon RX 6900 XT |
120 (17.6min, 61.2P0.1, 83.1P1) fps -23% |
AMD Radeon RX 6800 XT
AMD Ryzen 9 5950X, AMD Radeon RX 6800 XT |
112 (23.5min, 64P0.1, 80.8P1) fps -29% |
Media NVIDIA Titan RTX
(n=1) | |
Media NVIDIA GeForce RTX 3070
(98.1 - 98.7, n=2) | |
|
NVIDIA GeForce RTX 4080 Founders Edition
Intel Core i9-13900K, NVIDIA GeForce RTX 4080 |
260 (58.1min, 133.7P0.1, 187.5P1) fps +20% |
NVIDIA GeForce RTX 4090 Founders Edition
Intel Core i9-13900K, NVIDIA GeForce RTX 4090 |
255 (80.7min, 89.2P0.1, 169.4P1) fps +18% |
Gigabyte Aorus GeForce RTX 4070 Ti Master
Intel Core i9-13900K, NVIDIA GeForce RTX 4070 Ti |
249 (29.7min, 62.5P0.1, 182.6P1) fps +15% |
Media NVIDIA GeForce RTX 4070 Ti
(241 - 249, n=2) | |
Asus TUF Gaming GeForce RTX 4070 Ti
Intel Core i9-13900K, NVIDIA GeForce RTX 4070 Ti |
241 (107.5min, 136.3P0.1, 183.2P1) fps +12% |
Zotac Gaming GeForce RTX 3090 Ti AMP Extreme Holo
AMD Ryzen 7 5800X3D, NVIDIA GeForce RTX 3090 Ti |
231 (84.7min, 116.2P0.1, 160.4P1) fps +7% |
NVIDIA GeForce RTX 4070 Super Founders Edition
Intel Core i9-13900K, NVIDIA GeForce RTX 4070 SUPER |
216 (100.5min, 122.8P0.1, 159.4P1) fps |
Zotac Gaming GeForce RTX 4070 AMP Airo
Intel Core i9-13900K, NVIDIA GeForce RTX 4070 |
207 (53.5min, 121.4P0.1, 159.4P1) fps -4% |
Sapphire AMD Radeon RX 6950 XT Nitro+ Pure
AMD Ryzen 9 5900X, AMD Radeon RX 6950 XT |
175.5 (38.6min, 86.6P0.1, 117.6P1) fps -19% |
Media NVIDIA GeForce RTX 3080 Ti
(n=1) | |
Media NVIDIA GeForce RTX 3090
(157 - 158.8, n=2) | |
Media NVIDIA GeForce RTX 3080
(144 - 169, n=2) | |
AMD Radeon RX 6900 XT
AMD Ryzen 9 5950X, AMD Radeon RX 6900 XT |
138 (32.8min, 68.1P0.1, 90.2P1) fps -36% |
Media NVIDIA GeForce RTX 3070
(124 - 132, n=2) | |
Media NVIDIA Titan RTX
(n=1) | |
AMD Radeon RX 6800 XT
AMD Ryzen 9 5950X, AMD Radeon RX 6800 XT |
121 (23.7min, 68P0.1, 83.3P1) fps -44% |