Notebookcheck Logo

Recensione del Gigabyte GeForce RTX 4070 Super Gaming OC 12G: Batte la RTX 3090 e la RX 7800 XT per una differenza di 50 dollari rispetto alla Founders Edition

AD104 fatto bene. Gigabyte GeForce RTX 4070 Super Gaming OC presenta un die AD104 più veloce e un raffreddamento migliore che la distinguono completamente dalla scheda Founders Edition. La RTX 4070 Super Gaming OC offre guadagni palpabili rispetto alla RTX 3090 e alla AMD Radeon RX 7800 XT. La nostra recensione analizza se vale la pena spendere 50 dollari in più rispetto alla RTX 4070 Super Founders Edition.
Gigabyte GeForce RTX 4070 Super Gaming OC 12G in recensione

Recentemente abbiamo recensito la Nvidia GeForce RTX 4070 Super Founders Edition e abbiamo visto che offre prestazioni in linea con la RTX 3090. Oltre alla Founders Edition (FE), i partner della scheda aggiuntiva (AiB) di Nvidia hanno la propria interpretazione della nuova GPU AD104 con 7.168 core CUDA.

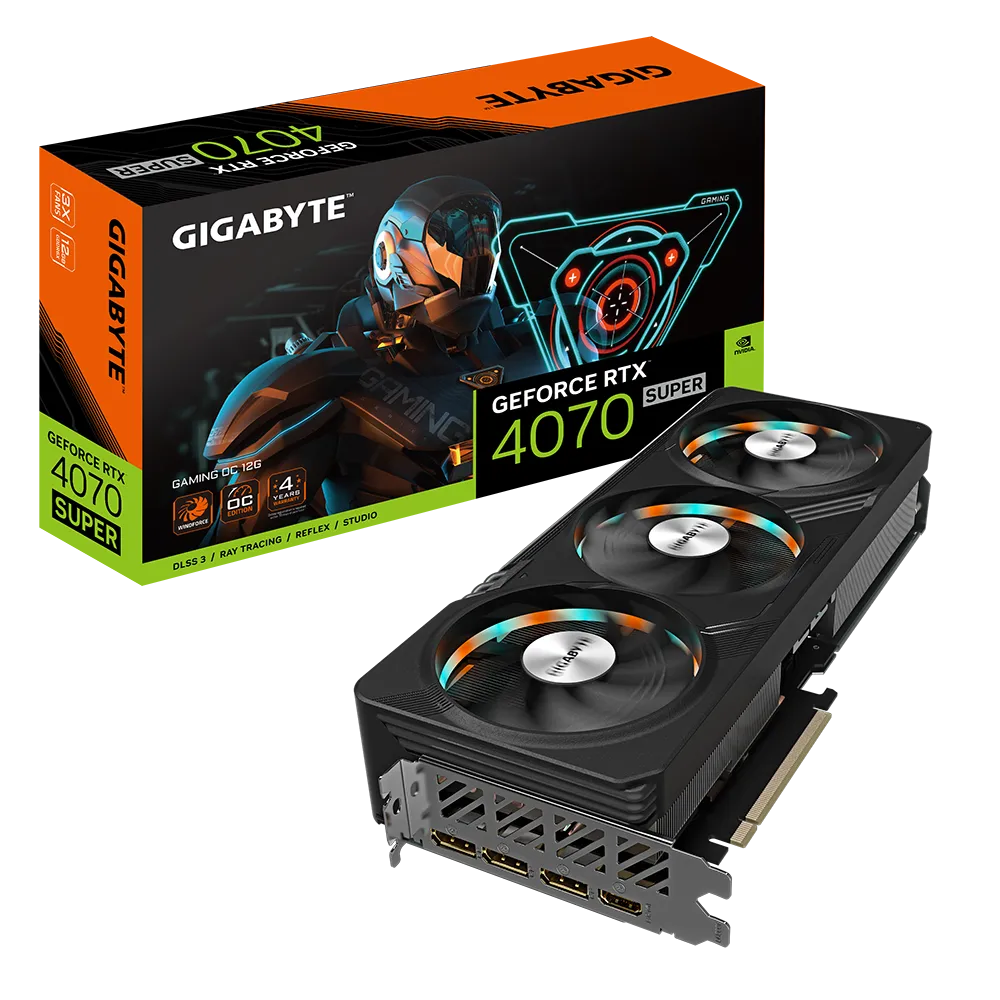
Una di queste offerte è la nuova Gigabyte GeForce RTX 4070 Super Gaming OC 12G.

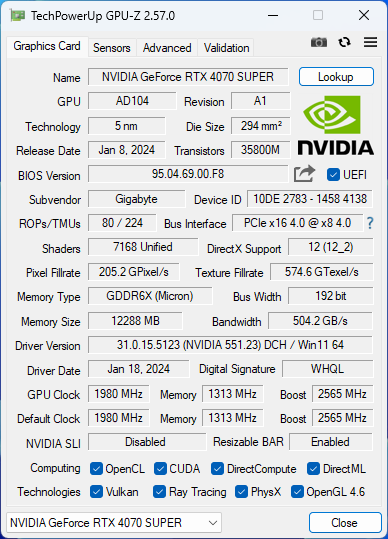
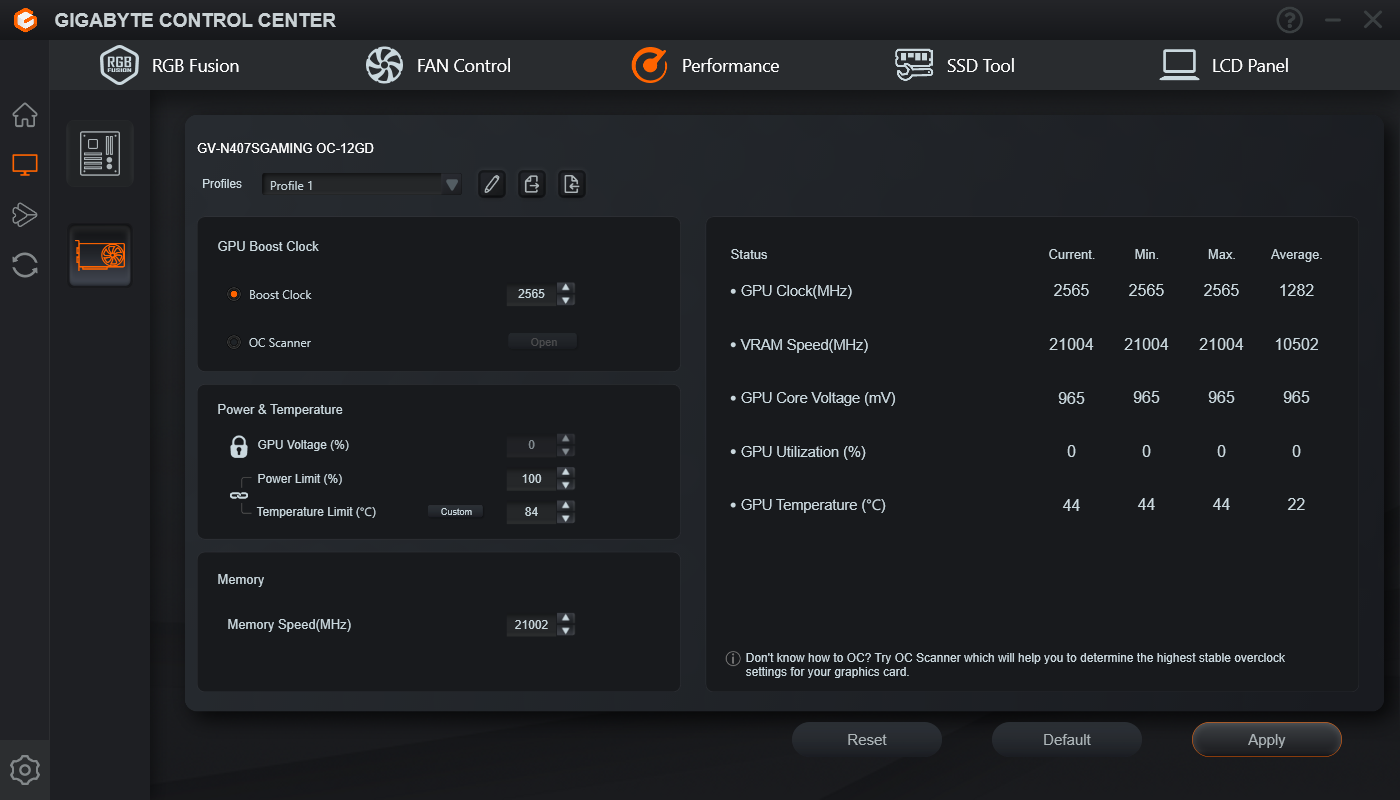
A parte le ovvie modifiche al design rispetto alla Founders Edition, Gigabyte GeForce RTX 4070 Super Gaming OC 12G offre anche un boost aumentato di 2.565 MHz rispetto al boost clock di riferimento di 2.475 MHz.

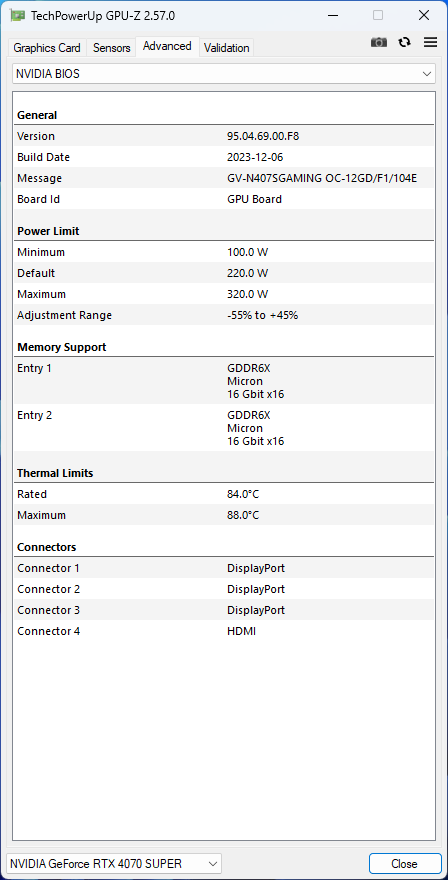
Inoltre, la scheda di Gigabyte offre anche una maggiore capacità di alimentazione, con la possibilità di spingere fino a 320 W rispetto ai 240 W massimi del TGP della RTX 4070 Super FE.

Gigabyte GeForce RTX 4070 Super Gaming OC 12G viene venduta al prezzo di ₹62.490 in India o 650 dollari negli Stati Uniti. La scheda viene fornita con una garanzia standard del produttore di tre anni, estendibile di un altro anno previa registrazione del prodotto.

In questa recensione, vediamo come il sovrapprezzo di 50 dollari della RTX 4070 Super Gaming OC 12G rispetto all'MSRP di 599 dollari della Founders Edition si traduce in vantaggi reali.

Confronto tra Gigabyte GeForce RTX 4070 Super Gaming OC 12G e altre GPU Nvidia

Specifiche RTX 4090 FE RTX 4080 Super FE RTX 4080 FE Asus TUF RTX 4070 Ti Gigabyte RTX 4070 Super Gaming OC ZotacRTX 4070 AMP Airo KFA2RTX 4060 Ti EX RTX 3090 Ti FE RTX 3090 FE RTX 3080 Ti FE RTX 3070 FE Titan RTX
Chip AD102 AD103 AD103 AD104 AD104 AD104 AD106 GA102 GA102 GA102 GA104 TU102
Processo FinFET Custom 4N Custom 4N Custom 4N Custom 4N Custom 4N Custom 4N Custom 4N 8 nm 8 nm 8 nm 8 nm 12 nm
CUDA Cores 16.384 10.240 9.728 7.680 7.168 5.888 4.352 10.752 10.496 10.240 5.888 4.608
Unità di struttura 512 320 304 240 224 184 136 336 328 320 184 288
Nuclei Tensori 512 4° Gen. 320 4° Gen. 304 4° Gen. 240 4° Gen. 224 4° Gen. 184 4° Gen. 136 4° Gen. 336 3° Gen. 328 3° Gen. 320 3° Gen. 184 3° Gen. 576 2° Gen.
RT Cores 128 3a Gen. 80 3a Gen. 76 3a Gen. 60 3a Gen. 56 3a Gen. 46 3a Gen. 34 3a Gen. 84 2a Gen. 82 2a Gen. 80 2a Gen. 46 2a Gen. 72
GPU Base Clock 2.235 MHz 2.295 MHz 2.205 MHz 2.310 MHz 1.980 MHz 1.920 MHz 2.310 MHz 1.560 MHz 1.395 MHz 1.365 MHz 1.500 MHz 1.350 MHz
GPU Boost Clock 2.520 MHz 2.550 MHz 2.505 MHz 2.760 MHz 2.565 MHz 2.535 MHz 2.535 MHz 1.860 MHz 1.695 MHz 1.665 MHz 1.750 MHz 1.770 MHz
Bus di memoria 384-bit 256-bit 256-bit 192-bit 192-bit 192-bit 128-bit 384-bit 384-bit 384-bit 256-bit 384-bit
Larghezza di banda della memoria 1.008 GB/s 736,3 GB/s 716,8 GB/s 504 GB/s 504 GB/s 504 GB/s 288 GB/s 1.008 GB/s 936 GB/s 912 GB/s 448 GB/s 672 GB/s
Memoria video 24 GB GDDR6X 16 GB GDDR6X 16 GB GDDR6X 12 GB GDDR6X 12 GB GDDR6X 12 GB GDDR6X 8 GB GDDR6 24 GB GDDR6X 24 GB GDDR6X 12 GB GDDR6X 8 GB GDDR6 24 GB GDDR6
Consumo energetico 450 W 320 W 320 W 285 W 220 W 215 W 160 W 450 W 350 W 350 W 220 W 280 W

Un tour di Gigabyte GeForce RTX 4070 Super Gaming OC 12G

Gigabyte GeForce RTX 4070 Super Gaming OC 12G sembra esattamente identico al suo predecessore RTX 4070. Pertanto, i cambiamenti sono interni e hanno a che fare con il nuovo core AD104 stesso.

Con le dimensioni di 300 x 130 x 57,6 mm, la RTX 4070 Super Gaming OC si adatta facilmente alla maggior parte dei casi ATX. Dato il peso relativamente leggero di 1,26 kg della scheda, Gigabyte non fornisce alcuna staffa anti-sagoma nella confezione.

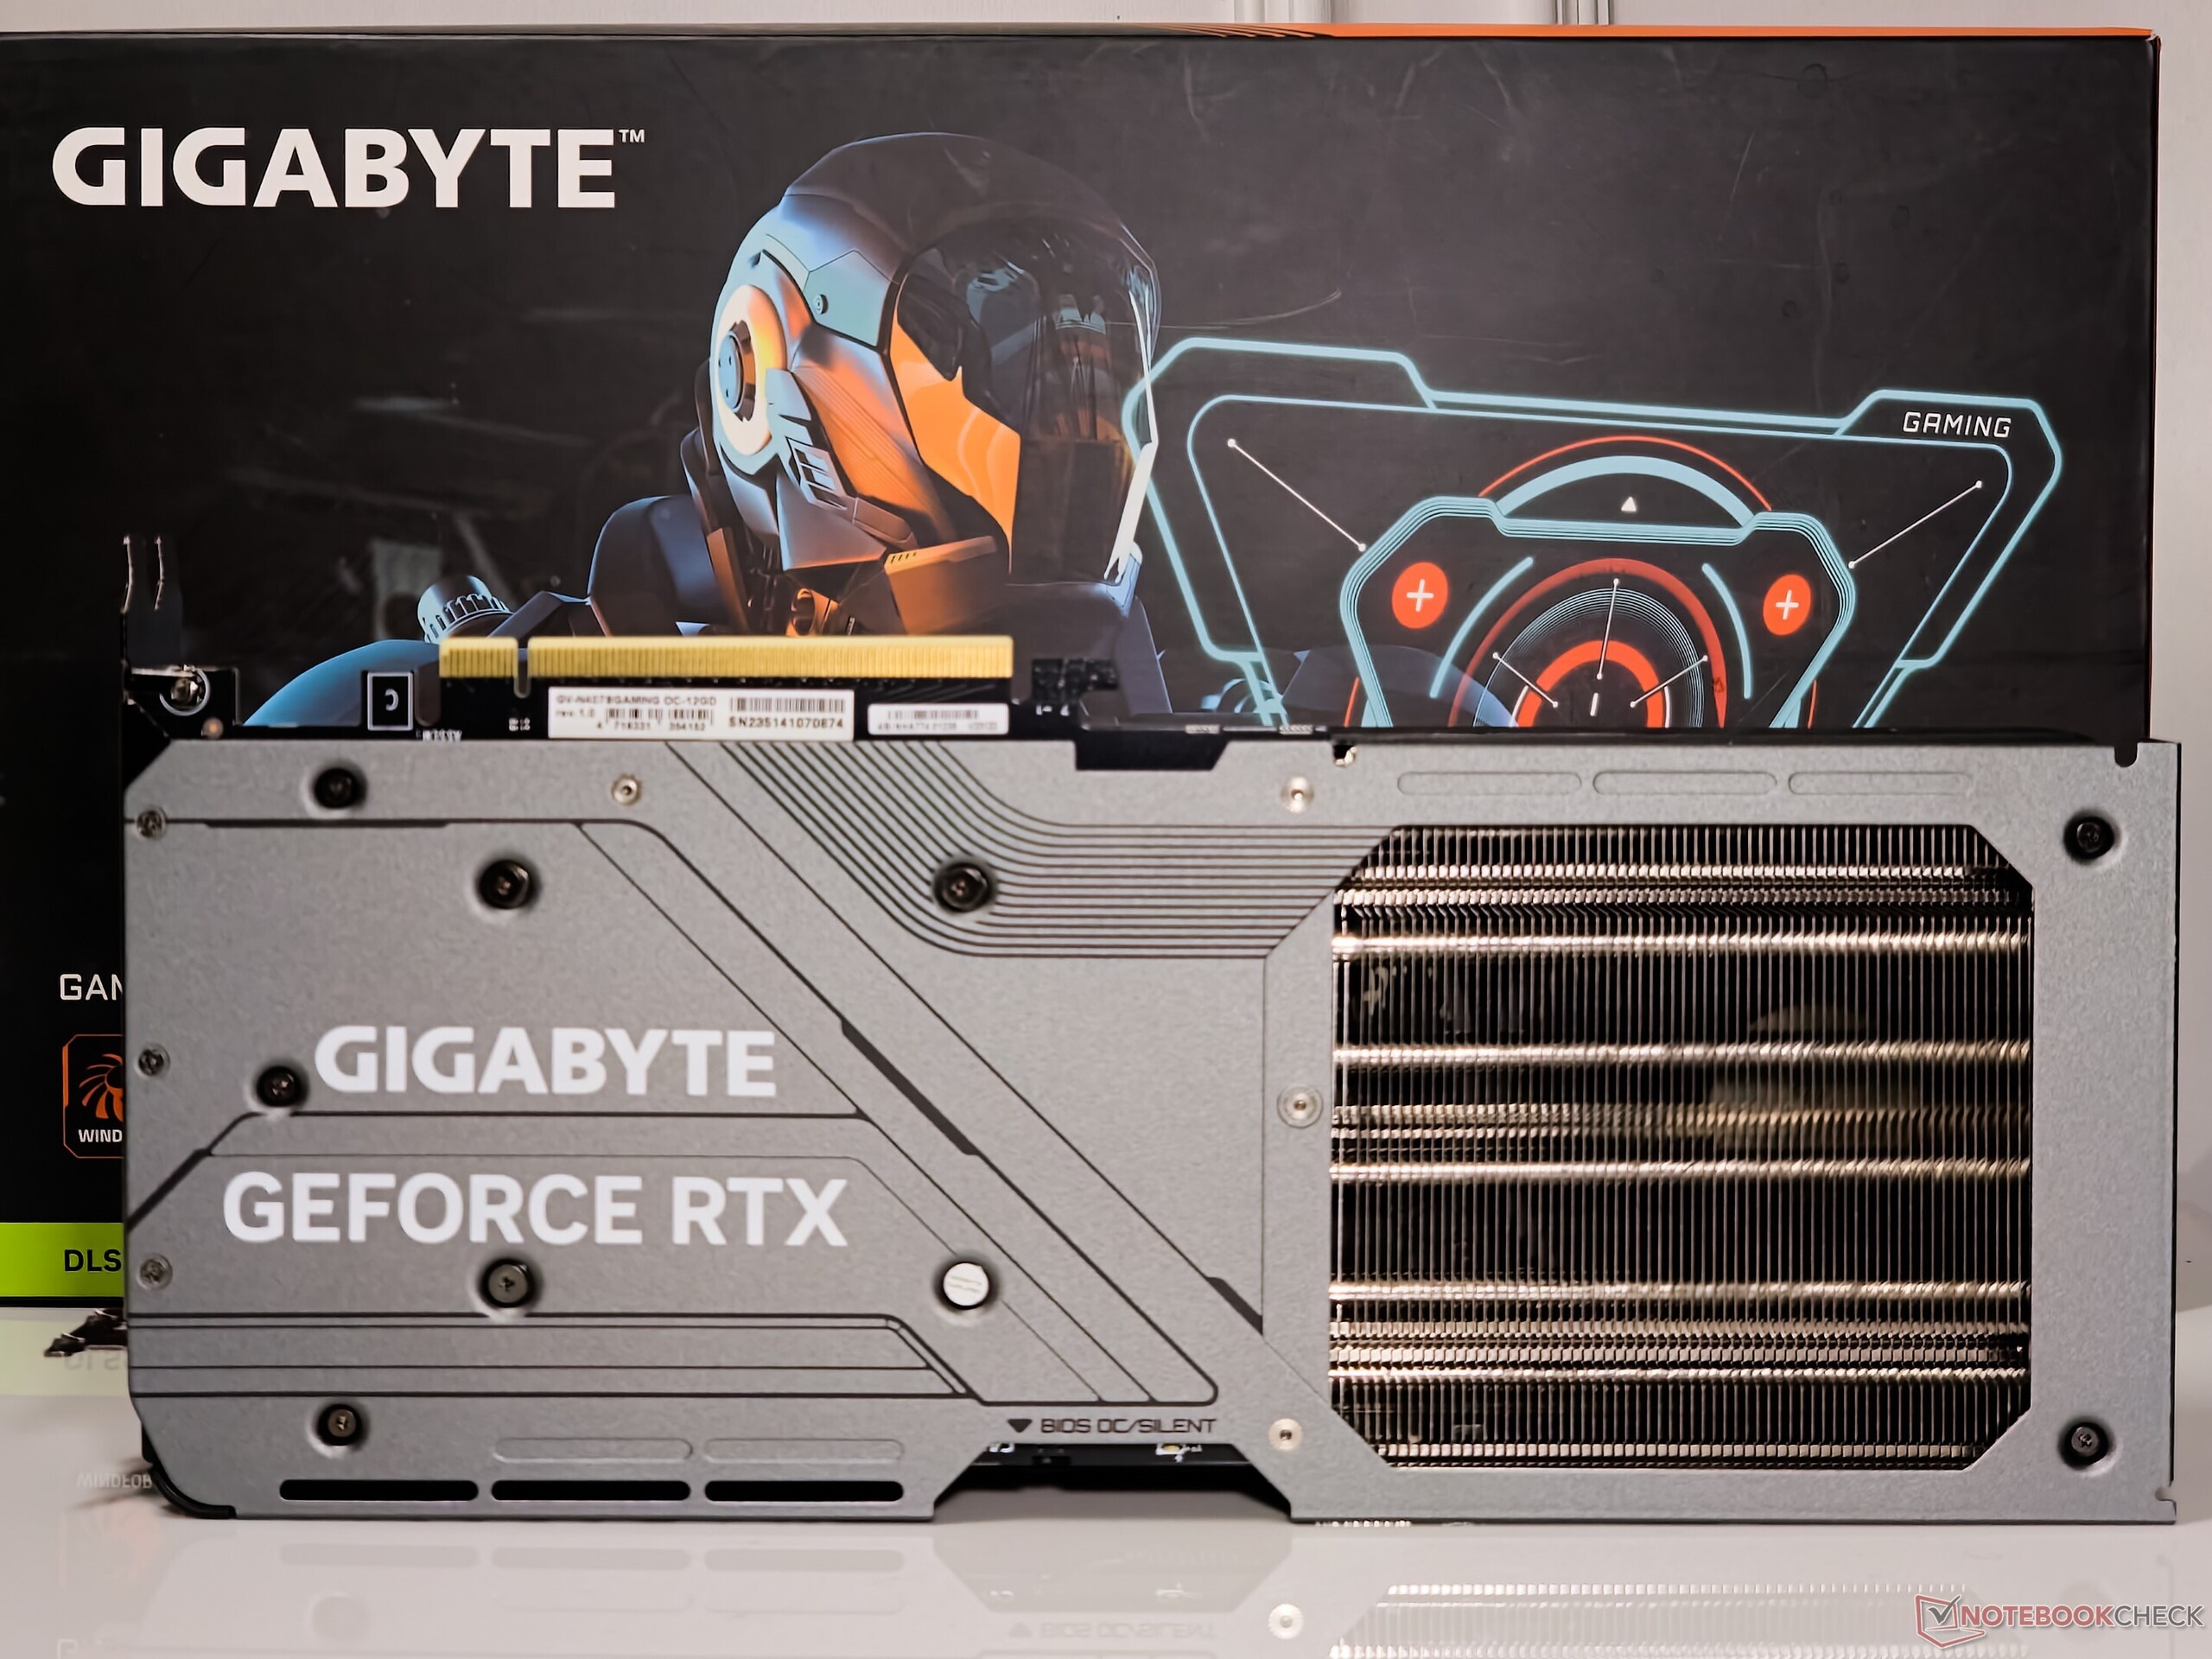
Il rivestimento anteriore della scheda è in plastica, ma la piastra posteriore è realizzata in metallo di alta qualità, con uno spazio adeguato per lo scarico dell'aria che l'azienda definisce "Screen cooling".

Gigabyte GeForce RTX 4070 Super Gaming OC 12G: Parte anteriore
Gigabyte GeForce RTX 4070 Super Gaming OC 12G: Posteriore
Gigabyte GeForce RTX 4070 Super Gaming OC 12G

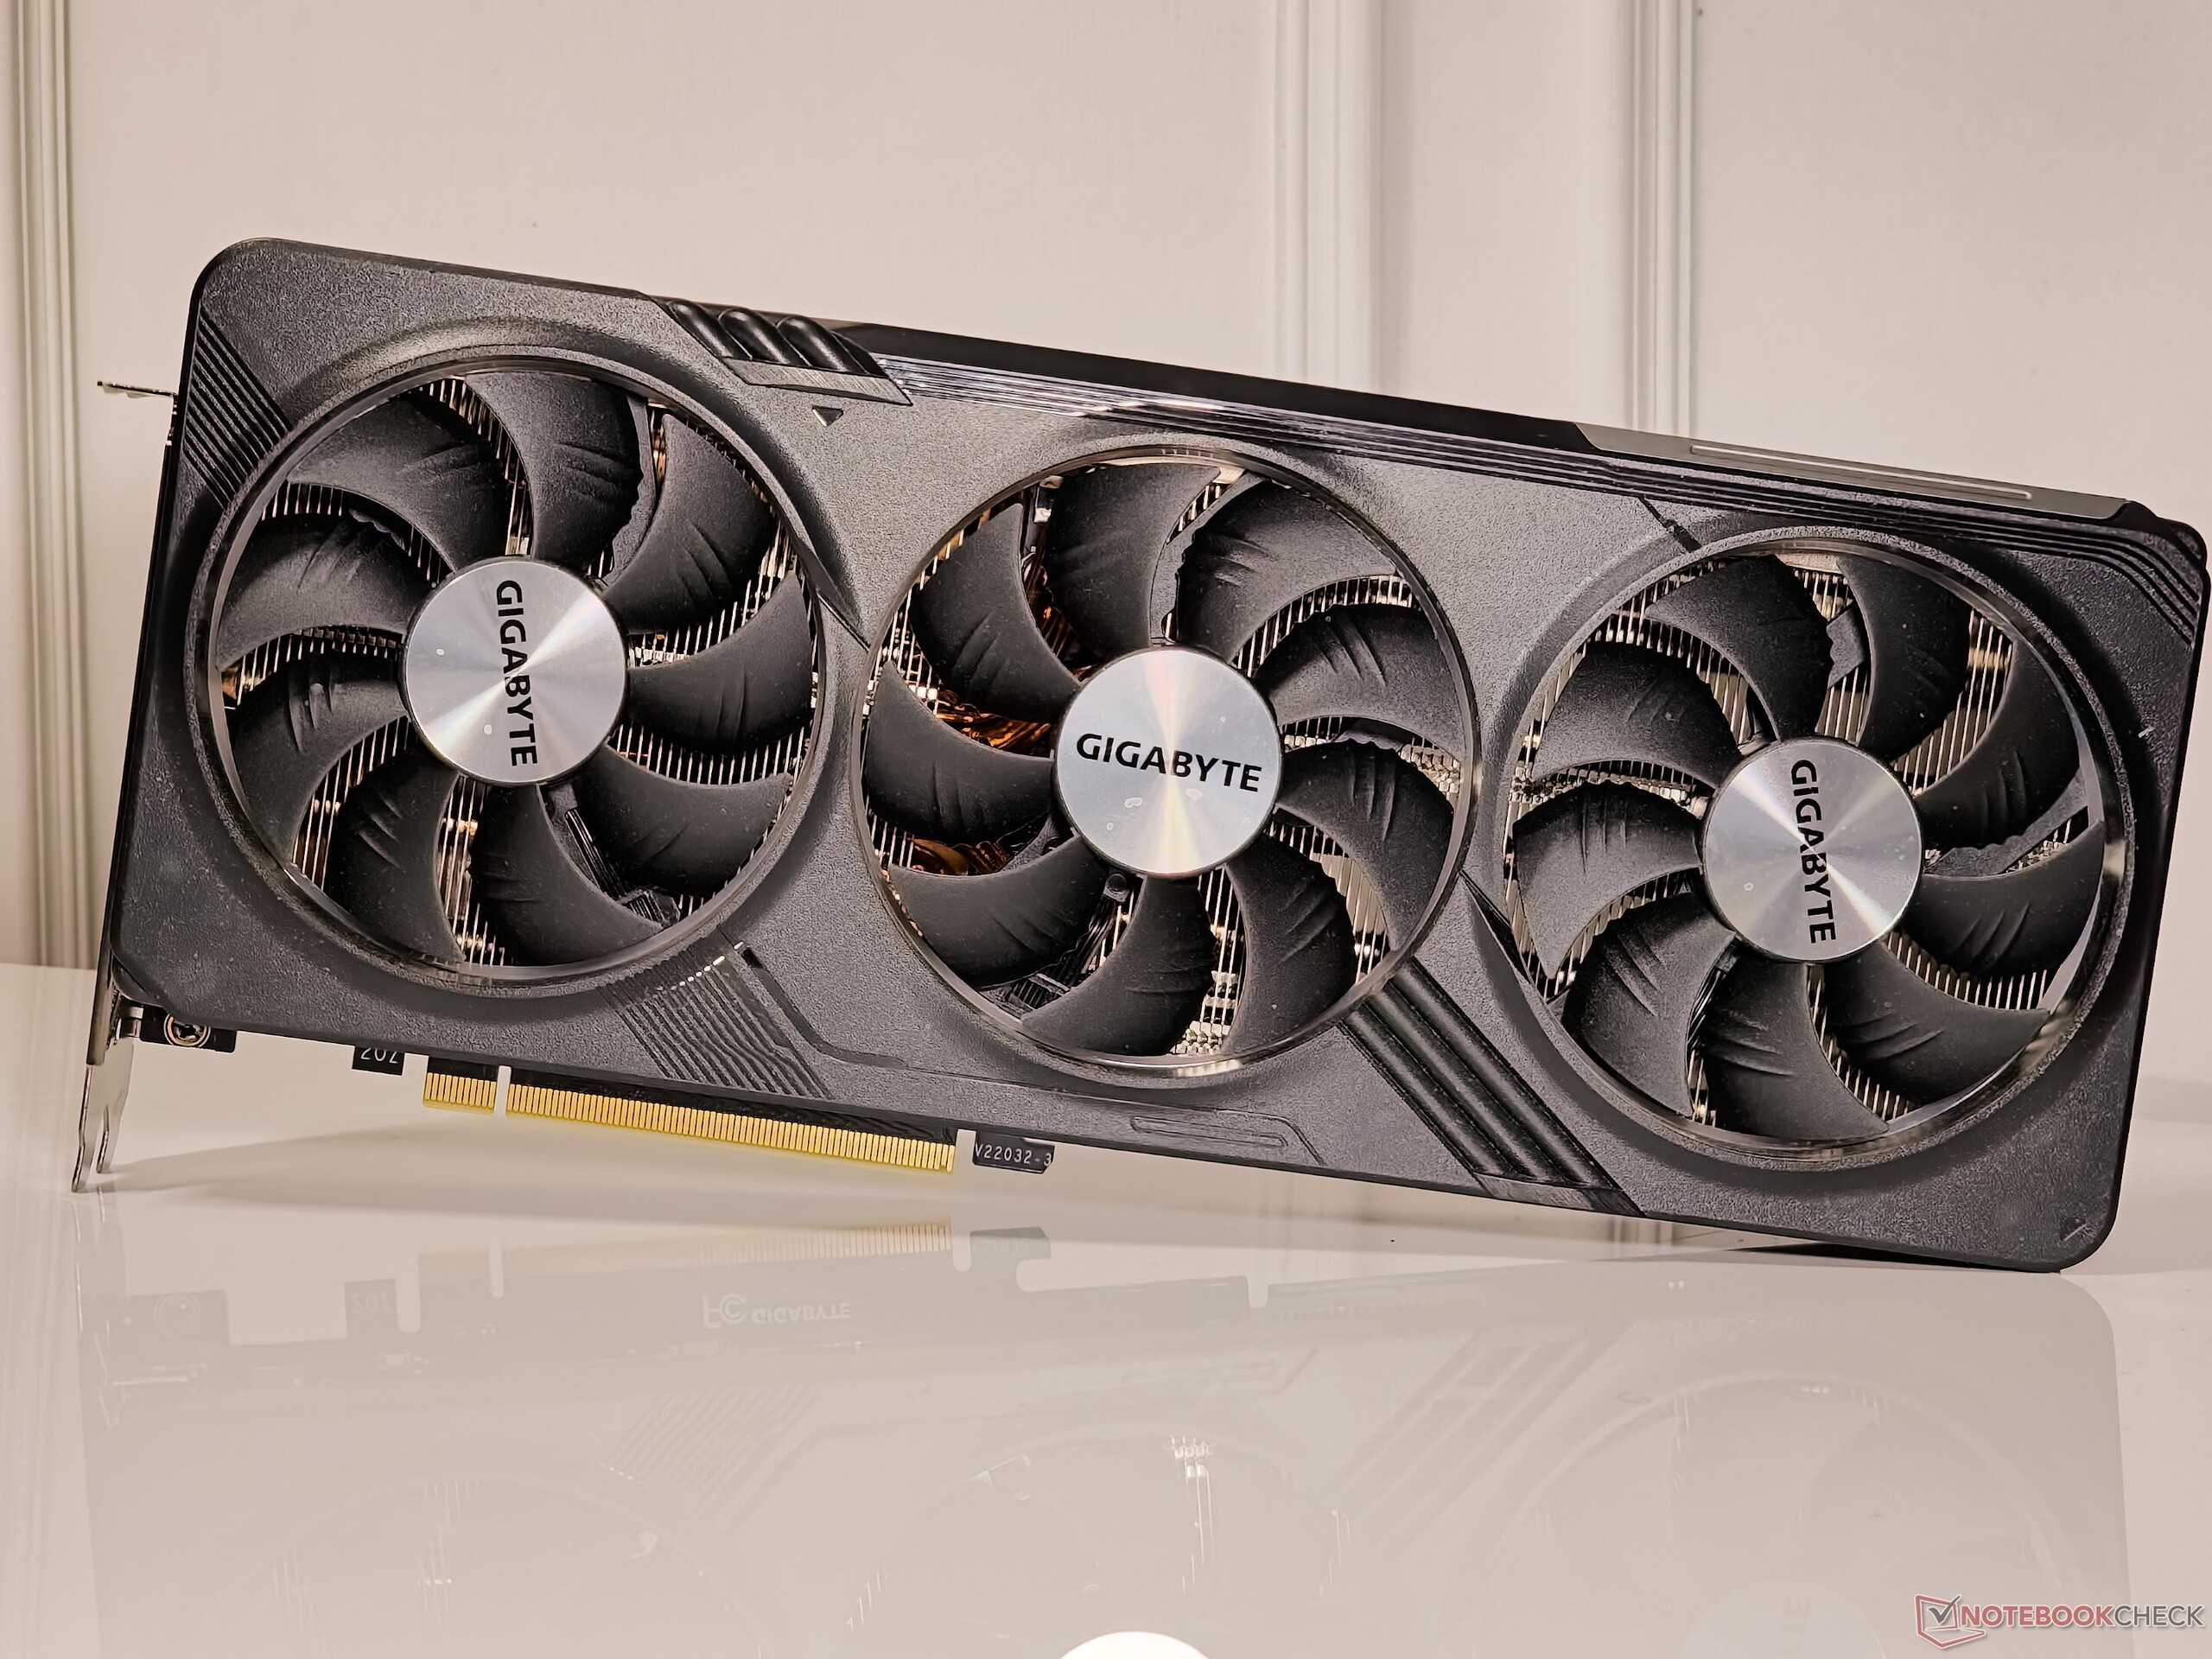
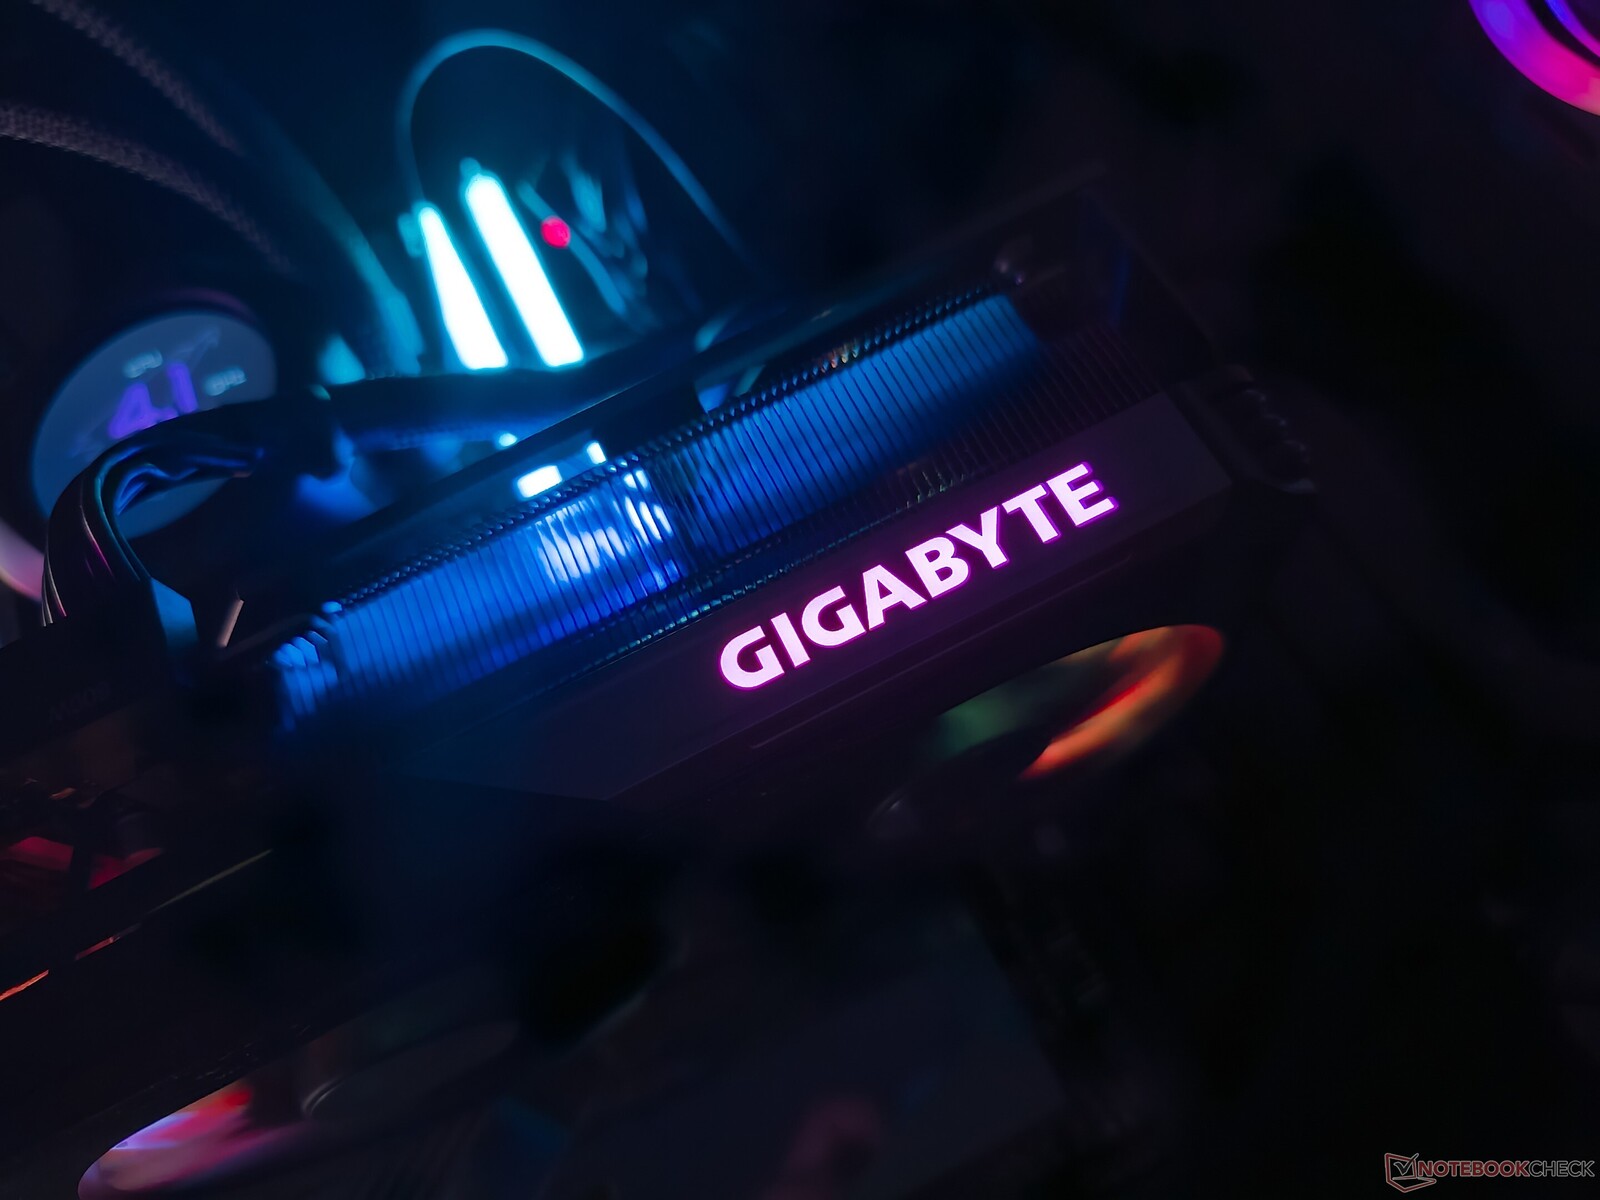
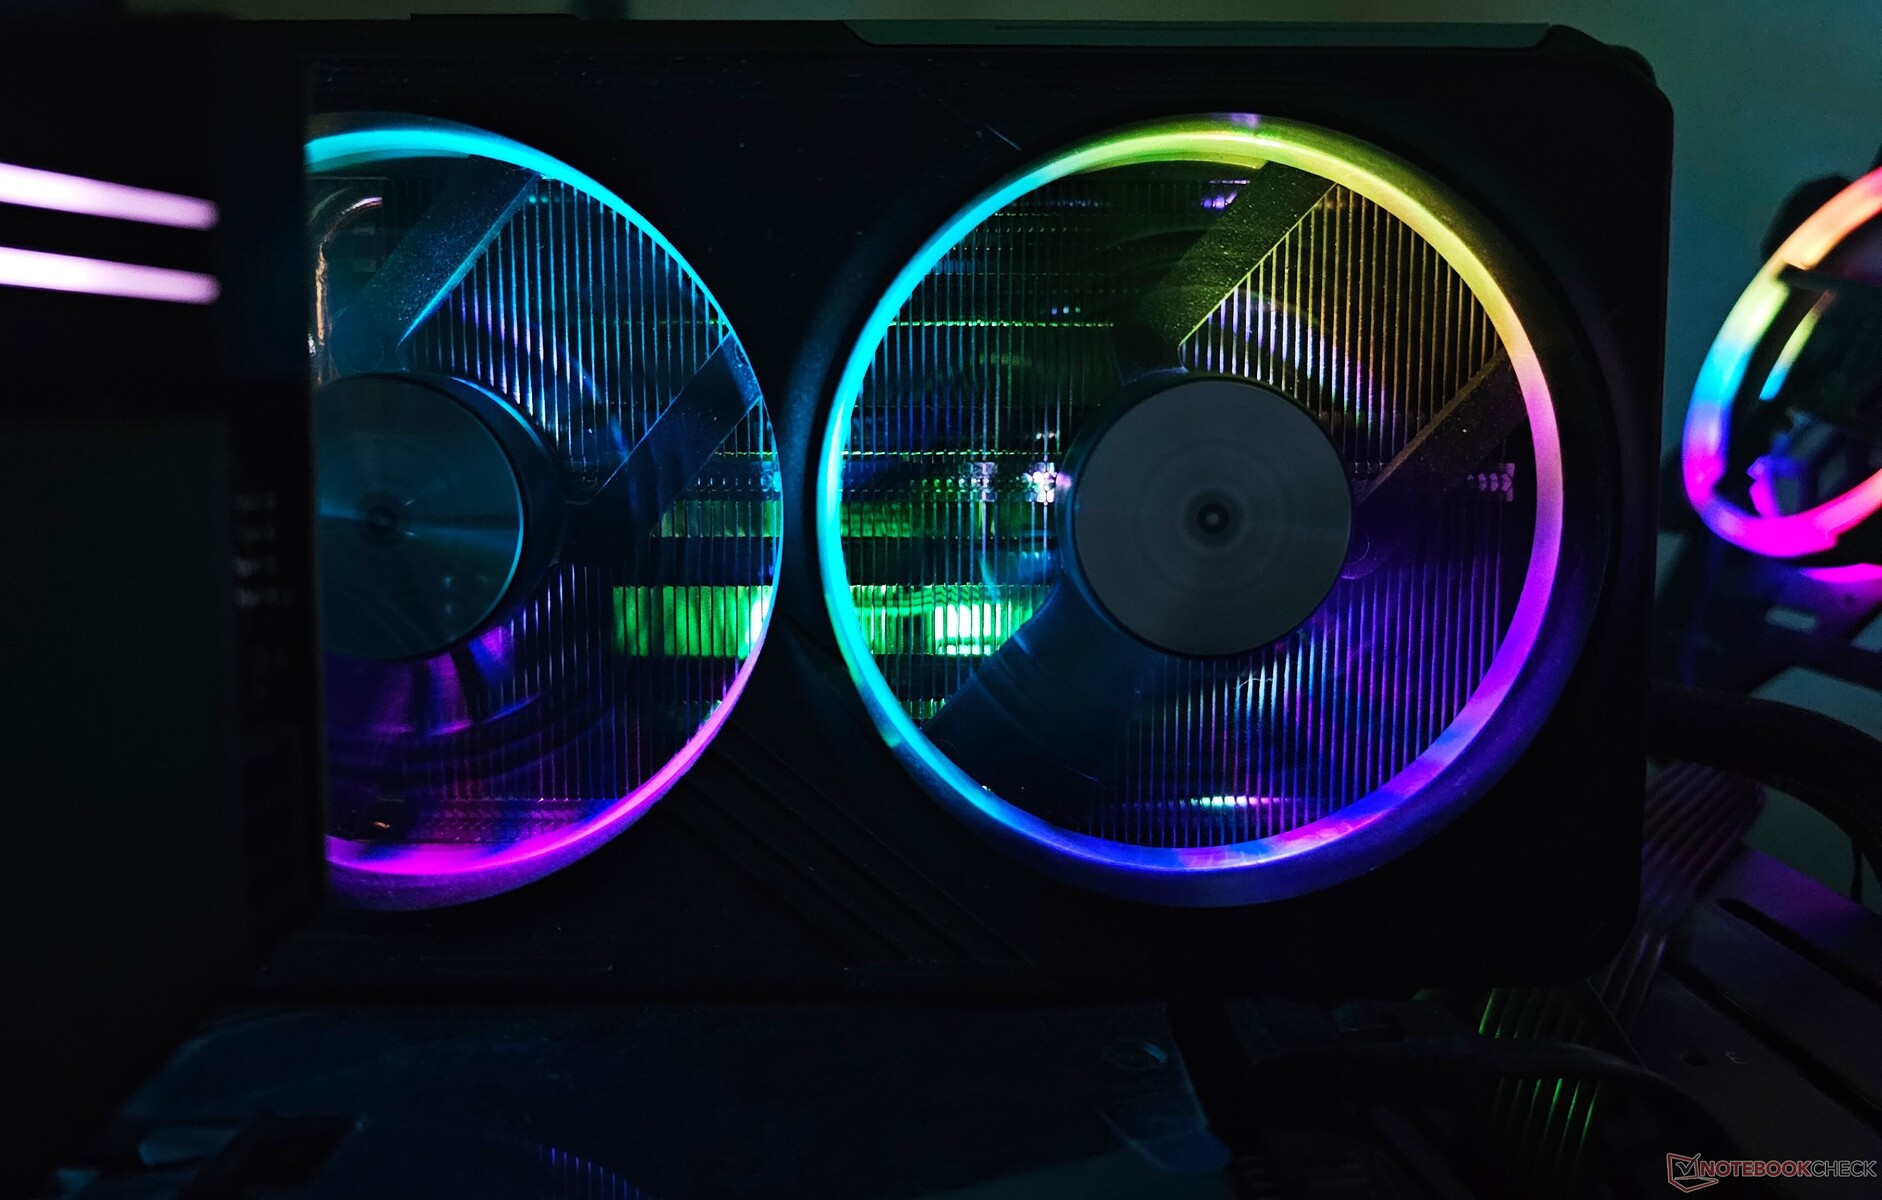
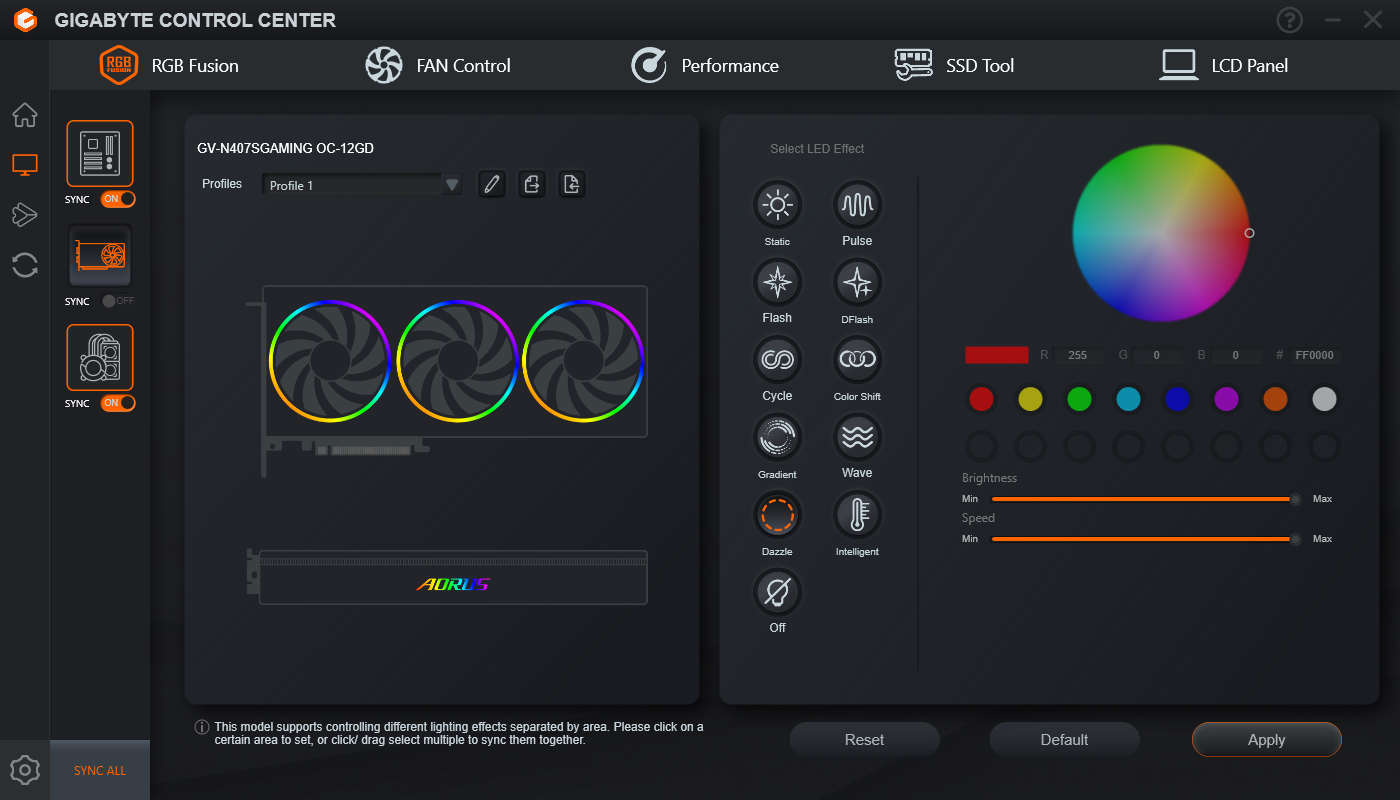
Le schede Gigabyte hanno un'estetica RGB un po' diversa rispetto alle loro controparti Aorus. Mentre le GPU Aorus, come la RTX 4070 Ti Masterhanno un sistema di illuminazione discontinuo con LED individuali su ogni aletta della ventola, le schede Gigabyte sfoggiano un anello RGB più convenzionale.

Quale sia l'aspetto migliore è una questione di preferenze, ma l'implementazione RGB nelle schede Aorus è certamente più evidente e spicca.

La RTX 4070 Super Gaming OC cerca anche di imitare la sua controparte Aorus, offrendo un pannello simile a un LCD sulla parte superiore. Tuttavia, non si tratta di un display LCD programmabile, ma solo di un elegante logo Gigabyte. Per fortuna, si illumina con un'illuminazione personalizzabile.

Sebbene sia comprensibile che gli OEM vogliano far risaltare il proprio marchio, gli utenti sarebbero più interessati a mostrare l'etichetta GeForce RTX anche in RGB. Sfortunatamente, questa non è una cosa che si vede in molte schede OEM.

Logo Gigabyte RGB sulla parte superiore
Effetti RGB sui ventilatori

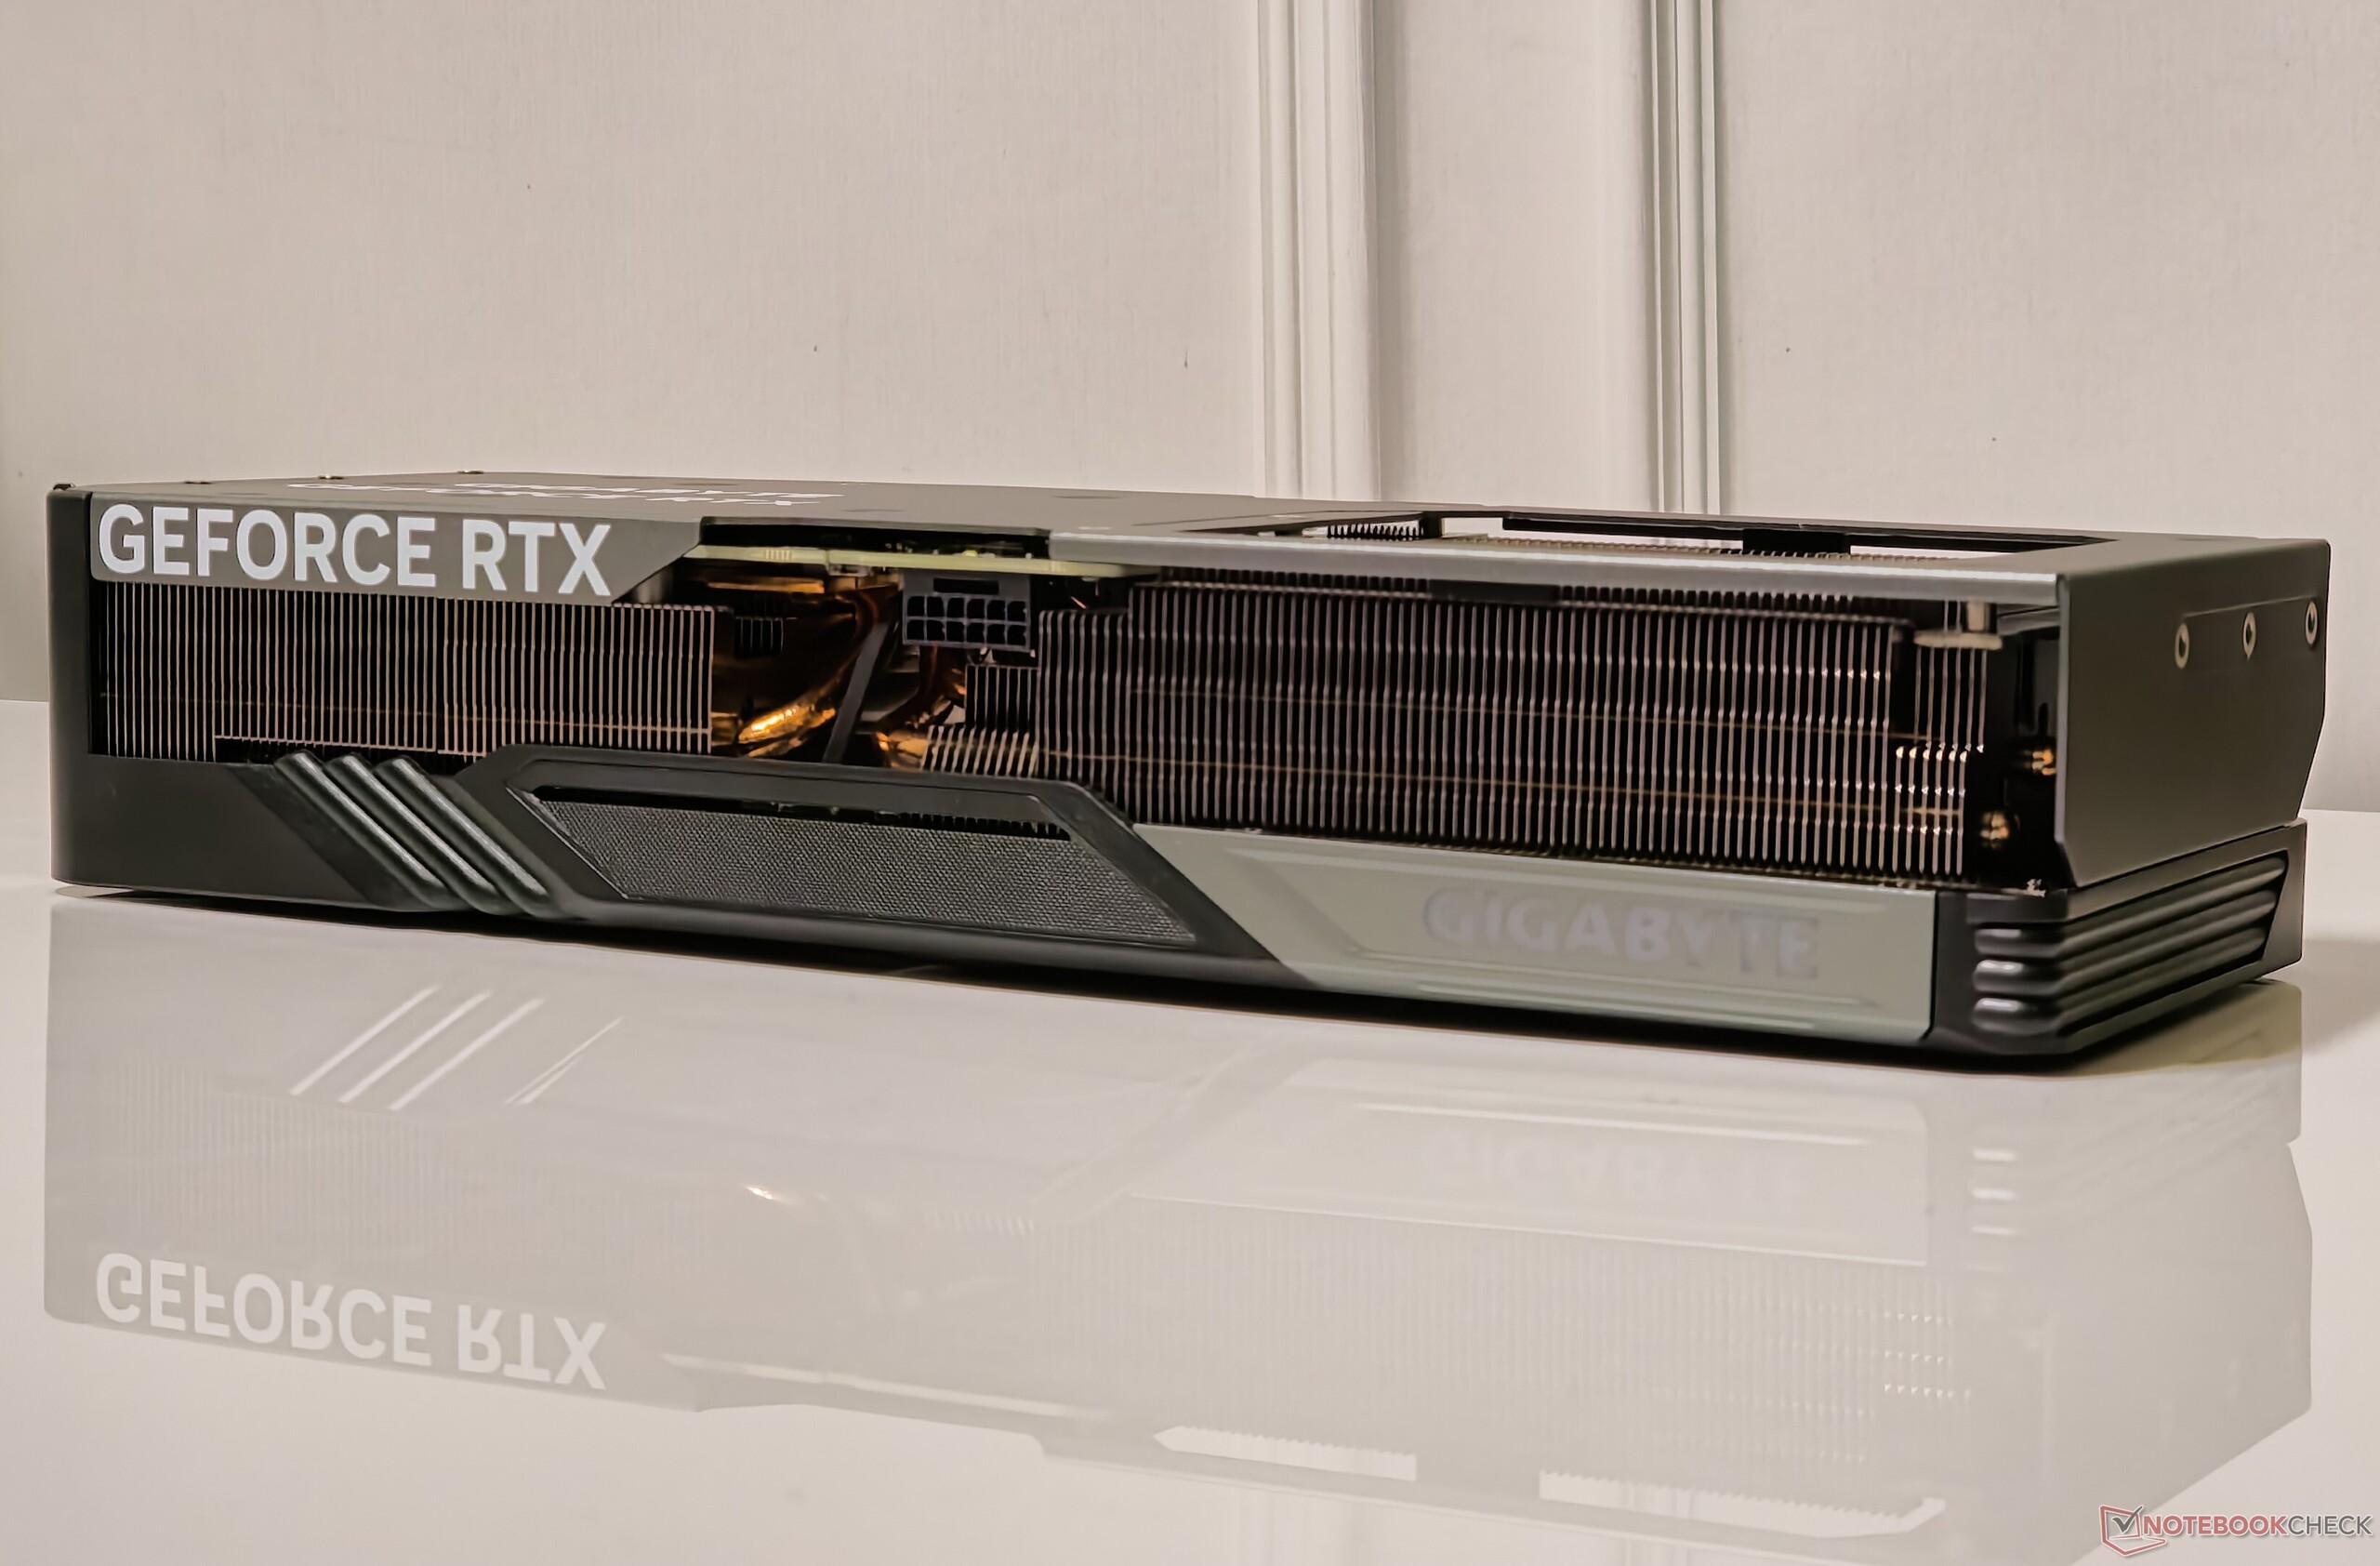
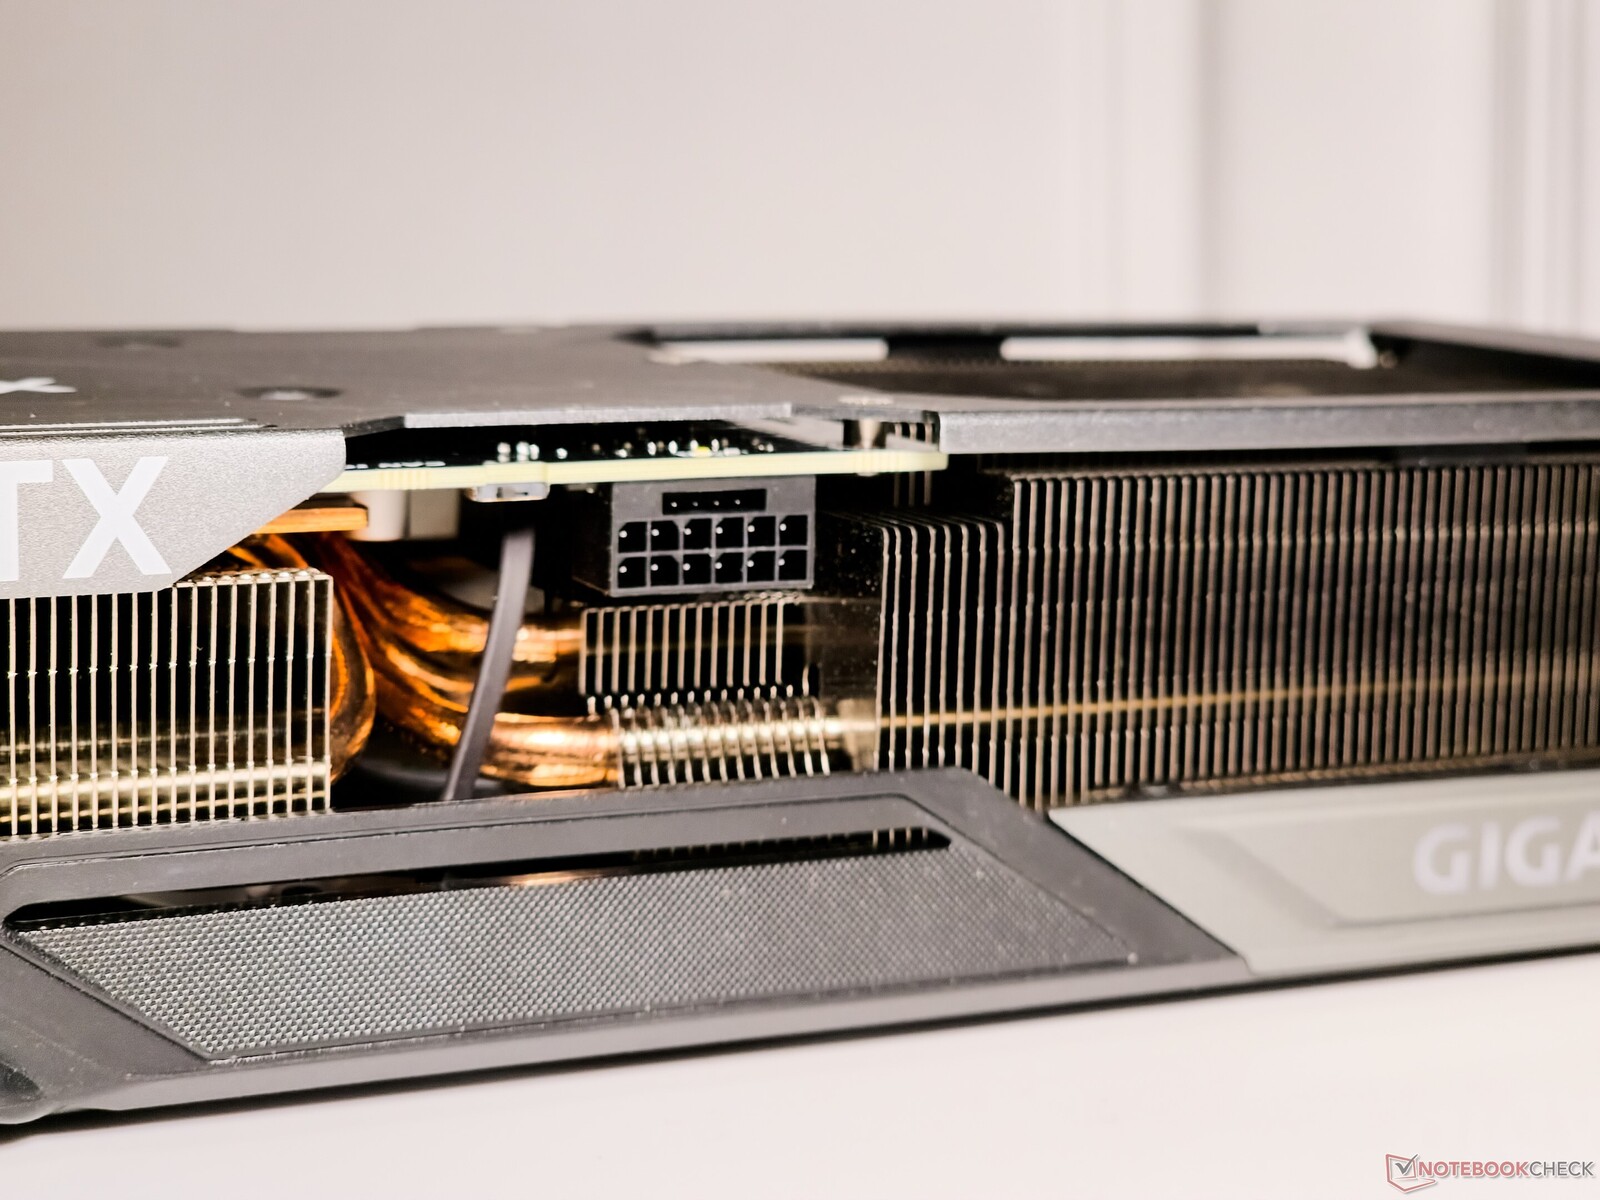
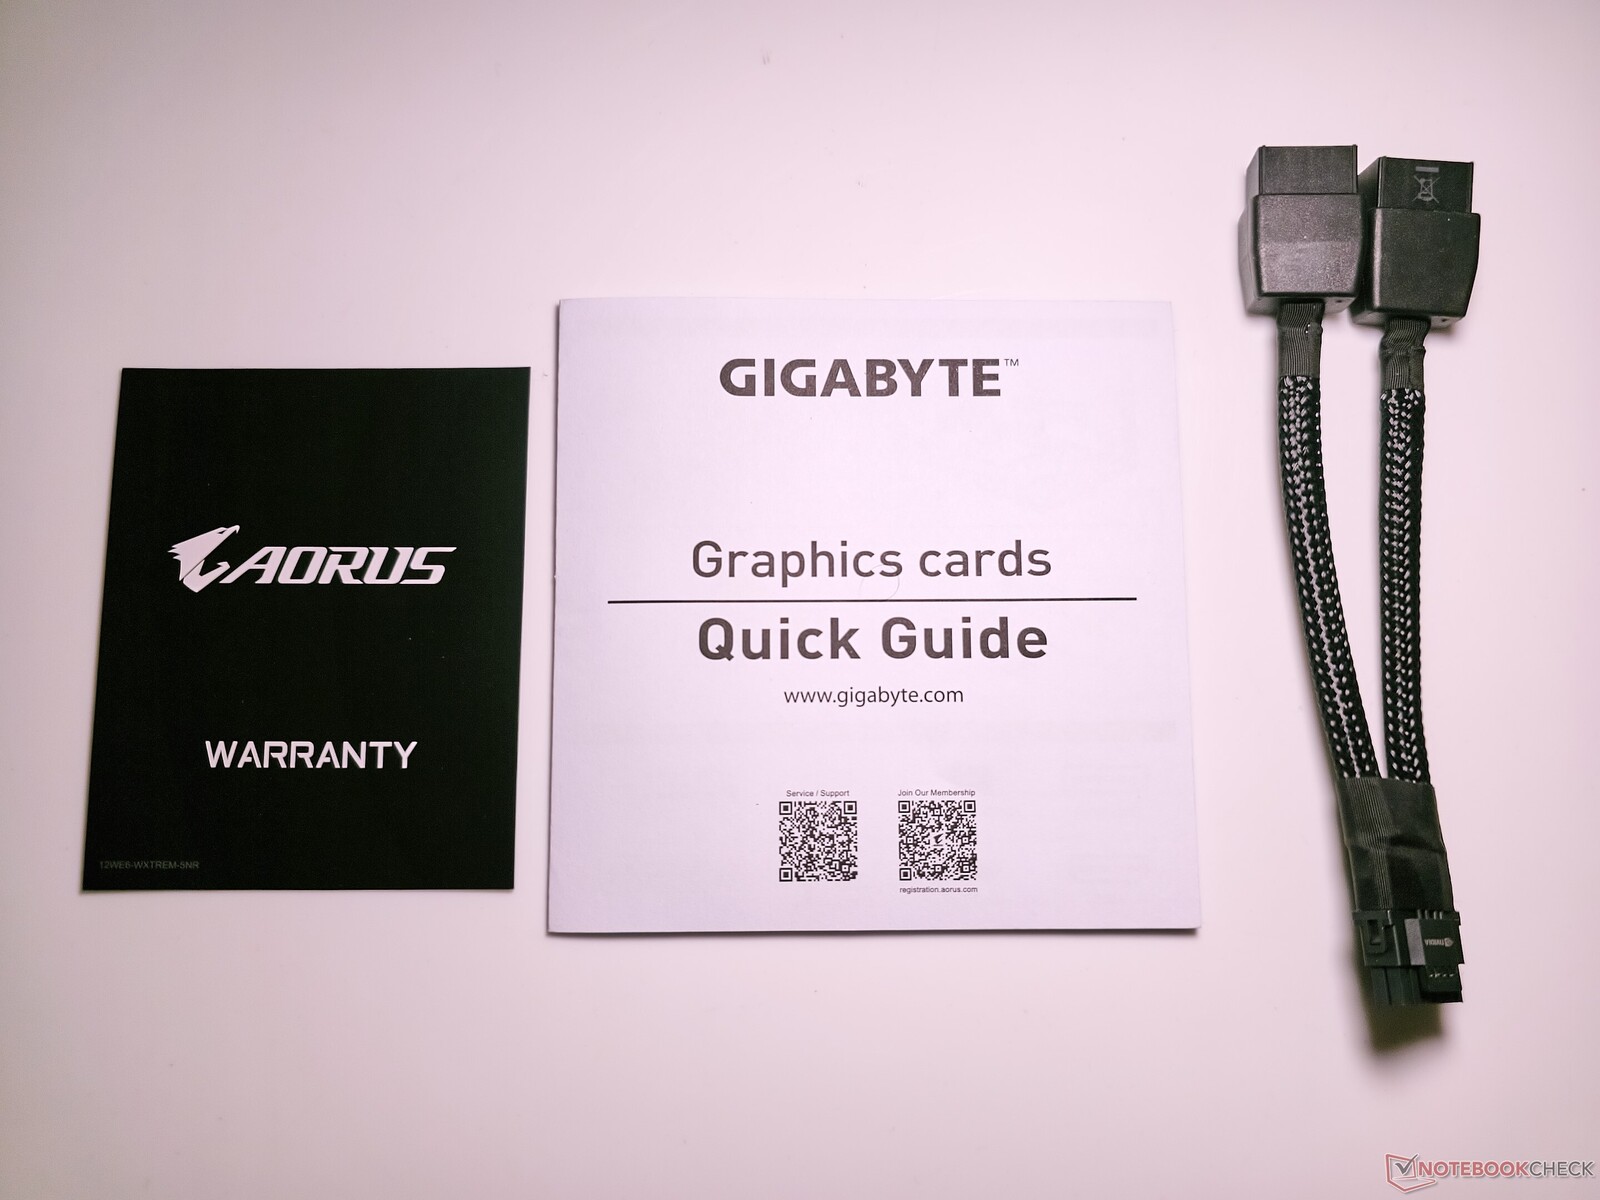
Nella confezione, riceve una scheda di garanzia, una guida di avvio rapido e un connettore di alimentazione da 12VHPWR a 2x 8 pin.

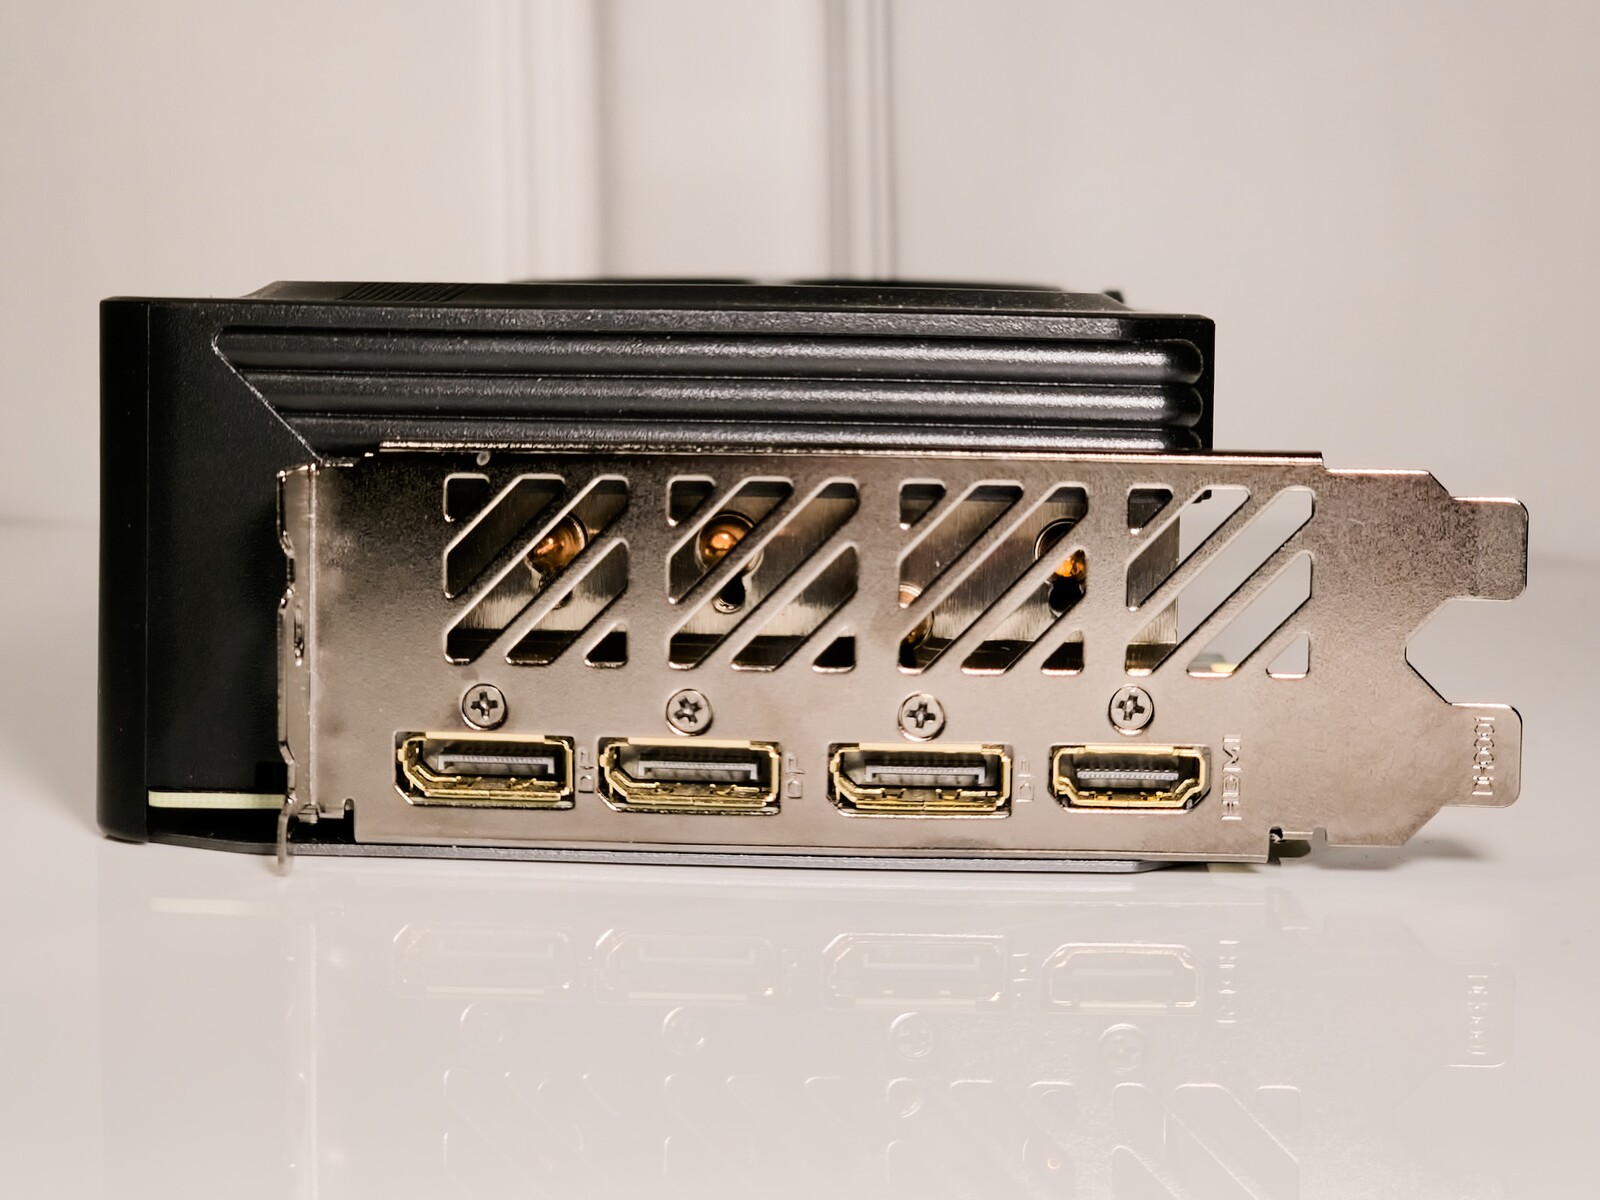
La RTX 4070 Super Gaming OC offre una serie di porte standard, tra cui 3x DisplayPort 1.4-out e 1x HDMI 2.1-out.

È presente anche un interruttore dual-BIOS che può alternare le modalità BIOS OC e Silent. Il connettore 12VHPWR si adatta perfettamente al cavo in dotazione con un clic soddisfacente. Accanto al connettore c'è un LED che indica se c'è qualche problema con la connessione di alimentazione.

connettore 12VHPWR
connettore 12VHPWR
3x DisplayPort 1.4-out, 1x HDMI 2.1a-out
Scheda di garanzia, guida di avvio rapido e cavo di alimentazione da 12VHPWR a 2x 8 pin

Gigabyte GeForce RTX 4070 Super Gaming OC 12G può incrementare fino a 2.565 MHz, con un significativo aumento del 45% dell'headroom TGP, fino a 320 W.

GPU-Z: Gigabyte GeForce RTX 4070 Super Gaming OC 12G

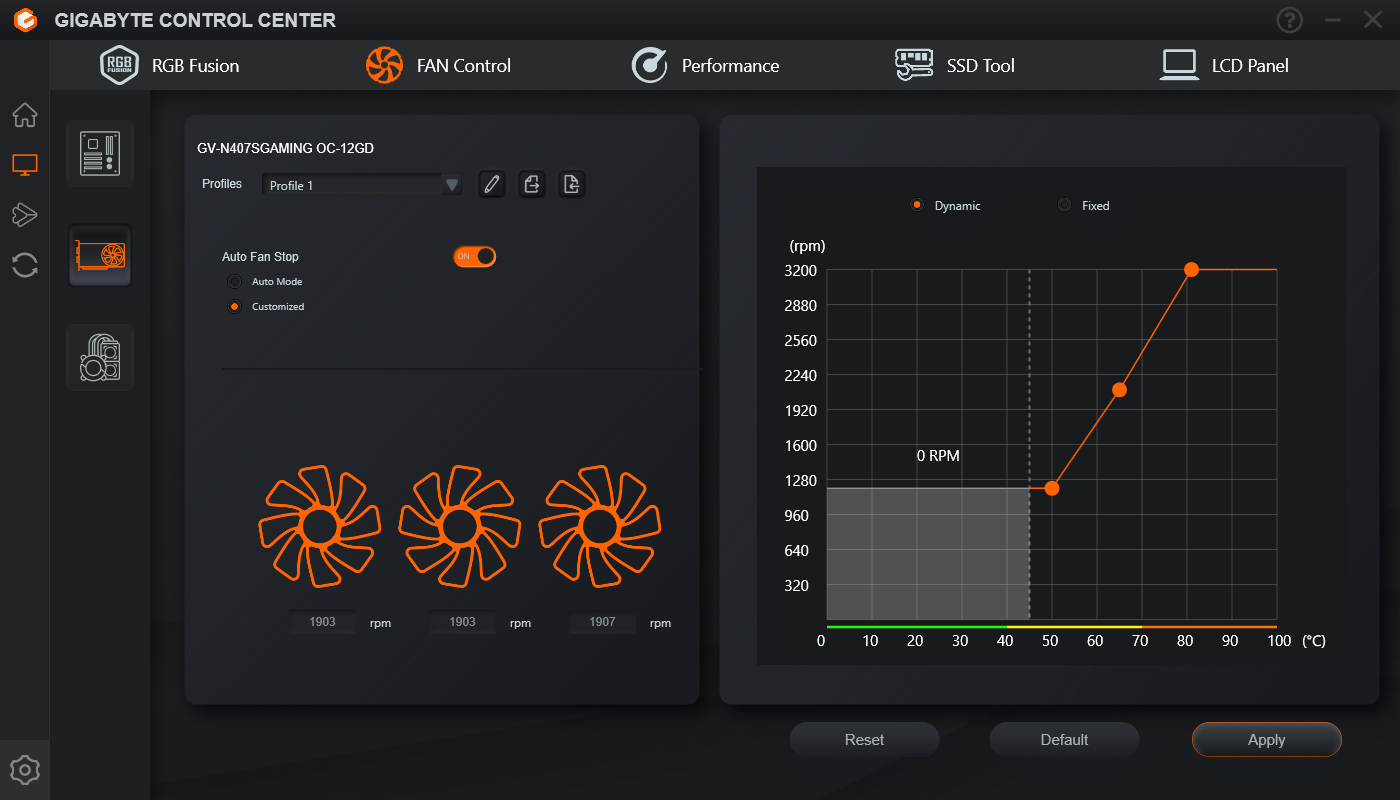
Gigabyte Control Center (GCC) aiuta a controllare vari aspetti della RTX 4070 Super Gaming OC. Il software ha avuto giorni difficili, ma ha fatto molta strada in termini di stabilità dalla nostra recensione della RTX 4070 Ti Master di Aorus.

Durante il tempo trascorso con la GPU, non abbiamo riscontrato alcun bug eclatante. Tuttavia, GCC deve essere ulteriormente perfezionato prima di poter essere affidabile al 100%.

Regolazione della curva del ventilatore
Impostazioni di overclock della GPU
Controlli RGB
Controlli RGB

Banco di prova: RTX 4070 Super Gaming OC dice ciao all'Intel Core i9-13900K

Come di consueto per molte recensioni di GPU recenti, il nostro sistema di test si basa sull'Intel Core i9-13900K Intel Core i9-13900K e sulla piattaforma Z790, per garantire che le schede non siano bloccate dalla CPU.

  • Banco di prova Cooler MasterFrame 700
  • Intel Core i9-13900K con PL1=PL2
  • Scheda madre Gigabyte Z790 Aorus Master
  • Gigabyte Aorus Gen4 2 TB NVMe SSD
  • Sabrent Rocket 4 Plus Gen4 2 TB NVMe SSD
  • 2x 16 GB di RAM Kingston Fury Renegade DDR5-6400 con timing 32-39-39-80 a 1,40 V
  • Monitor Gigabyte M28U 4K 144 Hz
  • Gigabyte Aorus Waterforce X II 360 Raffreddatore AiO
  • Alimentatore Cooler Master MVE Gold V2 1250 ATX 3.0 completamente modulare

È stato utilizzato Windows 11 23H2 con le ultime patch, insieme a Nvidia Game Ready Driver versione 551.23.

Sulla base dei nostri test, i numeri delle prestazioni di questa configurazione sono praticamente paragonabili a quelli di un AMD Ryzen 9 7950X e X670E.

Desideriamo ringraziare Cooler Master per aver fornito il banco di prova e l'alimentatore, Gigabyte per la scheda madre, la CPU, l'SSD, il raffreddatore AiO e il monitor, Sabrent per l'SSD e Kingston per la memoria.

Parametri di riferimento sintetici: Supera di un soffio la RTX 4070 Super FE

All'inizio, la RTX 4070 Super Gaming OC e la Founders Edition hanno prestazioni simili. Vediamo che la GPU di Gigabyte è leggermente superiore alla scheda FE nei singoli test, e questo è atteso, visti i boost leggermente superiori della RTX 4070 Super Gaming OC.

Tuttavia, i guadagni non sono davvero degni di nota e il delta delle prestazioni rientra molto bene nell'ambito delle variazioni da esecuzione a esecuzione.

Detto questo, la RTX 4070 Super Gaming OC 12G continua a dominare sulla Radeon RX 7800 OC 12G AMD Radeon RX 7800 XT ottenendo un vantaggio cumulativo del 9% nei test sintetici, pur mostrando i livelli di prestazioni della RTX 3090.

Performance Rating
NVIDIA GeForce RTX 4090 Founders Edition
Intel Core i9-13900K, NVIDIA GeForce RTX 4090
99.8 pt
AMD Radeon RX 7900 XTX
AMD Ryzen 9 7950X, AMD Radeon RX 7900 XTX
83 pt
NVIDIA GeForce RTX 4080 Founders Edition
Intel Core i9-13900K, NVIDIA GeForce RTX 4080
81.4 pt
AMD Radeon RX 7900 XT
AMD Ryzen 9 7950X, AMD Radeon RX 7900 XT
73.4 pt
Gigabyte Aorus GeForce RTX 4070 Ti Master
Intel Core i9-13900K, NVIDIA GeForce RTX 4070 Ti
68 pt
Asus TUF Gaming GeForce RTX 4070 Ti
Intel Core i9-13900K, NVIDIA GeForce RTX 4070 Ti
67.9 pt
Media NVIDIA GeForce RTX 4070 Ti
 
67.2 pt
Zotac Gaming GeForce RTX 3090 Ti AMP Extreme Holo
AMD Ryzen 7 5800X3D, NVIDIA GeForce RTX 3090 Ti
66.5 pt
Sapphire AMD Radeon RX 6950 XT Nitro+ Pure
AMD Ryzen 9 5900X, AMD Radeon RX 6950 XT
62.8 pt
Gigabyte GeForce RTX 4070 Super Gaming OC 12G
Intel Core i9-13900K, NVIDIA GeForce RTX 4070 SUPER
62.7 pt
Media NVIDIA GeForce RTX 3080 Ti
 
62.1 pt
NVIDIA GeForce RTX 4070 Super Founders Edition
Intel Core i9-13900K, NVIDIA GeForce RTX 4070 SUPER
61.9 pt
Media NVIDIA GeForce RTX 3090
 
61.9 pt
AMD Radeon RX 7800 XT
AMD Ryzen 9 7950X, AMD Radeon RX 7800 XT
57.7 pt
AMD Radeon RX 6900 XT
AMD Ryzen 9 5950X, AMD Radeon RX 6900 XT
56.5 pt
Zotac Gaming GeForce RTX 4070 AMP Airo
Intel Core i9-13900K, NVIDIA GeForce RTX 4070
55 pt
AMD Radeon RX 6800 XT
AMD Ryzen 9 5950X, AMD Radeon RX 6800 XT
53.5 pt
Media NVIDIA GeForce RTX 3080
 
51.7 pt
Sapphire Pulse Radeon RX 7700 XT
AMD Ryzen 9 7950X, AMD Radeon RX 7700 XT
49.5 pt
Media della classe Desktop
 
49.2 pt
Media NVIDIA Titan RTX
 
48.4 pt
Media NVIDIA GeForce RTX 3070
 
42.2 pt
Media NVIDIA GeForce RTX 4060 Ti 8G
 
41.6 pt
KFA2 GeForce RTX 4060 Ti EX, 16GB GDDR6
AMD Ryzen 9 7950X, NVIDIA GeForce RTX 4060 Ti 16G
40.1 pt
XFX Speedster QICK 308 Radeon RX 7600 Black Edition
AMD Ryzen 9 7950X, AMD Radeon RX 7600
36.4 pt
KFA2 GeForce RTX 4060 1-Click-OC 2X
AMD Ryzen 9 7950X, NVIDIA GeForce RTX 4060
35.4 pt
3DMark 11 / Performance GPU
NVIDIA GeForce RTX 4090 Founders Edition
Intel Core i9-13900K, NVIDIA GeForce RTX 4090
99834 Points +45%
NVIDIA GeForce RTX 4080 Founders Edition
Intel Core i9-13900K, NVIDIA GeForce RTX 4080
86838 Points +26%
AMD Radeon RX 7900 XTX
AMD Ryzen 9 7950X, AMD Radeon RX 7900 XTX
83322 Points +21%
AMD Radeon RX 7900 XT
AMD Ryzen 9 7950X, AMD Radeon RX 7900 XT
77784 Points +13%
Gigabyte Aorus GeForce RTX 4070 Ti Master
Intel Core i9-13900K, NVIDIA GeForce RTX 4070 Ti
76483 Points +11%
Asus TUF Gaming GeForce RTX 4070 Ti
Intel Core i9-13900K, NVIDIA GeForce RTX 4070 Ti
75990 Points +10%
Asus TUF Gaming GeForce RTX 4070 Ti
Intel Core i9-13900K, NVIDIA GeForce RTX 4070 Ti (Quiet BIOS)
75612 Points +10%
Media NVIDIA GeForce RTX 4070 Ti
  (74228 - 76483, n=5)
75509 Points +10%
Sapphire AMD Radeon RX 6950 XT Nitro+ Pure
AMD Ryzen 9 5900X, AMD Radeon RX 6950 XT
70480 Points +2%
Zotac Gaming GeForce RTX 3090 Ti AMP Extreme Holo
AMD Ryzen 7 5800X3D, NVIDIA GeForce RTX 3090 Ti
69481 Points +1%
Gigabyte GeForce RTX 4070 Super Gaming OC 12G
Intel Core i9-13900K, NVIDIA GeForce RTX 4070 SUPER
68894 Points
NVIDIA GeForce RTX 4070 Super Founders Edition
Intel Core i9-13900K, NVIDIA GeForce RTX 4070 SUPER
67852 Points -2%
AMD Radeon RX 7800 XT
AMD Ryzen 9 7950X, AMD Radeon RX 7800 XT
63292 Points -8%
Media NVIDIA GeForce RTX 3080 Ti
  (59799 - 62189, n=4)
60987 Points -11%
Media NVIDIA GeForce RTX 3090
  (55144 - 66934, n=17)
60853 Points -12%
Zotac Gaming GeForce RTX 4070 AMP Airo
Intel Core i9-13900K, NVIDIA GeForce RTX 4070
59510 Points -14%
AMD Radeon RX 6900 XT
AMD Ryzen 9 5950X, AMD Radeon RX 6900 XT
59119 Points -14%
Sapphire Pulse Radeon RX 7700 XT
AMD Ryzen 9 7950X, AMD Radeon RX 7700 XT
57340 Points -17%
Media NVIDIA GeForce RTX 3080
  (47287 - 57662, n=4)
53094 Points -23%
AMD Radeon RX 6800 XT
AMD Ryzen 9 5950X, AMD Radeon RX 6800 XT
52046 Points -24%
Media della classe Desktop
  (650 - 104464, n=36, ultimi 2 anni)
49254 Points -29%
Media NVIDIA Titan RTX
  (43461 - 51863, n=30)
49062 Points -29%
Media NVIDIA GeForce RTX 4060 Ti 8G
  (47481 - 48363, n=3)
47882 Points -30%
XFX Speedster QICK 308 Radeon RX 7600 Black Edition
AMD Ryzen 9 7950X, AMD Radeon RX 7600
43430 Points -37%
KFA2 GeForce RTX 4060 Ti EX, 16GB GDDR6
AMD Ryzen 9 7950X, NVIDIA GeForce RTX 4060 Ti 16G
43112 Points -37%
Media NVIDIA GeForce RTX 3070
  (26812 - 46878, n=9)
40835 Points -41%
KFA2 GeForce RTX 4060 1-Click-OC 2X
AMD Ryzen 9 7950X, NVIDIA GeForce RTX 4060
38191 Points -45%
3DMark / Fire Strike Graphics
AMD Radeon RX 7900 XTX
AMD Ryzen 9 7950X, AMD Radeon RX 7900 XTX
66967 Points +35%
NVIDIA GeForce RTX 4090 Founders Edition
Intel Core i9-13900K, NVIDIA GeForce RTX 4090
65879 Points +33%
AMD Radeon RX 7900 XT
AMD Ryzen 9 7950X, AMD Radeon RX 7900 XT
63712 Points +28%
Sapphire AMD Radeon RX 6950 XT Nitro+ Pure
AMD Ryzen 9 5900X, AMD Radeon RX 6950 XT
60092 Points +21%
NVIDIA GeForce RTX 4080 Founders Edition
Intel Core i9-13900K, NVIDIA GeForce RTX 4080
58893 Points +18%
Asus TUF Gaming GeForce RTX 4070 Ti
Intel Core i9-13900K, NVIDIA GeForce RTX 4070 Ti
53729 Points +8%
Asus TUF Gaming GeForce RTX 4070 Ti
Intel Core i9-13900K, NVIDIA GeForce RTX 4070 Ti (Quiet BIOS)
52903 Points +6%
Media NVIDIA GeForce RTX 4070 Ti
  (52769 - 53736, n=5)
53299 Points +7%
Zotac Gaming GeForce RTX 3090 Ti AMP Extreme Holo
AMD Ryzen 7 5800X3D, NVIDIA GeForce RTX 3090 Ti
53110 Points +7%
Gigabyte Aorus GeForce RTX 4070 Ti Master
Intel Core i9-13900K, NVIDIA GeForce RTX 4070 Ti
52769 Points +6%
AMD Radeon RX 6900 XT
AMD Ryzen 9 5950X, AMD Radeon RX 6900 XT
50587 Points +2%
AMD Radeon RX 7800 XT
AMD Ryzen 9 7950X, AMD Radeon RX 7800 XT
50181 Points +1%
AMD Radeon RX 6800 XT
AMD Ryzen 9 5950X, AMD Radeon RX 6800 XT
49735 Points 0%
Gigabyte GeForce RTX 4070 Super Gaming OC 12G
Intel Core i9-13900K, NVIDIA GeForce RTX 4070 SUPER
49709 Points
NVIDIA GeForce RTX 4070 Super Founders Edition
Intel Core i9-13900K, NVIDIA GeForce RTX 4070 SUPER
48043 Points -3%
Media NVIDIA GeForce RTX 3080 Ti
  (45785 - 48709, n=4)
47180 Points -5%
Media NVIDIA GeForce RTX 3090
  (41298 - 49282, n=17)
46856 Points -6%
Zotac Gaming GeForce RTX 4070 AMP Airo
Intel Core i9-13900K, NVIDIA GeForce RTX 4070
43583 Points -12%
Sapphire Pulse Radeon RX 7700 XT
AMD Ryzen 9 7950X, AMD Radeon RX 7700 XT
42801 Points -14%
Media NVIDIA GeForce RTX 3080
  (37604 - 40910, n=2)
39257 Points -21%
Media NVIDIA Titan RTX
  (33377 - 40910, n=30)
36062 Points -27%
Media NVIDIA GeForce RTX 4060 Ti 8G
  (33762 - 34547, n=3)
34185 Points -31%
XFX Speedster QICK 308 Radeon RX 7600 Black Edition
AMD Ryzen 9 7950X, AMD Radeon RX 7600
32404 Points -35%
KFA2 GeForce RTX 4060 Ti EX, 16GB GDDR6
AMD Ryzen 9 7950X, NVIDIA GeForce RTX 4060 Ti 16G
32275 Points -35%
Media della classe Desktop
  (523 - 70246, n=34, ultimi 2 anni)
31665 Points -36%
Media NVIDIA GeForce RTX 3070
  (20357 - 33270, n=7)
28949 Points -42%
KFA2 GeForce RTX 4060 1-Click-OC 2X
AMD Ryzen 9 7950X, NVIDIA GeForce RTX 4060
28111 Points -43%
3DMark / Fire Strike Ultra Graphics
NVIDIA GeForce RTX 4090 Founders Edition
Intel Core i9-13900K, NVIDIA GeForce RTX 4090
24276 Points +96%
AMD Radeon RX 7900 XTX
AMD Ryzen 9 7950X, AMD Radeon RX 7900 XTX
20214 Points +63%
NVIDIA GeForce RTX 4080 Founders Edition
Intel Core i9-13900K, NVIDIA GeForce RTX 4080
17122 Points +38%
AMD Radeon RX 7900 XT
AMD Ryzen 9 7950X, AMD Radeon RX 7900 XT
17078 Points +38%
Sapphire AMD Radeon RX 6950 XT Nitro+ Pure
AMD Ryzen 9 5900X, AMD Radeon RX 6950 XT
14978 Points +21%
Zotac Gaming GeForce RTX 3090 Ti AMP Extreme Holo
AMD Ryzen 7 5800X3D, NVIDIA GeForce RTX 3090 Ti
14026 Points +13%
Gigabyte Aorus GeForce RTX 4070 Ti Master
Intel Core i9-13900K, NVIDIA GeForce RTX 4070 Ti
13616 Points +10%
Asus TUF Gaming GeForce RTX 4070 Ti
Intel Core i9-13900K, NVIDIA GeForce RTX 4070 Ti
13546 Points +9%
Asus TUF Gaming GeForce RTX 4070 Ti
Intel Core i9-13900K, NVIDIA GeForce RTX 4070 Ti (Quiet BIOS)
13487 Points +9%
Media NVIDIA GeForce RTX 4070 Ti
  (13112 - 13616, n=5)
13390 Points +8%
AMD Radeon RX 6900 XT
AMD Ryzen 9 5950X, AMD Radeon RX 6900 XT
13370 Points +8%
AMD Radeon RX 6800 XT
AMD Ryzen 9 5950X, AMD Radeon RX 6800 XT
12626 Points +2%
AMD Radeon RX 7800 XT
AMD Ryzen 9 7950X, AMD Radeon RX 7800 XT
12529 Points +1%
Gigabyte GeForce RTX 4070 Super Gaming OC 12G
Intel Core i9-13900K, NVIDIA GeForce RTX 4070 SUPER
12389 Points
Media NVIDIA GeForce RTX 3090
  (11613 - 12587, n=14)
12289 Points -1%
Media NVIDIA GeForce RTX 3080 Ti
  (12050 - 12341, n=4)
12173 Points -2%
NVIDIA GeForce RTX 4070 Super Founders Edition
Intel Core i9-13900K, NVIDIA GeForce RTX 4070 SUPER
12086 Points -2%
Media NVIDIA GeForce RTX 3080
  (10645 - 10793, n=2)
10719 Points -13%
Sapphire Pulse Radeon RX 7700 XT
AMD Ryzen 9 7950X, AMD Radeon RX 7700 XT
10596 Points -14%
Media della classe Desktop
  (141 - 24650, n=24, ultimi 2 anni)
10444 Points -16%
Zotac Gaming GeForce RTX 4070 AMP Airo
Intel Core i9-13900K, NVIDIA GeForce RTX 4070
10103 Points -18%
Media NVIDIA Titan RTX
  (8461 - 10793, n=29)
8868 Points -28%
Media NVIDIA GeForce RTX 3070
  (8043 - 8483, n=5)
8250 Points -33%
XFX Speedster QICK 308 Radeon RX 7600 Black Edition
AMD Ryzen 9 7950X, AMD Radeon RX 7600
7305 Points -41%
Media NVIDIA GeForce RTX 4060 Ti 8G
  (7152 - 7298, n=3)
7223 Points -42%
KFA2 GeForce RTX 4060 Ti EX, 16GB GDDR6
AMD Ryzen 9 7950X, NVIDIA GeForce RTX 4060 Ti 16G
7058 Points -43%
KFA2 GeForce RTX 4060 1-Click-OC 2X
AMD Ryzen 9 7950X, NVIDIA GeForce RTX 4060
5668 Points -54%
3DMark / Fire Strike Extreme Graphics
NVIDIA GeForce RTX 4090 Founders Edition
Intel Core i9-13900K, NVIDIA GeForce RTX 4090
44295 Points +78%
AMD Radeon RX 7900 XTX
AMD Ryzen 9 7950X, AMD Radeon RX 7900 XTX
39570 Points +59%
AMD Radeon RX 7900 XT
AMD Ryzen 9 7950X, AMD Radeon RX 7900 XT
33747 Points +36%
NVIDIA GeForce RTX 4080 Founders Edition
Intel Core i9-13900K, NVIDIA GeForce RTX 4080
33475 Points +35%
Sapphire AMD Radeon RX 6950 XT Nitro+ Pure
AMD Ryzen 9 5900X, AMD Radeon RX 6950 XT
29704 Points +19%
Gigabyte Aorus GeForce RTX 4070 Ti Master
Intel Core i9-13900K, NVIDIA GeForce RTX 4070 Ti
27167 Points +9%
Asus TUF Gaming GeForce RTX 4070 Ti
Intel Core i9-13900K, NVIDIA GeForce RTX 4070 Ti
26970 Points +8%
Asus TUF Gaming GeForce RTX 4070 Ti
Intel Core i9-13900K, NVIDIA GeForce RTX 4070 Ti (Quiet BIOS)
26925 Points +8%
Media NVIDIA GeForce RTX 4070 Ti
  (26470 - 27167, n=5)
26845 Points +8%
Zotac Gaming GeForce RTX 3090 Ti AMP Extreme Holo
AMD Ryzen 7 5800X3D, NVIDIA GeForce RTX 3090 Ti
26797 Points +8%
AMD Radeon RX 6900 XT
AMD Ryzen 9 5950X, AMD Radeon RX 6900 XT
26650 Points +7%
AMD Radeon RX 7800 XT
AMD Ryzen 9 7950X, AMD Radeon RX 7800 XT
25279 Points +2%
AMD Radeon RX 6800 XT
AMD Ryzen 9 5950X, AMD Radeon RX 6800 XT
25015 Points +1%
Gigabyte GeForce RTX 4070 Super Gaming OC 12G
Intel Core i9-13900K, NVIDIA GeForce RTX 4070 SUPER
24874 Points
NVIDIA GeForce RTX 4070 Super Founders Edition
Intel Core i9-13900K, NVIDIA GeForce RTX 4070 SUPER
24154 Points -3%
Media NVIDIA GeForce RTX 3090
  (22075 - 24730, n=14)
23806 Points -4%
Media NVIDIA GeForce RTX 3080 Ti
  (23127 - 24250, n=4)
23668 Points -5%
Zotac Gaming GeForce RTX 4070 AMP Airo
Intel Core i9-13900K, NVIDIA GeForce RTX 4070
21053 Points -15%
Sapphire Pulse Radeon RX 7700 XT
AMD Ryzen 9 7950X, AMD Radeon RX 7700 XT
21006 Points -16%
Media NVIDIA GeForce RTX 3080
  (20007 - 20861, n=2)
20434 Points -18%
Media della classe Desktop
  (1053 - 44549, n=24, ultimi 2 anni)
20318 Points -18%
Media NVIDIA Titan RTX
  (16484 - 20861, n=29)
17649 Points -29%
Media NVIDIA GeForce RTX 4060 Ti 8G
  (15846 - 16250, n=3)
16051 Points -35%
Media NVIDIA GeForce RTX 3070
  (15503 - 16276, n=5)
15859 Points -36%
KFA2 GeForce RTX 4060 Ti EX, 16GB GDDR6
AMD Ryzen 9 7950X, NVIDIA GeForce RTX 4060 Ti 16G
15511 Points -38%
XFX Speedster QICK 308 Radeon RX 7600 Black Edition
AMD Ryzen 9 7950X, AMD Radeon RX 7600
14966 Points -40%
KFA2 GeForce RTX 4060 1-Click-OC 2X
AMD Ryzen 9 7950X, NVIDIA GeForce RTX 4060
13086 Points -47%
3DMark / Time Spy Graphics
NVIDIA GeForce RTX 4090 Founders Edition
Intel Core i9-13900K, NVIDIA GeForce RTX 4090
36101 Points +71%
AMD Radeon RX 7900 XTX
AMD Ryzen 9 7950X, AMD Radeon RX 7900 XTX
29699 Points +41%
NVIDIA GeForce RTX 4080 Founders Edition
Intel Core i9-13900K, NVIDIA GeForce RTX 4080
28133 Points +33%
AMD Radeon RX 7900 XT
AMD Ryzen 9 7950X, AMD Radeon RX 7900 XT
25874 Points +23%
Gigabyte Aorus GeForce RTX 4070 Ti Master
Intel Core i9-13900K, NVIDIA GeForce RTX 4070 Ti
23136 Points +10%
Asus TUF Gaming GeForce RTX 4070 Ti
Intel Core i9-13900K, NVIDIA GeForce RTX 4070 Ti
22982 Points +9%
Asus TUF Gaming GeForce RTX 4070 Ti
Intel Core i9-13900K, NVIDIA GeForce RTX 4070 Ti (Quiet BIOS)
22949 Points +9%
Media NVIDIA GeForce RTX 4070 Ti
  (22304 - 23136, n=5)
22791 Points +8%
Sapphire AMD Radeon RX 6950 XT Nitro+ Pure
AMD Ryzen 9 5900X, AMD Radeon RX 6950 XT
21719 Points +3%
Zotac Gaming GeForce RTX 3090 Ti AMP Extreme Holo
AMD Ryzen 7 5800X3D, NVIDIA GeForce RTX 3090 Ti
21645 Points +3%
Gigabyte GeForce RTX 4070 Super Gaming OC 12G
Intel Core i9-13900K, NVIDIA GeForce RTX 4070 SUPER
21117 Points
NVIDIA GeForce RTX 4070 Super Founders Edition
Intel Core i9-13900K, NVIDIA GeForce RTX 4070 SUPER
20867 Points -1%
AMD Radeon RX 7800 XT
AMD Ryzen 9 7950X, AMD Radeon RX 7800 XT
19369 Points -8%
Media NVIDIA GeForce RTX 3090
  (18685 - 20433, n=17)
19266 Points -9%
Media NVIDIA GeForce RTX 3080 Ti
  (19041 - 19460, n=4)
19237 Points -9%
AMD Radeon RX 6900 XT
AMD Ryzen 9 5950X, AMD Radeon RX 6900 XT
18210 Points -14%
Zotac Gaming GeForce RTX 4070 AMP Airo
Intel Core i9-13900K, NVIDIA GeForce RTX 4070
17847 Points -15%
AMD Radeon RX 6800 XT
AMD Ryzen 9 5950X, AMD Radeon RX 6800 XT
17603 Points -17%
Media NVIDIA GeForce RTX 3080
  (17467 - 17604, n=2)
17536 Points -17%
Media della classe Desktop
  (173 - 37589, n=33, ultimi 2 anni)
17279 Points -18%
Sapphire Pulse Radeon RX 7700 XT
AMD Ryzen 9 7950X, AMD Radeon RX 7700 XT
16777 Points -21%
Media NVIDIA Titan RTX
  (14216 - 15283, n=29)
14884 Points -30%
Media NVIDIA GeForce RTX 4060 Ti 8G
  (13293 - 13549, n=3)
13423 Points -36%
KFA2 GeForce RTX 4060 Ti EX, 16GB GDDR6
AMD Ryzen 9 7950X, NVIDIA GeForce RTX 4060 Ti 16G
13359 Points -37%
Media NVIDIA GeForce RTX 3070
  (11043 - 13579, n=7)
12616 Points -40%
XFX Speedster QICK 308 Radeon RX 7600 Black Edition
AMD Ryzen 9 7950X, AMD Radeon RX 7600
11062 Points -48%
KFA2 GeForce RTX 4060 1-Click-OC 2X
AMD Ryzen 9 7950X, NVIDIA GeForce RTX 4060
10494 Points -50%
Unigine Heaven 4.0 / Extreme Preset DX11
NVIDIA GeForce RTX 4090 Founders Edition
Intel Core i9-13900K, NVIDIA GeForce RTX 4090
466 (11min - 1031max) fps +66%
NVIDIA GeForce RTX 4080 Founders Edition
Intel Core i9-13900K, NVIDIA GeForce RTX 4080
389.4 (11.3min - 813.1max) fps +39%
AMD Radeon RX 7900 XTX
AMD Ryzen 9 7950X, AMD Radeon RX 7900 XTX
357.6 fps +27%
AMD Radeon RX 7900 XT
AMD Ryzen 9 7950X, AMD Radeon RX 7900 XT
319.7 fps +14%
Gigabyte Aorus GeForce RTX 4070 Ti Master
Intel Core i9-13900K, NVIDIA GeForce RTX 4070 Ti
317.9 (52.3min - 701.6max) fps +13%
Asus TUF Gaming GeForce RTX 4070 Ti
Intel Core i9-13900K, NVIDIA GeForce RTX 4070 Ti
317.6 (57.8min - 692.1max) fps +13%
Media NVIDIA GeForce RTX 4070 Ti
  (312 - 319, n=4)
317 fps +13%
Zotac Gaming GeForce RTX 3090 Ti AMP Extreme Holo
AMD Ryzen 7 5800X3D, NVIDIA GeForce RTX 3090 Ti
308.5 (9.7min - 627.1max) fps +10%
Media NVIDIA GeForce RTX 3090
  (272 - 315, n=11)
300 fps +7%
Media NVIDIA GeForce RTX 3080 Ti
  (290 - 312, n=4)
300 fps +7%
Sapphire AMD Radeon RX 6950 XT Nitro+ Pure
AMD Ryzen 9 5900X, AMD Radeon RX 6950 XT
293.8 fps +5%
Gigabyte GeForce RTX 4070 Super Gaming OC 12G
Intel Core i9-13900K, NVIDIA GeForce RTX 4070 SUPER
280.8 (51.7min - 649.1max) fps
NVIDIA GeForce RTX 4070 Super Founders Edition
Intel Core i9-13900K, NVIDIA GeForce RTX 4070 SUPER
276.1 (50.9min - 603max) fps -2%
AMD Radeon RX 6900 XT
AMD Ryzen 9 5950X, AMD Radeon RX 6900 XT
259.5 (49.3min - 537.2max) fps -8%
Zotac Gaming GeForce RTX 4070 AMP Airo
Intel Core i9-13900K, NVIDIA GeForce RTX 4070
248 (11min - 572.3max) fps -12%
AMD Radeon RX 6800 XT
AMD Ryzen 9 5950X, AMD Radeon RX 6800 XT
247.9 fps -12%
Media NVIDIA GeForce RTX 3080
  (233 - 253, n=2)
243 fps -13%
AMD Radeon RX 7800 XT
AMD Ryzen 9 7950X, AMD Radeon RX 7800 XT
242.7 fps -14%
Media NVIDIA Titan RTX
  (207 - 248, n=12)
236 fps -16%
Media della classe Desktop
  (4.5 - 472, n=24, ultimi 2 anni)
220 fps -22%
Sapphire Pulse Radeon RX 7700 XT
AMD Ryzen 9 7950X, AMD Radeon RX 7700 XT
211.7 fps -25%
Media NVIDIA GeForce RTX 3070
  (196.4 - 214, n=5)
206 fps -27%
Media NVIDIA GeForce RTX 4060 Ti 8G
  (178.9 - 181.6, n=3)
180.6 fps -36%
KFA2 GeForce RTX 4060 Ti EX, 16GB GDDR6
AMD Ryzen 9 7950X, NVIDIA GeForce RTX 4060 Ti 16G
174.8 fps -38%
KFA2 GeForce RTX 4060 1-Click-OC 2X
AMD Ryzen 9 7950X, NVIDIA GeForce RTX 4060
153.7 fps -45%
XFX Speedster QICK 308 Radeon RX 7600 Black Edition
AMD Ryzen 9 7950X, AMD Radeon RX 7600
148.1 fps -47%
Unigine Heaven 4.0 / Extreme Preset OpenGL
NVIDIA GeForce RTX 4090 Founders Edition
Intel Core i9-13900K, NVIDIA GeForce RTX 4090
443 (15min - 902max) fps +58%
AMD Radeon RX 7900 XTX
AMD Ryzen 9 7950X, AMD Radeon RX 7900 XTX
370.2 fps +32%
NVIDIA GeForce RTX 4080 Founders Edition
Intel Core i9-13900K, NVIDIA GeForce RTX 4080
364.2 (15min - 770.5max) fps +30%
AMD Radeon RX 7900 XT
AMD Ryzen 9 7950X, AMD Radeon RX 7900 XT
330.2 fps +18%
Gigabyte Aorus GeForce RTX 4070 Ti Master
Intel Core i9-13900K, NVIDIA GeForce RTX 4070 Ti
295.5 (50.3min - 602max) fps +6%
Media NVIDIA GeForce RTX 4070 Ti
  (291 - 297, n=4)
294 fps +5%
Asus TUF Gaming GeForce RTX 4070 Ti
Intel Core i9-13900K, NVIDIA GeForce RTX 4070 Ti
292.6 (15.2min - 600.3max) fps +5%
Zotac Gaming GeForce RTX 3090 Ti AMP Extreme Holo
AMD Ryzen 7 5800X3D, NVIDIA GeForce RTX 3090 Ti
292.5 (11.4min - 577.9max) fps +5%
Gigabyte GeForce RTX 4070 Super Gaming OC 12G
Intel Core i9-13900K, NVIDIA GeForce RTX 4070 SUPER
279.9 (14.2min - 655.5max) fps
NVIDIA GeForce RTX 4070 Super Founders Edition
Intel Core i9-13900K, NVIDIA GeForce RTX 4070 SUPER
276.1 (57.7min - 579max) fps -1%
Media NVIDIA GeForce RTX 3080 Ti
  (264 - 282, n=4)
274 fps -2%
Media NVIDIA GeForce RTX 3090
  (188.2 - 284, n=10)
270 fps -4%
AMD Radeon RX 7800 XT
AMD Ryzen 9 7950X, AMD Radeon RX 7800 XT
257.9 fps -8%
Media NVIDIA GeForce RTX 3080
  (232 - 243, n=2)
238 fps -15%
Zotac Gaming GeForce RTX 4070 AMP Airo
Intel Core i9-13900K, NVIDIA GeForce RTX 4070
230.2 (14.6min - 500.6max) fps -18%
Media NVIDIA Titan RTX
  (203 - 299, n=12)
223 fps -20%
Sapphire AMD Radeon RX 6950 XT Nitro+ Pure
AMD Ryzen 9 5900X, AMD Radeon RX 6950 XT
222.7 fps -20%
Sapphire Pulse Radeon RX 7700 XT
AMD Ryzen 9 7950X, AMD Radeon RX 7700 XT
213.2 fps -24%
Media della classe Desktop
  (4 - 450, n=24, ultimi 2 anni)
209 fps -25%
AMD Radeon RX 6900 XT
AMD Ryzen 9 5950X, AMD Radeon RX 6900 XT
206.5 (8.2min - 453.7max) fps -26%
AMD Radeon RX 6800 XT
AMD Ryzen 9 5950X, AMD Radeon RX 6800 XT
204 fps -27%
Media NVIDIA GeForce RTX 3070
  (187.5 - 196.1, n=4)
192.5 fps -31%
Media NVIDIA GeForce RTX 4060 Ti 8G
  (173 - 176, n=3)
174.7 fps -38%
KFA2 GeForce RTX 4060 Ti EX, 16GB GDDR6
AMD Ryzen 9 7950X, NVIDIA GeForce RTX 4060 Ti 16G
170.3 fps -39%
XFX Speedster QICK 308 Radeon RX 7600 Black Edition
AMD Ryzen 9 7950X, AMD Radeon RX 7600
147.2 fps -47%
KFA2 GeForce RTX 4060 1-Click-OC 2X
AMD Ryzen 9 7950X, NVIDIA GeForce RTX 4060
147 fps -47%
Unigine Valley 1.0 / Extreme HD DirectX
NVIDIA GeForce RTX 4090 Founders Edition
Intel Core i9-13900K, NVIDIA GeForce RTX 4090
283 (80min - 527max) fps +31%
NVIDIA GeForce RTX 4080 Founders Edition
Intel Core i9-13900K, NVIDIA GeForce RTX 4080
277.5 (71.7min - 487.9max) fps +29%
AMD Radeon RX 7900 XTX
AMD Ryzen 9 7950X, AMD Radeon RX 7900 XTX
264.5 fps +23%
AMD Radeon RX 7900 XT
AMD Ryzen 9 7950X, AMD Radeon RX 7900 XT
243.3 fps +13%
Asus TUF Gaming GeForce RTX 4070 Ti
Intel Core i9-13900K, NVIDIA GeForce RTX 4070 Ti
230.3 (78.9min - 451.1max) fps +7%
Media NVIDIA GeForce RTX 3080 Ti
  (206 - 240, n=4)
228 fps +6%
Media NVIDIA GeForce RTX 3090
  (184.2 - 247, n=11)
225 fps +5%
Media NVIDIA GeForce RTX 4070 Ti
  (208 - 230, n=4)
218 fps +1%
Gigabyte GeForce RTX 4070 Super Gaming OC 12G
Intel Core i9-13900K, NVIDIA GeForce RTX 4070 SUPER
215.3 (73.3min - 409.2max) fps
NVIDIA GeForce RTX 4070 Super Founders Edition
Intel Core i9-13900K, NVIDIA GeForce RTX 4070 SUPER
213.8 (75min - 414.5max) fps -1%
Sapphire AMD Radeon RX 6950 XT Nitro+ Pure
AMD Ryzen 9 5900X, AMD Radeon RX 6950 XT
209.2 fps -3%
Gigabyte Aorus GeForce RTX 4070 Ti Master
Intel Core i9-13900K, NVIDIA GeForce RTX 4070 Ti
207.5 (75.3min - 371.2max) fps -4%
Zotac Gaming GeForce RTX 3090 Ti AMP Extreme Holo
AMD Ryzen 7 5800X3D, NVIDIA GeForce RTX 3090 Ti
201.7 (48.5min - 338.7max) fps -6%
AMD Radeon RX 6900 XT
AMD Ryzen 9 5950X, AMD Radeon RX 6900 XT
200.8 (53.4min - 359.1max) fps -7%
Zotac Gaming GeForce RTX 4070 AMP Airo
Intel Core i9-13900K, NVIDIA GeForce RTX 4070
195.2 (57.6min - 374.2max) fps -9%
AMD Radeon RX 7800 XT
AMD Ryzen 9 7950X, AMD Radeon RX 7800 XT
191.3 fps -11%
AMD Radeon RX 6800 XT
AMD Ryzen 9 5950X, AMD Radeon RX 6800 XT
190.6 fps -11%
Media NVIDIA GeForce RTX 3080
  (176.2 - 181.8, n=2)
179 fps -17%
Media NVIDIA Titan RTX
  (135 - 191.4, n=12)
173.3 fps -20%
Media NVIDIA GeForce RTX 3070
  (155.1 - 168.5, n=5)
161.2 fps -25%
Sapphire Pulse Radeon RX 7700 XT
AMD Ryzen 9 7950X, AMD Radeon RX 7700 XT
160.1 fps -26%
Media della classe Desktop
  (3.7 - 292, n=24, ultimi 2 anni)
158.9 fps -26%
Media NVIDIA GeForce RTX 4060 Ti 8G
  (128.3 - 131.2, n=3)
129.8 fps -40%
KFA2 GeForce RTX 4060 Ti EX, 16GB GDDR6
AMD Ryzen 9 7950X, NVIDIA GeForce RTX 4060 Ti 16G
127.8 fps -41%
KFA2 GeForce RTX 4060 1-Click-OC 2X
AMD Ryzen 9 7950X, NVIDIA GeForce RTX 4060
115.3 fps -46%
XFX Speedster QICK 308 Radeon RX 7600 Black Edition
AMD Ryzen 9 7950X, AMD Radeon RX 7600
107.5 fps -50%
Unigine Valley 1.0 / Extreme HD Preset OpenGL
NVIDIA GeForce RTX 4090 Founders Edition
Intel Core i9-13900K, NVIDIA GeForce RTX 4090
315 (64min - 559max) fps +58%
NVIDIA GeForce RTX 4080 Founders Edition
Intel Core i9-13900K, NVIDIA GeForce RTX 4080
257 (79.3min - 462.8max) fps +29%
AMD Radeon RX 7900 XTX
AMD Ryzen 9 7950X, AMD Radeon RX 7900 XTX
254.2 fps +27%
Gigabyte Aorus GeForce RTX 4070 Ti Master
Intel Core i9-13900K, NVIDIA GeForce RTX 4070 Ti
230.9 (56.3min - 480.2max) fps +15%
AMD Radeon RX 7900 XT
AMD Ryzen 9 7950X, AMD Radeon RX 7900 XT
225.9 fps +13%
Zotac Gaming GeForce RTX 3090 Ti AMP Extreme Holo
AMD Ryzen 7 5800X3D, NVIDIA GeForce RTX 3090 Ti
208.4 (49.3min - 353max) fps +4%
Media NVIDIA GeForce RTX 4070 Ti
  (197.4 - 231, n=4)
208 fps +4%
Asus TUF Gaming GeForce RTX 4070 Ti
Intel Core i9-13900K, NVIDIA GeForce RTX 4070 Ti
206.8 (64.6min - 374.1max) fps +3%
Media NVIDIA GeForce RTX 3080 Ti
  (195.1 - 210, n=4)
204 fps +2%
Media NVIDIA GeForce RTX 3090
  (158.8 - 226, n=10)
203 fps +2%
NVIDIA GeForce RTX 4070 Super Founders Edition
Intel Core i9-13900K, NVIDIA GeForce RTX 4070 SUPER
200.4 (62.1min - 392.1max) fps 0%
Gigabyte GeForce RTX 4070 Super Gaming OC 12G
Intel Core i9-13900K, NVIDIA GeForce RTX 4070 SUPER
200 (63.6min - 393.8max) fps
AMD Radeon RX 7800 XT
AMD Ryzen 9 7950X, AMD Radeon RX 7800 XT
182 fps -9%
Sapphire AMD Radeon RX 6950 XT Nitro+ Pure
AMD Ryzen 9 5900X, AMD Radeon RX 6950 XT
176.9 fps -12%
Zotac Gaming GeForce RTX 4070 AMP Airo
Intel Core i9-13900K, NVIDIA GeForce RTX 4070
171.8 (61.5min - 301.3max) fps -14%
Media NVIDIA GeForce RTX 3080
  (163.8 - 172, n=2)
167.9 fps -16%
AMD Radeon RX 6900 XT
AMD Ryzen 9 5950X, AMD Radeon RX 6900 XT
167.4 (56.7min - 375.7max) fps -16%
AMD Radeon RX 6800 XT
AMD Ryzen 9 5950X, AMD Radeon RX 6800 XT
158.2 fps -21%
Media NVIDIA Titan RTX
  (139.2 - 181.2, n=12)
158.1 fps -21%
Media della classe Desktop
  (3.4 - 315, n=24, ultimi 2 anni)
151.3 fps -24%
Sapphire Pulse Radeon RX 7700 XT
AMD Ryzen 9 7950X, AMD Radeon RX 7700 XT
143 fps -28%
Media NVIDIA GeForce RTX 3070
  (140.2 - 144.9, n=4)
142.7 fps -29%
Media NVIDIA GeForce RTX 4060 Ti 8G
  (116.5 - 118.8, n=3)
117.8 fps -41%
KFA2 GeForce RTX 4060 Ti EX, 16GB GDDR6
AMD Ryzen 9 7950X, NVIDIA GeForce RTX 4060 Ti 16G
114.9 fps -43%
KFA2 GeForce RTX 4060 1-Click-OC 2X
AMD Ryzen 9 7950X, NVIDIA GeForce RTX 4060
104.5 fps -48%
XFX Speedster QICK 308 Radeon RX 7600 Black Edition
AMD Ryzen 9 7950X, AMD Radeon RX 7600
94.8 fps -53%
Unigine Superposition / 720p Low
Asus TUF Gaming GeForce RTX 4070 Ti
Intel Core i9-13900K, NVIDIA GeForce RTX 4070 Ti
56132 Points +11%
NVIDIA GeForce RTX 4090 Founders Edition
Intel Core i9-13900K, NVIDIA GeForce RTX 4090
55915 Points +10%
NVIDIA GeForce RTX 4080 Founders Edition
Intel Core i9-13900K, NVIDIA GeForce RTX 4080
55670 Points +10%
Gigabyte Aorus GeForce RTX 4070 Ti Master
Intel Core i9-13900K, NVIDIA GeForce RTX 4070 Ti
55232 Points +9%
Media NVIDIA GeForce RTX 4070 Ti
  (48835 - 56396, n=4)
54149 Points +7%
Zotac Gaming GeForce RTX 4070 AMP Airo
Intel Core i9-13900K, NVIDIA GeForce RTX 4070
52713 Points +4%
NVIDIA GeForce RTX 4070 Super Founders Edition
Intel Core i9-13900K, NVIDIA GeForce RTX 4070 SUPER
50724 Points 0%
Gigabyte GeForce RTX 4070 Super Gaming OC 12G
Intel Core i9-13900K, NVIDIA GeForce RTX 4070 SUPER
50629 Points
Media NVIDIA GeForce RTX 3080 Ti
  (43163 - 50738, n=4)
47400 Points -6%
Media NVIDIA GeForce RTX 4060 Ti 8G
  (46504 - 47695, n=3)
47288 Points -7%
AMD Radeon RX 7900 XTX
AMD Ryzen 9 7950X, AMD Radeon RX 7900 XTX
47274 Points -7%
Media NVIDIA GeForce RTX 3090
  (33329 - 54879, n=10)
46049 Points -9%
AMD Radeon RX 7900 XT
AMD Ryzen 9 7950X, AMD Radeon RX 7900 XT
45904 Points -9%
KFA2 GeForce RTX 4060 1-Click-OC 2X
AMD Ryzen 9 7950X, NVIDIA GeForce RTX 4060
45864 Points -9%
AMD Radeon RX 7800 XT
AMD Ryzen 9 7950X, AMD Radeon RX 7800 XT
45745 Points -10%
Zotac Gaming GeForce RTX 3090 Ti AMP Extreme Holo
AMD Ryzen 7 5800X3D, NVIDIA GeForce RTX 3090 Ti
45444 Points -10%
Sapphire Pulse Radeon RX 7700 XT
AMD Ryzen 9 7950X, AMD Radeon RX 7700 XT
45299 Points -11%
KFA2 GeForce RTX 4060 Ti EX, 16GB GDDR6
AMD Ryzen 9 7950X, NVIDIA GeForce RTX 4060 Ti 16G
43851 Points -13%
XFX Speedster QICK 308 Radeon RX 7600 Black Edition
AMD Ryzen 9 7950X, AMD Radeon RX 7600
42477 Points -16%
Media NVIDIA Titan RTX
  (25622 - 50876, n=9)
40891 Points -19%
Media della classe Desktop
  (2704 - 56132, n=22, ultimi 2 anni)
38418 Points -24%
AMD Radeon RX 6900 XT
AMD Ryzen 9 5950X, AMD Radeon RX 6900 XT
37023 Points -27%
AMD Radeon RX 6800 XT
AMD Ryzen 9 5950X, AMD Radeon RX 6800 XT
36452 Points -28%
Media NVIDIA GeForce RTX 3070
  (27330 - 40007, n=5)
34576 Points -32%
Sapphire AMD Radeon RX 6950 XT Nitro+ Pure
AMD Ryzen 9 5900X, AMD Radeon RX 6950 XT
33955 Points -33%
Media NVIDIA GeForce RTX 3080
  (30851 - 32183, n=2)
31517 Points -38%
Unigine Superposition / 1080p Extreme
NVIDIA GeForce RTX 4090 Founders Edition
Intel Core i9-13900K, NVIDIA GeForce RTX 4090
20729 Points +70%
AMD Radeon RX 7900 XTX
AMD Ryzen 9 7950X, AMD Radeon RX 7900 XTX
17264 Points +42%
NVIDIA GeForce RTX 4080 Founders Edition
Intel Core i9-13900K, NVIDIA GeForce RTX 4080
16623 Points +37%
AMD Radeon RX 7900 XT
AMD Ryzen 9 7950X, AMD Radeon RX 7900 XT
14181 Points +17%
Zotac Gaming GeForce RTX 3090 Ti AMP Extreme Holo
AMD Ryzen 7 5800X3D, NVIDIA GeForce RTX 3090 Ti
13803 Points +13%
Gigabyte Aorus GeForce RTX 4070 Ti Master
Intel Core i9-13900K, NVIDIA GeForce RTX 4070 Ti
13448 Points +11%
Asus TUF Gaming GeForce RTX 4070 Ti
Intel Core i9-13900K, NVIDIA GeForce RTX 4070 Ti
13266 Points +9%
Media NVIDIA GeForce RTX 4070 Ti
  (12837 - 13448, n=4)
13168 Points +8%
Media NVIDIA GeForce RTX 3090
  (11806 - 12694, n=11)
12209 Points 0%
Gigabyte GeForce RTX 4070 Super Gaming OC 12G
Intel Core i9-13900K, NVIDIA GeForce RTX 4070 SUPER
12163 Points
Media NVIDIA GeForce RTX 3080 Ti
  (12038 - 12347, n=4)
12139 Points 0%
Sapphire AMD Radeon RX 6950 XT Nitro+ Pure
AMD Ryzen 9 5900X, AMD Radeon RX 6950 XT
12079 Points -1%
NVIDIA GeForce RTX 4070 Super Founders Edition
Intel Core i9-13900K, NVIDIA GeForce RTX 4070 SUPER
12019 Points -1%
Media NVIDIA GeForce RTX 3080
  (10572 - 10822, n=2)
10697 Points -12%
AMD Radeon RX 6900 XT
AMD Ryzen 9 5950X, AMD Radeon RX 6900 XT
10683 Points -12%
AMD Radeon RX 7800 XT
AMD Ryzen 9 7950X, AMD Radeon RX 7800 XT
10145 Points -17%
Media della classe Desktop
  (286 - 21332, n=22, ultimi 2 anni)
10122 Points -17%
AMD Radeon RX 6800 XT
AMD Ryzen 9 5950X, AMD Radeon RX 6800 XT
10046 Points -17%
Zotac Gaming GeForce RTX 4070 AMP Airo
Intel Core i9-13900K, NVIDIA GeForce RTX 4070
9764 Points -20%
Media NVIDIA Titan RTX
  (8916 - 9285, n=9)
9051 Points -26%
Sapphire Pulse Radeon RX 7700 XT
AMD Ryzen 9 7950X, AMD Radeon RX 7700 XT
8732 Points -28%
Media NVIDIA GeForce RTX 3070
  (8276 - 8507, n=5)
8354 Points -31%
KFA2 GeForce RTX 4060 Ti EX, 16GB GDDR6
AMD Ryzen 9 7950X, NVIDIA GeForce RTX 4060 Ti 16G
7712 Points -37%
Media NVIDIA GeForce RTX 4060 Ti 8G
  (7085 - 7833, n=3)
7438 Points -39%
XFX Speedster QICK 308 Radeon RX 7600 Black Edition
AMD Ryzen 9 7950X, AMD Radeon RX 7600
6419 Points -47%
KFA2 GeForce RTX 4060 1-Click-OC 2X
AMD Ryzen 9 7950X, NVIDIA GeForce RTX 4060
5974 Points -51%
Unigine Superposition / 4k Optimized
NVIDIA GeForce RTX 4090 Founders Edition
Intel Core i9-13900K, NVIDIA GeForce RTX 4090
32977 Points +107%
AMD Radeon RX 7900 XTX
AMD Ryzen 9 7950X, AMD Radeon RX 7900 XTX
23174 Points +46%
NVIDIA GeForce RTX 4080 Founders Edition
Intel Core i9-13900K, NVIDIA GeForce RTX 4080
22343 Points +40%
AMD Radeon RX 7900 XT
AMD Ryzen 9 7950X, AMD Radeon RX 7900 XT
18806 Points +18%
Zotac Gaming GeForce RTX 3090 Ti AMP Extreme Holo
AMD Ryzen 7 5800X3D, NVIDIA GeForce RTX 3090 Ti
18426 Points +16%
Sapphire AMD Radeon RX 6950 XT Nitro+ Pure
AMD Ryzen 9 5900X, AMD Radeon RX 6950 XT
17725 Points +11%
Gigabyte Aorus GeForce RTX 4070 Ti Master
Intel Core i9-13900K, NVIDIA GeForce RTX 4070 Ti
17290 Points +9%
Asus TUF Gaming GeForce RTX 4070 Ti
Intel Core i9-13900K, NVIDIA GeForce RTX 4070 Ti
17184 Points +8%
Media NVIDIA GeForce RTX 4070 Ti
  (16889 - 17290, n=4)
17118 Points +8%
Media NVIDIA GeForce RTX 3090
  (15794 - 16868, n=11)
16326 Points +3%
Media NVIDIA GeForce RTX 3080 Ti
  (16108 - 16412, n=4)
16199 Points +2%
Gigabyte GeForce RTX 4070 Super Gaming OC 12G
Intel Core i9-13900K, NVIDIA GeForce RTX 4070 SUPER
15913 Points
NVIDIA GeForce RTX 4070 Super Founders Edition
Intel Core i9-13900K, NVIDIA GeForce RTX 4070 SUPER
15803 Points -1%
AMD Radeon RX 6900 XT
AMD Ryzen 9 5950X, AMD Radeon RX 6900 XT
14955 Points -6%
Media della classe Desktop
  (559 - 33488, n=21, ultimi 2 anni)
14724 Points -7%
Media NVIDIA GeForce RTX 3080
  (13984 - 14243, n=2)
14114 Points -11%
AMD Radeon RX 7800 XT
AMD Ryzen 9 7950X, AMD Radeon RX 7800 XT
13776 Points -13%
Zotac Gaming GeForce RTX 4070 AMP Airo
Intel Core i9-13900K, NVIDIA GeForce RTX 4070
13715 Points -14%
AMD Radeon RX 6800 XT
AMD Ryzen 9 5950X, AMD Radeon RX 6800 XT
13471 Points -15%
Media NVIDIA Titan RTX
  (11937 - 12644, n=9)
12203 Points -23%
Sapphire Pulse Radeon RX 7700 XT
AMD Ryzen 9 7950X, AMD Radeon RX 7700 XT
11256 Points -29%
Media NVIDIA GeForce RTX 3070
  (10544 - 10755, n=5)
10667 Points -33%
Media NVIDIA GeForce RTX 4060 Ti 8G
  (9579 - 9722, n=3)
9651 Points -39%
KFA2 GeForce RTX 4060 Ti EX, 16GB GDDR6
AMD Ryzen 9 7950X, NVIDIA GeForce RTX 4060 Ti 16G
9516 Points -40%
KFA2 GeForce RTX 4060 1-Click-OC 2X
AMD Ryzen 9 7950X, NVIDIA GeForce RTX 4060
7959 Points -50%
XFX Speedster QICK 308 Radeon RX 7600 Black Edition
AMD Ryzen 9 7950X, AMD Radeon RX 7600
7817 Points -51%
Unigine Superposition / 8k Optimized
NVIDIA GeForce RTX 4090 Founders Edition
Intel Core i9-13900K, NVIDIA GeForce RTX 4090
12826 Points +118%
AMD Radeon RX 7900 XTX
AMD Ryzen 9 7950X, AMD Radeon RX 7900 XTX
8751 Points +49%
NVIDIA GeForce RTX 4080 Founders Edition
Intel Core i9-13900K, NVIDIA GeForce RTX 4080
8556 Points +45%
Zotac Gaming GeForce RTX 3090 Ti AMP Extreme Holo
AMD Ryzen 7 5800X3D, NVIDIA GeForce RTX 3090 Ti
8213 Points +39%
Media NVIDIA GeForce RTX 3090
  (6969 - 7521, n=11)
7144 Points +21%
Media NVIDIA GeForce RTX 3080 Ti
  (6920 - 7161, n=4)
7070 Points +20%
AMD Radeon RX 7900 XT
AMD Ryzen 9 7950X, AMD Radeon RX 7900 XT
7034 Points +19%
Sapphire AMD Radeon RX 6950 XT Nitro+ Pure
AMD Ryzen 9 5900X, AMD Radeon RX 6950 XT
6645 Points +13%
Gigabyte Aorus GeForce RTX 4070 Ti Master
Intel Core i9-13900K, NVIDIA GeForce RTX 4070 Ti
6454 Points +10%
Asus TUF Gaming GeForce RTX 4070 Ti
Intel Core i9-13900K, NVIDIA GeForce RTX 4070 Ti
6427 Points +9%
Media NVIDIA GeForce RTX 4070 Ti
  (6380 - 6454, n=4)
6425 Points +9%
Media NVIDIA GeForce RTX 3080
  (6243 - 6346, n=2)
6295 Points +7%
Gigabyte GeForce RTX 4070 Super Gaming OC 12G
Intel Core i9-13900K, NVIDIA GeForce RTX 4070 SUPER
5892 Points
NVIDIA GeForce RTX 4070 Super Founders Edition
Intel Core i9-13900K, NVIDIA GeForce RTX 4070 SUPER
5844 Points -1%
Media della classe Desktop
  (237 - 13008, n=21, ultimi 2 anni)
5826 Points -1%
AMD Radeon RX 6900 XT
AMD Ryzen 9 5950X, AMD Radeon RX 6900 XT
5764 Points -2%
Media NVIDIA Titan RTX
  (5255 - 5571, n=9)
5393 Points -8%
AMD Radeon RX 7800 XT
AMD Ryzen 9 7950X, AMD Radeon RX 7800 XT
5307 Points -10%
AMD Radeon RX 6800 XT
AMD Ryzen 9 5950X, AMD Radeon RX 6800 XT
5256 Points -11%
Zotac Gaming GeForce RTX 4070 AMP Airo
Intel Core i9-13900K, NVIDIA GeForce RTX 4070
5253 Points -11%
Media NVIDIA GeForce RTX 3070
  (4587 - 4695, n=5)
4624 Points -22%
Sapphire Pulse Radeon RX 7700 XT
AMD Ryzen 9 7950X, AMD Radeon RX 7700 XT
4085 Points -31%
Media NVIDIA GeForce RTX 4060 Ti 8G
  (3520 - 3571, n=3)
3546 Points -40%
KFA2 GeForce RTX 4060 Ti EX, 16GB GDDR6
AMD Ryzen 9 7950X, NVIDIA GeForce RTX 4060 Ti 16G
3517 Points -40%
KFA2 GeForce RTX 4060 1-Click-OC 2X
AMD Ryzen 9 7950X, NVIDIA GeForce RTX 4060
3066 Points -48%
XFX Speedster QICK 308 Radeon RX 7600 Black Edition
AMD Ryzen 9 7950X, AMD Radeon RX 7600
2964 Points -50%
3DMark 11 Performance
51572 punti
3DMark Ice Storm Standard Score
279979 punti
3DMark Cloud Gate Standard Score
81504 punti
3DMark Fire Strike Score
41178 punti
3DMark Fire Strike Extreme Score
24458 punti
3DMark Time Spy Score
21292 punti
Aiuto

Prestazioni di calcolo: Proprio sulla scia della RTX 4070 Ti

Le prestazioni di calcolo sono praticamente indistinguibili dalla RTX 4070 Super FE. La RTX 4070 Super Gaming OC è in grado di battere in modo convincente la RTX 3090 Ti nei test GPU V-Ray, oltre a essere più veloce del 17% e del 21% rispetto alla RTX 3090 Ti Zotac GeForce Gaming RTX 4070 AMP Airo nel rendering di Blender 3.3 Classroom CUDA e Classroom Optix, rispettivamente.

La RTX 4070 Super Gaming OC si trova a poca distanza dalla Asus TUF Gaming GeForce RTX 4070 Ti e della RTX 4070 Ti Master di Aorus in Sala LuxMark. I test di Sala hanno tradizionalmente favorito le GPU AMD più vecchie, ma la RTX 4070 Super Gaming OC riesce comunque a ottenere un vantaggio del 27% rispetto alla AMD Radeon RX 7900 XTX.

V-Ray 5 Benchmark / GPU CUDA
NVIDIA GeForce RTX 4090 Founders Edition
Intel Core i9-13900K, NVIDIA GeForce RTX 4090 (5.0.1)
4224 mpaths +87%
NVIDIA GeForce RTX 4080 Founders Edition
Intel Core i9-13900K, NVIDIA GeForce RTX 4080 (5.0.1)
3067 mpaths +36%
Gigabyte Aorus GeForce RTX 4070 Ti Master
Intel Core i9-13900K, NVIDIA GeForce RTX 4070 Ti (5.0.1)
2371 mpaths +5%
Asus TUF Gaming GeForce RTX 4070 Ti
Intel Core i9-13900K, NVIDIA GeForce RTX 4070 Ti (5.0.1)
2322 mpaths +3%
Media NVIDIA GeForce RTX 4070 Ti
  (2278 - 2371, n=4)
2318 mpaths +3%
Gigabyte GeForce RTX 4070 Super Gaming OC 12G
Intel Core i9-13900K, NVIDIA GeForce RTX 4070 SUPER (5.0.1)
2254 mpaths
NVIDIA GeForce RTX 4070 Super Founders Edition
Intel Core i9-13900K, NVIDIA GeForce RTX 4070 SUPER (5.0.1)
2238 mpaths -1%
Zotac Gaming GeForce RTX 3090 Ti AMP Extreme Holo
AMD Ryzen 7 5800X3D, NVIDIA GeForce RTX 3090 Ti (5.0.1)
2195 mpaths -3%
Media NVIDIA GeForce RTX 3080 Ti
  (2045 - 2070, n=3)
2057 mpaths -9%
Media NVIDIA GeForce RTX 3090
  (1616 - 2131, n=14)
2019 mpaths -10%
Zotac Gaming GeForce RTX 4070 AMP Airo
Intel Core i9-13900K, NVIDIA GeForce RTX 4070 (5.0.1)
1874 mpaths -17%
Media della classe Desktop
  (13 - 4322, n=27, ultimi 2 anni)
1808 mpaths -20%
Media NVIDIA GeForce RTX 4060 Ti 8G
  (1375 - 1400, n=2)
1388 mpaths -38%
KFA2 GeForce RTX 4060 Ti EX, 16GB GDDR6
AMD Ryzen 9 7950X, NVIDIA GeForce RTX 4060 Ti 16G (5.0.1)
1387 mpaths -38%
Media NVIDIA GeForce RTX 3070
  (1109 - 1422, n=2)
1266 mpaths -44%
KFA2 GeForce RTX 4060 1-Click-OC 2X
AMD Ryzen 9 7950X, NVIDIA GeForce RTX 4060 (5.0.1)
1246 mpaths -45%
Media NVIDIA Titan RTX
  (668 - 1052, n=7)
910 mpaths -60%
AMD Radeon RX 7800 XT
AMD Ryzen 9 7950X, AMD Radeon RX 7800 XT (5.0.1)
666 mpaths -70%
Sapphire Pulse Radeon RX 7700 XT
AMD Ryzen 9 7950X, AMD Radeon RX 7700 XT (5.0.1)
663 mpaths -71%
XFX Speedster QICK 308 Radeon RX 7600 Black Edition
AMD Ryzen 9 7950X, AMD Radeon RX 7600 (5.0.1)
662 mpaths -71%
Sapphire AMD Radeon RX 6950 XT Nitro+ Pure
AMD Ryzen 9 5900X, AMD Radeon RX 6950 XT (5.0.1)
383 mpaths -83%
V-Ray 5 Benchmark / GPU RTX
NVIDIA GeForce RTX 4090 Founders Edition
Intel Core i9-13900K, NVIDIA GeForce RTX 4090 (5.0.1)
5935 mpaths +90%
NVIDIA GeForce RTX 4080 Founders Edition
Intel Core i9-13900K, NVIDIA GeForce RTX 4080 (5.0.1)
4193 mpaths +34%
Media della classe Desktop
  (992 - 6019, n=18, ultimi 2 anni)
3574 mpaths +14%
Gigabyte Aorus GeForce RTX 4070 Ti Master
Intel Core i9-13900K, NVIDIA GeForce RTX 4070 Ti (5.0.1)
3221 mpaths +3%
Asus TUF Gaming GeForce RTX 4070 Ti
Intel Core i9-13900K, NVIDIA GeForce RTX 4070 Ti (5.0.1)
3180 mpaths +2%
Media NVIDIA GeForce RTX 4070 Ti
  (3054 - 3221, n=4)
3151 mpaths +1%
Gigabyte GeForce RTX 4070 Super Gaming OC 12G
Intel Core i9-13900K, NVIDIA GeForce RTX 4070 SUPER (5.0.1)
3122 mpaths
NVIDIA GeForce RTX 4070 Super Founders Edition
Intel Core i9-13900K, NVIDIA GeForce RTX 4070 SUPER (5.0.1)
3088 mpaths -1%
Zotac Gaming GeForce RTX 3090 Ti AMP Extreme Holo
AMD Ryzen 7 5800X3D, NVIDIA GeForce RTX 3090 Ti (5.0.1)
2880 mpaths -8%
Media NVIDIA GeForce RTX 3090
  (2551 - 2979, n=14)
2813 mpaths -10%
Media NVIDIA GeForce RTX 3080 Ti
  (2727 - 2883, n=3)
2784 mpaths -11%
Zotac Gaming GeForce RTX 4070 AMP Airo
Intel Core i9-13900K, NVIDIA GeForce RTX 4070 (5.0.1)
2660 mpaths -15%
AMD Radeon RX 7800 XT
AMD Ryzen 9 7950X, AMD Radeon RX 7800 XT (5.0.1)
2024 mpaths -35%
Media NVIDIA GeForce RTX 4060 Ti 8G
  (1974 - 2024, n=2)
1999 mpaths -36%
KFA2 GeForce RTX 4060 Ti EX, 16GB GDDR6
AMD Ryzen 9 7950X, NVIDIA GeForce RTX 4060 Ti 16G (5.0.1)
1967 mpaths -37%
Sapphire Pulse Radeon RX 7700 XT
AMD Ryzen 9 7950X, AMD Radeon RX 7700 XT (5.0.1)
1967 mpaths -37%
KFA2 GeForce RTX 4060 1-Click-OC 2X
AMD Ryzen 9 7950X, NVIDIA GeForce RTX 4060 (5.0.1)
1856 mpaths -41%
Media NVIDIA GeForce RTX 3070
  (1610 - 1756, n=2)
1683 mpaths -46%
Media NVIDIA Titan RTX
  (1246 - 1348, n=7)
1299 mpaths -58%
V-Ray Benchmark Next 4.10 / GPU
NVIDIA GeForce RTX 4090 Founders Edition
Intel Core i9-13900K, NVIDIA GeForce RTX 4090 (v4.10.07 )
1847 mpaths +72%
NVIDIA GeForce RTX 4080 Founders Edition
Intel Core i9-13900K, NVIDIA GeForce RTX 4080 (v4.10.07 )
1455 mpaths +35%
NVIDIA GeForce RTX 4070 Super Founders Edition
Intel Core i9-13900K, NVIDIA GeForce RTX 4070 SUPER (v4.10.07 )
1075 mpaths 0%
Gigabyte GeForce RTX 4070 Super Gaming OC 12G
Intel Core i9-13900K, NVIDIA GeForce RTX 4070 SUPER (v4.10.07 )
1075 mpaths
Media NVIDIA GeForce RTX 4070 Ti
  (1056 - 1076, n=3)
1064 mpaths -1%
Asus TUF Gaming GeForce RTX 4070 Ti
Intel Core i9-13900K, NVIDIA GeForce RTX 4070 Ti (v4.10.07 )
1060 mpaths -1%
Gigabyte Aorus GeForce RTX 4070 Ti Master
Intel Core i9-13900K, NVIDIA GeForce RTX 4070 Ti (v4.10.07 )
1056 mpaths -2%
Zotac Gaming GeForce RTX 4070 AMP Airo
Intel Core i9-13900K, NVIDIA GeForce RTX 4070 (v4.10.07 )
966 mpaths -10%
Zotac Gaming GeForce RTX 3090 Ti AMP Extreme Holo
AMD Ryzen 7 5800X3D, NVIDIA GeForce RTX 3090 Ti (v4.10.07 )
902 mpaths -16%
Media NVIDIA GeForce RTX 3090
  (781 - 877, n=16)
856 mpaths -20%
Media NVIDIA GeForce RTX 3080 Ti
  (854 - 855, n=3)
854 mpaths -21%
Media della classe Desktop
  (4 - 1880, n=29, ultimi 2 anni)
792 mpaths -26%
Media NVIDIA GeForce RTX 3080
  (636 - 643, n=2)
640 mpaths -40%
Media NVIDIA GeForce RTX 4060 Ti 8G
  (626 - 649, n=2)
638 mpaths -41%
KFA2 GeForce RTX 4060 Ti EX, 16GB GDDR6
AMD Ryzen 9 7950X, NVIDIA GeForce RTX 4060 Ti 16G (v4.10.07 )
620 mpaths -42%
KFA2 GeForce RTX 4060 1-Click-OC 2X
AMD Ryzen 9 7950X, NVIDIA GeForce RTX 4060 (v4.10.07 )
601 mpaths -44%
Media NVIDIA GeForce RTX 3070
  (464 - 508, n=4)
478 mpaths -56%
Media NVIDIA Titan RTX
  (386 - 439, n=16)
400 mpaths -63%
XFX Speedster QICK 308 Radeon RX 7600 Black Edition
AMD Ryzen 9 7950X, AMD Radeon RX 7600 (v4.10.07 )
221 mpaths -79%
AMD Radeon RX 7800 XT
AMD Ryzen 9 7950X, AMD Radeon RX 7800 XT (v4.10.07 )
220 mpaths -80%
Sapphire Pulse Radeon RX 7700 XT
AMD Ryzen 9 7950X, AMD Radeon RX 7700 XT (v4.10.07 )
220 mpaths -80%
AMD Radeon RX 6800 XT
AMD Ryzen 9 5950X, AMD Radeon RX 6800 XT (v4.10.07 )
157 mpaths -85%
Sapphire AMD Radeon RX 6950 XT Nitro+ Pure
AMD Ryzen 9 5900X, AMD Radeon RX 6950 XT (v4.10.07 )
137 mpaths -87%
Blender / v3.3 Classroom CUDA
KFA2 GeForce RTX 4060 1-Click-OC 2X
AMD Ryzen 9 7950X, NVIDIA GeForce RTX 4060 (3.3.3)
40 Seconds * -111%
Media NVIDIA Titan RTX
  ()
31 Seconds * -63%
Zotac Gaming GeForce RTX 4070 AMP Airo
Intel Core i9-13900K, NVIDIA GeForce RTX 4070 (3.3.3)
23 Seconds * -21%
Media NVIDIA GeForce RTX 3080 Ti
  (21 - 22, n=2)
21.5 Seconds * -13%
Media NVIDIA GeForce RTX 3090
  (20 - 22, n=11)
21.4 Seconds * -13%
NVIDIA GeForce RTX 4070 Super Founders Edition
Intel Core i9-13900K, NVIDIA GeForce RTX 4070 SUPER (3.3.3)
19 Seconds * -0%
Gigabyte GeForce RTX 4070 Super Gaming OC 12G
Intel Core i9-13900K, NVIDIA GeForce RTX 4070 SUPER (3.3.3)
19 Seconds *
Media NVIDIA GeForce RTX 4070 Ti
  (18 - 19, n=2)
18.5 Seconds * +3%
Gigabyte Aorus GeForce RTX 4070 Ti Master
Intel Core i9-13900K, NVIDIA GeForce RTX 4070 Ti (3.3.2)
18 Seconds * +5%
Media della classe Desktop
  (10 - 23, n=15, ultimi 2 anni)
16.2 Seconds * +15%
Blender / v3.3 Classroom OPTIX/RTX
KFA2 GeForce RTX 4060 1-Click-OC 2X
AMD Ryzen 9 7950X, NVIDIA GeForce RTX 4060 (3.3.3)
21 Seconds * -91%
Media NVIDIA Titan RTX
  ()
21 Seconds * -91%
KFA2 GeForce RTX 4060 Ti EX, 16GB GDDR6
AMD Ryzen 9 7950X, NVIDIA GeForce RTX 4060 Ti 16G (3.3.3)
18 Seconds * -64%
Media NVIDIA GeForce RTX 4060 Ti 8G
  (18 - 18, n=2)
18 Seconds * -64%
Media NVIDIA GeForce RTX 3080 Ti
  (14 - 15, n=2)
14.5 Seconds * -32%
Zotac Gaming GeForce RTX 4070 AMP Airo
Intel Core i9-13900K, NVIDIA GeForce RTX 4070 (3.3.3)
14 Seconds * -27%
Media NVIDIA GeForce RTX 3090
  (13 - 14, n=11)
13.4 Seconds * -22%
Asus TUF Gaming GeForce RTX 4070 Ti
Intel Core i9-13900K, NVIDIA GeForce RTX 4070 Ti (3.3.2)
12 Seconds * -9%
Media NVIDIA GeForce RTX 4070 Ti
  (11 - 12, n=4)
11.5 Seconds * -5%
Gigabyte Aorus GeForce RTX 4070 Ti Master
Intel Core i9-13900K, NVIDIA GeForce RTX 4070 Ti (3.3.2)
11 Seconds * -0%
NVIDIA GeForce RTX 4070 Super Founders Edition
Intel Core i9-13900K, NVIDIA GeForce RTX 4070 SUPER (3.3.3)
11 Seconds * -0%
Gigabyte GeForce RTX 4070 Super Gaming OC 12G
Intel Core i9-13900K, NVIDIA GeForce RTX 4070 SUPER (3.3.3)
11 Seconds *
Media della classe Desktop
  (7 - 15, n=17, ultimi 2 anni)
10.6 Seconds * +4%
NVIDIA GeForce RTX 4080 Founders Edition
Intel Core i9-13900K, NVIDIA GeForce RTX 4080 (3.3.0)
10 Seconds * +9%
NVIDIA GeForce RTX 4090 Founders Edition
Intel Core i9-13900K, NVIDIA GeForce RTX 4090 (3.3.0)
8 Seconds * +27%
LuxMark v2.0 64Bit / Room GPUs-only
NVIDIA GeForce RTX 4090 Founders Edition
Intel Core i9-13900K, NVIDIA GeForce RTX 4090
12730 Samples/s +54%
NVIDIA GeForce RTX 4080 Founders Edition
Intel Core i9-13900K, NVIDIA GeForce RTX 4080
10491 Samples/s +27%
Gigabyte Aorus GeForce RTX 4070 Ti Master
Intel Core i9-13900K, NVIDIA GeForce RTX 4070 Ti
8436 Samples/s +2%
Asus TUF Gaming GeForce RTX 4070 Ti
Intel Core i9-13900K, NVIDIA GeForce RTX 4070 Ti
8413 Samples/s +2%
NVIDIA GeForce RTX 4070 Super Founders Edition
Intel Core i9-13900K, NVIDIA GeForce RTX 4070 SUPER
8262 Samples/s 0%
Gigabyte GeForce RTX 4070 Super Gaming OC 12G
Intel Core i9-13900K, NVIDIA GeForce RTX 4070 SUPER
8257 Samples/s
Media NVIDIA GeForce RTX 4070 Ti
  (7625 - 8436, n=4)
8065 Samples/s -2%
Zotac Gaming GeForce RTX 4070 AMP Airo
Intel Core i9-13900K, NVIDIA GeForce RTX 4070
7402 Samples/s -10%
Zotac Gaming GeForce RTX 3090 Ti AMP Extreme Holo
AMD Ryzen 7 5800X3D, NVIDIA GeForce RTX 3090 Ti
6221 Samples/s -25%
Media NVIDIA GeForce RTX 3080 Ti
  (5772 - 6464, n=4)
6138 Samples/s -26%
Media NVIDIA GeForce RTX 3090
  (5727 - 5985, n=9)
5893 Samples/s -29%
Media della classe Desktop
  (81 - 12730, n=23, ultimi 2 anni)
5398 Samples/s -35%
AMD Radeon RX 7900 XTX
AMD Ryzen 9 7950X, AMD Radeon RX 7900 XTX
5161 Samples/s -37%
Media NVIDIA GeForce RTX 3080
  (5112 - 5198, n=2)
5155 Samples/s -38%
Sapphire AMD Radeon RX 6950 XT Nitro+ Pure
AMD Ryzen 9 5900X, AMD Radeon RX 6950 XT
5097 Samples/s -38%
AMD Radeon RX 6900 XT
AMD Ryzen 9 5950X, AMD Radeon RX 6900 XT
5084 Samples/s -38%
AMD Radeon RX 6800 XT
AMD Ryzen 9 5950X, AMD Radeon RX 6800 XT
5057 Samples/s -39%
Media NVIDIA Titan RTX
  (4643 - 4703, n=2)
4673 Samples/s -43%
Media NVIDIA GeForce RTX 4060 Ti 8G
  (4558 - 4790, n=3)
4641 Samples/s -44%
KFA2 GeForce RTX 4060 Ti EX, 16GB GDDR6
AMD Ryzen 9 7950X, NVIDIA GeForce RTX 4060 Ti 16G
4570 Samples/s -45%
AMD Radeon RX 7900 XT
AMD Ryzen 9 7950X, AMD Radeon RX 7900 XT
4451 Samples/s -46%
KFA2 GeForce RTX 4060 1-Click-OC 2X
AMD Ryzen 9 7950X, NVIDIA GeForce RTX 4060
4063 Samples/s -51%
Media NVIDIA GeForce RTX 3070
  (2187 - 4293, n=3)
3588 Samples/s -57%
AMD Radeon RX 7800 XT
AMD Ryzen 9 7950X, AMD Radeon RX 7800 XT
3446 Samples/s -58%
Sapphire Pulse Radeon RX 7700 XT
AMD Ryzen 9 7950X, AMD Radeon RX 7700 XT
3258 Samples/s -61%
XFX Speedster QICK 308 Radeon RX 7600 Black Edition
AMD Ryzen 9 7950X, AMD Radeon RX 7600
2227 Samples/s -73%
LuxMark v2.0 64Bit / Sala GPUs-only
Sapphire AMD Radeon RX 6950 XT Nitro+ Pure
AMD Ryzen 9 5900X, AMD Radeon RX 6950 XT
31954 Samples/s +67%
AMD Radeon RX 6900 XT
AMD Ryzen 9 5950X, AMD Radeon RX 6900 XT
31400 Samples/s +64%
AMD Radeon RX 6800 XT
AMD Ryzen 9 5950X, AMD Radeon RX 6800 XT
28023 Samples/s +46%
NVIDIA GeForce RTX 4090 Founders Edition
Intel Core i9-13900K, NVIDIA GeForce RTX 4090
27828 Samples/s +45%
NVIDIA GeForce RTX 4080 Founders Edition
Intel Core i9-13900K, NVIDIA GeForce RTX 4080
24835 Samples/s +30%
Gigabyte Aorus GeForce RTX 4070 Ti Master
Intel Core i9-13900K, NVIDIA GeForce RTX 4070 Ti
20305 Samples/s +6%
Asus TUF Gaming GeForce RTX 4070 Ti
Intel Core i9-13900K, NVIDIA GeForce RTX 4070 Ti
20171 Samples/s +5%
Media NVIDIA GeForce RTX 4070 Ti
  (17719 - 20305, n=4)
19151 Samples/s 0%
Gigabyte GeForce RTX 4070 Super Gaming OC 12G
Intel Core i9-13900K, NVIDIA GeForce RTX 4070 SUPER
19131 Samples/s
NVIDIA GeForce RTX 4070 Super Founders Edition
Intel Core i9-13900K, NVIDIA GeForce RTX 4070 SUPER
19072 Samples/s 0%
Zotac Gaming GeForce RTX 3090 Ti AMP Extreme Holo
AMD Ryzen 7 5800X3D, NVIDIA GeForce RTX 3090 Ti
16046 Samples/s -16%
Media NVIDIA GeForce RTX 3080 Ti
  (14871 - 16438, n=4)
15612 Samples/s -18%
Zotac Gaming GeForce RTX 4070 AMP Airo
Intel Core i9-13900K, NVIDIA GeForce RTX 4070
15100 Samples/s -21%
AMD Radeon RX 7900 XTX
AMD Ryzen 9 7950X, AMD Radeon RX 7900 XTX
15019 Samples/s -21%
Media NVIDIA GeForce RTX 3090
  (14590 - 15242, n=9)
14945 Samples/s -22%
AMD Radeon RX 7900 XT
AMD Ryzen 9 7950X, AMD Radeon RX 7900 XT
13489 Samples/s -29%
Media NVIDIA GeForce RTX 3080
  (12797 - 12980, n=2)
12889 Samples/s -33%
Media della classe Desktop
  (147 - 27828, n=23, ultimi 2 anni)
12288 Samples/s -36%
Media NVIDIA GeForce RTX 4060 Ti 8G
  (11159 - 11281, n=3)
11235 Samples/s -41%
KFA2 GeForce RTX 4060 Ti EX, 16GB GDDR6
AMD Ryzen 9 7950X, NVIDIA GeForce RTX 4060 Ti 16G
11226 Samples/s -41%
Media NVIDIA Titan RTX
  (10799 - 10996, n=2)
10898 Samples/s -43%
AMD Radeon RX 7800 XT
AMD Ryzen 9 7950X, AMD Radeon RX 7800 XT
10158 Samples/s -47%
Media NVIDIA GeForce RTX 3070
  (10096 - 10115, n=3)
10107 Samples/s -47%
KFA2 GeForce RTX 4060 1-Click-OC 2X
AMD Ryzen 9 7950X, NVIDIA GeForce RTX 4060
8991 Samples/s -53%
Sapphire Pulse Radeon RX 7700 XT
AMD Ryzen 9 7950X, AMD Radeon RX 7700 XT
8614 Samples/s -55%
XFX Speedster QICK 308 Radeon RX 7600 Black Edition
AMD Ryzen 9 7950X, AMD Radeon RX 7600
5583 Samples/s -71%
ComputeMark v2.1 / Normal, Score
NVIDIA GeForce RTX 4090 Founders Edition
Intel Core i9-13900K, NVIDIA GeForce RTX 4090
86583 Points +80%
AMD Radeon RX 7900 XTX
AMD Ryzen 9 7950X, AMD Radeon RX 7900 XTX
62963 Points +31%
NVIDIA GeForce RTX 4080 Founders Edition
Intel Core i9-13900K, NVIDIA GeForce RTX 4080
62720 Points +30%
AMD Radeon RX 7900 XT
AMD Ryzen 9 7950X, AMD Radeon RX 7900 XT
57570 Points +20%
Zotac Gaming GeForce RTX 3090 Ti AMP Extreme Holo
AMD Ryzen 7 5800X3D, NVIDIA GeForce RTX 3090 Ti
52258 Points +9%
Gigabyte Aorus GeForce RTX 4070 Ti Master
Intel Core i9-13900K, NVIDIA GeForce RTX 4070 Ti
52251 Points +8%
Media NVIDIA GeForce RTX 4070 Ti
  (51287 - 52251, n=4)
51747 Points +7%
Asus TUF Gaming GeForce RTX 4070 Ti
Intel Core i9-13900K, NVIDIA GeForce RTX 4070 Ti
51616 Points +7%
Media NVIDIA GeForce RTX 3080 Ti
  (47377 - 48892, n=4)
48266 Points 0%
Gigabyte GeForce RTX 4070 Super Gaming OC 12G
Intel Core i9-13900K, NVIDIA GeForce RTX 4070 SUPER
48163 Points
NVIDIA GeForce RTX 4070 Super Founders Edition
Intel Core i9-13900K, NVIDIA GeForce RTX 4070 SUPER
47808 Points -1%
Media NVIDIA GeForce RTX 3090
  (44948 - 49118, n=9)
47804 Points -1%
Sapphire AMD Radeon RX 6950 XT Nitro+ Pure
AMD Ryzen 9 5900X, AMD Radeon RX 6950 XT
44959 Points -7%
AMD Radeon RX 7800 XT
AMD Ryzen 9 7950X, AMD Radeon RX 7800 XT
43852 Points -9%
Zotac Gaming GeForce RTX 4070 AMP Airo
Intel Core i9-13900K, NVIDIA GeForce RTX 4070
41933 Points -13%
AMD Radeon RX 6900 XT
AMD Ryzen 9 5950X, AMD Radeon RX 6900 XT
40857 Points -15%
Media NVIDIA GeForce RTX 3080
  (39924 - 41594, n=2)
40759 Points -15%
AMD Radeon RX 6800 XT
AMD Ryzen 9 5950X, AMD Radeon RX 6800 XT
38823 Points -19%
Sapphire Pulse Radeon RX 7700 XT
AMD Ryzen 9 7950X, AMD Radeon RX 7700 XT
38363 Points -20%
Media della classe Desktop
  (476 - 90920, n=24, ultimi 2 anni)
35064 Points -27%
KFA2 GeForce RTX 4060 Ti EX, 16GB GDDR6
AMD Ryzen 9 7950X, NVIDIA GeForce RTX 4060 Ti 16G
32285 Points -33%
Media NVIDIA GeForce RTX 4060 Ti 8G
  (31884 - 32410, n=3)
32125 Points -33%
Media NVIDIA GeForce RTX 3070
  (29330 - 30581, n=3)
30004 Points -38%
Media NVIDIA Titan RTX
  (27907 - 29830, n=3)
28802 Points -40%
XFX Speedster QICK 308 Radeon RX 7600 Black Edition
AMD Ryzen 9 7950X, AMD Radeon RX 7600
25119 Points -48%
KFA2 GeForce RTX 4060 1-Click-OC 2X
AMD Ryzen 9 7950X, NVIDIA GeForce RTX 4060
23841 Points -50%
ComputeMark v2.1 / Normal, QJuliaRayTrace
NVIDIA GeForce RTX 4090 Founders Edition
Intel Core i9-13900K, NVIDIA GeForce RTX 4090
31780 Points +60%
NVIDIA GeForce RTX 4080 Founders Edition
Intel Core i9-13900K, NVIDIA GeForce RTX 4080
24307 Points +22%
Gigabyte Aorus GeForce RTX 4070 Ti Master
Intel Core i9-13900K, NVIDIA GeForce RTX 4070 Ti
21619 Points +9%
Media NVIDIA GeForce RTX 4070 Ti
  (21107 - 21619, n=4)
21333 Points +7%
Asus TUF Gaming GeForce RTX 4070 Ti
Intel Core i9-13900K, NVIDIA GeForce RTX 4070 Ti
21276 Points +7%
Gigabyte GeForce RTX 4070 Super Gaming OC 12G
Intel Core i9-13900K, NVIDIA GeForce RTX 4070 SUPER
19861 Points
NVIDIA GeForce RTX 4070 Super Founders Edition
Intel Core i9-13900K, NVIDIA GeForce RTX 4070 SUPER
19738 Points -1%
Zotac Gaming GeForce RTX 3090 Ti AMP Extreme Holo
AMD Ryzen 7 5800X3D, NVIDIA GeForce RTX 3090 Ti
18550 Points -7%
AMD Radeon RX 7900 XTX
AMD Ryzen 9 7950X, AMD Radeon RX 7900 XTX
17915 Points -10%
Media NVIDIA GeForce RTX 3080 Ti
  (17050 - 17749, n=4)
17475 Points -12%
Media NVIDIA GeForce RTX 3090
  (16403 - 18223, n=10)
17454 Points -12%
Zotac Gaming GeForce RTX 4070 AMP Airo
Intel Core i9-13900K, NVIDIA GeForce RTX 4070
17091 Points -14%
AMD Radeon RX 7900 XT
AMD Ryzen 9 7950X, AMD Radeon RX 7900 XT
16990 Points -14%
Media NVIDIA GeForce RTX 3080
  (14718 - 15508, n=2)
15113 Points -24%
KFA2 GeForce RTX 4060 Ti EX, 16GB GDDR6
AMD Ryzen 9 7950X, NVIDIA GeForce RTX 4060 Ti 16G
13856 Points -30%
Media NVIDIA GeForce RTX 4060 Ti 8G
  (13563 - 13822, n=3)
13702 Points -31%
Sapphire AMD Radeon RX 6950 XT Nitro+ Pure
AMD Ryzen 9 5900X, AMD Radeon RX 6950 XT
13580 Points -32%
AMD Radeon RX 7800 XT
AMD Ryzen 9 7950X, AMD Radeon RX 7800 XT
13454 Points -32%
Media della classe Desktop
  (159 - 33698, n=24, ultimi 2 anni)
13343 Points -33%
Sapphire Pulse Radeon RX 7700 XT
AMD Ryzen 9 7950X, AMD Radeon RX 7700 XT
12925 Points -35%
AMD Radeon RX 6900 XT
AMD Ryzen 9 5950X, AMD Radeon RX 6900 XT
12255 Points -38%
Media NVIDIA GeForce RTX 3070
  (11510 - 11816, n=3)
11665 Points -41%
AMD Radeon RX 6800 XT
AMD Ryzen 9 5950X, AMD Radeon RX 6800 XT
11304 Points -43%
KFA2 GeForce RTX 4060 1-Click-OC 2X
AMD Ryzen 9 7950X, NVIDIA GeForce RTX 4060
9916 Points -50%
Media NVIDIA Titan RTX
  (9418 - 10129, n=3)
9748 Points -51%
XFX Speedster QICK 308 Radeon RX 7600 Black Edition
AMD Ryzen 9 7950X, AMD Radeon RX 7600
8897 Points -55%
ComputeMark v2.1 / Normal, Mandel Scalar
NVIDIA GeForce RTX 4090 Founders Edition
Intel Core i9-13900K, NVIDIA GeForce RTX 4090
21571 Points +91%
AMD Radeon RX 7900 XTX
AMD Ryzen 9 7950X, AMD Radeon RX 7900 XTX
15458 Points +37%
NVIDIA GeForce RTX 4080 Founders Edition
Intel Core i9-13900K, NVIDIA GeForce RTX 4080
14733 Points +30%
AMD Radeon RX 7900 XT
AMD Ryzen 9 7950X, AMD Radeon RX 7900 XT
13989 Points +24%
Gigabyte Aorus GeForce RTX 4070 Ti Master
Intel Core i9-13900K, NVIDIA GeForce RTX 4070 Ti
12449 Points +10%
Zotac Gaming GeForce RTX 3090 Ti AMP Extreme Holo
AMD Ryzen 7 5800X3D, NVIDIA GeForce RTX 3090 Ti
12406 Points +10%
Asus TUF Gaming GeForce RTX 4070 Ti
Intel Core i9-13900K, NVIDIA GeForce RTX 4070 Ti
12320 Points +9%
Media NVIDIA GeForce RTX 4070 Ti
  (12126 - 12449, n=4)
12302 Points +9%
Sapphire AMD Radeon RX 6950 XT Nitro+ Pure
AMD Ryzen 9 5900X, AMD Radeon RX 6950 XT
11854 Points +5%
Gigabyte GeForce RTX 4070 Super Gaming OC 12G
Intel Core i9-13900K, NVIDIA GeForce RTX 4070 SUPER
11317 Points
AMD Radeon RX 7800 XT
AMD Ryzen 9 7950X, AMD Radeon RX 7800 XT
11209 Points -1%
Media NVIDIA GeForce RTX 3080 Ti
  (11049 - 11318, n=4)
11196 Points -1%
Media NVIDIA GeForce RTX 3090
  (10650 - 11564, n=10)
11162 Points -1%
NVIDIA GeForce RTX 4070 Super Founders Edition
Intel Core i9-13900K, NVIDIA GeForce RTX 4070 SUPER
11149 Points -1%
AMD Radeon RX 6900 XT
AMD Ryzen 9 5950X, AMD Radeon RX 6900 XT
10834 Points -4%
Sapphire Pulse Radeon RX 7700 XT
AMD Ryzen 9 7950X, AMD Radeon RX 7700 XT
10601 Points -6%
AMD Radeon RX 6800 XT
AMD Ryzen 9 5950X, AMD Radeon RX 6800 XT
10018 Points -11%
Media NVIDIA GeForce RTX 3080
  (9554 - 9938, n=2)
9746 Points -14%
Zotac Gaming GeForce RTX 4070 AMP Airo
Intel Core i9-13900K, NVIDIA GeForce RTX 4070
9578 Points -15%
Media della classe Desktop
  (75 - 22731, n=24, ultimi 2 anni)
8325 Points -26%
KFA2 GeForce RTX 4060 Ti EX, 16GB GDDR6
AMD Ryzen 9 7950X, NVIDIA GeForce RTX 4060 Ti 16G
7454 Points -34%
Media NVIDIA GeForce RTX 4060 Ti 8G
  (7374 - 7511, n=3)
7431 Points -34%
Media NVIDIA GeForce RTX 3070
  (7042 - 7314, n=3)
7169 Points -37%
XFX Speedster QICK 308 Radeon RX 7600 Black Edition
AMD Ryzen 9 7950X, AMD Radeon RX 7600
6746 Points -40%
Media NVIDIA Titan RTX
  (5977 - 6406, n=3)
6184 Points -45%
KFA2 GeForce RTX 4060 1-Click-OC 2X
AMD Ryzen 9 7950X, NVIDIA GeForce RTX 4060
5153 Points -54%
ComputeMark v2.1 / Normal, Mandel Vector
NVIDIA GeForce RTX 4090 Founders Edition
Intel Core i9-13900K, NVIDIA GeForce RTX 4090
16199 Points +66%
AMD Radeon RX 7900 XTX
AMD Ryzen 9 7950X, AMD Radeon RX 7900 XTX
13737 Points +41%
AMD Radeon RX 7900 XT
AMD Ryzen 9 7950X, AMD Radeon RX 7900 XT
13022 Points +34%
NVIDIA GeForce RTX 4080 Founders Edition
Intel Core i9-13900K, NVIDIA GeForce RTX 4080
11772 Points +21%
Gigabyte Aorus GeForce RTX 4070 Ti Master
Intel Core i9-13900K, NVIDIA GeForce RTX 4070 Ti
10888 Points +12%
Asus TUF Gaming GeForce RTX 4070 Ti
Intel Core i9-13900K, NVIDIA GeForce RTX 4070 Ti
10771 Points +10%
Media NVIDIA GeForce RTX 4070 Ti
  (10541 - 10888, n=4)
10728 Points +10%
Zotac Gaming GeForce RTX 3090 Ti AMP Extreme Holo
AMD Ryzen 7 5800X3D, NVIDIA GeForce RTX 3090 Ti
10652 Points +9%
AMD Radeon RX 7800 XT
AMD Ryzen 9 7950X, AMD Radeon RX 7800 XT
9963 Points +2%
Gigabyte GeForce RTX 4070 Super Gaming OC 12G
Intel Core i9-13900K, NVIDIA GeForce RTX 4070 SUPER
9748 Points
Media NVIDIA GeForce RTX 3080 Ti
  (9513 - 9860, n=4)
9730 Points 0%
NVIDIA GeForce RTX 4070 Super Founders Edition
Intel Core i9-13900K, NVIDIA GeForce RTX 4070 SUPER
9629 Points -1%
Sapphire Pulse Radeon RX 7700 XT
AMD Ryzen 9 7950X, AMD Radeon RX 7700 XT
9568 Points -2%
Sapphire AMD Radeon RX 6950 XT Nitro+ Pure
AMD Ryzen 9 5900X, AMD Radeon RX 6950 XT
9555 Points -2%
Media NVIDIA GeForce RTX 3090
  (8038 - 10097, n=10)
9467 Points -3%
AMD Radeon RX 6900 XT
AMD Ryzen 9 5950X, AMD Radeon RX 6900 XT
8690 Points -11%
Zotac Gaming GeForce RTX 4070 AMP Airo
Intel Core i9-13900K, NVIDIA GeForce RTX 4070
8421 Points -14%
AMD Radeon RX 6800 XT
AMD Ryzen 9 5950X, AMD Radeon RX 6800 XT
8399 Points -14%
Media NVIDIA GeForce RTX 3080
  (7148 - 7540, n=2)
7344 Points -25%
Media della classe Desktop
  (97 - 16942, n=24, ultimi 2 anni)
6936 Points -29%
Media NVIDIA GeForce RTX 4060 Ti 8G
  (6815 - 6929, n=3)
6854 Points -30%
KFA2 GeForce RTX 4060 Ti EX, 16GB GDDR6
AMD Ryzen 9 7950X, NVIDIA GeForce RTX 4060 Ti 16G
6852 Points -30%
XFX Speedster QICK 308 Radeon RX 7600 Black Edition
AMD Ryzen 9 7950X, AMD Radeon RX 7600
5764 Points -41%
Media NVIDIA GeForce RTX 3070
  (5364 - 6266, n=3)
5707 Points -41%
Media NVIDIA Titan RTX
  (4944 - 5440, n=3)
5158 Points -47%
KFA2 GeForce RTX 4060 1-Click-OC 2X
AMD Ryzen 9 7950X, NVIDIA GeForce RTX 4060
4916 Points -50%
ComputeMark v2.1 / Normal, Fluid 2DTexArr
AMD Radeon RX 7900 XTX
AMD Ryzen 9 7950X, AMD Radeon RX 7900 XTX
7315 Points +103%
NVIDIA GeForce RTX 4090 Founders Edition
Intel Core i9-13900K, NVIDIA GeForce RTX 4090
6567 Points +82%
AMD Radeon RX 7900 XT
AMD Ryzen 9 7950X, AMD Radeon RX 7900 XT
6460 Points +79%
NVIDIA GeForce RTX 4080 Founders Edition
Intel Core i9-13900K, NVIDIA GeForce RTX 4080
5523 Points +53%
Zotac Gaming GeForce RTX 3090 Ti AMP Extreme Holo
AMD Ryzen 7 5800X3D, NVIDIA GeForce RTX 3090 Ti
4886 Points +36%
Media NVIDIA GeForce RTX 3080 Ti
  (4453 - 4546, n=4)
4498 Points +25%
Media NVIDIA GeForce RTX 3090
  (4344 - 4608, n=10)
4492 Points +25%
AMD Radeon RX 7800 XT
AMD Ryzen 9 7950X, AMD Radeon RX 7800 XT
4489 Points +25%
Sapphire AMD Radeon RX 6950 XT Nitro+ Pure
AMD Ryzen 9 5900X, AMD Radeon RX 6950 XT
4455 Points +24%
Media NVIDIA GeForce RTX 3080
  (4087 - 4159, n=2)
4123 Points +15%
AMD Radeon RX 6800 XT
AMD Ryzen 9 5950X, AMD Radeon RX 6800 XT
3947 Points +10%
AMD Radeon RX 6900 XT
AMD Ryzen 9 5950X, AMD Radeon RX 6900 XT
3924 Points +9%
Media NVIDIA Titan RTX
  (3691 - 3828, n=3)
3757 Points +4%
Media NVIDIA GeForce RTX 4070 Ti
  (3566 - 3724, n=4)
3647 Points +1%
Gigabyte GeForce RTX 4070 Super Gaming OC 12G
Intel Core i9-13900K, NVIDIA GeForce RTX 4070 SUPER
3599 Points
NVIDIA GeForce RTX 4070 Super Founders Edition
Intel Core i9-13900K, NVIDIA GeForce RTX 4070 SUPER
3592 Points 0%
Gigabyte Aorus GeForce RTX 4070 Ti Master
Intel Core i9-13900K, NVIDIA GeForce RTX 4070 Ti
3590 Points 0%
Asus TUF Gaming GeForce RTX 4070 Ti
Intel Core i9-13900K, NVIDIA GeForce RTX 4070 Ti
3566 Points -1%
Zotac Gaming GeForce RTX 4070 AMP Airo
Intel Core i9-13900K, NVIDIA GeForce RTX 4070
3404 Points -5%
Media della classe Desktop
  (60 - 6800, n=24, ultimi 2 anni)
2929 Points -19%
Media NVIDIA GeForce RTX 3070
  (2666 - 2706, n=3)
2692 Points -25%
Sapphire Pulse Radeon RX 7700 XT
AMD Ryzen 9 7950X, AMD Radeon RX 7700 XT
2666 Points -26%
Media NVIDIA GeForce RTX 4060 Ti 8G
  (2044 - 2060, n=3)
2049 Points -43%
KFA2 GeForce RTX 4060 Ti EX, 16GB GDDR6
AMD Ryzen 9 7950X, NVIDIA GeForce RTX 4060 Ti 16G
2039 Points -43%
KFA2 GeForce RTX 4060 1-Click-OC 2X
AMD Ryzen 9 7950X, NVIDIA GeForce RTX 4060
1912 Points -47%
XFX Speedster QICK 308 Radeon RX 7600 Black Edition
AMD Ryzen 9 7950X, AMD Radeon RX 7600
1878 Points -48%
ComputeMark v2.1 / Normal, Fluid 3DTex
NVIDIA GeForce RTX 4090 Founders Edition
Intel Core i9-13900K, NVIDIA GeForce RTX 4090
10465 Points +188%
AMD Radeon RX 7900 XTX
AMD Ryzen 9 7950X, AMD Radeon RX 7900 XTX
8537 Points +135%
AMD Radeon RX 7900 XT
AMD Ryzen 9 7950X, AMD Radeon RX 7900 XT
7109 Points +95%
NVIDIA GeForce RTX 4080 Founders Edition
Intel Core i9-13900K, NVIDIA GeForce RTX 4080
6385 Points +76%
Zotac Gaming GeForce RTX 3090 Ti AMP Extreme Holo
AMD Ryzen 7 5800X3D, NVIDIA GeForce RTX 3090 Ti
5764 Points +58%
Sapphire AMD Radeon RX 6950 XT Nitro+ Pure
AMD Ryzen 9 5900X, AMD Radeon RX 6950 XT
5515 Points +52%
Media NVIDIA GeForce RTX 3090
  (5246 - 5520, n=10)
5448 Points +50%
Media NVIDIA GeForce RTX 3080 Ti
  (5312 - 5422, n=4)
5368 Points +48%
AMD Radeon RX 6800 XT
AMD Ryzen 9 5950X, AMD Radeon RX 6800 XT
5154 Points +42%
AMD Radeon RX 6900 XT
AMD Ryzen 9 5950X, AMD Radeon RX 6900 XT
5154 Points +42%
AMD Radeon RX 7800 XT
AMD Ryzen 9 7950X, AMD Radeon RX 7800 XT
4736 Points +30%
Media NVIDIA GeForce RTX 3080
  (4417 - 4450, n=2)
4434 Points +22%
Media NVIDIA Titan RTX
  (3877 - 4027, n=3)
3955 Points +9%
Media NVIDIA GeForce RTX 4070 Ti
  (3683 - 3789, n=4)
3738 Points +3%
Gigabyte Aorus GeForce RTX 4070 Ti Master
Intel Core i9-13900K, NVIDIA GeForce RTX 4070 Ti
3705 Points +2%
NVIDIA GeForce RTX 4070 Super Founders Edition
Intel Core i9-13900K, NVIDIA GeForce RTX 4070 SUPER
3701 Points +2%
Asus TUF Gaming GeForce RTX 4070 Ti
Intel Core i9-13900K, NVIDIA GeForce RTX 4070 Ti
3683 Points +1%
Gigabyte GeForce RTX 4070 Super Gaming OC 12G
Intel Core i9-13900K, NVIDIA GeForce RTX 4070 SUPER
3638 Points
Media della classe Desktop
  (65 - 10749, n=24, ultimi 2 anni)
3532 Points -3%
Zotac Gaming GeForce RTX 4070 AMP Airo
Intel Core i9-13900K, NVIDIA GeForce RTX 4070
3438 Points -5%
Media NVIDIA GeForce RTX 3070
  (2749 - 2791, n=3)
2772 Points -24%
Sapphire Pulse Radeon RX 7700 XT
AMD Ryzen 9 7950X, AMD Radeon RX 7700 XT
2603 Points -28%
Media NVIDIA GeForce RTX 4060 Ti 8G
  (2088 - 2090, n=3)
2089 Points -43%
KFA2 GeForce RTX 4060 Ti EX, 16GB GDDR6
AMD Ryzen 9 7950X, NVIDIA GeForce RTX 4060 Ti 16G
2085 Points -43%
KFA2 GeForce RTX 4060 1-Click-OC 2X
AMD Ryzen 9 7950X, NVIDIA GeForce RTX 4060
1943 Points -47%
XFX Speedster QICK 308 Radeon RX 7600 Black Edition
AMD Ryzen 9 7950X, AMD Radeon RX 7600
1835 Points -50%

* ... Meglio usare valori piccoli

Prestazioni di gioco: L'aumento dei boost porta a guadagni minori ma graditi rispetto alla RTX 4070 Super FE

I vantaggi dell'aumento dei clock di boost iniziano a diventare evidenti nel gioco, in particolare con le impostazioni Ultra da 1080p a 4K.

I clock più elevati sembrano offrire un vantaggio cumulativo del 5% sulle prestazioni alla RTX 4070 Super Gaming OC rispetto alla RTX 4070 Super FE, che allarga ulteriormente il delta con la RTX 3090 media del 7%.

Se esaminati singolarmente, i guadagni massimi rispetto alla RTX 4070 Super FE sono stati riscontrati con The Witcher 3 1080p Ultra (+9%) e Shadow of the Tomb Raider QHD Ultra (+14%). Gli altri giochi del confronto hanno mostrato aumenti relativamente modesti degli fps medi.

Performance Rating - Percent
NVIDIA GeForce RTX 4090 Founders Edition
Intel Core i9-13900K, NVIDIA GeForce RTX 4090
99.8 pt
NVIDIA GeForce RTX 4080 Founders Edition
Intel Core i9-13900K, NVIDIA GeForce RTX 4080
85.2 pt
AMD Radeon RX 7900 XTX -3!
AMD Ryzen 9 7950X, AMD Radeon RX 7900 XTX
83.8 pt
AMD Radeon RX 7900 XT -3!
AMD Ryzen 9 7950X, AMD Radeon RX 7900 XT
74.6 pt
Asus TUF Gaming GeForce RTX 4070 Ti
Intel Core i9-13900K, NVIDIA GeForce RTX 4070 Ti
71.4 pt
Gigabyte Aorus GeForce RTX 4070 Ti Master
Intel Core i9-13900K, NVIDIA GeForce RTX 4070 Ti
71.3 pt
Zotac Gaming GeForce RTX 3090 Ti AMP Extreme Holo
AMD Ryzen 7 5800X3D, NVIDIA GeForce RTX 3090 Ti
71.1 pt
Media NVIDIA GeForce RTX 4070 Ti
 
70.2 pt
Gigabyte GeForce RTX 4070 Super Gaming OC 12G
Intel Core i9-13900K, NVIDIA GeForce RTX 4070 SUPER
65.4 pt
Media della classe Desktop
 
65.2 pt
Sapphire AMD Radeon RX 6950 XT Nitro+ Pure
AMD Ryzen 9 5900X, AMD Radeon RX 6950 XT
62.4 pt
NVIDIA GeForce RTX 4070 Super Founders Edition
Intel Core i9-13900K, NVIDIA GeForce RTX 4070 SUPER
62.4 pt
Media NVIDIA GeForce RTX 3080 Ti
 
61.8 pt
Media NVIDIA GeForce RTX 3090
 
61.3 pt
AMD Radeon RX 7800 XT -3!
AMD Ryzen 9 7950X, AMD Radeon RX 7800 XT
57.6 pt
Zotac Gaming GeForce RTX 4070 AMP Airo
Intel Core i9-13900K, NVIDIA GeForce RTX 4070
57.1 pt
AMD Radeon RX 6900 XT
AMD Ryzen 9 5950X, AMD Radeon RX 6900 XT
54.1 pt
Media NVIDIA GeForce RTX 3080
 
53 pt
AMD Radeon RX 6800 XT -1!
AMD Ryzen 9 5950X, AMD Radeon RX 6800 XT
50.7 pt
Sapphire Pulse Radeon RX 7700 XT -3!
AMD Ryzen 9 7950X, AMD Radeon RX 7700 XT
48.5 pt
Media NVIDIA Titan RTX
 
45 pt
Media NVIDIA GeForce RTX 4060 Ti 8G -3!
 
42.2 pt
KFA2 GeForce RTX 4060 Ti EX, 16GB GDDR6 -3!
AMD Ryzen 9 7950X, NVIDIA GeForce RTX 4060 Ti 16G
41.4 pt
Media NVIDIA GeForce RTX 3070
 
40.8 pt
XFX Speedster QICK 308 Radeon RX 7600 Black Edition -3!
AMD Ryzen 9 7950X, AMD Radeon RX 7600
33.9 pt
KFA2 GeForce RTX 4060 1-Click-OC 2X -3!
AMD Ryzen 9 7950X, NVIDIA GeForce RTX 4060
33.5 pt
The Witcher 3
3840x2160 Ultra Graphics & Postprocessing (HBAO+)
NVIDIA GeForce RTX 4090 Founders Edition
Intel Core i9-13900K, NVIDIA GeForce RTX 4090
170.7 (154min, 154.59P1) fps +92%
NVIDIA GeForce RTX 4080 Founders Edition
Intel Core i9-13900K, NVIDIA GeForce RTX 4080
128 (113min, 114.12P1) fps +44%
AMD Radeon RX 7900 XTX
AMD Ryzen 9 7950X, AMD Radeon RX 7900 XTX
125.8 (9.5min, 66.1P0.1, 94.8P1) fps +41%
Media della classe Desktop
  (55.9 - 178.6, n=20, ultimi 2 anni)
114.9 fps +29%
AMD Radeon RX 7900 XT
AMD Ryzen 9 7950X, AMD Radeon RX 7900 XT
109.4 (57.5min, 60.1P0.1, 86.2P1) fps +23%
Zotac Gaming GeForce RTX 3090 Ti AMP Extreme Holo
AMD Ryzen 7 5800X3D, NVIDIA GeForce RTX 3090 Ti
107.5 (97min, 97.56P1) fps +21%
Asus TUF Gaming GeForce RTX 4070 Ti
Intel Core i9-13900K, NVIDIA GeForce RTX 4070 Ti
98.3 (88min, 88.56P1) fps +10%
Media NVIDIA GeForce RTX 4070 Ti
  (92.4 - 98.3, n=4)
95.2 fps +7%
Media NVIDIA GeForce RTX 3080 Ti
  (93.1 - 96.4, n=4)
94.7 fps +6%
Gigabyte Aorus GeForce RTX 4070 Ti Master
Intel Core i9-13900K, NVIDIA GeForce RTX 4070 Ti
94.4 (86min, 86.46P1) fps +6%
Media NVIDIA GeForce RTX 3090
  (85.4 - 98.5, n=8)
93.4 fps +5%
Sapphire AMD Radeon RX 6950 XT Nitro+ Pure
AMD Ryzen 9 5900X, AMD Radeon RX 6950 XT
92.3 (10.8min, 48.8P0.1, 54.2P1) fps +4%
Gigabyte GeForce RTX 4070 Super Gaming OC 12G
Intel Core i9-13900K, NVIDIA GeForce RTX 4070 SUPER
89.1 (81min, 81.6P1) fps
NVIDIA GeForce RTX 4070 Super Founders Edition
Intel Core i9-13900K, NVIDIA GeForce RTX 4070 SUPER
84.5 (77min, 77P1) fps -5%
Media NVIDIA GeForce RTX 3080
  (78 - 85.7, n=2)
81.9 fps -8%
AMD Radeon RX 7800 XT
AMD Ryzen 9 7950X, AMD Radeon RX 7800 XT
80.4 fps -10%
Zotac Gaming GeForce RTX 4070 AMP Airo
Intel Core i9-13900K, NVIDIA GeForce RTX 4070
77.1 (69min, 69P1) fps -13%
AMD Radeon RX 6900 XT
AMD Ryzen 9 5950X, AMD Radeon RX 6900 XT
76.6 (70min, 70P1) fps -14%
Media NVIDIA Titan RTX
  ()
71.8 fps -19%
Sapphire Pulse Radeon RX 7700 XT
AMD Ryzen 9 7950X, AMD Radeon RX 7700 XT
64.4 (33min, 33.3P0.1, 56.3P1) fps -28%
Media NVIDIA GeForce RTX 3070
  (59 - 60.3, n=2)
59.7 fps -33%
Media NVIDIA GeForce RTX 4060 Ti 8G
  (53.9 - 54.3, n=3)
54.1 fps -39%
KFA2 GeForce RTX 4060 Ti EX, 16GB GDDR6
AMD Ryzen 9 7950X, NVIDIA GeForce RTX 4060 Ti 16G
53.1 fps -40%
XFX Speedster QICK 308 Radeon RX 7600 Black Edition
AMD Ryzen 9 7950X, AMD Radeon RX 7600
43.9 fps -51%
KFA2 GeForce RTX 4060 1-Click-OC 2X
AMD Ryzen 9 7950X, NVIDIA GeForce RTX 4060
43.7 fps -51%
3840x2160 High Graphics & Postprocessing (Nvidia HairWorks Off)
NVIDIA GeForce RTX 4090 Founders Edition
Intel Core i9-13900K, NVIDIA GeForce RTX 4090
274 (243min, 244.12P1) fps +100%
NVIDIA GeForce RTX 4080 Founders Edition
Intel Core i9-13900K, NVIDIA GeForce RTX 4080
204 (183min, 183.55P1) fps +49%
Zotac Gaming GeForce RTX 3090 Ti AMP Extreme Holo
AMD Ryzen 7 5800X3D, NVIDIA GeForce RTX 3090 Ti
172.9 (152min, 152.57P1) fps +26%
AMD Radeon RX 7900 XTX
AMD Ryzen 9 7950X, AMD Radeon RX 7900 XTX
163.8 (49.6min, 112P0.1, 134.1P1) fps +20%
Media della classe Desktop
  (16.1 - 282, n=23, ultimi 2 anni)
163.8 fps +20%
AMD Radeon RX 7900 XT
AMD Ryzen 9 7950X, AMD Radeon RX 7900 XT
158.5 (83.2min, 111.2P0.1, 122.8P1) fps +16%
Media NVIDIA GeForce RTX 3080 Ti
  (149 - 156.8, n=4)
152.4 fps +11%
Asus TUF Gaming GeForce RTX 4070 Ti
Intel Core i9-13900K, NVIDIA GeForce RTX 4070 Ti
151.9 (137min, 138.12P1) fps +11%
Media NVIDIA GeForce RTX 3090
  (128 - 160.2, n=12)
151.5 fps +11%
Gigabyte Aorus GeForce RTX 4070 Ti Master
Intel Core i9-13900K, NVIDIA GeForce RTX 4070 Ti
148.7 (130min, 130.59P1) fps +9%
Media NVIDIA GeForce RTX 4070 Ti
  (143 - 151.9, n=4)
148.2 fps +8%
Sapphire AMD Radeon RX 6950 XT Nitro+ Pure
AMD Ryzen 9 5900X, AMD Radeon RX 6950 XT
139.7 (10.4min, 105.6P0.1, 118.6P1) fps +2%
Gigabyte GeForce RTX 4070 Super Gaming OC 12G
Intel Core i9-13900K, NVIDIA GeForce RTX 4070 SUPER
136.7 (121min, 121.87P1) fps
NVIDIA GeForce RTX 4070 Super Founders Edition
Intel Core i9-13900K, NVIDIA GeForce RTX 4070 SUPER
129.4 (117min, 117.31P1) fps -5%
AMD Radeon RX 6900 XT
AMD Ryzen 9 5950X, AMD Radeon RX 6900 XT
122 (105min, 105P1) fps -11%
Zotac Gaming GeForce RTX 4070 AMP Airo
Intel Core i9-13900K, NVIDIA GeForce RTX 4070
116.9 (102min, 102P1) fps -14%
Media NVIDIA GeForce RTX 3080
  (114 - 115, n=2)
114.5 fps -16%
AMD Radeon RX 7800 XT
AMD Ryzen 9 7950X, AMD Radeon RX 7800 XT
112.9 fps -17%
AMD Radeon RX 6800 XT
AMD Ryzen 9 5950X, AMD Radeon RX 6800 XT
110 (97min) fps -20%
Media NVIDIA Titan RTX
  (94 - 107.1, n=28)
102.4 fps -25%
Media NVIDIA GeForce RTX 3070
  (84 - 93.9, n=5)
89.3 fps -35%
Sapphire Pulse Radeon RX 7700 XT
AMD Ryzen 9 7950X, AMD Radeon RX 7700 XT
88.7 (73.3min, 74.7P0.1, 79.4P1) fps -35%
Media NVIDIA GeForce RTX 4060 Ti 8G
  (78.5 - 80.4, n=3)
79.3 fps -42%
KFA2 GeForce RTX 4060 Ti EX, 16GB GDDR6
AMD Ryzen 9 7950X, NVIDIA GeForce RTX 4060 Ti 16G
78.5 fps -43%
KFA2 GeForce RTX 4060 1-Click-OC 2X
AMD Ryzen 9 7950X, NVIDIA GeForce RTX 4060
67.5 fps -51%
XFX Speedster QICK 308 Radeon RX 7600 Black Edition
AMD Ryzen 9 7950X, AMD Radeon RX 7600
58.7 fps -57%
1920x1080 Ultra Graphics & Postprocessing (HBAO+)
NVIDIA GeForce RTX 4090 Founders Edition
Intel Core i9-13900K, NVIDIA GeForce RTX 4090
297 (271min, 271P1) fps +41%
AMD Radeon RX 7900 XTX
AMD Ryzen 9 7950X, AMD Radeon RX 7900 XTX
297 (41.3min, 167.7P0.1, 245P1) fps +41%
AMD Radeon RX 7900 XT
AMD Ryzen 9 7950X, AMD Radeon RX 7900 XT
265 (104.1min, 151.5P0.1, 214P1) fps +26%
NVIDIA GeForce RTX 4080 Founders Edition
Intel Core i9-13900K, NVIDIA GeForce RTX 4080
254 (227min, 227P1) fps +21%
Asus TUF Gaming GeForce RTX 4070 Ti
Intel Core i9-13900K, NVIDIA GeForce RTX 4070 Ti
230 (207min, 208.68P1) fps +10%
Media NVIDIA GeForce RTX 4070 Ti
  (217 - 230, n=4)
223 fps +6%
Gigabyte Aorus GeForce RTX 4070 Ti Master
Intel Core i9-13900K, NVIDIA GeForce RTX 4070 Ti
220 (199min, 199.56P1) fps +5%
Gigabyte GeForce RTX 4070 Super Gaming OC 12G
Intel Core i9-13900K, NVIDIA GeForce RTX 4070 SUPER
210 (188min, 188.28P1) fps
Sapphire AMD Radeon RX 6950 XT Nitro+ Pure
AMD Ryzen 9 5900X, AMD Radeon RX 6950 XT
205 (10.2min, 109.8P0.1, 161.2P1) fps -2%
Zotac Gaming GeForce RTX 3090 Ti AMP Extreme Holo
AMD Ryzen 7 5800X3D, NVIDIA GeForce RTX 3090 Ti (110% PT)
196.3 (192min, 193P1) fps -7%
Zotac Gaming GeForce RTX 3090 Ti AMP Extreme Holo
AMD Ryzen 7 5800X3D, NVIDIA GeForce RTX 3090 Ti (100% PT)
193.4 (173min, 173.56P1) fps -8%
NVIDIA GeForce RTX 4070 Super Founders Edition
Intel Core i9-13900K, NVIDIA GeForce RTX 4070 SUPER
191.9 (175min, 175P1) fps -9%
AMD Radeon RX 7800 XT
AMD Ryzen 9 7950X, AMD Radeon RX 7800 XT
189.6 fps -10%
Media NVIDIA GeForce RTX 3080 Ti
  (174 - 184.6, n=4)
180.2 fps -14%
Media NVIDIA GeForce RTX 3090
  (160 - 192.6, n=16)
179.9 fps -14%
Zotac Gaming GeForce RTX 4070 AMP Airo
Intel Core i9-13900K, NVIDIA GeForce RTX 4070
168.6 (150min, 150.7P1) fps -20%
Media della classe Desktop
  (3.9 - 314, n=31, ultimi 2 anni)
168.6 fps -20%
Sapphire Pulse Radeon RX 7700 XT
AMD Ryzen 9 7950X, AMD Radeon RX 7700 XT
168.3 (89min, 96.5P0.1, 143.7P1) fps -20%
AMD Radeon RX 6900 XT
AMD Ryzen 9 5950X, AMD Radeon RX 6900 XT
163.6 (139min) fps -22%
AMD Radeon RX 6800 XT
AMD Ryzen 9 5950X, AMD Radeon RX 6800 XT
160 (138min) fps -24%
Media NVIDIA GeForce RTX 3080
  (145 - 152, n=2)
148.5 fps -29%
Media NVIDIA GeForce RTX 4060 Ti 8G
  (136.2 - 140.6, n=3)
139.1 fps -34%
Media NVIDIA Titan RTX
  (124 - 150, n=28)
137.7 fps -34%
KFA2 GeForce RTX 4060 Ti EX, 16GB GDDR6
AMD Ryzen 9 7950X, NVIDIA GeForce RTX 4060 Ti 16G
132.3 fps -37%
XFX Speedster QICK 308 Radeon RX 7600 Black Edition
AMD Ryzen 9 7950X, AMD Radeon RX 7600
122.5 fps -42%
KFA2 GeForce RTX 4060 1-Click-OC 2X
AMD Ryzen 9 7950X, NVIDIA GeForce RTX 4060
111.6 fps -47%
Media NVIDIA GeForce RTX 3070
  (52.8 - 132.2, n=7)
106.1 fps -49%
Metro Exodus
3840x2160 Ultra Quality AF:16x
NVIDIA GeForce RTX 4090 Founders Edition
Intel Core i9-13900K, NVIDIA GeForce RTX 4090
135 (72.48min) fps +77%
NVIDIA GeForce RTX 4080 Founders Edition
Intel Core i9-13900K, NVIDIA GeForce RTX 4080
105.7 (67.17min) fps +39%
AMD Radeon RX 7900 XTX
AMD Ryzen 9 7950X, AMD Radeon RX 7900 XTX
103.5 (66.43min) fps +36%
AMD Radeon RX 7900 XT
AMD Ryzen 9 7950X, AMD Radeon RX 7900 XT
86.9 (56.86min) fps +14%
Gigabyte Aorus GeForce RTX 4070 Ti Master
Intel Core i9-13900K, NVIDIA GeForce RTX 4070 Ti
85 (54.63min) fps +12%
Asus TUF Gaming GeForce RTX 4070 Ti
Intel Core i9-13900K, NVIDIA GeForce RTX 4070 Ti
84.5 (55.02min) fps +11%
Zotac Gaming GeForce RTX 3090 Ti AMP Extreme Holo
AMD Ryzen 7 5800X3D, NVIDIA GeForce RTX 3090 Ti
84.3 (52.3min) fps +11%
Media della classe Desktop
  (8.47 - 138.5, n=23, ultimi 2 anni)
83.6 fps +10%
Media NVIDIA GeForce RTX 4070 Ti
  (81.2 - 85, n=4)
83.4 fps +10%
Gigabyte GeForce RTX 4070 Super Gaming OC 12G
Intel Core i9-13900K, NVIDIA GeForce RTX 4070 SUPER
76.1 (49.56min) fps
Media NVIDIA GeForce RTX 3080 Ti
  (74.2 - 77.1, n=4)
75.7 fps -1%
Sapphire AMD Radeon RX 6950 XT Nitro+ Pure
AMD Ryzen 9 5900X, AMD Radeon RX 6950 XT
75 (50.07min) fps -1%
Media NVIDIA GeForce RTX 3090
  (70.6 - 77.3, n=12)
75 fps -1%
NVIDIA GeForce RTX 4070 Super Founders Edition
Intel Core i9-13900K, NVIDIA GeForce RTX 4070 SUPER
72.8 (46.78min) fps -4%
AMD Radeon RX 6900 XT
AMD Ryzen 9 5950X, AMD Radeon RX 6900 XT
66.7 (42.71min) fps -12%
AMD Radeon RX 7800 XT
AMD Ryzen 9 7950X, AMD Radeon RX 7800 XT
66.7 (43.89min) fps -12%
Zotac Gaming GeForce RTX 4070 AMP Airo
Intel Core i9-13900K, NVIDIA GeForce RTX 4070
65 (41.89min) fps -15%
Media NVIDIA GeForce RTX 3080
  (64.1 - 65.9, n=2)
65 fps -15%
Sapphire Pulse Radeon RX 7700 XT
AMD Ryzen 9 7950X, AMD Radeon RX 7700 XT
57 (38.42min) fps -25%
AMD Radeon RX 6800 XT
AMD Ryzen 9 5950X, AMD Radeon RX 6800 XT
56.3 (40.14min) fps -26%
Media NVIDIA Titan RTX
  (51.3 - 57.9, n=27)
54.9 fps -28%
Media NVIDIA GeForce RTX 3070
  (48.3 - 49.7, n=5)
48.9 fps -36%
Media NVIDIA GeForce RTX 4060 Ti 8G
  (48.4 - 49.3, n=3)
48.8 fps -36%
KFA2 GeForce RTX 4060 Ti EX, 16GB GDDR6
AMD Ryzen 9 7950X, NVIDIA GeForce RTX 4060 Ti 16G
48.1 (32min) fps -37%
KFA2 GeForce RTX 4060 1-Click-OC 2X
AMD Ryzen 9 7950X, NVIDIA GeForce RTX 4060
38.3 (25.16min) fps -50%
XFX Speedster QICK 308 Radeon RX 7600 Black Edition
AMD Ryzen 9 7950X, AMD Radeon RX 7600
38.1 (25.45min) fps -50%
2560x1440 Ultra Quality AF:16x
NVIDIA GeForce RTX 4090 Founders Edition
Intel Core i9-13900K, NVIDIA GeForce RTX 4090
176 (81.25min) fps +46%
NVIDIA GeForce RTX 4080 Founders Edition
Intel Core i9-13900K, NVIDIA GeForce RTX 4080
155.1 (77.58min) fps +28%
AMD Radeon RX 7900 XTX
AMD Ryzen 9 7950X, AMD Radeon RX 7900 XTX
154.5 (90.83min) fps +28%
AMD Radeon RX 7900 XT
AMD Ryzen 9 7950X, AMD Radeon RX 7900 XT
135 (79.57min) fps +12%
Gigabyte Aorus GeForce RTX 4070 Ti Master
Intel Core i9-13900K, NVIDIA GeForce RTX 4070 Ti
132.3 (73.1min) fps +10%
Asus TUF Gaming GeForce RTX 4070 Ti
Intel Core i9-13900K, NVIDIA GeForce RTX 4070 Ti
132.1 (72.92min) fps +9%
Media NVIDIA GeForce RTX 4070 Ti
  (126.7 - 132.3, n=4)
130 fps +8%
Zotac Gaming GeForce RTX 3090 Ti AMP Extreme Holo
AMD Ryzen 7 5800X3D, NVIDIA GeForce RTX 3090 Ti
125.3 (64.48min) fps +4%
Gigabyte GeForce RTX 4070 Super Gaming OC 12G
Intel Core i9-13900K, NVIDIA GeForce RTX 4070 SUPER
120.8 (68.31min) fps
Media della classe Desktop
  (14.8 - 181.3, n=23, ultimi 2 anni)
120.8 fps 0%
NVIDIA GeForce RTX 4070 Super Founders Edition
Intel Core i9-13900K, NVIDIA GeForce RTX 4070 SUPER
116.1 (66.05min) fps -4%
Sapphire AMD Radeon RX 6950 XT Nitro+ Pure
AMD Ryzen 9 5900X, AMD Radeon RX 6950 XT
115.5 (70.52min) fps -4%
Media NVIDIA GeForce RTX 3080 Ti
  (110 - 118, n=4)
114 fps -6%
Media NVIDIA GeForce RTX 3090
  (102 - 118.2, n=12)
113.2 fps -6%
Zotac Gaming GeForce RTX 4070 AMP Airo
Intel Core i9-13900K, NVIDIA GeForce RTX 4070
103.8 (60.52min) fps -14%
AMD Radeon RX 7800 XT
AMD Ryzen 9 7950X, AMD Radeon RX 7800 XT
102.6 (62.24min) fps -15%
AMD Radeon RX 6900 XT
AMD Ryzen 9 5950X, AMD Radeon RX 6900 XT
102 (59.52min) fps -16%
Media NVIDIA GeForce RTX 3080
  (92.2 - 97.4, n=2)
94.8 fps -22%
AMD Radeon RX 6800 XT
AMD Ryzen 9 5950X, AMD Radeon RX 6800 XT
94.6 (55.44min) fps -22%
Sapphire Pulse Radeon RX 7700 XT
AMD Ryzen 9 7950X, AMD Radeon RX 7700 XT
89.6 (55.65min) fps -26%
Media NVIDIA Titan RTX
  (69 - 92.9, n=26)
84 fps -30%
Media NVIDIA GeForce RTX 4060 Ti 8G
  (78.9 - 80.1, n=3)
79.4 fps -34%
KFA2 GeForce RTX 4060 Ti EX, 16GB GDDR6
AMD Ryzen 9 7950X, NVIDIA GeForce RTX 4060 Ti 16G
78.6 (46.09min) fps -35%
Media NVIDIA GeForce RTX 3070
  (74.4 - 78.3, n=5)
75.8 fps -37%
XFX Speedster QICK 308 Radeon RX 7600 Black Edition
AMD Ryzen 9 7950X, AMD Radeon RX 7600
64.9 (40.24min) fps -46%
KFA2 GeForce RTX 4060 1-Click-OC 2X
AMD Ryzen 9 7950X, NVIDIA GeForce RTX 4060
62.9 (36.84min) fps -48%
1920x1080 Ultra Quality AF:16x
NVIDIA GeForce RTX 4090 Founders Edition
Intel Core i9-13900K, NVIDIA GeForce RTX 4090
191.2 (84.99min) fps +27%
AMD Radeon RX 7900 XTX
AMD Ryzen 9 7950X, AMD Radeon RX 7900 XTX
183.5 (102.51min) fps +22%
NVIDIA GeForce RTX 4080 Founders Edition
Intel Core i9-13900K, NVIDIA GeForce RTX 4080
180 (82.56min) fps +20%
AMD Radeon RX 7900 XT
AMD Ryzen 9 7950X, AMD Radeon RX 7900 XT
164.6 (92.11min) fps +9%
Asus TUF Gaming GeForce RTX 4070 Ti
Intel Core i9-13900K, NVIDIA GeForce RTX 4070 Ti
161.4 (78.05min) fps +7%
Gigabyte Aorus GeForce RTX 4070 Ti Master
Intel Core i9-13900K, NVIDIA GeForce RTX 4070 Ti
161.2 (77.88min) fps +7%
Media NVIDIA GeForce RTX 4070 Ti
  (155.6 - 161.4, n=4)
158.8 fps +5%
Gigabyte GeForce RTX 4070 Super Gaming OC 12G
Intel Core i9-13900K, NVIDIA GeForce RTX 4070 SUPER
150.6 (76.71min) fps
Zotac Gaming GeForce RTX 3090 Ti AMP Extreme Holo
AMD Ryzen 7 5800X3D, NVIDIA GeForce RTX 3090 Ti
145.9 (68.14min) fps -3%
NVIDIA GeForce RTX 4070 Super Founders Edition
Intel Core i9-13900K, NVIDIA GeForce RTX 4070 SUPER
144.8 (73.65min) fps -4%
Sapphire AMD Radeon RX 6950 XT Nitro+ Pure
AMD Ryzen 9 5900X, AMD Radeon RX 6950 XT
140 (81.08min) fps -7%
Media NVIDIA GeForce RTX 3080 Ti
  (131 - 144.2, n=5)
135.4 fps -10%
Media NVIDIA GeForce RTX 3090
  (108 - 145, n=12)
135.3 fps -10%
Zotac Gaming GeForce RTX 4070 AMP Airo
Intel Core i9-13900K, NVIDIA GeForce RTX 4070
129.4 (68.29min) fps -14%
AMD Radeon RX 7800 XT
AMD Ryzen 9 7950X, AMD Radeon RX 7800 XT
128.5 (73.66min) fps -15%
AMD Radeon RX 6900 XT
AMD Ryzen 9 5950X, AMD Radeon RX 6900 XT
123 (67.67min) fps -18%
Media della classe Desktop
  (5.22 - 194.7, n=27, ultimi 2 anni)
121.2 fps -20%
AMD Radeon RX 6800 XT
AMD Ryzen 9 5950X, AMD Radeon RX 6800 XT
115 (64.52min) fps -24%
Sapphire Pulse Radeon RX 7700 XT
AMD Ryzen 9 7950X, AMD Radeon RX 7700 XT
113.9 (65.05min) fps -24%
Media NVIDIA GeForce RTX 3080
  (111 - 116, n=2)
113.5 fps -25%
Media NVIDIA Titan RTX
  (73 - 116, n=27)
102.2 fps -32%
Media NVIDIA GeForce RTX 4060 Ti 8G
  (100.6 - 101.8, n=3)
101.1 fps -33%
KFA2 GeForce RTX 4060 Ti EX, 16GB GDDR6
AMD Ryzen 9 7950X, NVIDIA GeForce RTX 4060 Ti 16G
100 (54.12min) fps -34%
Media NVIDIA GeForce RTX 3070
  (91.3 - 97.7, n=5)
93.9 fps -38%
XFX Speedster QICK 308 Radeon RX 7600 Black Edition
AMD Ryzen 9 7950X, AMD Radeon RX 7600
83.5 (48.41min) fps -45%
KFA2 GeForce RTX 4060 1-Click-OC 2X
AMD Ryzen 9 7950X, NVIDIA GeForce RTX 4060
80.2 (41.91min) fps -47%
Control
3840x2160 High Quality Preset (DX11)
NVIDIA GeForce RTX 4090 Founders Edition
Intel Core i9-13900K, NVIDIA GeForce RTX 4090
107.7 (83.4min, 85.3P0.1, 91.1P1) fps +85%
AMD Radeon RX 7900 XTX
AMD Ryzen 9 7950X, AMD Radeon RX 7900 XTX
89.4 (46.8min, 48.3P0.1, 52.1P1) fps +54%
NVIDIA GeForce RTX 4080 Founders Edition
Intel Core i9-13900K, NVIDIA GeForce RTX 4080
82.6 (15.4min, 68.7P0.1, 71.9P1) fps +42%
AMD Radeon RX 7900 XT
AMD Ryzen 9 7950X, AMD Radeon RX 7900 XT
75.8 (40.1min, 41.7P0.1, 43.6P1) fps +30%
Zotac Gaming GeForce RTX 3090 Ti AMP Extreme Holo
AMD Ryzen 7 5800X3D, NVIDIA GeForce RTX 3090 Ti
73.9 (46.2min, 53.2P0.1, 62.6P1) fps +27%
Media della classe Desktop
  (30.3 - 114.4, n=15, ultimi 2 anni)
66.5 fps +14%
Media NVIDIA GeForce RTX 4070 Ti
  (63.8 - 66.2, n=4)
65 fps +12%
Asus TUF Gaming GeForce RTX 4070 Ti
Intel Core i9-13900K, NVIDIA GeForce RTX 4070 Ti
64.9 (50min, 51.9P0.1, 56.5P1) fps +12%
Gigabyte Aorus GeForce RTX 4070 Ti Master
Intel Core i9-13900K, NVIDIA GeForce RTX 4070 Ti
64.9 (26.4min, 32.6P0.1, 55.9P1) fps +12%
Sapphire AMD Radeon RX 6950 XT Nitro+ Pure
AMD Ryzen 9 5900X, AMD Radeon RX 6950 XT
64.8 (33.1min, 33.6P0.1, 36.3P1) fps +11%
Media NVIDIA GeForce RTX 3080 Ti
  (63.9 - 64.9, n=3)
64.3 fps +10%
Media NVIDIA GeForce RTX 3090
  (61.3 - 66, n=5)
62.9 fps +8%
AMD Radeon RX 7800 XT
AMD Ryzen 9 7950X, AMD Radeon RX 7800 XT
58.2 (30.4min, 30.9P0.1, 32.7P1) fps 0%
Gigabyte GeForce RTX 4070 Super Gaming OC 12G
Intel Core i9-13900K, NVIDIA GeForce RTX 4070 SUPER
58.2 (43.4min, 48.2P0.1, 50.4P1) fps
NVIDIA GeForce RTX 4070 Super Founders Edition
Intel Core i9-13900K, NVIDIA GeForce RTX 4070 SUPER
57.4 (47.8min, 47.9P0.1, 50.2P1) fps -1%
Media NVIDIA GeForce RTX 3080
  (56.2 - 56.7, n=2)
56.5 fps -3%
AMD Radeon RX 6900 XT
AMD Ryzen 9 5950X, AMD Radeon RX 6900 XT
54.7 (39.8min, 41.7P0.1, 44.9P1) fps -6%
AMD Radeon RX 6900 XT
AMD Ryzen 9 5950X, AMD Radeon RX 6900 XT (SAM ENABLED)
53.9 (36.6min, 41.7P0.1, 43.5P1) fps -7%
AMD Radeon RX 6800 XT
AMD Ryzen 9 5950X, AMD Radeon RX 6800 XT
51.6 (46min) fps -11%
Zotac Gaming GeForce RTX 4070 AMP Airo
Intel Core i9-13900K, NVIDIA GeForce RTX 4070
50.2 (29.1min, 30P0.1, 37.6P1) fps -14%
Media NVIDIA Titan RTX
  (45.2 - 47.3, n=3)
46.5 fps -20%
Sapphire Pulse Radeon RX 7700 XT
AMD Ryzen 9 7950X, AMD Radeon RX 7700 XT
46.4 (24.9min, 25.5P0.1, 26.2P1) fps -20%
Media NVIDIA GeForce RTX 3070
  (40.6 - 42.3, n=3)
41.3 fps -29%
KFA2 GeForce RTX 4060 Ti EX, 16GB GDDR6
AMD Ryzen 9 7950X, NVIDIA GeForce RTX 4060 Ti 16G
36 (19.1min, 24.7P0.1, 31.1P1) fps -38%
Media NVIDIA GeForce RTX 4060 Ti 8G
  (34.3 - 37.3, n=3)
35.7 fps -39%
XFX Speedster QICK 308 Radeon RX 7600 Black Edition
AMD Ryzen 9 7950X, AMD Radeon RX 7600
31.3 (17.1min, 17.1P0.1, 17.6P1) fps -46%
KFA2 GeForce RTX 4060 1-Click-OC 2X
AMD Ryzen 9 7950X, NVIDIA GeForce RTX 4060
28.4 (20.2min, 21.3P0.1, 24.9P1) fps -51%
2560x1440 High Quality Preset (DX11)
NVIDIA GeForce RTX 4090 Founders Edition
Intel Core i9-13900K, NVIDIA GeForce RTX 4090
201 (84.1min, 146.6P0.1, 159P1) fps +74%
AMD Radeon RX 7900 XTX
AMD Ryzen 9 7950X, AMD Radeon RX 7900 XTX
184.9 (66.6min, 105.1P0.1, 121.7P1) fps +60%
NVIDIA GeForce RTX 4080 Founders Edition
Intel Core i9-13900K, NVIDIA GeForce RTX 4080
164.2 (59.2min, 121.2P0.1, 135.5P1) fps +42%
AMD Radeon RX 7900 XT
AMD Ryzen 9 7950X, AMD Radeon RX 7900 XT
156.4 (53.3min, 89.4P0.1, 95.9P1) fps +35%
Zotac Gaming GeForce RTX 3090 Ti AMP Extreme Holo
AMD Ryzen 7 5800X3D, NVIDIA GeForce RTX 3090 Ti
142.5 (51.8min, 81.9P0.1, 115.5P1) fps +23%
Sapphire AMD Radeon RX 6950 XT Nitro+ Pure
AMD Ryzen 9 5900X, AMD Radeon RX 6950 XT
133.5 (73.5min, 75.3P0.1, 83.4P1) fps +16%
Asus TUF Gaming GeForce RTX 4070 Ti
Intel Core i9-13900K, NVIDIA GeForce RTX 4070 Ti
130.6 (59min, 74P0.1, 107.3P1) fps +13%
Gigabyte Aorus GeForce RTX 4070 Ti Master
Intel Core i9-13900K, NVIDIA GeForce RTX 4070 Ti
130.6 (24.9min, 47.8P0.1, 108.8P1) fps +13%
Media della classe Desktop
  (60.9 - 232, n=15, ultimi 2 anni)
129.4 fps +12%
Media NVIDIA GeForce RTX 3080 Ti
  (122 - 125.5, n=3)
123.8 fps +7%
Media NVIDIA GeForce RTX 4070 Ti
  (100 - 130.6, n=4)
121.9 fps +6%
Media NVIDIA GeForce RTX 3090
  (115.8 - 123.7, n=5)
120.4 fps +4%
AMD Radeon RX 7800 XT
AMD Ryzen 9 7950X, AMD Radeon RX 7800 XT
120.3 (60.2min, 62.9P0.1, 68.1P1) fps +4%
Gigabyte GeForce RTX 4070 Super Gaming OC 12G
Intel Core i9-13900K, NVIDIA GeForce RTX 4070 SUPER
115.5 (64.7min, 91.1P0.1, 96.7P1) fps
AMD Radeon RX 6900 XT
AMD Ryzen 9 5950X, AMD Radeon RX 6900 XT
113 (71.5min, 73.2P0.1, 79.6P1) fps -2%
AMD Radeon RX 6900 XT
AMD Ryzen 9 5950X, AMD Radeon RX 6900 XT (SAM ENABLED)
113 (68min, 71.3P0.1, 81.1P1) fps -2%
NVIDIA GeForce RTX 4070 Super Founders Edition
Intel Core i9-13900K, NVIDIA GeForce RTX 4070 SUPER
112.6 (83.1min, 89.4P0.1, 94.5P1) fps -3%
AMD Radeon RX 6800 XT
AMD Ryzen 9 5950X, AMD Radeon RX 6800 XT
108 (93min) fps -6%
Media NVIDIA GeForce RTX 3080
  (105 - 106, n=2)
105.5 fps -9%
Zotac Gaming GeForce RTX 4070 AMP Airo
Intel Core i9-13900K, NVIDIA GeForce RTX 4070
101.8 (15.7min, 26.9P0.1, 84P1) fps -12%
Sapphire Pulse Radeon RX 7700 XT
AMD Ryzen 9 7950X, AMD Radeon RX 7700 XT
96.1 (51.5min, 52P0.1, 55P1) fps -17%
Media NVIDIA Titan RTX
  (89 - 93.6, n=3)
91.5 fps -21%
Media NVIDIA GeForce RTX 3070
  (79.8 - 82.5, n=3)
81.2 fps -30%
Media NVIDIA GeForce RTX 4060 Ti 8G
  (69.2 - 75.3, n=3)
73.2 fps -37%
KFA2 GeForce RTX 4060 Ti EX, 16GB GDDR6
AMD Ryzen 9 7950X, NVIDIA GeForce RTX 4060 Ti 16G
73.1 (43.1min, 53.6P0.1, 62.7P1) fps -37%
XFX Speedster QICK 308 Radeon RX 7600 Black Edition
AMD Ryzen 9 7950X, AMD Radeon RX 7600
63.6 (33.4min, 34.3P0.1, 36.6P1) fps -45%
KFA2 GeForce RTX 4060 1-Click-OC 2X
AMD Ryzen 9 7950X, NVIDIA GeForce RTX 4060
58.4 (38.3min, 43.3P0.1, 50.2P1) fps -49%
1920x1080 High Quality Preset (DX11)
AMD Radeon RX 7900 XTX
AMD Ryzen 9 7950X, AMD Radeon RX 7900 XTX
240 (18.1min, 136.2P0.1, 151.8P1) fps +33%
NVIDIA GeForce RTX 4090 Founders Edition
Intel Core i9-13900K, NVIDIA GeForce RTX 4090
238 (14.4min, 62.9P0.1, 153.8P1) fps +32%
NVIDIA GeForce RTX 4080 Founders Edition
Intel Core i9-13900K, NVIDIA GeForce RTX 4080
233 (7.49min, 27.2P0.1, 156.1P1) fps +29%
AMD Radeon RX 7900 XT
AMD Ryzen 9 7950X, AMD Radeon RX 7900 XT
233 (67.8min, 133.8P0.1, 152.6P1) fps +29%
Zotac Gaming GeForce RTX 3090 Ti AMP Extreme Holo
AMD Ryzen 7 5800X3D, NVIDIA GeForce RTX 3090 Ti
209 (55.6min, 119.8P0.1, 162.7P1) fps +16%
Sapphire AMD Radeon RX 6950 XT Nitro+ Pure
AMD Ryzen 9 5900X, AMD Radeon RX 6950 XT
205 (45.2min, 129.1P0.1, 150.8P1) fps +14%
Asus TUF Gaming GeForce RTX 4070 Ti
Intel Core i9-13900K, NVIDIA GeForce RTX 4070 Ti
202 (88min, 151.4P0.1, 165P1) fps +12%
Gigabyte Aorus GeForce RTX 4070 Ti Master
Intel Core i9-13900K, NVIDIA GeForce RTX 4070 Ti
201 (51.3min, 64.4P0.1, 157.9P1) fps +12%
Media NVIDIA GeForce RTX 4070 Ti
  (196.6 - 202, n=4)
199.9 fps +11%
AMD Radeon RX 7800 XT
AMD Ryzen 9 7950X, AMD Radeon RX 7800 XT
190.1 (56.5min, 107.1P0.1, 118.1P1) fps +6%
Media NVIDIA GeForce RTX 3080 Ti
  (181 - 190.7, n=3)
186.2 fps +3%
Media della classe Desktop
  (93.7 - 238, n=15, ultimi 2 anni)
181.3 fps +1%
Gigabyte GeForce RTX 4070 Super Gaming OC 12G
Intel Core i9-13900K, NVIDIA GeForce RTX 4070 SUPER
180.1 (66.2min, 132.5P0.1, 143.9P1) fps
Media NVIDIA GeForce RTX 3090
  (172.2 - 189.2, n=5)
179.9 fps 0%
AMD Radeon RX 6900 XT
AMD Ryzen 9 5950X, AMD Radeon RX 6900 XT
175 (56.8min, 96P0.1, 112P1) fps -3%
AMD Radeon RX 6900 XT
AMD Ryzen 9 5950X, AMD Radeon RX 6900 XT (SAM ENABLED)
174 (54min, 99P0.1, 112P1) fps -3%
NVIDIA GeForce RTX 4070 Super Founders Edition
Intel Core i9-13900K, NVIDIA GeForce RTX 4070 SUPER
172.7 (52.1min, 129.1P0.1, 139.6P1) fps -4%
AMD Radeon RX 6800 XT
AMD Ryzen 9 5950X, AMD Radeon RX 6800 XT
168 (145min) fps -7%
Zotac Gaming GeForce RTX 4070 AMP Airo
Intel Core i9-13900K, NVIDIA GeForce RTX 4070
159.5 (24.5min, 120.5P0.1, 131P1) fps -11%
Sapphire Pulse Radeon RX 7700 XT
AMD Ryzen 9 7950X, AMD Radeon RX 7700 XT
156.1 (52.1min, 85.6P0.1, 89.5P1) fps -13%
Media NVIDIA GeForce RTX 3080
  (151 - 155, n=2)
153 fps -15%
Media NVIDIA Titan RTX
  (135 - 141.9, n=3)
137.3 fps -24%
Media NVIDIA GeForce RTX 3070
  (117 - 124.9, n=3)
121.3 fps -33%
Media NVIDIA GeForce RTX 4060 Ti 8G
  (115.7 - 120.2, n=3)
118.1 fps -34%
KFA2 GeForce RTX 4060 Ti EX, 16GB GDDR6
AMD Ryzen 9 7950X, NVIDIA GeForce RTX 4060 Ti 16G
113.3 (49.6min, 62.7P0.1, 94.3P1) fps -37%
XFX Speedster QICK 308 Radeon RX 7600 Black Edition
AMD Ryzen 9 7950X, AMD Radeon RX 7600
100.3 (52.4min, 55.2P0.1, 57.3P1) fps -44%
KFA2 GeForce RTX 4060 1-Click-OC 2X
AMD Ryzen 9 7950X, NVIDIA GeForce RTX 4060
92.6 (60min, 71.7P0.1, 78.5P1) fps -49%
Borderlands 3
3840x2160 Badass Overall Quality (DX11)
NVIDIA GeForce RTX 4090 Founders Edition
Intel Core i9-13900K, NVIDIA GeForce RTX 4090
133.4 fps +94%
NVIDIA GeForce RTX 4080 Founders Edition
Intel Core i9-13900K, NVIDIA GeForce RTX 4080
95.7 fps +39%
AMD Radeon RX 7900 XTX
AMD Ryzen 9 7950X, AMD Radeon RX 7900 XTX
88.4 fps +28%
Zotac Gaming GeForce RTX 3090 Ti AMP Extreme Holo
AMD Ryzen 7 5800X3D, NVIDIA GeForce RTX 3090 Ti
83.8 fps +22%
Gigabyte Aorus GeForce RTX 4070 Ti Master
Intel Core i9-13900K, NVIDIA GeForce RTX 4070 Ti
74.9 fps +9%
AMD Radeon RX 7900 XT
AMD Ryzen 9 7950X, AMD Radeon RX 7900 XT
74.6 fps +8%
Media della classe Desktop
  (5.54 - 133.4, n=22, ultimi 2 anni)
74.4 fps +8%
Asus TUF Gaming GeForce RTX 4070 Ti
Intel Core i9-13900K, NVIDIA GeForce RTX 4070 Ti
74.1 fps +8%
Media NVIDIA GeForce RTX 4070 Ti
  (71.9 - 74.9, n=4)
73.4 fps +7%
Media NVIDIA GeForce RTX 3090
  (68 - 75.3, n=13)
72.8 fps +6%
Media NVIDIA GeForce RTX 3080 Ti
  (71.2 - 74, n=4)
72.8 fps +6%
Gigabyte GeForce RTX 4070 Super Gaming OC 12G
Intel Core i9-13900K, NVIDIA GeForce RTX 4070 SUPER
68.9 fps
NVIDIA GeForce RTX 4070 Super Founders Edition
Intel Core i9-13900K, NVIDIA GeForce RTX 4070 SUPER
66.2 fps -4%
Media NVIDIA GeForce RTX 3080
  (61.5 - 61.9, n=2)
61.7 fps -10%
Sapphire AMD Radeon RX 6950 XT Nitro+ Pure
AMD Ryzen 9 5900X, AMD Radeon RX 6950 XT
59.9 fps -13%
AMD Radeon RX 6900 XT
AMD Ryzen 9 5950X, AMD Radeon RX 6900 XT (SAM ENABLED)
59.8 fps -13%
AMD Radeon RX 6900 XT
AMD Ryzen 9 5950X, AMD Radeon RX 6900 XT
57.1 fps -17%
Zotac Gaming GeForce RTX 4070 AMP Airo
Intel Core i9-13900K, NVIDIA GeForce RTX 4070
58.8 fps -15%
AMD Radeon RX 7800 XT
AMD Ryzen 9 7950X, AMD Radeon RX 7800 XT
57.9 fps -16%
AMD Radeon RX 6800 XT
AMD Ryzen 9 5950X, AMD Radeon RX 6800 XT
53.6 fps -22%
Sapphire Pulse Radeon RX 7700 XT
AMD Ryzen 9 7950X, AMD Radeon RX 7700 XT
48 fps -30%
Media NVIDIA Titan RTX
  (46 - 52.8, n=29)
47.3 fps -31%
Media NVIDIA GeForce RTX 3070
  (42.7 - 46.3, n=5)
44.3 fps -36%
Media NVIDIA GeForce RTX 4060 Ti 8G
  (43.1 - 43.7, n=3)
43.5 fps -37%
KFA2 GeForce RTX 4060 Ti EX, 16GB GDDR6
AMD Ryzen 9 7950X, NVIDIA GeForce RTX 4060 Ti 16G
42.5 fps -38%
XFX Speedster QICK 308 Radeon RX 7600 Black Edition
AMD Ryzen 9 7950X, AMD Radeon RX 7600
34.5 fps -50%
KFA2 GeForce RTX 4060 1-Click-OC 2X
AMD Ryzen 9 7950X, NVIDIA GeForce RTX 4060
33.8 fps -51%
2560x1440 Badass Overall Quality (DX11)
NVIDIA GeForce RTX 4090 Founders Edition
Intel Core i9-13900K, NVIDIA GeForce RTX 4090
190 fps +45%
NVIDIA GeForce RTX 4080 Founders Edition
Intel Core i9-13900K, NVIDIA GeForce RTX 4080
170.5 fps +30%
AMD Radeon RX 7900 XTX
AMD Ryzen 9 7950X, AMD Radeon RX 7900 XTX
152.2 fps +16%
Zotac Gaming GeForce RTX 3090 Ti AMP Extreme Holo
AMD Ryzen 7 5800X3D, NVIDIA GeForce RTX 3090 Ti
143.1 fps +9%
Gigabyte Aorus GeForce RTX 4070 Ti Master
Intel Core i9-13900K, NVIDIA GeForce RTX 4070 Ti
142 fps +8%
Asus TUF Gaming GeForce RTX 4070 Ti
Intel Core i9-13900K, NVIDIA GeForce RTX 4070 Ti
140.6 fps +7%
Media NVIDIA GeForce RTX 4070 Ti
  (134.3 - 142, n=4)
138.3 fps +5%
AMD Radeon RX 7900 XT
AMD Ryzen 9 7950X, AMD Radeon RX 7900 XT
135.2 fps +3%
Gigabyte GeForce RTX 4070 Super Gaming OC 12G
Intel Core i9-13900K, NVIDIA GeForce RTX 4070 SUPER
131.2 fps
NVIDIA GeForce RTX 4070 Super Founders Edition
Intel Core i9-13900K, NVIDIA GeForce RTX 4070 SUPER
125.4 fps -4%
Media NVIDIA GeForce RTX 3080 Ti
  (114 - 130.2, n=4)
124.5 fps -5%
Media NVIDIA GeForce RTX 3090
  (105 - 131.6, n=13)
123.8 fps -6%
Media della classe Desktop
  (13.4 - 190, n=23, ultimi 2 anni)
120.8 fps -8%
Zotac Gaming GeForce RTX 4070 AMP Airo
Intel Core i9-13900K, NVIDIA GeForce RTX 4070
110.8 fps -16%
Sapphire AMD Radeon RX 6950 XT Nitro+ Pure
AMD Ryzen 9 5900X, AMD Radeon RX 6950 XT
110 fps -16%
AMD Radeon RX 6900 XT
AMD Ryzen 9 5950X, AMD Radeon RX 6900 XT (SAM ENABLED)
107 fps -18%
AMD Radeon RX 6900 XT
AMD Ryzen 9 5950X, AMD Radeon RX 6900 XT
105 fps -20%
AMD Radeon RX 7800 XT
AMD Ryzen 9 7950X, AMD Radeon RX 7800 XT
105.5 fps -20%
Media NVIDIA GeForce RTX 3080
  (95.7 - 103, n=2)
99.4 fps -24%
AMD Radeon RX 6800 XT
AMD Ryzen 9 5950X, AMD Radeon RX 6800 XT
93.6 fps -29%
Sapphire Pulse Radeon RX 7700 XT
AMD Ryzen 9 7950X, AMD Radeon RX 7700 XT
89.4 fps -32%
Media NVIDIA Titan RTX
  (74 - 93.1, n=29)
84.7 fps -35%
Media NVIDIA GeForce RTX 4060 Ti 8G
  (83.9 - 85.2, n=3)
84.4 fps -36%
KFA2 GeForce RTX 4060 Ti EX, 16GB GDDR6
AMD Ryzen 9 7950X, NVIDIA GeForce RTX 4060 Ti 16G
81.7 fps -38%
Media NVIDIA GeForce RTX 3070
  (75.1 - 82.9, n=5)
77.7 fps -41%
XFX Speedster QICK 308 Radeon RX 7600 Black Edition
AMD Ryzen 9 7950X, AMD Radeon RX 7600
65.7 fps -50%
KFA2 GeForce RTX 4060 1-Click-OC 2X
AMD Ryzen 9 7950X, NVIDIA GeForce RTX 4060
64.8 fps -51%
1920x1080 Badass Overall Quality (DX11)
NVIDIA GeForce RTX 4090 Founders Edition
Intel Core i9-13900K, NVIDIA GeForce RTX 4090
201 fps +21%
NVIDIA GeForce RTX 4080 Founders Edition
Intel Core i9-13900K, NVIDIA GeForce RTX 4080
199.4 fps +20%
Asus TUF Gaming GeForce RTX 4070 Ti
Intel Core i9-13900K, NVIDIA GeForce RTX 4070 Ti
186.9 fps +12%
Gigabyte Aorus GeForce RTX 4070 Ti Master
Intel Core i9-13900K, NVIDIA GeForce RTX 4070 Ti
185.3 fps +11%
AMD Radeon RX 7900 XTX
AMD Ryzen 9 7950X, AMD Radeon RX 7900 XTX
180.2 fps +8%
Media NVIDIA GeForce RTX 4070 Ti
  (171.4 - 186.9, n=4)
178.9 fps +7%
Zotac Gaming GeForce RTX 3090 Ti AMP Extreme Holo
AMD Ryzen 7 5800X3D, NVIDIA GeForce RTX 3090 Ti
173.3 fps +4%
AMD Radeon RX 7900 XT
AMD Ryzen 9 7950X, AMD Radeon RX 7900 XT
169.4 fps +2%
Gigabyte GeForce RTX 4070 Super Gaming OC 12G
Intel Core i9-13900K, NVIDIA GeForce RTX 4070 SUPER
166.6 fps
NVIDIA GeForce RTX 4070 Super Founders Edition
Intel Core i9-13900K, NVIDIA GeForce RTX 4070 SUPER
163.4 fps -2%
Zotac Gaming GeForce RTX 4070 AMP Airo
Intel Core i9-13900K, NVIDIA GeForce RTX 4070
154.5 fps -7%
Media NVIDIA GeForce RTX 3080 Ti
  (129 - 164.9, n=4)
151.5 fps -9%
Media NVIDIA GeForce RTX 3090
  (117 - 170.1, n=13)
150.7 fps -10%
AMD Radeon RX 7800 XT
AMD Ryzen 9 7950X, AMD Radeon RX 7800 XT
141.8 fps -15%
AMD Radeon RX 6900 XT
AMD Ryzen 9 5950X, AMD Radeon RX 6900 XT (SAM ENABLED)
131 fps -21%
AMD Radeon RX 6900 XT
AMD Ryzen 9 5950X, AMD Radeon RX 6900 XT
130 fps -22%
Media della classe Desktop
  (6.48 - 201, n=26, ultimi 2 anni)
129.9 fps -22%
Sapphire AMD Radeon RX 6950 XT Nitro+ Pure
AMD Ryzen 9 5900X, AMD Radeon RX 6950 XT
128.5 fps -23%
Sapphire Pulse Radeon RX 7700 XT
AMD Ryzen 9 7950X, AMD Radeon RX 7700 XT
126.4 fps -24%
Media NVIDIA GeForce RTX 3080
  (117 - 128, n=2)
122.5 fps -26%
Media NVIDIA GeForce RTX 4060 Ti 8G
  (121.5 - 123.5, n=3)
122.3 fps -27%
AMD Radeon RX 6800 XT
AMD Ryzen 9 5950X, AMD Radeon RX 6800 XT
120 fps -28%
KFA2 GeForce RTX 4060 Ti EX, 16GB GDDR6
AMD Ryzen 9 7950X, NVIDIA GeForce RTX 4060 Ti 16G
117.3 fps -30%
Media NVIDIA Titan RTX
  (77.2 - 128.7, n=29)
112 fps -33%
Media NVIDIA GeForce RTX 3070
  (95.3 - 108.9, n=5)
100.6 fps -40%
XFX Speedster QICK 308 Radeon RX 7600 Black Edition
AMD Ryzen 9 7950X, AMD Radeon RX 7600
96.2 fps -42%
KFA2 GeForce RTX 4060 1-Click-OC 2X
AMD Ryzen 9 7950X, NVIDIA GeForce RTX 4060
93.9 fps -44%
Shadow of the Tomb Raider
3840x2160 Highest Preset AA:T
NVIDIA GeForce RTX 4090 Founders Edition
Intel Core i9-13900K, NVIDIA GeForce RTX 4090
182 fps +88%
NVIDIA GeForce RTX 4080 Founders Edition
Intel Core i9-13900K, NVIDIA GeForce RTX 4080
134 fps +39%
AMD Radeon RX 7900 XTX
AMD Ryzen 9 7950X, AMD Radeon RX 7900 XTX
130.1 fps +35%
AMD Radeon RX 7900 XT
AMD Ryzen 9 7950X, AMD Radeon RX 7900 XT
109.6 fps +13%
Zotac Gaming GeForce RTX 3090 Ti AMP Extreme Holo
AMD Ryzen 7 5800X3D, NVIDIA GeForce RTX 3090 Ti
106 fps +10%
Gigabyte Aorus GeForce RTX 4070 Ti Master
Intel Core i9-13900K, NVIDIA GeForce RTX 4070 Ti
104.9 fps +8%
Asus TUF Gaming GeForce RTX 4070 Ti
Intel Core i9-13900K, NVIDIA GeForce RTX 4070 Ti
104.4 fps +8%
Media NVIDIA GeForce RTX 4070 Ti
  (102.7 - 104.9, n=4)
103.8 fps +7%
Media della classe Desktop
  (33 - 186, n=20, ultimi 2 anni)
103.4 fps +7%
Sapphire AMD Radeon RX 6950 XT Nitro+ Pure
AMD Ryzen 9 5900X, AMD Radeon RX 6950 XT
97.4 fps +1%
Gigabyte GeForce RTX 4070 Super Gaming OC 12G
Intel Core i9-13900K, NVIDIA GeForce RTX 4070 SUPER
96.7 fps
Media NVIDIA GeForce RTX 3090
  (89.3 - 99.7, n=12)
96.4 fps 0%
Media NVIDIA GeForce RTX 3080 Ti
  (93 - 98.6, n=3)
95.1 fps -2%
NVIDIA GeForce RTX 4070 Super Founders Edition
Intel Core i9-13900K, NVIDIA GeForce RTX 4070 SUPER
91.5 fps -5%
AMD Radeon RX 6900 XT
AMD Ryzen 9 5950X, AMD Radeon RX 6900 XT (SAM ENABLED)
86 fps -11%
AMD Radeon RX 6900 XT
AMD Ryzen 9 5950X, AMD Radeon RX 6900 XT
84 fps -13%
Media NVIDIA GeForce RTX 3080
  (83.9 - 87.9, n=2)
85.9 fps -11%
Zotac Gaming GeForce RTX 4070 AMP Airo
Intel Core i9-13900K, NVIDIA GeForce RTX 4070
83.7 fps -13%
AMD Radeon RX 7800 XT
AMD Ryzen 9 7950X, AMD Radeon RX 7800 XT
82.7 fps -14%
AMD Radeon RX 6800 XT
AMD Ryzen 9 5950X, AMD Radeon RX 6800 XT
79.6 fps -18%
Media NVIDIA Titan RTX
  (59 - 71.1, n=24)
66.9 fps -31%
Sapphire Pulse Radeon RX 7700 XT
AMD Ryzen 9 7950X, AMD Radeon RX 7700 XT
65.5 fps -32%
Media NVIDIA GeForce RTX 3070
  (61 - 63.5, n=4)
62.3 fps -36%
KFA2 GeForce RTX 4060 Ti EX, 16GB GDDR6
AMD Ryzen 9 7950X, NVIDIA GeForce RTX 4060 Ti 16G
58.5 fps -40%
Media NVIDIA GeForce RTX 4060 Ti 8G
  (58.1 - 58.7, n=3)
58.5 fps -40%
KFA2 GeForce RTX 4060 1-Click-OC 2X
AMD Ryzen 9 7950X, NVIDIA GeForce RTX 4060
46.4 fps -52%
XFX Speedster QICK 308 Radeon RX 7600 Black Edition
AMD Ryzen 9 7950X, AMD Radeon RX 7600
41.6 fps -57%
2560x1440 Highest Preset AA:T
NVIDIA GeForce RTX 4090 Founders Edition
Intel Core i9-13900K, NVIDIA GeForce RTX 4090
282 fps +50%
NVIDIA GeForce RTX 4080 Founders Edition
Intel Core i9-13900K, NVIDIA GeForce RTX 4080
248 fps +32%
AMD Radeon RX 7900 XTX
AMD Ryzen 9 7950X, AMD Radeon RX 7900 XTX
230 fps +22%
Gigabyte Aorus GeForce RTX 4070 Ti Master
Intel Core i9-13900K, NVIDIA GeForce RTX 4070 Ti
204 fps +9%
AMD Radeon RX 7900 XT
AMD Ryzen 9 7950X, AMD Radeon RX 7900 XT
203 fps +8%
Asus TUF Gaming GeForce RTX 4070 Ti
Intel Core i9-13900K, NVIDIA GeForce RTX 4070 Ti
202 fps +7%
Media NVIDIA GeForce RTX 4070 Ti
  (195.9 - 204, n=4)
199.9 fps +6%
Gigabyte GeForce RTX 4070 Super Gaming OC 12G
Intel Core i9-13900K, NVIDIA GeForce RTX 4070 SUPER
188 fps
Zotac Gaming GeForce RTX 3090 Ti AMP Extreme Holo
AMD Ryzen 7 5800X3D, NVIDIA GeForce RTX 3090 Ti
184 fps -2%
Sapphire AMD Radeon RX 6950 XT Nitro+ Pure
AMD Ryzen 9 5900X, AMD Radeon RX 6950 XT
184 fps -2%
Media della classe Desktop
  (61 - 282, n=21, ultimi 2 anni)
173.6 fps -8%
Media NVIDIA GeForce RTX 3090
  (137 - 172.3, n=12)
165.6 fps -12%
NVIDIA GeForce RTX 4070 Super Founders Edition
Intel Core i9-13900K, NVIDIA GeForce RTX 4070 SUPER
165.3 fps -12%
Media NVIDIA GeForce RTX 3080 Ti
  (157 - 173.3, n=3)
164.8 fps -12%
AMD Radeon RX 6900 XT
AMD Ryzen 9 5950X, AMD Radeon RX 6900 XT (SAM ENABLED)
163 fps -13%
AMD Radeon RX 6900 XT
AMD Ryzen 9 5950X, AMD Radeon RX 6900 XT
155 fps -18%
Zotac Gaming GeForce RTX 4070 AMP Airo
Intel Core i9-13900K, NVIDIA GeForce RTX 4070
162.6 fps -14%
AMD Radeon RX 7800 XT
AMD Ryzen 9 7950X, AMD Radeon RX 7800 XT
158.1 fps -16%
Media NVIDIA GeForce RTX 3080
  (147 - 152, n=2)
149.5 fps -20%
AMD Radeon RX 6800 XT
AMD Ryzen 9 5950X, AMD Radeon RX 6800 XT
148 fps -21%
Sapphire Pulse Radeon RX 7700 XT
AMD Ryzen 9 7950X, AMD Radeon RX 7700 XT
131.9 fps -30%
Media NVIDIA GeForce RTX 4060 Ti 8G
  (119.3 - 121.2, n=3)
120.3 fps -36%
KFA2 GeForce RTX 4060 Ti EX, 16GB GDDR6
AMD Ryzen 9 7950X, NVIDIA GeForce RTX 4060 Ti 16G
119.6 fps -36%
Media NVIDIA Titan RTX
  (98 - 128, n=23)
117.8 fps -37%
Media NVIDIA GeForce RTX 3070
  (108 - 116, n=4)
113.2 fps -40%
KFA2 GeForce RTX 4060 1-Click-OC 2X
AMD Ryzen 9 7950X, NVIDIA GeForce RTX 4060
96 fps -49%
XFX Speedster QICK 308 Radeon RX 7600 Black Edition
AMD Ryzen 9 7950X, AMD Radeon RX 7600
89.3 fps -52%
1920x1080 Highest Preset AA:T
NVIDIA GeForce RTX 4090 Founders Edition
Intel Core i9-13900K, NVIDIA GeForce RTX 4090
306 fps +20%
NVIDIA GeForce RTX 4080 Founders Edition
Intel Core i9-13900K, NVIDIA GeForce RTX 4080
303 fps +19%
AMD Radeon RX 7900 XTX
AMD Ryzen 9 7950X, AMD Radeon RX 7900 XTX
301 fps +18%
AMD Radeon RX 7900 XT
AMD Ryzen 9 7950X, AMD Radeon RX 7900 XT
282 fps +11%
Asus TUF Gaming GeForce RTX 4070 Ti
Intel Core i9-13900K, NVIDIA GeForce RTX 4070 Ti
280 fps +10%
Gigabyte Aorus GeForce RTX 4070 Ti Master
Intel Core i9-13900K, NVIDIA GeForce RTX 4070 Ti
280 fps +10%
Media NVIDIA GeForce RTX 4070 Ti
  (263 - 280, n=4)
272 fps +7%
Gigabyte GeForce RTX 4070 Super Gaming OC 12G
Intel Core i9-13900K, NVIDIA GeForce RTX 4070 SUPER
255 fps
Zotac Gaming GeForce RTX 3090 Ti AMP Extreme Holo
AMD Ryzen 7 5800X3D, NVIDIA GeForce RTX 3090 Ti
244 fps -4%
NVIDIA GeForce RTX 4070 Super Founders Edition
Intel Core i9-13900K, NVIDIA GeForce RTX 4070 SUPER
244 fps -4%
Zotac Gaming GeForce RTX 4070 AMP Airo
Intel Core i9-13900K, NVIDIA GeForce RTX 4070
239 fps -6%
Sapphire AMD Radeon RX 6950 XT Nitro+ Pure
AMD Ryzen 9 5900X, AMD Radeon RX 6950 XT
227 fps -11%
AMD Radeon RX 7800 XT
AMD Ryzen 9 7950X, AMD Radeon RX 7800 XT
221 fps -13%
Media NVIDIA GeForce RTX 3080 Ti
  (178 - 238, n=3)
209 fps -18%
Media NVIDIA GeForce RTX 3090
  (145 - 240, n=14)
204 fps -20%
AMD Radeon RX 6900 XT
AMD Ryzen 9 5950X, AMD Radeon RX 6900 XT
202 fps -21%
AMD Radeon RX 6900 XT
AMD Ryzen 9 5950X, AMD Radeon RX 6900 XT (SAM ENABLED)
199 fps -22%
Media della classe Desktop
  (10.5 - 306, n=24, ultimi 2 anni)
194.9 fps -24%
Sapphire Pulse Radeon RX 7700 XT
AMD Ryzen 9 7950X, AMD Radeon RX 7700 XT
194.1 fps -24%
AMD Radeon RX 6800 XT
AMD Ryzen 9 5950X, AMD Radeon RX 6800 XT
194 fps -24%
KFA2 GeForce RTX 4060 Ti EX, 16GB GDDR6
AMD Ryzen 9 7950X, NVIDIA GeForce RTX 4060 Ti 16G
182.7 fps -28%
Media NVIDIA GeForce RTX 4060 Ti 8G
  (181.6 - 184, n=3)
182.7 fps -28%
Media NVIDIA GeForce RTX 3080
  (177 - 185, n=2)
181 fps -29%
Media NVIDIA GeForce RTX 3070
  (138 - 160, n=4)
151.3 fps -41%
Media NVIDIA Titan RTX
  (106 - 178.8, n=24)
149.5 fps -41%
KFA2 GeForce RTX 4060 1-Click-OC 2X
AMD Ryzen 9 7950X, NVIDIA GeForce RTX 4060
148.1 fps -42%
XFX Speedster QICK 308 Radeon RX 7600 Black Edition
AMD Ryzen 9 7950X, AMD Radeon RX 7600
142.2 fps -44%
Mafia Definitive Edition
3840x2160 High Preset
NVIDIA GeForce RTX 4090 Founders Edition
Intel Core i9-13900K, NVIDIA GeForce RTX 4090
160.2 (42.5min, 66.5P0.1, 122.8P1) fps +93%
NVIDIA GeForce RTX 4080 Founders Edition
Intel Core i9-13900K, NVIDIA GeForce RTX 4080
115.6 (34.7min, 70.3P0.1, 99.3P1) fps +39%
Media della classe Desktop
  (72.3 - 160.2, n=11, ultimi 2 anni)
100.8 fps +21%
Zotac Gaming GeForce RTX 3090 Ti AMP Extreme Holo
AMD Ryzen 7 5800X3D, NVIDIA GeForce RTX 3090 Ti
99.2 (29.7min, 56P0.1, 77.1P1) fps +19%
Asus TUF Gaming GeForce RTX 4070 Ti
Intel Core i9-13900K, NVIDIA GeForce RTX 4070 Ti
88.9 (34.4min, 62P0.1, 77.4P1) fps +7%
Media NVIDIA GeForce RTX 4070 Ti
  (88.2 - 88.9, n=2)
88.6 fps +6%
Gigabyte Aorus GeForce RTX 4070 Ti Master
Intel Core i9-13900K, NVIDIA GeForce RTX 4070 Ti
88.2 (38min, 50P0.1, 75.9P1) fps +6%
Media NVIDIA GeForce RTX 3090
  (84.5 - 89.1, n=2)
86.8 fps +4%
Media NVIDIA GeForce RTX 3080 Ti
  ()
86.6 fps +4%
Gigabyte GeForce RTX 4070 Super Gaming OC 12G
Intel Core i9-13900K, NVIDIA GeForce RTX 4070 SUPER
83.2 (15.8min, 31.9P0.1, 71P1) fps
NVIDIA GeForce RTX 4070 Super Founders Edition
Intel Core i9-13900K, NVIDIA GeForce RTX 4070 SUPER
80.5 (17.6min, 28.5P0.1, 67.4P1) fps -3%
Sapphire AMD Radeon RX 6950 XT Nitro+ Pure
AMD Ryzen 9 5900X, AMD Radeon RX 6950 XT
80.4 (44.2min, 56.8P0.1, 70.5P1) fps -3%
Media NVIDIA GeForce RTX 3080
  (78.1 - 78.2, n=2)
78.2 fps -6%
Zotac Gaming GeForce RTX 4070 AMP Airo
Intel Core i9-13900K, NVIDIA GeForce RTX 4070
72.3 (32.3min, 50.2P0.1, 64.6P1) fps -13%
AMD Radeon RX 6900 XT
AMD Ryzen 9 5950X, AMD Radeon RX 6900 XT
67 (32.3min, 41.7P0.1, 44.7P1) fps -19%
Media NVIDIA Titan RTX
  ()
63.4 fps -24%
AMD Radeon RX 6800 XT
AMD Ryzen 9 5950X, AMD Radeon RX 6800 XT
62.6 (28min, 37.6P0.1, 49.2P1) fps -25%
Media NVIDIA GeForce RTX 3070
  (55.2 - 56.6, n=2)
55.9 fps -33%
2560x1440 High Preset
NVIDIA GeForce RTX 4090 Founders Edition
Intel Core i9-13900K, NVIDIA GeForce RTX 4090
238 (71.6min, 84.3P0.1, 162.7P1) fps +47%
NVIDIA GeForce RTX 4080 Founders Edition
Intel Core i9-13900K, NVIDIA GeForce RTX 4080
214 (100.6min, 149.1P0.1, 172.3P1) fps +33%
Media della classe Desktop
  (141.1 - 238, n=11, ultimi 2 anni)
181.4 fps +12%
Gigabyte Aorus GeForce RTX 4070 Ti Master
Intel Core i9-13900K, NVIDIA GeForce RTX 4070 Ti
175.5 (51.6min, 61P0.1, 140.4P1) fps +9%
Zotac Gaming GeForce RTX 3090 Ti AMP Extreme Holo
AMD Ryzen 7 5800X3D, NVIDIA GeForce RTX 3090 Ti
173.9 (73.1min, 101.4P0.1, 134.6P1) fps +8%
Media NVIDIA GeForce RTX 4070 Ti
  (171.9 - 175.5, n=2)
173.7 fps +8%
Asus TUF Gaming GeForce RTX 4070 Ti
Intel Core i9-13900K, NVIDIA GeForce RTX 4070 Ti
171.9 (100min, 119.6P0.1, 144.6P1) fps +6%
Gigabyte GeForce RTX 4070 Super Gaming OC 12G
Intel Core i9-13900K, NVIDIA GeForce RTX 4070 SUPER
161.5 (49min, 72.2P0.1, 133.4P1) fps
NVIDIA GeForce RTX 4070 Super Founders Edition
Intel Core i9-13900K, NVIDIA GeForce RTX 4070 SUPER
156.8 (45.5min, 105.1P0.1, 131P1) fps -3%
Sapphire AMD Radeon RX 6950 XT Nitro+ Pure
AMD Ryzen 9 5900X, AMD Radeon RX 6950 XT
156.2 (30min, 87.3P0.1, 114P1) fps -3%
Media NVIDIA GeForce RTX 3090
  (142.3 - 149, n=2)
145.7 fps -10%
Media NVIDIA GeForce RTX 3080 Ti
  ()
142 fps -12%
Zotac Gaming GeForce RTX 4070 AMP Airo
Intel Core i9-13900K, NVIDIA GeForce RTX 4070
141.1 (38.7min, 98.7P0.1, 118.6P1) fps -13%
Media NVIDIA GeForce RTX 3080
  (127 - 137, n=2)
132 fps -18%
AMD Radeon RX 6900 XT
AMD Ryzen 9 5950X, AMD Radeon RX 6900 XT
120 (17.6min, 61.2P0.1, 83.1P1) fps -26%
AMD Radeon RX 6800 XT
AMD Ryzen 9 5950X, AMD Radeon RX 6800 XT
112 (23.5min, 64P0.1, 80.8P1) fps -31%
Media NVIDIA Titan RTX
  ()
109 fps -33%
Media NVIDIA GeForce RTX 3070
  (98.1 - 98.7, n=2)
98.4 fps -39%
1920x1080 High Preset
NVIDIA GeForce RTX 4080 Founders Edition
Intel Core i9-13900K, NVIDIA GeForce RTX 4080
260 (58.1min, 133.7P0.1, 187.5P1) fps +15%
NVIDIA GeForce RTX 4090 Founders Edition
Intel Core i9-13900K, NVIDIA GeForce RTX 4090
255 (80.7min, 89.2P0.1, 169.4P1) fps +13%
Gigabyte Aorus GeForce RTX 4070 Ti Master
Intel Core i9-13900K, NVIDIA GeForce RTX 4070 Ti
249 (29.7min, 62.5P0.1, 182.6P1) fps +10%
Media NVIDIA GeForce RTX 4070 Ti
  (241 - 249, n=2)
245 fps +8%
Asus TUF Gaming GeForce RTX 4070 Ti
Intel Core i9-13900K, NVIDIA GeForce RTX 4070 Ti
241 (107.5min, 136.3P0.1, 183.2P1) fps +7%
Media della classe Desktop
  (207 - 260, n=11, ultimi 2 anni)
232 fps +3%
Zotac Gaming GeForce RTX 3090 Ti AMP Extreme Holo
AMD Ryzen 7 5800X3D, NVIDIA GeForce RTX 3090 Ti
231 (84.7min, 116.2P0.1, 160.4P1) fps +2%
Gigabyte GeForce RTX 4070 Super Gaming OC 12G
Intel Core i9-13900K, NVIDIA GeForce RTX 4070 SUPER
226 (46.9min, 116P0.1, 163.2P1) fps
NVIDIA GeForce RTX 4070 Super Founders Edition
Intel Core i9-13900K, NVIDIA GeForce RTX 4070 SUPER
216 (100.5min, 122.8P0.1, 159.4P1) fps -4%
Zotac Gaming GeForce RTX 4070 AMP Airo
Intel Core i9-13900K, NVIDIA GeForce RTX 4070
207 (53.5min, 121.4P0.1, 159.4P1) fps -8%
Sapphire AMD Radeon RX 6950 XT Nitro+ Pure
AMD Ryzen 9 5900X, AMD Radeon RX 6950 XT
175.5 (38.6min, 86.6P0.1, 117.6P1) fps -22%
Media NVIDIA GeForce RTX 3080 Ti
  ()
163 fps -28%
Media NVIDIA GeForce RTX 3090
  (157 - 158.8, n=2)
157.9 fps -30%
Media NVIDIA GeForce RTX 3080
  (144 - 169, n=2)
156.5 fps -31%
AMD Radeon RX 6900 XT
AMD Ryzen 9 5950X, AMD Radeon RX 6900 XT
138 (32.8min, 68.1P0.1, 90.2P1) fps -39%
Media NVIDIA GeForce RTX 3070
  (124 - 132, n=2)
128 fps -43%
Media NVIDIA Titan RTX
  ()
123.7 fps -45%
AMD Radeon RX 6800 XT
AMD Ryzen 9 5950X, AMD Radeon RX 6800 XT
121 (23.7min, 68P0.1, 83.3P1) fps -46%

Prestazioni del Ray Tracing

Questi guadagni percepiti si ripercuotono anche sulle prestazioni del ray-tracing nativo, anche se l'aumento è relativamente minore, nell'ordine del 2-7% a seconda del gioco e della risoluzione.

Il ray tracing in Far Cry 6 1080p Ultra e Cyberpunk 2077 1.6 4K Ultra sembra trarre i maggiori benefici rispetto alla RTX 4070 Super FE.

Metro Exodus - 1920x1080 Ultra Quality DXR AF:16x
AMD Radeon RX 7900 XTX
AMD Ryzen 9 7950X, AMD Radeon RX 7900 XTX
141.2 (89.03min) fps +12%
NVIDIA GeForce RTX 4080 Founders Edition
Intel Core i9-13900K, NVIDIA GeForce RTX 4080
137.2 (68.42min) fps +9%
NVIDIA GeForce RTX 4090 Founders Edition
Intel Core i9-13900K, NVIDIA GeForce RTX 4090
135 (73.53min) fps +7%
Media NVIDIA GeForce RTX 4070 Ti
  (128.8 - 133.3, n=4)
130.9 fps +4%
Gigabyte Aorus GeForce RTX 4070 Ti Master
Intel Core i9-13900K, NVIDIA GeForce RTX 4070 Ti
129 (64.57min) fps +2%
Asus TUF Gaming GeForce RTX 4070 Ti
Intel Core i9-13900K, NVIDIA GeForce RTX 4070 Ti
128.8 (62.96min) fps +2%
Zotac Gaming GeForce RTX 3090 Ti AMP Extreme Holo
AMD Ryzen 7 5800X3D, NVIDIA GeForce RTX 3090 Ti
128.5 (64.07min) fps +2%
Gigabyte GeForce RTX 4070 Super Gaming OC 12G
Intel Core i9-13900K, NVIDIA GeForce RTX 4070 SUPER
126.3 (69.94min) fps
AMD Radeon RX 7900 XT
AMD Ryzen 9 7950X, AMD Radeon RX 7900 XT
124.3 (78.88min) fps -2%
NVIDIA GeForce RTX 4070 Super Founders Edition
Intel Core i9-13900K, NVIDIA GeForce RTX 4070 SUPER
121.7 (67.66min) fps -4%
Media della classe Desktop
  (62.8 - 163.7, n=22, ultimi 2 anni)
119.4 fps -5%
Media NVIDIA GeForce RTX 3080 Ti
  (110 - 121.2, n=4)
114.8 fps -9%
Media NVIDIA GeForce RTX 3090
  (68.6 - 122.2, n=12)
111.4 fps -12%
Zotac Gaming GeForce RTX 4070 AMP Airo
Intel Core i9-13900K, NVIDIA GeForce RTX 4070
107.1 (58.82min) fps -15%
AMD Radeon RX 7800 XT
AMD Ryzen 9 7950X, AMD Radeon RX 7800 XT
98.4 (61.39min) fps -22%
Media NVIDIA GeForce RTX 3080
  (91.5 - 102, n=2)
96.8 fps -23%
AMD Radeon RX 6900 XT
AMD Ryzen 9 5950X, AMD Radeon RX 6900 XT
90.5 (55.53min) fps -28%
Sapphire Pulse Radeon RX 7700 XT
AMD Ryzen 9 7950X, AMD Radeon RX 7700 XT
88.1 (56.03min) fps -30%
Media NVIDIA Titan RTX
  (69 - 95.5, n=23)
86.1 fps -32%
AMD Radeon RX 6800 XT
AMD Ryzen 9 5950X, AMD Radeon RX 6800 XT
85.5 (52.71min) fps -32%
Media NVIDIA GeForce RTX 4060 Ti 8G
  (84.6 - 86.1, n=3)
85.2 fps -33%
KFA2 GeForce RTX 4060 Ti EX, 16GB GDDR6
AMD Ryzen 9 7950X, NVIDIA GeForce RTX 4060 Ti 16G
84.5 (47.97min) fps -33%
Media NVIDIA GeForce RTX 3070
  (80.4 - 83, n=5)
81.6 fps -35%
KFA2 GeForce RTX 4060 1-Click-OC 2X
AMD Ryzen 9 7950X, NVIDIA GeForce RTX 4060
67.2 (36.94min) fps -47%
XFX Speedster QICK 308 Radeon RX 7600 Black Edition
AMD Ryzen 9 7950X, AMD Radeon RX 7600
62.9 (40.28min) fps -50%
Control - 1920x1080 High Quality Preset & High Ray Tracing Preset (DX12)
NVIDIA GeForce RTX 4090 Founders Edition
Intel Core i9-13900K, NVIDIA GeForce RTX 4090
185.1 (103.4min, 132.2P0.1, 140.8P1) fps +59%
NVIDIA GeForce RTX 4080 Founders Edition
Intel Core i9-13900K, NVIDIA GeForce RTX 4080
162.8 (28.9min, 60.8P0.1, 129.4P1) fps +40%
AMD Radeon RX 7900 XTX
AMD Ryzen 9 7950X, AMD Radeon RX 7900 XTX
133.7 (23.2min, 92.6P0.1, 104.6P1) fps +15%
Zotac Gaming GeForce RTX 3090 Ti AMP Extreme Holo
AMD Ryzen 7 5800X3D, NVIDIA GeForce RTX 3090 Ti
130.8 (62.6min, 107.5P0.1, 113.8P1) fps +12%
Gigabyte Aorus GeForce RTX 4070 Ti Master
Intel Core i9-13900K, NVIDIA GeForce RTX 4070 Ti
129.1 (38.7min, 49.1P0.1, 101.2P1) fps +11%
Asus TUF Gaming GeForce RTX 4070 Ti
Intel Core i9-13900K, NVIDIA GeForce RTX 4070 Ti
128.3 (6.22min, 61.8P0.1, 107P1) fps +10%
Media NVIDIA GeForce RTX 4070 Ti
  (123.5 - 129.1, n=4)
126.7 fps +9%
Gigabyte GeForce RTX 4070 Super Gaming OC 12G
Intel Core i9-13900K, NVIDIA GeForce RTX 4070 SUPER
116.7 (28.4min, 92.4P0.1, 101.1P1) fps
Media della classe Desktop
  (58.6 - 185.1, n=15, ultimi 2 anni)
116.6 fps 0%
AMD Radeon RX 7900 XT
AMD Ryzen 9 7950X, AMD Radeon RX 7900 XT
116.1 (8.47min, 62.1P0.1, 91.4P1) fps -1%
Media NVIDIA GeForce RTX 3080 Ti
  (111 - 120.6, n=3)
115.2 fps -1%
NVIDIA GeForce RTX 4070 Super Founders Edition
Intel Core i9-13900K, NVIDIA GeForce RTX 4070 SUPER
113.8 (66.1min, 87.5P0.1, 97.9P1) fps -2%
Media NVIDIA GeForce RTX 3090
  (91.4 - 122.6, n=5)
111.1 fps -5%
Zotac Gaming GeForce RTX 4070 AMP Airo
Intel Core i9-13900K, NVIDIA GeForce RTX 4070
101.8 (30.1min, 42.5P0.1, 86.1P1) fps -13%
Media NVIDIA GeForce RTX 3080
  (98.1 - 103, n=2)
100.6 fps -14%
Sapphire AMD Radeon RX 6950 XT Nitro+ Pure
AMD Ryzen 9 5900X, AMD Radeon RX 6950 XT
97.7 (7.66min, 62.8P0.1, 73.5P1) fps -16%
AMD Radeon RX 7800 XT
AMD Ryzen 9 7950X, AMD Radeon RX 7800 XT
96.1 (18.2min, 69.2P0.1, 76.4P1) fps -18%
Media NVIDIA Titan RTX
  (63 - 120, n=3)
88.1 fps -25%
Sapphire Pulse Radeon RX 7700 XT
AMD Ryzen 9 7950X, AMD Radeon RX 7700 XT
79.9 (18.5min, 55.7P0.1, 65.6P1) fps -32%
AMD Radeon RX 6900 XT
AMD Ryzen 9 5950X, AMD Radeon RX 6900 XT (SAM ENABLED)
76.2 (38.7min, 43.3P0.1, 62.8P1) fps -35%
AMD Radeon RX 6900 XT
AMD Ryzen 9 5950X, AMD Radeon RX 6900 XT
73.1 (31.6min, 40.9P0.1, 62.6P1) fps -37%
KFA2 GeForce RTX 4060 Ti EX, 16GB GDDR6
AMD Ryzen 9 7950X, NVIDIA GeForce RTX 4060 Ti 16G
73 (15.8min, 59.4P0.1, 63.3P1) fps -37%
Media NVIDIA GeForce RTX 4060 Ti 8G
  (72.5 - 73.6, n=3)
73 fps -37%
Media NVIDIA GeForce RTX 3070
  (57.9 - 75.1, n=3)
68.5 fps -41%
AMD Radeon RX 6800 XT
AMD Ryzen 9 5950X, AMD Radeon RX 6800 XT
66.9 (60min) fps -43%
KFA2 GeForce RTX 4060 1-Click-OC 2X
AMD Ryzen 9 7950X, NVIDIA GeForce RTX 4060
57.5 (14.9min, 44.3P0.1, 50.6P1) fps -51%
XFX Speedster QICK 308 Radeon RX 7600 Black Edition
AMD Ryzen 9 7950X, AMD Radeon RX 7600
51.7 (6.96min, 38.6P0.1, 42P1) fps -56%
Watch Dogs Legion - 1920x1080 Ultra Preset + Ultra Ray Tracing (DX12)
NVIDIA GeForce RTX 4090 Founders Edition
Intel Core i9-13900K, NVIDIA GeForce RTX 4090
115.7 (18.56min, 92.59P1) fps +27%
NVIDIA GeForce RTX 4080 Founders Edition
Intel Core i9-13900K, NVIDIA GeForce RTX 4080
111.6 (76.88min, 90.46P1) fps +23%
Gigabyte Aorus GeForce RTX 4070 Ti Master
Intel Core i9-13900K, NVIDIA GeForce RTX 4070 Ti
99.4 (37.32min, 77.35P1) fps +9%
Media NVIDIA GeForce RTX 4070 Ti
  (98.9 - 99.4, n=2)
99.2 fps +9%
Asus TUF Gaming GeForce RTX 4070 Ti
Intel Core i9-13900K, NVIDIA GeForce RTX 4070 Ti
98.9 (72.06min, 82.17P1) fps +9%
Gigabyte GeForce RTX 4070 Super Gaming OC 12G
Intel Core i9-13900K, NVIDIA GeForce RTX 4070 SUPER
91.1 (18.45min, 75.38P1) fps
Zotac Gaming GeForce RTX 3090 Ti AMP Extreme Holo
AMD Ryzen 7 5800X3D, NVIDIA GeForce RTX 3090 Ti
88.7 (50.06min, 72.42P1) fps -3%
Media NVIDIA GeForce RTX 3090
  (75.7 - 110, n=3)
88 fps -3%
NVIDIA GeForce RTX 4070 Super Founders Edition
Intel Core i9-13900K, NVIDIA GeForce RTX 4070 SUPER
87.8 (19.1min, 71.63P1) fps -4%
Media della classe Desktop
  (35 - 115.7, n=14, ultimi 2 anni)
83.7 fps -8%
Zotac Gaming GeForce RTX 4070 AMP Airo
Intel Core i9-13900K, NVIDIA GeForce RTX 4070
75.3 (15.28min, 63.07P1) fps -17%
Media NVIDIA GeForce RTX 3080 Ti
  ()
75.1 fps -18%
AMD Radeon RX 6800 XT
AMD Ryzen 9 5950X, AMD Radeon RX 6800 XT
71.4 (47.71min, 55.63P1) fps -22%
Media NVIDIA GeForce RTX 3080
  (70.9 - 71.3, n=2)
71.1 fps -22%
Sapphire AMD Radeon RX 6950 XT Nitro+ Pure
AMD Ryzen 9 5900X, AMD Radeon RX 6950 XT
69 fps -24%
AMD Radeon RX 6900 XT
AMD Ryzen 9 5950X, AMD Radeon RX 6900 XT
55.6 (35.81min, 41.86P1) fps -39%
AMD Radeon RX 6900 XT
AMD Ryzen 9 5950X, AMD Radeon RX 6900 XT (SAM ENABLED)
55.5 (36.48min, 43.27P1) fps -39%
Media NVIDIA Titan RTX
  ()
55.4 fps -39%
Media NVIDIA GeForce RTX 3070
  (51.7 - 61, n=4)
55.1 fps -40%
Far Cry 6 - 1920x1080 Ultra Graphics Quality + HD Textures + DXR AA:T
NVIDIA GeForce RTX 4080 Founders Edition
Intel Core i9-13900K, NVIDIA GeForce RTX 4080
154 (125min) fps +7%
AMD Radeon RX 7900 XTX
AMD Ryzen 9 7950X, AMD Radeon RX 7900 XTX
152.1 (75min) fps +6%
NVIDIA GeForce RTX 4090 Founders Edition
Intel Core i9-13900K, NVIDIA GeForce RTX 4090
147 (125min) fps +2%
Asus TUF Gaming GeForce RTX 4070 Ti
Intel Core i9-13900K, NVIDIA GeForce RTX 4070 Ti
146 (122min) fps +1%
Gigabyte GeForce RTX 4070 Super Gaming OC 12G
Intel Core i9-13900K, NVIDIA GeForce RTX 4070 SUPER
144 (99min) fps
AMD Radeon RX 7900 XT
AMD Ryzen 9 7950X, AMD Radeon RX 7900 XT
143.6 (46min) fps 0%
Gigabyte Aorus GeForce RTX 4070 Ti Master
Intel Core i9-13900K, NVIDIA GeForce RTX 4070 Ti
139.5 (114min) fps -3%
Media NVIDIA GeForce RTX 4070 Ti
  (133.4 - 146, n=4)
138.9 fps -4%
Zotac Gaming GeForce RTX 4070 AMP Airo
Intel Core i9-13900K, NVIDIA GeForce RTX 4070
138 (108min) fps -4%
NVIDIA GeForce RTX 4070 Super Founders Edition
Intel Core i9-13900K, NVIDIA GeForce RTX 4070 SUPER
134 (119min) fps -7%
AMD Radeon RX 7800 XT
AMD Ryzen 9 7950X, AMD Radeon RX 7800 XT
129.4 (36min) fps -10%
Media della classe Desktop
  (19.1 - 154, n=17, ultimi 2 anni)
125 fps -13%
Zotac Gaming GeForce RTX 3090 Ti AMP Extreme Holo
AMD Ryzen 7 5800X3D, NVIDIA GeForce RTX 3090 Ti
122 (95min) fps -15%
Media NVIDIA GeForce RTX 3080 Ti
  (112 - 128.6, n=2)
120.3 fps -16%
Media NVIDIA GeForce RTX 3090
  (76 - 138.2, n=8)
112.6 fps -22%
KFA2 GeForce RTX 4060 Ti EX, 16GB GDDR6
AMD Ryzen 9 7950X, NVIDIA GeForce RTX 4060 Ti 16G
111.1 (100min) fps -23%
Sapphire Pulse Radeon RX 7700 XT
AMD Ryzen 9 7950X, AMD Radeon RX 7700 XT
104.1 (18min) fps -28%
Media NVIDIA Titan RTX
  (97 - 109.3, n=2)
103.2 fps -28%
Sapphire AMD Radeon RX 6950 XT Nitro+ Pure
AMD Ryzen 9 5900X, AMD Radeon RX 6950 XT
101.6 (24min) fps -29%
Media NVIDIA GeForce RTX 4060 Ti 8G
  (61.9 - 88, n=2)
75 fps -48%
Media NVIDIA GeForce RTX 3080
  ()
73 fps -49%
Media NVIDIA GeForce RTX 3070
  ()
71 fps -51%
XFX Speedster QICK 308 Radeon RX 7600 Black Edition
AMD Ryzen 9 7950X, AMD Radeon RX 7600
63.6 (31min) fps -56%
KFA2 GeForce RTX 4060 1-Click-OC 2X
AMD Ryzen 9 7950X, NVIDIA GeForce RTX 4060
34.8 (13min) fps -76%
Dying Light 2 - 1920x1080 High Quality Raytracing
NVIDIA GeForce RTX 4090 Founders Edition
Intel Core i9-13900K, NVIDIA GeForce RTX 4090
130 (49min, 97.7P0.1, 106.7P1) fps +80%
NVIDIA GeForce RTX 4080 Founders Edition
Intel Core i9-13900K, NVIDIA GeForce RTX 4080
98.7 (37.6min, 46.5P0.1, 74.3P1) fps +37%
Media NVIDIA GeForce RTX 3080 Ti
  ()
83.5 fps +16%
Media della classe Desktop
  (59.4 - 130, n=11, ultimi 2 anni)
83.5 fps +16%
Asus TUF Gaming GeForce RTX 4070 Ti
Intel Core i9-13900K, NVIDIA GeForce RTX 4070 Ti
82.9 (36.6min, 45.4P0.1, 69.2P1) fps +15%
Media NVIDIA GeForce RTX 4070 Ti
  (82.8 - 82.9, n=2)
82.9 fps +15%
Gigabyte Aorus GeForce RTX 4070 Ti Master
Intel Core i9-13900K, NVIDIA GeForce RTX 4070 Ti
82.8 (27.4min, 39.9P0.1, 59.6P1) fps +15%
Media NVIDIA Titan RTX
  ()
80.1 fps +11%
Zotac Gaming GeForce RTX 3090 Ti AMP Extreme Holo
AMD Ryzen 7 5800X3D, NVIDIA GeForce RTX 3090 Ti
76.4 (33.4min, 57.9P0.1, 62.6P1) fps +6%
Media NVIDIA GeForce RTX 3090
  (67.9 - 80.2, n=2)
74.1 fps +3%
Gigabyte GeForce RTX 4070 Super Gaming OC 12G
Intel Core i9-13900K, NVIDIA GeForce RTX 4070 SUPER
72.1 (43.6min, 49.9P0.1, 61.6P1) fps
NVIDIA GeForce RTX 4070 Super Founders Edition
Intel Core i9-13900K, NVIDIA GeForce RTX 4070 SUPER
70.9 (37min, 44.8P0.1, 58.5P1) fps -2%
Media NVIDIA GeForce RTX 3080
  ()
59.7 fps -17%
Zotac Gaming GeForce RTX 4070 AMP Airo
Intel Core i9-13900K, NVIDIA GeForce RTX 4070
59.4 (17.2min, 20.2P0.1, 49P1) fps -18%
Media NVIDIA GeForce RTX 3070
  ()
42.2 fps -41%
Cyberpunk 2077 1.6
3840x2160 Ray Tracing Ultra Preset (DLSS off)
NVIDIA GeForce RTX 4090 Founders Edition
Intel Core i9-13900K, NVIDIA GeForce RTX 4090 (1.6)
42.6 (32min) fps +102%
NVIDIA GeForce RTX 4080 Founders Edition
Intel Core i9-13900K, NVIDIA GeForce RTX 4080 (1.6)
30.7 (23.5min) fps +45%
Media della classe Desktop
  (1.4 - 43.8, n=19, ultimi 2 anni)
24.4 fps +16%
Zotac Gaming GeForce RTX 3090 Ti AMP Extreme Holo
AMD Ryzen 7 5800X3D, NVIDIA GeForce RTX 3090 Ti (1.52)
24.3 (16.3min) fps +15%
Gigabyte Aorus GeForce RTX 4070 Ti Master
Intel Core i9-13900K, NVIDIA GeForce RTX 4070 Ti (1.61)
23.9 (18min) fps +13%
Asus TUF Gaming GeForce RTX 4070 Ti
Intel Core i9-13900K, NVIDIA GeForce RTX 4070 Ti (1.61)
23.7 (18.1min) fps +12%
Media NVIDIA GeForce RTX 4070 Ti
  (21.6 - 23.9, n=4)
23.2 fps +10%
Gigabyte GeForce RTX 4070 Super Gaming OC 12G
Intel Core i9-13900K, NVIDIA GeForce RTX 4070 SUPER (1.63)
21.1 (2.68min) fps
Media NVIDIA GeForce RTX 3090
  (19.8 - 22.1, n=5)
21 fps 0%
AMD Radeon RX 7900 XTX
AMD Ryzen 9 7950X, AMD Radeon RX 7900 XTX (1.61)
20.7 (14.4min) fps -2%
NVIDIA GeForce RTX 4070 Super Founders Edition
Intel Core i9-13900K, NVIDIA GeForce RTX 4070 SUPER (1.63)
20 (9.7min) fps -5%
Media NVIDIA GeForce RTX 3080 Ti
  ()
18.6 fps -12%
AMD Radeon RX 7900 XT
AMD Ryzen 9 7950X, AMD Radeon RX 7900 XT (1.61)
17.6 (12min) fps -17%
Zotac Gaming GeForce RTX 4070 AMP Airo
Intel Core i9-13900K, NVIDIA GeForce RTX 4070 (1.62)
15.3 (11.7min) fps -27%
AMD Radeon RX 7800 XT
AMD Ryzen 9 7950X, AMD Radeon RX 7800 XT (1.6)
13.7 (10.2min) fps -35%
Media NVIDIA Titan RTX
  ()
13.4 fps -36%
KFA2 GeForce RTX 4060 Ti EX, 16GB GDDR6
AMD Ryzen 9 7950X, NVIDIA GeForce RTX 4060 Ti 16G (1.6)
13.2 (10min) fps -37%
Media NVIDIA GeForce RTX 3080
  ()
12.1 fps -43%
Sapphire Pulse Radeon RX 7700 XT
AMD Ryzen 9 7950X, AMD Radeon RX 7700 XT (1.6)
11.5 (7.84min) fps -45%
Sapphire Pulse Radeon RX 7700 XT
AMD Ryzen 9 7950X, AMD Radeon RX 7700 XT (1.6)
11.5 (7.84min) fps -45%
Media NVIDIA GeForce RTX 3070
  (5.4 - 6.6, n=2)
6 fps -72%
Media NVIDIA GeForce RTX 4060 Ti 8G
  (2.2 - 3.2, n=3)
2.6 fps -88%
KFA2 GeForce RTX 4060 1-Click-OC 2X
AMD Ryzen 9 7950X, NVIDIA GeForce RTX 4060 (1.6)
2.19 (1.635min) fps -90%
XFX Speedster QICK 308 Radeon RX 7600 Black Edition
AMD Ryzen 9 7950X, AMD Radeon RX 7600 (1.6)
2.05 (0.904min) fps -90%
1920x1080 Ray Tracing Ultra Preset (DLSS off)
NVIDIA GeForce RTX 4090 Founders Edition
Intel Core i9-13900K, NVIDIA GeForce RTX 4090 (1.6)
118.4 (92min) fps +66%
NVIDIA GeForce RTX 4080 Founders Edition
Intel Core i9-13900K, NVIDIA GeForce RTX 4080 (1.6)
100.1 (77.6min) fps +40%
Gigabyte Aorus GeForce RTX 4070 Ti Master
Intel Core i9-13900K, NVIDIA GeForce RTX 4070 Ti (1.61)
82.5 (32.1min) fps +15%
Asus TUF Gaming GeForce RTX 4070 Ti
Intel Core i9-13900K, NVIDIA GeForce RTX 4070 Ti (1.61)
81 (62.6min) fps +13%
Media NVIDIA GeForce RTX 4070 Ti
  (78.9 - 82.5, n=4)
81 fps +13%
Media della classe Desktop
  (23.8 - 130.1, n=20, ultimi 2 anni)
77.1 fps +8%
Zotac Gaming GeForce RTX 3090 Ti AMP Extreme Holo
AMD Ryzen 7 5800X3D, NVIDIA GeForce RTX 3090 Ti (1.52)
74.7 (57.7min) fps +4%
Gigabyte GeForce RTX 4070 Super Gaming OC 12G
Intel Core i9-13900K, NVIDIA GeForce RTX 4070 SUPER (1.63)
71.5 (56.7min) fps
Media NVIDIA GeForce RTX 3080 Ti
  ()
69.1 fps -3%
NVIDIA GeForce RTX 4070 Super Founders Edition
Intel Core i9-13900K, NVIDIA GeForce RTX 4070 SUPER (1.63)
68.9 (54.4min) fps -4%
Media NVIDIA GeForce RTX 3090
  (61.3 - 68, n=5)
65.5 fps -8%
AMD Radeon RX 7900 XTX
AMD Ryzen 9 7950X, AMD Radeon RX 7900 XTX (1.61)
64.6 (49.1min) fps -10%
Media NVIDIA GeForce RTX 3080
  ()
61.1 fps -15%
Zotac Gaming GeForce RTX 4070 AMP Airo
Intel Core i9-13900K, NVIDIA GeForce RTX 4070 (1.62)
60 (47.6min) fps -16%
AMD Radeon RX 7900 XT
AMD Ryzen 9 7950X, AMD Radeon RX 7900 XT (1.61)
57.1 (41.7min) fps -20%
KFA2 GeForce RTX 4060 Ti EX, 16GB GDDR6
AMD Ryzen 9 7950X, NVIDIA GeForce RTX 4060 Ti 16G (1.6)
49 (37min) fps -31%
Media NVIDIA GeForce RTX 4060 Ti 8G
  (48 - 49.6, n=3)
48.9 fps -32%
AMD Radeon RX 7800 XT
AMD Ryzen 9 7950X, AMD Radeon RX 7800 XT (1.6)
46 (33.3min) fps -36%
Media NVIDIA Titan RTX
  ()
43.3 fps -39%
Media NVIDIA GeForce RTX 3070
  (41.6 - 43.9, n=2)
42.8 fps -40%
Sapphire Pulse Radeon RX 7700 XT
AMD Ryzen 9 7950X, AMD Radeon RX 7700 XT (1.6)
39.8 (30min) fps -44%
Sapphire Pulse Radeon RX 7700 XT
AMD Ryzen 9 7950X, AMD Radeon RX 7700 XT (1.6)
39.8 (30min) fps -44%
Sapphire Pulse Radeon RX 7700 XT
AMD Ryzen 9 7950X, AMD Radeon RX 7700 XT (1.6)
39.8 (30min) fps -44%
KFA2 GeForce RTX 4060 1-Click-OC 2X
AMD Ryzen 9 7950X, NVIDIA GeForce RTX 4060 (1.6)
37.1 (27.9min) fps -48%
XFX Speedster QICK 308 Radeon RX 7600 Black Edition
AMD Ryzen 9 7950X, AMD Radeon RX 7600 (1.6)
22.4 (13.9min) fps -69%
Ghostwire Tokyo - 1920x1080 Highest Settings + Maximum Ray Tracing
NVIDIA GeForce RTX 4090 Founders Edition
Intel Core i9-13900K, NVIDIA GeForce RTX 4090
193.7 (38.5min, 66.5P0.1, 142.5P1) fps +46%
NVIDIA GeForce RTX 4080 Founders Edition
Intel Core i9-13900K, NVIDIA GeForce RTX 4080
166.2 (30.4min, 60P0.1, 115.2P1) fps +25%
Asus TUF Gaming GeForce RTX 4070 Ti
Intel Core i9-13900K, NVIDIA GeForce RTX 4070 Ti
139.3 (31.3min, 53.2P0.1, 89.7P1) fps +5%
Gigabyte Aorus GeForce RTX 4070 Ti Master
Intel Core i9-13900K, NVIDIA GeForce RTX 4070 Ti
138.7 (38.5min, 54.6P0.1, 89.8P1) fps +4%
Media NVIDIA GeForce RTX 4070 Ti
  (130.7 - 139.3, n=4)
136.5 fps +3%
AMD Radeon RX 7900 XTX
AMD Ryzen 9 7950X, AMD Radeon RX 7900 XTX
136.3 (39.1min, 76.4P0.1, 95.8P1) fps +3%
Media della classe Desktop
  (55.9 - 193.7, n=13, ultimi 2 anni)
136.3 fps +3%
Gigabyte GeForce RTX 4070 Super Gaming OC 12G
Intel Core i9-13900K, NVIDIA GeForce RTX 4070 SUPER
132.9 (13.7min, 19.3P0.1, 81.6P1) fps
NVIDIA GeForce RTX 4070 Super Founders Edition
Intel Core i9-13900K, NVIDIA GeForce RTX 4070 SUPER
128.3 (23.1min, 40.3P0.1, 80.7P1) fps -3%
Zotac Gaming GeForce RTX 3090 Ti AMP Extreme Holo
AMD Ryzen 7 5800X3D, NVIDIA GeForce RTX 3090 Ti
120.2 (33.8min, 55.2P0.1, 79.1P1) fps -10%
Media NVIDIA GeForce RTX 3080 Ti
  ()
119.9 fps -10%
AMD Radeon RX 7900 XT
AMD Ryzen 9 7950X, AMD Radeon RX 7900 XT
116.5 (30.3min, 71.6P0.1, 78.1P1) fps -12%
Zotac Gaming GeForce RTX 4070 AMP Airo
Intel Core i9-13900K, NVIDIA GeForce RTX 4070
112.2 (16.9min, 37.9P0.1, 67.5P1) fps -16%
Media NVIDIA GeForce RTX 3090
  (106 - 122, n=3)
111.6 fps -16%
Media NVIDIA GeForce RTX 3080
  ()
97.9 fps -26%
AMD Radeon RX 7800 XT
AMD Ryzen 9 7950X, AMD Radeon RX 7800 XT
95.3 (30.1min, 39.9P0.1, 57.5P1) fps -28%
KFA2 GeForce RTX 4060 Ti EX, 16GB GDDR6
AMD Ryzen 9 7950X, NVIDIA GeForce RTX 4060 Ti 16G
89.1 (34.3min, 49.2P0.1, 52.3P1) fps -33%
Media NVIDIA GeForce RTX 4060 Ti 8G
  (88 - 90.4, n=3)
89.1 fps -33%
Sapphire Pulse Radeon RX 7700 XT
AMD Ryzen 9 7950X, AMD Radeon RX 7700 XT
82.5 (20.2min, 38.6P0.1, 48.8P1) fps -38%
Media NVIDIA Titan RTX
  (74.5 - 79, n=2)
76.8 fps -42%
Media NVIDIA GeForce RTX 3070
  ()
76.3 fps -43%
KFA2 GeForce RTX 4060 1-Click-OC 2X
AMD Ryzen 9 7950X, NVIDIA GeForce RTX 4060
72.3 (38min, 39.5P0.1, 40.8P1) fps -46%
XFX Speedster QICK 308 Radeon RX 7600 Black Edition
AMD Ryzen 9 7950X, AMD Radeon RX 7600
52.8 (26.9min, 27.7P0.1, 28.6P1) fps -60%
The Callisto Protocol - 1920x1080 Ultra Preset (without FSR Upscaling) + Full Ray-Tracing
AMD Radeon RX 7800 XT
AMD Ryzen 9 7950X, AMD Radeon RX 7800 XT
99.3 fps +2%
AMD Radeon RX 7900 XTX
AMD Ryzen 9 7950X, AMD Radeon RX 7900 XTX
98 fps 0%
Gigabyte GeForce RTX 4070 Super Gaming OC 12G
Intel Core i9-13900K, NVIDIA GeForce RTX 4070 SUPER
97.64 fps
NVIDIA GeForce RTX 4070 Super Founders Edition
Intel Core i9-13900K, NVIDIA GeForce RTX 4070 SUPER
94.09 fps -4%
Sapphire Pulse Radeon RX 7700 XT
AMD Ryzen 9 7950X, AMD Radeon RX 7700 XT
92.4 fps -5%
AMD Radeon RX 7900 XT
AMD Ryzen 9 7950X, AMD Radeon RX 7900 XT
89 fps -9%
Media NVIDIA GeForce RTX 4070 Ti
  (82.1 - 97.5, n=4)
88.8 fps -9%
Asus TUF Gaming GeForce RTX 4070 Ti
Intel Core i9-13900K, NVIDIA GeForce RTX 4070 Ti
88.58 fps -9%
Gigabyte Aorus GeForce RTX 4070 Ti Master
Intel Core i9-13900K, NVIDIA GeForce RTX 4070 Ti
87 fps -11%
KFA2 GeForce RTX 4060 Ti EX, 16GB GDDR6
AMD Ryzen 9 7950X, NVIDIA GeForce RTX 4060 Ti 16G
86.6 fps -11%
Media della classe Desktop
  (50.2 - 97.6, n=7, ultimi 2 anni)
86 fps -12%
Zotac Gaming GeForce RTX 4070 AMP Airo
Intel Core i9-13900K, NVIDIA GeForce RTX 4070
82 fps -16%
Media NVIDIA GeForce RTX 4060 Ti 8G
  (66.8 - 90.7, n=3)
81.1 fps -17%
Media NVIDIA GeForce RTX 3080 Ti
  ()
76 fps -22%
Media NVIDIA GeForce RTX 3080
  ()
71.3 fps -27%
XFX Speedster QICK 308 Radeon RX 7600 Black Edition
AMD Ryzen 9 7950X, AMD Radeon RX 7600
65.8 fps -33%
Media NVIDIA GeForce RTX 3070
  ()
61.8 fps -37%
Media NVIDIA Titan RTX
  ()
58.7 fps -40%
basso medio alto ultraQHD4K DLSS4K
GTA V (2015) 188.3 187.9 186.9 158.8 147.2 166.6
The Witcher 3 (2015) 418 210 159.1 136.7
Dota 2 Reborn (2015) 250 228 221 209 202
Final Fantasy XV Benchmark (2018) 235 235 197.1 150.5 85.2
X-Plane 11.11 (2018) 233 196.4 152.4 129.1
Far Cry 5 (2018) 201 191 185 104
Strange Brigade (2018) 601 398 437 385 270 134.7
Shadow of the Tomb Raider (2018) 260 255 188 96.7
Metro Exodus (2019) 186.1 150.6 120.8 76.1
Control (2019) 180.1 115.5 69 58.2
Borderlands 3 (2019) 184.2 166.6 131.2 68.9
Mafia Definitive Edition (2020) 226 161.5 83.2
Watch Dogs Legion (2020) 142.3 109.2 63.4
Far Cry 6 (2021) 193.7 143.9 145.9 82.7
Dying Light 2 (2022) 157 108 54.5
Cyberpunk 2077 1.6 (2022) 161.8 146 92.8 44.9
Ghostwire Tokyo (2022) 284 291 194.8 92.7
F1 22 (2022) 381 403 340 136.3 88.8 44.6
The Callisto Protocol (2022) 216.05 155.69 123.75 78.04
F1 23 (2023) 380 406 357 125.9 81.2 69.7 40.7
Baldur's Gate 3 (2023) 203 203 142.7 119.7 71.7
Cyberpunk 2077 2.0 Phantom Liberty (2023) 162.1 141.9 89.6 38.9
Assassin's Creed Mirage (2023) 204 169 130 106 77
Alan Wake 2 (2023) 114.1 79.7 44.2 42.7
Call of Duty Modern Warfare 3 2023 (2023) 184 165 120 100 70
Avatar Frontiers of Pandora (2023) 129.9 101.2 67.6 60.5 34.6

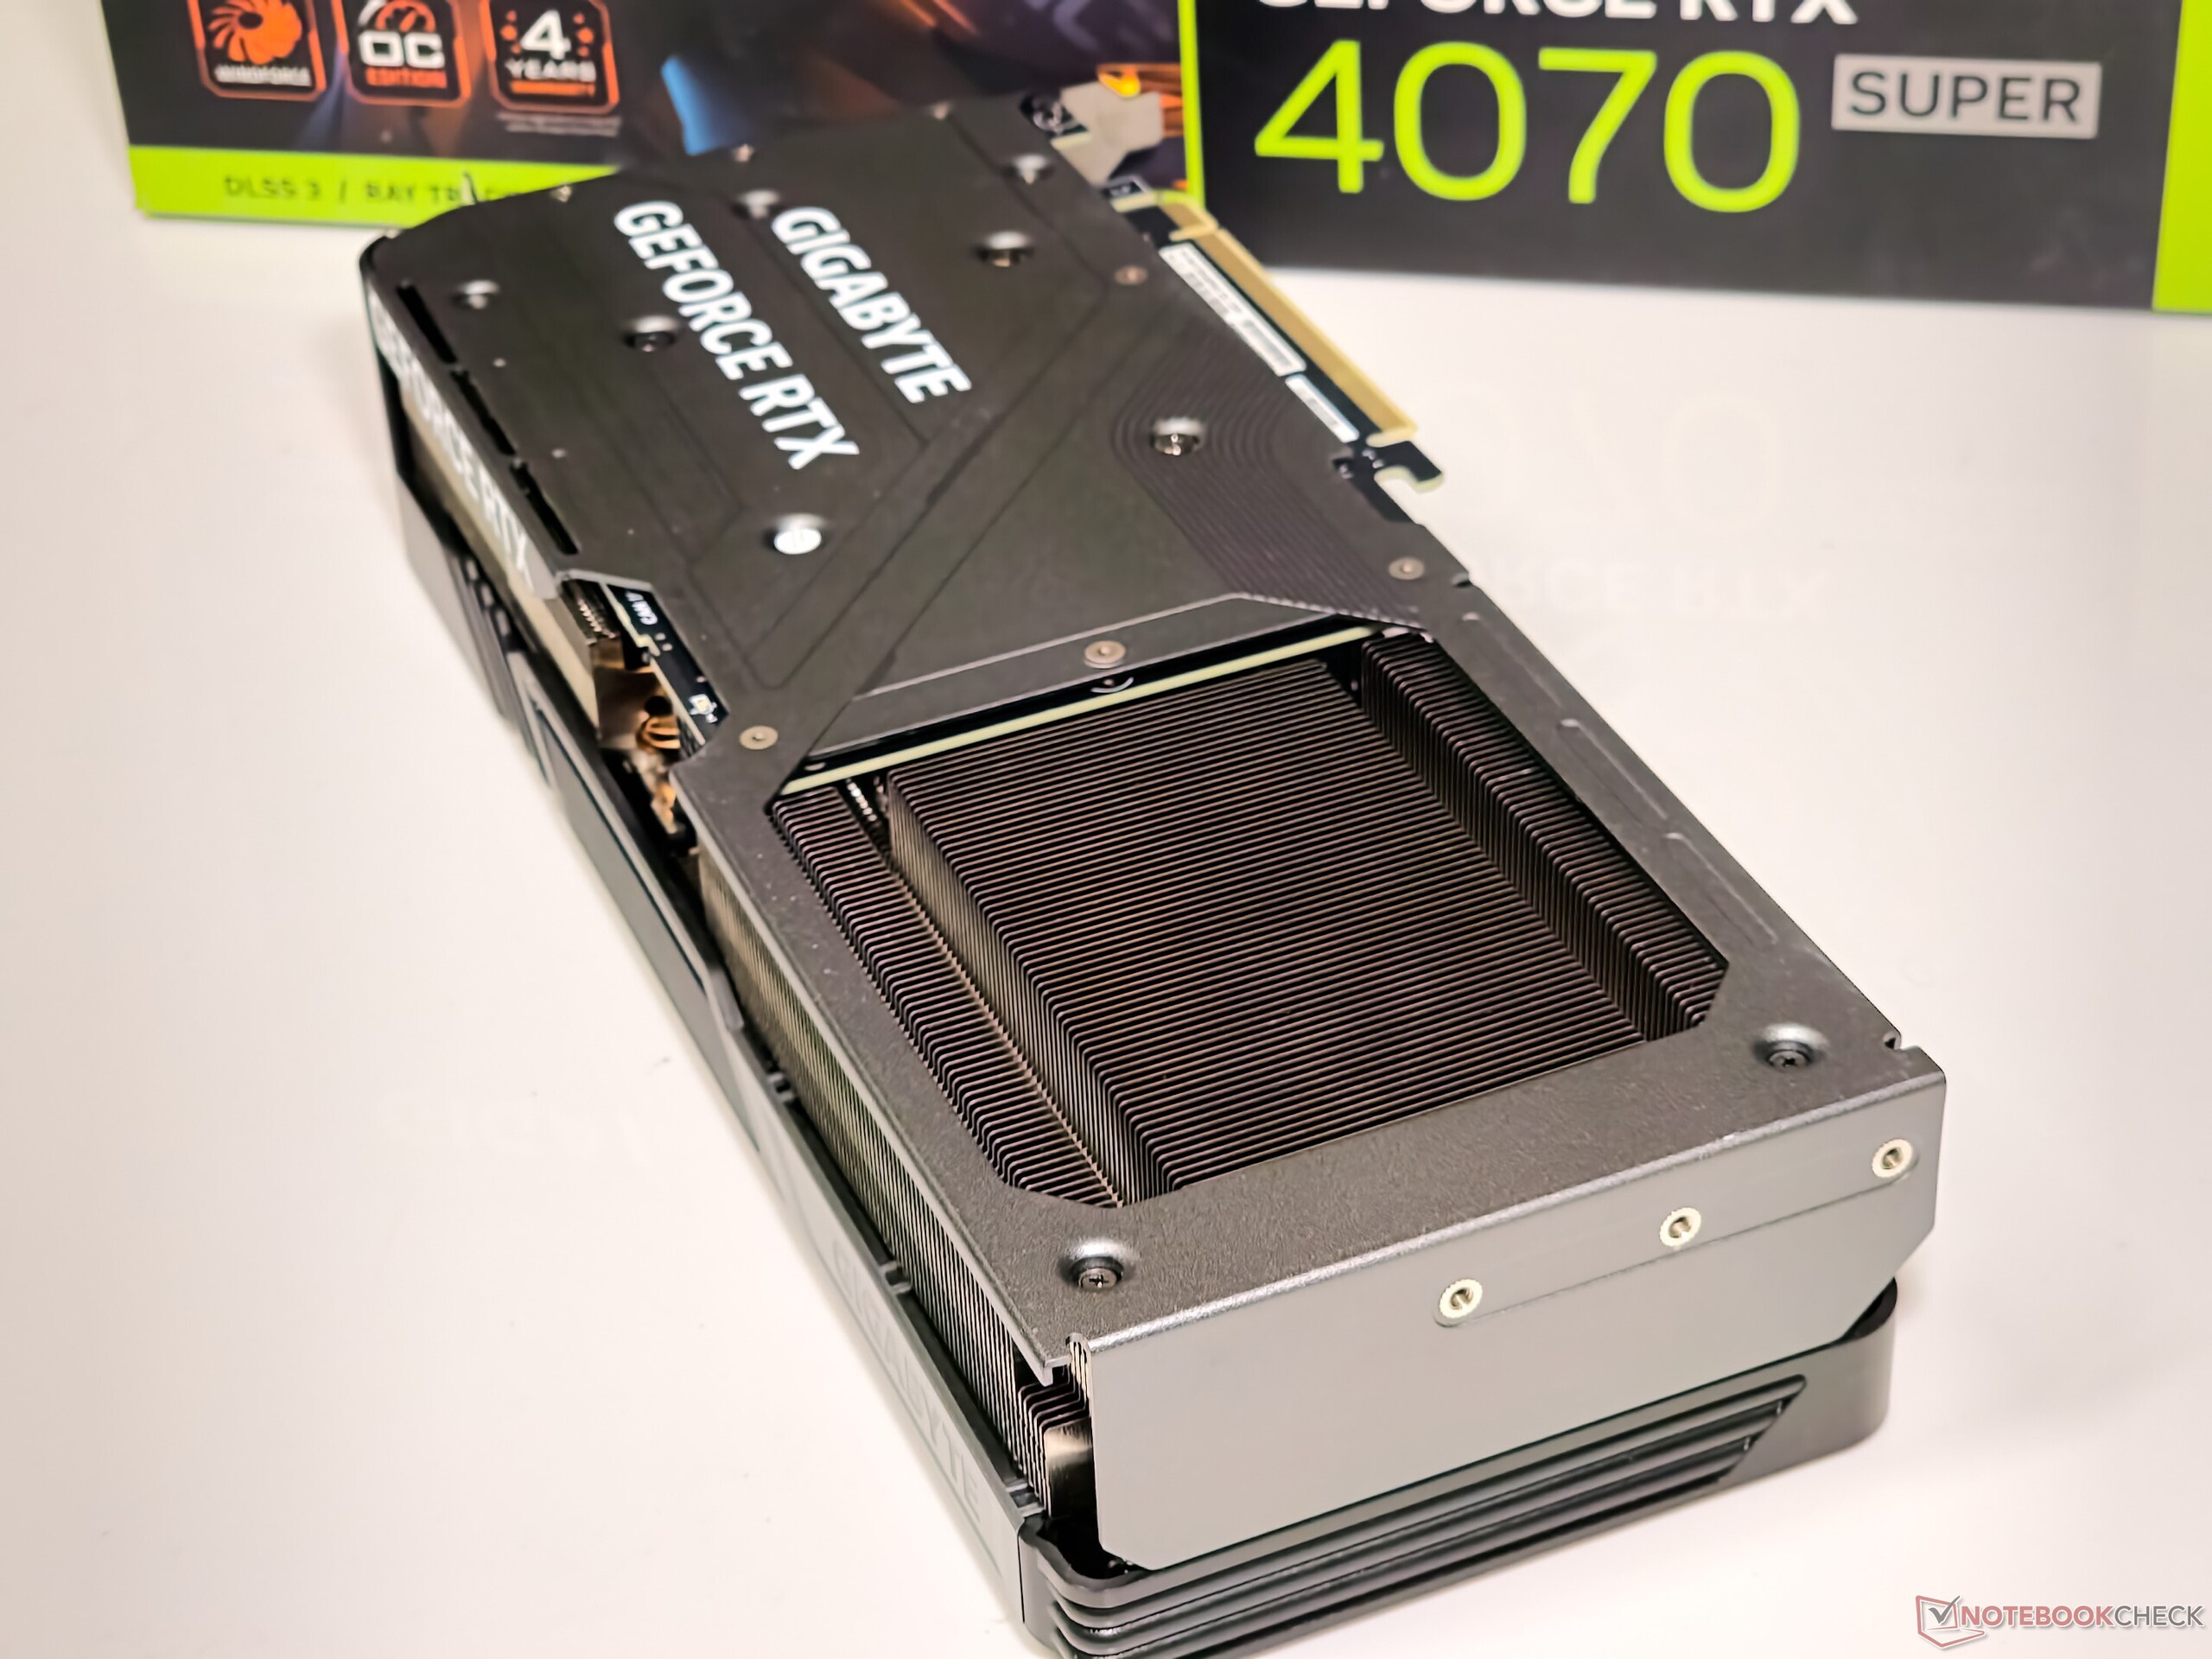
Emissioni: Rumore più elevato ma temperature più basse rispetto alla RTX 4070 Super FE

La RTX 4070 Super Gaming OC è dotata di otto heatpipe in rame

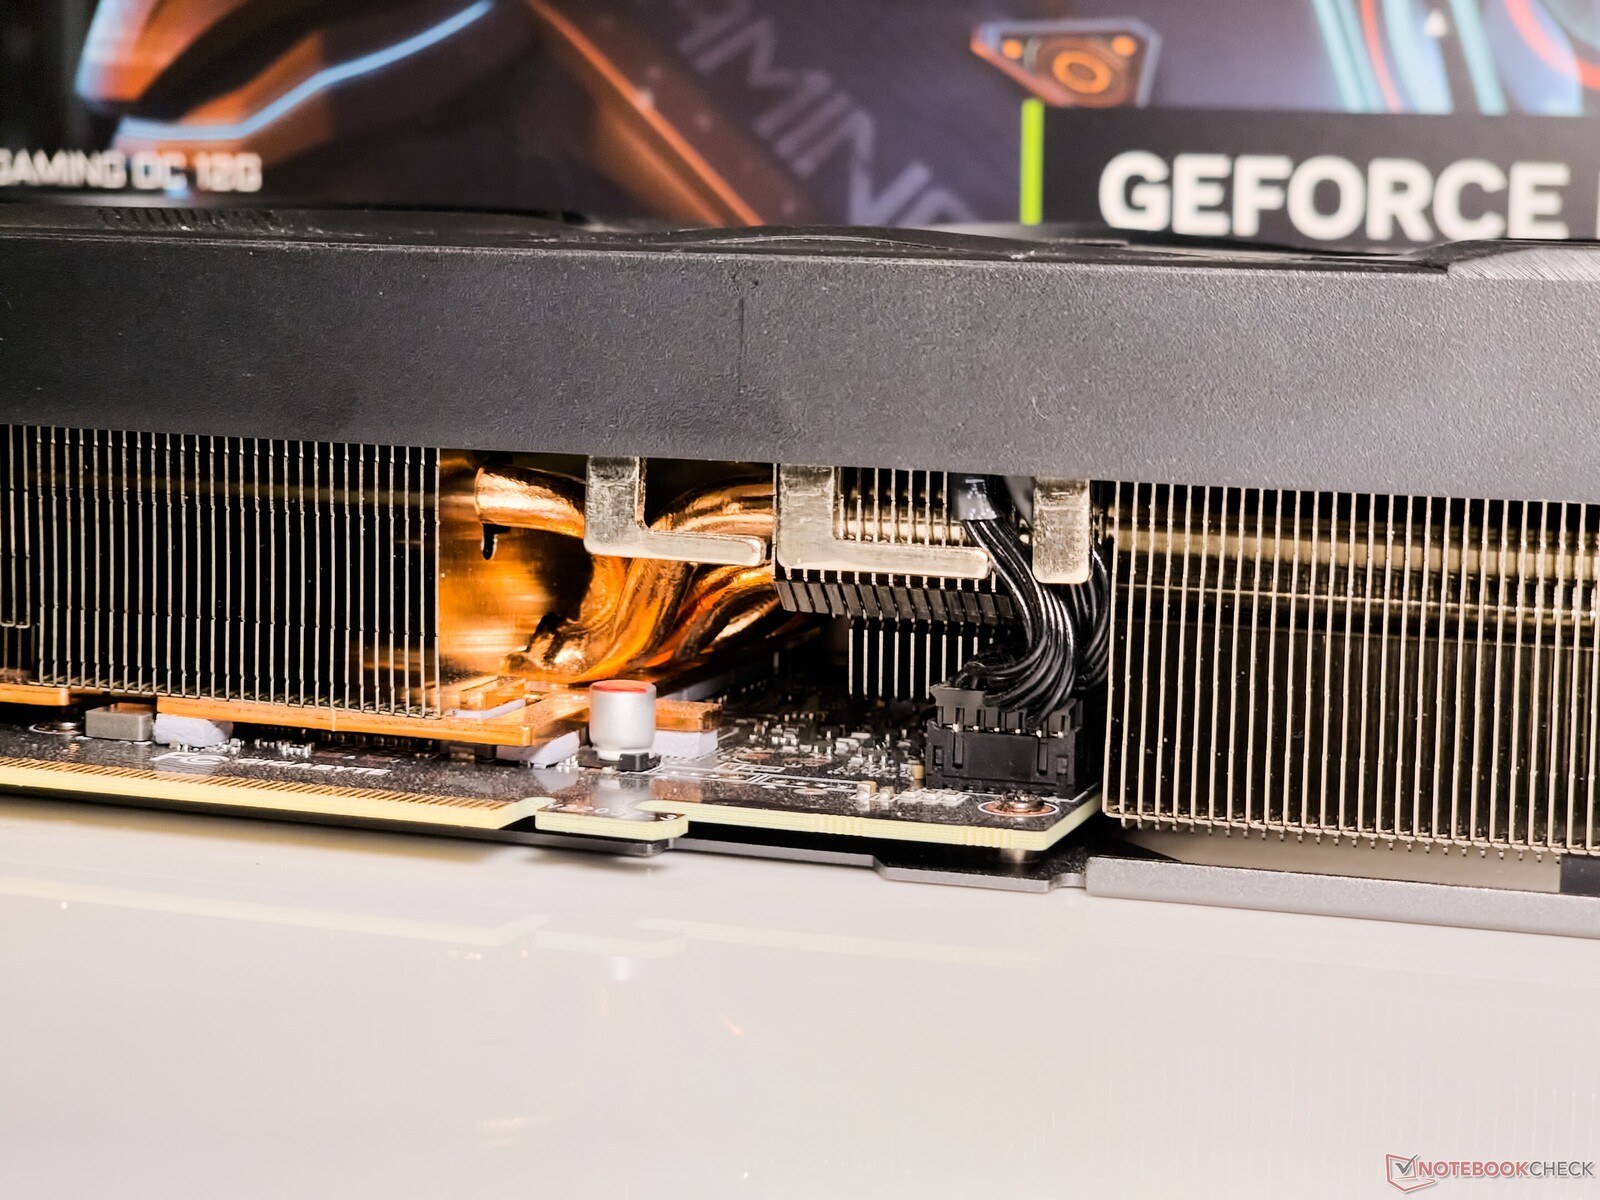
Gigabyte RTX 4070 Super Gaming OC utilizza il sistema di raffreddamento WindForce, di proprietà dell'azienda, con tre ventole da 90 mm e un totale di otto heatpipes in rame

Almeno fino alla generazione Turing, le schede Founder Edition di Nvidia hanno tipicamente faticato a mostrare buoni profili di emissione di calore e rumore rispetto alle loro controparti AiB.

Le cose sono cambiate a partire da Ampere e con Ada abbiamo visto quanto sia coerente ed efficiente il nuovo design termico di Nvidia. Le schede FE hanno stabilito un elevato parametro di riferimento per le schede AiB.
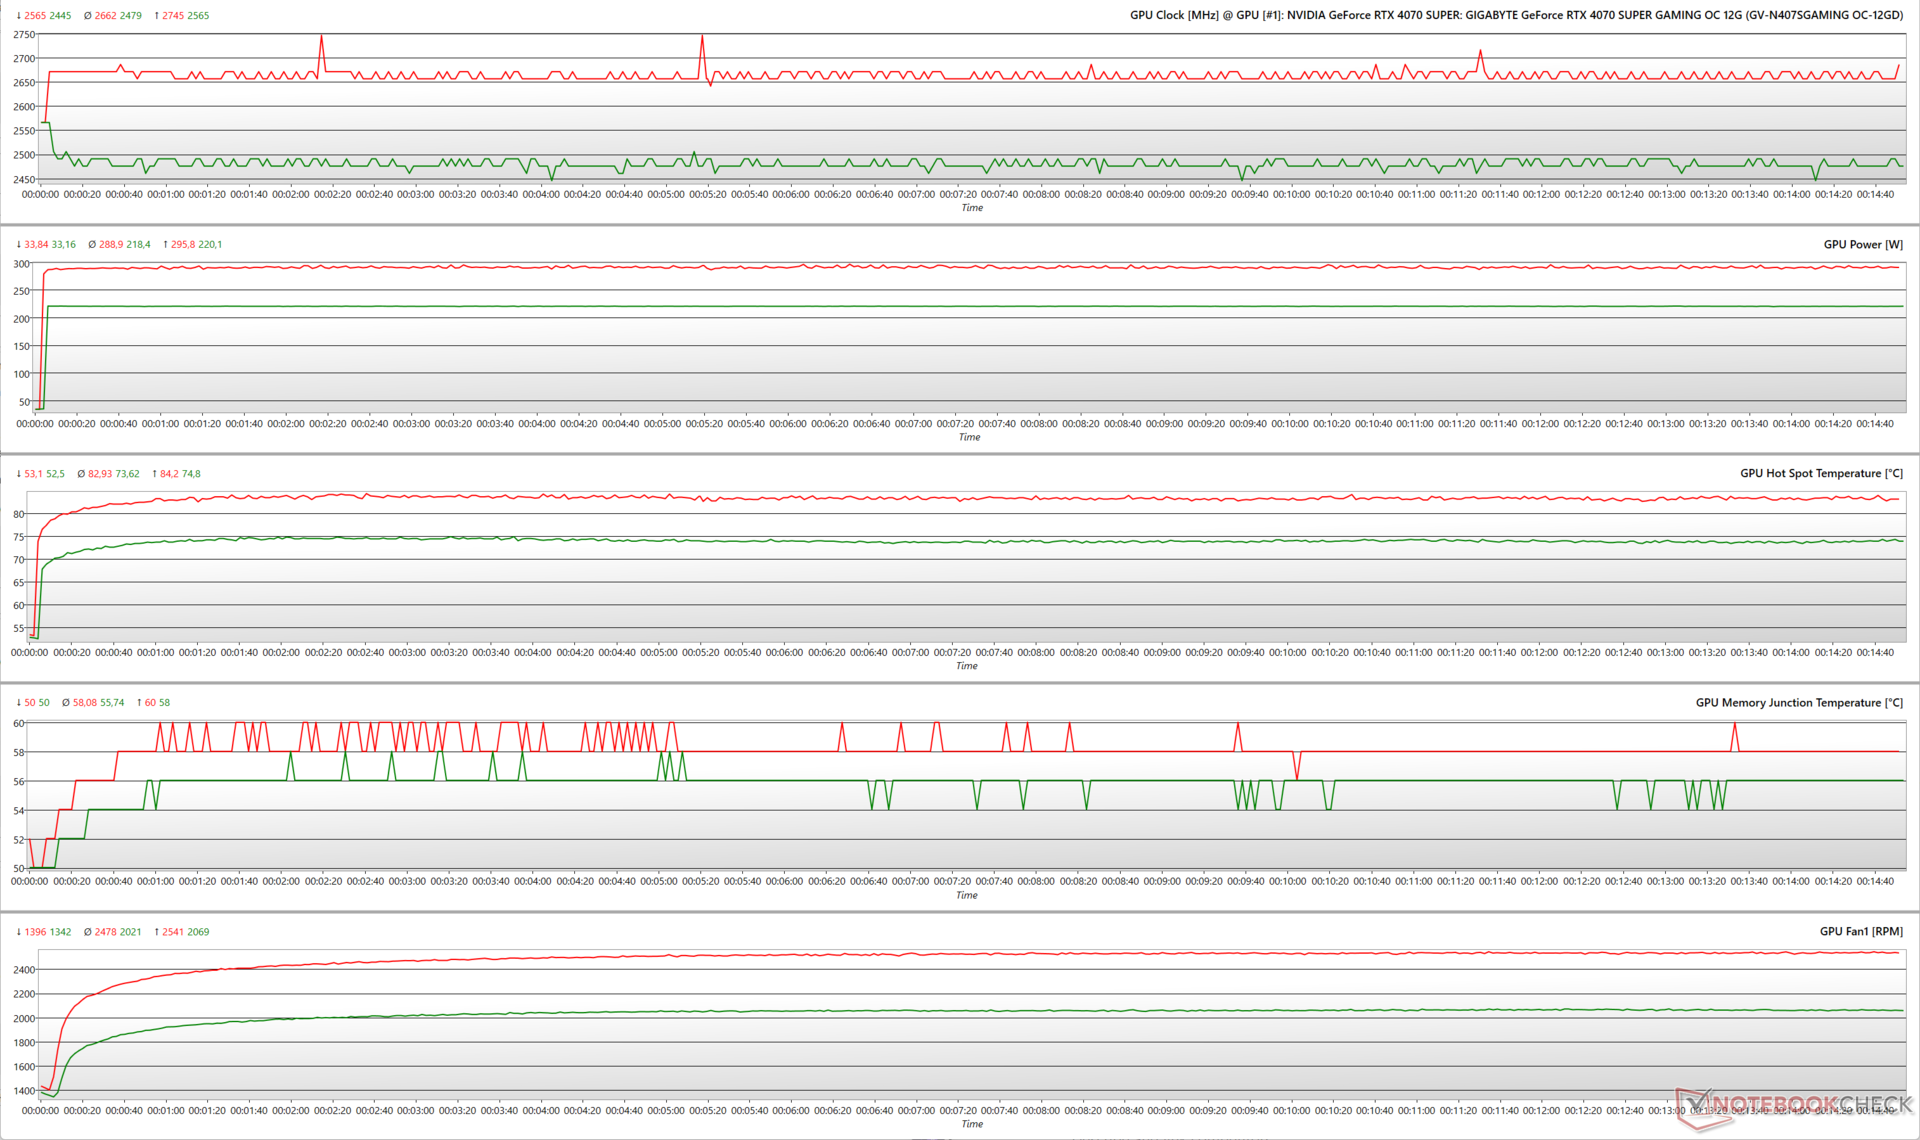
Test di stress

Poiché RTX 4070 Super Gaming OC consente di espandere l'headroom di potenza disponibile del 45% fino a 320 W, abbiamo testato la scheda sia al 100% che al 145% di power target (PT) per vedere come vengono influenzati i vari parametri della GPU.

Lo stress FurMark a 1280 x 720 senza AA vede la RTX 4070 Super Gaming OC aumentare fino a 2.565 MHz al 100% di PT e 2.745 MHz al 145% di PT. Mentre la GPU è in grado di massimizzare i 220 W TGP al 100% PT, può utilizzare solo 296 W al 145%, anche se il valore teorico può arrivare a 320 W.

Naturalmente, l'aumento del target di potenza ha anche un effetto sulle termiche. Le temperature dei punti caldi al 100% di PT si aggirano in media intorno ai 74 °C, che aumentano a 83 °C di media al 145% di PT.

Di conseguenza, le velocità delle ventole aumentano del 23% circa passando dal 100% PT al 145% PT.

In uno stress più reale con The Witcher 3 a 1080p Ultra, vediamo che l'aumento dell'obiettivo di potenza non ha alcun effetto sui clock. Indipendentemente dall'obiettivo di potenza, la RTX 4070 Super Gaming OC mantiene un livello costante di 2.805 MHz, consumando tra 208 e 214 W. Anche le temperature dei punti caldi non variano molto tra questi profili di potenza.

Questi test affermano ancora una volta che Ada non dipende dall'headroom TGP per aumentare opportunisticamente i clock. Infatti, il boost massimo di RTX 4070 Super Gaming OC è ancora inferiore a quello di RTX 4070 Super FE (2.820 MHz). Tuttavia, l'implementazione di Gigabyte porta a un clock medio del core leggermente migliore (2.805 MHz) rispetto a quello della Founders Edition (2.776 MHz).

Parametri della GPU durante lo stress FurMark (Verde - 100% PT; Rosso - 145% PT; BIOS OC)
Parametri della GPU durante lo stress di The Witcher 3 a 1080p Ultra (Verde - 100% PT; Rosso - 145% PT; BIOS OC)

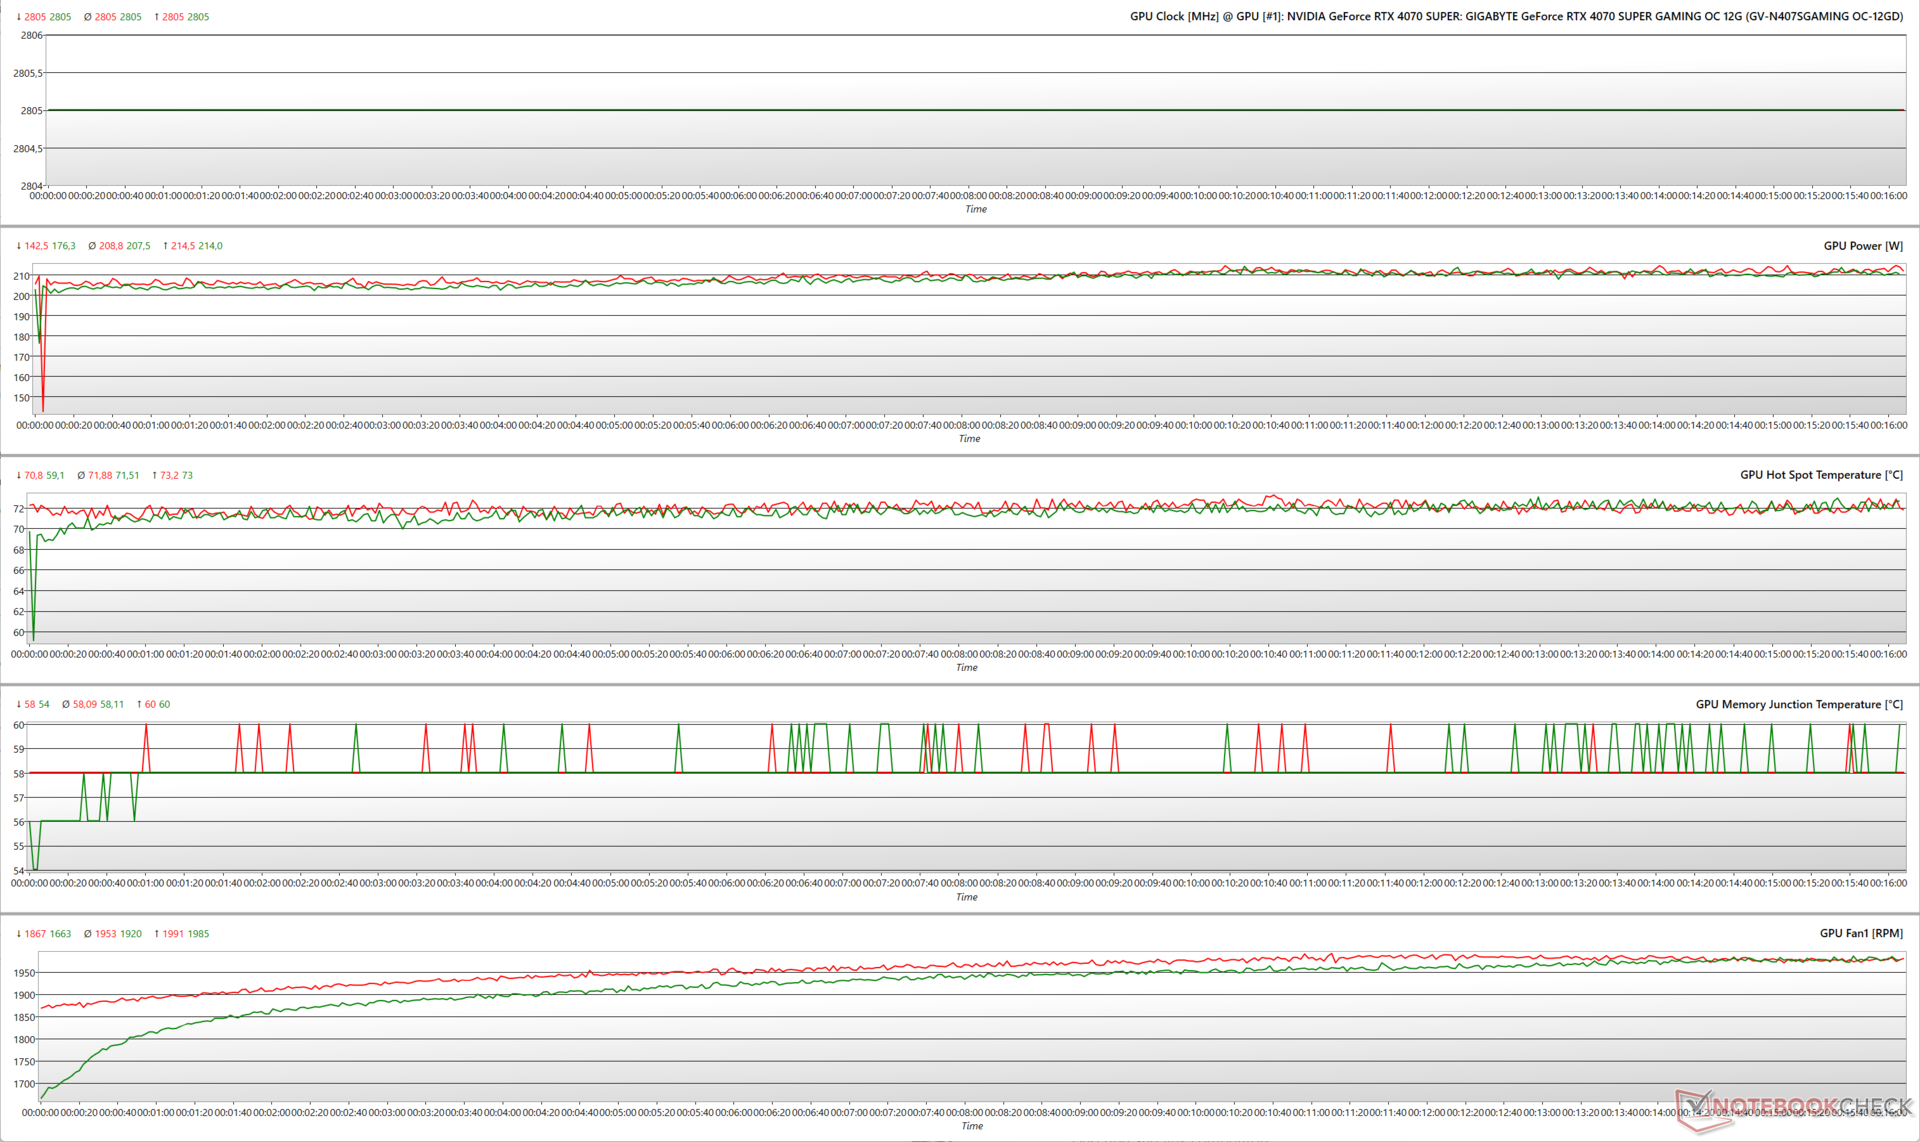
Il grafico FPS di Witcher 3

L'implementazione a tripla ventola di RTX 4070 Super Gaming OC fa un buon lavoro nel garantire prestazioni ben sostenute, come dimostrano i frame rate costanti che vediamo con The Witcher 3 con impostazioni 1080p Ultra e 4K Ultra.

0153045607590105120135150165180195Tooltip
Gigabyte GeForce RTX 4070 Super Gaming OC 12G i9-13900K, NVIDIA GeForce RTX 4070 SUPER; 1920x1080 Ultra Graphics & Postprocessing (HBAO+): Ø198.9 (195-202)
Gigabyte GeForce RTX 4070 Super Gaming OC 12G i9-13900K, NVIDIA GeForce RTX 4070 SUPER; 3840x2160 Ultra Graphics & Postprocessing (HBAO+): Ø88.6 (86-90)

Temperature di superficie

A una temperatura ambiente di 22 °C, il rivestimento anteriore rimane relativamente fresco a 30 °C, mentre la base del pannello posteriore vicino al connettore PCIe raggiunge i 44,5 °C. Abbiamo misurato 46,3 °C vicino al connettore 12VHPWR.

Nel complesso, il sistema di raffreddamento fornito sembra fare un lavoro decente nel mantenere temperature superficiali tollerabili sotto carico.
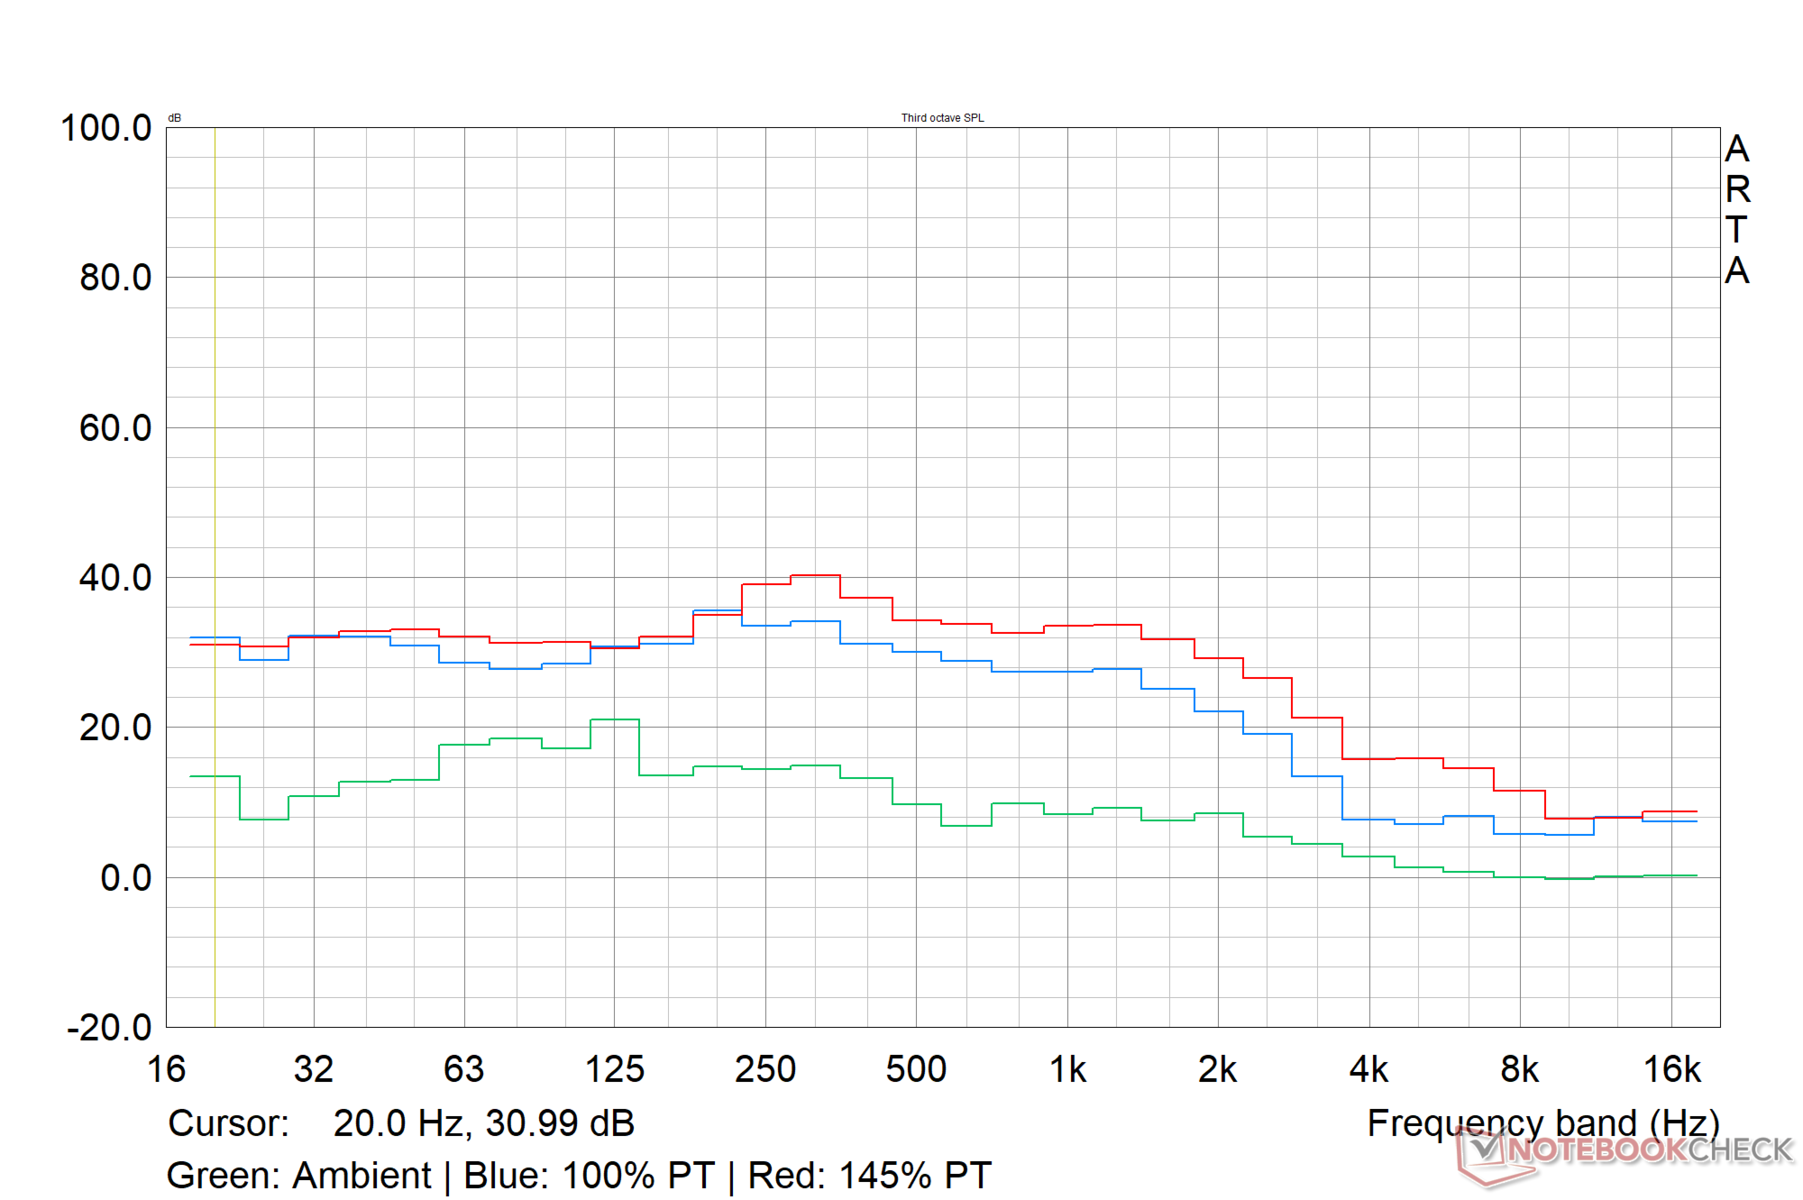
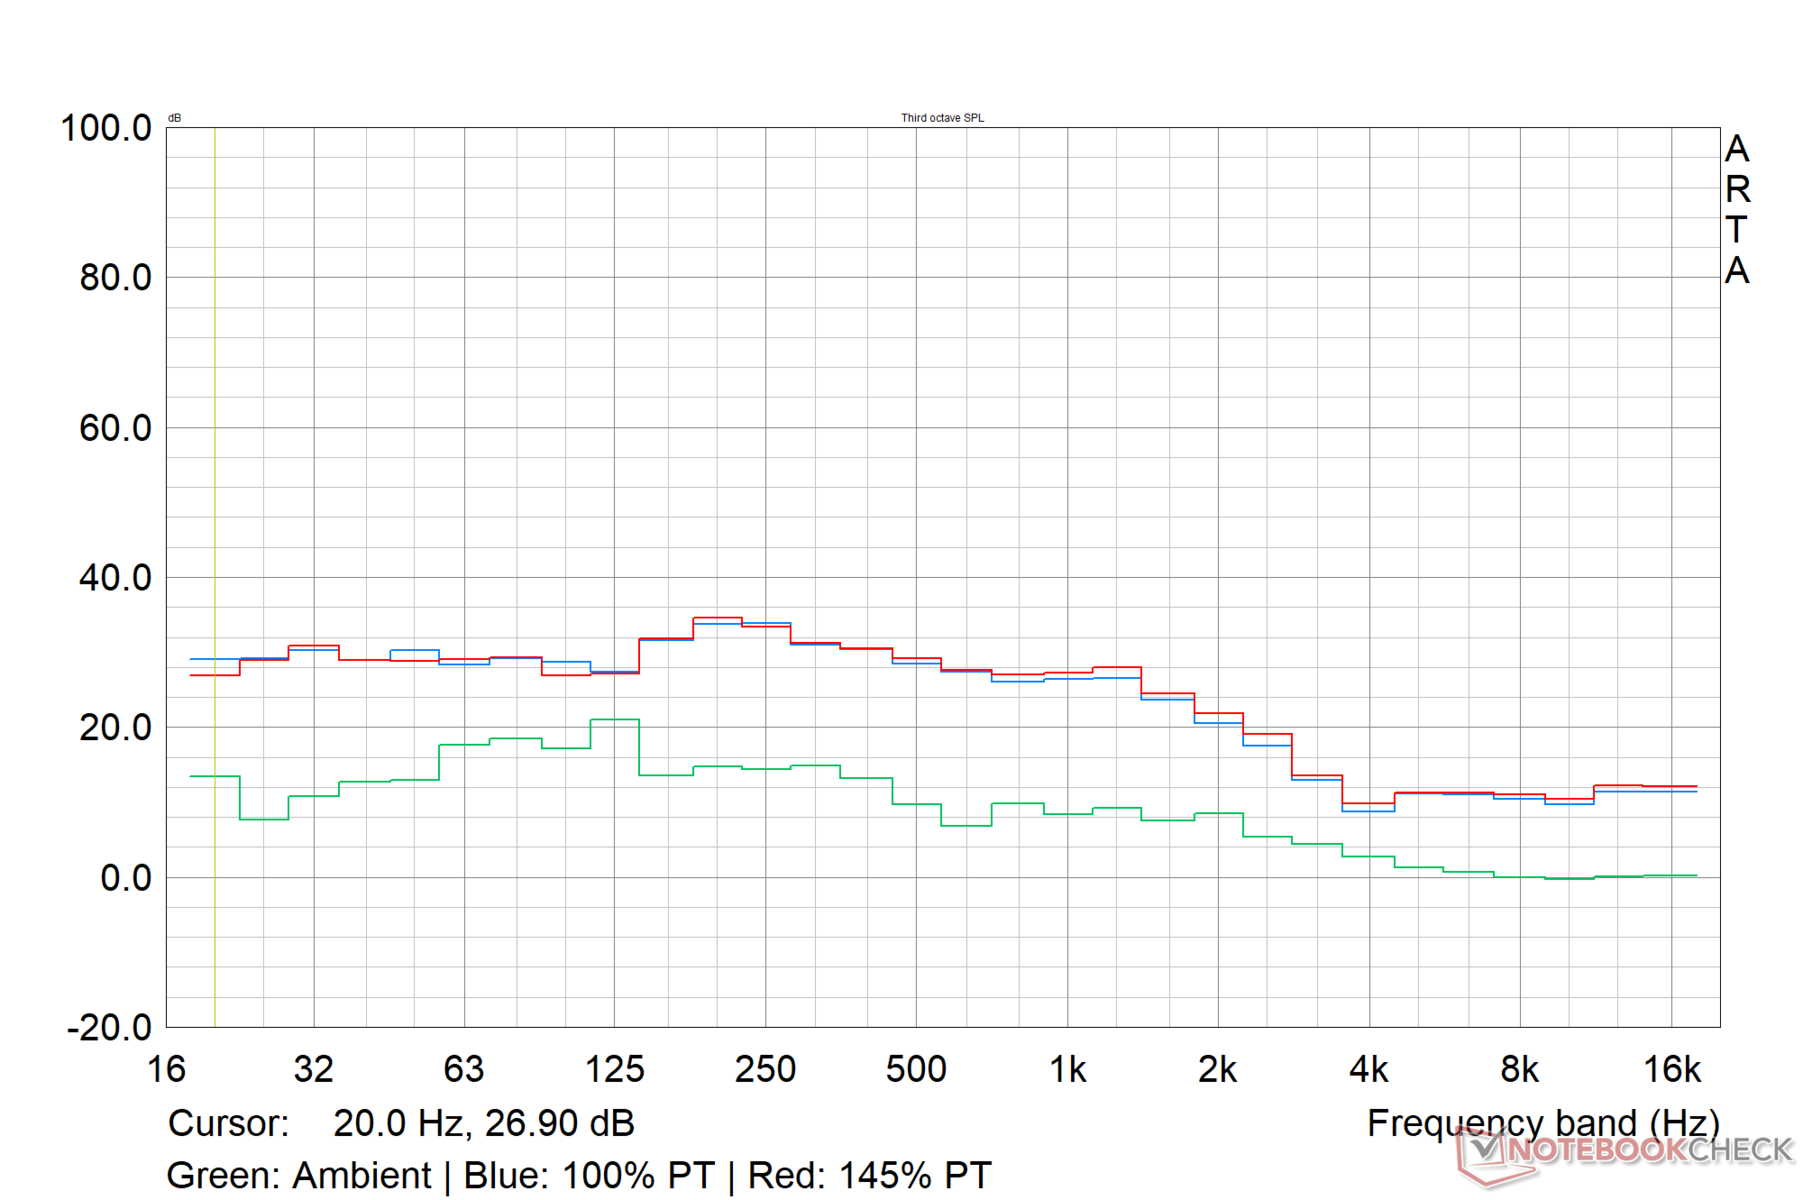
Temperature di superficie: Rivestimento anteriore
Temperature di superficie: Piastra posteriore
Temperature di superficie: connettore di alimentazione 12VHPWR

Livelli di rumore

I ventilatori WindForce tripli hanno emissioni acustiche tollerabili sotto carico

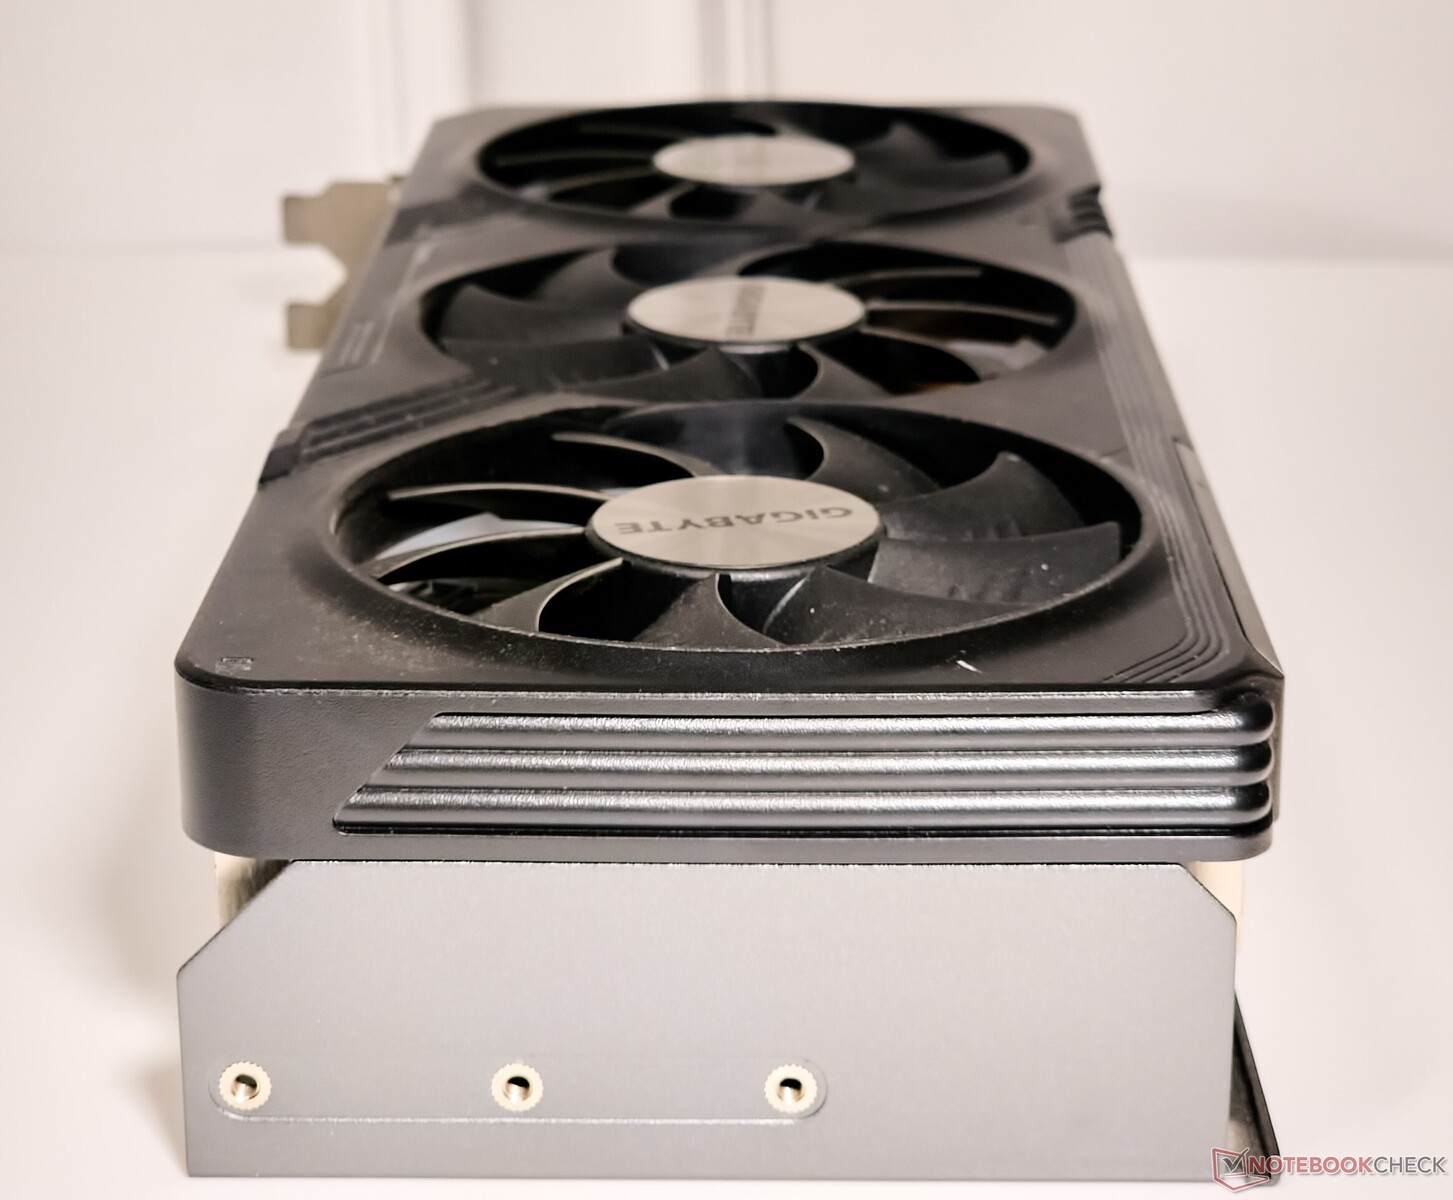
Delle tre ventole della RTX 4070 Super Gaming OC, quella sinistra e quella destra girano in senso antiorario, mentre la ventola centrale gira in senso orario per fornire un buon contrappeso.

Secondo Gigabyte, queste ventole utilizzano un cuscinetto a manicotto con nano lubrificante al grafene che si sostiene offra una durata equivalente a quella di un cuscinetto a doppia sfera, senza il rumore.

Gigabyte implementa un arresto completo della ventola in idle e fornisce due modalità operative VBIOS - BIOS OC e Silent.

In pratica, non abbiamo osservato differenze tangibili nei livelli di pressione sonora (SPL) misurati durante gli stress test eseguiti con obiettivi di potenza al 100% e al 145% in entrambe le modalità VBIOS.

Tuttavia, l'SPL massimo che abbiamo potuto registrare è stato di 43,32 db(A) a 2.541 RPM - comprensibile considerando la configurazione a tre ventole.

Al contrario, le ventole della RTX 4070 Super Founders Edition rimangono sempre sotto i 35 dB(A) SPL. Ma il compromesso è la temperatura dell'hot spot superiore di 10 °C e la temperatura della giunzione della memoria superiore di 14 °C nella scheda FE rispetto alla RTX 4070 Super Gaming OC.

Ambient: 19.50 dB(A); System Idle: 24 dB(A)
Stress Test Modalità VBIOS / Power Target Velocità massima della ventola (RPM) Rumore della ventola dB A.Velocità della ventola (RPM) Rumore della ventola dB(A)
FurMark 1280 x 720, senza AA BIOS OC / 100% 2.069 37,70
FurMark 1280 x 720, senza AA BIOS silenzioso / 100% 1.930 37,11
FurMark 1280 x 720, senza AA BIOS OC / 145% 2.541 43,32
FurMark 1280 x 720, senza AA BIOS silenzioso / 145% 2.366 42,72
Witcher 3 1080p Ultra BIOS OC / 100% 1.985 35,88
Witcher 3 1080p Ultra BIOS silenzioso / 100% 1.842 35,72
Witcher 3 1080p Ultra BIOS OC / 145% 1.991 36,54
Witcher 3 1080p Ultra BIOS silenzioso / 145% 1.878 35,8
Profilo di rumore RTX 4070 Super Gaming OC durante lo stress FuMark (BIOS OC)
Profilo del rumore di RTX 4070 Super Gaming OC durante lo stress di The Witcher 3 1080p Ultra (BIOS OC)

Gestione dell'energia: Eccellente efficienza energetica nei giochi

Rispetto alla RTX 4070 Super FE, la RTX 4070 Super Gaming OC di Gigabyte dimostra un'efficienza energetica migliorata del 6% in The Witcher 3 1080p Ultra, che la mette davanti anche alla RTX 4090 Founders Edition. La Radeon RX 7900 XT è ancora in cima alle classifiche di efficienza, ma non di molto.

Ancora una volta, vediamo che il consumo medio di energia dalla parete rimane invariato anche con un obiettivo di alimentazione del 145% durante lo stress con The Witcher 3 a 1080p Ultra. Questo conferma le nostre osservazioni nel test di stress del gioco di cui sopra, che non mostra differenze di TGP o di clock a entrambi gli obiettivi di potenza.

Power Consumption: External monitor

0255075100125150175200225250275300325350375400425Tooltip
Gigabyte GeForce RTX 4070 Super Gaming OC 12G; 1280x720 FurMark 1.19 GPU Stress Test (external Monitor); 145% PT, BIOS OC: Ø413 (403-440)
Gigabyte GeForce RTX 4070 Super Gaming OC 12G; 1280x720 FurMark 1.19 GPU Stress Test (external Monitor); 100% PT, BIOS OC: Ø335 (330-359)
Gigabyte GeForce RTX 4070 Super Gaming OC 12G; 1920x1080 The Witcher 3 ultra (external Monitor); 100% PT, BIOS OC: Ø388 (373-438)
Gigabyte GeForce RTX 4070 Super Gaming OC 12G; 1920x1080 The Witcher 3 ultra (external Monitor); 145% PT, BIOS OC: Ø388 (377-418)
Gigabyte GeForce RTX 4070 Super Gaming OC 12G; Idle 1min (external Monitor): Ø122.6 (114.8-153.4)
Power Consumption / FurMark 1.19 GPU Stress Test (external Monitor)
NVIDIA GeForce RTX 4090 Founders Edition
Intel Core i9-13900K, NVIDIA GeForce RTX 4090 (133% PT OC, Idle: 81.25 W)
704 (666min, 670P1 - 717max) Watt * -70%
NVIDIA GeForce RTX 4090 Founders Edition
Intel Core i9-13900K, NVIDIA GeForce RTX 4090 (100% PT, Idle: 81.25 W)
558 (551min, 553P1 - 566max) Watt * -35%
Zotac Gaming GeForce RTX 3090 Ti AMP Extreme Holo
AMD Ryzen 7 5800X3D, NVIDIA GeForce RTX 3090 Ti (110% PT, Idle: 102 W)
648 (629min, 637P1 - 658max) Watt * -57%
Zotac Gaming GeForce RTX 3090 Ti AMP Extreme Holo
AMD Ryzen 7 5800X3D, NVIDIA GeForce RTX 3090 Ti (100% PT; Quiet BIOS, Idle: 102 W)
599 (587min, 588P1 - 666max) Watt * -45%
Zotac Gaming GeForce RTX 3090 Ti AMP Extreme Holo
AMD Ryzen 7 5800X3D, NVIDIA GeForce RTX 3090 Ti (100% PT; Amplify BIOS, Idle: 102 W)
598 (584min, 595P1 - 608max) Watt * -45%
Sapphire AMD Radeon RX 6950 XT Nitro+ Pure
AMD Ryzen 9 5900X, AMD Radeon RX 6950 XT
564 (525min, 551P1 - 601max) Watt * -37%
AMD Radeon RX 7900 XTX
AMD Ryzen 9 7950X, AMD Radeon RX 7900 XTX (Idle: 86.5 W)
518 (501min, 502P1 - 525max) Watt * -25%
AMD Radeon RX 7900 XT
AMD Ryzen 9 7950X, AMD Radeon RX 7900 XT (Idle: 84.6 W)
513 (500min, 506P1 - 527max) Watt * -24%
Media NVIDIA GeForce RTX 3080
  (Idle: 492 - 505, n=2 W)
499 Watt * -21%
Media NVIDIA GeForce RTX 3090
  (Idle: 281 - 551, n=8 W)
469 Watt * -14%
NVIDIA GeForce RTX 4080 Founders Edition
Intel Core i9-13900K, NVIDIA GeForce RTX 4080 (110% PT, Idle: 78.45 W)
466 (461min, 462P1 - 488max) Watt * -13%
NVIDIA GeForce RTX 4080 Founders Edition
Intel Core i9-13900K, NVIDIA GeForce RTX 4080 (100% PT, Idle: 78.45 W)
429 (423min, 424P1 - 436max) Watt * -4%
Media NVIDIA GeForce RTX 3080 Ti
  (Idle: 427 - 513, n=3 W)
464 Watt * -12%
AMD Radeon RX 6900 XT
AMD Ryzen 9 5950X, AMD Radeon RX 6900 XT (Idle: 99.15 W)
456.8 (378.13min - 484.67max) Watt * -11%
AMD Radeon RX 6800 XT
AMD Ryzen 9 5950X, AMD Radeon RX 6800 XT (Idle: 99.5 W)
447.9 (413min - 484max) Watt * -8%
Gigabyte Aorus GeForce RTX 4070 Ti Master
Intel Core i9-13900K, NVIDIA GeForce RTX 4070 Ti (OC BIOS; 128% PT, Idle: 75.5 W)
446 (436min, 437P1 - 452max) Watt * -8%
Gigabyte Aorus GeForce RTX 4070 Ti Master
Intel Core i9-13900K, NVIDIA GeForce RTX 4070 Ti (OC BIOS; 100% PT, Idle: 75.5 W)
405 (397min, 398P1 - 416max) Watt * +2%
Gigabyte Aorus GeForce RTX 4070 Ti Master
Intel Core i9-13900K, NVIDIA GeForce RTX 4070 Ti (Silent BIOS; 100% PT, Idle: 75.5 W)
404 (396min, 398P1 - 417max) Watt * +2%
Asus TUF Gaming GeForce RTX 4070 Ti
Intel Core i9-13900K, NVIDIA GeForce RTX 4070 Ti (Perf BIOS / 110% PT, Idle: 75.4 W)
443 (440min, 440P1 - 465max) Watt * -7%
Asus TUF Gaming GeForce RTX 4070 Ti
Intel Core i9-13900K, NVIDIA GeForce RTX 4070 Ti (Quiet BIOS / 100% PT, Idle: 75.4 W)
410 (408min, 409P1 - 415max) Watt * +1%
Asus TUF Gaming GeForce RTX 4070 Ti
Intel Core i9-13900K, NVIDIA GeForce RTX 4070 Ti (Perf BIOS / 100% PT, Idle: 75.4 W)
406 (401min, 402P1 - 430max) Watt * +2%
Media NVIDIA GeForce RTX 4070 Ti
  (Idle: 404 - 451, n=8 W)
422 Watt * -2%
Media NVIDIA Titan RTX
  (Idle:  W)
419 Watt * -1%
Gigabyte GeForce RTX 4070 Super Gaming OC 12G
Intel Core i9-13900K, NVIDIA GeForce RTX 4070 SUPER (145% PT, BIOS OC, Idle: 122.6 W)
413 (403min, 404P1 - 440max) Watt *
Gigabyte GeForce RTX 4070 Super Gaming OC 12G
Intel Core i9-13900K, NVIDIA GeForce RTX 4070 SUPER (100% PT, BIOS OC, Idle: 122.6 W)
335 (330min, 330P1 - 359max) Watt * +19%
AMD Radeon RX 7800 XT
AMD Ryzen 9 7950X, AMD Radeon RX 7800 XT
408 (375min, 380P1 - 434max) Watt * +1%
Sapphire Pulse Radeon RX 7700 XT
AMD Ryzen 9 7950X, AMD Radeon RX 7700 XT
365 (359min, 360P1 - 373max) Watt * +12%
NVIDIA GeForce RTX 4070 Super Founders Edition
Intel Core i9-13900K, NVIDIA GeForce RTX 4070 SUPER (109% PT, Idle: 114.9 W)
355 (344min, 346P1 - 372max) Watt * +14%
NVIDIA GeForce RTX 4070 Super Founders Edition
Intel Core i9-13900K, NVIDIA GeForce RTX 4070 SUPER (100% PT, Idle: 114.9 W)
333 (321min, 323P1 - 351max) Watt * +19%
Zotac Gaming GeForce RTX 4070 AMP Airo
Intel Core i9-13900K, NVIDIA GeForce RTX 4070 (120% PT, Idle: 94.4 W)
351 (344min, 345P1 - 400max) Watt * +15%
Zotac Gaming GeForce RTX 4070 AMP Airo
Intel Core i9-13900K, NVIDIA GeForce RTX 4070 (100% PT, Idle: 94.4 W)
311 (307min, 307P1 - 371max) Watt * +25%
Media NVIDIA GeForce RTX 3070
  (Idle: 281 - 393, n=6 W)
348 Watt * +16%
XFX Speedster QICK 308 Radeon RX 7600 Black Edition
AMD Ryzen 9 7950X, AMD Radeon RX 7600
333 (323min, 325P1 - 352max) Watt * +19%
Media della classe Desktop
  (Idle: 11.3 - 704, n=33, ultimi 2 anni W)
307 Watt * +26%
KFA2 GeForce RTX 4060 Ti EX, 16GB GDDR6
AMD Ryzen 9 7950X, NVIDIA GeForce RTX 4060 Ti 16G
304 (297min, 298P1 - 311max) Watt * +26%
KFA2 GeForce RTX 4060 1-Click-OC 2X
AMD Ryzen 9 7950X, NVIDIA GeForce RTX 4060
251 (244min, 245P1 - 259max) Watt * +39%
Power Consumption / The Witcher 3 ultra (external Monitor)
Sapphire AMD Radeon RX 6950 XT Nitro+ Pure
AMD Ryzen 9 5900X, AMD Radeon RX 6950 XT
589 (583min, 584P1 - 598max) Watt * -52%
Zotac Gaming GeForce RTX 3090 Ti AMP Extreme Holo
AMD Ryzen 7 5800X3D, NVIDIA GeForce RTX 3090 Ti (110% PT, Idle: 102 W)
569 (555min, 557P1 - 580max) Watt * -47%
Zotac Gaming GeForce RTX 3090 Ti AMP Extreme Holo
AMD Ryzen 7 5800X3D, NVIDIA GeForce RTX 3090 Ti (100% PT, Idle: 102 W)
561 (533min, 542P1 - 582max) Watt * -45%
NVIDIA GeForce RTX 4090 Founders Edition
Intel Core i9-13900K, NVIDIA GeForce RTX 4090 (133% PT OC, Idle: 81.25 W)
552 (541min, 545P1 - 569max) Watt * -42%
NVIDIA GeForce RTX 4090 Founders Edition
Intel Core i9-13900K, NVIDIA GeForce RTX 4090 (100% PT, Idle: 81.25 W)
499 (493min, 494P1 - 519max) Watt * -29%
AMD Radeon RX 7900 XTX
AMD Ryzen 9 7950X, AMD Radeon RX 7900 XTX (Idle: 86.5 W)
540 (527min, 530P1 - 564max) Watt * -39%
Media NVIDIA GeForce RTX 3090
  (Idle: 464 - 597, n=17 W)
524 Watt * -35%
Media NVIDIA GeForce RTX 3080 Ti
  (Idle: 490 - 528, n=3 W)
506 Watt * -30%
AMD Radeon RX 6800 XT
AMD Ryzen 9 5950X, AMD Radeon RX 6800 XT (Idle: 99.5 W)
505 (389min - 543max) Watt * -30%
Media NVIDIA GeForce RTX 3080
  (Idle: 498 - 505, n=2 W)
502 Watt * -29%
AMD Radeon RX 6900 XT
AMD Ryzen 9 5950X, AMD Radeon RX 6900 XT (Idle: 99.15 W)
488.3 (459.99min - 512.79max) Watt * -26%
NVIDIA GeForce RTX 4080 Founders Edition
Intel Core i9-13900K, NVIDIA GeForce RTX 4080 (110% PT, Idle: 78.45 W)
463 (451min, 453P1 - 481max) Watt * -19%
NVIDIA GeForce RTX 4080 Founders Edition
Intel Core i9-13900K, NVIDIA GeForce RTX 4080 (100% PT, Idle: 78.45 W)
420 (410min, 411P1 - 448max) Watt * -8%
AMD Radeon RX 7900 XT
AMD Ryzen 9 7950X, AMD Radeon RX 7900 XT (Idle: 84.6 W)
459 (451min, 453P1 - 488max) Watt * -18%
AMD Radeon RX 7800 XT
AMD Ryzen 9 7950X, AMD Radeon RX 7800 XT
425 (421min, 422P1 - 429max) Watt * -10%
Asus TUF Gaming GeForce RTX 4070 Ti
Intel Core i9-13900K, NVIDIA GeForce RTX 4070 Ti (Perf BIOS / 110% PT, Idle: 75.4 W)
422 (412min, 413P1 - 452max) Watt * -9%
Asus TUF Gaming GeForce RTX 4070 Ti
Intel Core i9-13900K, NVIDIA GeForce RTX 4070 Ti (Perf BIOS / 100% PT, Idle: 75.4 W)
419 (414min, 415P1 - 438max) Watt * -8%
Asus TUF Gaming GeForce RTX 4070 Ti
Intel Core i9-13900K, NVIDIA GeForce RTX 4070 Ti (Quiet BIOS / 100% PT, Idle: 75.4 W)
418 (411min, 412P1 - 433max) Watt * -8%
Media NVIDIA GeForce RTX 4070 Ti
  (Idle: 404 - 426, n=8 W)
415 Watt * -7%
Gigabyte Aorus GeForce RTX 4070 Ti Master
Intel Core i9-13900K, NVIDIA GeForce RTX 4070 Ti (Silent BIOS; 100% PT, Idle: 75.5 W)
414 (406min, 407P1 - 432max) Watt * -7%
Gigabyte Aorus GeForce RTX 4070 Ti Master
Intel Core i9-13900K, NVIDIA GeForce RTX 4070 Ti (OC BIOS; 128% PT, Idle: 75.5 W)
410 (401min, 403P1 - 435max) Watt * -6%
Gigabyte Aorus GeForce RTX 4070 Ti Master
Intel Core i9-13900K, NVIDIA GeForce RTX 4070 Ti (OC BIOS; 100% PT, Idle: 75.5 W)
404 (397min, 398P1 - 427max) Watt * -4%
Media NVIDIA Titan RTX
  (Idle: 371 - 463, n=27 W)
408 Watt * -5%
Media NVIDIA GeForce RTX 3070
  (Idle: 317 - 550, n=5 W)
401 Watt * -3%
Gigabyte GeForce RTX 4070 Super Gaming OC 12G
Intel Core i9-13900K, NVIDIA GeForce RTX 4070 SUPER (100% PT, BIOS OC, Idle: 122.6 W)
388 (373min, 375P1 - 438max) Watt *
Gigabyte GeForce RTX 4070 Super Gaming OC 12G
Intel Core i9-13900K, NVIDIA GeForce RTX 4070 SUPER (145% PT, BIOS OC, Idle: 122.6 W)
388 (377min, 377P1 - 418max) Watt * -0%
Sapphire Pulse Radeon RX 7700 XT
AMD Ryzen 9 7950X, AMD Radeon RX 7700 XT
384 (379min, 380P1 - 391max) Watt * +1%
NVIDIA GeForce RTX 4070 Super Founders Edition
Intel Core i9-13900K, NVIDIA GeForce RTX 4070 SUPER (109% PT, Idle: 114.9 W)
377 (365min, 366P1 - 407max) Watt * +3%
NVIDIA GeForce RTX 4070 Super Founders Edition
Intel Core i9-13900K, NVIDIA GeForce RTX 4070 SUPER (100% PT, Idle: 114.9 W)
372 (359min, 361P1 - 402max) Watt * +4%
Zotac Gaming GeForce RTX 4070 AMP Airo
Intel Core i9-13900K, NVIDIA GeForce RTX 4070 (120% PT, Idle: 94.4 W)
358 (348min, 350P1 - 400max) Watt * +8%
Zotac Gaming GeForce RTX 4070 AMP Airo
Intel Core i9-13900K, NVIDIA GeForce RTX 4070 (100% PT, Idle: 94.4 W)
353 (347min, 348P1 - 440max) Watt * +9%
Media della classe Desktop
  (Idle: 19.1 - 569, n=37, ultimi 2 anni W)
354 Watt * +9%
XFX Speedster QICK 308 Radeon RX 7600 Black Edition
AMD Ryzen 9 7950X, AMD Radeon RX 7600
346 (340min, 341P1 - 351max) Watt * +11%
KFA2 GeForce RTX 4060 Ti EX, 16GB GDDR6
AMD Ryzen 9 7950X, NVIDIA GeForce RTX 4060 Ti 16G
310 (306min, 307P1 - 336max) Watt * +20%
KFA2 GeForce RTX 4060 1-Click-OC 2X
AMD Ryzen 9 7950X, NVIDIA GeForce RTX 4060
272 (264min, 266P1 - 297max) Watt * +30%
Power Consumption / Witcher 3 ultra Efficiency (external Monitor)
AMD Radeon RX 7900 XT
AMD Ryzen 9 7950X, AMD Radeon RX 7900 XT
0.577 fps per Watt +7%
AMD Radeon RX 7900 XTX
AMD Ryzen 9 7950X, AMD Radeon RX 7900 XTX
0.55 fps per Watt +2%
NVIDIA GeForce RTX 4080 Founders Edition
Intel Core i9-13900K, NVIDIA GeForce RTX 4080
0.549 fps per Watt +1%
Asus TUF Gaming GeForce RTX 4070 Ti
Intel Core i9-13900K, NVIDIA GeForce RTX 4070 Ti
0.545 fps per Watt +1%
Gigabyte GeForce RTX 4070 Super Gaming OC 12G
Intel Core i9-13900K, NVIDIA GeForce RTX 4070 SUPER
0.541 fps per Watt
NVIDIA GeForce RTX 4090 Founders Edition
Intel Core i9-13900K, NVIDIA GeForce RTX 4090
0.538 fps per Watt -1%
Media NVIDIA GeForce RTX 4070 Ti
  (0.509 - 0.548, n=4)
0.533 fps per Watt -1%
Gigabyte Aorus GeForce RTX 4070 Ti Master
Intel Core i9-13900K, NVIDIA GeForce RTX 4070 Ti
0.531 fps per Watt -2%
NVIDIA GeForce RTX 4070 Super Founders Edition
Intel Core i9-13900K, NVIDIA GeForce RTX 4070 SUPER
0.509 fps per Watt -6%
Zotac Gaming GeForce RTX 4070 AMP Airo
Intel Core i9-13900K, NVIDIA GeForce RTX 4070
0.4709 fps per Watt -13%
AMD Radeon RX 7800 XT
AMD Ryzen 9 7950X, AMD Radeon RX 7800 XT
0.4461 fps per Watt -18%
Sapphire Pulse Radeon RX 7700 XT
AMD Ryzen 9 7950X, AMD Radeon RX 7700 XT
0.4383 fps per Watt -19%
Media della classe Desktop
  (0.1429 - 0.652, n=26, ultimi 2 anni)
0.437 fps per Watt -19%
KFA2 GeForce RTX 4060 Ti EX, 16GB GDDR6
AMD Ryzen 9 7950X, NVIDIA GeForce RTX 4060 Ti 16G
0.4268 fps per Watt -21%
KFA2 GeForce RTX 4060 1-Click-OC 2X
AMD Ryzen 9 7950X, NVIDIA GeForce RTX 4060
0.4103 fps per Watt -24%
Media NVIDIA GeForce RTX 3080 Ti
  (0.3496 - 0.3735, n=3)
0.3607 fps per Watt -33%
XFX Speedster QICK 308 Radeon RX 7600 Black Edition
AMD Ryzen 9 7950X, AMD Radeon RX 7600
0.354 fps per Watt -35%
Sapphire AMD Radeon RX 6950 XT Nitro+ Pure
AMD Ryzen 9 5900X, AMD Radeon RX 6950 XT
0.348 fps per Watt -36%
Zotac Gaming GeForce RTX 3090 Ti AMP Extreme Holo
AMD Ryzen 7 5800X3D, NVIDIA GeForce RTX 3090 Ti
0.345 fps per Watt -36%
Media NVIDIA GeForce RTX 3090
  (0.268 - 0.3954, n=14)
0.3429 fps per Watt -37%
Media NVIDIA Titan RTX
  (0.2926 - 0.385, n=26)
0.3382 fps per Watt -37%
AMD Radeon RX 6900 XT
AMD Ryzen 9 5950X, AMD Radeon RX 6900 XT
0.335 fps per Watt -38%
Media NVIDIA GeForce RTX 3070
  (0.22 - 0.3911, n=5)
0.3211 fps per Watt -41%
AMD Radeon RX 6800 XT
AMD Ryzen 9 5950X, AMD Radeon RX 6800 XT
0.3168 fps per Watt -41%
Media NVIDIA GeForce RTX 3080
  (0.291 - 0.301, n=2)
0.296 fps per Watt -45%
1280x720 FurMark 1.19 GPU Stress Test (external Monitor)
350.77
1920x1080 The Witcher 3 ultra (external Monitor)
357.59

* ... Meglio usare valori piccoli

Pro

+ Buona qualità costruttiva
+ Effetti di illuminazione RGB decenti
+ Guadagni percepibili nel gioco rispetto alla RTX 3090 e alla Radeon RX 7800 XT rispetto alla Founders Edition
+ Capace sistema di raffreddamento WindForce a tripla ventola
+ Molto efficiente dal punto di vista energetico nei carichi di lavoro di gioco

Contro

- Il Centro di Controllo Gigabyte è ora utilizzabile, ma ha ancora bisogno di essere perfezionato
- 12 GB di VRAM a 192 bit possono essere limitanti quando si tratta di texture pesanti
- Livelli di rumore della ventola più elevati
- Nessuna differenza tangibile nel rumore della ventola tra le modalità OC e Silent VBIOS
- Sicuramente si potrebbe ridurre il prezzo

Verdetto: Il sovrapprezzo di 50 dollari per la RTX 4070 Super Gaming OC non è privo di vantaggi

Gigabyte GeForce RTX 4070 Super Gaming OC 12G. Unità di recensione per gentile concessione di Gigabyte India.

La Nvidia GeForce RTX 4070 Super Founders Edition(599 dollari su Best Buy) è una scheda AD104 di per sé molto capace. Ma la varietà è la spezia della vita, quindi gli acquirenti hanno anche una buona selezione di schede partner AiB tra cui scegliere.

Gigabyte GeForce RTX 4070 Super Gaming OC 12G porta avanti lo stesso linguaggio di design dello scorso anno. Ha un bel backplate in metallo, un robusto raffreddamento a tripla ventola e 8 heatpipe con un'ampia ventilazione e un'estetica RGB decente.

La RTX 4070 Super Gaming OC viene fornita con un overclock di fabbrica a 2.565 MHz. Sebbene i test sintetici e di calcolo cumulativi non mostrino alcun beneficio tangibile, l'OC spinge la scheda ben oltre la RTX 3090 nel gioco.

I giocatori che puntano a 1440p Ultra con frame rate elevati saranno soddisfatti dell'RTX 4070 Super Gaming OC. Buoni frame rate a 4K Ultra non sono un sogno irrealizzabile, ma i titoli moderni richiederanno un aiuto da parte degli upscaler.

Se è a caccia di fotogrammi con AD104 (e RGB), Gigabyte GeForce RTX 4070 Super Gaming OC potrebbe essere una scelta migliore rispetto alla RTX 4070 Super Founders Edition, a patto che non le dispiaccia l'aumento di 50 dollari per un incremento delle prestazioni del 3-5%"

Il sistema di raffreddamento WindForce di Gigabyte si dimostra abbastanza efficace nel mantenere la GPU fresca senza problemi di throttling. La configurazione a tre ventole è un po' più rumorosa di quella che abbiamo con la Founders Edition, ma non è un motore a reazione e aiuta a mantenere basse le temperature dei punti caldi e della memoria.

Tecnicamente, l'interruttore VBIOS è ridondante, poiché può benissimo giocare con le curve delle ventole a suo piacimento. Ma visto che c'è, vorremmo vedere ulteriori perfezionamenti con le modalità VBIOS. Non c'è alcuna differenza percepibile nel rumore della ventola tra queste modalità. Gli utenti che non si sentono a proprio agio con le curve personalizzate delle ventole rimarrebbero delusi sapendo che la modalità Silent ha un profilo di rumore simile a quello dell'opzione OC predefinita del BIOS.

Tutto sommato, l'approccio di Gigabyte alla più recente GPU AD104 sotto forma di RTX 4070 Super Gaming OC ha successo per la maggior parte. L'RTX 4070 Super Gaming OC aumenta ulteriormente il divario con l'AMD Radeon RX 7800 AMD Radeon RX 7800 XT (a partire da 490 dollari su Amazon). La scheda AMD offre una maggiore quantità di VRAM, ma la bilancia si inclina verso Nvidia quando si tratta di generazione di fotogrammi DLSS e tecnologie di ricostruzione dei raggi, oltre agli upscaler AMD FSR e Intel XeSS.

E già che c'è, tenga d'occhio le vendite di liquidazione delle scorte della RTX 4070 Ti, ora EoL, che potrebbero essere disponibili a prezzi vicini o addirittura inferiori a quelli della RTX 4070 Super.

Prezzo e disponibilità

Gigabyte GeForce RTX 4070 Super Gaming OC 12G è attualmente in vendita a 650 dollari su Best Buy US e Amazon US.

In India, la scheda non è ancora elencata su Amazon IN, ma ufficialmente ha un MSRP di ₹62.490 con alcune differenze di prezzo tra i distributori locali.

Transparency

The present review sample was made available to the author as a loan by the manufacturer or a shop for the purposes of review. The lender had no influence on this review, nor did the manufacturer receive a copy of this review before publication. There was no obligation to publish this review.

Pricecompare

Please share our article, every link counts!
> Recensioni e prove di notebook, tablets e smartphones > Recensioni e prove > Recensioni e prove > Recensione del Gigabyte GeForce RTX 4070 Super Gaming OC 12G: Batte la RTX 3090 e la RX 7800 XT per una differenza di 50 dollari rispetto alla Founders Edition
Vaidyanathan Subramaniam, 2024-02-17 (Update: 2024-02-19)