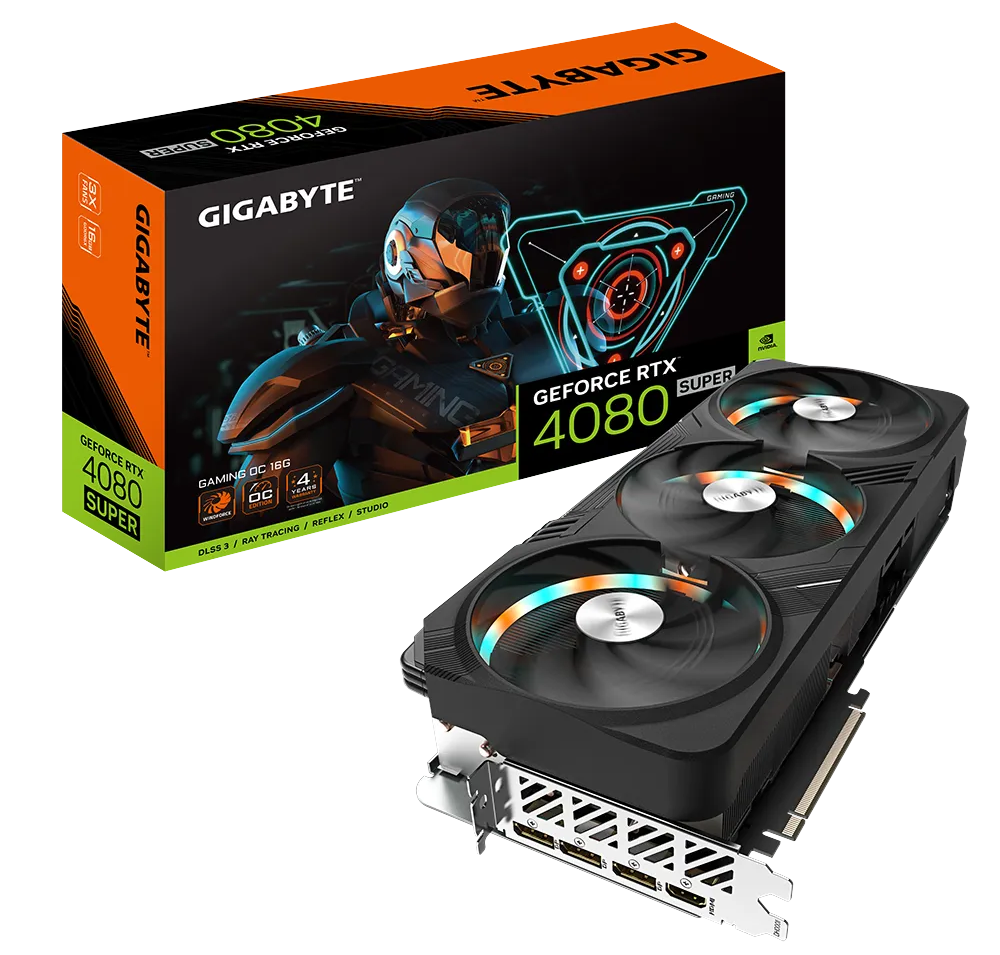
Recensione della Gigabyte GeForce RTX 4080 Super Gaming OC 16G: sfida la RX 7900 XTX ma con 200 dollari in meno rispetto alla RTX 4080 non Super

Finora abbiamo recensito diverse nuove GPU della serie RTX 40 Super, tra cui la RTX 4070 Super Founders Edition, Gigabyte RTX 4070 Super Gaming OCe la Asus TUF Gaming RTX 4070 Ti Super.
Ora abbiamo con noi la Gigabyte GeForce RTX 4080 Super Gaming OC 16G - un aggiornamento a metà del ciclo di vita che sostituisce completamente la precedente controparte RTX 4080.
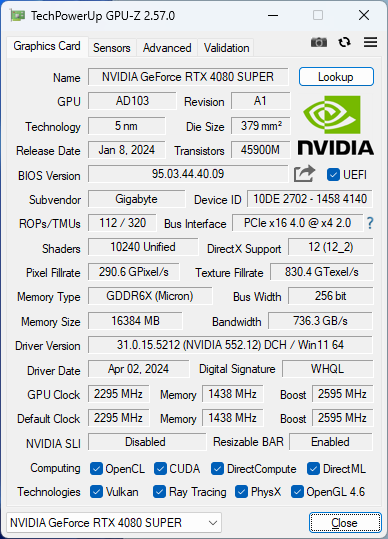
Mentre la RTX 4080 originale presentava 9.728 core CUDA, la nuova RTX 4080 Super massimizza completamente il die AD103, con tutti i 10.240 core CUDA che lavorano a pieno regime. Si tratta solo di un aumento del 5% nel conteggio degli shader, che non è molto impressionante a differenza della RTX 4070 Super (+21%) e della RTX 4070 Super Ti (+10%). La VRAM rimane invariata a 16 GB GDDR6X, ma la larghezza di banda complessiva viene leggermente aumentata a 736,3 GB/s rispetto ai 716,8 GB/s della RTX 4080 non Super.
La RTX 4080 Super viene venduta a un prezzo MSRP di 1.000 dollari rispetto ai 200 dollari in più dell'originale. La versione di Gigabyte della RTX 4080 Super aggiunge alcuni vantaggi extra per un sovrapprezzo nominale di 50 dollari al prezzo MSRP di 1.050 dollari.
In India, questa GPU è attualmente disponibile in una fascia compresa tra ₹1.20.000 e ₹1.28.000, a seconda del rivenditore, e viene fornita con una garanzia standard di tre anni estendibile di un ulteriore anno.
In questa recensione, diamo un'occhiata alla Gigabyte RTX 4080 Super Gaming OC e vediamo se i presunti guadagni di prestazioni e il prezzo sono ragionevoli, soprattutto con il lancio di Blackwell previsto per la fine dell'anno.
Confronto tra Gigabyte GeForce RTX 4080 Super Gaming OC 16G e altre GPU Nvidia
| Specifiche | RTX 4090 FE | Gigabyte RTX 4080 Super Gaming OC | RTX 4080 FE | Asus TUF RTX 4070 Ti Super | RTX 4070 Super FE | ZotacRTX 4070 AMP Airo | KFA2RTX 4060 Ti EX | RTX 3090 Ti FE | RTX 3090 FE | RTX 3080 Ti FE | RTX 3070 FE | Titan RTX |
|---|---|---|---|---|---|---|---|---|---|---|---|---|
| Chip | AD102 | AD103 | AD103 | AD103 | AD104 | AD104 | AD106 | GA102 | GA102 | GA102 | GA104 | TU102 |
| Processo FinFET | Custom 4N | Custom 4N | Custom 4N | Custom 4N | Custom 4N | Custom 4N | Custom 4N | 8 nm | 8 nm | 8 nm | 8 nm | 12 nm |
| CUDA Cores | 16.384 | 10.240 | 9.728 | 8.448 | 7.168 | 5.888 | 4.352 | 10.752 | 10.496 | 10.240 | 5.888 | 4.608 |
| Unità di struttura | 512 | 320 | 304 | 264 | 224 | 184 | 136 | 336 | 328 | 320 | 184 | 288 |
| Nuclei Tensori | 512 4° Gen. | 320 4° Gen. | 304 4° Gen. | 264 4° Gen. | 224 4° Gen. | 184 4° Gen. | 136 4° Gen. | 336 3° Gen. | 328 3° Gen. | 320 3° Gen. | 184 3° Gen. | 576 2° Gen. |
| RT Cores | 128 3a Gen. | 80 3a Gen. | 76 3a Gen. | 66 3a Gen. | 56 3a Gen. | 46 3a Gen. | 34 3a Gen. | 84 2a Gen. | 82 2a Gen. | 80 2a Gen. | 46 2a Gen. | 72 |
| GPU Base Clock | 2.235 MHz | 2.295 MHz | 2.205 MHz | 2.340 MHz | 1.980 MHz | 1.920 MHz | 2.310 MHz | 1.560 MHz | 1.395 MHz | 1.365 MHz | 1.500 MHz | 1.350 MHz |
| GPU Boost Clock | 2.520 MHz | 2.595 MHz | 2.505 MHz | 2.610 MHz | 2.475 MHz | 2.535 MHz | 2.535 MHz | 1.860 MHz | 1.695 MHz | 1.665 MHz | 1.750 MHz | 1.770 MHz |
| Bus di memoria | 384 bit | 256 bit | 256 bit | 256 bit | 192 bit | 192 bit | 128 bit | 384 bit | 384 bit | 384 bit | 256 bit | 384 bit |
| Larghezza di banda della memoria | 1.008 GB/s | 736,3 GB/s | 716,8 GB/s | 672 GB/s | 504 GB/s | 504 GB/s | 288 GB/s | 1.008 GB/s | 936 GB/s | 912 GB/s | 448 GB/s | 672 GB/s |
| Memoria video | 24 GB GDDR6X | 16 GB GDDR6X | 16 GB GDDR6X | 16 GB GDDR6X | 12 GB GDDR6X | 12 GB GDDR6X | 8 GB GDDR6 | 24 GB GDDR6X | 24 GB GDDR6X | 12 GB GDDR6X | 8 GB GDDR6 | 24 GB GDDR6 |
| Consumo energetico | 450 W | 320 W | 320 W | 285 W | 220 W | 215 W | 160 W | 450 W | 350 W | 350 W | 220 W | 280 W |
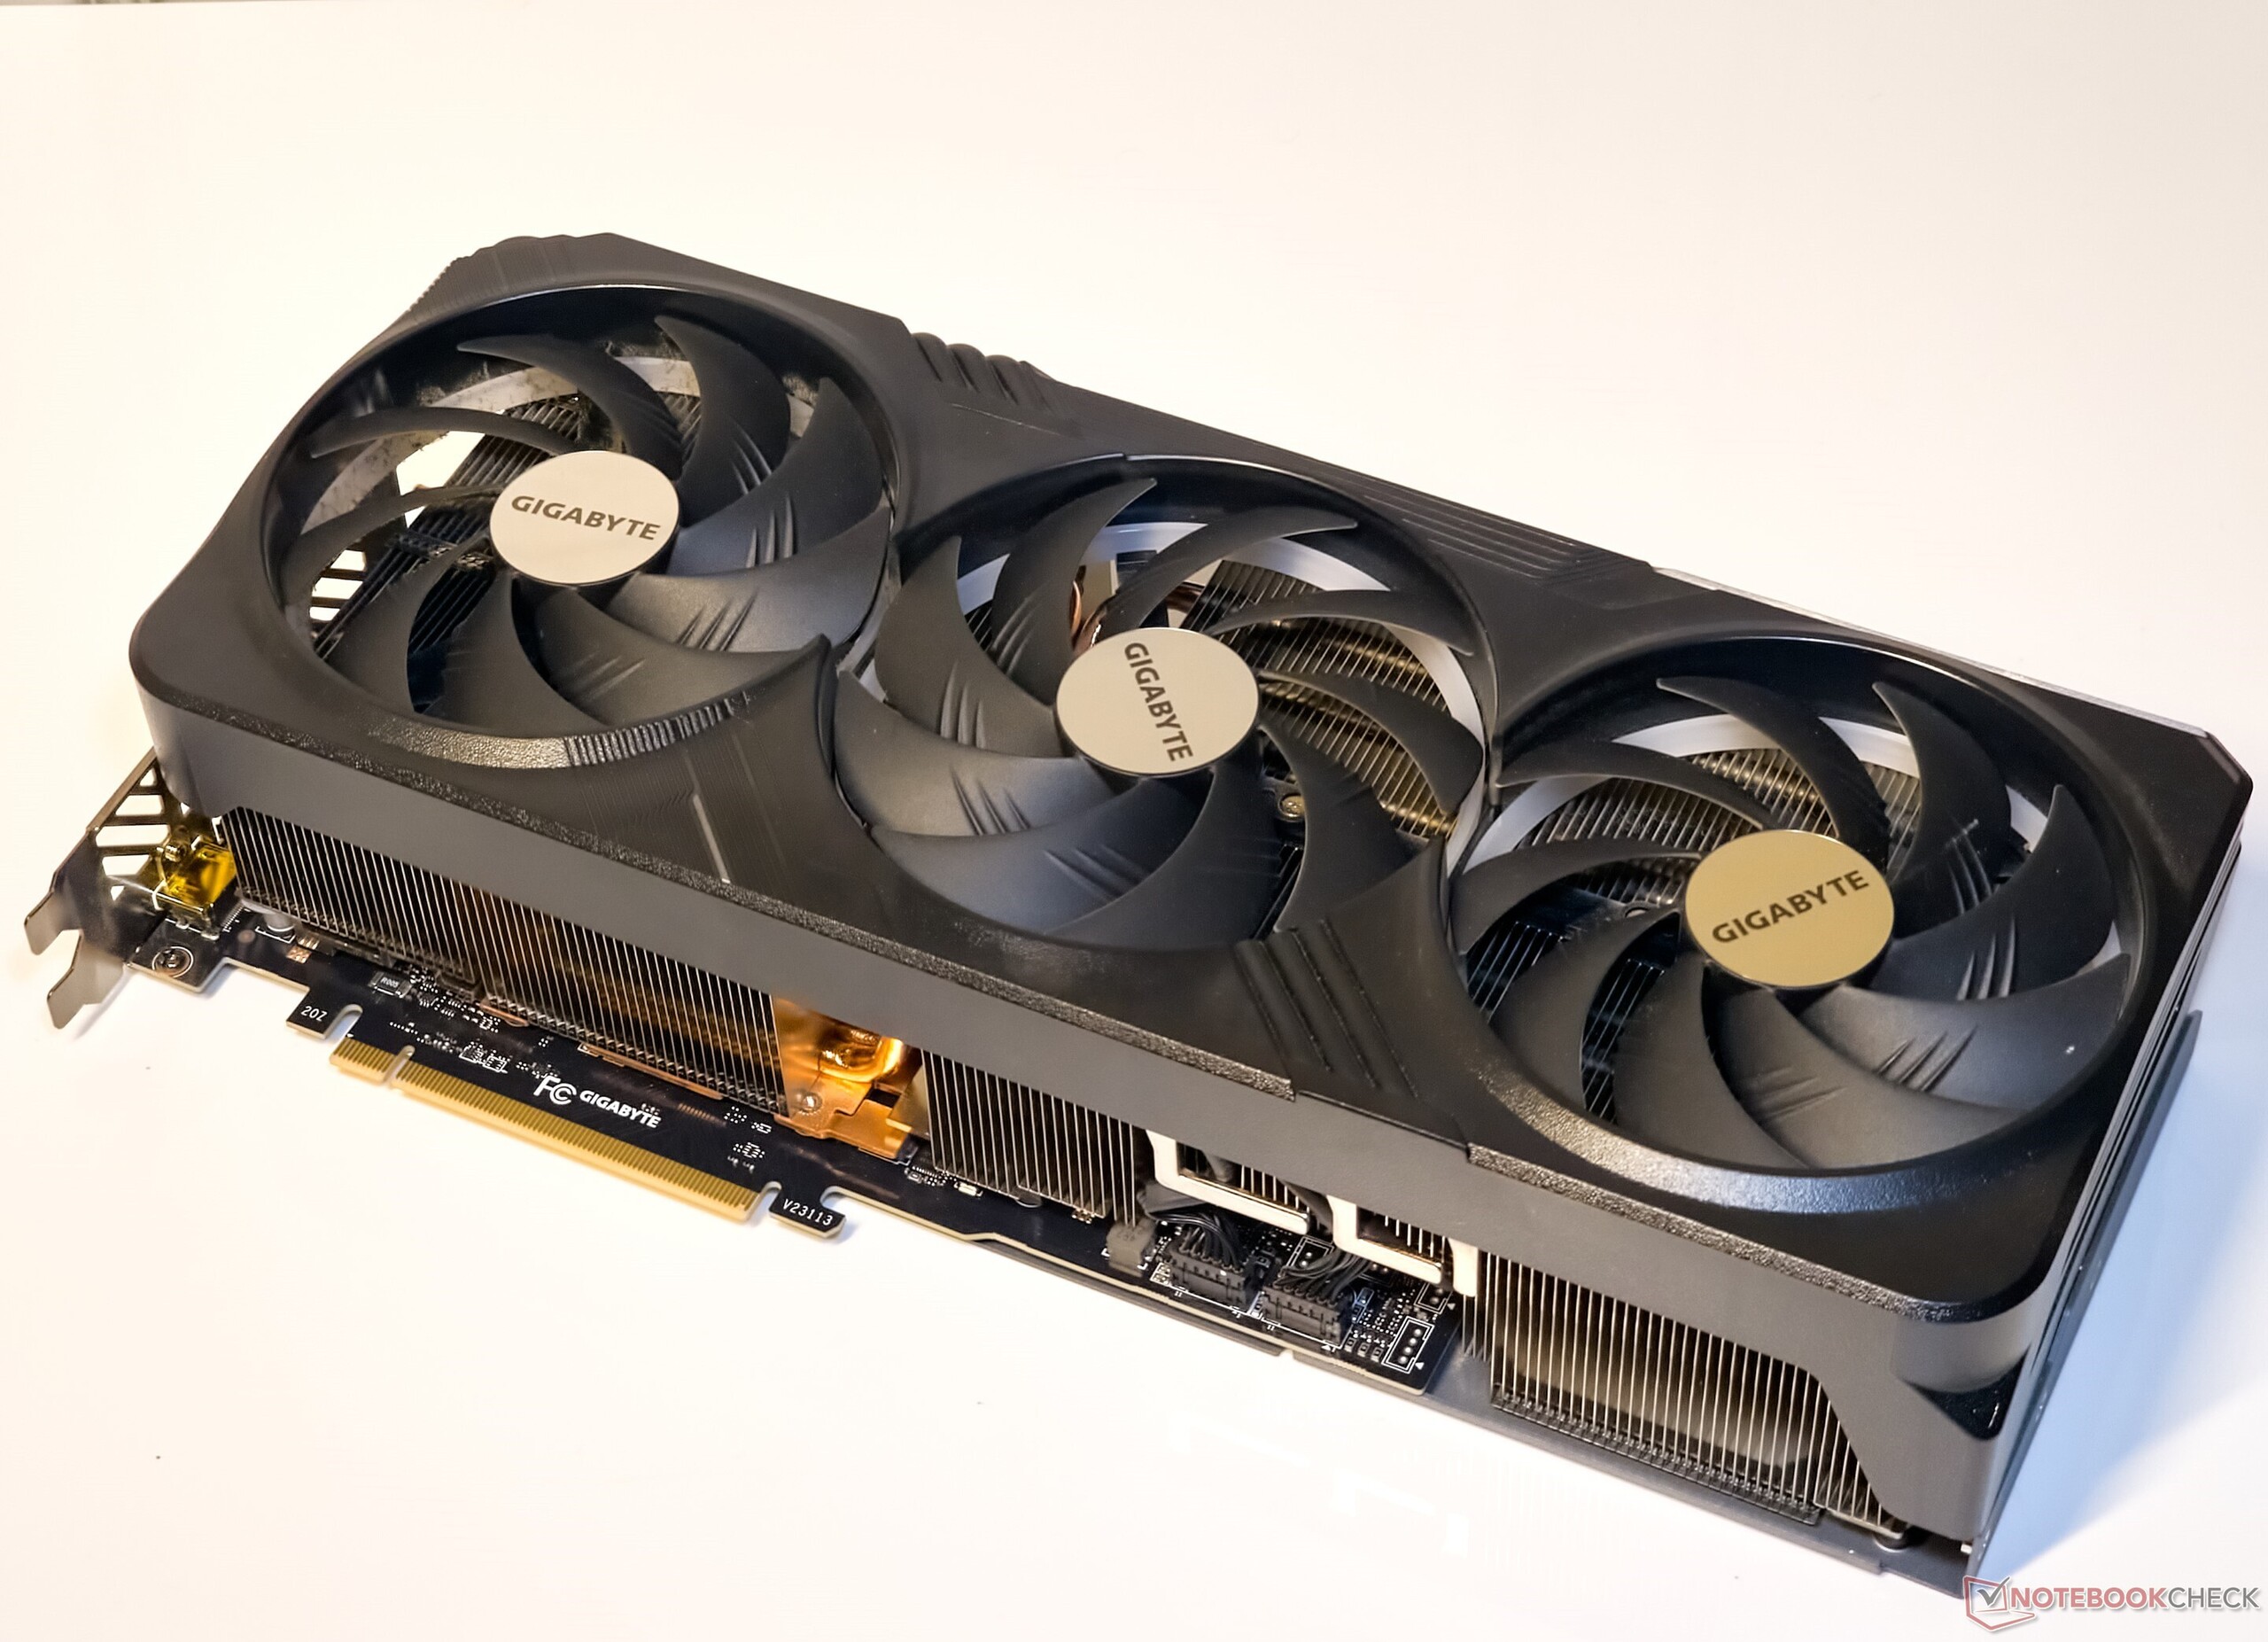
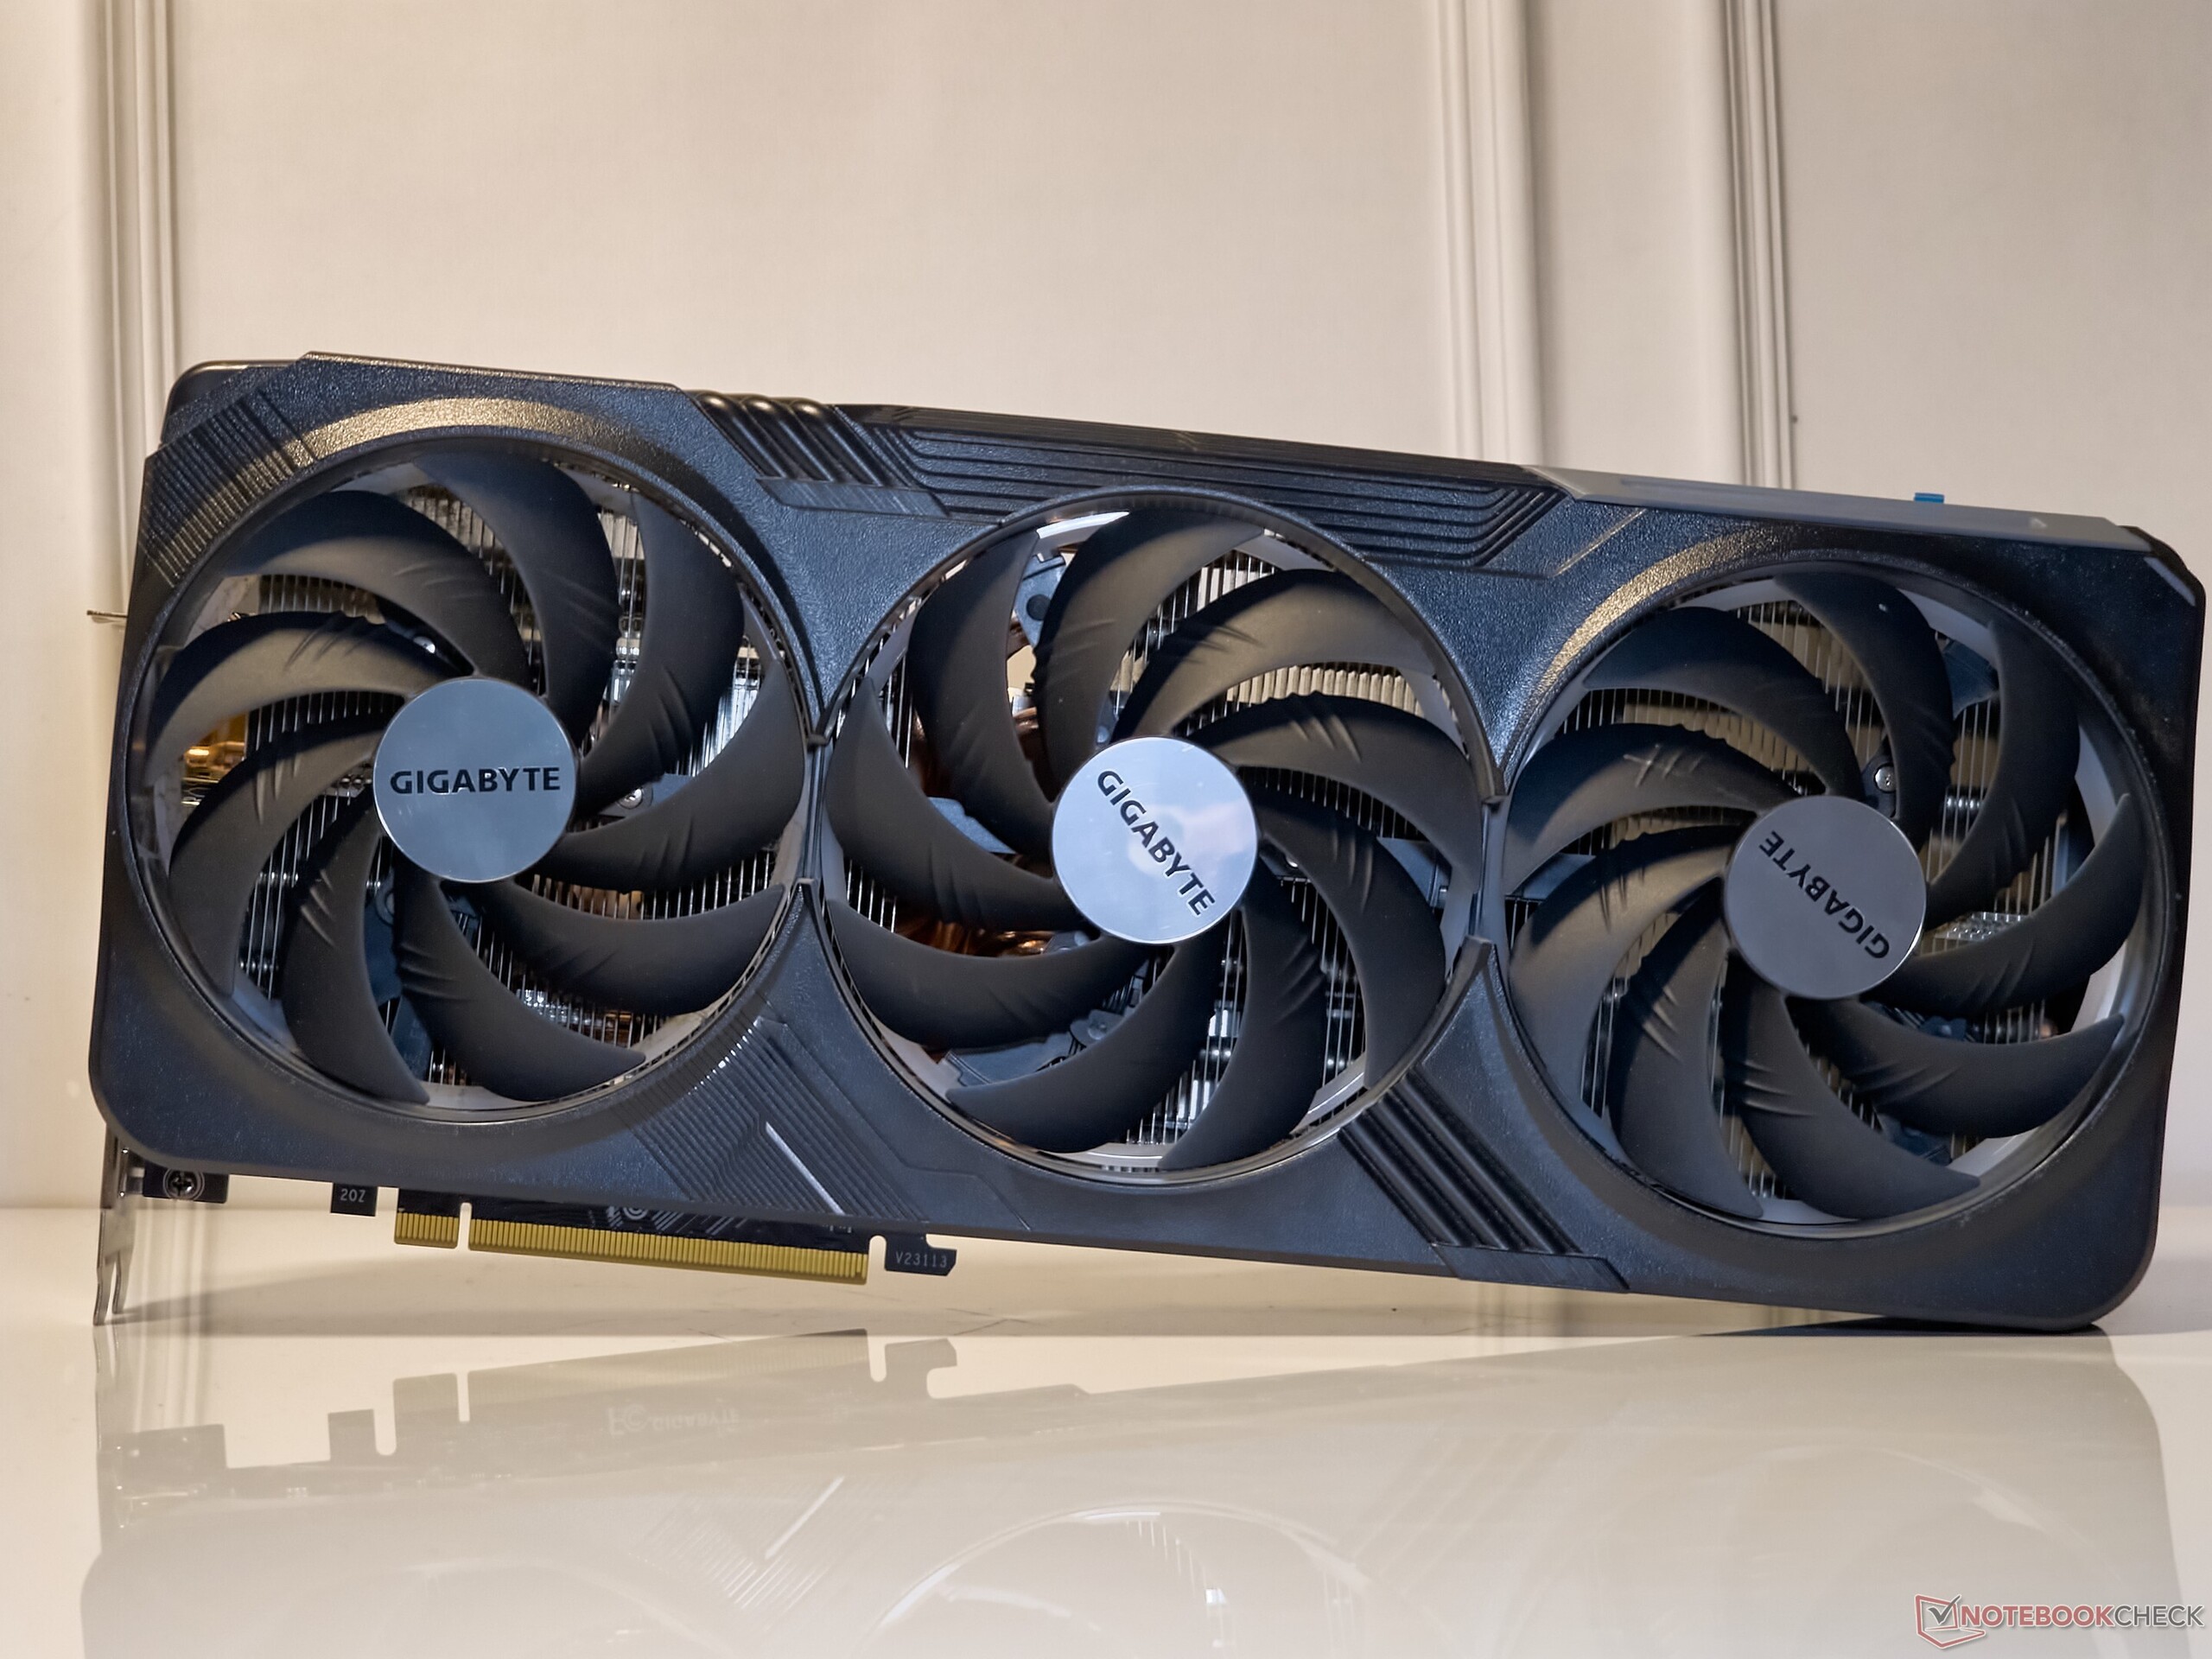
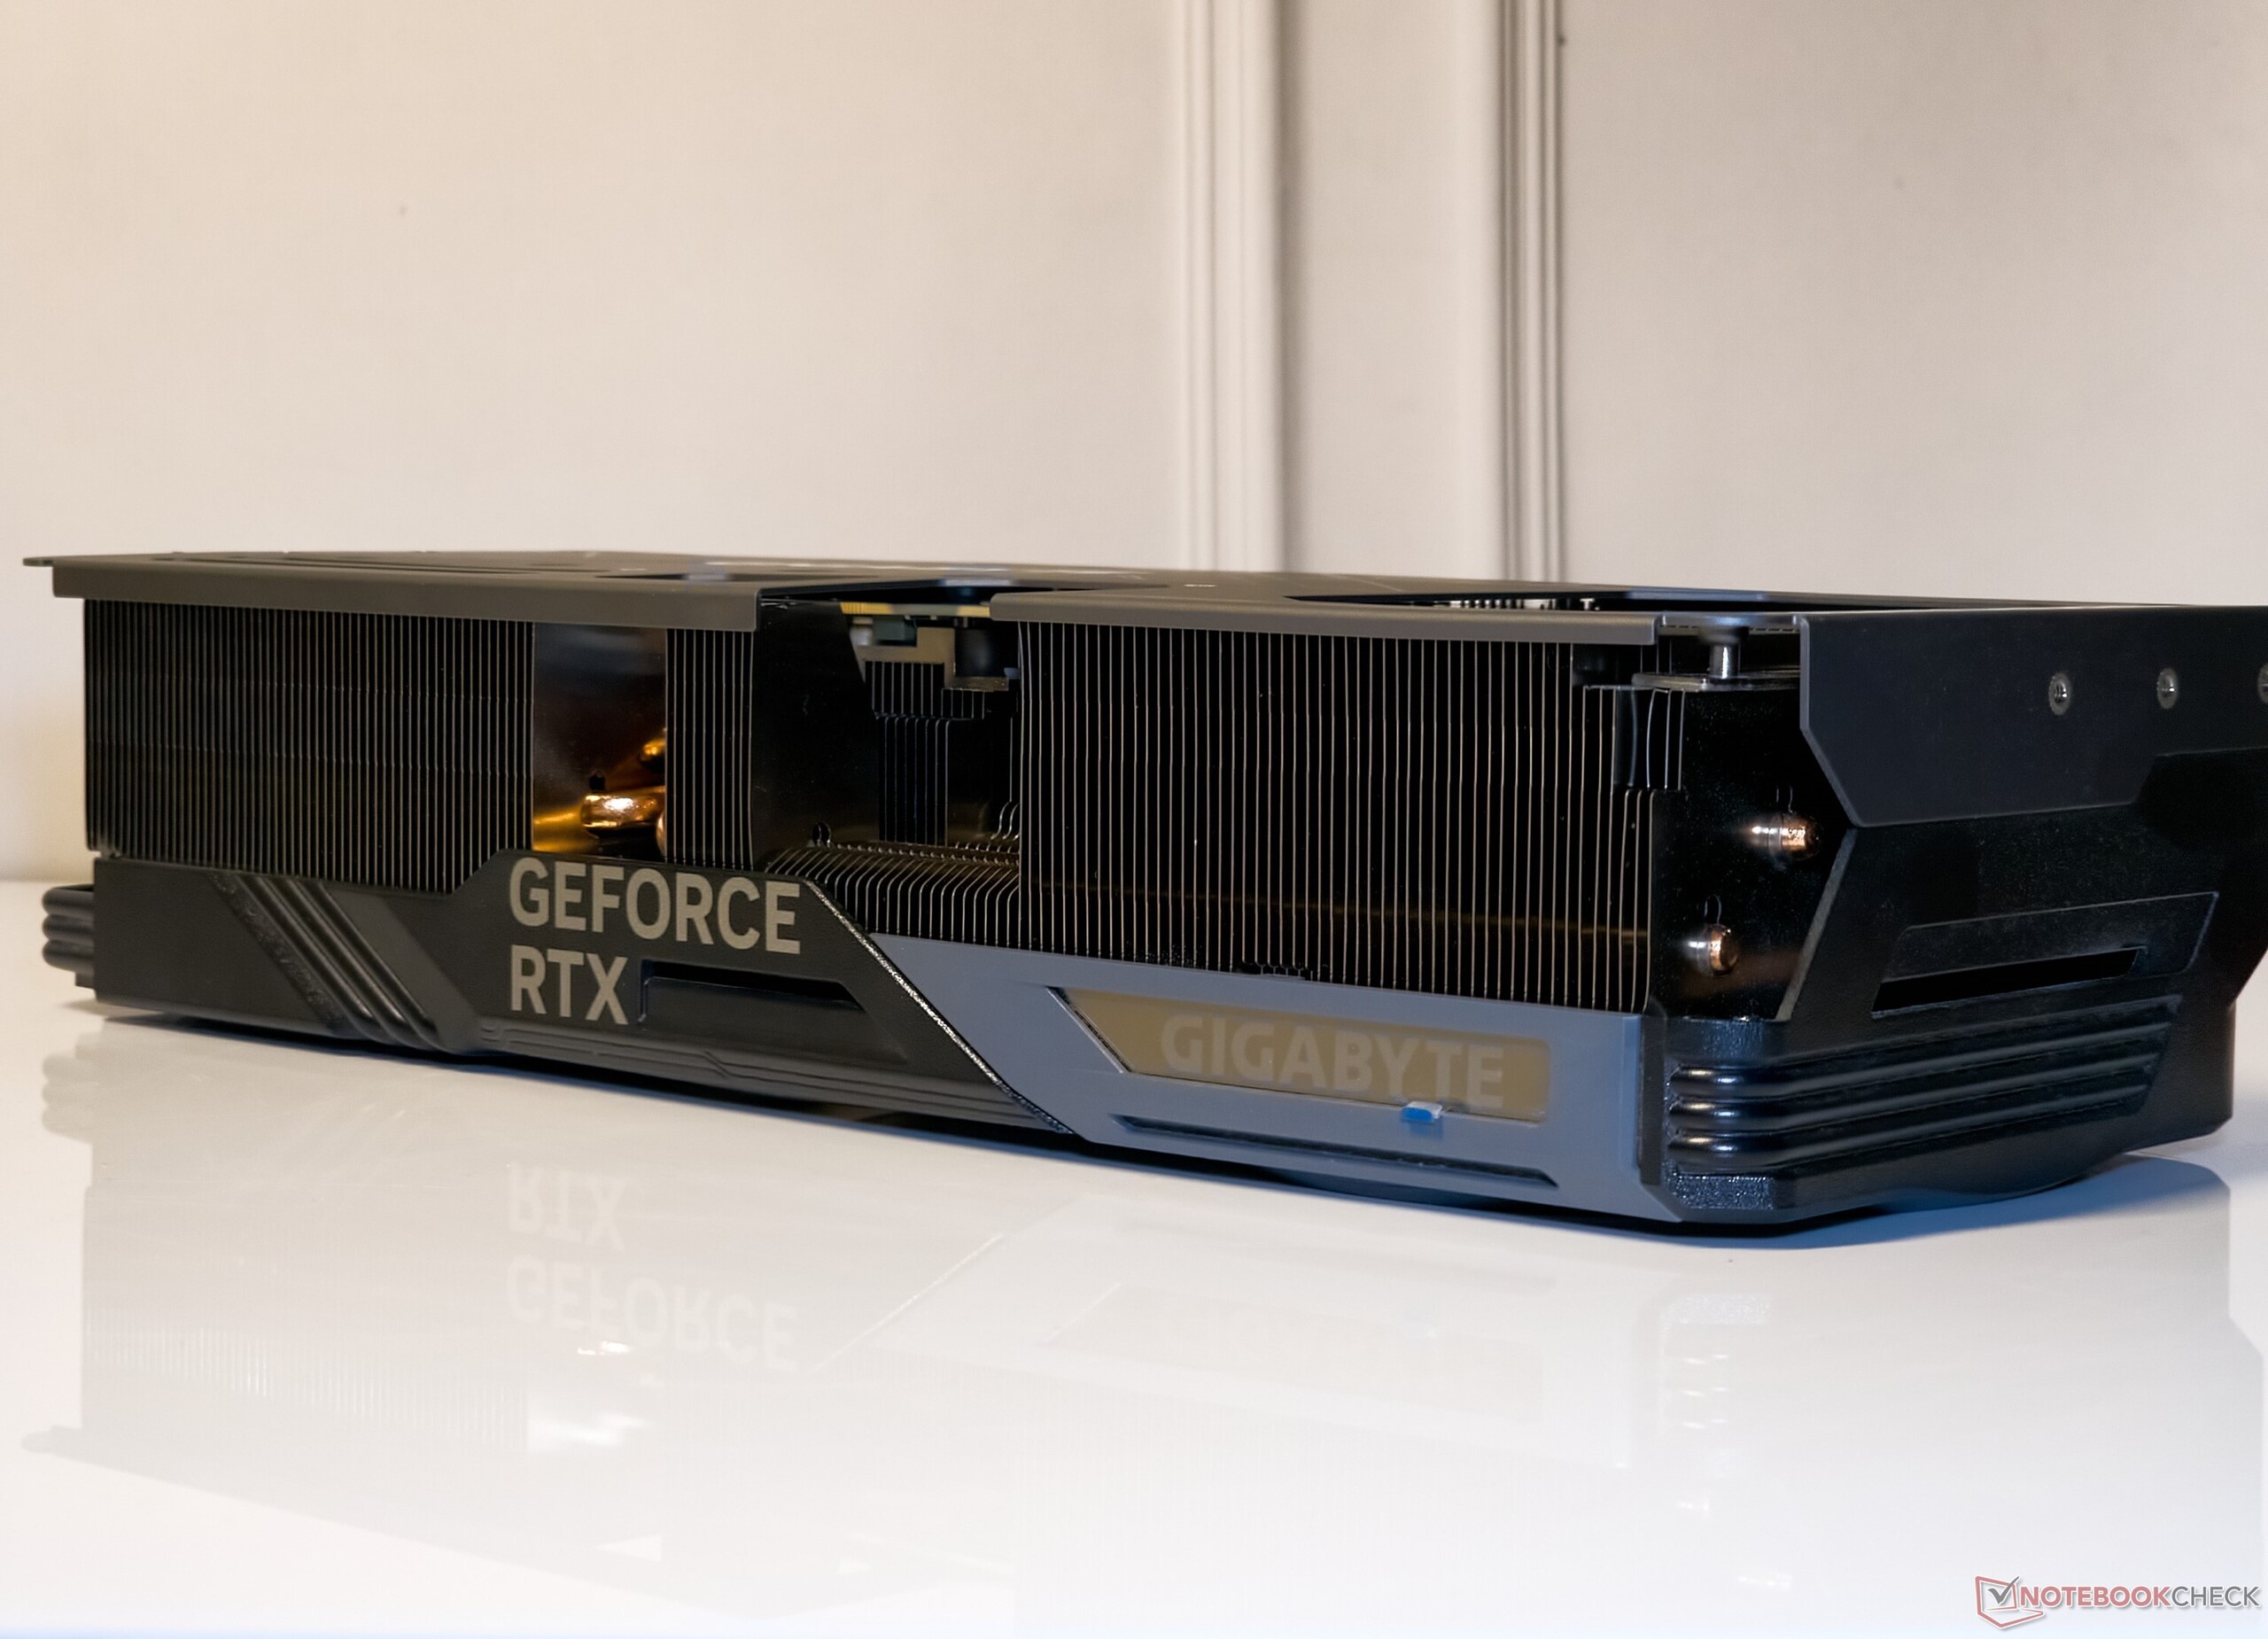
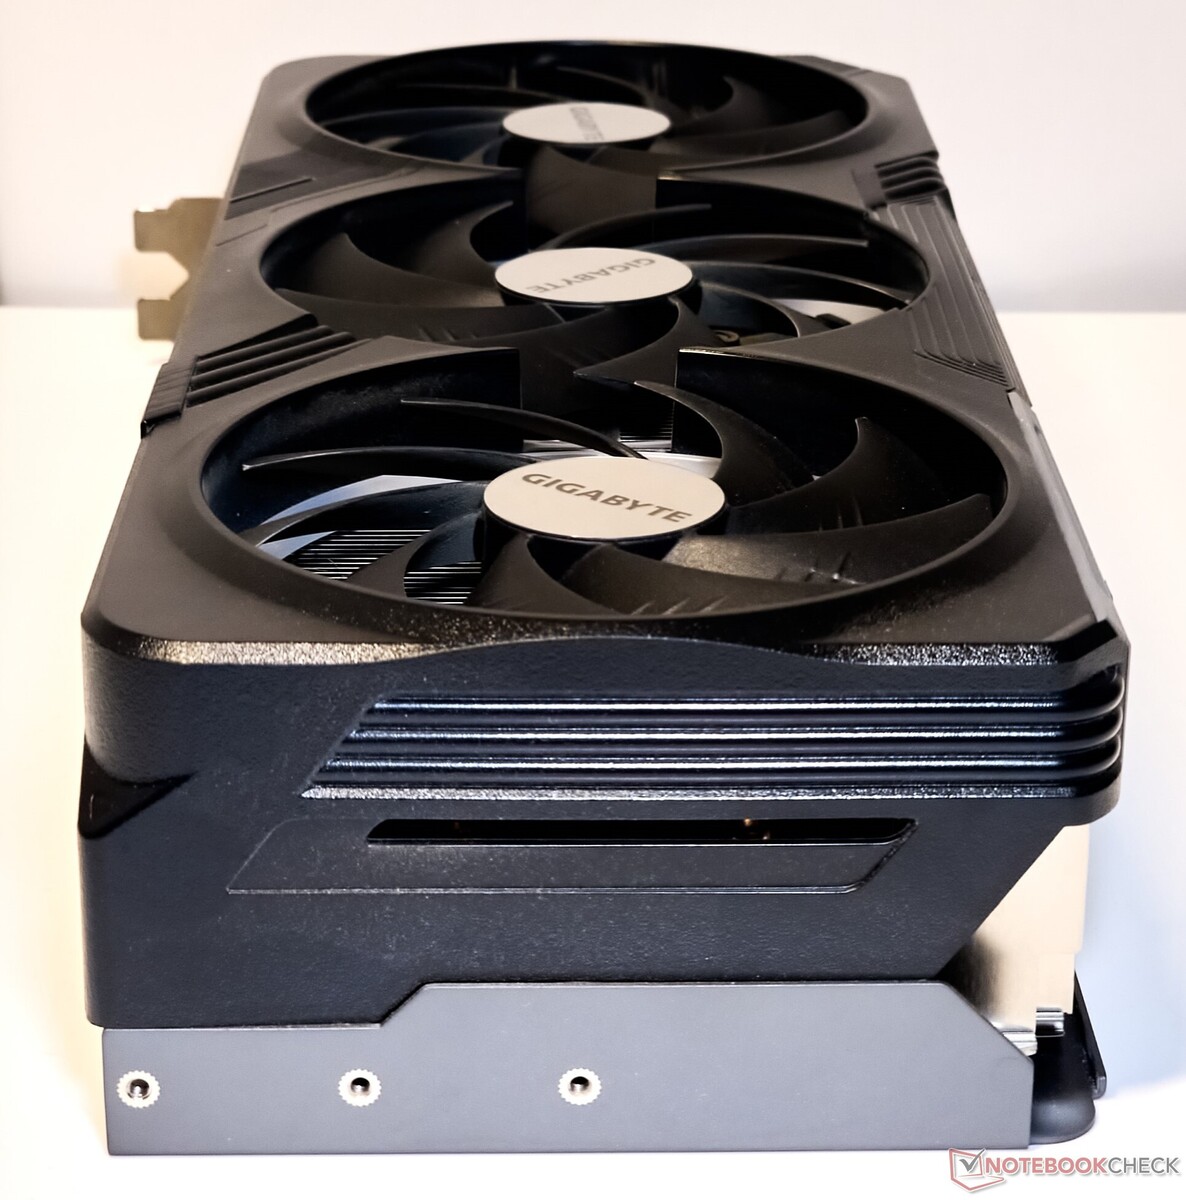
Gigabyte GeForce RTX 4080 Super Gaming OC da vicino
Gigabyte non ha cambiato il design della RTX 4080 Super Gaming OC 16G rispetto al suo predecessore non-Super. Con dimensioni pari a 342 x 150 x 75 mm e un peso di circa 1,74 kg, la RTX 4080 Super Gaming OC occupa quasi tre slot PCIe sulla scheda, per cui è in grado di trarre vantaggio da un case più grande e, idealmente, da una scheda madre E-ATX.
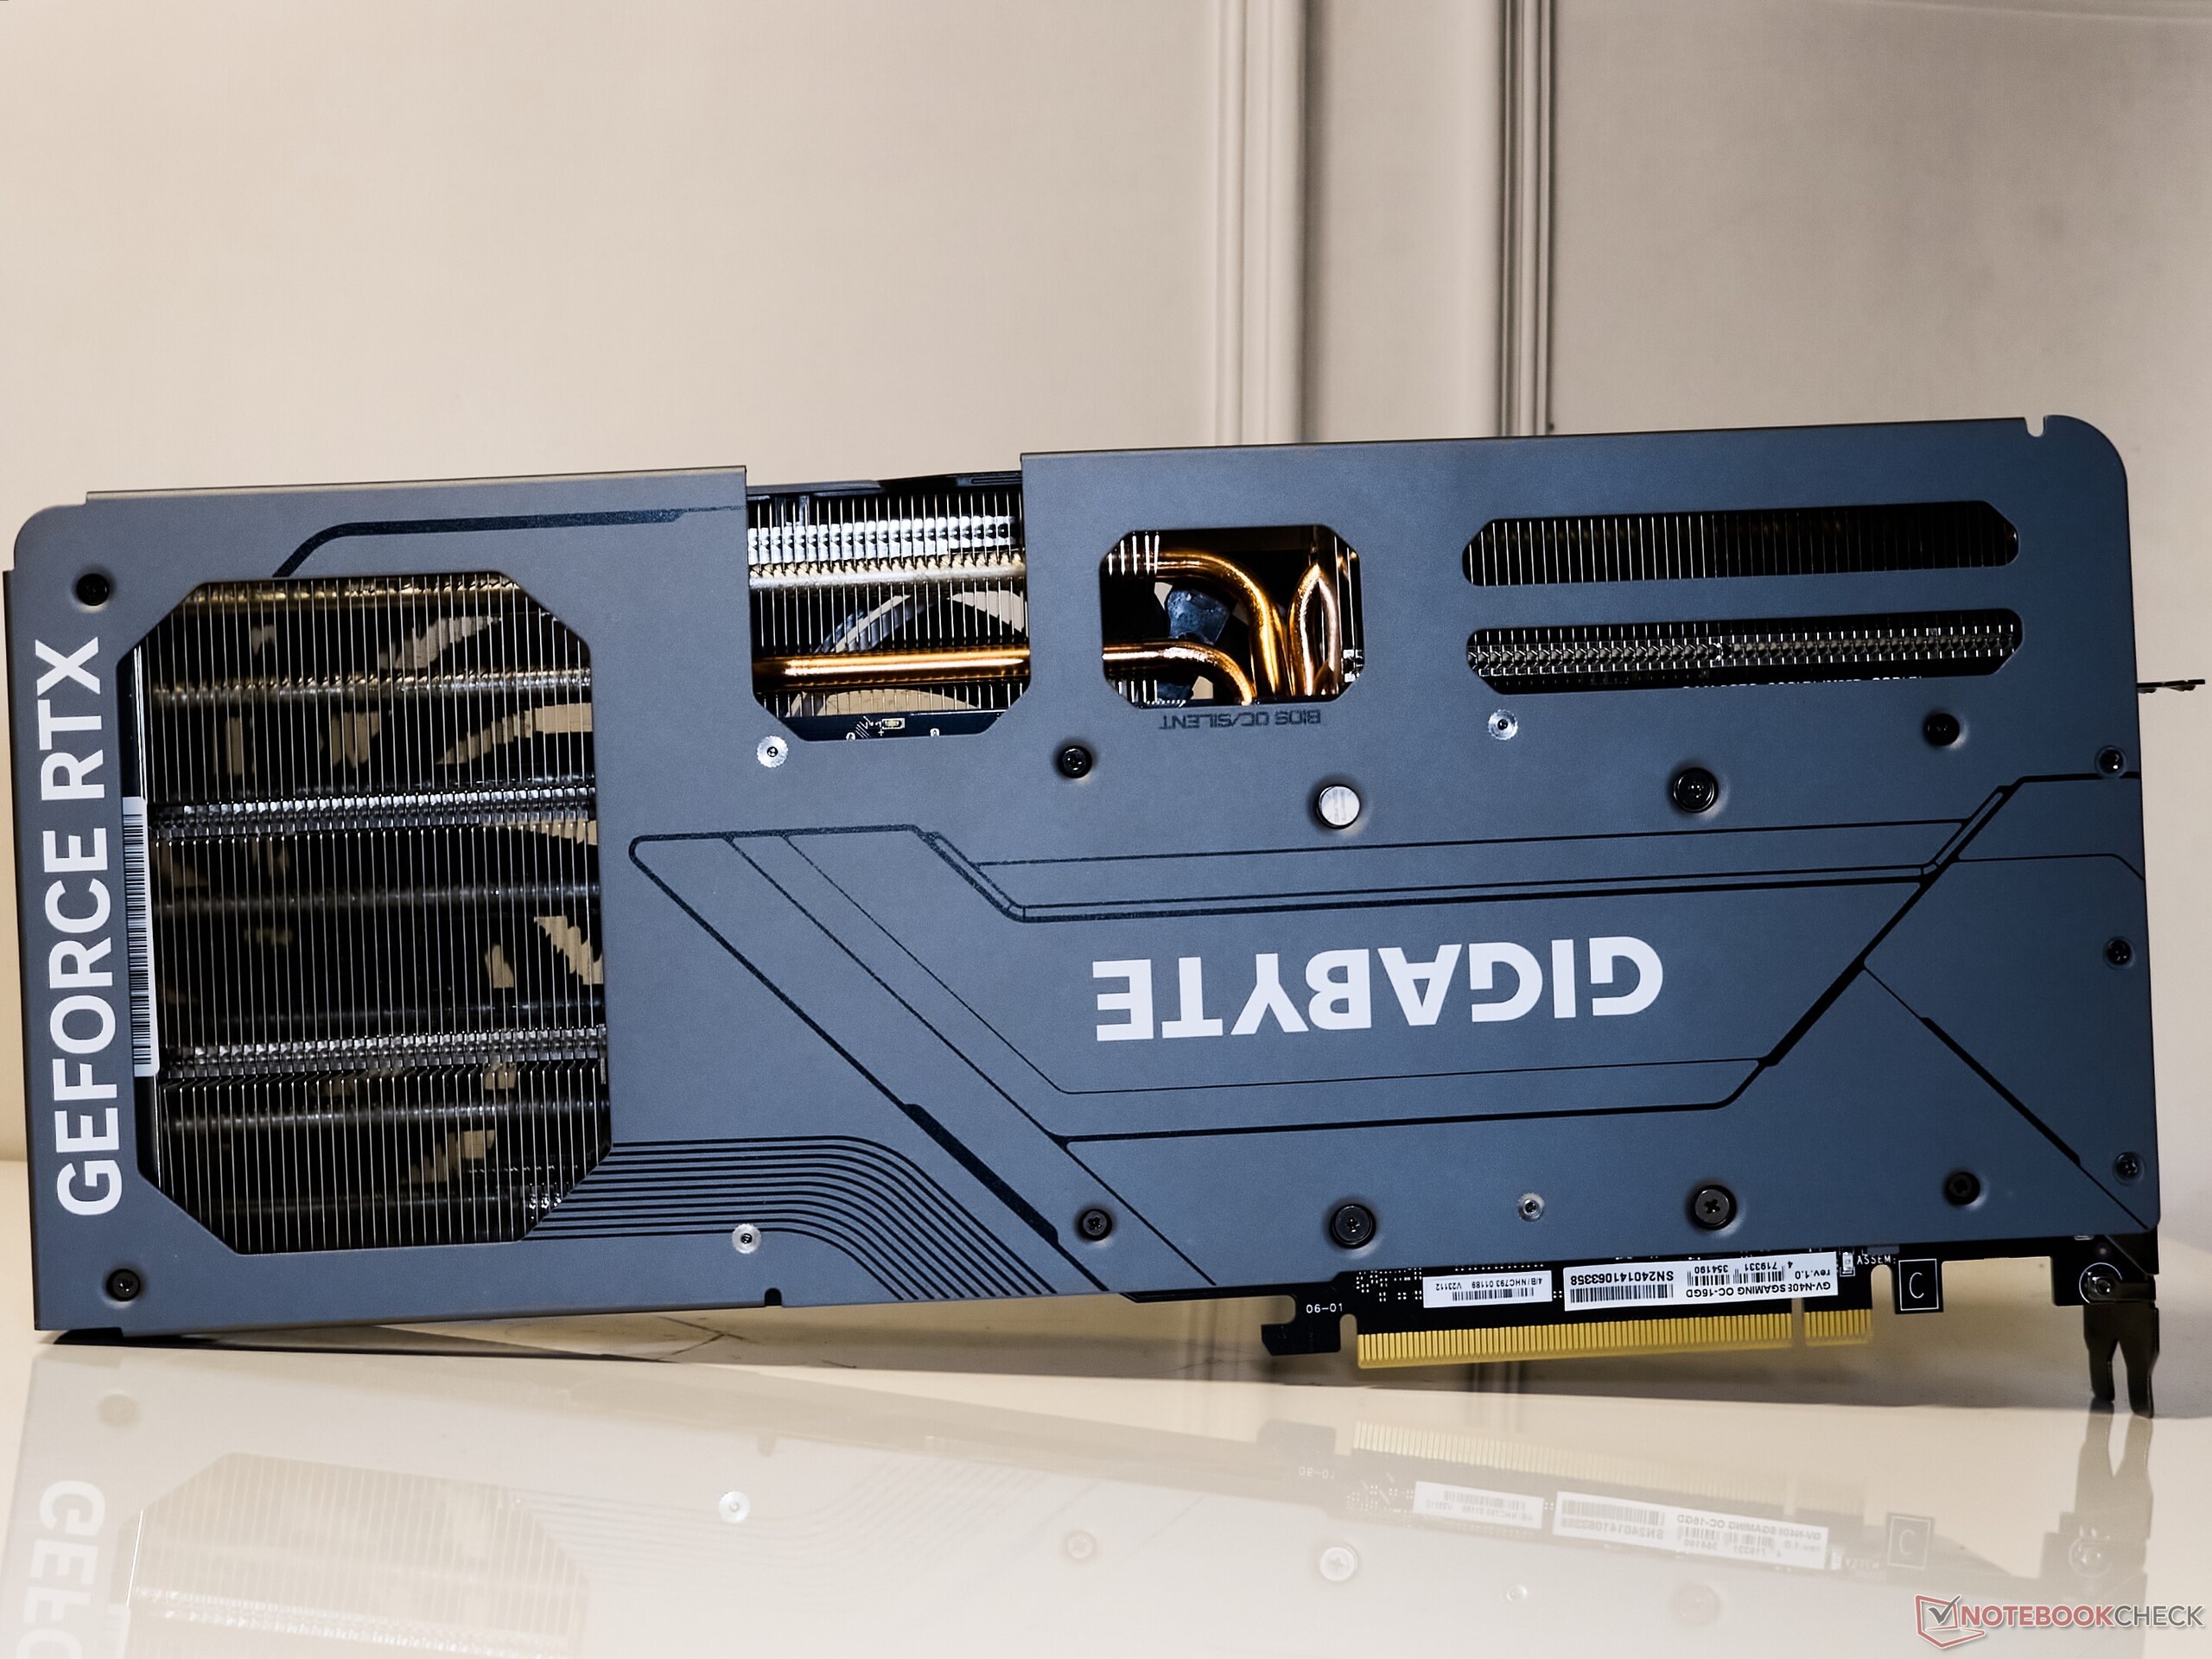
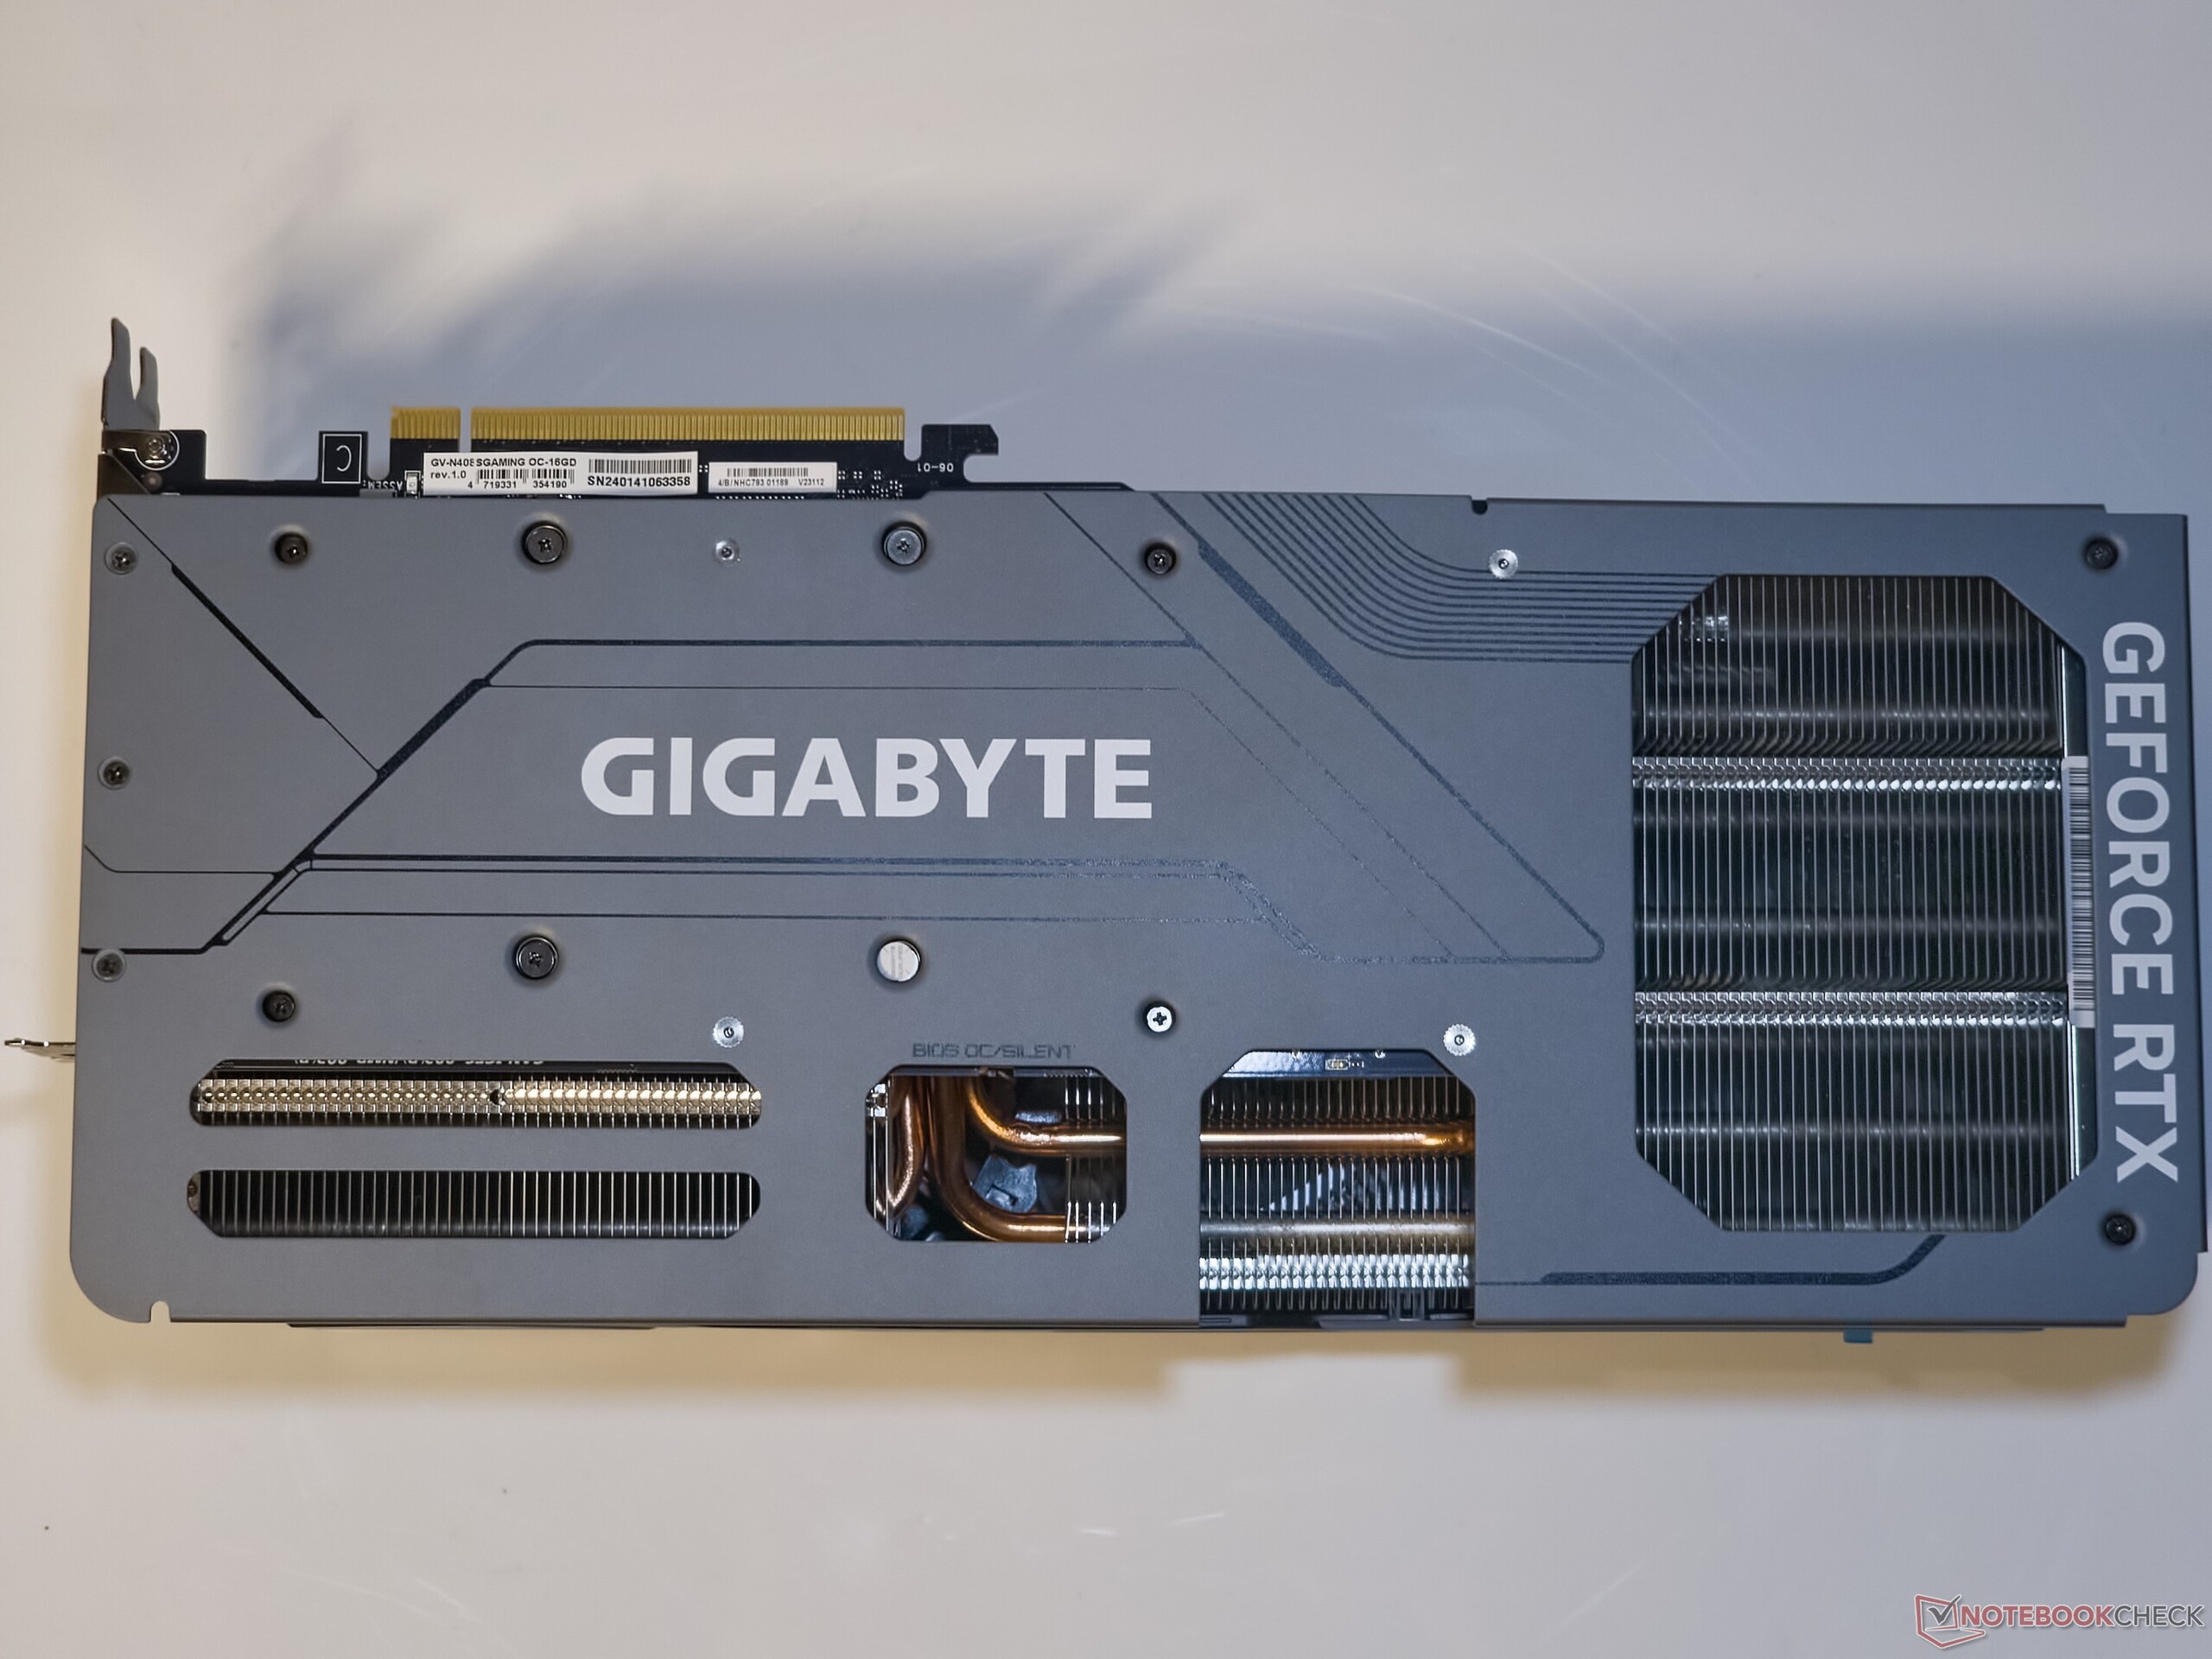
La scheda presenta un rivestimento anteriore in plastica ma robusto e una piastra posteriore in metallo. Gli effetti RGB sono simili a quelli che abbiamo visto con la RTX 4070 Super Gaming OC: un logo Gigabyte incandescente sulla parte superiore e un'illuminazione ad anello lungo la circonferenza di ogni ventola.
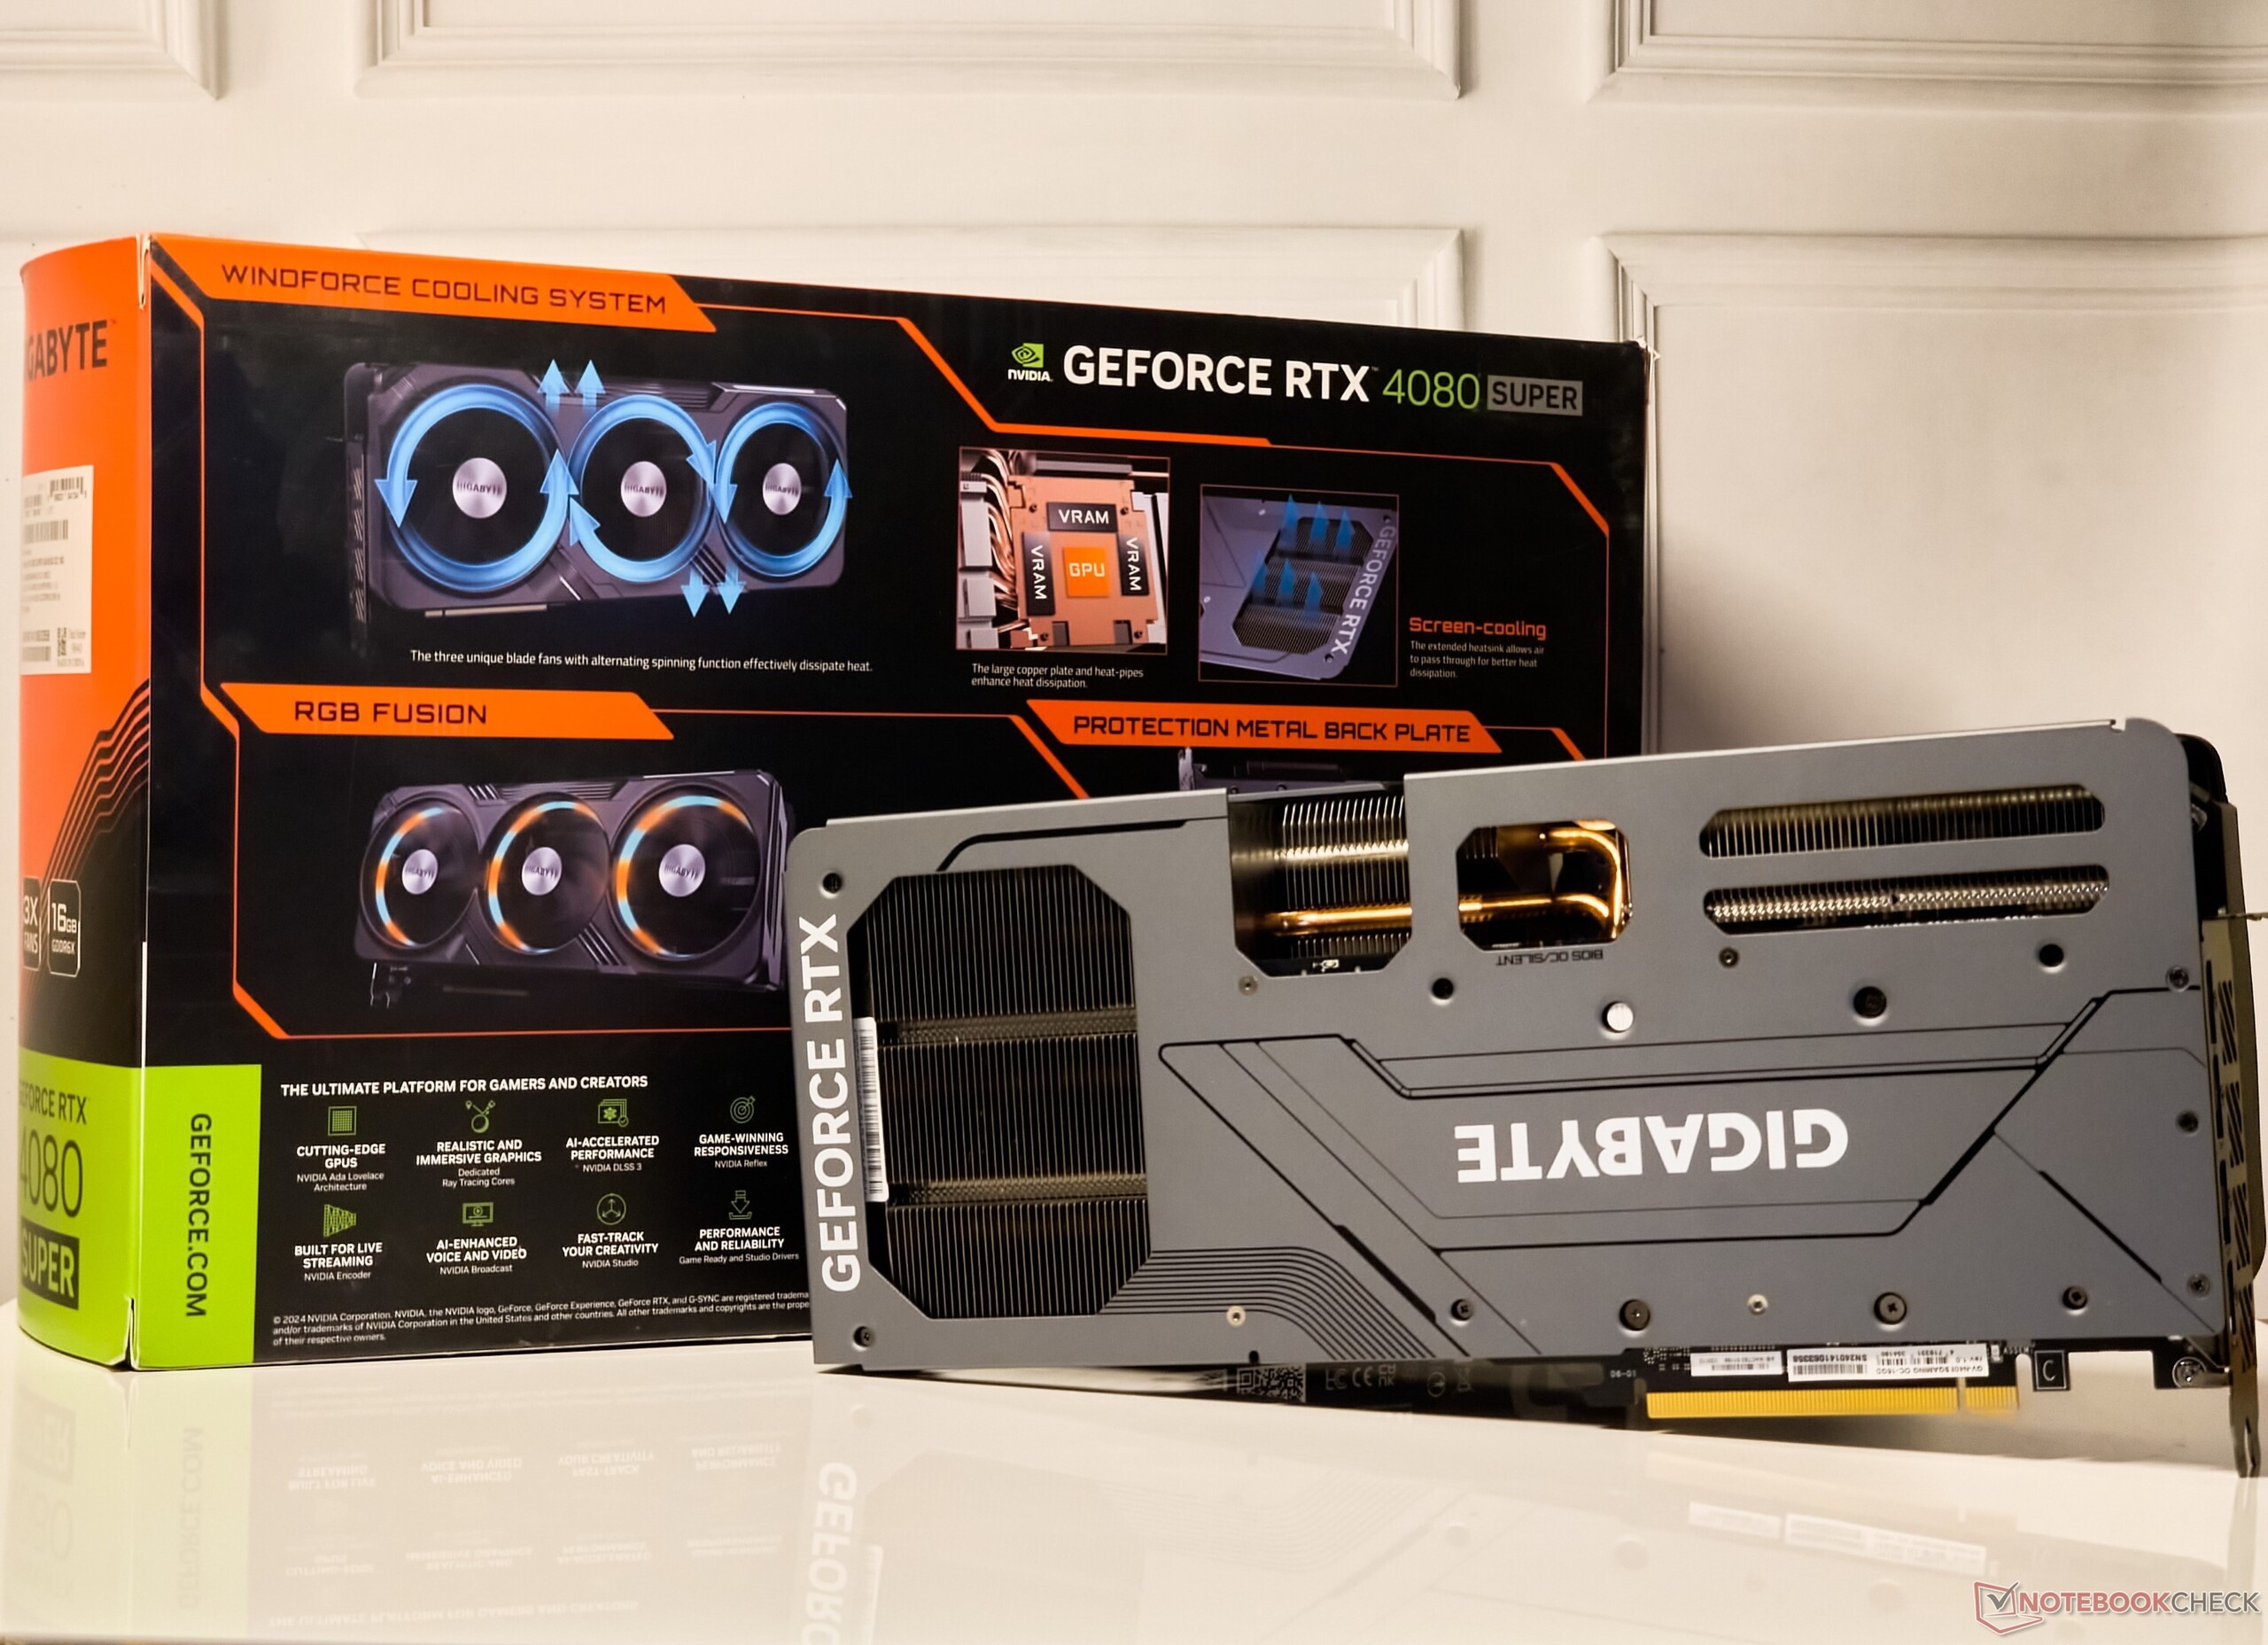
Il contenuto della confezione include una guida rapida, una scheda di garanzia, un connettore di alimentazione da 12VHPWR a 3x 8-pin, staffe di supporto e viti.
La RTX 4080 Super Gaming OC offre la serie standard di porte, tra cui 3x DisplayPort 1.4-out e 1x HDMI 2.1a-out.
Come è standard con le schede Gigabyte, è presente un interruttore dual-BIOS per alternare le modalità BIOS OC e Silent.
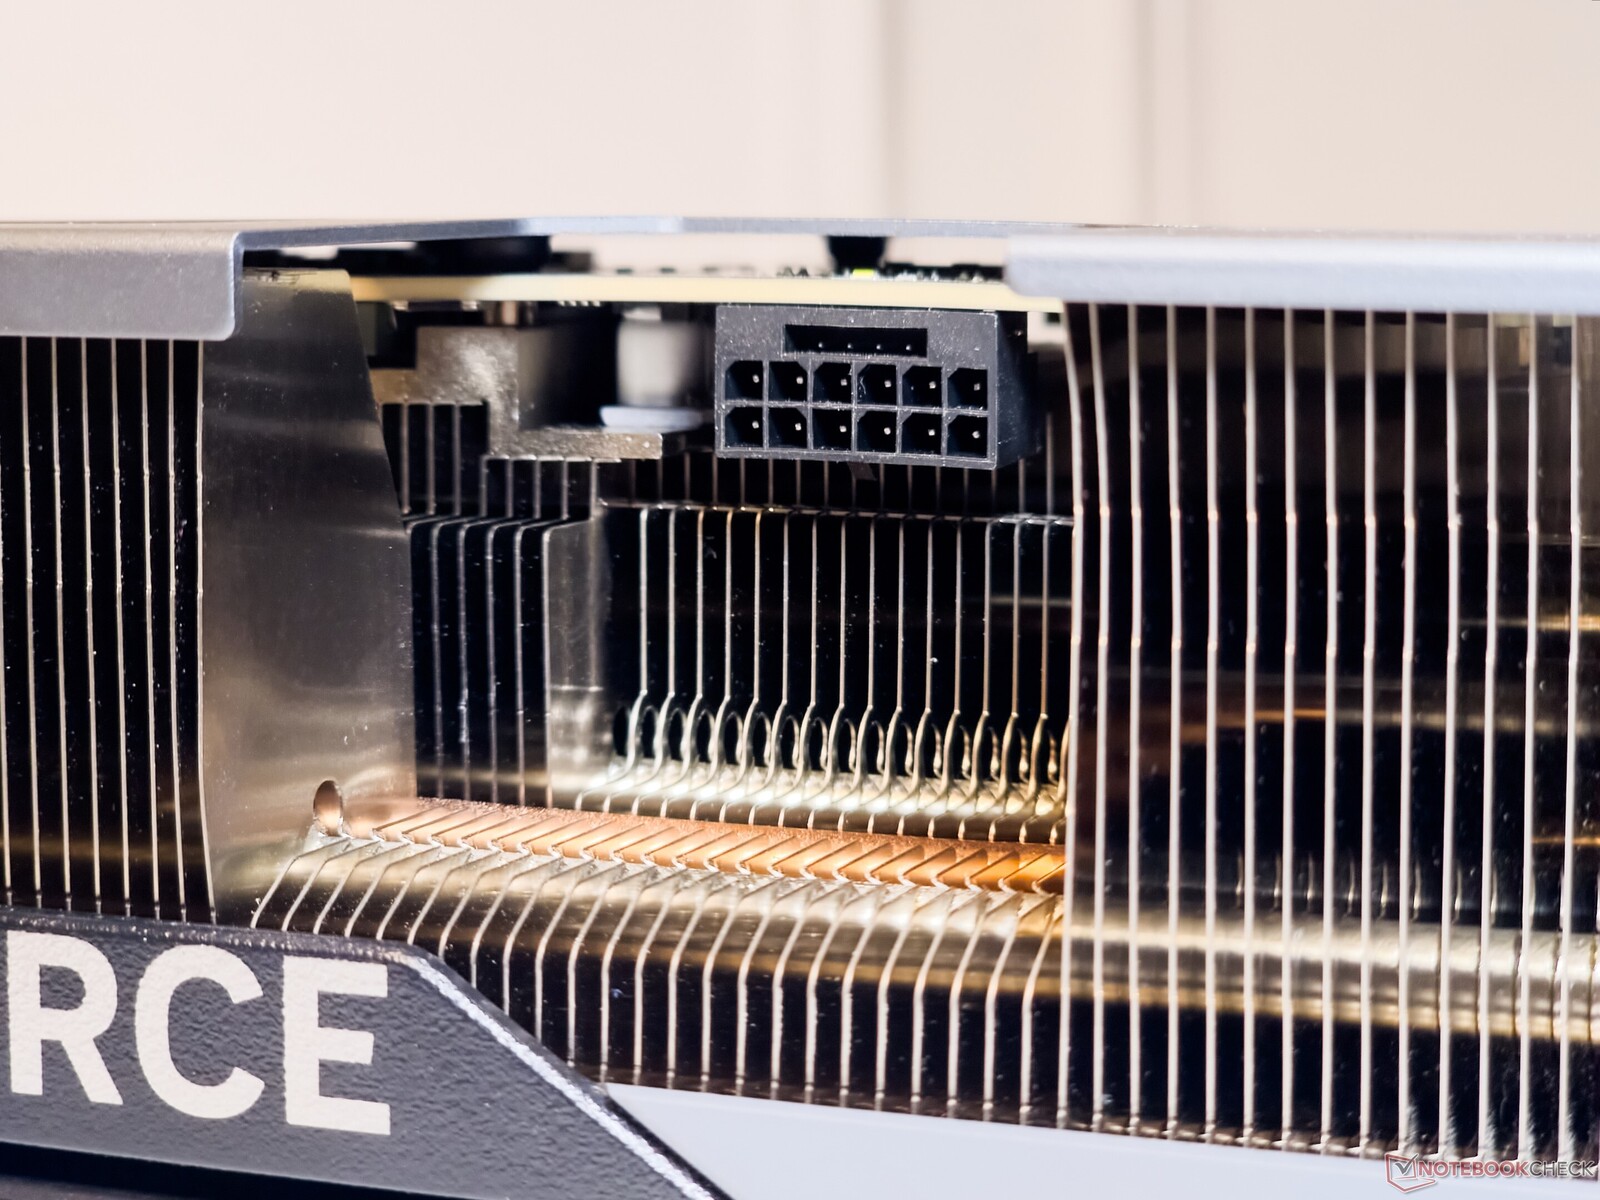
L'alimentazione della GPU è gestita dal connettore 12VHPWR, ormai predefinito. Non abbiamo incontrato alcun problema nell'adattare il connettore PCIe Gen 5 a 16 pin dell'alimentatore. Come misura precauzionale, Gigabyte fornisce anche un indicatore LED che si illumina per segnalare eventuali problemi di connessione.


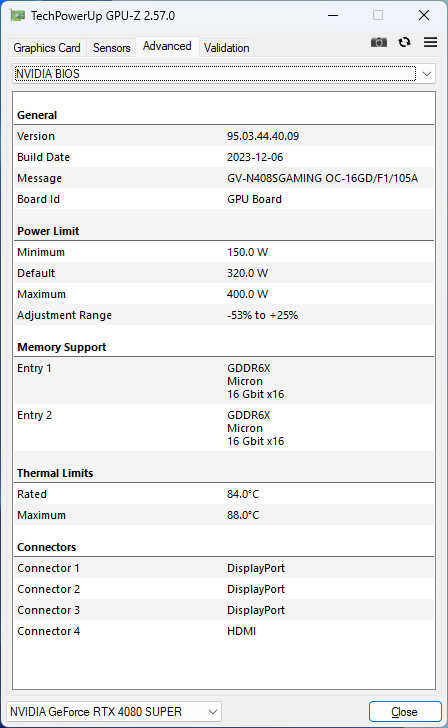
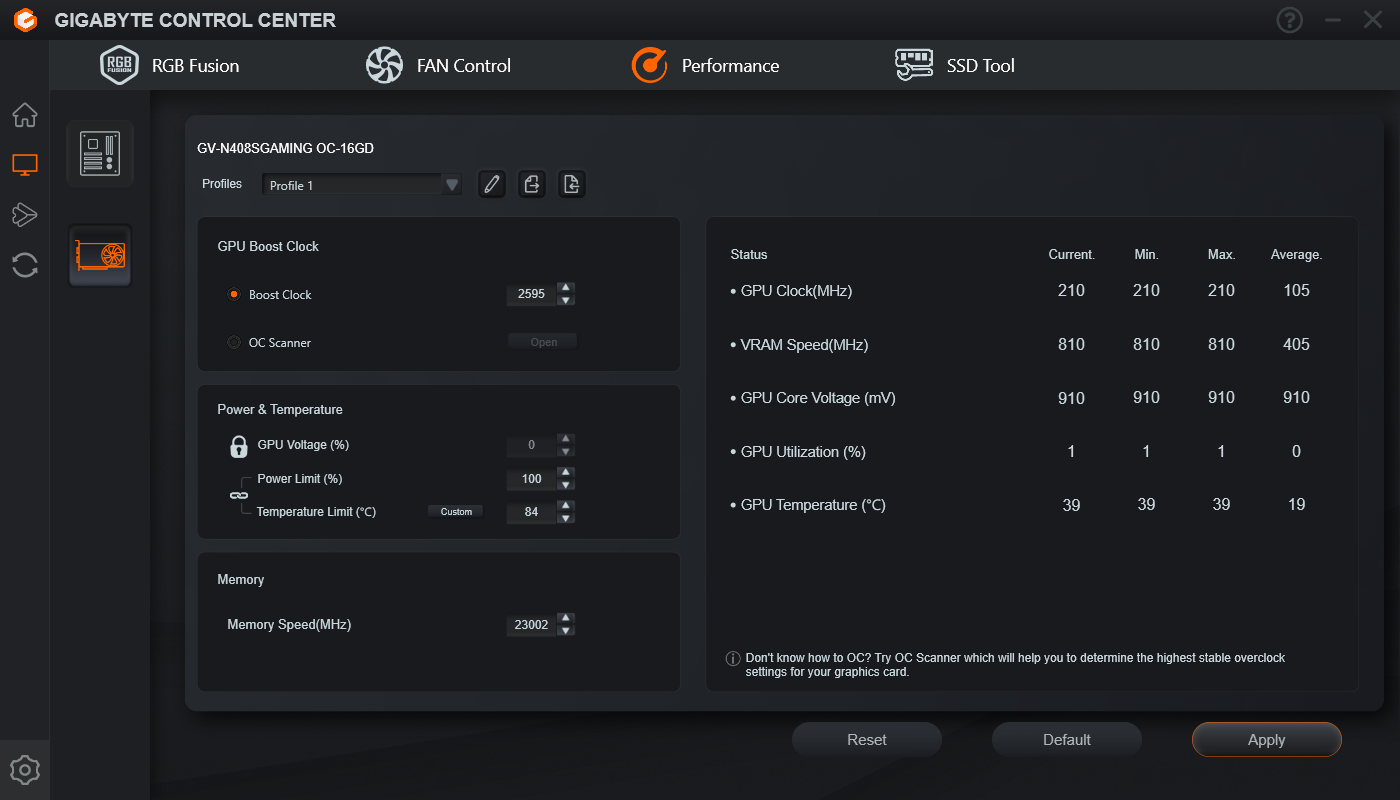
Gigabyte GeForce RTX 4080 Super Gaming OC 16G può aumentare la potenza fino a 2.595 MHz e ha un'aggiunta del 25% di headroom di potenza per consentire aumenti TGP fino a 400 W.
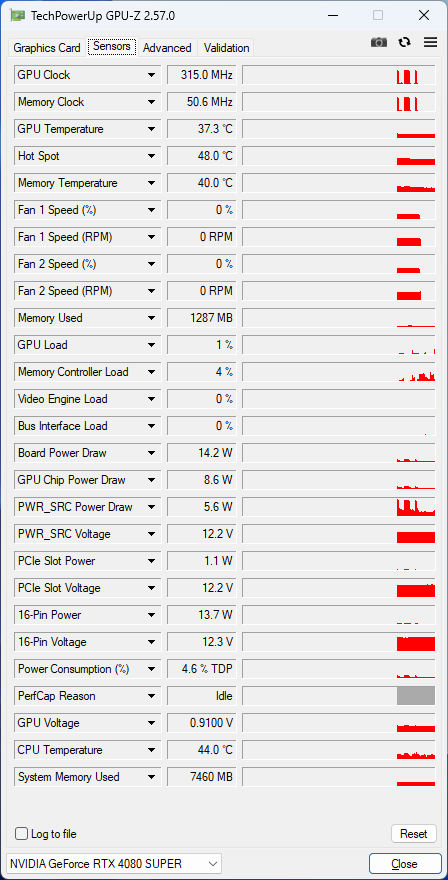
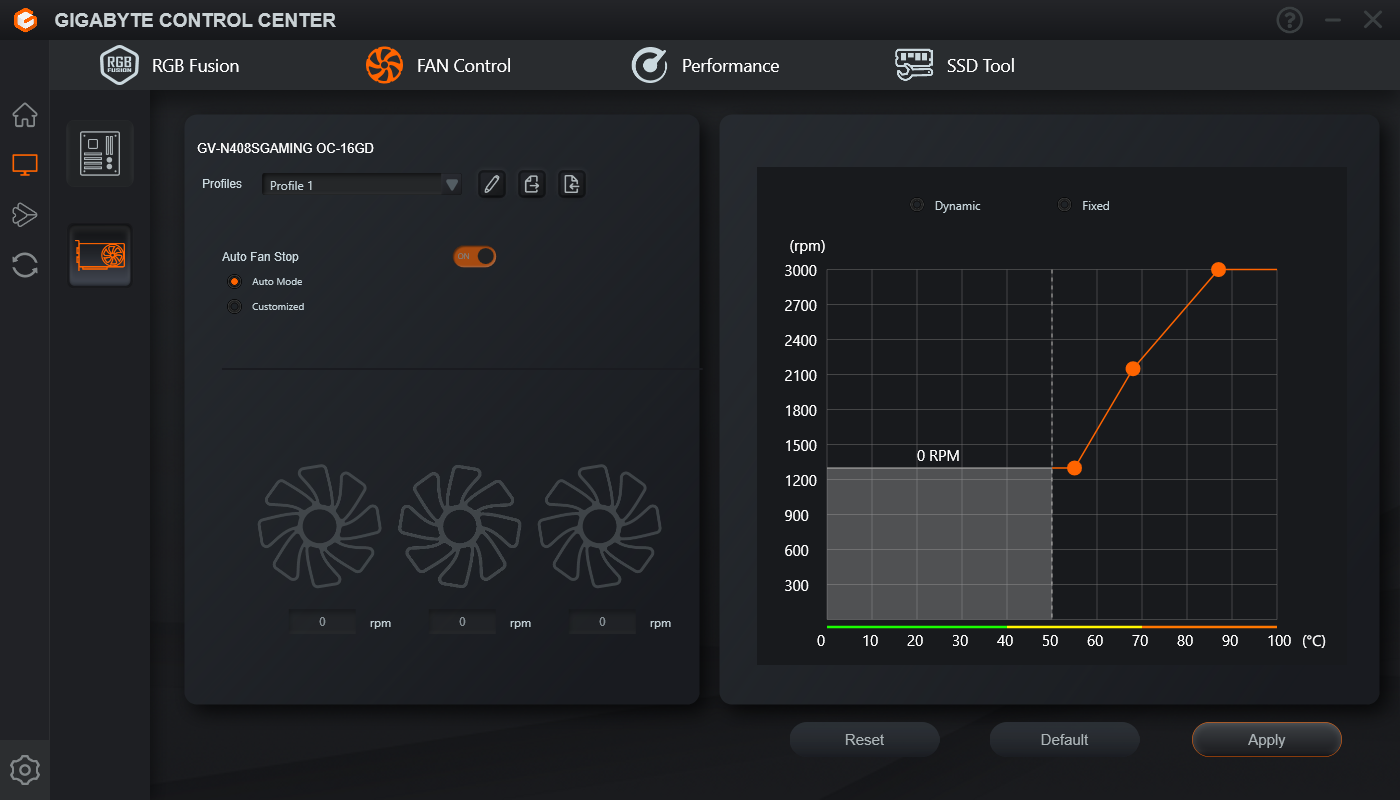
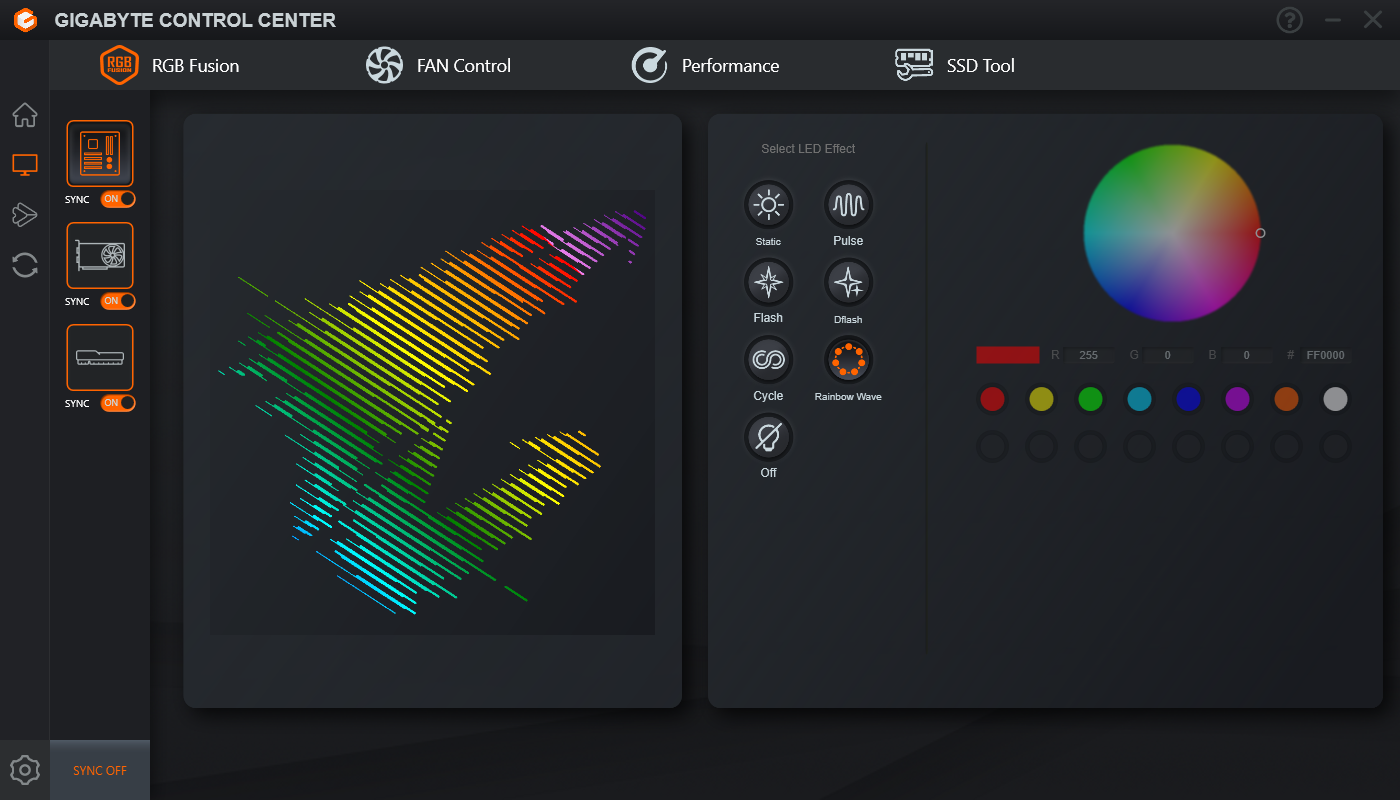
Gli aspetti della GPU, come l'overclocking, le curve delle ventole e gli effetti RGB, possono essere controllati tramite il Gigabyte Control Center.
Banco di prova: RTX 4080 Super Gaming OC insieme al Core i9-13900K
Il nostro sistema di prova continua a basarsi sulla piattaforma Intel Core i9-13900K e Z790, per garantire che le schede non siano bloccate dalla CPU. La configurazione comprende:
- Banco di prova Cooler MasterFrame 700
- Intel Core i9-13900K con PL1=PL2
- Scheda madre Gigabyte Z790 Aorus Master
- Gigabyte Aorus Gen4 2 TB NVMe SSD
- Sabrent Rocket 4 Plus Gen4 2 TB NVMe SSD
- 2x 16 GB di RAM Kingston Fury Renegade DDR5-6400 con timing 32-39-39-80 a 1,40 V
- MonitorMSI MAG 274UPF 4K 144 Hz
- Raffreddatore Cooler Master MasterLiquid ML360L V2 ARGB AiO
- Cooler Master MVE Gold V2 1250 ATX 3.0 alimentatore completamente modulare
È stato utilizzato Windows 11 23H2 con le ultime patch, insieme al driver Nvidia Game Ready versione 552.12.
In base ai nostri test interni, i numeri delle prestazioni del Core i9-13900K e del chipset Z790 sono paragonabili a quelli di un AMD Ryzen 9 7950X e configurazione X670E.
Desideriamo ringraziare Cooler Master per aver fornito il banco di prova, il raffreddatore e l'alimentatore, Gigabyte per la scheda madre, la CPU e l'SSD, Sabrent per l'SSD, MSI per il monitor e Kingston per la memoria.
Parametri sintetici: guadagni complessivi del 5% rispetto alla RTX 4080
Le prestazioni sintetiche cumulative dei benchmark mostrano che la RTX 4080 Super Gaming OC ha un vantaggio del 5% rispetto alla RTX 4080 Founders Edition (FE), che corrisponde a un aumento equivalente dei core CUDA. Sono stati osservati delta più grandi tra queste due schede in 3DMark Port Royal (+7%) e 3DMark 11 Performance GPU (11%).
La RTX 4080 Super Gaming OC si collega in gran parte alla scheda AMD Radeon RX 7900 XTX nei test sintetici complessivi, ma quest'ultima mostra guadagni decenti in 3DMark Fire Strike e Time Spy.
I punteggi Unigine mostrano un guadagno compreso tra il 2 e il 5% con la RTX 4080 Super Gaming OC rispetto alla RTX 4080 Founders Edition.
La RTX 4090 Founders Edition continua a essere la scheda da battere, con punteggi superiori del 25% rispetto alla RTX 4080 Super Gaming OC.
3DMark 11: 1280x720 Performance GPU
3DMark: 1920x1080 Fire Strike Graphics | 3840x2160 Fire Strike Ultra Graphics | Fire Strike Extreme Graphics | 2560x1440 Time Spy Graphics | 2560x1440 Port Royal Graphics | 2560x1440 Speed Way Score
Unigine Heaven 4.0: Extreme Preset DX11 | Extreme Preset OpenGL
Unigine Valley 1.0: 1920x1080 Extreme HD DirectX AA:x8 | 1920x1080 Extreme HD Preset OpenGL AA:x8
Unigine Superposition: 1280x720 720p Low | 1920x1080 1080p Extreme | 3840x2160 4k Optimized | 7680x4320 8k Optimized
| Performance rating | |
| NVIDIA GeForce RTX 4090 Founders Edition | |
| AMD Radeon RX 7900 XTX | |
| Gigabyte GeForce RTX 4080 Super Gaming OC | |
| NVIDIA GeForce RTX 4080 Founders Edition | |
| Media della classe Desktop | |
| AMD Radeon RX 7900 XT | |
| Asus TUF Gaming GeForce RTX 4070 Ti Super | |
| Gigabyte Aorus GeForce RTX 4070 Ti Master | |
| Asus TUF Gaming GeForce RTX 4070 Ti | |
| Media NVIDIA GeForce RTX 4070 Ti | |
| Gigabyte GeForce RTX 4070 Super Gaming OC 12G | |
| Media NVIDIA GeForce RTX 3090 | |
| Media NVIDIA GeForce RTX 3080 Ti | |
| NVIDIA GeForce RTX 4070 Super Founders Edition | |
| AMD Radeon RX 7800 XT | |
| Zotac Gaming GeForce RTX 4070 AMP Airo | |
| Media NVIDIA GeForce RTX 3080 -1! | |
| Sapphire Pulse Radeon RX 7700 XT | |
| Media NVIDIA Titan RTX | |
| Media NVIDIA GeForce RTX 4060 Ti 8G | |
| KFA2 GeForce RTX 4060 Ti EX, 16GB GDDR6 | |
| XFX Speedster QICK 308 Radeon RX 7600 Black Edition | |
| KFA2 GeForce RTX 4060 1-Click-OC 2X | |
| 3DMark / Speed Way Score | |
| NVIDIA GeForce RTX 4090 Founders Edition | |
| Gigabyte GeForce RTX 4080 Super Gaming OC | |
| Media della classe Desktop (492 - 14564, n=42, ultimi 2 anni) | |
| NVIDIA GeForce RTX 4080 Founders Edition | |
| Asus TUF Gaming GeForce RTX 4070 Ti Super | |
| AMD Radeon RX 7900 XTX | |
| Gigabyte Aorus GeForce RTX 4070 Ti Master | |
| Media NVIDIA GeForce RTX 4070 Ti (5392 - 5546, n=6) | |
| Asus TUF Gaming GeForce RTX 4070 Ti | |
| Asus TUF Gaming GeForce RTX 4070 Ti (Quiet BIOS) | |
| Gigabyte GeForce RTX 4070 Super Gaming OC 12G | |
| Media NVIDIA GeForce RTX 3090 (5173 - 5299, n=4) | |
| Media NVIDIA GeForce RTX 3080 Ti (5195 - 5223, n=2) | |
| NVIDIA GeForce RTX 4070 Super Founders Edition | |
| AMD Radeon RX 7900 XT | |
| Zotac Gaming GeForce RTX 4070 AMP Airo | |
| AMD Radeon RX 7800 XT | |
| Media NVIDIA Titan RTX (3182 - 3205, n=3) | |
| Media NVIDIA GeForce RTX 4060 Ti 8G (3158 - 3206, n=3) | |
| KFA2 GeForce RTX 4060 Ti EX, 16GB GDDR6 | |
| Sapphire Pulse Radeon RX 7700 XT | |
| KFA2 GeForce RTX 4060 1-Click-OC 2X | |
| XFX Speedster QICK 308 Radeon RX 7600 Black Edition | |
| Unigine Heaven 4.0 / Extreme Preset DX11 | |
| NVIDIA GeForce RTX 4090 Founders Edition | |
| Gigabyte GeForce RTX 4080 Super Gaming OC | |
| AMD Radeon RX 7900 XTX | |
| NVIDIA GeForce RTX 4080 Founders Edition | |
| AMD Radeon RX 7900 XT | |
| Gigabyte Aorus GeForce RTX 4070 Ti Master | |
| Asus TUF Gaming GeForce RTX 4070 Ti | |
| Media della classe Desktop (10.9 - 545, n=44, ultimi 2 anni) | |
| Media NVIDIA GeForce RTX 4070 Ti (298 - 319, n=5) | |
| Asus TUF Gaming GeForce RTX 4070 Ti Super | |
| Media NVIDIA GeForce RTX 3090 (272 - 315, n=12) | |
| Media NVIDIA GeForce RTX 3080 Ti (290 - 312, n=4) | |
| Gigabyte GeForce RTX 4070 Super Gaming OC 12G | |
| NVIDIA GeForce RTX 4070 Super Founders Edition | |
| Zotac Gaming GeForce RTX 4070 AMP Airo | |
| Media NVIDIA GeForce RTX 3080 (233 - 253, n=2) | |
| AMD Radeon RX 7800 XT | |
| Media NVIDIA Titan RTX (207 - 248, n=12) | |
| Sapphire Pulse Radeon RX 7700 XT | |
| Media NVIDIA GeForce RTX 4060 Ti 8G (170.7 - 181.6, n=4) | |
| KFA2 GeForce RTX 4060 Ti EX, 16GB GDDR6 | |
| KFA2 GeForce RTX 4060 1-Click-OC 2X | |
| XFX Speedster QICK 308 Radeon RX 7600 Black Edition | |
| Unigine Heaven 4.0 / Extreme Preset OpenGL | |
| NVIDIA GeForce RTX 4090 Founders Edition | |
| Gigabyte GeForce RTX 4080 Super Gaming OC | |
| AMD Radeon RX 7900 XTX | |
| NVIDIA GeForce RTX 4080 Founders Edition | |
| AMD Radeon RX 7900 XT | |
| Asus TUF Gaming GeForce RTX 4070 Ti Super | |
| Media della classe Desktop (11.7 - 551, n=30, ultimi 2 anni) | |
| Gigabyte Aorus GeForce RTX 4070 Ti Master | |
| Media NVIDIA GeForce RTX 4070 Ti (291 - 297, n=4) | |
| Asus TUF Gaming GeForce RTX 4070 Ti | |
| Gigabyte GeForce RTX 4070 Super Gaming OC 12G | |
| NVIDIA GeForce RTX 4070 Super Founders Edition | |
| Media NVIDIA GeForce RTX 3080 Ti (264 - 282, n=4) | |
| Media NVIDIA GeForce RTX 3090 (188.2 - 284, n=11) | |
| AMD Radeon RX 7800 XT | |
| Media NVIDIA GeForce RTX 3080 (232 - 243, n=2) | |
| Zotac Gaming GeForce RTX 4070 AMP Airo | |
| Media NVIDIA Titan RTX (203 - 299, n=12) | |
| Sapphire Pulse Radeon RX 7700 XT | |
| Media NVIDIA GeForce RTX 4060 Ti 8G (173 - 176, n=3) | |
| KFA2 GeForce RTX 4060 Ti EX, 16GB GDDR6 | |
| XFX Speedster QICK 308 Radeon RX 7600 Black Edition | |
| KFA2 GeForce RTX 4060 1-Click-OC 2X | |
| Unigine Valley 1.0 / Extreme HD DirectX | |
| NVIDIA GeForce RTX 4090 Founders Edition | |
| Gigabyte GeForce RTX 4080 Super Gaming OC | |
| NVIDIA GeForce RTX 4080 Founders Edition | |
| AMD Radeon RX 7900 XTX | |
| AMD Radeon RX 7900 XT | |
| Asus TUF Gaming GeForce RTX 4070 Ti Super | |
| Asus TUF Gaming GeForce RTX 4070 Ti | |
| Media NVIDIA GeForce RTX 3080 Ti (206 - 240, n=4) | |
| Media NVIDIA GeForce RTX 3090 (184.2 - 247, n=12) | |
| Media NVIDIA GeForce RTX 4070 Ti (208 - 230, n=5) | |
| Gigabyte GeForce RTX 4070 Super Gaming OC 12G | |
| NVIDIA GeForce RTX 4070 Super Founders Edition | |
| Gigabyte Aorus GeForce RTX 4070 Ti Master | |
| Media della classe Desktop (9.8 - 295, n=44, ultimi 2 anni) | |
| Zotac Gaming GeForce RTX 4070 AMP Airo | |
| AMD Radeon RX 7800 XT | |
| Media NVIDIA GeForce RTX 3080 (176.2 - 181.8, n=2) | |
| Media NVIDIA Titan RTX (135 - 191.4, n=12) | |
| Sapphire Pulse Radeon RX 7700 XT | |
| Media NVIDIA GeForce RTX 4060 Ti 8G (128.3 - 132.9, n=4) | |
| KFA2 GeForce RTX 4060 Ti EX, 16GB GDDR6 | |
| KFA2 GeForce RTX 4060 1-Click-OC 2X | |
| XFX Speedster QICK 308 Radeon RX 7600 Black Edition | |
| Unigine Valley 1.0 / Extreme HD Preset OpenGL | |
| NVIDIA GeForce RTX 4090 Founders Edition | |
| Gigabyte GeForce RTX 4080 Super Gaming OC | |
| NVIDIA GeForce RTX 4080 Founders Edition | |
| AMD Radeon RX 7900 XTX | |
| Asus TUF Gaming GeForce RTX 4070 Ti Super | |
| Gigabyte Aorus GeForce RTX 4070 Ti Master | |
| AMD Radeon RX 7900 XT | |
| Media NVIDIA GeForce RTX 4070 Ti (197.4 - 231, n=4) | |
| Asus TUF Gaming GeForce RTX 4070 Ti | |
| Media NVIDIA GeForce RTX 3090 (158.8 - 226, n=11) | |
| Media NVIDIA GeForce RTX 3080 Ti (195.1 - 210, n=4) | |
| Media della classe Desktop (9.1 - 313, n=30, ultimi 2 anni) | |
| NVIDIA GeForce RTX 4070 Super Founders Edition | |
| Gigabyte GeForce RTX 4070 Super Gaming OC 12G | |
| AMD Radeon RX 7800 XT | |
| Zotac Gaming GeForce RTX 4070 AMP Airo | |
| Media NVIDIA GeForce RTX 3080 (163.8 - 172, n=2) | |
| Media NVIDIA Titan RTX (139.2 - 181.2, n=12) | |
| Sapphire Pulse Radeon RX 7700 XT | |
| Media NVIDIA GeForce RTX 4060 Ti 8G (116.5 - 118.8, n=3) | |
| KFA2 GeForce RTX 4060 Ti EX, 16GB GDDR6 | |
| KFA2 GeForce RTX 4060 1-Click-OC 2X | |
| XFX Speedster QICK 308 Radeon RX 7600 Black Edition | |
| Unigine Superposition / 720p Low | |
| Asus TUF Gaming GeForce RTX 4070 Ti | |
| NVIDIA GeForce RTX 4090 Founders Edition | |
| Gigabyte Aorus GeForce RTX 4070 Ti Master | |
| Media NVIDIA GeForce RTX 4070 Ti (48835 - 56396, n=4) | |
| Zotac Gaming GeForce RTX 4070 AMP Airo | |
| Gigabyte GeForce RTX 4080 Super Gaming OC | |
| NVIDIA GeForce RTX 4080 Founders Edition | |
| NVIDIA GeForce RTX 4070 Super Founders Edition | |
| Gigabyte GeForce RTX 4070 Super Gaming OC 12G | |
| Asus TUF Gaming GeForce RTX 4070 Ti Super | |
| Media della classe Desktop (4614 - 64541, n=27, ultimi 2 anni) | |
| Media NVIDIA GeForce RTX 3090 (33329 - 63518, n=11) | |
| Media NVIDIA GeForce RTX 3080 Ti (43163 - 50738, n=4) | |
| Media NVIDIA GeForce RTX 4060 Ti 8G (46504 - 47695, n=3) | |
| AMD Radeon RX 7900 XTX | |
| AMD Radeon RX 7900 XT | |
| KFA2 GeForce RTX 4060 1-Click-OC 2X | |
| AMD Radeon RX 7800 XT | |
| Sapphire Pulse Radeon RX 7700 XT | |
| KFA2 GeForce RTX 4060 Ti EX, 16GB GDDR6 | |
| XFX Speedster QICK 308 Radeon RX 7600 Black Edition | |
| Media NVIDIA Titan RTX (25622 - 50876, n=9) | |
| Media NVIDIA GeForce RTX 3080 (30851 - 32183, n=2) | |
| Unigine Superposition / 1080p Extreme | |
| NVIDIA GeForce RTX 4090 Founders Edition | |
| AMD Radeon RX 7900 XTX | |
| Gigabyte GeForce RTX 4080 Super Gaming OC | |
| Media della classe Desktop (280 - 28841, n=30, ultimi 2 anni) | |
| NVIDIA GeForce RTX 4080 Founders Edition | |
| AMD Radeon RX 7900 XT | |
| Gigabyte Aorus GeForce RTX 4070 Ti Master | |
| Asus TUF Gaming GeForce RTX 4070 Ti Super | |
| Asus TUF Gaming GeForce RTX 4070 Ti | |
| Media NVIDIA GeForce RTX 4070 Ti (12837 - 13448, n=4) | |
| Media NVIDIA GeForce RTX 3090 (11806 - 12694, n=12) | |
| Gigabyte GeForce RTX 4070 Super Gaming OC 12G | |
| Media NVIDIA GeForce RTX 3080 Ti (12038 - 12347, n=4) | |
| NVIDIA GeForce RTX 4070 Super Founders Edition | |
| Media NVIDIA GeForce RTX 3080 (10572 - 10822, n=2) | |
| AMD Radeon RX 7800 XT | |
| Zotac Gaming GeForce RTX 4070 AMP Airo | |
| Media NVIDIA Titan RTX (8916 - 9285, n=9) | |
| Sapphire Pulse Radeon RX 7700 XT | |
| KFA2 GeForce RTX 4060 Ti EX, 16GB GDDR6 | |
| Media NVIDIA GeForce RTX 4060 Ti 8G (7085 - 7833, n=3) | |
| XFX Speedster QICK 308 Radeon RX 7600 Black Edition | |
| KFA2 GeForce RTX 4060 1-Click-OC 2X | |
| Unigine Superposition / 4k Optimized | |
| NVIDIA GeForce RTX 4090 Founders Edition | |
| AMD Radeon RX 7900 XTX | |
| Gigabyte GeForce RTX 4080 Super Gaming OC | |
| Media della classe Desktop (2379 - 45354, n=42, ultimi 2 anni) | |
| NVIDIA GeForce RTX 4080 Founders Edition | |
| Asus TUF Gaming GeForce RTX 4070 Ti Super | |
| AMD Radeon RX 7900 XT | |
| Gigabyte Aorus GeForce RTX 4070 Ti Master | |
| Asus TUF Gaming GeForce RTX 4070 Ti | |
| Media NVIDIA GeForce RTX 4070 Ti (16889 - 17290, n=5) | |
| Media NVIDIA GeForce RTX 3090 (15794 - 16868, n=12) | |
| Media NVIDIA GeForce RTX 3080 Ti (16108 - 16412, n=4) | |
| Gigabyte GeForce RTX 4070 Super Gaming OC 12G | |
| NVIDIA GeForce RTX 4070 Super Founders Edition | |
| Media NVIDIA GeForce RTX 3080 (13984 - 14243, n=2) | |
| AMD Radeon RX 7800 XT | |
| Zotac Gaming GeForce RTX 4070 AMP Airo | |
| Media NVIDIA Titan RTX (11937 - 12644, n=9) | |
| Sapphire Pulse Radeon RX 7700 XT | |
| Media NVIDIA GeForce RTX 4060 Ti 8G (9438 - 9722, n=4) | |
| KFA2 GeForce RTX 4060 Ti EX, 16GB GDDR6 | |
| KFA2 GeForce RTX 4060 1-Click-OC 2X | |
| XFX Speedster QICK 308 Radeon RX 7600 Black Edition | |
| Unigine Superposition / 8k Optimized | |
| NVIDIA GeForce RTX 4090 Founders Edition | |
| Media della classe Desktop (914 - 18770, n=42, ultimi 2 anni) | |
| AMD Radeon RX 7900 XTX | |
| Gigabyte GeForce RTX 4080 Super Gaming OC | |
| NVIDIA GeForce RTX 4080 Founders Edition | |
| Media NVIDIA GeForce RTX 3090 (6961 - 7521, n=12) | |
| Asus TUF Gaming GeForce RTX 4070 Ti Super | |
| Media NVIDIA GeForce RTX 3080 Ti (6920 - 7161, n=4) | |
| AMD Radeon RX 7900 XT | |
| Gigabyte Aorus GeForce RTX 4070 Ti Master | |
| Asus TUF Gaming GeForce RTX 4070 Ti | |
| Media NVIDIA GeForce RTX 4070 Ti (6276 - 6454, n=5) | |
| Media NVIDIA GeForce RTX 3080 (6243 - 6346, n=2) | |
| Gigabyte GeForce RTX 4070 Super Gaming OC 12G | |
| NVIDIA GeForce RTX 4070 Super Founders Edition | |
| Media NVIDIA Titan RTX (5255 - 5571, n=9) | |
| AMD Radeon RX 7800 XT | |
| Zotac Gaming GeForce RTX 4070 AMP Airo | |
| Sapphire Pulse Radeon RX 7700 XT | |
| Media NVIDIA GeForce RTX 4060 Ti 8G (3477 - 3571, n=4) | |
| KFA2 GeForce RTX 4060 Ti EX, 16GB GDDR6 | |
| KFA2 GeForce RTX 4060 1-Click-OC 2X | |
| XFX Speedster QICK 308 Radeon RX 7600 Black Edition | |
3DMark 11: 1280x720 Performance GPU
3DMark: 1920x1080 Fire Strike Graphics | 3840x2160 Fire Strike Ultra Graphics | Fire Strike Extreme Graphics | 2560x1440 Time Spy Graphics | 2560x1440 Port Royal Graphics | 2560x1440 Speed Way Score
Unigine Heaven 4.0: Extreme Preset DX11 | Extreme Preset OpenGL
Unigine Valley 1.0: 1920x1080 Extreme HD DirectX AA:x8 | 1920x1080 Extreme HD Preset OpenGL AA:x8
Unigine Superposition: 1280x720 720p Low | 1920x1080 1080p Extreme | 3840x2160 4k Optimized | 7680x4320 8k Optimized
| 3DMark 11 Performance | 57532 punti | |
| 3DMark Ice Storm Standard Score | 294683 punti | |
| 3DMark Cloud Gate Standard Score | 80761 punti | |
| 3DMark Fire Strike Score | 45427 punti | |
| 3DMark Fire Strike Extreme Score | 31385 punti | |
| 3DMark Time Spy Score | 27111 punti | |
Aiuto | ||
Prestazioni di calcolo: Guadagni significativi rispetto alla RX 7900 XTX
La RTX 4080 Super Gaming OC è in grado di terminare il rendering di Blender CUDA Classroom un secondo prima della RTX 4080 FE ed è circa il 3% più veloce in V-Ray 5 CUDA.
I punteggi di LuxMark Sala sono pari tra queste due GPU e la RTX 4080 Super Gaming OC ottiene un enorme vantaggio del 62% sulla RX 7900 XTX in questo test.
Anche se entrambe le GPU RX 7900 XT e RX 7900 XTX si comportano bene nella maggior parte dei test ComputeMark, la RTX 4080 Super Gaming OC ottiene un vantaggio significativo nel QJuliaRayTrace, che spinge la scheda di Gigabyte leggermente davanti alle due ammiraglie AMD in questo benchmark.
Blender: v3.3 Classroom CUDA | v3.3 Classroom OPTIX/RTX
LuxMark v2.0 64Bit: Room GPUs-only | Sala GPUs-only
ComputeMark v2.1: 1024x600 Normal, Score | 1024x600 Normal, QJuliaRayTrace | 1024x600 Normal, Mandel Scalar | 1024x600 Normal, Mandel Vector | 1024x600 Normal, Fluid 2DTexArr | 1024x600 Normal, Fluid 3DTex
| V-Ray 5 Benchmark / GPU CUDA | |
| NVIDIA GeForce RTX 4090 Founders Edition (5.0.1) | |
| Gigabyte GeForce RTX 4080 Super Gaming OC (5.0.1) | |
| NVIDIA GeForce RTX 4080 Founders Edition | |
| Media della classe Desktop (356 - 5824, n=40, ultimi 2 anni) | |
| Asus TUF Gaming GeForce RTX 4070 Ti Super (5.0.1) | |
| Gigabyte Aorus GeForce RTX 4070 Ti Master (5.0.1) | |
| Media NVIDIA GeForce RTX 4070 Ti (2278 - 2395, n=5) | |
| Asus TUF Gaming GeForce RTX 4070 Ti (5.0.1) | |
| Gigabyte GeForce RTX 4070 Super Gaming OC 12G (5.0.1) | |
| NVIDIA GeForce RTX 4070 Super Founders Edition (5.0.1) | |
| Media NVIDIA GeForce RTX 3080 Ti (2045 - 2070, n=3) | |
| Media NVIDIA GeForce RTX 3090 (1616 - 2131, n=15) | |
| Zotac Gaming GeForce RTX 4070 AMP Airo (5.0.1) | |
| KFA2 GeForce RTX 4060 Ti EX, 16GB GDDR6 (5.0.1) | |
| Media NVIDIA GeForce RTX 4060 Ti 8G (1375 - 1400, n=3) | |
| KFA2 GeForce RTX 4060 1-Click-OC 2X (5.0.1) | |
| Media NVIDIA Titan RTX (668 - 1052, n=7) | |
| AMD Radeon RX 7800 XT (5.0.1) | |
| Sapphire Pulse Radeon RX 7700 XT (5.0.1) | |
| XFX Speedster QICK 308 Radeon RX 7600 Black Edition (5.0.1) | |
| V-Ray 5 Benchmark / GPU RTX | |
| NVIDIA GeForce RTX 4090 Founders Edition (5.0.1) | |
| Media della classe Desktop (1408 - 7496, n=35, ultimi 2 anni) | |
| Gigabyte GeForce RTX 4080 Super Gaming OC (5.0.1) | |
| NVIDIA GeForce RTX 4080 Founders Edition | |
| Asus TUF Gaming GeForce RTX 4070 Ti Super (5.0.1) | |
| Gigabyte Aorus GeForce RTX 4070 Ti Master (5.0.1) | |
| Asus TUF Gaming GeForce RTX 4070 Ti (5.0.1) | |
| Media NVIDIA GeForce RTX 4070 Ti (3054 - 3221, n=5) | |
| Gigabyte GeForce RTX 4070 Super Gaming OC 12G (5.0.1) | |
| NVIDIA GeForce RTX 4070 Super Founders Edition (5.0.1) | |
| Media NVIDIA GeForce RTX 3090 (2551 - 2979, n=15) | |
| Media NVIDIA GeForce RTX 3080 Ti (2727 - 2883, n=3) | |
| Zotac Gaming GeForce RTX 4070 AMP Airo (5.0.1) | |
| AMD Radeon RX 7800 XT (5.0.1) | |
| KFA2 GeForce RTX 4060 Ti EX, 16GB GDDR6 (5.0.1) | |
| Sapphire Pulse Radeon RX 7700 XT (5.0.1) | |
| Media NVIDIA GeForce RTX 4060 Ti 8G (1860 - 2024, n=3) | |
| KFA2 GeForce RTX 4060 1-Click-OC 2X (5.0.1) | |
| Media NVIDIA Titan RTX (1246 - 1348, n=7) | |
| Blender / v3.3 Classroom CUDA | |
| KFA2 GeForce RTX 4060 1-Click-OC 2X (3.3.3) | |
| Media NVIDIA Titan RTX (n=1) | |
| Media NVIDIA GeForce RTX 4060 Ti 8G (n=1) | |
| Zotac Gaming GeForce RTX 4070 AMP Airo (3.3.3) | |
| Media NVIDIA GeForce RTX 3080 Ti (21 - 22, n=2) | |
| Media NVIDIA GeForce RTX 3090 (20 - 22, n=13) | |
| NVIDIA GeForce RTX 4070 Super Founders Edition (3.3.3) | |
| Gigabyte GeForce RTX 4070 Super Gaming OC 12G (3.3.3) | |
| Media NVIDIA GeForce RTX 4070 Ti (18 - 19, n=3) | |
| Media della classe Desktop (8 - 54, n=31, ultimi 2 anni) | |
| Gigabyte Aorus GeForce RTX 4070 Ti Master (3.3.2) | |
| Asus TUF Gaming GeForce RTX 4070 Ti Super (3.3.3) | |
| NVIDIA GeForce RTX 4080 Founders Edition (3.3.3) | |
| Gigabyte GeForce RTX 4080 Super Gaming OC (3.3.3) | |
| Blender / v3.3 Classroom OPTIX/RTX | |
| KFA2 GeForce RTX 4060 1-Click-OC 2X (3.3.3) | |
| Media NVIDIA Titan RTX (n=1) | |
| KFA2 GeForce RTX 4060 Ti EX, 16GB GDDR6 (3.3.3) | |
| Media NVIDIA GeForce RTX 4060 Ti 8G (17 - 18, n=3) | |
| Media NVIDIA GeForce RTX 3080 Ti (14 - 15, n=2) | |
| Zotac Gaming GeForce RTX 4070 AMP Airo (3.3.3) | |
| Media NVIDIA GeForce RTX 3090 (13 - 14, n=13) | |
| Asus TUF Gaming GeForce RTX 4070 Ti (3.3.2) | |
| Media NVIDIA GeForce RTX 4070 Ti (11 - 12, n=5) | |
| Gigabyte Aorus GeForce RTX 4070 Ti Master (3.3.2) | |
| NVIDIA GeForce RTX 4070 Super Founders Edition (3.3.3) | |
| Gigabyte GeForce RTX 4070 Super Gaming OC 12G (3.3.3) | |
| Media della classe Desktop (5 - 19, n=30, ultimi 2 anni) | |
| Asus TUF Gaming GeForce RTX 4070 Ti Super (3.3.3) | |
| NVIDIA GeForce RTX 4080 Founders Edition (3.3.3) | |
| NVIDIA GeForce RTX 4090 Founders Edition (3.3.0) | |
| Gigabyte GeForce RTX 4080 Super Gaming OC (3.3.3) | |
| LuxMark v2.0 64Bit / Room GPUs-only | |
| NVIDIA GeForce RTX 4090 Founders Edition | |
| Gigabyte GeForce RTX 4080 Super Gaming OC | |
| NVIDIA GeForce RTX 4080 Founders Edition | |
| Asus TUF Gaming GeForce RTX 4070 Ti Super | |
| Media della classe Desktop (370 - 14722, n=40, ultimi 2 anni) | |
| Gigabyte Aorus GeForce RTX 4070 Ti Master | |
| Asus TUF Gaming GeForce RTX 4070 Ti | |
| NVIDIA GeForce RTX 4070 Super Founders Edition | |
| Gigabyte GeForce RTX 4070 Super Gaming OC 12G | |
| Media NVIDIA GeForce RTX 4070 Ti (7625 - 8436, n=5) | |
| Zotac Gaming GeForce RTX 4070 AMP Airo | |
| Media NVIDIA GeForce RTX 3080 Ti (5772 - 6464, n=4) | |
| Media NVIDIA GeForce RTX 3090 (5727 - 5985, n=10) | |
| AMD Radeon RX 7900 XTX | |
| Media NVIDIA GeForce RTX 3080 (5112 - 5198, n=2) | |
| Media NVIDIA GeForce RTX 4060 Ti 8G (4558 - 5058, n=4) | |
| Media NVIDIA Titan RTX (4643 - 4703, n=2) | |
| KFA2 GeForce RTX 4060 Ti EX, 16GB GDDR6 | |
| AMD Radeon RX 7900 XT | |
| KFA2 GeForce RTX 4060 1-Click-OC 2X | |
| AMD Radeon RX 7800 XT | |
| Sapphire Pulse Radeon RX 7700 XT | |
| XFX Speedster QICK 308 Radeon RX 7600 Black Edition | |
| LuxMark v2.0 64Bit / Sala GPUs-only | |
| NVIDIA GeForce RTX 4090 Founders Edition | |
| NVIDIA GeForce RTX 4080 Founders Edition | |
| Gigabyte GeForce RTX 4080 Super Gaming OC | |
| Gigabyte Aorus GeForce RTX 4070 Ti Master | |
| Asus TUF Gaming GeForce RTX 4070 Ti | |
| Asus TUF Gaming GeForce RTX 4070 Ti Super | |
| Media NVIDIA GeForce RTX 4070 Ti (17719 - 20305, n=5) | |
| Media della classe Desktop (600 - 33461, n=40, ultimi 2 anni) | |
| Gigabyte GeForce RTX 4070 Super Gaming OC 12G | |
| NVIDIA GeForce RTX 4070 Super Founders Edition | |
| Media NVIDIA GeForce RTX 3080 Ti (14871 - 16438, n=4) | |
| Zotac Gaming GeForce RTX 4070 AMP Airo | |
| AMD Radeon RX 7900 XTX | |
| Media NVIDIA GeForce RTX 3090 (14590 - 15242, n=10) | |
| AMD Radeon RX 7900 XT | |
| Media NVIDIA GeForce RTX 3080 (12797 - 12980, n=2) | |
| Media NVIDIA GeForce RTX 4060 Ti 8G (11159 - 12428, n=4) | |
| KFA2 GeForce RTX 4060 Ti EX, 16GB GDDR6 | |
| Media NVIDIA Titan RTX (10799 - 10996, n=2) | |
| AMD Radeon RX 7800 XT | |
| KFA2 GeForce RTX 4060 1-Click-OC 2X | |
| Sapphire Pulse Radeon RX 7700 XT | |
| XFX Speedster QICK 308 Radeon RX 7600 Black Edition | |
| ComputeMark v2.1 / Normal, Score | |
| NVIDIA GeForce RTX 4090 Founders Edition | |
| Gigabyte GeForce RTX 4080 Super Gaming OC | |
| AMD Radeon RX 7900 XTX | |
| NVIDIA GeForce RTX 4080 Founders Edition | |
| Media della classe Desktop (1629 - 120417, n=44, ultimi 2 anni) | |
| AMD Radeon RX 7900 XT | |
| Asus TUF Gaming GeForce RTX 4070 Ti Super | |
| Gigabyte Aorus GeForce RTX 4070 Ti Master | |
| Asus TUF Gaming GeForce RTX 4070 Ti | |
| Media NVIDIA GeForce RTX 4070 Ti (49909 - 52251, n=5) | |
| Media NVIDIA GeForce RTX 3080 Ti (47377 - 48892, n=4) | |
| Gigabyte GeForce RTX 4070 Super Gaming OC 12G | |
| NVIDIA GeForce RTX 4070 Super Founders Edition | |
| Media NVIDIA GeForce RTX 3090 (44948 - 49118, n=10) | |
| AMD Radeon RX 7800 XT | |
| Zotac Gaming GeForce RTX 4070 AMP Airo | |
| Media NVIDIA GeForce RTX 3080 (39924 - 41594, n=2) | |
| Sapphire Pulse Radeon RX 7700 XT | |
| KFA2 GeForce RTX 4060 Ti EX, 16GB GDDR6 | |
| Media NVIDIA GeForce RTX 4060 Ti 8G (29999 - 32410, n=4) | |
| Media NVIDIA Titan RTX (27907 - 29830, n=3) | |
| XFX Speedster QICK 308 Radeon RX 7600 Black Edition | |
| KFA2 GeForce RTX 4060 1-Click-OC 2X | |
| ComputeMark v2.1 / Normal, QJuliaRayTrace | |
| NVIDIA GeForce RTX 4090 Founders Edition | |
| Gigabyte GeForce RTX 4080 Super Gaming OC | |
| NVIDIA GeForce RTX 4080 Founders Edition | |
| Gigabyte Aorus GeForce RTX 4070 Ti Master | |
| Asus TUF Gaming GeForce RTX 4070 Ti Super | |
| Asus TUF Gaming GeForce RTX 4070 Ti | |
| Media NVIDIA GeForce RTX 4070 Ti (20405 - 21619, n=5) | |
| Media della classe Desktop (403 - 40008, n=44, ultimi 2 anni) | |
| Gigabyte GeForce RTX 4070 Super Gaming OC 12G | |
| NVIDIA GeForce RTX 4070 Super Founders Edition | |
| AMD Radeon RX 7900 XTX | |
| Media NVIDIA GeForce RTX 3080 Ti (17050 - 17749, n=4) | |
| Media NVIDIA GeForce RTX 3090 (16403 - 18223, n=11) | |
| Zotac Gaming GeForce RTX 4070 AMP Airo | |
| AMD Radeon RX 7900 XT | |
| Media NVIDIA GeForce RTX 3080 (14718 - 15508, n=2) | |
| KFA2 GeForce RTX 4060 Ti EX, 16GB GDDR6 | |
| AMD Radeon RX 7800 XT | |
| Media NVIDIA GeForce RTX 4060 Ti 8G (12697 - 13822, n=4) | |
| Sapphire Pulse Radeon RX 7700 XT | |
| KFA2 GeForce RTX 4060 1-Click-OC 2X | |
| Media NVIDIA Titan RTX (9418 - 10129, n=3) | |
| XFX Speedster QICK 308 Radeon RX 7600 Black Edition | |
| ComputeMark v2.1 / Normal, Mandel Scalar | |
| NVIDIA GeForce RTX 4090 Founders Edition | |
| AMD Radeon RX 7900 XTX | |
| Gigabyte GeForce RTX 4080 Super Gaming OC | |
| NVIDIA GeForce RTX 4080 Founders Edition | |
| AMD Radeon RX 7900 XT | |
| Media della classe Desktop (490 - 28468, n=44, ultimi 2 anni) | |
| Asus TUF Gaming GeForce RTX 4070 Ti Super | |
| Gigabyte Aorus GeForce RTX 4070 Ti Master | |
| Asus TUF Gaming GeForce RTX 4070 Ti | |
| Media NVIDIA GeForce RTX 4070 Ti (11924 - 12449, n=5) | |
| Gigabyte GeForce RTX 4070 Super Gaming OC 12G | |
| AMD Radeon RX 7800 XT | |
| Media NVIDIA GeForce RTX 3080 Ti (11049 - 11318, n=4) | |
| NVIDIA GeForce RTX 4070 Super Founders Edition | |
| Media NVIDIA GeForce RTX 3090 (10650 - 11564, n=11) | |
| Sapphire Pulse Radeon RX 7700 XT | |
| Media NVIDIA GeForce RTX 3080 (9554 - 9938, n=2) | |
| Zotac Gaming GeForce RTX 4070 AMP Airo | |
| KFA2 GeForce RTX 4060 Ti EX, 16GB GDDR6 | |
| Media NVIDIA GeForce RTX 4060 Ti 8G (6996 - 7511, n=4) | |
| XFX Speedster QICK 308 Radeon RX 7600 Black Edition | |
| Media NVIDIA Titan RTX (5977 - 6406, n=3) | |
| KFA2 GeForce RTX 4060 1-Click-OC 2X | |
| ComputeMark v2.1 / Normal, Mandel Vector | |
| NVIDIA GeForce RTX 4090 Founders Edition | |
| AMD Radeon RX 7900 XTX | |
| AMD Radeon RX 7900 XT | |
| Gigabyte GeForce RTX 4080 Super Gaming OC | |
| Media della classe Desktop (318 - 24838, n=44, ultimi 2 anni) | |
| NVIDIA GeForce RTX 4080 Founders Edition | |
| Gigabyte Aorus GeForce RTX 4070 Ti Master | |
| Asus TUF Gaming GeForce RTX 4070 Ti Super | |
| Asus TUF Gaming GeForce RTX 4070 Ti | |
| Media NVIDIA GeForce RTX 4070 Ti (10424 - 10888, n=5) | |
| AMD Radeon RX 7800 XT | |
| Gigabyte GeForce RTX 4070 Super Gaming OC 12G | |
| Media NVIDIA GeForce RTX 3080 Ti (9513 - 9860, n=4) | |
| NVIDIA GeForce RTX 4070 Super Founders Edition | |
| Sapphire Pulse Radeon RX 7700 XT | |
| Media NVIDIA GeForce RTX 3090 (8038 - 10097, n=11) | |
| Zotac Gaming GeForce RTX 4070 AMP Airo | |
| Media NVIDIA GeForce RTX 3080 (7148 - 7540, n=2) | |
| KFA2 GeForce RTX 4060 Ti EX, 16GB GDDR6 | |
| Media NVIDIA GeForce RTX 4060 Ti 8G (6419 - 6929, n=4) | |
| XFX Speedster QICK 308 Radeon RX 7600 Black Edition | |
| Media NVIDIA Titan RTX (4944 - 5440, n=3) | |
| KFA2 GeForce RTX 4060 1-Click-OC 2X | |
| ComputeMark v2.1 / Normal, Fluid 2DTexArr | |
| AMD Radeon RX 7900 XTX | |
| NVIDIA GeForce RTX 4090 Founders Edition | |
| AMD Radeon RX 7900 XT | |
| Gigabyte GeForce RTX 4080 Super Gaming OC | |
| NVIDIA GeForce RTX 4080 Founders Edition | |
| Media della classe Desktop (188 - 8647, n=44, ultimi 2 anni) | |
| Asus TUF Gaming GeForce RTX 4070 Ti Super | |
| Media NVIDIA GeForce RTX 3080 Ti (4453 - 4546, n=4) | |
| AMD Radeon RX 7800 XT | |
| Media NVIDIA GeForce RTX 3090 (4344 - 4608, n=11) | |
| Media NVIDIA GeForce RTX 3080 (4087 - 4159, n=2) | |
| Media NVIDIA Titan RTX (3691 - 3828, n=3) | |
| Media NVIDIA GeForce RTX 4070 Ti (3539 - 3724, n=5) | |
| Gigabyte GeForce RTX 4070 Super Gaming OC 12G | |
| NVIDIA GeForce RTX 4070 Super Founders Edition | |
| Gigabyte Aorus GeForce RTX 4070 Ti Master | |
| Asus TUF Gaming GeForce RTX 4070 Ti | |
| Zotac Gaming GeForce RTX 4070 AMP Airo | |
| Sapphire Pulse Radeon RX 7700 XT | |
| KFA2 GeForce RTX 4060 Ti EX, 16GB GDDR6 | |
| Media NVIDIA GeForce RTX 4060 Ti 8G (1924 - 2060, n=4) | |
| KFA2 GeForce RTX 4060 1-Click-OC 2X | |
| XFX Speedster QICK 308 Radeon RX 7600 Black Edition | |
| ComputeMark v2.1 / Normal, Fluid 3DTex | |
| NVIDIA GeForce RTX 4090 Founders Edition | |
| AMD Radeon RX 7900 XTX | |
| Media della classe Desktop (222 - 18731, n=44, ultimi 2 anni) | |
| AMD Radeon RX 7900 XT | |
| Gigabyte GeForce RTX 4080 Super Gaming OC | |
| NVIDIA GeForce RTX 4080 Founders Edition | |
| Media NVIDIA GeForce RTX 3090 (5246 - 5520, n=11) | |
| Media NVIDIA GeForce RTX 3080 Ti (5312 - 5422, n=4) | |
| Asus TUF Gaming GeForce RTX 4070 Ti Super | |
| AMD Radeon RX 7800 XT | |
| Media NVIDIA GeForce RTX 3080 (4417 - 4450, n=2) | |
| Media NVIDIA Titan RTX (3877 - 4027, n=3) | |
| Media NVIDIA GeForce RTX 4070 Ti (3616 - 3789, n=5) | |
| Gigabyte Aorus GeForce RTX 4070 Ti Master | |
| NVIDIA GeForce RTX 4070 Super Founders Edition | |
| Asus TUF Gaming GeForce RTX 4070 Ti | |
| Gigabyte GeForce RTX 4070 Super Gaming OC 12G | |
| Zotac Gaming GeForce RTX 4070 AMP Airo | |
| Sapphire Pulse Radeon RX 7700 XT | |
| KFA2 GeForce RTX 4060 Ti EX, 16GB GDDR6 | |
| Media NVIDIA GeForce RTX 4060 Ti 8G (1962 - 2090, n=4) | |
| KFA2 GeForce RTX 4060 1-Click-OC 2X | |
| XFX Speedster QICK 308 Radeon RX 7600 Black Edition | |
Blender: v3.3 Classroom CUDA | v3.3 Classroom OPTIX/RTX
LuxMark v2.0 64Bit: Room GPUs-only | Sala GPUs-only
ComputeMark v2.1: 1024x600 Normal, Score | 1024x600 Normal, QJuliaRayTrace | 1024x600 Normal, Mandel Scalar | 1024x600 Normal, Mandel Vector | 1024x600 Normal, Fluid 2DTexArr | 1024x600 Normal, Fluid 3DTex
* ... Meglio usare valori piccoli
Prestazioni di gioco: RX 7900 XTX è in vantaggio in raster
Mentre la RTX 4090 rimane ancora la GPU più ambita a due anni dal suo lancio, la nuova RTX 4080 Super è l'offerta di punta mainstream di Nvidia per i giocatori.
La RTX 4080 Super Gaming OC è superiore del 12% rispetto alla RTX 4080 FE nei test di gioco cumulativi a 1080p, 1440p e 4K Ultra, mentre batte la RTX 3090 media del 28%.
La RX 7900 XTX ha ancora un vantaggio del 4% sulla RTX 4080 Super Gaming OC, nonostante quest'ultima mostri buoni guadagni in F1 22, Borderlands 3e Final Fantasy XV.
La RTX 4080 Super è in grado di raggiungere 100 fps in molti titoli AAA a 4K Ultra. L'uso di upscaler come DLSS, FSR e XeSS è consigliato per un'esperienza di gioco più fluida nei titoli moderni ad alto contenuto di texture, tra cui Cyberpunk 2077 2.0 Phantom Libertyalan Wake 2 e Avatar: Frontiers of Pandora.
The Witcher 3: 3840x2160 Ultra Graphics & Postprocessing (HBAO+) | 3840x2160 High Graphics & Postprocessing (Nvidia HairWorks Off) | 1920x1080 Ultra Graphics & Postprocessing (HBAO+)
Metro Exodus: 3840x2160 Ultra Quality AF:16x | 2560x1440 Ultra Quality AF:16x | 1920x1080 Ultra Quality AF:16x
Control: 3840x2160 High Quality Preset | 2560x1440 High Quality Preset | 1920x1080 High Quality Preset
Borderlands 3: 3840x2160 Badass Overall Quality (DX11) | 2560x1440 Badass Overall Quality (DX11) | 1920x1080 Badass Overall Quality (DX11)
Shadow of the Tomb Raider: 3840x2160 Highest Preset AA:T | 2560x1440 Highest Preset AA:T | 1920x1080 Highest Preset AA:T
F1 22: 3840x2160 Ultra High Preset AA:T AF:16x | 2560x1440 Ultra High Preset AA:T AF:16x | 1920x1080 Ultra High Preset AA:T AF:16x
Final Fantasy XV Benchmark: 3840x2160 High Quality | 2560x1440 High Quality | 1920x1080 High Quality
| Performance rating | |
| NVIDIA GeForce RTX 4090 Founders Edition | |
| AMD Radeon RX 7900 XTX | |
| Gigabyte GeForce RTX 4080 Super Gaming OC | |
| AMD Radeon RX 7900 XT | |
| NVIDIA GeForce RTX 4080 Founders Edition | |
| Asus TUF Gaming GeForce RTX 4070 Ti Super -1! | |
| Asus TUF Gaming GeForce RTX 4070 Ti | |
| Gigabyte Aorus GeForce RTX 4070 Ti Master | |
| Media NVIDIA GeForce RTX 4070 Ti | |
| Gigabyte GeForce RTX 4070 Super Gaming OC 12G | |
| Media NVIDIA GeForce RTX 3080 Ti | |
| Media NVIDIA GeForce RTX 3090 | |
| NVIDIA GeForce RTX 4070 Super Founders Edition | |
| AMD Radeon RX 7800 XT | |
| Zotac Gaming GeForce RTX 4070 AMP Airo | |
| Media NVIDIA GeForce RTX 3080 | |
| Sapphire Pulse Radeon RX 7700 XT | |
| Media NVIDIA Titan RTX | |
| Media NVIDIA GeForce RTX 4060 Ti 8G | |
| KFA2 GeForce RTX 4060 Ti EX, 16GB GDDR6 | |
| KFA2 GeForce RTX 4060 1-Click-OC 2X | |
| XFX Speedster QICK 308 Radeon RX 7600 Black Edition | |
| The Witcher 3 / Ultra Graphics & Postprocessing (HBAO+) | |
| NVIDIA GeForce RTX 4090 Founders Edition | |
| AMD Radeon RX 7900 XTX | |
| Gigabyte GeForce RTX 4080 Super Gaming OC | |
| NVIDIA GeForce RTX 4080 Founders Edition | |
| AMD Radeon RX 7900 XT | |
| Asus TUF Gaming GeForce RTX 4070 Ti Super | |
| Asus TUF Gaming GeForce RTX 4070 Ti | |
| Media NVIDIA GeForce RTX 4070 Ti (92.4 - 98.3, n=4) | |
| Media NVIDIA GeForce RTX 3080 Ti (93.1 - 96.4, n=4) | |
| Gigabyte Aorus GeForce RTX 4070 Ti Master | |
| Media NVIDIA GeForce RTX 3090 (85.4 - 98.5, n=10) | |
| Gigabyte GeForce RTX 4070 Super Gaming OC 12G | |
| NVIDIA GeForce RTX 4070 Super Founders Edition | |
| Media NVIDIA GeForce RTX 3080 (78 - 85.7, n=2) | |
| AMD Radeon RX 7800 XT | |
| Zotac Gaming GeForce RTX 4070 AMP Airo | |
| Media NVIDIA Titan RTX (n=1) | |
| Sapphire Pulse Radeon RX 7700 XT | |
| Media NVIDIA GeForce RTX 4060 Ti 8G (53.9 - 54.3, n=3) | |
| KFA2 GeForce RTX 4060 Ti EX, 16GB GDDR6 | |
| XFX Speedster QICK 308 Radeon RX 7600 Black Edition | |
| KFA2 GeForce RTX 4060 1-Click-OC 2X | |
| The Witcher 3 / High Graphics & Postprocessing (Nvidia HairWorks Off) | |
| NVIDIA GeForce RTX 4090 Founders Edition | |
| Gigabyte GeForce RTX 4080 Super Gaming OC | |
| NVIDIA GeForce RTX 4080 Founders Edition | |
| AMD Radeon RX 7900 XTX | |
| AMD Radeon RX 7900 XT | |
| Media NVIDIA GeForce RTX 3080 Ti (149 - 156.8, n=4) | |
| Media NVIDIA GeForce RTX 3090 (128 - 160.2, n=14) | |
| Asus TUF Gaming GeForce RTX 4070 Ti | |
| Gigabyte Aorus GeForce RTX 4070 Ti Master | |
| Media NVIDIA GeForce RTX 4070 Ti (143 - 151.9, n=4) | |
| Gigabyte GeForce RTX 4070 Super Gaming OC 12G | |
| NVIDIA GeForce RTX 4070 Super Founders Edition | |
| Zotac Gaming GeForce RTX 4070 AMP Airo | |
| Media NVIDIA GeForce RTX 3080 (114 - 115, n=2) | |
| AMD Radeon RX 7800 XT | |
| Media NVIDIA Titan RTX (94 - 107.1, n=28) | |
| Sapphire Pulse Radeon RX 7700 XT | |
| Media NVIDIA GeForce RTX 4060 Ti 8G (78.5 - 80.4, n=3) | |
| KFA2 GeForce RTX 4060 Ti EX, 16GB GDDR6 | |
| KFA2 GeForce RTX 4060 1-Click-OC 2X | |
| XFX Speedster QICK 308 Radeon RX 7600 Black Edition | |
| The Witcher 3 / Ultra Graphics & Postprocessing (HBAO+) | |
| NVIDIA GeForce RTX 4090 Founders Edition | |
| AMD Radeon RX 7900 XTX | |
| AMD Radeon RX 7900 XT | |
| NVIDIA GeForce RTX 4080 Founders Edition | |
| Gigabyte GeForce RTX 4080 Super Gaming OC | |
| Asus TUF Gaming GeForce RTX 4070 Ti | |
| Media NVIDIA GeForce RTX 4070 Ti (217 - 230, n=5) | |
| Gigabyte Aorus GeForce RTX 4070 Ti Master | |
| Asus TUF Gaming GeForce RTX 4070 Ti Super | |
| Gigabyte GeForce RTX 4070 Super Gaming OC 12G | |
| NVIDIA GeForce RTX 4070 Super Founders Edition | |
| AMD Radeon RX 7800 XT | |
| Media NVIDIA GeForce RTX 3090 (160 - 192.6, n=18) | |
| Media NVIDIA GeForce RTX 3080 Ti (174 - 184.6, n=4) | |
| Zotac Gaming GeForce RTX 4070 AMP Airo | |
| Sapphire Pulse Radeon RX 7700 XT | |
| Media NVIDIA GeForce RTX 3080 (145 - 152, n=2) | |
| Media NVIDIA GeForce RTX 4060 Ti 8G (134.1 - 140.6, n=4) | |
| Media NVIDIA Titan RTX (124 - 150, n=28) | |
| KFA2 GeForce RTX 4060 Ti EX, 16GB GDDR6 | |
| XFX Speedster QICK 308 Radeon RX 7600 Black Edition | |
| KFA2 GeForce RTX 4060 1-Click-OC 2X | |
| Metro Exodus / Ultra Quality | |
| NVIDIA GeForce RTX 4090 Founders Edition | |
| AMD Radeon RX 7900 XTX | |
| Gigabyte GeForce RTX 4080 Super Gaming OC | |
| NVIDIA GeForce RTX 4080 Founders Edition | |
| AMD Radeon RX 7900 XT | |
| Gigabyte Aorus GeForce RTX 4070 Ti Master | |
| Asus TUF Gaming GeForce RTX 4070 Ti | |
| Asus TUF Gaming GeForce RTX 4070 Ti Super | |
| Media NVIDIA GeForce RTX 4070 Ti (81.2 - 85, n=4) | |
| Gigabyte GeForce RTX 4070 Super Gaming OC 12G | |
| Media NVIDIA GeForce RTX 3080 Ti (74.2 - 77.1, n=4) | |
| Media NVIDIA GeForce RTX 3090 (70.6 - 77.3, n=12) | |
| NVIDIA GeForce RTX 4070 Super Founders Edition | |
| AMD Radeon RX 7800 XT | |
| Zotac Gaming GeForce RTX 4070 AMP Airo | |
| Media NVIDIA GeForce RTX 3080 (64.1 - 65.9, n=2) | |
| Sapphire Pulse Radeon RX 7700 XT | |
| Media NVIDIA Titan RTX (51.3 - 57.9, n=27) | |
| Media NVIDIA GeForce RTX 4060 Ti 8G (48.4 - 49.3, n=3) | |
| KFA2 GeForce RTX 4060 Ti EX, 16GB GDDR6 | |
| KFA2 GeForce RTX 4060 1-Click-OC 2X | |
| XFX Speedster QICK 308 Radeon RX 7600 Black Edition | |
| Metro Exodus / Ultra Quality | |
| NVIDIA GeForce RTX 4090 Founders Edition | |
| AMD Radeon RX 7900 XTX | |
| Gigabyte GeForce RTX 4080 Super Gaming OC | |
| AMD Radeon RX 7900 XT | |
| Gigabyte Aorus GeForce RTX 4070 Ti Master | |
| Asus TUF Gaming GeForce RTX 4070 Ti | |
| Asus TUF Gaming GeForce RTX 4070 Ti Super | |
| Media NVIDIA GeForce RTX 4070 Ti (126.7 - 132.3, n=4) | |
| NVIDIA GeForce RTX 4080 Founders Edition | |
| Gigabyte GeForce RTX 4070 Super Gaming OC 12G | |
| NVIDIA GeForce RTX 4070 Super Founders Edition | |
| Media NVIDIA GeForce RTX 3080 Ti (110 - 118, n=4) | |
| Media NVIDIA GeForce RTX 3090 (102 - 118.2, n=12) | |
| Zotac Gaming GeForce RTX 4070 AMP Airo | |
| AMD Radeon RX 7800 XT | |
| Media NVIDIA GeForce RTX 3080 (92.2 - 97.4, n=2) | |
| Sapphire Pulse Radeon RX 7700 XT | |
| Media NVIDIA Titan RTX (69 - 92.9, n=26) | |
| Media NVIDIA GeForce RTX 4060 Ti 8G (78.9 - 80.1, n=3) | |
| KFA2 GeForce RTX 4060 Ti EX, 16GB GDDR6 | |
| XFX Speedster QICK 308 Radeon RX 7600 Black Edition | |
| KFA2 GeForce RTX 4060 1-Click-OC 2X | |
| Metro Exodus / Ultra Quality | |
| NVIDIA GeForce RTX 4090 Founders Edition | |
| AMD Radeon RX 7900 XTX | |
| Gigabyte GeForce RTX 4080 Super Gaming OC | |
| AMD Radeon RX 7900 XT | |
| Asus TUF Gaming GeForce RTX 4070 Ti | |
| Gigabyte Aorus GeForce RTX 4070 Ti Master | |
| Media NVIDIA GeForce RTX 4070 Ti (155.6 - 161.4, n=4) | |
| Asus TUF Gaming GeForce RTX 4070 Ti Super | |
| Gigabyte GeForce RTX 4070 Super Gaming OC 12G | |
| NVIDIA GeForce RTX 4080 Founders Edition | |
| NVIDIA GeForce RTX 4070 Super Founders Edition | |
| Media NVIDIA GeForce RTX 3080 Ti (131 - 144.2, n=5) | |
| Media NVIDIA GeForce RTX 3090 (108 - 145, n=12) | |
| Zotac Gaming GeForce RTX 4070 AMP Airo | |
| AMD Radeon RX 7800 XT | |
| Sapphire Pulse Radeon RX 7700 XT | |
| Media NVIDIA GeForce RTX 3080 (111 - 116, n=2) | |
| Media NVIDIA Titan RTX (73 - 116, n=27) | |
| Media NVIDIA GeForce RTX 4060 Ti 8G (100.6 - 101.8, n=3) | |
| KFA2 GeForce RTX 4060 Ti EX, 16GB GDDR6 | |
| XFX Speedster QICK 308 Radeon RX 7600 Black Edition | |
| KFA2 GeForce RTX 4060 1-Click-OC 2X | |
| Control / High Quality Preset | |
| NVIDIA GeForce RTX 4090 Founders Edition | |
| AMD Radeon RX 7900 XTX | |
| Gigabyte GeForce RTX 4080 Super Gaming OC | |
| AMD Radeon RX 7900 XT | |
| NVIDIA GeForce RTX 4080 Founders Edition | |
| Asus TUF Gaming GeForce RTX 4070 Ti Super | |
| Media NVIDIA GeForce RTX 4070 Ti (63.8 - 66.2, n=4) | |
| Asus TUF Gaming GeForce RTX 4070 Ti | |
| Gigabyte Aorus GeForce RTX 4070 Ti Master | |
| Media NVIDIA GeForce RTX 3080 Ti (63.9 - 64.9, n=3) | |
| Media NVIDIA GeForce RTX 3090 (61.3 - 66, n=5) | |
| AMD Radeon RX 7800 XT | |
| Gigabyte GeForce RTX 4070 Super Gaming OC 12G | |
| NVIDIA GeForce RTX 4070 Super Founders Edition | |
| Media NVIDIA GeForce RTX 3080 (56.2 - 56.7, n=2) | |
| Zotac Gaming GeForce RTX 4070 AMP Airo | |
| Media NVIDIA Titan RTX (45.2 - 47.3, n=3) | |
| Sapphire Pulse Radeon RX 7700 XT | |
| KFA2 GeForce RTX 4060 Ti EX, 16GB GDDR6 | |
| Media NVIDIA GeForce RTX 4060 Ti 8G (34.3 - 37.3, n=3) | |
| XFX Speedster QICK 308 Radeon RX 7600 Black Edition | |
| KFA2 GeForce RTX 4060 1-Click-OC 2X | |
| Control / High Quality Preset | |
| NVIDIA GeForce RTX 4090 Founders Edition | |
| AMD Radeon RX 7900 XTX | |
| AMD Radeon RX 7900 XT | |
| Gigabyte GeForce RTX 4080 Super Gaming OC | |
| Asus TUF Gaming GeForce RTX 4070 Ti | |
| Gigabyte Aorus GeForce RTX 4070 Ti Master | |
| Asus TUF Gaming GeForce RTX 4070 Ti Super | |
| Media NVIDIA GeForce RTX 3080 Ti (122 - 125.5, n=3) | |
| Media NVIDIA GeForce RTX 4070 Ti (100 - 130.6, n=4) | |
| Media NVIDIA GeForce RTX 3090 (115.8 - 123.7, n=5) | |
| AMD Radeon RX 7800 XT | |
| NVIDIA GeForce RTX 4080 Founders Edition | |
| Gigabyte GeForce RTX 4070 Super Gaming OC 12G | |
| NVIDIA GeForce RTX 4070 Super Founders Edition | |
| Media NVIDIA GeForce RTX 3080 (105 - 106, n=2) | |
| Zotac Gaming GeForce RTX 4070 AMP Airo | |
| Sapphire Pulse Radeon RX 7700 XT | |
| Media NVIDIA Titan RTX (89 - 93.6, n=3) | |
| Media NVIDIA GeForce RTX 4060 Ti 8G (69.2 - 75.3, n=3) | |
| KFA2 GeForce RTX 4060 Ti EX, 16GB GDDR6 | |
| XFX Speedster QICK 308 Radeon RX 7600 Black Edition | |
| KFA2 GeForce RTX 4060 1-Click-OC 2X | |
| Control / High Quality Preset | |
| AMD Radeon RX 7900 XTX | |
| NVIDIA GeForce RTX 4090 Founders Edition | |
| AMD Radeon RX 7900 XT | |
| Gigabyte GeForce RTX 4080 Super Gaming OC | |
| Asus TUF Gaming GeForce RTX 4070 Ti | |
| Gigabyte Aorus GeForce RTX 4070 Ti Master | |
| Media NVIDIA GeForce RTX 4070 Ti (196.6 - 202, n=4) | |
| Asus TUF Gaming GeForce RTX 4070 Ti Super | |
| AMD Radeon RX 7800 XT | |
| Media NVIDIA GeForce RTX 3080 Ti (181 - 190.7, n=3) | |
| Gigabyte GeForce RTX 4070 Super Gaming OC 12G | |
| Media NVIDIA GeForce RTX 3090 (172.2 - 189.2, n=5) | |
| NVIDIA GeForce RTX 4070 Super Founders Edition | |
| NVIDIA GeForce RTX 4080 Founders Edition | |
| Zotac Gaming GeForce RTX 4070 AMP Airo | |
| Sapphire Pulse Radeon RX 7700 XT | |
| Media NVIDIA GeForce RTX 3080 (151 - 155, n=2) | |
| Media NVIDIA Titan RTX (135 - 141.9, n=3) | |
| Media NVIDIA GeForce RTX 4060 Ti 8G (115.7 - 120.2, n=3) | |
| KFA2 GeForce RTX 4060 Ti EX, 16GB GDDR6 | |
| XFX Speedster QICK 308 Radeon RX 7600 Black Edition | |
| KFA2 GeForce RTX 4060 1-Click-OC 2X | |
| Borderlands 3 / Badass Overall Quality (DX11) | |
| NVIDIA GeForce RTX 4090 Founders Edition | |
| Gigabyte GeForce RTX 4080 Super Gaming OC | |
| NVIDIA GeForce RTX 4080 Founders Edition | |
| AMD Radeon RX 7900 XTX | |
| Asus TUF Gaming GeForce RTX 4070 Ti Super | |
| Gigabyte Aorus GeForce RTX 4070 Ti Master | |
| AMD Radeon RX 7900 XT | |
| Asus TUF Gaming GeForce RTX 4070 Ti | |
| Media NVIDIA GeForce RTX 4070 Ti (71.9 - 74.9, n=4) | |
| Media NVIDIA GeForce RTX 3090 (68 - 75.3, n=13) | |
| Media NVIDIA GeForce RTX 3080 Ti (71.2 - 74, n=4) | |
| Gigabyte GeForce RTX 4070 Super Gaming OC 12G | |
| NVIDIA GeForce RTX 4070 Super Founders Edition | |
| Media NVIDIA GeForce RTX 3080 (61.5 - 61.9, n=2) | |
| Zotac Gaming GeForce RTX 4070 AMP Airo | |
| AMD Radeon RX 7800 XT | |
| Sapphire Pulse Radeon RX 7700 XT | |
| Media NVIDIA Titan RTX (46 - 52.8, n=29) | |
| Media NVIDIA GeForce RTX 4060 Ti 8G (43.1 - 43.7, n=3) | |
| KFA2 GeForce RTX 4060 Ti EX, 16GB GDDR6 | |
| XFX Speedster QICK 308 Radeon RX 7600 Black Edition | |
| KFA2 GeForce RTX 4060 1-Click-OC 2X | |
| Borderlands 3 / Badass Overall Quality (DX11) | |
| NVIDIA GeForce RTX 4090 Founders Edition | |
| Gigabyte GeForce RTX 4080 Super Gaming OC | |
| NVIDIA GeForce RTX 4080 Founders Edition | |
| AMD Radeon RX 7900 XTX | |
| Asus TUF Gaming GeForce RTX 4070 Ti Super | |
| Gigabyte Aorus GeForce RTX 4070 Ti Master | |
| Asus TUF Gaming GeForce RTX 4070 Ti | |
| Media NVIDIA GeForce RTX 4070 Ti (134.3 - 142, n=4) | |
| AMD Radeon RX 7900 XT | |
| Gigabyte GeForce RTX 4070 Super Gaming OC 12G | |
| NVIDIA GeForce RTX 4070 Super Founders Edition | |
| Media NVIDIA GeForce RTX 3080 Ti (114 - 130.2, n=4) | |
| Media NVIDIA GeForce RTX 3090 (105 - 131.6, n=13) | |
| Zotac Gaming GeForce RTX 4070 AMP Airo | |
| AMD Radeon RX 7800 XT | |
| Media NVIDIA GeForce RTX 3080 (95.7 - 103, n=2) | |
| Sapphire Pulse Radeon RX 7700 XT | |
| Media NVIDIA Titan RTX (74 - 93.1, n=29) | |
| Media NVIDIA GeForce RTX 4060 Ti 8G (83.9 - 85.2, n=3) | |
| KFA2 GeForce RTX 4060 Ti EX, 16GB GDDR6 | |
| XFX Speedster QICK 308 Radeon RX 7600 Black Edition | |
| KFA2 GeForce RTX 4060 1-Click-OC 2X | |
| Borderlands 3 / Badass Overall Quality (DX11) | |
| NVIDIA GeForce RTX 4090 Founders Edition | |
| Asus TUF Gaming GeForce RTX 4070 Ti | |
| Gigabyte GeForce RTX 4080 Super Gaming OC | |
| Gigabyte Aorus GeForce RTX 4070 Ti Master | |
| AMD Radeon RX 7900 XTX | |
| Media NVIDIA GeForce RTX 4070 Ti (171.4 - 186.9, n=4) | |
| NVIDIA GeForce RTX 4080 Founders Edition | |
| Asus TUF Gaming GeForce RTX 4070 Ti Super | |
| AMD Radeon RX 7900 XT | |
| Gigabyte GeForce RTX 4070 Super Gaming OC 12G | |
| NVIDIA GeForce RTX 4070 Super Founders Edition | |
| Zotac Gaming GeForce RTX 4070 AMP Airo | |
| Media NVIDIA GeForce RTX 3080 Ti (129 - 164.9, n=4) | |
| Media NVIDIA GeForce RTX 3090 (117 - 170.1, n=13) | |
| AMD Radeon RX 7800 XT | |
| Sapphire Pulse Radeon RX 7700 XT | |
| Media NVIDIA GeForce RTX 3080 (117 - 128, n=2) | |
| Media NVIDIA GeForce RTX 4060 Ti 8G (121.5 - 123.5, n=3) | |
| KFA2 GeForce RTX 4060 Ti EX, 16GB GDDR6 | |
| Media NVIDIA Titan RTX (77.2 - 128.7, n=29) | |
| XFX Speedster QICK 308 Radeon RX 7600 Black Edition | |
| KFA2 GeForce RTX 4060 1-Click-OC 2X | |
| Shadow of the Tomb Raider / Highest Preset | |
| NVIDIA GeForce RTX 4090 Founders Edition | |
| AMD Radeon RX 7900 XTX | |
| Gigabyte GeForce RTX 4080 Super Gaming OC | |
| NVIDIA GeForce RTX 4080 Founders Edition | |
| AMD Radeon RX 7900 XT | |
| Asus TUF Gaming GeForce RTX 4070 Ti Super | |
| Gigabyte Aorus GeForce RTX 4070 Ti Master | |
| Asus TUF Gaming GeForce RTX 4070 Ti | |
| Media NVIDIA GeForce RTX 4070 Ti (102.7 - 104.9, n=4) | |
| Gigabyte GeForce RTX 4070 Super Gaming OC 12G | |
| Media NVIDIA GeForce RTX 3090 (89.3 - 99.7, n=12) | |
| Media NVIDIA GeForce RTX 3080 Ti (93 - 98.6, n=3) | |
| NVIDIA GeForce RTX 4070 Super Founders Edition | |
| Media NVIDIA GeForce RTX 3080 (83.9 - 87.9, n=2) | |
| Zotac Gaming GeForce RTX 4070 AMP Airo | |
| AMD Radeon RX 7800 XT | |
| Media NVIDIA Titan RTX (59 - 71.1, n=24) | |
| Sapphire Pulse Radeon RX 7700 XT | |
| KFA2 GeForce RTX 4060 Ti EX, 16GB GDDR6 | |
| Media NVIDIA GeForce RTX 4060 Ti 8G (58.1 - 58.7, n=3) | |
| KFA2 GeForce RTX 4060 1-Click-OC 2X | |
| XFX Speedster QICK 308 Radeon RX 7600 Black Edition | |
| Shadow of the Tomb Raider / Highest Preset | |
| NVIDIA GeForce RTX 4090 Founders Edition | |
| AMD Radeon RX 7900 XTX | |
| Gigabyte GeForce RTX 4080 Super Gaming OC | |
| Asus TUF Gaming GeForce RTX 4070 Ti Super | |
| Gigabyte Aorus GeForce RTX 4070 Ti Master | |
| AMD Radeon RX 7900 XT | |
| Asus TUF Gaming GeForce RTX 4070 Ti | |
| Media NVIDIA GeForce RTX 4070 Ti (195.9 - 204, n=4) | |
| NVIDIA GeForce RTX 4080 Founders Edition | |
| Gigabyte GeForce RTX 4070 Super Gaming OC 12G | |
| Media NVIDIA GeForce RTX 3090 (137 - 172.3, n=12) | |
| NVIDIA GeForce RTX 4070 Super Founders Edition | |
| Media NVIDIA GeForce RTX 3080 Ti (157 - 173.3, n=3) | |
| Zotac Gaming GeForce RTX 4070 AMP Airo | |
| AMD Radeon RX 7800 XT | |
| Media NVIDIA GeForce RTX 3080 (147 - 152, n=2) | |
| Sapphire Pulse Radeon RX 7700 XT | |
| Media NVIDIA GeForce RTX 4060 Ti 8G (119.3 - 121.2, n=3) | |
| KFA2 GeForce RTX 4060 Ti EX, 16GB GDDR6 | |
| Media NVIDIA Titan RTX (98 - 128, n=23) | |
| KFA2 GeForce RTX 4060 1-Click-OC 2X | |
| XFX Speedster QICK 308 Radeon RX 7600 Black Edition | |
| Shadow of the Tomb Raider / Highest Preset | |
| NVIDIA GeForce RTX 4090 Founders Edition | |
| AMD Radeon RX 7900 XTX | |
| AMD Radeon RX 7900 XT | |
| Asus TUF Gaming GeForce RTX 4070 Ti | |
| Gigabyte Aorus GeForce RTX 4070 Ti Master | |
| Media NVIDIA GeForce RTX 4070 Ti (263 - 280, n=4) | |
| Gigabyte GeForce RTX 4080 Super Gaming OC | |
| Asus TUF Gaming GeForce RTX 4070 Ti Super | |
| Gigabyte GeForce RTX 4070 Super Gaming OC 12G | |
| NVIDIA GeForce RTX 4070 Super Founders Edition | |
| Zotac Gaming GeForce RTX 4070 AMP Airo | |
| NVIDIA GeForce RTX 4080 Founders Edition | |
| AMD Radeon RX 7800 XT | |
| Media NVIDIA GeForce RTX 3080 Ti (178 - 238, n=3) | |
| Media NVIDIA GeForce RTX 3090 (145 - 240, n=14) | |
| Sapphire Pulse Radeon RX 7700 XT | |
| KFA2 GeForce RTX 4060 Ti EX, 16GB GDDR6 | |
| Media NVIDIA GeForce RTX 4060 Ti 8G (181.6 - 184, n=3) | |
| Media NVIDIA GeForce RTX 3080 (177 - 185, n=2) | |
| Media NVIDIA Titan RTX (106 - 178.8, n=24) | |
| KFA2 GeForce RTX 4060 1-Click-OC 2X | |
| XFX Speedster QICK 308 Radeon RX 7600 Black Edition | |
The Witcher 3: 3840x2160 Ultra Graphics & Postprocessing (HBAO+) | 3840x2160 High Graphics & Postprocessing (Nvidia HairWorks Off) | 1920x1080 Ultra Graphics & Postprocessing (HBAO+)
Metro Exodus: 3840x2160 Ultra Quality AF:16x | 2560x1440 Ultra Quality AF:16x | 1920x1080 Ultra Quality AF:16x
Control: 3840x2160 High Quality Preset | 2560x1440 High Quality Preset | 1920x1080 High Quality Preset
Borderlands 3: 3840x2160 Badass Overall Quality (DX11) | 2560x1440 Badass Overall Quality (DX11) | 1920x1080 Badass Overall Quality (DX11)
Shadow of the Tomb Raider: 3840x2160 Highest Preset AA:T | 2560x1440 Highest Preset AA:T | 1920x1080 Highest Preset AA:T
F1 22: 3840x2160 Ultra High Preset AA:T AF:16x | 2560x1440 Ultra High Preset AA:T AF:16x | 1920x1080 Ultra High Preset AA:T AF:16x
Final Fantasy XV Benchmark: 3840x2160 High Quality | 2560x1440 High Quality | 1920x1080 High Quality
Prestazioni del Ray Tracing
Giochi come Metro Exodus (edizione non migliorata), Controle Far Cry 6 la RX 7900 XTX riesce a battere di poco la RTX 4080 Super Gaming OC nel ray tracing nativo a 1080p Ultra.
Detto questo, la RTX 4080 Super Gaming OC riesce a ottenere un vantaggio compreso tra il 3 e il 17% rispetto alla RTX 4080 FE nel ray tracing nativo a 1080p.
| Alan Wake 2 | |
| 3840x2160 High Preset + High Ray Tracing + Quality DLSS + FG | |
| Media della classe Desktop (26.2 - 152.7, n=18, ultimi 2 anni) | |
| Gigabyte GeForce RTX 4080 Super Gaming OC | |
| NVIDIA GeForce RTX 4080 Founders Edition | |
| Asus TUF Gaming GeForce RTX 4070 Ti Super | |
| Media NVIDIA GeForce RTX 4070 Ti (n=1) | |
| Gigabyte GeForce RTX 4070 Super Gaming OC 12G | |
| NVIDIA GeForce RTX 4070 Super Founders Edition | |
| Media NVIDIA GeForce RTX 4060 Ti 8G (n=1) | |
| 1920x1080 High Preset + High Ray Tracing | |
| Gigabyte GeForce RTX 4080 Super Gaming OC | |
| Asus TUF Gaming GeForce RTX 4070 Ti Super | |
| NVIDIA GeForce RTX 4080 Founders Edition | |
| Media NVIDIA GeForce RTX 4070 Ti (n=1) | |
| Media della classe Desktop (23.8 - 132.2, n=28, ultimi 2 anni) | |
| Gigabyte GeForce RTX 4070 Super Gaming OC 12G | |
| NVIDIA GeForce RTX 4070 Super Founders Edition | |
| Media NVIDIA GeForce RTX 3090 (44.6 - 52, n=3) | |
| Media NVIDIA GeForce RTX 4060 Ti 8G (n=1) | |
| Media NVIDIA Titan RTX (n=1) | |
| Sapphire Pulse Radeon RX 7700 XT | |
| XFX Speedster QICK 308 Radeon RX 7600 Black Edition | |
| basso | medio | alto | ultra | QHD | 4K DLSS | 4K FSR | 4K | |
|---|---|---|---|---|---|---|---|---|
| GTA V (2015) | 188.2 | 188 | 186.9 | 165.4 | 164.6 | 163.6 | ||
| The Witcher 3 (2015) | 470 | 241 | 196.2 | 186.4 | ||||
| Dota 2 Reborn (2015) | 273 | 245 | 236 | 222 | 214 | |||
| Final Fantasy XV Benchmark (2018) | 235 | 236 | 225 | 193.5 | 117.8 | |||
| X-Plane 11.11 (2018) | 236 | 207 | 154.9 | 132.2 | ||||
| Far Cry 5 (2018) | 206 | 202 | 193 | 134 | ||||
| Strange Brigade (2018) | 626 | 519 | 501 | 480 | 389 | 197.3 | ||
| Shadow of the Tomb Raider (2018) | 271 | 262 | 224 | 127.5 | ||||
| Metro Exodus (2019) | 203 | 169.4 | 144.9 | 97.7 | ||||
| Control (2019) | 221 | 206 | 145 | 86.4 | 76.5 | |||
| Borderlands 3 (2019) | 184.4 | 186.3 | 161.6 | 97.6 | ||||
| Mafia Definitive Edition (2020) | 248 | 232 | 202 | 111.4 | ||||
| Watch Dogs Legion (2020) | 149 | 144.5 | 127 | 80.5 | ||||
| Far Cry 6 (2021) | 212 | 194.4 | 179.8 | 162.8 | 99.3 | |||
| Dying Light 2 (2022) | 217 | 165.9 | 123.7 | 65 | ||||
| Cyberpunk 2077 1.6 (2022) | 209 | 208 | 198.4 | 187.8 | 127.9 | 63 | ||
| Ghostwire Tokyo (2022) | 299 | 298 | 247 | 120 | ||||
| F1 22 (2022) | 368 | 166.4 | 112.9 | 59.2 | ||||
| F1 23 (2023) | 393 | 165.4 | 108.3 | 94.5 | 54.5 | |||
| Baldur's Gate 3 (2023) | 245 | 237 | 232 | 186.8 | 160.7 | 97.6 | ||
| Cyberpunk 2077 (2023) | 197.5 | 198.3 | 186.9 | 173.8 | 121.7 | 55.6 | ||
| Assassin's Creed Mirage (2023) | 243 | 191 | 158 | 135 | 101 | |||
| Alan Wake 2 (2023) | 130.1 | 122.4 | 90.1 | 77.6 | 53.5 | |||
| Avatar Frontiers of Pandora (2023) | 158.9 | 128.8 | 90.1 | 81.1 | 48.4 | |||
| Skull & Bones (2024) | 205 | 172 | 137 | 114 | 105 | 101 | 78 |
Emissioni: Rumorosità più elevata, ma prestazioni relativamente senza acceleratore sotto stress
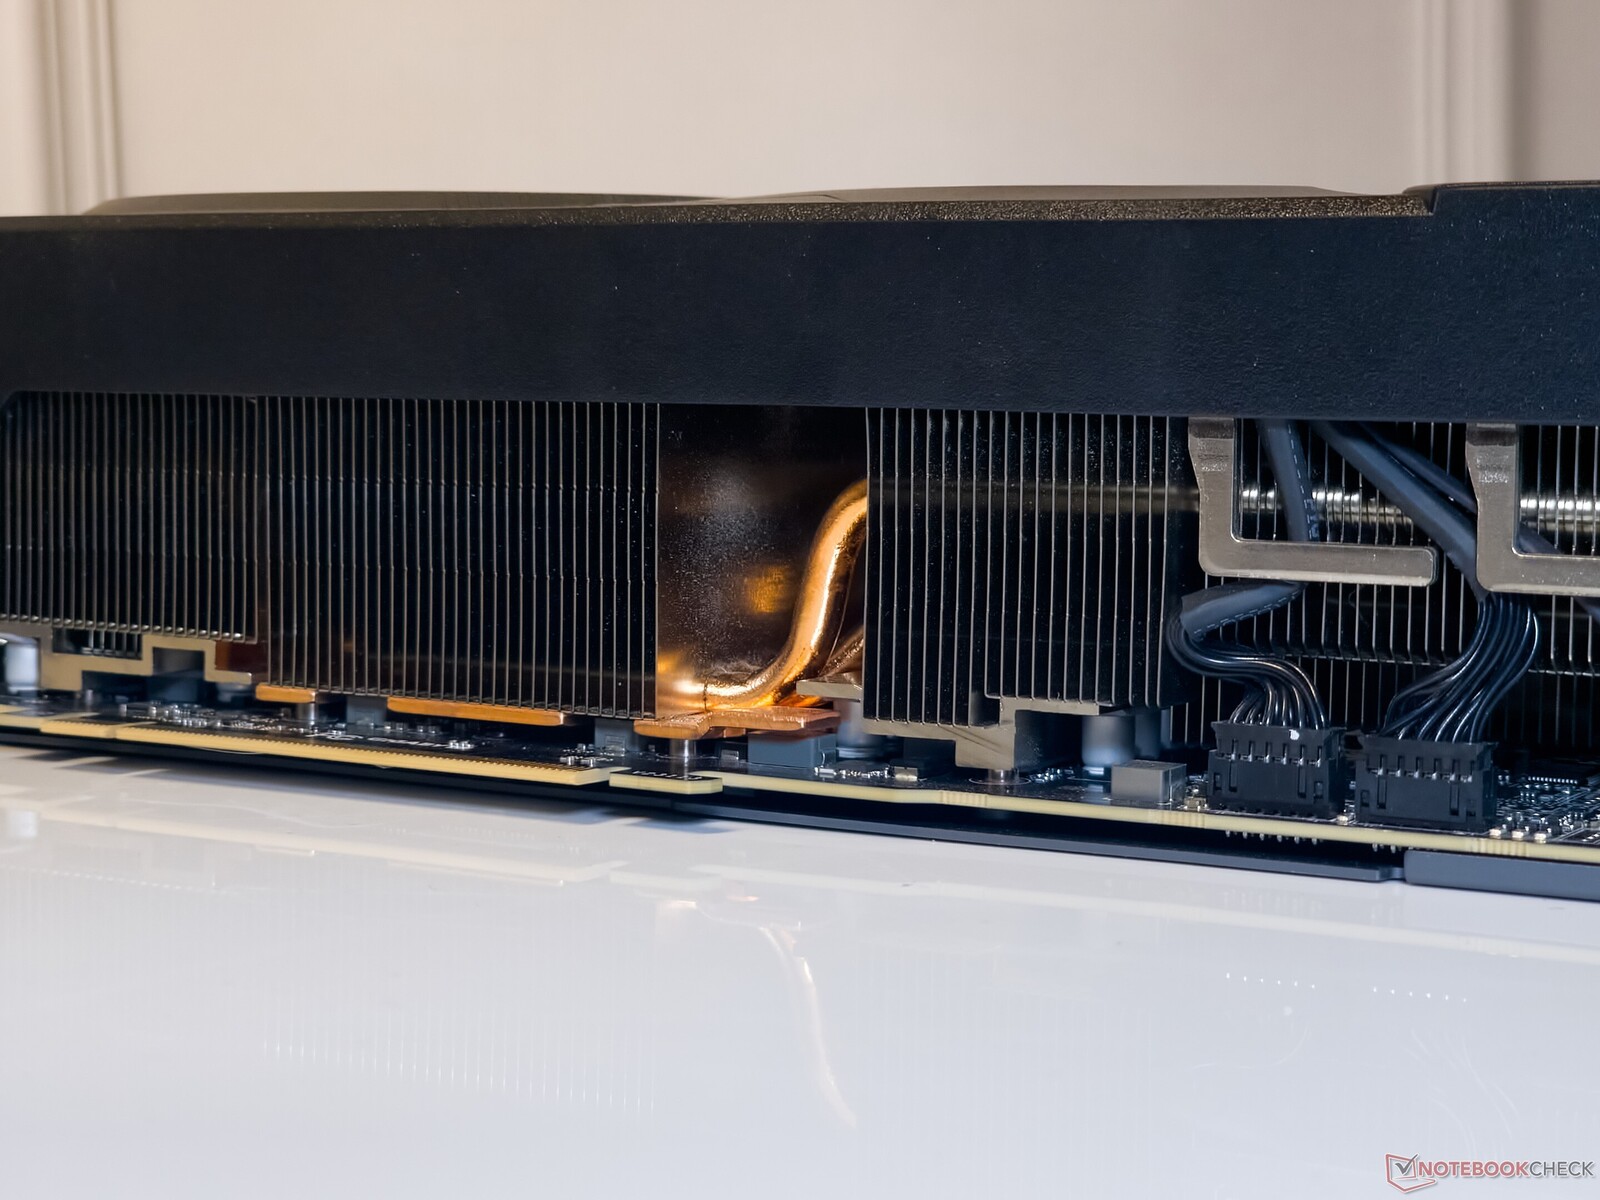
La RTX 4080 Super Gaming OC sfrutta il sistema di raffreddamento WindForce di Gigabyte, composto da tre ventole da 110 mm a rotazione alternata e nove heatpipes, oltre a una piastra di rame a contatto diretto.
Secondo Gigabyte, le ventole con cuscinetti a manicotto utilizzano un nano lubrificante al grafene che presumibilmente aiuta a prolungare la durata di vita, come le ventole con doppio cuscinetto a sfera.
La piastra posteriore in metallo presenta un'ampia apertura per lo scarico dell'aria che, di fatto, è un'estensione del dissipatore.
Test di stress
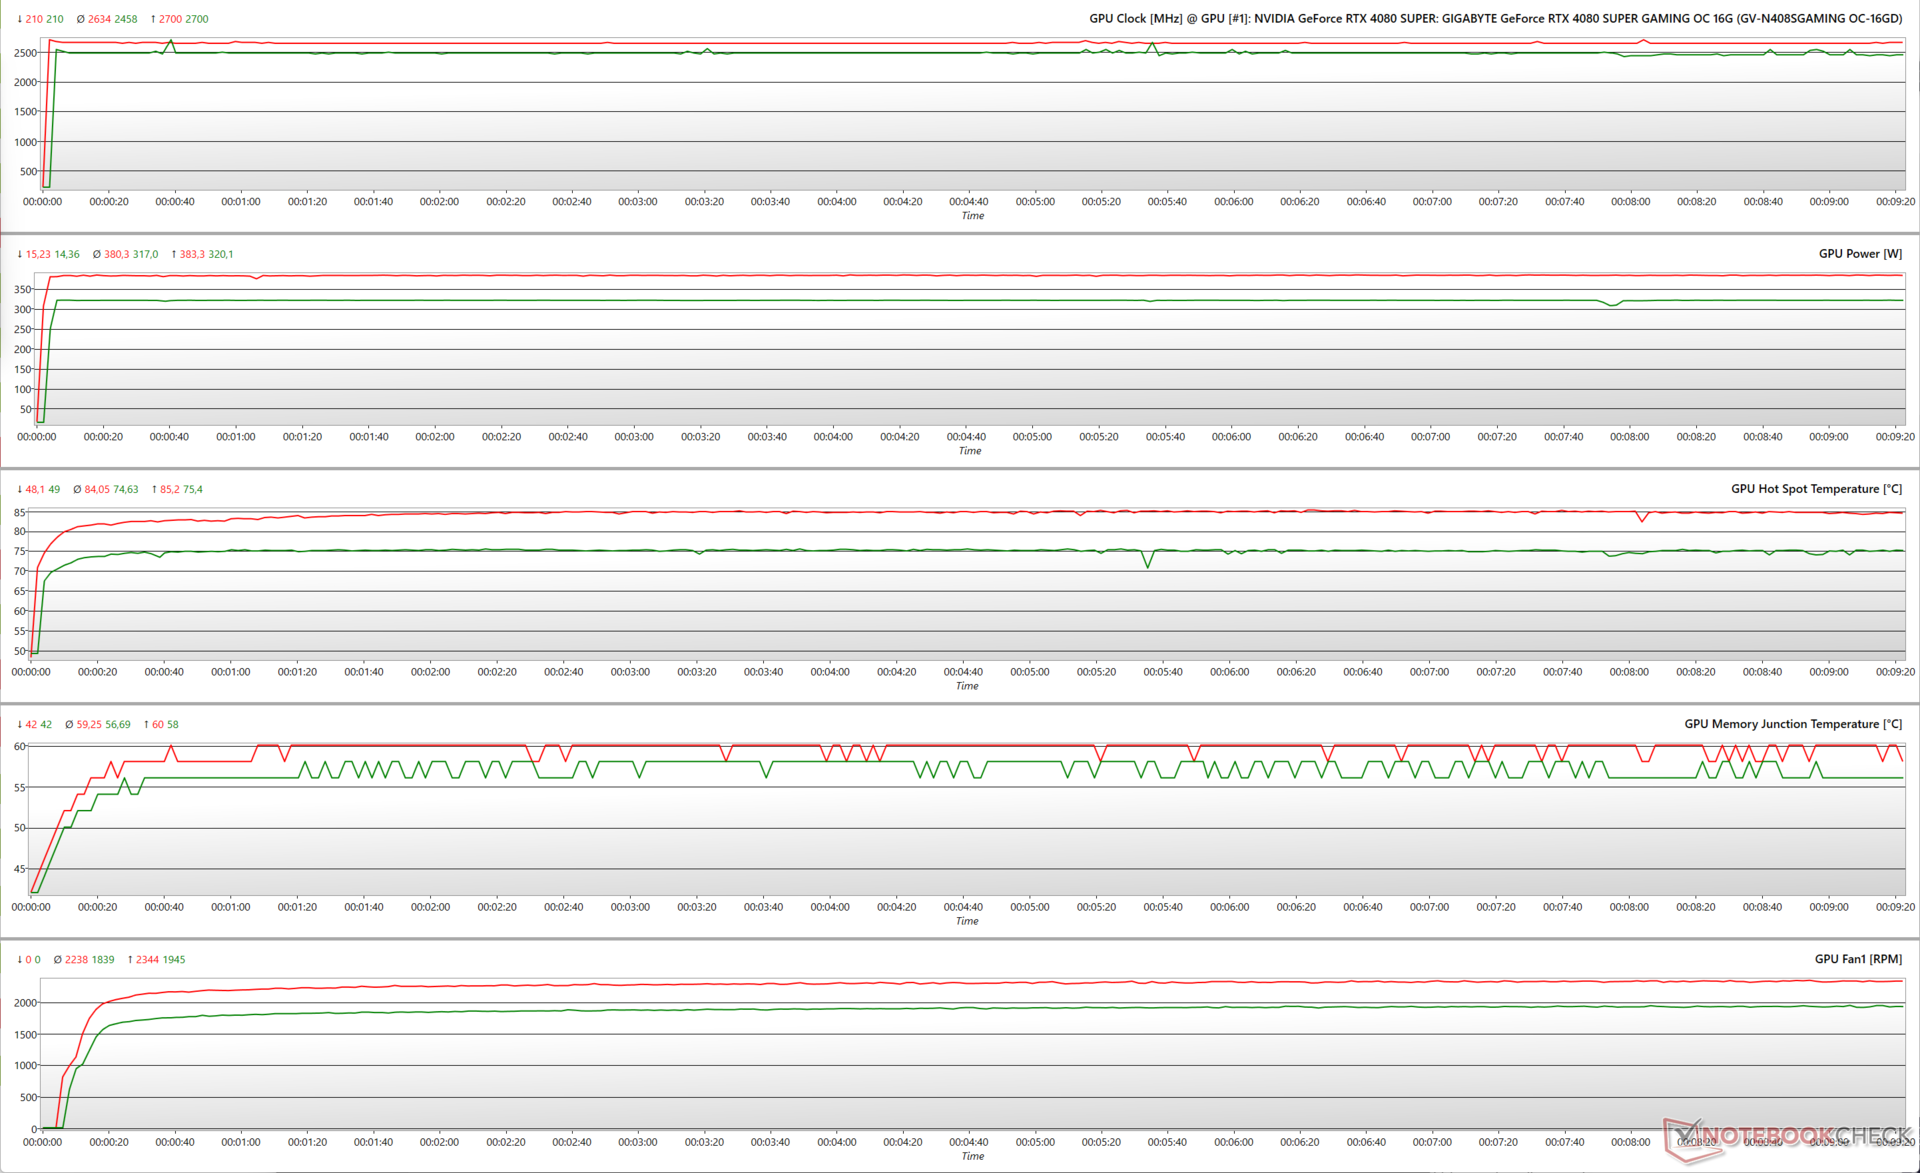
Stressando la RTX 4080 Super Gaming OC con FurMark (1.280 x 720, nessun AA), la GPU utilizza i 320 W TGP disponibili con un obiettivo di potenza del 100% (PT). Ciò si traduce in un boost clock medio di 2.458 MHz e in temperature hotspot vicine ai 75 °C.
Con un PT del 125%, la GPU è in grado di utilizzare solo 383 W dei 400 W teoricamente disponibili. Questo è stato osservato in precedenza anche con la RTX 4070 Super Gaming OC.
Vediamo che la GPU raggiunge un clock medio di 2.634 MHz, con la temperatura dell'hotspot che sale di conseguenza a 84°C.
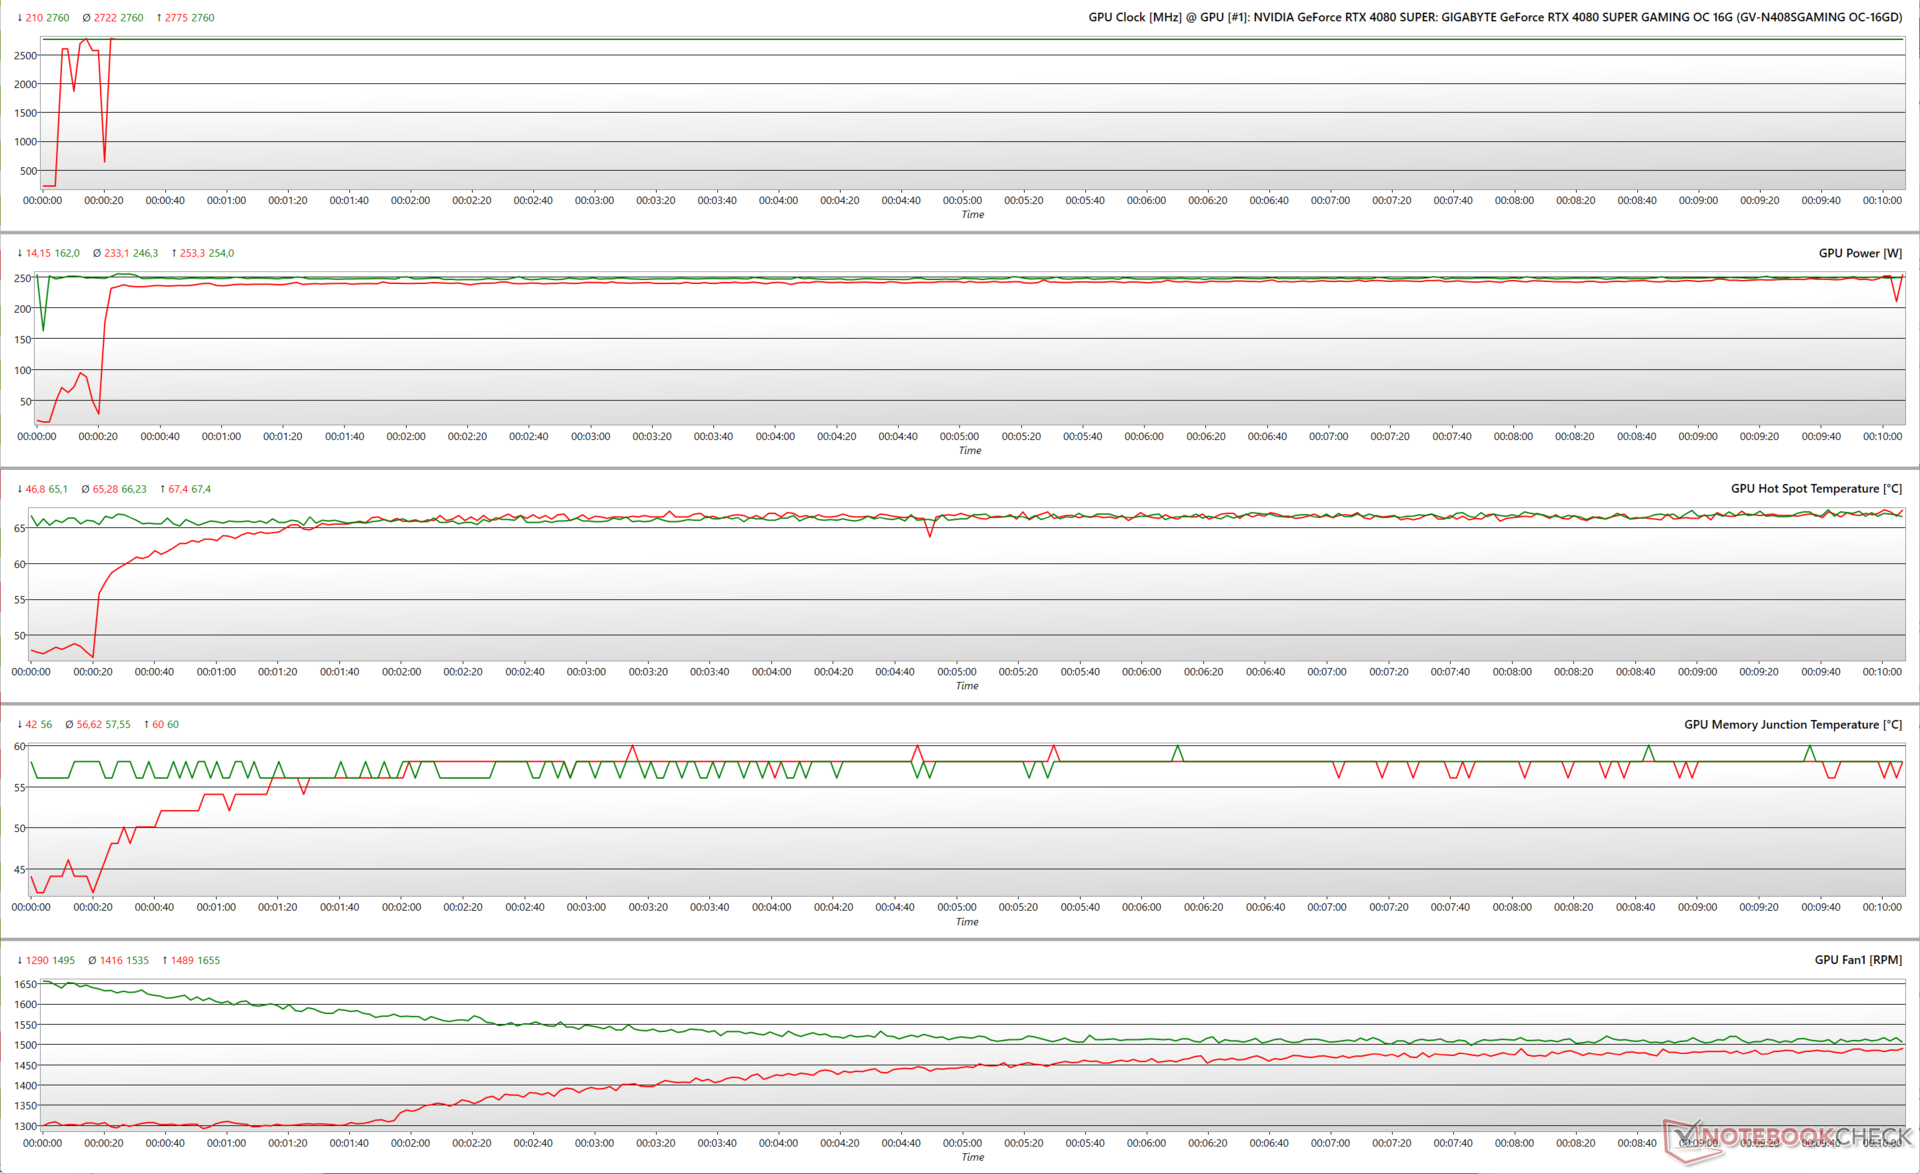
Quando si esegue Il Witcher 3 a 1080p Ultra, la RTX 4080 Super Gaming OC riesce a sostenere un clock costante di 2.760 MHz al 100% del PT, pur consumando 254 W.
Come di norma con le schede Ada, l'aumento del target di potenza nei carichi di lavoro di gioco non conferisce alcun beneficio apparente. Parametri come la velocità di clock, l'assorbimento di energia e le temperature hotspot sono identici nello stress di The Witcher 3 anche al 125% di PT.
Il grafico FPS di Witcher 3
Il sistema di raffreddamento WindForce di Gigabyte sembra funzionare bene per alleviare qualsiasi problema di throttling. Non abbiamo osservato alcun calo di fotogrammi durante lo stress test con The Witcher 3 a 1080p Ultra e 4K Ultra.
Temperature di superficie
Le temperature di superficie sotto carico sono per lo più tollerabili. A una temperatura ambiente di 23 °C, il rivestimento anteriore in plastica rimane relativamente fresco a 28,5 °C, mentre il pannello posteriore in metallo sfiora i 48 °C.
Anche la zona vicino al connettore 12VHPWR diventa piuttosto calda, raggiungendo i 50 °C.


Livelli di rumore
La RTX 4080 Super Gaming OC ha un profilo di rumore più forte rispetto a quello che abbiamo osservato in precedenza con la RTX 4070 Super Gaming OC.
Detto questo, le ventole si fermano completamente in idle e iniziano a girare solo dopo che la temperatura del nucleo tocca i 55 °C, come da curva predefinita delle ventole.
Gli utenti possono scegliere tra le modalità BIOS OC e Silent VBIOS, ma non abbiamo osservato differenze significative tra queste due durante i test. L'interruttore VBIOS sembra in realtà superfluo, dato che è possibile regolare facilmente le curve delle ventole a proprio piacimento nell'applicazione Gigabyte Control Center.
Tuttavia, abbiamo registrato un livello massimo di pressione sonora (SPL) di 54,21 dB(A) mentre stressavamo la GPU con FurMark in modalità BIOS OC con un PT del 125%.
I livelli di rumore durante il gioco con The Witcher 3 a 1080p Ultra sono rimasti sotto i 50 dB(A) SPL in tutte le modalità testate.
| Stress Test | Modalità VBIOS / Power Target | Velocità massima della ventola (RPM) Rumore della ventola dB A.Velocità della ventola (RPM) | Rumore della ventola dB(A) |
| FurMark 1280 x 720, senza AA | BIOS OC / 100% | 1.937 | 49,37 |
| FurMark 1280 x 720, senza AA | BIOS silenzioso / 100% | 1.997 | 50,09 |
| FurMark 1280 x 720, senza AA | BIOS OC / 125% | 2.326 | 54,21 |
| FurMark 1280 x 720, senza AA | BIOS silenzioso / 125% | 2.302 | 54,10 |
| Witcher 3 1080p Ultra | BIOS OC / 100% | 1.814 | 48,24 |
| Witcher 3 1080p Ultra | BIOS silenzioso / 100% | 1.801 | 48,66 |
| Witcher 3 1080p Ultra | BIOS OC / 125% | 1.866 | 49,29 |
| Witcher 3 1080p Ultra | BIOS silenzioso / 125% | 1.813 | 49,13 |
Gestione dell'energia: Paragonabile alla RTX 4080 FE al 100% del PT
La RTX 4080 Super Gaming OC non è la più parsimoniosa per quanto riguarda il consumo energetico, dato il potente die AD103, ma è comunque più economica del 20% rispetto alla RX 7900 XTX.
Il consumo energetico della scheda Gigabyte durante i test FurMark e The Witcher 3 è paragonabile a quello della RTX 4080 FE con un PT al 100%, pur essendo il 6% meno efficiente di quest'ultima.
I consumi energetici durante la riproduzione di The Witcher 3 a 1080p Ultra sono solo marginalmente più alti passando da un PT del 100% a uno del 125%, rispetto a un delta del 15% più percepibile in FurMark.
Power Consumption: External monitor
| 1280x720 FurMark 1.19 GPU Stress Test (external Monitor) | |
| 1920x1080 The Witcher 3 ultra (external Monitor) | |
* ... Meglio usare valori piccoli
Pro
Contro
Verdetto: guadagni incrementali con l'AD103 completo, a un prezzo di listino ridotto

Gigabyte GeForce RTX 4080 Super Gaming OC 16G sostituisce completamente il suo predecessore RTX 4080 a un prezzo inferiore, offrendo il 5% in più di shader, un boost nominale di 45 MHz e una memoria leggermente più veloce. Gigabyte ha mantenuto tutti gli aspetti familiari della variante di ultima generazione: un design a tre slot, una configurazione WindForce a tre ventole con nove heatpipes e un RGB decente.
Nel complesso, la scheda di Gigabyte riesce a superare di poco la RTX 4080 Founders Edition in termini di sintesi, in corrispondenza con l'aumento del numero di shader. I delta sono stati sorprendentemente più ampi nei test di gioco, ma i guadagni esatti, se ci sono, dipenderanno dal gioco stesso e dalla risoluzione a cui si gioca.
RTX 4090 Founders Edition (1.599 dollari su Best Buy) è ancora in testa alle classifiche, e Nvidia ha pochi incentivi a lanciare una RTX 4090 Ti o Super, dato che il Team Red sembra disinvolto nei confronti di qualsiasi tentativo di disturbare lo status quo dell'ammiraglia.
Gigabyte RTX 4080 Super Gaming OC 16G offre ottime prestazioni di gioco 4K che migliorano solo con il supporto delle nuove tecnologie DLSS. L'aumento di 50 dollari rispetto alla RTX 4080 Super FE non è del tutto sprecato, ma la AMD Radeon RX 7900 XTX è un'offerta altrettanto competente se vuole risparmiare un po' di più"
Sembra che Nvidia abbia giocato bene le sue carte (gioco di parole) riducendo l'MSRP della RTX 4080 FE di 200 dollari. Idealmente questo avrebbe dovuto essere il prezzo già nel 2022, ma c'è voluto un po' di tempo prima che arrivasse la AMD Radeon RX 7900 XTX (a partire da 926 dollari su Amazon) per offrire una parvenza di concorrenza.
Entrambe le schede sono ottime per i giochi ad alta frequenza di aggiornamento a 1440p e 4K 60 fps nativi, ma la RX 7900 XTX sembra essere una scelta migliore in termini di rapporto qualità-prezzo in questo segmento.
Tuttavia, la RTX 4080 Super Gaming OC presenta dei vantaggi che solo le schede Nvidia possono offrire al momento. Questi includono migliori prestazioni complessive di ray tracing, insieme al supporto delle tecnologie di generazione di fotogrammi DLSS 3 e di ricostruzione del raggio DLSS 3.5 e un'efficienza energetica notevolmente migliorata.
Gigabyte offre una serie di funzionalità decenti per il sovrapprezzo di 50 dollari, come un raffreddatore altamente capace, un doppio switch VBIOS, una buona estetica, staffe di supporto per evitare l'abbassamento della GPU e una garanzia di quattro anni.
Ma ha senso spendere mille dollari per una nuova GPU a questo punto? Forse no. La RTX 4070 Super di (a partire da 600 dollari su Amazon) è già in grado di giocare in 4K in modo decente con un po' di aiuto per l'upscaling, e potrebbe essere prudente aspettare e vedere cosa hanno da offrire le prossime GPU Nvidia Blackwell e AMD RDNA 4 nel corso dell'anno.
L'originale RTX 4080 non-Super è ufficialmente EoL'd, ma non è una cattiva idea andare a caccia di grandi occasioni nel suo mercato locale.
Prezzo e disponibilità
Gigabyte GeForce RTX 4080 Super Gaming OC 16G ha un prezzo ufficiale di 1.050 dollari MSRP, ma attualmente viene venduta a 1.100 dollari sia su Amazon US che su Best Buy US.
La scheda non è ancora presente su Amazon India, ma i prezzi nei negozi locali possono variare da ₹1.20.000 a ₹1.28.000.
Transparency
La selezione dei dispositivi da recensire viene effettuata dalla nostra redazione. Il campione di prova è stato fornito all'autore come prestito dal produttore o dal rivenditore ai fini di questa recensione. L'istituto di credito non ha avuto alcuna influenza su questa recensione, né il produttore ne ha ricevuto una copia prima della pubblicazione. Non vi era alcun obbligo di pubblicare questa recensione. In quanto società mediatica indipendente, Notebookcheck non è soggetta all'autorità di produttori, rivenditori o editori.
Ecco come Notebookcheck esegue i test
Ogni anno, Notebookcheck esamina in modo indipendente centinaia di laptop e smartphone utilizzando procedure standardizzate per garantire che tutti i risultati siano comparabili. Da circa 20 anni sviluppiamo continuamente i nostri metodi di prova e nel frattempo stabiliamo gli standard di settore. Nei nostri laboratori di prova, tecnici ed editori esperti utilizzano apparecchiature di misurazione di alta qualità. Questi test comportano un processo di validazione in più fasi. Il nostro complesso sistema di valutazione si basa su centinaia di misurazioni e parametri di riferimento ben fondati, che mantengono l'obiettività.Price comparison

