Recensione del portatile Acer Swift Edge 16 Ryzen 7 7840U: CPU Zen 4 e OLED da 3,2K 120 Hz

L'Acer Swift Edge SFE16 è stato aggiornato questa stagione per supportare la nuova CPU Zen 4 Ryzen 7 7840U, rispetto allo Zen 3+ Ryzen 7 7735U rilasciato solo pochi mesi prima. Il modello aggiornato è dotato anche di un nuovo pannello OLED Samsung da 3,2K a 120 Hz, invece del 4K a 60 Hz della configurazione Zen 3+.
A parte le differenze di CPU e GPU di cui sopra, sia lo Swift Edge SFE16 Zen 4 che lo Swift Edge SFE16 Zen 3+ utilizzano chassis simili, con alcune differenze che noteremo in questa recensione. Internamente, tuttavia, molti aspetti della scheda madre sono cambiati. Consigliamo di consultare la nostra recensione della Swift Edge SFE16 Zen 3+ per saperne di più sulle caratteristiche fisiche del modello.
Tra le alternative allo Swift Edge ci sono altri Ultrabook leggeri da 16 pollici come il modello LG Gram 16, Samsung Galaxy Book3 Pro 16,Asus VivoBook 16o ilHuawei MateBook 16s.
Lo Swift Edge 16 non deve essere confuso con lo Swift X 16 Recensione dell'Acer Swift X 16 (2022): un portatile da 16 pollici con potenti aggiornamenti che è un portatile più spesso con CPU serie H più veloci e grafica dedicata GeForce RTX.
Altre recensioni di Acer:
Potenziali concorrenti a confronto
Punteggio | Data | Modello | Peso | Altezza | Dimensione | Risoluzione | Prezzo |
|---|---|---|---|---|---|---|---|
| 88.6 % v7 (old) | 10/2023 | Acer Swift Edge SFE16 Ryzen 7 7840U R7 7840U, Radeon 780M | 1.2 kg | 13 mm | 16.00" | 3200x2000 | |
| 87.5 % v7 (old) | 06/2023 | Acer Swift Edge SFE16-42-R1GM R7 7735U, Radeon 680M | 1.2 kg | 13.95 mm | 16.00" | 3840x2400 | |
| 88 % v7 (old) | 08/2023 | Lenovo Slim Pro 9i 16IRP8 i9-13905H, GeForce RTX 4050 Laptop GPU | 2.2 kg | 18.2 mm | 16.00" | 3200x2000 | |
| 86.3 % v7 (old) | 05/2023 | Asus VivoBook Pro 16 i7-12700H, GeForce RTX 3050 Ti Laptop GPU | 1.9 kg | 20 mm | 16.00" | 2560x1600 | |
| 89.4 % v7 (old) | 04/2023 | Samsung Galaxy Book3 Ultra 16 i7-13700H, GeForce RTX 4050 Laptop GPU | 1.8 kg | 16.5 mm | 16.00" | 2880x1800 | |
| 86.4 % v7 (old) | 07/2022 | Huawei MateBook 16s i7 i7-12700H, Iris Xe G7 96EUs | 2 kg | 17.8 mm | 16.00" | 2520x1680 |
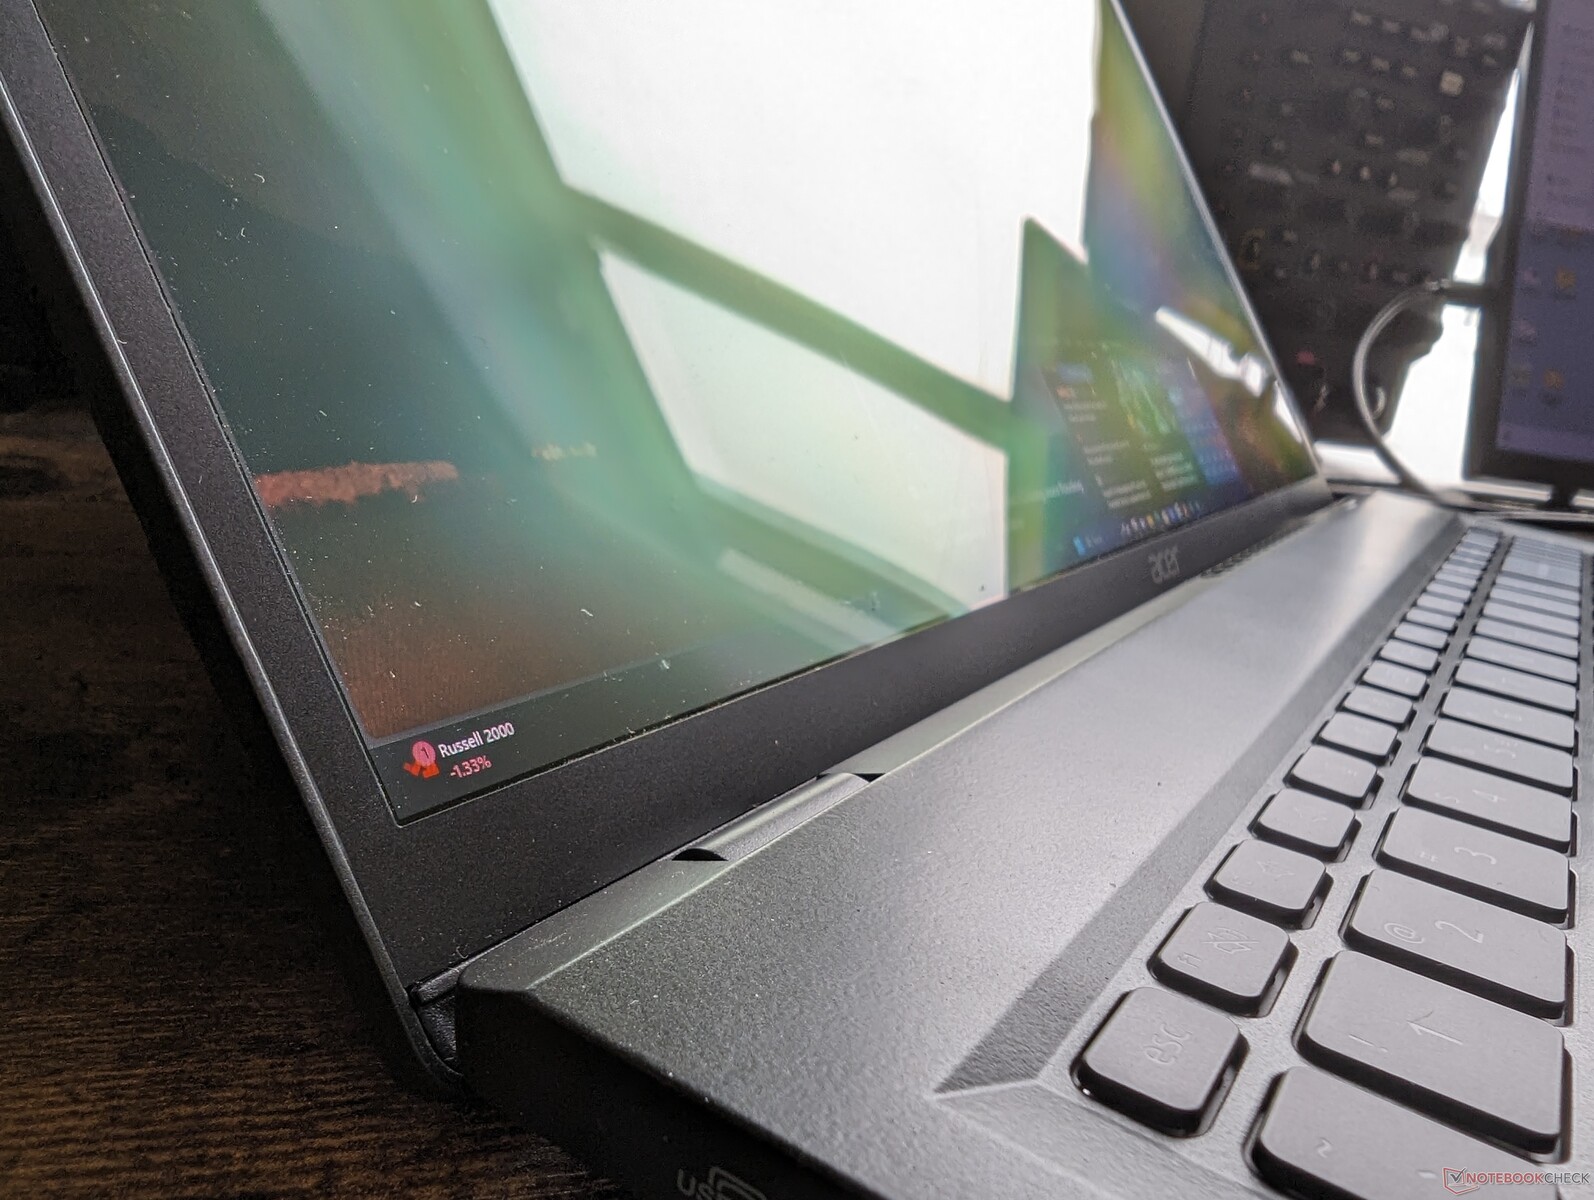
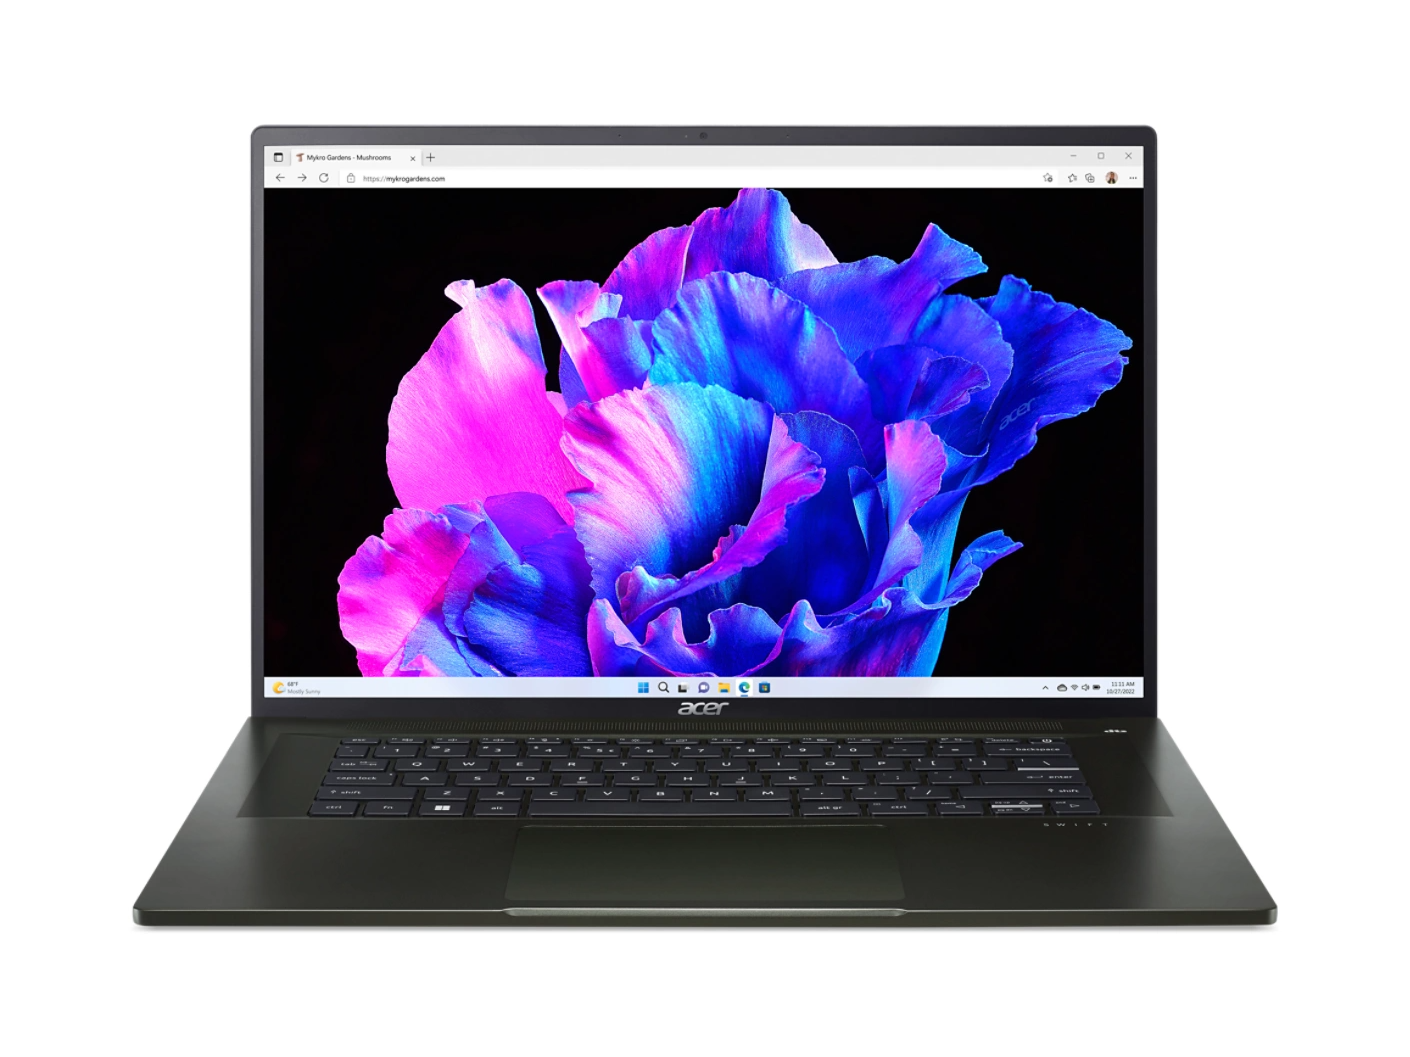
Caso
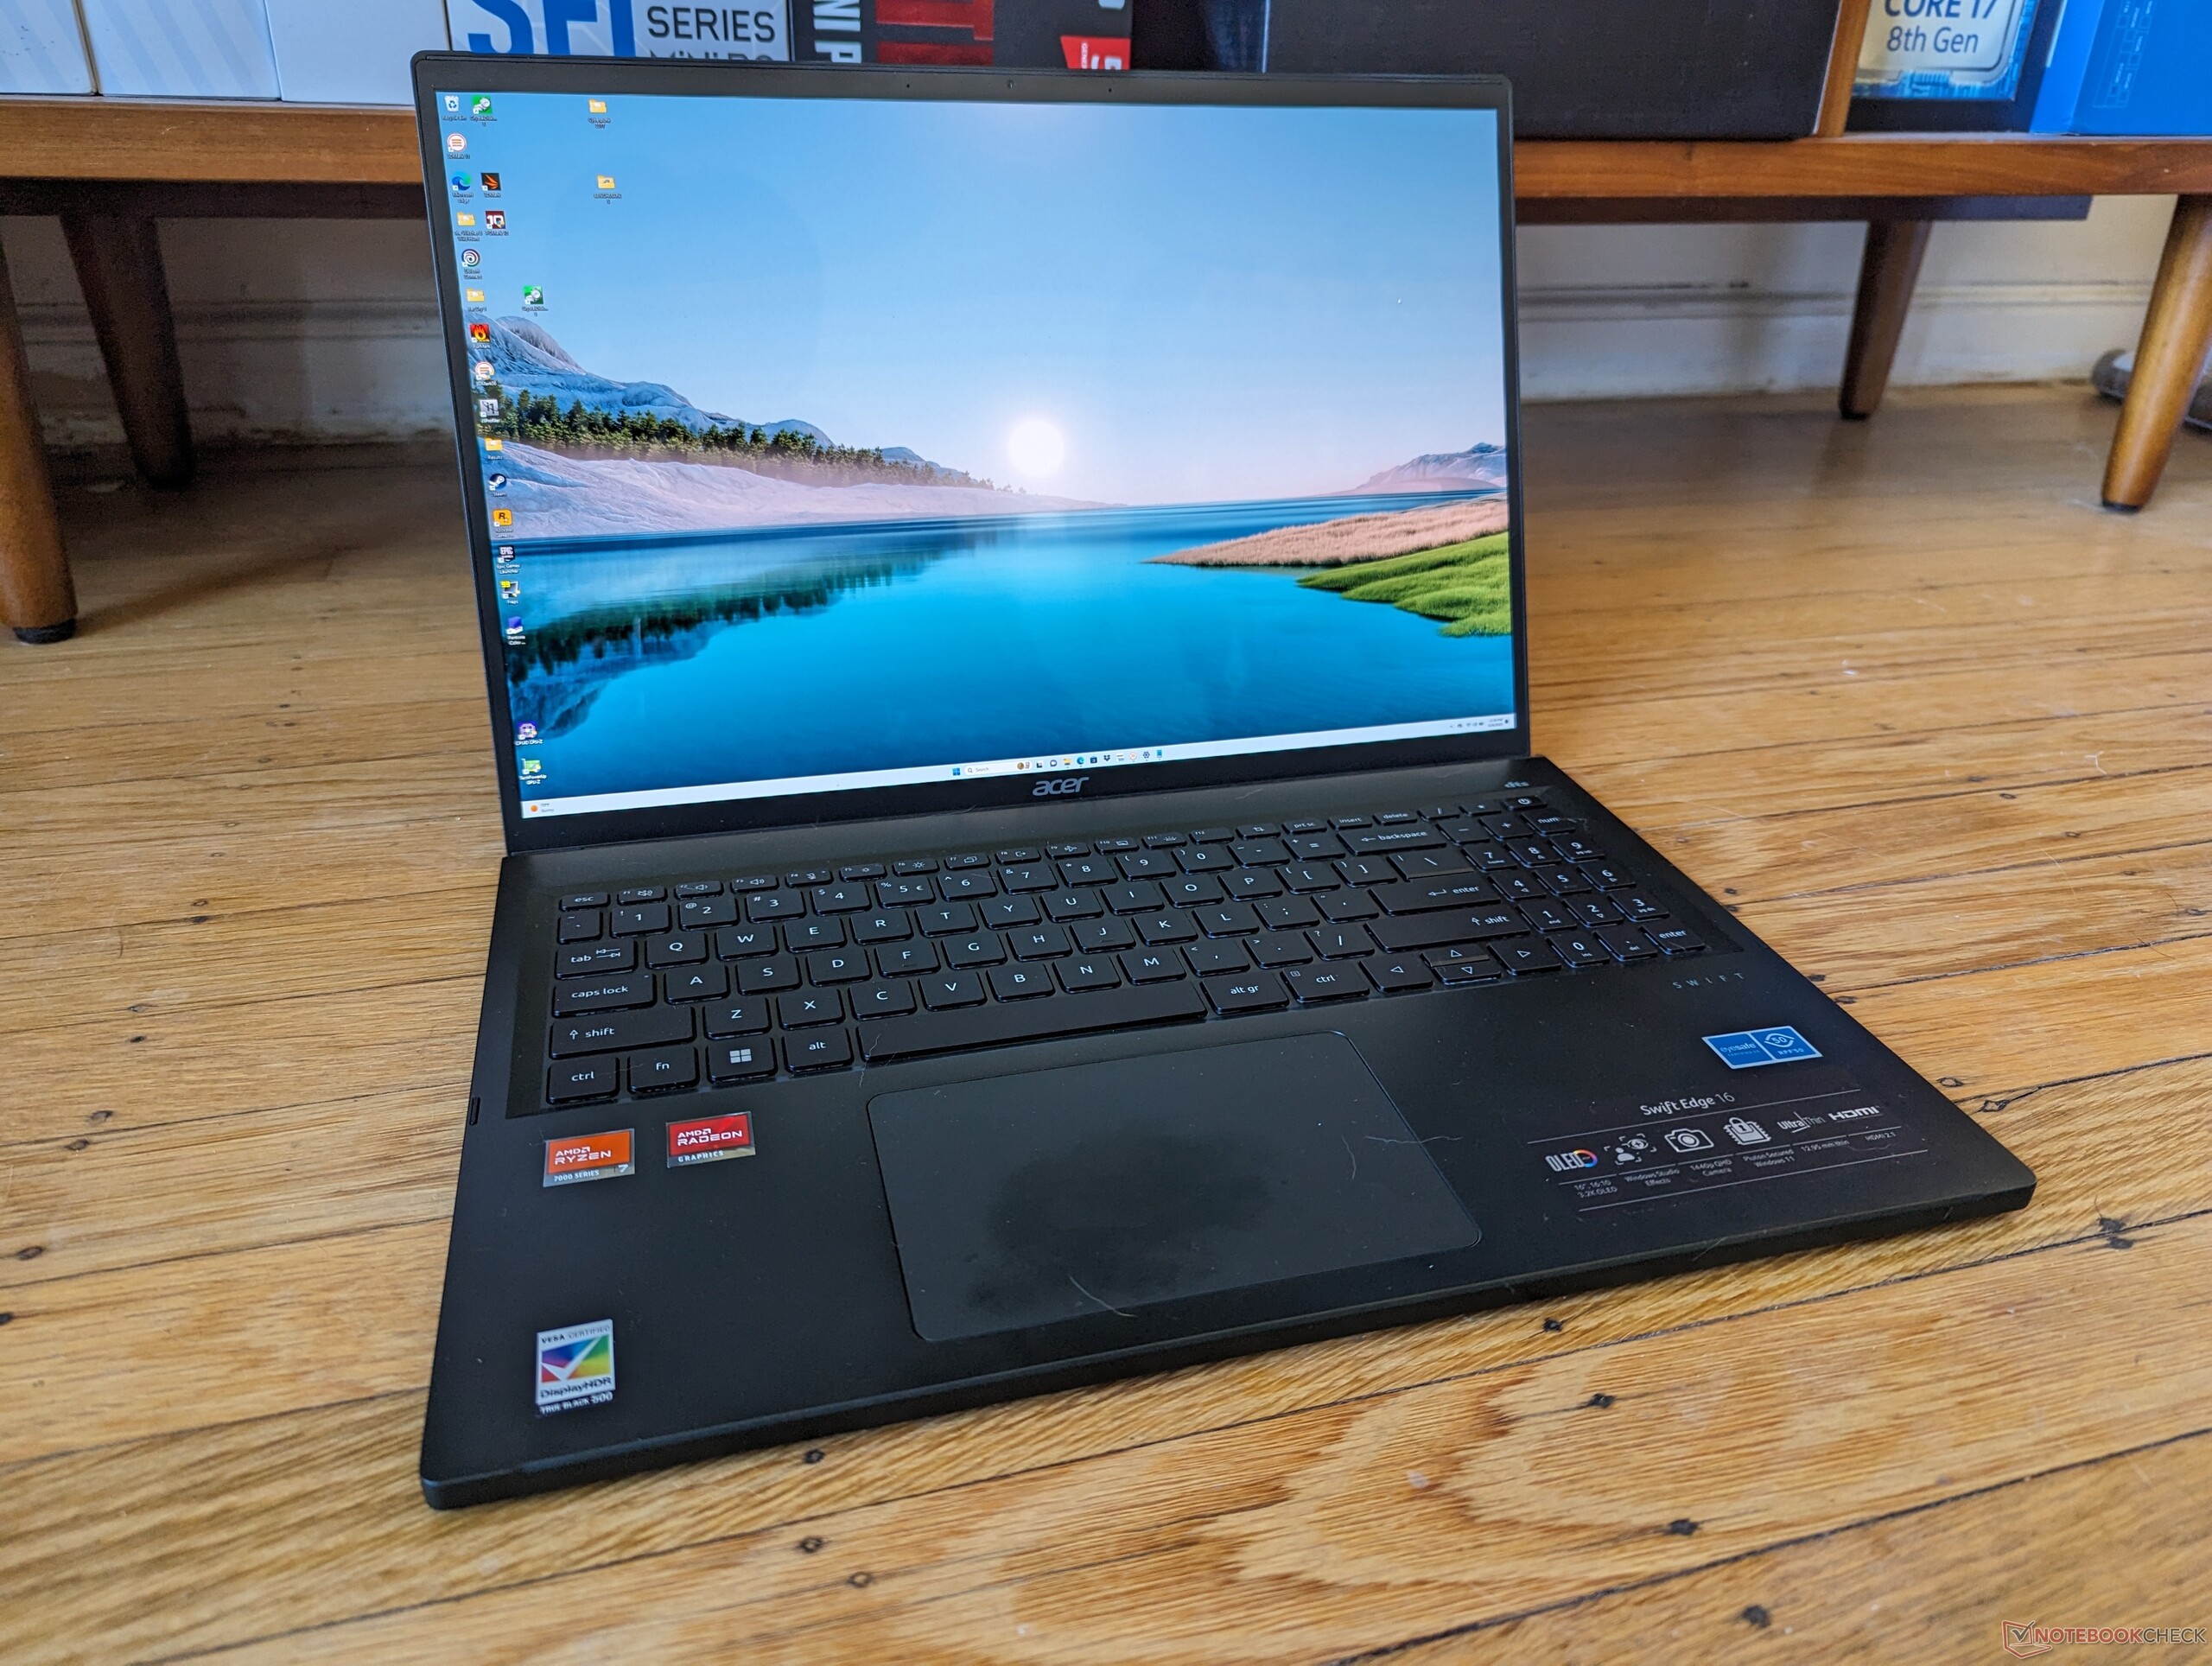
Lo Swift Edge 16 Zen 4 può sembrare identico allo Swift Edge 16 Zen 3+ a prima vista, ma i cambiamenti esterni sono evidenti ad un'analisi più attenta. In primo luogo, la nuova versione integra un tastierino numerico, che mancava nella versione Zen 3+. In secondo luogo, le griglie di ventilazione sopra la prima fila di tasti della tastiera sono scomparse e il bordo anteriore è ora continuo senza tagli. Quest'ultimo è un cambiamento strano perché rende il coperchio più difficile da aprire.
A parte questo, il modello utilizza gli stessi materiali lisci del telaio in magnesio e alluminio, le stesse porte e lo stesso posizionamento e il clickpad delle stesse dimensioni. Le dimensioni sono solo leggermente più larghe e più sottili questa volta, ma le differenze sono difficili da notare nella pratica.
Lettore di schede SD
Acer ha aggiunto un lettore MicroSD che mancava nella configurazione Ryzen 7 7735U. Tuttavia, la velocità di trasferimento è circa 3 volte più lenta rispetto ai lettori di schede SD dei modelli concorrenti come l'Asus VivoBook Pro 16 o Samsung Galaxy Book3 Ultra 16.
| SD Card Reader | |
| average JPG Copy Test (av. of 3 runs) | |
| Lenovo Slim Pro 9i 16IRP8 (PNY EliteX-Pro60 V60 256 GB) | |
| Samsung Galaxy Book3 Ultra 16 (AV PRO microSD 128 GB V60) | |
| Asus VivoBook Pro 16 (AV Pro SD microSD 128 GB V60) | |
| Acer Swift Edge SFE16 Ryzen 7 7840U (AV Pro V60) | |
| maximum AS SSD Seq Read Test (1GB) | |
| Lenovo Slim Pro 9i 16IRP8 (PNY EliteX-Pro60 V60 256 GB) | |
| Samsung Galaxy Book3 Ultra 16 (AV PRO microSD 128 GB V60) | |
| Asus VivoBook Pro 16 (AV Pro SD microSD 128 GB V60) | |
| Acer Swift Edge SFE16 Ryzen 7 7840U (AV Pro V60) | |
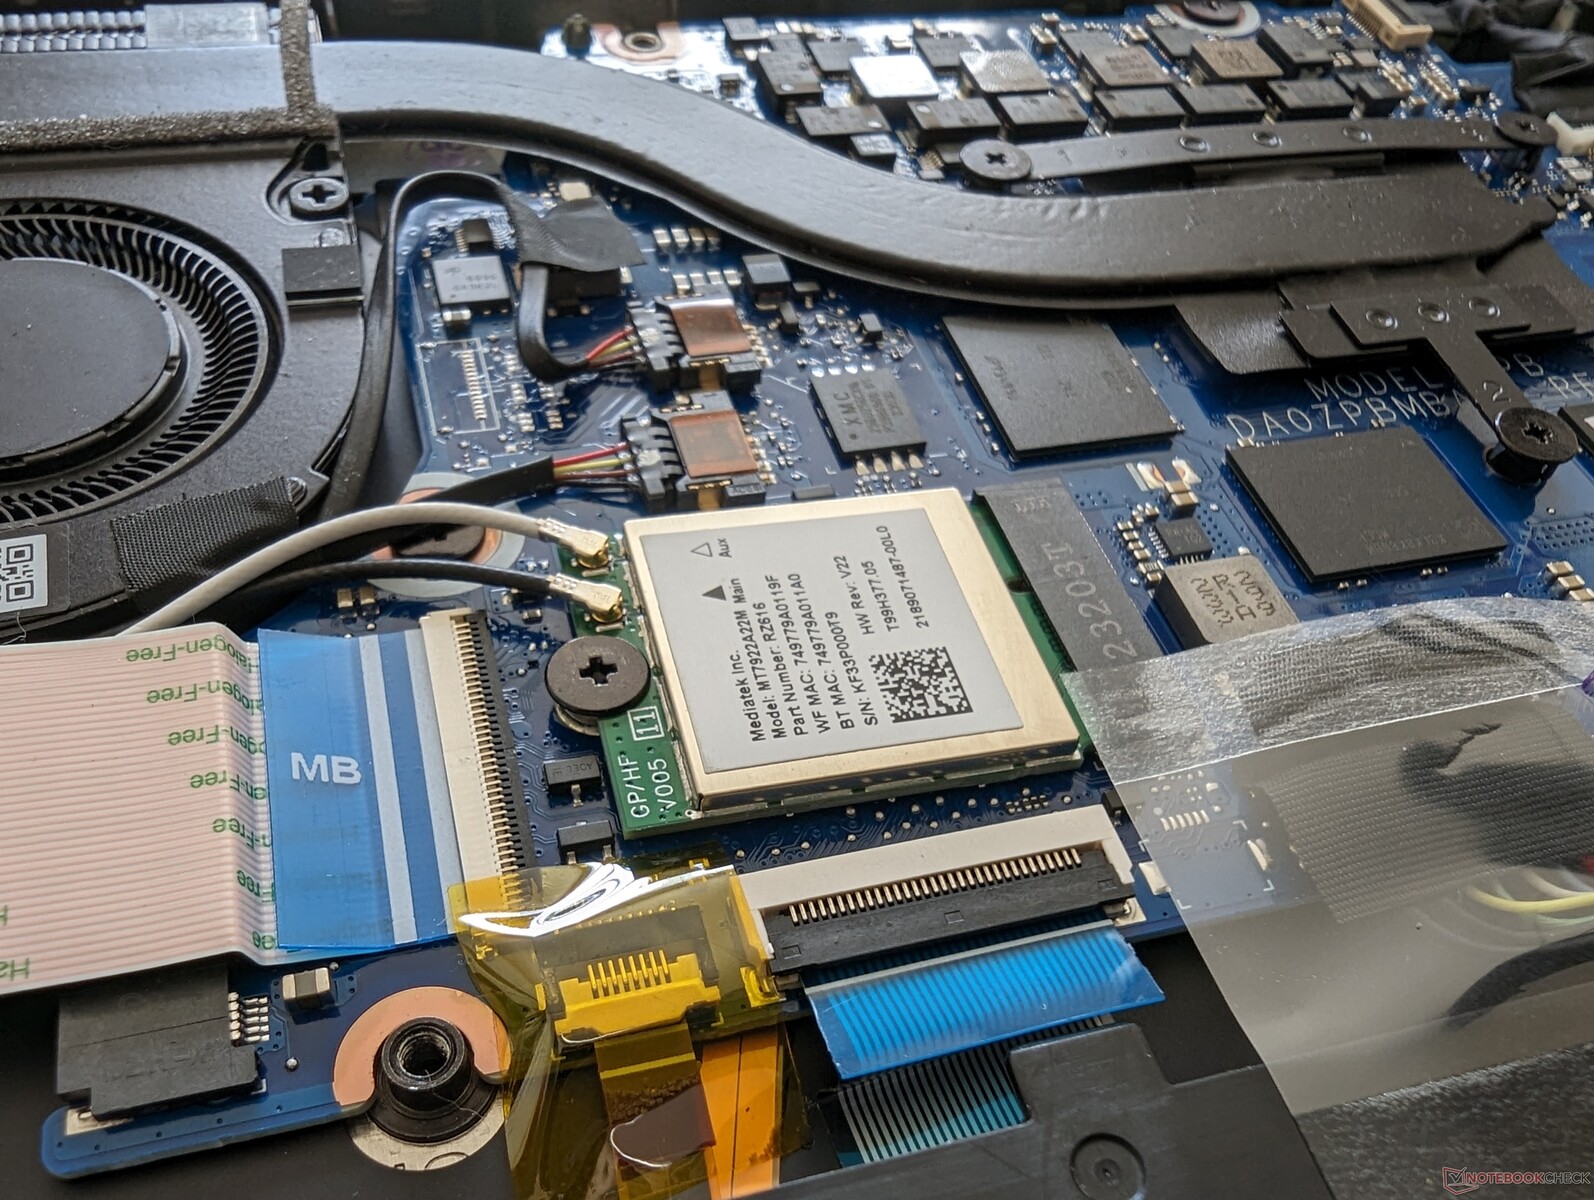
Comunicazione
Il modulo MediaTek ha una velocità di trasmissione insolitamente lenta quando è in Wi-Fi 6, simile a quella che abbiamo osservato sulla configurazione Zen 3+. La velocità del Wi-Fi 6E è invece eccellente quando è abbinato alla nostra rete Asus AXE11000 a 6 GHz.
Webcam
La webcam è da 3,7 MP con registrazione fino a 1440p30 rispetto ai 2,1 MP e 1080p30 della configurazione Zen 3+, per un'immagine leggermente più nitida.
Non c'è ancora un otturatore privacy integrato nella webcam o un supporto IR.


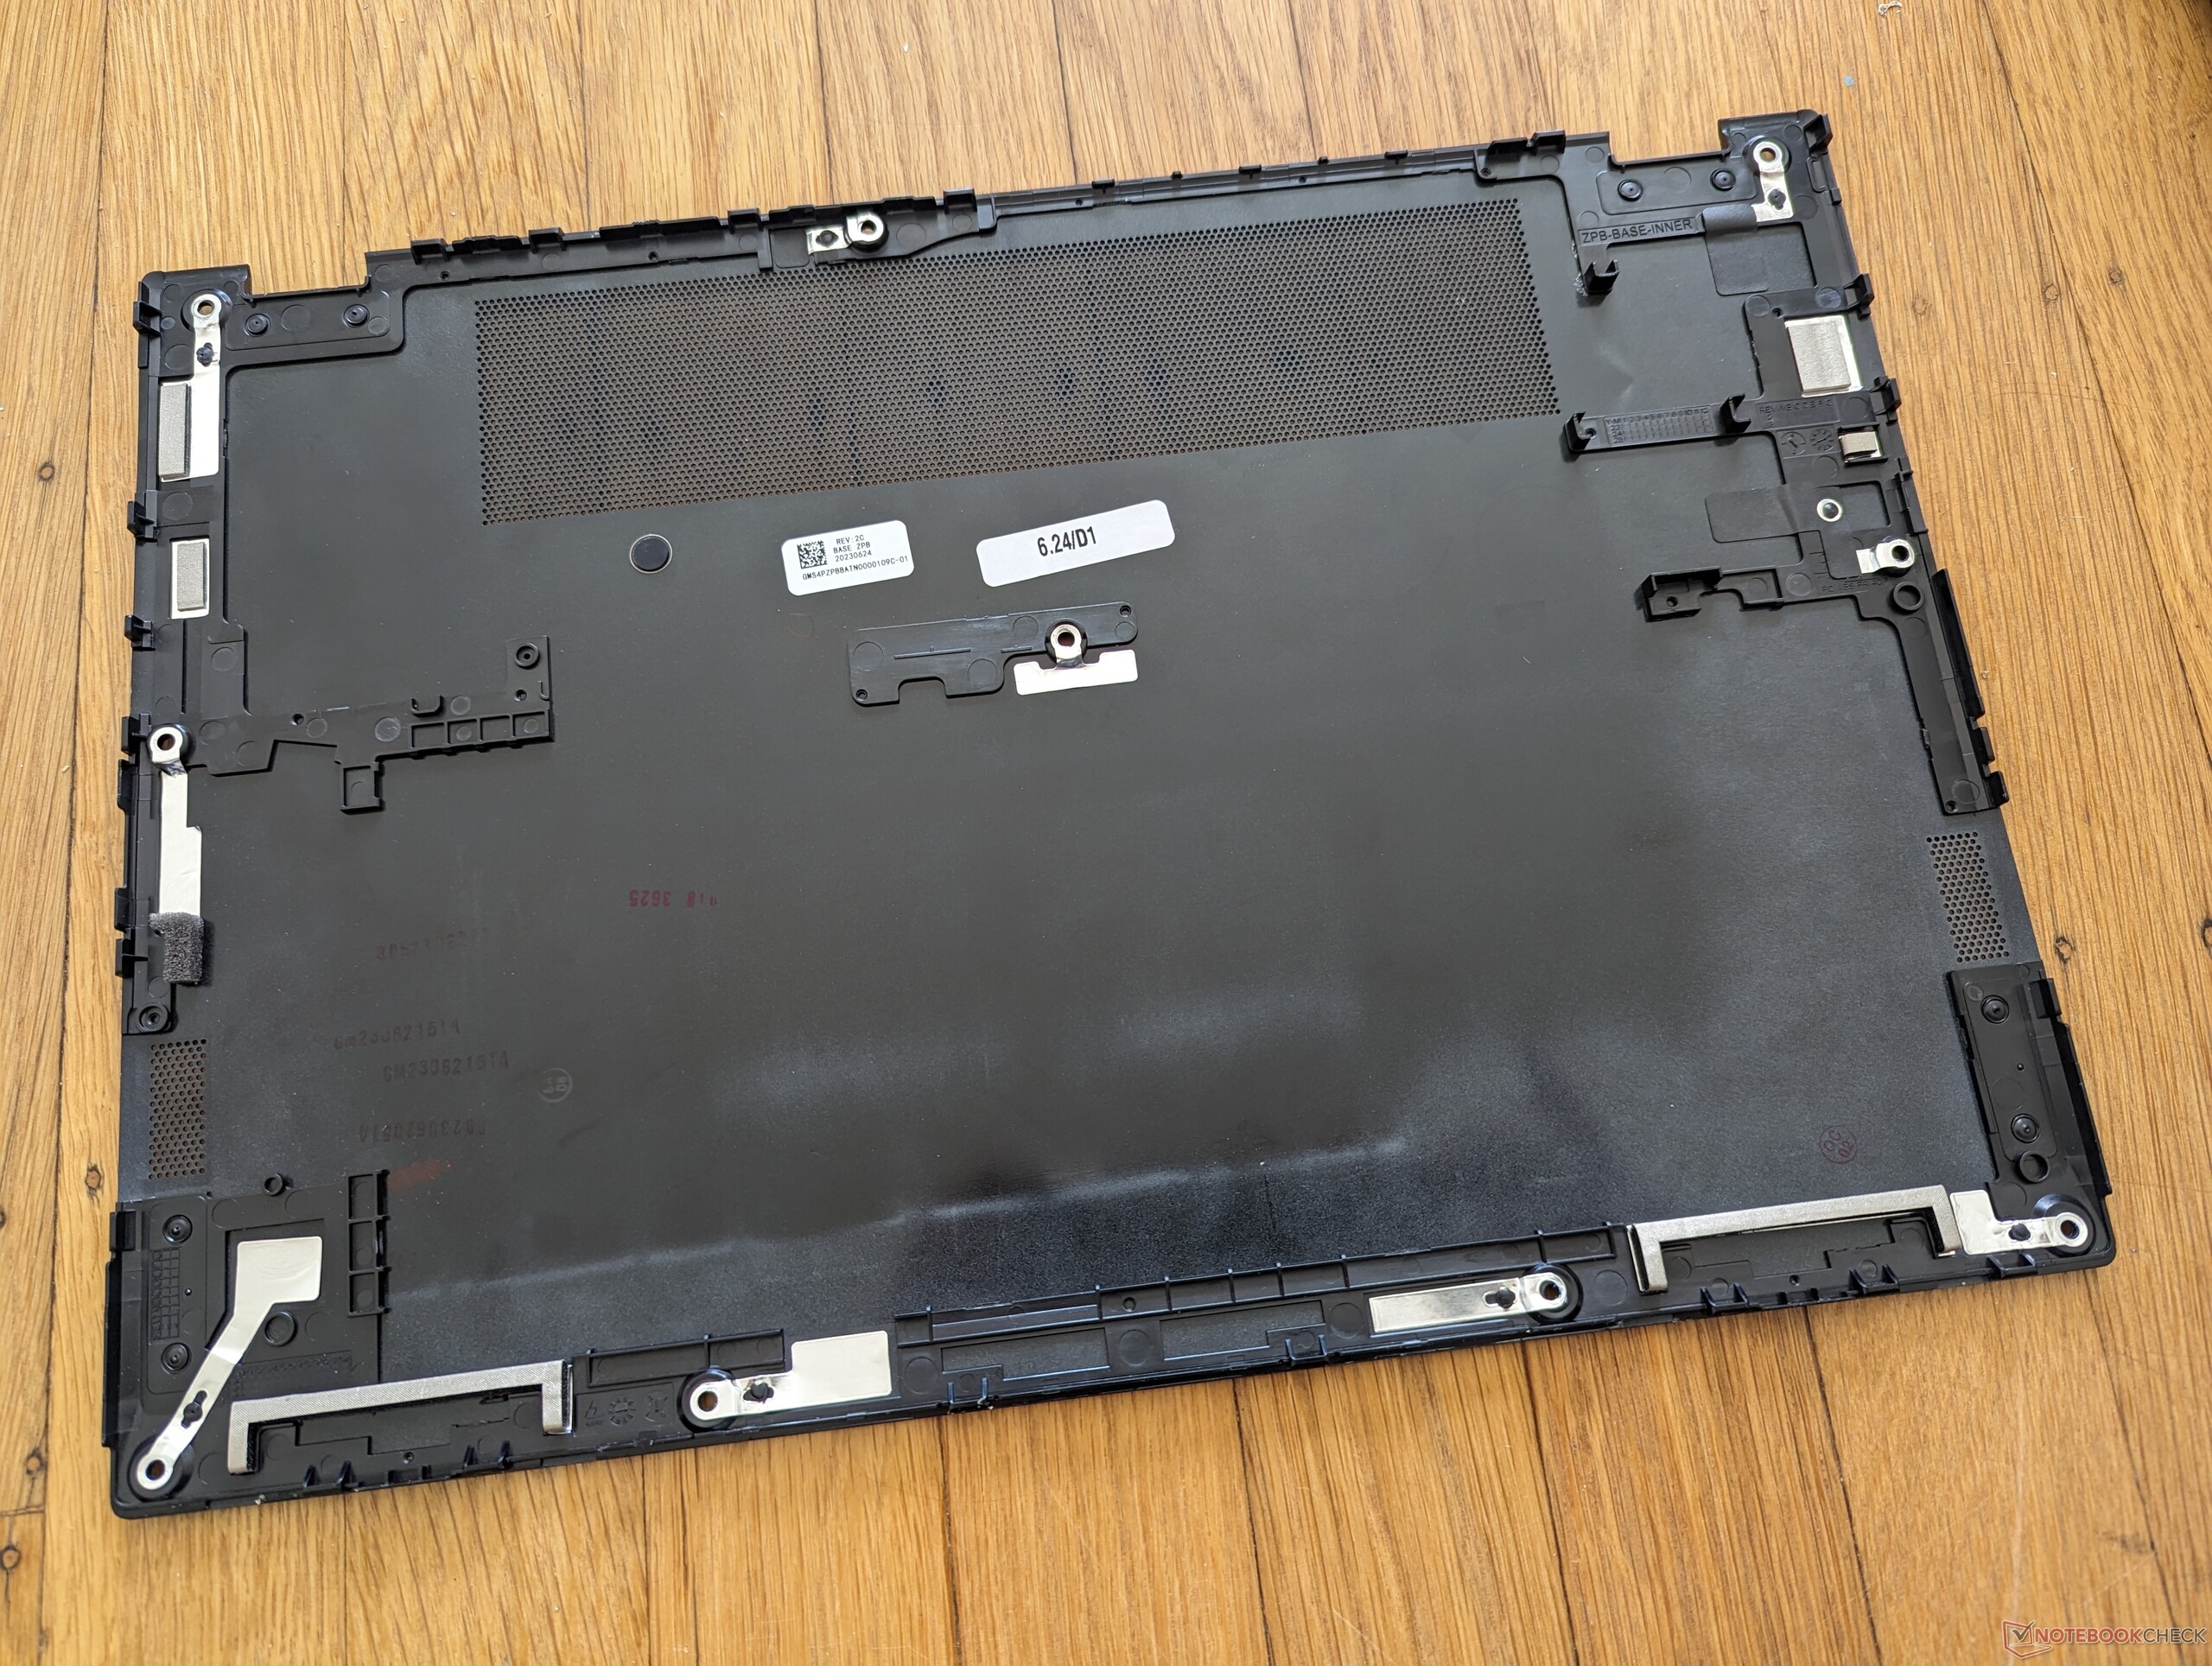
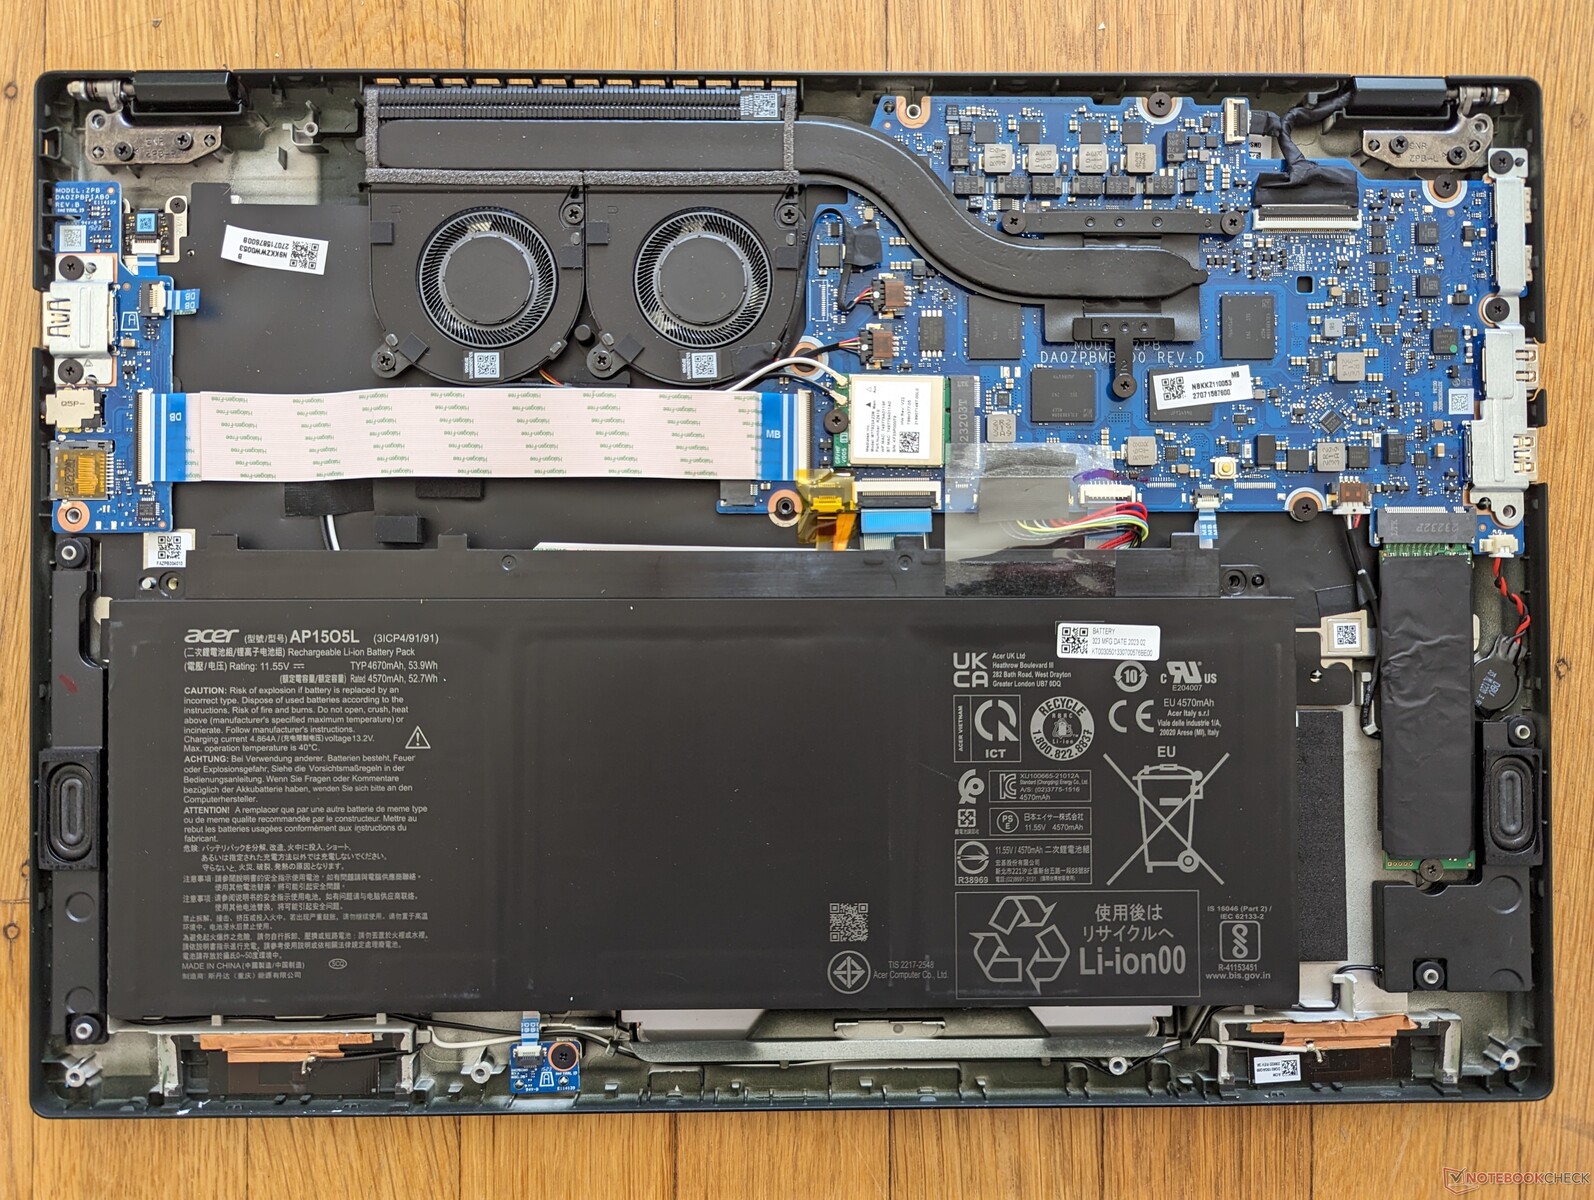
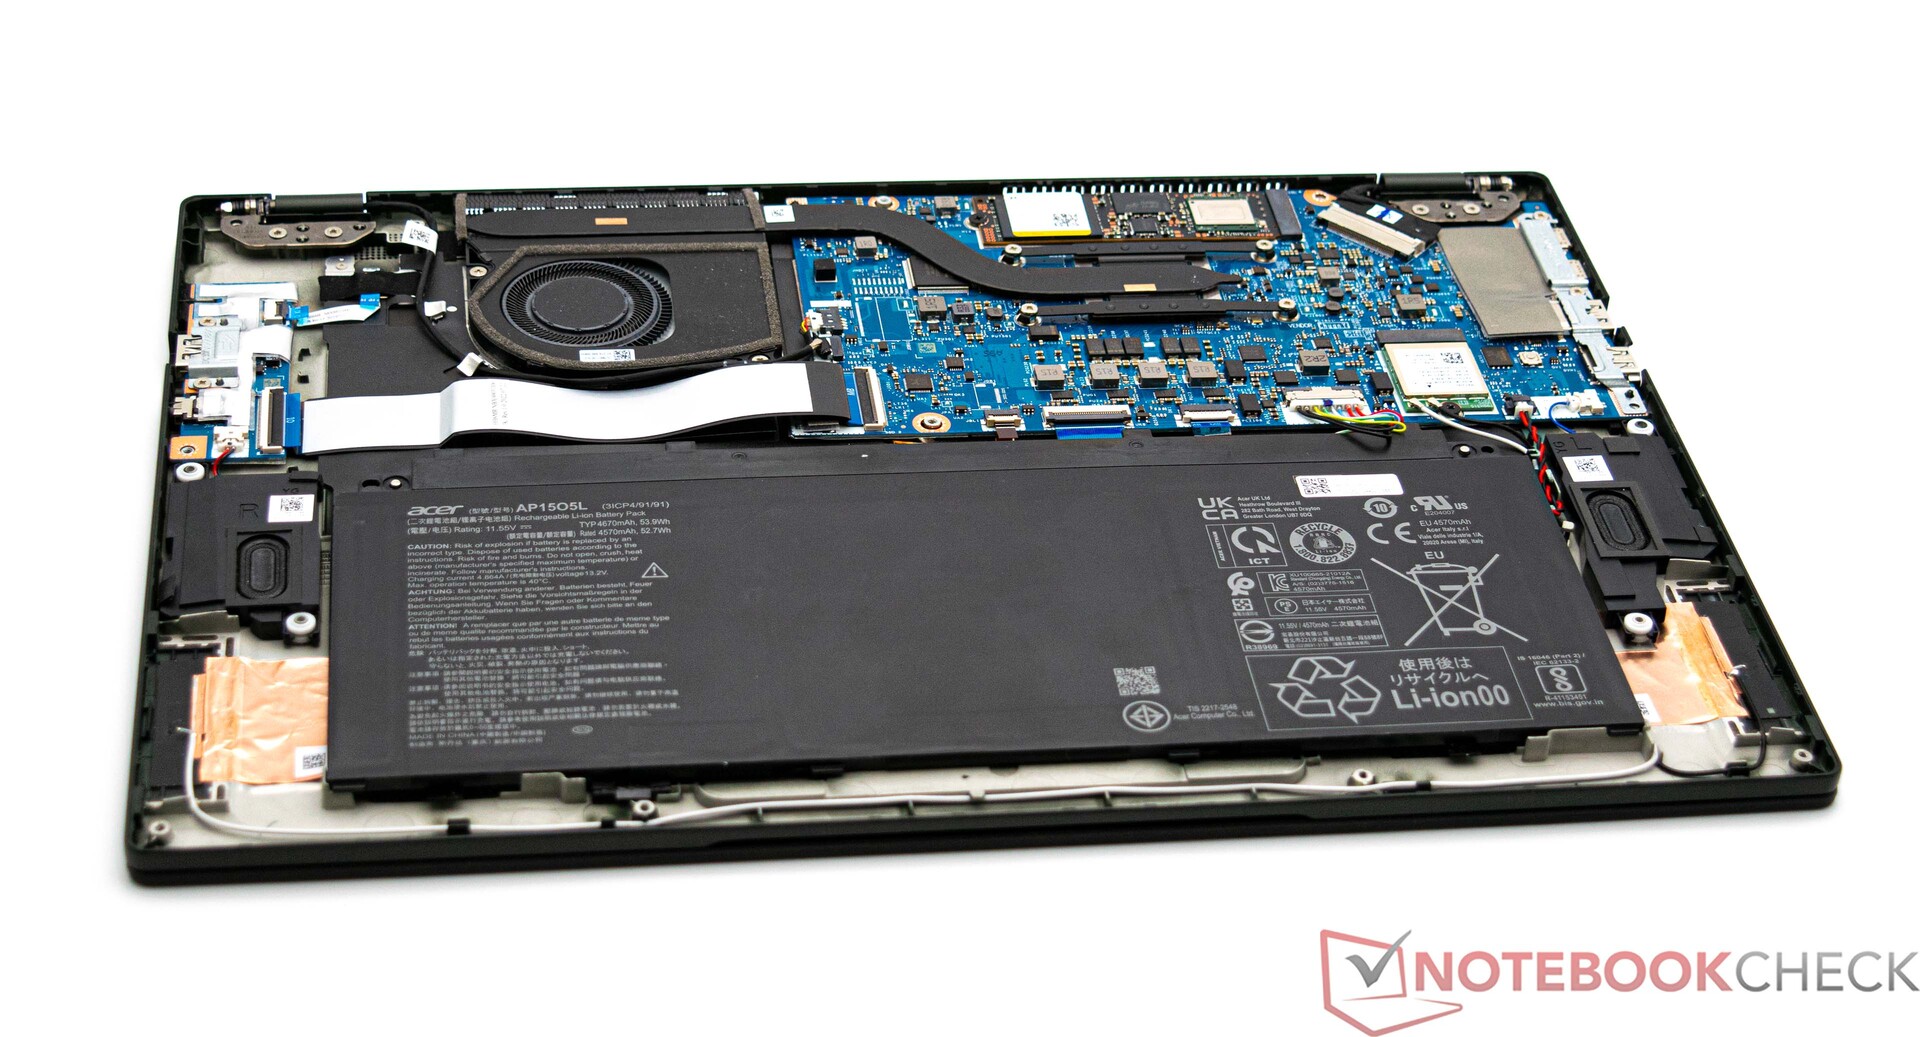
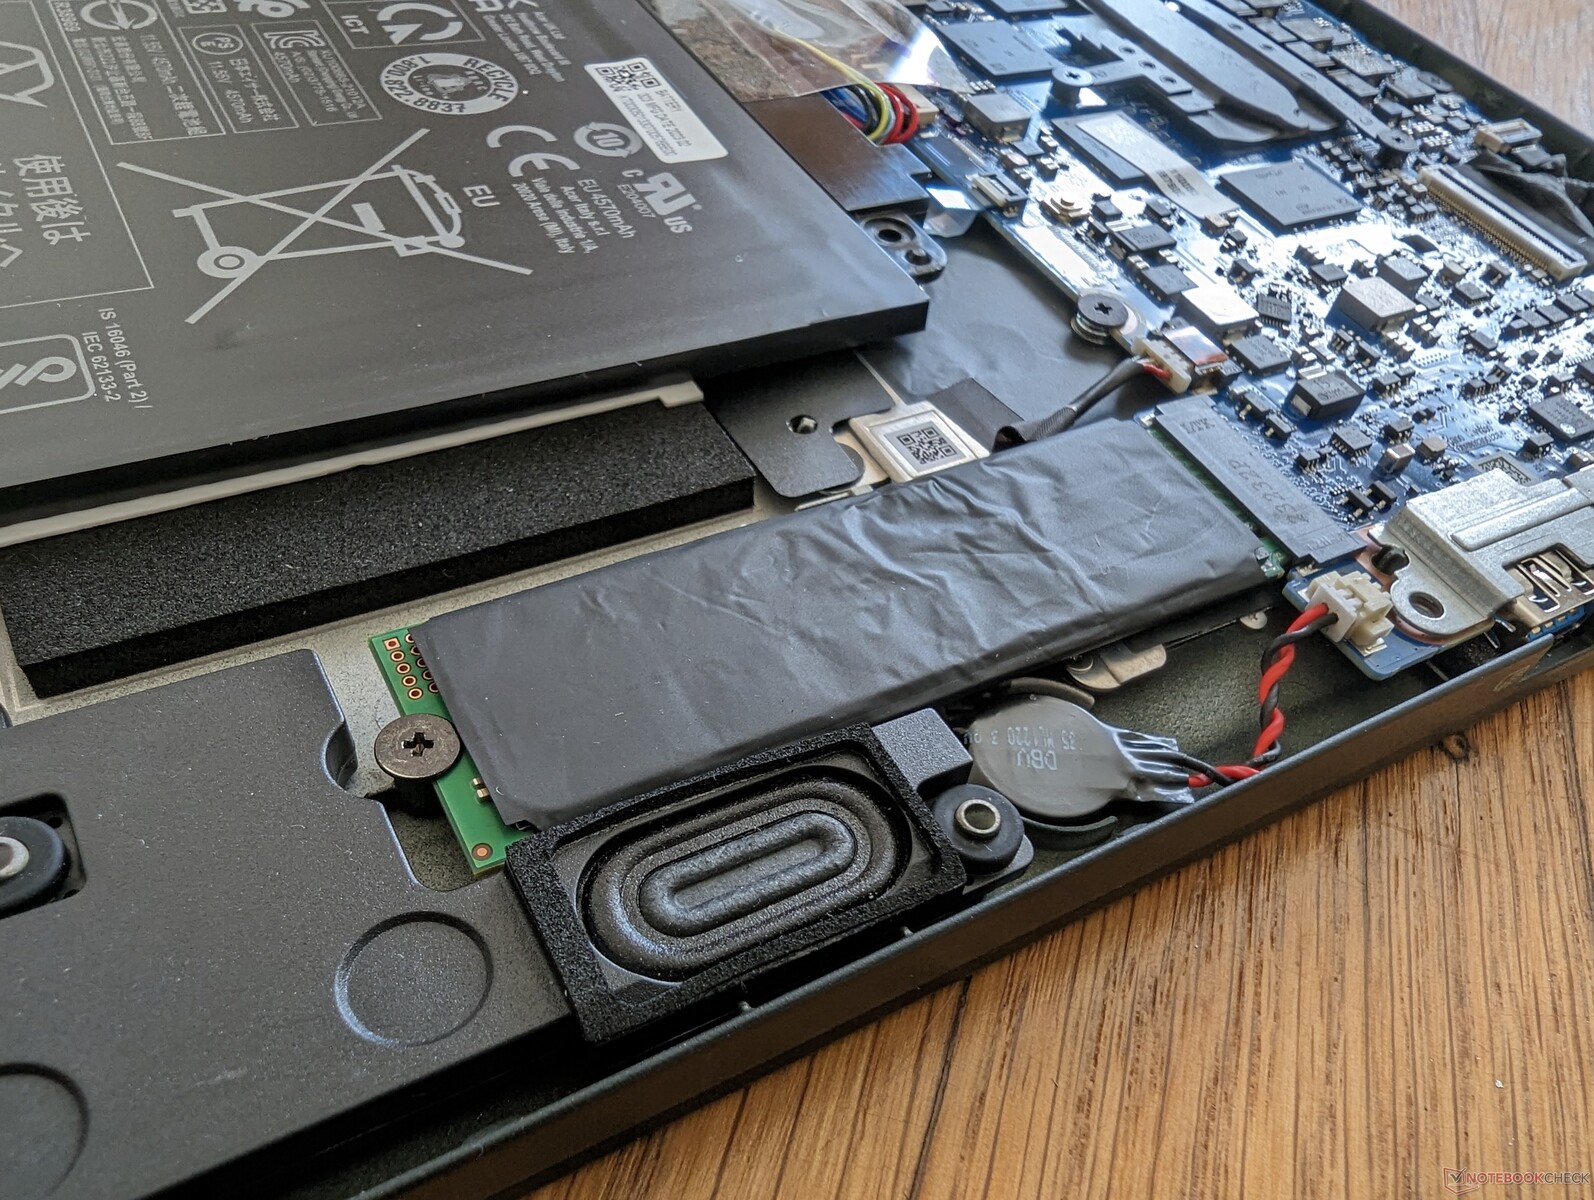
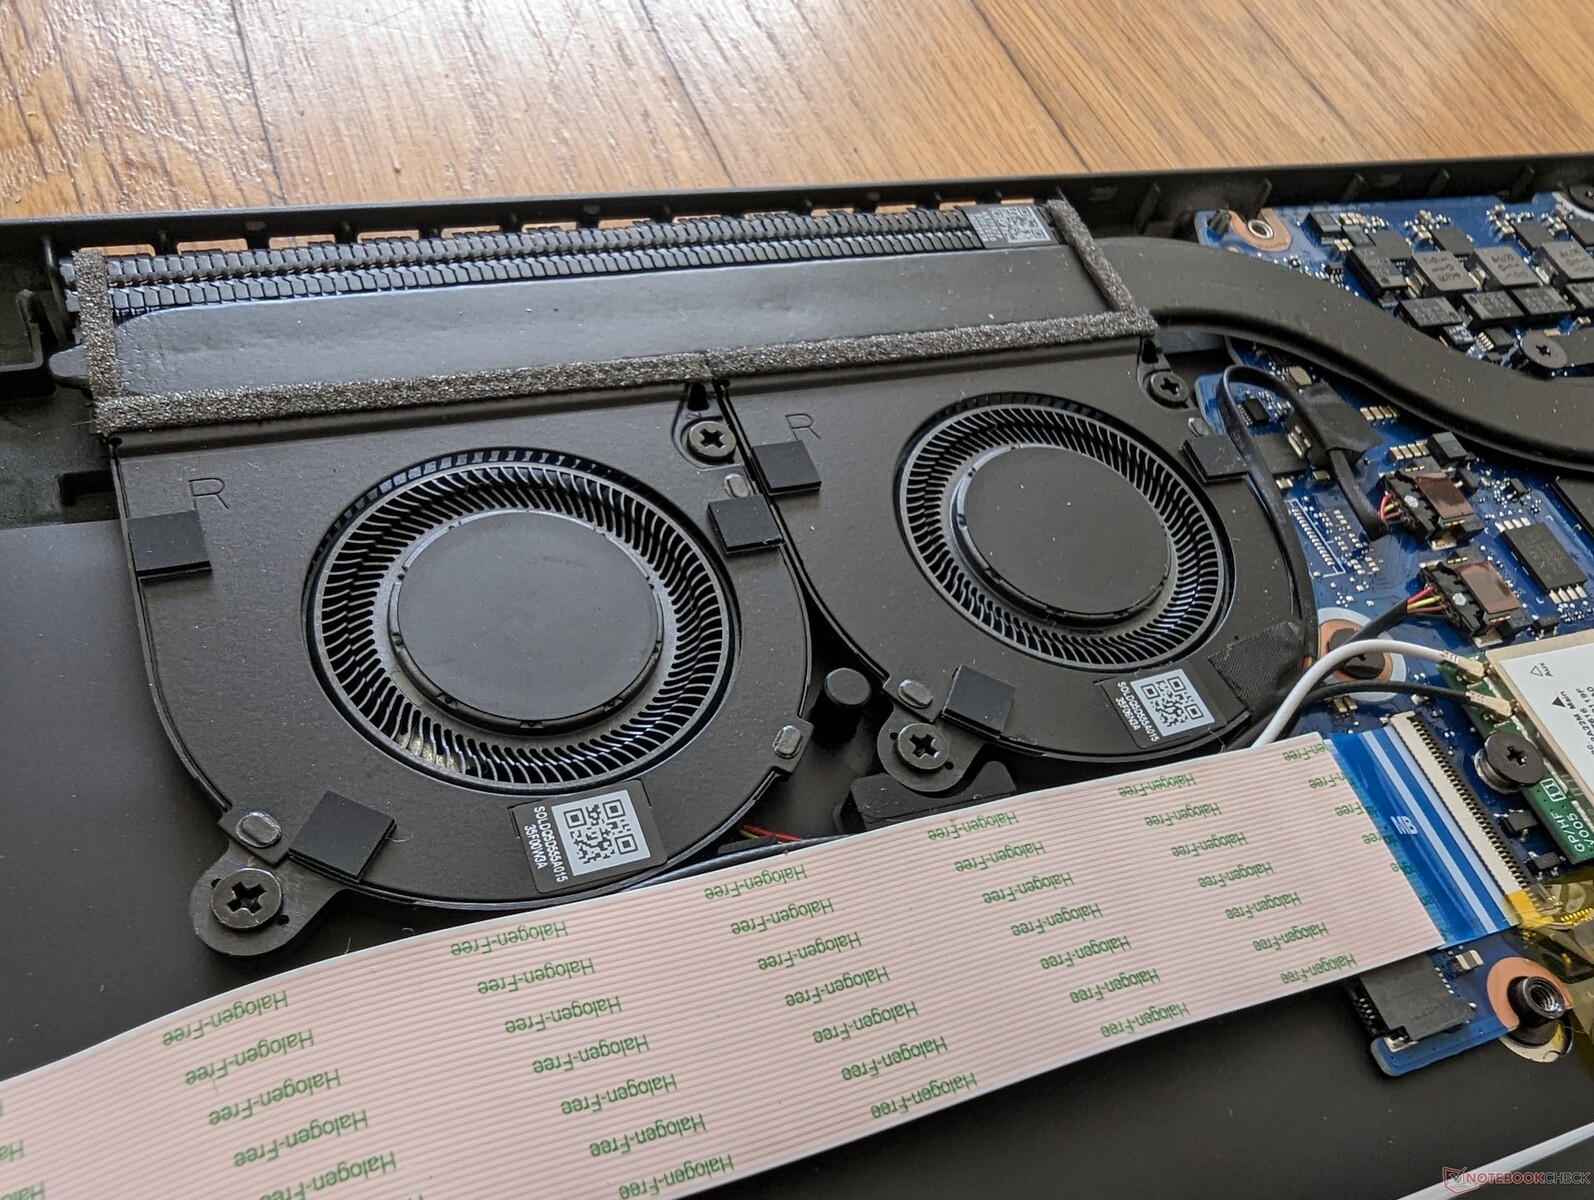
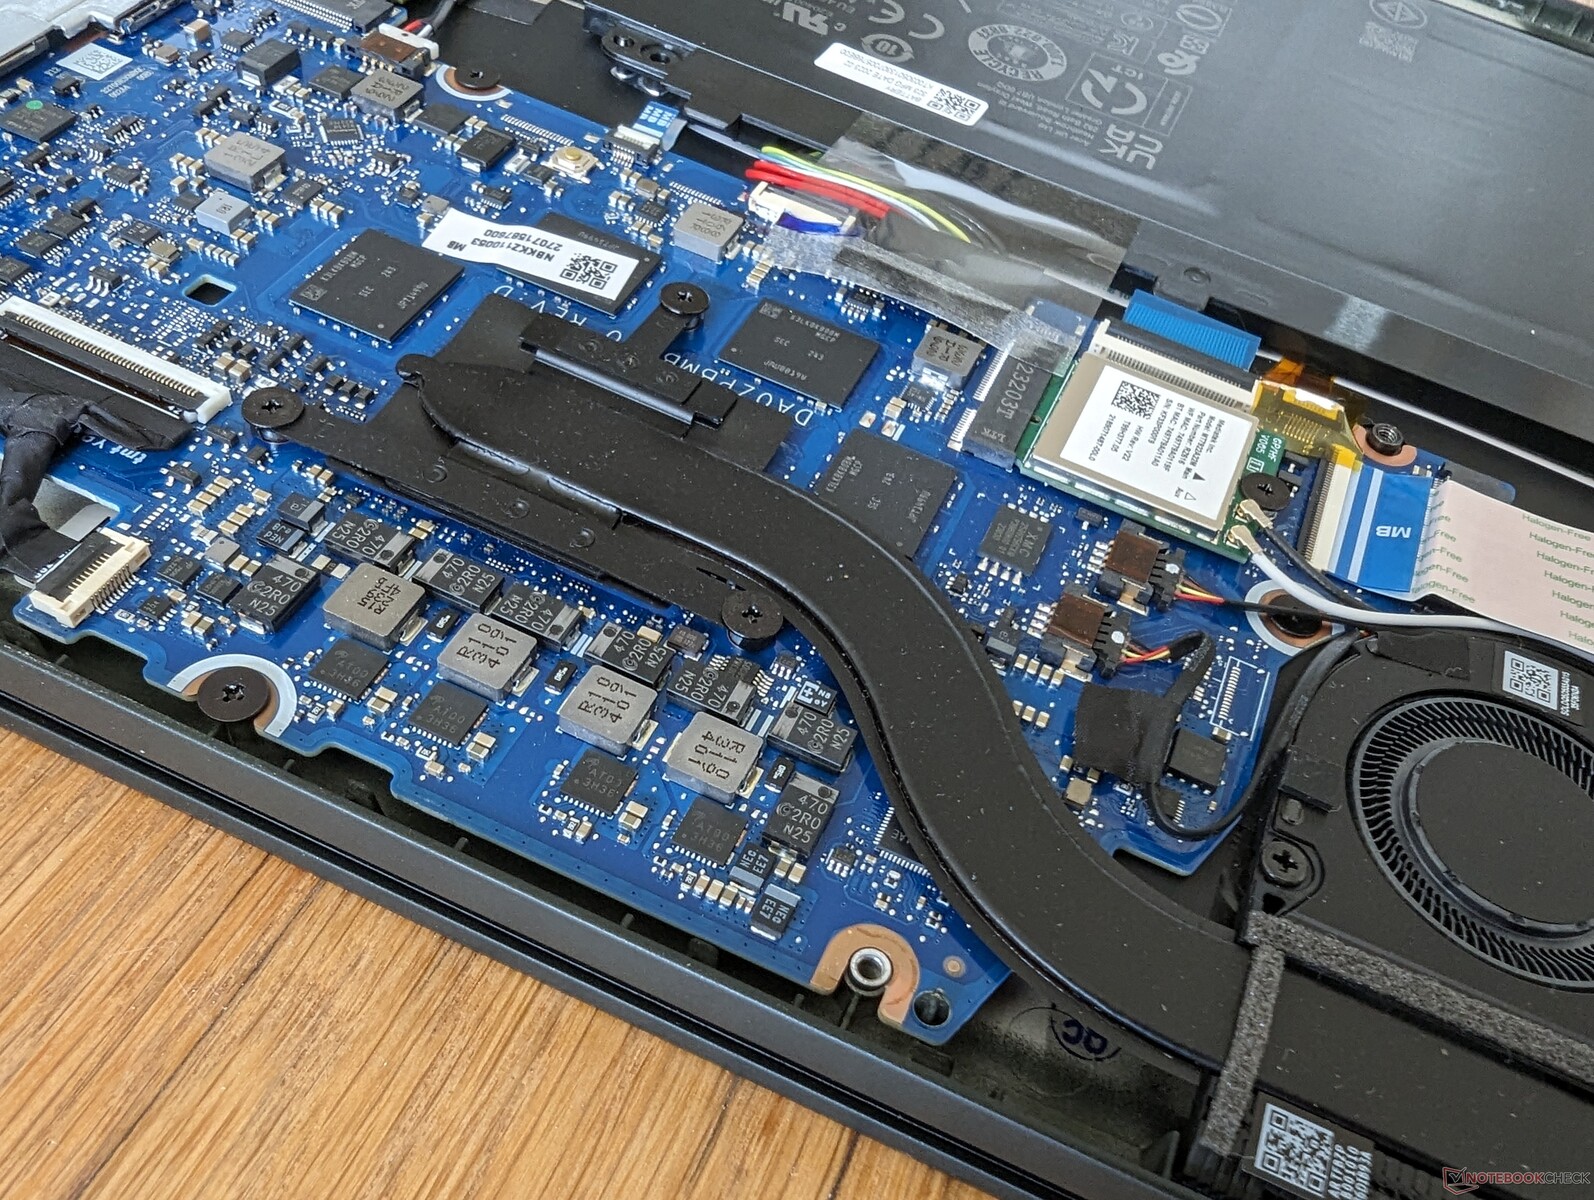
Manutenzione
Il pannello inferiore è facile da aprire con una chiave Torx. Le ventole e la scheda madre sono cambiate in modo sostanziale tra i modelli Zen 3+ e Zen 4, come mostrano le immagini qui sotto. L'SSD, ad esempio, si trova ora accanto alla batteria.
Accessori e garanzia
La confezione non contiene altri extra oltre alla documentazione e all'adattatore CA. Se acquistata negli Stati Uniti, la garanzia limitata del produttore è di un anno.
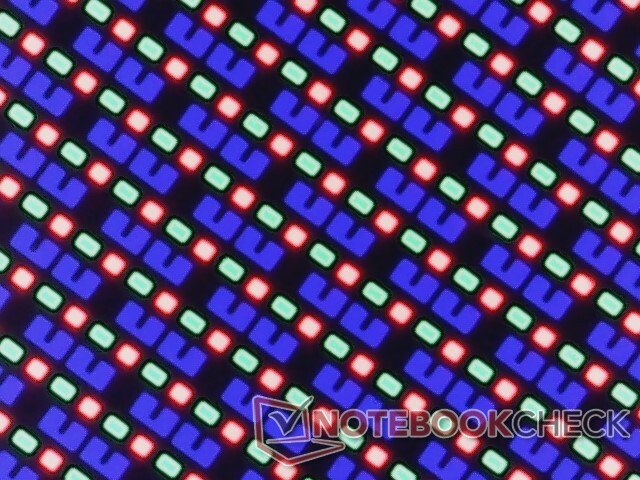
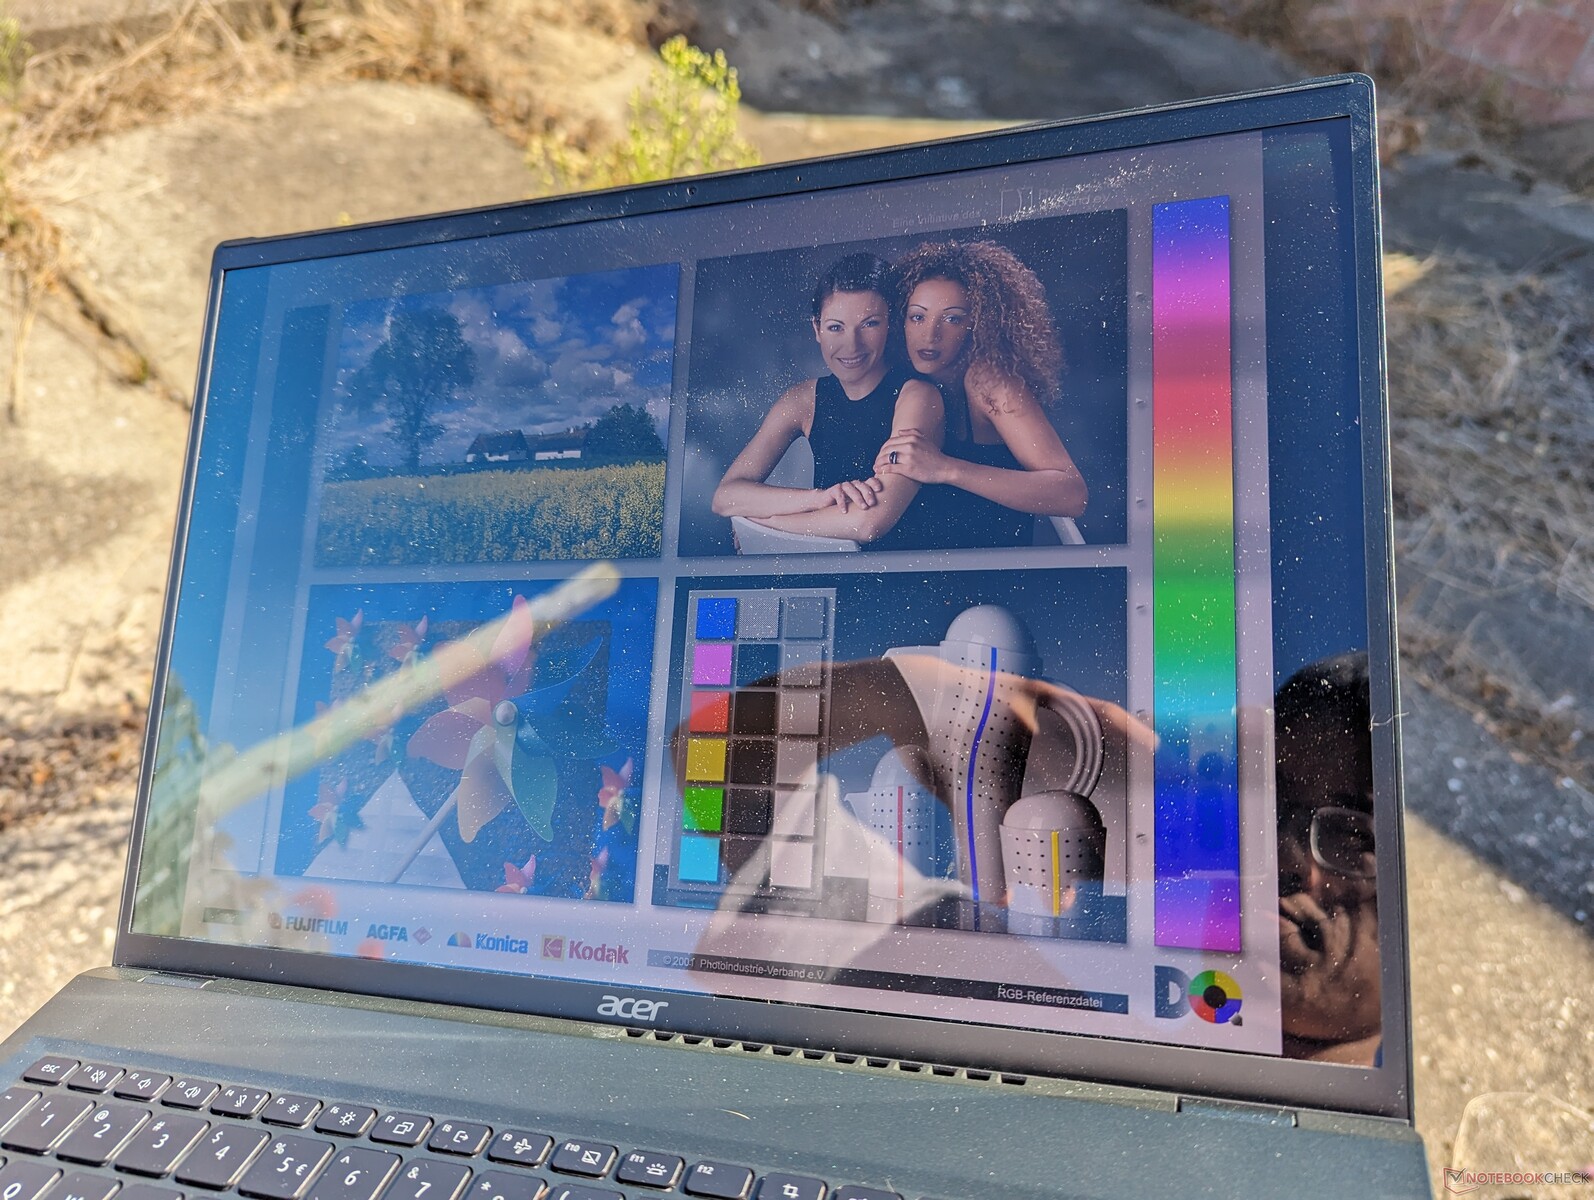
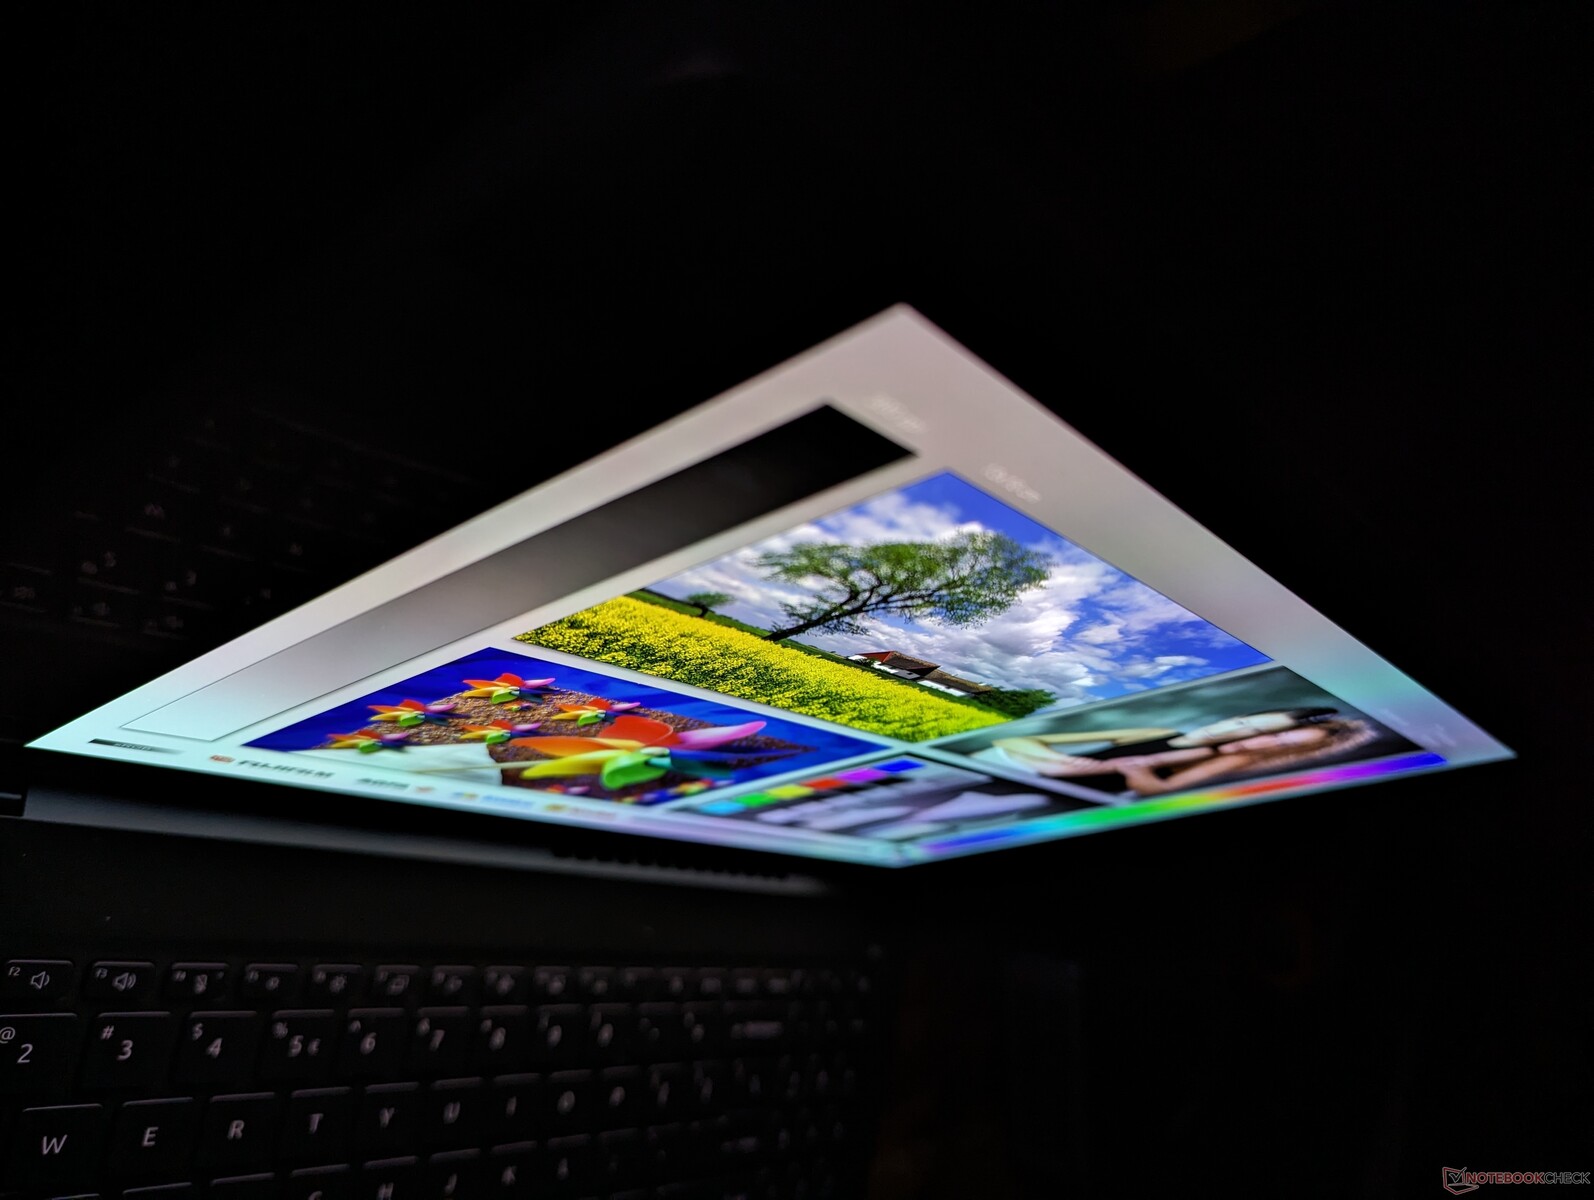
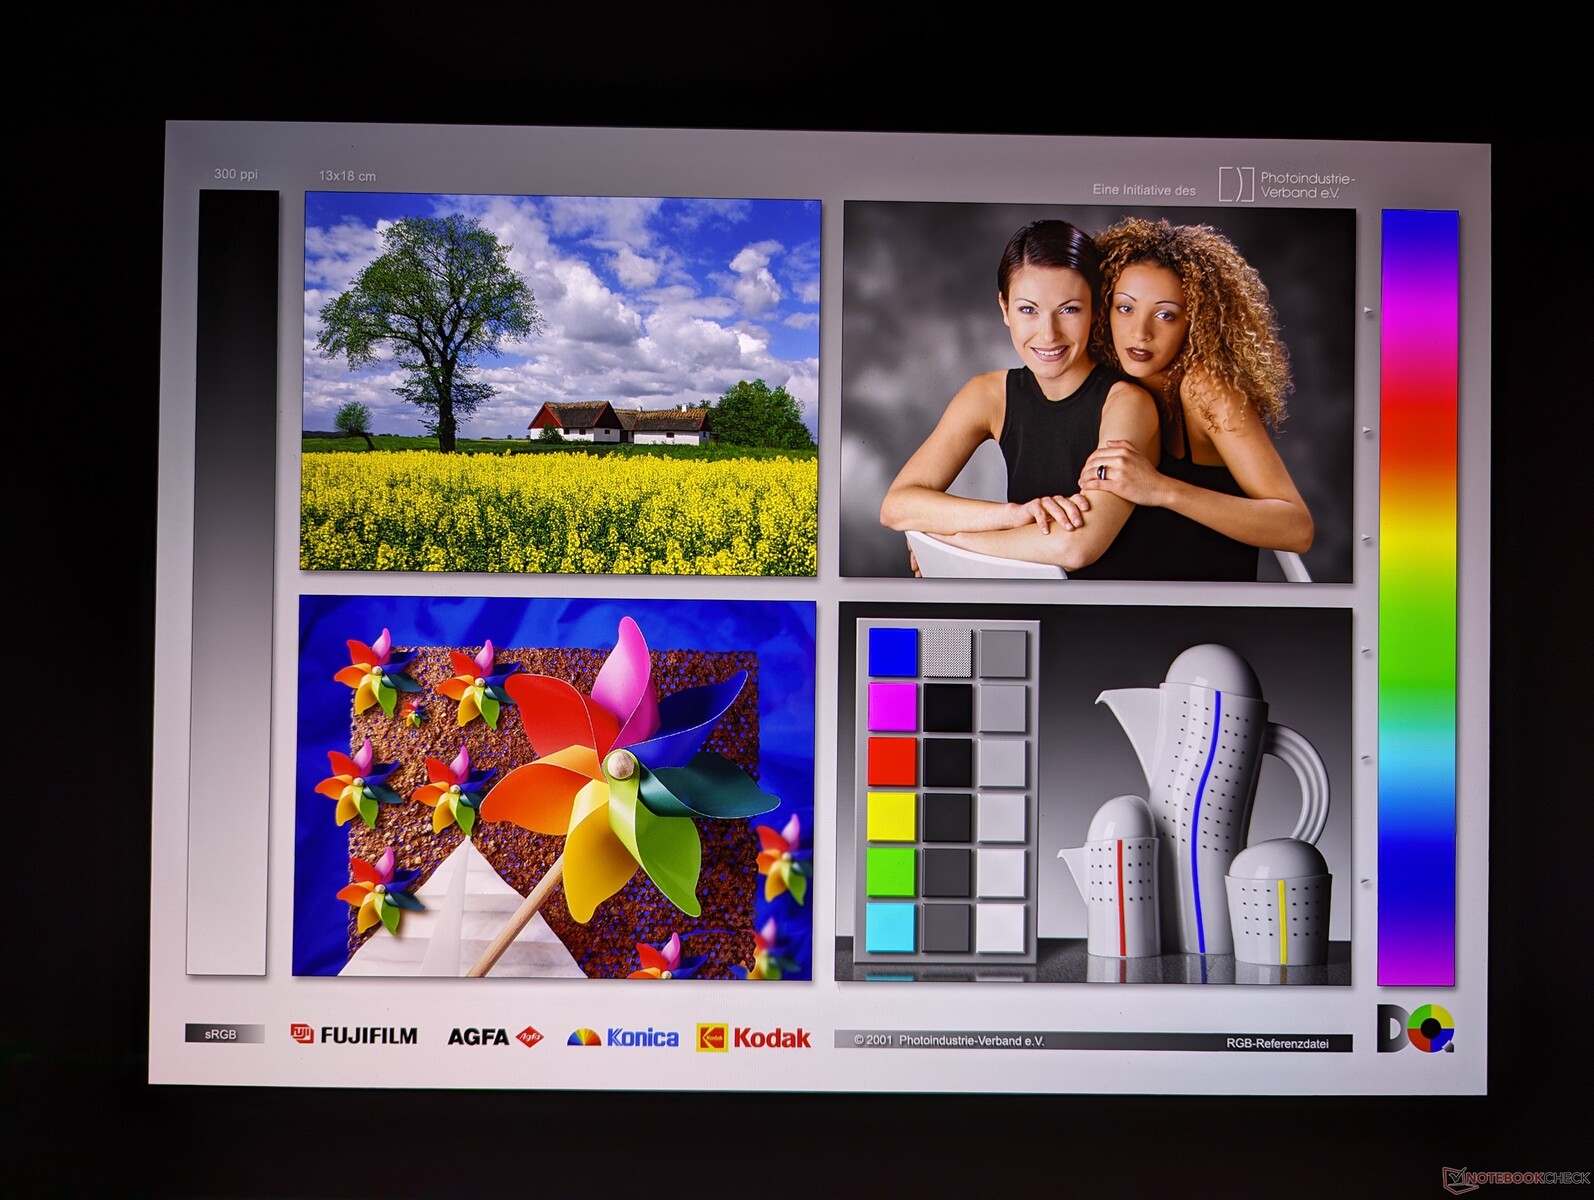
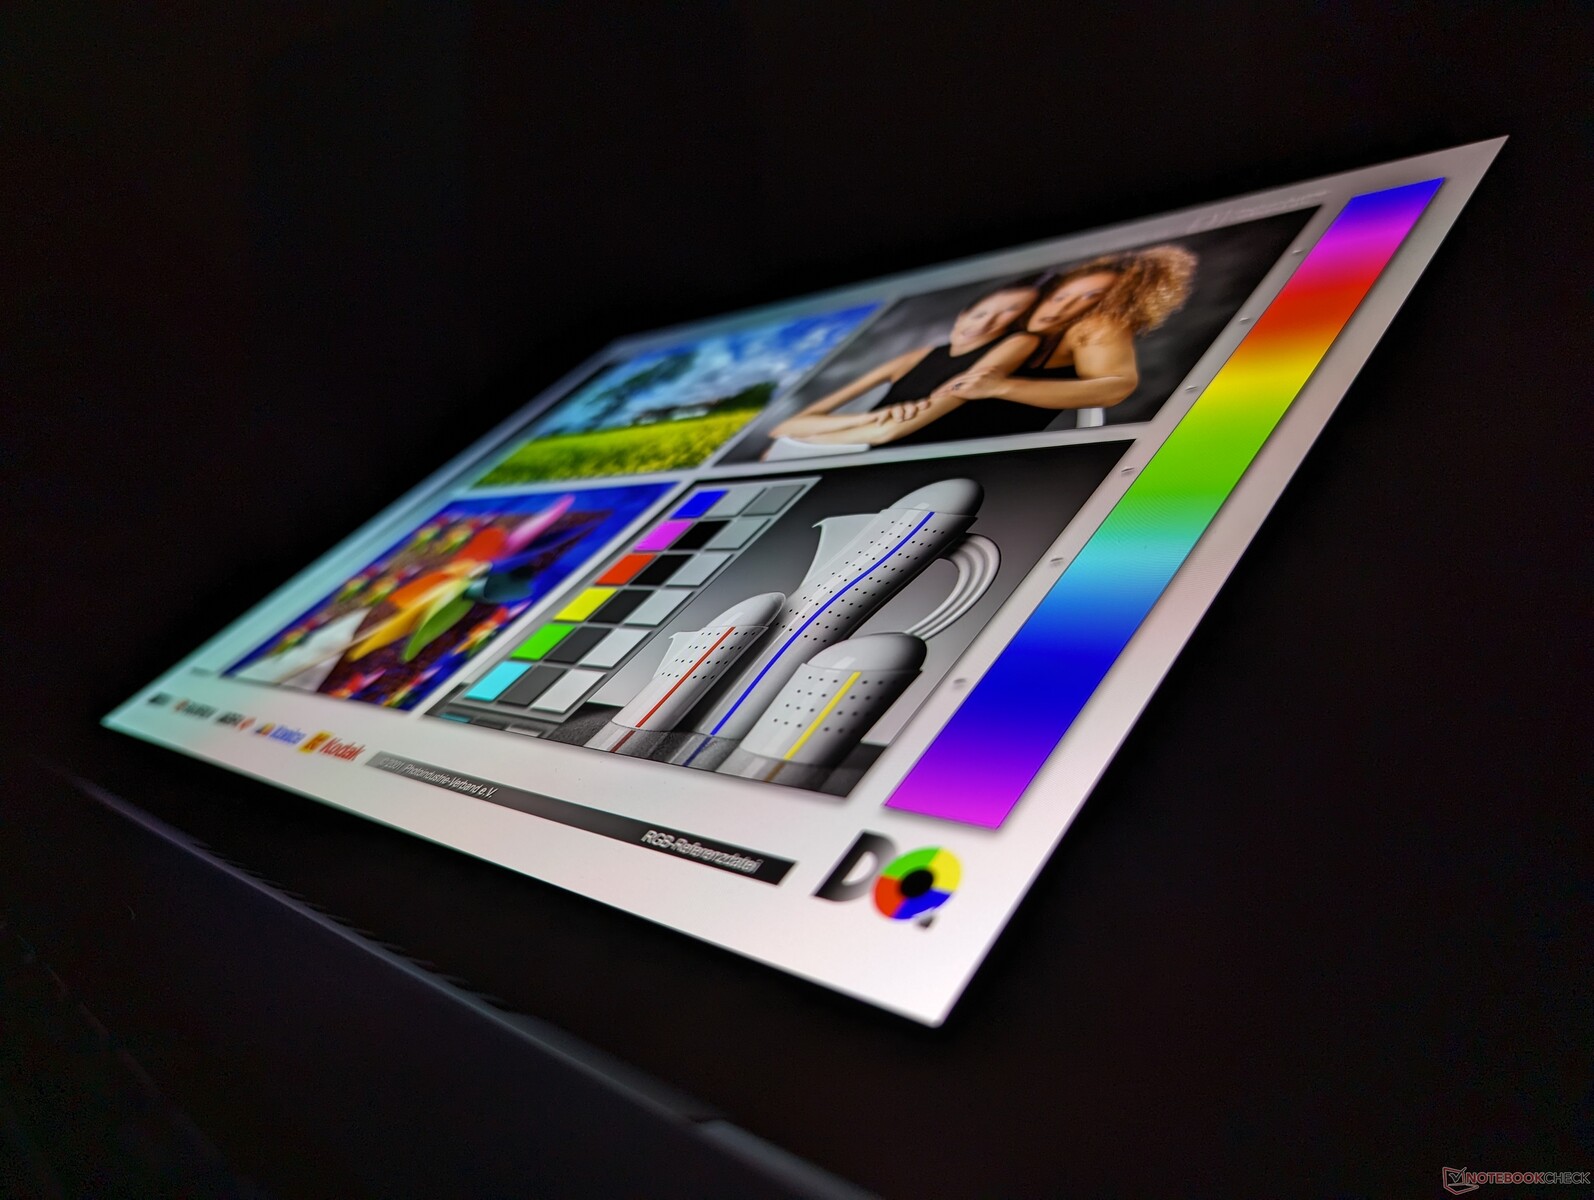
Display
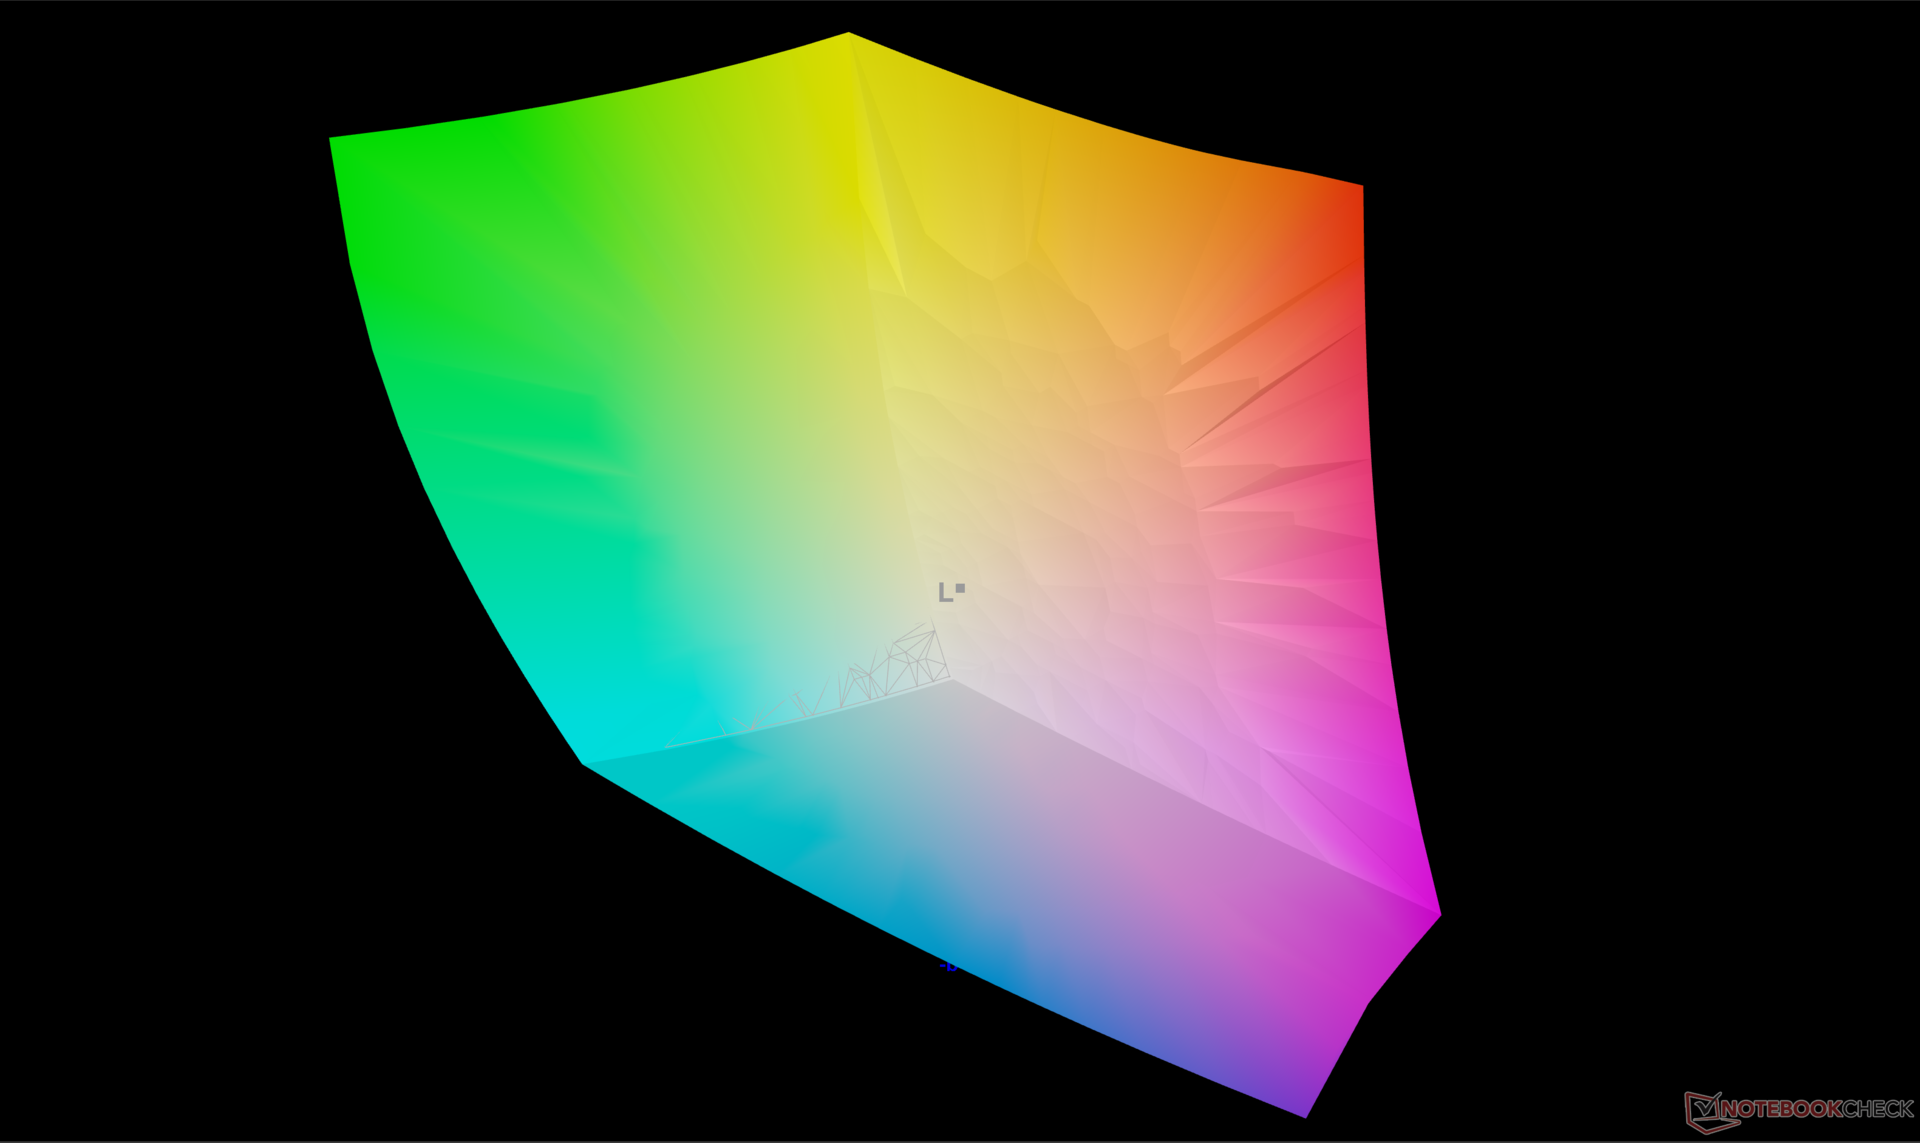
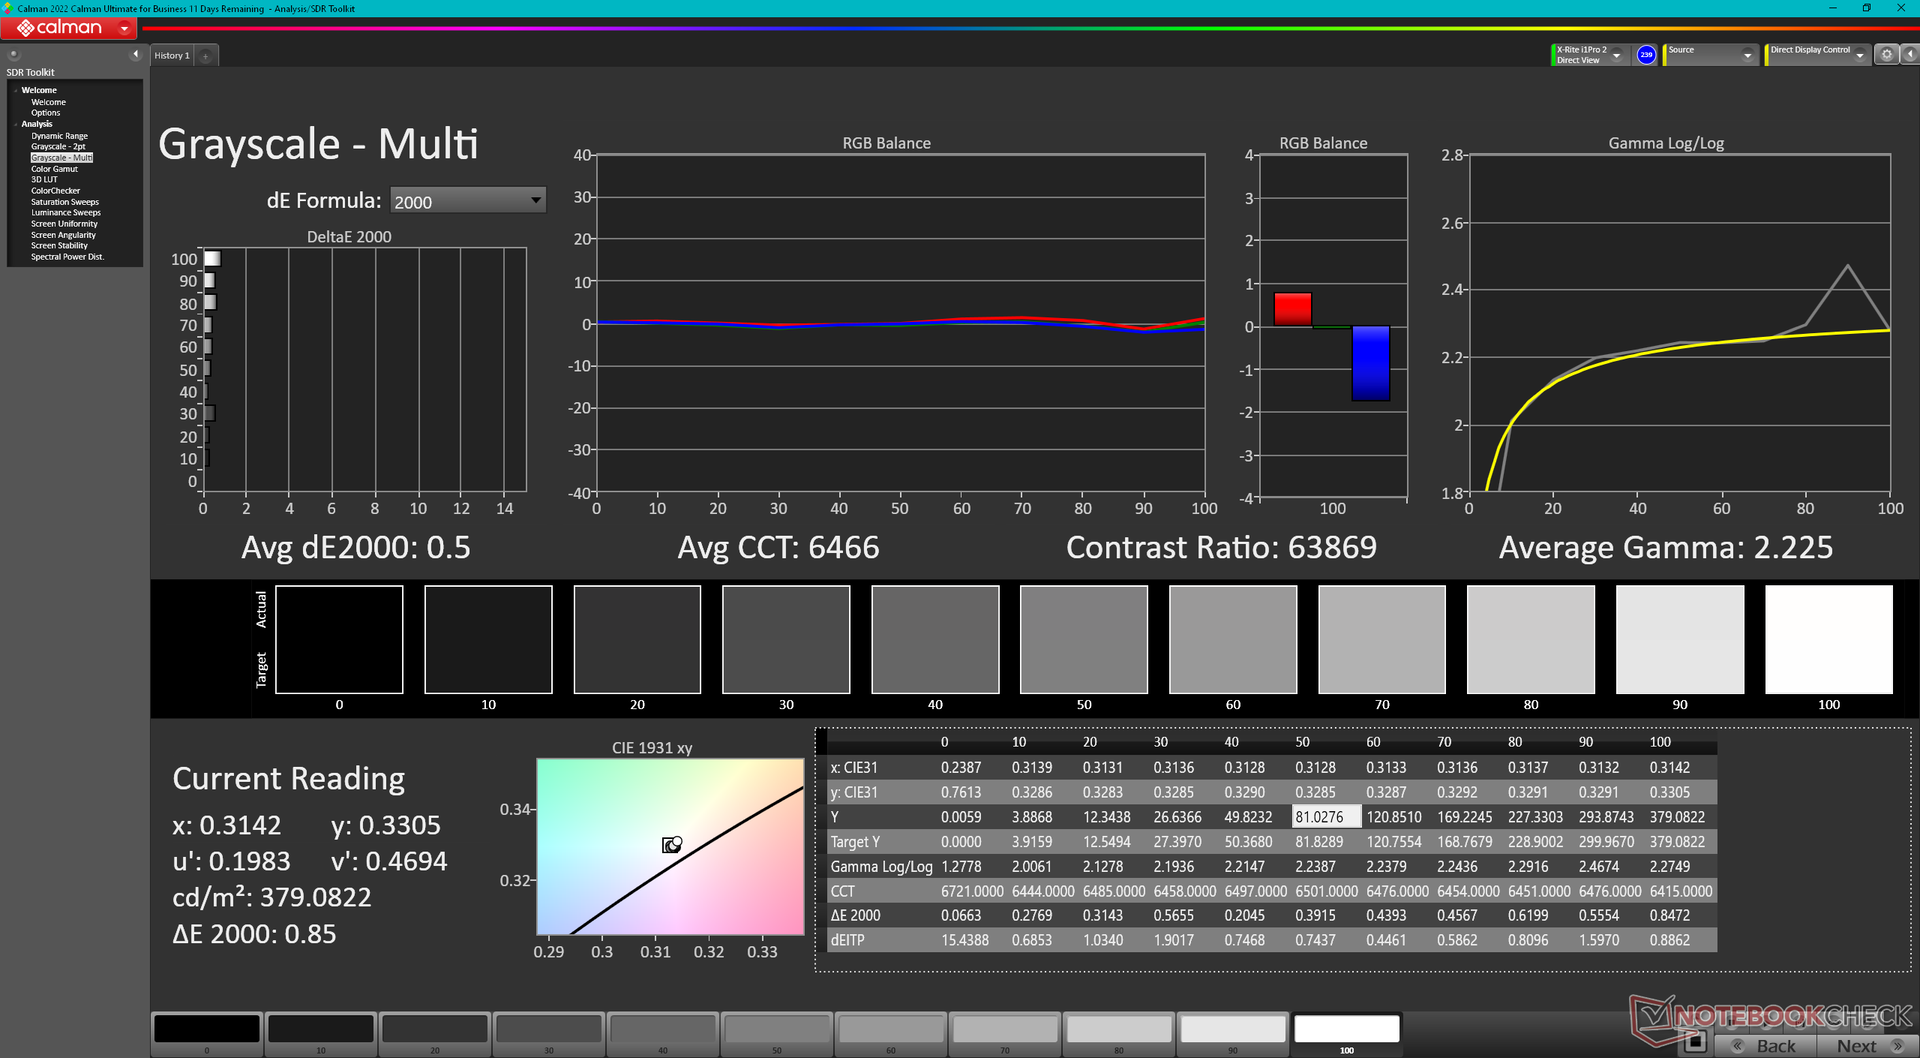
La nostra unità viene fornita con un display OLED da 3200 x 2000 120 Hz invece del display OLED da 3840 x 2400 60 Hz presente sulla nostra precedente unità Zen 3+ Swift Edge 16 in recensione. Per il resto, i due pannelli Samsung offrono coperture cromatiche, livelli di luminosità e di nero simili e tempi di risposta molto rapidi. L'opzione a risoluzione più alta può essere più utile per alcune applicazioni come Excel o finestre multitasking affiancate, ma è difficile tornare a 60 Hz una volta che ci si è abituati alla più veloce frequenza di aggiornamento di 120 Hz della nostra opzione a risoluzione inferiore 3.2K. Per i giochi, il display a 120 Hz consente di puntare a 40 FPS invece che a 30 FPS senza doversi preoccupare dello screen tearing.
| |||||||||||||||||||||||||
Distribuzione della luminosità: 98 %
Al centro con la batteria: 379.8 cd/m²
Contrasto: ∞:1 (Nero: 0 cd/m²)
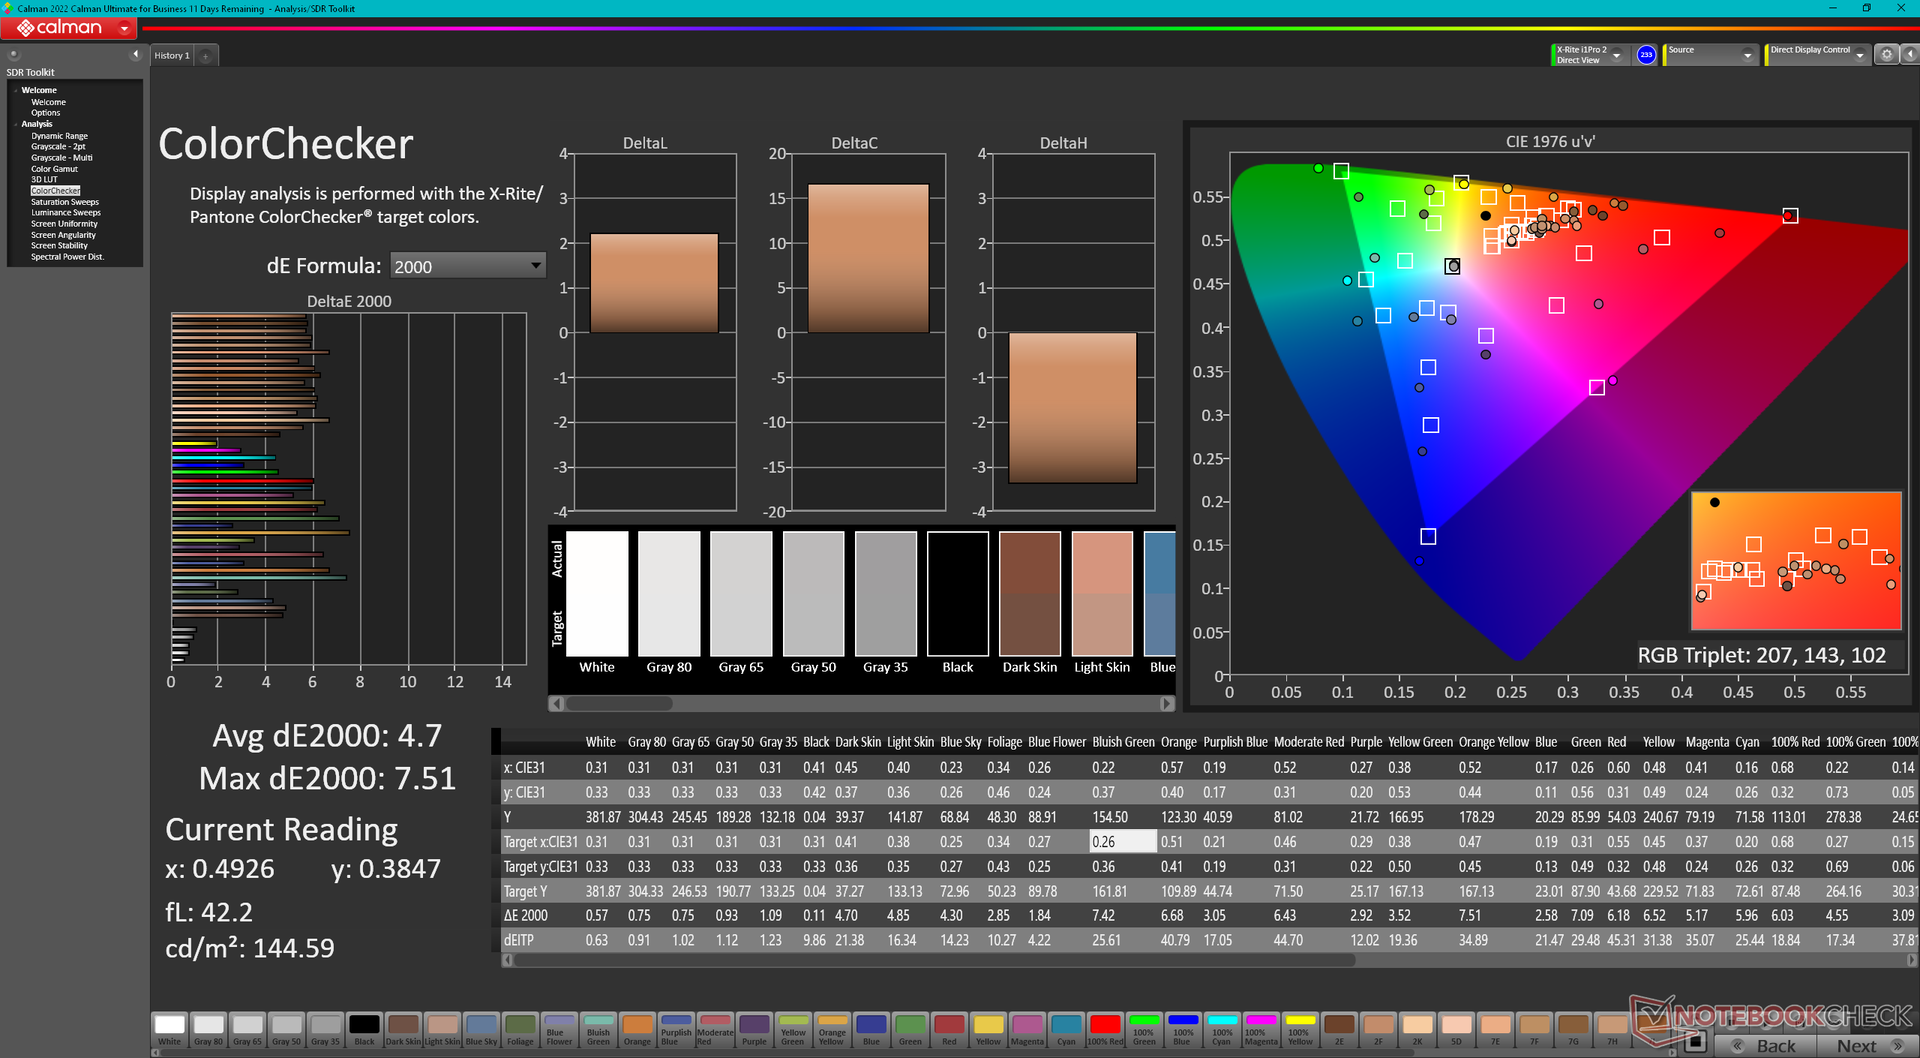
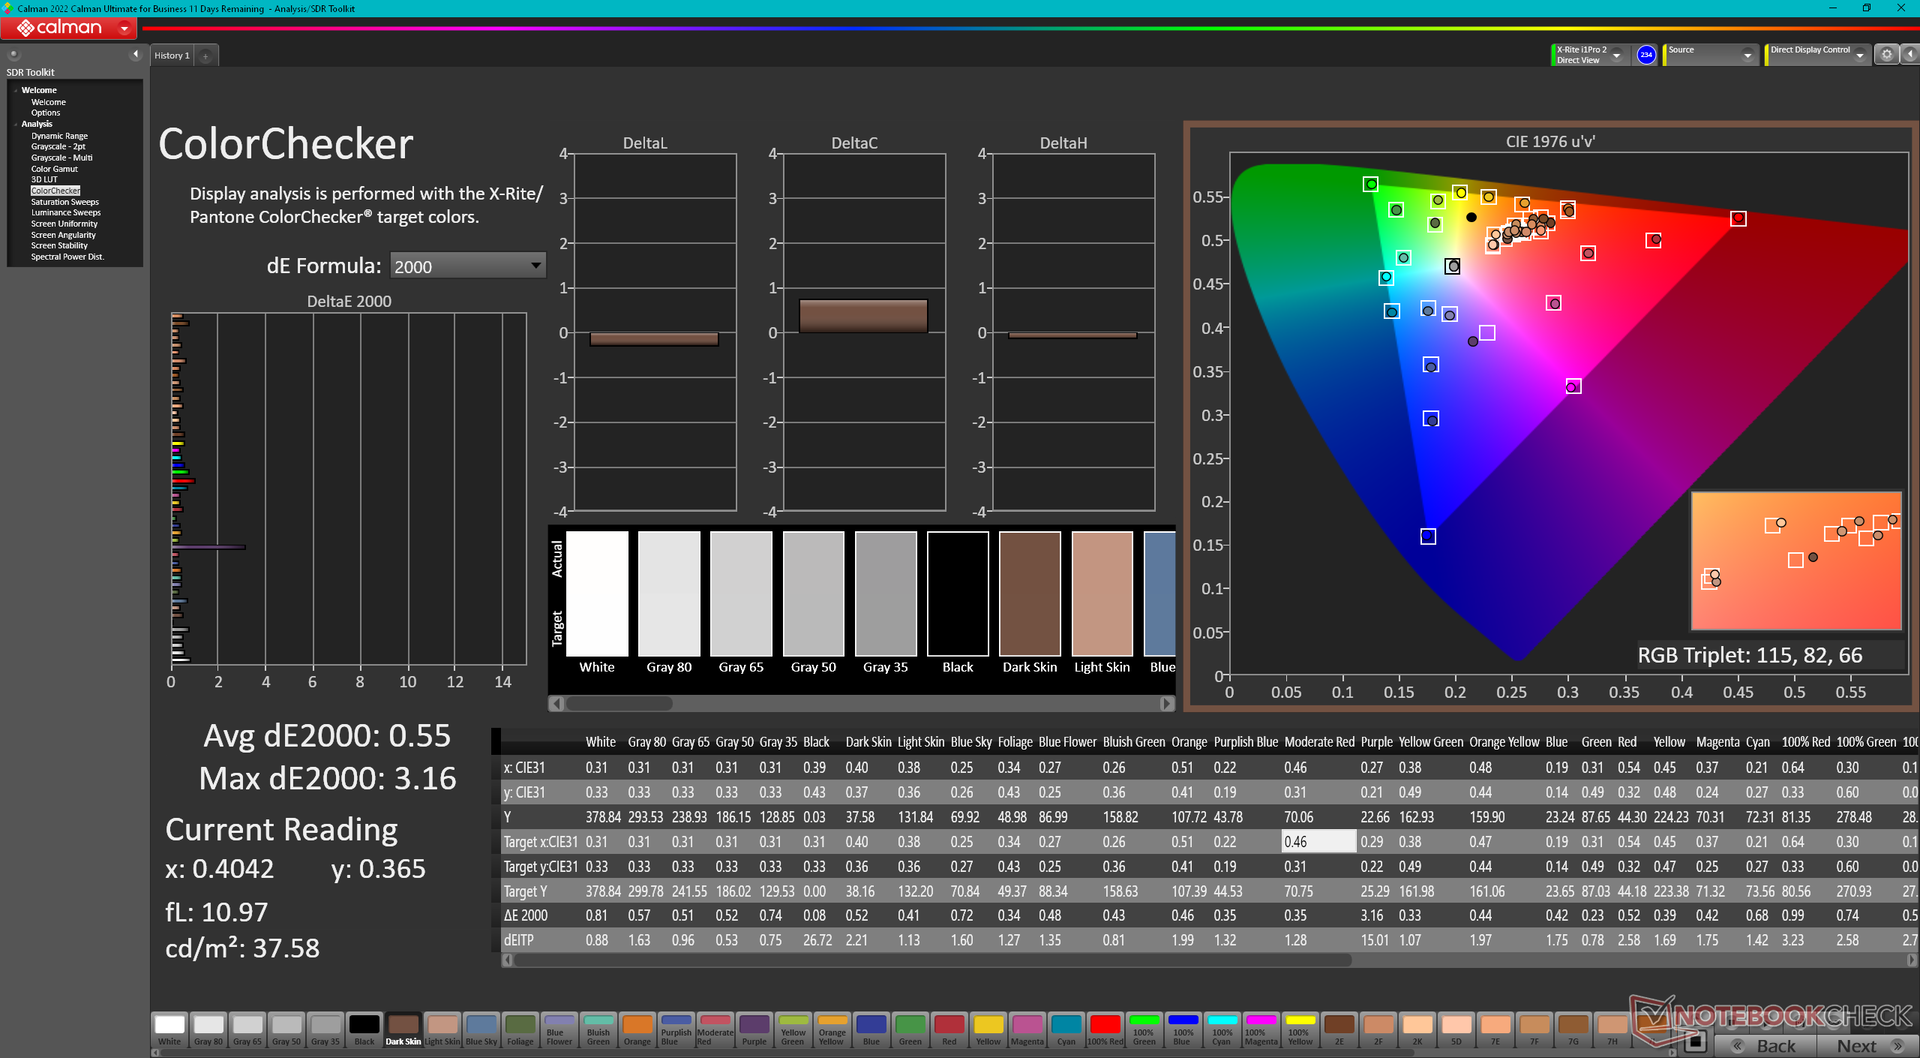
ΔE ColorChecker Calman: 4.7 | ∀{0.5-29.43 Ø4.71}
calibrated: 0.55
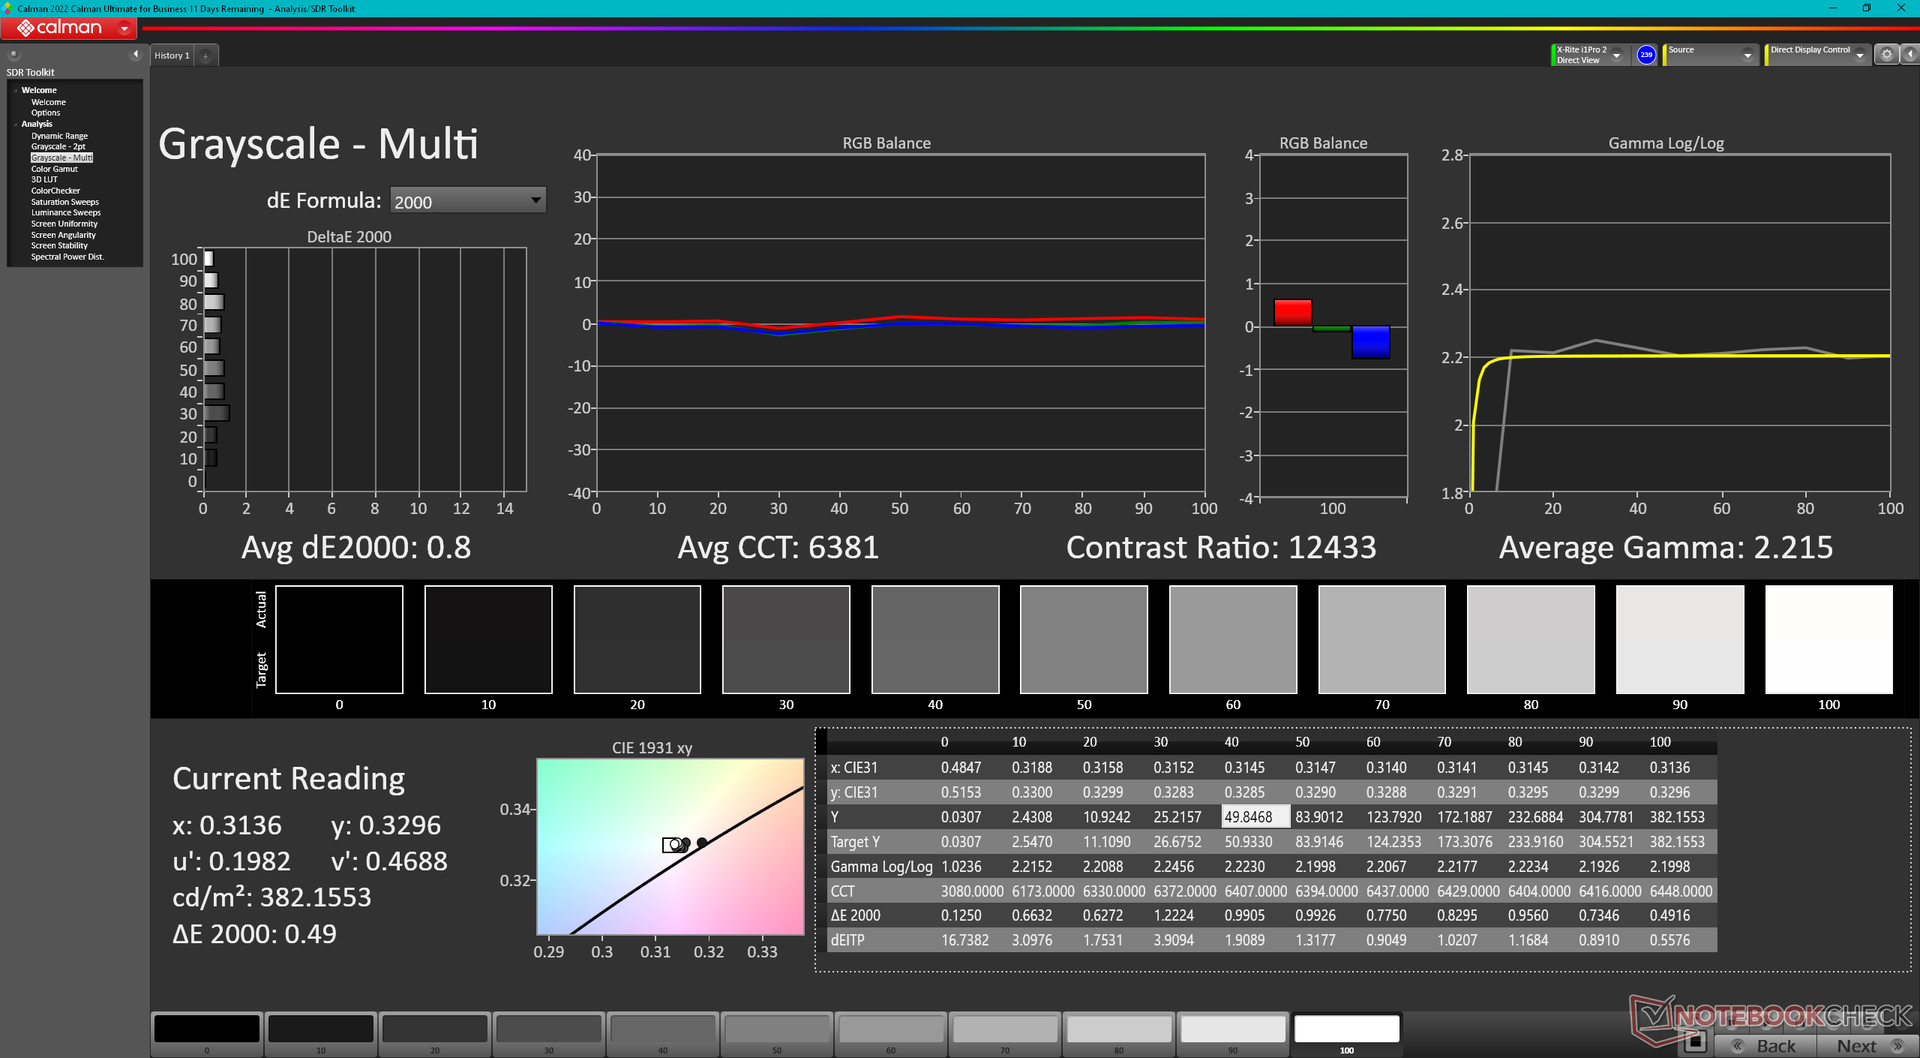
ΔE Greyscale Calman: 0.8 | ∀{0.09-98 Ø4.96}
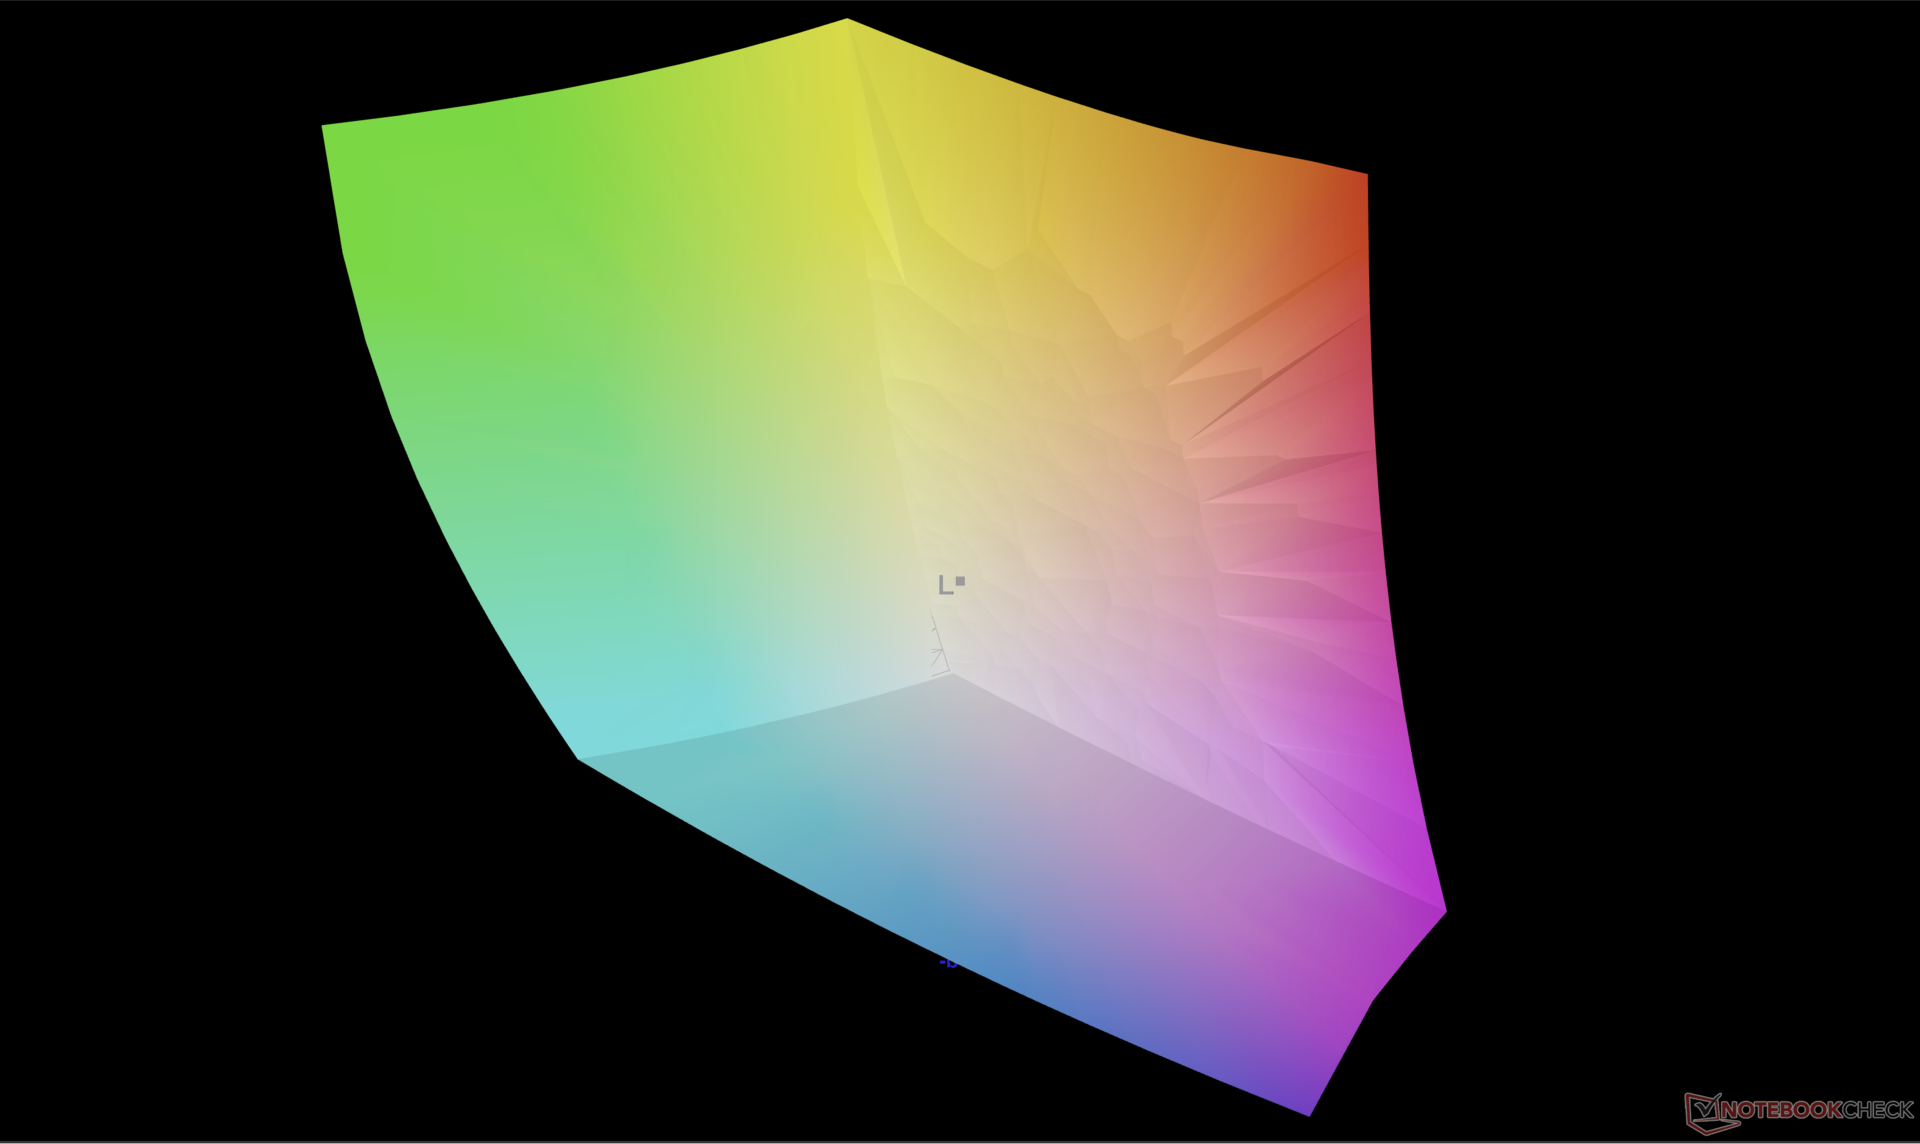
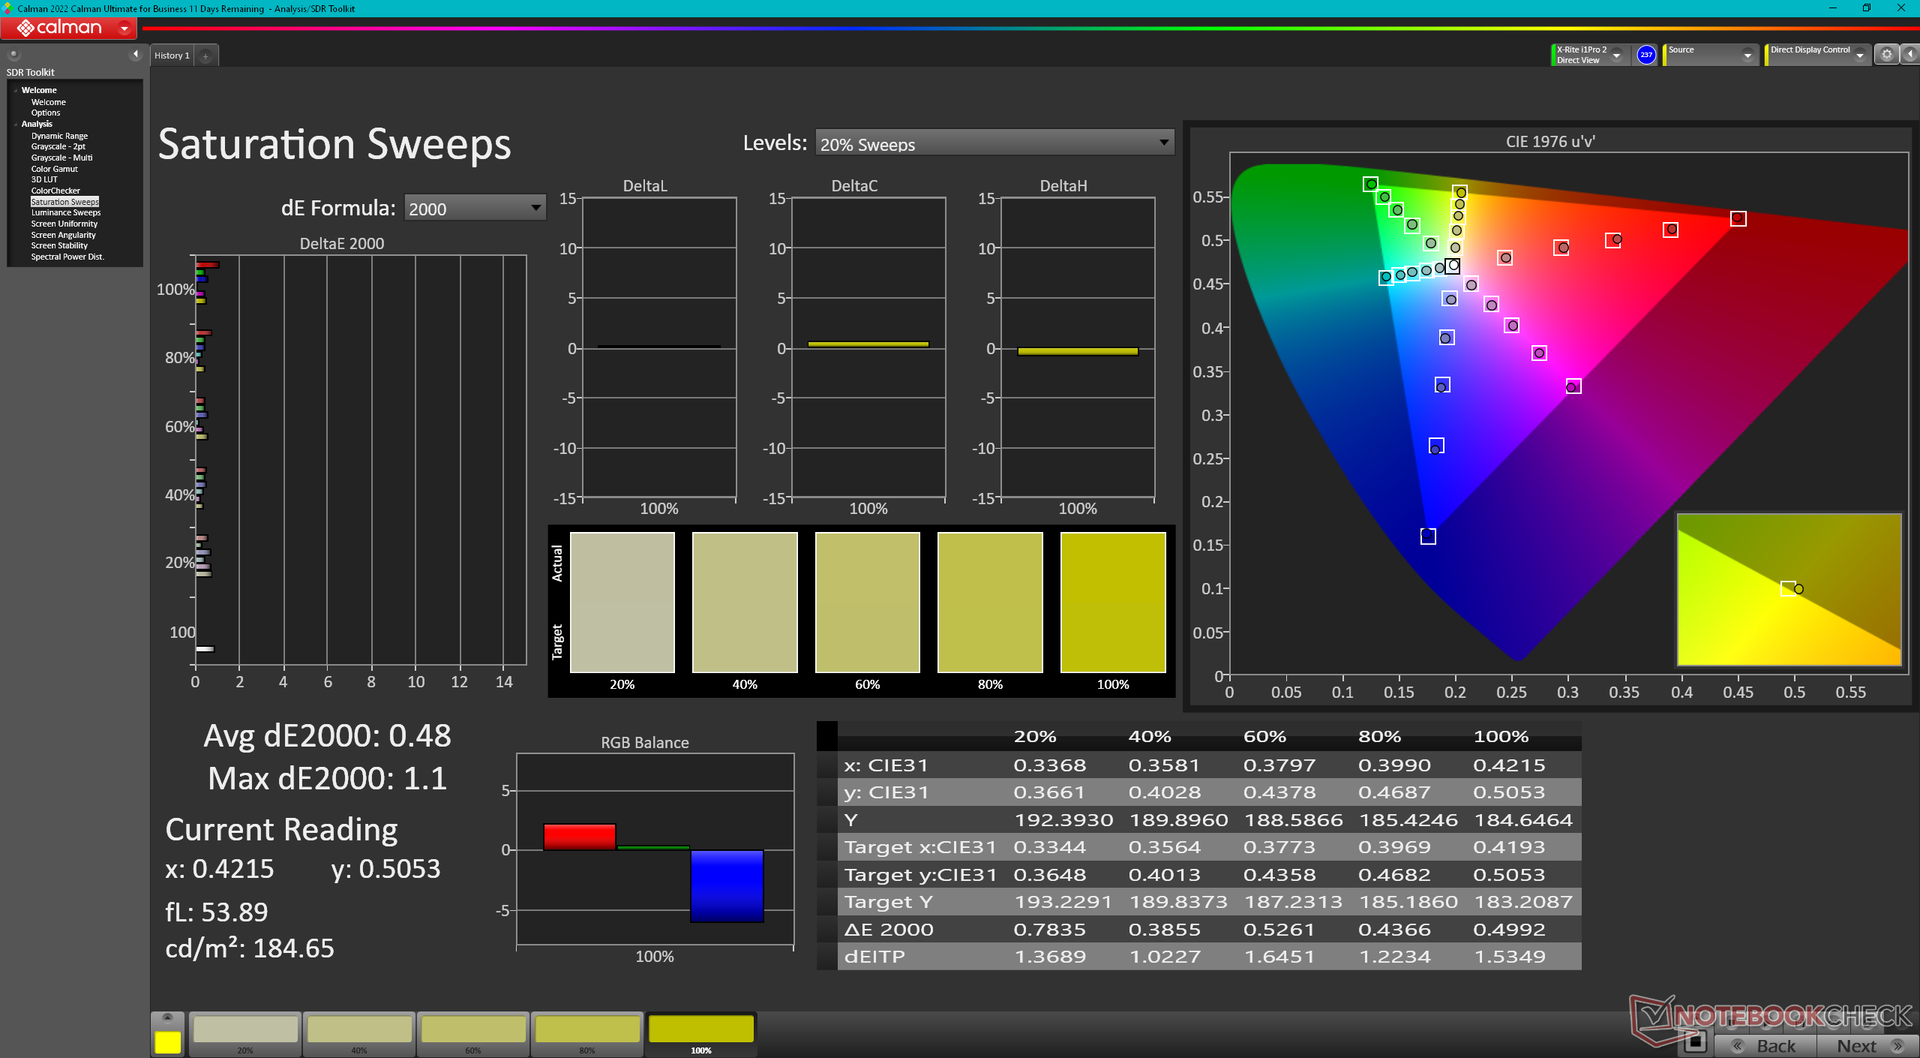
100% AdobeRGB 1998 (Argyll 3D)
100% sRGB (Argyll 3D)
99.9% Display P3 (Argyll 3D)
Gamma: 2.22
CCT: 6381 K
| Acer Swift Edge SFE16 Ryzen 7 7840U Samsung ATNA60BX03-0, OLED, 3200x2000, 16" | Acer Swift Edge SFE16-42-R1GM Samsung SDC4168, OLED, 3840x2400, 16" | Lenovo Slim Pro 9i 16IRP8 LEN160-3.2K, Mini-LED, 3200x2000, 16" | Asus VivoBook Pro 16 Au Optronics B160QAN02.L, IPS, 2560x1600, 16" | Samsung Galaxy Book3 Ultra 16 Samsung ATNA60CL03-0, AMOLED, 2880x1800, 16" | Huawei MateBook 16s i7 BOE XS TV160DKT-NH0, IPS, 2520x1680, 16" | |
|---|---|---|---|---|---|---|
| Display | -1% | -7% | -5% | -1% | -24% | |
| Display P3 Coverage (%) | 99.9 | 99.7 0% | 95.1 -5% | 98.5 -1% | 99.9 0% | 64.5 -35% |
| sRGB Coverage (%) | 100 | 100 0% | 99.9 0% | 99.9 0% | 100 0% | 96.7 -3% |
| AdobeRGB 1998 Coverage (%) | 100 | 97.2 -3% | 84.6 -15% | 86.1 -14% | 96.3 -4% | 66.6 -33% |
| Response Times | -226% | -1588% | -476% | 25% | -4192% | |
| Response Time Grey 50% / Grey 80% * (ms) | 0.57 ? | 2 ? -251% | 14 ? -2356% | 2 ? -251% | 0.49 ? 14% | 35.7 ? -6163% |
| Response Time Black / White * (ms) | 1 ? | 3 ? -200% | 9.2 ? -820% | 8 ? -700% | 0.65 ? 35% | 23.2 ? -2220% |
| PWM Frequency (Hz) | 238.8 | 239 ? | 5784 ? | 240 ? | ||
| Screen | -66% | -198% | -42% | -49% | -3% | |
| Brightness middle (cd/m²) | 379.8 | 369 -3% | 627.4 65% | 504 33% | 400 5% | 311 -18% |
| Brightness (cd/m²) | 383 | 371 -3% | 618 61% | 465 21% | 399 4% | 319 -17% |
| Brightness Distribution (%) | 98 | 97 -1% | 95 -3% | 87 -11% | 93 -5% | 91 -7% |
| Black Level * (cd/m²) | 0.19 | 0.35 | 0.03 | 0.17 | ||
| Colorchecker dE 2000 * | 4.7 | 2.3 51% | 5.84 -24% | 1.83 61% | 2.3 51% | 1 79% |
| Colorchecker dE 2000 max. * | 7.51 | 4.37 42% | 10.22 -36% | 5.51 27% | 4.15 45% | 1.7 77% |
| Colorchecker dE 2000 calibrated * | 0.55 | 2.87 -422% | 4.45 -709% | 1.34 -144% | 1.66 -202% | 0.8 -45% |
| Greyscale dE 2000 * | 0.8 | 1.83 -129% | 6.7 -738% | 3.02 -278% | 2.7 -238% | 1.5 -88% |
| Gamma | 2.22 99% | 2.39 92% | 2.77 79% | 2.39 92% | 2.266 97% | 2.15 102% |
| CCT | 6381 102% | 6392 102% | 5795 112% | 6688 97% | 7047 92% | 6432 101% |
| Contrast (:1) | 3302 | 1440 | 13333 | 1829 | ||
| Media totale (Programma / Settaggio) | -98% /
-77% | -598% /
-382% | -174% /
-105% | -8% /
-25% | -1406% /
-706% |
* ... Meglio usare valori piccoli
Tempi di risposta del Display
| ↔ Tempi di risposta dal Nero al Bianco | ||
|---|---|---|
| 1 ms ... aumenta ↗ e diminuisce ↘ combinato | ↗ 0.55 ms Incremento | 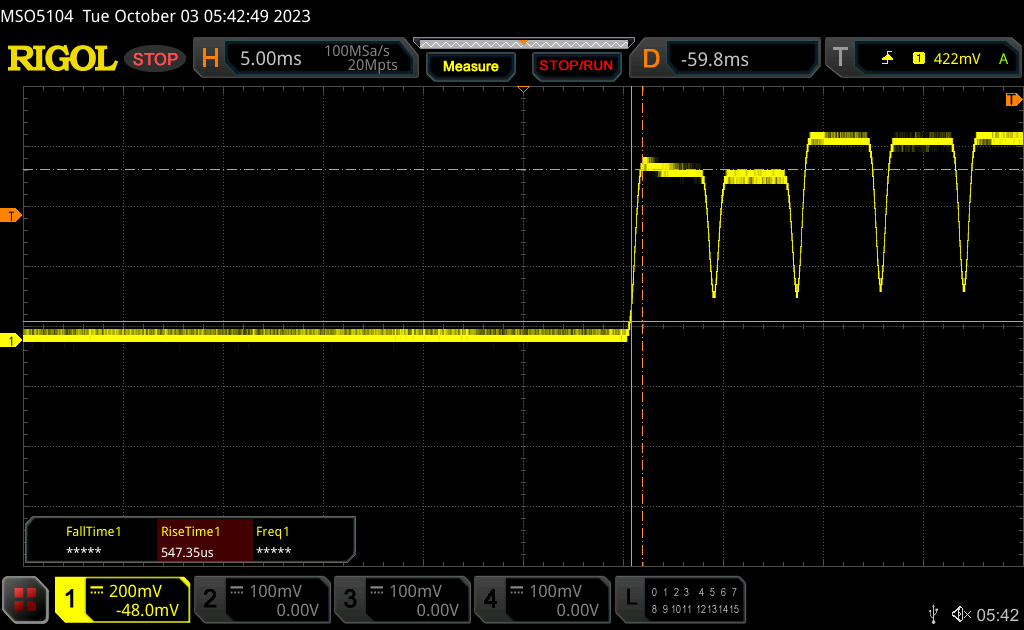 |
| ↘ 0.45 ms Calo | ||
| Lo schermo ha mostrato valori di risposta molto veloci nei nostri tests ed è molto adatto per i gaming veloce. In confronto, tutti i dispositivi di test variano da 0.1 (minimo) a 240 (massimo) ms. » 4 % di tutti i dispositivi è migliore. Questo significa che i tempi di risposta rilevati sono migliori rispettto alla media di tutti i dispositivi testati (19.8 ms). | ||
| ↔ Tempo di risposta dal 50% Grigio all'80% Grigio | ||
| 0.57 ms ... aumenta ↗ e diminuisce ↘ combinato | ↗ 0.28 ms Incremento | 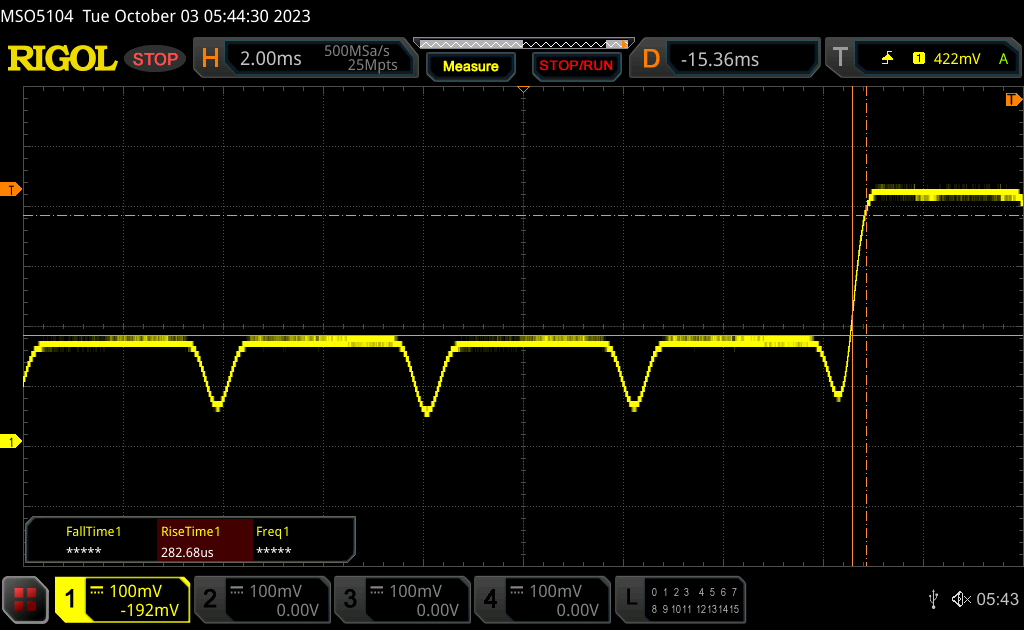 |
| ↘ 0.29 ms Calo | ||
| Lo schermo ha mostrato valori di risposta molto veloci nei nostri tests ed è molto adatto per i gaming veloce. In confronto, tutti i dispositivi di test variano da 0.165 (minimo) a 636 (massimo) ms. » 1 % di tutti i dispositivi è migliore. Questo significa che i tempi di risposta rilevati sono migliori rispettto alla media di tutti i dispositivi testati (31 ms). | ||
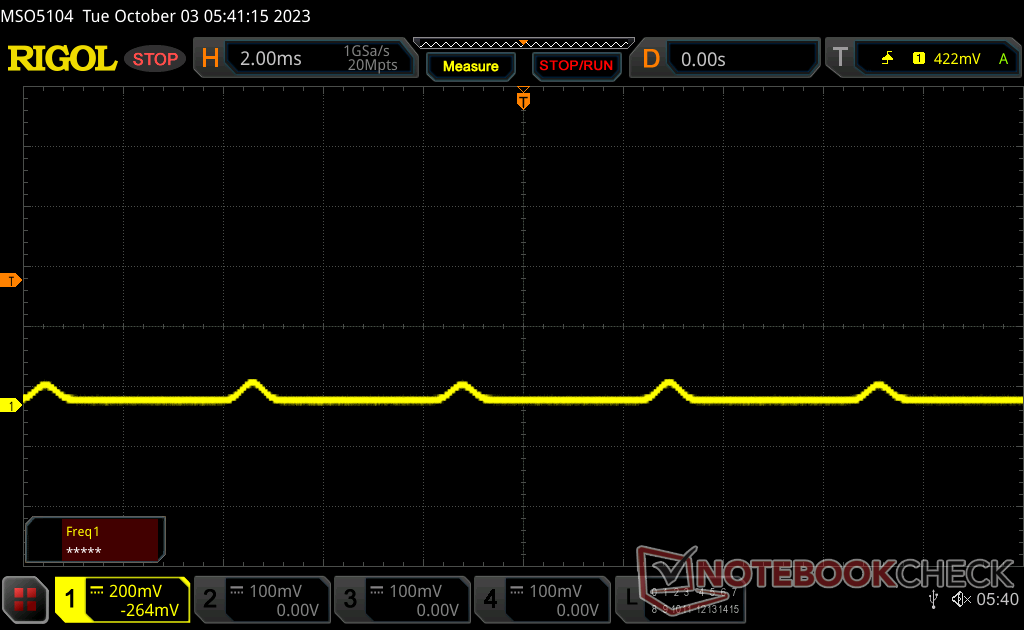
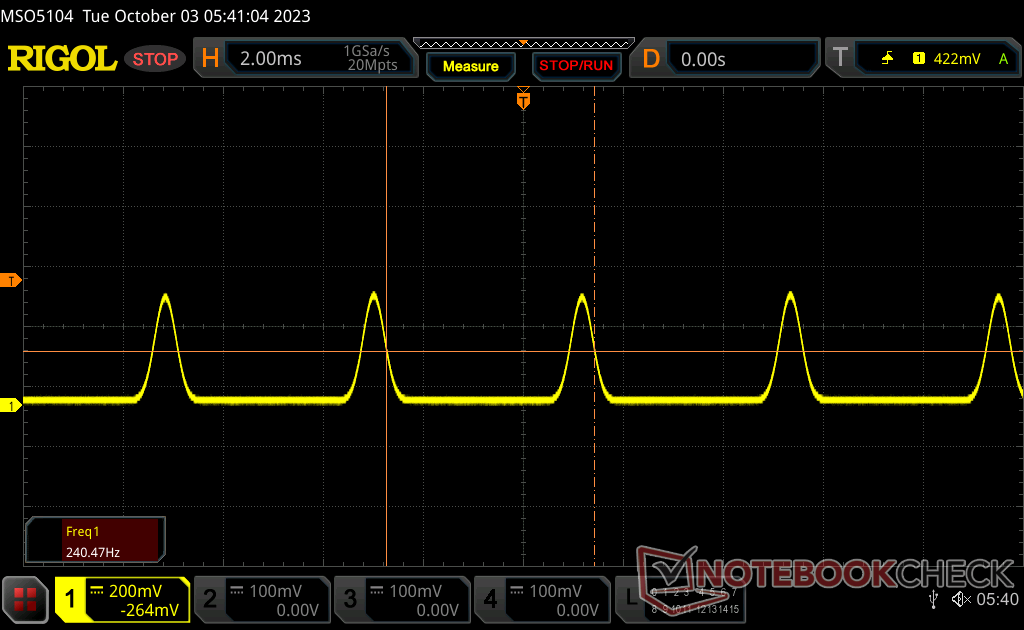
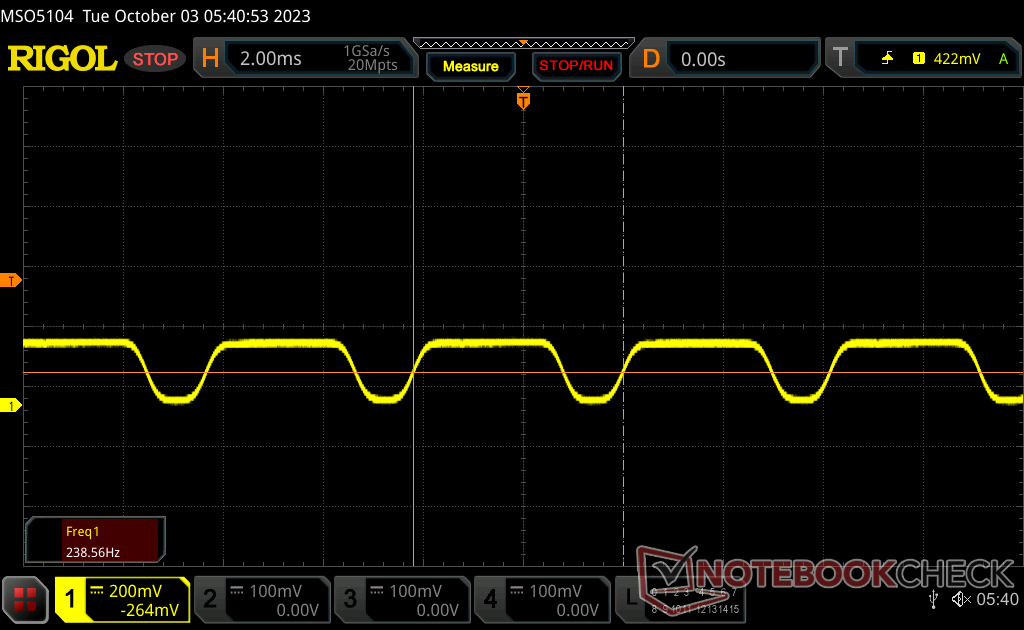
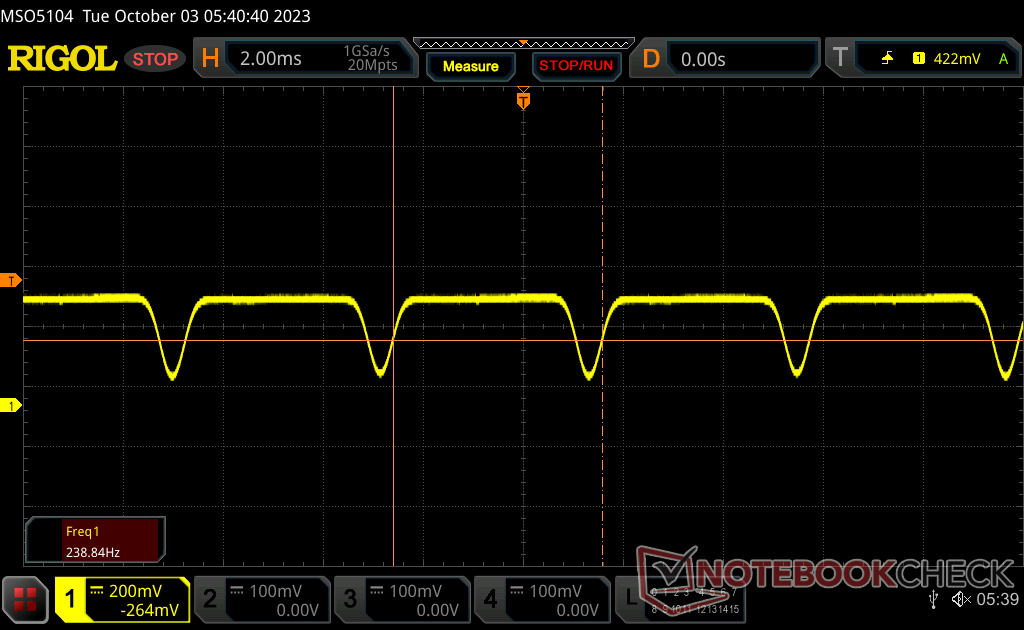
Sfarfallio dello schermo / PWM (Pulse-Width Modulation)
| flickering dello schermo / PWM rilevato | 238.8 Hz | 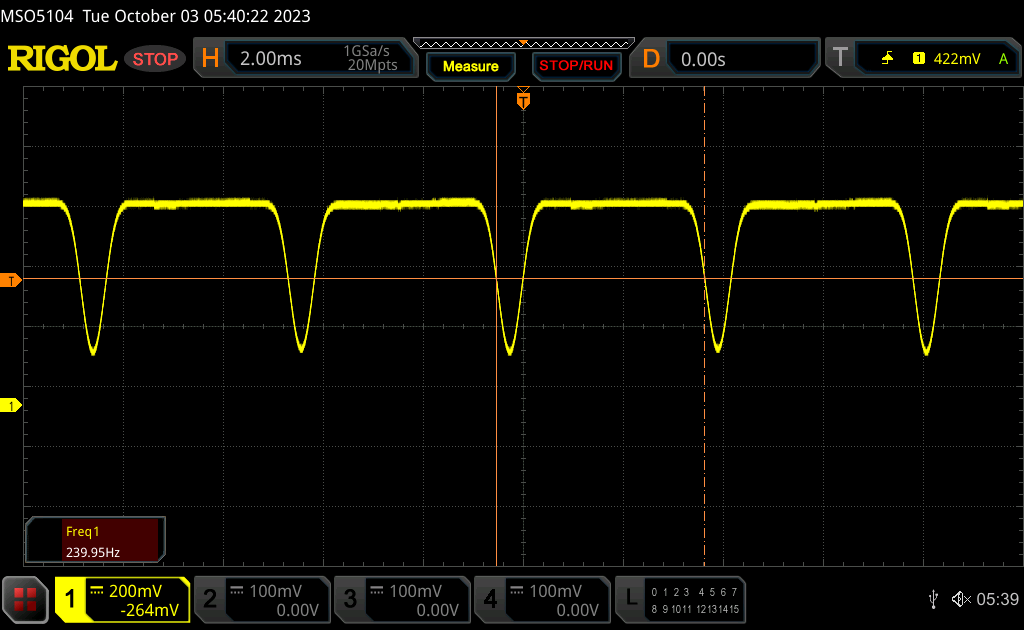 | |
Il display sfarfalla a 238.8 Hz (Probabilmente a causa dell'uso di PWM) . La frequenza di 238.8 Hz è relativamente bassa, quindi gli utenti sensibili potrebbero notare il flickering ed accusare stanchezza agli occhi a questo livello di luminosità e a livelli inferiori. In confronto: 52 % di tutti i dispositivi testati non utilizza PWM per ridurre la luminosita' del display. Se è rilevato PWM, una media di 7747 (minimo: 5 - massimo: 343500) Hz è stata rilevata. | |||
Una modulazione di larghezza di impulso costante di 238 Hz è presente a tutti i livelli di luminosità, compresa l'impostazione massima. Questo comportamento è comune nei display OLED, dagli smartphone ai computer portatili.
Prestazioni
Condizioni di test
Abbiamo impostato Windows in modalità Prestazioni prima di eseguire i benchmark qui sotto. Acer non include alcun software specializzato per la regolazione delle prestazioni o del display, a differenza della serie Asus VivoBook.
Il FreeSync non è supportato sul display interno.
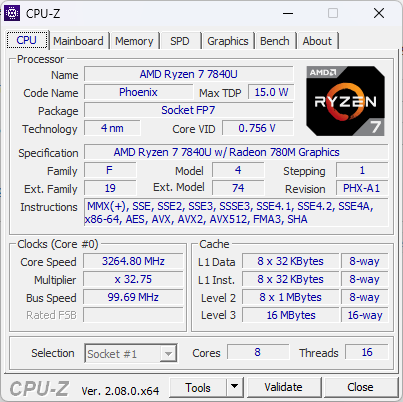
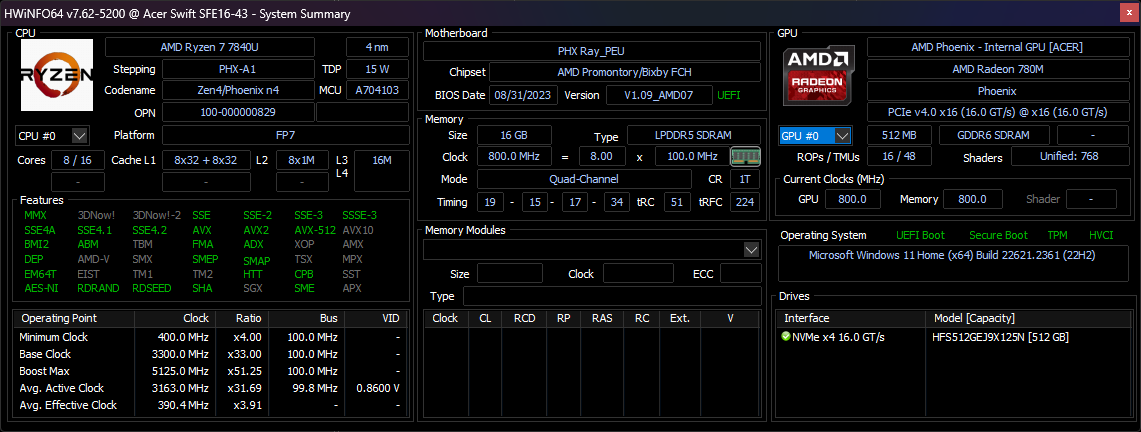
Processore
Le prestazioni multi-thread sono leggermente ma costantemente indietro rispetto alla maggior parte degli altri portatili con lo stesso Ryzen 7 7840U. Il recente AMD Framework Laptop 13.5per esempio, è più veloce del 15 percento. La discrepanza è dovuta al potenziale Turbo Core più debole della CPU dell'Acer, dovuto alla soluzione di raffreddamento ridotta rispetto alle dimensioni dello schermo da 16 pollici. I punteggi di CineBench R15 xT diminuirebbero fino al 21% nel tempo, come mostra il nostro grafico di confronto qui sotto.
Le prestazioni complessive sono comunque superiori a quelle dello Zen 3+ Ryzen 7 7735U nel vecchio Acer Swift Edge SFE16-42-R1GM di circa il 15% sia nei carichi single-threaded che multi-threaded, nonostante il throttling.
Cinebench R15 Multi Loop
Cinebench R23: Multi Core | Single Core
Cinebench R20: CPU (Multi Core) | CPU (Single Core)
Cinebench R15: CPU Multi 64Bit | CPU Single 64Bit
Blender: v2.79 BMW27 CPU
7-Zip 18.03: 7z b 4 | 7z b 4 -mmt1
Geekbench 5.5: Multi-Core | Single-Core
HWBOT x265 Benchmark v2.2: 4k Preset
LibreOffice : 20 Documents To PDF
R Benchmark 2.5: Overall mean
* ... Meglio usare valori piccoli
AIDA64: FP32 Ray-Trace | FPU Julia | CPU SHA3 | CPU Queen | FPU SinJulia | FPU Mandel | CPU AES | CPU ZLib | FP64 Ray-Trace | CPU PhotoWorxx
| Performance rating | |
| Lenovo Slim Pro 9i 16IRP8 | |
| Media AMD Ryzen 7 7840U | |
| Acer Swift Edge SFE16 Ryzen 7 7840U | |
| Samsung Galaxy Book3 Ultra 16 | |
| Asus VivoBook Pro 16 | |
| Acer Swift Edge SFE16-42-R1GM | |
| Huawei MateBook 16s i7 | |
| AIDA64 / FP32 Ray-Trace | |
| Media AMD Ryzen 7 7840U (17924 - 25901, n=11) | |
| Lenovo Slim Pro 9i 16IRP8 | |
| Acer Swift Edge SFE16 Ryzen 7 7840U | |
| Asus VivoBook Pro 16 | |
| Samsung Galaxy Book3 Ultra 16 | |
| Acer Swift Edge SFE16-42-R1GM | |
| Huawei MateBook 16s i7 | |
| AIDA64 / FPU Julia | |
| Lenovo Slim Pro 9i 16IRP8 | |
| Media AMD Ryzen 7 7840U (78360 - 109745, n=11) | |
| Acer Swift Edge SFE16 Ryzen 7 7840U | |
| Asus VivoBook Pro 16 | |
| Acer Swift Edge SFE16-42-R1GM | |
| Samsung Galaxy Book3 Ultra 16 | |
| Huawei MateBook 16s i7 | |
| AIDA64 / CPU Queen | |
| Lenovo Slim Pro 9i 16IRP8 | |
| Asus VivoBook Pro 16 | |
| Samsung Galaxy Book3 Ultra 16 | |
| Media AMD Ryzen 7 7840U (83206 - 114294, n=10) | |
| Acer Swift Edge SFE16 Ryzen 7 7840U | |
| Huawei MateBook 16s i7 | |
| Acer Swift Edge SFE16-42-R1GM | |
| AIDA64 / FPU SinJulia | |
| Media AMD Ryzen 7 7840U (11969 - 14822, n=11) | |
| Acer Swift Edge SFE16 Ryzen 7 7840U | |
| Lenovo Slim Pro 9i 16IRP8 | |
| Acer Swift Edge SFE16-42-R1GM | |
| Samsung Galaxy Book3 Ultra 16 | |
| Asus VivoBook Pro 16 | |
| Huawei MateBook 16s i7 | |
| AIDA64 / FPU Mandel | |
| Media AMD Ryzen 7 7840U (40720 - 58482, n=11) | |
| Lenovo Slim Pro 9i 16IRP8 | |
| Acer Swift Edge SFE16 Ryzen 7 7840U | |
| Acer Swift Edge SFE16-42-R1GM | |
| Asus VivoBook Pro 16 | |
| Samsung Galaxy Book3 Ultra 16 | |
| Huawei MateBook 16s i7 | |
| AIDA64 / CPU ZLib | |
| Lenovo Slim Pro 9i 16IRP8 | |
| Samsung Galaxy Book3 Ultra 16 | |
| Asus VivoBook Pro 16 | |
| Media AMD Ryzen 7 7840U (801 - 1047, n=11) | |
| Acer Swift Edge SFE16 Ryzen 7 7840U | |
| Huawei MateBook 16s i7 | |
| Acer Swift Edge SFE16-42-R1GM | |
| AIDA64 / FP64 Ray-Trace | |
| Media AMD Ryzen 7 7840U (9347 - 13846, n=11) | |
| Lenovo Slim Pro 9i 16IRP8 | |
| Acer Swift Edge SFE16 Ryzen 7 7840U | |
| Asus VivoBook Pro 16 | |
| Samsung Galaxy Book3 Ultra 16 | |
| Acer Swift Edge SFE16-42-R1GM | |
| Huawei MateBook 16s i7 | |
| AIDA64 / CPU PhotoWorxx | |
| Lenovo Slim Pro 9i 16IRP8 | |
| Samsung Galaxy Book3 Ultra 16 | |
| Huawei MateBook 16s i7 | |
| Media AMD Ryzen 7 7840U (26206 - 38173, n=11) | |
| Acer Swift Edge SFE16 Ryzen 7 7840U | |
| Acer Swift Edge SFE16-42-R1GM | |
| Asus VivoBook Pro 16 | |
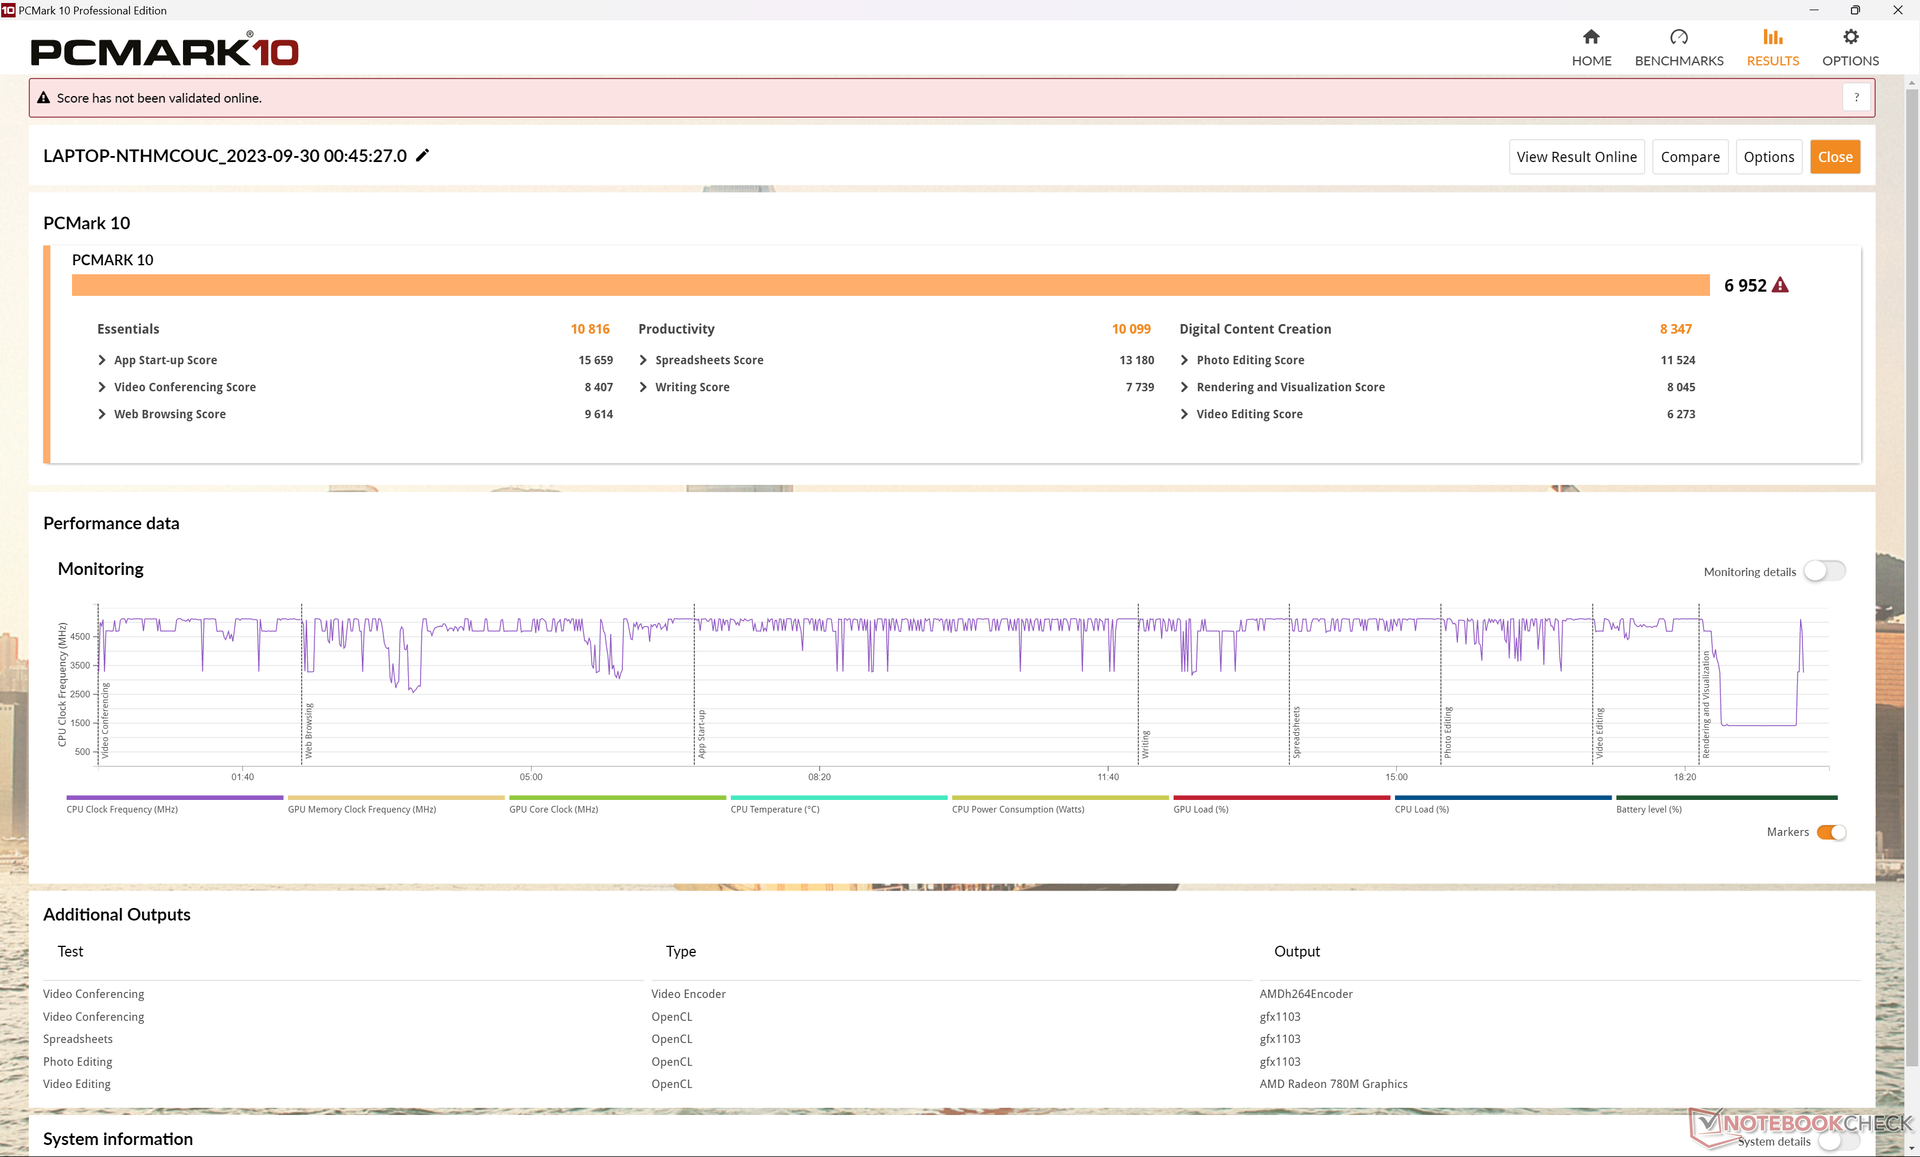
Prestazioni del sistema
CrossMark: Overall | Productivity | Creativity | Responsiveness
| PCMark 10 / Score | |
| Lenovo Slim Pro 9i 16IRP8 | |
| Acer Swift Edge SFE16 Ryzen 7 7840U | |
| Samsung Galaxy Book3 Ultra 16 | |
| Asus VivoBook Pro 16 | |
| Media AMD Ryzen 7 7840U, AMD Radeon 780M (5866 - 7157, n=10) | |
| Huawei MateBook 16s i7 | |
| Acer Swift Edge SFE16-42-R1GM | |
| PCMark 10 / Essentials | |
| Huawei MateBook 16s i7 | |
| Lenovo Slim Pro 9i 16IRP8 | |
| Acer Swift Edge SFE16 Ryzen 7 7840U | |
| Samsung Galaxy Book3 Ultra 16 | |
| Media AMD Ryzen 7 7840U, AMD Radeon 780M (9068 - 11081, n=10) | |
| Asus VivoBook Pro 16 | |
| Acer Swift Edge SFE16-42-R1GM | |
| PCMark 10 / Productivity | |
| Acer Swift Edge SFE16 Ryzen 7 7840U | |
| Lenovo Slim Pro 9i 16IRP8 | |
| Acer Swift Edge SFE16-42-R1GM | |
| Asus VivoBook Pro 16 | |
| Media AMD Ryzen 7 7840U, AMD Radeon 780M (7323 - 10099, n=10) | |
| Samsung Galaxy Book3 Ultra 16 | |
| Huawei MateBook 16s i7 | |
| PCMark 10 / Digital Content Creation | |
| Lenovo Slim Pro 9i 16IRP8 | |
| Samsung Galaxy Book3 Ultra 16 | |
| Asus VivoBook Pro 16 | |
| Acer Swift Edge SFE16 Ryzen 7 7840U | |
| Media AMD Ryzen 7 7840U, AMD Radeon 780M (7204 - 8987, n=10) | |
| Acer Swift Edge SFE16-42-R1GM | |
| Huawei MateBook 16s i7 | |
| CrossMark / Overall | |
| Huawei MateBook 16s i7 | |
| Acer Swift Edge SFE16 Ryzen 7 7840U | |
| Lenovo Slim Pro 9i 16IRP8 | |
| Asus VivoBook Pro 16 | |
| Samsung Galaxy Book3 Ultra 16 | |
| Media AMD Ryzen 7 7840U, AMD Radeon 780M (1256 - 1804, n=10) | |
| Acer Swift Edge SFE16-42-R1GM | |
| CrossMark / Productivity | |
| Huawei MateBook 16s i7 | |
| Acer Swift Edge SFE16 Ryzen 7 7840U | |
| Asus VivoBook Pro 16 | |
| Lenovo Slim Pro 9i 16IRP8 | |
| Media AMD Ryzen 7 7840U, AMD Radeon 780M (1261 - 1798, n=10) | |
| Samsung Galaxy Book3 Ultra 16 | |
| Acer Swift Edge SFE16-42-R1GM | |
| CrossMark / Creativity | |
| Lenovo Slim Pro 9i 16IRP8 | |
| Huawei MateBook 16s i7 | |
| Acer Swift Edge SFE16 Ryzen 7 7840U | |
| Asus VivoBook Pro 16 | |
| Samsung Galaxy Book3 Ultra 16 | |
| Media AMD Ryzen 7 7840U, AMD Radeon 780M (1251 - 1835, n=10) | |
| Acer Swift Edge SFE16-42-R1GM | |
| CrossMark / Responsiveness | |
| Huawei MateBook 16s i7 | |
| Acer Swift Edge SFE16 Ryzen 7 7840U | |
| Asus VivoBook Pro 16 | |
| Samsung Galaxy Book3 Ultra 16 | |
| Lenovo Slim Pro 9i 16IRP8 | |
| Media AMD Ryzen 7 7840U, AMD Radeon 780M (1082 - 1775, n=10) | |
| Acer Swift Edge SFE16-42-R1GM | |
| PCMark 10 Score | 6952 punti | |
Aiuto | ||
| AIDA64 / Memory Copy | |
| Lenovo Slim Pro 9i 16IRP8 | |
| Samsung Galaxy Book3 Ultra 16 | |
| Huawei MateBook 16s i7 | |
| Acer Swift Edge SFE16 Ryzen 7 7840U | |
| Media AMD Ryzen 7 7840U (43255 - 70532, n=12) | |
| Acer Swift Edge SFE16-42-R1GM | |
| Asus VivoBook Pro 16 | |
| AIDA64 / Memory Read | |
| Lenovo Slim Pro 9i 16IRP8 | |
| Samsung Galaxy Book3 Ultra 16 | |
| Huawei MateBook 16s i7 | |
| Acer Swift Edge SFE16 Ryzen 7 7840U | |
| Media AMD Ryzen 7 7840U (37399 - 61602, n=11) | |
| Acer Swift Edge SFE16-42-R1GM | |
| Asus VivoBook Pro 16 | |
| AIDA64 / Memory Write | |
| Acer Swift Edge SFE16 Ryzen 7 7840U | |
| Lenovo Slim Pro 9i 16IRP8 | |
| Samsung Galaxy Book3 Ultra 16 | |
| Media AMD Ryzen 7 7840U (46797 - 92289, n=13) | |
| Huawei MateBook 16s i7 | |
| Acer Swift Edge SFE16-42-R1GM | |
| Asus VivoBook Pro 16 | |
| AIDA64 / Memory Latency | |
| Media AMD Ryzen 7 7840U (90 - 137.2, n=12) | |
| Acer Swift Edge SFE16 Ryzen 7 7840U | |
| Huawei MateBook 16s i7 | |
| Lenovo Slim Pro 9i 16IRP8 | |
| Acer Swift Edge SFE16-42-R1GM | |
| Samsung Galaxy Book3 Ultra 16 | |
| Asus VivoBook Pro 16 | |
* ... Meglio usare valori piccoli
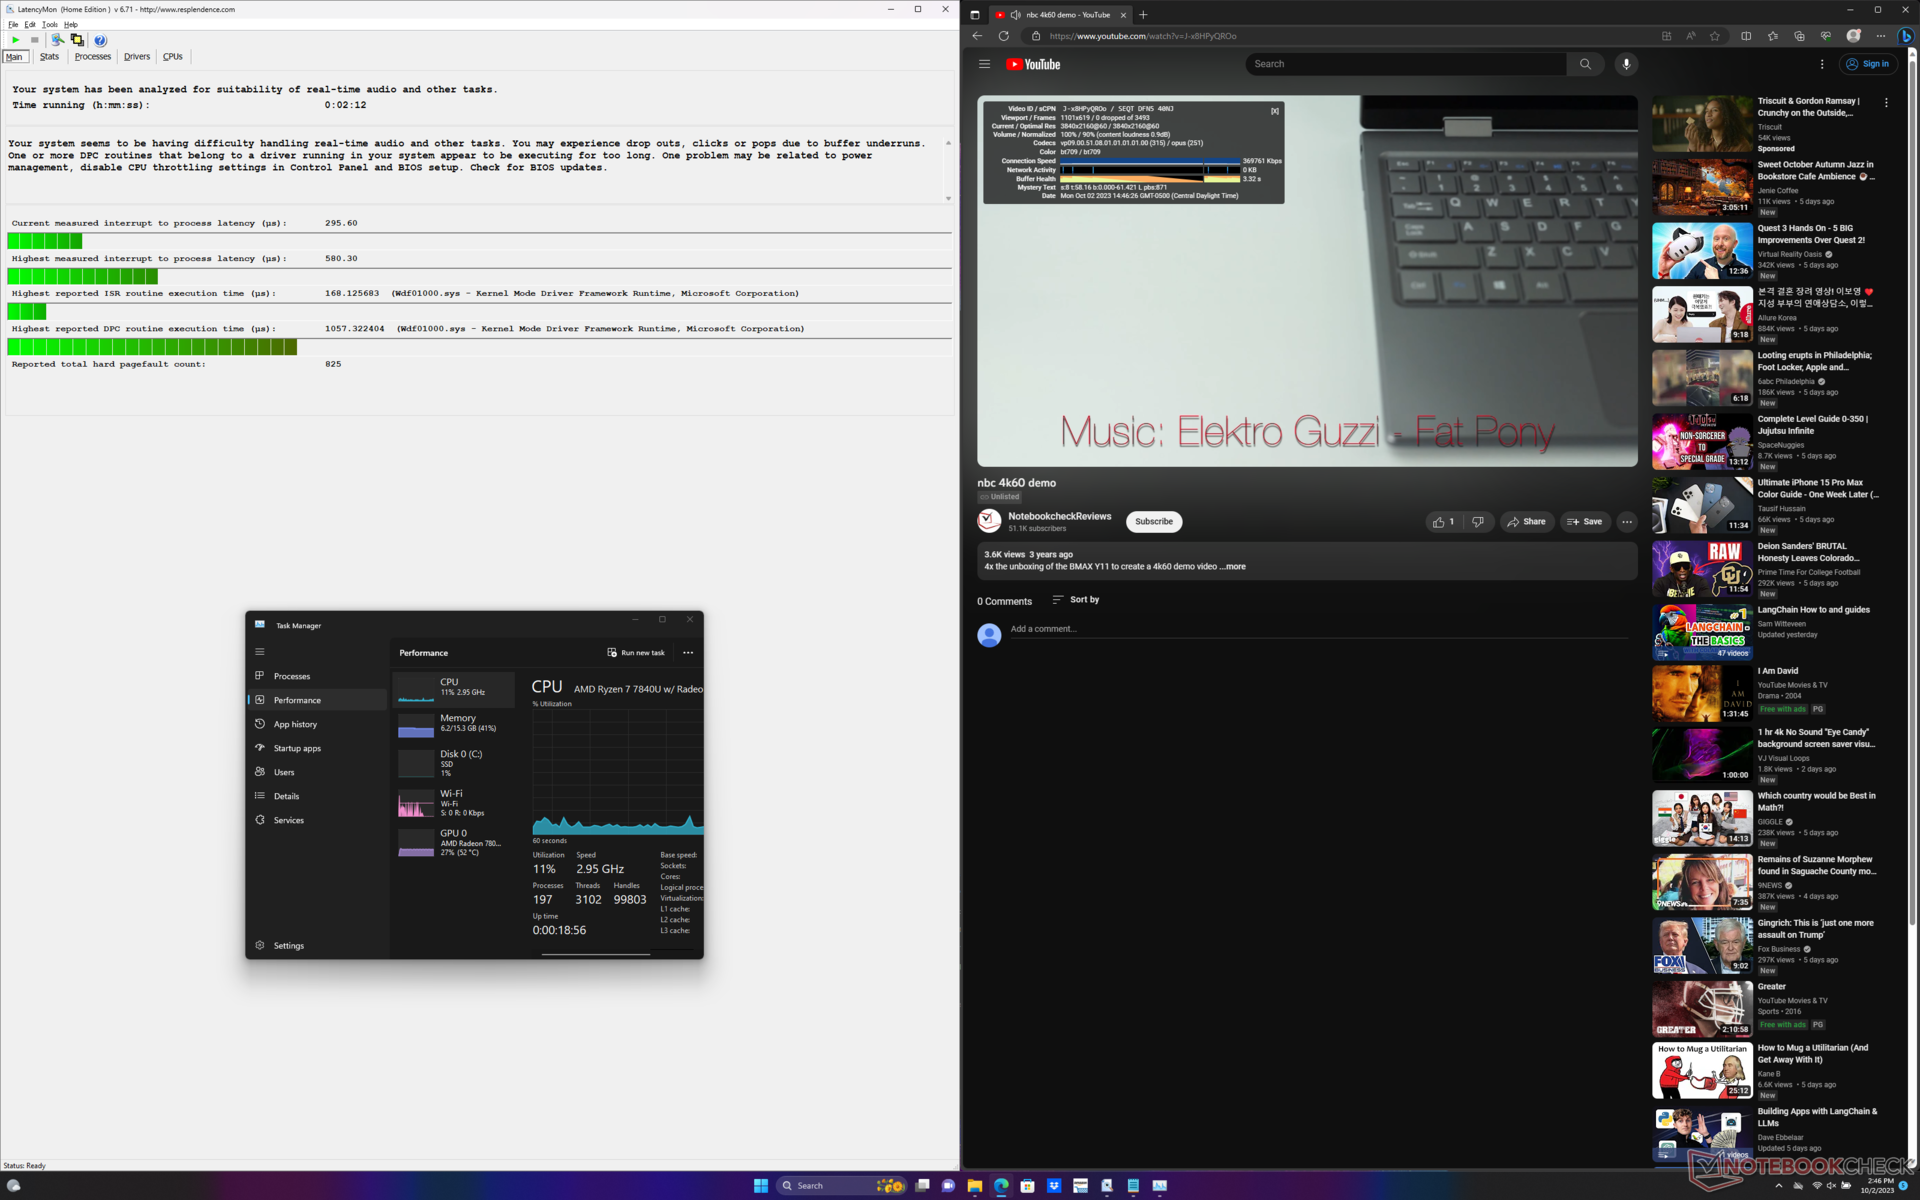
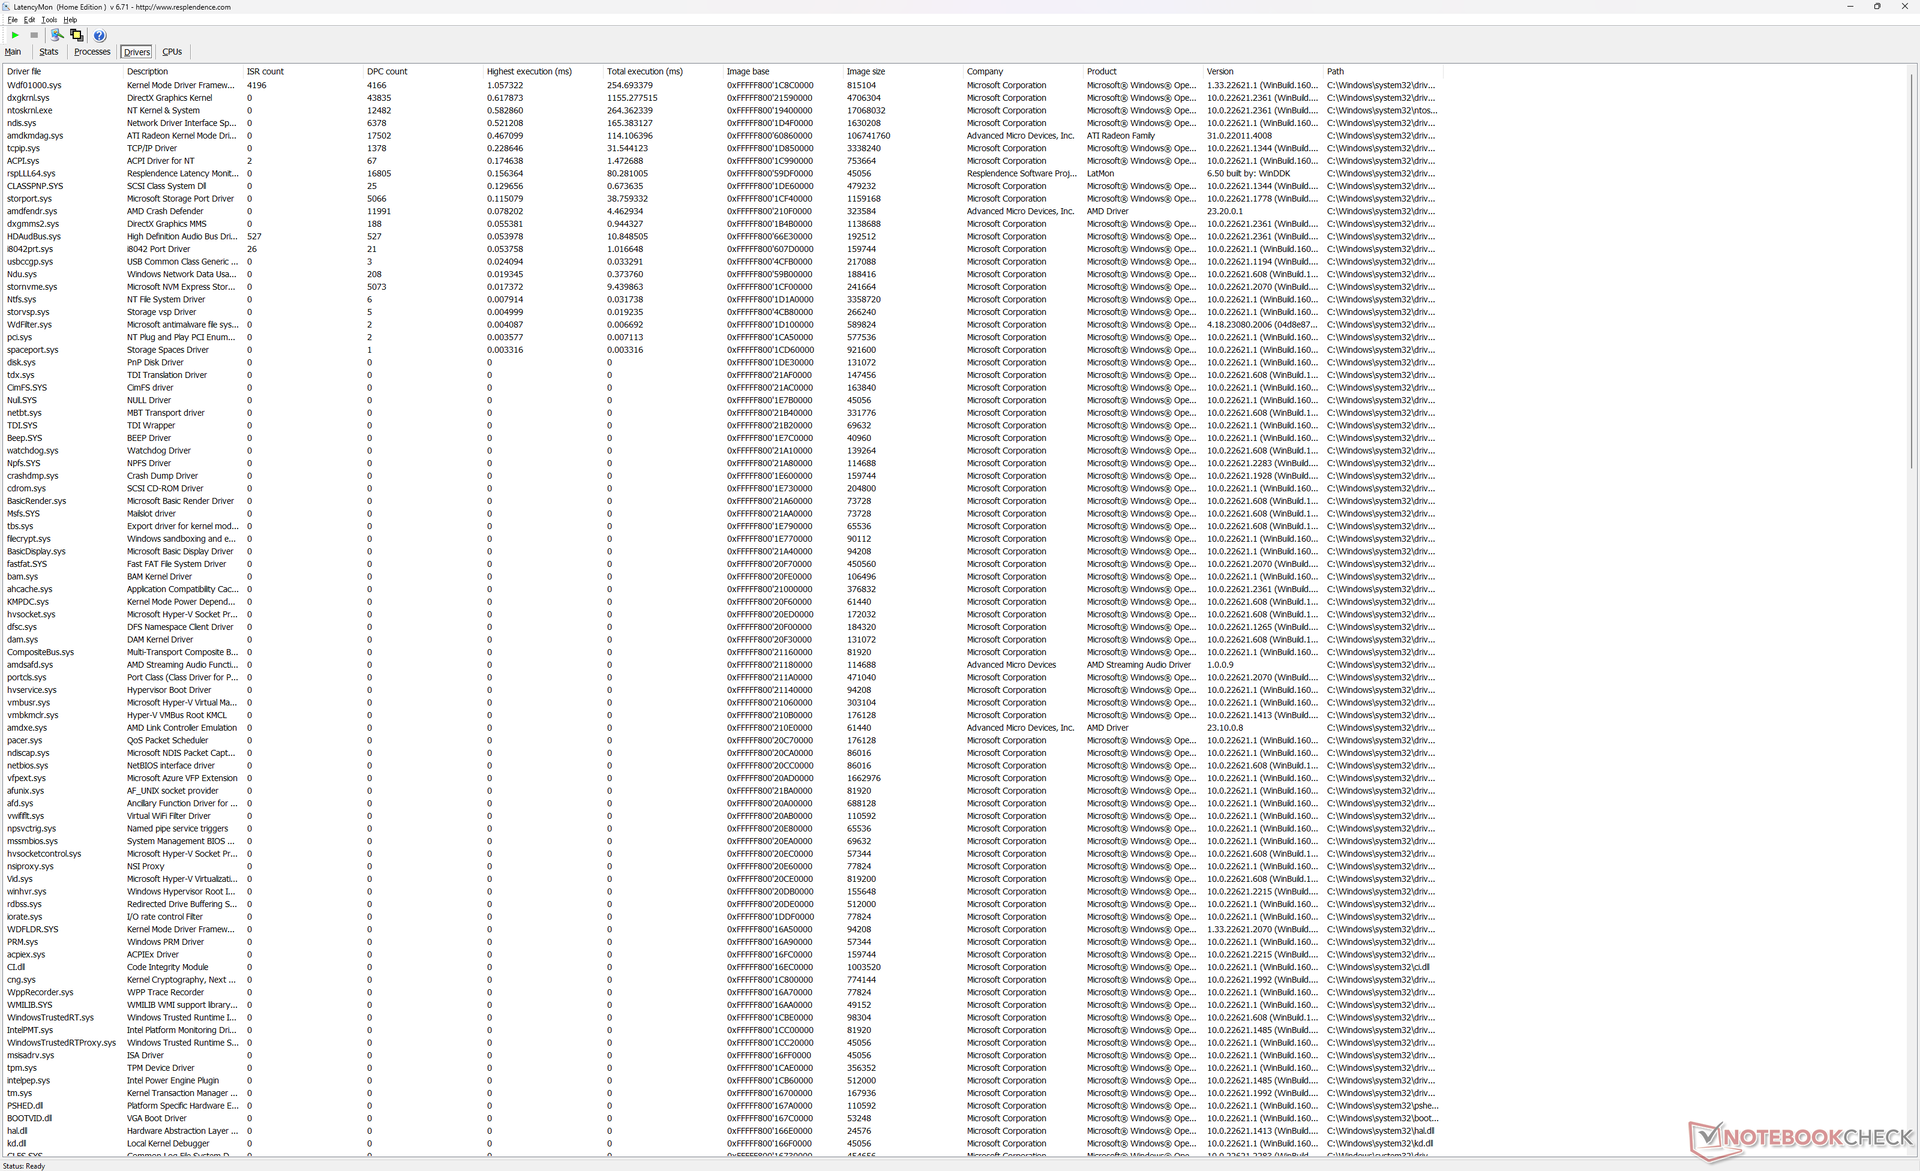
Latenza DPC
LatencyMon non rivela alcun problema di DPC quando si aprono più schede del browser della nostra homepage. anche la riproduzione di video 4K a 60 FPS è perfetta, senza alcuna perdita di fotogrammi.
| DPC Latencies / LatencyMon - interrupt to process latency (max), Web, Youtube, Prime95 | |
| Samsung Galaxy Book3 Ultra 16 | |
| Acer Swift Edge SFE16-42-R1GM | |
| Asus VivoBook Pro 16 | |
| Lenovo Slim Pro 9i 16IRP8 | |
| Acer Swift Edge SFE16 Ryzen 7 7840U | |
* ... Meglio usare valori piccoli
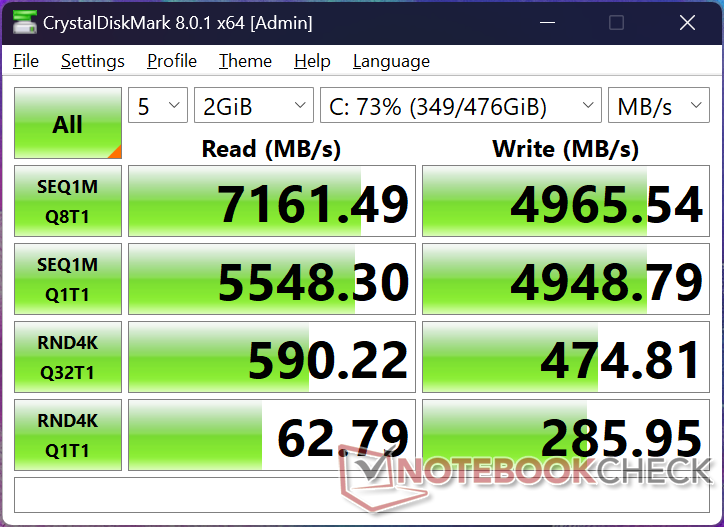
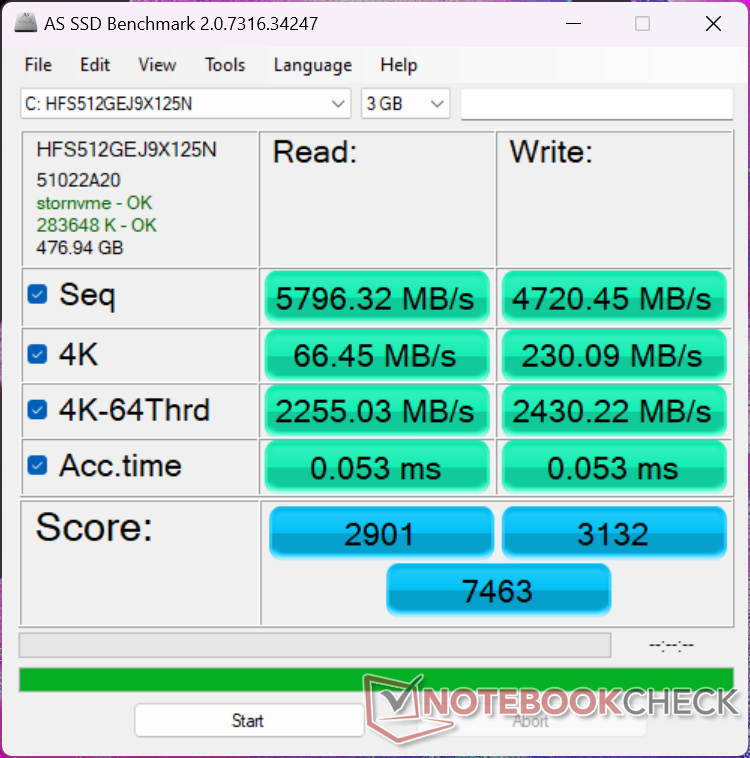
Dispositivi di archiviazione
La nostra unità di prova viene fornita con un SK hynix HFS512GEJ9X125N che sulla carta rivaleggia con il Samsung PM9A1. In realtà, però, l'unità sulla nostra unità si è bloccata fino a 3500 MB/s dopo appena un paio di minuti di stress, come mostra il grafico qui sotto. Questo comportamento è stato osservato anche sul nostro vecchio Swift Edge 16 e suggerisce che le unità soffrono di un raffreddamento o di una dissipazione del calore inadeguati.

| Drive Performance rating - Percent | |
| Acer Swift Edge SFE16 Ryzen 7 7840U | |
| Samsung Galaxy Book3 Ultra 16 | |
| Acer Swift Edge SFE16-42-R1GM | |
| Lenovo Slim Pro 9i 16IRP8 | |
| Huawei MateBook 16s i7 | |
| Asus VivoBook Pro 16 | |
* ... Meglio usare valori piccoli
Disk Throttling: DiskSpd Read Loop, Queue Depth 8
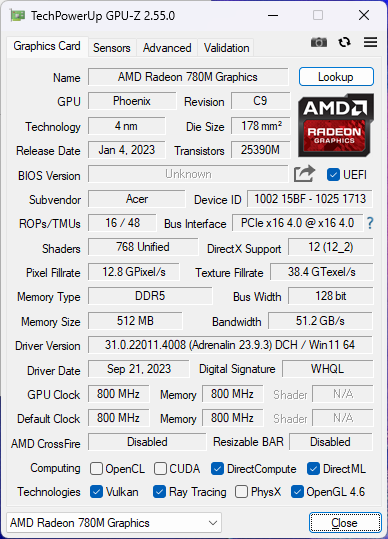
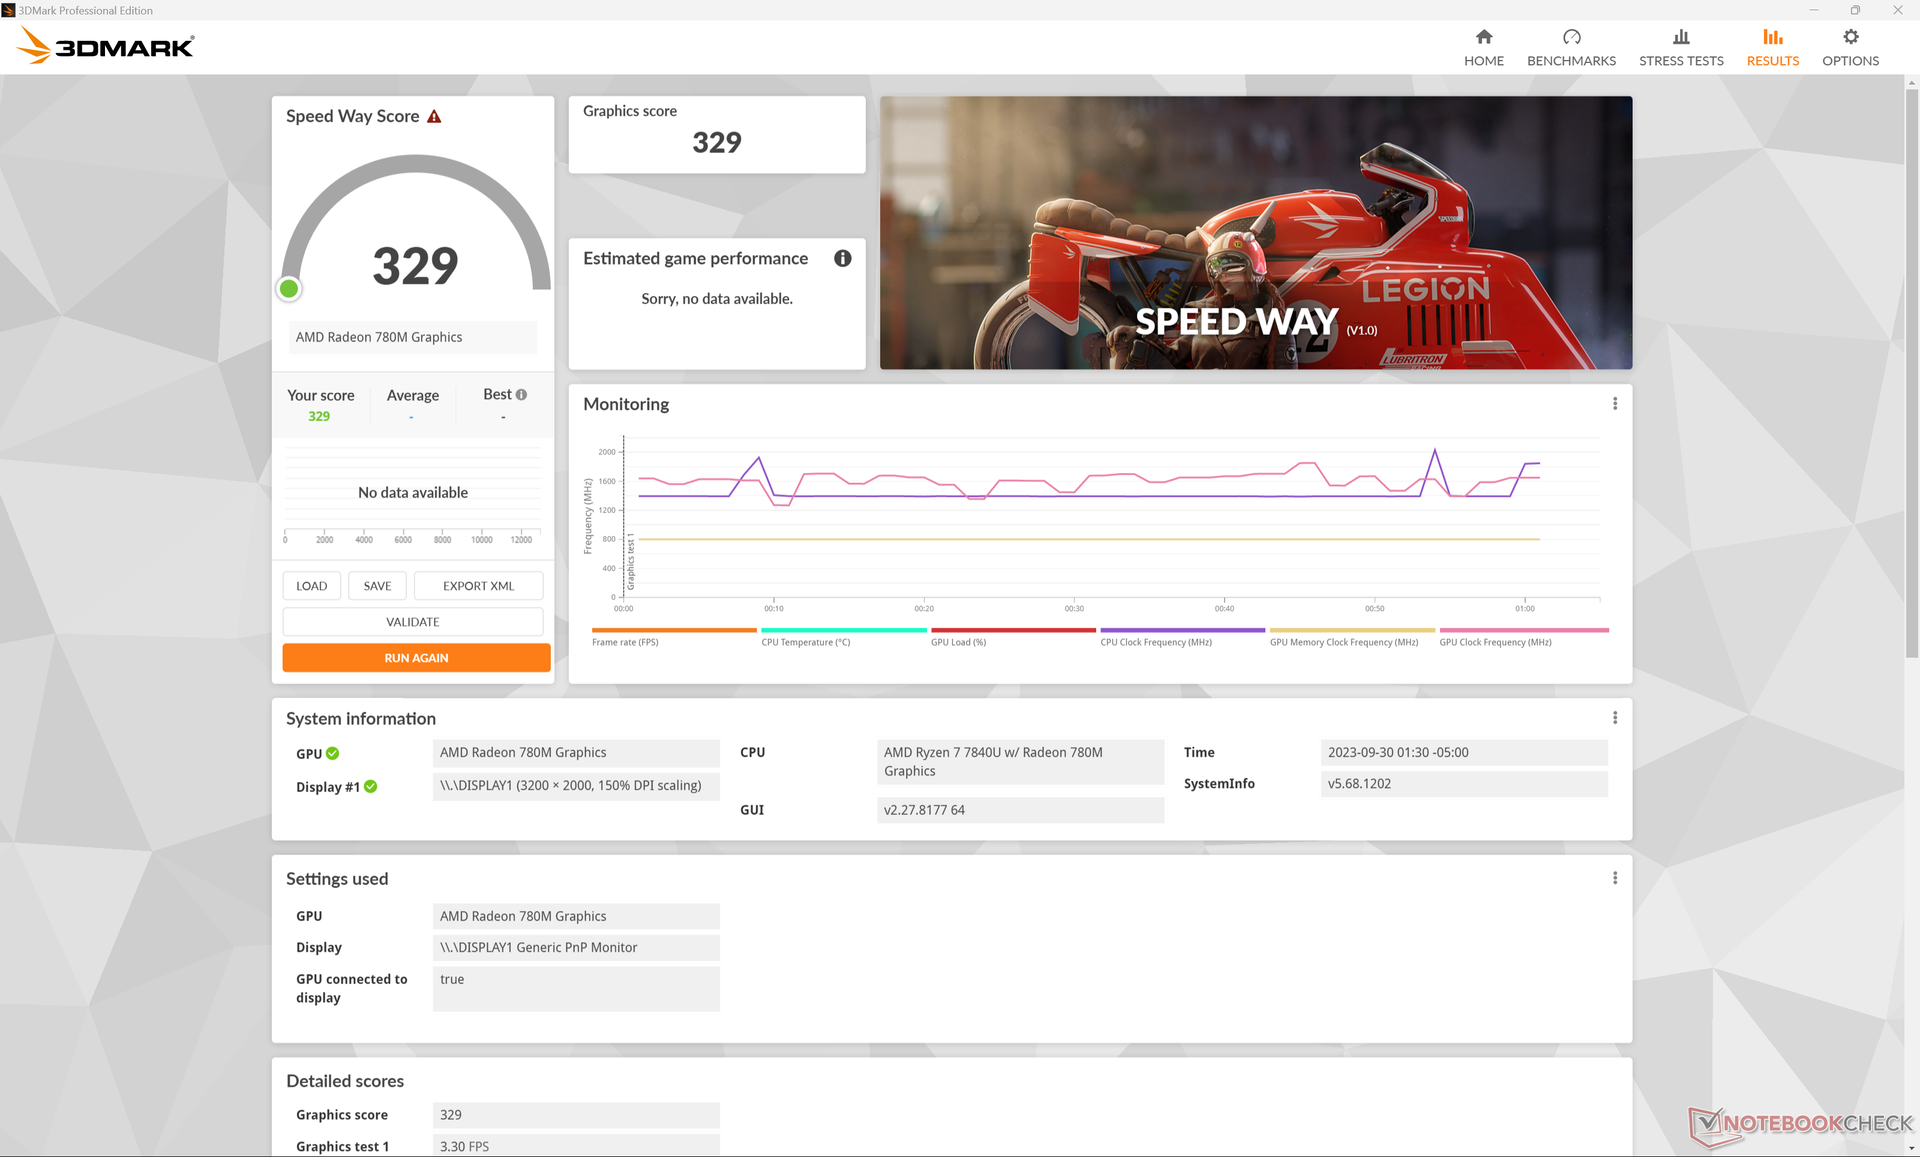
Prestazioni della GPU
Il modello 2022 Radeon 680M rappresentava già un enorme passo avanti rispetto alla precedente serie RX Vega e quindi la 2023 Radeon 780M è più che altro un aggiornamento minore con miglioramenti marginali. In questo caso, la Radeon 780M del nostro Acer è solo di pochi punti percentuali più veloce della 680M nella configurazione Zen 3+.
L'impostazione del sistema in modalità Bilanciata invece che in modalità Prestazioni o il funzionamento a batteria influiscono sulle prestazioni complessive, come mostra la tabella dei risultati di Fire Strike.
| Profilo energetico | Punteggio grafico | Punteggio fisico | Punteggio combinato |
| Modalità Prestazioni | 7156 | 20127 | 2511 |
| Modalità equilibrata | 4682 (-37%) | 15022 (-25%) | 1726 (-31%) |
| Alimentazione a batteria | 4982 (-33%) | 14856 (-26%) | 1734 (-31%) |
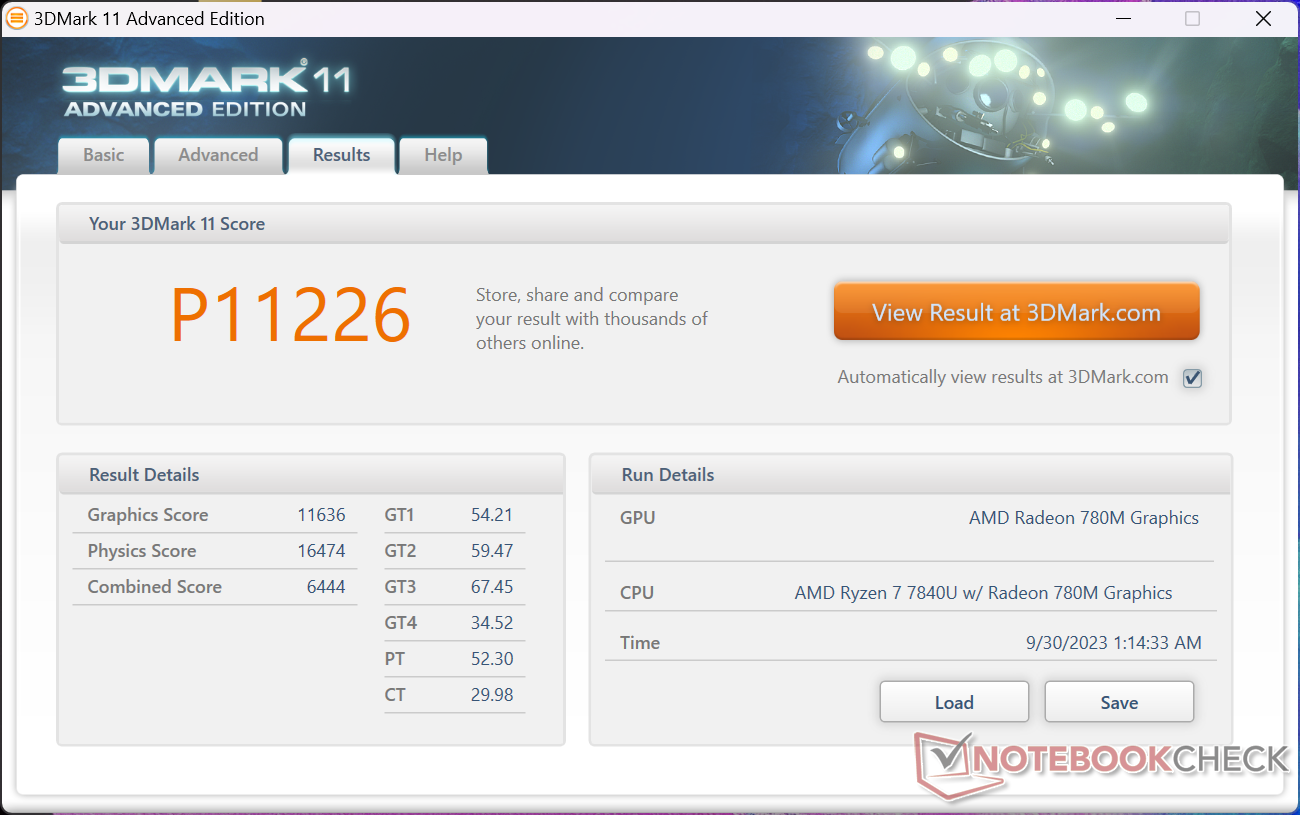
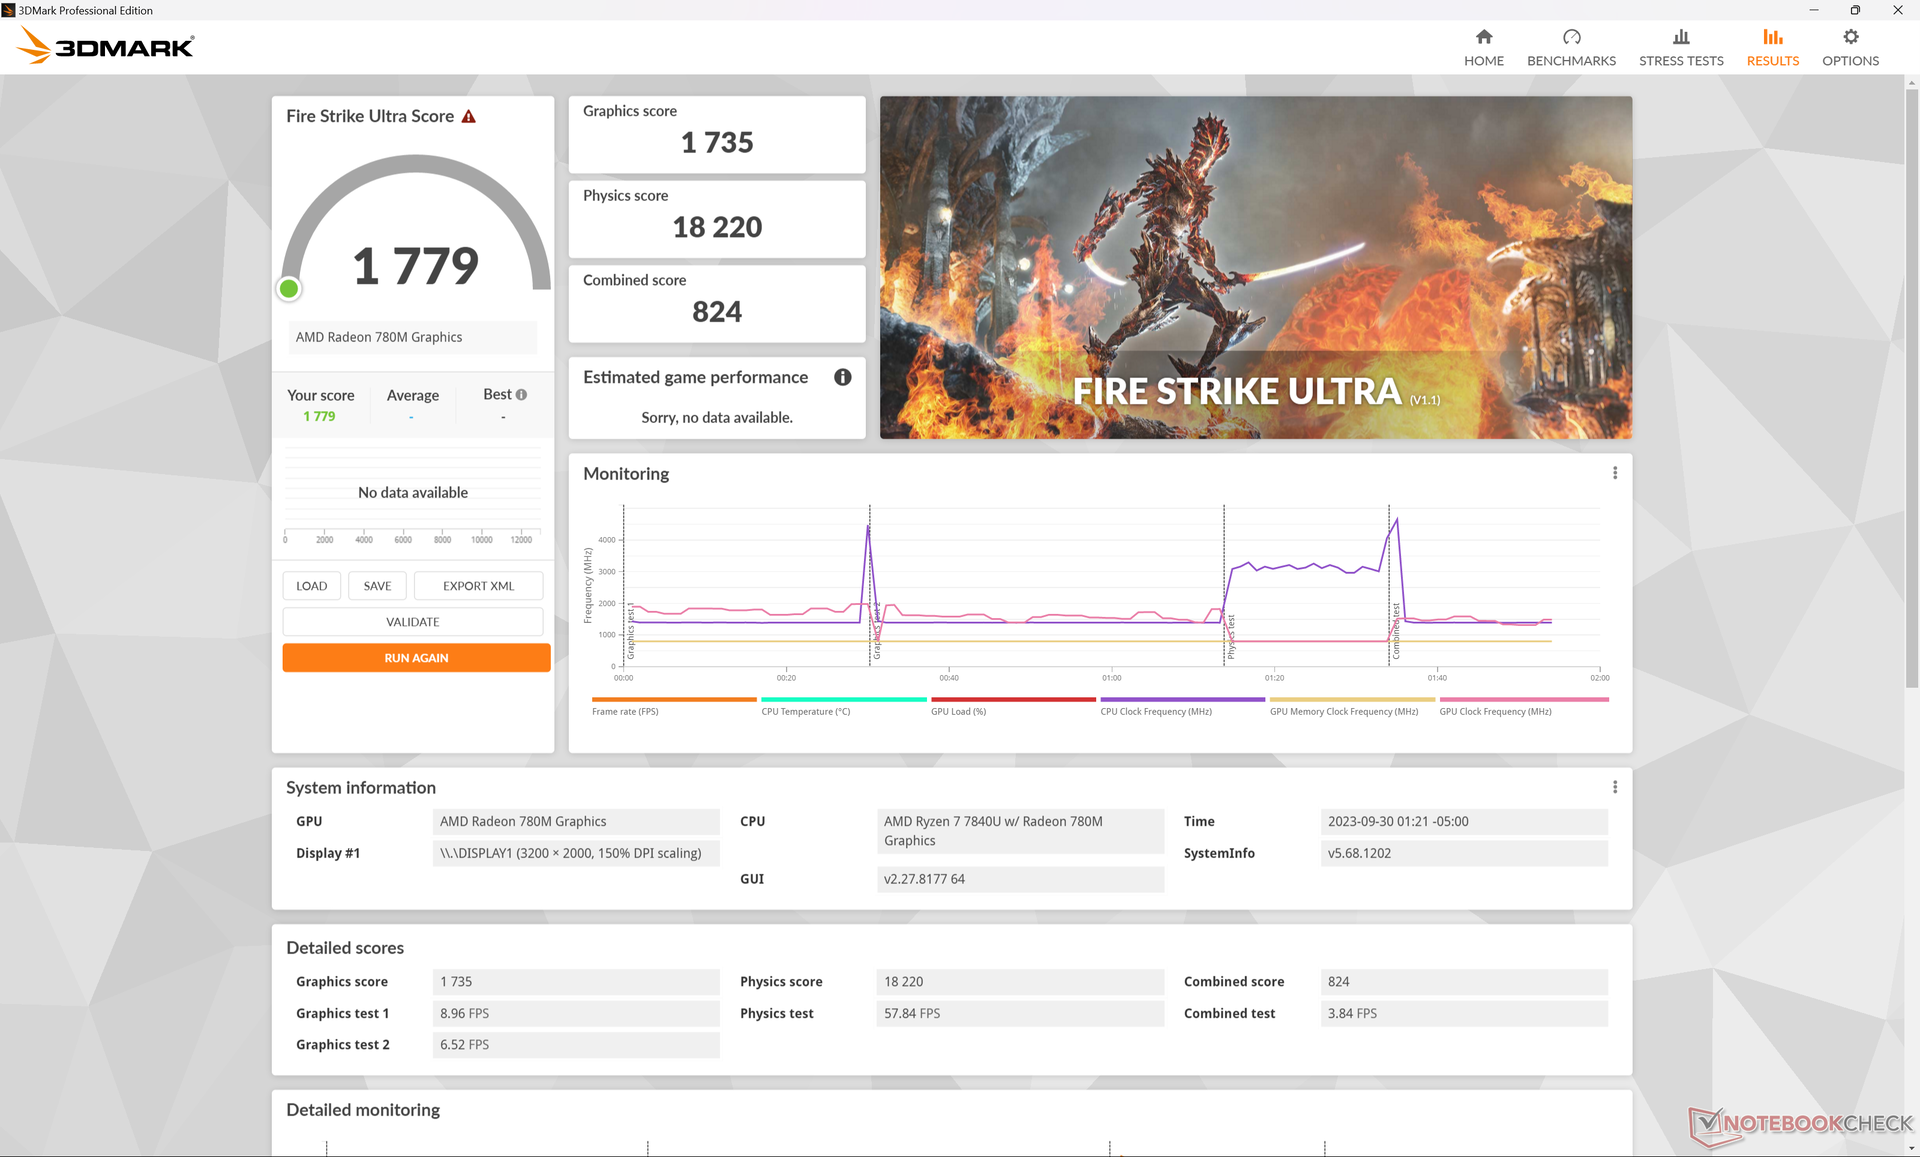
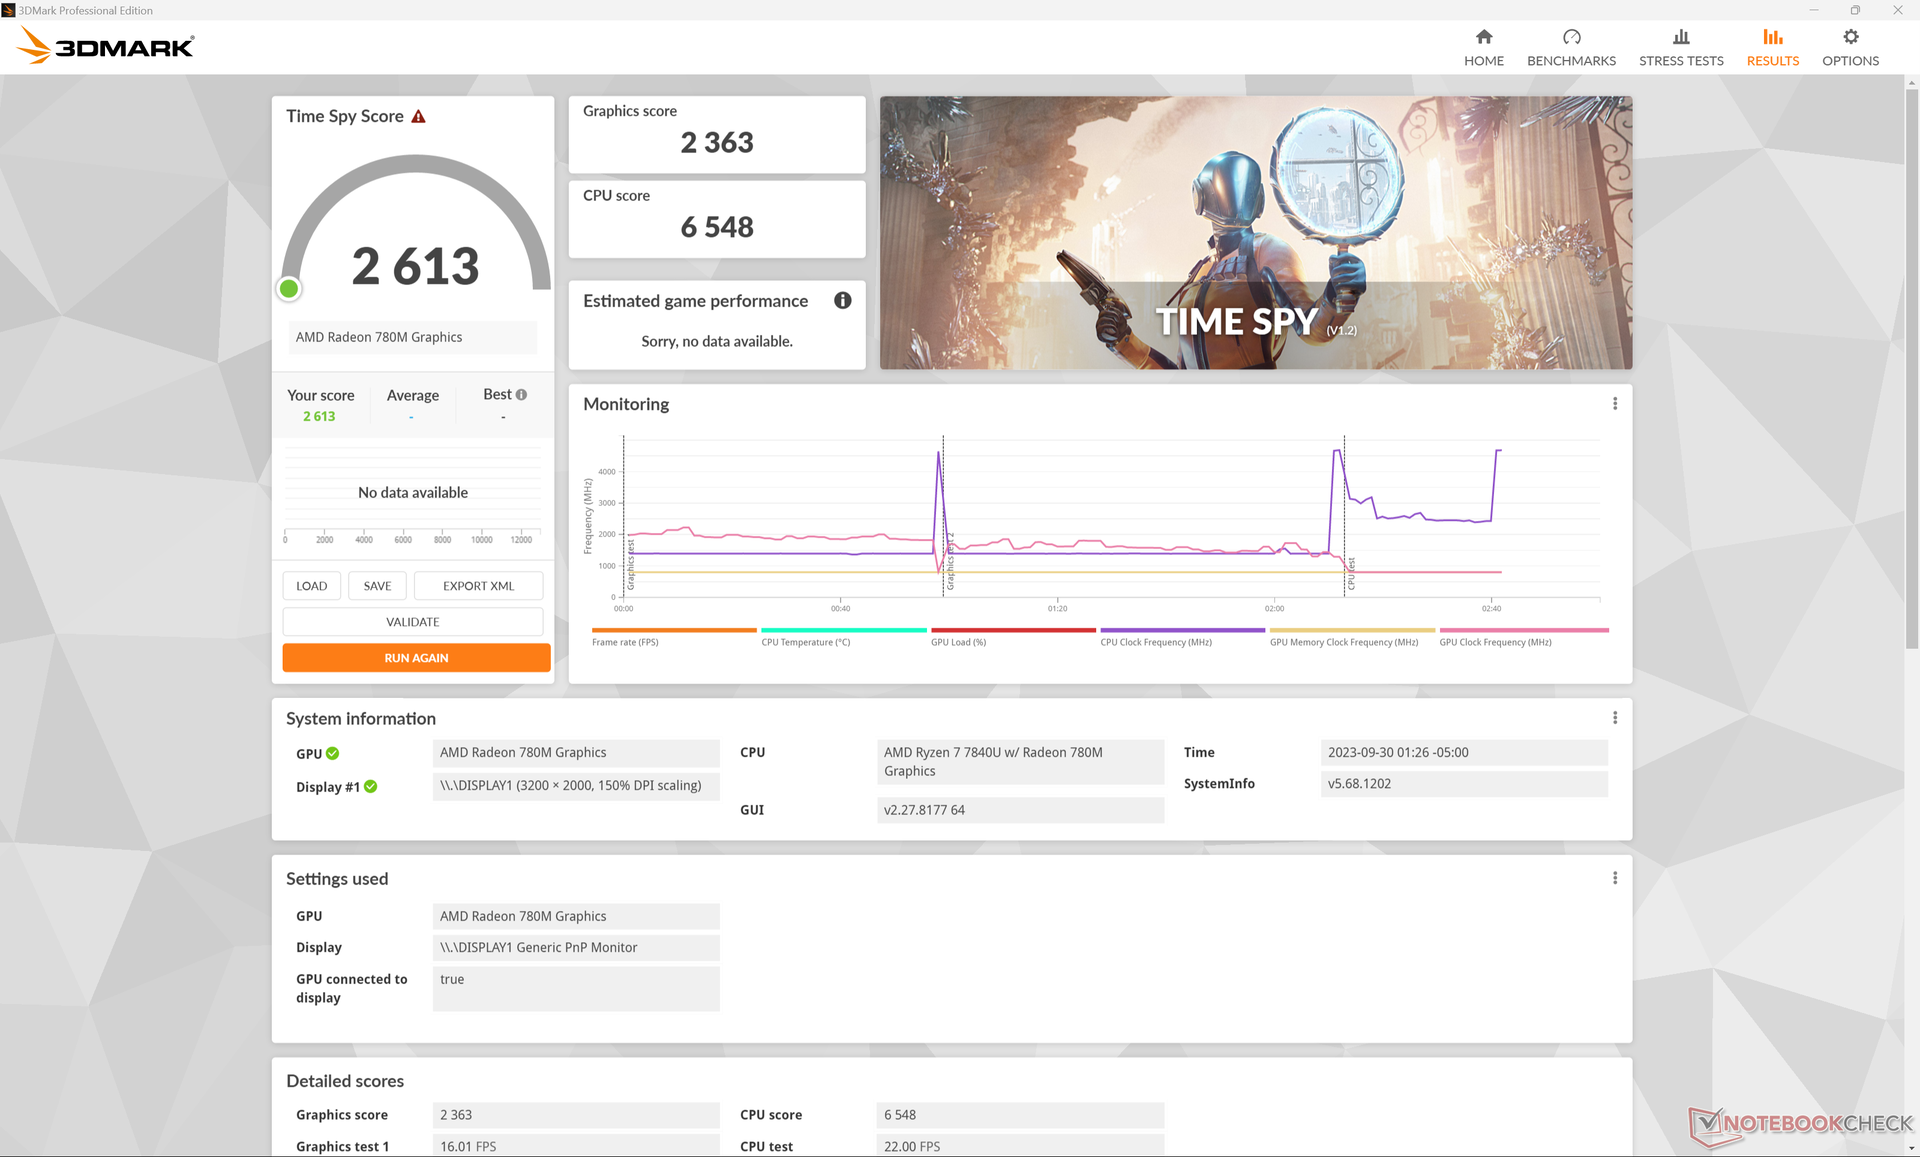
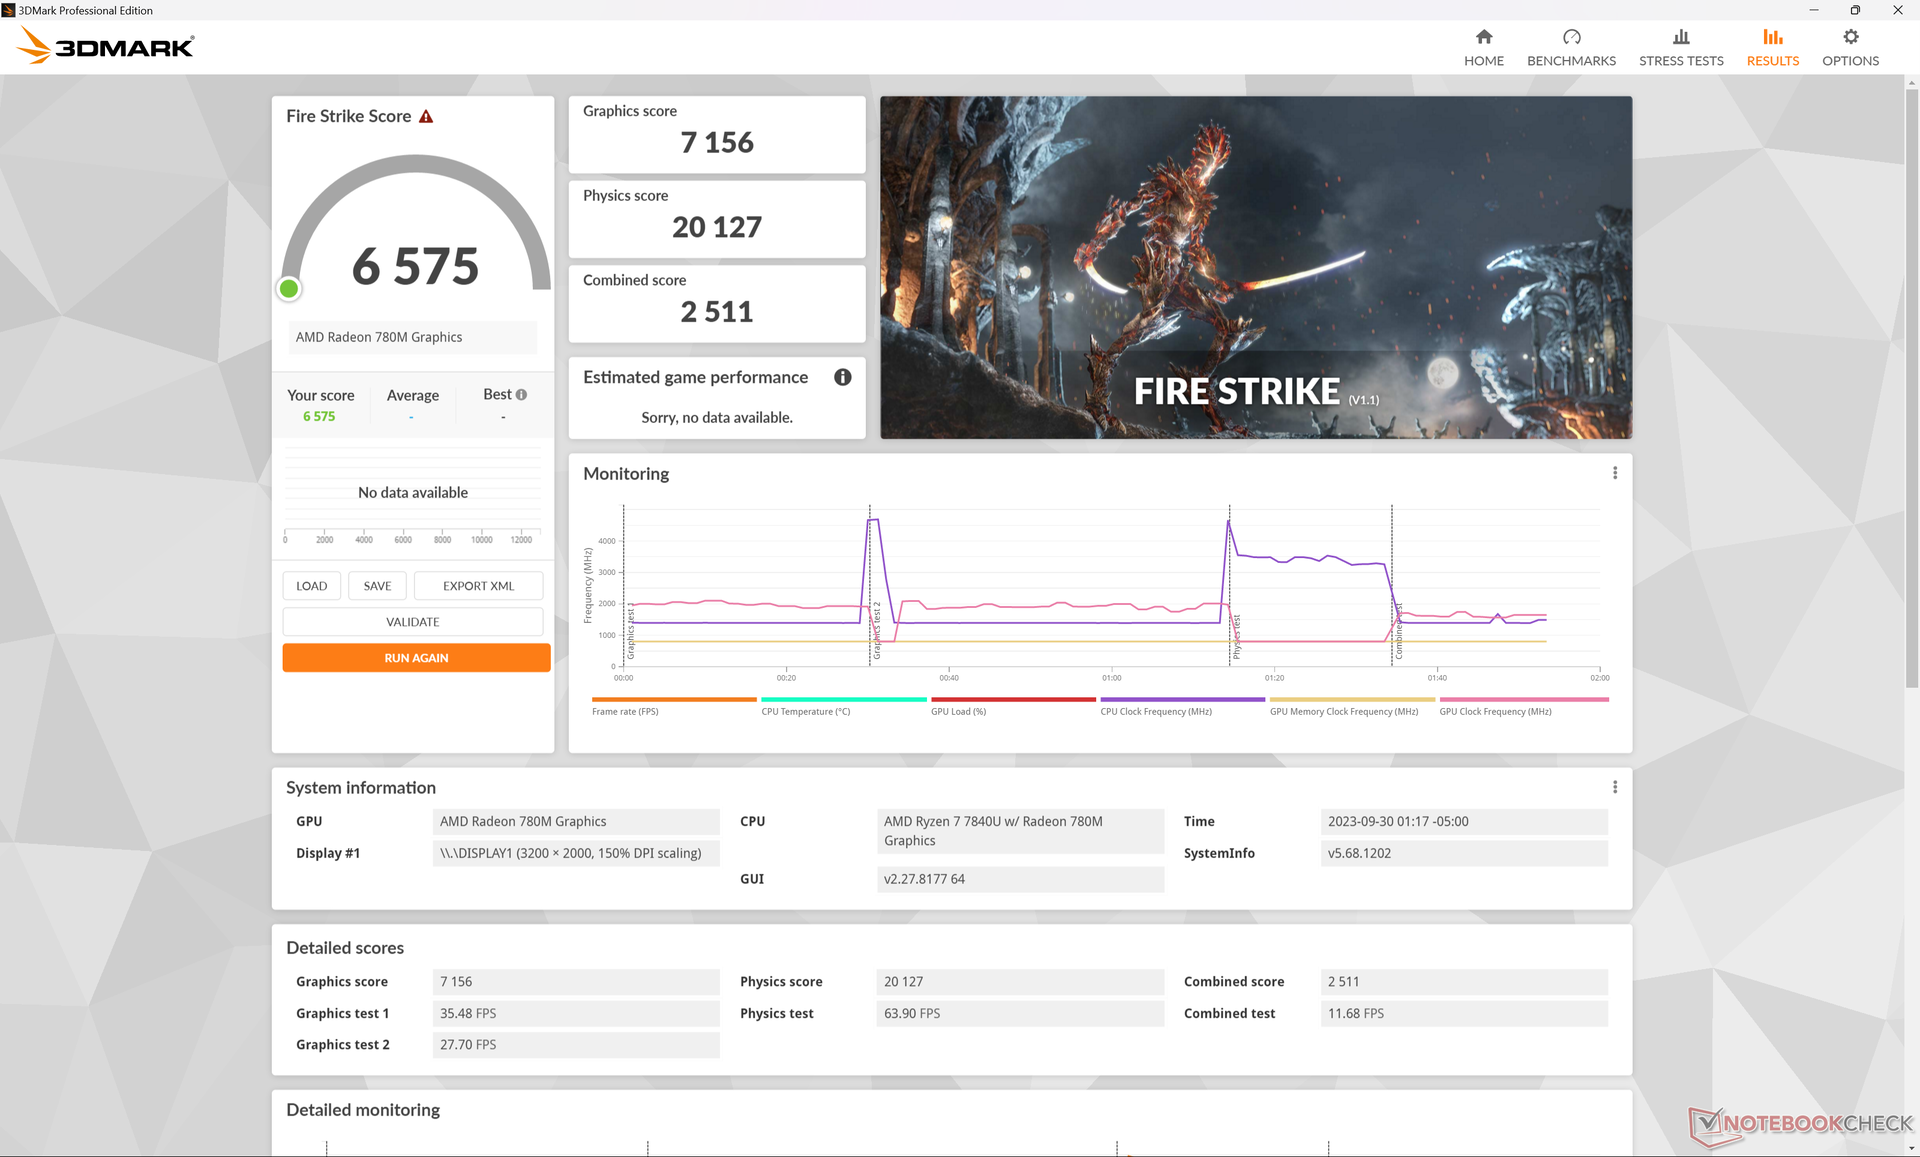
| 3DMark 11 Performance | 11226 punti | |
| 3DMark Fire Strike Score | 6575 punti | |
| 3DMark Time Spy Score | 2613 punti | |
Aiuto | ||
* ... Meglio usare valori piccoli
Anche le prestazioni della GPU si sono ridotte nel tempo, come abbiamo osservato durante l'esecuzione del test CineBench R15 xT di cui sopra. Quando è al minimo su Witcher 3ad esempio, la frequenza dei fotogrammi partiva da 45 FPS per poi rallentare e stabilizzarsi intorno ai 30 FPS.
Witcher 3 FPS Chart
| basso | medio | alto | ultra | |
|---|---|---|---|---|
| GTA V (2015) | 139.3 | 53.9 | 21 | |
| The Witcher 3 (2015) | 109.8 | 36.1 | 20.4 | |
| Dota 2 Reborn (2015) | 128.1 | 101.5 | 66.8 | 61.4 |
| Final Fantasy XV Benchmark (2018) | 50.5 | 27.4 | 21.2 | |
| X-Plane 11.11 (2018) | 49.1 | 37 | 30.3 | |
| Far Cry 5 (2018) | 53 | 28 | 26 | 24 |
| Strange Brigade (2018) | 139.8 | 60.6 | 49.5 | 41.3 |
| Cyberpunk 2077 1.6 (2022) | 26.7 | 20.8 | 17.3 | 15.9 |
| Tiny Tina's Wonderlands (2022) | 34.3 | 28.4 | 18.6 | 16.5 |
| F1 22 (2022) | 65.4 | 62.1 | 42.6 | 9.92 |
Emissioni
Rumore del sistema
La rumorosità della ventola non è cambiata rispetto alla configurazione dello Zen 3+, anche se il numero di ventole è cambiato. Questo è un peccato perché la ventola della nostra unità di test Zen 3+ pulsava frequentemente e rumorosamente non appena venivano introdotti carichi più pesanti e la nostra unità Zen 4 non sarebbe stata diversa. Il rumore della ventola si aggira regolarmente intorno ai 28 dB(A) contro uno sfondo silenzioso di 24 dB(A) durante la navigazione web o lo streaming, mentre i carichi più pesanti si stabilizzano a 41 dB(A) come in precedenza.
Rumorosità
| Idle |
| 24.1 / 24.3 / 28 dB(A) |
| Sotto carico |
| 41 / 40.9 dB(A) |
 | ||
30 dB silenzioso 40 dB(A) udibile 50 dB(A) rumoroso |
||
min: | ||
| Acer Swift Edge SFE16 Ryzen 7 7840U Radeon 780M, R7 7840U, SK hynix HFS512GEJ9X125N | Acer Swift Edge SFE16-42-R1GM Radeon 680M, R7 7735U, Micron 3400 1TB MTFDKBA1T0TFH | Lenovo Slim Pro 9i 16IRP8 GeForce RTX 4050 Laptop GPU, i9-13905H, Samsung PM9A1 MZVL21T0HCLR | Asus VivoBook Pro 16 GeForce RTX 3050 Ti Laptop GPU, i7-12700H, Intel SSD 670p SSDPEKNU010TZ | Samsung Galaxy Book3 Ultra 16 GeForce RTX 4050 Laptop GPU, i7-13700H, Samsung PM9A1 MZVL2512HCJQ | Huawei MateBook 16s i7 Iris Xe G7 96EUs, i7-12700H, Silicon Motion PCIe-8 SSD | |
|---|---|---|---|---|---|---|
| Noise | -7% | -1% | -15% | -3% | 4% | |
| off /ambiente * (dB) | 23.4 | 25.7 -10% | 22.7 3% | 25.2 -8% | 25 -7% | 24 -3% |
| Idle Minimum * (dB) | 24.1 | 25.7 -7% | 22.7 6% | 25.2 -5% | 26 -8% | 24 -0% |
| Idle Average * (dB) | 24.3 | 27 -11% | 22.7 7% | 25.2 -4% | 27 -11% | 25.2 -4% |
| Idle Maximum * (dB) | 28 | 29.3 -5% | 27.5 2% | 25.2 10% | 28 -0% | 27.2 3% |
| Load Average * (dB) | 41 | 42.3 -3% | 28.9 30% | 55.1 -34% | 40 2% | 34.8 15% |
| Witcher 3 ultra * (dB) | 40.9 | 52.6 -29% | 39 5% | 34.8 15% | ||
| Load Maximum * (dB) | 40.9 | 42.7 -4% | 52.5 -28% | 61.5 -50% | 41 -0% | 39 5% |
* ... Meglio usare valori piccoli
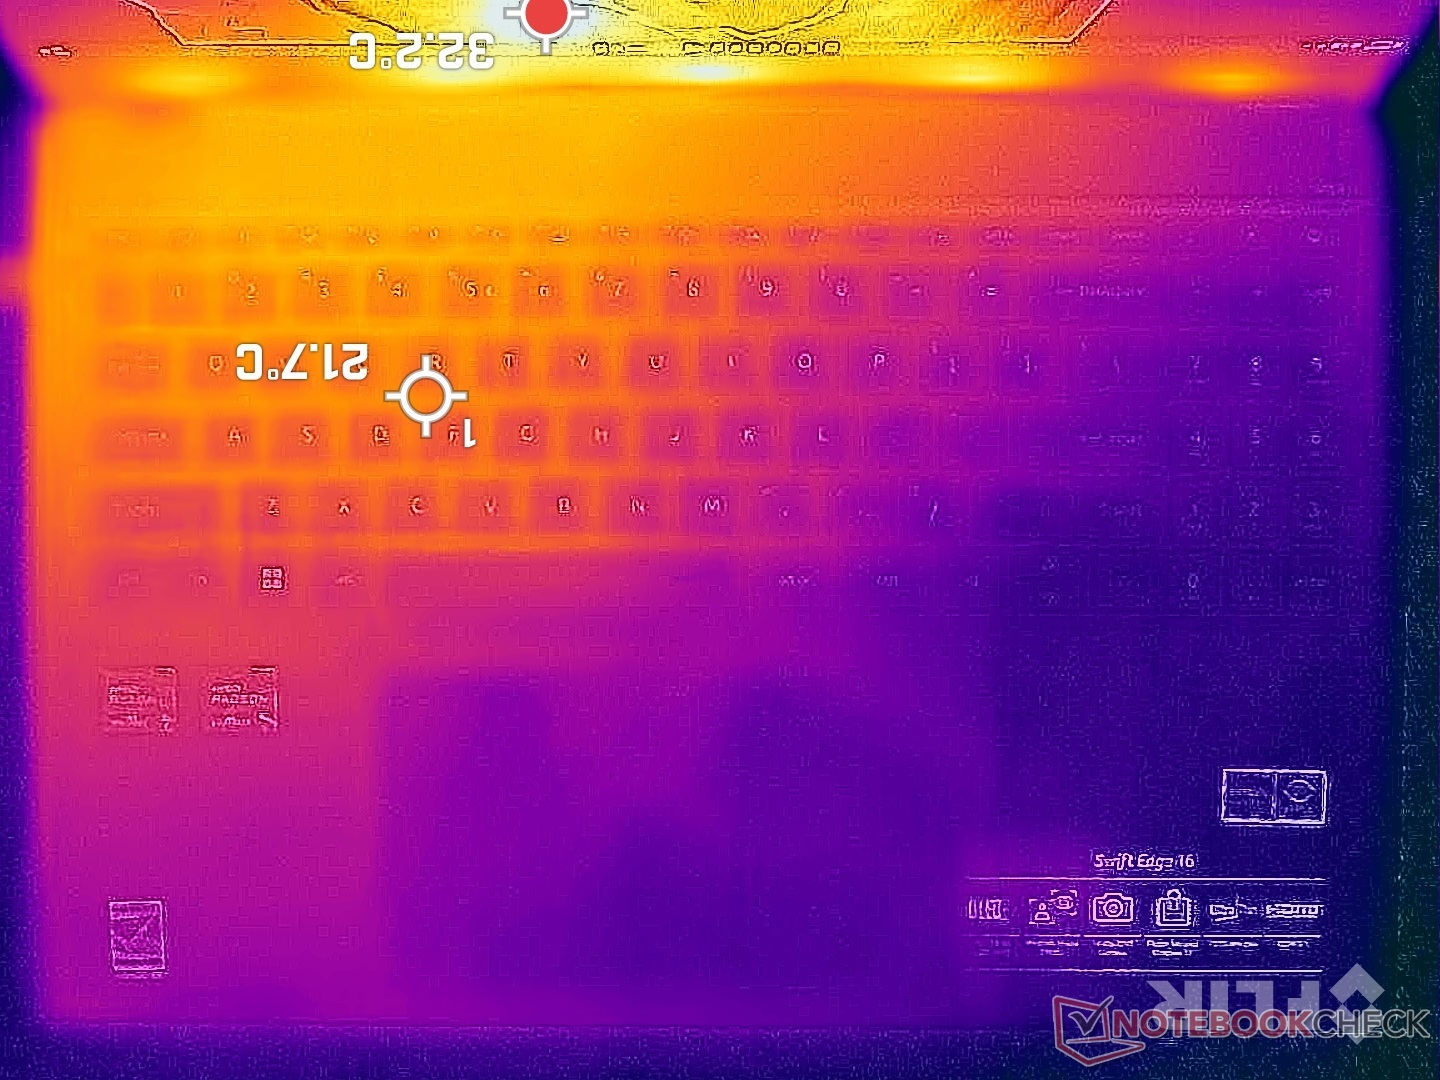
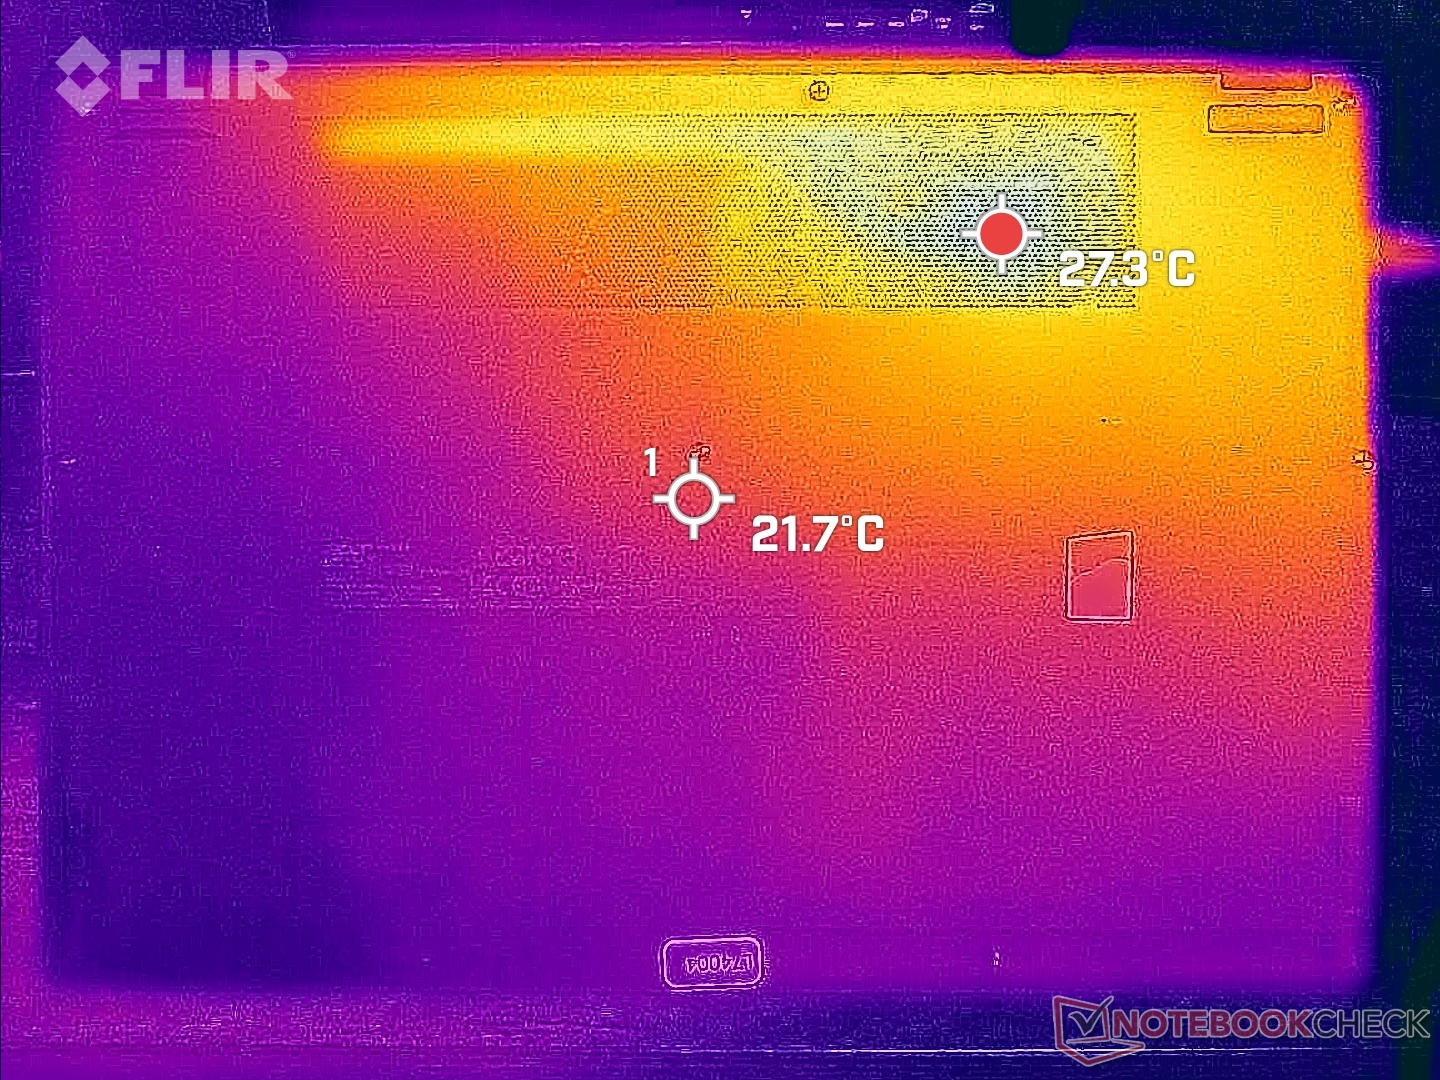
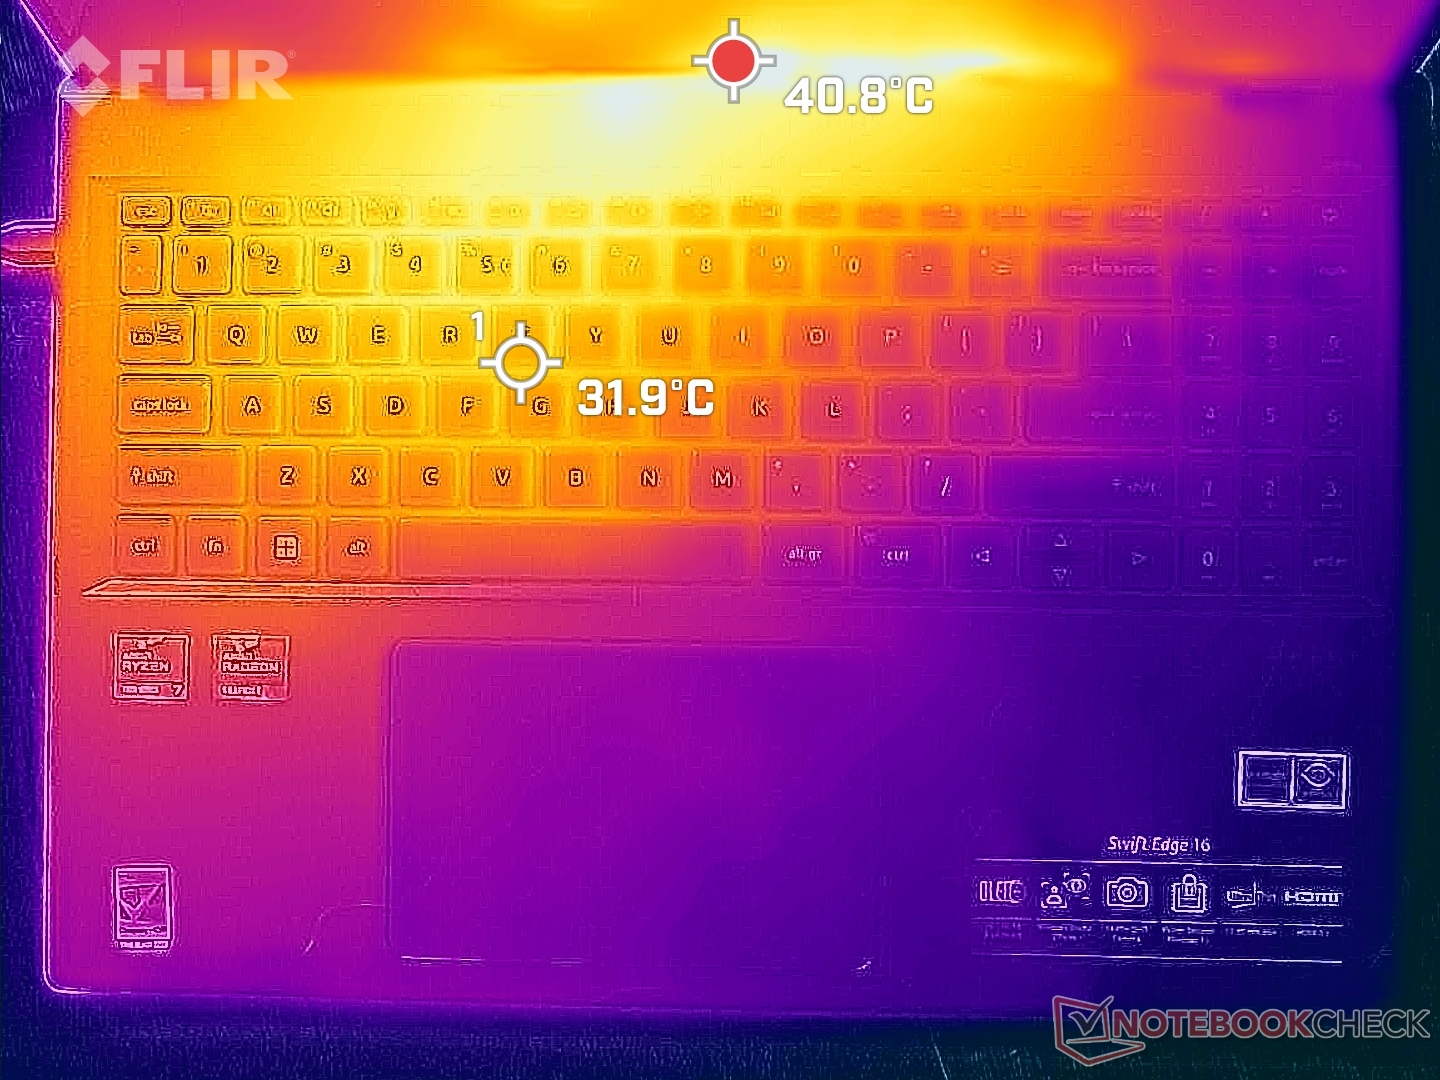
Temperatura
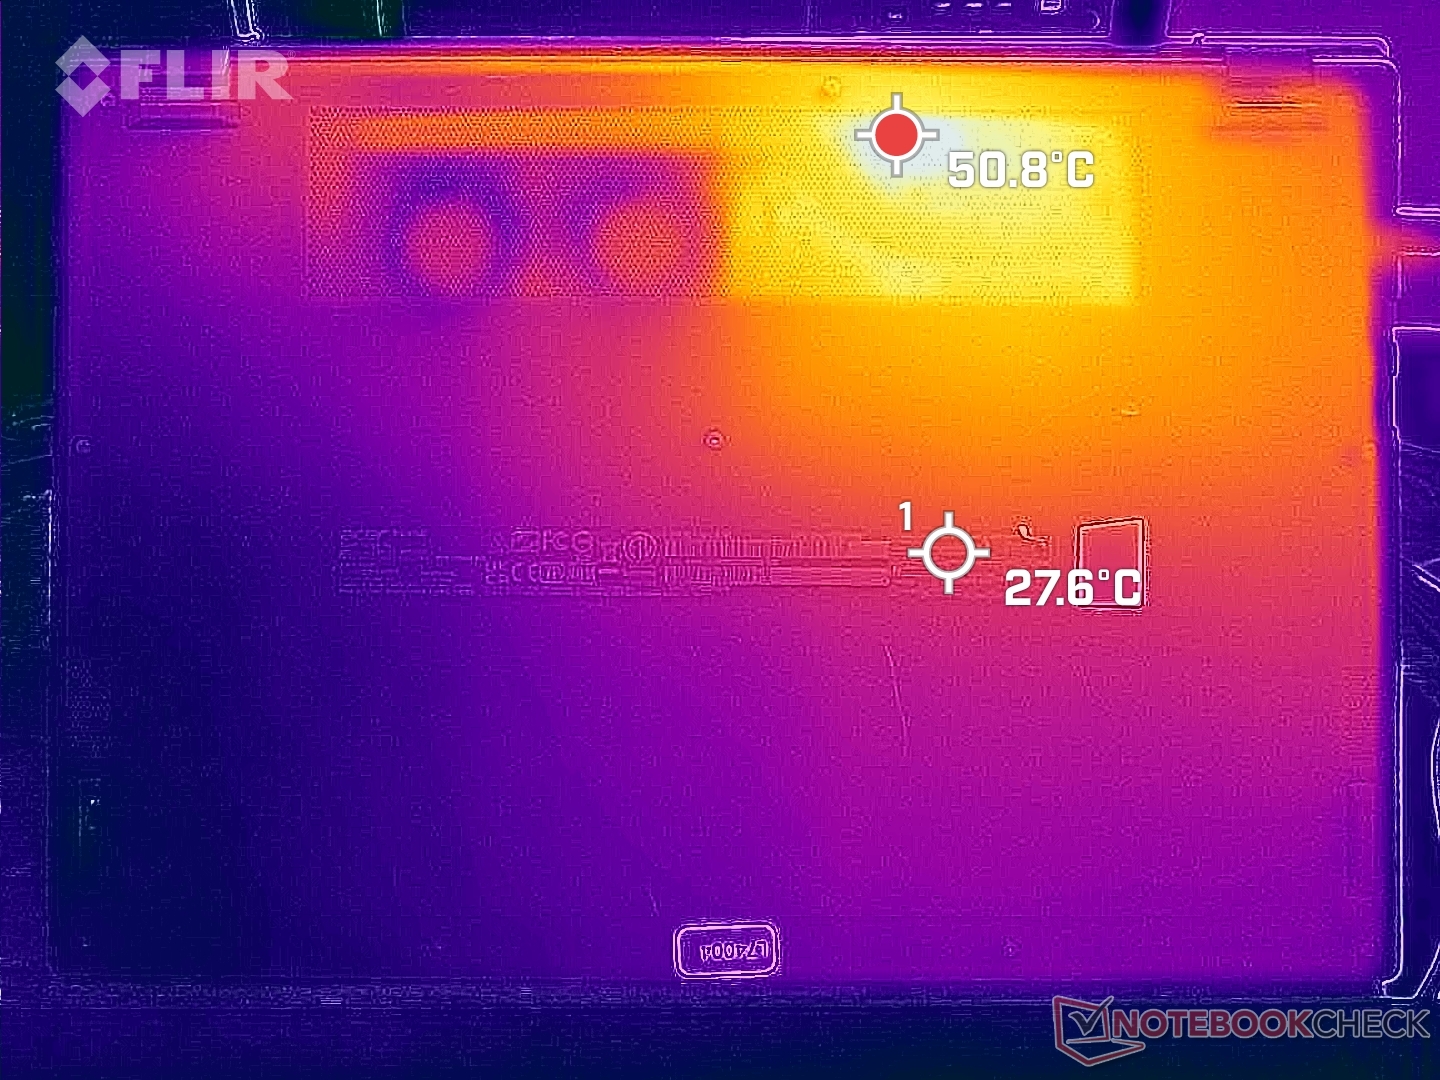
Le temperature di superficie non sono significativamente più fredde o più calde di quelle registrate con la configurazione Ryzen 7 7735U Configurazione Ryzen 7 7735U. I punti caldi sul fondo raggiungono ancora più di 50 C vicino alle prese d'aria, mentre la superficie superiore vicino alle cerniere può variare da 40 C a 50 C a seconda dell'angolo del coperchio. È improbabile che le mani tocchino queste aree calde per lunghi periodi durante il gioco.
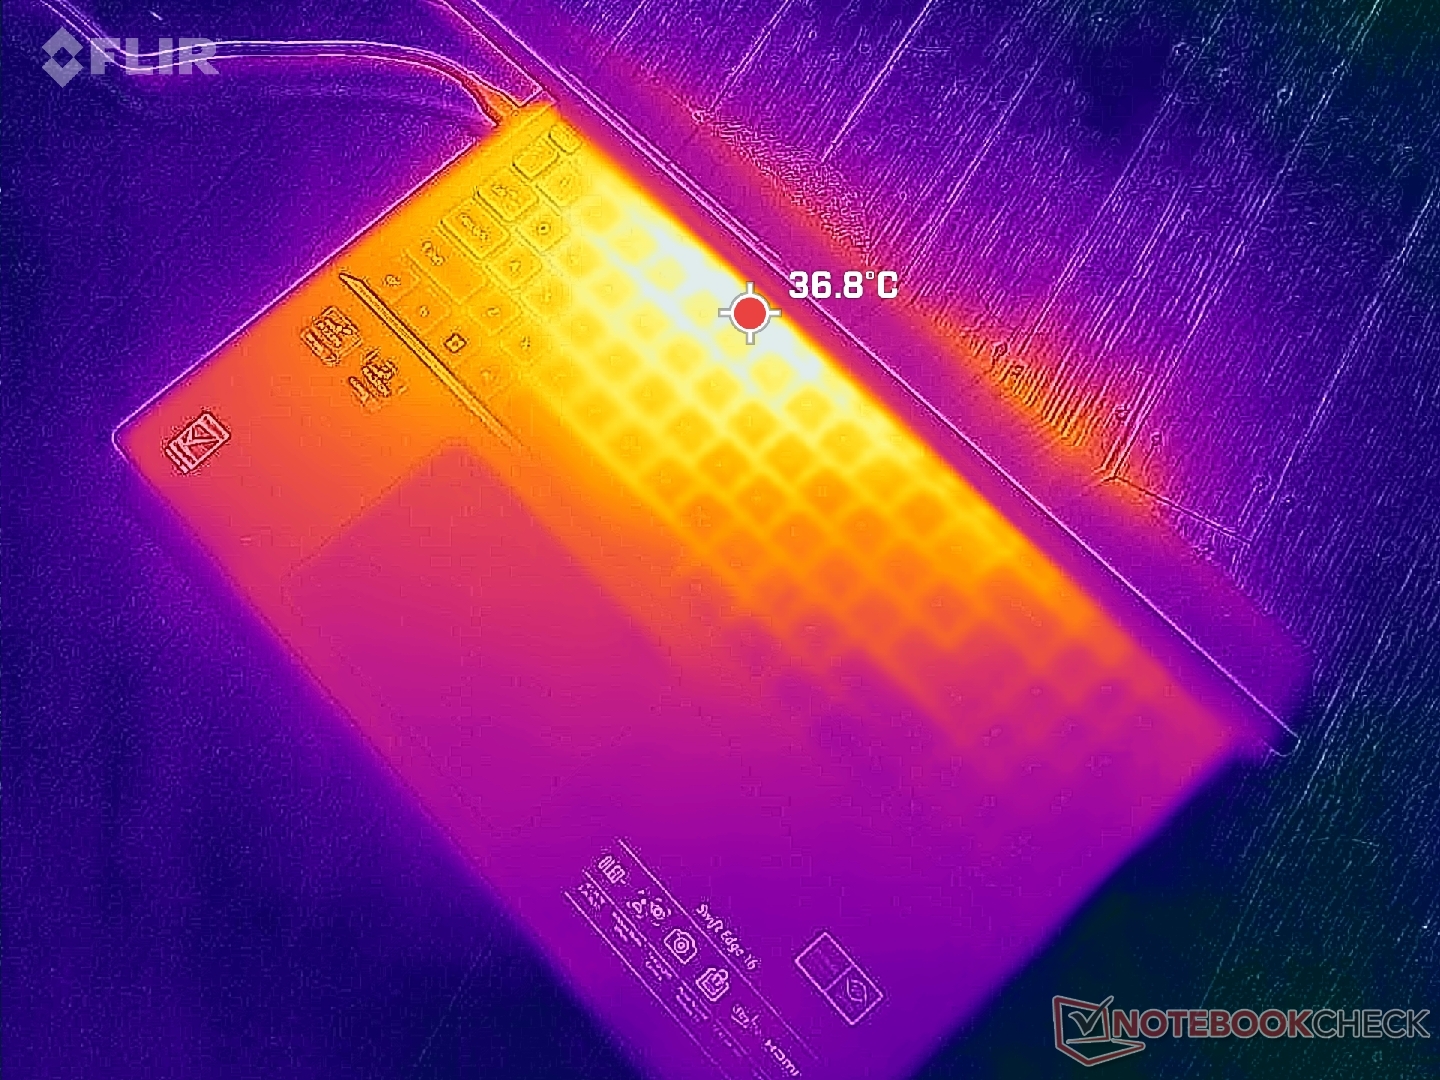
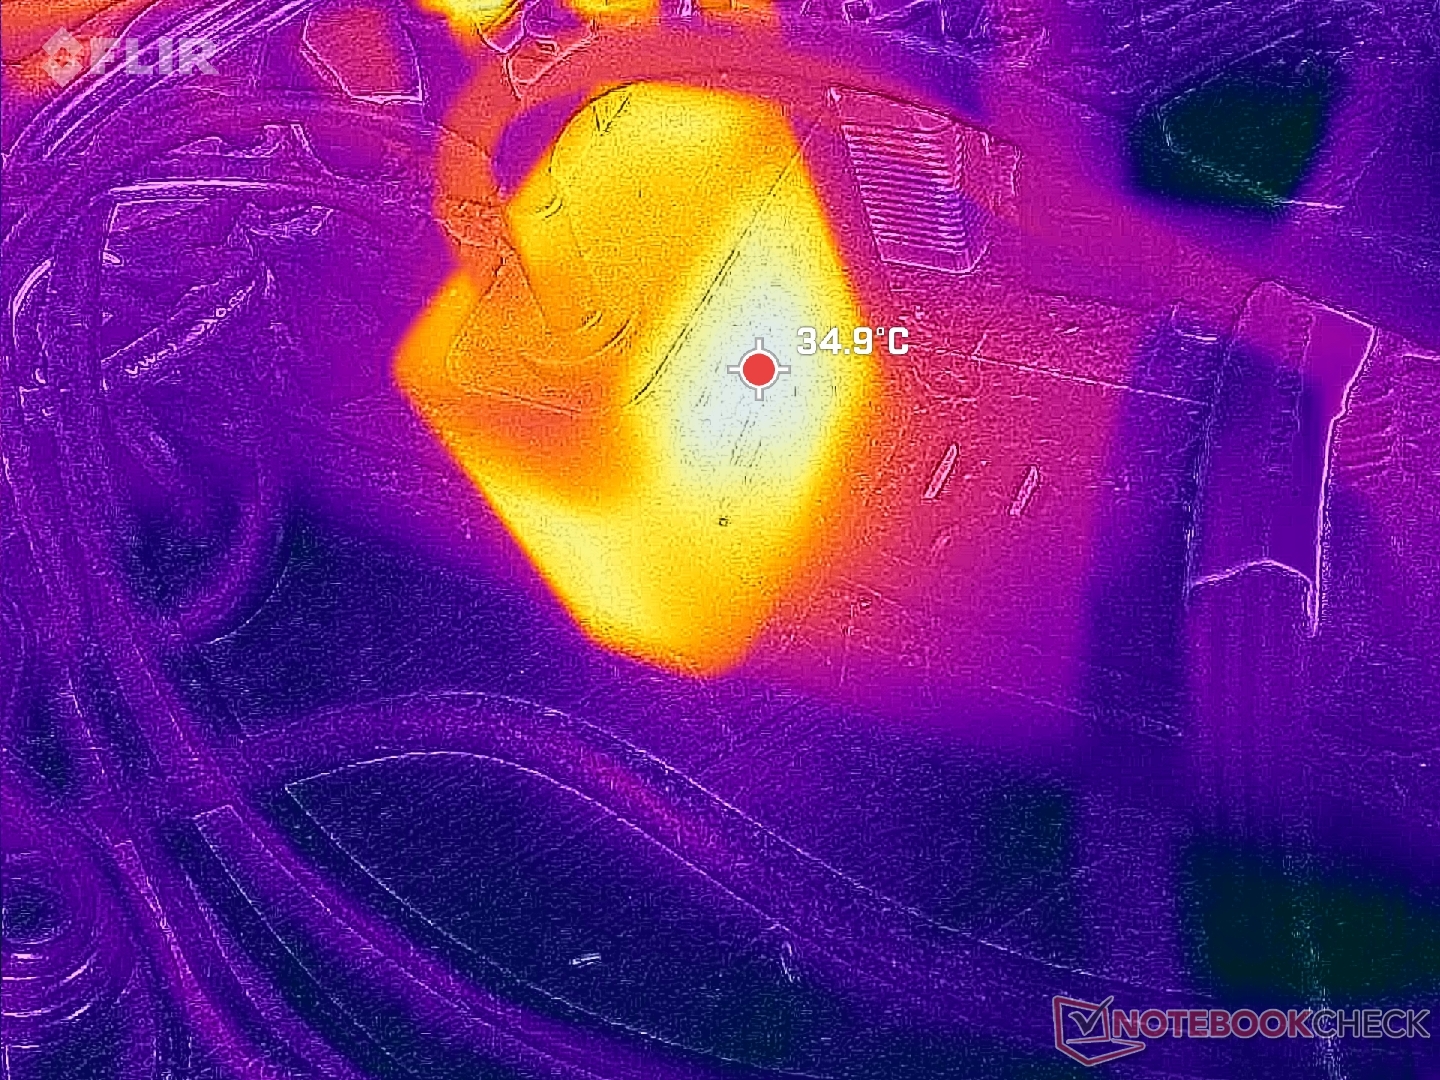
(±) La temperatura massima sul lato superiore è di 41.6 °C / 107 F, rispetto alla media di 34.3 °C / 94 F, che varia da 21.2 a 62.5 °C per questa classe Office.
(-) Il lato inferiore si riscalda fino ad un massimo di 46.6 °C / 116 F, rispetto alla media di 36.8 °C / 98 F
(+) In idle, la temperatura media del lato superiore è di 27 °C / 81 F, rispetto alla media deld ispositivo di 29.5 °C / 85 F.
(+) I poggiapolsi e il touchpad sono piu' freddi della temperatura della pelle con un massimo di 26.6 °C / 79.9 F e sono quindi freddi al tatto.
(±) La temperatura media della zona del palmo della mano di dispositivi simili e'stata di 27.5 °C / 81.5 F (+0.9 °C / 1.6 F).
| Acer Swift Edge SFE16 Ryzen 7 7840U AMD Ryzen 7 7840U, AMD Radeon 780M | Acer Swift Edge SFE16-42-R1GM AMD Ryzen 7 7735U, AMD Radeon 680M | Lenovo Slim Pro 9i 16IRP8 Intel Core i9-13905H, NVIDIA GeForce RTX 4050 Laptop GPU | Asus VivoBook Pro 16 Intel Core i7-12700H, NVIDIA GeForce RTX 3050 Ti Laptop GPU | Samsung Galaxy Book3 Ultra 16 Intel Core i7-13700H, NVIDIA GeForce RTX 4050 Laptop GPU | Huawei MateBook 16s i7 Intel Core i7-12700H, Intel Iris Xe Graphics G7 96EUs | |
|---|---|---|---|---|---|---|
| Heat | -7% | 3% | -13% | 12% | 1% | |
| Maximum Upper Side * (°C) | 41.6 | 49.4 -19% | 37.8 9% | 44.2 -6% | 41 1% | 40.9 2% |
| Maximum Bottom * (°C) | 46.6 | 44.7 4% | 44.8 4% | 53 -14% | 44 6% | 48.3 -4% |
| Idle Upper Side * (°C) | 30.4 | 34 -12% | 30.6 -1% | 32.1 -6% | 23 24% | 29.2 4% |
| Idle Bottom * (°C) | 31 | 31.6 -2% | 31 -0% | 38.4 -24% | 26 16% | 30.4 2% |
* ... Meglio usare valori piccoli
Stress test
Il potenziale limitato del Turbo Core dell'Acer può essere osservato durante lo stress test con i benchmark. Le frequenze di clock e l'assorbimento di potenza della scheda all'avvio dello stress Prime95 aumentavano rispettivamente a 3,5 GHz e 30 W, prima di scendere costantemente a soli 2,3 GHz e 18 W nel minuto successivo. Anche la temperatura del core si è stabilizzata a un valore relativamente basso di 64 C. Ripetendo questo test sul AMD Framework Laptop 13.5 con la stessa CPU, si otterrebbero valori più elevati: 3,2 GHz, 35 W e 85 C.
La temperatura del nucleo in funzione Witcher 3 si stabilizzerebbe a soli 56 C, ovvero circa 15 C in meno rispetto al Framework di cui sopra. È chiaro che il sistema dà la priorità a temperature superficiali più basse rispetto a prestazioni più elevate.
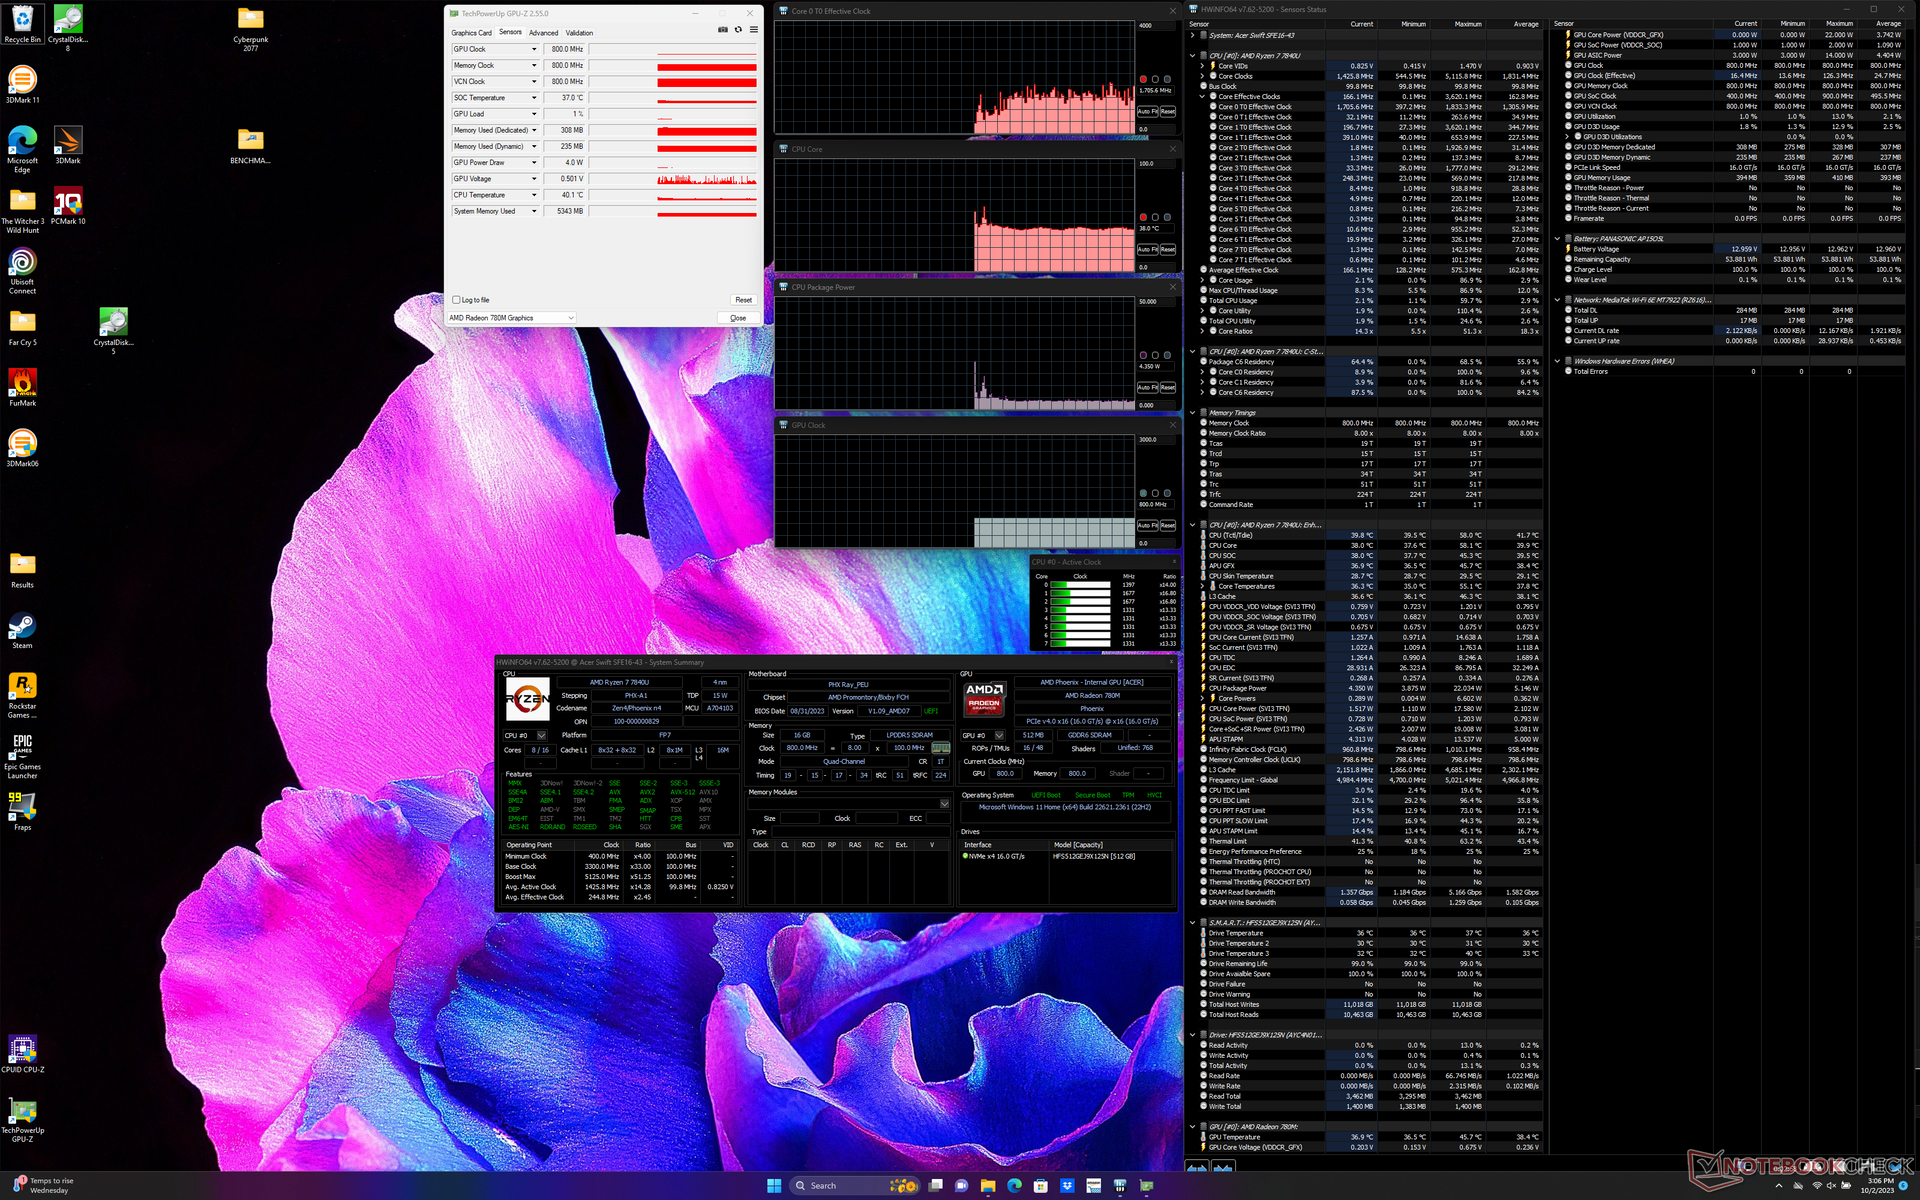
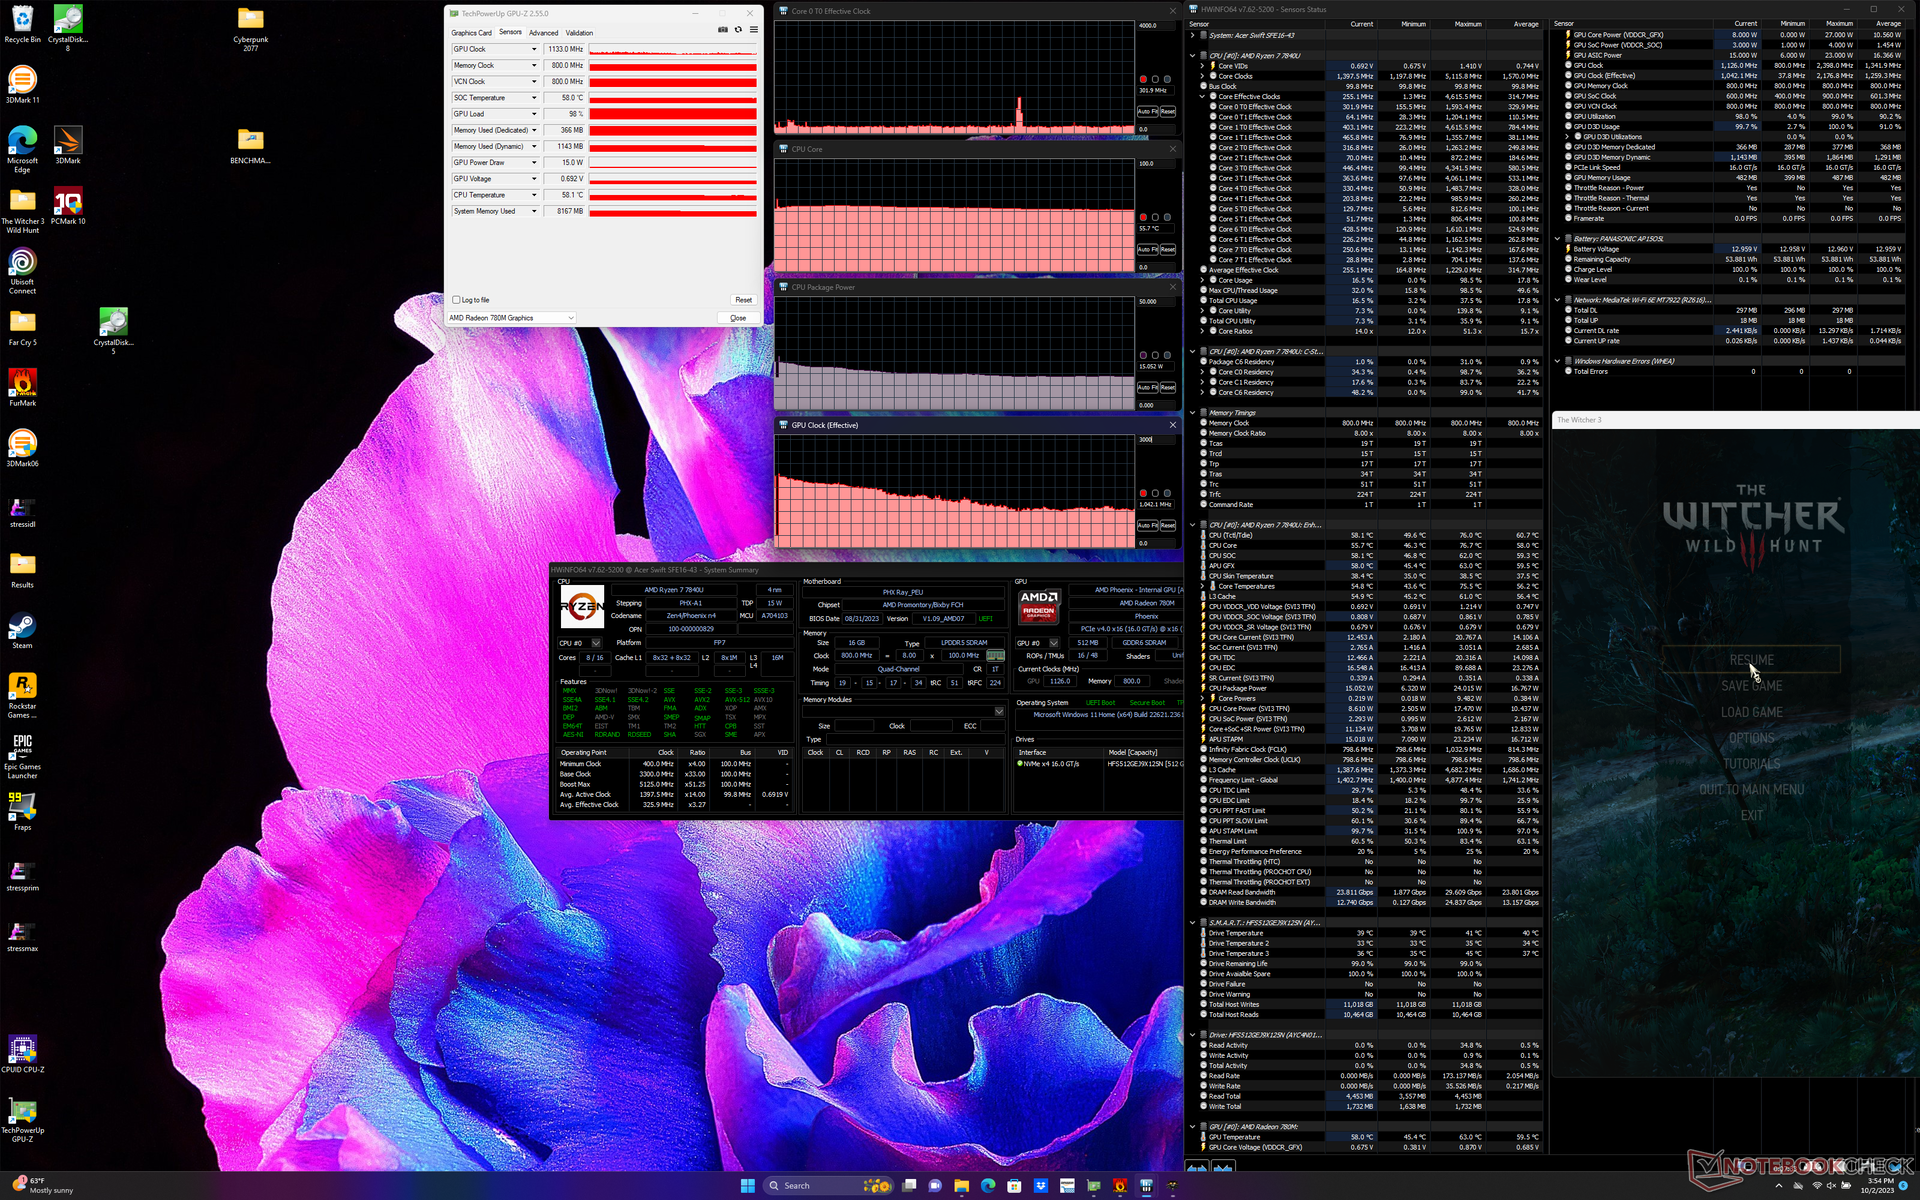
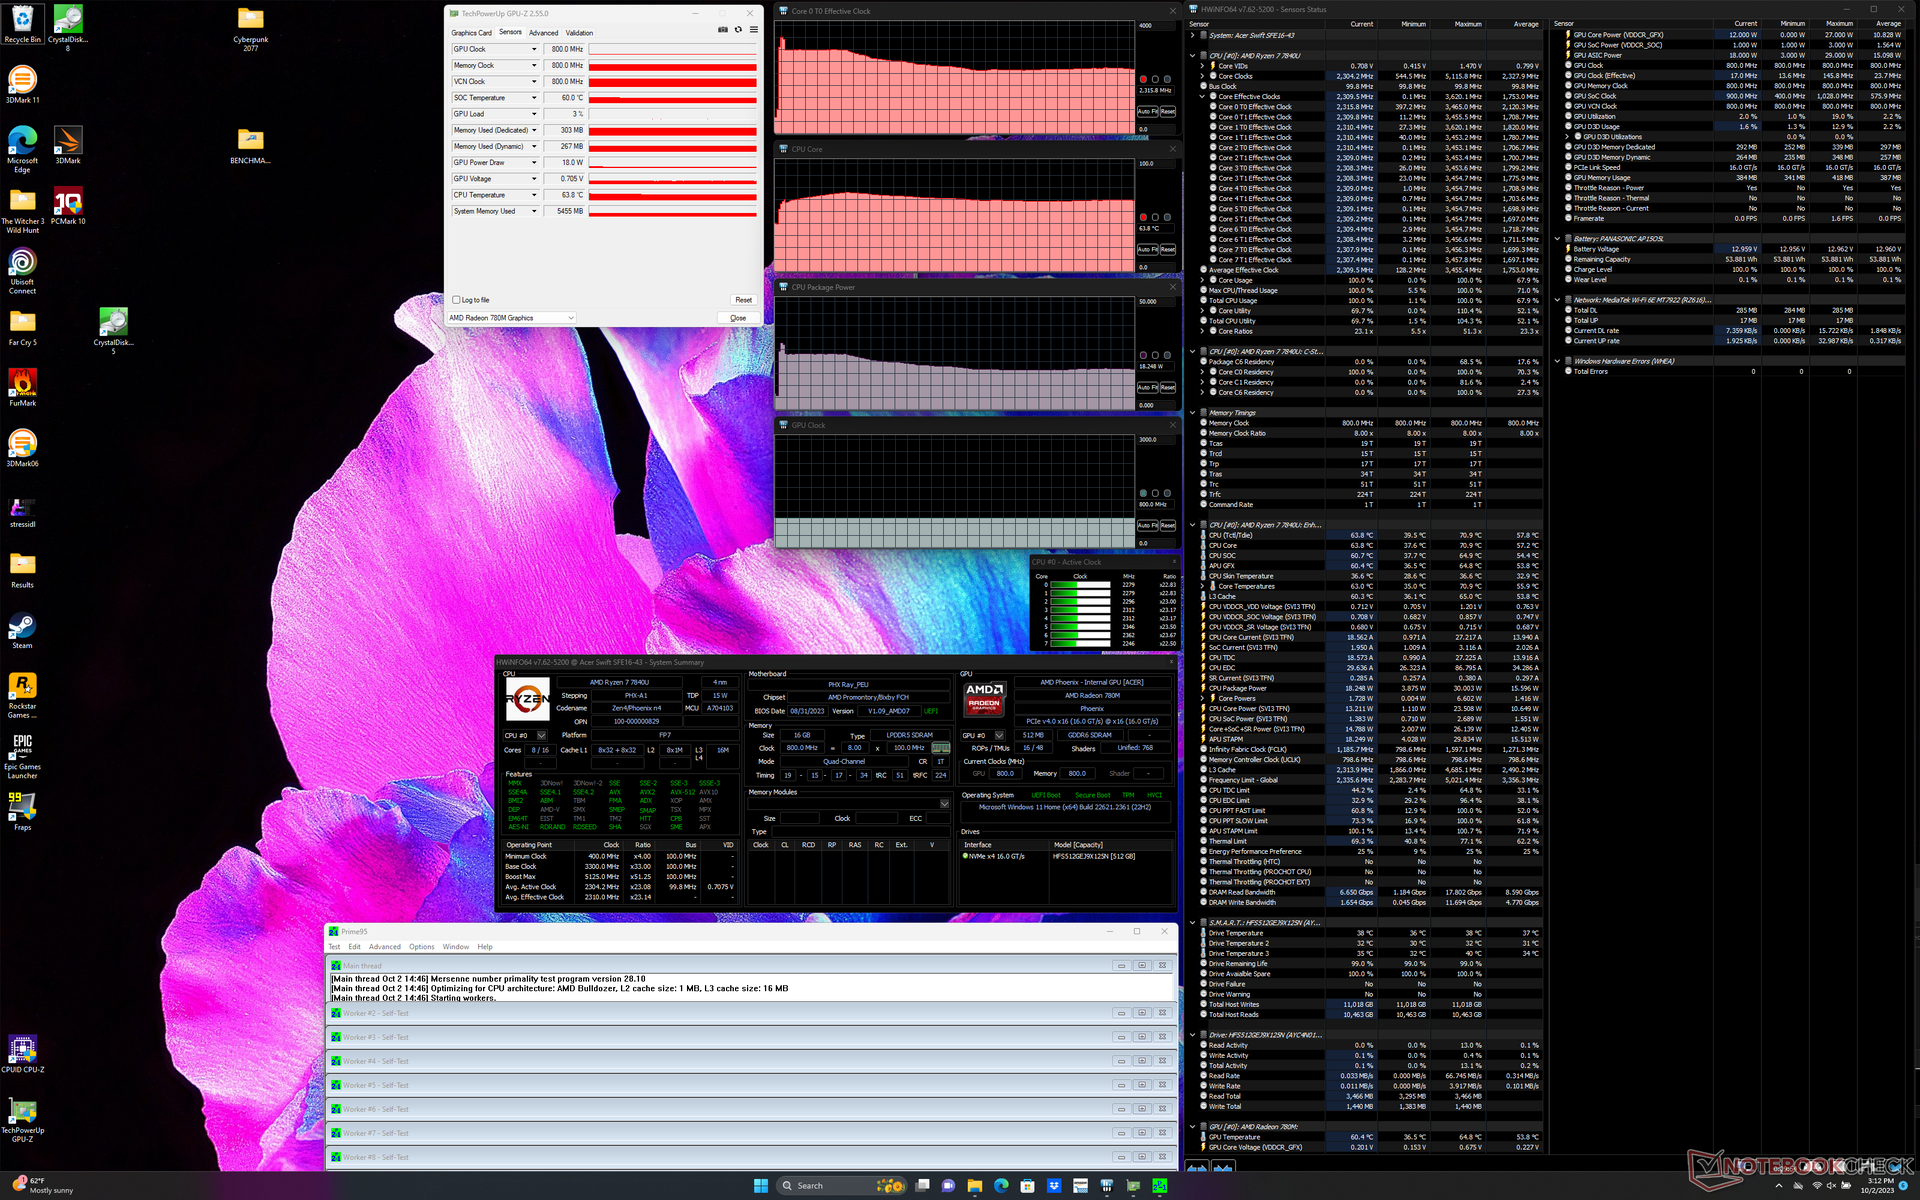
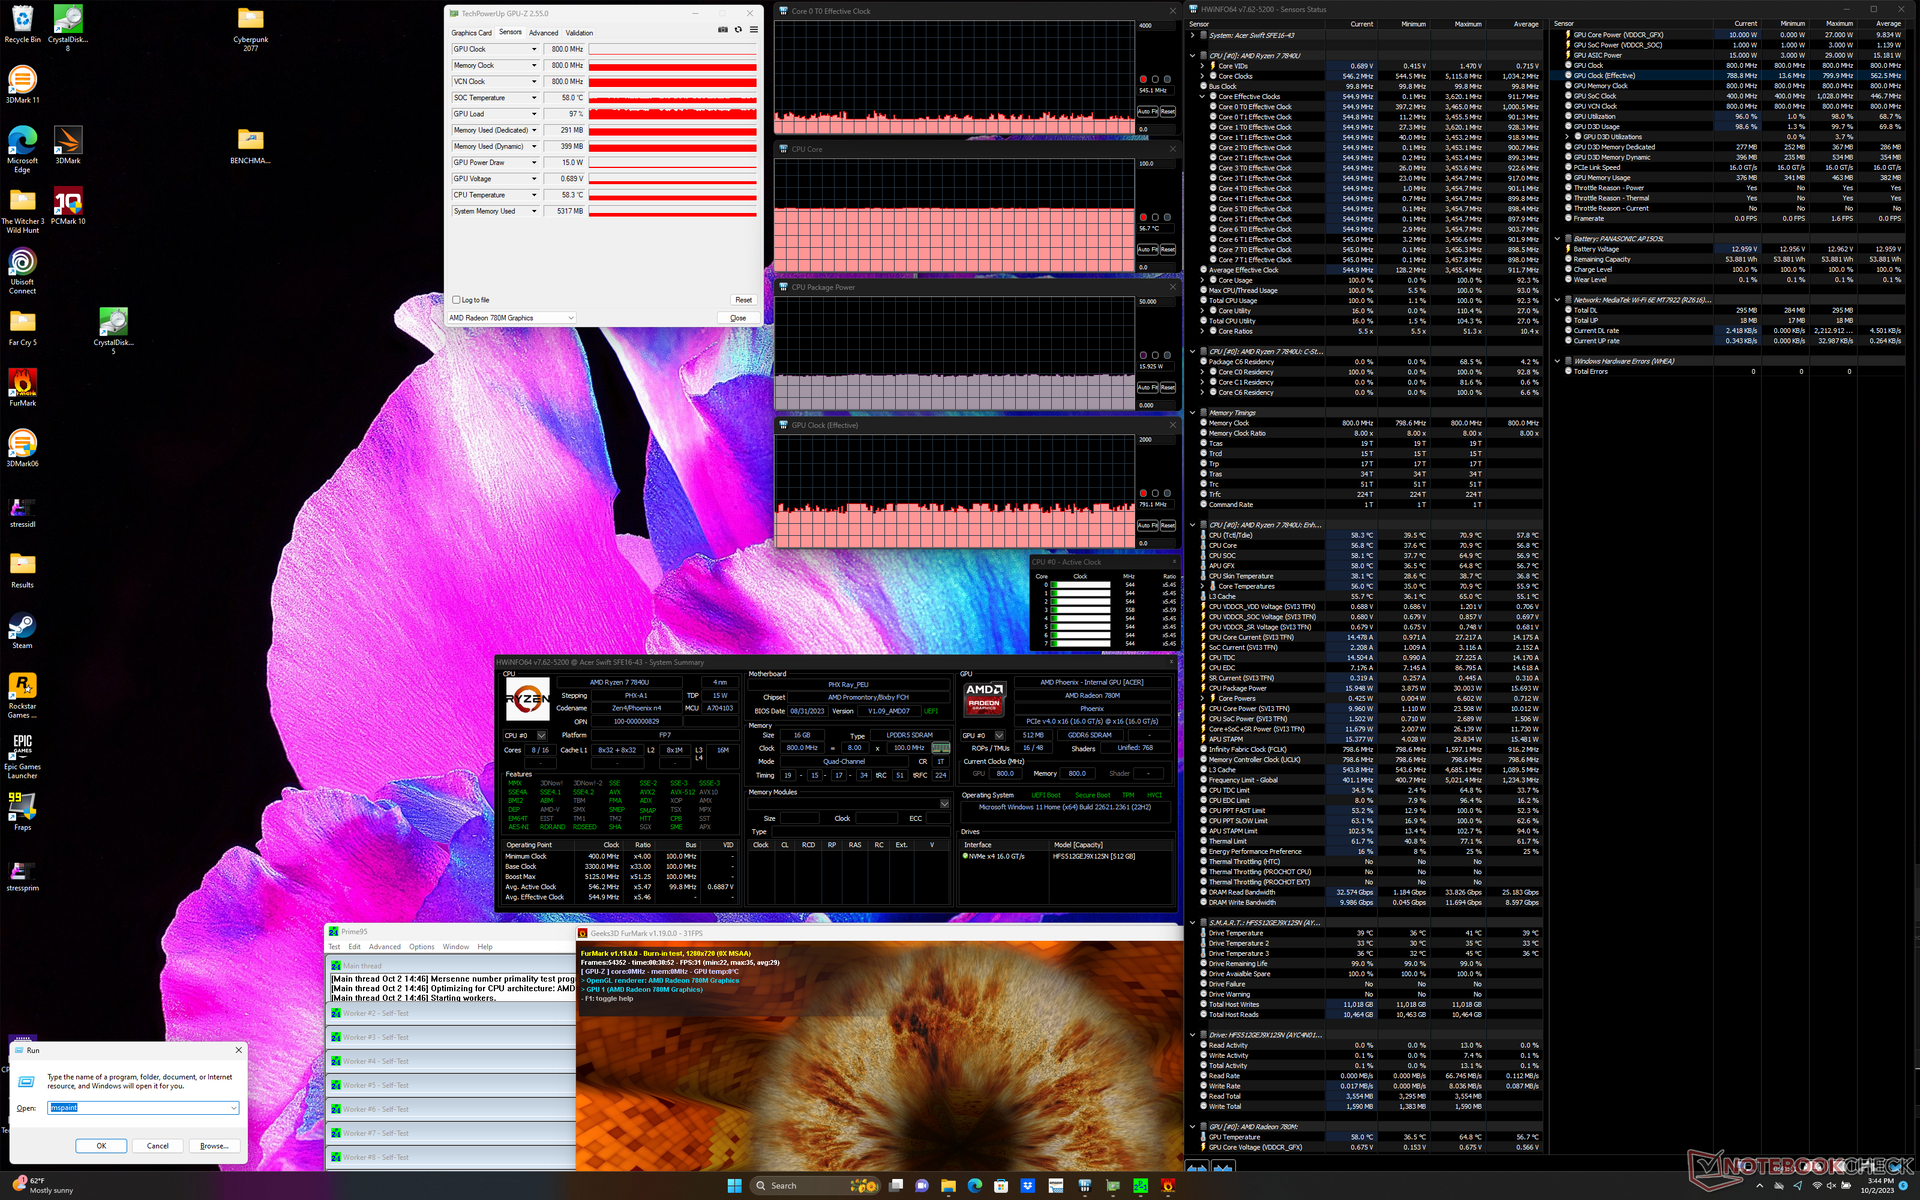
| Clock della CPU (GHz) | Clock della GPU (MHz) | Temperatura media della CPU (°C) | |
| Sistema inattivo | -- | -- | 38 |
| Stress Prime95 | 2,3 | -- | 64 |
| Prime95 + FurMark Stress | 0,5 | 791 | 57 |
| Witcher 3 Stress | 0,3 | 1042 | 56 |
Altoparlanti
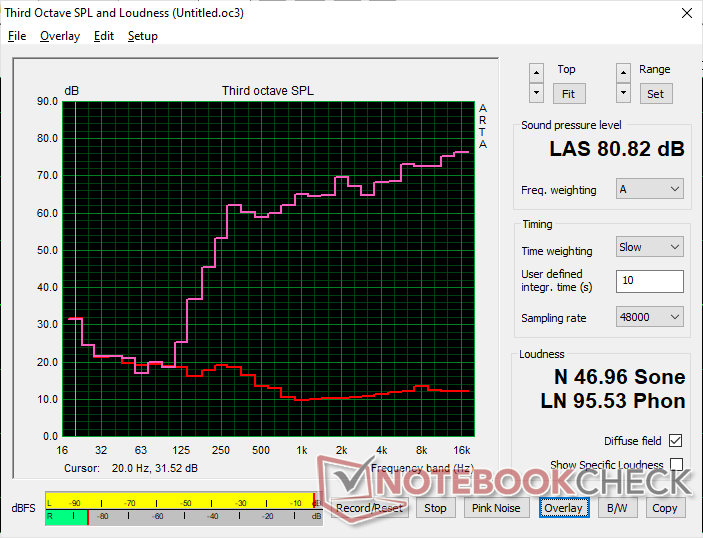
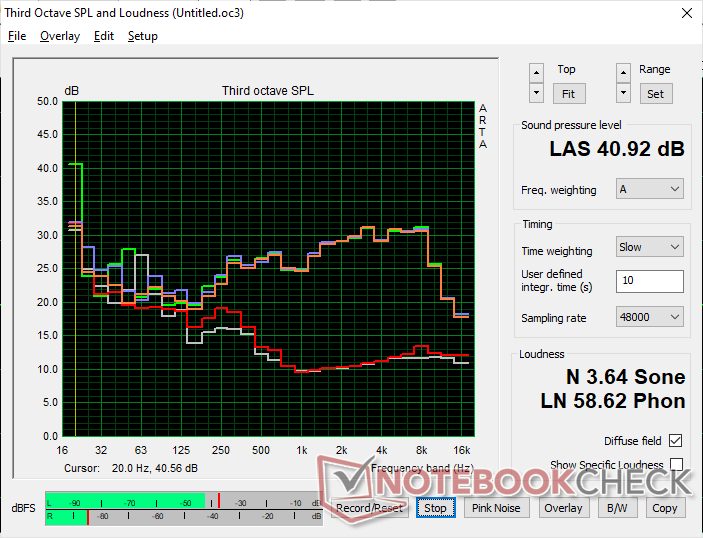
Acer Swift Edge SFE16 Ryzen 7 7840U analisi audio
(±) | potenza degli altiparlanti media ma buona (80.8 dB)
Bassi 100 - 315 Hz
(-) | quasi nessun basso - in media 24.5% inferiori alla media
(±) | la linearità dei bassi è media (14.2% delta rispetto alla precedente frequenza)
Medi 400 - 2000 Hz
(+) | medi bilanciati - solo only 2.9% rispetto alla media
(+) | medi lineari (3.5% delta rispetto alla precedente frequenza)
Alti 2 - 16 kHz
(+) | Alti bilanciati - appena 4.8% dalla media
(+) | alti lineari (3.7% delta rispetto alla precedente frequenza)
Nel complesso 100 - 16.000 Hz
(±) | la linearità complessiva del suono è media (19.8% di differenza rispetto alla media
Rispetto alla stessa classe
» 41% di tutti i dispositivi testati in questa classe è stato migliore, 9% simile, 50% peggiore
» Il migliore ha avuto un delta di 7%, medio di 21%, peggiore di 53%
Rispetto a tutti i dispositivi testati
» 51% di tutti i dispositivi testati in questa classe è stato migliore, 7% similare, 42% peggiore
» Il migliore ha avuto un delta di 4%, medio di 23%, peggiore di 134%
Apple MacBook Pro 16 2021 M1 Pro analisi audio
(+) | gli altoparlanti sono relativamente potenti (84.7 dB)
Bassi 100 - 315 Hz
(+) | bassi buoni - solo 3.8% dalla media
(+) | bassi in lineaa (5.2% delta rispetto alla precedente frequenza)
Medi 400 - 2000 Hz
(+) | medi bilanciati - solo only 1.3% rispetto alla media
(+) | medi lineari (2.1% delta rispetto alla precedente frequenza)
Alti 2 - 16 kHz
(+) | Alti bilanciati - appena 1.9% dalla media
(+) | alti lineari (2.7% delta rispetto alla precedente frequenza)
Nel complesso 100 - 16.000 Hz
(+) | suono nel complesso lineare (4.6% differenza dalla media)
Rispetto alla stessa classe
» 0% di tutti i dispositivi testati in questa classe è stato migliore, 0% simile, 100% peggiore
» Il migliore ha avuto un delta di 5%, medio di 17%, peggiore di 45%
Rispetto a tutti i dispositivi testati
» 0% di tutti i dispositivi testati in questa classe è stato migliore, 0% similare, 100% peggiore
» Il migliore ha avuto un delta di 4%, medio di 23%, peggiore di 134%
Gestione dell'energia
Consumo di energia
Il consumo di energia al minimo è superiore a quello della maggior parte dei portatili con GPU integrata, a causa dell'elevata frequenza di aggiornamento a 120 Hz e del pannello OLED della nostra configurazione Acer, che notoriamente richiede più energia rispetto ai normali IPS a 60 Hz. La visualizzazione di un'immagine completamente bianca a 120 Hz consumerebbe fino a 19 W, rispetto a meno della metà del Framework Laptop 13.5.
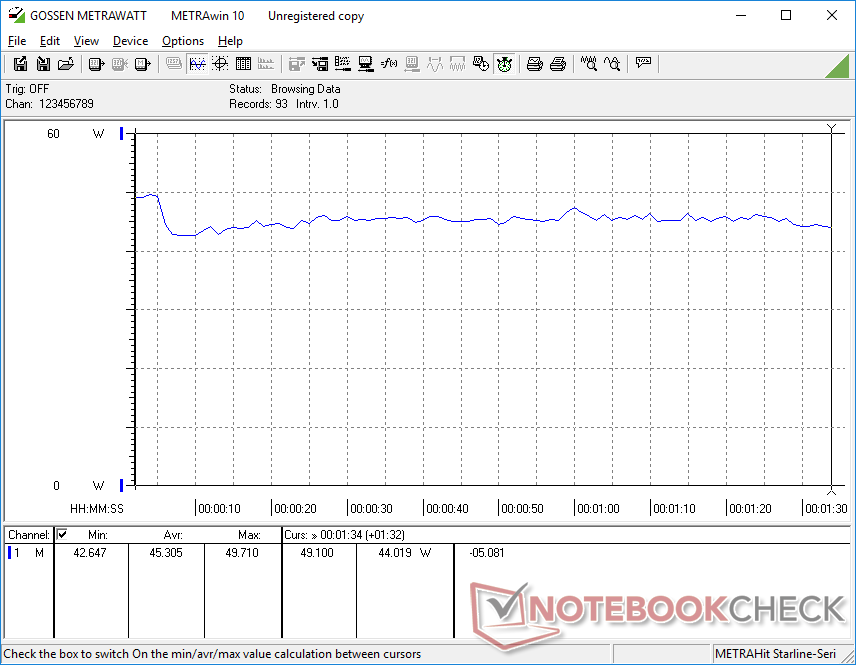
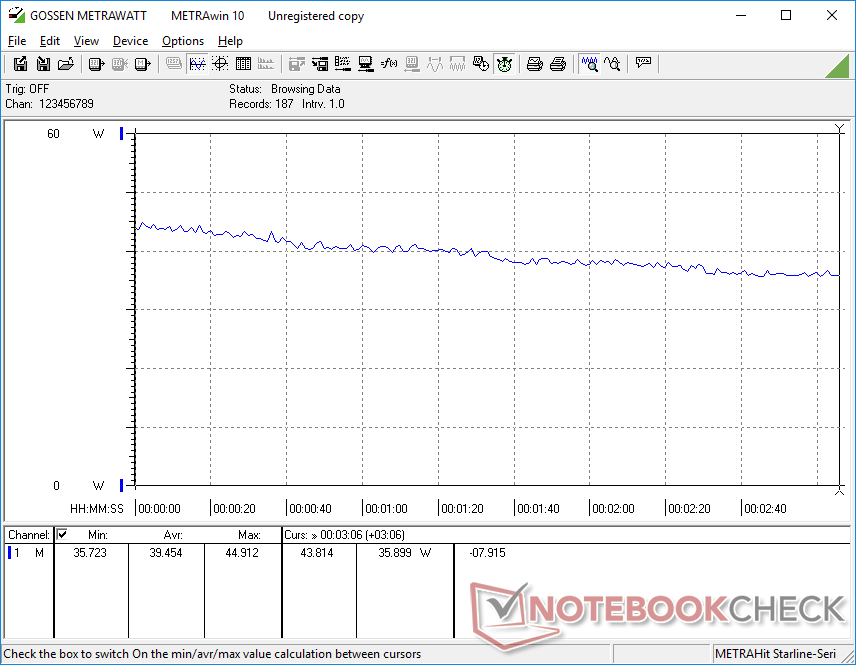
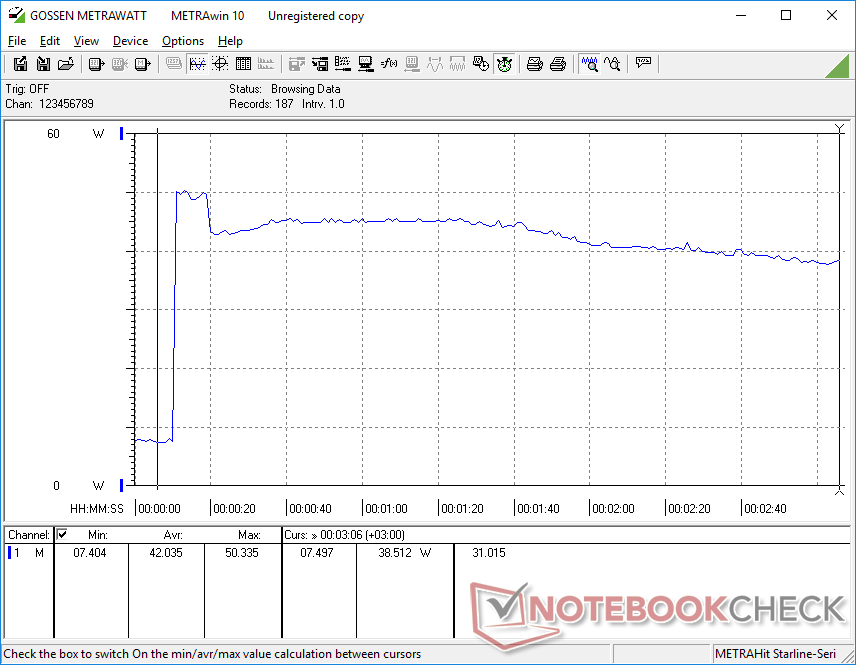
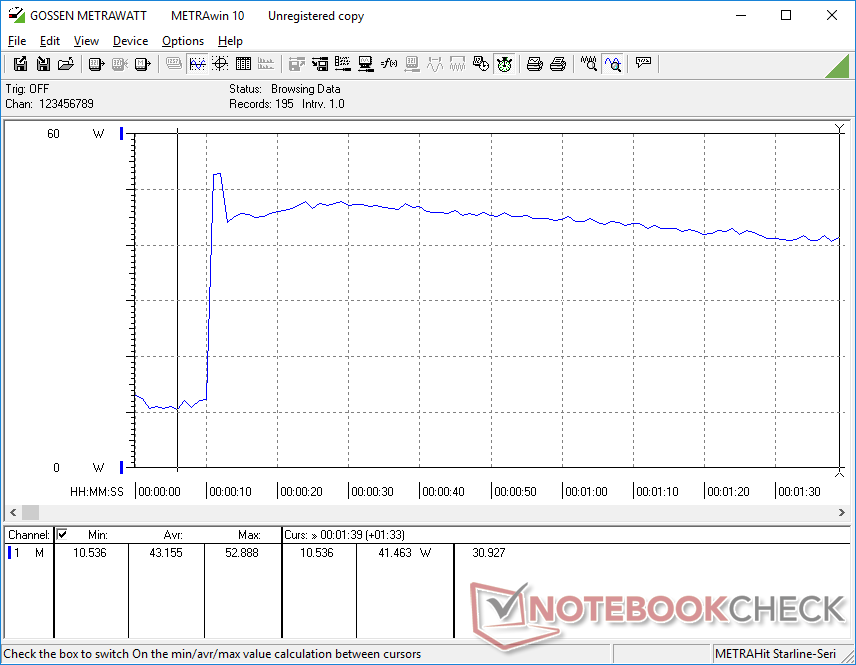
Al contrario, il consumo di energia durante i giochi sarebbe inferiore a quanto previsto a causa della tendenza al throttling del processore. I consumi iniziano ad essere elevati all'inizio del test per poi diminuire costantemente nel tempo, come mostrano i grafici sottostanti, che suggeriscono la tendenza al throttling delle prestazioni.
| Off / Standby | |
| Idle | |
| Sotto carico |
|
Leggenda:
min: | |
| Acer Swift Edge SFE16 Ryzen 7 7840U R7 7840U, Radeon 780M, SK hynix HFS512GEJ9X125N, OLED, 3200x2000, 16" | Acer Swift Edge SFE16-42-R1GM R7 7735U, Radeon 680M, Micron 3400 1TB MTFDKBA1T0TFH, OLED, 3840x2400, 16" | Lenovo Slim Pro 9i 16IRP8 i9-13905H, GeForce RTX 4050 Laptop GPU, Samsung PM9A1 MZVL21T0HCLR, Mini-LED, 3200x2000, 16" | Asus VivoBook Pro 16 i7-12700H, GeForce RTX 3050 Ti Laptop GPU, Intel SSD 670p SSDPEKNU010TZ, IPS, 2560x1600, 16" | Samsung Galaxy Book3 Ultra 16 i7-13700H, GeForce RTX 4050 Laptop GPU, Samsung PM9A1 MZVL2512HCJQ, AMOLED, 2880x1800, 16" | Huawei MateBook 16s i7 i7-12700H, Iris Xe G7 96EUs, Silicon Motion PCIe-8 SSD, IPS, 2520x1680, 16" | |
|---|---|---|---|---|---|---|
| Power Consumption | 4% | -166% | -102% | -15% | -30% | |
| Idle Minimum * (Watt) | 7.1 | 8.6 -21% | 16 -125% | 8.7 -23% | 3 58% | 6.8 4% |
| Idle Average * (Watt) | 10.1 | 7.7 24% | 30 -197% | 13.1 -30% | 5 50% | 13.2 -31% |
| Idle Maximum * (Watt) | 18.6 | 9.3 50% | 30.4 -63% | 18.3 2% | 11 41% | 13.8 26% |
| Load Average * (Watt) | 45.3 | 47.9 -6% | 78.9 -74% | 116 -156% | 72 -59% | 75.2 -66% |
| Witcher 3 ultra * (Watt) | 39.5 | 46.3 -17% | 155.3 -293% | 117.6 -198% | 69.7 -76% | 56.1 -42% |
| Load Maximum * (Watt) | 52.9 | 56 -6% | 180.4 -241% | 162 -206% | 108 -104% | 90.6 -71% |
* ... Meglio usare valori piccoli
Power Consumption Witcher 3 / Stresstest
Power Consumption external Monitor
Durata della batteria
L'autonomia WLAN è inferiore a quella registrata sulla nostra precedente unità di quasi due ore intere, anche quando entrambi sono impostati con le stesse impostazioni di profilo energetico e le stesse condizioni del browser. La frequenza di aggiornamento di 120 Hz è probabilmente un fattore che contribuisce alle differenze di durata della batteria.
| Acer Swift Edge SFE16 Ryzen 7 7840U R7 7840U, Radeon 780M, 54 Wh | Acer Swift Edge SFE16-42-R1GM R7 7735U, Radeon 680M, 54 Wh | Lenovo Slim Pro 9i 16IRP8 i9-13905H, GeForce RTX 4050 Laptop GPU, 75 Wh | Asus VivoBook Pro 16 i7-12700H, GeForce RTX 3050 Ti Laptop GPU, 70 Wh | Samsung Galaxy Book3 Ultra 16 i7-13700H, GeForce RTX 4050 Laptop GPU, 76 Wh | Huawei MateBook 16s i7 i7-12700H, Iris Xe G7 96EUs, 84 Wh | |
|---|---|---|---|---|---|---|
| Autonomia della batteria | 30% | 18% | 30% | 71% | 45% | |
| WiFi v1.3 (h) | 5.6 | 7.3 30% | 6.6 18% | 7.3 30% | 9.6 71% | 8.1 45% |
| Reader / Idle (h) | 10.9 | 18.2 | ||||
| H.264 (h) | 8.6 | 13.4 | 9.3 | |||
| Load (h) | 1.5 | 1.8 | 1.9 |
Pro
Contro
Verdetto - Aggiornamenti minori ma degni di nota
Il Zen 3+ Swift Edge 16 era già uno dei nostri portatili da 16 pollici preferiti e l'aggiornamento della configurazione Zen 4 non fa che consolidare la nostra posizione. Il livello di potenza della CPU e soprattutto della GPU è elevato, considerando il peso ridotto e il profilo sottile. Nel frattempo, il display OLED 3,2K 120 Hz è uno dei migliori che abbiamo visto su qualsiasi portatile multimediale per l'elaborazione di testi, l'editing, la navigazione, i video e persino i giochi. Se volete massimizzare le prestazioni e la qualità del display riducendo al minimo il peso, lo Swift Edge 16 fa davvero centro.
Il Ryzen 7 7840U offre un discreto incremento delle prestazioni rispetto alla già ottima configurazione Ryzen 7 7735U Swift Edge 16. Gli utenti apprezzeranno l'OLED a 120 Hz e il peso ridotto, ma la durata media della batteria e il rallentamento delle prestazioni potrebbero infastidire gli utenti più esigenti.
I tagli emergono quando si guarda oltre la CPU e il display. Poiché il portatile è estremamente leggero per le sue dimensioni, è stato necessario rimuovere o ridurre alcune caratteristiche, come la soluzione di raffreddamento più piccola, la capacità della batteria ridotta e la mancanza di Gorilla Glass o del touchscreen per mantenere il peso basso. Di conseguenza, la CPU funziona un po' più lentamente del previsto, la durata della batteria è solo nella media, l'unità SSD si blocca sotto sforzo e il display è più soggetto a torsioni e oscillazioni di quanto vorremmo. Anche l'espansione è limitata, poiché la RAM è saldata e viene supportata solo un'unità SSD interna.
Se avete assolutamente bisogno della potenza delle CPU della serie H e delle GPU RTX di GeForce, allora potreste prendere in considerazione il più pesante Swift X 16, Asus VivoBook Pro 16oGalaxy Book3 Ultra 16 invece. I viaggiatori costanti apprezzeranno di più lo Swift Edge 16, perché potranno sfruttare più regolarmente il peso ridotto del sistema senza sacrificare la qualità del display o le prestazioni.
Prezzo e disponibilità
L'Acer Swift Edge SFE16 recensito con Ryzen 7 7840U è ora ampiamente disponibile presso Best Buy a 1300 dollari.
Acer Swift Edge SFE16 Ryzen 7 7840U
- 10/06/2023 v7 (old)
Allen Ngo
Transparency
La selezione dei dispositivi da recensire viene effettuata dalla nostra redazione. Il campione di prova è stato fornito all'autore come prestito dal produttore o dal rivenditore ai fini di questa recensione. L'istituto di credito non ha avuto alcuna influenza su questa recensione, né il produttore ne ha ricevuto una copia prima della pubblicazione. Non vi era alcun obbligo di pubblicare questa recensione. In quanto società mediatica indipendente, Notebookcheck non è soggetta all'autorità di produttori, rivenditori o editori.
Ecco come Notebookcheck esegue i test
Ogni anno, Notebookcheck esamina in modo indipendente centinaia di laptop e smartphone utilizzando procedure standardizzate per garantire che tutti i risultati siano comparabili. Da circa 20 anni sviluppiamo continuamente i nostri metodi di prova e nel frattempo stabiliamo gli standard di settore. Nei nostri laboratori di prova, tecnici ed editori esperti utilizzano apparecchiature di misurazione di alta qualità. Questi test comportano un processo di validazione in più fasi. Il nostro complesso sistema di valutazione si basa su centinaia di misurazioni e parametri di riferimento ben fondati, che mantengono l'obiettività.Price comparison

