Recensione dell'Asus VivoBook Pro 16: Un portatile multimediale con Core i7, RTX 3050 Ti e DCI-P3
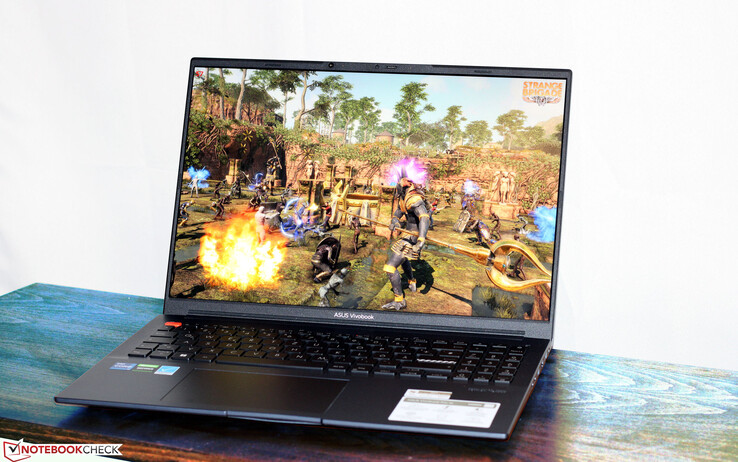
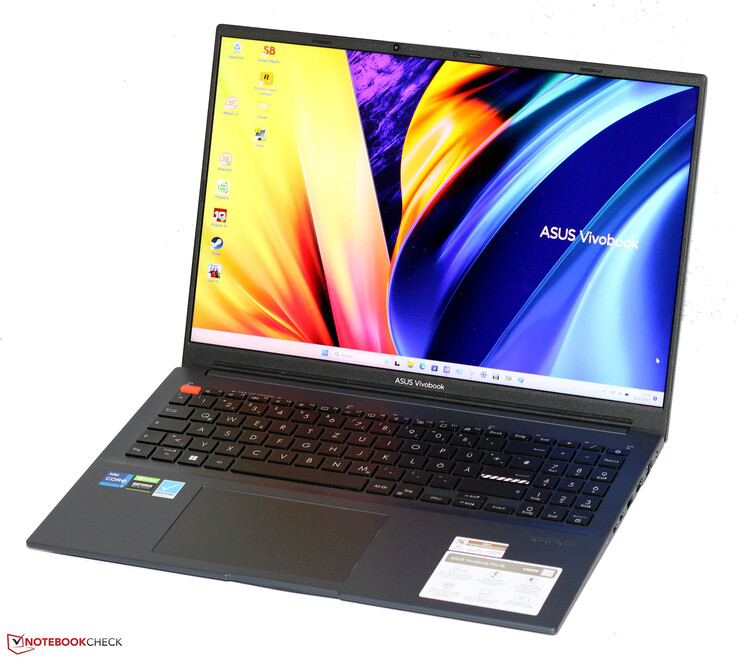
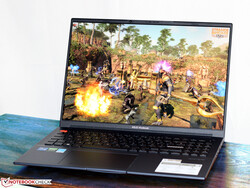
L'Asus VivoBook è un portatile da 16 pollici per giocatori e creativi. Il portatile è dotato di un hardware adeguato: ACore i7-12700H,GeForce RTX 3050 Tie un luminoso display IPS in formato 16:10 con un'ottima precisione dei colori. Questo portatile è simile alVivoBook Pro 16X che abbiamo testato in precedenza, ma non sono costruiti in modo identico. I concorrenti di questo portatile sono i modelli Dell Inspiron 16 Plus 7620, ilXMG Fusion 15 (Mid 22)e l'Acer Swift X 16.
Potenziali concorrenti a confronto
Punteggio | Data | Modello | Peso | Altezza | Dimensione | Risoluzione | Prezzo |
|---|---|---|---|---|---|---|---|
| 86.3 % v7 (old) | 05/2023 | Asus VivoBook Pro 16 i7-12700H, GeForce RTX 3050 Ti Laptop GPU | 1.9 kg | 20 mm | 16.00" | 2560x1600 | |
| 86.4 % v7 (old) | 11/2022 | Acer Swift X SFX16-52G-77RX i7-1260P, A370M | 1.8 kg | 21.2 mm | 16.00" | 2560x1600 | |
| 87.4 % v7 (old) | 08/2022 | Dell Inspiron 16 Plus 7620 i7-12700H, GeForce RTX 3050 Ti Laptop GPU | 2.1 kg | 18.99 mm | 16.00" | 3072x1920 | |
| 87.4 % v7 (old) | 08/2022 | Schenker XMG Fusion 15 (Mid 22) i7-11800H, GeForce RTX 3070 Laptop GPU | 1.9 kg | 21.65 mm | 15.60" | 2560x1440 |
I nostri Top 10
» Top 10 Portatili Multimedia
» Top 10 Portatili Gaming
» Top 10 Portatili Gaming Leggeri
» Top 10 Portatili da Ufficio e Business economici
» Top 10 Portatili Premium da Ufficio/Business
» Top 10 Portatili sotto i 300 Euro
» Top 10 Portatili sotto i 500 Euro
» Top 10 dei Portatili Workstation
» Top 10 Subnotebooks
» Top 10 Ultrabooks
» Top 10 Convertibili
» Top 10 Tablets
» Top 10 Tablets Windows
» Top 10 Smartphones
Case e caratteristiche - Il VivoBook con Thunderbolt 4
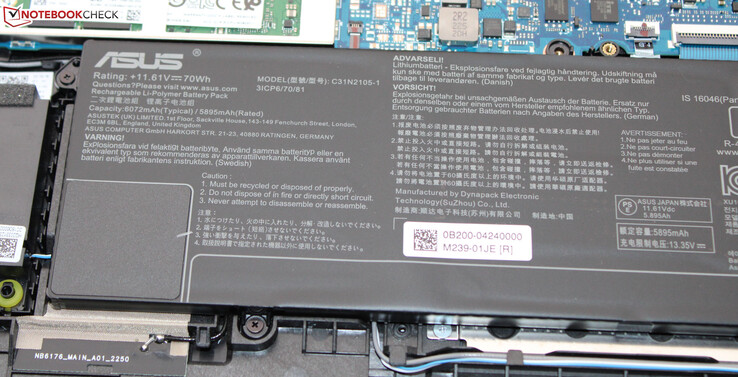
Il VivoBook è di colore blu scuro (Quiet Blue) e presenta superfici lisce e opache. L'unità di base (in plastica) e il coperchio (in alluminio) possono essere ruotati un po' troppo facilmente. L'angolo massimo di apertura del coperchio è di 180 gradi. La batteria (avvitata, non incollata) e il resto dei componenti interni del portatile sono accessibili dopo aver rimosso la parte inferiore del case.
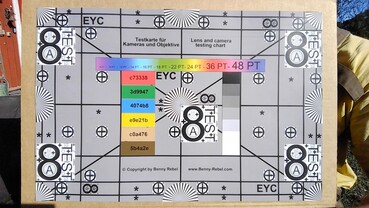
Il dispositivo dispone di due porte USB-A (USB 3.2 Gen 1) e di due porte USB-C (1x Thunderbolt 4, 1x USB 3.2 Gen 2). Queste ultime supportano l'alimentazione e la porta TB4 può anche emettere un segnale DisplayPort. In totale, sono presenti due uscite video (1x DP, 1x HDMI). Il lettore di schede SD (scheda di riferimento: AV PRO microSD 128 GB V60) offre una velocità nella media. Un aspetto positivo: La webcam (2,1 MP, max. 1.920 x 1.080 pixel) ha una copertura meccanica.
In condizioni ottimali (assenza di dispositivi WiFi nelle vicinanze, breve distanza tra il portatile e il PC server), è possibile ottenere ottime velocità di trasmissione dati WiFi. Il portatile utilizza un chip WiFi 6E (Mediatek MT7922). Le connessioni cablate sono gestite da un chip Realtek (RTL 816878111; 1 GBit/s).
| SD Card Reader | |
| average JPG Copy Test (av. of 3 runs) | |
| Media della classe Multimedia (21.1 - 531, n=45, ultimi 2 anni) | |
| Schenker XMG Fusion 15 (Mid 22) (AV PRO microSD 128 GB V60) | |
| Asus VivoBook Pro 16 (AV Pro SD microSD 128 GB V60) | |
| Dell Inspiron 16 Plus 7620 (Toshiba Exceria Pro SDXC 64 GB UHS-II) | |
| maximum AS SSD Seq Read Test (1GB) | |
| Media della classe Multimedia (27.4 - 1455, n=45, ultimi 2 anni) | |
| Asus VivoBook Pro 16 (AV Pro SD microSD 128 GB V60) | |
| Dell Inspiron 16 Plus 7620 (Toshiba Exceria Pro SDXC 64 GB UHS-II) | |
Dispositivi di input - Il computer Asus con tastiera illuminata
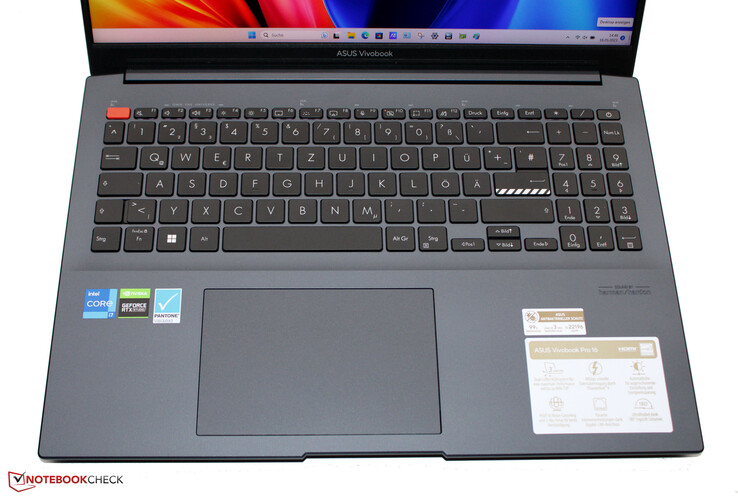
I tasti della tastiera chiclet (parzialmente curvi e con tre modalità di illuminazione) hanno un'inclinazione media e un punto di pressione chiaro. Hanno un buon livello di resistenza, ma potrebbero essere un po' più nitidi. La tastiera presenta un leggero cedimento durante la digitazione, ma non si tratta di un aspetto negativo. Nel complesso, la tastiera del portatile Asus va bene per l'uso quotidiano.
Il click pad (13 x 8,5 cm) sostituisce il mouse e la sua superficie liscia permette alle dita di scivolare comodamente su di esso. Reagisce agli input fino ai bordi, ha un sollevamento minimo e un punto di pressione chiaro.
Display - Pannello 16:10 con copertura DCI-P3
| |||||||||||||||||||||||||
Distribuzione della luminosità: 87 %
Al centro con la batteria: 509 cd/m²
Contrasto: 1440:1 (Nero: 0.35 cd/m²)
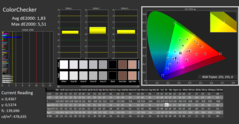
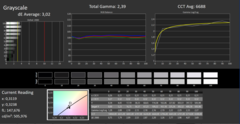
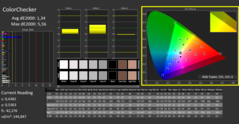
ΔE ColorChecker Calman: 1.83 | ∀{0.5-29.43 Ø4.77}
calibrated: 1.34
ΔE Greyscale Calman: 3.02 | ∀{0.09-98 Ø5}
86.1% AdobeRGB 1998 (Argyll 3D)
99.9% sRGB (Argyll 3D)
98.5% Display P3 (Argyll 3D)
Gamma: 2.39
CCT: 6688 K
| Asus VivoBook Pro 16 Au Optronics B160QAN02.L, IPS, 2560x1600, 16" | Dell Inspiron 16 Plus 7620 BOE NE16N41, IPS, 3072x1920, 16" | Schenker XMG Fusion 15 (Mid 22) BOE CQ NE156QHM-NY2, IPS, 2560x1440, 15.6" | Acer Swift X SFX16-52G-77RX B160QAN02.M, IPS-LED, 2560x1600, 16" | |
|---|---|---|---|---|
| Display | -14% | -19% | -11% | |
| Display P3 Coverage (%) | 98.5 | 70.8 -28% | 67.3 -32% | 76.4 -22% |
| sRGB Coverage (%) | 99.9 | 99.5 0% | 96.7 -3% | 100 0% |
| AdobeRGB 1998 Coverage (%) | 86.1 | 73.2 -15% | 68.2 -21% | 76.6 -11% |
| Response Times | -1025% | -234% | -819% | |
| Response Time Grey 50% / Grey 80% * (ms) | 2 ? | 38 ? -1800% | 11.6 ? -480% | 33 ? -1550% |
| Response Time Black / White * (ms) | 8 ? | 28 ? -250% | 7 ? 12% | 15 ? -88% |
| PWM Frequency (Hz) | ||||
| Screen | 7% | -32% | -4% | |
| Brightness middle (cd/m²) | 504 | 288.9 -43% | 326 -35% | 411 -18% |
| Brightness (cd/m²) | 465 | 276 -41% | 303 -35% | 378 -19% |
| Brightness Distribution (%) | 87 | 92 6% | 89 2% | 83 -5% |
| Black Level * (cd/m²) | 0.35 | 0.26 26% | 0.33 6% | 0.29 17% |
| Contrast (:1) | 1440 | 1111 -23% | 988 -31% | 1417 -2% |
| Colorchecker dE 2000 * | 1.83 | 1.88 -3% | 2.73 -49% | 2.18 -19% |
| Colorchecker dE 2000 max. * | 5.51 | 4.37 21% | 9.54 -73% | 4.84 12% |
| Colorchecker dE 2000 calibrated * | 1.34 | 0.42 69% | 1.36 -1% | 1.48 -10% |
| Greyscale dE 2000 * | 3.02 | 1.4 54% | 5.2 -72% | 2.68 11% |
| Gamma | 2.39 92% | 2.3 96% | 2.074 106% | 2.43 91% |
| CCT | 6688 97% | 6634 98% | 6911 94% | 6717 97% |
| Media totale (Programma / Settaggio) | -344% /
-145% | -95% /
-58% | -278% /
-122% |
* ... Meglio usare valori piccoli
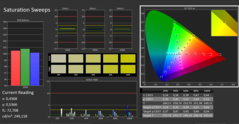
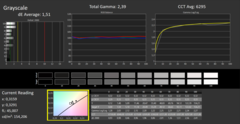
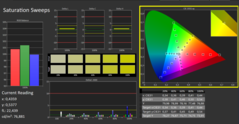
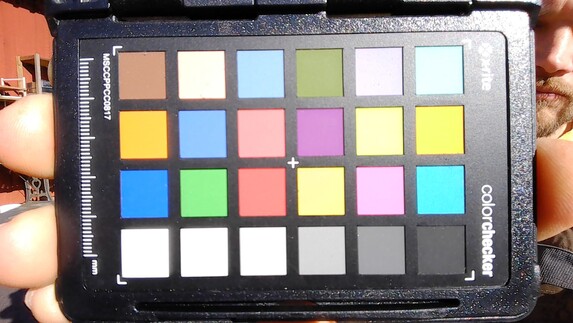
Grazie alla certificazione X Rite Pantone, lo schermo ha una rappresentazione dei colori molto naturale: Con deviazioni di circa 1,8, offre risultati accettabili (DeltaE < 3) già dalla confezione. La calibrazione porta a una deviazione minore di 1,3 e a toni di grigio più equilibrati. La precisione del colore non è un problema: il pannello è in grado di rappresentare l'intero spazio colore DCI P3 e l'86% dello spazio Adobe RGB.
Tempi di risposta del Display
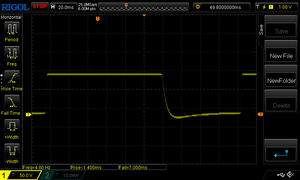
| ↔ Tempi di risposta dal Nero al Bianco | ||
|---|---|---|
| 8 ms ... aumenta ↗ e diminuisce ↘ combinato | ↗ 1 ms Incremento | |
| ↘ 7 ms Calo | ||
| Lo schermo mostra veloci tempi di risposta durante i nostri tests e dovrebbe esere adatto al gaming In confronto, tutti i dispositivi di test variano da 0.1 (minimo) a 240 (massimo) ms. » 21 % di tutti i dispositivi è migliore. Questo significa che i tempi di risposta rilevati sono migliori rispettto alla media di tutti i dispositivi testati (20.1 ms). | ||
| ↔ Tempo di risposta dal 50% Grigio all'80% Grigio | ||
| 2 ms ... aumenta ↗ e diminuisce ↘ combinato | ↗ 1 ms Incremento | |
| ↘ 1 ms Calo | ||
| Lo schermo ha mostrato valori di risposta molto veloci nei nostri tests ed è molto adatto per i gaming veloce. In confronto, tutti i dispositivi di test variano da 0.165 (minimo) a 636 (massimo) ms. » 9 % di tutti i dispositivi è migliore. Questo significa che i tempi di risposta rilevati sono migliori rispettto alla media di tutti i dispositivi testati (31.5 ms). | ||
Sfarfallio dello schermo / PWM (Pulse-Width Modulation)
| flickering dello schermo / PWM non rilevato | |||
In confronto: 53 % di tutti i dispositivi testati non utilizza PWM per ridurre la luminosita' del display. Se è rilevato PWM, una media di 8042 (minimo: 5 - massimo: 343500) Hz è stata rilevata. | |||
Prestazioni - Alder Lake e Ampere
La serie VivoBook Pro 16 è composta da 5 gamme di modelli (vedere il numero di modello )) che si basano su diverse generazioni di CPU e GPU. L'attuale modello K6602ZE utilizza CPU Alder Lake e una GPUGeForce-RTX-3050-TgPU. L'MRSP del nostro dispositivo di prova è di 1.247 dollari. Altre varianti non erano disponibili al momento del test.
Condizioni di test
Con la combinazione di tasti "Fn" + "F" è possibile passare da una modalità di raffreddamento all'altra, specifica del produttore (vedi tabella). Abbiamo utilizzato la "modalità standard" (benchmark) e la "modalità whisper" (test della batteria).
| Modalità Performance | Modalità Standard | Modalità Sussurro | |
|---|---|---|---|
| Limite di potenza 1 (HWInfo) | 80 watt | 50 watt | 28 watt |
| Limite di potenza 2 (HWInfo) | 120 watt | 120 watt | 120 watt |
| TGP (Witcher 3) | 65 watt | 50 watt | 25 watt |
Processore
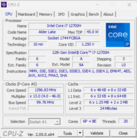
Il portatile è dotato diCore-i7-12700H(Alder Lake) è composto da 6 core per le prestazioni (hyper threading, 2,4 - 4,7 GHz) e 8 core per l'efficienza (senza hyper threading, 1,8 - 3,5 GHz). In totale, si tratta di 20 core logici della CPU.
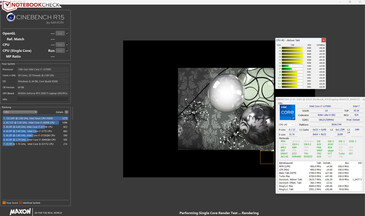
Abbiamo misurato i migliori risultati del benchmark utilizzando la "modalità prestazioni" attivata, anche se la distanza dalla "modalità standard" era minima. In ogni caso, questi valori sono inferiori alla media della CPU. In modalità batteria, le prestazioni in single-thread (127 punti) sono state ridotte in misura maggiore rispetto alle prestazioni in multi-thread (1.695 punti).
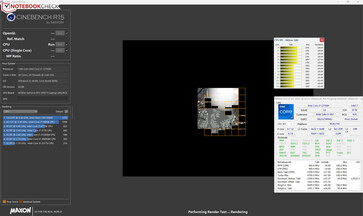
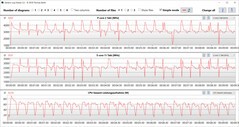
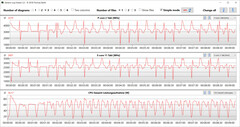
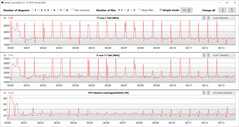
Il test del ciclo CB15 ha dimostrato che: Il carico continuo del multi-thread ha portato la velocità di clock del turbo a diminuire dalla prima alla quarta esecuzione. Successivamente, i tassi sono rimasti costanti. L'utilizzo della "modalità prestazioni" non ha comportato alcun miglioramento delle prestazioni.
Cinebench R15 Multi continuous test
| CPU Performance rating - Percent | |
| Media della classe Multimedia | |
| Media Intel Core i7-12700H | |
| Dell Inspiron 16 Plus 7620 | |
| Asus VivoBook Pro 16 | |
| Acer Swift X SFX16-52G-77RX | |
| Schenker XMG Fusion 15 (Mid 22) | |
* ... Meglio usare valori piccoli
AIDA64: FP32 Ray-Trace | FPU Julia | CPU SHA3 | CPU Queen | FPU SinJulia | FPU Mandel | CPU AES | CPU ZLib | FP64 Ray-Trace | CPU PhotoWorxx
| Performance rating | |
| Media della classe Multimedia | |
| Schenker XMG Fusion 15 (Mid 22) | |
| Asus VivoBook Pro 16 | |
| Dell Inspiron 16 Plus 7620 | |
| Media Intel Core i7-12700H | |
| Acer Swift X SFX16-52G-77RX | |
| AIDA64 / FP32 Ray-Trace | |
| Media della classe Multimedia (2214 - 50388, n=58, ultimi 2 anni) | |
| Asus VivoBook Pro 16 (v6.75.6100) | |
| Dell Inspiron 16 Plus 7620 (v6.70.6000) | |
| Schenker XMG Fusion 15 (Mid 22) (v6.70.6000) | |
| Media Intel Core i7-12700H (2585 - 17957, n=63) | |
| Acer Swift X SFX16-52G-77RX (v6.70.6000) | |
| AIDA64 / FPU Julia | |
| Media della classe Multimedia (12867 - 201874, n=59, ultimi 2 anni) | |
| Asus VivoBook Pro 16 (v6.75.6100) | |
| Dell Inspiron 16 Plus 7620 (v6.70.6000) | |
| Schenker XMG Fusion 15 (Mid 22) (v6.70.6000) | |
| Media Intel Core i7-12700H (12439 - 90760, n=63) | |
| Acer Swift X SFX16-52G-77RX (v6.70.6000) | |
| AIDA64 / CPU SHA3 | |
| Schenker XMG Fusion 15 (Mid 22) (v6.70.6000) | |
| Media della classe Multimedia (653 - 8623, n=59, ultimi 2 anni) | |
| Asus VivoBook Pro 16 (v6.75.6100) | |
| Media Intel Core i7-12700H (833 - 4242, n=63) | |
| Dell Inspiron 16 Plus 7620 (v6.70.6000) | |
| Acer Swift X SFX16-52G-77RX (v6.70.6000) | |
| AIDA64 / CPU Queen | |
| Asus VivoBook Pro 16 (v6.75.6100) | |
| Media Intel Core i7-12700H (57923 - 103202, n=63) | |
| Dell Inspiron 16 Plus 7620 (v6.70.6000) | |
| Schenker XMG Fusion 15 (Mid 22) | |
| Acer Swift X SFX16-52G-77RX (v6.70.6000) | |
| Media della classe Multimedia (13483 - 181505, n=59, ultimi 2 anni) | |
| AIDA64 / FPU SinJulia | |
| Media della classe Multimedia (1240 - 28794, n=59, ultimi 2 anni) | |
| Media Intel Core i7-12700H (3249 - 9939, n=63) | |
| Asus VivoBook Pro 16 (v6.75.6100) | |
| Schenker XMG Fusion 15 (Mid 22) (v6.70.6000) | |
| Dell Inspiron 16 Plus 7620 (v6.70.6000) | |
| Acer Swift X SFX16-52G-77RX (v6.70.6000) | |
| AIDA64 / FPU Mandel | |
| Media della classe Multimedia (6395 - 105740, n=58, ultimi 2 anni) | |
| Schenker XMG Fusion 15 (Mid 22) (v6.70.6000) | |
| Asus VivoBook Pro 16 (v6.75.6100) | |
| Dell Inspiron 16 Plus 7620 (v6.70.6000) | |
| Media Intel Core i7-12700H (7135 - 44760, n=63) | |
| Acer Swift X SFX16-52G-77RX (v6.70.6000) | |
| AIDA64 / CPU AES | |
| Schenker XMG Fusion 15 (Mid 22) (v6.70.6000) | |
| Media Intel Core i7-12700H (31839 - 144360, n=63) | |
| Media della classe Multimedia (13243 - 152179, n=59, ultimi 2 anni) | |
| Asus VivoBook Pro 16 (v6.75.6100) | |
| Dell Inspiron 16 Plus 7620 (v6.70.6000) | |
| Acer Swift X SFX16-52G-77RX (v6.70.6000) | |
| AIDA64 / CPU ZLib | |
| Media della classe Multimedia (167.2 - 2022, n=59, ultimi 2 anni) | |
| Dell Inspiron 16 Plus 7620 (v6.70.6000) | |
| Media Intel Core i7-12700H (305 - 1171, n=63) | |
| Asus VivoBook Pro 16 (v6.75.6100) | |
| Schenker XMG Fusion 15 (Mid 22) (v6.70.6000) | |
| Acer Swift X SFX16-52G-77RX (v6.70.6000) | |
| AIDA64 / FP64 Ray-Trace | |
| Media della classe Multimedia (1014 - 26875, n=59, ultimi 2 anni) | |
| Asus VivoBook Pro 16 (v6.75.6100) | |
| Schenker XMG Fusion 15 (Mid 22) (v6.70.6000) | |
| Dell Inspiron 16 Plus 7620 (v6.70.6000) | |
| Media Intel Core i7-12700H (1437 - 9692, n=63) | |
| Acer Swift X SFX16-52G-77RX (v6.70.6000) | |
| AIDA64 / CPU PhotoWorxx | |
| Media della classe Multimedia (12860 - 65787, n=59, ultimi 2 anni) | |
| Acer Swift X SFX16-52G-77RX (v6.70.6000) | |
| Dell Inspiron 16 Plus 7620 (v6.70.6000) | |
| Media Intel Core i7-12700H (12863 - 52207, n=63) | |
| Schenker XMG Fusion 15 (Mid 22) (v6.70.6000) | |
| Asus VivoBook Pro 16 (v6.75.6100) | |
Prestazioni del sistema
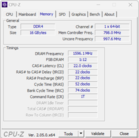
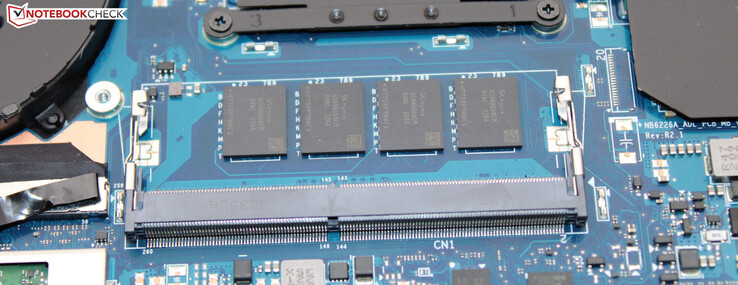
Il suo sistema fluido è in grado di gestire giochi, streaming e rendering. Una parte della sua potenza di elaborazione è inutilizzata, poiché la RAM (16 GB, DDR4-3200, onboard) funziona solo in modalità a canale singolo. L'installazione di un modulo di memoria (= modalità dual-channel attiva) risolverebbe il problema e aumenterebbe la velocità di trasmissione dei dati a livelli simili a quelli dei concorrenti con la stessa memoria.
CrossMark: Overall | Productivity | Creativity | Responsiveness
| PCMark 10 / Score | |
| Media della classe Multimedia (4325 - 10386, n=54, ultimi 2 anni) | |
| Dell Inspiron 16 Plus 7620 | |
| Media Intel Core i7-12700H, NVIDIA GeForce RTX 3050 Ti Laptop GPU (6623 - 7075, n=5) | |
| Asus VivoBook Pro 16 | |
| Schenker XMG Fusion 15 (Mid 22) | |
| Acer Swift X SFX16-52G-77RX | |
| PCMark 10 / Essentials | |
| Acer Swift X SFX16-52G-77RX | |
| Media della classe Multimedia (8025 - 11664, n=54, ultimi 2 anni) | |
| Media Intel Core i7-12700H, NVIDIA GeForce RTX 3050 Ti Laptop GPU (9540 - 10970, n=5) | |
| Dell Inspiron 16 Plus 7620 | |
| Schenker XMG Fusion 15 (Mid 22) | |
| Asus VivoBook Pro 16 | |
| PCMark 10 / Productivity | |
| Media della classe Multimedia (7323 - 18233, n=54, ultimi 2 anni) | |
| Dell Inspiron 16 Plus 7620 | |
| Media Intel Core i7-12700H, NVIDIA GeForce RTX 3050 Ti Laptop GPU (8530 - 9555, n=5) | |
| Asus VivoBook Pro 16 | |
| Schenker XMG Fusion 15 (Mid 22) | |
| Acer Swift X SFX16-52G-77RX | |
| PCMark 10 / Digital Content Creation | |
| Media della classe Multimedia (3651 - 16240, n=54, ultimi 2 anni) | |
| Dell Inspiron 16 Plus 7620 | |
| Asus VivoBook Pro 16 | |
| Media Intel Core i7-12700H, NVIDIA GeForce RTX 3050 Ti Laptop GPU (8855 - 9542, n=5) | |
| Acer Swift X SFX16-52G-77RX | |
| Schenker XMG Fusion 15 (Mid 22) | |
| CrossMark / Overall | |
| Media della classe Multimedia (866 - 2426, n=62, ultimi 2 anni) | |
| Dell Inspiron 16 Plus 7620 | |
| Acer Swift X SFX16-52G-77RX | |
| Media Intel Core i7-12700H, NVIDIA GeForce RTX 3050 Ti Laptop GPU (1654 - 1872, n=5) | |
| Asus VivoBook Pro 16 | |
| Schenker XMG Fusion 15 (Mid 22) | |
| CrossMark / Productivity | |
| Acer Swift X SFX16-52G-77RX | |
| Media della classe Multimedia (913 - 2344, n=62, ultimi 2 anni) | |
| Asus VivoBook Pro 16 | |
| Media Intel Core i7-12700H, NVIDIA GeForce RTX 3050 Ti Laptop GPU (1595 - 1792, n=5) | |
| Dell Inspiron 16 Plus 7620 | |
| Schenker XMG Fusion 15 (Mid 22) | |
| CrossMark / Creativity | |
| Media della classe Multimedia (907 - 2820, n=62, ultimi 2 anni) | |
| Dell Inspiron 16 Plus 7620 | |
| Media Intel Core i7-12700H, NVIDIA GeForce RTX 3050 Ti Laptop GPU (1699 - 1993, n=5) | |
| Acer Swift X SFX16-52G-77RX | |
| Asus VivoBook Pro 16 | |
| Schenker XMG Fusion 15 (Mid 22) | |
| CrossMark / Responsiveness | |
| Asus VivoBook Pro 16 | |
| Acer Swift X SFX16-52G-77RX | |
| Schenker XMG Fusion 15 (Mid 22) | |
| Media Intel Core i7-12700H, NVIDIA GeForce RTX 3050 Ti Laptop GPU (1383 - 1768, n=5) | |
| Dell Inspiron 16 Plus 7620 | |
| Media della classe Multimedia (605 - 2024, n=62, ultimi 2 anni) | |
| PCMark 8 Home Score Accelerated v2 | 4565 punti | |
| PCMark 8 Work Score Accelerated v2 | 5386 punti | |
| PCMark 10 Score | 6652 punti | |
Aiuto | ||
| AIDA64 / Memory Copy | |
| Media della classe Multimedia (21158 - 109252, n=59, ultimi 2 anni) | |
| Acer Swift X SFX16-52G-77RX | |
| Dell Inspiron 16 Plus 7620 | |
| Media Intel Core i7-12700H (25615 - 80511, n=63) | |
| Schenker XMG Fusion 15 (Mid 22) | |
| Asus VivoBook Pro 16 | |
| AIDA64 / Memory Read | |
| Media della classe Multimedia (19699 - 125604, n=59, ultimi 2 anni) | |
| Acer Swift X SFX16-52G-77RX | |
| Dell Inspiron 16 Plus 7620 | |
| Media Intel Core i7-12700H (25586 - 79442, n=63) | |
| Schenker XMG Fusion 15 (Mid 22) | |
| Asus VivoBook Pro 16 | |
| AIDA64 / Memory Write | |
| Media della classe Multimedia (17733 - 117933, n=59, ultimi 2 anni) | |
| Acer Swift X SFX16-52G-77RX | |
| Dell Inspiron 16 Plus 7620 | |
| Media Intel Core i7-12700H (23679 - 88660, n=63) | |
| Schenker XMG Fusion 15 (Mid 22) | |
| Asus VivoBook Pro 16 | |
| AIDA64 / Memory Latency | |
| Media della classe Multimedia (7 - 535, n=59, ultimi 2 anni) | |
| Acer Swift X SFX16-52G-77RX | |
| Dell Inspiron 16 Plus 7620 | |
| Schenker XMG Fusion 15 (Mid 22) | |
| Asus VivoBook Pro 16 | |
| Media Intel Core i7-12700H (76.2 - 133.9, n=61) | |
* ... Meglio usare valori piccoli
Latenza DPC
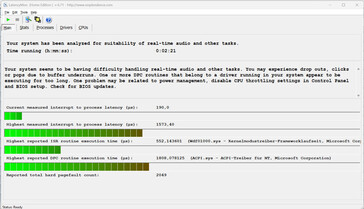
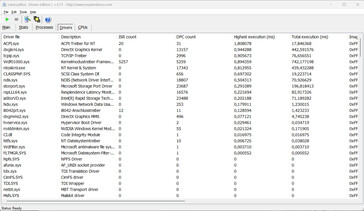
Il test standardizzato di monitoraggio della latenza (navigazione web, riproduzione video 4k, Prime95 ad alto carico) ha rivelato alcune anomalie. Il sistema non sembra essere adatto all'editing video e audio in tempo reale. I futuri aggiornamenti del software potrebbero portare a miglioramenti o addirittura a peggioramenti.
| DPC Latencies / LatencyMon - interrupt to process latency (max), Web, Youtube, Prime95 | |
| Schenker XMG Fusion 15 (Mid 22) | |
| Asus VivoBook Pro 16 | |
| Dell Inspiron 16 Plus 7620 | |
| Acer Swift X SFX16-52G-77RX | |
* ... Meglio usare valori piccoli
Dispositivi di archiviazione
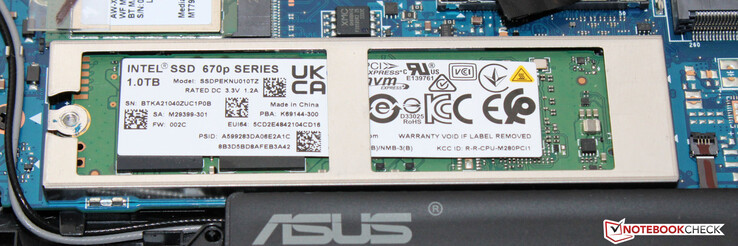
Asus ha dotato il notebook di un'unità SSD PCIe-3 (M.2-2280) di Intel, con una capacità di 1 TB. Offre una buona velocità di trasferimento dati, ma non può essere considerata un'unità SSD d'élite. Il computer offre spazio per un secondo SSD.
* ... Meglio usare valori piccoli
reading continuous performance: DiskSpd Read Loop, Queue Depth 8
Scheda grafica
I nostri benchmark e test di gioco hanno rivelato che la GeForce RTX 3050 Tilaptop GPU (TGP: 65 watt) è appena inferiore alla media della GPU ("modalità standard"). L'uso della "modalità prestazioni" ha portato a tassi superiori del 10-15% - secondo il test di Witcher 3, il TGP era esaurito. L'utilizzo della modalità dGPU (tramite l'applicazione MyAsus) non ha portato a nessun miglioramento delle prestazioni.
Il computer consente di giocare in FHD utilizzando impostazioni basse o alte e in HD utilizzando impostazioni basse o medie (modalità whisper). Quest'ultima ha abbassato il TGP a 25 watt, con conseguente riduzione delle emissioni acustiche.
| 3DMark 06 Standard Score | 45370 punti | |
| 3DMark 11 Performance | 16180 punti | |
| 3DMark Cloud Gate Standard Score | 45033 punti | |
| 3DMark Fire Strike Score | 11448 punti | |
| 3DMark Time Spy Score | 4969 punti | |
Aiuto | ||
| V-Ray Benchmark Next 4.10 | |
| GPU | |
| Schenker XMG Fusion 15 (Mid 22) (v4.10.07 ) | |
| Media della classe Multimedia (32 - 1191, n=58, ultimi 2 anni) | |
| Media NVIDIA GeForce RTX 3050 Ti Laptop GPU (171 - 216, n=22) | |
| Asus VivoBook Pro 16 (v4.10.07 ) | |
| Acer Swift X SFX16-52G-77RX (v4.10.07 ) | |
| CPU | |
| Media della classe Multimedia (4772 - 35165, n=58, ultimi 2 anni) | |
| Asus VivoBook Pro 16 (v4.10.07 ) | |
| Acer Swift X SFX16-52G-77RX (v4.10.07 ) | |
| Schenker XMG Fusion 15 (Mid 22) (v4.10.07 ) | |
| Media NVIDIA GeForce RTX 3050 Ti Laptop GPU (5796 - 16665, n=22) | |
* ... Meglio usare valori piccoli
| The Witcher 3 - 1920x1080 Ultra Graphics & Postprocessing (HBAO+) | |
| Schenker XMG Fusion 15 (Mid 22) | |
| Dell Inspiron 16 Plus 7620 | |
| Media della classe Multimedia (11 - 121, n=25, ultimi 2 anni) | |
| Media NVIDIA GeForce RTX 3050 Ti Laptop GPU (19 - 58.5, n=29) | |
| Asus VivoBook Pro 16 | |
| Acer Swift X SFX16-52G-77RX | |
| Final Fantasy XV Benchmark - 1920x1080 High Quality | |
| Schenker XMG Fusion 15 (Mid 22) (1.3) | |
| Dell Inspiron 16 Plus 7620 (1.3) | |
| Media della classe Multimedia (7.61 - 144.4, n=64, ultimi 2 anni) | |
| Media NVIDIA GeForce RTX 3050 Ti Laptop GPU (23.5 - 106, n=24) | |
| Asus VivoBook Pro 16 (1.3) | |
| Acer Swift X SFX16-52G-77RX (1.3) | |
| Strange Brigade - 1920x1080 ultra AA:ultra AF:16 | |
| Schenker XMG Fusion 15 (Mid 22) (1.47.22.14 D3D12) | |
| Dell Inspiron 16 Plus 7620 (1.47.22.14 D3D12) | |
| Media della classe Multimedia (13.3 - 303, n=64, ultimi 2 anni) | |
| Media NVIDIA GeForce RTX 3050 Ti Laptop GPU (34.8 - 101.3, n=25) | |
| Asus VivoBook Pro 16 (1.47.22.14 D3D12) | |
| Acer Swift X SFX16-52G-77RX (1.47.22.14 D3D12) | |
| Dota 2 Reborn - 1920x1080 ultra (3/3) best looking | |
| Dell Inspiron 16 Plus 7620 | |
| Schenker XMG Fusion 15 (Mid 22) | |
| Media NVIDIA GeForce RTX 3050 Ti Laptop GPU (67.3 - 145, n=27) | |
| Asus VivoBook Pro 16 | |
| Media della classe Multimedia (29 - 179.9, n=66, ultimi 2 anni) | |
| Acer Swift X SFX16-52G-77RX | |
Witcher 3 FPS diagram
| basso | medio | alto | ultra | QHD | |
|---|---|---|---|---|---|
| GTA V (2015) | 175.1 | 170.9 | 111.9 | 53.8 | 39 |
| The Witcher 3 (2015) | 218.5 | 150.8 | 87.6 | 47.1 | |
| Dota 2 Reborn (2015) | 134.6 | 118.9 | 108.5 | 101.6 | |
| Final Fantasy XV Benchmark (2018) | 112.7 | 65 | 46.2 | 32 | |
| X-Plane 11.11 (2018) | 125.4 | 110.2 | 90.5 | ||
| Strange Brigade (2018) | 241 | 121.2 | 98.3 | 84.5 | 61 |
| Doom Eternal (2020) | 188.1 | 120 | |||
| Flight Simulator 2020 (2020) | 99 | 52.1 | 38.4 | 26.4 | 19.6 |
| F1 22 (2022) | 127.5 | 115.3 | 73.1 | 24.3 | 17.4 |
| FIFA 23 (2022) | 78.2 | ||||
| Uncharted Legacy of Thieves Collection (2022) | 48.4 | 30.5 | 20.6 | 20 | 14.1 |
| Call of Duty Modern Warfare 2 2022 (2022) | 63 | 58 | 44 | 36 | |
| Spider-Man Miles Morales (2022) | 66.6 | 53.6 | 44.8 | 36.8 | 26.3 |
| The Callisto Protocol (2022) | 82.5 | 62.2 | 58.3 | 31.7 | 21.4 |
| Need for Speed Unbound (2022) | 73.9 | 62.6 | 35.5 | 27.9 | 15.6 |
| High On Life (2023) | 104.7 | 77.5 | 60.3 | 50.8 | 31.8 |
| The Witcher 3 v4 (2023) | 88.4 | 75.6 | 36.8 | 32.4 | 19.6 |
| Dead Space Remake (2023) | 37.2 | 35.1 | 28.2 | 24.6 | 9.81 |
| Hogwarts Legacy (2023) | 63.9 | 50 | 40.2 | 32.8 | 25 |
| Returnal (2023) | 52 | 50 | 45 | 34 | 27 |
| Atomic Heart (2023) | 94.3 | 71.4 | 41.6 | 32.3 | 24.5 |
| Company of Heroes 3 (2023) | 106.2 | 91.1 | 68.4 | 68.5 | 48.8 |
| Sons of the Forest (2023) | 54.9 | 38.8 | 35.4 | 33.3 | 25.6 |
| Resident Evil 4 Remake (2023) | 74.6 | 47.4 | 41 | 8.97 | 7.82 |
| The Last of Us (2023) | 44.9 | 32.9 | 25.6 | ||
| Dead Island 2 (2023) | 95.7 | 75.7 | 64.1 | 58 | 45.9 |
| Star Wars Jedi Survivor (2023) | 36.9 | 31 | 28.9 | 25.8 | 15.4 |
Emissioni e potenza - Il computer Asus è rumoroso
Emissioni acustiche
Sia in modalità idle che nell'uso quotidiano (ufficio, internet), il portatile funziona generalmente in modo silenzioso, a volte addirittura in silenzio. A pieno carico, abbiamo misurato emissioni acustiche fino a 61,5 dB(A) ("modalità prestazioni") - decisamente troppo elevate. L'utilizzo della "modalità standard" ha portato a un rapporto più equilibrato tra rumore e prestazioni, anche se il dissipatore ha fatto un bel po' di rumore.
la modalità "Whisper" sarà probabilmente la prima scelta della maggior parte degli utenti: fa esattamente quello che dice l'etichetta. Le ventole funzionano a bassa velocità anche sotto carico e sono appena percettibili, a scapito della potenza di elaborazione. È ancora possibile giocare, ma solo in HD.
Rumorosità
| Idle |
| 25.2 / 25.2 / 25.2 dB(A) |
| Sotto carico |
| 55.1 / 61.5 dB(A) |
 | ||
30 dB silenzioso 40 dB(A) udibile 50 dB(A) rumoroso |
||
min: | ||
| Asus VivoBook Pro 16 GeForce RTX 3050 Ti Laptop GPU, i7-12700H, Intel SSD 670p SSDPEKNU010TZ | Dell Inspiron 16 Plus 7620 GeForce RTX 3050 Ti Laptop GPU, i7-12700H, Kioxia BG5 KBG50ZNS512G | Schenker XMG Fusion 15 (Mid 22) GeForce RTX 3070 Laptop GPU, i7-11800H, Samsung SSD 980 Pro 1TB MZ-V8P1T0BW | Acer Swift X SFX16-52G-77RX A370M, i7-1260P, WDC PC SN810 1TB | |
|---|---|---|---|---|
| Noise | 3% | 0% | 8% | |
| off /ambiente * (dB) | 25.2 | 23.3 8% | 26 -3% | 25 1% |
| Idle Minimum * (dB) | 25.2 | 25.7 -2% | 26 -3% | 25 1% |
| Idle Average * (dB) | 25.2 | 26.1 -4% | 28 -11% | 25 1% |
| Idle Maximum * (dB) | 25.2 | 30.6 -21% | 31 -23% | 25 1% |
| Load Average * (dB) | 55.1 | 46.2 16% | 45 18% | 44.7 19% |
| Load Maximum * (dB) | 61.5 | 49.4 20% | 48 22% | 45.6 26% |
| Witcher 3 ultra * (dB) | 49.2 | 46 |
* ... Meglio usare valori piccoli
Temperatura
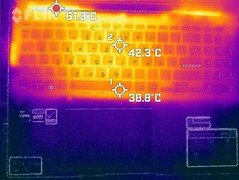
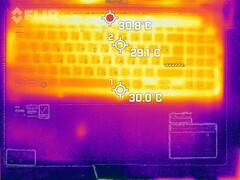
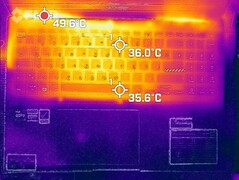
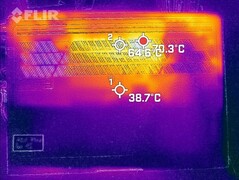
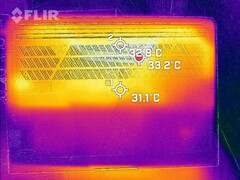
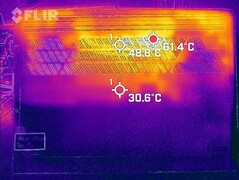
Sotto carico, il portatile ha raggiunto temperature piuttosto elevate, ma in media le temperature hanno raggiunto livelli moderati. Ciò significa che abbiamo misurato un massimo di 55,5 °C durante il nostro stress test. Nell'uso quotidiano, tuttavia, le temperature rientrano generalmente in un intervallo accettabile.
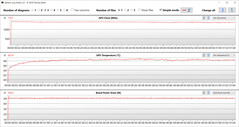
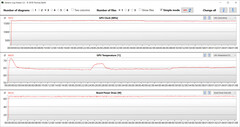
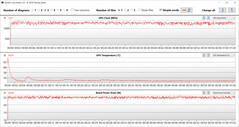
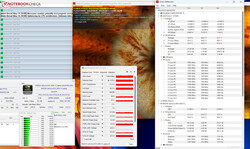
Lo stress test (Prime95 e Furmark in uso continuo) simula uno scenario estremo per verificare la stabilità del sistema a pieno carico. La CPU ha iniziato lo stress test con frequenze di clock medie (P: 3,2 - 3,3 GHz; E: 2,7 GHz) e il core grafico aveva una frequenza di 1,1 - 1,4 GHz. Mentre le velocità della CPU sono scese nel corso del test, le velocità di clock della GPU sono aumentate leggermente.
(±) La temperatura massima sul lato superiore è di 44.2 °C / 112 F, rispetto alla media di 36.9 °C / 98 F, che varia da 21.1 a 71 °C per questa classe Multimedia.
(-) Il lato inferiore si riscalda fino ad un massimo di 53 °C / 127 F, rispetto alla media di 39.2 °C / 103 F
(+) In idle, la temperatura media del lato superiore è di 27.9 °C / 82 F, rispetto alla media deld ispositivo di 31.3 °C / 88 F.
(±) Riproducendo The Witcher 3, la temperatura media per il lato superiore e' di 33.3 °C / 92 F, rispetto alla media del dispositivo di 31.3 °C / 88 F.
(+) I poggiapolsi e il touchpad sono piu' freddi della temperatura della pelle con un massimo di 23.7 °C / 74.7 F e sono quindi freddi al tatto.
(+) La temperatura media della zona del palmo della mano di dispositivi simili e'stata di 28.7 °C / 83.7 F (+5 °C / 9 F).
| Asus VivoBook Pro 16 Intel Core i7-12700H, NVIDIA GeForce RTX 3050 Ti Laptop GPU | Dell Inspiron 16 Plus 7620 Intel Core i7-12700H, NVIDIA GeForce RTX 3050 Ti Laptop GPU | Schenker XMG Fusion 15 (Mid 22) Intel Core i7-11800H, NVIDIA GeForce RTX 3070 Laptop GPU | Acer Swift X SFX16-52G-77RX Intel Core i7-1260P, Intel Arc A370M | |
|---|---|---|---|---|
| Heat | 10% | -13% | 3% | |
| Maximum Upper Side * (°C) | 44.2 | 46 -4% | 52 -18% | 49.4 -12% |
| Maximum Bottom * (°C) | 53 | 45.8 14% | 63 -19% | 55.5 -5% |
| Idle Upper Side * (°C) | 32.1 | 29.2 9% | 37 -15% | 28.4 12% |
| Idle Bottom * (°C) | 38.4 | 31 19% | 38 1% | 32.6 15% |
* ... Meglio usare valori piccoli
Altoparlanti
Gli altoparlanti stereo producono un suono decente, ma i bassi sono quasi inesistenti.
Asus VivoBook Pro 16 analisi audio
(+) | gli altoparlanti sono relativamente potenti (88.5 dB)
Bassi 100 - 315 Hz
(-) | quasi nessun basso - in media 20.8% inferiori alla media
(±) | la linearità dei bassi è media (12.8% delta rispetto alla precedente frequenza)
Medi 400 - 2000 Hz
(+) | medi bilanciati - solo only 2.2% rispetto alla media
(+) | medi lineari (4.7% delta rispetto alla precedente frequenza)
Alti 2 - 16 kHz
(±) | alti elevati - circa 7.4% superiori alla media
(+) | alti lineari (5.9% delta rispetto alla precedente frequenza)
Nel complesso 100 - 16.000 Hz
(±) | la linearità complessiva del suono è media (16.2% di differenza rispetto alla media
Rispetto alla stessa classe
» 39% di tutti i dispositivi testati in questa classe è stato migliore, 8% simile, 53% peggiore
» Il migliore ha avuto un delta di 5%, medio di 17%, peggiore di 45%
Rispetto a tutti i dispositivi testati
» 25% di tutti i dispositivi testati in questa classe è stato migliore, 5% similare, 69% peggiore
» Il migliore ha avuto un delta di 4%, medio di 24%, peggiore di 134%
Dell Inspiron 16 Plus 7620 analisi audio
(+) | gli altoparlanti sono relativamente potenti (87.8 dB)
Bassi 100 - 315 Hz
(-) | quasi nessun basso - in media 22.2% inferiori alla media
(±) | la linearità dei bassi è media (9.7% delta rispetto alla precedente frequenza)
Medi 400 - 2000 Hz
(+) | medi bilanciati - solo only 3.3% rispetto alla media
(+) | medi lineari (5.3% delta rispetto alla precedente frequenza)
Alti 2 - 16 kHz
(+) | Alti bilanciati - appena 2.5% dalla media
(+) | alti lineari (4.7% delta rispetto alla precedente frequenza)
Nel complesso 100 - 16.000 Hz
(+) | suono nel complesso lineare (13.4% differenza dalla media)
Rispetto alla stessa classe
» 25% di tutti i dispositivi testati in questa classe è stato migliore, 5% simile, 70% peggiore
» Il migliore ha avuto un delta di 5%, medio di 17%, peggiore di 45%
Rispetto a tutti i dispositivi testati
» 13% di tutti i dispositivi testati in questa classe è stato migliore, 4% similare, 83% peggiore
» Il migliore ha avuto un delta di 4%, medio di 24%, peggiore di 134%
Consumo di energia
Il portatile non ha mostrato alcun consumo energetico significativo. I valori misurati sono nella norma per l'hardware installato. Il test di Witcher 3 è stato eseguito con un consumo energetico costante. L'alimentatore (150 watt) è sufficientemente dimensionato.
| Off / Standby | |
| Idle | |
| Sotto carico |
|
Leggenda:
min: | |
| Asus VivoBook Pro 16 i7-12700H, GeForce RTX 3050 Ti Laptop GPU, Intel SSD 670p SSDPEKNU010TZ, IPS, 2560x1600, 16" | Dell Inspiron 16 Plus 7620 i7-12700H, GeForce RTX 3050 Ti Laptop GPU, Kioxia BG5 KBG50ZNS512G, IPS, 3072x1920, 16" | Schenker XMG Fusion 15 (Mid 22) i7-11800H, GeForce RTX 3070 Laptop GPU, Samsung SSD 980 Pro 1TB MZ-V8P1T0BW, IPS, 2560x1440, 15.6" | Acer Swift X SFX16-52G-77RX i7-1260P, A370M, WDC PC SN810 1TB, IPS-LED, 2560x1600, 16" | Media NVIDIA GeForce RTX 3050 Ti Laptop GPU | Media della classe Multimedia | |
|---|---|---|---|---|---|---|
| Power Consumption | 12% | -26% | 42% | 10% | 30% | |
| Idle Minimum * (Watt) | 8.7 | 6.8 22% | 12 -38% | 3.7 57% | 8.2 ? 6% | 6.09 ? 30% |
| Idle Average * (Watt) | 13.1 | 9.6 27% | 17 -30% | 7.6 42% | 12.6 ? 4% | 10.6 ? 19% |
| Idle Maximum * (Watt) | 18.3 | 17 7% | 24 -31% | 11.1 39% | 17.2 ? 6% | 12.6 ? 31% |
| Load Average * (Watt) | 116 | 117.5 -1% | 106 9% | 70 40% | 92 ? 21% | 69.2 ? 40% |
| Witcher 3 ultra * (Watt) | 117.6 | 113.1 4% | 159.9 -36% | 68.8 41% | ||
| Load Maximum * (Watt) | 162 | 137.4 15% | 208 -28% | 108 33% | 139.1 ? 14% | 115.8 ? 29% |
* ... Meglio usare valori piccoli
power consumption Witcher 3 / stress test
Power consumption with external monitor
Durata della batteria
Pro
Contro
Verdetto - Un dispositivo multimediale tuttofare con uno schermo impressionante
Editing video e fotografico, streaming, rendering e giochi: Sono tutti punti di forza del VivoBook Pro 16. Il suoCore 7-12700HeGeForce RTX 3050 Ti Laptopforniscono tutta la potenza necessaria: entrambi i componenti funzionano costantemente con velocità di clock elevate. Tuttavia, non viene sfruttato appieno il suo potenziale, poiché la RAM funziona solo in modalità a canale singolo.
Il VivoBook Pro 16 di Asus è un portatile adatto ai giocatori e ai creatori che non danno troppa importanza all'hardware più recente.
Il portatile si riscalda solo un po' sotto carico, ma può diventare molto rumoroso, persino troppo. Un aspetto positivo: Il dispositivo offre una modalità whisper che consente di ridurre le emissioni sonore prodotte dal portatile a scapito delle prestazioni, consentendo almeno di lavorare in modo più rilassato.
La struttura compatta, il peso relativamente ridotto (1,9 kg) e i tempi di autonomia decenti (WLAN: 7:15 ore) rendono il VivoBook un dispositivo abbastanza mobile. Un aspetto positivo: La batteria può essere ricaricata con un alimentatore USB-C (min. 65 watt, 20 V) - entrambe le porte USB-C supportano l'alimentazione. Non è necessario continuare a utilizzare l'alimentatore proprietario in dotazione.
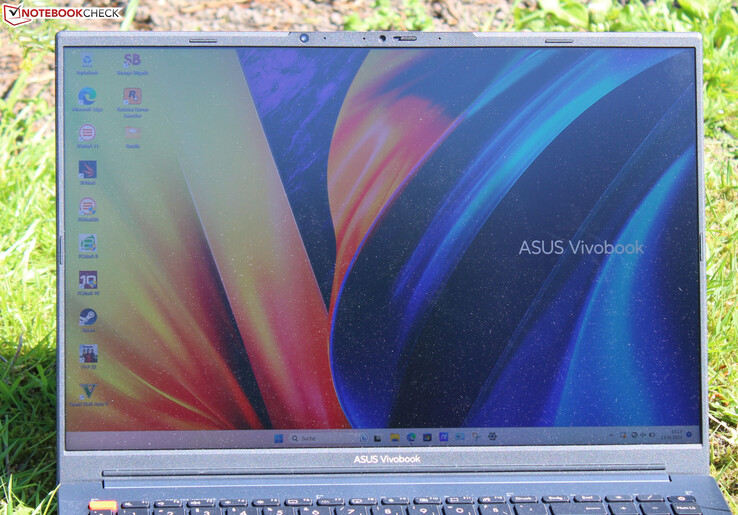
Il nostro esemplare di prova non dispone di uno schermo OLED, ma è generalmente disponibile all'interno della serie VivoBook Pro 16. Non dovrebbe mancare: Lo schermo IPS installato (16 pollici, 2.560 x 1.600 pixel) in formato 16:10 convince per la luminosità, il buon contrasto, gli angoli di visione stabili, i tempi di reazione brevi, l'ottima rappresentazione dei colori e l'eccellente copertura dello spazio colore.
in alternativa, si può dare un'occhiata al modelloDell Inspiron 16 Plus 7620: A parità di prestazioni, offre tempi di esecuzione notevolmente migliori. Un'alternativa economica è il modelloAcer Swift X 16che offre prestazioni grafiche inferiori, ma tempi di esecuzione molto buoni e un prezzo di circa 1.000 dollari.
Prezzo e disponibilità
La versione dell'Asus VivoBook Pro 16 che abbiamo testato può essere acquistata su Amazon per 1.247 dollari.
Asus VivoBook Pro 16
- 05/22/2023 v7 (old)
Sascha Mölck
Transparency
La selezione dei dispositivi da recensire viene effettuata dalla nostra redazione. Il campione di prova è stato fornito all'autore come prestito dal produttore o dal rivenditore ai fini di questa recensione. L'istituto di credito non ha avuto alcuna influenza su questa recensione, né il produttore ne ha ricevuto una copia prima della pubblicazione. Non vi era alcun obbligo di pubblicare questa recensione. In quanto società mediatica indipendente, Notebookcheck non è soggetta all'autorità di produttori, rivenditori o editori.
Ecco come Notebookcheck esegue i test
Ogni anno, Notebookcheck esamina in modo indipendente centinaia di laptop e smartphone utilizzando procedure standardizzate per garantire che tutti i risultati siano comparabili. Da circa 20 anni sviluppiamo continuamente i nostri metodi di prova e nel frattempo stabiliamo gli standard di settore. Nei nostri laboratori di prova, tecnici ed editori esperti utilizzano apparecchiature di misurazione di alta qualità. Questi test comportano un processo di validazione in più fasi. Il nostro complesso sistema di valutazione si basa su centinaia di misurazioni e parametri di riferimento ben fondati, che mantengono l'obiettività.

