Recensione del laptop Dell Inspiron 16 Plus 7630: 60 W GeForce RTX 4060 non è poi così male

Il Dell Inspiron 16 Plus 7630 del 2023 succede al 2022 Inspiron 16 Plus 7620 dell'anno scorso con interni ed esterni aggiornati, nonostante il modello 2022 fosse già una riprogettazione completa del 2021 Inspiron 16 Plus 7610. È raro vedere una serie sottoposta a tre importanti riprogettazioni per tre anni di fila, dato che i produttori più comunemente rivedono l'esterno solo una volta ogni pochi anni. Come altri portatili multimediali del 2023, l'Inspiron 16 Plus 7630 integra CPU Intel Raptor Lake-H di 13a generazione e GPU Nvidia Ada Lovelace.
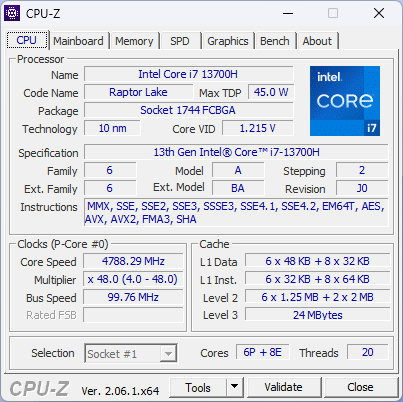
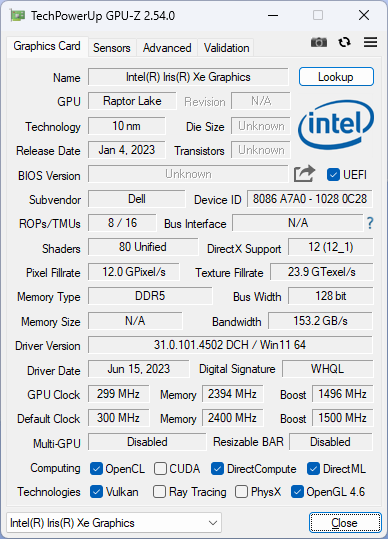
La nostra unità di recensione è una configurazione di fascia alta con CPU Core i7-13700H, GPU GeForce RTX 4060 e display IPS da 2560 x 1600 120 Hz al prezzo di circa 1250 dollari. Sono in preparazione SKU inferiori con Core i5-13500H, iris Xe integrato, RTX 3050, RTX 4050 o display 1200p 60 Hz. Sono previste anche varianti AMD con Ryzen 5 7640HS e Ryzen 7 7840HS con il nome di modello Inspiron 16 Plus 7635.
Le alternative all'Inspiron 16 Plus 7630 includono altri portatili multimediali da 16 pollici come Lenovo Slim Pro 9i 16, Asus VivoBook Pro 16X, HP Envy 16, o MSI Summit E16 Flip. L'Inspiron 16 Plus 7630 non deve essere confuso con l'Inspiron 16 standard, più lento, o con l'Inspiron 16 Plus 7630 2-in-1 che hanno specifiche e caratteristiche molto diverse.
Potenziali concorrenti a confronto
Punteggio | Data | Modello | Peso | Altezza | Dimensione | Risoluzione | Prezzo |
|---|---|---|---|---|---|---|---|
| 87.1 % v7 (old) | 08/2023 | Dell Inspiron 16 Plus 7630 i7-13700H, GeForce RTX 4060 Laptop GPU | 2.2 kg | 19.95 mm | 16.00" | 2560x1600 | |
| 87.4 % v7 (old) | 08/2022 | Dell Inspiron 16 Plus 7620 i7-12700H, GeForce RTX 3050 Ti Laptop GPU | 2.1 kg | 18.99 mm | 16.00" | 3072x1920 | |
| 88 % v7 (old) | 08/2023 | Lenovo Slim Pro 9i 16IRP8 i9-13905H, GeForce RTX 4050 Laptop GPU | 2.2 kg | 18.2 mm | 16.00" | 3200x2000 | |
| 86.2 % v7 (old) | 07/2023 | Asus Vivobook Pro 16X K6604JV-MX016W i9-13980HX, GeForce RTX 4060 Laptop GPU | 2.1 kg | 22.8 mm | 16.00" | 3200x2000 | |
| 86.9 % v7 (old) | 09/2022 | HP Envy 16 h0112nr i7-12700H, GeForce RTX 3060 Laptop GPU | 2.3 kg | 19.8 mm | 16.00" | 3840x2400 | |
| 84.2 % v7 (old) | 10/2022 | MSI Summit E16 Flip A12UDT-031 i7-1280P, GeForce RTX 3050 Ti Laptop GPU | 1.9 kg | 16.85 mm | 16.00" | 2560x1600 |
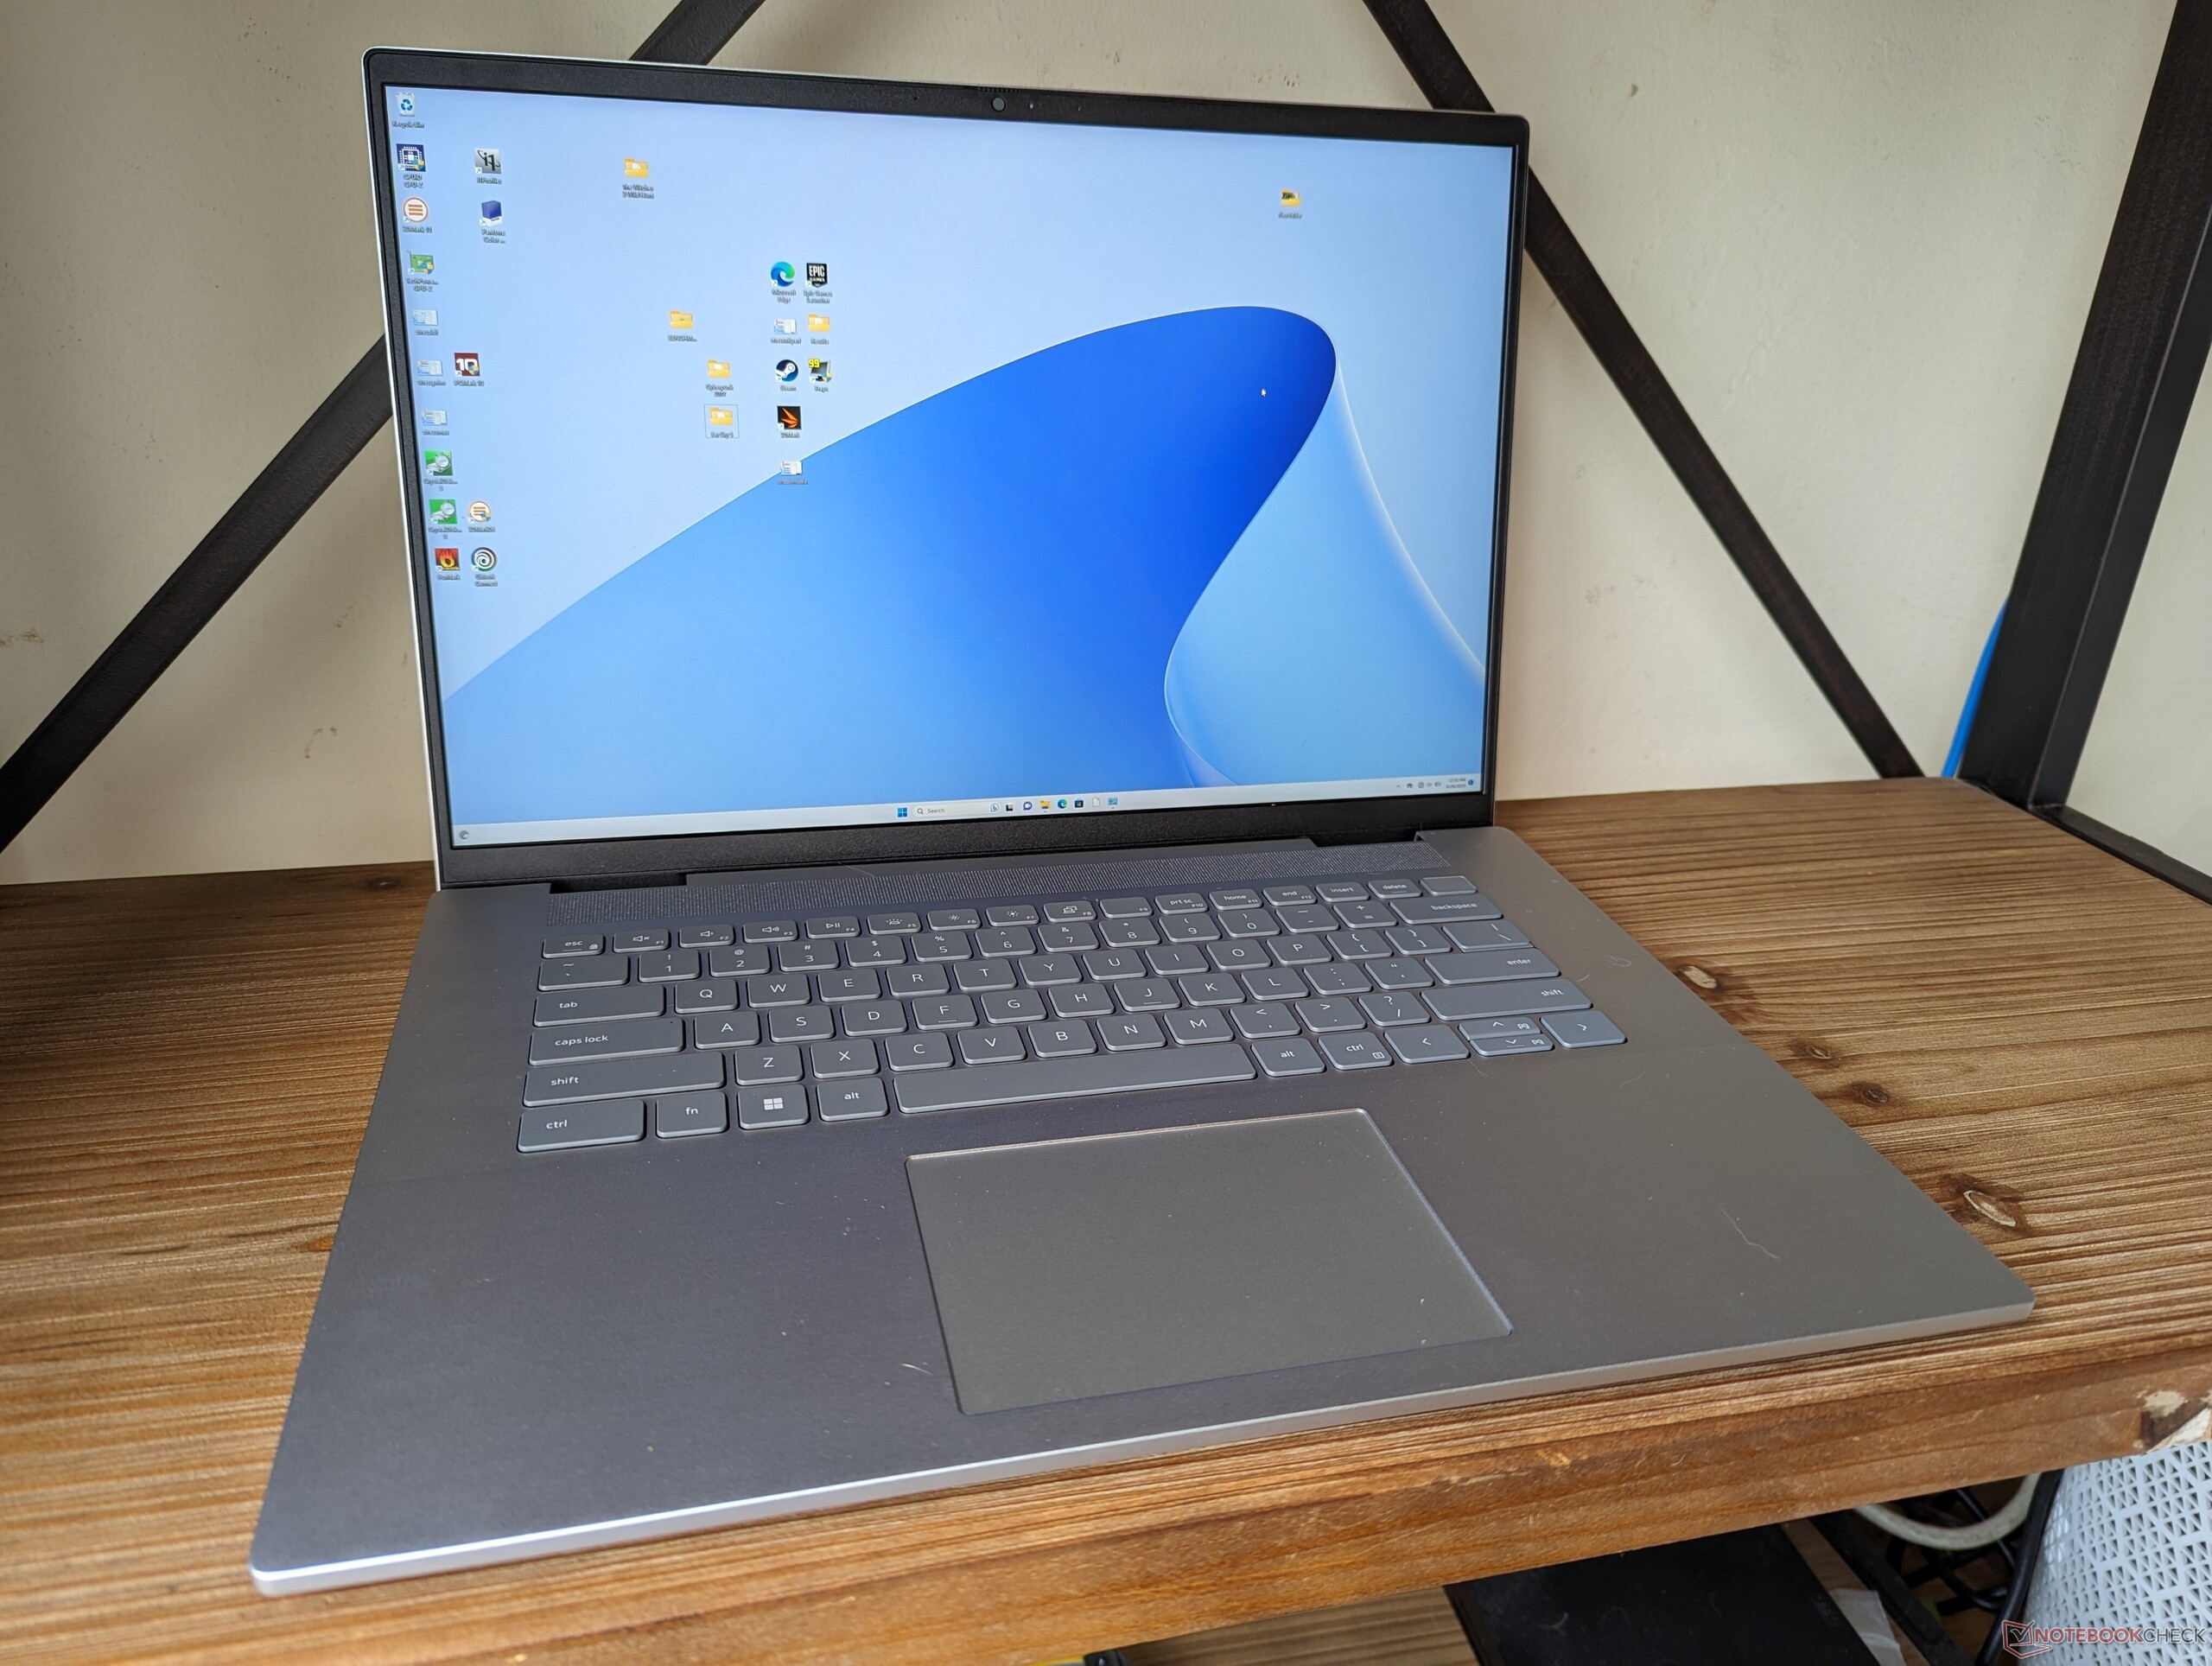
Caso - Mantenere la semplicità
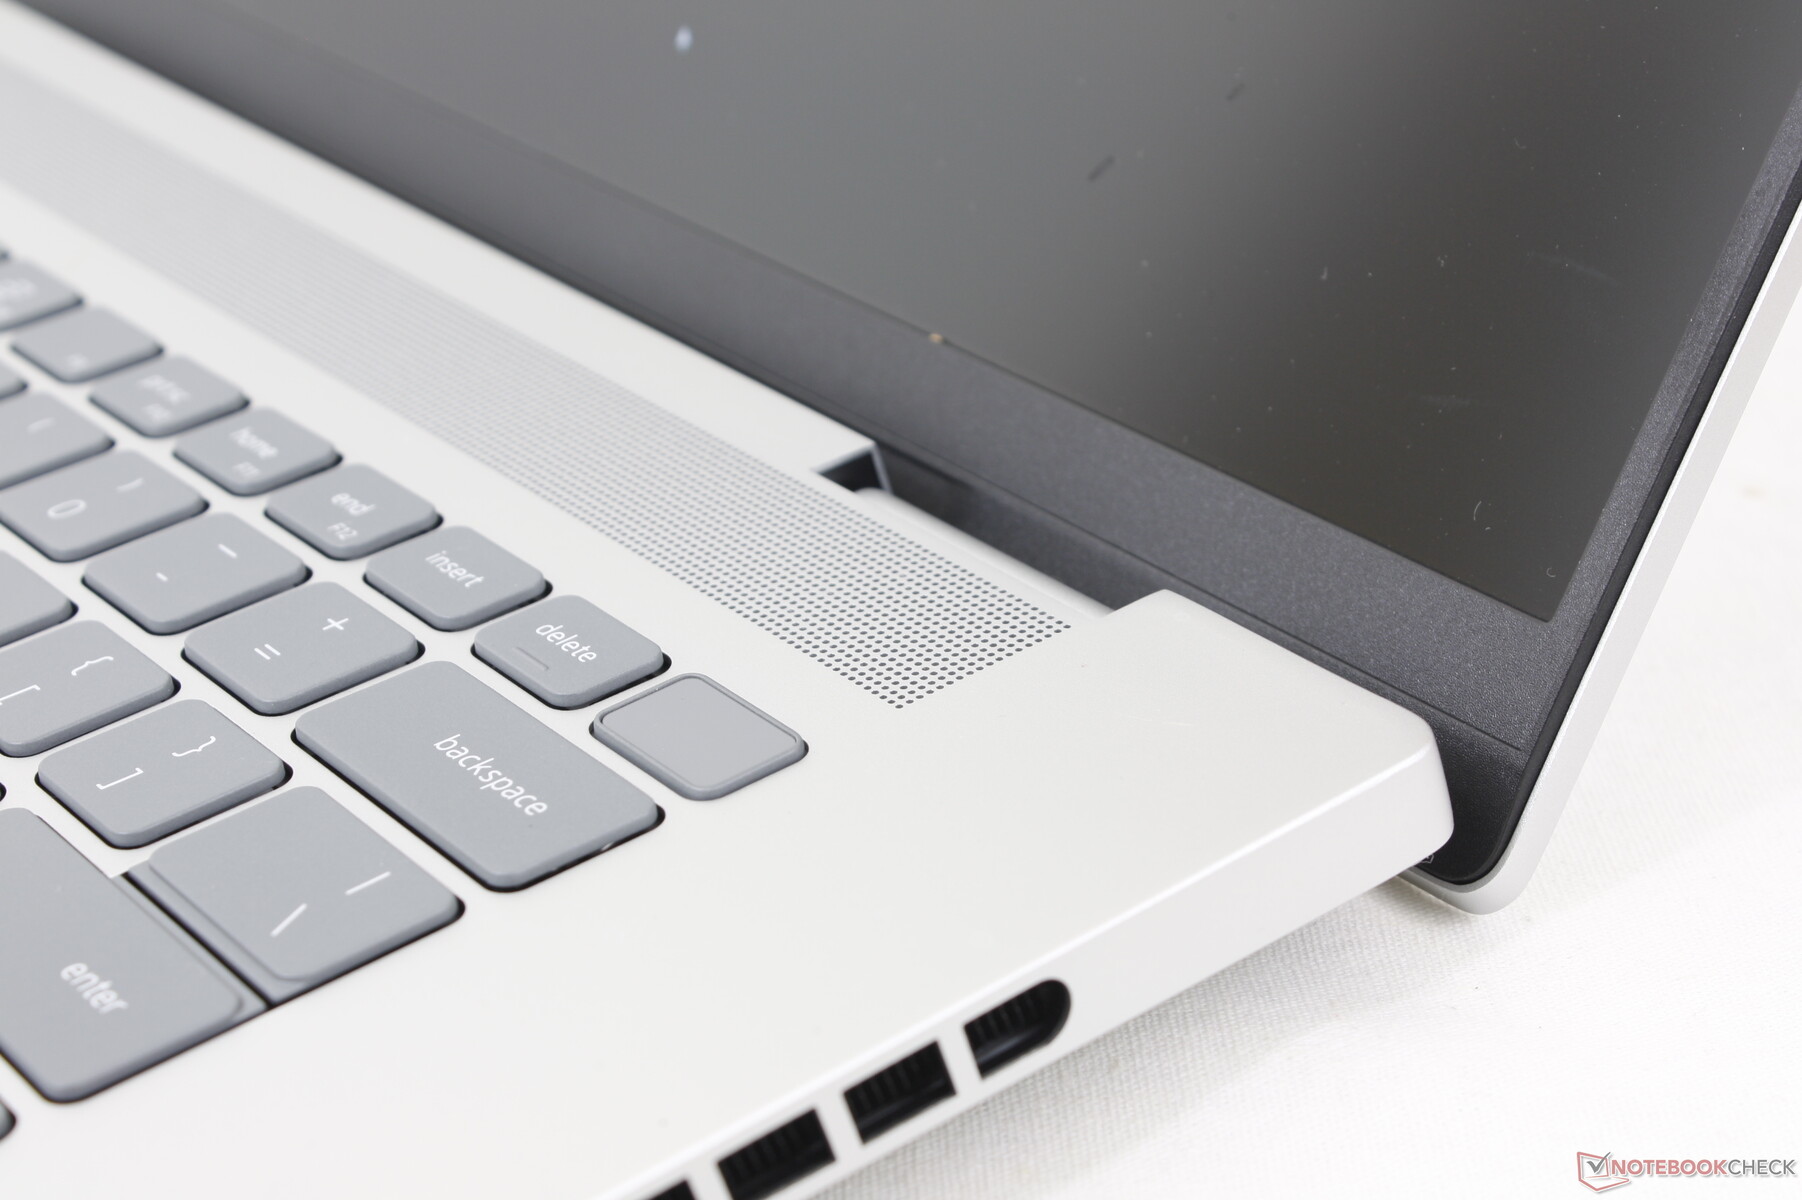
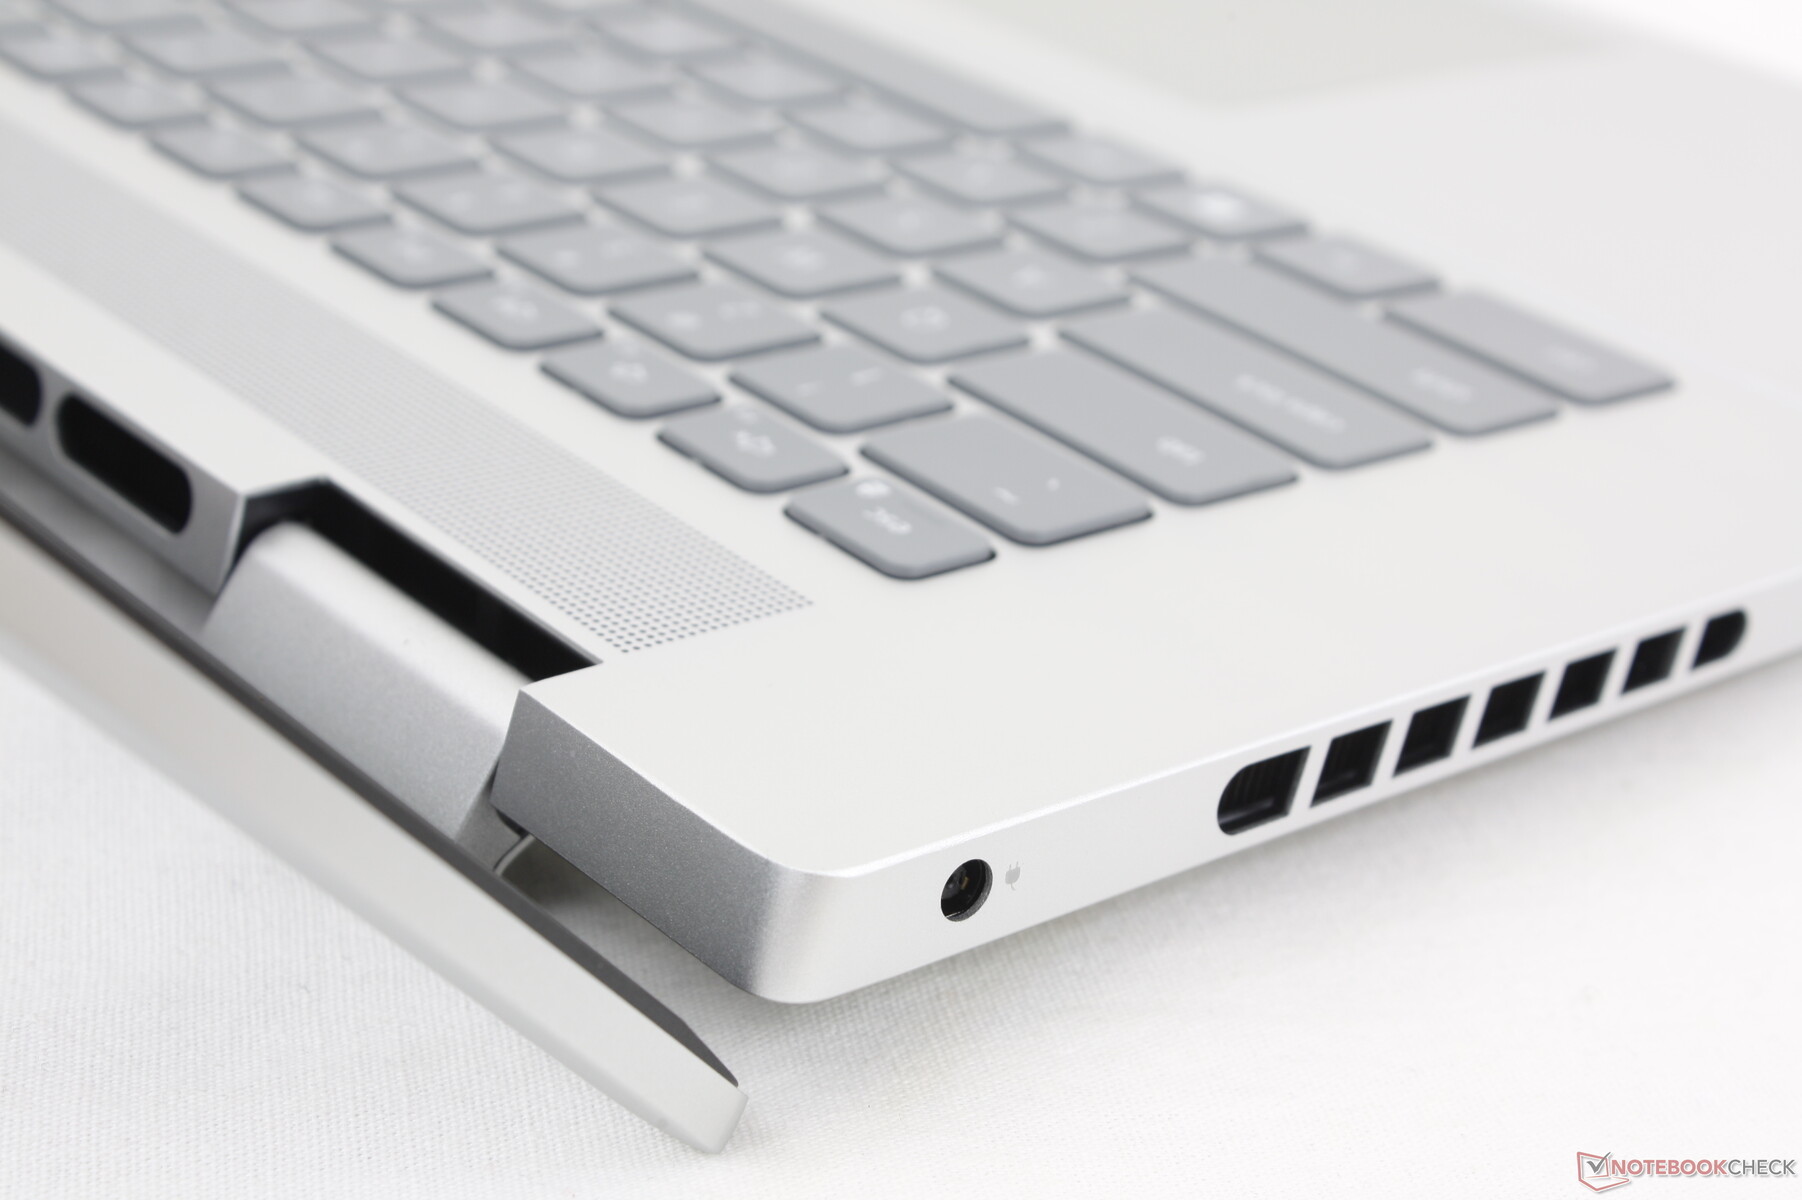
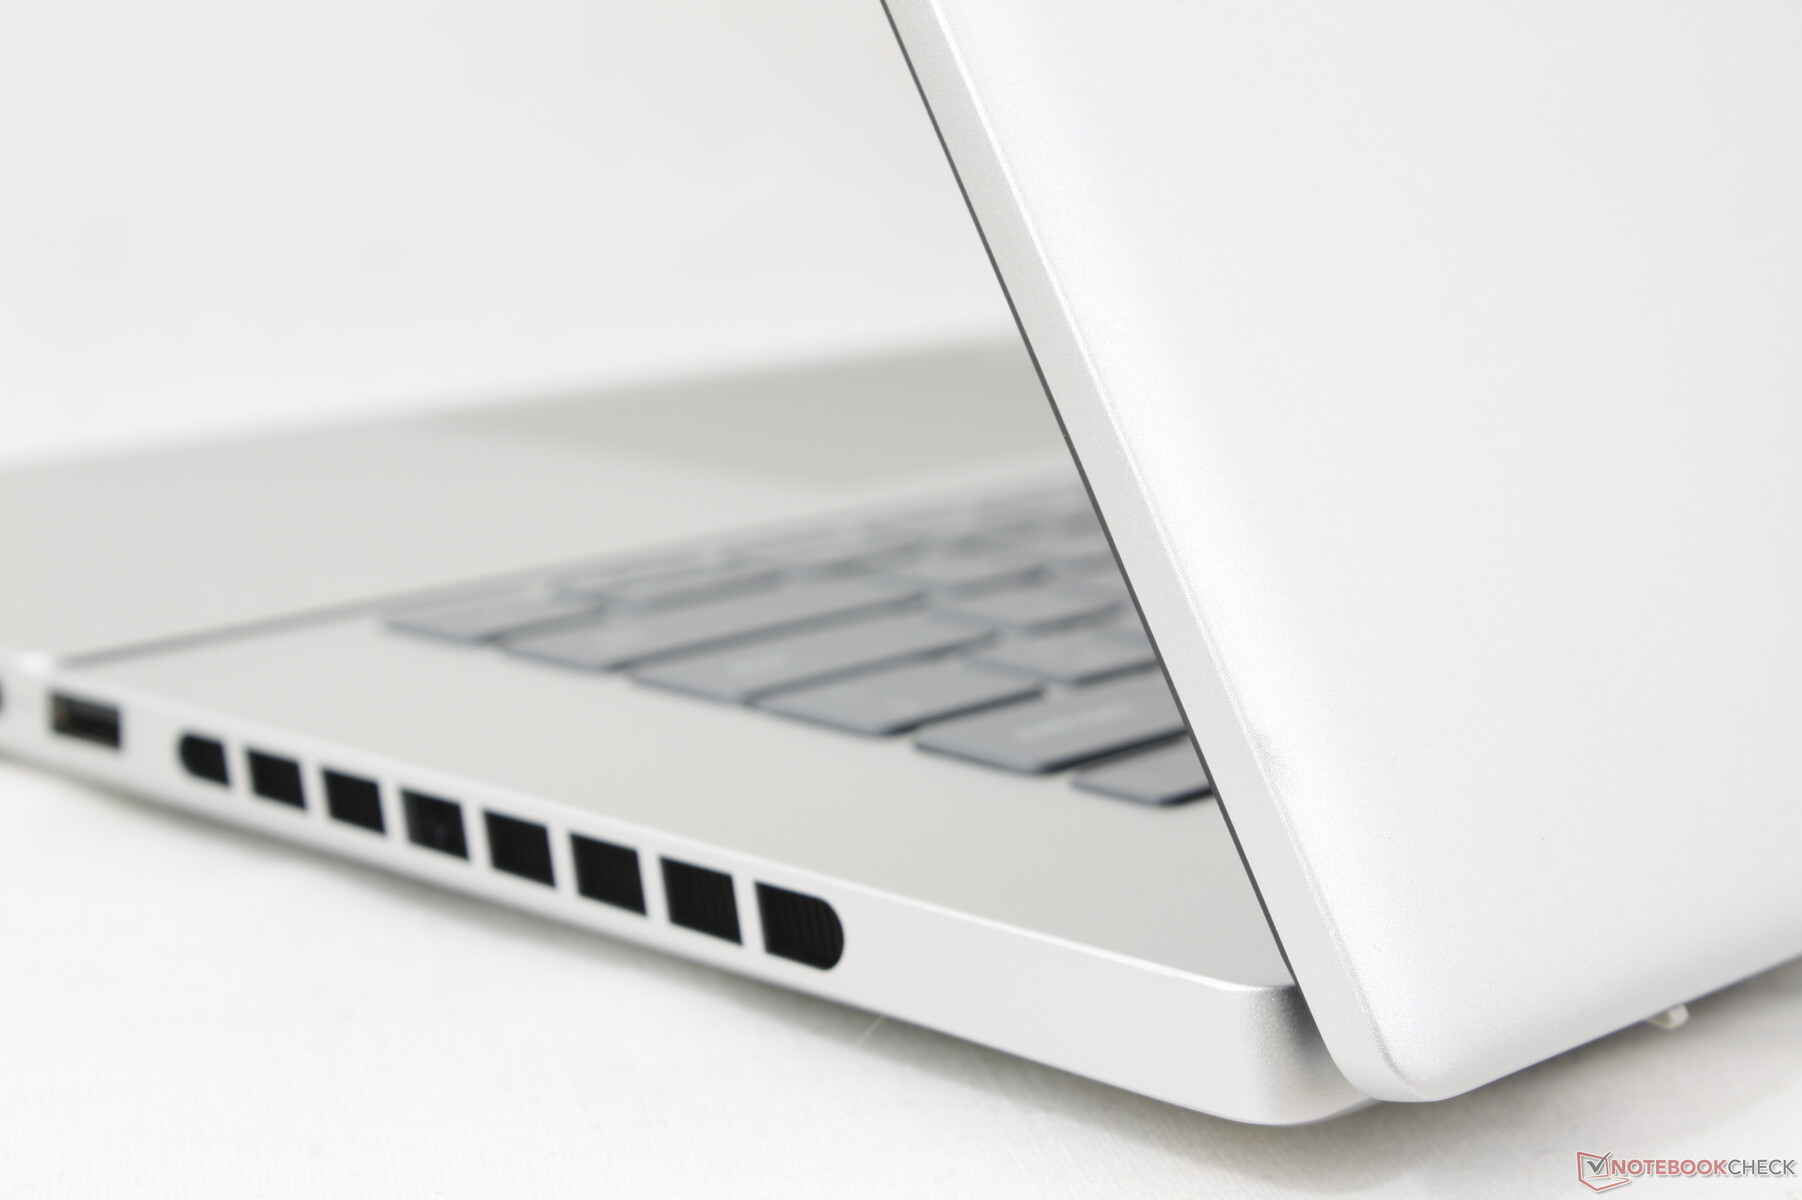
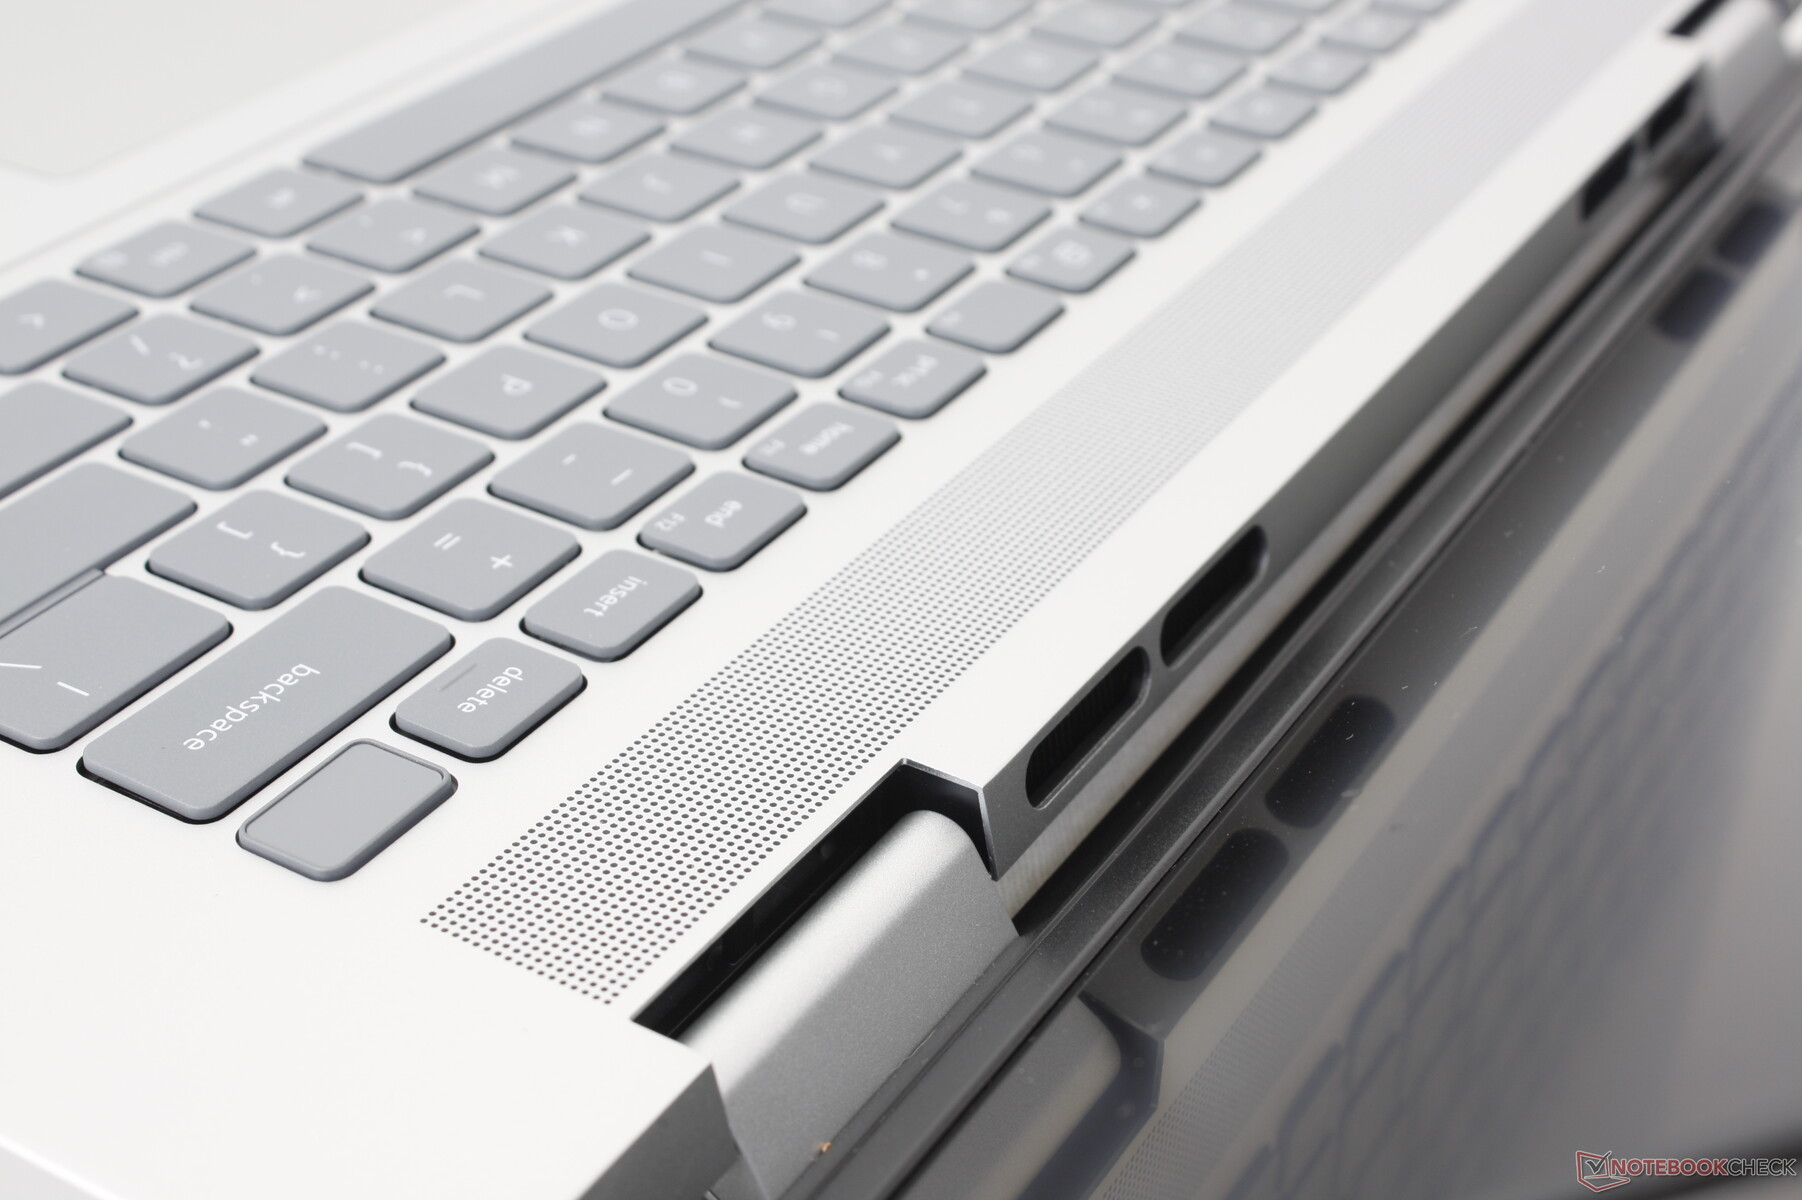
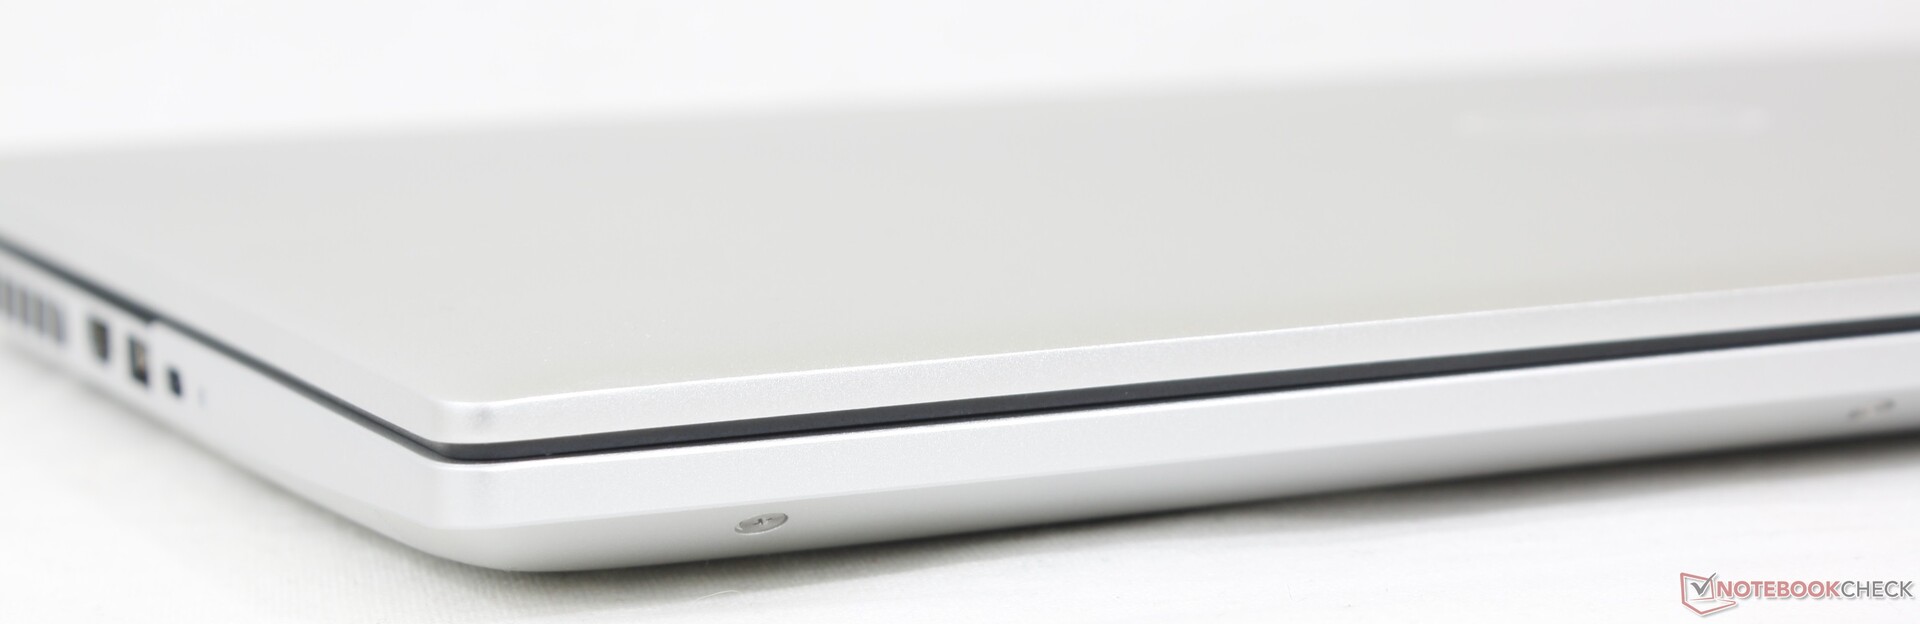
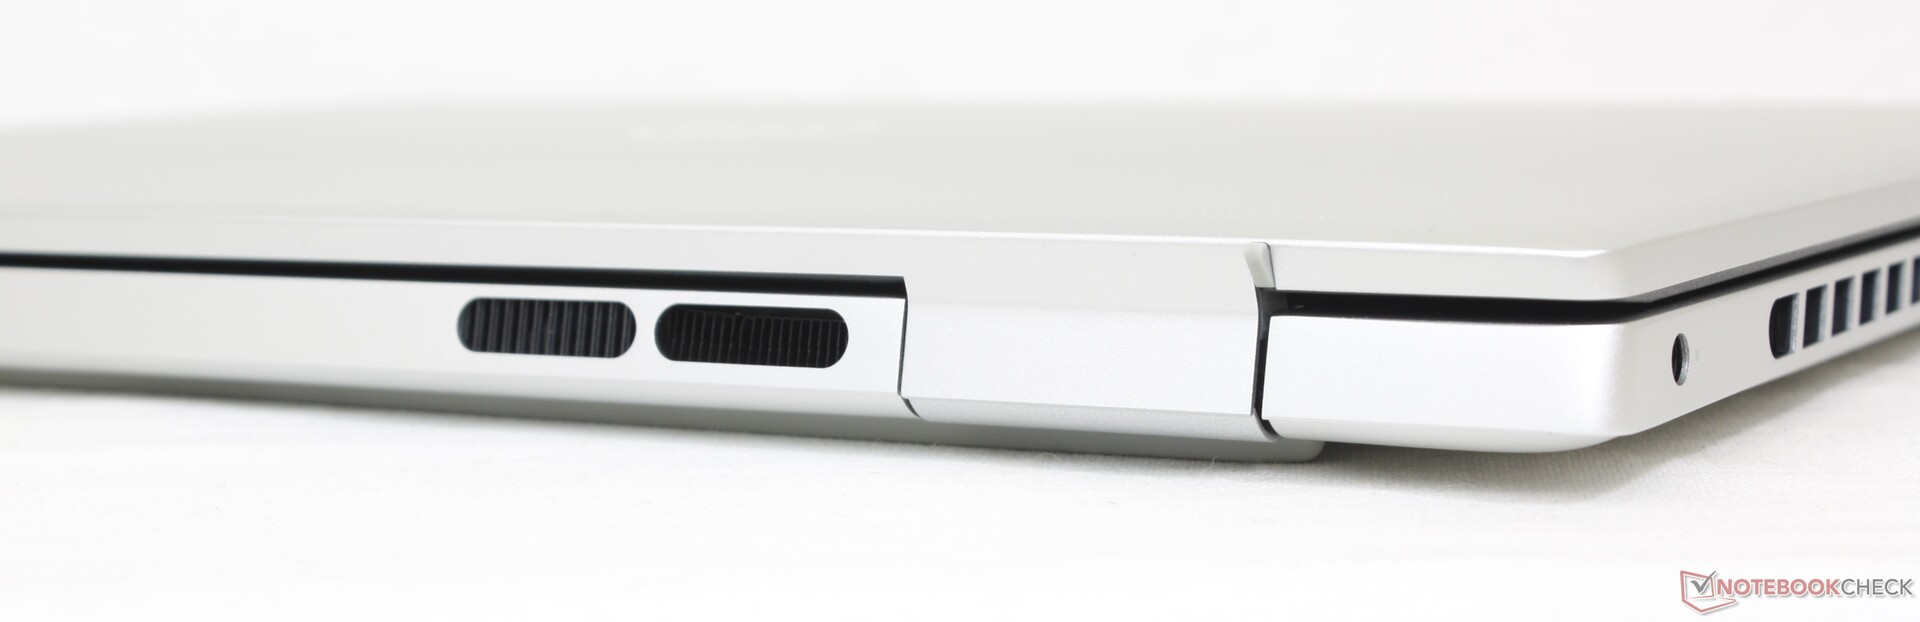
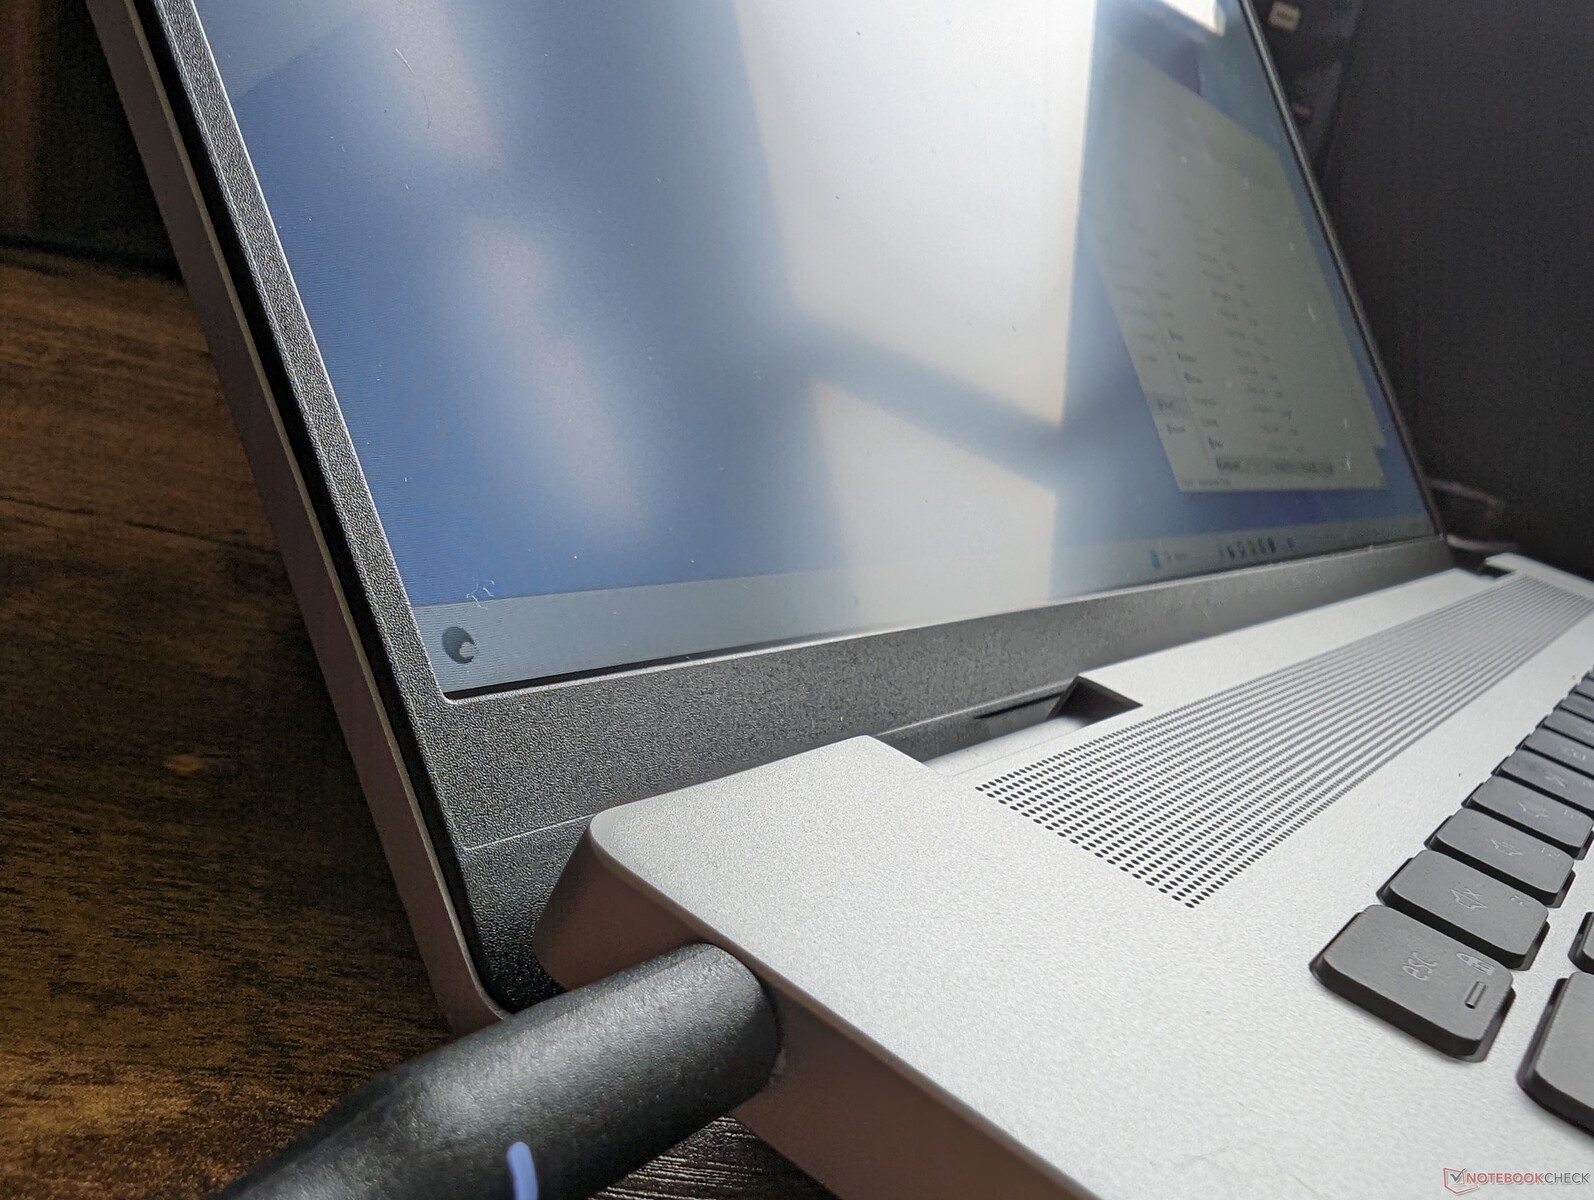
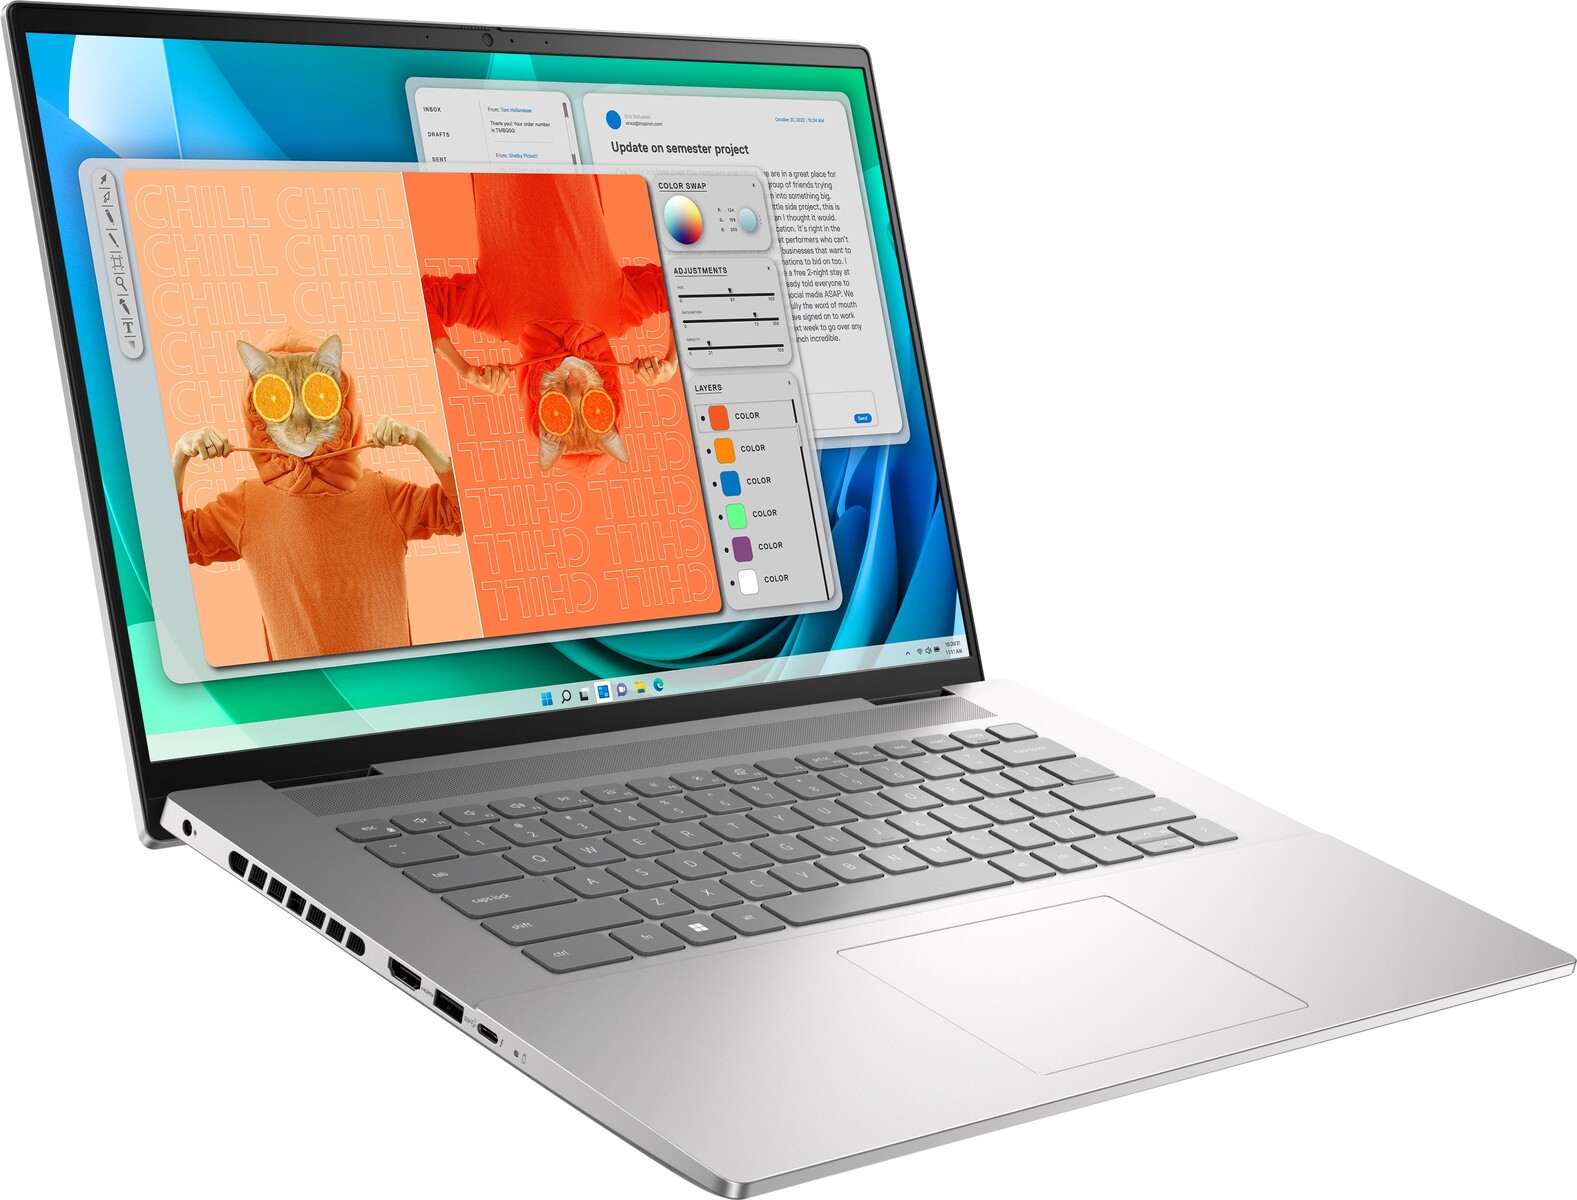
L'Inspiron 16 Plus 7630 presenta tre notevoli modifiche esterne rispetto al modello dello scorso anno. In primo luogo, e forse l'aspetto più importante, le cerniere sono state ridisegnate per essere più spesse e resistenti rispetto al passato. In secondo luogo, sono state aggiunte delle griglie di ventilazione lungo i bordi per favorire il raffreddamento. Infine, sono stati rimossi i poggiapolsi in Mylar e il clickpad, proprio come nell'Inspiron 16 Plus 7635 2-in-1. I primi due in particolare dovrebbero aumentare la durata del sistema, mentre l'ultimo è probabilmente una misura di risparmio.
Per il resto, la rigidità complessiva dello chassis è più o meno la stessa dell'Inspiron 16 Plus 7620, dato che gli scheletri sono realizzati con gli stessi materiali. L'unità si sente forte in mano, come l'Envy 16 Plus 7620 Envy 16ma con un coperchio leggermente più debole, dato che il Dell non ha un vetro Gorilla Glass di rinforzo.
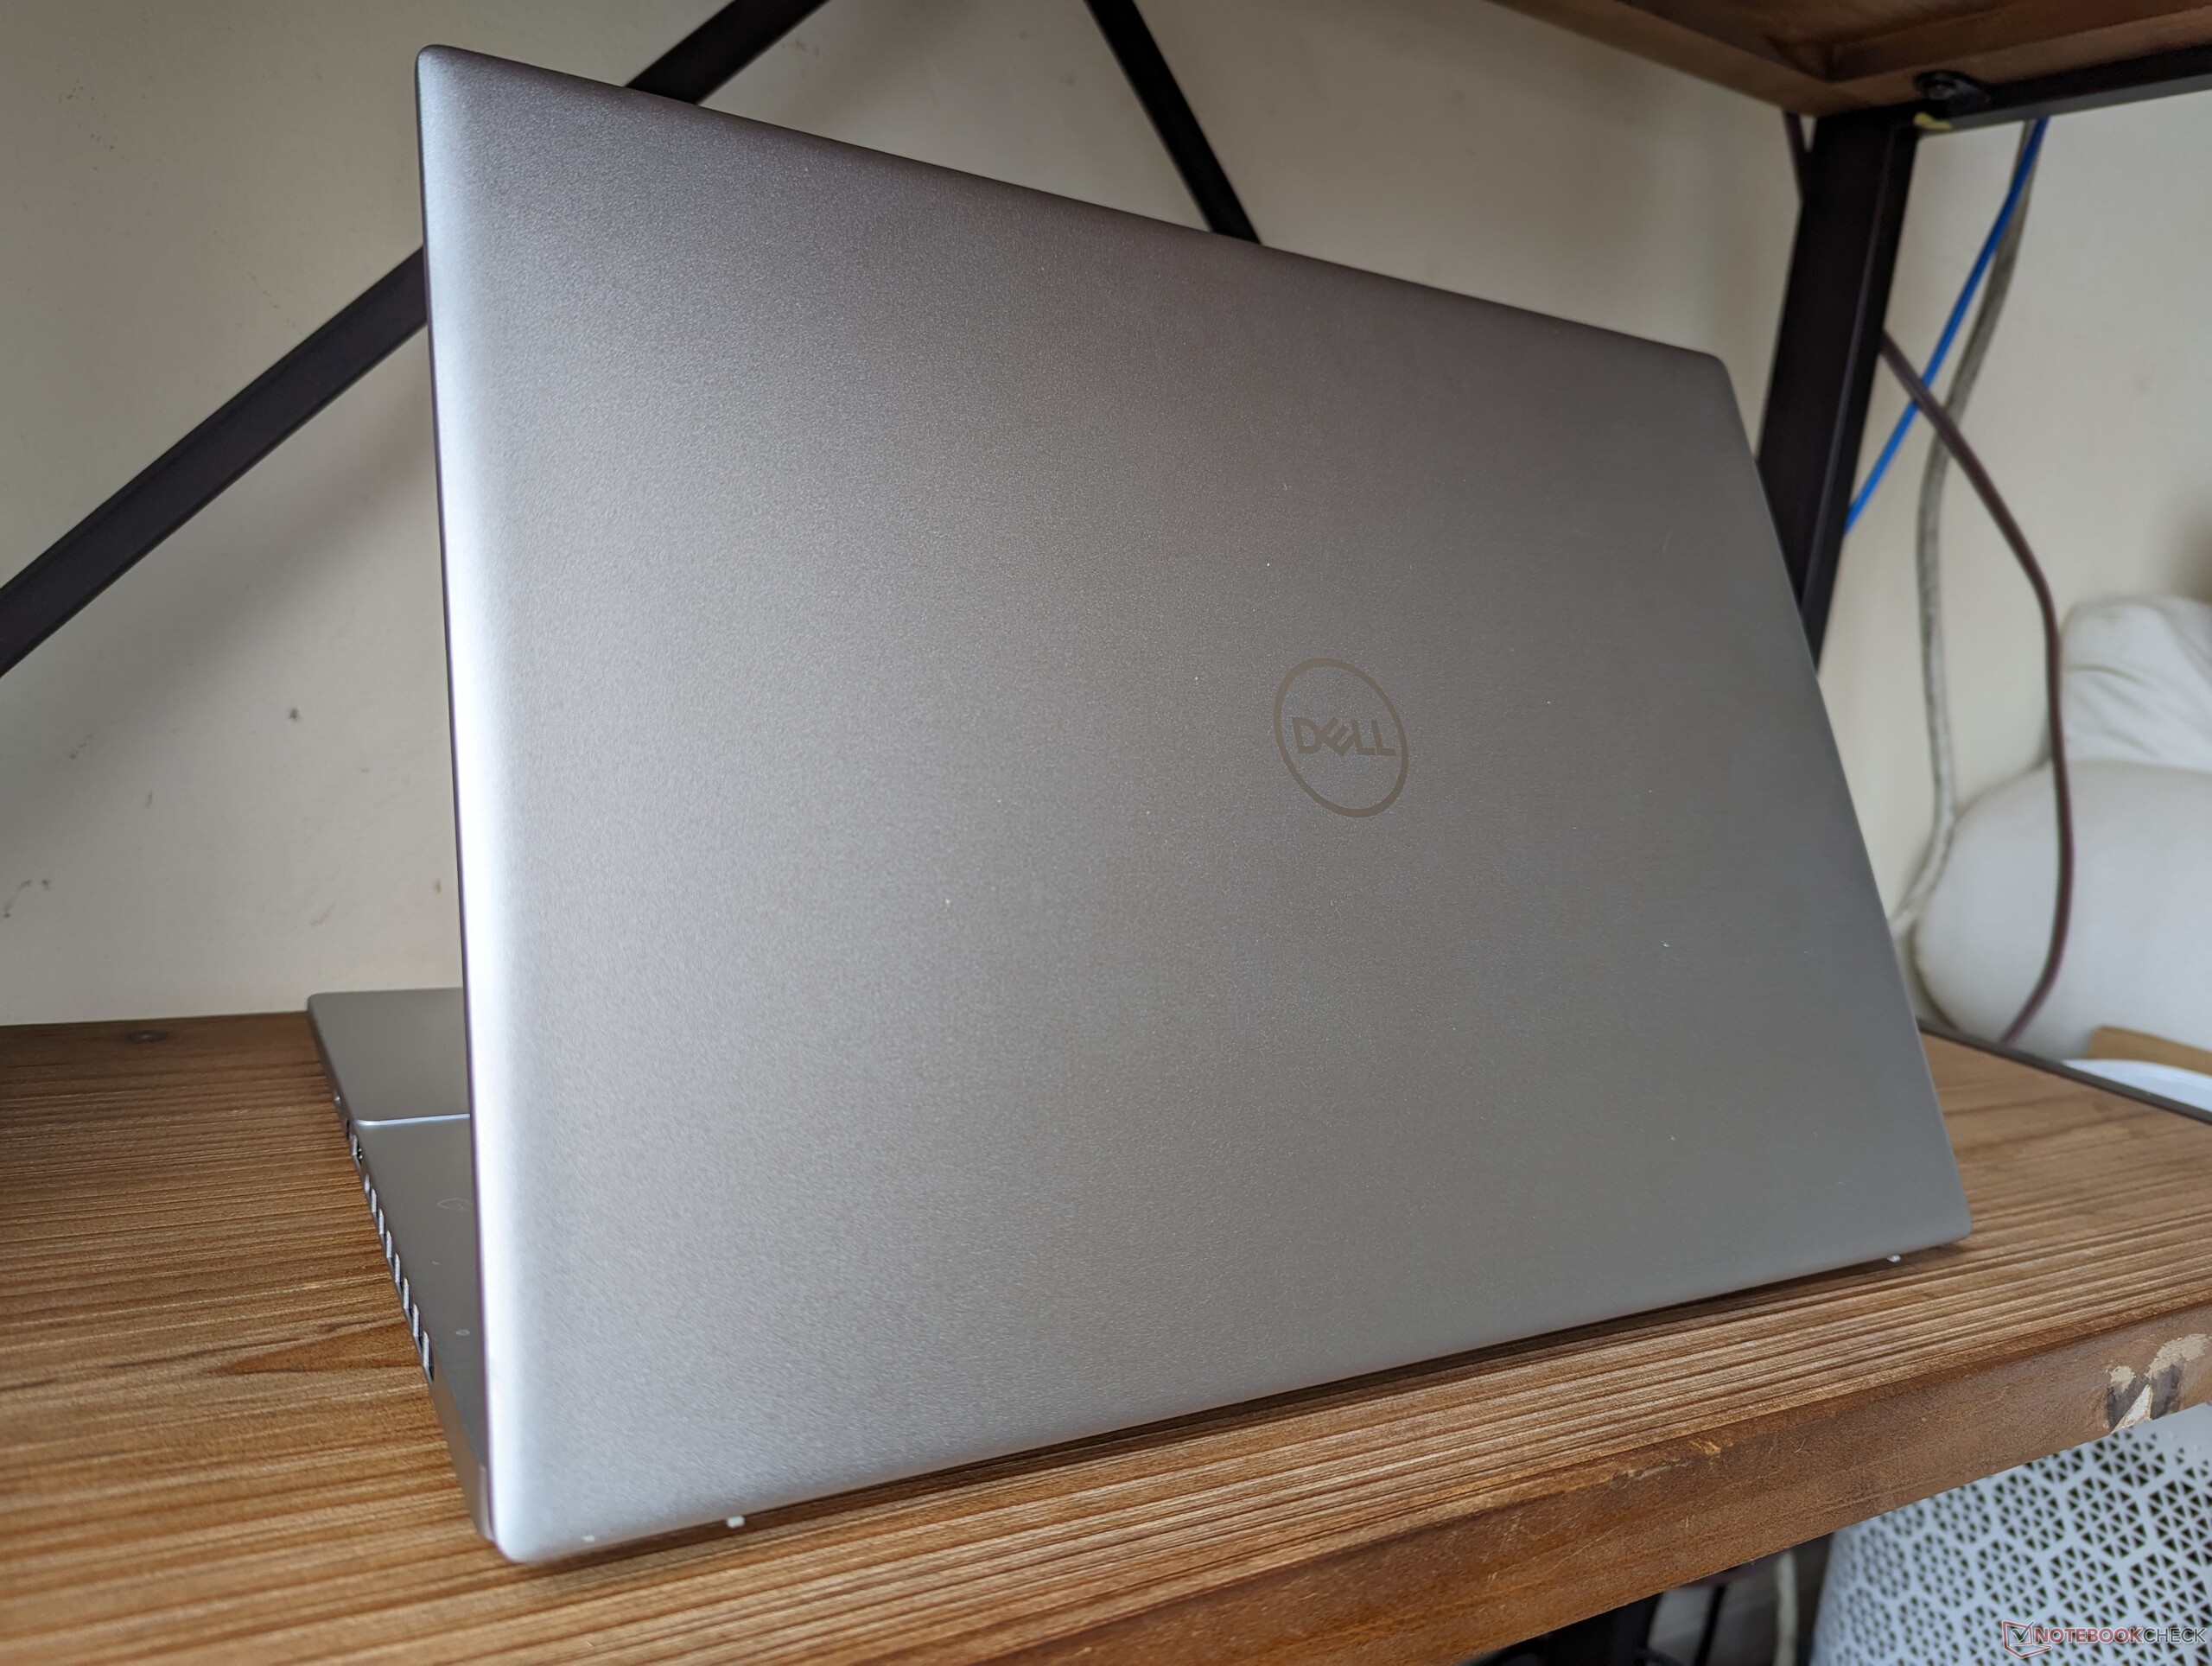
Le dimensioni e il peso sono rimasti pressoché invariati rispetto al design dell'anno scorso, se non leggermente più pesanti di circa 100 g. Sebbene non sia esattamente leggero, il Dell è comunque paragonabile ad alternative come lo Slim Pro 9i 16 o l' Envy 16 sotto questo aspetto.
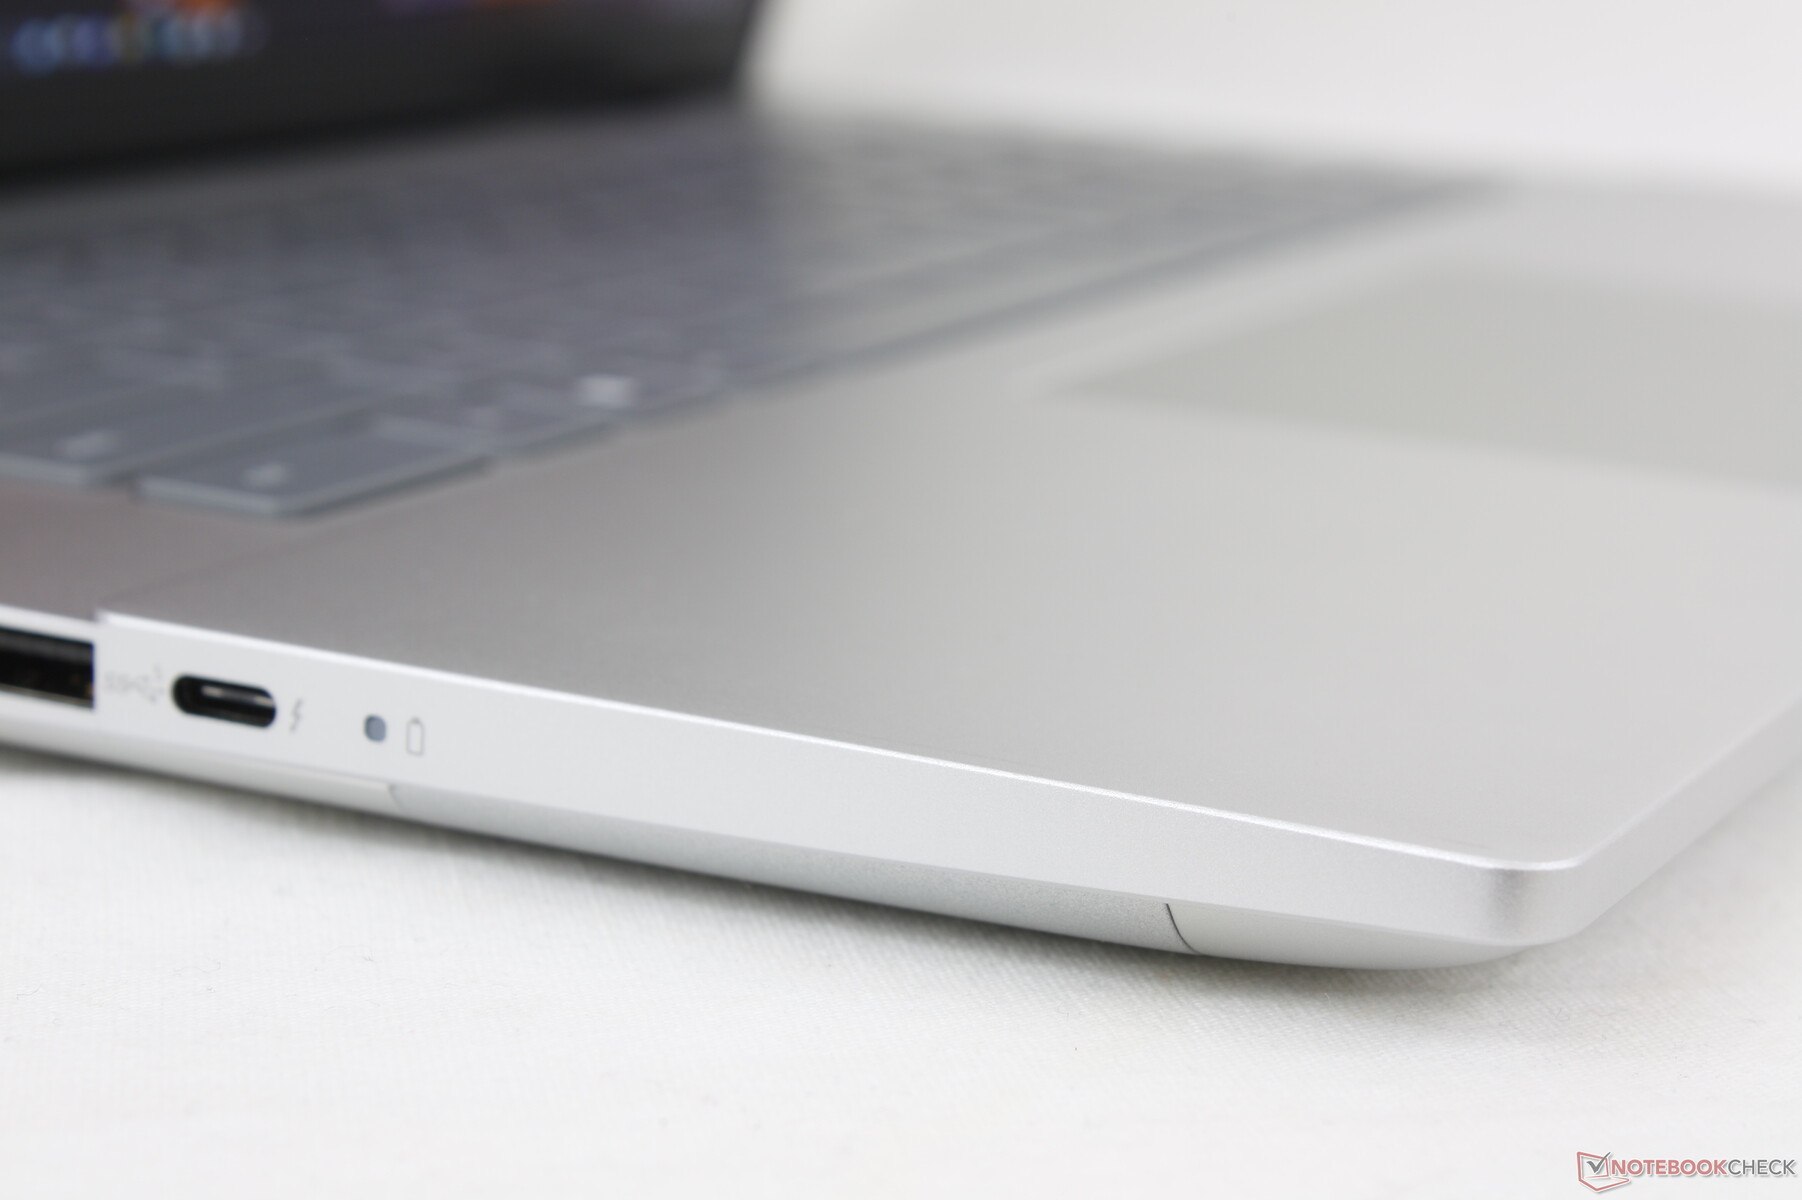
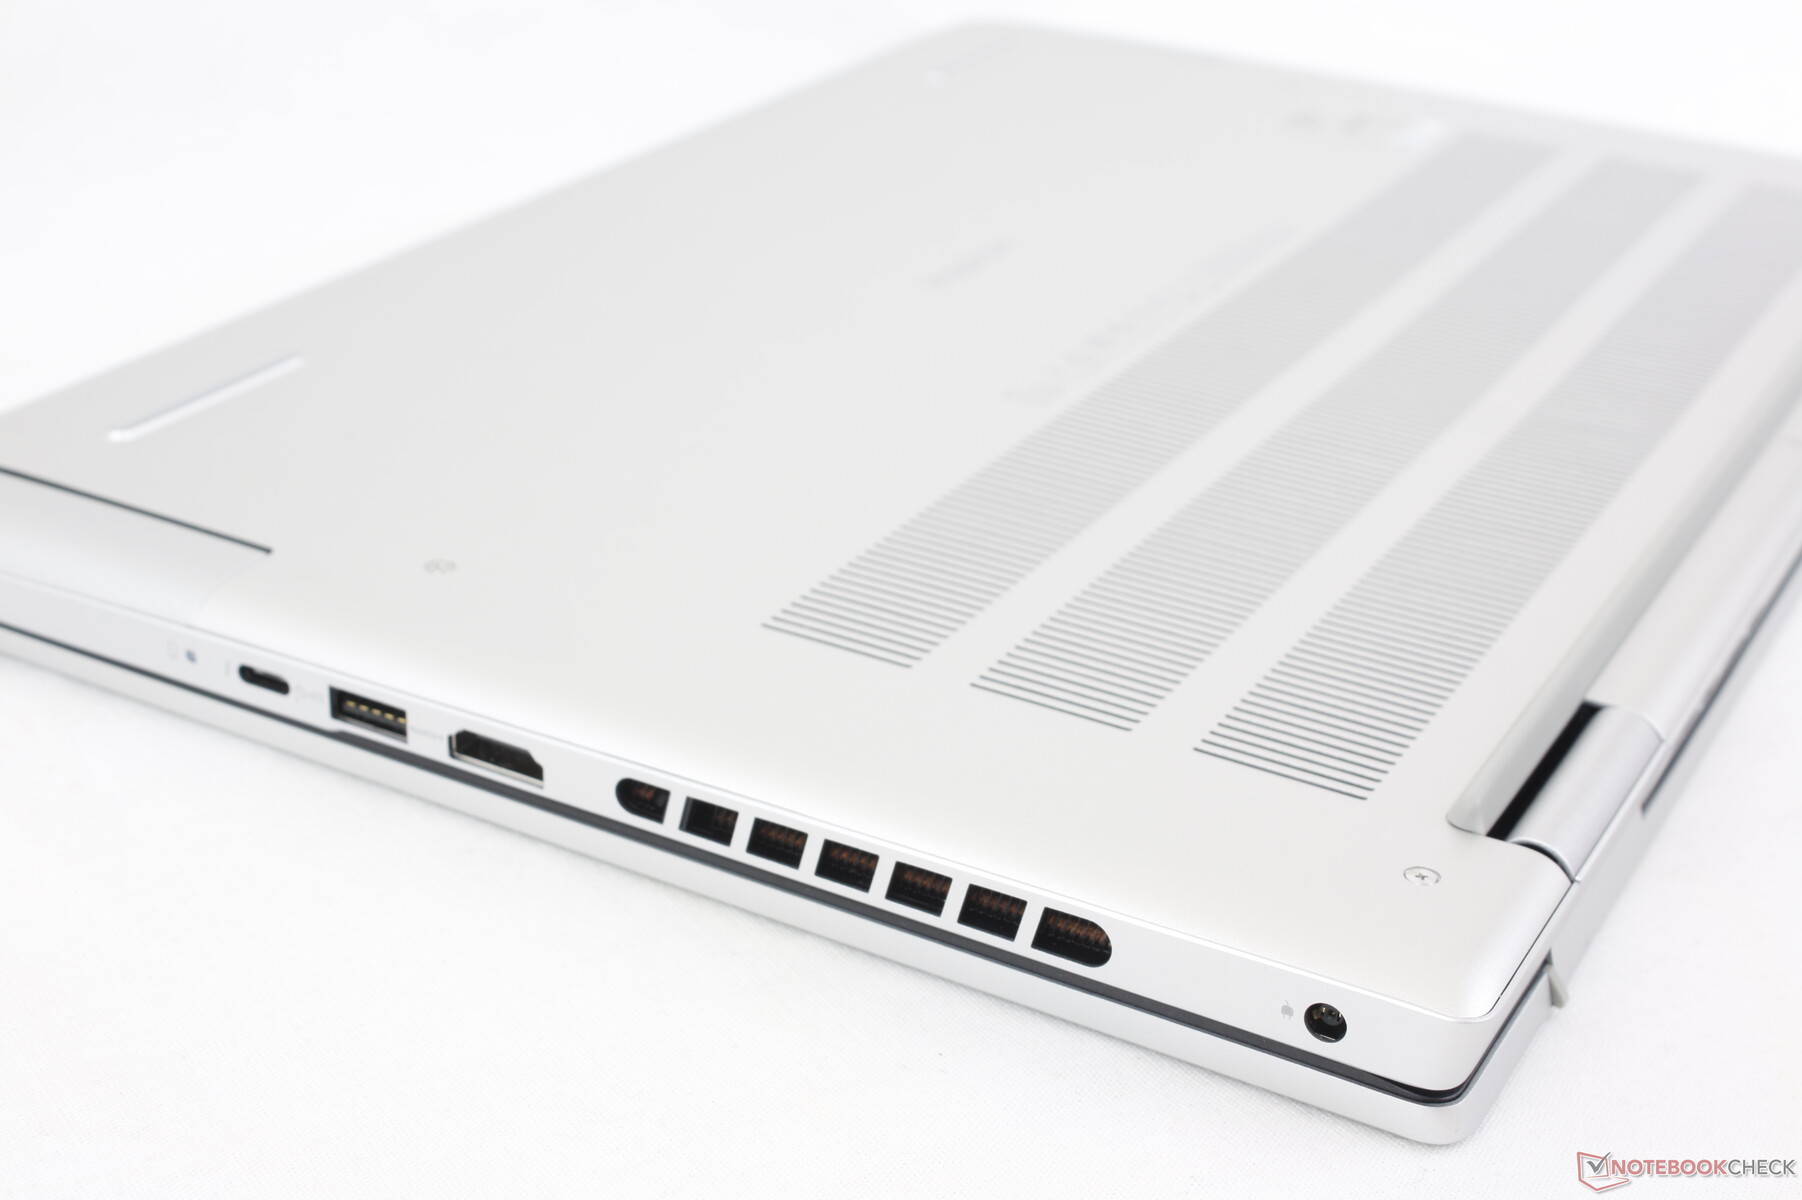
Connettività - Potrebbe essere utile un maggior numero di USB-C
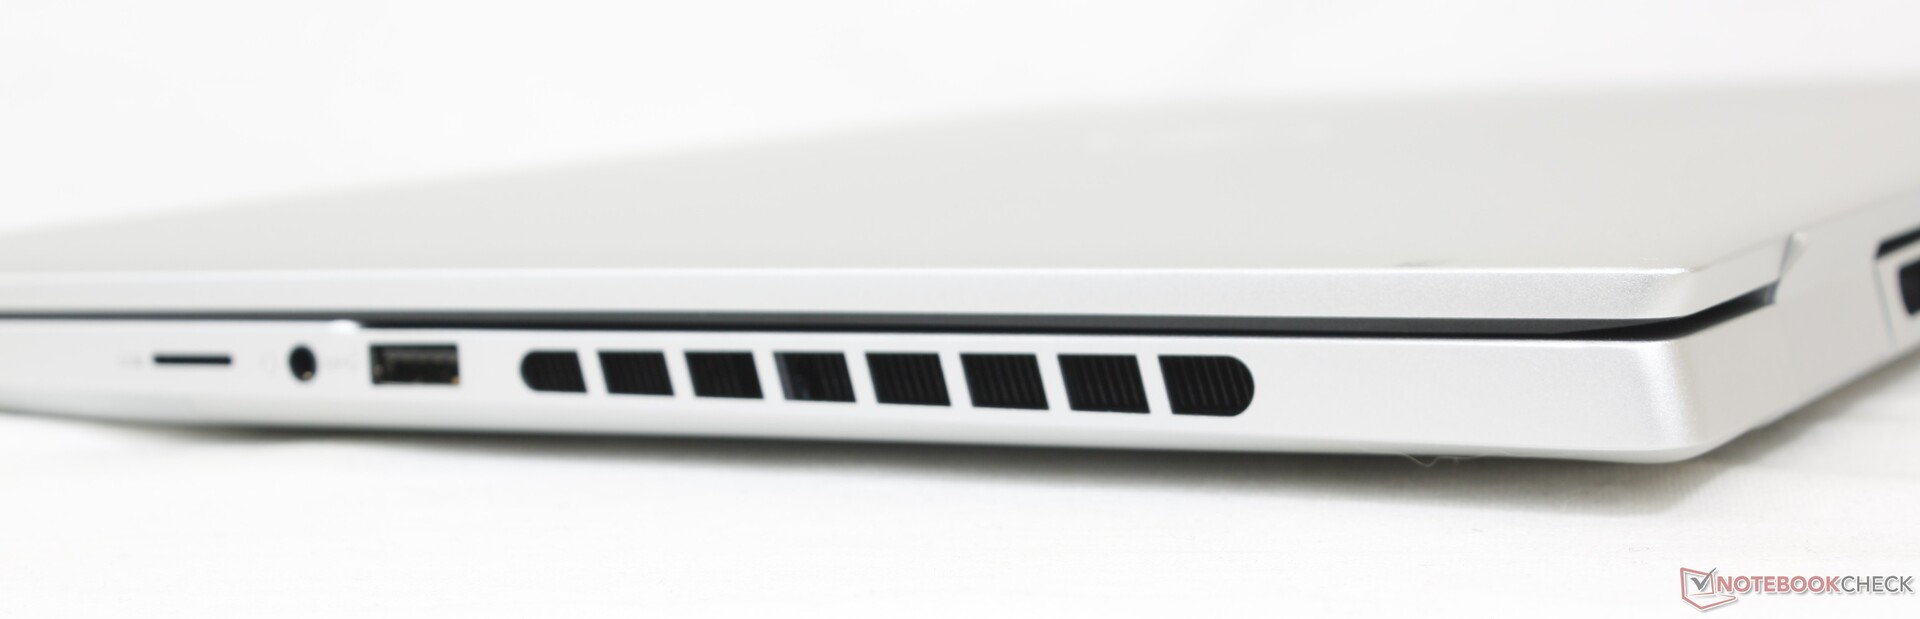
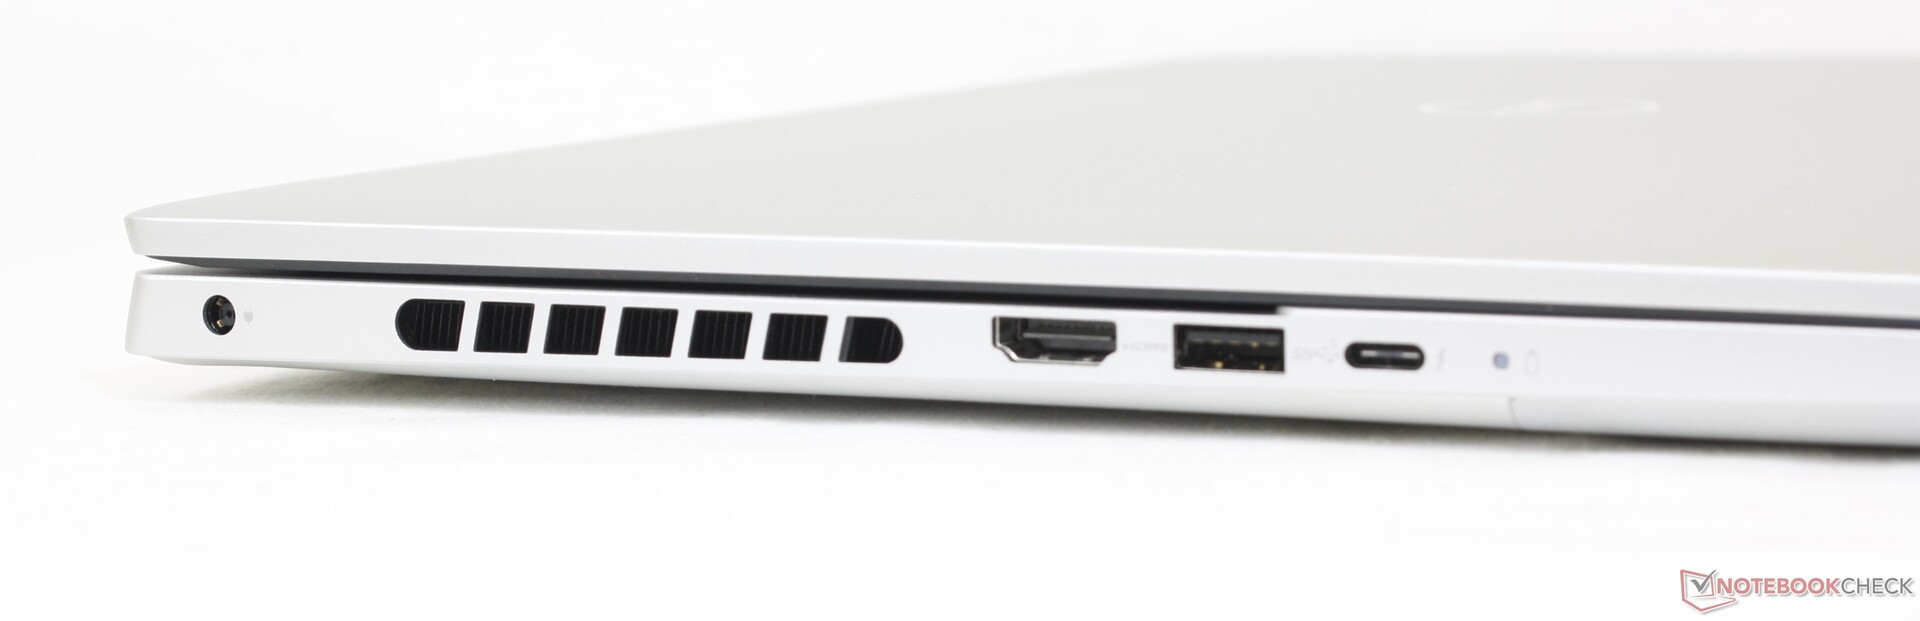
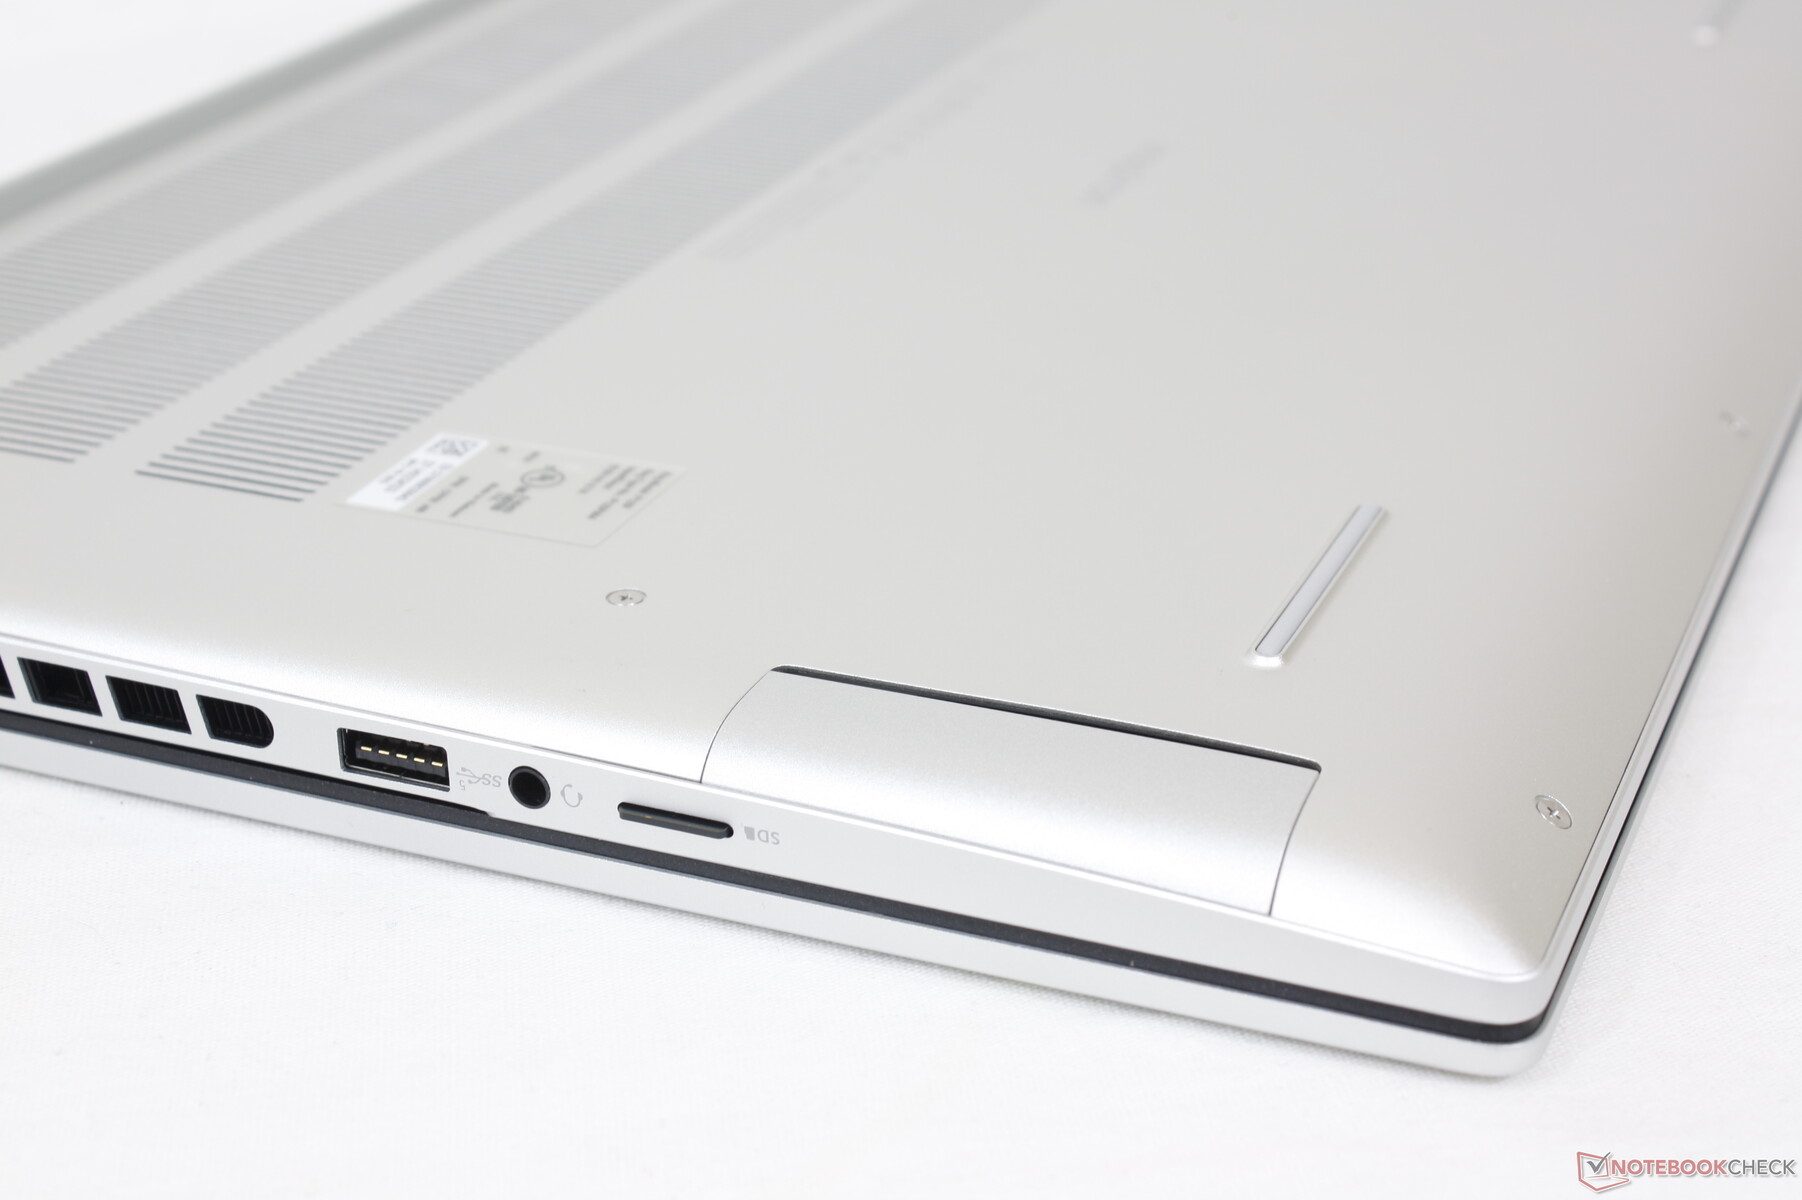
Il posizionamento delle porte e le opzioni includono tutto ciò che è presente nel modello dello scorso anno, ma con un notevole downgrade: il lettore di schede SD full-size è stato rimosso per passare a un lettore microSD più piccolo su tutte le configurazioni RTX 4060. Alternative come l'Envy 16 o il VivoBook Pro 16X integrano più porte USB-C rispetto al nostro Dell o hanno lettori di schede SD a grandezza naturale.
Ci piacerebbe anche vedere i futuri modelli Inspiron abbandonare la porta proprietaria dell'adattatore CA a barile in favore della ricarica USB-C, come avviene per le serie XPS 15 e XPS 17.
Lettore di schede SD
Mentre la serie XPS ospita alcuni dei lettori di schede SD più veloci di tutti i portatili, la serie Inspiron ne include alcuni tra i più lenti. Per spostare 1 GB di immagini dalla nostra scheda di prova UHS-II al desktop sono stati necessari oltre 50 secondi, contro i soli 5-6 secondi di un XPS 15 XPS 15 o XPS 17.
| SD Card Reader | |
| average JPG Copy Test (av. of 3 runs) | |
| MSI Summit E16 Flip A12UDT-031 (AV Pro SD microSD 128 GB V60) | |
| Asus Vivobook Pro 16X K6604JV-MX016W | |
| Lenovo Slim Pro 9i 16IRP8 (PNY EliteX-Pro60 V60 256 GB) | |
| HP Envy 16 h0112nr (AV Pro SD microSD 128 GB V60) | |
| Dell Inspiron 16 Plus 7620 (Toshiba Exceria Pro SDXC 64 GB UHS-II) | |
| Dell Inspiron 16 Plus 7630 (AV Pro SD microSD 128 GB V60) | |
| maximum AS SSD Seq Read Test (1GB) | |
| MSI Summit E16 Flip A12UDT-031 (AV Pro SD microSD 128 GB V60) | |
| Asus Vivobook Pro 16X K6604JV-MX016W | |
| Lenovo Slim Pro 9i 16IRP8 (PNY EliteX-Pro60 V60 256 GB) | |
| HP Envy 16 h0112nr (AV Pro SD microSD 128 GB V60) | |
| Dell Inspiron 16 Plus 7620 (Toshiba Exceria Pro SDXC 64 GB UHS-II) | |
| Dell Inspiron 16 Plus 7630 (AV Pro SD microSD 128 GB V60) | |
Comunicazione
La connettività Wi-Fi 6E e Bluetooth 5.3 è affidata a un Intel AX211. Abbiamo riscontrato prestazioni costanti e affidabili quando siamo stati accoppiati alla nostra rete di test Asus AXE11000 a 6GHz.
Un modulo MediaTek è invece incluso se configurato con una CPU AMD.
Webcam
La webcam da 2 MP è diventata uno standard nella maggior parte dei portatili multimediali. I modelli più costosi di HP includono webcam da 5 MP o addirittura da 8 MP se la qualità della webcam è prioritaria.
È presente un cursore fisico per la privacy, ma l'IR non è supportato.


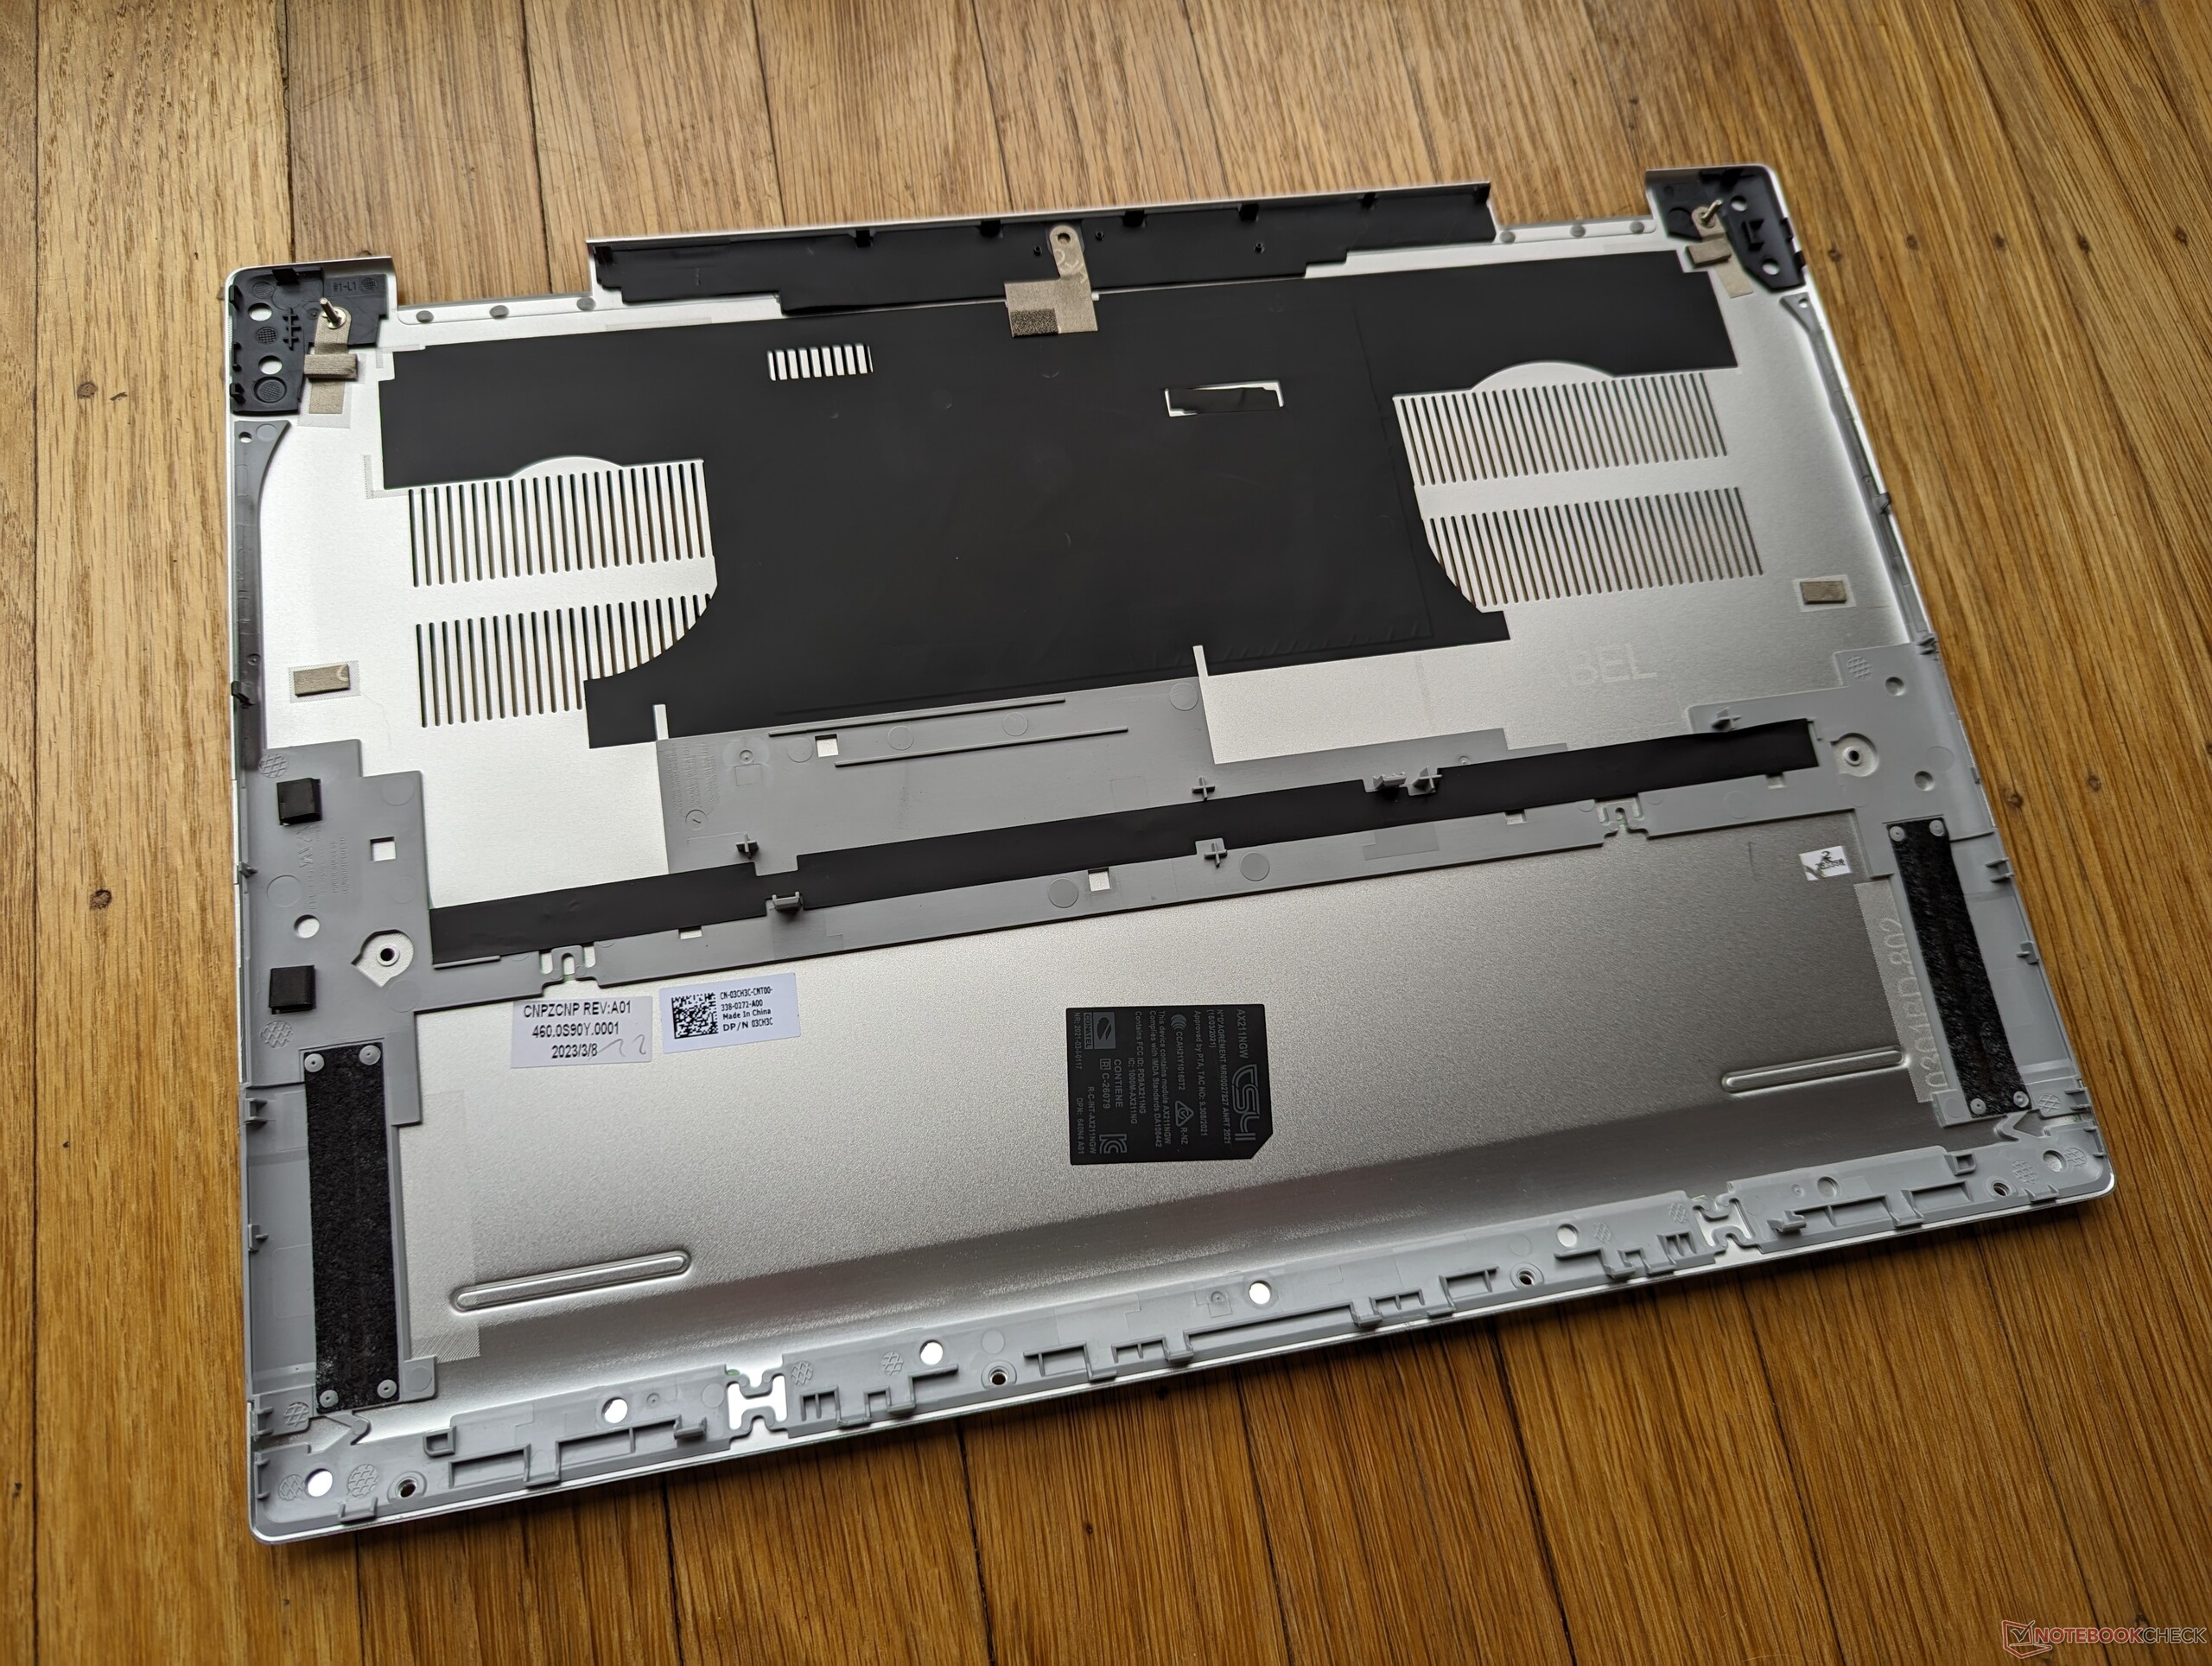
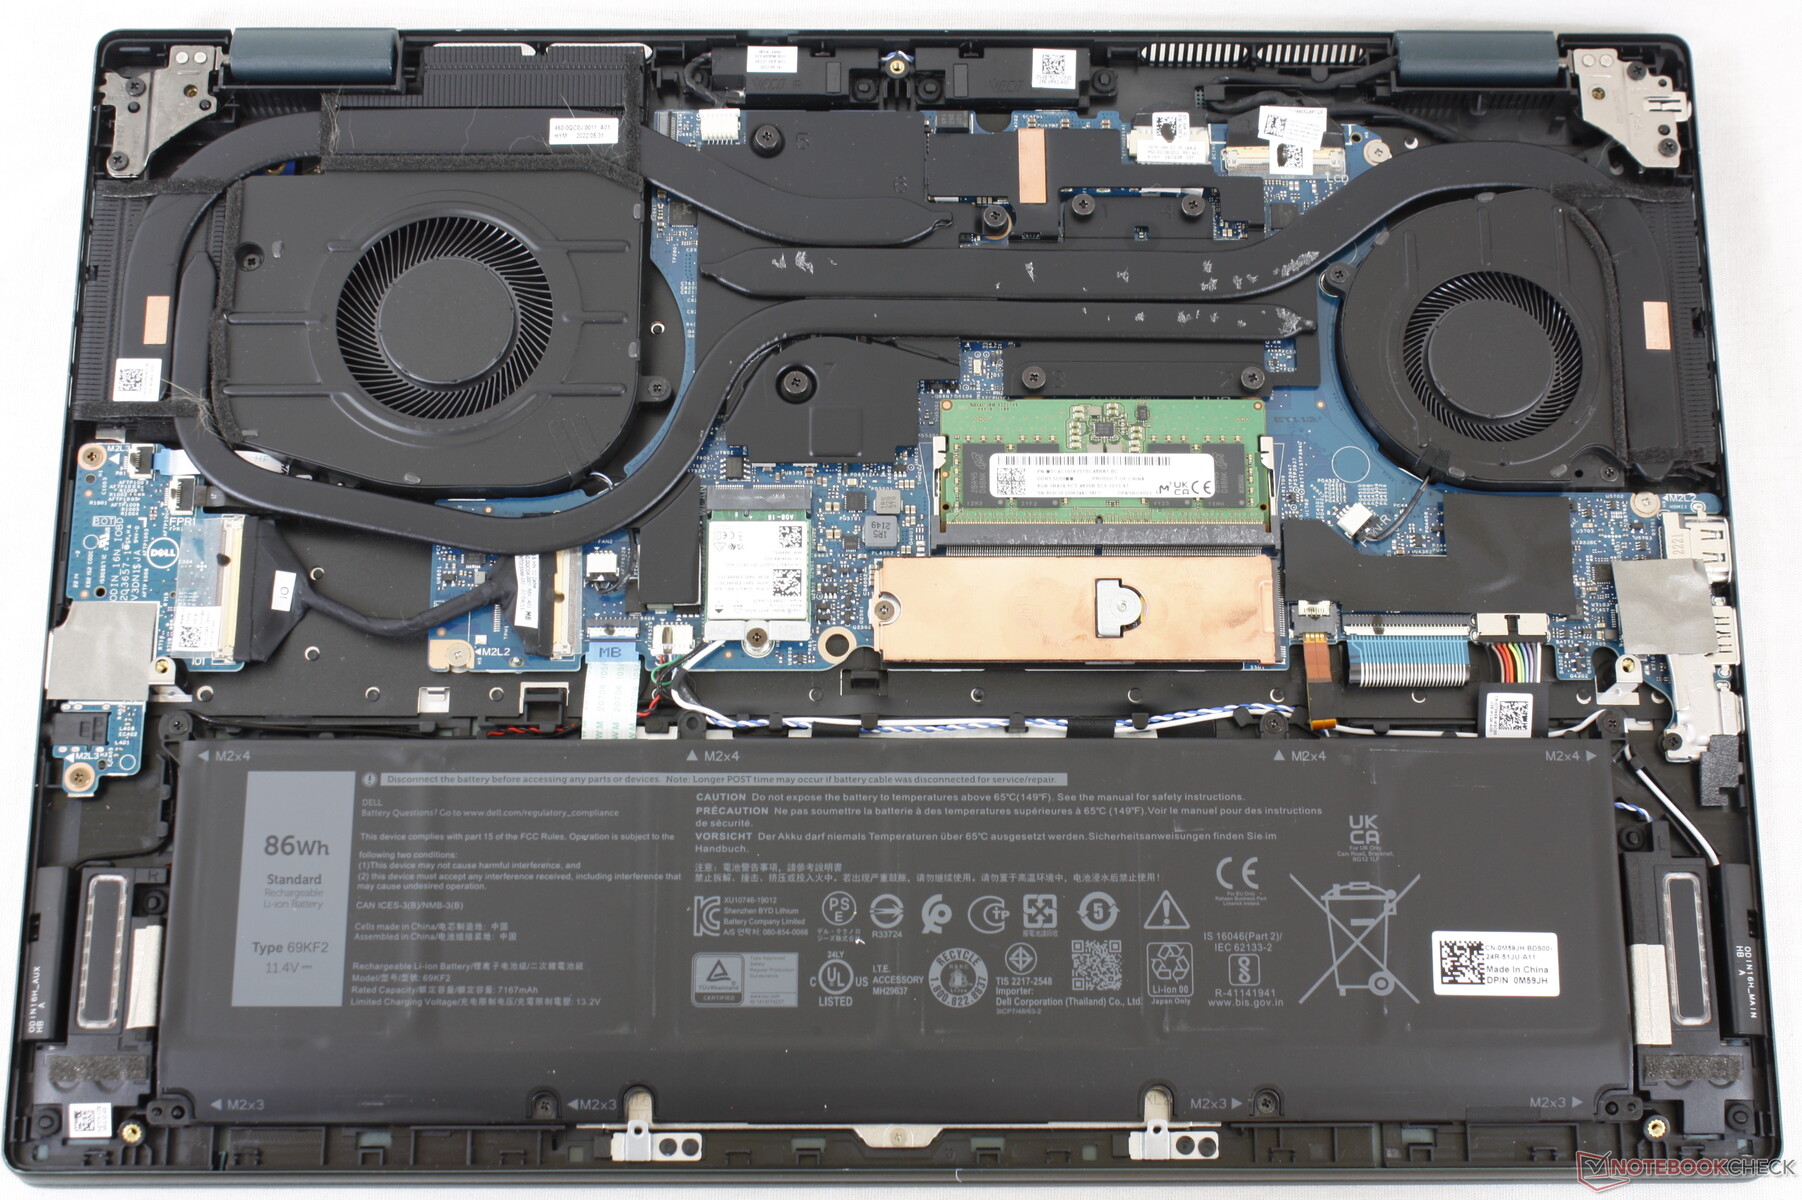
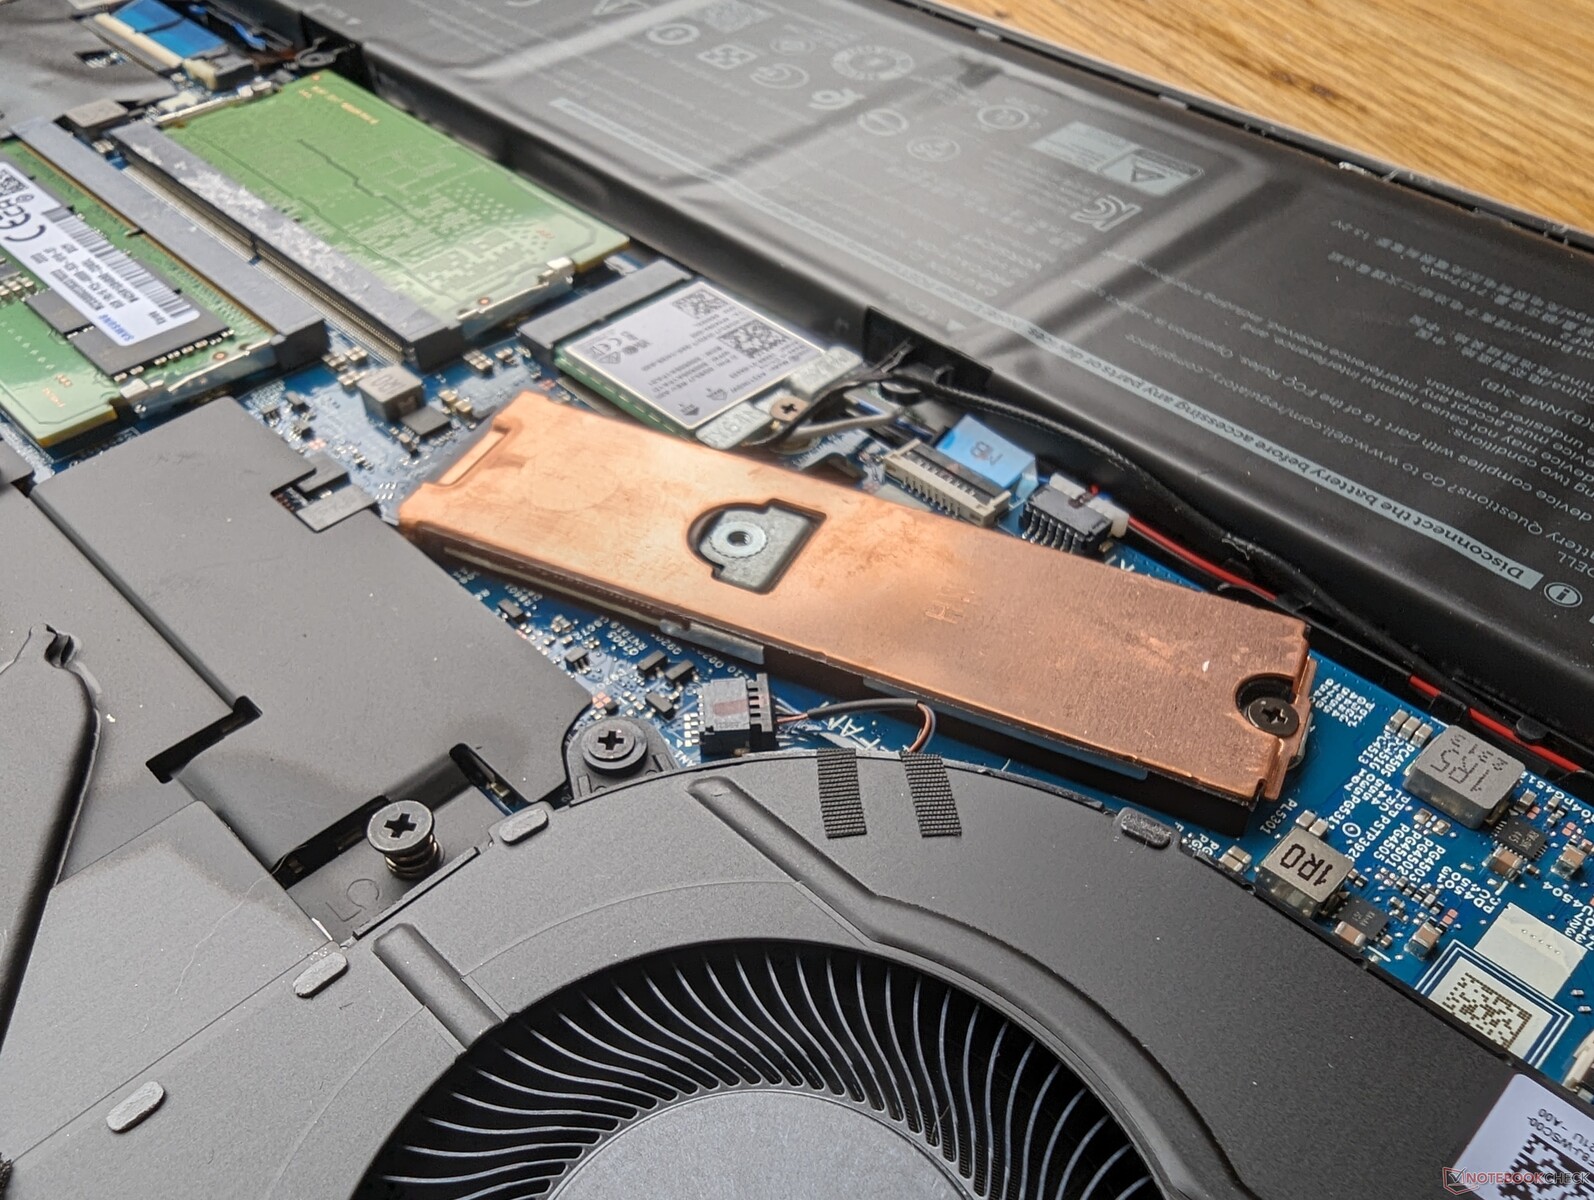
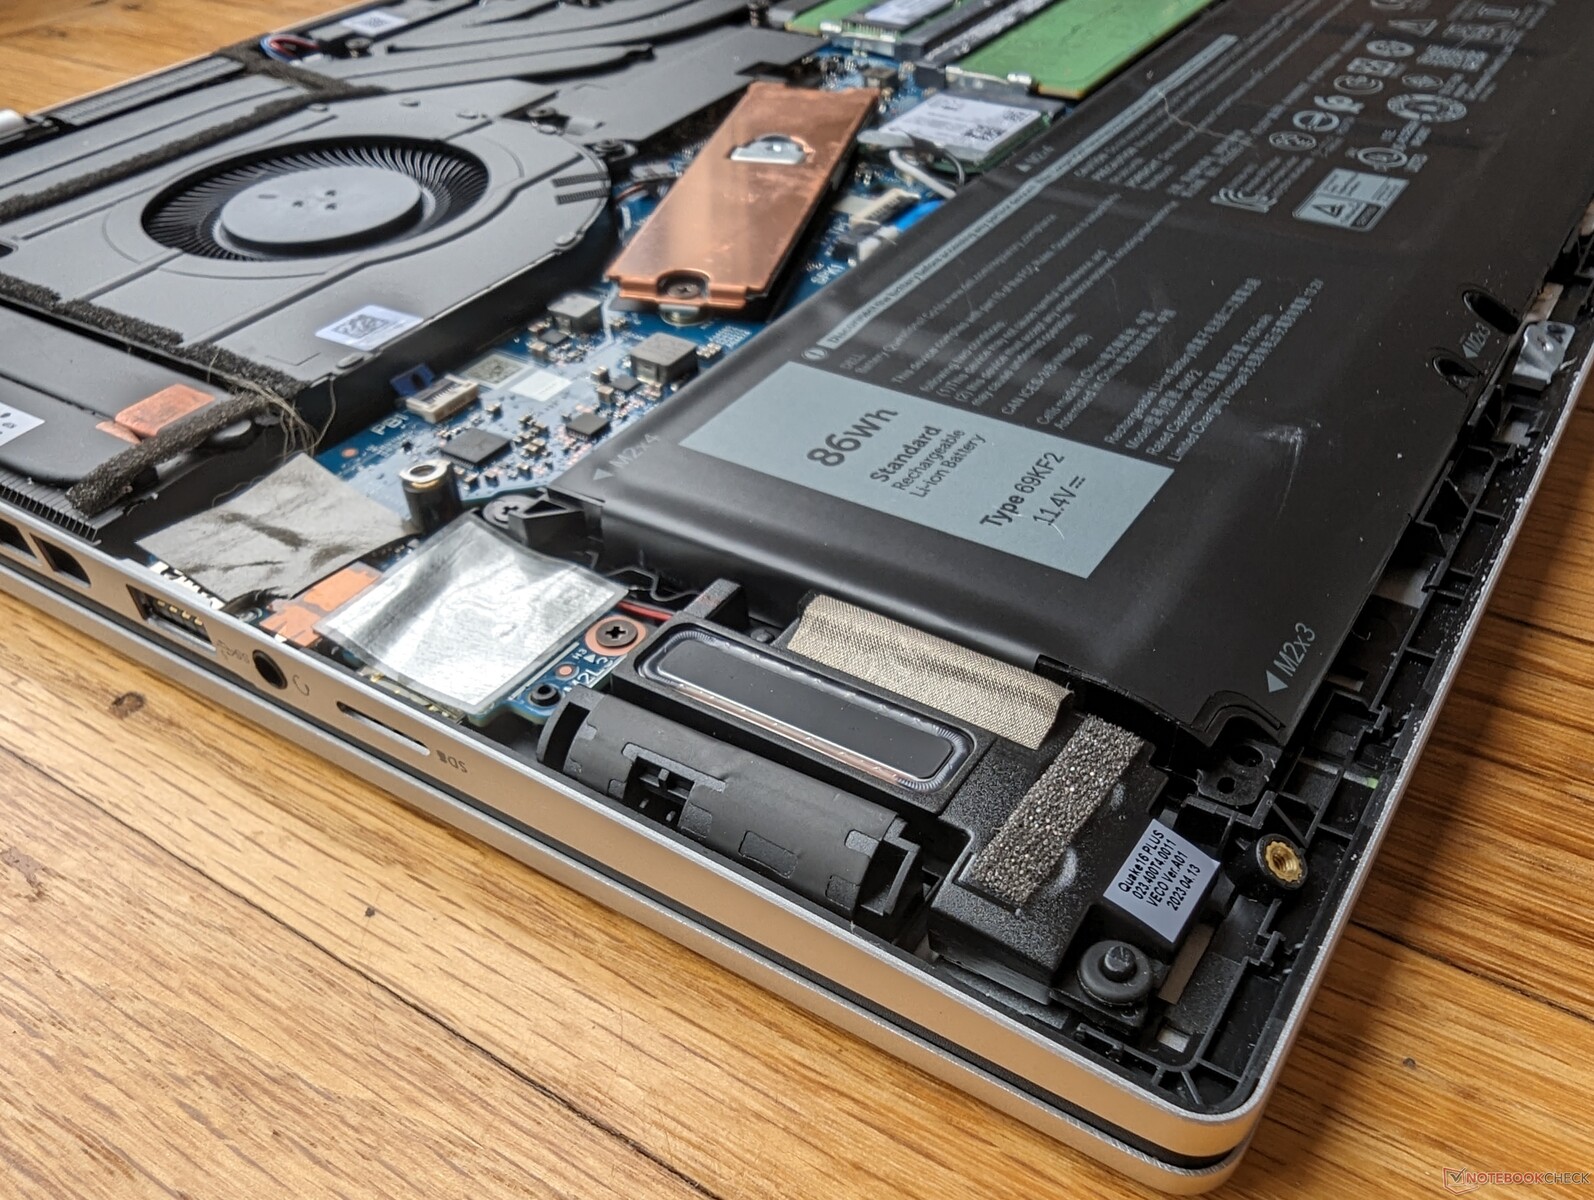
Manutenzione
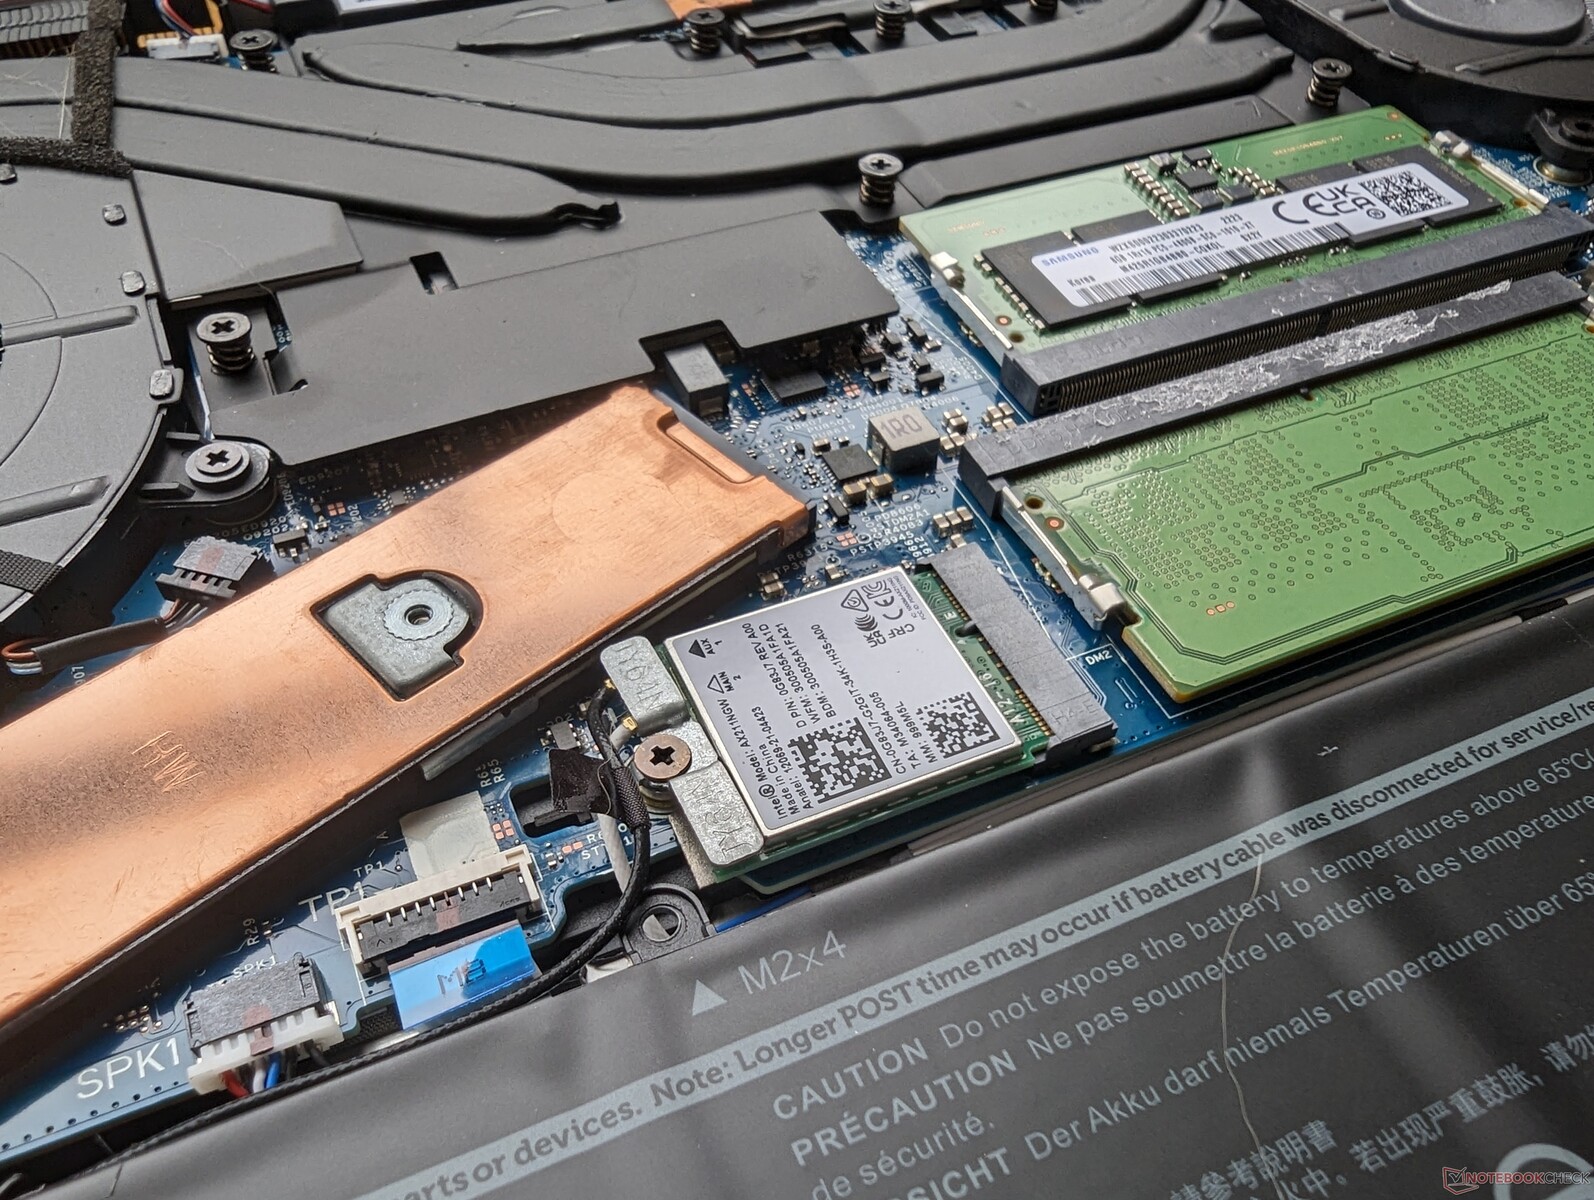
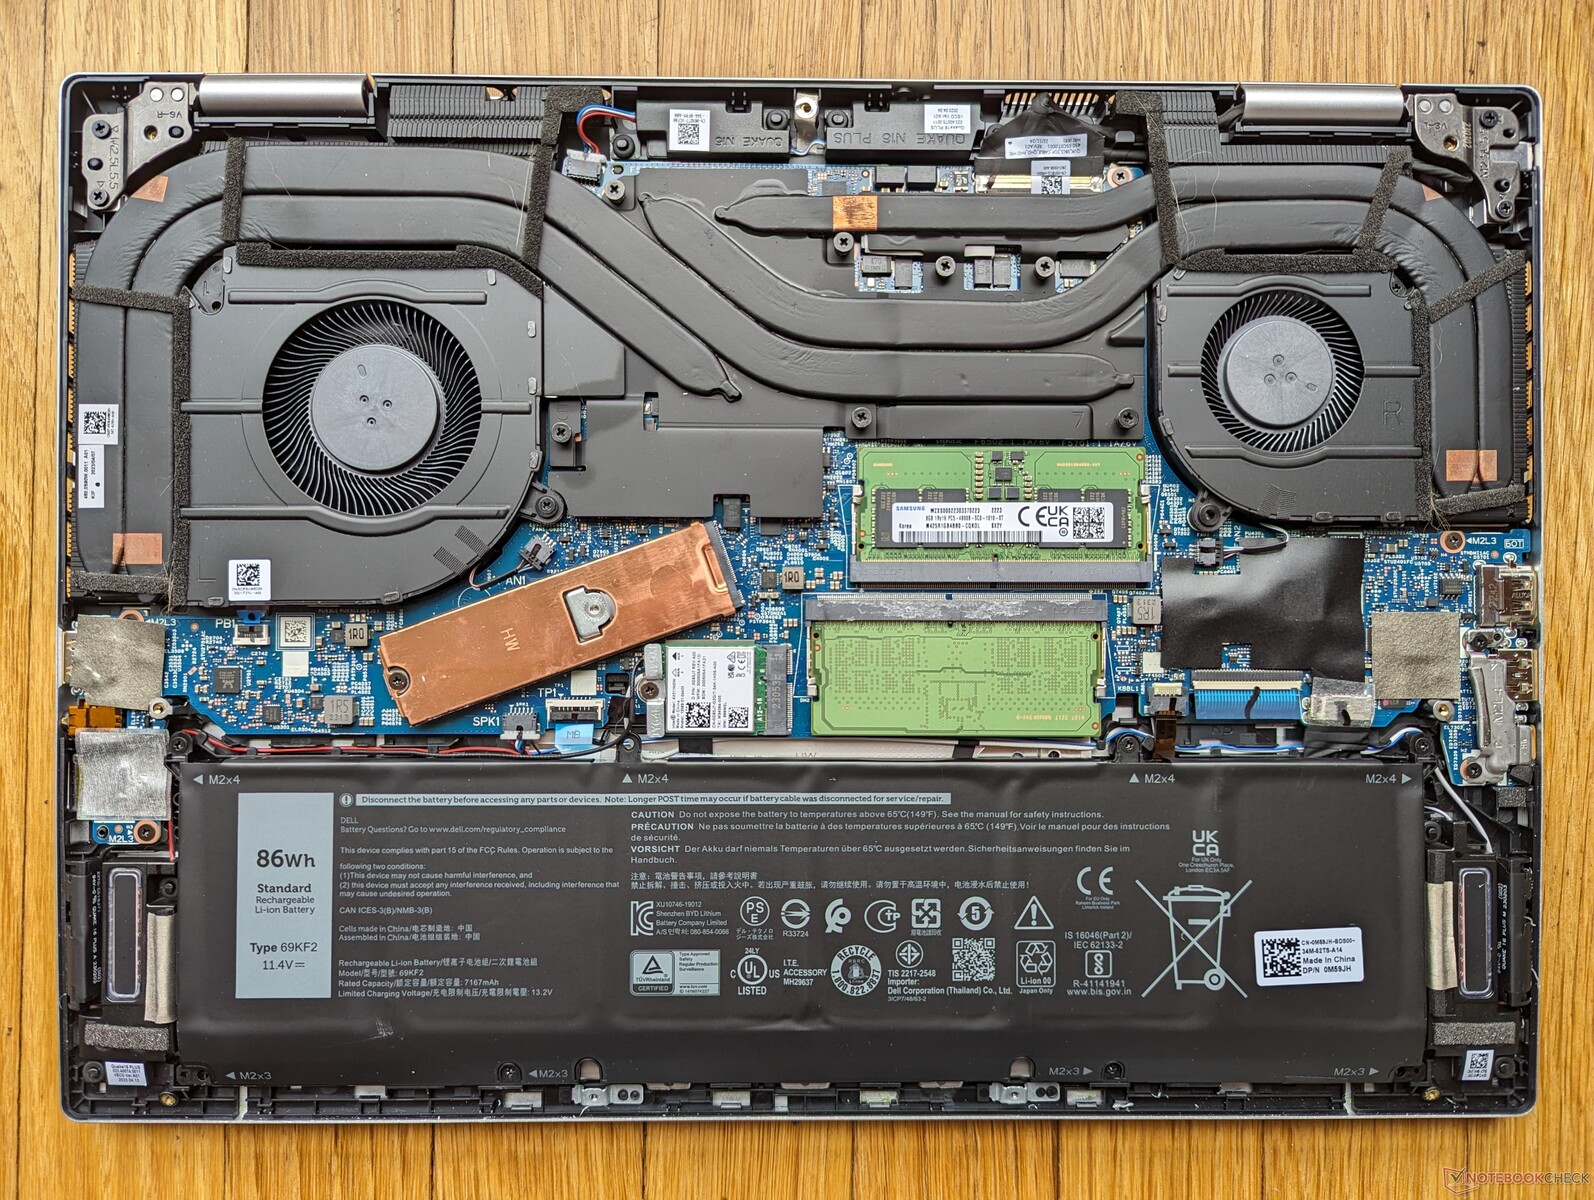
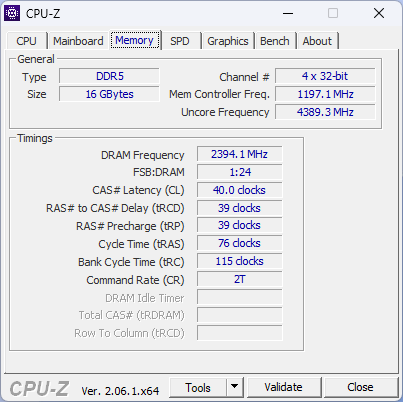
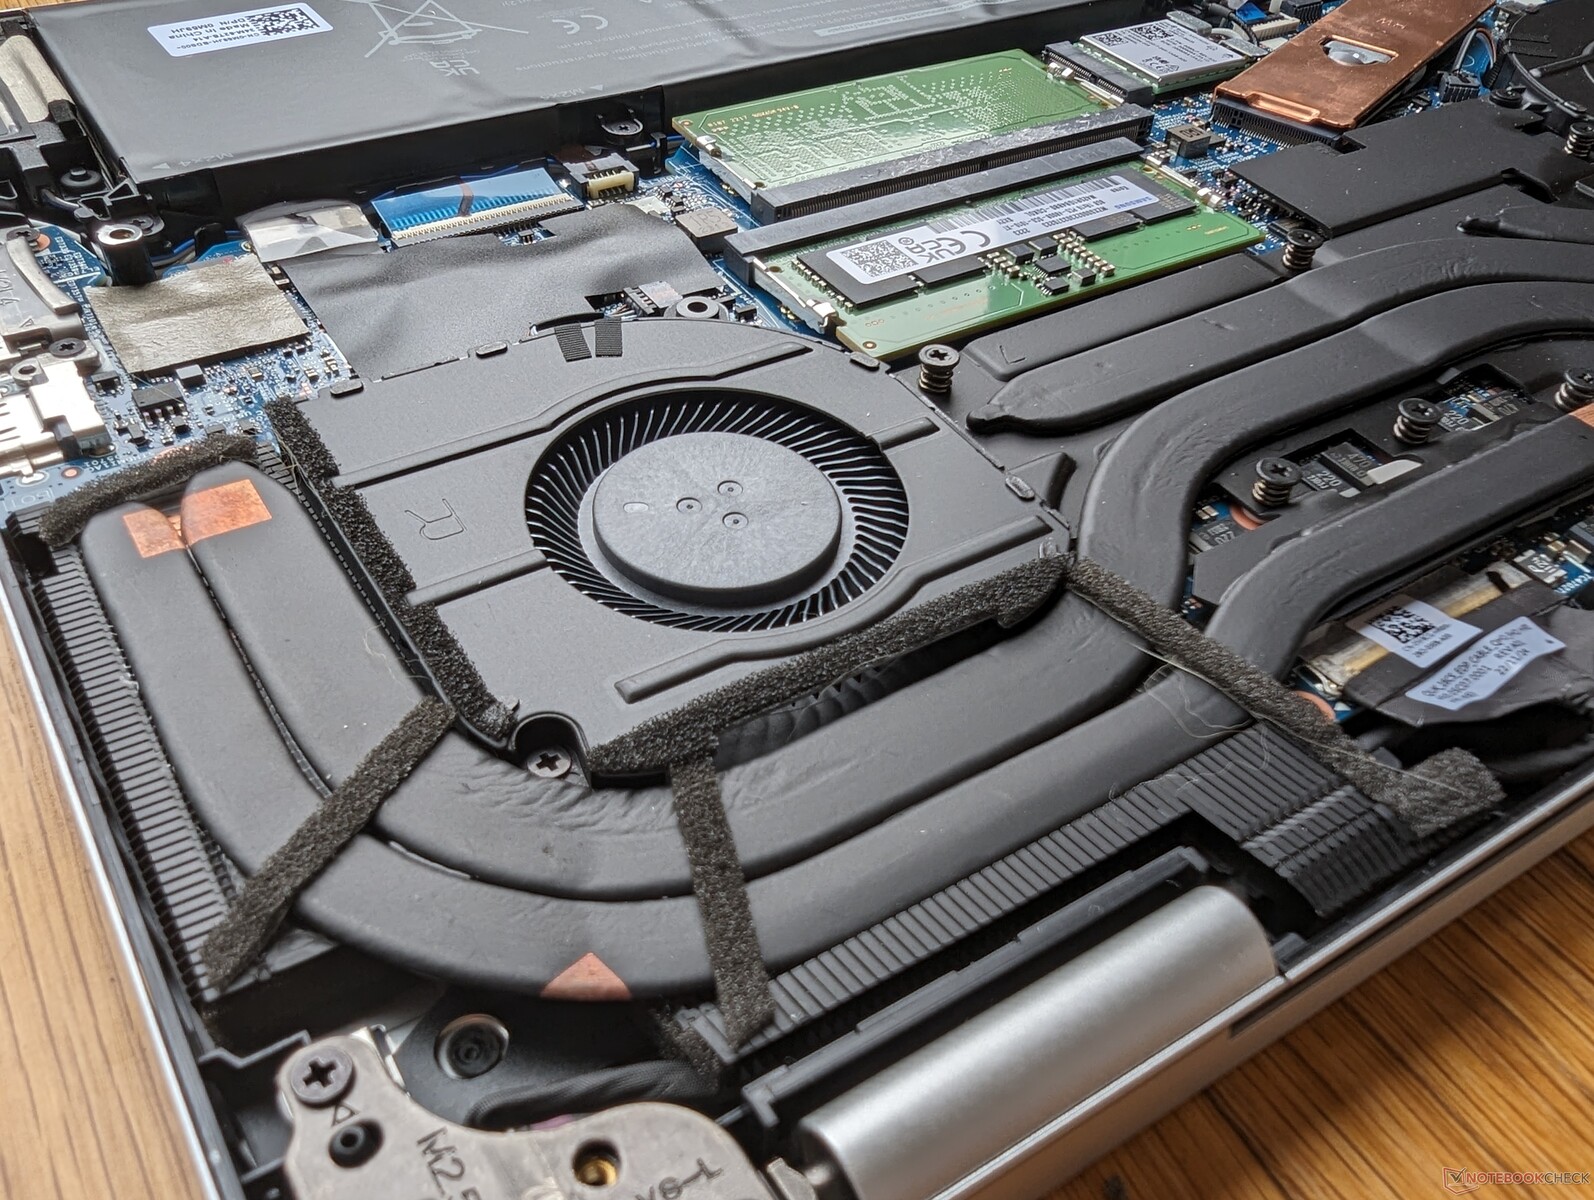
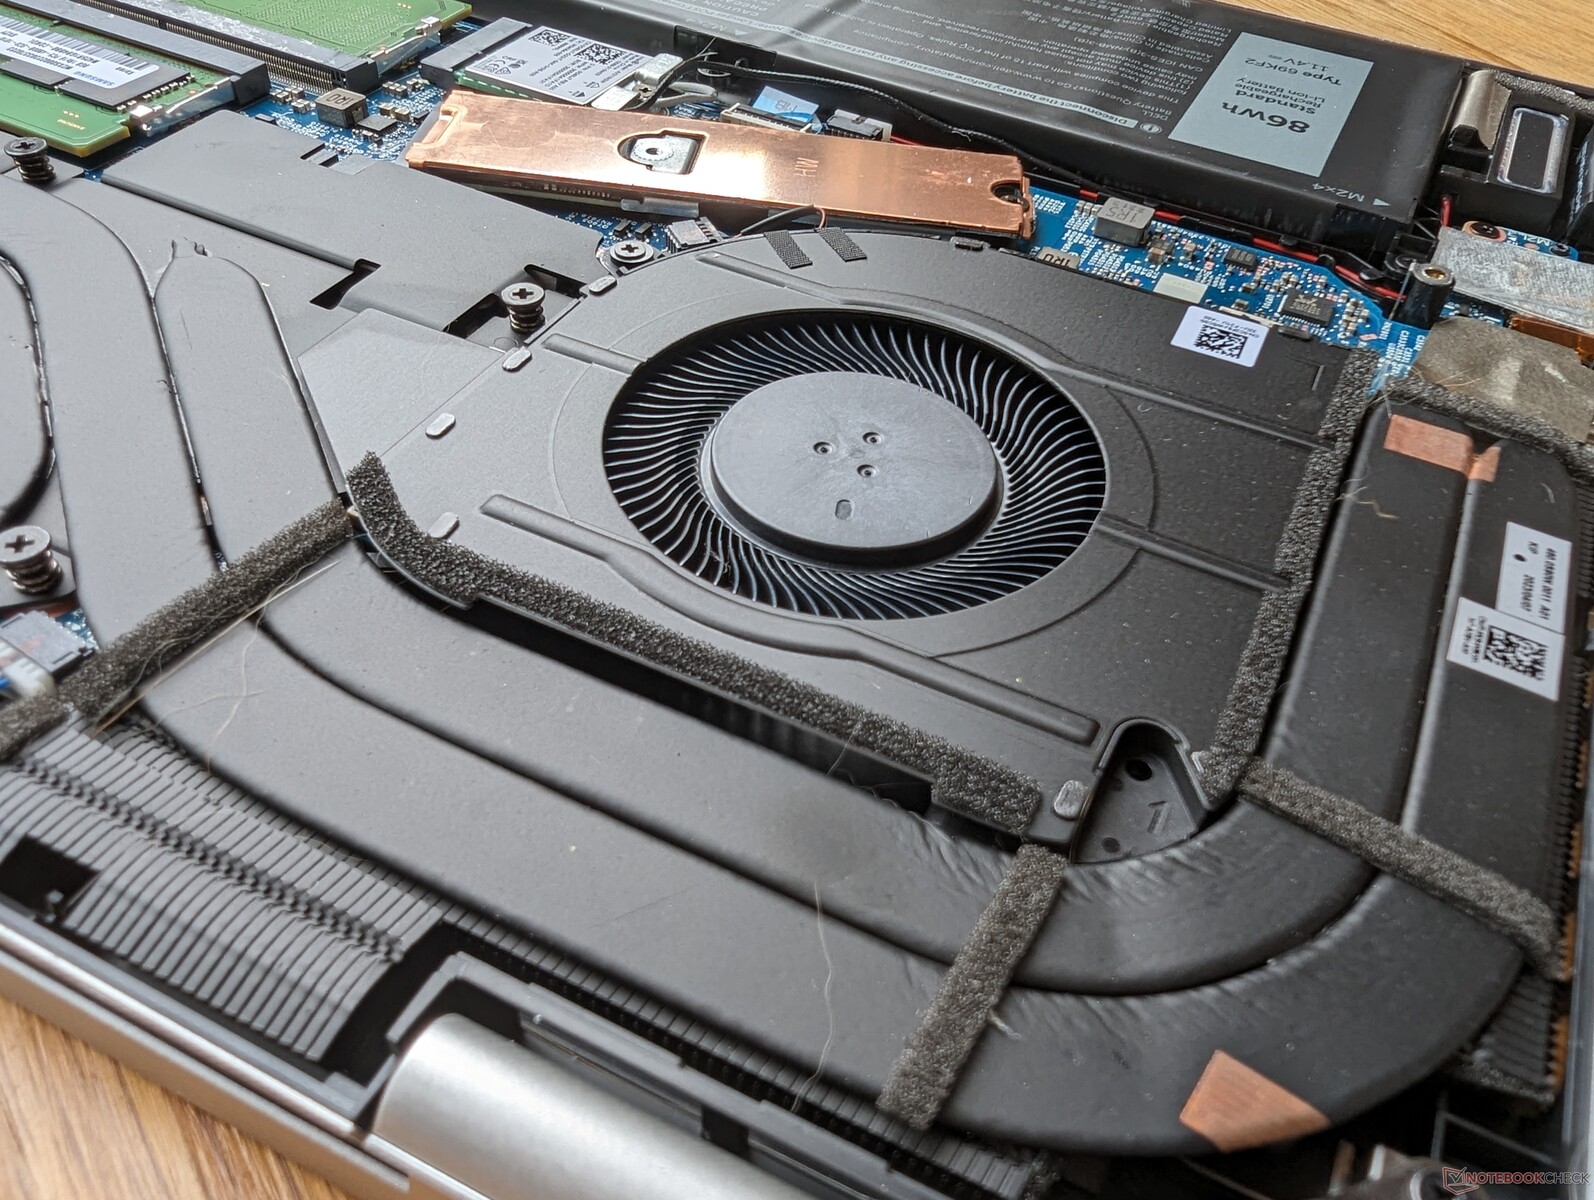
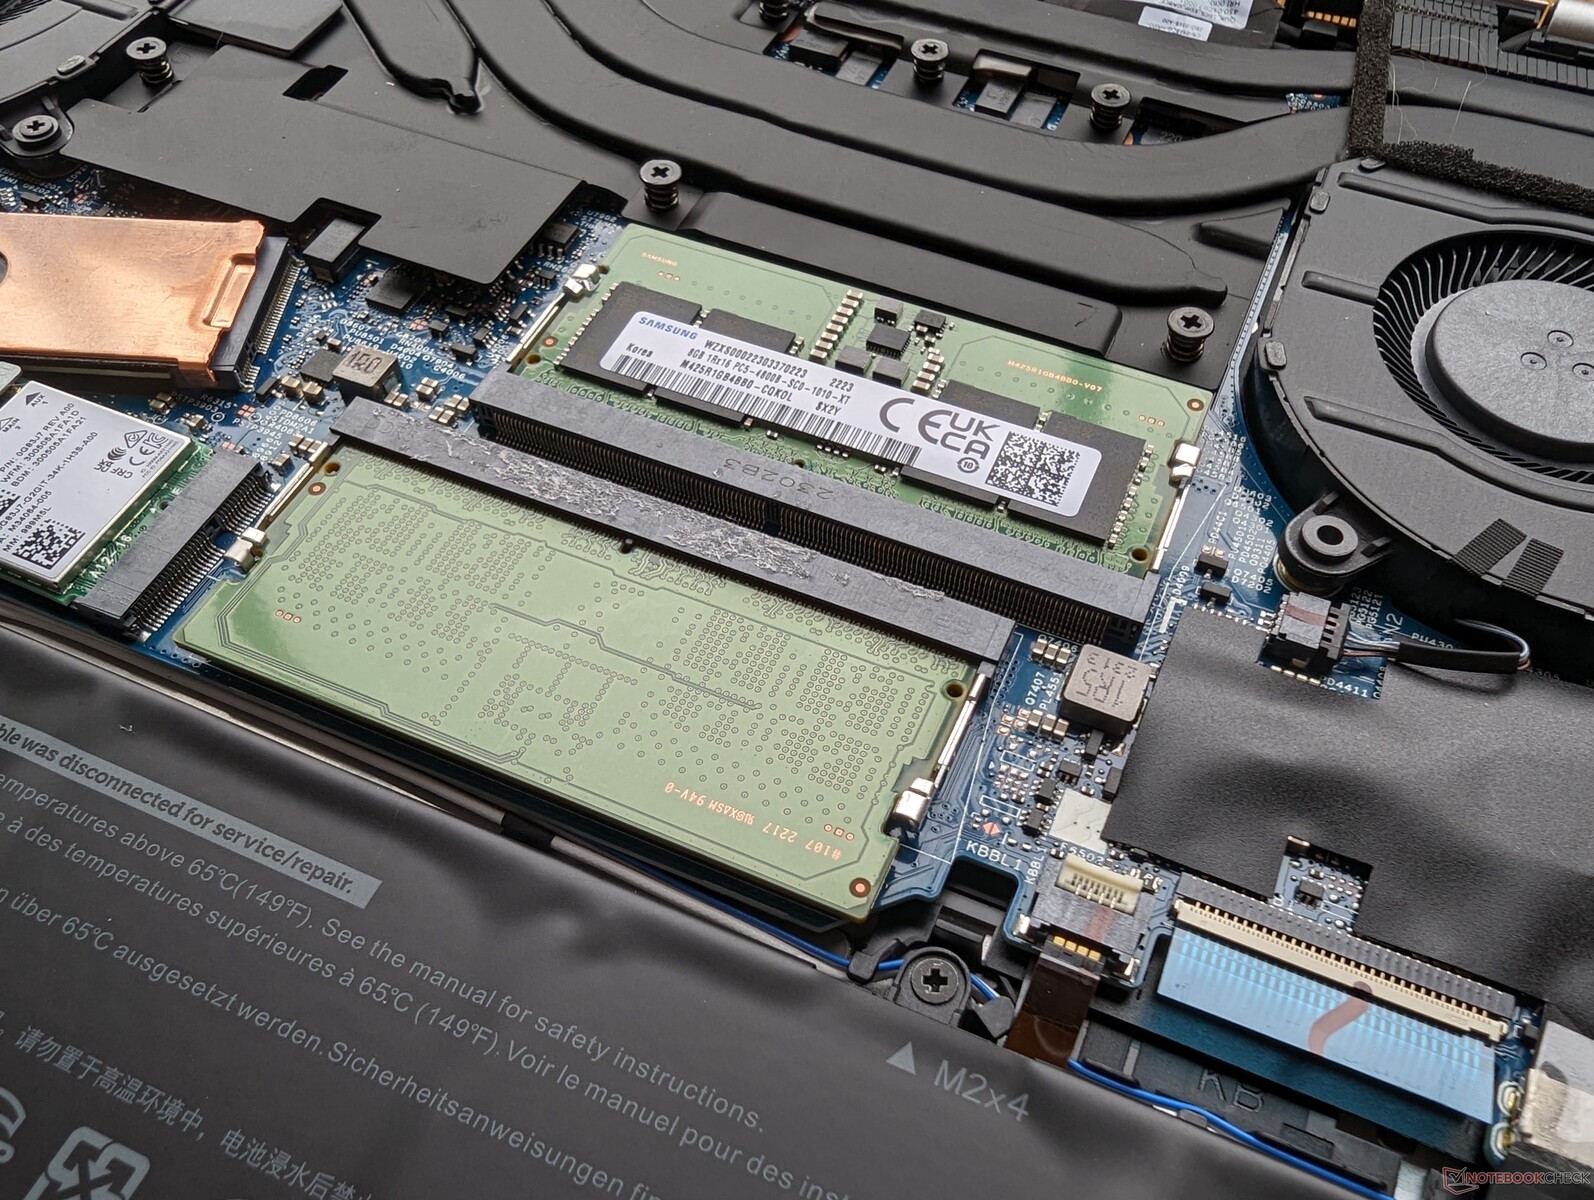
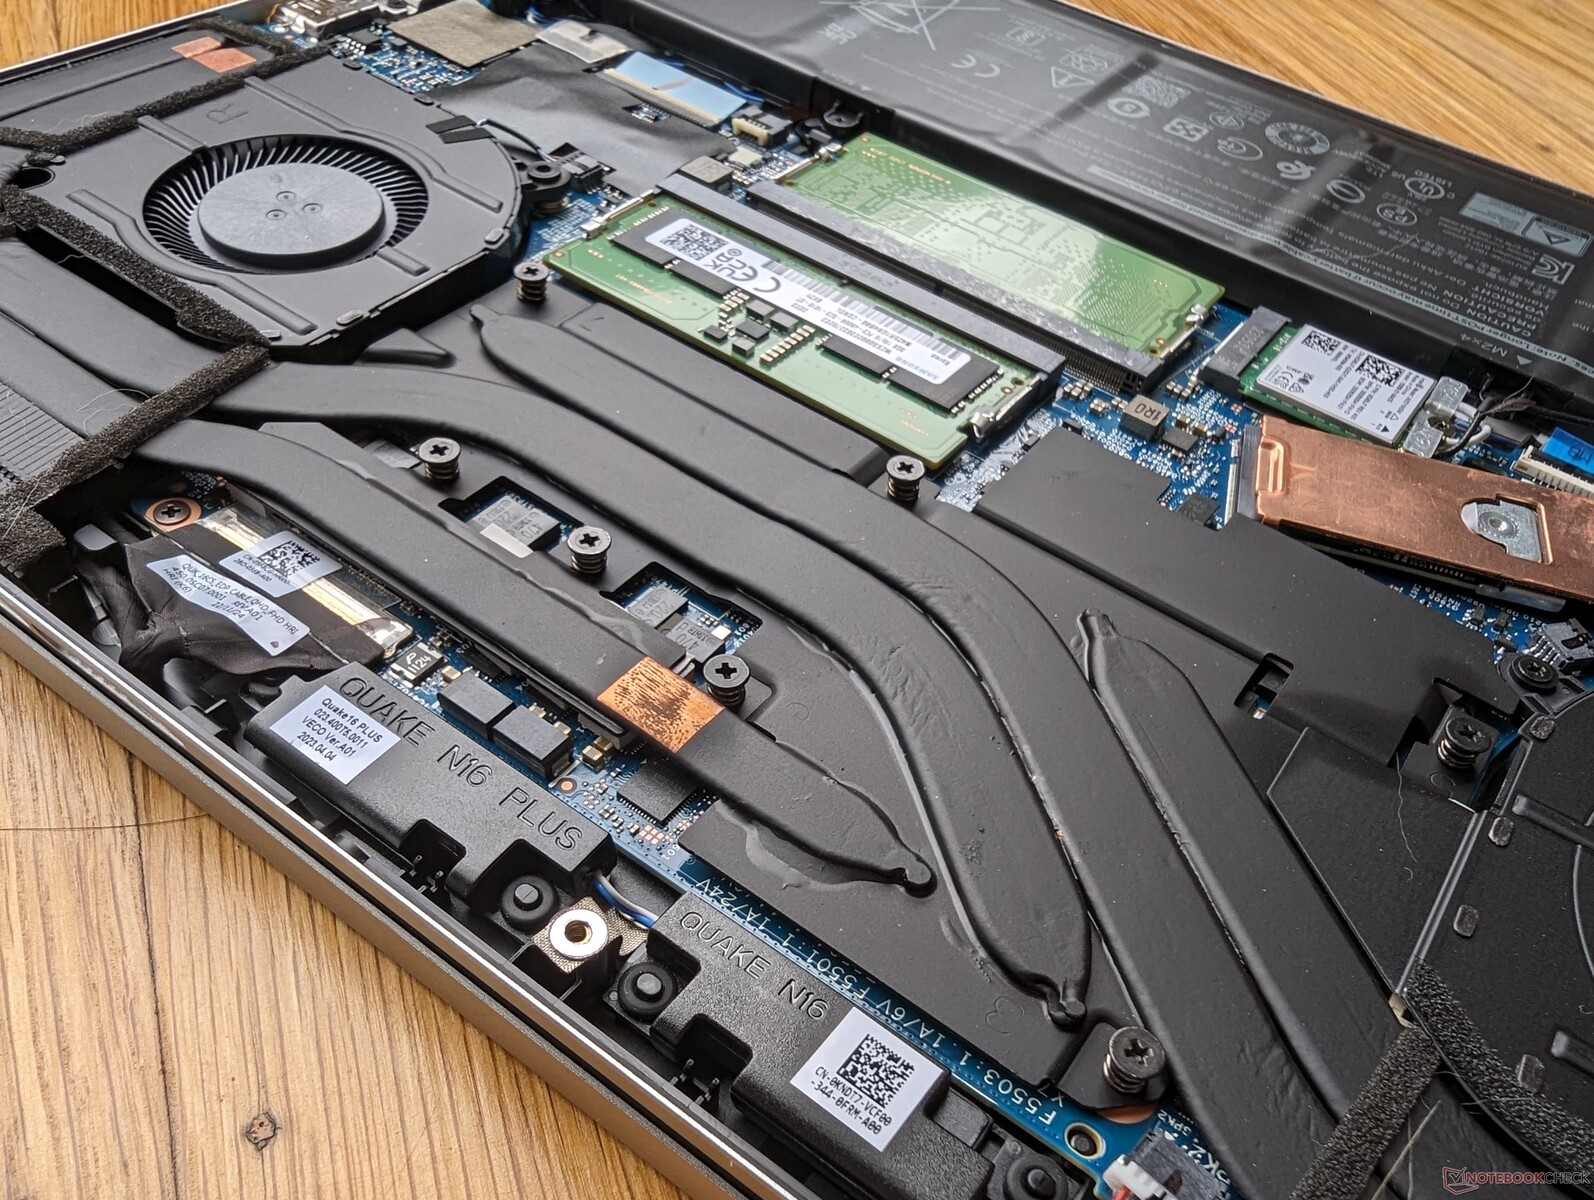
Il pannello inferiore richiede solo un cacciavite Phillips e un bordo affilato per una manutenzione relativamente facile. I proprietari hanno accesso diretto agli slot SSD, WLAN e 2x SODIMM, mentre il modello dell'anno scorso era limitato a un solo slot SODIMM, come mostrano le foto di confronto qui sotto. Le ventole sono più grandi e con heat pipe in rame più spesse per migliorare il potenziale di raffreddamento.
Si noti che la versione AMD di questo modello utilizza RAM LPDDR5 saldata, a differenza dell'approccio 2x SODIMM completamente espandibile della nostra versione Intel.
Accessori e garanzia
La confezione non contiene altri extra oltre all'adattatore CA e alla documentazione. Se acquistato negli Stati Uniti, si applica la consueta garanzia limitata di un anno del produttore.
Dispositivi di input - Sensazione di familiarità con l'Inspiron
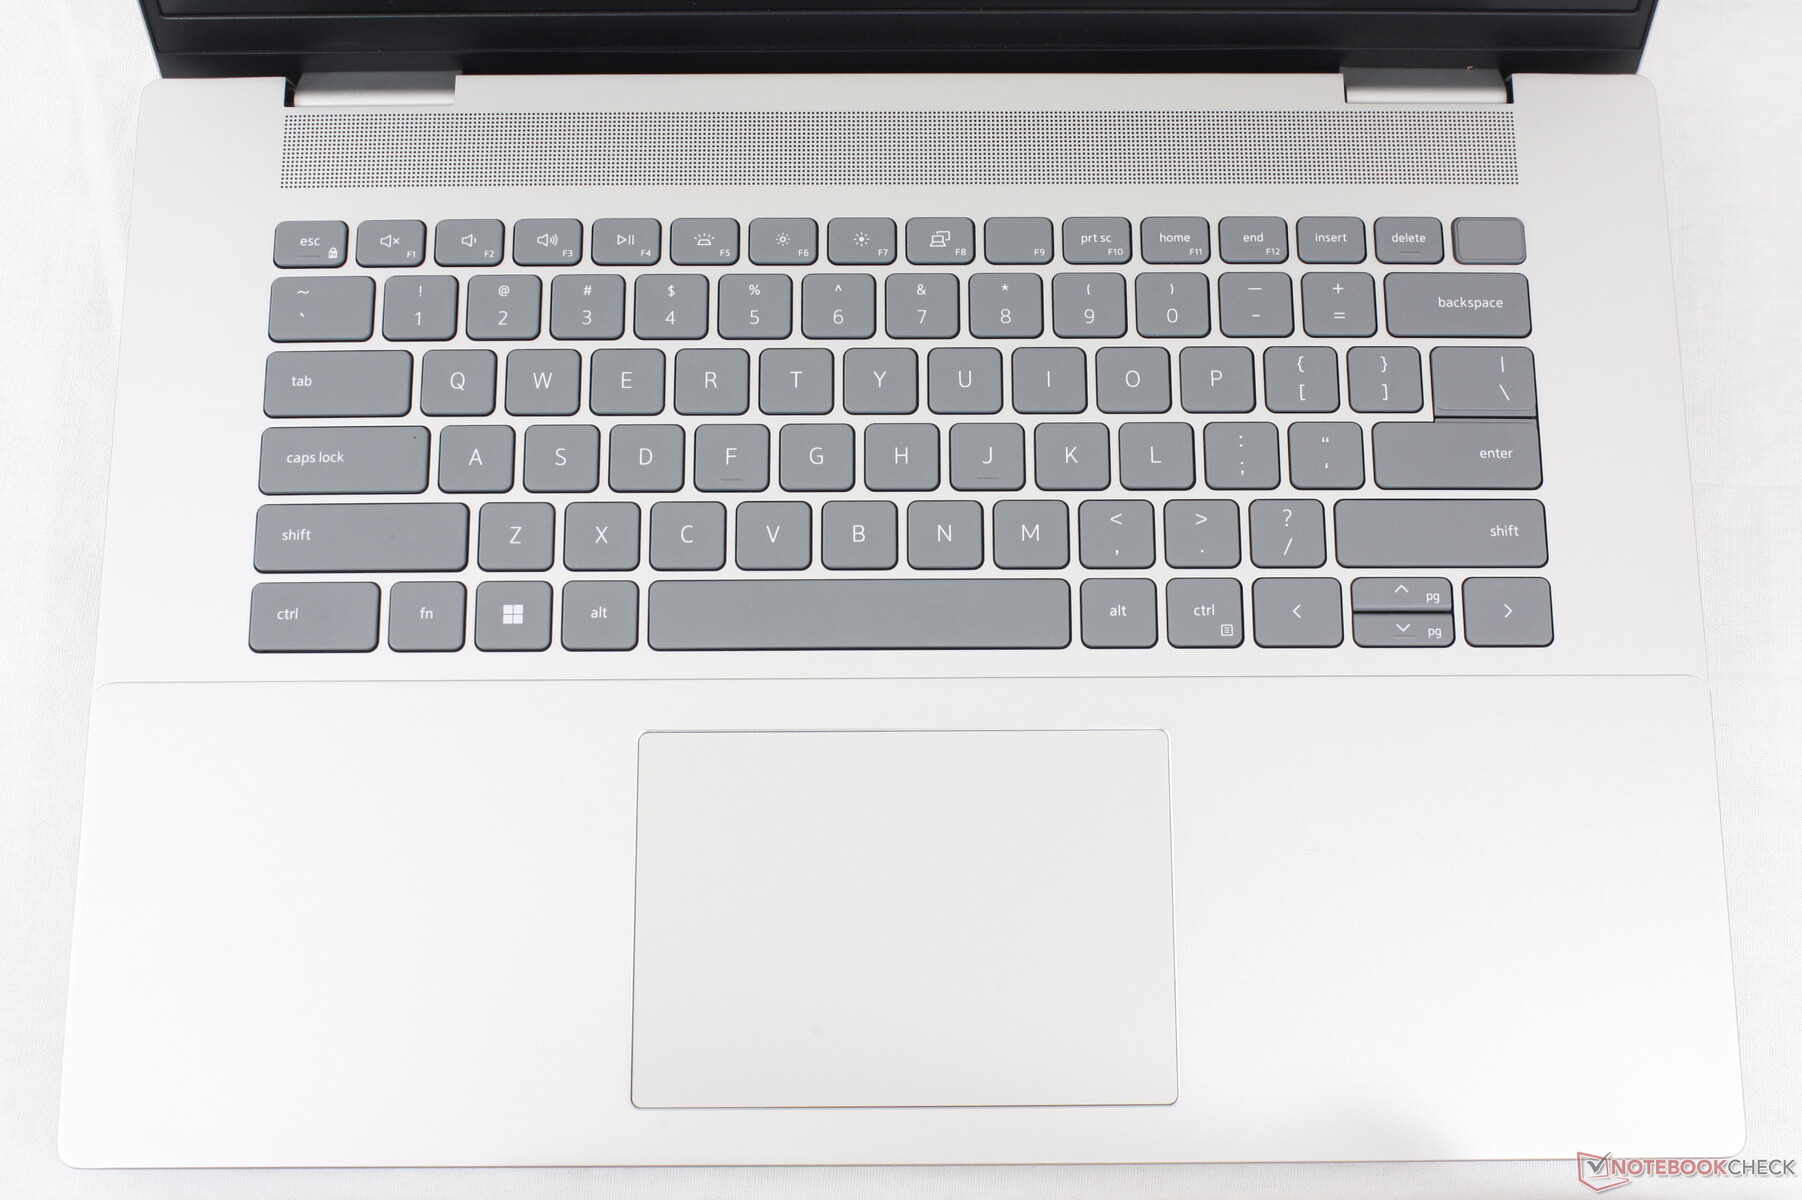
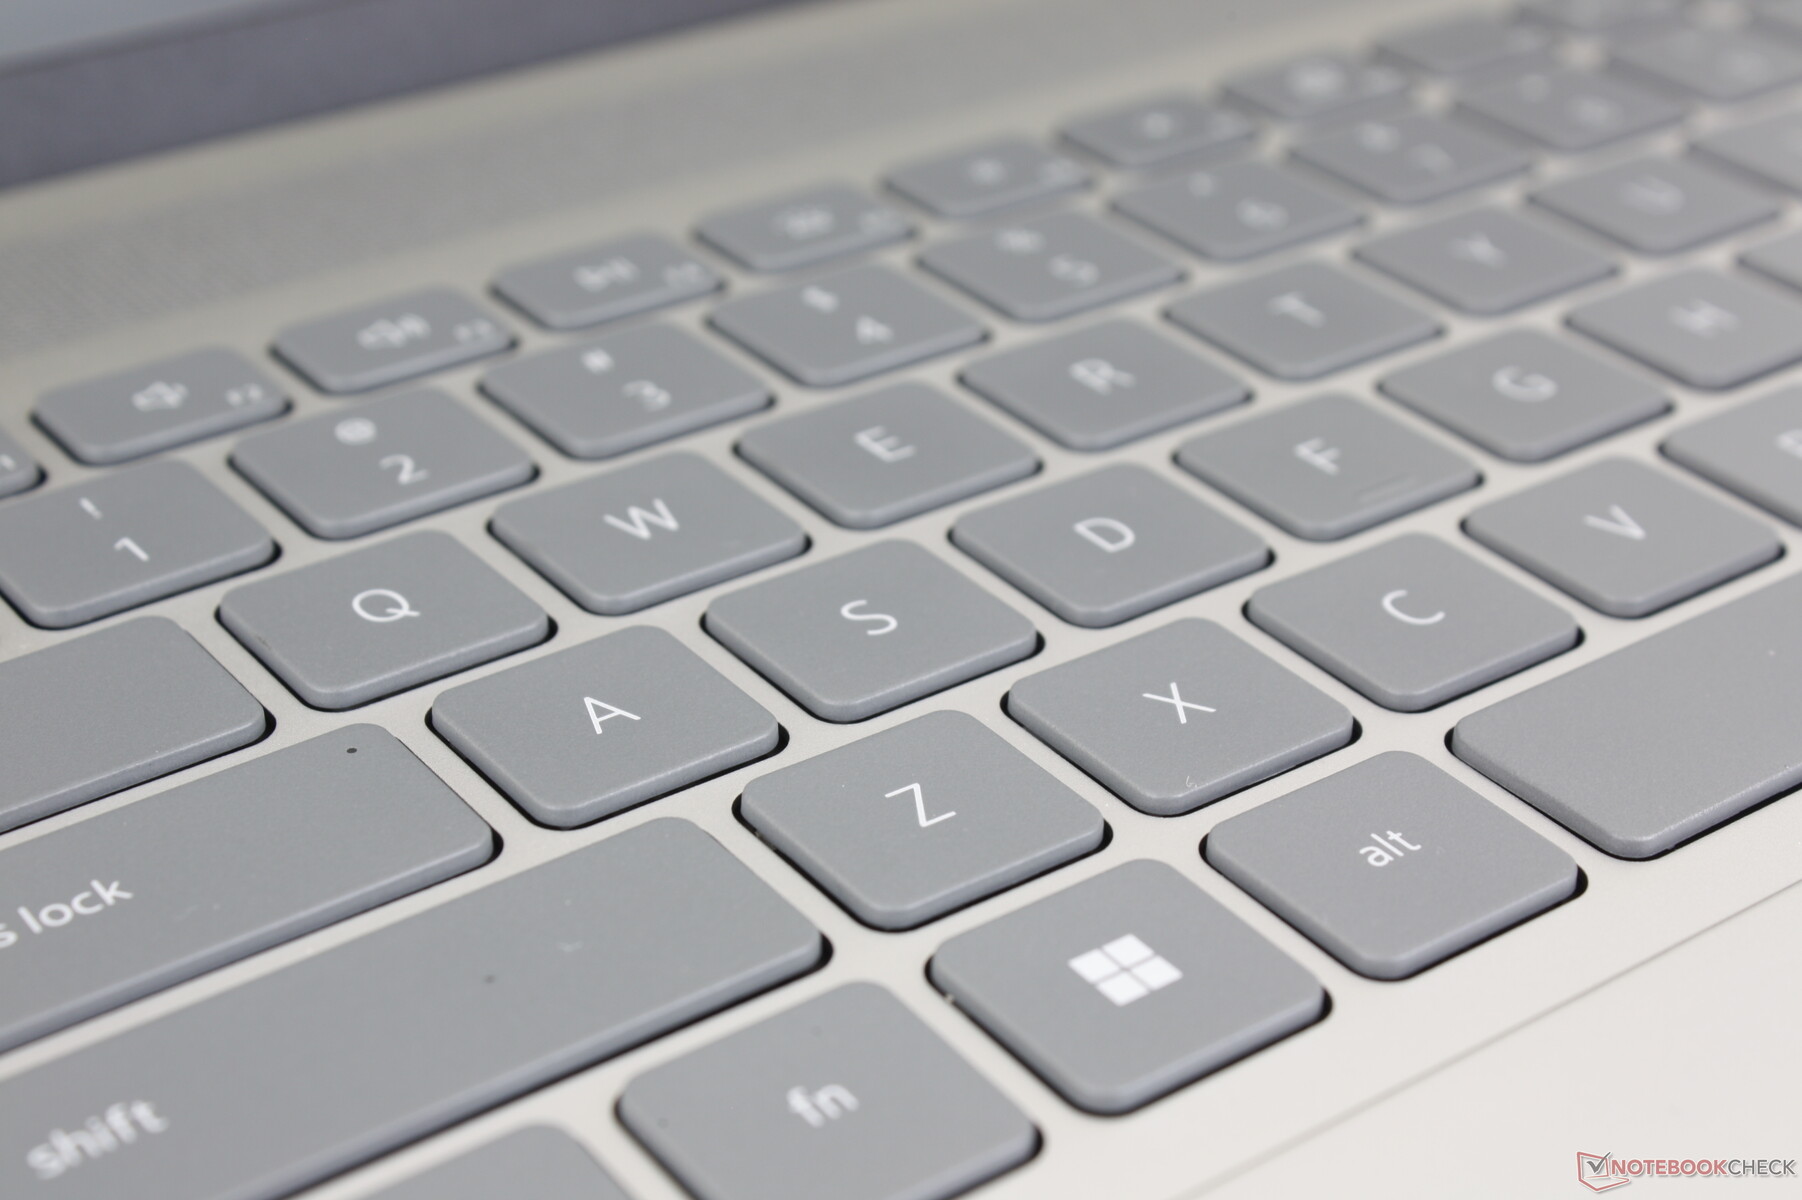
Tastiera
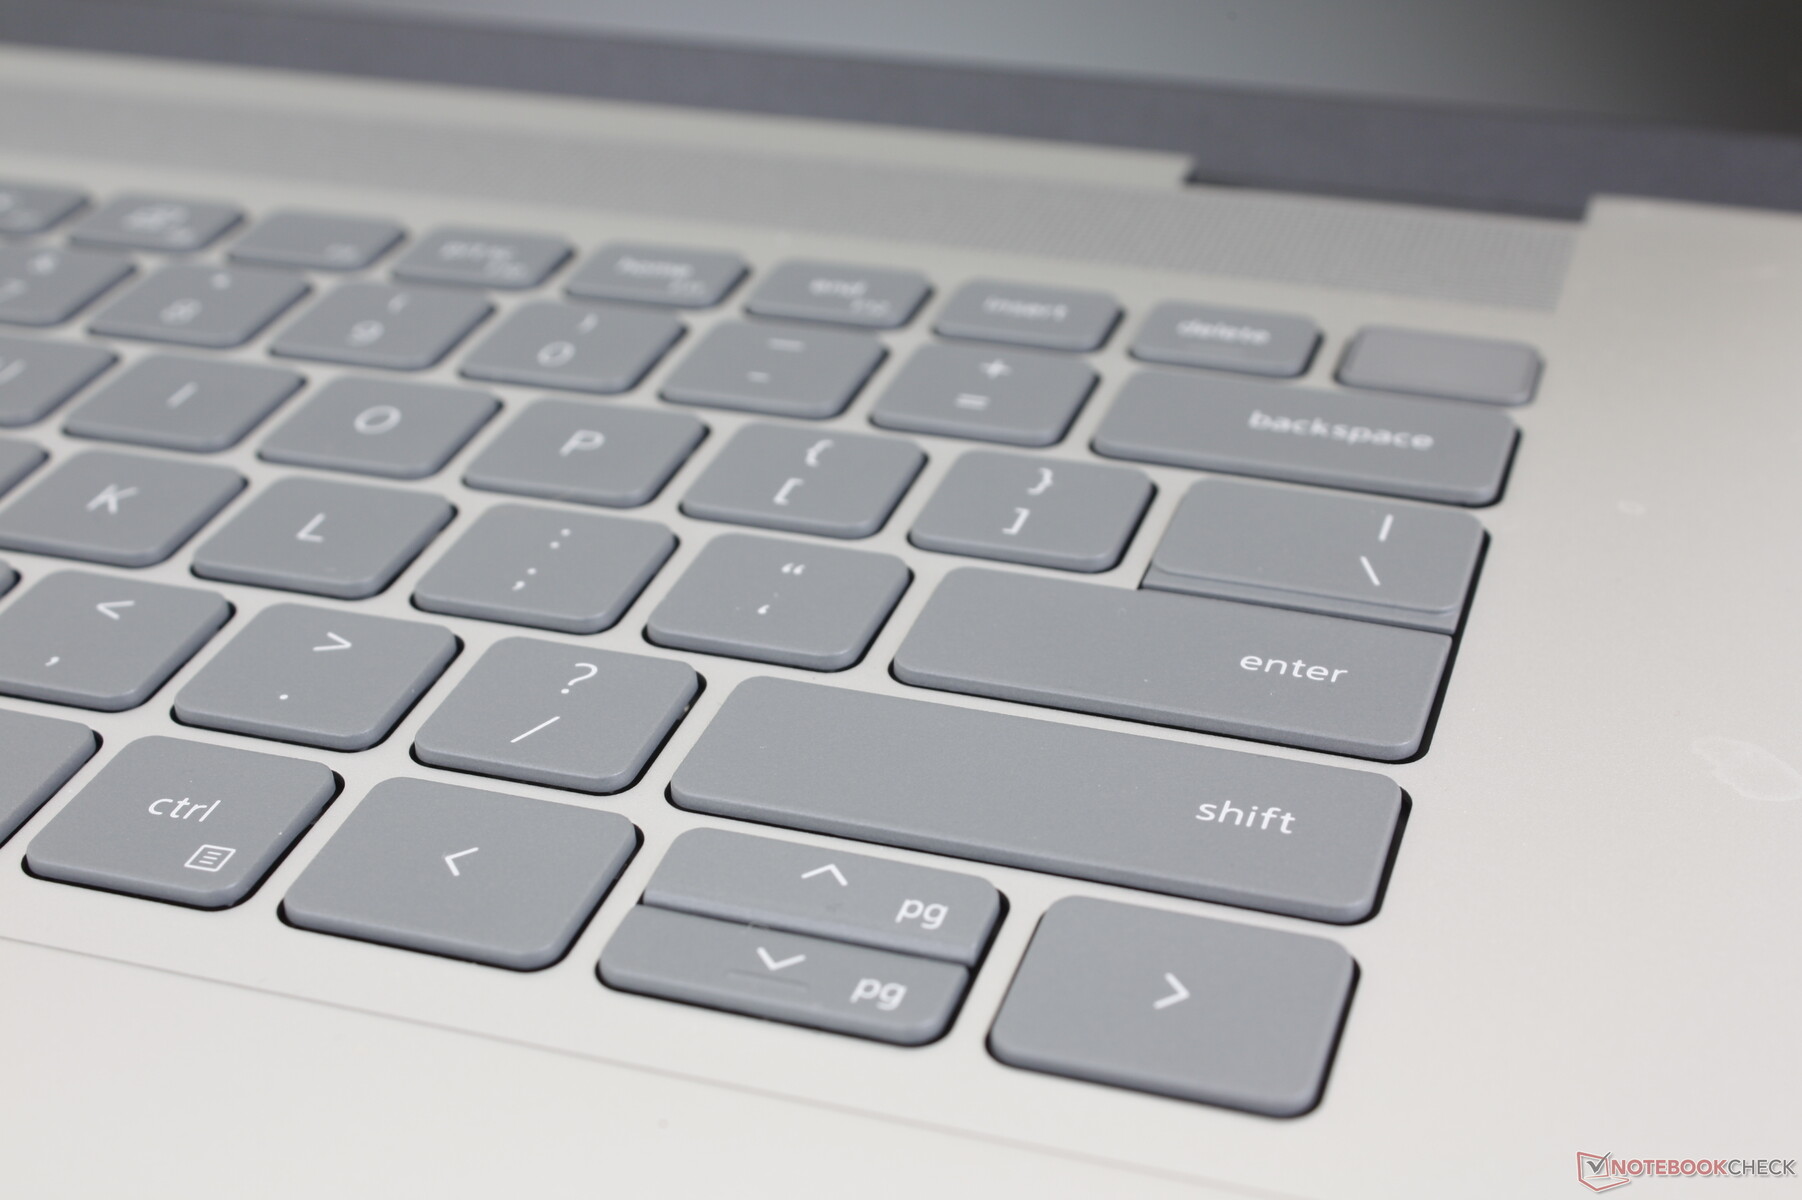
L'esperienza di digitazione rimane identica a quella dell' Inspiron 16 Plus 7620 fino a ciascun tasto funzione e azione secondaria. Questo non è necessariamente un aspetto negativo, poiché la coerenza tra i diversi modelli Inspiron è apprezzata. Tuttavia, altri computer portatili multimediali come l LG Gram 16 o HP Spectre x360 16 hanno tasti decisamente più solidi e confortevoli.
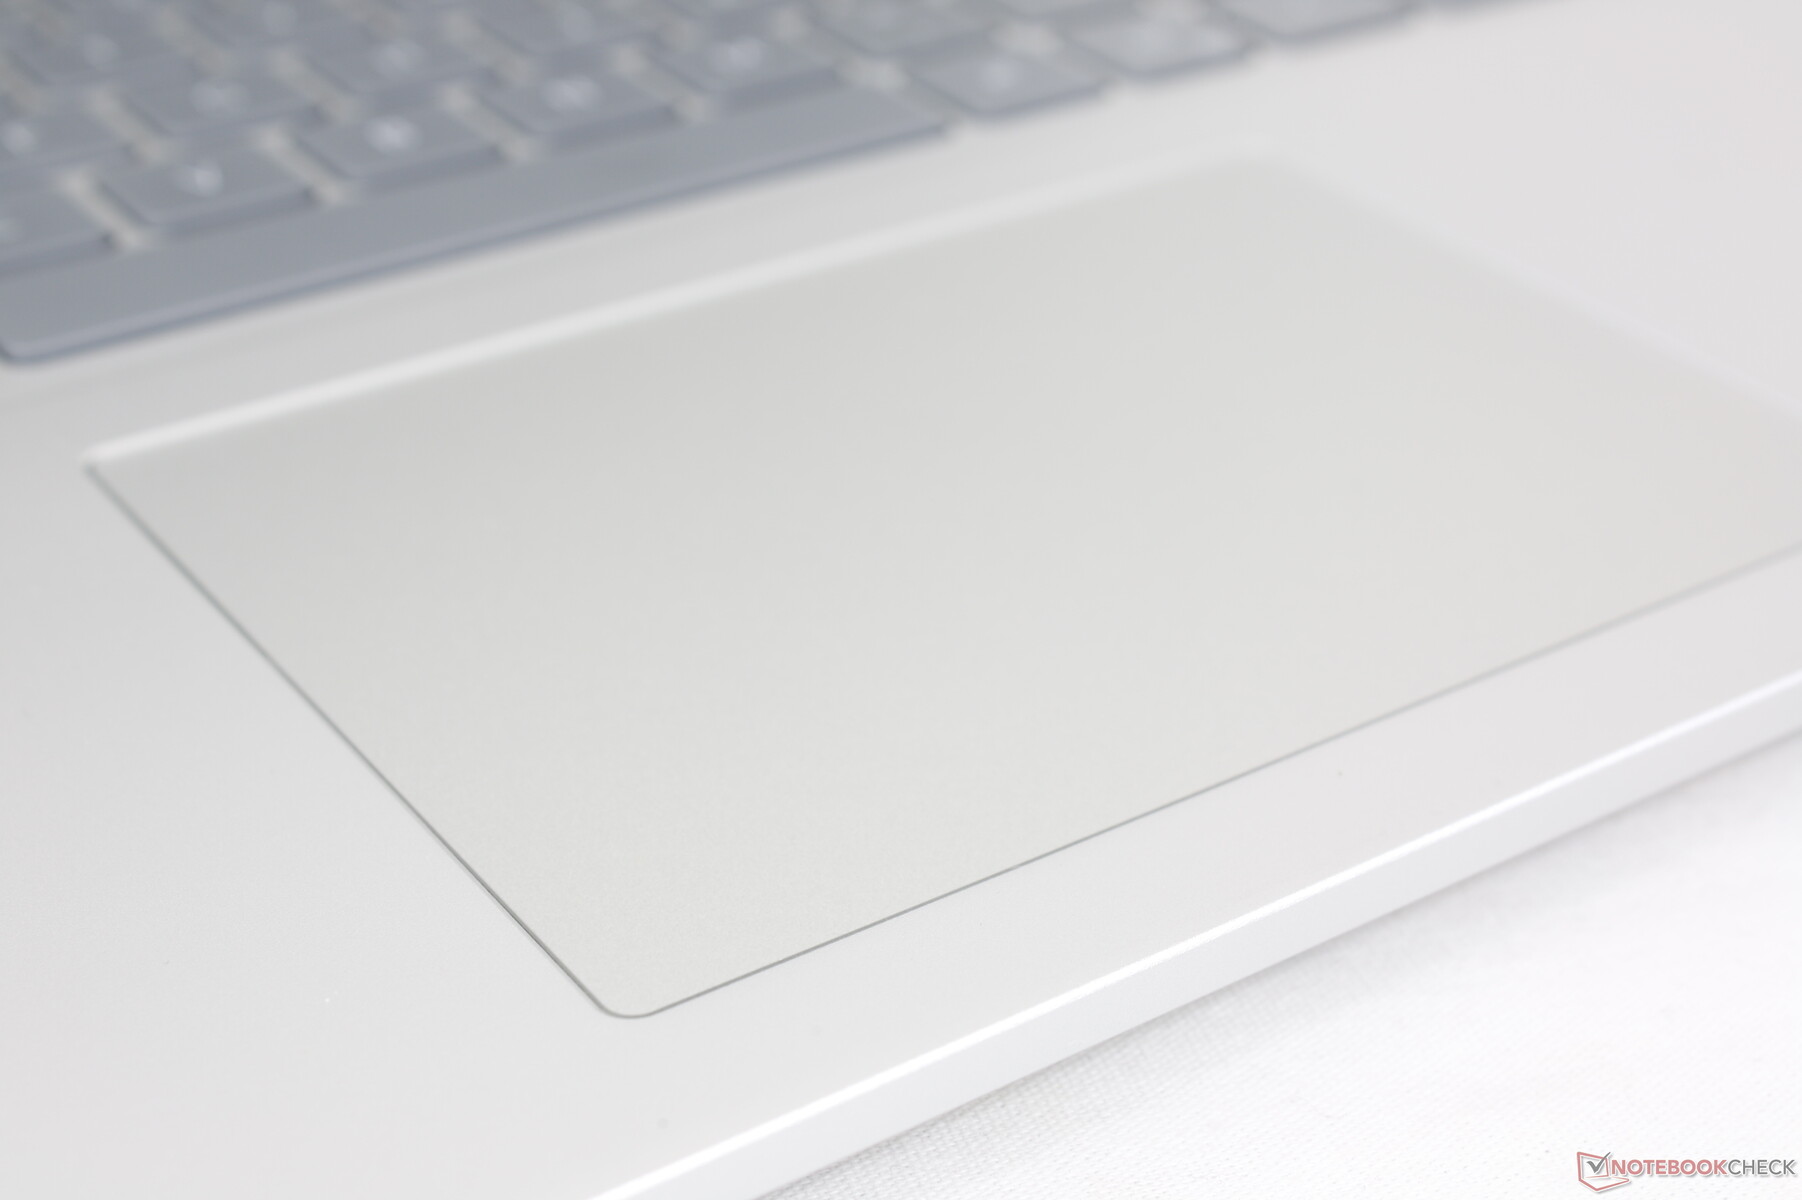
Touchpad
Il clickpad ha le stesse dimensioni di quello del modello dello scorso anno (11,5 x 8 cm). Lo scorrimento è fluido, con un po' di aderenza alle velocità più basse, per input più precisi. Il feedback quando si preme sul clickpad è sfortunatamente un po' troppo morbido, nonostante il forte clic.
Display - Decente ma con opzioni limitate
Le opzioni di visualizzazione sono cambiate rispetto al precedente Inspiron 16 Plus 7620. Il pannello 3K 3072 x 1920 è stato eliminato a favore di queste due nuove opzioni:
- 2560 x 1600 (2,5K), 120 Hz
- 1920 x 1200, 60 Hz
Entrambe le opzioni sono IPS e non touch e non supportano G-Sync. Le nostre misurazioni qui sotto riflettono solo l'opzione a 1600p in grassetto.
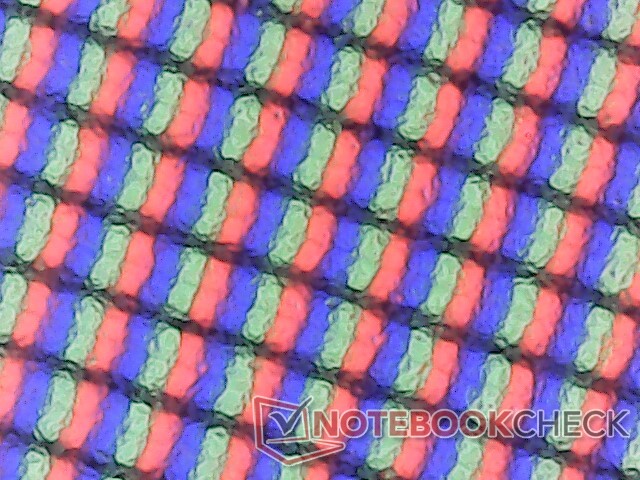
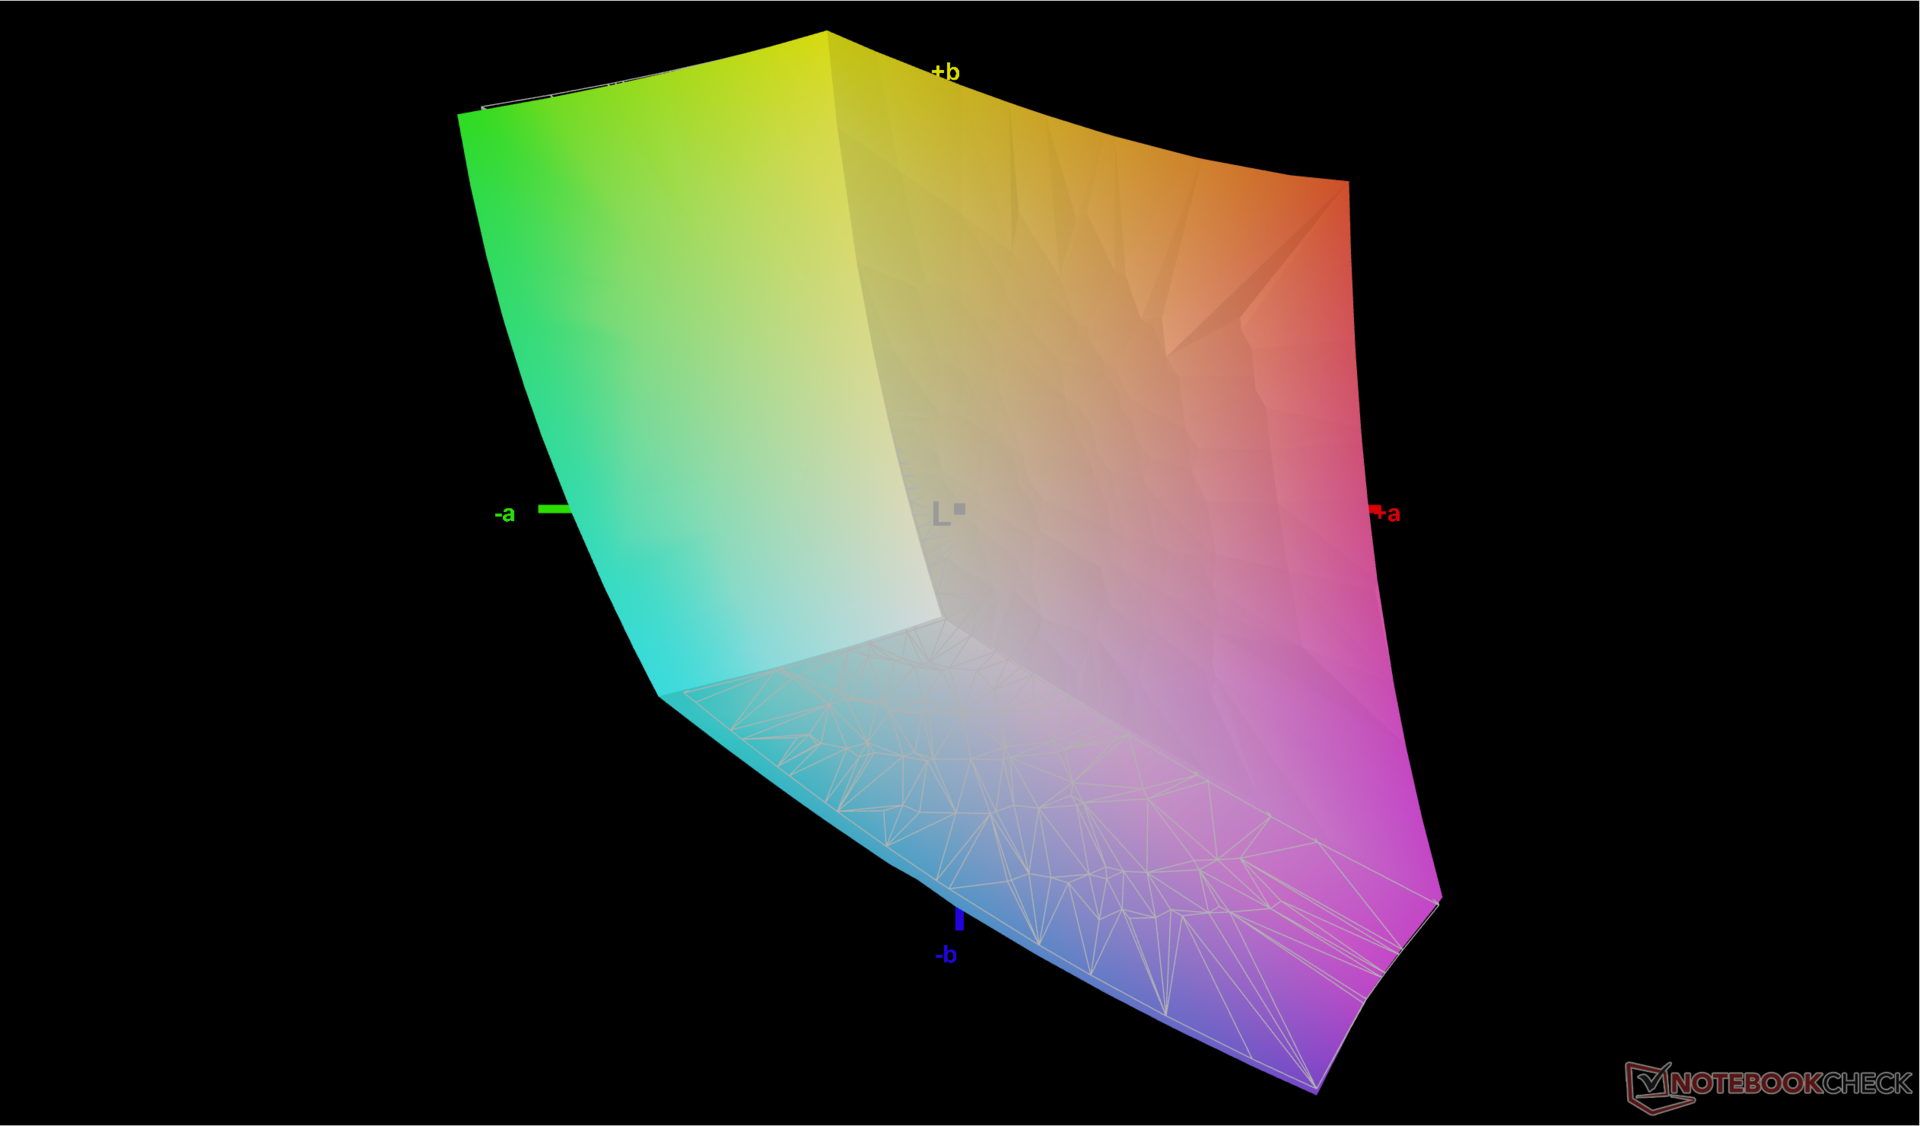
Rispetto al pannello BOE 3K dell'anno scorso, il nuovo pannello LG Philips 2.5K ha una frequenza di aggiornamento nativa doppia al costo di una risoluzione nativa inferiore. Per il resto, la copertura completa sRGB, la luminosità di 300 nit, il rapporto di contrasto >1000:1 e i tempi di risposta medi sono abbastanza simili tra loro. Tuttavia, modelli concorrenti come il Vivobook Pro 16X o Envy 16 offrono opzioni di risoluzione più elevate con colori ancora più intensi che i creatori di contenuti potrebbero apprezzare. Il nostro pannello LG Philips è quindi più attento al budget.
| |||||||||||||||||||||||||
Distribuzione della luminosità: 92 %
Al centro con la batteria: 299.4 cd/m²
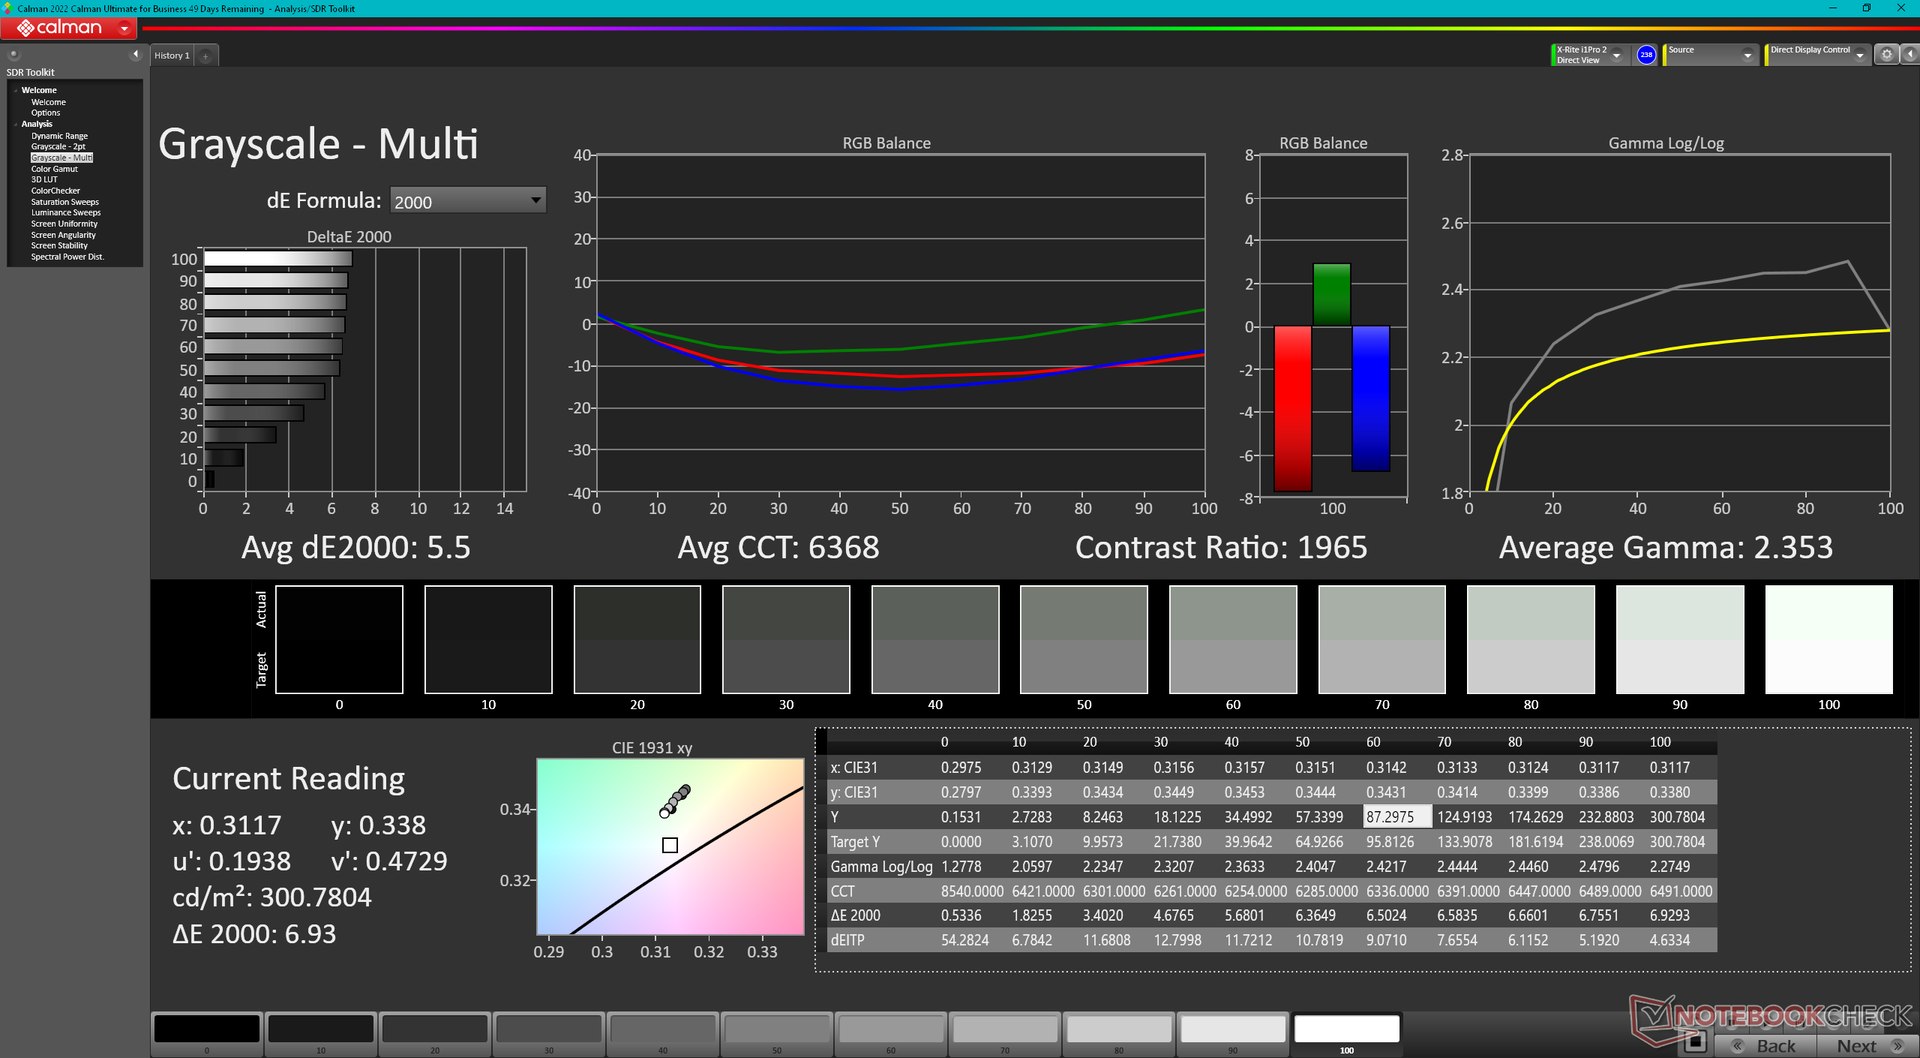
Contrasto: 1426:1 (Nero: 0.21 cd/m²)
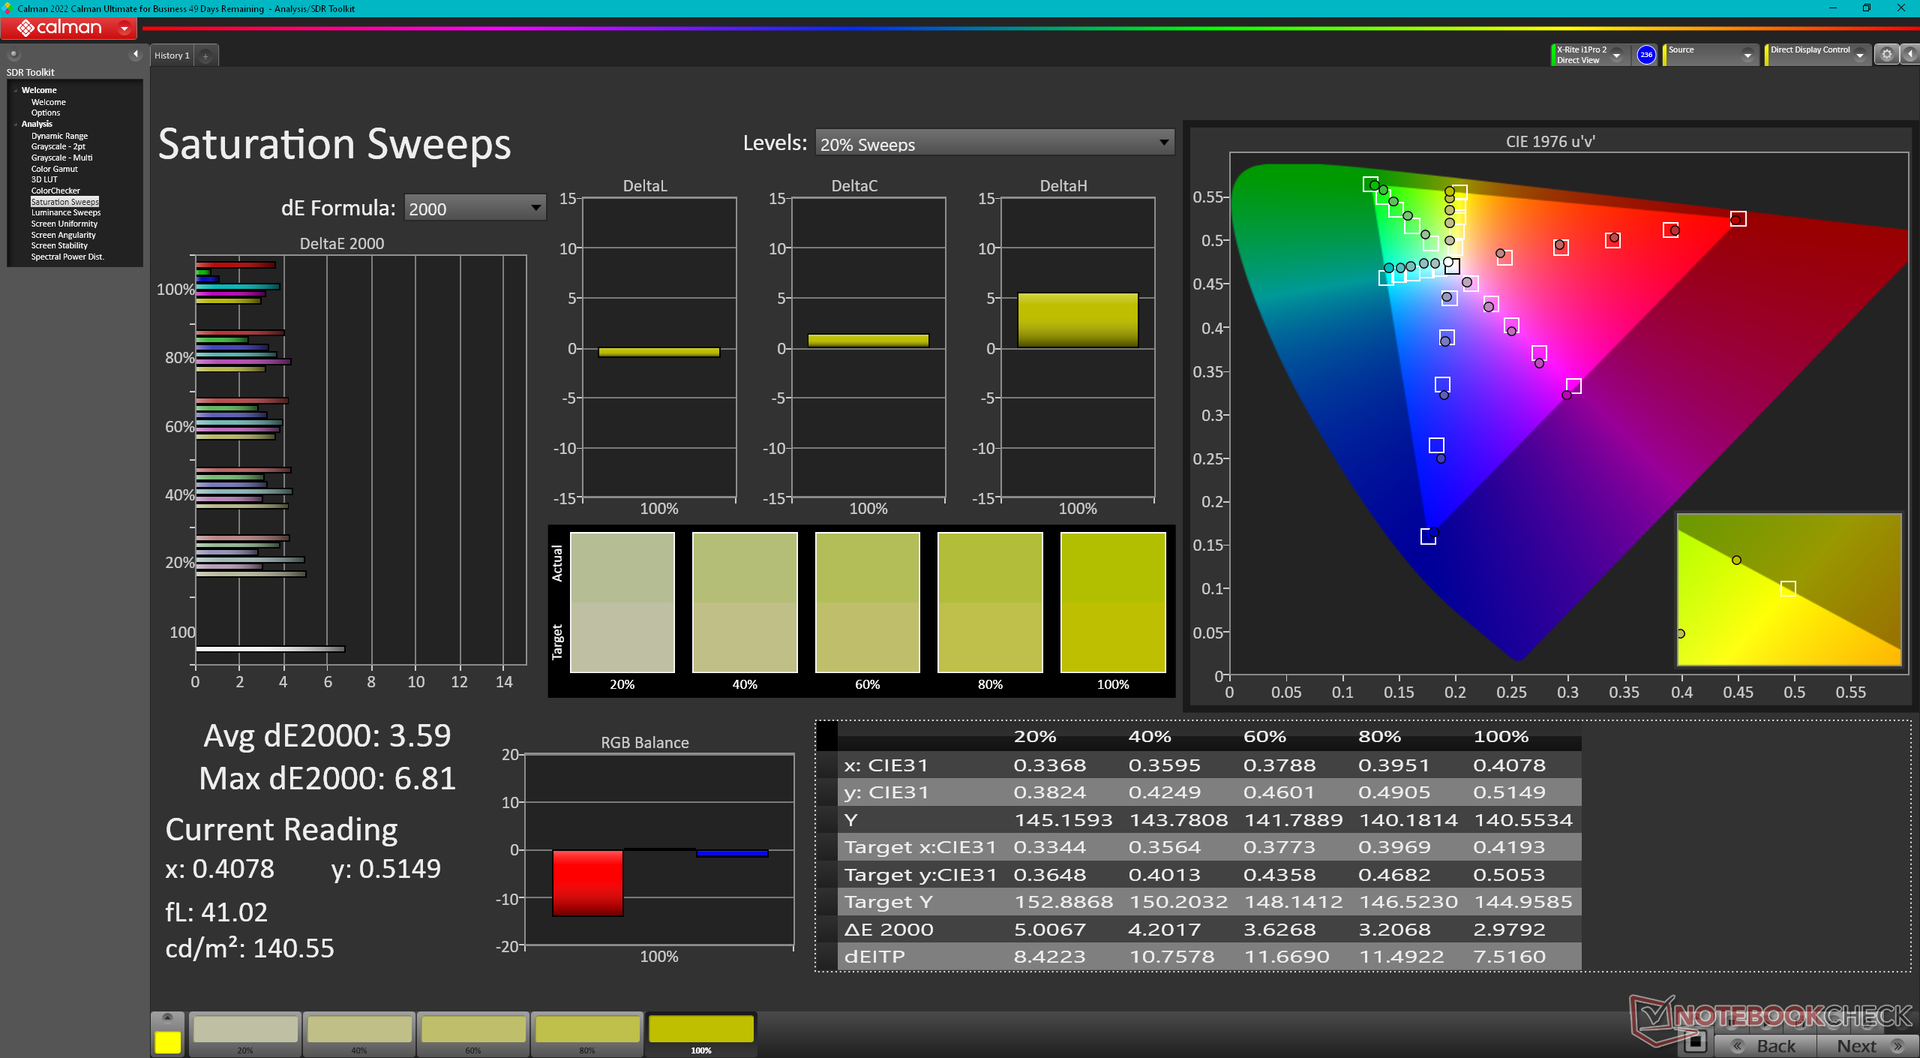
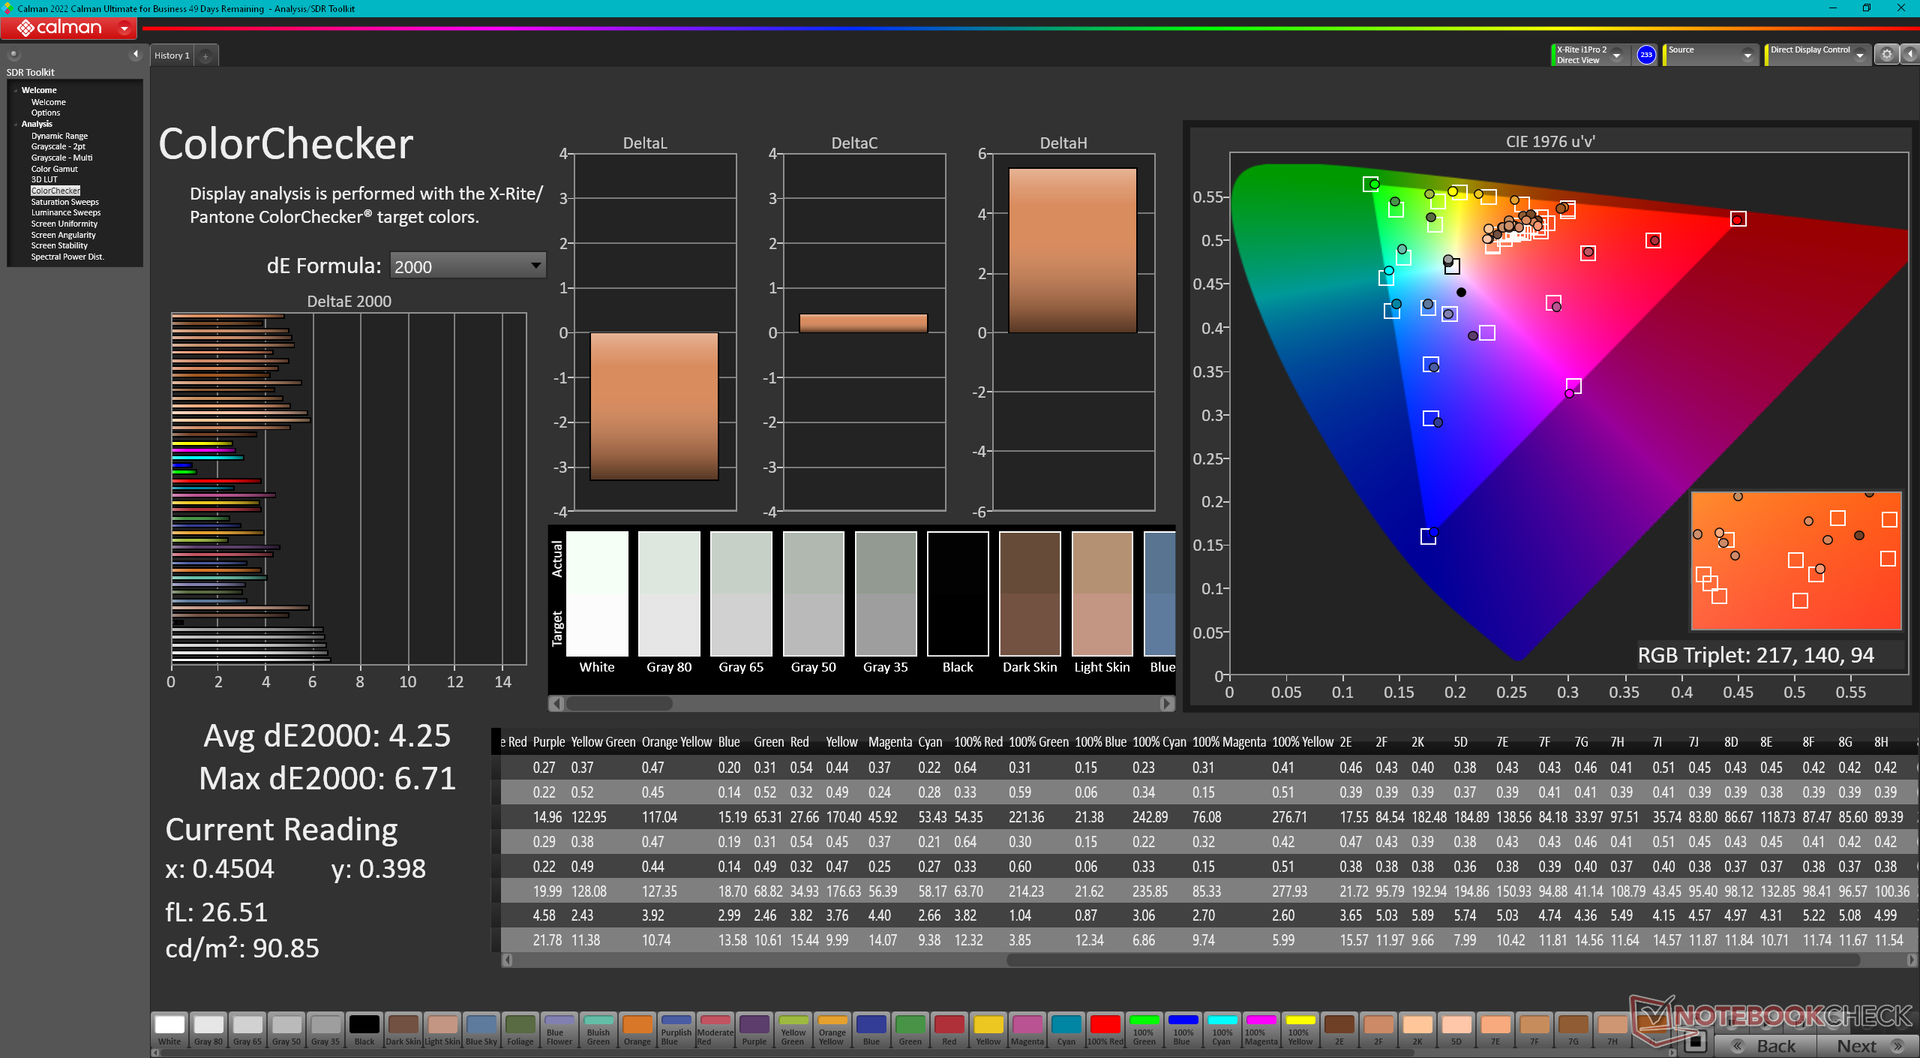
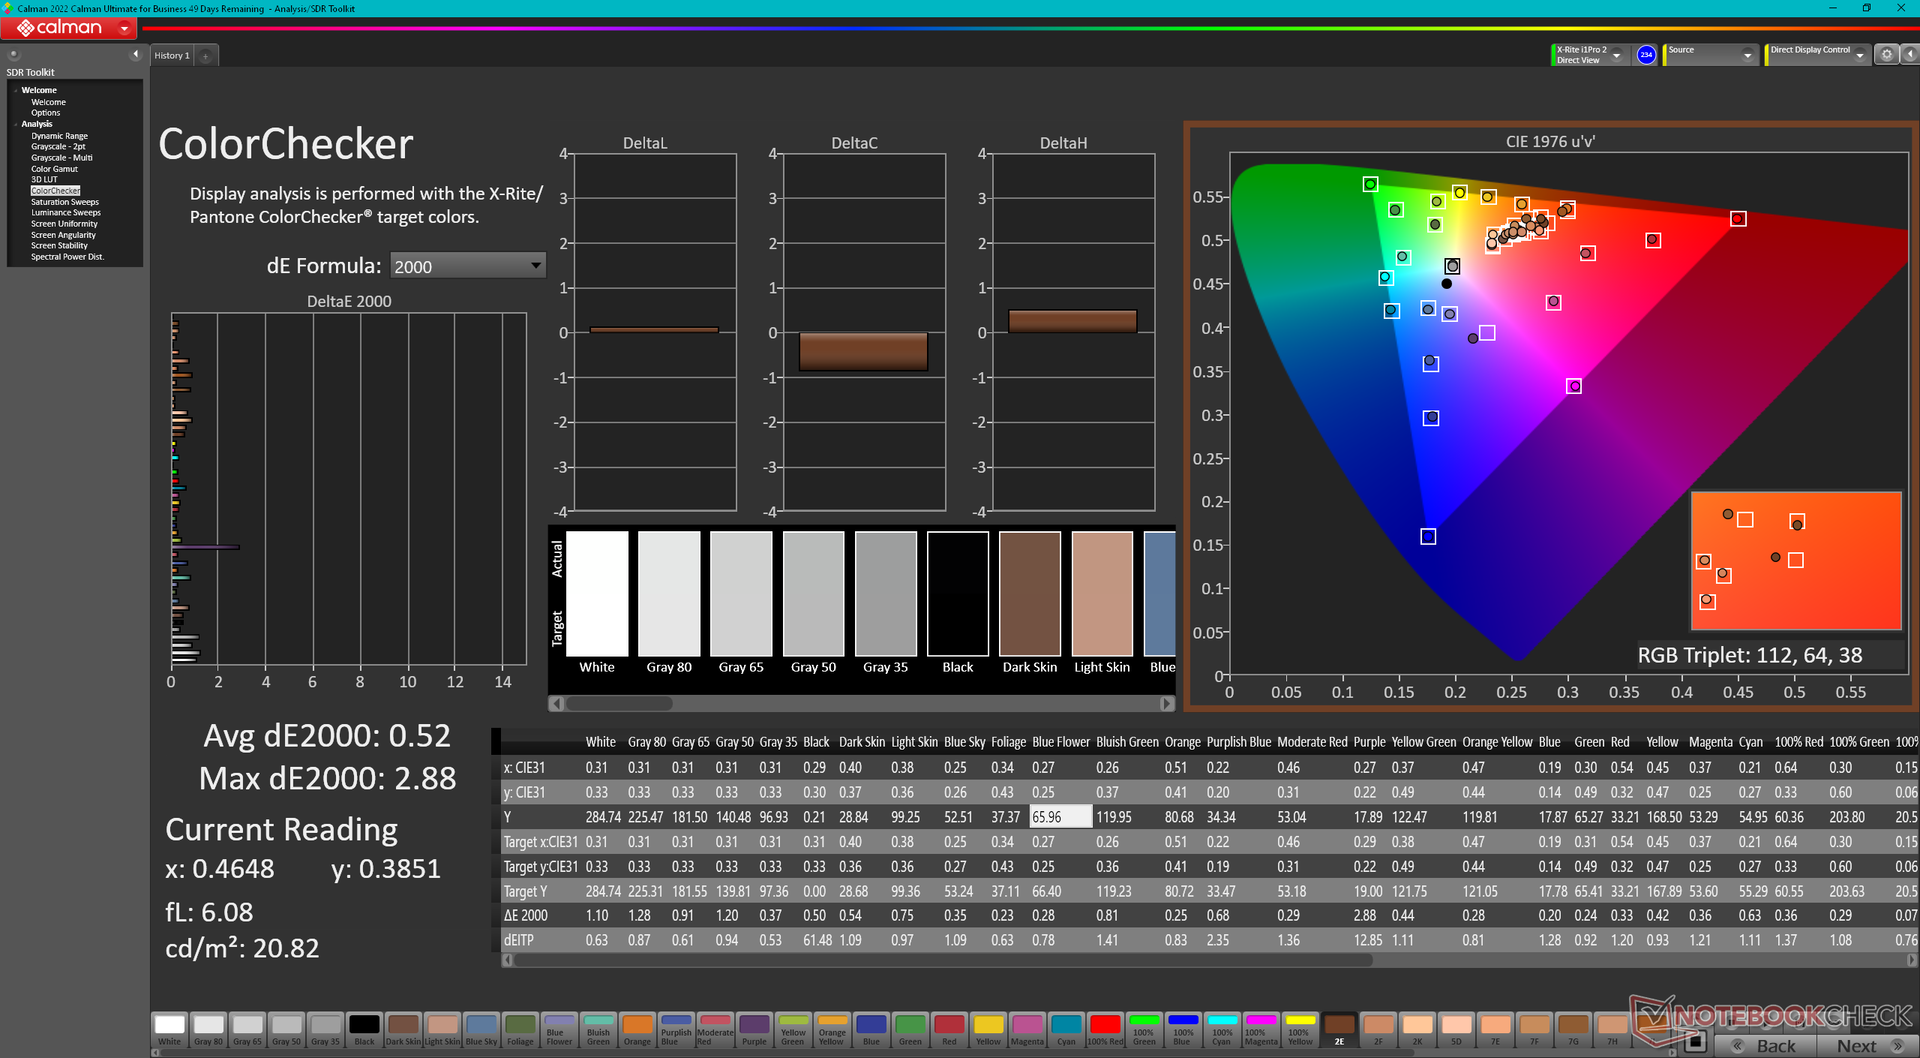
ΔE ColorChecker Calman: 4.25 | ∀{0.5-29.43 Ø4.71}
calibrated: 0.52
ΔE Greyscale Calman: 5.5 | ∀{0.09-98 Ø4.96}
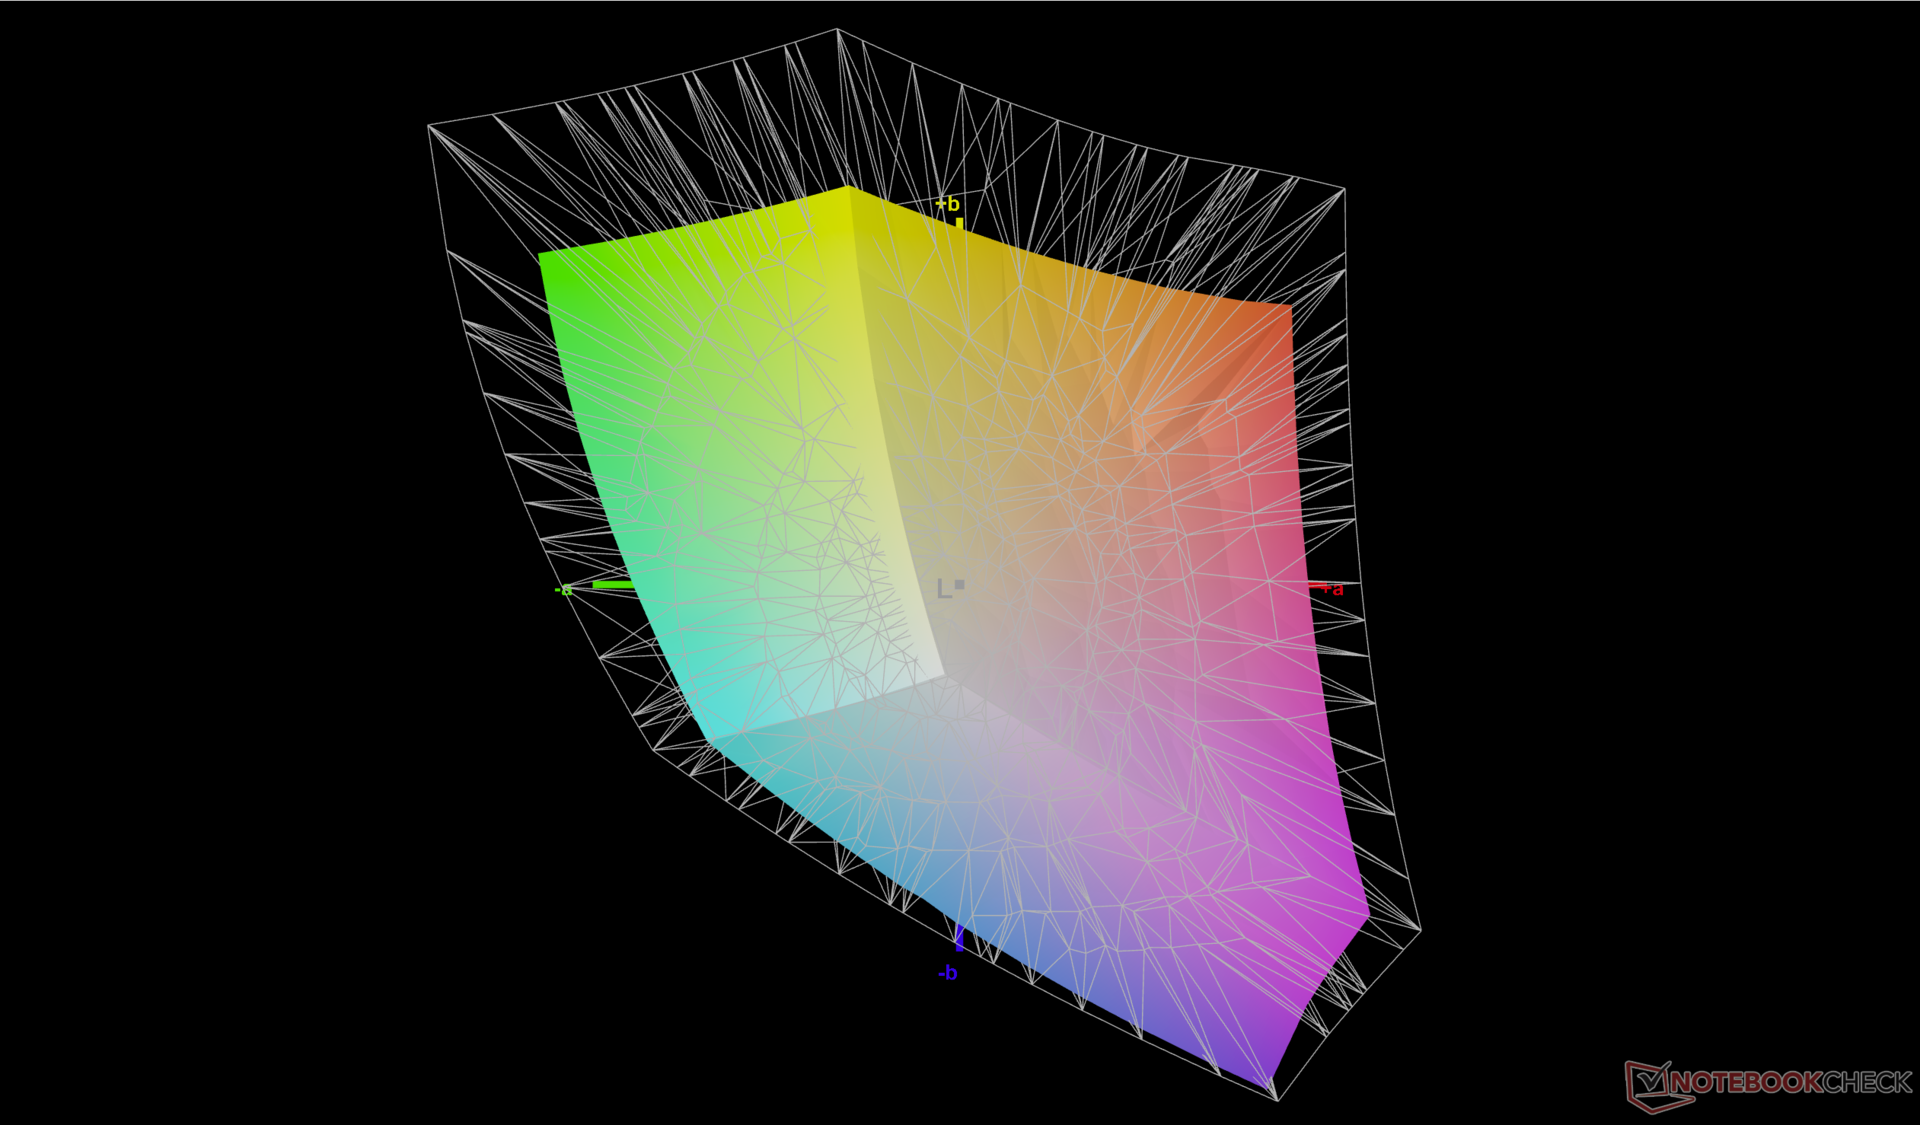
72.3% AdobeRGB 1998 (Argyll 3D)
99.6% sRGB (Argyll 3D)
70.1% Display P3 (Argyll 3D)
Gamma: 2.35
CCT: 6368 K
| Dell Inspiron 16 Plus 7630 LG Philips 160WQ2, IPS, 2560x1600, 16" | Dell Inspiron 16 Plus 7620 BOE NE16N41, IPS, 3072x1920, 16" | Lenovo Slim Pro 9i 16IRP8 LEN160-3.2K, Mini-LED, 3200x2000, 16" | Asus Vivobook Pro 16X K6604JV-MX016W Samsung SDC4178 ATNA60BX01-1, OLED, 3200x2000, 16" | HP Envy 16 h0112nr Samsung SDC4174, OLED, 3840x2400, 16" | MSI Summit E16 Flip A12UDT-031 AU Optronics B16QAN02.N, IPS, 2560x1600, 16" | |
|---|---|---|---|---|---|---|
| Display | 1% | 18% | 24% | 21% | 20% | |
| Display P3 Coverage (%) | 70.1 | 70.8 1% | 95.1 36% | 98.4 40% | 99.3 42% | 98.9 41% |
| sRGB Coverage (%) | 99.6 | 99.5 0% | 99.9 0% | 99.7 0% | 100 0% | 100 0% |
| AdobeRGB 1998 Coverage (%) | 72.3 | 73.2 1% | 84.6 17% | 95.8 33% | 88 22% | 86.5 20% |
| Response Times | -13% | 61% | 95% | 93% | 63% | |
| Response Time Grey 50% / Grey 80% * (ms) | 35 ? | 38 ? -9% | 14 ? 60% | 1.6 ? 95% | 2 ? 94% | 13 ? 63% |
| Response Time Black / White * (ms) | 24.2 ? | 28 ? -16% | 9.2 ? 62% | 1.4 ? 94% | 1.9 ? 92% | 9 ? 63% |
| PWM Frequency (Hz) | 5784 ? | 120 ? | 240.4 ? | |||
| Screen | 14% | -55% | 35% | 30% | -5% | |
| Brightness middle (cd/m²) | 299.4 | 288.9 -4% | 627.4 110% | 347 16% | 328.8 10% | 314 5% |
| Brightness (cd/m²) | 290 | 276 -5% | 618 113% | 346 19% | 332 14% | 294 1% |
| Brightness Distribution (%) | 92 | 92 0% | 95 3% | 97 5% | 97 5% | 89 -3% |
| Black Level * (cd/m²) | 0.21 | 0.26 -24% | 0.19 10% | 0.06 71% | 0.28 -33% | |
| Contrast (:1) | 1426 | 1111 -22% | 3302 132% | 5783 306% | 1121 -21% | |
| Colorchecker dE 2000 * | 4.25 | 1.88 56% | 5.84 -37% | 1.89 56% | 1.53 64% | 3.08 28% |
| Colorchecker dE 2000 max. * | 6.71 | 4.37 35% | 10.22 -52% | 3.26 51% | 6.04 10% | 5.49 18% |
| Colorchecker dE 2000 calibrated * | 0.52 | 0.42 19% | 4.45 -756% | 1.97 -279% | 0.88 -69% | |
| Greyscale dE 2000 * | 5.5 | 1.4 75% | 6.7 -22% | 1.55 72% | 1.3 76% | 3.99 27% |
| Gamma | 2.35 94% | 2.3 96% | 2.77 79% | 2.39 92% | 2.18 101% | 2.3 96% |
| CCT | 6368 102% | 6634 98% | 5795 112% | 6458 101% | 6362 102% | 6219 105% |
| Media totale (Programma / Settaggio) | 1% /
8% | 8% /
-23% | 51% /
41% | 48% /
39% | 26% /
10% |
* ... Meglio usare valori piccoli
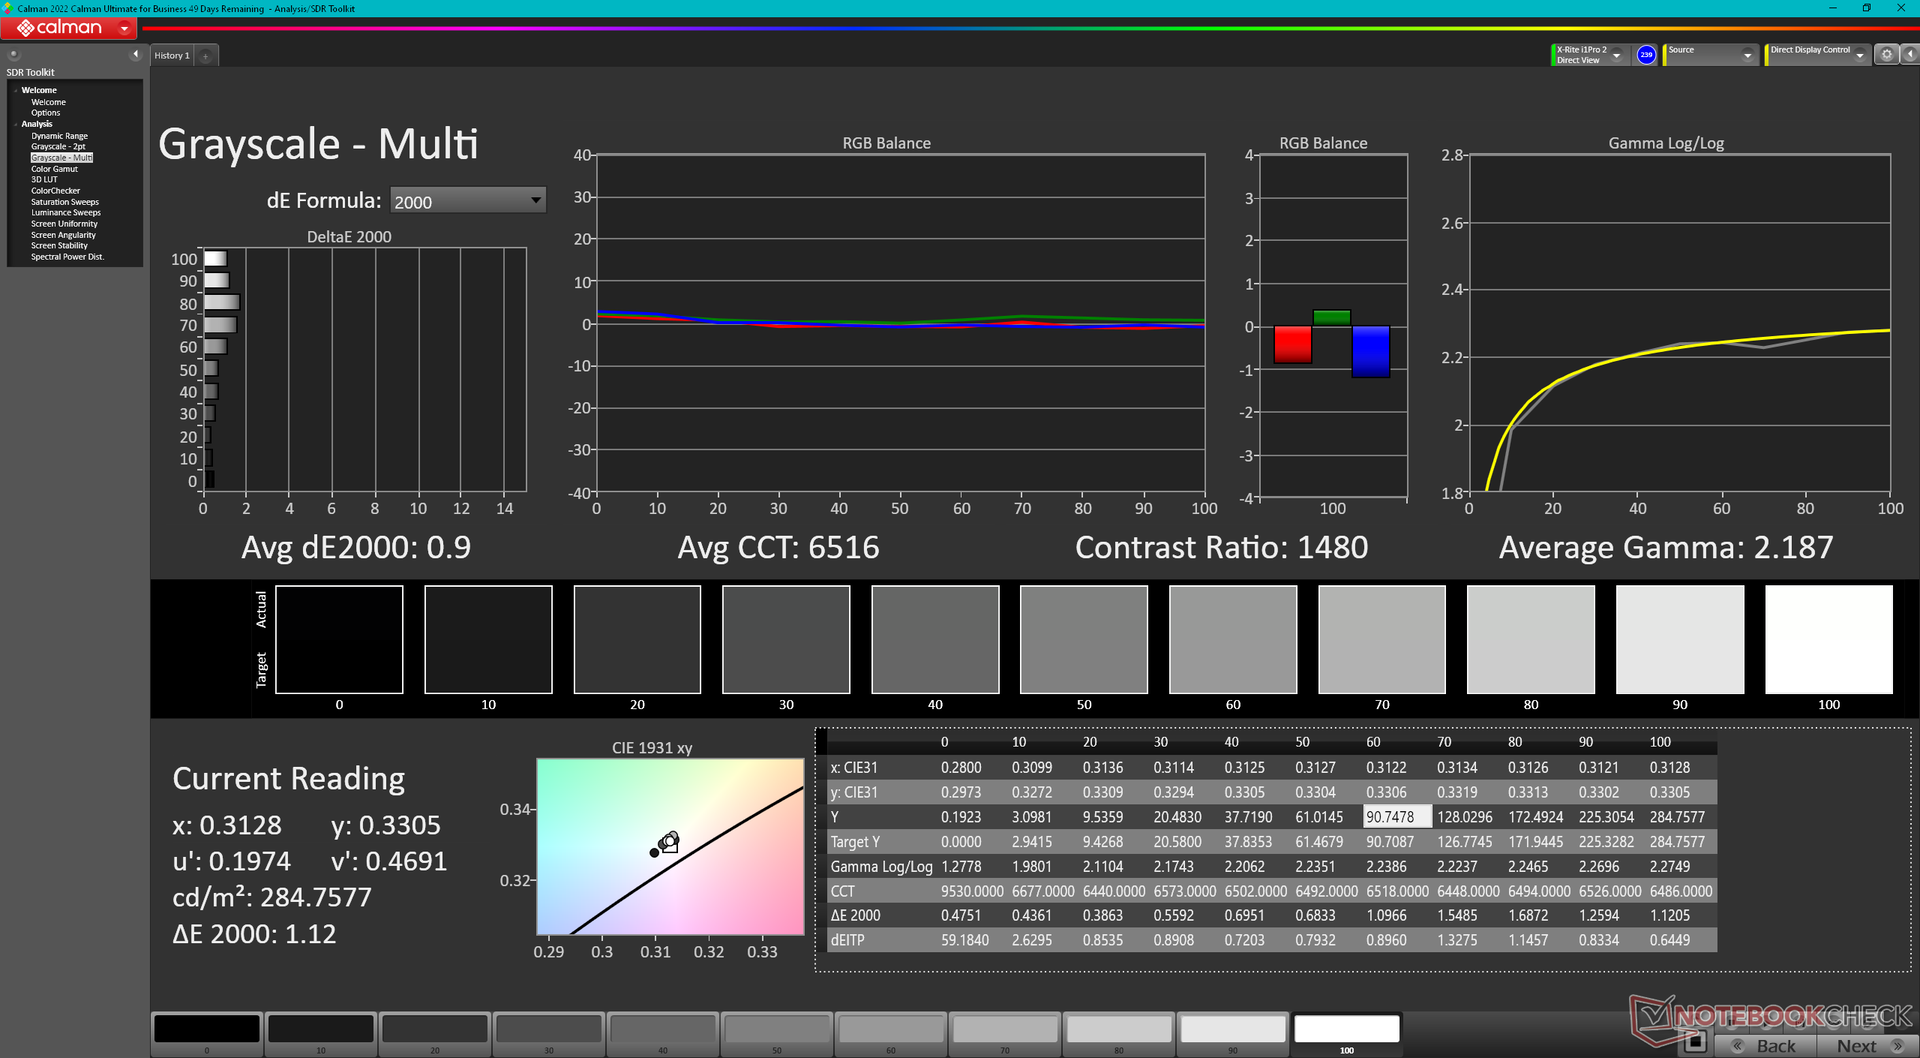
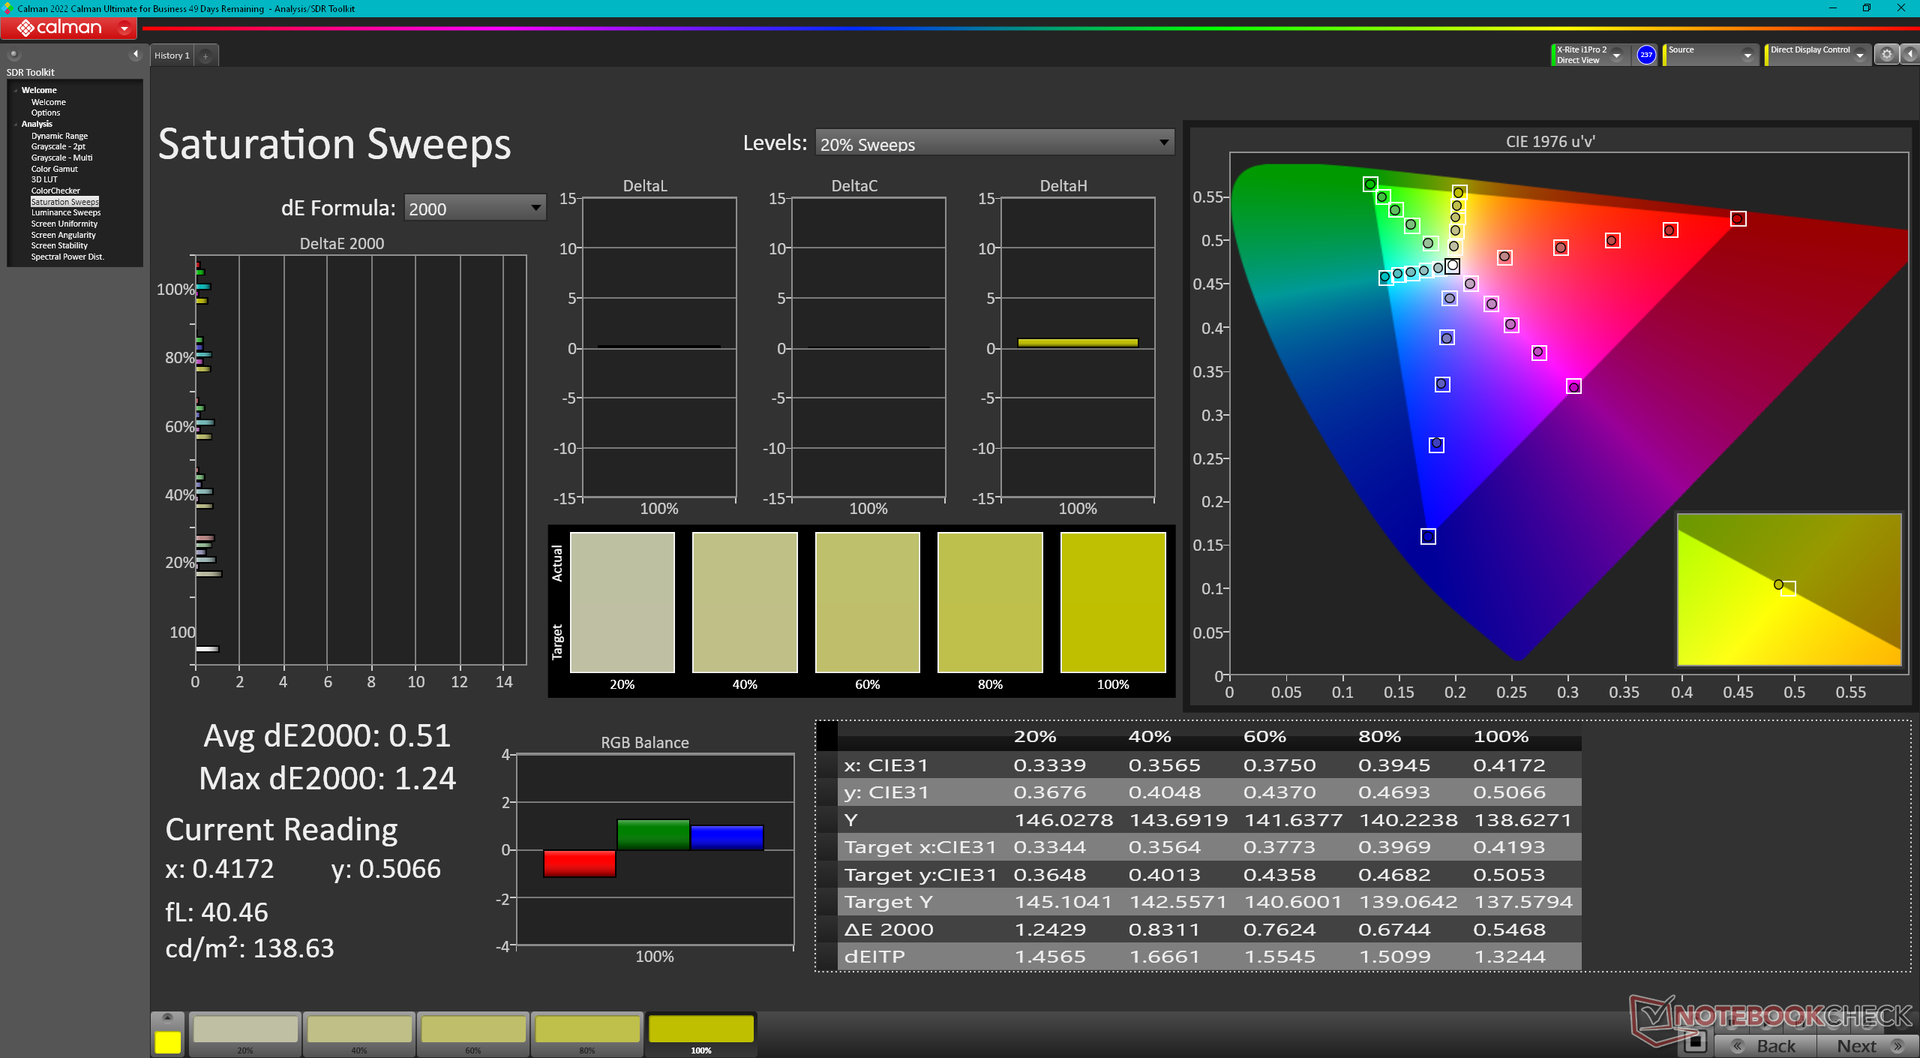
Il display non è pre-calibrato e presenta valori medi di deltaE della scala di grigi e del colore pari a 5,5 e 4,25, rispettivamente. Anche la temperatura del colore è più calda del solito (6368). Una corretta calibrazione con il nostro colorimetro X-Rite risolverebbe tutti questi problemi per un display sensibilmente più accurato, come dimostrano i risultati di CalMAN riportati di seguito. Il nostro profilo ICM calibrato è disponibile per il download gratuito se non si dispone di strumenti di calibrazione propri.
Tempi di risposta del Display
| ↔ Tempi di risposta dal Nero al Bianco | ||
|---|---|---|
| 24.2 ms ... aumenta ↗ e diminuisce ↘ combinato | ↗ 10.8 ms Incremento | 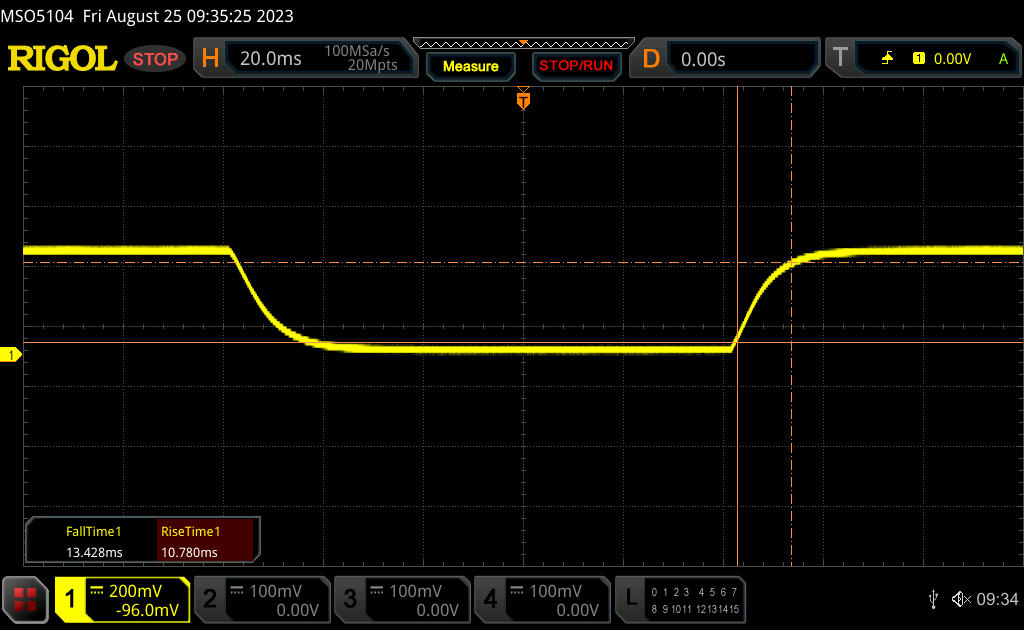 |
| ↘ 13.4 ms Calo | ||
| Lo schermo mostra buoni tempi di risposta durante i nostri tests, ma potrebbe essere troppo lento per i gamers competitivi. In confronto, tutti i dispositivi di test variano da 0.1 (minimo) a 240 (massimo) ms. » 57 % di tutti i dispositivi è migliore. Questo significa che i tempi di risposta rilevati sono peggiori rispetto alla media di tutti i dispositivi testati (19.8 ms). | ||
| ↔ Tempo di risposta dal 50% Grigio all'80% Grigio | ||
| 35 ms ... aumenta ↗ e diminuisce ↘ combinato | ↗ 15.7 ms Incremento | 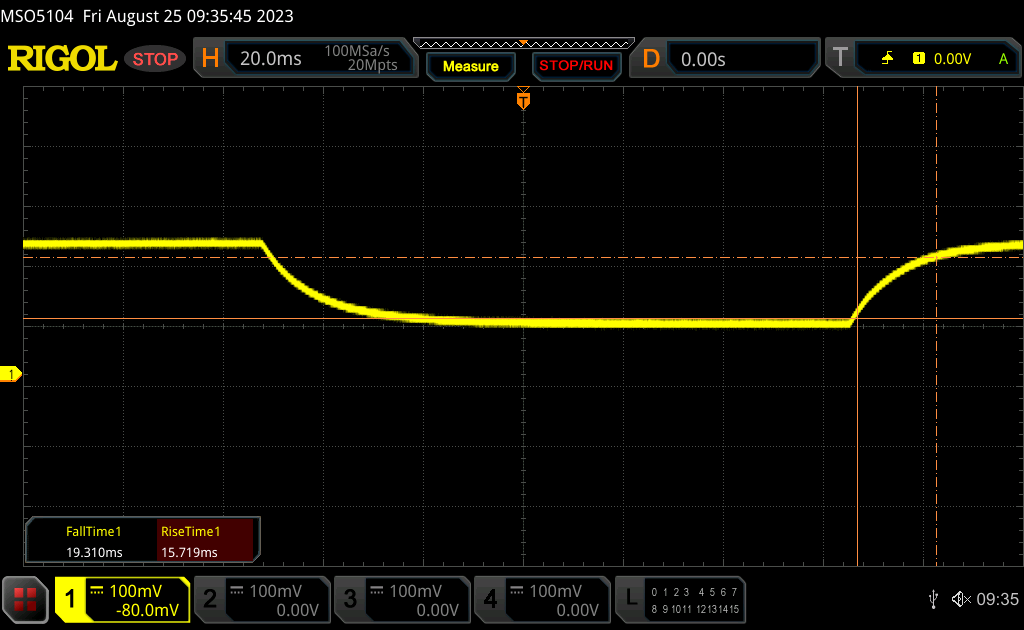 |
| ↘ 19.3 ms Calo | ||
| Lo schermo mostra tempi di risposta lenti nei nostri tests e sarà insoddisfacente per i gamers. In confronto, tutti i dispositivi di test variano da 0.165 (minimo) a 636 (massimo) ms. » 49 % di tutti i dispositivi è migliore. Questo significa che i tempi di risposta rilevati sono peggiori rispetto alla media di tutti i dispositivi testati (30.9 ms). | ||
Sfarfallio dello schermo / PWM (Pulse-Width Modulation)
| flickering dello schermo / PWM non rilevato | 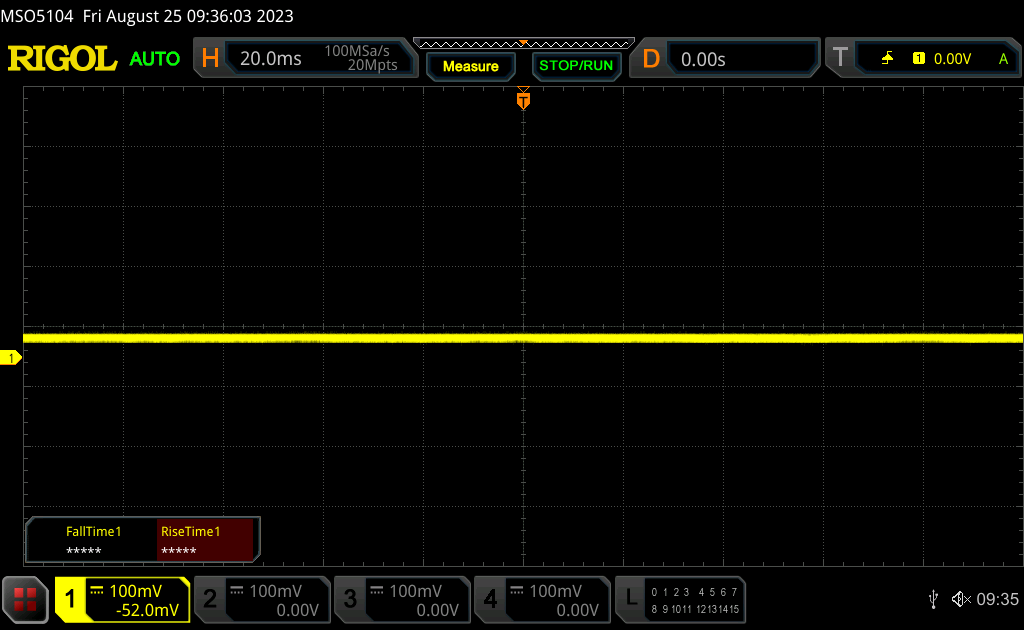 | ||
In confronto: 52 % di tutti i dispositivi testati non utilizza PWM per ridurre la luminosita' del display. Se è rilevato PWM, una media di 7744 (minimo: 5 - massimo: 343500) Hz è stata rilevata. | |||
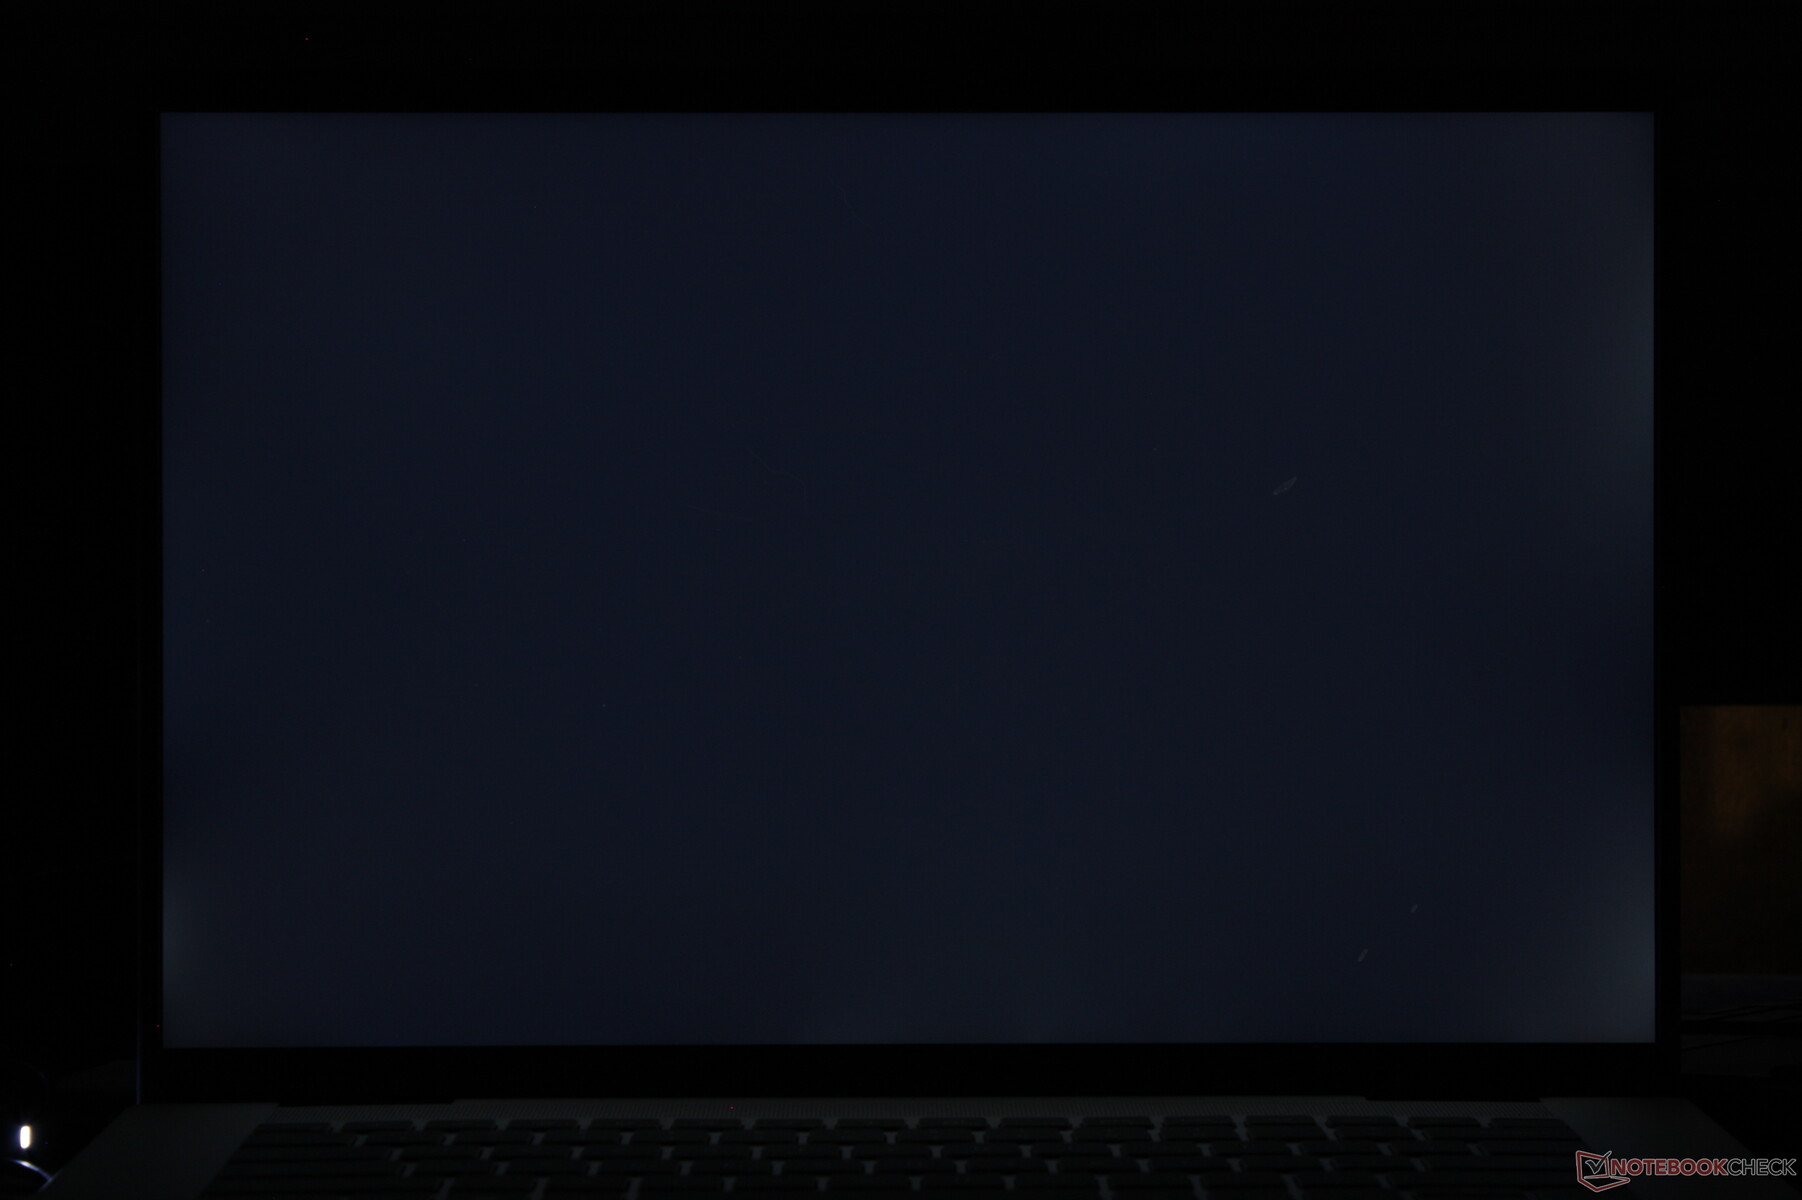
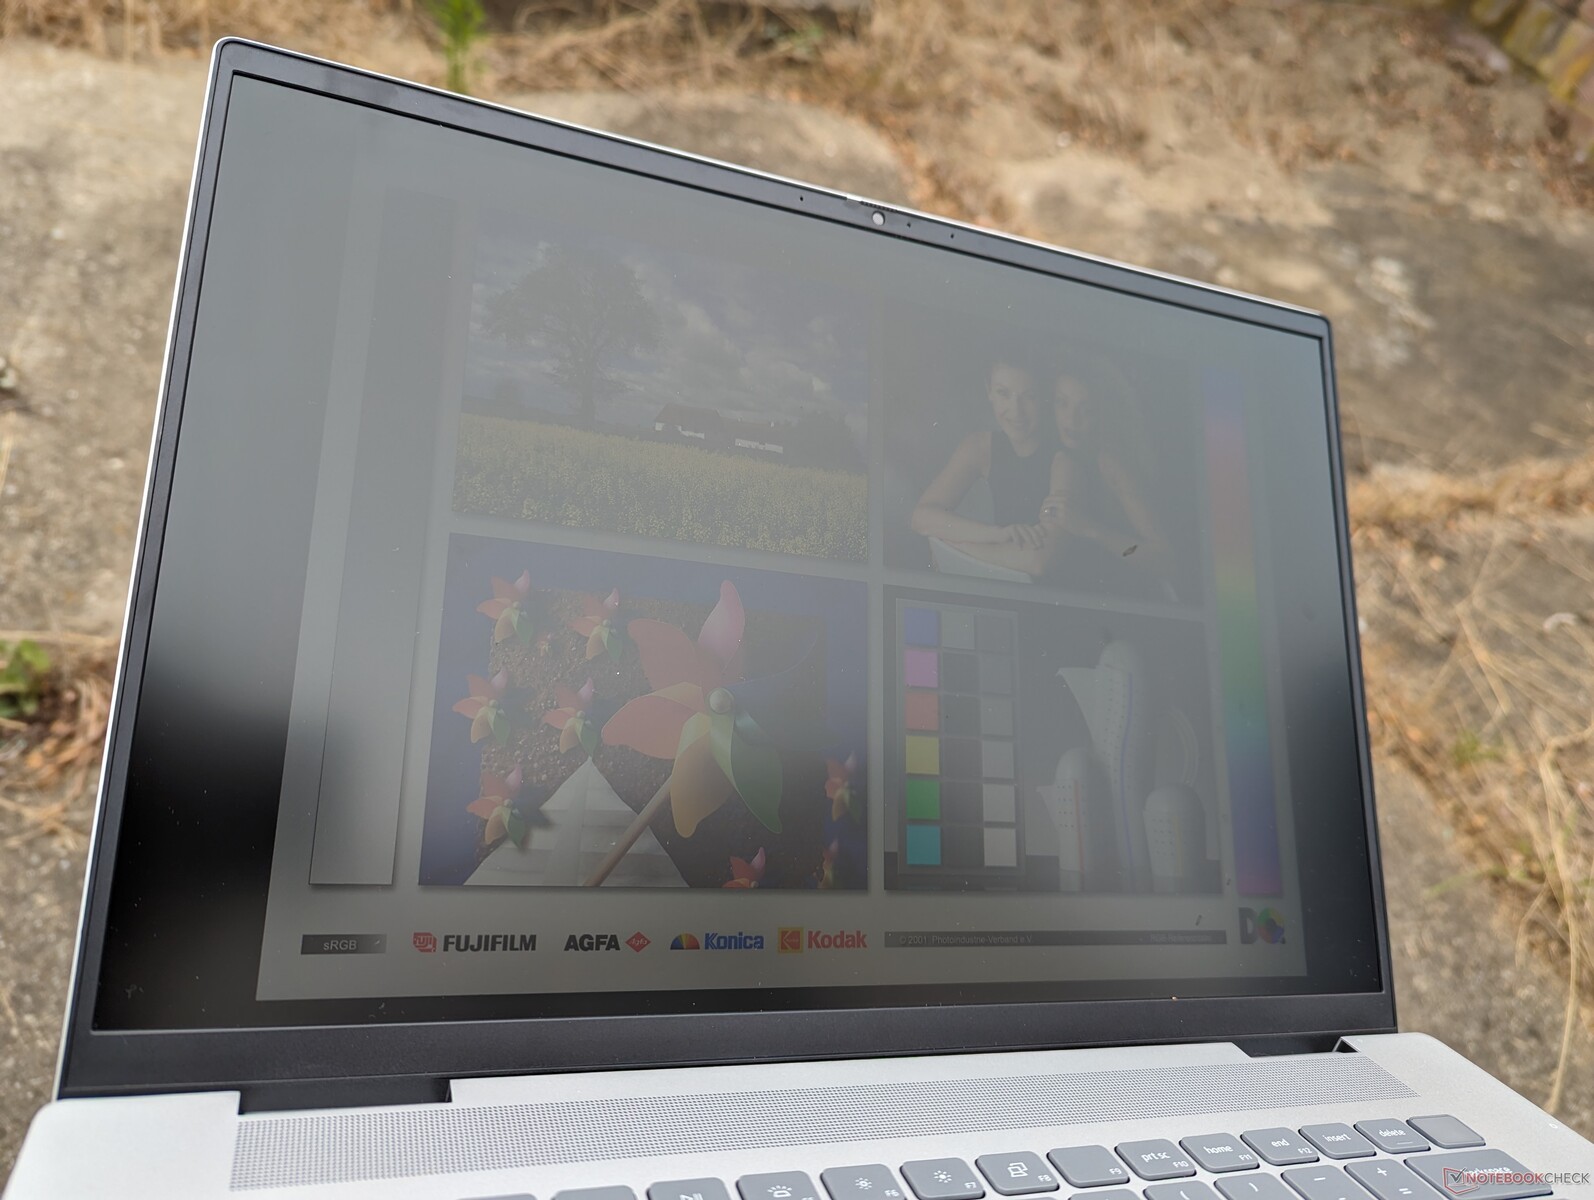
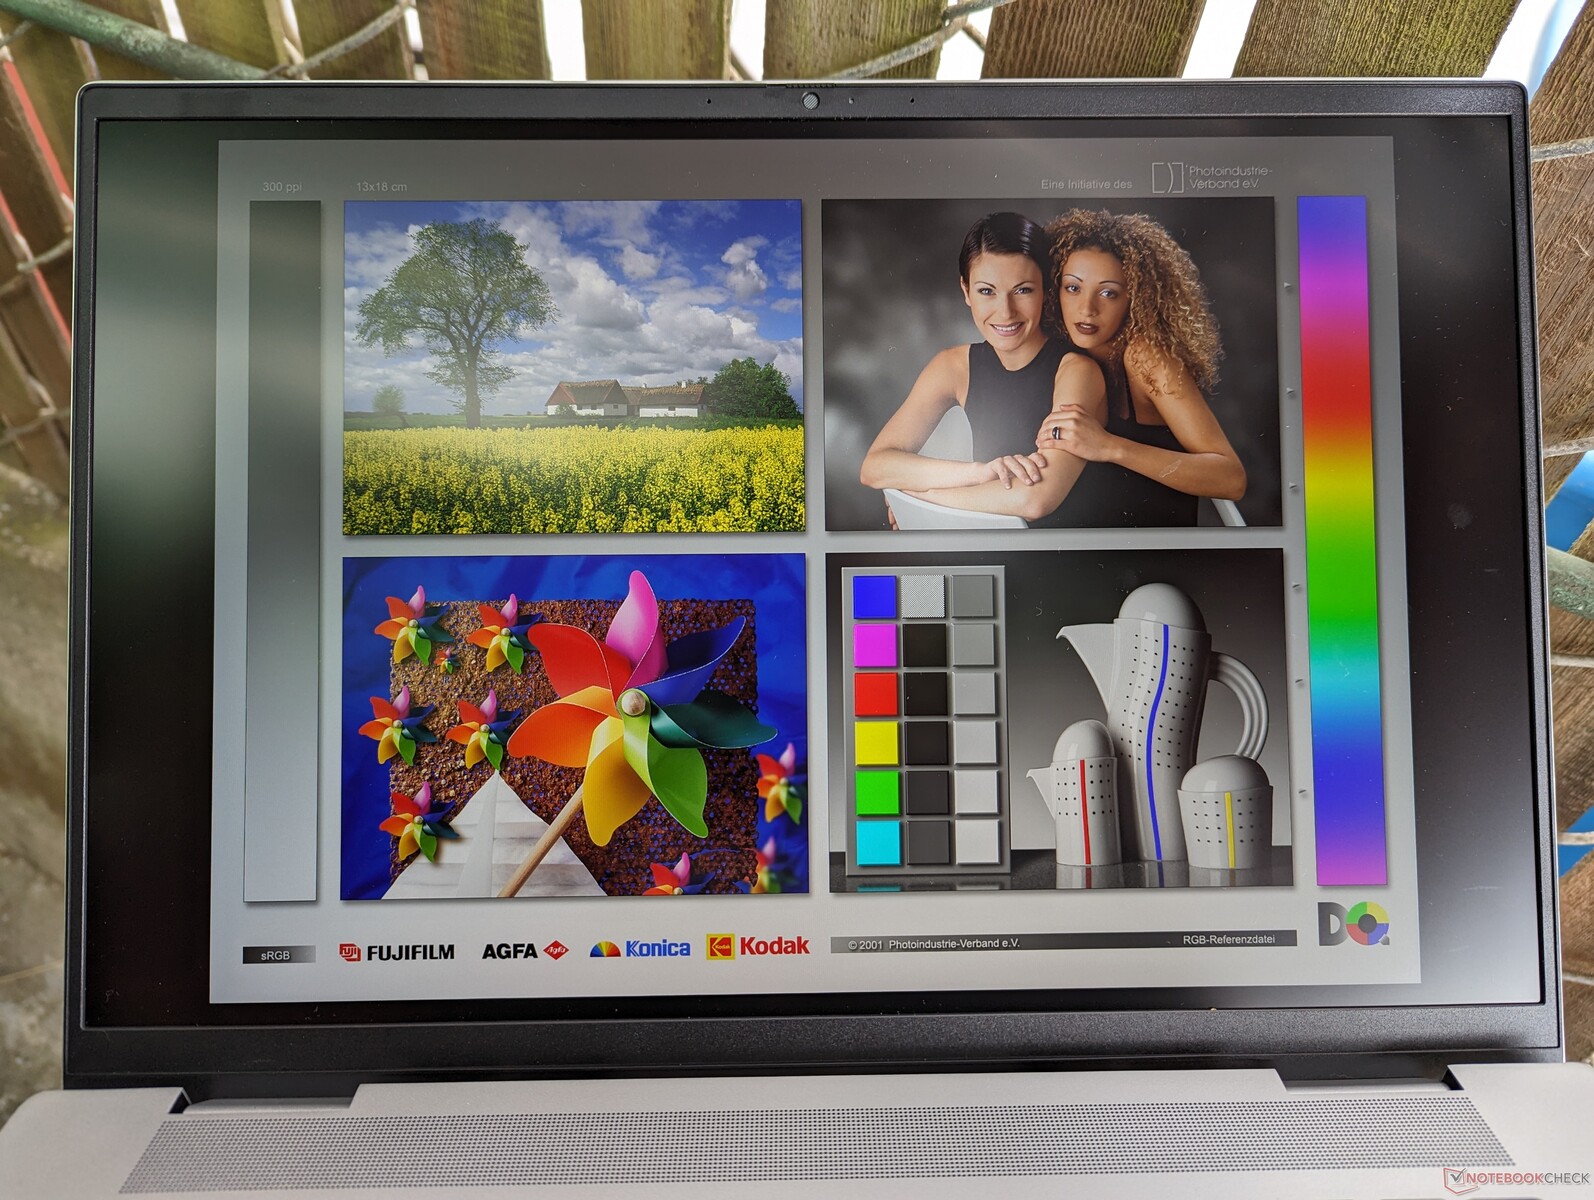
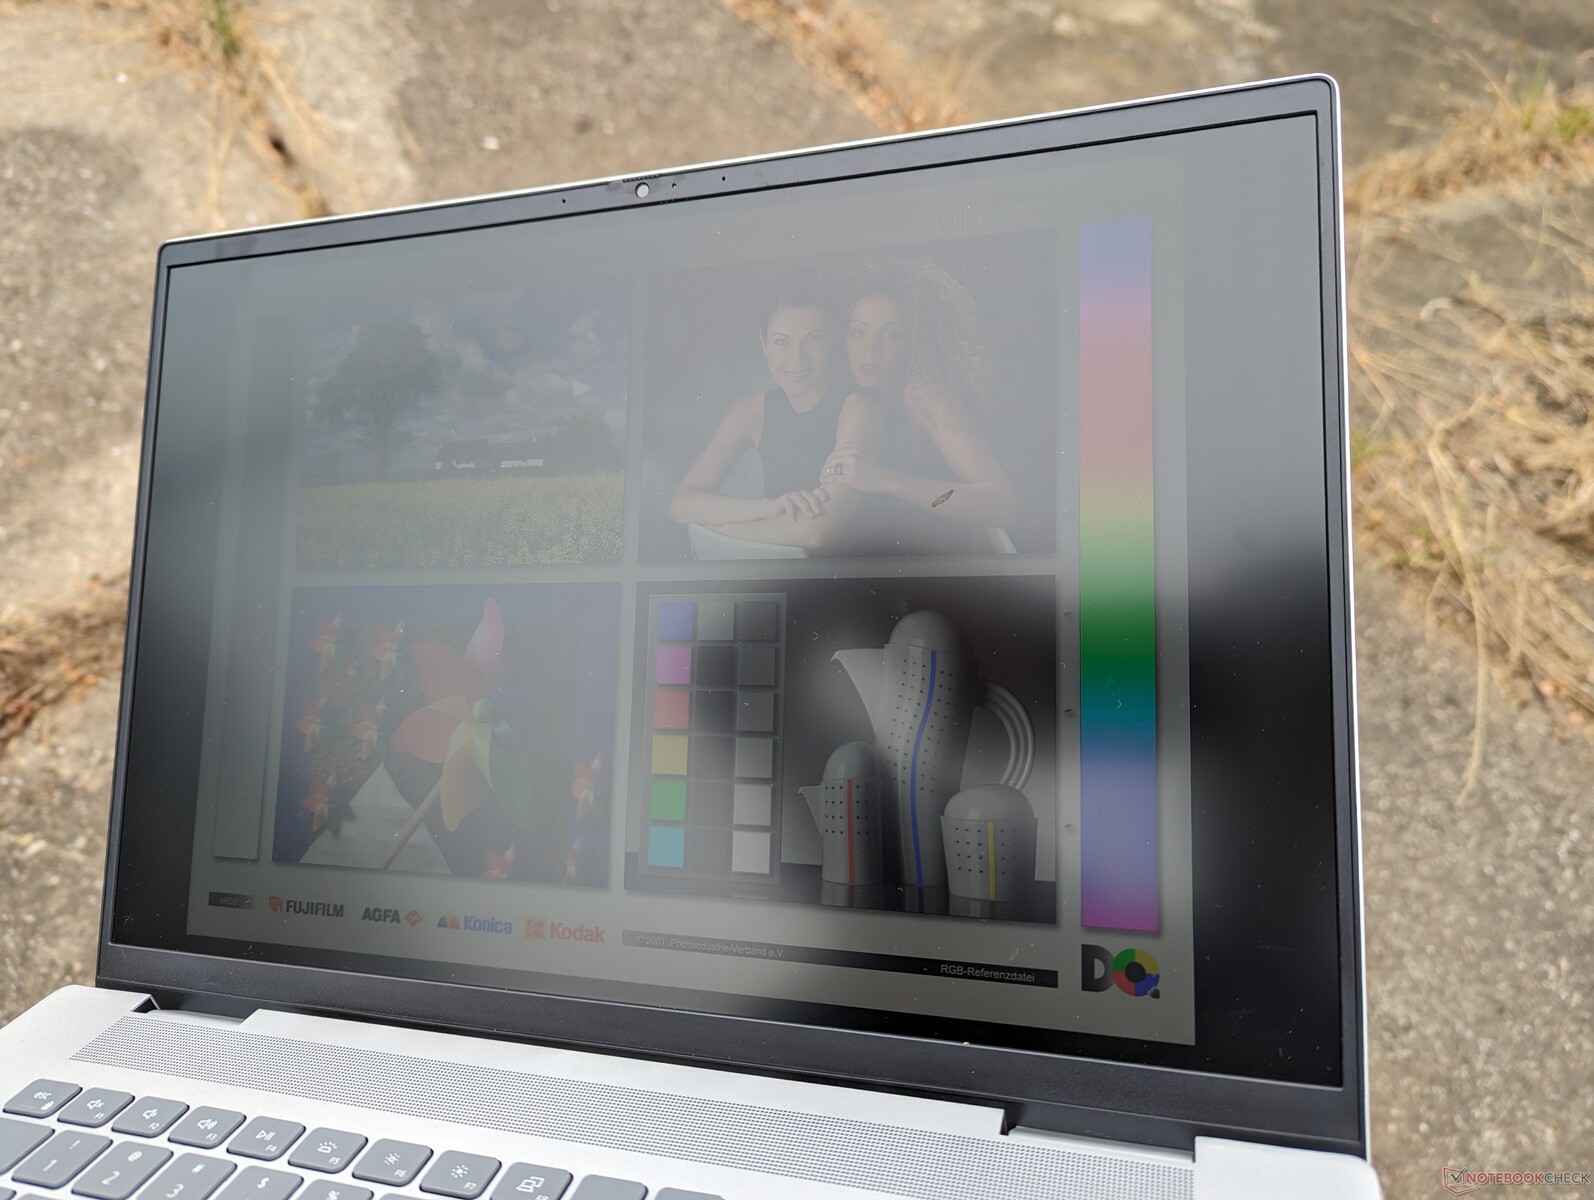
La visibilità all'aperto è paragonabile a quella del modello dell'anno scorso e decente solo quando è all'ombra per ridurre al minimo i riflessi. Altri portatili da 16 pollici con mini-LED o OLED come lo Yoga 9i 16 o il Razer Blade 16 tendono a essere più luminosi per una migliore visibilità all'aperto, ma sono anche molto più costosi del nostro Dell.
Prestazioni - Intel 13th Gen Raptor Lake-H
Condizioni di test
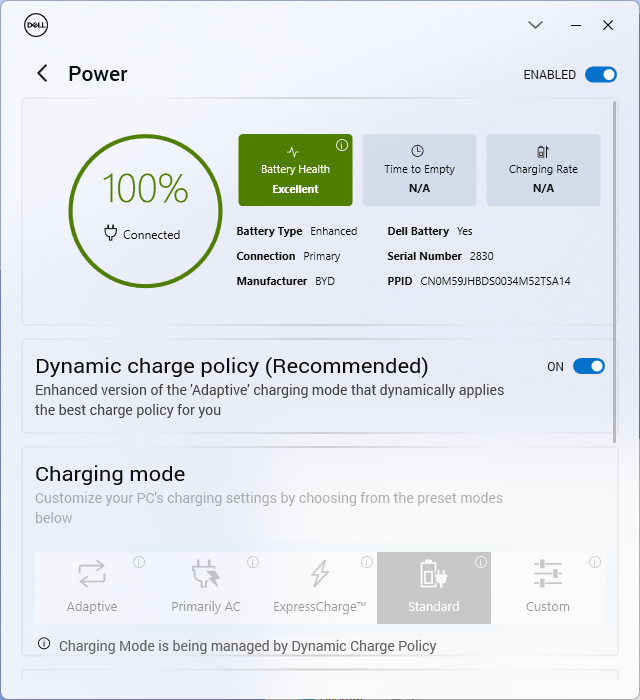
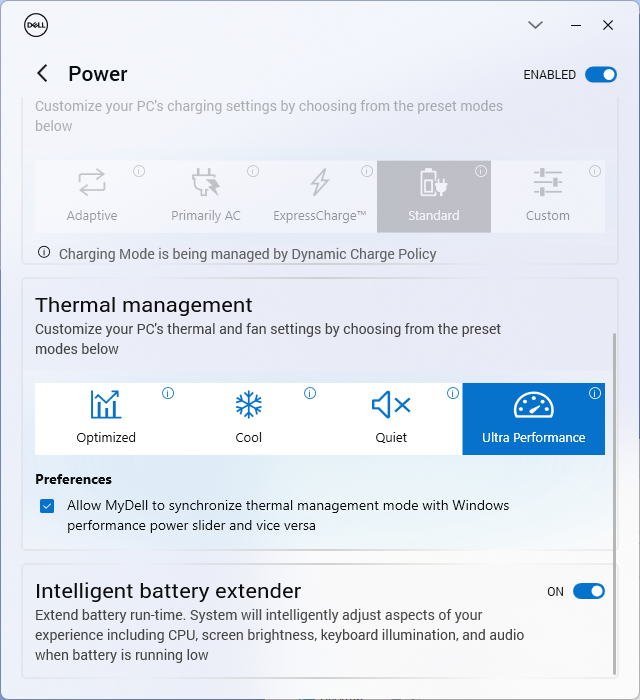
Abbiamo impostato la nostra unità in modalità Performance tramite il software MyDell preinstallato prima di eseguire i benchmark qui sotto. I profili di alimentazione MyDell possono sincronizzarsi con i profili di alimentazione di Windows per ridurre la confusione ed evitare conflitti di impostazioni.
L'Inspiron non supporta Advanced Optimus o MUX, caratteristiche invece comuni ai modelli dedicati ai giochi della serie G di Dell o della serie Alienware.
Processore
Prestazioni della CPU del nostro Core i7-13700H di 13a generazione Core i7-13700H è solo fino al 10% più veloce del Core i7-13700H di 12a generazione Core i7-12700H dell'Inspiron 16 Plus 7620 dello scorso anno. Una volta che i rispettivi vantaggi del Turbo Boost diminuiscono, tuttavia, le differenze di prestazioni si assottigliano ulteriormente, come dimostrano i risultati del loop CineBench R15 xT riportati di seguito. In altre parole, l'Inspiron 16 Plus 7630 è solo marginalmente più veloce del modello dello scorso anno per quanto riguarda le prestazioni del processore.
Passando al processore Core i5-13500H dovrebbe avere un impatto sulle prestazioni del processore solo di circa il 10%, in base alla nostra esperienza con l'Asus VivoBook 14X Asus VivoBook 14X. Nel frattempo, il processore AMD Ryzen 7 7840HS basato su AMD dovrebbe avere prestazioni pari a quelle del nostro Core i7-13700H.
Cinebench R15 Multi Loop
Cinebench R23: Multi Core | Single Core
Cinebench R20: CPU (Multi Core) | CPU (Single Core)
Cinebench R15: CPU Multi 64Bit | CPU Single 64Bit
Blender: v2.79 BMW27 CPU
7-Zip 18.03: 7z b 4 | 7z b 4 -mmt1
Geekbench 5.5: Multi-Core | Single-Core
HWBOT x265 Benchmark v2.2: 4k Preset
LibreOffice : 20 Documents To PDF
R Benchmark 2.5: Overall mean
* ... Meglio usare valori piccoli
AIDA64: FP32 Ray-Trace | FPU Julia | CPU SHA3 | CPU Queen | FPU SinJulia | FPU Mandel | CPU AES | CPU ZLib | FP64 Ray-Trace | CPU PhotoWorxx
| Performance rating | |
| Asus Vivobook Pro 16X K6604JV-MX016W | |
| Lenovo Slim Pro 9i 16IRP8 | |
| Media Intel Core i7-13700H | |
| Dell Inspiron 16 Plus 7630 | |
| MSI Summit E16 Flip A12UDT-031 | |
| HP Envy 16 h0112nr | |
| Dell Inspiron 16 Plus 7620 | |
| AIDA64 / FP32 Ray-Trace | |
| Asus Vivobook Pro 16X K6604JV-MX016W | |
| Lenovo Slim Pro 9i 16IRP8 | |
| Media Intel Core i7-13700H (4986 - 18908, n=29) | |
| Dell Inspiron 16 Plus 7630 | |
| MSI Summit E16 Flip A12UDT-031 | |
| Dell Inspiron 16 Plus 7620 | |
| HP Envy 16 h0112nr | |
| AIDA64 / FPU Julia | |
| Asus Vivobook Pro 16X K6604JV-MX016W | |
| Lenovo Slim Pro 9i 16IRP8 | |
| Media Intel Core i7-13700H (25360 - 92359, n=29) | |
| Dell Inspiron 16 Plus 7630 | |
| MSI Summit E16 Flip A12UDT-031 | |
| Dell Inspiron 16 Plus 7620 | |
| HP Envy 16 h0112nr | |
| AIDA64 / CPU SHA3 | |
| Asus Vivobook Pro 16X K6604JV-MX016W | |
| Lenovo Slim Pro 9i 16IRP8 | |
| Media Intel Core i7-13700H (1339 - 4224, n=29) | |
| Dell Inspiron 16 Plus 7630 | |
| MSI Summit E16 Flip A12UDT-031 | |
| Dell Inspiron 16 Plus 7620 | |
| HP Envy 16 h0112nr | |
| AIDA64 / CPU Queen | |
| Asus Vivobook Pro 16X K6604JV-MX016W | |
| Lenovo Slim Pro 9i 16IRP8 | |
| Dell Inspiron 16 Plus 7630 | |
| HP Envy 16 h0112nr | |
| MSI Summit E16 Flip A12UDT-031 | |
| Media Intel Core i7-13700H (59324 - 107159, n=29) | |
| Dell Inspiron 16 Plus 7620 | |
| AIDA64 / FPU SinJulia | |
| Asus Vivobook Pro 16X K6604JV-MX016W | |
| Lenovo Slim Pro 9i 16IRP8 | |
| Dell Inspiron 16 Plus 7630 | |
| Media Intel Core i7-13700H (4800 - 11050, n=29) | |
| MSI Summit E16 Flip A12UDT-031 | |
| Dell Inspiron 16 Plus 7620 | |
| HP Envy 16 h0112nr | |
| AIDA64 / FPU Mandel | |
| Asus Vivobook Pro 16X K6604JV-MX016W | |
| Lenovo Slim Pro 9i 16IRP8 | |
| Media Intel Core i7-13700H (12321 - 45118, n=29) | |
| Dell Inspiron 16 Plus 7630 | |
| MSI Summit E16 Flip A12UDT-031 | |
| Dell Inspiron 16 Plus 7620 | |
| HP Envy 16 h0112nr | |
| AIDA64 / CPU AES | |
| HP Envy 16 h0112nr | |
| Asus Vivobook Pro 16X K6604JV-MX016W | |
| Lenovo Slim Pro 9i 16IRP8 | |
| Media Intel Core i7-13700H (28769 - 151254, n=29) | |
| Dell Inspiron 16 Plus 7620 | |
| MSI Summit E16 Flip A12UDT-031 | |
| Dell Inspiron 16 Plus 7630 | |
| AIDA64 / CPU ZLib | |
| Asus Vivobook Pro 16X K6604JV-MX016W | |
| Lenovo Slim Pro 9i 16IRP8 | |
| Dell Inspiron 16 Plus 7620 | |
| Media Intel Core i7-13700H (389 - 1215, n=29) | |
| MSI Summit E16 Flip A12UDT-031 | |
| Dell Inspiron 16 Plus 7630 | |
| HP Envy 16 h0112nr | |
| AIDA64 / FP64 Ray-Trace | |
| Asus Vivobook Pro 16X K6604JV-MX016W | |
| Lenovo Slim Pro 9i 16IRP8 | |
| Media Intel Core i7-13700H (2540 - 10135, n=29) | |
| Dell Inspiron 16 Plus 7630 | |
| MSI Summit E16 Flip A12UDT-031 | |
| Dell Inspiron 16 Plus 7620 | |
| HP Envy 16 h0112nr | |
| AIDA64 / CPU PhotoWorxx | |
| Lenovo Slim Pro 9i 16IRP8 | |
| Asus Vivobook Pro 16X K6604JV-MX016W | |
| MSI Summit E16 Flip A12UDT-031 | |
| Media Intel Core i7-13700H (12872 - 52727, n=29) | |
| Dell Inspiron 16 Plus 7630 | |
| HP Envy 16 h0112nr | |
| Dell Inspiron 16 Plus 7620 | |
Prestazioni del sistema
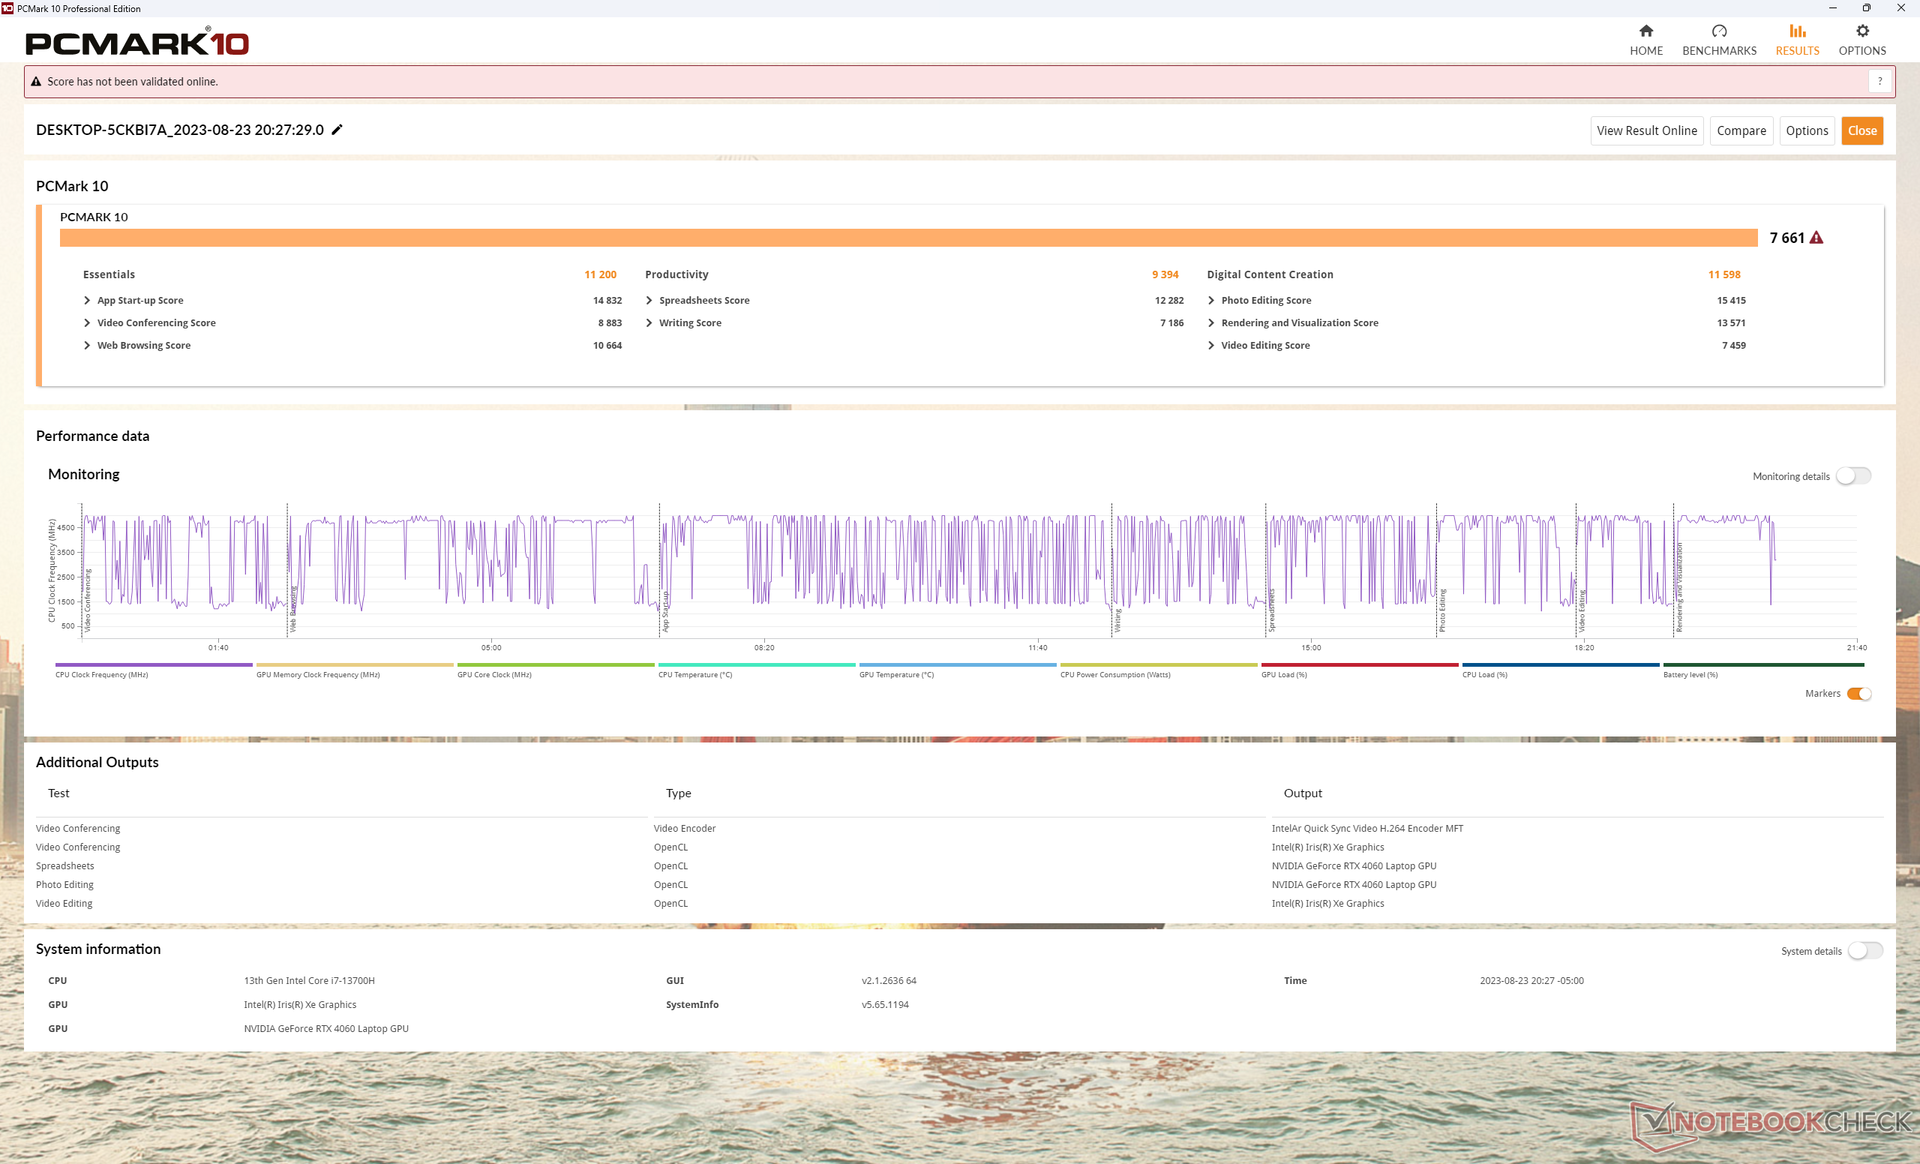
I punteggi di PCMark sono costantemente superiori a quelli dell'Inspiron 16 Plus 7620 dello scorso anno, in particolare nel sottotest Creazione di contenuti digitali, dove le prestazioni della GPU sono più importanti.
Non abbiamo riscontrato problemi di wake-from-sleep o BSOD, a differenza di quanto accaduto con il recente Alienware m16 R1.
CrossMark: Overall | Productivity | Creativity | Responsiveness
| PCMark 10 / Score | |
| Lenovo Slim Pro 9i 16IRP8 | |
| Dell Inspiron 16 Plus 7630 | |
| HP Envy 16 h0112nr | |
| Media Intel Core i7-13700H, NVIDIA GeForce RTX 4060 Laptop GPU (7157 - 7661, n=5) | |
| Asus Vivobook Pro 16X K6604JV-MX016W | |
| Dell Inspiron 16 Plus 7620 | |
| MSI Summit E16 Flip A12UDT-031 | |
| PCMark 10 / Essentials | |
| HP Envy 16 h0112nr | |
| Lenovo Slim Pro 9i 16IRP8 | |
| Dell Inspiron 16 Plus 7630 | |
| Media Intel Core i7-13700H, NVIDIA GeForce RTX 4060 Laptop GPU (10179 - 11200, n=5) | |
| Asus Vivobook Pro 16X K6604JV-MX016W | |
| Dell Inspiron 16 Plus 7620 | |
| MSI Summit E16 Flip A12UDT-031 | |
| PCMark 10 / Productivity | |
| Lenovo Slim Pro 9i 16IRP8 | |
| Media Intel Core i7-13700H, NVIDIA GeForce RTX 4060 Laptop GPU (8238 - 10249, n=5) | |
| Dell Inspiron 16 Plus 7630 | |
| HP Envy 16 h0112nr | |
| Dell Inspiron 16 Plus 7620 | |
| Asus Vivobook Pro 16X K6604JV-MX016W | |
| MSI Summit E16 Flip A12UDT-031 | |
| PCMark 10 / Digital Content Creation | |
| Dell Inspiron 16 Plus 7630 | |
| Lenovo Slim Pro 9i 16IRP8 | |
| Media Intel Core i7-13700H, NVIDIA GeForce RTX 4060 Laptop GPU (10308 - 11862, n=5) | |
| HP Envy 16 h0112nr | |
| Dell Inspiron 16 Plus 7620 | |
| Asus Vivobook Pro 16X K6604JV-MX016W | |
| MSI Summit E16 Flip A12UDT-031 | |
| CrossMark / Overall | |
| Asus Vivobook Pro 16X K6604JV-MX016W | |
| Dell Inspiron 16 Plus 7630 | |
| HP Envy 16 h0112nr | |
| Lenovo Slim Pro 9i 16IRP8 | |
| Dell Inspiron 16 Plus 7620 | |
| Media Intel Core i7-13700H, NVIDIA GeForce RTX 4060 Laptop GPU (1629 - 1849, n=5) | |
| MSI Summit E16 Flip A12UDT-031 | |
| CrossMark / Productivity | |
| Asus Vivobook Pro 16X K6604JV-MX016W | |
| Dell Inspiron 16 Plus 7630 | |
| HP Envy 16 h0112nr | |
| Dell Inspiron 16 Plus 7620 | |
| Lenovo Slim Pro 9i 16IRP8 | |
| Media Intel Core i7-13700H, NVIDIA GeForce RTX 4060 Laptop GPU (1561 - 1743, n=5) | |
| MSI Summit E16 Flip A12UDT-031 | |
| CrossMark / Creativity | |
| Asus Vivobook Pro 16X K6604JV-MX016W | |
| Lenovo Slim Pro 9i 16IRP8 | |
| Dell Inspiron 16 Plus 7630 | |
| HP Envy 16 h0112nr | |
| Dell Inspiron 16 Plus 7620 | |
| Media Intel Core i7-13700H, NVIDIA GeForce RTX 4060 Laptop GPU (1691 - 2064, n=5) | |
| MSI Summit E16 Flip A12UDT-031 | |
| CrossMark / Responsiveness | |
| Asus Vivobook Pro 16X K6604JV-MX016W | |
| HP Envy 16 h0112nr | |
| Dell Inspiron 16 Plus 7630 | |
| MSI Summit E16 Flip A12UDT-031 | |
| Dell Inspiron 16 Plus 7620 | |
| Media Intel Core i7-13700H, NVIDIA GeForce RTX 4060 Laptop GPU (1381 - 1656, n=5) | |
| Lenovo Slim Pro 9i 16IRP8 | |
| PCMark 10 Score | 7661 punti | |
Aiuto | ||
| AIDA64 / Memory Copy | |
| Lenovo Slim Pro 9i 16IRP8 | |
| Asus Vivobook Pro 16X K6604JV-MX016W | |
| MSI Summit E16 Flip A12UDT-031 | |
| Media Intel Core i7-13700H (24334 - 78081, n=29) | |
| Dell Inspiron 16 Plus 7630 | |
| HP Envy 16 h0112nr | |
| Dell Inspiron 16 Plus 7620 | |
| AIDA64 / Memory Read | |
| Asus Vivobook Pro 16X K6604JV-MX016W | |
| Lenovo Slim Pro 9i 16IRP8 | |
| Dell Inspiron 16 Plus 7630 | |
| HP Envy 16 h0112nr | |
| MSI Summit E16 Flip A12UDT-031 | |
| Media Intel Core i7-13700H (23681 - 79656, n=29) | |
| Dell Inspiron 16 Plus 7620 | |
| AIDA64 / Memory Write | |
| Lenovo Slim Pro 9i 16IRP8 | |
| Asus Vivobook Pro 16X K6604JV-MX016W | |
| Media Intel Core i7-13700H (22986 - 99898, n=29) | |
| Dell Inspiron 16 Plus 7630 | |
| HP Envy 16 h0112nr | |
| MSI Summit E16 Flip A12UDT-031 | |
| Dell Inspiron 16 Plus 7620 | |
| AIDA64 / Memory Latency | |
| MSI Summit E16 Flip A12UDT-031 | |
| Lenovo Slim Pro 9i 16IRP8 | |
| Dell Inspiron 16 Plus 7620 | |
| Media Intel Core i7-13700H (82.4 - 136.8, n=29) | |
| Dell Inspiron 16 Plus 7630 | |
| HP Envy 16 h0112nr | |
| Asus Vivobook Pro 16X K6604JV-MX016W | |
* ... Meglio usare valori piccoli
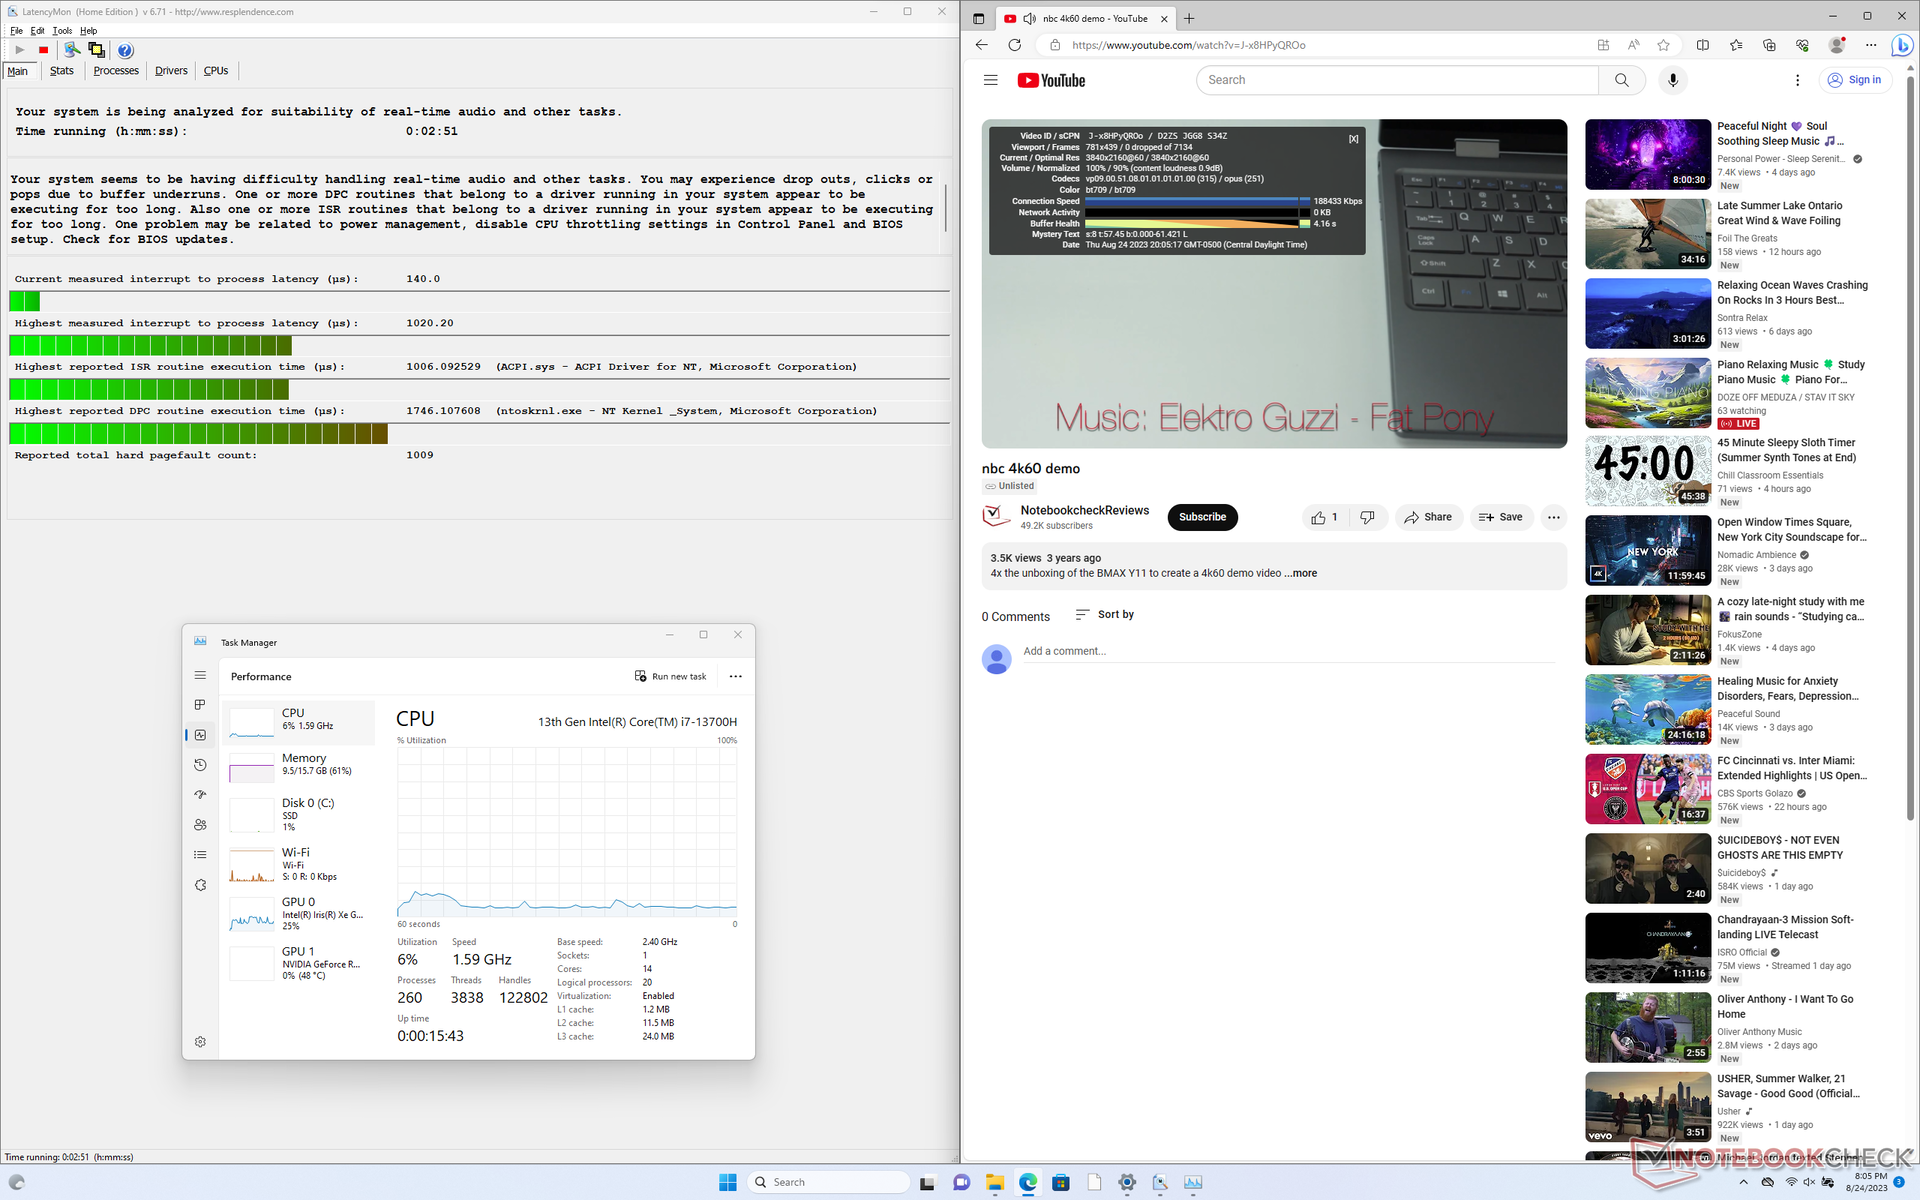
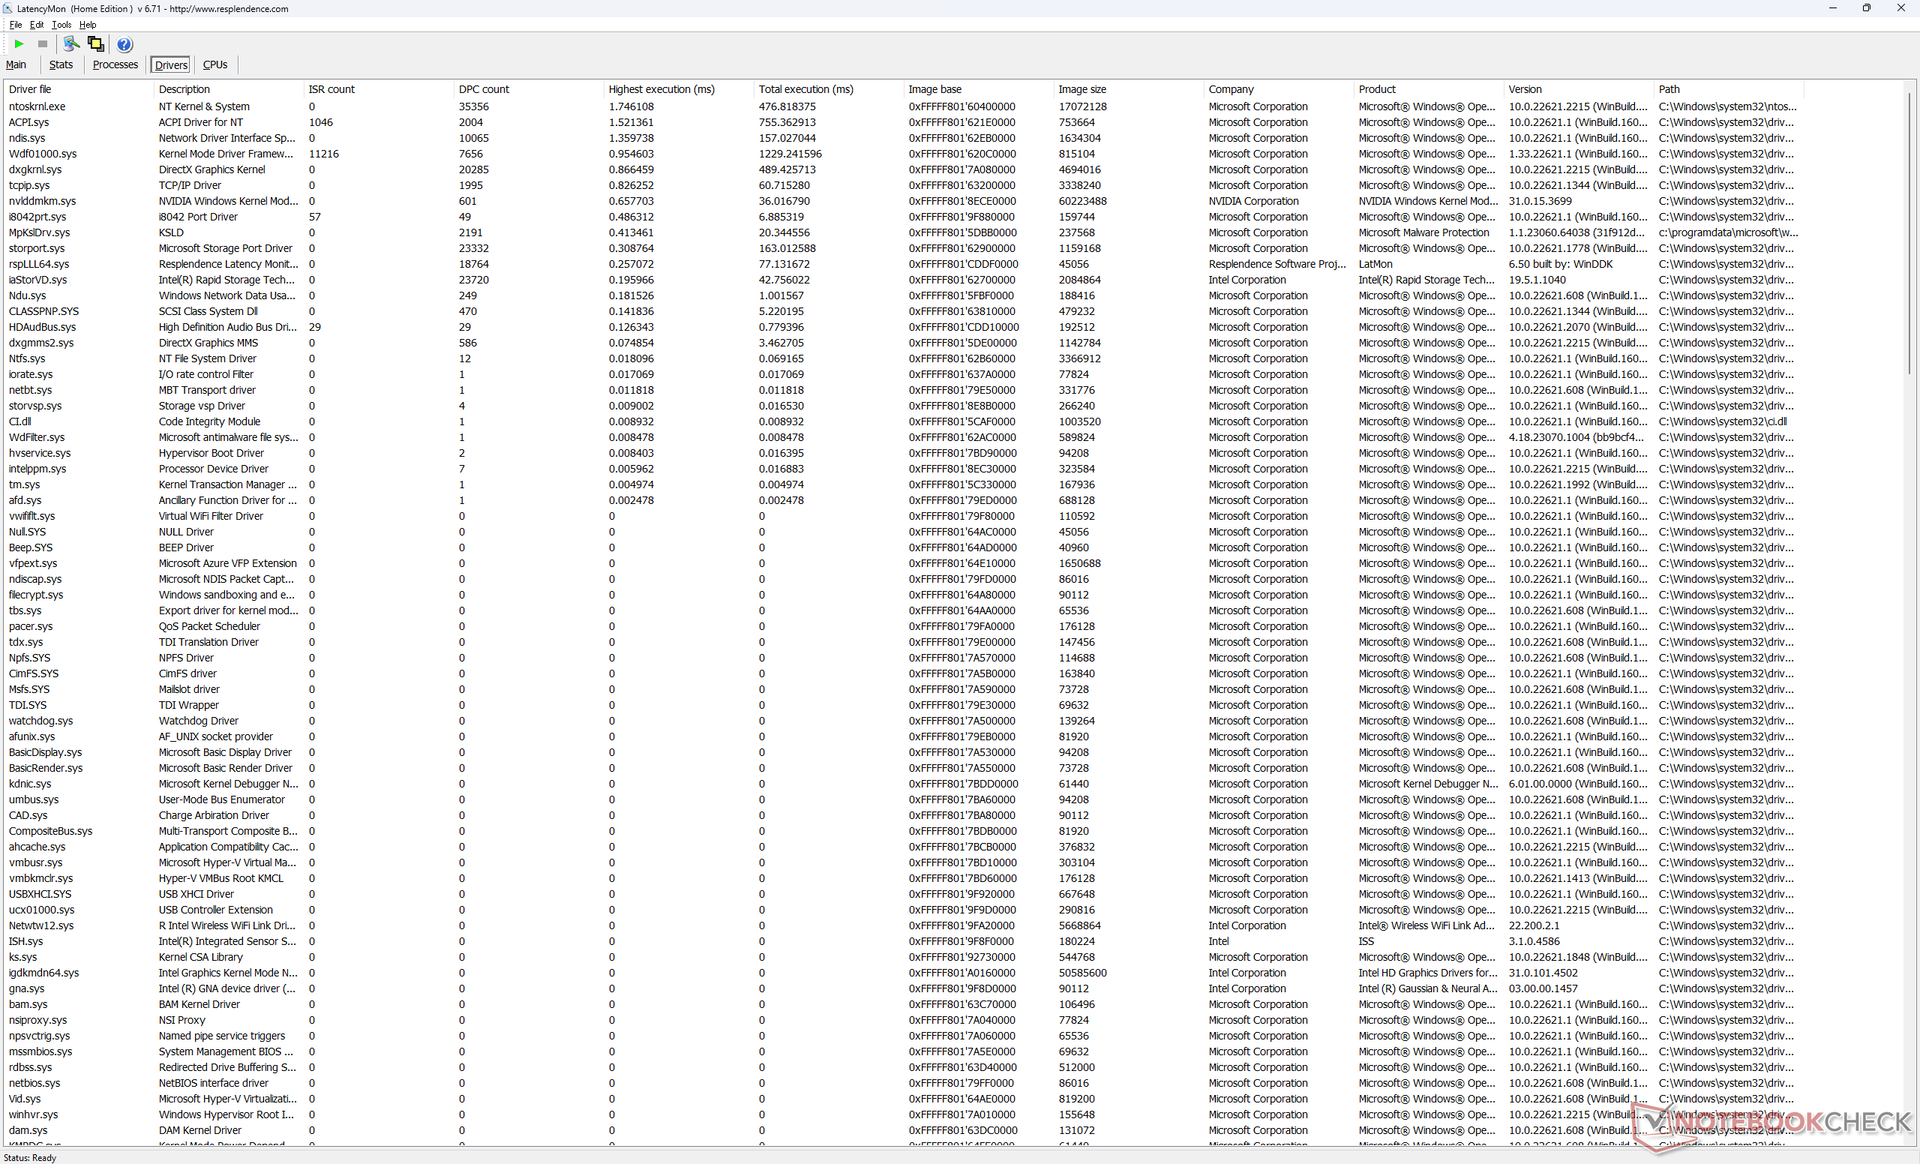
Latenza DPC
LatencyMon mostra solo lievi problemi di DPC quando si aprono più schede del browser della nostra homepage. la riproduzione di video 4K a 60 FPS è perfetta e non si registrano cadute di fotogrammi, a differenza del recente Alienware m16 R1, dove i salti di fotogramma erano persistenti.
| DPC Latencies / LatencyMon - interrupt to process latency (max), Web, Youtube, Prime95 | |
| Asus Vivobook Pro 16X K6604JV-MX016W | |
| Lenovo Slim Pro 9i 16IRP8 | |
| Dell Inspiron 16 Plus 7630 | |
| Dell Inspiron 16 Plus 7620 | |
| MSI Summit E16 Flip A12UDT-031 | |
| HP Envy 16 h0112nr | |
* ... Meglio usare valori piccoli
Dispositivi di archiviazione - Supporta solo un'unità SSD
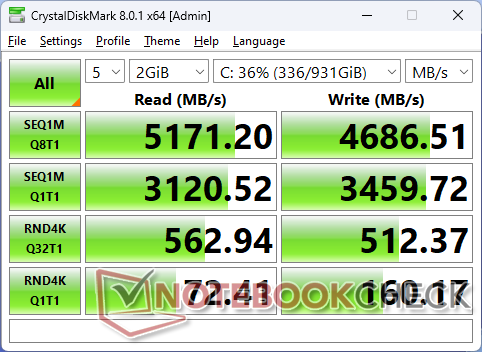
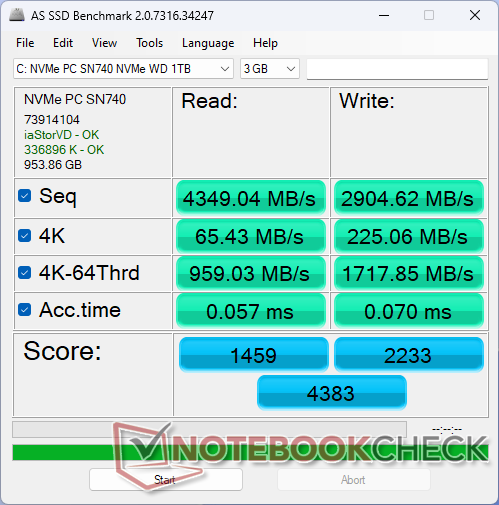
La nostra unità è dotata di un disco di fascia media Western Digital SN740 PCIe4 x4 NVMe che offre una velocità di trasferimento fino a 5200 MB/s. Tuttavia, questo valore massimo è sostenibile solo per circa un minuto, prima di scendere a 2400 MB/s, come mostrano i risultati del nostro test DiskSpd di seguito. Questa limitazione non è un problema per le prestazioni di gioco e per la maggior parte degli scenari di utilizzo.
Il modello supporta solo un'unità SSD interna, mentre altri portatili da 16 pollici, come l'Envy 16, supportano un'unità SSD interna Envy 16 possono supportare fino a due unità.

| Drive Performance rating - Percent | |
| MSI Summit E16 Flip A12UDT-031 | |
| Lenovo Slim Pro 9i 16IRP8 | |
| HP Envy 16 h0112nr | |
| Dell Inspiron 16 Plus 7630 | |
| Asus Vivobook Pro 16X K6604JV-MX016W | |
| Dell Inspiron 16 Plus 7620 | |
* ... Meglio usare valori piccoli
Disk Throttling: DiskSpd Read Loop, Queue Depth 8
Prestazioni della GPU
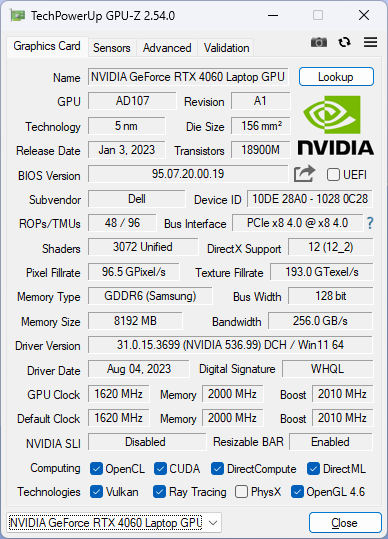
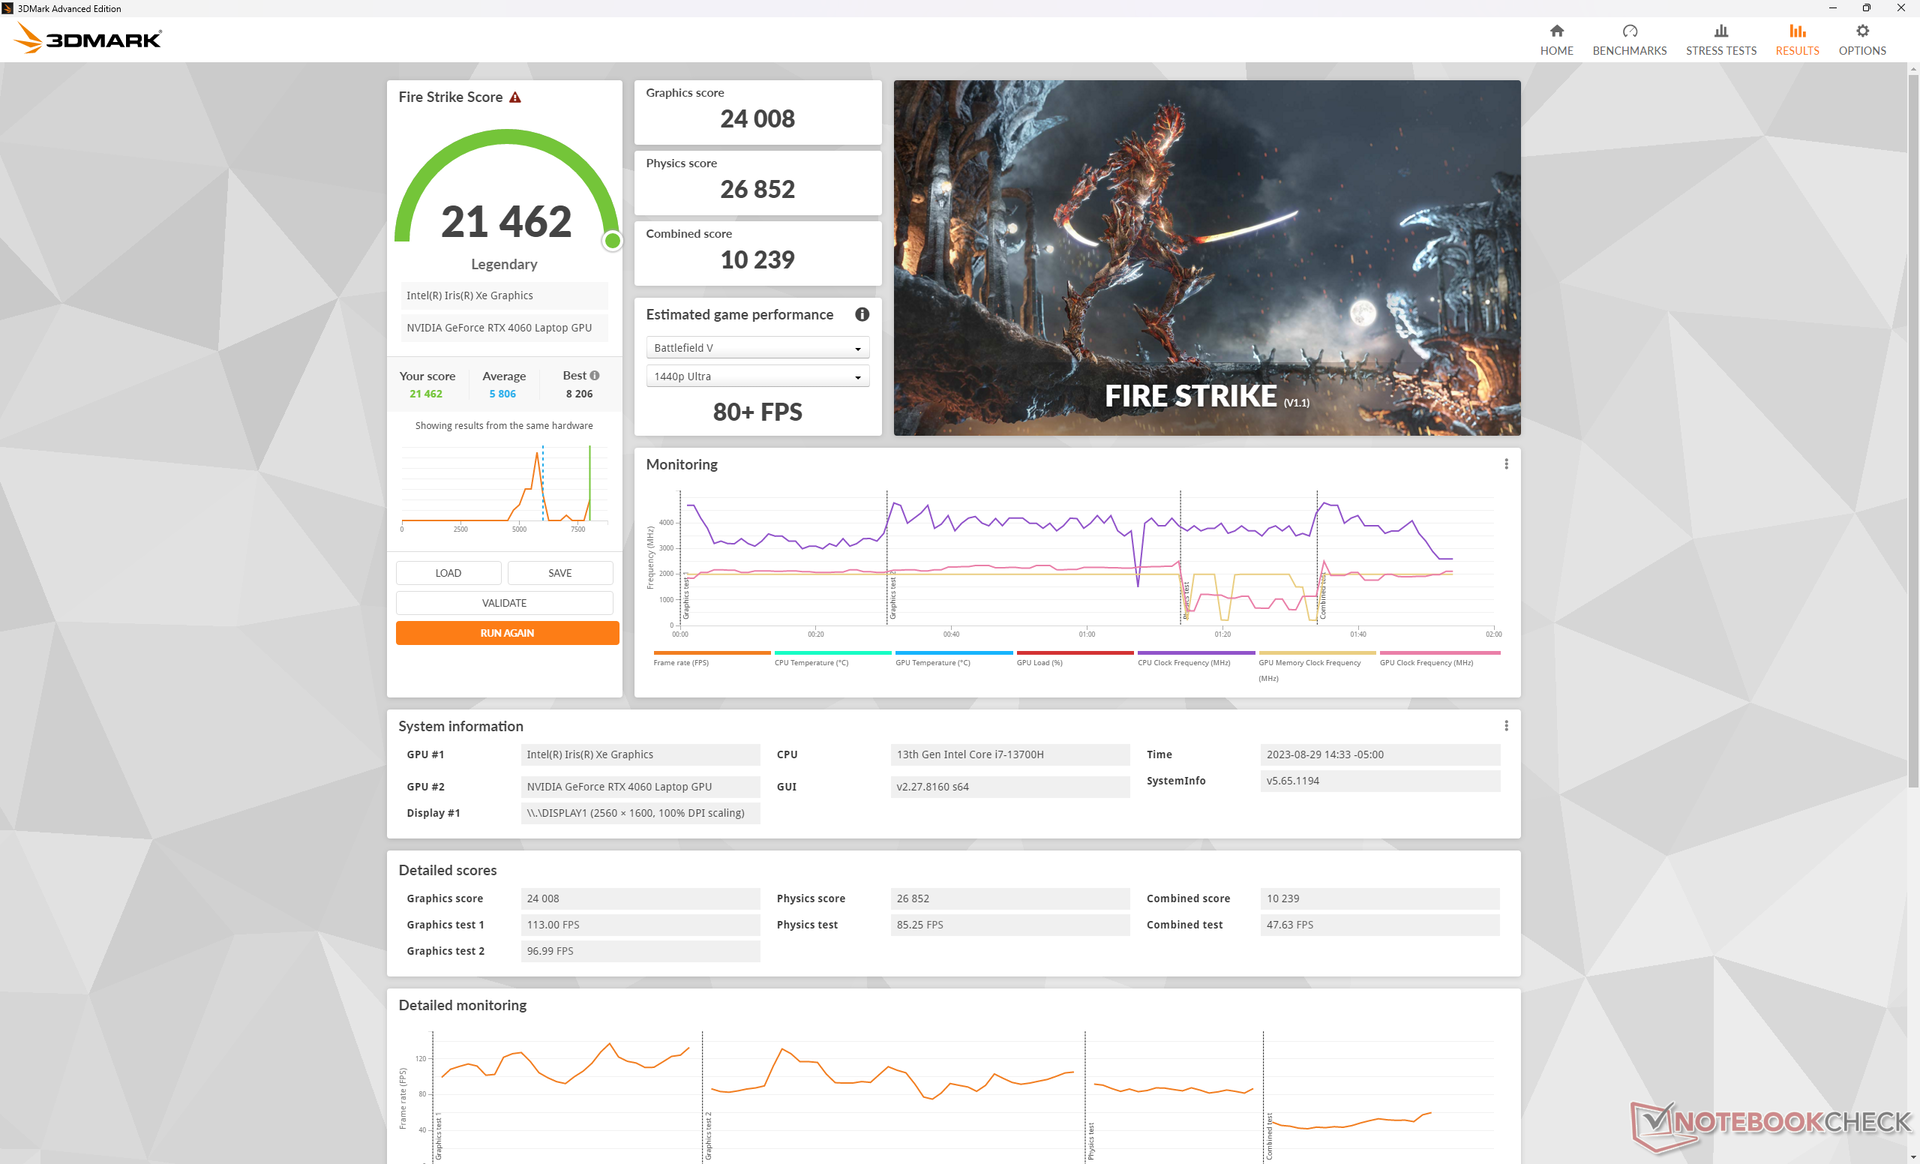
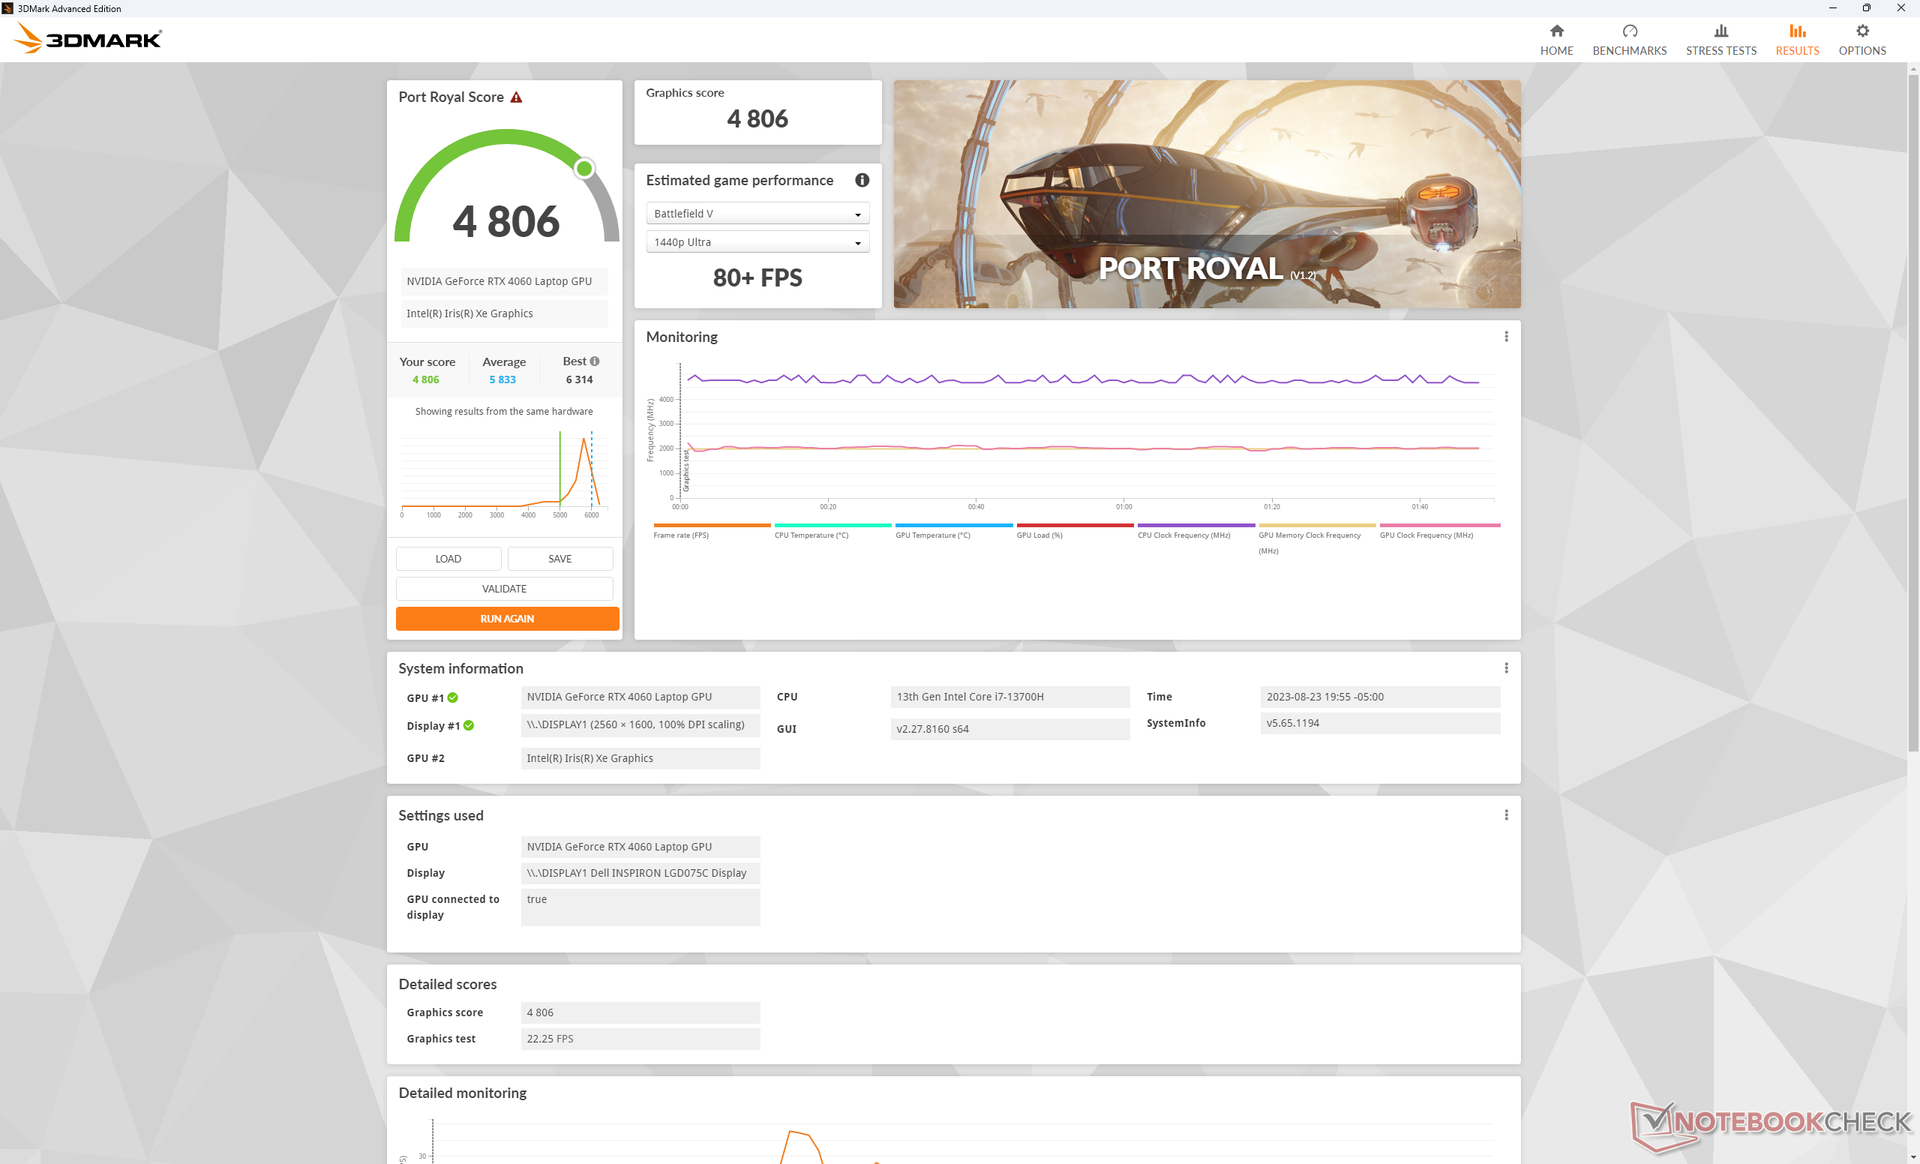
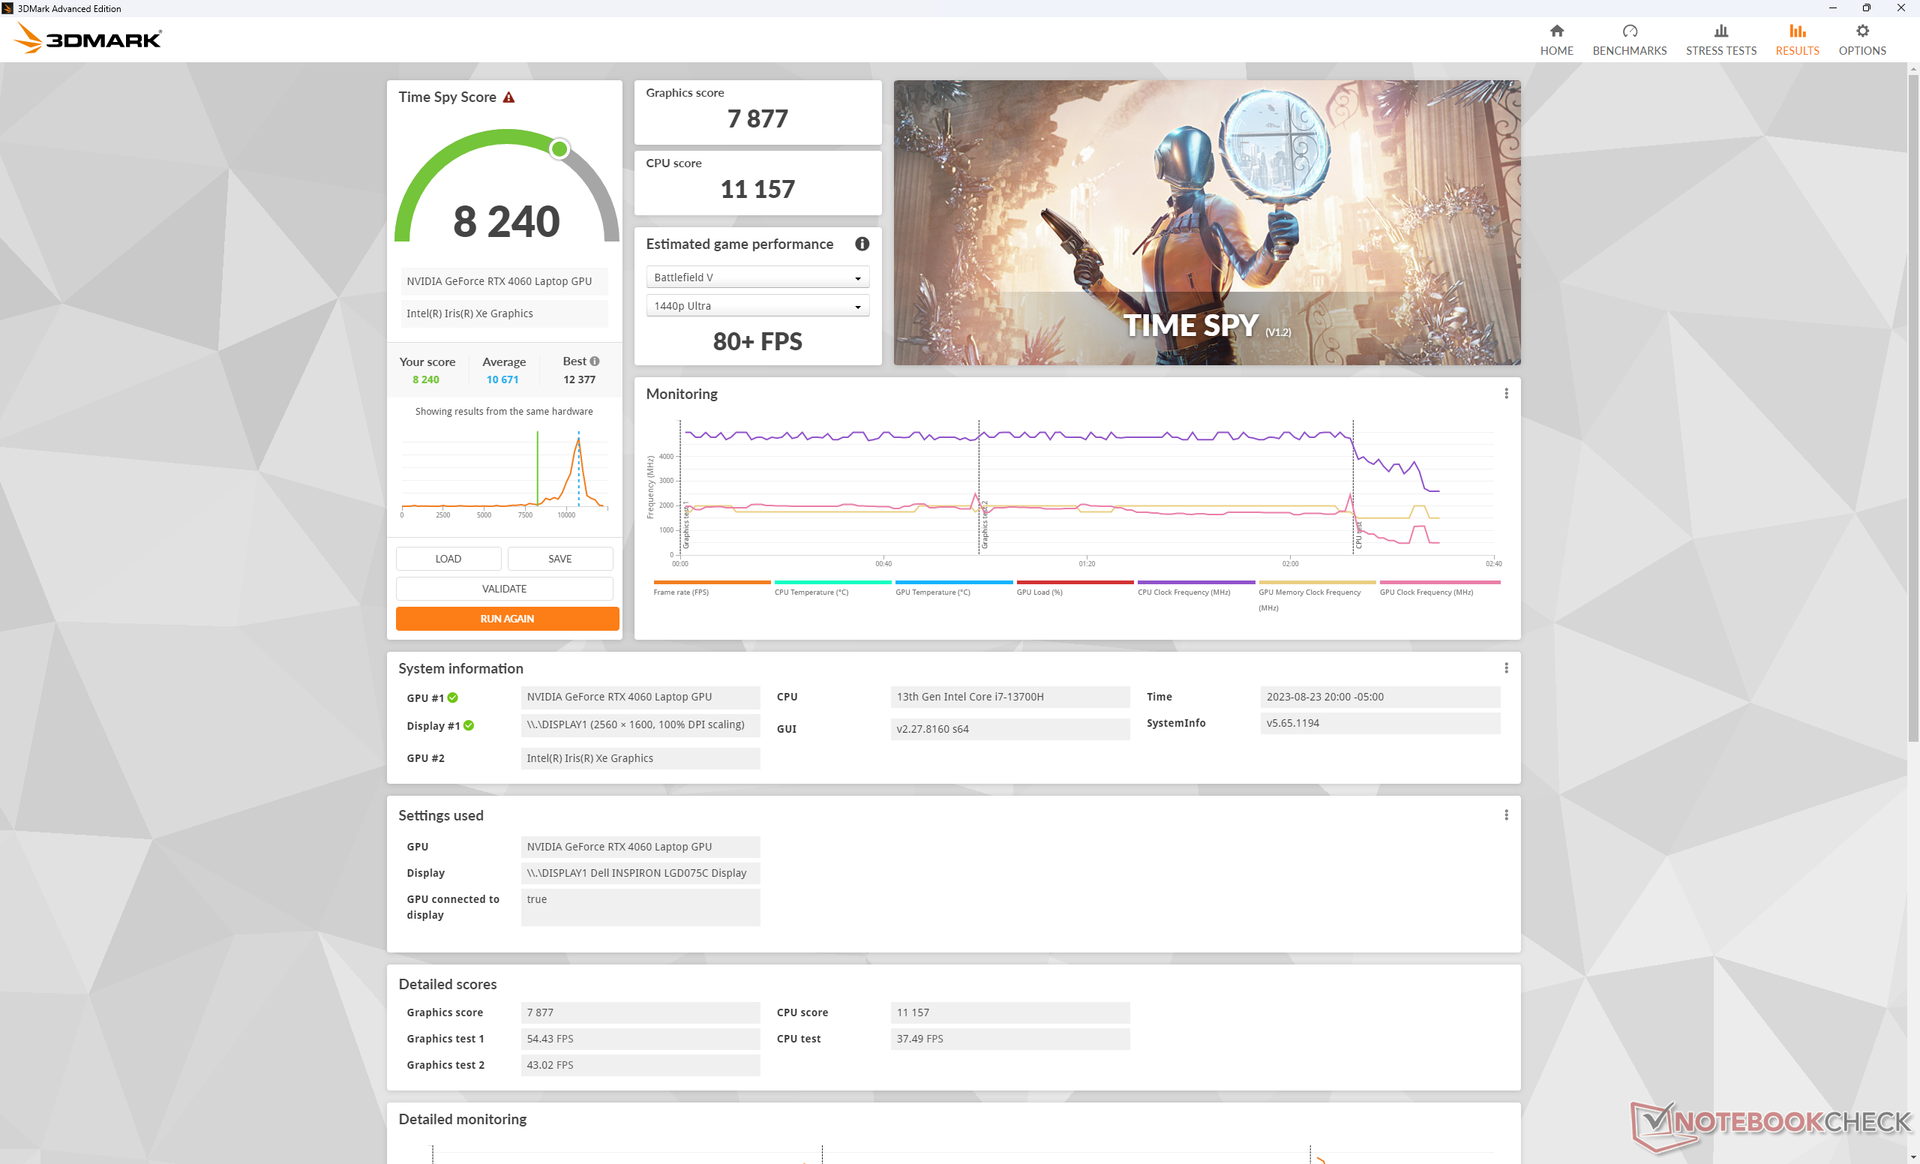
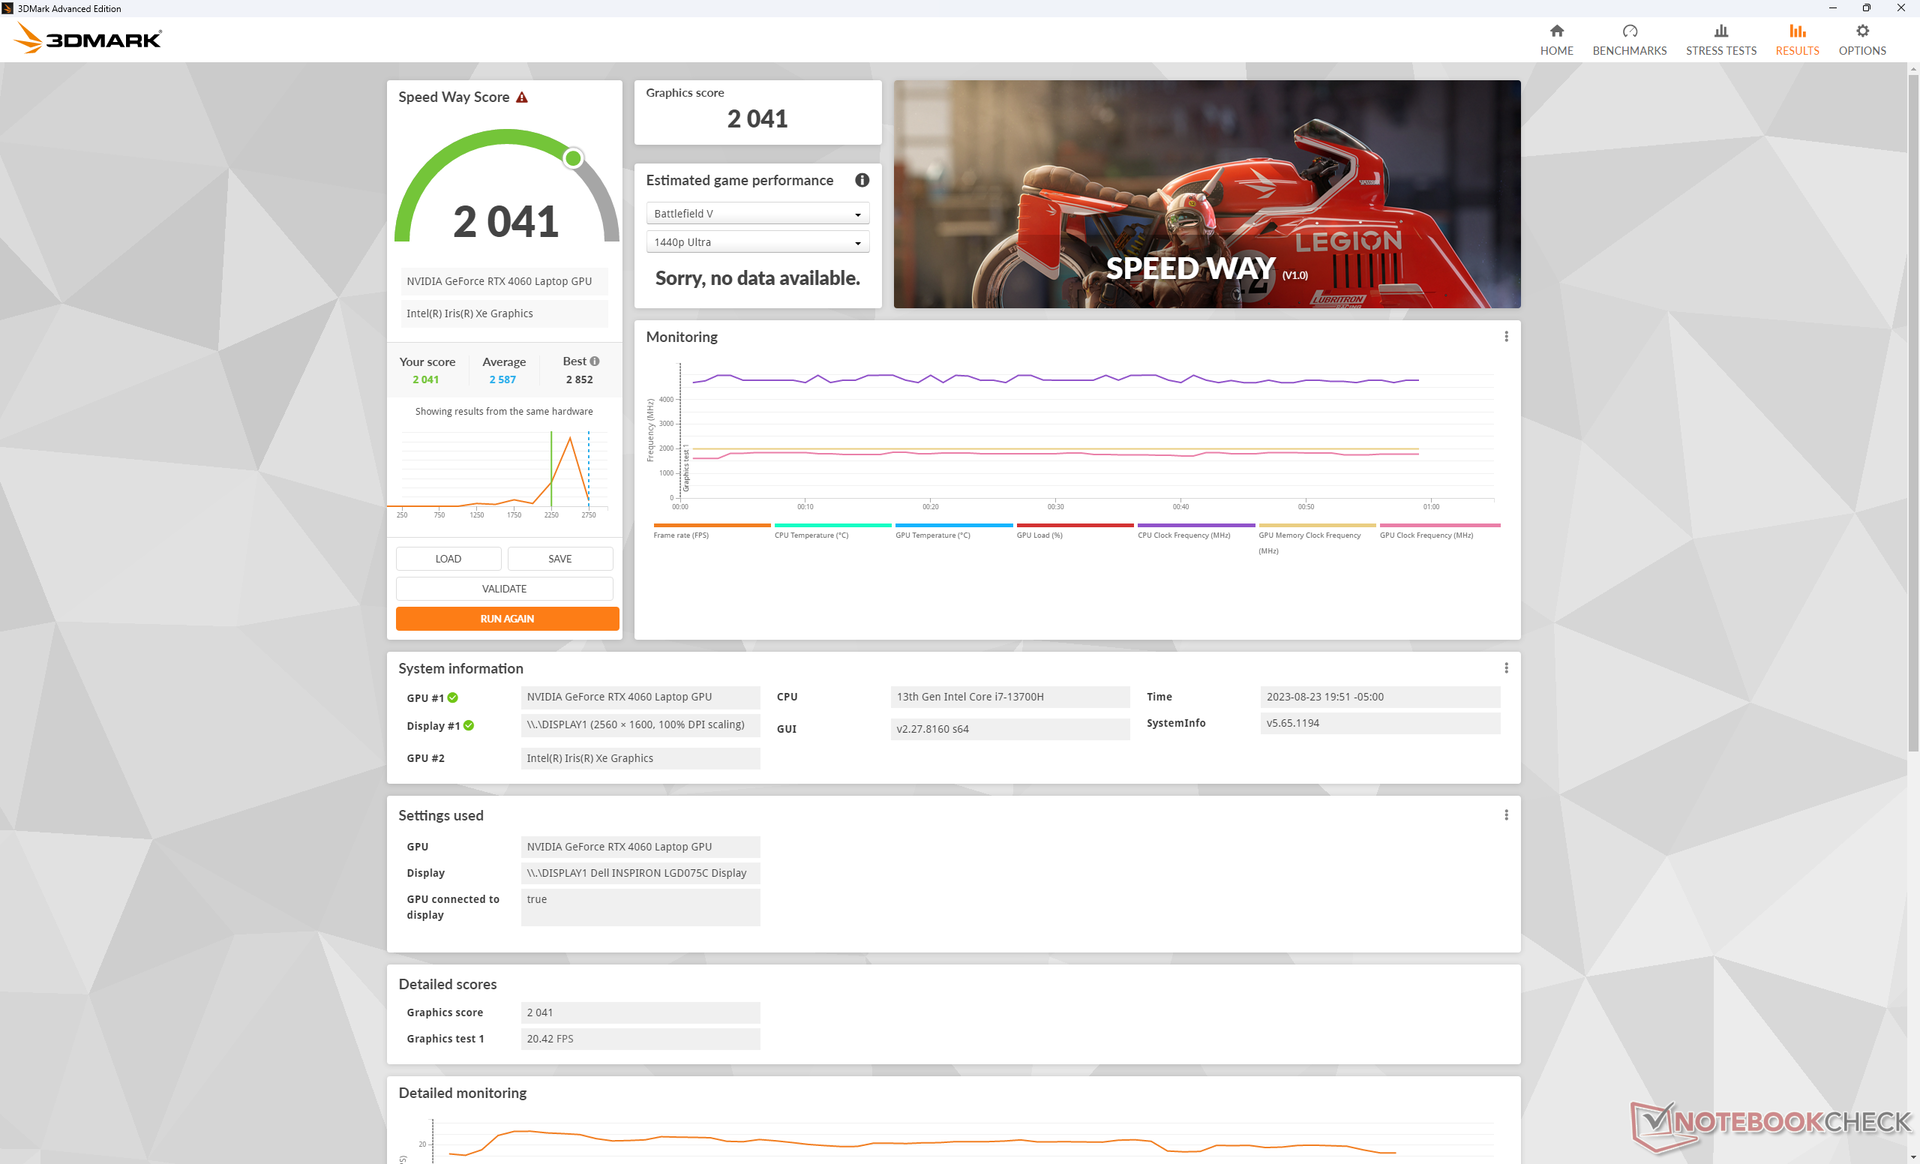
La RTX 4060 di GeForce nel nostro Dell è più lenta di circa il 10-15% rispetto alla media dei laptop del nostro database equipaggiati con la stessa GPU. La differenza è probabilmente dovuta all'obiettivo di 60 W TGP relativamente basso dell'Inspiron 16 Plus 7630, dato che la maggior parte dei laptop con RTX 4060 tendono a essere laptop dedicati al gioco ottimizzati per gamme di potenza della GPU più elevate, pari a 90 W o superiori. Le prestazioni complessive sono quindi più paragonabili a quelle di GeForce RTX 4050 nel Lenovo Slim Pro 9i 16, il che è un po' deludente da vedere. Ciononostante, il miglioramento delle prestazioni da una generazione all'altra rispetto alla RTX 3050 Ti dell'Inspiron 16 Plus 7620 dello scorso anno è ancora significativo e va dal 40 al 60%.
Gli utenti potrebbero prendere in considerazione la possibilità di configurare l'Inspiron 16 Plus 7630 con la più economica RTX 4050, dato che l'opzione RTX 4060 ha prestazioni inferiori. Tutte le opzioni di GPU puntano allo stesso TGP di 60 W.
Il passaggio dalla modalità Performance alla modalità Balanced influisce pesantemente sulle prestazioni della CPU, mentre le prestazioni della GPU rimangono pressoché invariate, come mostrano i risultati di Fire Strike. Assicuratevi di essere in modalità Performance se eseguite attività ad alta intensità di CPU.
| Profilo energetico | Punteggio grafico | Punteggio di fisica | Punteggio combinato |
| Potenza della batteria | 19574 (-9%) | 10010 (-61%) | 4793 (-46%) |
| Modalità bilanciata | 23511 (-2%) | 15963 (-41%) | 8110 (-21%) |
| Modalità Performance | 24008 | 26852 | 10239 |

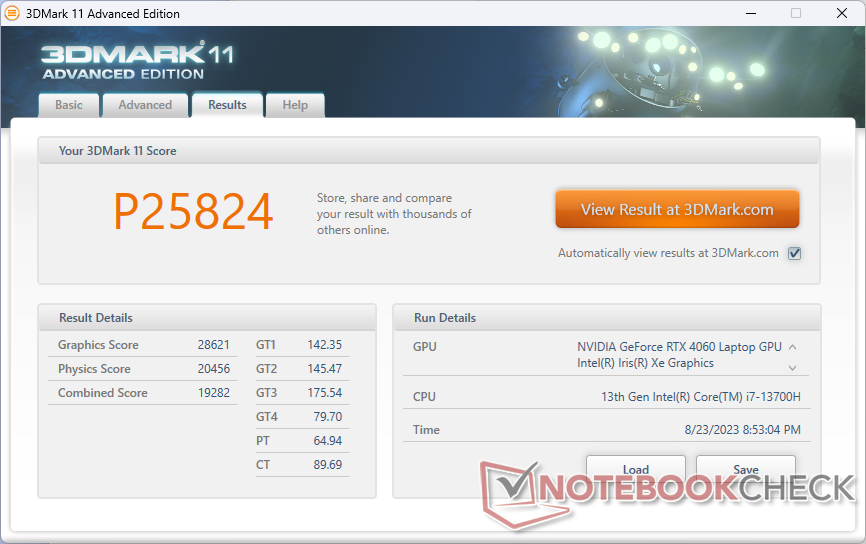
| 3DMark 11 Performance | 25824 punti | |
| 3DMark Fire Strike Score | 19289 punti | |
| 3DMark Time Spy Score | 8240 punti | |
Aiuto | ||
* ... Meglio usare valori piccoli
Prestazioni di gioco
Come previsto dai risultati di 3DMark, le prestazioni di gioco complessive sono leggermente inferiori alla media per un laptop con grafica RTX 4060. Tiny Tina's Wonderlands, ad esempio, gira a 48 FPS con le impostazioni massime a 1440p, rispetto ai 57 FPS della maggior parte degli altri laptop RTX 4060. Purtroppo la serie Inspiron 7630 non supporta il G-Sync, che avrebbe attenuato il frame tearing.
Witcher 3 FPS Chart
| basso | medio | alto | ultra | QHD | |
|---|---|---|---|---|---|
| The Witcher 3 (2015) | 409.3 | 275.3 | 169.5 | 90.9 | 68 |
| Dota 2 Reborn (2015) | 184.7 | 166.6 | 157.9 | 146.1 | |
| Final Fantasy XV Benchmark (2018) | 172.2 | 122.2 | 88.9 | 64.4 | |
| X-Plane 11.11 (2018) | 153.5 | 135.7 | 109.7 | ||
| Far Cry 5 (2018) | 133 | 120 | 115 | 103 | 83 |
| Strange Brigade (2018) | 378 | 234 | 185.9 | 161 | 110.9 |
| Cyberpunk 2077 1.6 (2022) | 108.1 | 84.2 | 72.9 | 65.7 | 40.8 |
| Tiny Tina's Wonderlands (2022) | 169.5 | 141.5 | 92.1 | 71.4 | 48 |
| F1 22 (2022) | 205 | 201 | 148.4 | 53.8 | 34.1 |
| Returnal (2023) | 71 | 68 | 63 | 57 | 39 |
Emissioni
Rumore di sistema: più silenzioso e più forte di prima
Le ventole interne possono essere silenziose quando sono al minimo sul desktop, ma il più delle volte si aggirano intorno ai 26-28 dB(A) quando si eseguono carichi comuni come browser web o flussi video. Inoltre, sono in grado di rimanere relativamente silenziose per un bel po' di tempo anche quando vengono introdotti carichi più elevati, mentre le ventole dell'Inspiron 16 Plus 7620 pulsano più rapidamente e prontamente. Quando si esegue 3DMark 06, ad esempio, il rumore della ventola sale a 35 dB(A) solo verso la fine della prima scena di benchmark di 90 secondi.
Il rumore della ventola aumenta in modo significativo durante l'esecuzione di giochi. Mentre l'Inspiron 16 Plus 7630 è generalmente più silenzioso del modello dell'anno scorso quando si eseguono carichi non impegnativi, il contrario è vero quando si gioca. Il rumore della ventola raggiunge quasi 53 dB(A) quando si utilizza Witcher 3, rispetto ai 49 dB(A) dell'Inspiron 16 Plus 7620. Tuttavia, il valore di 50 dB(A) è paragonabile a quello di concorrenti come loSlim Pro 9i 16 o Envy 16.
È interessante notare che la modifica del profilo di potenza tra le modalità Bilanciata e Prestazioni non influisce sul limite massimo di rumorosità della ventola durante i giochi, poiché il livello massimo è sempre di 52,5 dB(A) in entrambe le impostazioni.
Rumorosità
| Idle |
| 23.2 / 23.2 / 23.2 dB(A) |
| Sotto carico |
| 35.1 / 52.5 dB(A) |
 | ||
30 dB silenzioso 40 dB(A) udibile 50 dB(A) rumoroso |
||
min: | ||
| Dell Inspiron 16 Plus 7630 GeForce RTX 4060 Laptop GPU, i7-13700H, WD PC SN740 SDDPTQD-1T00 | Dell Inspiron 16 Plus 7620 GeForce RTX 3050 Ti Laptop GPU, i7-12700H, Kioxia BG5 KBG50ZNS512G | Lenovo Slim Pro 9i 16IRP8 GeForce RTX 4050 Laptop GPU, i9-13905H, Samsung PM9A1 MZVL21T0HCLR | Asus Vivobook Pro 16X K6604JV-MX016W GeForce RTX 4060 Laptop GPU, i9-13980HX, Solidigm P41 Plus SSDPFKNU010TZ | HP Envy 16 h0112nr GeForce RTX 3060 Laptop GPU, i7-12700H, Micron 3400 1TB MTFDKBA1T0TFH | MSI Summit E16 Flip A12UDT-031 GeForce RTX 3050 Ti Laptop GPU, i7-1280P, Samsung PM9A1 MZVL22T0HBLB | |
|---|---|---|---|---|---|---|
| Noise | -11% | 1% | -21% | -6% | -14% | |
| off /ambiente * (dB) | 23.2 | 23.3 -0% | 22.7 2% | 25.2 -9% | 22.8 2% | 25 -8% |
| Idle Minimum * (dB) | 23.2 | 25.7 -11% | 22.7 2% | 26.6 -15% | 22.9 1% | 25 -8% |
| Idle Average * (dB) | 23.2 | 26.1 -13% | 22.7 2% | 26.6 -15% | 22.9 1% | 25 -8% |
| Idle Maximum * (dB) | 23.2 | 30.6 -32% | 27.5 -19% | 29.2 -26% | 30.5 -31% | 28.9 -25% |
| Load Average * (dB) | 35.1 | 46.2 -32% | 28.9 18% | 53.4 -52% | 41.4 -18% | 49.3 -40% |
| Witcher 3 ultra * (dB) | 52.5 | 49.2 6% | 52.6 -0% | 51.1 3% | ||
| Load Maximum * (dB) | 52.5 | 49.4 6% | 52.5 -0% | 56.9 -8% | 51.4 2% | 48.2 8% |
* ... Meglio usare valori piccoli
Temperatura
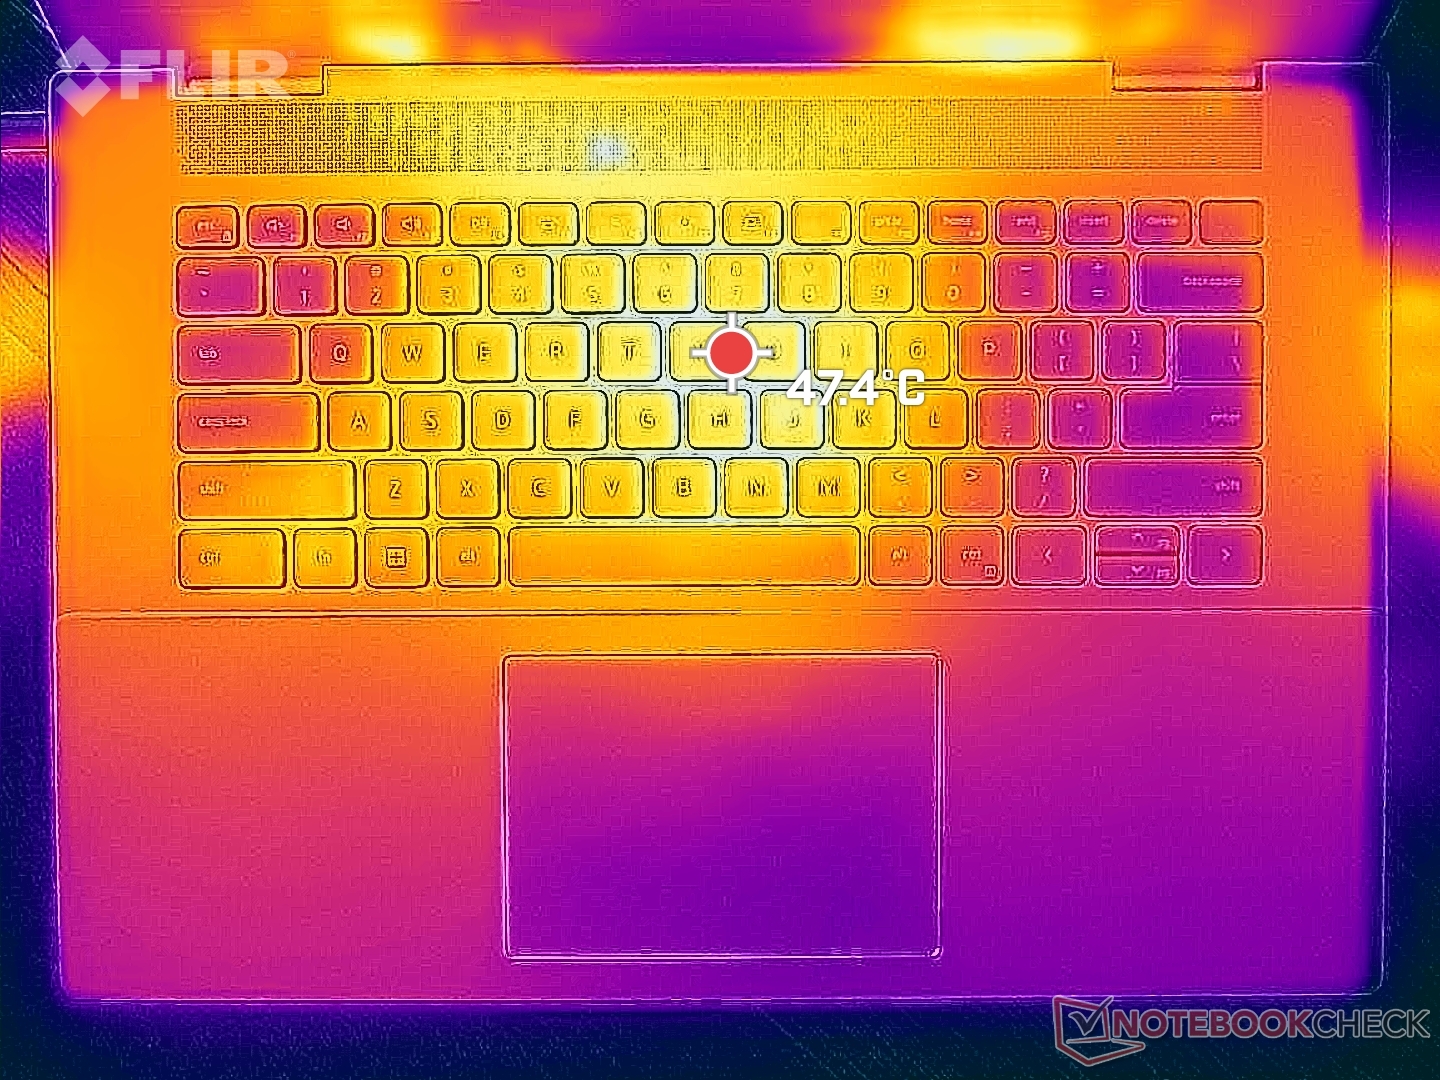
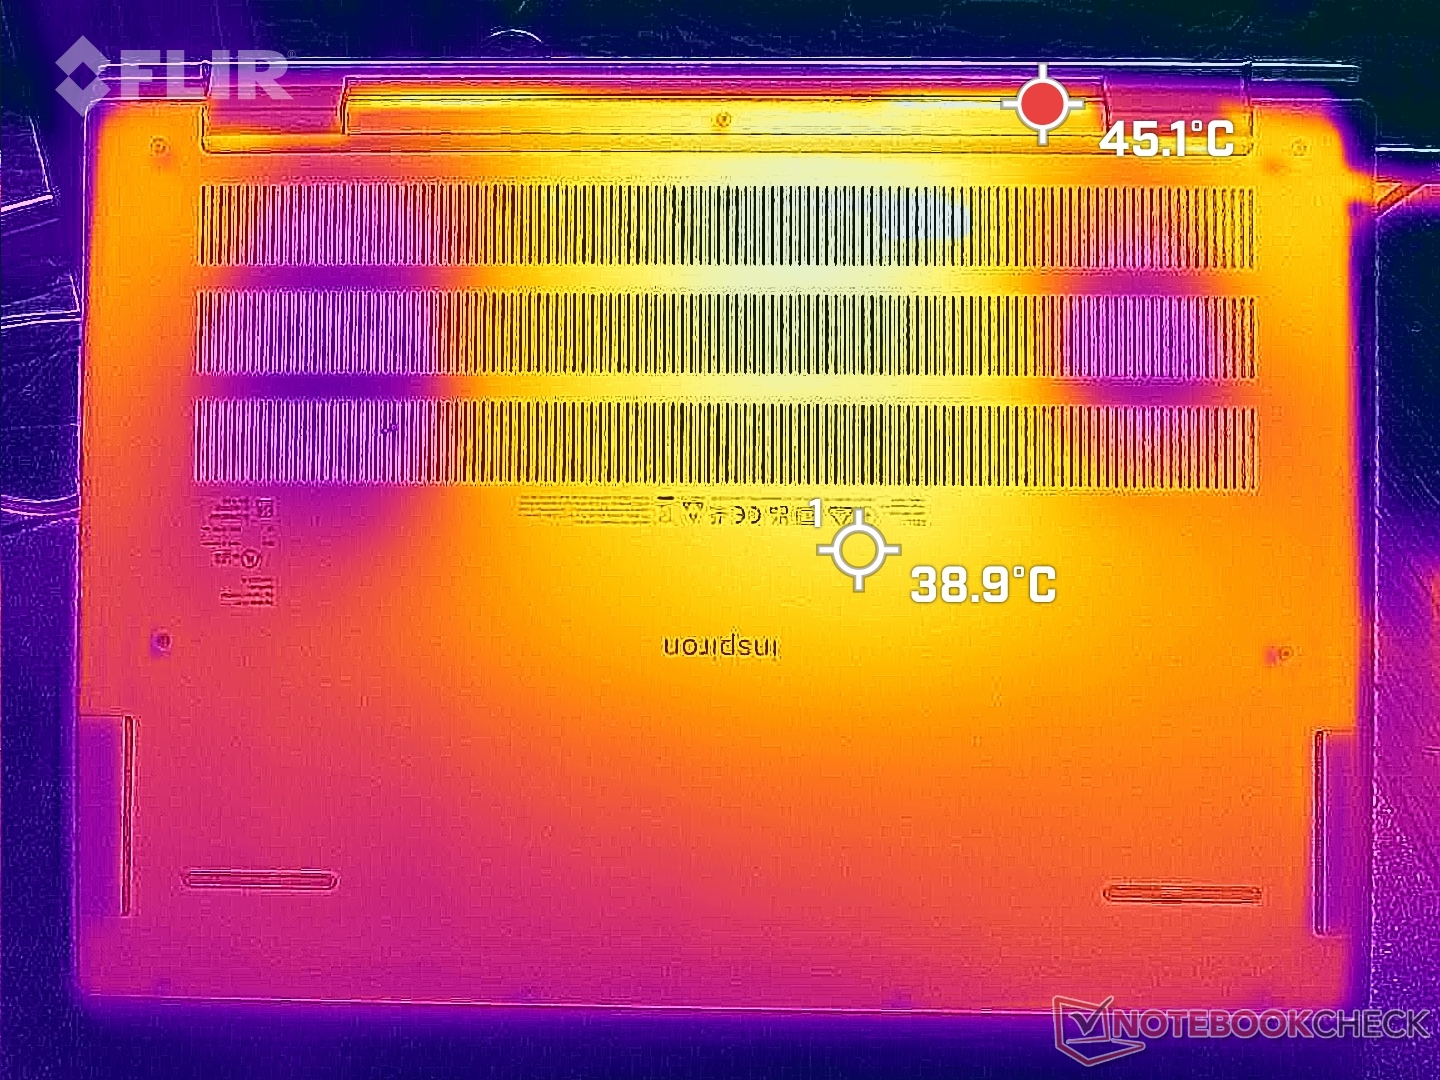
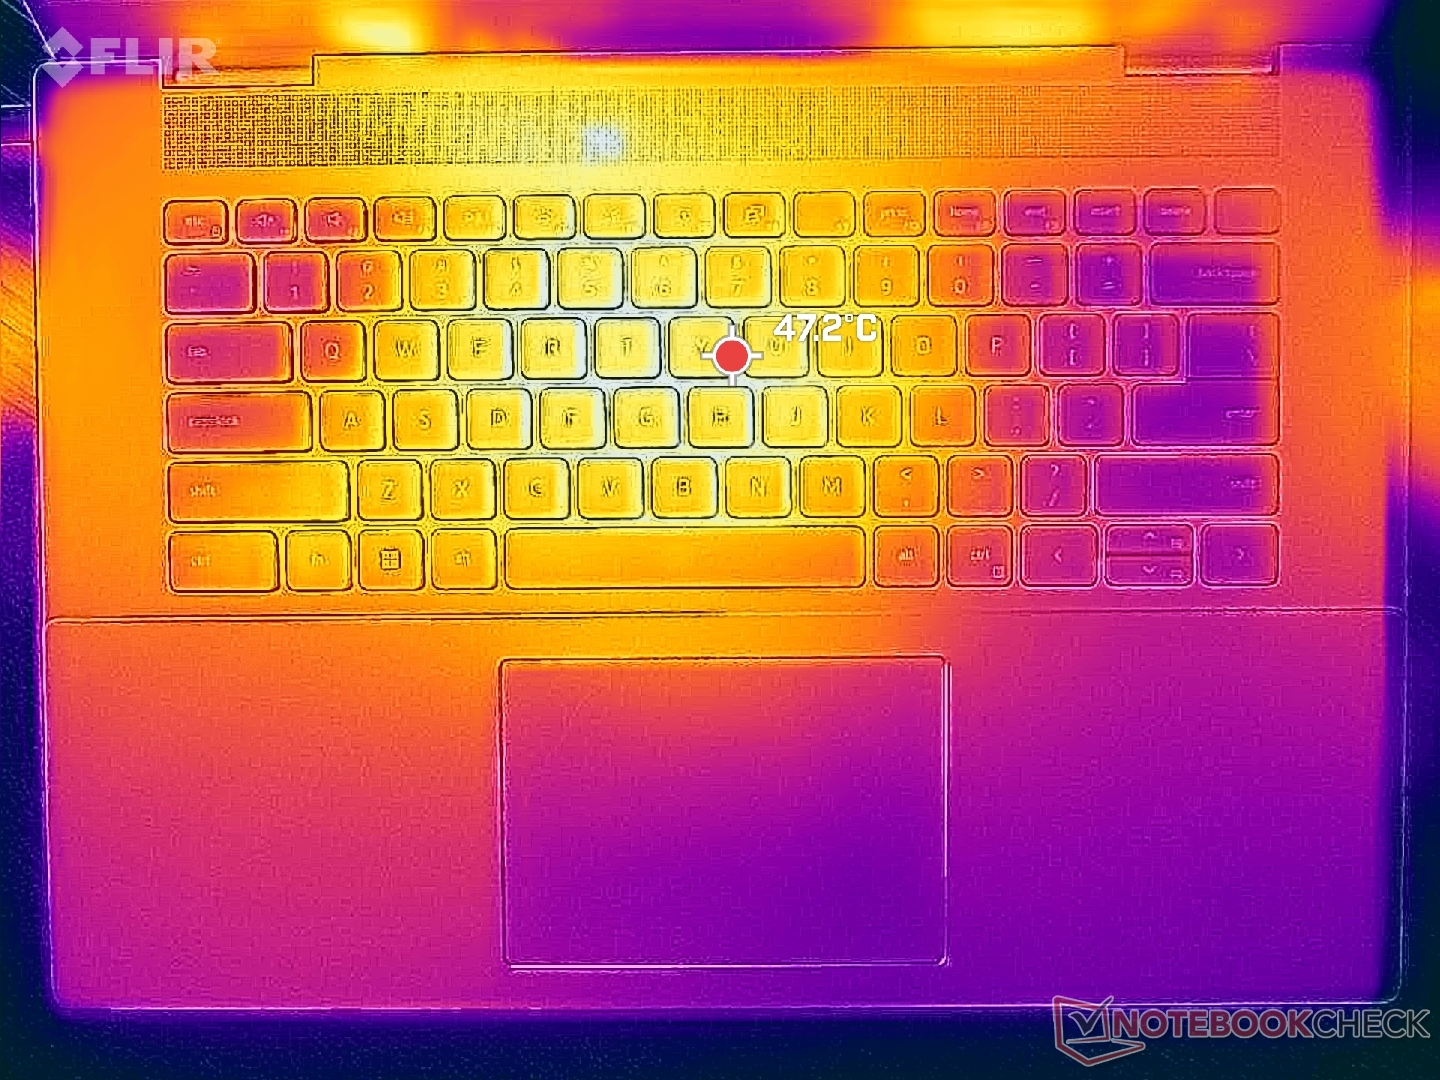
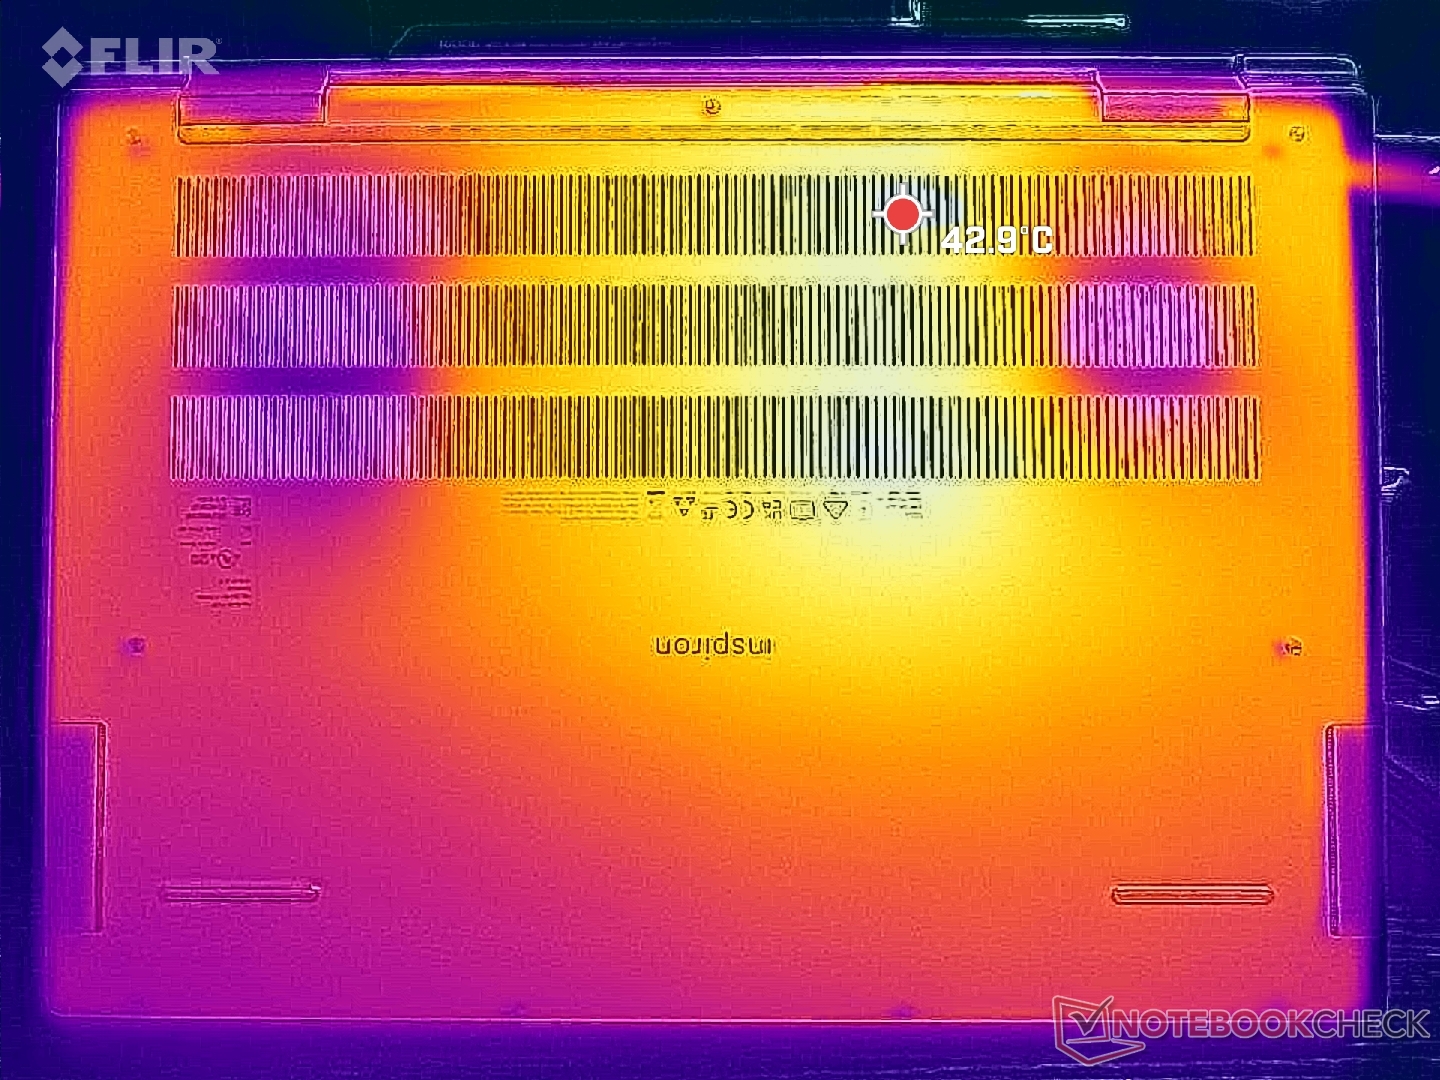
Le temperature della superficie quando si eseguono carichi impegnativi come i giochi sono più calde del previsto. I punti caldi sulla parte superiore e inferiore possono raggiungere rispettivamente i 48 C e i 43 C, vicino al centro della tastiera. Anche il poggiapolsi può essere molto caldo, fino a 37 C, rispetto ai 31 C del modello Vivobook Pro 16.Asus Vivobook Pro 16X o HP Envy 16. Si tratta sicuramente di un prodotto che scalda di più le mani rispetto ad altri computer portatili.
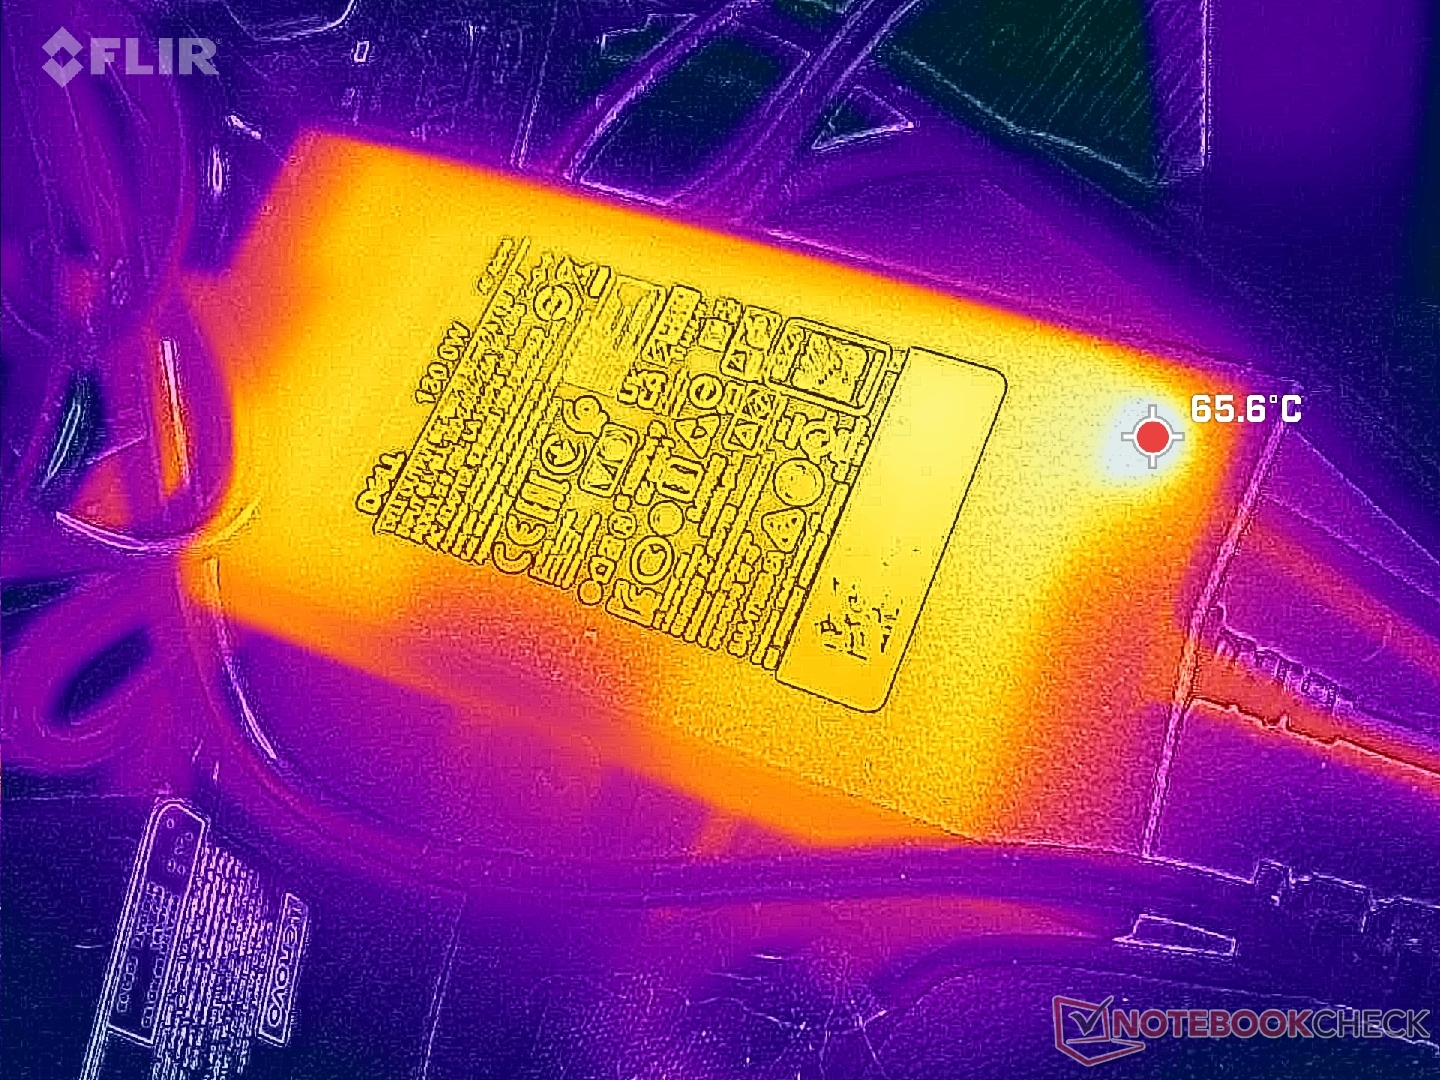
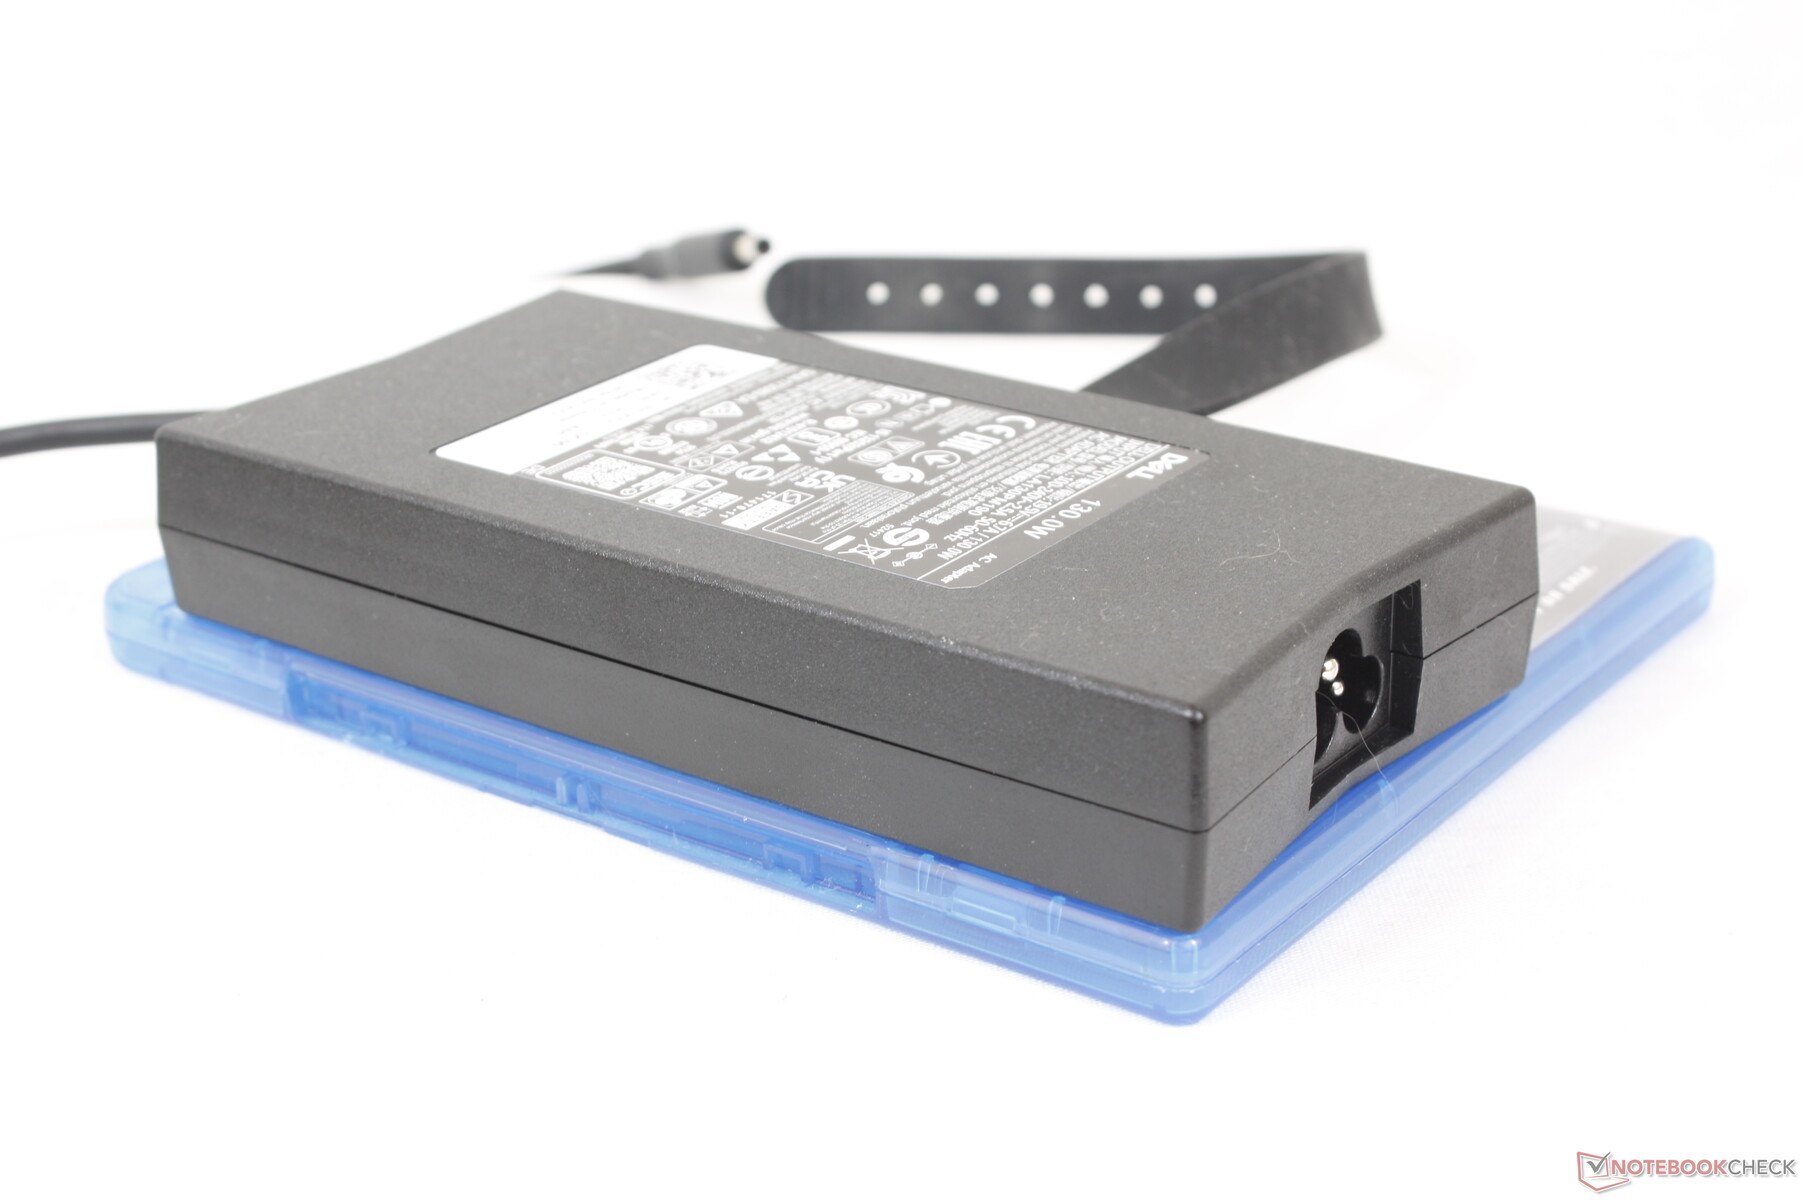
Inoltre, l'adattatore CA è notevolmente più caldo della media, con oltre 65 C. È consigliabile lasciare ampio spazio all'adattatore CA per ogni evenienza.
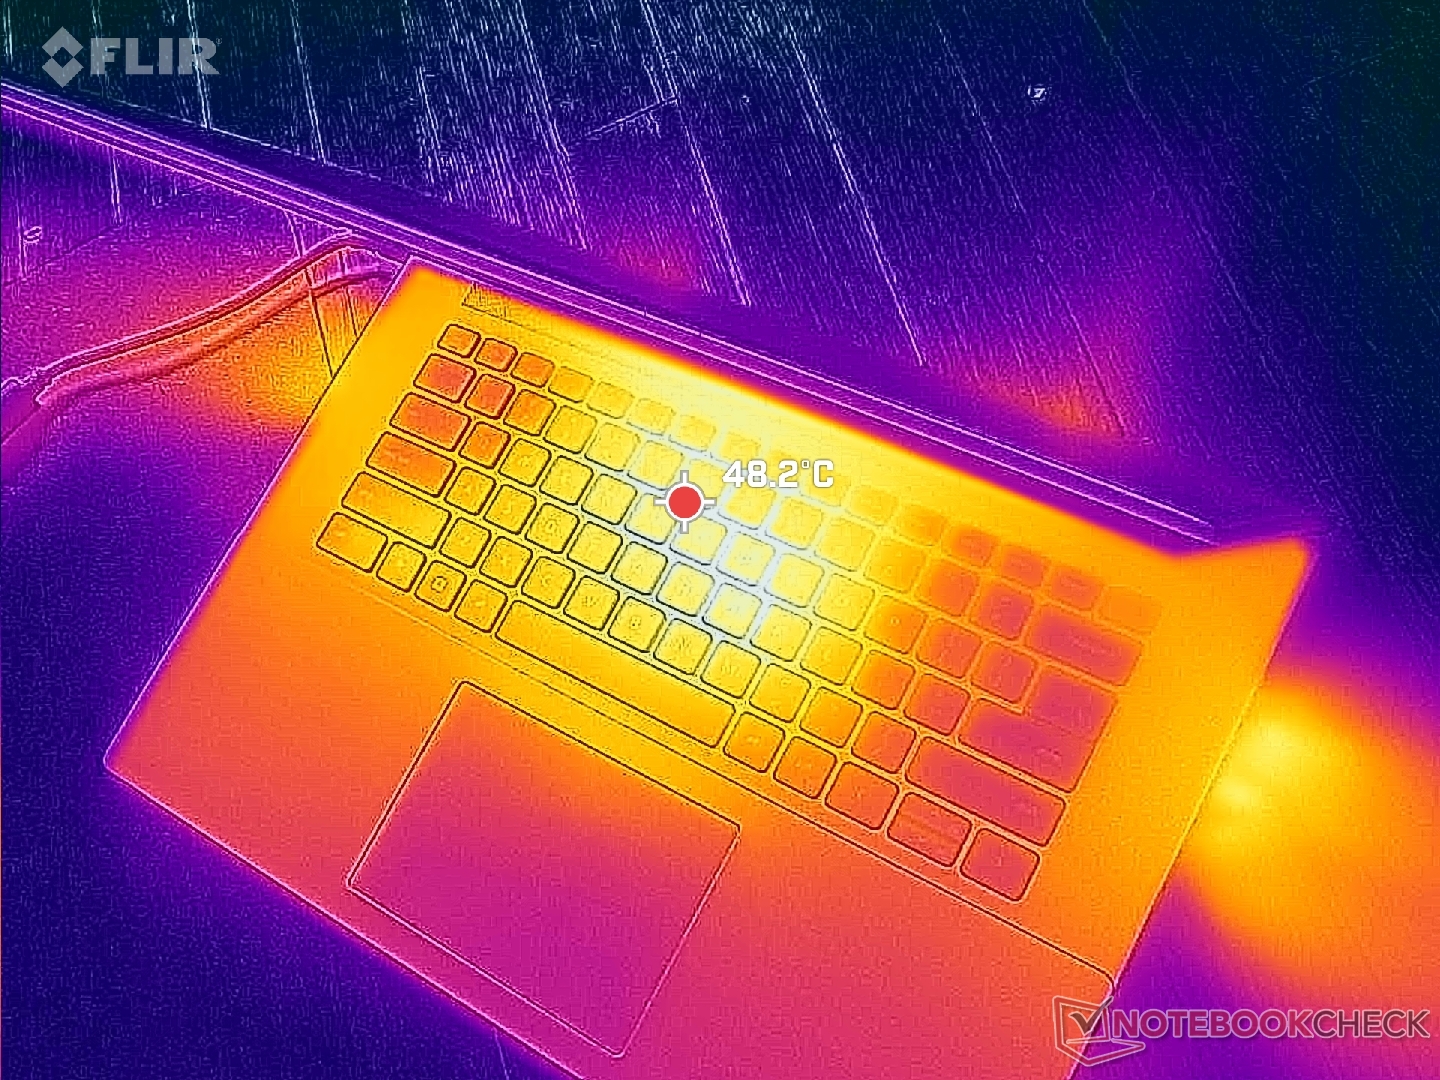
(-) La temperatura massima sul lato superiore è di 47.8 °C / 118 F, rispetto alla media di 36.8 °C / 98 F, che varia da 21 a 71 °C per questa classe Multimedia.
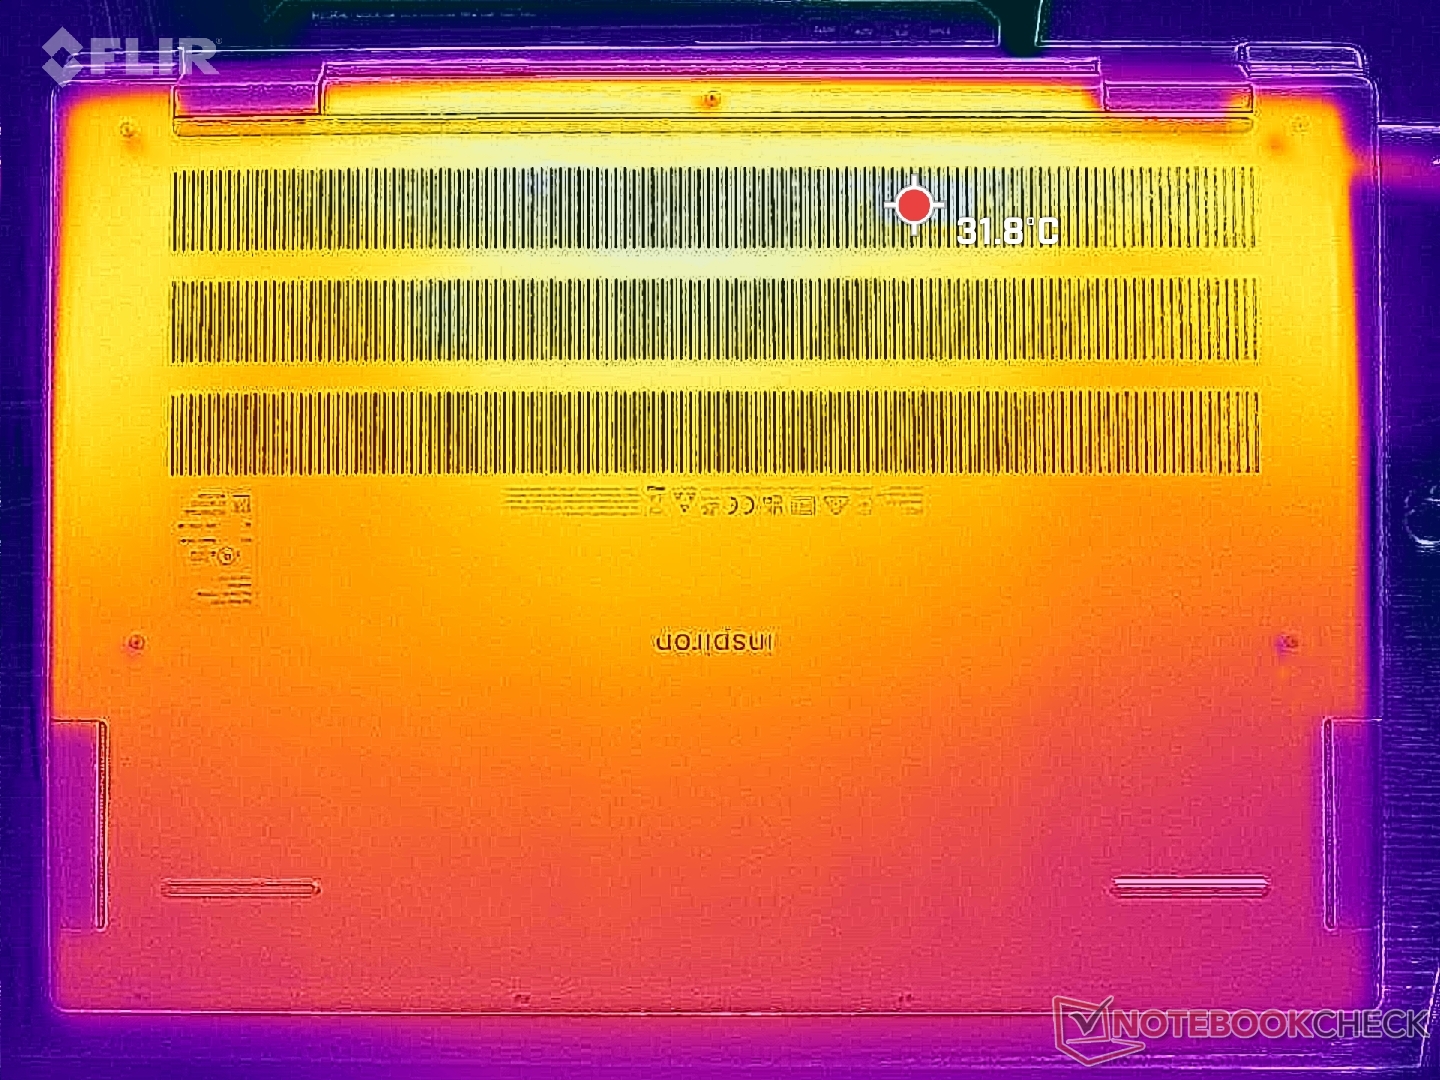
(±) Il lato inferiore si riscalda fino ad un massimo di 42.2 °C / 108 F, rispetto alla media di 39.1 °C / 102 F
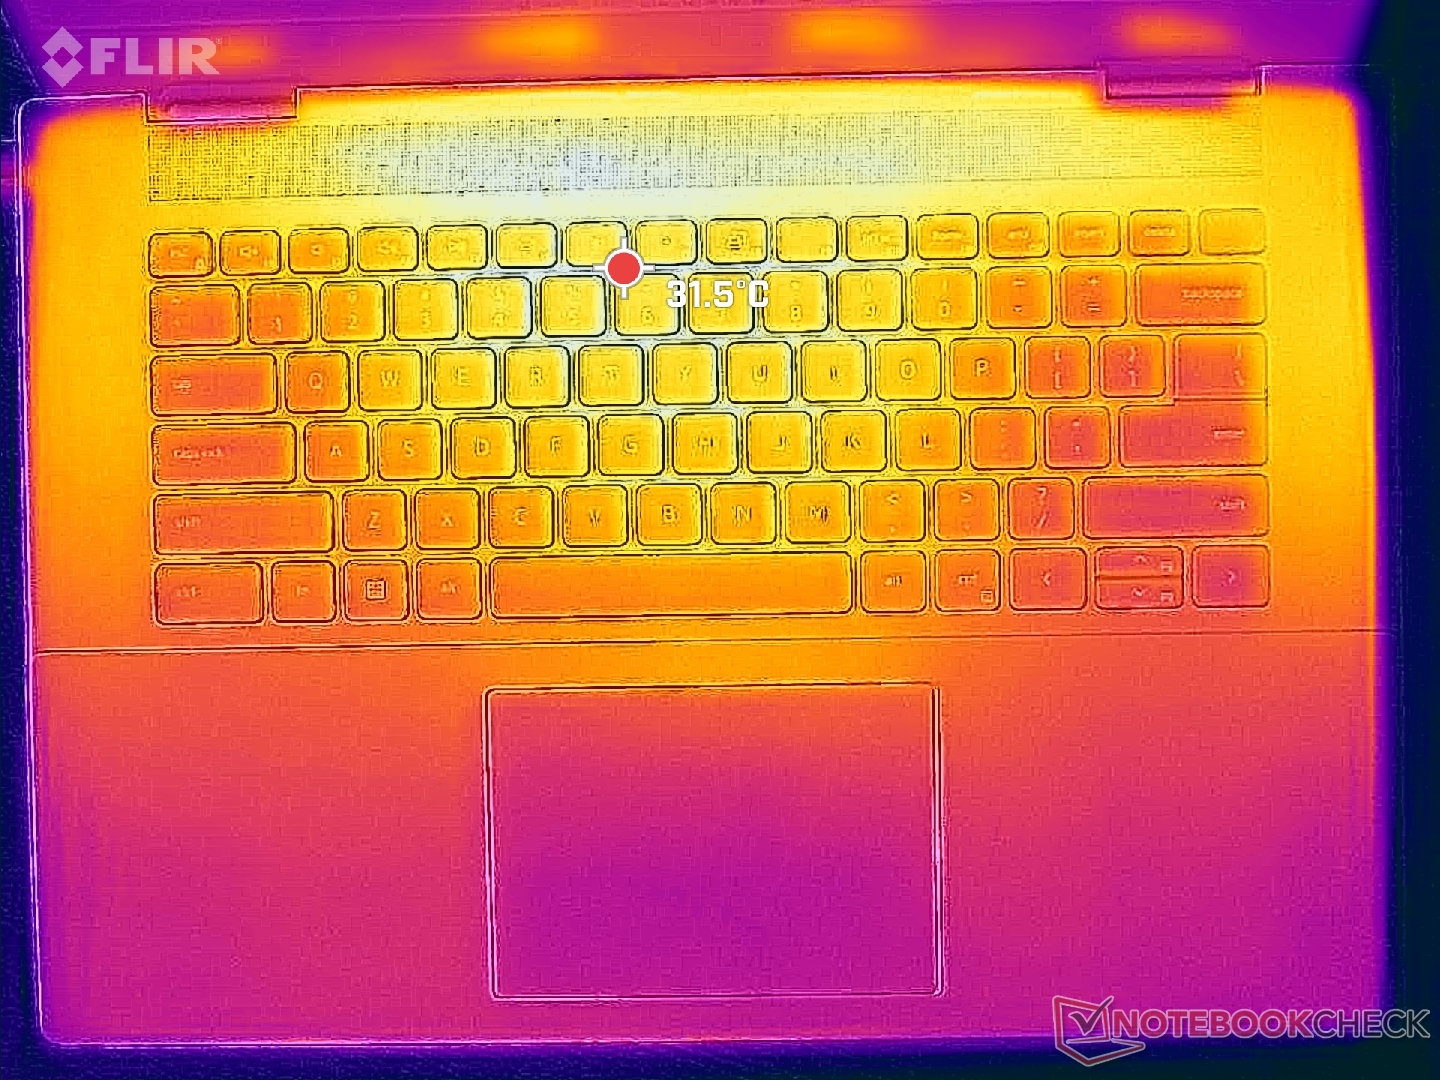
(±) In idle, la temperatura media del lato superiore è di 32 °C / 90 F, rispetto alla media deld ispositivo di 31.3 °C / 88 F.
(-) Riproducendo The Witcher 3, la temperatura media per il lato superiore e' di 40.6 °C / 105 F, rispetto alla media del dispositivo di 31.3 °C / 88 F.
(±) I poggiapolsi e il touchpad possono diventare molto caldi al tatto con un massimo di 36.6 °C / 97.9 F.
(-) La temperatura media della zona del palmo della mano di dispositivi simili e'stata di 28.7 °C / 83.7 F (-7.9 °C / -14.2 F).
| Dell Inspiron 16 Plus 7630 Intel Core i7-13700H, NVIDIA GeForce RTX 4060 Laptop GPU | Dell Inspiron 16 Plus 7620 Intel Core i7-12700H, NVIDIA GeForce RTX 3050 Ti Laptop GPU | Lenovo Slim Pro 9i 16IRP8 Intel Core i9-13905H, NVIDIA GeForce RTX 4050 Laptop GPU | Asus Vivobook Pro 16X K6604JV-MX016W Intel Core i9-13980HX, NVIDIA GeForce RTX 4060 Laptop GPU | HP Envy 16 h0112nr Intel Core i7-12700H, NVIDIA GeForce RTX 3060 Laptop GPU | MSI Summit E16 Flip A12UDT-031 Intel Core i7-1280P, NVIDIA GeForce RTX 3050 Ti Laptop GPU | |
|---|---|---|---|---|---|---|
| Heat | 6% | 10% | -3% | 3% | 2% | |
| Maximum Upper Side * (°C) | 47.8 | 46 4% | 37.8 21% | 39.7 17% | 45.2 5% | 49.2 -3% |
| Maximum Bottom * (°C) | 42.2 | 45.8 -9% | 44.8 -6% | 60 -42% | 44 -4% | 50.2 -19% |
| Idle Upper Side * (°C) | 35.2 | 29.2 17% | 30.6 13% | 30.9 12% | 33.6 5% | 29.4 16% |
| Idle Bottom * (°C) | 35 | 31 11% | 31 11% | 34.7 1% | 32.6 7% | 30 14% |
* ... Meglio usare valori piccoli
Stress test
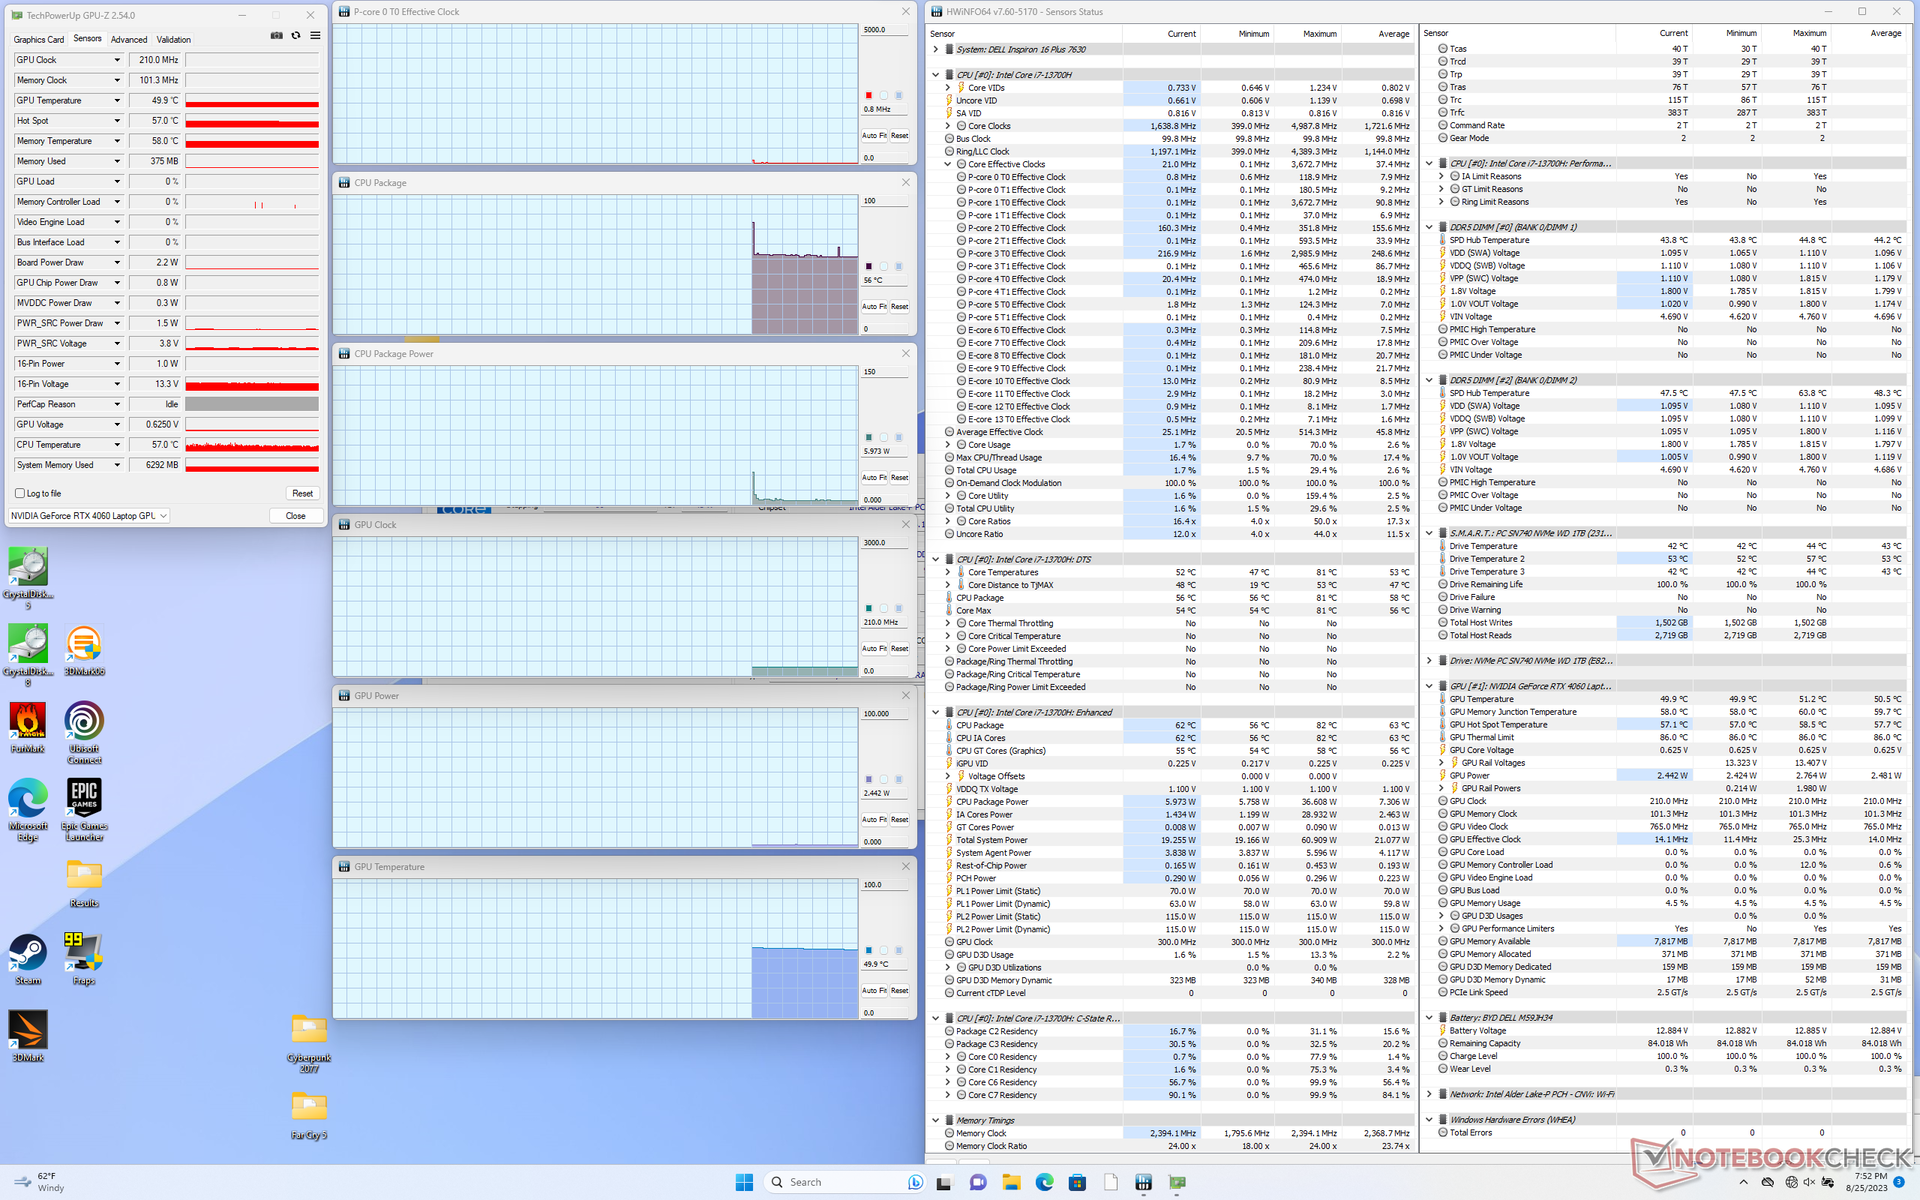
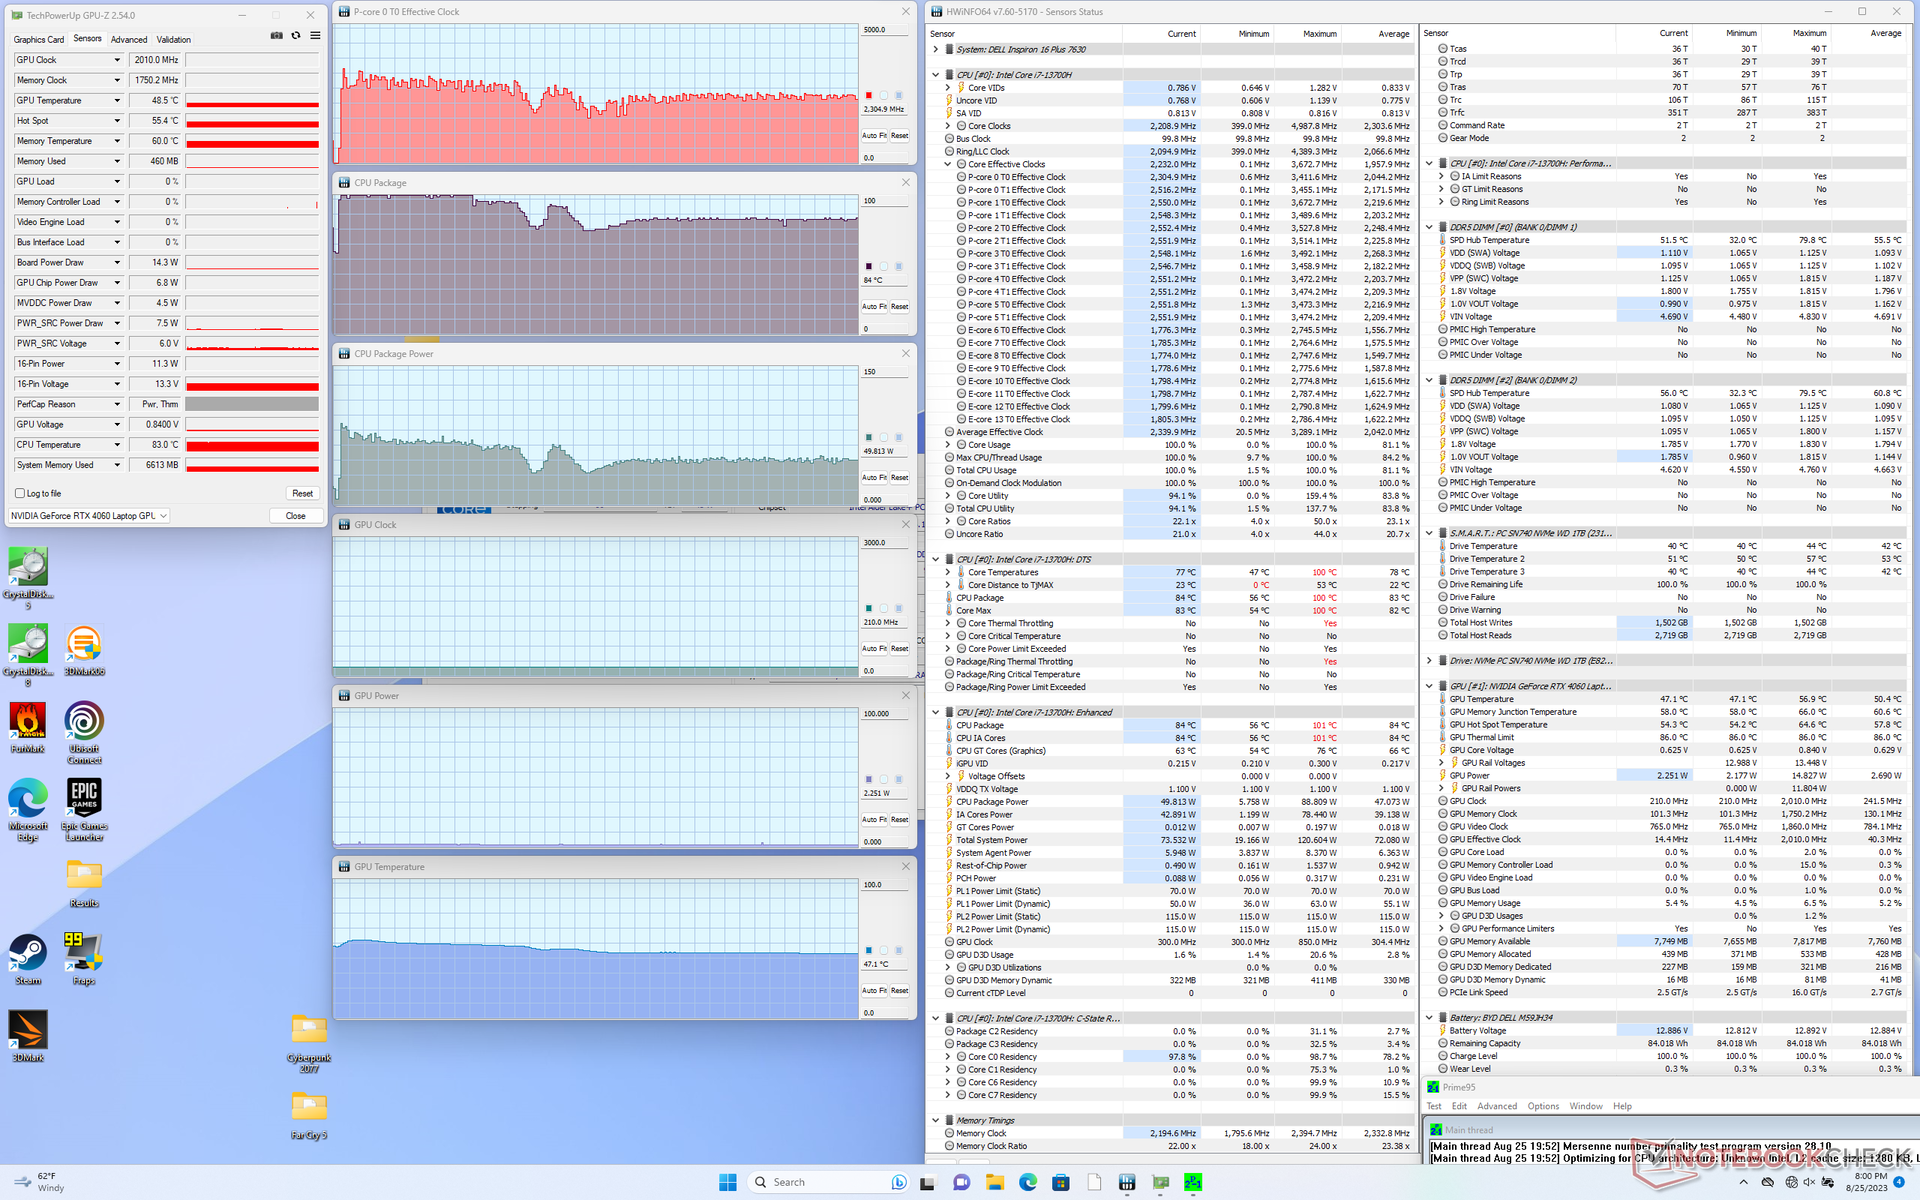
Quando si esegue Prime95, la CPU sale a 3,4 GHz, 89 W e 100 C per pochi secondi, prima di stabilizzarsi a circa 2,3 GHz e 50 W per mantenere una temperatura del nucleo più ragionevole di 84 C. Anche il modello dell'anno scorso si stabilizzava intorno agli stessi valori durante lo stesso test.
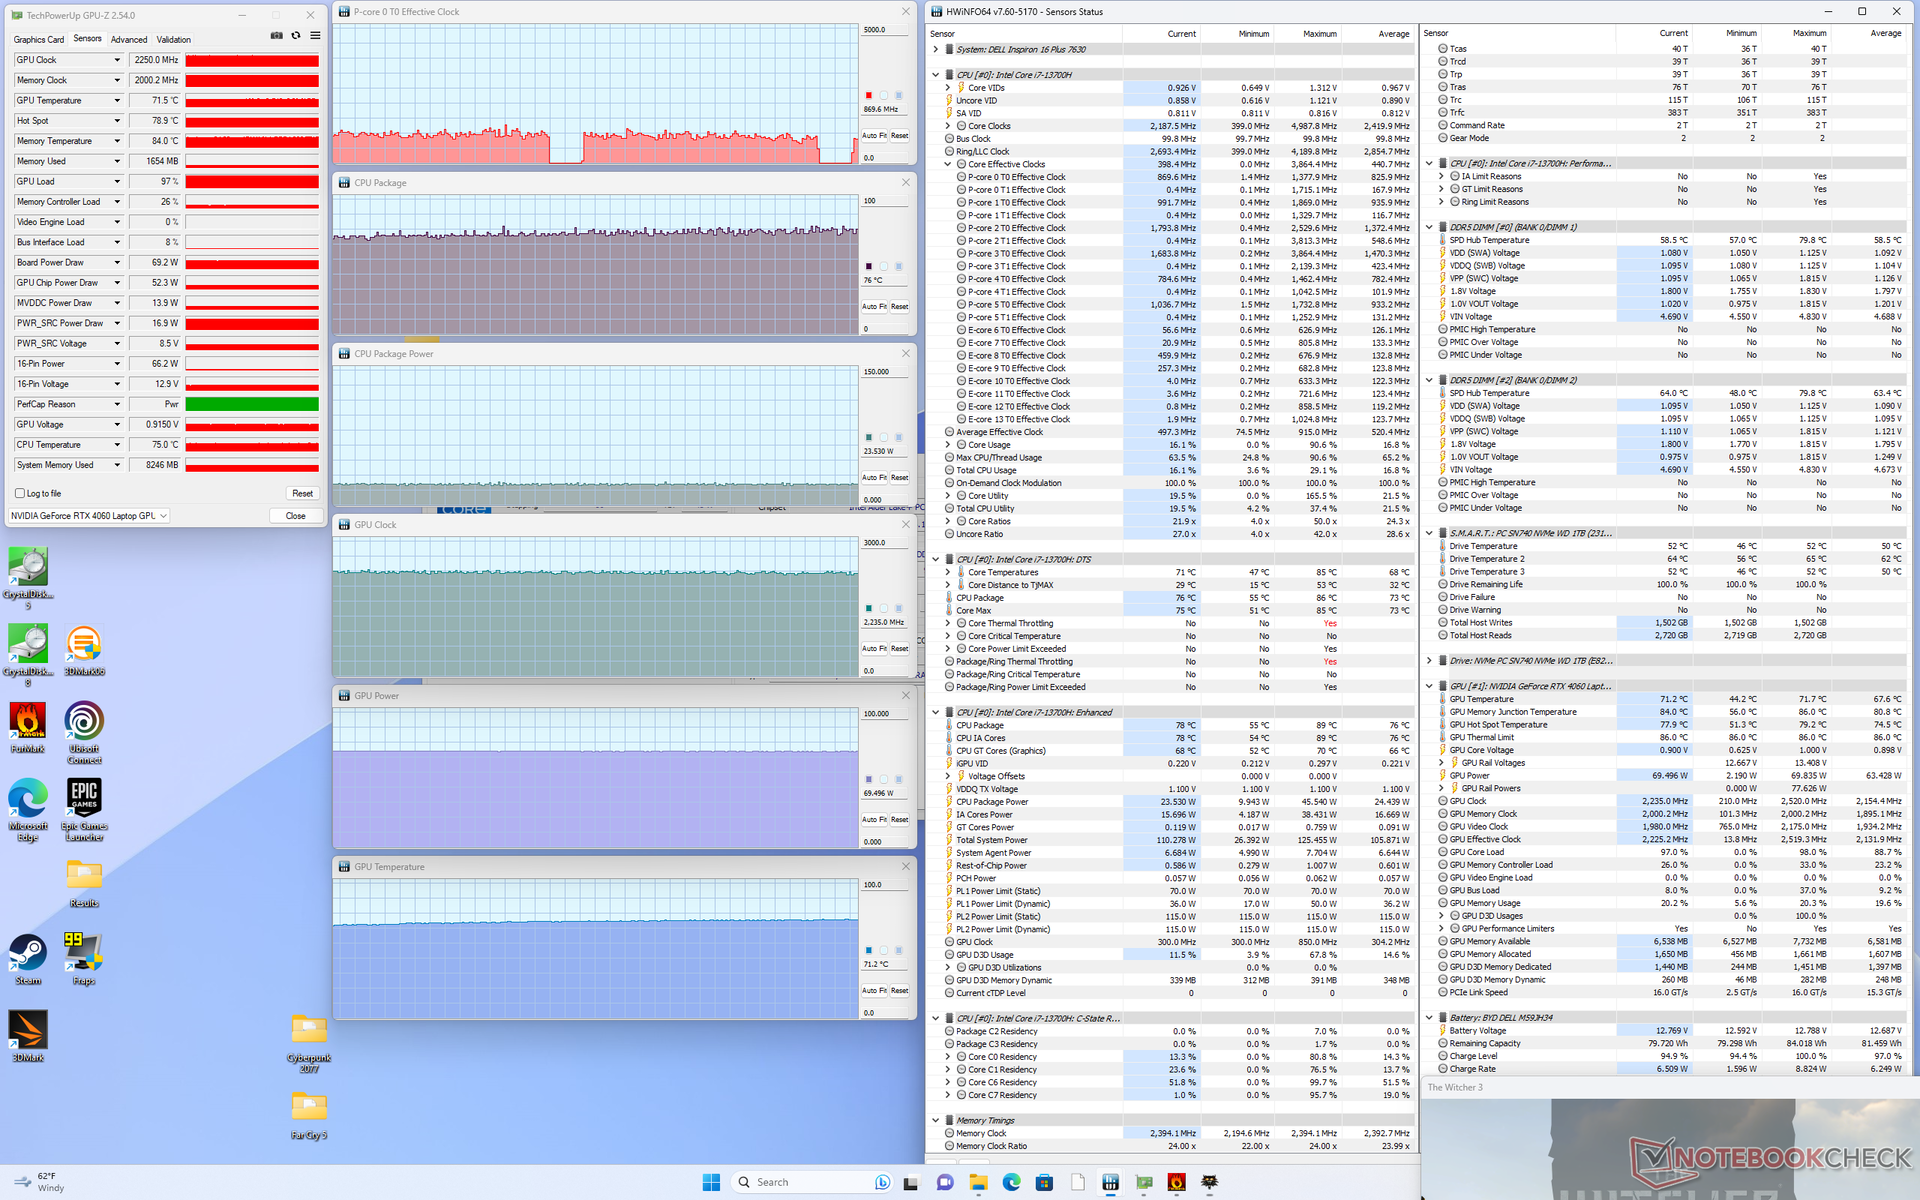
Quando si esegue Witcher 3 in modalità Performance per rappresentare i carichi di gioco tipici, la GPU Nvidia si stabilizza a 2235 MHz, 71 C e 69 W secondo HWiNFO. Il passaggio alla modalità Balanced non influisce in modo significativo su questi valori, il che è in linea con le osservazioni di Fire Strike di cui sopra. È interessante notare che le temperature del core sarebbero molto più basse di quelle registrate sull'Inspiron 16 Plus 7620 Inspiron 16 Plus 7620 con lo stesso gioco, probabilmente a causa del rumore più forte della ventola e dei miglioramenti generali della soluzione di raffreddamento.
Si noti che mentre HWiNFO riporta un assorbimento di potenza della GPU di 69 W durante il gioco, Dell pubblicizza una potenza della GPU di soli 60 W. Il pannello di controllo Nvidia riporta una potenza della GPU target di 70 W.
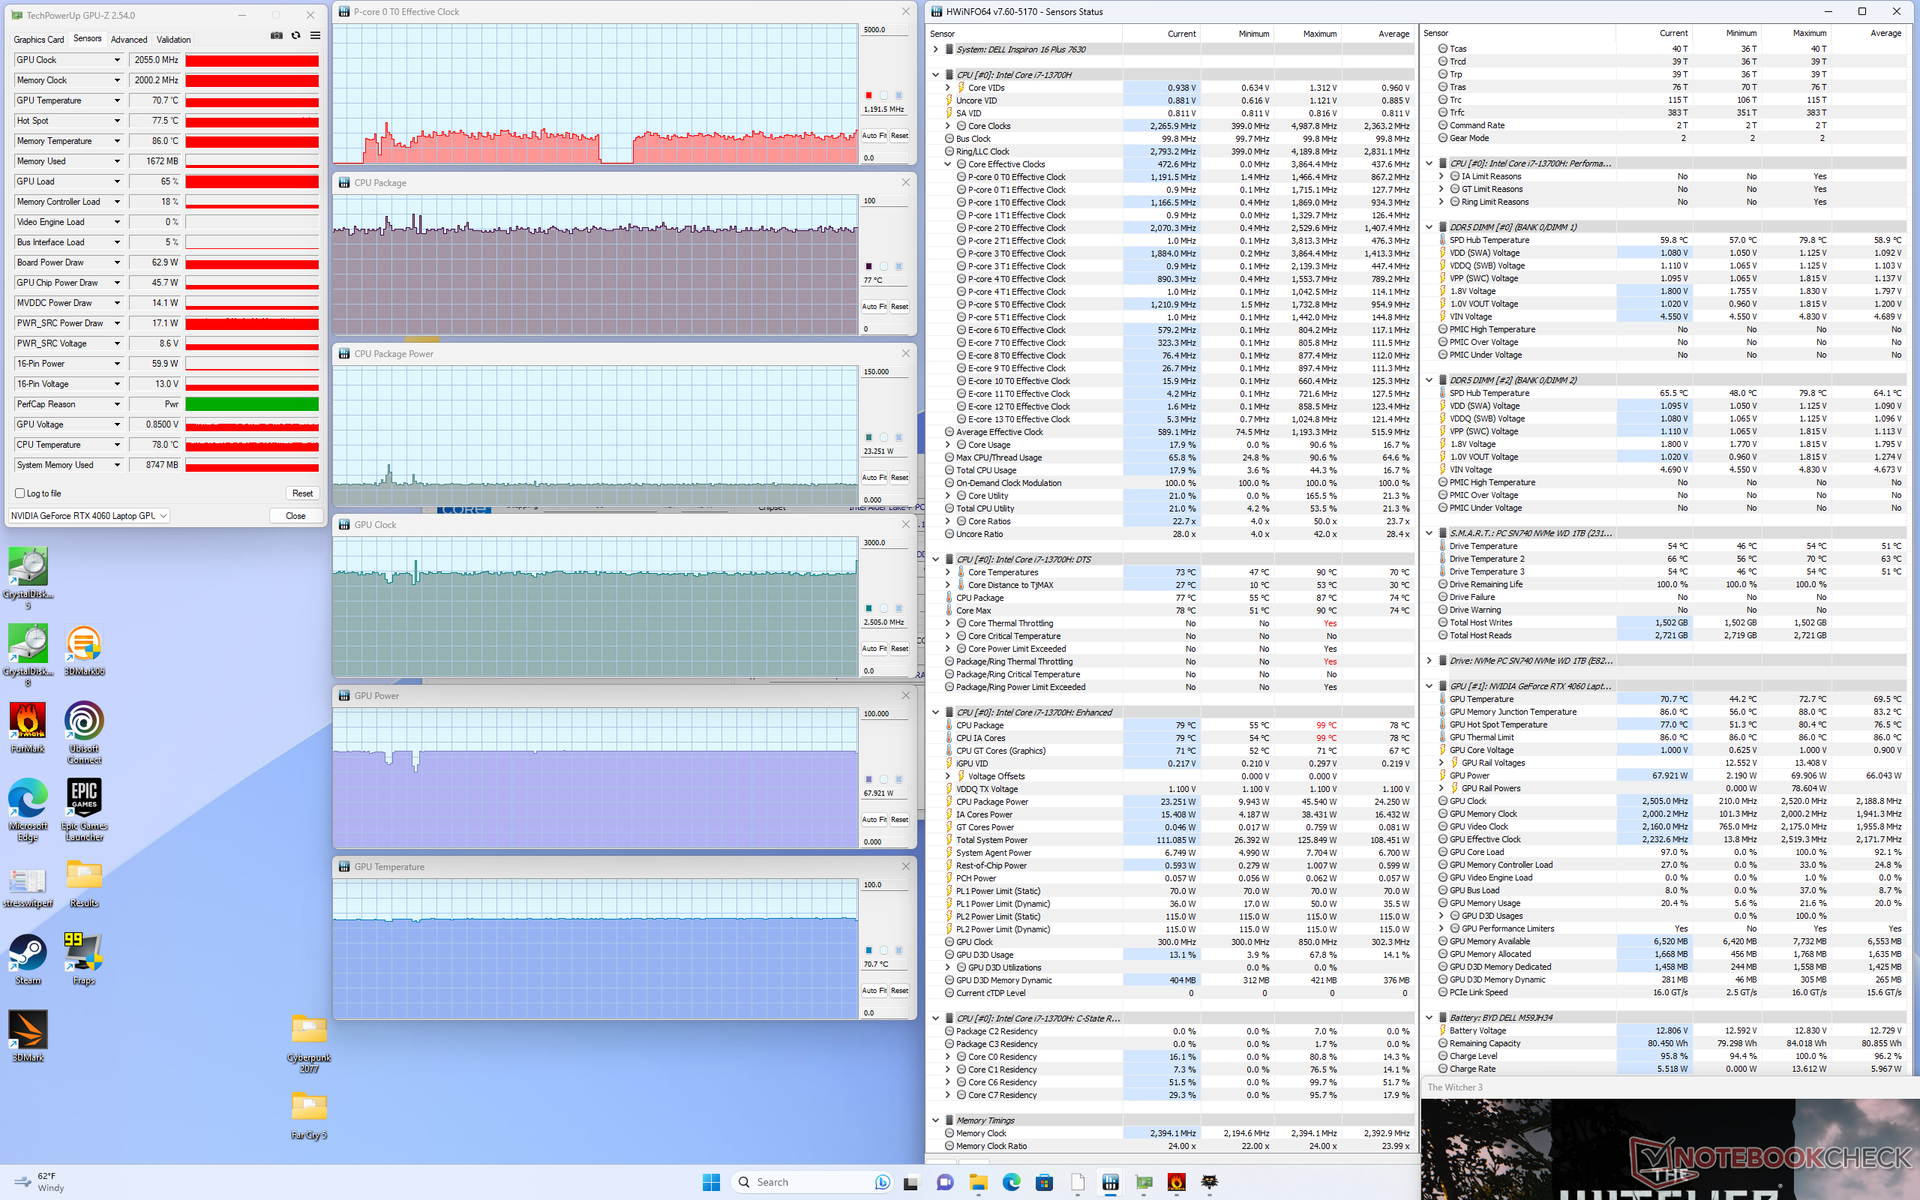
| Clock della CPU (GHz) | Clock della GPU (MHz) | Temperatura media della CPU (°C) | Temperatura media della GPU (°C) | |
| Sistema inattivo | -- | -- | 56 | 50 |
| Stress Prime95 | 2,3 - 2,4 | -- | 84 | 47 |
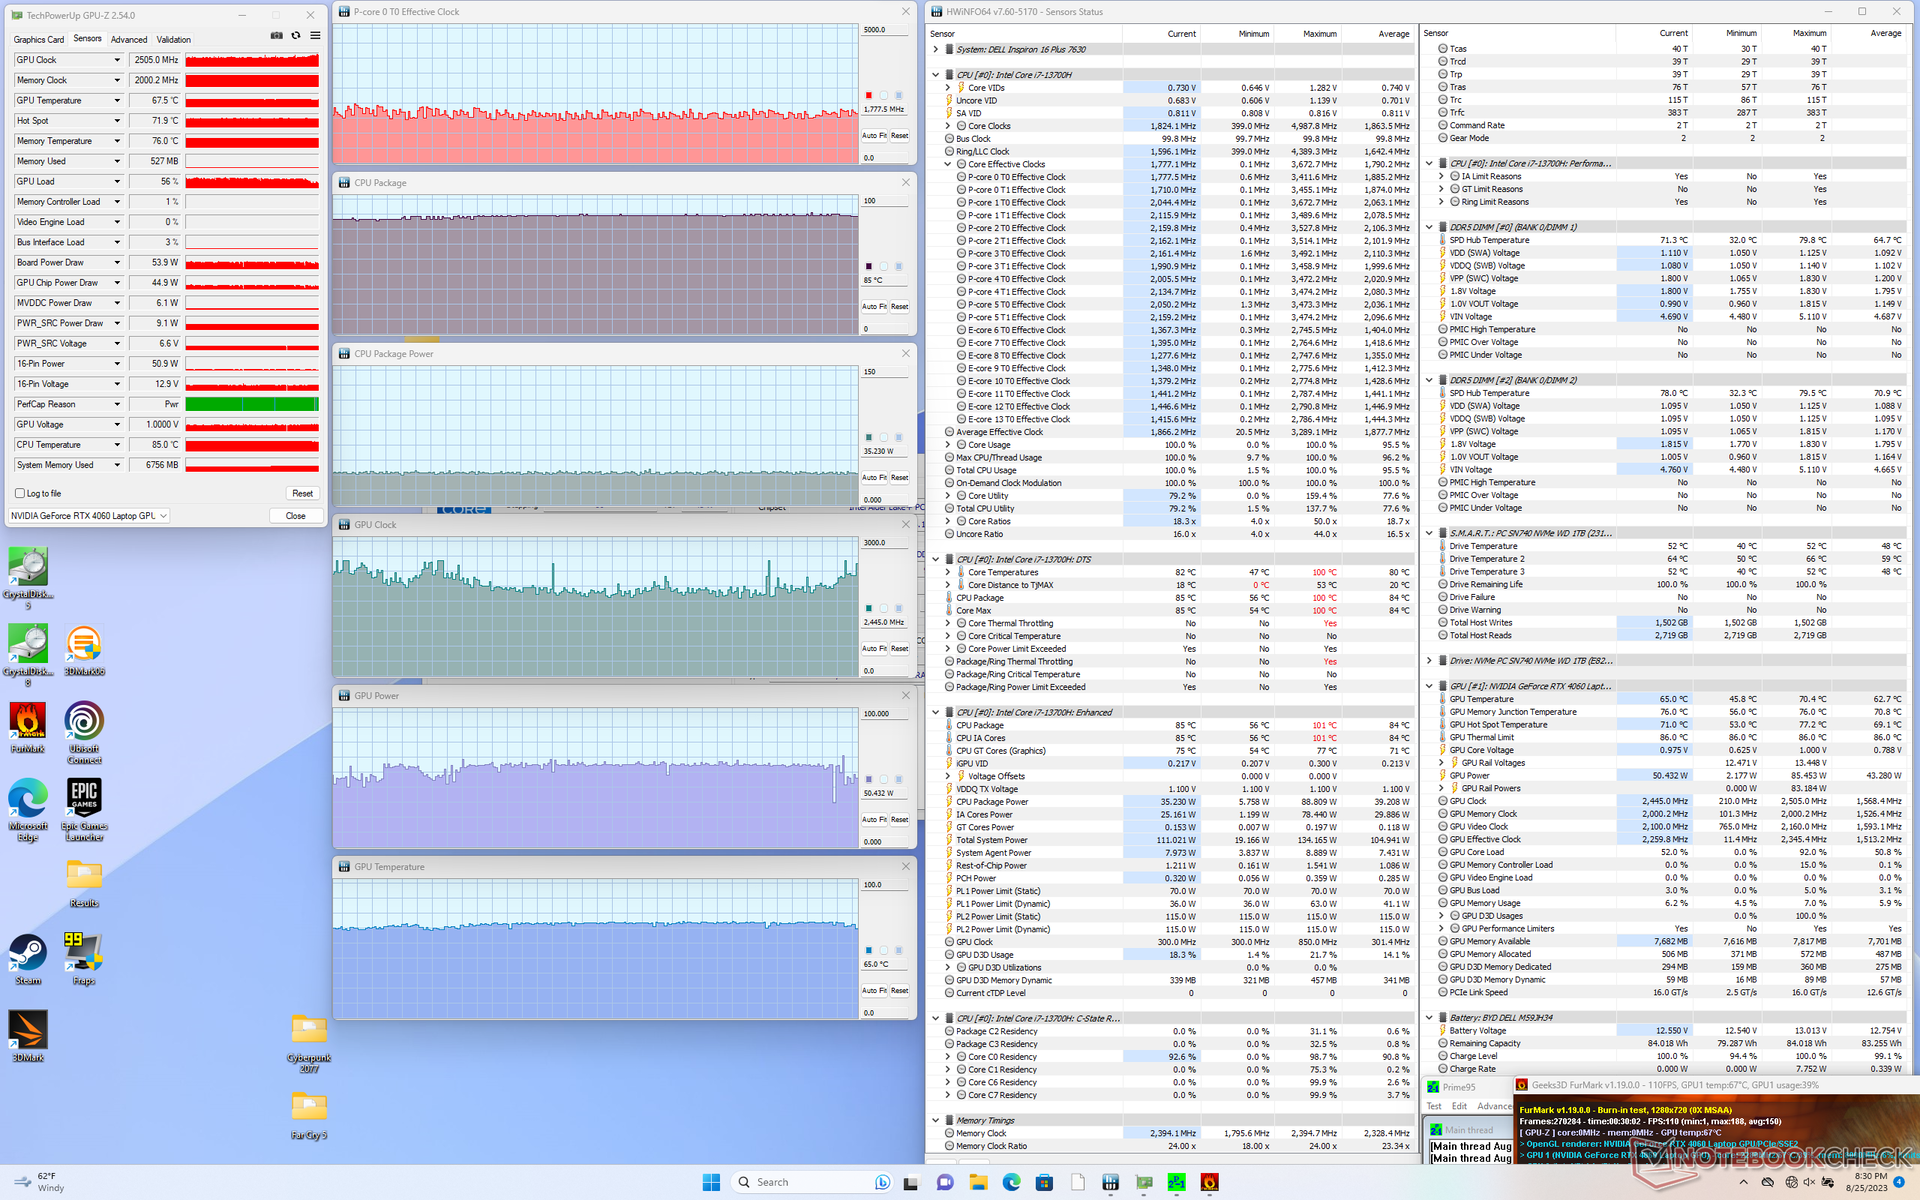
| StressPrime95 + FurMark | ~1,8 | ~2445 | 85 | 65 |
| Witcher 3 Stress (modalità bilanciata) | ~1,1 | 2055 | 77 | 71 |
| Witcher 3 Stress (modalità Performance) | ~1,1 | 2250 | 76 | 71 |
Altoparlanti
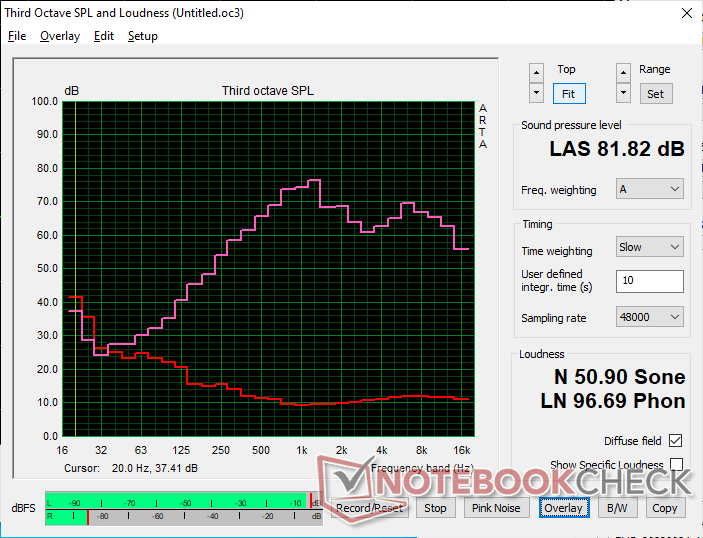
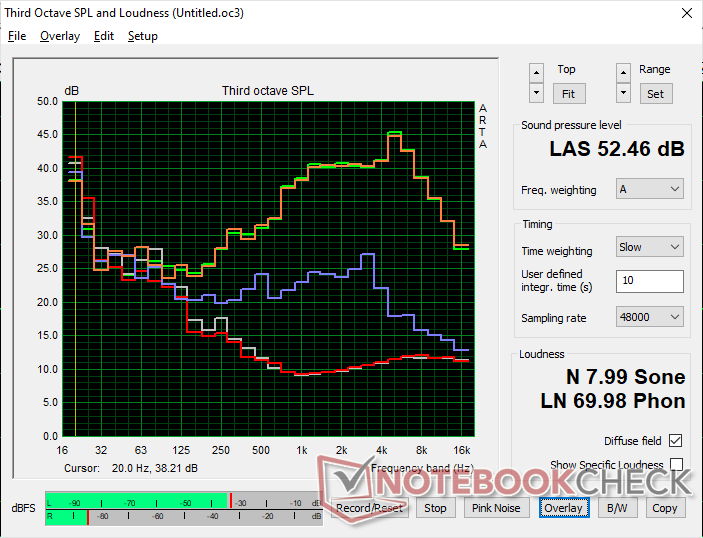
Dell Inspiron 16 Plus 7630 analisi audio
(±) | potenza degli altiparlanti media ma buona (81.8 dB)
Bassi 100 - 315 Hz
(-) | quasi nessun basso - in media 17% inferiori alla media
(±) | la linearità dei bassi è media (8.4% delta rispetto alla precedente frequenza)
Medi 400 - 2000 Hz
(±) | medi elevati - circa 6.3% superiore alla media
(+) | medi lineari (6.2% delta rispetto alla precedente frequenza)
Alti 2 - 16 kHz
(+) | Alti bilanciati - appena 2.2% dalla media
(+) | alti lineari (5.6% delta rispetto alla precedente frequenza)
Nel complesso 100 - 16.000 Hz
(±) | la linearità complessiva del suono è media (15.9% di differenza rispetto alla media
Rispetto alla stessa classe
» 40% di tutti i dispositivi testati in questa classe è stato migliore, 6% simile, 54% peggiore
» Il migliore ha avuto un delta di 5%, medio di 17%, peggiore di 45%
Rispetto a tutti i dispositivi testati
» 25% di tutti i dispositivi testati in questa classe è stato migliore, 5% similare, 70% peggiore
» Il migliore ha avuto un delta di 4%, medio di 23%, peggiore di 134%
Apple MacBook Pro 16 2021 M1 Pro analisi audio
(+) | gli altoparlanti sono relativamente potenti (84.7 dB)
Bassi 100 - 315 Hz
(+) | bassi buoni - solo 3.8% dalla media
(+) | bassi in lineaa (5.2% delta rispetto alla precedente frequenza)
Medi 400 - 2000 Hz
(+) | medi bilanciati - solo only 1.3% rispetto alla media
(+) | medi lineari (2.1% delta rispetto alla precedente frequenza)
Alti 2 - 16 kHz
(+) | Alti bilanciati - appena 1.9% dalla media
(+) | alti lineari (2.7% delta rispetto alla precedente frequenza)
Nel complesso 100 - 16.000 Hz
(+) | suono nel complesso lineare (4.6% differenza dalla media)
Rispetto alla stessa classe
» 0% di tutti i dispositivi testati in questa classe è stato migliore, 0% simile, 100% peggiore
» Il migliore ha avuto un delta di 5%, medio di 17%, peggiore di 45%
Rispetto a tutti i dispositivi testati
» 0% di tutti i dispositivi testati in questa classe è stato migliore, 0% similare, 100% peggiore
» Il migliore ha avuto un delta di 4%, medio di 23%, peggiore di 134%
Gestione dell'energia
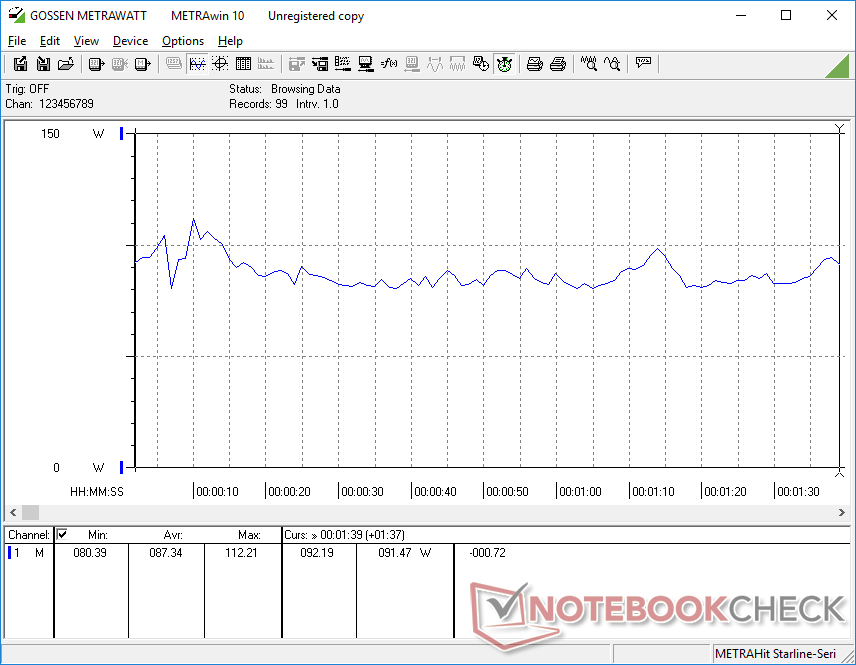
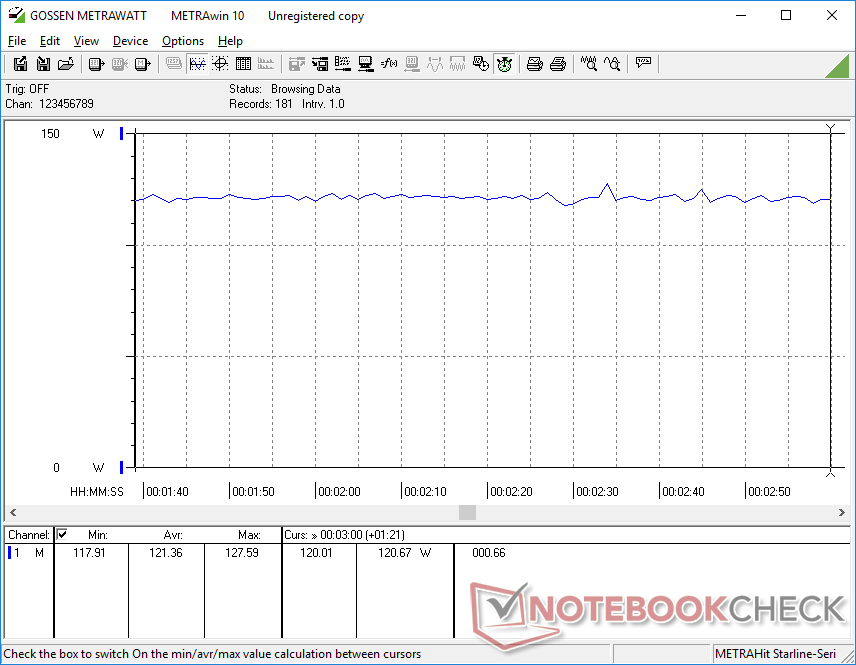
Consumo energetico - Prestazioni GPU elevate per watt
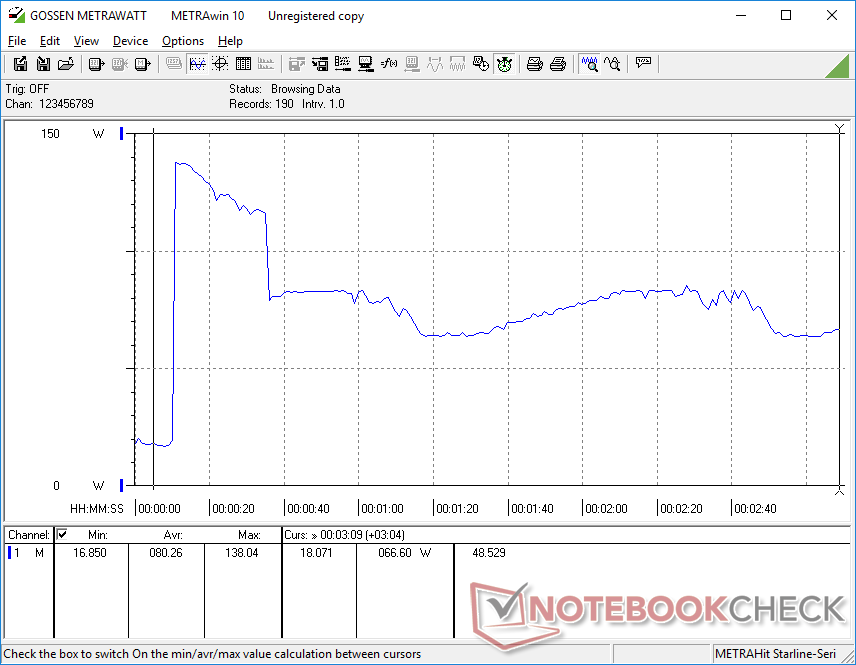
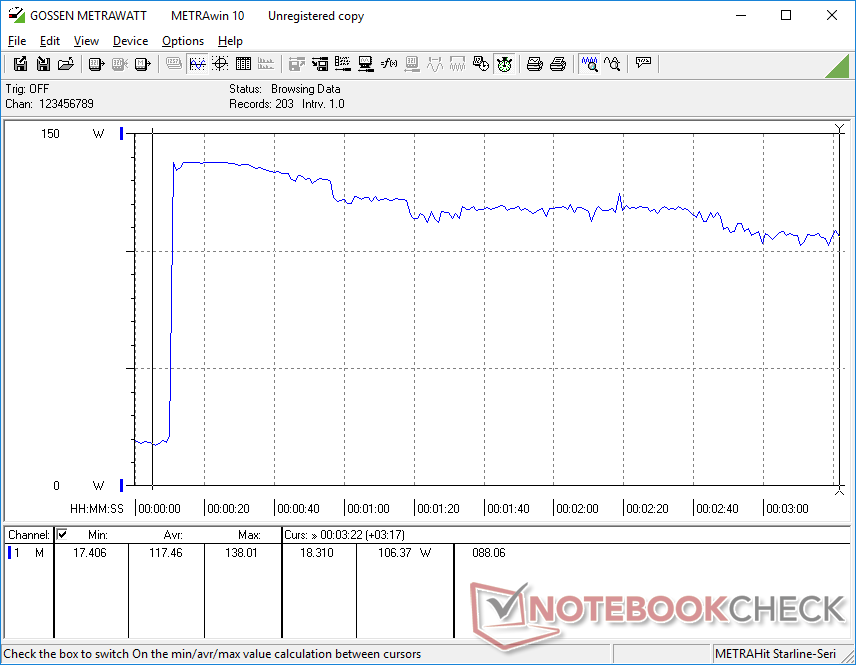
Il consumo è leggermente superiore a quello del modello dell'anno scorso quando è al minimo sul desktop o durante l'esecuzione di giochi. L'aumento dell'8% durante l'esecuzione di giochi, tuttavia, impallidisce in confronto all'aumento del 40-60% delle prestazioni grafiche rispetto alla RTX 3050 Ti. Pertanto, le prestazioni per watt sono ancora a favore del modello più recente, anche se il consumo energetico può essere leggermente superiore.
I portatili da gioco con la stessa CPU e GPU del Dell Inspiron, come ad esempio il modelloAcer Nitro 17tendono ad essere più avidi di energia, poiché puntano a livelli di potenza più elevati per ottenere maggiori prestazioni dai processori. Quando si gioca, ad esempio, l'Acer richiede circa 30 W in più.
Siamo riusciti a misurare un consumo massimo temporaneo di 138 W dall'adattatore CA di medie dimensioni (~15 x 7,4 x 2,5 cm) da 130 W quando la CPU e la GPU sono al 100% di utilizzo. Si noti che le configurazioni senza grafica discreta vengono fornite con un adattatore CA da 90 W, più piccolo.
| Off / Standby | |
| Idle | |
| Sotto carico |
|
Leggenda:
min: | |
| Dell Inspiron 16 Plus 7630 i7-13700H, GeForce RTX 4060 Laptop GPU, WD PC SN740 SDDPTQD-1T00, IPS, 2560x1600, 16" | Dell Inspiron 16 Plus 7620 i7-12700H, GeForce RTX 3050 Ti Laptop GPU, Kioxia BG5 KBG50ZNS512G, IPS, 3072x1920, 16" | Lenovo Slim Pro 9i 16IRP8 i9-13905H, GeForce RTX 4050 Laptop GPU, Samsung PM9A1 MZVL21T0HCLR, Mini-LED, 3200x2000, 16" | Asus Vivobook Pro 16X K6604JV-MX016W i9-13980HX, GeForce RTX 4060 Laptop GPU, Solidigm P41 Plus SSDPFKNU010TZ, OLED, 3200x2000, 16" | HP Envy 16 h0112nr i7-12700H, GeForce RTX 3060 Laptop GPU, Micron 3400 1TB MTFDKBA1T0TFH, OLED, 3840x2400, 16" | MSI Summit E16 Flip A12UDT-031 i7-1280P, GeForce RTX 3050 Ti Laptop GPU, Samsung PM9A1 MZVL22T0HBLB, IPS, 2560x1600, 16" | |
|---|---|---|---|---|---|---|
| Power Consumption | 15% | -28% | -23% | -9% | 22% | |
| Idle Minimum * (Watt) | 15.6 | 6.8 56% | 16 -3% | 13.8 12% | 10 36% | 9.8 37% |
| Idle Average * (Watt) | 17.7 | 9.6 46% | 30 -69% | 16 10% | 10.9 38% | 15.3 14% |
| Idle Maximum * (Watt) | 20.6 | 17 17% | 30.4 -48% | 19 8% | 27.8 -35% | 16.3 21% |
| Load Average * (Watt) | 87.4 | 117.5 -34% | 78.9 10% | 147 -68% | 116.4 -33% | 87 -0% |
| Witcher 3 ultra * (Watt) | 121.7 | 113.1 7% | 155.3 -28% | 147.8 -21% | 133.7 -10% | 86.1 29% |
| Load Maximum * (Watt) | 138 | 137.4 -0% | 180.4 -31% | 244 -77% | 209.8 -52% | 100 28% |
* ... Meglio usare valori piccoli
Power Consumption Witcher 3 / Stresstest
Power Consumption external Monitor
Durata della batteria
Sia la capacità che l'autonomia della batteria sono rimaste invariate. Siamo riusciti a registrare 9,5 ore di navigazione WLAN in modalità Balanced, un tempo più lungo rispetto a modelli concorrenti come il Lenovo Slim Pro 9i 16IRP8.Lenovo Slim Pro 9i 16IRP8 o HP Envy 16 di almeno un paio d'ore ciascuno.
La ricarica da vuoto a pieno regime richiede circa 90 minuti con l'adattatore CA in dotazione. Il sistema può essere ricaricato anche con adattatori USB-C come quelli forniti con la serie XPS.
| Dell Inspiron 16 Plus 7630 i7-13700H, GeForce RTX 4060 Laptop GPU, 86 Wh | Dell Inspiron 16 Plus 7620 i7-12700H, GeForce RTX 3050 Ti Laptop GPU, 86 Wh | Lenovo Slim Pro 9i 16IRP8 i9-13905H, GeForce RTX 4050 Laptop GPU, 75 Wh | Asus Vivobook Pro 16X K6604JV-MX016W i9-13980HX, GeForce RTX 4060 Laptop GPU, 90 Wh | HP Envy 16 h0112nr i7-12700H, GeForce RTX 3060 Laptop GPU, 83 Wh | MSI Summit E16 Flip A12UDT-031 i7-1280P, GeForce RTX 3050 Ti Laptop GPU, 82 Wh | |
|---|---|---|---|---|---|---|
| Autonomia della batteria | -2% | -30% | -12% | -0% | -24% | |
| Reader / Idle (h) | 17.6 | 18.6 6% | 17.8 1% | |||
| WiFi v1.3 (h) | 9.4 | 9.6 2% | 6.6 -30% | 6.5 -31% | 7.9 -16% | 7.1 -24% |
| Load (h) | 1.4 | 1.2 -14% | 1.5 7% | 1.6 14% | ||
| H.264 (h) | 5.3 |
Pro
Contro
Verdetto - Aggiornamento per una GPU più veloce
Gli aggiornamenti rispetto al modello dello scorso anno Inspiron 16 Plus 7620 sono più significativi di quanto inizialmente previsto sotto molti aspetti. A parte l'enorme aumento delle prestazioni grafiche quando si passa dalla RTX 3050 Ti alla RTX 4060, il rumore della ventola più silenzioso e più forte tra i due modelli è notevole, così come le temperature del nucleo più fresche sul modello più recente. Le opzioni per i display sono diverse, in quanto ora includono una frequenza di aggiornamento opzionale di 120 Hz, mentre gli aggiornamenti SODIMM offrono ora due slot anziché uno. Anche le cerniere più rigide sono un cambiamento gradito per ridurre le possibilità che si rompano troppo presto. L'esperienza d'uso è sufficientemente migliorata, anche se le prestazioni della CPU sono stantie e la tastiera rimane la stessa di prima.
L'Inspiron 16 Plus 7630 si basa sull'equilibrio. Le sue caratteristiche e prestazioni sono sufficienti a soddisfare la maggior parte degli scopi multimediali e di gioco senza dover spendere un occhio della testa.
Tuttavia, come computer portatile multimediale e da gioco, l'Inspiron 16 Plus 7630 manca di alcune caratteristiche che i computer portatili multimediali e da gioco più impegnativi tendono ad avere. Dal punto di vista multimediale, i possessori dell'Inspiron 16 Plus 7630 non potranno contare su colori DCi-P3 più pieni, risoluzioni native più elevate e un veloce lettore di schede SD integrato. Per quanto riguarda i giochi, il sistema omette G-Sync e MUX e la sua RTX 4060 è generalmente più lenta della media. L'Inspiron 16 Plus 7630 è ottimo per la creazione di contenuti e per i giochi, ma gli utenti che si orientano maggiormente verso la creazione di contenuti dovrebbero prendere in considerazione un HP Envy 16 o Asus ZenBook Pro Duo mentre per i giocatori più accaniti è meglio scegliere macchine da gioco dedicate come il modello Dell G o un Asus ROG.
Prezzo e disponibilità
Dell sta ora distribuendo l'Inspiron 16 Plus 7630 con Core i7 e RTX 4060 al prezzo di 1250 dollari.
Dell Inspiron 16 Plus 7630
- 08/30/2023 v7 (old)
Allen Ngo
Transparency
La selezione dei dispositivi da recensire viene effettuata dalla nostra redazione. Il campione di prova è stato fornito all'autore come prestito dal produttore o dal rivenditore ai fini di questa recensione. L'istituto di credito non ha avuto alcuna influenza su questa recensione, né il produttore ne ha ricevuto una copia prima della pubblicazione. Non vi era alcun obbligo di pubblicare questa recensione. In quanto società mediatica indipendente, Notebookcheck non è soggetta all'autorità di produttori, rivenditori o editori.
Ecco come Notebookcheck esegue i test
Ogni anno, Notebookcheck esamina in modo indipendente centinaia di laptop e smartphone utilizzando procedure standardizzate per garantire che tutti i risultati siano comparabili. Da circa 20 anni sviluppiamo continuamente i nostri metodi di prova e nel frattempo stabiliamo gli standard di settore. Nei nostri laboratori di prova, tecnici ed editori esperti utilizzano apparecchiature di misurazione di alta qualità. Questi test comportano un processo di validazione in più fasi. Il nostro complesso sistema di valutazione si basa su centinaia di misurazioni e parametri di riferimento ben fondati, che mantengono l'obiettività.Price comparison

