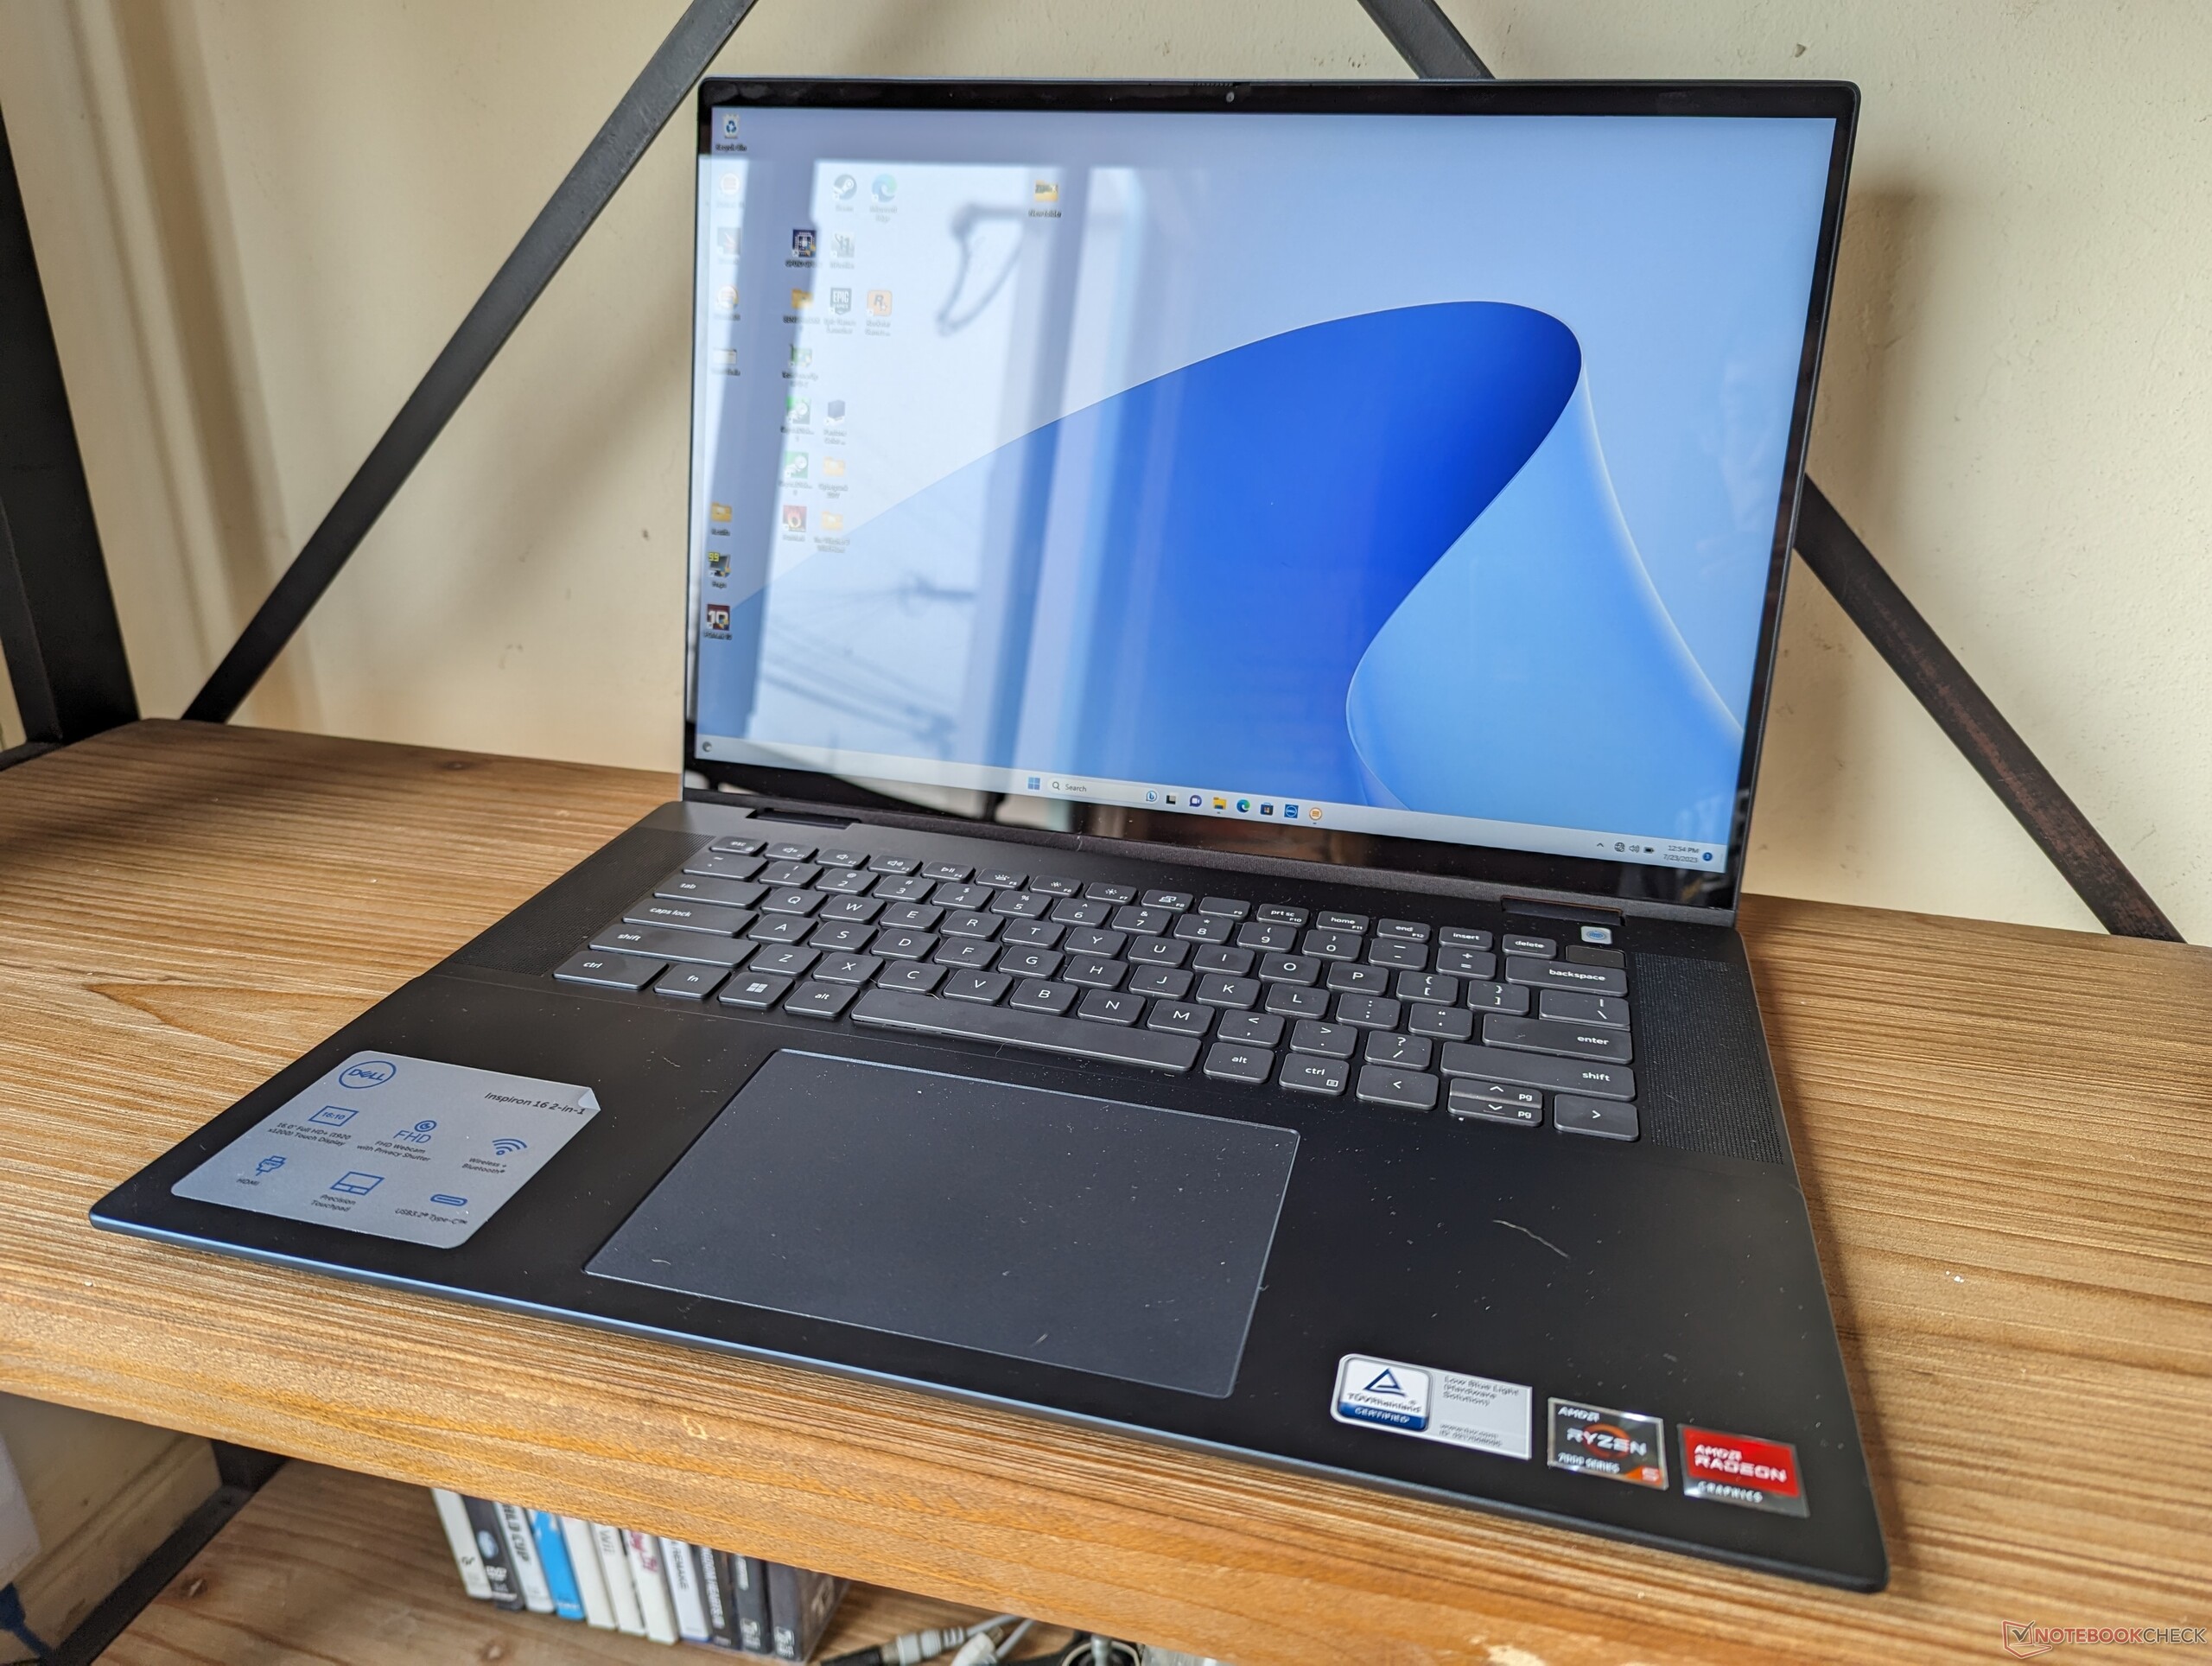
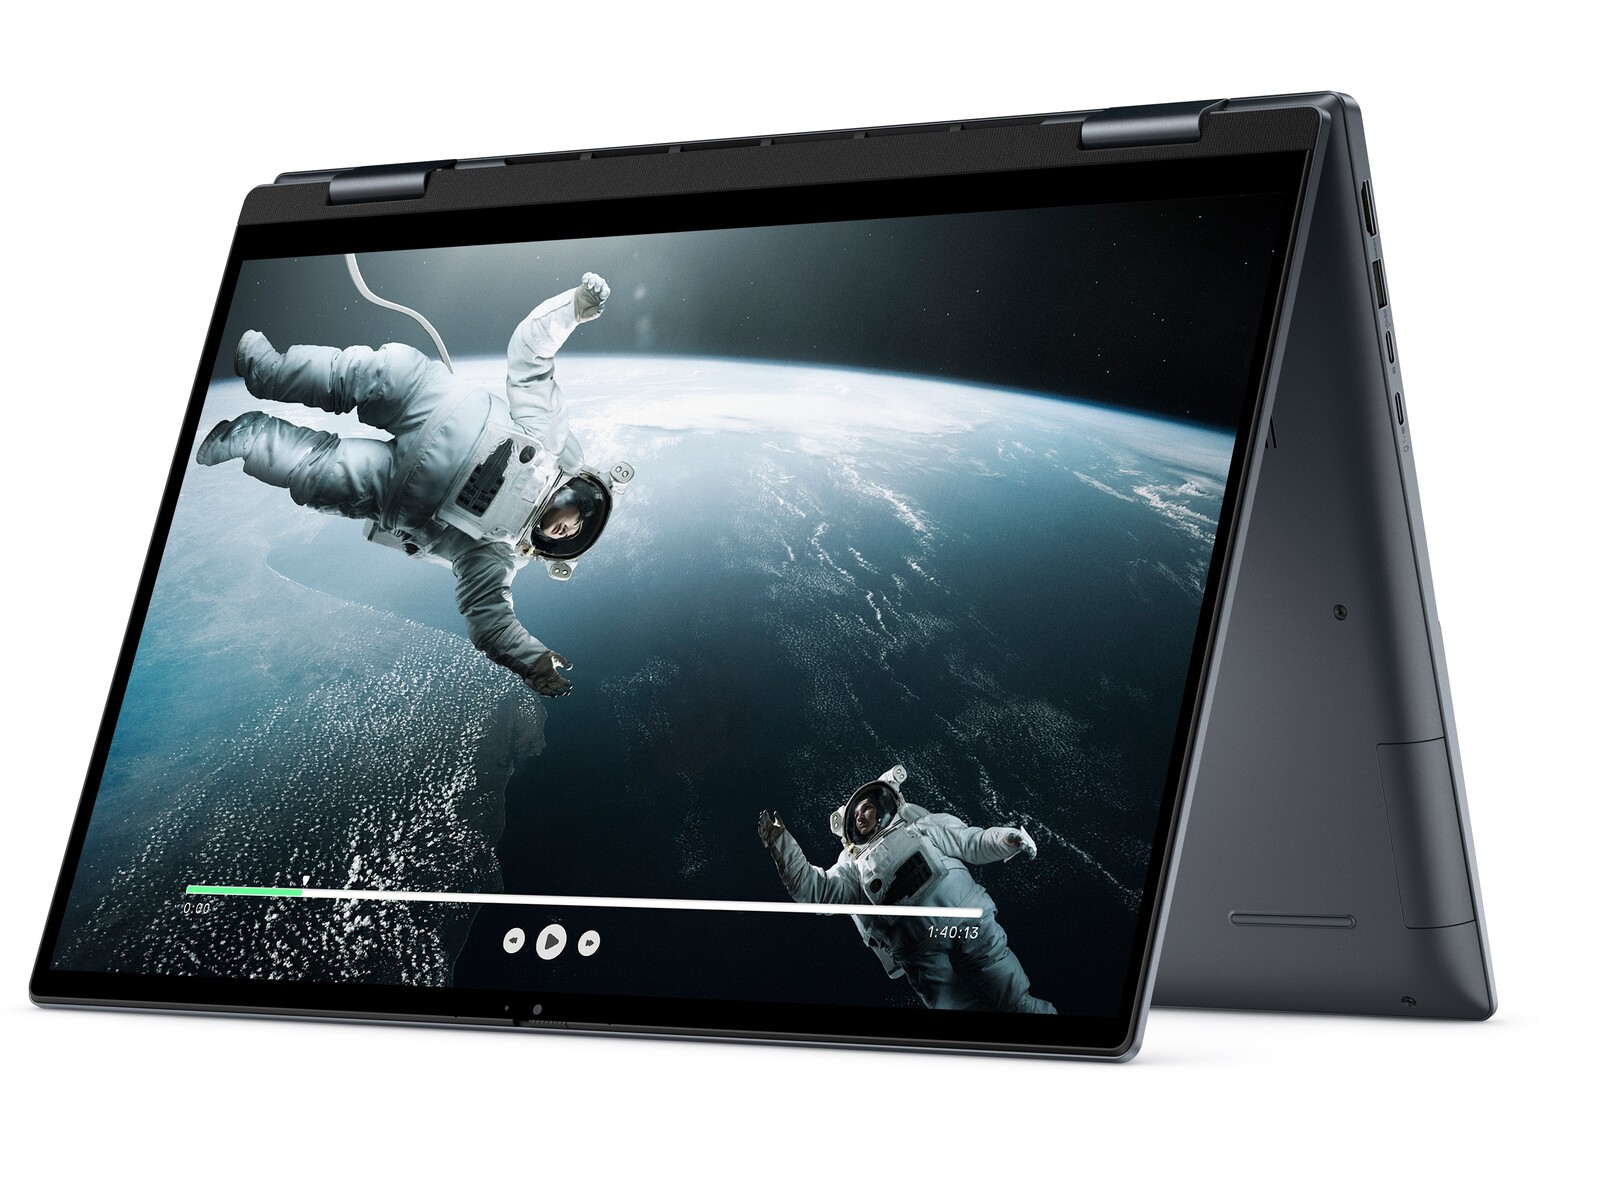
Recensione del portatile 2-in-1 Dell Inspiron 16 7635: Un Inspiron 16 7630 annacquato con AMD Ryzen

L'Inspiron 16 7635 2-in-1 è la versione AMD dell'Inspiron 16 7630 2-in-1 basato su Intel. Come gli altri modelli Inspiron, si rivolge alla categoria consumer di fascia media ed economica, in contrasto con la serie business-centrica Latitude o prosumer XPS di fascia più alta. Succede direttamente all'Inspiron 16 7620 2-in-1 dello scorso anno Inspiron 16 7620 2-in-1 dello scorso anno con nuove CPU e un design esterno rivisto.
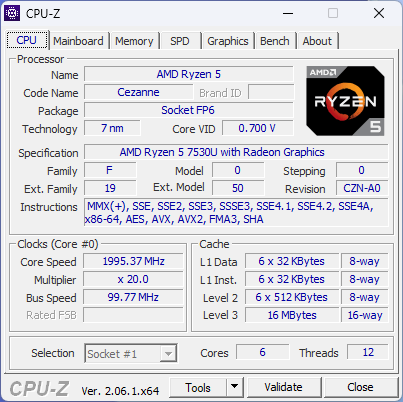
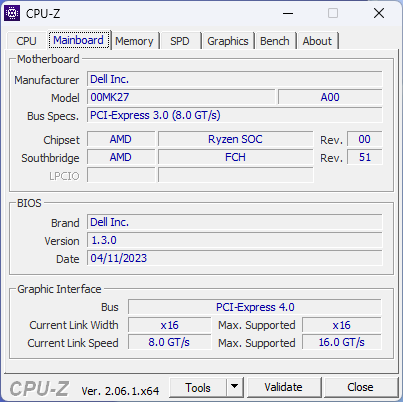
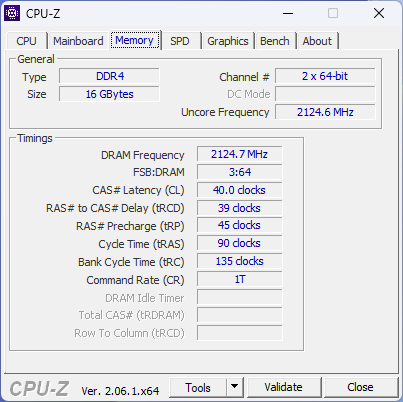
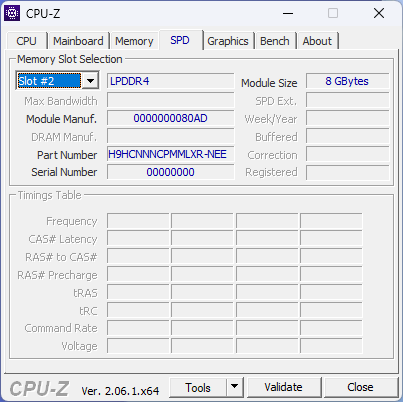
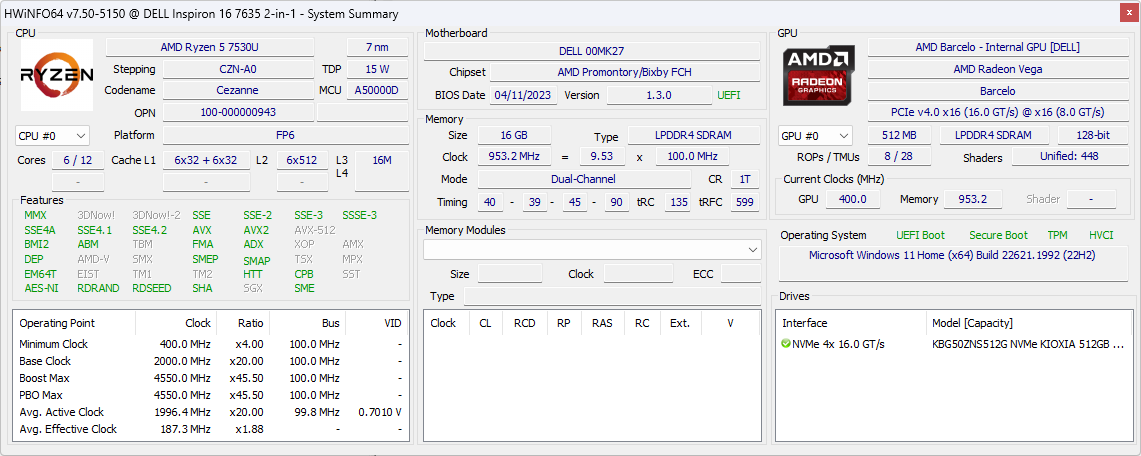
La nostra unità di prova specifica è una configurazione di fascia bassa con CPU Zen 3 Ryzen 5 7530U, 16 GB di RAM LPDDR4x 4266 MHz saldata e SSD NVMe da 512 GB per un prezzo al dettaglio di circa 900 dollari. È disponibile un'opzione Ryzen 7 7730U di fascia più alta, ma al momento tutte le SKU AMD vengono fornite con lo stesso pannello IPS da 1200p, mentre la versione Intel ha un'opzione OLED da 2400p più costosa.
Le alternative all'Inspiron 16 7635 2-in-1 includono altri portatili convertibili di grandi dimensioni come il Lenovo Flex 5 16 o il più potente MSI Summit E16 Flipo HP Spectre x360 16.
Altre recensioni Dell:
Potenziali concorrenti a confronto
Punteggio | Data | Modello | Peso | Altezza | Dimensione | Risoluzione | Prezzo |
|---|---|---|---|---|---|---|---|
| 84.6 % v7 (old) | 07/2023 | Dell Inspiron 16 7635 2-in-1 R5 7530U, Vega 7 | 2 kg | 18.99 mm | 16.00" | 1920x1200 | |
| 87.5 % v7 (old) | 06/2023 | Acer Swift Edge SFE16-42-R1GM R7 7735U, Radeon 680M | 1.2 kg | 13.95 mm | 16.00" | 3840x2400 | |
| 85.8 % v7 (old) | 05/2023 | Lenovo Yoga 7 16IRL8 i7-1355U, Iris Xe G7 96EUs | 2 kg | 16.99 mm | 16.00" | 1920x1200 | |
| 85.6 % v7 (old) | 05/2023 | Samsung Galaxy Book3 Pro 16 i5-1340P, Iris Xe G7 80EUs | 1.6 kg | 12.5 mm | 16.00" | 2880x1800 | |
| 80.7 % v7 (old) | 04/2023 | Lenovo IdeaPad Flex 5 16ABR G8 R7 7730U, Vega 8 | 2 kg | 18.7 mm | 16.00" | 1920x1200 | |
| 85.7 % v7 (old) | 06/2022 | Dell Inspiron 16 7620 2-in-1 i7-1260P, Iris Xe G7 96EUs | 2.1 kg | 18.41 mm | 16.00" | 1920x1200 |
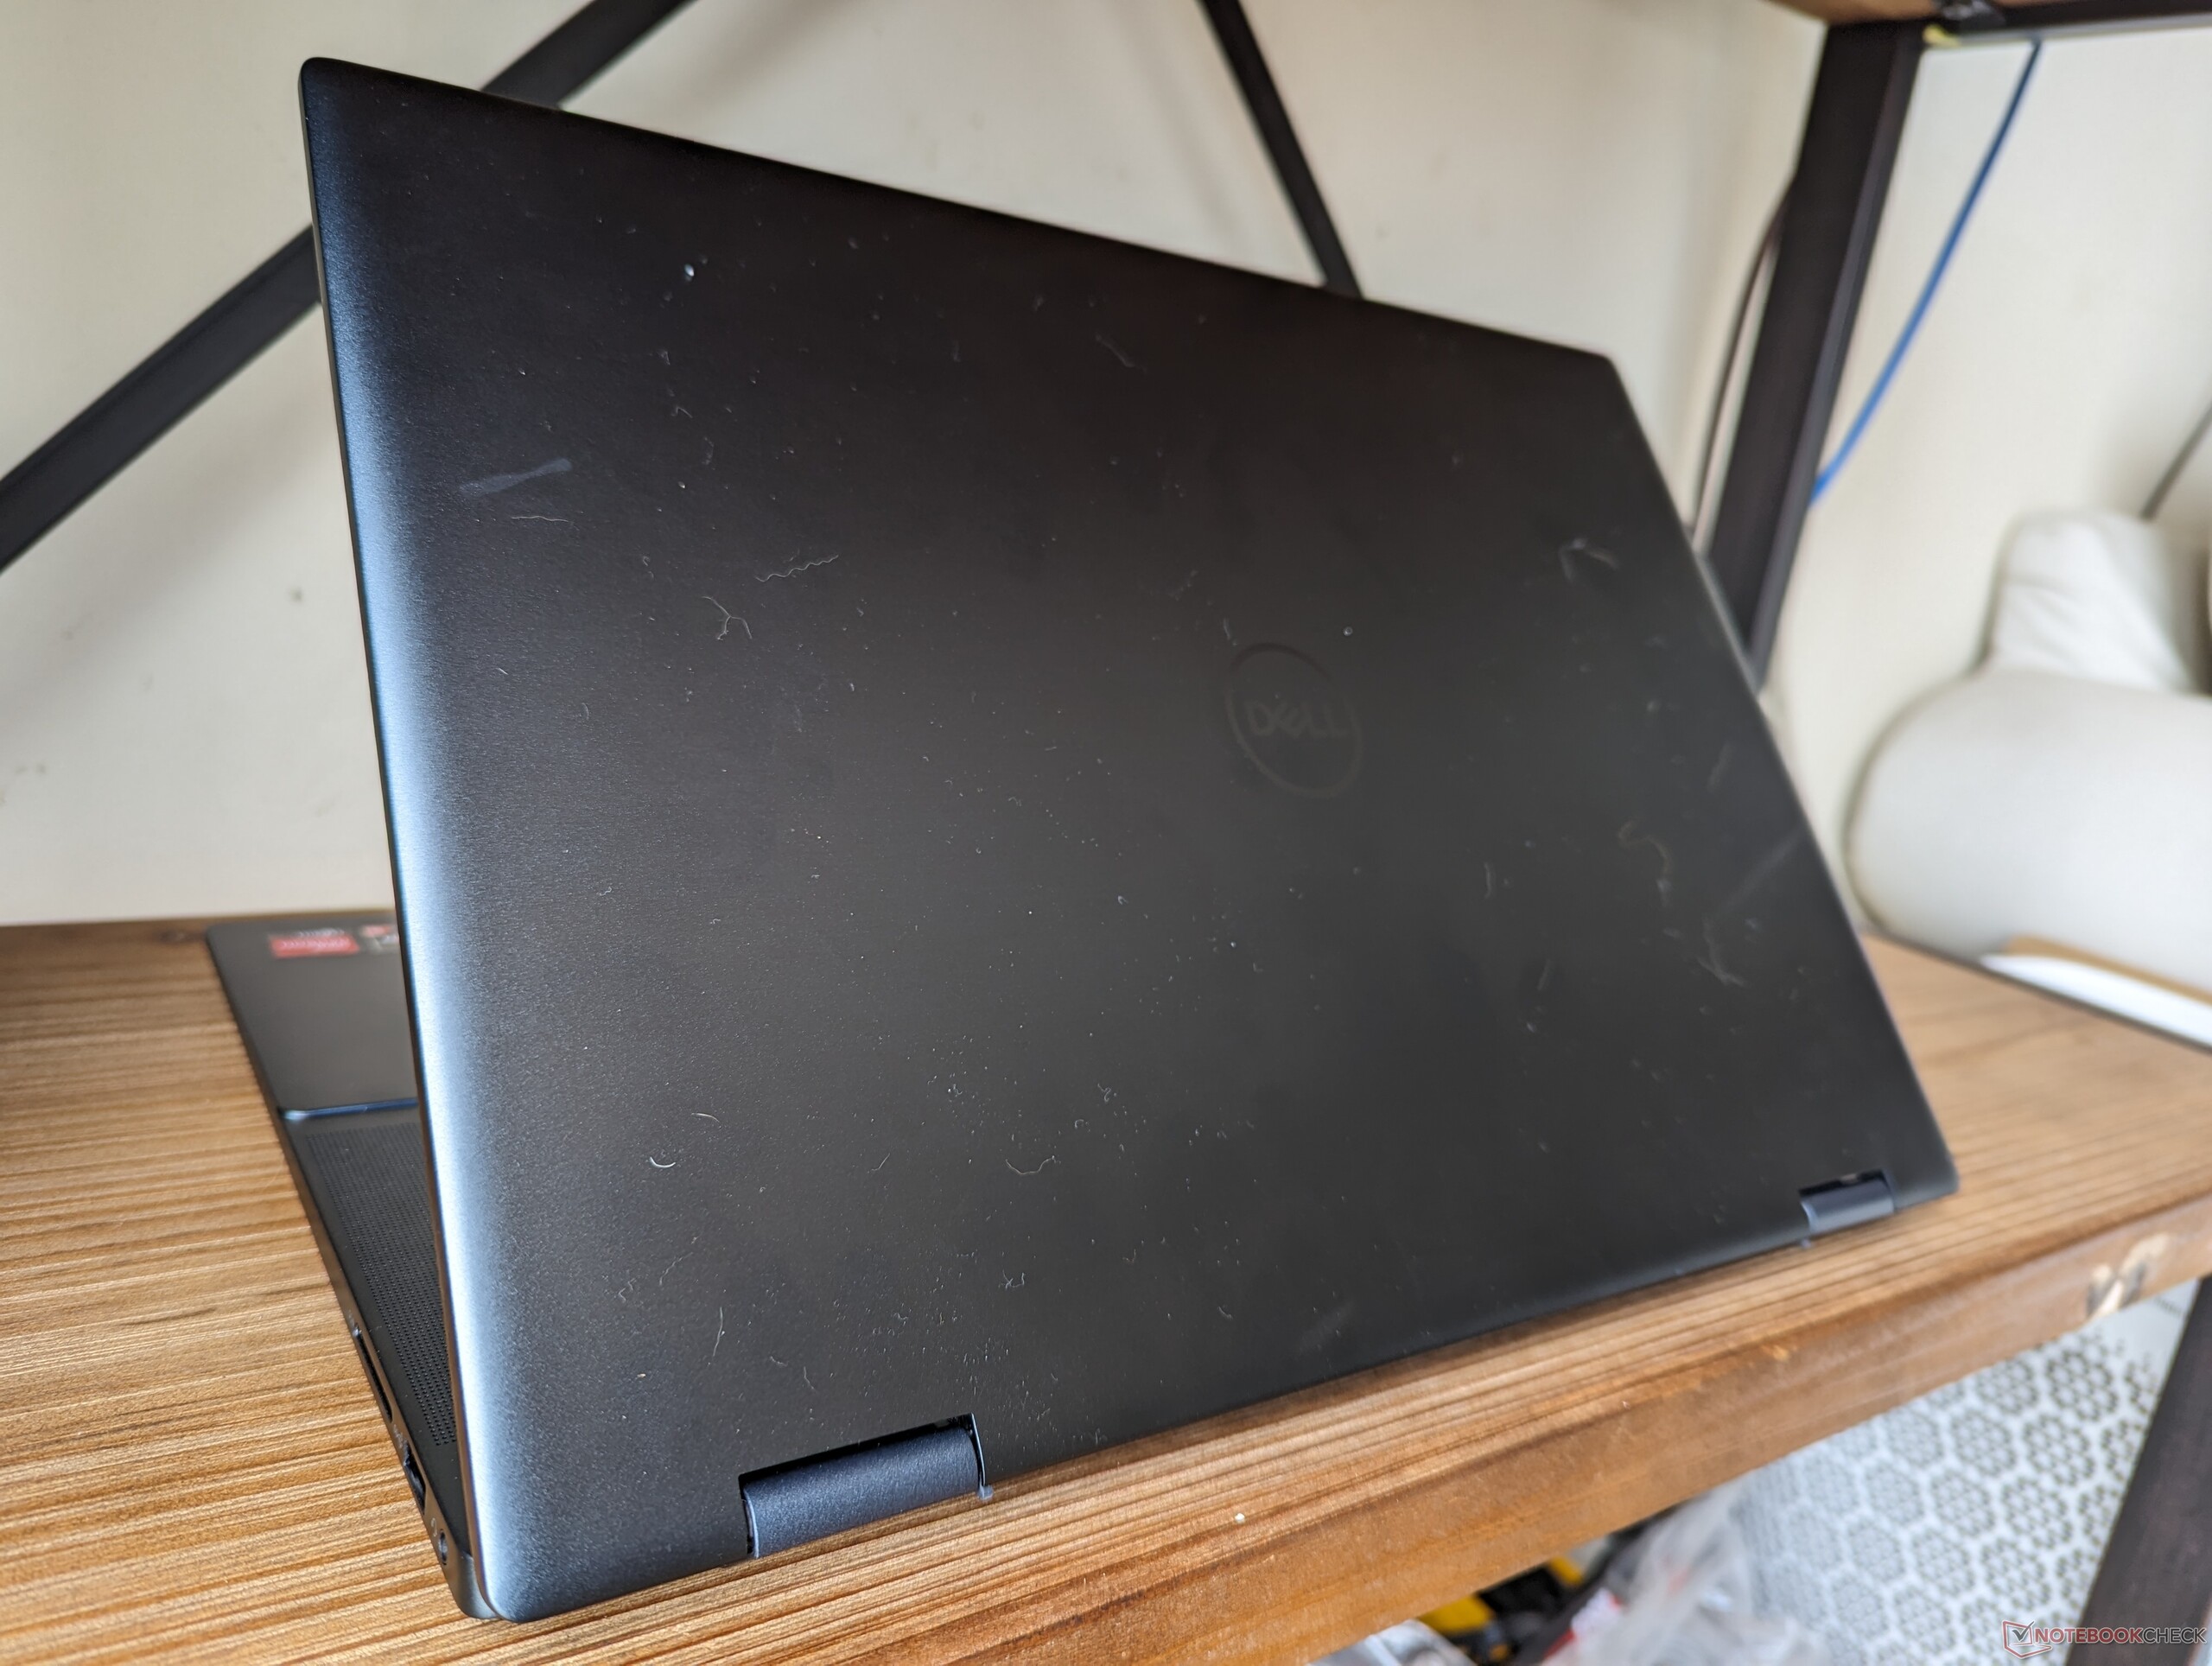
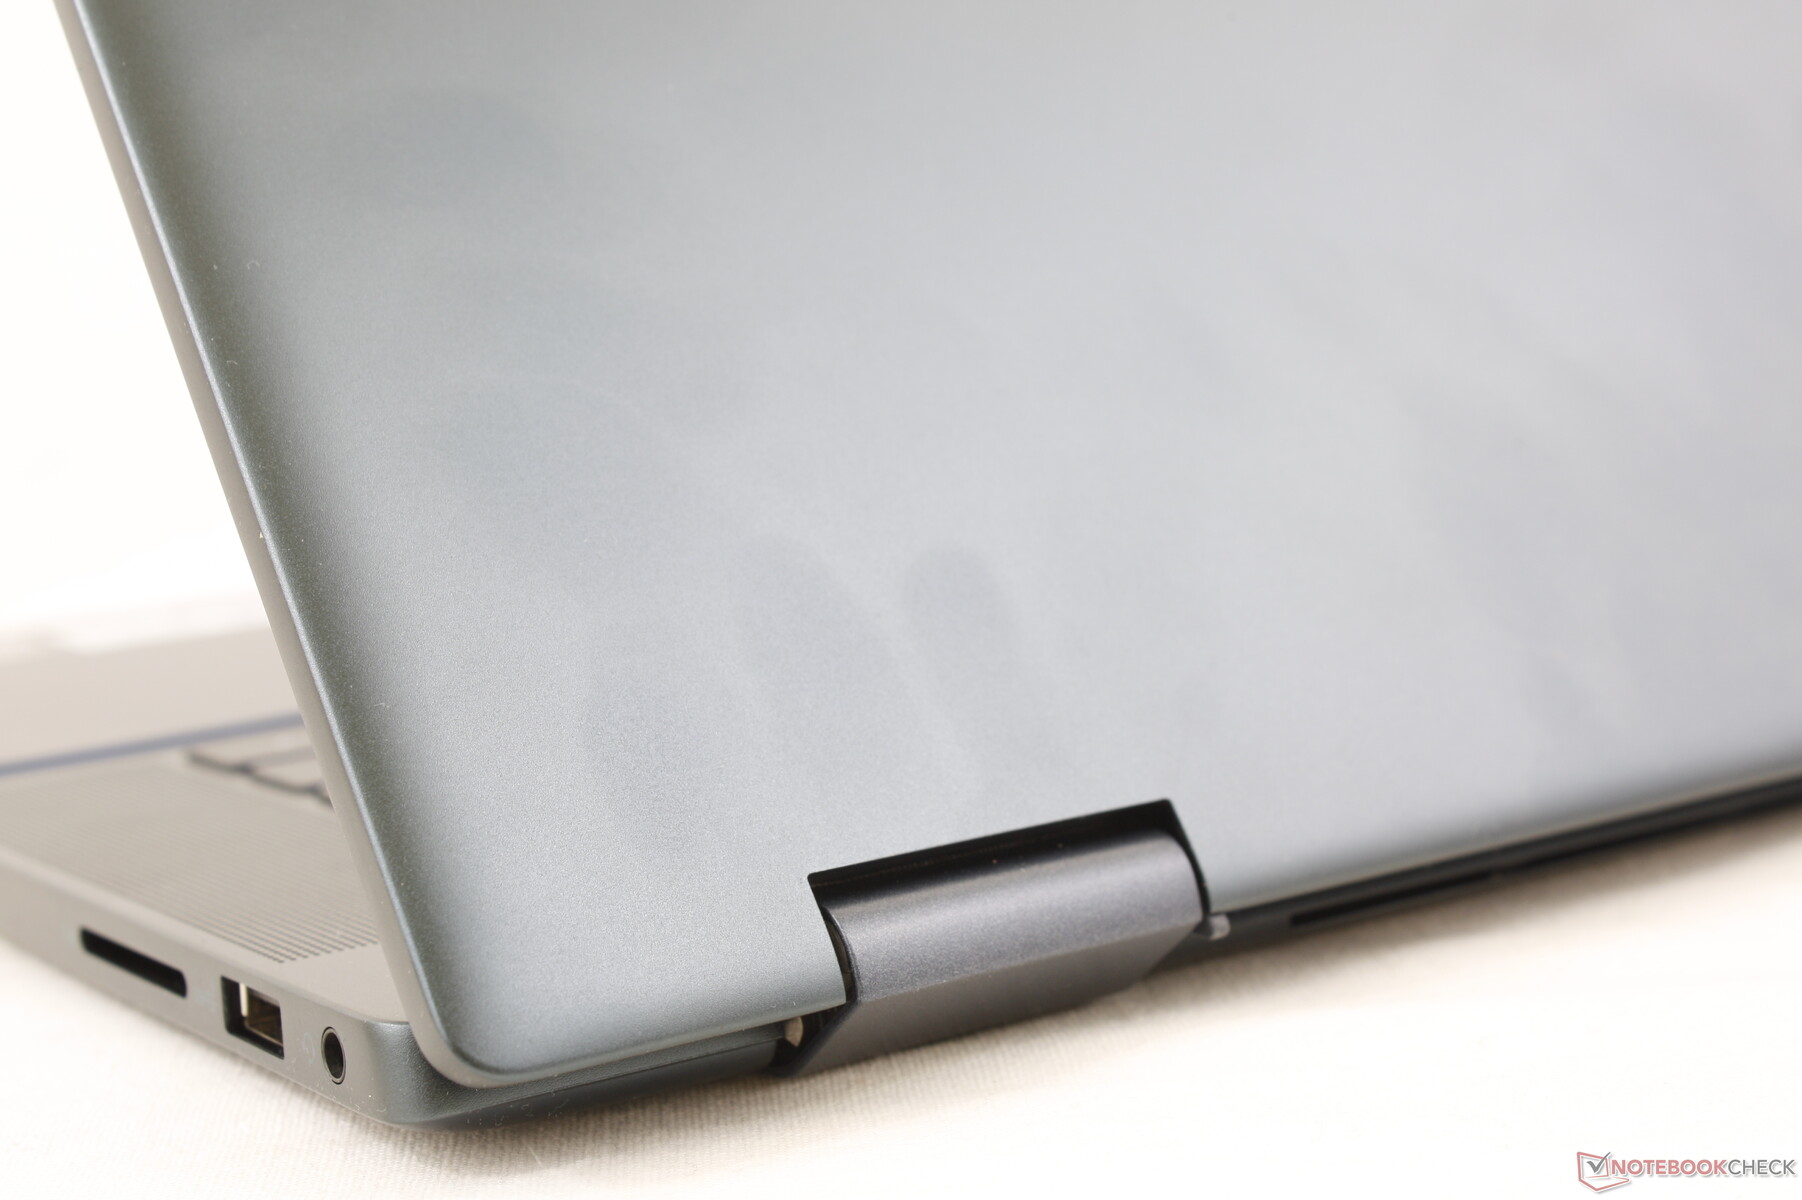
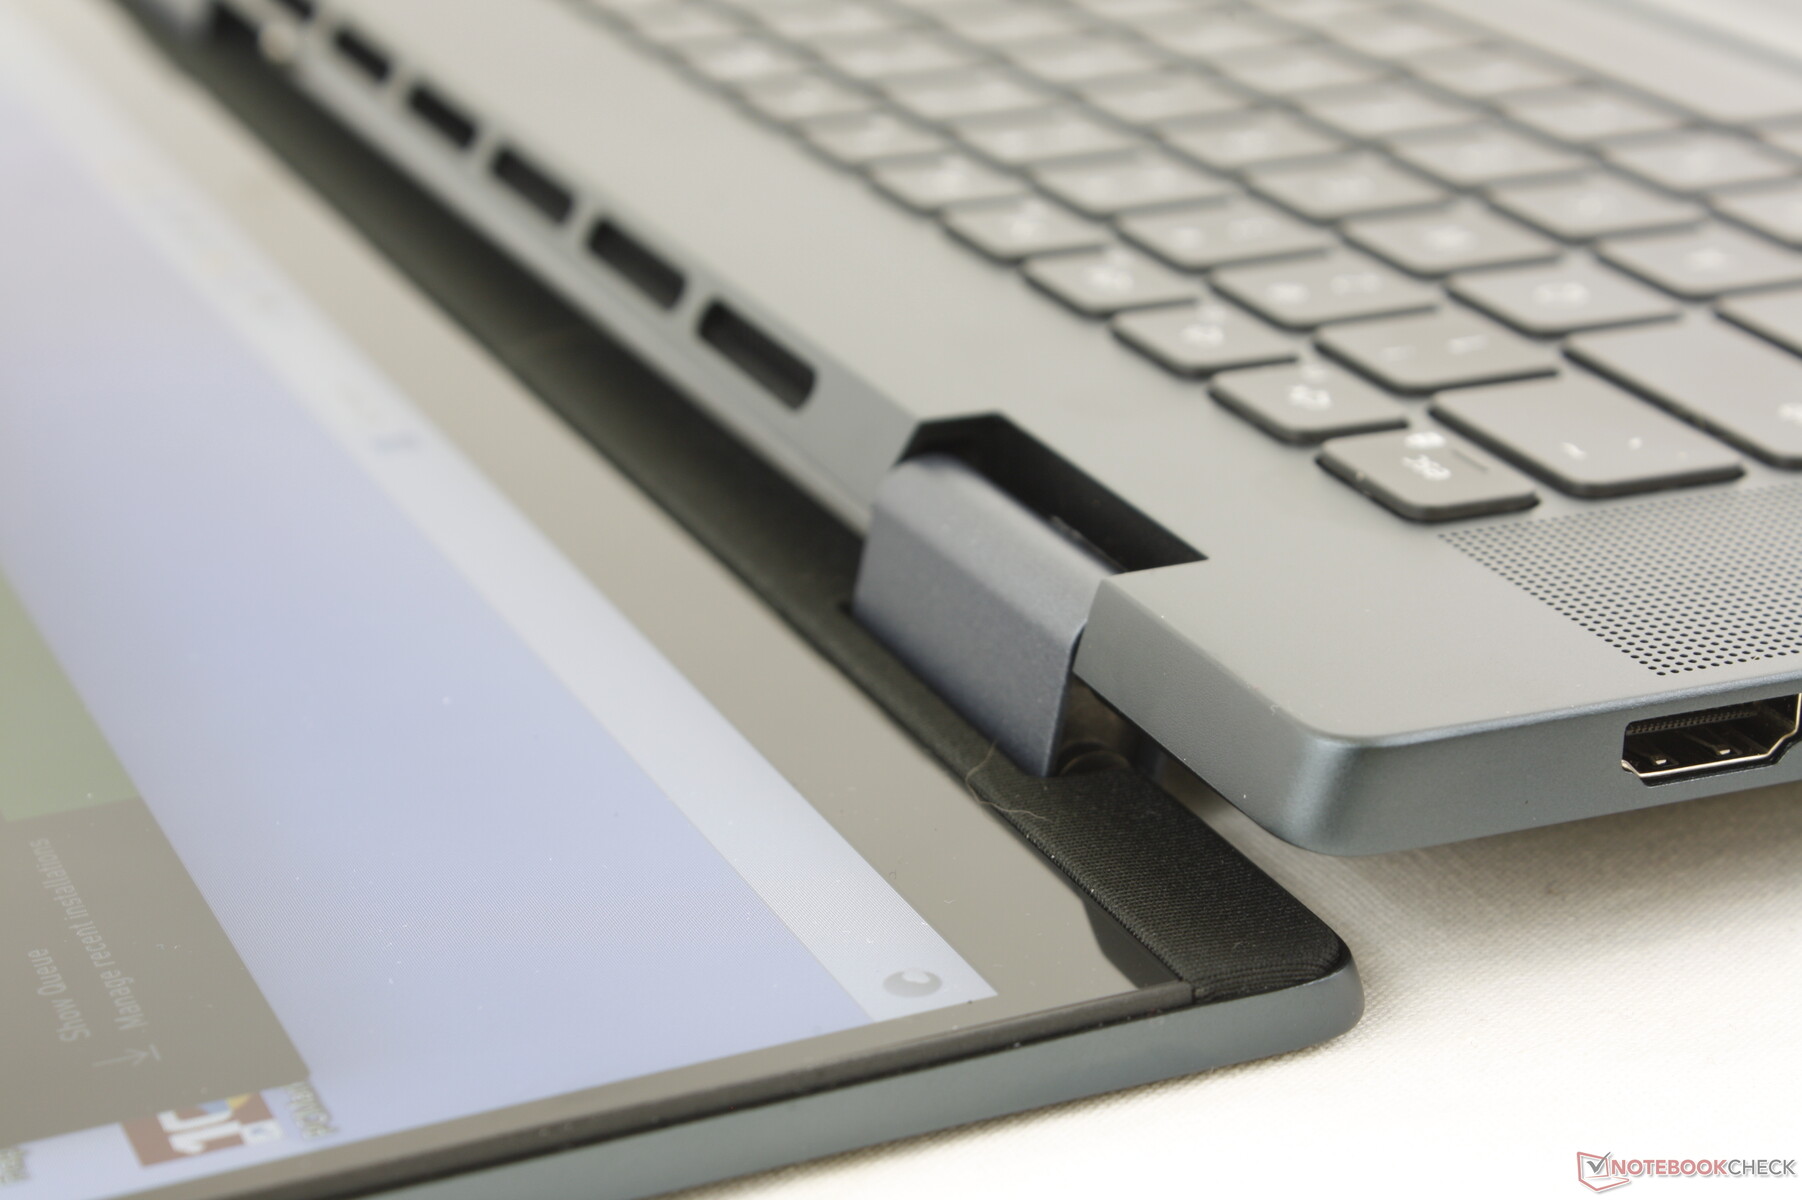
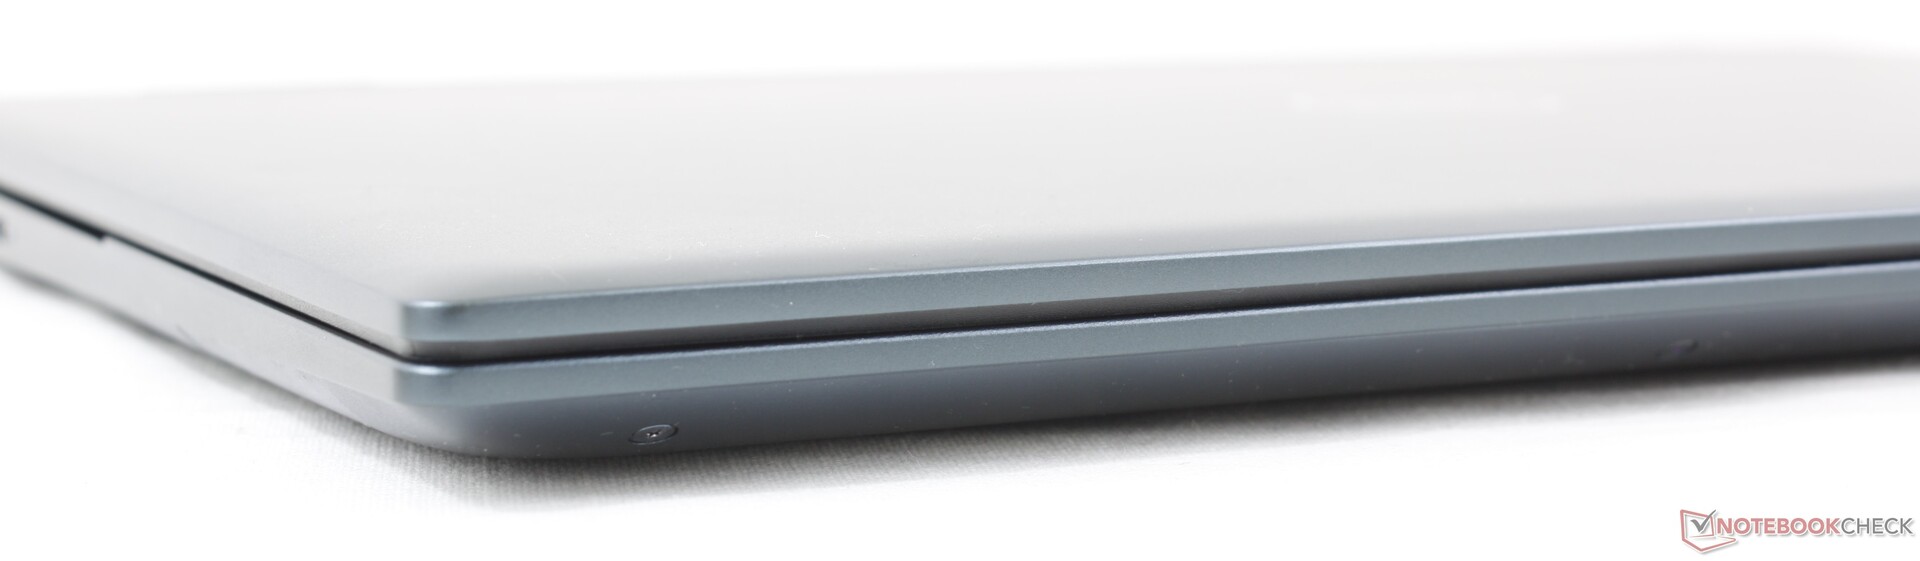
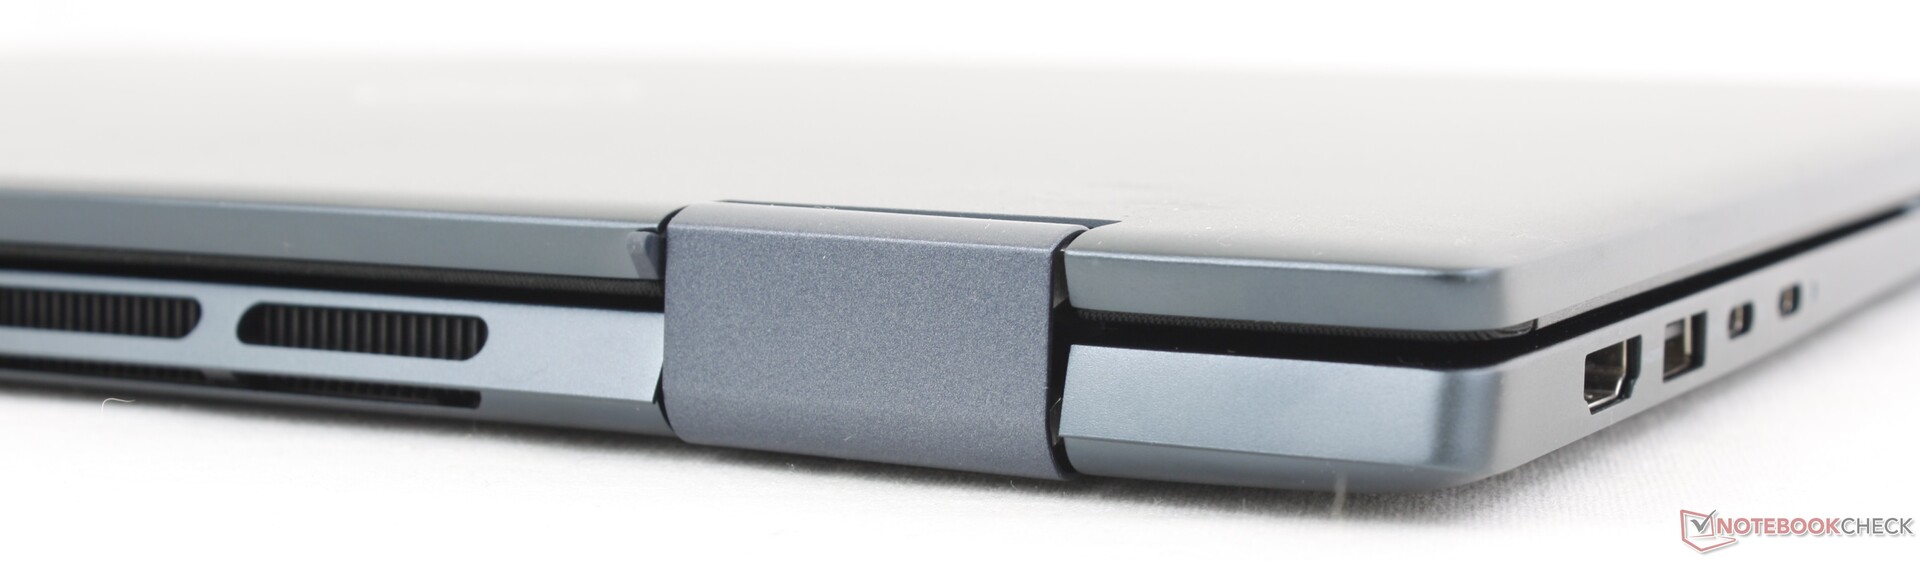
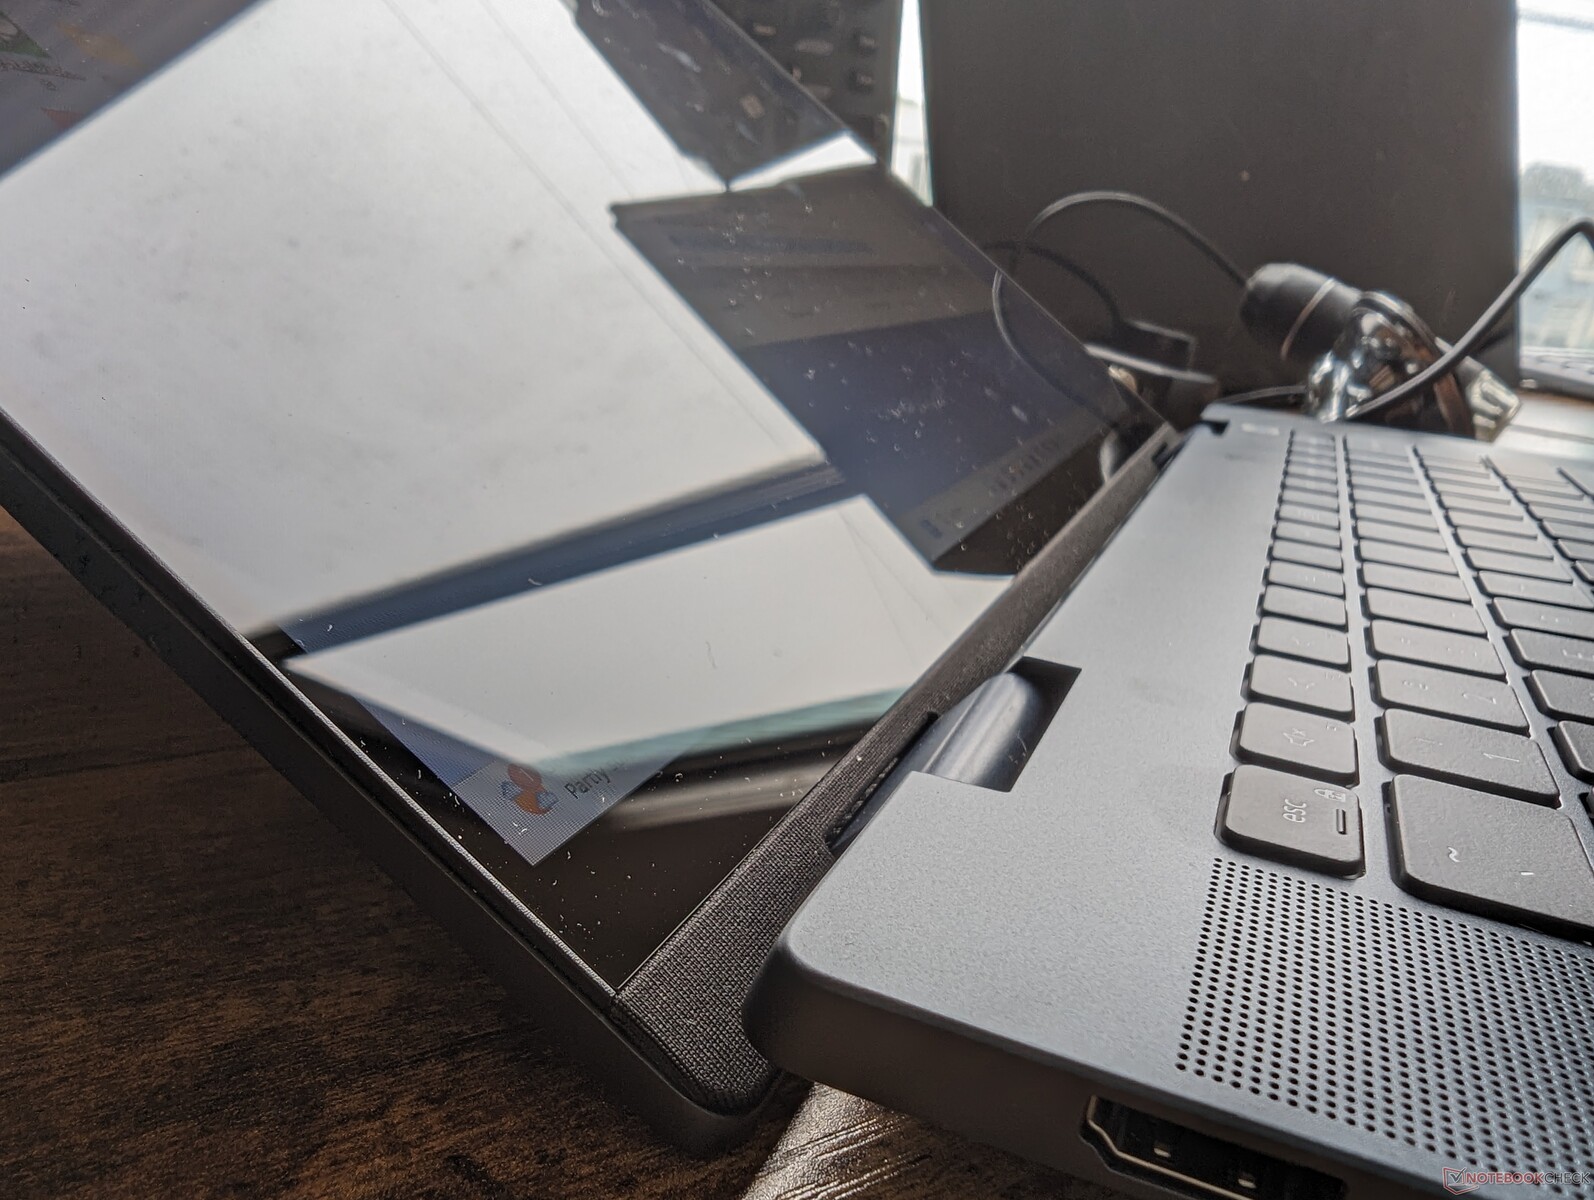
Caso - Caduta silenziosa di Mylar
Dell ha fatto un gran parlare dell'uso del Mylar nell'Inspiron 16 7620 2-in-1 dell'anno scorso e quindi è un po' sconcertante vedere che improvvisamente non c'è più nell'Inspiron 16 7630/7635 di quest'anno. Al suo posto, lo chassis è ora costituito da una combinazione di alluminio e plastica riciclata per una combinazione di colori e un aspetto più monotono. Anche le cerniere sono state ridisegnate per essere più piatte e lungo la parte posteriore sono presenti ulteriori griglie di ventilazione per favorire il raffreddamento.
La qualità del telaio è rimasta pressoché invariata rispetto all'anno precedente, nonostante le modifiche esterne. Il peso elevato contribuisce a creare una base solida per una prima impressione di solidità che è solo un passo indietro rispetto al molto più costoso e altrettanto pesante HP Spectre x360 16.HP Spectre x360 16.
Forse per coincidenza, dimensioni e peso sono quasi identici a quelli del concorrenteIdeaPad Flex 5 16. Il nuovo modello, purtroppo, non è più piccolo o più leggero rispetto all'Inspiron 16 7620 2-in-1 dello scorso anno e quindi rimane un portatile relativamente pesante anche per la categoria dei 16 pollici.
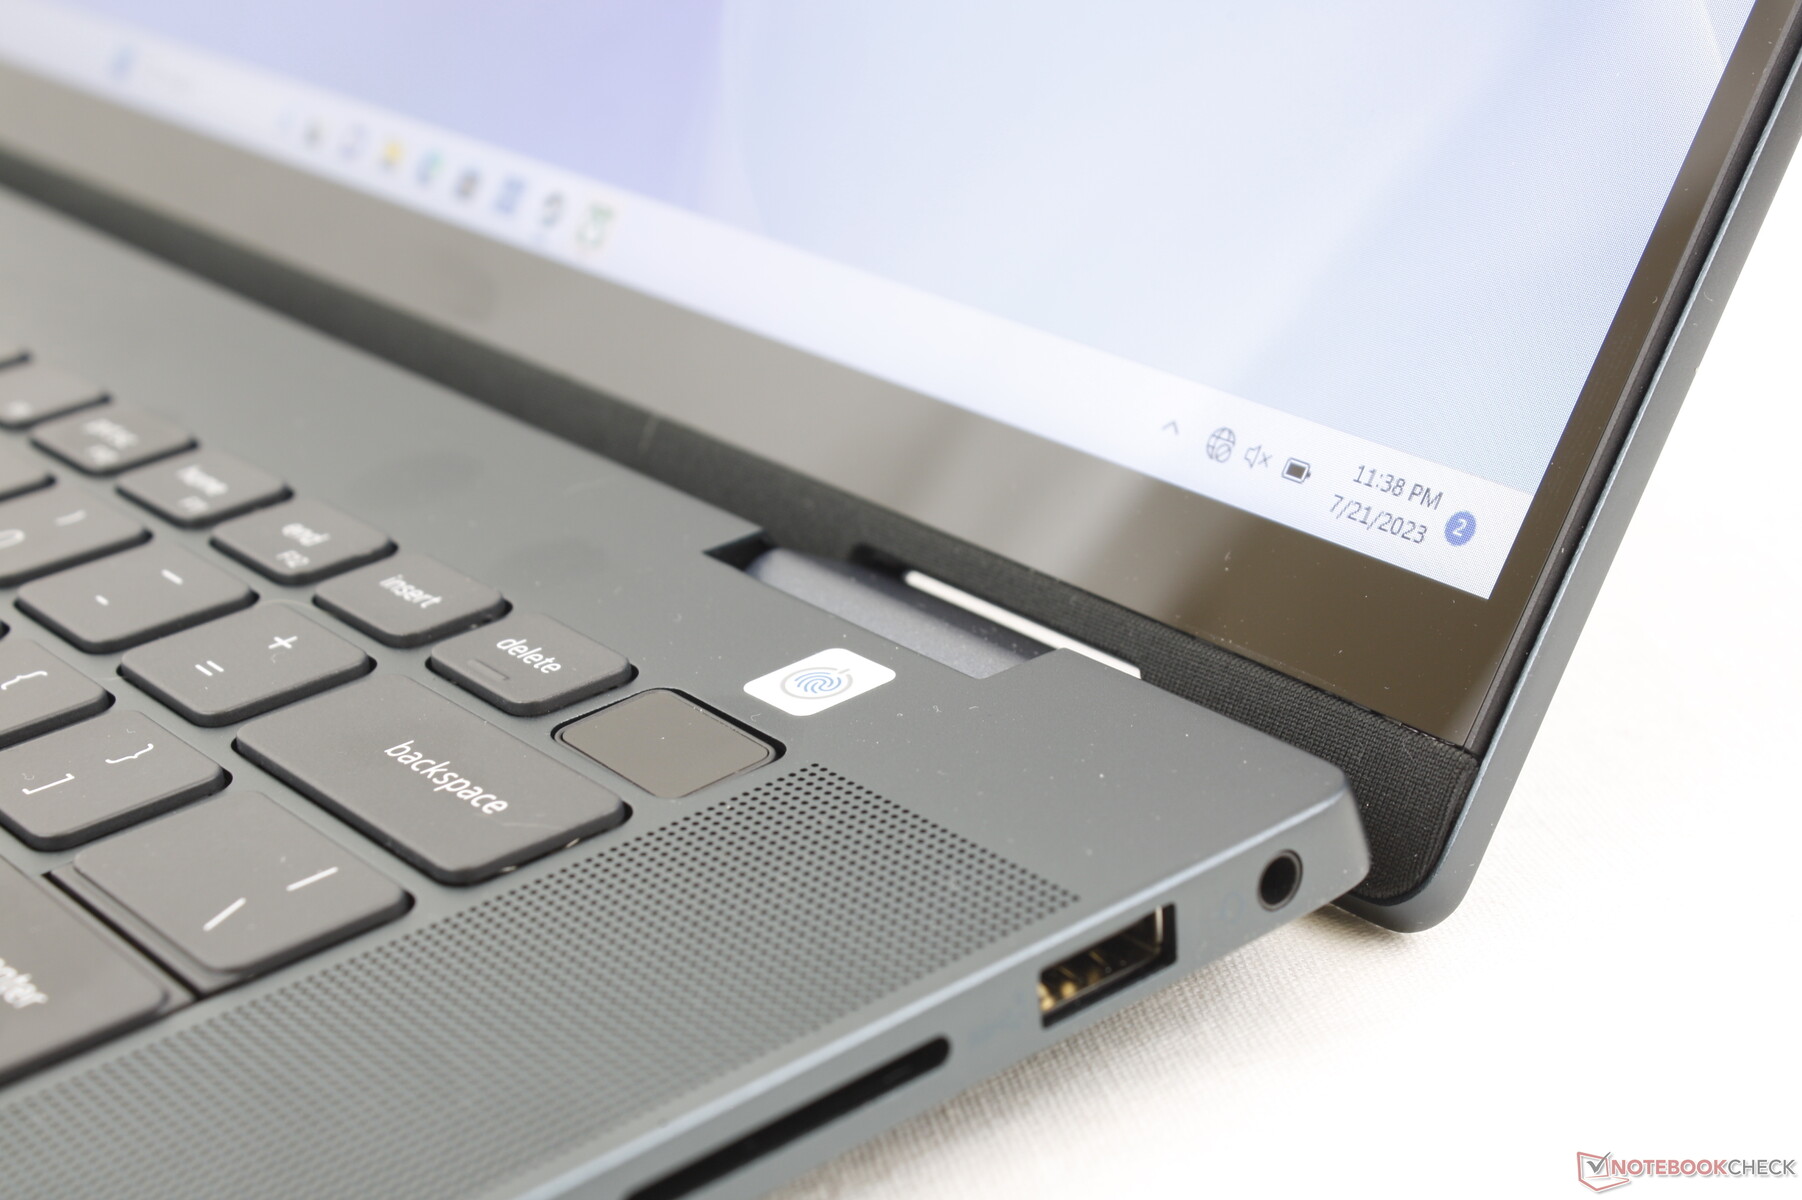
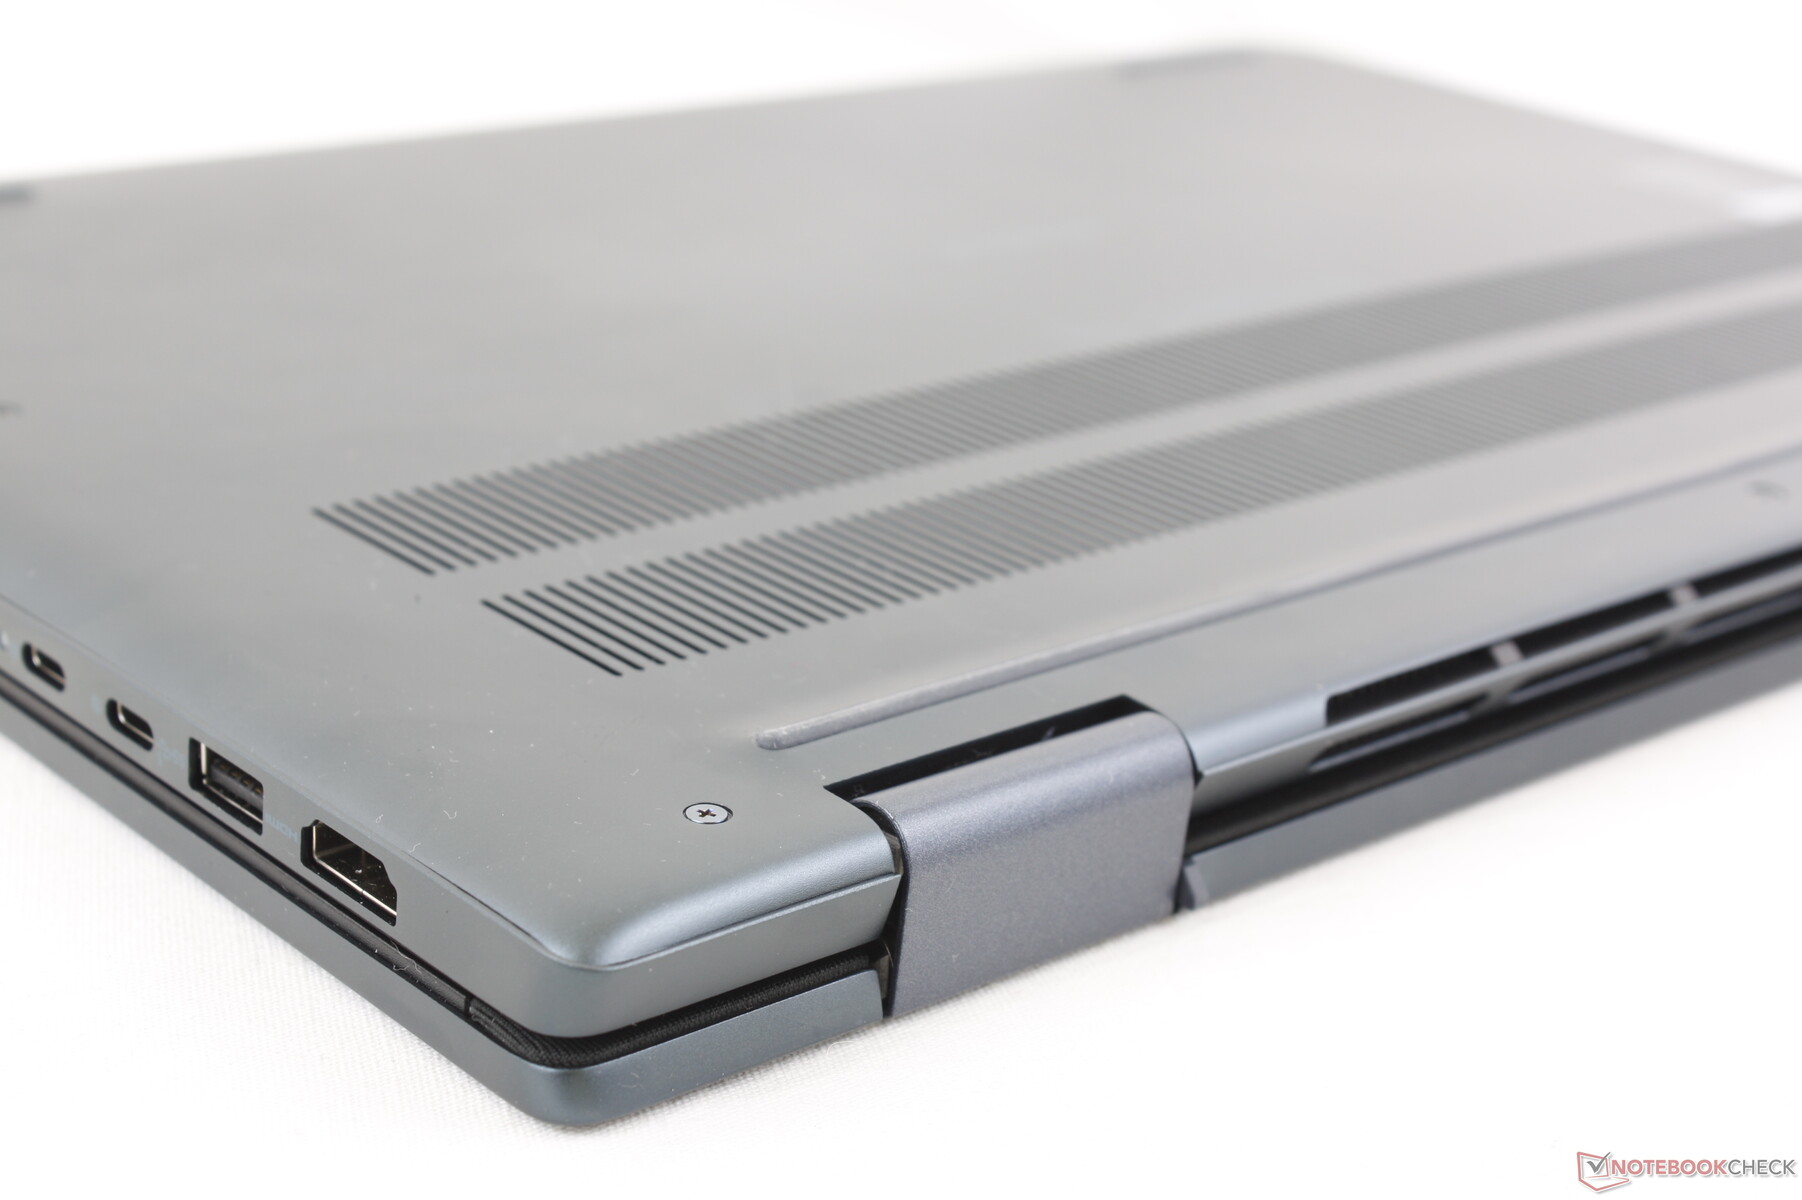
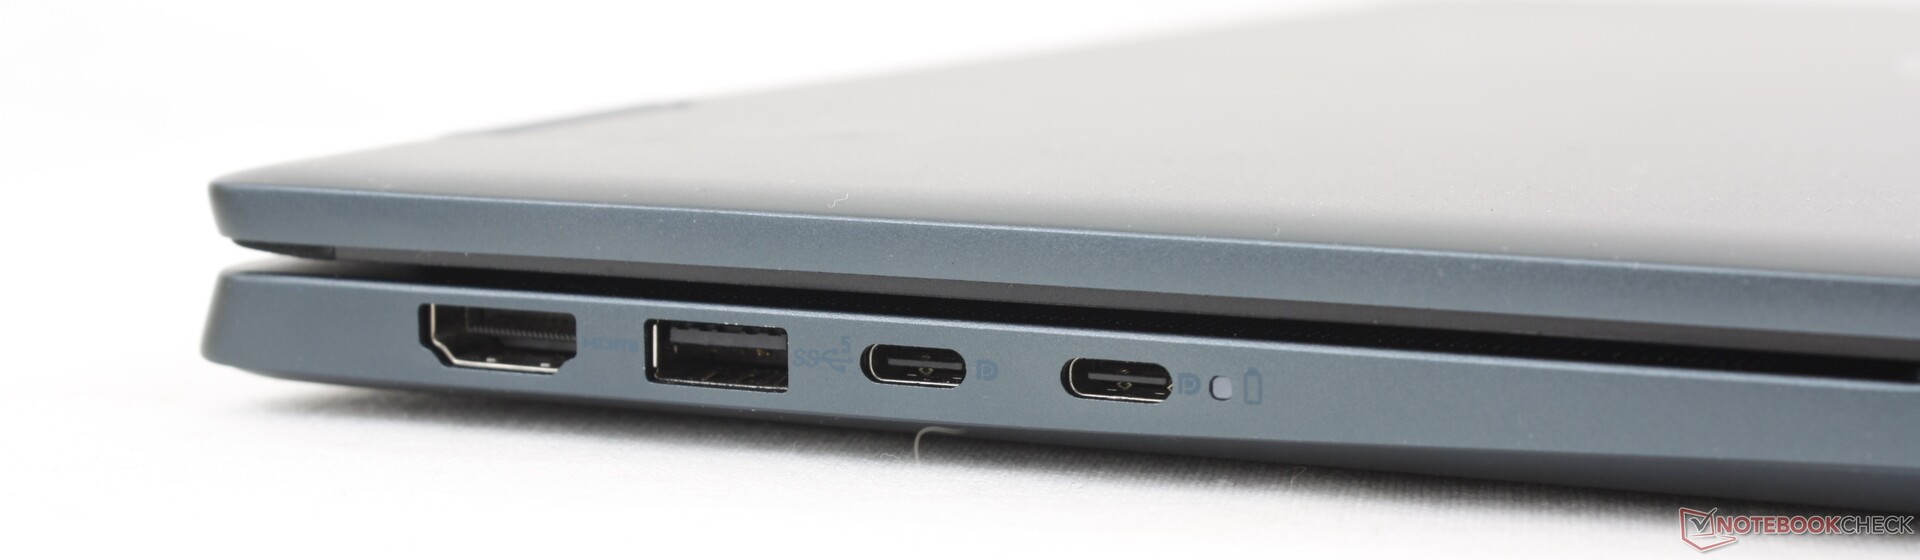
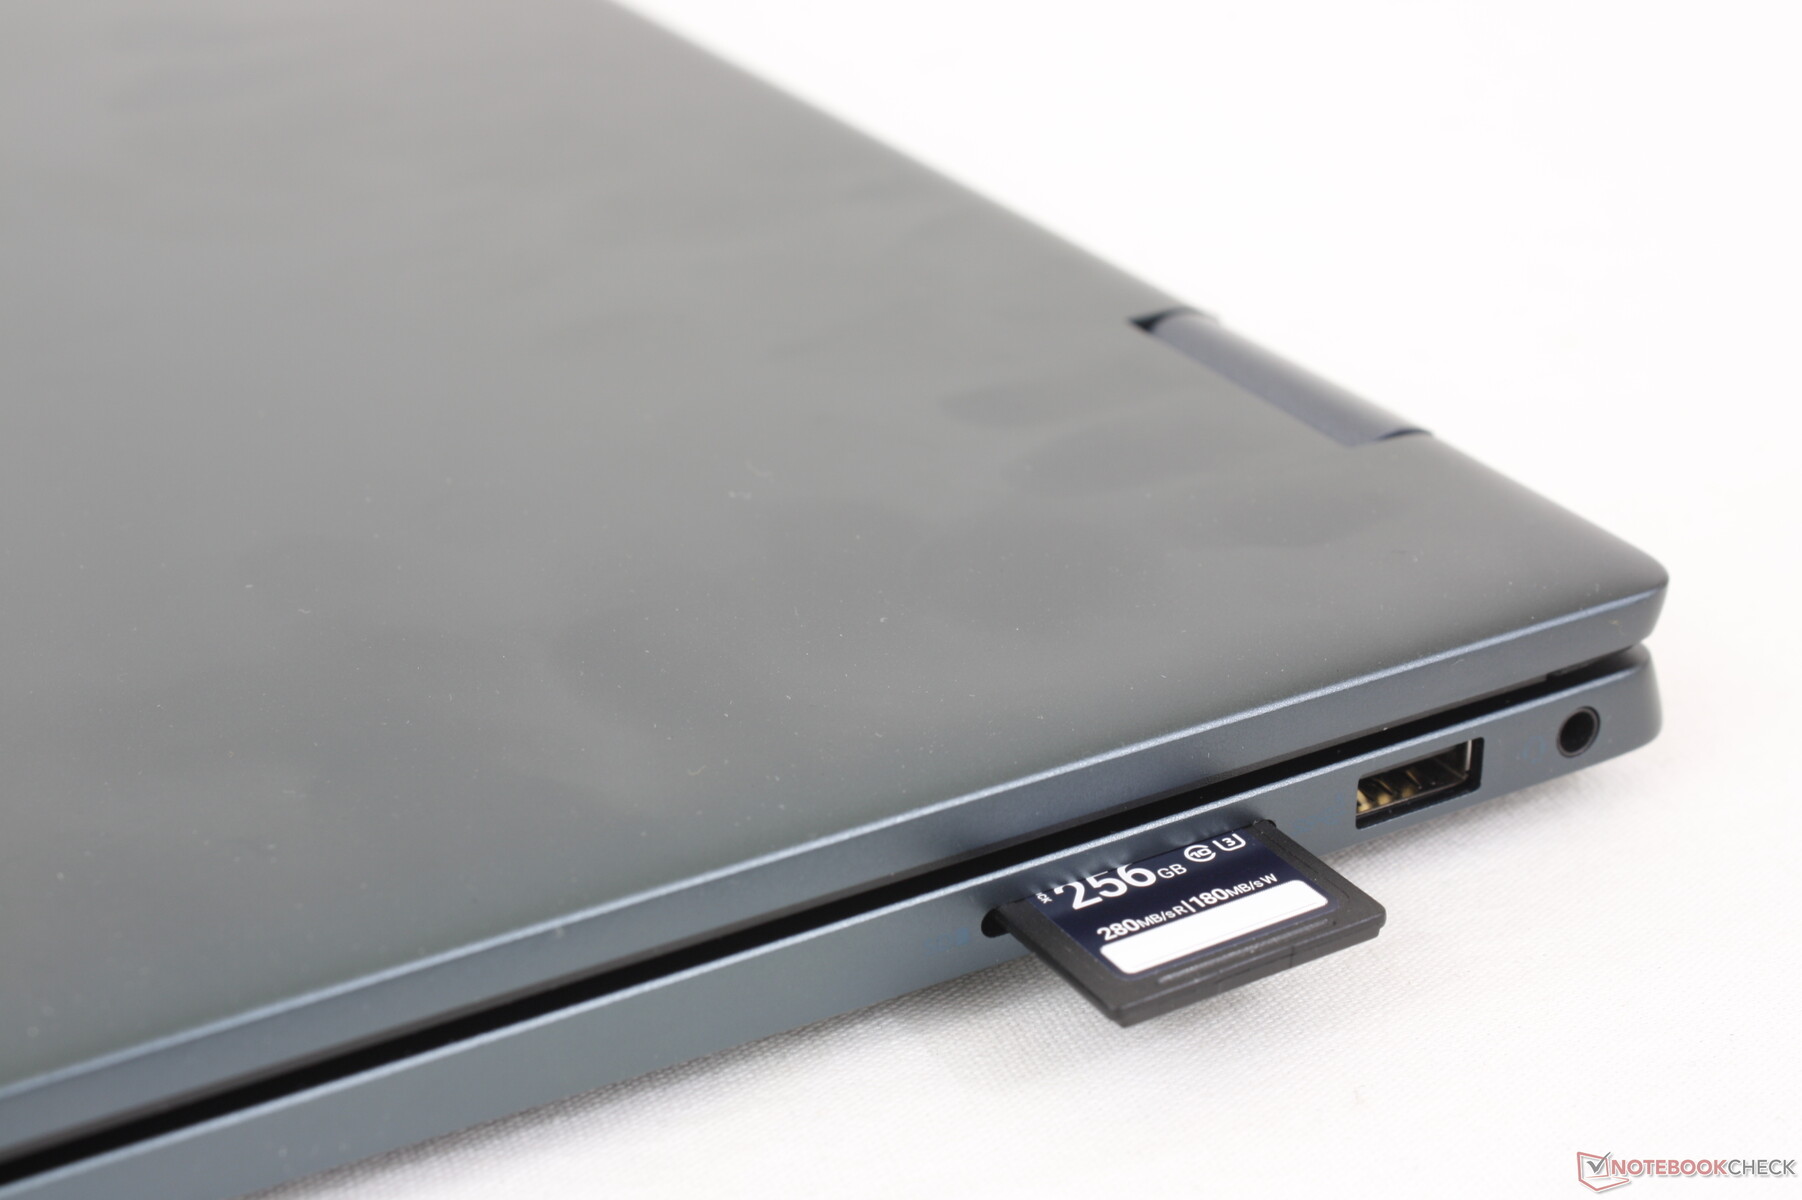
Connettività - Nessun supporto Thunderbolt
Il modello conserva tutte le porte presenti sul modello Inspiron 16 7620 2-in-1 dello scorso anno. La differenza principale, tuttavia, è che nella nostra configurazione AMD manca il supporto Thunderbolt. La varietà di porte è comunque paragonabile a quella di altri portatili da 16 pollici, come l'IdeaPad Flex 5 16 o l'Acer Swift Edge SFE16 Acer Swift Edge SFE16.
Tenete presente che la porta HDMI è solo 1.4 invece di 2.0. Per supportare correttamente i monitor esterni 4K a 60 Hz, è necessario utilizzare le porte USB-C.
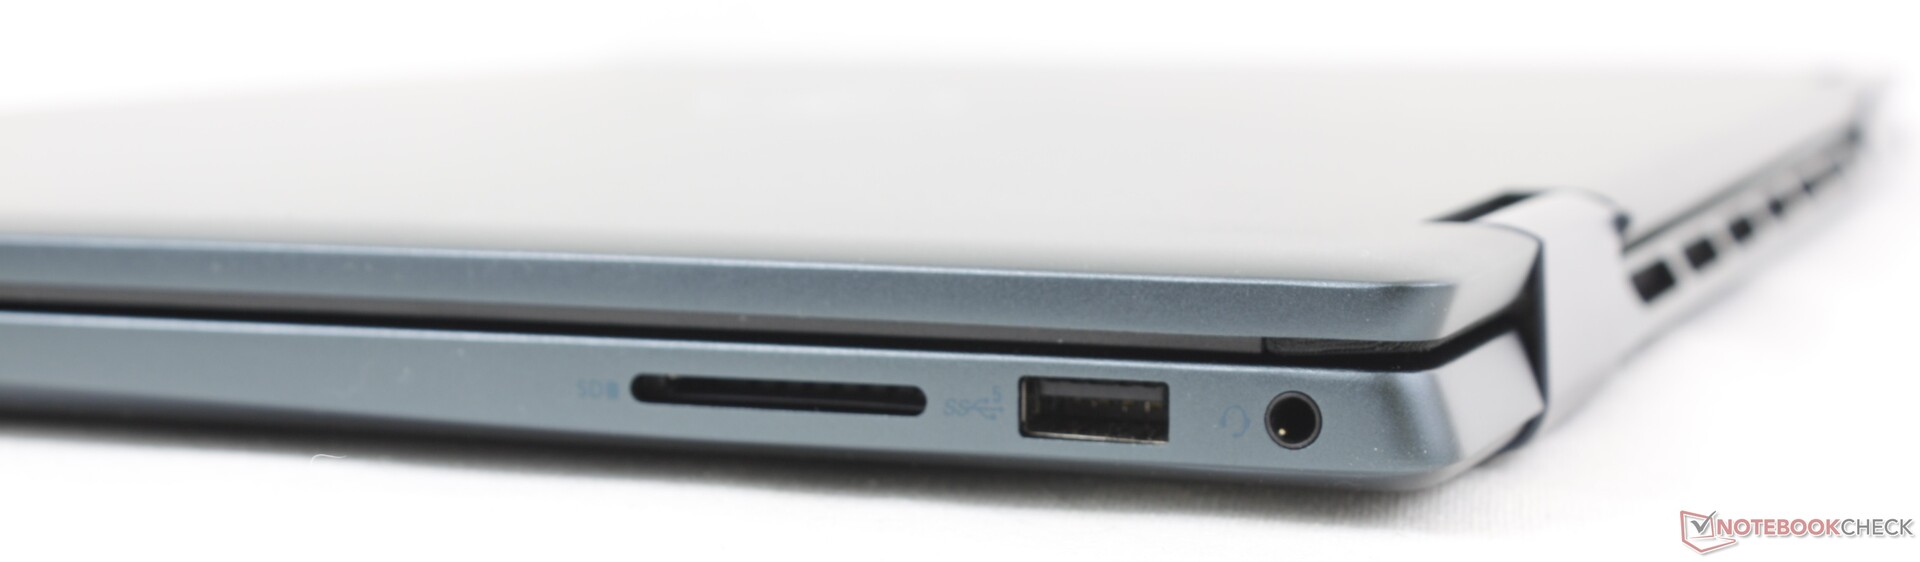
Lettore di schede SD
Il lettore di schede integrato è leggermente più veloce di prima, ma la velocità di trasferimento è ancora circa la metà di quella del Lenovo IdeaPad Flex 5 16 o del Lenovo Book Pro 16 Galaxy Book3 Pro 16. Lo spostamento di 1 GB di immagini dalla nostra scheda PNY UHS-II di prova al desktop richiede circa 32 secondi, rispetto ai 17 secondi del già citato Lenovo.
| SD Card Reader | |
| average JPG Copy Test (av. of 3 runs) | |
| Lenovo IdeaPad Flex 5 16ABR G8 (Angelibird AV Pro V60) | |
| Samsung Galaxy Book3 Pro 16 | |
| Lenovo Yoga 7 16IRL8 (AV Pro SD microSD 128 GB V60) | |
| Dell Inspiron 16 7635 2-in-1 (PNY EliteX-Pro60 V60 256 GB) | |
| Dell Inspiron 16 7620 2-in-1 (Toshiba Exceria Pro SDXC 64 GB UHS-II) | |
| maximum AS SSD Seq Read Test (1GB) | |
| Lenovo Yoga 7 16IRL8 (AV Pro SD microSD 128 GB V60) | |
| Lenovo IdeaPad Flex 5 16ABR G8 (Angelibird AV Pro V60) | |
| Samsung Galaxy Book3 Pro 16 | |
| Dell Inspiron 16 7635 2-in-1 (PNY EliteX-Pro60 V60 256 GB) | |
| Dell Inspiron 16 7620 2-in-1 (Toshiba Exceria Pro SDXC 64 GB UHS-II) | |
Comunicazione
L'Inspiron AMD viene fornito con il MediaTek Wi-Fi 6E MT7922, mentre l'Inspiron Intel viene fornito con l'AX211. Entrambi i moduli sono compatibili con i router Wi-Fi 6E o 6 GHz. Le prestazioni sono costanti e senza problemi quando sono accoppiati al nostro Asus AXE11000.
Webcam
La webcam a 1080p e l'otturatore per la privacy sono di serie su tutte le configurazioni, per non avere sorprese in termini di qualità dell'immagine. Solo il modello Intel, tuttavia, è dotato di un sensore IR opzionale.


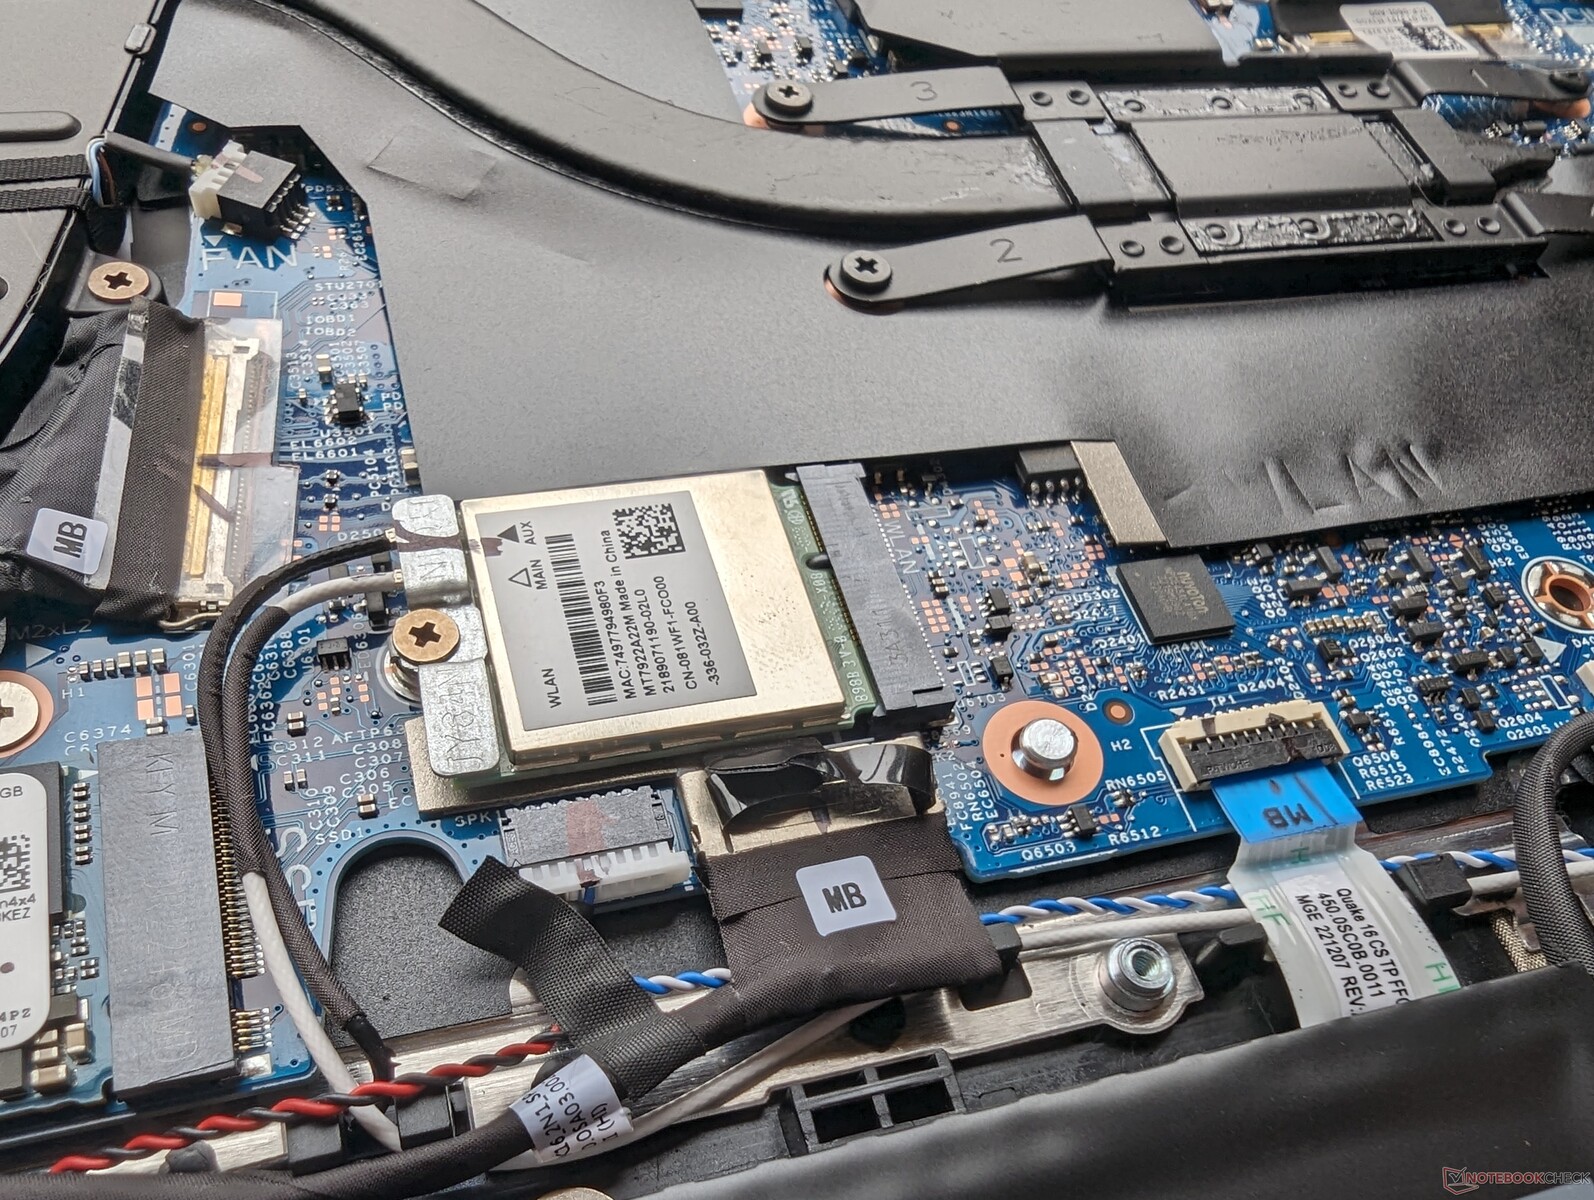
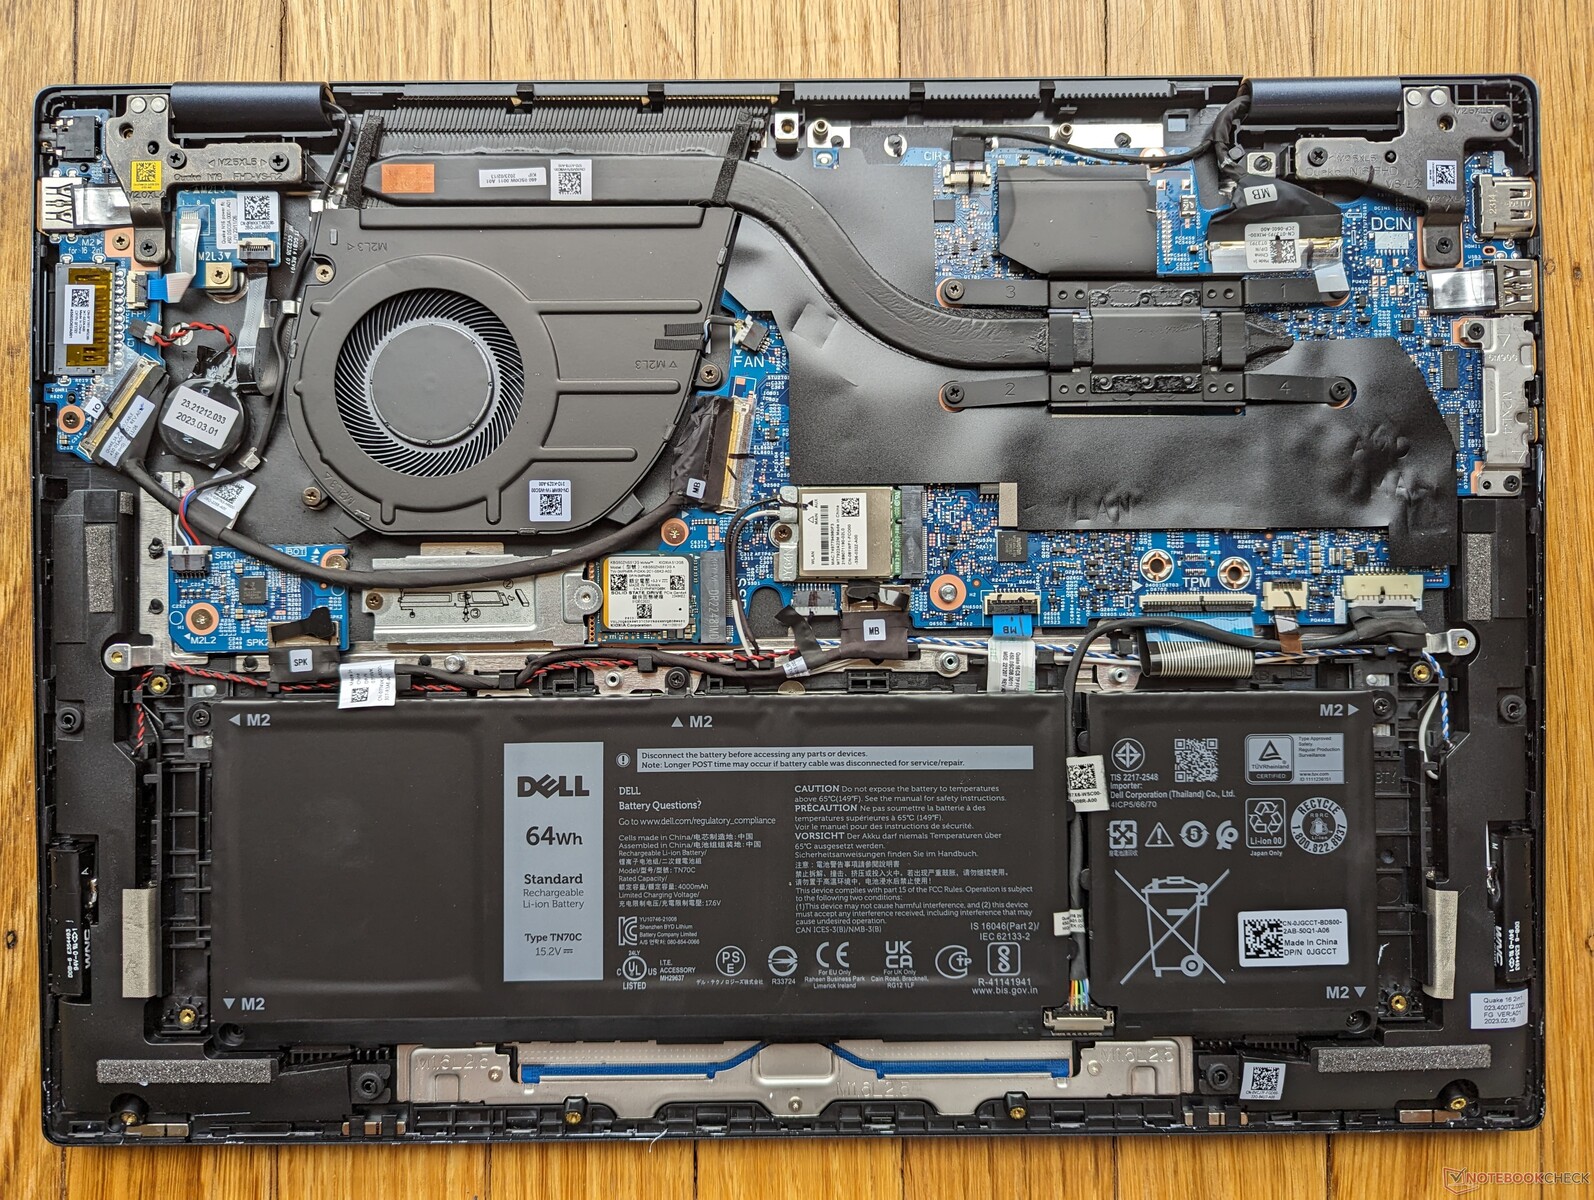
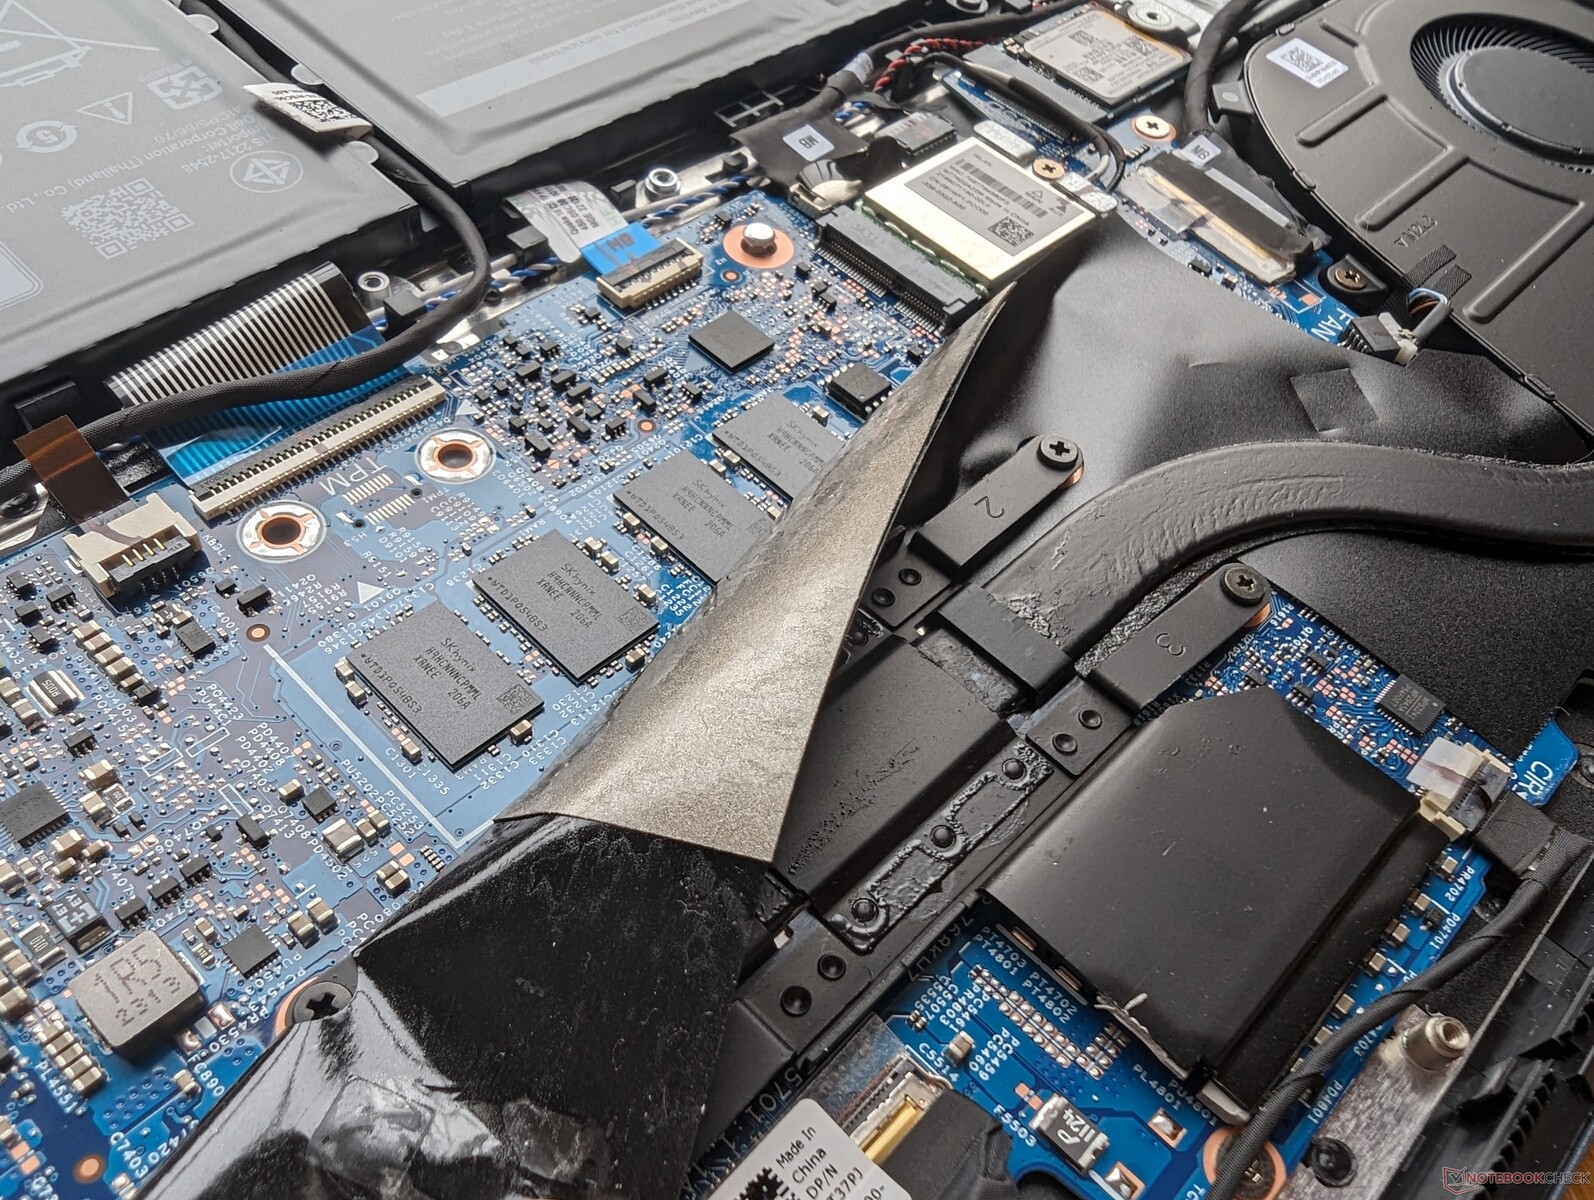
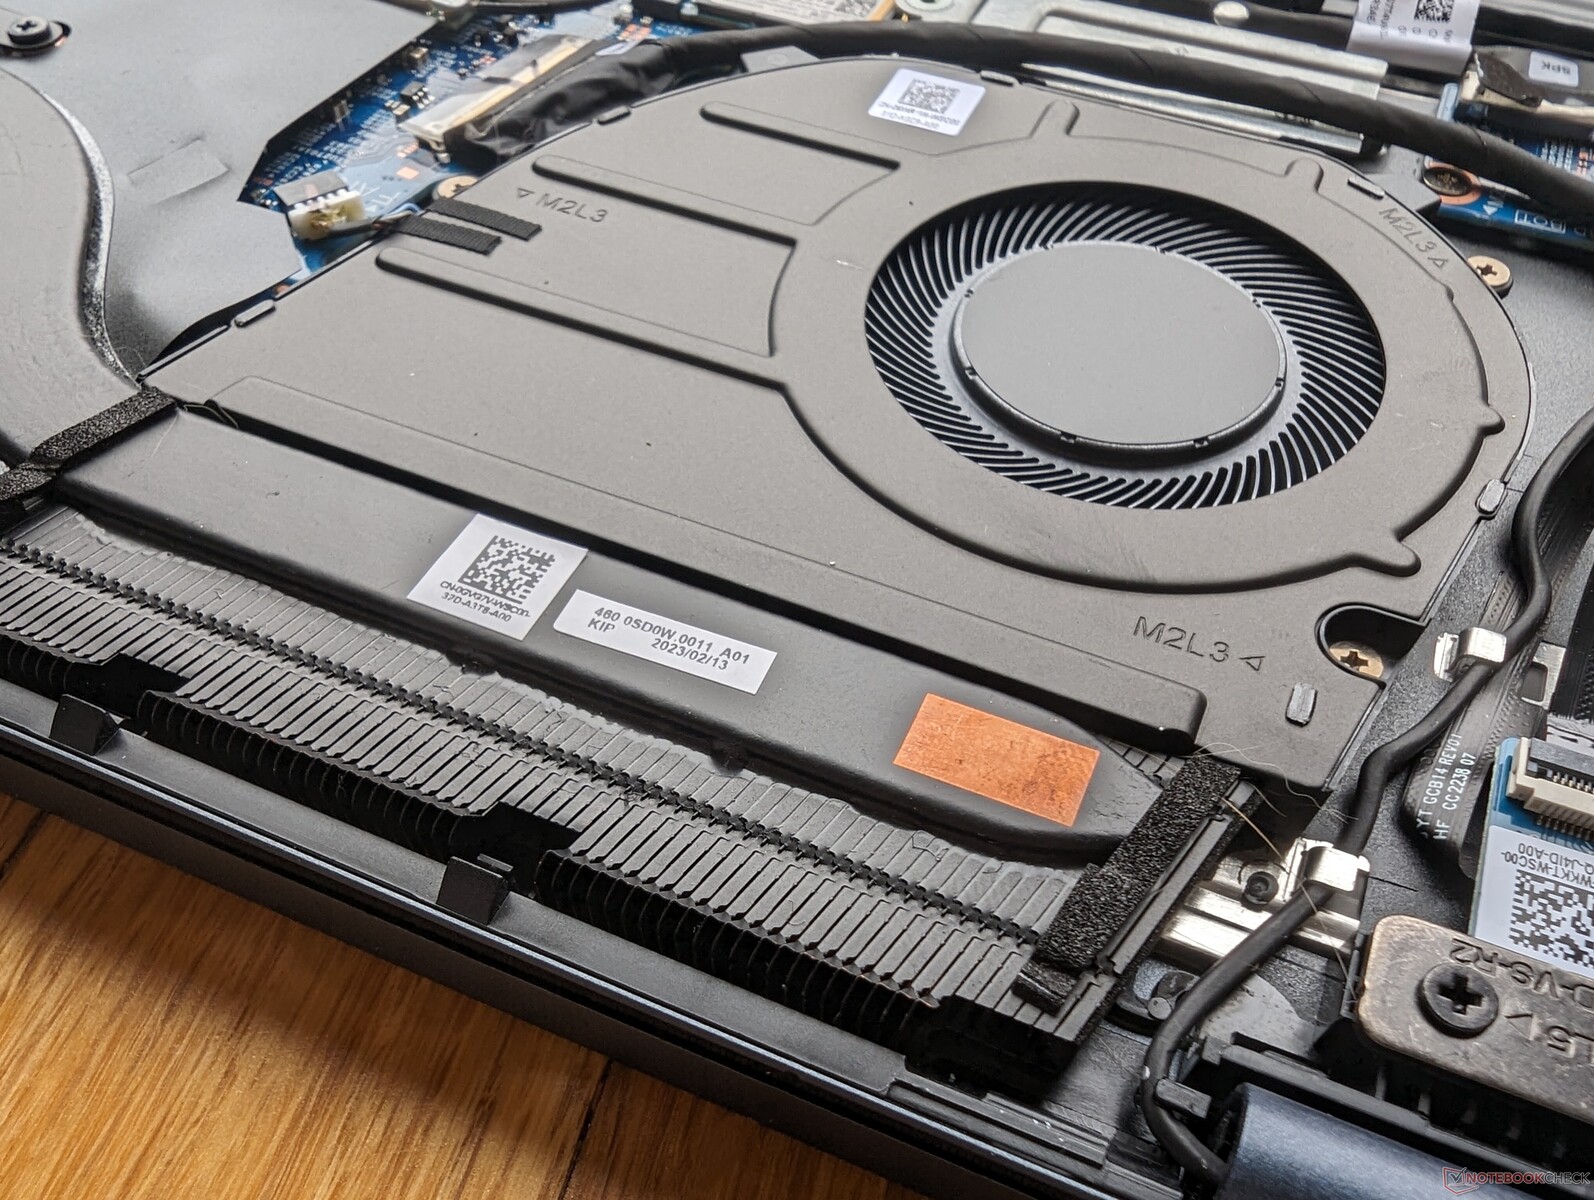
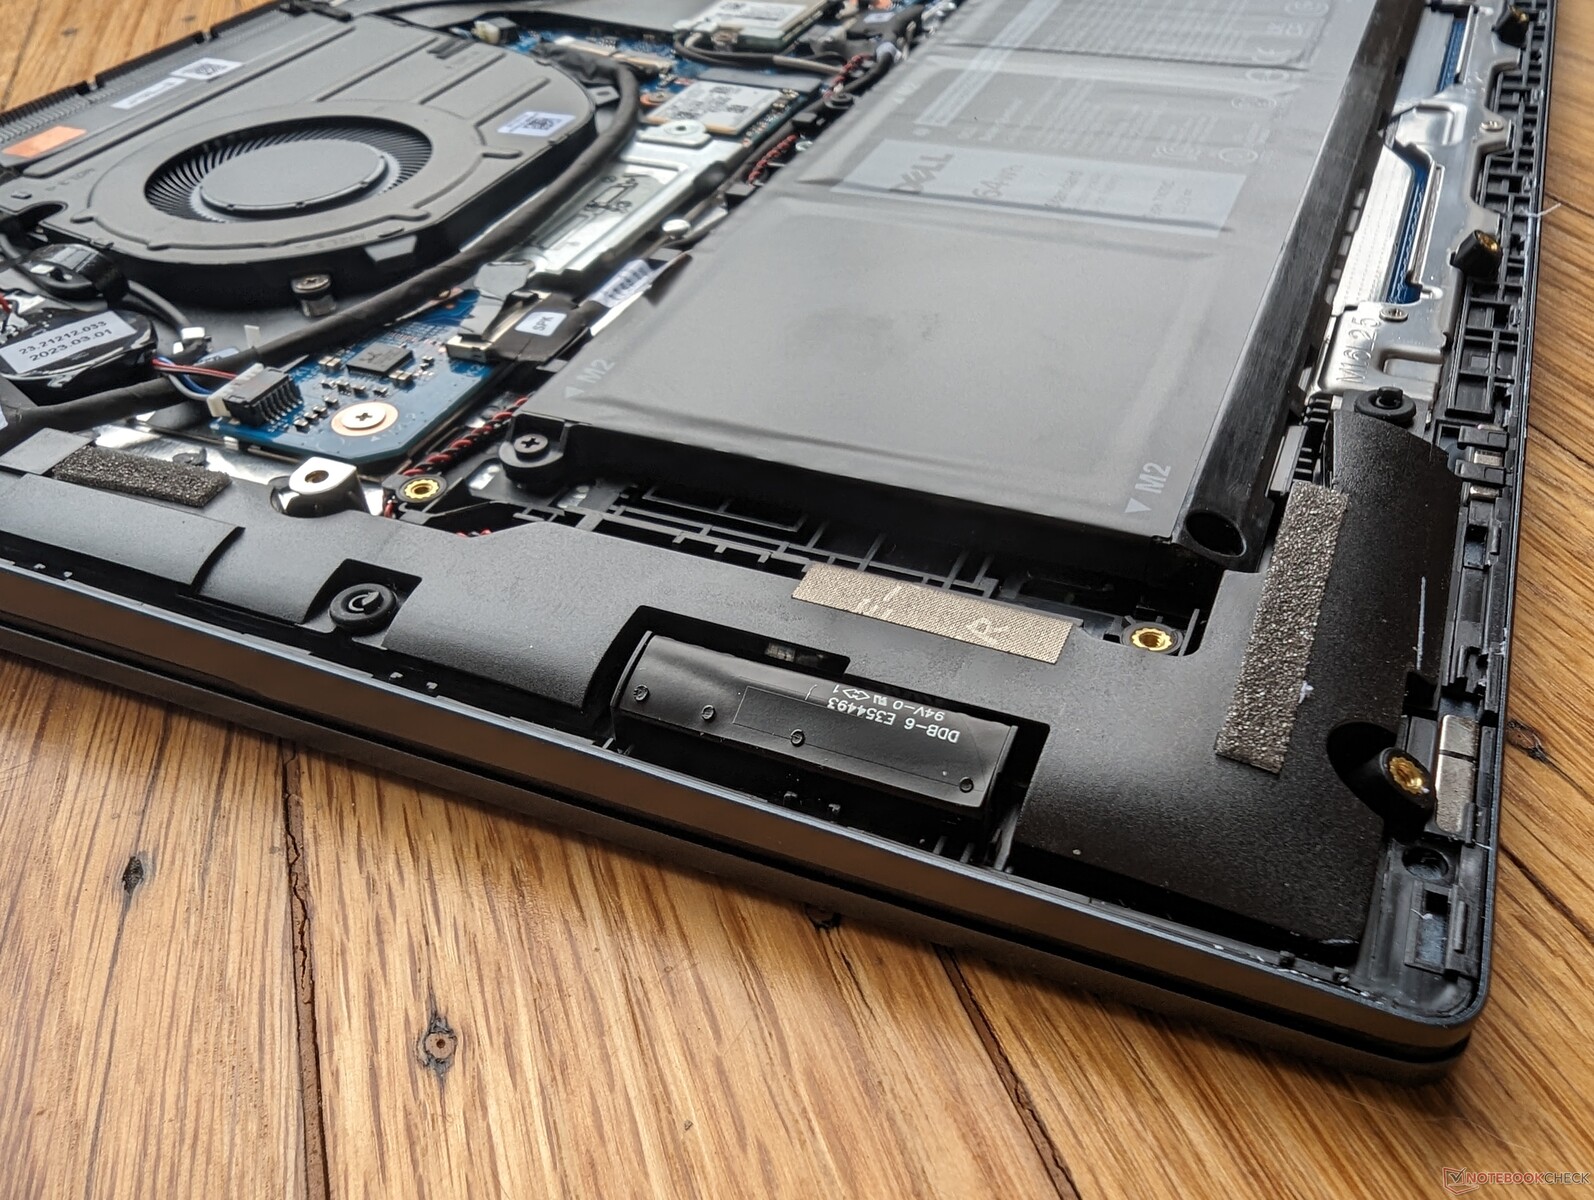
Manutenzione
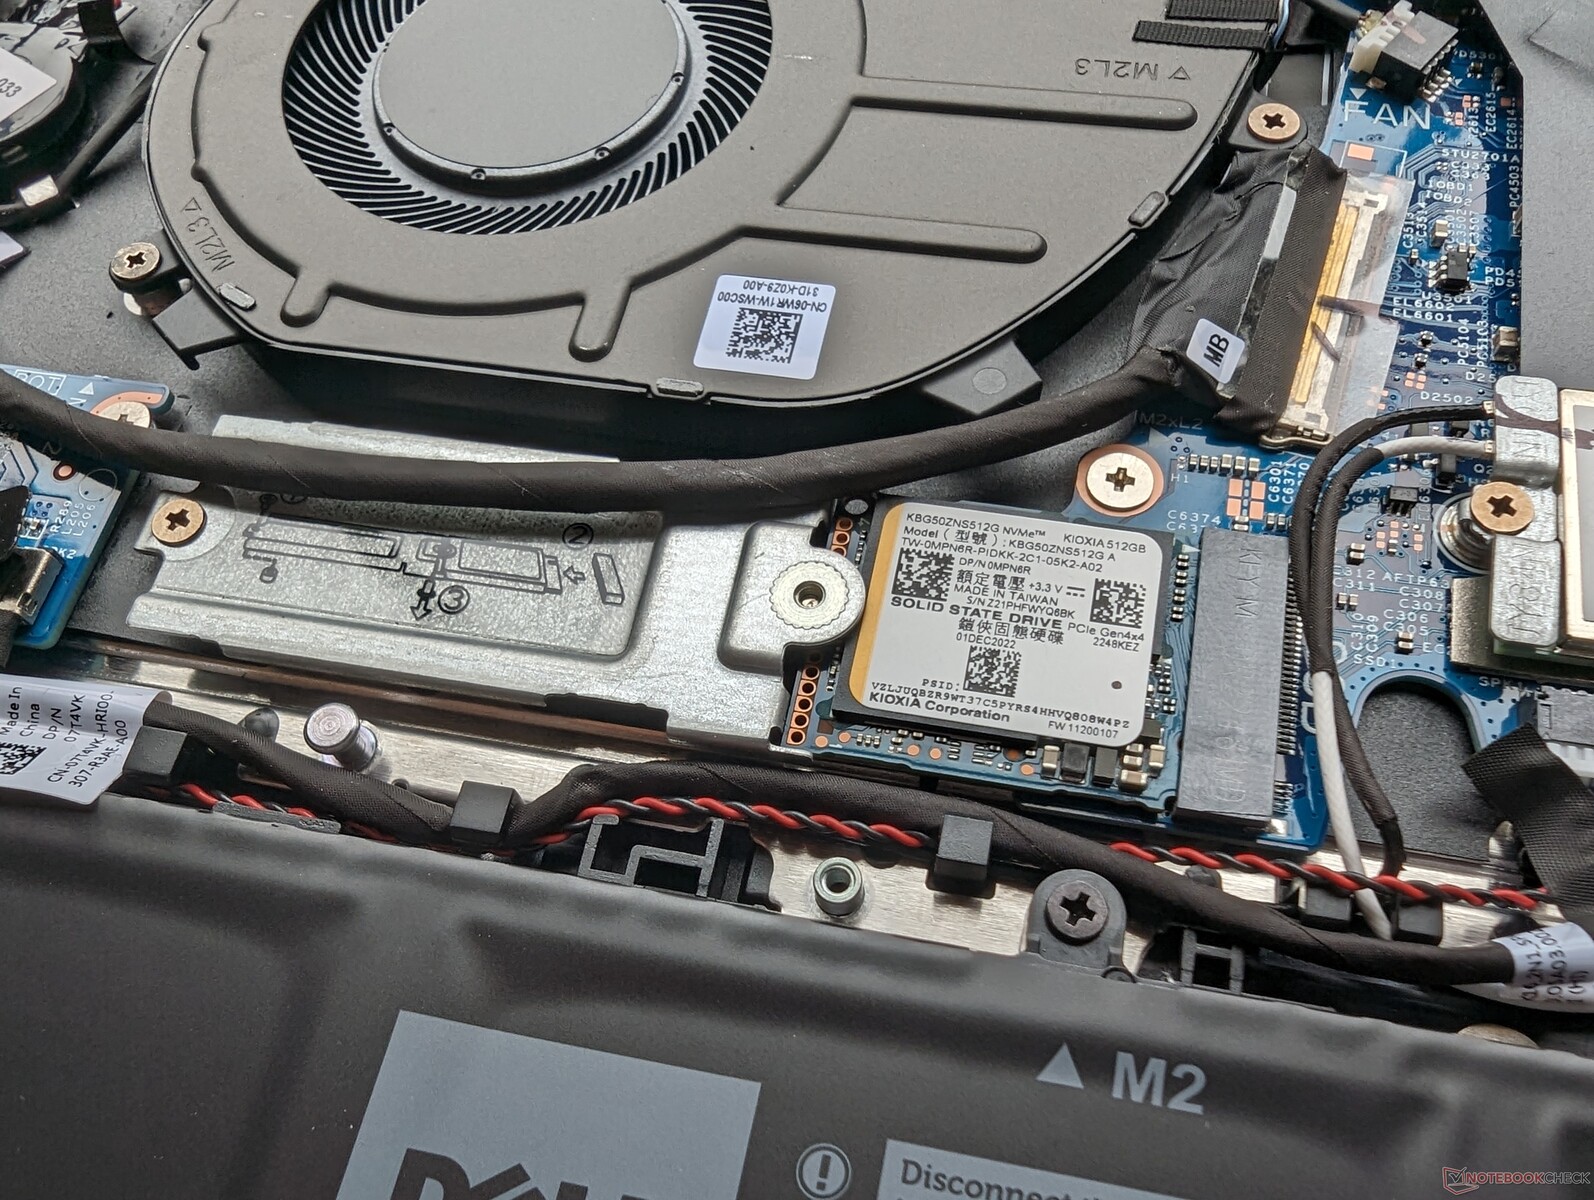
Il pannello inferiore è fissato da nove viti Phillips. Si noti che le chiusure intorno ai bordi sono molto strette e quindi si consiglia di utilizzare un bordo di plastica affilato per fare leva con attenzione sul pannello partendo dal retro.
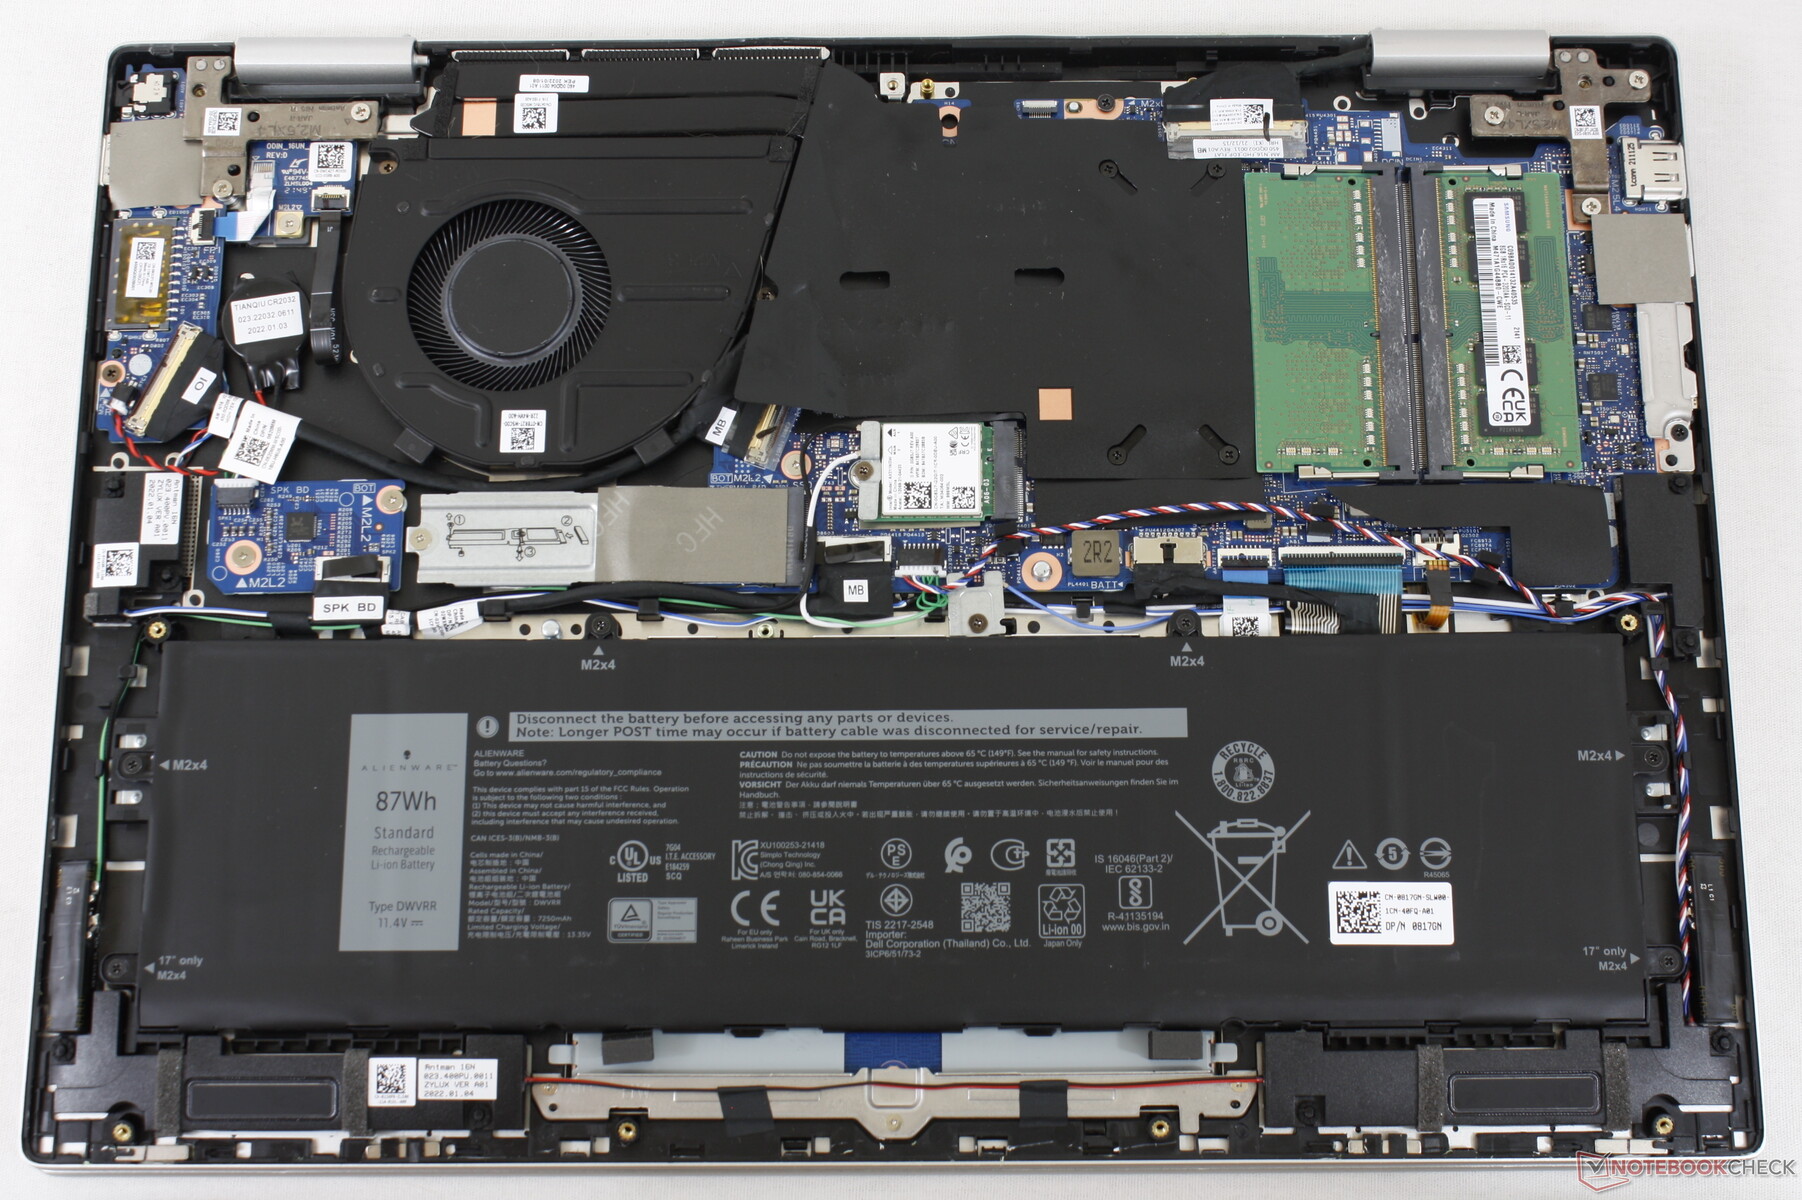
La RAM è ora saldata sul modello 2023, mentre era aggiornabile dall'utente sulla versione 2022, come mostrano le immagini qui sotto.
Accessori e garanzia
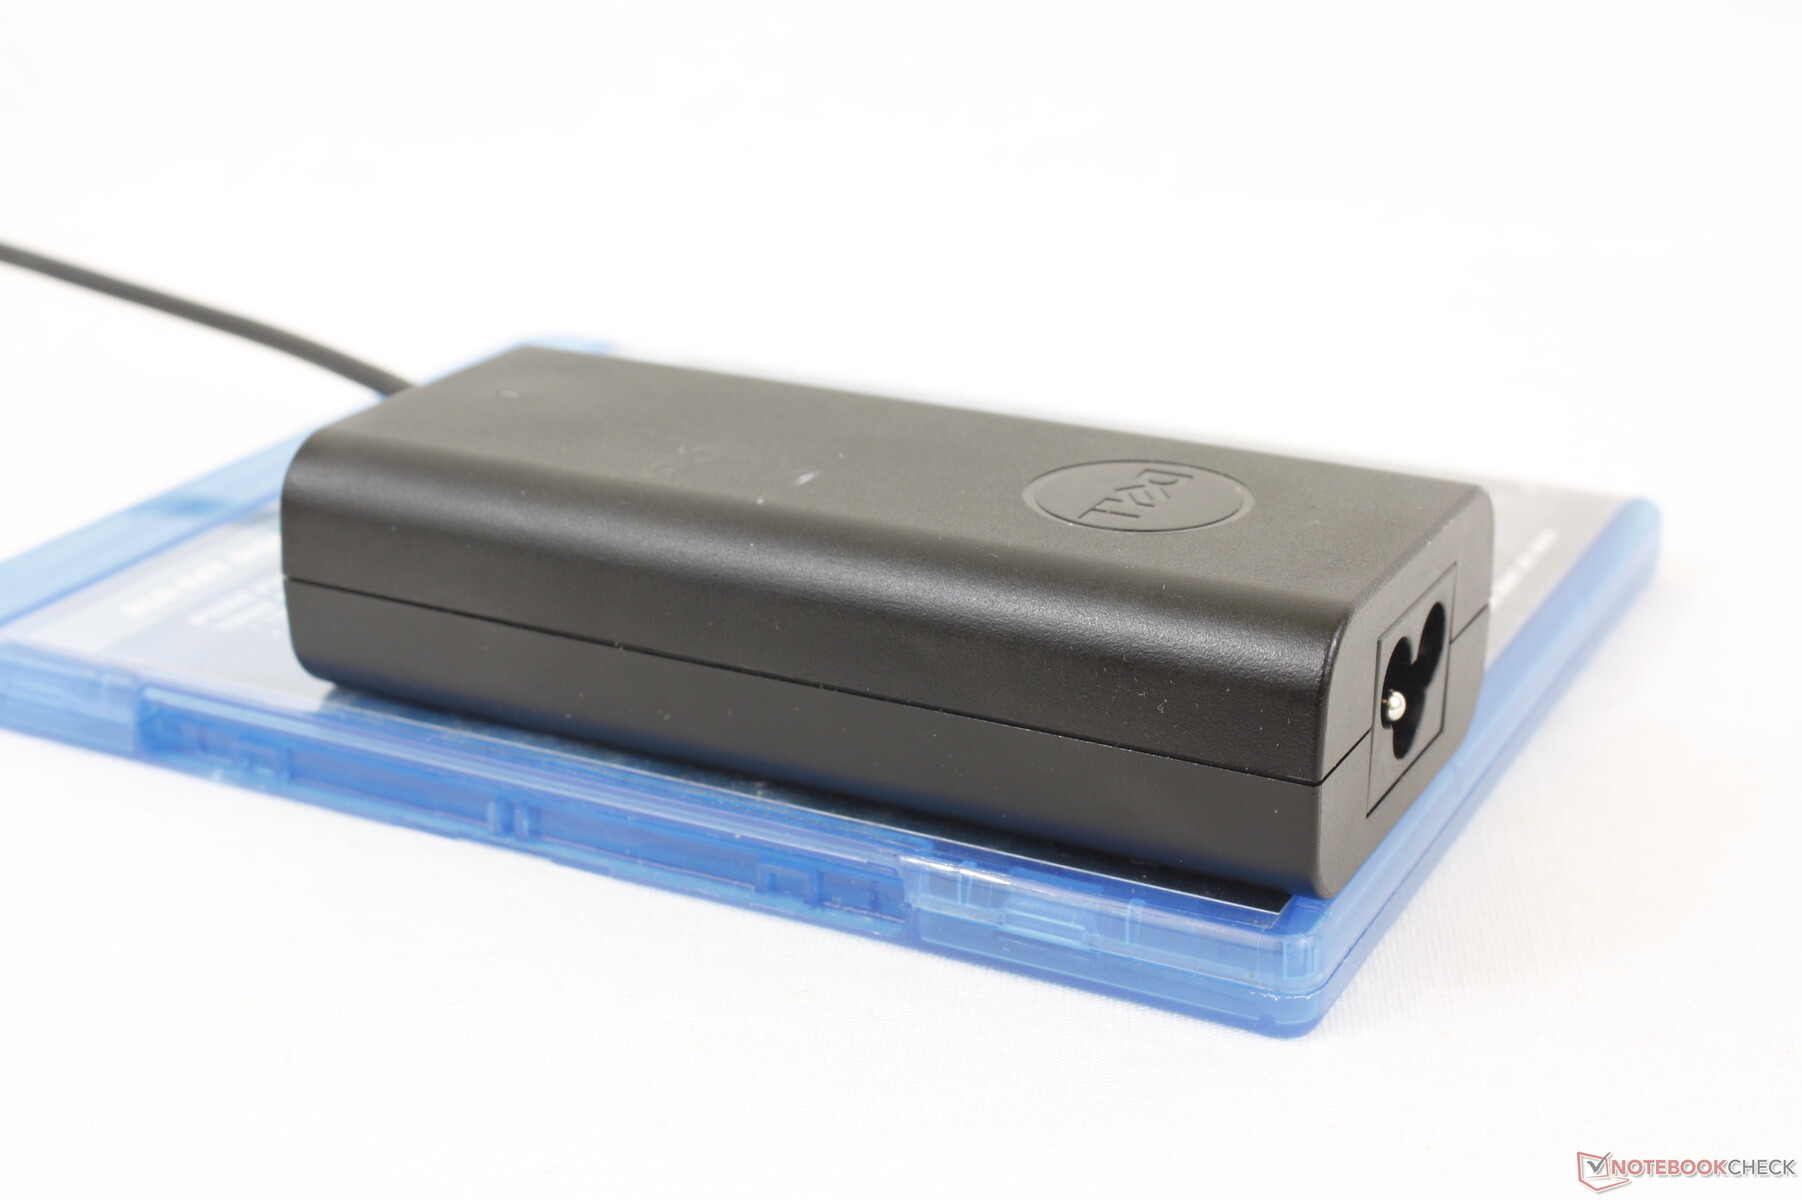
La confezione non contiene altri extra oltre all'adattatore CA e alla documentazione. Se acquistato negli Stati Uniti, si applica la consueta garanzia limitata di un anno del produttore.
Dispositivi di ingresso
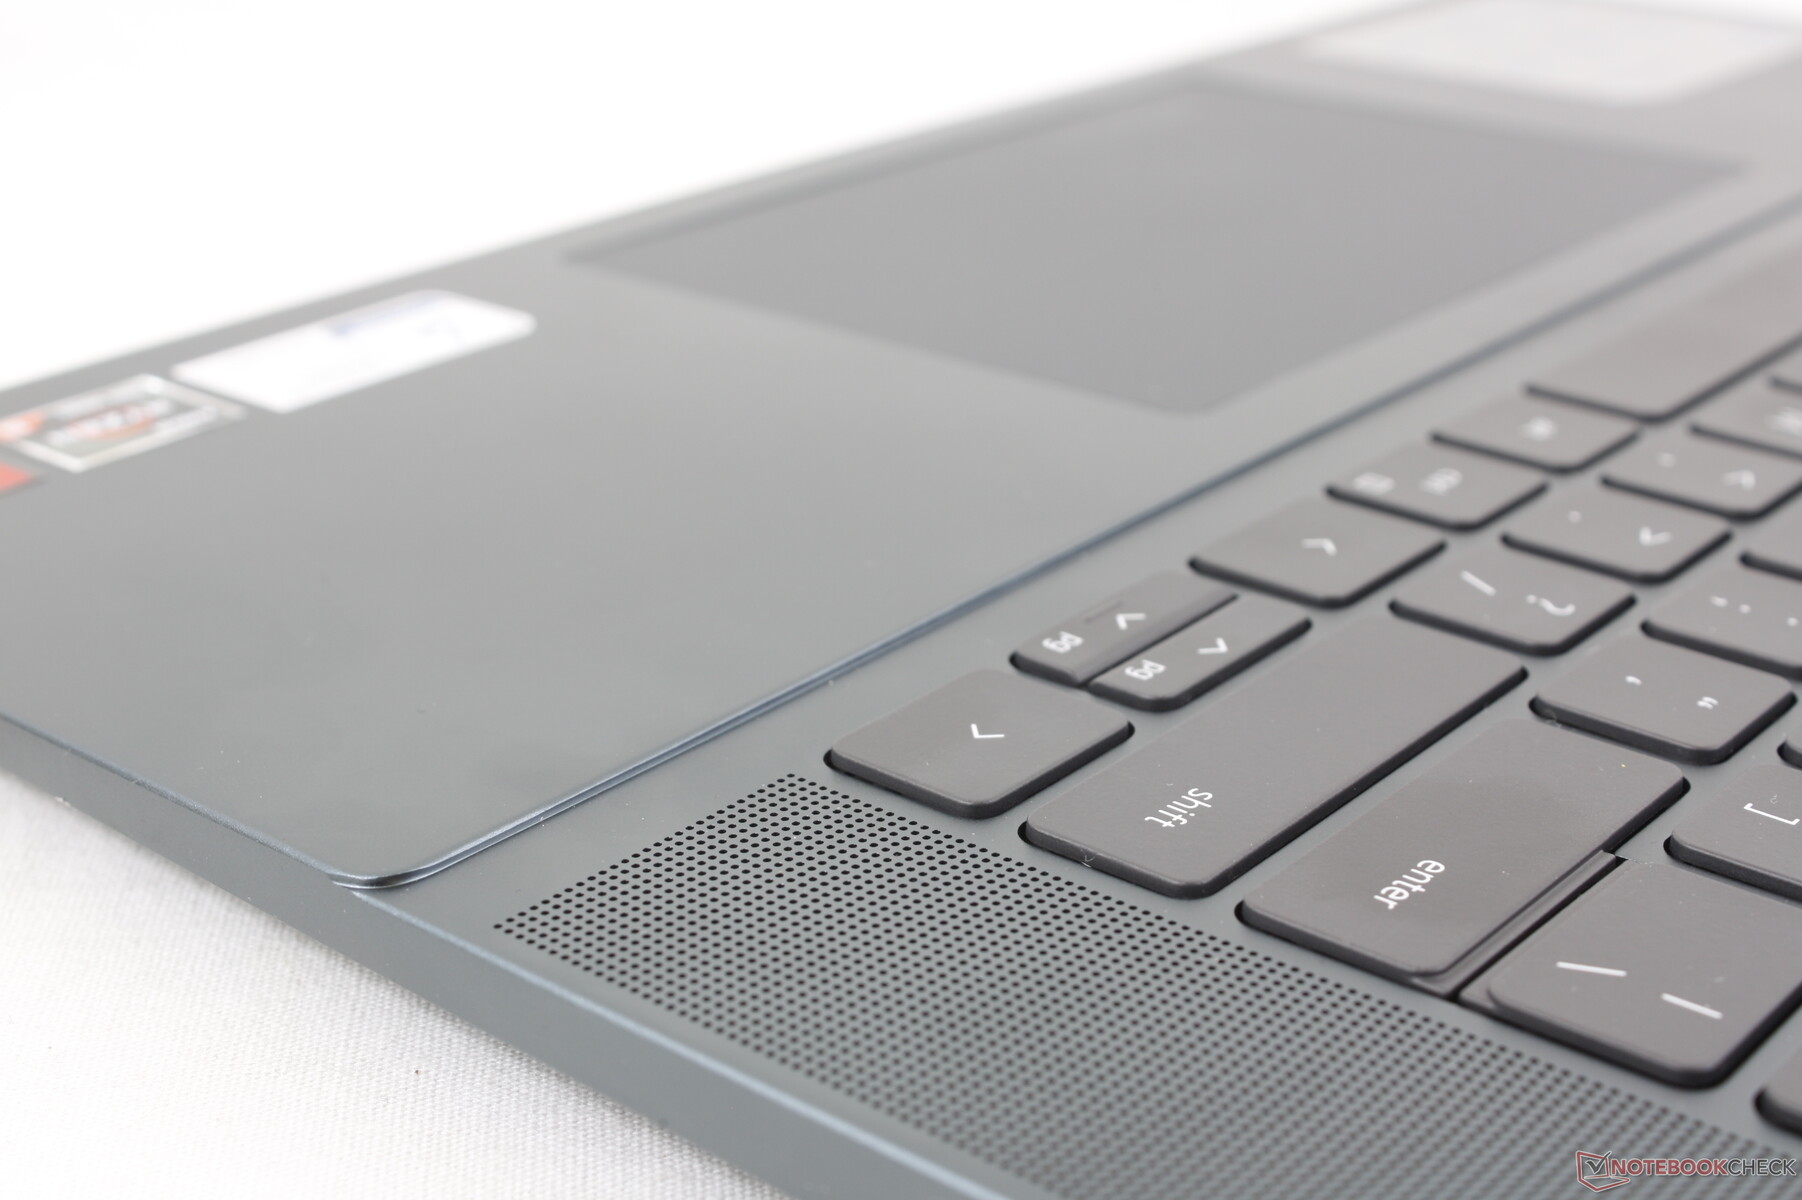
Tastiera
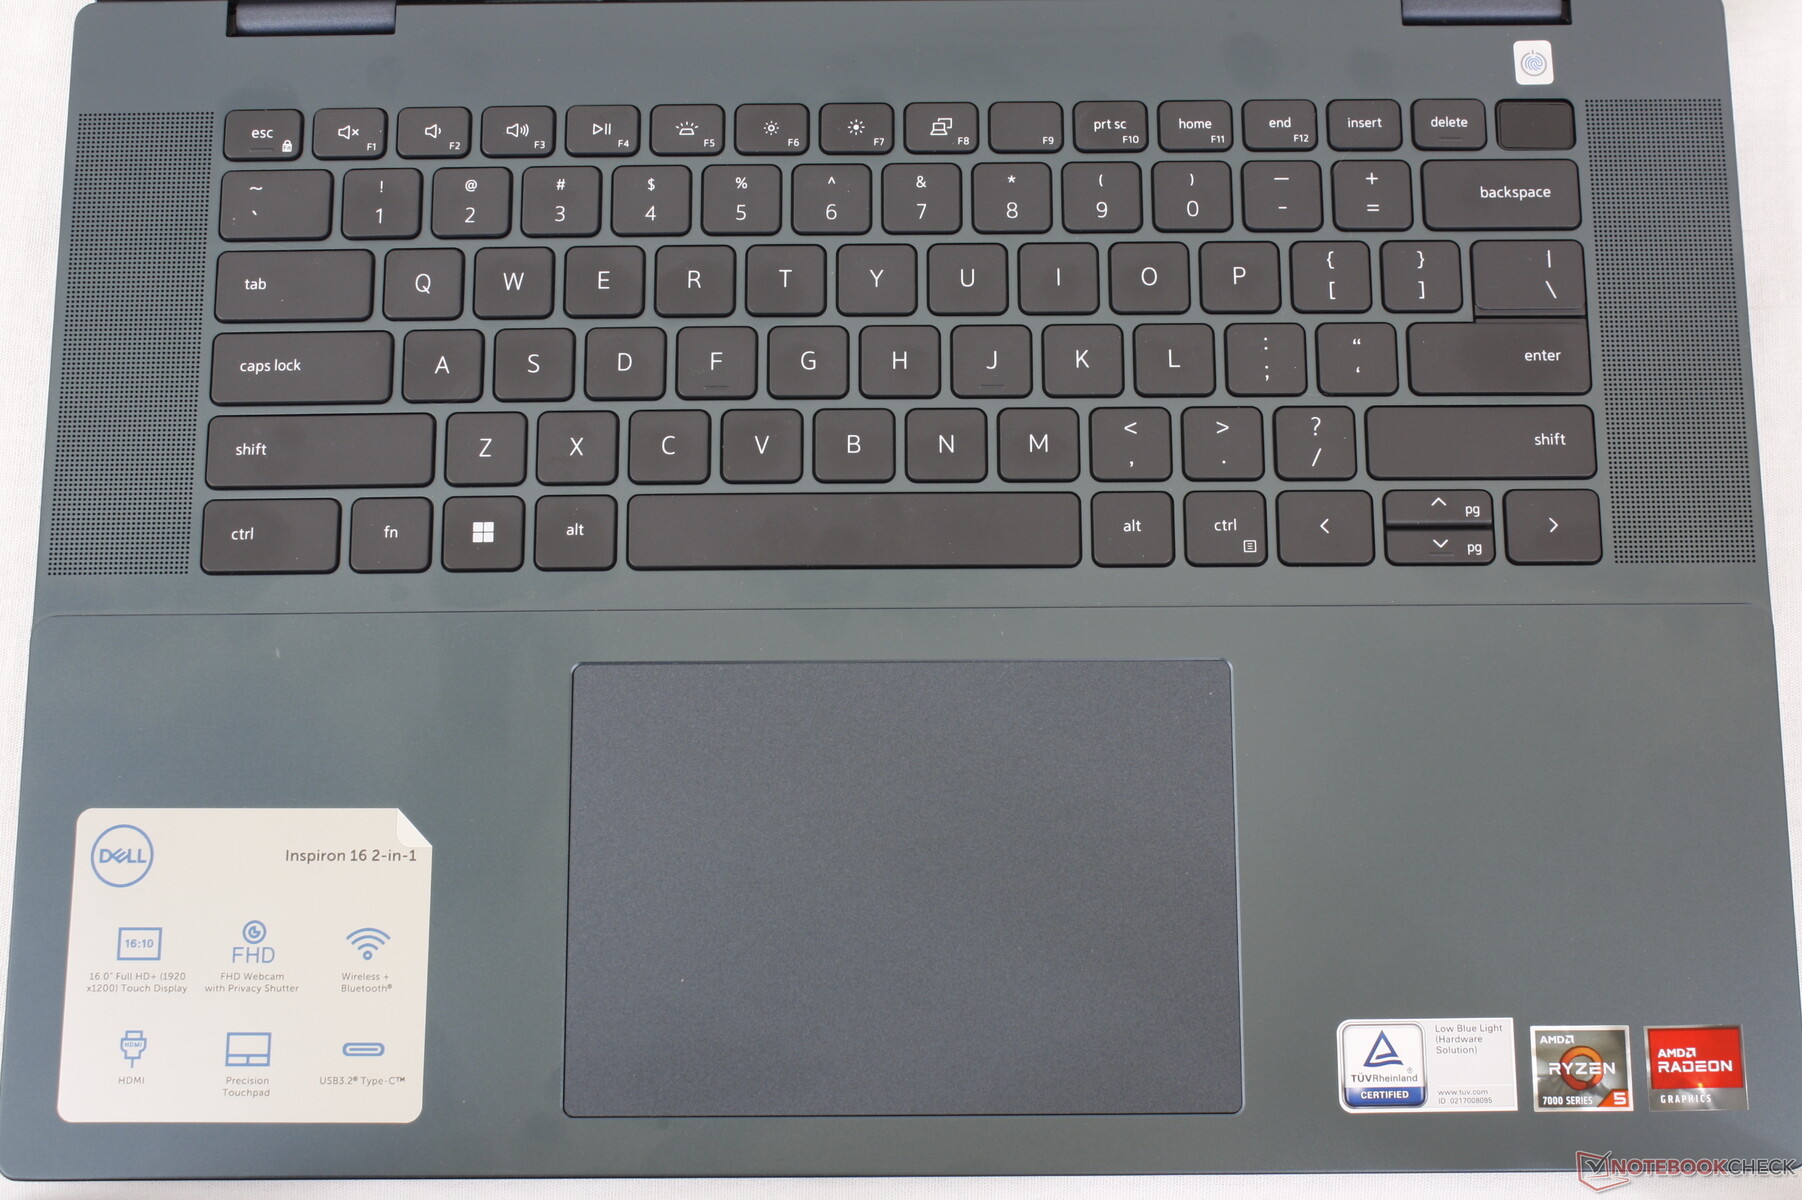
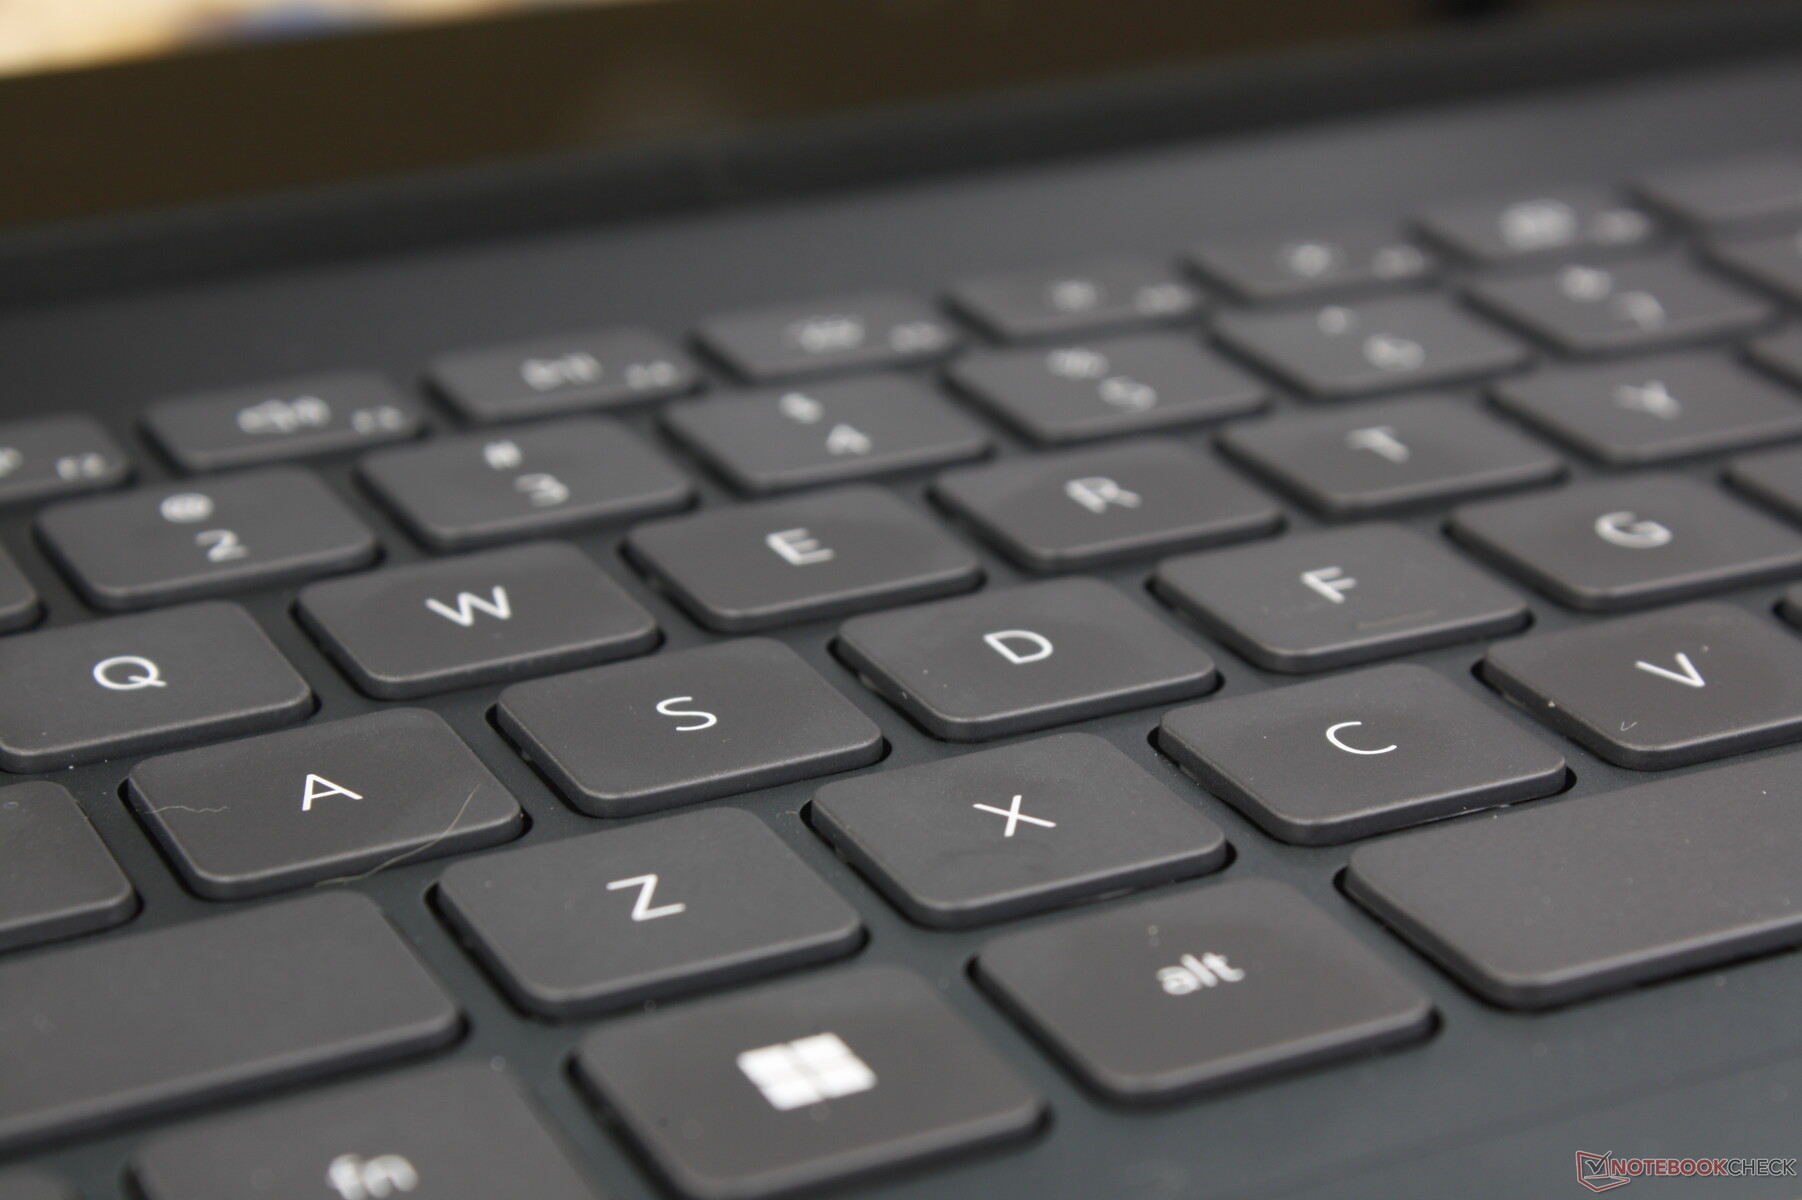
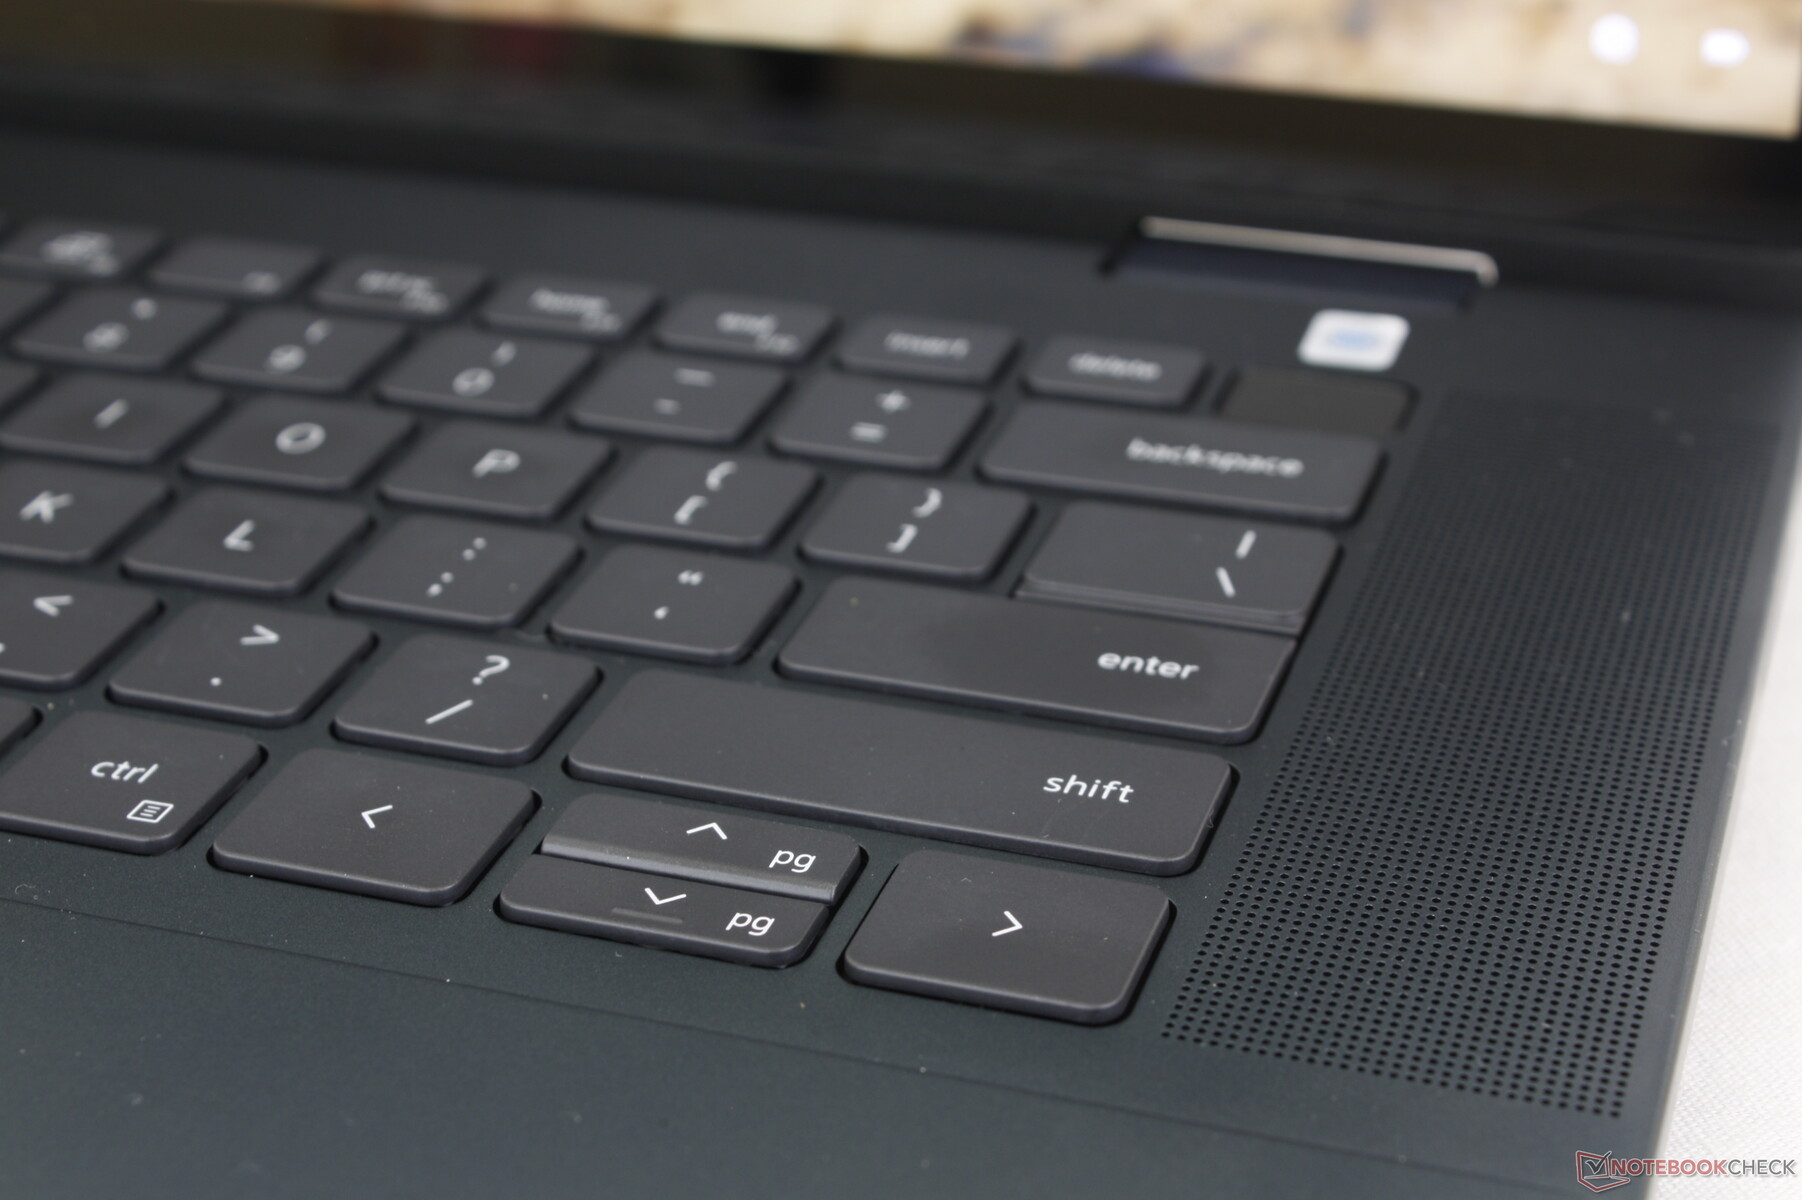
L'esperienza di digitazione è abbastanza coerente tra i portatili Inspiron e quindi i tasti QWERTY rimangono relativamente morbidi e con una corsa ridotta. Anche il modello da 14 pollici Inspiron 14 utilizza la stessa tastiera dell'Inspiron 16 da 16 pollici, con l'unica differenza che l'Inspiron 16 integra degli altoparlanti aggiuntivi che si aprono ai lati della tastiera. Gli altoparlanti aggiunti al posto del tastierino numerico sottolineano il fatto che l'Inspiron 16 7635 2-in-1 è principalmente un PC multimediale.
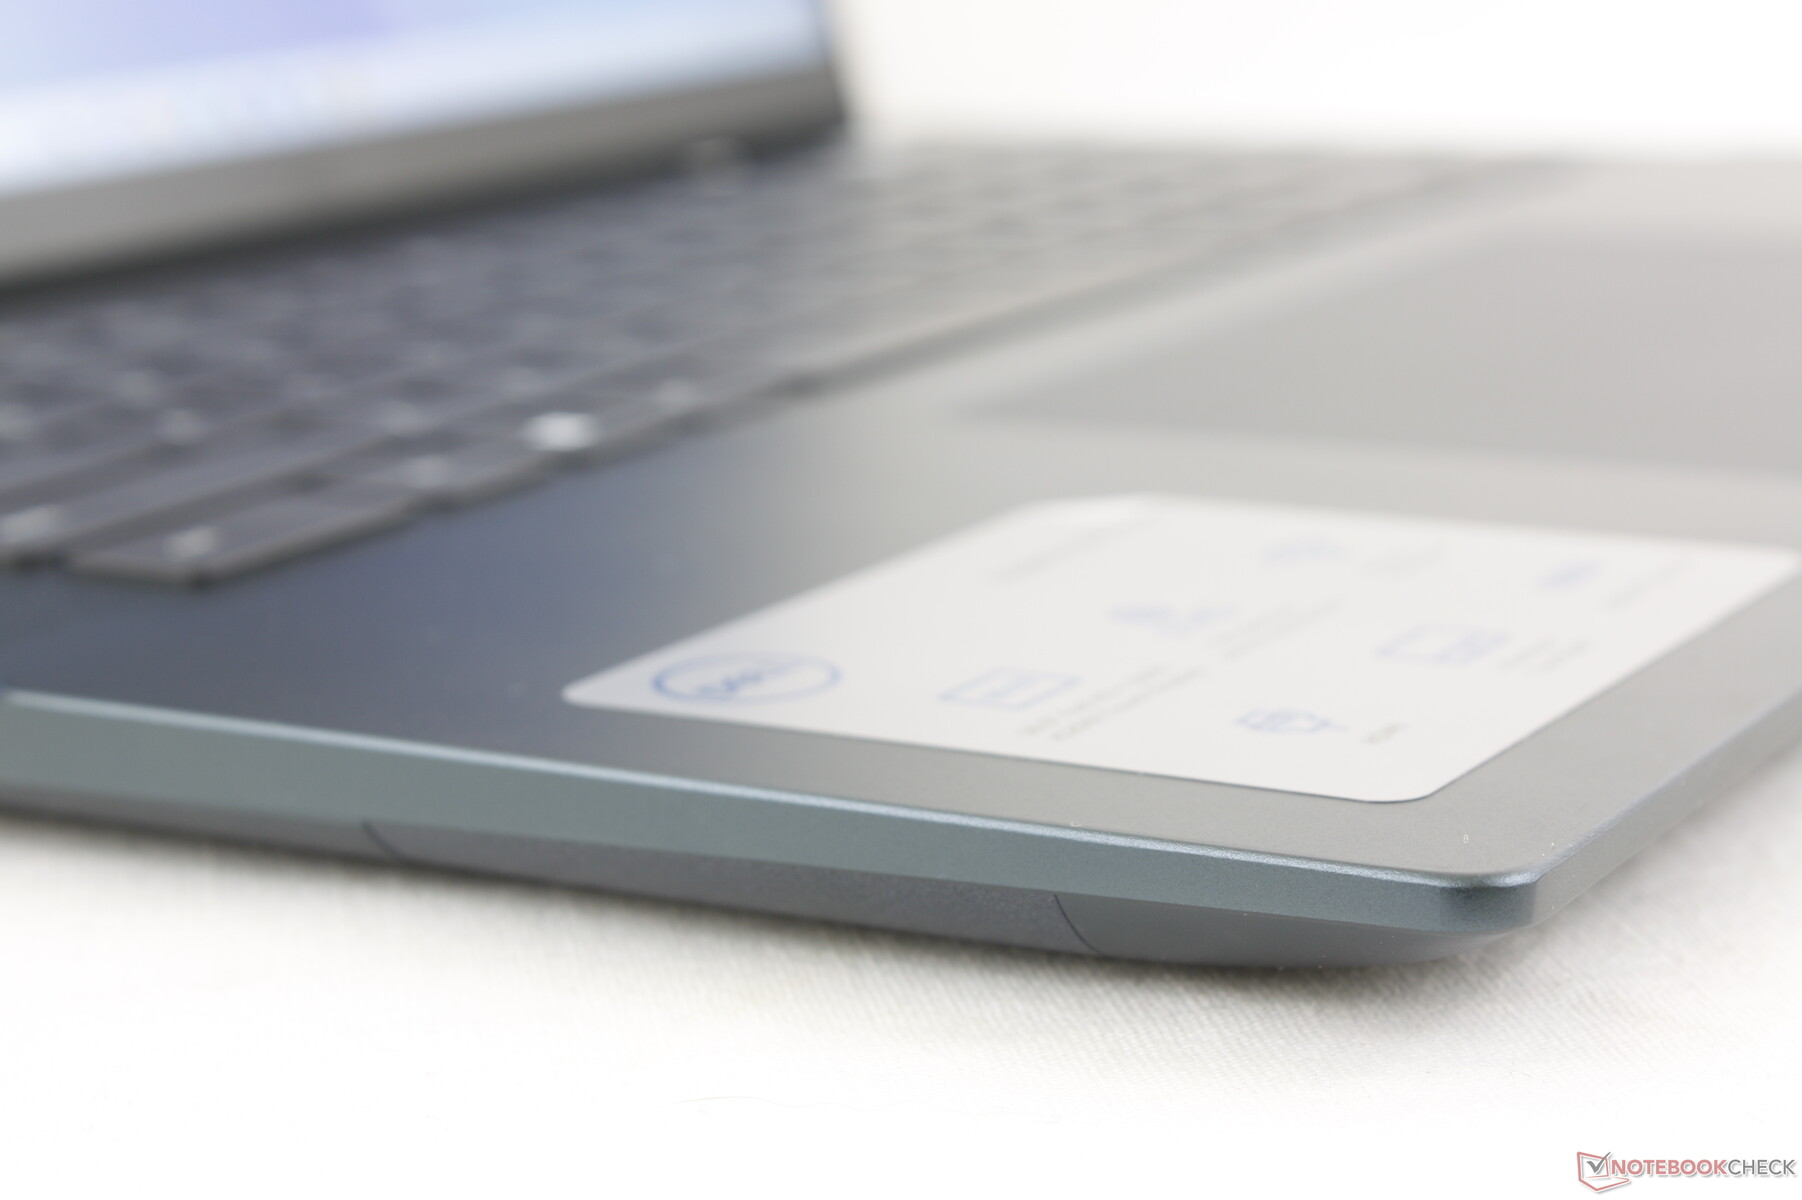
Touchpad
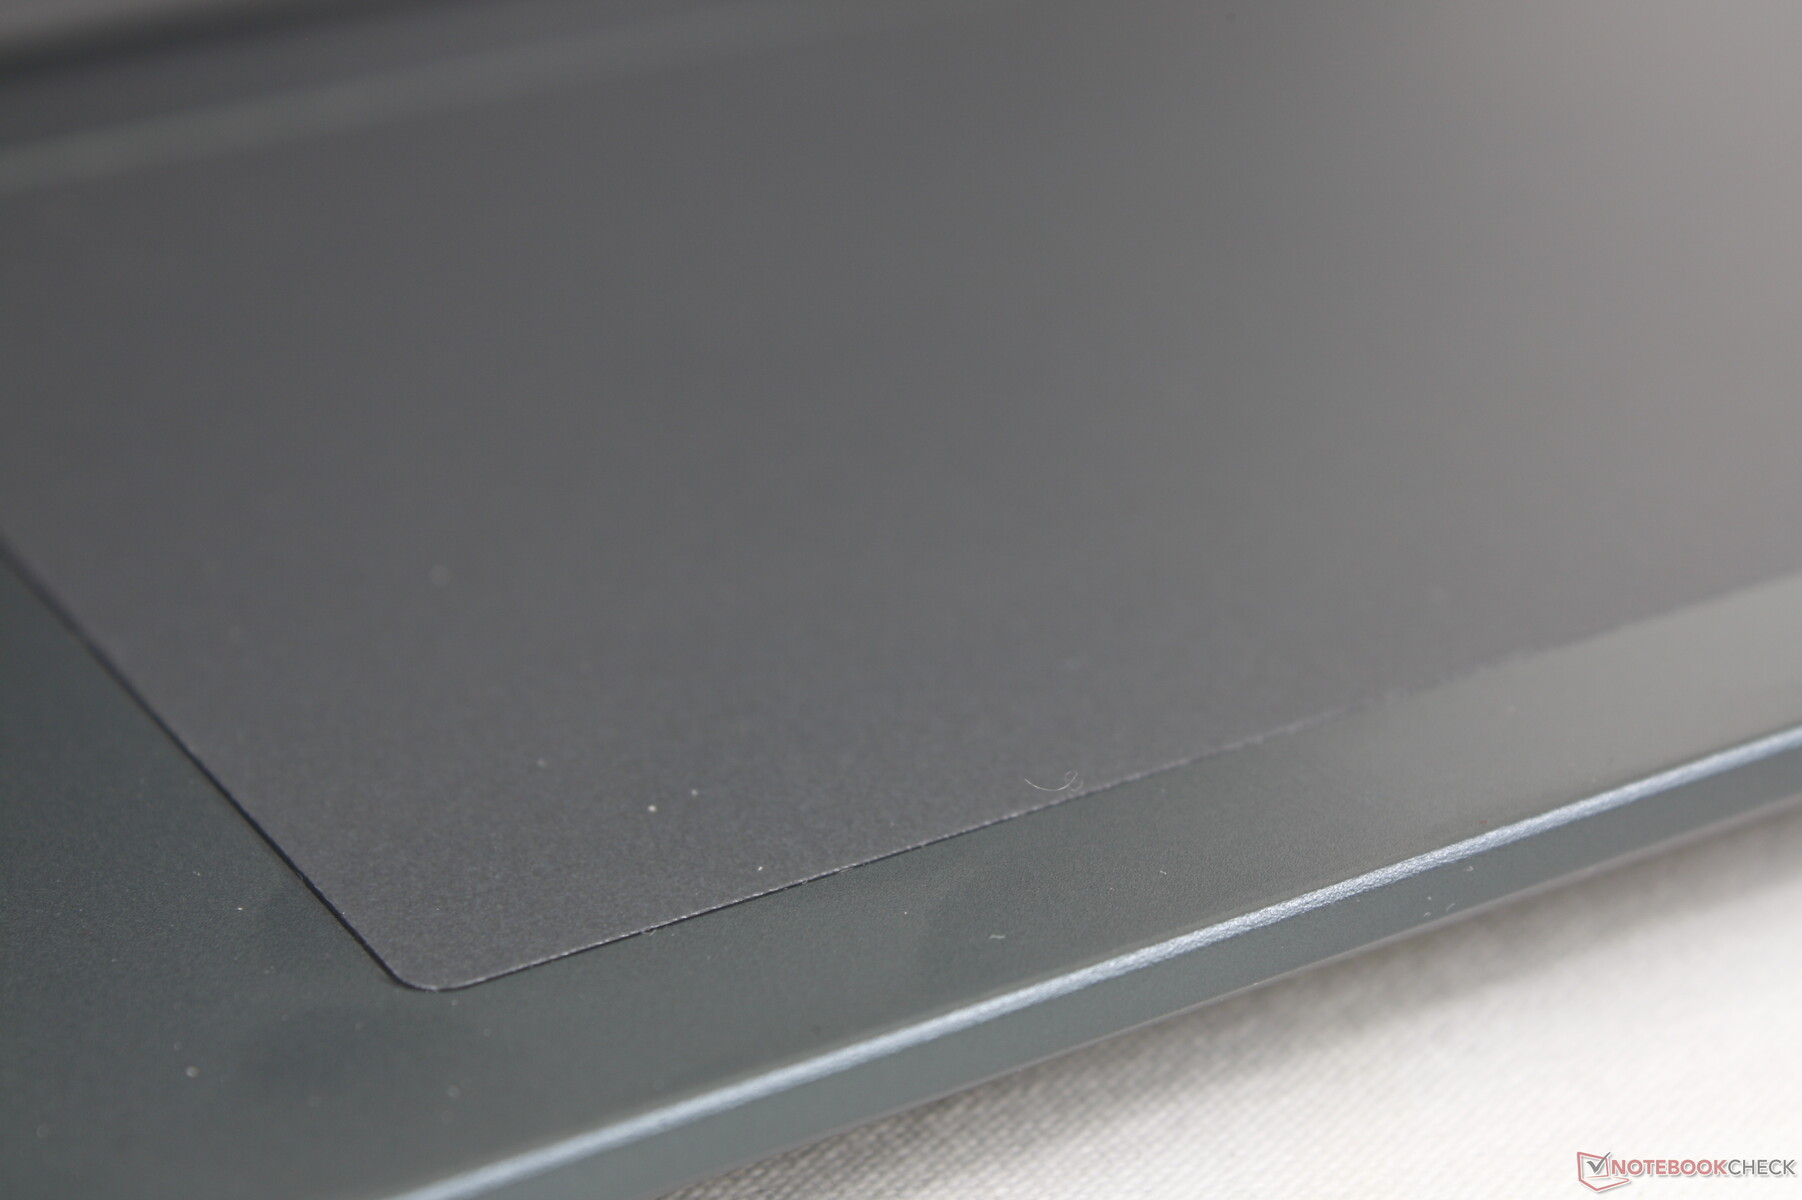
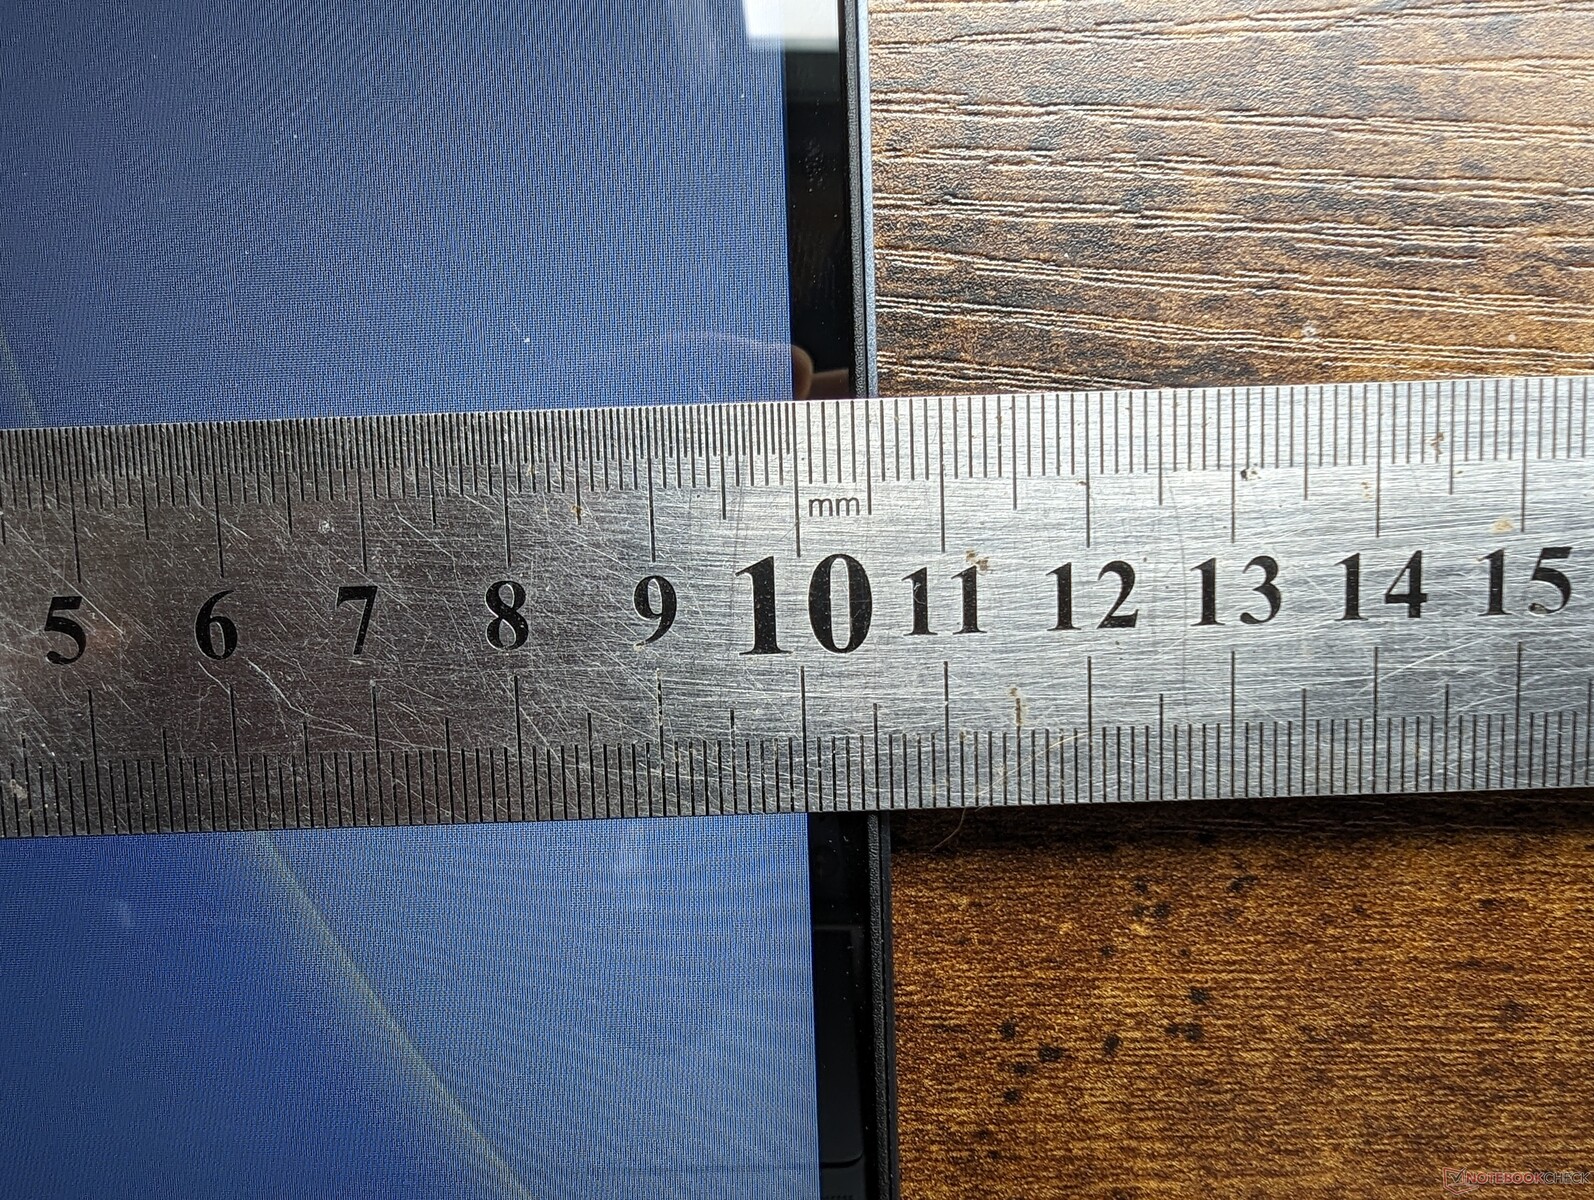
Le dimensioni del clickpad (13,3 x 9 cm) sono rimaste invariate rispetto al modello dello scorso anno, anche se il design visivo del clickpad è tornato a un aspetto più tradizionale. Sfortunatamente, il feedback quando si fa clic sulla superficie non è migliorato e quindi rimane morbido e poco profondo rispetto al clickpad più solido dell'HP Spectre HP Spectre clickpad.
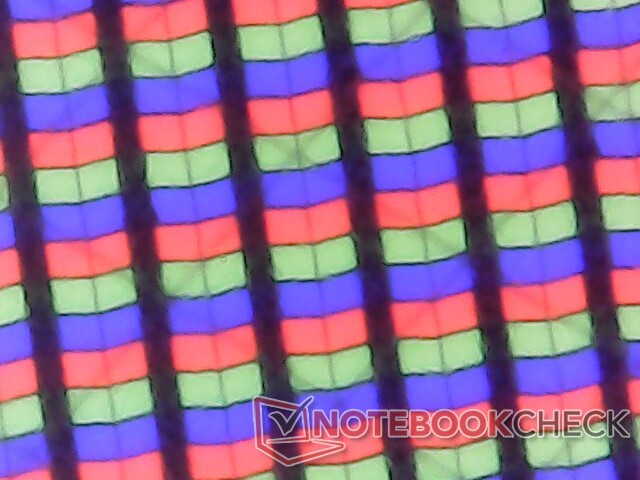
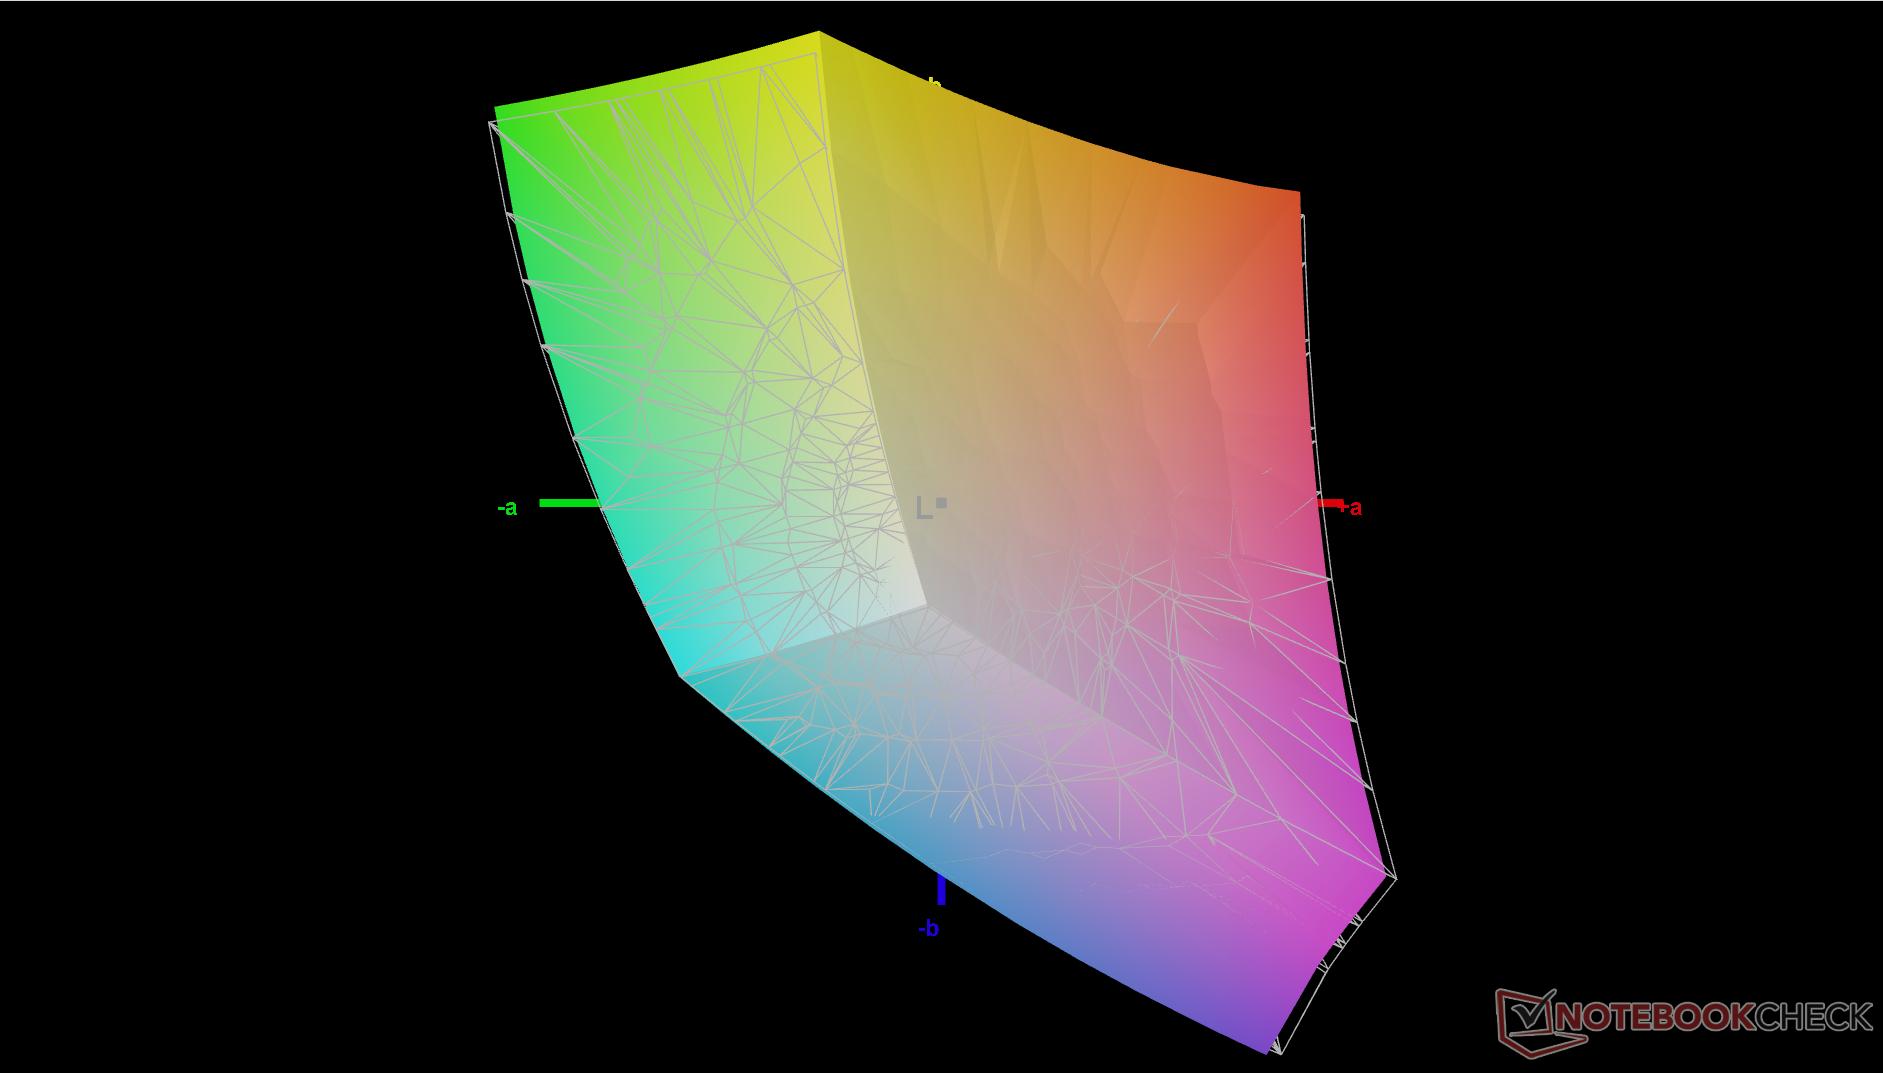
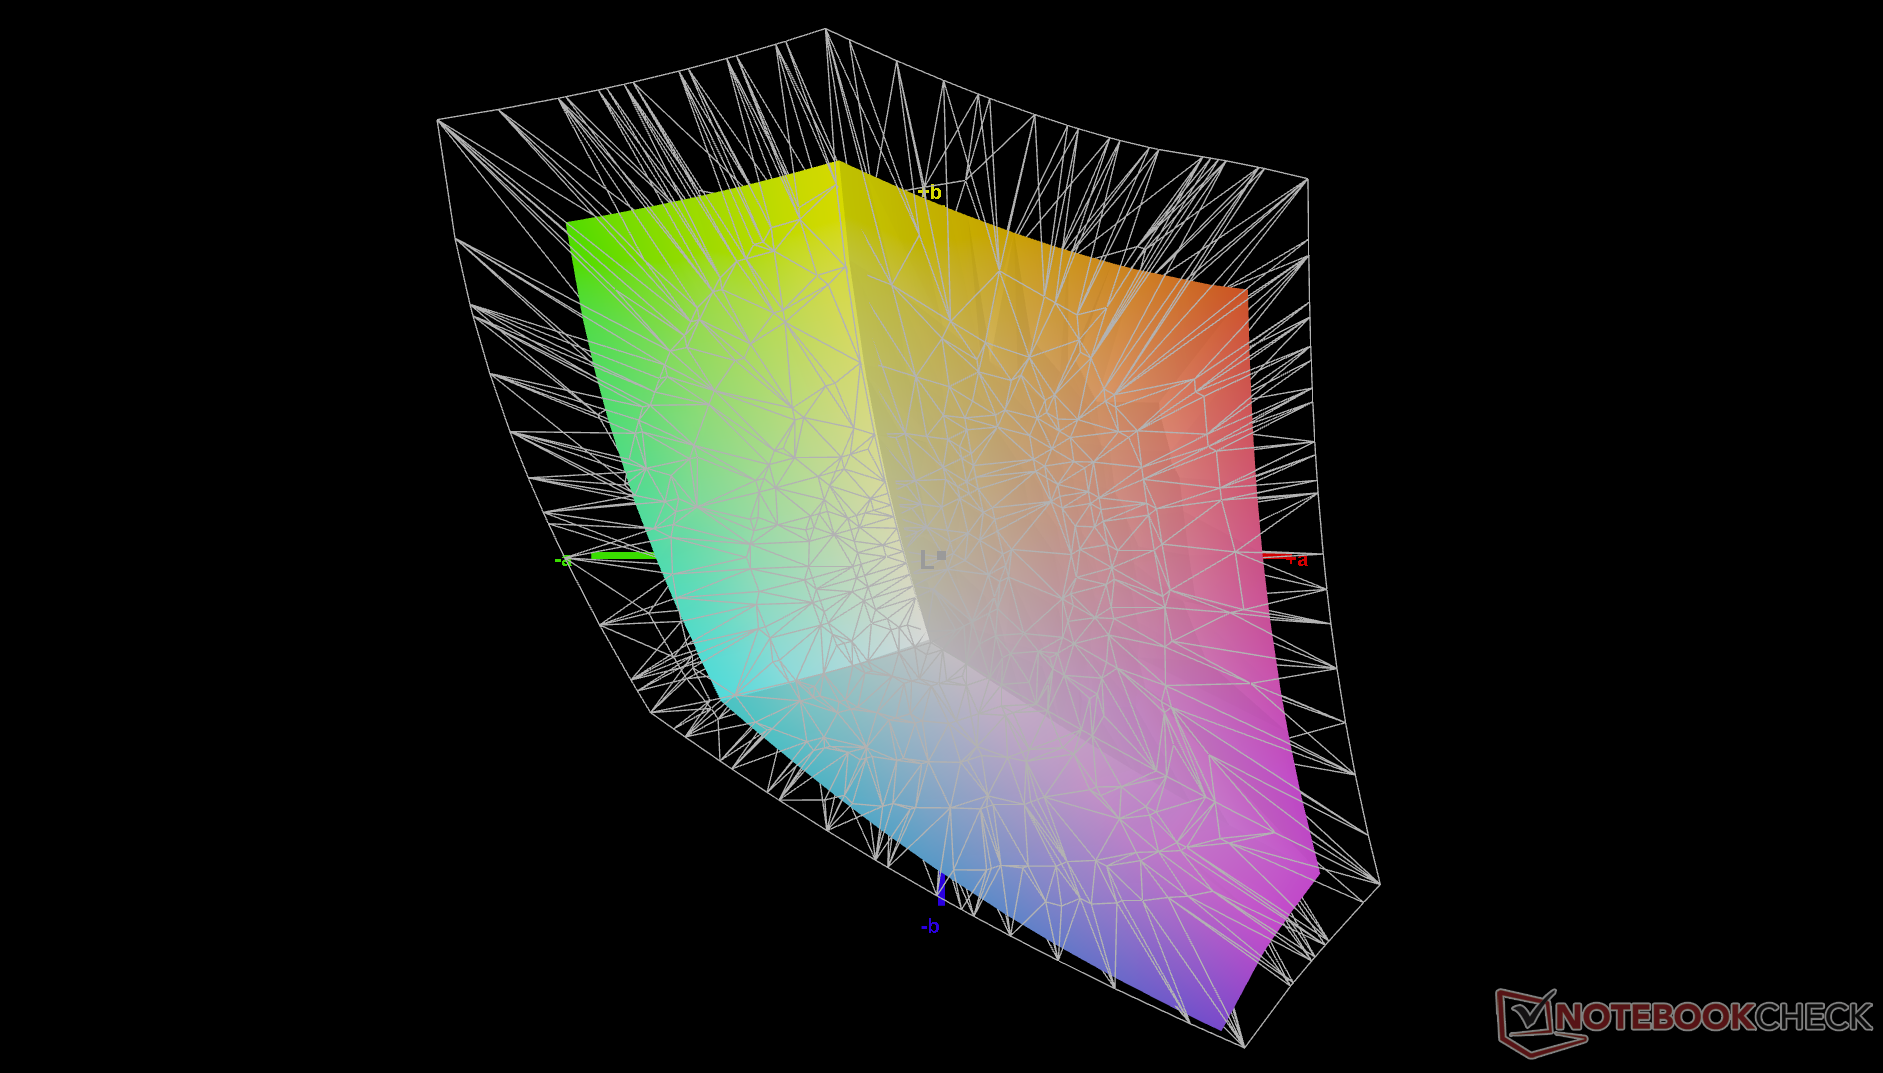
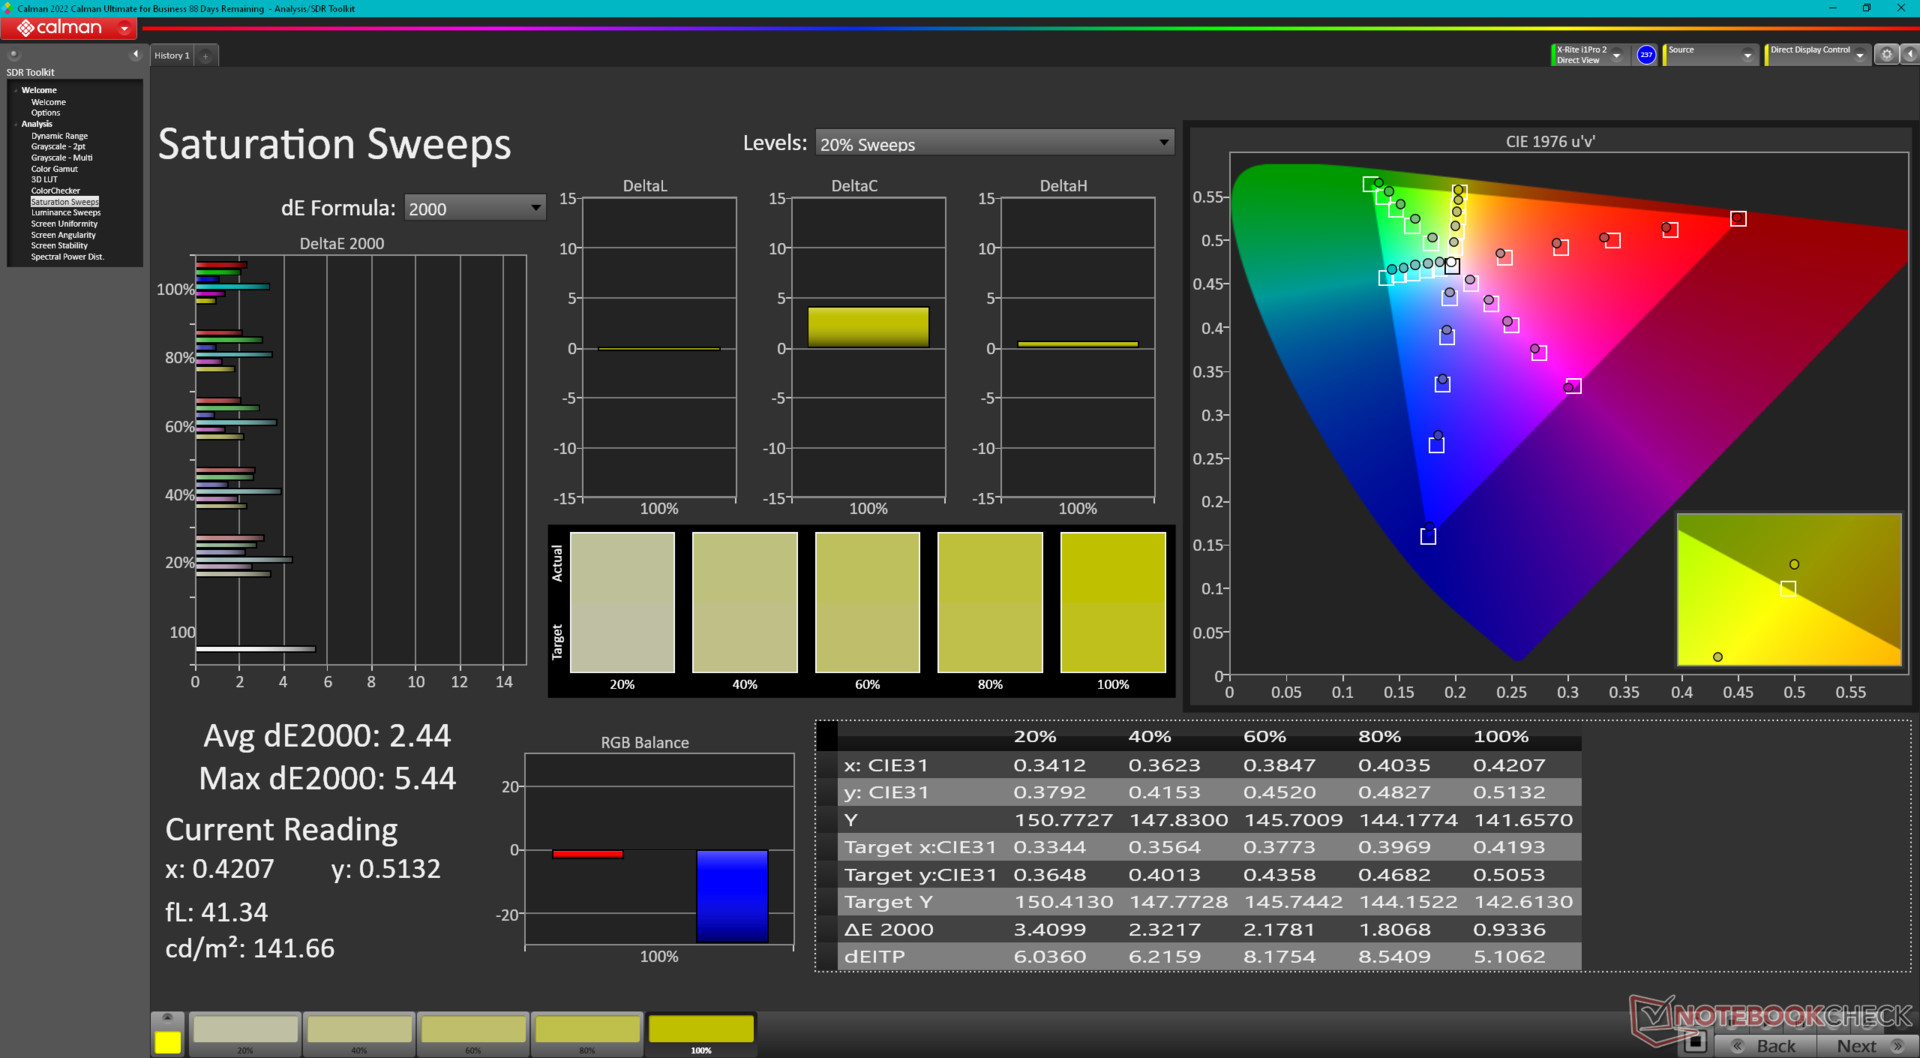
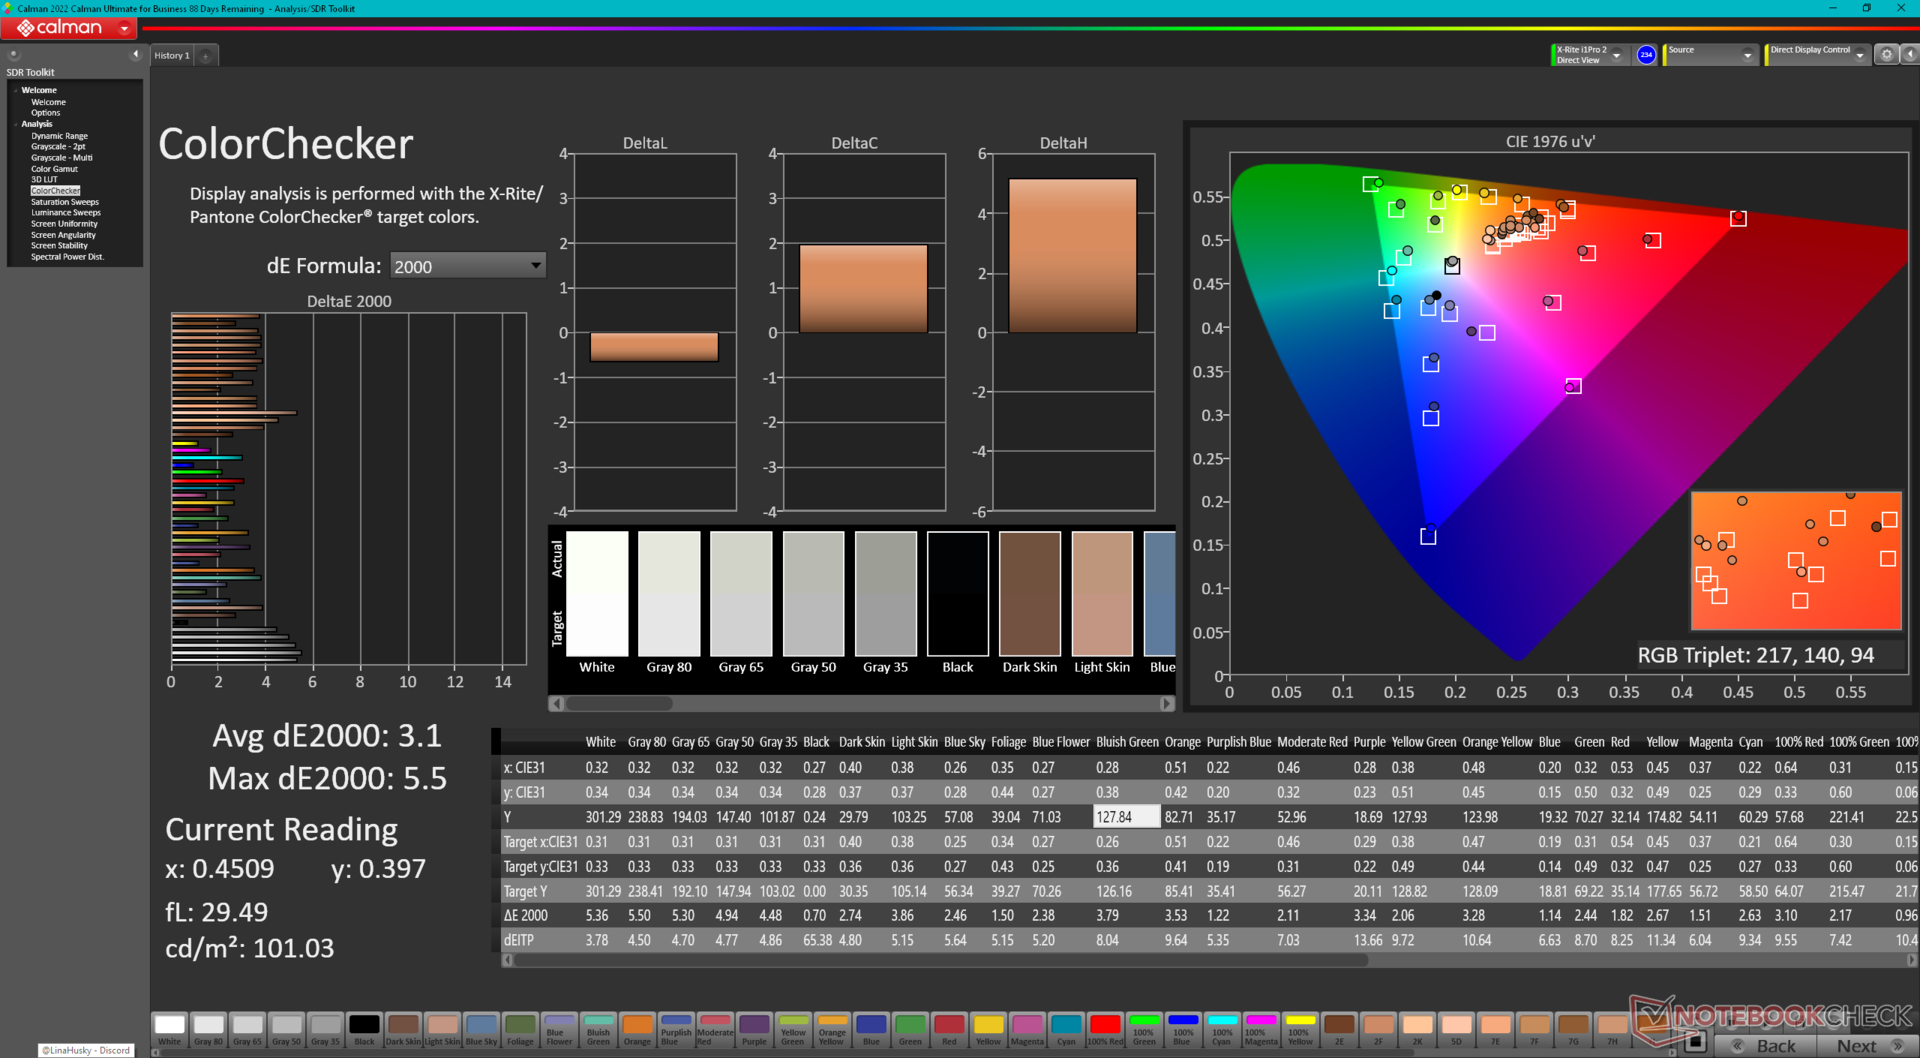
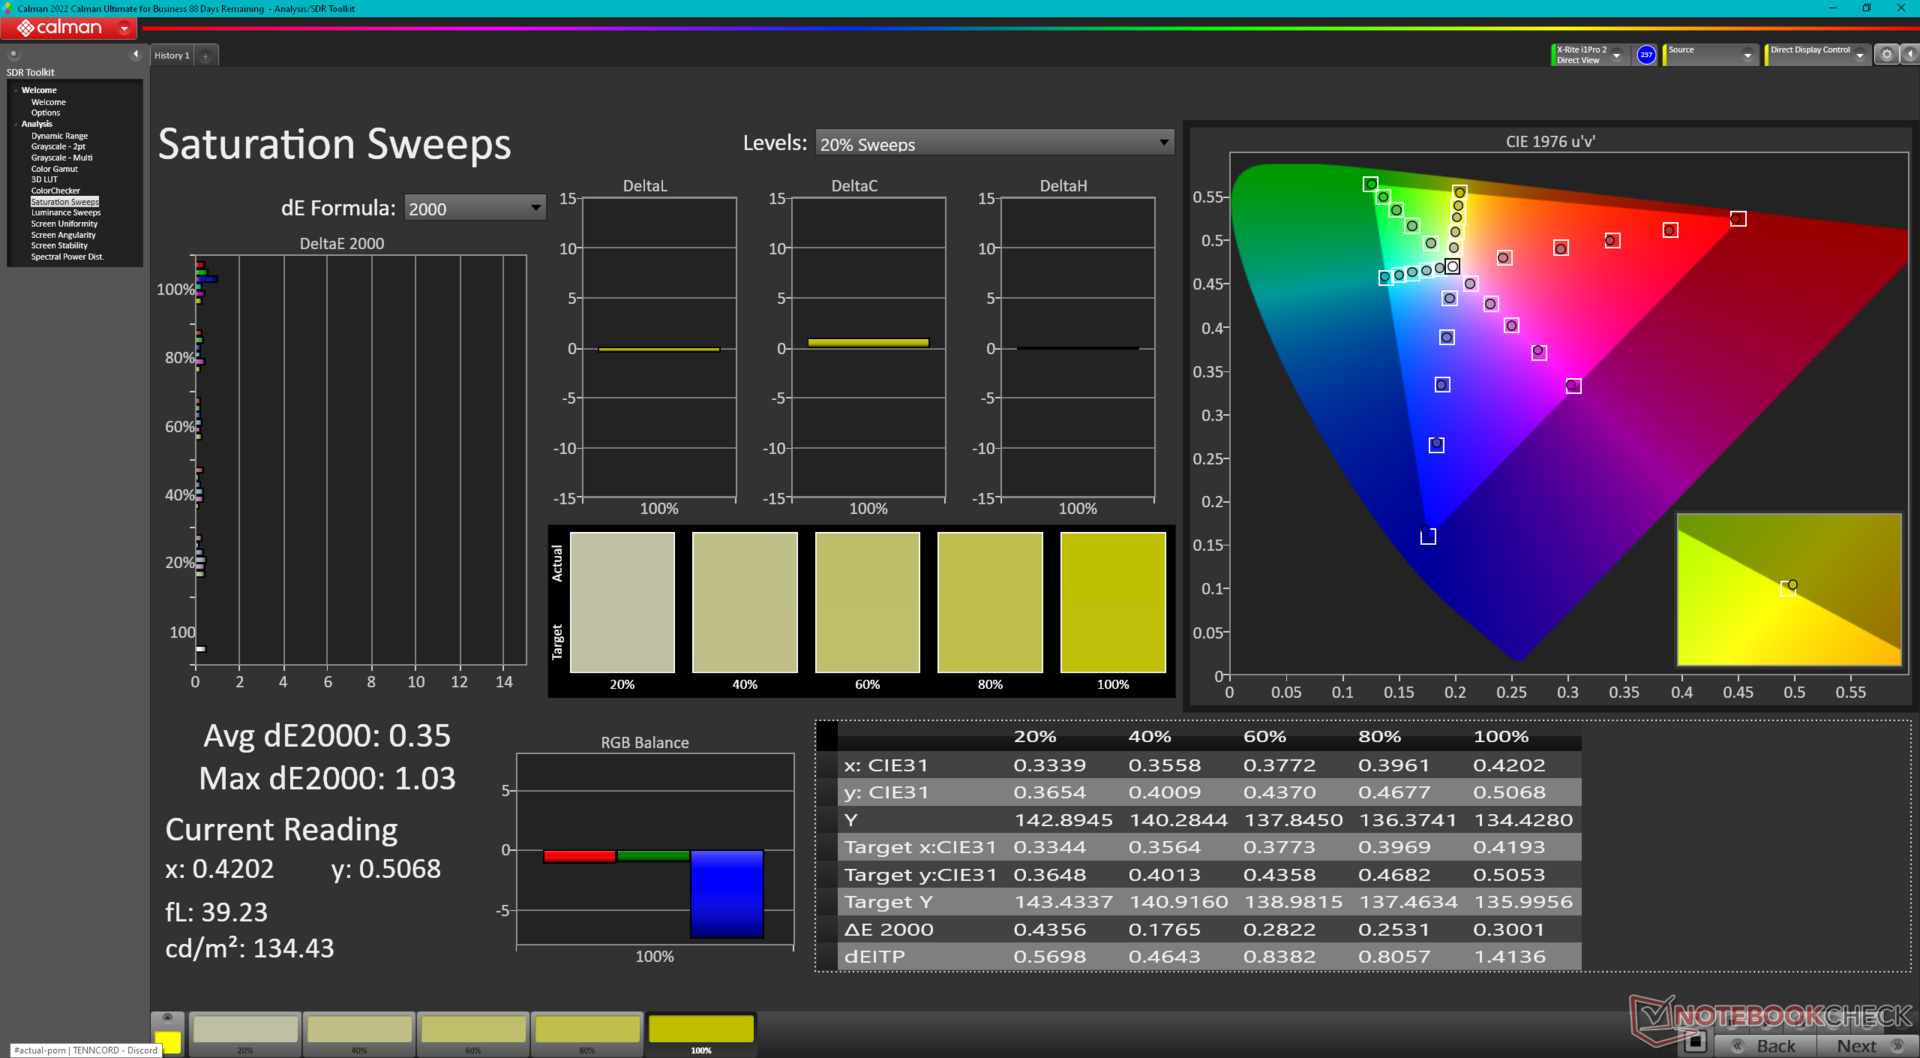
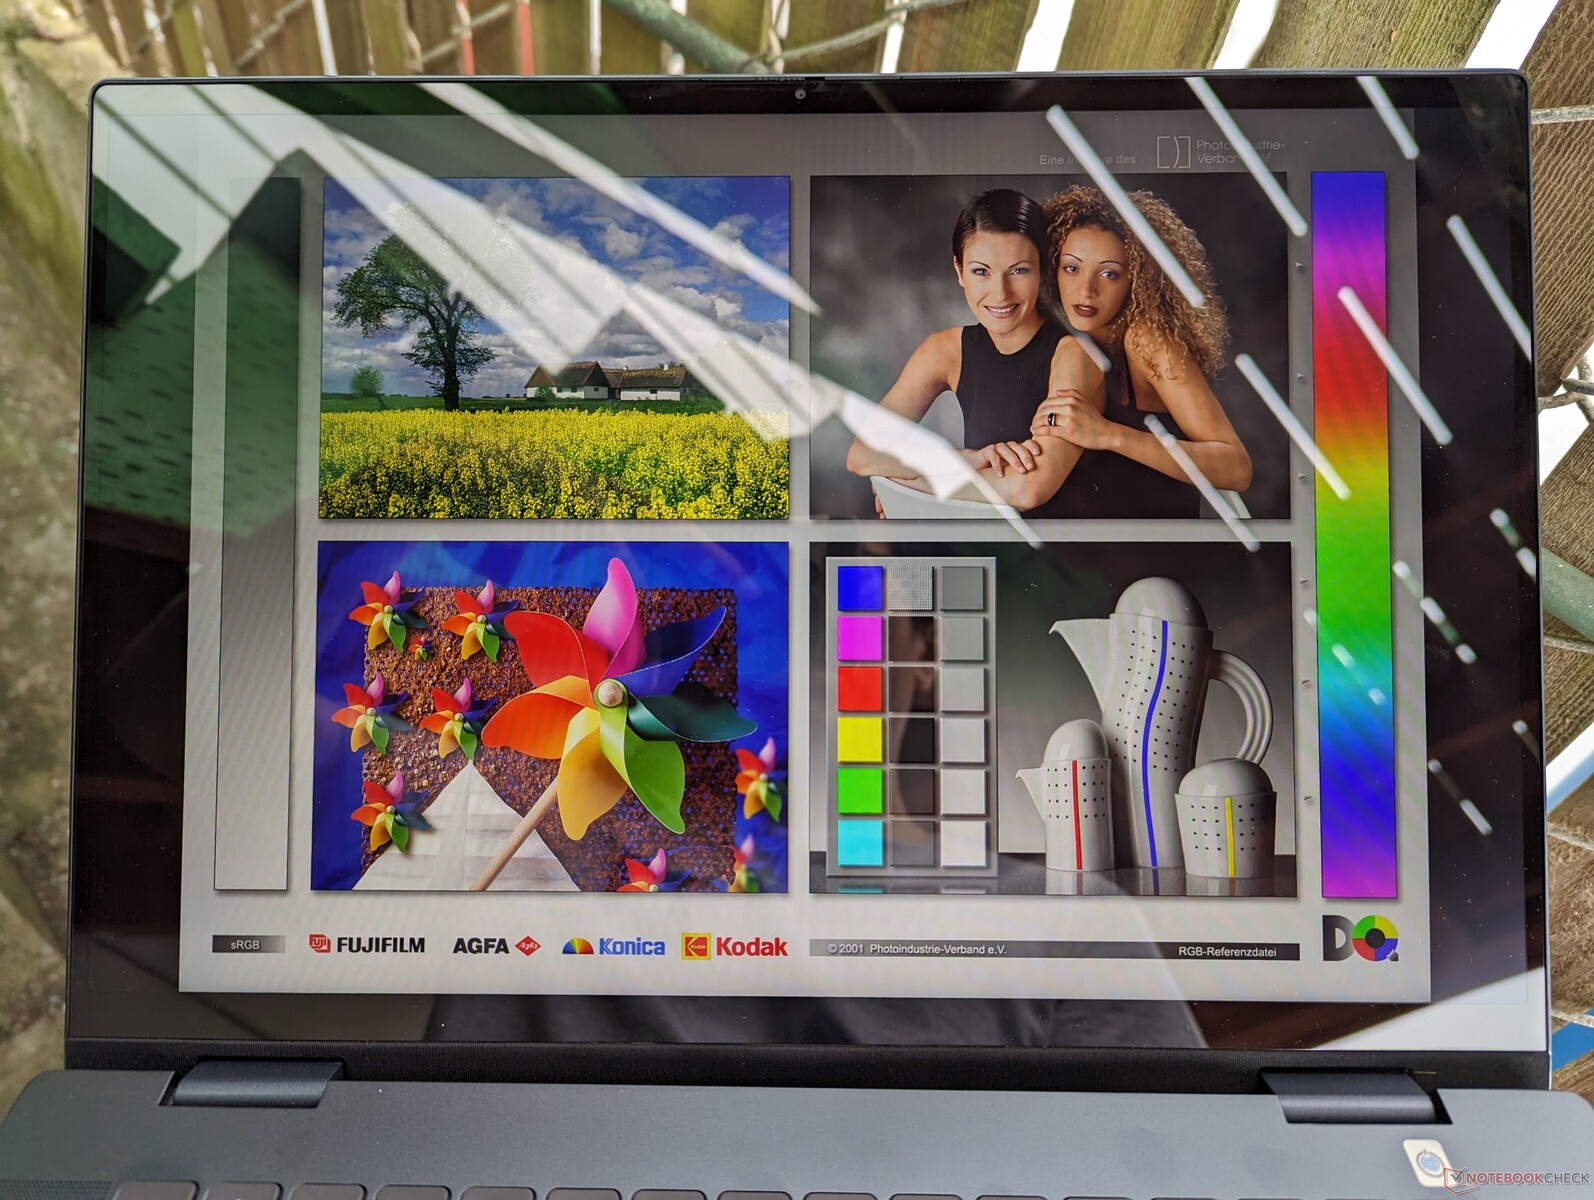
Display - Colori sRGB completi
Questo modello è il primo nel nostro database a essere fornito con il pannello IPS Chi Mei 160JCA, mentre il pannello del modello dello scorso anno era il BOE NV16N45. Per il resto, le caratteristiche principali sono quasi identiche tra i due pannelli, compresi i rapporti di contrasto di circa 1000:1, la copertura completa sRGB, la frequenza di aggiornamento di 60 Hz e i tempi di risposta medi. L'esperienza visiva è quindi essenzialmente la stessa tra i modelli 2022 e 2023, a meno che non venga configurato con l'opzione OLED a 2400p dell'Inspiron 16 7630 2-in-1 basato su Intel.
Sebbene il nostro pannello Chi Mei sia di qualità superiore rispetto al LEN160WUXGA dell'IdeaPad Flex 5 16, il pannello Chi Mei è di qualità superiore.IdeaPad Flex 5 16 in termini di colori, sarebbe stato bello vedere Dell fare un passo in più quest'anno includendo opzioni di frequenza di aggiornamento più veloci a 90 Hz o 120 Hz per un'interfaccia utente più fluida.
| |||||||||||||||||||||||||
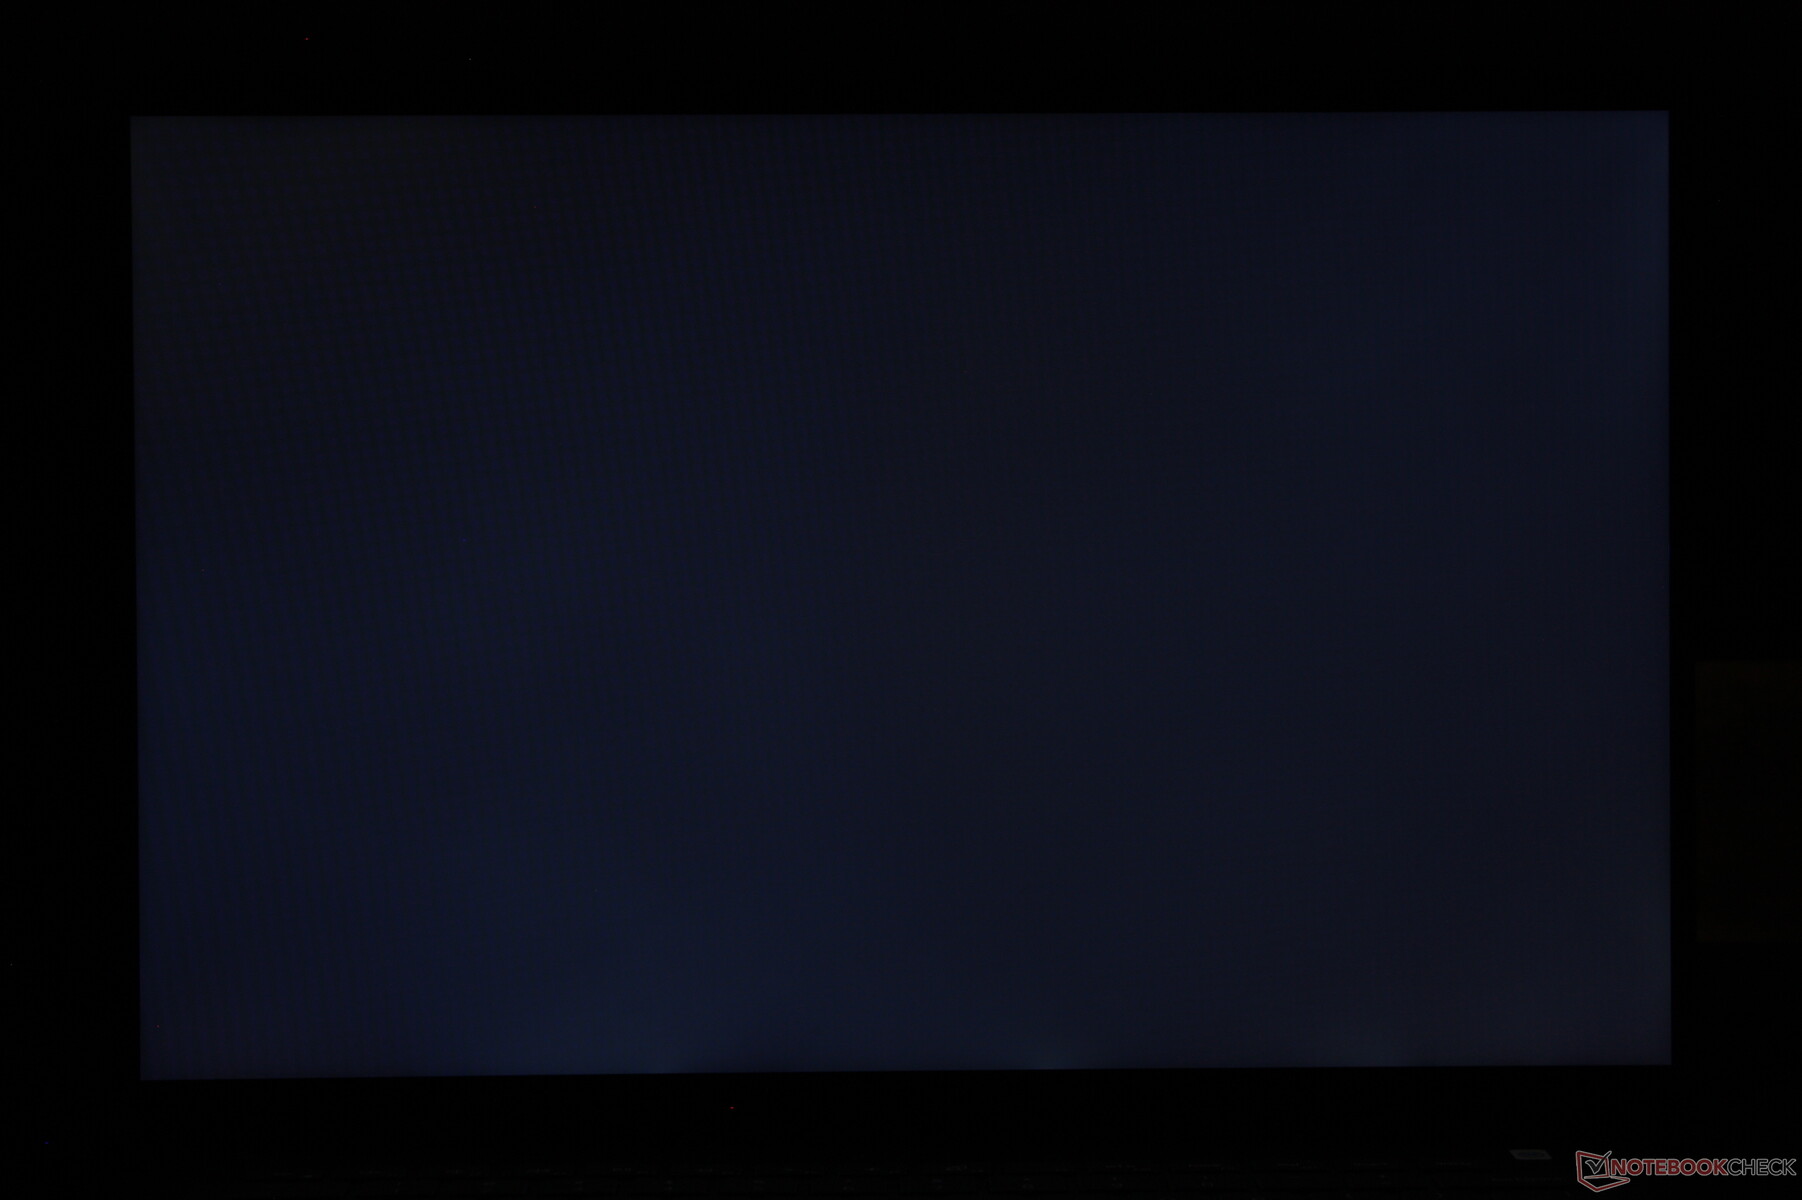
Distribuzione della luminosità: 79 %
Al centro con la batteria: 301.3 cd/m²
Contrasto: 1076:1 (Nero: 0.28 cd/m²)
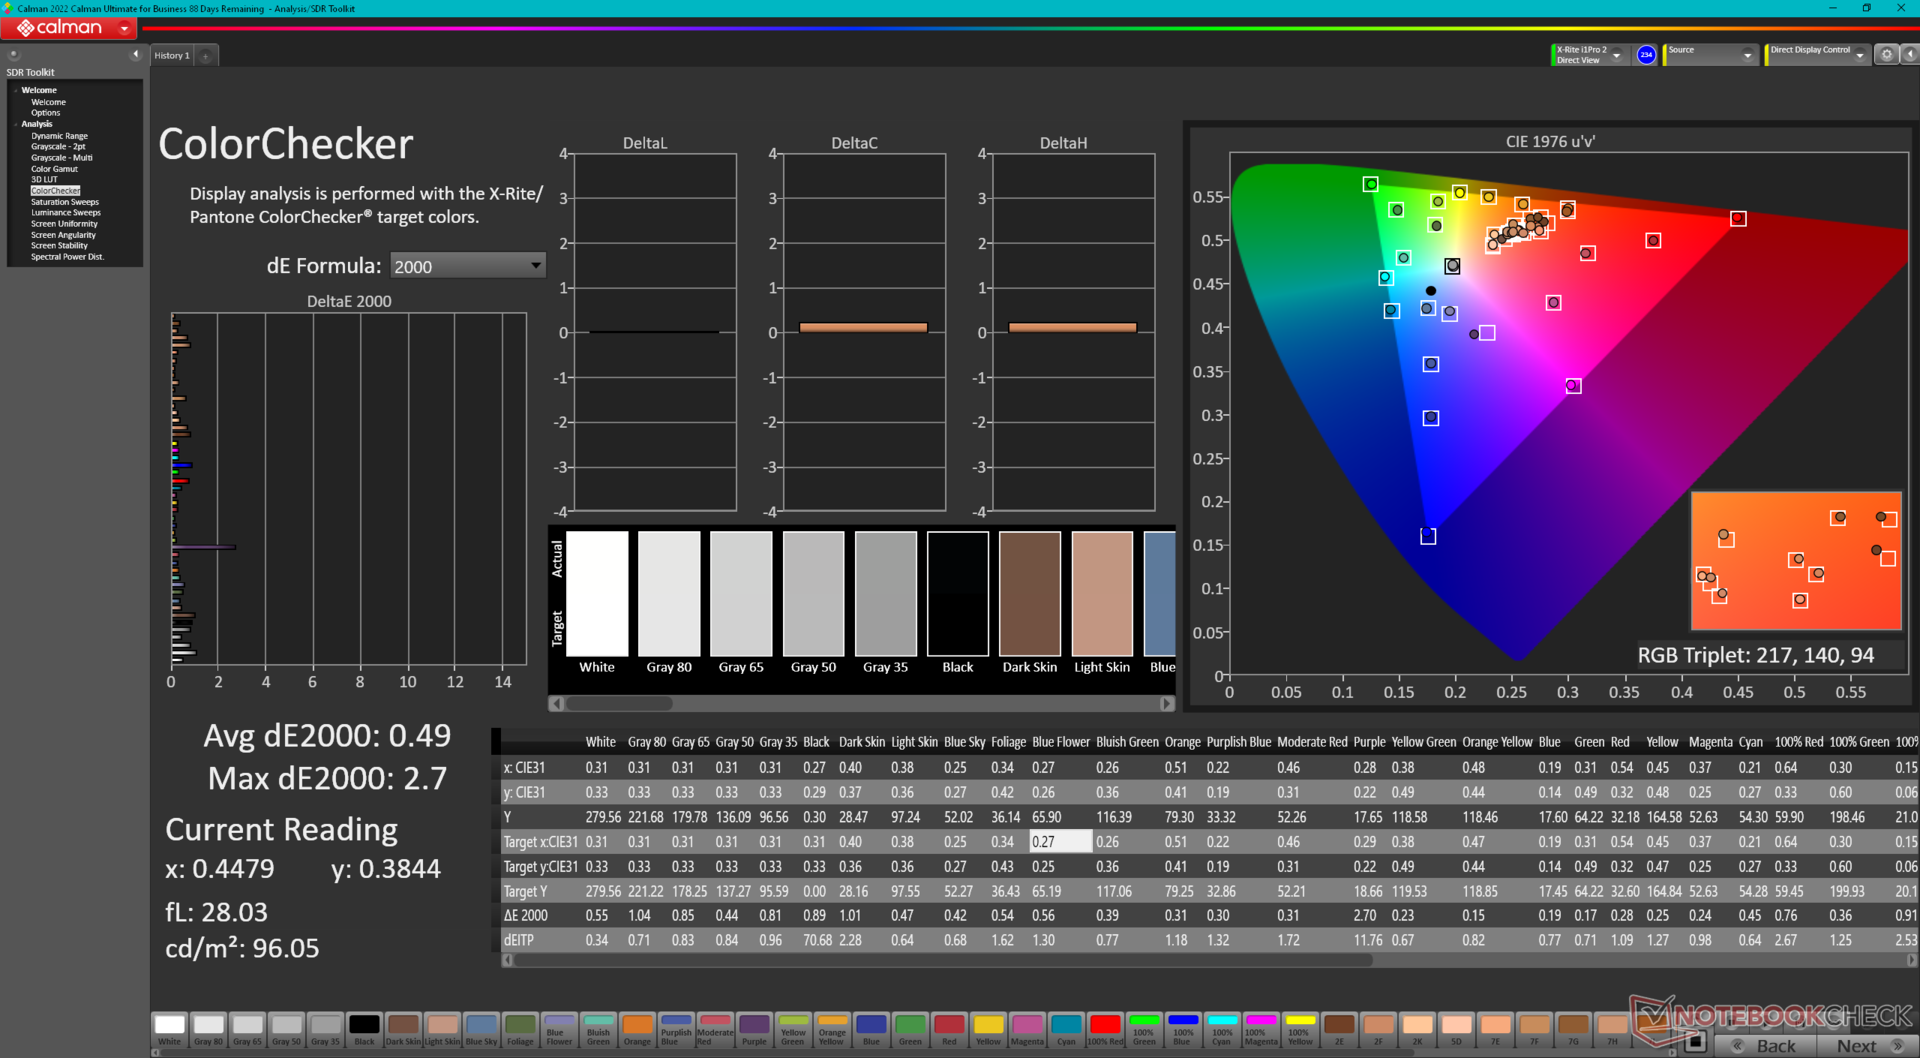
ΔE ColorChecker Calman: 3.1 | ∀{0.5-29.43 Ø4.71}
calibrated: 0.49
ΔE Greyscale Calman: 3.9 | ∀{0.09-98 Ø4.96}
69.5% AdobeRGB 1998 (Argyll 3D)
98.2% sRGB (Argyll 3D)
67.4% Display P3 (Argyll 3D)
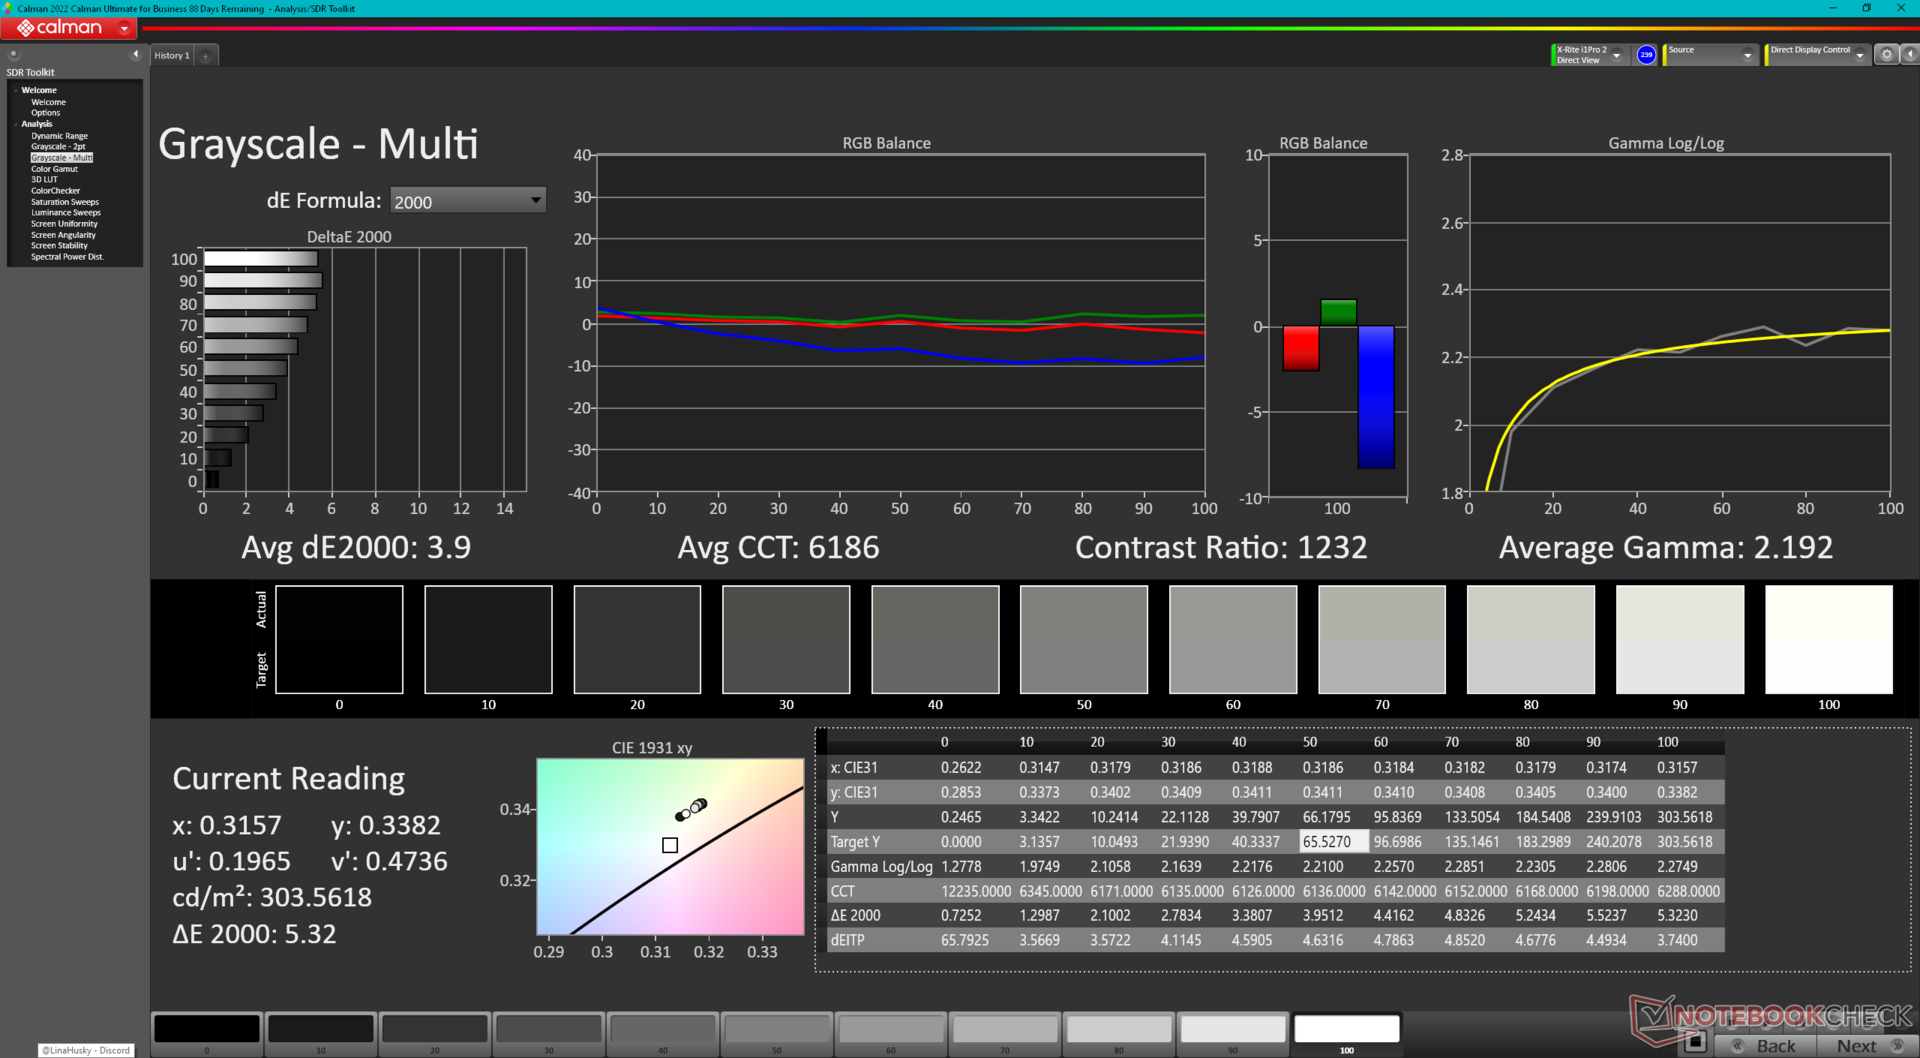
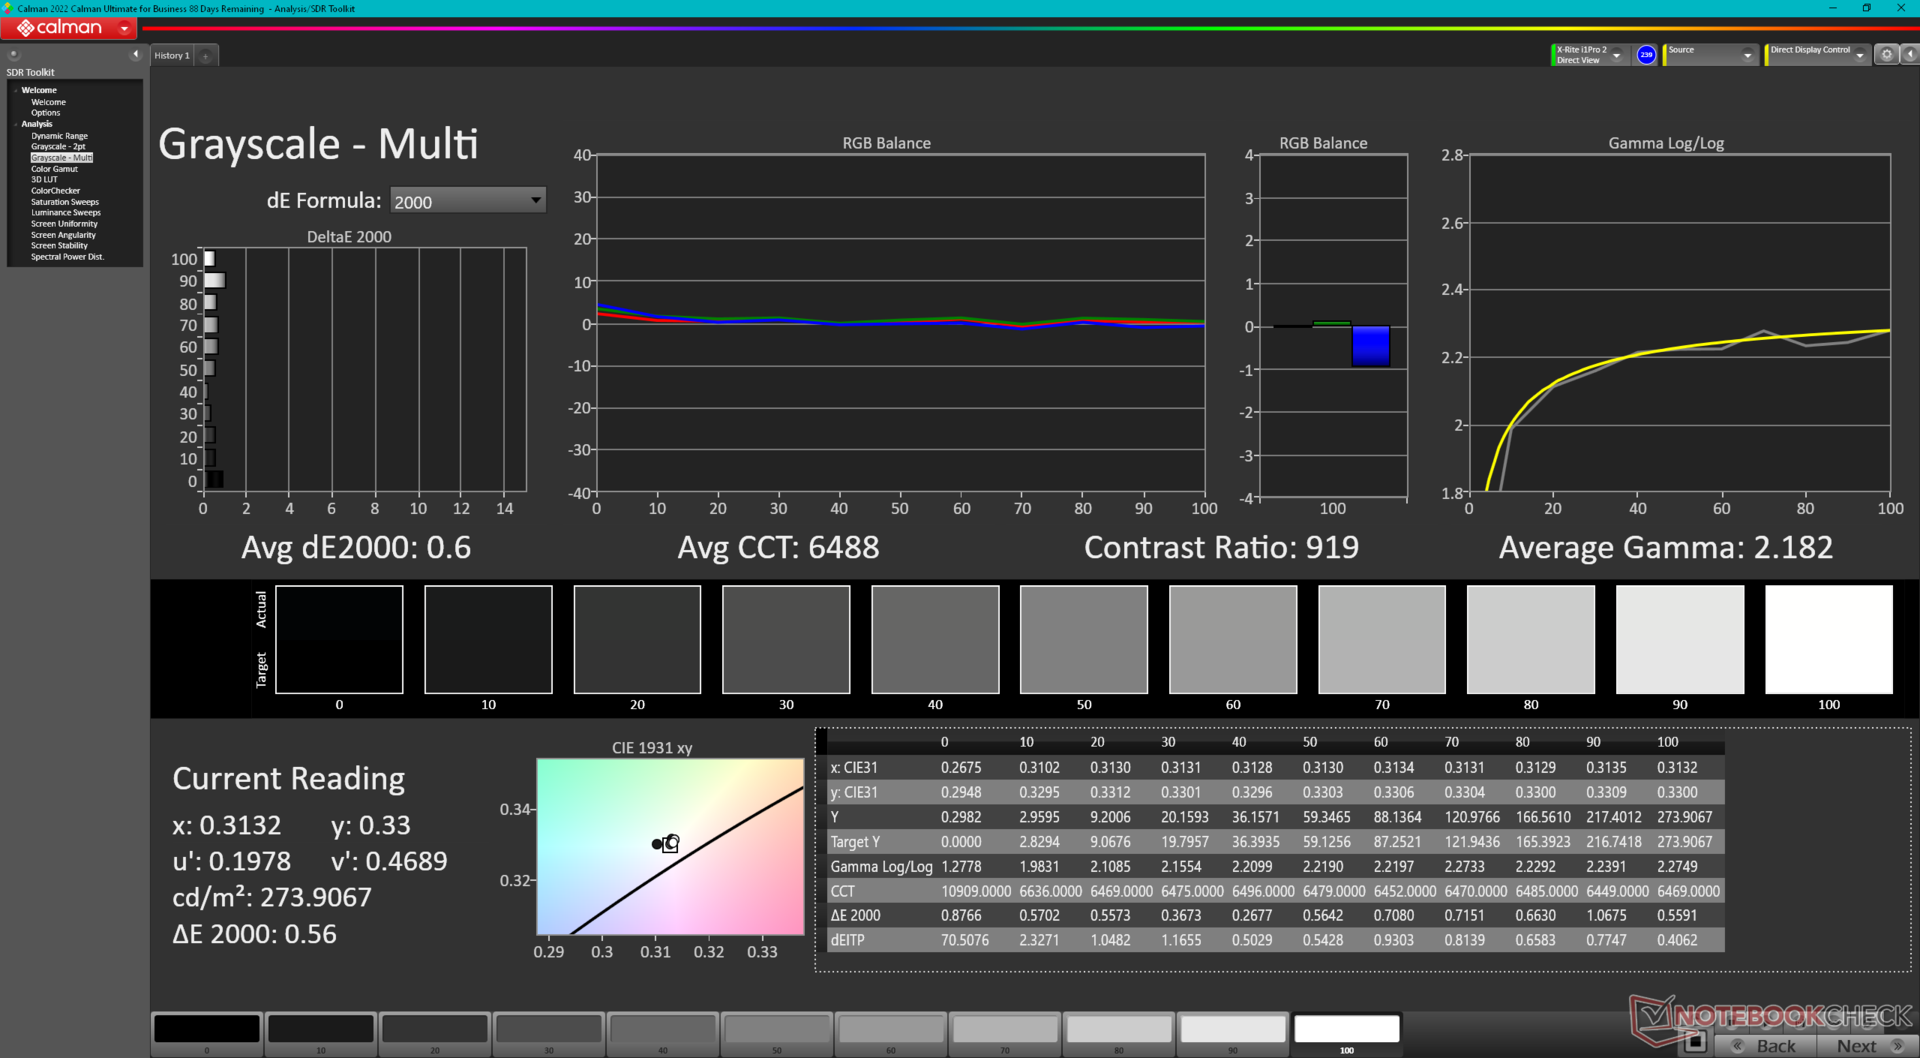
Gamma: 2.19
CCT: 6186 K
| Dell Inspiron 16 7635 2-in-1 Chi Mei 160JCA, IPS, 1920x1200, 16" | Acer Swift Edge SFE16-42-R1GM Samsung SDC4168, OLED, 3840x2400, 16" | Lenovo Yoga 7 16IRL8 LEN160FHD, IPS, 1920x1200, 16" | Samsung Galaxy Book3 Pro 16 Samsung ATNA60CL03-0, AMOLED, 2880x1800, 16" | Lenovo IdeaPad Flex 5 16ABR G8 LEN160WUXGA, IPS, 1920x1200, 16" | Dell Inspiron 16 7620 2-in-1 BOE NV16N45, IPS, 1920x1200, 16" | |
|---|---|---|---|---|---|---|
| Display | 30% | -37% | 30% | -41% | -1% | |
| Display P3 Coverage (%) | 67.4 | 99.7 48% | 42 -38% | 99.7 48% | 40 -41% | 67 -1% |
| sRGB Coverage (%) | 98.2 | 100 2% | 62.8 -36% | 100 2% | 57.6 -41% | 95.9 -2% |
| AdobeRGB 1998 Coverage (%) | 69.5 | 97.2 40% | 43.5 -37% | 97 40% | 41.3 -41% | 69.3 0% |
| Response Times | 89% | -15% | 91% | -16% | -15% | |
| Response Time Grey 50% / Grey 80% * (ms) | 27.6 ? | 2 ? 93% | 31.8 ? -15% | 2 ? 93% | 33 ? -20% | 32 ? -16% |
| Response Time Black / White * (ms) | 18.2 ? | 3 ? 84% | 20.9 ? -15% | 2 ? 89% | 20.2 ? -11% | 20.8 ? -14% |
| PWM Frequency (Hz) | 239 ? | |||||
| Screen | -43% | -63% | 250% | -149% | -24% | |
| Brightness middle (cd/m²) | 301.3 | 369 22% | 279.4 -7% | 412 37% | 392 30% | 320.7 6% |
| Brightness (cd/m²) | 269 | 371 38% | 257 -4% | 412 53% | 371 38% | 309 15% |
| Brightness Distribution (%) | 79 | 97 23% | 81 3% | 98 24% | 89 13% | 90 14% |
| Black Level * (cd/m²) | 0.28 | 0.18 36% | 0.015 95% | 0.25 11% | 0.36 -29% | |
| Contrast (:1) | 1076 | 1552 44% | 27467 2453% | 1568 46% | 891 -17% | |
| Colorchecker dE 2000 * | 3.1 | 2.3 26% | 5.12 -65% | 2.34 25% | 7.3 -135% | 4.18 -35% |
| Colorchecker dE 2000 max. * | 5.5 | 4.37 21% | 19.42 -253% | 3.34 39% | 20.8 -278% | 8.48 -54% |
| Colorchecker dE 2000 calibrated * | 0.49 | 2.87 -486% | 1.84 -276% | 2.95 -502% | 5.4 -1002% | 0.77 -57% |
| Greyscale dE 2000 * | 3.9 | 1.83 53% | 5.5 -41% | 2.78 29% | 6.5 -67% | 6.3 -62% |
| Gamma | 2.19 100% | 2.39 92% | 2.22 99% | 2.5 88% | 2.29 96% | 2.21 100% |
| CCT | 6186 105% | 6392 102% | 6407 101% | 6879 94% | 5993 108% | 6258 104% |
| Media totale (Programma / Settaggio) | 25% /
-3% | -38% /
-50% | 124% /
180% | -69% /
-107% | -13% /
-18% |
* ... Meglio usare valori piccoli
Il display non viene fornito pre-calibrato, come ci si può aspettare da un apparecchio economico. Tuttavia, i valori medi di deltaE della scala di grigi e del colore non sono male, rispettivamente 3,9 e 3,1. Una corretta calibrazione migliorerebbe ulteriormente le medie, portandole a 0,6 e 0,49. Consigliamo quindi di applicare il nostro profilo ICM calibrato di cui sopra per sfruttare al meglio i colori sRGB del pannello.
Tempi di risposta del Display
| ↔ Tempi di risposta dal Nero al Bianco | ||
|---|---|---|
| 18.2 ms ... aumenta ↗ e diminuisce ↘ combinato | ↗ 9.6 ms Incremento | 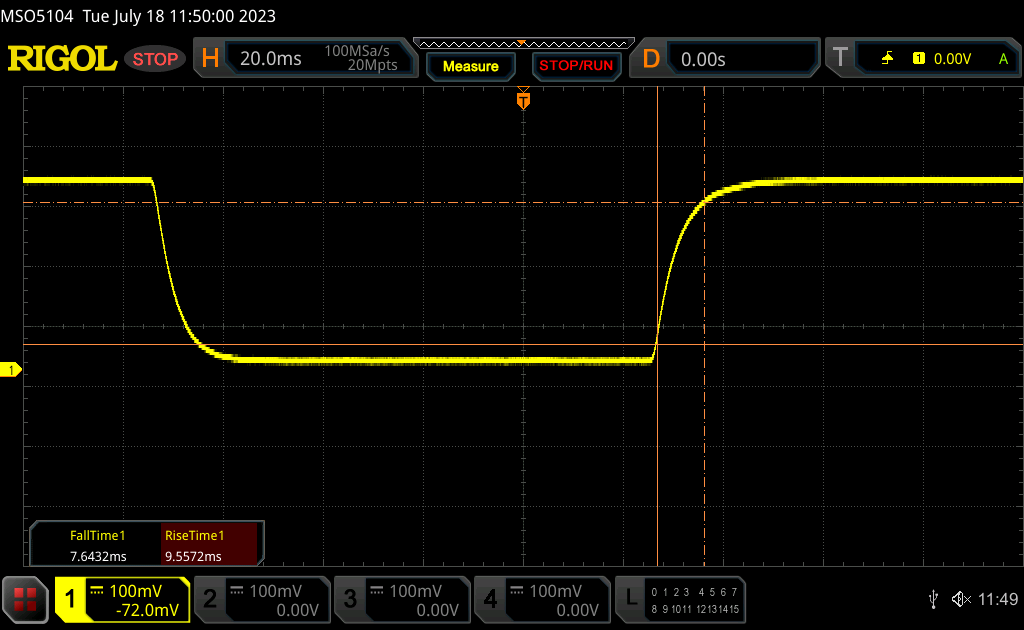 |
| ↘ 7.6 ms Calo | ||
| Lo schermo mostra buoni tempi di risposta durante i nostri tests, ma potrebbe essere troppo lento per i gamers competitivi. In confronto, tutti i dispositivi di test variano da 0.1 (minimo) a 240 (massimo) ms. » 41 % di tutti i dispositivi è migliore. Questo significa che i tempi di risposta rilevati sono simili alla media di tutti i dispositivi testati (19.8 ms). | ||
| ↔ Tempo di risposta dal 50% Grigio all'80% Grigio | ||
| 27.6 ms ... aumenta ↗ e diminuisce ↘ combinato | ↗ 13.2 ms Incremento | 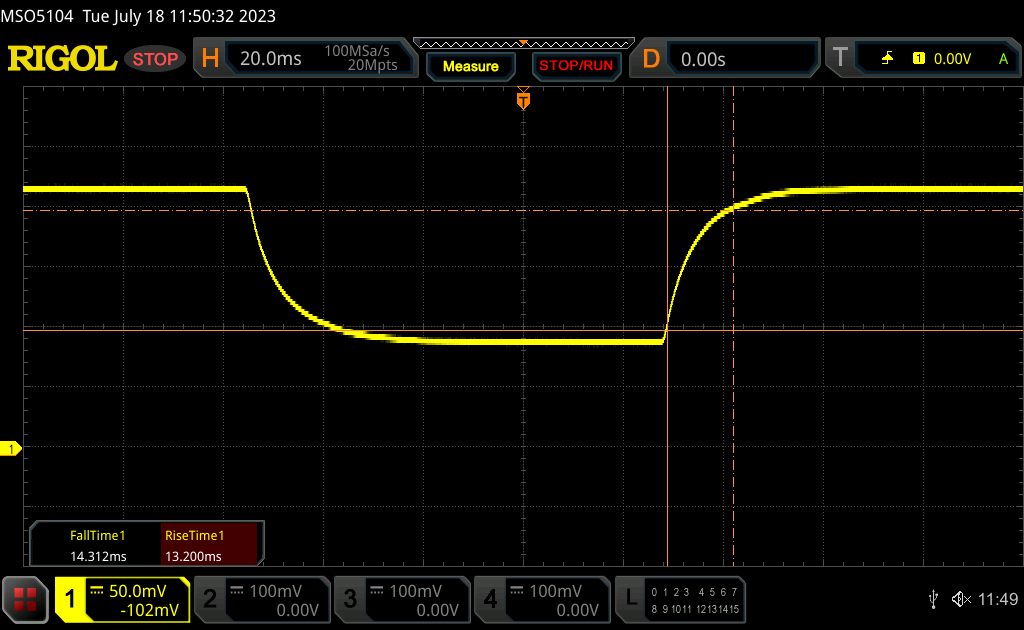 |
| ↘ 14.3 ms Calo | ||
| Lo schermo mostra tempi di risposta relativamente lenti nei nostri tests e potrebbe essere troppo lento per i gamers. In confronto, tutti i dispositivi di test variano da 0.165 (minimo) a 636 (massimo) ms. » 37 % di tutti i dispositivi è migliore. Questo significa che i tempi di risposta rilevati sono migliori rispettto alla media di tutti i dispositivi testati (31 ms). | ||
Sfarfallio dello schermo / PWM (Pulse-Width Modulation)
| flickering dello schermo / PWM non rilevato | 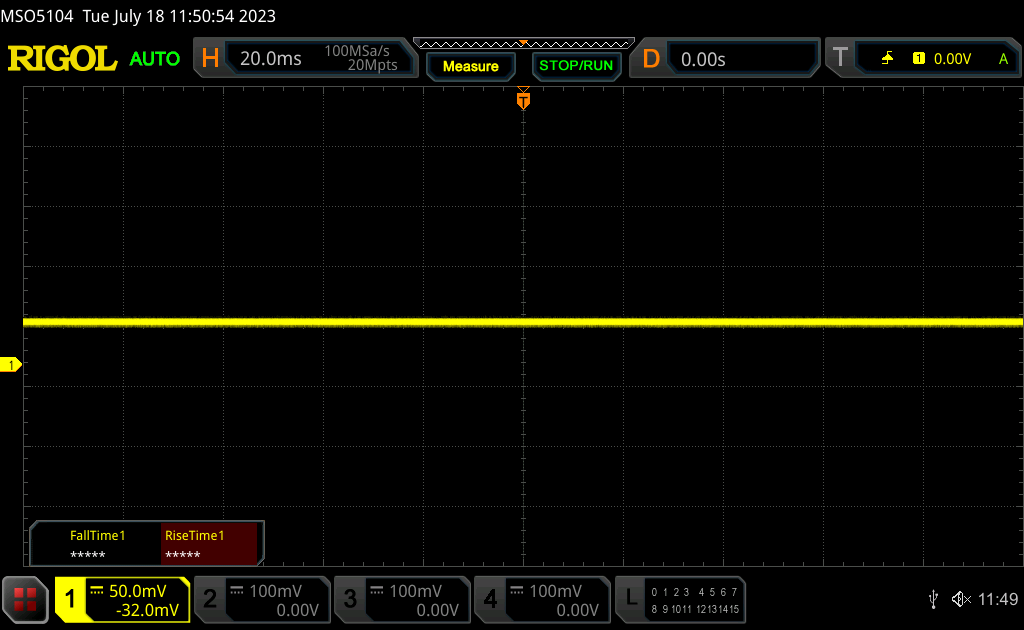 | ||
In confronto: 52 % di tutti i dispositivi testati non utilizza PWM per ridurre la luminosita' del display. Se è rilevato PWM, una media di 7757 (minimo: 5 - massimo: 343500) Hz è stata rilevata. | |||
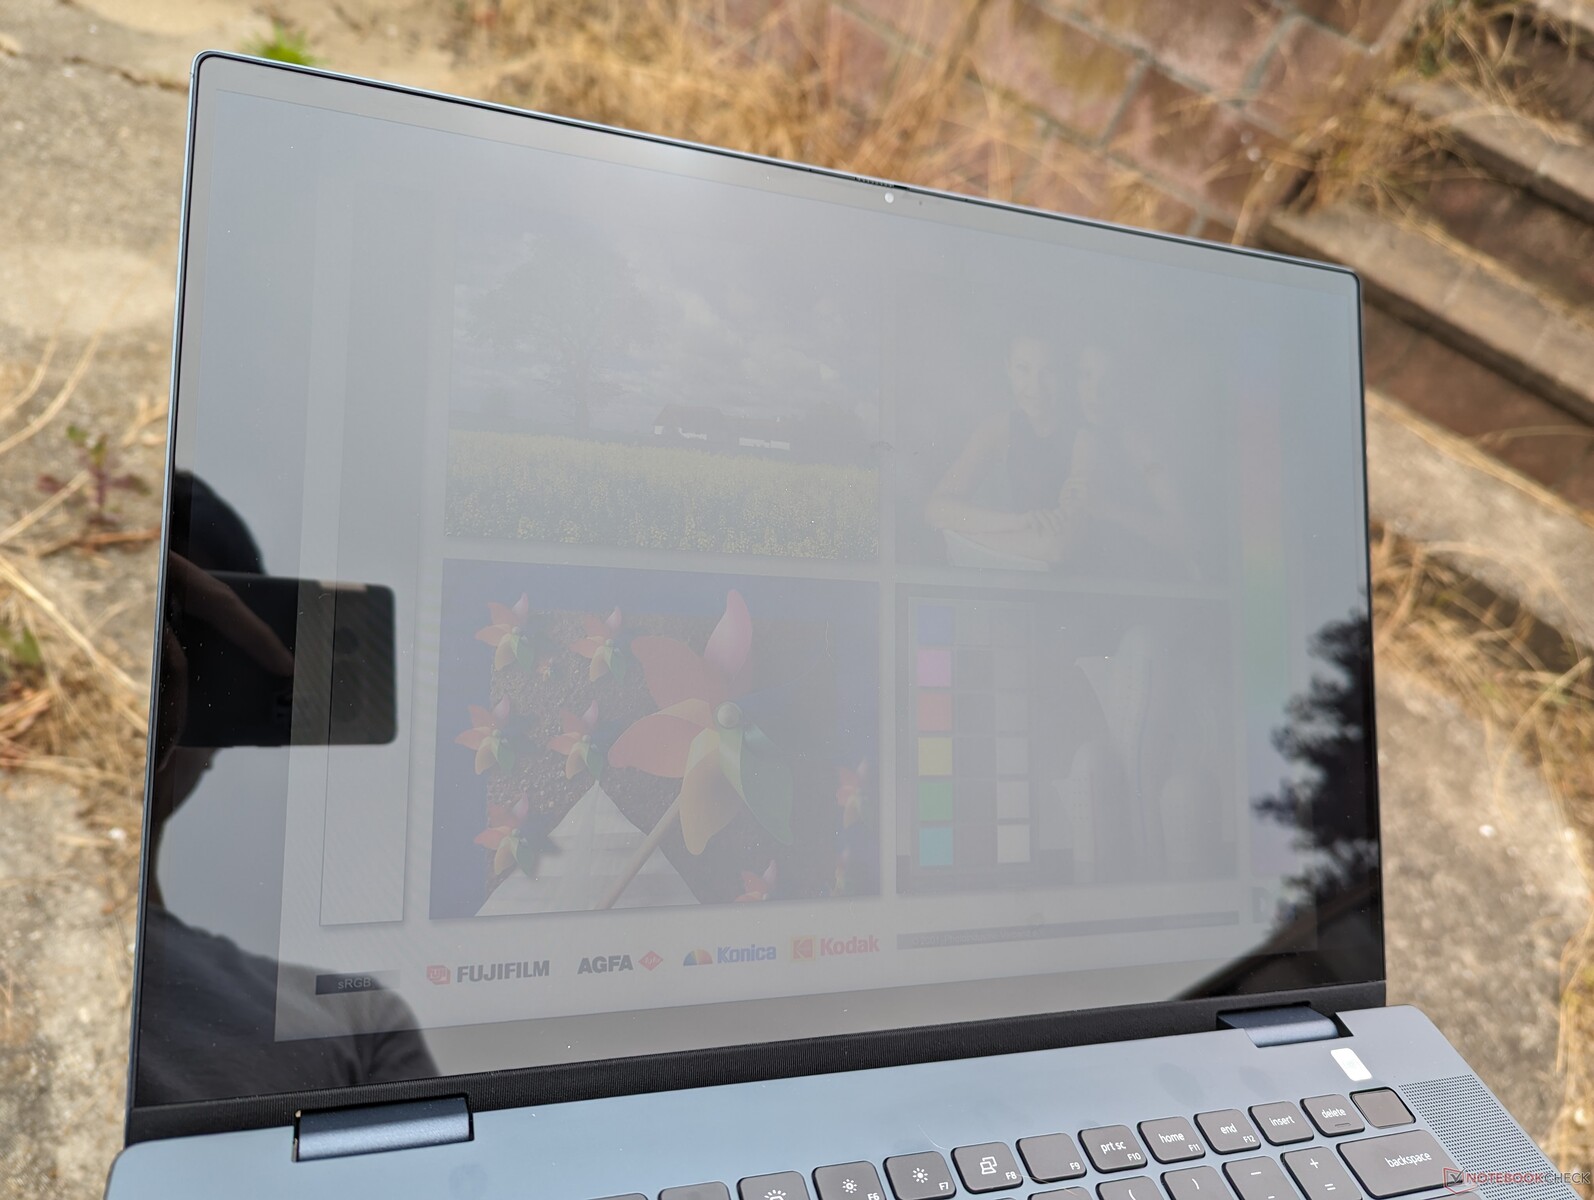
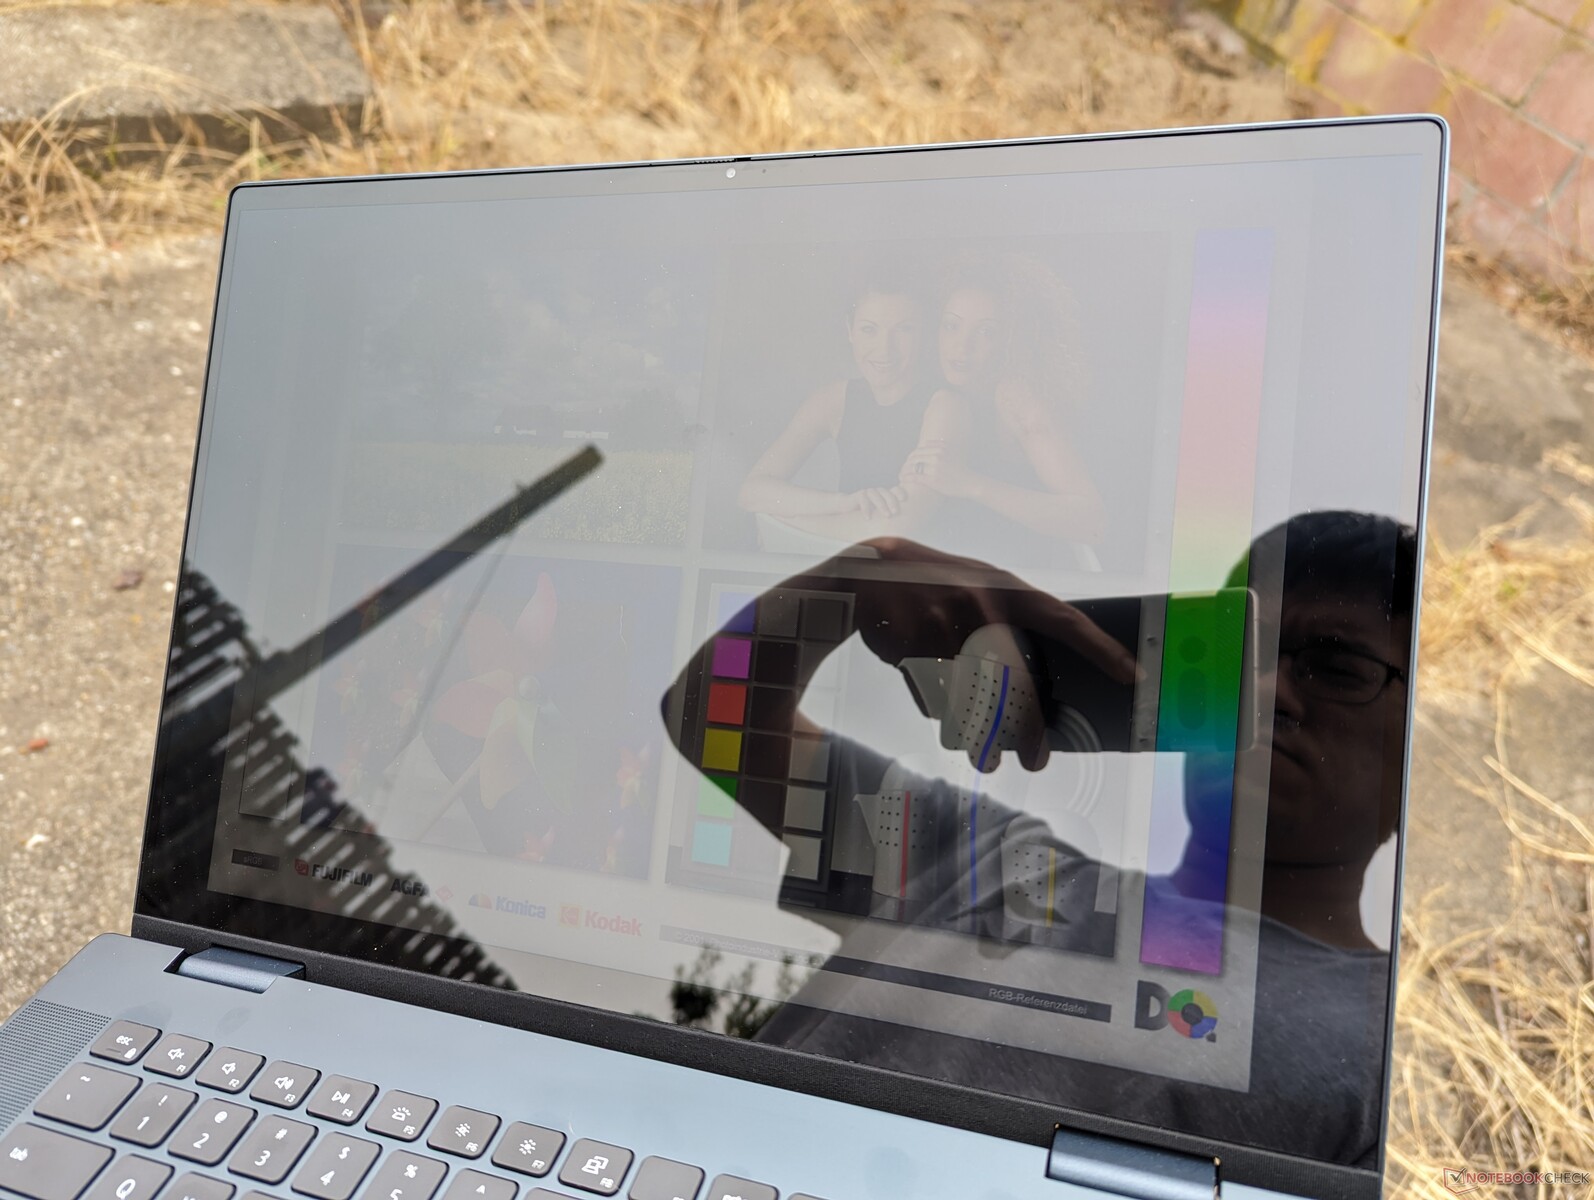
La visibilità all'aperto è nella media, poiché il touchscreen a 300 nit non è abbastanza luminoso da ridurre o superare in modo significativo i riflessi. Tablet come l'iPad iPad Pro 12.6 possono essere due volte più luminosi o più. Il Dell è prima di tutto un convertibile multimediale per ambienti interni.
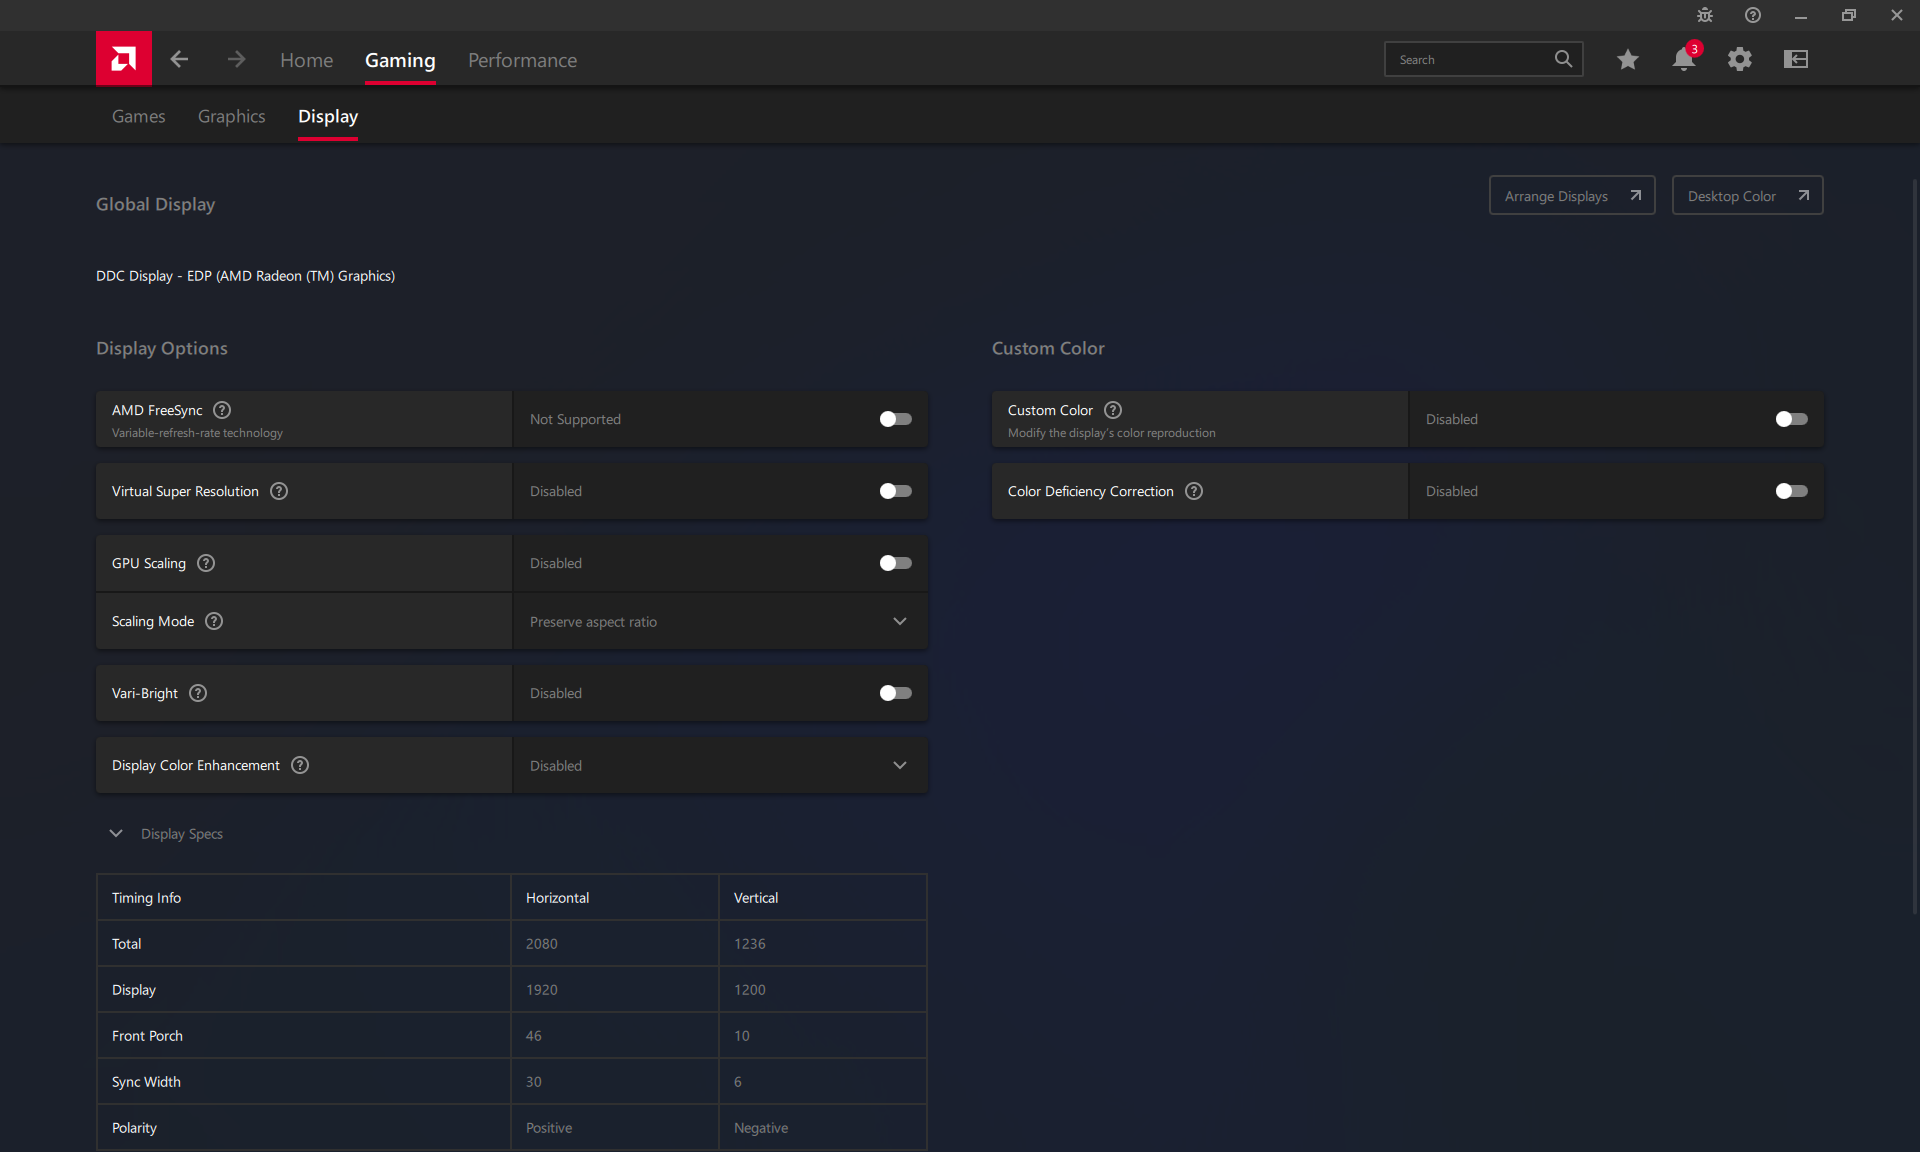
Assicurarsi di disabilitare AMD Vari-Bright tramite AMD Adrenalin, altrimenti la luminosità massima si riduce quando si utilizza la batteria.
Prestazioni - Non tutte le CPU Ryzen 7000 sono Zen 4
Condizioni di test
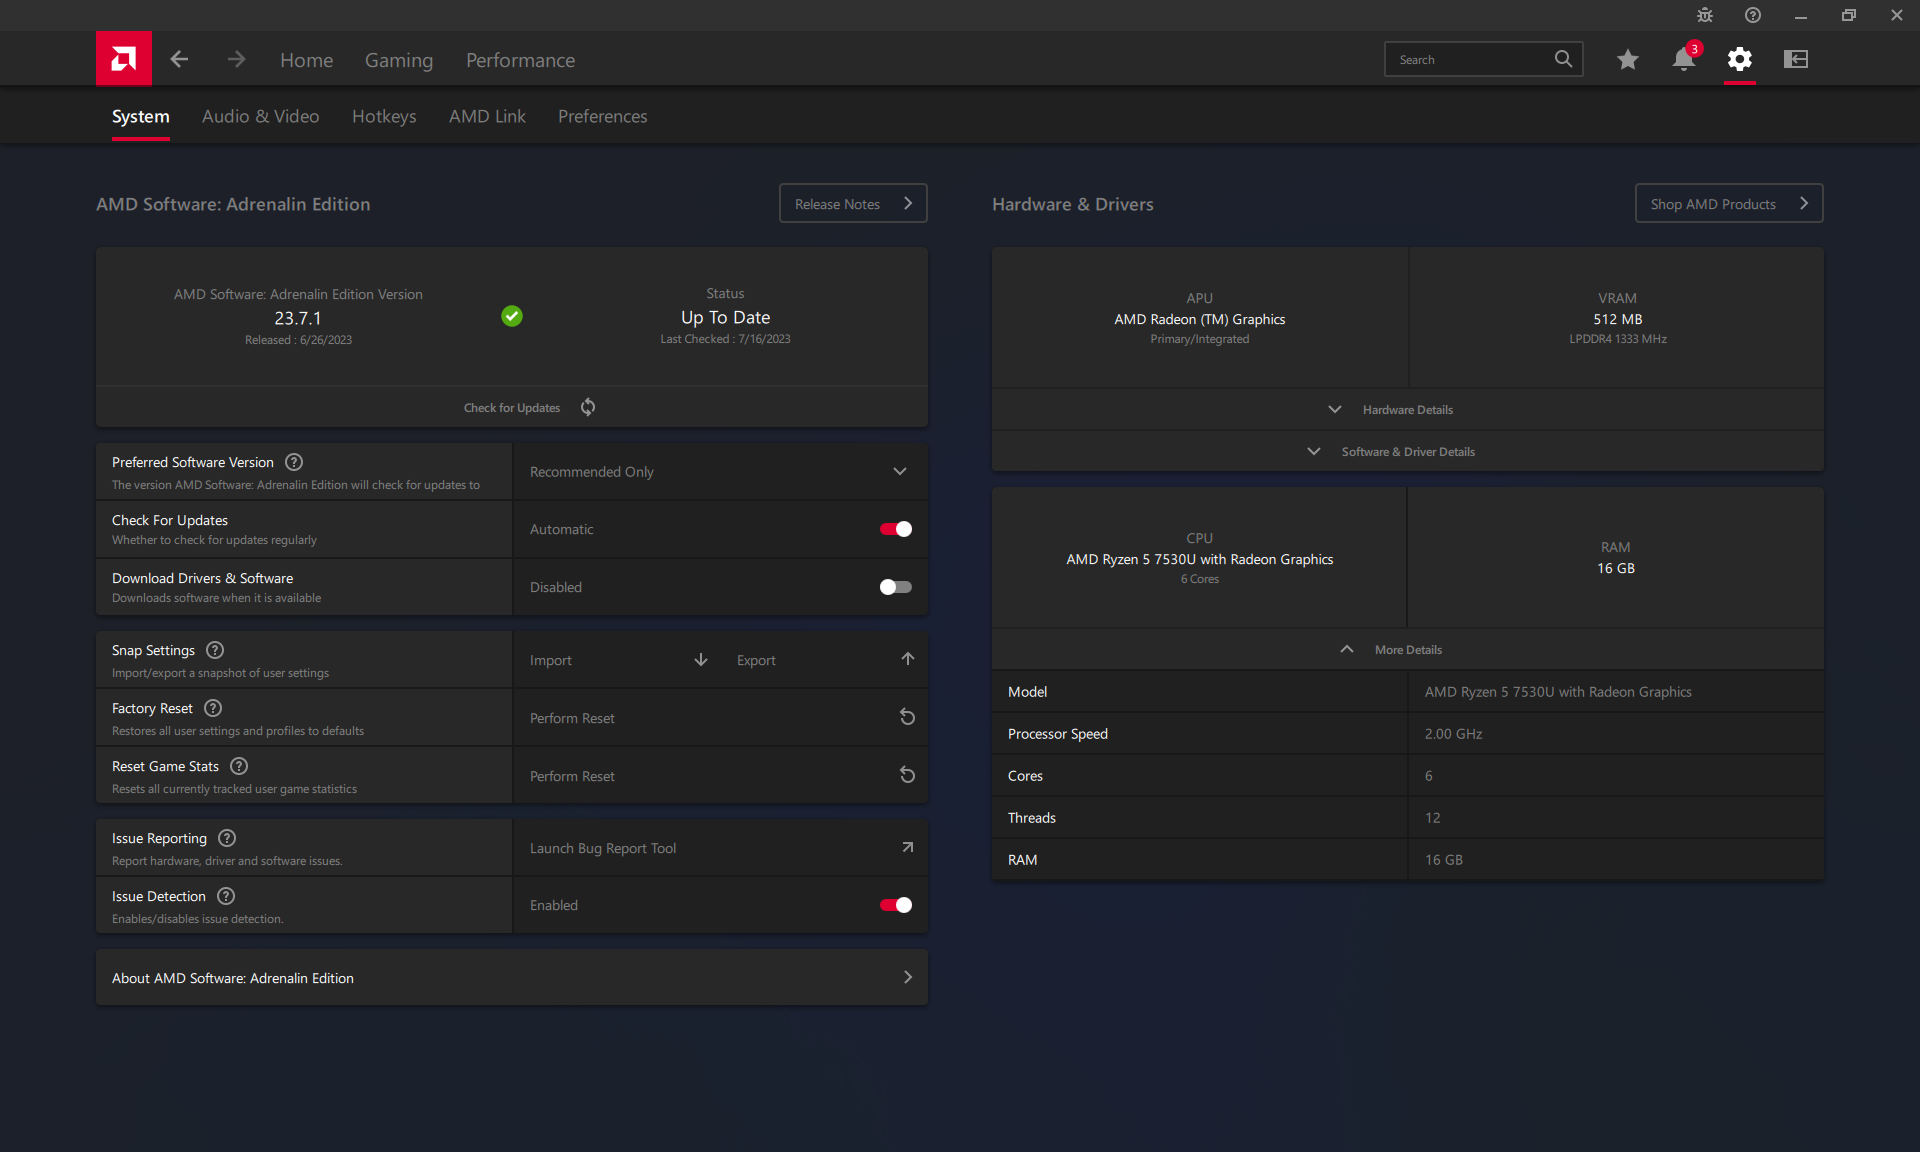
Abbiamo impostato la nostra unità in modalità Performance tramite Windows prima di eseguire i benchmark qui sotto. Ulteriori impostazioni grafiche sono disponibili su AMD Adrenalin, che non era precaricato sulla nostra unità. Si consiglia di installare lo strumento di rilevamento automatico AMD per Adrenalin e i driver grafici più recenti.
Processore
IlRyzen 5 7530U ha prestazioni pressoché identiche a quelle del Ryzen 5 6600H anche se con una potenza inferiore e prestazioni più elevate per watt. Si tratta quindi di una CPU di fascia media paragonabile al concorrente Core i5-1235U o Core i7-1255U presenti in molti Ultrabook come il modellohP Spectre x360 13,5. Tuttavia, come è tipico di AMD, le prestazioni a thread singolo sono più lente di circa il 15-20% rispetto ai suddetti processori Intel.
L'aggiornamento all'8-core Ryzen 7 7730U dal nostro Ryzen 5 7530U a 6 core, si prevede un aumento delle prestazioni multi-thread di circa il 15-35%, in base al tempo trascorso con l'IdeaPad Flex 5 16. Il Core i7-1360P dell'Intel Inspiron avrebbe prestazioni ancora più elevate.
Cinebench R15 Multi Loop
Cinebench R23: Multi Core | Single Core
Cinebench R20: CPU (Multi Core) | CPU (Single Core)
Cinebench R15: CPU Multi 64Bit | CPU Single 64Bit
Blender: v2.79 BMW27 CPU
7-Zip 18.03: 7z b 4 | 7z b 4 -mmt1
Geekbench 5.5: Multi-Core | Single-Core
HWBOT x265 Benchmark v2.2: 4k Preset
LibreOffice : 20 Documents To PDF
R Benchmark 2.5: Overall mean
* ... Meglio usare valori piccoli
AIDA64: FP32 Ray-Trace | FPU Julia | CPU SHA3 | CPU Queen | FPU SinJulia | FPU Mandel | CPU AES | CPU ZLib | FP64 Ray-Trace | CPU PhotoWorxx
| Performance rating | |
| Acer Swift Edge SFE16-42-R1GM | |
| Lenovo IdeaPad Flex 5 16ABR G8 | |
| Samsung Galaxy Book3 Pro 16 | |
| Dell Inspiron 16 7635 2-in-1 | |
| Media AMD Ryzen 5 7530U | |
| Lenovo Yoga 7 16IRL8 | |
| Dell Inspiron 16 7620 2-in-1 | |
| AIDA64 / FP32 Ray-Trace | |
| Lenovo IdeaPad Flex 5 16ABR G8 | |
| Acer Swift Edge SFE16-42-R1GM | |
| Dell Inspiron 16 7635 2-in-1 | |
| Media AMD Ryzen 5 7530U (7609 - 10970, n=9) | |
| Samsung Galaxy Book3 Pro 16 | |
| Lenovo Yoga 7 16IRL8 | |
| Dell Inspiron 16 7620 2-in-1 | |
| AIDA64 / FPU Julia | |
| Lenovo IdeaPad Flex 5 16ABR G8 | |
| Acer Swift Edge SFE16-42-R1GM | |
| Dell Inspiron 16 7635 2-in-1 | |
| Media AMD Ryzen 5 7530U (48473 - 68384, n=9) | |
| Samsung Galaxy Book3 Pro 16 | |
| Lenovo Yoga 7 16IRL8 | |
| Dell Inspiron 16 7620 2-in-1 | |
| AIDA64 / CPU Queen | |
| Lenovo IdeaPad Flex 5 16ABR G8 | |
| Acer Swift Edge SFE16-42-R1GM | |
| Samsung Galaxy Book3 Pro 16 | |
| Dell Inspiron 16 7620 2-in-1 | |
| Dell Inspiron 16 7635 2-in-1 | |
| Media AMD Ryzen 5 7530U (66646 - 78105, n=8) | |
| Lenovo Yoga 7 16IRL8 | |
| AIDA64 / FPU SinJulia | |
| Acer Swift Edge SFE16-42-R1GM | |
| Lenovo IdeaPad Flex 5 16ABR G8 | |
| Dell Inspiron 16 7635 2-in-1 | |
| Media AMD Ryzen 5 7530U (7611 - 9248, n=9) | |
| Samsung Galaxy Book3 Pro 16 | |
| Dell Inspiron 16 7620 2-in-1 | |
| Lenovo Yoga 7 16IRL8 | |
| AIDA64 / FPU Mandel | |
| Lenovo IdeaPad Flex 5 16ABR G8 | |
| Acer Swift Edge SFE16-42-R1GM | |
| Dell Inspiron 16 7635 2-in-1 | |
| Media AMD Ryzen 5 7530U (26912 - 37624, n=9) | |
| Samsung Galaxy Book3 Pro 16 | |
| Lenovo Yoga 7 16IRL8 | |
| Dell Inspiron 16 7620 2-in-1 | |
| AIDA64 / CPU ZLib | |
| Samsung Galaxy Book3 Pro 16 | |
| Lenovo Yoga 7 16IRL8 | |
| Acer Swift Edge SFE16-42-R1GM | |
| Lenovo IdeaPad Flex 5 16ABR G8 | |
| Dell Inspiron 16 7620 2-in-1 | |
| Dell Inspiron 16 7635 2-in-1 | |
| Media AMD Ryzen 5 7530U (443 - 612, n=9) | |
| AIDA64 / FP64 Ray-Trace | |
| Lenovo IdeaPad Flex 5 16ABR G8 | |
| Acer Swift Edge SFE16-42-R1GM | |
| Dell Inspiron 16 7635 2-in-1 | |
| Media AMD Ryzen 5 7530U (4008 - 5738, n=9) | |
| Samsung Galaxy Book3 Pro 16 | |
| Lenovo Yoga 7 16IRL8 | |
| Dell Inspiron 16 7620 2-in-1 | |
| AIDA64 / CPU PhotoWorxx | |
| Samsung Galaxy Book3 Pro 16 | |
| Lenovo Yoga 7 16IRL8 | |
| Acer Swift Edge SFE16-42-R1GM | |
| Dell Inspiron 16 7635 2-in-1 | |
| Lenovo IdeaPad Flex 5 16ABR G8 | |
| Dell Inspiron 16 7620 2-in-1 | |
| Media AMD Ryzen 5 7530U (9832 - 19525, n=9) | |
Prestazioni del sistema
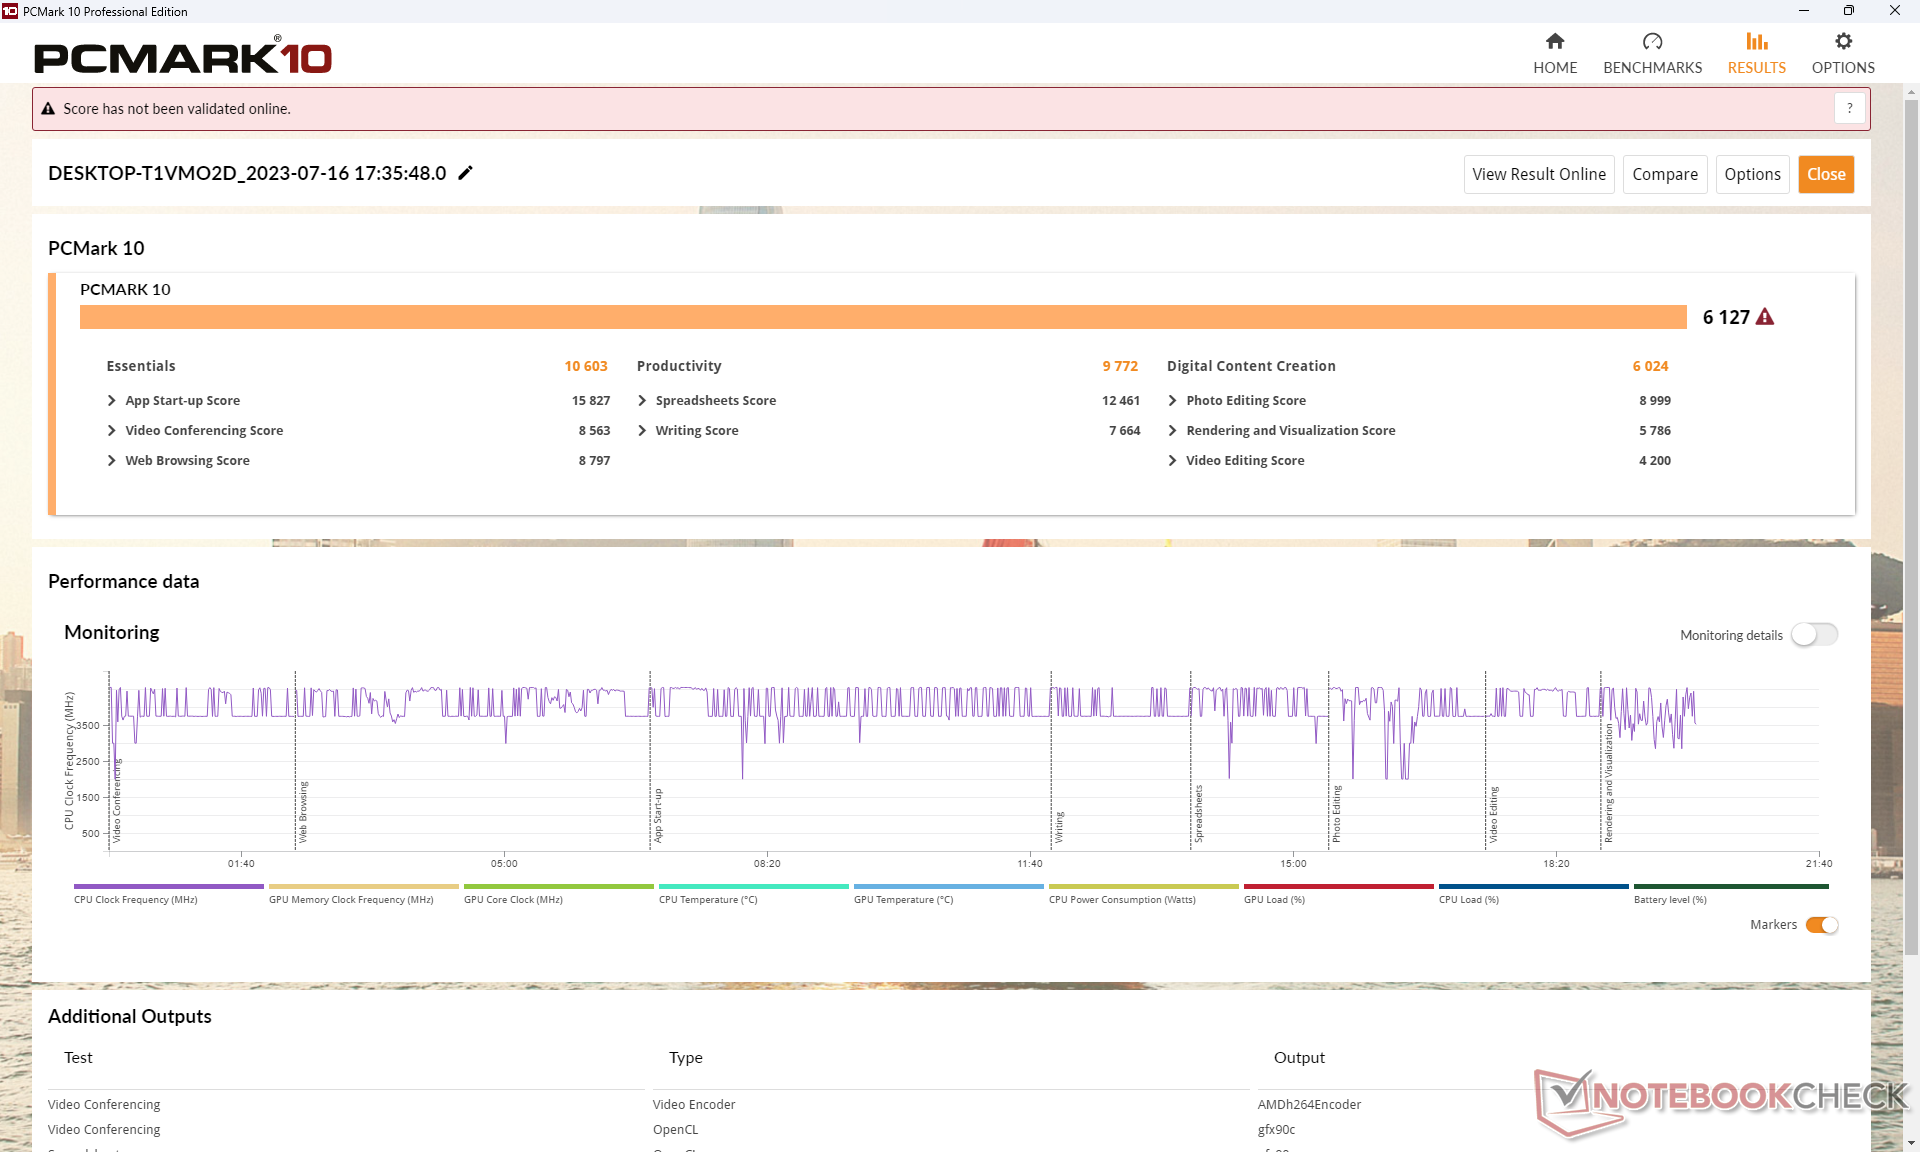
I risultati di PCMark sono paragonabili a quelli di alternative con processori Core-U e persino Core-P, come il Samsung Galaxy Book3 Pro 16 o il Dell Inspiron 16 7620 2-in-1 dello scorso anno. È interessante notare che il sottotest Produttività favorisce il nostro sistema Dell con margini più ampi.
CrossMark: Overall | Productivity | Creativity | Responsiveness
| PCMark 10 / Score | |
| Lenovo IdeaPad Flex 5 16ABR G8 | |
| Acer Swift Edge SFE16-42-R1GM | |
| Dell Inspiron 16 7635 2-in-1 | |
| Media AMD Ryzen 5 7530U, AMD Radeon RX Vega 7 (5686 - 6209, n=8) | |
| Lenovo Yoga 7 16IRL8 | |
| Samsung Galaxy Book3 Pro 16 | |
| Dell Inspiron 16 7620 2-in-1 | |
| PCMark 10 / Essentials | |
| Lenovo Yoga 7 16IRL8 | |
| Lenovo IdeaPad Flex 5 16ABR G8 | |
| Dell Inspiron 16 7635 2-in-1 | |
| Samsung Galaxy Book3 Pro 16 | |
| Media AMD Ryzen 5 7530U, AMD Radeon RX Vega 7 (9183 - 11242, n=8) | |
| Dell Inspiron 16 7620 2-in-1 | |
| Acer Swift Edge SFE16-42-R1GM | |
| PCMark 10 / Productivity | |
| Media AMD Ryzen 5 7530U, AMD Radeon RX Vega 7 (8983 - 14037, n=8) | |
| Dell Inspiron 16 7635 2-in-1 | |
| Lenovo IdeaPad Flex 5 16ABR G8 | |
| Acer Swift Edge SFE16-42-R1GM | |
| Lenovo Yoga 7 16IRL8 | |
| Samsung Galaxy Book3 Pro 16 | |
| Dell Inspiron 16 7620 2-in-1 | |
| PCMark 10 / Digital Content Creation | |
| Acer Swift Edge SFE16-42-R1GM | |
| Lenovo Yoga 7 16IRL8 | |
| Samsung Galaxy Book3 Pro 16 | |
| Lenovo IdeaPad Flex 5 16ABR G8 | |
| Dell Inspiron 16 7635 2-in-1 | |
| Dell Inspiron 16 7620 2-in-1 | |
| Media AMD Ryzen 5 7530U, AMD Radeon RX Vega 7 (4941 - 6093, n=8) | |
| CrossMark / Overall | |
| Lenovo Yoga 7 16IRL8 | |
| Samsung Galaxy Book3 Pro 16 | |
| Dell Inspiron 16 7620 2-in-1 | |
| Acer Swift Edge SFE16-42-R1GM | |
| Lenovo IdeaPad Flex 5 16ABR G8 | |
| Media AMD Ryzen 5 7530U, AMD Radeon RX Vega 7 (1029 - 1336, n=7) | |
| Dell Inspiron 16 7635 2-in-1 | |
| CrossMark / Productivity | |
| Lenovo Yoga 7 16IRL8 | |
| Samsung Galaxy Book3 Pro 16 | |
| Dell Inspiron 16 7620 2-in-1 | |
| Acer Swift Edge SFE16-42-R1GM | |
| Lenovo IdeaPad Flex 5 16ABR G8 | |
| Media AMD Ryzen 5 7530U, AMD Radeon RX Vega 7 (1115 - 1370, n=7) | |
| Dell Inspiron 16 7635 2-in-1 | |
| CrossMark / Creativity | |
| Lenovo Yoga 7 16IRL8 | |
| Samsung Galaxy Book3 Pro 16 | |
| Dell Inspiron 16 7620 2-in-1 | |
| Lenovo IdeaPad Flex 5 16ABR G8 | |
| Acer Swift Edge SFE16-42-R1GM | |
| Dell Inspiron 16 7635 2-in-1 | |
| Media AMD Ryzen 5 7530U, AMD Radeon RX Vega 7 (992 - 1390, n=7) | |
| CrossMark / Responsiveness | |
| Samsung Galaxy Book3 Pro 16 | |
| Lenovo Yoga 7 16IRL8 | |
| Dell Inspiron 16 7620 2-in-1 | |
| Acer Swift Edge SFE16-42-R1GM | |
| Media AMD Ryzen 5 7530U, AMD Radeon RX Vega 7 (900 - 1096, n=7) | |
| Lenovo IdeaPad Flex 5 16ABR G8 | |
| Dell Inspiron 16 7635 2-in-1 | |
| PCMark 10 Score | 6127 punti | |
Aiuto | ||
| AIDA64 / Memory Copy | |
| Samsung Galaxy Book3 Pro 16 | |
| Lenovo Yoga 7 16IRL8 | |
| Acer Swift Edge SFE16-42-R1GM | |
| Dell Inspiron 16 7635 2-in-1 | |
| Lenovo IdeaPad Flex 5 16ABR G8 | |
| Dell Inspiron 16 7620 2-in-1 | |
| Media AMD Ryzen 5 7530U (20155 - 42853, n=9) | |
| AIDA64 / Memory Read | |
| Samsung Galaxy Book3 Pro 16 | |
| Lenovo Yoga 7 16IRL8 | |
| Acer Swift Edge SFE16-42-R1GM | |
| Dell Inspiron 16 7620 2-in-1 | |
| Dell Inspiron 16 7635 2-in-1 | |
| Lenovo IdeaPad Flex 5 16ABR G8 | |
| Media AMD Ryzen 5 7530U (23068 - 40270, n=9) | |
| AIDA64 / Memory Write | |
| Samsung Galaxy Book3 Pro 16 | |
| Lenovo Yoga 7 16IRL8 | |
| Acer Swift Edge SFE16-42-R1GM | |
| Dell Inspiron 16 7620 2-in-1 | |
| Dell Inspiron 16 7635 2-in-1 | |
| Lenovo IdeaPad Flex 5 16ABR G8 | |
| Media AMD Ryzen 5 7530U (22954 - 41838, n=9) | |
| AIDA64 / Memory Latency | |
| Lenovo IdeaPad Flex 5 16ABR G8 | |
| Dell Inspiron 16 7635 2-in-1 | |
| Acer Swift Edge SFE16-42-R1GM | |
| Media AMD Ryzen 5 7530U (88.1 - 110.8, n=9) | |
| Lenovo Yoga 7 16IRL8 | |
| Samsung Galaxy Book3 Pro 16 | |
* ... Meglio usare valori piccoli
Latenza DPC
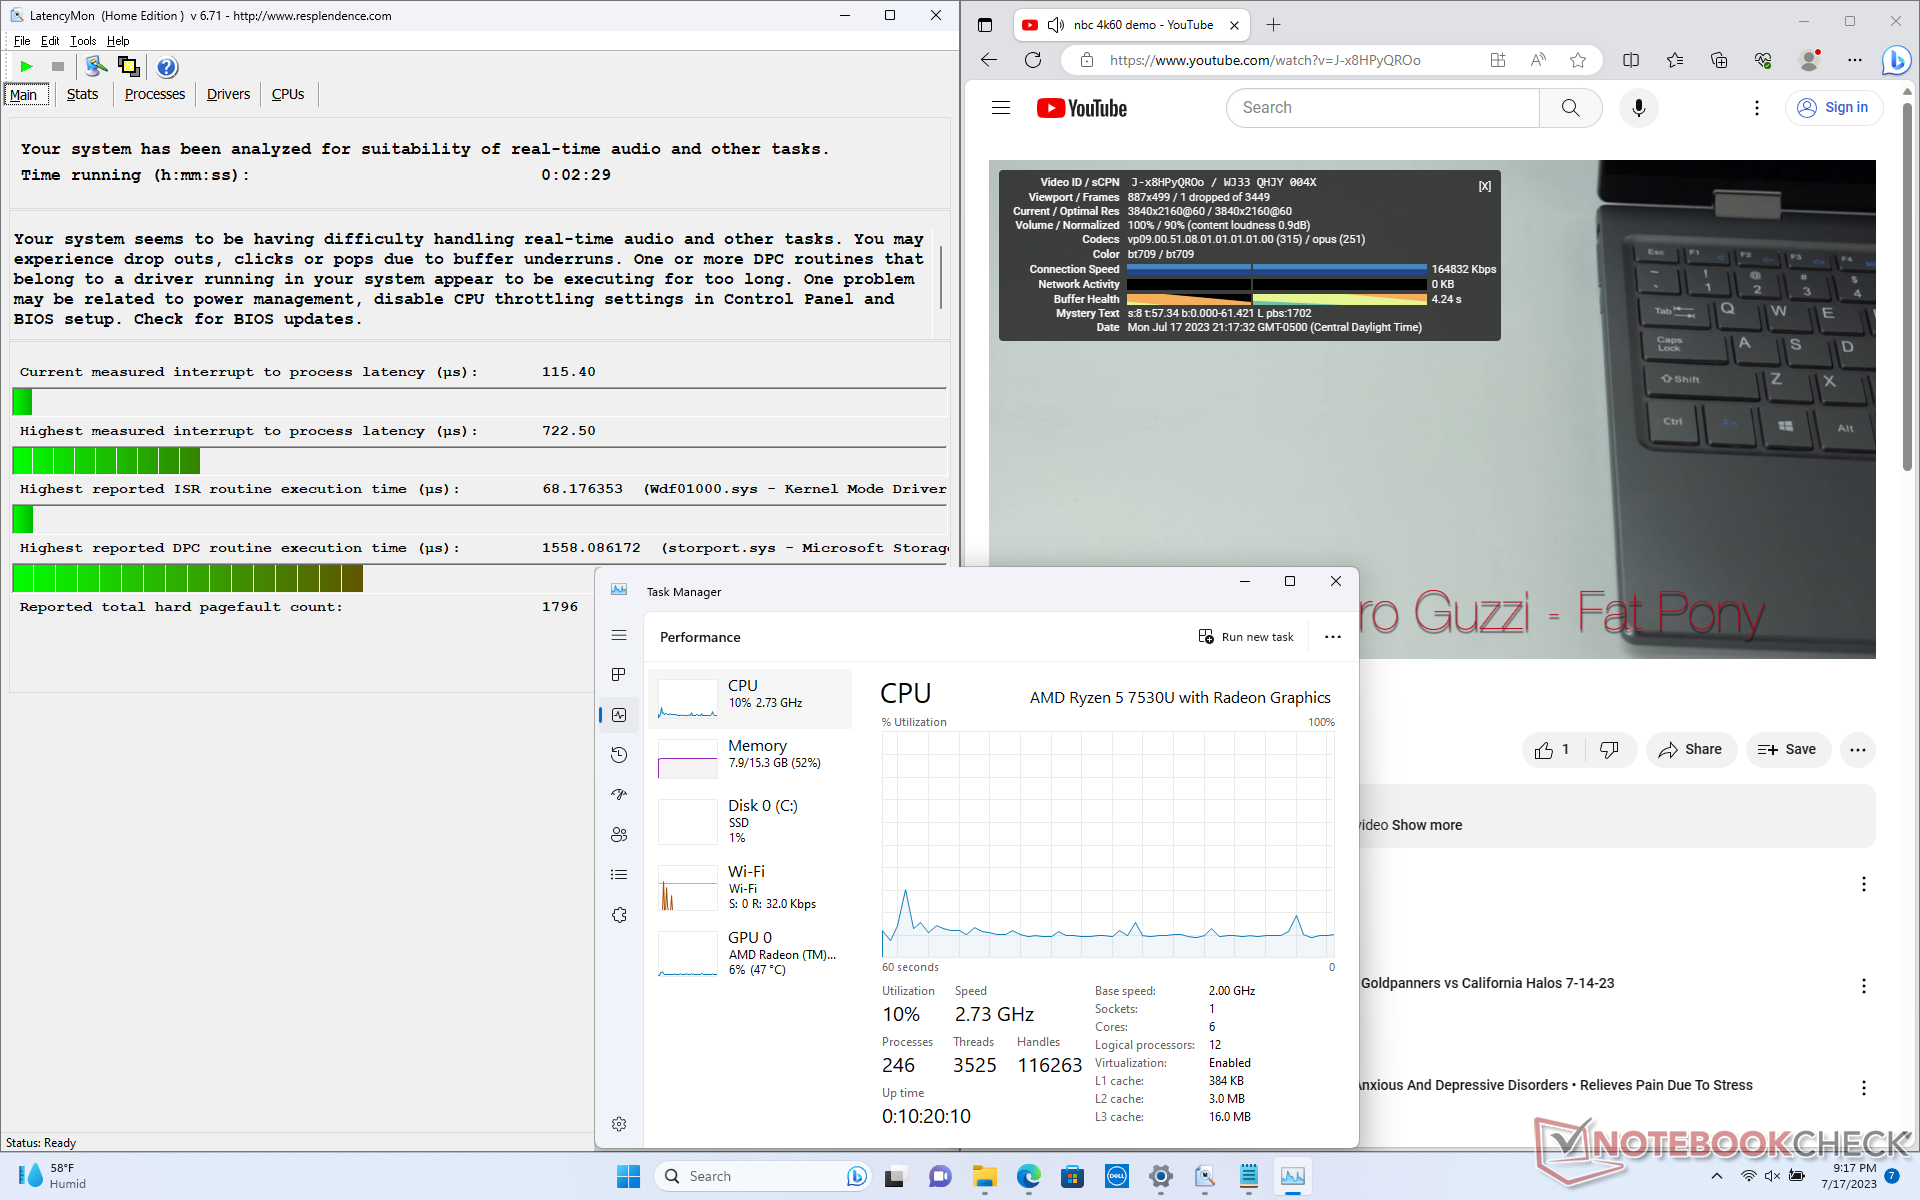
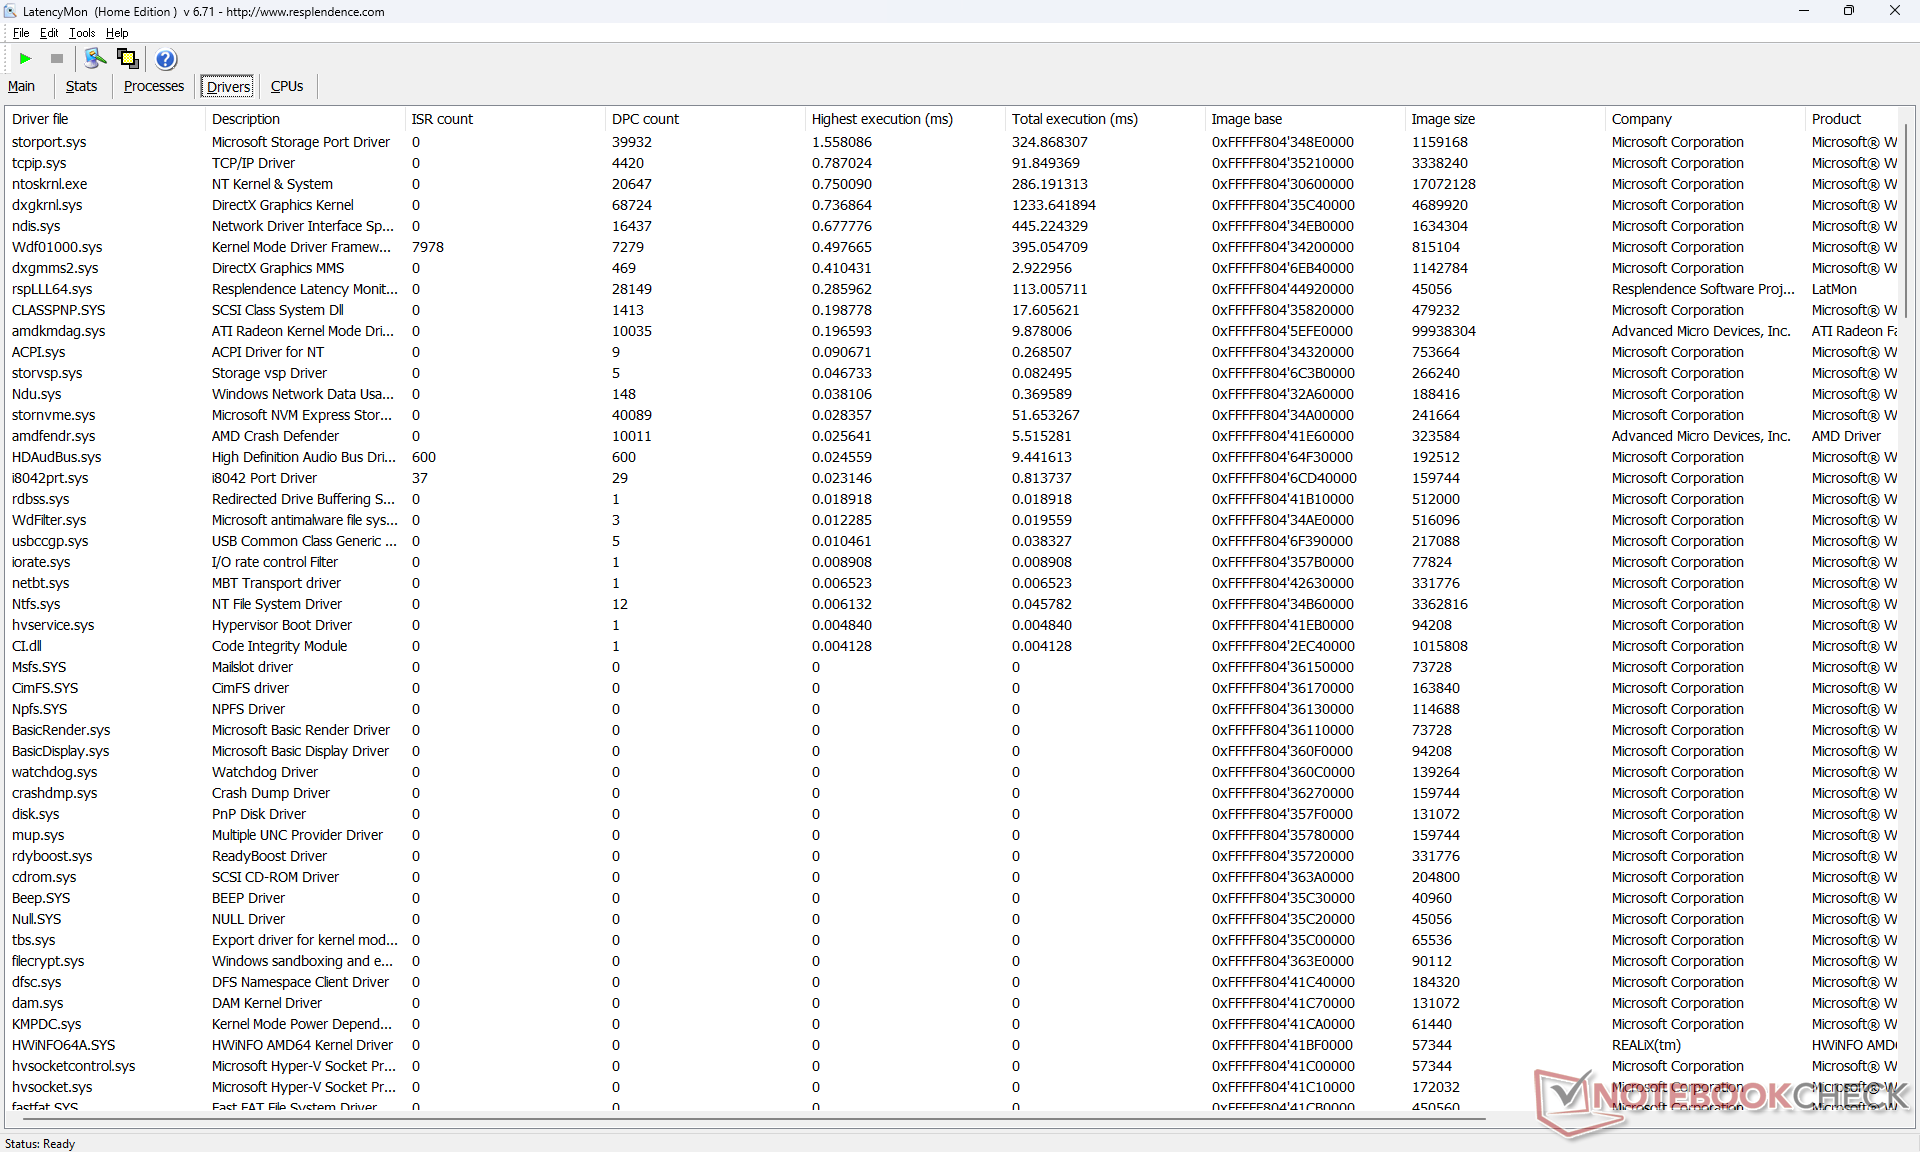
LatencyMon segnala solo lievi problemi di DPC quando si aprono più schede della nostra homepage. la riproduzione di video 4K a 60 FPS è invece eccellente, con una sola caduta di fotogrammi registrata durante il nostro video di prova di un minuto.
| DPC Latencies / LatencyMon - interrupt to process latency (max), Web, Youtube, Prime95 | |
| Acer Swift Edge SFE16-42-R1GM | |
| Lenovo IdeaPad Flex 5 16ABR G8 | |
| Lenovo Yoga 7 16IRL8 | |
| Dell Inspiron 16 7635 2-in-1 | |
| Dell Inspiron 16 7620 2-in-1 | |
| Samsung Galaxy Book3 Pro 16 | |
* ... Meglio usare valori piccoli
Dispositivi di archiviazione
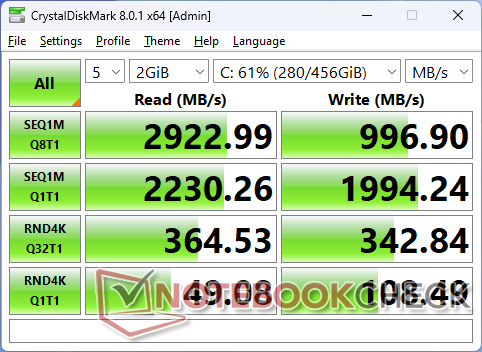
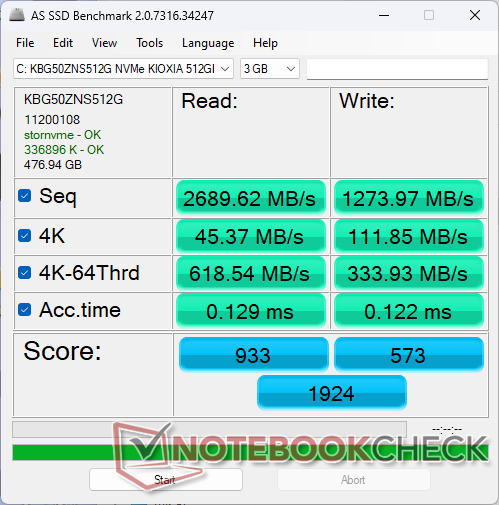
La nostra unità di prova viene fornita con un apparecchio economico Kioxia KBG50ZNS512G PCIe4 x4 NVMe che, secondo il produttore, offre velocità massime di lettura e scrittura sequenziale fino a 3500 MB/s e 2700 MB/s rispettivamente. Nei nostri test di stress, tuttavia, siamo riusciti a raggiungere solo poco più di 2200 MB/s anche dopo diversi test, il che suggerisce che l'unità potrebbe avere problemi a mantenere le velocità di trasferimento massime per periodi prolungati. Tuttavia, questo non è un problema per la maggior parte degli scenari multimediali e per i carichi di lavoro quotidiani con il browser.

| Drive Performance rating - Percent | |
| Acer Swift Edge SFE16-42-R1GM | |
| Lenovo Yoga 7 16IRL8 | |
| Samsung Galaxy Book3 Pro 16 | |
| Lenovo IdeaPad Flex 5 16ABR G8 | |
| Dell Inspiron 16 7635 2-in-1 | |
| Dell Inspiron 16 7620 2-in-1 | |
* ... Meglio usare valori piccoli
Disk Throttling: DiskSpd Read Loop, Queue Depth 8
Prestazioni della GPU
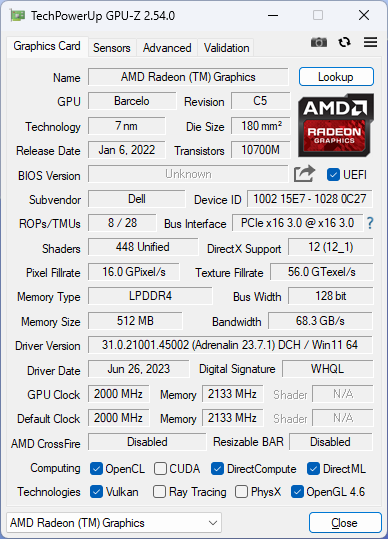
Come processore Zen 3, il Ryzen 5 7530U utilizza la vecchia Radeon RX Vega 7 invece della più recente Radeon 680M o 780M che si trovano rispettivamente sui processori Zen 3+ e Zen 4. Questo è un peccato, perché la Radeon 680M avrebbe aumentato le prestazioni grafiche in modo significativo, dal 70 all'80%, per essere più veloce di qualsiasi soluzione Intel Iris Xe attuale. Invece, le prestazioni grafiche complessive sono inferiori di circa il 25% rispetto alle vecchie soluzioni Iris Xe 96 EU. Ci aspettiamo che le prestazioni siano ancora più basse se configurato con soli 8 GB di RAM di sistema saldata.
L'aggiornamento alla Radeon RX Vega 8 nella configurazione Ryzen 7 7730U di fascia più alta dovrebbe aumentare le prestazioni grafiche solo marginalmente, del 5%.
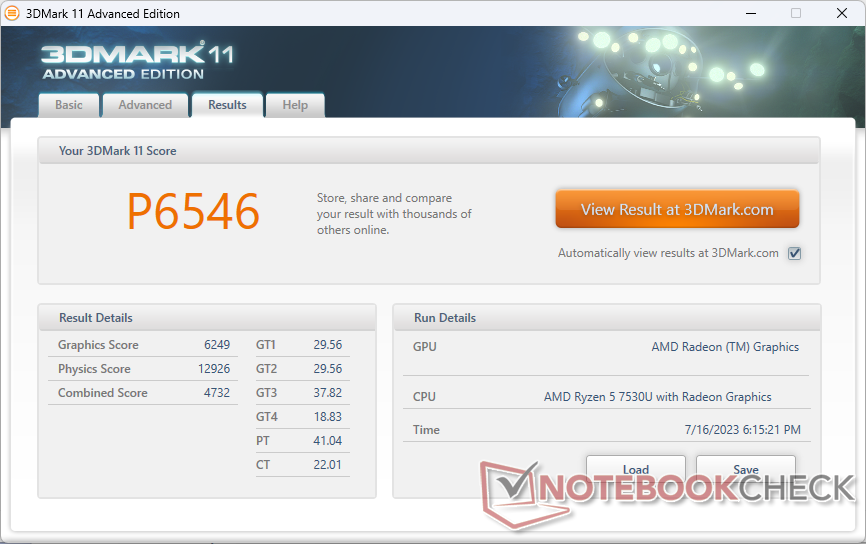
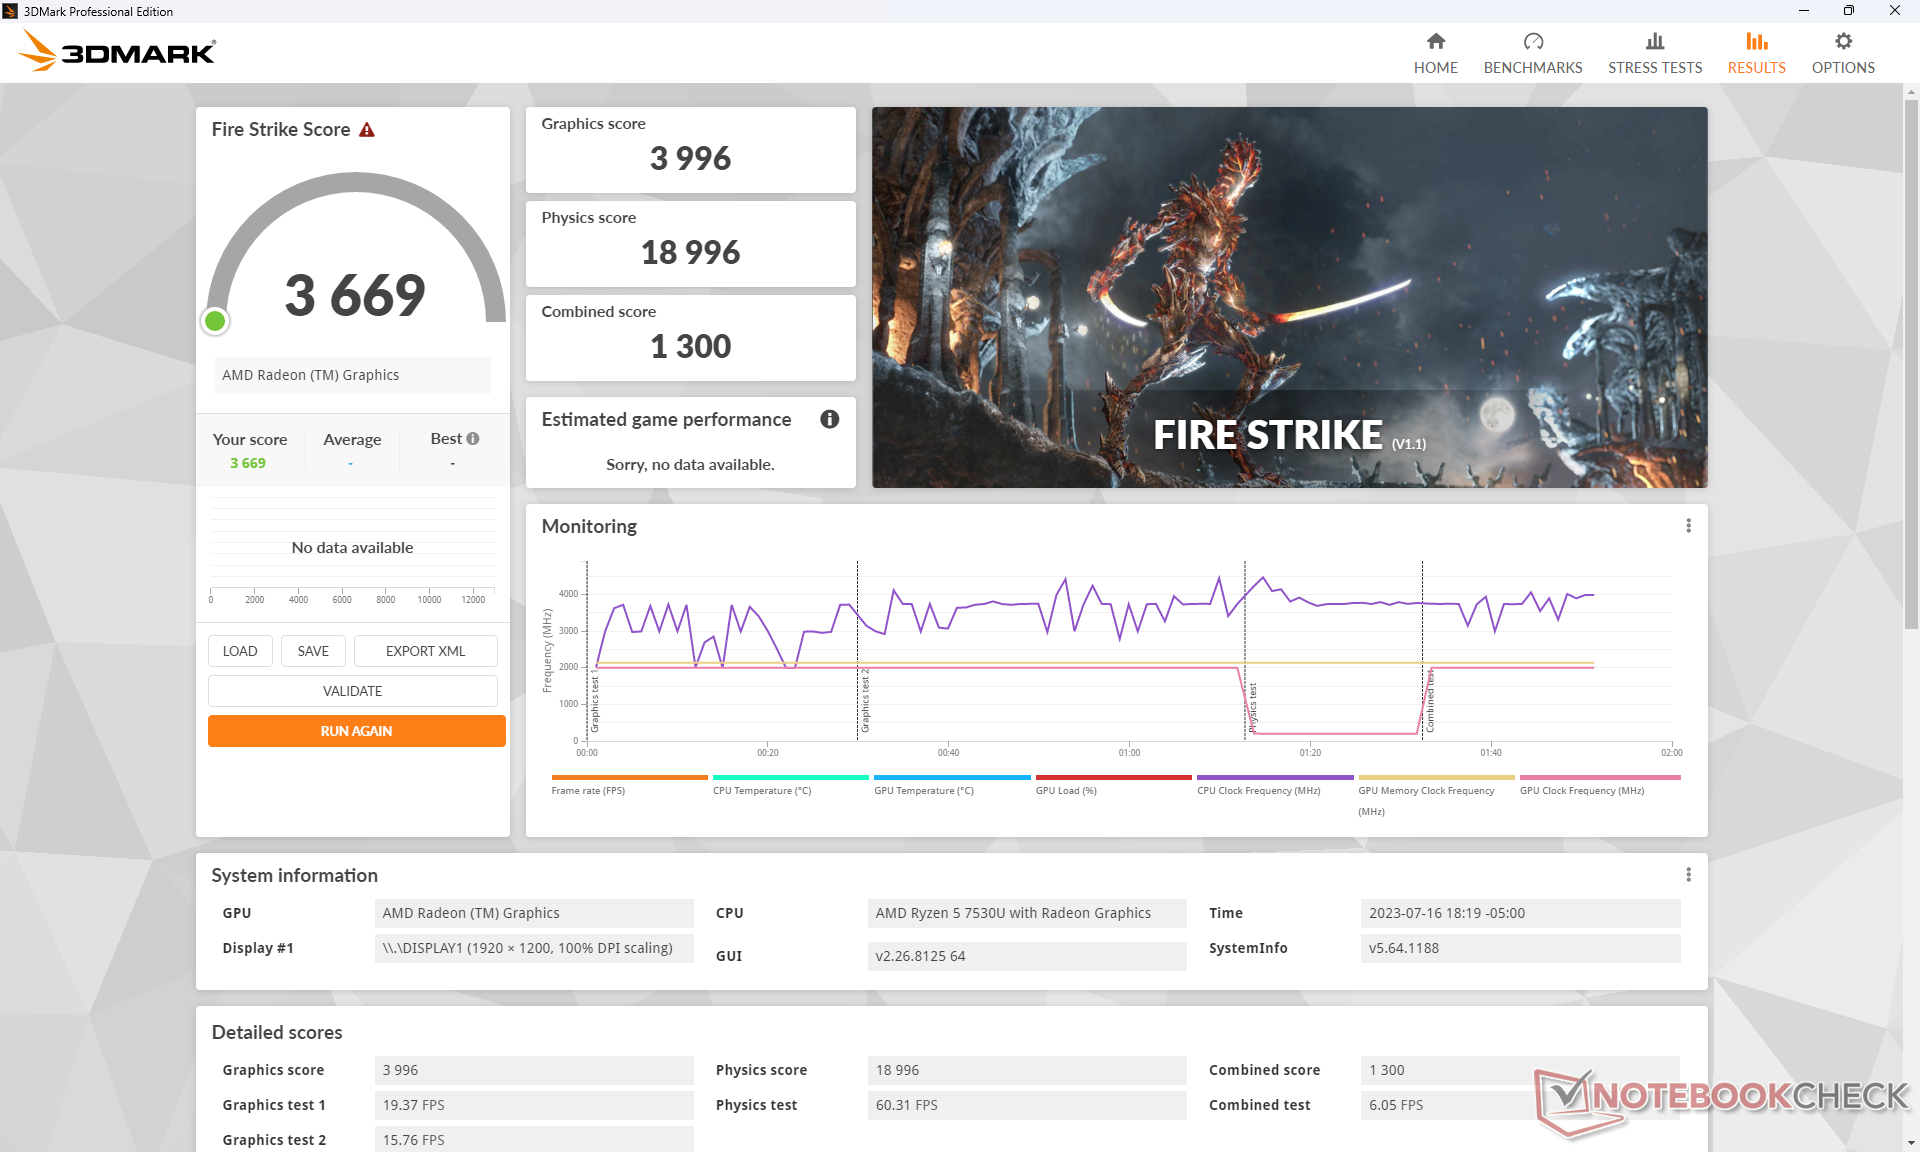
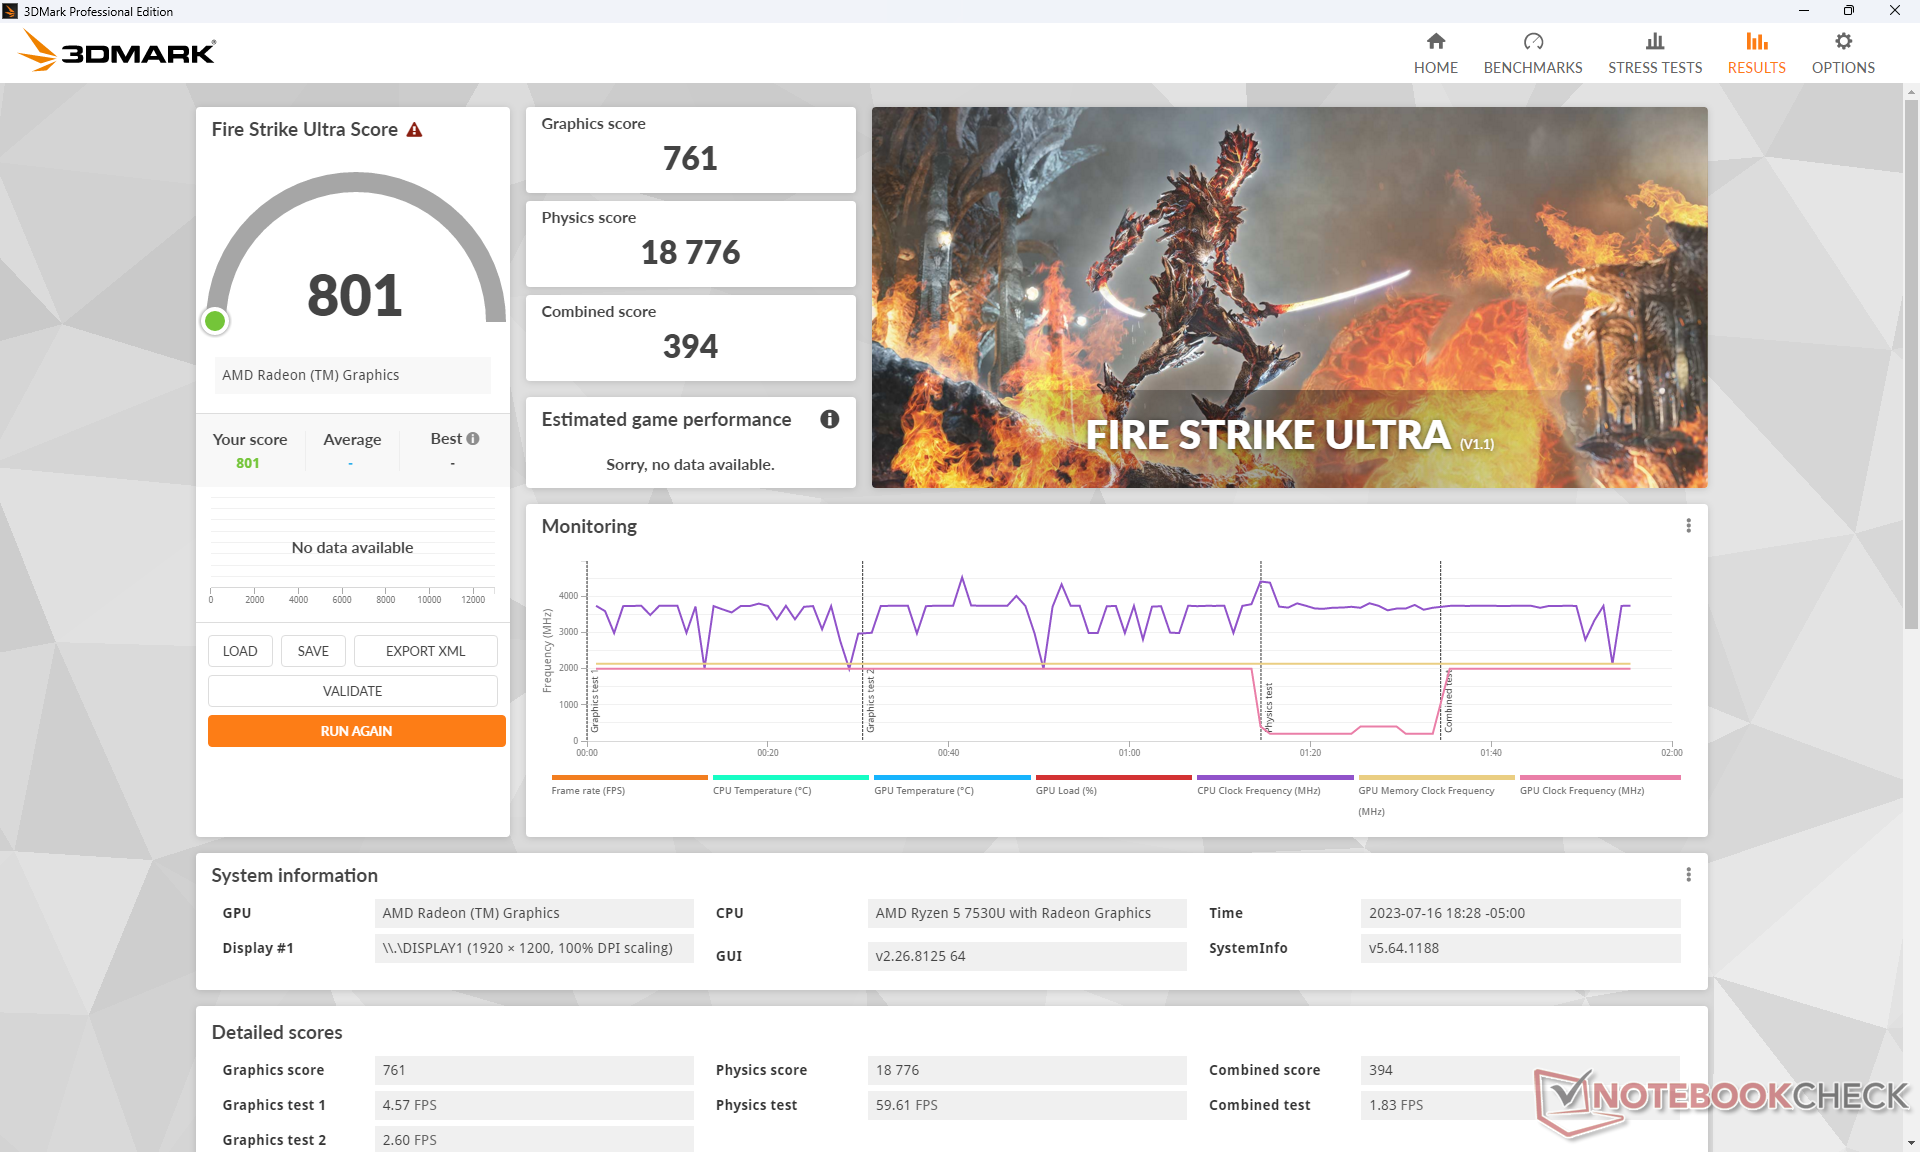
| 3DMark 11 Performance | 6546 punti | |
| 3DMark Fire Strike Score | 3669 punti | |
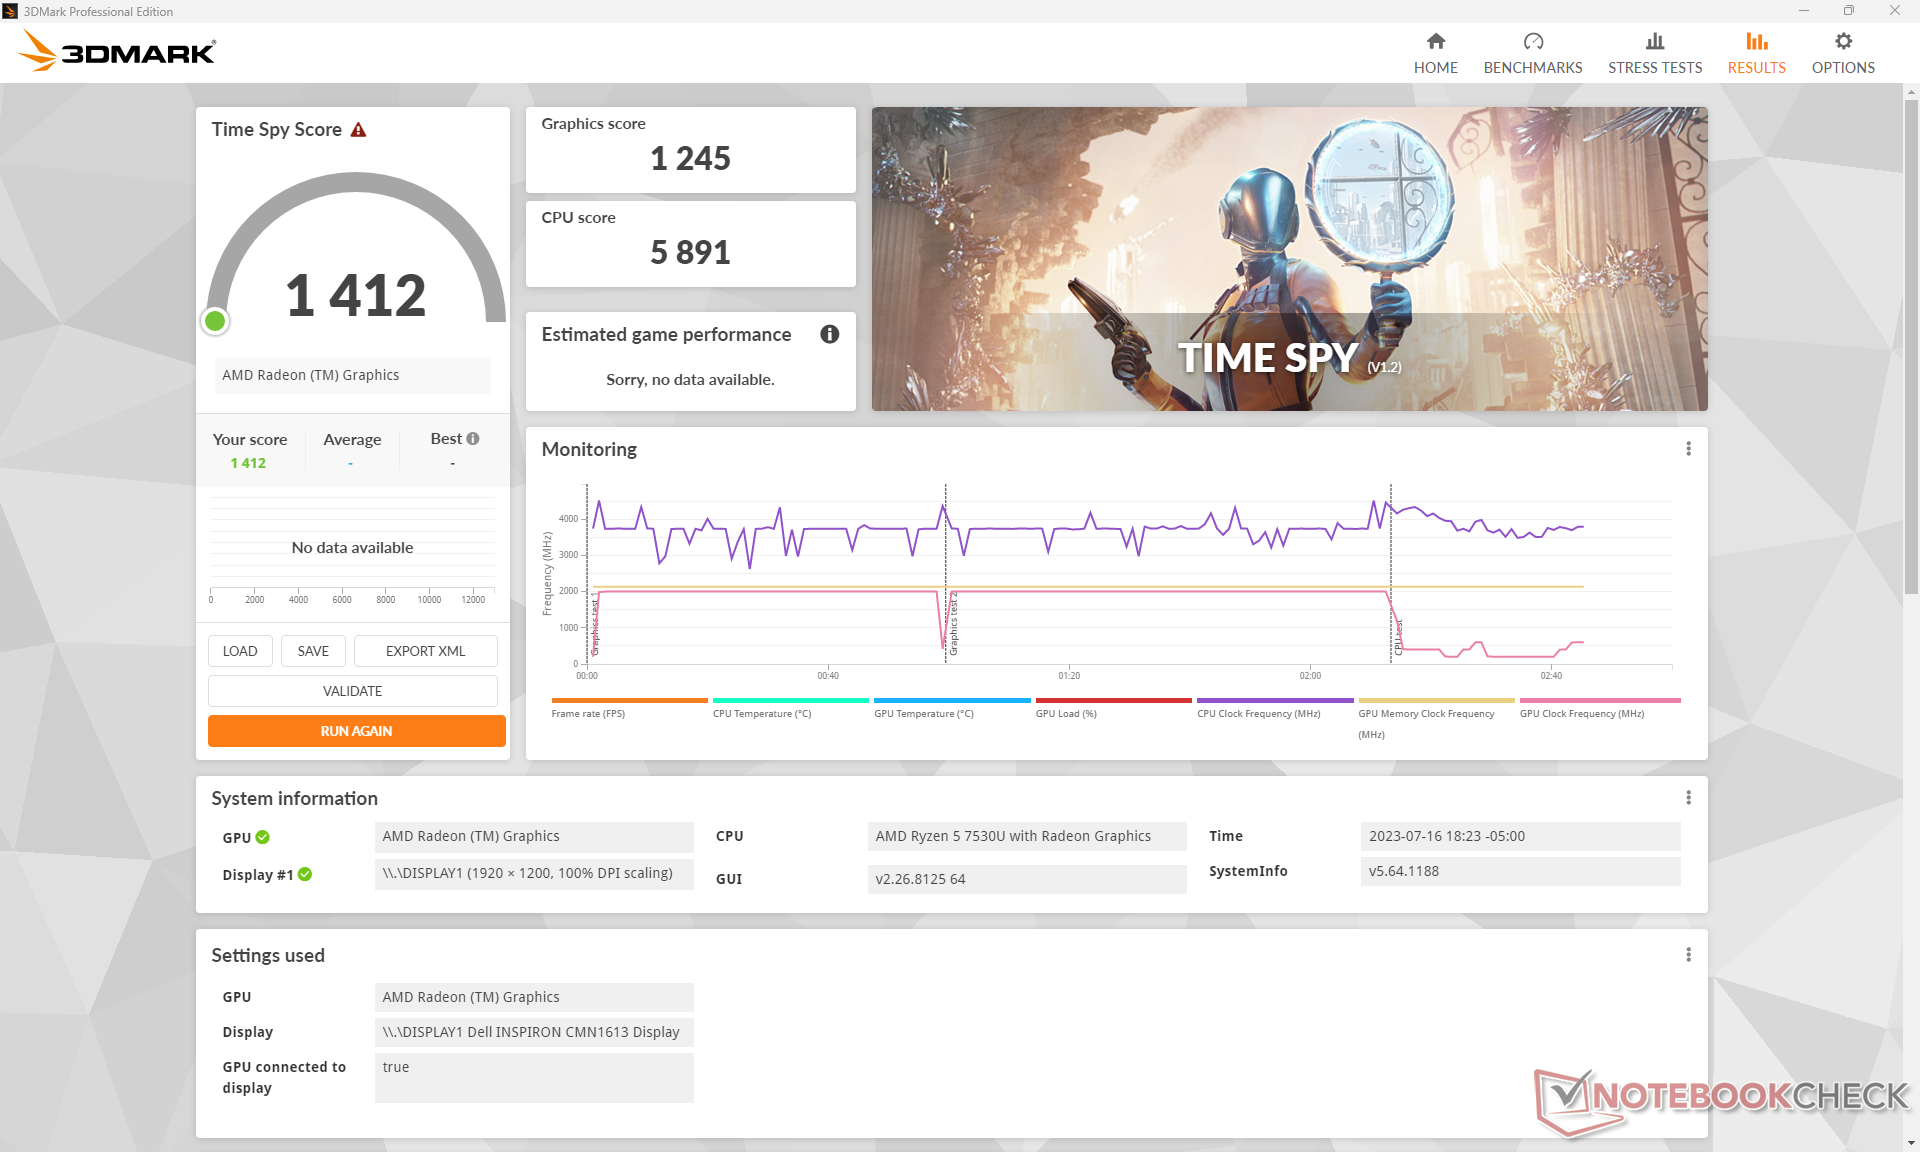
| 3DMark Time Spy Score | 1412 punti | |
Aiuto | ||
* ... Meglio usare valori piccoli
| Returnal | |
| 1280x720 Low Preset | |
| Beelink GTR7 7840HS | |
| Dell Inspiron 16 7635 2-in-1 | |
| Media AMD Radeon RX Vega 7 (18 - 18, n=2) | |
| 1920x1080 Low Preset | |
| Beelink GTR7 7840HS | |
| Dell Inspiron 16 7635 2-in-1 | |
| Media AMD Radeon RX Vega 7 (12 - 13, n=2) | |
| 1920x1080 Medium Preset | |
| Beelink GTR7 7840HS | |
| Dell Inspiron 16 7635 2-in-1 | |
| Media AMD Radeon RX Vega 7 (11 - 12, n=2) | |
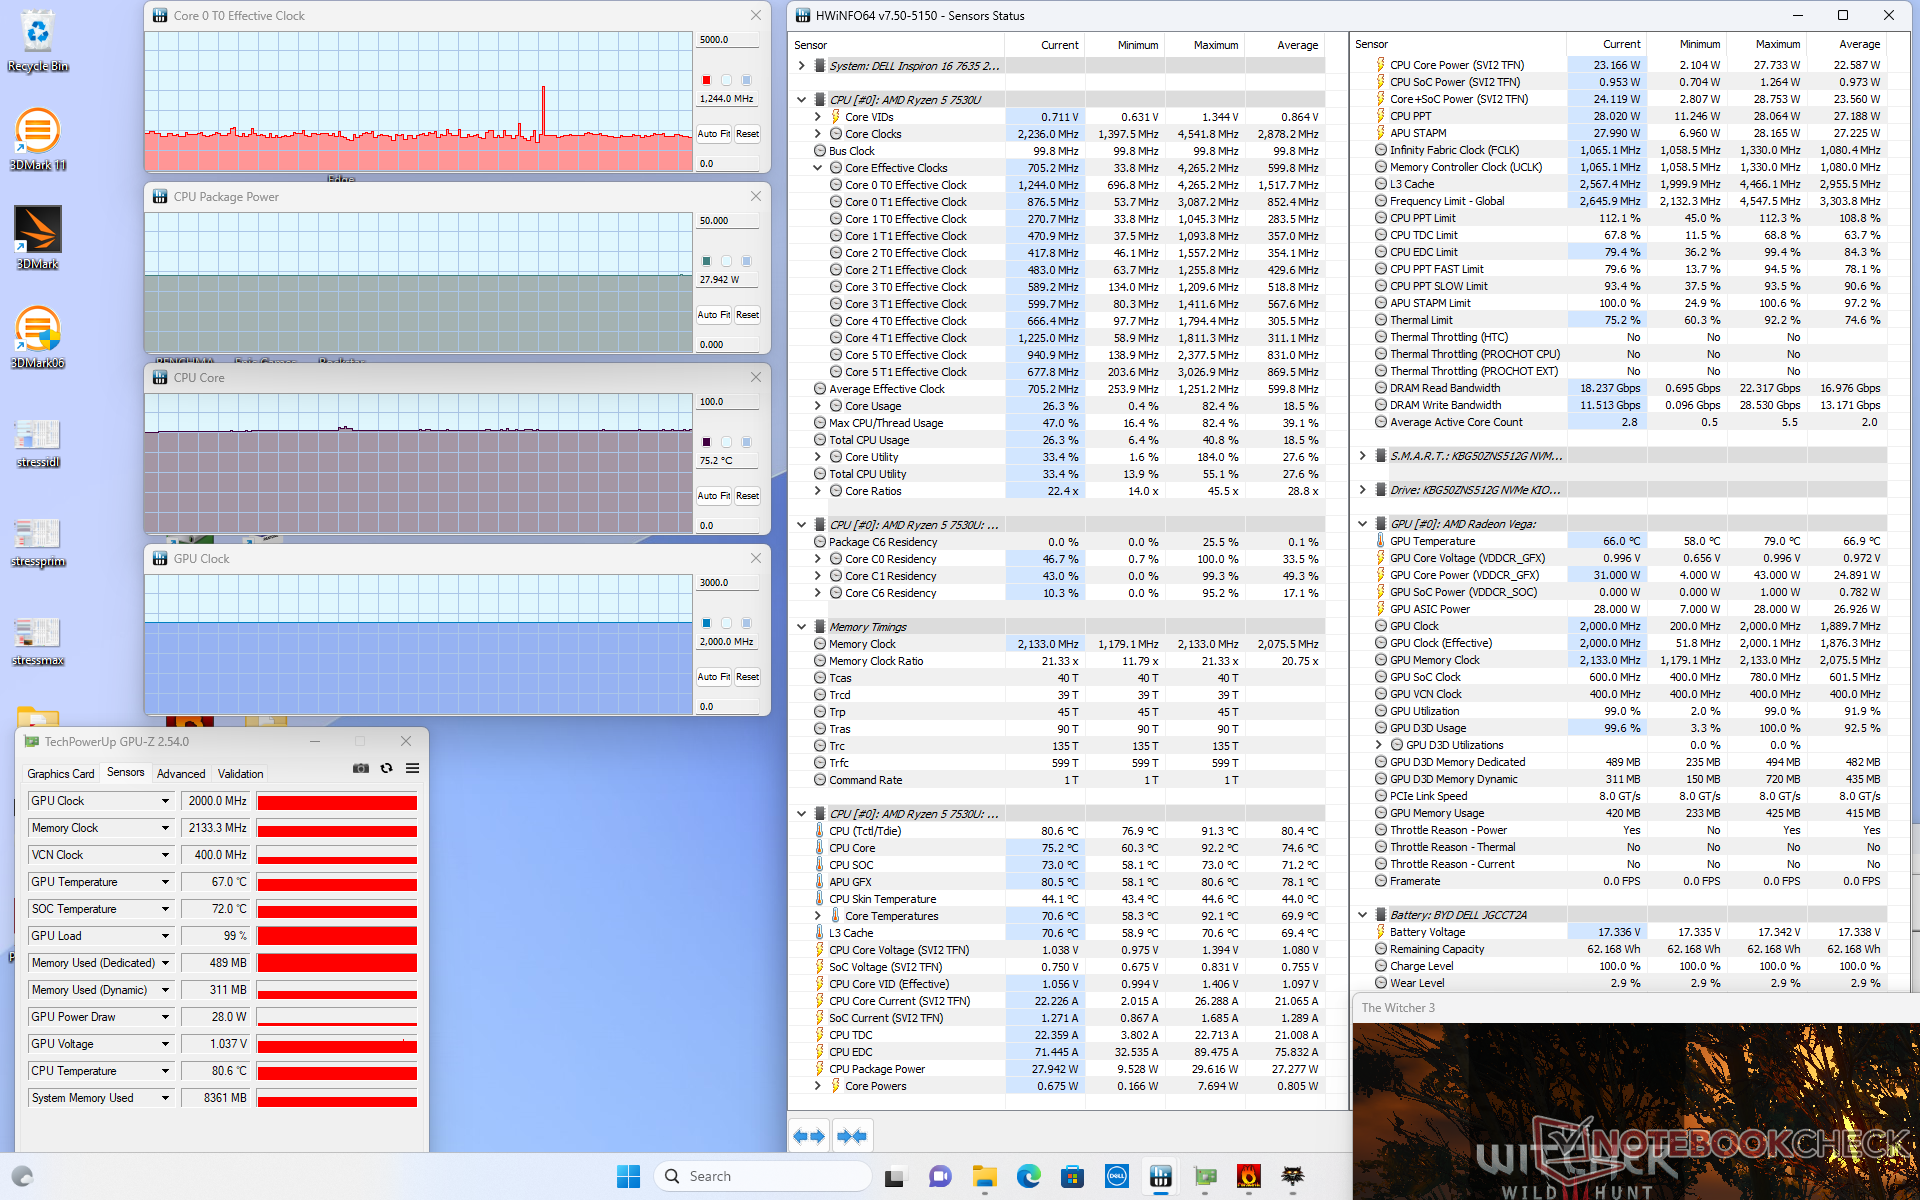
La frequenza dei fotogrammi al minimo su Witcher 3 occasionalmente, ma costantemente, si riduce di quasi 15 FPS per brevi periodi prima di tornare alla normalità. Questo comportamento è sfavorevole in quanto suggerisce problemi ai driver grafici o l'interruzione di attività in background a livello di sistema operativo.
Witcher 3 FPS Chart
| basso | medio | alto | ultra | |
|---|---|---|---|---|
| GTA V (2015) | 24.1 | 9.55 | ||
| The Witcher 3 (2015) | 79.6 | 24.5 | 15.7 | |
| Dota 2 Reborn (2015) | 109 | 90.7 | 55.4 | 52.4 |
| Final Fantasy XV Benchmark (2018) | 37.5 | 18.8 | 12.9 | |
| X-Plane 11.11 (2018) | 38.4 | 30.4 | 26.3 | |
| Strange Brigade (2018) | 86.8 | 33.8 | 28.1 | 23.2 |
| Cyberpunk 2077 1.6 (2022) | 20.3 | 15.3 | 10.5 | 8.5 |
| Tiny Tina's Wonderlands (2022) | 28.8 | 21.2 | 12.9 | 9.2 |
| F1 22 (2022) | 36.2 | 32.3 | 23.9 | 17.1 |
| Returnal (2023) | 13 | 12 |
Emissioni
Rumore del sistema
La ventola è generalmente silenziosa durante i carichi bassi, come la navigazione o lo streaming video, dove tende ad aggirarsi intorno ai 27 dB(A) contro uno sfondo silenzioso di 23,6 dB(A). Quando si è sottoposti a carichi più pesanti, come 3DMark 06, tuttavia, il rumore della ventola balza rapidamente a poco più di 40 dB(A) anche con il profilo di alimentazione bilanciato. Siamo riusciti a registrare una rumorosità massima della ventola di poco superiore a 44 dB(A) quando si eseguono carichi elevati, come i giochi, che è ancora più forte di quella registrata sul vecchio Inspiron 16 7620 2-in-1.Inspiron 16 7620 2-in-1.
Rumorosità
| Idle |
| 23.6 / 23.6 / 23.6 dB(A) |
| Sotto carico |
| 40.3 / 44.2 dB(A) |
 | ||
30 dB silenzioso 40 dB(A) udibile 50 dB(A) rumoroso |
||
min: | ||
| Dell Inspiron 16 7635 2-in-1 Vega 7, R5 7530U, Kioxia BG5 KBG50ZNS512G | Acer Swift Edge SFE16-42-R1GM Radeon 680M, R7 7735U, Micron 3400 1TB MTFDKBA1T0TFH | Lenovo Yoga 7 16IRL8 Iris Xe G7 96EUs, i7-1355U, WD PC SN740 512GB SDDPMQD-512G-1101 | Samsung Galaxy Book3 Pro 16 Iris Xe G7 80EUs, i5-1340P, WD PC SN740 256GB SDDPNQD-256G | Lenovo IdeaPad Flex 5 16ABR G8 Vega 8, R7 7730U, Samsung PM9B1 1024GB MZAL41T0HBLB | Dell Inspiron 16 7620 2-in-1 Iris Xe G7 96EUs, i7-1260P, Toshiba KBG40ZNS512G NVMe | |
|---|---|---|---|---|---|---|
| Noise | -10% | -0% | -11% | -0% | 8% | |
| off /ambiente * (dB) | 23.6 | 25.7 -9% | 22.8 3% | 25.2 -7% | 24.2 -3% | 23.2 2% |
| Idle Minimum * (dB) | 23.6 | 25.7 -9% | 22.9 3% | 25.2 -7% | 24.2 -3% | 23.5 -0% |
| Idle Average * (dB) | 23.6 | 27 -14% | 22.9 3% | 25.2 -7% | 24.2 -3% | 23.5 -0% |
| Idle Maximum * (dB) | 23.6 | 29.3 -24% | 26.9 -14% | 29.3 -24% | 28.7 -22% | 23.5 -0% |
| Load Average * (dB) | 40.3 | 42.3 -5% | 41.7 -3% | 46.4 -15% | 33.1 18% | 29.4 27% |
| Witcher 3 ultra * (dB) | 44.2 | 41.5 6% | 41.8 5% | 35.6 19% | ||
| Load Maximum * (dB) | 44.2 | 42.7 3% | 43.6 1% | 46.4 -5% | 41.8 5% | 39.7 10% |
* ... Meglio usare valori piccoli
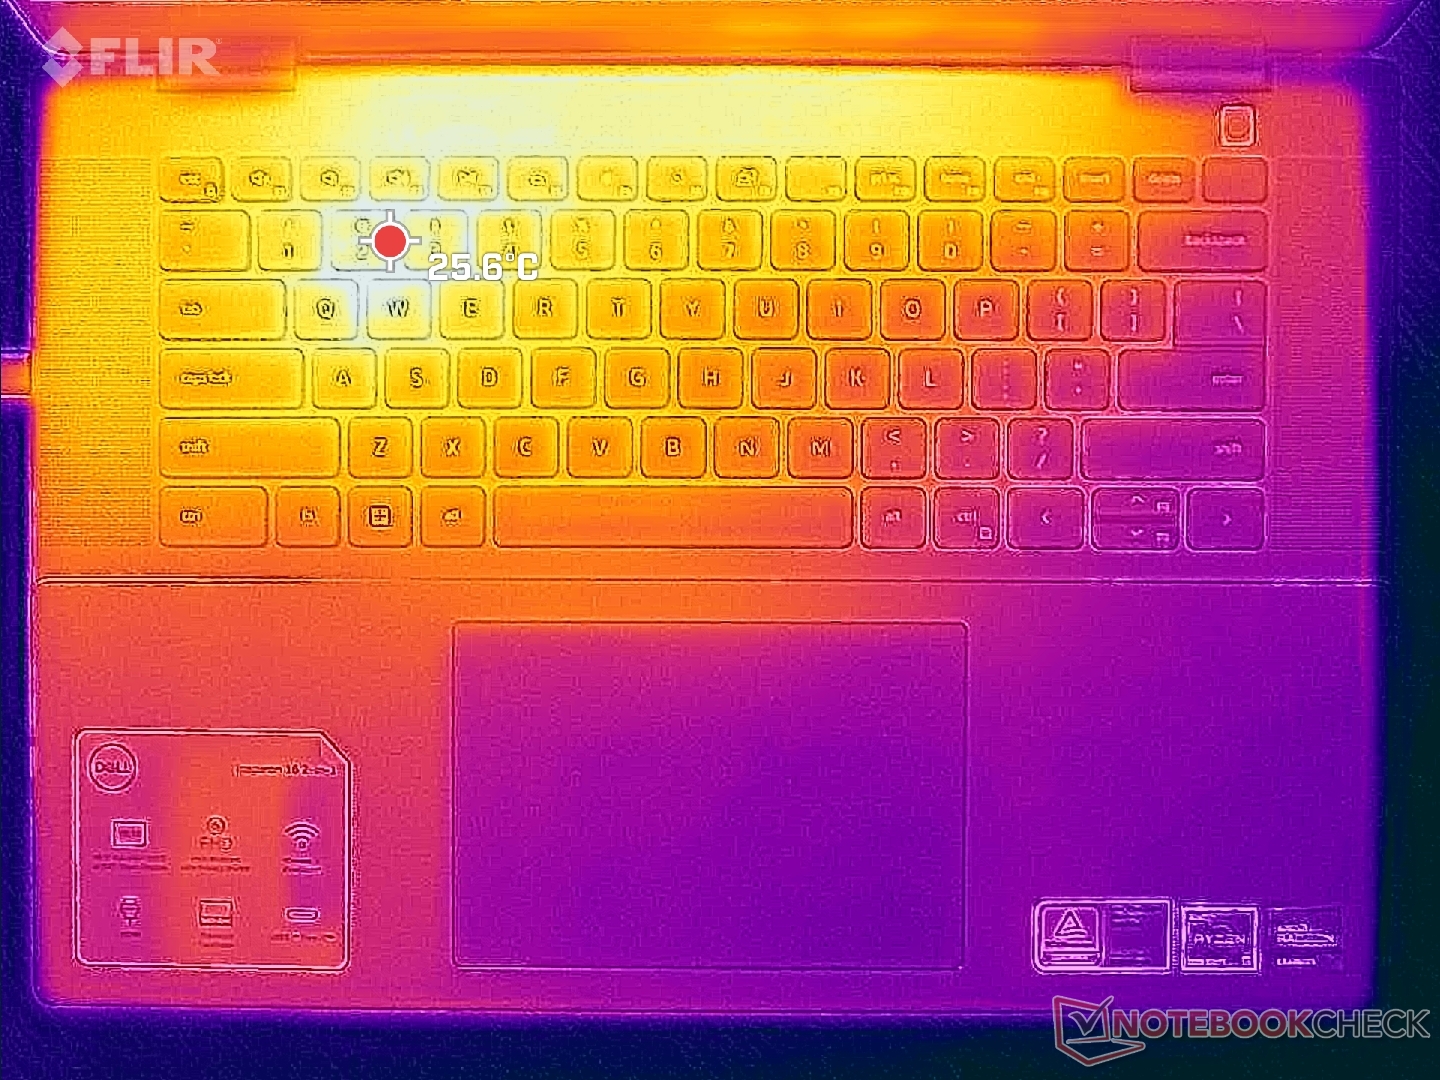
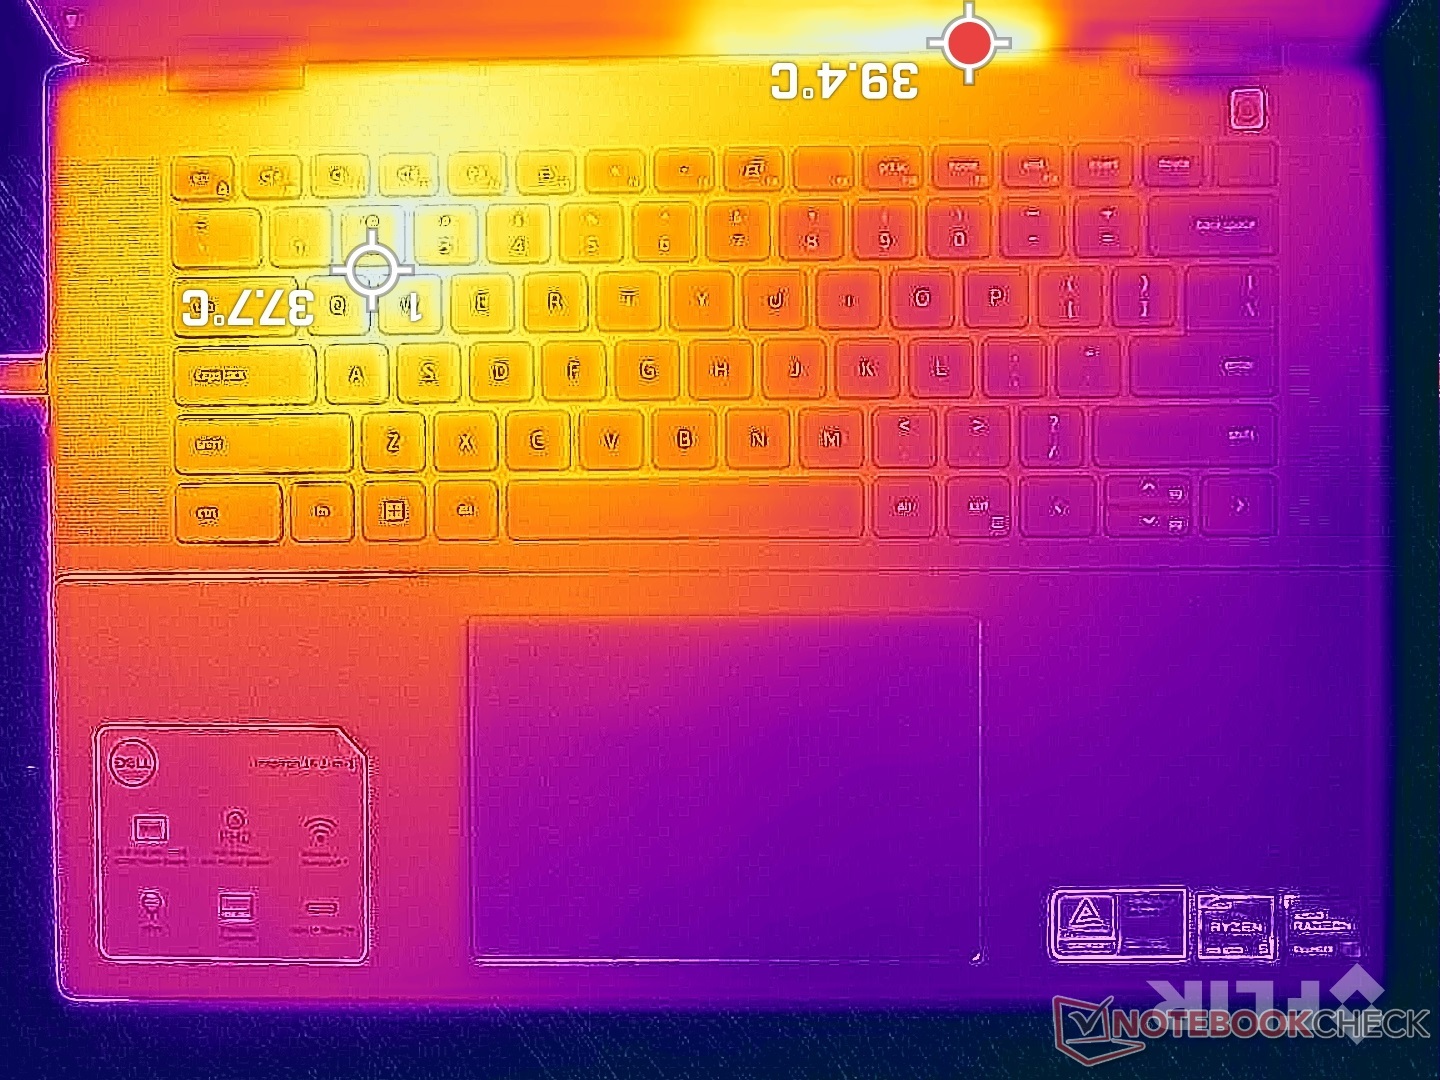
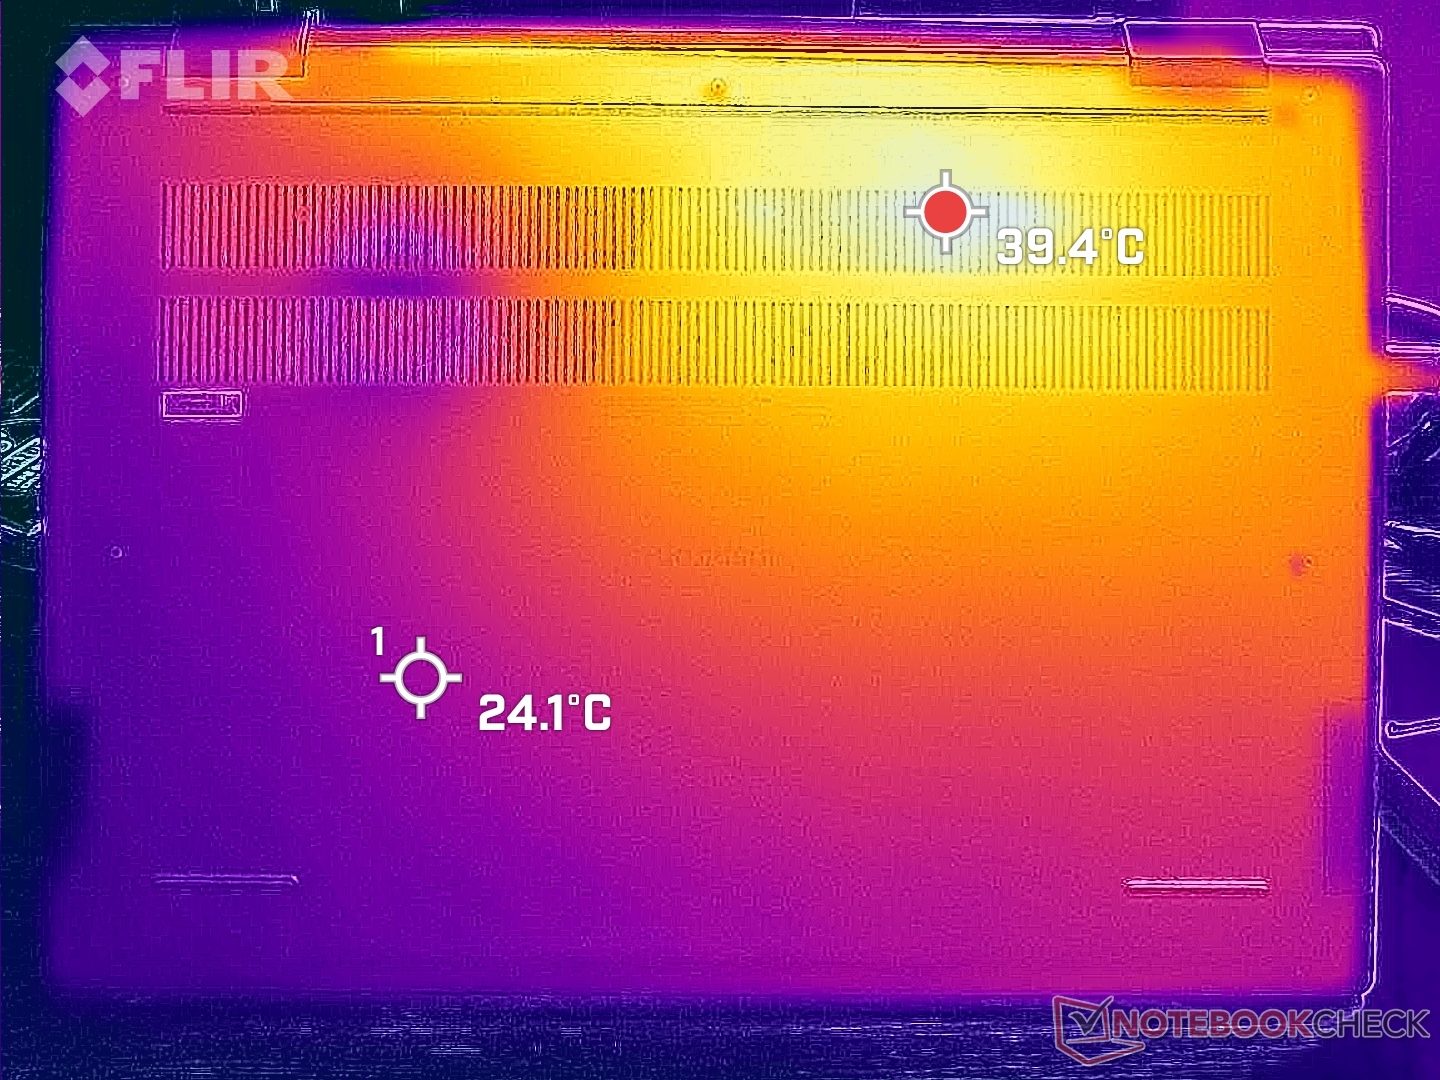
Temperatura
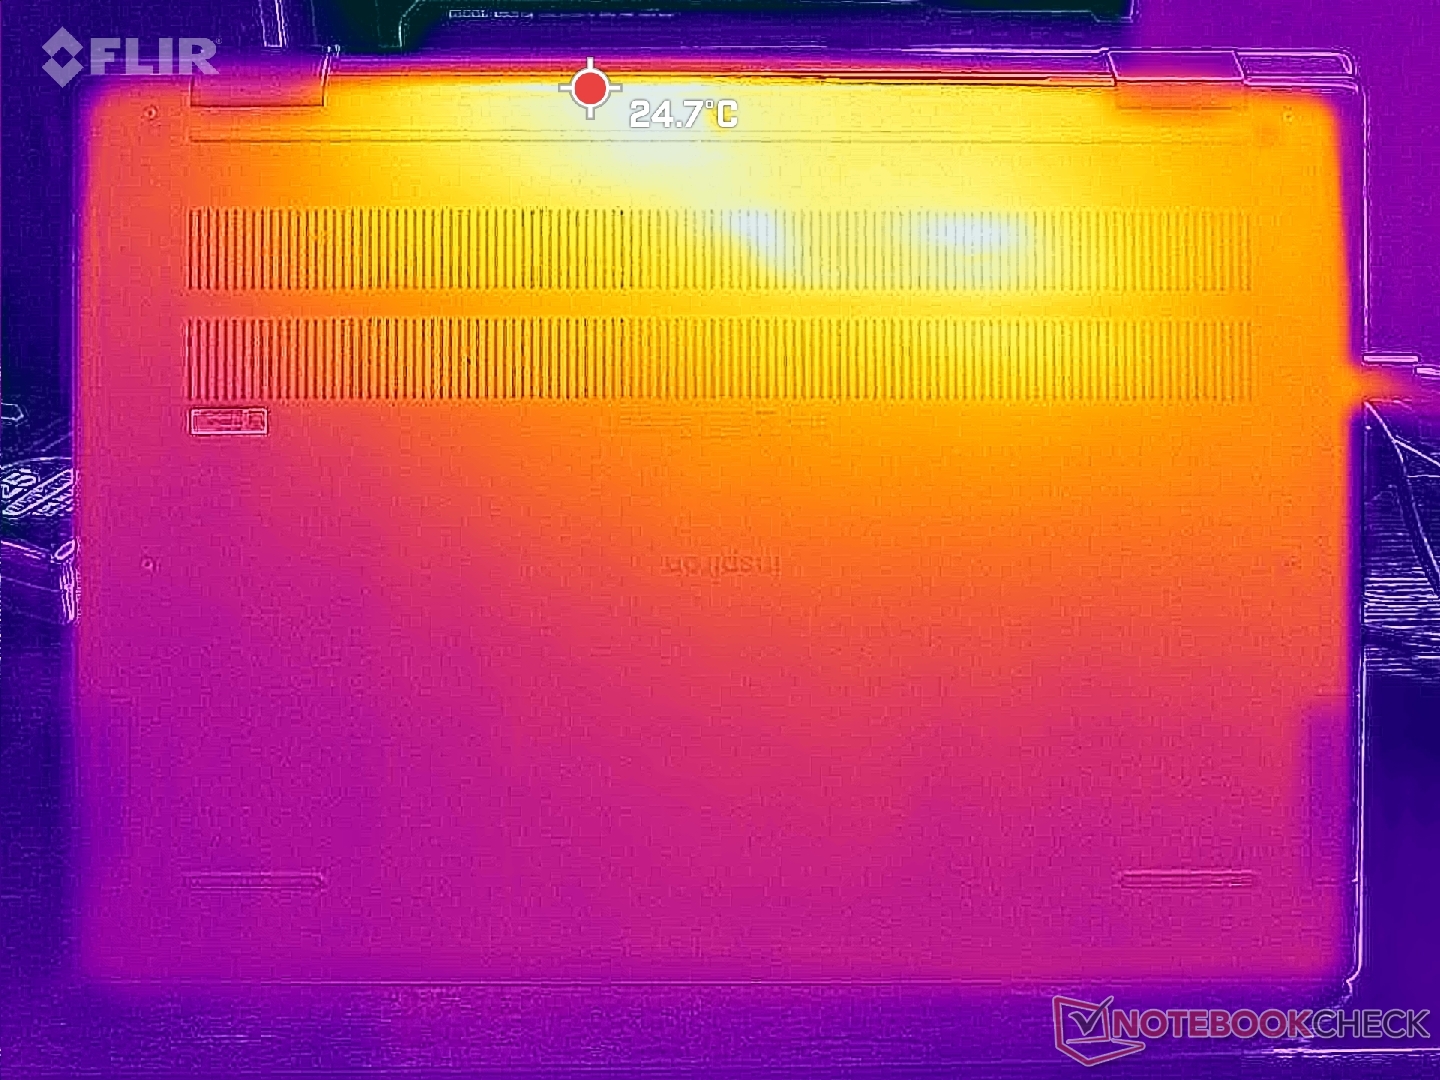
Le temperature di superficie sono più calde sulla metà sinistra della tastiera anziché al centro, poiché il posizionamento del processore è cambiato rispetto al design dello scorso anno. I punti caldi possono raggiungere poco più di 40 C sulle superfici superiore e inferiore, il che è comunque sensibilmente più fresco rispetto all'IdeaPad Flex 5 16.IdeaPad Flex 5 16 o del vecchio Inspiron 16 7620 2-in-1 dove le temperature superficiali possono raggiungere quasi i 50 C sotto carico. La rumorosità generalmente più elevata della ventola dell'Inspiron 16 7635 2-in-1 potrebbe essere in parte responsabile delle temperature superficiali più basse.
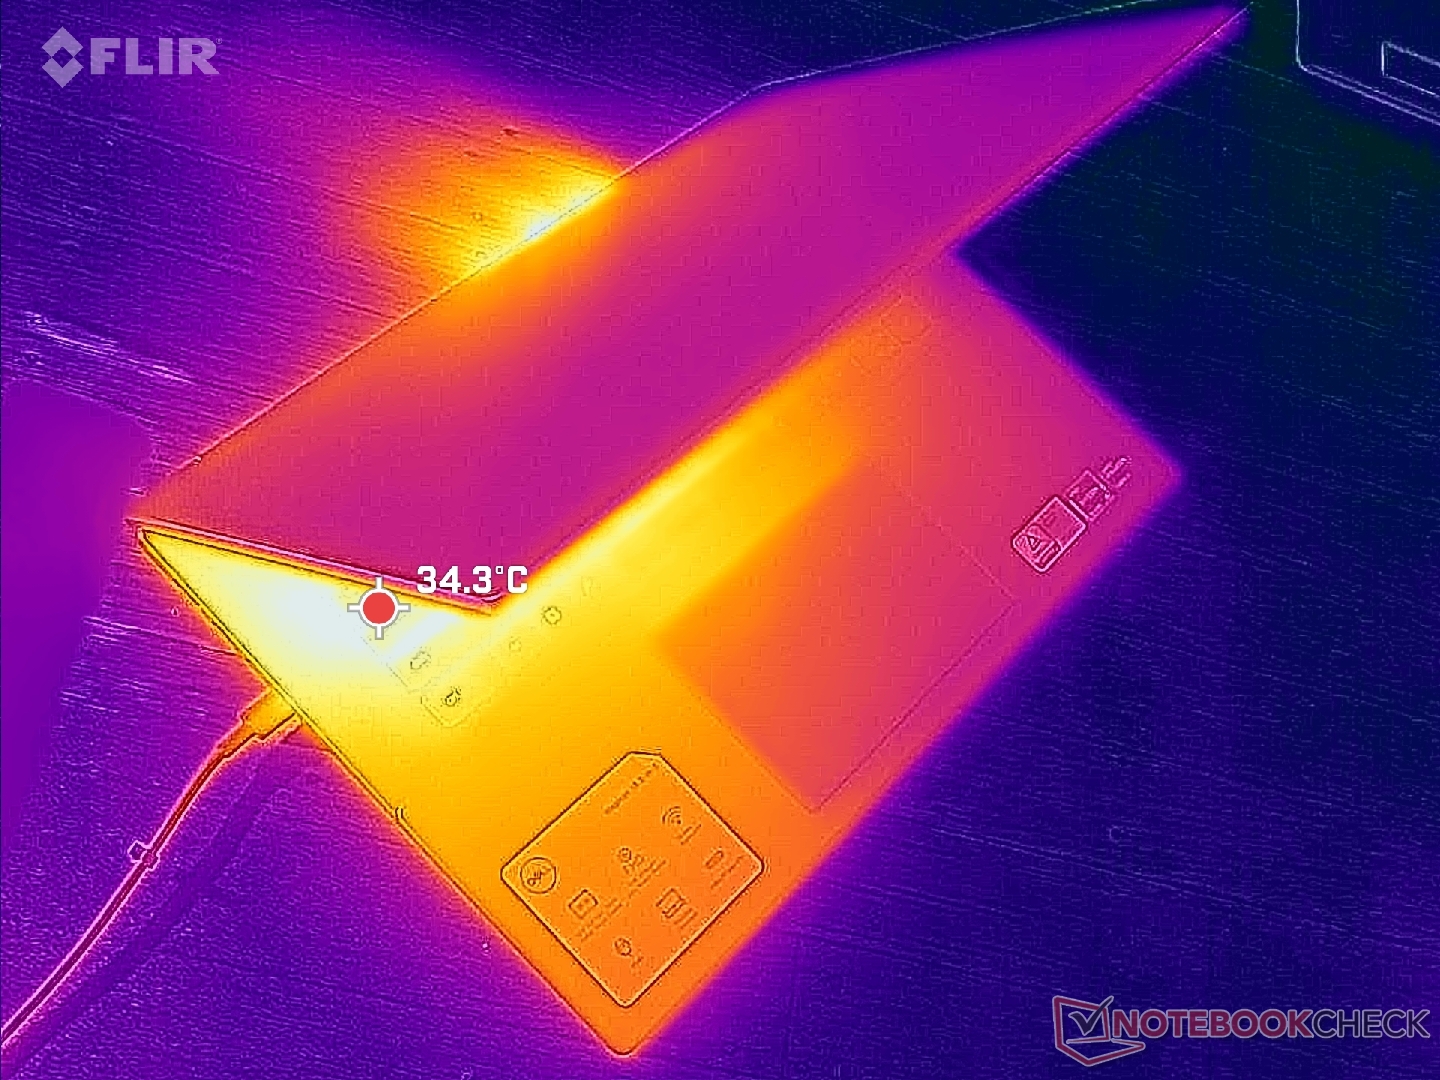
(±) La temperatura massima sul lato superiore è di 41.6 °C / 107 F, rispetto alla media di 35.4 °C / 96 F, che varia da 19.6 a 60 °C per questa classe Convertible.
(+) Il lato inferiore si riscalda fino ad un massimo di 39 °C / 102 F, rispetto alla media di 36.9 °C / 98 F
(+) In idle, la temperatura media del lato superiore è di 25.8 °C / 78 F, rispetto alla media deld ispositivo di 30.3 °C / 87 F.
(+) I poggiapolsi e il touchpad sono piu' freddi della temperatura della pelle con un massimo di 31.4 °C / 88.5 F e sono quindi freddi al tatto.
(-) La temperatura media della zona del palmo della mano di dispositivi simili e'stata di 28 °C / 82.4 F (-3.4 °C / -6.1 F).
| Dell Inspiron 16 7635 2-in-1 AMD Ryzen 5 7530U, AMD Radeon RX Vega 7 | Acer Swift Edge SFE16-42-R1GM AMD Ryzen 7 7735U, AMD Radeon 680M | Lenovo Yoga 7 16IRL8 Intel Core i7-1355U, Intel Iris Xe Graphics G7 96EUs | Samsung Galaxy Book3 Pro 16 Intel Core i5-1340P, Intel Iris Xe Graphics G7 80EUs | Lenovo IdeaPad Flex 5 16ABR G8 AMD Ryzen 7 7730U, AMD Radeon RX Vega 8 (Ryzen 4000/5000) | Dell Inspiron 16 7620 2-in-1 Intel Core i7-1260P, Intel Iris Xe Graphics G7 96EUs | |
|---|---|---|---|---|---|---|
| Heat | -15% | -1% | -9% | -5% | -13% | |
| Maximum Upper Side * (°C) | 41.6 | 49.4 -19% | 37.6 10% | 41.6 -0% | 51.4 -24% | 42.2 -1% |
| Maximum Bottom * (°C) | 39 | 44.7 -15% | 40 -3% | 45 -15% | 47.8 -23% | 47.4 -22% |
| Idle Upper Side * (°C) | 29.4 | 34 -16% | 30.4 -3% | 31 -5% | 24.8 16% | 32.2 -10% |
| Idle Bottom * (°C) | 28.6 | 31.6 -10% | 30.6 -7% | 33.6 -17% | 24.9 13% | 33.6 -17% |
* ... Meglio usare valori piccoli
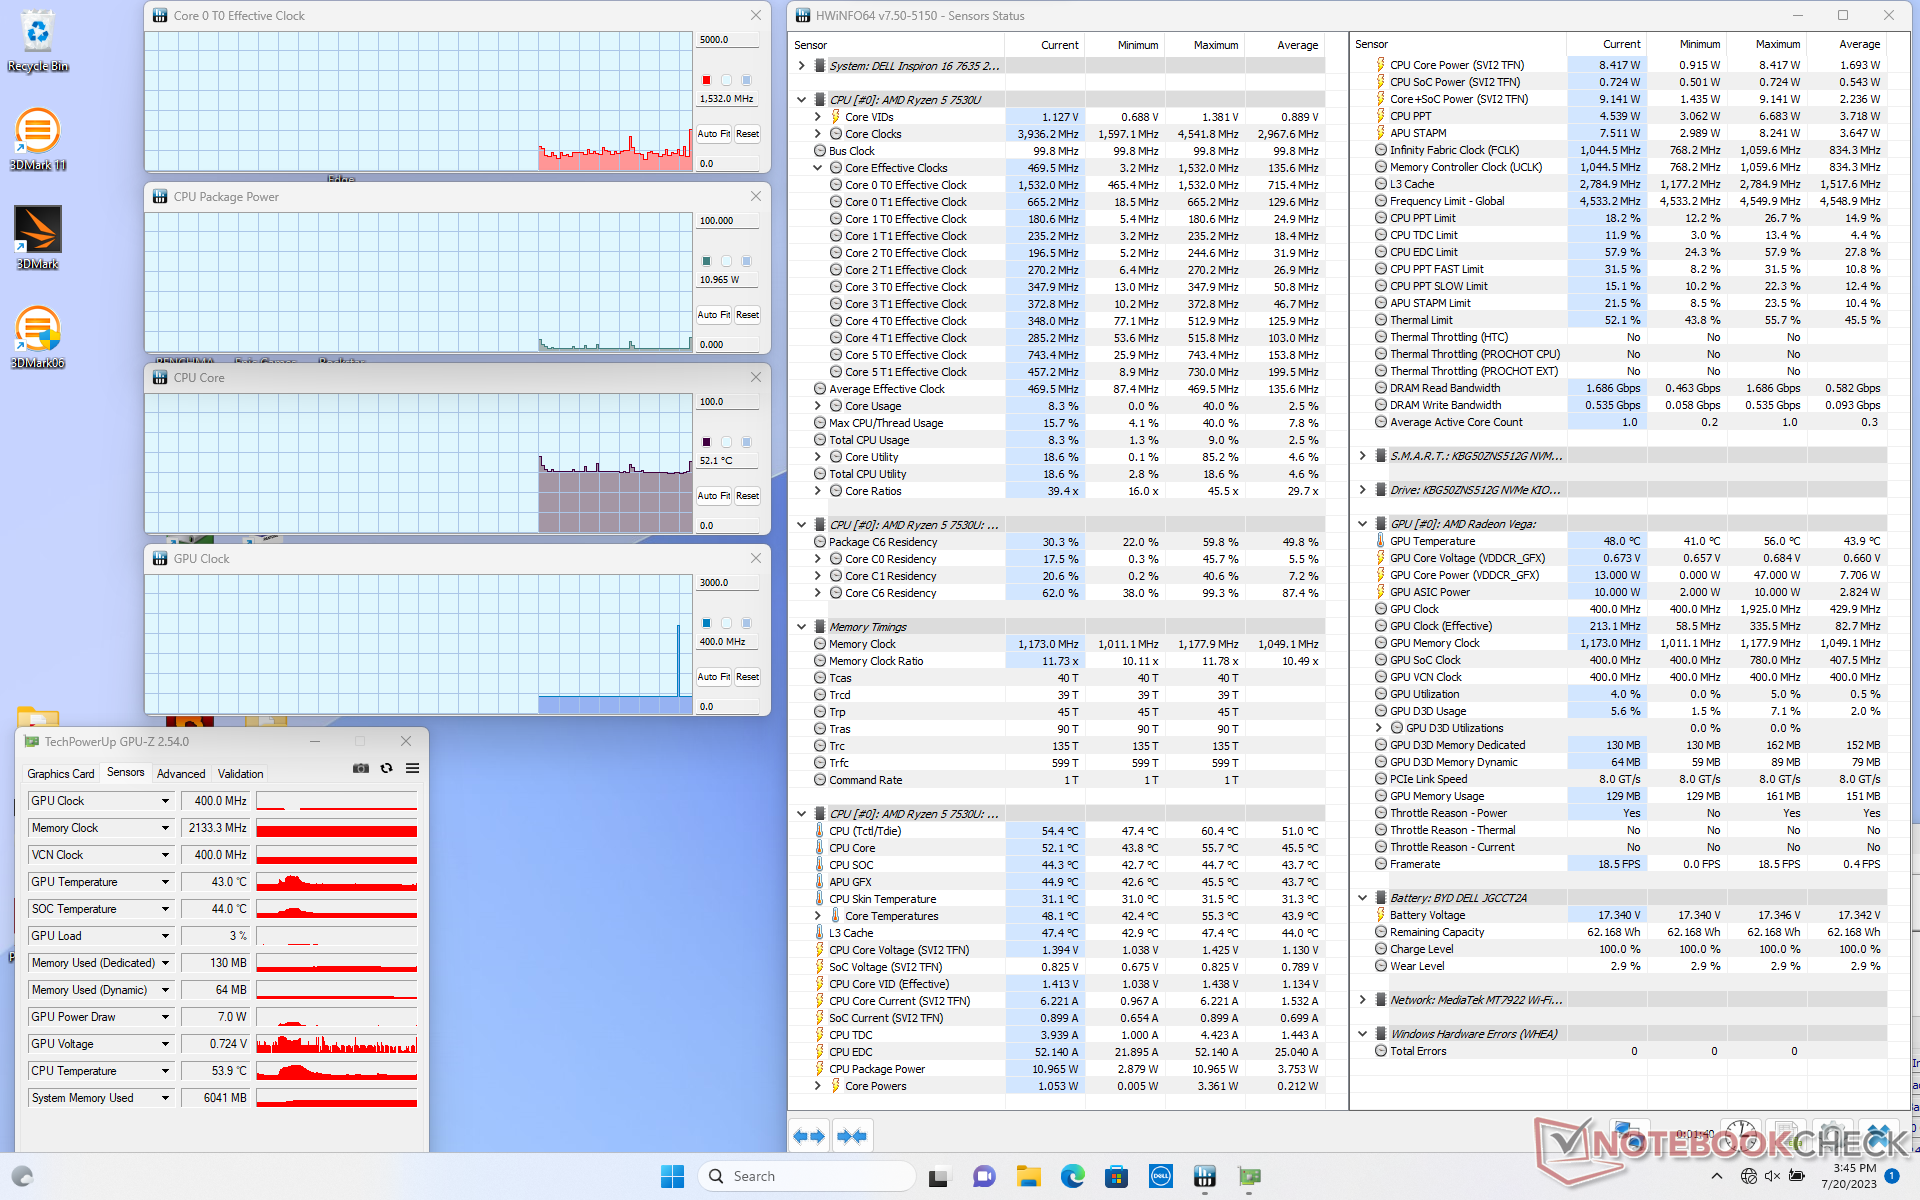
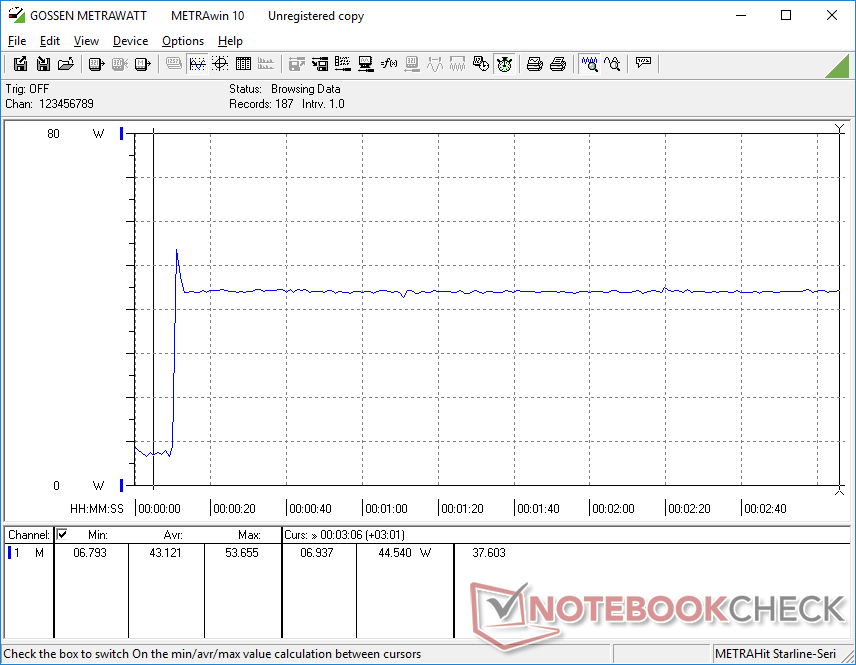
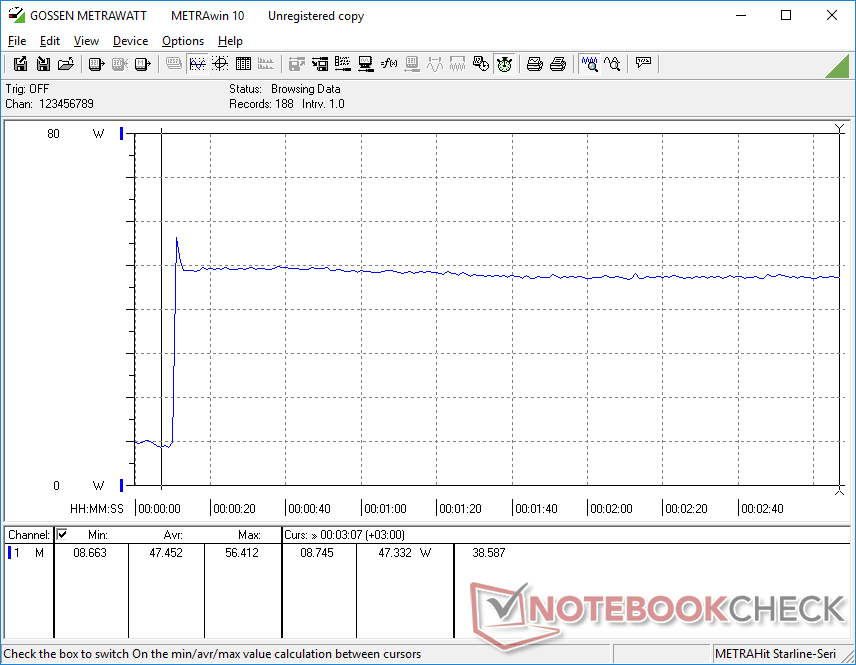
Stress test
Le frequenze di clock del processore, l'assorbimento di potenza della scheda e la temperatura durante l'esecuzione di Prime95 hanno raggiunto rispettivamente 3,4 GHz, 35 W e 81 C. Alla fine la CPU si stabilizzava a 3 GHz, 28 W e 90 C dopo appena un minuto, rispetto agli 81 C dell'Inspiron 16 7620 2-in-1 alimentato da Intel dello scorso anno.
Il funzionamento a batteria riduce leggermente le prestazioni. Un test 3DMark 11 a batteria restituisce punteggi di Fisica e Grafica rispettivamente di 12497 e 5935 punti, rispetto a 12926 e 6249 punti con l'alimentazione a rete.
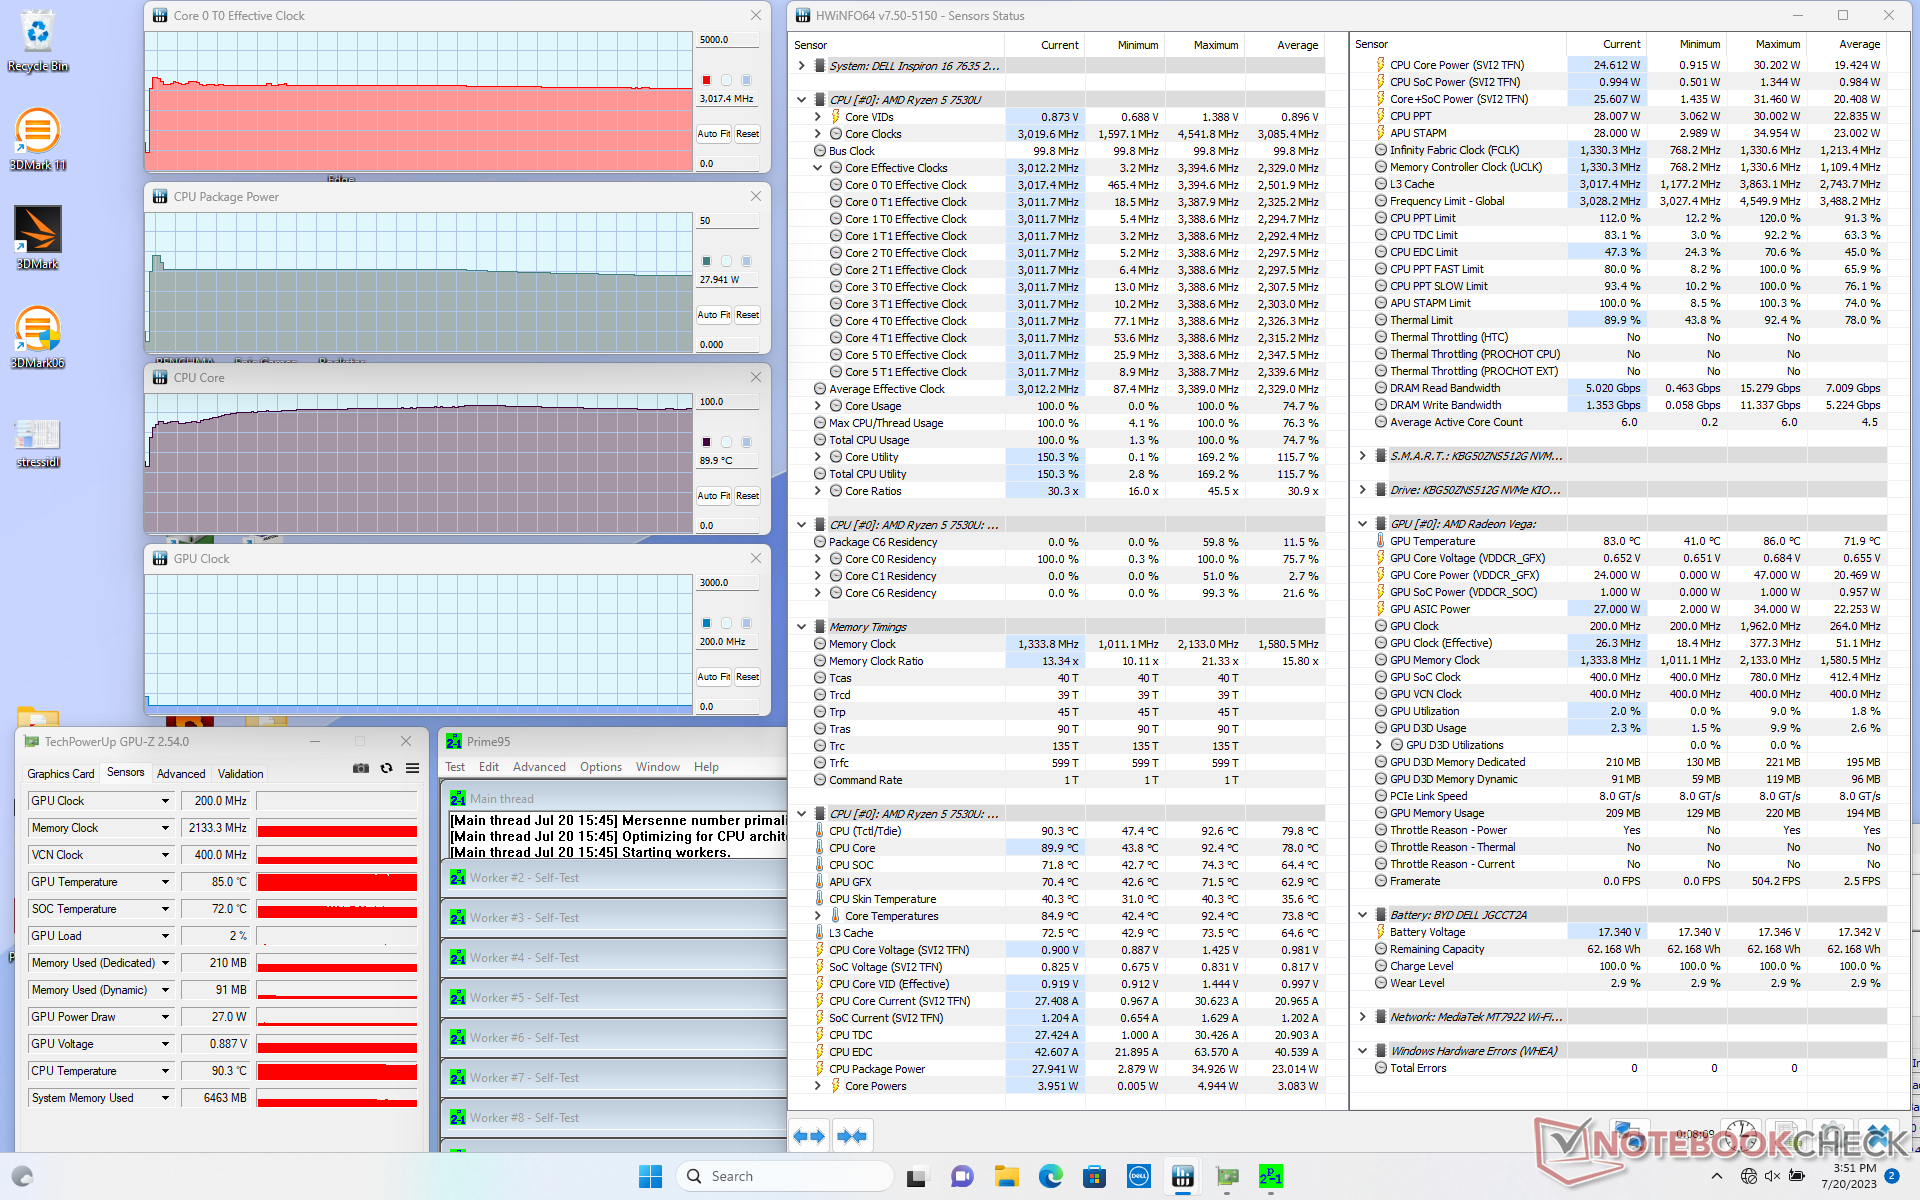
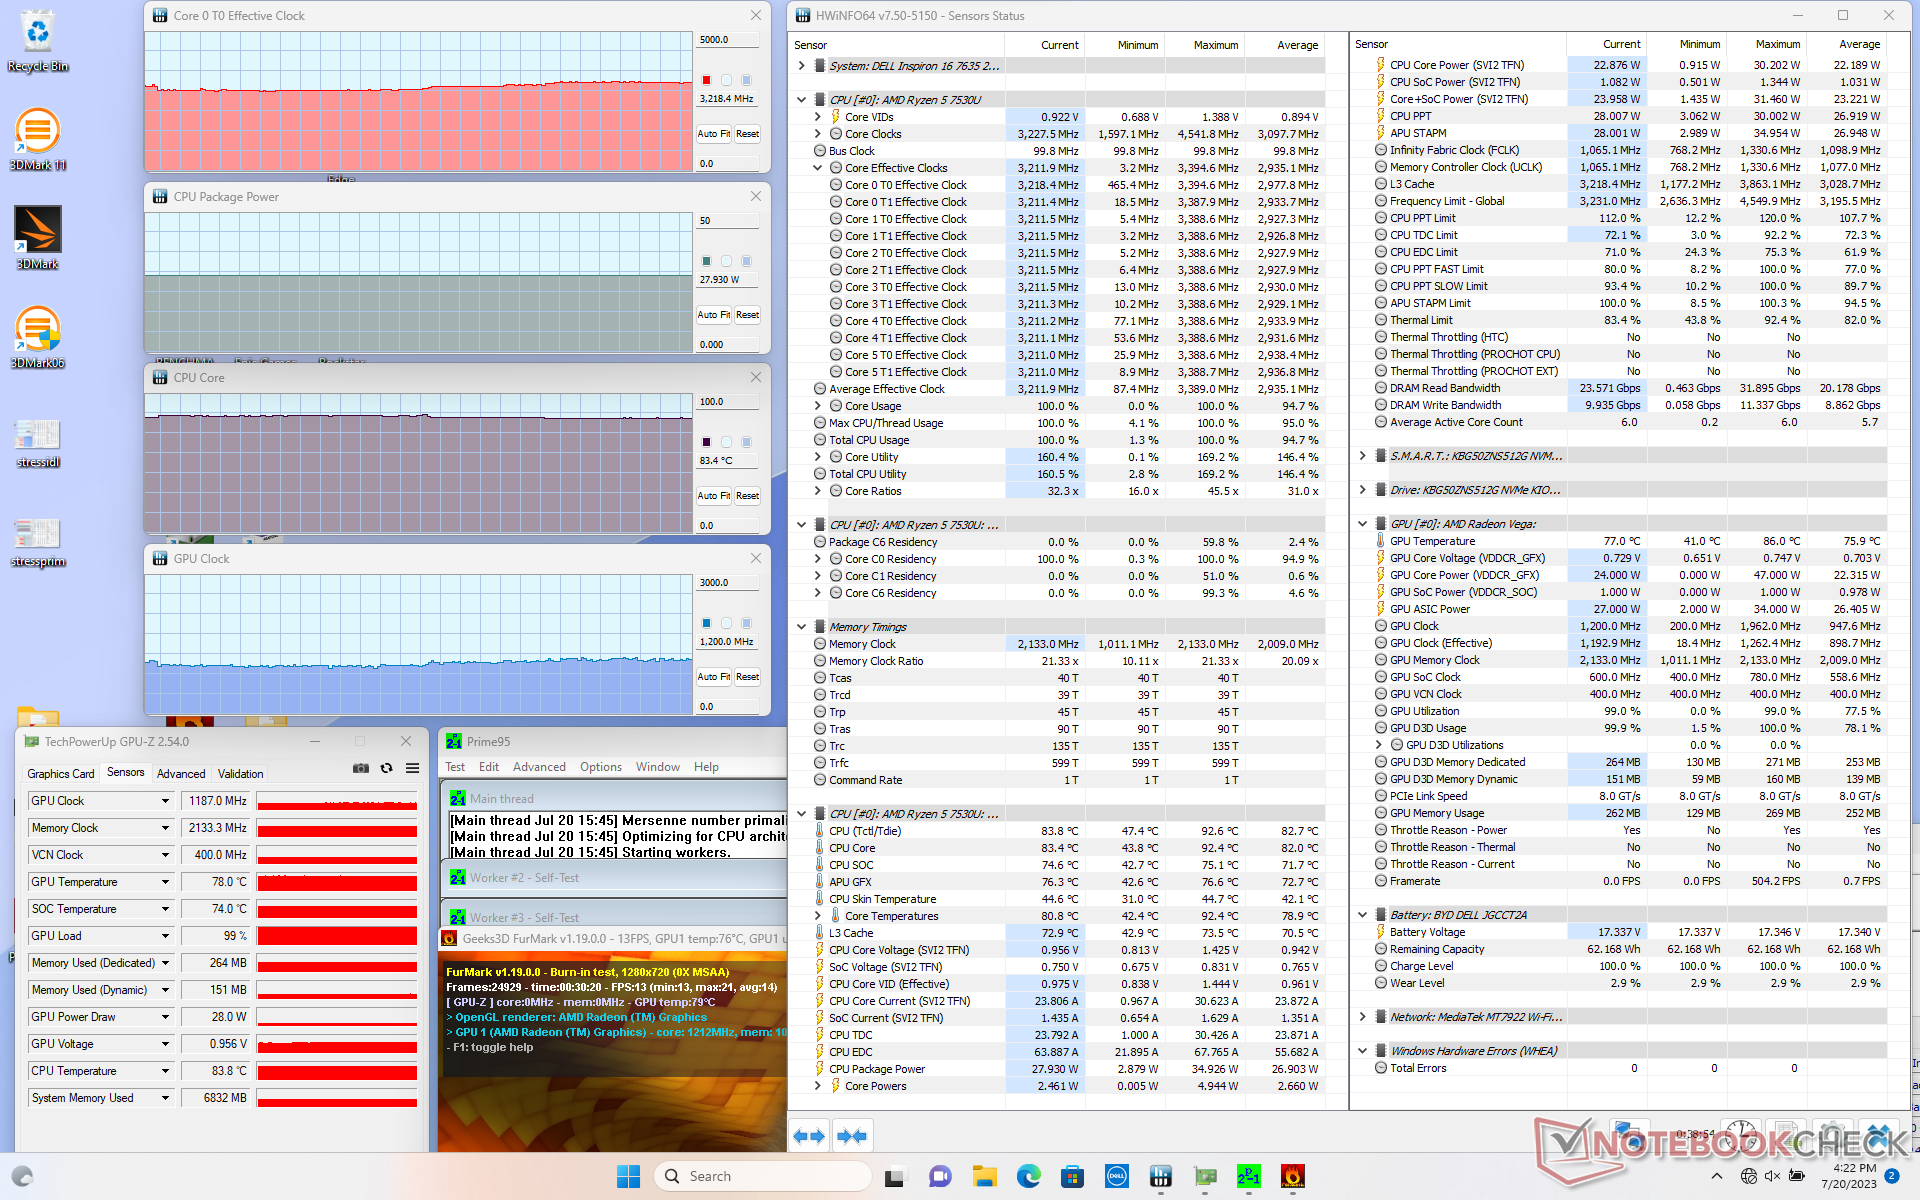
| Clock della CPU (GHz) | Clock della GPU (MHz) | Temperatura media della CPU (°C) | |
| Sistema inattivo | -- | -- | 52 |
| Stress Prime95 | 3.0 | -- | 90 |
| Prime95 + FurMark Stress | 3.1 - 3.2 | 1187 | 83 |
| Witcher 3 Stress | 1.2 | 2000 | 75 |
Altoparlanti
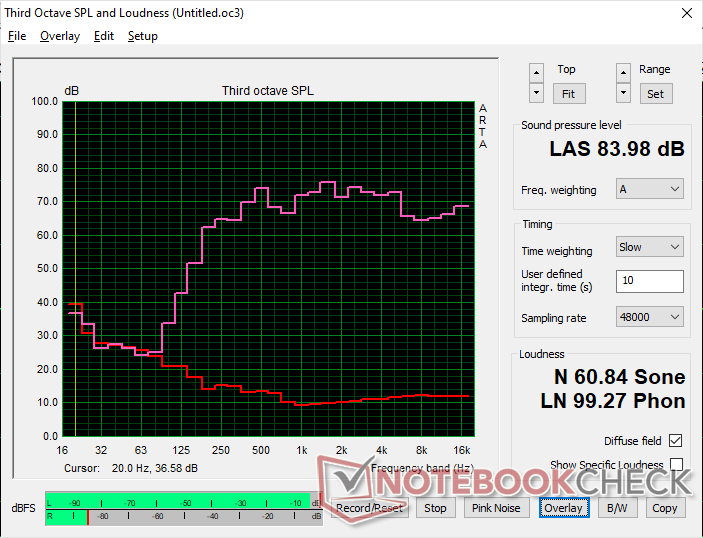
Dell Inspiron 16 7635 2-in-1 analisi audio
(+) | gli altoparlanti sono relativamente potenti (84 dB)
Bassi 100 - 315 Hz
(±) | bassi ridotti - in media 14.9% inferiori alla media
(±) | la linearità dei bassi è media (11.9% delta rispetto alla precedente frequenza)
Medi 400 - 2000 Hz
(+) | medi bilanciati - solo only 3.5% rispetto alla media
(+) | medi lineari (6.9% delta rispetto alla precedente frequenza)
Alti 2 - 16 kHz
(+) | Alti bilanciati - appena 4.1% dalla media
(+) | alti lineari (3.7% delta rispetto alla precedente frequenza)
Nel complesso 100 - 16.000 Hz
(+) | suono nel complesso lineare (12.2% differenza dalla media)
Rispetto alla stessa classe
» 12% di tutti i dispositivi testati in questa classe è stato migliore, 4% simile, 84% peggiore
» Il migliore ha avuto un delta di 6%, medio di 20%, peggiore di 57%
Rispetto a tutti i dispositivi testati
» 10% di tutti i dispositivi testati in questa classe è stato migliore, 2% similare, 88% peggiore
» Il migliore ha avuto un delta di 4%, medio di 23%, peggiore di 134%
Apple MacBook Pro 16 2021 M1 Pro analisi audio
(+) | gli altoparlanti sono relativamente potenti (84.7 dB)
Bassi 100 - 315 Hz
(+) | bassi buoni - solo 3.8% dalla media
(+) | bassi in lineaa (5.2% delta rispetto alla precedente frequenza)
Medi 400 - 2000 Hz
(+) | medi bilanciati - solo only 1.3% rispetto alla media
(+) | medi lineari (2.1% delta rispetto alla precedente frequenza)
Alti 2 - 16 kHz
(+) | Alti bilanciati - appena 1.9% dalla media
(+) | alti lineari (2.7% delta rispetto alla precedente frequenza)
Nel complesso 100 - 16.000 Hz
(+) | suono nel complesso lineare (4.6% differenza dalla media)
Rispetto alla stessa classe
» 0% di tutti i dispositivi testati in questa classe è stato migliore, 0% simile, 100% peggiore
» Il migliore ha avuto un delta di 5%, medio di 17%, peggiore di 45%
Rispetto a tutti i dispositivi testati
» 0% di tutti i dispositivi testati in questa classe è stato migliore, 0% similare, 100% peggiore
» Il migliore ha avuto un delta di 4%, medio di 23%, peggiore di 134%
Gestione dell'energia
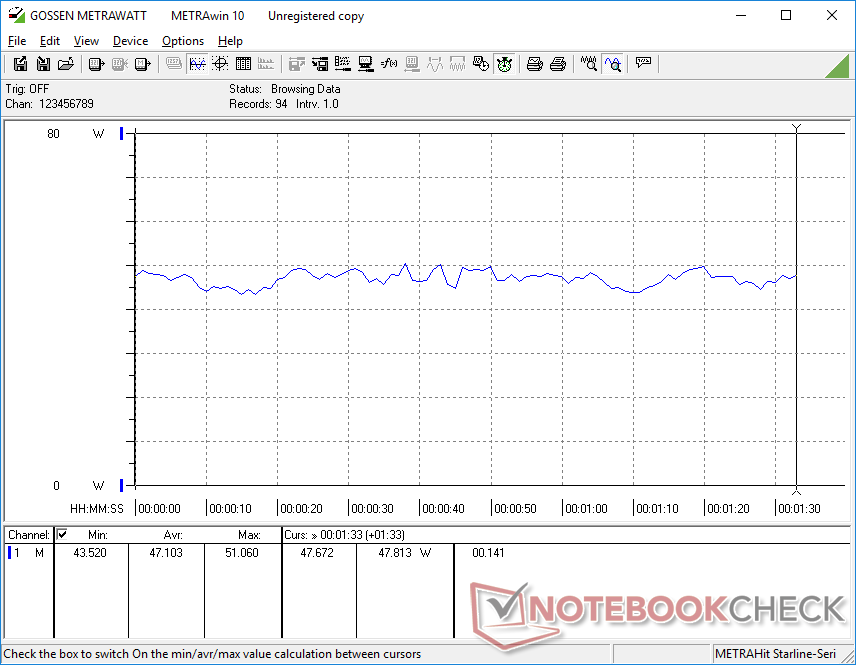
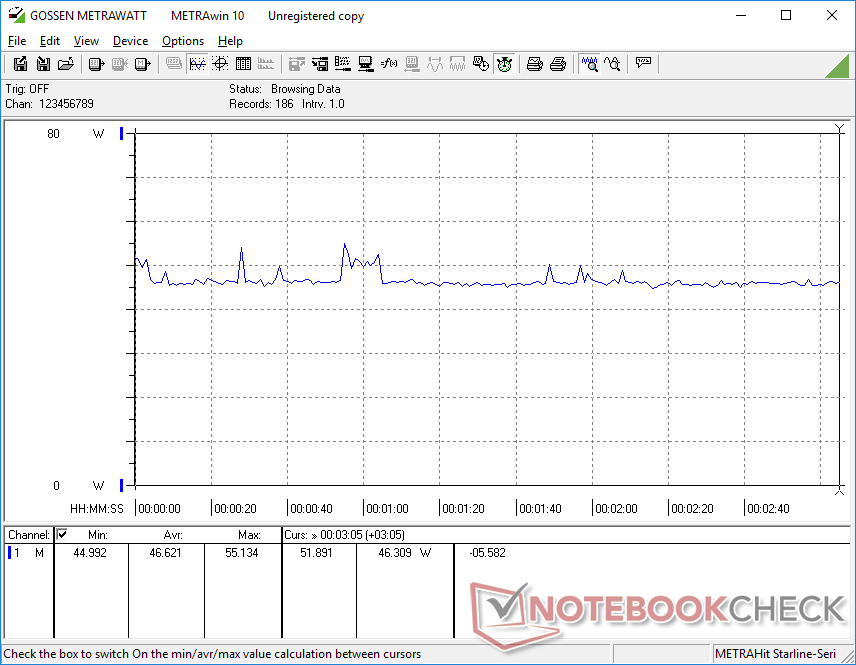
Consumo di energia
Il consumo di energia nella maggior parte delle condizioni è costantemente inferiore a quello dell'Inspiron 16 7620 2-in-1 con processore Core-P dello scorso anno, il che potrebbe essere responsabile dei buoni risultati di durata della batteria riportati nella sezione successiva. È anche inferiore a quello dello Yoga 7 16IRL8 con processore Core-U Yoga 7 16IRL8 per mostrare un'eccellente performance per watt rispetto alla concorrenza.
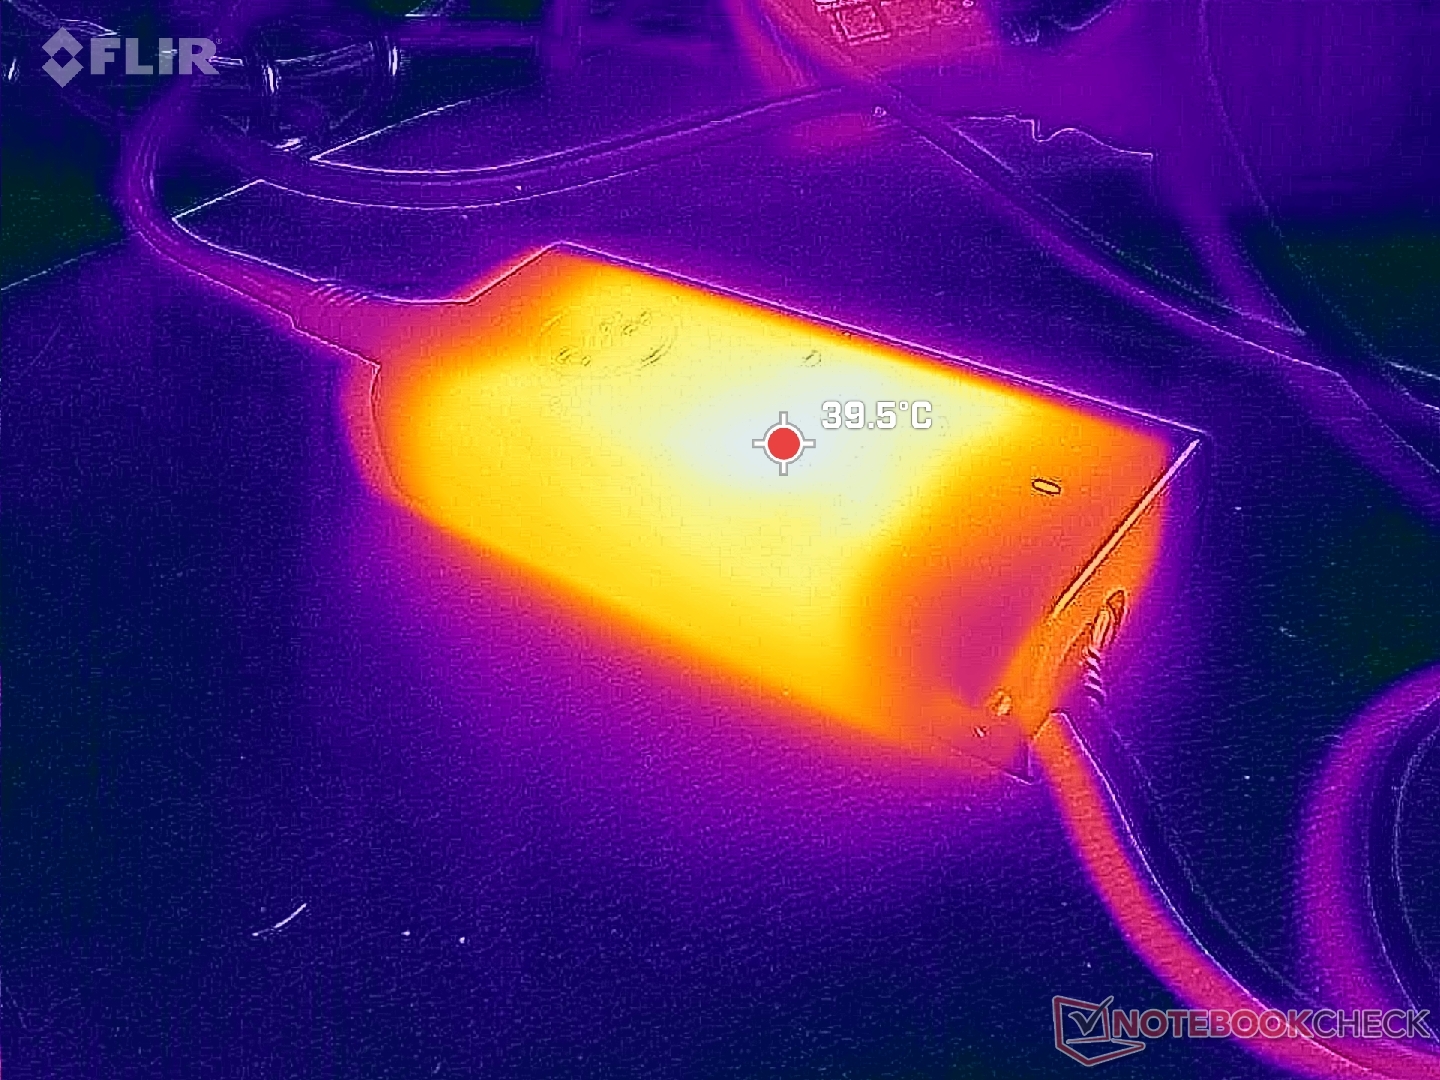
Siamo riusciti a misurare un consumo massimo di 57 W dall'adattatore CA da 65 W di dimensioni medio-piccole (~11,2 x 5 x 2,8 cm) quando la CPU è al 100%. L'ampio overhead garantisce che il sistema possa continuare a caricarsi durante l'esecuzione di carichi impegnativi, anche se ad un ritmo più lento, e che la CPU non sia imbottigliata da un adattatore CA di dimensioni insufficienti.
| Off / Standby | |
| Idle | |
| Sotto carico |
|
Leggenda:
min: | |
| Dell Inspiron 16 7635 2-in-1 R5 7530U, Vega 7, Kioxia BG5 KBG50ZNS512G, IPS, 1920x1200, 16" | Acer Swift Edge SFE16-42-R1GM R7 7735U, Radeon 680M, Micron 3400 1TB MTFDKBA1T0TFH, OLED, 3840x2400, 16" | Lenovo Yoga 7 16IRL8 i7-1355U, Iris Xe G7 96EUs, WD PC SN740 512GB SDDPMQD-512G-1101, IPS, 1920x1200, 16" | Samsung Galaxy Book3 Pro 16 i5-1340P, Iris Xe G7 80EUs, WD PC SN740 256GB SDDPNQD-256G, AMOLED, 2880x1800, 16" | Lenovo IdeaPad Flex 5 16ABR G8 R7 7730U, Vega 8, Samsung PM9B1 1024GB MZAL41T0HBLB, IPS, 1920x1200, 16" | Dell Inspiron 16 7620 2-in-1 i7-1260P, Iris Xe G7 96EUs, Toshiba KBG40ZNS512G NVMe, IPS, 1920x1200, 16" | |
|---|---|---|---|---|---|---|
| Power Consumption | -15% | -8% | 8% | -21% | -10% | |
| Idle Minimum * (Watt) | 4.8 | 8.6 -79% | 3.3 31% | 3.9 19% | 5.4 -13% | 5.3 -10% |
| Idle Average * (Watt) | 7.6 | 7.7 -1% | 10.2 -34% | 4.8 37% | 11.1 -46% | 8.3 -9% |
| Idle Maximum * (Watt) | 8.7 | 9.3 -7% | 10.3 -18% | 10 -15% | 11.6 -33% | 9.6 -10% |
| Load Average * (Watt) | 47.1 | 47.9 -2% | 55.2 -17% | 44 7% | 52.7 -12% | 54.3 -15% |
| Witcher 3 ultra * (Watt) | 46.6 | 46.3 1% | 43.8 6% | 42.3 9% | 47.6 -2% | 43.9 6% |
| Load Maximum * (Watt) | 56.4 | 56 1% | 65.7 -16% | 63 -12% | 67 -19% | 70 -24% |
* ... Meglio usare valori piccoli
Power Consumption Witcher 3 / Stresstest
Power Consumption external Monitor
Durata della batteria
L'Inspiron 16 7635 2-in-1 è dotato di una batteria da 64 Wh, rispetto a quella più grande da 86 Wh dell'Inspiron 16 7630 2-in-1 o 7620 2-in-1. Gli utenti AMD si trovano quindi in una situazione di svantaggio, poiché la batteria più grande è attualmente un'esclusiva delle configurazioni Intel.
La durata della batteria è comunque molto buona nonostante la batteria più piccola sulla nostra unità AMD. Siamo riusciti a registrare 14,5 ore di navigazione WLAN nel mondo reale, quasi le stesse che abbiamo registrato sull'Inspiron 16 7620 2-in-1 con processore Intel dello scorso anno. È più lungo del modello con equipaggiamento simile IdeaPad Flex 5 16 di diverse ore.
La ricarica da vuoto a pieno regime con l'adattatore CA in dotazione richiede circa 2 ore.
| Dell Inspiron 16 7635 2-in-1 R5 7530U, Vega 7, 64 Wh | Acer Swift Edge SFE16-42-R1GM R7 7735U, Radeon 680M, 54 Wh | Lenovo Yoga 7 16IRL8 i7-1355U, Iris Xe G7 96EUs, 71 Wh | Samsung Galaxy Book3 Pro 16 i5-1340P, Iris Xe G7 80EUs, 76 Wh | Lenovo IdeaPad Flex 5 16ABR G8 R7 7730U, Vega 8, 52.5 Wh | Dell Inspiron 16 7620 2-in-1 i7-1260P, Iris Xe G7 96EUs, 87 Wh | |
|---|---|---|---|---|---|---|
| Autonomia della batteria | -43% | -17% | -3% | -37% | 11% | |
| Reader / Idle (h) | 26 | 10.9 -58% | 19 -27% | 30.4 17% | 17 -35% | |
| WiFi v1.3 (h) | 14.5 | 7.3 -50% | 9.4 -35% | 10.2 -30% | 9.8 -32% | 14.6 1% |
| Load (h) | 1.9 | 1.5 -21% | 2.1 11% | 2 5% | 1.1 -42% | 3.2 68% |
| H.264 (h) | 8.6 | 14.4 | 13.1 |
Pro
Contro
Verdetto - Molti angoli tagliati rispetto all'Inspiron 16 7630 2-in-1
L'Inspiron 16 7635 2-in-1 con processore AMD è più di un semplice cambio di processore rispetto all'Inspiron 16 7630 2-in-1 con processore Intel. Mancano le opzioni per un touchscreen OLED a risoluzione più elevata, il sensore IR, le opzioni di grafica discreta, una batteria più grande e il supporto Thunderbolt, il tutto in nome di un prezzo leggermente inferiore. Se siete disposti a pagare solo 100 dollari in più, vi consigliamo di prendere in considerazione il Core i7-1360P Inspiron 16 7630 2-in-1 invece della nostra configurazione Ryzen 5, in quanto offre prestazioni più elevate di CPU e GPU e il doppio della capacità di archiviazione. È un po' più pesante di 100 g, ma entrambe le versioni del modello sono già abbastanza pesanti, a partire da 2 kg ciascuna.
I colori sRGB più intensi dell'Inspiron 16 7635 2-in-1 danno a Dell un vantaggio rispetto al concorrente
Lenovo
Flex 5 16.
Per le revisioni future, ci piacerebbe vedere opzioni di processori Zen 4 o almeno Zen 3+ per migliorare le mediocri prestazioni grafiche. L'opzione Ryzen 7 7730U non è consigliata in quanto più costosa, più lenta e con meno funzioni rispetto alla configurazione Core i7-1360P. Il modello Inspiron 16 7620 2-in-1 dello scorso anno sarebbe ancora da prendere in considerazione, soprattutto perché quest'ultima revisione non è più leggera o più portatile.
Prezzo e disponibilità
L'Inspiron 16 7635 2-in-1 e l'Inspiron 16 7630 2-in-1 sono ora in vendita direttamente da Dell a partire rispettivamente da 650 e 800 dollari. La nostra configurazione specifica, come quella recensita, viene venduta a 900 dollari.
Dell Inspiron 16 7635 2-in-1
- 07/23/2023 v7 (old)
Allen Ngo
Transparency
La selezione dei dispositivi da recensire viene effettuata dalla nostra redazione. Il campione di prova è stato fornito all'autore come prestito dal produttore o dal rivenditore ai fini di questa recensione. L'istituto di credito non ha avuto alcuna influenza su questa recensione, né il produttore ne ha ricevuto una copia prima della pubblicazione. Non vi era alcun obbligo di pubblicare questa recensione. In quanto società mediatica indipendente, Notebookcheck non è soggetta all'autorità di produttori, rivenditori o editori.
Ecco come Notebookcheck esegue i test
Ogni anno, Notebookcheck esamina in modo indipendente centinaia di laptop e smartphone utilizzando procedure standardizzate per garantire che tutti i risultati siano comparabili. Da circa 20 anni sviluppiamo continuamente i nostri metodi di prova e nel frattempo stabiliamo gli standard di settore. Nei nostri laboratori di prova, tecnici ed editori esperti utilizzano apparecchiature di misurazione di alta qualità. Questi test comportano un processo di validazione in più fasi. Il nostro complesso sistema di valutazione si basa su centinaia di misurazioni e parametri di riferimento ben fondati, che mantengono l'obiettività.Price comparison

