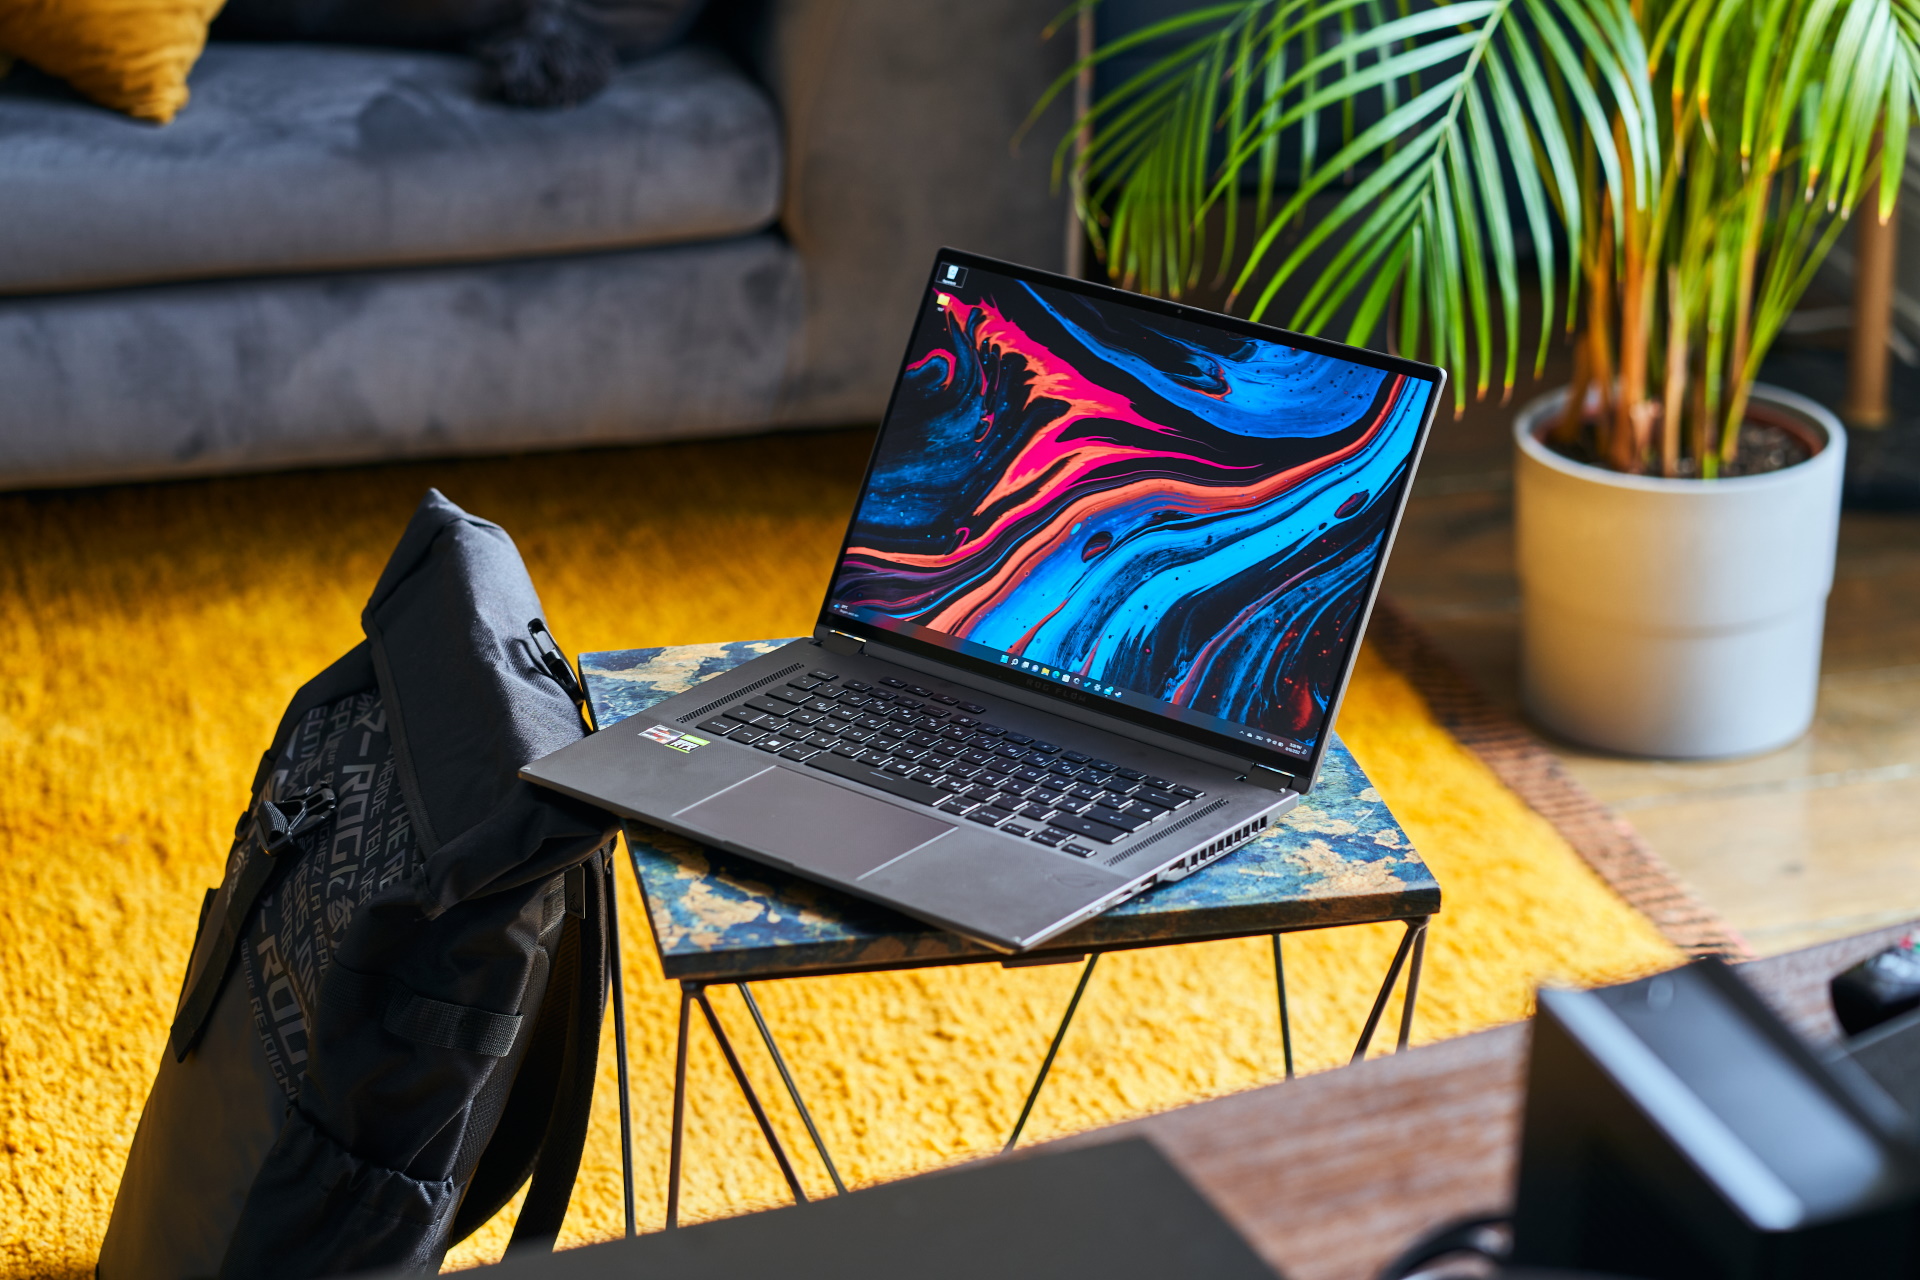
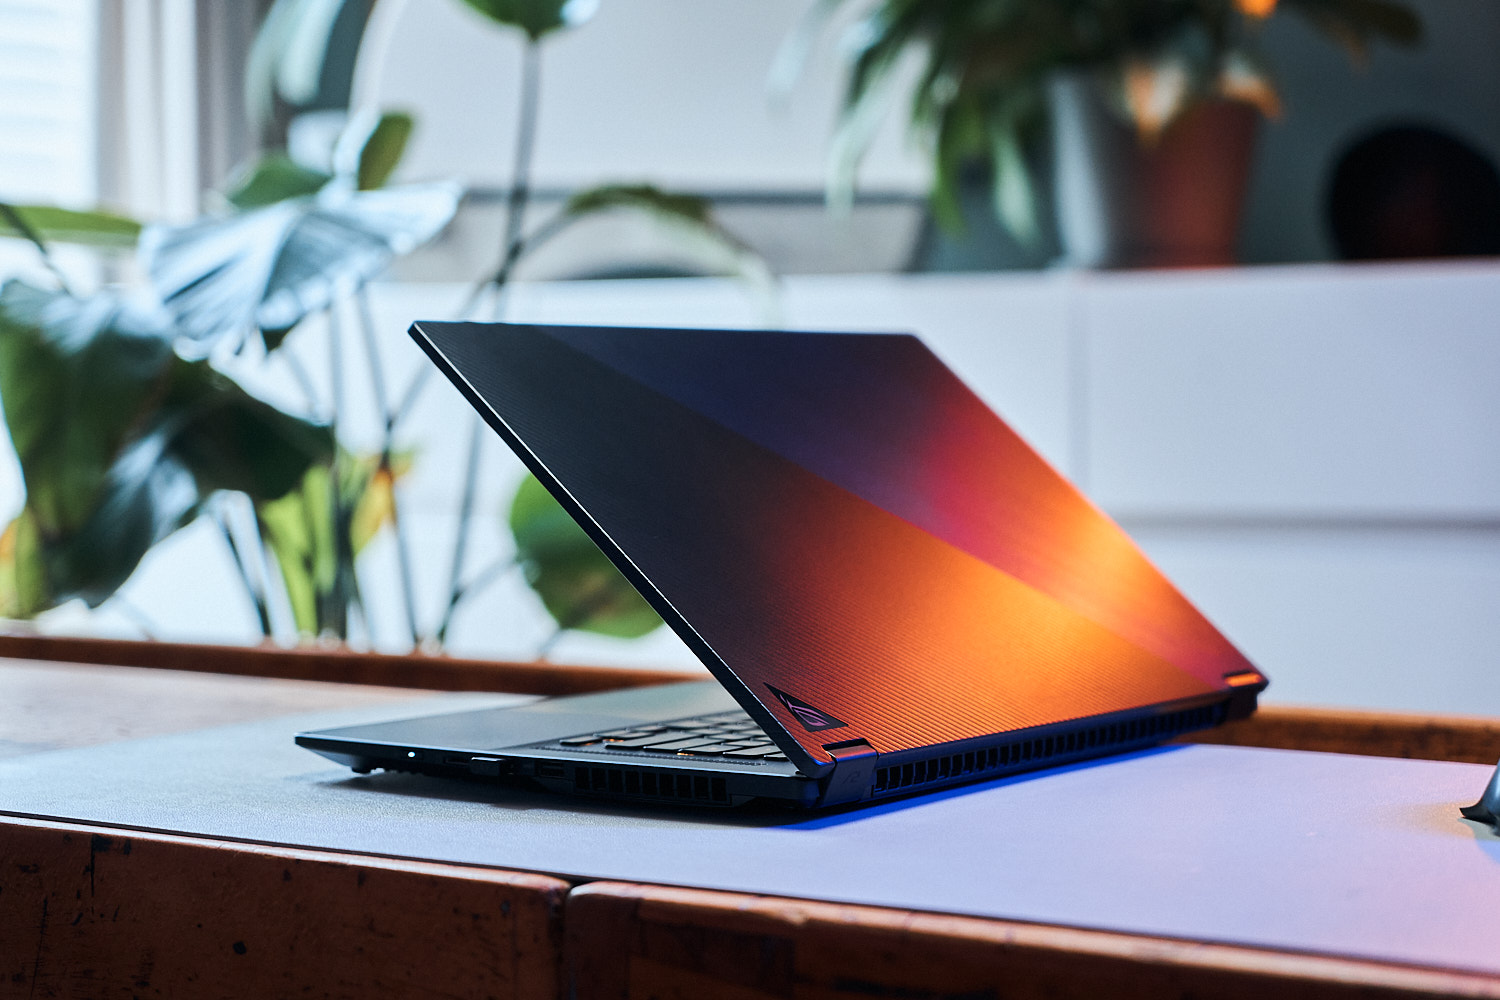
Recensione del sottile portatile Asus ROG Flow X16: Una potente workstation per il gaming 2-in-1 da 16 pollici con display touchscreen

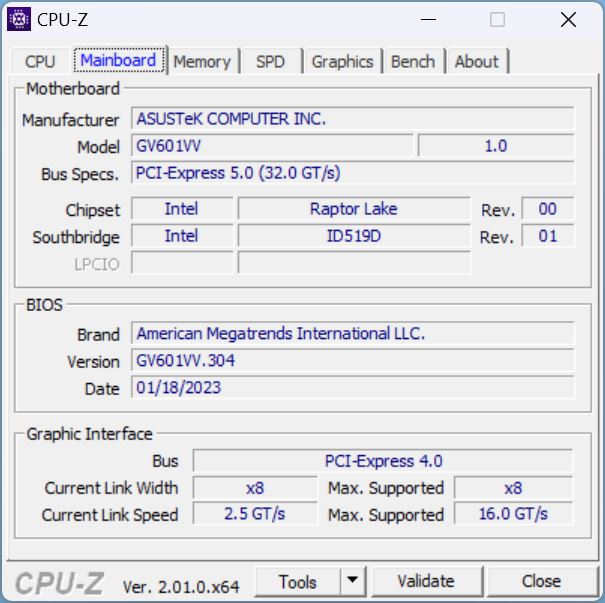
L'anno scorso, il ROG Flow X16è stato il nostro primo portatile da gioco dotato di un display mini-LED. A quel punto, il portatile era in anticipo sui tempi e, per questo motivo, Asus sembra non aver avuto motivo di dare a questo modello una revisione completa. Tuttavia, la versione che stiamo recensendo è priva del display mini-LED. Tuttavia, molte caratteristiche rimangono invariate, come il case e le porte, con Asus che cambia solo la generazione di CPU/GPU.
Allo stesso modo, Asus è attualmente all'avanguardia anche nella realizzazione di nuovi concetti, come dimostra il nuovo Asus ROG Ally così come l'Asus ROG Flow Z13tablet da gioco. L'X16 non è esattamente il dispositivo di tutti i giorni: Si tratta di un portatile da gioco ultrasottile che è allo stesso tempo un 2-in-1. Il display può essere ruotato di 360 gradi e può essere utilizzato come tablet grazie al touchscreen. Il display può essere ruotato di 360 gradi e può essere utilizzato come tablet grazie al touchscreen. Poiché la concorrenza diretta è difficile da trovare, è per questo che lo confrontiamo con le normali macchine da gioco. Oltre al suo predecessore, stiamo usando anche ilSamsung Galaxy Book3 Ultra 16e ilLenovo Legion Pro 5, ilLenovo Yoga Pro 7 14 G8e ilMSI Katana 17 B13V per un confronto.
Poiché diverse caratteristiche del modello dell'anno scorso sono rimaste invariate, non prestiamo particolare attenzione al case, agli accessori, all'assistenza e ai dispositivi di input, ma preferiamo indicarvi la nostra recensione del modello dell'anno scorso Asus ROG Flow X16 GV601RWper ulteriori informazioni.
Potenziali concorrenti a confronto
Punteggio | Data | Modello | Peso | Altezza | Dimensione | Risoluzione | Prezzo |
|---|---|---|---|---|---|---|---|
| 89.7 % v7 (old) | 06/2023 | Asus ROG Flow X16 GV601V i9-13900H, GeForce RTX 4060 Laptop GPU | 2.1 kg | 19.4 mm | 16.00" | 2560x1600 | |
| 89.5 % v7 (old) | 08/2022 | Asus ROG Flow X16 GV601RW-M5082W R9 6900HS, GeForce RTX 3070 Ti Laptop GPU | 2.1 kg | 19.4 mm | 16.10" | 2560x1600 | |
| 88.8 % v7 (old) | 05/2023 | Samsung Galaxy Book3 Ultra 16, i9-13900H RTX 4070 i9-13900H, GeForce RTX 4070 Laptop GPU | 1.8 kg | 16.8 mm | 16.00" | 2880x1800 | |
| 87.9 % v7 (old) | 05/2023 | Lenovo Legion Pro 5 16IRX8 i7-13700HX, GeForce RTX 4060 Laptop GPU | 2.5 kg | 26.8 mm | 16.00" | 2560x1600 | |
| 90.2 % v7 (old) | 05/2023 | Lenovo Yoga Pro 7 14IRH G8 i7-13700H, GeForce RTX 4050 Laptop GPU | 1.5 kg | 15.6 mm | 14.50" | 3072x1920 | |
| 82.1 % v7 (old) | 02/2023 | MSI Katana 17 B13VFK i7-13620H, GeForce RTX 4060 Laptop GPU | 2.8 kg | 25.2 mm | 17.30" | 1920x1080 |
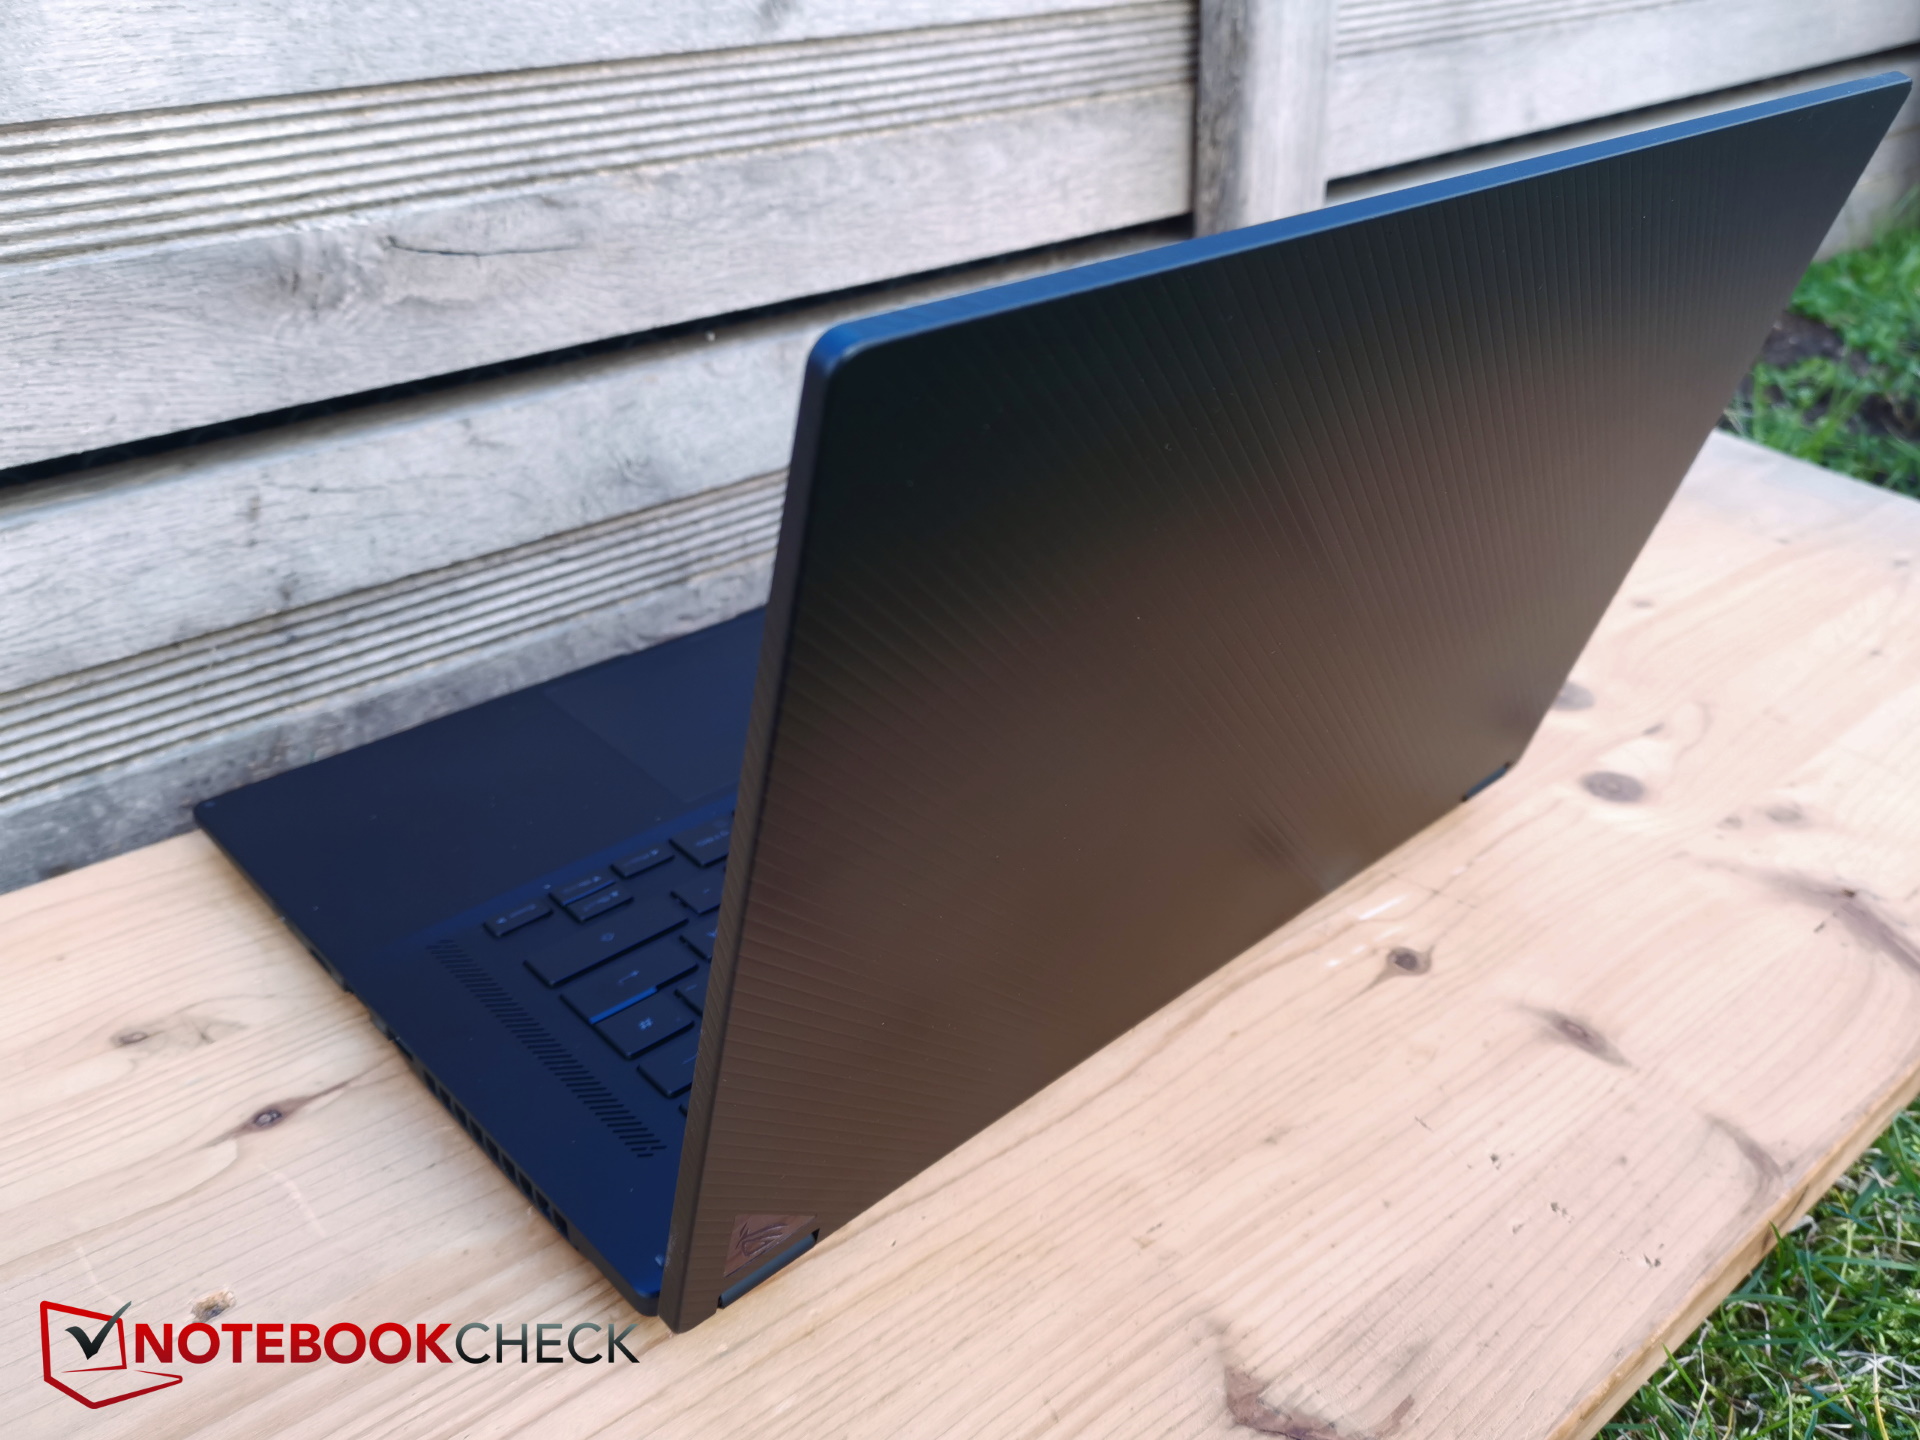
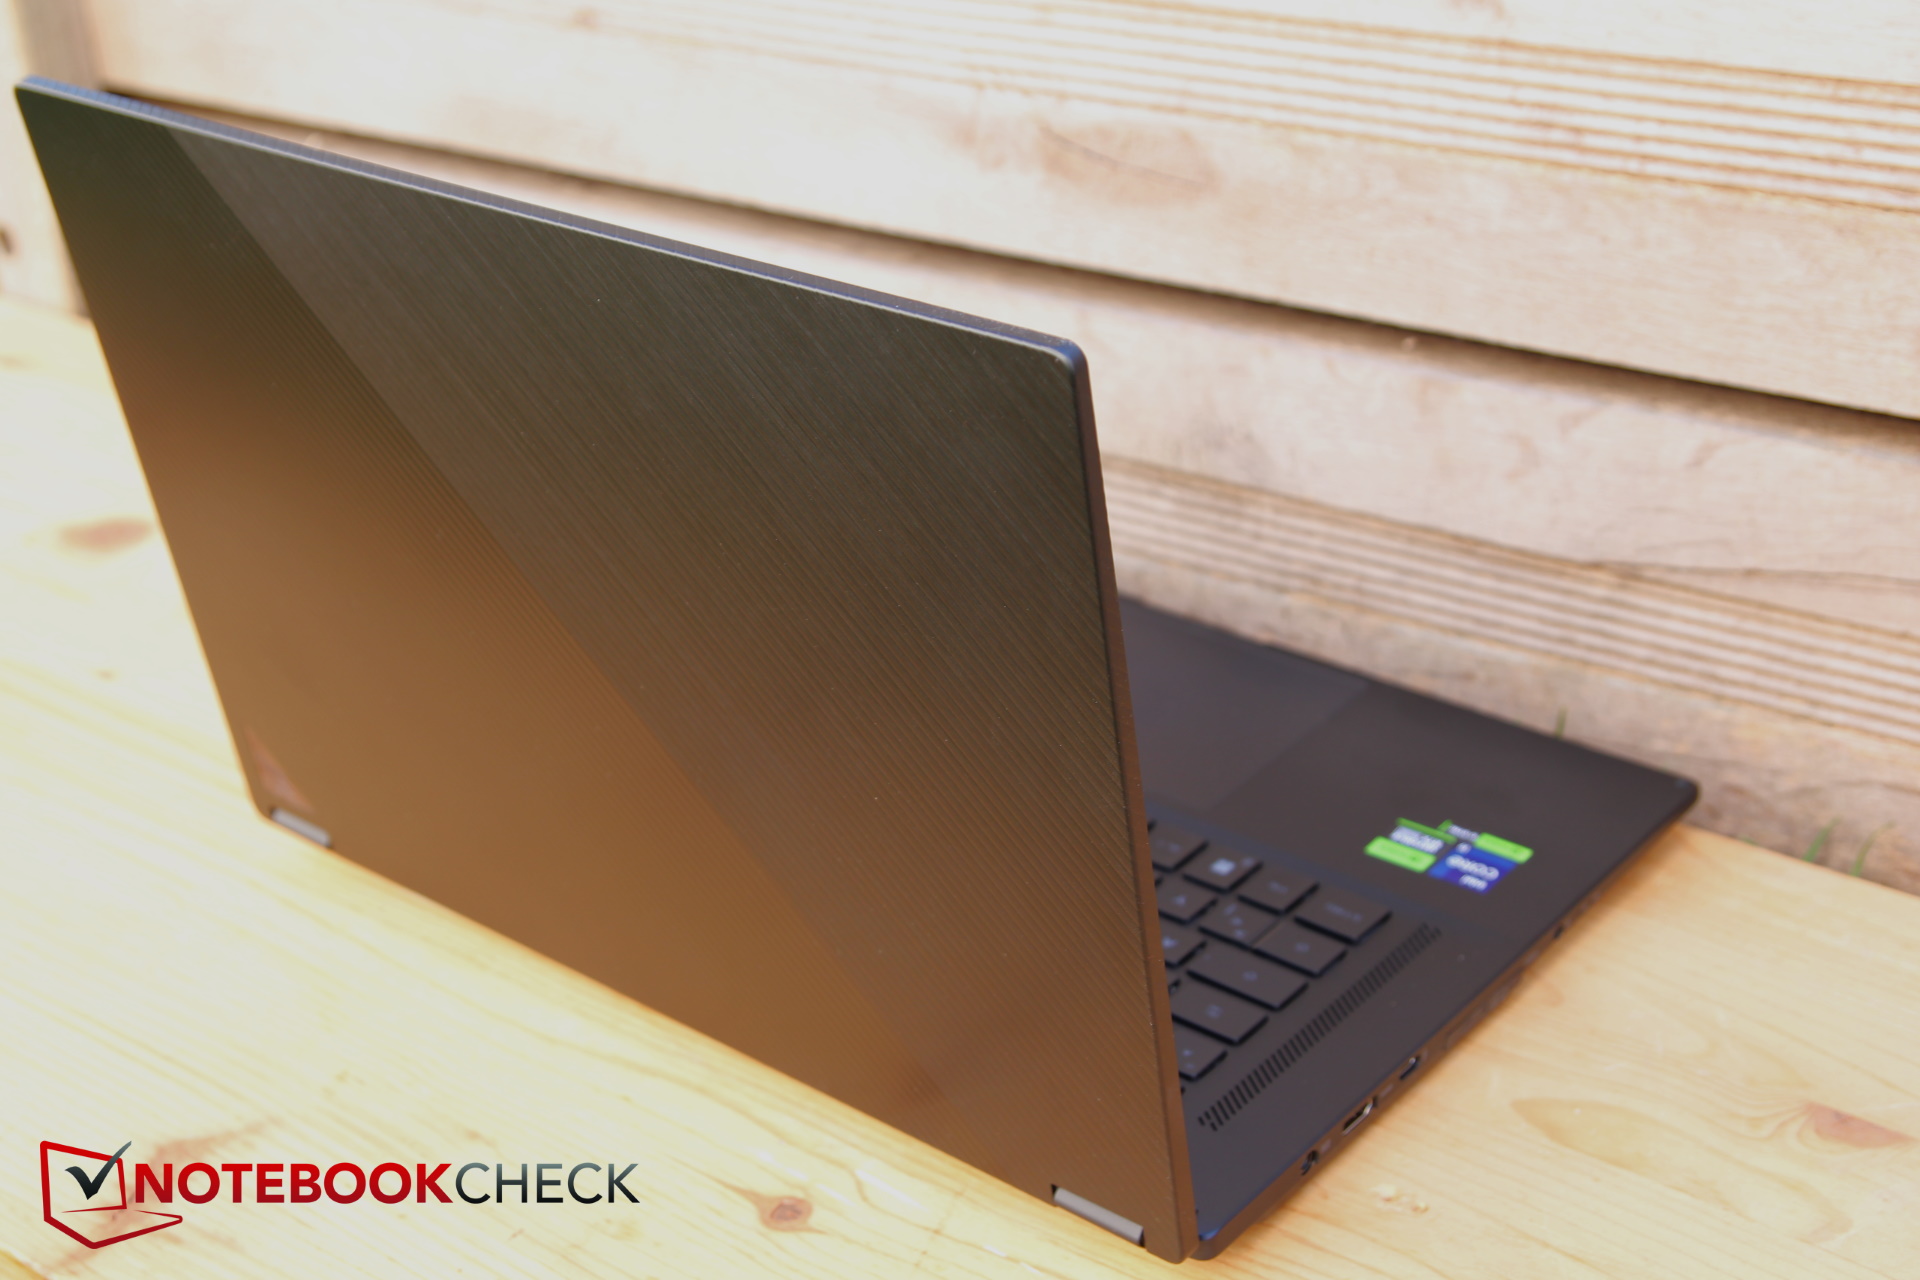
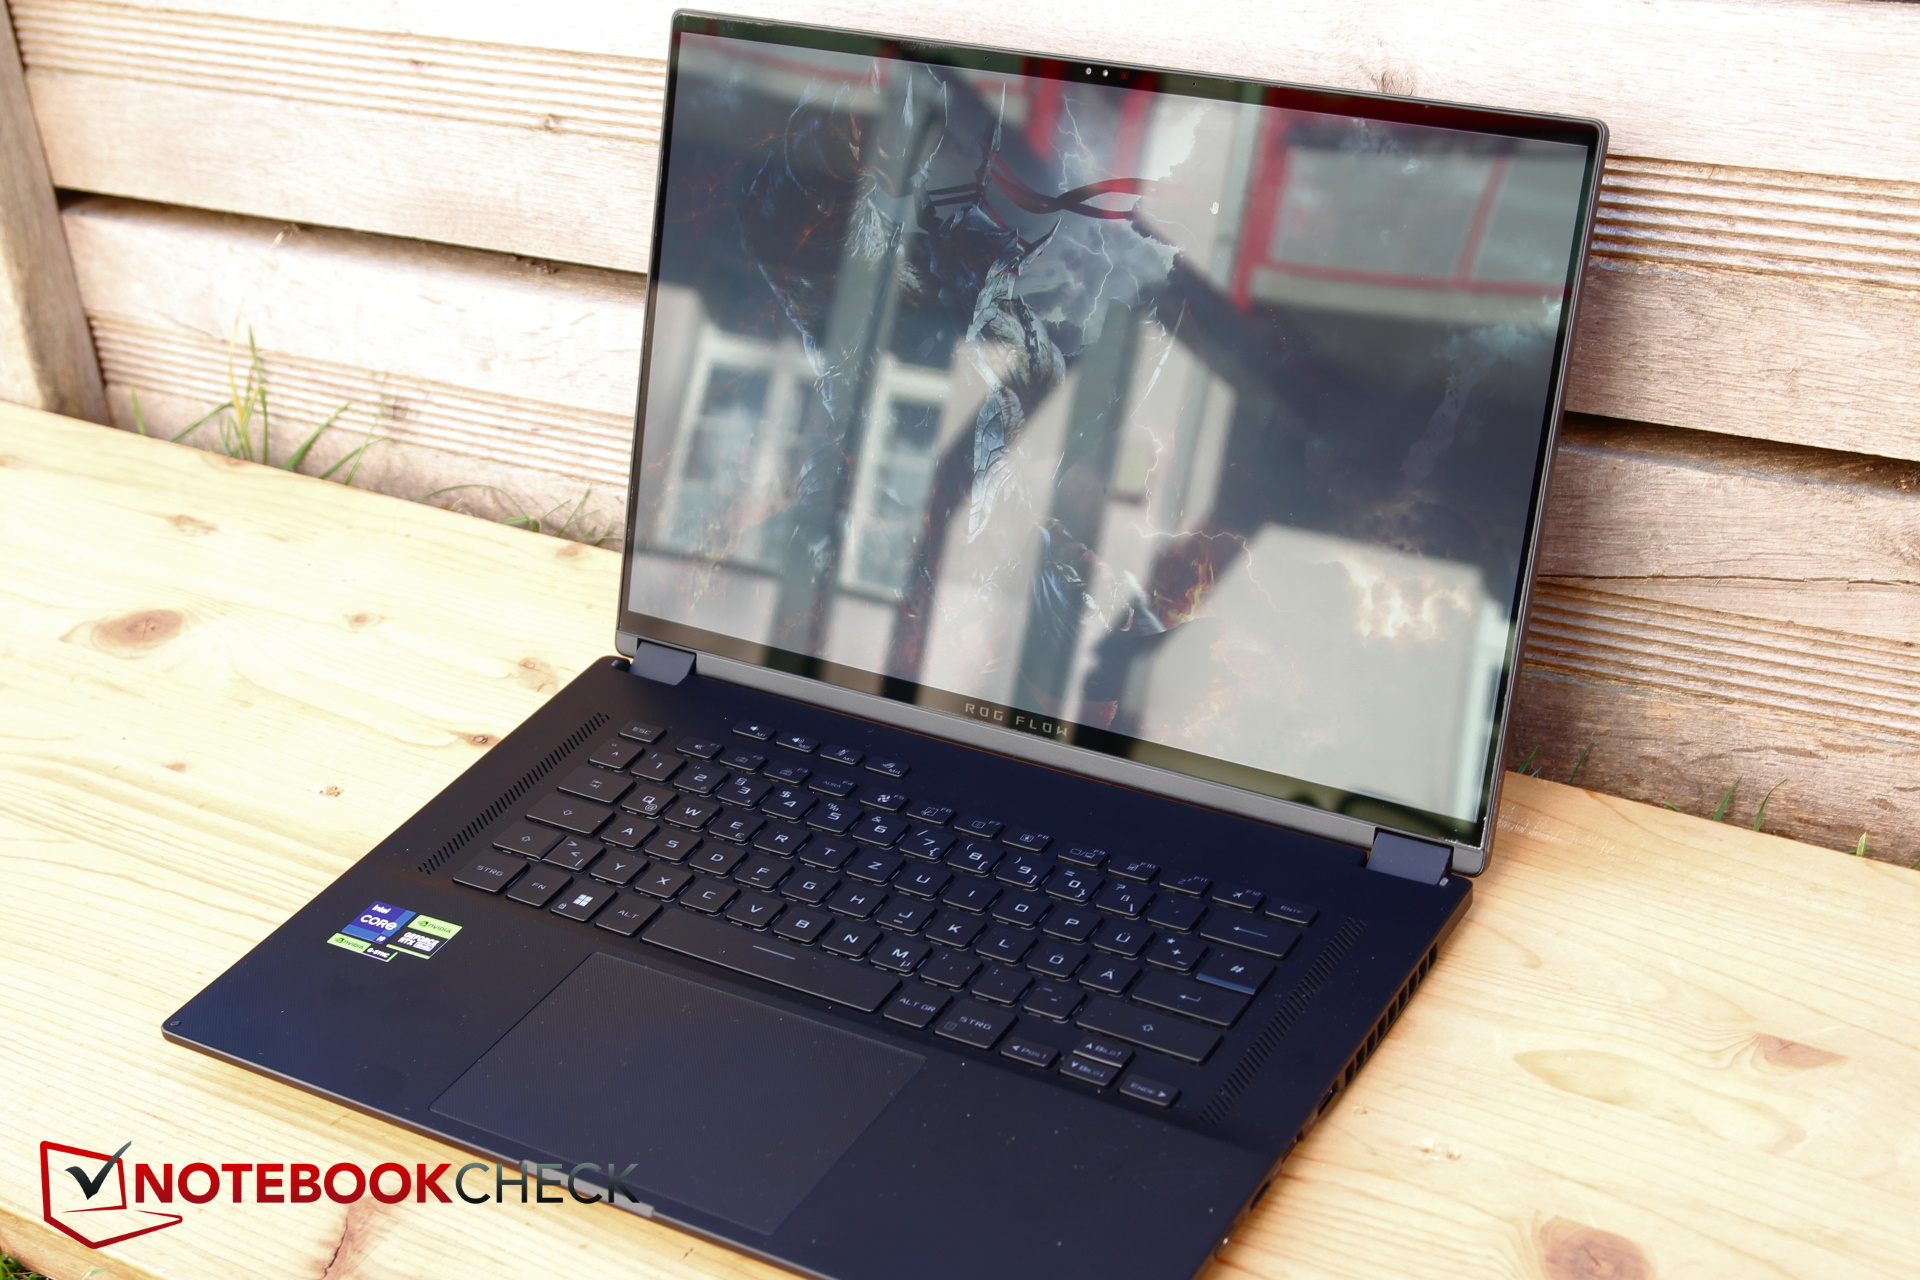
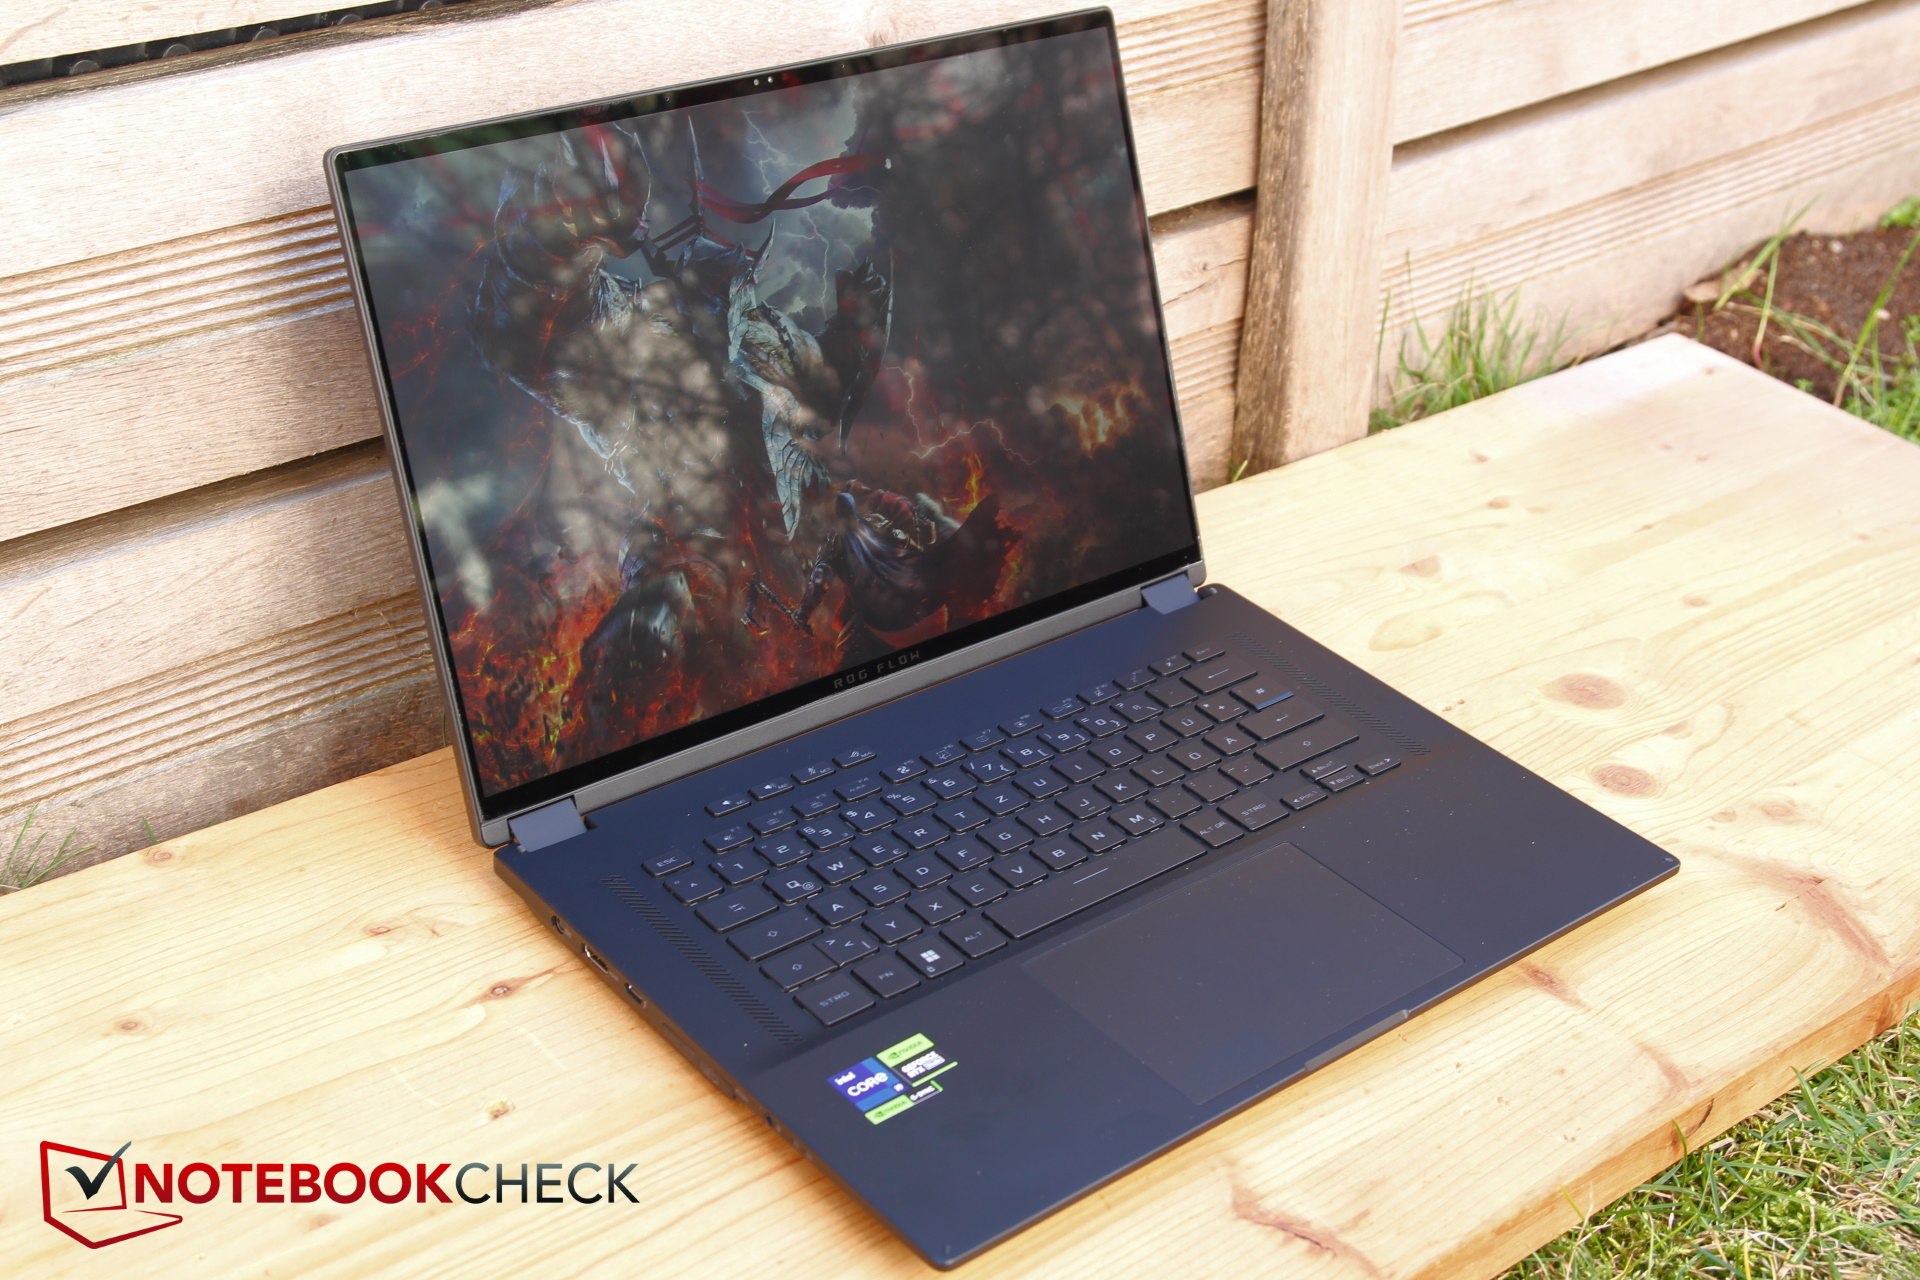
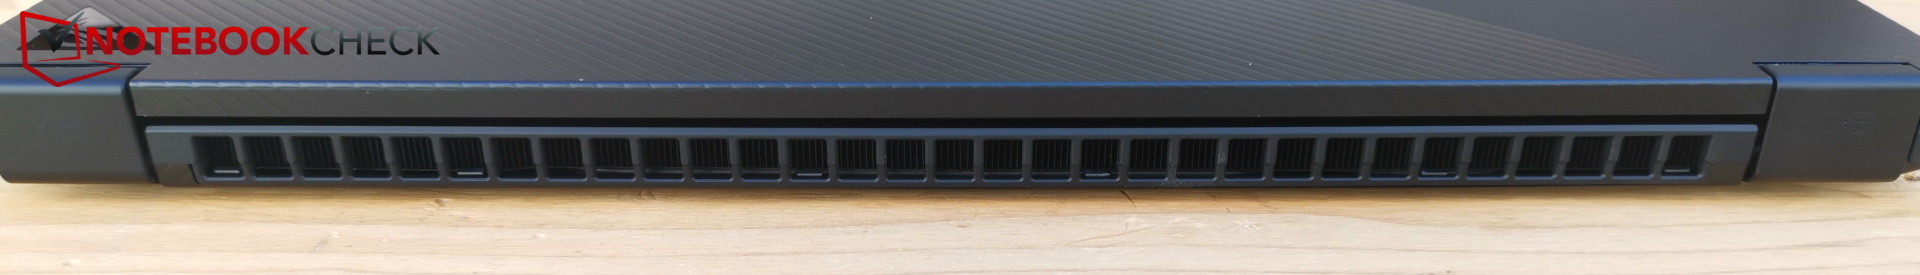
Caso - Sottile e buono come l'anno scorso
Il logo sul coperchio della custodia è leggermente diverso ma, a parte questo, tutto è rimasto sostanzialmente invariato.

Caratteristiche - Interfaccia mobile TB4 e XG
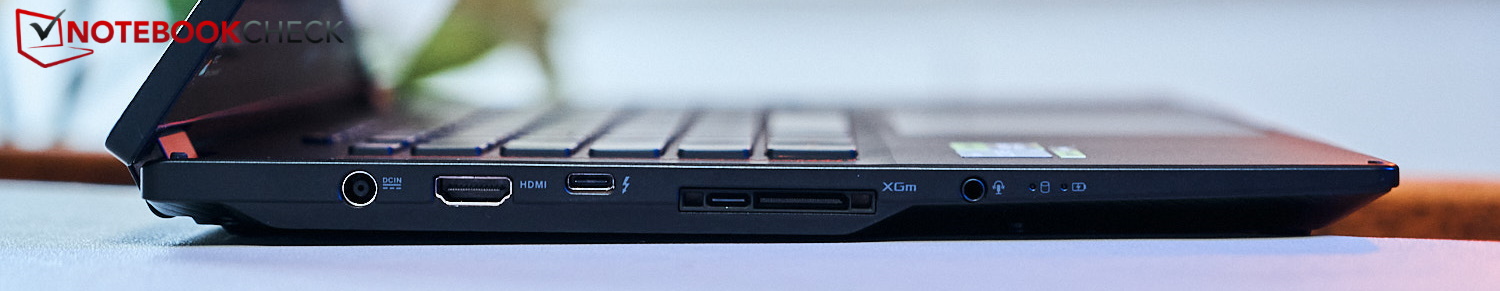
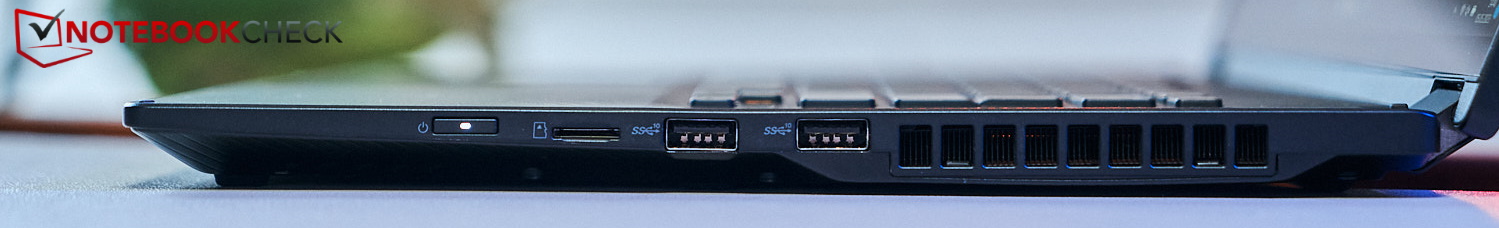
Lettore di schede SD
| SD Card Reader | |
| average JPG Copy Test (av. of 3 runs) | |
| Asus ROG Flow X16 GV601RW-M5082W (AV Pro SD microSD 128 GB V60) | |
| Media della classe Gaming (20.9 - 210, n=54, ultimi 2 anni) | |
| Asus ROG Flow X16 GV601V | |
| Samsung Galaxy Book3 Ultra 16, i9-13900H RTX 4070 (AV Pro SD microSD 128 GB V60) | |
| maximum AS SSD Seq Read Test (1GB) | |
| Asus ROG Flow X16 GV601V | |
| Asus ROG Flow X16 GV601RW-M5082W (AV Pro SD microSD 128 GB V60) | |
| Media della classe Gaming (25.5 - 261, n=51, ultimi 2 anni) | |
| Samsung Galaxy Book3 Ultra 16, i9-13900H RTX 4070 (AV Pro SD microSD 128 GB V60) | |
Comunicazione
Le velocità di trasferimento con l'AX211 di Intel in una rete a 6 GHz sono molto elevate e stabili (circa 1,6 MBit/s), mentre in una rete a 5 GHz sono possibili velocità di trasferimento ridotte, pari a solo 1 MBit/s circa.
Webcam
In quest'area, Asus ha aggiornato la fotocamera a 720p presente nel modello dello scorso anno con una Full HD. Le immagini sono decenti, ma la deviazione dei colori è un po' alta.


Sicurezza
Il TPM è disponibile grazie al chip Intel, ma mancano un sensore di impronte digitali e un lucchetto Kensington. La fotocamera è compatibile con Windows Hello.
Accessori
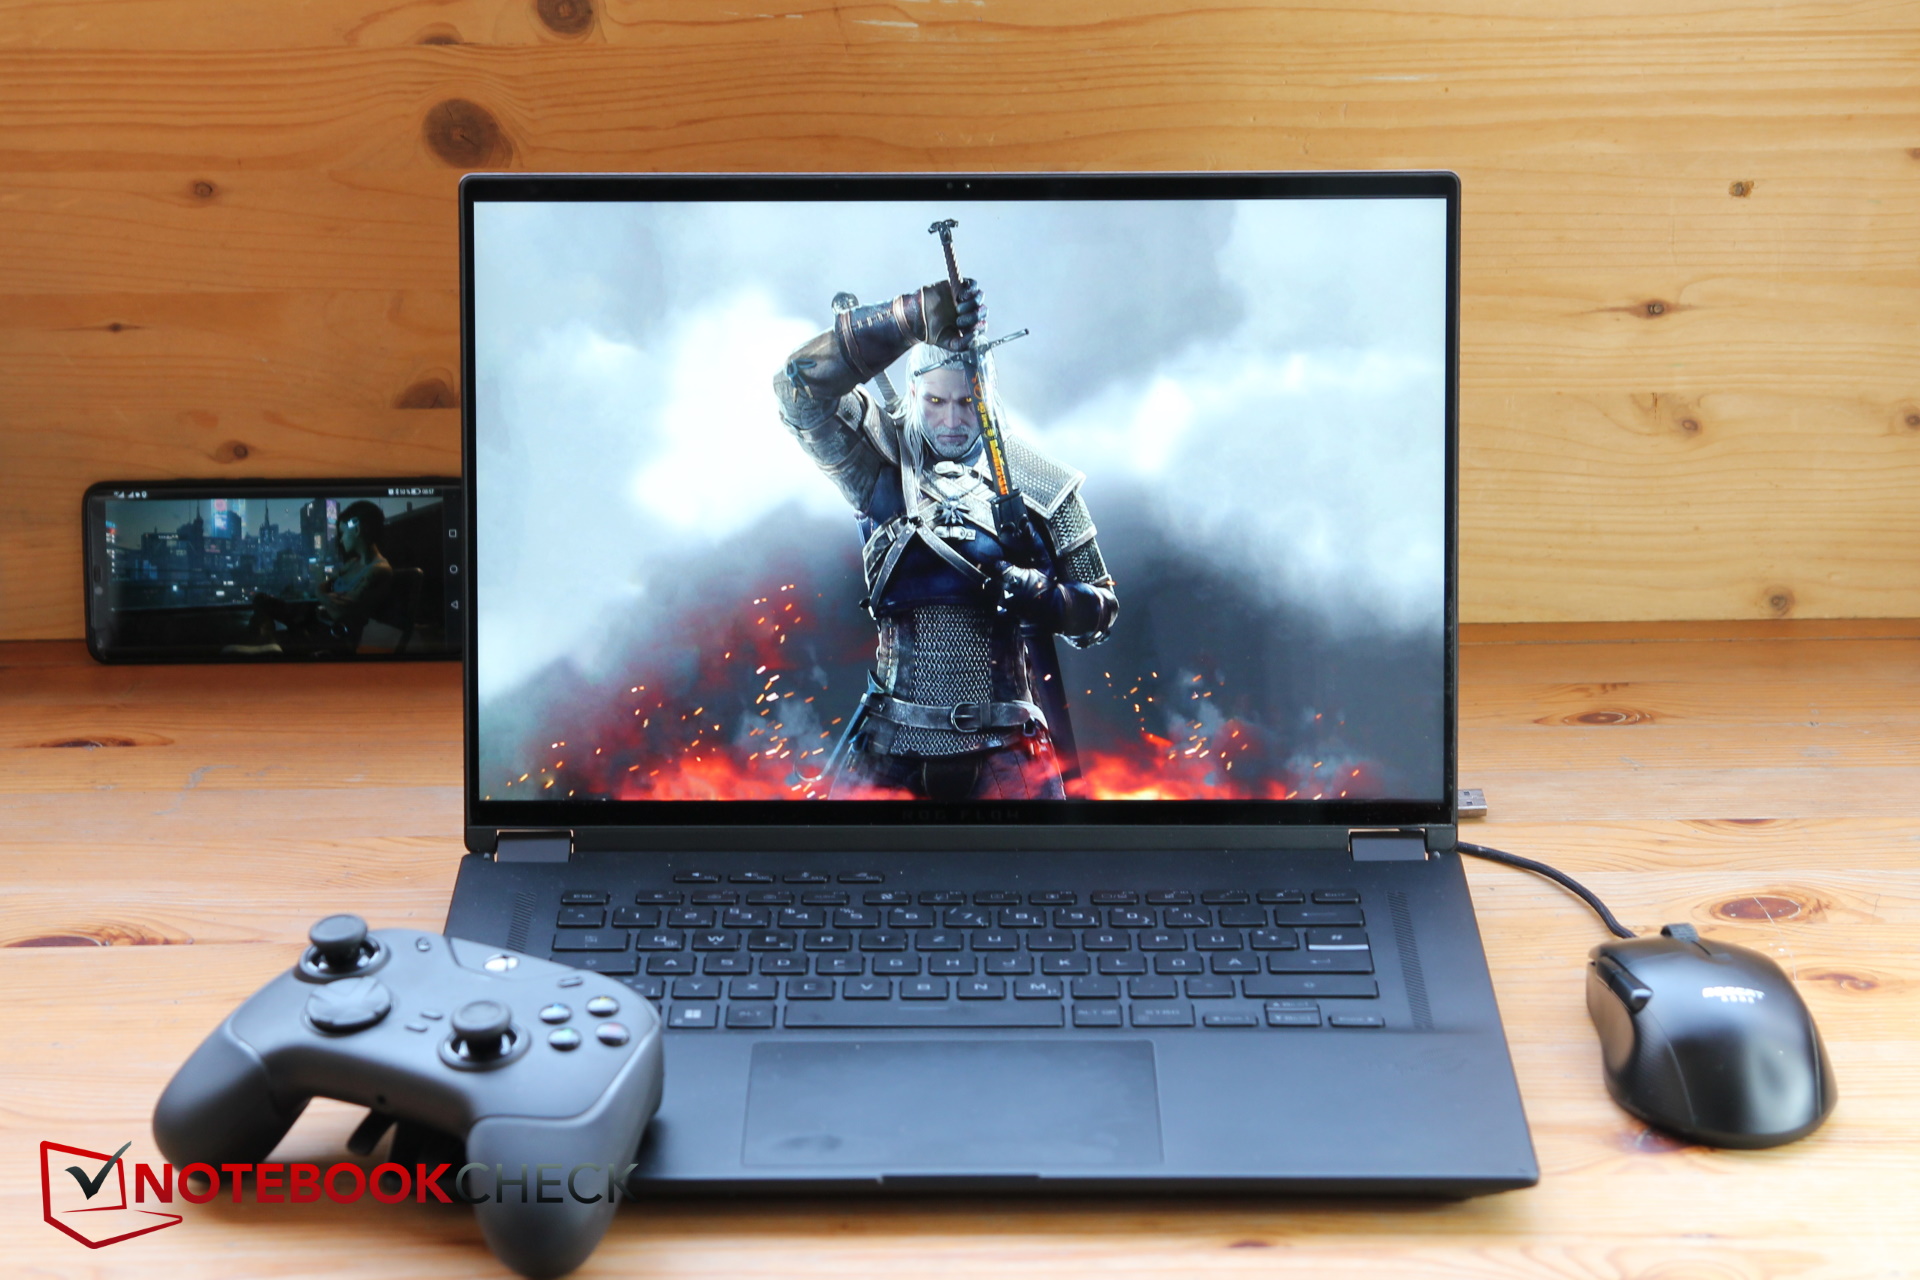
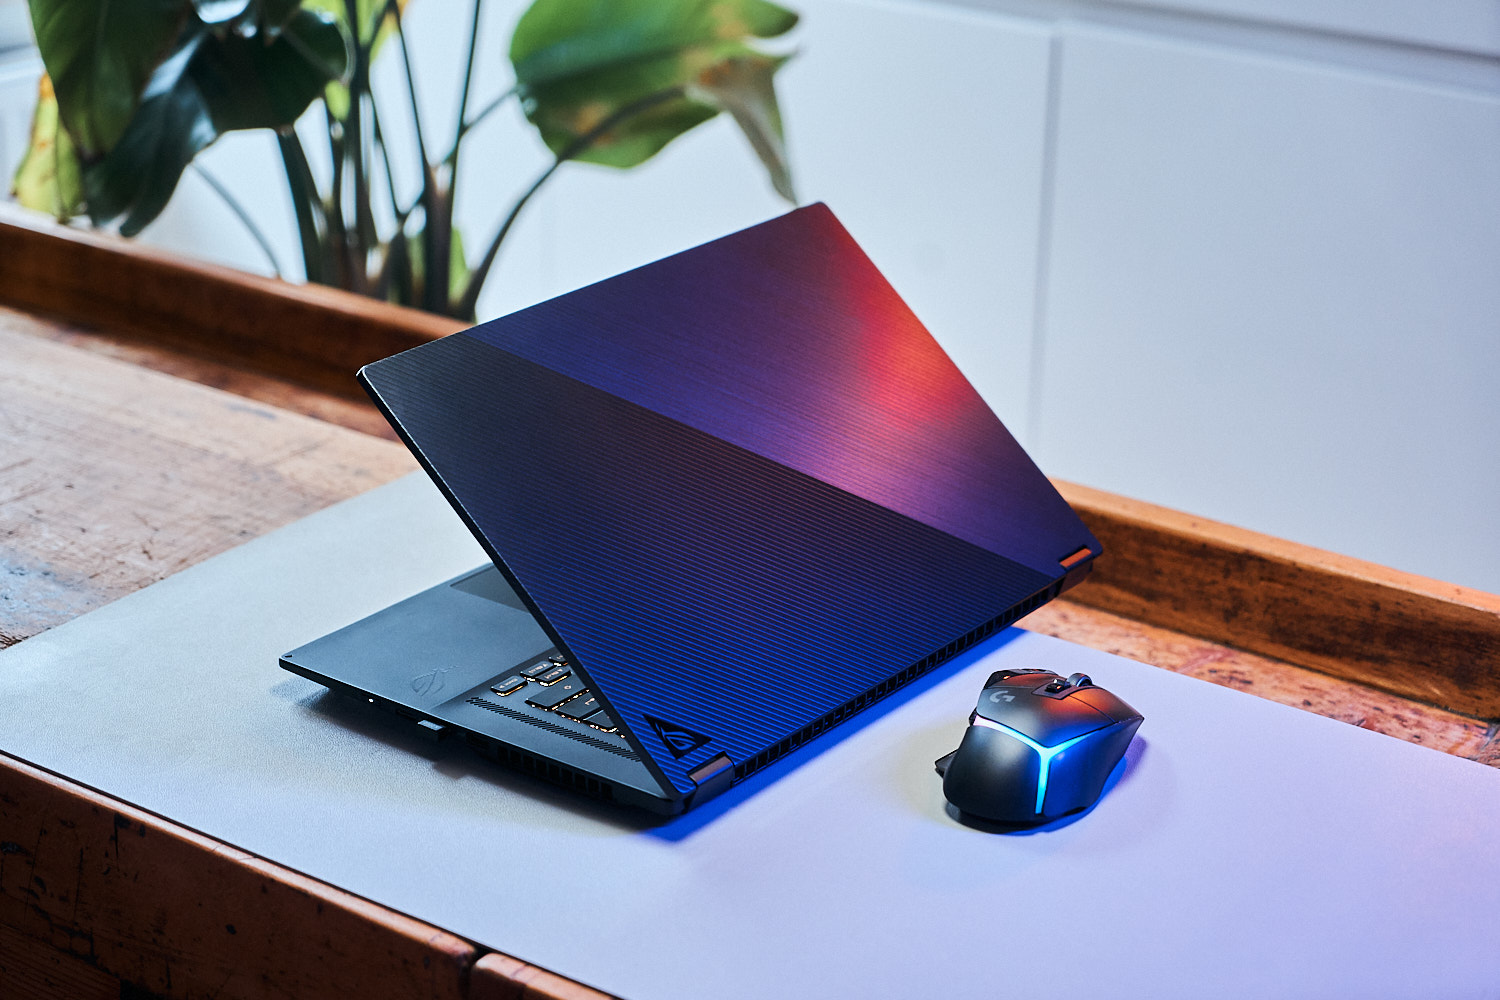
Purtroppo quest'anno lo stilo non è incluso e, in teoria, si riceve un portatile senza alcun accessorio aggiuntivo. Tuttavia, a seconda della confezione, sono inclusi uno zaino per laptop con marchio ROG, le cuffie ROG Fusion II 300 e il mouse ROG Gladius III.
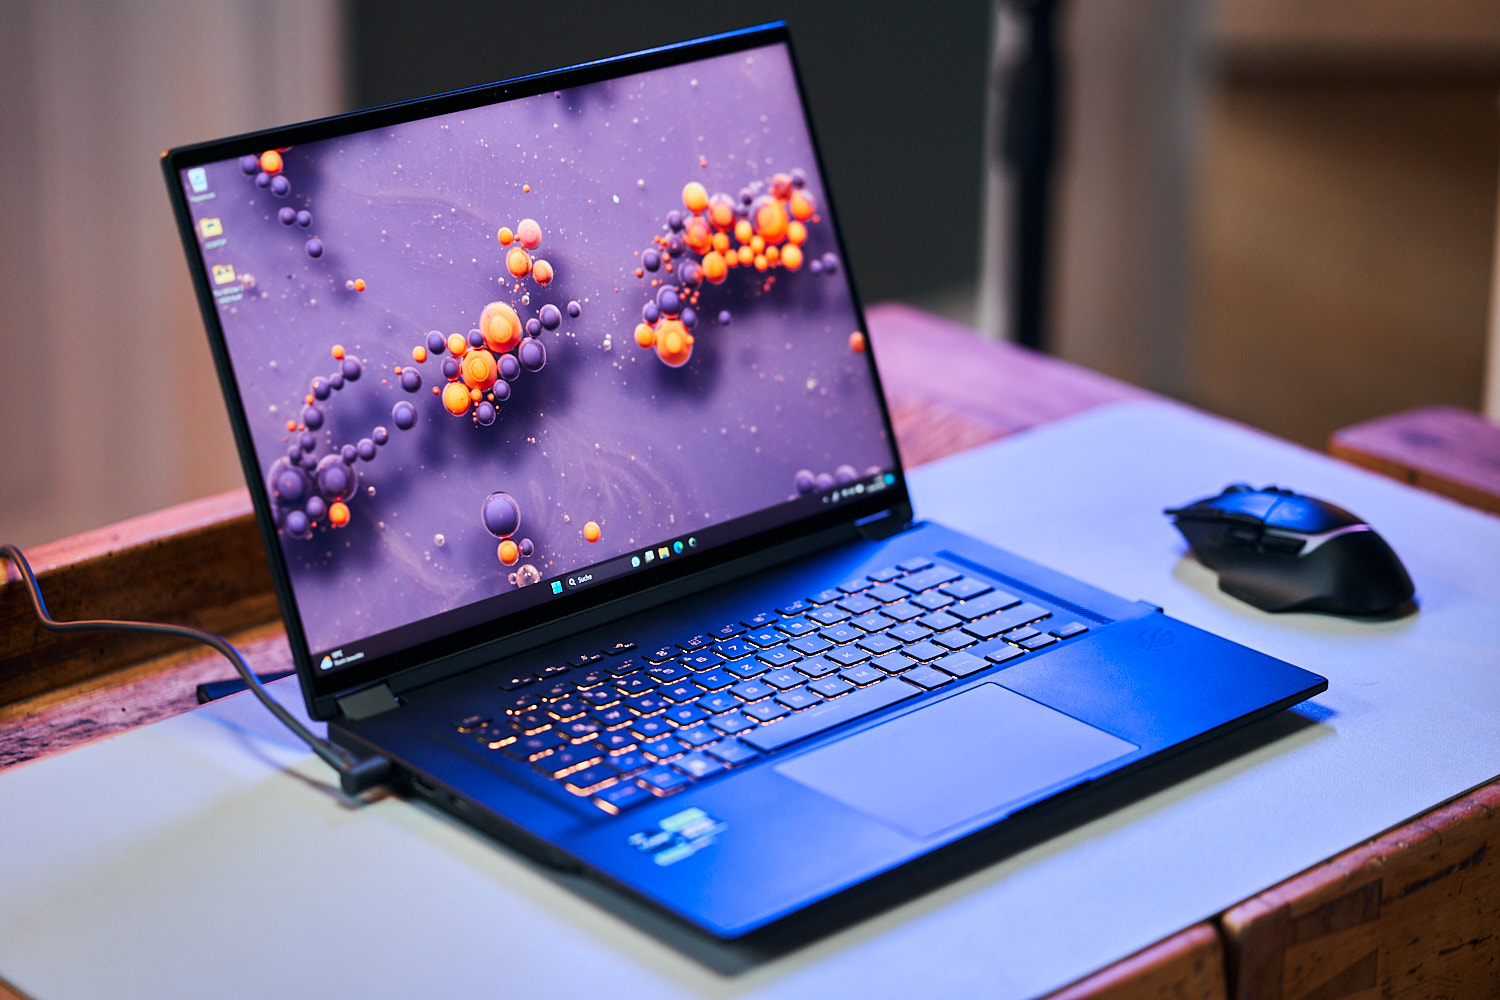
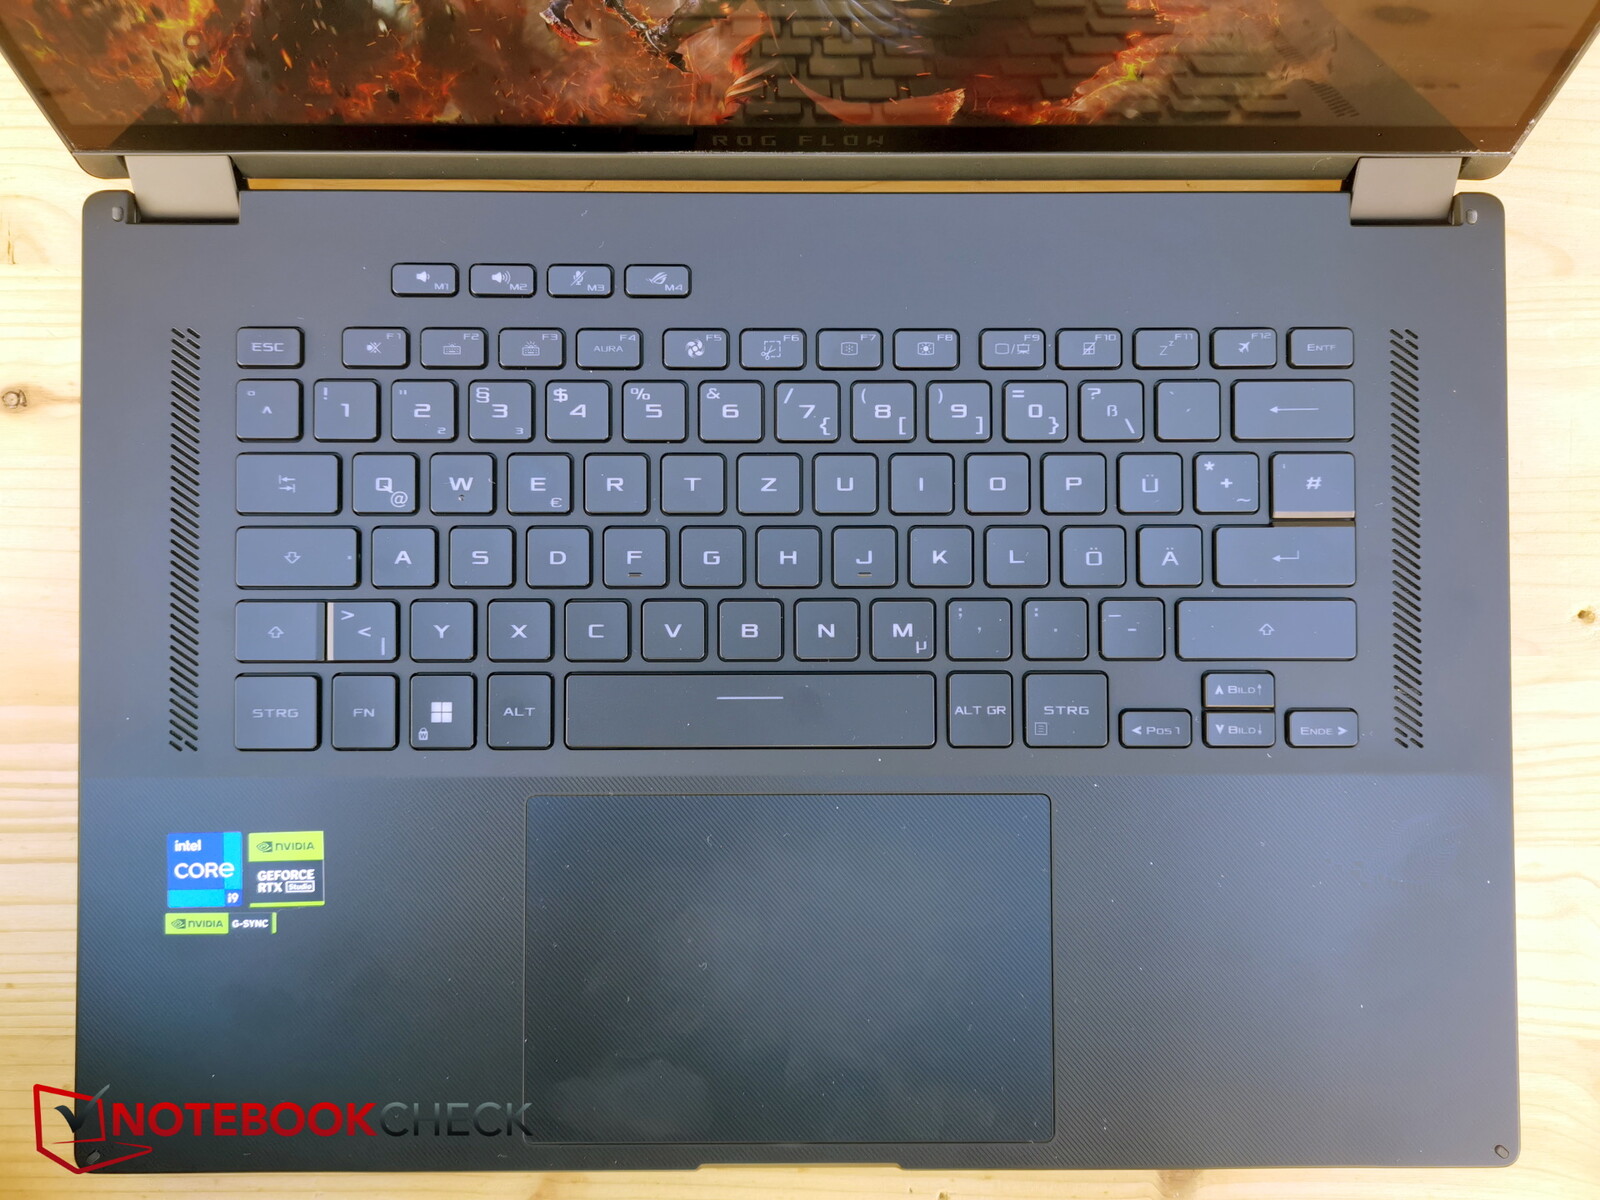
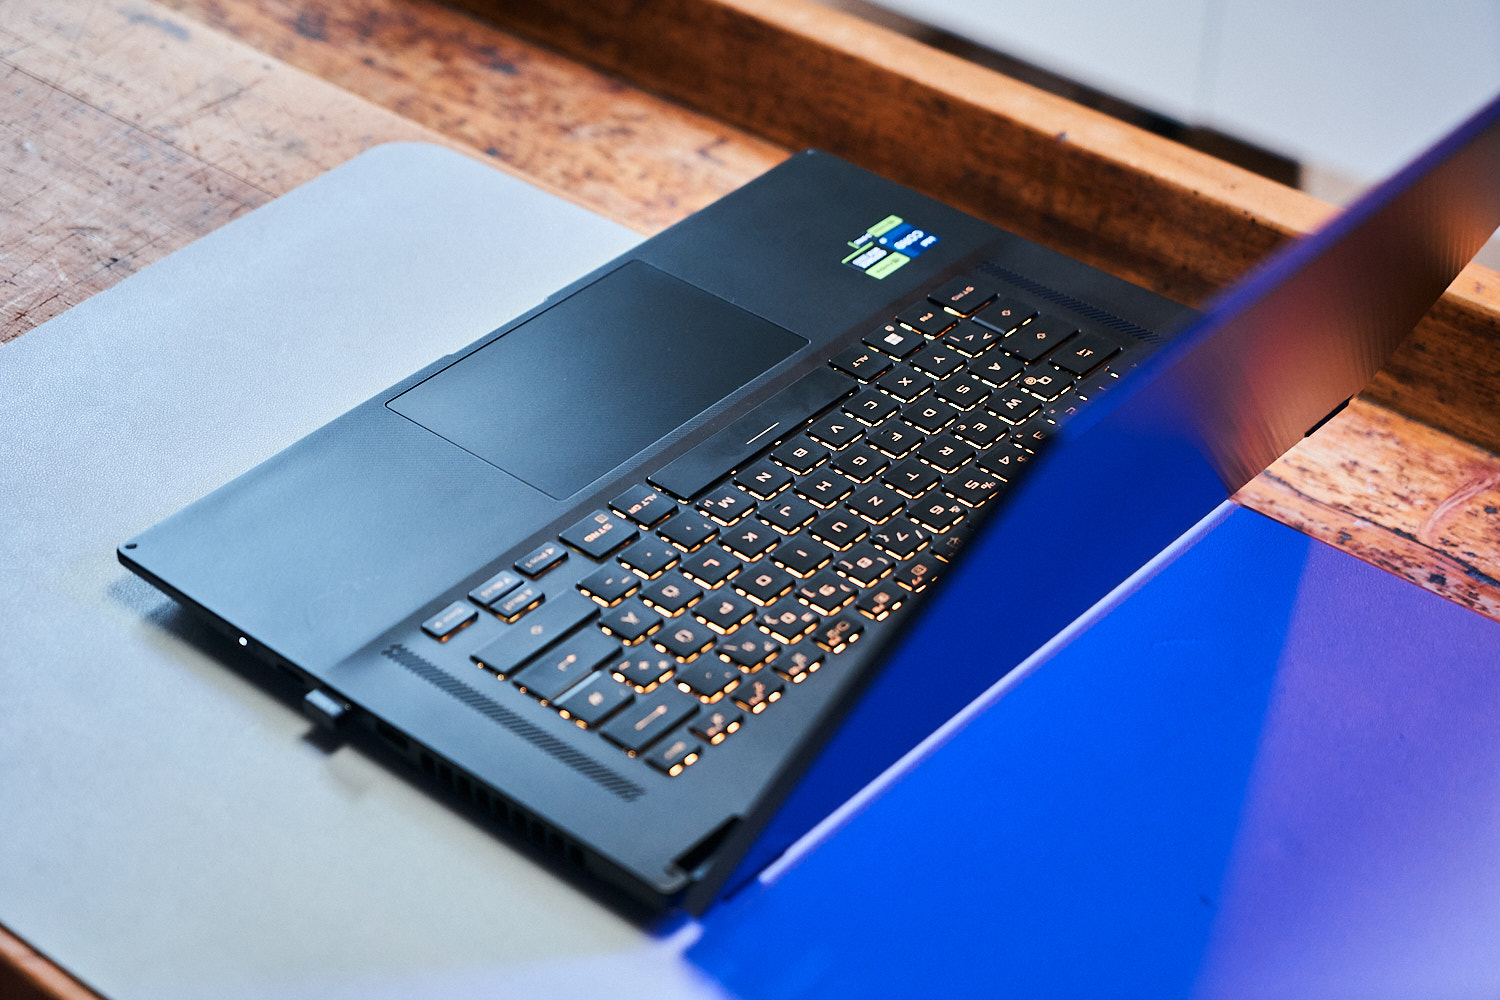
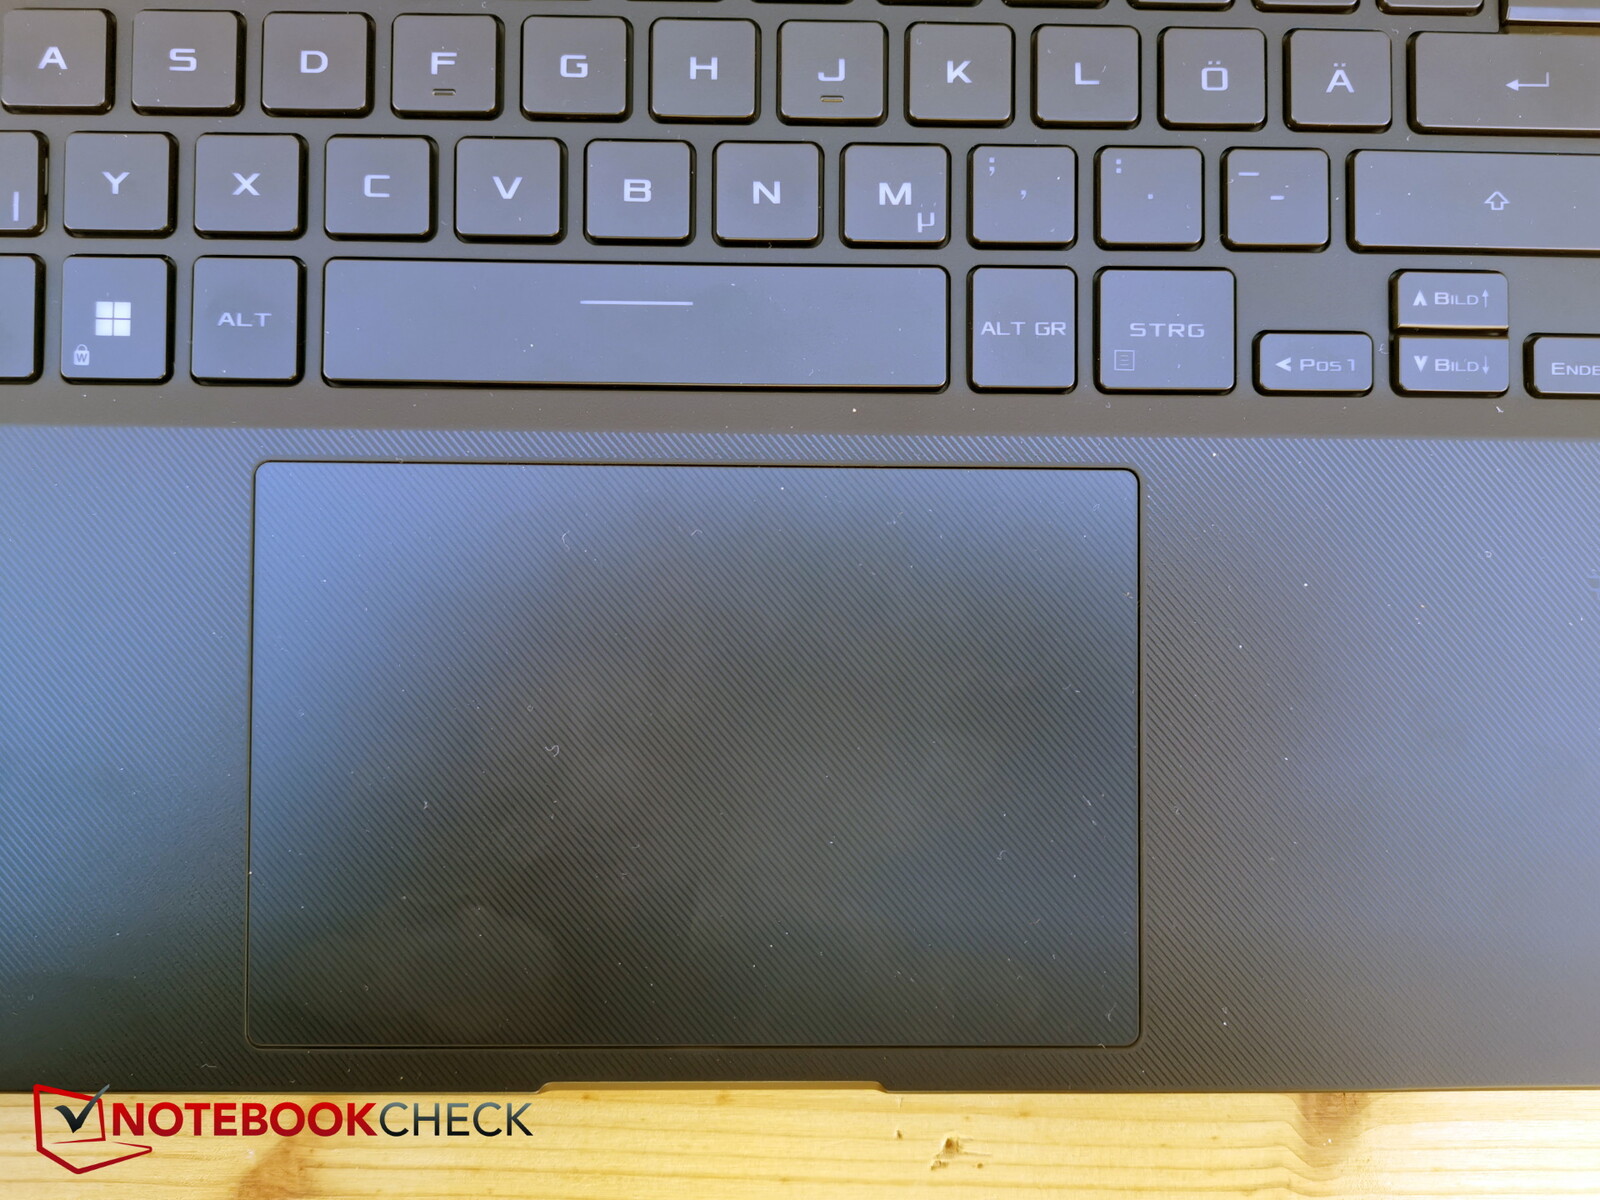
Dispositivi di input - L'X16 è dotato di un ampio touchpad

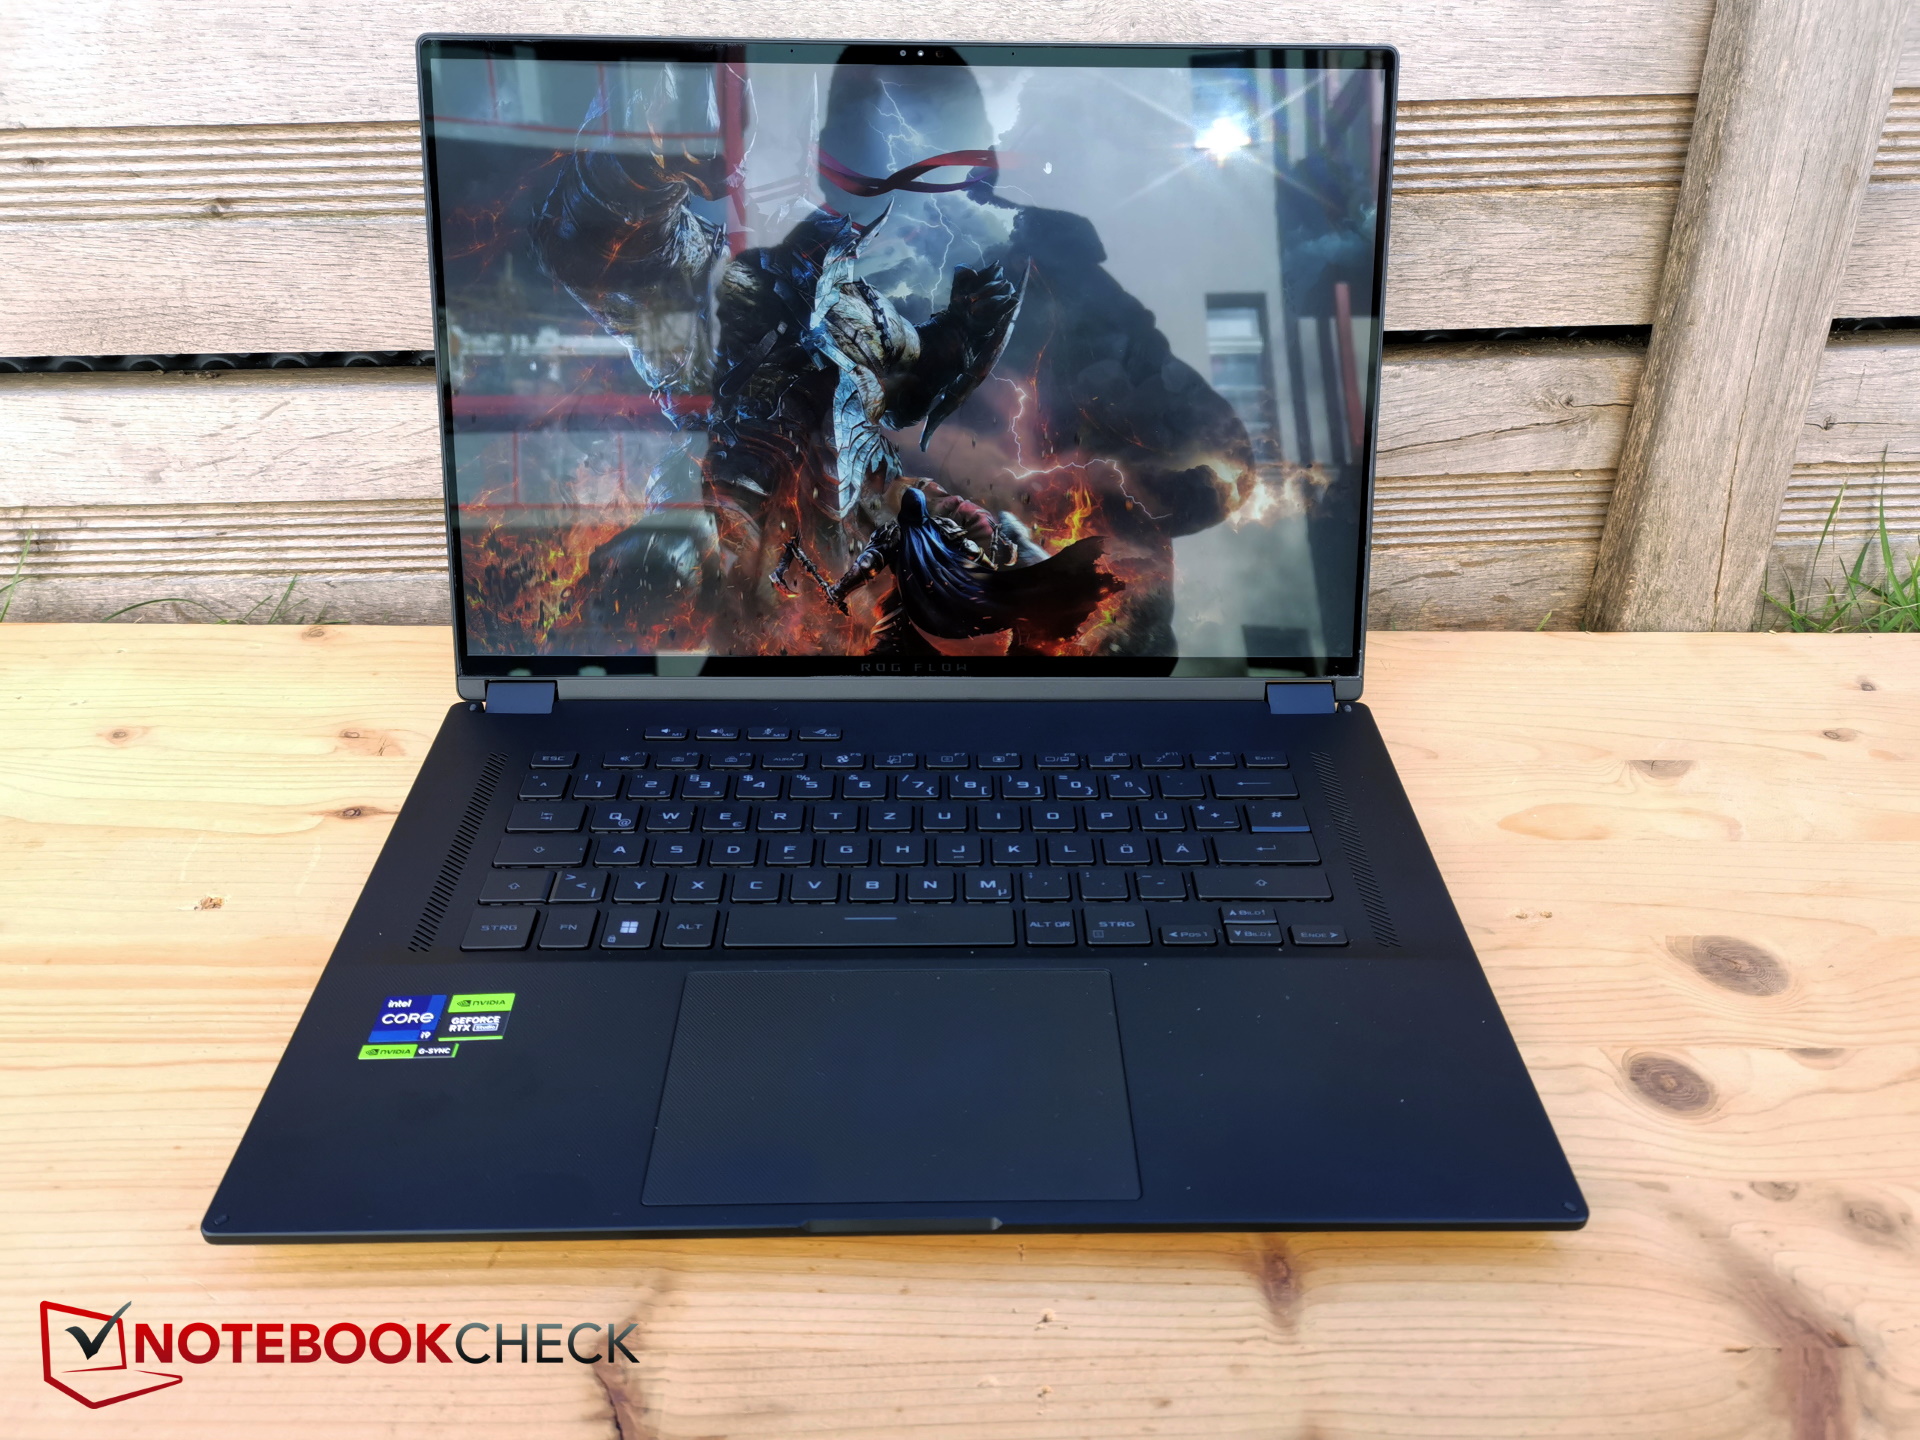
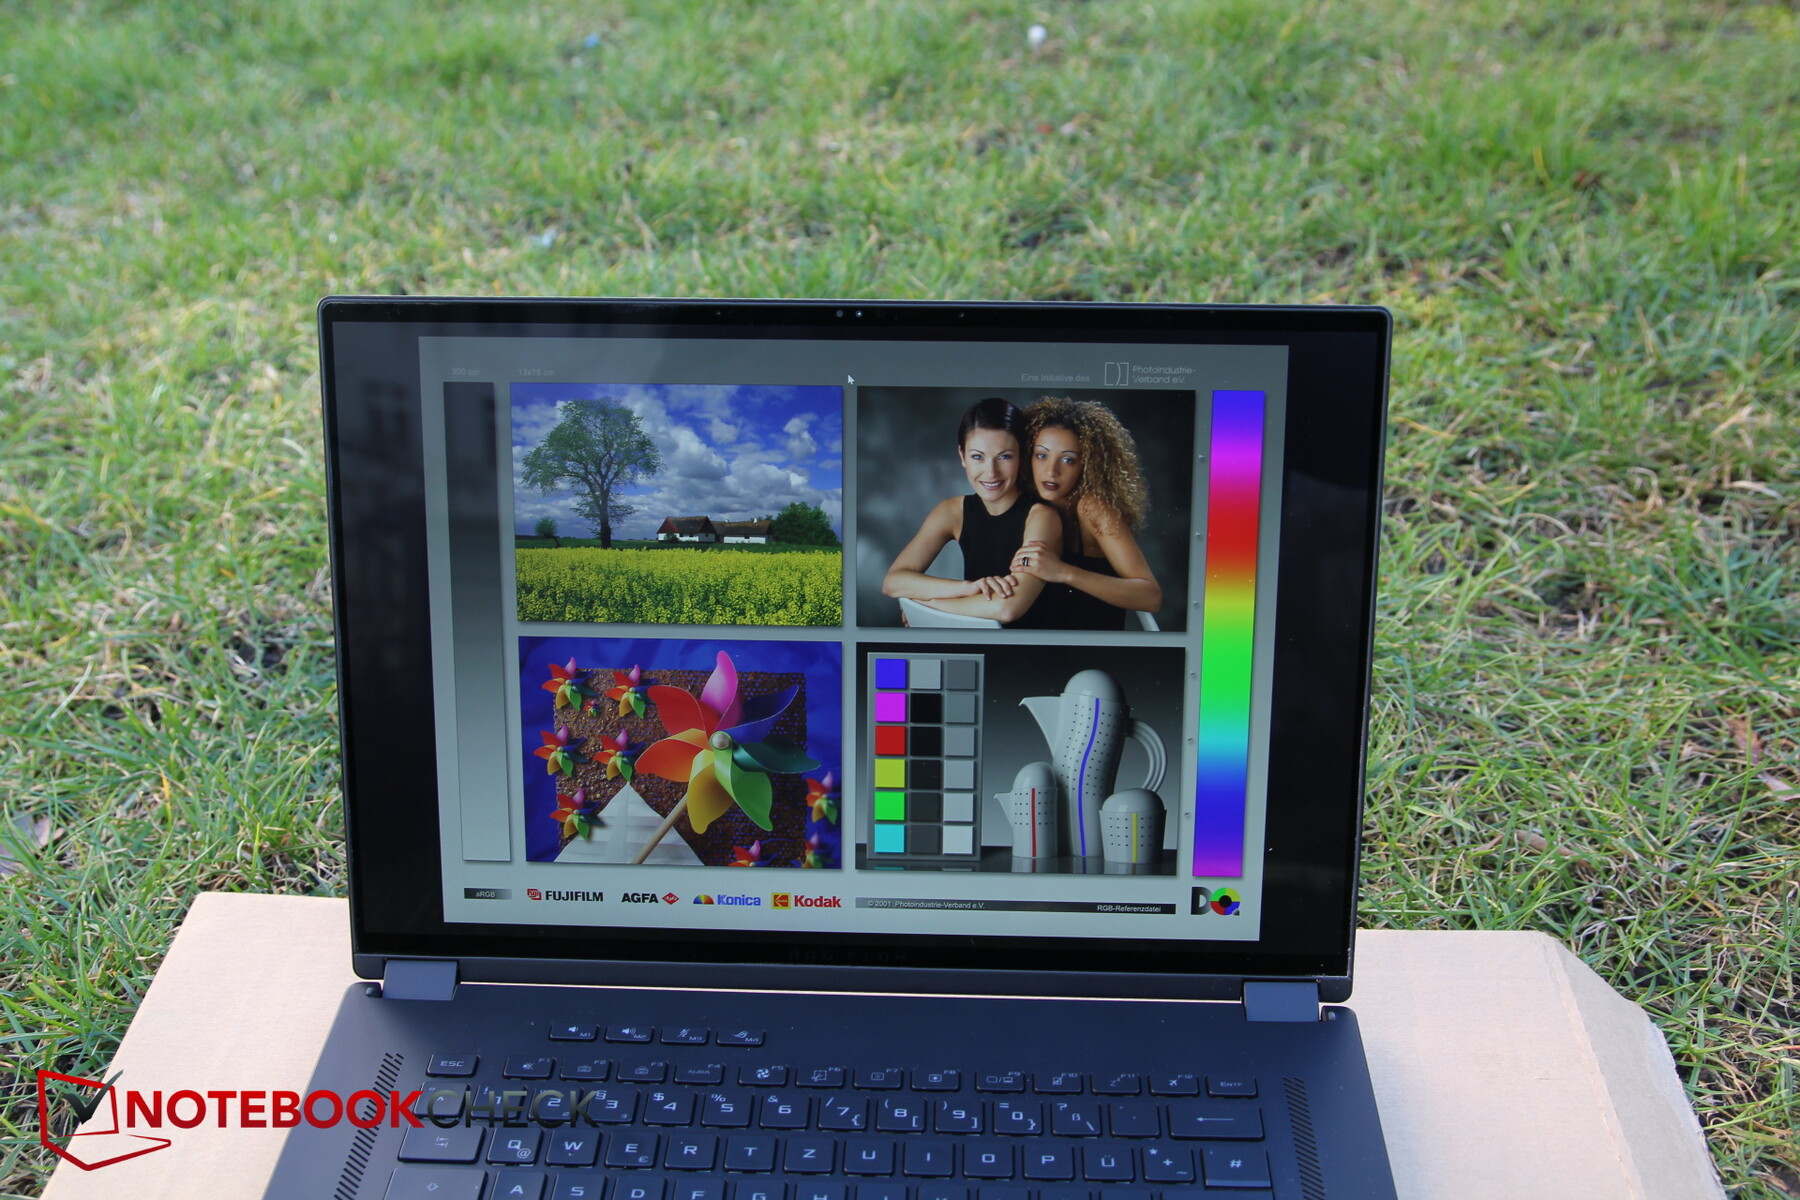
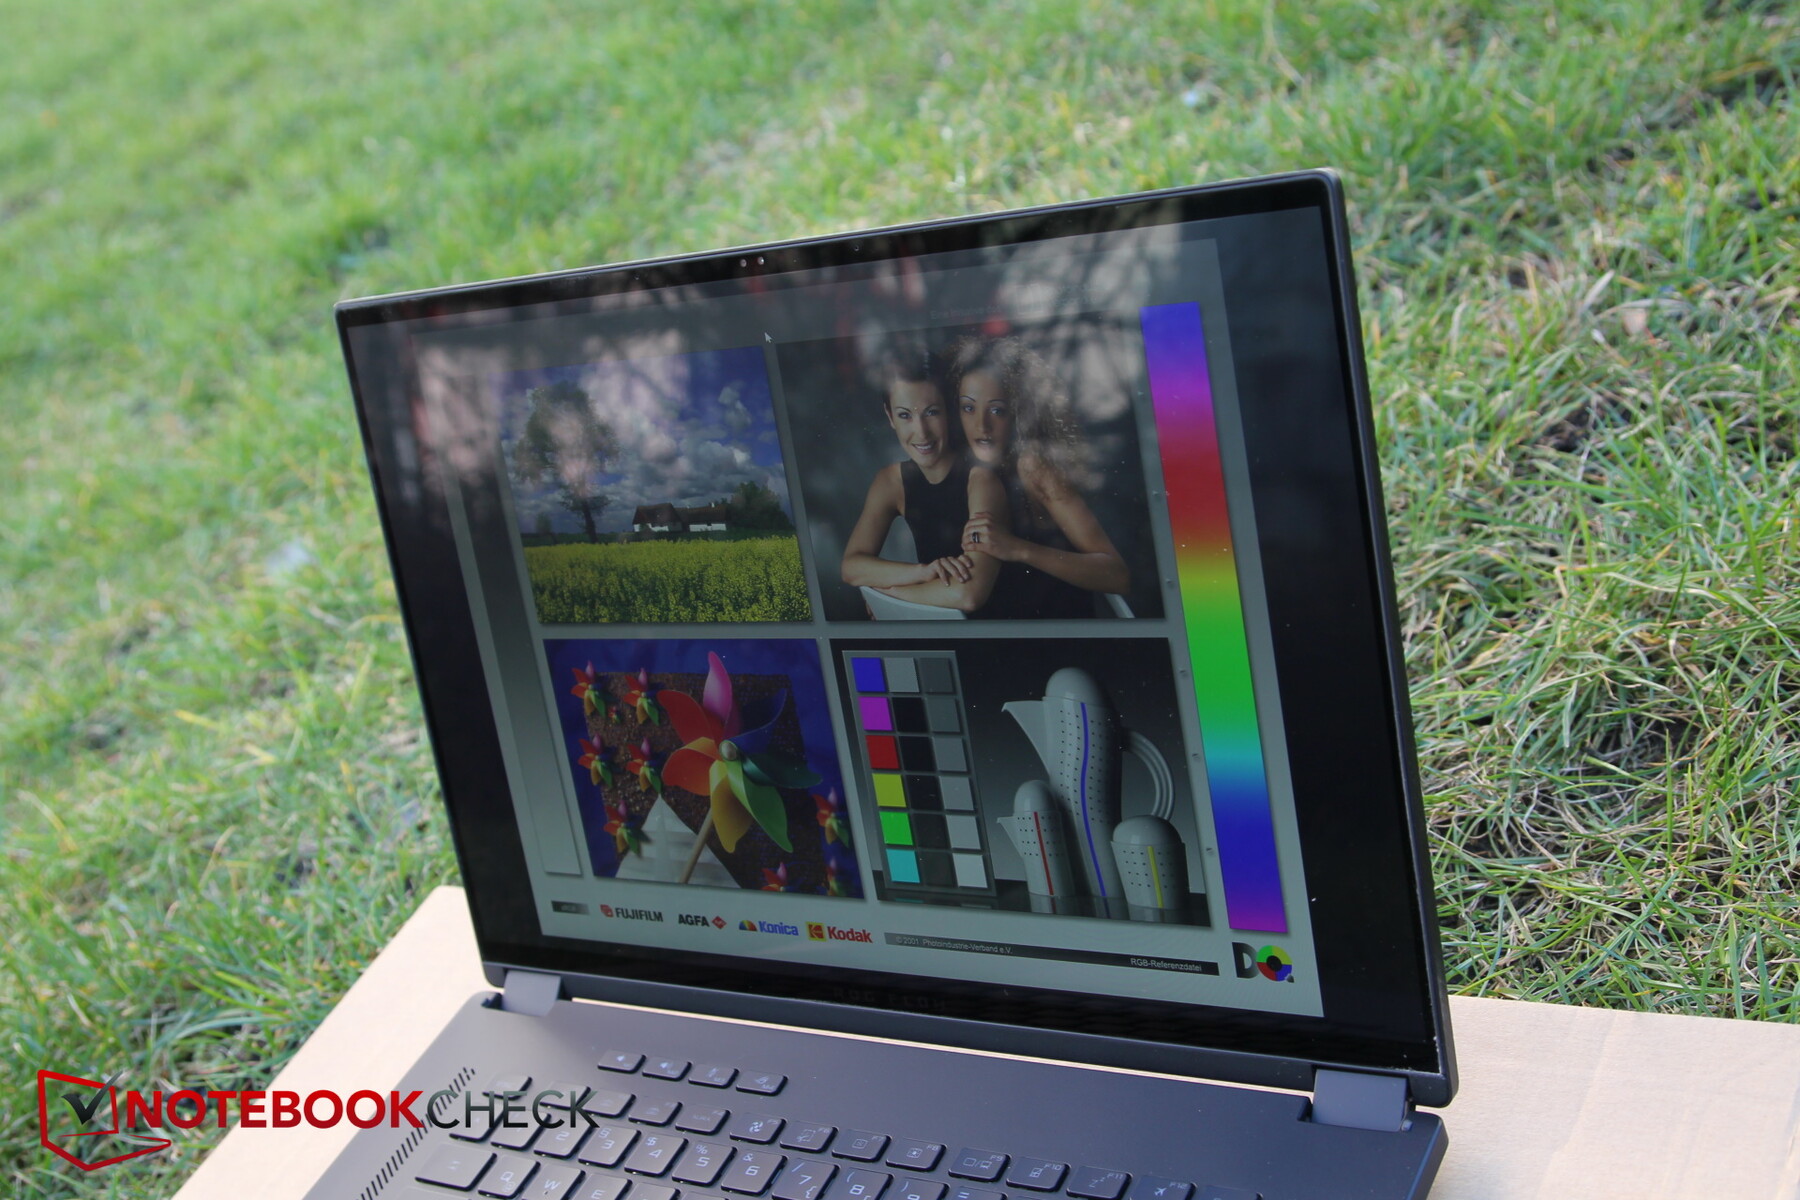
Display - Con o senza mini-LED?
L'X16 ospita il pannello IPS da 16 pollici Asus TMX1603 o TL160ADMP03-0 con funzionalità touchscreen ma senza mini-LED. Lo stesso pannello, anche se nella variante non touch, si trova anche nel modello Asus ROG Strix G16. Si tratta di un display in formato 16:10 da 2560 x 1600 pixel che supporta l'input tramite stilo. Purtroppo, a differenza dell'anno scorso quando lo stilo era incluso, quest'anno deve essere acquistato separatamente.
Inoltre, come l'anno scorso, è possibile scegliere un pannello con retroilluminazione mini-LED, ancora una volta migliorata: Il numero di zone di regolazione è stato raddoppiato a 1.024, la frequenza di aggiornamento è passata da 165 a 240 Hz e la luminosità di picco è aumentata leggermente a 1100 nit (HDR). Purtroppo, il pannello mini-LED (recensito qui) è disponibile solo per RTX 4070o da modelli con specifiche superiori e quindi non è presente nel nostro modello in prova.
Tuttavia, il sito web di Asus dà l'impressione che tutti i modelli siano dotati di display mini-LED, anche quelli con RTX 4050 e RTX 4060. Quindi, fate molta attenzione al momento dell'acquisto!

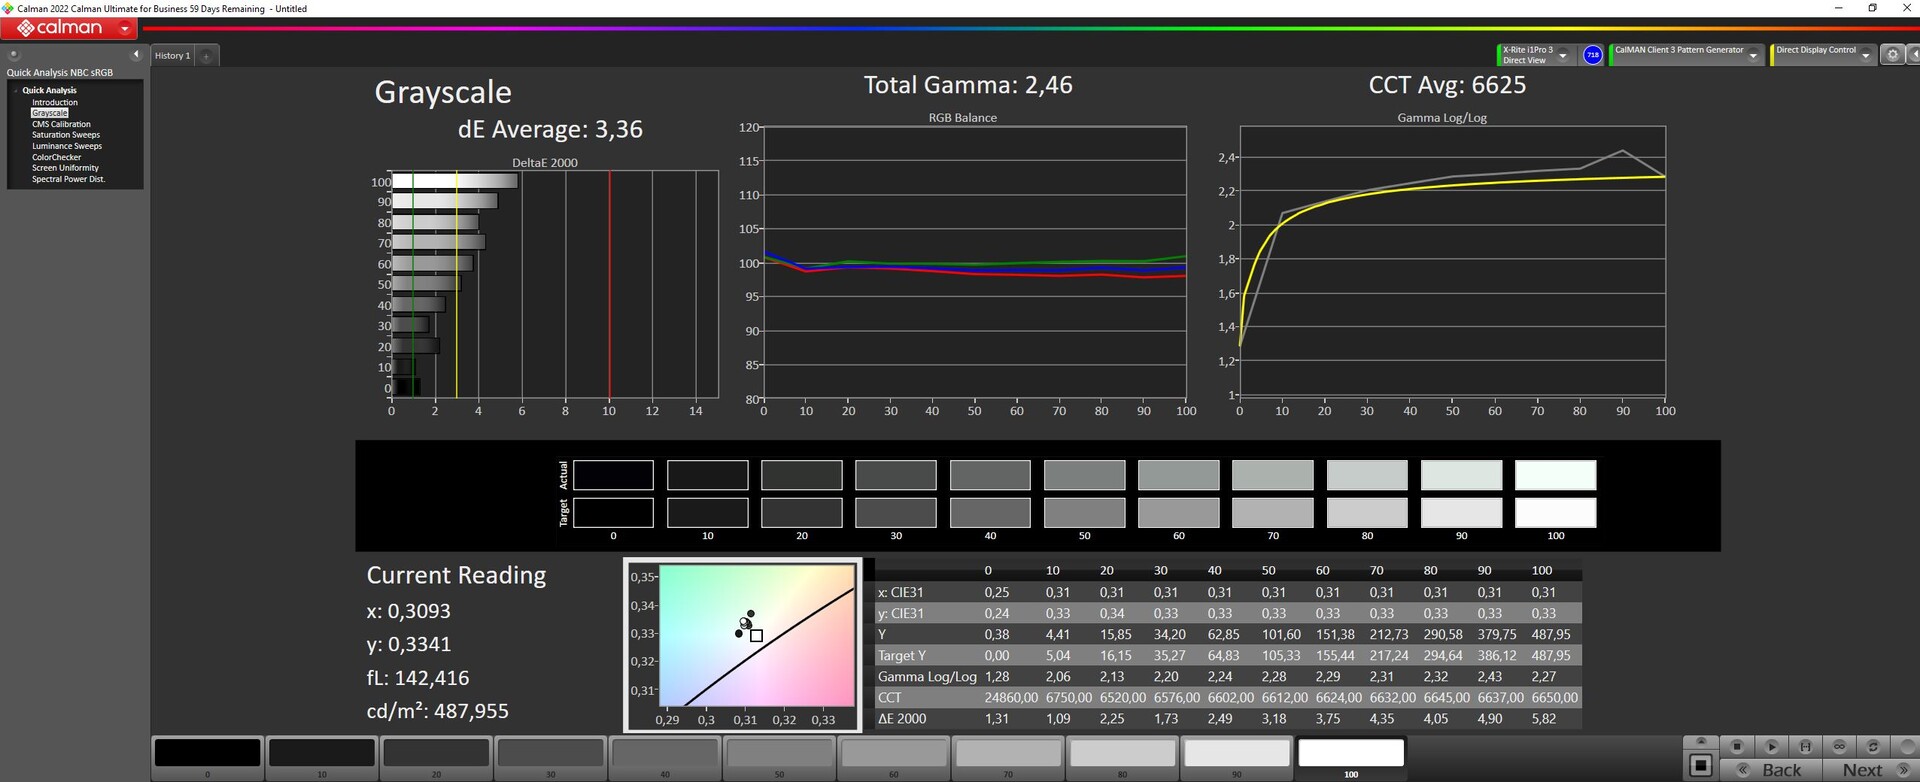
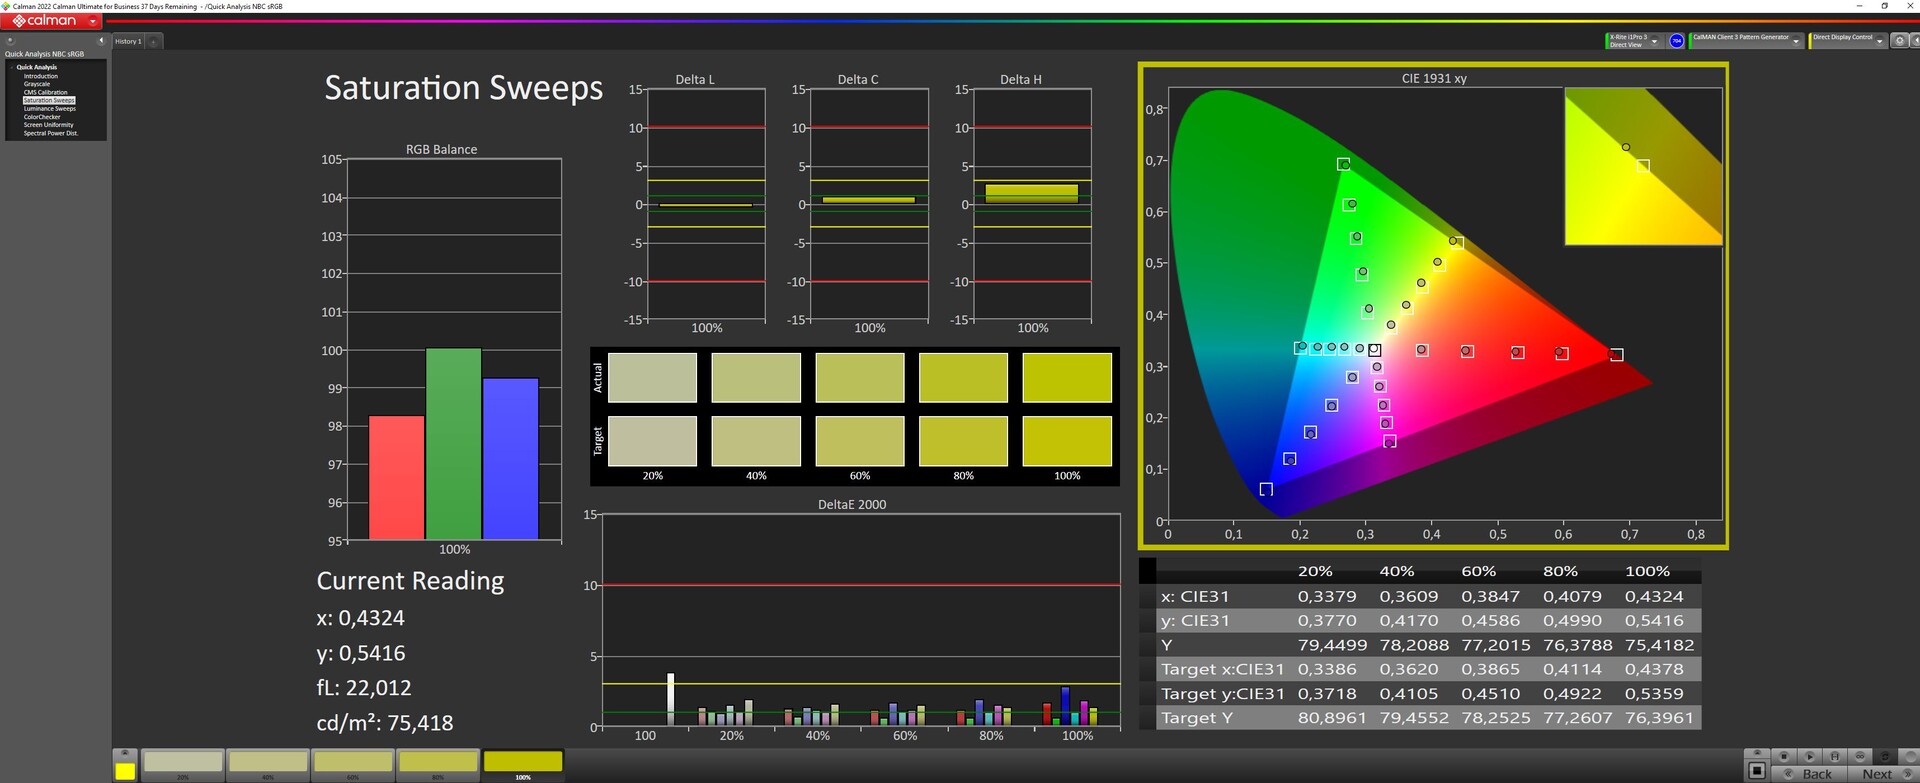
Tuttavia, anche senza mini-LED, il nostro modello standard ha misurato una luminosità media di circa 469 nit con un'illuminazione molto buona del 91%. I livelli di nero sono di un accettabile 0,39, con un rapporto di contrasto di 1.246:1. I tempi di risposta sono molto rapidi, non c'è da preoccuparsi.
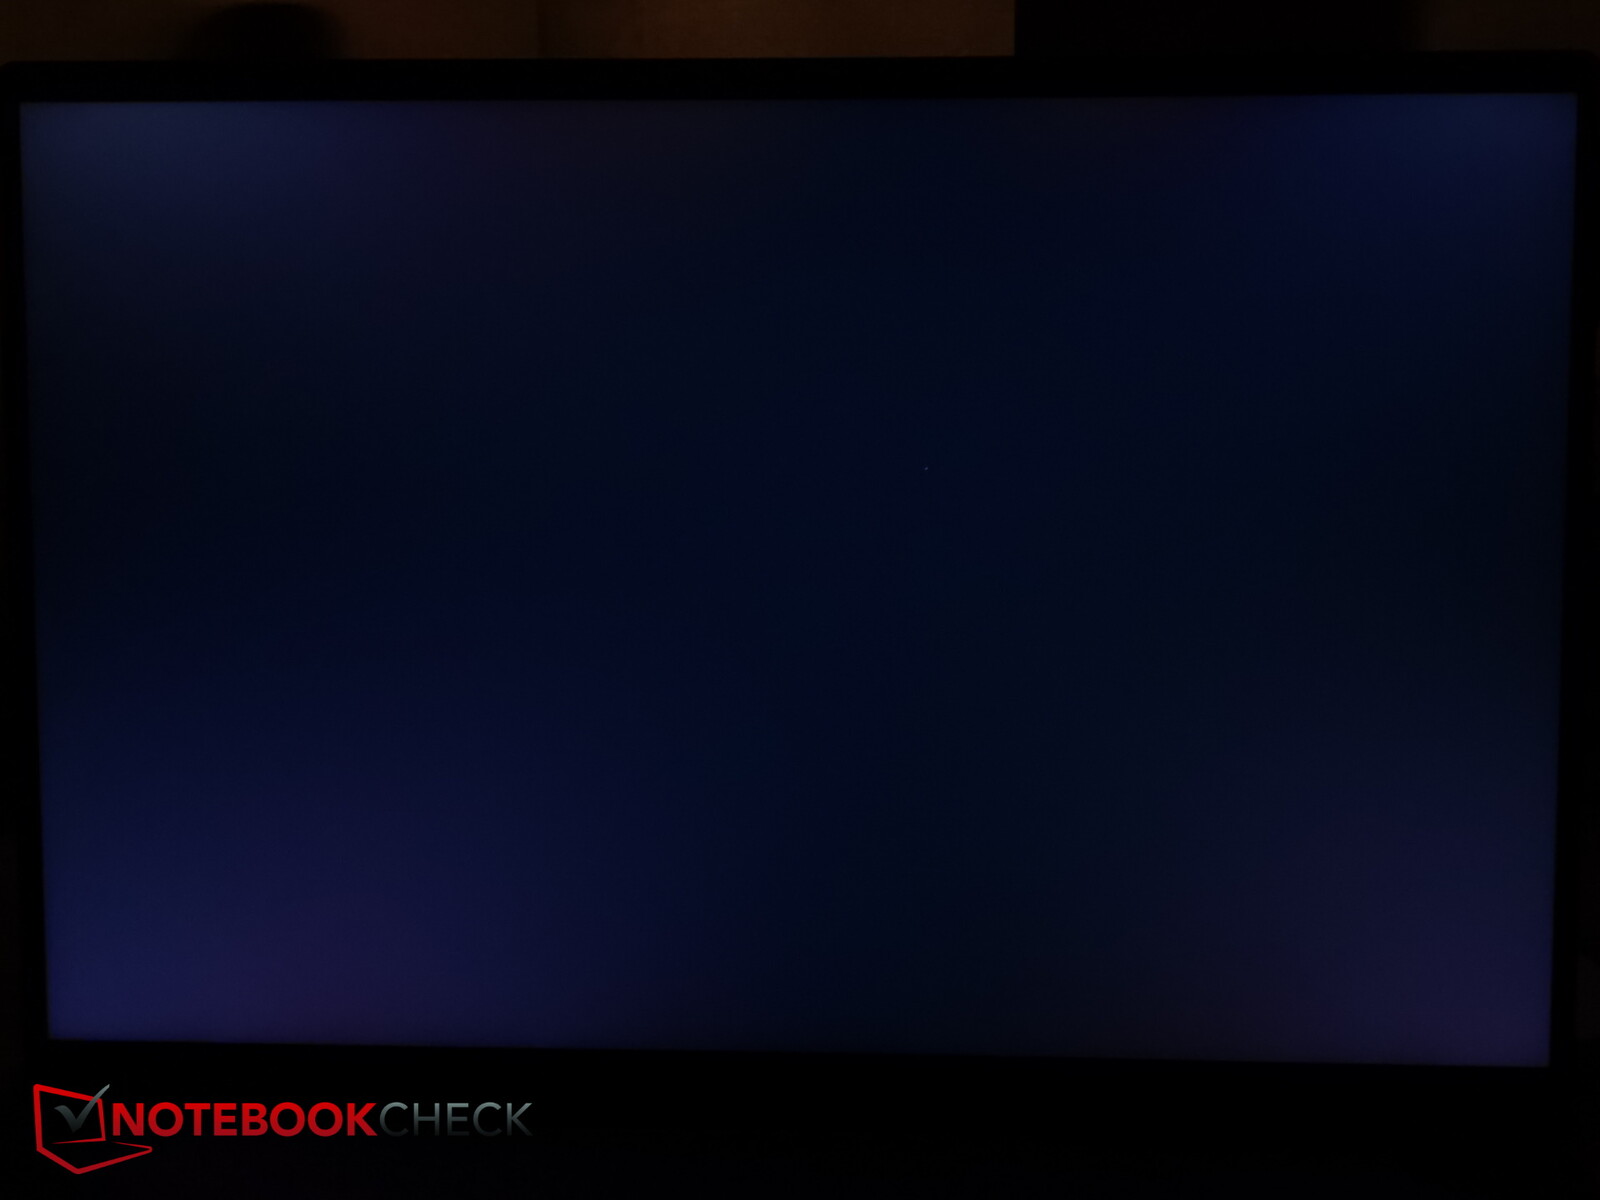
I tempi di risposta sono molto rapidi, non c'è bisogno di preoccuparsi del PWM e il bleeding della retroilluminazione è minimo, visibile solo lungo il bordo superiore.
| |||||||||||||||||||||||||
Distribuzione della luminosità: 91 %
Al centro con la batteria: 487 cd/m²
Contrasto: 1246:1 (Nero: 0.39 cd/m²)
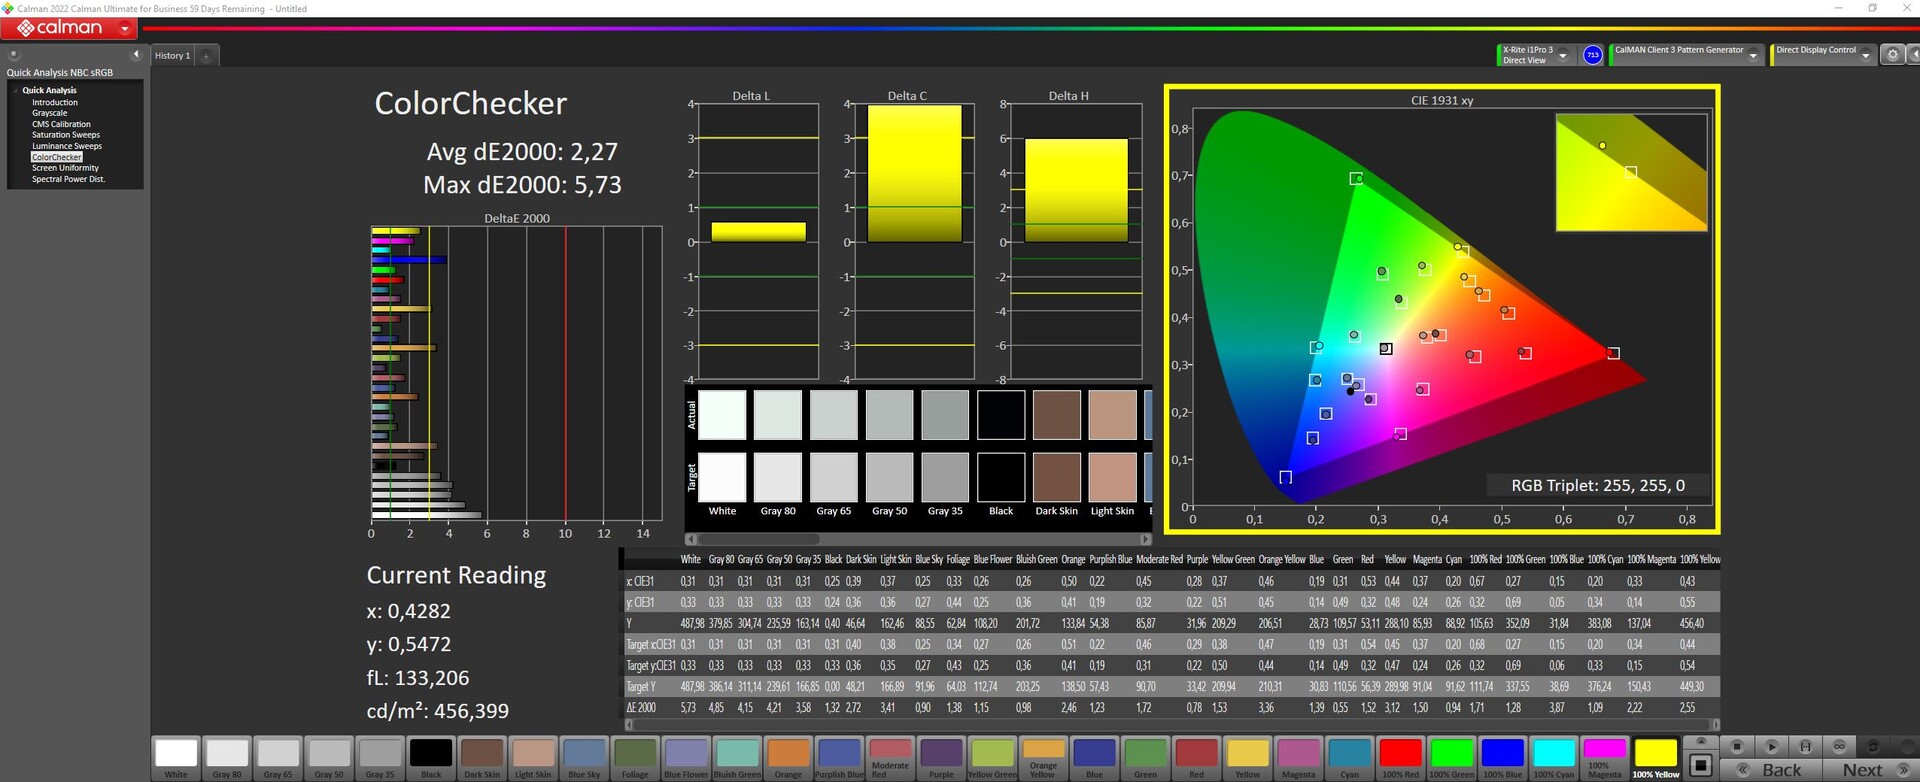
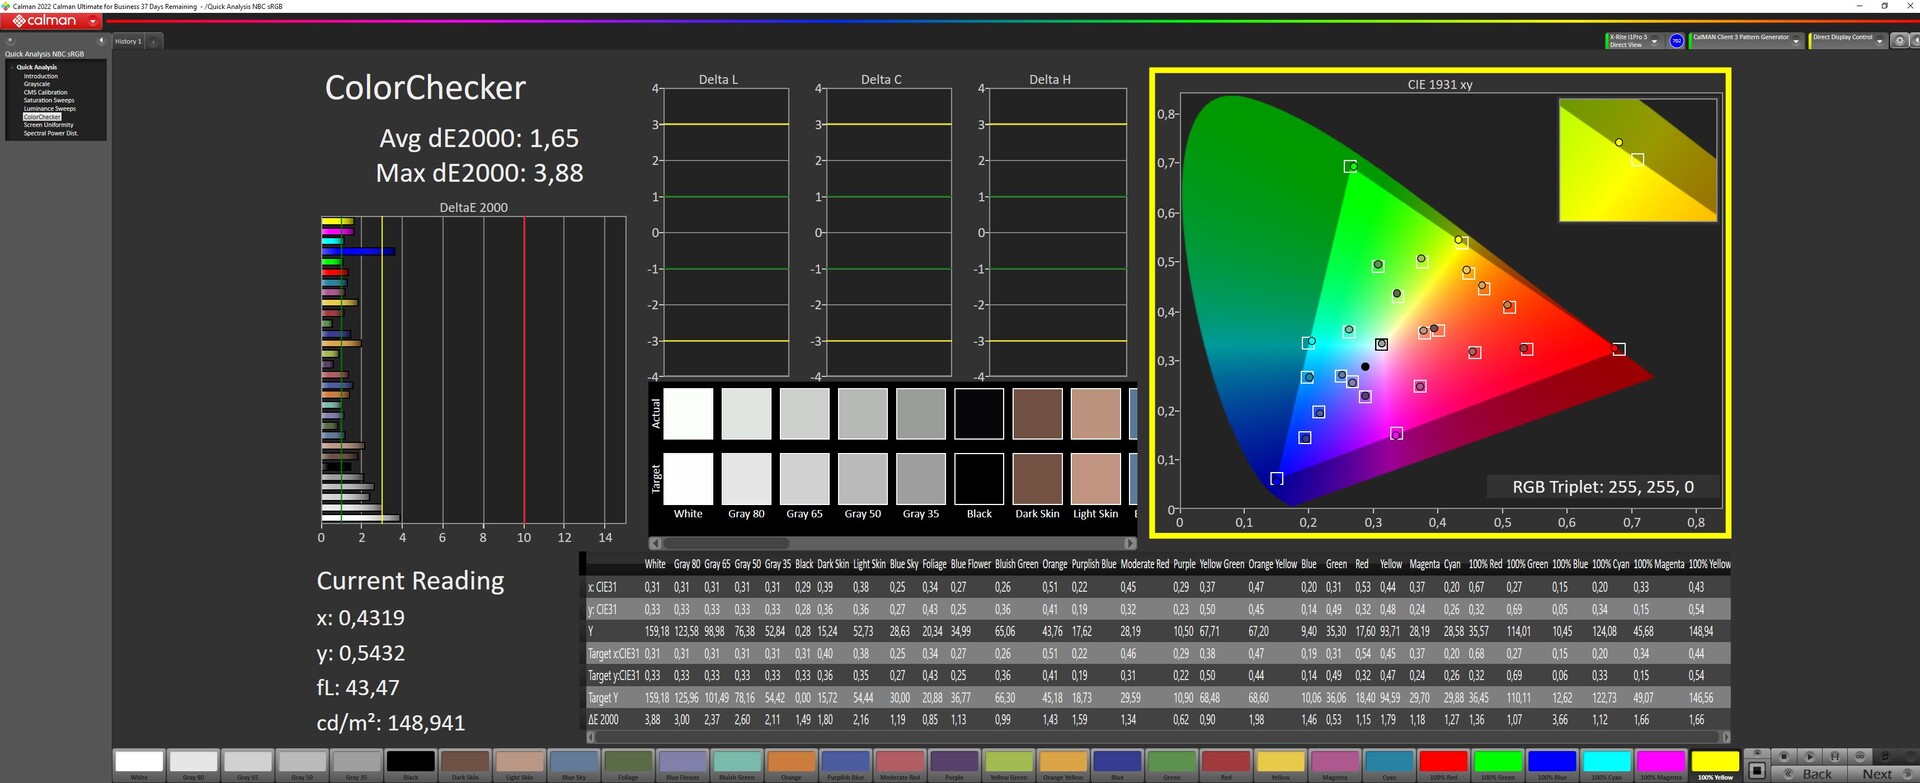
ΔE ColorChecker Calman: 2.27 | ∀{0.5-29.43 Ø4.72}
calibrated: 0.6
ΔE Greyscale Calman: 3.36 | ∀{0.09-98 Ø4.97}
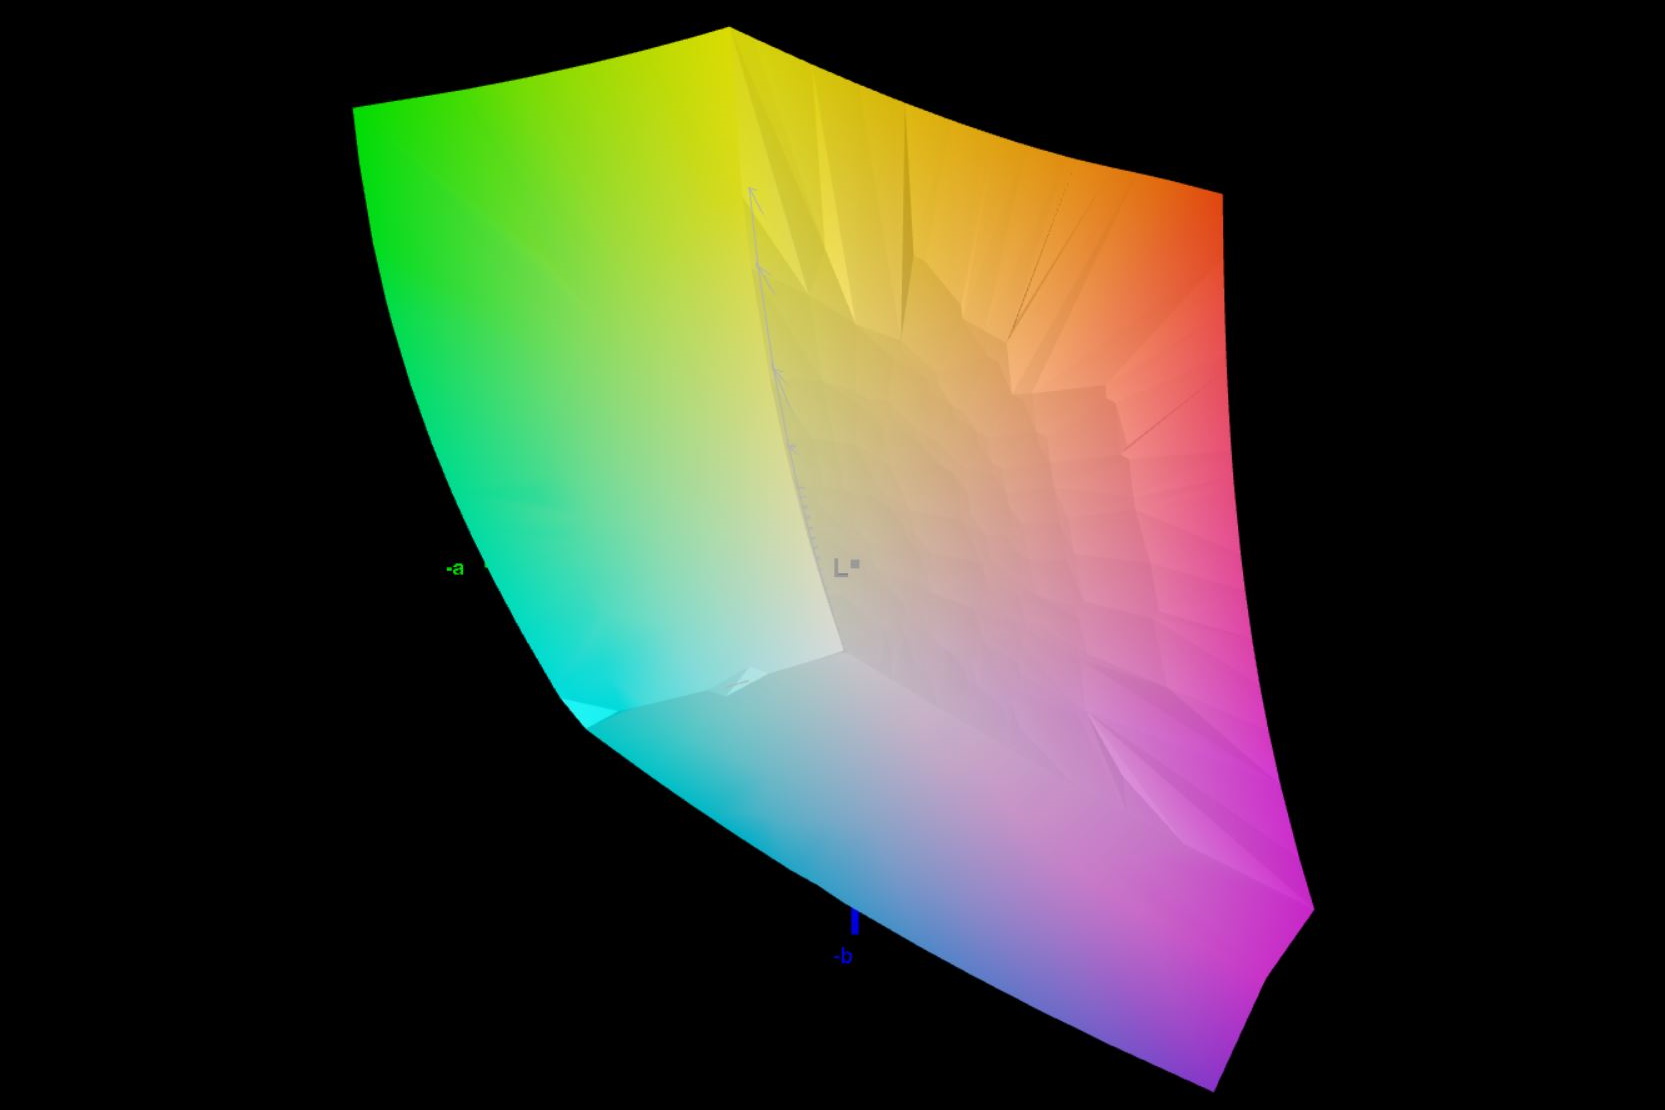
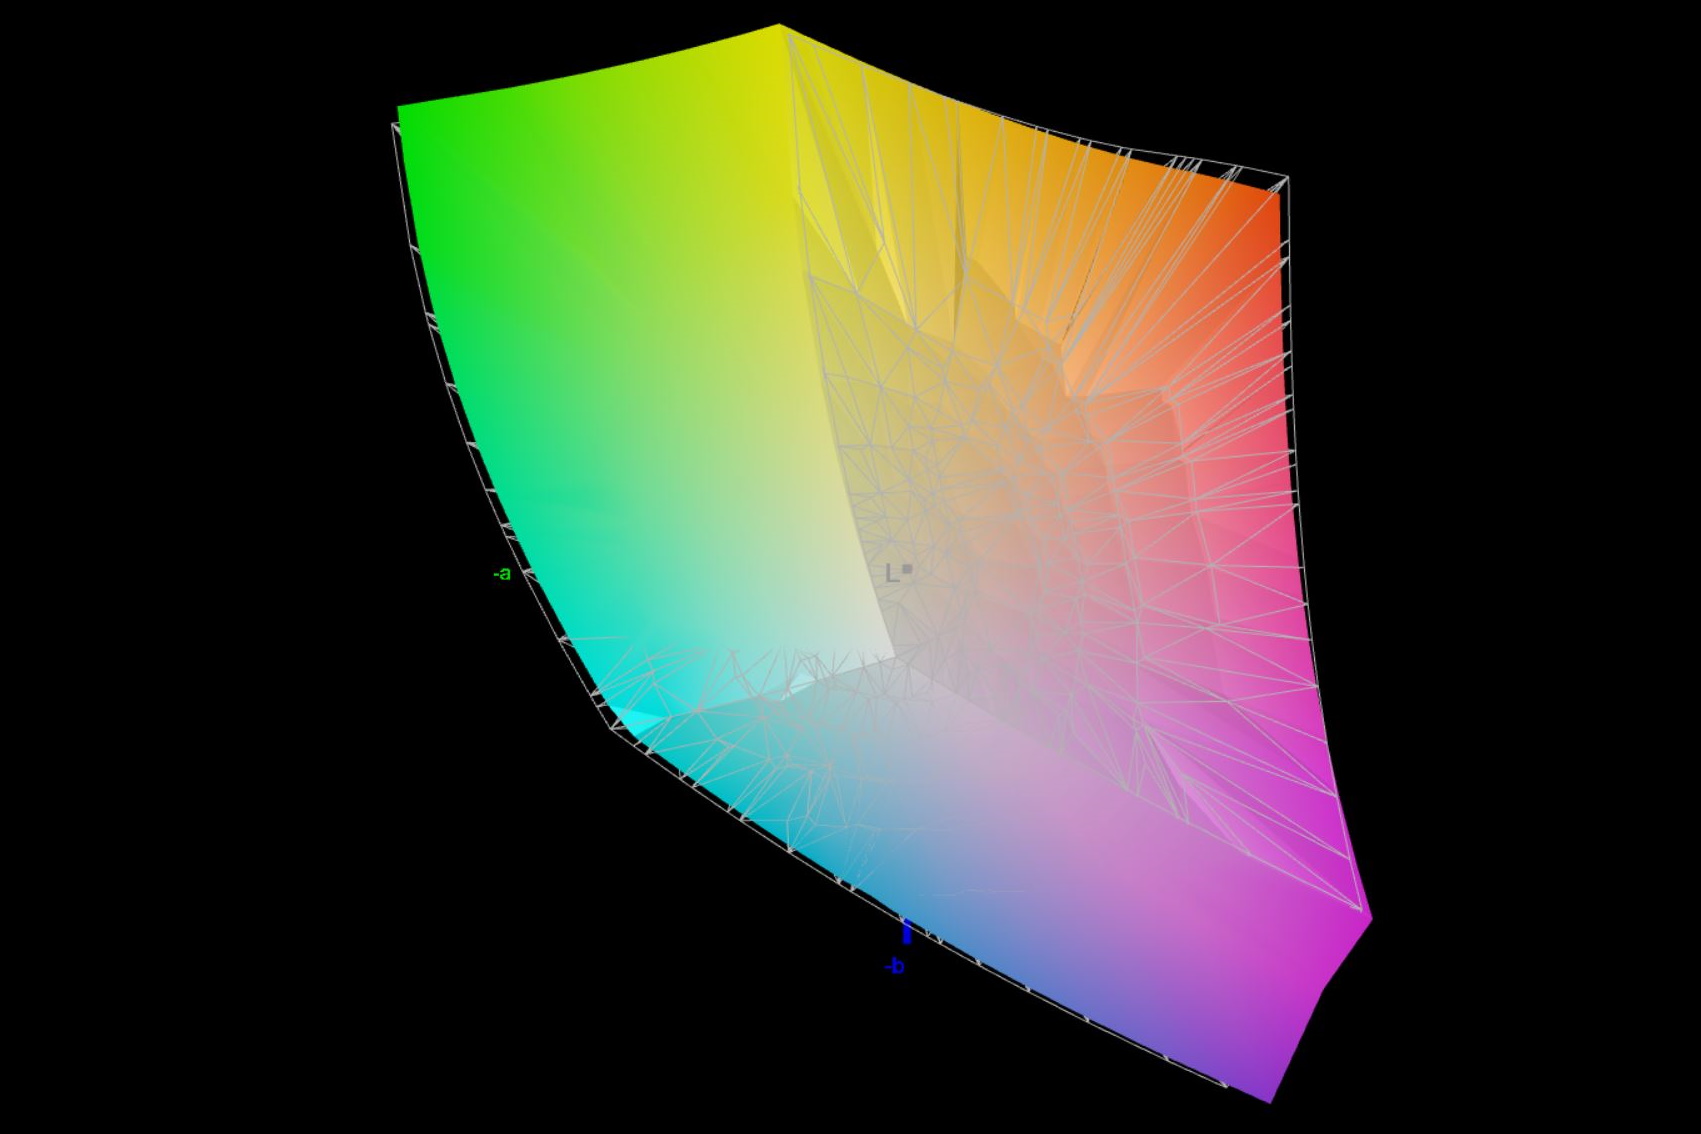
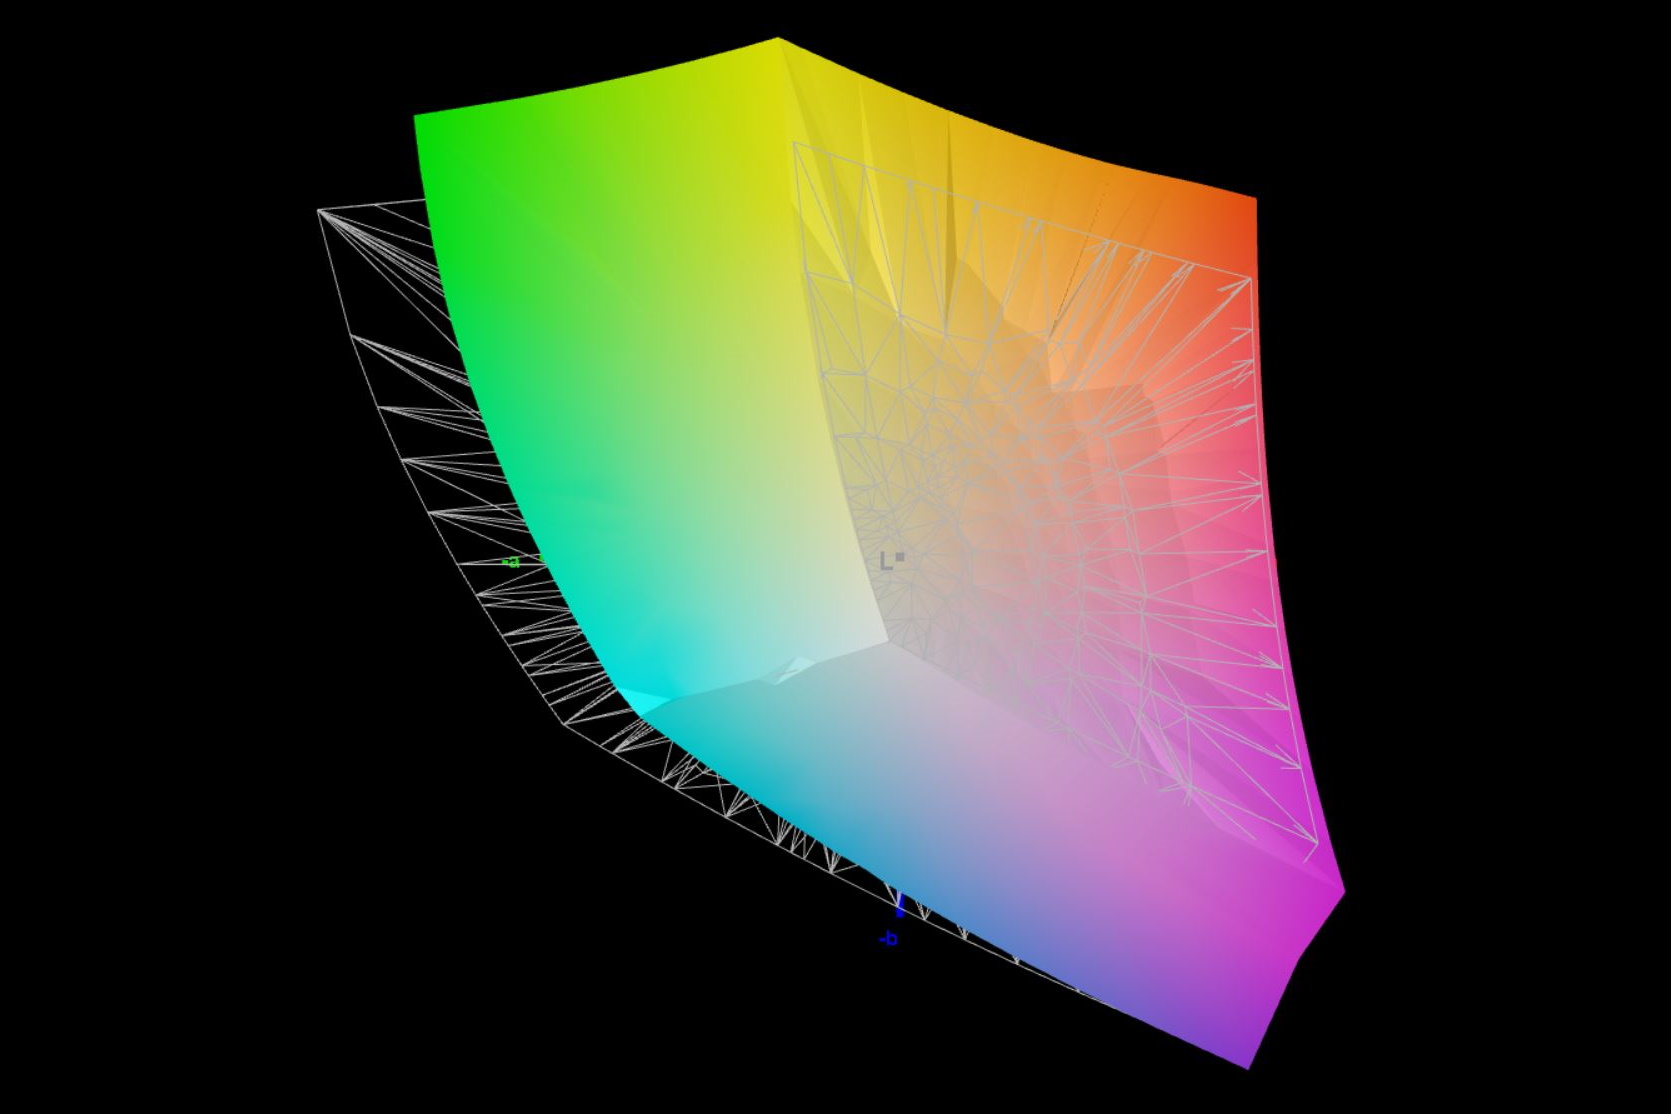
84.63% AdobeRGB 1998 (Argyll 3D)
99.92% sRGB (Argyll 3D)
96.61% Display P3 (Argyll 3D)
Gamma: 2.46
CCT: 6625 K
| Asus ROG Flow X16 GV601V TMX1603 (TL160ADMP03-0), IPS, 2560x1600, 16" | Asus ROG Flow X16 GV601RW-M5082W AUO B160QAN02.S, Mini LED, 2560x1600, 16.1" | Samsung Galaxy Book3 Ultra 16, i9-13900H RTX 4070 Samsung SDC4185 ATNA60CL03-0, OLED / AMOLED, 2880x1800, 16" | Lenovo Legion Pro 5 16IRX8 AU Optronics B160QAN03.1, IPS, 2560x1600, 16" | Lenovo Yoga Pro 7 14IRH G8 LEN145-3K, IPS, 3072x1920, 14.5" | MSI Katana 17 B13VFK B173HAN04.9, IPS LED, 1920x1080, 17.3" | |
|---|---|---|---|---|---|---|
| Display | 3% | 4% | -13% | 2% | -49% | |
| Display P3 Coverage (%) | 96.61 | 99.82 3% | 95.3 -1% | 71.2 -26% | 98.7 2% | 40.8 -58% |
| sRGB Coverage (%) | 99.92 | 99.99 0% | 99.1 -1% | 98.8 -1% | 100 0% | 61 -39% |
| AdobeRGB 1998 Coverage (%) | 84.63 | 90.21 7% | 97.4 15% | 73.3 -13% | 87.6 4% | 42.2 -50% |
| Response Times | -117% | 61% | -160% | -419% | -505% | |
| Response Time Grey 50% / Grey 80% * (ms) | 3.8 ? | 11 ? -189% | 2 ? 47% | 14.5 ? -282% | 31.5 ? -729% | 33 ? -768% |
| Response Time Black / White * (ms) | 7.6 ? | 11 ? -45% | 2 ? 74% | 10.4 ? -37% | 15.8 ? -108% | 26 ? -242% |
| PWM Frequency (Hz) | 7400 ? | 250 ? | ||||
| Screen | 16% | 2% | 8% | 26% | -111% | |
| Brightness middle (cd/m²) | 486 | 498 2% | 403 -17% | 405.7 -17% | 441 -9% | 267 -45% |
| Brightness (cd/m²) | 469 | 502 7% | 408 -13% | 368 -22% | 453 -3% | 256 -45% |
| Brightness Distribution (%) | 91 | 94 3% | 98 8% | 87 -4% | 92 1% | 93 2% |
| Black Level * (cd/m²) | 0.39 | 0.11 72% | 0.38 3% | 0.34 13% | 0.21 46% | |
| Contrast (:1) | 1246 | 4527 263% | 1068 -14% | 1297 4% | 1271 2% | |
| Colorchecker dE 2000 * | 2.27 | 1.87 18% | 2.63 -16% | 1.65 27% | 0.6 74% | 4.7 -107% |
| Colorchecker dE 2000 max. * | 5.73 | 6.15 -7% | 4.07 29% | 4.2 27% | 1.3 77% | 20.4 -256% |
| Colorchecker dE 2000 calibrated * | 0.6 | 1.94 -223% | 0.53 12% | 0.6 -0% | 4.5 -650% | |
| Greyscale dE 2000 * | 3.36 | 3.15 6% | 2.69 20% | 1.2 64% | 0.8 76% | 1.5 55% |
| Gamma | 2.46 89% | 330.95 1% | 2.48 89% | 2.3 96% | 2.2 100% | 2.12 104% |
| CCT | 6625 98% | 7294 89% | 6907 94% | 6453 101% | 6597 99% | 6552 99% |
| Media totale (Programma / Settaggio) | -33% /
-6% | 22% /
13% | -55% /
-20% | -130% /
-43% | -222% /
-154% |
* ... Meglio usare valori piccoli
Asus pubblicizza il dispositivo con il 100% di DCI P3 e noi abbiamo misurato circa il 97%. AdobeRGB è coperto all'85% circa e sRGB completamente.
Per una migliore accuratezza dei colori, è utile ridurre la luminosità dell'X16 a circa il 50%. Di conseguenza, il DeltaE della scala di grigi migliora da 3,36 a solo 2. Inoltre, il DeltaE di ColorChecker si riduce ulteriormente. Una nuova calibrazione con i1Profiler non ha senso.
Tempi di risposta del Display
| ↔ Tempi di risposta dal Nero al Bianco | ||
|---|---|---|
| 7.6 ms ... aumenta ↗ e diminuisce ↘ combinato | ↗ 4 ms Incremento | 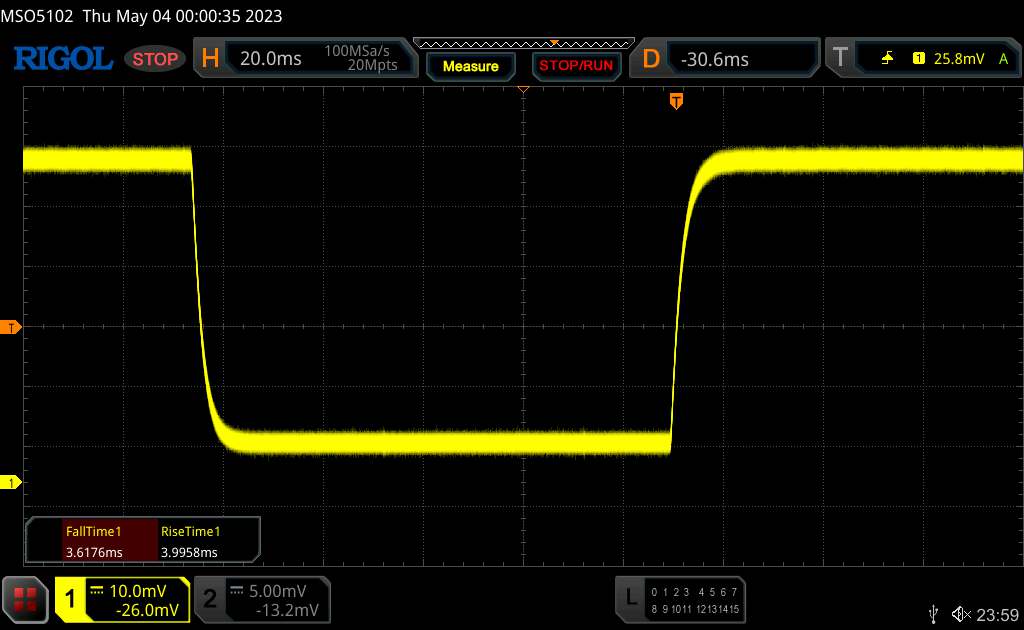 |
| ↘ 3.6 ms Calo | ||
| Lo schermo ha mostrato valori di risposta molto veloci nei nostri tests ed è molto adatto per i gaming veloce. In confronto, tutti i dispositivi di test variano da 0.1 (minimo) a 240 (massimo) ms. » 22 % di tutti i dispositivi è migliore. Questo significa che i tempi di risposta rilevati sono migliori rispettto alla media di tutti i dispositivi testati (19.8 ms). | ||
| ↔ Tempo di risposta dal 50% Grigio all'80% Grigio | ||
| 3.8 ms ... aumenta ↗ e diminuisce ↘ combinato | ↗ 1.8 ms Incremento | 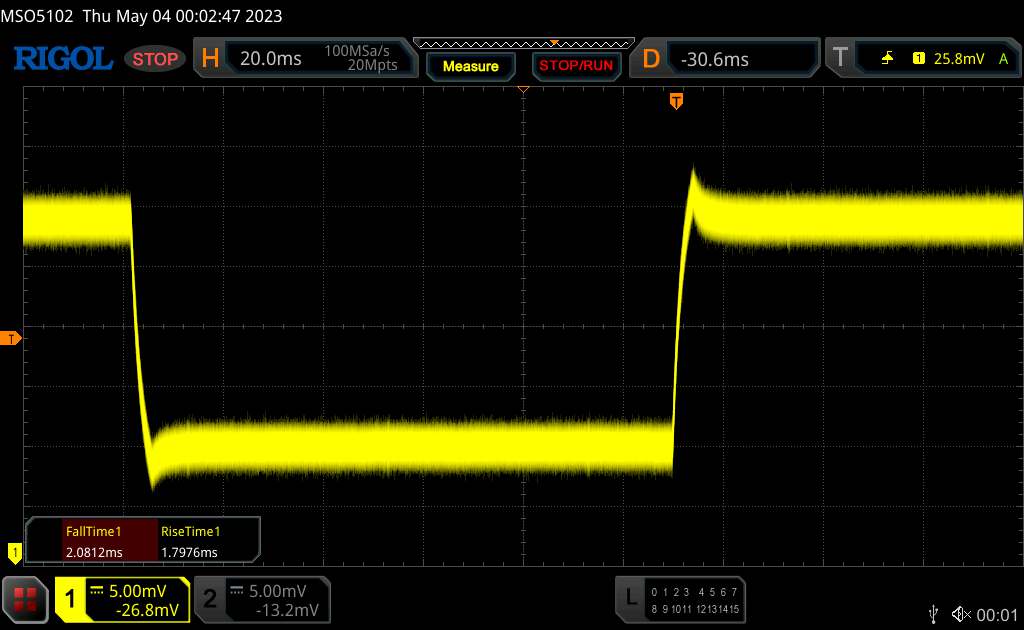 |
| ↘ 2 ms Calo | ||
| Lo schermo ha mostrato valori di risposta molto veloci nei nostri tests ed è molto adatto per i gaming veloce. In confronto, tutti i dispositivi di test variano da 0.165 (minimo) a 636 (massimo) ms. » 15 % di tutti i dispositivi è migliore. Questo significa che i tempi di risposta rilevati sono migliori rispettto alla media di tutti i dispositivi testati (31 ms). | ||
Sfarfallio dello schermo / PWM (Pulse-Width Modulation)
| flickering dello schermo / PWM non rilevato |  | ||
In confronto: 52 % di tutti i dispositivi testati non utilizza PWM per ridurre la luminosita' del display. Se è rilevato PWM, una media di 7763 (minimo: 5 - massimo: 343500) Hz è stata rilevata. | |||
All'esterno, la luminosità molto elevata è utile sia alla luce diretta del sole che all'ombra. Se visto da un'ampia angolazione, il display touchscreen lucido ostacola l'esperienza visiva.

Prestazioni - Uno slate Asus potente
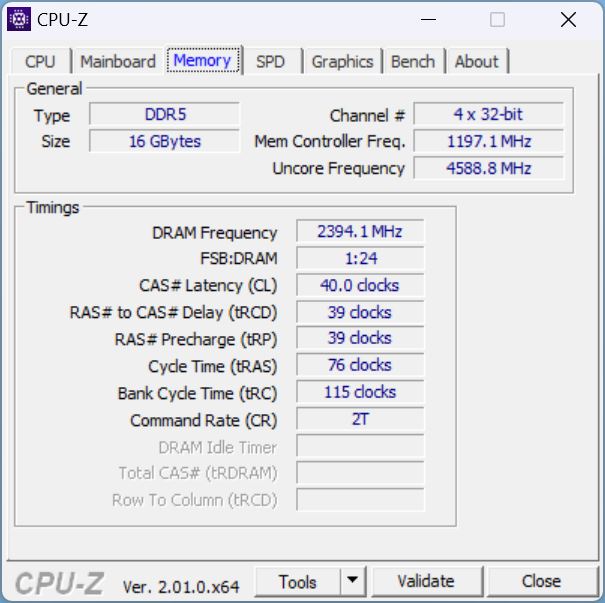
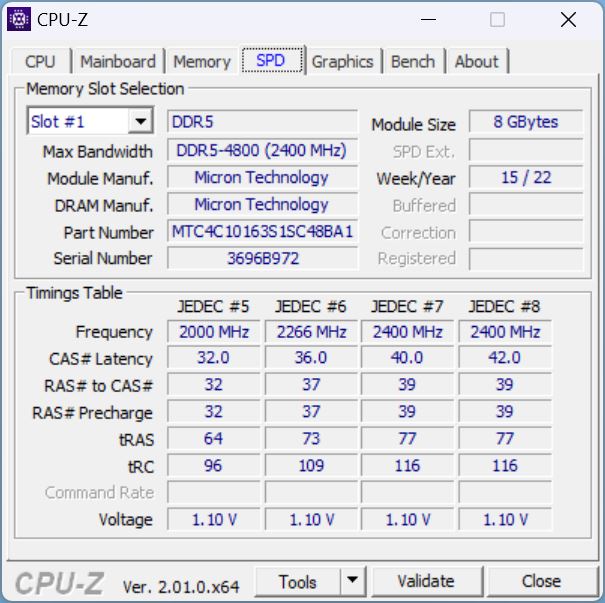
Tutte le configurazioni hanno in comune il Core i9-13900H. A scelta, questo è abbinato a unaRTX 4050, RTX 4060 o RTX 4070. Secondo il sito web, le SKU con le due schede grafiche più deboli sono dotate solo di 8 GB di RAM, mentre la configurazione RTX 4070 è dotata di 16 GB. Tuttavia, la nostra unità di recensione è equipaggiata con una RTX 4060 e 16 GB di RAM. Sembra che Asus abbia aggiornato il nostro modello di recensione. Inoltre, il dispositivo può essere dotato di un massimo di 64 GB di RAM.


Condizioni di prova
I portatili da gioco Asus hanno sempre due applicazioni preinstallate dal produttore che ricordano quasi un bloatware. MyAsus è responsabile delle domande di supporto, mentre Armory Crate funge da centro di controllo e, come purtroppo è consuetudine di questi tempi, da raccolta dati. L'applicazione non è ancora particolarmente matura, soprattutto per quanto riguarda la traduzione. Ci sono continuamente parti mancanti o tagliate. Inoltre, a volte l'applicazione si aggiorna volontariamente all'avvio, il che significa che l'utente deve aspettare a lungo prima di avere accesso a elementi come le modalità di prestazione - fastidioso!

Ci sono in totale quattro modalità di prestazioni (Windows, Quiet, Performance, Turbo, Manual). Per ottenere i migliori risultati di benchmark, abbiamo scelto la modalità Turbo. Tuttavia, presentiamo comunque tutti i risultati ottenuti utilizzando le altre modalità. Qui si trova anche l'interruttore MUX, ovvero la commutazione tra iGPU e dGPU.


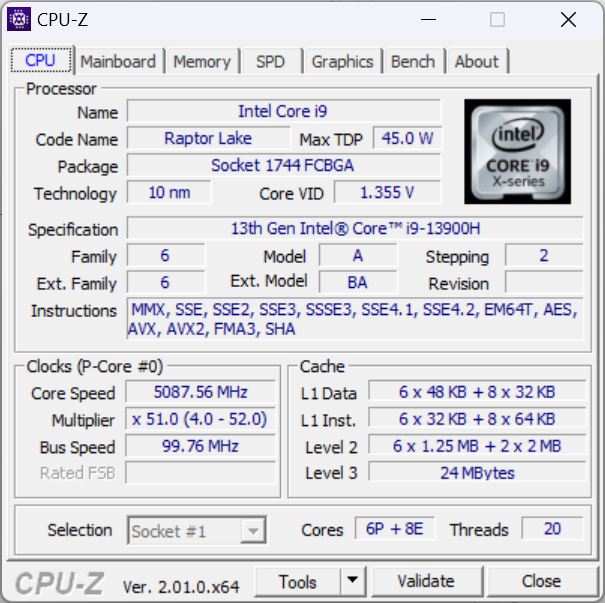
Processore
Nonostante il case sottile, l'X16 ospita un Intel Core i9-13900H, una CPU Raptor Lake di fascia alta con 6 core P e 8 core E che può funzionare da 1,9 GHz (velocità di clock di base del core E) fino a 5,4 GHz (turbo single-core).
Dato che la nuova serie H non presenta quasi nessuna modifica rispetto alla serie Alder Lake, non sorprende che l'X16 non riesca a staccarsi dalla concorrenza dello scorso anno. Lenovo Legion Pro 7con la sua CPU HX, si trova in una posizione diversa. Tuttavia, è impressionante che il punteggio sia superiore di ben il 10% rispetto alla media dell'i9-13900H del nostro database, nonostante il fattore di forma sottile.
Dopo le prime due o tre prove, il valore è sceso leggermente. Di seguito è riportato il TDP della CPU a seconda della modalità di prestazioni selezionata, anche se questi valori sono più teorici (HWinfo). Di conseguenza, la CPU difficilmente assorbe più di 100 watt, anche quando si utilizza la modalità turbo in CinebenchR15 e durante un'esecuzione in modalità silenziosa il TDP è sceso sotto i 60 watt.
In modalità batteria, la modalità silenziosa viene selezionata automaticamente. La modalità Turbo è bloccata, ma in teoria è ancora possibile attivare l'alimentazione.
| Leistungsmodus/TDP della CPU | PL1 | PL2 | Punteggio |
|---|---|---|---|
| Turbo | 110 | 135 | 3,100 |
| Resistenza | 100 | 120 | 2,882 |
| Rendimento | 80 | 100 | 2,342 |
| Akku Leistung | 38 | 60 | 2,199 |
| Akku Leise | 30 | 30 | 1,604 |
Cinebench R15 Multi Continuous Test
Cinebench R23: Multi Core | Single Core
Cinebench R20: CPU (Multi Core) | CPU (Single Core)
Cinebench R15: CPU Multi 64Bit | CPU Single 64Bit
Blender: v2.79 BMW27 CPU
7-Zip 18.03: 7z b 4 | 7z b 4 -mmt1
Geekbench 5.5: Multi-Core | Single-Core
HWBOT x265 Benchmark v2.2: 4k Preset
LibreOffice : 20 Documents To PDF
R Benchmark 2.5: Overall mean
| CPU Performance rating | |
| Lenovo Legion Pro 7 16IRX8H | |
| Media della classe Gaming | |
| Asus ROG Flow X16 GV601V | |
| Asus ROG Zephyrus M16 GU604VY-NM042X | |
| Apple MacBook Pro 16 2023 M2 Max -6! | |
| MSI Creator Z16P B12UHST | |
| Media Intel Core i9-13900H | |
| Lenovo Legion Slim 7-16IAH 82TF004YGE | |
| MSI Katana 17 B13VFK | |
| Razer Blade 15 OLED (Early 2022) | |
| Lenovo Legion S7 16ARHA7 | |
| Asus ROG Flow X16 GV601RW-M5082W | |
| Corsair Voyager a1600 | |
| Cinebench R20 / CPU (Multi Core) | |
| Lenovo Legion Pro 7 16IRX8H | |
| Media della classe Gaming (4029 - 16108, n=109, ultimi 2 anni) | |
| Asus ROG Flow X16 GV601V | |
| Asus ROG Zephyrus M16 GU604VY-NM042X | |
| MSI Creator Z16P B12UHST | |
| Lenovo Legion Slim 7-16IAH 82TF004YGE | |
| Media Intel Core i9-13900H (4935 - 7716, n=25) | |
| Razer Blade 15 OLED (Early 2022) | |
| MSI Katana 17 B13VFK | |
| Lenovo Legion S7 16ARHA7 | |
| Asus ROG Flow X16 GV601RW-M5082W | |
| Corsair Voyager a1600 | |
| Apple MacBook Pro 16 2023 M2 Max | |
| Cinebench R20 / CPU (Single Core) | |
| Lenovo Legion Pro 7 16IRX8H | |
| Media della classe Gaming (442 - 895, n=109, ultimi 2 anni) | |
| Asus ROG Flow X16 GV601V | |
| Asus ROG Zephyrus M16 GU604VY-NM042X | |
| MSI Creator Z16P B12UHST | |
| Media Intel Core i9-13900H (428 - 792, n=25) | |
| MSI Katana 17 B13VFK | |
| Lenovo Legion Slim 7-16IAH 82TF004YGE | |
| Razer Blade 15 OLED (Early 2022) | |
| Lenovo Legion S7 16ARHA7 | |
| Asus ROG Flow X16 GV601RW-M5082W | |
| Corsair Voyager a1600 | |
| Apple MacBook Pro 16 2023 M2 Max | |
| Cinebench R15 / CPU Single 64Bit | |
| Lenovo Legion Pro 7 16IRX8H | |
| Media della classe Gaming (188.8 - 343, n=109, ultimi 2 anni) | |
| Asus ROG Zephyrus M16 GU604VY-NM042X | |
| Asus ROG Flow X16 GV601V | |
| MSI Creator Z16P B12UHST | |
| Media Intel Core i9-13900H (211 - 297, n=26) | |
| MSI Katana 17 B13VFK | |
| Lenovo Legion S7 16ARHA7 | |
| Lenovo Legion Slim 7-16IAH 82TF004YGE | |
| Razer Blade 15 OLED (Early 2022) | |
| Corsair Voyager a1600 | |
| Asus ROG Flow X16 GV601RW-M5082W | |
| Apple MacBook Pro 16 2023 M2 Max | |
| Blender / v2.79 BMW27 CPU | |
| Corsair Voyager a1600 | |
| Asus ROG Flow X16 GV601RW-M5082W | |
| Razer Blade 15 OLED (Early 2022) | |
| MSI Katana 17 B13VFK | |
| Lenovo Legion S7 16ARHA7 | |
| Media Intel Core i9-13900H (166 - 268, n=24) | |
| MSI Creator Z16P B12UHST | |
| Lenovo Legion Slim 7-16IAH 82TF004YGE | |
| Asus ROG Flow X16 GV601V | |
| Asus ROG Zephyrus M16 GU604VY-NM042X | |
| Media della classe Gaming (80 - 330, n=107, ultimi 2 anni) | |
| Lenovo Legion Pro 7 16IRX8H | |
| 7-Zip 18.03 / 7z b 4 -mmt1 | |
| Lenovo Legion Pro 7 16IRX8H | |
| Media della classe Gaming (4199 - 7436, n=108, ultimi 2 anni) | |
| Asus ROG Flow X16 GV601V | |
| Asus ROG Zephyrus M16 GU604VY-NM042X | |
| MSI Creator Z16P B12UHST | |
| Lenovo Legion S7 16ARHA7 | |
| Media Intel Core i9-13900H (3665 - 6600, n=25) | |
| Corsair Voyager a1600 | |
| MSI Katana 17 B13VFK | |
| Asus ROG Flow X16 GV601RW-M5082W | |
| Lenovo Legion Slim 7-16IAH 82TF004YGE | |
| Razer Blade 15 OLED (Early 2022) | |
| HWBOT x265 Benchmark v2.2 / 4k Preset | |
| Lenovo Legion Pro 7 16IRX8H | |
| Media della classe Gaming (11.5 - 44.3, n=108, ultimi 2 anni) | |
| Asus ROG Zephyrus M16 GU604VY-NM042X | |
| Asus ROG Flow X16 GV601V | |
| MSI Creator Z16P B12UHST | |
| Lenovo Legion Slim 7-16IAH 82TF004YGE | |
| Media Intel Core i9-13900H (14.1 - 22.3, n=25) | |
| Lenovo Legion S7 16ARHA7 | |
| Razer Blade 15 OLED (Early 2022) | |
| MSI Katana 17 B13VFK | |
| Corsair Voyager a1600 | |
| Asus ROG Flow X16 GV601RW-M5082W | |
| LibreOffice / 20 Documents To PDF | |
| Corsair Voyager a1600 | |
| MSI Katana 17 B13VFK | |
| Asus ROG Flow X16 GV601RW-M5082W | |
| Razer Blade 15 OLED (Early 2022) | |
| Asus ROG Zephyrus M16 GU604VY-NM042X | |
| Media della classe Gaming (19 - 88.8, n=108, ultimi 2 anni) | |
| Lenovo Legion S7 16ARHA7 | |
| Media Intel Core i9-13900H (34.4 - 82.8, n=25) | |
| Lenovo Legion Pro 7 16IRX8H | |
| Lenovo Legion Slim 7-16IAH 82TF004YGE | |
| MSI Creator Z16P B12UHST | |
| Asus ROG Flow X16 GV601V | |
| R Benchmark 2.5 / Overall mean | |
| Razer Blade 15 OLED (Early 2022) | |
| Asus ROG Flow X16 GV601RW-M5082W | |
| Corsair Voyager a1600 | |
| Lenovo Legion Slim 7-16IAH 82TF004YGE | |
| Lenovo Legion S7 16ARHA7 | |
| Media Intel Core i9-13900H (0.4052 - 0.723, n=25) | |
| MSI Katana 17 B13VFK | |
| MSI Creator Z16P B12UHST | |
| Media della classe Gaming (0.3439 - 0.759, n=109, ultimi 2 anni) | |
| Asus ROG Flow X16 GV601V | |
| Asus ROG Zephyrus M16 GU604VY-NM042X | |
| Lenovo Legion Pro 7 16IRX8H | |
* ... Meglio usare valori piccoli
AIDA64: FP32 Ray-Trace | FPU Julia | CPU SHA3 | CPU Queen | FPU SinJulia | FPU Mandel | CPU AES | CPU ZLib | FP64 Ray-Trace | CPU PhotoWorxx
| Performance rating | |
| Media della classe Gaming | |
| Asus ROG Flow X16 GV601RW-M5082W | |
| Lenovo Legion S7 16ARHA7 | |
| Corsair Voyager a1600 | |
| Asus ROG Flow X16 GV601V | |
| Lenovo Legion Slim 7-16IAH 82TF004YGE | |
| Media Intel Core i9-13900H | |
| Razer Blade 15 OLED (Early 2022) | |
| MSI Creator Z16P B12UHST | |
| MSI Katana 17 B13VFK | |
| AIDA64 / FP32 Ray-Trace | |
| Media della classe Gaming (10227 - 85542, n=107, ultimi 2 anni) | |
| Lenovo Legion Slim 7-16IAH 82TF004YGE | |
| Asus ROG Flow X16 GV601RW-M5082W | |
| Lenovo Legion S7 16ARHA7 | |
| Corsair Voyager a1600 | |
| Media Intel Core i9-13900H (6788 - 19557, n=25) | |
| MSI Katana 17 B13VFK | |
| Razer Blade 15 OLED (Early 2022) | |
| Asus ROG Flow X16 GV601V | |
| MSI Creator Z16P B12UHST | |
| AIDA64 / FPU Julia | |
| Media della classe Gaming (51376 - 238426, n=107, ultimi 2 anni) | |
| Lenovo Legion S7 16ARHA7 | |
| Asus ROG Flow X16 GV601RW-M5082W | |
| Corsair Voyager a1600 | |
| Asus ROG Flow X16 GV601V | |
| Lenovo Legion Slim 7-16IAH 82TF004YGE | |
| Media Intel Core i9-13900H (22551 - 95579, n=25) | |
| Razer Blade 15 OLED (Early 2022) | |
| MSI Katana 17 B13VFK | |
| MSI Creator Z16P B12UHST | |
| AIDA64 / CPU SHA3 | |
| Media della classe Gaming (2180 - 9817, n=107, ultimi 2 anni) | |
| Asus ROG Flow X16 GV601V | |
| Lenovo Legion Slim 7-16IAH 82TF004YGE | |
| Asus ROG Flow X16 GV601RW-M5082W | |
| Lenovo Legion S7 16ARHA7 | |
| Media Intel Core i9-13900H (2491 - 4270, n=25) | |
| Corsair Voyager a1600 | |
| Razer Blade 15 OLED (Early 2022) | |
| MSI Creator Z16P B12UHST | |
| MSI Katana 17 B13VFK | |
| AIDA64 / CPU Queen | |
| Media della classe Gaming (49785 - 173351, n=94, ultimi 2 anni) | |
| Asus ROG Flow X16 GV601V | |
| Lenovo Legion S7 16ARHA7 | |
| MSI Creator Z16P B12UHST | |
| Razer Blade 15 OLED (Early 2022) | |
| Corsair Voyager a1600 | |
| Media Intel Core i9-13900H (65121 - 120936, n=25) | |
| Asus ROG Flow X16 GV601RW-M5082W | |
| Lenovo Legion Slim 7-16IAH 82TF004YGE | |
| MSI Katana 17 B13VFK | |
| AIDA64 / FPU SinJulia | |
| Media della classe Gaming (4424 - 33636, n=107, ultimi 2 anni) | |
| Corsair Voyager a1600 | |
| Lenovo Legion S7 16ARHA7 | |
| Asus ROG Flow X16 GV601RW-M5082W | |
| Asus ROG Flow X16 GV601V | |
| MSI Creator Z16P B12UHST | |
| Lenovo Legion Slim 7-16IAH 82TF004YGE | |
| Razer Blade 15 OLED (Early 2022) | |
| Media Intel Core i9-13900H (6108 - 11631, n=25) | |
| MSI Katana 17 B13VFK | |
| AIDA64 / FPU Mandel | |
| Media della classe Gaming (25115 - 128721, n=107, ultimi 2 anni) | |
| Lenovo Legion S7 16ARHA7 | |
| Asus ROG Flow X16 GV601RW-M5082W | |
| Corsair Voyager a1600 | |
| Asus ROG Flow X16 GV601V | |
| Lenovo Legion Slim 7-16IAH 82TF004YGE | |
| Media Intel Core i9-13900H (11283 - 48474, n=25) | |
| Razer Blade 15 OLED (Early 2022) | |
| MSI Katana 17 B13VFK | |
| MSI Creator Z16P B12UHST | |
| AIDA64 / CPU AES | |
| Asus ROG Flow X16 GV601RW-M5082W | |
| Lenovo Legion Slim 7-16IAH 82TF004YGE | |
| Lenovo Legion S7 16ARHA7 | |
| Corsair Voyager a1600 | |
| Media della classe Gaming (39258 - 247074, n=107, ultimi 2 anni) | |
| MSI Creator Z16P B12UHST | |
| Razer Blade 15 OLED (Early 2022) | |
| Media Intel Core i9-13900H (3691 - 149377, n=25) | |
| Asus ROG Flow X16 GV601V | |
| MSI Katana 17 B13VFK | |
| AIDA64 / CPU ZLib | |
| Media della classe Gaming (574 - 2531, n=107, ultimi 2 anni) | |
| Asus ROG Flow X16 GV601V | |
| MSI Creator Z16P B12UHST | |
| Razer Blade 15 OLED (Early 2022) | |
| Media Intel Core i9-13900H (789 - 1254, n=25) | |
| Lenovo Legion Slim 7-16IAH 82TF004YGE | |
| Asus ROG Flow X16 GV601RW-M5082W | |
| Lenovo Legion S7 16ARHA7 | |
| Corsair Voyager a1600 | |
| MSI Katana 17 B13VFK | |
| AIDA64 / FP64 Ray-Trace | |
| Media della classe Gaming (5509 - 45446, n=107, ultimi 2 anni) | |
| Asus ROG Flow X16 GV601V | |
| Asus ROG Flow X16 GV601RW-M5082W | |
| Lenovo Legion S7 16ARHA7 | |
| Lenovo Legion Slim 7-16IAH 82TF004YGE | |
| Corsair Voyager a1600 | |
| Media Intel Core i9-13900H (3655 - 10716, n=25) | |
| MSI Katana 17 B13VFK | |
| Razer Blade 15 OLED (Early 2022) | |
| MSI Creator Z16P B12UHST | |
| AIDA64 / CPU PhotoWorxx | |
| Media della classe Gaming (12271 - 89891, n=107, ultimi 2 anni) | |
| MSI Creator Z16P B12UHST | |
| Media Intel Core i9-13900H (10871 - 50488, n=25) | |
| Asus ROG Flow X16 GV601V | |
| Lenovo Legion Slim 7-16IAH 82TF004YGE | |
| Razer Blade 15 OLED (Early 2022) | |
| Razer Blade 15 OLED (Early 2022) | |
| MSI Katana 17 B13VFK | |
| Corsair Voyager a1600 | |
| Asus ROG Flow X16 GV601RW-M5082W | |
| Lenovo Legion S7 16ARHA7 | |
Prestazioni del sistema
Nei test PCMark10, l'X16 si è comportato come, se non un po' meglio del previsto. Non ci sono state anomalie o cali in nessuno dei nostri subtest.

CrossMark: Overall | Productivity | Creativity | Responsiveness
| PCMark 10 / Score | |
| Media della classe Gaming (5828 - 11574, n=95, ultimi 2 anni) | |
| Asus ROG Zephyrus M16 GU604VY-NM042X | |
| MSI Creator Z16P B12UHST | |
| Asus ROG Flow X16 GV601V | |
| Lenovo Legion Pro 7 16IRX8H | |
| Media Intel Core i9-13900H, NVIDIA GeForce RTX 4060 Laptop GPU (7578 - 7884, n=3) | |
| Lenovo Legion S7 16ARHA7 | |
| Lenovo Legion Slim 7-16IAH 82TF004YGE | |
| Razer Blade 15 OLED (Early 2022) | |
| Corsair Voyager a1600 | |
| MSI Katana 17 B13VFK | |
| Asus ROG Flow X16 GV601RW-M5082W | |
| PCMark 10 / Essentials | |
| Lenovo Legion Pro 7 16IRX8H | |
| Asus ROG Zephyrus M16 GU604VY-NM042X | |
| Asus ROG Flow X16 GV601V | |
| Media Intel Core i9-13900H, NVIDIA GeForce RTX 4060 Laptop GPU (11235 - 11539, n=3) | |
| MSI Creator Z16P B12UHST | |
| Lenovo Legion Slim 7-16IAH 82TF004YGE | |
| MSI Katana 17 B13VFK | |
| Lenovo Legion S7 16ARHA7 | |
| Media della classe Gaming (8810 - 12600, n=99, ultimi 2 anni) | |
| Razer Blade 15 OLED (Early 2022) | |
| Corsair Voyager a1600 | |
| Asus ROG Flow X16 GV601RW-M5082W | |
| PCMark 10 / Productivity | |
| MSI Creator Z16P B12UHST | |
| Asus ROG Zephyrus M16 GU604VY-NM042X | |
| Media della classe Gaming (6845 - 21327, n=97, ultimi 2 anni) | |
| Lenovo Legion Pro 7 16IRX8H | |
| Asus ROG Flow X16 GV601V | |
| Media Intel Core i9-13900H, NVIDIA GeForce RTX 4060 Laptop GPU (9888 - 10222, n=3) | |
| Razer Blade 15 OLED (Early 2022) | |
| Lenovo Legion S7 16ARHA7 | |
| Asus ROG Flow X16 GV601RW-M5082W | |
| Lenovo Legion Slim 7-16IAH 82TF004YGE | |
| MSI Katana 17 B13VFK | |
| Corsair Voyager a1600 | |
| PCMark 10 / Digital Content Creation | |
| Media della classe Gaming (7602 - 19657, n=97, ultimi 2 anni) | |
| Asus ROG Zephyrus M16 GU604VY-NM042X | |
| MSI Creator Z16P B12UHST | |
| Lenovo Legion S7 16ARHA7 | |
| Corsair Voyager a1600 | |
| Asus ROG Flow X16 GV601V | |
| Media Intel Core i9-13900H, NVIDIA GeForce RTX 4060 Laptop GPU (10418 - 11272, n=3) | |
| Lenovo Legion Slim 7-16IAH 82TF004YGE | |
| Razer Blade 15 OLED (Early 2022) | |
| Lenovo Legion Pro 7 16IRX8H | |
| MSI Katana 17 B13VFK | |
| Asus ROG Flow X16 GV601RW-M5082W | |
| CrossMark / Overall | |
| Media della classe Gaming (1366 - 2409, n=96, ultimi 2 anni) | |
| Asus ROG Zephyrus M16 GU604VY-NM042X | |
| Asus ROG Flow X16 GV601V | |
| Media Intel Core i9-13900H, NVIDIA GeForce RTX 4060 Laptop GPU (1874 - 1983, n=3) | |
| Apple MacBook Pro 16 2023 M2 Max | |
| Lenovo Legion Slim 7-16IAH 82TF004YGE | |
| MSI Katana 17 B13VFK | |
| Razer Blade 15 OLED (Early 2022) | |
| Lenovo Legion S7 16ARHA7 | |
| Asus ROG Flow X16 GV601RW-M5082W | |
| Corsair Voyager a1600 | |
| CrossMark / Productivity | |
| Asus ROG Flow X16 GV601V | |
| Media della classe Gaming (1386 - 2254, n=96, ultimi 2 anni) | |
| Asus ROG Zephyrus M16 GU604VY-NM042X | |
| Media Intel Core i9-13900H, NVIDIA GeForce RTX 4060 Laptop GPU (1779 - 1889, n=3) | |
| Lenovo Legion Slim 7-16IAH 82TF004YGE | |
| MSI Katana 17 B13VFK | |
| Lenovo Legion S7 16ARHA7 | |
| Razer Blade 15 OLED (Early 2022) | |
| Apple MacBook Pro 16 2023 M2 Max | |
| Asus ROG Flow X16 GV601RW-M5082W | |
| Corsair Voyager a1600 | |
| CrossMark / Creativity | |
| Apple MacBook Pro 16 2023 M2 Max | |
| Asus ROG Zephyrus M16 GU604VY-NM042X | |
| Media della classe Gaming (1343 - 2729, n=96, ultimi 2 anni) | |
| Asus ROG Flow X16 GV601V | |
| Media Intel Core i9-13900H, NVIDIA GeForce RTX 4060 Laptop GPU (2104 - 2195, n=3) | |
| MSI Katana 17 B13VFK | |
| Lenovo Legion Slim 7-16IAH 82TF004YGE | |
| Razer Blade 15 OLED (Early 2022) | |
| Lenovo Legion S7 16ARHA7 | |
| Asus ROG Flow X16 GV601RW-M5082W | |
| Corsair Voyager a1600 | |
| CrossMark / Responsiveness | |
| Lenovo Legion Slim 7-16IAH 82TF004YGE | |
| MSI Katana 17 B13VFK | |
| Media della classe Gaming (1226 - 2334, n=96, ultimi 2 anni) | |
| Asus ROG Flow X16 GV601V | |
| Asus ROG Zephyrus M16 GU604VY-NM042X | |
| Media Intel Core i9-13900H, NVIDIA GeForce RTX 4060 Laptop GPU (1548 - 1698, n=3) | |
| Razer Blade 15 OLED (Early 2022) | |
| Lenovo Legion S7 16ARHA7 | |
| Asus ROG Flow X16 GV601RW-M5082W | |
| Apple MacBook Pro 16 2023 M2 Max | |
| Corsair Voyager a1600 | |
| PCMark 10 Score | 7884 punti | |
Aiuto | ||
| AIDA64 / Memory Copy | |
| Media della classe Gaming (21750 - 129946, n=107, ultimi 2 anni) | |
| Samsung Galaxy Book3 Ultra 16, i9-13900H RTX 4070 | |
| Lenovo Yoga Pro 7 14IRH G8 | |
| Media Intel Core i9-13900H (37448 - 74486, n=25) | |
| Asus ROG Flow X16 GV601V | |
| Lenovo Legion Pro 5 16IRX8 | |
| MSI Katana 17 B13VFK | |
| Asus ROG Flow X16 GV601RW-M5082W | |
| AIDA64 / Memory Read | |
| Media della classe Gaming (22956 - 118858, n=107, ultimi 2 anni) | |
| Samsung Galaxy Book3 Ultra 16, i9-13900H RTX 4070 | |
| Lenovo Yoga Pro 7 14IRH G8 | |
| Asus ROG Flow X16 GV601V | |
| Lenovo Legion Pro 5 16IRX8 | |
| Media Intel Core i9-13900H (41599 - 75433, n=25) | |
| MSI Katana 17 B13VFK | |
| Asus ROG Flow X16 GV601RW-M5082W | |
| AIDA64 / Memory Write | |
| Samsung Galaxy Book3 Ultra 16, i9-13900H RTX 4070 | |
| Media della classe Gaming (22297 - 135096, n=107, ultimi 2 anni) | |
| Lenovo Yoga Pro 7 14IRH G8 | |
| Lenovo Legion Pro 5 16IRX8 | |
| Media Intel Core i9-13900H (36152 - 88505, n=25) | |
| Asus ROG Flow X16 GV601V | |
| Asus ROG Flow X16 GV601RW-M5082W | |
| MSI Katana 17 B13VFK | |
| AIDA64 / Memory Latency | |
| Media della classe Gaming (75.3 - 259, n=107, ultimi 2 anni) | |
| Lenovo Yoga Pro 7 14IRH G8 | |
| Samsung Galaxy Book3 Ultra 16, i9-13900H RTX 4070 | |
| MSI Katana 17 B13VFK | |
| Asus ROG Flow X16 GV601RW-M5082W | |
| Asus ROG Flow X16 GV601V | |
| Media Intel Core i9-13900H (75.8 - 102.3, n=25) | |
| Lenovo Legion Pro 5 16IRX8 | |
* ... Meglio usare valori piccoli
Latenze DPC
Quando si aprono più schede del browser, il software visualizza le latenze di LatencyMon. Tuttavia, il nostro video di YouTube a 4K/60fps è stato eseguito senza problemi e senza cadute di fotogrammi. Tuttavia, i punteggi potrebbero essere un po' più bassi, soprattutto per il gruppo di creatori di contenuti target.


| DPC Latencies / LatencyMon - interrupt to process latency (max), Web, Youtube, Prime95 | |
| Samsung Galaxy Book3 Ultra 16, i9-13900H RTX 4070 | |
| MSI Katana 17 B13VFK | |
| Asus ROG Flow X16 GV601V | |
| Asus ROG Flow X16 GV601RW-M5082W | |
| Lenovo Yoga Pro 7 14IRH G8 | |
| Lenovo Legion Pro 5 16IRX8 | |
* ... Meglio usare valori piccoli
Memoria di massa
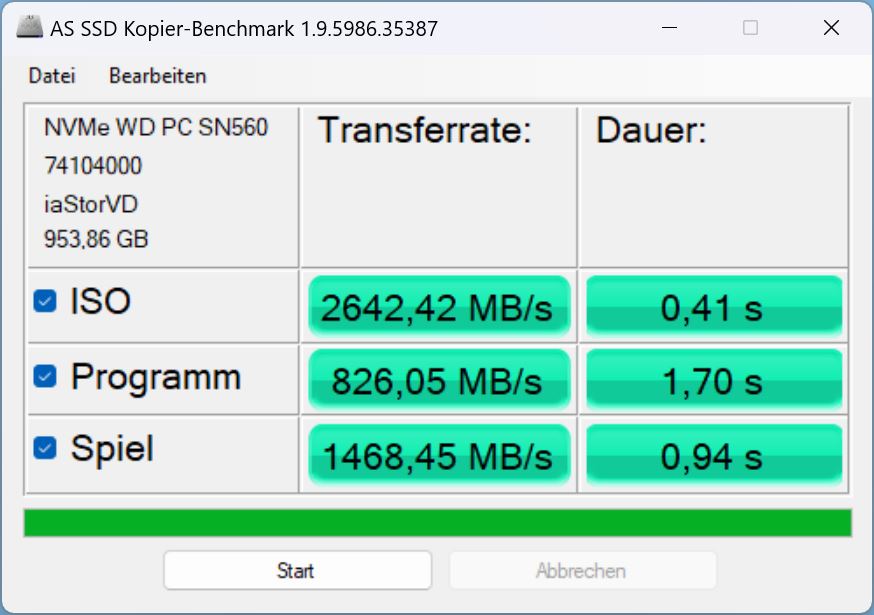
Asus ha montato un'unità SSD PCIe-4.0-x4-NVMe da 1 TB di Western Digital. Ancora una volta, l'unità di archiviazione si trova in fondo alla classifica dei migliori SSD.Lista dei migliori SSD. L'unità SSD Micron del modello precedente era significativamente più veloce, con una media di circa il 42%!
Naturalmente, per l'uso domestico, l'unità SSD è sufficientemente veloce, ma per gli utenti professionali - la categoria a cui si rivolge l'X16 - questo passo indietro nelle prestazioni è alquanto deplorevole.


* ... Meglio usare valori piccoli
Continuous performance Read: DiskSpd Read Loop, Queue Depth 8
Scheda grafica
Il nostro modello in prova ospita unaNvidia Geforce RTX 4060. UnaRTX 4050o unaRTX 4070sono disponibili. La scheda può assorbire un massimo di 120 watt, compreso un boost dinamico di 20 watt.
Nei benchmark 3DMark ha ottenuto prestazioni migliori del 10% circa (turbo) rispetto alla media dei laptop RTX 4060 del nostro database.
Se confrontiamo i risultati tra la modalità turbo e quella performance, è particolarmente evidente che le prestazioni grafiche aumentano, ma quelle della CPU e della fisica tendono a diminuire (vedere Cloud Gate o Fire Strike).


Lontano dal muro, le prestazioni grafiche diminuiscono. In modalità prestazioni, il punteggio grafico di Fire Strike è sceso di circa il 17% e in modalità silenziosa di ben il 42%.


| 3DMark 11 Performance | 31662 punti | |
| 3DMark Cloud Gate Standard Score | 62454 punti | |
| 3DMark Fire Strike Score | 24131 punti | |
| 3DMark Time Spy Score | 10794 punti | |
Aiuto | ||
* ... Meglio usare valori piccoli
| Premiere Pro PugetBench - Overall Score 0.9 | |
| MSI Stealth 17 Studio A13VH-014 | |
| Asus ROG Flow X16 GV601V | |
| Asus Zephyrus Duo 16 GX650PY-NM006W | |
| MSI Titan GT77 HX 13VI | |
| Apple MacBook Pro 14 2023 M2 Pro | |
| Asus ROG Zephyrus G14 GA402XY | |
Prestazioni di gioco
In Full HD, quasi tutti i giochi che abbiamo testato funzionano senza problemi al massimo dei dettagli. Le risorse a disposizione sono sufficienti anche per il QHD e solo i titoli più esigenti, come The Last of Us, sono rimasti a corto di risorse.
Nel nostro confronto, il Flow X16 è allo stesso livello della Katana 17 la cui RTX 4060 ha un TGP massimo di 105 watt. D'altra parte, solo il 5% la separa dalla Legion 5 la cui RTX 4060 ha un TGP di 140 watt. Questo dimostra ancora una volta che la GPU difficilmente riesce a beneficiare di TGP più elevati, come evidenziato dal nostro collega nella sua analisi delle nuove schede Nvidia Geforce RTX 4000. Il predecessore, con la sua RTX 3070 Ti, la batte di ben il 21%.
| The Witcher 3 - 1920x1080 Ultra Graphics & Postprocessing (HBAO+) | |
| Media della classe Gaming (95 - 240, n=7, ultimi 2 anni) | |
| Lenovo Legion Pro 5 16IRX8 | |
| Asus ROG Flow X16 GV601V | |
| MSI Katana 17 B13VFK | |
| Asus ROG Flow X16 GV601RW-M5082W | |
| Samsung Galaxy Book3 Ultra 16, i9-13900H RTX 4070 | |
| Lenovo Yoga Pro 7 14IRH G8 | |
| Strange Brigade - 1920x1080 ultra AA:ultra AF:16 | |
| Media della classe Gaming (76.3 - 456, n=88, ultimi 2 anni) | |
| Asus ROG Flow X16 GV601V | |
| MSI Katana 17 B13VFK | |
| Asus ROG Flow X16 GV601RW-M5082W | |
| Samsung Galaxy Book3 Ultra 16, i9-13900H RTX 4070 | |
Il framerate di Witcher 3 mostra la solita curva giorno/notte, ma per il resto è molto stabile. Secondo il log di GPU-Z, la velocità di clock del core è quasi costante a 2.460 MHz e anche la velocità di clock della memoria è stabile (2 GHz).
La temperatura della GPU ha subito alcune fluttuazioni con una media di circa 75 °C, ma è aumentata continuamente verso la fine dell'ora, il che significa che la velocità di clock potrebbe essere limitata durante i periodi di funzionamento più lunghi.
La scheda ha assorbito solo 92,5 watt in media e abbiamo visto picchi estremamente brevi di 110 watt, ma i possibili 120 watt non sono mai stati raggiunti.
Con la suaRTX 4070laGalaxy Book3 non ha alcuna possibilità di competere con la nostra X16 che, dal punto di vista tecnico, riesce persino ad avvicinarsi alla Legion 5.


Witcher 3 FPS diagram
| basso | medio | alto | ultra | QHD | 4K | |
|---|---|---|---|---|---|---|
| GTA V (2015) | 184.4 | 179.8 | 173.9 | 110.3 | 79.4 | |
| The Witcher 3 (2015) | 214.8 | 106.5 | ||||
| Dota 2 Reborn (2015) | 188.3 | 166 | 162.8 | 149.2 | 115.5 | |
| Final Fantasy XV Benchmark (2018) | 100.8 | |||||
| X-Plane 11.11 (2018) | 174 | 145.4 | 116.4 | 105.6 | ||
| Far Cry 5 (2018) | 140 | 130 | 99 | |||
| Strange Brigade (2018) | 419 | 266 | 225 | 192.5 | 129.2 | |
| Shadow of the Tomb Raider (2018) | 150 | 137 | 93 | |||
| Assassin´s Creed Valhalla (2020) | 114 | 98 | 71 | |||
| Far Cry 6 (2021) | 120 | 108 | 79 | |||
| Cyberpunk 2077 1.6 (2022) | 84.25 | 76.64 | 48.71 | |||
| F1 22 (2022) | 257 | 218 | 183.9 | 64.8 | 42.3 | |
| Call of Duty Modern Warfare 2 2022 (2022) | 91 | 86 | 61 | |||
| Hogwarts Legacy (2023) | 106.9 | 91.9 | 42.8 | |||
| The Last of Us (2023) | 71.2 | 53.1 | 32.7 |
Emissioni - La silenziosità è possibile anche con il Flow X16
Emissioni acustiche
In condizioni di funzionamento al minimo, le ventole sono rimaste per lo più ferme. Sotto carico, il rumore dipende chiaramente dalla modalità di prestazioni selezionata. Ad esempio, quando si gioca in modalità turbo, le ventole raggiungono oltre 50 dB, mentre in modalità prestazioni si attestano su un livello molto più tollerabile di 44 dB. Questa differenza relativamente grande dovrebbe rendere più sopportabile il piccolo calo delle prestazioni in modalità prestazioni. In modalità silenziosa, il livello di decibel è sceso a soli 37 dB.
In modalità turbo, le ventole hanno funzionato per un bel po' dopo aver eseguito attività impegnative come i giochi, anche se non alla massima velocità. Tuttavia, anche in modalità idle, l'X16 rimane rumoroso per alcuni minuti, se si è appena svolta una sessione di gioco.
Per i creatori di contenuti, consigliamo quindi di utilizzare la modalità performance (o anche quiet), poiché sono molto più silenziose con un calo tollerabile della potenza disponibile.
Durante il funzionamento in idle, Windows o anche i processi in background di Asus continuano a disturbare le ventole silenziose. Queste ventole entrano in funzione, soprattutto in modalità turbo.
| Modus/Witcher 3 Ultra | FPS | Lautstärke in dB | Durchschnittsverbrauch in W |
|---|---|---|---|
| Turbo | 102 | 50,92 | 142 |
| Leistung | 92 | 44 | |
| Leise | 80 | 37,53 | 106 |
Rumorosità
| Idle |
| 24 / 24 / 24 dB(A) |
| Sotto carico |
| 36.71 / 50.92 dB(A) |
 | ||
30 dB silenzioso 40 dB(A) udibile 50 dB(A) rumoroso |
||
min: | ||
| Asus ROG Flow X16 GV601V GeForce RTX 4060 Laptop GPU, i9-13900H, WD PC SN560 SDDPNQE-1T00 | Asus ROG Flow X16 GV601RW-M5082W GeForce RTX 3070 Ti Laptop GPU, R9 6900HS, Micron 3400 1TB MTFDKBA1T0TFH | Samsung Galaxy Book3 Ultra 16, i9-13900H RTX 4070 GeForce RTX 4070 Laptop GPU, i9-13900H, Samsung PM9A1 MZVL21T0HCLR | Lenovo Legion Pro 5 16IRX8 GeForce RTX 4060 Laptop GPU, i7-13700HX, SK hynix PC801 HFS512GEJ9X115N | Lenovo Yoga Pro 7 14IRH G8 GeForce RTX 4050 Laptop GPU, i7-13700H, Samsung PM9A1 MZVL21T0HCLR | MSI Katana 17 B13VFK GeForce RTX 4060 Laptop GPU, i7-13620H, Micron 2400 MTFDKBA1T0QFM | |
|---|---|---|---|---|---|---|
| Noise | -13% | -9% | 1% | -6% | -19% | |
| off /ambiente * (dB) | 24 | 25.5 -6% | 25.2 -5% | 23 4% | 22.9 5% | 24.5 -2% |
| Idle Minimum * (dB) | 24 | 25.5 -6% | 25.2 -5% | 23.1 4% | 22.9 5% | 24.5 -2% |
| Idle Average * (dB) | 24 | 25.5 -6% | 25.2 -5% | 23.1 4% | 22.9 5% | 24.5 -2% |
| Idle Maximum * (dB) | 24 | 27.4 -14% | 31.3 -30% | 26.6 -11% | 36.8 -53% | 40 -67% |
| Load Average * (dB) | 36.71 | 49.9 -36% | 38.8 -6% | 34.7 5% | 43.7 -19% | 48.3 -32% |
| Witcher 3 ultra * (dB) | 50.92 | 47.6 7% | 46.2 9% | 56 -10% | ||
| Load Maximum * (dB) | 50.92 | 55 -8% | 51.2 -1% | 54.8 -8% | 46.2 9% | 59.1 -16% |
* ... Meglio usare valori piccoli
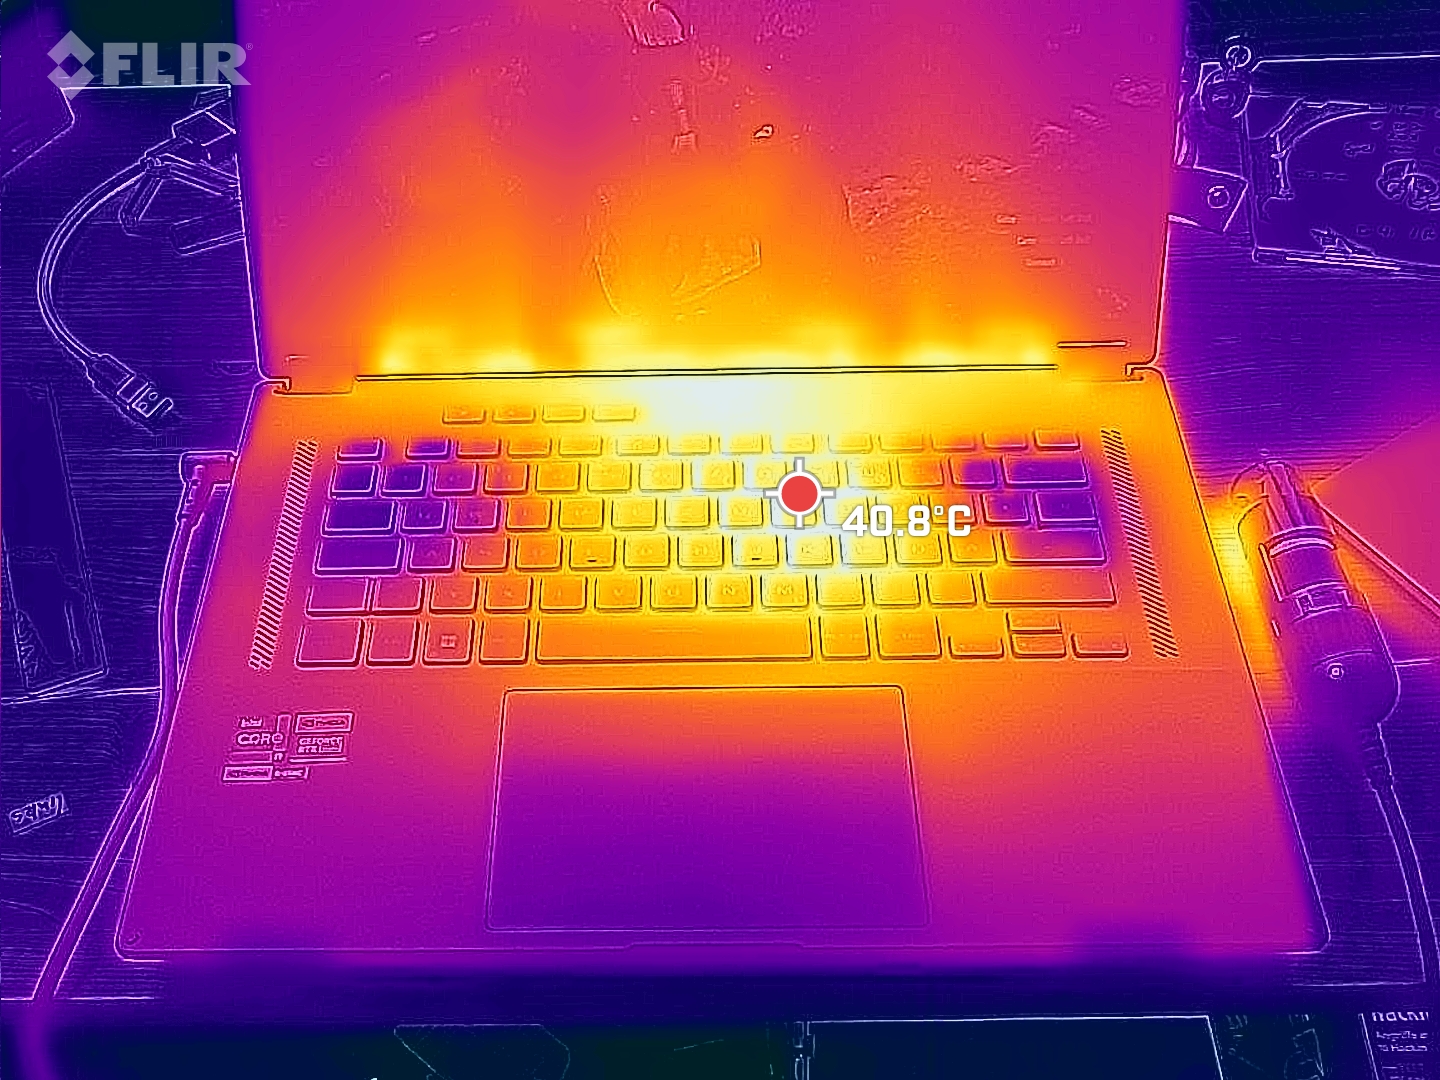
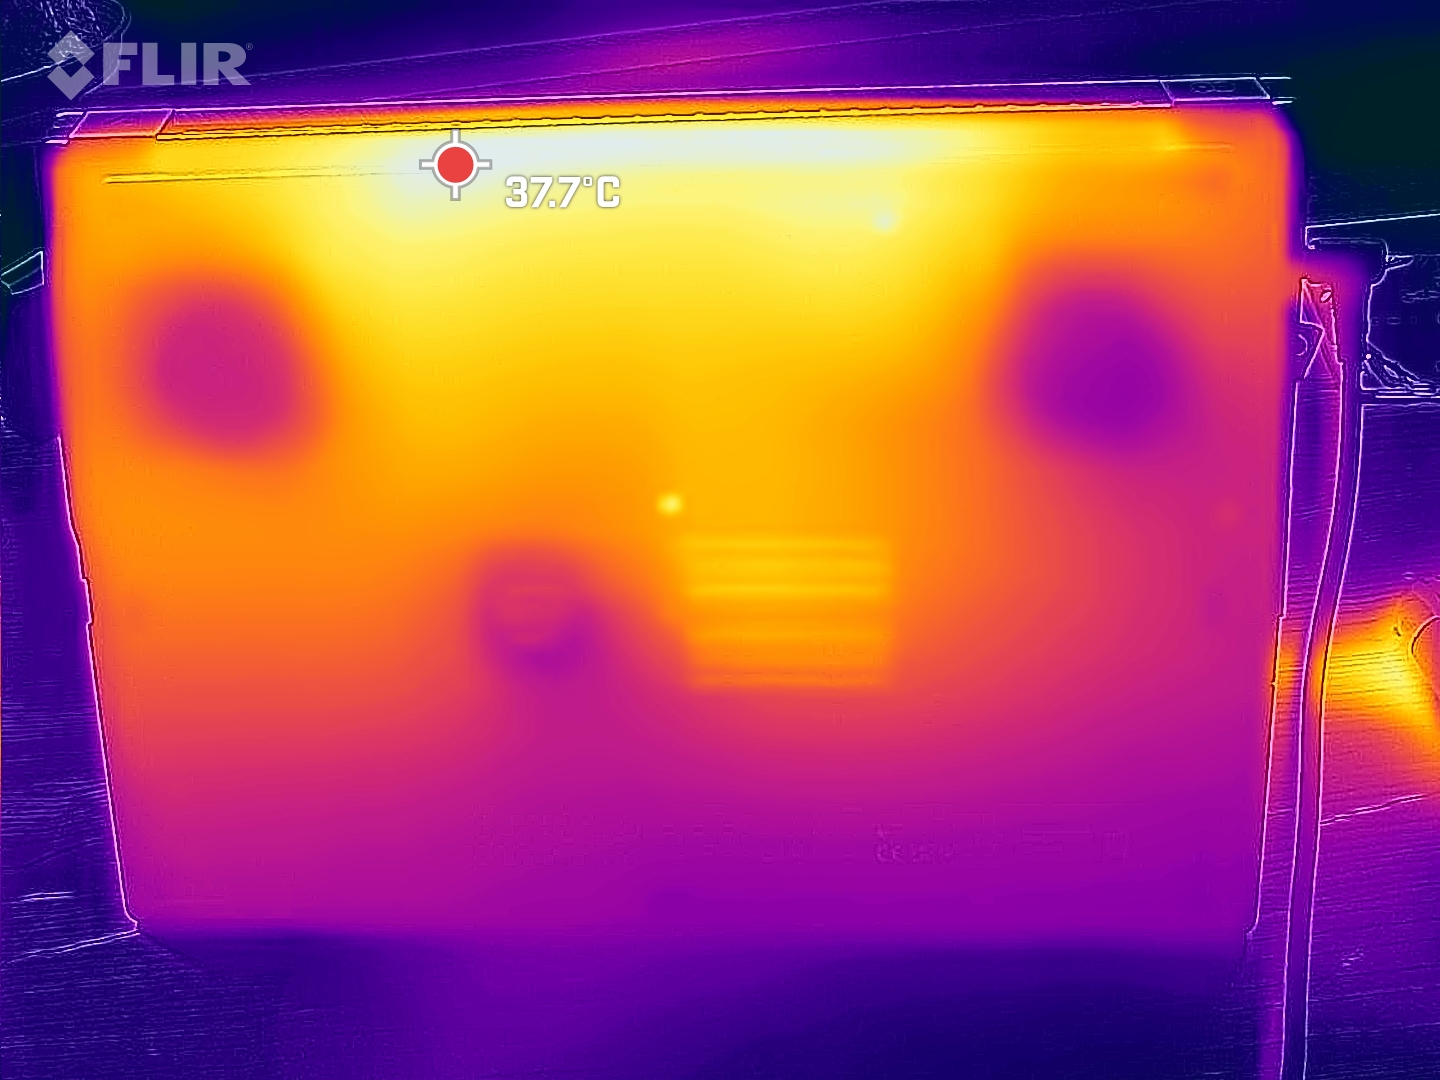
Temperatura
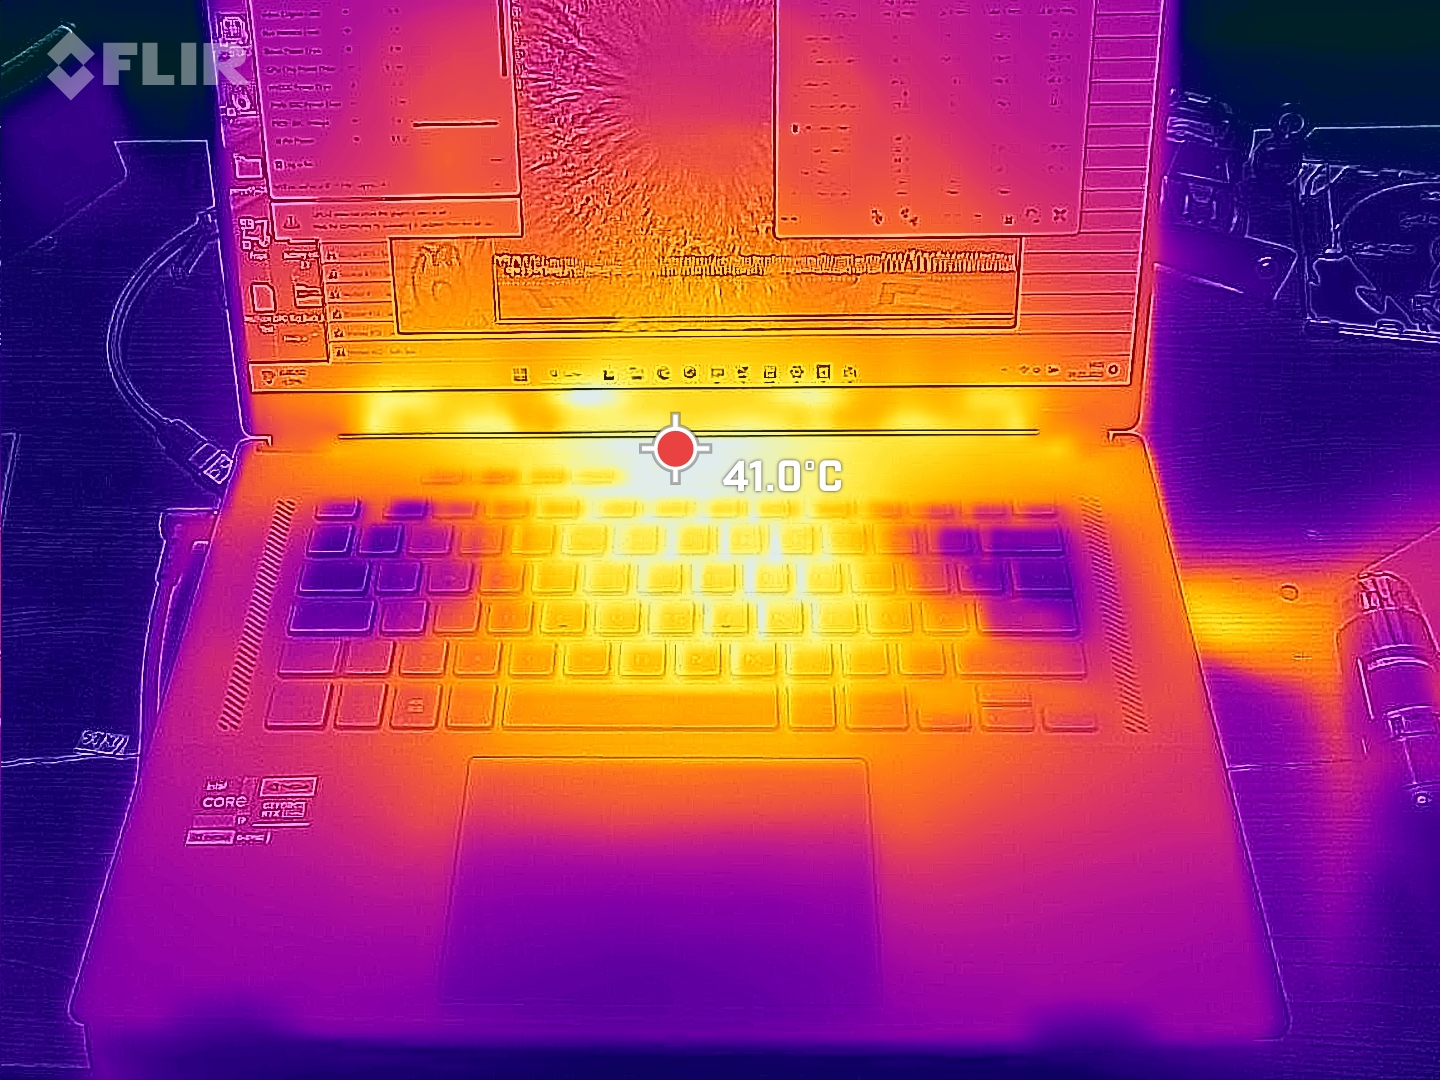
Durante il gioco, ci sono punti caldi di circa 50 °C che si trovano nella parte centrale e superiore del dispositivo e verso la parte posteriore, mentre il palm rest e i tasti WASD rimangono relativamente freddi. La parte inferiore del portatile non si riscalda eccessivamente.
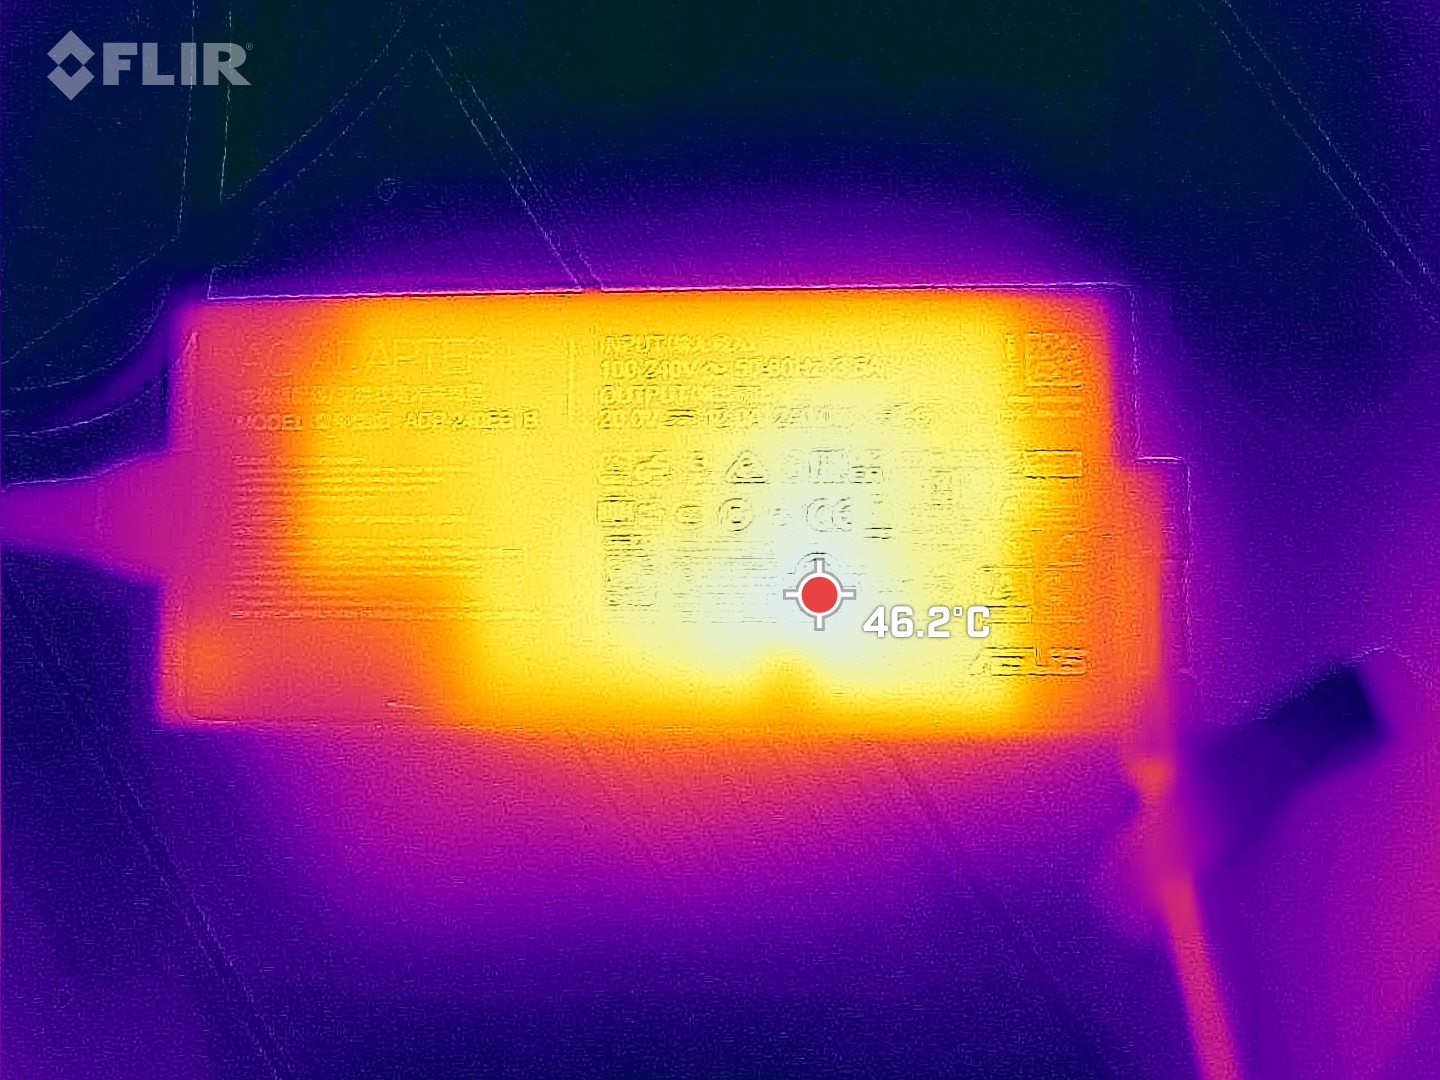
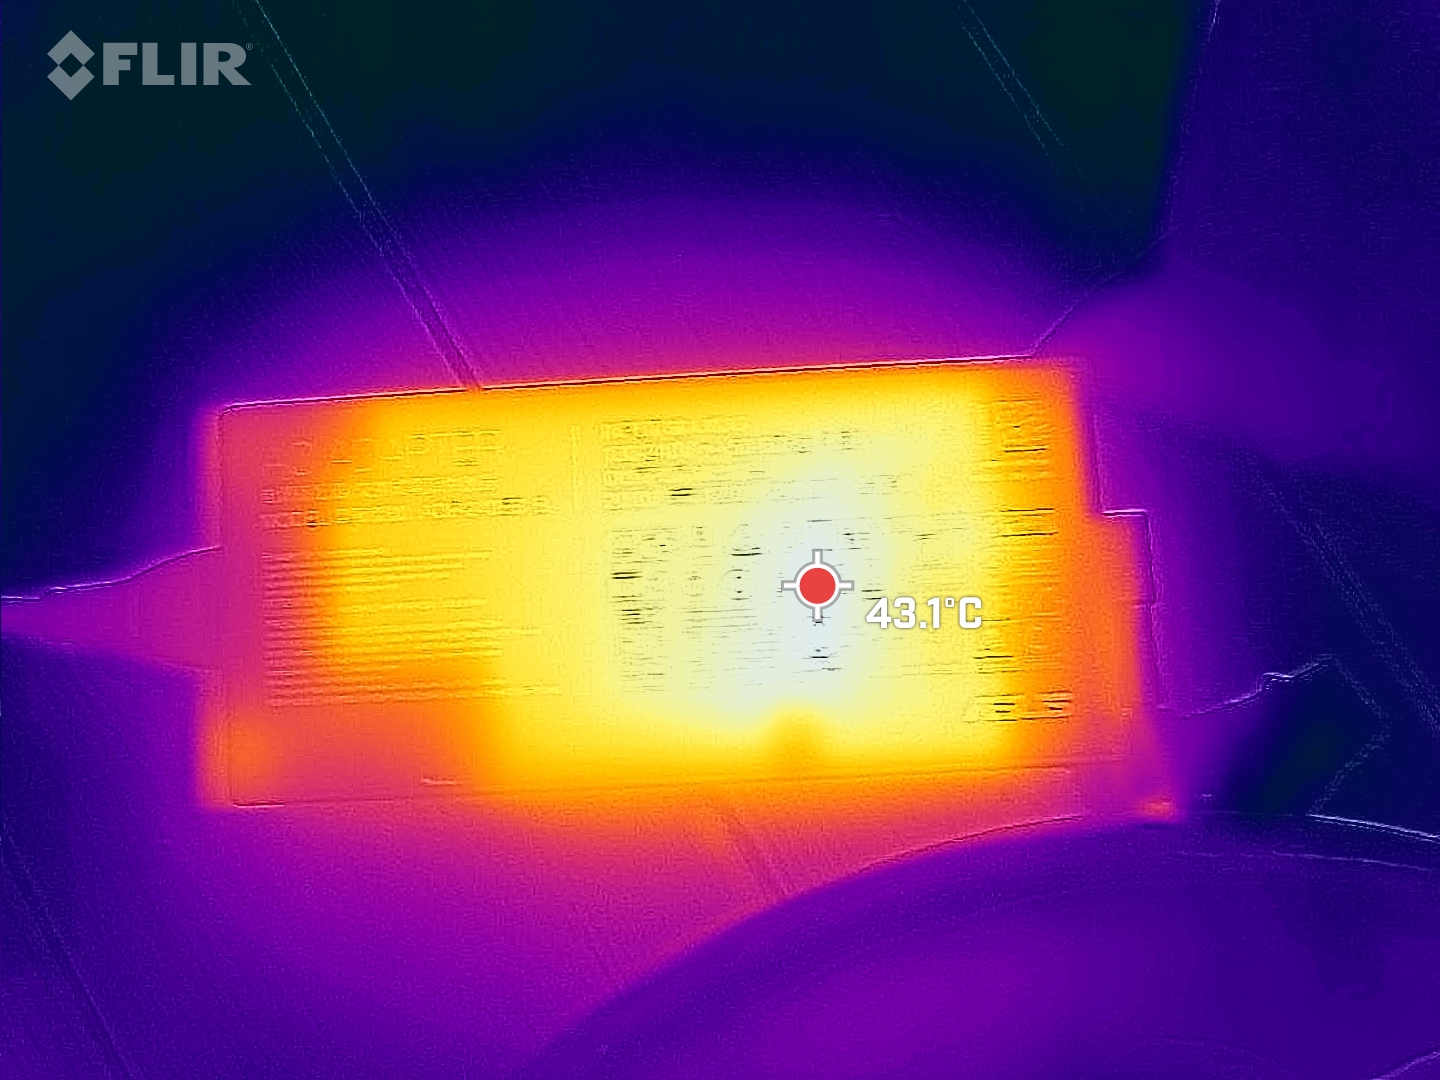
Tuttavia, anche in caso di utilizzo inattivo, l'alimentatore può diventare molto caldo. Sono sufficienti pochi processi in background durante il funzionamento inattivo per riscaldare la sottile PSU a una temperatura di 45 °C!
(-) La temperatura massima sul lato superiore è di 46 °C / 115 F, rispetto alla media di 40.4 °C / 105 F, che varia da 21.2 a 68.8 °C per questa classe Gaming.
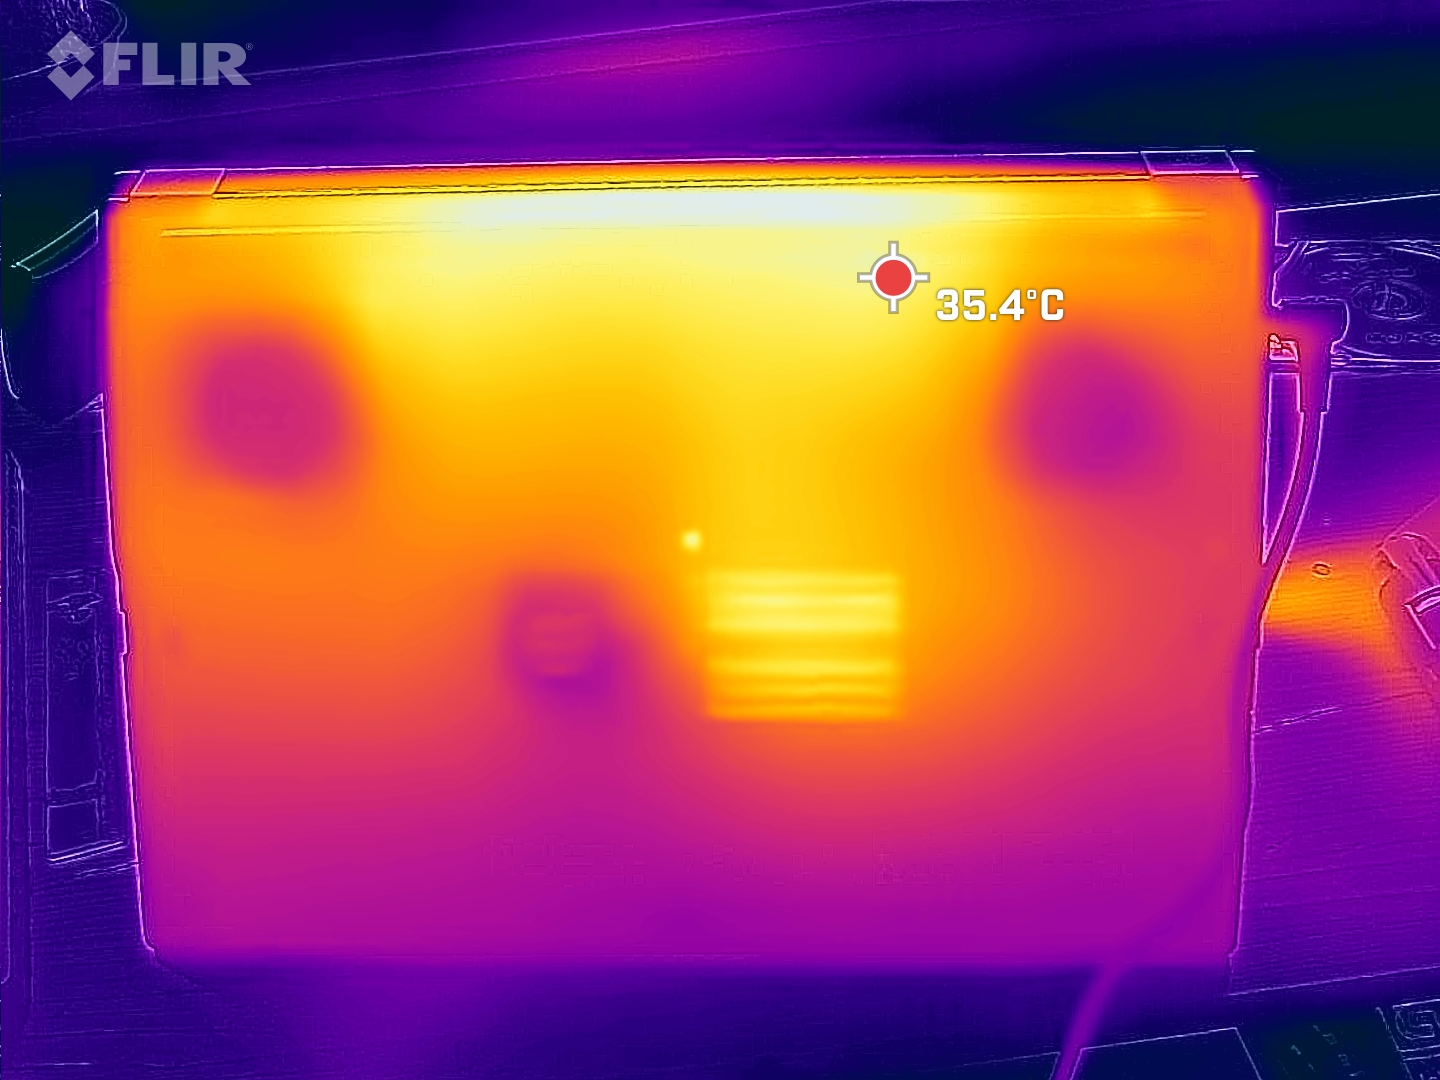
(±) Il lato inferiore si riscalda fino ad un massimo di 41 °C / 106 F, rispetto alla media di 43.2 °C / 110 F
(+) In idle, la temperatura media del lato superiore è di 31.9 °C / 89 F, rispetto alla media deld ispositivo di 33.9 °C / 93 F.
(±) Riproducendo The Witcher 3, la temperatura media per il lato superiore e' di 37.4 °C / 99 F, rispetto alla media del dispositivo di 33.9 °C / 93 F.
(+) I poggiapolsi e il touchpad sono piu' freddi della temperatura della pelle con un massimo di 31 °C / 87.8 F e sono quindi freddi al tatto.
(-) La temperatura media della zona del palmo della mano di dispositivi simili e'stata di 28.8 °C / 83.8 F (-2.2 °C / -4 F).
| Asus ROG Flow X16 GV601V Intel Core i9-13900H, NVIDIA GeForce RTX 4060 Laptop GPU | Asus ROG Flow X16 GV601RW-M5082W AMD Ryzen 9 6900HS, NVIDIA GeForce RTX 3070 Ti Laptop GPU | Samsung Galaxy Book3 Ultra 16, i9-13900H RTX 4070 Intel Core i9-13900H, NVIDIA GeForce RTX 4070 Laptop GPU | Lenovo Legion Pro 5 16IRX8 Intel Core i7-13700HX, NVIDIA GeForce RTX 4060 Laptop GPU | Lenovo Yoga Pro 7 14IRH G8 Intel Core i7-13700H, NVIDIA GeForce RTX 4050 Laptop GPU | MSI Katana 17 B13VFK Intel Core i7-13620H, NVIDIA GeForce RTX 4060 Laptop GPU | |
|---|---|---|---|---|---|---|
| Heat | -13% | -4% | 0% | 4% | 2% | |
| Maximum Upper Side * (°C) | 46 | 55.1 -20% | 45.9 -0% | 42.8 7% | 41.6 10% | 41.6 10% |
| Maximum Bottom * (°C) | 41 | 50.3 -23% | 50.9 -24% | 50 -22% | 55.7 -36% | 43.1 -5% |
| Idle Upper Side * (°C) | 36 | 35.5 1% | 31.6 12% | 29.6 18% | 25.9 28% | 32 11% |
| Idle Bottom * (°C) | 33 | 36.1 -9% | 34.2 -4% | 34 -3% | 28 15% | 35.8 -8% |
* ... Meglio usare valori piccoli
Test da sforzo
All'inizio, i core hanno raggiunto quasi 4 GHz e la CPU ha assorbito 85 watt. Tuttavia, dopo circa un minuto, le temperature dei core hanno raggiunto i 96 °C e le prestazioni si sono notevolmente ridotte. La velocità di clock dei core è scesa a 2,4 GHz per alcuni minuti e il TDP era di soli 35 watt. Ciò ha comportato un ulteriore calo della temperatura. Dopo qualche minuto, la velocità è aumentata e ha fluttuato in modo considerevole, attestandosi su una media di circa 2,6 GHz. La riduzione del TDP a 35 watt per alcuni minuti era un fenomeno che si verificava regolarmente, dopodiché il TDP tornava a fluttuare periodicamente. Con la temperatura che scendeva altrettanto rapidamente, non era l'unica ragione di questo comportamento.
In misura minore, la GPU era simile. Le fasi relativamente stabili erano molto più brevi e i valori complessivi fluttuavano maggiormente. La velocità di clock ha oscillato ripetutamente da 2,4 GHz a 2,4 GHz fino a soli 500 MHz e oltre, mentre la velocità di clock della memoria ha mostrato fluttuazioni altrettanto estreme. La temperatura media è stata di 65 °C e ha raggiunto un massimo di 82 °C. Il consumo energetico si è attestato su una media di 46 watt, ma è saltato ripetutamente a 90 watt o oltre 100 watt.


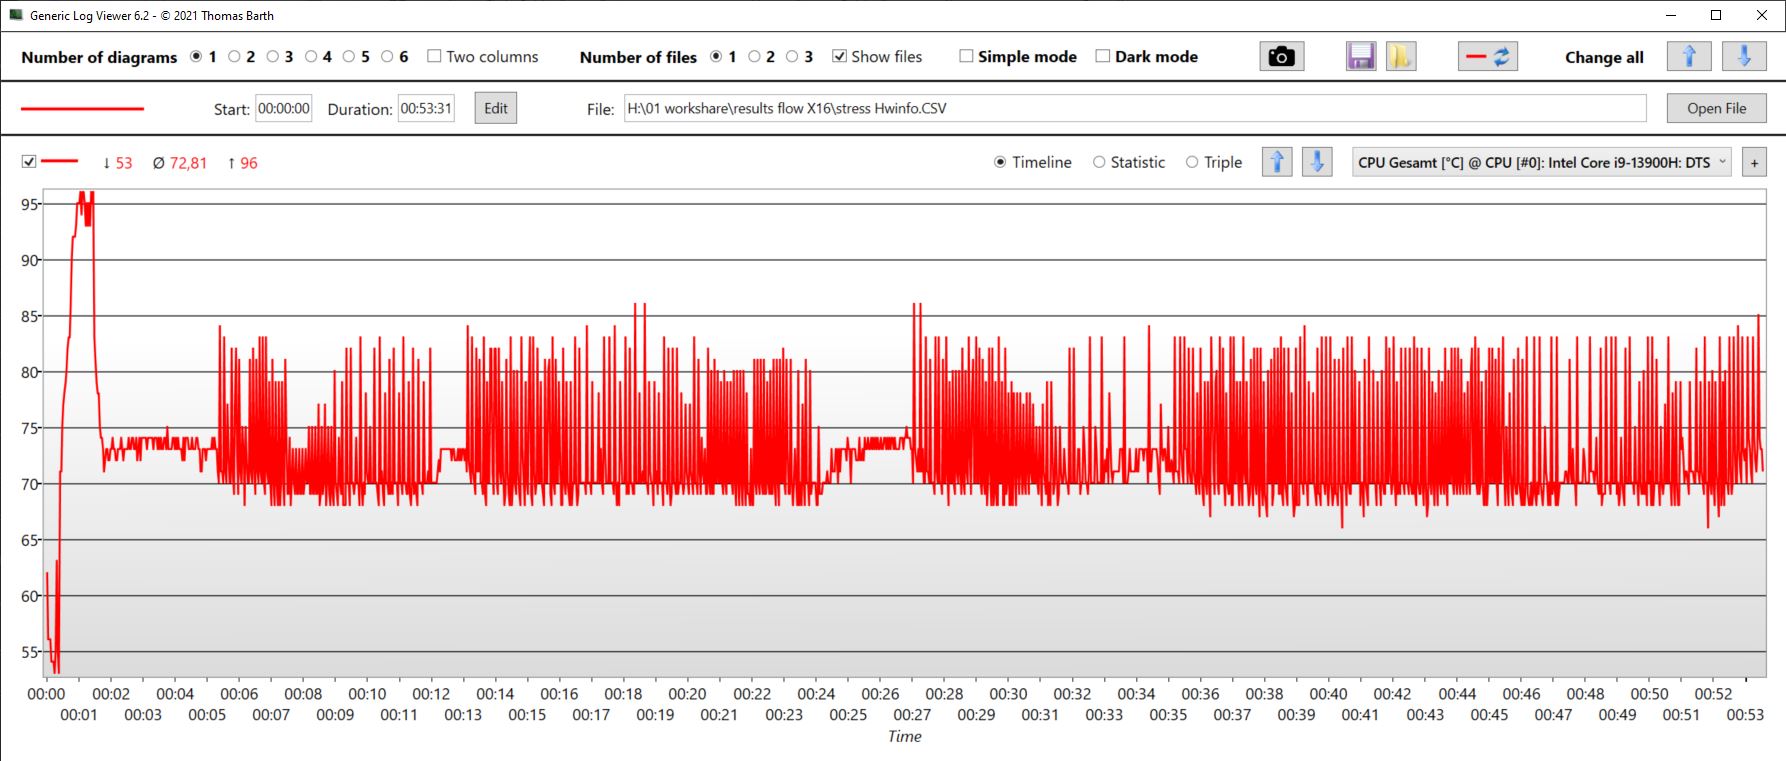


| Clock della CPU (GHz) | Clock della GPU (MHz) | Temperatura media della CPU (°C) | Temperatura media della GPU (°C) | |
| Prime95 + FurMark Stress | 2,6 | 1.870 | 73 | 65 |
| Witcher 3 StressAllerdings könnten die Boxen etwas lauter | 505 | 2.460 | 67,6 | 75 |
Altoparlanti
I diffusori offrono medi e alti equilibrati e i bassi sono ovviamente più bassi, anche se meno che in altri modelli. Tutto sommato, però, gli altoparlanti potrebbero suonare un po' più forte.
Il jack per cuffie da 3,5 mm consente di collegare dispositivi analogici.
Asus ROG Flow X16 GV601V analisi audio
(±) | potenza degli altiparlanti media ma buona (77.38 dB)
Bassi 100 - 315 Hz
(±) | bassi ridotti - in media 9.6% inferiori alla media
(±) | la linearità dei bassi è media (9.2% delta rispetto alla precedente frequenza)
Medi 400 - 2000 Hz
(+) | medi bilanciati - solo only 4.7% rispetto alla media
(±) | linearità dei medi adeguata (7.5% delta rispetto alla precedente frequenza)
Alti 2 - 16 kHz
(+) | Alti bilanciati - appena 2.2% dalla media
(+) | alti lineari (6.1% delta rispetto alla precedente frequenza)
Nel complesso 100 - 16.000 Hz
(+) | suono nel complesso lineare (12% differenza dalla media)
Rispetto alla stessa classe
» 12% di tutti i dispositivi testati in questa classe è stato migliore, 4% simile, 84% peggiore
» Il migliore ha avuto un delta di 6%, medio di 18%, peggiore di 132%
Rispetto a tutti i dispositivi testati
» 9% di tutti i dispositivi testati in questa classe è stato migliore, 2% similare, 88% peggiore
» Il migliore ha avuto un delta di 4%, medio di 24%, peggiore di 134%
Lenovo Legion Pro 5 16IRX8 analisi audio
(±) | potenza degli altiparlanti media ma buona (72.7 dB)
Bassi 100 - 315 Hz
(-) | quasi nessun basso - in media 23.7% inferiori alla media
(±) | la linearità dei bassi è media (10.7% delta rispetto alla precedente frequenza)
Medi 400 - 2000 Hz
(+) | medi bilanciati - solo only 3.8% rispetto alla media
(±) | linearità dei medi adeguata (7.1% delta rispetto alla precedente frequenza)
Alti 2 - 16 kHz
(+) | Alti bilanciati - appena 3.7% dalla media
(+) | alti lineari (6.7% delta rispetto alla precedente frequenza)
Nel complesso 100 - 16.000 Hz
(±) | la linearità complessiva del suono è media (21.9% di differenza rispetto alla media
Rispetto alla stessa classe
» 79% di tutti i dispositivi testati in questa classe è stato migliore, 6% simile, 16% peggiore
» Il migliore ha avuto un delta di 6%, medio di 18%, peggiore di 132%
Rispetto a tutti i dispositivi testati
» 63% di tutti i dispositivi testati in questa classe è stato migliore, 7% similare, 30% peggiore
» Il migliore ha avuto un delta di 4%, medio di 24%, peggiore di 134%
Gestione dell'energia - Buona ma non eccezionale
Gestione dell'energia
Quando è inattivo, il nostro X16 non è così economico come il Galaxy Book3, anche a causa del luminoso display touchscreen. Ciononostante, durante l'utilizzo inattivo, il dispositivo si distingue da Legion 5. Tuttavia, guardando il Katana da 17 pollici, è chiaro che il Flow X16 potrebbe essere un po' più efficiente dal punto di vista energetico quando è inattivo.
Quando si gioca, il consumo è paragonabile a quello delKatana 17con prestazioni leggermente migliori. Allo stesso tempo, ilLegion 5assorbe molta più energia dalla parete. Quest'ultima considerazione vale anche per il suo predecessoil nuovo Asus è diventato sensibilmente più efficiente.
| Off / Standby | |
| Idle | |
| Sotto carico |
|
Leggenda:
min: | |
| Asus ROG Flow X16 GV601V i9-13900H, GeForce RTX 4060 Laptop GPU, WD PC SN560 SDDPNQE-1T00, IPS, 2560x1600, 16" | Asus ROG Flow X16 GV601RW-M5082W R9 6900HS, GeForce RTX 3070 Ti Laptop GPU, Micron 3400 1TB MTFDKBA1T0TFH, Mini LED, 2560x1600, 16.1" | Samsung Galaxy Book3 Ultra 16, i9-13900H RTX 4070 i9-13900H, GeForce RTX 4070 Laptop GPU, Samsung PM9A1 MZVL21T0HCLR, OLED / AMOLED, 2880x1800, 16" | Lenovo Legion Pro 5 16IRX8 i7-13700HX, GeForce RTX 4060 Laptop GPU, SK hynix PC801 HFS512GEJ9X115N, IPS, 2560x1600, 16" | Lenovo Yoga Pro 7 14IRH G8 i7-13700H, GeForce RTX 4050 Laptop GPU, Samsung PM9A1 MZVL21T0HCLR, IPS, 3072x1920, 14.5" | MSI Katana 17 B13VFK i7-13620H, GeForce RTX 4060 Laptop GPU, Micron 2400 MTFDKBA1T0QFM, IPS LED, 1920x1080, 17.3" | Media NVIDIA GeForce RTX 4060 Laptop GPU | Media della classe Gaming | |
|---|---|---|---|---|---|---|---|---|
| Power Consumption | -48% | 41% | -63% | 23% | 0% | -5% | -24% | |
| Idle Minimum * (Watt) | 9.6 | 12.2 -27% | 4.3 55% | 24.5 -155% | 7.6 21% | 12.2 -27% | 11.5 ? -20% | 13.1 ? -36% |
| Idle Average * (Watt) | 16 | 25.5 -59% | 4.6 71% | 29.2 -83% | 13.3 17% | 14.9 7% | 16 ? -0% | 18.8 ? -18% |
| Idle Maximum * (Watt) | 16.9 | 29.8 -76% | 11.4 33% | 34.3 -103% | 13.7 19% | 15.8 7% | 20.3 ? -20% | 24.4 ? -44% |
| Load Average * (Watt) | 104 | 183 -76% | 97 7% | 98.7 5% | 88.2 15% | 85.22 18% | 92.9 ? 11% | 108.6 ? -4% |
| Witcher 3 ultra * (Watt) | 142 | 183.6 -29% | 100.9 29% | 178.6 -26% | 94.2 34% | 151.1 -6% | ||
| Load Maximum * (Watt) | 214 | 253 -18% | 107 50% | 249.6 -17% | 143 33% | 212.8 1% | 210 ? 2% | 255 ? -19% |
* ... Meglio usare valori piccoli
Power consumption Witcher 3 / Stress test
Power consumption with an external monitor
Durata della batteria
Il nostro modello in prova ha mantenuto le stesse dimensioni della batteria (90 Wh) del modello precedente predecessore. In questo modo, la batteria del sottile X16 è più grande di quella che si trova nelle macchine da gioco di dimensioni normali e di livello medio, come ad esempio il modello Legion 5.
Pertanto, ci si può aspettare una lunga durata della batteria. Questo ha reso il nostro test Wi-Fi ancora più sorprendente. I concorrenti con batterie più piccole, come il Galaxy Book3 (76 Wh) o lo Yoga Pro 7 (73 Wh), hanno una resistenza altrettanto buona. Questa è un'area in cui l'X16 potrebbe migliorare il suo consumo energetico inattivo.
La durata della batteria è comunque buona ma, considerando le dimensioni della batteria, ci si poteva aspettare tempi di autonomia migliori, almeno quando si tratta di attività poco impegnative come la navigazione in Internet. Inoltre, quando si naviga sul web in modalità batteria, assicurarsi che sia selezionata la modalità silenziosa e non le prestazioni.
| Asus ROG Flow X16 GV601V i9-13900H, GeForce RTX 4060 Laptop GPU, 90 Wh | Asus ROG Flow X16 GV601RW-M5082W R9 6900HS, GeForce RTX 3070 Ti Laptop GPU, 90 Wh | Samsung Galaxy Book3 Ultra 16, i9-13900H RTX 4070 i9-13900H, GeForce RTX 4070 Laptop GPU, 76 Wh | Lenovo Legion Pro 5 16IRX8 i7-13700HX, GeForce RTX 4060 Laptop GPU, 80 Wh | Lenovo Yoga Pro 7 14IRH G8 i7-13700H, GeForce RTX 4050 Laptop GPU, 73 Wh | MSI Katana 17 B13VFK i7-13620H, GeForce RTX 4060 Laptop GPU, 53.5 Wh | Media della classe Gaming | |
|---|---|---|---|---|---|---|---|
| Autonomia della batteria | -34% | -13% | -55% | 6% | -48% | -3% | |
| H.264 (h) | 8.9 | 9 1% | 12.4 39% | 8.9 ? 0% | |||
| WiFi v1.3 (h) | 7.9 | 5.7 -28% | 8 1% | 3.4 -57% | 9.9 25% | 2.9 -63% | 7 ? -11% |
| Load (h) | 1.5 | 0.9 -40% | 0.9 -40% | 0.7 -53% | 0.8 -47% | 1 -33% | 1.51 ? 1% |
| Witcher 3 ultra (h) | 0.9 | ||||||
| Reader / Idle (h) | 6.7 | 8.71 ? |
Pro
Contro
Verdetto - Un dispositivo meraviglioso e molto versatile
L'Asus ROG Flow X16 è soprattutto una cosa: versatile! È un dispositivo di lavoro sottile e mobile, è un 2-in-1, un tablet, una potente workstation e persino un PC da gioco. Ma c'è qualcosa di ancora più sorprendente: Fa tutte queste cose molto bene senza commettere grossi errori. È tutto tranne che un pigro compromesso.
Infatti, nonostante le dimensioni compatte e la funzionalità 2-in-1, l'hardware non è soggetto a rallentamenti e vanta, almeno in modalità turbo, prestazioni superiori alla media. Anche se in questo caso il rumore si fa sentire, non è più forte di quello della concorrenza, che si concentra esclusivamente sul gioco. Tuttavia, anche dopo aver terminato un periodo di carico pesante, le ventole continuano a funzionare per un bel po' di tempo.
Cambiamo la categoria del prodotto in "Gaming", poiché il punteggio è di circa 2,4 punti percentuali superiore a quello della categoria "Convertible".
L'Asus ROG Flow X16 è una workstation da gioco 2-in-1 estremamente versatile e potente con un buon display touchscreen.
Finora le alternative di questo tipo sono poche. Attualmente, Asus stessa sembra essere molto propensa a sperimentare. I potenziali acquirenti potrebbero dare un'occhiata a un dispositivo che abbiamo citato all'inizio dell'articolo, il tablet da gioco Asus ROG Flow Z13. IlSamsung Galaxy Book3 Ultra 16(89%) è altrettanto valido, ma un po' lento nonostante la GPU più potente. Le specifiche più deboliLenovo Yoga Pro 7 14 G8(90%) merita di essere preso in considerazione.
Prezzo e disponibilità
Attualmente, la nostra configurazione del Flow X16 con RTX 4060 non è disponibile su Amazon o BestBuy. Tuttavia, su quest'ultimo negozio, il modello RTX 4070 può essere acquistato a 2699,99 dollari.
Asus ROG Flow X16 GV601V
- 06/08/2023 v7 (old)
Christian Hintze
Transparency
La selezione dei dispositivi da recensire viene effettuata dalla nostra redazione. Il campione di prova è stato fornito all'autore come prestito dal produttore o dal rivenditore ai fini di questa recensione. L'istituto di credito non ha avuto alcuna influenza su questa recensione, né il produttore ne ha ricevuto una copia prima della pubblicazione. Non vi era alcun obbligo di pubblicare questa recensione. In quanto società mediatica indipendente, Notebookcheck non è soggetta all'autorità di produttori, rivenditori o editori.
Ecco come Notebookcheck esegue i test
Ogni anno, Notebookcheck esamina in modo indipendente centinaia di laptop e smartphone utilizzando procedure standardizzate per garantire che tutti i risultati siano comparabili. Da circa 20 anni sviluppiamo continuamente i nostri metodi di prova e nel frattempo stabiliamo gli standard di settore. Nei nostri laboratori di prova, tecnici ed editori esperti utilizzano apparecchiature di misurazione di alta qualità. Questi test comportano un processo di validazione in più fasi. Il nostro complesso sistema di valutazione si basa su centinaia di misurazioni e parametri di riferimento ben fondati, che mantengono l'obiettività.Price comparison

