Recensione dell'Asus ROG Flow Z13: una RTX 4060 in un impressionante tablet per il gaming

Steam Deck, Asus ROG Ally e altri stanno rendendo rispettabile il concetto di PC da gioco di piccole dimensioni. Le nuove generazioni di CPU e GPU sono sempre più efficienti e i produttori stanno cercando di coprire nuove nicchie installando componenti potenti in case sempre più piccoli e quindi più mobili.
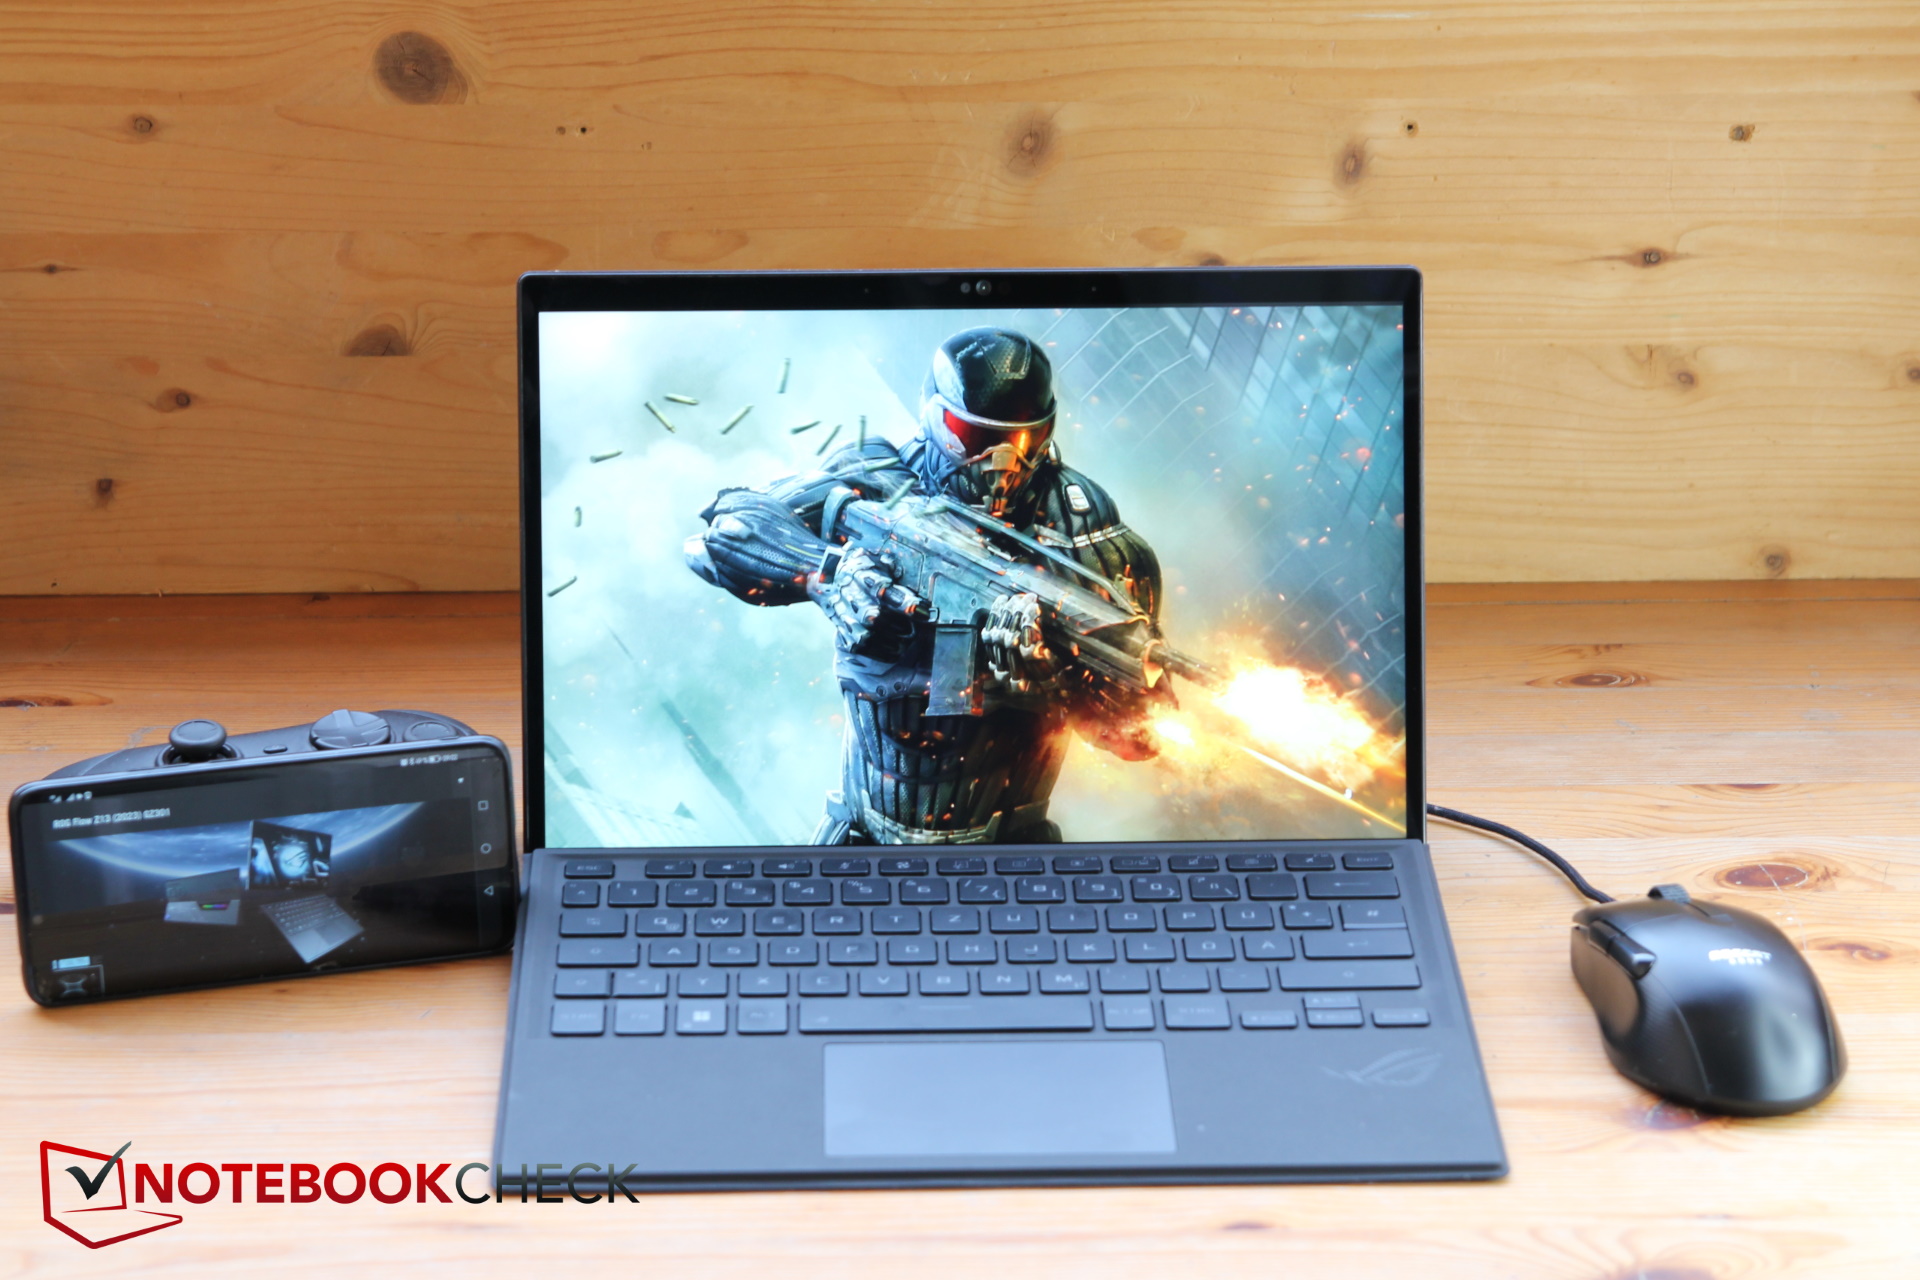
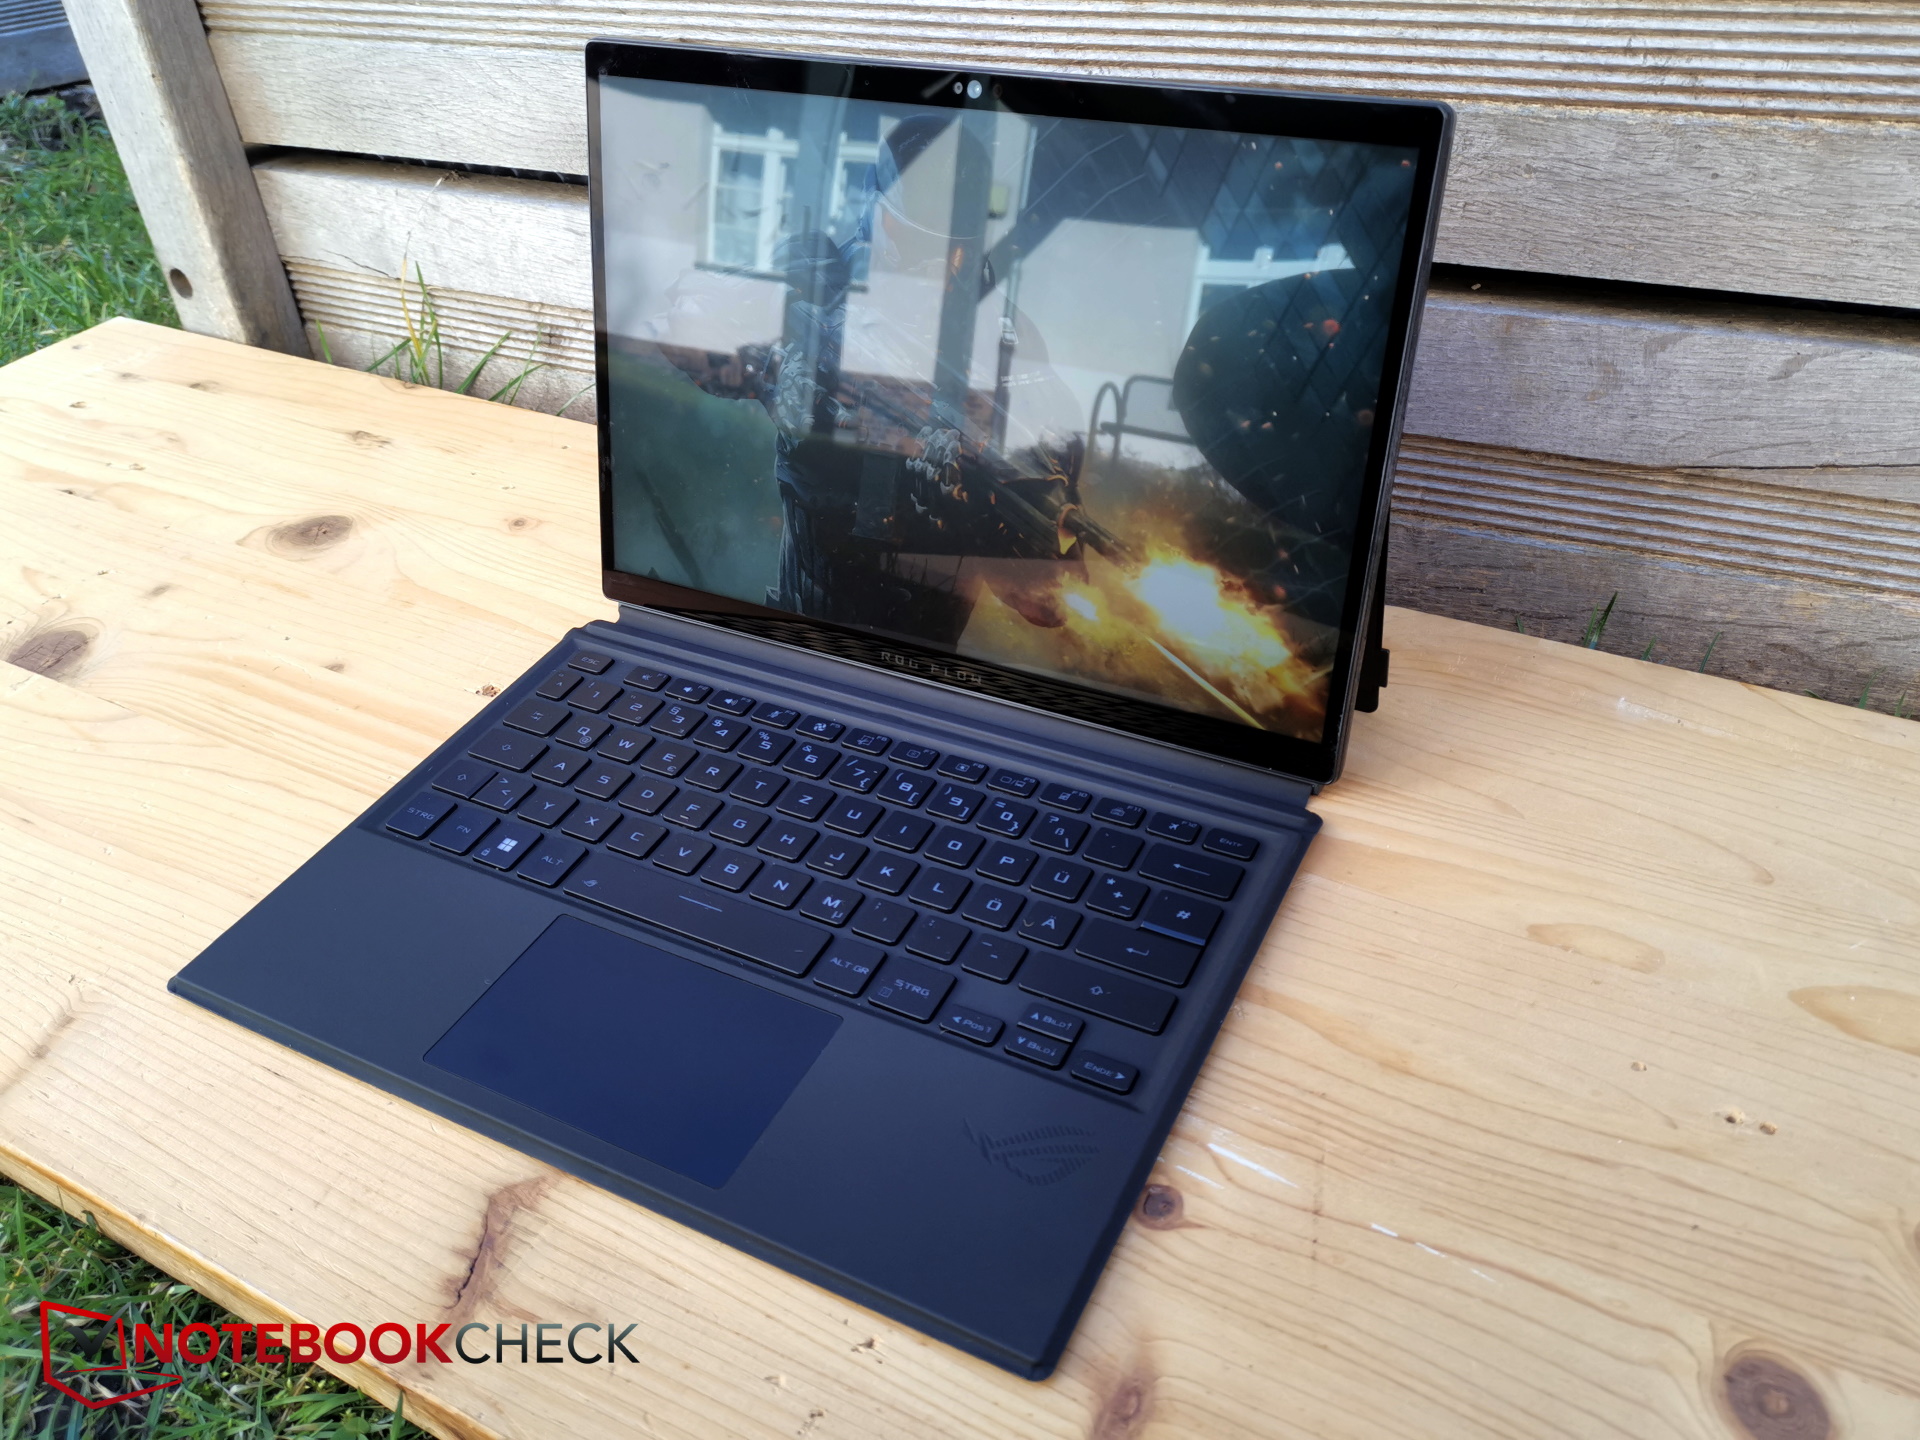
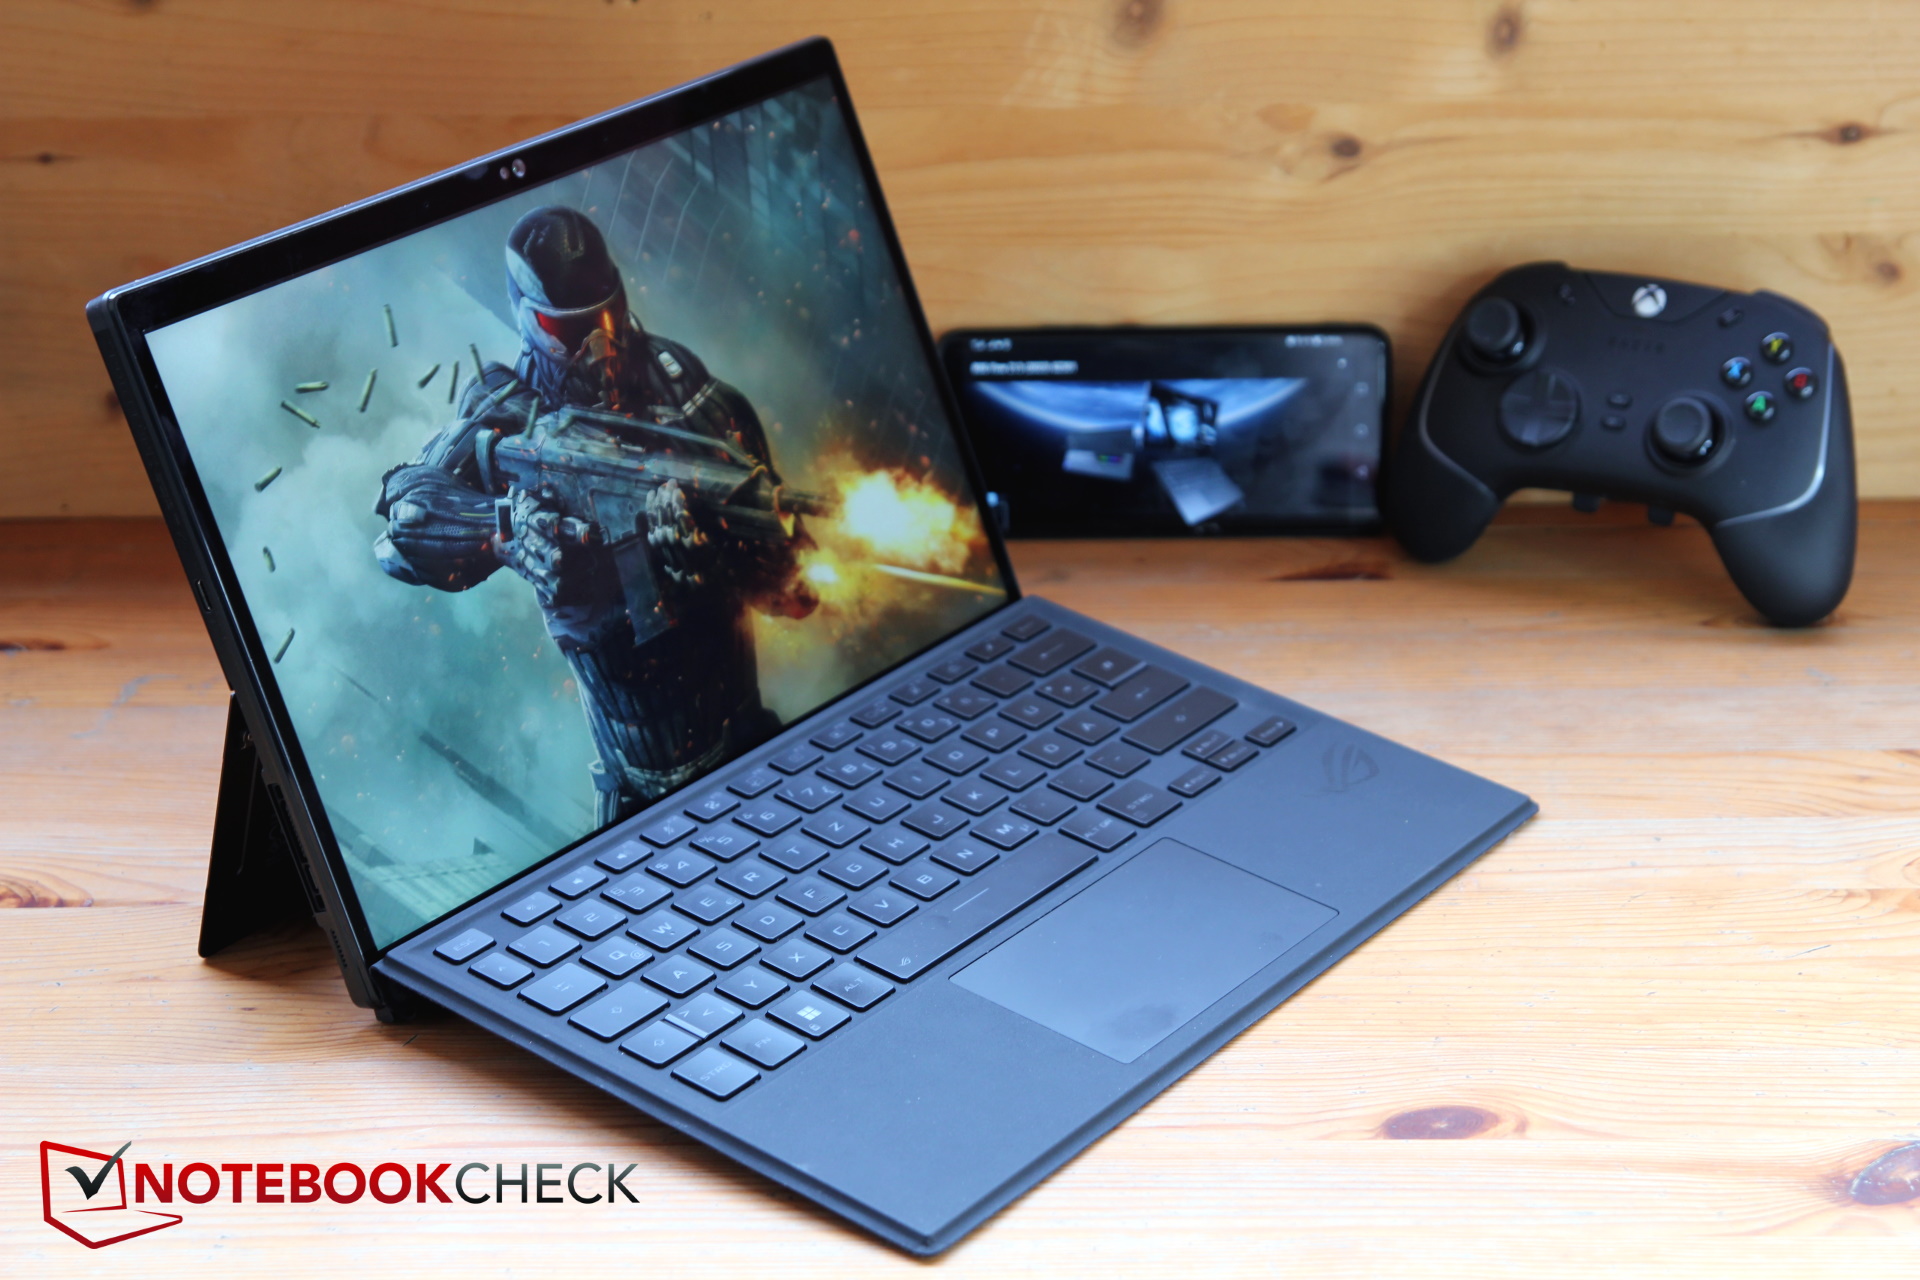
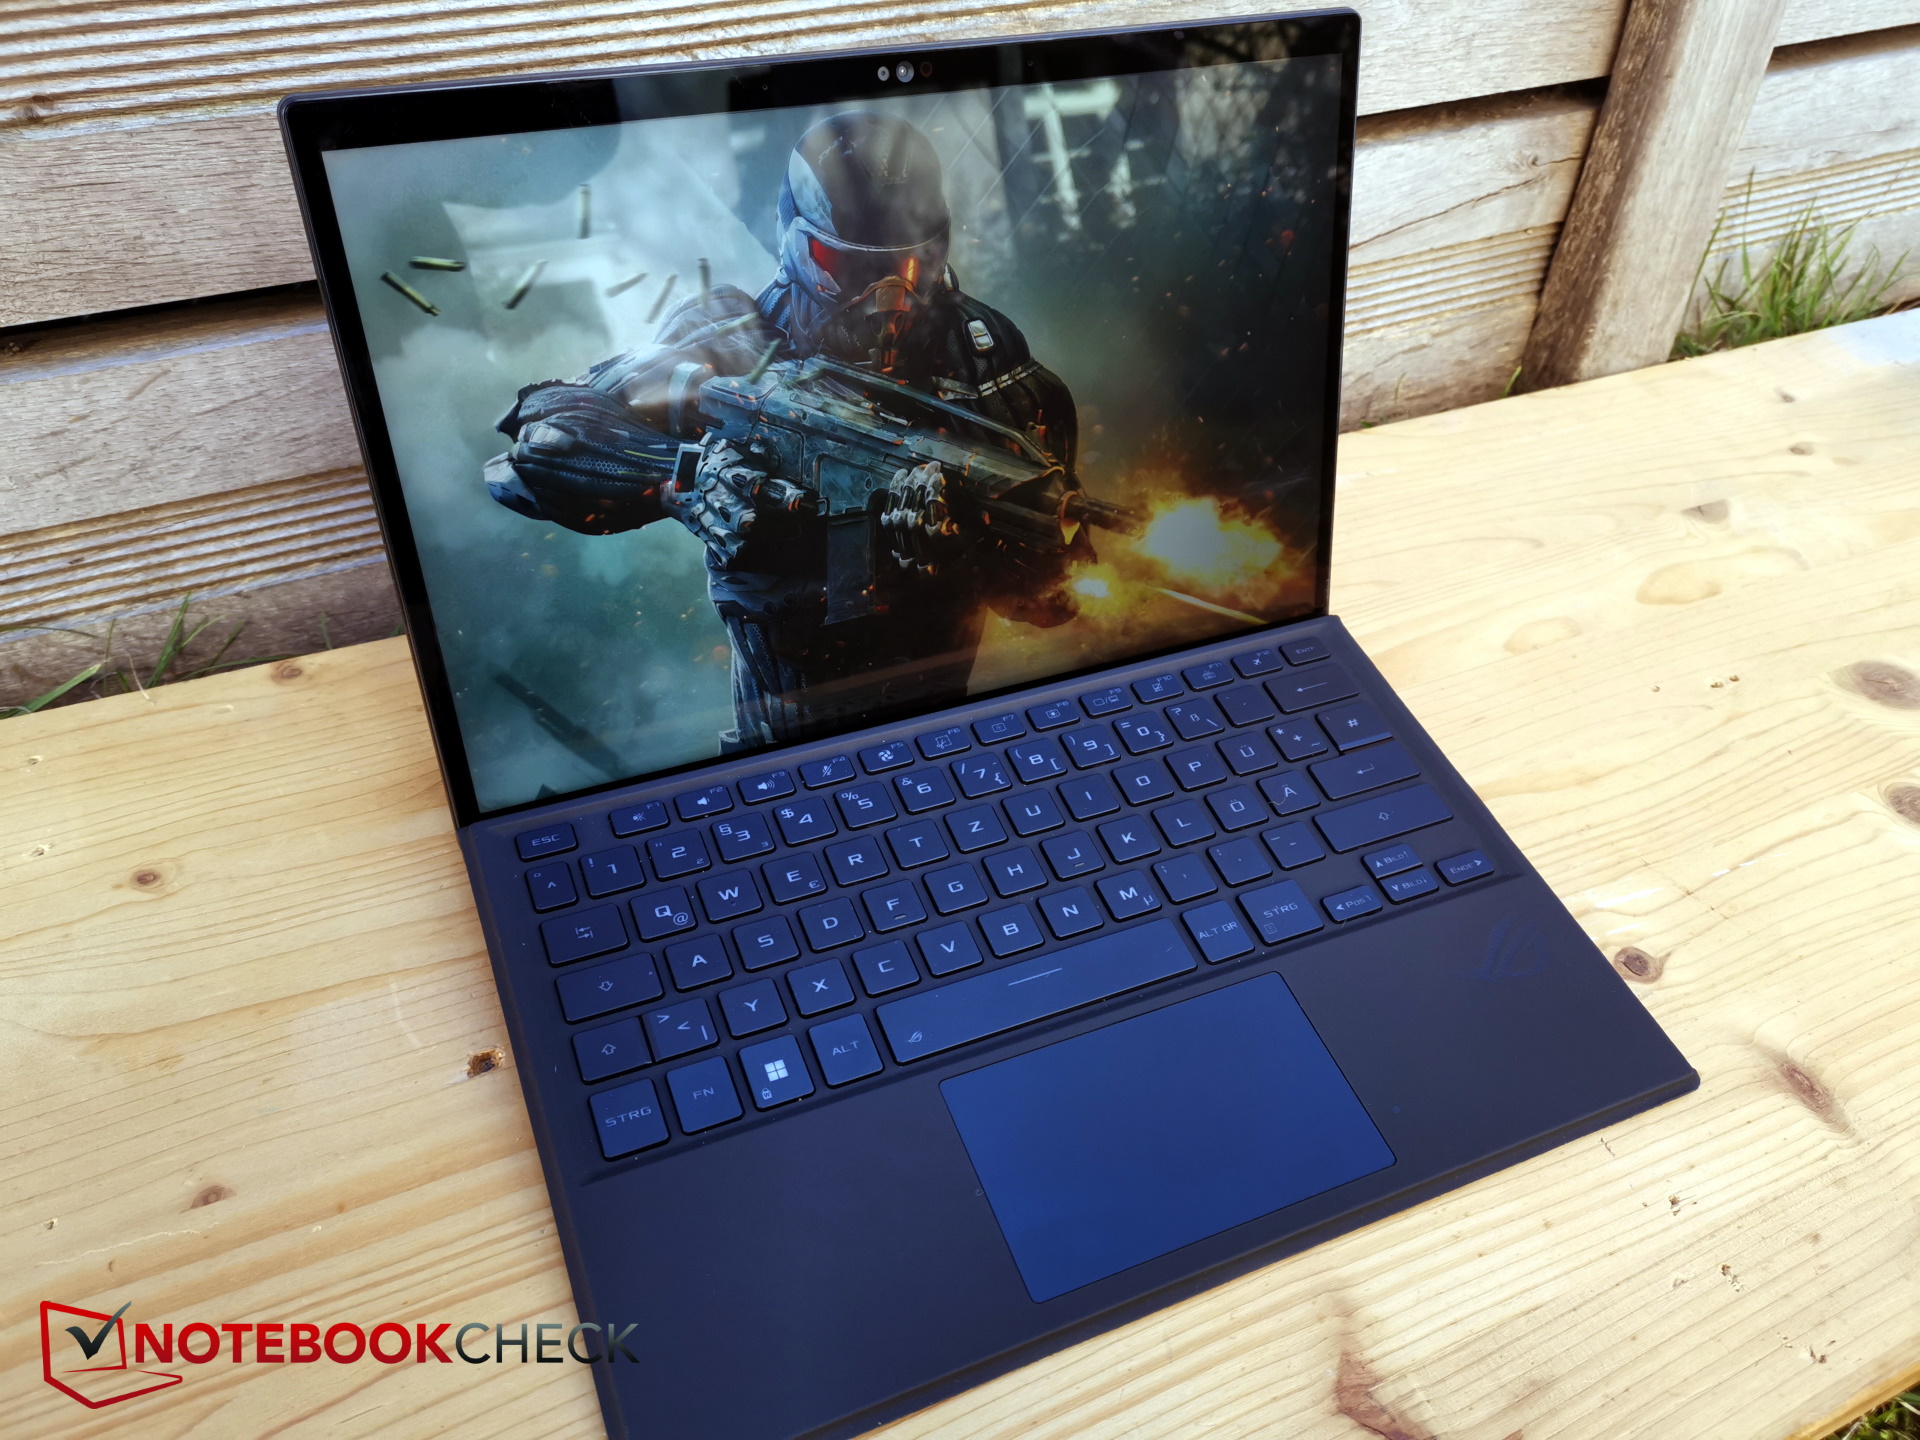
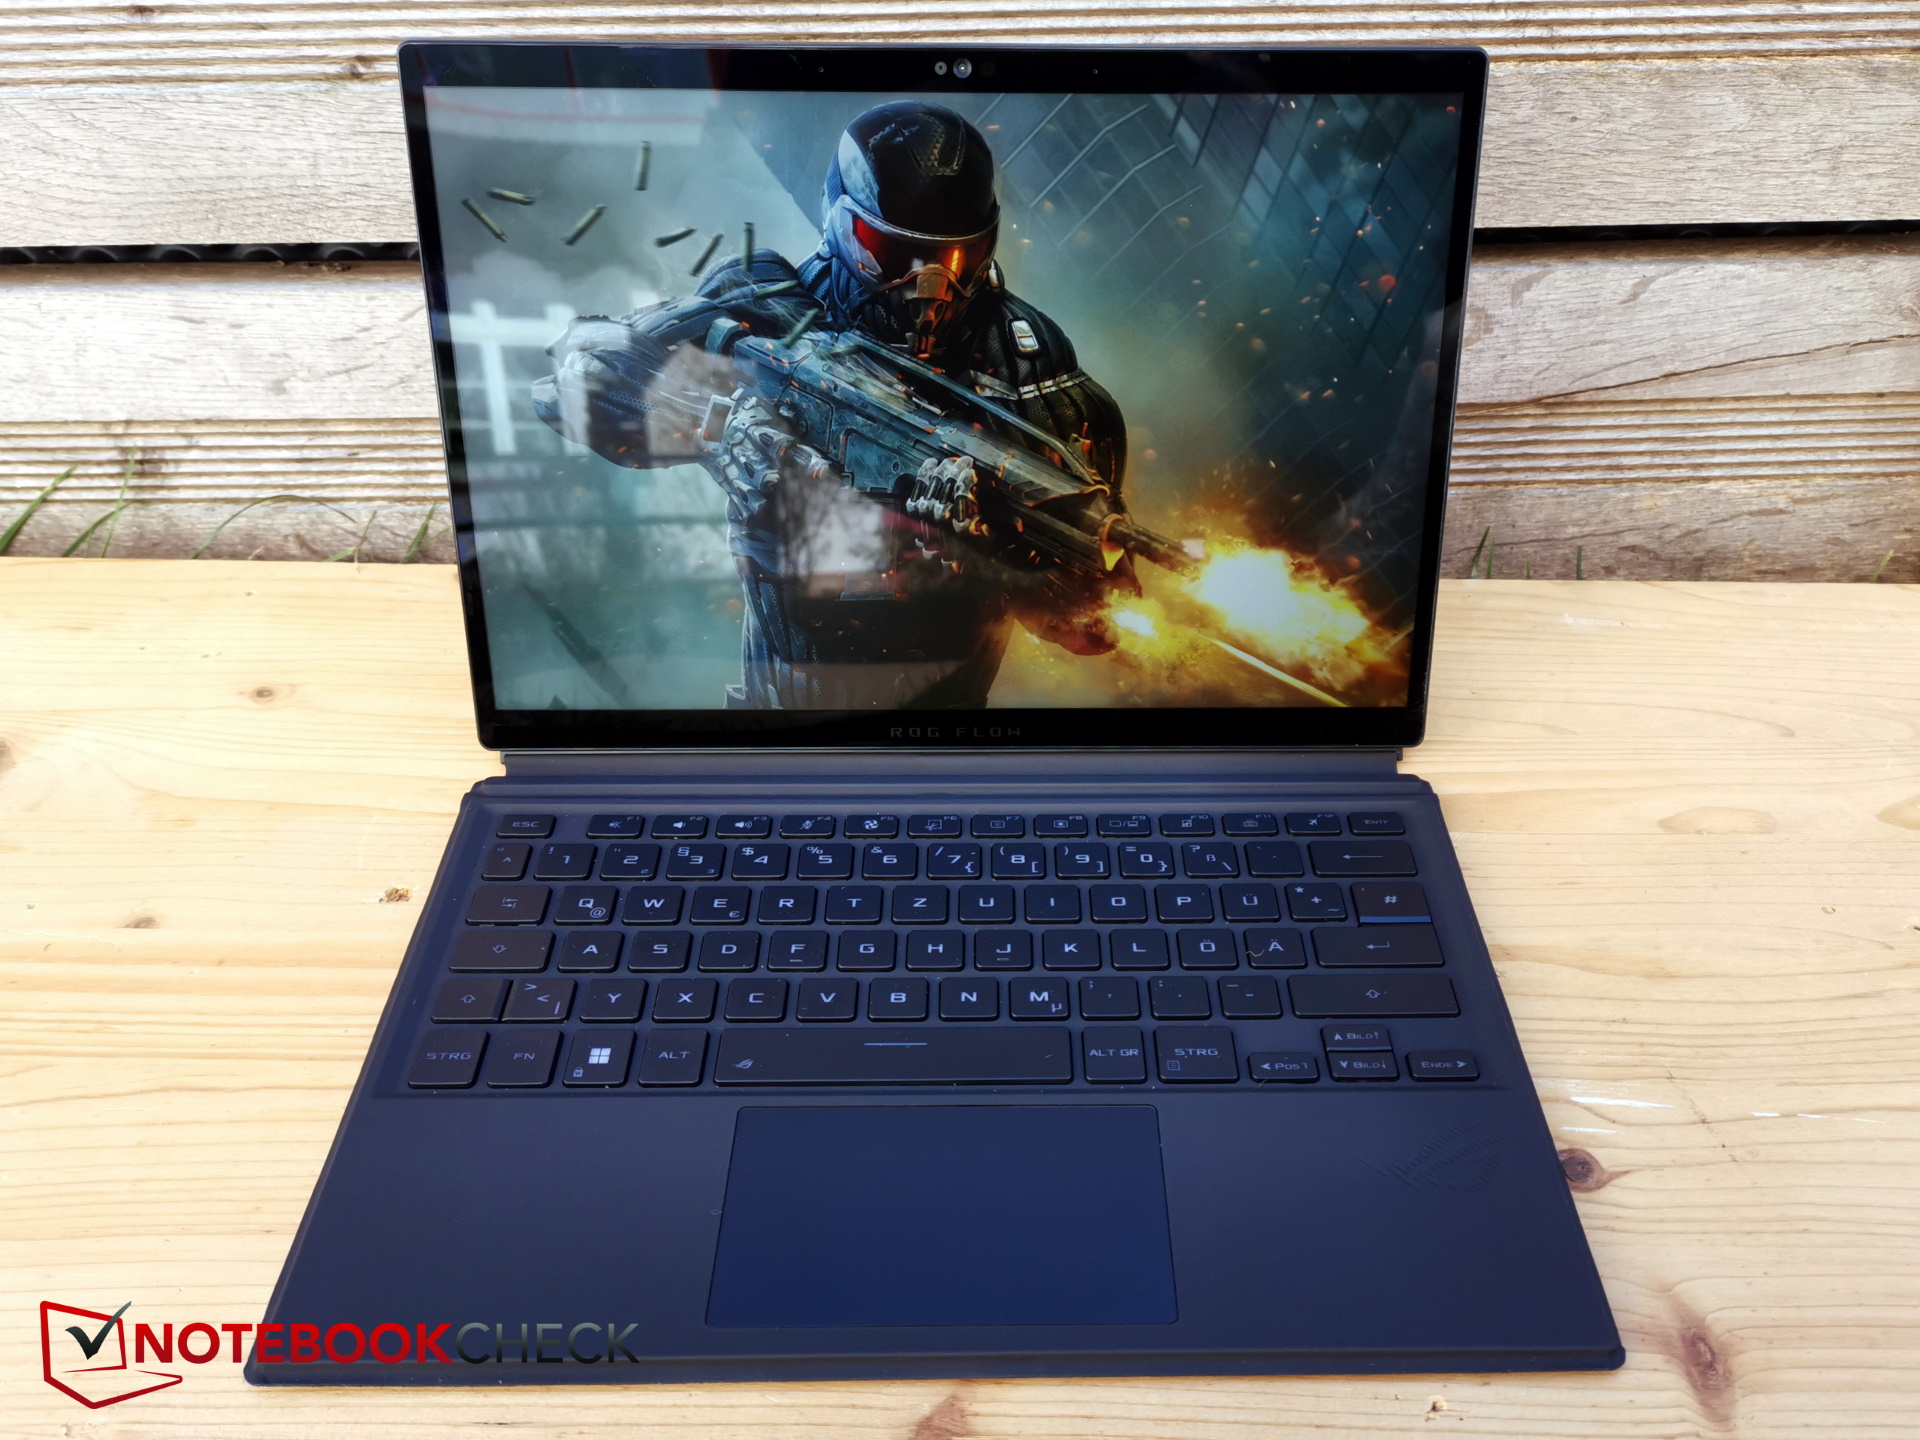
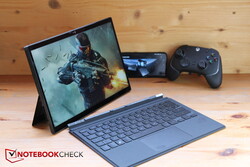
L'Asus ROG Flow Z13 è un tablet da 13 pollici con uno schermo touchscreen ad alta risoluzione e una tastiera agganciabile magneticamente. La particolarità è che, al posto di componenti da ufficio temperati ed economici, questo tablet non così sottile utilizza un vero hardware da gioco di fascia alta. Questo dispositivo compatto e potente dovrebbe interessare anche i creatori di contenuti.
Di recente abbiamo anche recensito un'edizione speciale dello Z13, che ha un case diverso e una RTX 4070, mentre il predecessore aveva solo una RTX 3050 Ti. Naturalmente, includiamo entrambi i modelli per un confronto.
Il campo dei concorrenti per il confronto è sottile, quindi dobbiamo ricorrere a veri portatili da gioco oltre al predecessore e all'edizione speciale. Per un confronto delle prestazioni del RTX 4060, utilizziamo il nuovo MSI Katana 17 e il MSI Cyborg 15, altrimenti lo confrontiamo con il Acer Predator Triton 300 SE da 14 pollici dello scorso anno (RTX 3060
).
Potenziali concorrenti a confronto
Punteggio | Data | Modello | Peso | Altezza | Dimensione | Risoluzione | Prezzo |
|---|---|---|---|---|---|---|---|
| 89.1 % v7 (old) | 04/2023 | Asus ROG Flow Z13 GZ301V i9-13900H, GeForce RTX 4060 Laptop GPU | 1.6 kg | 14.2 mm | 13.40" | 2560x1600 | |
| 89.4 % v7 (old) | 04/2023 | Asus ROG Flow Z13 ACRNM i9-13900H, GeForce RTX 4070 Laptop GPU | 1.7 kg | 20 mm | 13.40" | 2560x1600 | |
| 86.8 % v7 (old) | 03/2022 | Asus ROG Flow Z13 GZ301ZE i9-12900H, GeForce RTX 3050 Ti Laptop GPU | 1.2 kg | 12 mm | 13.40" | 1920x1200 | |
| 82.1 % v7 (old) | 02/2023 | MSI Katana 17 B13VFK i7-13620H, GeForce RTX 4060 Laptop GPU | 2.8 kg | 25.2 mm | 17.30" | 1920x1080 | |
| 86 % v7 (old) | 11/2022 | Acer Predator Triton 300 SE i9-12900H, GeForce RTX 3060 Laptop GPU | 1.7 kg | 19.8 mm | 14.00" | 2880x1800 | |
| 82.4 % v7 (old) | 04/2023 | MSI Cyborg 15 A12VF i7-12650H, GeForce RTX 4060 Laptop GPU | 2 kg | 22.9 mm | 15.60" | 1920x1080 |
Custodia - La tavoletta leggermente più spessa
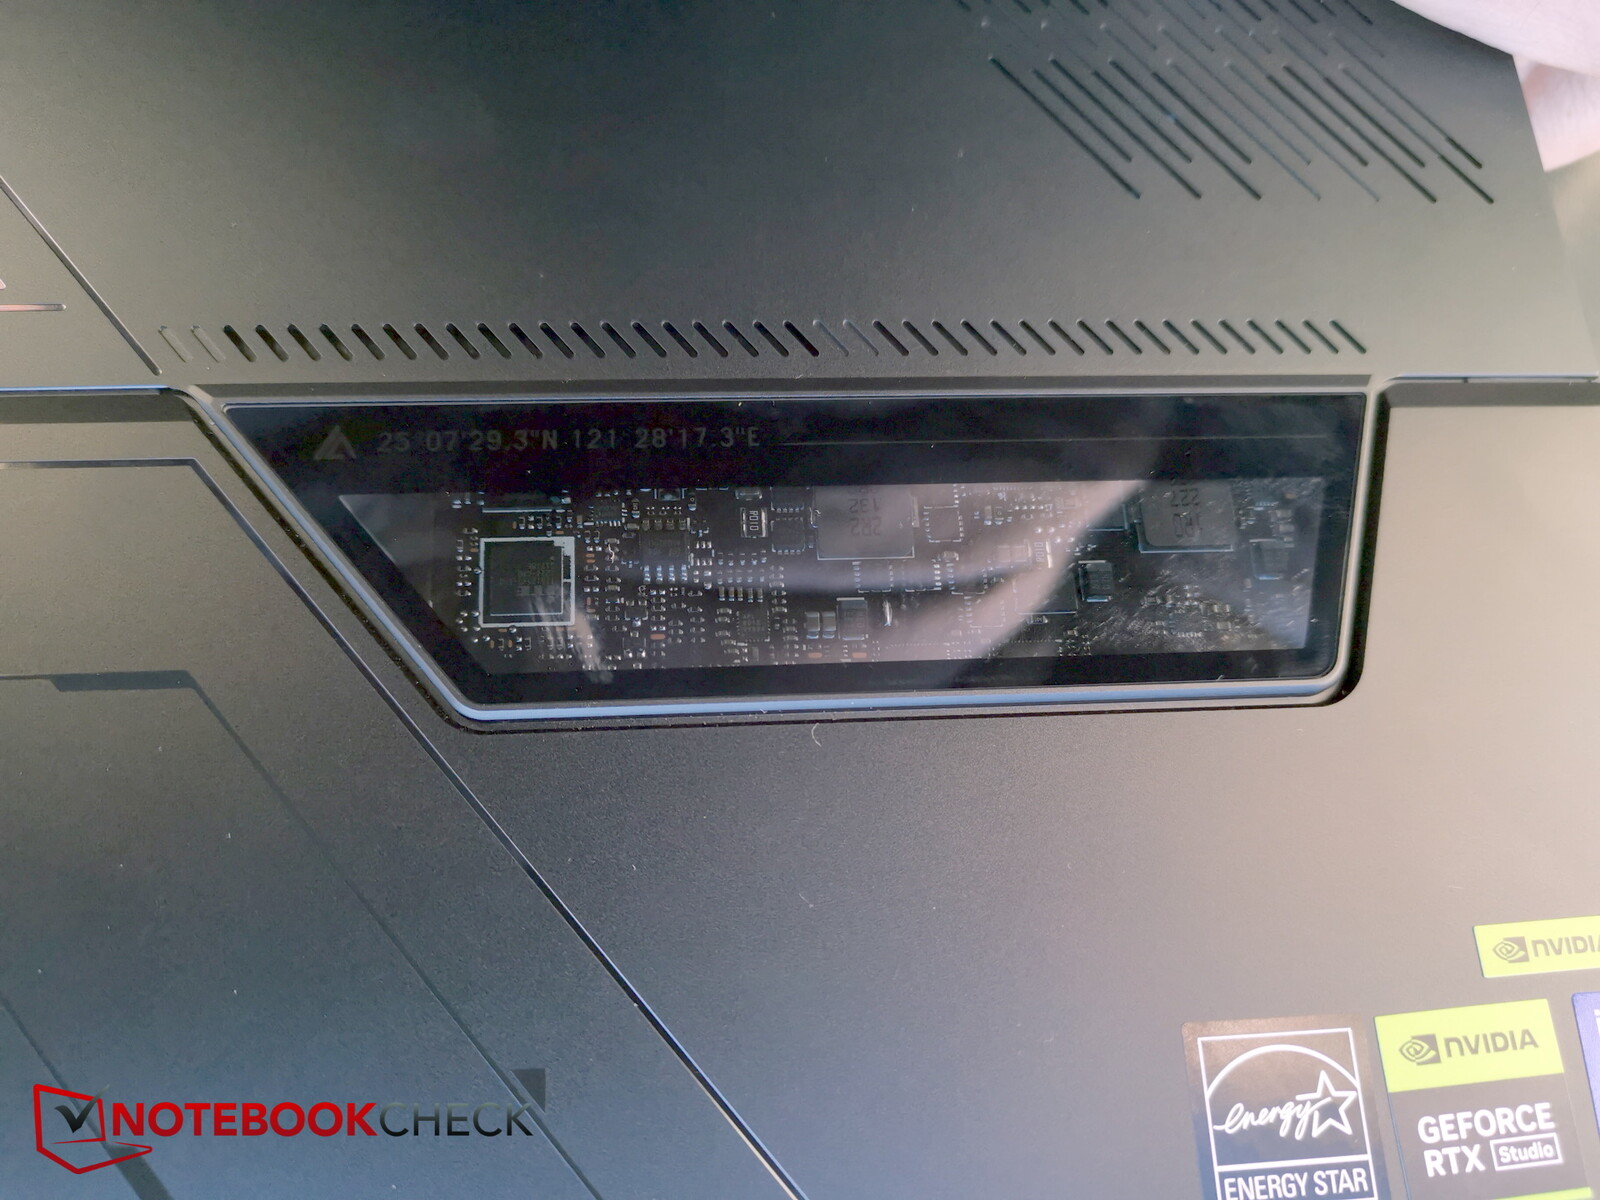
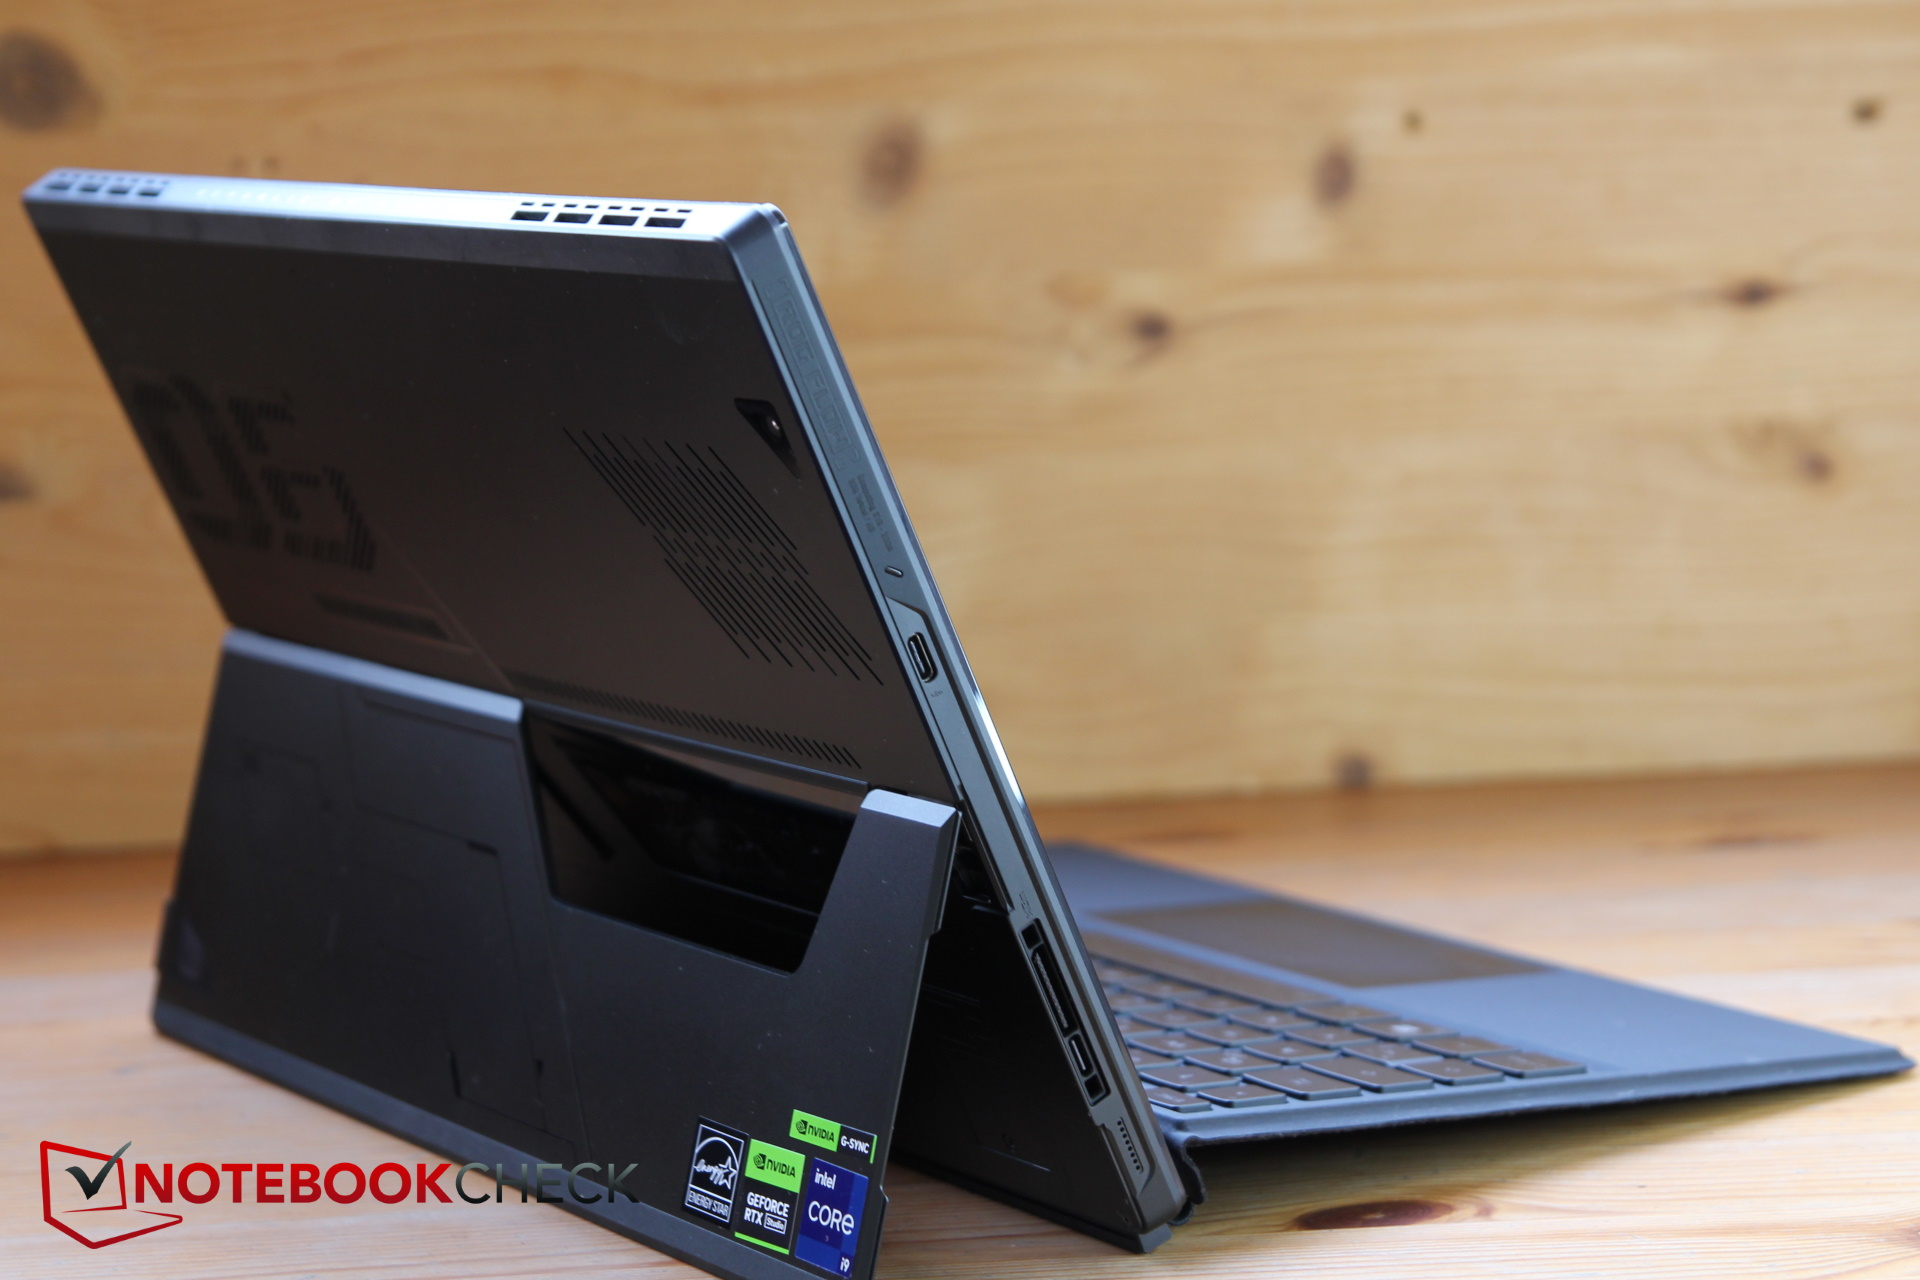
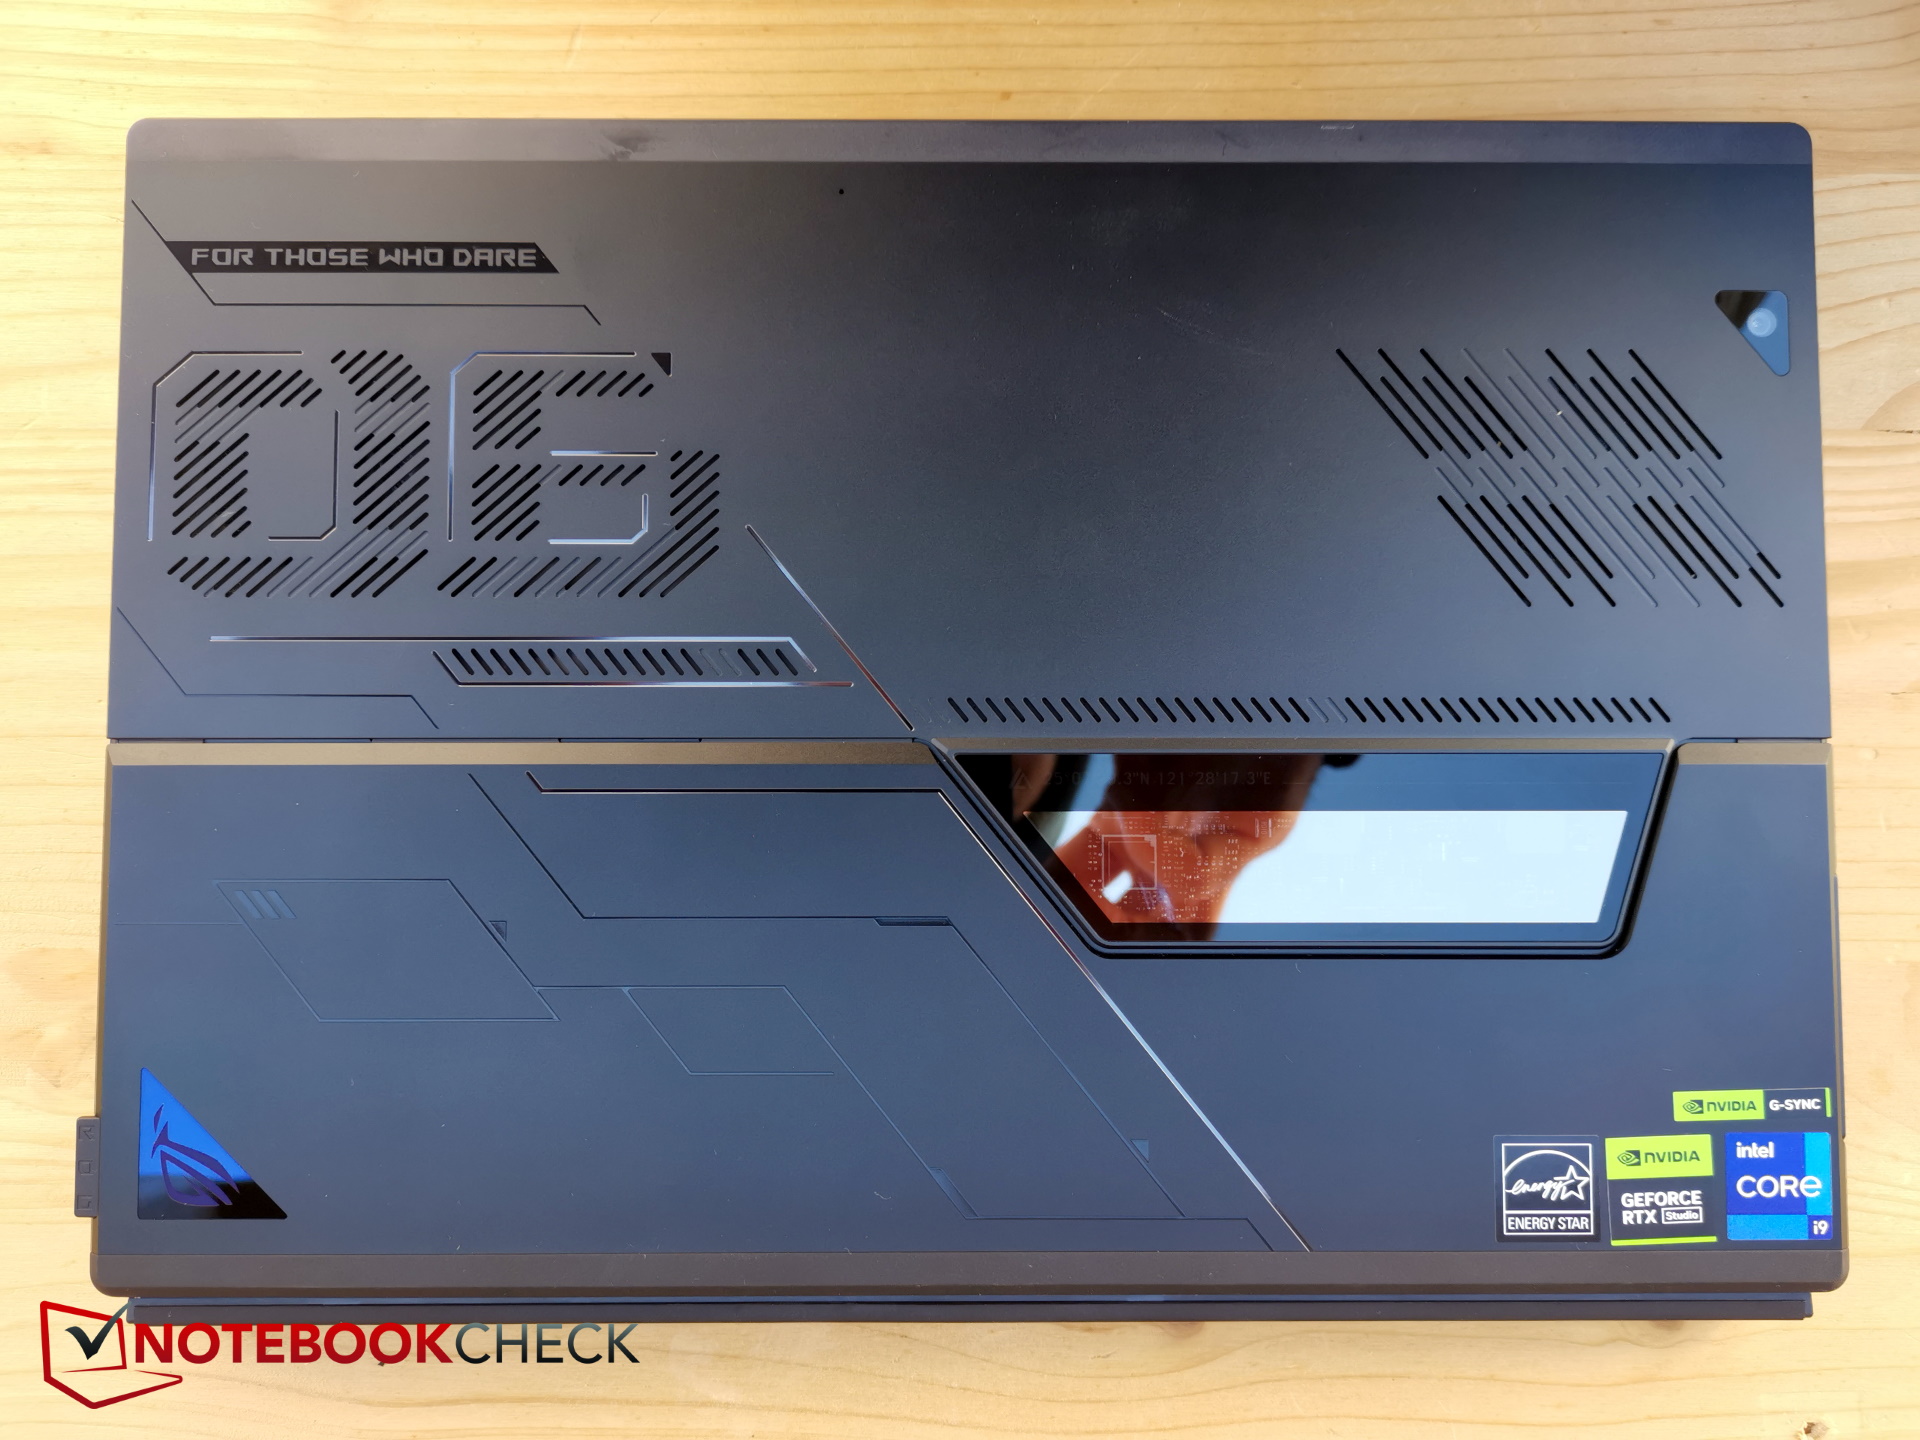
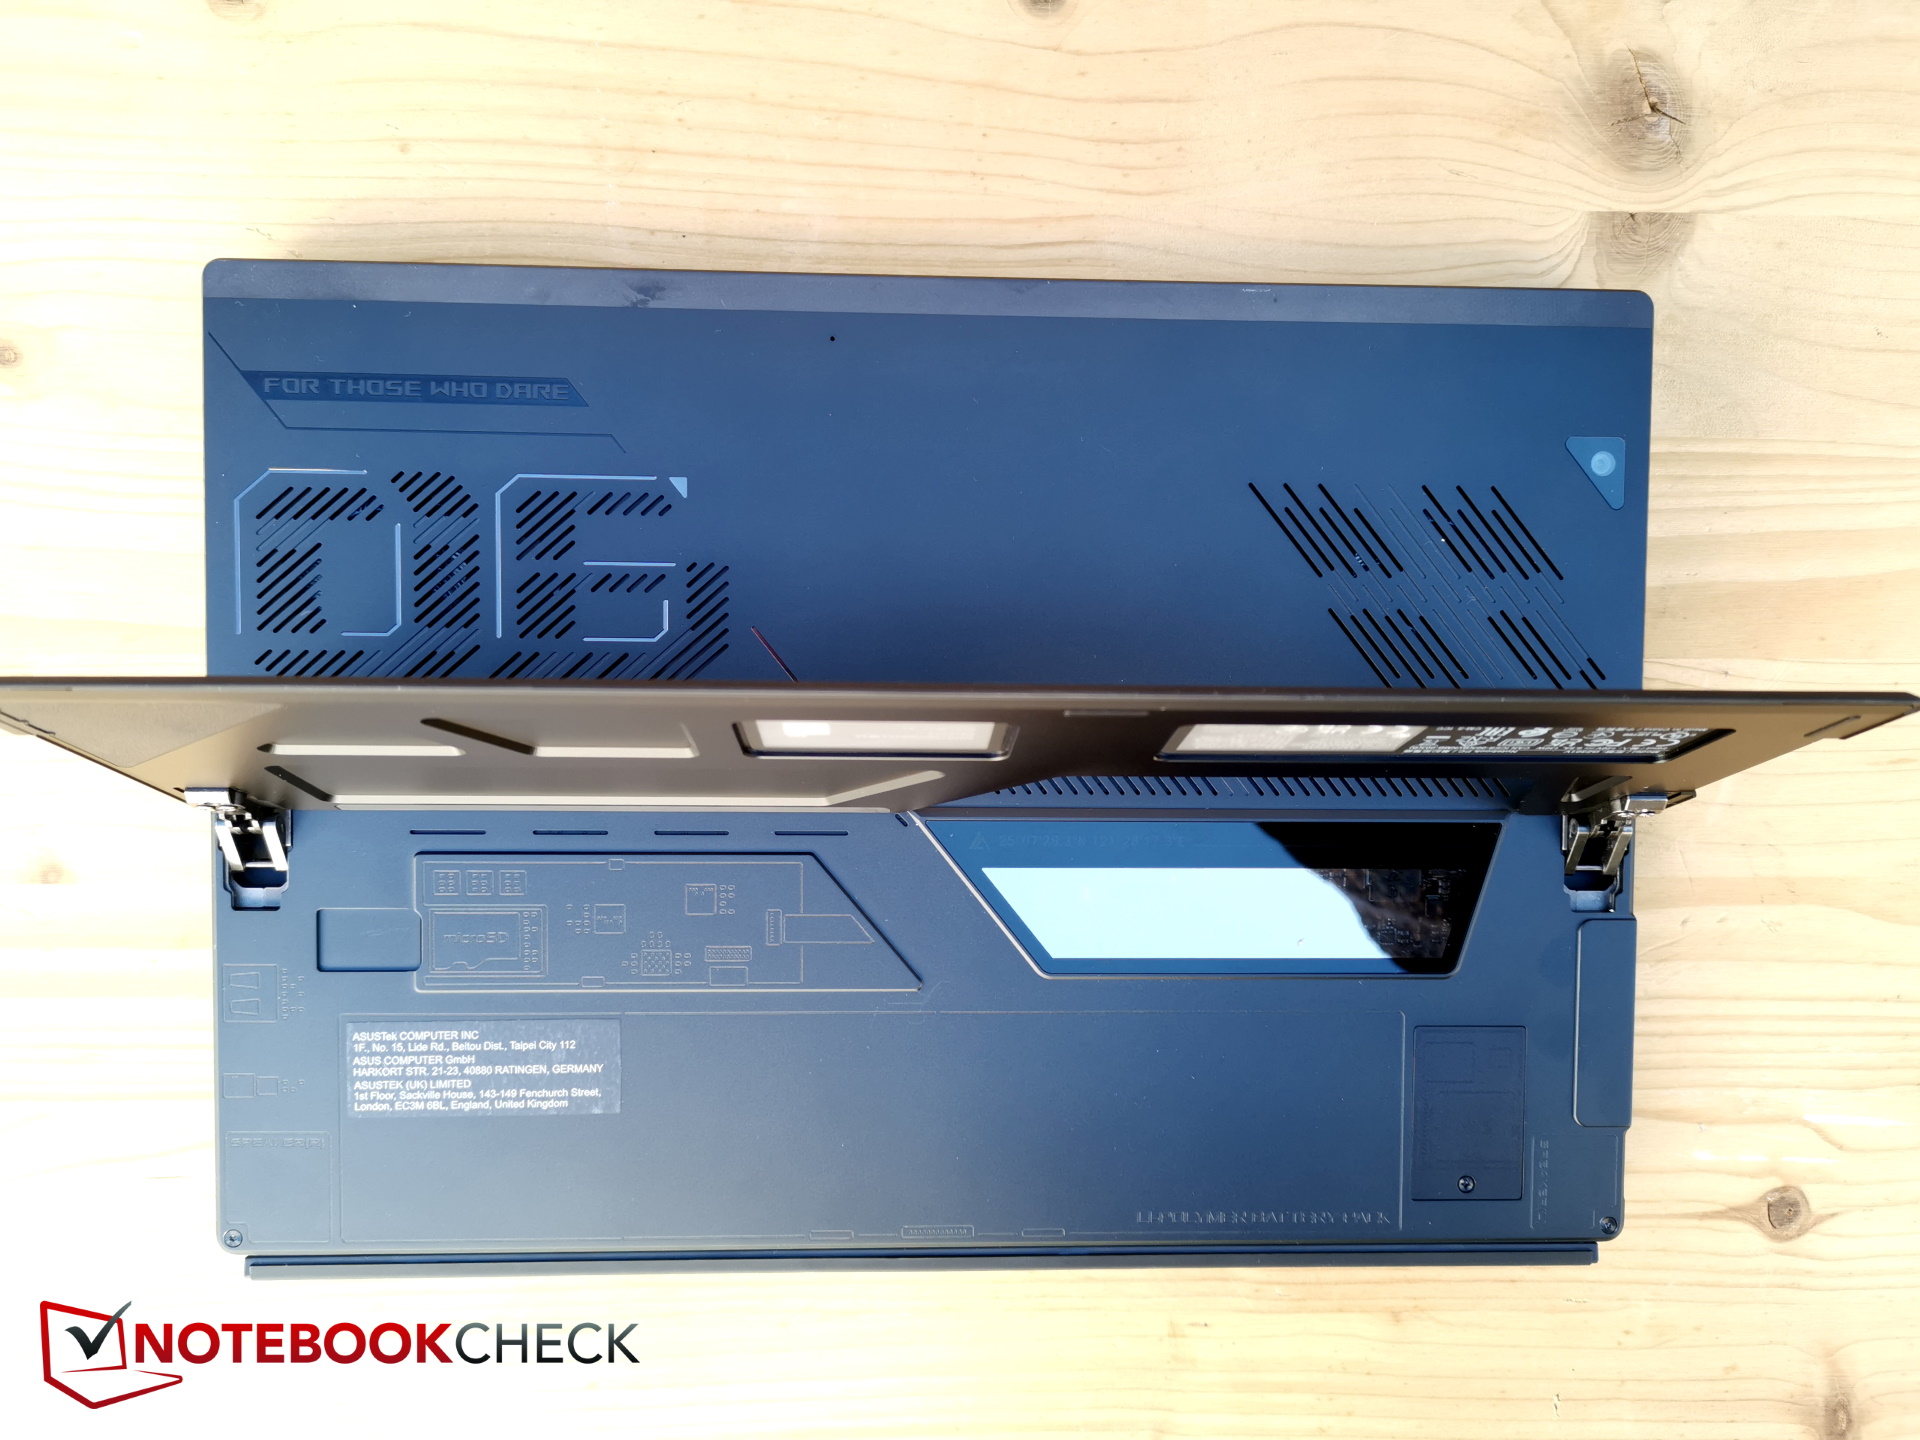
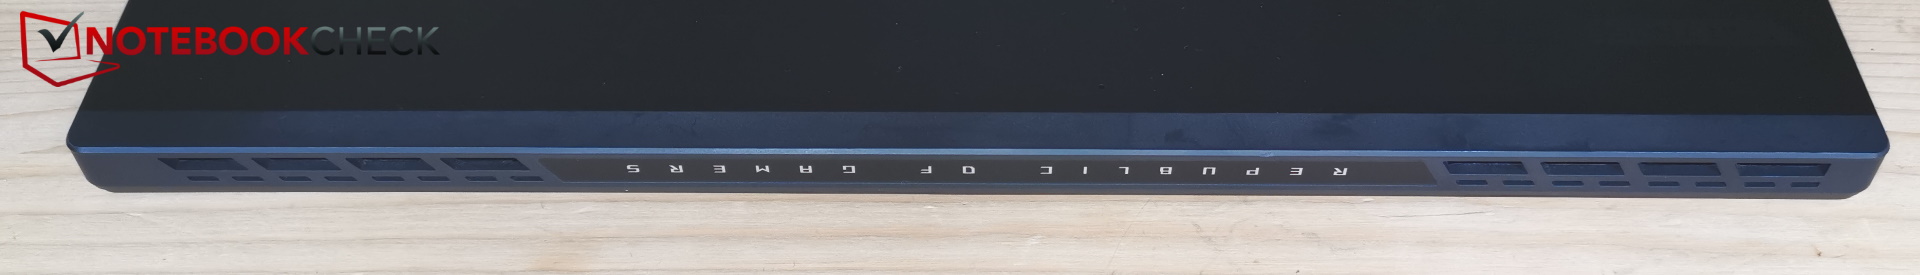
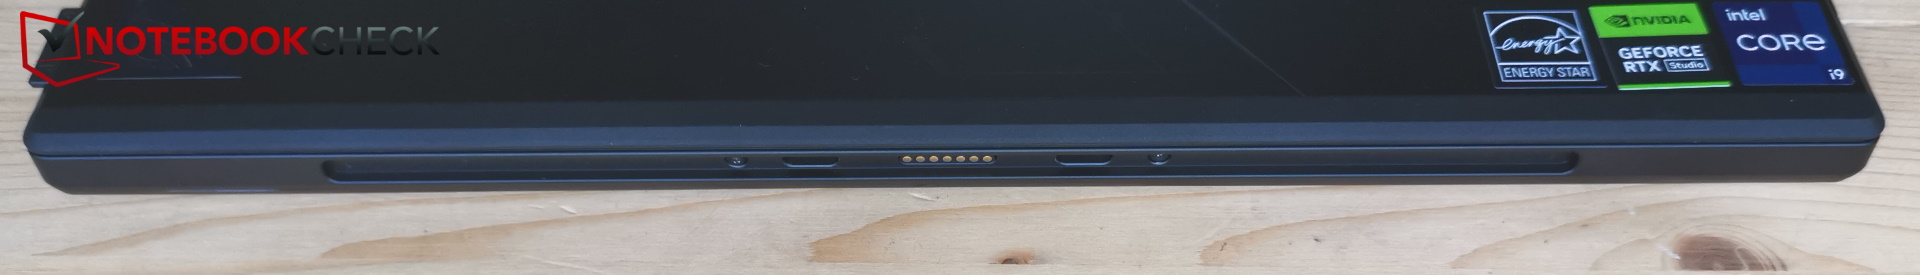
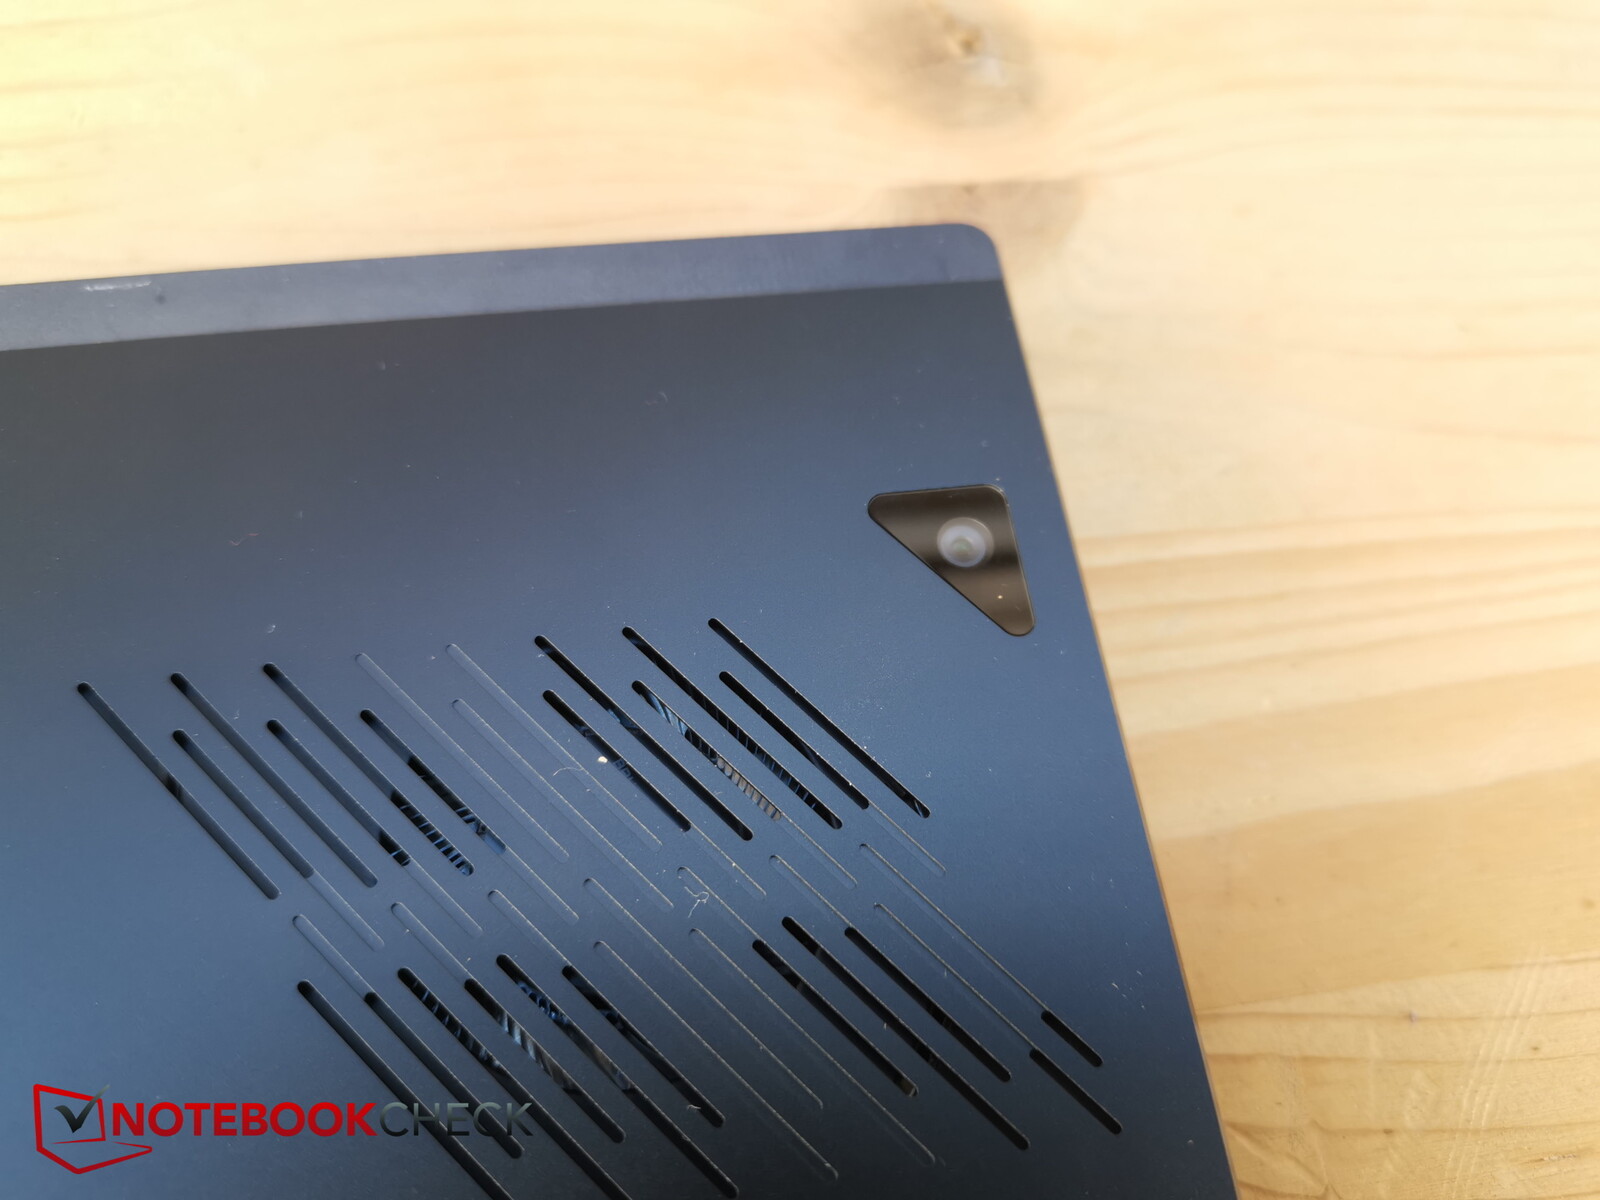
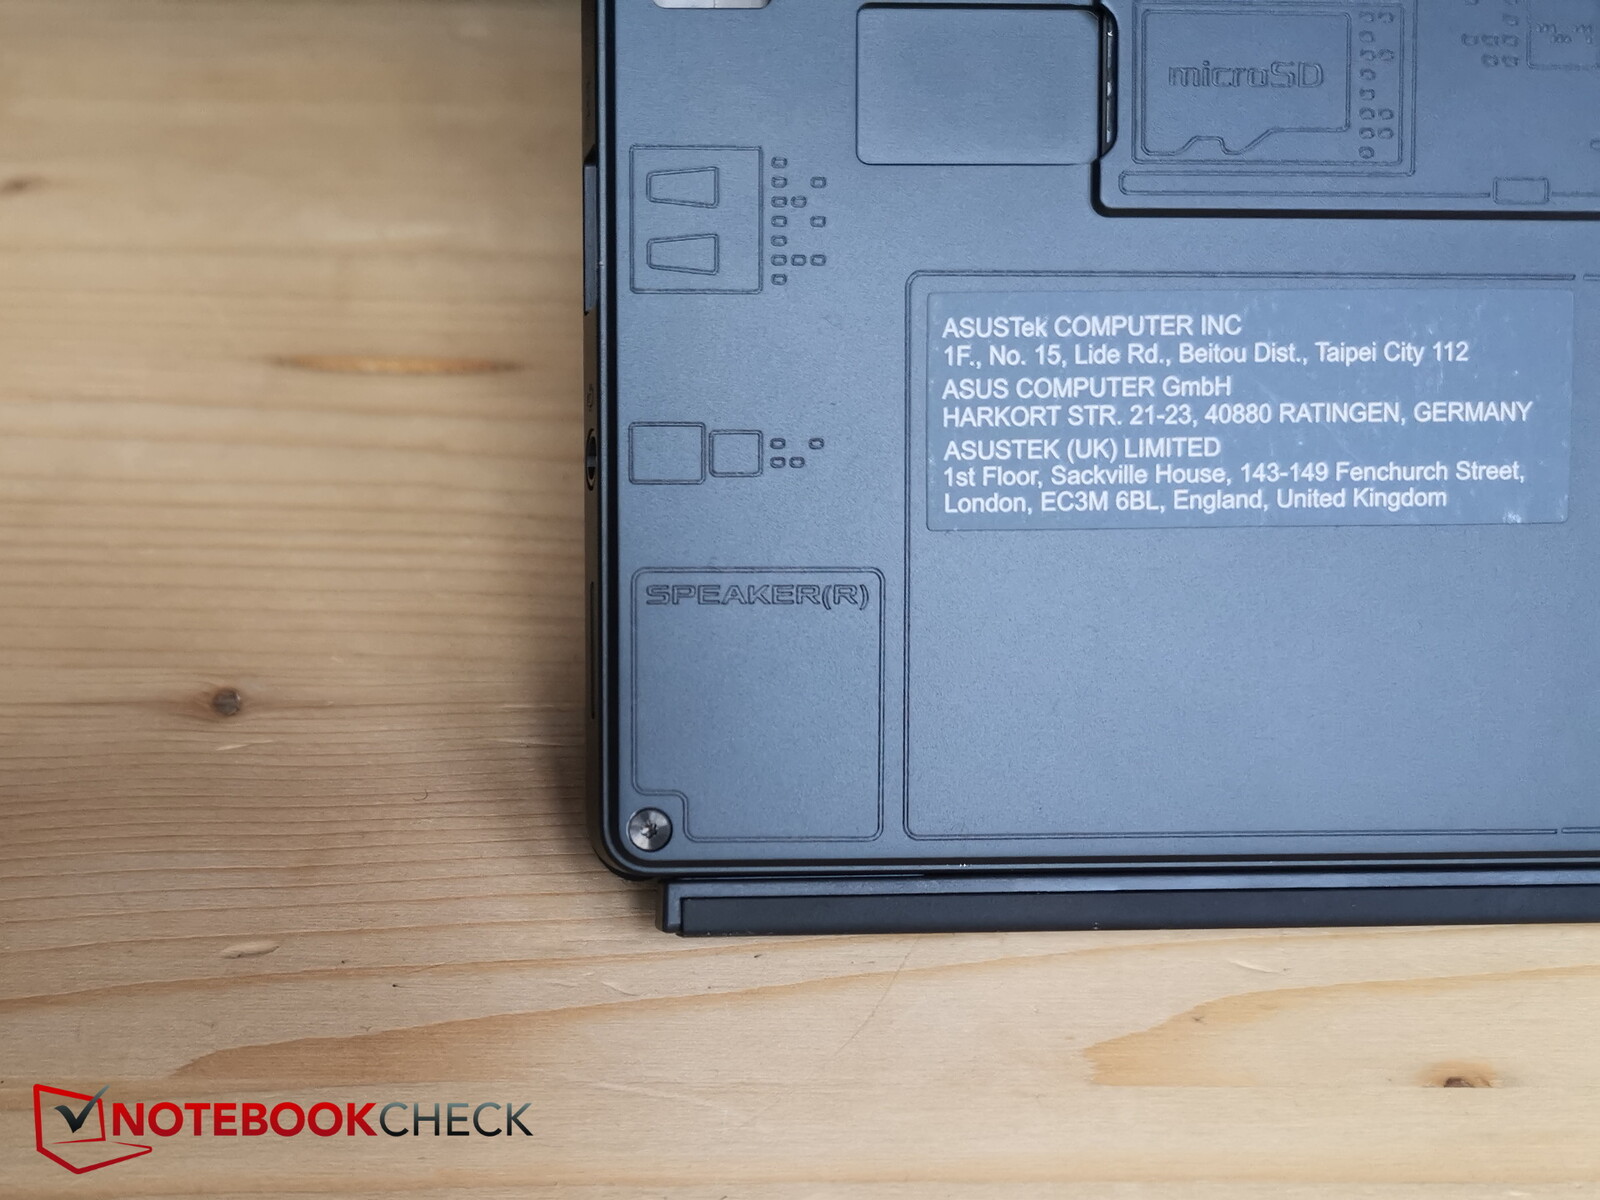
Anche senza la tracolla o il design quasi rugged dell'edizione speciale, lo Z13 attira l'attenzione: il retro è per lo più in alluminio, la cui metà inferiore è ripiegabile come stand, e c'è un'interessante e stretta "finestra di visualizzazione" con vista sull'hardware interno del tablet da gioco.
Le prese d'aria si trovano nella parte superiore dei due angoli e sul retro. La fotocamera principale sul retro si inserisce in modo quasi impercettibile nel design generalmente elegante in alto a destra.
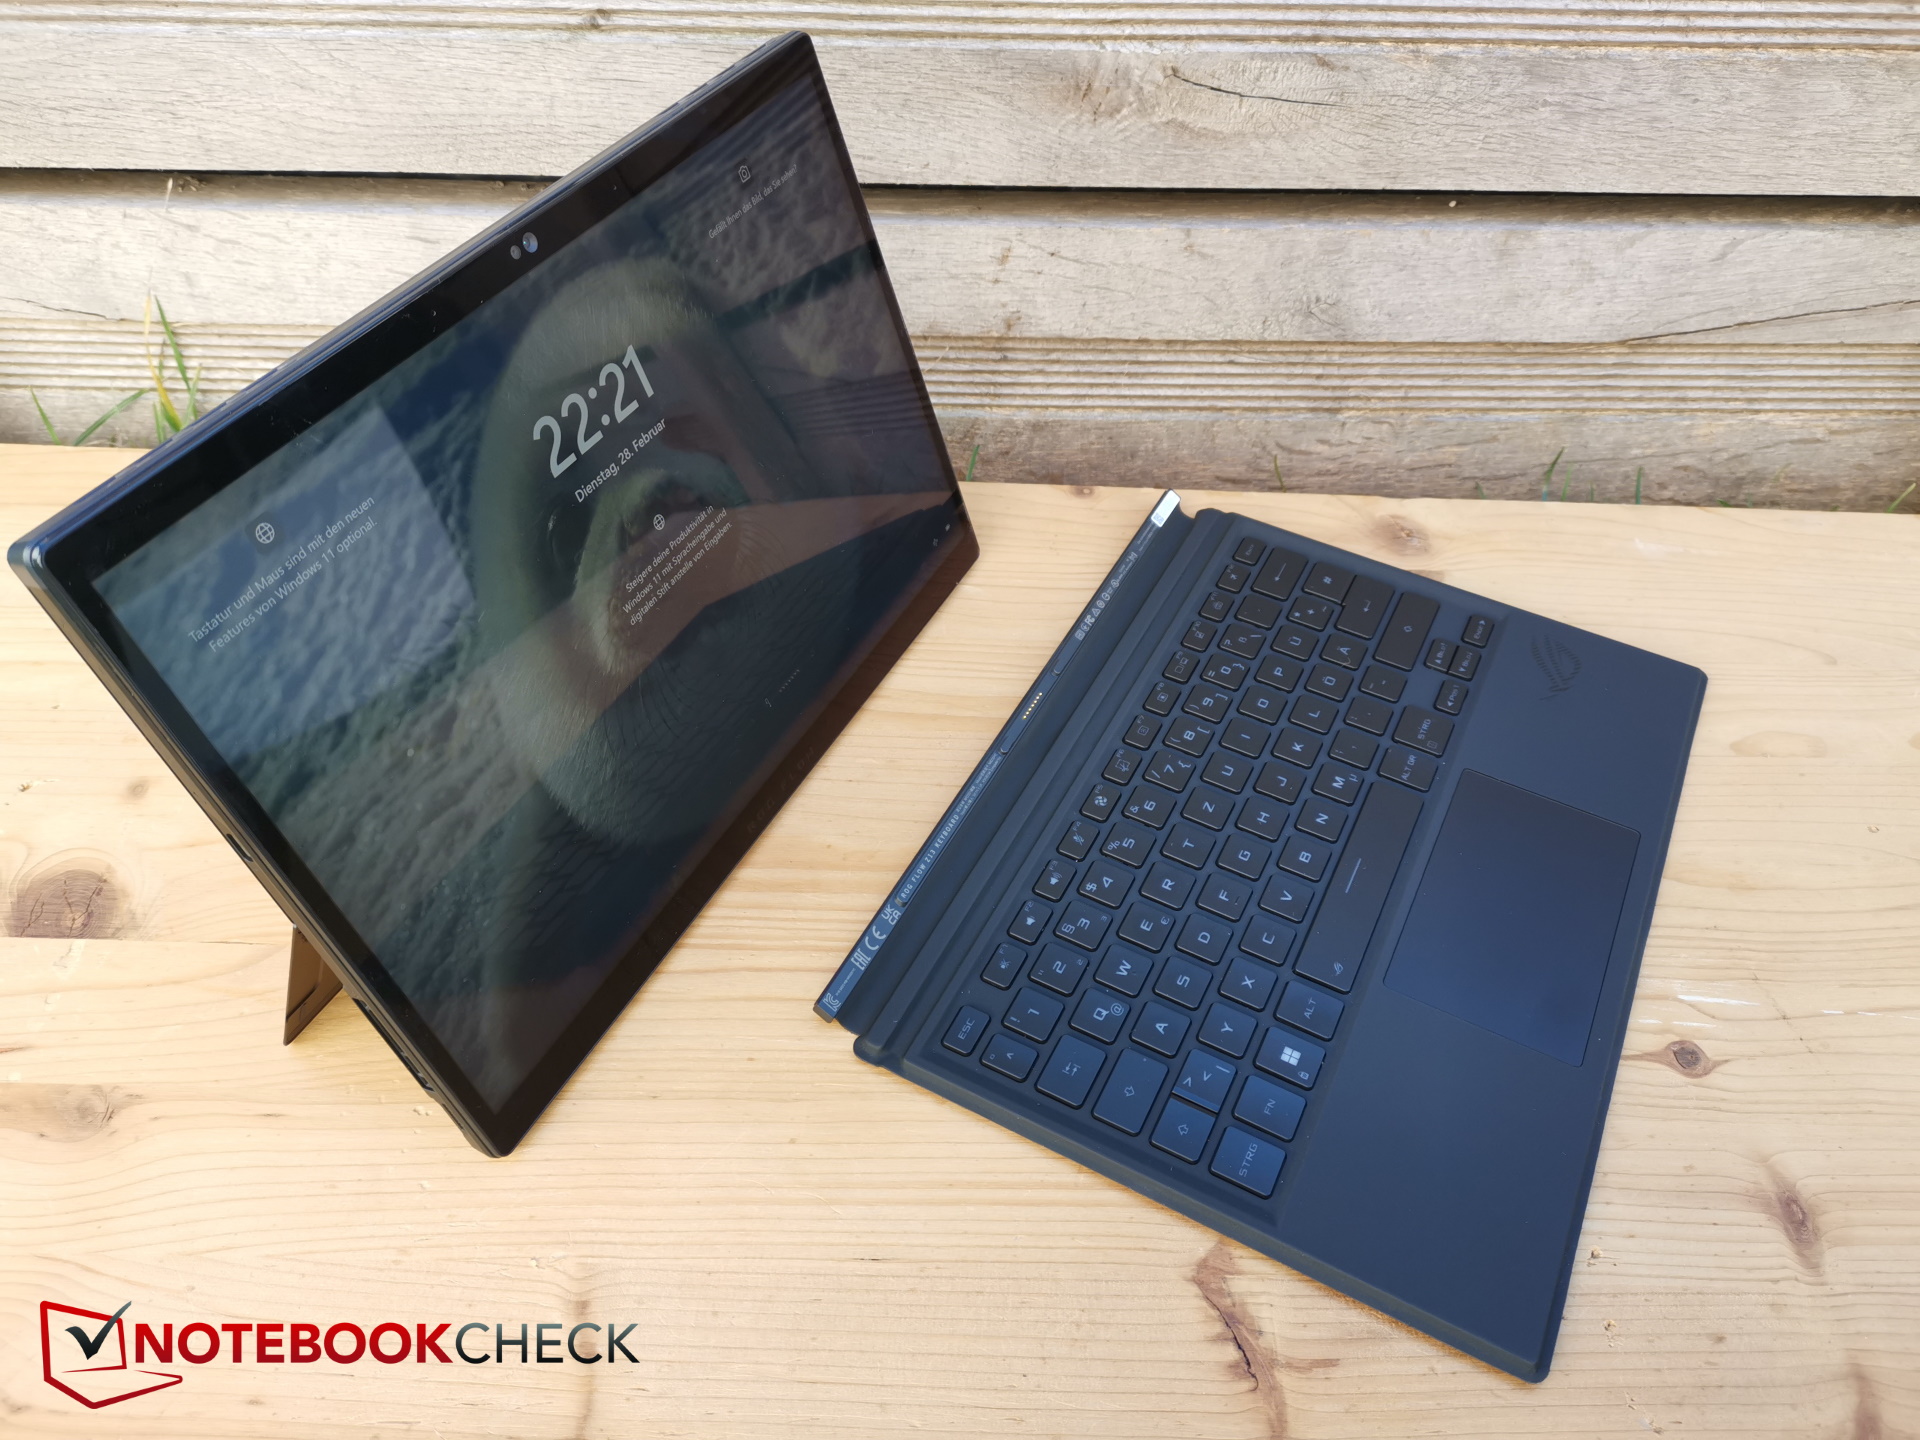
Il tablet è molto stabile grazie al telaio in alluminio e allo spessore generale e non si può torcere. Anche le cerniere del supporto sono molto stabili e mantengono il tablet in una buona posizione in piedi.
Il coperchio della tastiera è agganciato magneticamente. Naturalmente, il sottile dock è un po' meno resistente alle torsioni, ma serve allo scopo.
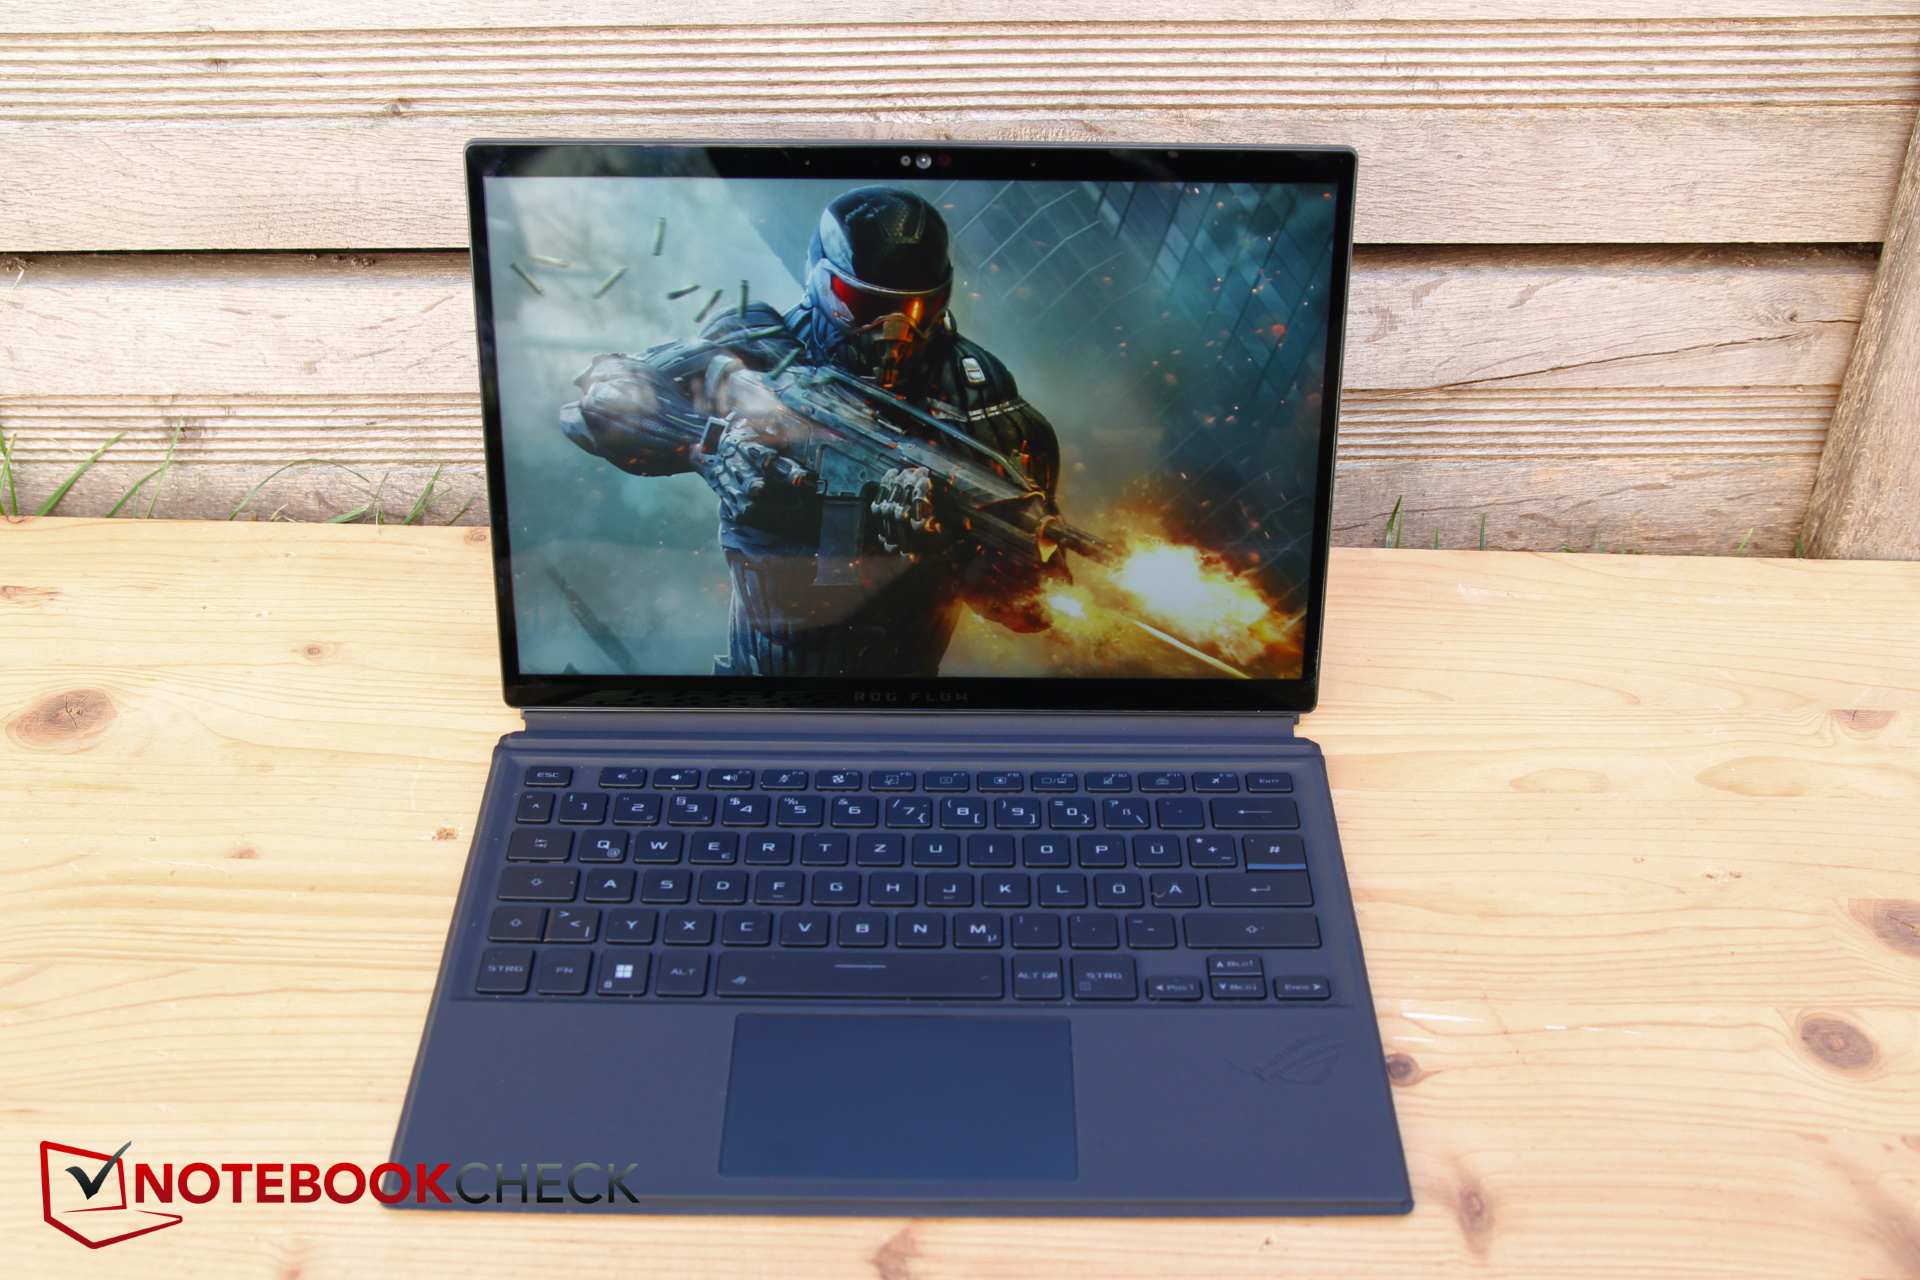
Per essere un tablet da 13 pollici, lo Z13 è relativamente spesso e pesante. Questo non sorprende, visto il potente hardware, e il dispositivo è ancora incredibilmente piccolo rispetto a portatili da gioco molto più grandi. Il peso totale include la tastiera, mentre il tablet da solo pesa circa 360 g in meno.
Le dimensioni registrate, tuttavia, rappresentano il tablet senza la tastiera dock. Con la tastiera, la larghezza aumenta a 21,1 cm e lo spessore a circa 1,8 cm, ancora al di sotto delle dimensioni della più ingombrante edizione speciale. Il predecessore era un po' più sottile, con 12 mm.
Naturalmente anche altri tablet sono più sottili, come l'iPad Pro 12.9 di Apple, che è meno della metà. In compenso è più largo, ma anche meno lungo.
Equipaggiamento - Adatto per RTX 4090!
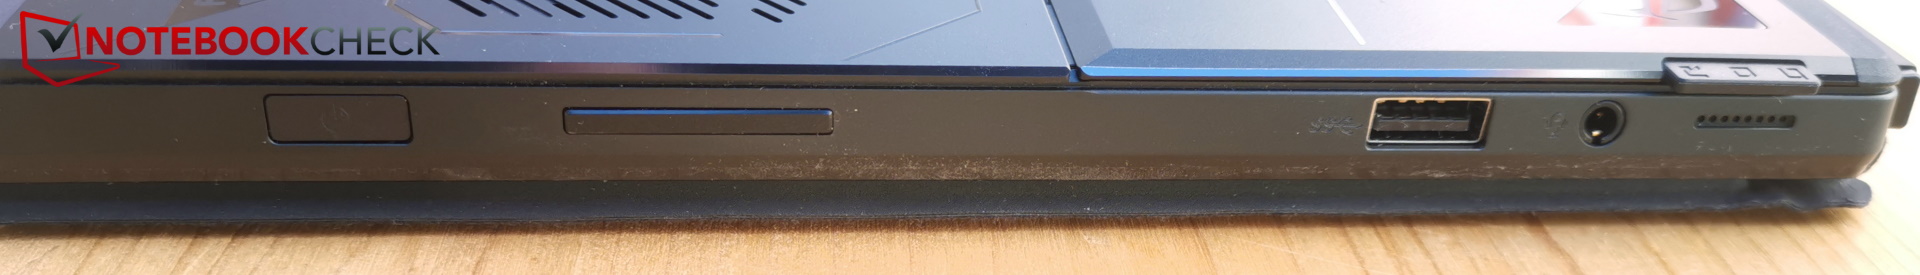
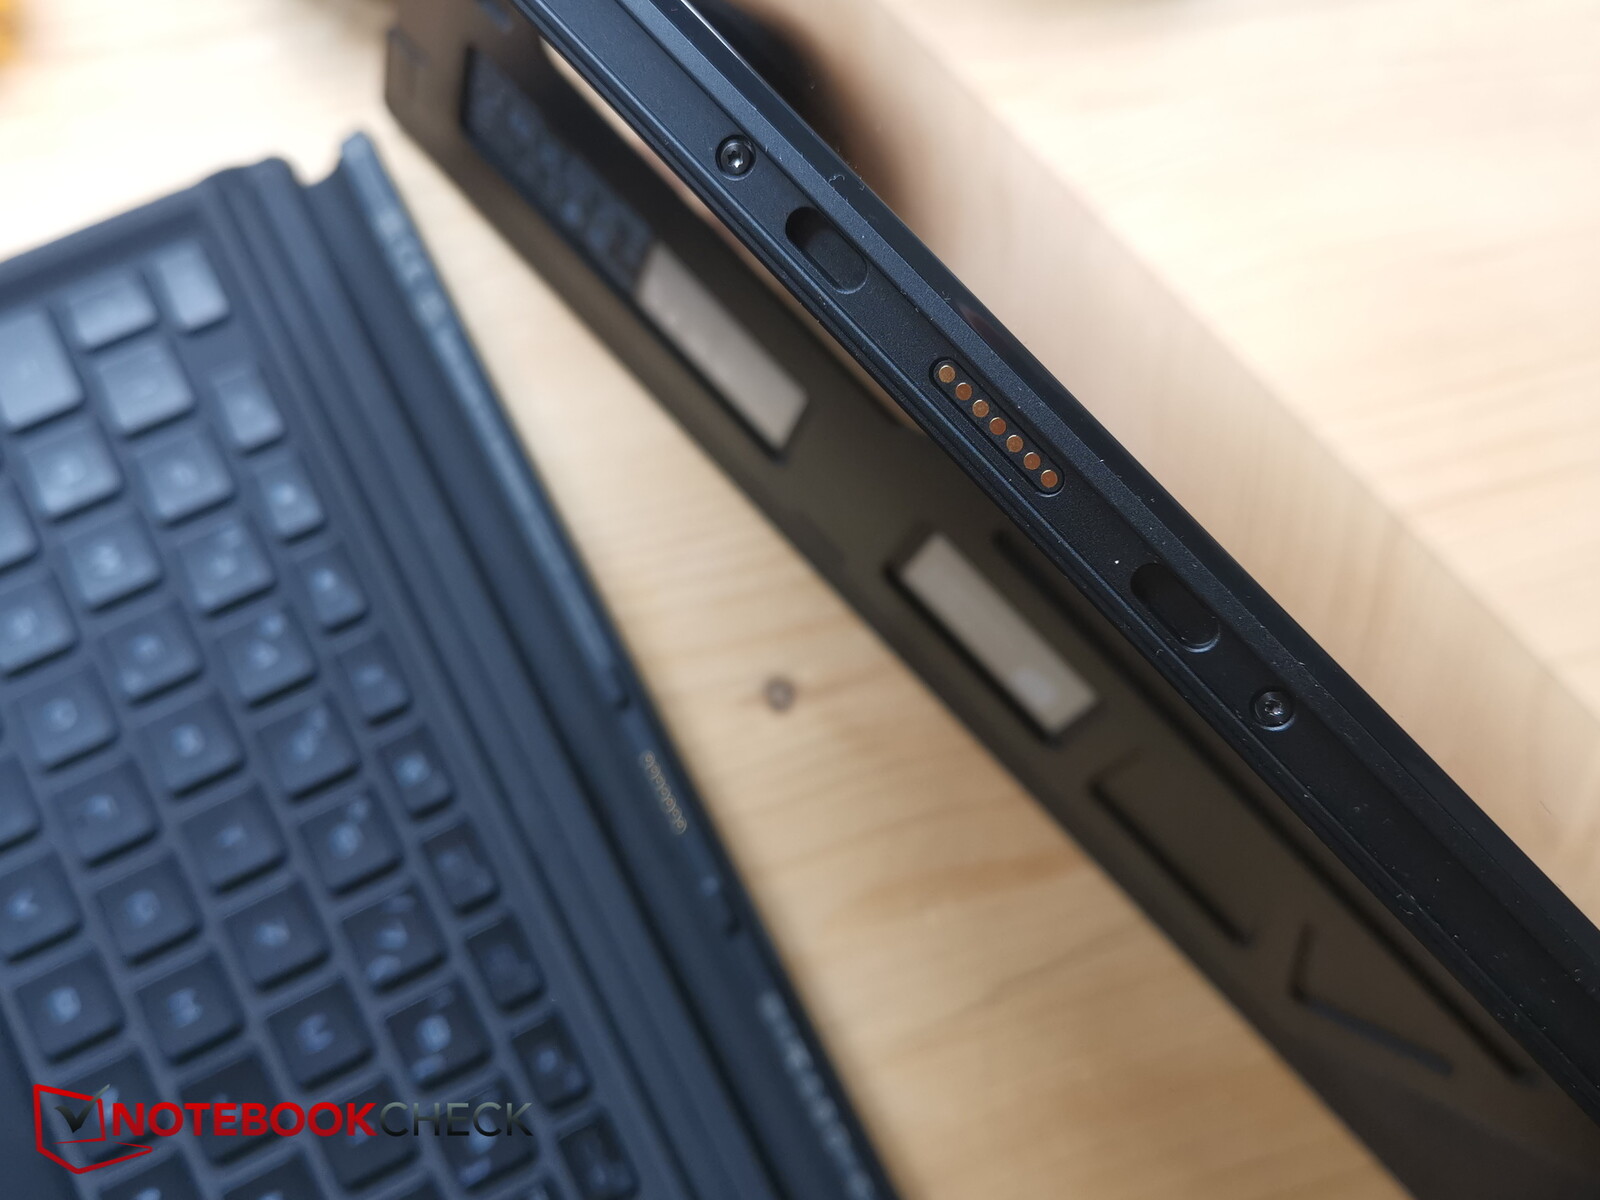
A prima vista, c'è solo una porta USB-C con Thunderbolt sul lato sinistro e una porta USB-A e un jack per cuffie sul lato destro. Una striscia di gomma copre altre porte, in particolare una porta docking chiamata ROG XG Mobile Interface e una seconda porta USB-C. L'XG Mobile è un dock con porte aggiuntive e ospita una RTX 4090 esterna. A 1.999,99 dollari, il ROG XG Mobile costa almeno quanto il nostro Z13.
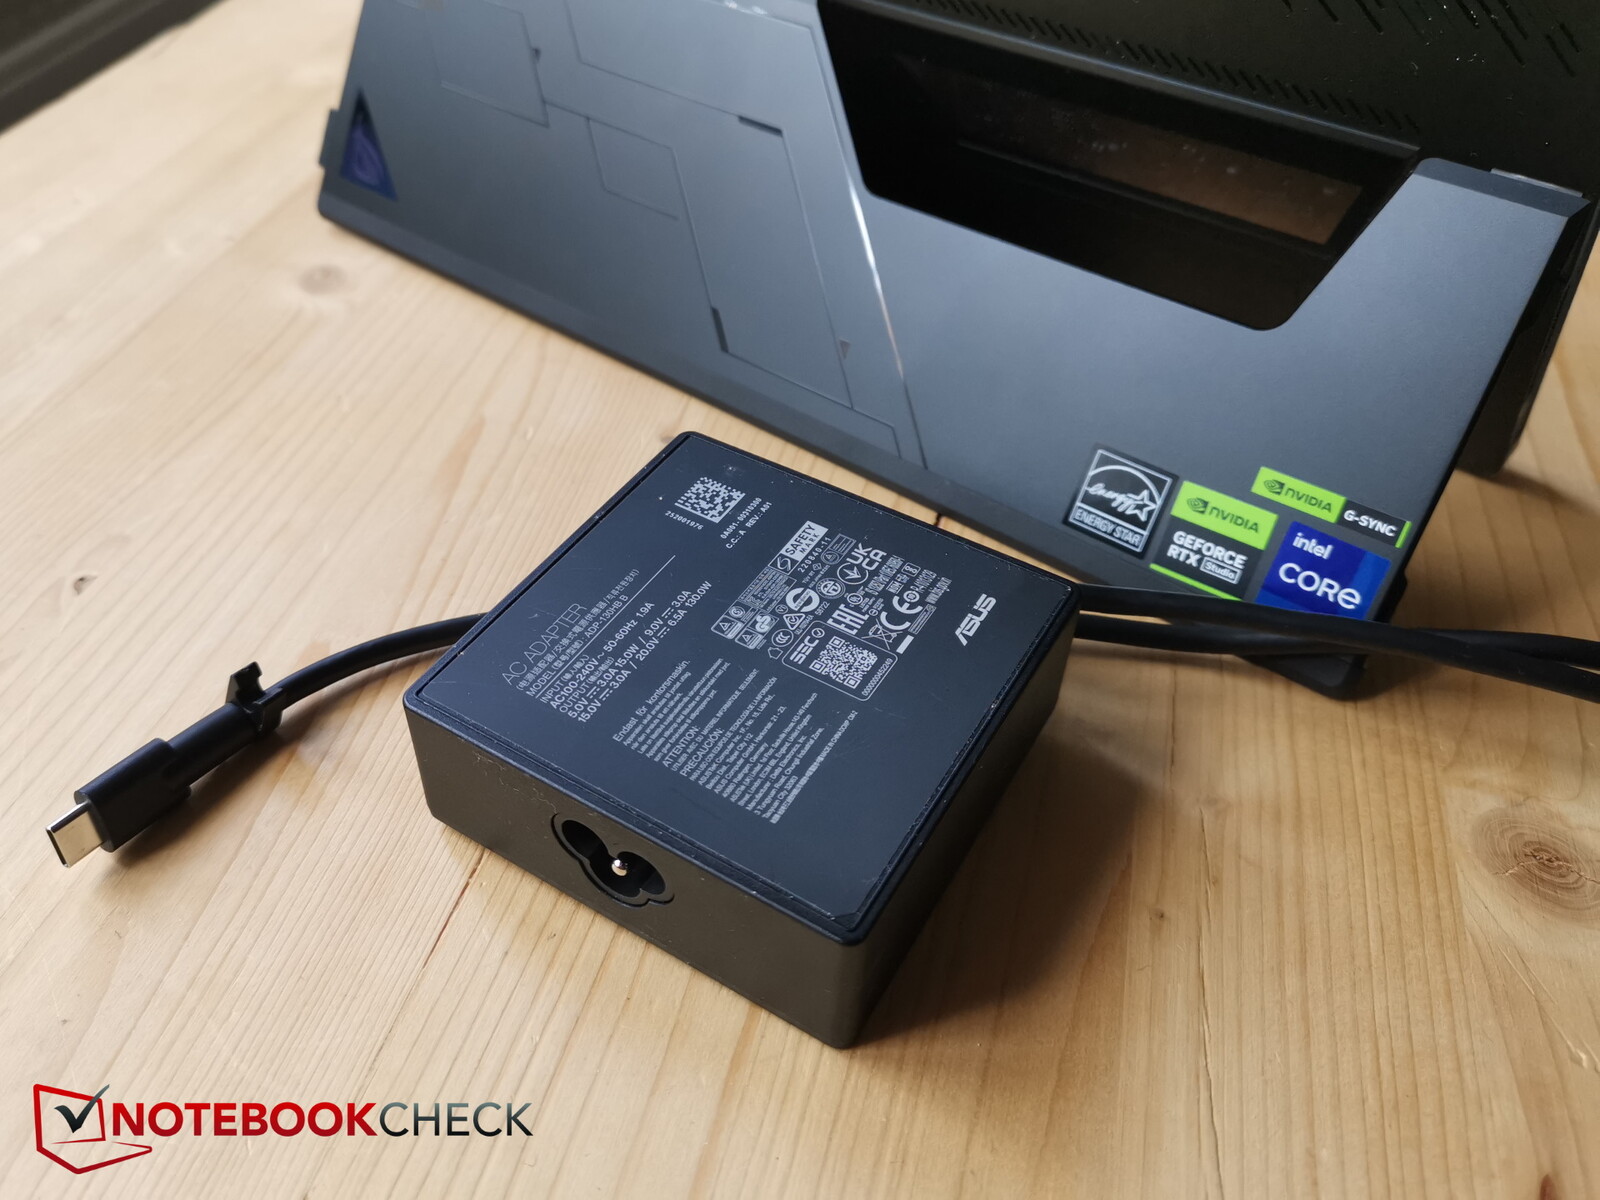
Entrambe le porte USB-C supportano DisplayPort e Power Delivery, quindi il tablet può essere ricaricato anche tramite queste porte. Anche l'alimentatore incluso, più piccolo e da 130 W, è di tipo USB-C.
Naturalmente, su un tablet si deve fare a meno di porte dedicate come LAN, HDMI e simili. Un hub UDB può essere d'aiuto se necessario, e lo stesso vale per il collegamento dei gamepad. Almeno c'è un lettore di microSD.
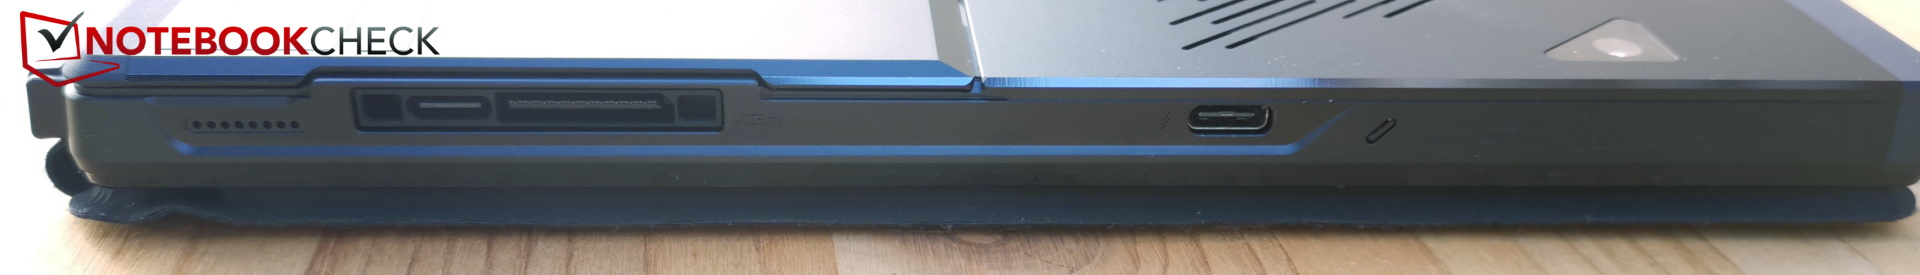
Lettore di schede SD
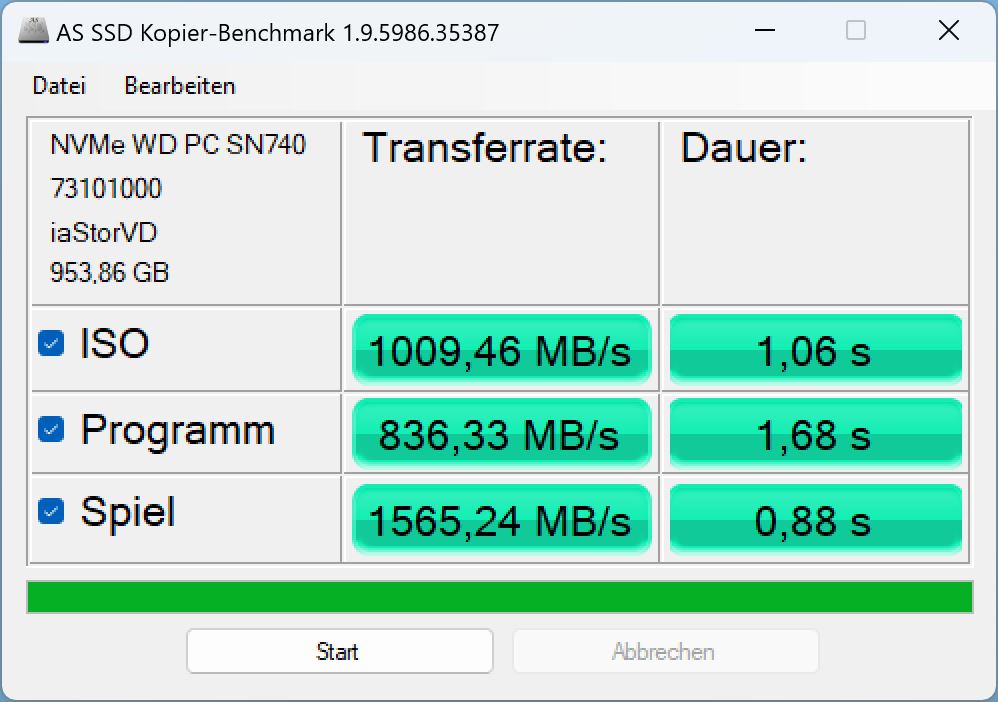
Il lettore microSD si trova sotto il supporto, quindi non è raggiungibile in modalità tablet; bisogna prima aprire il supporto. Il lettore ha impiegato poco più di cinque secondi per copiare 1 GB di immagini dalla nostra scheda di riferimento AV PRO microSD 128 GB V60 al desktop. La velocità del lettore di schede è molto elevata nel campo di confronto, in particolare le velocità di lettura nel benchmark AS-SSD.
| SD Card Reader | |
| average JPG Copy Test (av. of 3 runs) | |
| Asus ROG Flow Z13 GZ301V | |
| Asus ROG Flow Z13 ACRNM (Angelbird AV Pro V60) | |
| Media della classe Gaming (20.9 - 210, n=54, ultimi 2 anni) | |
| Asus ROG Flow Z13 GZ301ZE (Angelbird AV Pro V60) | |
| maximum AS SSD Seq Read Test (1GB) | |
| Asus ROG Flow Z13 GZ301ZE (Angelbird AV Pro V60) | |
| Asus ROG Flow Z13 ACRNM (Angelbird AV Pro V60) | |
| Asus ROG Flow Z13 GZ301V | |
| Media della classe Gaming (25.5 - 261, n=51, ultimi 2 anni) | |
Comunicazione
Intel fornisce all'AX211 il modulo Wi-Fi Wifi6E, che comunica nella banda dei 6 GHz ed è abbastanza veloce e stabile.
Webcam
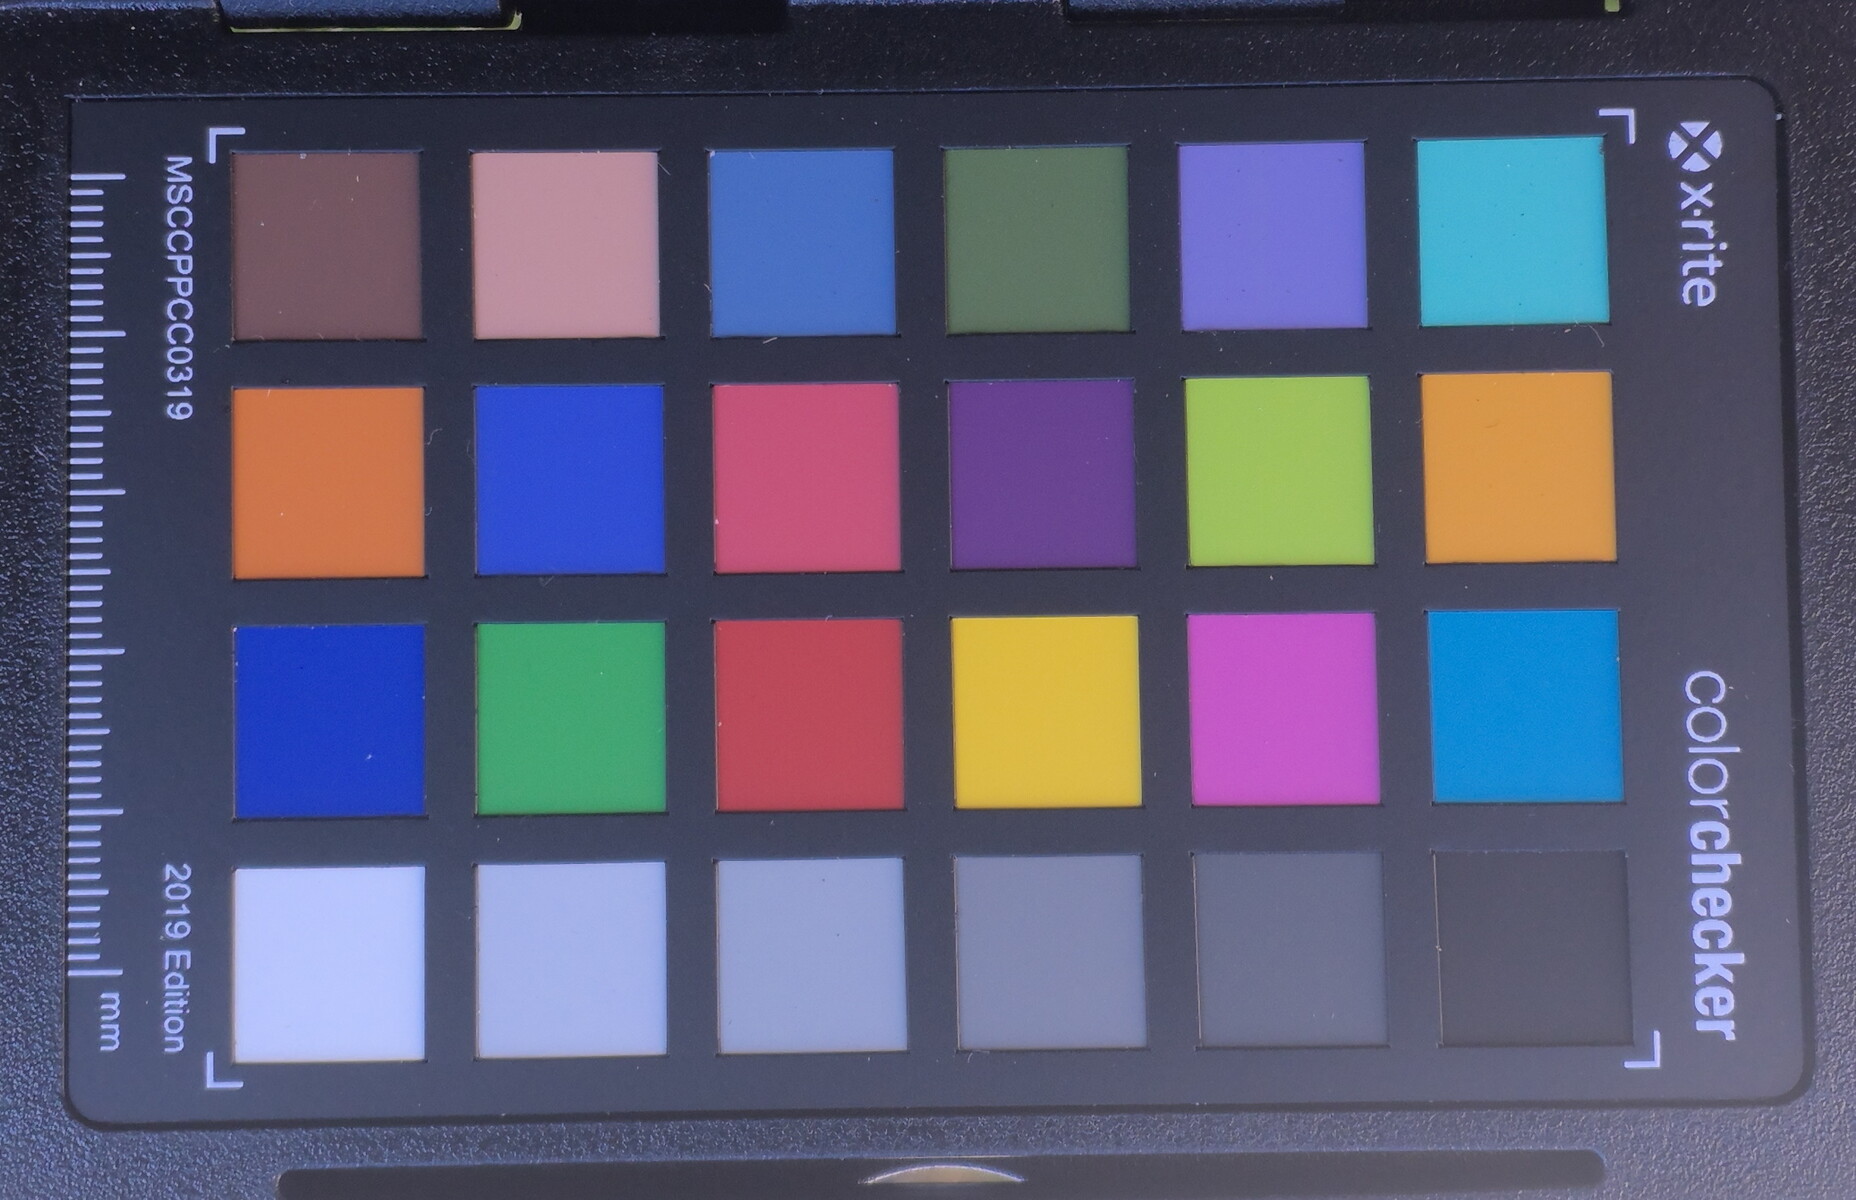
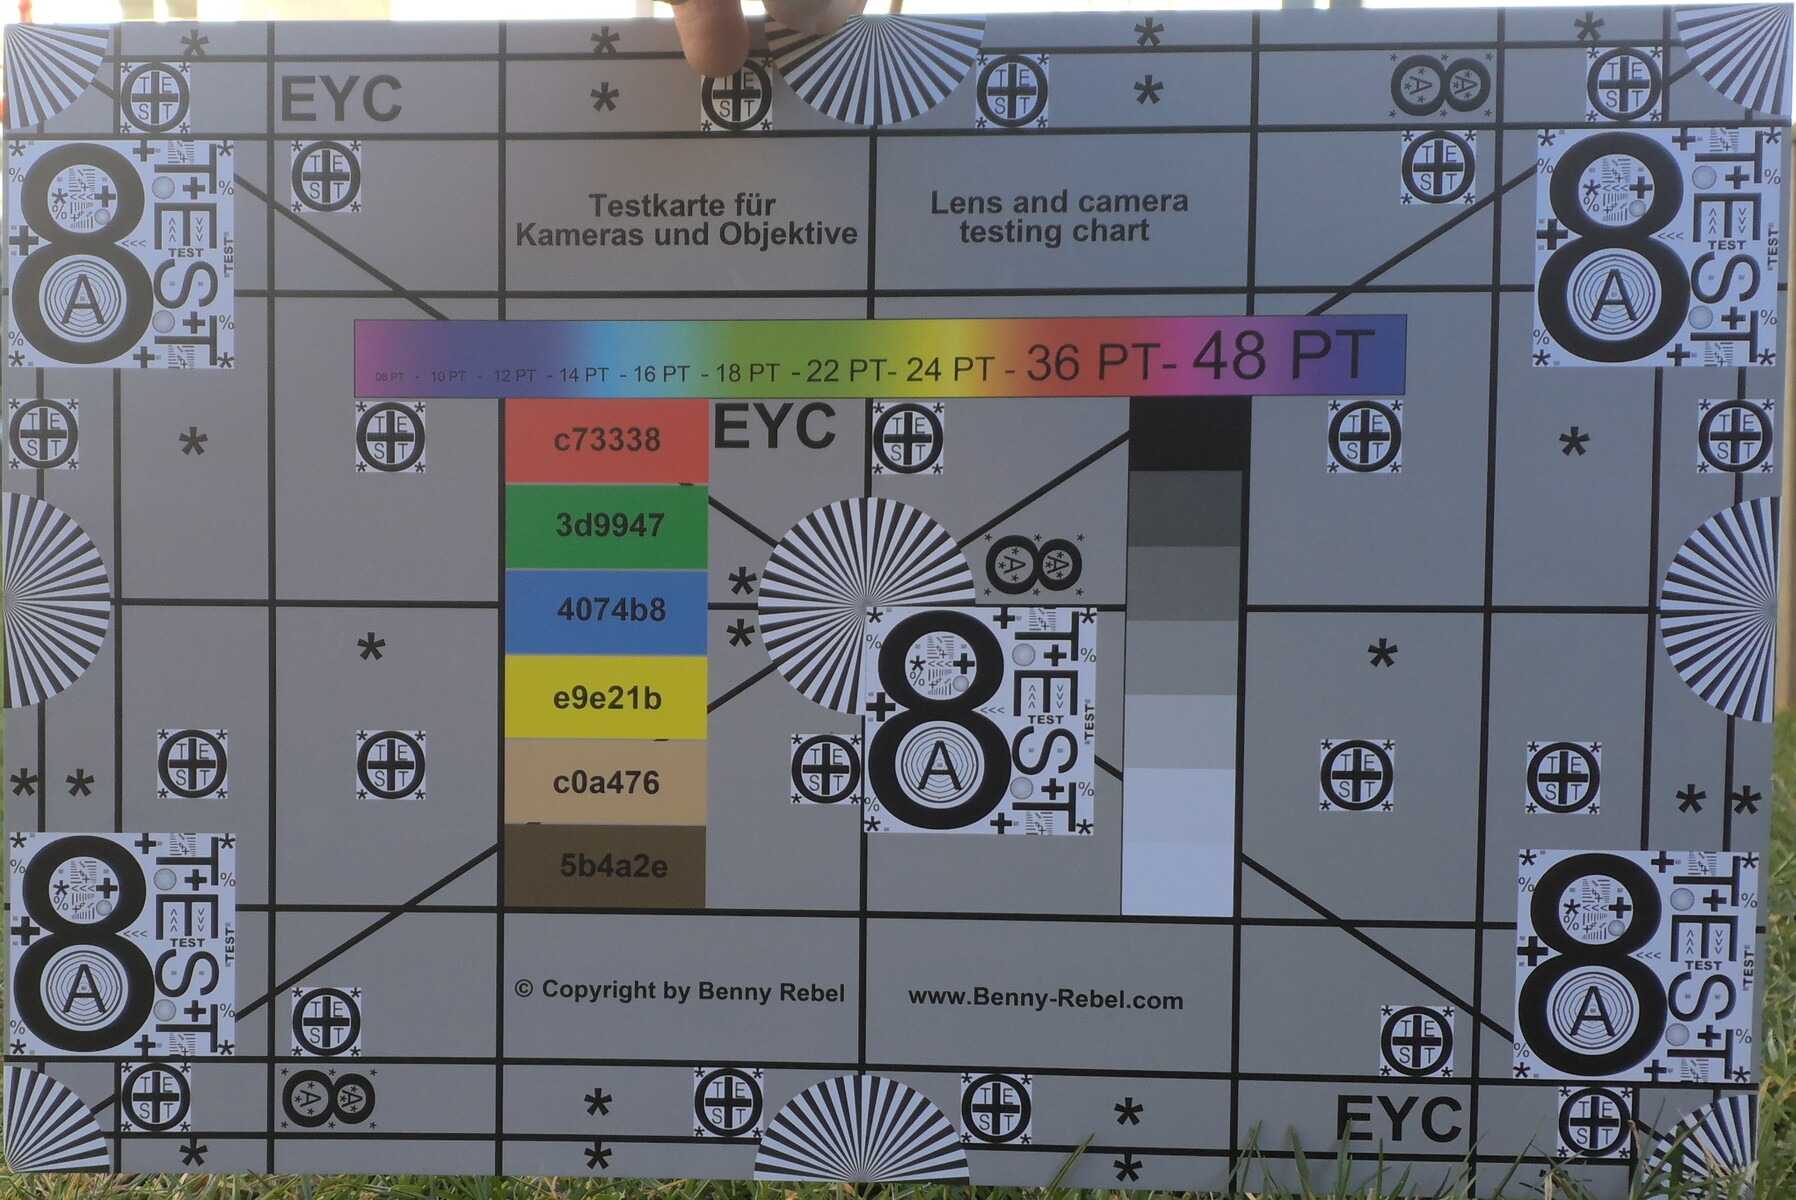
Sul fronte, una fotocamera IR da 5 MP viene utilizzata per scattare selfie, effettuare il login tramite Windows Hello e per le videochiamate. Come di consueto per i tablet, è presente anche una fotocamera principale sul retro, con una risoluzione di 13 MP.
I video e le foto vengono registrati "solo" in 2 MP o in Full HD, ma la qualità della webcam è decisamente migliore rispetto alla maggior parte dei modelli di laptop, soprattutto in condizioni di luce non ottimali. Anche se c'è un po' di rumore nelle immagini e il rosso ha deviazioni di colore troppo elevate, i colori e i contrasti sono comunque impressionanti.
La fotocamera è la stessa dell'edizione speciale. La nostra video recensione su https://www.youtube.com/watch?v=ORXFWsPgZmY&feature=youtu.beinclude le riprese di prova di entrambe le fotocamere e dei microfoni.


Sicurezza
È presente il TPM 2.0, ma mancano altre funzioni come il Kensington o il sensore di impronte digitali. Oltre al TPM, Asus include anche le funzioni di sicurezza "BIOS Administrator Password" e "User Password Protection", che ci piacciono.
Accessori
Lo Z13 viene fornito con un copritastiera e un alimentatore USB-C da 130 W, ma non ci sono altri accessori.
Naturalmente, l'interfaccia XG Mobile è un accessorio aggiuntivo. Si tratta di un hub e di una eGPU (RTX 4090) in uno, ma costa 1.999,99 dollari in più.
Manutenzione
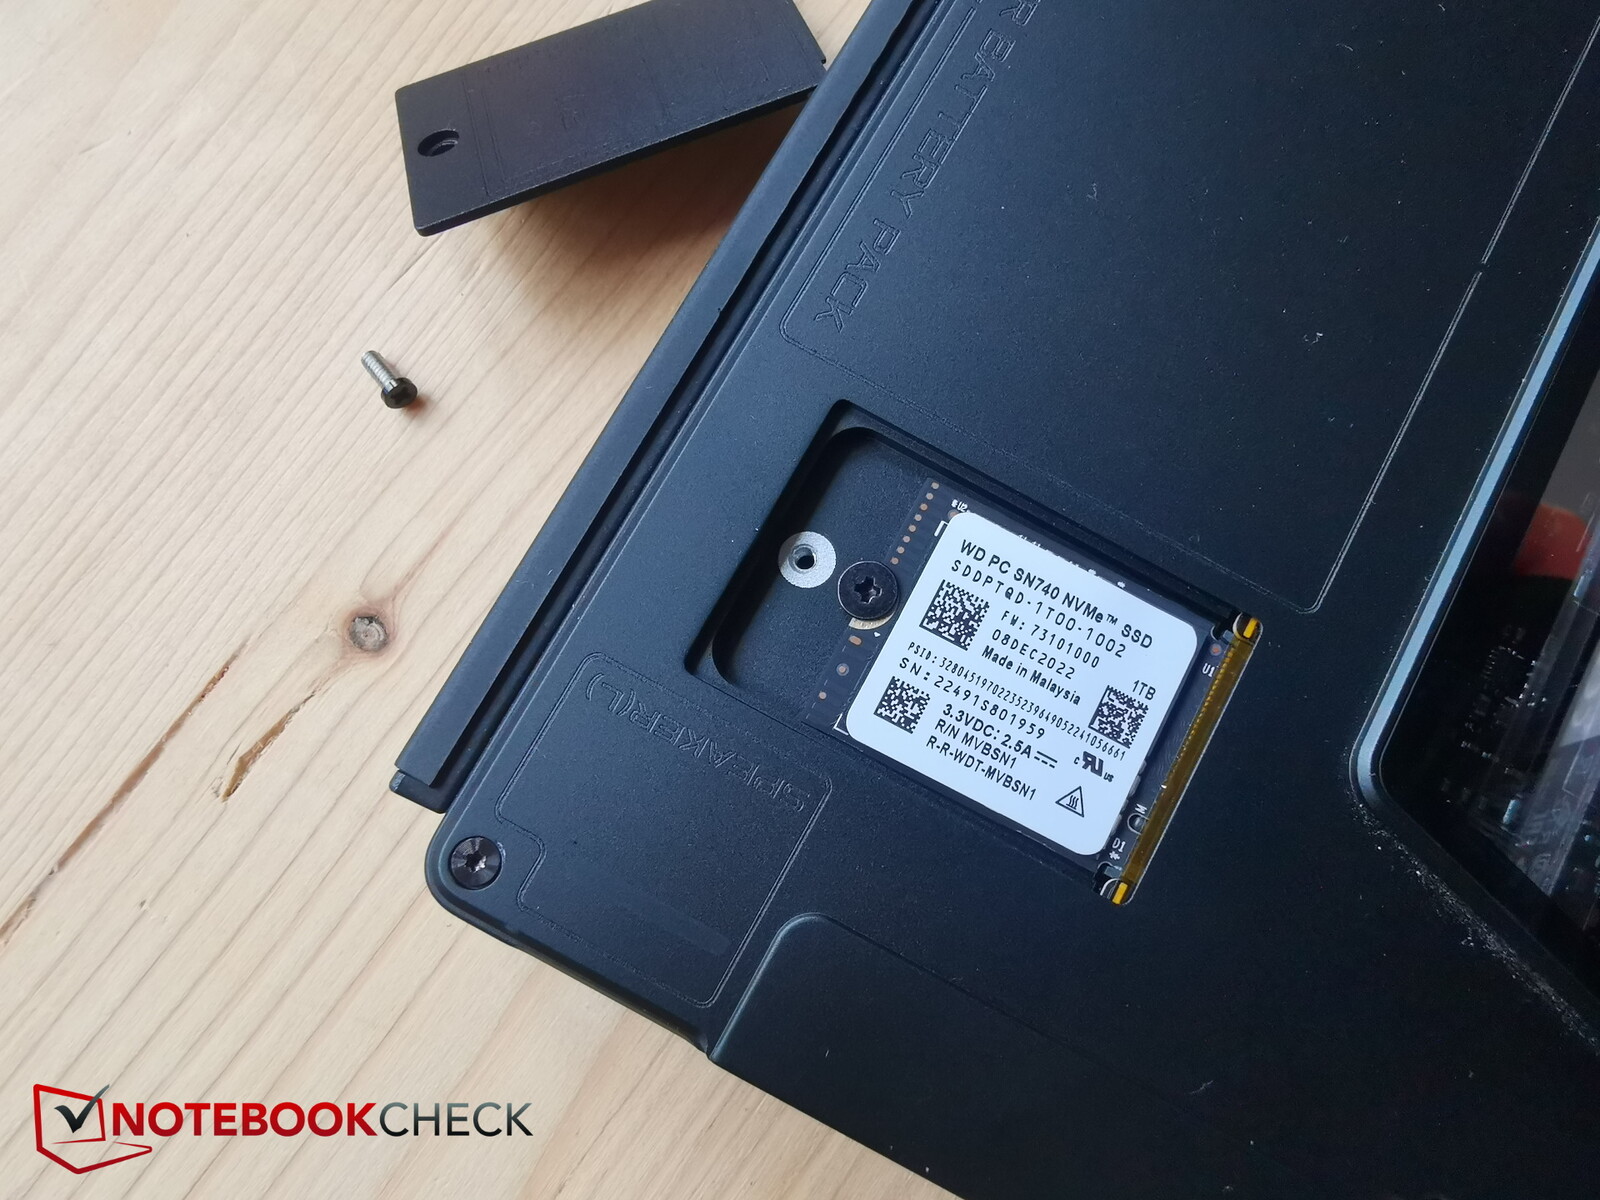
Certo, giocare su un tablet è fantastico, ma quando si tratta di manutenzione, incontriamo uno degli svantaggi del tablet rispetto ai "normali" portatili da gioco: lo Z13 non può essere aperto facilmente dall'utente. C'è almeno un piccolo sportello per la manutenzione sotto la cerniera, attraverso il quale è possibile accedere all'SSD nel fattore di forma M.2 2230 e sostituirlo. Non è possibile spolverare le ventole, cambiare il modulo Wifi o la RAM sullo Z13.
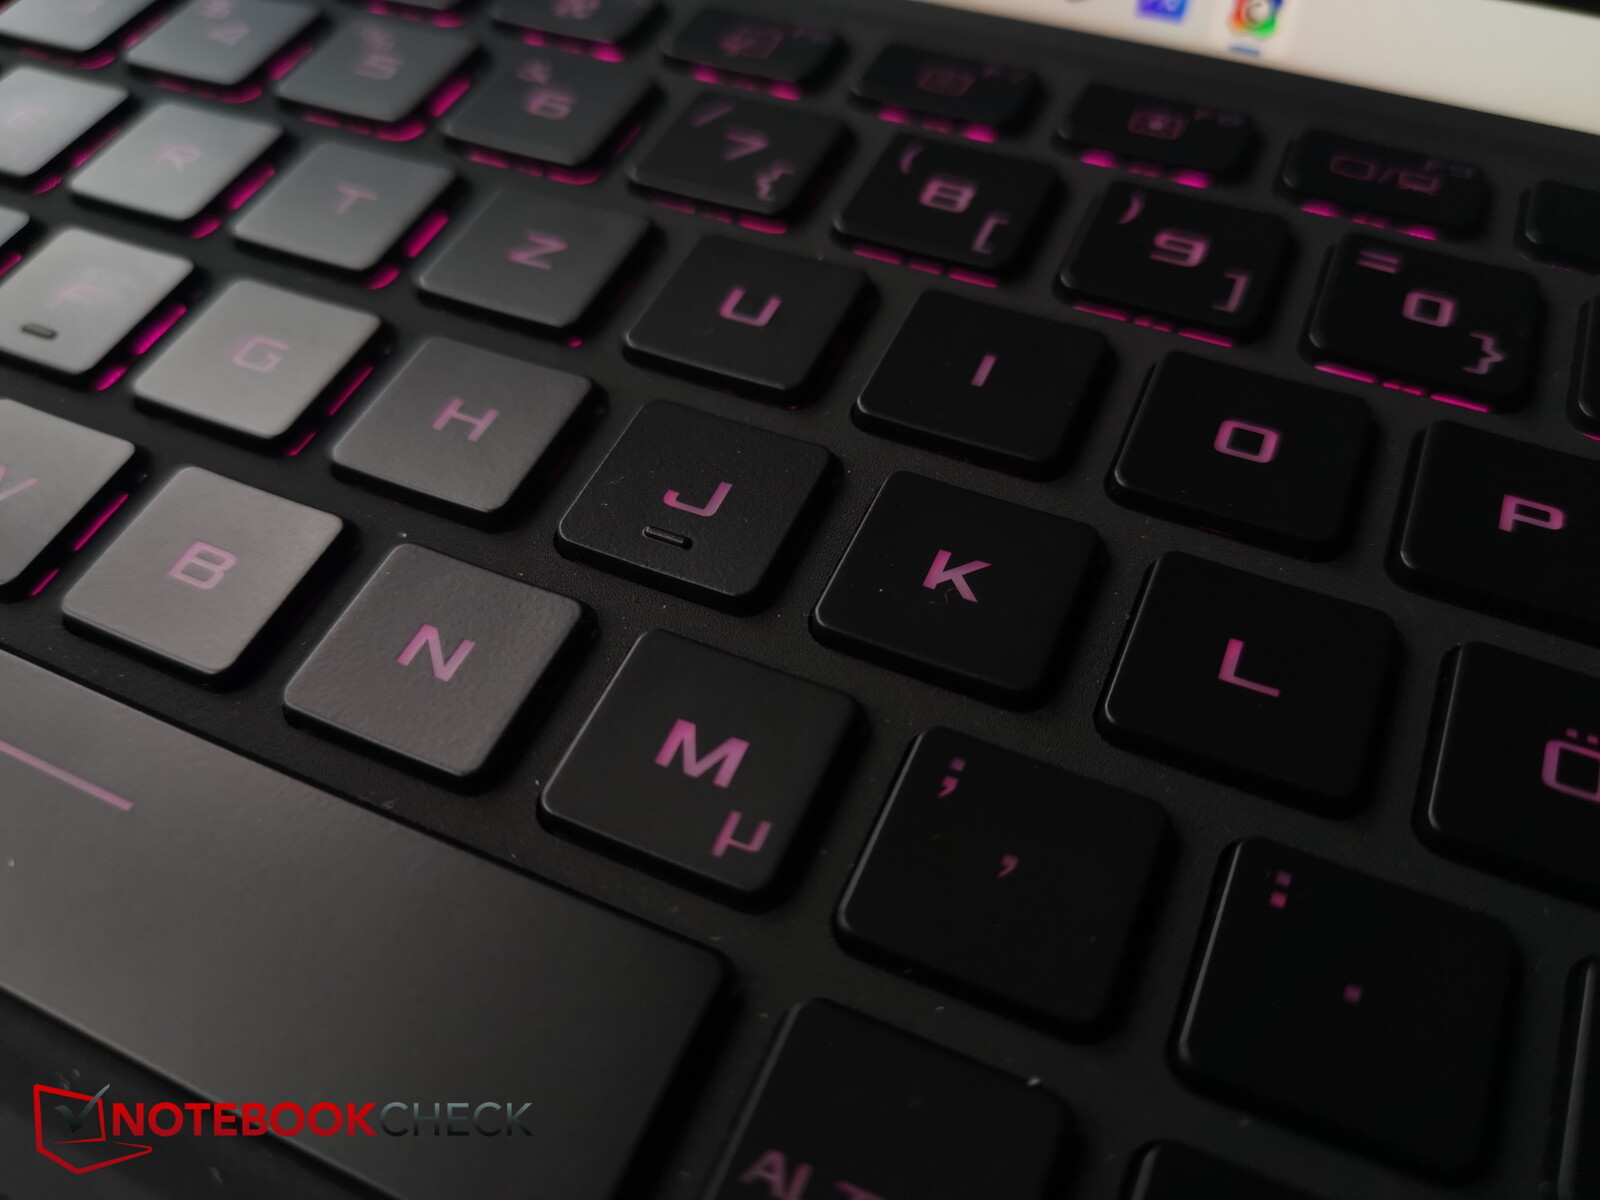
Dispositivi di input - Z13 con tastiera o touchscreen
Il tablet ha un touchscreen capacitivo che funziona in modo eccellente e supporta anche l'input tramite penna. Tuttavia, lo stilo associato non è incluso e costa altri 79,99 dollari.
Il copritastiera è attaccato al bordo inferiore dello Z13 tramite perni magnetici e riceve anche l'alimentazione per la retroilluminazione.
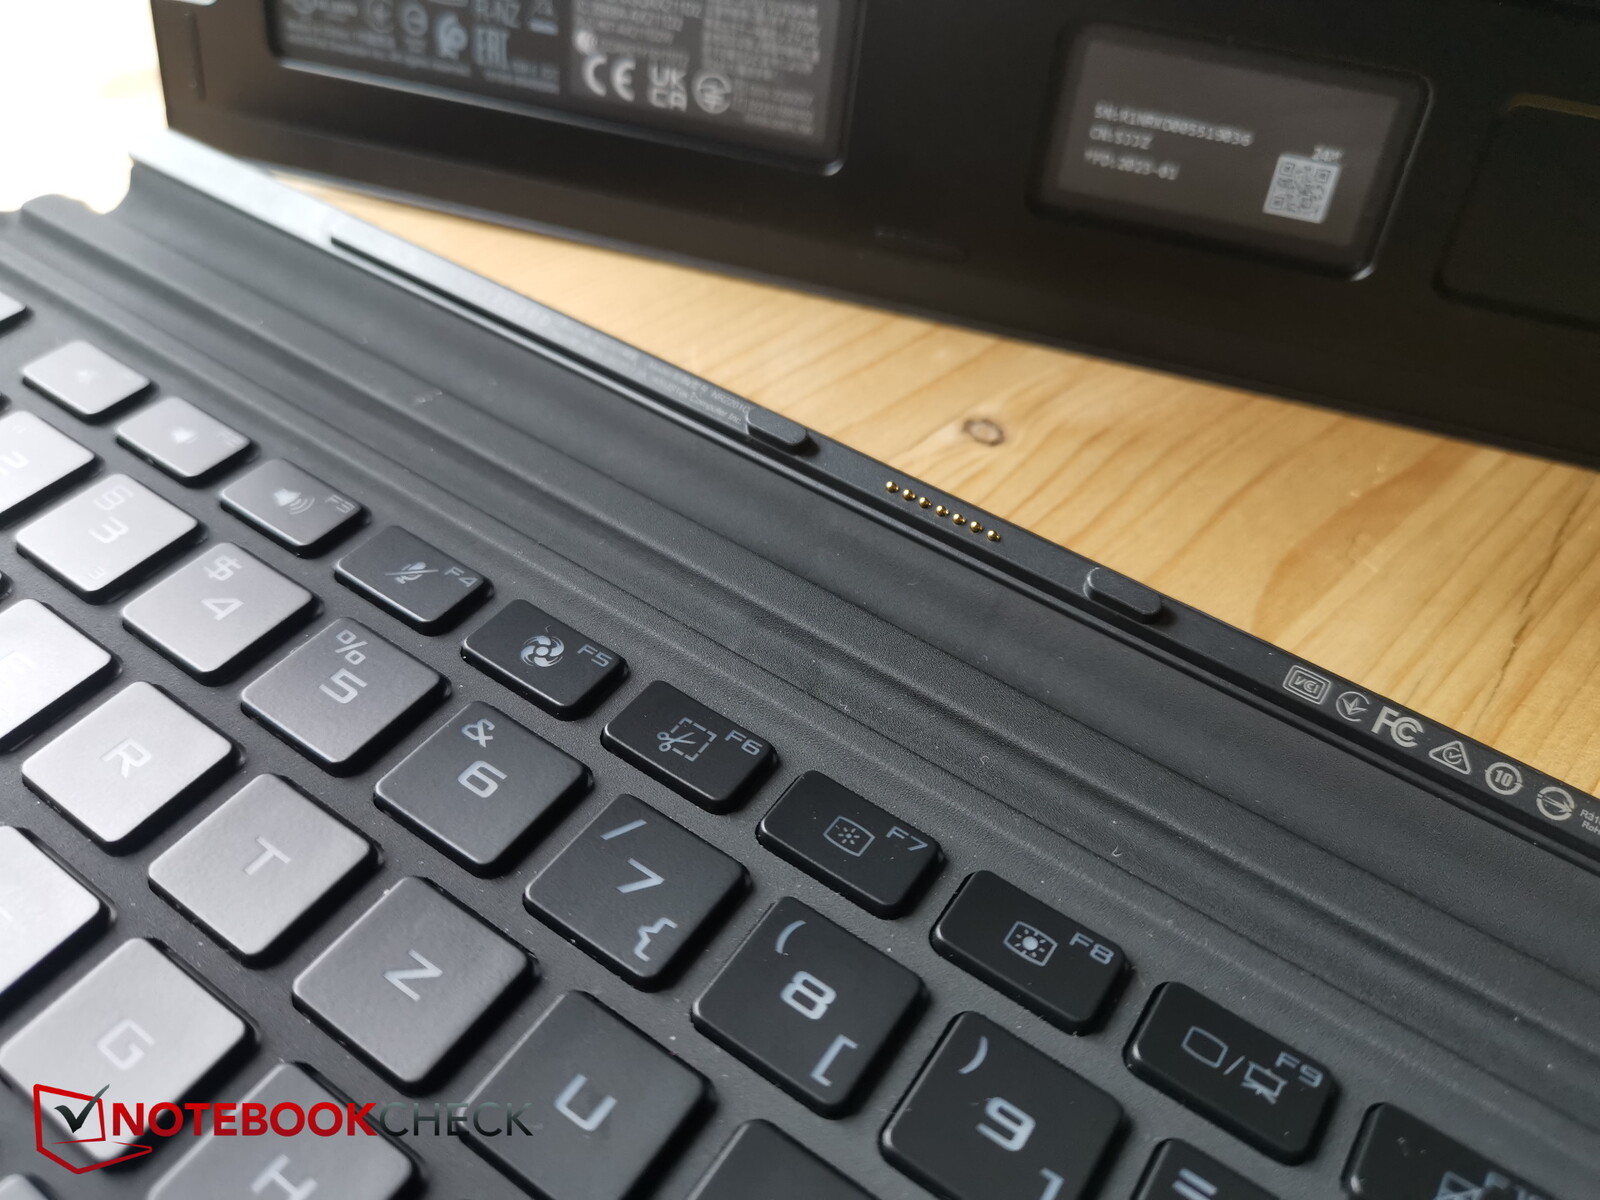
La tastiera si illumina in diversi colori e con tre livelli di luminosità. Può essere appoggiata sulla scrivania o leggermente inclinata, il che modifica leggermente il rumore di battitura. Ma in genere è ancora moderato.
Una tastiera cover è naturalmente un po' meno stabile di una tastiera fissa. La tastiera si piega un po' durante la digitazione, soprattutto se inclinata, ma rimane entro limiti tollerabili. Almeno la corsa dei tasti di 1,7 mm è abbastanza profonda per questo tipo di tastiera. Anche il feedback è notevole, tanto che la digitazione è rapida nonostante le dimensioni piuttosto ridotte dei tasti.
Le scritte sono facilmente visibili con una luce decente, ma potrebbero essere un po' più luminose per aumentare il contrasto tra i tasti scuri e le scritte poco luminose. La retroilluminazione aiuta al buio.
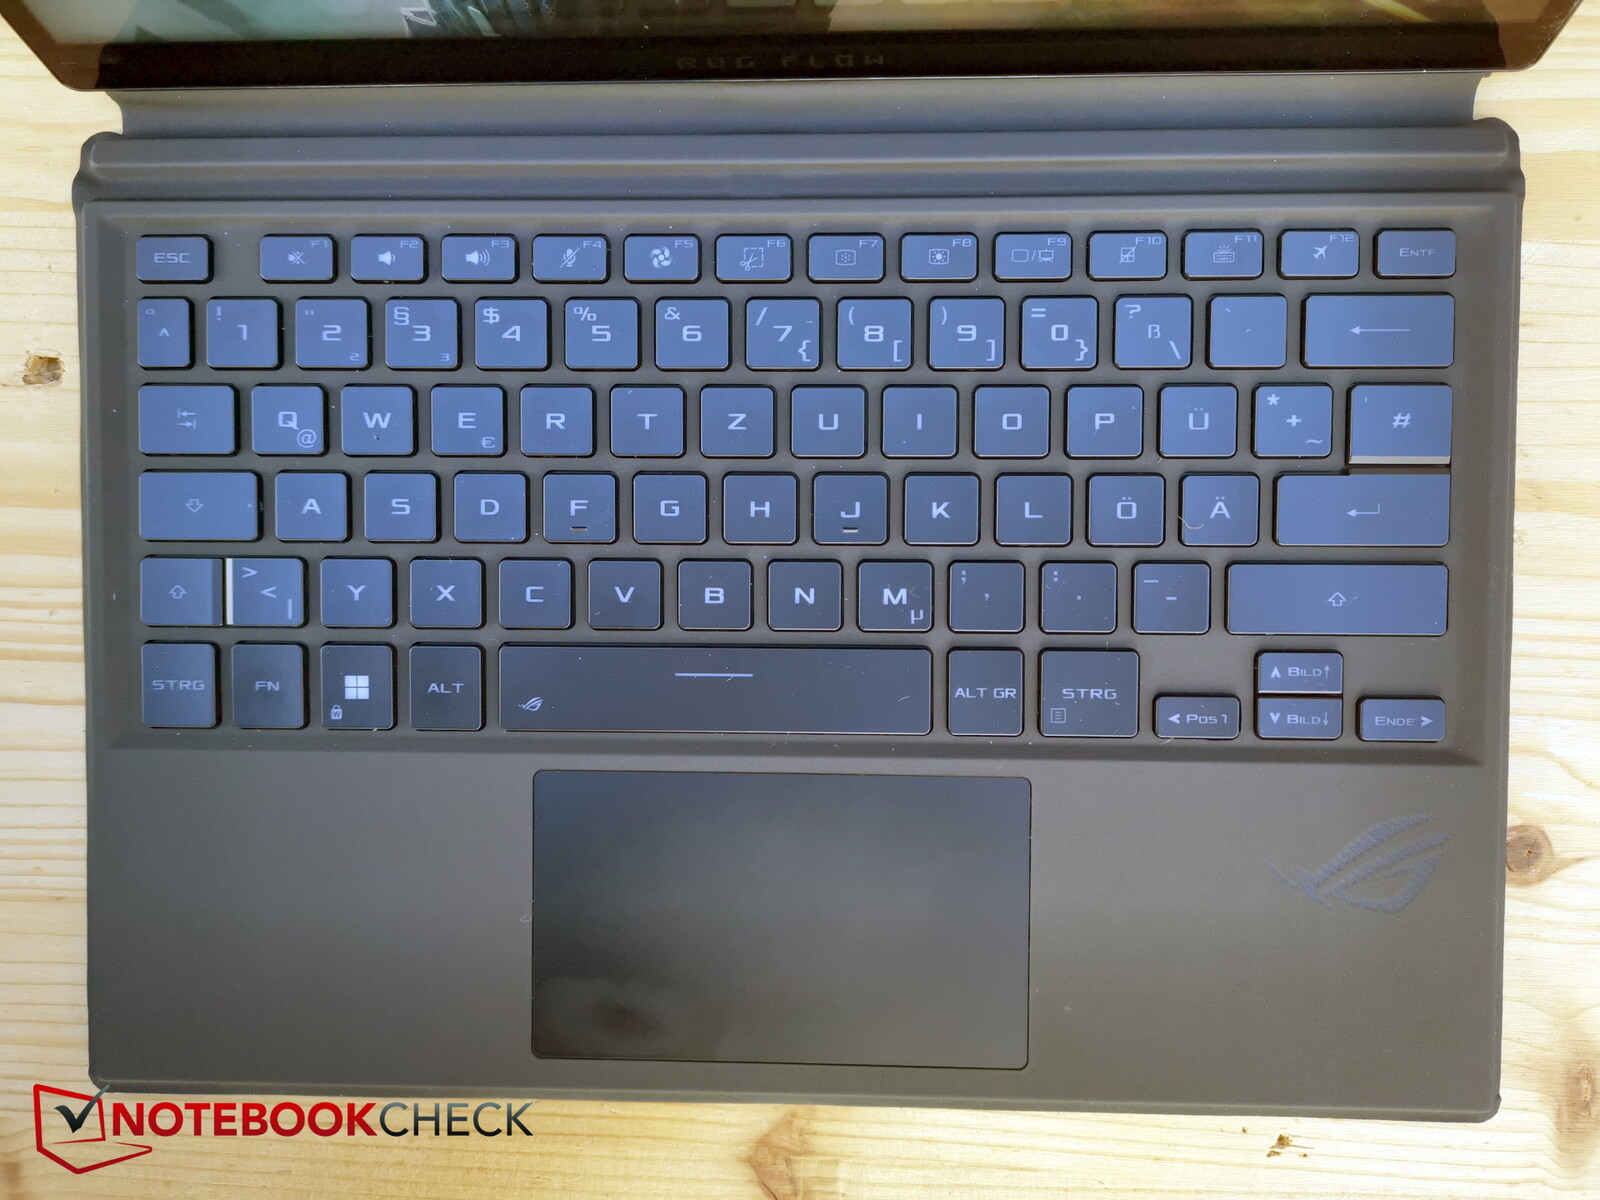
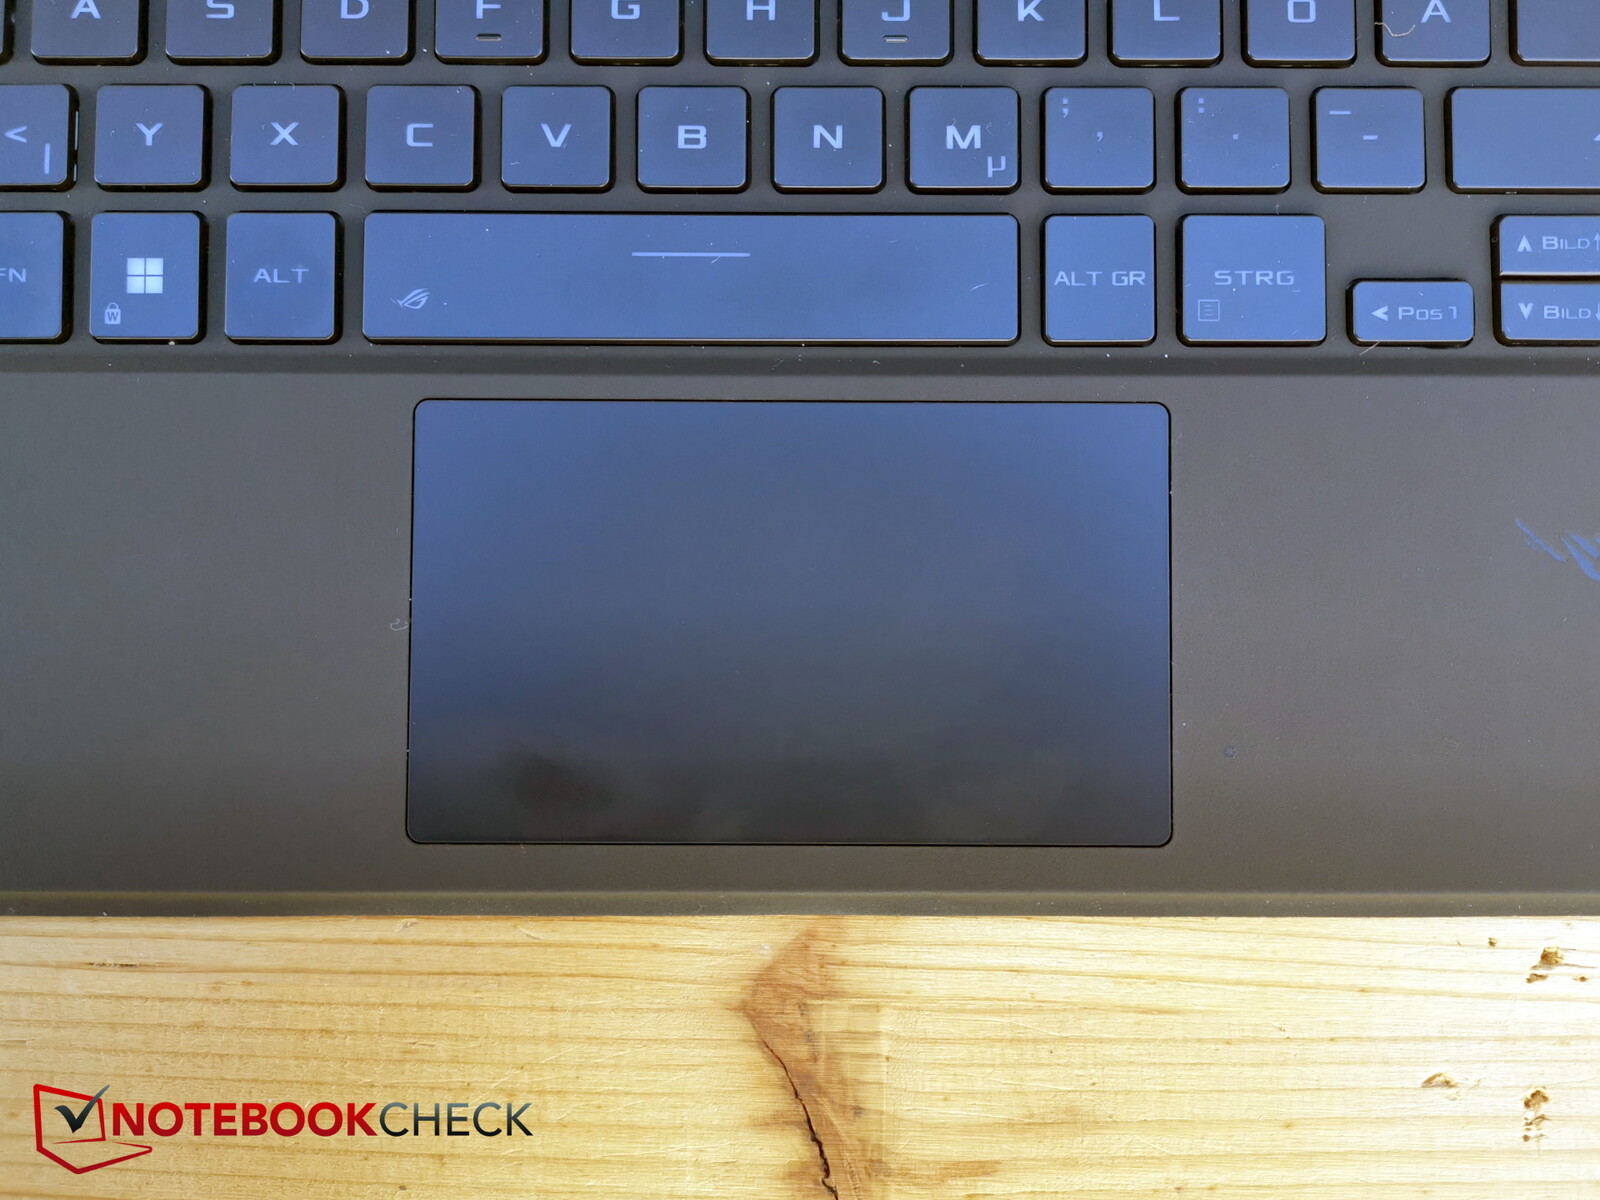
Il touchpad è naturalmente relativamente piccolo (circa 10,5 x 6,1 cm), ma offre buone proprietà di scorrimento e difficilmente vacilla, anche durante i movimenti molto lenti.
I tasti integrati hanno una corsa molto breve, ma un feedback evidente. Il tasto destro è un po' più rumoroso e sembra avere una corsa più lunga.
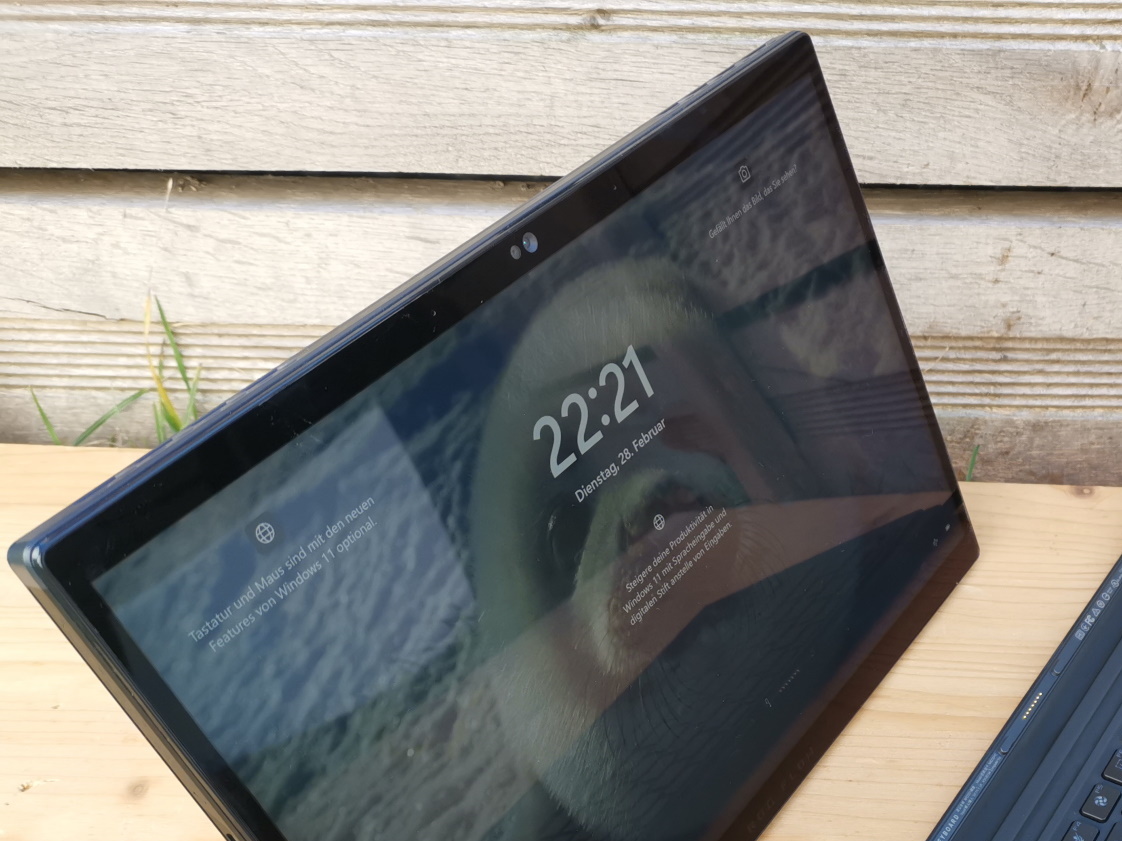
Display - ROG Nebula QHD+ e 500 nits
Asus ha cambiato il pannello: invece di Sharp, il nuovo modello proviene da Tianma Micro Electronics, con sede in Cina e Giappone. Il display da 13,4 pollici ha una risoluzione di 2.560 x 1.600 in formato 16:10 e offre una frequenza di aggiornamento di 165 Hz.
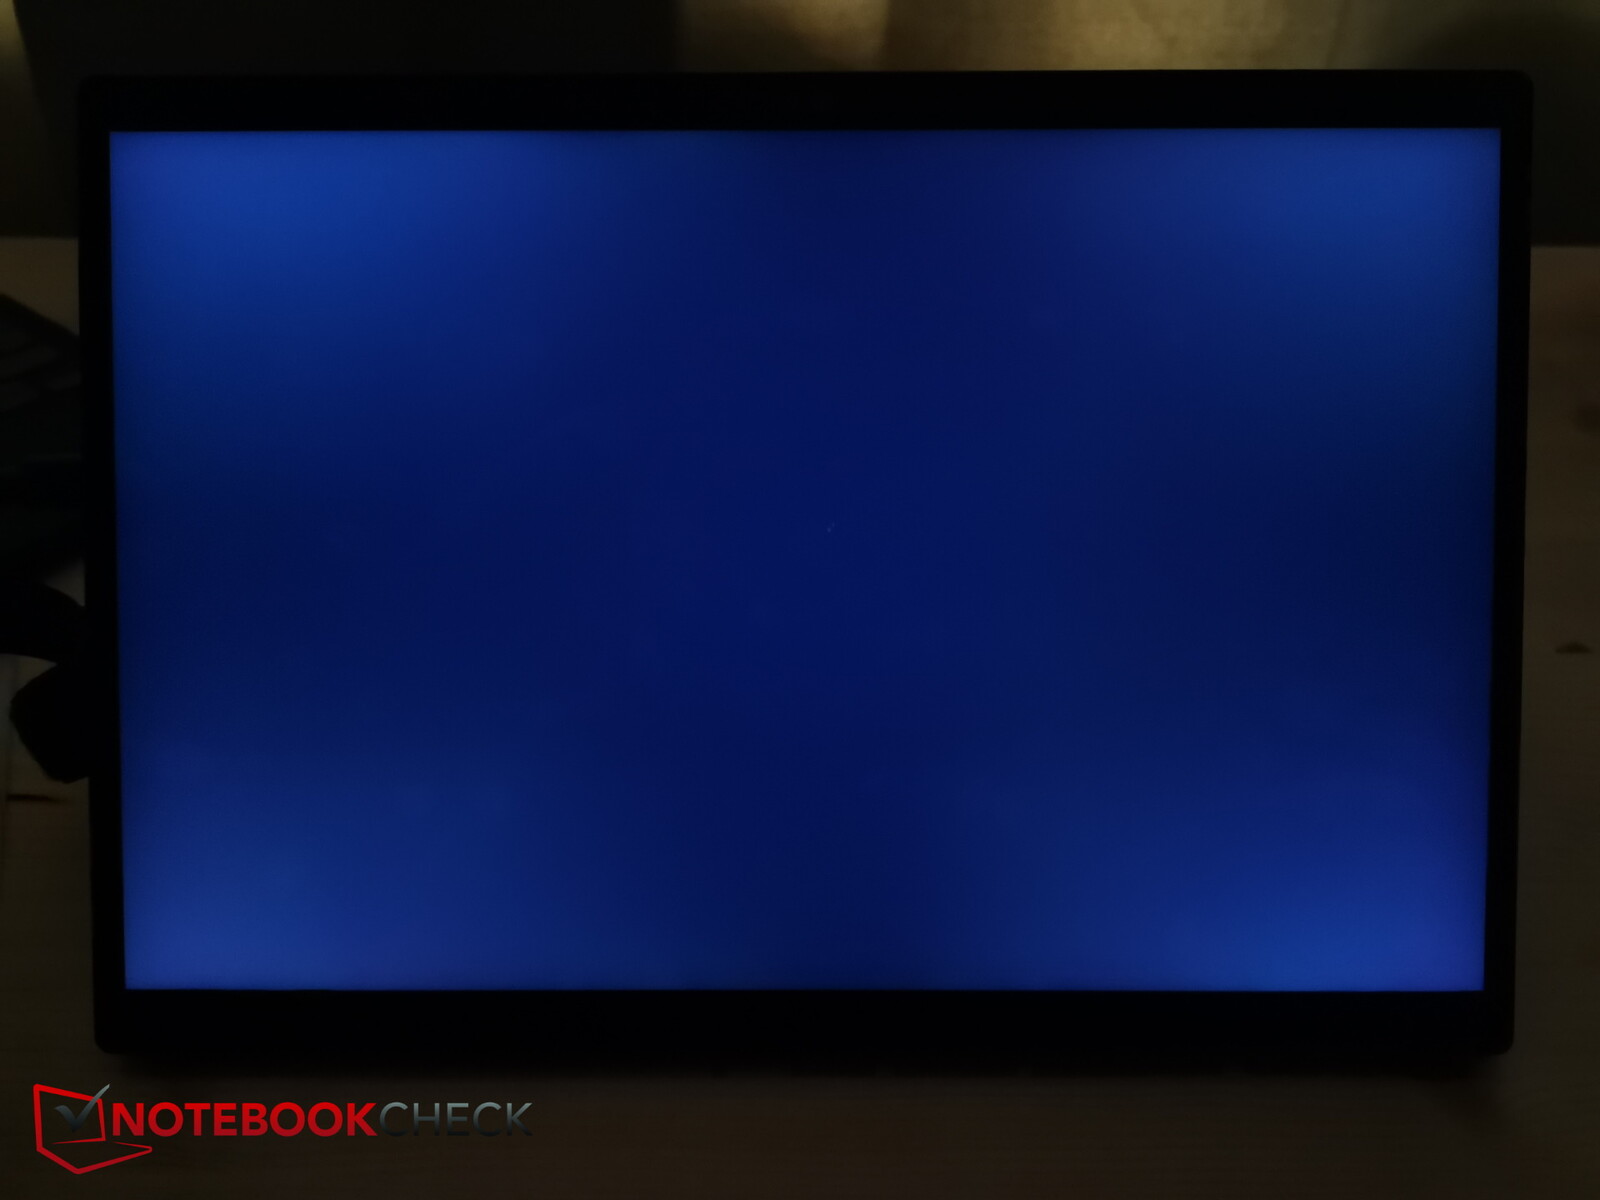
La luminosità è molto buona con poco più di 500 nit in modalità SDR, mentre l'illuminazione (88%) diminuisce un po' soprattutto verso il bordo inferiore destro. Il valore del nero non è paragonabile a quello di un OLED, ma il contrasto è comunque buono.
I tempi di risposta sono rapidi sia da nero a bianco che da grigio a grigio. Il bleeding dello schermo non è visibile sul nostro Z13. Nel complesso, abbiamo un display touch luminoso e ad alta risoluzione.
| |||||||||||||||||||||||||
Distribuzione della luminosità: 88 %
Al centro con la batteria: 538 cd/m²
Contrasto: 1193:1 (Nero: 0.45 cd/m²)
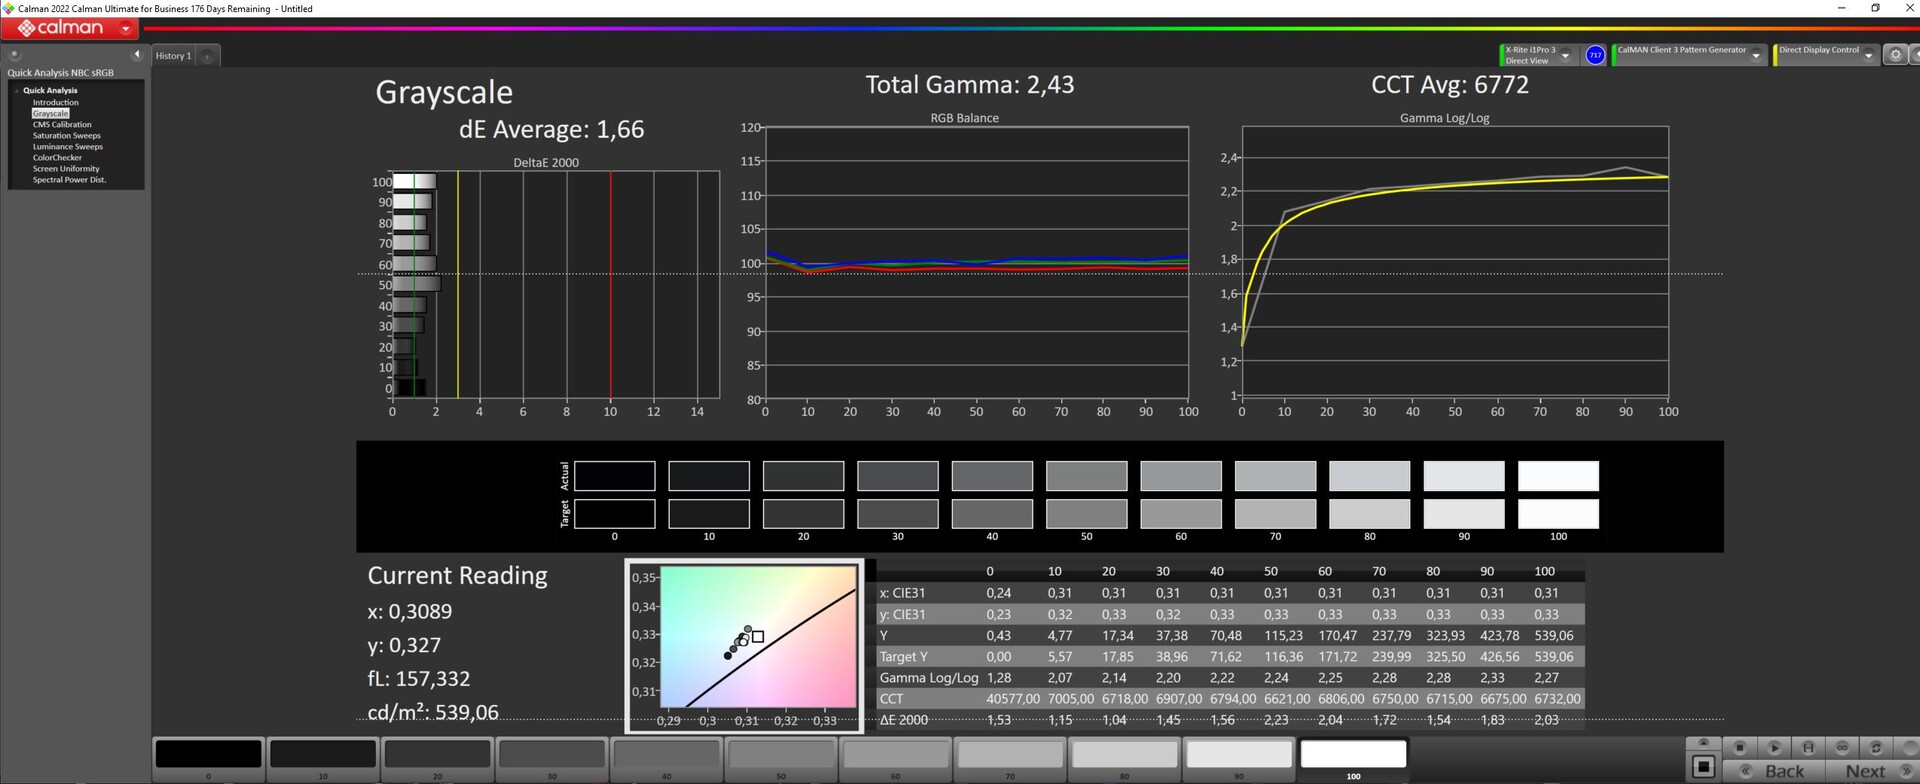
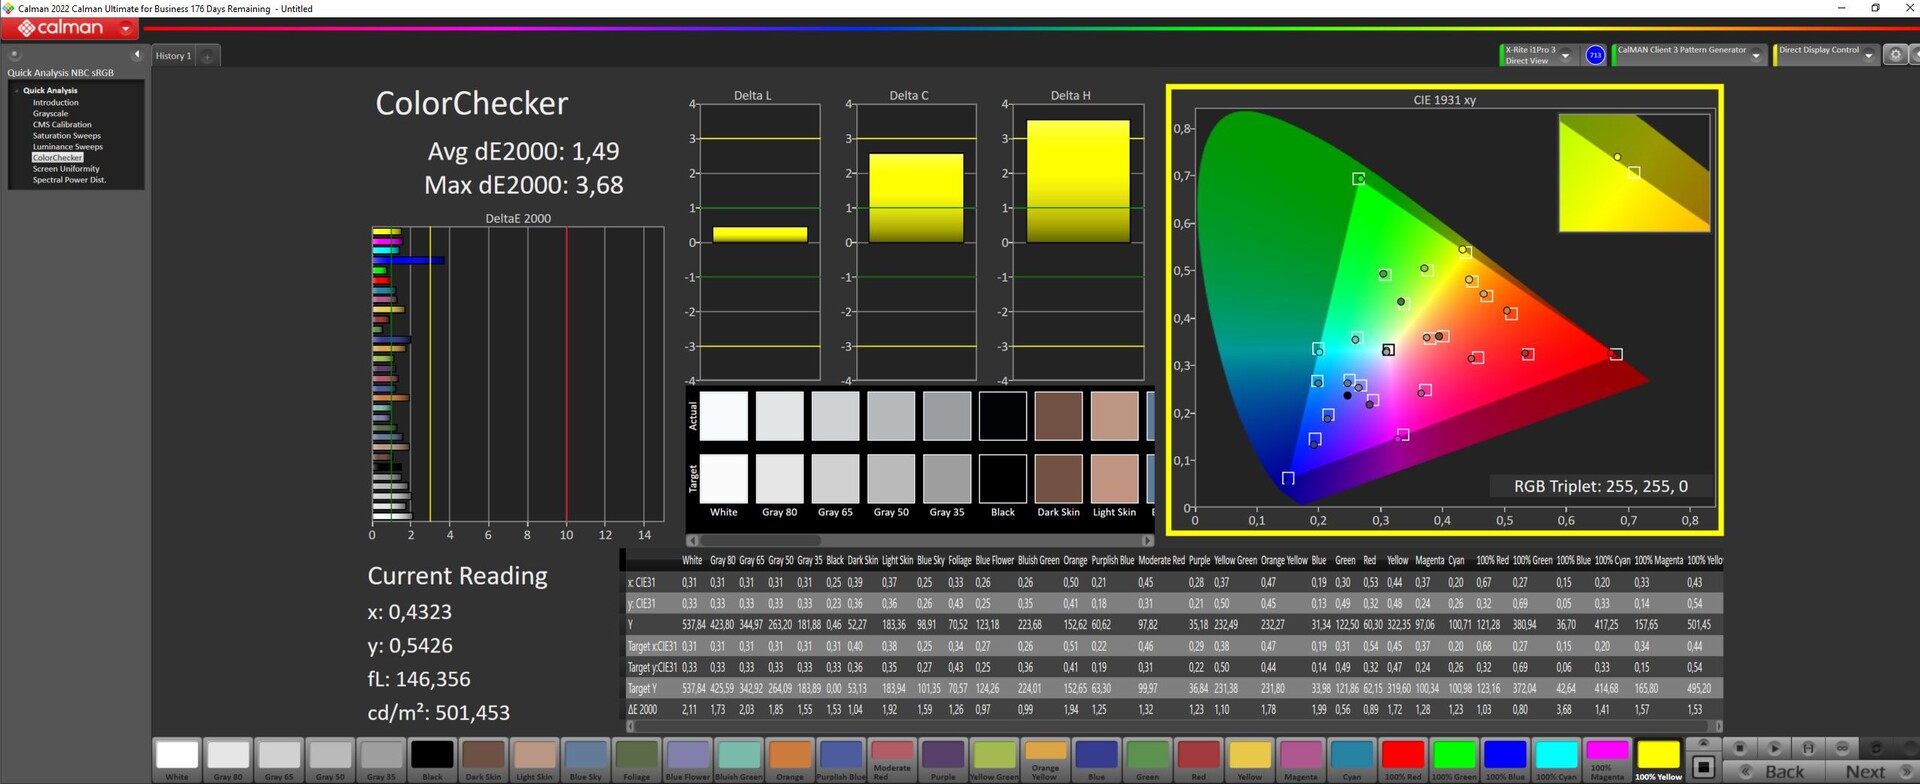
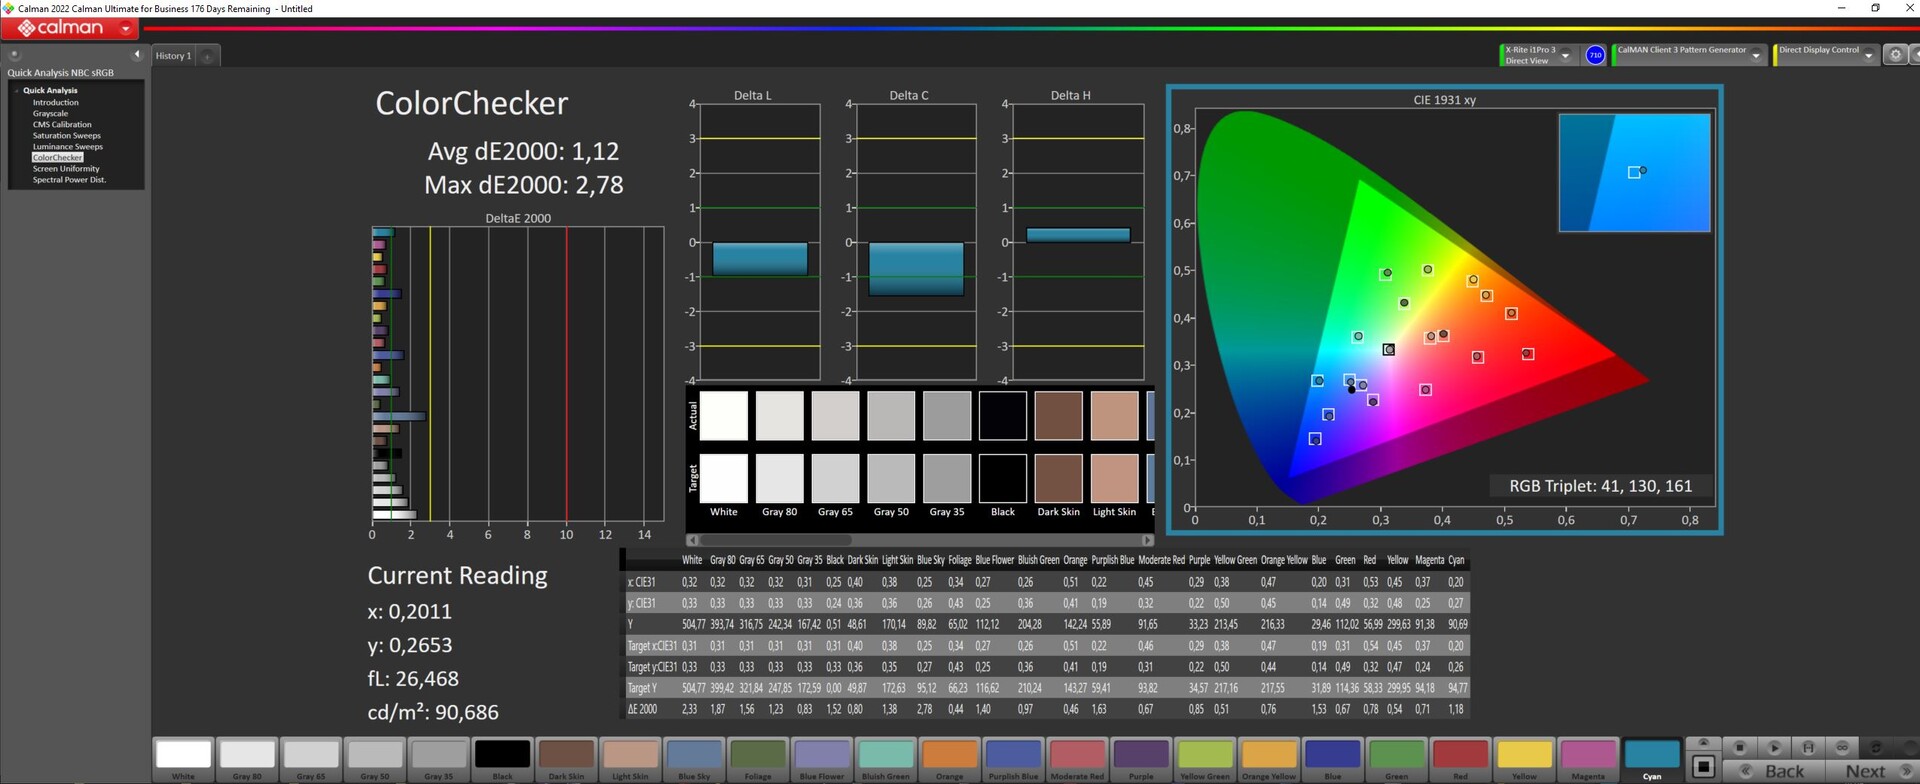
ΔE ColorChecker Calman: 1.49 | ∀{0.5-29.43 Ø4.71}
calibrated: 1.12
ΔE Greyscale Calman: 1.66 | ∀{0.09-98 Ø4.96}
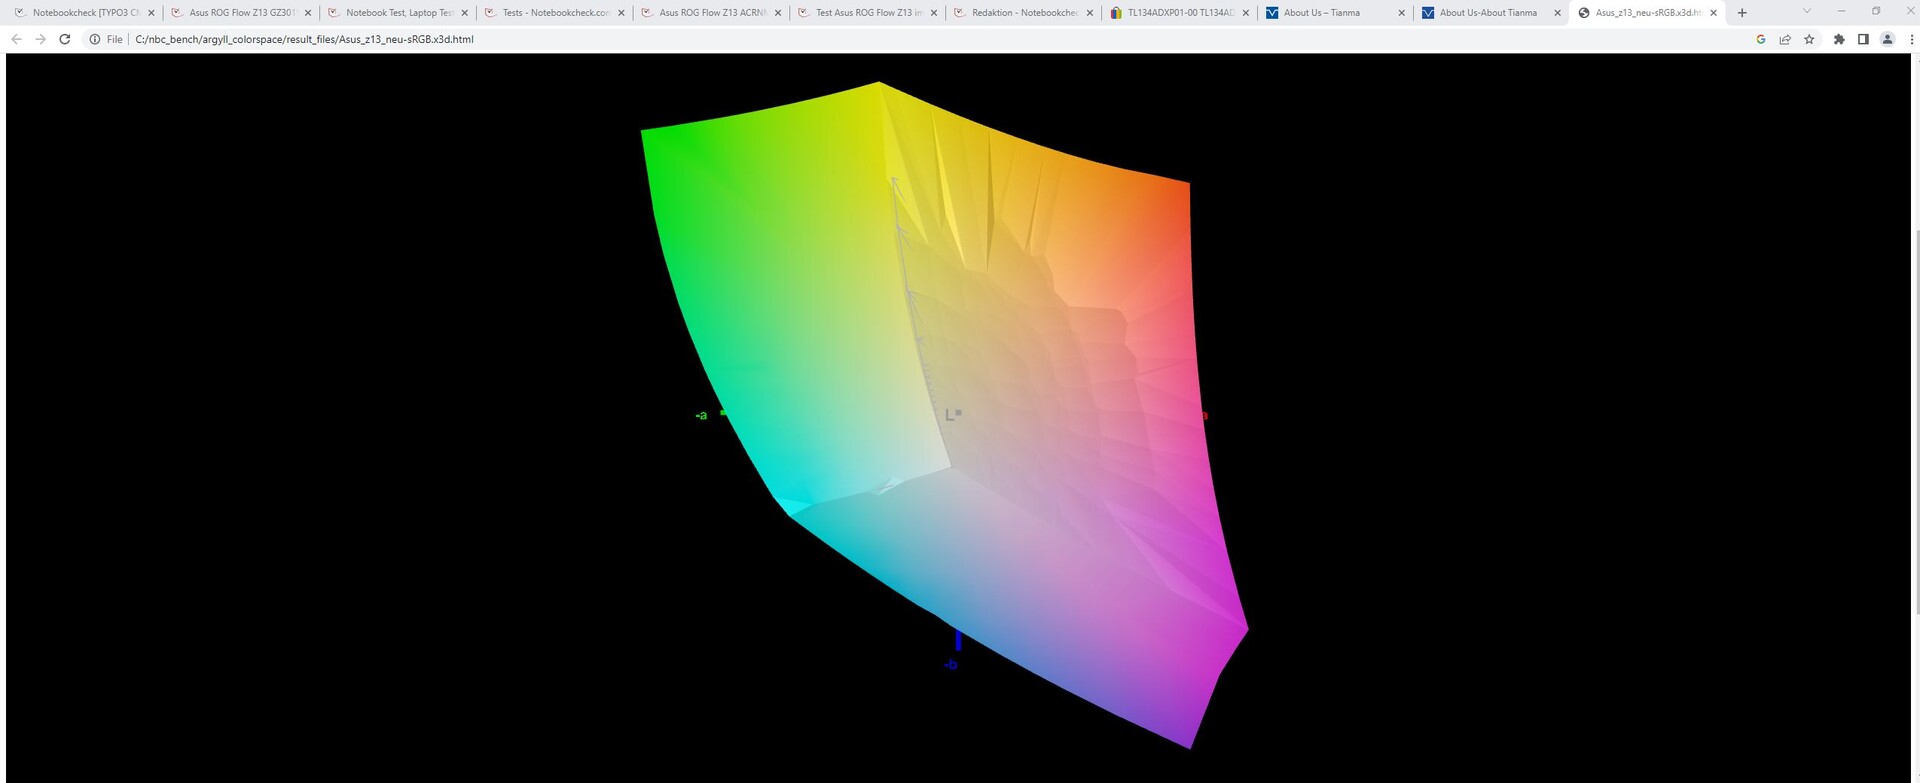
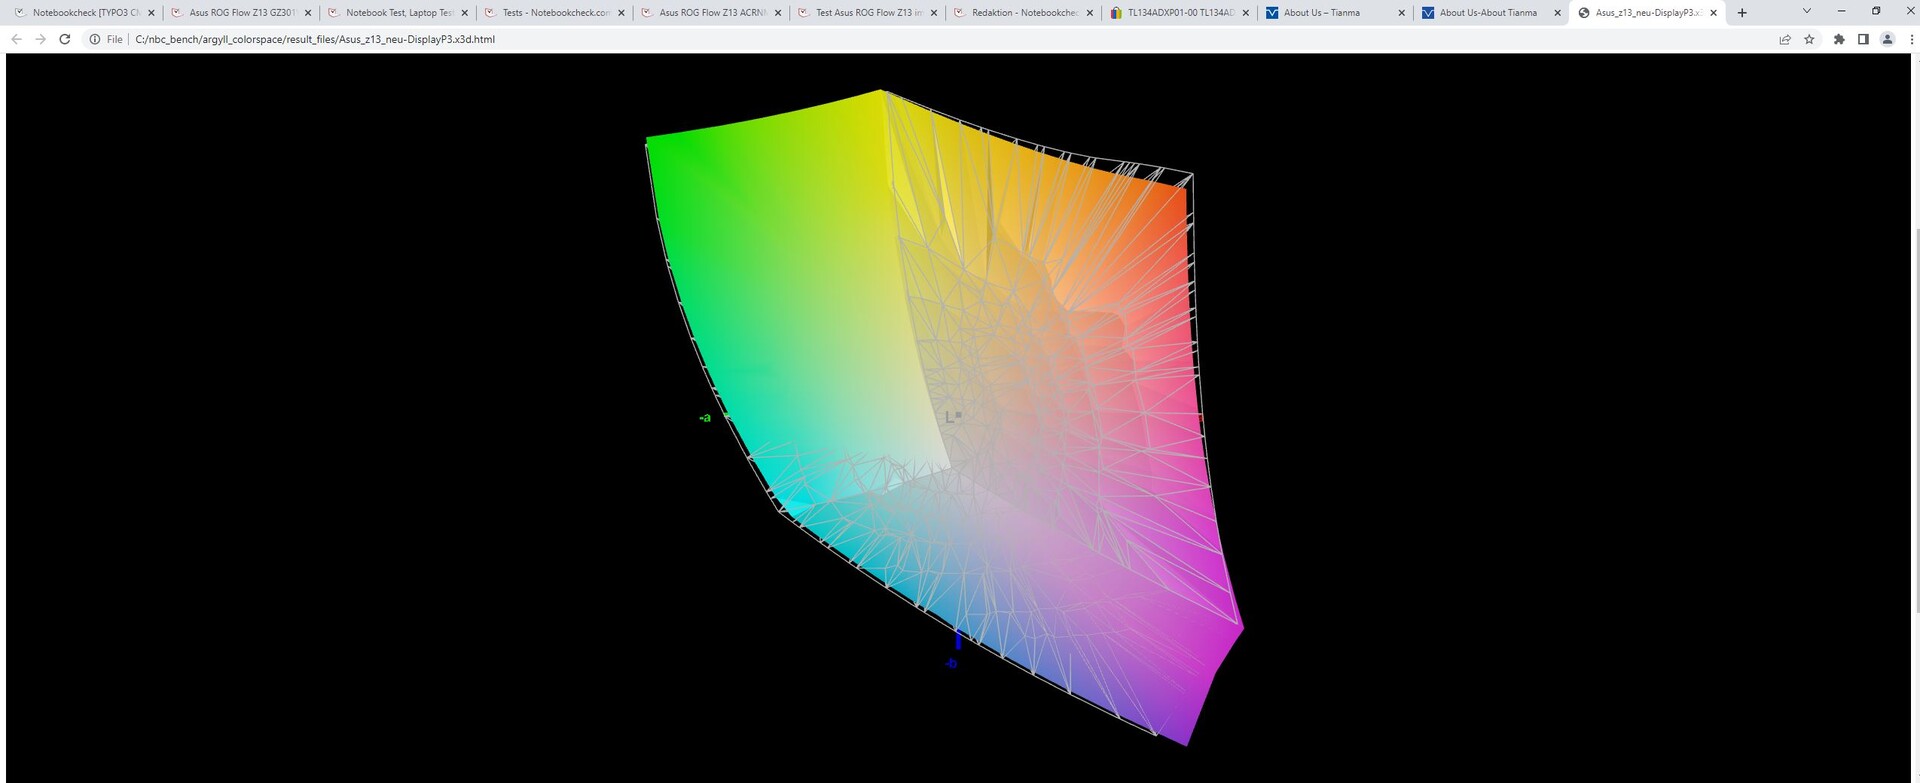
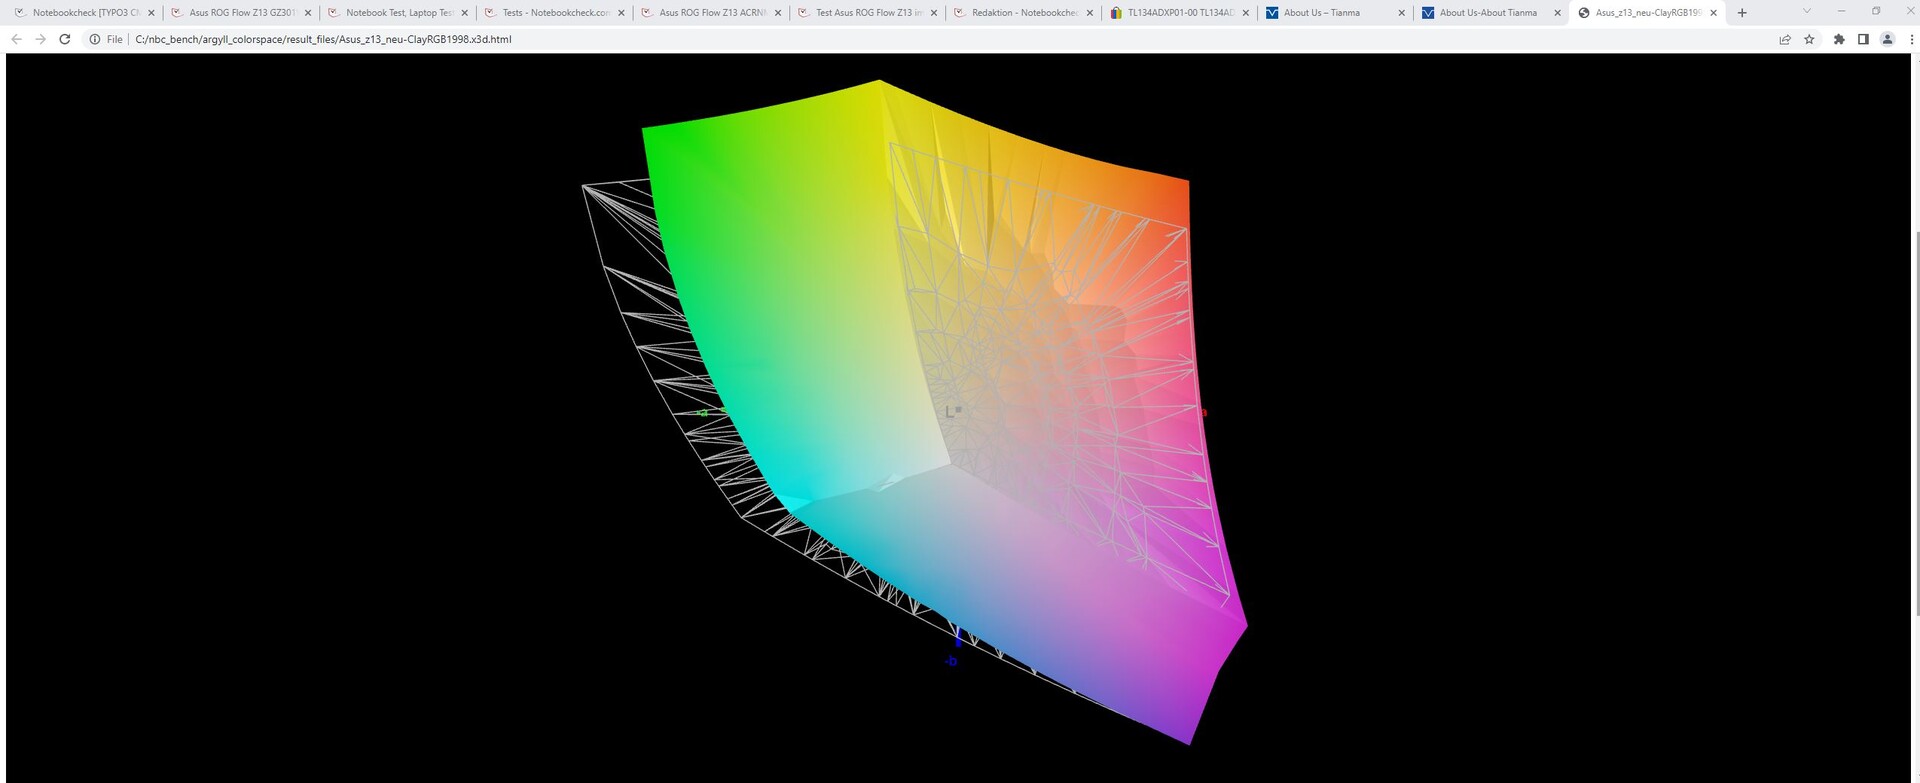
85.3% AdobeRGB 1998 (Argyll 3D)
99.9% sRGB (Argyll 3D)
97% Display P3 (Argyll 3D)
Gamma: 2.43
CCT: 6772 K
| Asus ROG Flow Z13 GZ301V TL134ADXP01-0, IPS, 2560x1600, 13.4" | Asus ROG Flow Z13 ACRNM TL134ADXP01-0, IPS, 2560x1600, 13.4" | Asus ROG Flow Z13 GZ301ZE LQ134N1JW54, IPS, 1920x1200, 13.4" | MSI Katana 17 B13VFK B173HAN04.9, IPS LED, 1920x1080, 17.3" | Acer Predator Triton 300 SE Samsung ATNA40YK07-0, OLED, 2880x1800, 14" | MSI Cyborg 15 A12VF AU Optronics B156HAN15.1, IPS, 1920x1080, 15.6" | |
|---|---|---|---|---|---|---|
| Display | 0% | -17% | -49% | 6% | -47% | |
| Display P3 Coverage (%) | 97 | 96.94 0% | 67.5 -30% | 40.8 -58% | 99.9 3% | 42.3 -56% |
| sRGB Coverage (%) | 99.9 | 99.92 0% | 97.1 -3% | 61 -39% | 100 0% | 62.6 -37% |
| AdobeRGB 1998 Coverage (%) | 85.3 | 85.17 0% | 69.3 -19% | 42.2 -51% | 99 16% | 43.7 -49% |
| Response Times | 61% | -374% | -354% | 79% | -177% | |
| Response Time Grey 50% / Grey 80% * (ms) | 6.5 ? | 2.1 ? 68% | 44 ? -577% | 33 ? -408% | 1.36 ? 79% | 22 ? -238% |
| Response Time Black / White * (ms) | 6.5 ? | 3 ? 54% | 17.6 ? -171% | 26 ? -300% | 1.36 ? 79% | 14 ? -115% |
| PWM Frequency (Hz) | 367.6 ? | |||||
| Screen | -15% | -5% | -111% | -60% | -66% | |
| Brightness middle (cd/m²) | 537 | 464 -14% | 515 -4% | 267 -50% | 414.3 -23% | 247 -54% |
| Brightness (cd/m²) | 511 | 455 -11% | 476 -7% | 256 -50% | 416 -19% | 234 -54% |
| Brightness Distribution (%) | 88 | 89 1% | 87 -1% | 93 6% | 99 13% | 89 1% |
| Black Level * (cd/m²) | 0.45 | 0.4 11% | 0.35 22% | 0.21 53% | 0.25 44% | |
| Contrast (:1) | 1193 | 1160 -3% | 1471 23% | 1271 7% | 988 -17% | |
| Colorchecker dE 2000 * | 1.49 | 2 -34% | 1.6 -7% | 4.7 -215% | 4.68 -214% | 3.78 -154% |
| Colorchecker dE 2000 max. * | 3.68 | 4.2 -14% | 4 -9% | 20.4 -454% | 7.78 -111% | 6.42 -74% |
| Colorchecker dE 2000 calibrated * | 1.12 | 1.2 -7% | 1.2 -7% | 4.5 -302% | 3.94 -252% | |
| Greyscale dE 2000 * | 1.66 | 2.7 -63% | 2.5 -51% | 1.5 10% | 1.8 -8% | 2.16 -30% |
| Gamma | 2.43 91% | 2.24 98% | 2.2 100% | 2.12 104% | 2.22 99% | 2.33 94% |
| CCT | 6772 96% | 6832 95% | 6939 94% | 6552 99% | 6207 105% | 6906 94% |
| Media totale (Programma / Settaggio) | 15% /
-1% | -132% /
-60% | -171% /
-132% | 8% /
-17% | -97% /
-78% |
* ... Meglio usare valori piccoli
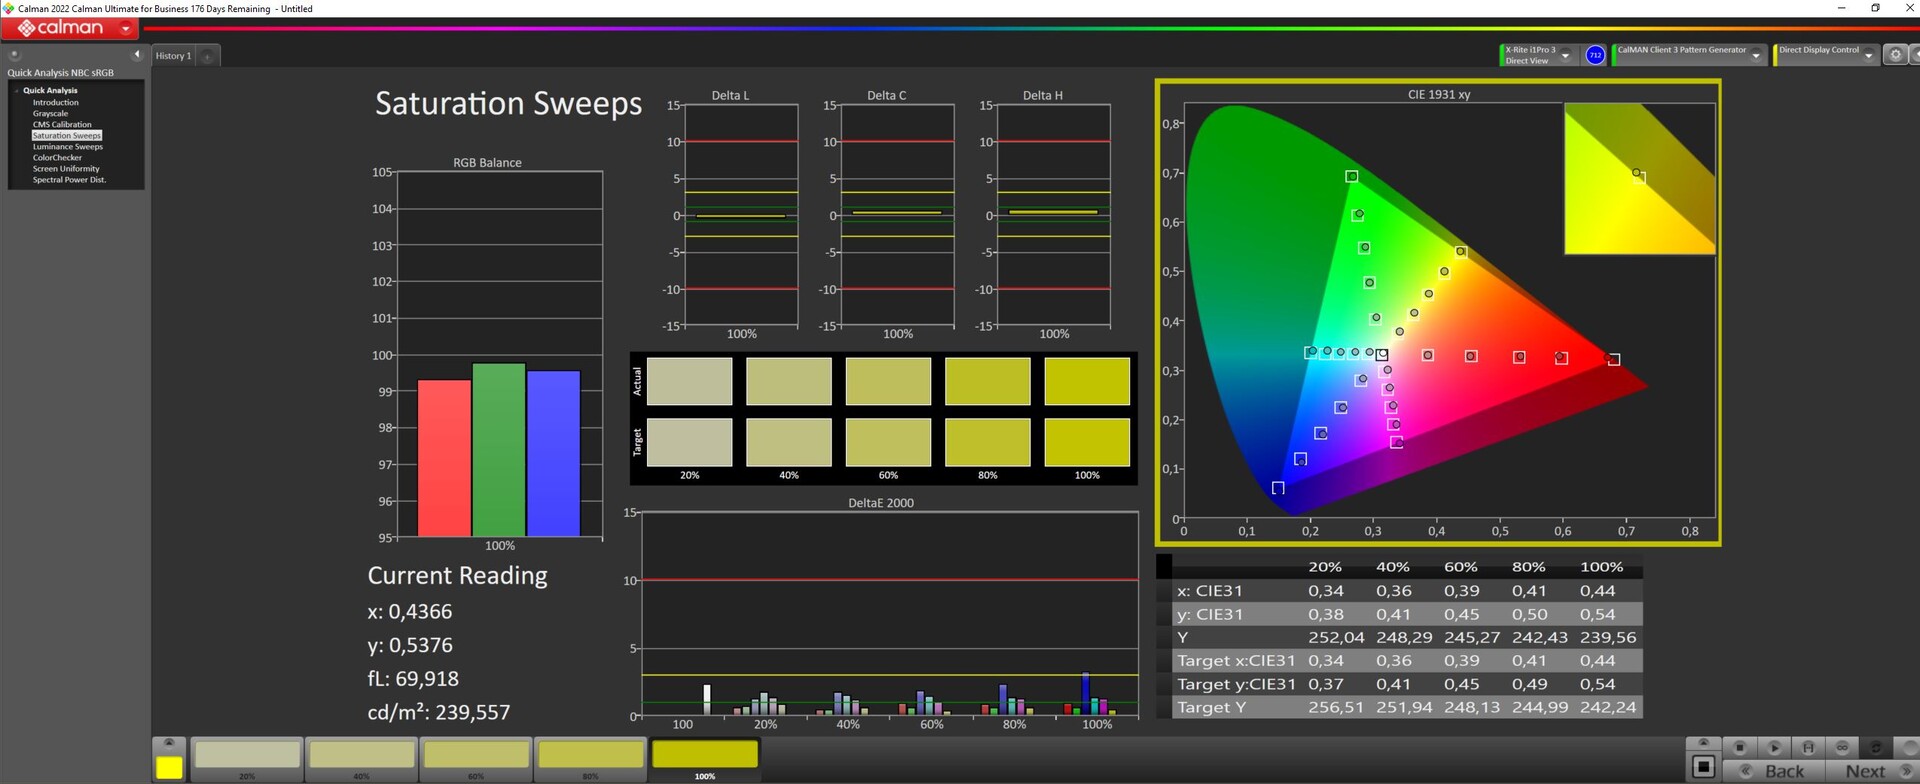
Asus specifica il 100% di DCI-P3; noi abbiamo misurato il 97%. AdobeRGB ha una copertura dell'85%, mentre sRGB è completamente coperto, naturalmente.
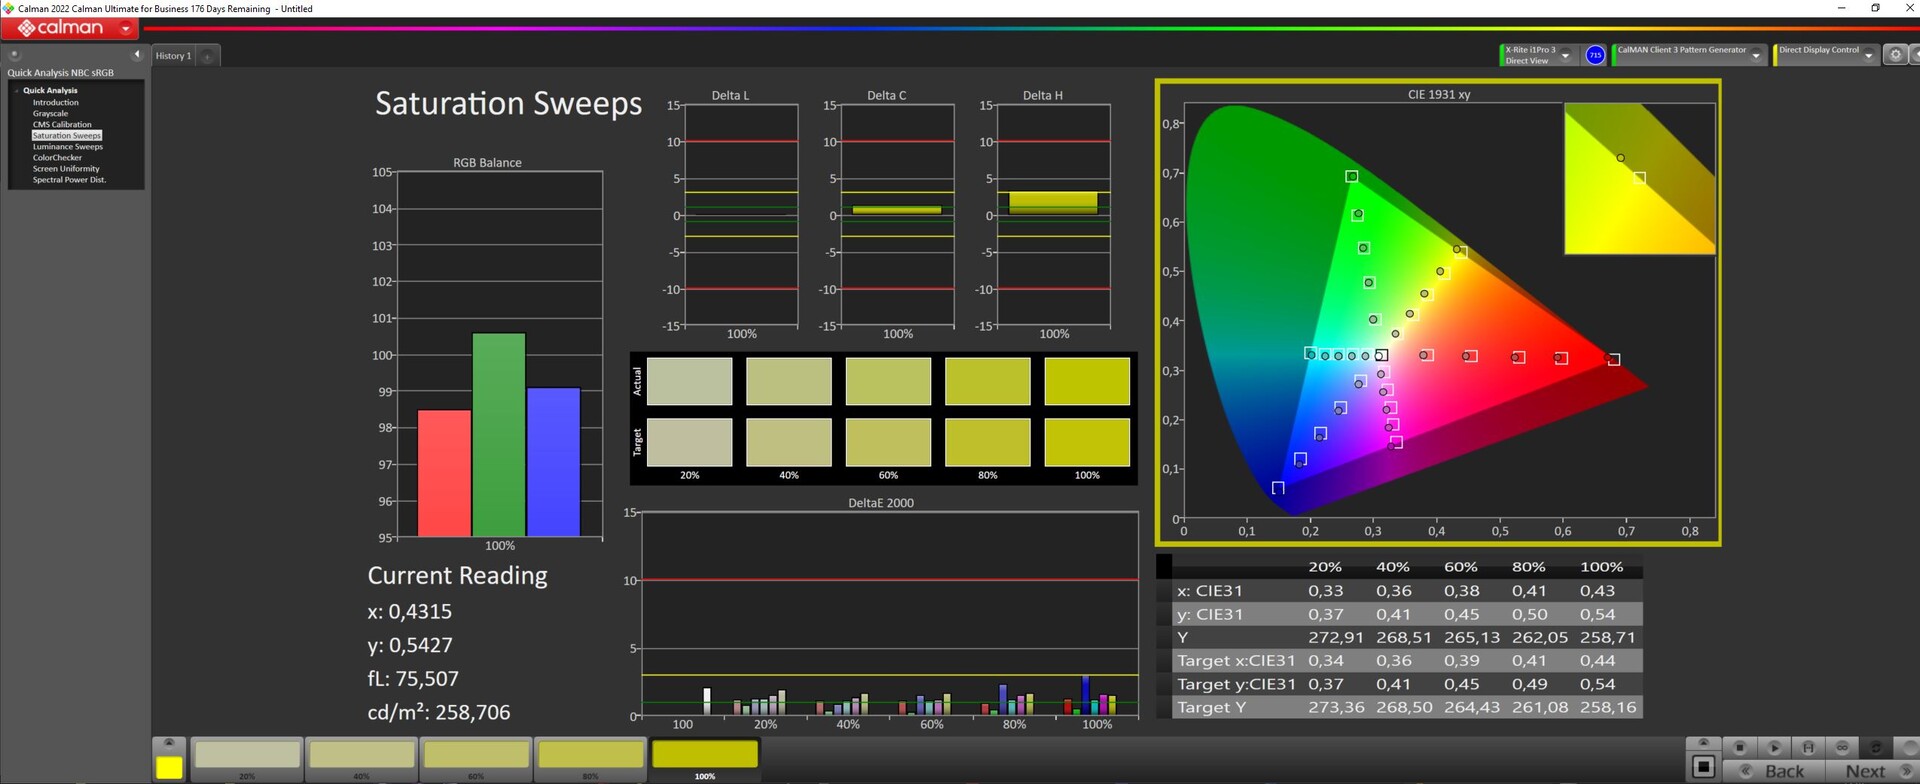
Il display è già ben calibrato ex-novo e presenta valori DeltaE, ovvero deviazioni inferiori a 2 sia per la scala di grigi che per il ColorChecker. Una calibrazione manuale con Portrait Display's Calman Color Calibration riduce ulteriormente le deviazioni. Il nostro profilo icc può essere scaricato qui sopra.
Insieme alla buona copertura dello spazio colore, abbiamo un display adatto all'editing di foto e video.

Tempi di risposta del Display
| ↔ Tempi di risposta dal Nero al Bianco | ||
|---|---|---|
| 6.5 ms ... aumenta ↗ e diminuisce ↘ combinato | ↗ 3.1 ms Incremento | 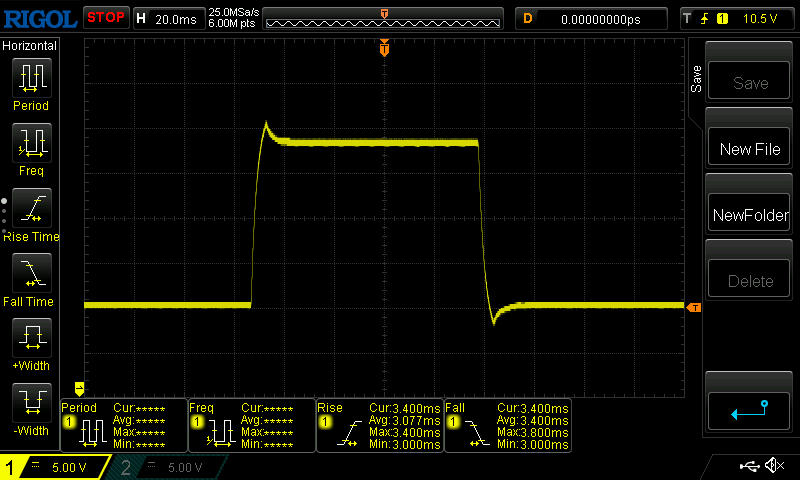 |
| ↘ 3.4 ms Calo | ||
| Lo schermo ha mostrato valori di risposta molto veloci nei nostri tests ed è molto adatto per i gaming veloce. In confronto, tutti i dispositivi di test variano da 0.1 (minimo) a 240 (massimo) ms. » 21 % di tutti i dispositivi è migliore. Questo significa che i tempi di risposta rilevati sono migliori rispettto alla media di tutti i dispositivi testati (19.8 ms). | ||
| ↔ Tempo di risposta dal 50% Grigio all'80% Grigio | ||
| 6.5 ms ... aumenta ↗ e diminuisce ↘ combinato | ↗ 3.1 ms Incremento | 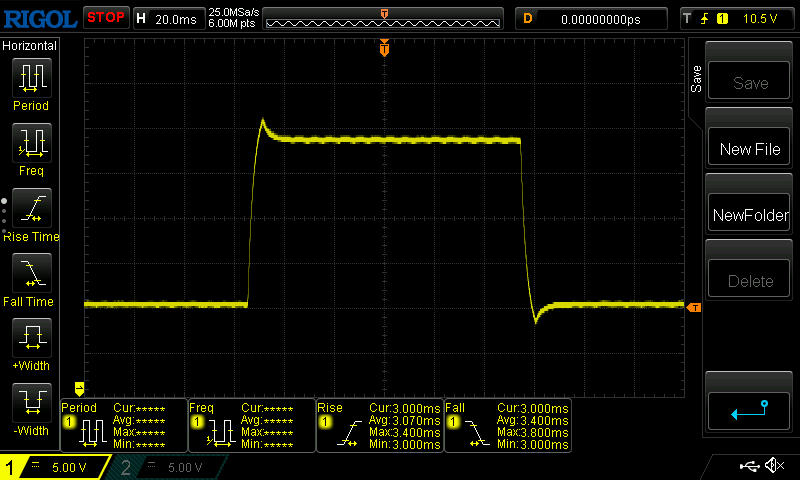 |
| ↘ 3.4 ms Calo | ||
| Lo schermo ha mostrato valori di risposta molto veloci nei nostri tests ed è molto adatto per i gaming veloce. In confronto, tutti i dispositivi di test variano da 0.165 (minimo) a 636 (massimo) ms. » 20 % di tutti i dispositivi è migliore. Questo significa che i tempi di risposta rilevati sono migliori rispettto alla media di tutti i dispositivi testati (31 ms). | ||
Sfarfallio dello schermo / PWM (Pulse-Width Modulation)
| flickering dello schermo / PWM non rilevato | 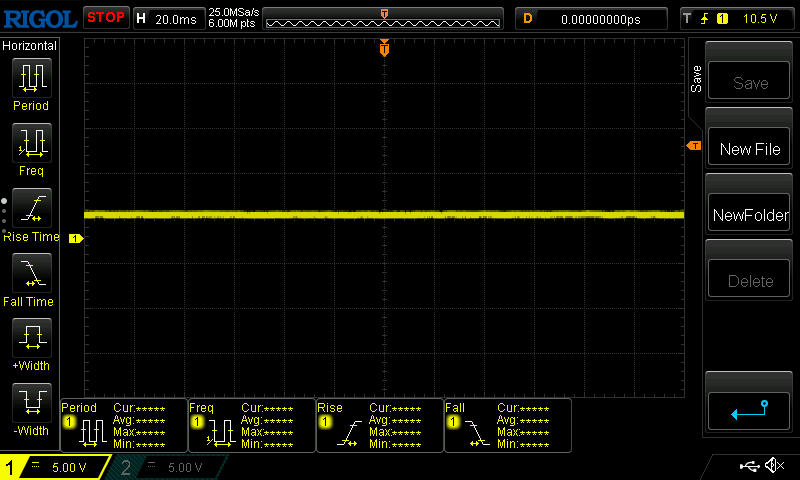 | ||
In confronto: 52 % di tutti i dispositivi testati non utilizza PWM per ridurre la luminosita' del display. Se è rilevato PWM, una media di 7757 (minimo: 5 - massimo: 343500) Hz è stata rilevata. | |||
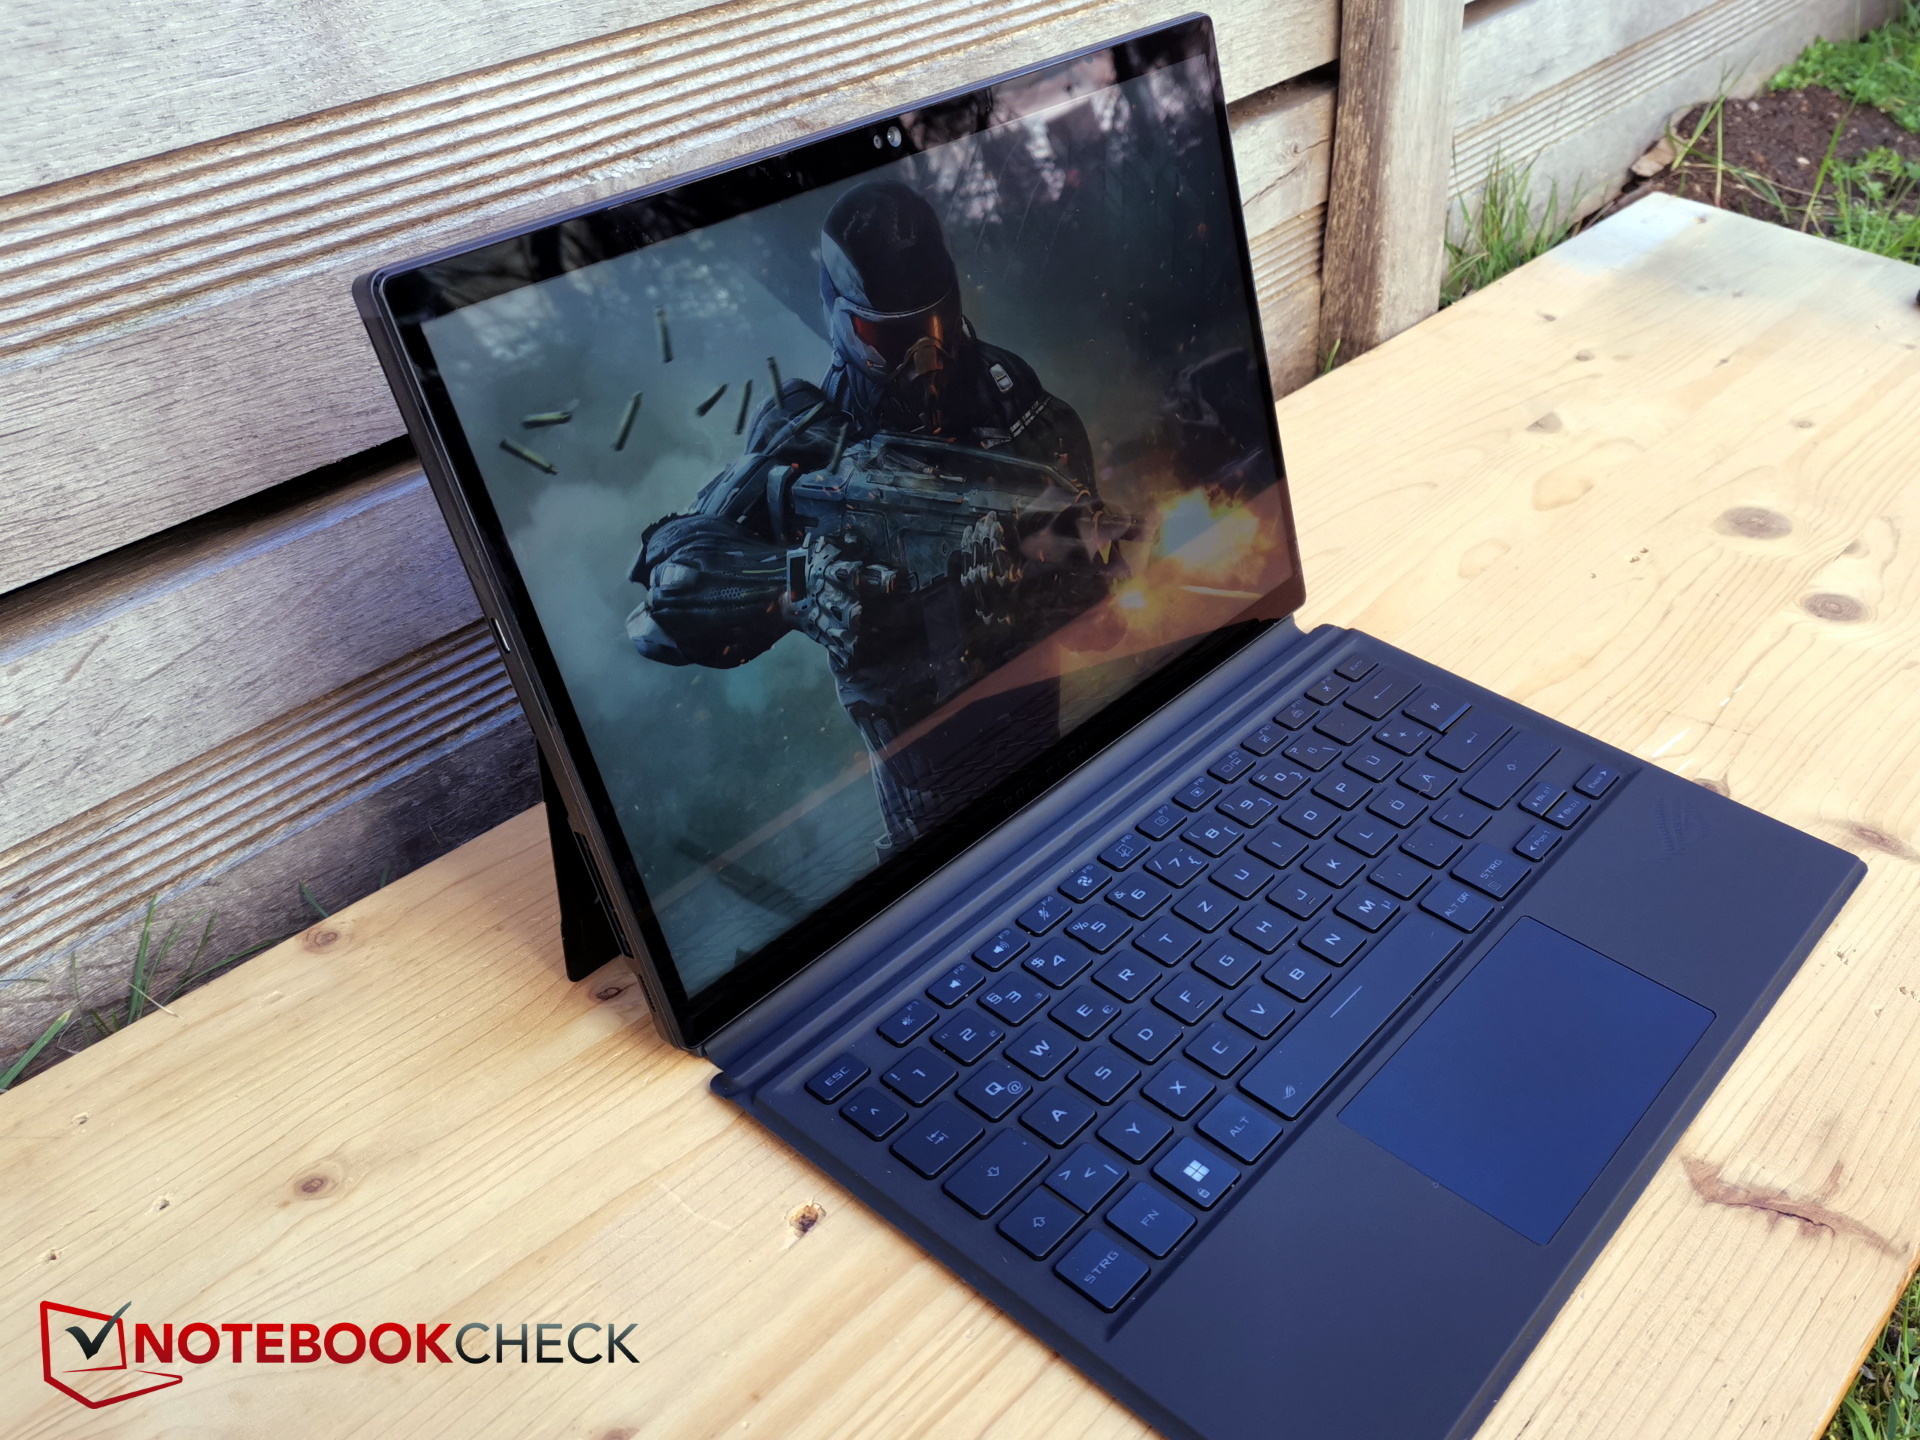
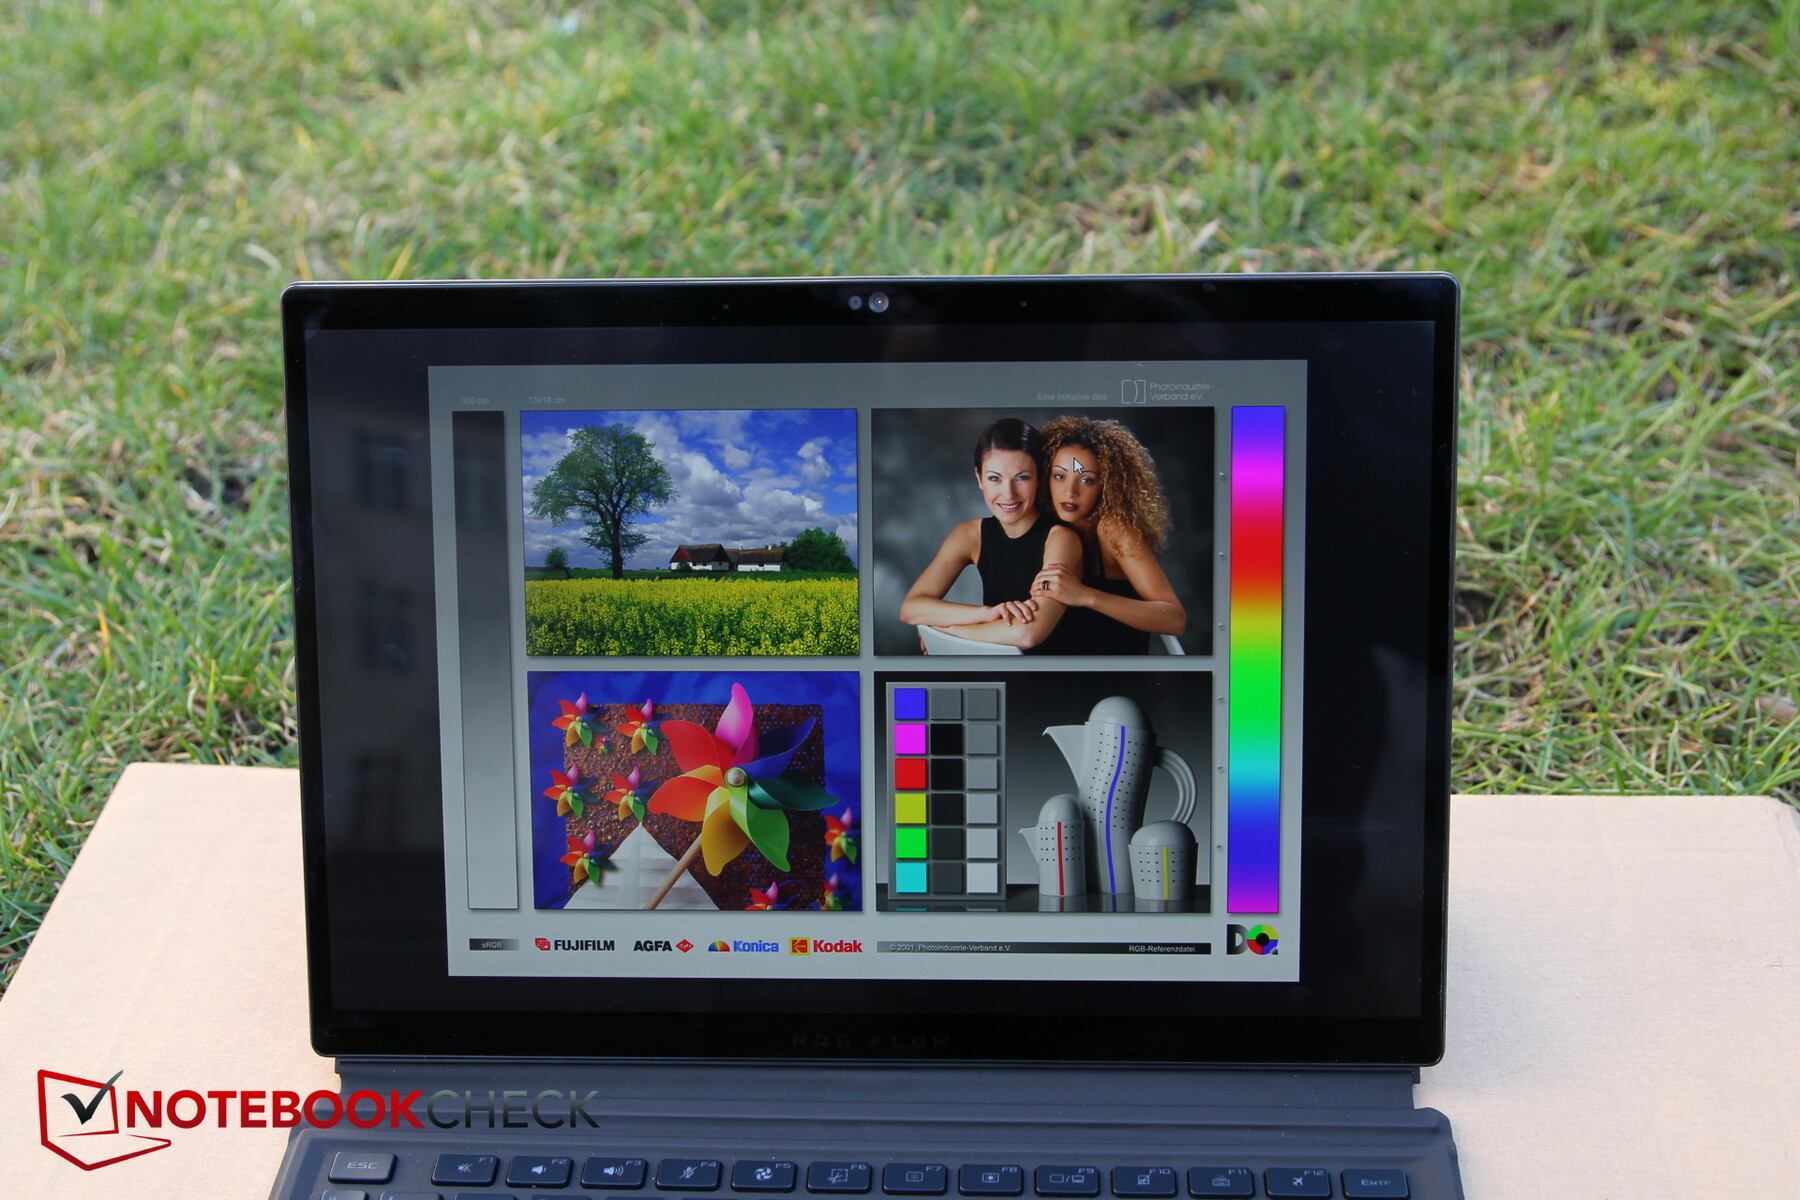
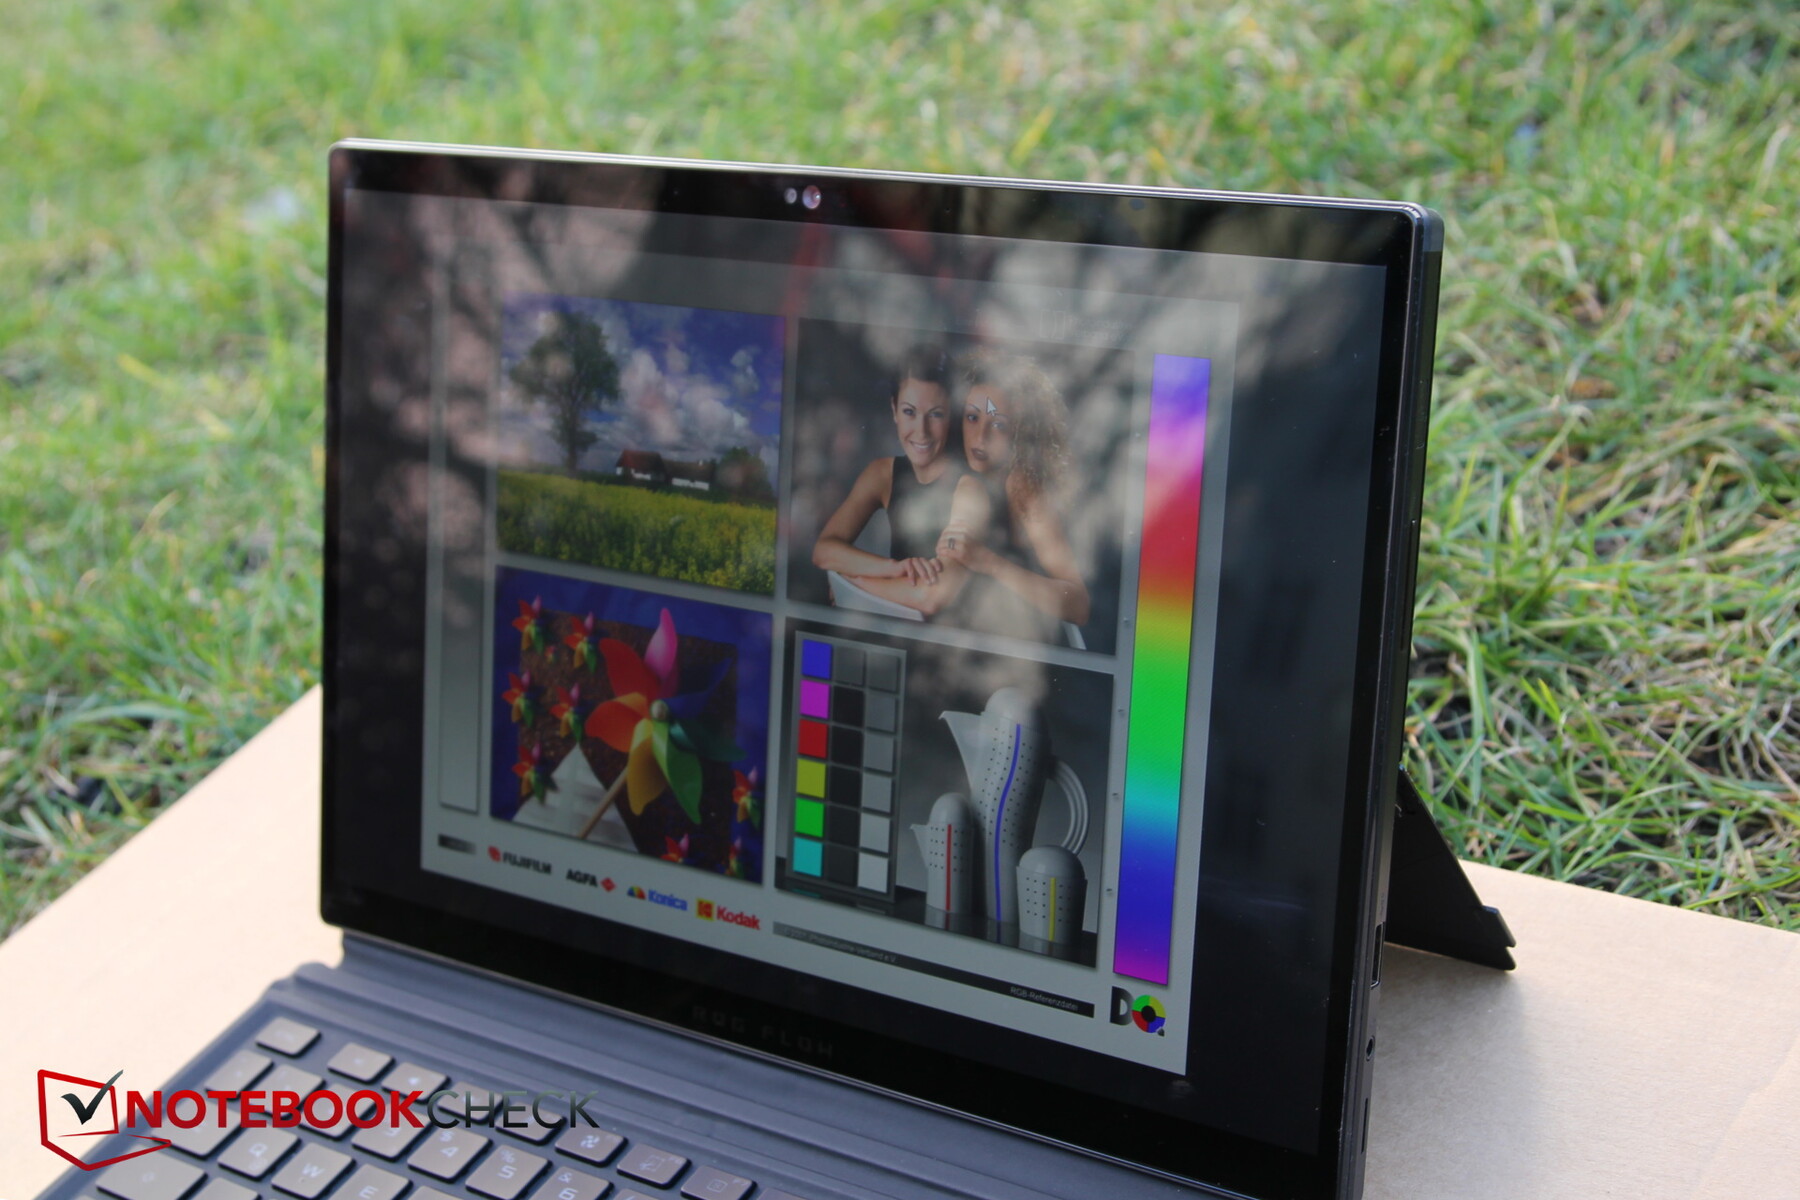
All'esterno, lo Z13 si posiziona bene nelle zone d'ombra senza luce diretta, grazie soprattutto alla buona luminosità. Tuttavia, la superficie riflettente si rivela rapidamente controproducente in presenza di luce diretta.
Quando si guarda lo schermo dai lati, si dimostra molto stabile nell'angolo di visione.

Prestazioni - Tablet? No, portatile da gioco!
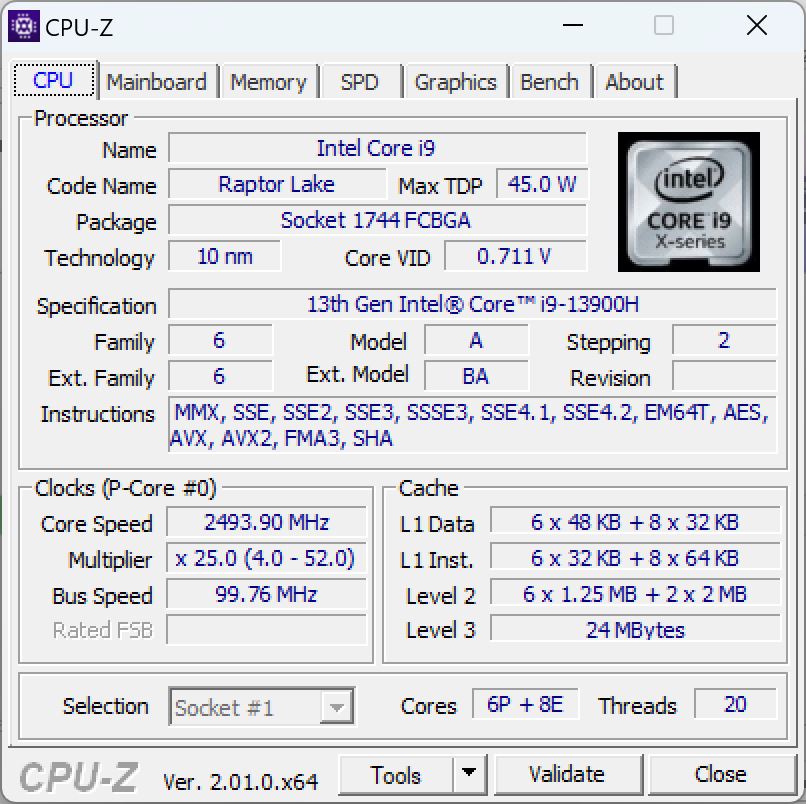
Non si tratta di un tipico tablet, ma di un vero e proprio portatile da gioco, in quanto la combinazione di un processoreCore i9-13900H e una RTX 4060e 16 GB di RAM. In alternativa, lo Z13 è disponibile anche con una RTX 4050, e l'edizione speciale, che si differenzia in molte aree, ha persino una RTX 4070 RTX 4070.
Quindi dovreste essere in grado di giocare a tutti i giochi attuali su questo tablet. Allo stesso tempo, il potente tablet Asus dovrebbe essere interessante anche per i creatori di contenuti.
Condizioni di test
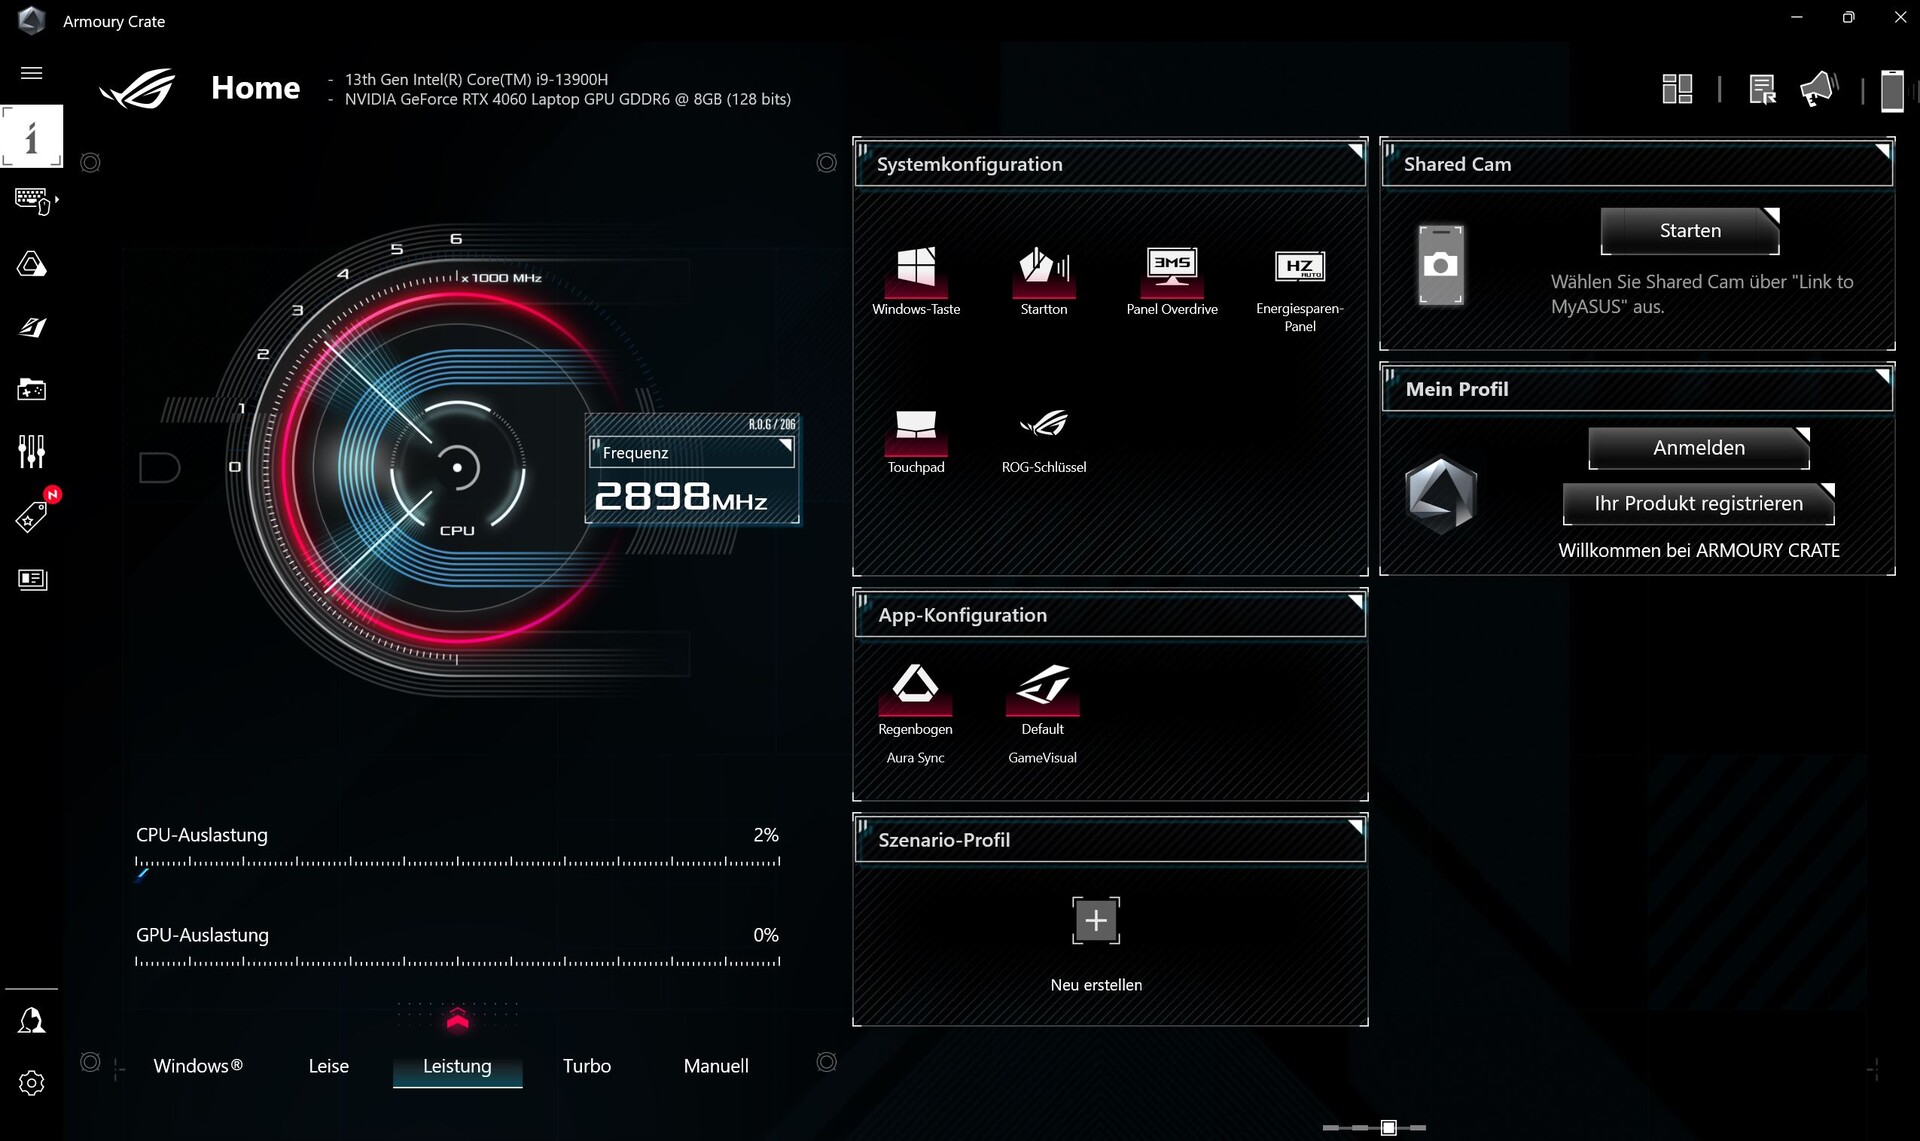
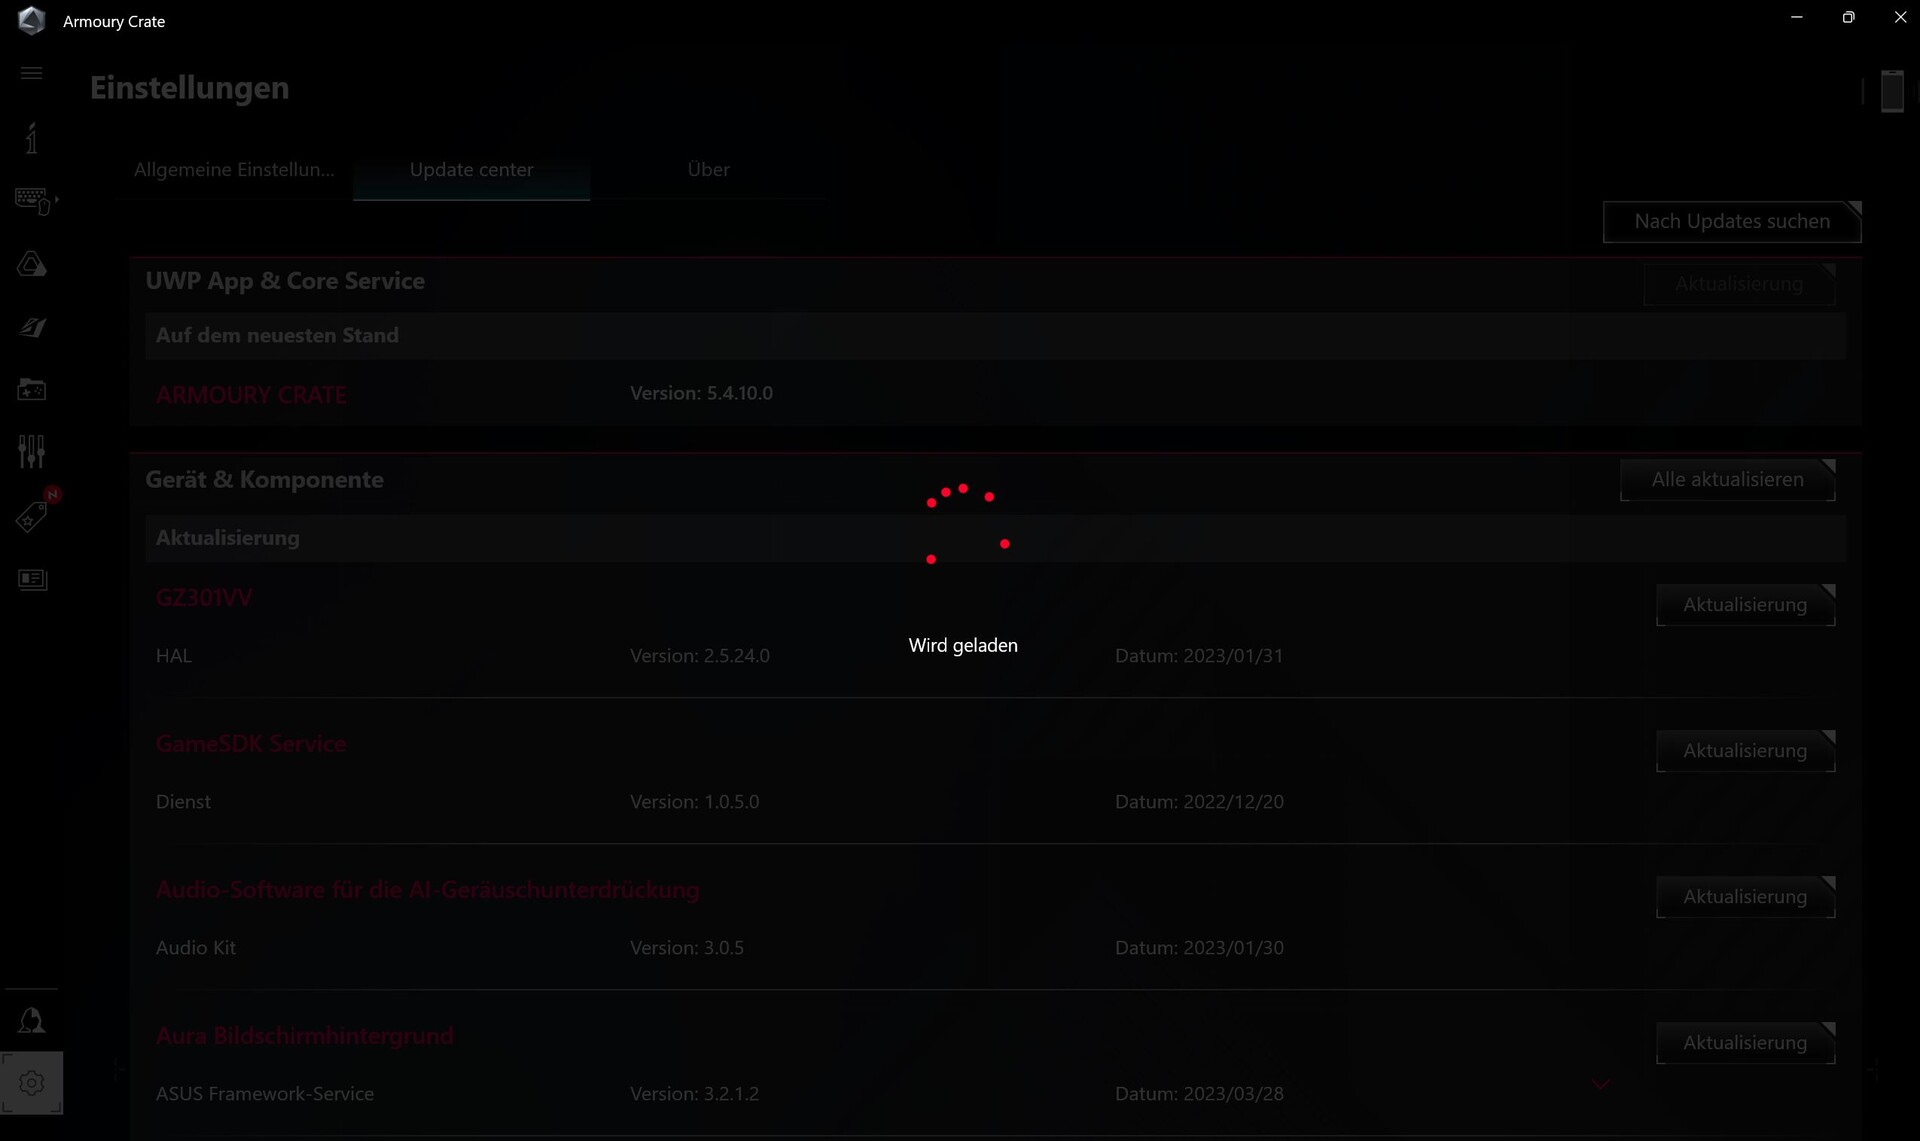
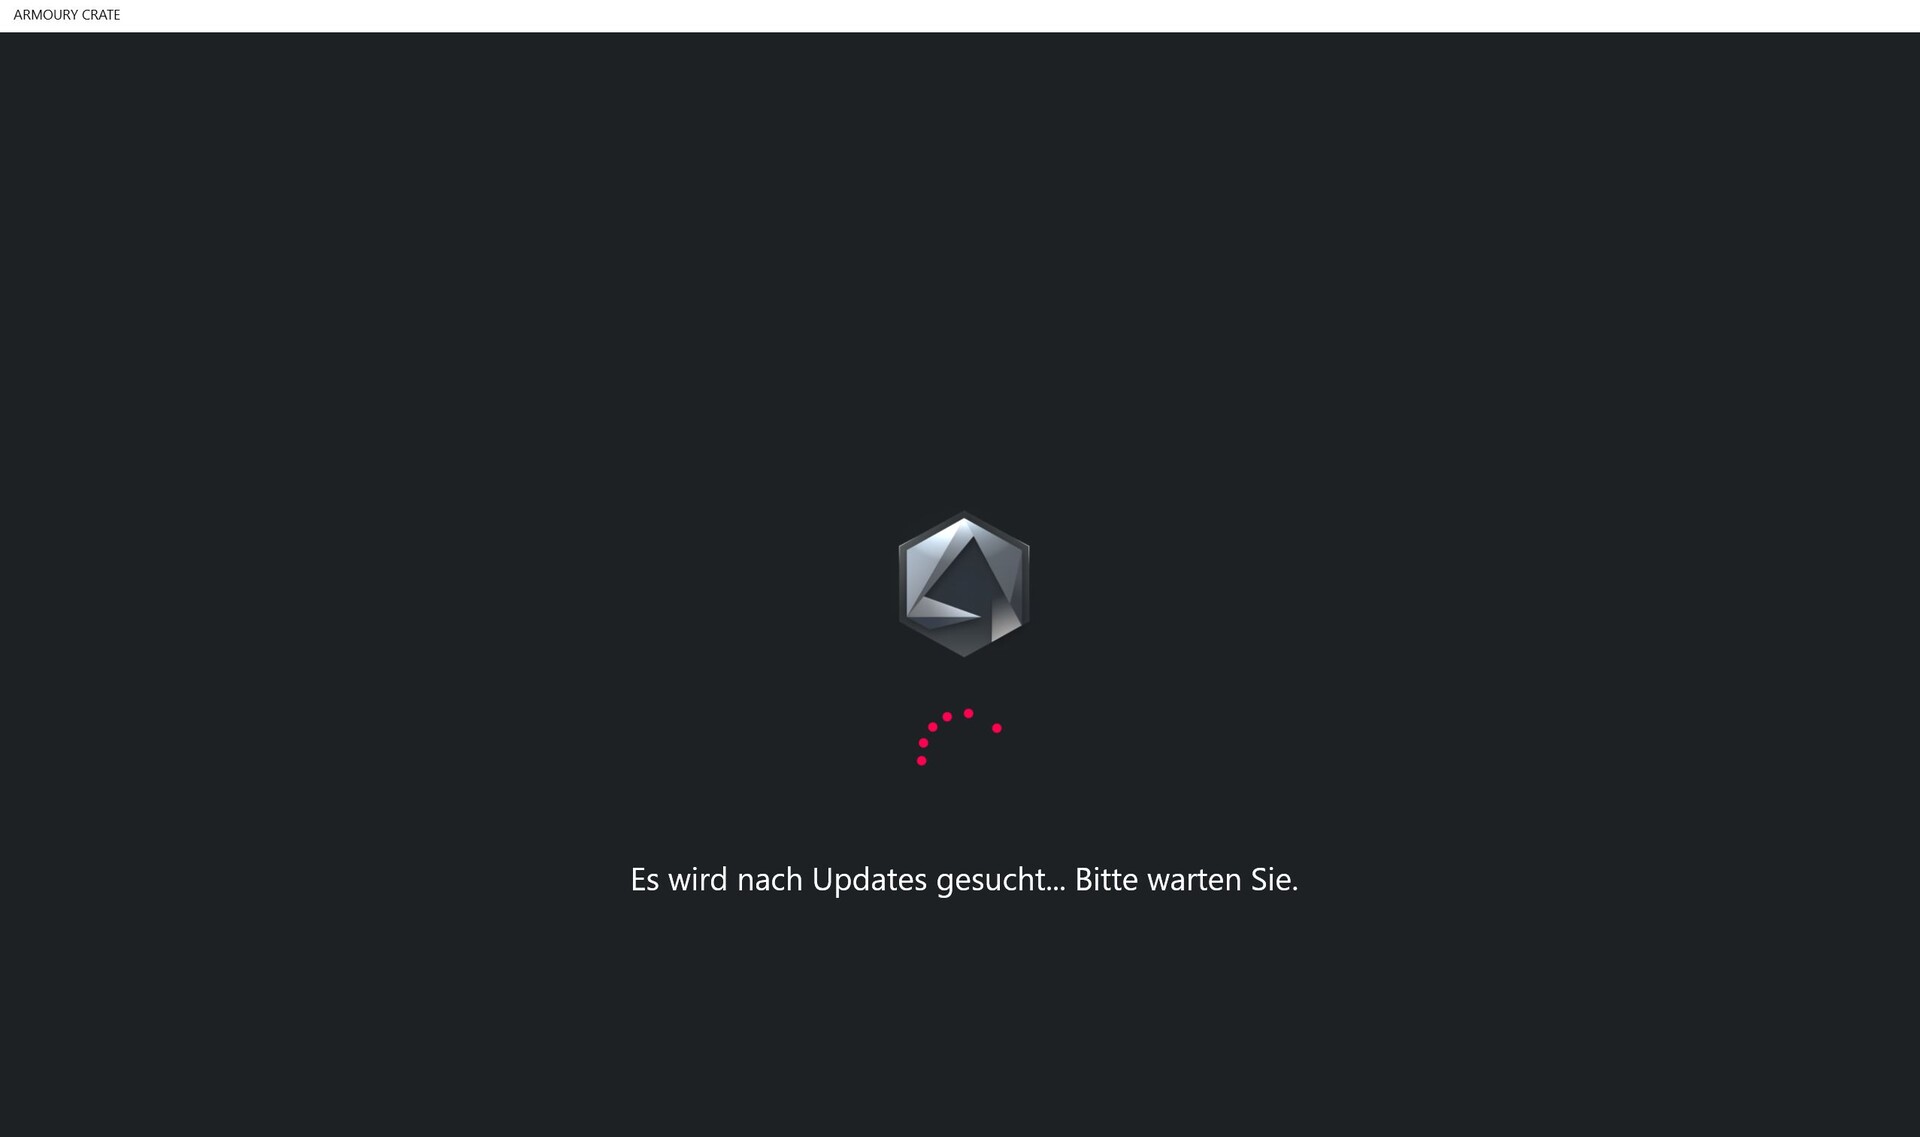
I dispositivi da gioco di Asus hanno sempre almeno due app preinstallate. Gli aggiornamenti e le informazioni di servizio sono disponibili tramite MyAsus, mentre le impostazioni delle prestazioni vengono effettuate nell'app Armoury Crate. Quest'ultima imita il Centro di Controllo.
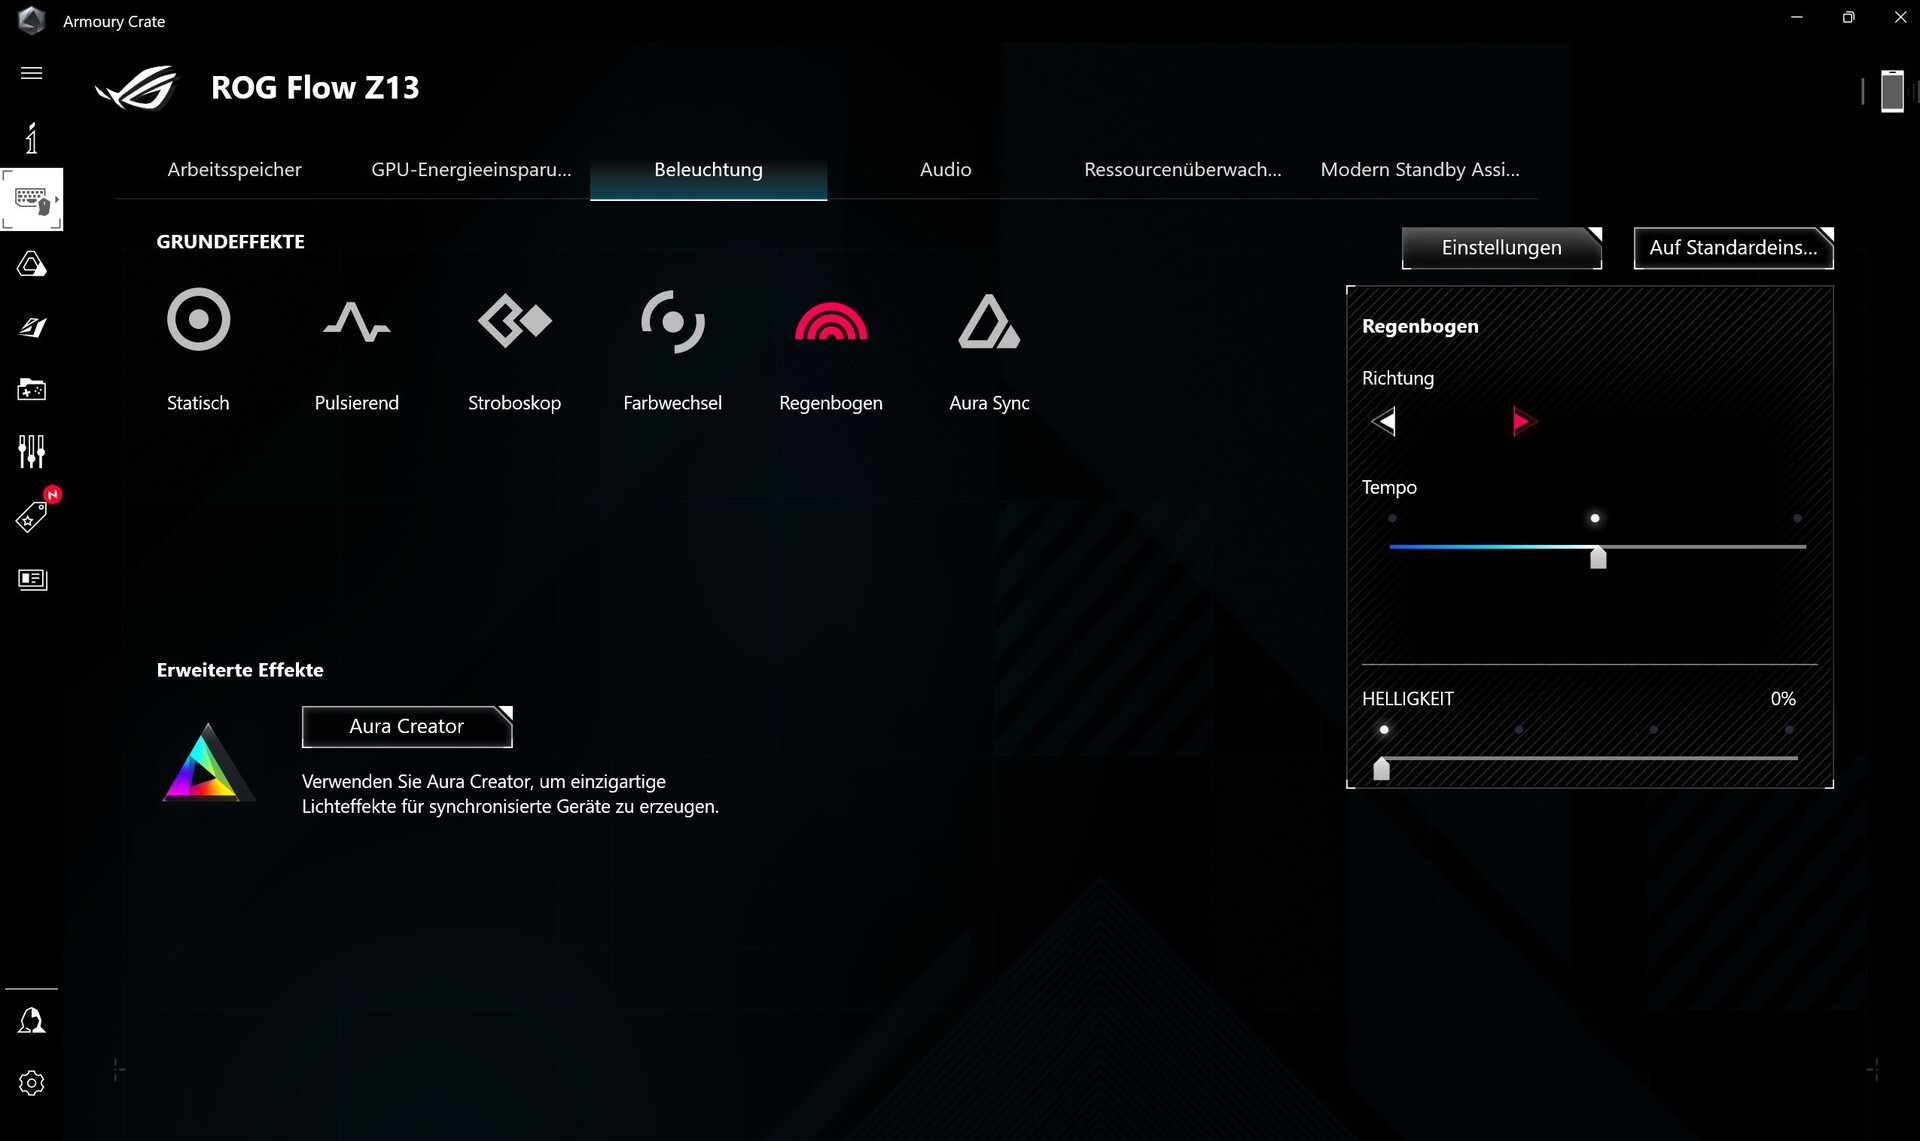
Gli utenti dovrebbero familiarizzare con il software: oltre alle quattro modalità di prestazioni Quiet, Performance, Turbo e Manual, c'è la possibilità di cambiare la grafica, personalizzare l'illuminazione, configurare l'audio e molto altro. Per poterlo fare, è necessario acconsentire preventivamente alla raccolta dei dati (anonimizzati) di Asus. Inoltre, l'app cerca gli aggiornamenti per un tempo terribilmente lungo, e a volte la ricerca viene attivata involontariamente. Almeno l'app può essere facilmente chiusa e riavviata.
A causa del carattere simile a un tablet, abbiamo eseguito tutti i benchmark in modalità Performance , ma presentiamo anche i valori per le modalità Turbo e Quiet .

Processore
L'Intel Core i9-13900H di solito non trova posto in un tablet, poiché è più probabile che appaia nei portatili da gioco. La CPU Gen13 di fascia alta della serie Alder-Lage ha tutti i 6 core P e gli 8 core E, che hanno un clock compreso tra 1,9 (core E con clock di base) e 5,4 GHz (turbo singolo).
A seconda della modalità di prestazioni, i valori PL1 e PL2 variano:
| Modalità di funzionamento | PL1 | PL2 | CB R23 Multi |
|---|---|---|---|
| Silenzioso | 20 | 36 | 8,686 |
| Performance | 55 | 95 | 15.788 |
| Turbo | 65 | 95 | 16,811 |
| Batteria | 55 | 55 | 14,283 |
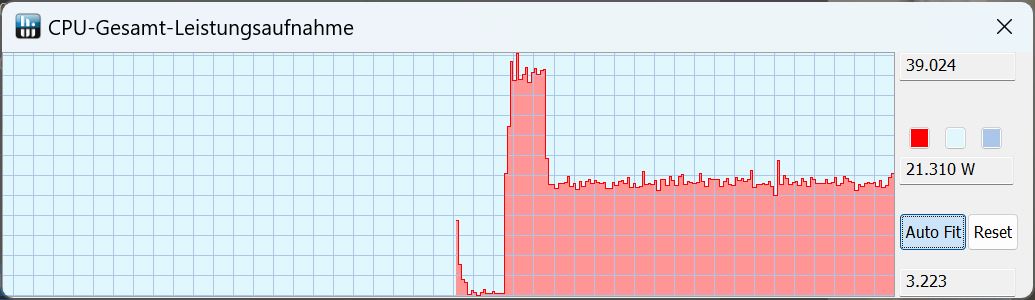
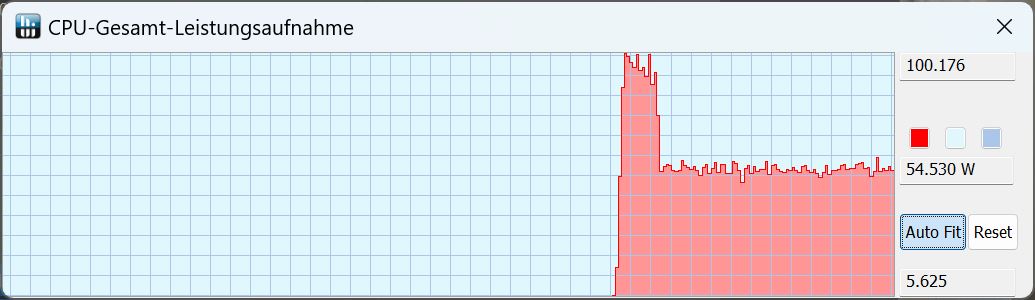
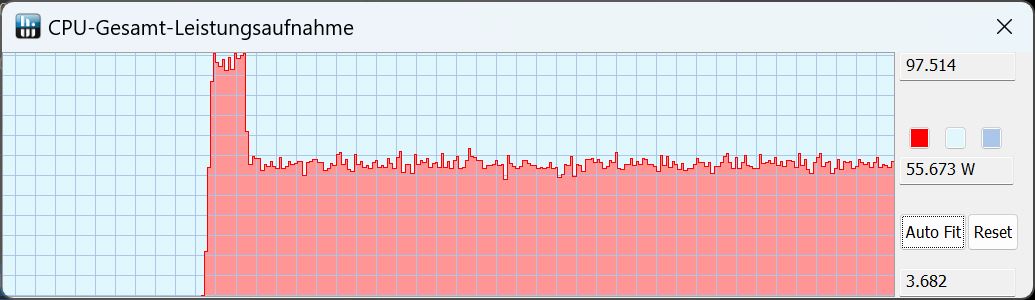
Nel ciclo Cinebench, lo Z13 raggiunge inizialmente un TDP di 100 W, ma scende rapidamente a circa 55 W prima di rimanere stabile. Parallelamente, il punteggio è leggermente più alto nei primi due cicli di CB15, poi scende un po' e si stabilizza, mentre altri gamer con la stessa CPU sono più costanti e quindi calcolano anche più velocemente nel tempo. D'altra parte, la differenza tra il tablet e i portatili da gioco è notevolmente ridotta in termini di prestazioni della CPU.
Le prestazioni sono di altissimo livello in tutti i test, e la valutazione delle prestazioni è esattamente alla pari con uni9-13900Hquasi non ci si accorge che si tratta di un tablet.
Lontano dalla presa di corrente, le prestazioni della CPU scendono da 2908 a 1875 punti in Cinebench R15, con una differenza di circa il 35%.
Cinebench R15 Multi Sustained Load
Cinebench R23: Multi Core | Single Core
Cinebench R20: CPU (Multi Core) | CPU (Single Core)
Cinebench R15: CPU Multi 64Bit | CPU Single 64Bit
Blender: v2.79 BMW27 CPU
7-Zip 18.03: 7z b 4 | 7z b 4 -mmt1
Geekbench 5.5: Multi-Core | Single-Core
HWBOT x265 Benchmark v2.2: 4k Preset
LibreOffice : 20 Documents To PDF
R Benchmark 2.5: Overall mean
| CPU Performance rating | |
| Media della classe Gaming | |
| Asus ROG Flow Z13 GZ301V | |
| Asus ROG Flow Z13 ACRNM | |
| Media Intel Core i9-13900H | |
| Asus ROG Flow Z13 GZ301ZE | |
| Acer Predator Triton 300 SE | |
| MSI Katana 17 B13VFK | |
| MSI Cyborg 15 A12VF | |
| Cinebench R23 / Multi Core | |
| Media della classe Gaming (10488 - 42661, n=107, ultimi 2 anni) | |
| Asus ROG Flow Z13 ACRNM | |
| Asus ROG Flow Z13 GZ301V | |
| Media Intel Core i9-13900H (11997 - 20385, n=28) | |
| Acer Predator Triton 300 SE | |
| MSI Katana 17 B13VFK | |
| Asus ROG Flow Z13 GZ301ZE | |
| MSI Cyborg 15 A12VF | |
| Cinebench R23 / Single Core | |
| Asus ROG Flow Z13 GZ301V | |
| Asus ROG Flow Z13 ACRNM | |
| Media della classe Gaming (1166 - 2415, n=107, ultimi 2 anni) | |
| Asus ROG Flow Z13 GZ301ZE | |
| Acer Predator Triton 300 SE | |
| Media Intel Core i9-13900H (1297 - 2054, n=26) | |
| MSI Katana 17 B13VFK | |
| MSI Cyborg 15 A12VF | |
| Cinebench R20 / CPU (Multi Core) | |
| Media della classe Gaming (4029 - 16433, n=106, ultimi 2 anni) | |
| Asus ROG Flow Z13 ACRNM | |
| Asus ROG Flow Z13 GZ301V | |
| Media Intel Core i9-13900H (4935 - 7716, n=25) | |
| Acer Predator Triton 300 SE | |
| MSI Katana 17 B13VFK | |
| MSI Cyborg 15 A12VF | |
| Asus ROG Flow Z13 GZ301ZE | |
| Cinebench R20 / CPU (Single Core) | |
| Asus ROG Flow Z13 GZ301V | |
| Media della classe Gaming (442 - 913, n=106, ultimi 2 anni) | |
| Asus ROG Flow Z13 ACRNM | |
| Asus ROG Flow Z13 GZ301ZE | |
| Acer Predator Triton 300 SE | |
| Media Intel Core i9-13900H (428 - 792, n=25) | |
| MSI Katana 17 B13VFK | |
| MSI Cyborg 15 A12VF | |
| Cinebench R15 / CPU Multi 64Bit | |
| Media della classe Gaming (1578 - 6330, n=105, ultimi 2 anni) | |
| Asus ROG Flow Z13 GZ301V | |
| Asus ROG Flow Z13 ACRNM | |
| Asus ROG Flow Z13 GZ301ZE | |
| Media Intel Core i9-13900H (2061 - 3100, n=26) | |
| Acer Predator Triton 300 SE | |
| MSI Katana 17 B13VFK | |
| MSI Cyborg 15 A12VF | |
| Cinebench R15 / CPU Single 64Bit | |
| Media della classe Gaming (188.8 - 350, n=106, ultimi 2 anni) | |
| Asus ROG Flow Z13 GZ301V | |
| Asus ROG Flow Z13 ACRNM | |
| Asus ROG Flow Z13 GZ301ZE | |
| Acer Predator Triton 300 SE | |
| Media Intel Core i9-13900H (211 - 297, n=26) | |
| MSI Katana 17 B13VFK | |
| MSI Cyborg 15 A12VF | |
| Blender / v2.79 BMW27 CPU | |
| MSI Cyborg 15 A12VF | |
| Asus ROG Flow Z13 GZ301ZE | |
| MSI Katana 17 B13VFK | |
| Media Intel Core i9-13900H (166 - 268, n=24) | |
| Acer Predator Triton 300 SE | |
| Asus ROG Flow Z13 GZ301V | |
| Asus ROG Flow Z13 ACRNM | |
| Media della classe Gaming (79 - 330, n=104, ultimi 2 anni) | |
| 7-Zip 18.03 / 7z b 4 | |
| Media della classe Gaming (33491 - 148086, n=105, ultimi 2 anni) | |
| Asus ROG Flow Z13 GZ301V | |
| Asus ROG Flow Z13 ACRNM | |
| Media Intel Core i9-13900H (45045 - 79032, n=25) | |
| Acer Predator Triton 300 SE | |
| Asus ROG Flow Z13 GZ301ZE | |
| MSI Katana 17 B13VFK | |
| MSI Cyborg 15 A12VF | |
| 7-Zip 18.03 / 7z b 4 -mmt1 | |
| Asus ROG Flow Z13 GZ301V | |
| Media della classe Gaming (4199 - 7436, n=105, ultimi 2 anni) | |
| Asus ROG Flow Z13 ACRNM | |
| Asus ROG Flow Z13 GZ301ZE | |
| Media Intel Core i9-13900H (3665 - 6600, n=25) | |
| MSI Cyborg 15 A12VF | |
| MSI Katana 17 B13VFK | |
| Acer Predator Triton 300 SE | |
| Geekbench 5.5 / Multi-Core | |
| Media della classe Gaming (6460 - 28263, n=105, ultimi 2 anni) | |
| Asus ROG Flow Z13 GZ301V | |
| Asus ROG Flow Z13 ACRNM | |
| Asus ROG Flow Z13 GZ301ZE | |
| Acer Predator Triton 300 SE | |
| Media Intel Core i9-13900H (9094 - 15410, n=26) | |
| MSI Katana 17 B13VFK | |
| MSI Cyborg 15 A12VF | |
| Geekbench 5.5 / Single-Core | |
| Media della classe Gaming (986 - 2474, n=105, ultimi 2 anni) | |
| Asus ROG Flow Z13 GZ301V | |
| Asus ROG Flow Z13 ACRNM | |
| Media Intel Core i9-13900H (1140 - 2043, n=26) | |
| Asus ROG Flow Z13 GZ301ZE | |
| Acer Predator Triton 300 SE | |
| MSI Katana 17 B13VFK | |
| MSI Cyborg 15 A12VF | |
| HWBOT x265 Benchmark v2.2 / 4k Preset | |
| Media della classe Gaming (11.5 - 44.4, n=105, ultimi 2 anni) | |
| Asus ROG Flow Z13 ACRNM | |
| Asus ROG Flow Z13 GZ301V | |
| Acer Predator Triton 300 SE | |
| Media Intel Core i9-13900H (14.1 - 22.3, n=25) | |
| Asus ROG Flow Z13 GZ301ZE | |
| MSI Katana 17 B13VFK | |
| MSI Cyborg 15 A12VF | |
| MSI Cyborg 15 A12VF | |
| LibreOffice / 20 Documents To PDF | |
| Asus ROG Flow Z13 ACRNM | |
| MSI Katana 17 B13VFK | |
| Media della classe Gaming (33.2 - 88.8, n=105, ultimi 2 anni) | |
| Media Intel Core i9-13900H (34.4 - 82.8, n=25) | |
| Asus ROG Flow Z13 GZ301ZE | |
| Acer Predator Triton 300 SE | |
| Asus ROG Flow Z13 GZ301V | |
| MSI Cyborg 15 A12VF | |
| R Benchmark 2.5 / Overall mean | |
| MSI Cyborg 15 A12VF | |
| Media Intel Core i9-13900H (0.4052 - 0.723, n=25) | |
| MSI Katana 17 B13VFK | |
| Acer Predator Triton 300 SE | |
| Media della classe Gaming (0.3439 - 0.759, n=106, ultimi 2 anni) | |
| Asus ROG Flow Z13 GZ301ZE | |
| Asus ROG Flow Z13 ACRNM | |
| Asus ROG Flow Z13 GZ301V | |
* ... Meglio usare valori piccoli
AIDA64: FP32 Ray-Trace | FPU Julia | CPU SHA3 | CPU Queen | FPU SinJulia | FPU Mandel | CPU AES | CPU ZLib | FP64 Ray-Trace | CPU PhotoWorxx
| Performance rating | |
| Media della classe Gaming | |
| Acer Predator Triton 300 SE | |
| Asus ROG Flow Z13 ACRNM | |
| Asus ROG Flow Z13 GZ301V | |
| Media Intel Core i9-13900H | |
| MSI Cyborg 15 A12VF | |
| MSI Katana 17 B13VFK | |
| Asus ROG Flow Z13 GZ301ZE | |
| AIDA64 / FP32 Ray-Trace | |
| Media della classe Gaming (10227 - 85542, n=105, ultimi 2 anni) | |
| Asus ROG Flow Z13 ACRNM | |
| Asus ROG Flow Z13 GZ301V | |
| Acer Predator Triton 300 SE | |
| Media Intel Core i9-13900H (6788 - 19557, n=25) | |
| MSI Katana 17 B13VFK | |
| MSI Cyborg 15 A12VF | |
| Asus ROG Flow Z13 GZ301ZE | |
| AIDA64 / FPU Julia | |
| Media della classe Gaming (51376 - 238426, n=105, ultimi 2 anni) | |
| Asus ROG Flow Z13 ACRNM | |
| Asus ROG Flow Z13 GZ301V | |
| Media Intel Core i9-13900H (22551 - 95579, n=25) | |
| Acer Predator Triton 300 SE | |
| MSI Cyborg 15 A12VF | |
| MSI Katana 17 B13VFK | |
| Asus ROG Flow Z13 GZ301ZE | |
| AIDA64 / CPU SHA3 | |
| Media della classe Gaming (2180 - 10115, n=105, ultimi 2 anni) | |
| Asus ROG Flow Z13 ACRNM | |
| Acer Predator Triton 300 SE | |
| Media Intel Core i9-13900H (2491 - 4270, n=25) | |
| Asus ROG Flow Z13 GZ301V | |
| MSI Cyborg 15 A12VF | |
| MSI Katana 17 B13VFK | |
| Asus ROG Flow Z13 GZ301ZE | |
| AIDA64 / CPU Queen | |
| Media della classe Gaming (49785 - 173351, n=90, ultimi 2 anni) | |
| Asus ROG Flow Z13 GZ301V | |
| Asus ROG Flow Z13 ACRNM | |
| Acer Predator Triton 300 SE | |
| Media Intel Core i9-13900H (65121 - 120936, n=25) | |
| Asus ROG Flow Z13 GZ301ZE | |
| MSI Cyborg 15 A12VF | |
| MSI Katana 17 B13VFK | |
| AIDA64 / FPU SinJulia | |
| Media della classe Gaming (4424 - 33636, n=105, ultimi 2 anni) | |
| Asus ROG Flow Z13 ACRNM | |
| Asus ROG Flow Z13 GZ301V | |
| Acer Predator Triton 300 SE | |
| Media Intel Core i9-13900H (6108 - 11631, n=25) | |
| Asus ROG Flow Z13 GZ301ZE | |
| MSI Cyborg 15 A12VF | |
| MSI Katana 17 B13VFK | |
| AIDA64 / FPU Mandel | |
| Media della classe Gaming (25115 - 128721, n=105, ultimi 2 anni) | |
| Asus ROG Flow Z13 ACRNM | |
| Asus ROG Flow Z13 GZ301V | |
| Media Intel Core i9-13900H (11283 - 48474, n=25) | |
| Acer Predator Triton 300 SE | |
| MSI Katana 17 B13VFK | |
| MSI Cyborg 15 A12VF | |
| Asus ROG Flow Z13 GZ301ZE | |
| AIDA64 / CPU AES | |
| Acer Predator Triton 300 SE | |
| Media della classe Gaming (39258 - 247074, n=105, ultimi 2 anni) | |
| Media Intel Core i9-13900H (3691 - 149377, n=25) | |
| Asus ROG Flow Z13 GZ301ZE | |
| Asus ROG Flow Z13 ACRNM | |
| Asus ROG Flow Z13 GZ301V | |
| MSI Cyborg 15 A12VF | |
| MSI Katana 17 B13VFK | |
| AIDA64 / CPU ZLib | |
| Media della classe Gaming (574 - 2531, n=105, ultimi 2 anni) | |
| Asus ROG Flow Z13 ACRNM | |
| Asus ROG Flow Z13 GZ301V | |
| Media Intel Core i9-13900H (789 - 1254, n=25) | |
| Acer Predator Triton 300 SE | |
| Asus ROG Flow Z13 GZ301ZE | |
| MSI Cyborg 15 A12VF | |
| MSI Katana 17 B13VFK | |
| AIDA64 / FP64 Ray-Trace | |
| Media della classe Gaming (5509 - 45446, n=105, ultimi 2 anni) | |
| Asus ROG Flow Z13 ACRNM | |
| Asus ROG Flow Z13 GZ301V | |
| Media Intel Core i9-13900H (3655 - 10716, n=25) | |
| Acer Predator Triton 300 SE | |
| MSI Katana 17 B13VFK | |
| MSI Cyborg 15 A12VF | |
| Asus ROG Flow Z13 GZ301ZE | |
| AIDA64 / CPU PhotoWorxx | |
| Acer Predator Triton 300 SE | |
| Media della classe Gaming (12271 - 89891, n=105, ultimi 2 anni) | |
| Asus ROG Flow Z13 ACRNM | |
| Asus ROG Flow Z13 GZ301ZE | |
| Asus ROG Flow Z13 GZ301V | |
| Media Intel Core i9-13900H (10871 - 50488, n=25) | |
| MSI Cyborg 15 A12VF | |
| MSI Katana 17 B13VFK | |
Prestazioni del sistema
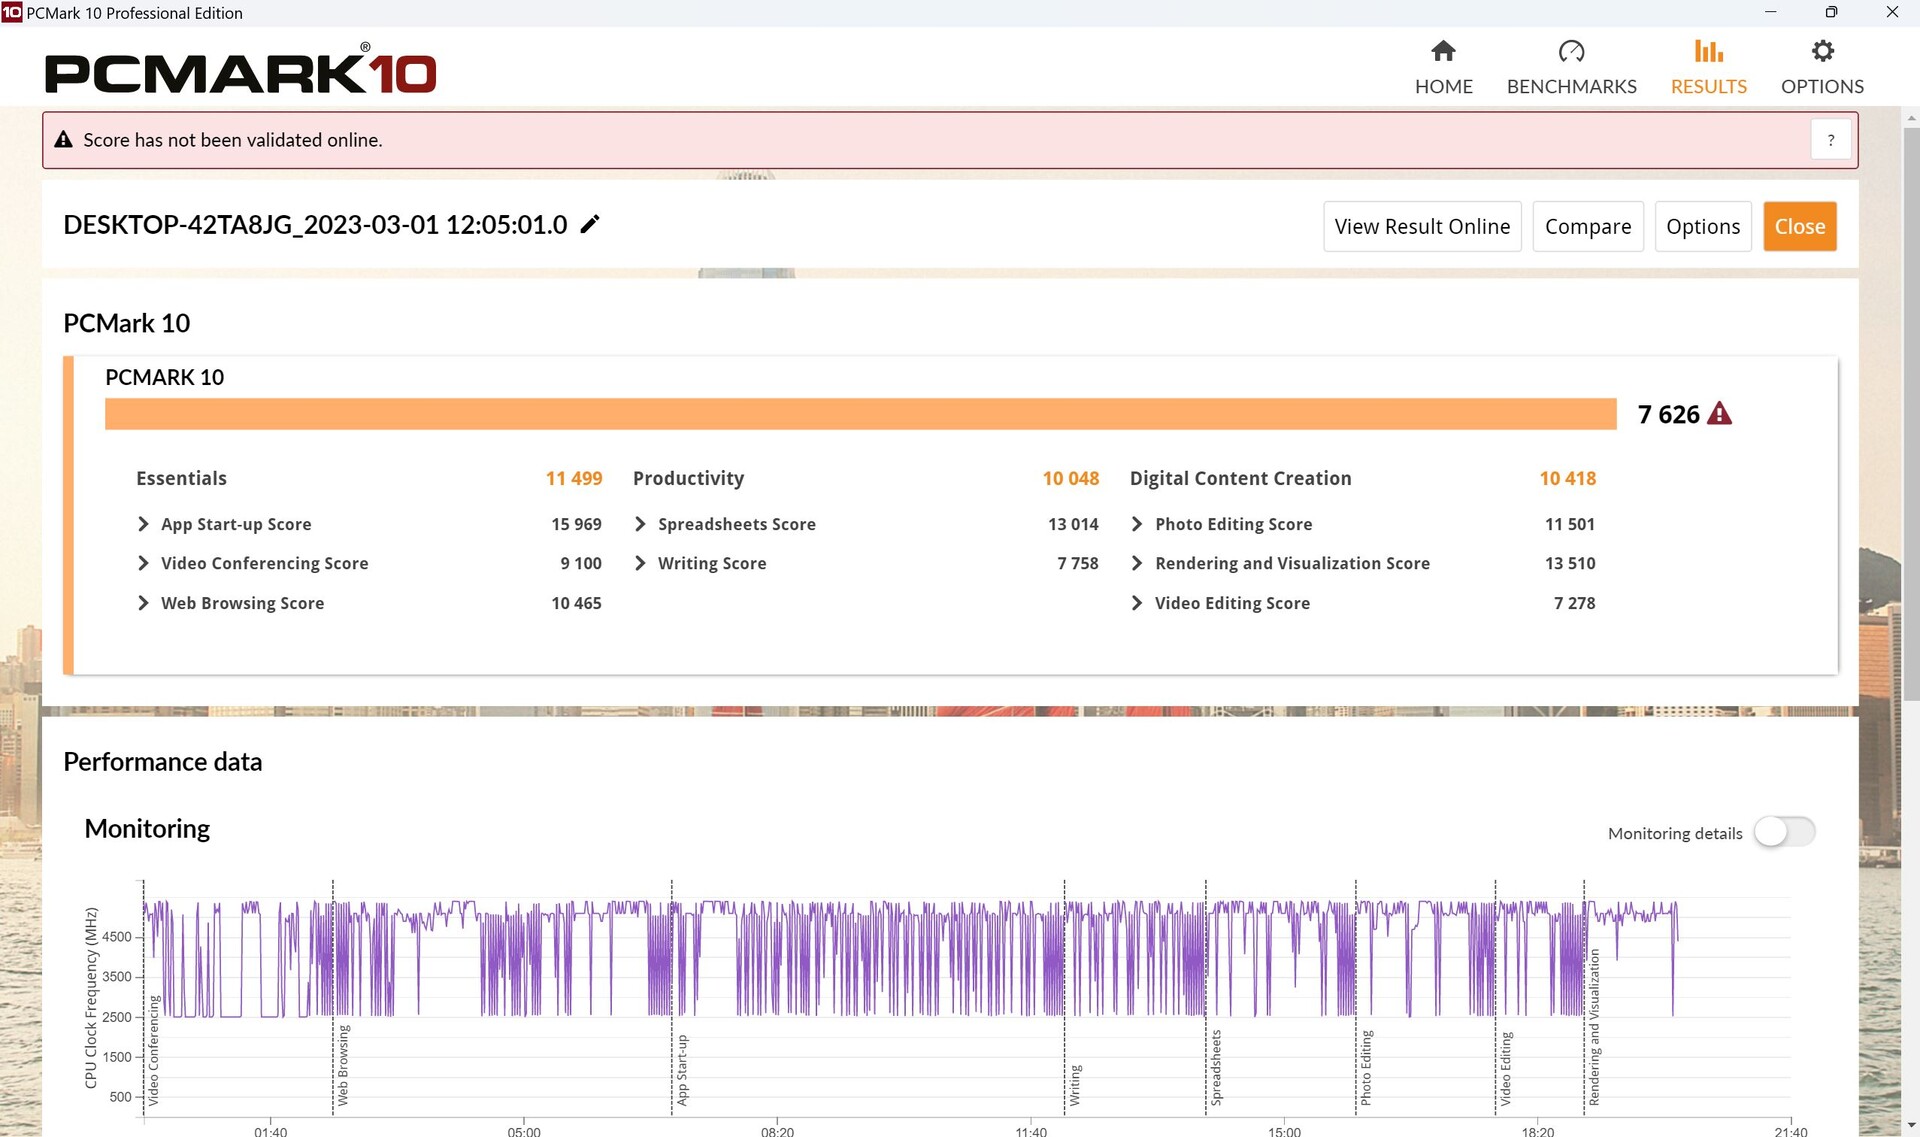
Lo Z13 si comporta bene in PCMark 10. Lascia il suopredecessoredi circa il 17%; il Gigabyte Aero 16con la stessa CPU ha un vantaggio di solo il 6%, il che è piuttosto impressionante per un tablet!
Anche nell'uso quotidiano tutto è meravigliosamente fluido.
CrossMark: Overall | Productivity | Creativity | Responsiveness
| PCMark 10 / Score | |
| Media della classe Gaming (5828 - 12414, n=93, ultimi 2 anni) | |
| Asus ROG Flow Z13 ACRNM | |
| Media Intel Core i9-13900H, NVIDIA GeForce RTX 4060 Laptop GPU (7578 - 7884, n=3) | |
| Asus ROG Flow Z13 GZ301V | |
| Acer Predator Triton 300 SE | |
| MSI Katana 17 B13VFK | |
| MSI Cyborg 15 A12VF | |
| Asus ROG Flow Z13 GZ301ZE | |
| PCMark 10 / Essentials | |
| Asus ROG Flow Z13 GZ301V | |
| Media Intel Core i9-13900H, NVIDIA GeForce RTX 4060 Laptop GPU (11235 - 11539, n=3) | |
| Acer Predator Triton 300 SE | |
| Asus ROG Flow Z13 ACRNM | |
| MSI Katana 17 B13VFK | |
| Asus ROG Flow Z13 GZ301ZE | |
| MSI Cyborg 15 A12VF | |
| Media della classe Gaming (8810 - 11935, n=97, ultimi 2 anni) | |
| PCMark 10 / Productivity | |
| Media della classe Gaming (6845 - 25323, n=95, ultimi 2 anni) | |
| Acer Predator Triton 300 SE | |
| Media Intel Core i9-13900H, NVIDIA GeForce RTX 4060 Laptop GPU (9888 - 10222, n=3) | |
| Asus ROG Flow Z13 GZ301V | |
| MSI Cyborg 15 A12VF | |
| Asus ROG Flow Z13 ACRNM | |
| Asus ROG Flow Z13 GZ301ZE | |
| MSI Katana 17 B13VFK | |
| PCMark 10 / Digital Content Creation | |
| Media della classe Gaming (7602 - 19954, n=95, ultimi 2 anni) | |
| Asus ROG Flow Z13 ACRNM | |
| Media Intel Core i9-13900H, NVIDIA GeForce RTX 4060 Laptop GPU (10418 - 11272, n=3) | |
| Acer Predator Triton 300 SE | |
| Asus ROG Flow Z13 GZ301V | |
| MSI Katana 17 B13VFK | |
| MSI Cyborg 15 A12VF | |
| Asus ROG Flow Z13 GZ301ZE | |
| CrossMark / Overall | |
| Asus ROG Flow Z13 GZ301ZE | |
| Media della classe Gaming (1366 - 2409, n=94, ultimi 2 anni) | |
| Asus ROG Flow Z13 GZ301V | |
| Acer Predator Triton 300 SE | |
| Media Intel Core i9-13900H, NVIDIA GeForce RTX 4060 Laptop GPU (1874 - 1983, n=3) | |
| Asus ROG Flow Z13 ACRNM | |
| MSI Katana 17 B13VFK | |
| MSI Cyborg 15 A12VF | |
| CrossMark / Productivity | |
| Asus ROG Flow Z13 GZ301ZE | |
| Asus ROG Flow Z13 GZ301V | |
| Acer Predator Triton 300 SE | |
| Media della classe Gaming (1386 - 2254, n=94, ultimi 2 anni) | |
| Media Intel Core i9-13900H, NVIDIA GeForce RTX 4060 Laptop GPU (1779 - 1889, n=3) | |
| Asus ROG Flow Z13 ACRNM | |
| MSI Katana 17 B13VFK | |
| MSI Cyborg 15 A12VF | |
| CrossMark / Creativity | |
| Media della classe Gaming (1343 - 2786, n=94, ultimi 2 anni) | |
| Asus ROG Flow Z13 GZ301V | |
| Asus ROG Flow Z13 ACRNM | |
| Asus ROG Flow Z13 GZ301ZE | |
| Media Intel Core i9-13900H, NVIDIA GeForce RTX 4060 Laptop GPU (2104 - 2195, n=3) | |
| Acer Predator Triton 300 SE | |
| MSI Katana 17 B13VFK | |
| MSI Cyborg 15 A12VF | |
| CrossMark / Responsiveness | |
| Asus ROG Flow Z13 GZ301ZE | |
| Acer Predator Triton 300 SE | |
| MSI Katana 17 B13VFK | |
| Media della classe Gaming (1226 - 2334, n=94, ultimi 2 anni) | |
| Asus ROG Flow Z13 GZ301V | |
| Asus ROG Flow Z13 ACRNM | |
| MSI Cyborg 15 A12VF | |
| Media Intel Core i9-13900H, NVIDIA GeForce RTX 4060 Laptop GPU (1548 - 1698, n=3) | |
| PCMark 10 Score | 7626 punti | |
Aiuto | ||
| AIDA64 / Memory Copy | |
| Asus ROG Flow Z13 GZ301ZE | |
| Acer Predator Triton 300 SE | |
| Media della classe Gaming (21750 - 129946, n=105, ultimi 2 anni) | |
| Asus ROG Flow Z13 GZ301V | |
| Asus ROG Flow Z13 ACRNM | |
| Media Intel Core i9-13900H (37448 - 74486, n=25) | |
| MSI Cyborg 15 A12VF | |
| MSI Katana 17 B13VFK | |
| AIDA64 / Memory Read | |
| Acer Predator Triton 300 SE | |
| Media della classe Gaming (22956 - 118858, n=105, ultimi 2 anni) | |
| Asus ROG Flow Z13 GZ301ZE | |
| MSI Cyborg 15 A12VF | |
| Asus ROG Flow Z13 ACRNM | |
| Asus ROG Flow Z13 GZ301V | |
| Media Intel Core i9-13900H (41599 - 75433, n=25) | |
| MSI Katana 17 B13VFK | |
| AIDA64 / Memory Write | |
| Media della classe Gaming (22297 - 135096, n=105, ultimi 2 anni) | |
| Asus ROG Flow Z13 GZ301V | |
| Asus ROG Flow Z13 ACRNM | |
| Media Intel Core i9-13900H (36152 - 88505, n=25) | |
| Acer Predator Triton 300 SE | |
| Asus ROG Flow Z13 GZ301ZE | |
| MSI Cyborg 15 A12VF | |
| MSI Katana 17 B13VFK | |
| AIDA64 / Memory Latency | |
| Media della classe Gaming (75.3 - 259, n=105, ultimi 2 anni) | |
| Asus ROG Flow Z13 GZ301ZE | |
| Acer Predator Triton 300 SE | |
| MSI Katana 17 B13VFK | |
| MSI Cyborg 15 A12VF | |
| Asus ROG Flow Z13 ACRNM | |
| Media Intel Core i9-13900H (75.8 - 102.3, n=25) | |
| Asus ROG Flow Z13 GZ301V | |
* ... Meglio usare valori piccoli
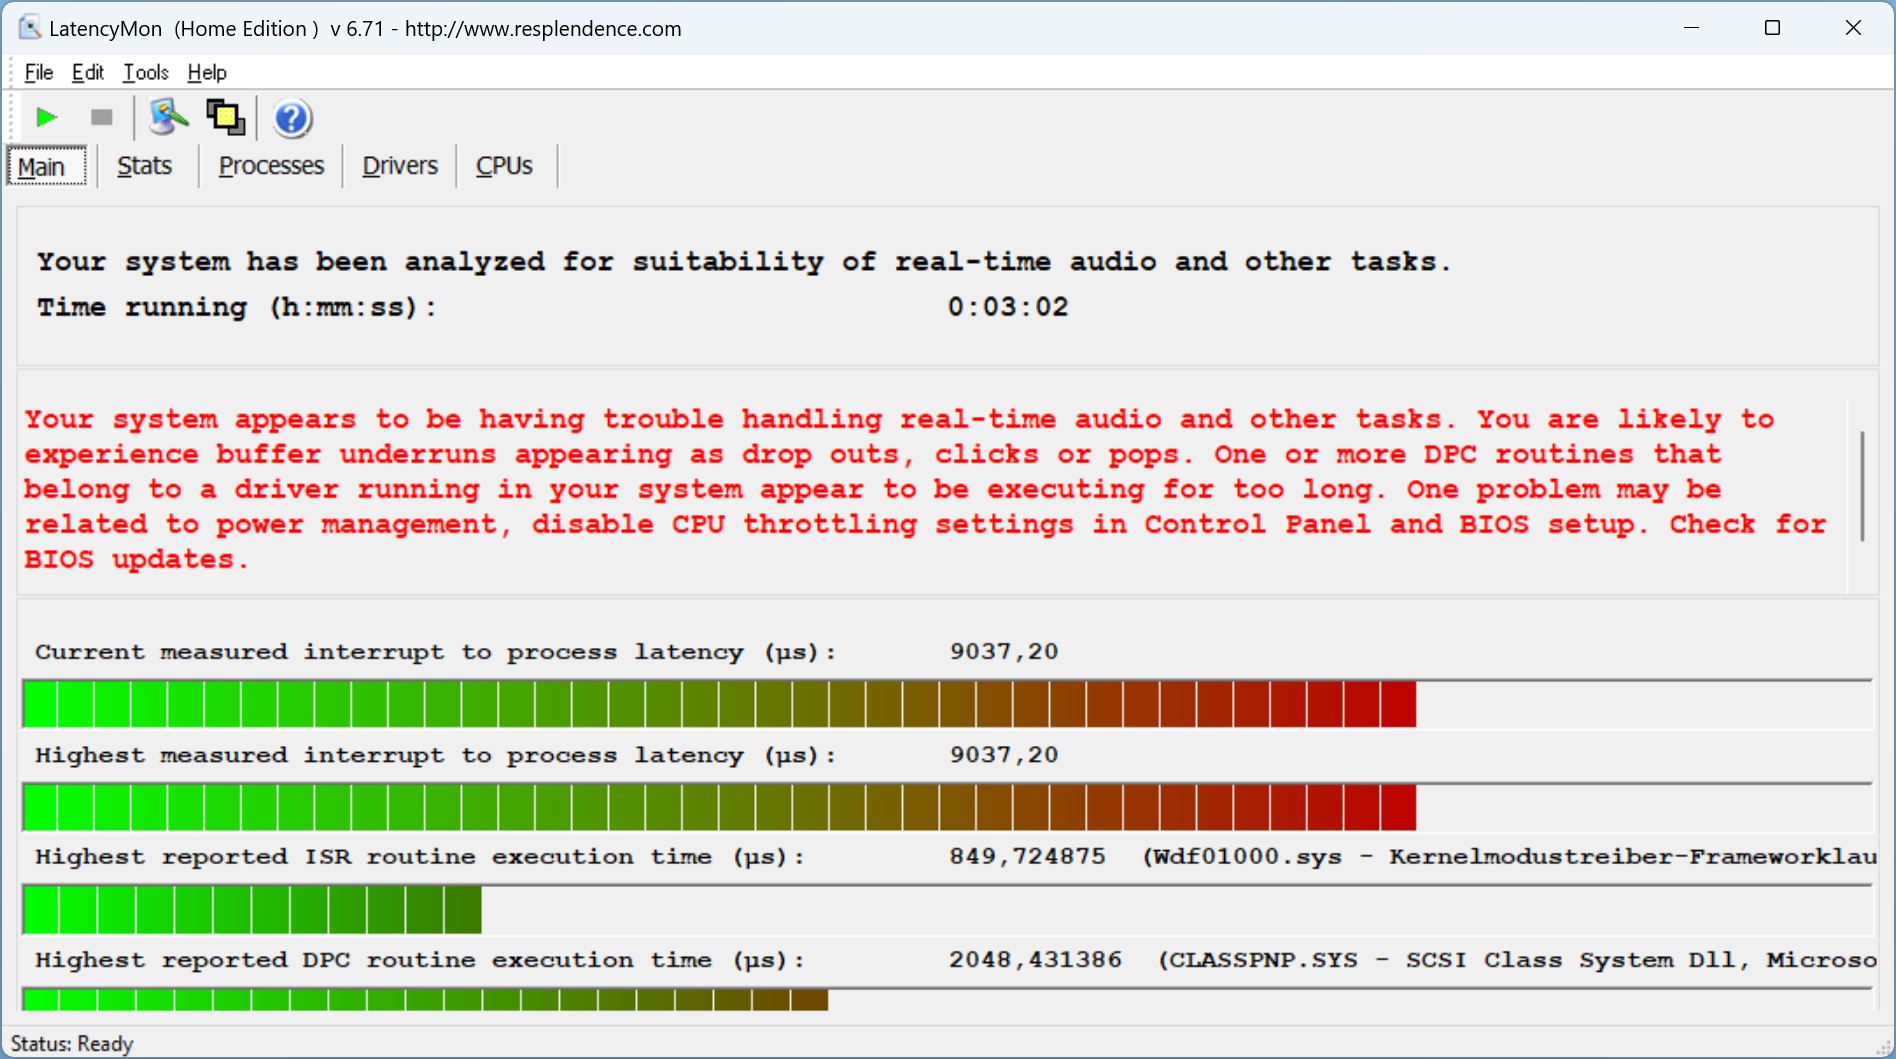
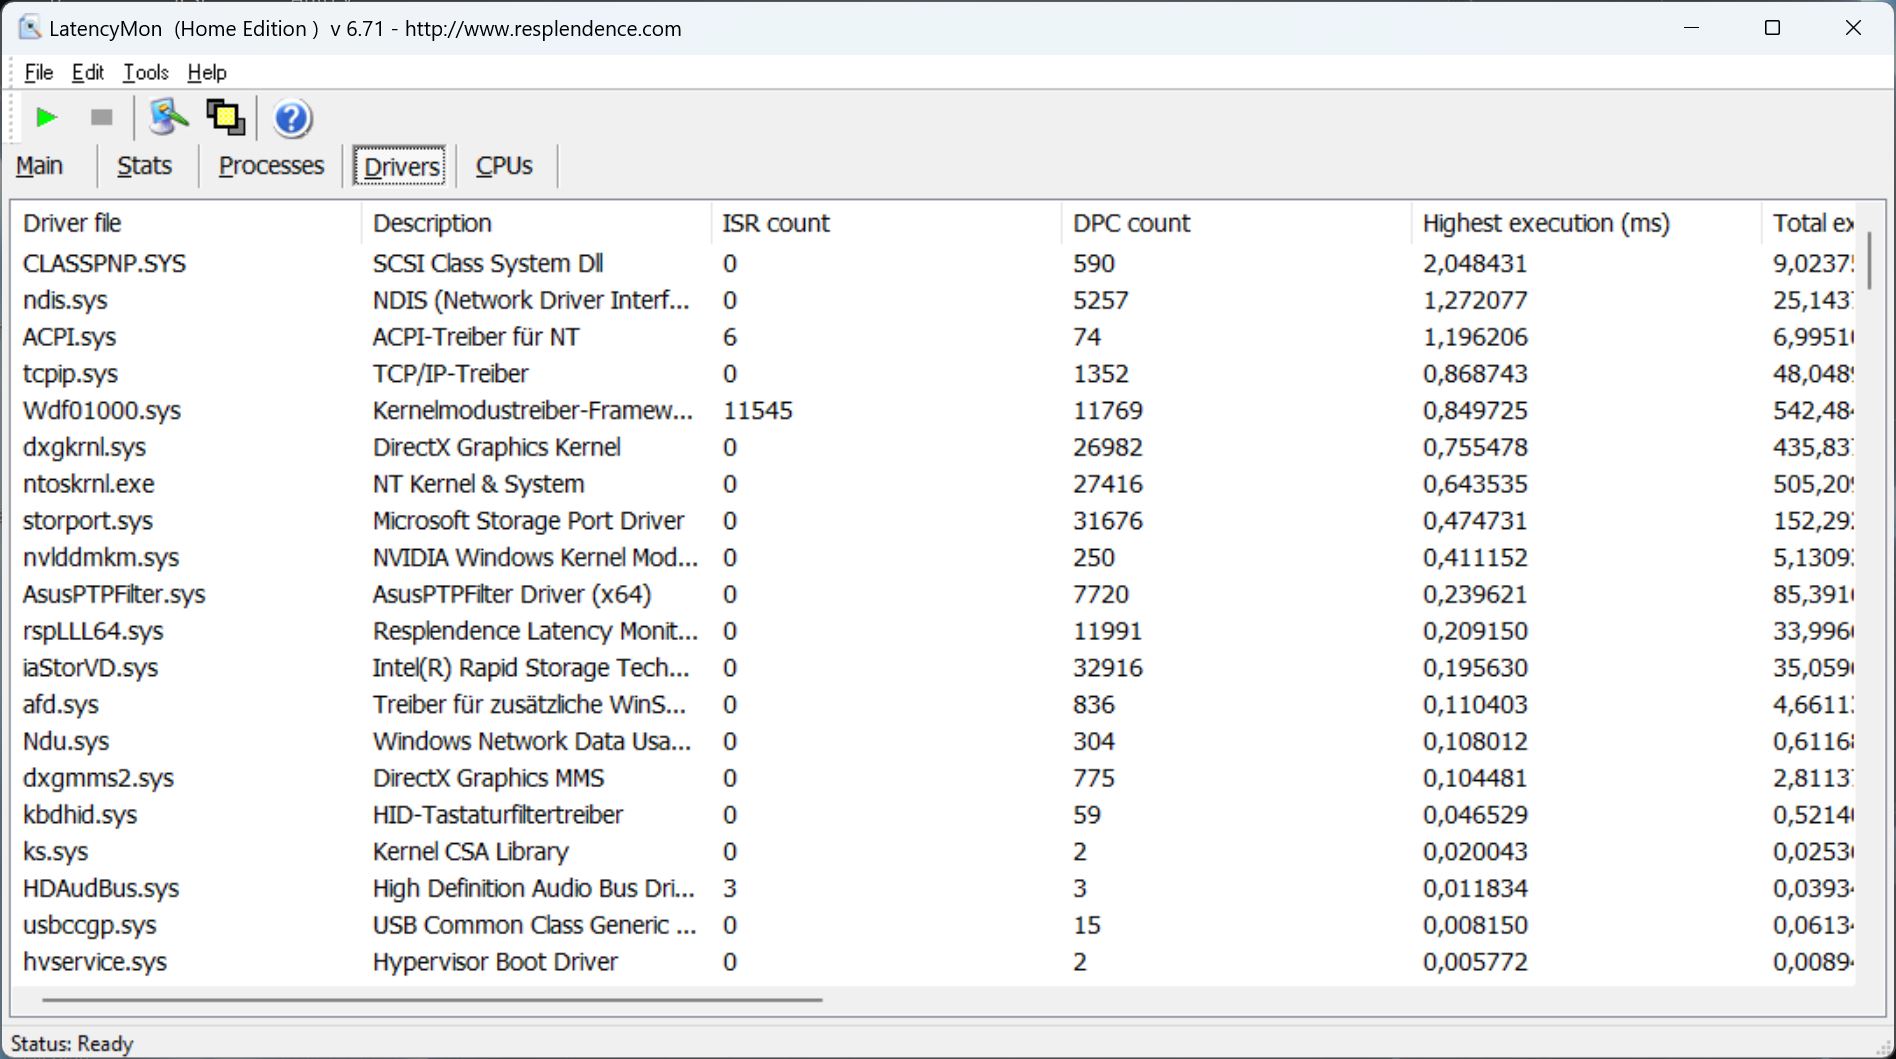
Latenza DPC
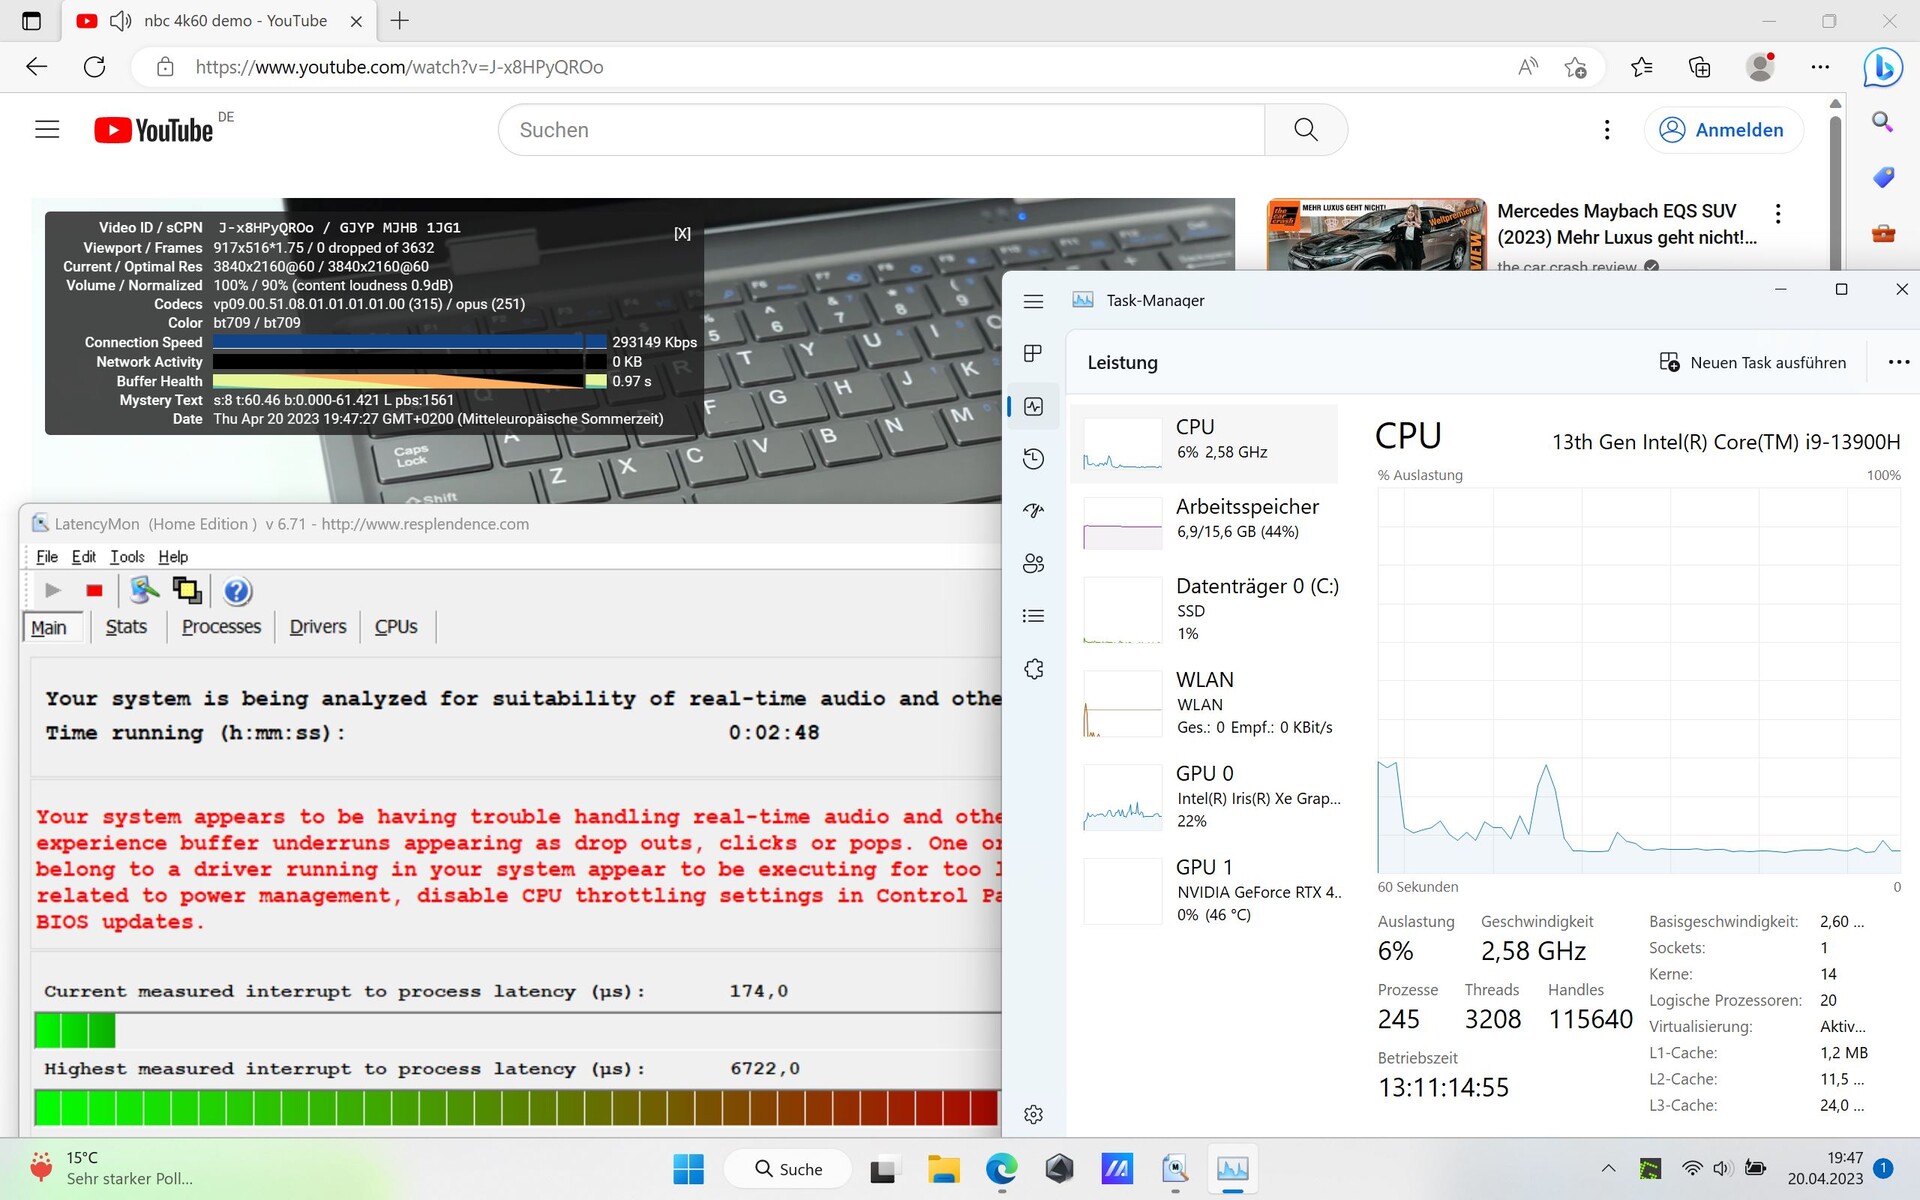
Quando si apre il browser web, si verificano le prime latenze, che si intensificano con l'apertura di più schede. Anche la riproduzione del nostro video di YouTube a 4K/60fps aumenta ulteriormente le latenze, anche se non si verificano cadute di fotogrammi. Alla fine, si stabilisce un valore molto alto e il problema delle latenze elevate nei driver Nvidia attuali dovrebbe essere in gran parte eliminato. Il Geforce 531.68 è stato rilasciato durante la nostra recensione, ma l'aggiornamento non ha cambiato nulla per quanto riguarda gli alti tassi di latenza. Quindi c'è sicuramente un margine di miglioramento per lo Z13 sotto questo aspetto, soprattutto se Asus vuole rivolgersi ai professionisti.
Un altro test ha rivelato una latenza di oltre 5.500 us durante l'apertura di un file di testo e la copia di un URL negli appunti.
| DPC Latencies / LatencyMon - interrupt to process latency (max), Web, Youtube, Prime95 | |
| Asus ROG Flow Z13 GZ301V | |
| Acer Predator Triton 300 SE | |
| MSI Katana 17 B13VFK | |
| Asus ROG Flow Z13 ACRNM | |
| Asus ROG Flow Z13 GZ301ZE | |
| MSI Cyborg 15 A12VF | |
* ... Meglio usare valori piccoli
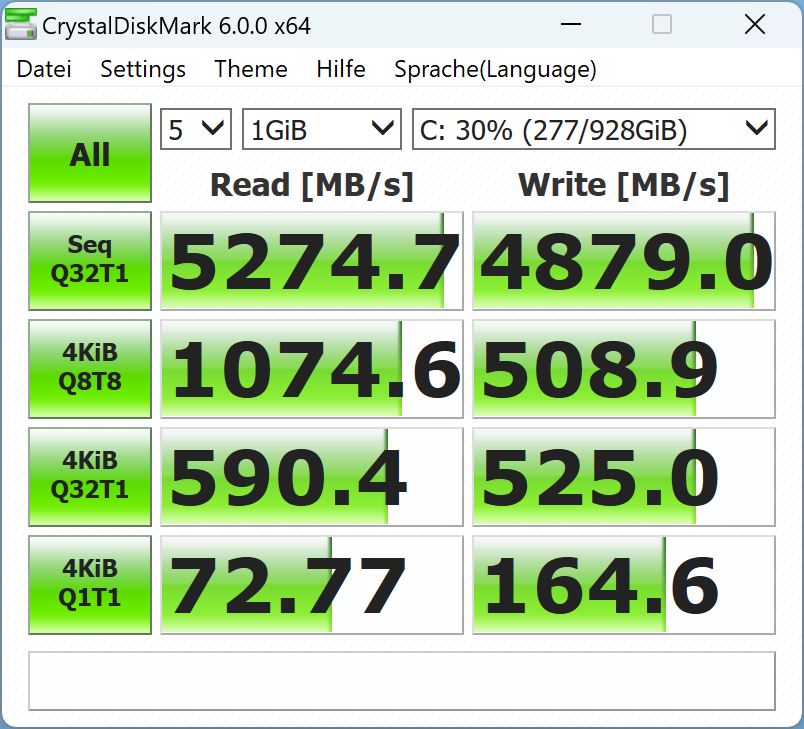
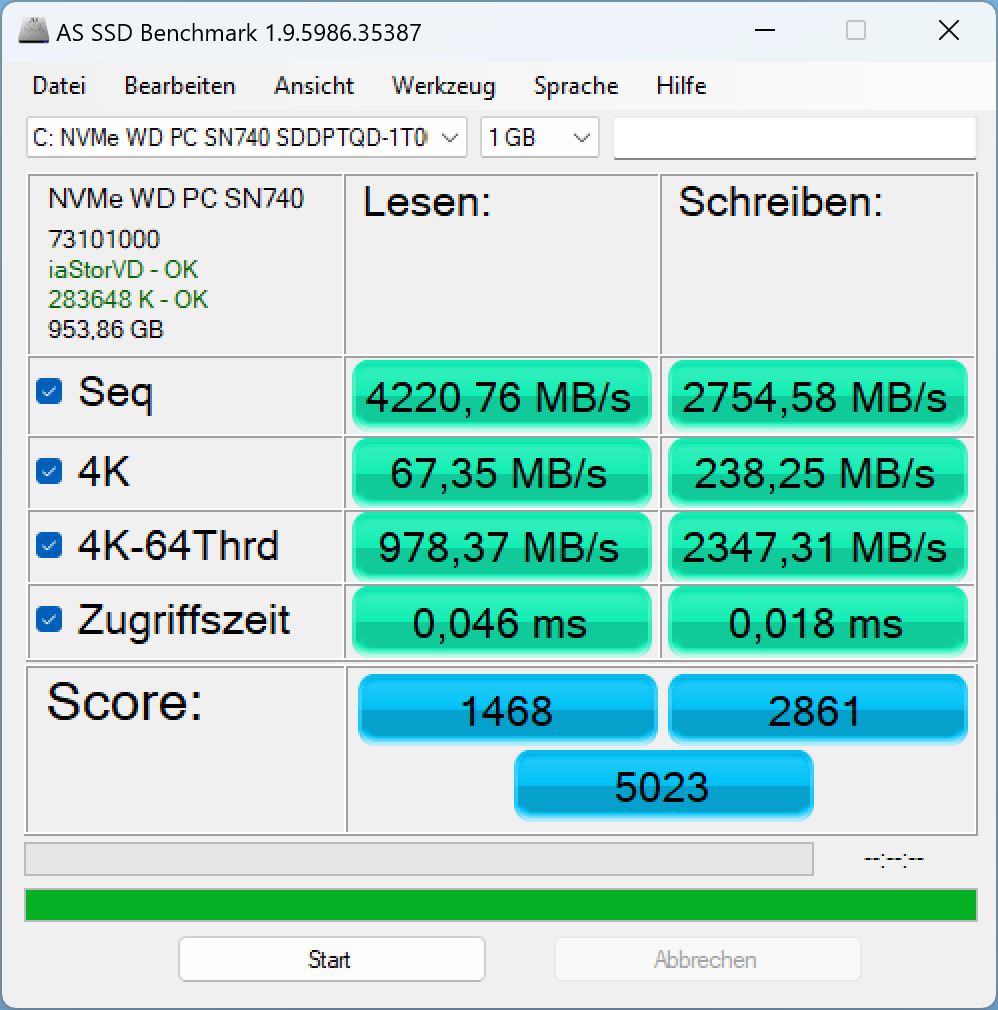
Dispositivi di archiviazione
A causa dello spazio limitato disponibile, Asus installa un'unità SSD NVMe da 1 TB nel piccolo formato M.2 2230. Le sostituzioni sono solitamente un po' più costose rispetto alle unità SSD M.2 2280 comunemente utilizzate. L'unità Western Digital SN740 si è classificata al 110 posto nellanostro elenco dei miglioriquindi non è il modello più veloce, ma supporta PCIe 4.0 e raggiunge la velocità desiderata. Soprattutto, raggiunge costantemente questa velocità, almeno in modalità Performance .

* ... Meglio usare valori piccoli
Sustained Read Performance: DiskSpd Read Loop, Queue Depth 8
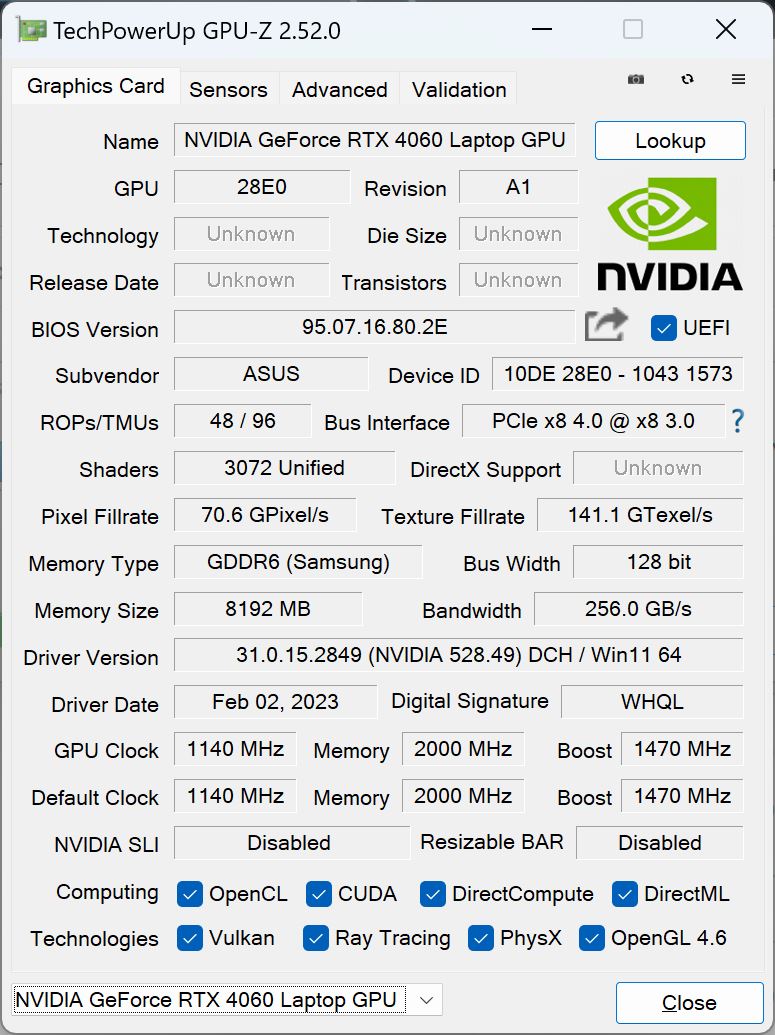
Scheda grafica
Il tablet contiene una Nvidia Geforce RTX 4060 - l'unica domanda è dove si trova nel sottile case. Naturalmente, con il fattore di forma del tablet si devono accettare alcuni tagli alle prestazioni 3D, quindi il consumo energetico è limitato a un massimo di 65 W (50 + 15 W Dynamic Boost).
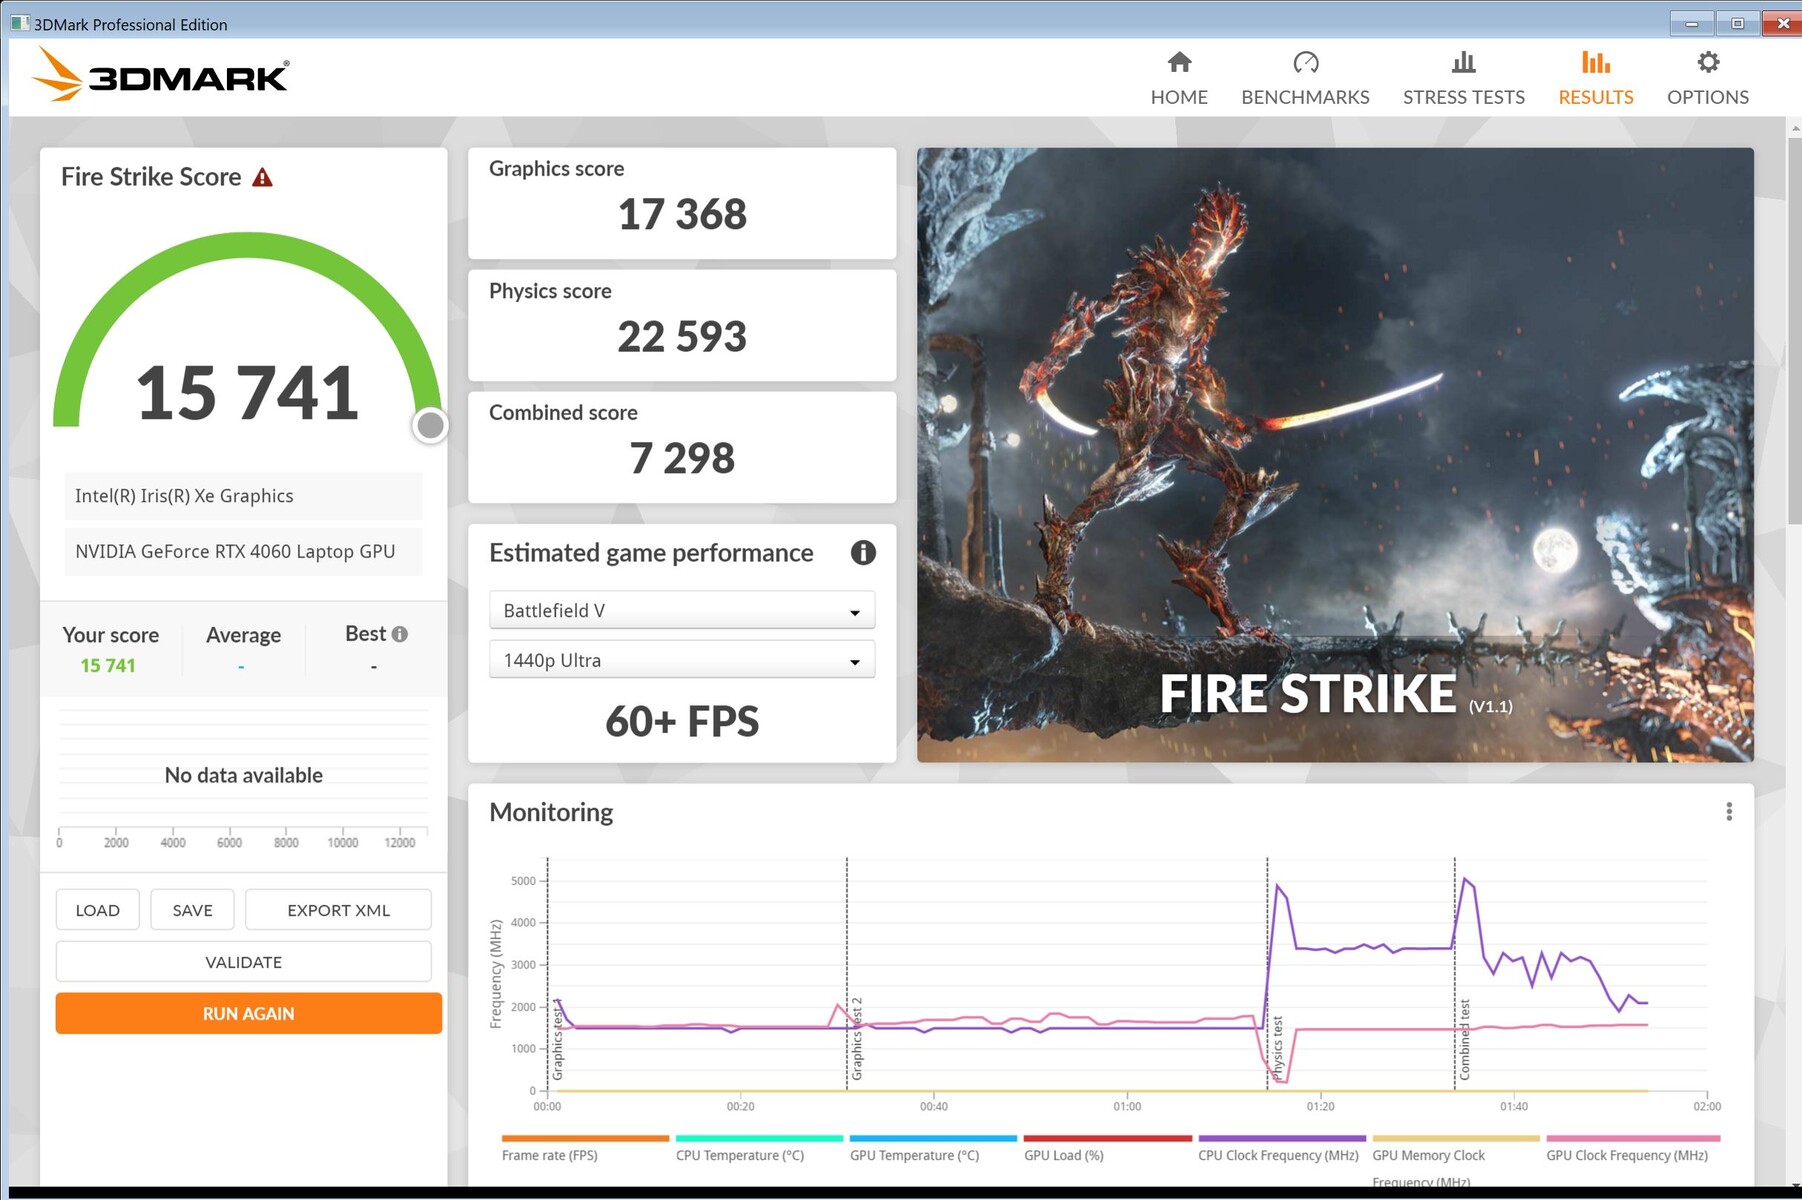
In 3DMark, il passaggio alla dGPU tramite Optimus a volte non funziona. Se si passa alla dGPU tramite MUX, i punteggi sono molto più vicini alla concorrenza dopo un riavvio.
In termini di risultati, la RTX 4060 dello Z13 ha prestazioni inferiori di circa il 17-18% rispetto alla media dei portatili da gioco con la stessa GPU.
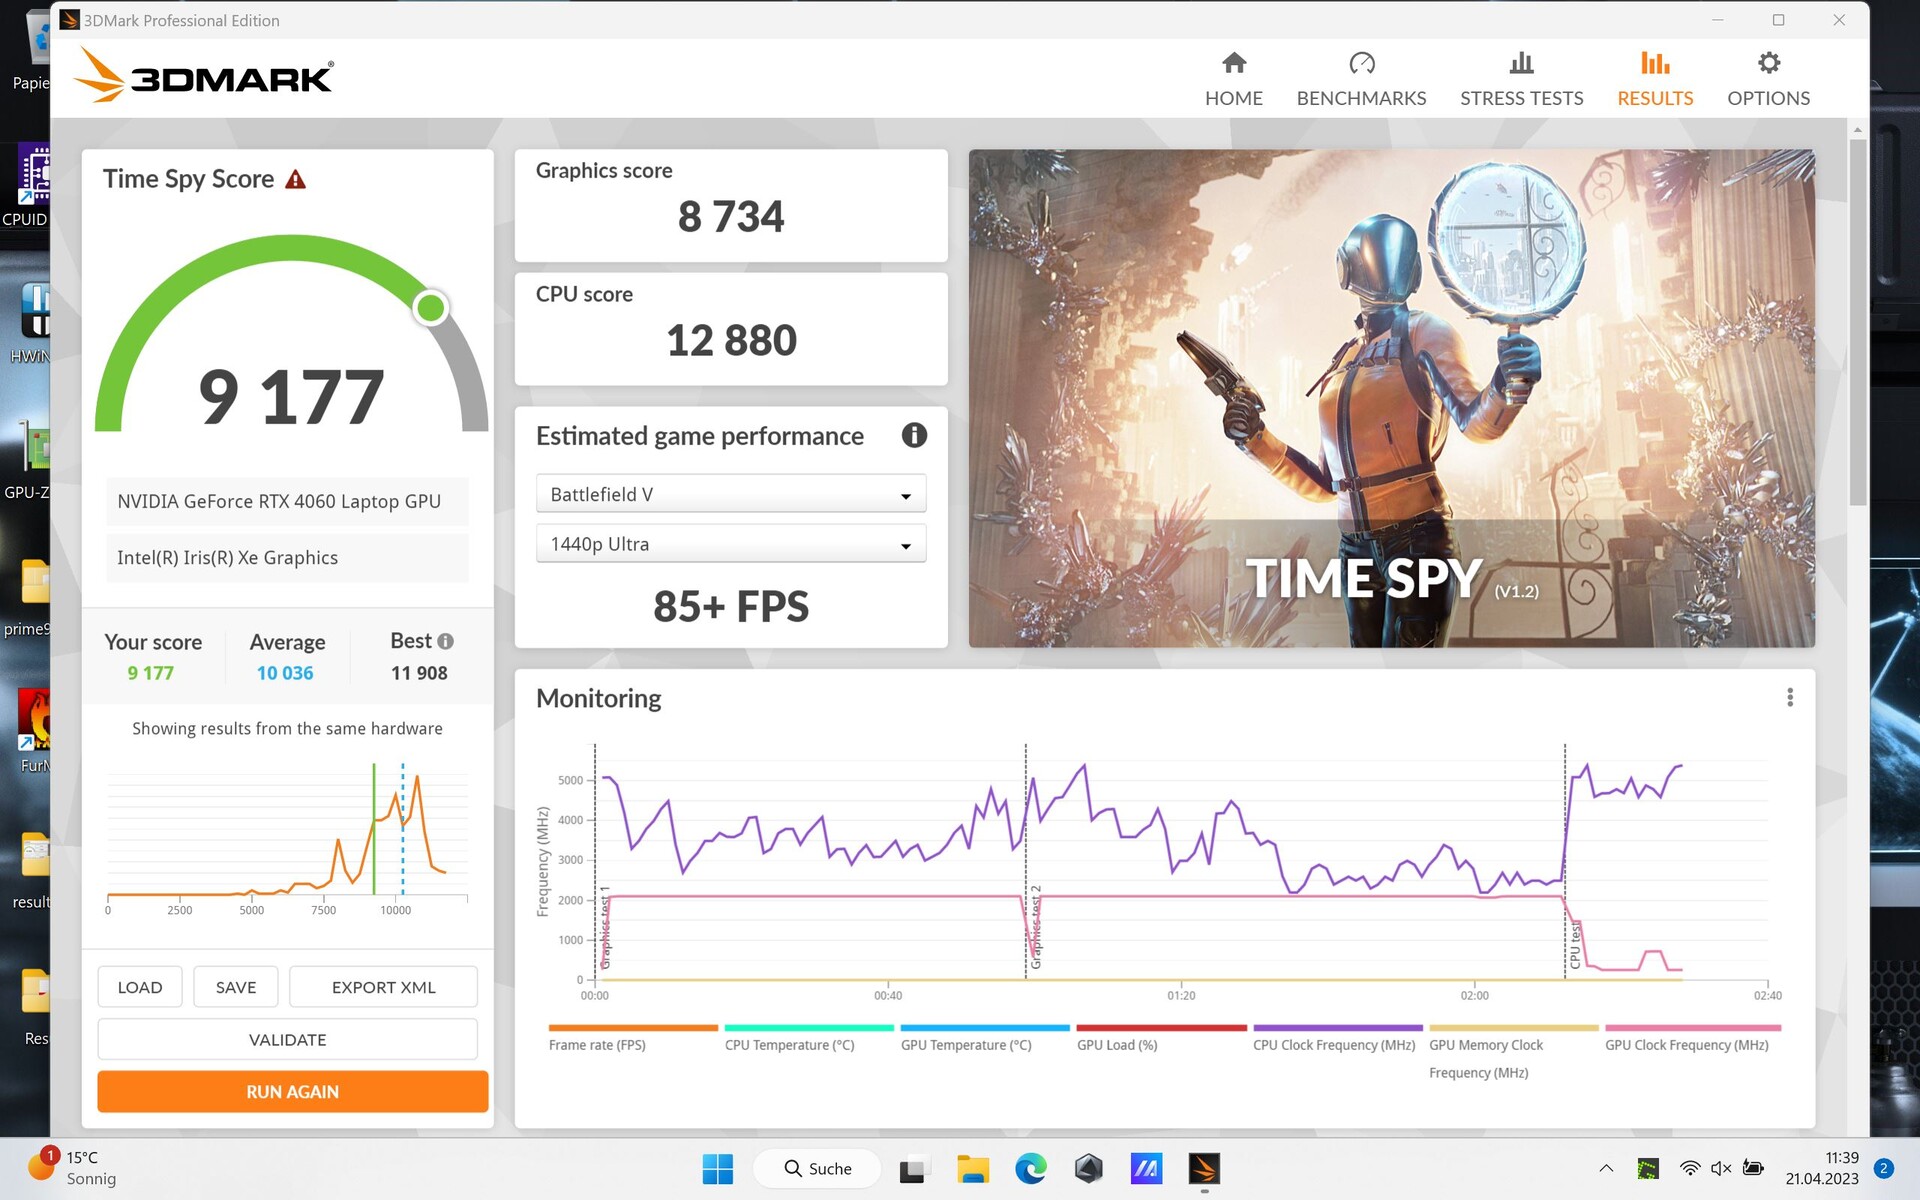
A differenza del test della CPU, i punteggi nei benchmark sintetici beneficiano chiaramente della modalità Turbo . In questo caso, il vantaggio dei portatili da gioco nella valutazione delle prestazioni si riduce a solo il quattro percento! L'edizione speciale con la RTX 4070 (anch'essa in modalità Turbo ) è solo il sette per cento più veloce.
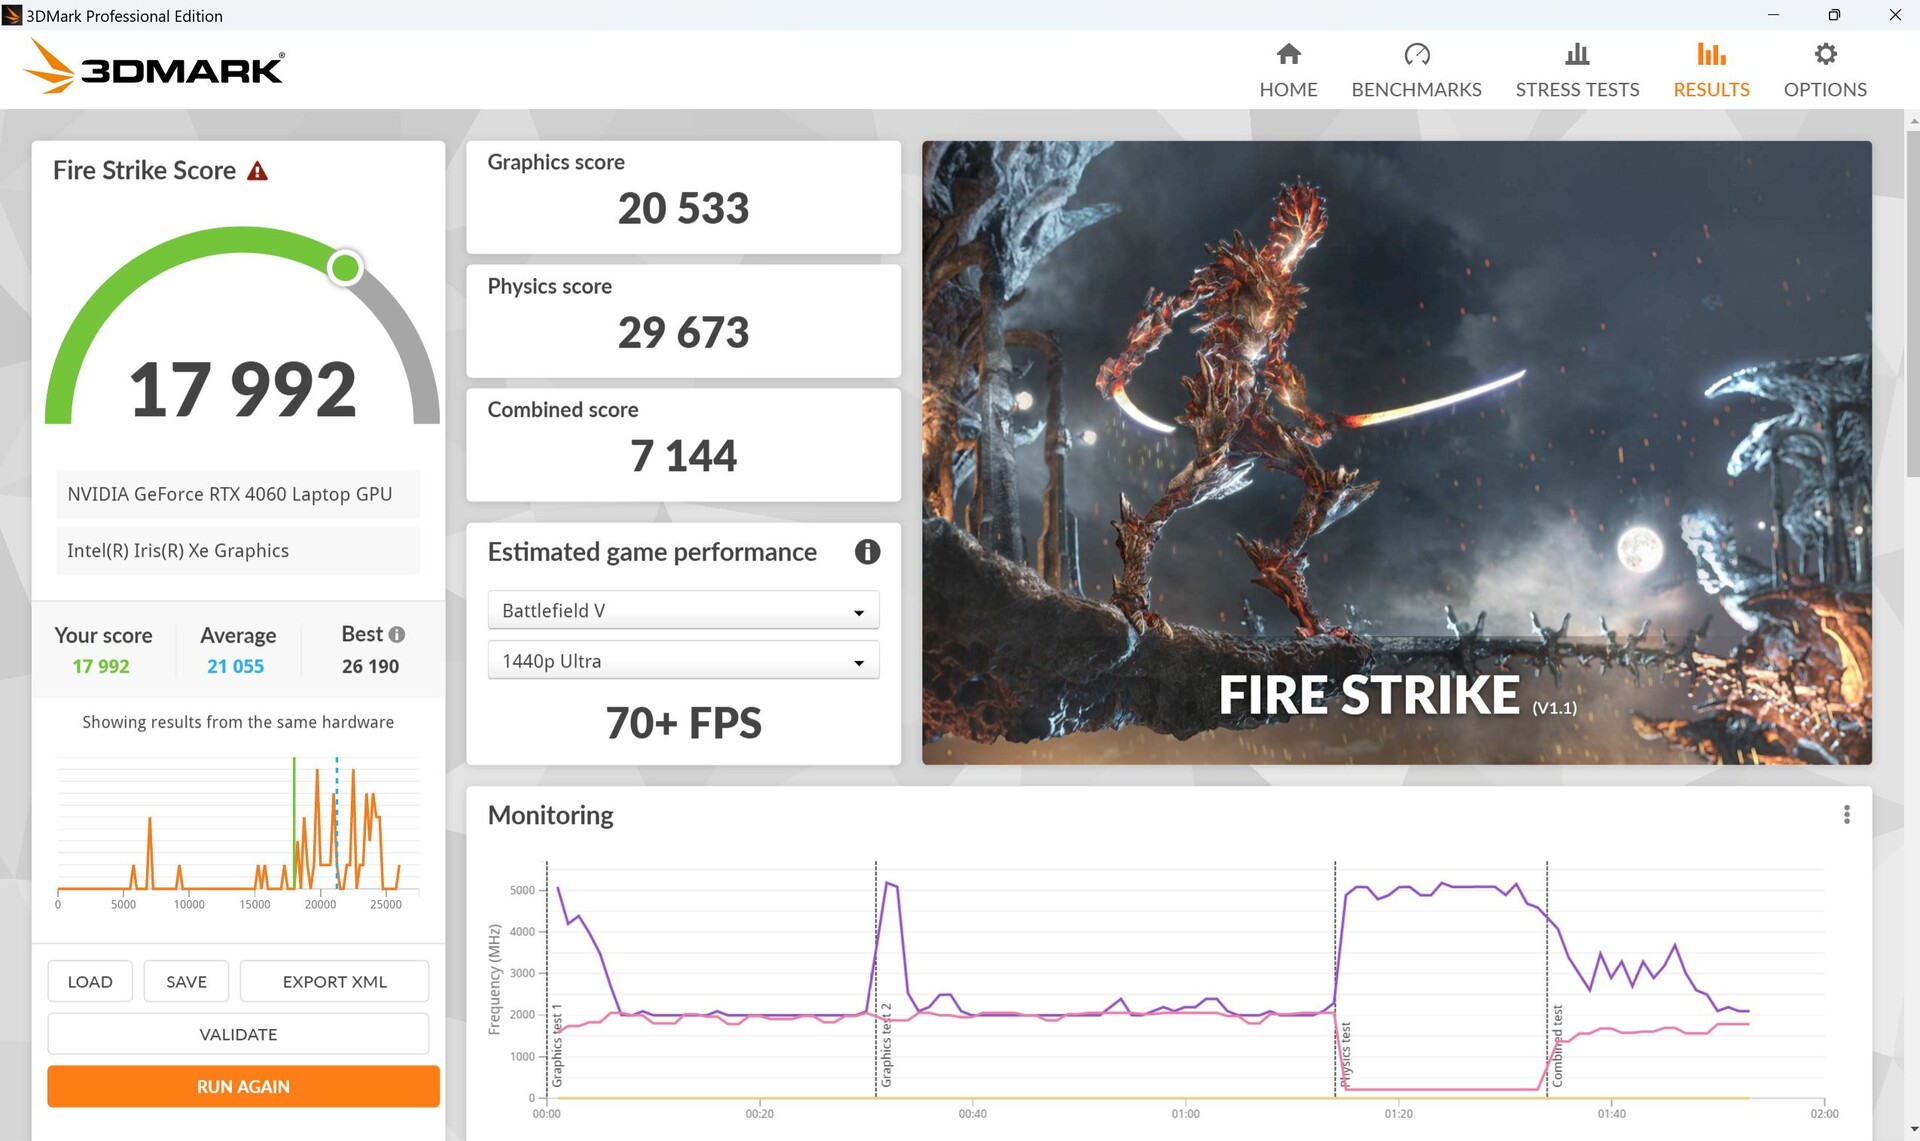
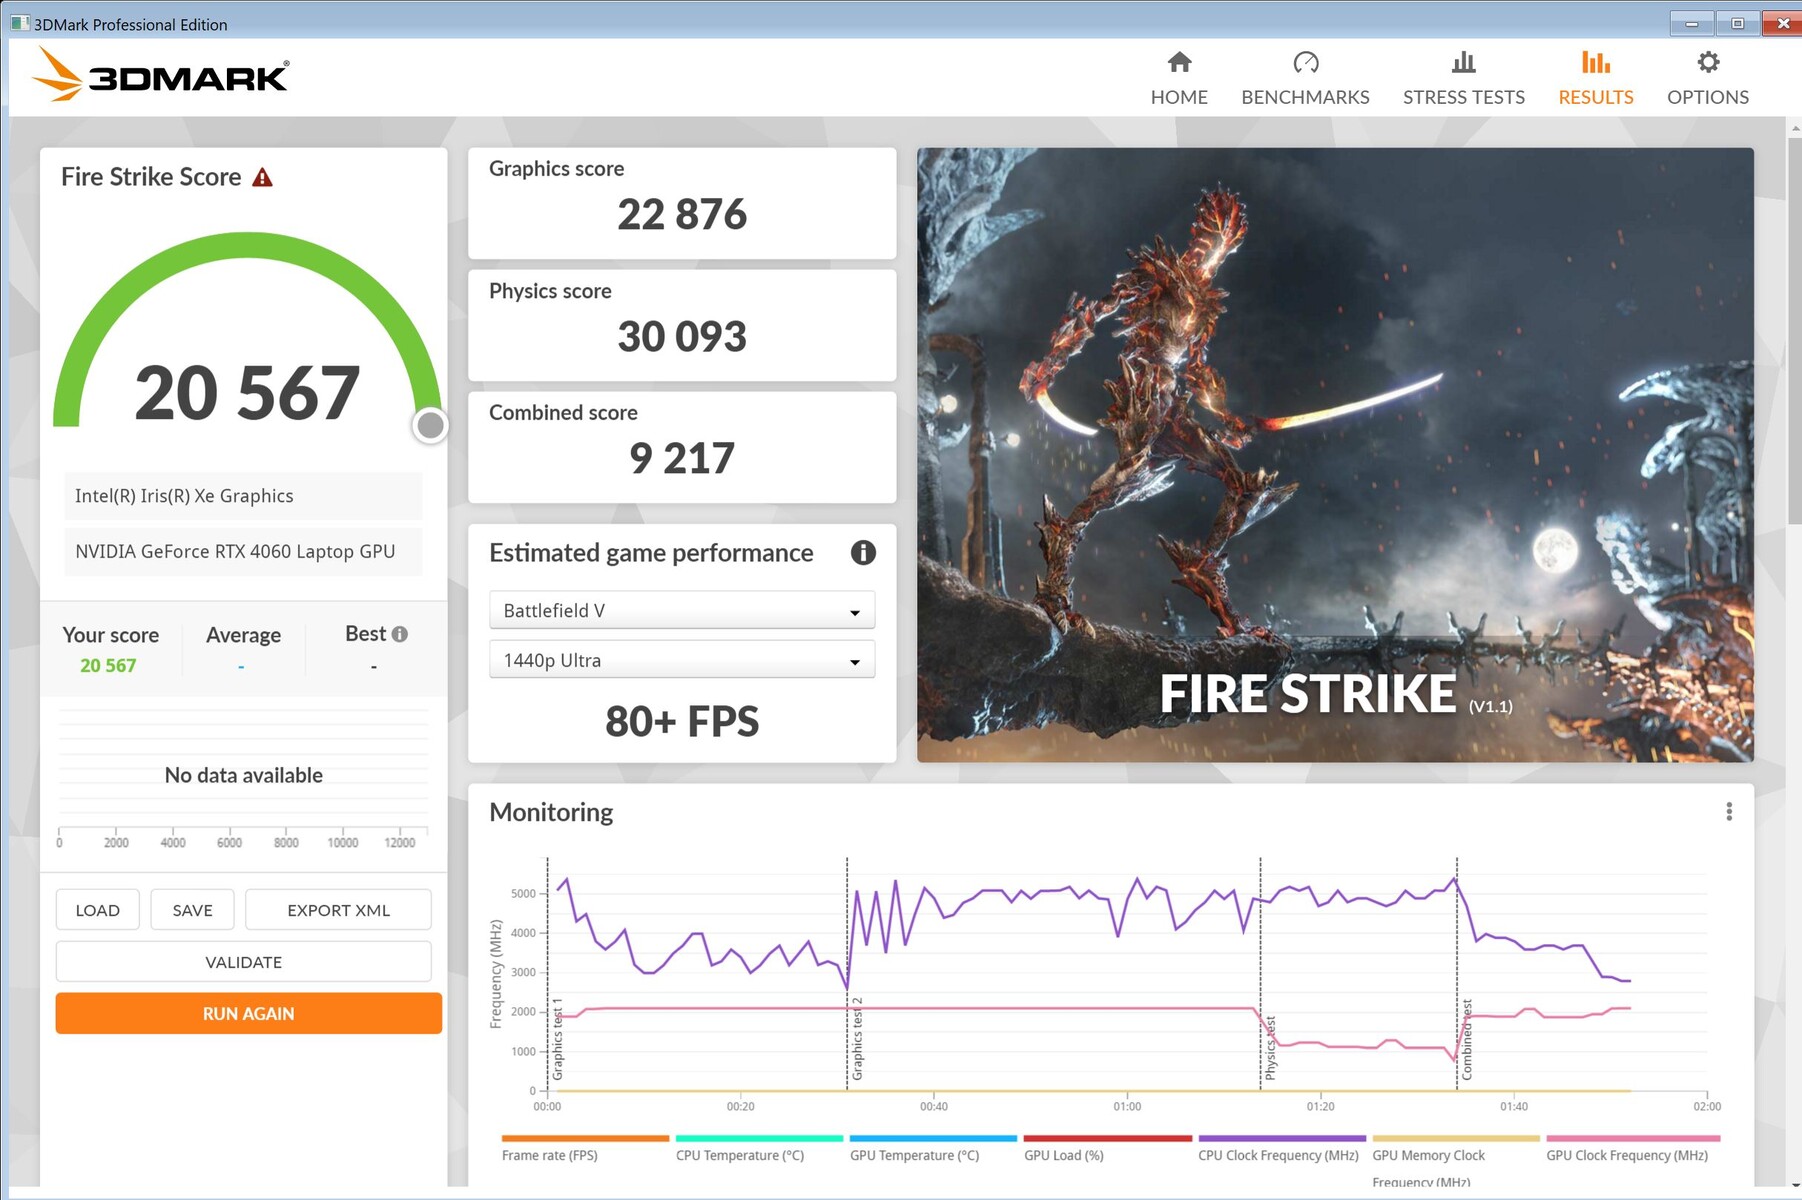
Se si scollega il tablet dalla rete elettrica, le prestazioni 3D diminuiscono, ma in misura significativamente inferiore a quanto ci aspettavamo: un'altra esecuzione di Fire Strike ha prodotto comunque 17.368 punti 3D invece dei 20.553 punti della rete elettrica. Quindi è ancora possibile giocare con lo Z13 in movimento senza una presa di corrente, ma la domanda è per quanto tempo. Maggiori informazioni di seguito.
| 3DMark Performance rating - Percent | |
| Media della classe Gaming | |
| MSI Katana 17 B13VFK | |
| Media NVIDIA GeForce RTX 4060 Laptop GPU | |
| ROG Flow Z13 Turbo | |
| Asus ROG Flow Z13 ACRNM -1! | |
| MSI Cyborg 15 A12VF | |
| ROG Flow Z13 Leistung | |
| Asus ROG Flow Z13 GZ301ZE -1! | |
| 3DMark 11 - 1280x720 Performance GPU | |
| Media della classe Gaming (21841 - 80022, n=104, ultimi 2 anni) | |
| MSI Katana 17 B13VFK | |
| Media NVIDIA GeForce RTX 4060 Laptop GPU (28136 - 38912, n=57) | |
| Asus ROG Flow Z13 ACRNM | |
| ROG Flow Z13 Turbo | |
| ROG Flow Z13 Leistung | |
| MSI Cyborg 15 A12VF | |
| Asus ROG Flow Z13 GZ301ZE | |
| 3DMark | |
| 1280x720 Cloud Gate Standard Graphics | |
| MSI Katana 17 B13VFK | |
| Media NVIDIA GeForce RTX 4060 Laptop GPU (81407 - 180228, n=29) | |
| Media della classe Gaming (86886 - 223650, n=60, ultimi 2 anni) | |
| MSI Cyborg 15 A12VF | |
| ROG Flow Z13 Turbo | |
| ROG Flow Z13 Leistung | |
| 1920x1080 Fire Strike Graphics | |
| Media della classe Gaming (12242 - 62849, n=115, ultimi 2 anni) | |
| MSI Katana 17 B13VFK | |
| Media NVIDIA GeForce RTX 4060 Laptop GPU (20533 - 29656, n=54) | |
| Asus ROG Flow Z13 ACRNM | |
| ROG Flow Z13 Turbo | |
| MSI Cyborg 15 A12VF | |
| ROG Flow Z13 Leistung | |
| Asus ROG Flow Z13 GZ301ZE | |
| 2560x1440 Time Spy Graphics | |
| Media della classe Gaming (5012 - 26212, n=115, ultimi 2 anni) | |
| MSI Katana 17 B13VFK | |
| Media NVIDIA GeForce RTX 4060 Laptop GPU (7484 - 11451, n=56) | |
| Asus ROG Flow Z13 ACRNM | |
| ROG Flow Z13 Turbo | |
| ROG Flow Z13 Leistung | |
| MSI Cyborg 15 A12VF | |
| Asus ROG Flow Z13 GZ301ZE | |
| 3DMark 11 Performance | 26702 punti | |
| 3DMark Cloud Gate Standard Score | 55913 punti | |
| 3DMark Fire Strike Score | 17992 punti | |
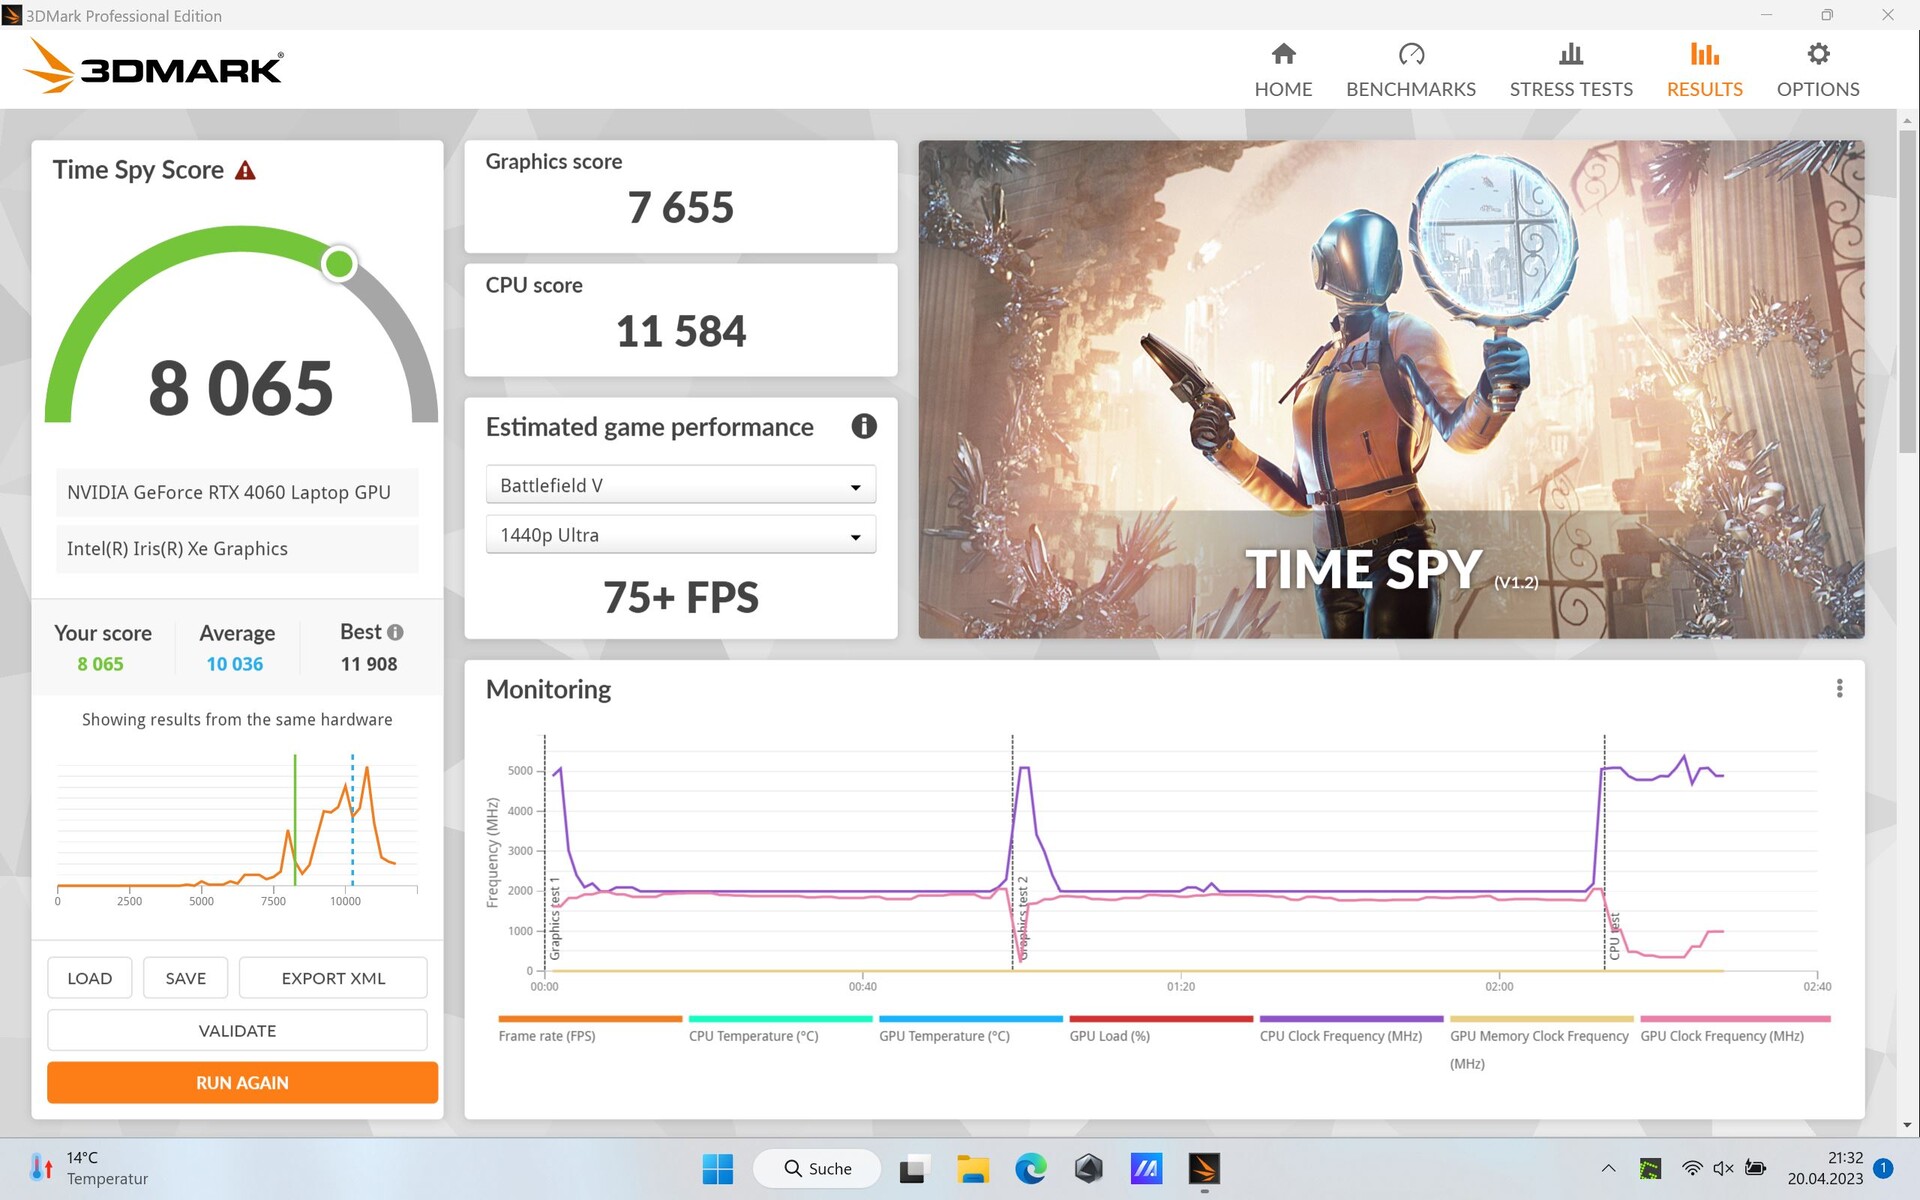
| 3DMark Time Spy Score | 8065 punti | |
Aiuto | ||
* ... Meglio usare valori piccoli
Prestazioni di gioco
Il gioco sul tablet è perfettamente possibile con lo Z13, alla luce dei benchmark. Tuttavia, il fatto che laRTX 4060può consumare solo un massimo di 55 W diventa subito chiaro. I videogiocatori più grandi, come il Katana 17 con la stessa GPU hanno un TGP più elevato e quindi ottengono risultati migliori; ad esempio, la suddetta Katana è più veloce del 28% in Witcher 3 Ultra. Il MSI Cyborgraggiunge tassi simili, ma la sua RTX 4060 può consumare solo 45 W.
Far Cry 5 è ancora giocabile a 71 fps alla risoluzione 16:9 di 2.560 x 1.440 in modalità Performance , mentre la modalità Turbo riesce a spremere qualche fps in più.
Dying Light 2 gira a 52 fps in FHD e con impostazioni elevate ed è quindi inferiore del 12% rispetto ai portatili con la stessa GPU. In modalità Turbo si arriva a 56,7 fps, quasi alla pari con la RTX 4060 media. 35 fps è il risultato in 2560x1440. È possibile attivare anche il Ray Tracing, ma solo insieme a Frame Generation (supporto AI), con un risultato di circa 36 fps.
Quasi tutti i giochi possono quindi essere giocati ad alte risoluzioni in FullHD, a volte anche in QHD. Impressionante per un tablet.
| Modalità di prestazione | Witcher 3 FHD Ultra | Dying Light 2 FHD High |
|---|---|---|
| Tranquillo | 67 fps | 41 fps |
| Performance | 77 fps | 52 fps |
| Turbo | 83 fps | 56,7 fps |
| Performance rating - Percent | |
| Media della classe Gaming | |
| MSI Katana 17 B13VFK | |
| Asus ROG Flow Z13 ACRNM | |
| MSI Cyborg 15 A12VF | |
| ROG Flow Z13 Leistung | |
| Asus ROG Flow Z13 GZ301ZE | |
| The Witcher 3 - 1920x1080 Ultra Graphics & Postprocessing (HBAO+) | |
| Media della classe Gaming (104.7 - 240, n=7, ultimi 2 anni) | |
| MSI Katana 17 B13VFK | |
| Asus ROG Flow Z13 ACRNM | |
| MSI Cyborg 15 A12VF | |
| ROG Flow Z13 Leistung | |
| Asus ROG Flow Z13 GZ301ZE | |
| GTA V - 1920x1080 Highest AA:4xMSAA + FX AF:16x | |
| Media della classe Gaming (48.3 - 186.9, n=94, ultimi 2 anni) | |
| MSI Katana 17 B13VFK | |
| Asus ROG Flow Z13 ACRNM | |
| MSI Cyborg 15 A12VF | |
| ROG Flow Z13 Leistung | |
| Asus ROG Flow Z13 GZ301ZE | |
| Final Fantasy XV Benchmark - 1920x1080 High Quality | |
| Media della classe Gaming (41 - 215, n=95, ultimi 2 anni) | |
| Asus ROG Flow Z13 GZ301ZE | |
| MSI Katana 17 B13VFK | |
| Asus ROG Flow Z13 ACRNM | |
| MSI Cyborg 15 A12VF | |
| ROG Flow Z13 Leistung | |
| Strange Brigade - 1920x1080 ultra AA:ultra AF:16 | |
| Media della classe Gaming (76.3 - 458, n=87, ultimi 2 anni) | |
| MSI Katana 17 B13VFK | |
| Asus ROG Flow Z13 ACRNM | |
| MSI Cyborg 15 A12VF | |
| ROG Flow Z13 Leistung | |
| Asus ROG Flow Z13 GZ301ZE | |
| Dota 2 Reborn - 1920x1080 ultra (3/3) best looking | |
| MSI Katana 17 B13VFK | |
| Media della classe Gaming (84.8 - 248, n=107, ultimi 2 anni) | |
| ROG Flow Z13 Leistung | |
| Asus ROG Flow Z13 GZ301ZE | |
| MSI Cyborg 15 A12VF | |
| Asus ROG Flow Z13 ACRNM | |
| X-Plane 11.11 - 1920x1080 high (fps_test=3) | |
| MSI Katana 17 B13VFK | |
| Asus ROG Flow Z13 ACRNM | |
| ROG Flow Z13 Leistung | |
| Media della classe Gaming (55.5 - 143.5, n=109, ultimi 2 anni) | |
| MSI Cyborg 15 A12VF | |
| Asus ROG Flow Z13 GZ301ZE | |
| The Witcher 3 | |
| 1920x1080 High Graphics & Postprocessing (Nvidia HairWorks Off) | |
| Media della classe Gaming (341 - 404, n=2, ultimi 2 anni) | |
| MSI Katana 17 B13VFK | |
| Media NVIDIA GeForce RTX 4060 Laptop GPU (110 - 229, n=36) | |
| Acer Predator Triton 300 SE | |
| Asus ROG Flow Z13 GZ301V | |
| MSI Cyborg 15 A12VF | |
| Asus ROG Flow Z13 GZ301ZE | |
| 1920x1080 Ultra Graphics & Postprocessing (HBAO+) | |
| Media della classe Gaming (104.7 - 240, n=7, ultimi 2 anni) | |
| MSI Katana 17 B13VFK | |
| Media NVIDIA GeForce RTX 4060 Laptop GPU (77 - 159.7, n=42) | |
| Asus ROG Flow Z13 ACRNM | |
| MSI Cyborg 15 A12VF | |
| Asus ROG Flow Z13 GZ301V | |
| Acer Predator Triton 300 SE | |
| Asus ROG Flow Z13 GZ301ZE | |
| Dying Light 2 | |
| 1920x1080 High Quality | |
| MSI Katana 17 B13VFK | |
| Media NVIDIA GeForce RTX 4060 Laptop GPU (52 - 64.7, n=2) | |
| Asus ROG Flow Z13 GZ301V | |
| 2560x1440 High Quality | |
| MSI Katana 17 B13VFK | |
| Media NVIDIA GeForce RTX 4060 Laptop GPU (35.6 - 43.8, n=2) | |
| Asus ROG Flow Z13 GZ301V | |
| 1920x1080 High Quality Raytracing | |
| MSI Katana 17 B13VFK | |
| Media NVIDIA GeForce RTX 4060 Laptop GPU (23.5 - 30.8, n=2) | |
| Asus ROG Flow Z13 GZ301V | |
La frequenza dei fotogrammi di Witcher 3 è molto stabile e presenta il tipico carattere di onda (cambiamento giorno/notte). Un'osservazione interessante è che, in modalità Turbo , il nostro Z13 sembra essere veloce quanto l'edizioneedizione speciale con la sua RTX 4070.
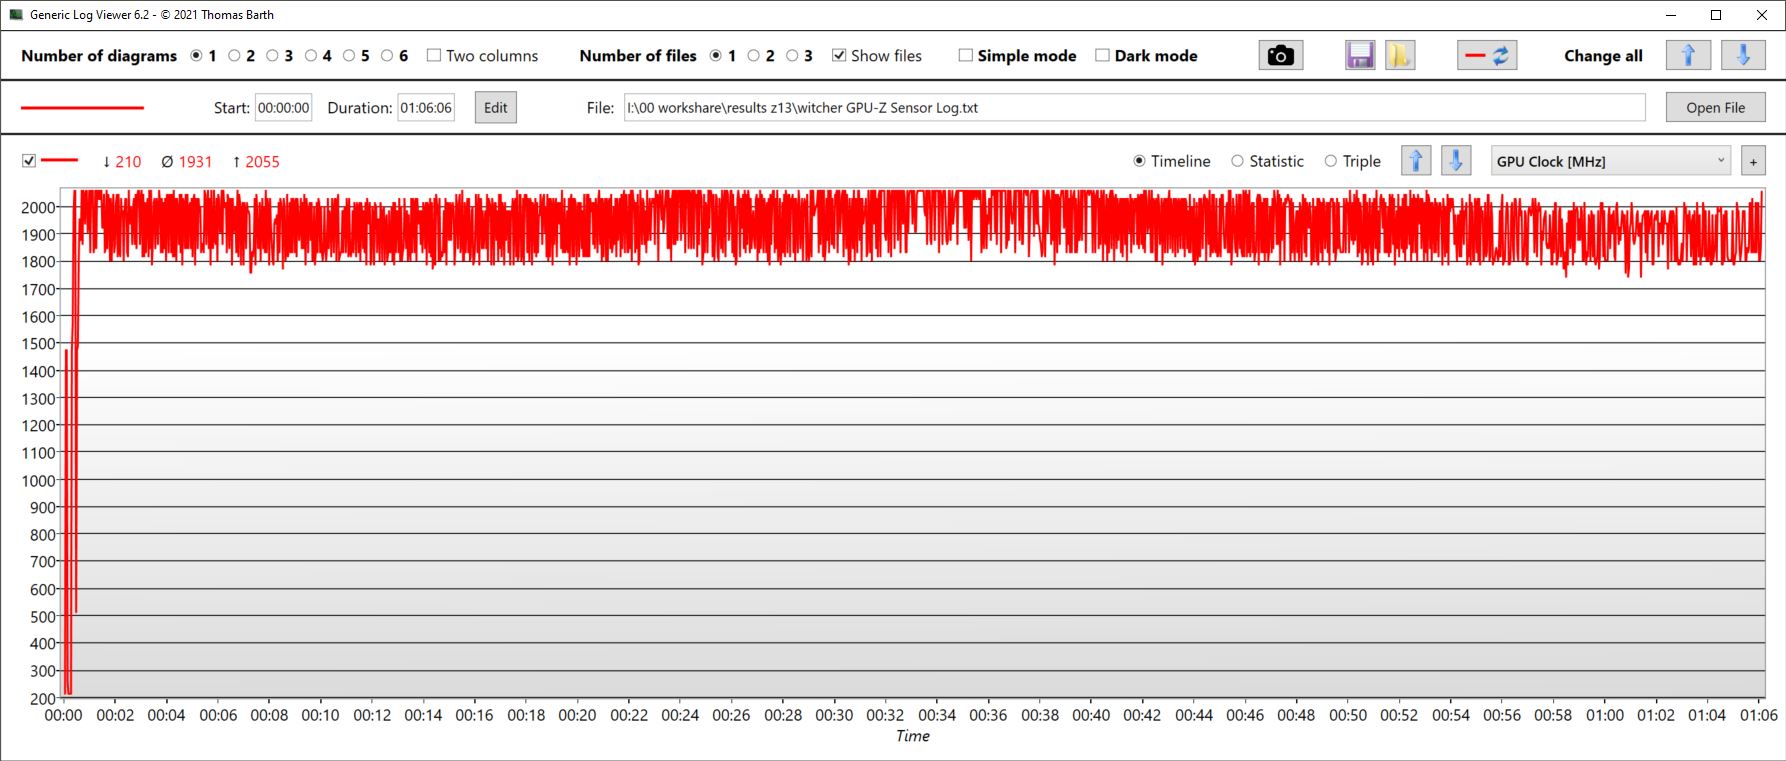
Osservando i dati di registro, il massimo di 65 W non viene esaurito in modalità Performance . Qui la GPU assorbe un massimo di 55 W dall'alimentatore e una media di poco inferiore a 50 W. La GPU si riscalda a circa 64 °C e ha una frequenza di clock media di 1,9 GHz. Il clock della memoria oscilla tra 1.400 e 1.750 MHz.
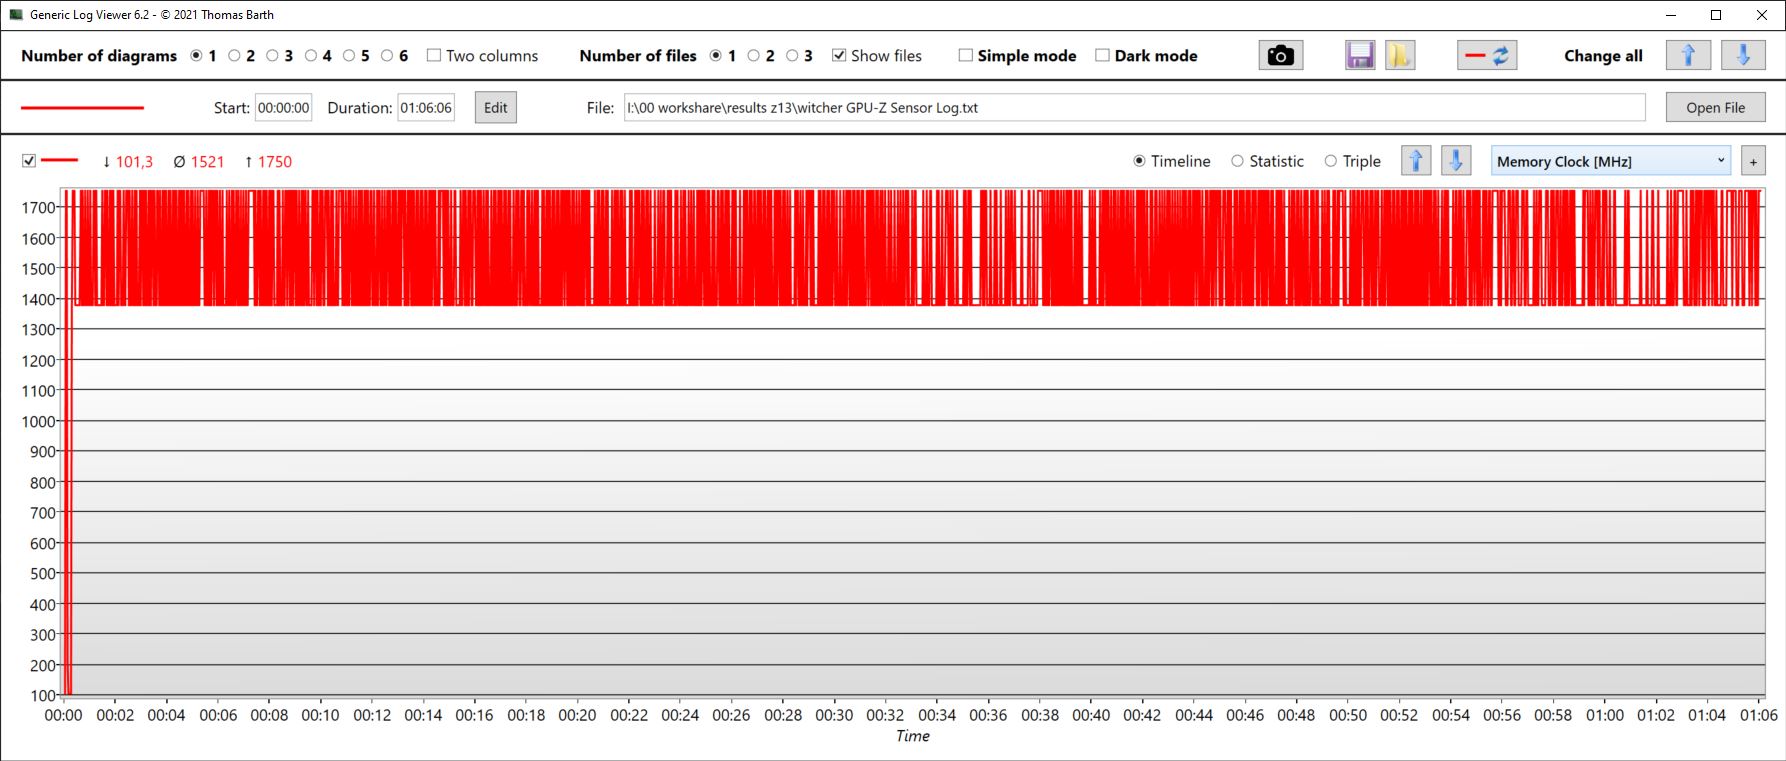
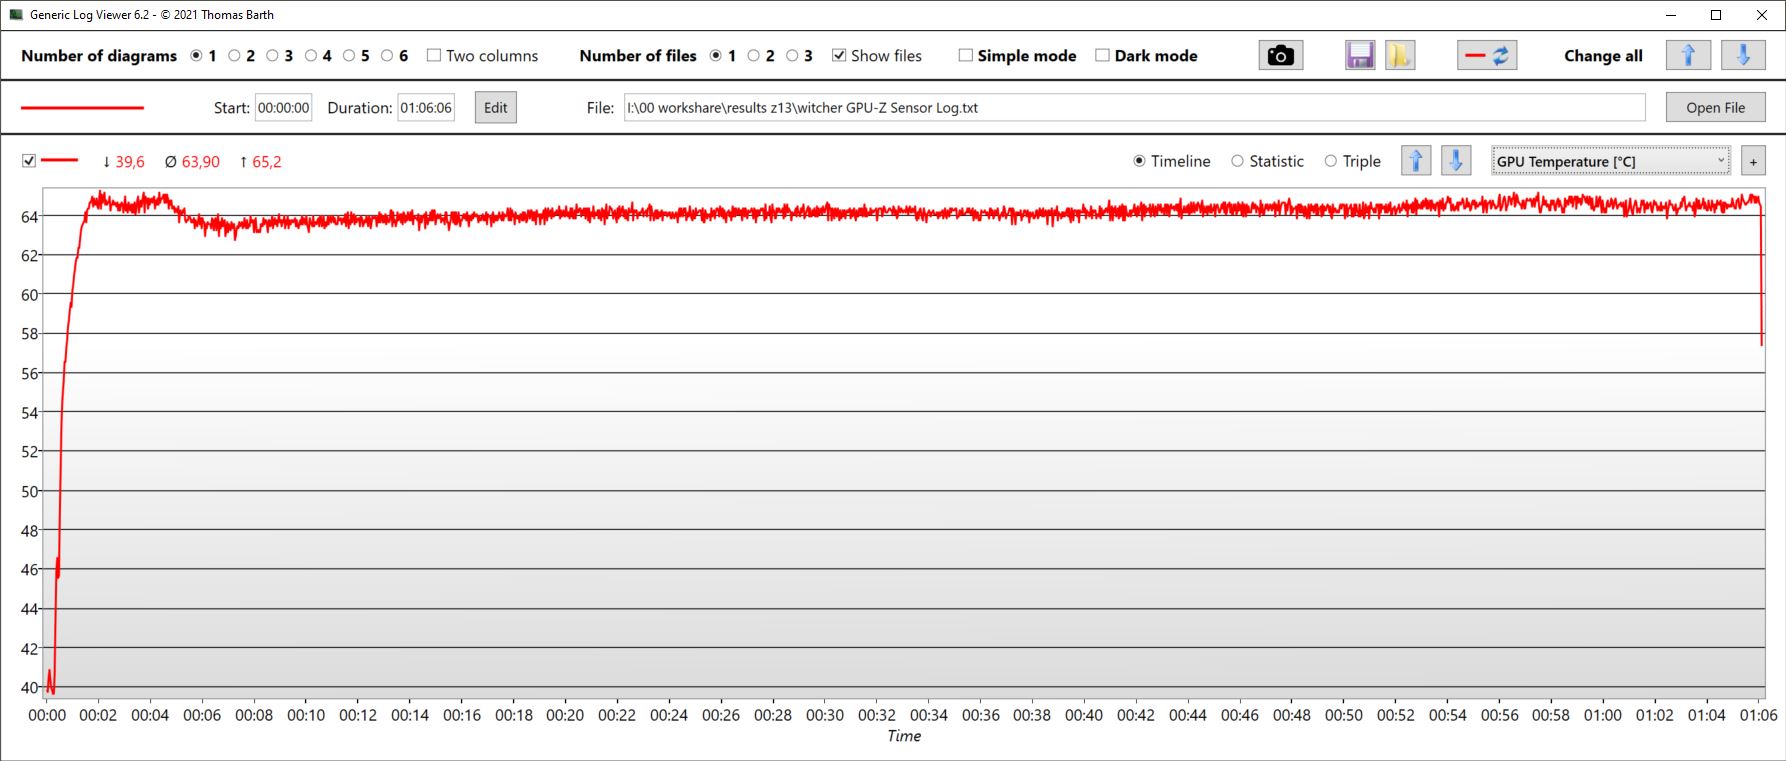
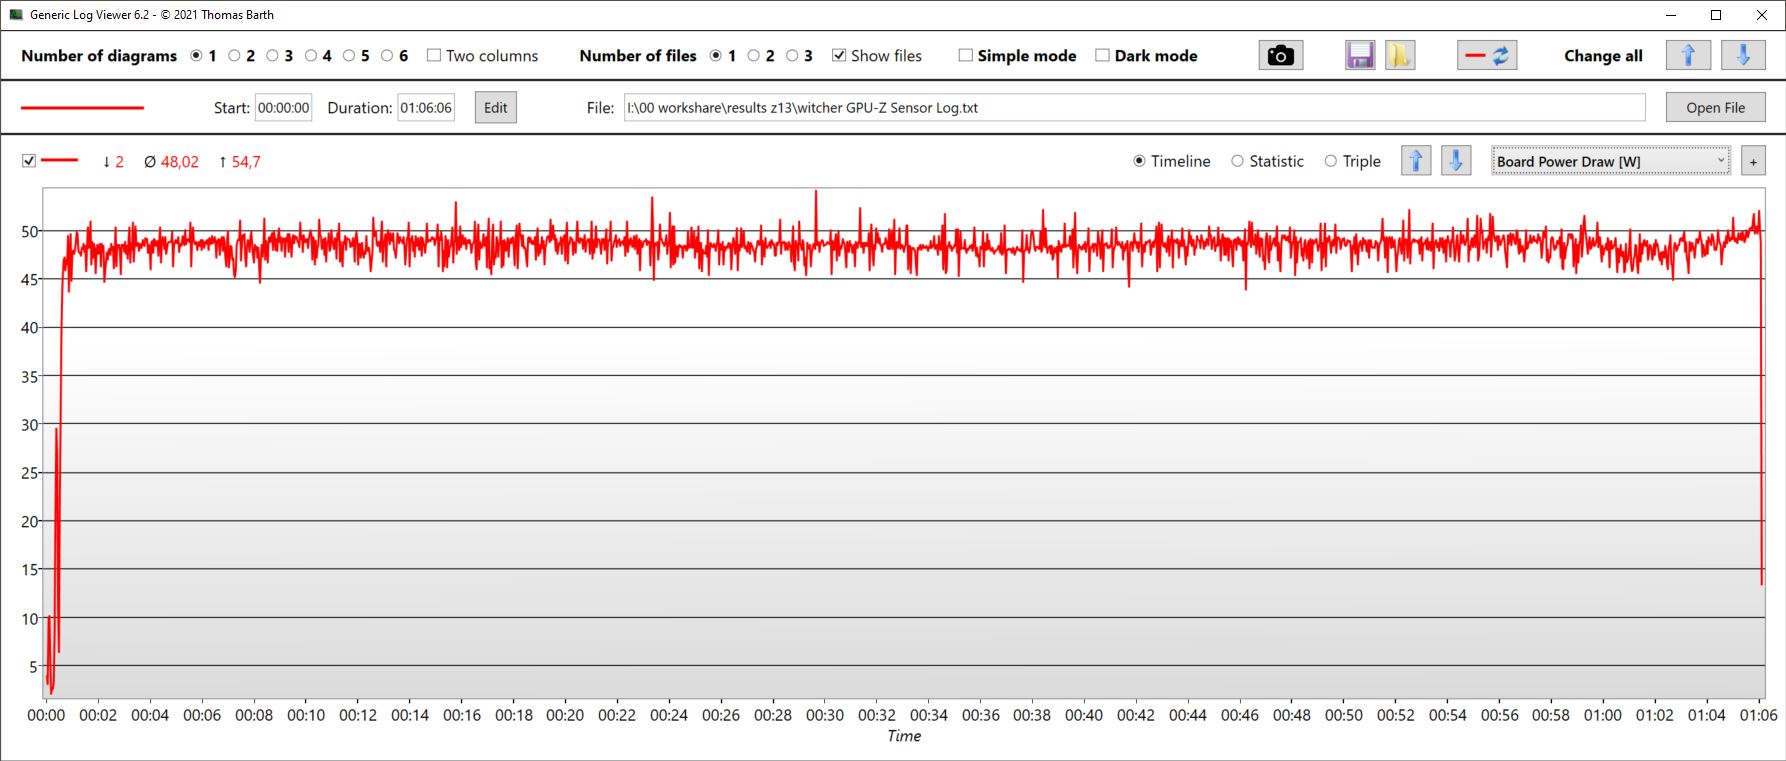
Witcher 3 FPS chart
| basso | medio | alto | ultra | QHD | 4K | |
|---|---|---|---|---|---|---|
| GTA V (2015) | 183.4 | 173.1 | 144 | 76.9 | ||
| The Witcher 3 (2015) | 325 | 228 | 143 | 77 | ||
| Dota 2 Reborn (2015) | 173.3 | 156 | 148.8 | 139.3 | ||
| Final Fantasy XV Benchmark (2018) | 100.8 | 75.1 | 56 | 32.2 | ||
| X-Plane 11.11 (2018) | 154.8 | 129.1 | 103.6 | |||
| Far Cry 5 (2018) | 154 | 110 | 104 | 95 | 71 | |
| Strange Brigade (2018) | 385 | 196.2 | 156.1 | 135.3 | ||
| Dying Light 2 (2022) | 80 | 64 | 52 | 35.6 |
Emissioni - Più silenzioso di alcuni portatili da gioco
Rumore
Nonostante le dimensioni ridotte, lo Z13 non è eccessivamente rumoroso rispetto ad altri gamer. In modalità Performance , abbiamo misurato circa 41 dB durante il gioco. In modalità Turbo , invece, il volume sale a circa 47 dB. Si tratta ovviamente di un volume elevato per un tablet, ma altri notebook da gioco superano facilmente i 50 dB.
Per inciso, le ventole interne girano a circa 36 dB in modalità Quiet . Rispetto alla modalità Turbo , si perde circa il 19% di prestazioni, ma si ottiene un dispositivo più silenzioso del 23%.
| Modalità di prestazioni | Livello di rumore della ventola | Frequenza di aggiornamento |
|---|---|---|
| Silenzioso | 36 dB | 67 fps |
| Performance | 41 dB | 77 fps |
| Turbo | 47 dB | 83 fps |
Rumorosità
| Idle |
| 24 / 24 / 24 dB(A) |
| Sotto carico |
| 38.61 / 43.59 dB(A) |
 | ||
30 dB silenzioso 40 dB(A) udibile 50 dB(A) rumoroso |
||
min: | ||
| Asus ROG Flow Z13 GZ301V GeForce RTX 4060 Laptop GPU, i9-13900H, WD PC SN740 SDDPTQD-1T00 | Asus ROG Flow Z13 ACRNM GeForce RTX 4070 Laptop GPU, i9-13900H, WD PC SN740 SDDPTQD-1T00 | Asus ROG Flow Z13 GZ301ZE GeForce RTX 3050 Ti Laptop GPU, i9-12900H, Micron 2450 1TB MTFDKBK1T0TFK | MSI Katana 17 B13VFK GeForce RTX 4060 Laptop GPU, i7-13620H, Micron 2400 MTFDKBA1T0QFM | Acer Predator Triton 300 SE GeForce RTX 3060 Laptop GPU, i9-12900H, Micron 3400 1TB MTFDKBA1T0TFH | MSI Cyborg 15 A12VF GeForce RTX 4060 Laptop GPU, i7-12650H, Samsung PM9B1 1024GB MZVL41T0HBLB | |
|---|---|---|---|---|---|---|
| Noise | -11% | -1% | -24% | -18% | -36% | |
| off /ambiente * (dB) | 24 | 24 -0% | 24.5 -2% | 24.5 -2% | 23.8 1% | 27 -13% |
| Idle Minimum * (dB) | 24 | 24 -0% | 24.5 -2% | 24.5 -2% | 23.8 1% | 27 -13% |
| Idle Average * (dB) | 24 | 24 -0% | 24.5 -2% | 24.5 -2% | 23.8 1% | 37.5 -56% |
| Idle Maximum * (dB) | 24 | 36.5 -52% | 24.5 -2% | 40 -67% | 30.6 -28% | 38 -58% |
| Load Average * (dB) | 38.61 | 41.3 -7% | 41 -6% | 48.3 -25% | 44.2 -14% | 56.3 -46% |
| Witcher 3 ultra * (dB) | 41.24 | 44.7 -8% | 41 1% | 56 -36% | 60.1 -46% | |
| Load Maximum * (dB) | 43.59 | 46.9 -8% | 41 6% | 59.1 -36% | 60 -38% | 56.3 -29% |
* ... Meglio usare valori piccoli
Temperatura
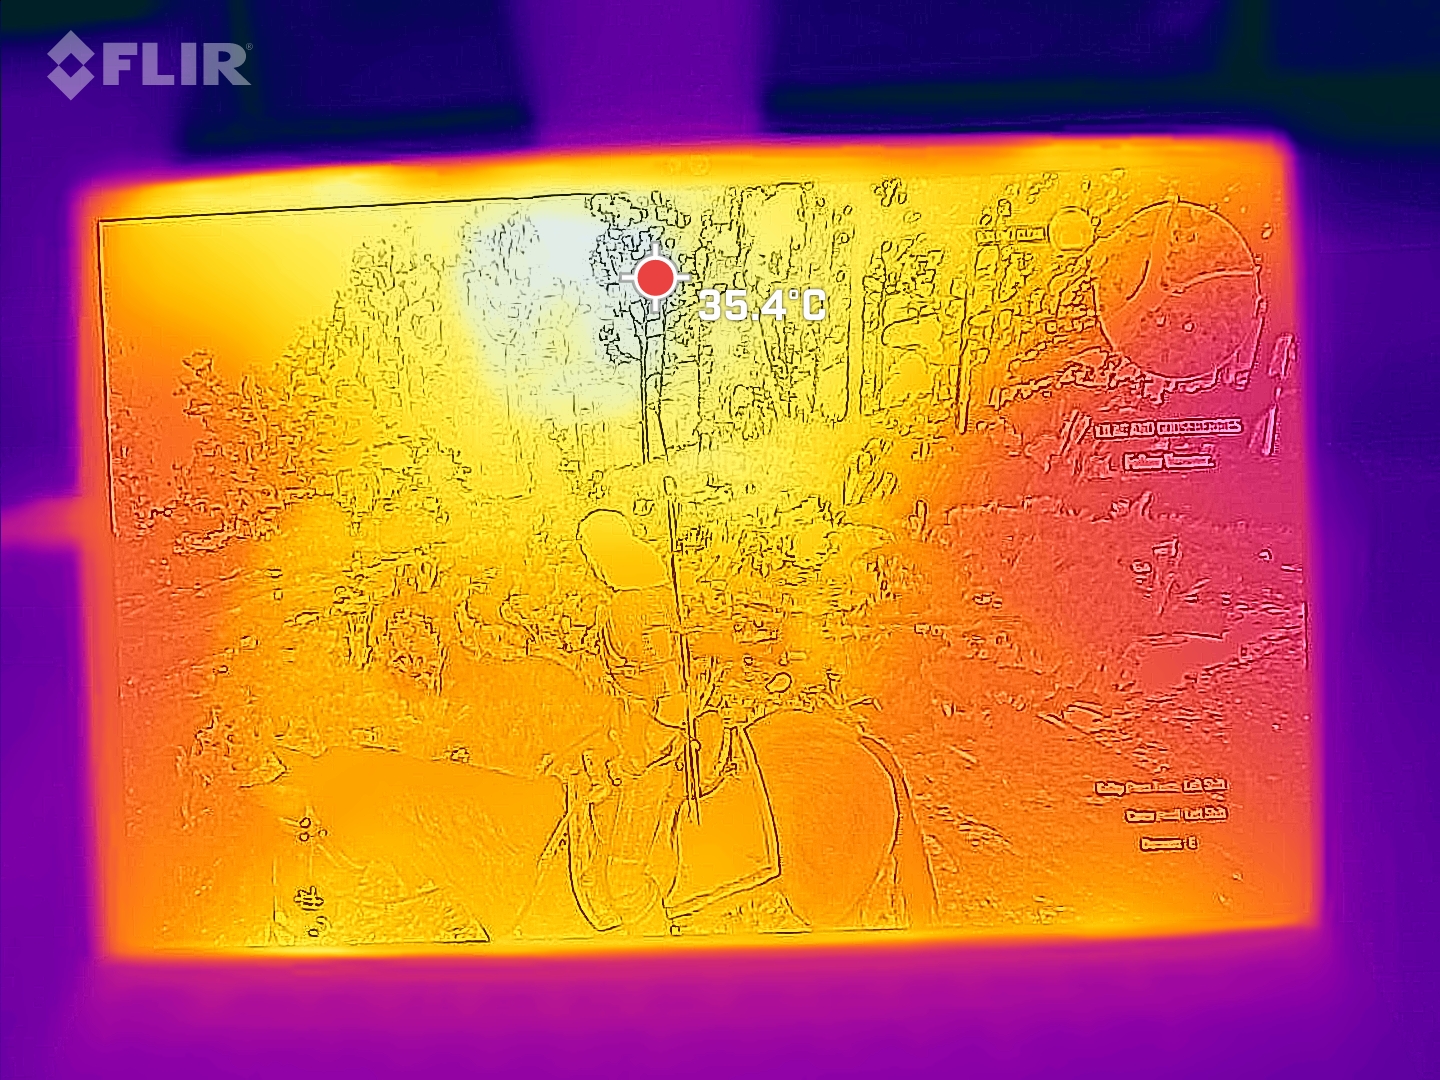
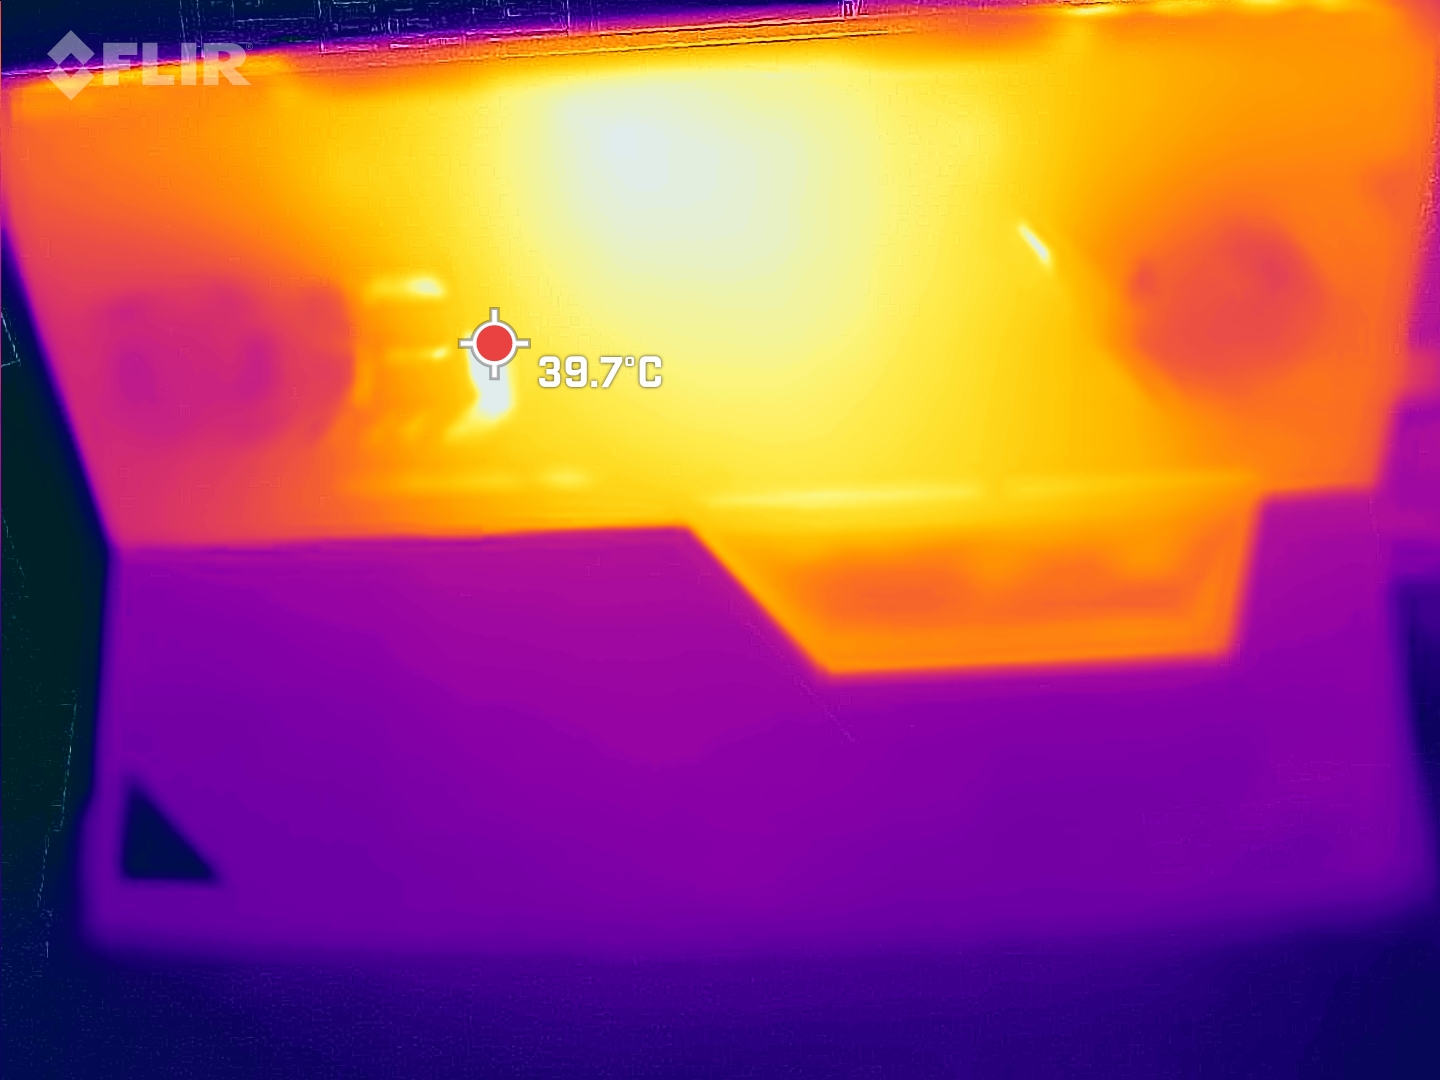
In particolare durante i giochi, lo Z13 si riscalda moderatamente, almeno in modalità Performance . Abbiamo misurato punti caldi di 42 °C sul retro durante Witcher 3 Ultra. Le temperature di superficie sono aumentate fino a 47 °C nello stress test. Poiché la tastiera è solo agganciata, il palm rest e i tasti WASD rimangono sempre freschi.
(±) La temperatura massima sul lato superiore è di 42 °C / 108 F, rispetto alla media di 40.4 °C / 105 F, che varia da 21.2 a 68.8 °C per questa classe Gaming.
(-) Il lato inferiore si riscalda fino ad un massimo di 47 °C / 117 F, rispetto alla media di 43.2 °C / 110 F
(+) In idle, la temperatura media del lato superiore è di 25.8 °C / 78 F, rispetto alla media deld ispositivo di 33.9 °C / 93 F.
(±) Riproducendo The Witcher 3, la temperatura media per il lato superiore e' di 35.3 °C / 96 F, rispetto alla media del dispositivo di 33.9 °C / 93 F.
(±) I poggiapolsi e il touchpad possono diventare molto caldi al tatto con un massimo di 38 °C / 100.4 F.
(-) La temperatura media della zona del palmo della mano di dispositivi simili e'stata di 28.8 °C / 83.8 F (-9.2 °C / -16.6 F).
| Asus ROG Flow Z13 GZ301V Intel Core i9-13900H, NVIDIA GeForce RTX 4060 Laptop GPU | Asus ROG Flow Z13 ACRNM Intel Core i9-13900H, NVIDIA GeForce RTX 4070 Laptop GPU | Asus ROG Flow Z13 GZ301ZE Intel Core i9-12900H, NVIDIA GeForce RTX 3050 Ti Laptop GPU | MSI Katana 17 B13VFK Intel Core i7-13620H, NVIDIA GeForce RTX 4060 Laptop GPU | Acer Predator Triton 300 SE Intel Core i9-12900H, NVIDIA GeForce RTX 3060 Laptop GPU | MSI Cyborg 15 A12VF Intel Core i7-12650H, NVIDIA GeForce RTX 4060 Laptop GPU | |
|---|---|---|---|---|---|---|
| Heat | 6% | -5% | -7% | 0% | 3% | |
| Maximum Upper Side * (°C) | 42 | 42.5 -1% | 45.3 -8% | 41.6 1% | 43 -2% | 47.5 -13% |
| Maximum Bottom * (°C) | 47 | 42.6 9% | 48.3 -3% | 43.1 8% | 46.4 1% | 35.5 24% |
| Idle Upper Side * (°C) | 27 | 26.2 3% | 29.2 -8% | 32 -19% | 28.2 -4% | 27.7 -3% |
| Idle Bottom * (°C) | 30 | 26 13% | 30 -0% | 35.8 -19% | 28.4 5% | 29.5 2% |
* ... Meglio usare valori piccoli
Stress test
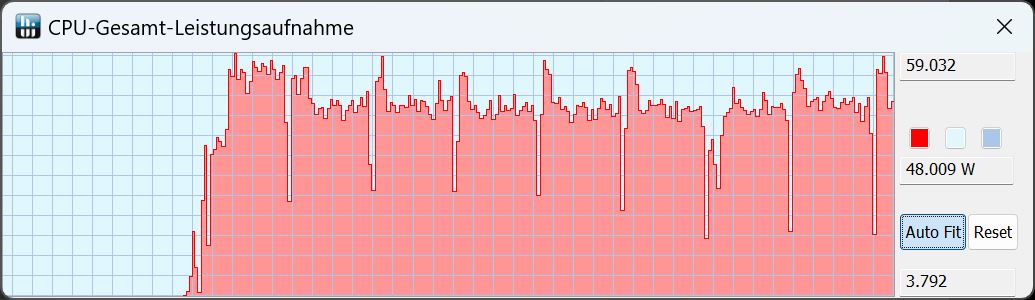
I core della CPU iniziano il nostro stress test brevemente a 4,1 GHz e consumano 95 W. La temperatura del core sale a 86 °C dopo pochi secondi, dopodiché va in throttling. Alla fine, le frequenze di clock si stabilizzano tra i 2 e i 3,2 GHz con un consumo energetico di circa 43 W, e le temperature si stabilizzano a circa 75 °C.
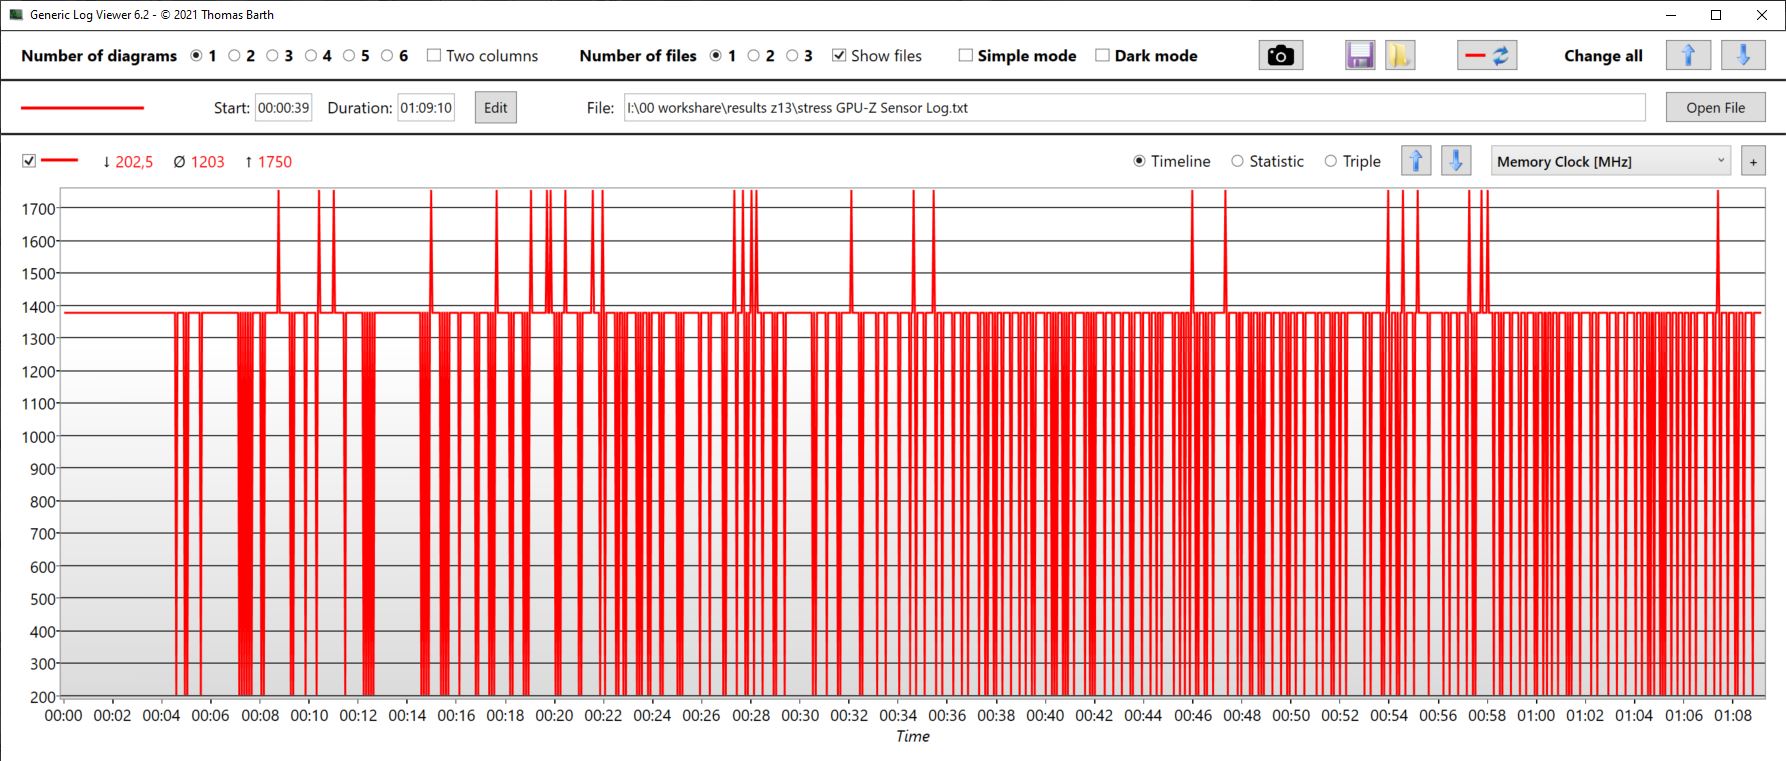
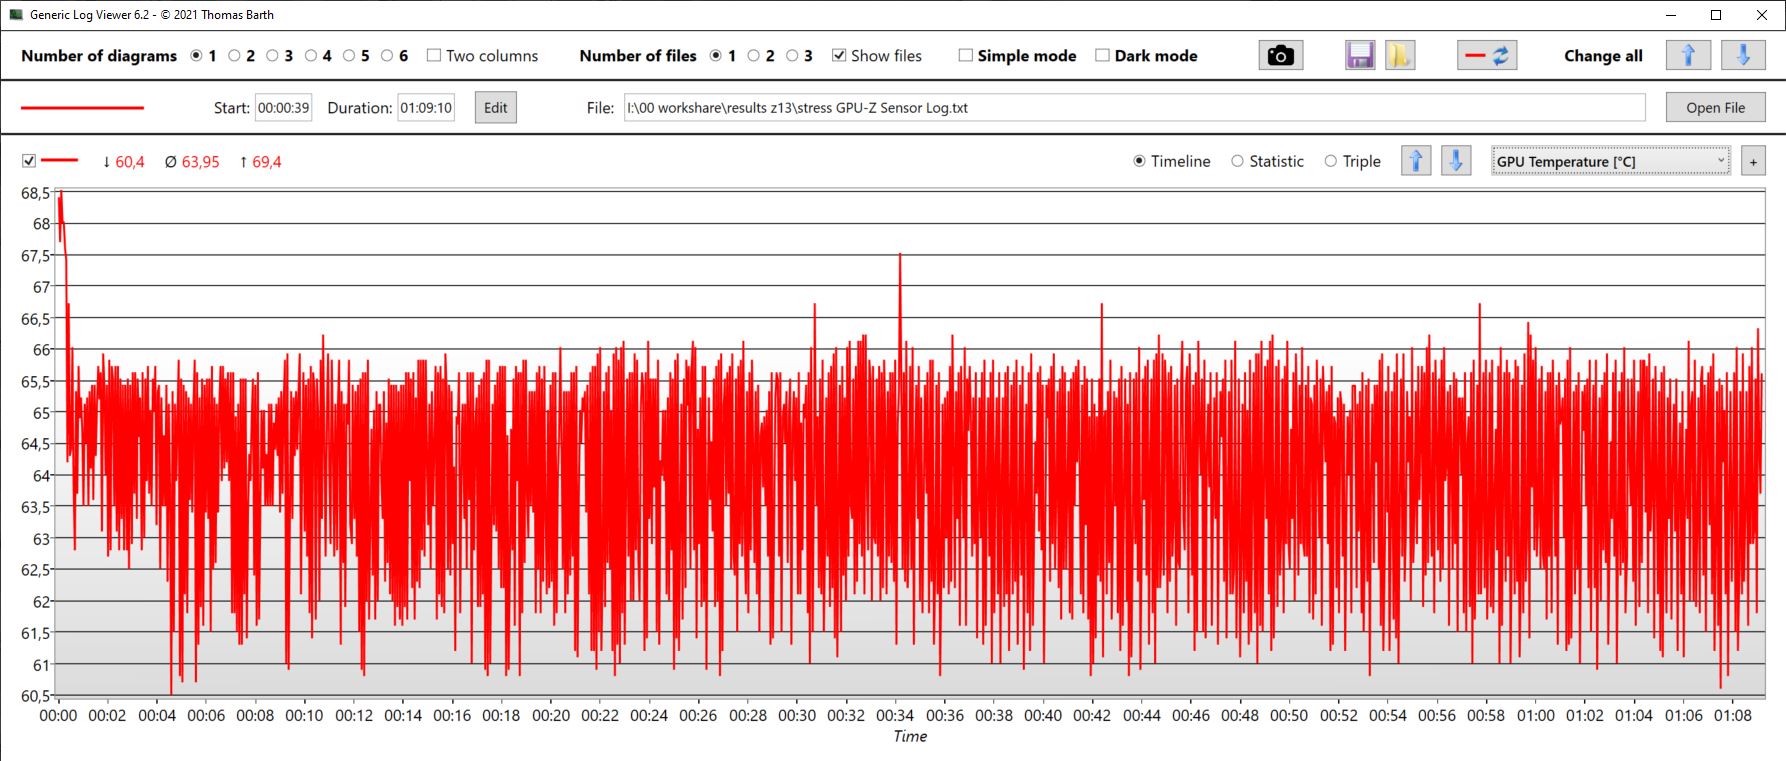
Allo stesso tempo, il clock della GPU oscilla fortemente tra 750 e 2055 MHz durante l'intero test. Anche il clock della memoria è molto incoerente e cerca di rimanere a 1,2 GHz, ma scende regolarmente a 200 MHz. La scheda grafica si riscalda fino a circa 64 °C, ma non supera mai i 70 °C. Anche il consumo energetico oscilla, ma è di soli 23 W in media. Sono stati misurati picchi di carico di 50,5 W.
Quindi, se sia la CPU che la GPU sono sottoposte a un carico pesante, le prestazioni fluttuano notevolmente e le prestazioni 3D in particolare vengono meno. Il TDP di soli 23 W e il calo della frequenza di clock della memoria a soli 200 MHz riflettono chiaramente questa situazione.

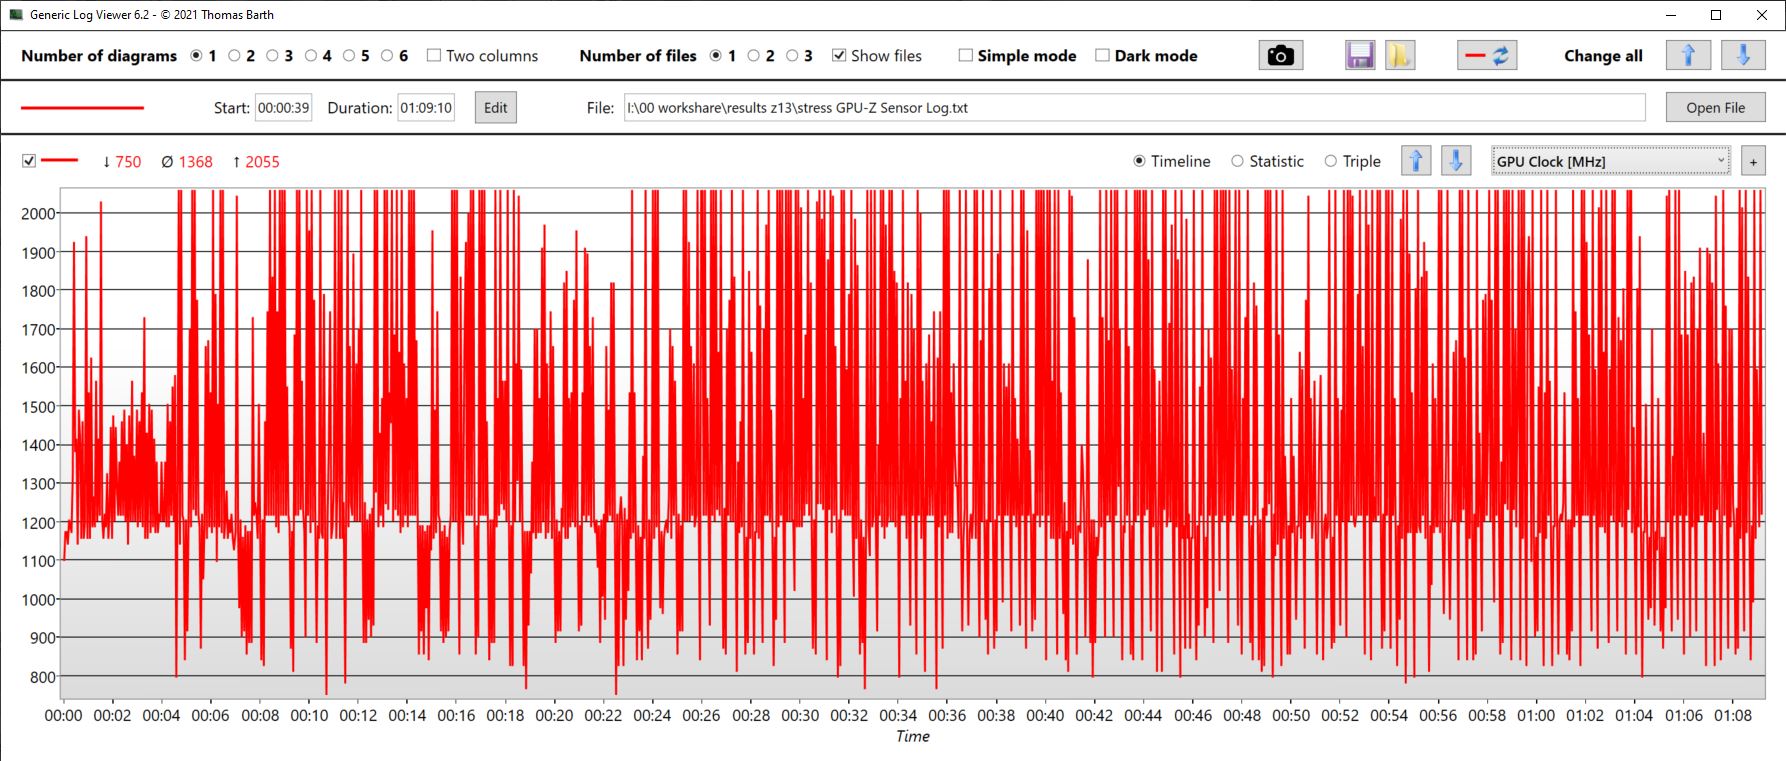
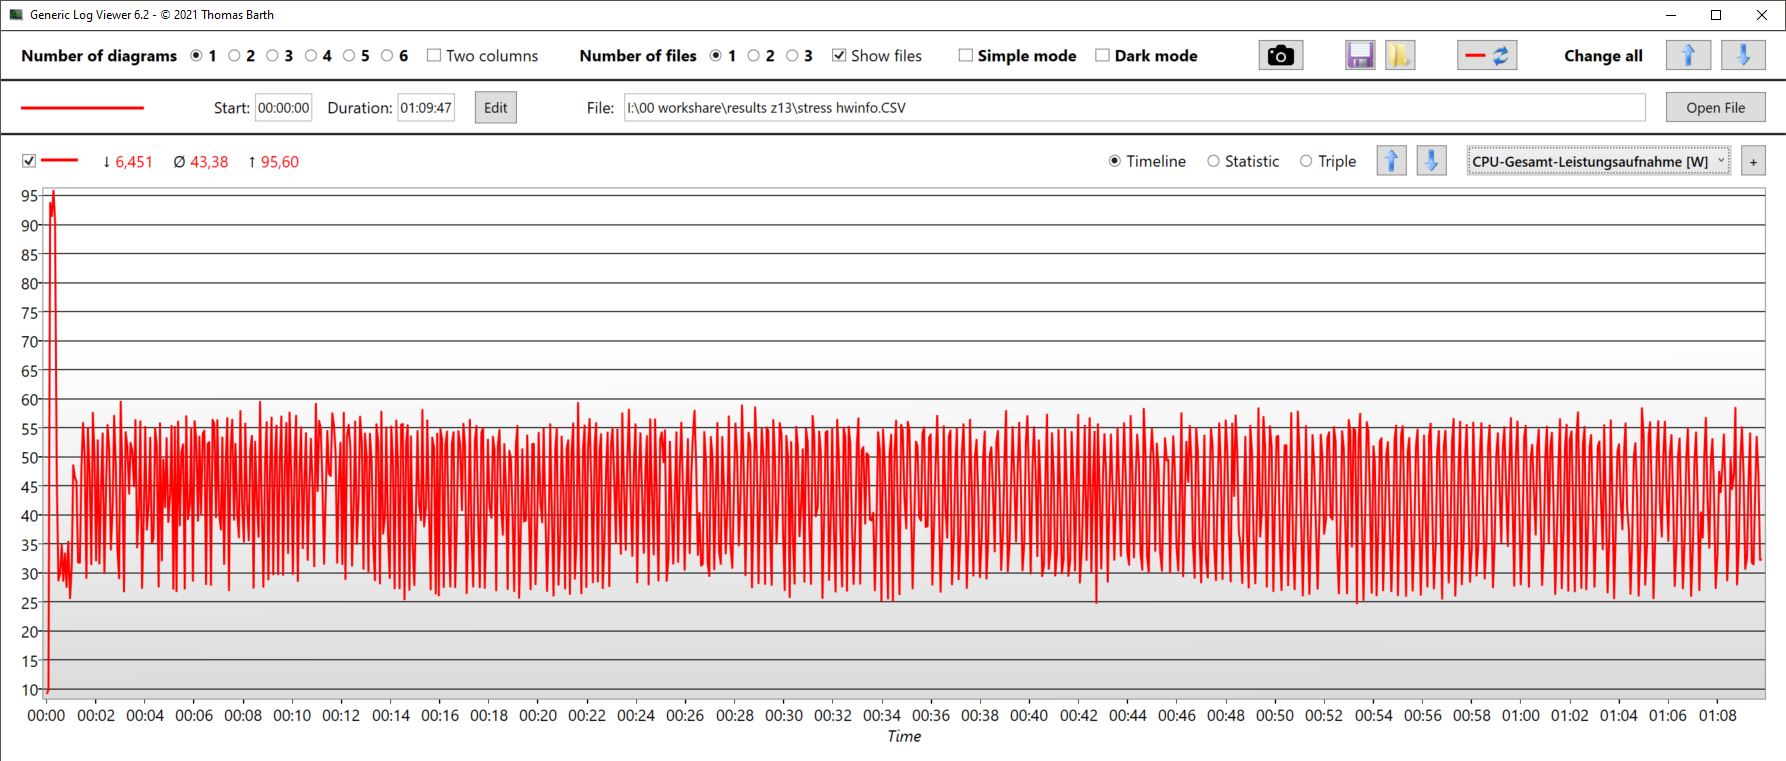
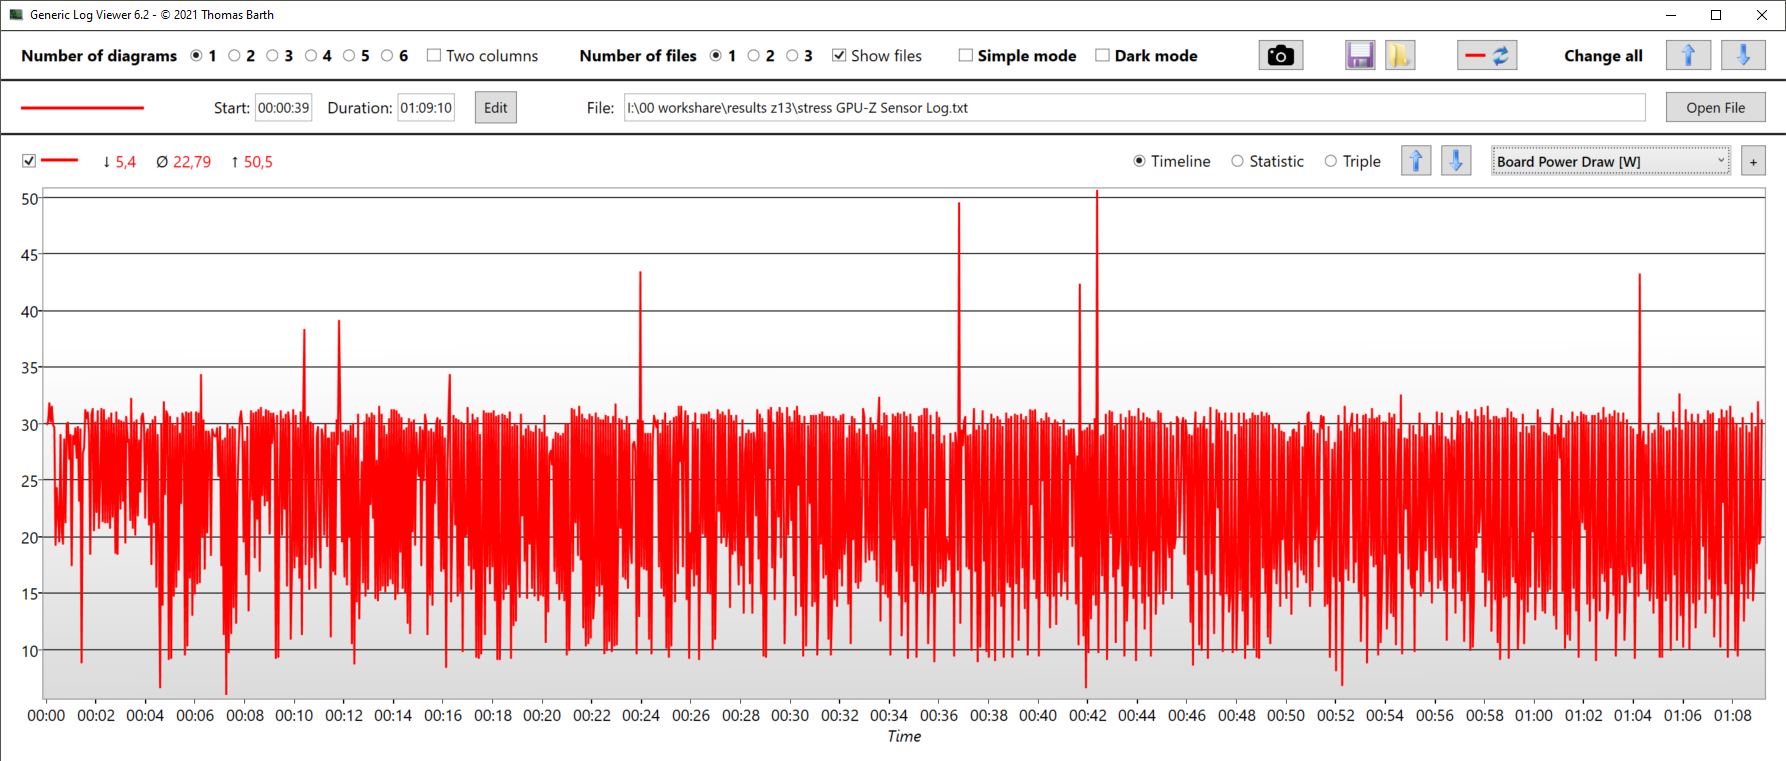
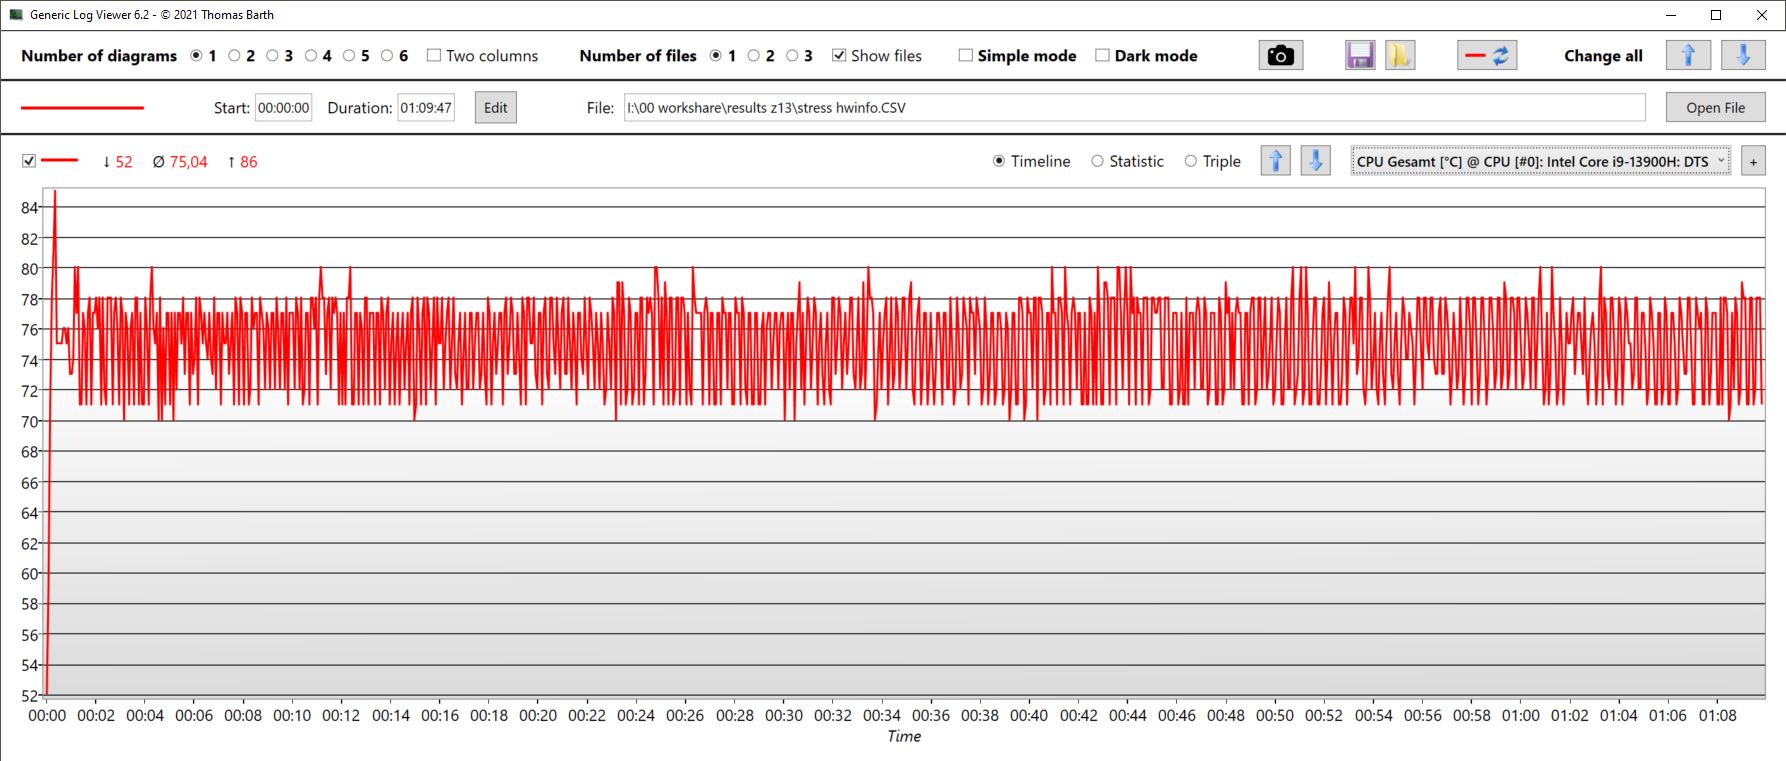
| Clock della CPU (GHz) | clock della GPU (MHz) | temperatura media della CPU (°C) | temperatura media della GPU (°C) | |
| Prime95 + FurMark stress | 2,65 | 1.368 | 75 | 64 |
| Witcher 3 stress | 382 | 1,931 | 66 | 64 |
Altoparlanti
Asus ha installato altoparlanti stereo nei due angoli inferiori del tablet, diretti verso l'esterno. Poiché il suono non è diretto verso la parte anteriore ma piuttosto verso i lati, gli altoparlanti non sono particolarmente forti.
I medi e gli alti bilanciati sono buoni, la mancanza di bassi meno. I dispositivi audio possono essere collegati tramite la porta per le cuffie.
Asus ROG Flow Z13 GZ301V analisi audio
(±) | potenza degli altiparlanti media ma buona (78.64 dB)
Bassi 100 - 315 Hz
(-) | quasi nessun basso - in media 17.5% inferiori alla media
(±) | la linearità dei bassi è media (7.5% delta rispetto alla precedente frequenza)
Medi 400 - 2000 Hz
(+) | medi bilanciati - solo only 2.9% rispetto alla media
(+) | medi lineari (5.8% delta rispetto alla precedente frequenza)
Alti 2 - 16 kHz
(+) | Alti bilanciati - appena 1.8% dalla media
(+) | alti lineari (4.8% delta rispetto alla precedente frequenza)
Nel complesso 100 - 16.000 Hz
(±) | la linearità complessiva del suono è media (15% di differenza rispetto alla media
Rispetto alla stessa classe
» 32% di tutti i dispositivi testati in questa classe è stato migliore, 6% simile, 62% peggiore
» Il migliore ha avuto un delta di 6%, medio di 18%, peggiore di 132%
Rispetto a tutti i dispositivi testati
» 21% di tutti i dispositivi testati in questa classe è stato migliore, 4% similare, 75% peggiore
» Il migliore ha avuto un delta di 4%, medio di 23%, peggiore di 134%
MSI Cyborg 15 A12VF analisi audio
(±) | potenza degli altiparlanti media ma buona (77.79 dB)
Bassi 100 - 315 Hz
(-) | quasi nessun basso - in media 19.8% inferiori alla media
(±) | la linearità dei bassi è media (12.2% delta rispetto alla precedente frequenza)
Medi 400 - 2000 Hz
(+) | medi bilanciati - solo only 1.8% rispetto alla media
(+) | medi lineari (5% delta rispetto alla precedente frequenza)
Alti 2 - 16 kHz
(+) | Alti bilanciati - appena 4.2% dalla media
(+) | alti lineari (3.9% delta rispetto alla precedente frequenza)
Nel complesso 100 - 16.000 Hz
(+) | suono nel complesso lineare (14.2% differenza dalla media)
Rispetto alla stessa classe
» 25% di tutti i dispositivi testati in questa classe è stato migliore, 7% simile, 68% peggiore
» Il migliore ha avuto un delta di 6%, medio di 18%, peggiore di 132%
Rispetto a tutti i dispositivi testati
» 17% di tutti i dispositivi testati in questa classe è stato migliore, 4% similare, 79% peggiore
» Il migliore ha avuto un delta di 4%, medio di 23%, peggiore di 134%
Gestione dell'alimentazione - Non particolarmente parsimoniosa
Consumo di energia
Un tablet da gioco non è ovviamente così economico rispetto ad altri tablet. Tuttavia, il confronto con i portatili da gioco è sorprendente. Ad esempio, l'MSI Cyborg consuma complessivamente meno nonostante uno schermo molto più grande e prestazioni simili. Mentre i tassi di consumo sono quasi gli stessi durante il gioco, lo Z13 non si comporta particolarmente bene nel consumo inattivo. Il Cyborg è molto più parsimonioso. Il consumo in idle significativamente inferiore con un monitor esterno suggerisce che il display Nebula, luminoso e ad alta risoluzione, assorbe molta energia.
Le differenze di consumo in Witcher 3 Ultra (a seconda della modalità di prestazione) sono elencate nella tabella seguente.
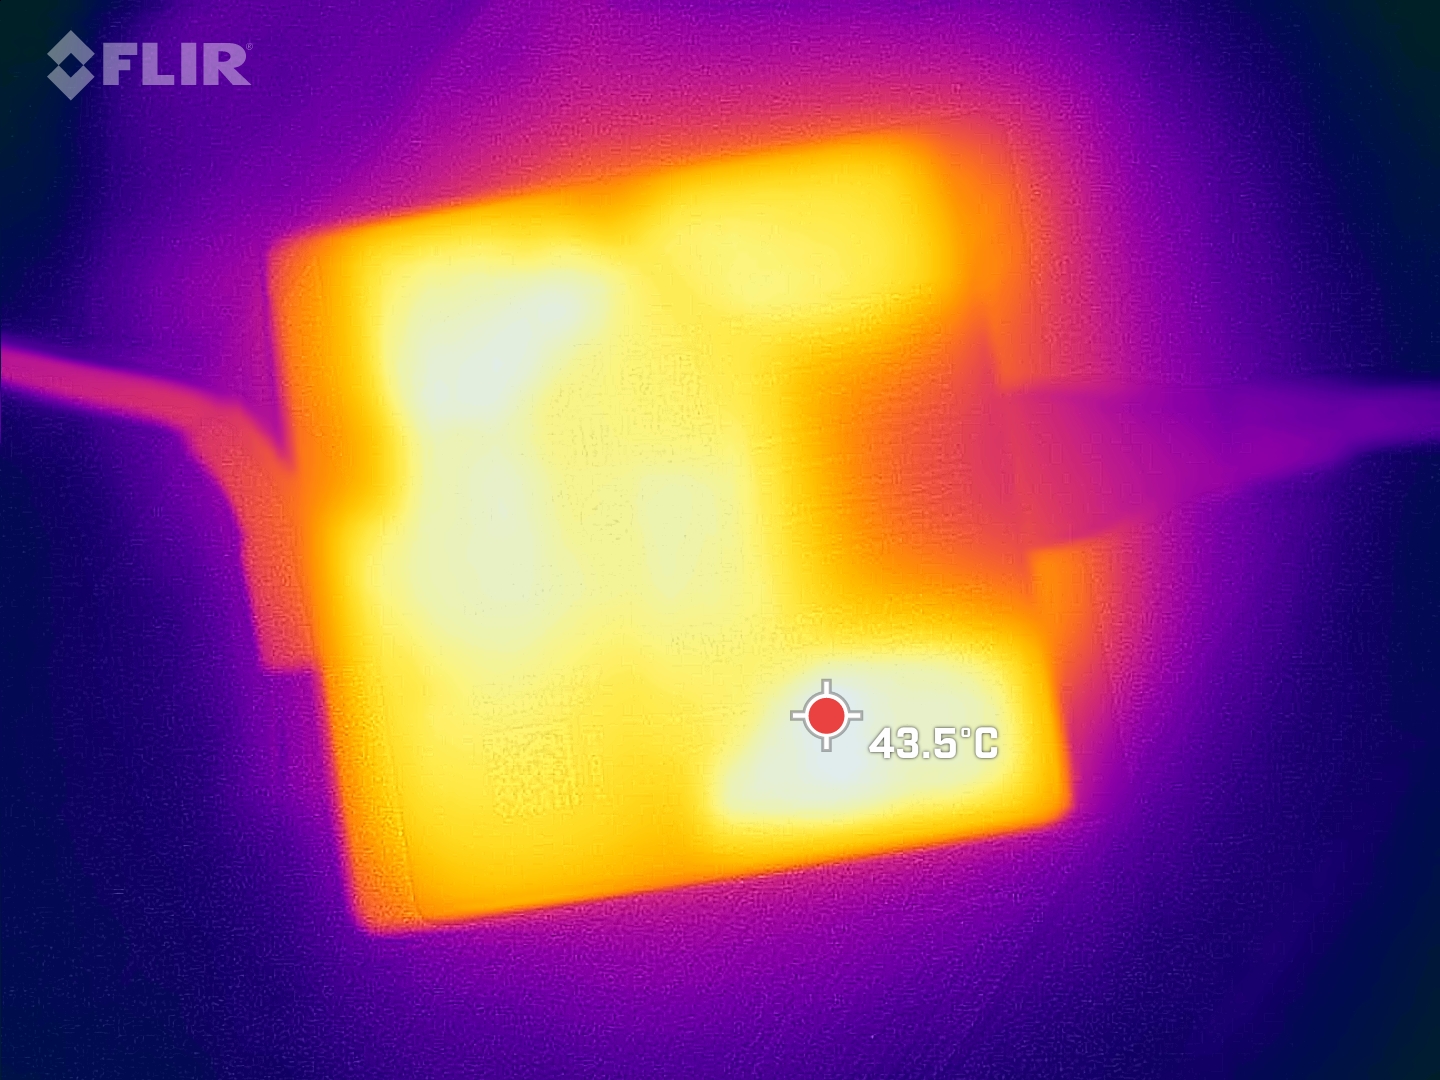
Abbiamo misurato picchi a breve termine di 135 W massimi. È probabile che questo esaurisca l'alimentatore USB-C da 130 W, piacevolmente piccolo, ma abbiamo misurato un consumo medio di 102 W nello stress test, quindi non dovrebbero esserci problemi.
| Modalità di prestazioni/valori di misurazione | Livello di rumore della ventola | Frequenza di aggiornamento | Consumo |
|---|---|---|---|
| Silenzioso | 36 dB | 67 fps | 76 W |
| Performance | 41 dB | 77 fps | 88 W |
| Turbo | 47 dB | 83 fps | 105 W |
| Off / Standby | |
| Idle | |
| Sotto carico |
|
Leggenda:
min: | |
| Asus ROG Flow Z13 GZ301V i9-13900H, GeForce RTX 4060 Laptop GPU, WD PC SN740 SDDPTQD-1T00, IPS, 2560x1600, 13.4" | Asus ROG Flow Z13 ACRNM i9-13900H, GeForce RTX 4070 Laptop GPU, WD PC SN740 SDDPTQD-1T00, IPS, 2560x1600, 13.4" | Asus ROG Flow Z13 GZ301ZE i9-12900H, GeForce RTX 3050 Ti Laptop GPU, Micron 2450 1TB MTFDKBK1T0TFK, IPS, 1920x1200, 13.4" | MSI Katana 17 B13VFK i7-13620H, GeForce RTX 4060 Laptop GPU, Micron 2400 MTFDKBA1T0QFM, IPS LED, 1920x1080, 17.3" | Acer Predator Triton 300 SE i9-12900H, GeForce RTX 3060 Laptop GPU, Micron 3400 1TB MTFDKBA1T0TFH, OLED, 2880x1800, 14" | MSI Cyborg 15 A12VF i7-12650H, GeForce RTX 4060 Laptop GPU, Samsung PM9B1 1024GB MZVL41T0HBLB, IPS, 1920x1080, 15.6" | Media NVIDIA GeForce RTX 4060 Laptop GPU | Media della classe Gaming | |
|---|---|---|---|---|---|---|---|---|
| Power Consumption | -4% | 10% | -34% | -26% | 16% | -35% | -60% | |
| Idle Minimum * (Watt) | 8.5 | 8.9 -5% | 8.8 -4% | 12.2 -44% | 7.6 11% | 6 29% | 11.5 ? -35% | 13 ? -53% |
| Idle Average * (Watt) | 12.4 | 12.6 -2% | 12.1 2% | 14.9 -20% | 12.3 1% | 8.8 29% | 16 ? -29% | 19 ? -53% |
| Idle Maximum * (Watt) | 13.3 | 13 2% | 12.7 5% | 15.8 -19% | 17.6 -32% | 11.9 11% | 20.3 ? -53% | 24.6 ? -85% |
| Load Average * (Watt) | 93 | 92.5 1% | 72.3 22% | 85.22 8% | 111 -19% | 89 4% | 92.9 ? -0% | 110.7 ? -19% |
| Witcher 3 ultra * (Watt) | 87.8 | 104.4 -19% | 77.3 12% | 151.1 -72% | 117.1 -33% | 90.3 -3% | ||
| Load Maximum * (Watt) | 135 | 133.6 1% | 103.1 24% | 212.8 -58% | 245.8 -82% | 99 27% | 210 ? -56% | 259 ? -92% |
* ... Meglio usare valori piccoli
Power consumption Witcher 3 / Stress test
Power consumption with an external monitor
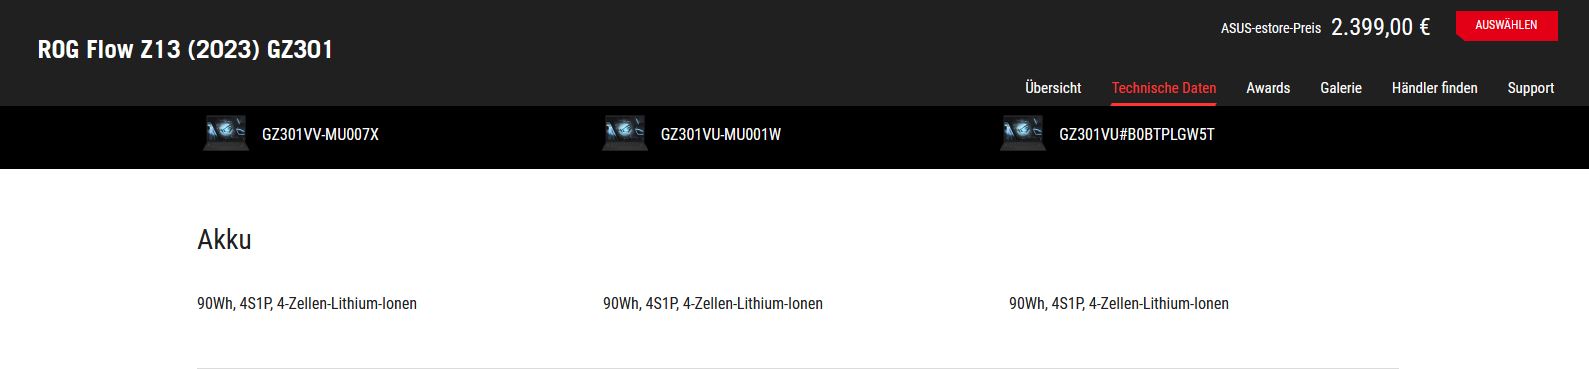
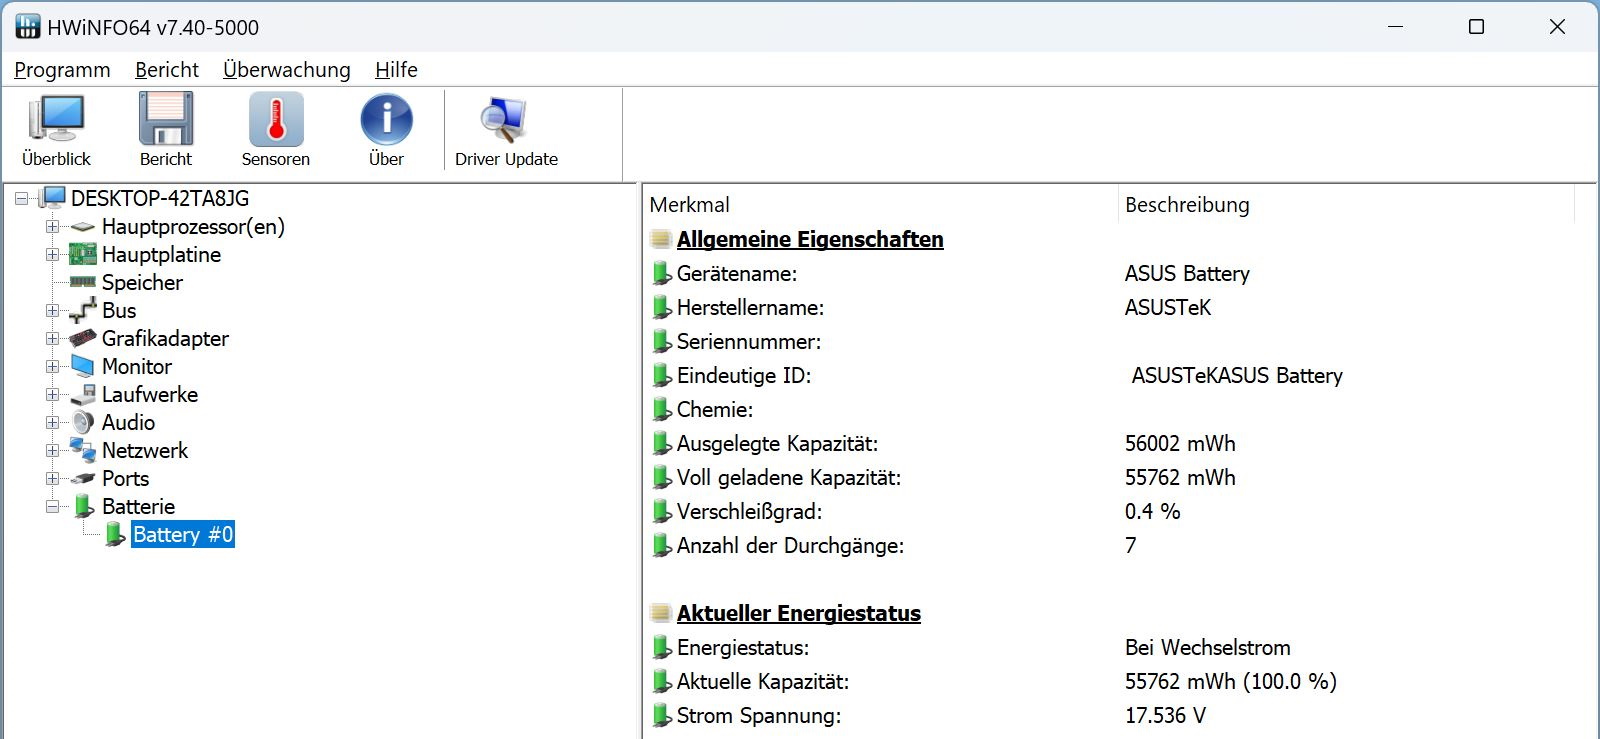
Durata della batteria
Nella scheda tecnica sul sito web dello Z13, Asus indica una batteria da 90 Wh, il che è sbagliato! Proprio come il predecessore e l'edizione speciale, il nuovo Z13 ha una batteria da 56 Wh e una batteria da 90 Wh difficilmente si adatterebbe al tablet. Sul sito web, invece, la batteria è correttamente indicata come 56 Wh.
Questo valore è sufficiente per poco meno di 5 ore di navigazione web a luminosità ridotta o per una serata cinematografica di 5 ore e 44 minuti, sempre a 150 nits.
In precedenza abbiamo lodato la perdita di prestazioni relativamente bassa durante i giochi. Tuttavia, le prestazioni relativamente elevate riducono l'autonomia, tanto che è possibile giocare a Witcher 3 Ultra solo per 50 minuti.
Il MSI Cyborgcon prestazioni simili e una batteria di dimensioni simili dura molto di più in tutti i test sulla batteria, mentre il Katana 17si comporta peggio in condizioni simili.
| Asus ROG Flow Z13 GZ301V i9-13900H, GeForce RTX 4060 Laptop GPU, 56 Wh | Asus ROG Flow Z13 ACRNM i9-13900H, GeForce RTX 4070 Laptop GPU, 56 Wh | Asus ROG Flow Z13 GZ301ZE i9-12900H, GeForce RTX 3050 Ti Laptop GPU, 56 Wh | MSI Katana 17 B13VFK i7-13620H, GeForce RTX 4060 Laptop GPU, 53.5 Wh | Acer Predator Triton 300 SE i9-12900H, GeForce RTX 3060 Laptop GPU, 76 Wh | MSI Cyborg 15 A12VF i7-12650H, GeForce RTX 4060 Laptop GPU, 53.5 Wh | Media della classe Gaming | |
|---|---|---|---|---|---|---|---|
| Autonomia della batteria | 11% | 15% | -21% | 27% | 83% | 56% | |
| H.264 (h) | 4.7 | 5.2 11% | 6 28% | 8 70% | 8.32 ? 77% | ||
| WiFi v1.3 (h) | 5 | 6.6 32% | 5.6 12% | 2.9 -42% | 6.2 24% | 7.5 50% | 7.11 ? 42% |
| Witcher 3 ultra (h) | 0.8 | 0.8 0% | |||||
| Load (h) | 1 | 0.9 -10% | 1.2 20% | 1 0% | 1.3 30% | 2.3 130% | 1.502 ? 50% |
| Reader / Idle (h) | 8.1 | 13.6 | 8.27 ? |
Pro
Contro
Verdetto - Il gioco AAA su tablet è possibile
Ad essere onesti, ci aspettavamo che gli svantaggi del piccolo fattore di forma fossero molto più pronunciati con un hardware potente. Ma l'Asus ROG Flow Z13 dimostra che i giochi AAA possono funzionare anche su un tablet. I giochi attuali in Full HD possono essere giocati senza esitazioni.
Naturalmente, le prestazioni sono un po' più basse rispetto ai grandi portatili da gioco con TGP più elevati, ma i compromessi sono piuttosto ridotti. Allo stesso tempo, i parametri di gioco critici, come il rumore della ventola o le temperature, sono molto moderati, a volte addirittura contenuti.
Se Asus riuscirà a tenere sotto controllo le latenze dpc, piuttosto elevate, anche i creatori saranno contenti del tablet ad alte prestazioni con display Nebula ad alta risoluzione e fotocamere relativamente buone.
Si deve "solo" rinunciare a una serie di opzioni di manutenzione, a una tastiera decente e a un'ampia gamma di porte.
L'Asus ROG FLow Z13 è in grado di riprodurre senza problemi i giochi attuali in Full HD o addirittura in risoluzione nativa QHD+ grazie alla RTX 4060.
I tablet da gioco alternativi di questo livello sono rari, quindi lo Z13 occupa attualmente una nicchia. Per questo motivo, al momento, lo Z13 occupa una nicchia altrettanto rari portatili da 13 o addirittura 14 pollici per un'alternativa.
Prezzo e disponibilità
Nel negozio web statunitense di Asus, solo la variante RTX 4050 dello Z13 sembra essere disponibile al prezzo di 1.749,99 dollarima attualmente non è disponibile. Gli acquirenti interessati in altre località sono invitati a controllare direttamente tramite il negozio web di Asus (se applicabile) per vedere quali configurazioni sono disponibili.
Asus ROG Flow Z13 GZ301V
- 04/26/2023 v7 (old)
Christian Hintze
Transparency
La selezione dei dispositivi da recensire viene effettuata dalla nostra redazione. Il campione di prova è stato fornito all'autore come prestito dal produttore o dal rivenditore ai fini di questa recensione. L'istituto di credito non ha avuto alcuna influenza su questa recensione, né il produttore ne ha ricevuto una copia prima della pubblicazione. Non vi era alcun obbligo di pubblicare questa recensione. In quanto società mediatica indipendente, Notebookcheck non è soggetta all'autorità di produttori, rivenditori o editori.
Ecco come Notebookcheck esegue i test
Ogni anno, Notebookcheck esamina in modo indipendente centinaia di laptop e smartphone utilizzando procedure standardizzate per garantire che tutti i risultati siano comparabili. Da circa 20 anni sviluppiamo continuamente i nostri metodi di prova e nel frattempo stabiliamo gli standard di settore. Nei nostri laboratori di prova, tecnici ed editori esperti utilizzano apparecchiature di misurazione di alta qualità. Questi test comportano un processo di validazione in più fasi. Il nostro complesso sistema di valutazione si basa su centinaia di misurazioni e parametri di riferimento ben fondati, che mantengono l'obiettività.Price comparison

