Recensione dell'Asus ROG Flow Z13 ACRNM - Laptop convertibile per il gaming con RTX 4070
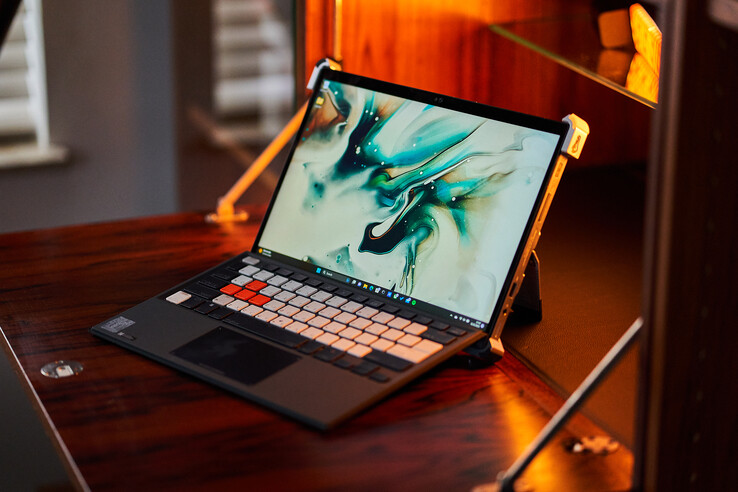
L'Asus ROG Flow Z13 è un tablet da gioco con un potente processore e una scheda grafica dedicata. Oltre al modello normale 2023 con Core i9-13900H e fino al GeForce RTX 4060 Laptop, che è attualmente anche in recensione, Asus offre anche un'edizione speciale in collaborazione con il marchio di moda tedesco ACRONYM, che ottiene uno chassis completamente ridisegnato e il più potente GeForce RTX 4070 Laptop. Abbiamo recensito il convertibile da gioco per scoprire se il prezzo di 3400 euro è giustificato. Il convertibile è dotato di uno schermo IPS WQHD da 13,4 pollici con frequenza di aggiornamento di 165 Hz, 32 GB di RAM LPDDR5 e un'unità SSD M.2-2230 da 1 TB, che può essere sostituita.
È anche possibile utilizzare il convertibile da gioco con la GPU esterna Asus XG Mobile con RTX 4090 Laptop, ma è un'opzione molto costosa a 2500 euro. Durante la recensione includeremo anche alcuni benchmark della eGPU.
Potenziali concorrenti a confronto
Punteggio | Data | Modello | Peso | Altezza | Dimensione | Risoluzione | Prezzo |
|---|---|---|---|---|---|---|---|
| 89.4 % v7 (old) | 04/2023 | Asus ROG Flow Z13 ACRNM i9-13900H, GeForce RTX 4070 Laptop GPU | 1.7 kg | 20 mm | 13.40" | 2560x1600 | |
| 86.8 % v7 (old) | 03/2022 | Asus ROG Flow Z13 GZ301ZE i9-12900H, GeForce RTX 3050 Ti Laptop GPU | 1.2 kg | 12 mm | 13.40" | 1920x1200 | |
| 86.7 % v7 (old) | 03/2022 | Alienware x14 i7 RTX 3060 i7-12700H, GeForce RTX 3060 Laptop GPU | 1.8 kg | 14.5 mm | 14.00" | 1920x1080 | |
| 89.4 % v7 (old) | 05/2022 | Razer Blade 14 Ryzen 9 6900HX R9 6900HX, GeForce RTX 3070 Ti Laptop GPU | 1.8 kg | 16.8 mm | 14.00" | 2560x1440 | |
| 86.7 % v7 (old) | 03/2022 | Asus ROG Zephyrus G14 GA402RK R9 6900HS, Radeon RX 6800S | 1.7 kg | 19.5 mm | 14.00" | 2560x1600 |
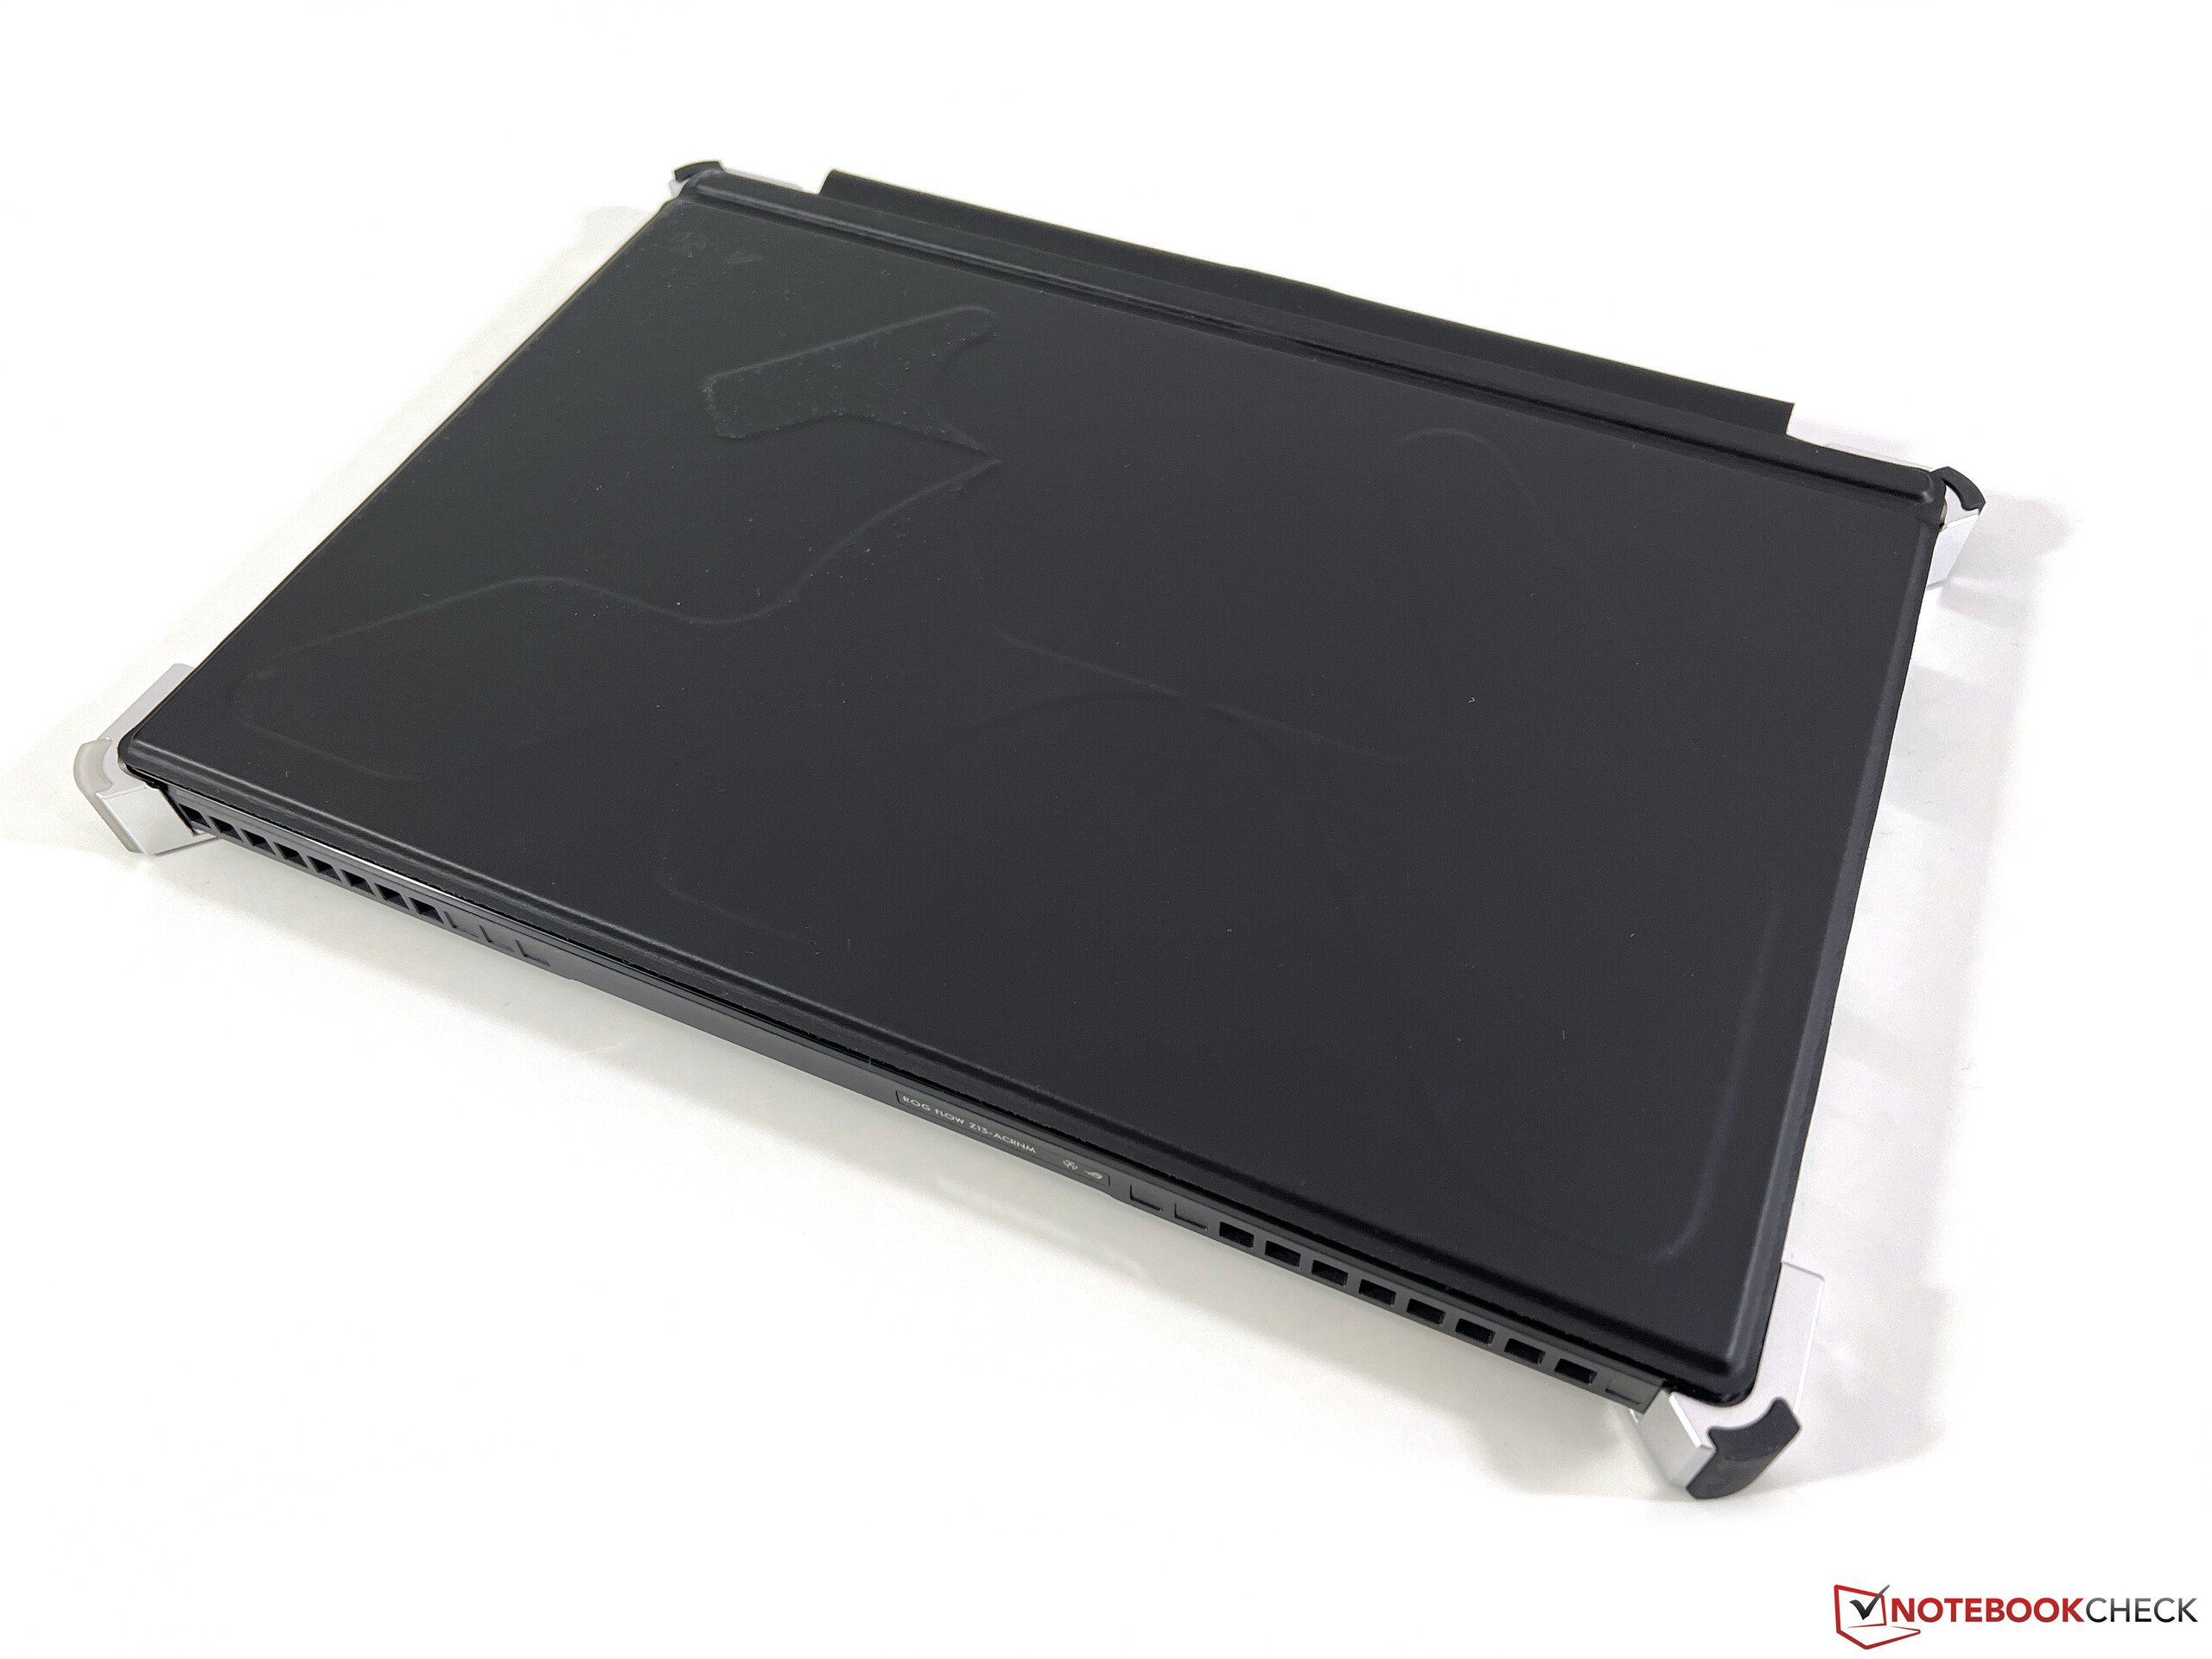
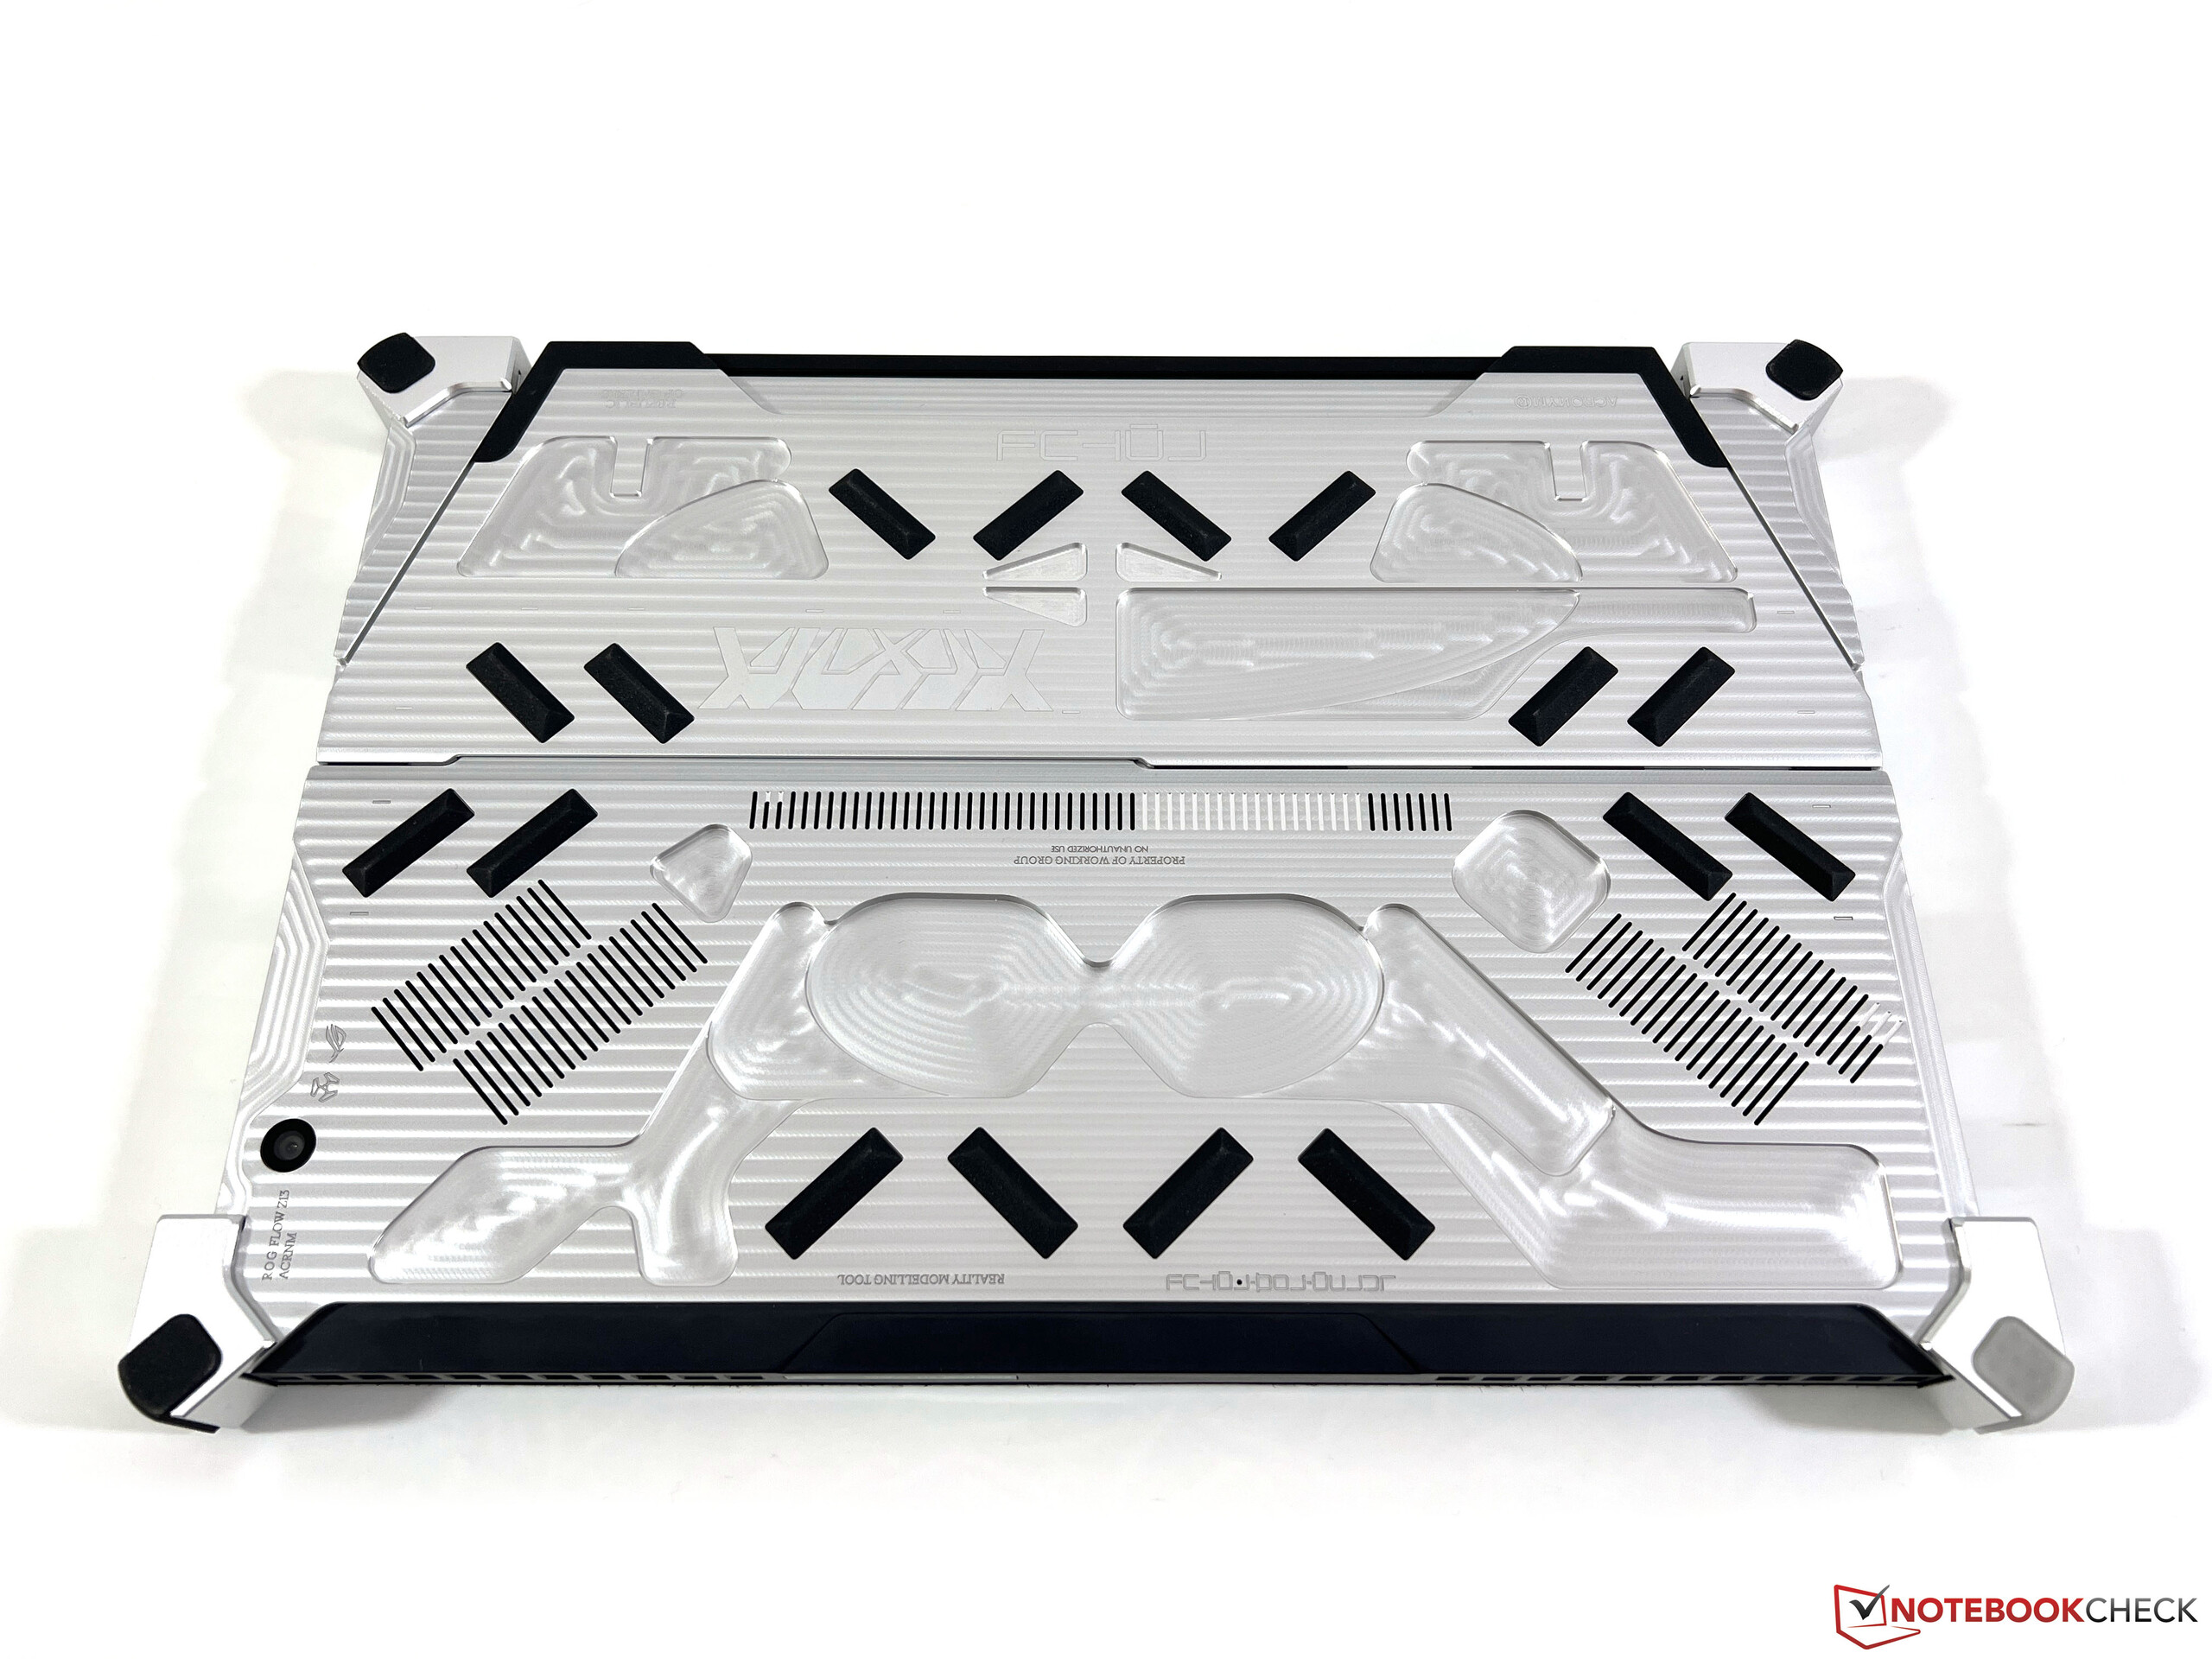
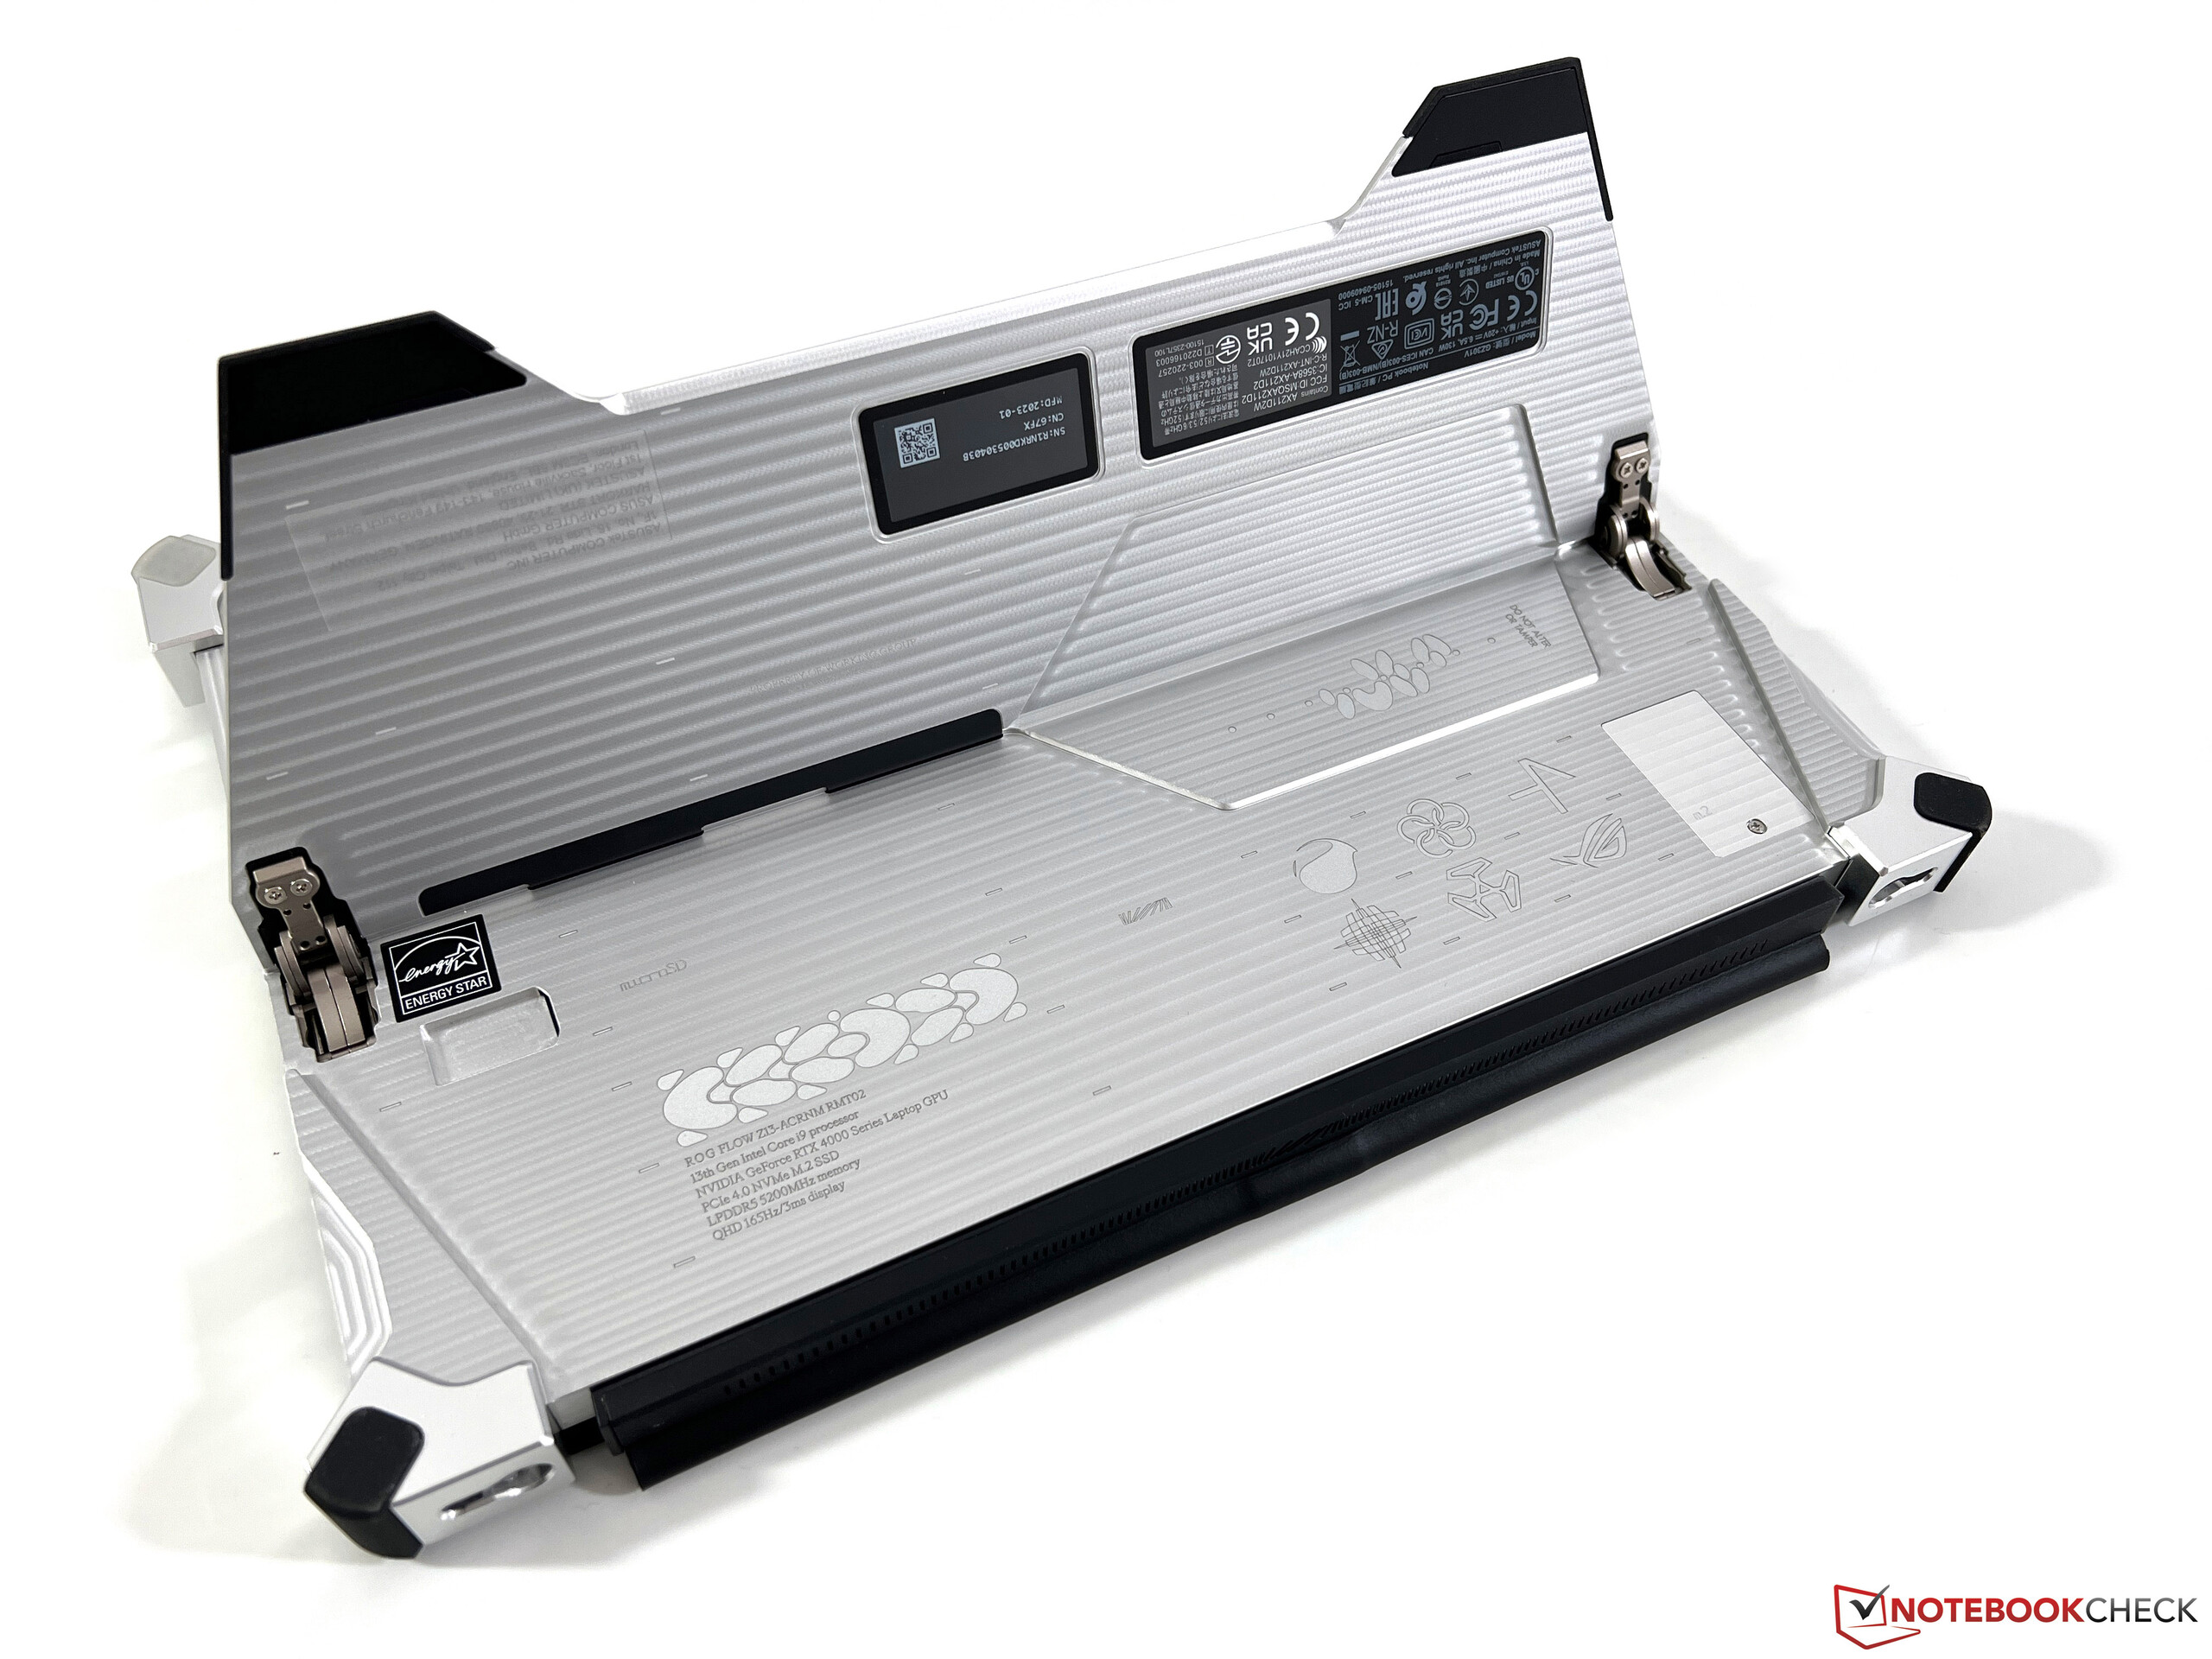
Case - Flow Z13 con un sorprendente telaio in alluminio
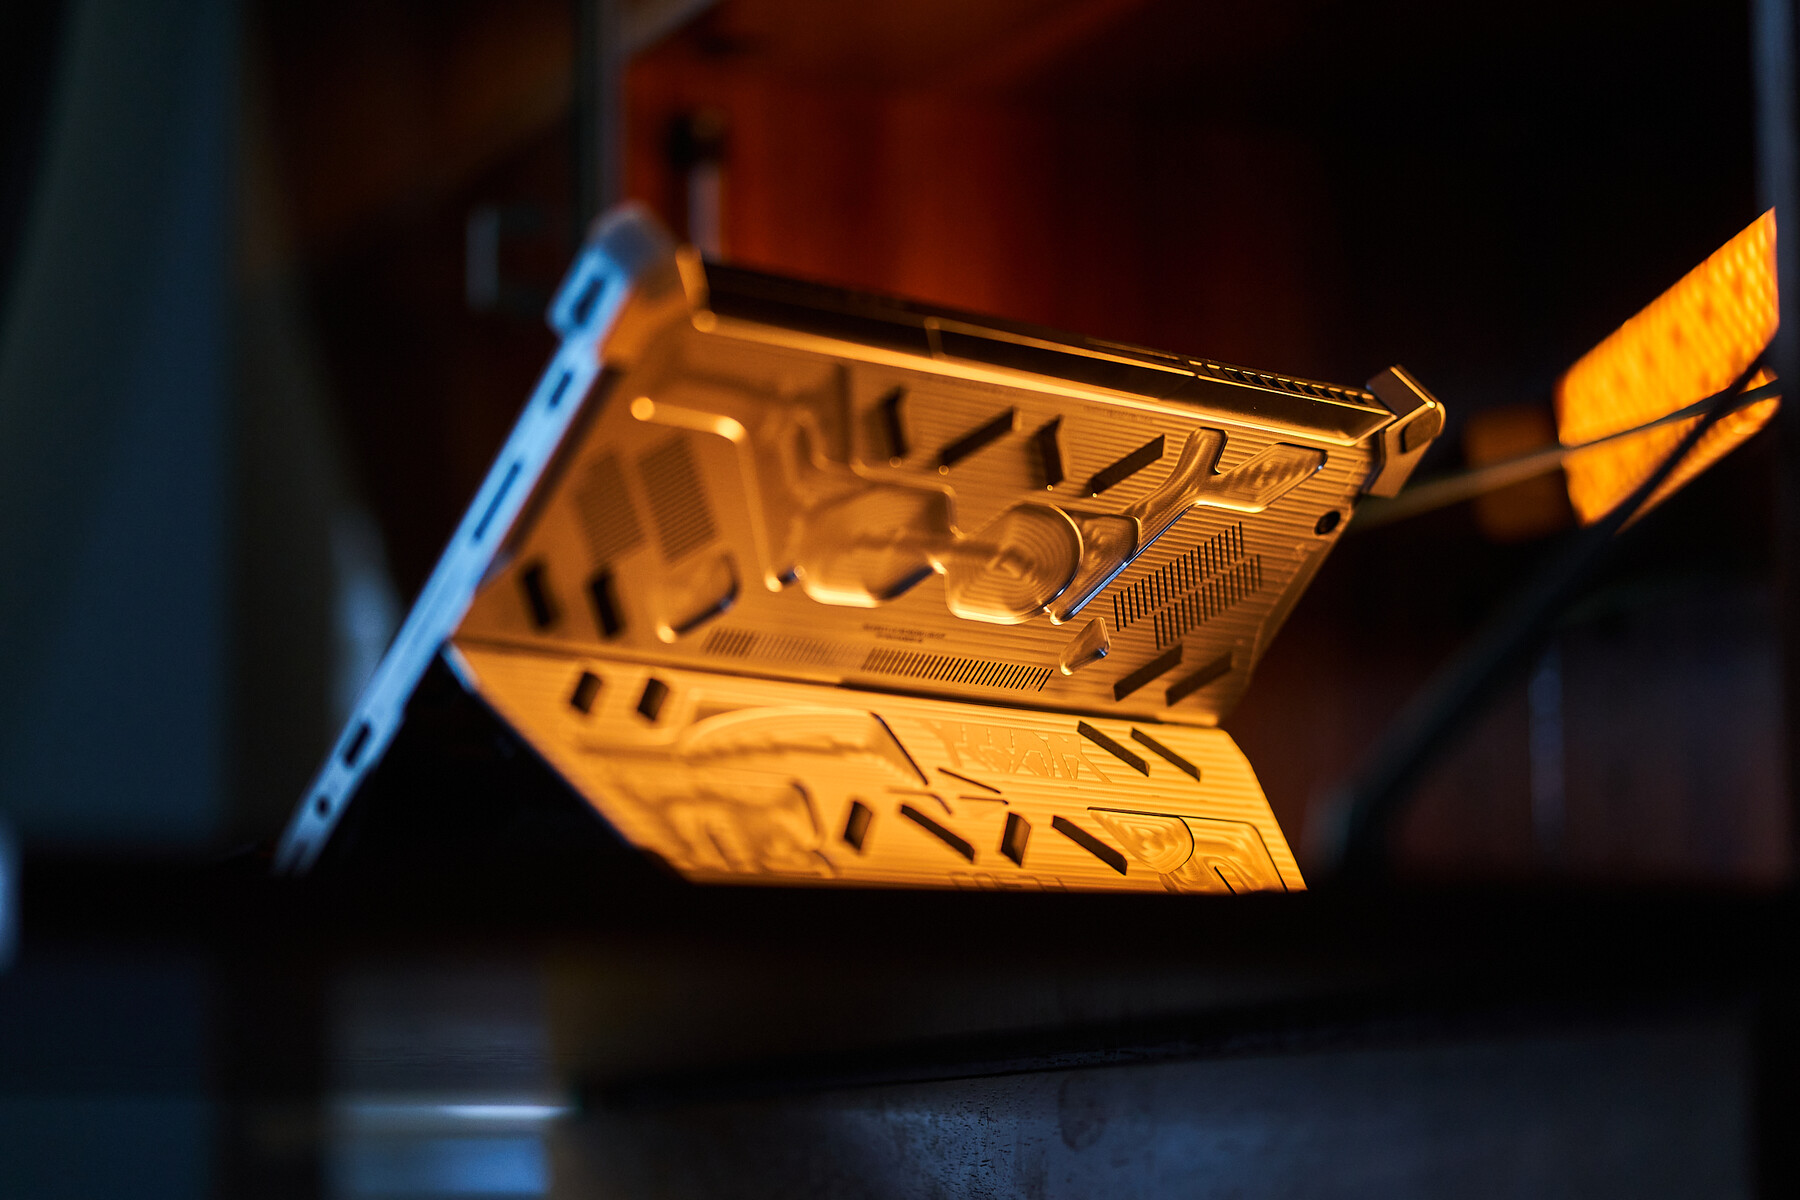
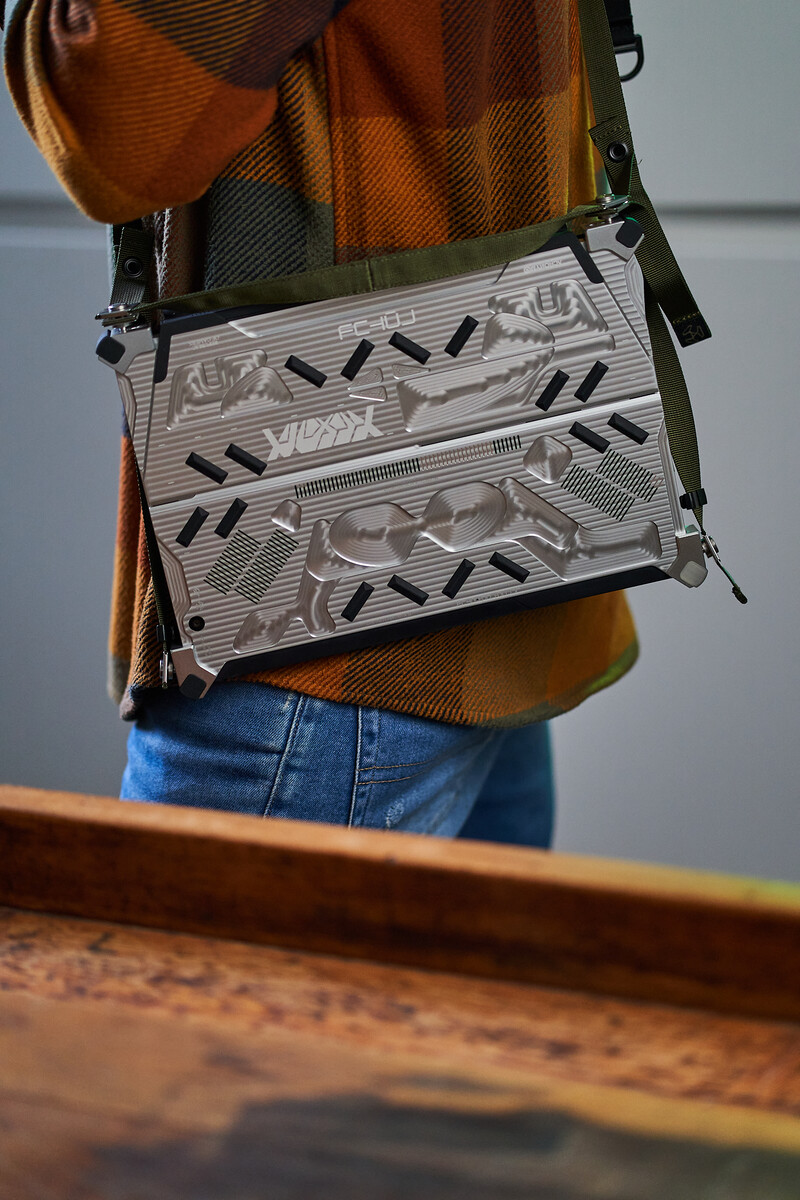
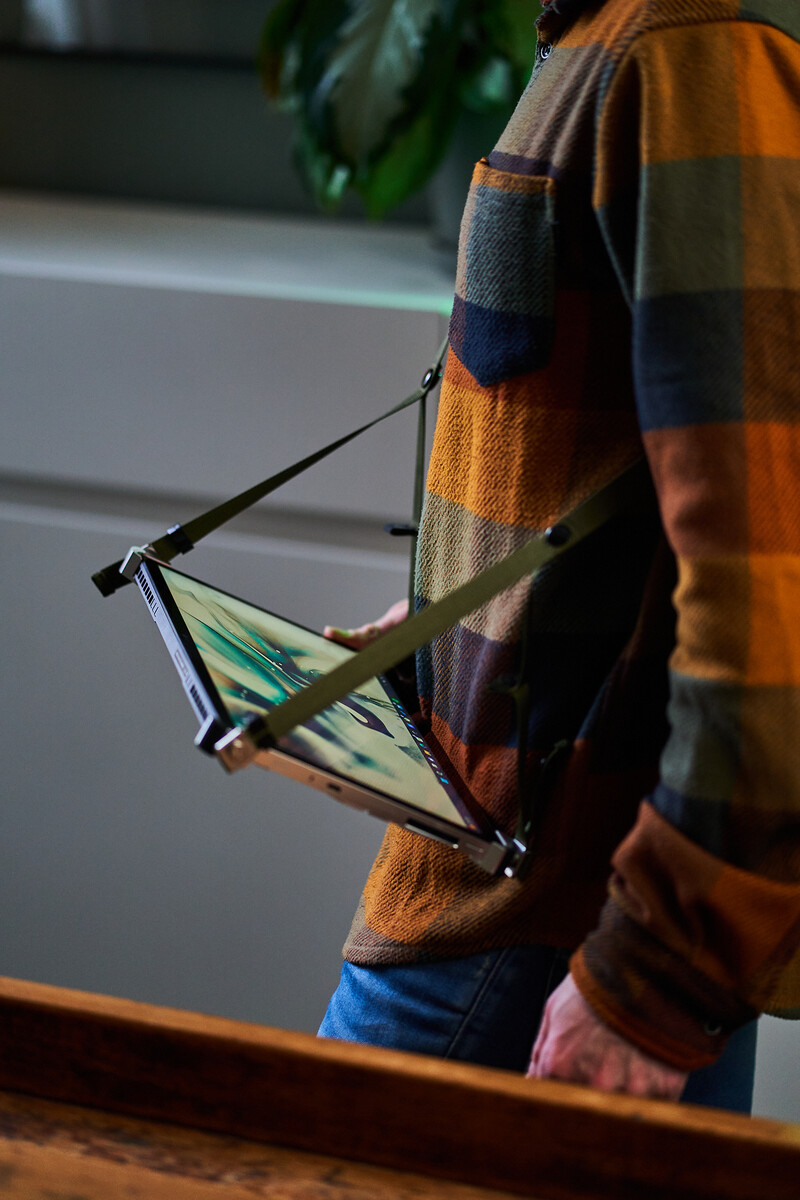
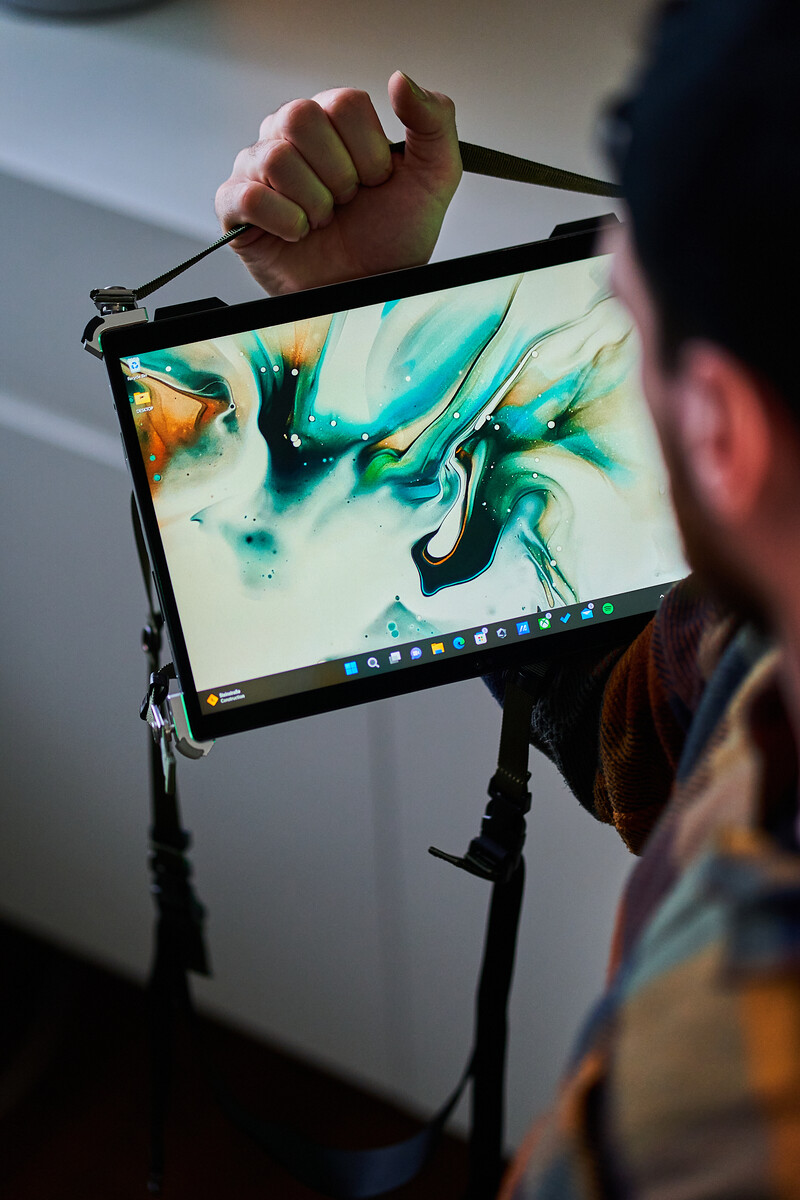
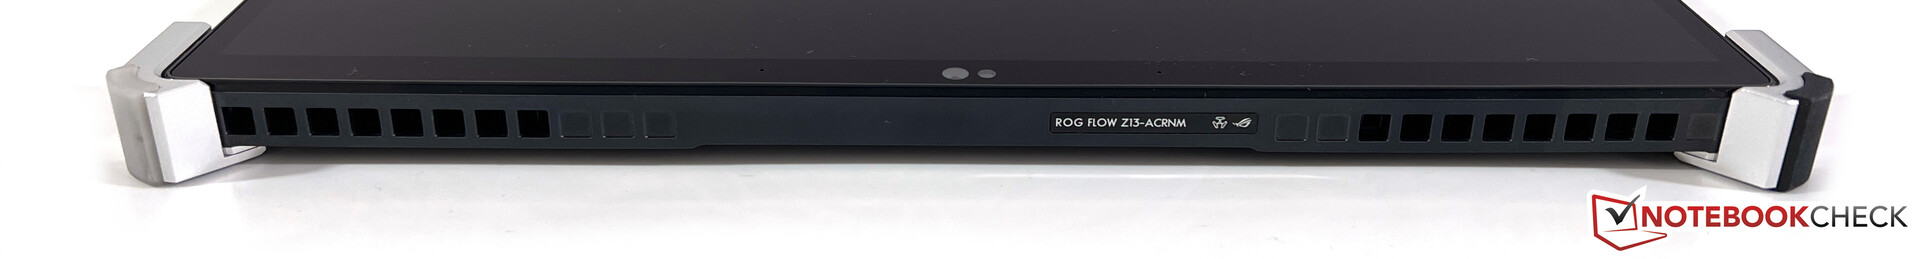
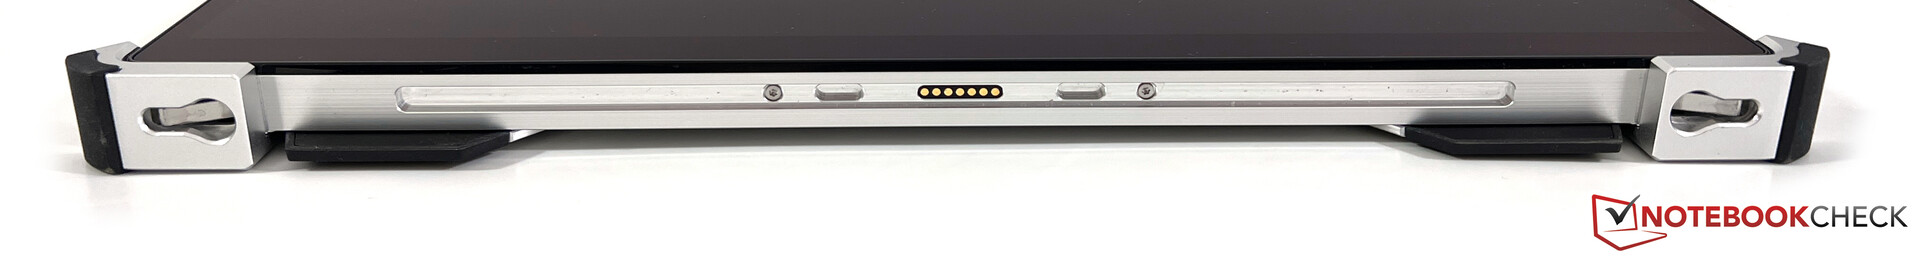
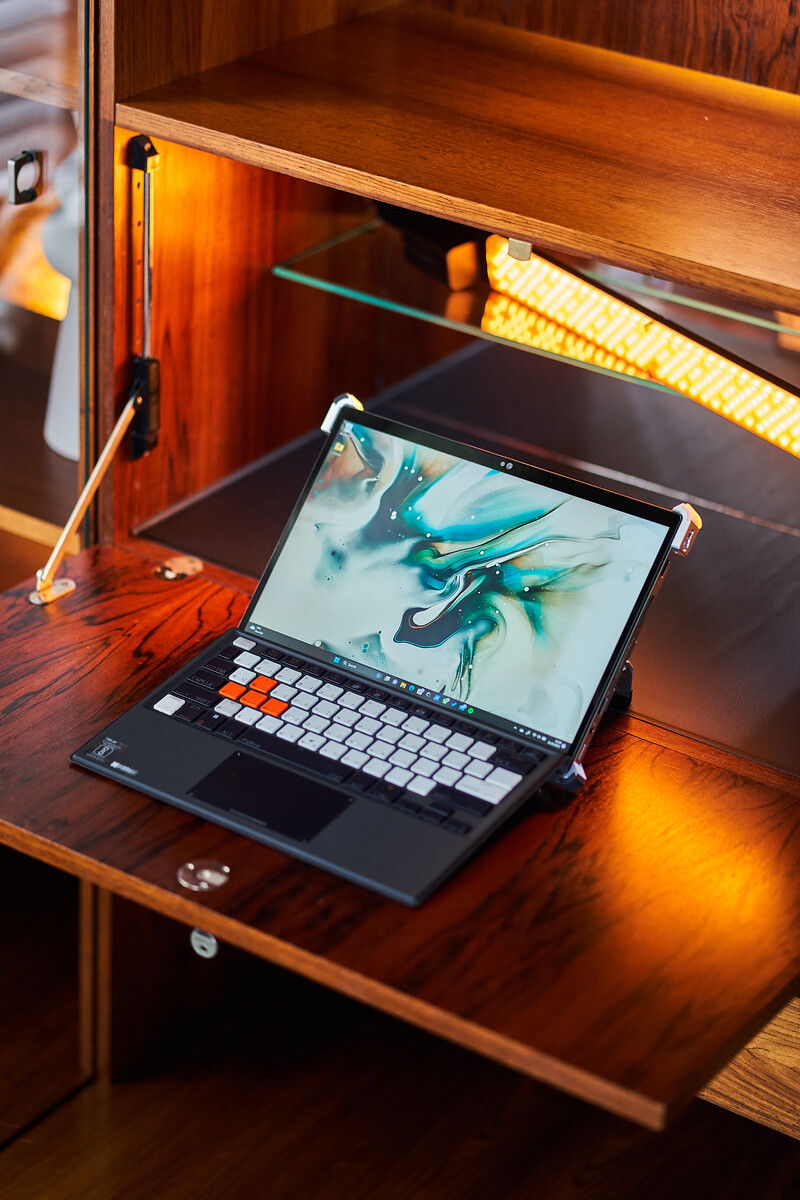
È possibile notare immediatamente che l'edizione speciale ACRNM utilizza uno chassis completamente diverso rispetto al modello normaleROG Flow Z13. La caratteristica più evidente è la copertura posteriore in alluminio lavorato a controllo numerico e si può vedere dove la macchina ha rimosso il materiale. Asus ha anche incluso strisce gommate per una migliore presa e c'è del materiale aggiuntivo intorno agli angoli. Il ROG Flow Z13 ACRNM ha quasi l'aspetto di un tablet ruggedized e la stabilità soddisfa sicuramente i requisiti, ma il dispositivo è anche piuttosto pesante con i suoi 1,7 kg (convertibile + tastiera). Asus lo sa bene e i quattro angoli sono anche punti di fissaggio per le cinghie in dotazione. Queste possono essere utilizzate per trasportare il dispositivo come una borsa a tracolla o per utilizzarlo davanti al corpo, come illustrato nelle immagini sottostanti.
Anche il cavalletto integrato sul retro lascia una buona impressione e le cerniere non traballano. Ci piace particolarmente il fatto che anche gli angoli del cavalletto siano gommati, il che significa che non si graffia e che è possibile utilizzare il convertibile anche in modalità verticale.
Nel complesso, l'edizione ACRNM del ROG Flow Z13 è sicuramente un design molto appariscente e non piacerà a tutti. A noi piace e pensiamo che sia adatto all'orientamento del dispositivo. Non è possibile aprire lo chassis per pulire le ventole, ad esempio, ma si può almeno accedere all'unità SSD compatta M.2-2230 tramite lo sportello di manutenzione sul retro.
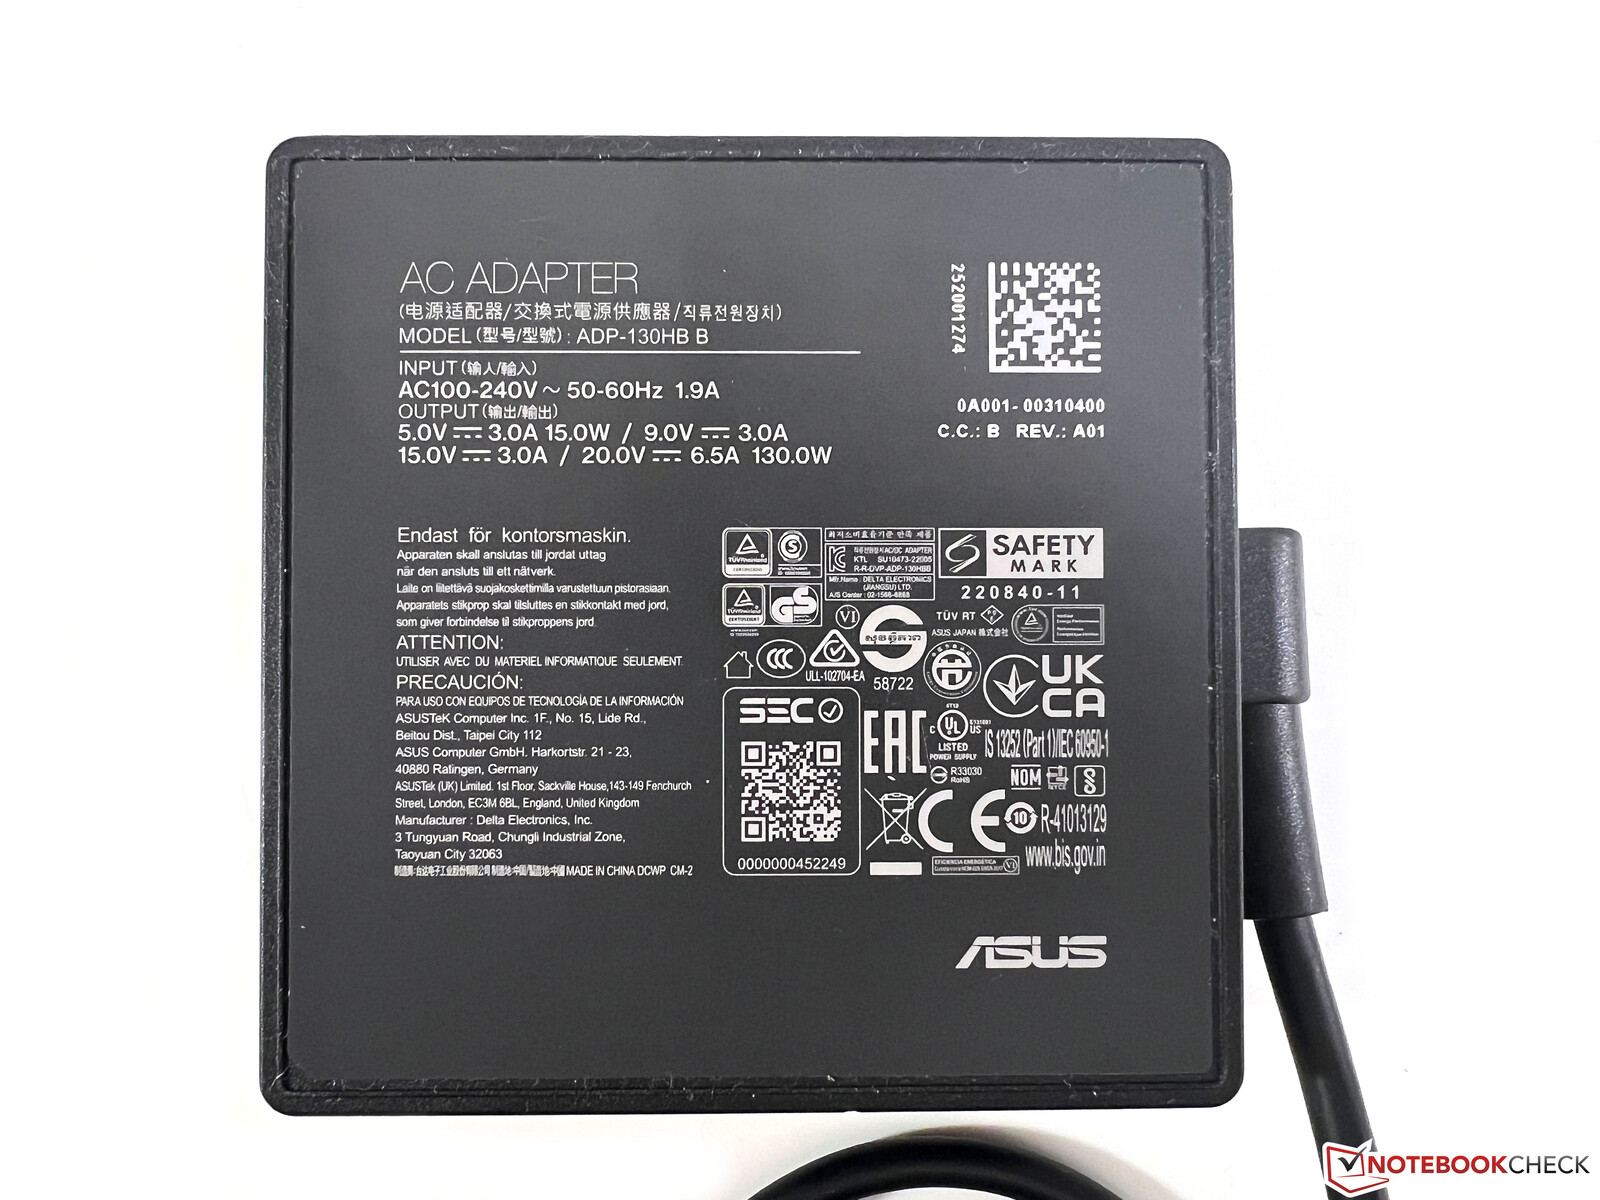
Abbiamo già accennato al peso elevato di 1,7 kg (sezione tablet ~1,3 kg) e lo chassis è anche più ingombrante rispetto al normaleROG Flow Z13. L'alimentatore compatto da 130W pesa 565 grammi.
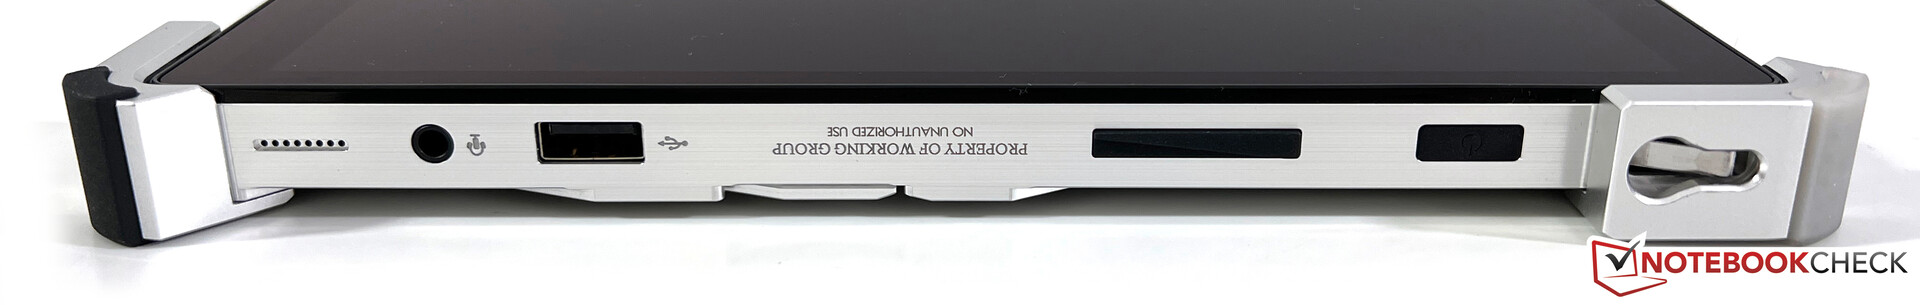
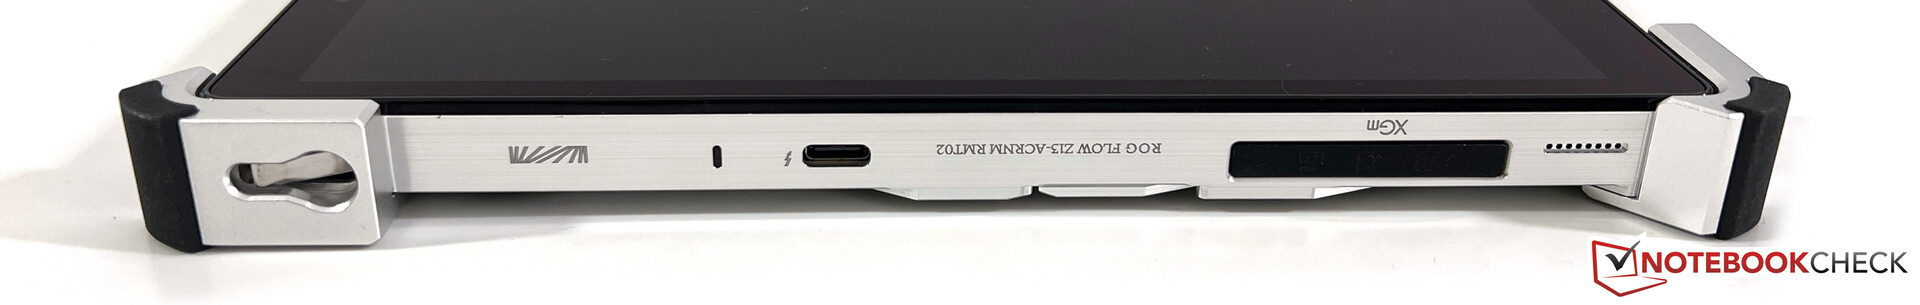
Connettività - Thunderbolt e eGPU
Il Flow Z13 è ancora un convertibile, quindi la varietà di porte è limitata. Tuttavia, la situazione non è così negativa e si dispone di una normale porta USB-A in combinazione con due porte USB-C e il connettore per la GPU esterna. Entrambe le porte USB-C possono essere utilizzate per caricare il convertibile e supportano anche l'uscita video.
Lettore di schede SD
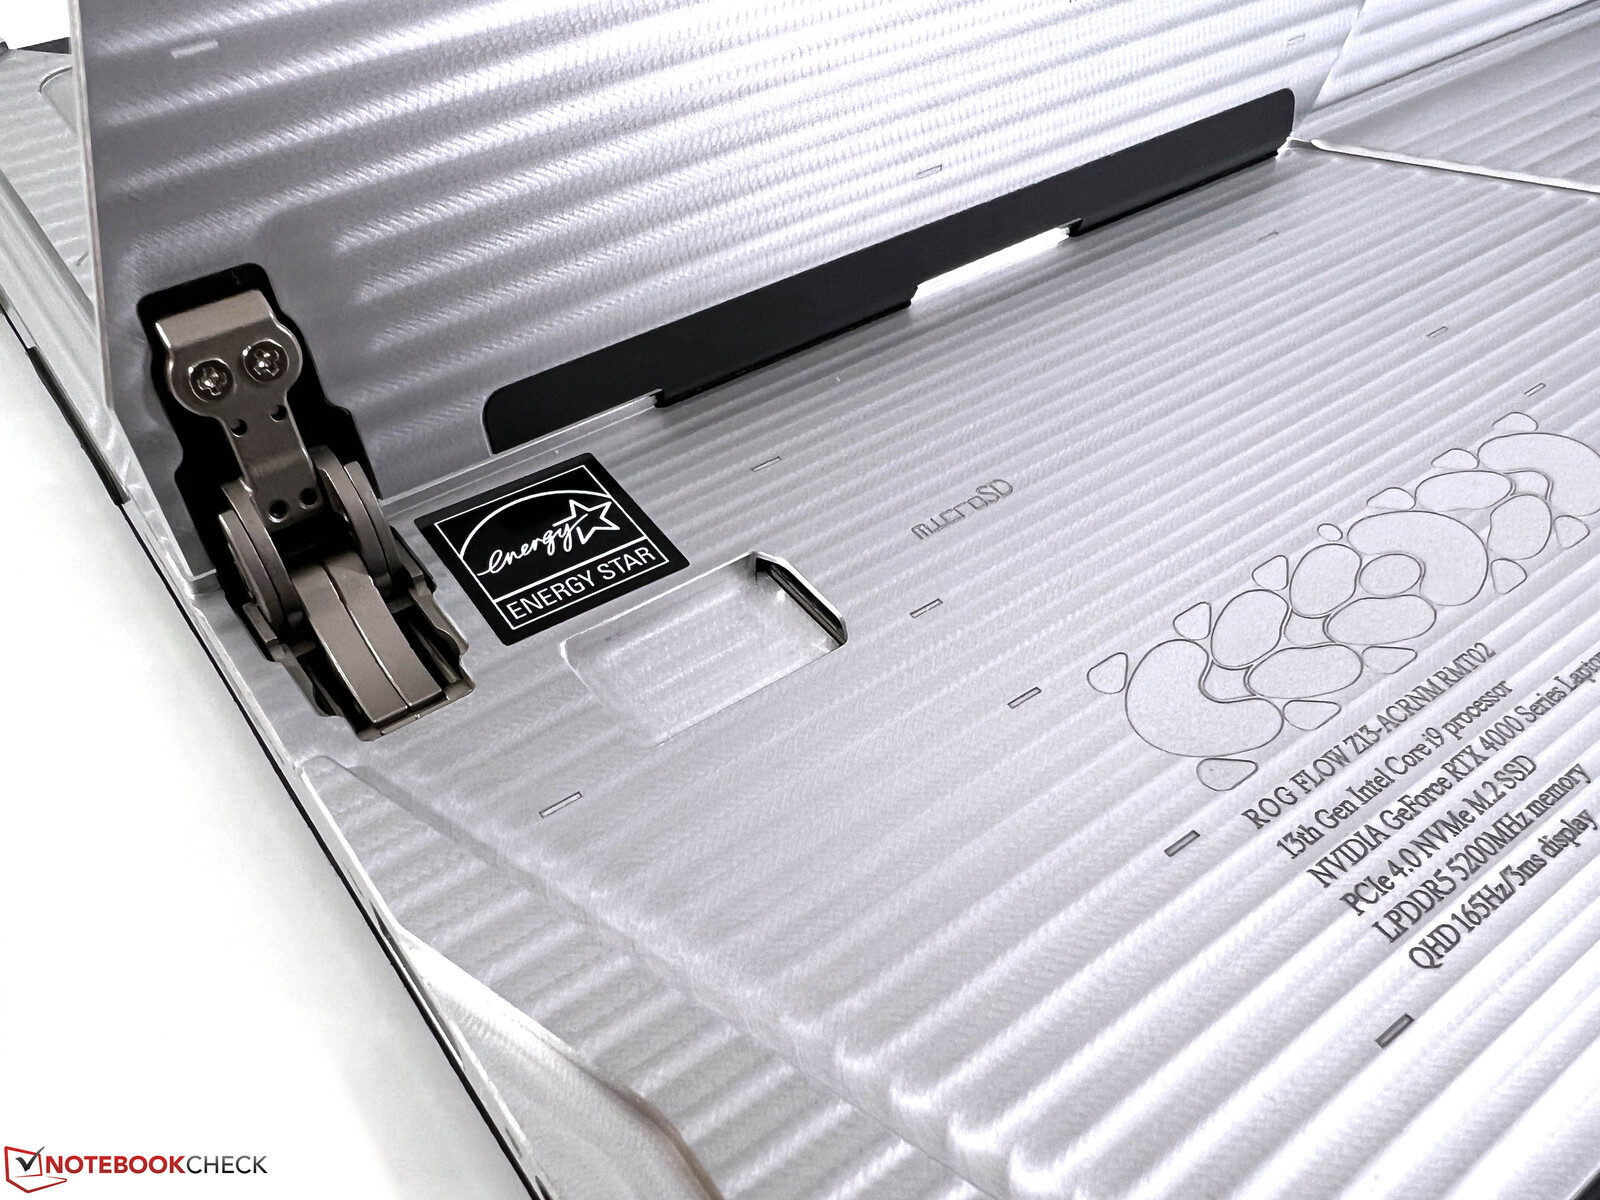
Asus ha implementato un lettore microSD (meccanismo a molla) dietro la kickstand, di facile accesso. Abbiamo misurato velocità di trasferimento fino a 211 MB/s e 190 MB/s quando abbiamo copiato i file immagine dalla nostra scheda di riferimento (Angelbird AV Pro V60).
| SD Card Reader | |
| average JPG Copy Test (av. of 3 runs) | |
| Alienware x14 i7 RTX 3060 (Angelbird AV Pro V60) | |
| Asus ROG Flow Z13 ACRNM (Angelbird AV Pro V60) | |
| Asus ROG Zephyrus G14 GA402RK (AV PRO microSD 128 GB V60) | |
| Media della classe Gaming (20.9 - 210, n=54, ultimi 2 anni) | |
| Asus ROG Flow Z13 GZ301ZE (Angelbird AV Pro V60) | |
| maximum AS SSD Seq Read Test (1GB) | |
| Asus ROG Flow Z13 GZ301ZE (Angelbird AV Pro V60) | |
| Alienware x14 i7 RTX 3060 (Angelbird AV Pro V60) | |
| Asus ROG Flow Z13 ACRNM (Angelbird AV Pro V60) | |
| Asus ROG Zephyrus G14 GA402RK (AV PRO microSD 128 GB V60) | |
| Media della classe Gaming (25.5 - 261, n=51, ultimi 2 anni) | |
Comunicazione
Il ROG Flow Z13 utilizza l'attuale modulo Wi-Fi Intel AX211, che supporta anche l'ultimo standard Wi-Fi 6E. Tuttavia, siamo riusciti a stabilire una connessione con la corrispondente rete a 6 GHz del nostro router di riferimento di Asus, ma anche le prestazioni con la rete a 5 GHz erano molto buone e stabili.
| Networking | |
| Asus ROG Flow Z13 ACRNM | |
| iperf3 transmit AXE11000 | |
| iperf3 receive AXE11000 | |
| Asus ROG Flow Z13 GZ301ZE | |
| iperf3 transmit AX12 | |
| iperf3 receive AX12 | |
| Alienware x14 i7 RTX 3060 | |
| iperf3 transmit AX12 | |
| iperf3 receive AX12 | |
| Razer Blade 14 Ryzen 9 6900HX | |
| iperf3 transmit AX12 | |
| iperf3 receive AX12 | |
| Asus ROG Zephyrus G14 GA402RK | |
| iperf3 transmit AXE11000 | |
| iperf3 receive AXE11000 | |
Webcam
Oltre a una fotocamera IR da 5 MP per Windows Hello, Asus ha incluso una nuova fotocamera da 13 MP nella cornice superiore del display. La qualità dell'immagine è molto migliore rispetto alle normali fotocamere da 720p o addirittura 1080p dei normali portatili. Abbiamo anche incluso un esempio di registrazione (video e audio) nella nostra recensione su YouTube di https://www.youtube.com/watch?v=ORXFWsPgZmYin modo che possiate avere un'impressione migliore delle prestazioni.


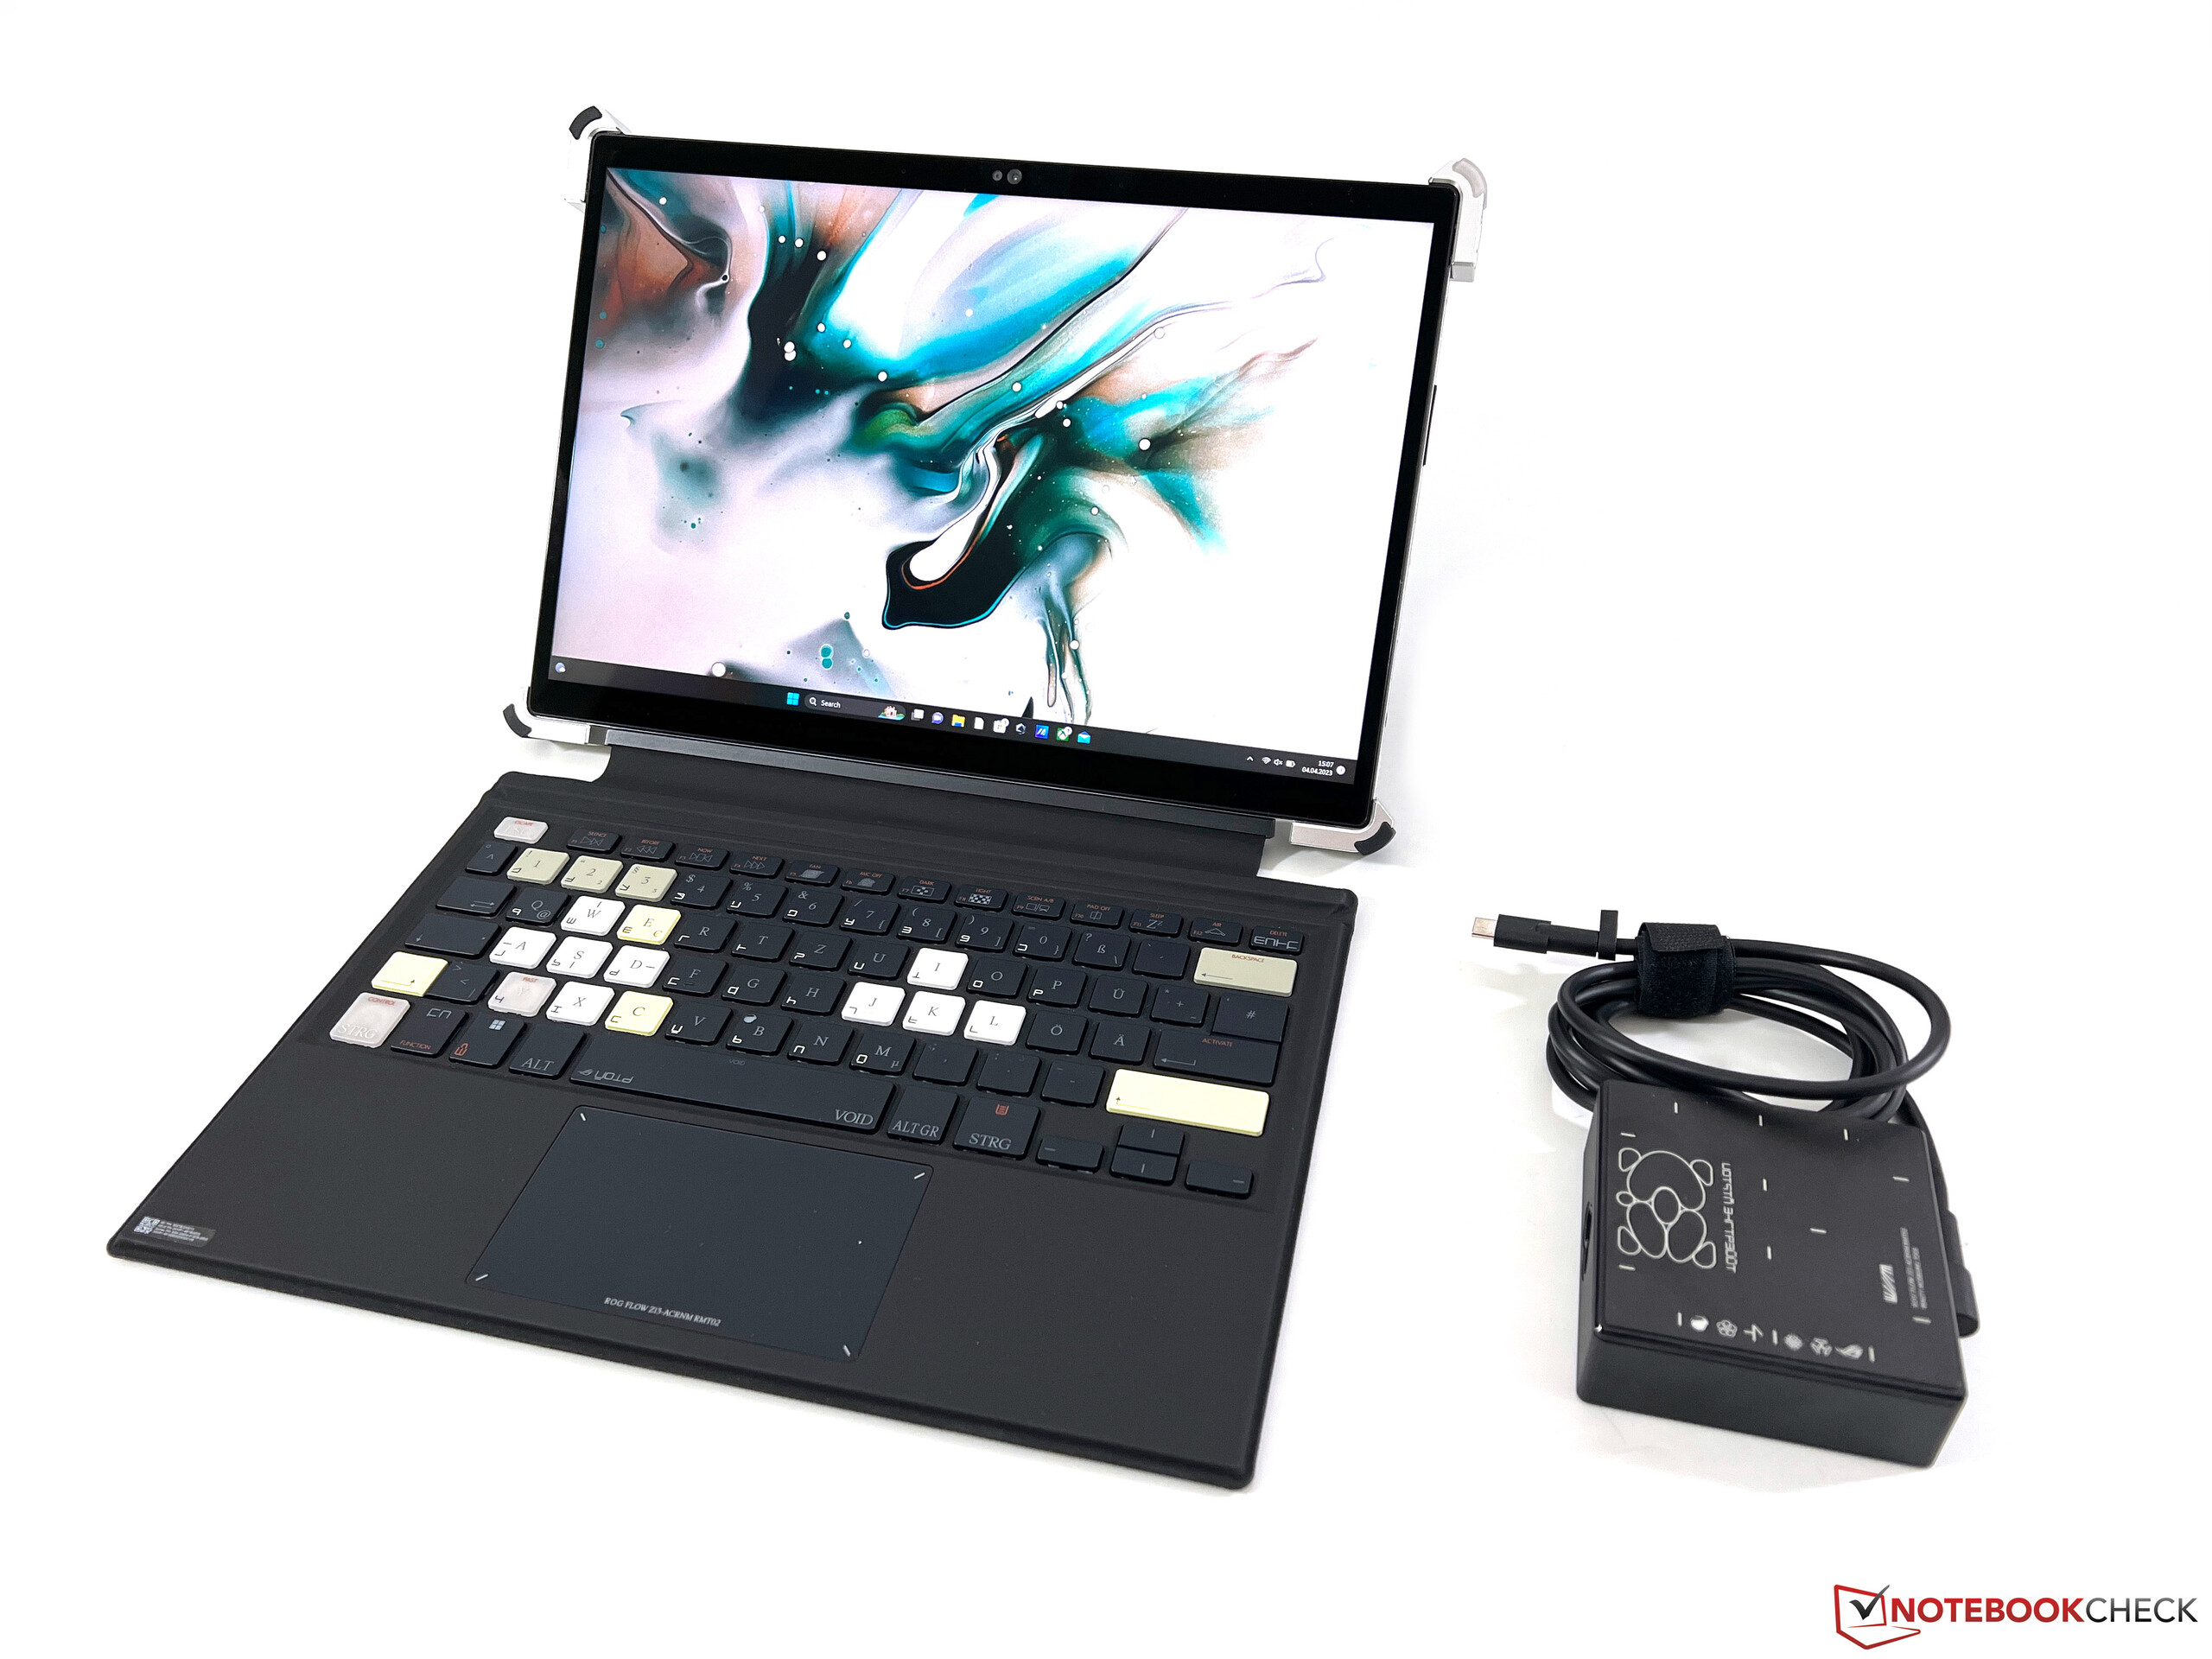
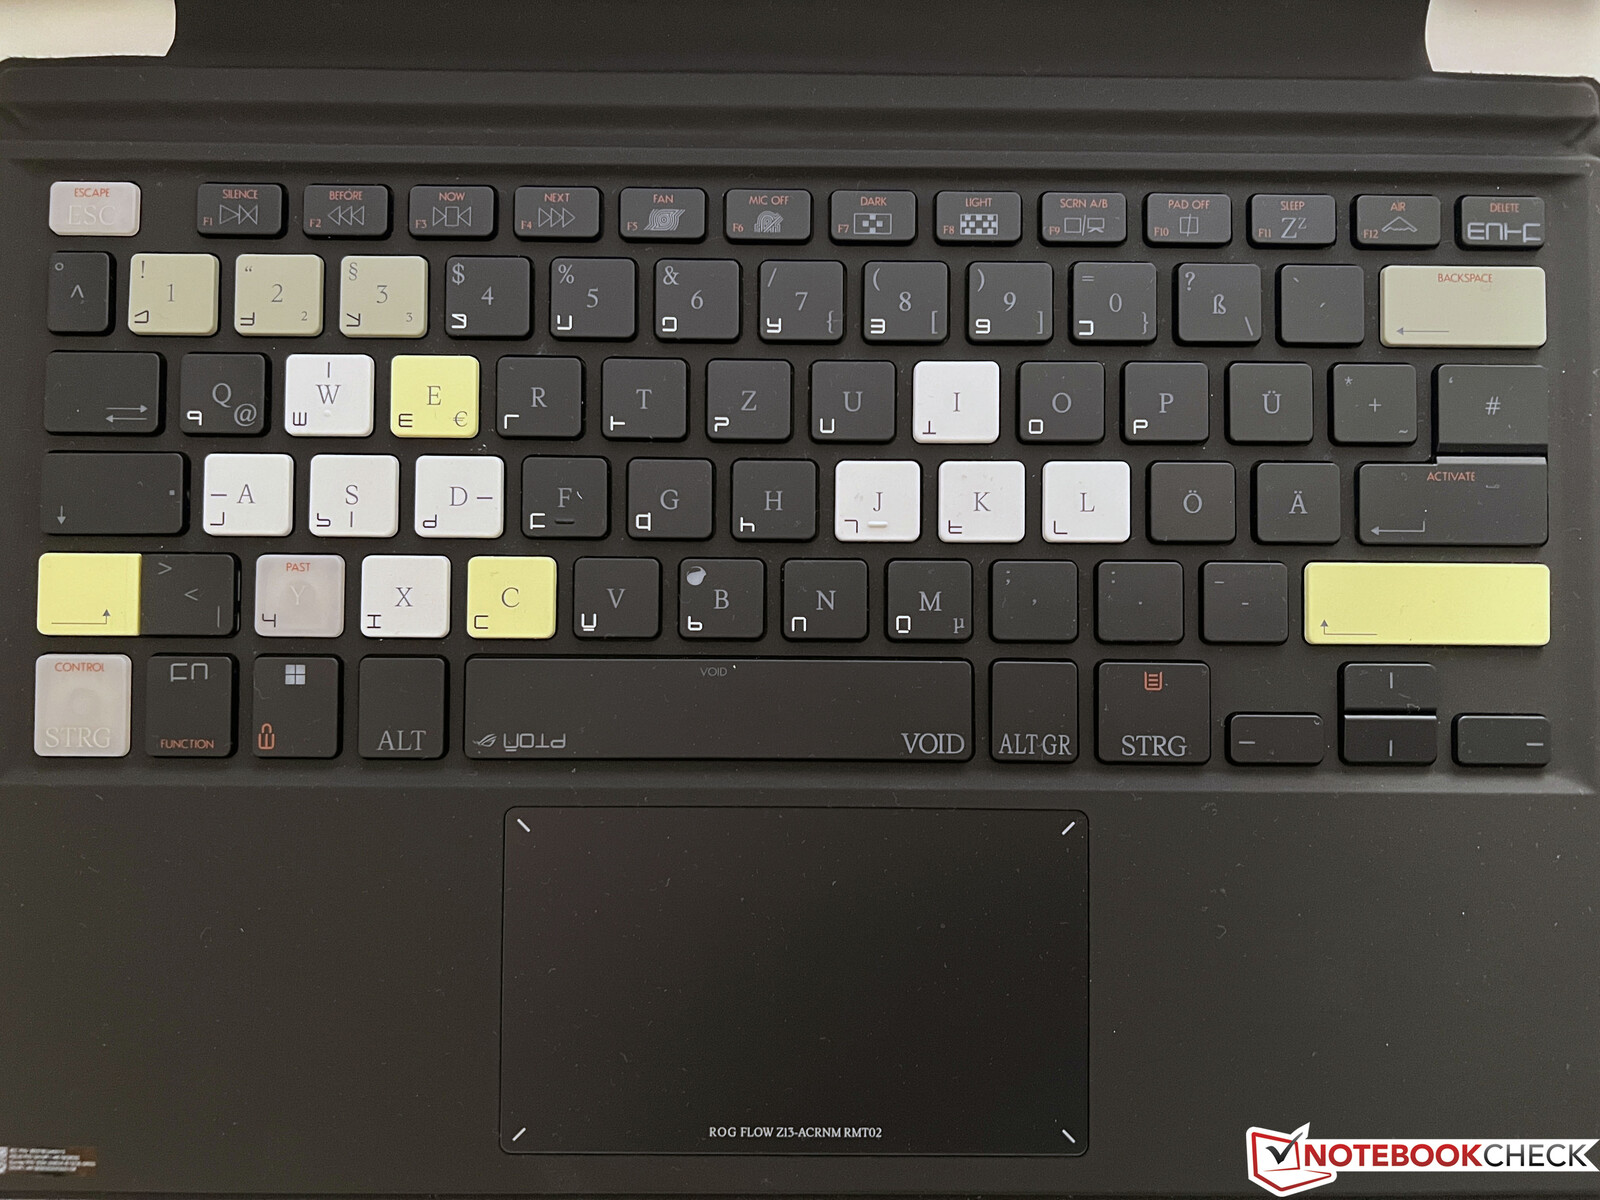
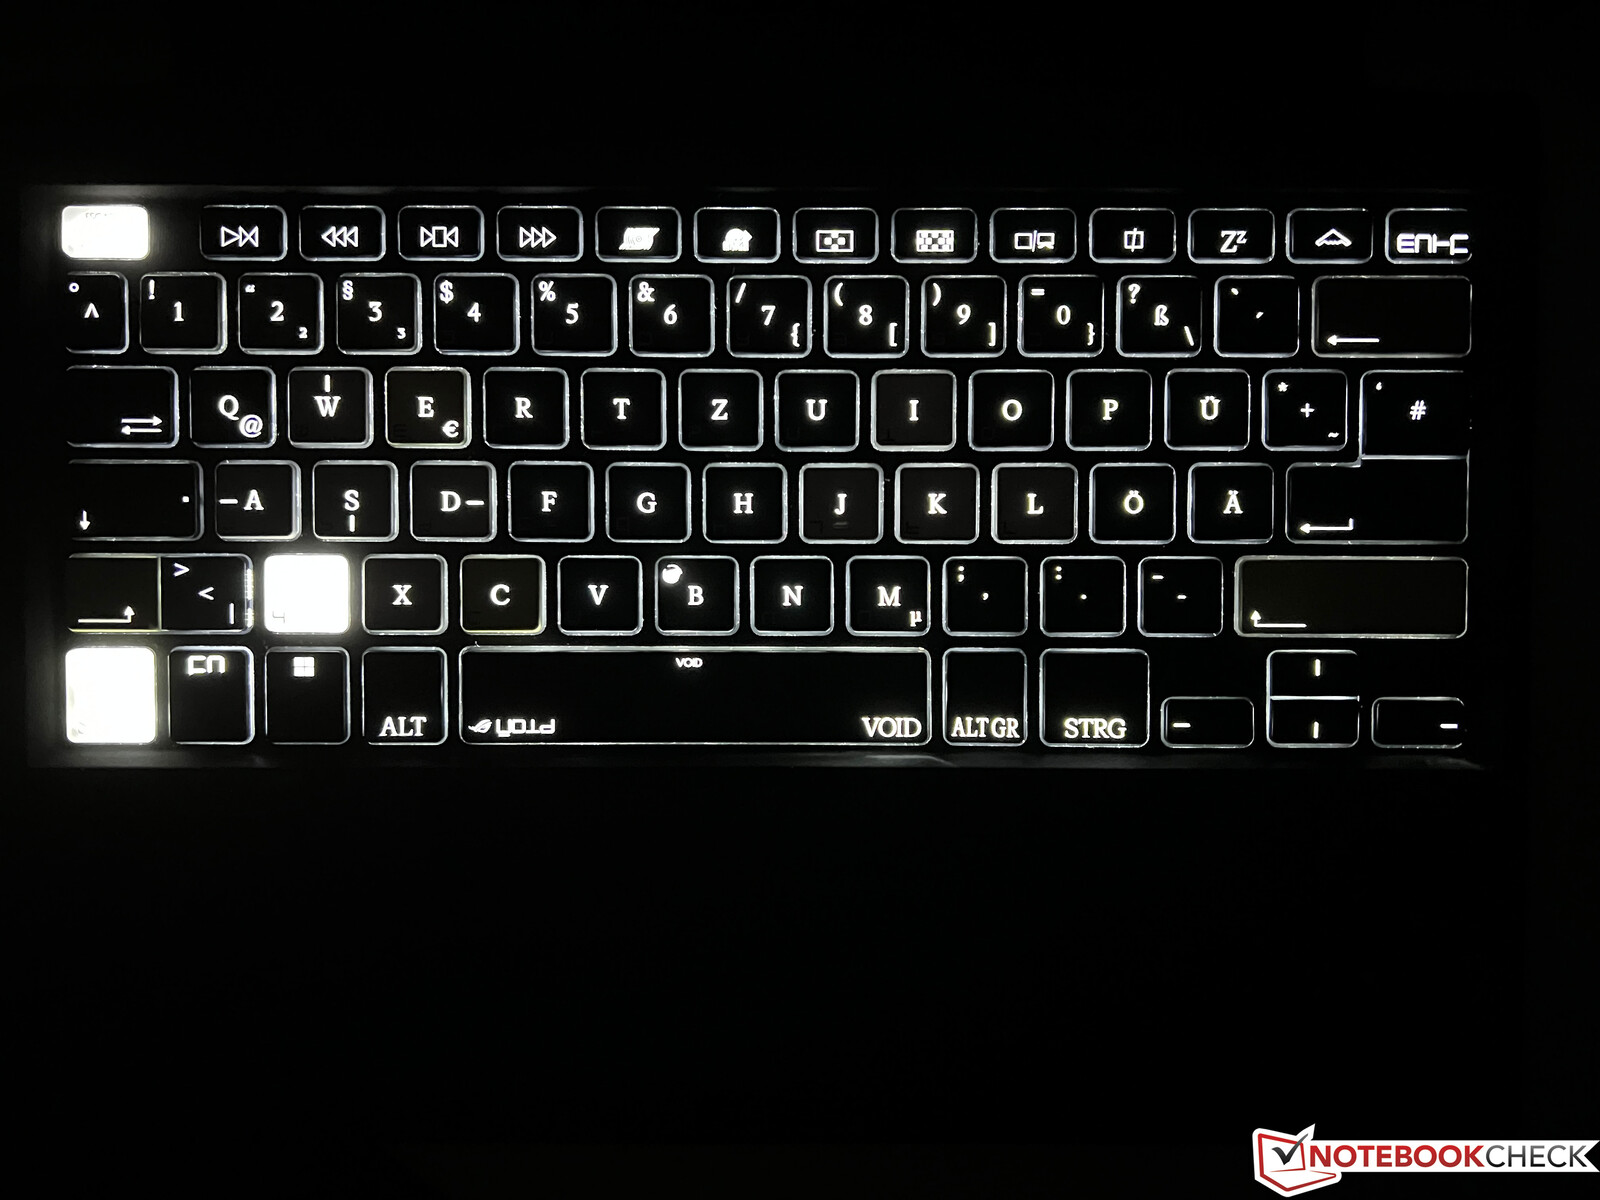
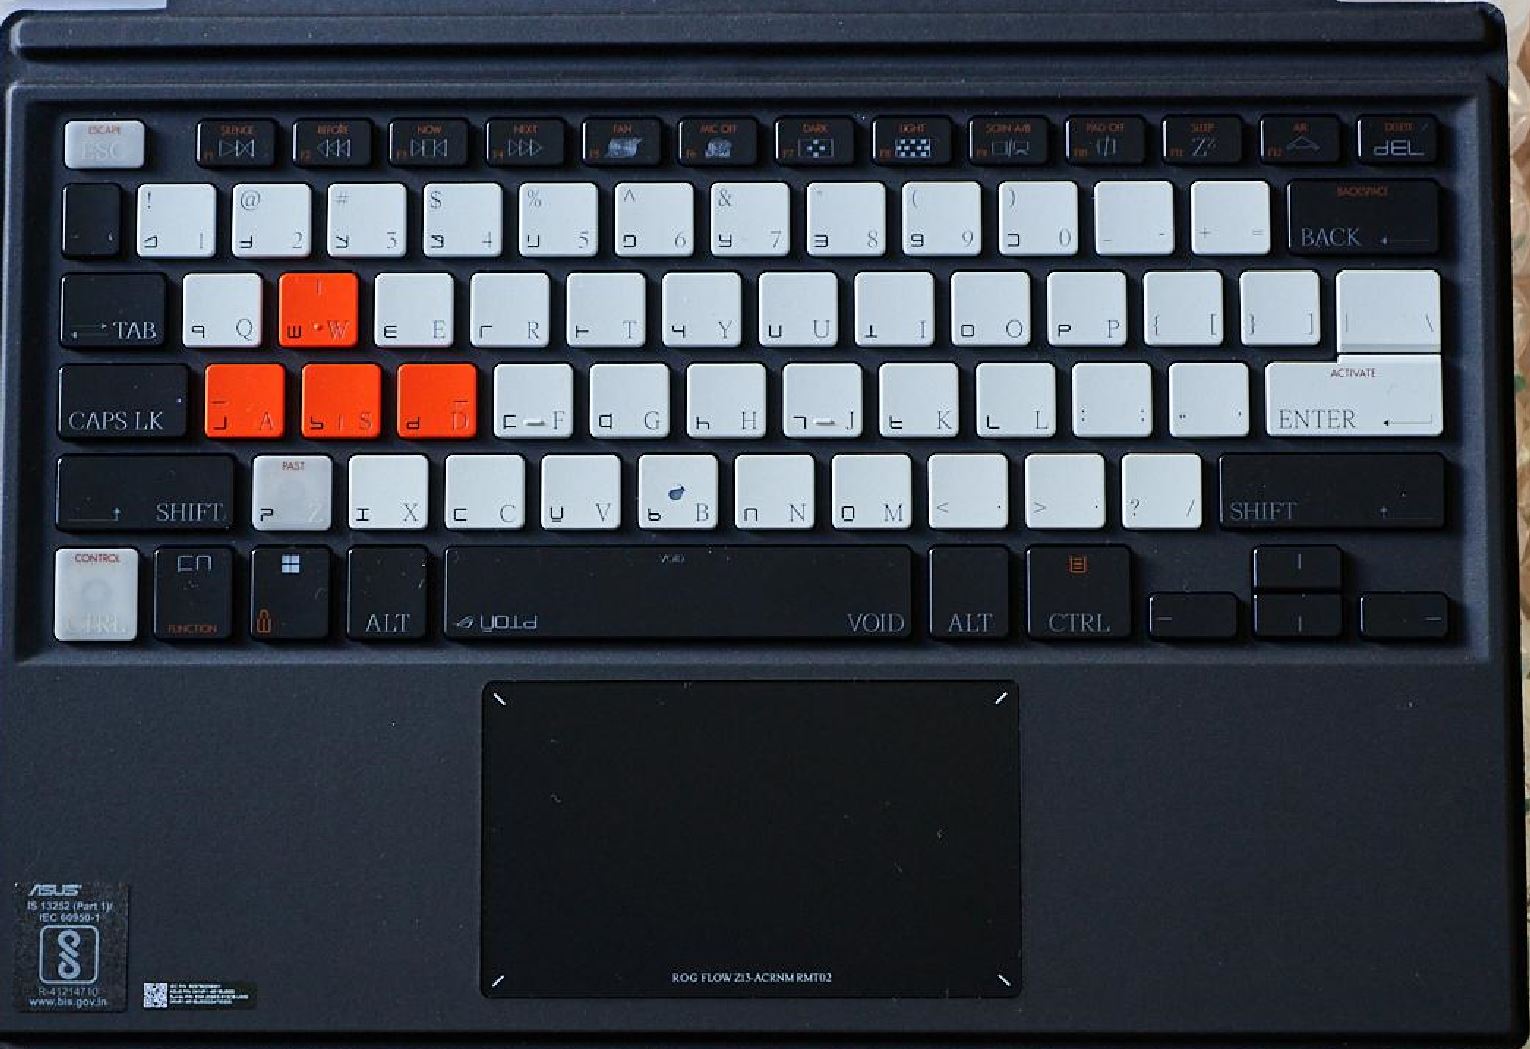
Dispositivi di input - ROG Flow con due tastiere
Asus distribuisce il ROG Flow z13 ACRNM con due diversi copritastiera, che sono anche piuttosto pesanti (358 grammi) e spessi per un convertibile. Come di consueto, è possibile utilizzare la tastiera in due angolazioni: piatta sulla superficie o leggermente inclinata. La tastiera è sorprendentemente robusta e la corsa dei tasti è abbastanza lunga per una tastiera staccabile.
Il design dei tasti è insolito come lo chassis e questo crea qualche problema, poiché i simboli aggiuntivi sui tasti possono confondere quotidianamente quando non si riesce a digitare senza guardare. Il contrasto dei tasti neri non è sufficiente, mentre i simboli aggiuntivi hanno un contrasto elevato, il che è fastidioso. Il problema si risolve in ambienti bui, poiché l'illuminazione della tastiera illumina solo i simboli importanti.
Il touchpad è piuttosto piccolo (10,5 x 6 cm) e i suoni di clic sono piuttosto forti, ma funziona bene. Il touchscreen capacitivo non presenta problemi ed è possibile utilizzarlo anche con un digitalizzatore. Asus fornisce il convertibile con lo stilo SA203 (4096 livelli di pressione) e non abbiamo notato alcun problema.
Display - WQHD con 165 Hz
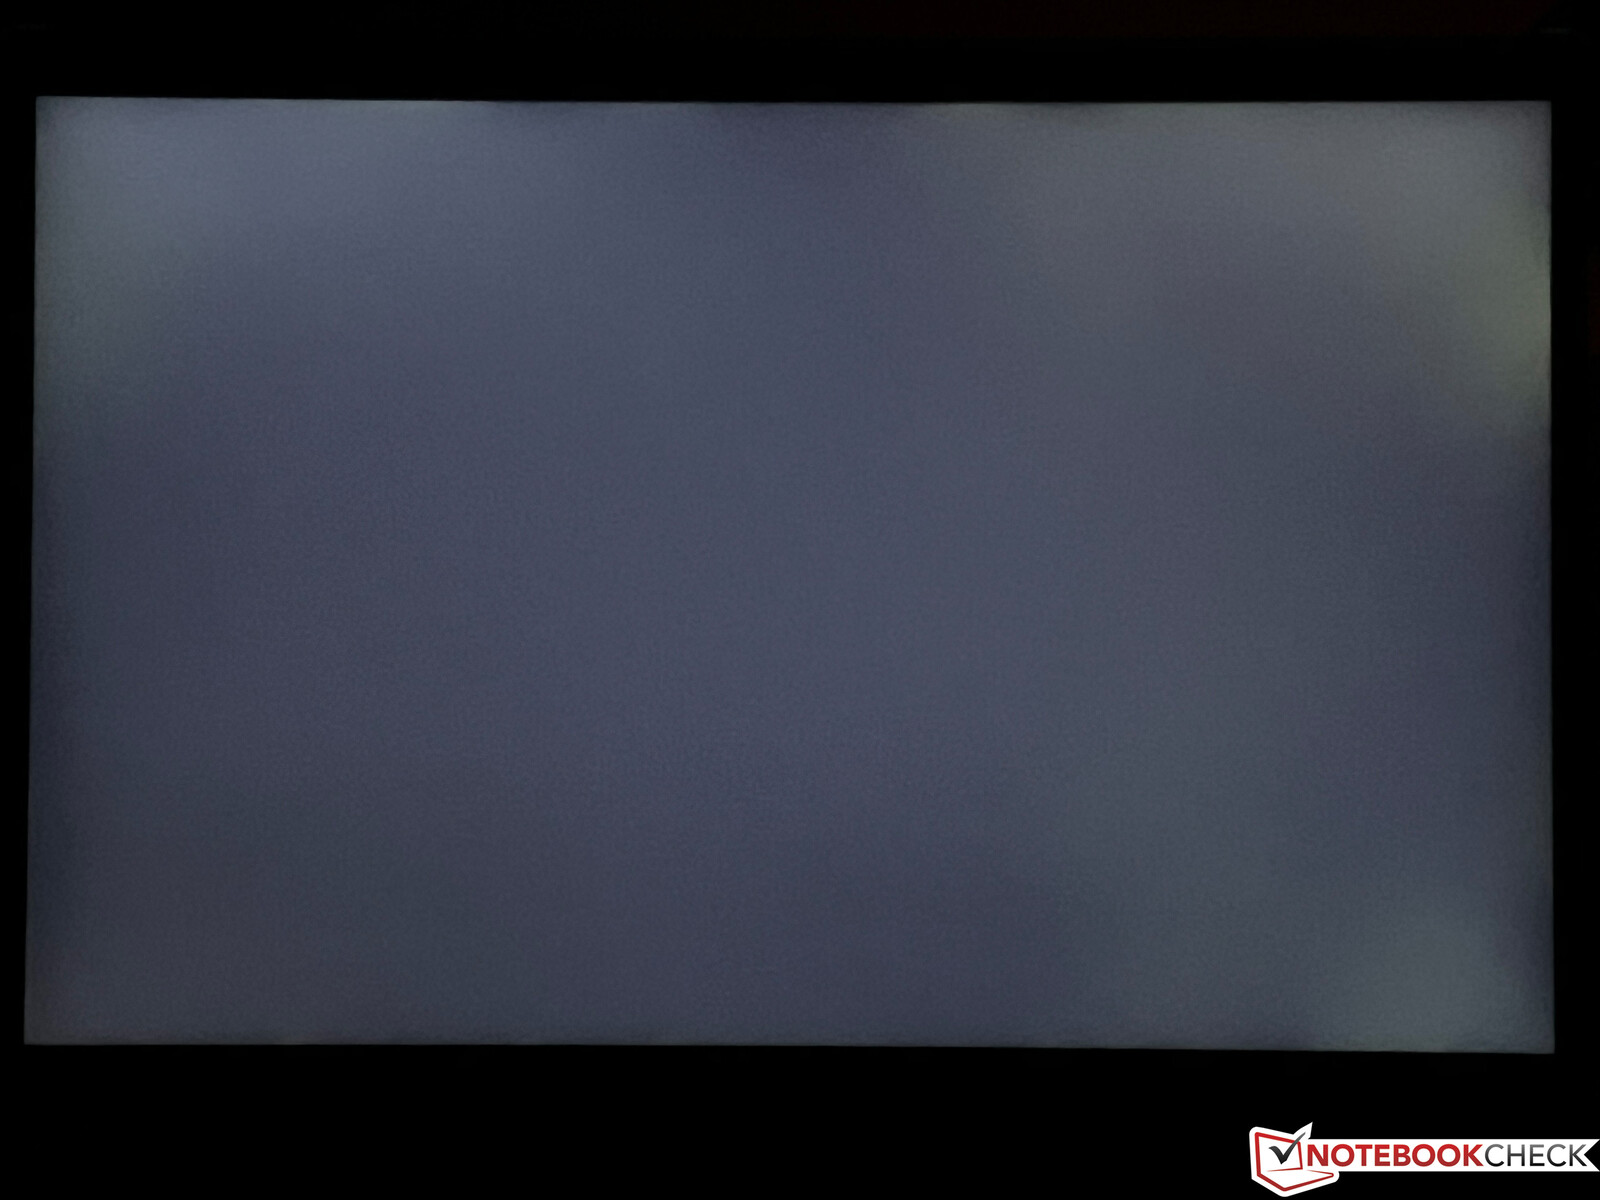
Asus ha aggiornato anche il display e non ci sono differenze tra la nostra edizione ACRNM e la versione normale del ROG Flow Z13. Entrambi utilizzano un pannello WQHD a risoluzione più elevata (2560 x 1600 pixel, 16:10) con una frequenza di aggiornamento maggiore di 165 Hz. La qualità dell'immagine soggettiva è eccellente e i movimenti sono molto fluidi. I tempi di risposta sono rapidi e non c'è traccia di sfarfallio PWM. La nostra unità di prova non ha avuto problemi di retroilluminazione.
La luminosità media è di 455 nits in combinazione con un valore del nero leggermente più alto di 0,4, che si traduce in un rapporto di contrasto di 1160:1. Si tratta di un risultato decente, ma tutto ciò che è stato fatto è stato molto più facile da ottenere. Si tratta di un risultato decente, ma tutti i rivali basati su IPS (compreso il predecessore), ad eccezione delRazer Blade 14offrono risultati migliori in termini di contrasto. La luminosità del pannello non può essere controllata tramite il sensore di luce ambientale.
| |||||||||||||||||||||||||
Distribuzione della luminosità: 89 %
Al centro con la batteria: 464 cd/m²
Contrasto: 1160:1 (Nero: 0.4 cd/m²)
ΔE ColorChecker Calman: 2 | ∀{0.5-29.43 Ø4.71}
calibrated: 1.2
ΔE Greyscale Calman: 2.7 | ∀{0.09-98 Ø4.96}
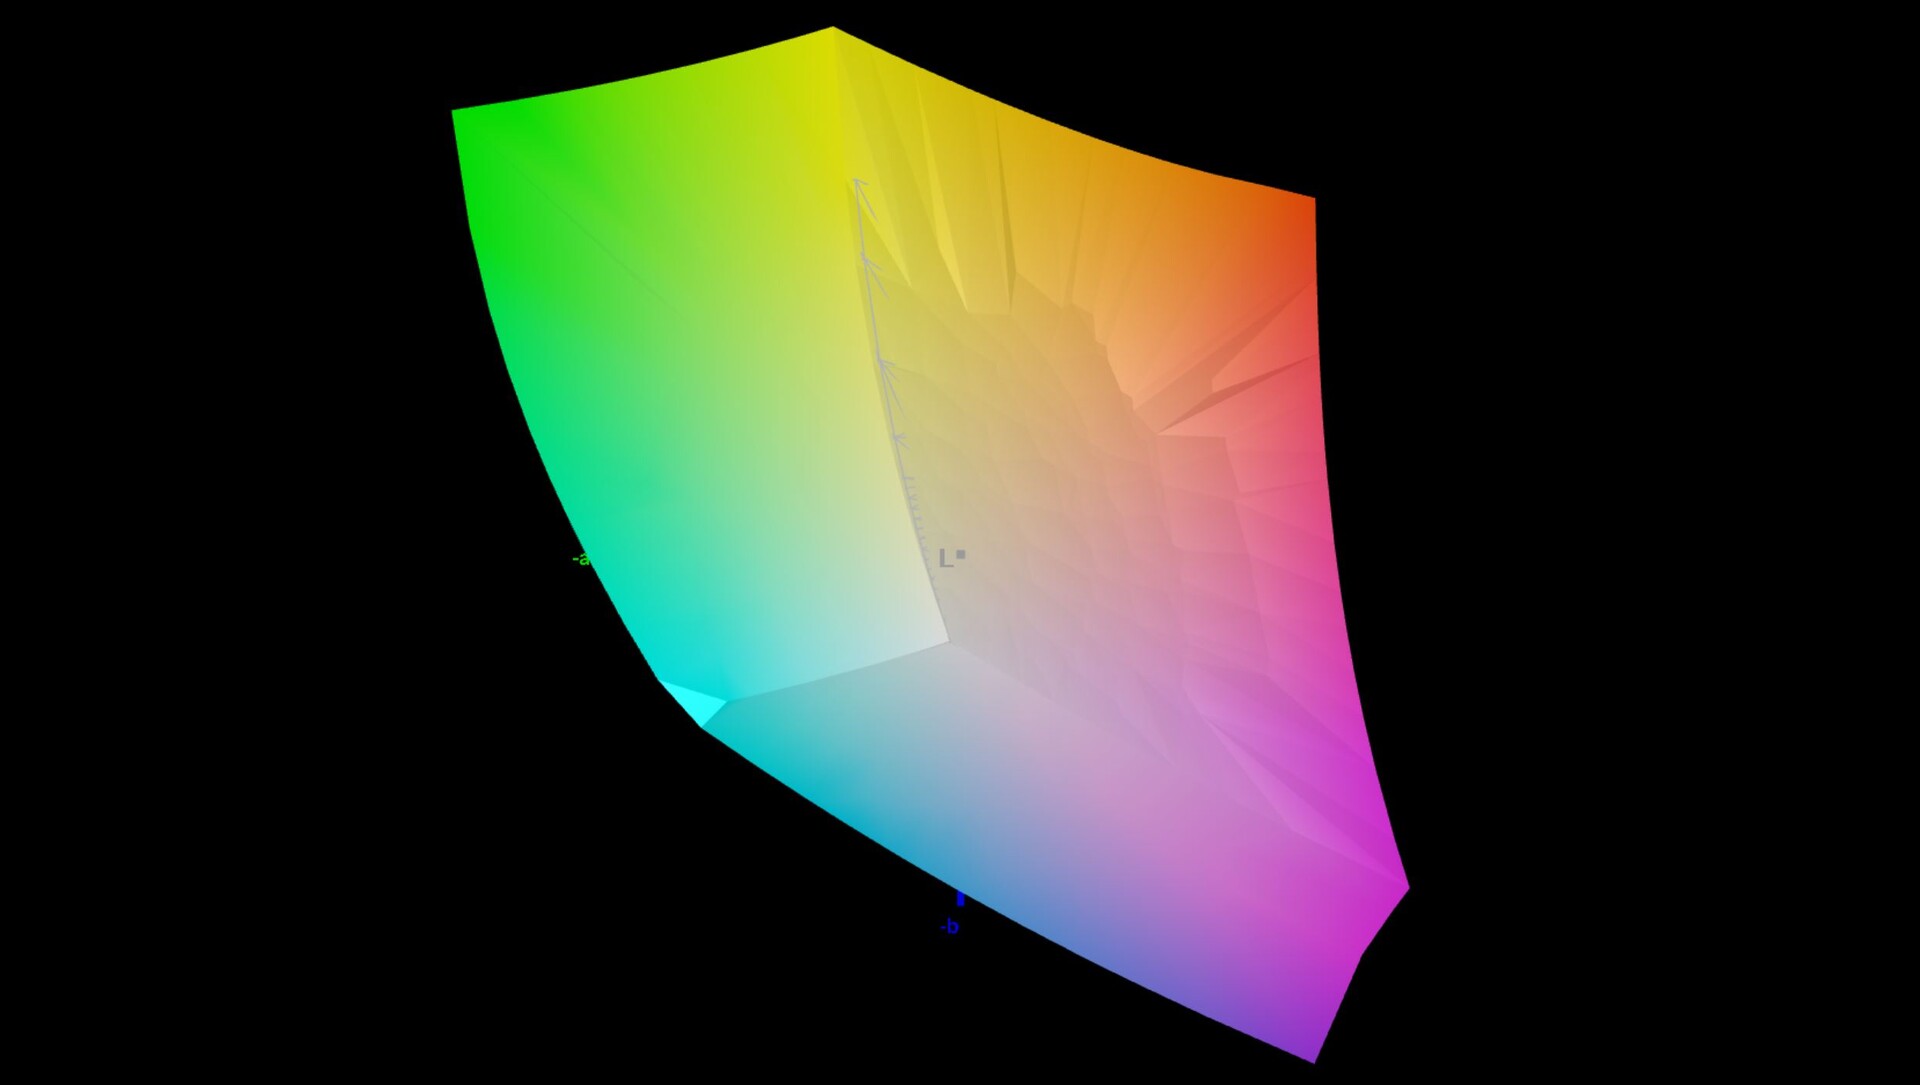
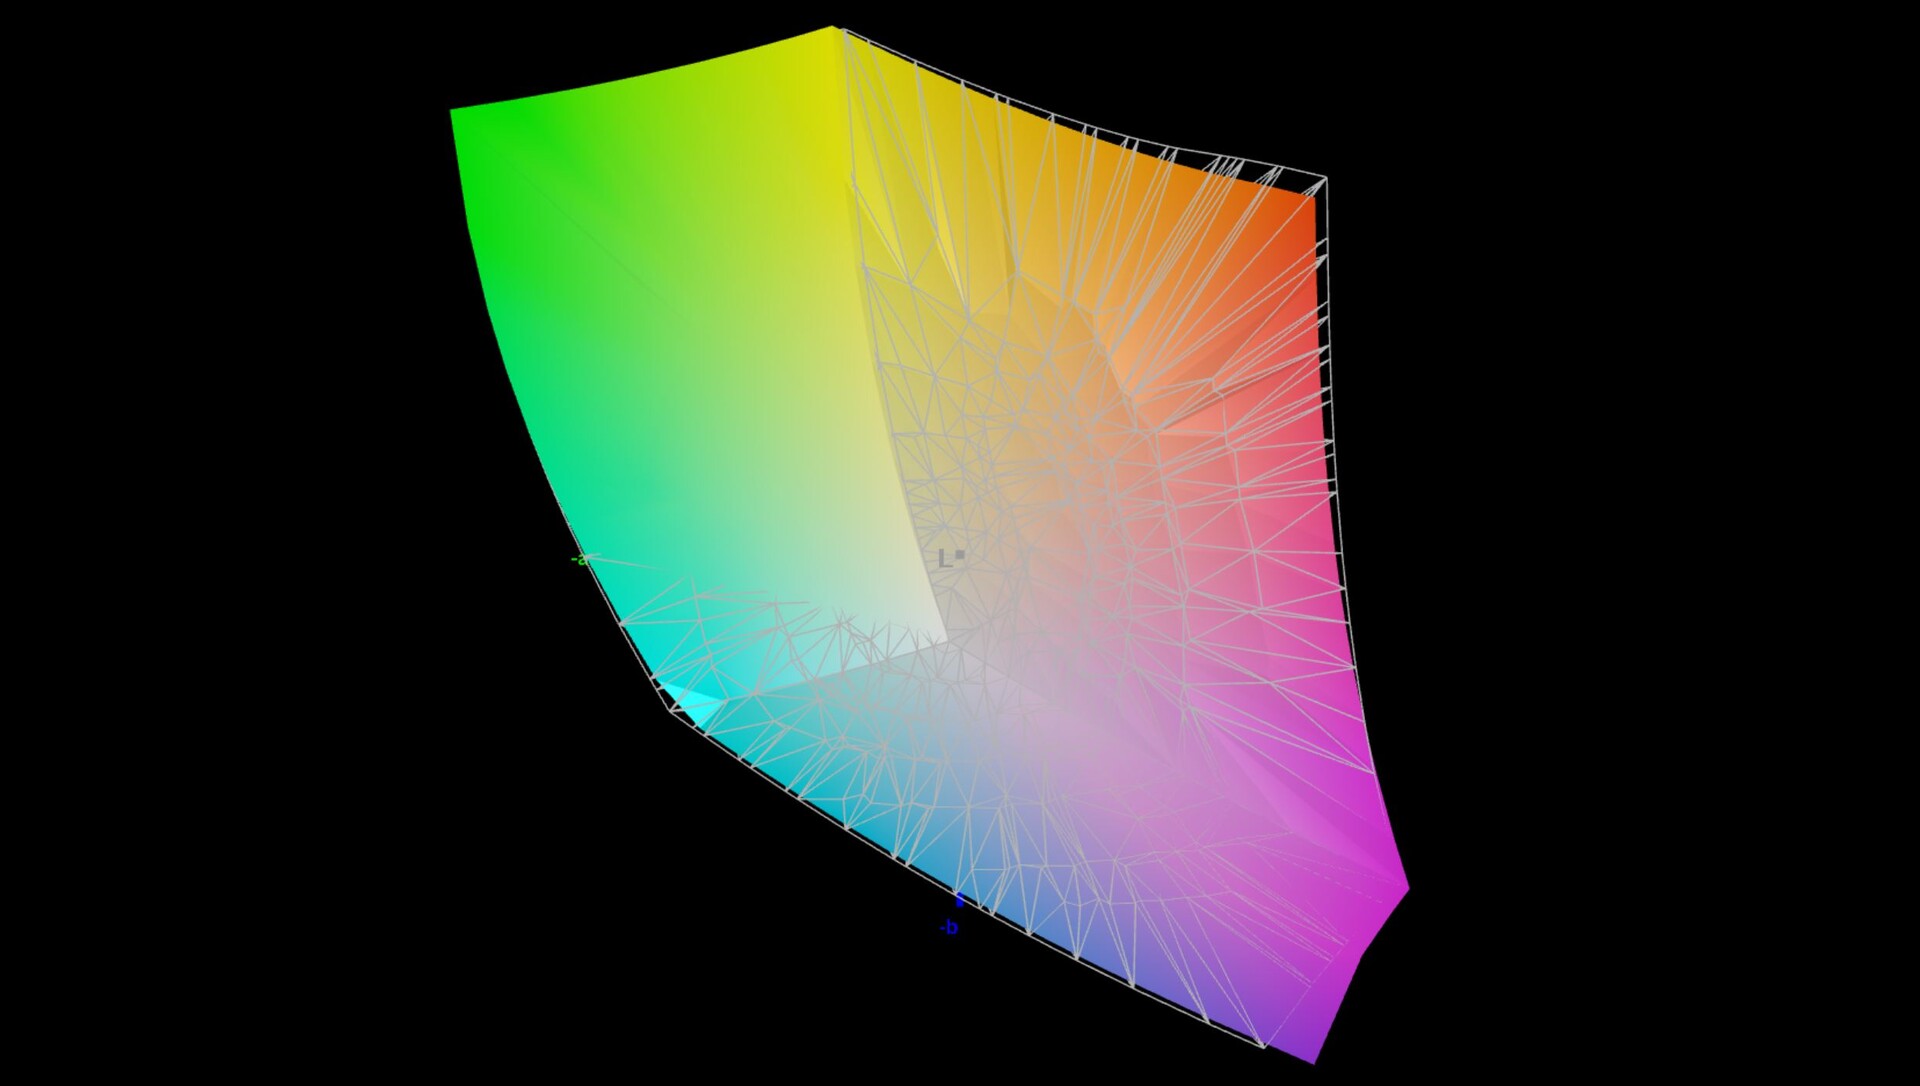
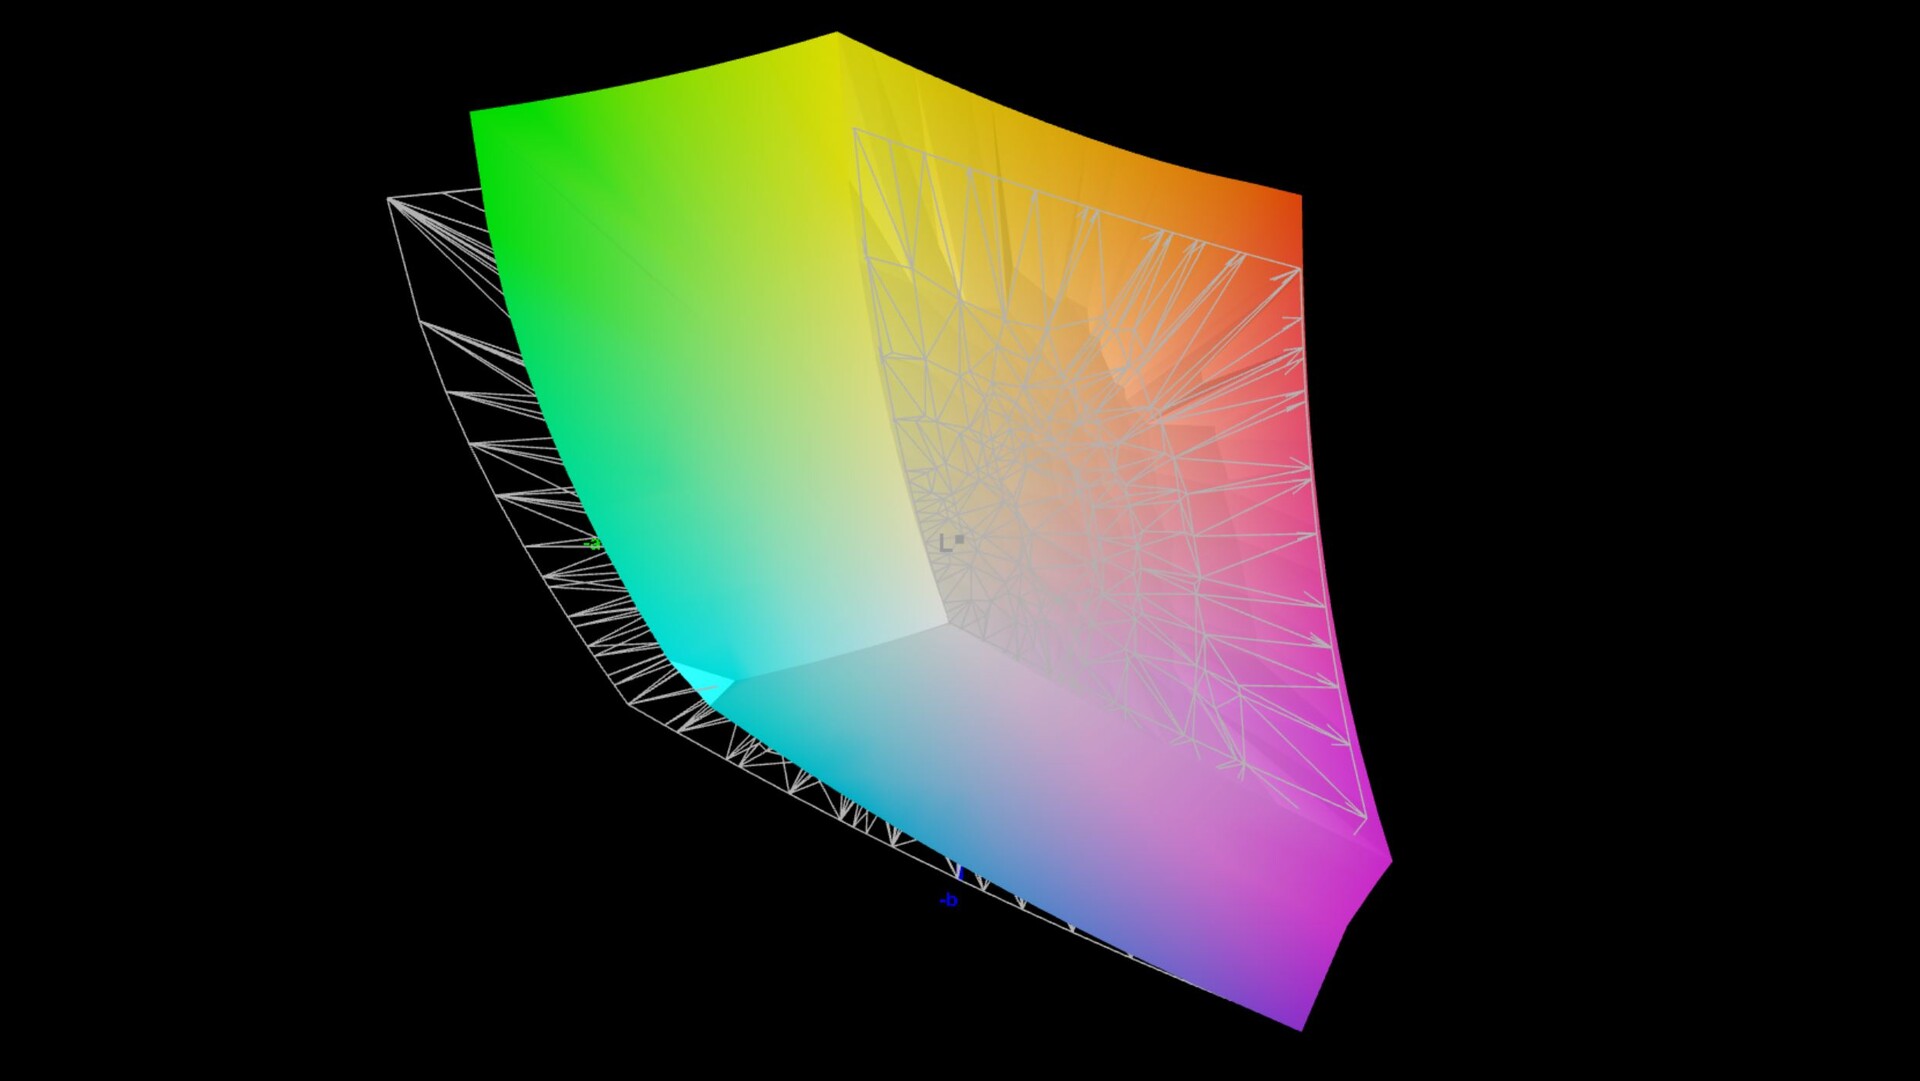
85.17% AdobeRGB 1998 (Argyll 3D)
99.92% sRGB (Argyll 3D)
96.94% Display P3 (Argyll 3D)
Gamma: 2.24
CCT: 6832 K
| Asus ROG Flow Z13 ACRNM TL134ADXP01-0, IPS, 2560x1600, 13.4" | Asus ROG Flow Z13 GZ301ZE LQ134N1JW54, IPS, 1920x1200, 13.4" | Alienware x14 i7 RTX 3060 SHP154D, IPS, 1920x1080, 14" | Razer Blade 14 Ryzen 9 6900HX TL140BDXP02-0, IPS, 2560x1440, 14" | Asus ROG Zephyrus G14 GA402RK NE140QDM-NX1 (BOE0A1D), IPS-Level, 2560x1600, 14" | |
|---|---|---|---|---|---|
| Display | -17% | 2% | 0% | 0% | |
| Display P3 Coverage (%) | 96.94 | 67.5 -30% | 99.6 3% | 97.2 0% | 97.4 0% |
| sRGB Coverage (%) | 99.92 | 97.1 -3% | 100 0% | 99.9 0% | 99.9 0% |
| AdobeRGB 1998 Coverage (%) | 85.17 | 69.3 -19% | 87.6 3% | 85.7 1% | 85.5 0% |
| Response Times | -1241% | -255% | -554% | -210% | |
| Response Time Grey 50% / Grey 80% * (ms) | 2.1 ? | 44 ? -1995% | 9.6 ? -357% | 16.8 ? -700% | 8.8 ? -319% |
| Response Time Black / White * (ms) | 3 ? | 17.6 ? -487% | 7.6 ? -153% | 15.2 ? -407% | 6 ? -100% |
| PWM Frequency (Hz) | 27170 ? | ||||
| Screen | 10% | -11% | 0% | -20% | |
| Brightness middle (cd/m²) | 464 | 515 11% | 434 -6% | 354 -24% | 480 3% |
| Brightness (cd/m²) | 455 | 476 5% | 411 -10% | 328 -28% | 456 0% |
| Brightness Distribution (%) | 89 | 87 -2% | 89 0% | 86 -3% | 80 -10% |
| Black Level * (cd/m²) | 0.4 | 0.35 13% | 0.25 37% | 0.37 7% | 0.48 -20% |
| Contrast (:1) | 1160 | 1471 27% | 1736 50% | 957 -17% | 1000 -14% |
| Colorchecker dE 2000 * | 2 | 1.6 20% | 3 -50% | 1.66 17% | 2.62 -31% |
| Colorchecker dE 2000 max. * | 4.2 | 4 5% | 7.1 -69% | 3.83 9% | 6.71 -60% |
| Colorchecker dE 2000 calibrated * | 1.2 | 1.2 -0% | 0.7 42% | 1.12 7% | |
| Greyscale dE 2000 * | 2.7 | 2.5 7% | 5.1 -89% | 1.6 41% | 4.2 -56% |
| Gamma | 2.24 98% | 2.2 100% | 2.19 100% | 2.23 99% | 2.16 102% |
| CCT | 6832 95% | 6939 94% | 6204 105% | 6542 99% | 7122 91% |
| Media totale (Programma / Settaggio) | -416% /
-175% | -88% /
-43% | -185% /
-85% | -77% /
-43% |
* ... Meglio usare valori piccoli
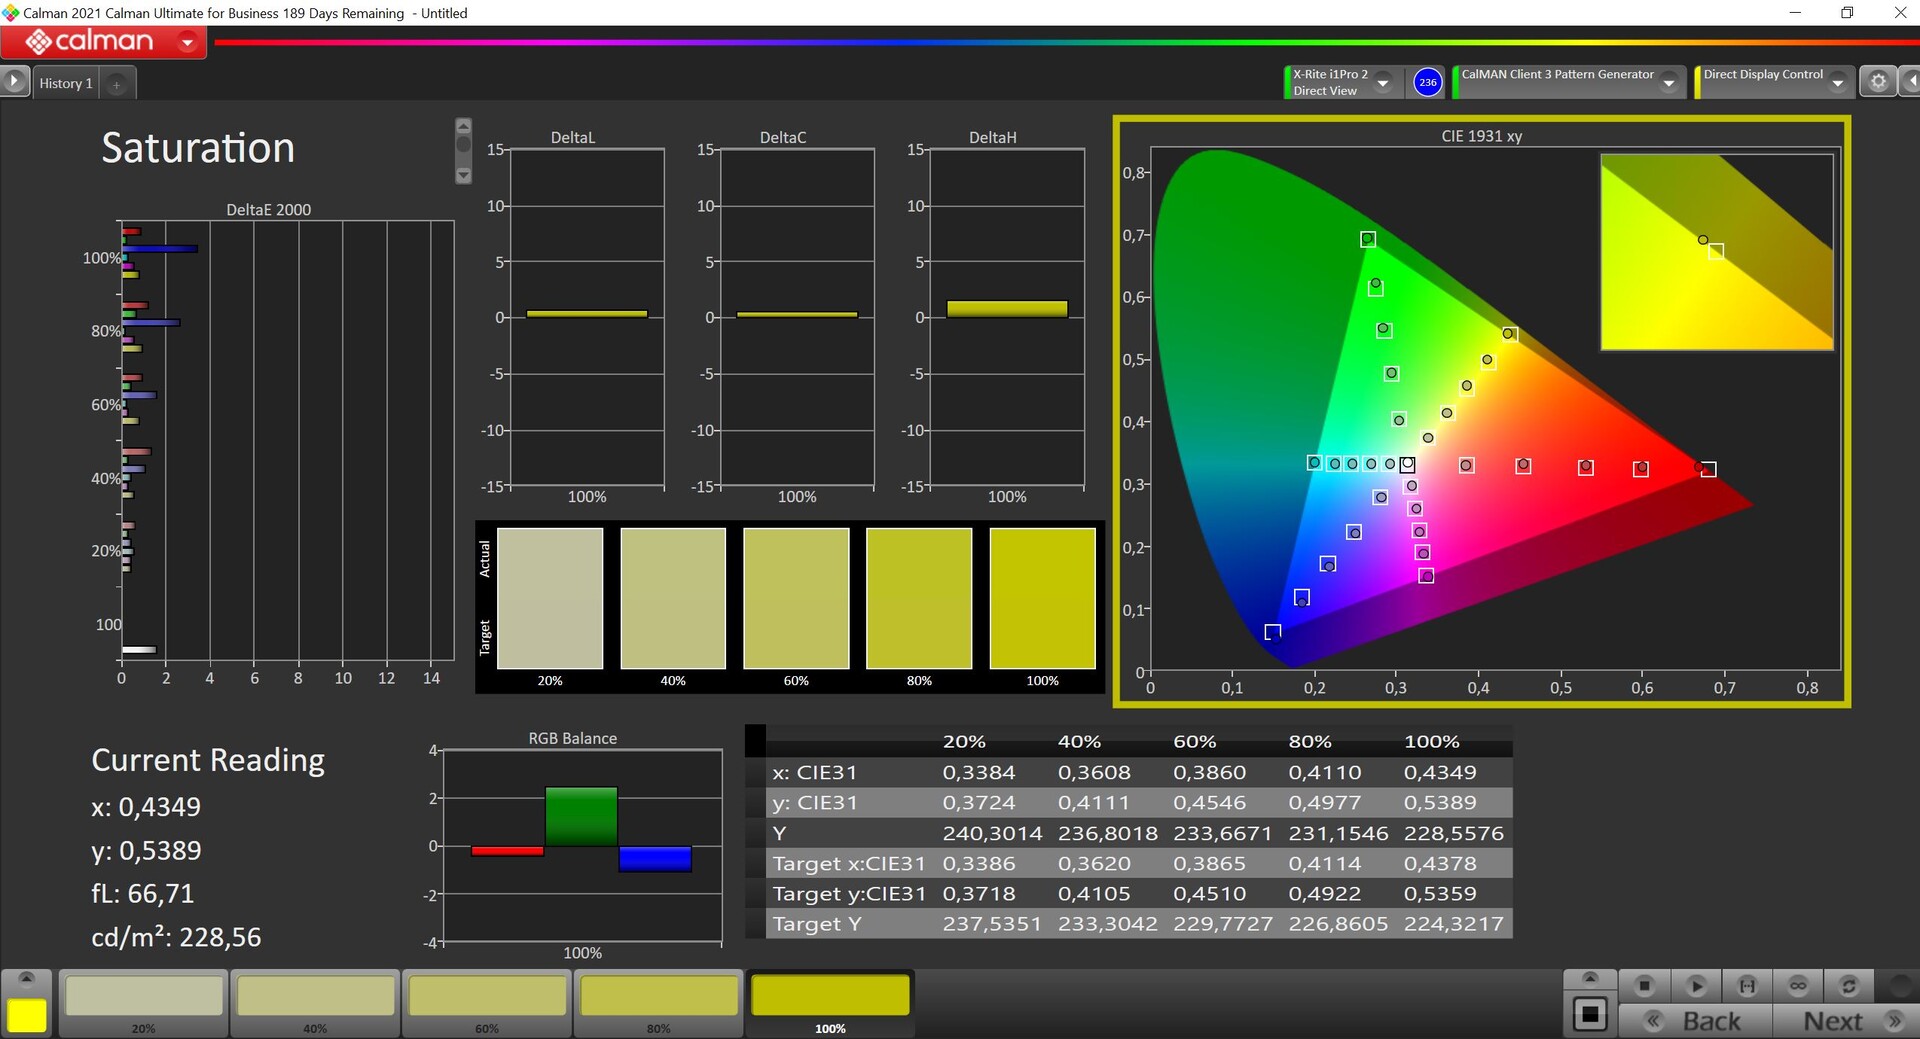
Abbiamo analizzato il pannello con il software professionale CalMAN (X-Rite i1 Pro2) con il profilo colore nativo del software Armoury Crate. Esiste anche un profilo sRGB dedicato quando si vuole lavorare nello spazio colore più piccolo. I risultati sono già decenti e solo una manciata di colori si discostano dall'obiettivo DeltaE-2000 di 3. C'è anche una leggera colata di blu in combinazione con una temperatura del colore leggermente più fredda, ma questo si nota solo nel confronto diretto con uno schermo calibrato.
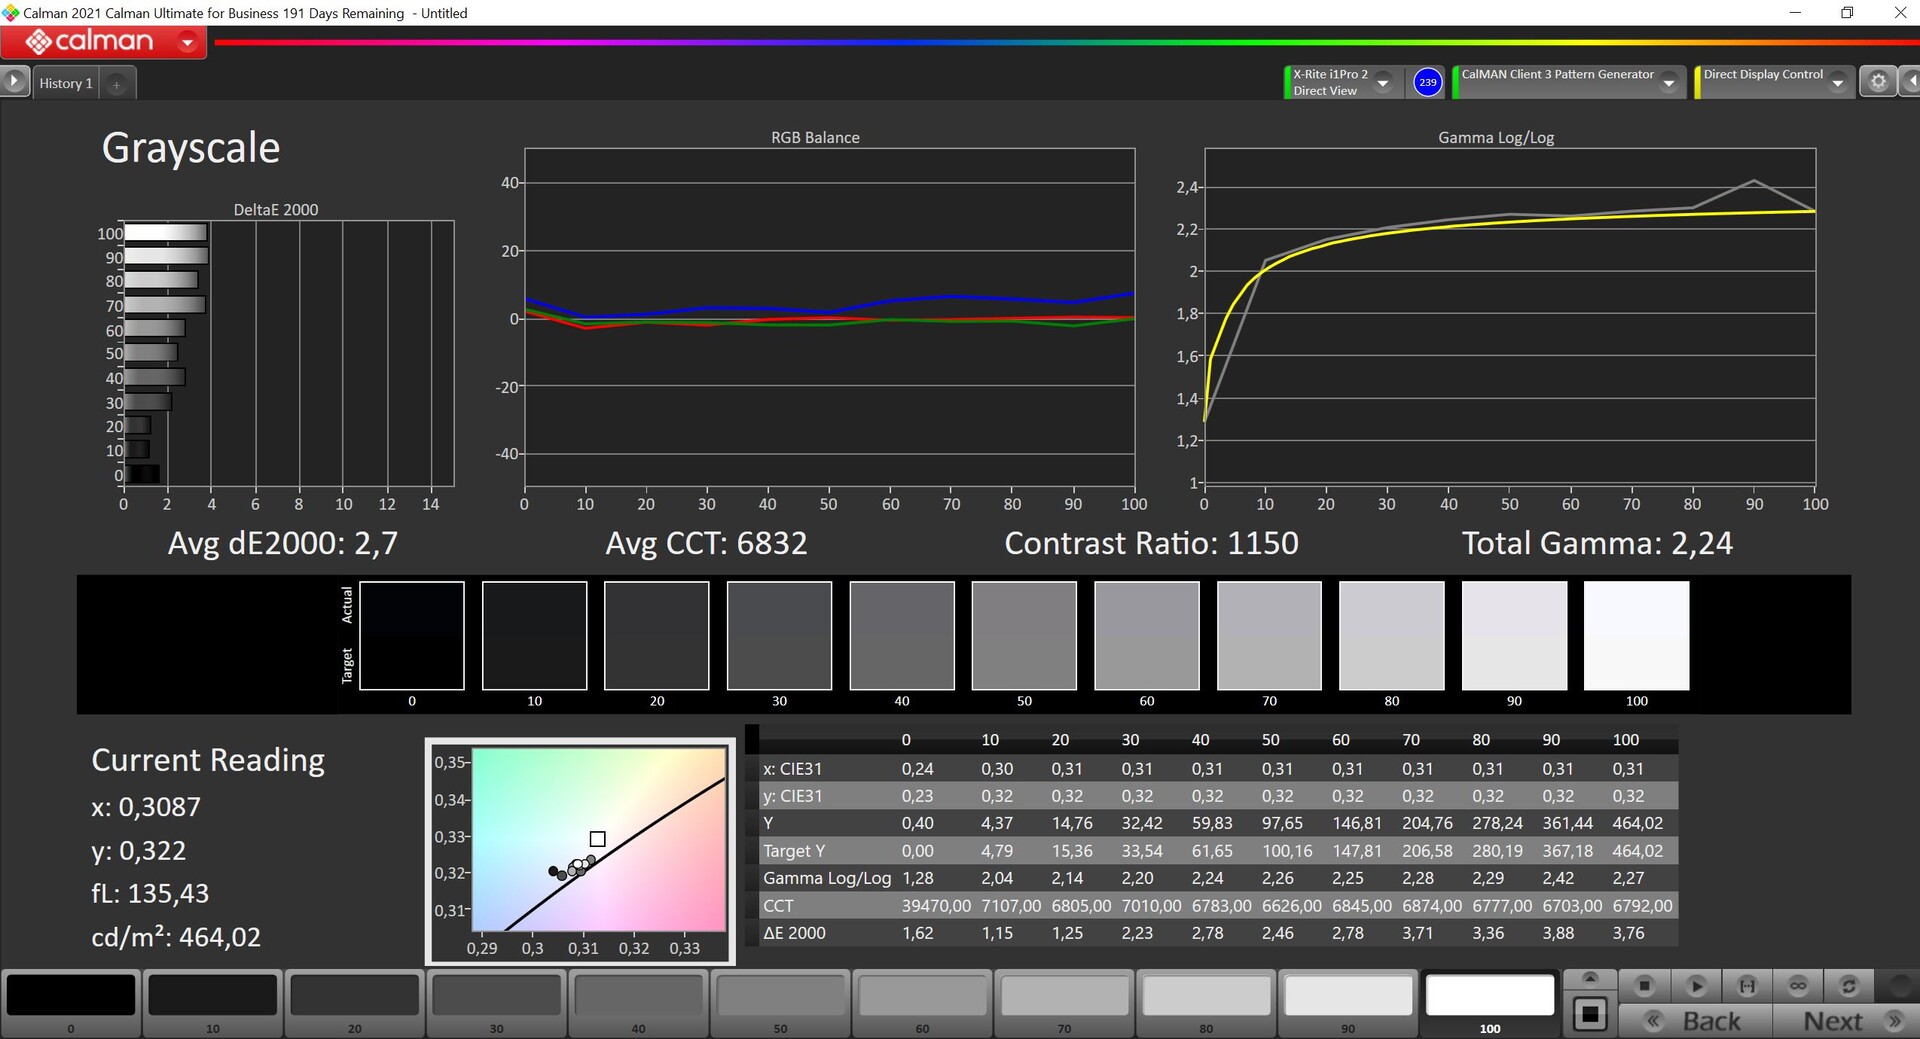
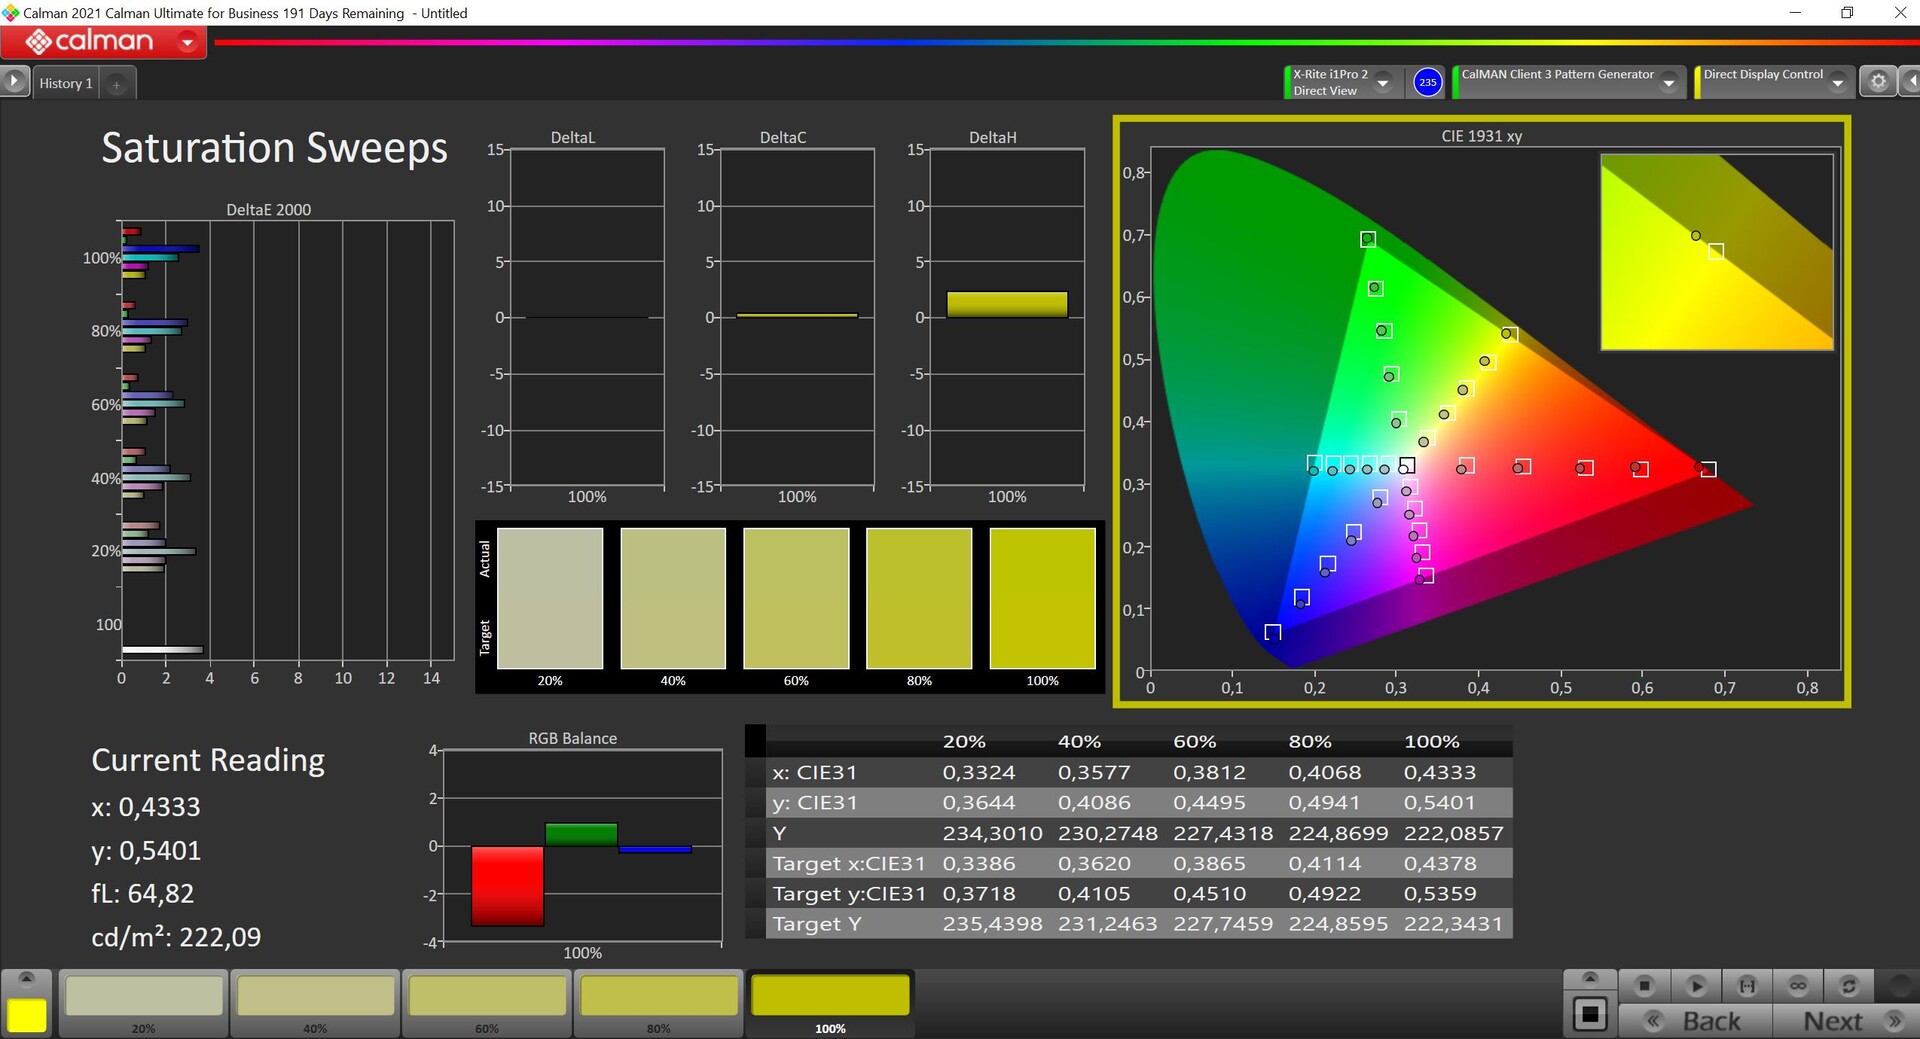
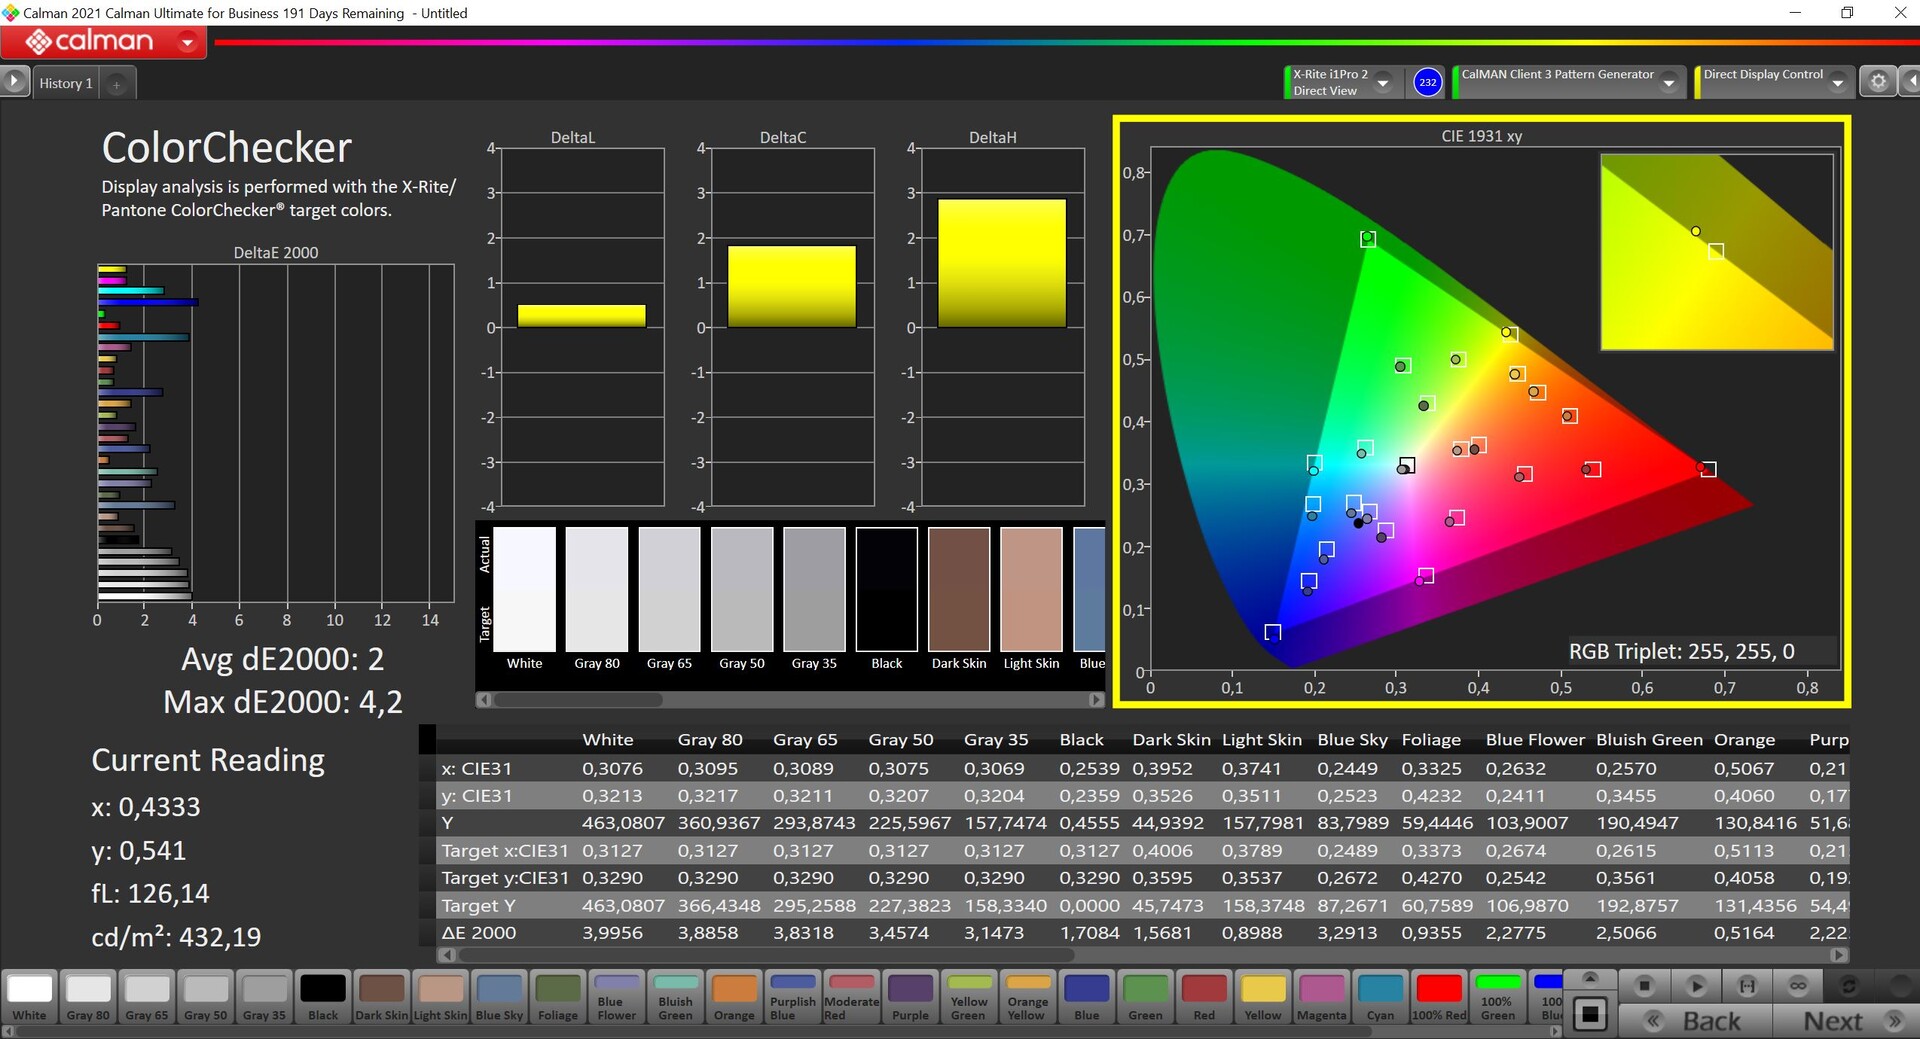
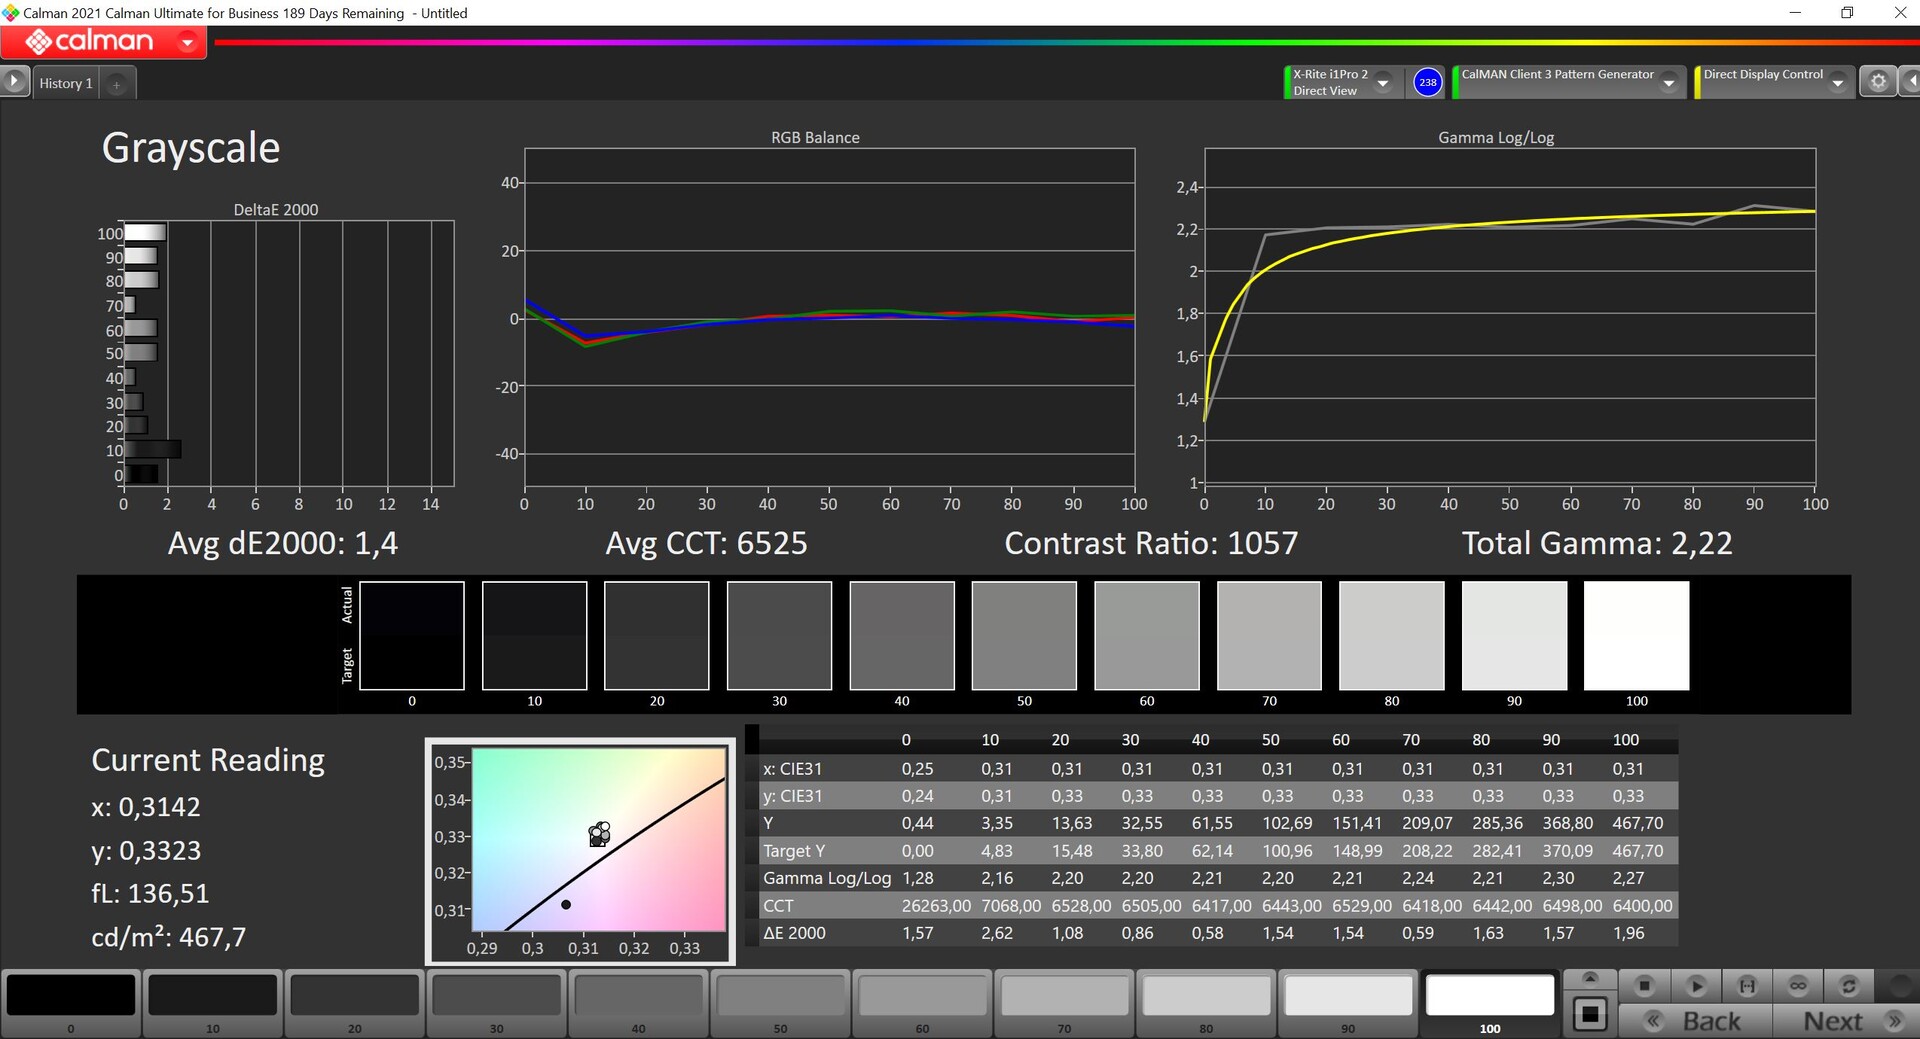
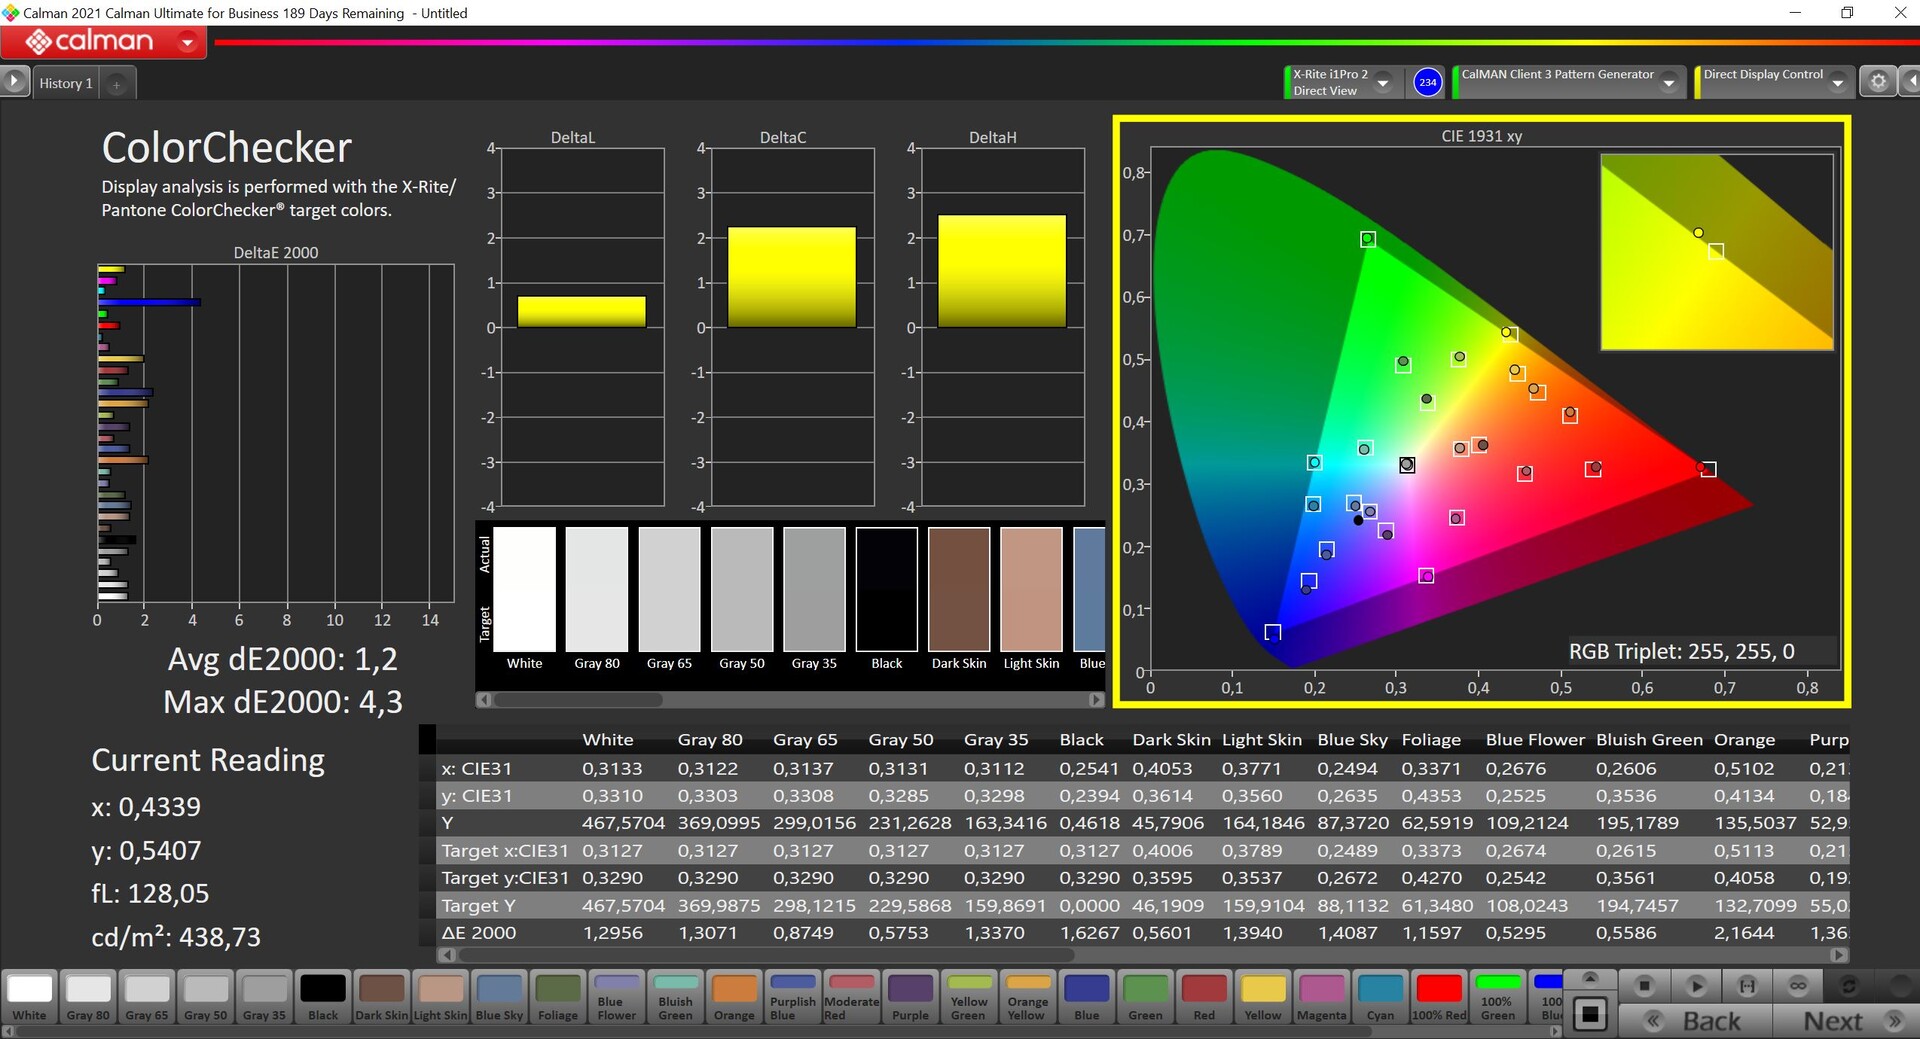
La nostra calibrazione (il profilo corrispondente può essere scaricato gratuitamente nel riquadro in alto) migliora la qualità della scala di grigi e la presentazione dei colori. Solo il 100% di blu è ancora un outlier, ma è comunque possibile utilizzare il pannello per l'editing di immagini e video in combinazione con l'elevata copertura DCI-P3. Se si vuole solo giocare con il Flow Z13, non è necessario calibrare lo schermo.
Tempi di risposta del Display
| ↔ Tempi di risposta dal Nero al Bianco | ||
|---|---|---|
| 3 ms ... aumenta ↗ e diminuisce ↘ combinato | ↗ 3 ms Incremento | 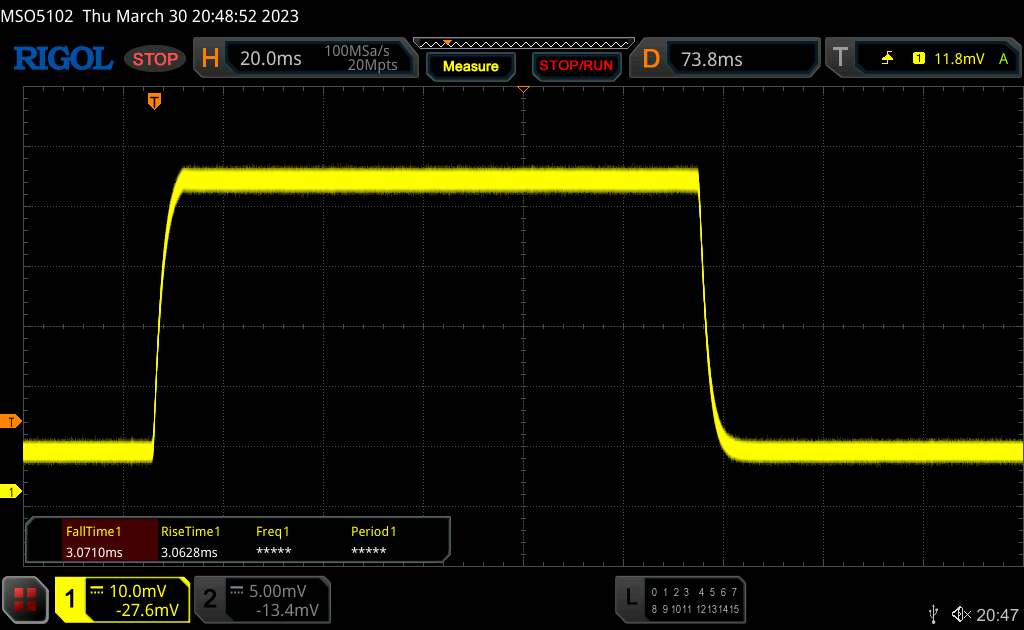 |
| ↘ 3 ms Calo | ||
| Lo schermo ha mostrato valori di risposta molto veloci nei nostri tests ed è molto adatto per i gaming veloce. In confronto, tutti i dispositivi di test variano da 0.1 (minimo) a 240 (massimo) ms. » 15 % di tutti i dispositivi è migliore. Questo significa che i tempi di risposta rilevati sono migliori rispettto alla media di tutti i dispositivi testati (19.8 ms). | ||
| ↔ Tempo di risposta dal 50% Grigio all'80% Grigio | ||
| 2.1 ms ... aumenta ↗ e diminuisce ↘ combinato | ↗ 2.1 ms Incremento | 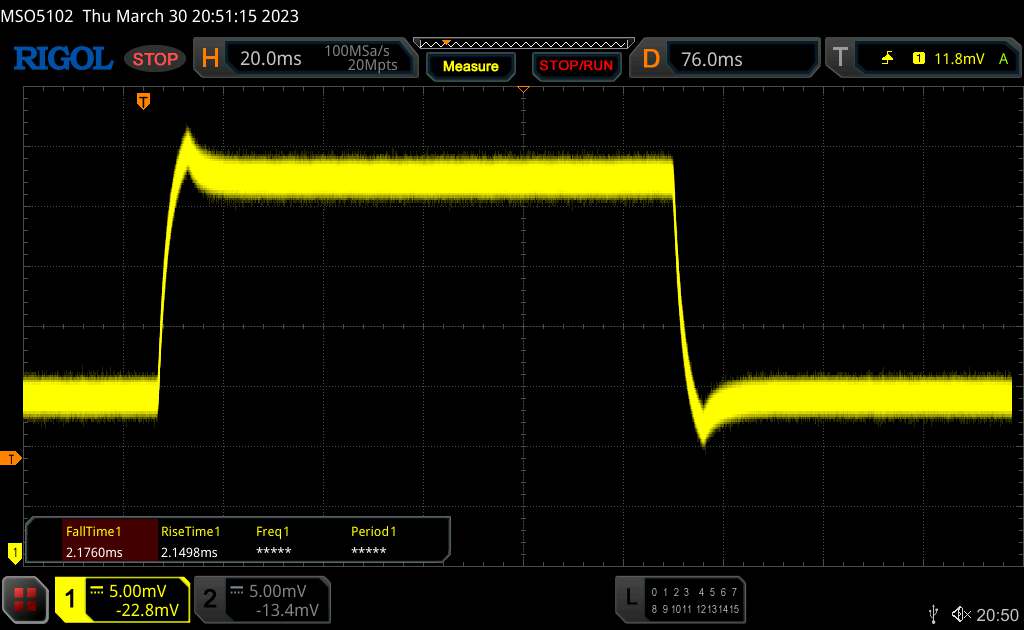 |
| ↘ 2.1 ms Calo | ||
| Lo schermo ha mostrato valori di risposta molto veloci nei nostri tests ed è molto adatto per i gaming veloce. In confronto, tutti i dispositivi di test variano da 0.165 (minimo) a 636 (massimo) ms. » 11 % di tutti i dispositivi è migliore. Questo significa che i tempi di risposta rilevati sono migliori rispettto alla media di tutti i dispositivi testati (31 ms). | ||
Sfarfallio dello schermo / PWM (Pulse-Width Modulation)
| flickering dello schermo / PWM non rilevato | 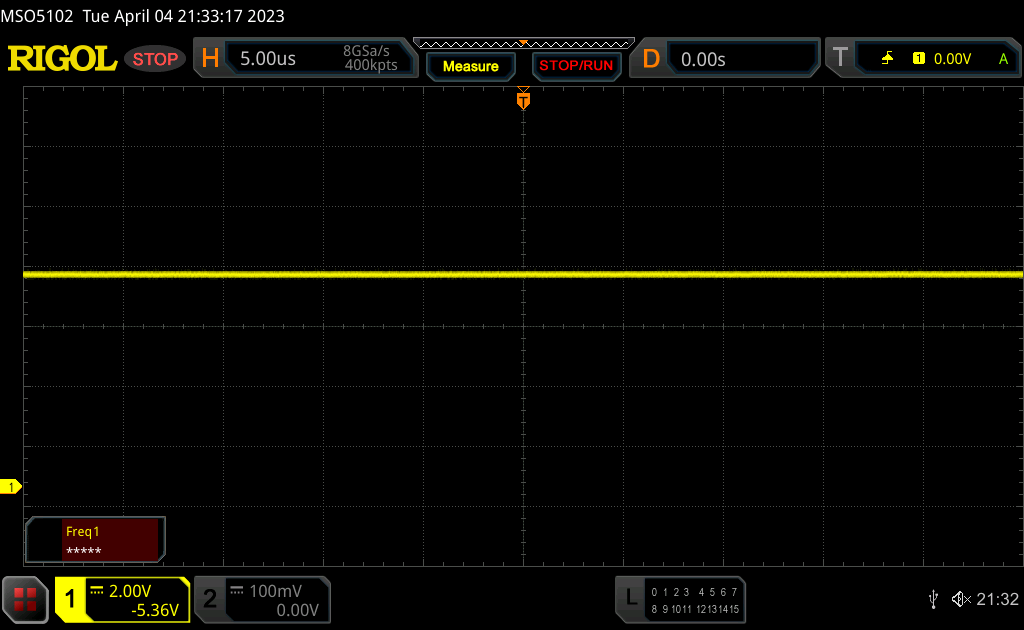 | ||
In confronto: 52 % di tutti i dispositivi testati non utilizza PWM per ridurre la luminosita' del display. Se è rilevato PWM, una media di 7757 (minimo: 5 - massimo: 343500) Hz è stata rilevata. | |||
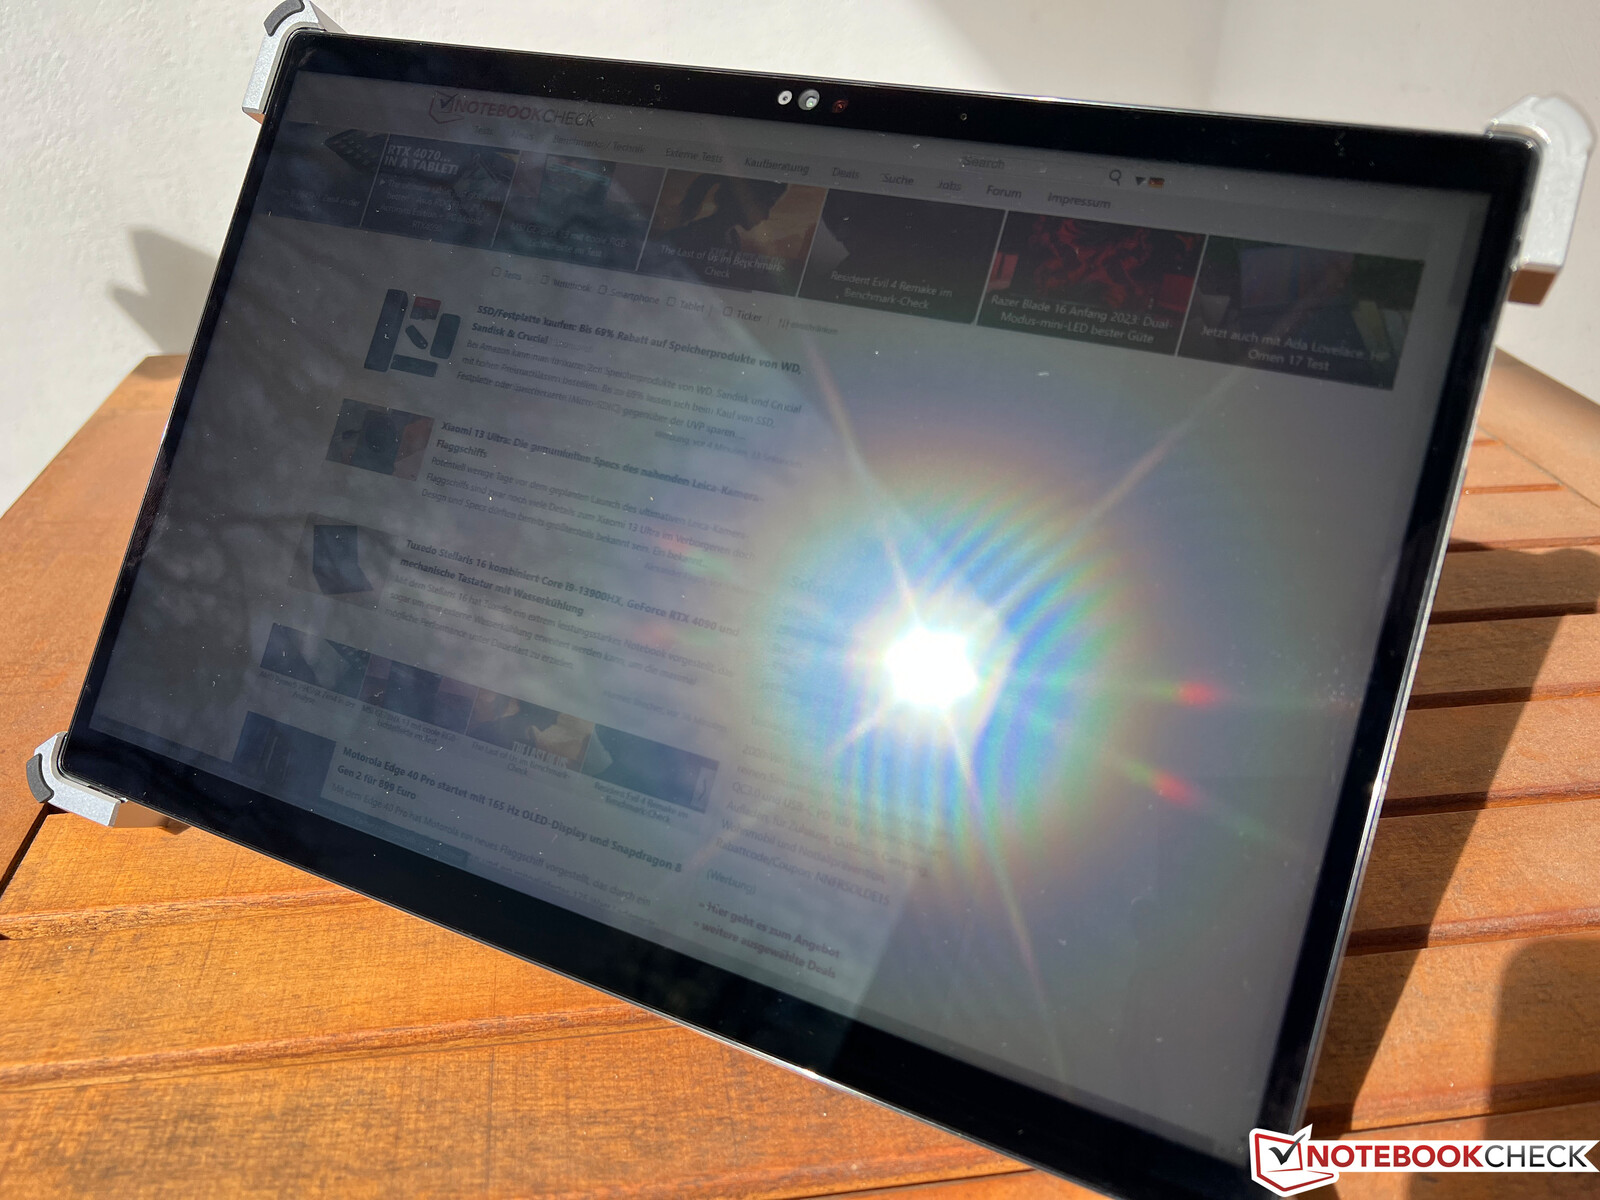
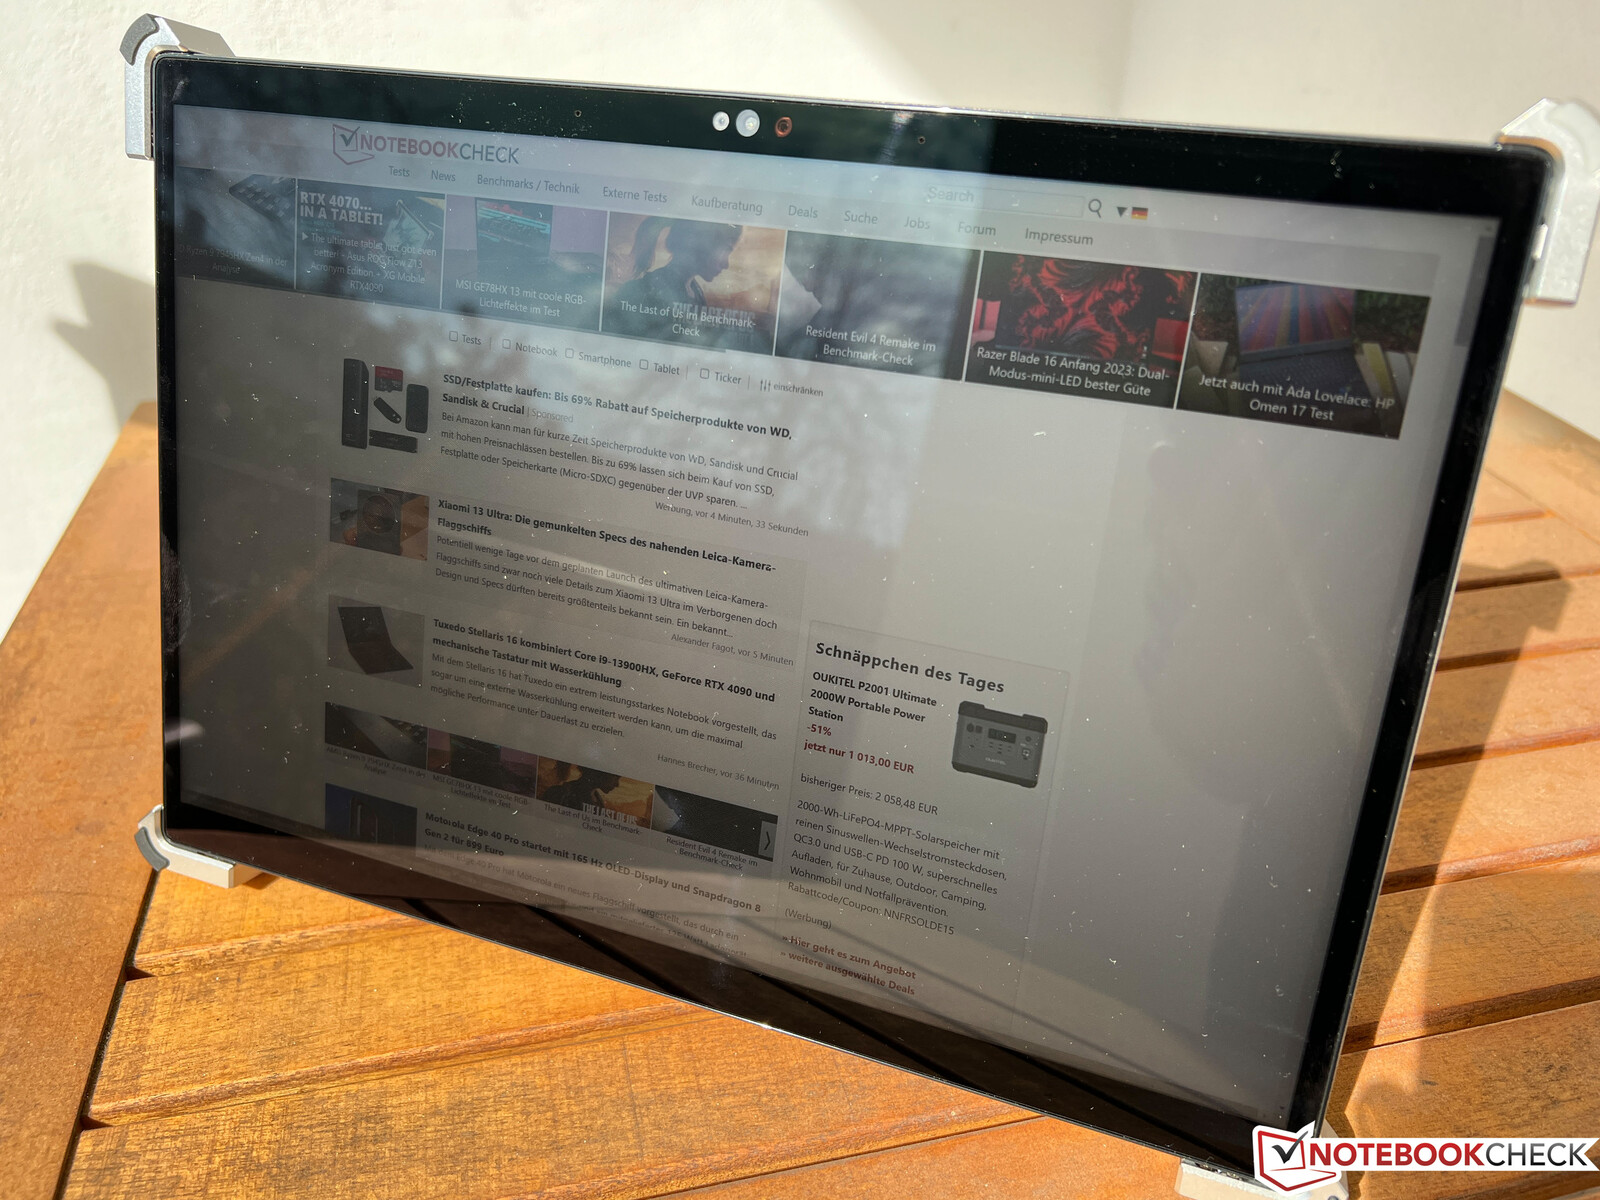
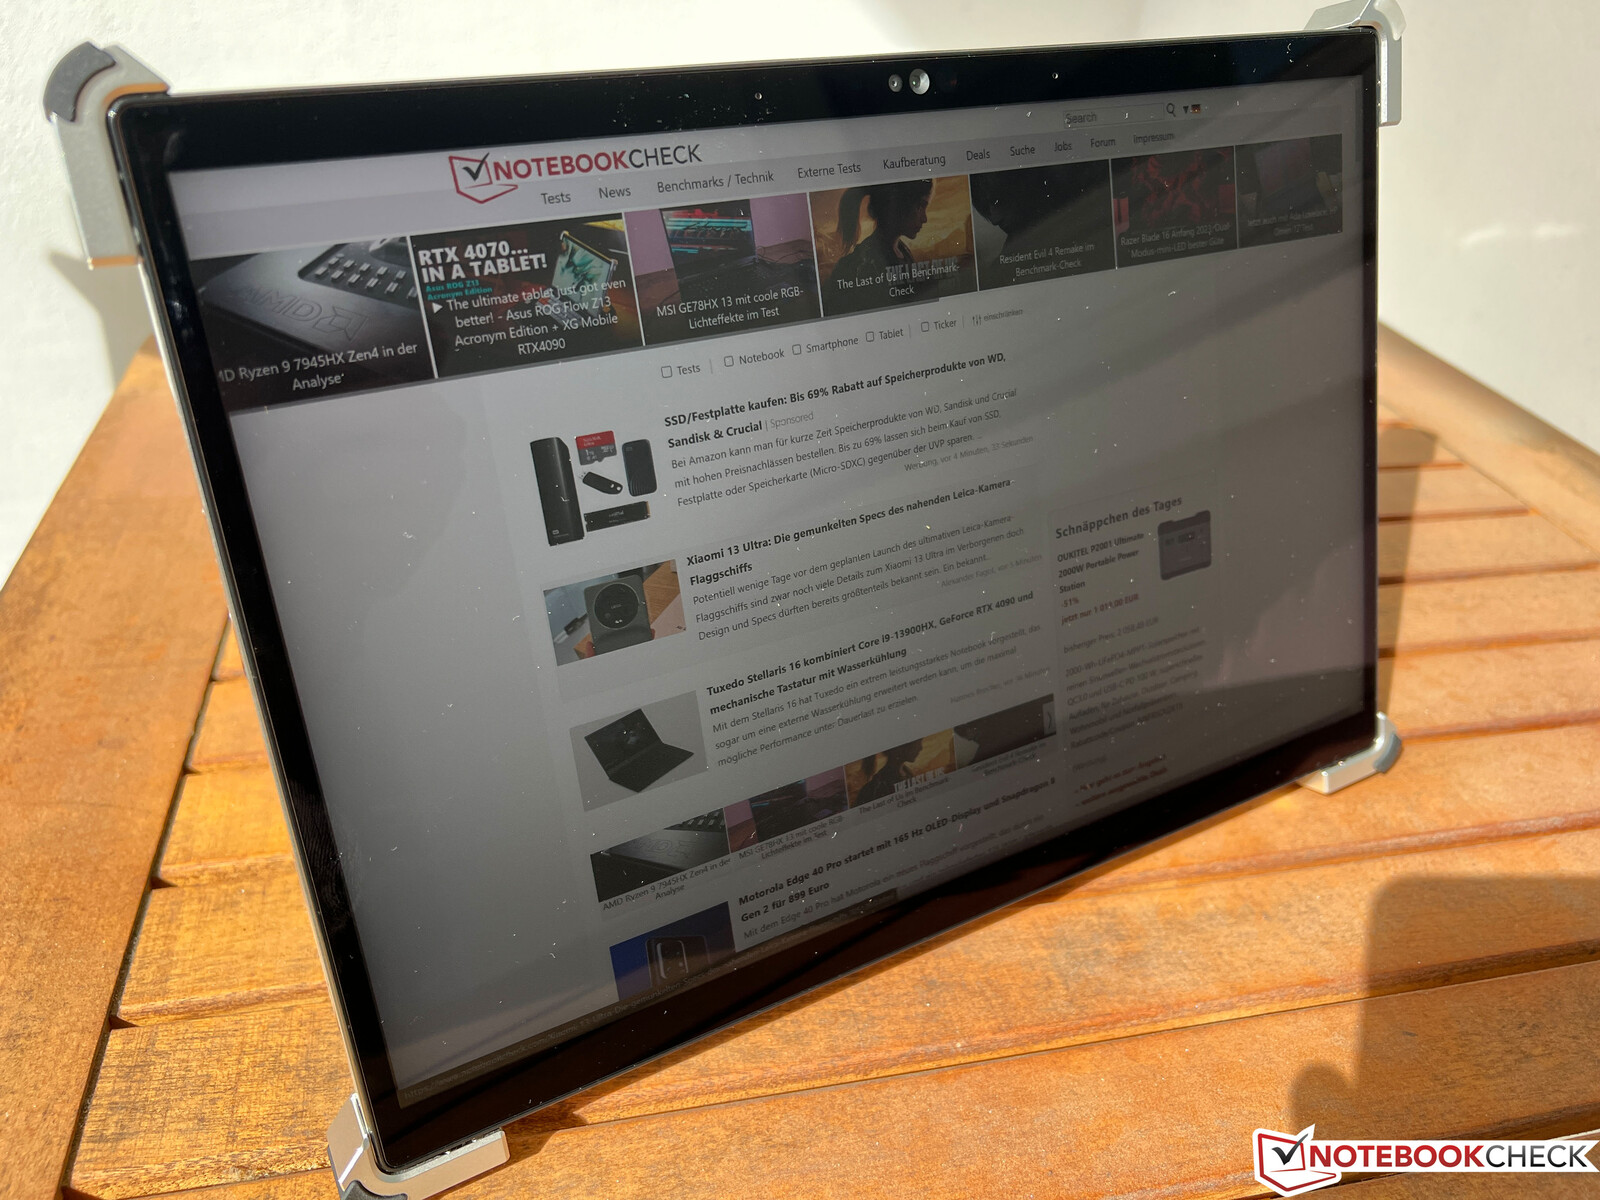
Ovviamente bisogna evitare i riflessi delle fonti di luce diretta sul touchscreen lucido, ma non è riflettente come molti altri pannelli e si può utilizzare il convertibile anche in ambienti molto luminosi. La stabilità dell'angolo di visione dello schermo IPS è molto buona.

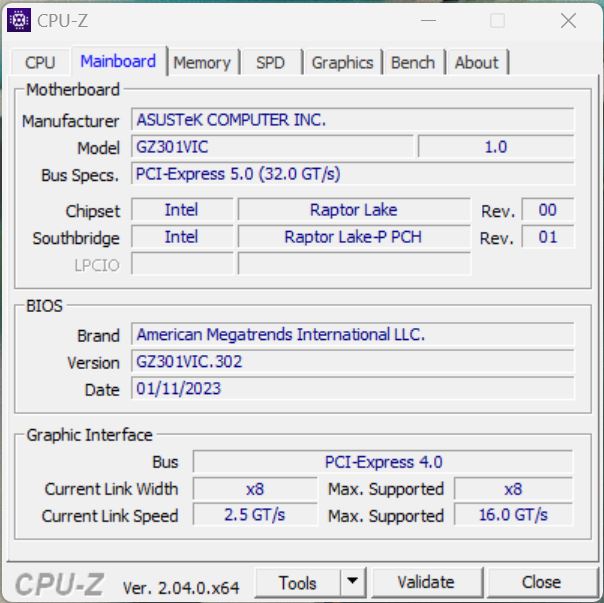
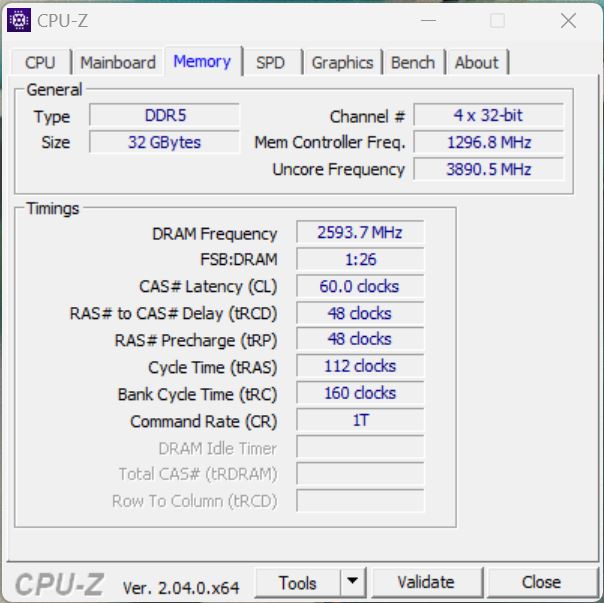
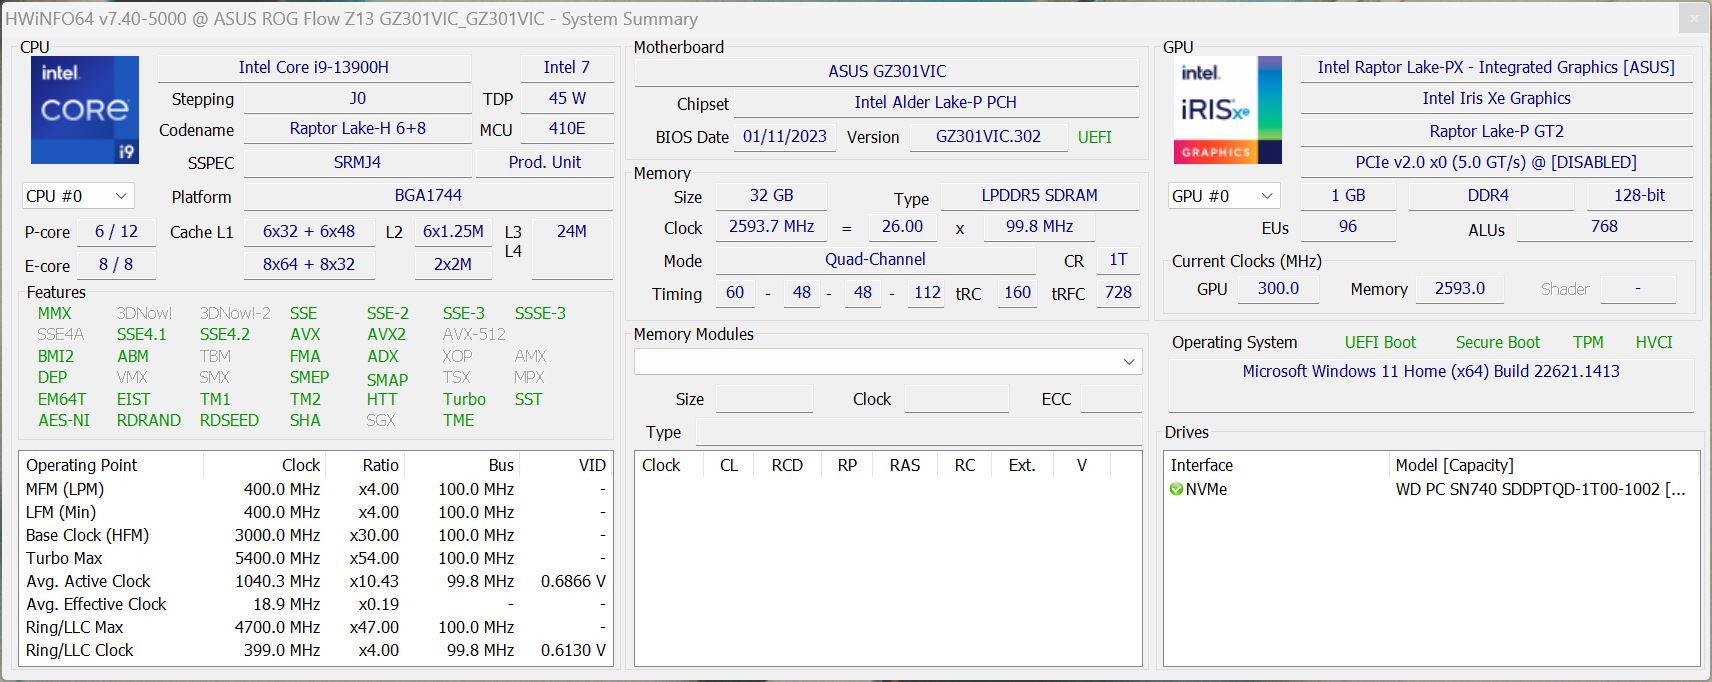
Performance - Lago dei Raptor e Ada Lovelace
Tutte le versioni del ROG Flow Z13 2023 sono dotate del processoreIntel Core i9-13900Hma la nostra edizione speciale ACRNM riceve anche la nuovaNvidia GeForce RTX 4070 Laptop(versione da 65W). La nostra unità viene fornita con 32 GB di RAM LPDDR5-5200 e un'unità SSD PCIe-4.0 da 1 TB.
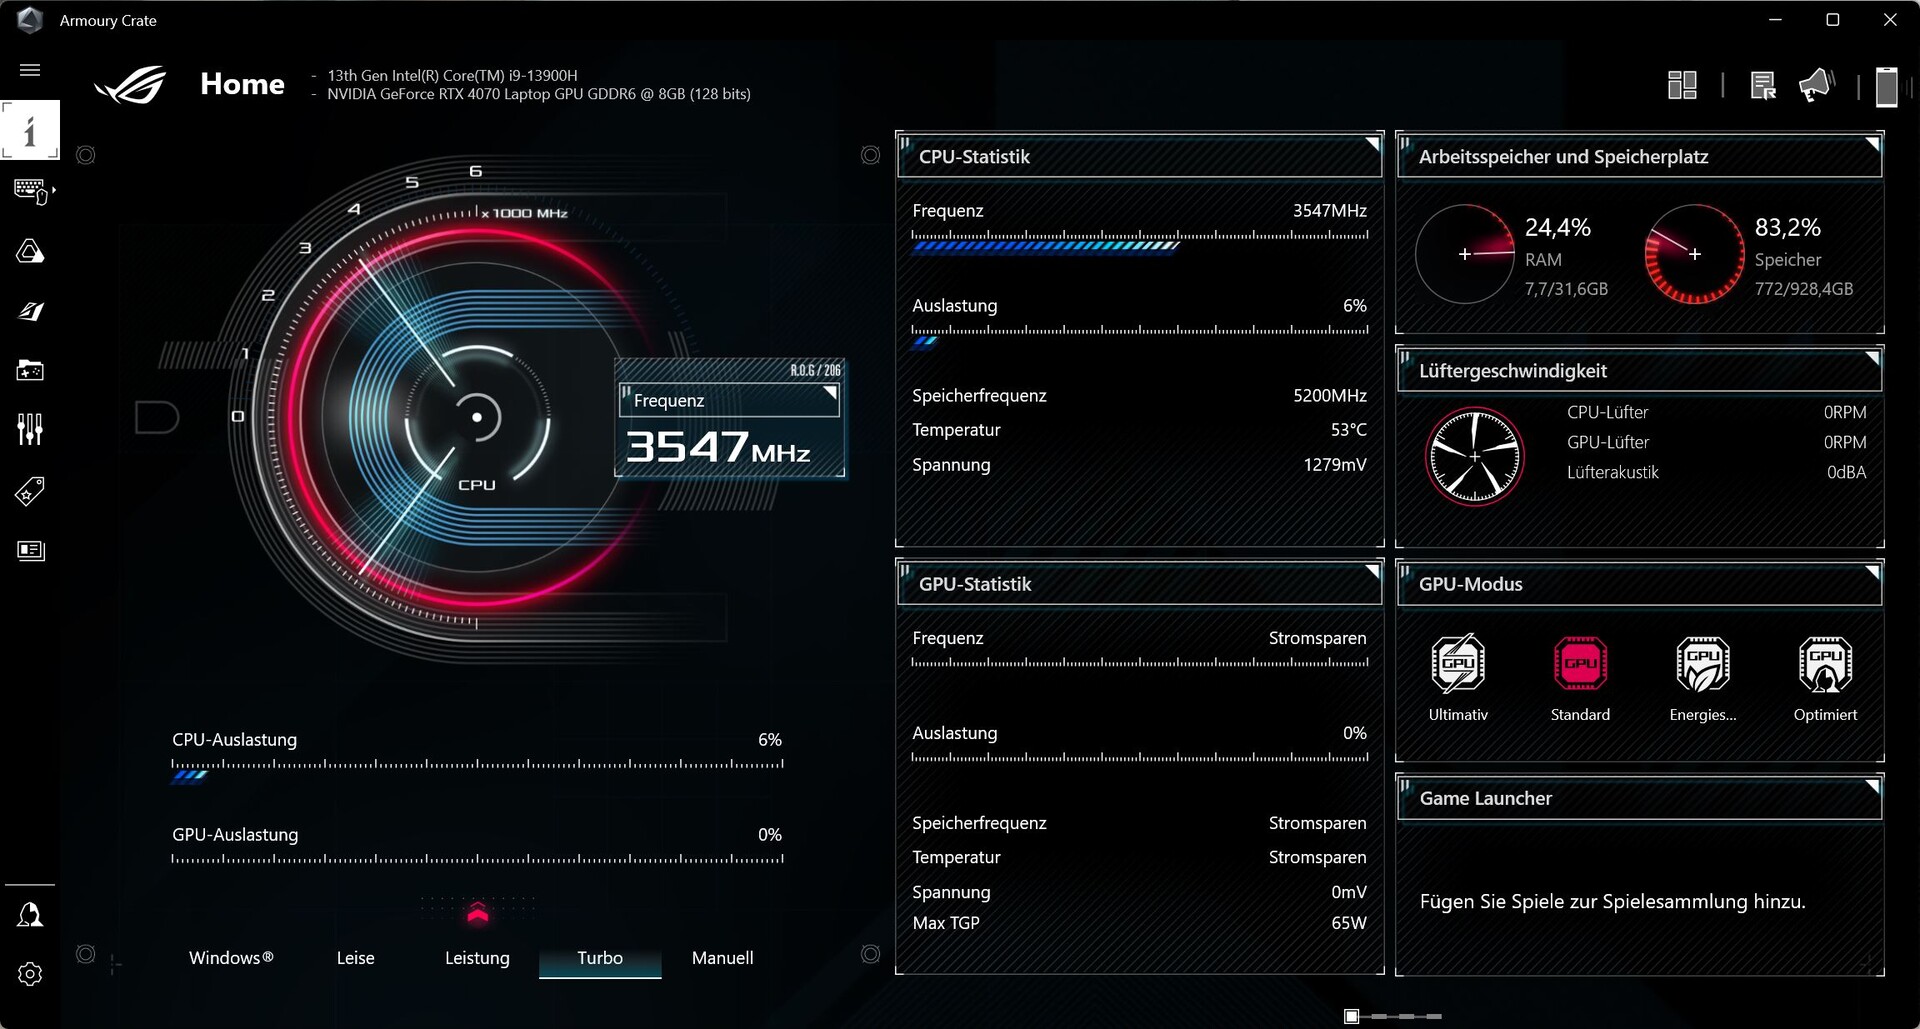
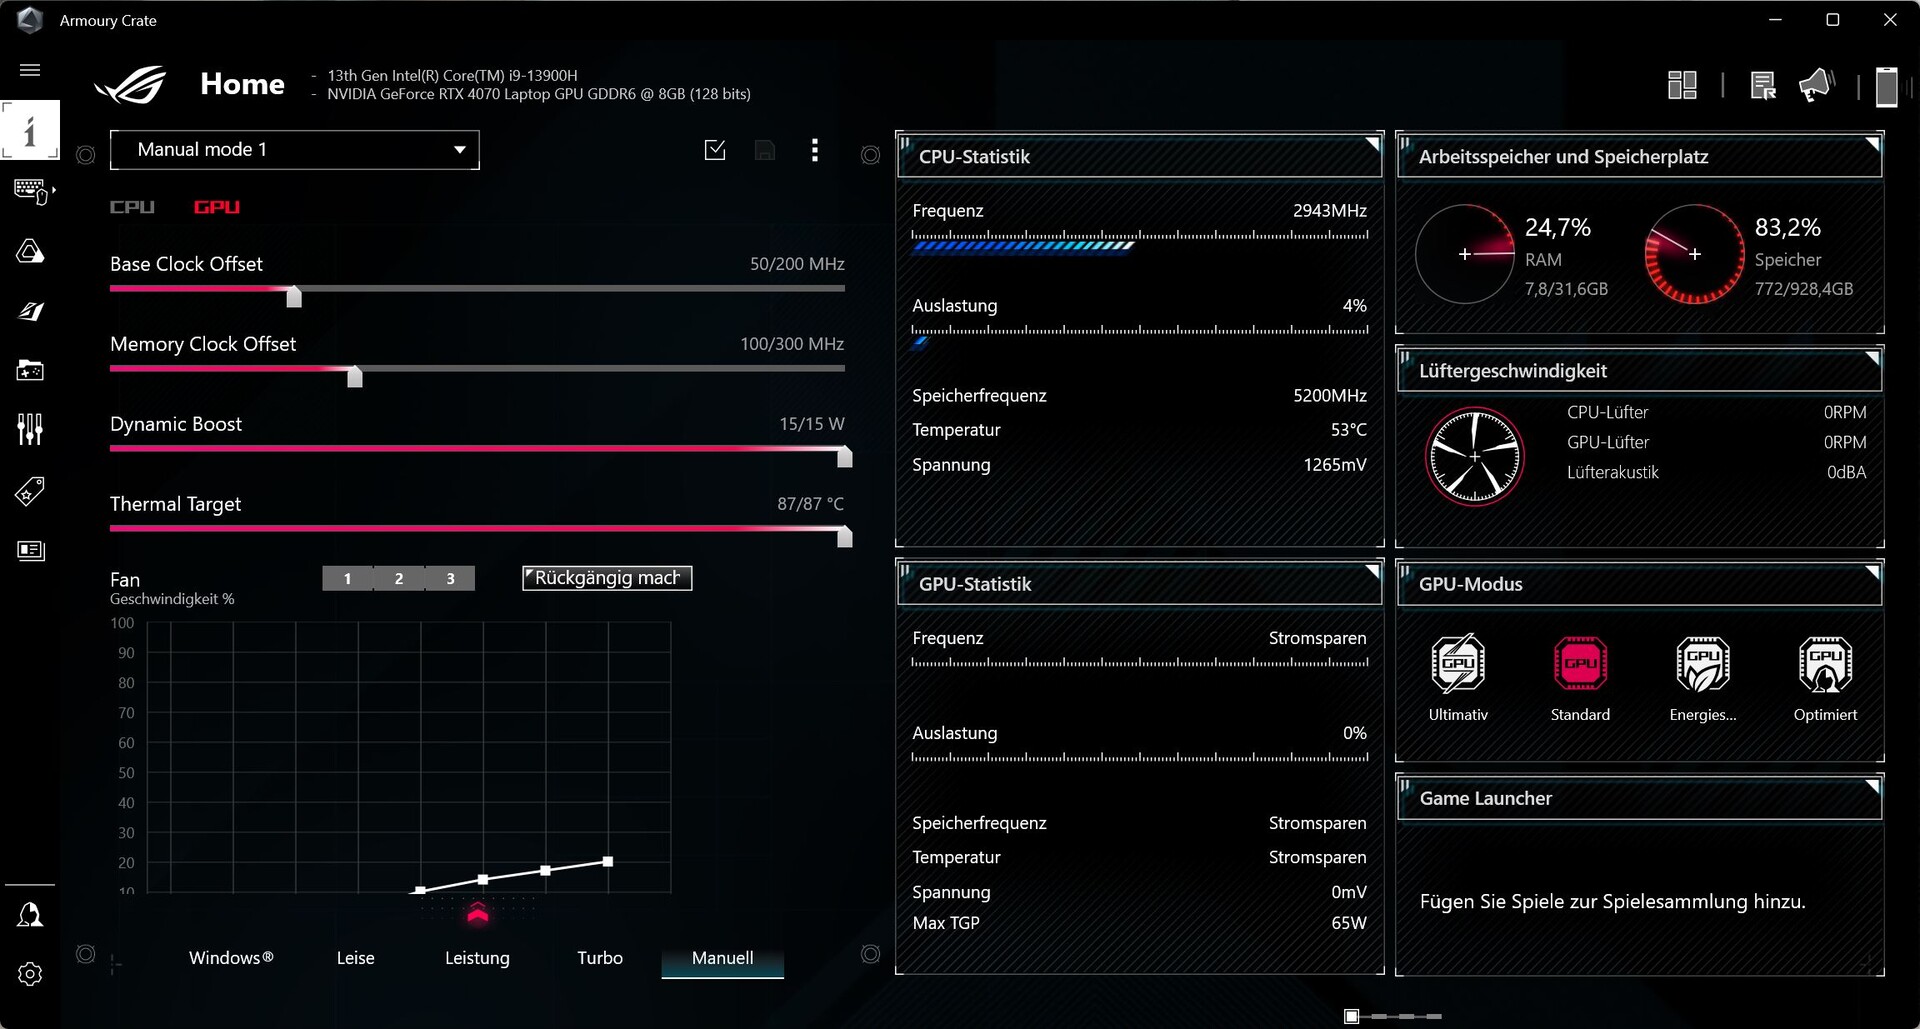
Recensione Impostazioni
Conosciamo già il software Armoury Crate da altri dispositivi ROG e offre impostazioni complete per le modalità di alimentazione e il comportamento delle GPU. È possibile, ad esempio, disattivare completamente l'iGPU. Come in altri modelli ROG, abbiamo notato che la GPU dedicata deve essere attiva quando si collega uno schermo esterno, il che aumenta il consumo energetico nelle situazioni quotidiane. Abbiamo elencato le modalità di alimentazione di ROG nella seguente tabella:
| Carico della CPU | Carico della GPU | Stress test | Rumore massimo della ventola | CB R23 Multi | Time Spy Grafica | |
|---|---|---|---|---|---|---|
| Silenzioso | 36/20 Watt | 35 Watt | CPU: 20 Watt GPU: 35 Watt |
36,5 dB(A) | 8207 punti | 7344 punti |
| Prestazioni | 100/55 Watt | 50 Watt | CPU: ~35 Watt GPU: 30 Watt |
43,4 dB(A) | 15557 punti | 8720 punti |
| Turbo | 100/65 Watt | 65 Watt | CPU: 30-50 Watt GPU: 45 Watt |
46,9 dB(A) | 18682 punti | 9513 punti |
Per i nostri benchmark e le nostre misurazioni abbiamo utilizzato la modalità Turbo per ottenere le massime prestazioni della GPU. Si noti che la modalità Turbo è disponibile solo quando l'alimentatore è collegato. Daremo anche un'occhiata al rumore della ventola con gli altri profili di alimentazione.
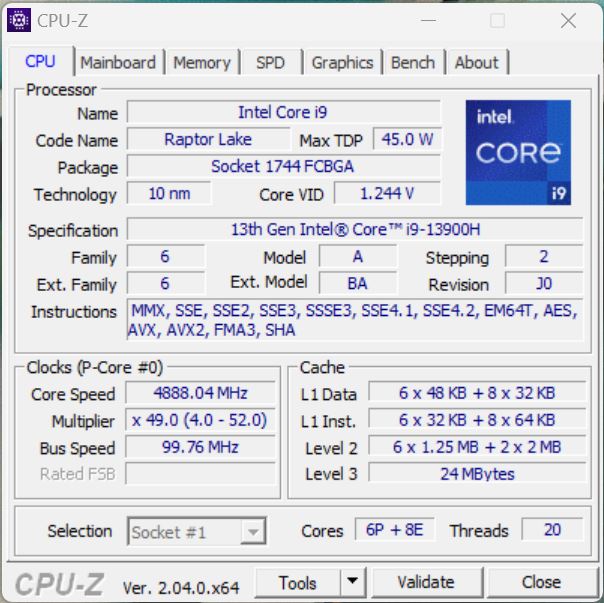
Processore - Core i9-13900H
Il nuovo Intel Raptor LakeCore i9-13900Hè fondamentalmente il vecchioCore i9-12900Hdella versione precedente con frequenze Turbo leggermente aumentate. La CPU può consumare 100 Watt per brevi periodi e 65 Watt per carichi di lavoro sostenuti in modalità Turbo. Ciò significa che siamo ancora molto lontani dal potenziale massimo del Core i9, ma i risultati complessivi sono comunque molto buoni considerando le dimensioni compatte. Il consumo della batteria è limitato a 40 Watt, il che significa che si perderà circa il 25% delle prestazioni della CPU in scenari multi-core. Si veda la nostra sezione tecnica per ulteriori benchmark.
Cinebench R15 Multi Loop
Cinebench R23: Multi Core | Single Core
Cinebench R20: CPU (Multi Core) | CPU (Single Core)
Cinebench R15: CPU Multi 64Bit | CPU Single 64Bit
Blender: v2.79 BMW27 CPU
7-Zip 18.03: 7z b 4 | 7z b 4 -mmt1
Geekbench 5.5: Multi-Core | Single-Core
HWBOT x265 Benchmark v2.2: 4k Preset
LibreOffice : 20 Documents To PDF
R Benchmark 2.5: Overall mean
| CPU Performance rating | |
| Media della classe Gaming | |
| Asus ROG Zephyrus M16 GU604VY-NM042X | |
| Asus ROG Flow Z13 GZ301V | |
| Asus ROG Flow Z13 ACRNM | |
| Asus ROG Flow Z13 GZ301ZE | |
| Media Intel Core i9-13900H | |
| Gigabyte AERO 16 OLED BSF | |
| Apple MacBook Pro 14 2023 M2 Pro -6! | |
| Alienware x14 i7 RTX 3060 | |
| Razer Blade 14 Ryzen 9 6900HX | |
| Asus ROG Zephyrus G14 GA402RK | |
| Microsoft Surface Pro 9, i7-1255U | |
| Cinebench R23 / Multi Core | |
| Media della classe Gaming (10488 - 42661, n=107, ultimi 2 anni) | |
| Asus ROG Zephyrus M16 GU604VY-NM042X | |
| Gigabyte AERO 16 OLED BSF | |
| Asus ROG Flow Z13 ACRNM | |
| Asus ROG Flow Z13 GZ301V | |
| Media Intel Core i9-13900H (11997 - 20385, n=28) | |
| Alienware x14 i7 RTX 3060 | |
| Asus ROG Flow Z13 GZ301ZE | |
| Apple MacBook Pro 14 2023 M2 Pro | |
| Razer Blade 14 Ryzen 9 6900HX | |
| Asus ROG Zephyrus G14 GA402RK | |
| Microsoft Surface Pro 9, i7-1255U | |
| Cinebench R23 / Single Core | |
| Asus ROG Flow Z13 GZ301V | |
| Asus ROG Flow Z13 ACRNM | |
| Media della classe Gaming (1166 - 2415, n=107, ultimi 2 anni) | |
| Asus ROG Zephyrus M16 GU604VY-NM042X | |
| Asus ROG Flow Z13 GZ301ZE | |
| Media Intel Core i9-13900H (1297 - 2054, n=26) | |
| Alienware x14 i7 RTX 3060 | |
| Gigabyte AERO 16 OLED BSF | |
| Microsoft Surface Pro 9, i7-1255U | |
| Apple MacBook Pro 14 2023 M2 Pro | |
| Asus ROG Zephyrus G14 GA402RK | |
| Razer Blade 14 Ryzen 9 6900HX | |
| Cinebench R20 / CPU (Multi Core) | |
| Media della classe Gaming (4029 - 16433, n=106, ultimi 2 anni) | |
| Asus ROG Zephyrus M16 GU604VY-NM042X | |
| Gigabyte AERO 16 OLED BSF | |
| Asus ROG Flow Z13 ACRNM | |
| Asus ROG Flow Z13 GZ301V | |
| Media Intel Core i9-13900H (4935 - 7716, n=25) | |
| Alienware x14 i7 RTX 3060 | |
| Asus ROG Flow Z13 GZ301ZE | |
| Razer Blade 14 Ryzen 9 6900HX | |
| Asus ROG Zephyrus G14 GA402RK | |
| Apple MacBook Pro 14 2023 M2 Pro | |
| Microsoft Surface Pro 9, i7-1255U | |
| Cinebench R20 / CPU (Single Core) | |
| Asus ROG Flow Z13 GZ301V | |
| Media della classe Gaming (442 - 913, n=106, ultimi 2 anni) | |
| Asus ROG Flow Z13 ACRNM | |
| Asus ROG Zephyrus M16 GU604VY-NM042X | |
| Asus ROG Flow Z13 GZ301ZE | |
| Media Intel Core i9-13900H (428 - 792, n=25) | |
| Alienware x14 i7 RTX 3060 | |
| Gigabyte AERO 16 OLED BSF | |
| Microsoft Surface Pro 9, i7-1255U | |
| Asus ROG Zephyrus G14 GA402RK | |
| Razer Blade 14 Ryzen 9 6900HX | |
| Apple MacBook Pro 14 2023 M2 Pro | |
| Cinebench R15 / CPU Multi 64Bit | |
| Media della classe Gaming (1578 - 6330, n=105, ultimi 2 anni) | |
| Asus ROG Zephyrus M16 GU604VY-NM042X | |
| Gigabyte AERO 16 OLED BSF | |
| Asus ROG Flow Z13 GZ301V | |
| Asus ROG Flow Z13 ACRNM | |
| Asus ROG Flow Z13 GZ301ZE | |
| Media Intel Core i9-13900H (2061 - 3100, n=26) | |
| Alienware x14 i7 RTX 3060 | |
| Razer Blade 14 Ryzen 9 6900HX | |
| Apple MacBook Pro 14 2023 M2 Pro | |
| Asus ROG Zephyrus G14 GA402RK | |
| Microsoft Surface Pro 9, i7-1255U | |
| Cinebench R15 / CPU Single 64Bit | |
| Media della classe Gaming (188.8 - 350, n=106, ultimi 2 anni) | |
| Asus ROG Flow Z13 GZ301V | |
| Asus ROG Zephyrus M16 GU604VY-NM042X | |
| Asus ROG Flow Z13 ACRNM | |
| Asus ROG Flow Z13 GZ301ZE | |
| Media Intel Core i9-13900H (211 - 297, n=26) | |
| Asus ROG Zephyrus G14 GA402RK | |
| Alienware x14 i7 RTX 3060 | |
| Razer Blade 14 Ryzen 9 6900HX | |
| Gigabyte AERO 16 OLED BSF | |
| Apple MacBook Pro 14 2023 M2 Pro | |
| Microsoft Surface Pro 9, i7-1255U | |
| Blender / v2.79 BMW27 CPU | |
| Microsoft Surface Pro 9, i7-1255U | |
| Asus ROG Zephyrus G14 GA402RK | |
| Alienware x14 i7 RTX 3060 | |
| Razer Blade 14 Ryzen 9 6900HX | |
| Asus ROG Flow Z13 GZ301ZE | |
| Media Intel Core i9-13900H (166 - 268, n=24) | |
| Asus ROG Flow Z13 GZ301V | |
| Asus ROG Flow Z13 ACRNM | |
| Gigabyte AERO 16 OLED BSF | |
| Asus ROG Zephyrus M16 GU604VY-NM042X | |
| Media della classe Gaming (79 - 330, n=104, ultimi 2 anni) | |
| 7-Zip 18.03 / 7z b 4 | |
| Media della classe Gaming (33491 - 148086, n=105, ultimi 2 anni) | |
| Asus ROG Zephyrus M16 GU604VY-NM042X | |
| Gigabyte AERO 16 OLED BSF | |
| Asus ROG Flow Z13 GZ301V | |
| Asus ROG Flow Z13 ACRNM | |
| Alienware x14 i7 RTX 3060 | |
| Media Intel Core i9-13900H (45045 - 79032, n=25) | |
| Asus ROG Flow Z13 GZ301ZE | |
| Razer Blade 14 Ryzen 9 6900HX | |
| Asus ROG Zephyrus G14 GA402RK | |
| Microsoft Surface Pro 9, i7-1255U | |
| 7-Zip 18.03 / 7z b 4 -mmt1 | |
| Asus ROG Flow Z13 GZ301V | |
| Media della classe Gaming (4199 - 7436, n=105, ultimi 2 anni) | |
| Asus ROG Flow Z13 ACRNM | |
| Asus ROG Zephyrus M16 GU604VY-NM042X | |
| Asus ROG Flow Z13 GZ301ZE | |
| Media Intel Core i9-13900H (3665 - 6600, n=25) | |
| Asus ROG Zephyrus G14 GA402RK | |
| Razer Blade 14 Ryzen 9 6900HX | |
| Alienware x14 i7 RTX 3060 | |
| Gigabyte AERO 16 OLED BSF | |
| Microsoft Surface Pro 9, i7-1255U | |
| Geekbench 5.5 / Multi-Core | |
| Media della classe Gaming (6460 - 28263, n=105, ultimi 2 anni) | |
| Asus ROG Zephyrus M16 GU604VY-NM042X | |
| Apple MacBook Pro 14 2023 M2 Pro | |
| Asus ROG Flow Z13 GZ301V | |
| Asus ROG Flow Z13 ACRNM | |
| Asus ROG Flow Z13 GZ301ZE | |
| Gigabyte AERO 16 OLED BSF | |
| Alienware x14 i7 RTX 3060 | |
| Media Intel Core i9-13900H (9094 - 15410, n=26) | |
| Asus ROG Zephyrus G14 GA402RK | |
| Razer Blade 14 Ryzen 9 6900HX | |
| Microsoft Surface Pro 9, i7-1255U | |
| Geekbench 5.5 / Single-Core | |
| Media della classe Gaming (986 - 2474, n=105, ultimi 2 anni) | |
| Asus ROG Flow Z13 GZ301V | |
| Asus ROG Flow Z13 ACRNM | |
| Asus ROG Zephyrus M16 GU604VY-NM042X | |
| Apple MacBook Pro 14 2023 M2 Pro | |
| Media Intel Core i9-13900H (1140 - 2043, n=26) | |
| Asus ROG Flow Z13 GZ301ZE | |
| Alienware x14 i7 RTX 3060 | |
| Gigabyte AERO 16 OLED BSF | |
| Microsoft Surface Pro 9, i7-1255U | |
| Asus ROG Zephyrus G14 GA402RK | |
| Razer Blade 14 Ryzen 9 6900HX | |
| HWBOT x265 Benchmark v2.2 / 4k Preset | |
| Media della classe Gaming (11.5 - 44.4, n=105, ultimi 2 anni) | |
| Asus ROG Zephyrus M16 GU604VY-NM042X | |
| Gigabyte AERO 16 OLED BSF | |
| Asus ROG Flow Z13 ACRNM | |
| Asus ROG Flow Z13 GZ301V | |
| Media Intel Core i9-13900H (14.1 - 22.3, n=25) | |
| Razer Blade 14 Ryzen 9 6900HX | |
| Alienware x14 i7 RTX 3060 | |
| Asus ROG Flow Z13 GZ301ZE | |
| Asus ROG Zephyrus G14 GA402RK | |
| Microsoft Surface Pro 9, i7-1255U | |
| LibreOffice / 20 Documents To PDF | |
| Asus ROG Flow Z13 ACRNM | |
| Gigabyte AERO 16 OLED BSF | |
| Microsoft Surface Pro 9, i7-1255U | |
| Asus ROG Zephyrus M16 GU604VY-NM042X | |
| Razer Blade 14 Ryzen 9 6900HX | |
| Media della classe Gaming (33.2 - 88.8, n=105, ultimi 2 anni) | |
| Asus ROG Zephyrus G14 GA402RK | |
| Media Intel Core i9-13900H (34.4 - 82.8, n=25) | |
| Asus ROG Flow Z13 GZ301ZE | |
| Asus ROG Flow Z13 GZ301V | |
| Alienware x14 i7 RTX 3060 | |
| R Benchmark 2.5 / Overall mean | |
| Microsoft Surface Pro 9, i7-1255U | |
| Gigabyte AERO 16 OLED BSF | |
| Razer Blade 14 Ryzen 9 6900HX | |
| Asus ROG Zephyrus G14 GA402RK | |
| Alienware x14 i7 RTX 3060 | |
| Media Intel Core i9-13900H (0.4052 - 0.723, n=25) | |
| Media della classe Gaming (0.3439 - 0.759, n=106, ultimi 2 anni) | |
| Asus ROG Flow Z13 GZ301ZE | |
| Asus ROG Flow Z13 ACRNM | |
| Asus ROG Zephyrus M16 GU604VY-NM042X | |
| Asus ROG Flow Z13 GZ301V | |
* ... Meglio usare valori piccoli
AIDA64: FP32 Ray-Trace | FPU Julia | CPU SHA3 | CPU Queen | FPU SinJulia | FPU Mandel | CPU AES | CPU ZLib | FP64 Ray-Trace | CPU PhotoWorxx
| Performance rating | |
| Media della classe Gaming | |
| Gigabyte AERO 16 OLED BSF | |
| Razer Blade 14 Ryzen 9 6900HX | |
| Asus ROG Flow Z13 ACRNM | |
| Asus ROG Zephyrus G14 GA402RK | |
| Asus ROG Flow Z13 GZ301V | |
| Media Intel Core i9-13900H | |
| Alienware x14 i7 RTX 3060 | |
| Asus ROG Flow Z13 GZ301ZE | |
| AIDA64 / FP32 Ray-Trace | |
| Media della classe Gaming (10227 - 85542, n=105, ultimi 2 anni) | |
| Gigabyte AERO 16 OLED BSF | |
| Asus ROG Flow Z13 ACRNM | |
| Razer Blade 14 Ryzen 9 6900HX | |
| Asus ROG Flow Z13 GZ301V | |
| Media Intel Core i9-13900H (6788 - 19557, n=25) | |
| Asus ROG Zephyrus G14 GA402RK | |
| Alienware x14 i7 RTX 3060 | |
| Asus ROG Flow Z13 GZ301ZE | |
| AIDA64 / FPU Julia | |
| Media della classe Gaming (51376 - 238426, n=105, ultimi 2 anni) | |
| Razer Blade 14 Ryzen 9 6900HX | |
| Gigabyte AERO 16 OLED BSF | |
| Asus ROG Zephyrus G14 GA402RK | |
| Asus ROG Flow Z13 ACRNM | |
| Asus ROG Flow Z13 GZ301V | |
| Media Intel Core i9-13900H (22551 - 95579, n=25) | |
| Alienware x14 i7 RTX 3060 | |
| Asus ROG Flow Z13 GZ301ZE | |
| AIDA64 / CPU SHA3 | |
| Media della classe Gaming (2180 - 10115, n=105, ultimi 2 anni) | |
| Gigabyte AERO 16 OLED BSF | |
| Asus ROG Flow Z13 ACRNM | |
| Media Intel Core i9-13900H (2491 - 4270, n=25) | |
| Asus ROG Flow Z13 GZ301V | |
| Razer Blade 14 Ryzen 9 6900HX | |
| Asus ROG Zephyrus G14 GA402RK | |
| Alienware x14 i7 RTX 3060 | |
| Asus ROG Flow Z13 GZ301ZE | |
| AIDA64 / CPU Queen | |
| Media della classe Gaming (49785 - 173351, n=90, ultimi 2 anni) | |
| Asus ROG Flow Z13 GZ301V | |
| Asus ROG Flow Z13 ACRNM | |
| Media Intel Core i9-13900H (65121 - 120936, n=25) | |
| Asus ROG Flow Z13 GZ301ZE | |
| Asus ROG Zephyrus G14 GA402RK | |
| Razer Blade 14 Ryzen 9 6900HX | |
| Alienware x14 i7 RTX 3060 | |
| Gigabyte AERO 16 OLED BSF | |
| AIDA64 / FPU SinJulia | |
| Media della classe Gaming (4424 - 33636, n=105, ultimi 2 anni) | |
| Razer Blade 14 Ryzen 9 6900HX | |
| Asus ROG Zephyrus G14 GA402RK | |
| Asus ROG Flow Z13 ACRNM | |
| Gigabyte AERO 16 OLED BSF | |
| Asus ROG Flow Z13 GZ301V | |
| Media Intel Core i9-13900H (6108 - 11631, n=25) | |
| Alienware x14 i7 RTX 3060 | |
| Asus ROG Flow Z13 GZ301ZE | |
| AIDA64 / FPU Mandel | |
| Media della classe Gaming (25115 - 128721, n=105, ultimi 2 anni) | |
| Razer Blade 14 Ryzen 9 6900HX | |
| Asus ROG Zephyrus G14 GA402RK | |
| Gigabyte AERO 16 OLED BSF | |
| Asus ROG Flow Z13 ACRNM | |
| Asus ROG Flow Z13 GZ301V | |
| Media Intel Core i9-13900H (11283 - 48474, n=25) | |
| Alienware x14 i7 RTX 3060 | |
| Asus ROG Flow Z13 GZ301ZE | |
| AIDA64 / CPU AES | |
| Gigabyte AERO 16 OLED BSF | |
| Razer Blade 14 Ryzen 9 6900HX | |
| Asus ROG Zephyrus G14 GA402RK | |
| Media della classe Gaming (39258 - 247074, n=105, ultimi 2 anni) | |
| Alienware x14 i7 RTX 3060 | |
| Media Intel Core i9-13900H (3691 - 149377, n=25) | |
| Asus ROG Flow Z13 GZ301ZE | |
| Asus ROG Flow Z13 ACRNM | |
| Asus ROG Flow Z13 GZ301V | |
| AIDA64 / CPU ZLib | |
| Media della classe Gaming (574 - 2531, n=105, ultimi 2 anni) | |
| Asus ROG Flow Z13 ACRNM | |
| Gigabyte AERO 16 OLED BSF | |
| Asus ROG Flow Z13 GZ301V | |
| Media Intel Core i9-13900H (789 - 1254, n=25) | |
| Alienware x14 i7 RTX 3060 | |
| Asus ROG Flow Z13 GZ301ZE | |
| Razer Blade 14 Ryzen 9 6900HX | |
| Asus ROG Zephyrus G14 GA402RK | |
| AIDA64 / FP64 Ray-Trace | |
| Media della classe Gaming (5509 - 45446, n=105, ultimi 2 anni) | |
| Gigabyte AERO 16 OLED BSF | |
| Asus ROG Flow Z13 ACRNM | |
| Razer Blade 14 Ryzen 9 6900HX | |
| Asus ROG Flow Z13 GZ301V | |
| Media Intel Core i9-13900H (3655 - 10716, n=25) | |
| Asus ROG Zephyrus G14 GA402RK | |
| Alienware x14 i7 RTX 3060 | |
| Asus ROG Flow Z13 GZ301ZE | |
| AIDA64 / CPU PhotoWorxx | |
| Alienware x14 i7 RTX 3060 | |
| Media della classe Gaming (12271 - 89891, n=105, ultimi 2 anni) | |
| Gigabyte AERO 16 OLED BSF | |
| Asus ROG Flow Z13 ACRNM | |
| Asus ROG Flow Z13 GZ301ZE | |
| Asus ROG Flow Z13 GZ301V | |
| Media Intel Core i9-13900H (10871 - 50488, n=25) | |
| Asus ROG Zephyrus G14 GA402RK | |
| Razer Blade 14 Ryzen 9 6900HX | |
Prestazioni del sistema
Le prestazioni di sistema del ROG Flow Z13 sono eccellenti, come dimostrano i buoni punteggi dei benchmark e le nostre impressioni soggettive sulle prestazioni.
CrossMark: Overall | Productivity | Creativity | Responsiveness
| PCMark 10 / Score | |
| Media della classe Gaming (5828 - 12414, n=93, ultimi 2 anni) | |
| Gigabyte AERO 16 OLED BSF | |
| Asus ROG Flow Z13 ACRNM | |
| Asus ROG Flow Z13 ACRNM | |
| Asus ROG Zephyrus G14 GA402RK | |
| Media Intel Core i9-13900H, NVIDIA GeForce RTX 4070 Laptop GPU (5855 - 8538, n=8) | |
| Asus ROG Flow Z13 GZ301V | |
| Razer Blade 14 Ryzen 9 6900HX | |
| Alienware x14 i7 RTX 3060 | |
| Asus ROG Flow Z13 GZ301ZE | |
| PCMark 10 / Essentials | |
| Asus ROG Flow Z13 ACRNM | |
| Asus ROG Flow Z13 GZ301V | |
| Gigabyte AERO 16 OLED BSF | |
| Asus ROG Flow Z13 ACRNM | |
| Razer Blade 14 Ryzen 9 6900HX | |
| Asus ROG Zephyrus G14 GA402RK | |
| Media Intel Core i9-13900H, NVIDIA GeForce RTX 4070 Laptop GPU (8835 - 11940, n=8) | |
| Asus ROG Flow Z13 GZ301ZE | |
| Media della classe Gaming (8810 - 11935, n=97, ultimi 2 anni) | |
| Alienware x14 i7 RTX 3060 | |
| PCMark 10 / Productivity | |
| Media della classe Gaming (6845 - 25323, n=95, ultimi 2 anni) | |
| Asus ROG Flow Z13 ACRNM | |
| Asus ROG Flow Z13 GZ301V | |
| Asus ROG Flow Z13 ACRNM | |
| Media Intel Core i9-13900H, NVIDIA GeForce RTX 4070 Laptop GPU (7967 - 10991, n=8) | |
| Asus ROG Zephyrus G14 GA402RK | |
| Asus ROG Flow Z13 GZ301ZE | |
| Alienware x14 i7 RTX 3060 | |
| Gigabyte AERO 16 OLED BSF | |
| Razer Blade 14 Ryzen 9 6900HX | |
| PCMark 10 / Digital Content Creation | |
| Media della classe Gaming (7602 - 19954, n=95, ultimi 2 anni) | |
| Gigabyte AERO 16 OLED BSF | |
| Asus ROG Flow Z13 ACRNM | |
| Asus ROG Zephyrus G14 GA402RK | |
| Media Intel Core i9-13900H, NVIDIA GeForce RTX 4070 Laptop GPU (7738 - 13575, n=8) | |
| Asus ROG Flow Z13 ACRNM | |
| Razer Blade 14 Ryzen 9 6900HX | |
| Asus ROG Flow Z13 GZ301V | |
| Alienware x14 i7 RTX 3060 | |
| Asus ROG Flow Z13 GZ301ZE | |
| CrossMark / Overall | |
| Asus ROG Flow Z13 GZ301ZE | |
| Media della classe Gaming (1366 - 2409, n=94, ultimi 2 anni) | |
| Asus ROG Flow Z13 GZ301V | |
| Asus ROG Flow Z13 ACRNM | |
| Alienware x14 i7 RTX 3060 | |
| Gigabyte AERO 16 OLED BSF | |
| Media Intel Core i9-13900H, NVIDIA GeForce RTX 4070 Laptop GPU (1104 - 1974, n=7) | |
| CrossMark / Productivity | |
| Asus ROG Flow Z13 GZ301ZE | |
| Asus ROG Flow Z13 GZ301V | |
| Media della classe Gaming (1386 - 2254, n=94, ultimi 2 anni) | |
| Asus ROG Flow Z13 ACRNM | |
| Alienware x14 i7 RTX 3060 | |
| Gigabyte AERO 16 OLED BSF | |
| Media Intel Core i9-13900H, NVIDIA GeForce RTX 4070 Laptop GPU (1058 - 1914, n=7) | |
| CrossMark / Creativity | |
| Media della classe Gaming (1343 - 2786, n=94, ultimi 2 anni) | |
| Asus ROG Flow Z13 GZ301V | |
| Asus ROG Flow Z13 ACRNM | |
| Asus ROG Flow Z13 GZ301ZE | |
| Alienware x14 i7 RTX 3060 | |
| Media Intel Core i9-13900H, NVIDIA GeForce RTX 4070 Laptop GPU (1178 - 2254, n=7) | |
| Gigabyte AERO 16 OLED BSF | |
| CrossMark / Responsiveness | |
| Asus ROG Flow Z13 GZ301ZE | |
| Gigabyte AERO 16 OLED BSF | |
| Alienware x14 i7 RTX 3060 | |
| Media della classe Gaming (1226 - 2334, n=94, ultimi 2 anni) | |
| Asus ROG Flow Z13 GZ301V | |
| Asus ROG Flow Z13 ACRNM | |
| Media Intel Core i9-13900H, NVIDIA GeForce RTX 4070 Laptop GPU (1037 - 1952, n=7) | |
| PCMark 10 Score | 8018 punti | |
Aiuto | ||
| AIDA64 / Memory Copy | |
| Alienware x14 i7 RTX 3060 | |
| Asus ROG Flow Z13 GZ301ZE | |
| Media della classe Gaming (21750 - 129946, n=105, ultimi 2 anni) | |
| Asus ROG Flow Z13 GZ301V | |
| Asus ROG Flow Z13 ACRNM | |
| Gigabyte AERO 16 OLED BSF | |
| Media Intel Core i9-13900H (37448 - 74486, n=25) | |
| Asus ROG Zephyrus G14 GA402RK | |
| Razer Blade 14 Ryzen 9 6900HX | |
| AIDA64 / Memory Read | |
| Alienware x14 i7 RTX 3060 | |
| Media della classe Gaming (22956 - 118858, n=105, ultimi 2 anni) | |
| Asus ROG Flow Z13 GZ301ZE | |
| Gigabyte AERO 16 OLED BSF | |
| Asus ROG Flow Z13 ACRNM | |
| Asus ROG Flow Z13 GZ301V | |
| Media Intel Core i9-13900H (41599 - 75433, n=25) | |
| Asus ROG Zephyrus G14 GA402RK | |
| Razer Blade 14 Ryzen 9 6900HX | |
| AIDA64 / Memory Write | |
| Media della classe Gaming (22297 - 135096, n=105, ultimi 2 anni) | |
| Asus ROG Flow Z13 GZ301V | |
| Asus ROG Flow Z13 ACRNM | |
| Gigabyte AERO 16 OLED BSF | |
| Media Intel Core i9-13900H (36152 - 88505, n=25) | |
| Alienware x14 i7 RTX 3060 | |
| Asus ROG Flow Z13 GZ301ZE | |
| Asus ROG Zephyrus G14 GA402RK | |
| Razer Blade 14 Ryzen 9 6900HX | |
| AIDA64 / Memory Latency | |
| Alienware x14 i7 RTX 3060 | |
| Media della classe Gaming (75.3 - 259, n=105, ultimi 2 anni) | |
| Asus ROG Flow Z13 GZ301ZE | |
| Gigabyte AERO 16 OLED BSF | |
| Asus ROG Flow Z13 ACRNM | |
| Media Intel Core i9-13900H (75.8 - 102.3, n=25) | |
| Asus ROG Flow Z13 GZ301V | |
| Razer Blade 14 Ryzen 9 6900HX | |
| Asus ROG Zephyrus G14 GA402RK | |
* ... Meglio usare valori piccoli
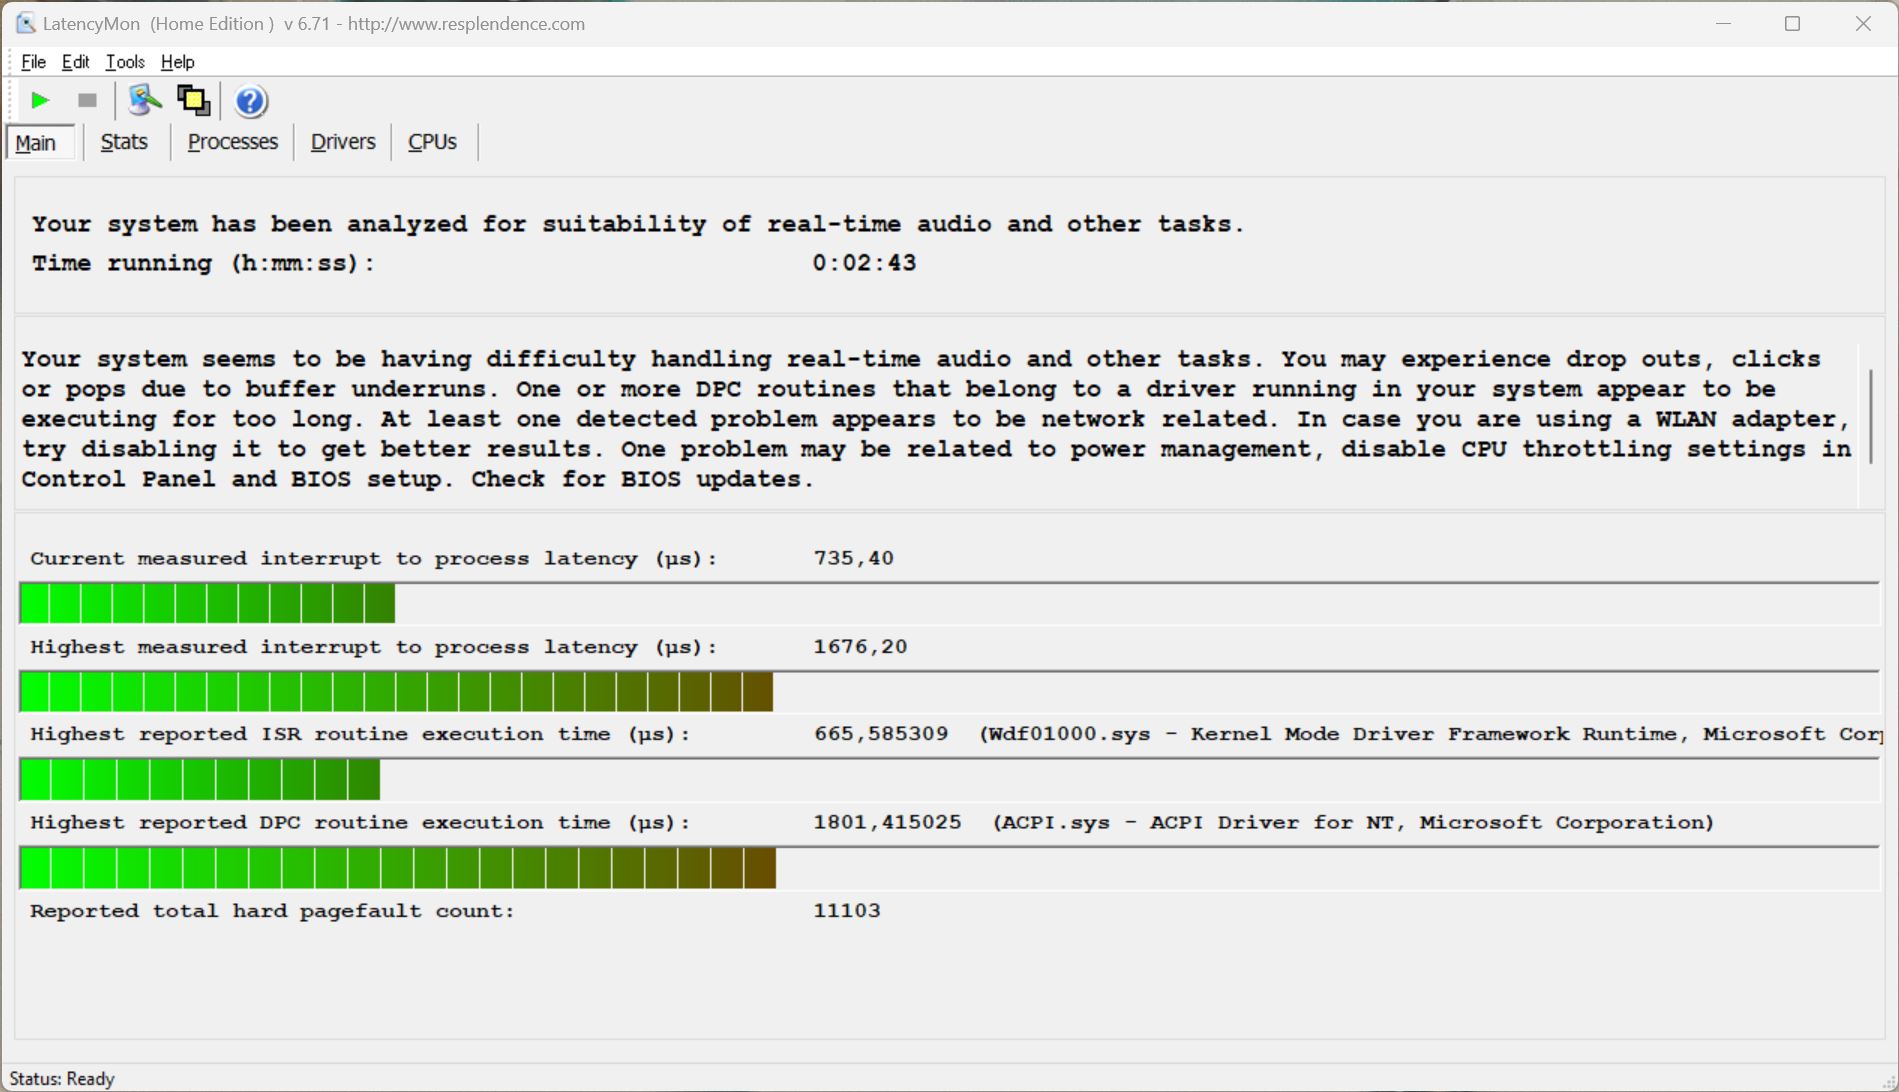
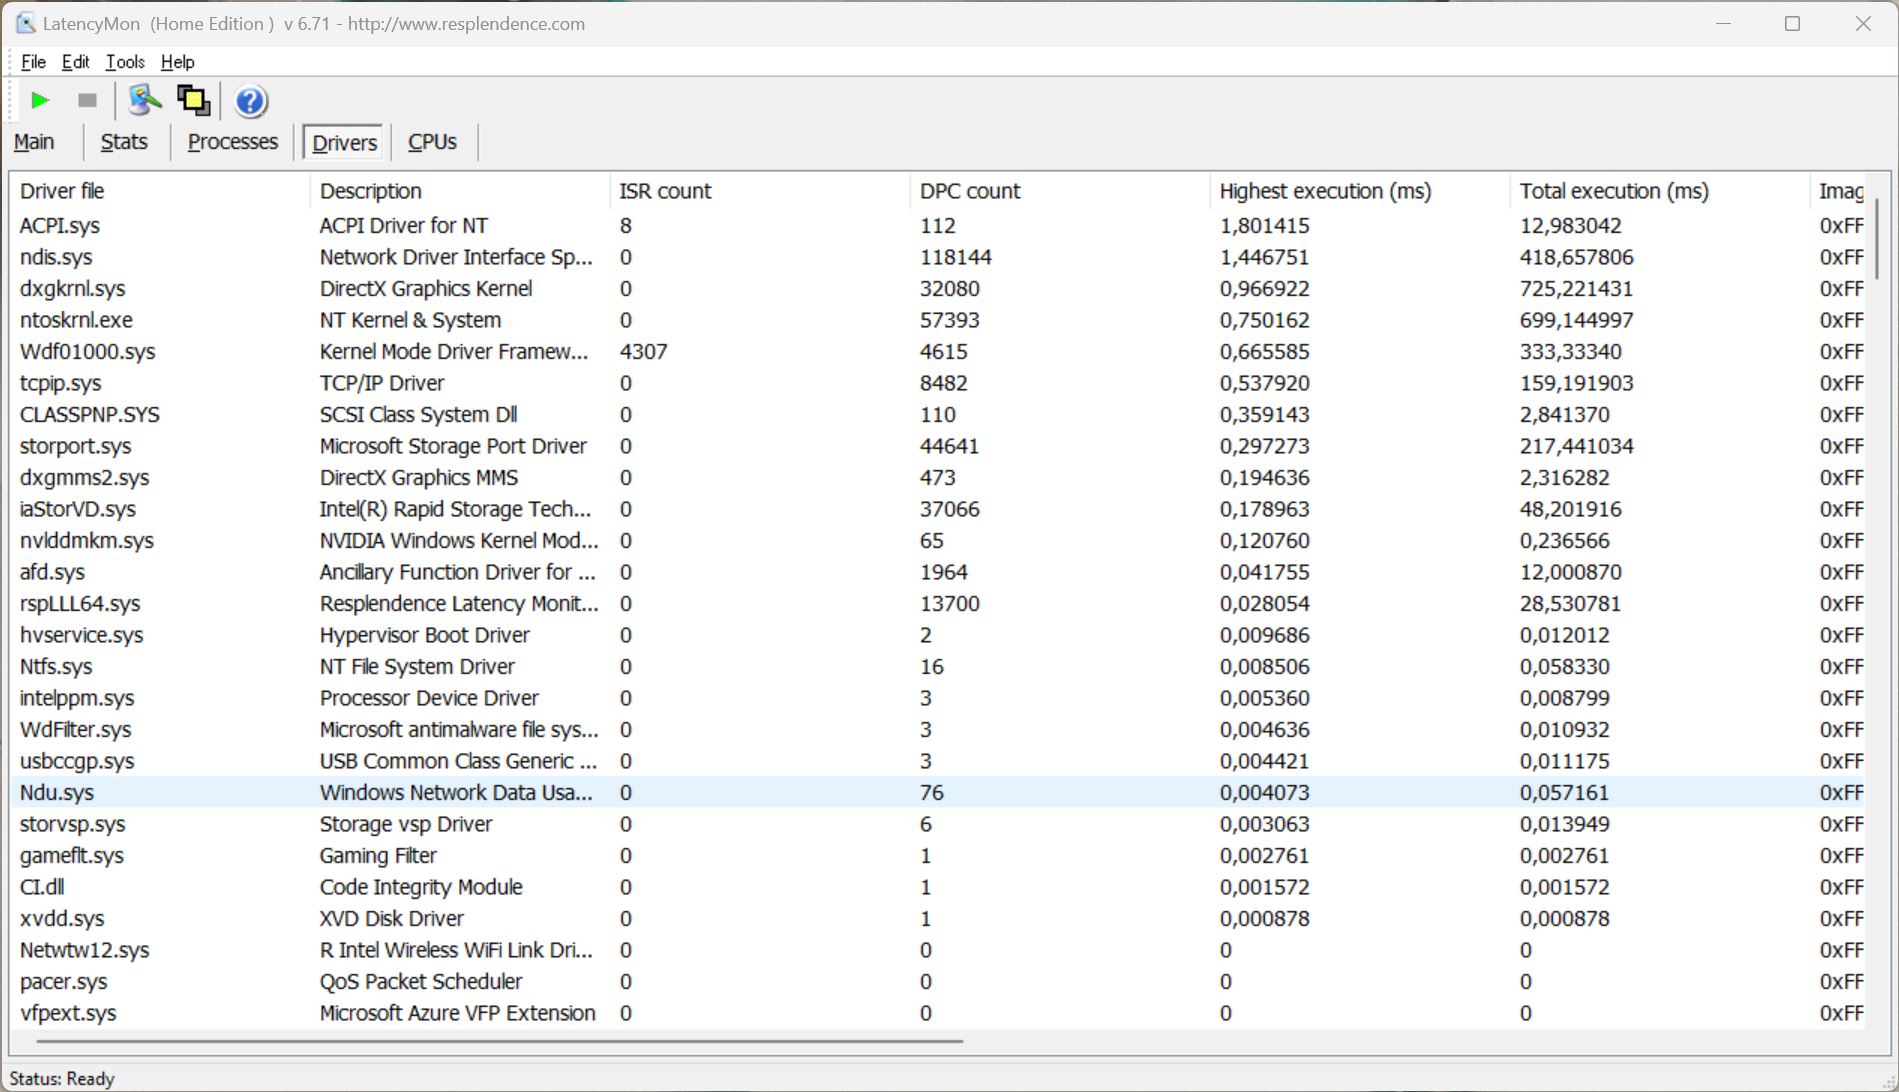
Latenza DPC
Il nostro test di latenza standardizzato (navigazione web, riproduzione 4K di YouTube, carico della CPU) mostra alcuni problemi con l'attuale versione del BIOS, ma potrebbe anche essere il risultato del driver della GPU Nvidia (da un po' di tempo sono stati segnalati problemi di latenza DPC). La situazione potrebbe migliorare con i futuri aggiornamenti software.
| DPC Latencies / LatencyMon - interrupt to process latency (max), Web, Youtube, Prime95 | |
| Asus ROG Zephyrus G14 GA402RK | |
| Asus ROG Flow Z13 ACRNM | |
| Asus ROG Flow Z13 GZ301ZE | |
| Razer Blade 14 Ryzen 9 6900HX | |
| Alienware x14 i7 RTX 3060 | |
* ... Meglio usare valori piccoli
Dispositivi di archiviazione
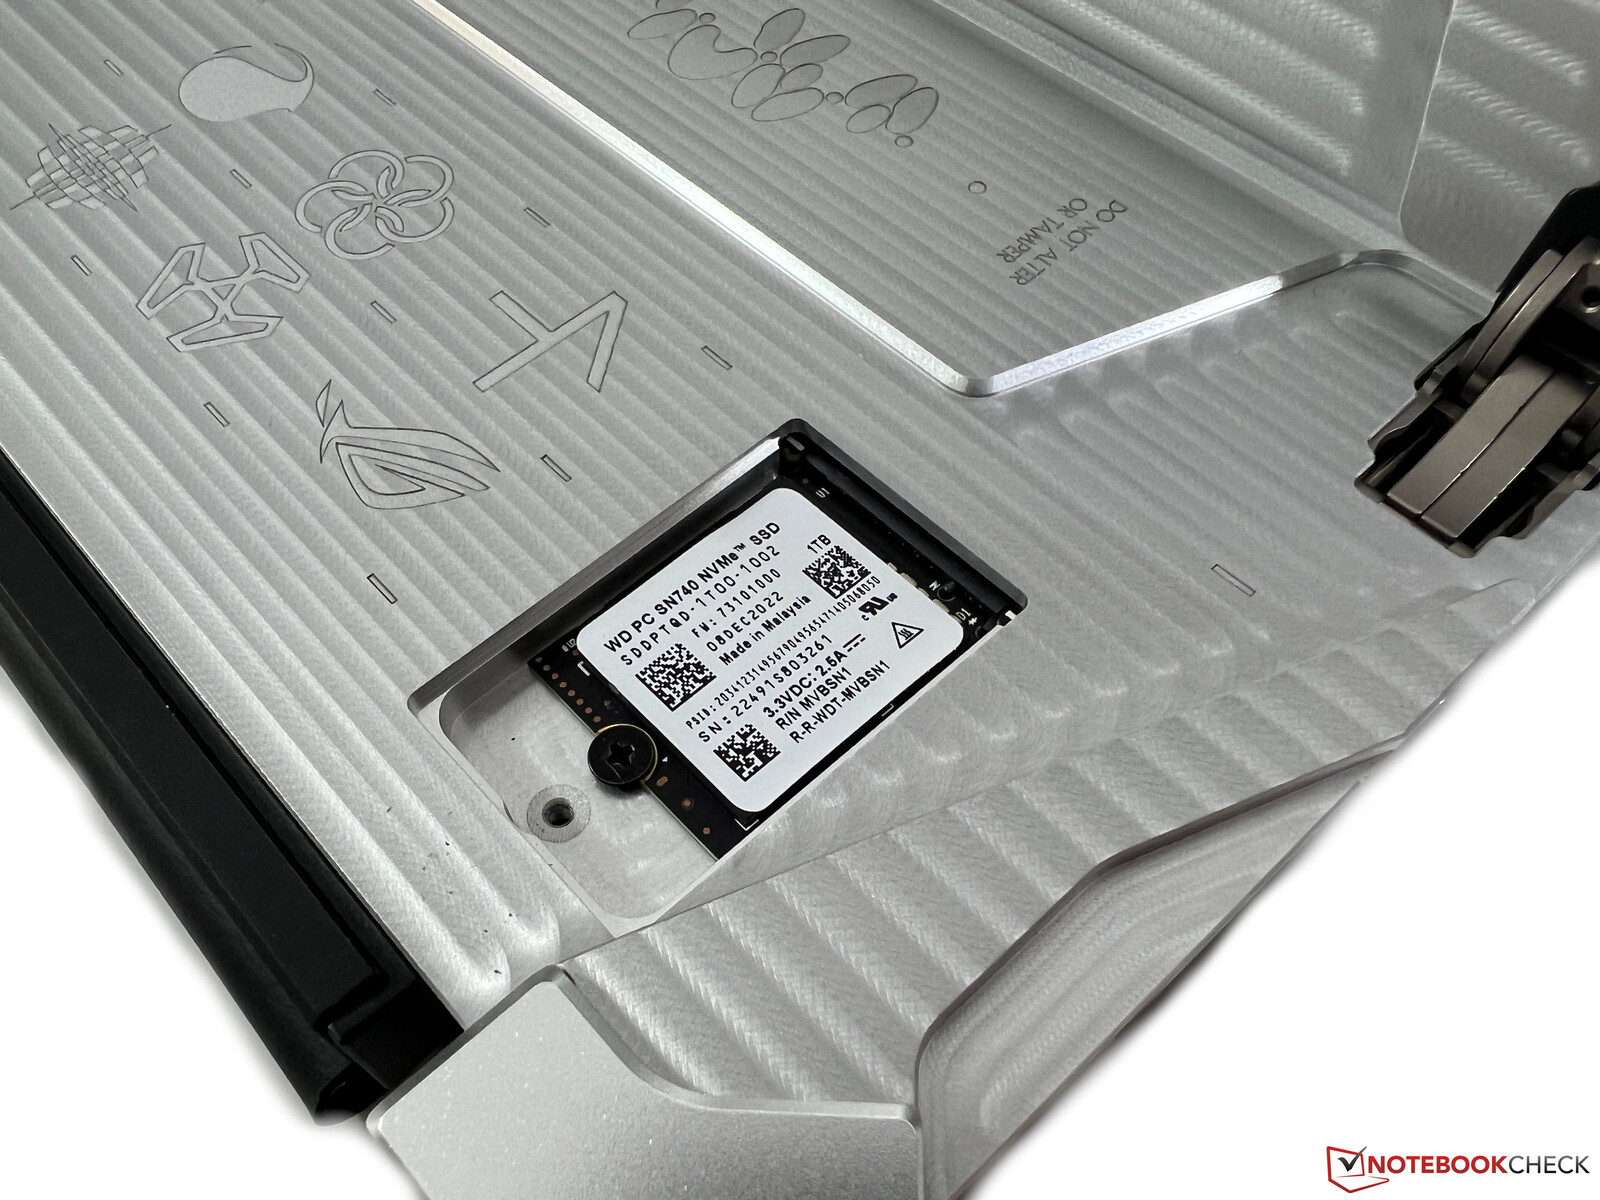
Asus utilizza un NVMe-SSD M.2-2230 estremamente compatto, accessibile e sostituibile tramite il portello di manutenzione sul retro del tablet. La nostra unità in prova è equipaggiata con la versione da 1 TB del Western Digital SN740, una moderna unità PCIe 4.0 con velocità di trasferimento massima di 5150 MB/s. Ciò significa che non è l'unità più veloce, ma raggiunge le prestazioni dichiarate ed è stabile anche con carichi di lavoro sostenuti. Nel complesso, un buon risultato per un'unità SSD compatta. Altri benchmark sulle unità SSD sono elencati qui.

* ... Meglio usare valori piccoli
Disk throttling: DiskSpd Read Loop, Queue Depth 8
Prestazioni della GPU
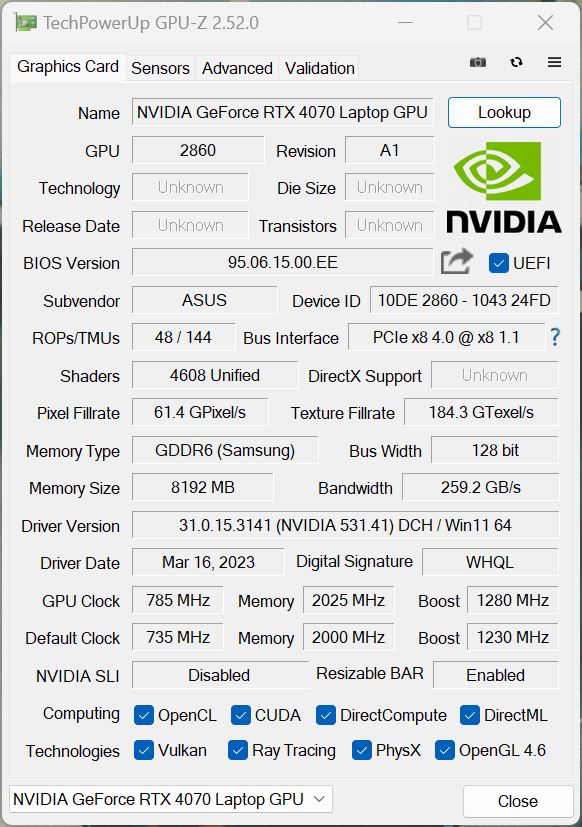
L'edizione ACRNM del ROG Flow Z13 è equipaggiata con il nuovoNvidia GeForce RTX 4070 Laptopmentre la versione normale è limitata allaRTX 4060 Laptop. Entrambi i modelli utilizzano però le varianti da 65W, il che significa che le prestazioni non sono paragonabili alle versioni che consumano 100-110 Watt che queste GPU possono consumare (non hanno bisogno di maggiore potenza durante il gioco, i numeri TGP più elevati sono irrilevanti per queste GPU). La GPU da sola ha un TGP di 50 Watt in combinazione con 15 Watt di Dynamic Boost del processore.
La RTX 4070 Laptop è ovviamente un enorme upgrade rispetto allaRTX 3050 Tidel predecessore e vediamo un vantaggio di quasi il 130 % per il nuovo modello nei benchmark sintetici. Il normale Flow Z13 con RTX 4060 Laptop, invece, è circa il 20% più lento. Rispetto alla versione più veloce del laptop RTX 4070, come quella utilizzata nel modelloGigabyte Aero 16il modello da 65W è circa il 20% più lento e il portatile RTX 4060 più veloce (MSI Katana 17) è anche un po' più veloce. Tuttavia, il portatile RTX 4070 da 65W è ancora superiore al vecchio modello RTX 3070 Ti.RTX 3070 Tidel Razer Blade 14 e anche dellaRTX 3060dell'Alienware x14.Alienware x14. Se si investe nella eGPU XG Mobile con laLaptop RTX 4090(TGP massimo di 150W), è possibile raddoppiare le prestazioni della GPU.
Le prestazioni complessive della GPU sono molto buone se si considera il fattore di forma ridotto e le prestazioni sono molto stabili anche con carichi di lavoro sostenuti (stress test diTime Spy: 96,3%). Il consumo di energia della GPU è però limitato a 35 Watt con l'alimentazione a batteria, il che comporta un deficit di prestazioni di circa il 25%. Altri benchmark della GPU sono disponibili nella nostra sezione tecnica.
| 3DMark 11 Performance | 29603 punti | |
| 3DMark Fire Strike Score | 20875 punti | |
| 3DMark Time Spy Score | 9917 punti | |
| 3DMark Steel Nomad Score | 2228 punti | |
| 3DMark Steel Nomad Light Score | 9949 punti | |
Aiuto | ||
| Blender / v3.3 Classroom OPTIX/RTX | |
| Asus ROG Flow Z13 GZ301V | |
| Asus ROG Flow Z13 ACRNM | |
| Media NVIDIA GeForce RTX 4070 Laptop GPU (18 - 30, n=68) | |
| Gigabyte AERO 16 OLED BSF | |
| Media della classe Gaming (9 - 32, n=106, ultimi 2 anni) | |
| Asus ROG Flow Z13 ACRNM | |
| Blender / v3.3 Classroom CUDA | |
| Asus ROG Flow Z13 GZ301V | |
| Asus ROG Flow Z13 ACRNM | |
| Media NVIDIA GeForce RTX 4070 Laptop GPU (32 - 50, n=67) | |
| Gigabyte AERO 16 OLED BSF | |
| Media della classe Gaming (15 - 228, n=106, ultimi 2 anni) | |
| Blender / v3.3 Classroom CPU | |
| Asus ROG Flow Z13 GZ301V | |
| Asus ROG Flow Z13 ACRNM | |
| Gigabyte AERO 16 OLED BSF | |
| Media NVIDIA GeForce RTX 4070 Laptop GPU (158 - 440, n=67) | |
| Media della classe Gaming (122 - 565, n=102, ultimi 2 anni) | |
* ... Meglio usare valori piccoli
Prestazioni di gioco
Anche le prestazioni di gioco sono molto buone ed è possibile giocare a titoli moderni con la risoluzione nativa QHD al massimo dei dettagli. Tuttavia, il Ray Tracing è spesso troppo impegnativo, quindi è necessario ricorrere all'upscaling. Il Flow Z13 con la versione da 65W della RTX 4070 Laptop rimane ancora una volta indietro rispetto alle versioni più potenti della RTX 4070 Laptop e della 4060 Laptop, ma rimane davanti alla RTX 3070 Ti. Ancora una volta bisogna considerare il fattore di forma compatto e le prestazioni di gioco sono stabili anche durante le sessioni di gioco più lunghe.
| Performance rating - Percent | |
| Media della classe Gaming | |
| Asus ROG Flow Z13 ACRNM | |
| Gigabyte AERO 16 OLED BSF | |
| MSI Katana 17 B13VFK | |
| Asus ROG Flow Z13 ACRNM | |
| Razer Blade 14 Ryzen 9 6900HX | |
| Alienware x14 i7 RTX 3060 -1! | |
| Asus ROG Zephyrus G14 GA402RK | |
| The Witcher 3 - 1920x1080 Ultra Graphics & Postprocessing (HBAO+) | |
| Media della classe Gaming (104.7 - 240, n=7, ultimi 2 anni) | |
| Asus ROG Flow Z13 ACRNM | |
| Gigabyte AERO 16 OLED BSF | |
| MSI Katana 17 B13VFK | |
| Razer Blade 14 Ryzen 9 6900HX | |
| Asus ROG Zephyrus G14 GA402RK | |
| Asus ROG Flow Z13 ACRNM | |
| Alienware x14 i7 RTX 3060 | |
| Alienware x14 i7 RTX 3060 | |
| GTA V - 1920x1080 Highest AA:4xMSAA + FX AF:16x | |
| Media della classe Gaming (48.3 - 186.9, n=94, ultimi 2 anni) | |
| Gigabyte AERO 16 OLED BSF | |
| MSI Katana 17 B13VFK | |
| Asus ROG Flow Z13 ACRNM | |
| Asus ROG Flow Z13 ACRNM | |
| Razer Blade 14 Ryzen 9 6900HX | |
| Alienware x14 i7 RTX 3060 | |
| Asus ROG Zephyrus G14 GA402RK | |
| Final Fantasy XV Benchmark - 1920x1080 High Quality | |
| Media della classe Gaming (41 - 215, n=95, ultimi 2 anni) | |
| Asus ROG Flow Z13 ACRNM | |
| Gigabyte AERO 16 OLED BSF | |
| Razer Blade 14 Ryzen 9 6900HX | |
| MSI Katana 17 B13VFK | |
| Asus ROG Flow Z13 ACRNM | |
| Asus ROG Zephyrus G14 GA402RK | |
| Alienware x14 i7 RTX 3060 | |
| Strange Brigade - 1920x1080 ultra AA:ultra AF:16 | |
| Media della classe Gaming (76.3 - 458, n=87, ultimi 2 anni) | |
| Asus ROG Flow Z13 ACRNM | |
| Gigabyte AERO 16 OLED BSF | |
| MSI Katana 17 B13VFK | |
| Razer Blade 14 Ryzen 9 6900HX | |
| Asus ROG Zephyrus G14 GA402RK | |
| Asus ROG Flow Z13 ACRNM | |
| Alienware x14 i7 RTX 3060 | |
| Dota 2 Reborn - 1920x1080 ultra (3/3) best looking | |
| MSI Katana 17 B13VFK | |
| Media della classe Gaming (84.8 - 248, n=107, ultimi 2 anni) | |
| Alienware x14 i7 RTX 3060 | |
| Gigabyte AERO 16 OLED BSF | |
| Asus ROG Flow Z13 ACRNM | |
| Asus ROG Flow Z13 ACRNM | |
| Razer Blade 14 Ryzen 9 6900HX | |
| Asus ROG Zephyrus G14 GA402RK | |
| X-Plane 11.11 - 1920x1080 high (fps_test=3) | |
| MSI Katana 17 B13VFK | |
| Gigabyte AERO 16 OLED BSF | |
| Asus ROG Flow Z13 ACRNM | |
| Asus ROG Flow Z13 ACRNM | |
| Media della classe Gaming (55.5 - 143.5, n=109, ultimi 2 anni) | |
| Razer Blade 14 Ryzen 9 6900HX | |
| Asus ROG Zephyrus G14 GA402RK | |
| Cyberpunk 2077 1.6 - 2560x1440 Ultra Preset | |
| Asus ROG Flow Z13 ACRNM | |
| Asus ROG Flow Z13 ACRNM | |
| Media NVIDIA GeForce RTX 4070 Laptop GPU (30 - 63.9, n=24) | |
| Gigabyte AERO 16 OLED BSF | |
| MSI Katana 17 B13VFK | |
| Razer Blade 14 Ryzen 9 6900HX | |
| Asus ROG Zephyrus G14 GA402RK | |
| Call of Duty Modern Warfare 2 2022 - 2560x1440 Extreme Quality Preset AA:T2X Filmic SM | |
| Asus ROG Flow Z13 ACRNM | |
| Media NVIDIA GeForce RTX 4070 Laptop GPU (59 - 77, n=9) | |
| Gigabyte AERO 16 OLED BSF | |
| Razer Blade 15 OLED (Early 2022) | |
| MSI Katana 17 B13VFK | |
| Asus ROG Flow Z13 ACRNM | |
| Far Cry 6 - 2560x1440 Ultra Graphics Quality + HD Textures AA:T | |
| Media della classe Gaming (n=1ultimi 2 anni) | |
| Asus ROG Flow Z13 ACRNM | |
| Media NVIDIA GeForce RTX 4070 Laptop GPU (70 - 91, n=11) | |
| Asus ROG Zephyrus G14 GA402RK | |
| Asus ROG Flow Z13 ACRNM | |
| MSI Katana 17 B13VFK | |
| GTA V - 2560x1440 Highest AA:4xMSAA + FX AF:16x | |
| Media della classe Gaming (36.9 - 183.9, n=72, ultimi 2 anni) | |
| Asus ROG Flow Z13 ACRNM | |
| Razer Blade 15 OLED (Early 2022) | |
| Razer Blade 15 OLED (Early 2022) | |
| Gigabyte AERO 16 OLED BSF | |
| Razer Blade 14 Ryzen 9 6900HX | |
| Media NVIDIA GeForce RTX 4070 Laptop GPU (36.9 - 102.2, n=51) | |
| MSI Katana 17 B13VFK | |
| Asus ROG Flow Z13 ACRNM | |
| Spider-Man Miles Morales - 2560x1440 Very High Preset AA:T | |
| Asus ROG Flow Z13 ACRNM | |
| Razer Blade 15 OLED (Early 2022) | |
| Media NVIDIA GeForce RTX 4070 Laptop GPU (53.1 - 86, n=3) | |
| Gigabyte AERO 16 OLED BSF | |
| MSI Katana 17 B13VFK | |
| Asus ROG Flow Z13 ACRNM | |
Witcher 3 FPS chart
| basso | medio | alto | ultra | QHD DLSS | QHD | 4K | |
|---|---|---|---|---|---|---|---|
| GTA V (2015) | 182.2 | 175.4 | 165.8 | 94.8 | 75.9 | ||
| The Witcher 3 (2015) | 83.2 | ||||||
| Dota 2 Reborn (2015) | 171 | 152.5 | 142.8 | 135 | 107 | ||
| Final Fantasy XV Benchmark (2018) | 128.2 | 93.3 | 71.6 | 40.3 | |||
| X-Plane 11.11 (2018) | 165.7 | 141.8 | 110.3 | 103.4 | |||
| Strange Brigade (2018) | 393 | 249 | 202 | 174.8 | 122.8 | ||
| Shadow of the Tomb Raider (2018) | 117 | 86 | |||||
| Assassin´s Creed Valhalla (2020) | 86 | 65 | |||||
| Far Cry 6 (2021) | 92 | 70 | |||||
| Cyberpunk 2077 1.6 (2022) | 71.62 | 53.88 | |||||
| Tiny Tina's Wonderlands (2022) | 79.7 | 57.61 | |||||
| F1 22 (2022) | 192.3 | 190 | 163 | 61.8 | 40.9 | ||
| Call of Duty Modern Warfare 2 2022 (2022) | 80 | 59 | |||||
| Spider-Man Miles Morales (2022) | 82.3 | 53.1 | |||||
| Baldur's Gate 3 (2023) | 86.1 | 62.3 | |||||
| Cyberpunk 2077 (2023) | 66.79 | 49.7 | 40.1 | ||||
| Horizon Forbidden West (2024) | 56.1 | 54.6 | 45.5 | ||||
| Ghost of Tsushima (2024) | 55.3 | 57 | 43.6 | ||||
| F1 24 (2024) | 58.4 | 57 | 36.8 | ||||
| Black Myth: Wukong (2024) | 25 | 28 | 18 | ||||
| Star Wars Outlaws (2024) | 35.4 | 35.3 | 25.9 | ||||
| God of War Ragnarök (2024) | 76.2 | 78 | 60.5 | ||||
| Call of Duty Black Ops 6 (2024) | 71 | 60 | 52 | ||||
| Indiana Jones and the Great Circle (2024) | 97.5 | 55 | 39.4 | ||||
| Monster Hunter Wilds (2025) | 39.7 | 35.69 | 29 |
Emissioni - Altoparlanti deboli
Rumore del sistema
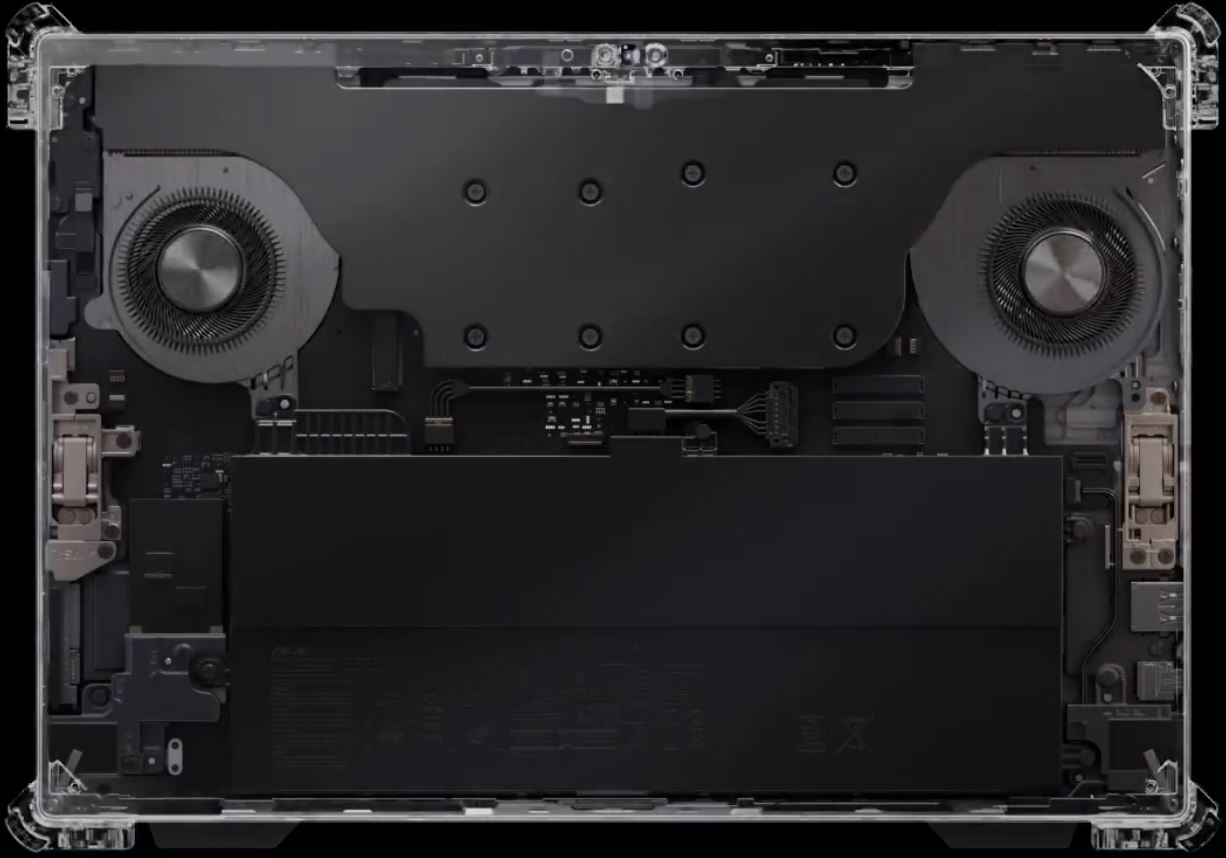
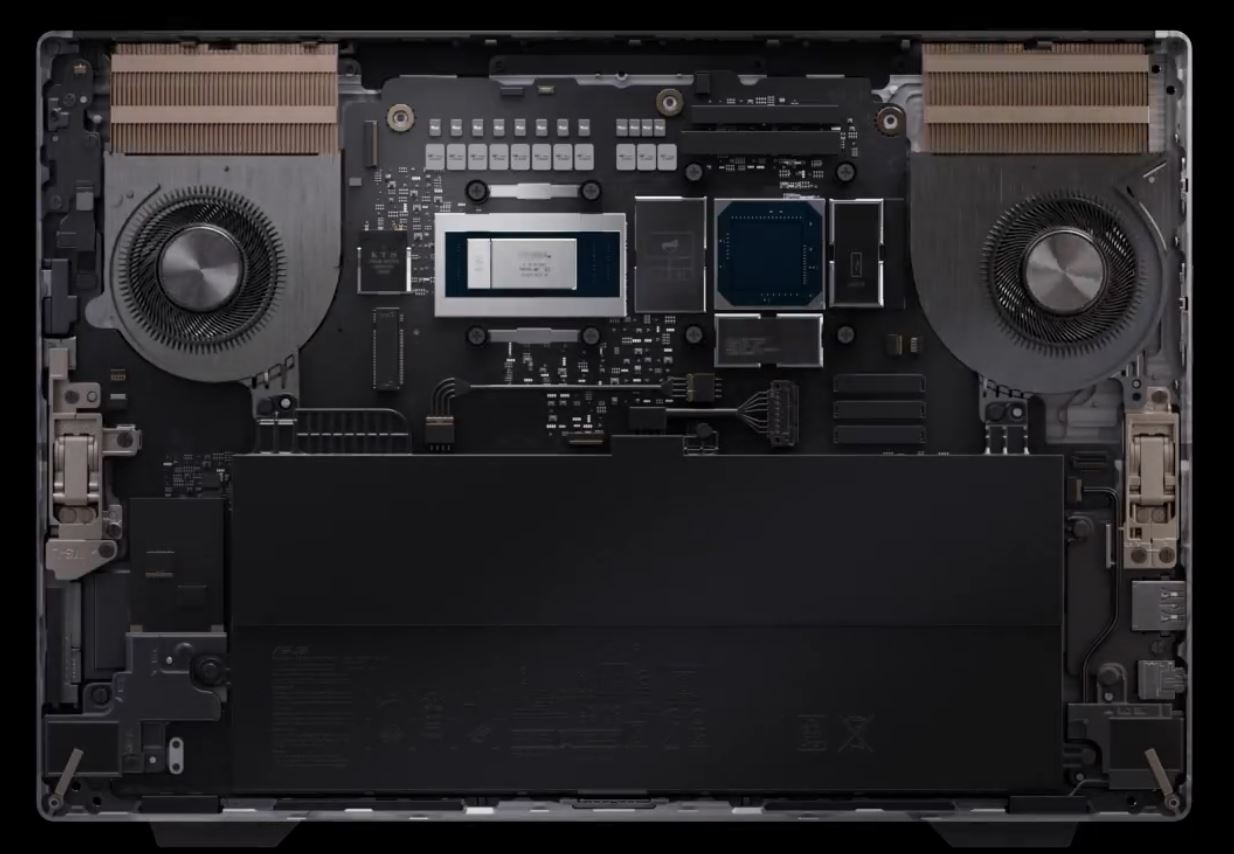
Asus utilizza due ventole, metallo liquido per una migliore dissipazione del calore e una camera di vapore per la soluzione di raffreddamento. La rumorosità delle ventole dipende principalmente dal profilo di potenza selezionato e non raccomandiamo la modalità Turbo per i carichi di lavoro quotidiani, poiché in questa modalità le ventole raggiungono immediatamente i 37 dB(A) quando iniziano a girare. La modalità Quiet è molto più adatta ed è molto più silenziosa per carichi di lavoro leggeri. Le ventole sono generalmente più rumorose sotto carico rispetto al vecchio ROG Flow Z13 con RT.ROG Flow Z13 con RTX 3050 Ti. Il mormorio della ventola in sé non è fastidioso, ma si nota una leggera vibrazione alle velocità più elevate. Abbiamo elencato i risultati della rumorosità con diverse modalità di alimentazione nella tabella sottostante:
| Silenzioso | Prestazioni | Turbo | |
|---|---|---|---|
| Carico medio | 31,3 dB(A) | 40,6 dB(A) | 41,3 dB(A) |
| Witcher 3 Impostazioni ultra | 35,7 dB(A) | 40,6 dB(A) | 44,7 dB(A) |
| Stress test | 36,5 dB(A) | 43,4 dB(A) | 46,9 dB(A) |
Abbiamo anche notato un rumore acuto quando il dispositivo è in standby e l'alimentatore è collegato. È silenzioso, ma decisamente evidente e fastidioso. Asus dovrebbe esaminare questo problema.
Rumorosità
| Idle |
| 24 / 24 / 36.5 dB(A) |
| Sotto carico |
| 41.3 / 46.9 dB(A) |
 | ||
30 dB silenzioso 40 dB(A) udibile 50 dB(A) rumoroso |
||
min: | ||
| Asus ROG Flow Z13 ACRNM GeForce RTX 4070 Laptop GPU, i9-13900H, WD PC SN740 SDDPTQD-1T00 | Asus ROG Flow Z13 GZ301ZE GeForce RTX 3050 Ti Laptop GPU, i9-12900H, Micron 2450 1TB MTFDKBK1T0TFK | Alienware x14 i7 RTX 3060 GeForce RTX 3060 Laptop GPU, i7-12700H, WDC PC SN810 1TB | Razer Blade 14 Ryzen 9 6900HX GeForce RTX 3070 Ti Laptop GPU, R9 6900HX, Samsung PM9A1 MZVL21T0HCLR | Asus ROG Zephyrus G14 GA402RK Radeon RX 6800S, R9 6900HS, Micron 2450 1TB MTFDKBK1T0TFK | |
|---|---|---|---|---|---|
| Noise | 7% | -2% | 11% | 1% | |
| off /ambiente * (dB) | 24 | 24.5 -2% | 24.7 -3% | 23.3 3% | 24 -0% |
| Idle Minimum * (dB) | 24 | 24.5 -2% | 24.7 -3% | 23.3 3% | 24 -0% |
| Idle Average * (dB) | 24 | 24.5 -2% | 24.7 -3% | 23.3 3% | 26 -8% |
| Idle Maximum * (dB) | 36.5 | 24.5 33% | 30.9 15% | 23.3 36% | 31 15% |
| Load Average * (dB) | 41.3 | 41 1% | 40 3% | 34.7 16% | 45 -9% |
| Witcher 3 ultra * (dB) | 44.7 | 41 8% | 51.5 -15% | 42.1 6% | 43 4% |
| Load Maximum * (dB) | 46.9 | 41 13% | 51.5 -10% | 42.1 10% | 45 4% |
* ... Meglio usare valori piccoli
Temperatura
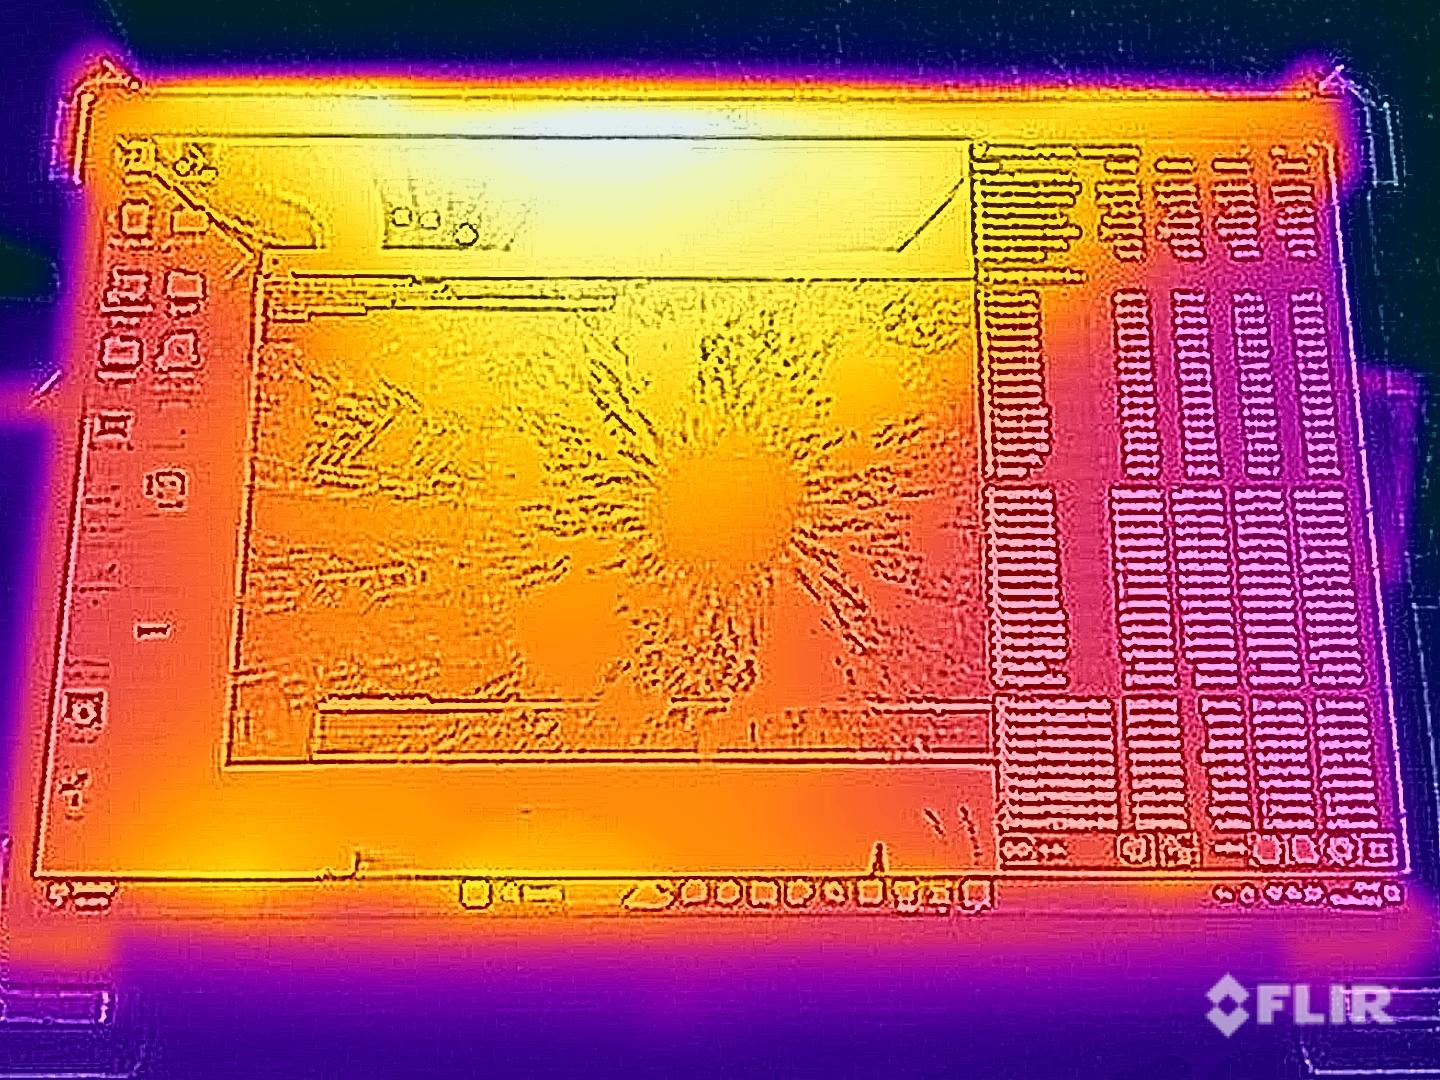
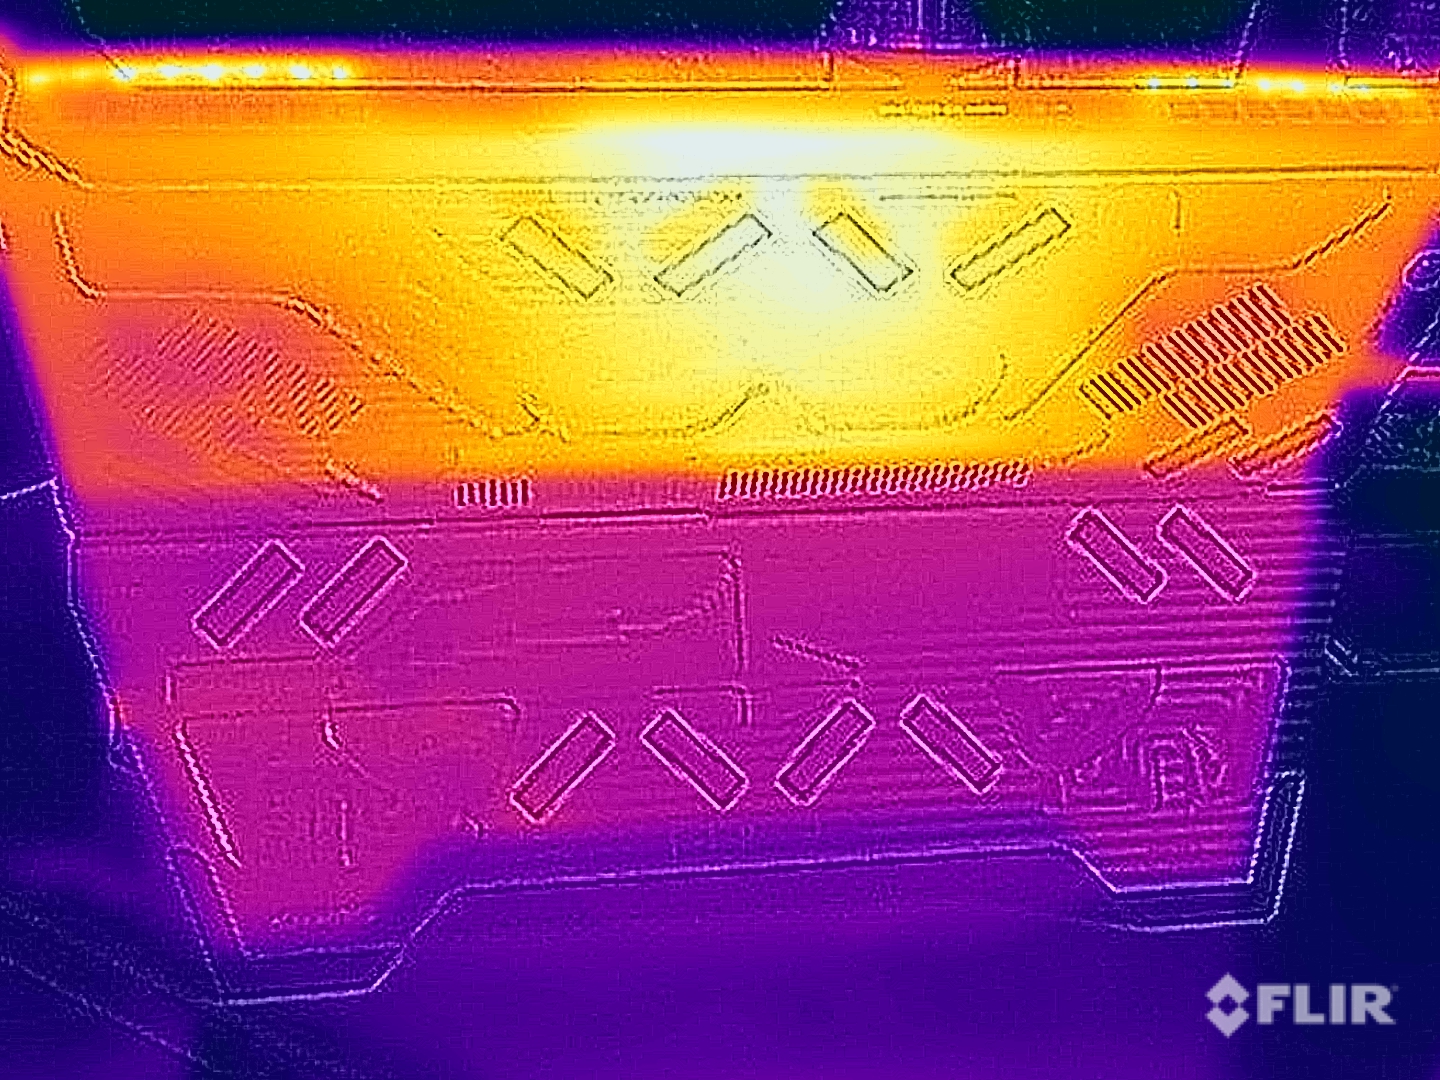
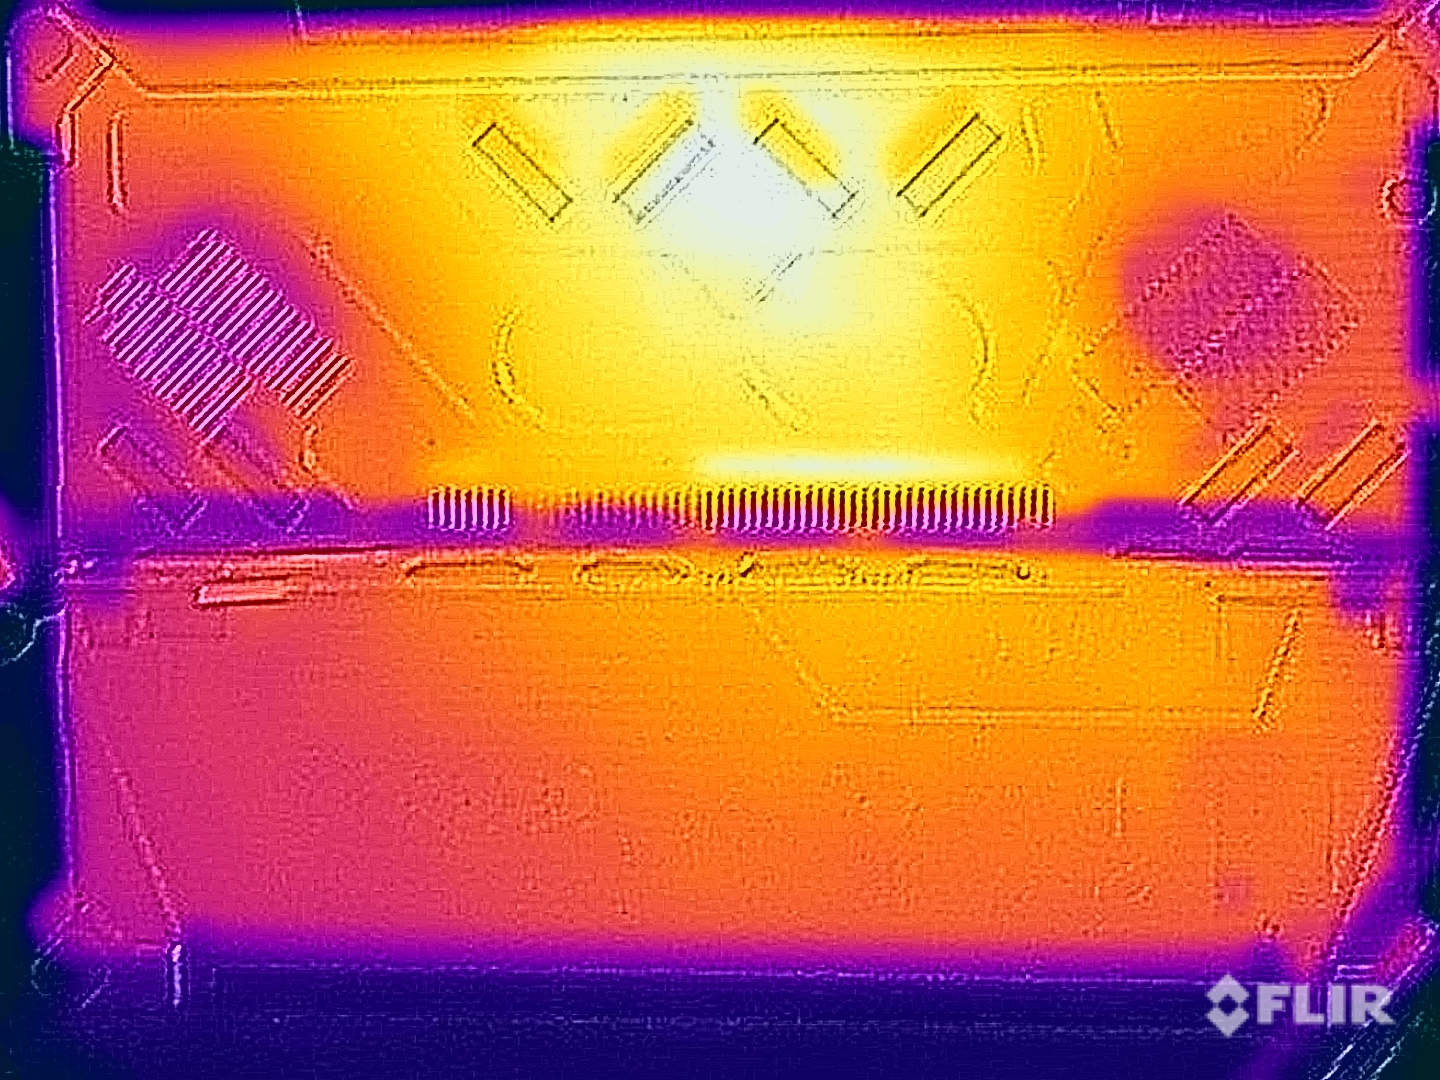
Asus gestisce molto bene le temperature di superficie del Flow Z13 ACRNM e lo chassis più ingombrante ha sicuramente un impatto positivo sui risultati. Il dispositivo è molto fresco in scenari di carico di lavoro leggero e si può ancora usare come tablet sotto carico massimo senza alcuna limitazione. Possiamo misurare fino a ~42 °C nella parte posteriore, che è un notevole miglioramento rispetto al predecessore con la RTX 3050 Ti (fino a 48 °C).
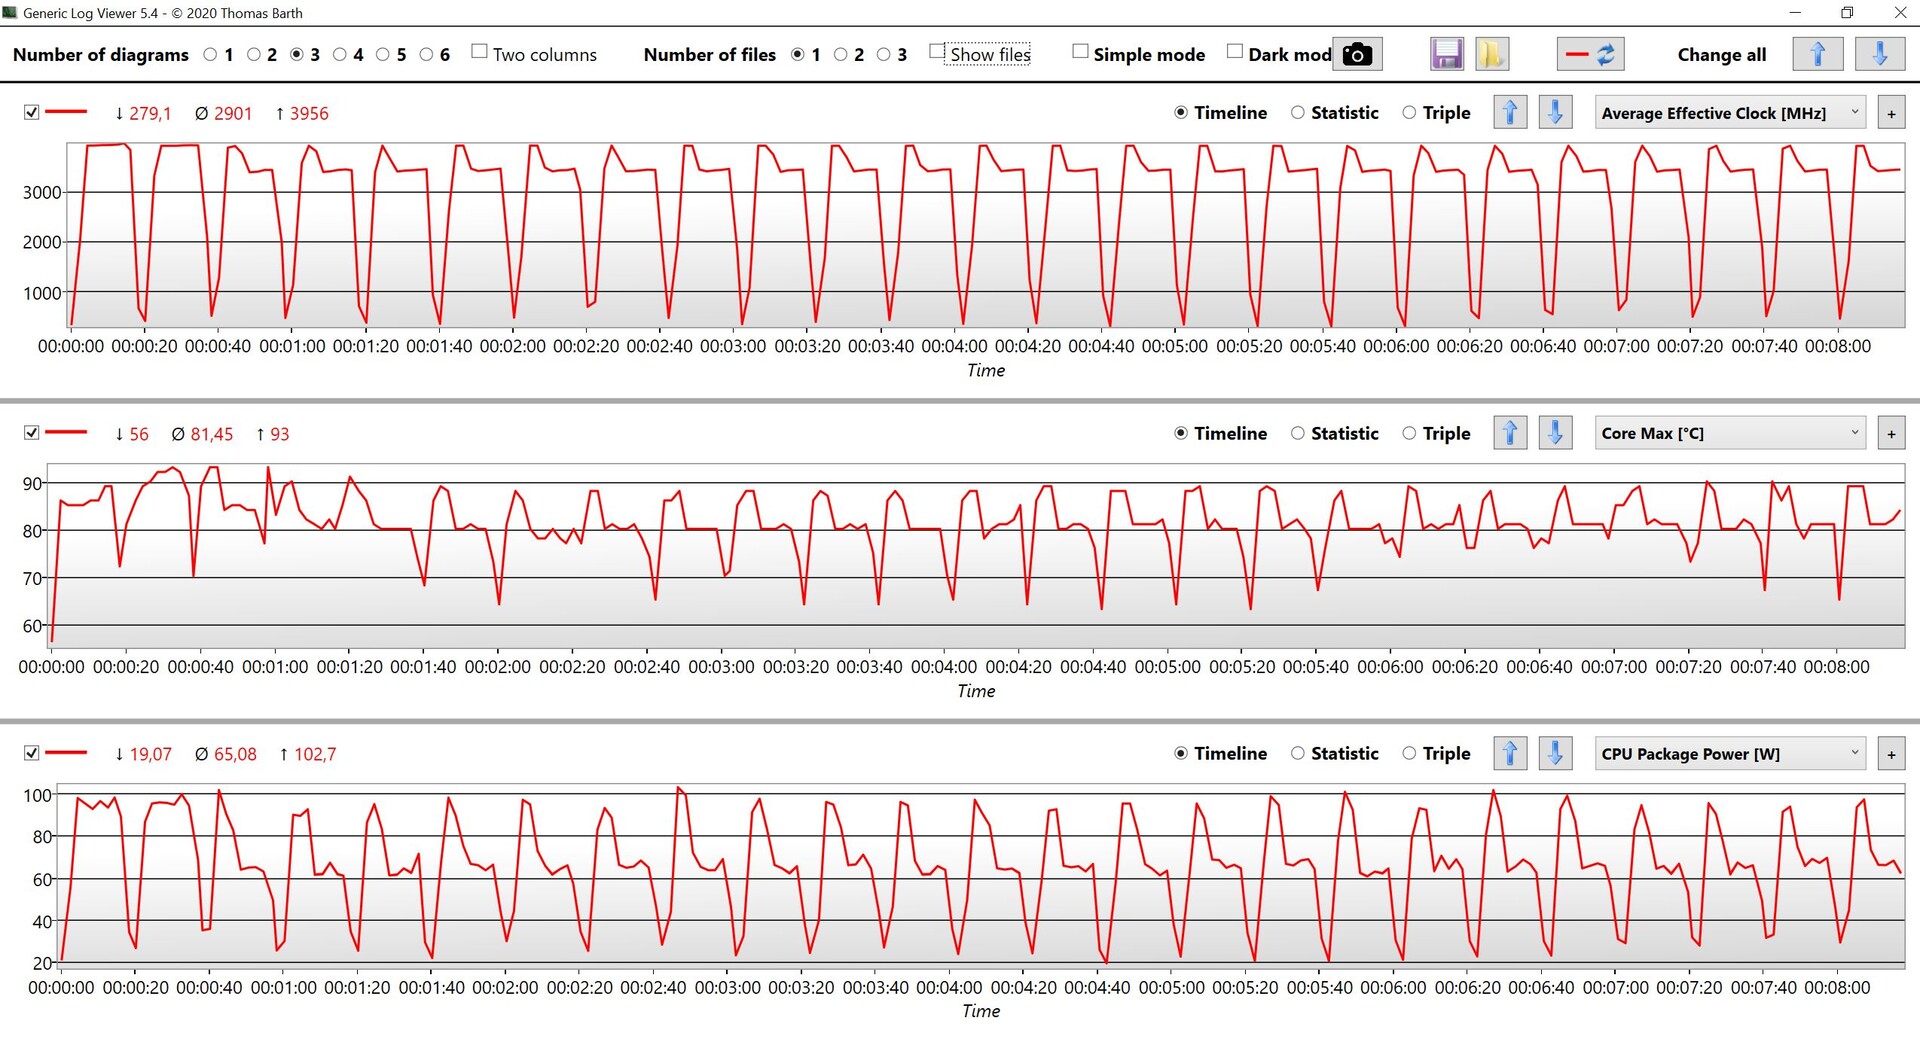
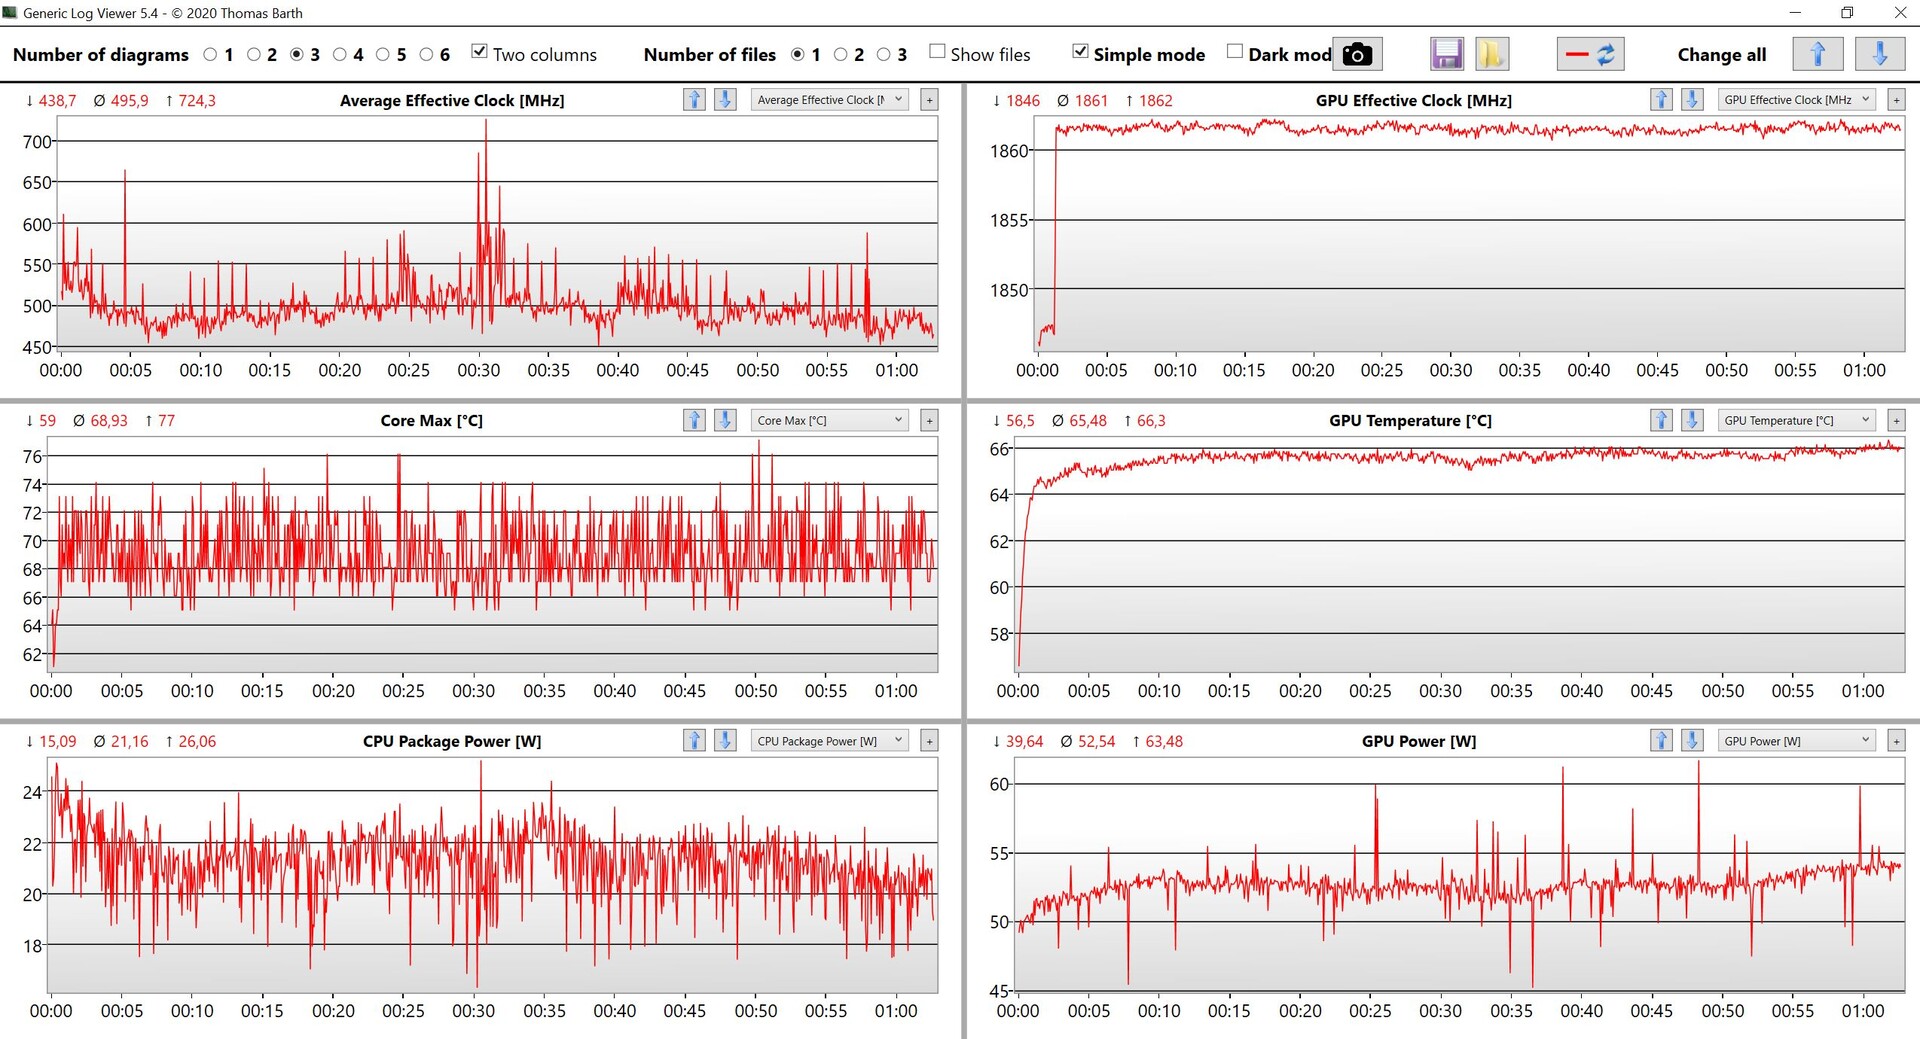
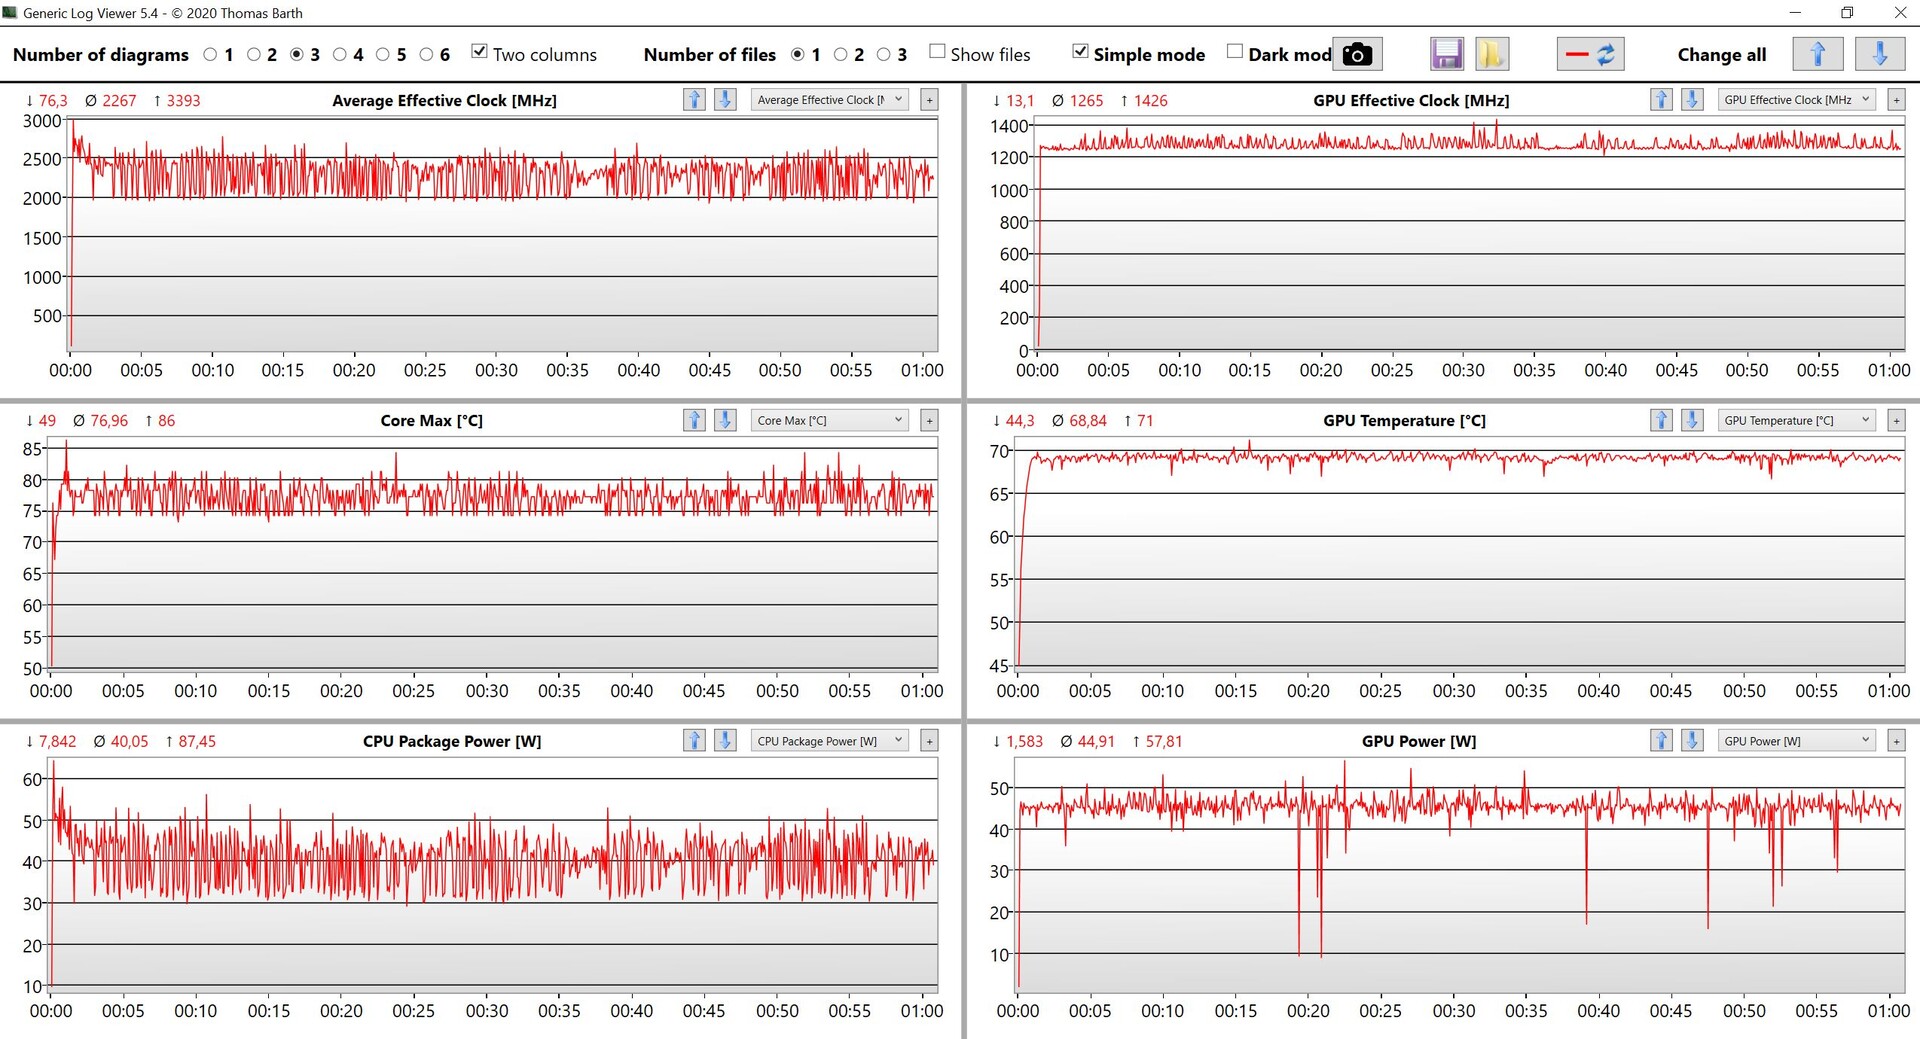
Anche le prestazioni durante il nostro stress test sono buone. La GPU mantiene 45 Watt e il consumo del processore oscilla tra 30-50 Watt. Questi valori scendono a 18W per la CPU e 26W per la GPU con l'alimentazione a batteria. Non abbiamo notato un calo delle prestazioni subito dopo lo stress test.
(±) La temperatura massima sul lato superiore è di 42.5 °C / 109 F, rispetto alla media di 40.4 °C / 105 F, che varia da 21.2 a 68.8 °C per questa classe Gaming.
(±) Il lato inferiore si riscalda fino ad un massimo di 42.6 °C / 109 F, rispetto alla media di 43.2 °C / 110 F
(+) In idle, la temperatura media del lato superiore è di 25.6 °C / 78 F, rispetto alla media deld ispositivo di 33.9 °C / 93 F.
(±) Riproducendo The Witcher 3, la temperatura media per il lato superiore e' di 37.4 °C / 99 F, rispetto alla media del dispositivo di 33.9 °C / 93 F.
(+) I poggiapolsi e il touchpad raggiungono la temperatura massima della pelle (35.2 °C / 95.4 F) e quindi non sono caldi.
(-) La temperatura media della zona del palmo della mano di dispositivi simili e'stata di 28.8 °C / 83.8 F (-6.4 °C / -11.6 F).
| Asus ROG Flow Z13 ACRNM Intel Core i9-13900H, NVIDIA GeForce RTX 4070 Laptop GPU | Asus ROG Flow Z13 GZ301ZE Intel Core i9-12900H, NVIDIA GeForce RTX 3050 Ti Laptop GPU | Alienware x14 i7 RTX 3060 Intel Core i7-12700H, NVIDIA GeForce RTX 3060 Laptop GPU | Razer Blade 14 Ryzen 9 6900HX AMD Ryzen 9 6900HX, NVIDIA GeForce RTX 3070 Ti Laptop GPU | Asus ROG Zephyrus G14 GA402RK AMD Ryzen 9 6900HS, AMD Radeon RX 6800S | |
|---|---|---|---|---|---|
| Heat | -12% | -8% | -21% | -24% | |
| Maximum Upper Side * (°C) | 42.5 | 45.3 -7% | 51.3 -21% | 40.6 4% | 55 -29% |
| Maximum Bottom * (°C) | 42.6 | 48.3 -13% | 44.4 -4% | 42.6 -0% | 55 -29% |
| Idle Upper Side * (°C) | 26.2 | 29.2 -11% | 27.2 -4% | 38 -45% | 30 -15% |
| Idle Bottom * (°C) | 26 | 30 -15% | 26.6 -2% | 37 -42% | 32 -23% |
* ... Meglio usare valori piccoli
Altoparlanti
I due altoparlanti stereo sono sicuramente un punto debole del convertibile, perché il suono è molto sottile e mancano i bassi. Né la musica, né i film, né i giochi sono davvero piacevoli e durante il gioco si sente anche il rumore della ventola, quindi consigliamo di utilizzare delle cuffie.
Asus ROG Flow Z13 ACRNM analisi audio
(±) | potenza degli altiparlanti media ma buona (80.3 dB)
Bassi 100 - 315 Hz
(-) | quasi nessun basso - in media 18.3% inferiori alla media
(±) | la linearità dei bassi è media (10.1% delta rispetto alla precedente frequenza)
Medi 400 - 2000 Hz
(+) | medi bilanciati - solo only 3.4% rispetto alla media
(+) | medi lineari (4.5% delta rispetto alla precedente frequenza)
Alti 2 - 16 kHz
(±) | alti elevati - circa 6.1% superiori alla media
(+) | alti lineari (3.5% delta rispetto alla precedente frequenza)
Nel complesso 100 - 16.000 Hz
(±) | la linearità complessiva del suono è media (19% di differenza rispetto alla media
Rispetto alla stessa classe
» 63% di tutti i dispositivi testati in questa classe è stato migliore, 8% simile, 28% peggiore
» Il migliore ha avuto un delta di 6%, medio di 18%, peggiore di 132%
Rispetto a tutti i dispositivi testati
» 45% di tutti i dispositivi testati in questa classe è stato migliore, 7% similare, 48% peggiore
» Il migliore ha avuto un delta di 4%, medio di 23%, peggiore di 134%
Apple MacBook Pro 16 2021 M1 Pro analisi audio
(+) | gli altoparlanti sono relativamente potenti (84.7 dB)
Bassi 100 - 315 Hz
(+) | bassi buoni - solo 3.8% dalla media
(+) | bassi in lineaa (5.2% delta rispetto alla precedente frequenza)
Medi 400 - 2000 Hz
(+) | medi bilanciati - solo only 1.3% rispetto alla media
(+) | medi lineari (2.1% delta rispetto alla precedente frequenza)
Alti 2 - 16 kHz
(+) | Alti bilanciati - appena 1.9% dalla media
(+) | alti lineari (2.7% delta rispetto alla precedente frequenza)
Nel complesso 100 - 16.000 Hz
(+) | suono nel complesso lineare (4.6% differenza dalla media)
Rispetto alla stessa classe
» 0% di tutti i dispositivi testati in questa classe è stato migliore, 0% simile, 100% peggiore
» Il migliore ha avuto un delta di 5%, medio di 17%, peggiore di 45%
Rispetto a tutti i dispositivi testati
» 0% di tutti i dispositivi testati in questa classe è stato migliore, 0% similare, 100% peggiore
» Il migliore ha avuto un delta di 4%, medio di 23%, peggiore di 134%
Gestione dell'energia - 165 Hz costi di funzionamento
Consumo di energia
Il consumo di energia al minimo è praticamente identico a quello del vecchioFlow Z13ma la nuova versione ha bisogno di molta più energia sotto carico. Misuriamo circa 100 Watt durante il gioco, ma il dispositivo ha bisogno di più dei 133,6 Watt massimi all'inizio dello stress test. Il sistema assorbe anche tra i 4 e i 18 Watt dalla batteria nei primi due secondi, ma poi il consumo si stabilizza a circa 115 Watt. Si tratta di uno scenario estremo e l'alimentatore da 130 W in dotazione è comunque sufficiente.
| Off / Standby | |
| Idle | |
| Sotto carico |
|
Leggenda:
min: | |
| Asus ROG Flow Z13 ACRNM i9-13900H, GeForce RTX 4070 Laptop GPU, WD PC SN740 SDDPTQD-1T00, IPS, 2560x1600, 13.4" | Asus ROG Flow Z13 GZ301ZE i9-12900H, GeForce RTX 3050 Ti Laptop GPU, Micron 2450 1TB MTFDKBK1T0TFK, IPS, 1920x1200, 13.4" | Alienware x14 i7 RTX 3060 i7-12700H, GeForce RTX 3060 Laptop GPU, WDC PC SN810 1TB, IPS, 1920x1080, 14" | Razer Blade 14 Ryzen 9 6900HX R9 6900HX, GeForce RTX 3070 Ti Laptop GPU, Samsung PM9A1 MZVL21T0HCLR, IPS, 2560x1440, 14" | Asus ROG Zephyrus G14 GA402RK R9 6900HS, Radeon RX 6800S, Micron 2450 1TB MTFDKBK1T0TFK, IPS-Level, 2560x1600, 14" | Media NVIDIA GeForce RTX 4070 Laptop GPU | Media della classe Gaming | |
|---|---|---|---|---|---|---|---|
| Power Consumption | 13% | 1% | -58% | -24% | -50% | -60% | |
| Idle Minimum * (Watt) | 8.9 | 8.8 1% | 7.9 11% | 10.2 -15% | 7 21% | 13.2 ? -48% | 13 ? -46% |
| Idle Average * (Watt) | 12.6 | 12.1 4% | 11.1 12% | 26 -106% | 14 -11% | 18.2 ? -44% | 19 ? -51% |
| Idle Maximum * (Watt) | 13 | 12.7 2% | 11.8 9% | 26.7 -105% | 22 -69% | 24.6 ? -89% | 24.6 ? -89% |
| Load Average * (Watt) | 92.5 | 72.3 22% | 107.4 -16% | 89.3 3% | 98 -6% | 97 ? -5% | 110.7 ? -20% |
| Witcher 3 ultra * (Watt) | 104.4 | 77.3 26% | 111 -6% | 158.7 -52% | 141 -35% | ||
| Load Maximum * (Watt) | 133.6 | 103.1 23% | 140.4 -5% | 227.5 -70% | 188 -41% | 221 ? -65% | 259 ? -94% |
* ... Meglio usare valori piccoli
Power consumption Witcher 3 / Stress test
Power consumption with external screen
Durata della batteria
La capacità della batteria è ancora di 56 Wh e abbiamo determinato un'autonomia di oltre 6,5 ore a 60 Hz (~5,5 ore a 165 Hz) per il nostro test Wi-Fi con una luminosità regolata di 150 nits (52% della luminosità massima dell'unità in prova). Alla massima luminosità, il nostro test Wi-Fi dura poco più di 5 ore a 60 Hz e poco più di 4 ore a 165 Hz. Questi risultati non sono ovviamente eccezionali, ma non sorprendono nemmeno considerando il potente hardware e la batteria relativamente piccola. Dovreste assolutamente prevedere delle soste di ricarica quando fate un viaggio più lungo. Una carica dal 5 al 60% richiede solo circa 30 minuti quando il dispositivo è acceso; una carica completa richiede circa 80 minuti.
| Asus ROG Flow Z13 ACRNM i9-13900H, GeForce RTX 4070 Laptop GPU, 56 Wh | Alienware x14 i7 RTX 3060 i7-12700H, GeForce RTX 3060 Laptop GPU, 80 Wh | Razer Blade 14 Ryzen 9 6900HX R9 6900HX, GeForce RTX 3070 Ti Laptop GPU, 62 Wh | Asus ROG Zephyrus G14 GA402RK R9 6900HS, Radeon RX 6800S, 76 Wh | Asus ROG Flow Z13 GZ301ZE i9-12900H, GeForce RTX 3050 Ti Laptop GPU, 56 Wh | Media della classe Gaming | |
|---|---|---|---|---|---|---|
| Autonomia della batteria | 35% | 61% | 22% | 11% | 45% | |
| H.264 (h) | 5.2 | 9.4 81% | 6 15% | 8.32 ? 60% | ||
| WiFi v1.3 (h) | 6.6 | 8.9 35% | 9.5 44% | 9.5 44% | 5.6 -15% | 7.11 ? 8% |
| Load (h) | 0.9 | 0.8 -11% | 1.6 78% | 0.9 0% | 1.2 33% | 1.502 ? 67% |
| Witcher 3 ultra (h) | 0.8 | 0.8 |
Pro
Contro
Verdetto - ROG Flow Z13 ACRNM convince per design e prestazioni
Il modello dello scorso annoROG Flow Z13era già un prodotto piuttosto unico con il Core i9-12900H e la RTX 3050 Ti di GeForce, ma il modello 2023 rappresenta un enorme miglioramento, soprattutto in termini di prestazioni della GPU. La nostra edizione speciale ACRNM è equipaggiata con la nuovaGeForce RTX 4070 Laptopche non ha problemi con i giochi moderni alla risoluzione QHD nativa. Il Core i9-13900H è ancora una volta un processore molto potente, ma l'aspetto più sorprendente dell'edizione speciale è ovviamente il design dello chassis con la copertura posteriore lavorata a CNC e il materiale aggiuntivo negli angoli, compreso il punto di fissaggio per le cinghie incluse. Il design ci piace e il convertibile è estremamente robusto, quasi come un dispositivo resistente, il che si riflette anche nel peso elevato di 1,7 kg (compreso il copritastiera).
Anche il copritastiera dell'edizione ACRNM si differenzia dal modello normaleROG Flow Z13e si hanno addirittura due modelli diversi. Bisogna però distinguere tra due aspetti. Entrambi i copritastiera sono un po' più spessi della versione normale, il che è positivo per la stabilità e finora non abbiamo mai recensito una tastiera staccabile con un'esperienza di digitazione così buona. Le scritte e il contrasto (o la loro mancanza), invece, sono una catastrofe e il design era chiaramente più importante dell'ergonomia. Questo sarà un problema se non si digita alla cieca.
L'edizione ACRNM dell'Asus ROG Flow Z13 è un convertibile da gioco molto potente e dal design accattivante. Grazie alla nuova RTX 4070 Laptop è in grado di gestire anche i giochi moderni sullo schermo WQHD.
Le prestazioni delRTX 4070 Laptopè buona, ma bisogna tenere presente che si tratta solo della versione da 65W. I portatili da gioco più grandi con RTX 4070 Laptop e persino RTX 4060 Laptop offriranno maggiori prestazioni, ma le prestazioni complessive sono comunque eccellenti considerando le dimensioni compatte del Flow Z13 e c'è anche un enorme miglioramento rispetto al modello precedente. Le ventole sono molto udibili in modalità Turbo e ci sono leggere vibrazioni. Abbiamo anche notato un suono acuto durante lo standby.
Il display ha ora una risoluzione WQHD con 165 Hz e viene utilizzato sia per l'ACRNM che per la versione normale del Flow Z13. Nel complesso, lo schermo IPS lascia una buona impressione per i giochi grazie all'alta frequenza e ai tempi di risposta rapidi. È anche in grado di gestire l'editing delle immagini e non abbiamo rilevato alcuno sfarfallio PWM.
Il ROG Flow Z13 normale è purtroppo disponibile solo con le RTX 4060 Laptop (o 4050 Laptop e RTX 2050 Laptop, rispettivamente), ma tutte sono anche versioni da 65W, quindi questa limitazione non è necessaria. Il design del modello normale è molto più conservativo e più interessante per alcuni utenti. In questo momento stiamo recensendo anche la versione normale con RTX 4060 Laptop e la recensione sarà pubblicata a breve. Il nostro ROG Flow Z13 perfetto utilizzerebbe lo chassis normale con il laptop RTX 4070 e la copertura della tastiera più spessa dell'edizione ACRNM, ma senza le scritte inutili. Il ROG Flow Z13 non ha ancora una concorrenza nel mercato dei convertibili e per ottenere un livello di prestazioni paragonabile è necessario acquistare un notebook da gioco da 14 pollici.
Prezzo e disponibilità
Il ROG Flow Z13 ACRNM può essere ordinato su nell'Asus eStore al prezzo di 2499 dollari.
Asus ROG Flow Z13 ACRNM
- 04/09/2023 v7 (old)
Andreas Osthoff
Transparency
La selezione dei dispositivi da recensire viene effettuata dalla nostra redazione. Il campione di prova è stato fornito all'autore come prestito dal produttore o dal rivenditore ai fini di questa recensione. L'istituto di credito non ha avuto alcuna influenza su questa recensione, né il produttore ne ha ricevuto una copia prima della pubblicazione. Non vi era alcun obbligo di pubblicare questa recensione. In quanto società mediatica indipendente, Notebookcheck non è soggetta all'autorità di produttori, rivenditori o editori.
Ecco come Notebookcheck esegue i test
Ogni anno, Notebookcheck esamina in modo indipendente centinaia di laptop e smartphone utilizzando procedure standardizzate per garantire che tutti i risultati siano comparabili. Da circa 20 anni sviluppiamo continuamente i nostri metodi di prova e nel frattempo stabiliamo gli standard di settore. Nei nostri laboratori di prova, tecnici ed editori esperti utilizzano apparecchiature di misurazione di alta qualità. Questi test comportano un processo di validazione in più fasi. Il nostro complesso sistema di valutazione si basa su centinaia di misurazioni e parametri di riferimento ben fondati, che mantengono l'obiettività.Price comparison

