Recensione del laptop Asus VivoBook 14X OLED K3405: Laptop multimediale senza fronzoli con Core i5-13500H e vibrante display OLED da 2,8K

Asus ha lanciato quest'anno diversi VivoBook aggiornati. Mentre il nuovo VivoBook 15X offre le opzioni Intel Raptor Lake-P e AMD Ryzen 7030U Barcelo-R, il VivoBook Pro 16Xè in grado di aumentare il livello di prestazioni fino al Core i9-13980HX. Ora ci concentriamo sul VivoBook 14X, dotato di CPU Raptor Lake-H45.
Il VivoBook 14X ci offre il primo assaggio del processoreIntel Core i5-13500Hinsieme a una CPU Nvidia RTX 30.GPU per computer portatili Nvidia GeForce RTX 3050. Gli OLED sono ormai diventati più o meno la colonna portante dei VivoBook, ad esclusione di alcune SKU di fascia bassa. In questo caso, il VivoBook 14X vanta un display OLED da 14 pollici 2,8K con una frequenza di aggiornamento di 90 Hz.
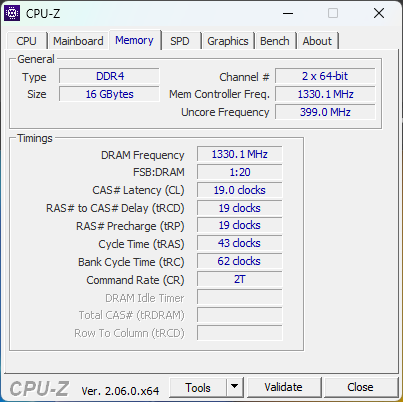
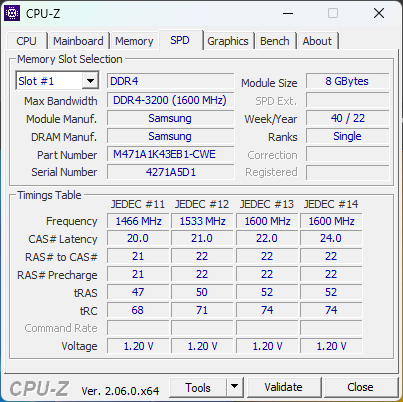
Asus equipaggia il portatile con 16 GB di RAM DDR4-3200, Wi-Fi 6E e un'unità SSD NVMe da 512 GB. Questa configurazione costa ₹96.990 (1.172 dollari).
Potenziali concorrenti a confronto
Punteggio | Data | Modello | Peso | Altezza | Dimensione | Risoluzione | Prezzo |
|---|---|---|---|---|---|---|---|
| 85.6 % v7 (old) | 08/2023 | Asus VivoBook 14X K3405 i5-13500H, GeForce RTX 3050 4GB Laptop GPU | 1.4 kg | 18.9 mm | 14.00" | 2880x1800 | |
| 86.3 % v7 (old) | 07/2023 | Acer Swift X SFX14-71G i7-13700H, GeForce RTX 4050 Laptop GPU | 1.5 kg | 17.9 mm | 14.50" | 2880x1800 | |
| 85.4 % v7 (old) | 07/2023 | MSI Stealth 14 Studio A13V i7-13700H, GeForce RTX 4050 Laptop GPU | 1.7 kg | 19 mm | 14.00" | 2560x1600 | |
| 89.4 % v7 (old) | 05/2023 | Gigabyte Aero 14 OLED BMF i7-13700H, GeForce RTX 4050 Laptop GPU | 1.4 kg | 17 mm | 14.00" | 2880x1800 | |
| 89.2 % v7 (old) | 04/2023 | Lenovo Slim Pro 7 14ARP8 R7 7735HS, GeForce RTX 3050 6GB Laptop GPU | 1.6 kg | 15.6 mm | 14.50" | 2560x1600 | |
| 88.8 % v7 (old) | 10/2022 | Schenker Vision 14 2022 RTX 3050 Ti i7-12700H, GeForce RTX 3050 Ti Laptop GPU | 1.3 kg | 16.6 mm | 14.00" | 2880x1800 |
Telaio: Leggero ma utilitario
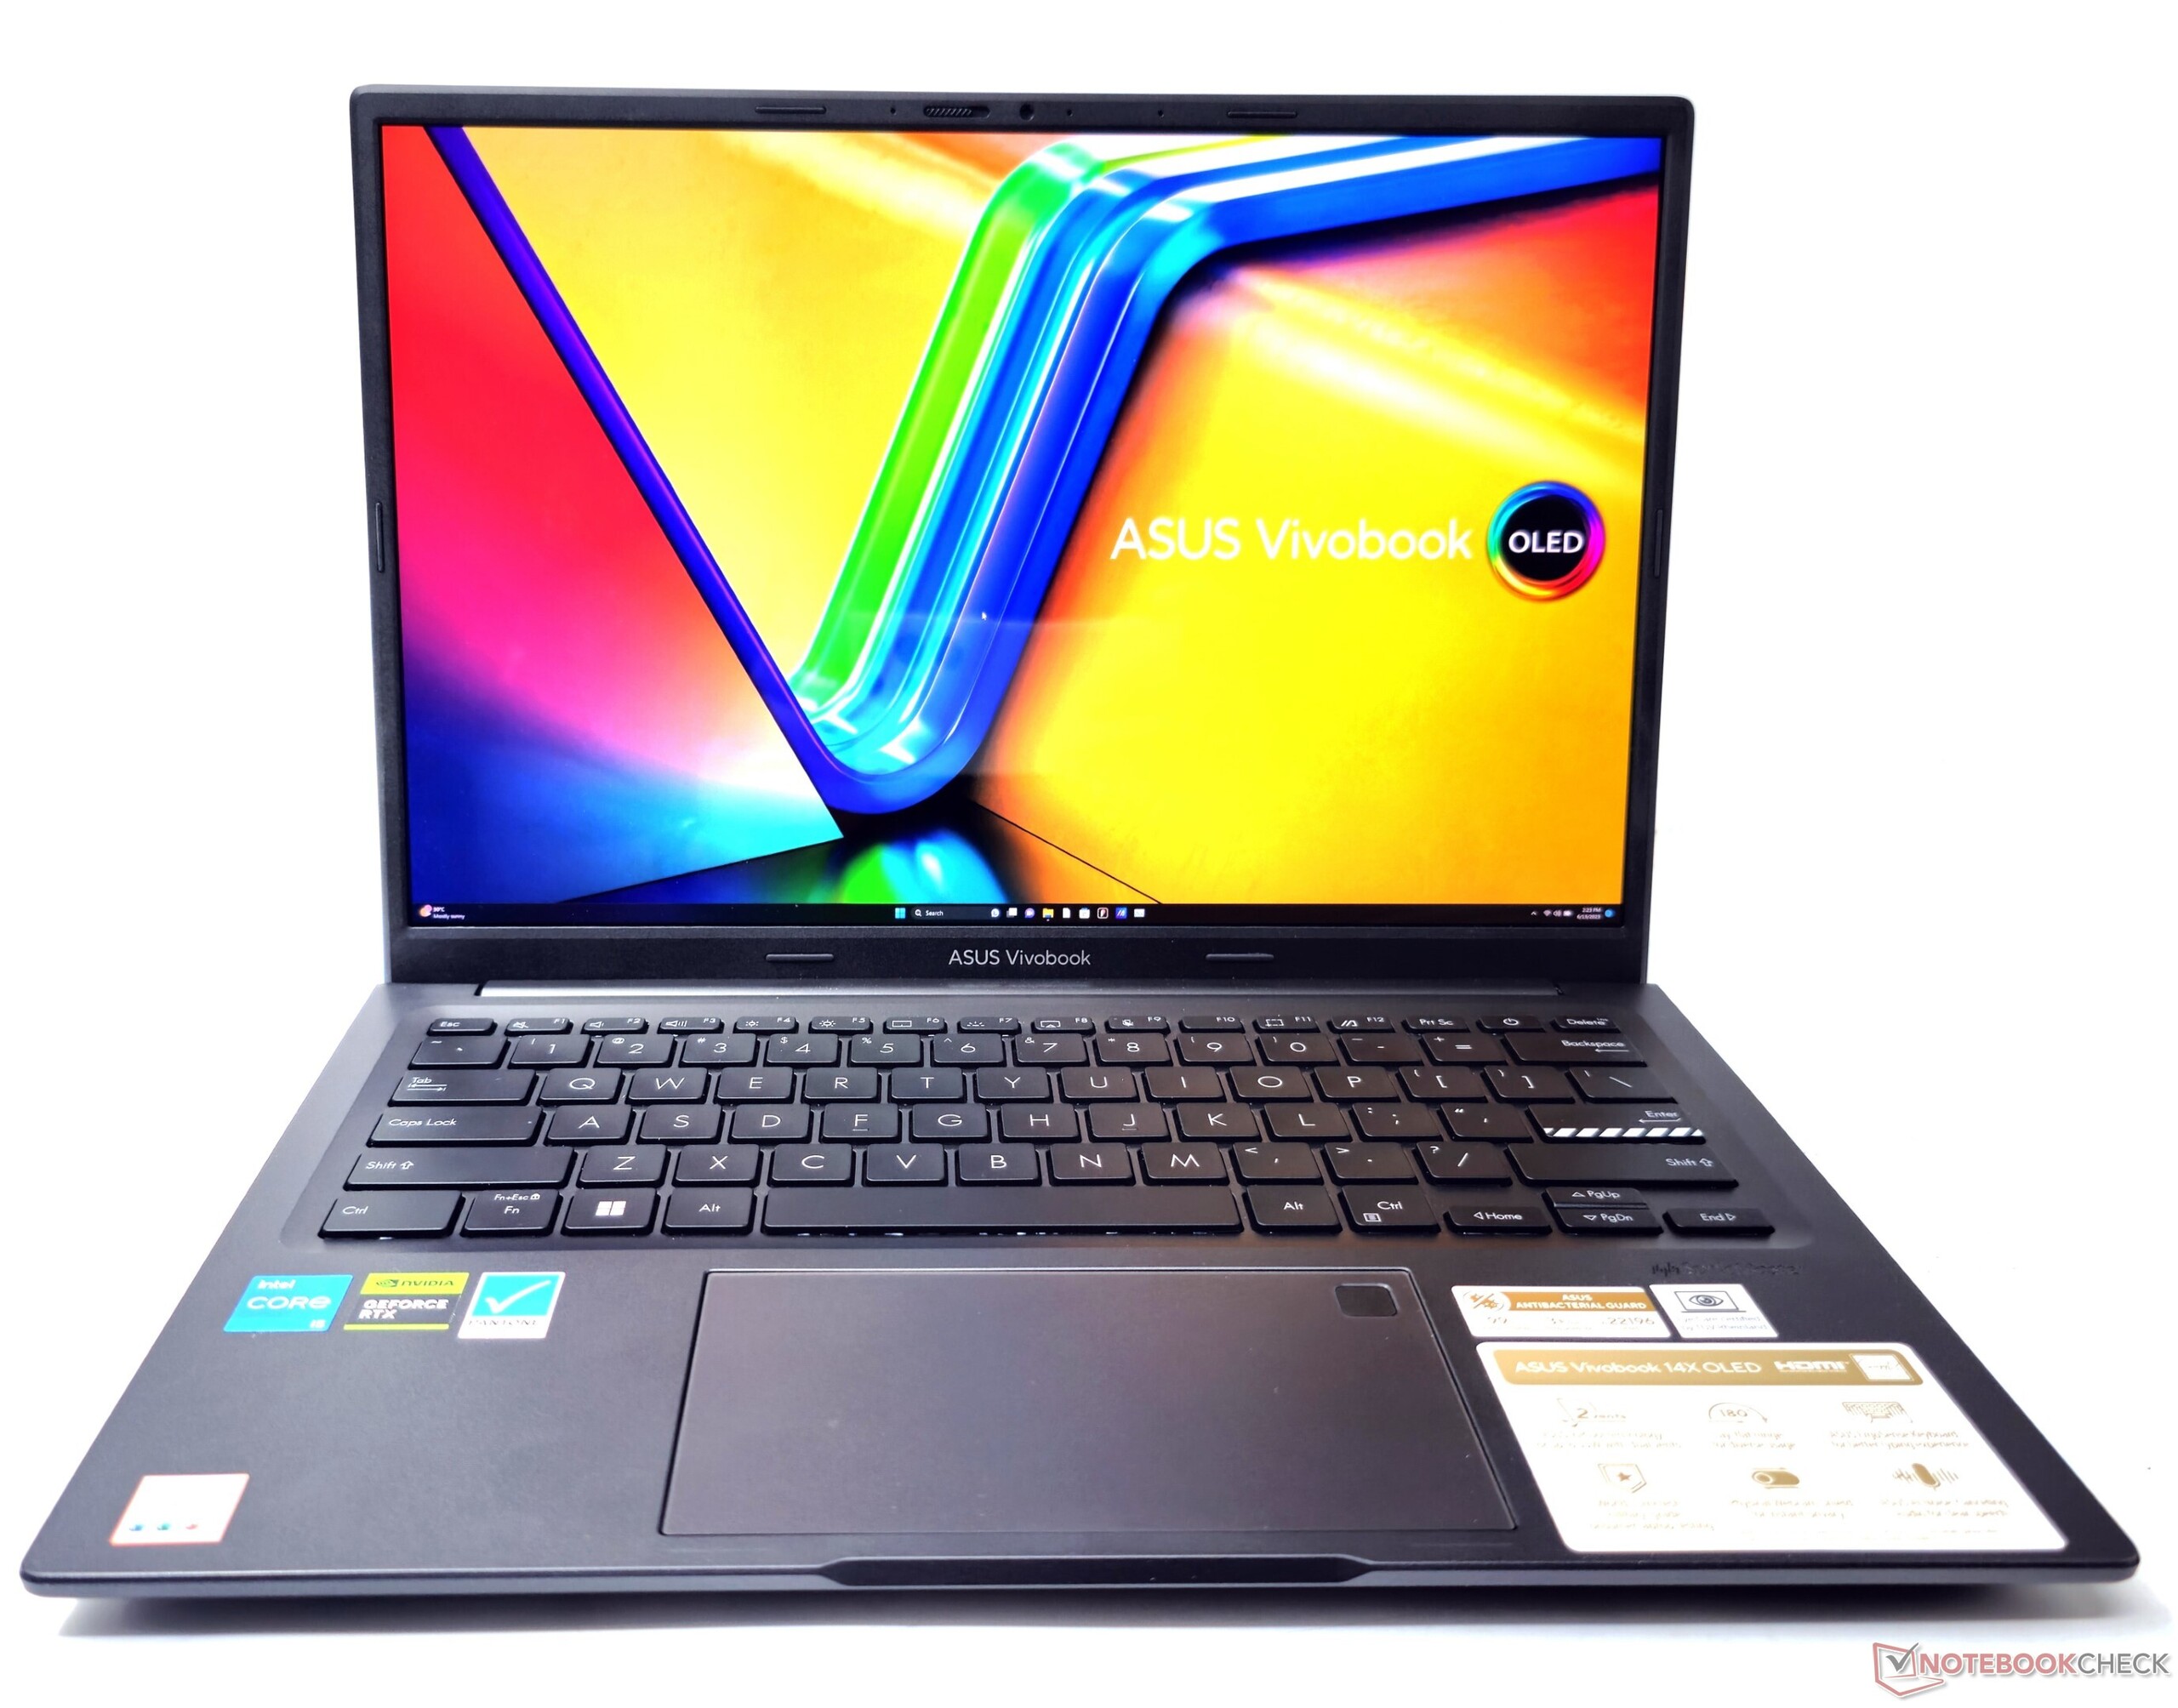
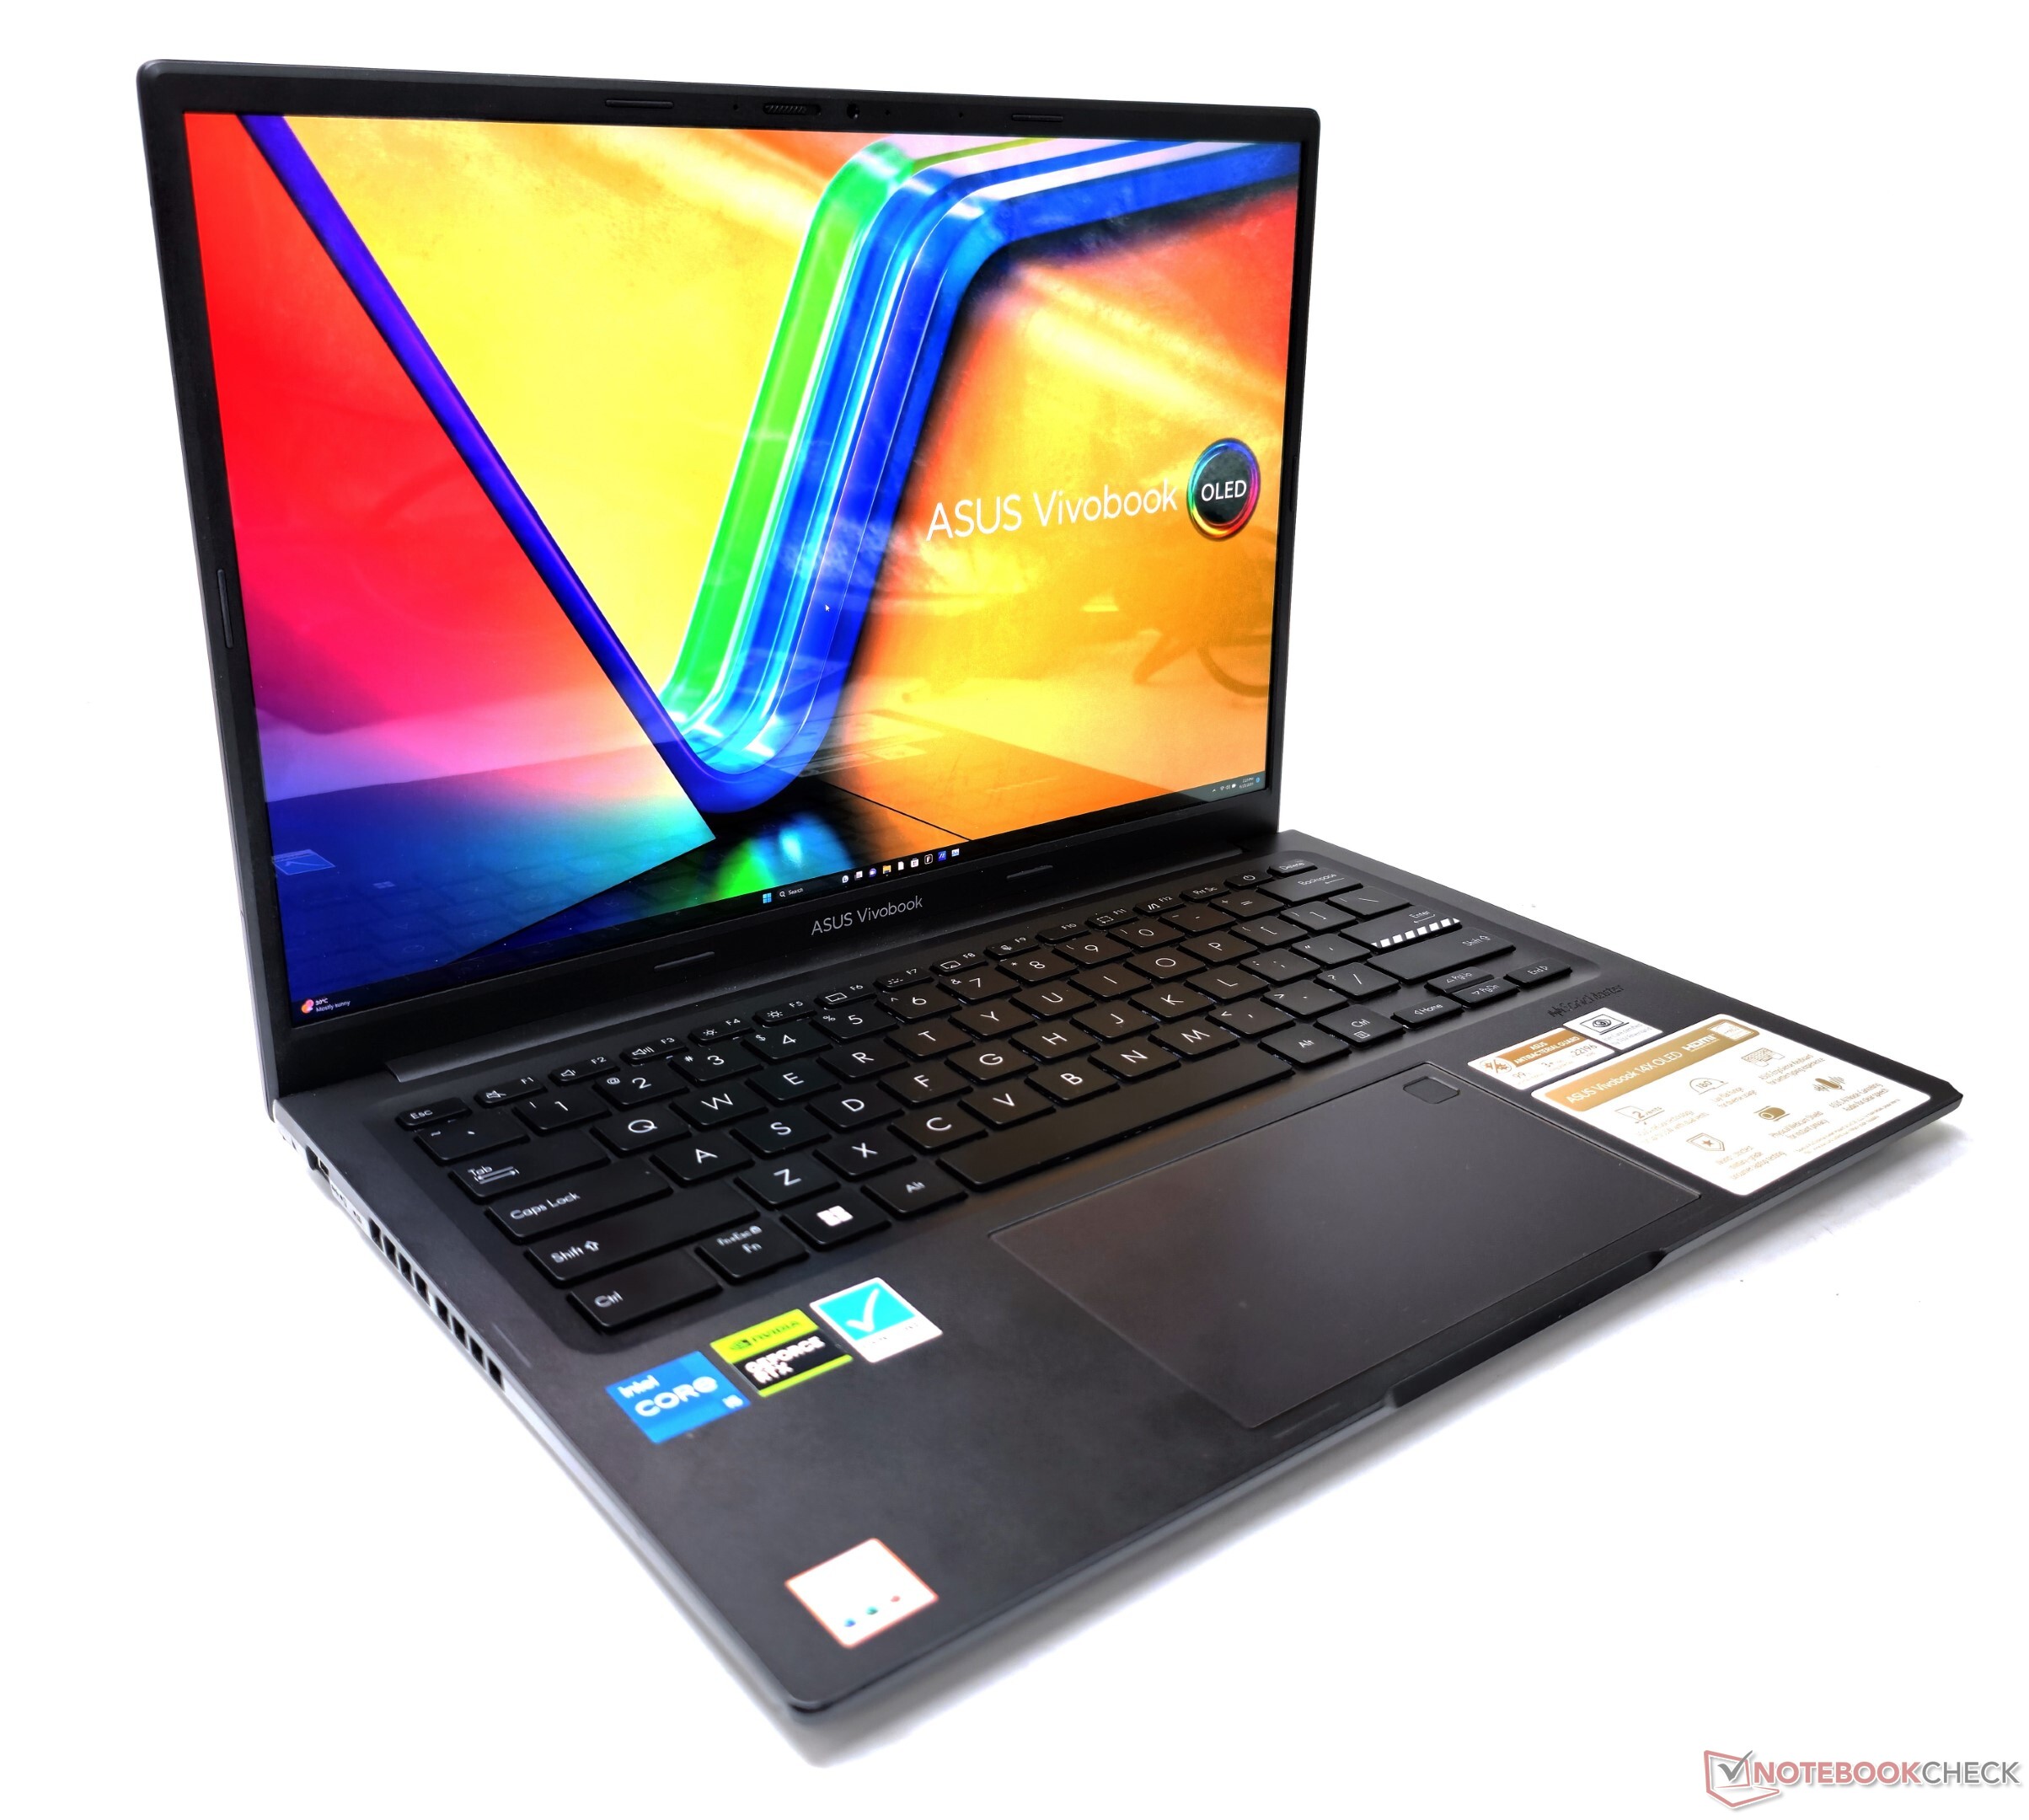
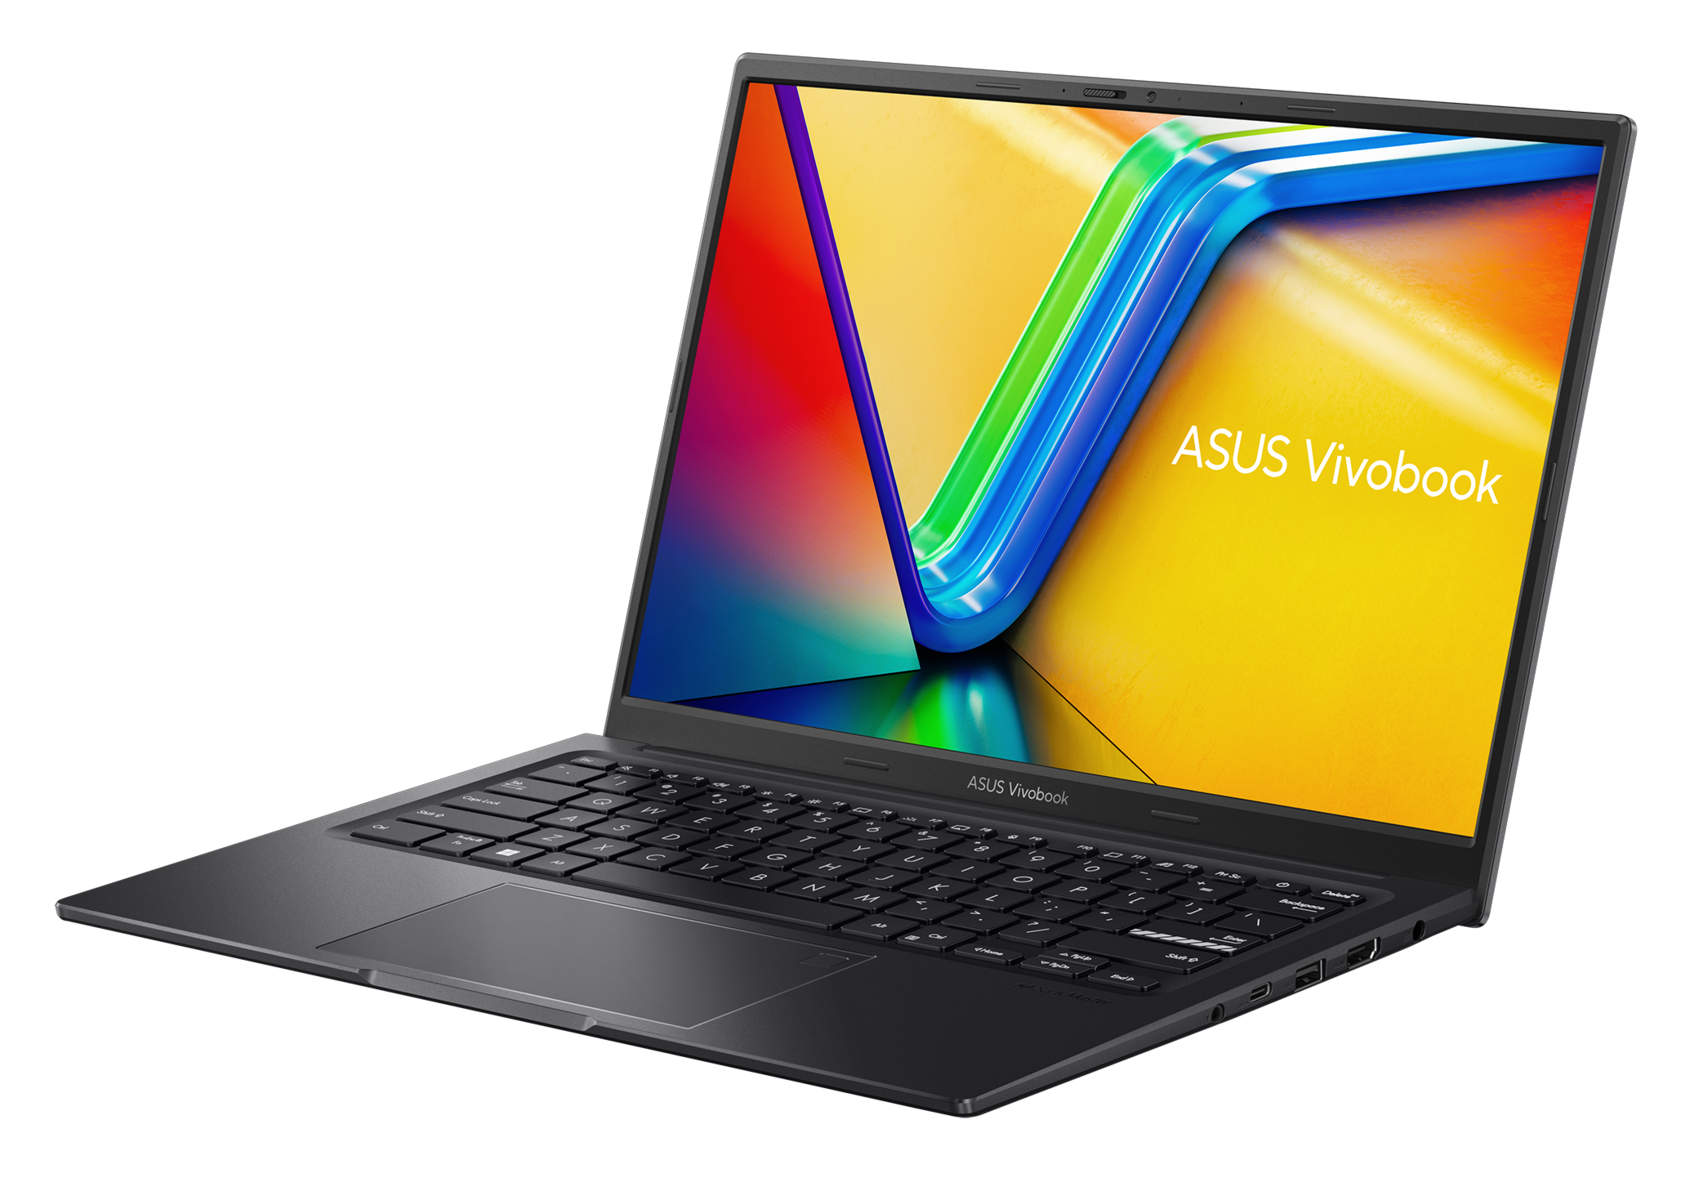
Come il VivoBook 15X, Asus offre il VivoBook 14X in due opzioni di colore: Cool Silver e Indie Black (la nostra variante). Come di solito accade con i VivoBook, lo chassis di 1,4 kg ha una struttura in plastica, mentre il coperchio metallico presenta il caratteristico logo VivoBook.
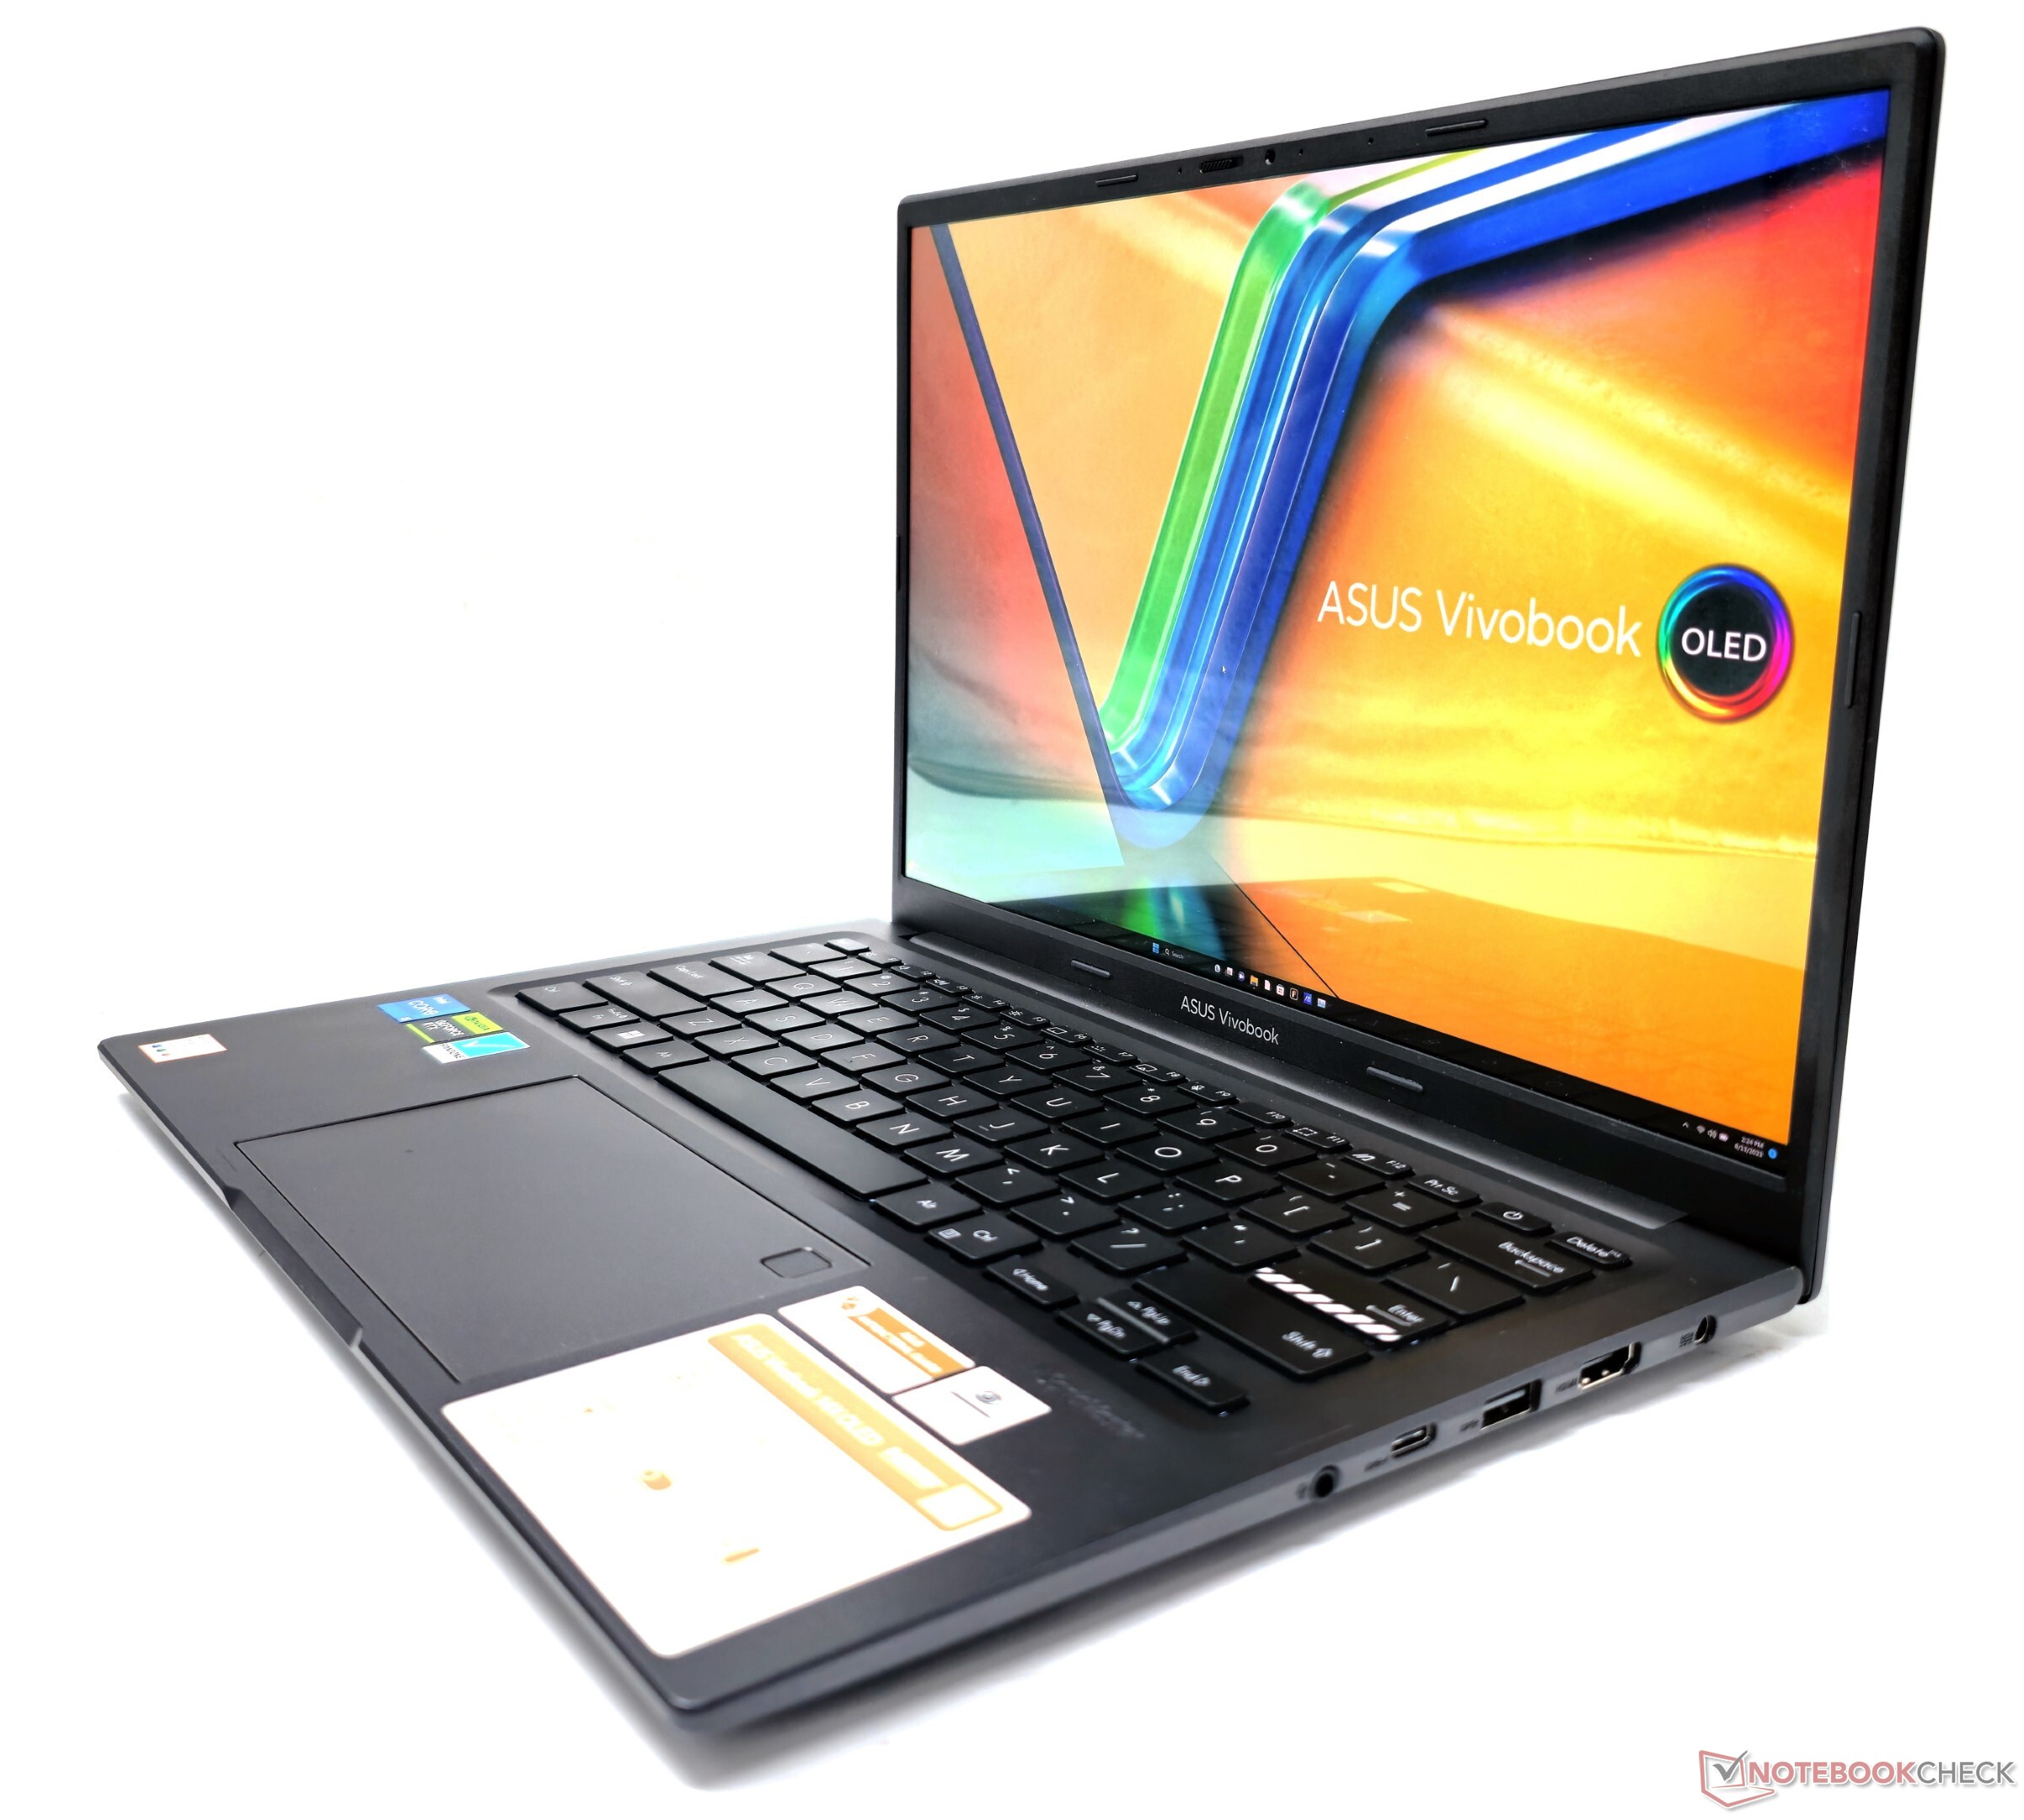
L'apertura del coperchio del display è un gioco da ragazzi, richiede solo un dito, e il portatile rimane stabile senza scivolare. Il display può essere posizionato in piano con un angolo di 180°. Il display e il piano della tastiera presentano una certa flessione, ma non dovrebbe essere un problema durante il normale utilizzo.
Le cerniere sono solide, senza scricchiolii o resistenze eccessive. È presente anche la protezione antimicrobica di Asus, che si dice inibisca la crescita dei batteri per almeno tre anni. Asus sostiene inoltre che il portatile soddisfa gli standard di durata MIL-STD-810H.
Connettività: Le prestazioni del Wi-Fi 6E non sono all'altezza
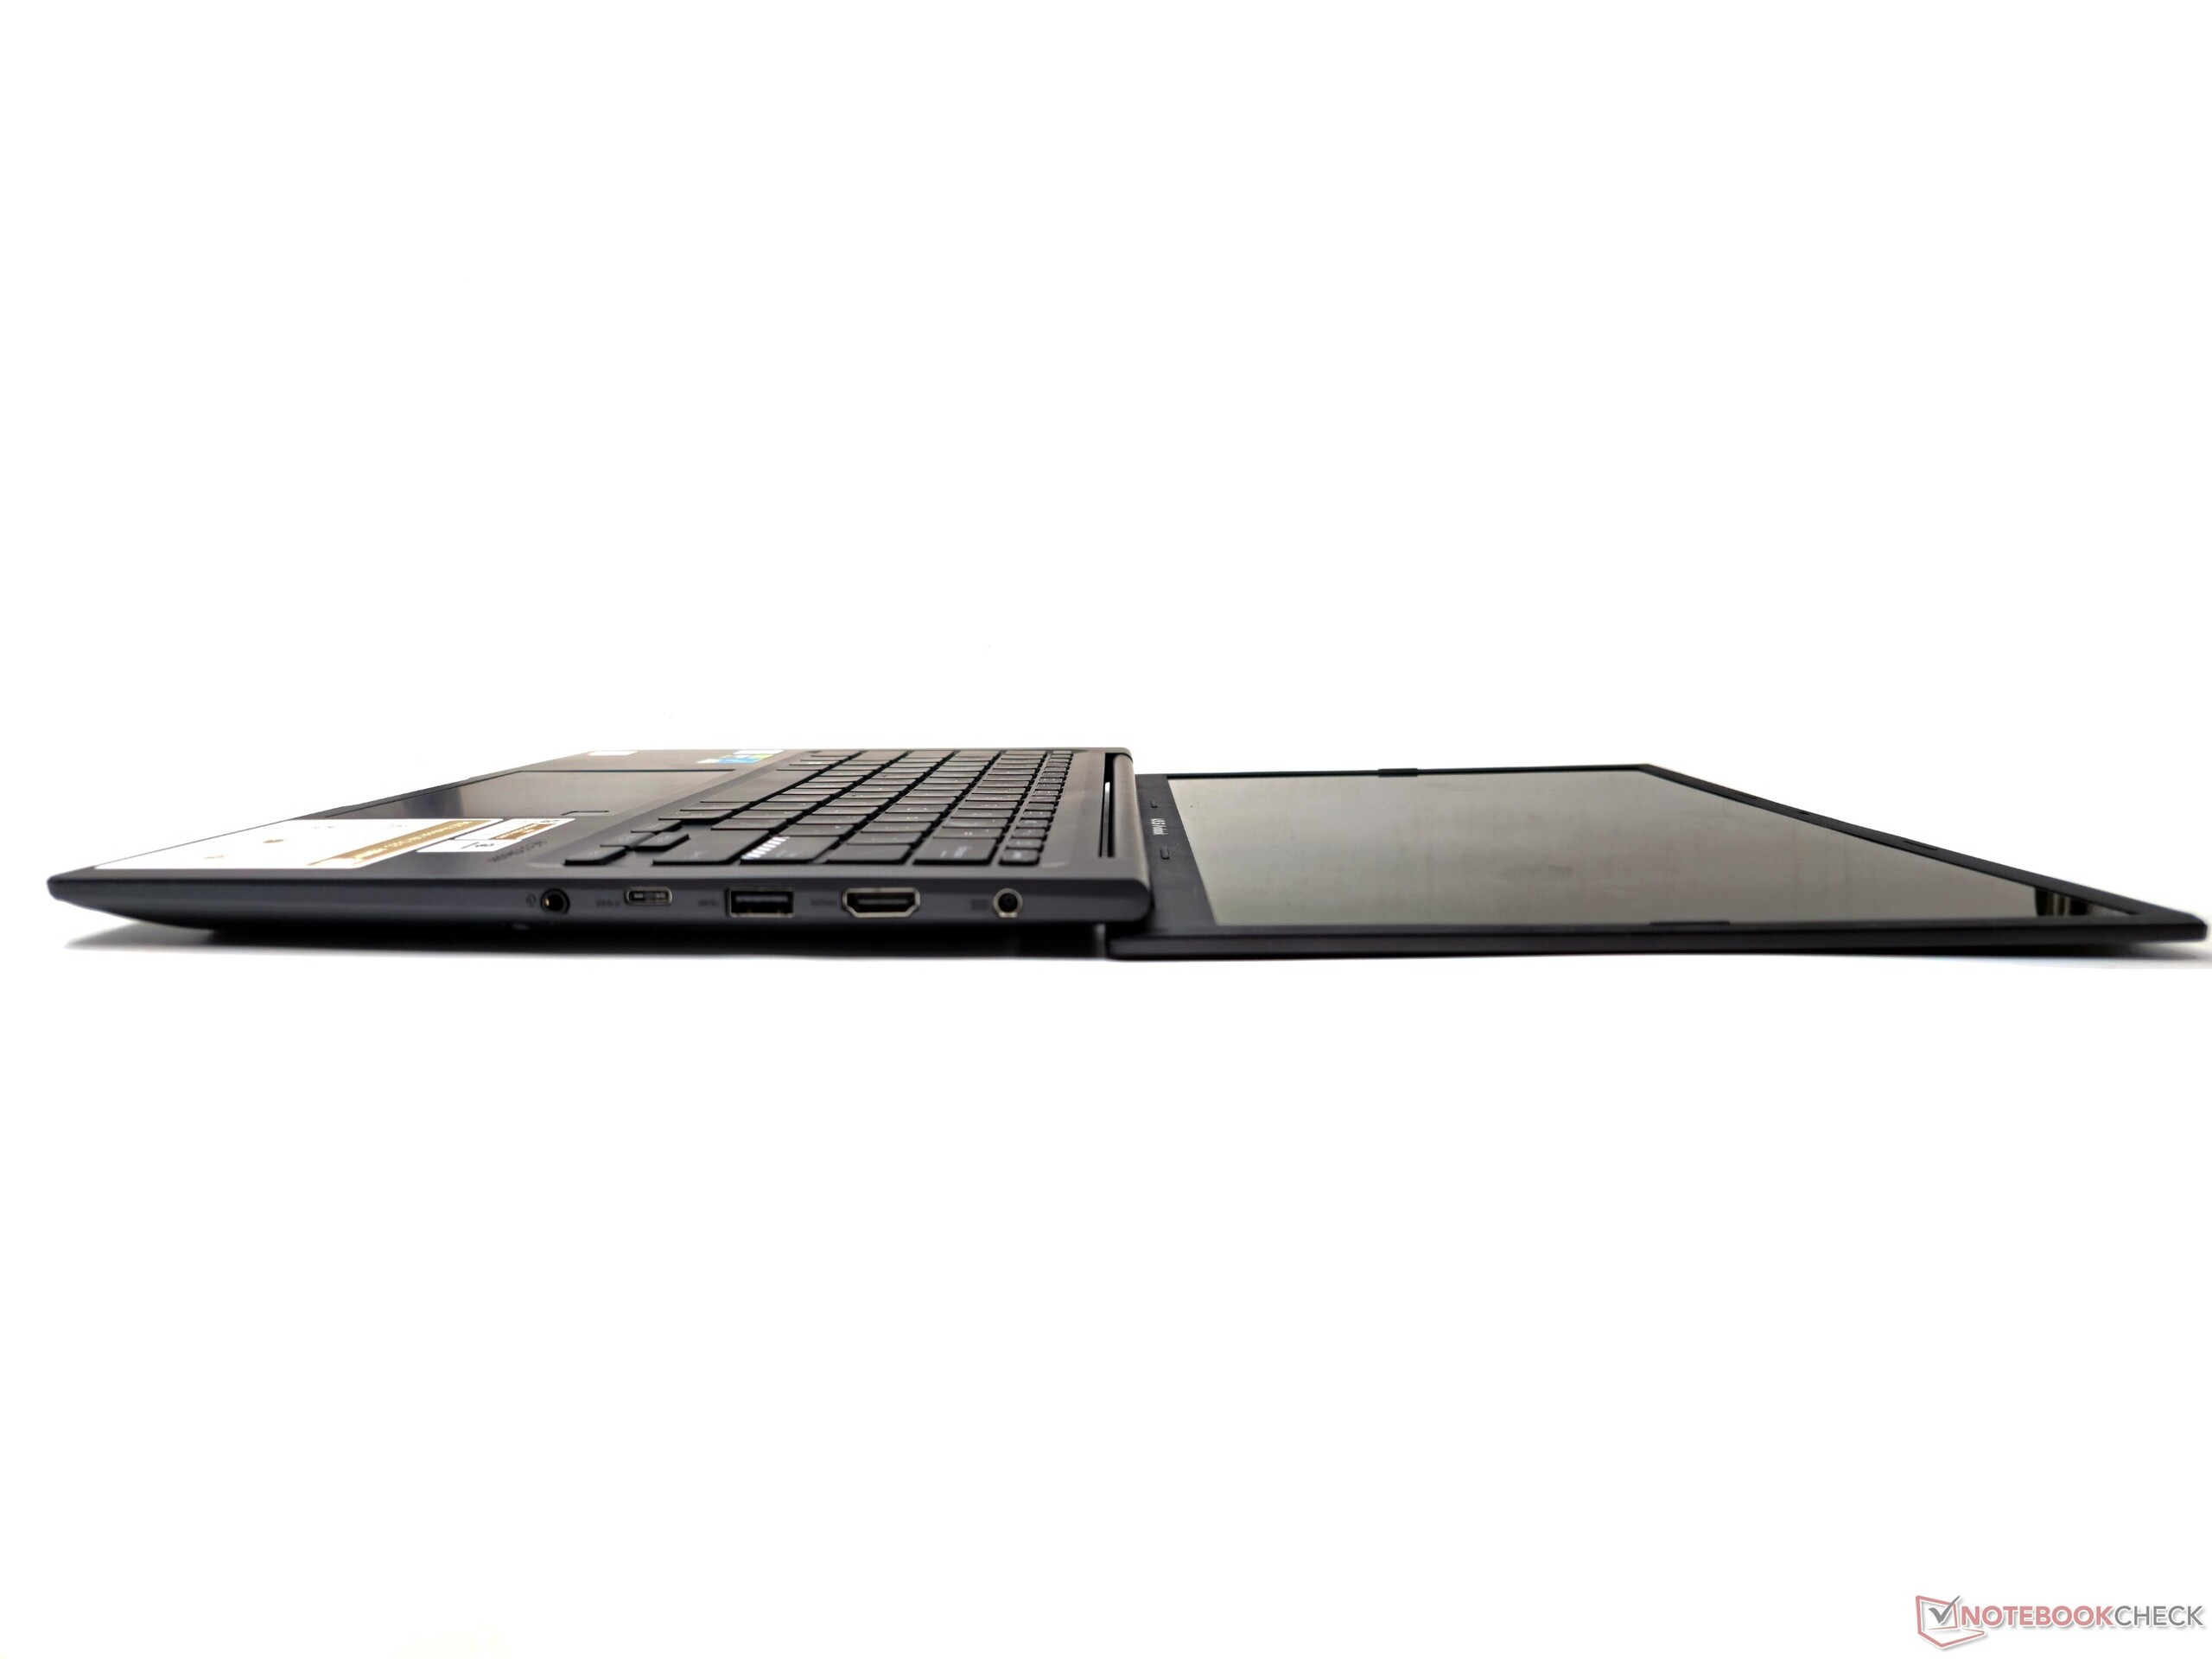
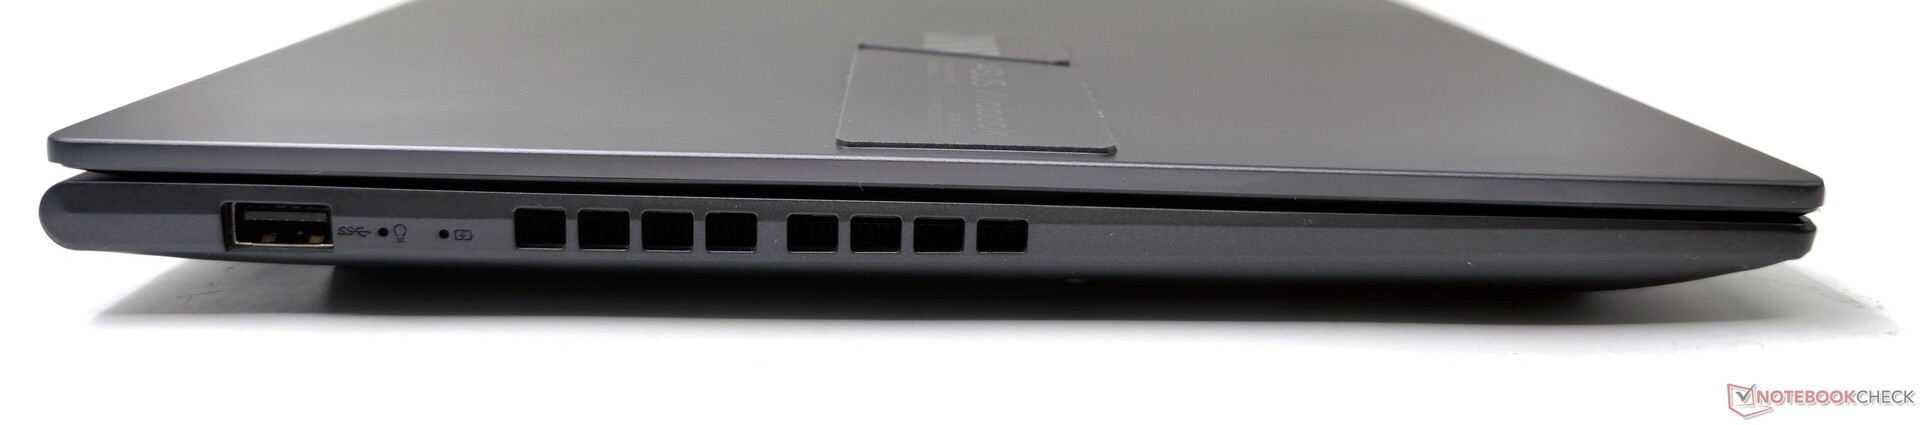
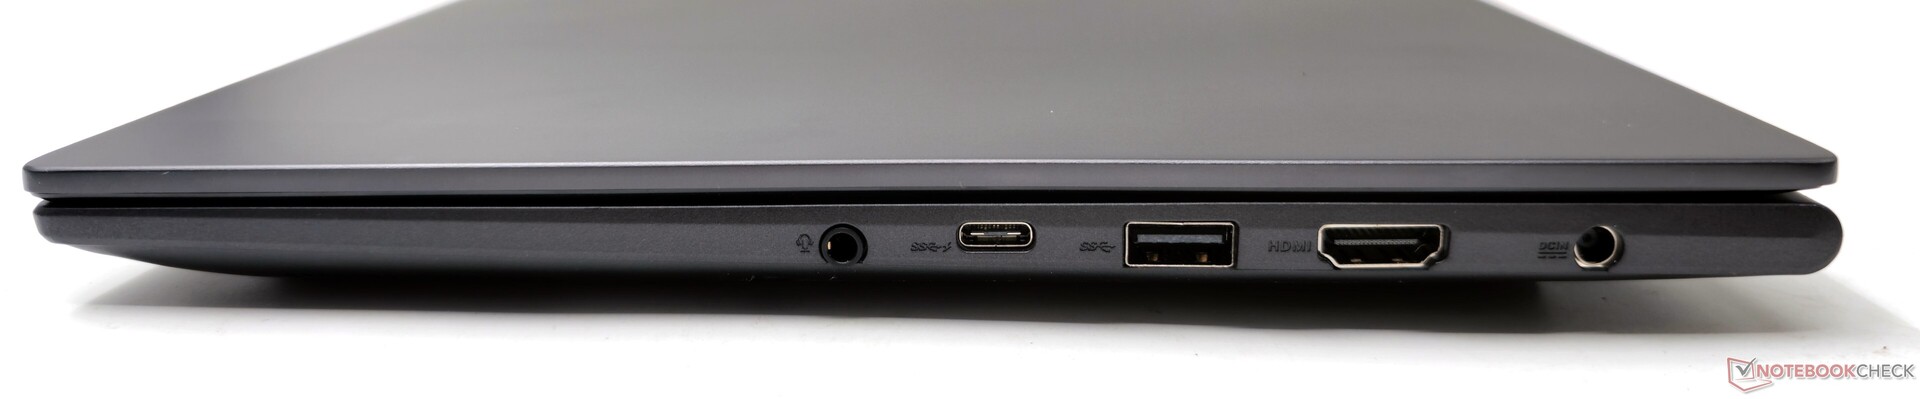
La disposizione delle porte è simile a quella già vista sul VivoBook 15X. Sul lato sinistro è presente una singola porta USB 3.2 Gen1 Type-A, mentre le altre sono posizionate sul lato destro.
Questa distribuzione unilaterale delle porte può essere fastidiosa, soprattutto quando si utilizza un mouse esterno e se si intende collegare più periferiche. Tuttavia, lo spazio tra le porte è sufficiente e non causa problemi di connettività.
Comunicazione
La scheda Intel Wi-Fi 6E AX211 mostra prestazioni eccellenti nella banda dei 5 GHz senza cali percepibili quando viene testata con il nostro router di riferimento Asus ROG Rapture GT-AXE11000.
Tuttavia, lo stesso non si può dire per la banda a 6 GHz, che mostra prestazioni incoerenti con regolari cali di throughput durante il test.
In confronto, il Gigabyte Aero 14 OLED con scheda Intel Wi-Fi 6E AX210 si comporta bene in entrambe le bande.
| Networking / iperf3 transmit AXE11000 | |
| Asus VivoBook 14X K3405 (iperf 3.1.3) | |
| Acer Swift X SFX14-71G | |
| Gigabyte Aero 14 OLED BMF (iperf 3.1.3) | |
| MSI Stealth 14 Studio A13V | |
| Schenker Vision 14 2022 RTX 3050 Ti (iperf 3.1.3) | |
| Media della classe Multimedia (606 - 1978, n=61, ultimi 2 anni) | |
| Lenovo Slim Pro 7 14ARP8 (iperf 3.1.3) | |
| Media Intel Wi-Fi 6E AX211 (64 - 1921, n=276) | |
| Networking / iperf3 receive AXE11000 | |
| Asus VivoBook 14X K3405 (iperf 3.1.3) | |
| Gigabyte Aero 14 OLED BMF (iperf 3.1.3) | |
| Schenker Vision 14 2022 RTX 3050 Ti (iperf 3.1.3) | |
| MSI Stealth 14 Studio A13V | |
| Acer Swift X SFX14-71G | |
| Lenovo Slim Pro 7 14ARP8 (iperf 3.1.3) | |
| Media Intel Wi-Fi 6E AX211 (582 - 1890, n=276) | |
| Media della classe Multimedia (682 - 1818, n=61, ultimi 2 anni) | |
| Networking / iperf3 transmit AXE11000 6GHz | |
| Gigabyte Aero 14 OLED BMF (iperf 3.1.3) | |
| Media della classe Multimedia (869 - 2373, n=25, ultimi 2 anni) | |
| Asus VivoBook 14X K3405 (iperf 3.1.3) | |
| Media Intel Wi-Fi 6E AX211 (385 - 1851, n=226) | |
| Networking / iperf3 receive AXE11000 6GHz | |
| Gigabyte Aero 14 OLED BMF (iperf 3.1.3) | |
| Media della classe Multimedia (1212 - 2361, n=25, ultimi 2 anni) | |
| Asus VivoBook 14X K3405 (iperf 3.1.3) | |
| Media Intel Wi-Fi 6E AX211 (700 - 1857, n=226) | |
Webcam
La webcam integrata a 720p del VivoBook 14X presenta una scarsa nitidezza e significative deviazioni di colore. Il test X-Rite ColorChecker Passport rivela il Delta E più alto, pari a 22,45, con il colore Blu violaceo.
Sebbene la webcam possa essere sufficiente per le videochiamate occasionali, Asus avrebbe dovuto dotare il portatile di un modulo a 1080p per migliorare la qualità.
Per una maggiore privacy è presente un otturatore fisico della webcam.


Sicurezza
I login biometrici sono facilitati da uno scanner di impronte digitali incorporato nel touchpad. Inoltre, è presente anche un modulo TPM 2.0.
Accessori e garanzia
Nella confezione non ci sono altri accessori, a parte l'alimentatore da 90 W e la solita documentazione.
In India, Asus offre il VivoBook 14X con una garanzia standard di un anno. Chi acquista il portatile prima del 31 agosto 2023 può anche usufruire dei vantaggi di Back to College che includono diverse opzioni di estensione della garanzia e di protezione locale contro i danni accidentali che vanno da ₹99 a ₹2.999.
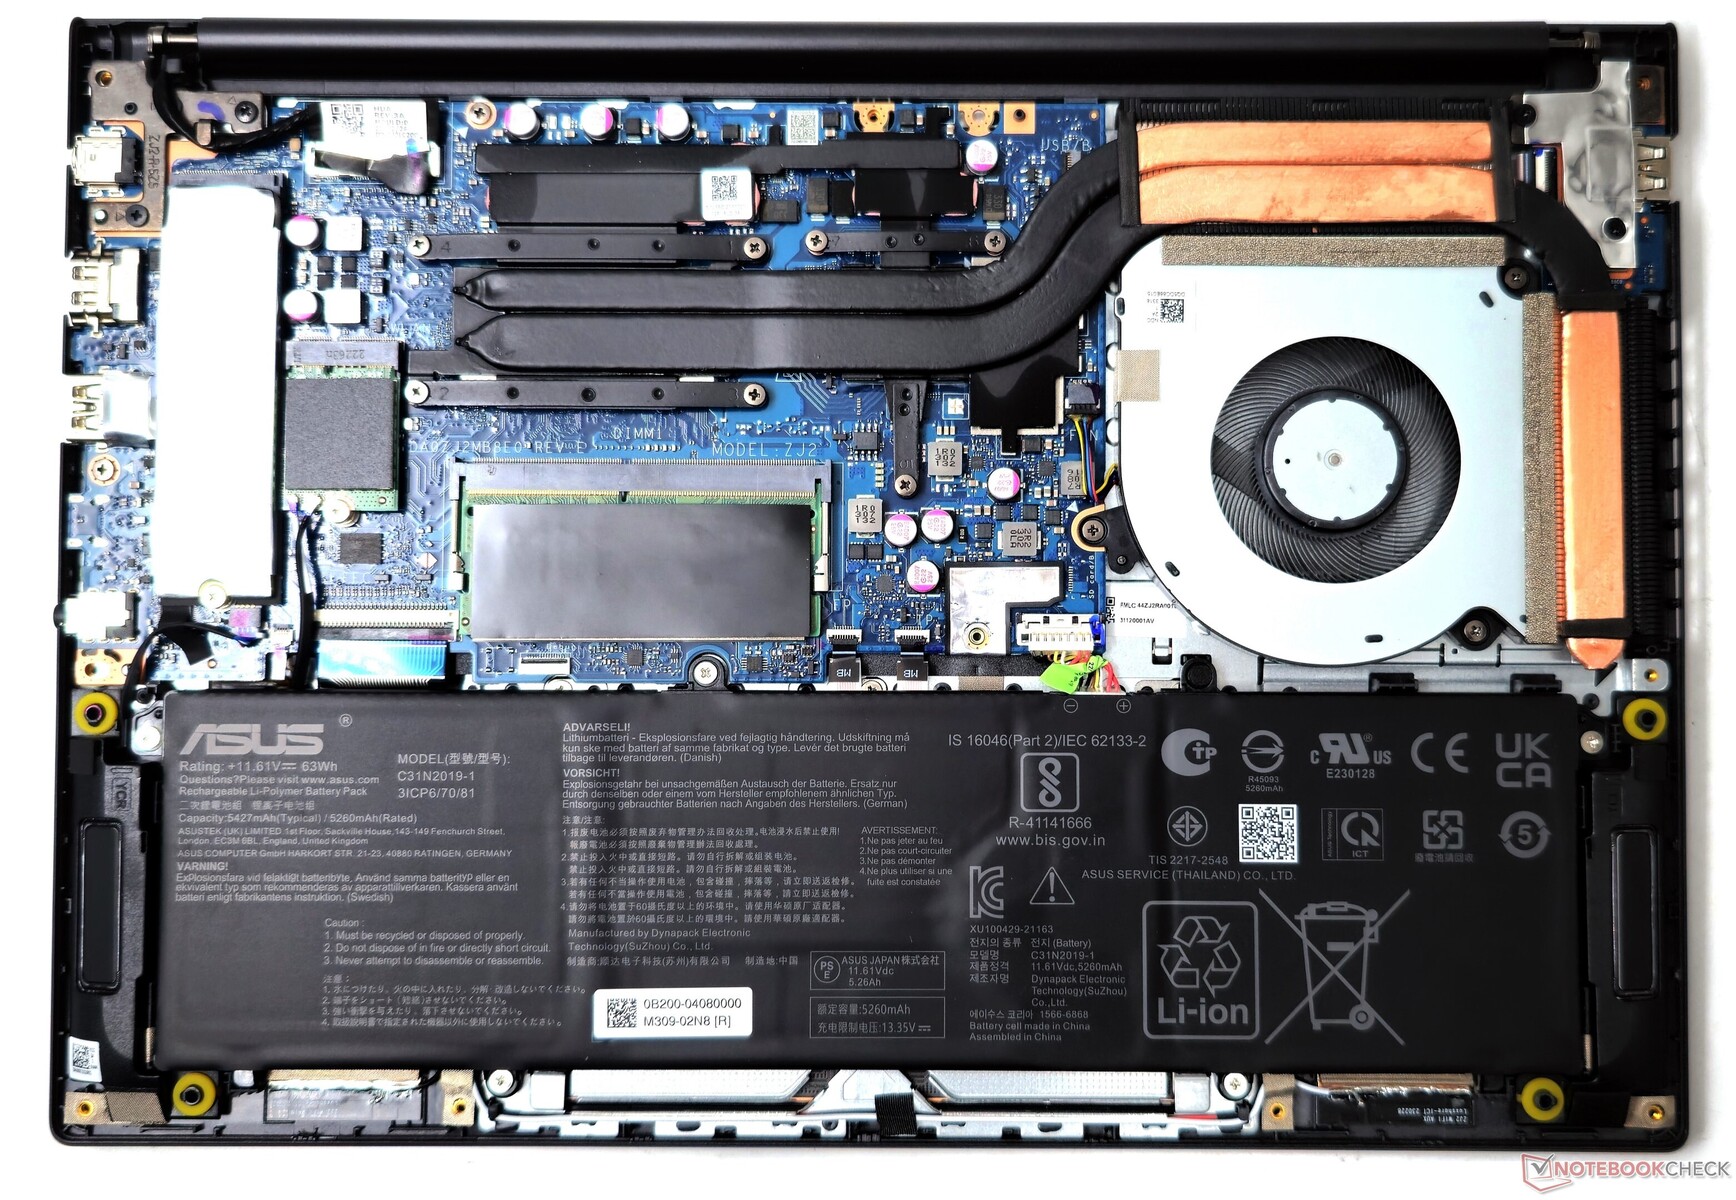
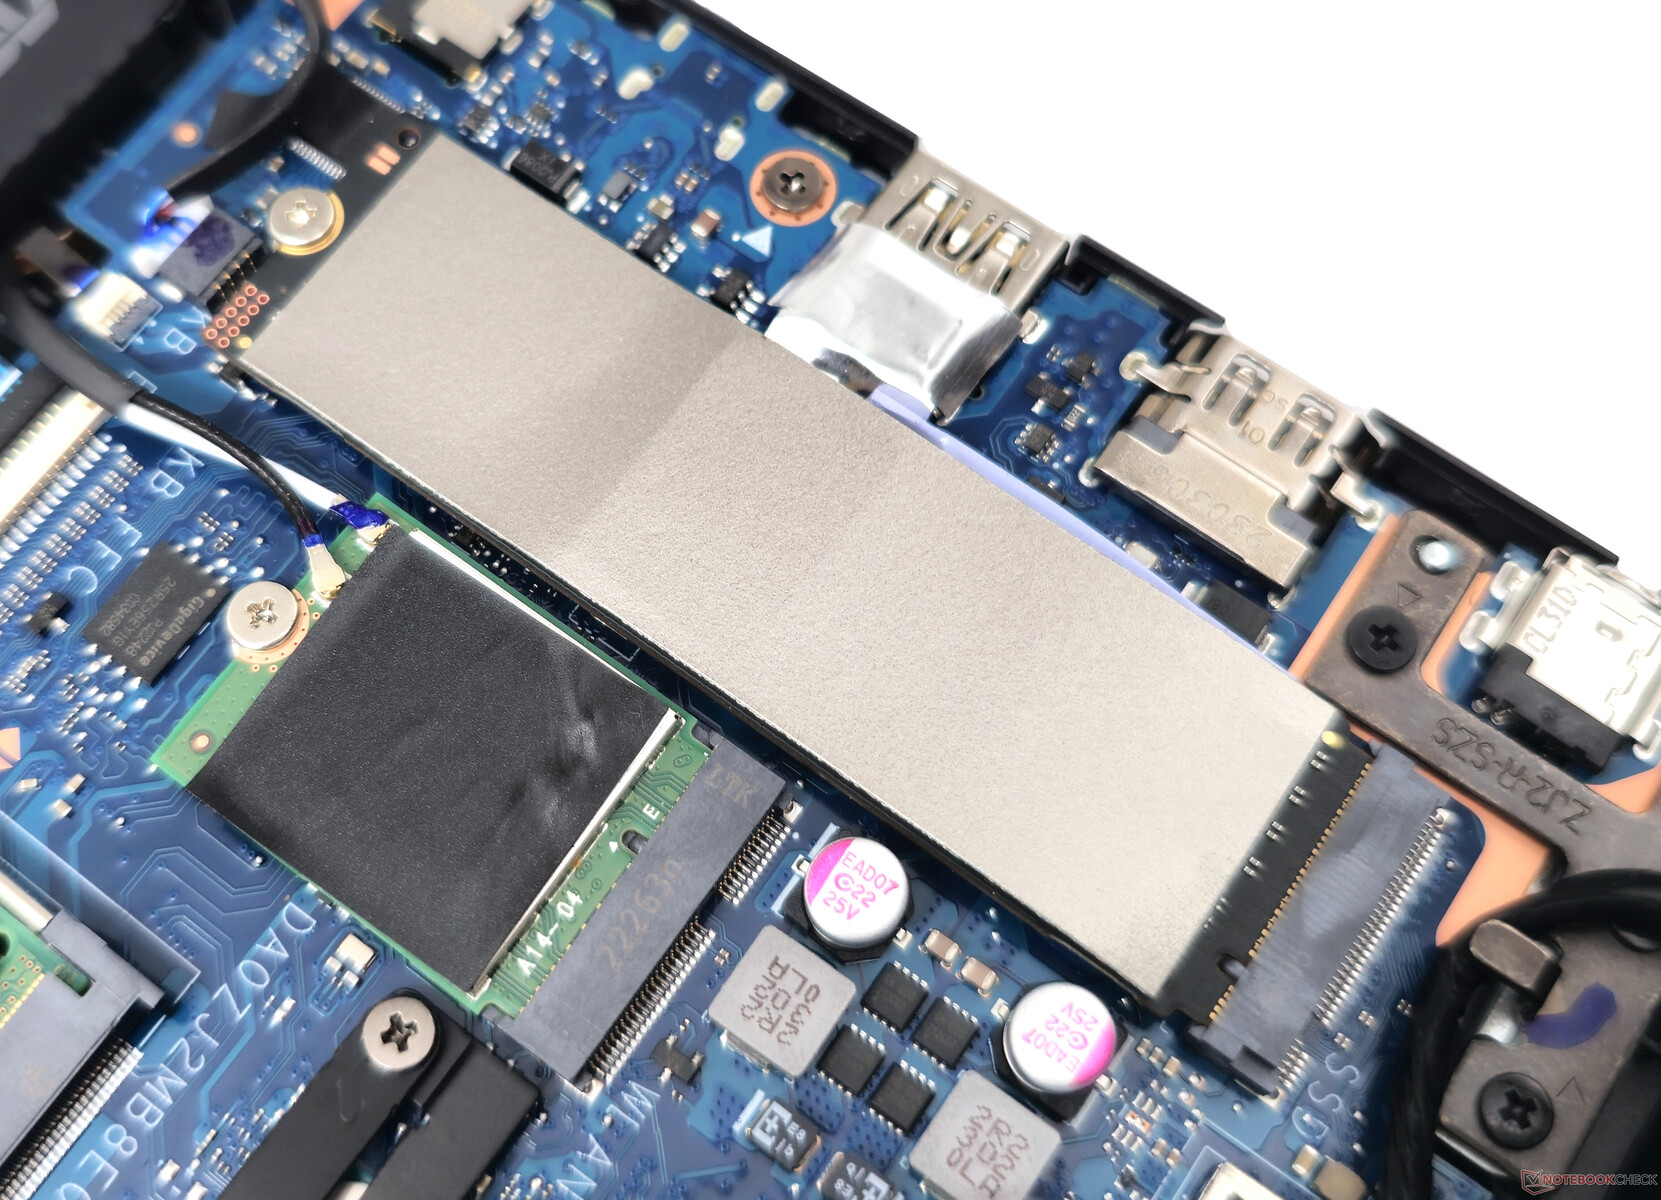
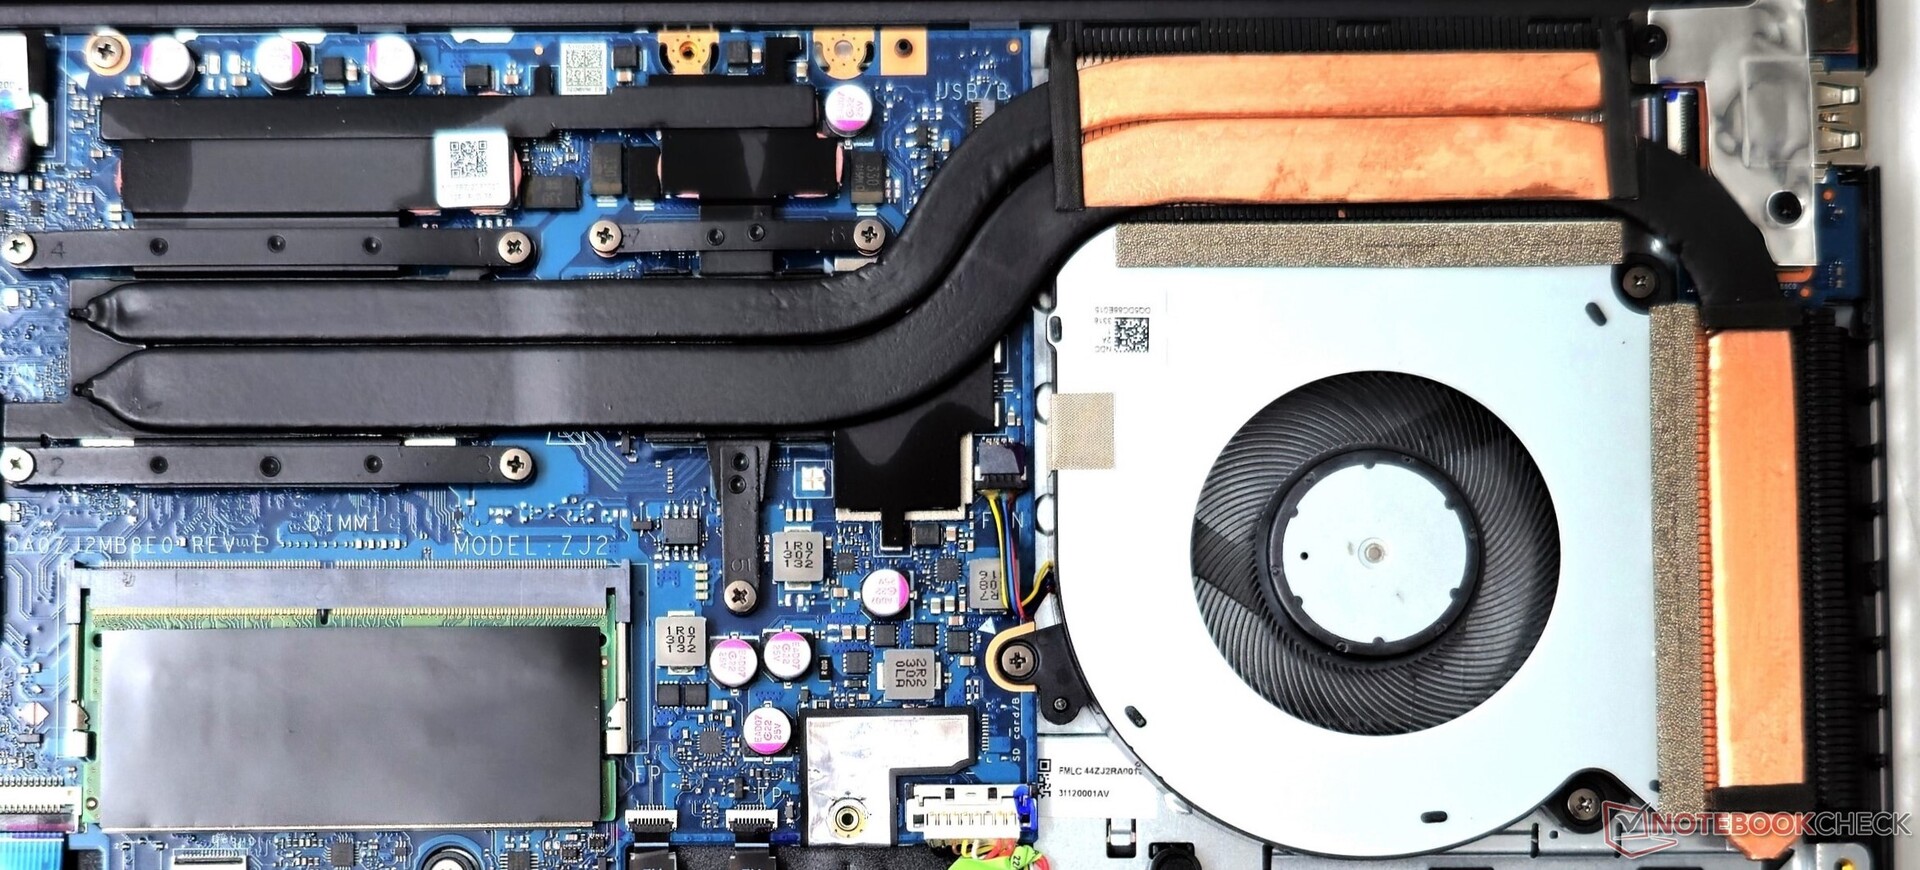
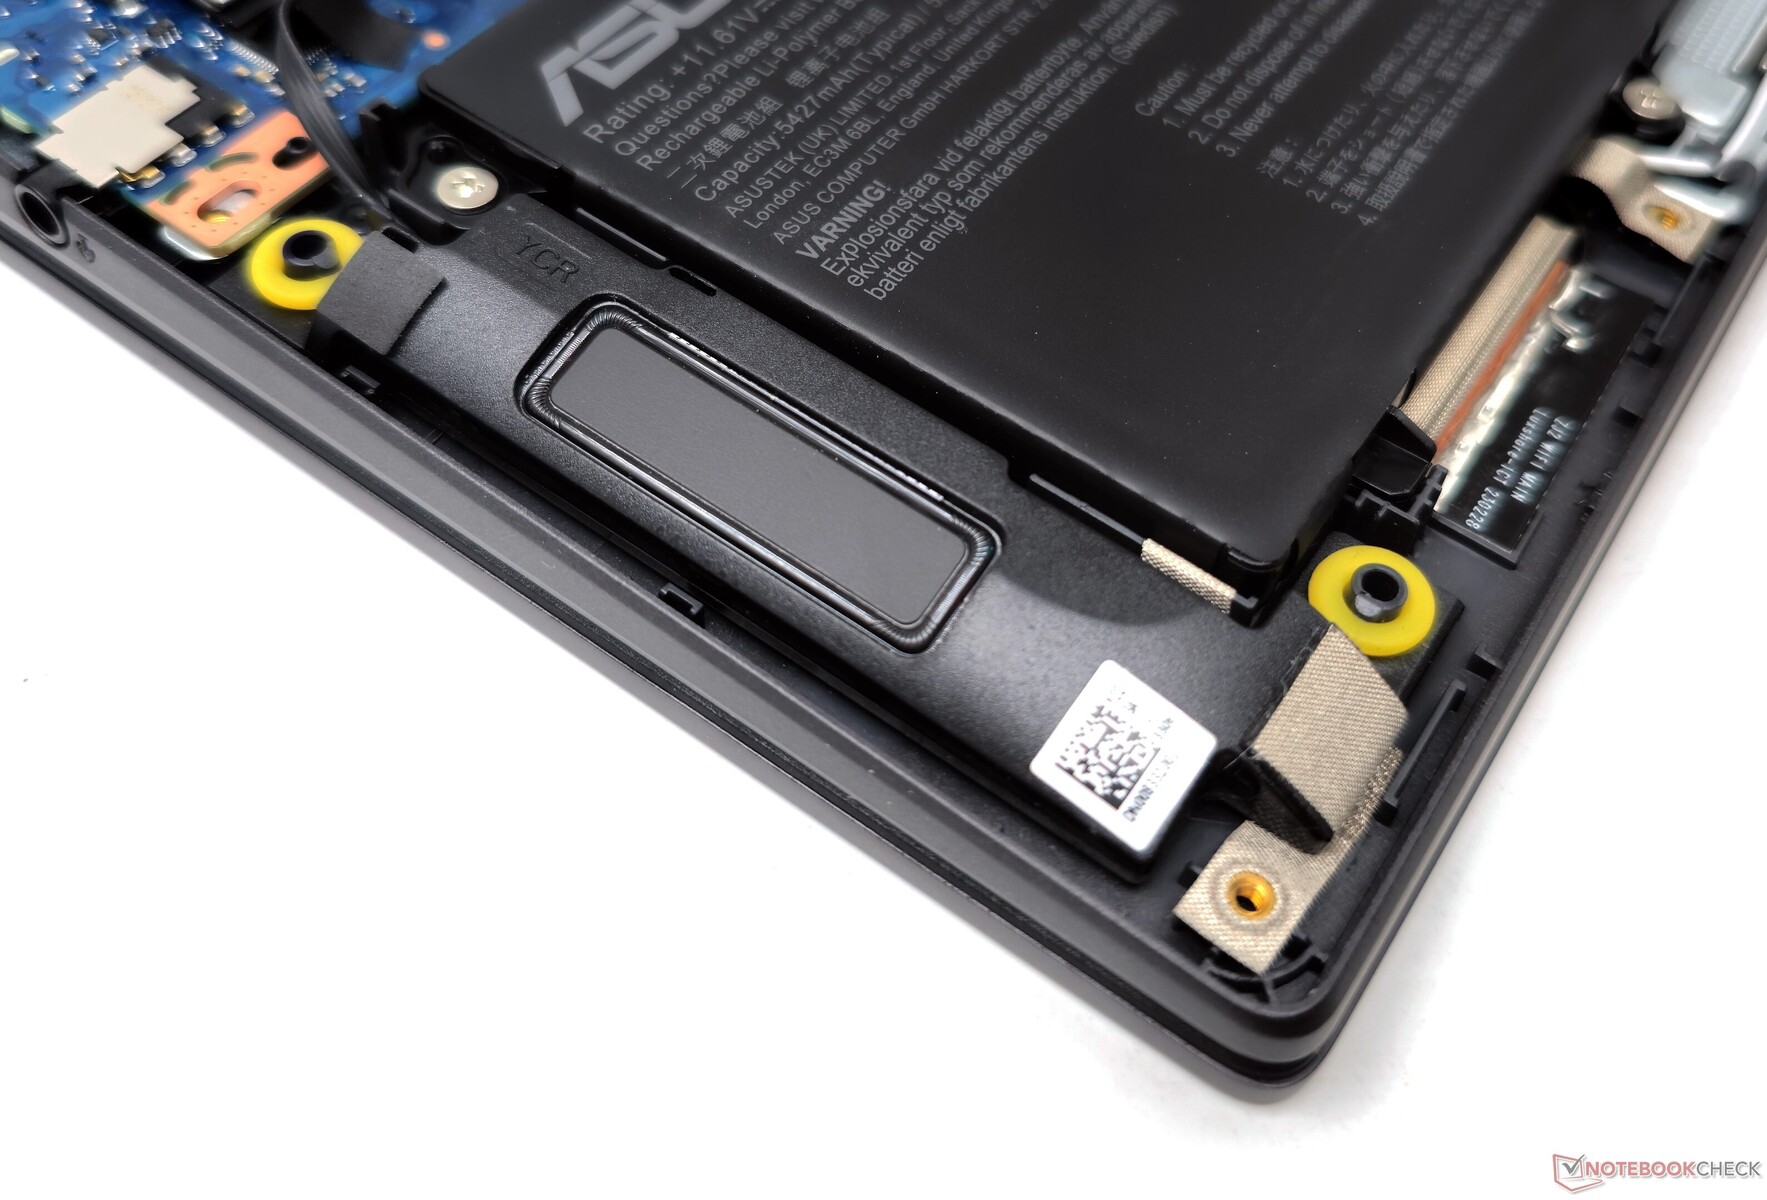
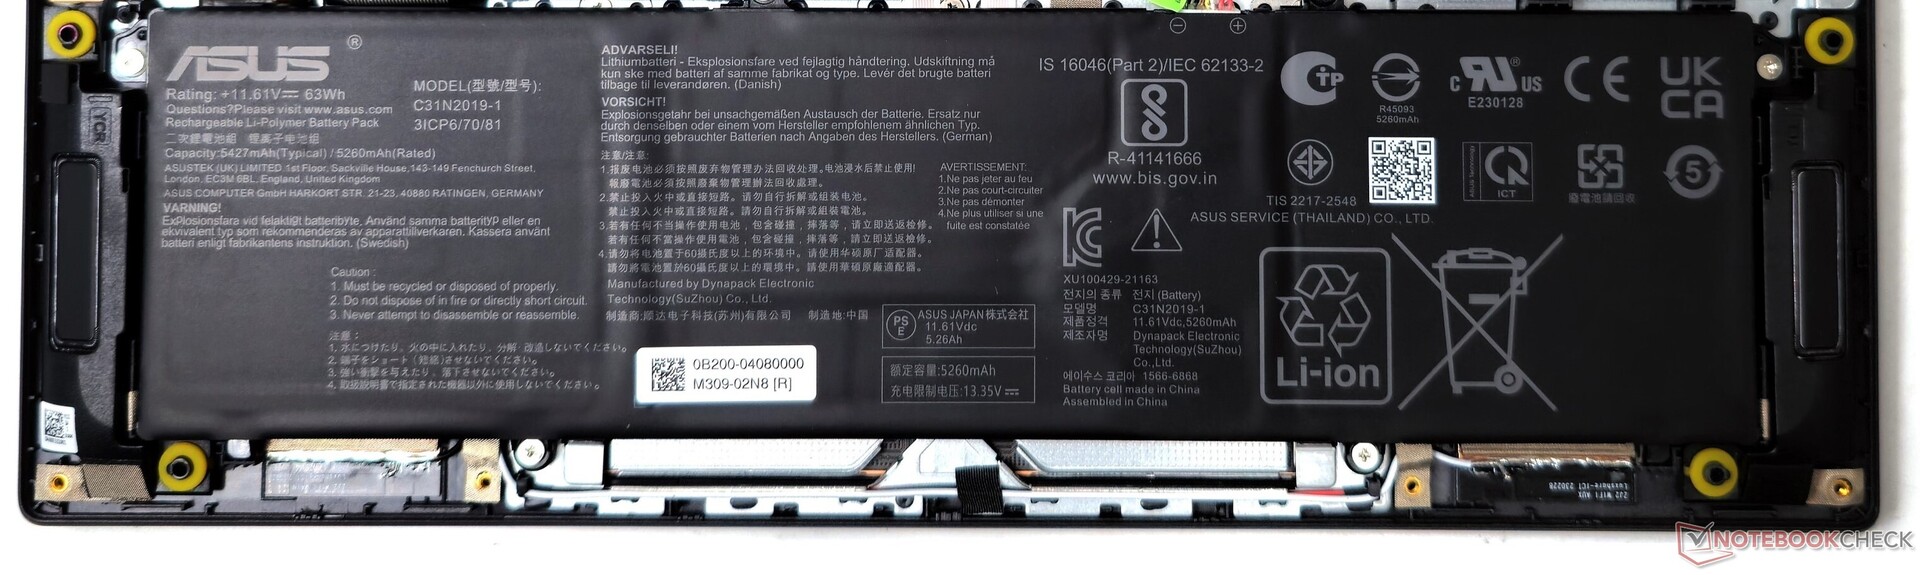
Manutenzione
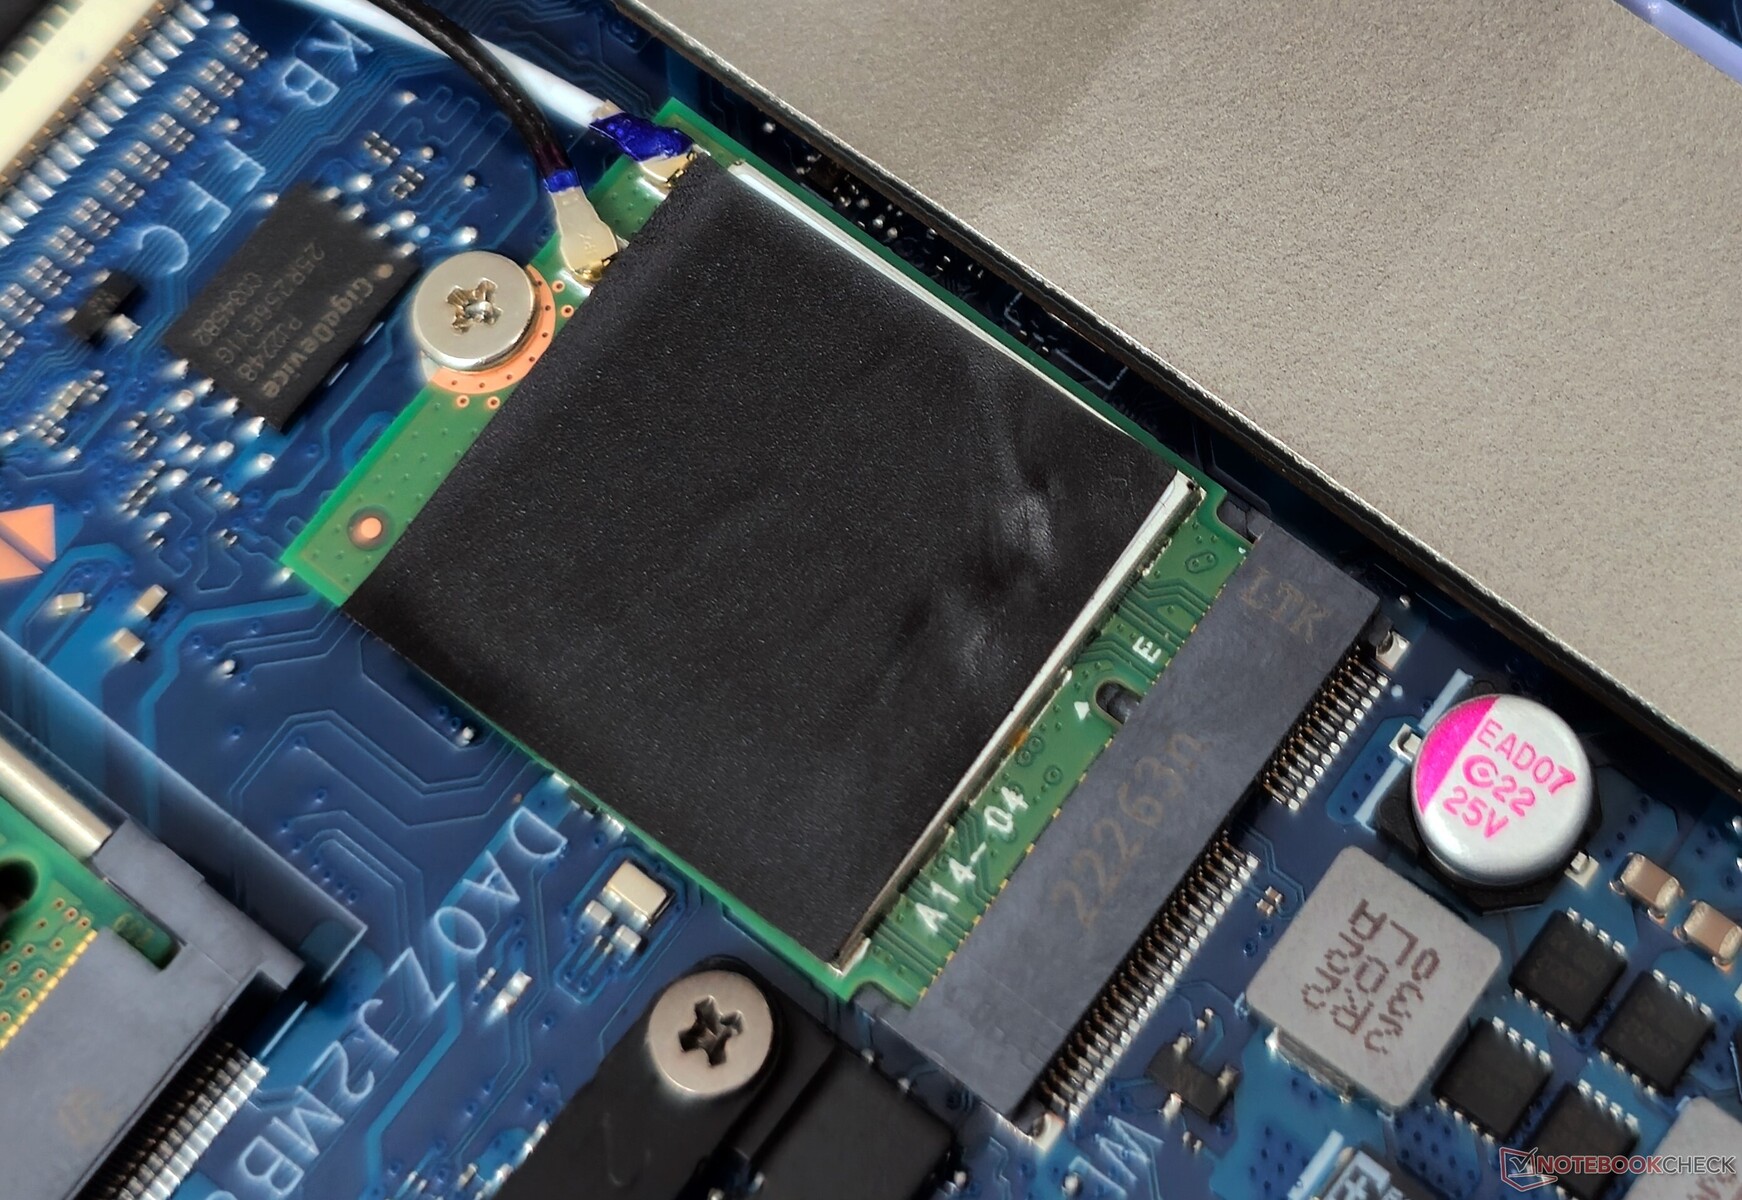
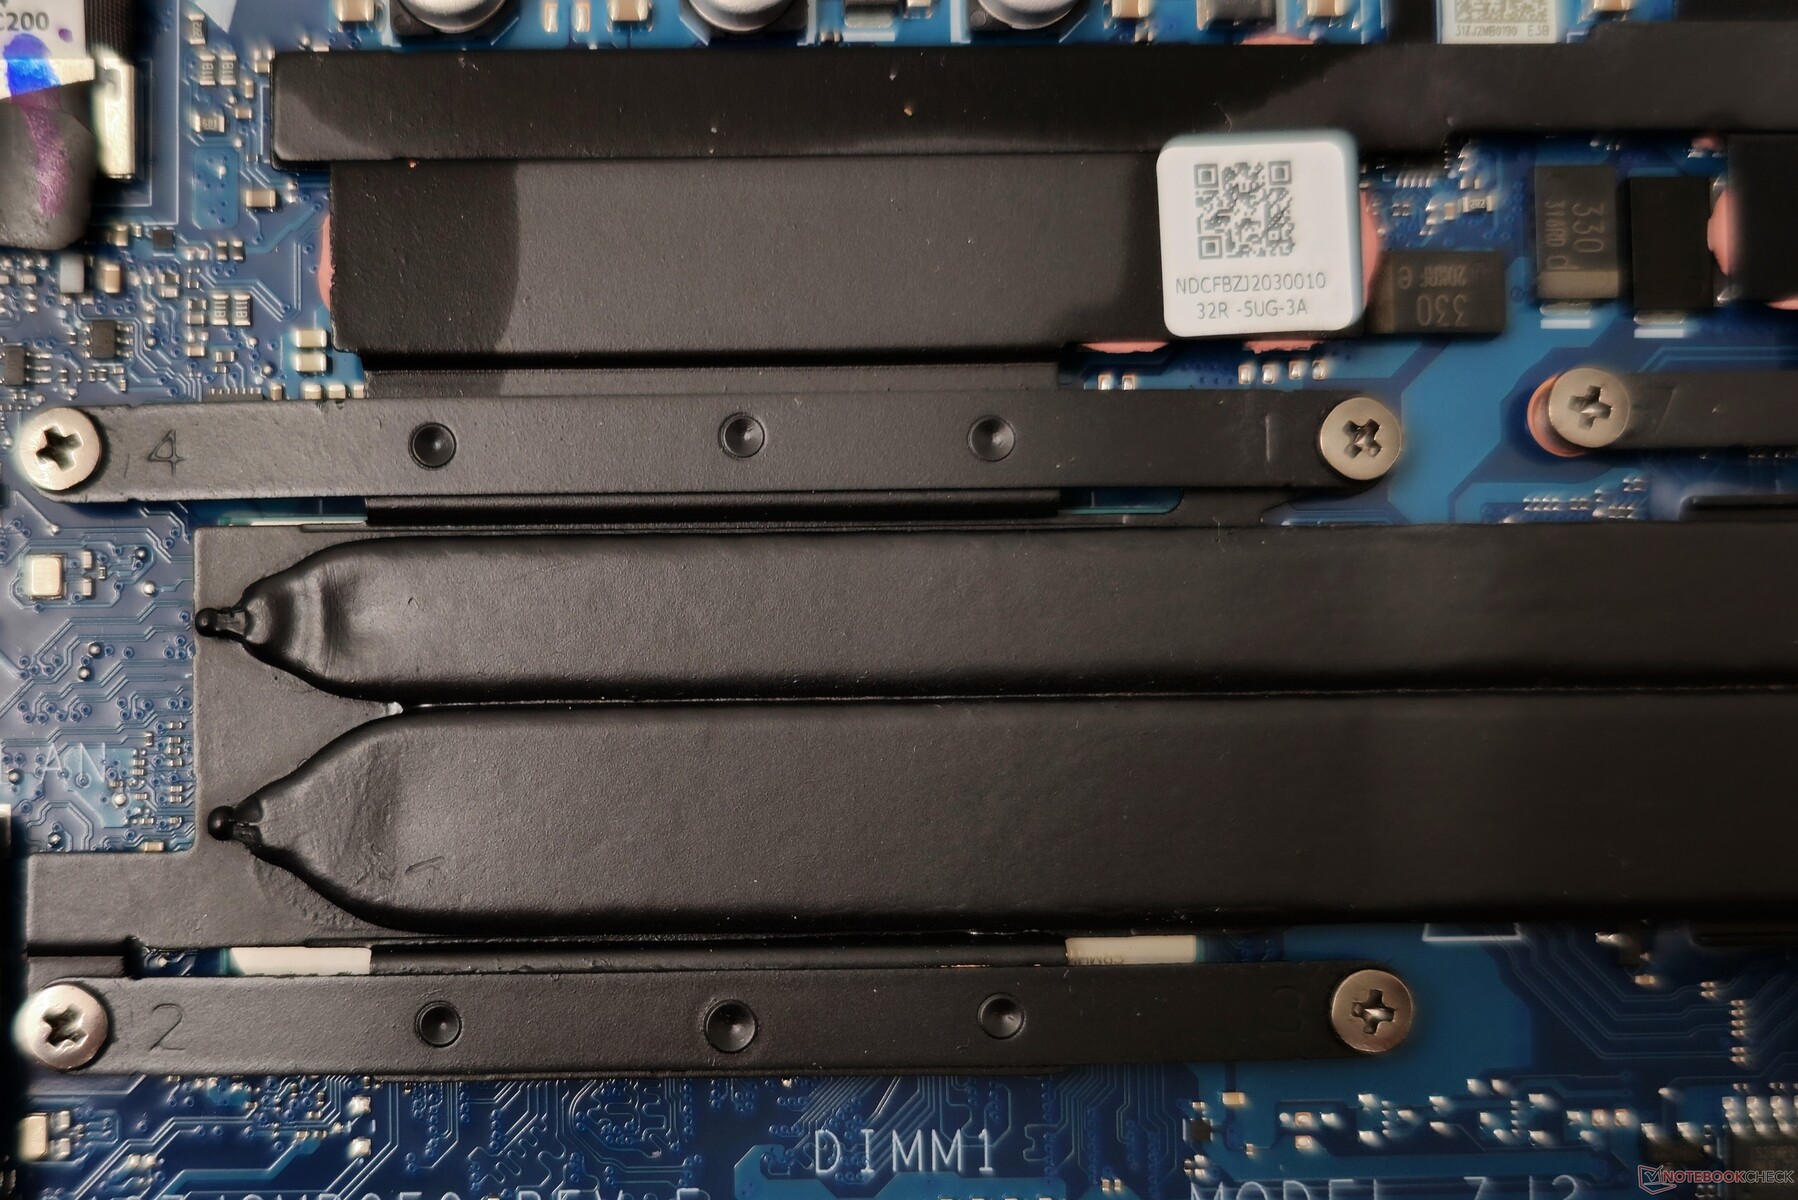
Per accedere ai componenti interni è necessario rimuovere sette viti PH0 dal pannello posteriore. Una volta all'interno, è possibile sostituire facilmente la scheda WLAN e l'unità SSD NVMe.
Vale la pena notare che 8 GB di RAM sono saldati sulla scheda madre, il che significa che è possibile aggiornare solo uno slot SO-DIMM. La batteria può essere svitata e sostituita se necessario.
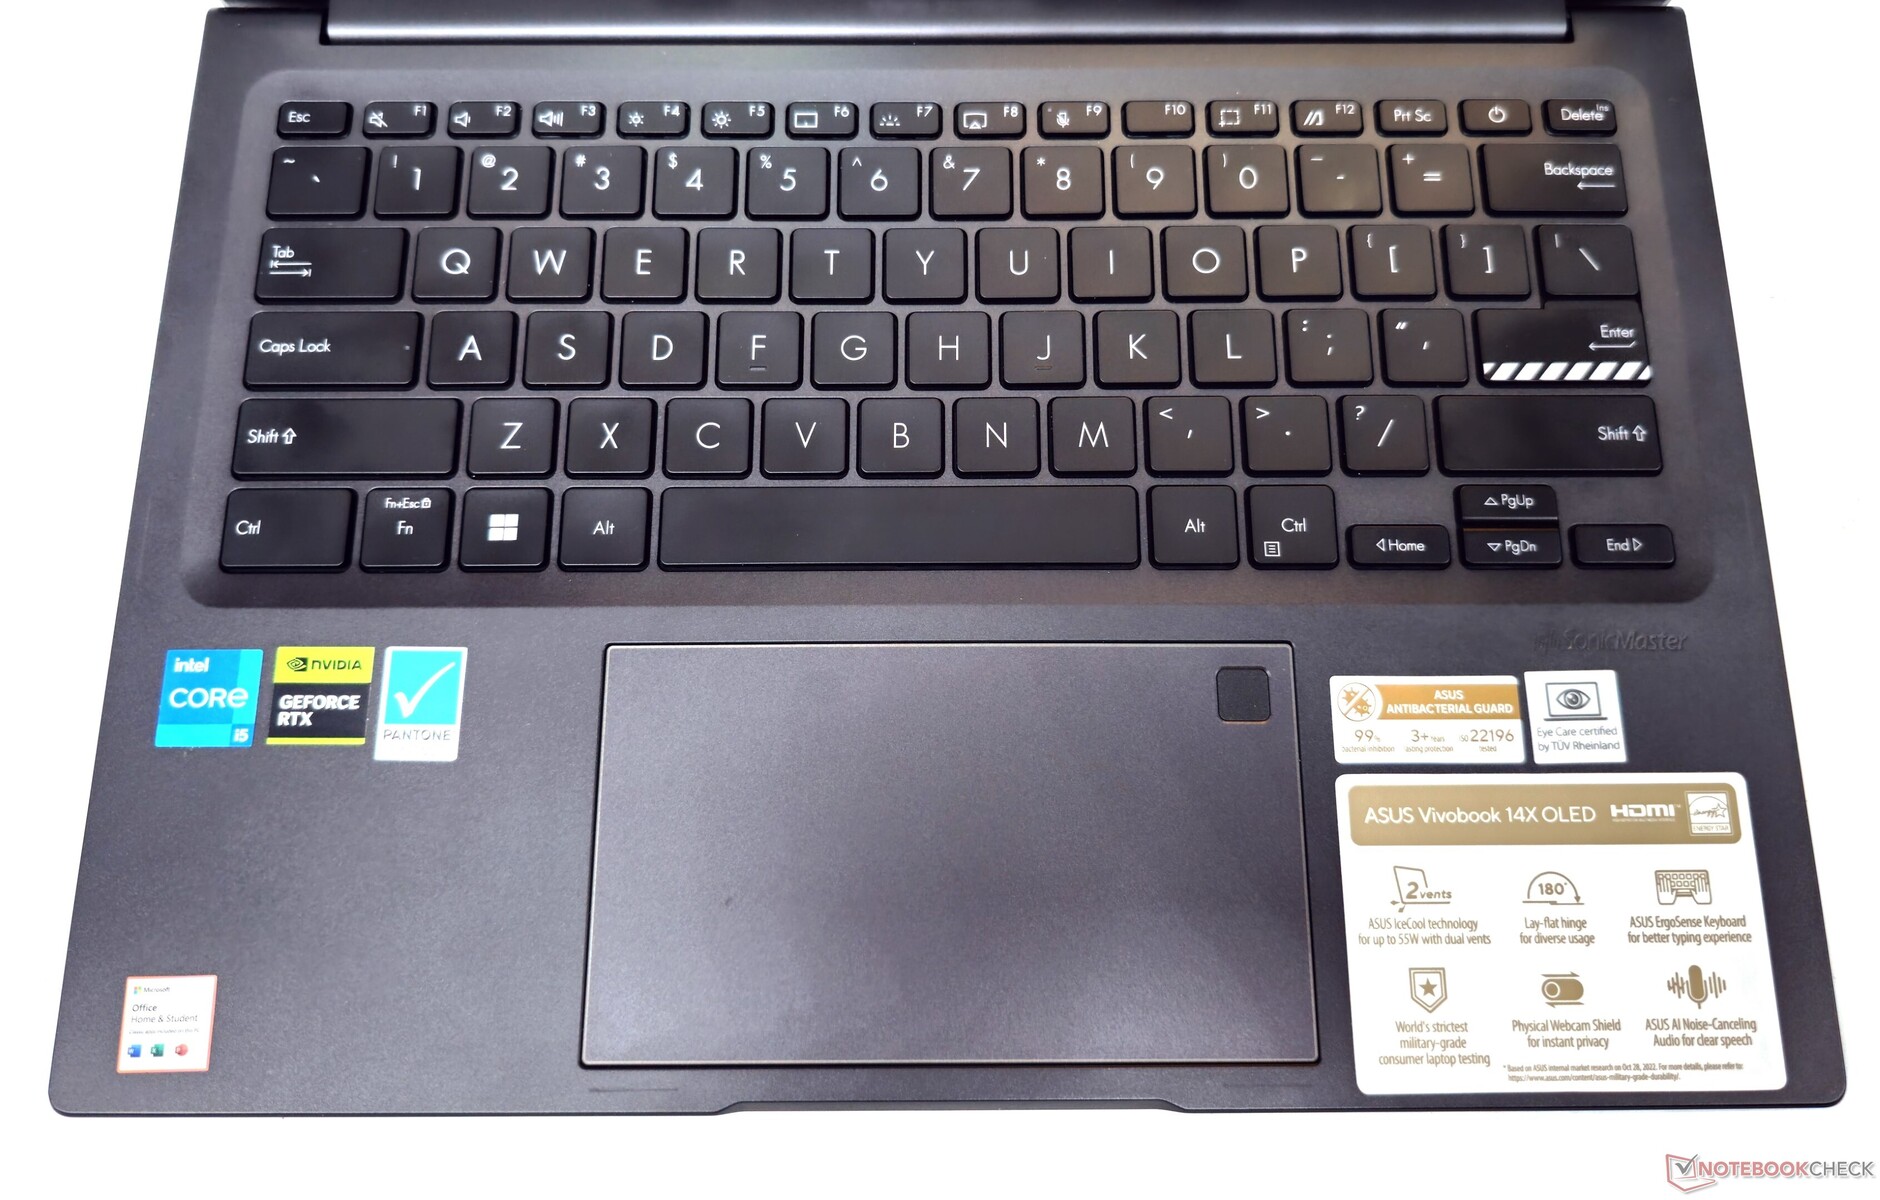
Dispositivi di input: Tastiera e touchpad decenti
Tastiera
Il VivoBook 14X è dotato di quella che Asus chiama tastiera ErgoSense, che offre una corsa dei tasti di 1,4 mm. Digitare su questa tastiera è un'esperienza confortevole, grazie ai copritasti bombati e ai tasti ben distanziati.
La fila superiore contiene i tasti F1-F12 e i tasti speciali, le cui funzioni principali possono essere configurate tramite l'applicazione MyAsus. I tasti freccia possono sembrare un po' stretti, ma questo è tipico di un portatile con questo fattore di forma. La retroilluminazione a tre livelli offre una discreta leggibilità in ambienti bui.
Touchpad
Il touchpad del VivoBook 14X misura 7,5 cm x 13 cm, offrendo ampio spazio per la navigazione e un'esperienza di scorrimento fluida.
L'intera superficie funge da pulsante sinistro del mouse e i clic sono reattivi e relativamente silenziosi.
Display: OLED 2,8K con HDR e PWM a 90 Hz
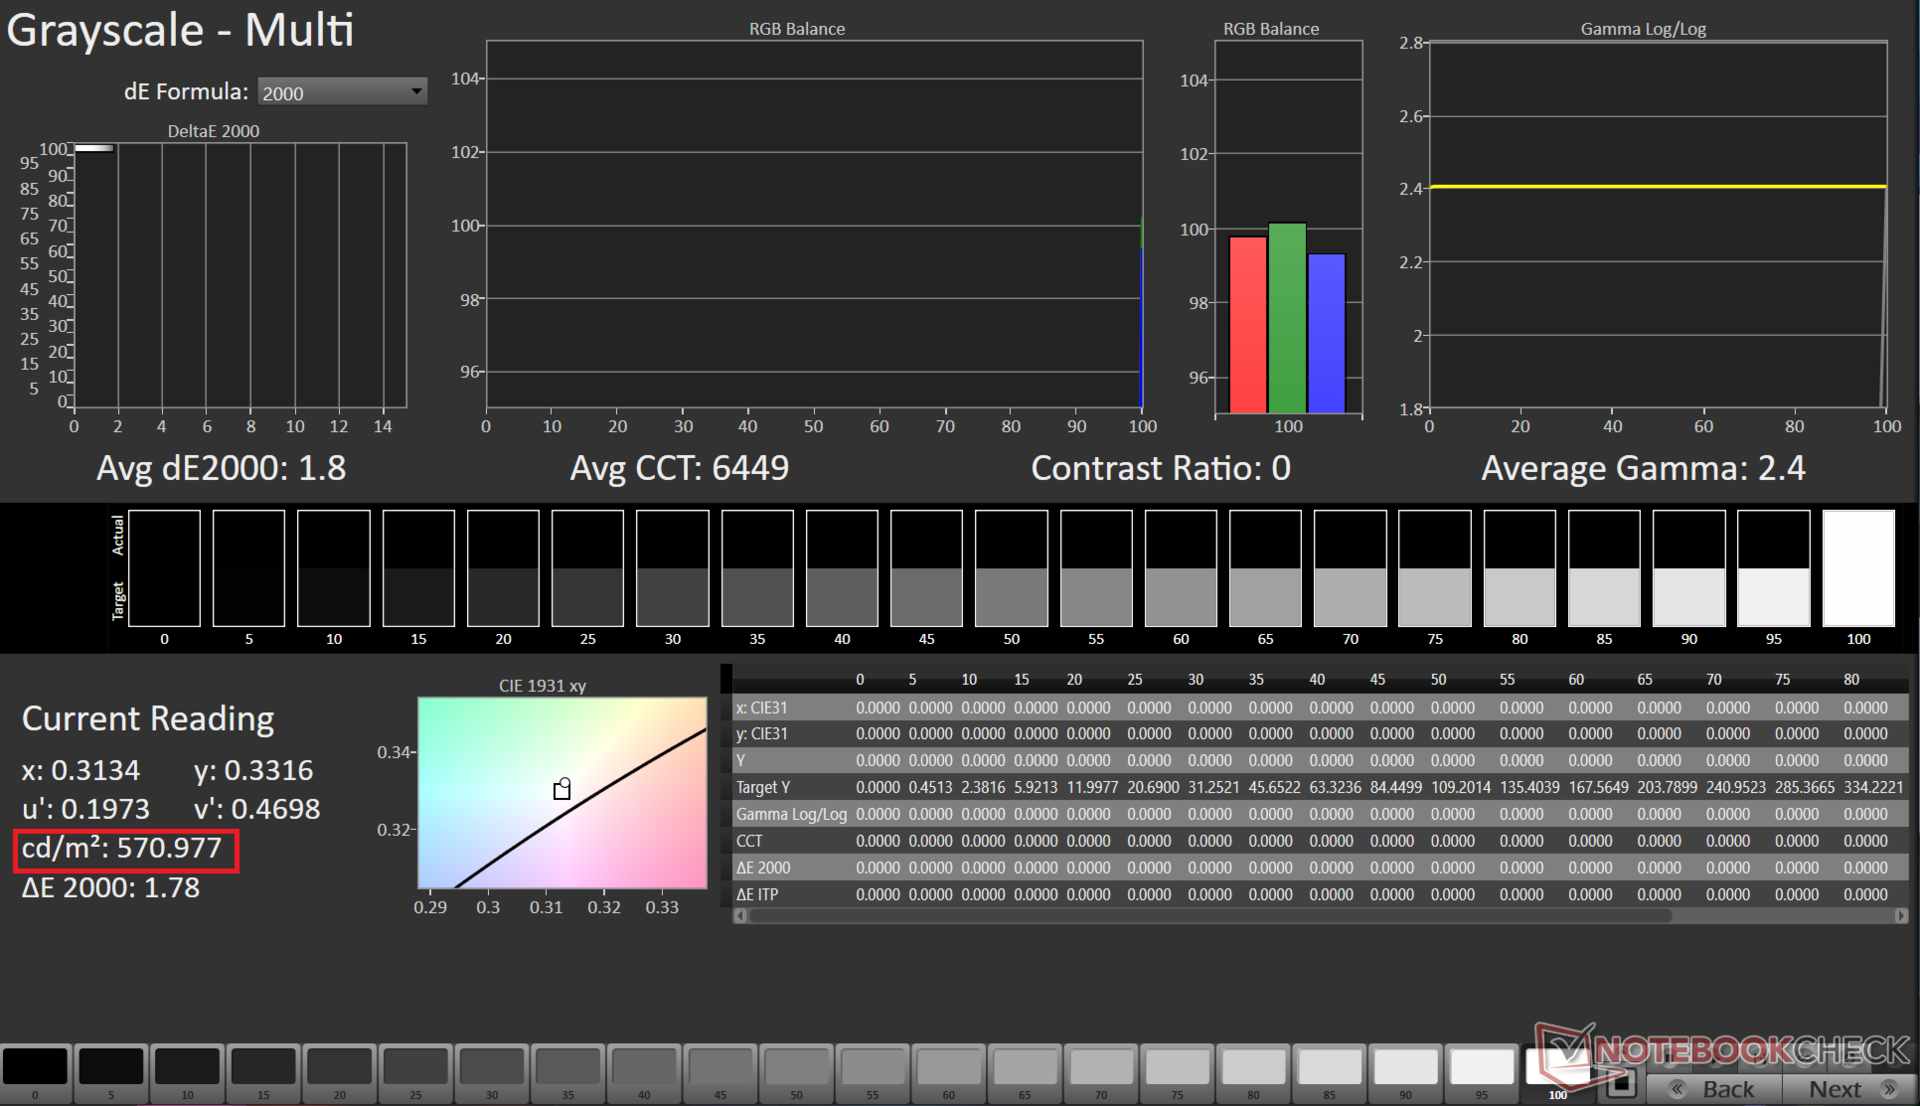
Il pannello OLED Samsung 2880 x 1800 16:10 90 Hz del VivoBook 14X offre una buona distribuzione della luminosità e un rapporto di contrasto sostanzialmente infinito.
Abbiamo misurato una luminosità massima di 373 nits in modalità SDR. Il display è certificato per VESA DisplayHDR True Black 600 e abbiamo potuto misurare fino a 571 nits durante la riproduzione di contenuti HDR. Non c'è alcun effetto di retroilluminazione, dato che si tratta di un display OLED.
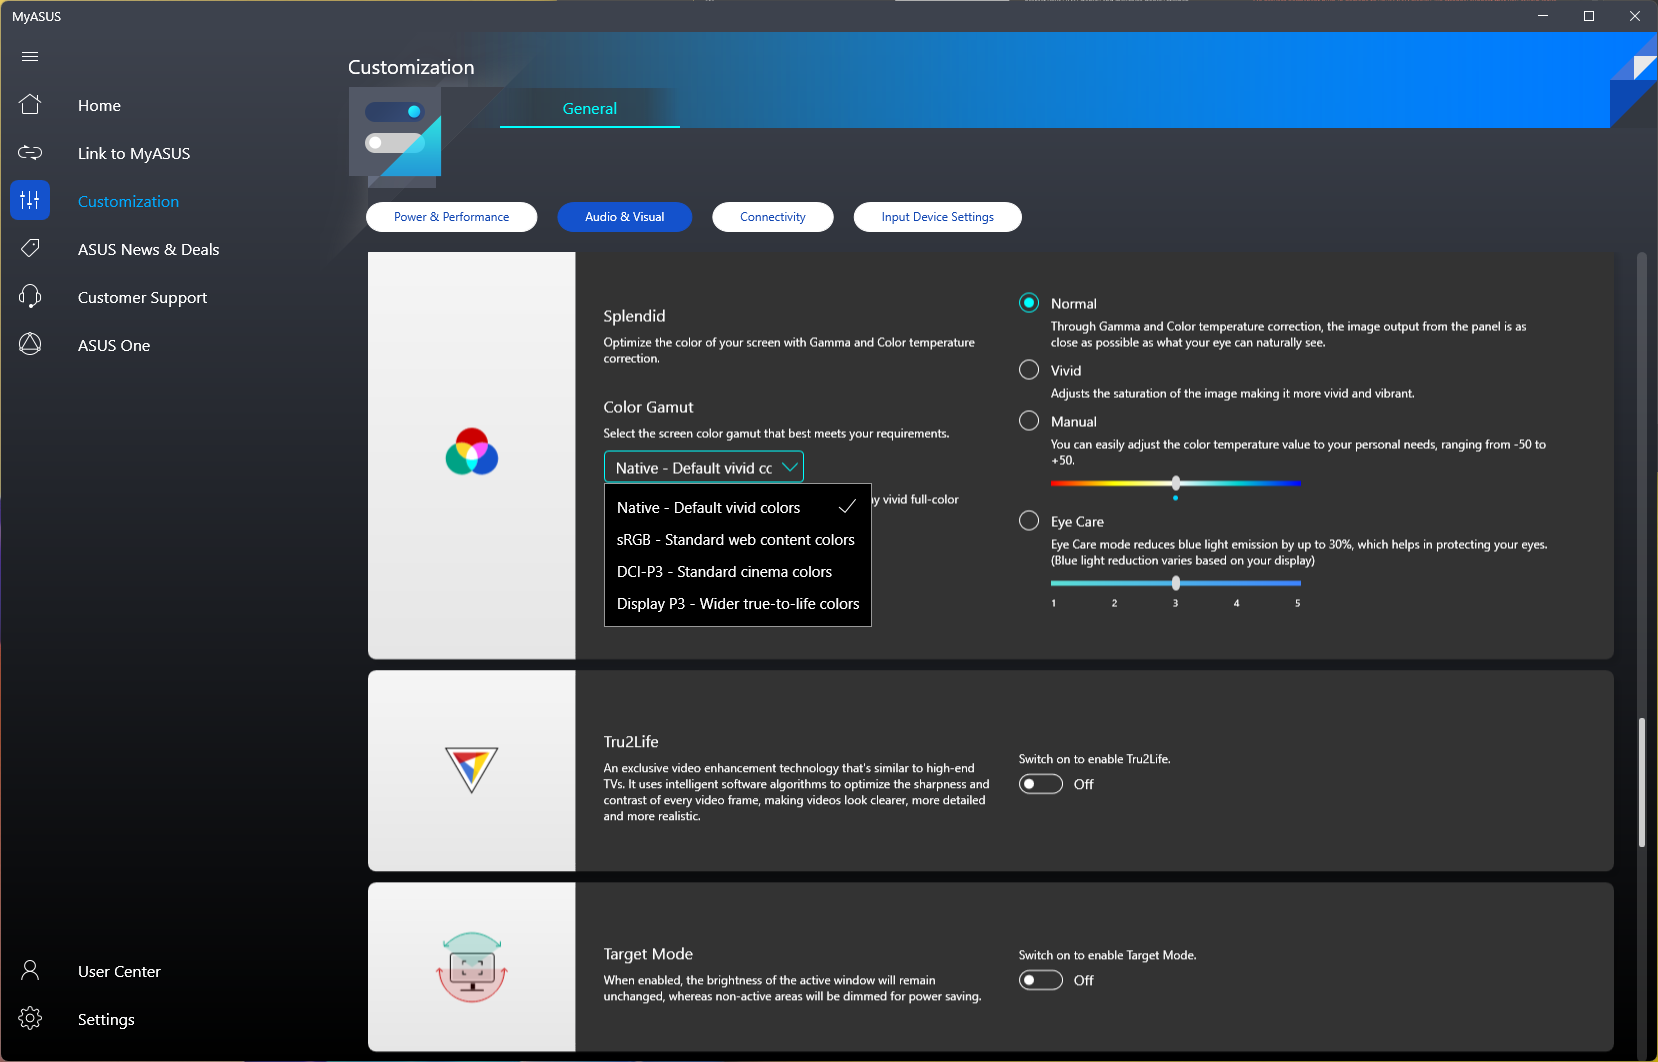
L'applicazione MyAsus offre diverse opzioni di visualizzazione. Abbiamo eseguito tutti i test utilizzando la modalità Normale, predefinita in fabbrica, con una gamma cromatica nativa.

| |||||||||||||||||||||||||
Distribuzione della luminosità: 85 %
Al centro con la batteria: 367 cd/m²
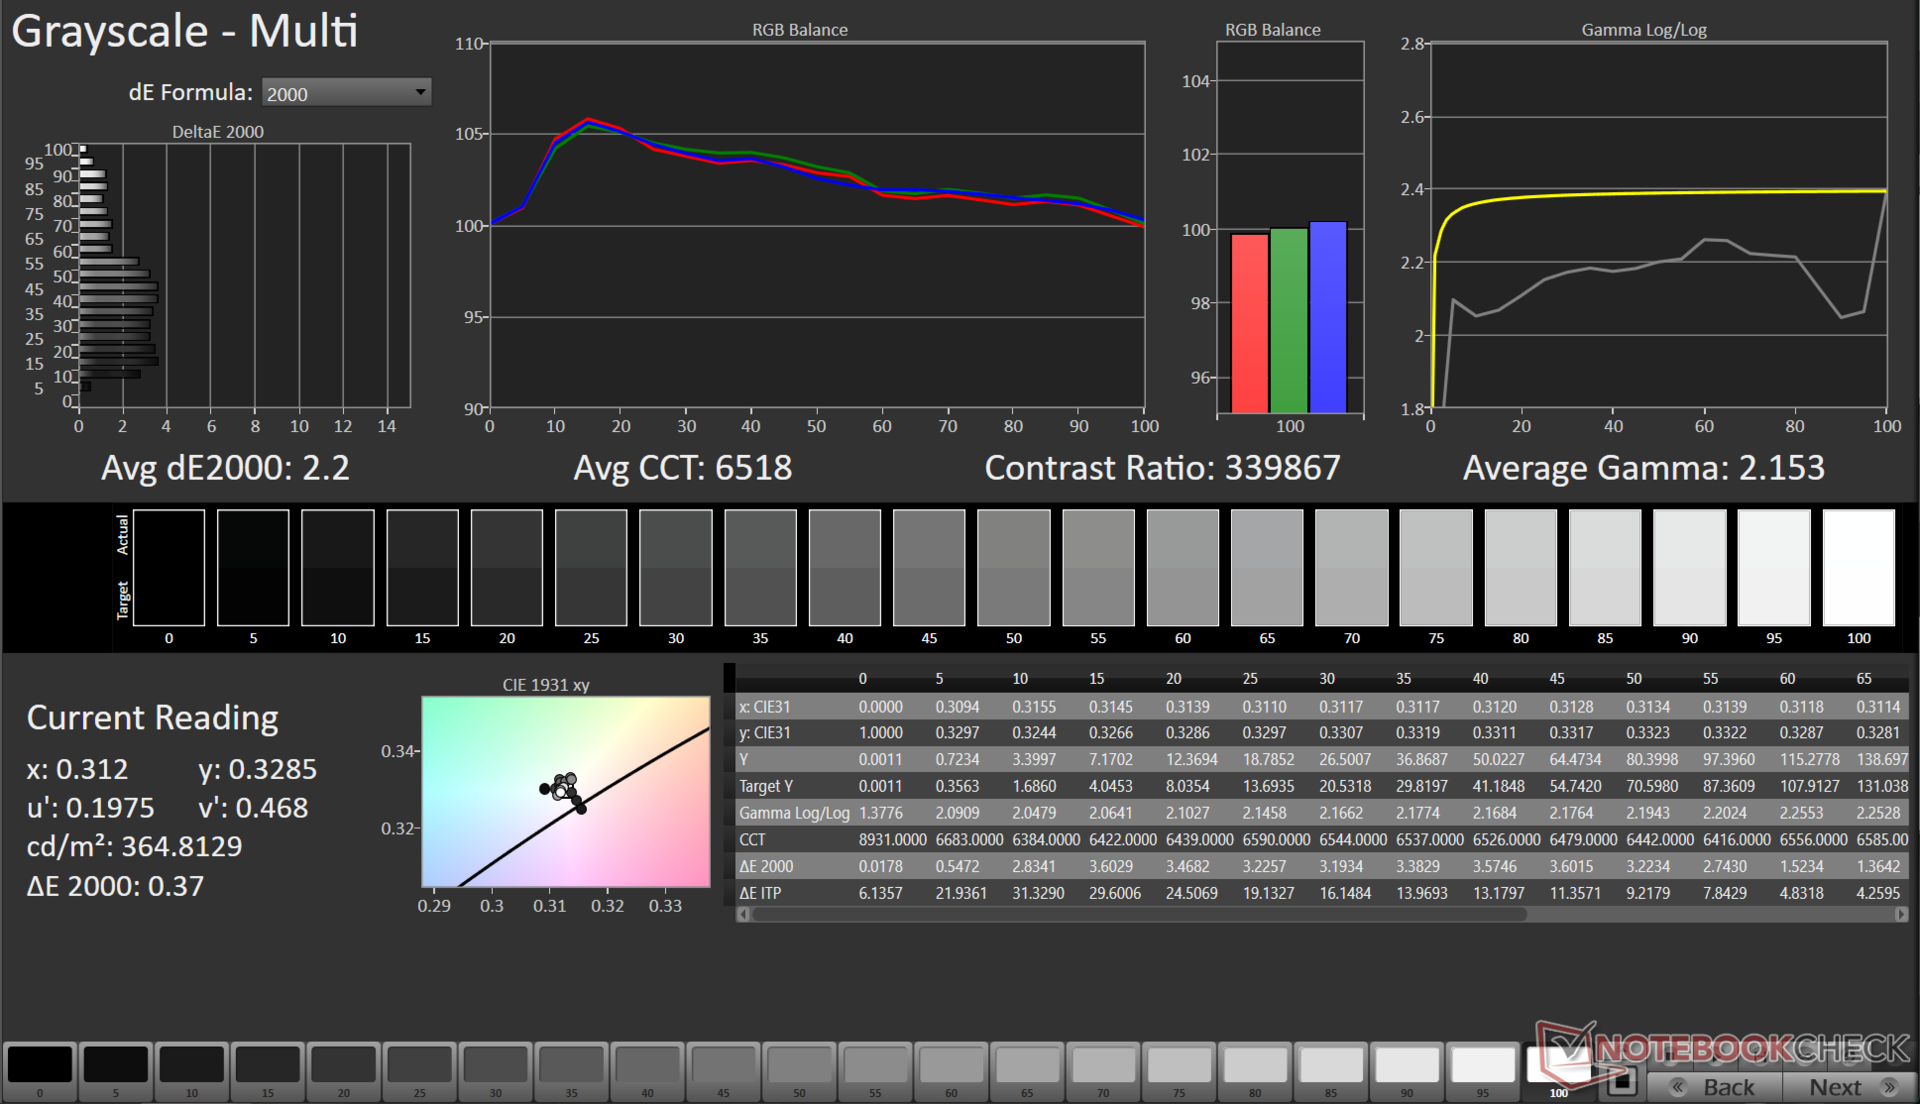
Contrasto: ∞:1 (Nero: 0 cd/m²)
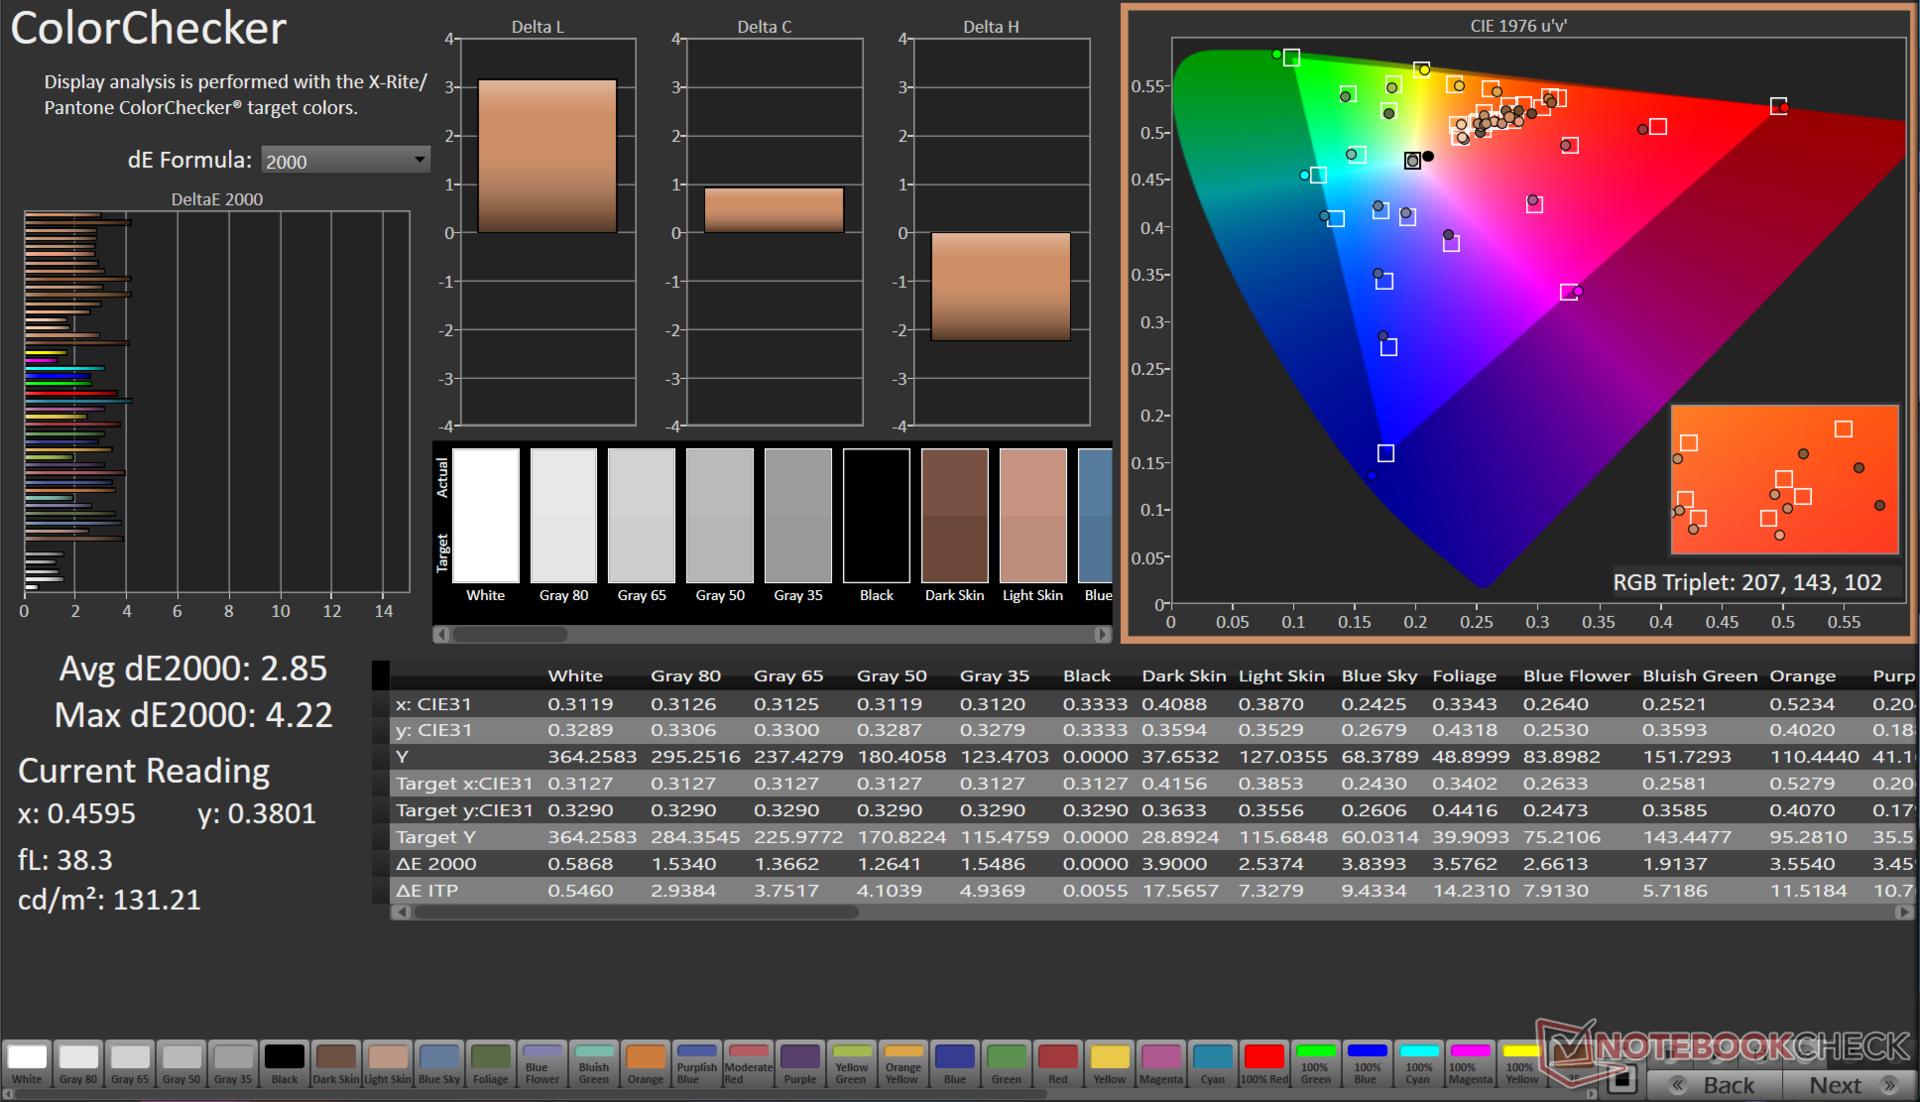
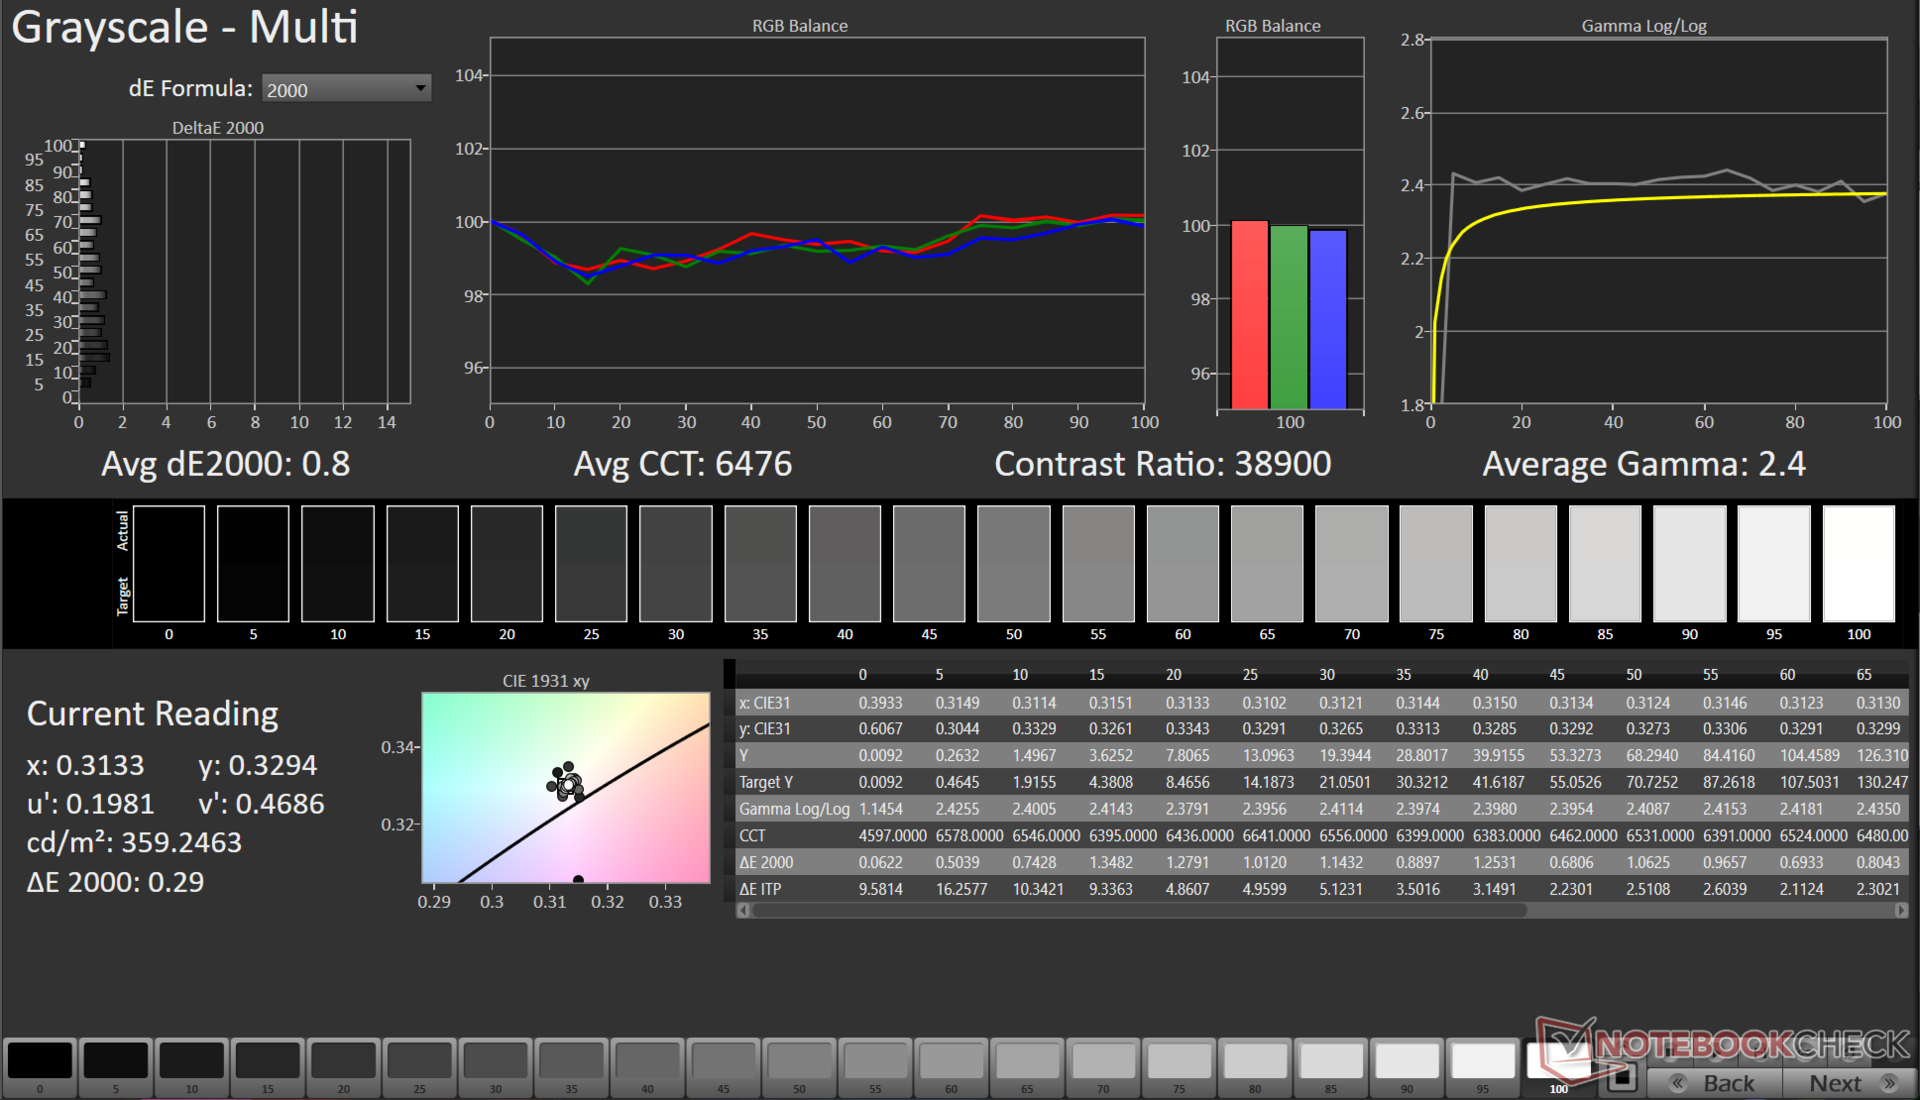
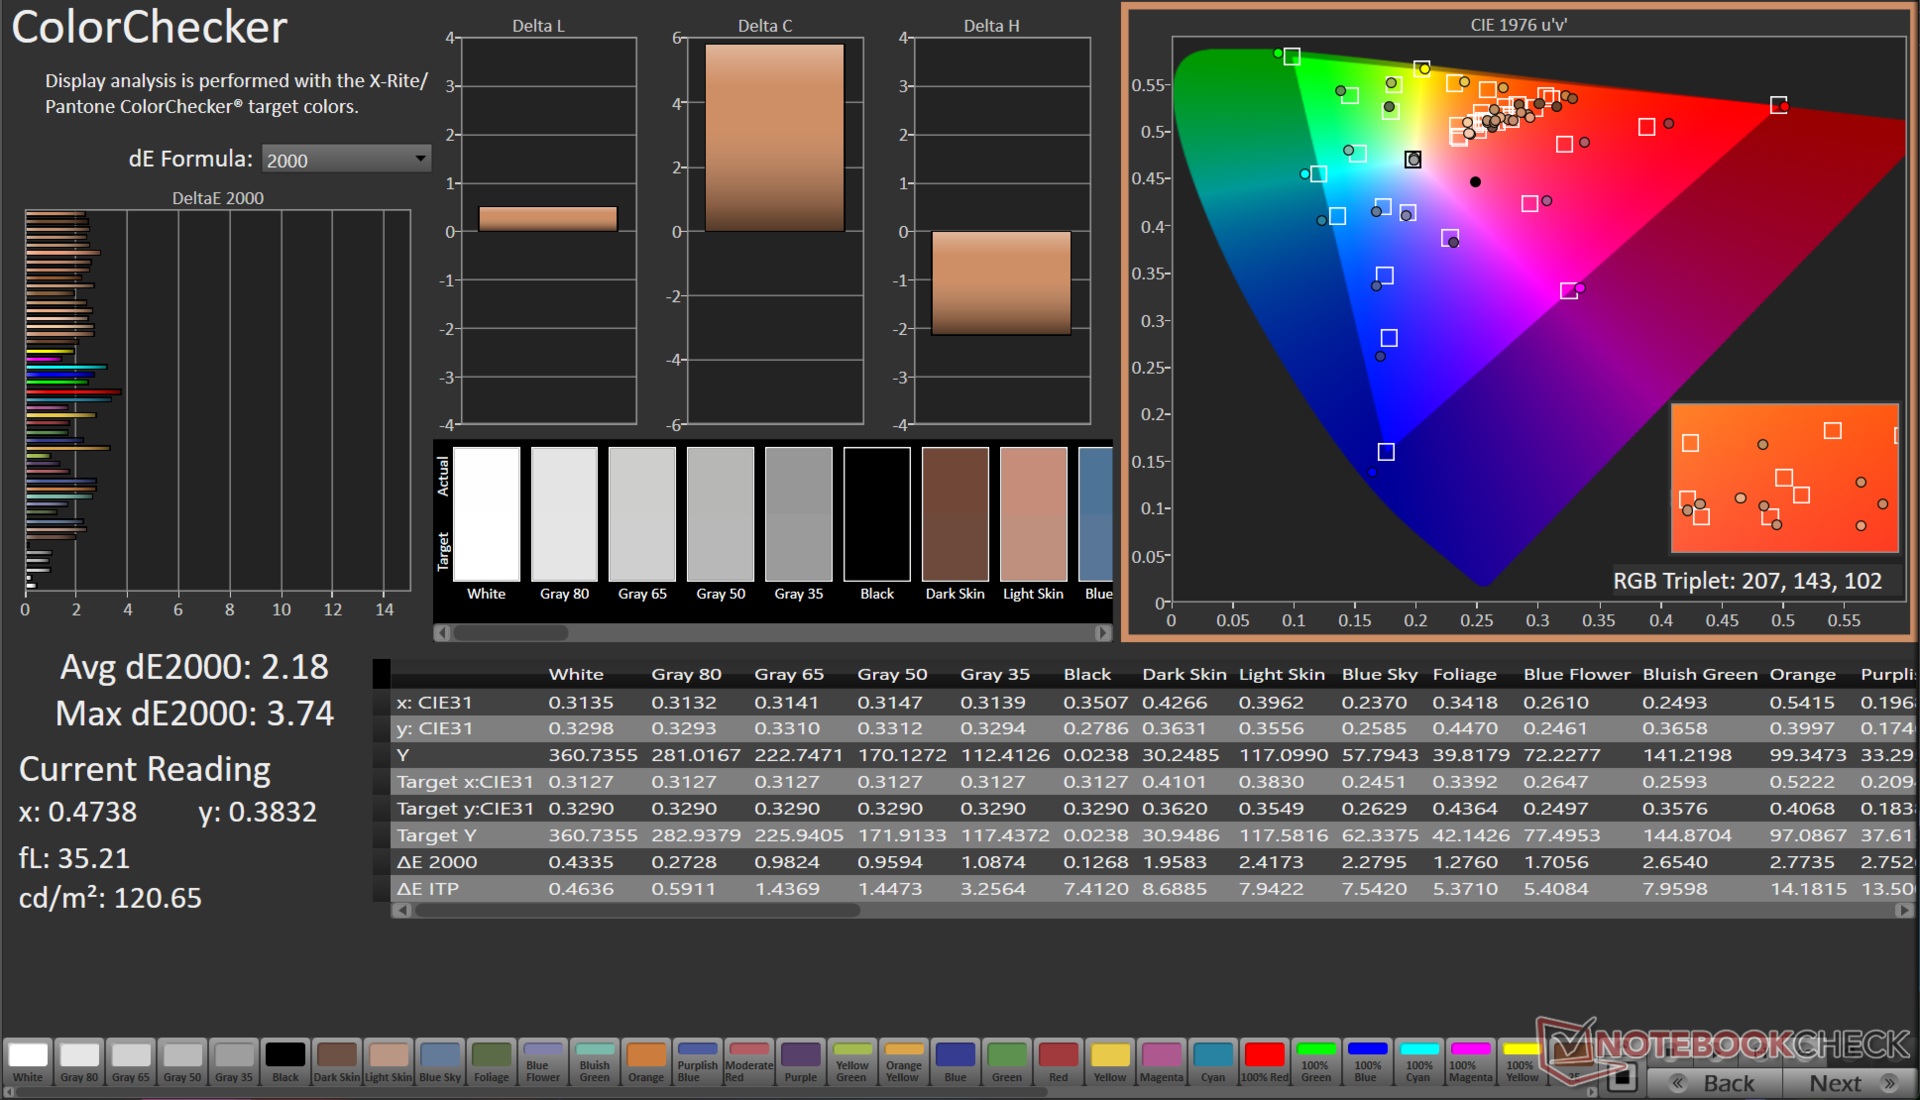
ΔE ColorChecker Calman: 2.85 | ∀{0.5-29.43 Ø4.72}
calibrated: 2.18
ΔE Greyscale Calman: 2.2 | ∀{0.09-98 Ø4.97}
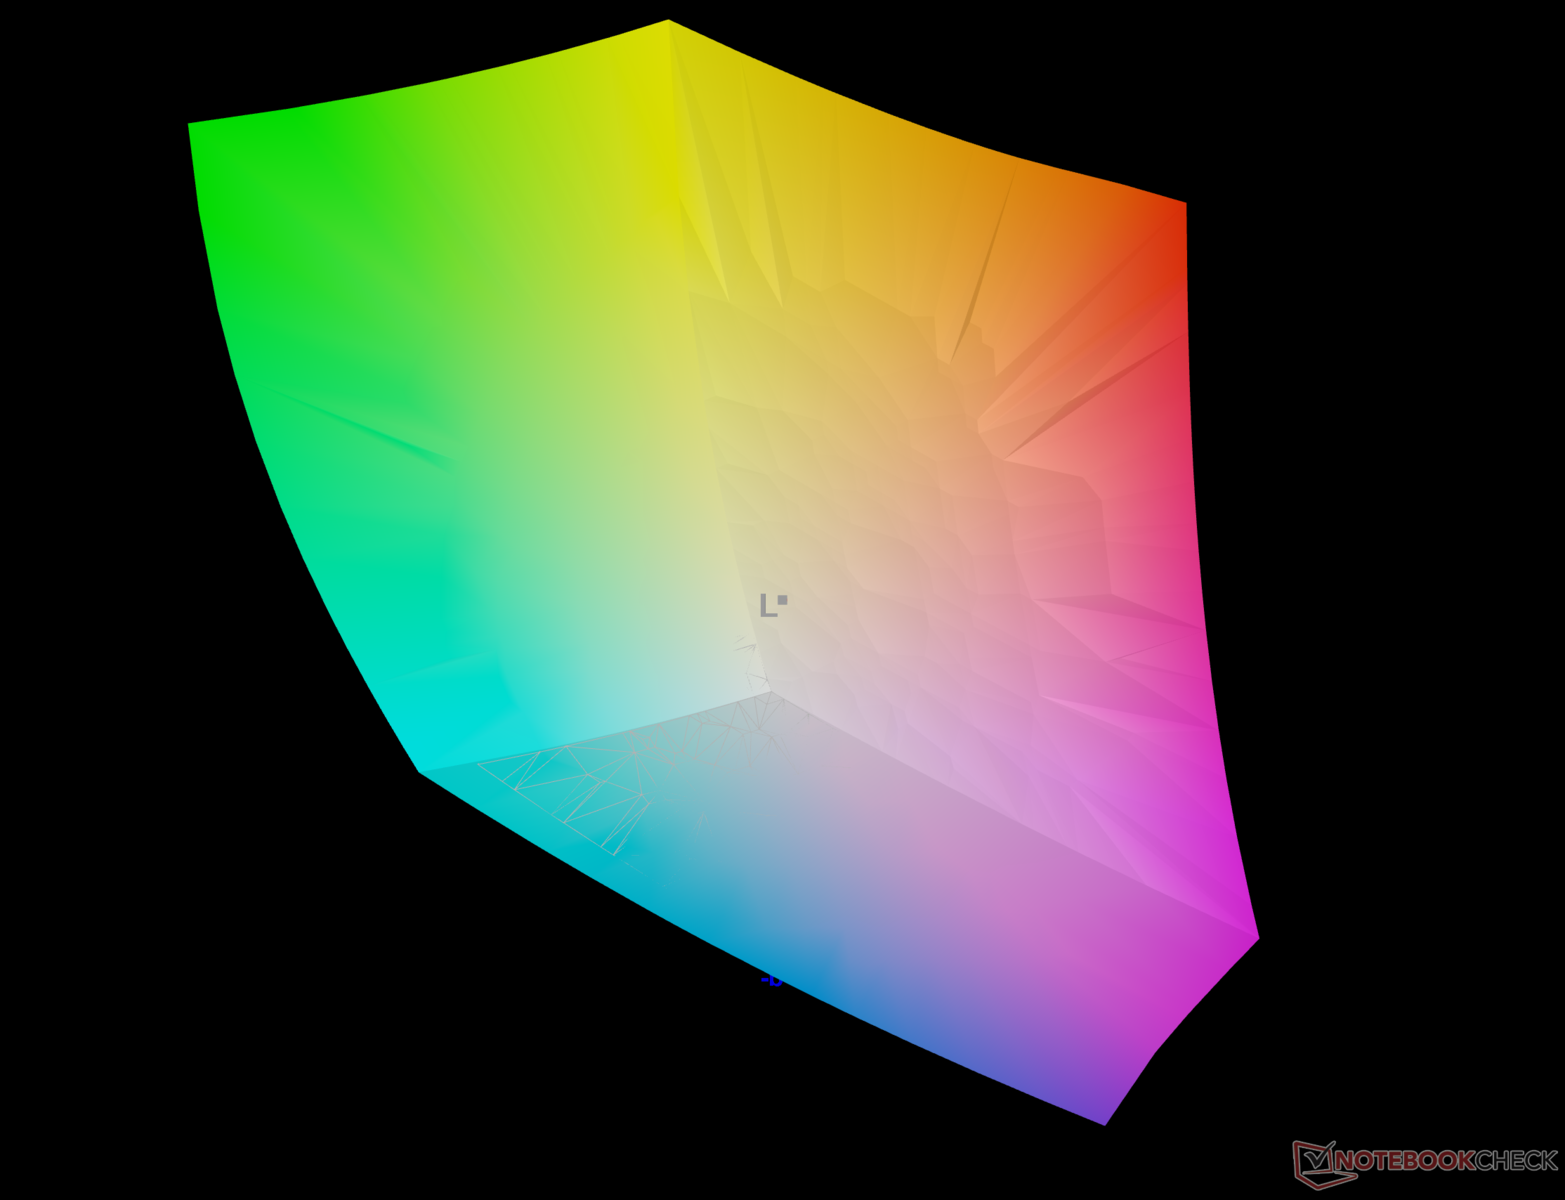
96.5% AdobeRGB 1998 (Argyll 3D)
100% sRGB (Argyll 3D)
99.9% Display P3 (Argyll 3D)
Gamma: 2.15
CCT: 6518 K
| Asus VivoBook 14X K3405 Samsung ATNA40YK07-1, , 2880x1800, 14" | Acer Swift X SFX14-71G ATNA45AF03-0, OLED, 2880x1800, 14.5" | MSI Stealth 14 Studio A13V B140QAN06.T, IPS, 2560x1600, 14" | Gigabyte Aero 14 OLED BMF Samsung SDC4192 (ATNA40YK14-0), OLED, 2880x1800, 14" | Lenovo Slim Pro 7 14ARP8 LEN89C1, IPS, 2560x1600, 14.5" | Schenker Vision 14 2022 RTX 3050 Ti MNE007ZA1-1, IPS, 2880x1800, 14" | |
|---|---|---|---|---|---|---|
| Display | 0% | -5% | -3% | -17% | -17% | |
| Display P3 Coverage (%) | 99.9 | 99.9 0% | 96.2 -4% | 99.8 0% | 72.9 -27% | 74.1 -26% |
| sRGB Coverage (%) | 100 | 99.9 0% | 99.6 0% | 100 0% | 98.2 -2% | 97.4 -3% |
| AdobeRGB 1998 Coverage (%) | 96.5 | 96.2 0% | 85.3 -12% | 88.7 -8% | 74.6 -23% | 75.3 -22% |
| Response Times | 81% | -159% | -13% | -1350% | -1320% | |
| Response Time Grey 50% / Grey 80% * (ms) | 1.15 ? | 0.4 ? 65% | 5.5 ? -378% | 2.4 ? -109% | 31.8 ? -2665% | 31.5 ? -2639% |
| Response Time Black / White * (ms) | 14.4 ? | 0.6 ? 96% | 5.8 ? 60% | 2.4 ? 83% | 19.3 ? -34% | 14.5 ? -1% |
| PWM Frequency (Hz) | 90.02 ? | 240 ? | 300 | |||
| Screen | 15% | 3% | 45% | -16% | -14% | |
| Brightness middle (cd/m²) | 369 | 388 5% | 419 14% | 423 15% | 344.7 -7% | 421 14% |
| Brightness (cd/m²) | 364 | 390 7% | 402 10% | 427 17% | 334 -8% | 416 14% |
| Brightness Distribution (%) | 85 | 98 15% | 89 5% | 98 15% | 92 8% | 89 5% |
| Black Level * (cd/m²) | 0.43 | 0.1 | 0.31 | 0.28 | ||
| Colorchecker dE 2000 * | 2.85 | 2.2 23% | 2.3 19% | 0.55 81% | 3.01 -6% | 3.2 -12% |
| Colorchecker dE 2000 max. * | 4.22 | 3.9 8% | 5.8 -37% | 1.15 73% | 6.3 -49% | 5.5 -30% |
| Colorchecker dE 2000 calibrated * | 2.18 | 1.9 13% | 0.9 59% | 1.15 47% | 0.83 62% | 2 8% |
| Greyscale dE 2000 * | 2.2 | 1.4 36% | 3.3 -50% | 0.69 69% | 4.6 -109% | 4.4 -100% |
| Gamma | 2.15 102% | 2.22 99% | 2.14 103% | 2.42 91% | 2.28 96% | 2.22 99% |
| CCT | 6518 100% | 6380 102% | 6550 99% | 6479 100% | 6420 101% | 6384 102% |
| Contrast (:1) | 974 | 4230 | 1112 | 1504 | ||
| Media totale (Programma / Settaggio) | 32% /
22% | -54% /
-26% | 10% /
24% | -461% /
-238% | -450% /
-233% |
* ... Meglio usare valori piccoli
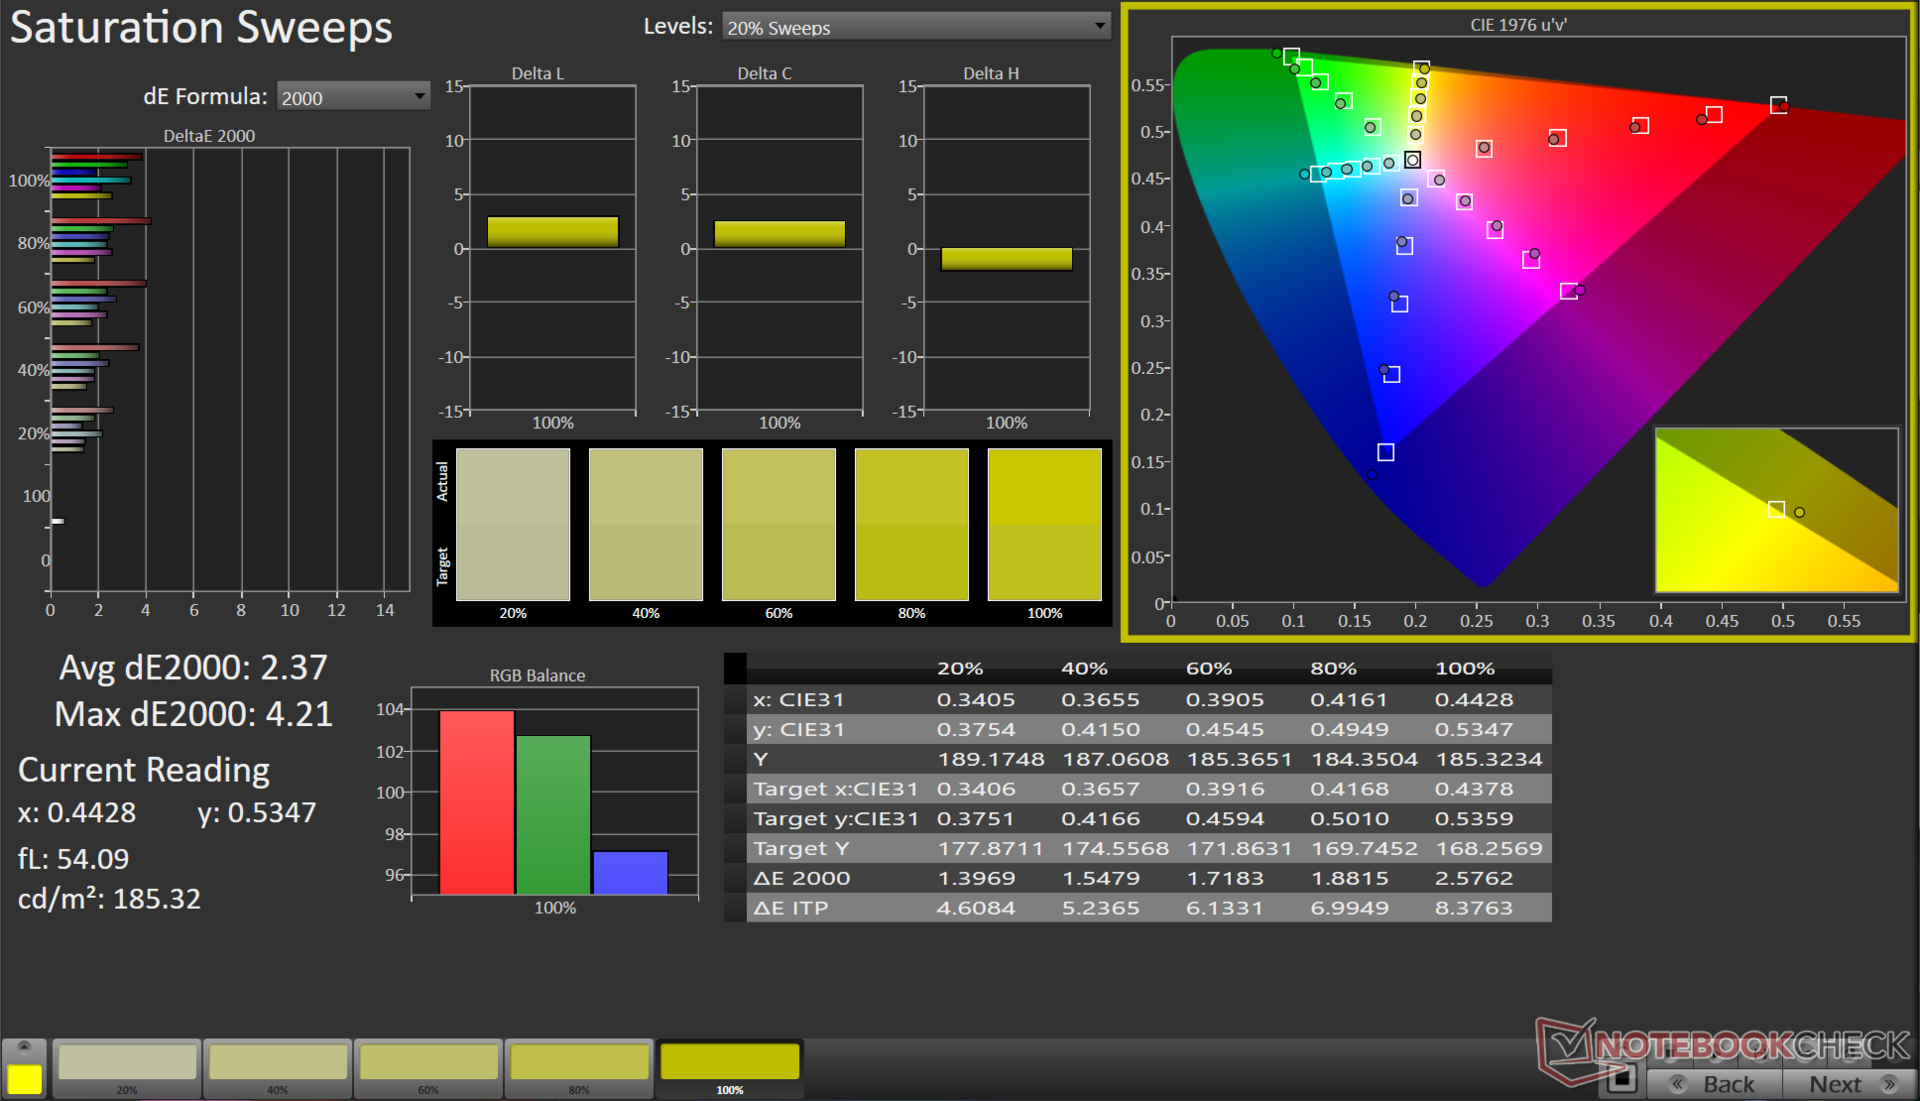
I creatori di contenuti saranno soddisfatti dell'impressionante copertura dell'intero spazio colore sRGB (100%) e della copertura quasi completa delle gamme cromatiche Adobe RGB (96,5%) e Display P3 (99,9%).


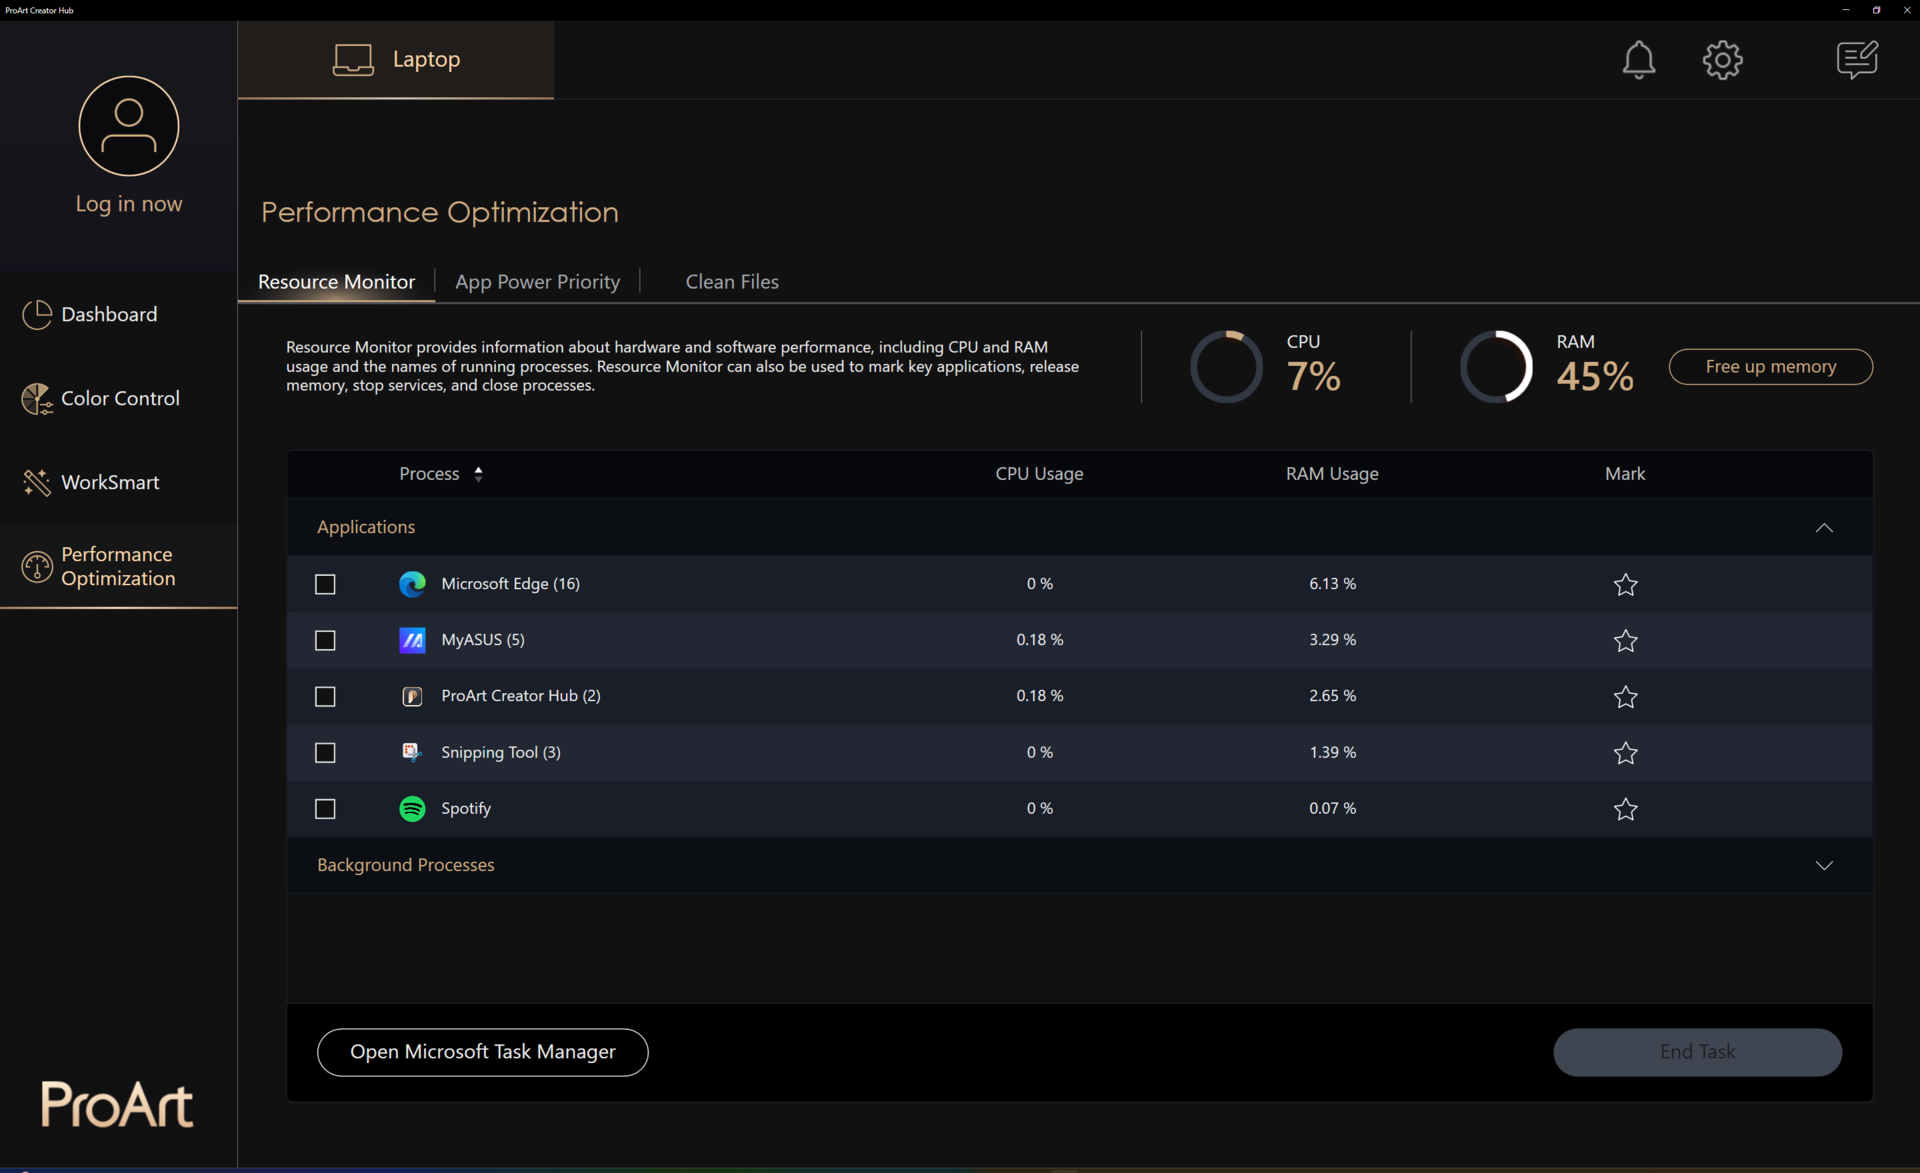
Abbiamo eseguito la calibrazione del colore nello spazio colore Display P3. Il VivoBook 14X mostra già valori bassi di Delta E in Scala di grigi e ColorChecker. È inoltre possibile utilizzare ProArt Creator Hub e un calibratore X-Rite i1Display compatibile per eseguire la propria calibrazione.
Utilizzando il nostro spettrofotometro X-Rite i1Basic Pro 3 e il software Calman Ultimate di Portrait Displays, siamo riusciti a ottenere un Delta E significativamente più basso di 0,8 nella scala dei grigi. Tuttavia, sono stati riscontrati solo miglioramenti marginali nei valori ColorChecker.
Il file ICC calibrato può essere scaricato dal link qui sopra.
Tempi di risposta del Display
| ↔ Tempi di risposta dal Nero al Bianco | ||
|---|---|---|
| 14.4 ms ... aumenta ↗ e diminuisce ↘ combinato | ↗ 12.8 ms Incremento | 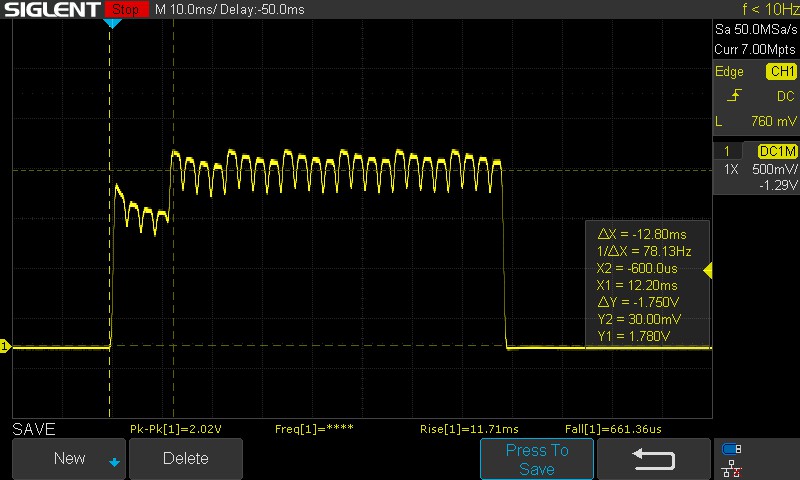 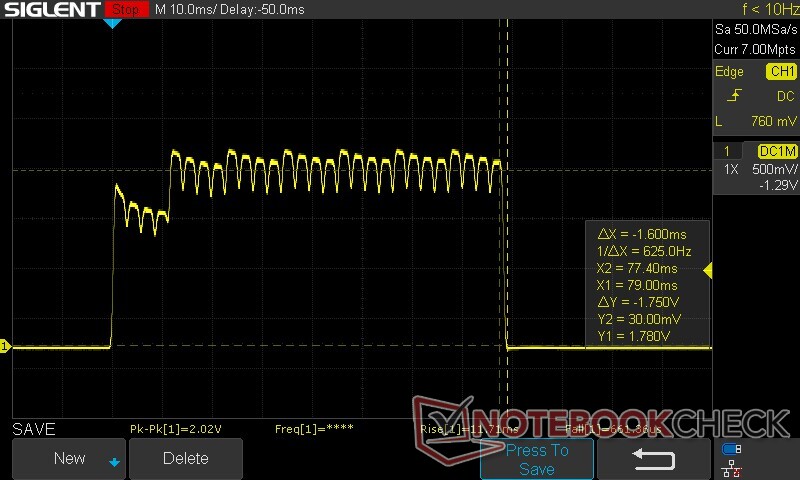 |
| ↘ 1.6 ms Calo | ||
| Lo schermo mostra buoni tempi di risposta durante i nostri tests, ma potrebbe essere troppo lento per i gamers competitivi. In confronto, tutti i dispositivi di test variano da 0.1 (minimo) a 240 (massimo) ms. » 35 % di tutti i dispositivi è migliore. Questo significa che i tempi di risposta rilevati sono migliori rispettto alla media di tutti i dispositivi testati (19.8 ms). | ||
| ↔ Tempo di risposta dal 50% Grigio all'80% Grigio | ||
| 1.15 ms ... aumenta ↗ e diminuisce ↘ combinato | ↗ 0.57 ms Incremento | 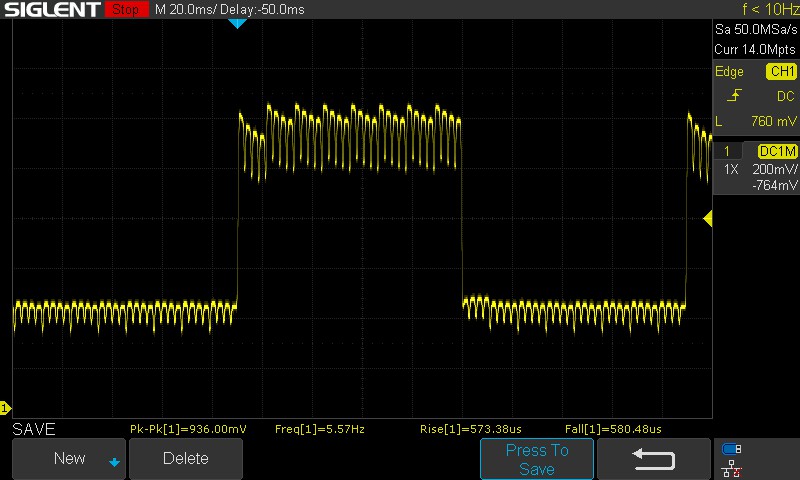 |
| ↘ 0.58 ms Calo | ||
| Lo schermo ha mostrato valori di risposta molto veloci nei nostri tests ed è molto adatto per i gaming veloce. In confronto, tutti i dispositivi di test variano da 0.165 (minimo) a 636 (massimo) ms. » 5 % di tutti i dispositivi è migliore. Questo significa che i tempi di risposta rilevati sono migliori rispettto alla media di tutti i dispositivi testati (31 ms). | ||
La misurazione manuale è stata necessaria per stimare i tempi di risposta a causa dello sfarfallio di fondo. La transizione da 100% nero a 100% bianco richiede 14,4 ms, un tempo leggermente superiore per un pannello OLED. Tuttavia, le transizioni dal 50% di grigio all'80% di grigio sono molto più rapide, con 1,15 ms.
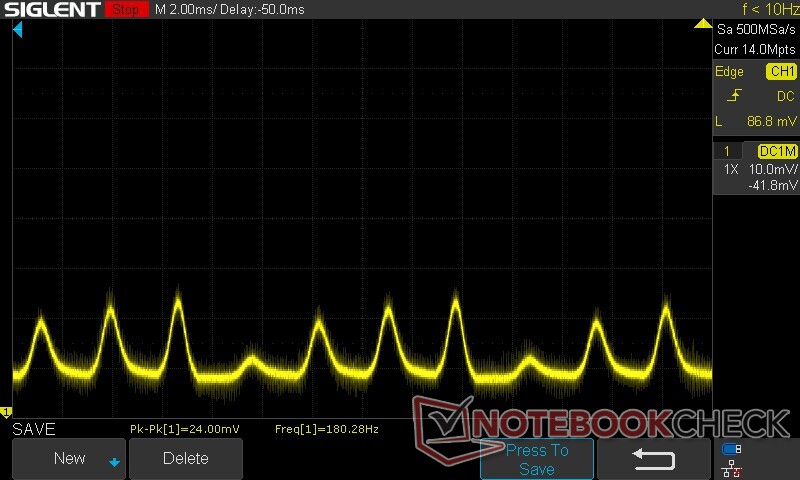
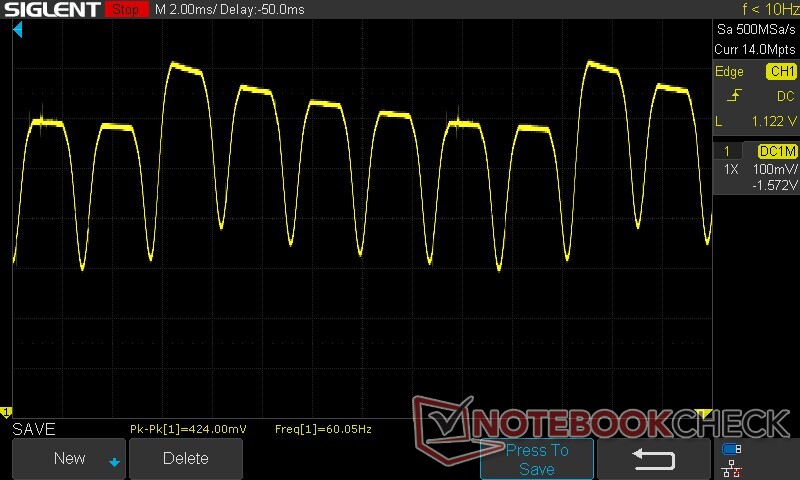
Sfarfallio dello schermo / PWM (Pulse-Width Modulation)
| flickering dello schermo / PWM rilevato | 90.02 Hz | 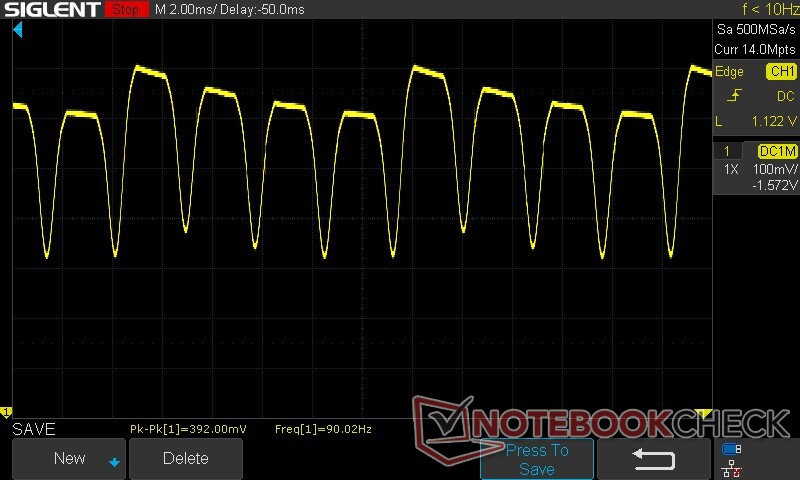 | |
| ≤ 100 luminosita' cd/m² | |||
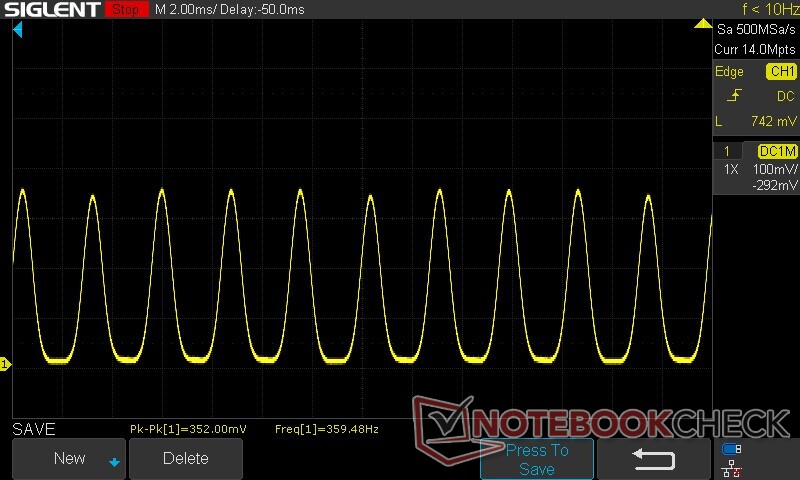
Il display sfarfalla a 90.02 Hz (Probabilmente a causa dell'uso di PWM) Flickering rilevato ad una luminosita' di 100 cd/m² o inferiore. Non dovrebbe verificarsi flickering o PWM sopra questo valore di luminosita'. La frequenza di 90.02 Hz è molto bassa, quindi il flickering potrebbe causare stanchezza agli occhi e mal di testa con un utilizzo prolungato. Il flickering di verifica con settaggi di luminosita' relativamente bassa, quindi un utilizzo prolungato a questi livelli o a livelli ingeriori potrebbe causare stanchezza agli occhi. In confronto: 52 % di tutti i dispositivi testati non utilizza PWM per ridurre la luminosita' del display. Se è rilevato PWM, una media di 7772 (minimo: 5 - massimo: 343500) Hz è stata rilevata. | |||
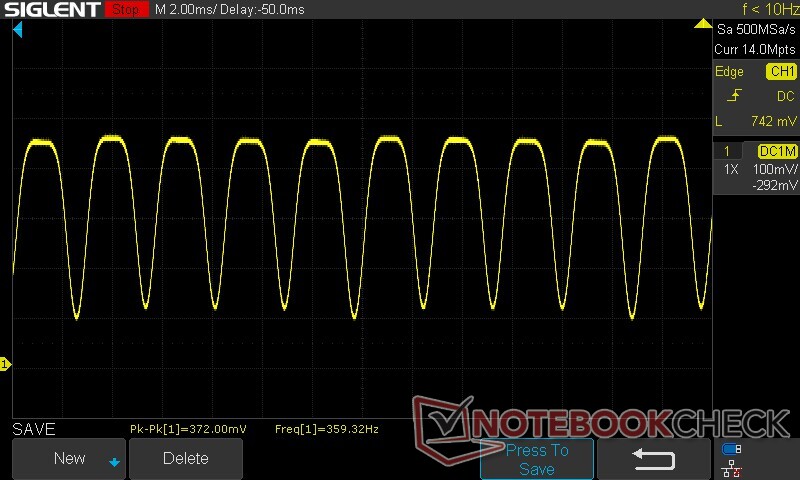
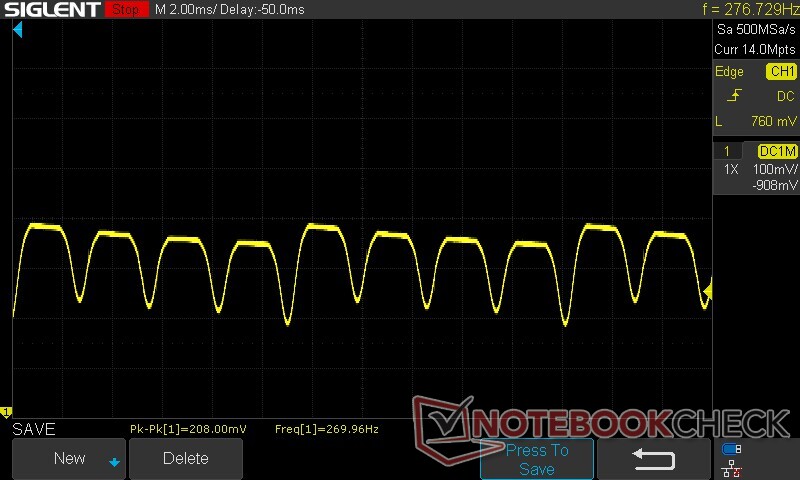
Il pannello utilizza una regolazione continua a 90 Hz tra il 75% e il 100% della luminosità. Al di sotto del 75%, il pannello passa a una frequenza PWM di circa 360 Hz.
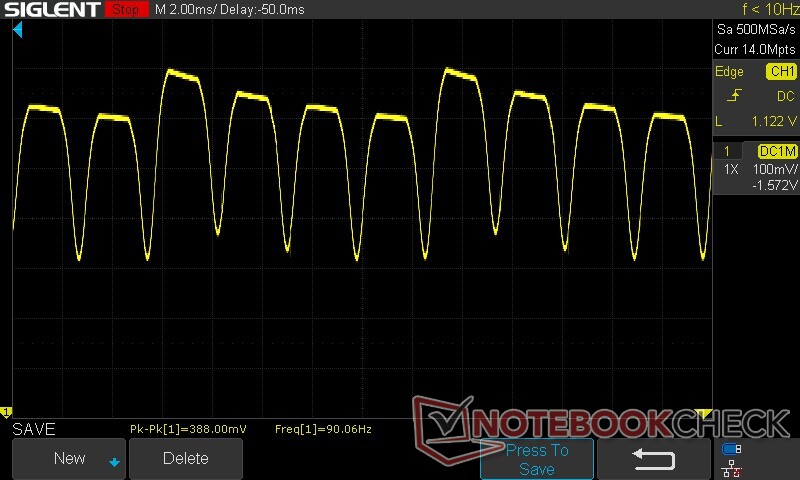
Il DC Dimming a 90 Hz dovrebbe essere relativamente meno faticoso per gli occhi rispetto allo sfarfallio PWM. Questa frequenza scende a 60 Hz alla corrispondente frequenza di aggiornamento.
Si consiglia di impostare i livelli di luminosità al di sopra del 50% per ridurre al minimo l'affaticamento visivo.
Per ulteriori informazioni, consultare "Perché il PWM è un problema" e "Analisi: Dimmerazione DC vs PWM - È possibile dimmerare i display AMOLED senza sfarfallio?". Una panoramica del PWM misurato su tutti i dispositivi recensiti è disponibile nella nostra Tabella di classificazione PWM.
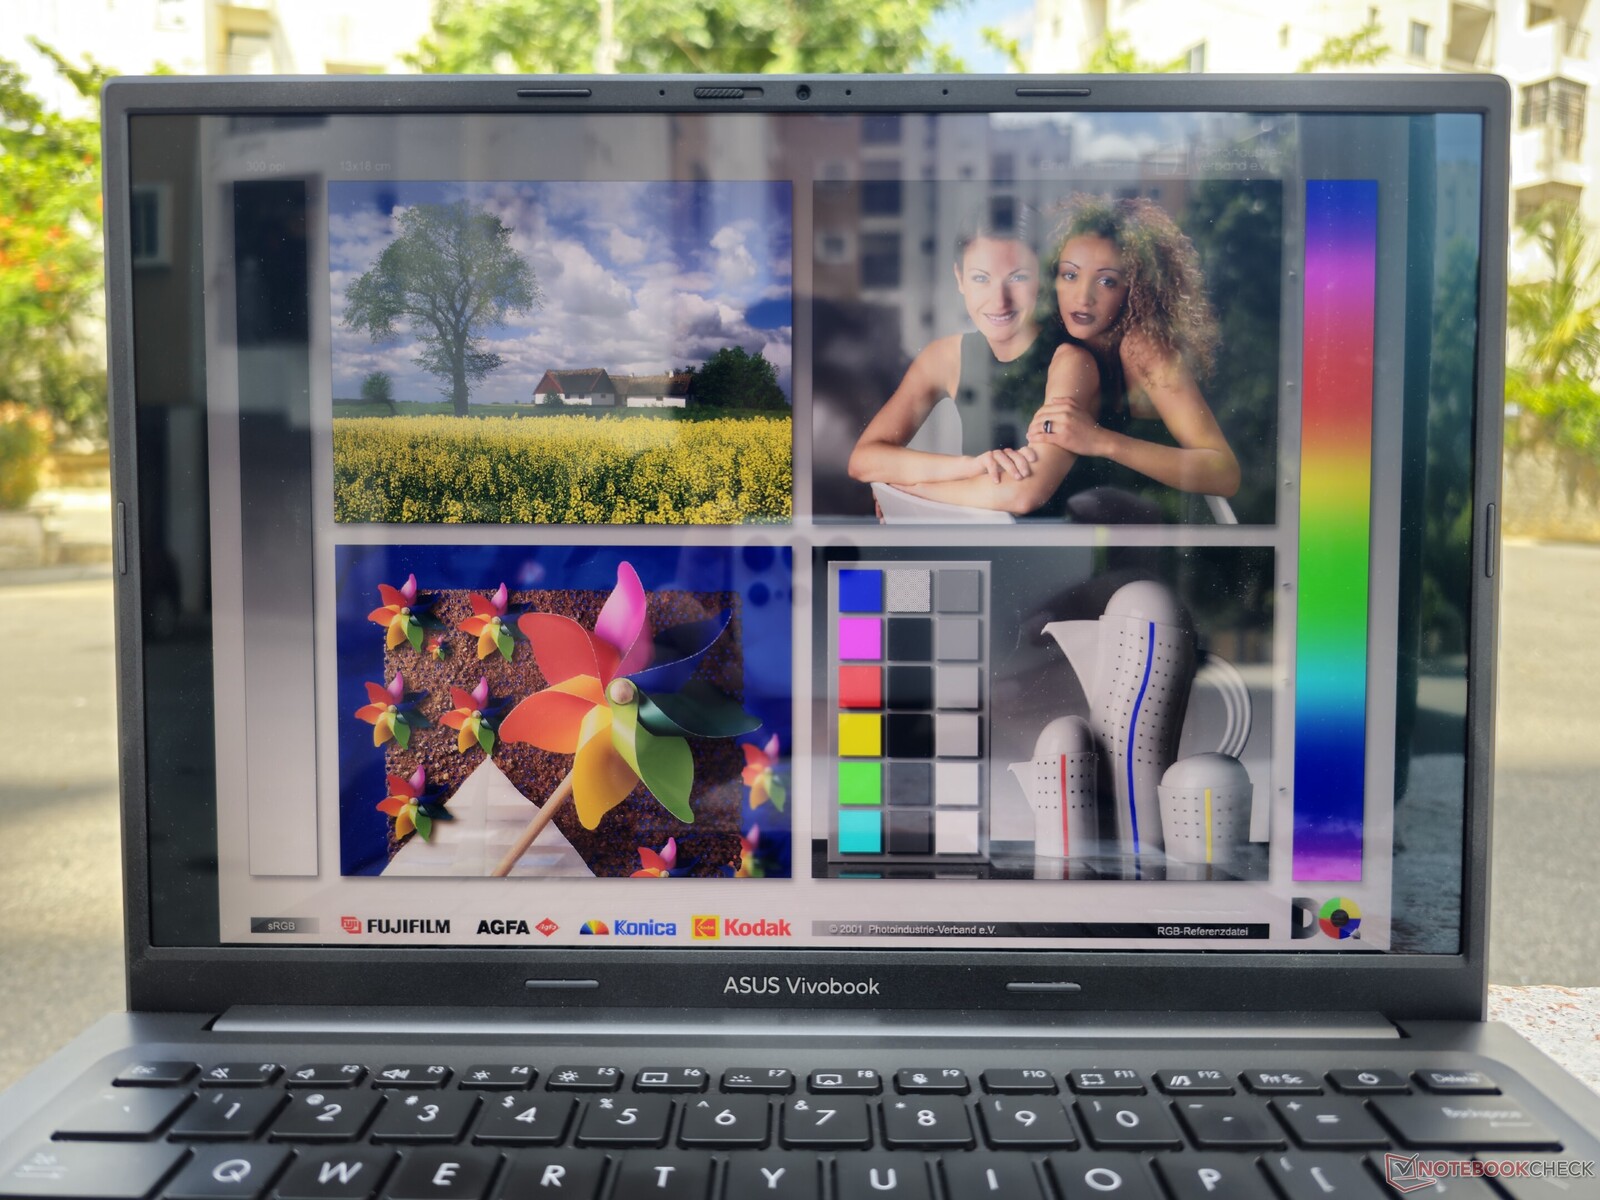
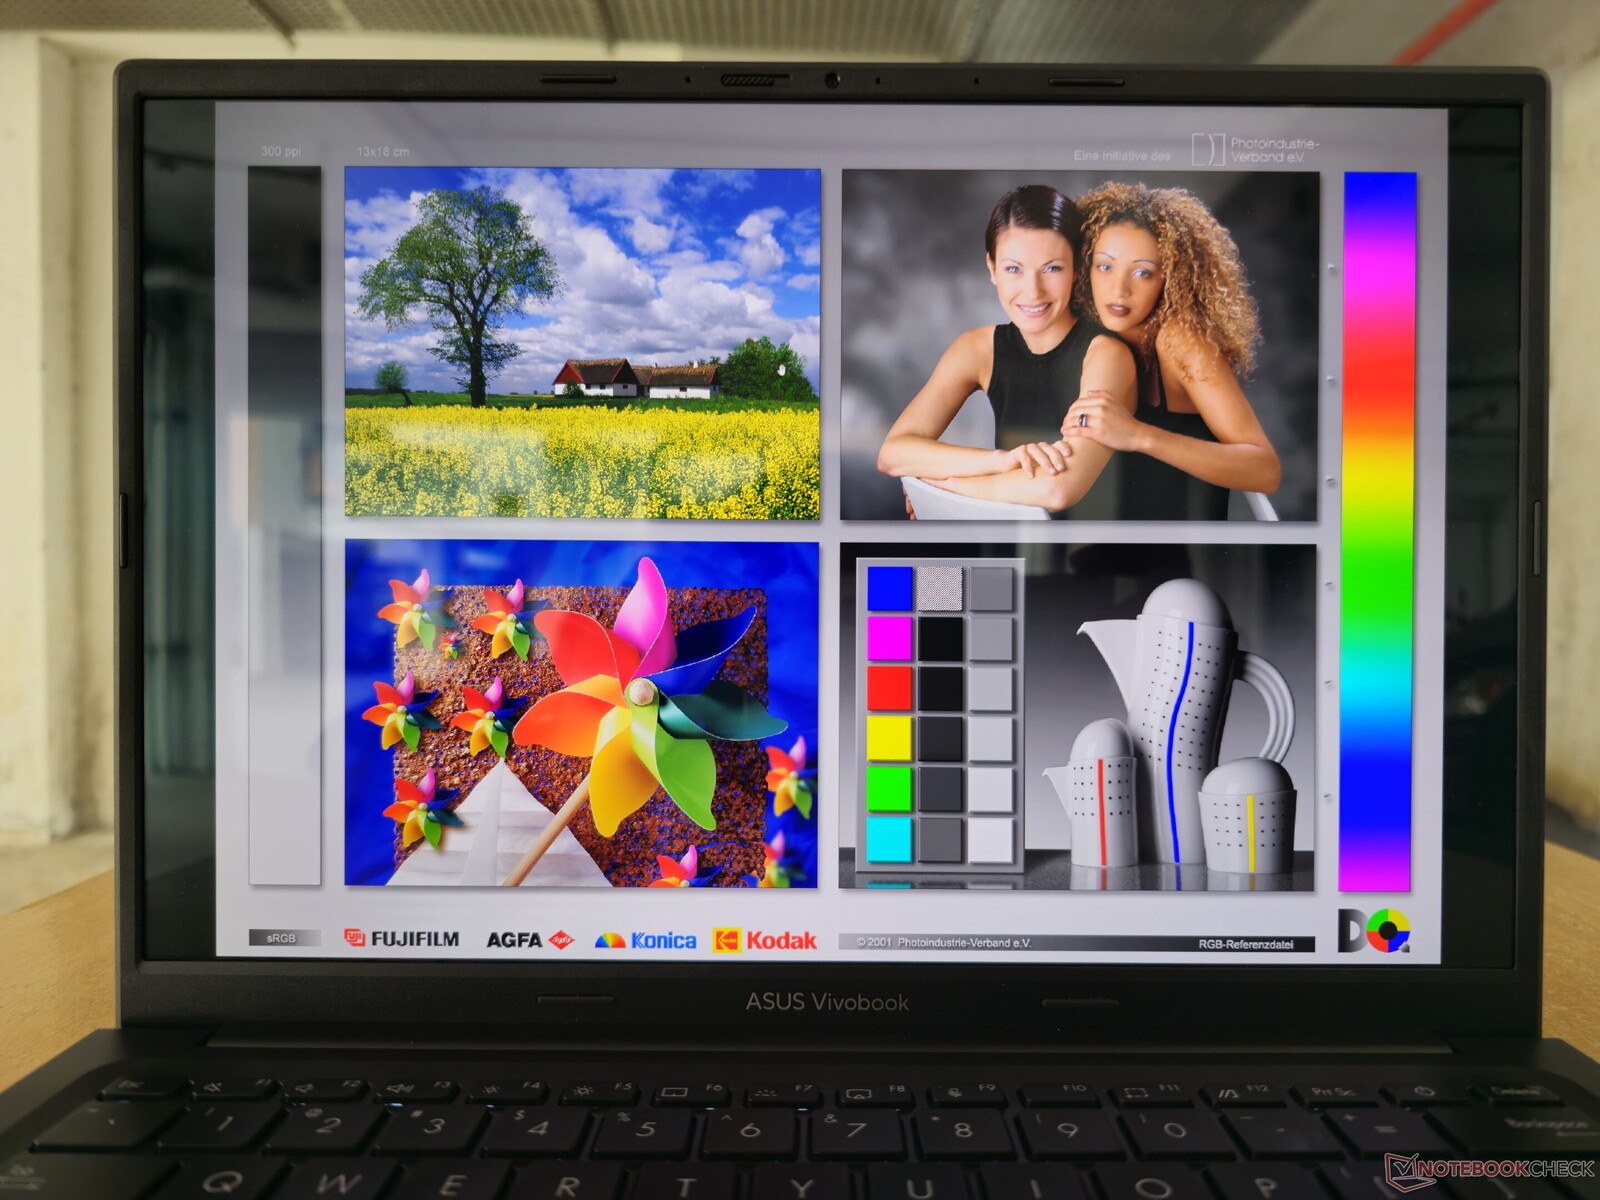
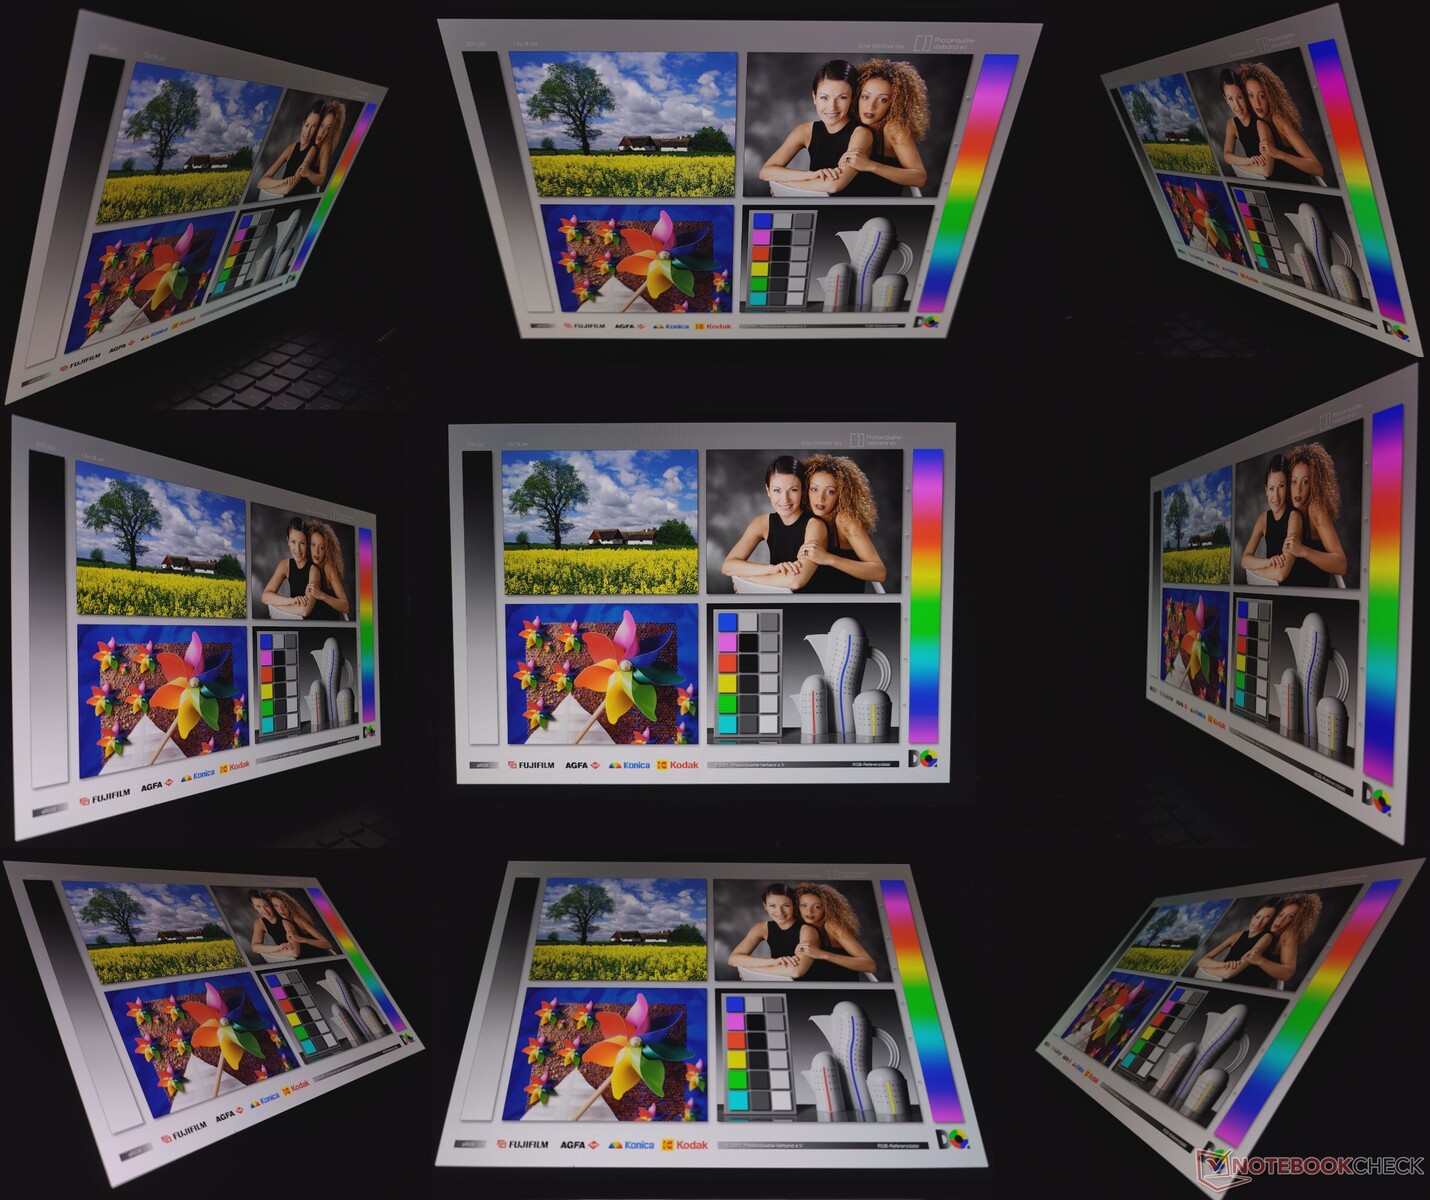
La visione all'aperto sotto la luce del sole può essere fastidiosa a causa dello schermo lucido. Gli angoli di visione sono buoni, con una perdita minima di luminosità agli angoli estremi e nessuna sfumatura verde visibile.
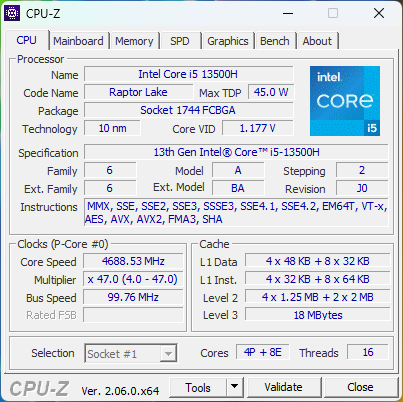
Prestazioni: Core i5-13500H con un po' di strozzatura
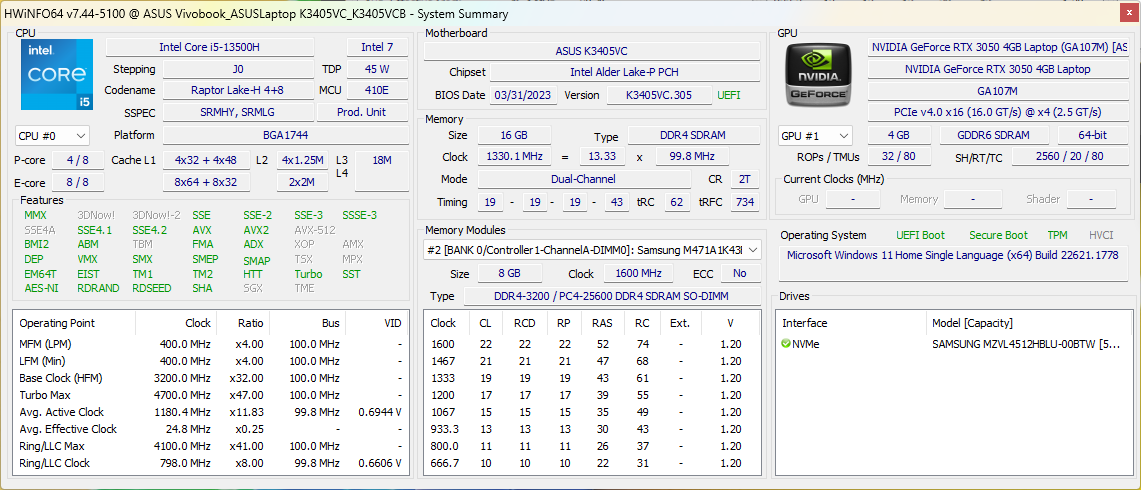
Il nostro Asus VivoBook 14X OLED è alimentato dal processore Intel Core i5-13500H CPU e GPU Nvidia GeForce RTX 3050 4 GB per computer portatili. Le SKU RTX 3050 possono essere configurate con un Core i5-13500H o un Core i9-13900H.
Un RTX 2050 Mobile ma solo con un Core i5-13500H.
Condizioni di test
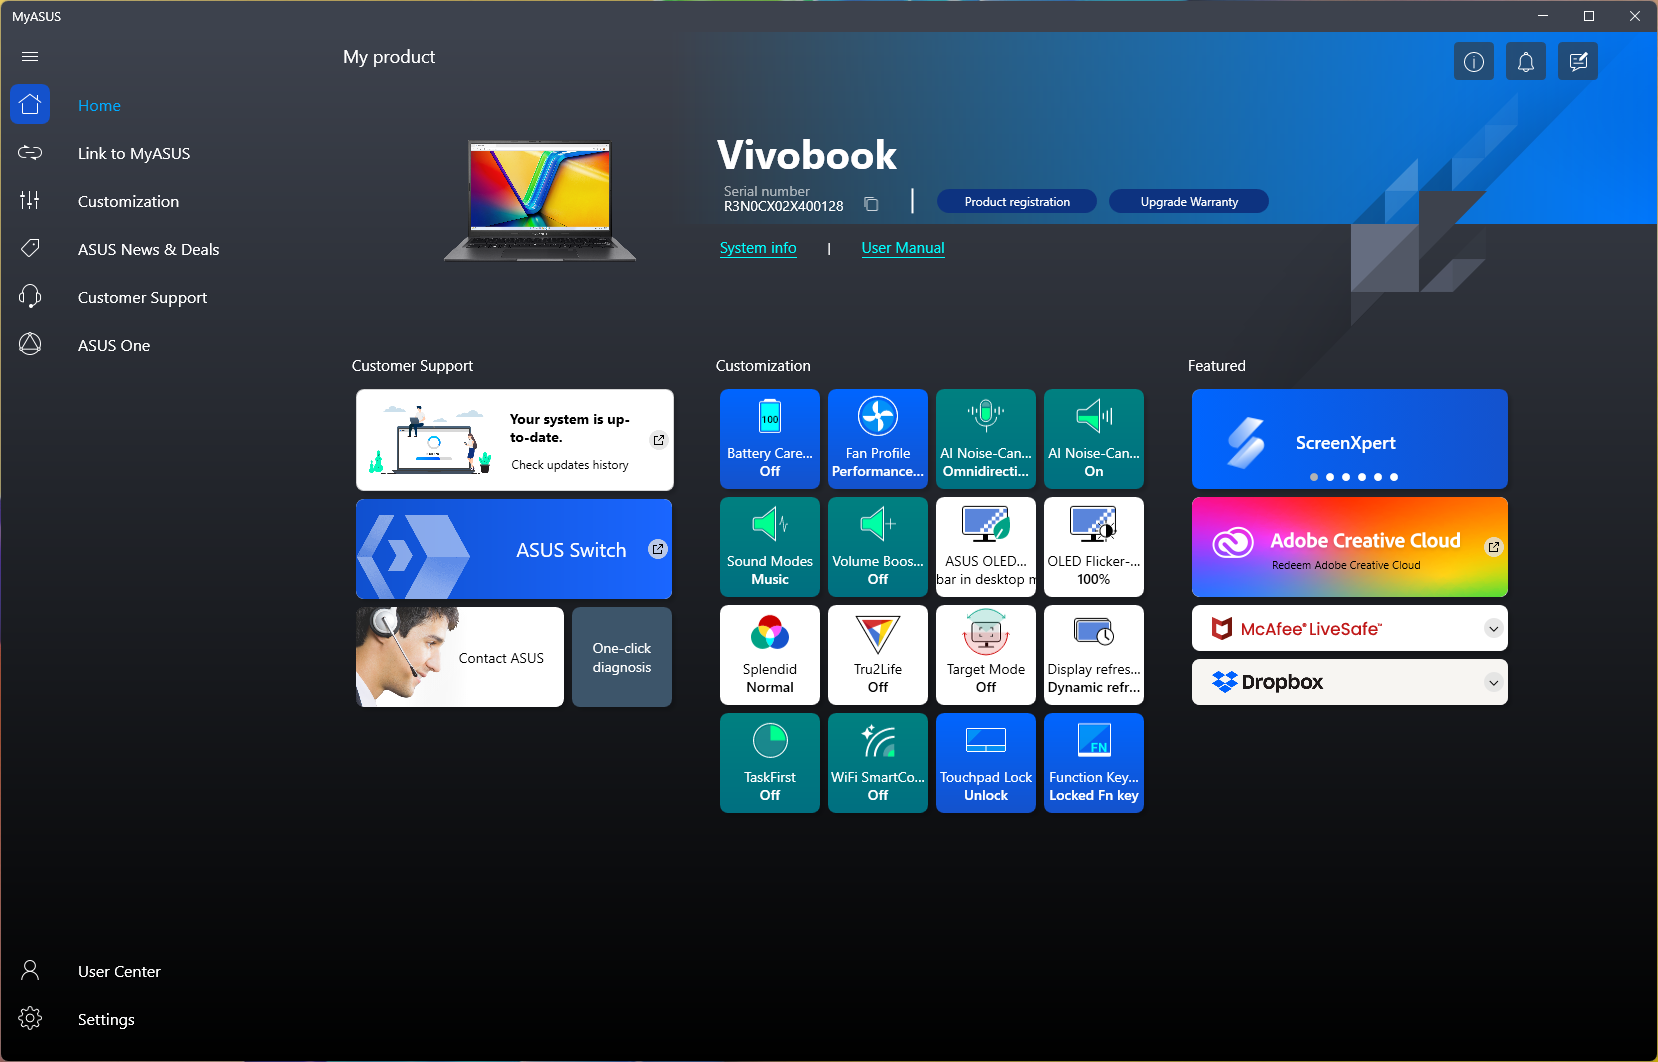
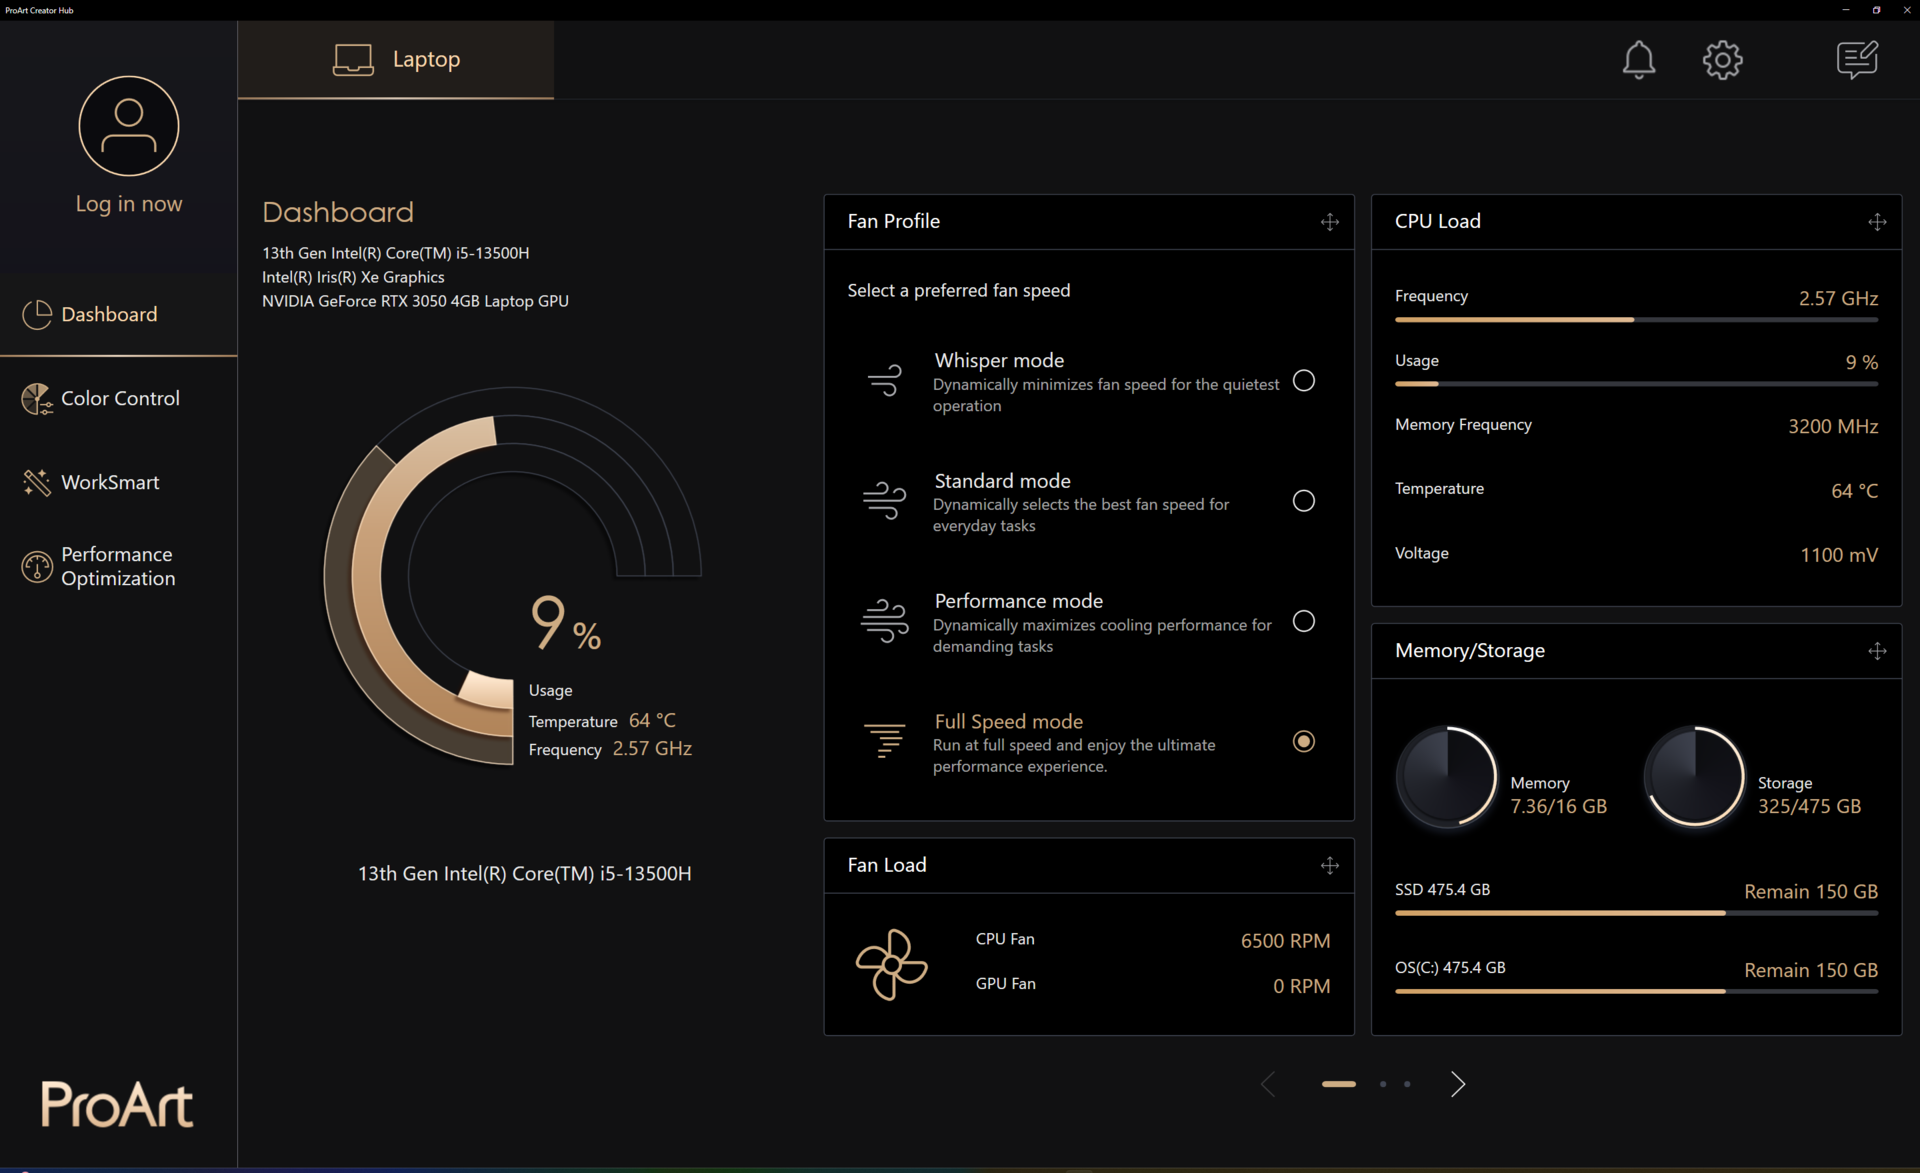
Asus divide in modo ridondante le impostazioni delle prestazioni tra l'applicazione MyAsus e ProArt Creator Hub, anche se l'applicazione MyAsus dovrebbe essere sufficiente nella maggior parte dei casi. Tuttavia, è necessario utilizzare ProArt Creator Hub per accedere alla modalità Full Speed.
Abbiamo utilizzato la modalità Full Speed per tutti i benchmark delle prestazioni e la modalità Standard per i test della batteria.
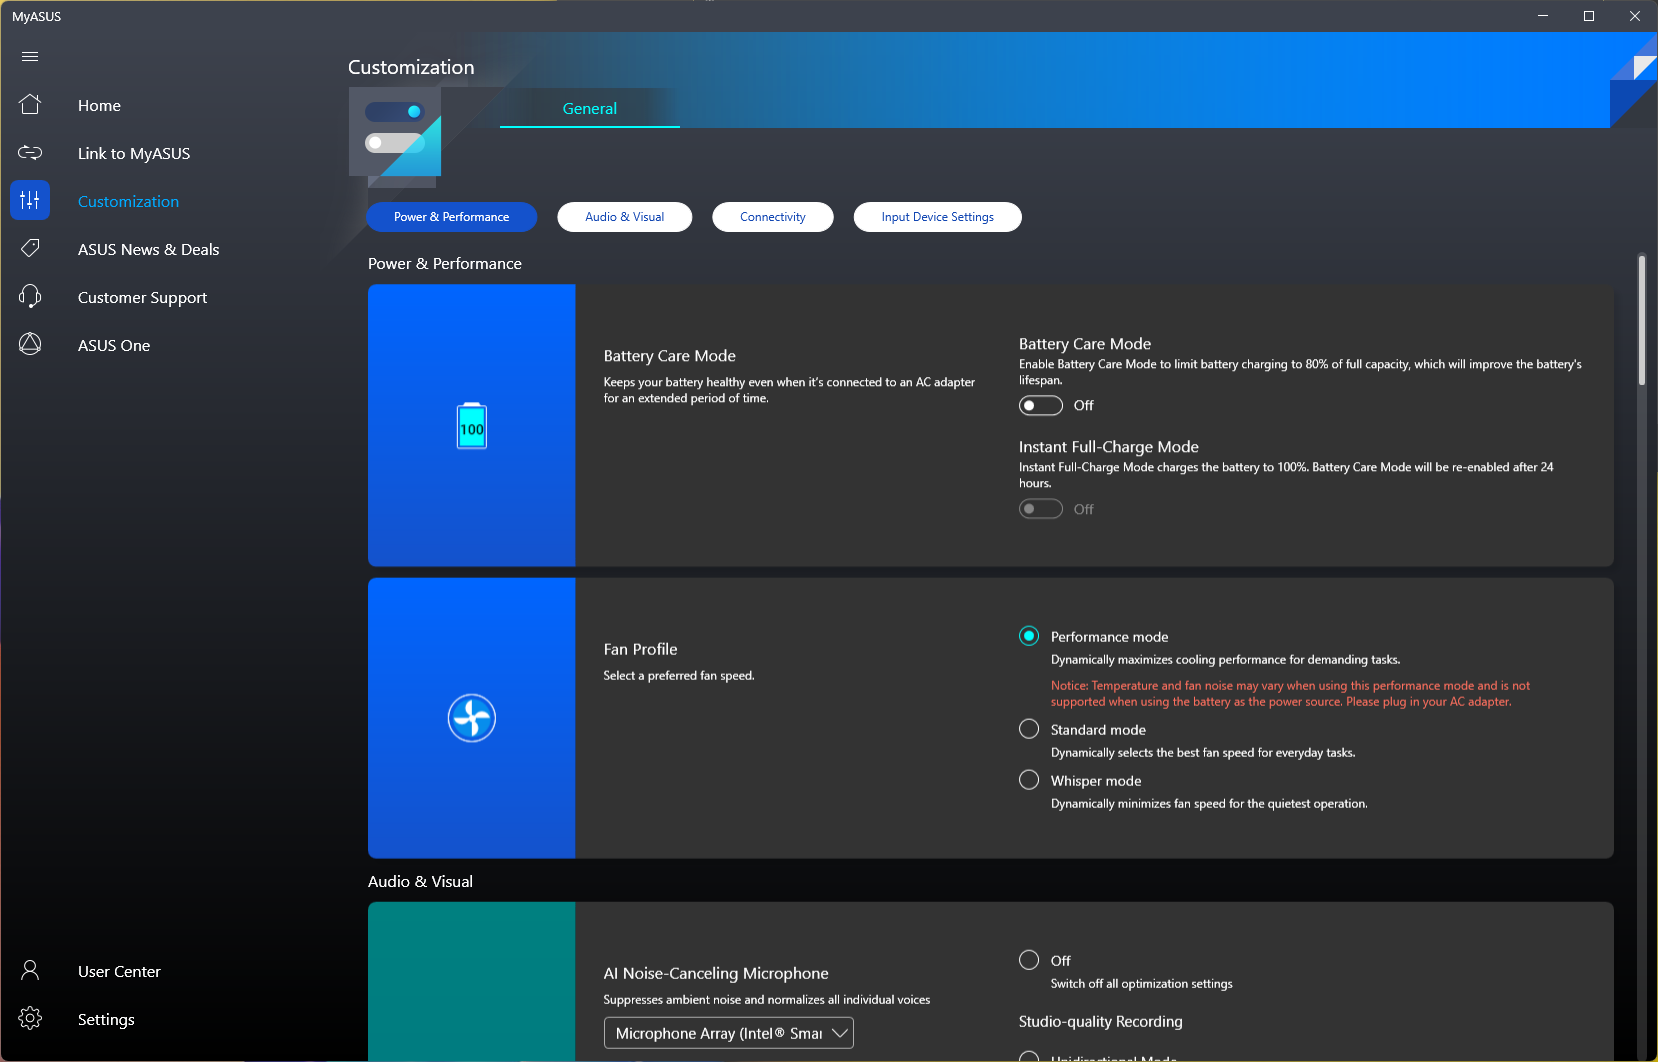
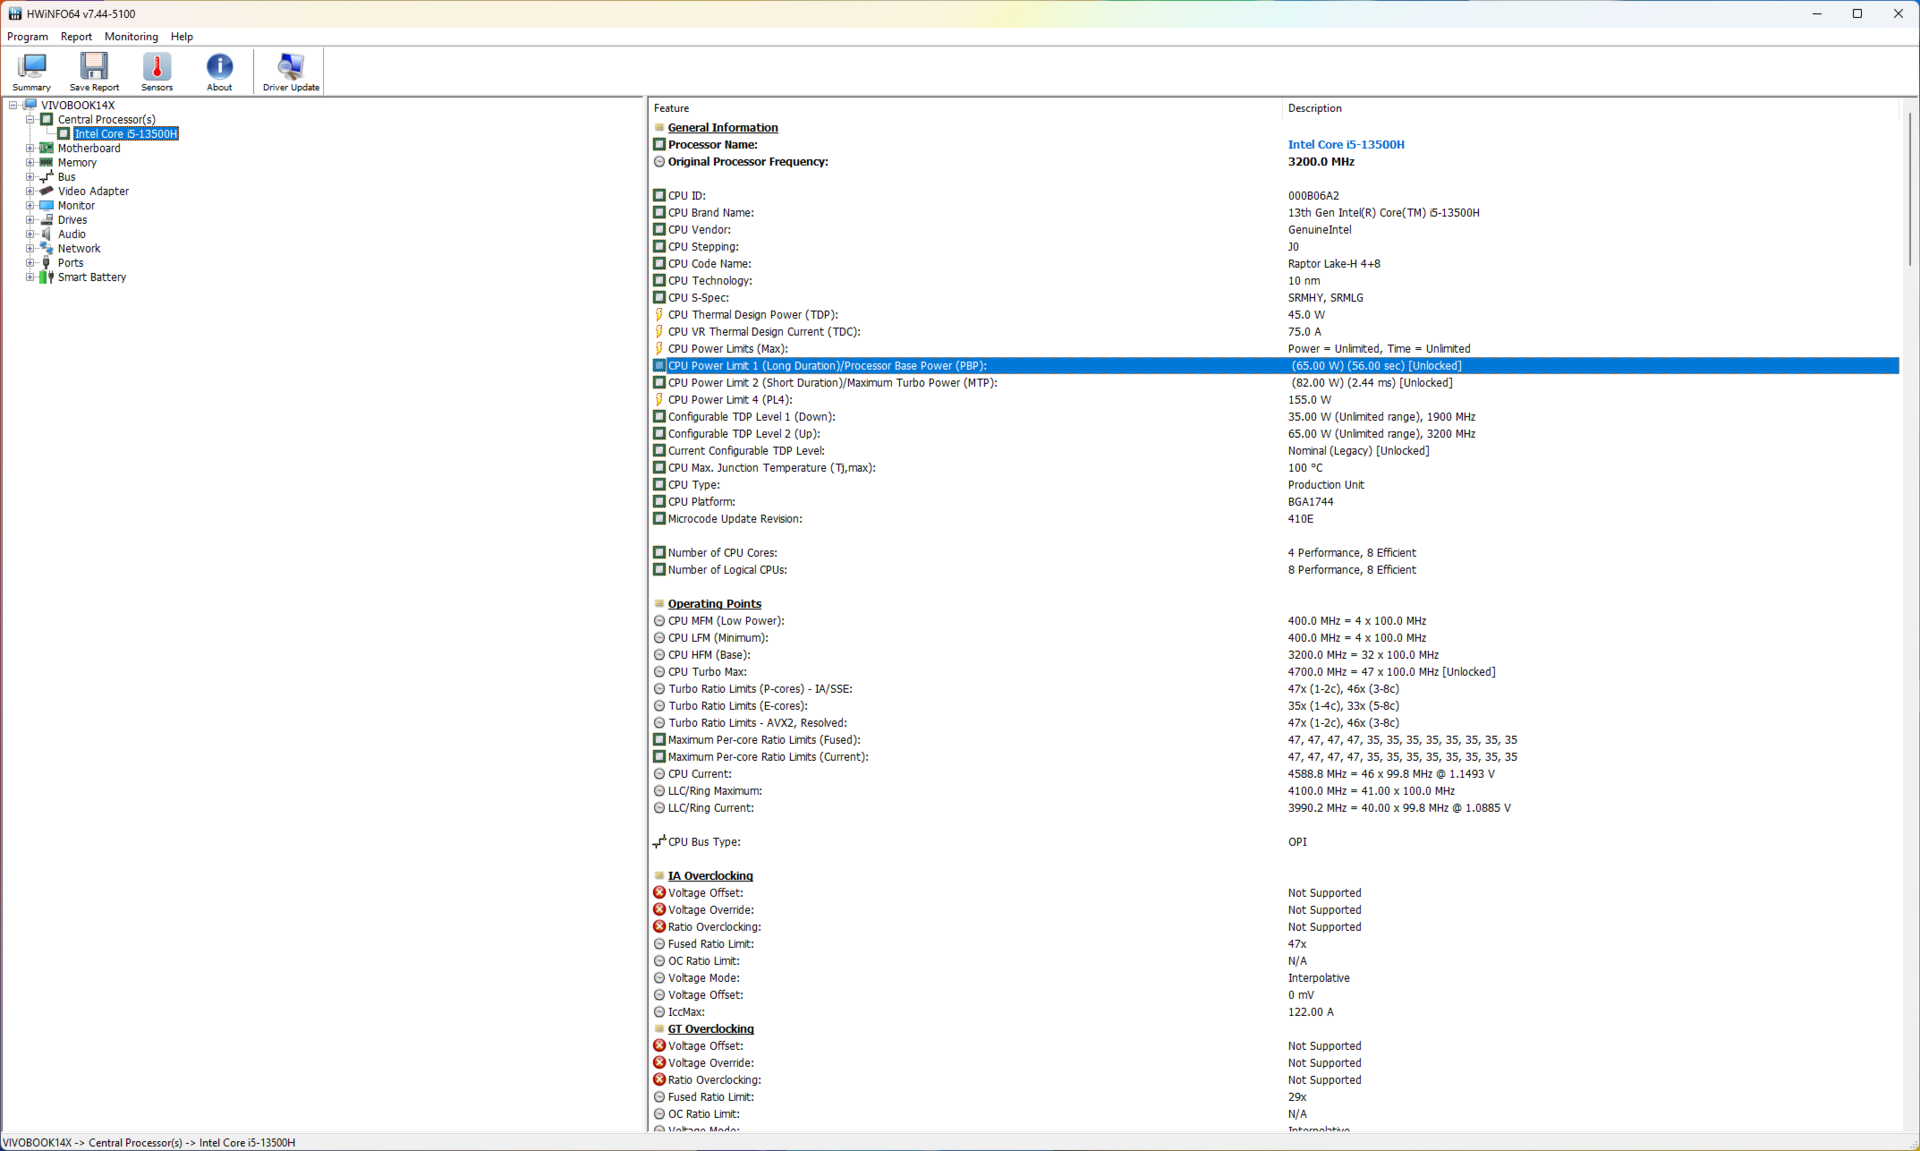
La tabella seguente illustra come i valori PL1 e PL2 del Core i5-13500H variano a seconda dell'impostazione delle prestazioni scelta.
| Modalità Performance | PL1 (PBP) / Tau | PL2 (MTP) / Tau |
|---|---|---|
| Whisper | 30 W / 56 s | 54 W / 2,44 ms |
| Standard | 50 W / 56 s | 82 W / 2,44 ms |
| Performance | 55 W / 56 s | 82 W / 2,44 ms |
| Velocità massima | 65 W / 56 s | 82 W / 2,44 ms |
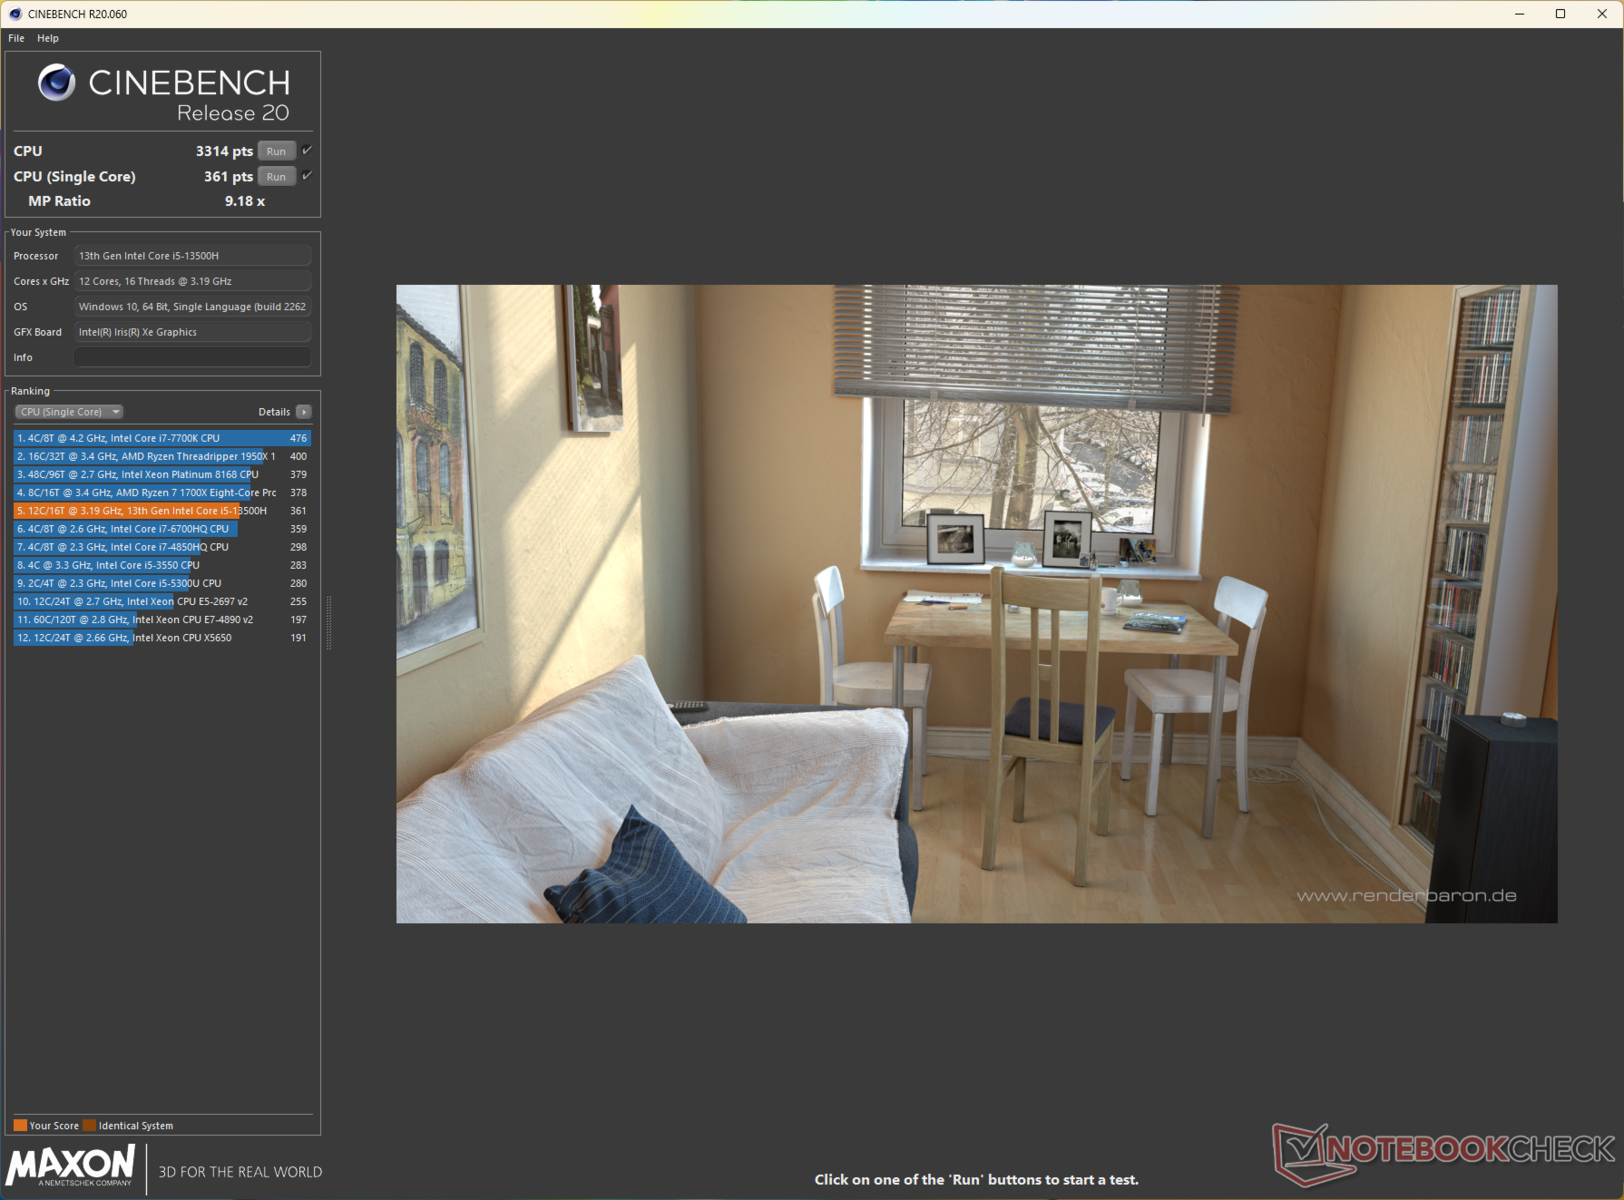
Processore
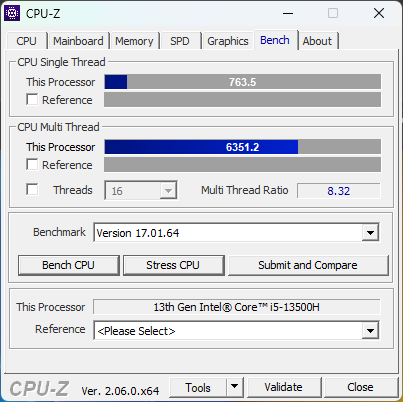
Il Core i5-13500H offre 12 core (4P + 8E) e 16 thread con boost single-core fino a 4,7 GHz e un TDP di 45 W. Le prestazioni complessive della CPU sono ampiamente in linea con quelle di un Core i7-12700Hma è inferiore di circa il 10% rispetto alCore i7-13700H nel modello MSI Stealth 14 Studio.
Detto questo, le prestazioni della CPU scendono di circa il 18% alla fine del test Cinebench R15 multi-core loop. Tuttavia, questo throttling non è così drastico rispetto a quanto osservato con il Core i7-13700H nell'MSI Stealth 14 Studio.Acer Swift X SFX14.
Cinebench R15 Multi Loop
Cinebench R23: Multi Core | Single Core
Cinebench R20: CPU (Multi Core) | CPU (Single Core)
Cinebench R15: CPU Multi 64Bit | CPU Single 64Bit
Blender: v2.79 BMW27 CPU
7-Zip 18.03: 7z b 4 | 7z b 4 -mmt1
Geekbench 5.5: Multi-Core | Single-Core
HWBOT x265 Benchmark v2.2: 4k Preset
LibreOffice : 20 Documents To PDF
R Benchmark 2.5: Overall mean
| CPU Performance rating | |
| Media della classe Multimedia | |
| MSI Stealth 14 Studio A13V | |
| Gigabyte Aero 14 OLED BMF | |
| Acer Swift X SFX14-71G | |
| Schenker Vision 14 2022 RTX 3050 Ti | |
| Media Intel Core i5-13500H | |
| Asus VivoBook 14X K3405 | |
| Lenovo Slim Pro 7 14ARP8 | |
| Cinebench R23 / Multi Core | |
| MSI Stealth 14 Studio A13V | |
| Media della classe Multimedia (4861 - 33362, n=81, ultimi 2 anni) | |
| Acer Swift X SFX14-71G | |
| Schenker Vision 14 2022 RTX 3050 Ti | |
| Media Intel Core i5-13500H (13542 - 16335, n=5) | |
| Asus VivoBook 14X K3405 | |
| Gigabyte Aero 14 OLED BMF | |
| Lenovo Slim Pro 7 14ARP8 | |
| Cinebench R23 / Single Core | |
| Media della classe Multimedia (1128 - 2459, n=73, ultimi 2 anni) | |
| Acer Swift X SFX14-71G | |
| Gigabyte Aero 14 OLED BMF | |
| Media Intel Core i5-13500H (1704 - 1799, n=5) | |
| Asus VivoBook 14X K3405 | |
| Schenker Vision 14 2022 RTX 3050 Ti | |
| MSI Stealth 14 Studio A13V | |
| Lenovo Slim Pro 7 14ARP8 | |
| Cinebench R20 / CPU (Multi Core) | |
| MSI Stealth 14 Studio A13V | |
| Media della classe Multimedia (1887 - 12912, n=64, ultimi 2 anni) | |
| Acer Swift X SFX14-71G | |
| Schenker Vision 14 2022 RTX 3050 Ti | |
| Asus VivoBook 14X K3405 | |
| Media Intel Core i5-13500H (5108 - 6212, n=5) | |
| Gigabyte Aero 14 OLED BMF | |
| Lenovo Slim Pro 7 14ARP8 | |
| Cinebench R20 / CPU (Single Core) | |
| Acer Swift X SFX14-71G | |
| Media della classe Multimedia (425 - 853, n=64, ultimi 2 anni) | |
| Gigabyte Aero 14 OLED BMF | |
| Schenker Vision 14 2022 RTX 3050 Ti | |
| Media Intel Core i5-13500H (655 - 687, n=5) | |
| Asus VivoBook 14X K3405 | |
| MSI Stealth 14 Studio A13V | |
| Lenovo Slim Pro 7 14ARP8 | |
| Cinebench R15 / CPU Multi 64Bit | |
| MSI Stealth 14 Studio A13V | |
| Media della classe Multimedia (856 - 5224, n=68, ultimi 2 anni) | |
| Gigabyte Aero 14 OLED BMF | |
| Acer Swift X SFX14-71G | |
| Media Intel Core i5-13500H (2234 - 2475, n=5) | |
| Asus VivoBook 14X K3405 | |
| Schenker Vision 14 2022 RTX 3050 Ti | |
| Lenovo Slim Pro 7 14ARP8 | |
| Cinebench R15 / CPU Single 64Bit | |
| Media della classe Multimedia (184.8 - 326, n=66, ultimi 2 anni) | |
| Acer Swift X SFX14-71G | |
| Gigabyte Aero 14 OLED BMF | |
| Schenker Vision 14 2022 RTX 3050 Ti | |
| Media Intel Core i5-13500H (243 - 261, n=5) | |
| Asus VivoBook 14X K3405 | |
| MSI Stealth 14 Studio A13V | |
| Lenovo Slim Pro 7 14ARP8 | |
| Blender / v2.79 BMW27 CPU | |
| Acer Swift X SFX14-71G | |
| Schenker Vision 14 2022 RTX 3050 Ti | |
| Media della classe Multimedia (100 - 557, n=65, ultimi 2 anni) | |
| Lenovo Slim Pro 7 14ARP8 | |
| Media Intel Core i5-13500H (205 - 263, n=6) | |
| Asus VivoBook 14X K3405 | |
| Gigabyte Aero 14 OLED BMF | |
| MSI Stealth 14 Studio A13V | |
| 7-Zip 18.03 / 7z b 4 | |
| MSI Stealth 14 Studio A13V | |
| Gigabyte Aero 14 OLED BMF | |
| Media della classe Multimedia (26062 - 130368, n=62, ultimi 2 anni) | |
| Acer Swift X SFX14-71G | |
| Lenovo Slim Pro 7 14ARP8 | |
| Media Intel Core i5-13500H (50846 - 58567, n=6) | |
| Asus VivoBook 14X K3405 | |
| Schenker Vision 14 2022 RTX 3050 Ti | |
| 7-Zip 18.03 / 7z b 4 -mmt1 | |
| Acer Swift X SFX14-71G | |
| Gigabyte Aero 14 OLED BMF | |
| Media della classe Multimedia (3666 - 7545, n=63, ultimi 2 anni) | |
| Schenker Vision 14 2022 RTX 3050 Ti | |
| Media Intel Core i5-13500H (5500 - 5885, n=6) | |
| Asus VivoBook 14X K3405 | |
| MSI Stealth 14 Studio A13V | |
| Lenovo Slim Pro 7 14ARP8 | |
| Geekbench 5.5 / Multi-Core | |
| MSI Stealth 14 Studio A13V | |
| Media della classe Multimedia (4652 - 20422, n=62, ultimi 2 anni) | |
| Acer Swift X SFX14-71G | |
| Schenker Vision 14 2022 RTX 3050 Ti | |
| Gigabyte Aero 14 OLED BMF | |
| Media Intel Core i5-13500H (9312 - 11465, n=5) | |
| Asus VivoBook 14X K3405 | |
| Lenovo Slim Pro 7 14ARP8 | |
| Geekbench 5.5 / Single-Core | |
| Media della classe Multimedia (805 - 2974, n=62, ultimi 2 anni) | |
| Gigabyte Aero 14 OLED BMF | |
| Acer Swift X SFX14-71G | |
| Schenker Vision 14 2022 RTX 3050 Ti | |
| Media Intel Core i5-13500H (1674 - 1762, n=5) | |
| MSI Stealth 14 Studio A13V | |
| Asus VivoBook 14X K3405 | |
| Lenovo Slim Pro 7 14ARP8 | |
| HWBOT x265 Benchmark v2.2 / 4k Preset | |
| Media della classe Multimedia (5.26 - 36.1, n=63, ultimi 2 anni) | |
| MSI Stealth 14 Studio A13V | |
| Lenovo Slim Pro 7 14ARP8 | |
| Asus VivoBook 14X K3405 | |
| Media Intel Core i5-13500H (14.4 - 17.9, n=6) | |
| Gigabyte Aero 14 OLED BMF | |
| Schenker Vision 14 2022 RTX 3050 Ti | |
| Acer Swift X SFX14-71G | |
| LibreOffice / 20 Documents To PDF | |
| Lenovo Slim Pro 7 14ARP8 | |
| MSI Stealth 14 Studio A13V | |
| Media Intel Core i5-13500H (44 - 65.5, n=5) | |
| Media della classe Multimedia (23.9 - 146.7, n=64, ultimi 2 anni) | |
| Asus VivoBook 14X K3405 | |
| Schenker Vision 14 2022 RTX 3050 Ti | |
| Gigabyte Aero 14 OLED BMF | |
| Acer Swift X SFX14-71G | |
| R Benchmark 2.5 / Overall mean | |
| Lenovo Slim Pro 7 14ARP8 | |
| MSI Stealth 14 Studio A13V | |
| Asus VivoBook 14X K3405 | |
| Media Intel Core i5-13500H (0.471 - 0.51, n=6) | |
| Media della classe Multimedia (0.3604 - 0.947, n=63, ultimi 2 anni) | |
| Schenker Vision 14 2022 RTX 3050 Ti | |
| Gigabyte Aero 14 OLED BMF | |
| Acer Swift X SFX14-71G | |
* ... Meglio usare valori piccoli
L'esecuzione del loop multi-core Cinebench R15 in diverse modalità di prestazioni rivela che l'implementazione del Core i5-13500H del VivoBook 14X non è in grado di utilizzare completamente il budget TDP assegnato. Nei profili Standard e Full Speed, il picco di potenza del pacchetto osservato è di soli 70 W contro gli 82 W consentiti.
Inoltre, questo livello di potenza viene raggiunto solo durante il loop iniziale, con il clock massimo intorno ai 3,5 GHz. In modalità Whisper, il processore può utilizzare fino a 54 W di picco, ma la media è di appena 16 W durante il test.
Cinebench R20 è in picchiata in modalità batteria, con cali del 45% e del 41% nelle prestazioni single-core e multi-core, rispettivamente.
AIDA64: FP32 Ray-Trace | FPU Julia | CPU SHA3 | CPU Queen | FPU SinJulia | FPU Mandel | CPU AES | CPU ZLib | FP64 Ray-Trace | CPU PhotoWorxx
| Performance rating | |
| MSI Stealth 14 Studio A13V | |
| Media della classe Multimedia | |
| Lenovo Slim Pro 7 14ARP8 | |
| Gigabyte Aero 14 OLED BMF | |
| Asus VivoBook 14X K3405 | |
| Media Intel Core i5-13500H | |
| Schenker Vision 14 2022 RTX 3050 Ti | |
| Acer Swift X SFX14-71G | |
| AIDA64 / FP32 Ray-Trace | |
| Media della classe Multimedia (2214 - 50388, n=60, ultimi 2 anni) | |
| MSI Stealth 14 Studio A13V | |
| Lenovo Slim Pro 7 14ARP8 | |
| Asus VivoBook 14X K3405 | |
| Media Intel Core i5-13500H (11081 - 15390, n=6) | |
| Gigabyte Aero 14 OLED BMF | |
| Schenker Vision 14 2022 RTX 3050 Ti | |
| Acer Swift X SFX14-71G | |
| AIDA64 / FPU Julia | |
| Lenovo Slim Pro 7 14ARP8 | |
| MSI Stealth 14 Studio A13V | |
| Media della classe Multimedia (12867 - 201874, n=61, ultimi 2 anni) | |
| Asus VivoBook 14X K3405 | |
| Media Intel Core i5-13500H (56813 - 74251, n=6) | |
| Gigabyte Aero 14 OLED BMF | |
| Schenker Vision 14 2022 RTX 3050 Ti | |
| Acer Swift X SFX14-71G | |
| AIDA64 / CPU SHA3 | |
| Media della classe Multimedia (626 - 8623, n=61, ultimi 2 anni) | |
| MSI Stealth 14 Studio A13V | |
| Asus VivoBook 14X K3405 | |
| Lenovo Slim Pro 7 14ARP8 | |
| Media Intel Core i5-13500H (2621 - 3623, n=6) | |
| Gigabyte Aero 14 OLED BMF | |
| Schenker Vision 14 2022 RTX 3050 Ti | |
| Acer Swift X SFX14-71G | |
| AIDA64 / CPU Queen | |
| Gigabyte Aero 14 OLED BMF | |
| MSI Stealth 14 Studio A13V | |
| Acer Swift X SFX14-71G | |
| Schenker Vision 14 2022 RTX 3050 Ti | |
| Lenovo Slim Pro 7 14ARP8 | |
| Media Intel Core i5-13500H (77835 - 85727, n=6) | |
| Asus VivoBook 14X K3405 | |
| Media della classe Multimedia (13483 - 181505, n=48, ultimi 2 anni) | |
| AIDA64 / FPU SinJulia | |
| Lenovo Slim Pro 7 14ARP8 | |
| MSI Stealth 14 Studio A13V | |
| Media della classe Multimedia (886 - 28794, n=61, ultimi 2 anni) | |
| Gigabyte Aero 14 OLED BMF | |
| Schenker Vision 14 2022 RTX 3050 Ti | |
| Media Intel Core i5-13500H (7249 - 8086, n=6) | |
| Asus VivoBook 14X K3405 | |
| Acer Swift X SFX14-71G | |
| AIDA64 / FPU Mandel | |
| Lenovo Slim Pro 7 14ARP8 | |
| Media della classe Multimedia (6395 - 105740, n=60, ultimi 2 anni) | |
| MSI Stealth 14 Studio A13V | |
| Asus VivoBook 14X K3405 | |
| Media Intel Core i5-13500H (27820 - 38336, n=6) | |
| Gigabyte Aero 14 OLED BMF | |
| Schenker Vision 14 2022 RTX 3050 Ti | |
| Acer Swift X SFX14-71G | |
| AIDA64 / CPU AES | |
| Gigabyte Aero 14 OLED BMF | |
| Asus VivoBook 14X K3405 | |
| Media Intel Core i5-13500H (62657 - 120493, n=6) | |
| Acer Swift X SFX14-71G | |
| MSI Stealth 14 Studio A13V | |
| Schenker Vision 14 2022 RTX 3050 Ti | |
| Media della classe Multimedia (8171 - 126790, n=61, ultimi 2 anni) | |
| Lenovo Slim Pro 7 14ARP8 | |
| AIDA64 / CPU ZLib | |
| MSI Stealth 14 Studio A13V | |
| Media della classe Multimedia (143.8 - 2022, n=61, ultimi 2 anni) | |
| Schenker Vision 14 2022 RTX 3050 Ti | |
| Asus VivoBook 14X K3405 | |
| Media Intel Core i5-13500H (782 - 992, n=6) | |
| Gigabyte Aero 14 OLED BMF | |
| Lenovo Slim Pro 7 14ARP8 | |
| Acer Swift X SFX14-71G | |
| AIDA64 / FP64 Ray-Trace | |
| Media della classe Multimedia (1014 - 26875, n=61, ultimi 2 anni) | |
| MSI Stealth 14 Studio A13V | |
| Lenovo Slim Pro 7 14ARP8 | |
| Asus VivoBook 14X K3405 | |
| Media Intel Core i5-13500H (5955 - 8495, n=6) | |
| Gigabyte Aero 14 OLED BMF | |
| Schenker Vision 14 2022 RTX 3050 Ti | |
| Acer Swift X SFX14-71G | |
| AIDA64 / CPU PhotoWorxx | |
| Gigabyte Aero 14 OLED BMF | |
| Media della classe Multimedia (8187 - 88154, n=61, ultimi 2 anni) | |
| Acer Swift X SFX14-71G | |
| MSI Stealth 14 Studio A13V | |
| Media Intel Core i5-13500H (20212 - 37618, n=6) | |
| Schenker Vision 14 2022 RTX 3050 Ti | |
| Lenovo Slim Pro 7 14ARP8 | |
| Asus VivoBook 14X K3405 | |
Prestazioni del sistema
Il VivoBook 14X rimane indietro rispetto all'MSI Stealth 14 nei test PCMark 10 e CrossMark, ma non di molto. Le prestazioni complessive del sistema nell'uso quotidiano sono fluide e reattive.
CrossMark: Overall | Productivity | Creativity | Responsiveness
AIDA64: Memory Copy | Memory Read | Memory Write | Memory Latency
| PCMark 10 / Score | |
| Media della classe Multimedia (4325 - 10386, n=58, ultimi 2 anni) | |
| Gigabyte Aero 14 OLED BMF | |
| Acer Swift X SFX14-71G | |
| MSI Stealth 14 Studio A13V | |
| Asus VivoBook 14X K3405 | |
| Media Intel Core i5-13500H, NVIDIA GeForce RTX 3050 4GB Laptop GPU (n=1) | |
| Schenker Vision 14 2022 RTX 3050 Ti | |
| Lenovo Slim Pro 7 14ARP8 | |
| PCMark 10 / Essentials | |
| Gigabyte Aero 14 OLED BMF | |
| Acer Swift X SFX14-71G | |
| Media della classe Multimedia (8025 - 11664, n=57, ultimi 2 anni) | |
| Schenker Vision 14 2022 RTX 3050 Ti | |
| MSI Stealth 14 Studio A13V | |
| Asus VivoBook 14X K3405 | |
| Media Intel Core i5-13500H, NVIDIA GeForce RTX 3050 4GB Laptop GPU (n=1) | |
| Lenovo Slim Pro 7 14ARP8 | |
| PCMark 10 / Productivity | |
| Media della classe Multimedia (7323 - 18233, n=57, ultimi 2 anni) | |
| Acer Swift X SFX14-71G | |
| Gigabyte Aero 14 OLED BMF | |
| Asus VivoBook 14X K3405 | |
| Media Intel Core i5-13500H, NVIDIA GeForce RTX 3050 4GB Laptop GPU (n=1) | |
| Schenker Vision 14 2022 RTX 3050 Ti | |
| MSI Stealth 14 Studio A13V | |
| Lenovo Slim Pro 7 14ARP8 | |
| PCMark 10 / Digital Content Creation | |
| MSI Stealth 14 Studio A13V | |
| Media della classe Multimedia (3651 - 16240, n=57, ultimi 2 anni) | |
| Acer Swift X SFX14-71G | |
| Gigabyte Aero 14 OLED BMF | |
| Lenovo Slim Pro 7 14ARP8 | |
| Schenker Vision 14 2022 RTX 3050 Ti | |
| Asus VivoBook 14X K3405 | |
| Media Intel Core i5-13500H, NVIDIA GeForce RTX 3050 4GB Laptop GPU (n=1) | |
| CrossMark / Overall | |
| Acer Swift X SFX14-71G | |
| Media della classe Multimedia (866 - 2728, n=67, ultimi 2 anni) | |
| Gigabyte Aero 14 OLED BMF | |
| MSI Stealth 14 Studio A13V | |
| Schenker Vision 14 2022 RTX 3050 Ti | |
| Asus VivoBook 14X K3405 | |
| Media Intel Core i5-13500H, NVIDIA GeForce RTX 3050 4GB Laptop GPU (n=1) | |
| Lenovo Slim Pro 7 14ARP8 | |
| CrossMark / Productivity | |
| Acer Swift X SFX14-71G | |
| Gigabyte Aero 14 OLED BMF | |
| Media della classe Multimedia (931 - 2489, n=67, ultimi 2 anni) | |
| MSI Stealth 14 Studio A13V | |
| Schenker Vision 14 2022 RTX 3050 Ti | |
| Asus VivoBook 14X K3405 | |
| Media Intel Core i5-13500H, NVIDIA GeForce RTX 3050 4GB Laptop GPU (n=1) | |
| Lenovo Slim Pro 7 14ARP8 | |
| CrossMark / Creativity | |
| Media della classe Multimedia (907 - 3465, n=67, ultimi 2 anni) | |
| Acer Swift X SFX14-71G | |
| Gigabyte Aero 14 OLED BMF | |
| MSI Stealth 14 Studio A13V | |
| Schenker Vision 14 2022 RTX 3050 Ti | |
| Asus VivoBook 14X K3405 | |
| Media Intel Core i5-13500H, NVIDIA GeForce RTX 3050 4GB Laptop GPU (n=1) | |
| Lenovo Slim Pro 7 14ARP8 | |
| CrossMark / Responsiveness | |
| Acer Swift X SFX14-71G | |
| Gigabyte Aero 14 OLED BMF | |
| MSI Stealth 14 Studio A13V | |
| Schenker Vision 14 2022 RTX 3050 Ti | |
| Media della classe Multimedia (605 - 2024, n=67, ultimi 2 anni) | |
| Asus VivoBook 14X K3405 | |
| Media Intel Core i5-13500H, NVIDIA GeForce RTX 3050 4GB Laptop GPU (n=1) | |
| Lenovo Slim Pro 7 14ARP8 | |
| AIDA64 / Memory Copy | |
| Media della classe Multimedia (11299 - 132135, n=61, ultimi 2 anni) | |
| Gigabyte Aero 14 OLED BMF | |
| Acer Swift X SFX14-71G | |
| MSI Stealth 14 Studio A13V | |
| Lenovo Slim Pro 7 14ARP8 | |
| Schenker Vision 14 2022 RTX 3050 Ti | |
| Asus VivoBook 14X K3405 | |
| Media Intel Core i5-13500H, NVIDIA GeForce RTX 3050 4GB Laptop GPU (n=1) | |
| AIDA64 / Memory Read | |
| Media della classe Multimedia (11624 - 174586, n=61, ultimi 2 anni) | |
| Gigabyte Aero 14 OLED BMF | |
| MSI Stealth 14 Studio A13V | |
| Acer Swift X SFX14-71G | |
| Lenovo Slim Pro 7 14ARP8 | |
| Asus VivoBook 14X K3405 | |
| Media Intel Core i5-13500H, NVIDIA GeForce RTX 3050 4GB Laptop GPU (n=1) | |
| Schenker Vision 14 2022 RTX 3050 Ti | |
| AIDA64 / Memory Write | |
| Gigabyte Aero 14 OLED BMF | |
| Media della classe Multimedia (11755 - 134998, n=61, ultimi 2 anni) | |
| Acer Swift X SFX14-71G | |
| Lenovo Slim Pro 7 14ARP8 | |
| MSI Stealth 14 Studio A13V | |
| Schenker Vision 14 2022 RTX 3050 Ti | |
| Asus VivoBook 14X K3405 | |
| Media Intel Core i5-13500H, NVIDIA GeForce RTX 3050 4GB Laptop GPU (n=1) | |
| AIDA64 / Memory Latency | |
| Media della classe Multimedia (7 - 535, n=60, ultimi 2 anni) | |
| Lenovo Slim Pro 7 14ARP8 | |
| Acer Swift X SFX14-71G | |
| Gigabyte Aero 14 OLED BMF | |
| Schenker Vision 14 2022 RTX 3050 Ti | |
| Asus VivoBook 14X K3405 | |
| Media Intel Core i5-13500H, NVIDIA GeForce RTX 3050 4GB Laptop GPU (n=1) | |
| MSI Stealth 14 Studio A13V | |
* ... Meglio usare valori piccoli
| PCMark 8 Home Score Accelerated v2 | 5514 punti | |
| PCMark 8 Work Score Accelerated v2 | 6078 punti | |
| PCMark 10 Score | 6645 punti | |
Aiuto | ||
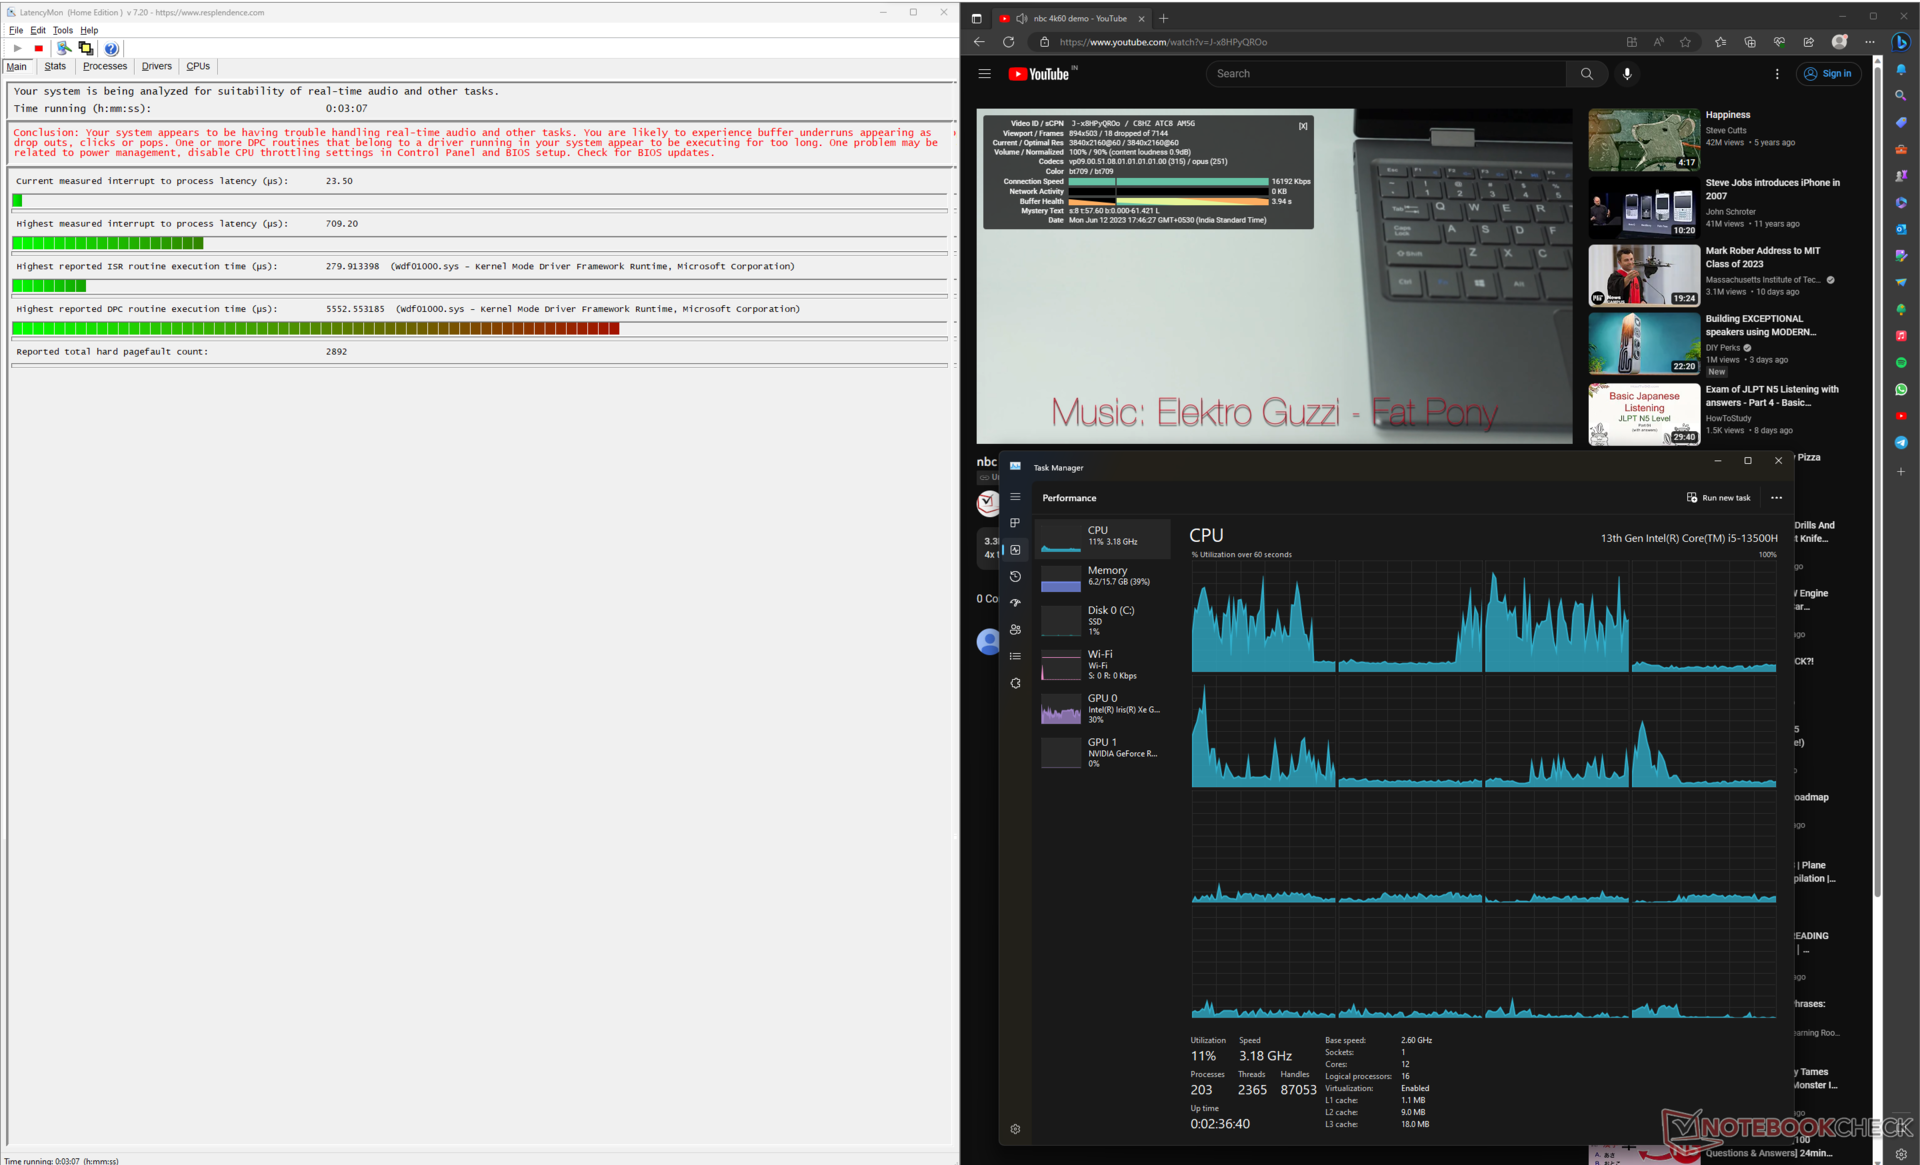
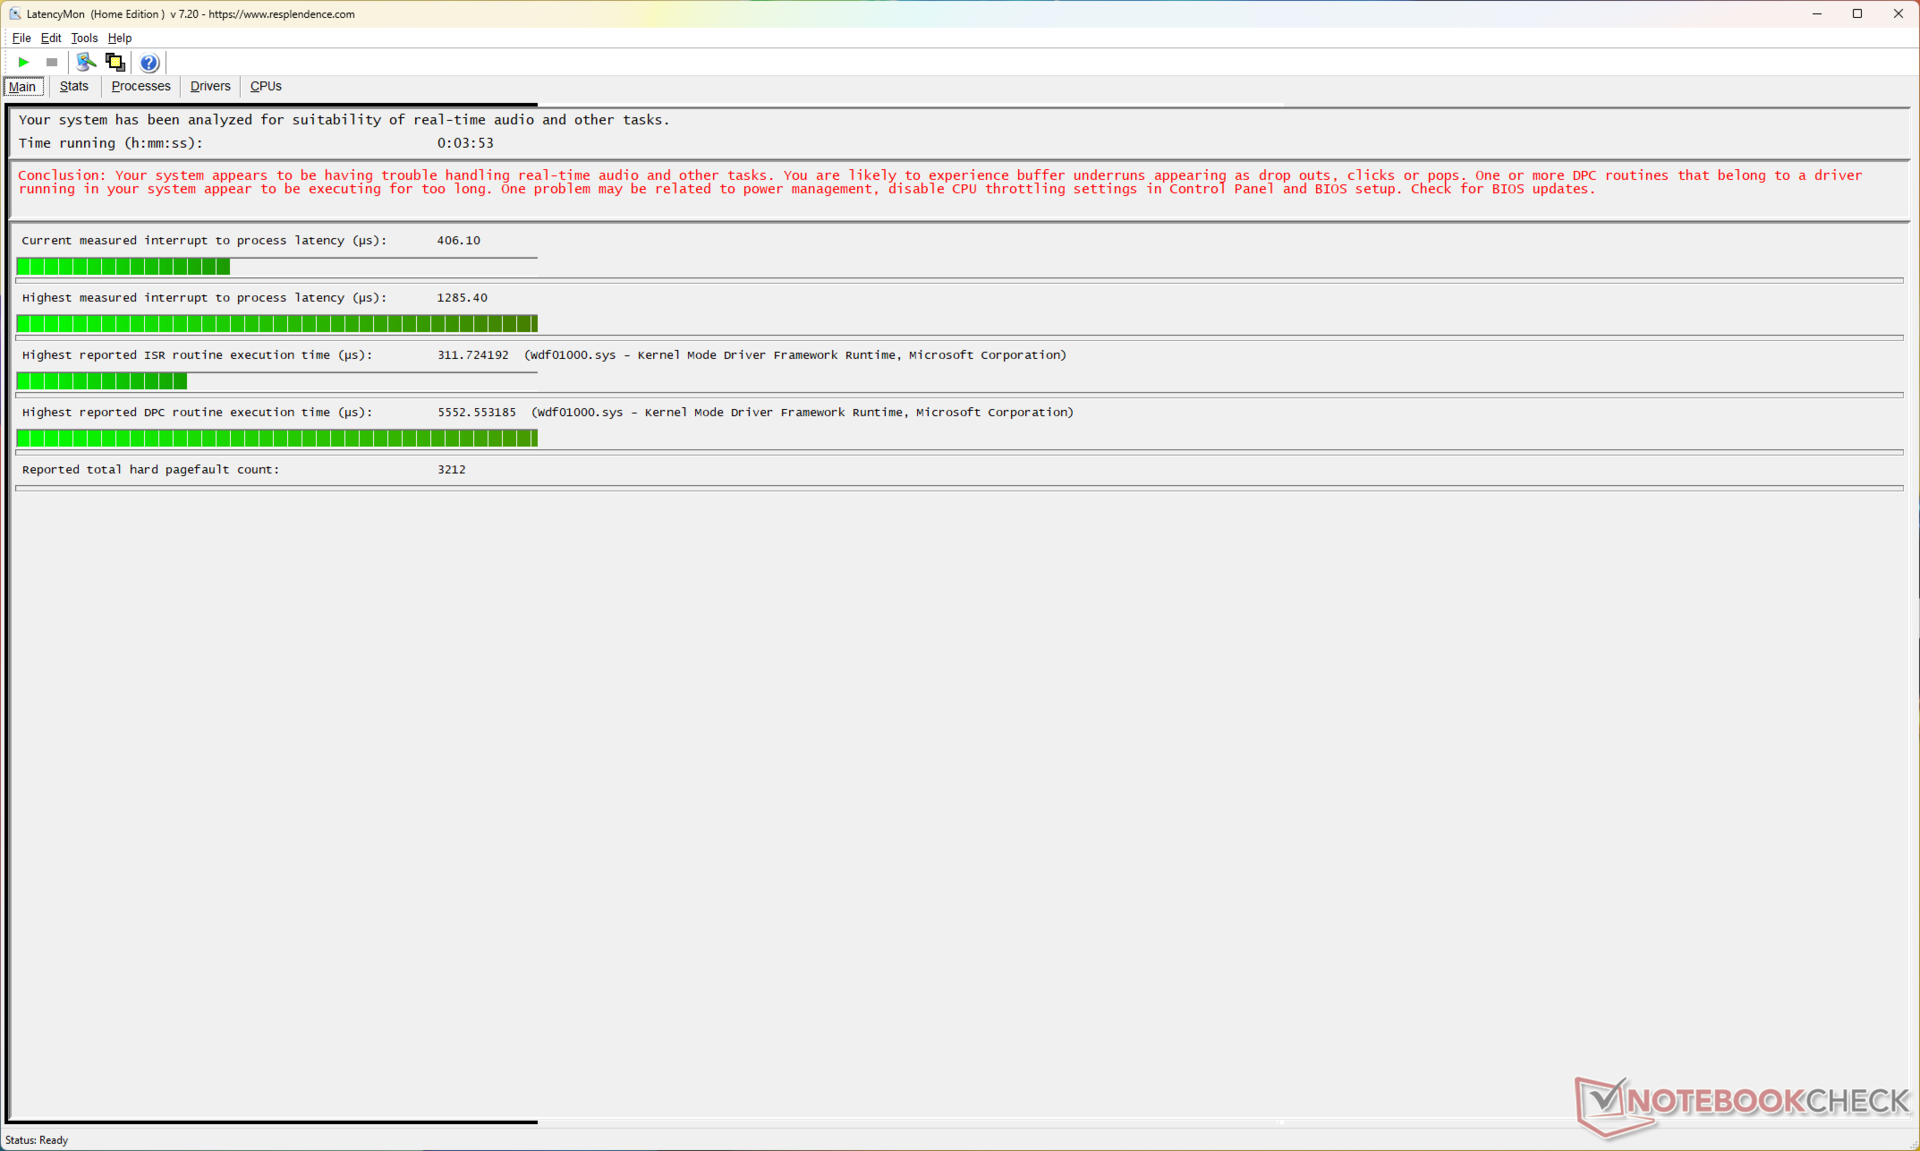
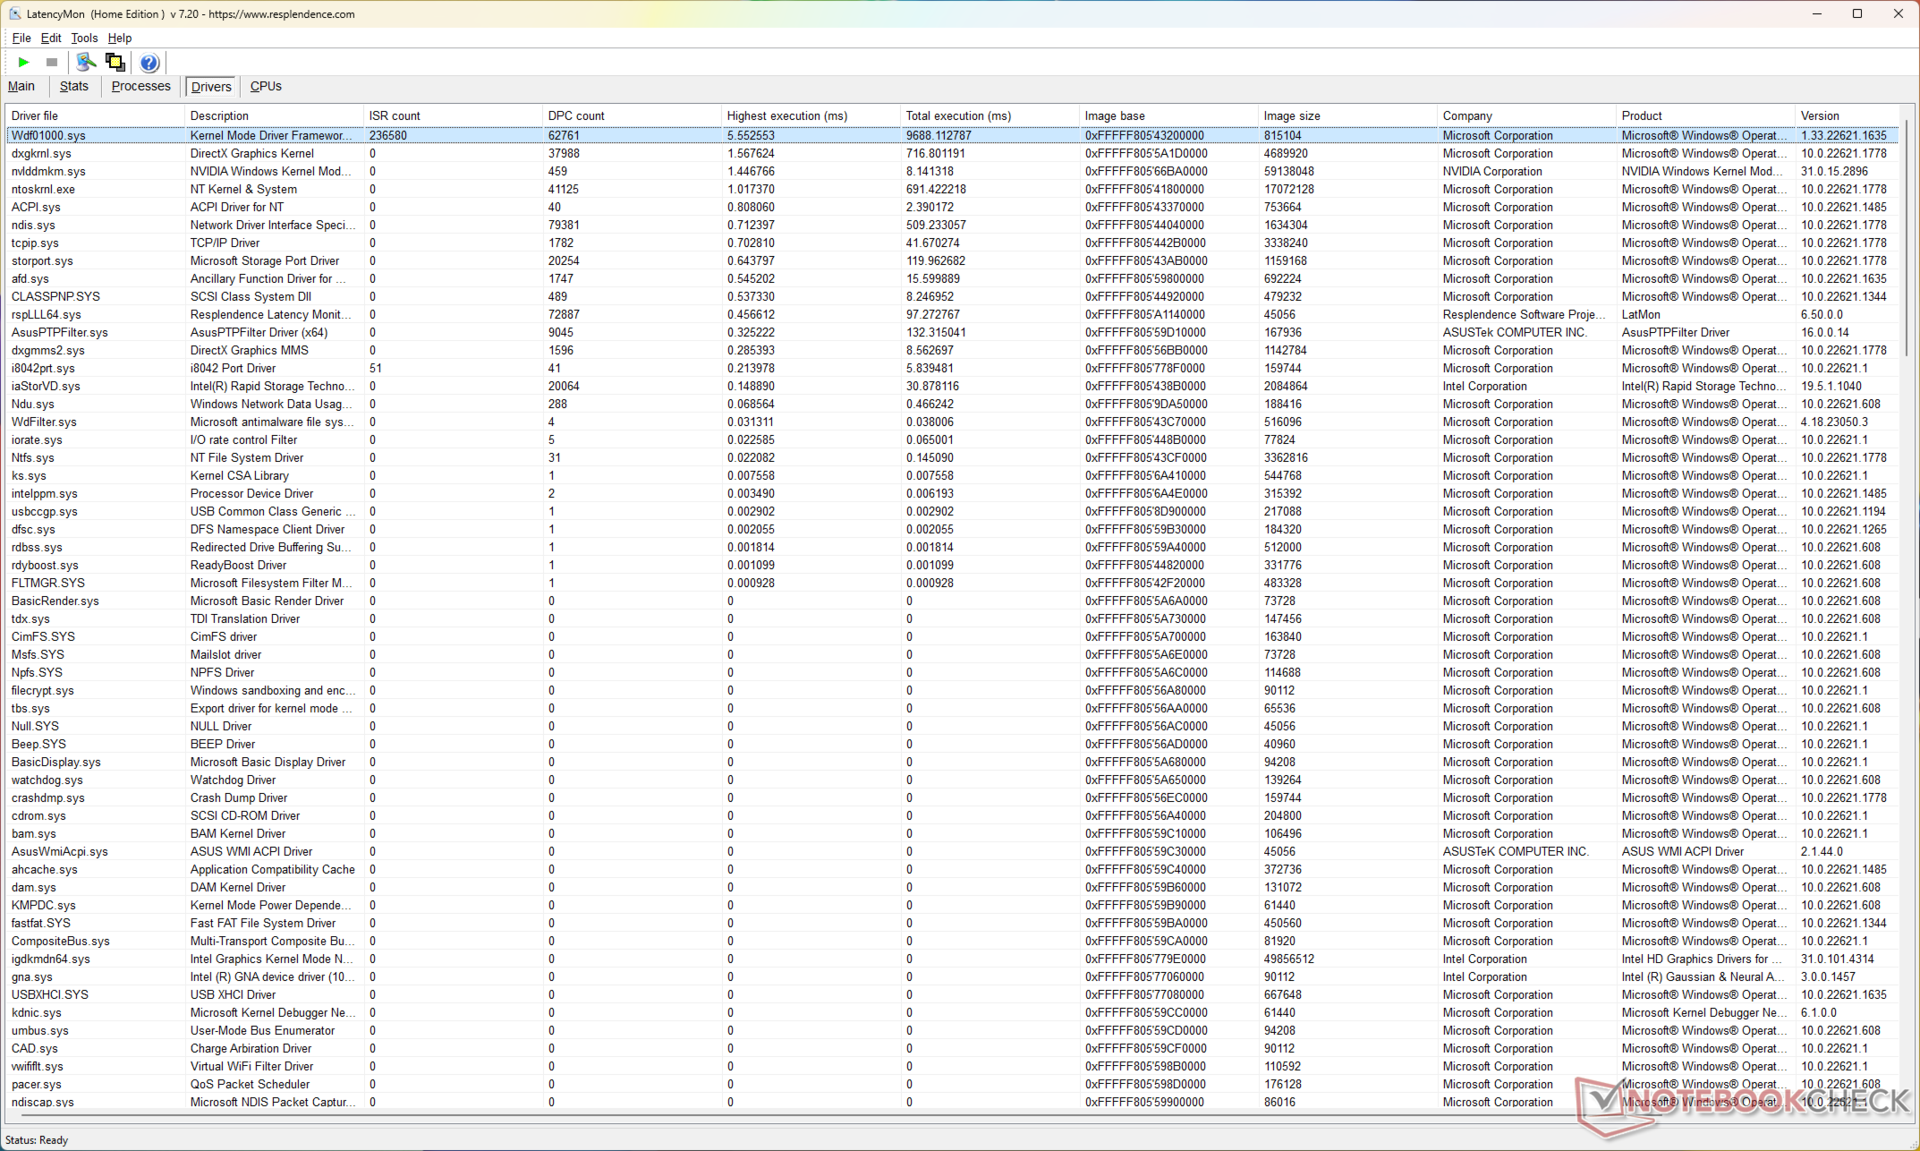
Latenza DPC
La latenza DPC sembra essere più elevata. La latenza interrupt-to-process misurata è stata inizialmente di 709,20 µs durante la riproduzione di un video YouTube 4K.
Questo valore è salito a 1285,40 µs dopo uno stress Prime95 di 10 secondi, suggerendo che i flussi di lavoro in tempo reale possono essere influenzati da un carico pesante.
| DPC Latencies / LatencyMon - interrupt to process latency (max), Web, Youtube, Prime95 | |
| Acer Swift X SFX14-71G | |
| Gigabyte Aero 14 OLED BMF | |
| MSI Stealth 14 Studio A13V | |
| Lenovo Slim Pro 7 14ARP8 | |
| Asus VivoBook 14X K3405 | |
| Schenker Vision 14 2022 RTX 3050 Ti | |
* ... Meglio usare valori piccoli
Il nostroClassifica della latenza DPCoffre ulteriori confronti sulla latenza dei dispositivi recensiti.
Dispositivi di archiviazione
L'unità SSD Samsung PM9B1 NVMe installata offre prestazioni soddisfacenti per la maggior parte delle applicazioni. Asus ha fornito un pad termico sotto l'unità, che aiuta a mantenere relativamente stabili le prestazioni durante il test DiskSpd read loop.
Detto questo, l'SSD PM9B1 è significativamente inferiore alla concorrenza in quasi tutti gli aspetti, tranne che per le scritture 4K. Non c'è spazio per l'espansione dello storage.

* ... Meglio usare valori piccoli
Disk Throttling: DiskSpd Read Loop, Queue Depth 8
Ulteriori confronti sulle prestazioni di archiviazione sono disponibili nei nostri Benchmark di HDD e SSD pagina.
Prestazioni della GPU
Asus implementa una GPU da 40 W GPU Nvidia GeForce RTX 3050 da 4 GB per computer portatili nel VivoBook 14X. La RTX 3050 da 4 GB è obsoleta per un dispositivo del 2023 con processore Intel di 13a generazione e questo si riflette nei benchmark sintetici e di gioco.
Le prestazioni cumulative di 3DMark sono inferiori del 23% rispetto a quelle della RTX 3050 Ti nel test Schenker Vision 14e del 26% rispetto alla RTX 3050 6 GB nel modello Lenovo Slim Pro 7.
Anche il VivoBook 14X è in ritardo del 38% rispetto al più recente 35 W RTX 4050 del Gigabyte Aero 14 OLED.
| 3DMark 11 Performance | 13942 punti | |
| 3DMark Ice Storm Standard Score | 70334 punti | |
| 3DMark Cloud Gate Standard Score | 36793 punti | |
| 3DMark Fire Strike Score | 8504 punti | |
| 3DMark Fire Strike Extreme Score | 4371 punti | |
| 3DMark Time Spy Score | 3832 punti | |
Aiuto | ||
| Blender / v3.3 Classroom OPTIX/RTX | |
| Asus VivoBook 14X K3405 | |
| Media NVIDIA GeForce RTX 3050 4GB Laptop GPU (53 - 99, n=12) | |
| Lenovo Slim Pro 7 14ARP8 | |
| Schenker Vision 14 2022 RTX 3050 Ti | |
| Media della classe Multimedia (12 - 105, n=24, ultimi 2 anni) | |
| Gigabyte Aero 14 OLED BMF | |
| Acer Swift X SFX14-71G | |
| MSI Stealth 14 Studio A13V | |
| Blender / v3.3 Classroom CUDA | |
| Asus VivoBook 14X K3405 | |
| Asus VivoBook 14X K3405 | |
| Media NVIDIA GeForce RTX 3050 4GB Laptop GPU (97 - 152, n=13) | |
| Lenovo Slim Pro 7 14ARP8 | |
| Schenker Vision 14 2022 RTX 3050 Ti | |
| Gigabyte Aero 14 OLED BMF | |
| Media della classe Multimedia (20 - 186, n=24, ultimi 2 anni) | |
| Acer Swift X SFX14-71G | |
| Blender / v3.3 Classroom CPU | |
| Media NVIDIA GeForce RTX 3050 4GB Laptop GPU (388 - 937, n=11) | |
| Acer Swift X SFX14-71G | |
| Schenker Vision 14 2022 RTX 3050 Ti | |
| Gigabyte Aero 14 OLED BMF | |
| Asus VivoBook 14X K3405 | |
| Lenovo Slim Pro 7 14ARP8 | |
| Media della classe Multimedia (134.5 - 1042, n=67, ultimi 2 anni) | |
| MSI Stealth 14 Studio A13V | |
* ... Meglio usare valori piccoli
Prestazioni di gioco
Il VivoBook 14X non è destinato a un pubblico di videogiocatori, ma è comunque in grado di giocare decentemente a 1080p Ultra, in particolare con i titoli eSports meno impegnativi.
È possibile ottenere aumenti percettibili della frequenza dei fotogrammi sfruttando gli algoritmi di upscaling nei giochi supportati.
| The Witcher 3 - 1920x1080 Ultra Graphics & Postprocessing (HBAO+) | |
| MSI Stealth 14 Studio A13V | |
| Gigabyte Aero 14 OLED BMF | |
| Gigabyte Aero 14 OLED BMF | |
| Acer Swift X SFX14-71G | |
| Lenovo Slim Pro 7 14ARP8 | |
| Media della classe Multimedia (11 - 121, n=13, ultimi 2 anni) | |
| Schenker Vision 14 2022 RTX 3050 Ti | |
| Asus VivoBook 14X K3405 | |
| Final Fantasy XV Benchmark - 1920x1080 High Quality | |
| MSI Stealth 14 Studio A13V | |
| Acer Swift X SFX14-71G | |
| Gigabyte Aero 14 OLED BMF | |
| Media della classe Multimedia (7.61 - 144.4, n=66, ultimi 2 anni) | |
| Lenovo Slim Pro 7 14ARP8 | |
| Schenker Vision 14 2022 RTX 3050 Ti | |
| Asus VivoBook 14X K3405 | |
| Strange Brigade - 1920x1080 ultra AA:ultra AF:16 | |
| MSI Stealth 14 Studio A13V | |
| Acer Swift X SFX14-71G | |
| Gigabyte Aero 14 OLED BMF | |
| Media della classe Multimedia (13.3 - 303, n=66, ultimi 2 anni) | |
| Schenker Vision 14 2022 RTX 3050 Ti | |
| Asus VivoBook 14X K3405 | |
| Dota 2 Reborn - 1920x1080 ultra (3/3) best looking | |
| MSI Stealth 14 Studio A13V | |
| Gigabyte Aero 14 OLED BMF | |
| Acer Swift X SFX14-71G | |
| Asus VivoBook 14X K3405 | |
| Schenker Vision 14 2022 RTX 3050 Ti | |
| Lenovo Slim Pro 7 14ARP8 | |
| Media della classe Multimedia (29 - 179.9, n=68, ultimi 2 anni) | |
Il grafico FPS di Witcher 3
Non ci sono grossi problemi con il raffreddamento della GPU, dato che abbiamo osservato frame rate relativamente stabili durante l'esecuzione di The Witcher 3 a 1080p Ultra.
Witcher 3 FPS Chart
| basso | medio | alto | ultra | QHD | 4K | |
|---|---|---|---|---|---|---|
| GTA V (2015) | 175 | 167.8 | 100.4 | 48.4 | 33.7 | 32 |
| The Witcher 3 (2015) | 150.4 | 68.8 | 70.6 | 40 | 24.4 | |
| Dota 2 Reborn (2015) | 163.4 | 141 | 135.3 | 115.3 | 57.1 | |
| Final Fantasy XV Benchmark (2018) | 99.4 | 52.5 | 37.7 | 27.3 | 15 | |
| X-Plane 11.11 (2018) | 111 | 95.2 | 78.9 | 66.1 | ||
| Far Cry 5 (2018) | 127 | 68 | 61 | 57 | 39 | 19 |
| Strange Brigade (2018) | 179.7 | 78.6 | 65.2 | 57.9 | 41.1 | 23.4 |
| F1 2021 (2021) | 232 | 123.6 | 96 | 44.1 | 32.1 | 12.7 |
| Cyberpunk 2077 1.6 (2022) | 51.7 | 38.2 | 28.4 | 25.3 | 15.6 | 5.57 |
| F1 22 (2022) | 119.4 | 108.5 | 75.2 | 21.3 | 13.2 | 5.9 |
Date un'occhiata al nostro sito dedicato GPU per computer portatili Nvidia GeForce RTX 3050 per ulteriori informazioni e confronti delle prestazioni.
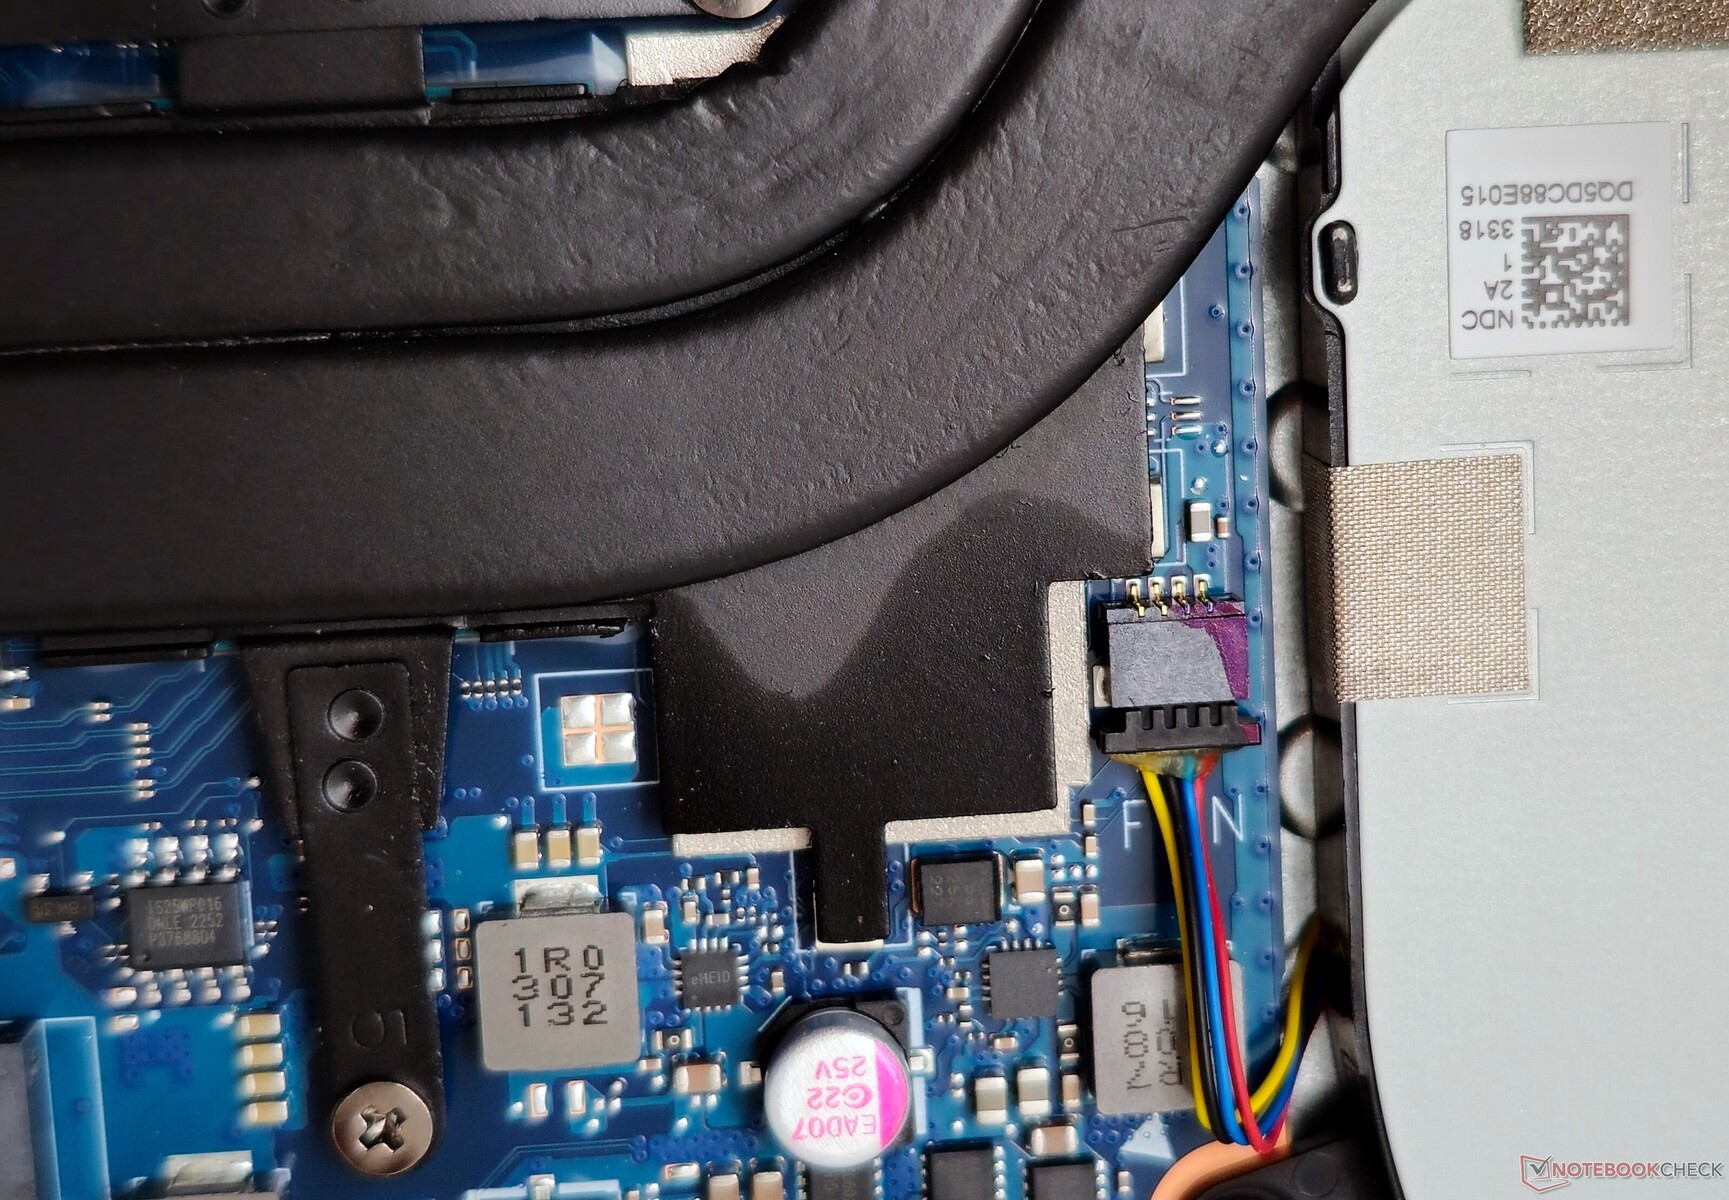
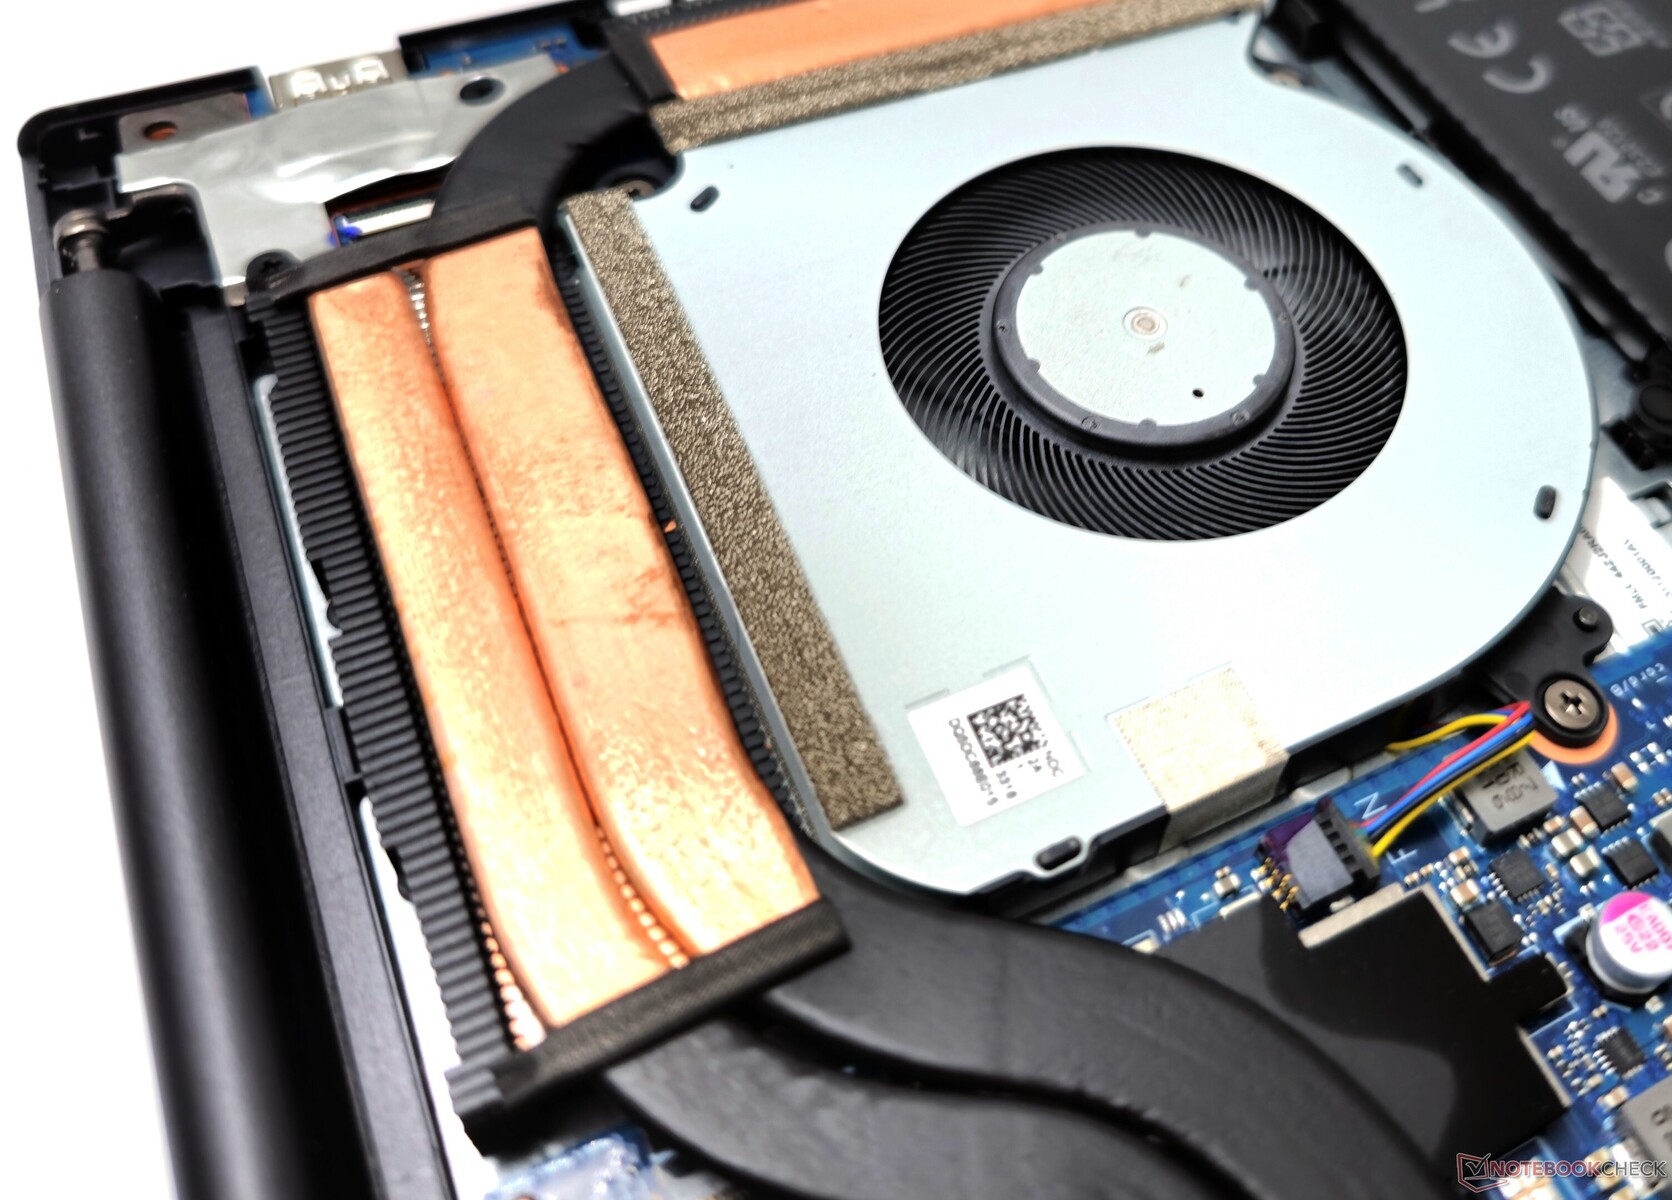
Emissioni: Combinazione di ventola singola e tubo di calore spinto all'estremo
Rumore del sistema
Asus equipaggia il VivoBook 14X con una singola ventola per raffreddare sia la CPU che la GPU. Analogamente a quanto abbiamo riscontrato con altri modelli VivoBook, Asus sembra aver fissato un limite al rumore massimo della ventola per ogni profilo di prestazioni.
L'azienda dichiara un rumore della ventola inferiore a 40 dB(A) nel profilo Standard. Abbiamo registrato livelli di pressione sonora di 31 dB(A) in modalità Whisper, 42 dB(A) in Standard e quasi 53 dB(A) in modalità Performance.
Il profilo della modalità Full Speed mantiene un SPL costante di quasi 53 dB(A) indipendentemente dal carico.
Rumorosità
| Idle |
| 22.08 / 22.08 / 22.08 dB(A) |
| Sotto carico |
| 52.98 / 52.67 dB(A) |
 | ||
30 dB silenzioso 40 dB(A) udibile 50 dB(A) rumoroso |
||
min: | ||
| Modalità di prestazioni | Inattivo dB(A) | Carico medio dB(A) | Carico massimo dB(A) | Il Witcher 3 1080p Ultra dB(A) |
|---|---|---|---|---|
| Whisper | 21,73 | 30,61 | 31,13 | 30,67 / 34 fps |
| Standard | 21,62 | 42,33 | 42,12 | 42,23 / 38 fps |
| Prestazioni | 22,08 | 52,98 | 52,67 | 52,65 / 40 fps |
| Asus VivoBook 14X K3405 i5-13500H, GeForce RTX 3050 4GB Laptop GPU | Acer Swift X SFX14-71G i7-13700H, GeForce RTX 4050 Laptop GPU | MSI Stealth 14 Studio A13V i7-13700H, GeForce RTX 4050 Laptop GPU | Gigabyte Aero 14 OLED BMF i7-13700H, GeForce RTX 4050 Laptop GPU | Lenovo Slim Pro 7 14ARP8 R7 7735HS, GeForce RTX 3050 6GB Laptop GPU | Schenker Vision 14 2022 RTX 3050 Ti i7-12700H, GeForce RTX 3050 Ti Laptop GPU | |
|---|---|---|---|---|---|---|
| Noise | -14% | -10% | -11% | 4% | -4% | |
| off /ambiente * (dB) | 21.46 | 24.8 -16% | 25.3 -18% | 24 -12% | 22.7 -6% | 24.4 -14% |
| Idle Minimum * (dB) | 22.08 | 28.2 -28% | 25.3 -15% | 24 -9% | 22.8 -3% | 24.4 -11% |
| Idle Average * (dB) | 22.08 | 31.8 -44% | 25 -13% | 24 -9% | 22.8 -3% | 24.4 -11% |
| Idle Maximum * (dB) | 22.08 | 31.8 -44% | 33.7 -53% | 35.71 -62% | 22.8 -3% | 27.8 -26% |
| Load Average * (dB) | 52.98 | 38.2 28% | 42.2 20% | 43.8 17% | 43.3 18% | |
| Witcher 3 ultra * (dB) | 52.7 | 50 5% | 51 3% | 40.22 24% | 43.8 17% | 48.2 9% |
| Load Maximum * (dB) | 52.67 | 52.2 1% | 51 3% | 51.93 1% | 47.1 11% | 48.8 7% |
* ... Meglio usare valori piccoli
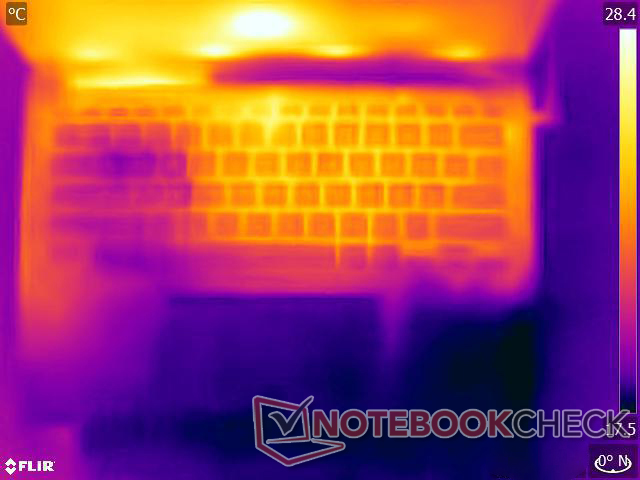
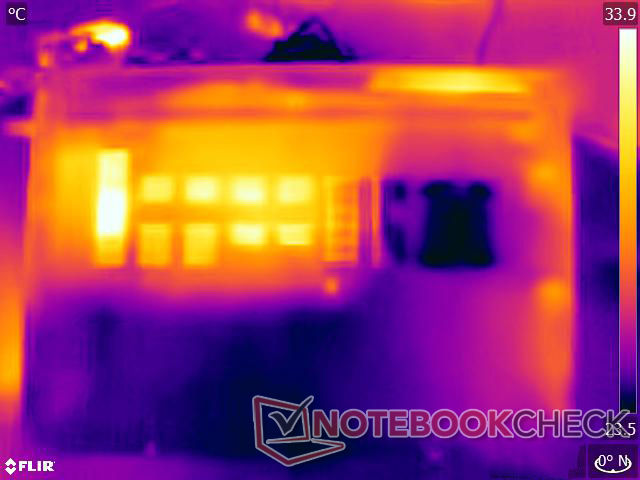
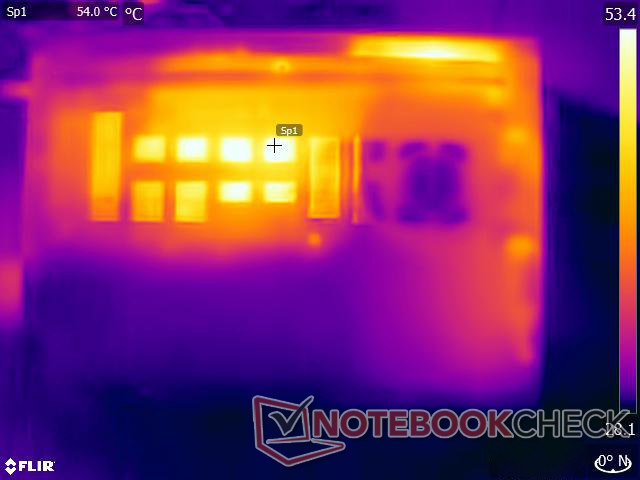
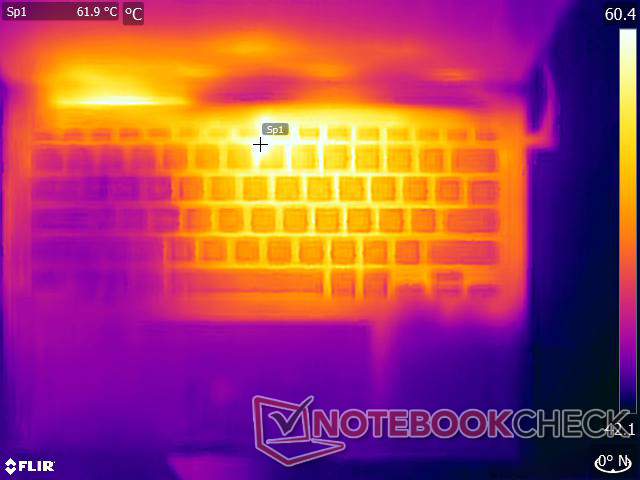
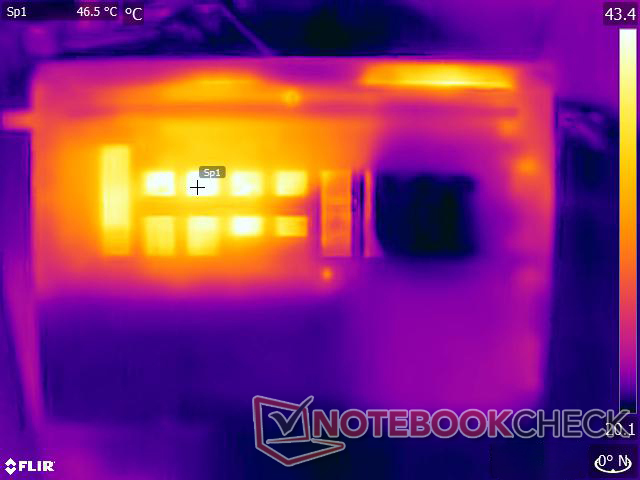
Temperatura
Asus dichiara di aver migliorato le prestazioni termiche grazie al nuovo design delle ventole, ma la combinazione di due heatpipe con una sola ventola ha i suoi limiti nel mantenere sotto controllo le temperature superficiali in caso di stress.
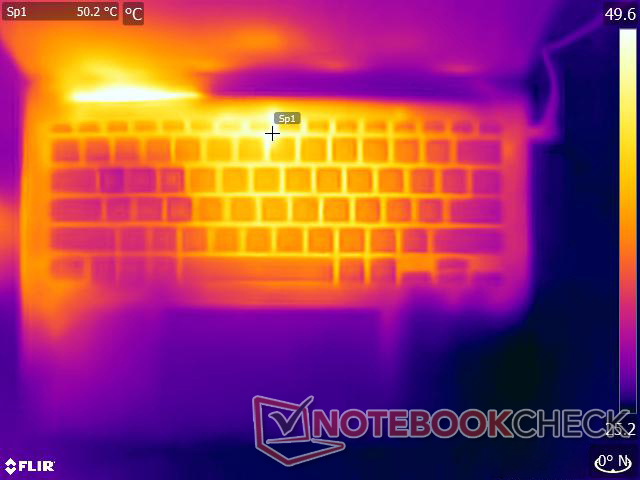
Abbiamo registrato temperature fino a 49 °C sulla parte superiore e fino a 54 °C su quella inferiore sotto carico massimo. Le aree del touchpad e del poggiapolsi destro rimangono comunque relativamente fresche.
(-) La temperatura massima sul lato superiore è di 49.2 °C / 121 F, rispetto alla media di 36.8 °C / 98 F, che varia da 21 a 71 °C per questa classe Multimedia.
(-) Il lato inferiore si riscalda fino ad un massimo di 54 °C / 129 F, rispetto alla media di 39.1 °C / 102 F
(+) In idle, la temperatura media del lato superiore è di 30.6 °C / 87 F, rispetto alla media deld ispositivo di 31.3 °C / 88 F.
(±) Riproducendo The Witcher 3, la temperatura media per il lato superiore e' di 37.8 °C / 100 F, rispetto alla media del dispositivo di 31.3 °C / 88 F.
(+) I poggiapolsi e il touchpad raggiungono la temperatura massima della pelle (35.4 °C / 95.7 F) e quindi non sono caldi.
(-) La temperatura media della zona del palmo della mano di dispositivi simili e'stata di 28.7 °C / 83.7 F (-6.7 °C / -12 F).
| Asus VivoBook 14X K3405 Intel Core i5-13500H, NVIDIA GeForce RTX 3050 4GB Laptop GPU | Acer Swift X SFX14-71G Intel Core i7-13700H, NVIDIA GeForce RTX 4050 Laptop GPU | MSI Stealth 14 Studio A13V Intel Core i7-13700H, NVIDIA GeForce RTX 4050 Laptop GPU | Gigabyte Aero 14 OLED BMF Intel Core i7-13700H, NVIDIA GeForce RTX 4050 Laptop GPU | Lenovo Slim Pro 7 14ARP8 AMD Ryzen 7 7735HS, NVIDIA GeForce RTX 3050 6GB Laptop GPU | Schenker Vision 14 2022 RTX 3050 Ti Intel Core i7-12700H, NVIDIA GeForce RTX 3050 Ti Laptop GPU | |
|---|---|---|---|---|---|---|
| Heat | 16% | -0% | 18% | 21% | 9% | |
| Maximum Upper Side * (°C) | 49.2 | 46.4 6% | 46.9 5% | 42 15% | 42.2 14% | 48.4 2% |
| Maximum Bottom * (°C) | 54 | 49 9% | 56.1 -4% | 52 4% | 49 9% | 57.1 -6% |
| Idle Upper Side * (°C) | 33.6 | 26.5 21% | 33.8 -1% | 26 23% | 24.4 27% | 28.1 16% |
| Idle Bottom * (°C) | 37.6 | 26.6 29% | 37.9 -1% | 27 28% | 25.2 33% | 29 23% |
* ... Meglio usare valori piccoli
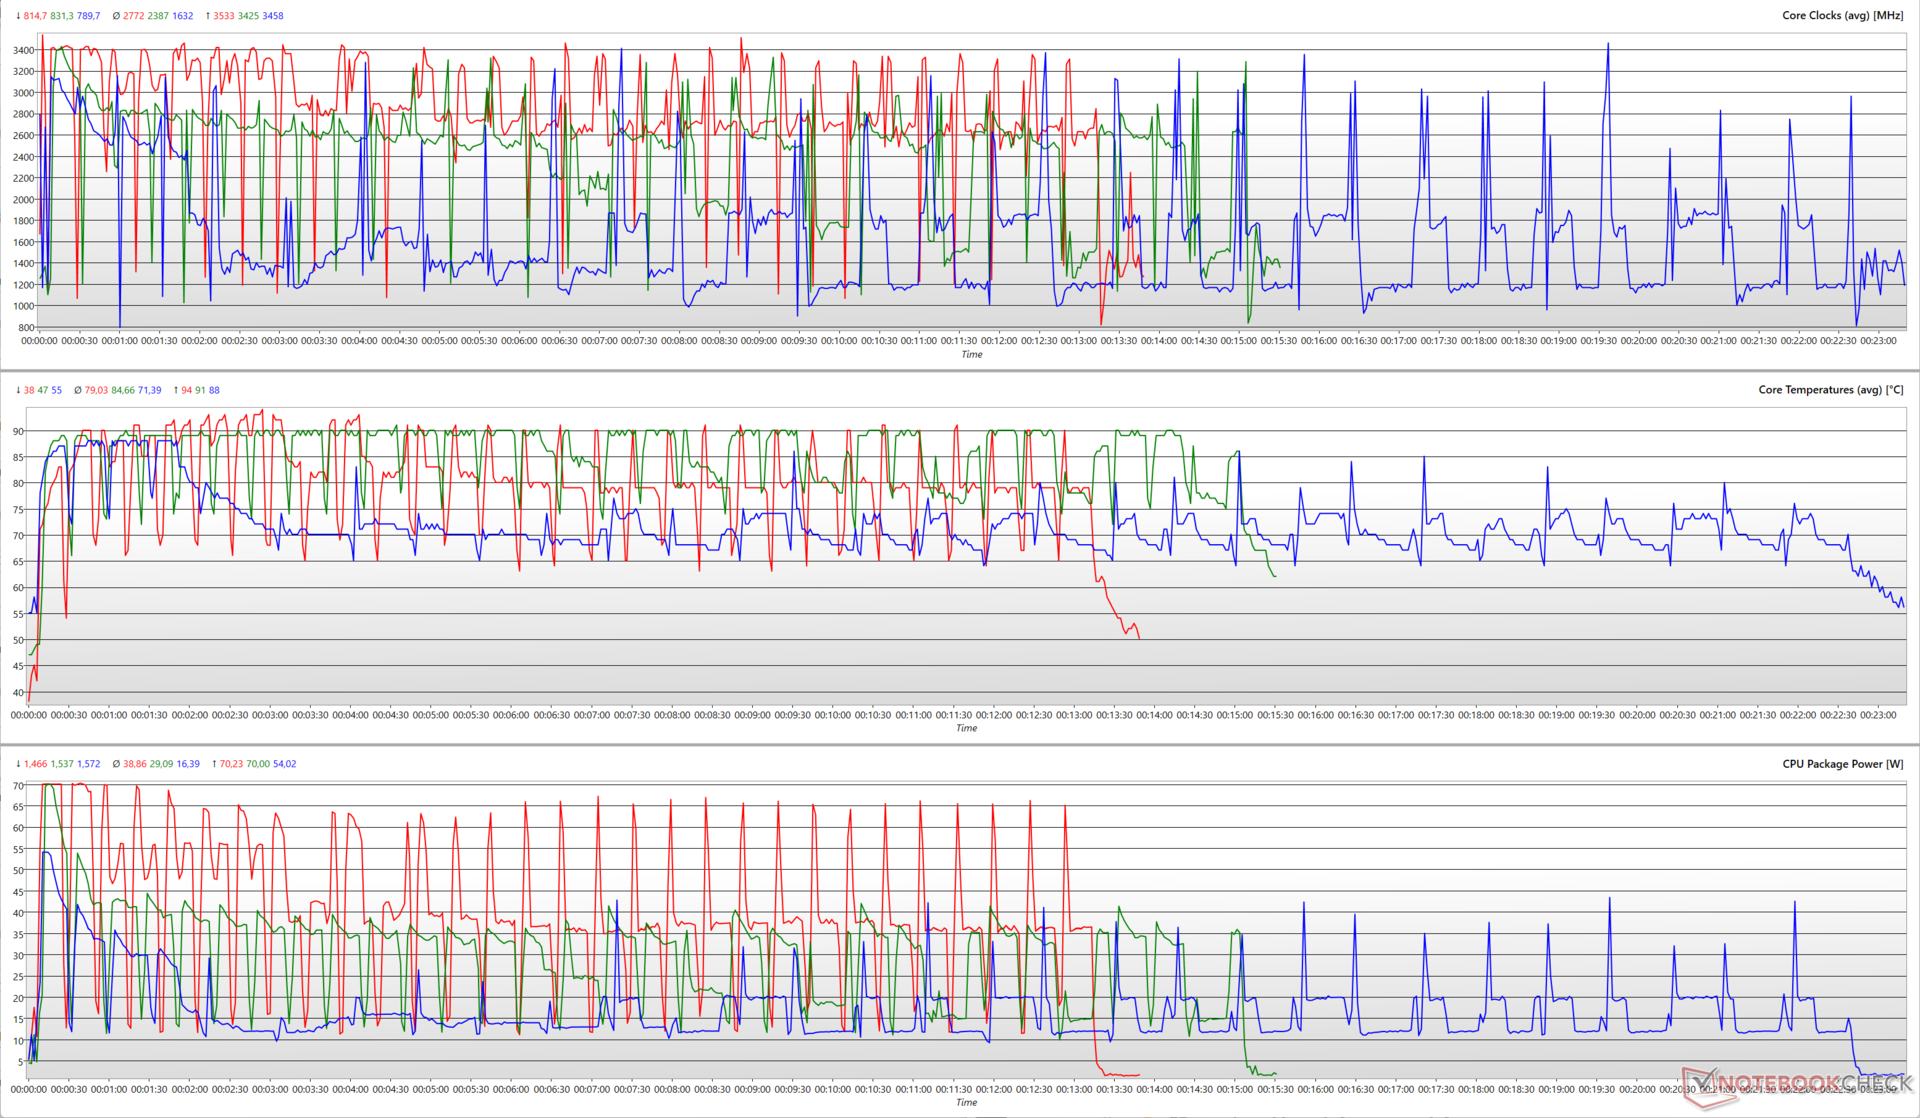
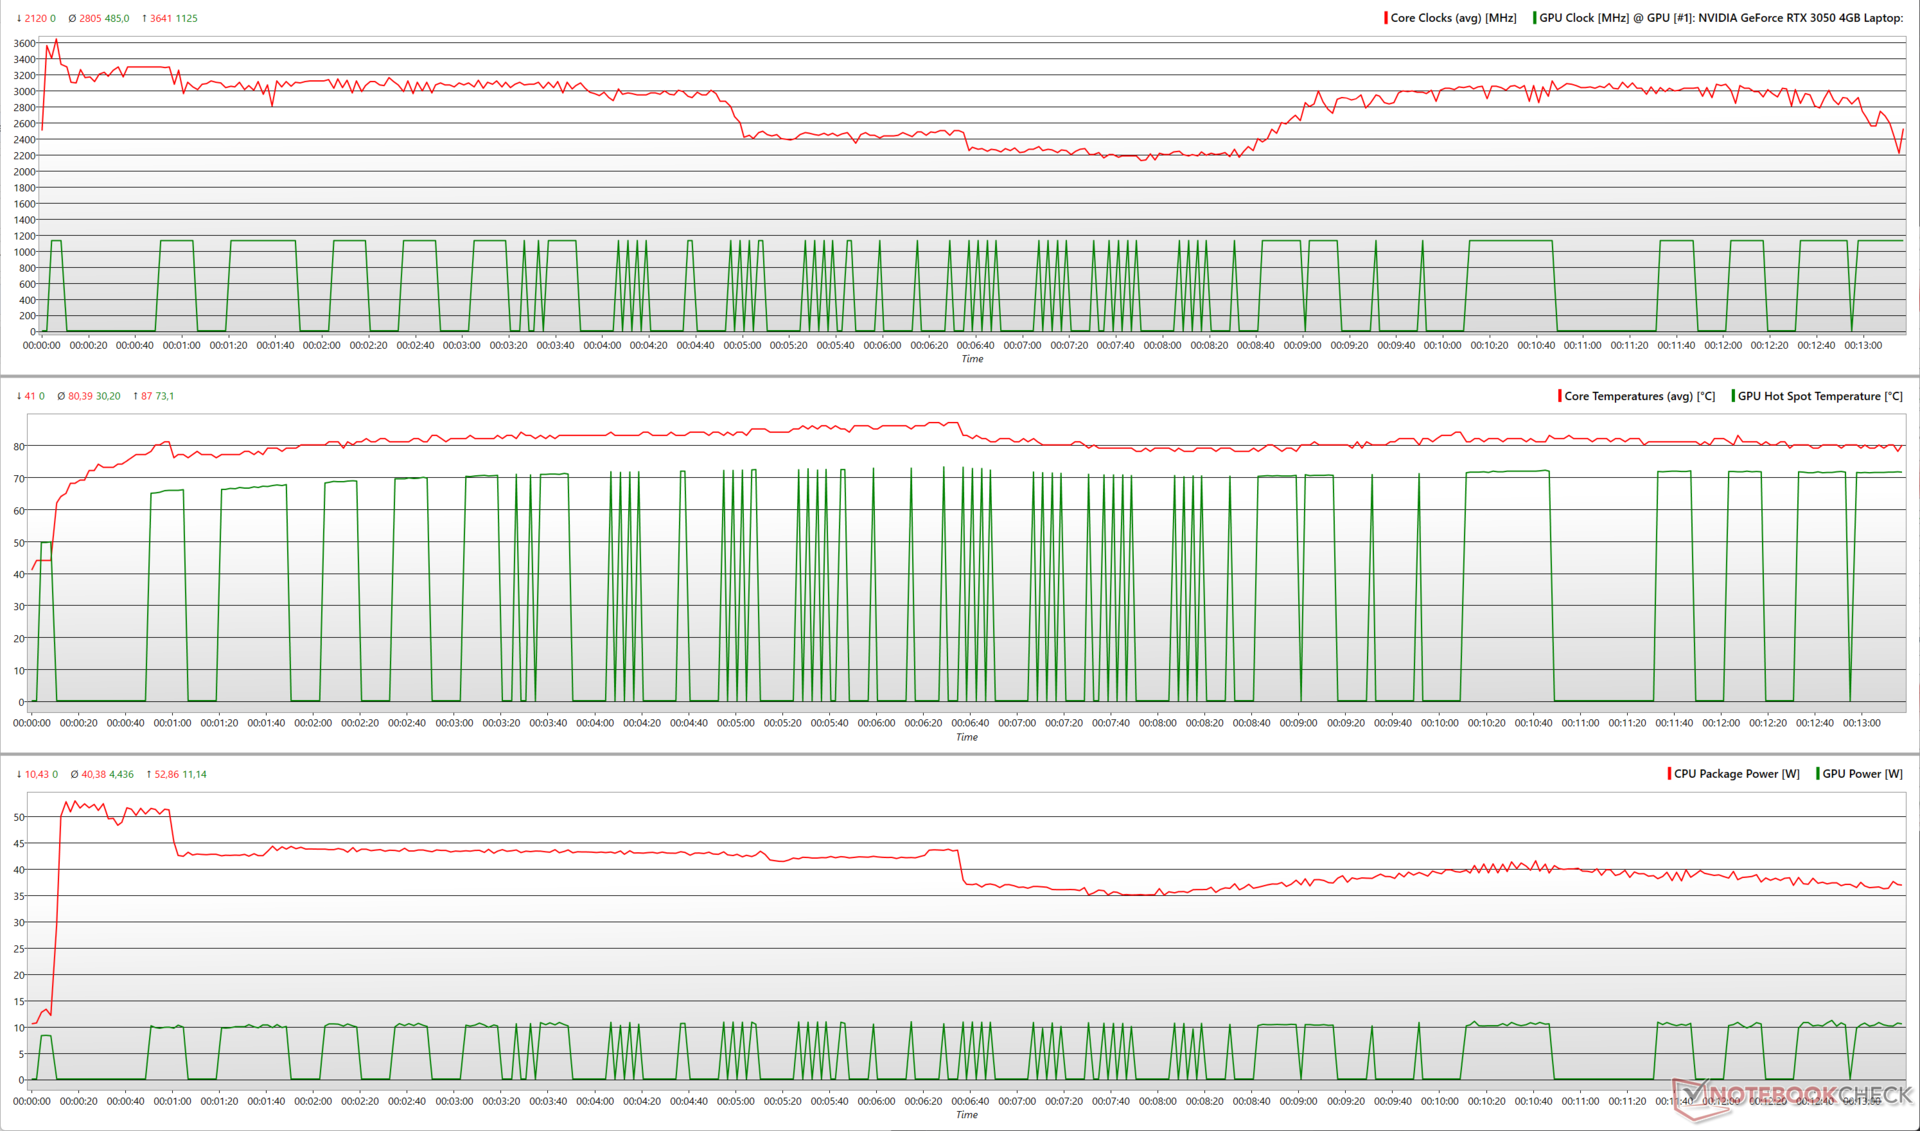
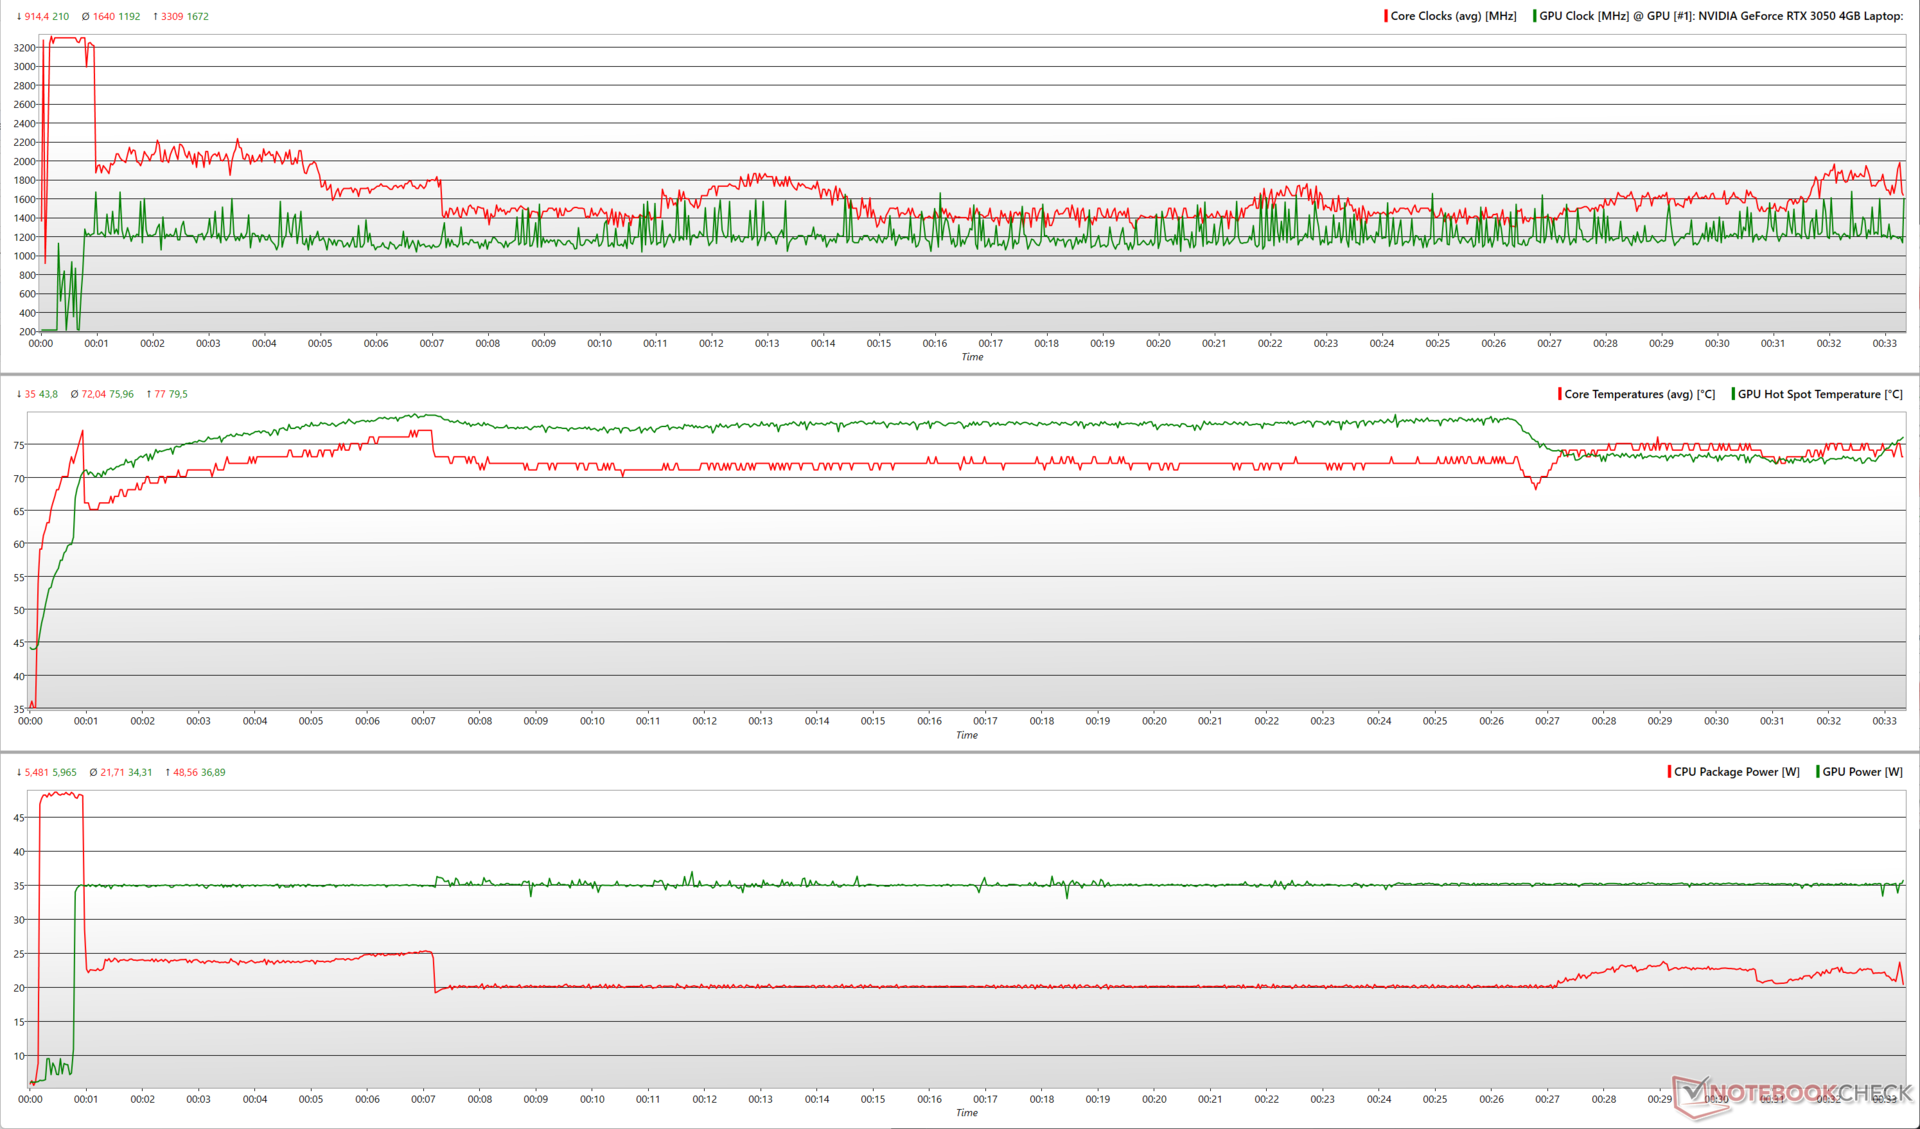
Stress test
Stressando il VivoBook 14X con Prime95 in-place large FFT, il Core i5-13500H raggiunge un picco di 3,6 GHz e consuma quasi 53 W di energia.
Aggiungendo FurMark al mix, la potenza di picco della CPU scende a 48,6 W e si mantiene a 22 W. La RTX 3050 mostra clock medi di 1.192 MHz con un consumo energetico costante di 34 W.
| Stress Test | Clock della CPU (GHz) | Clock della GPU (MHz) | Temperatura media della CPU (°C) | Temperatura media della GPU (°C) |
| Sistema inattivo | 3,8 | 0 | 40 | 25,1 |
| Prime95 | 2,95 | 0 | 80 | 25,3 |
| Prime95 + FurMark | 1,75 | 1.177 | 72 | 68,3 |
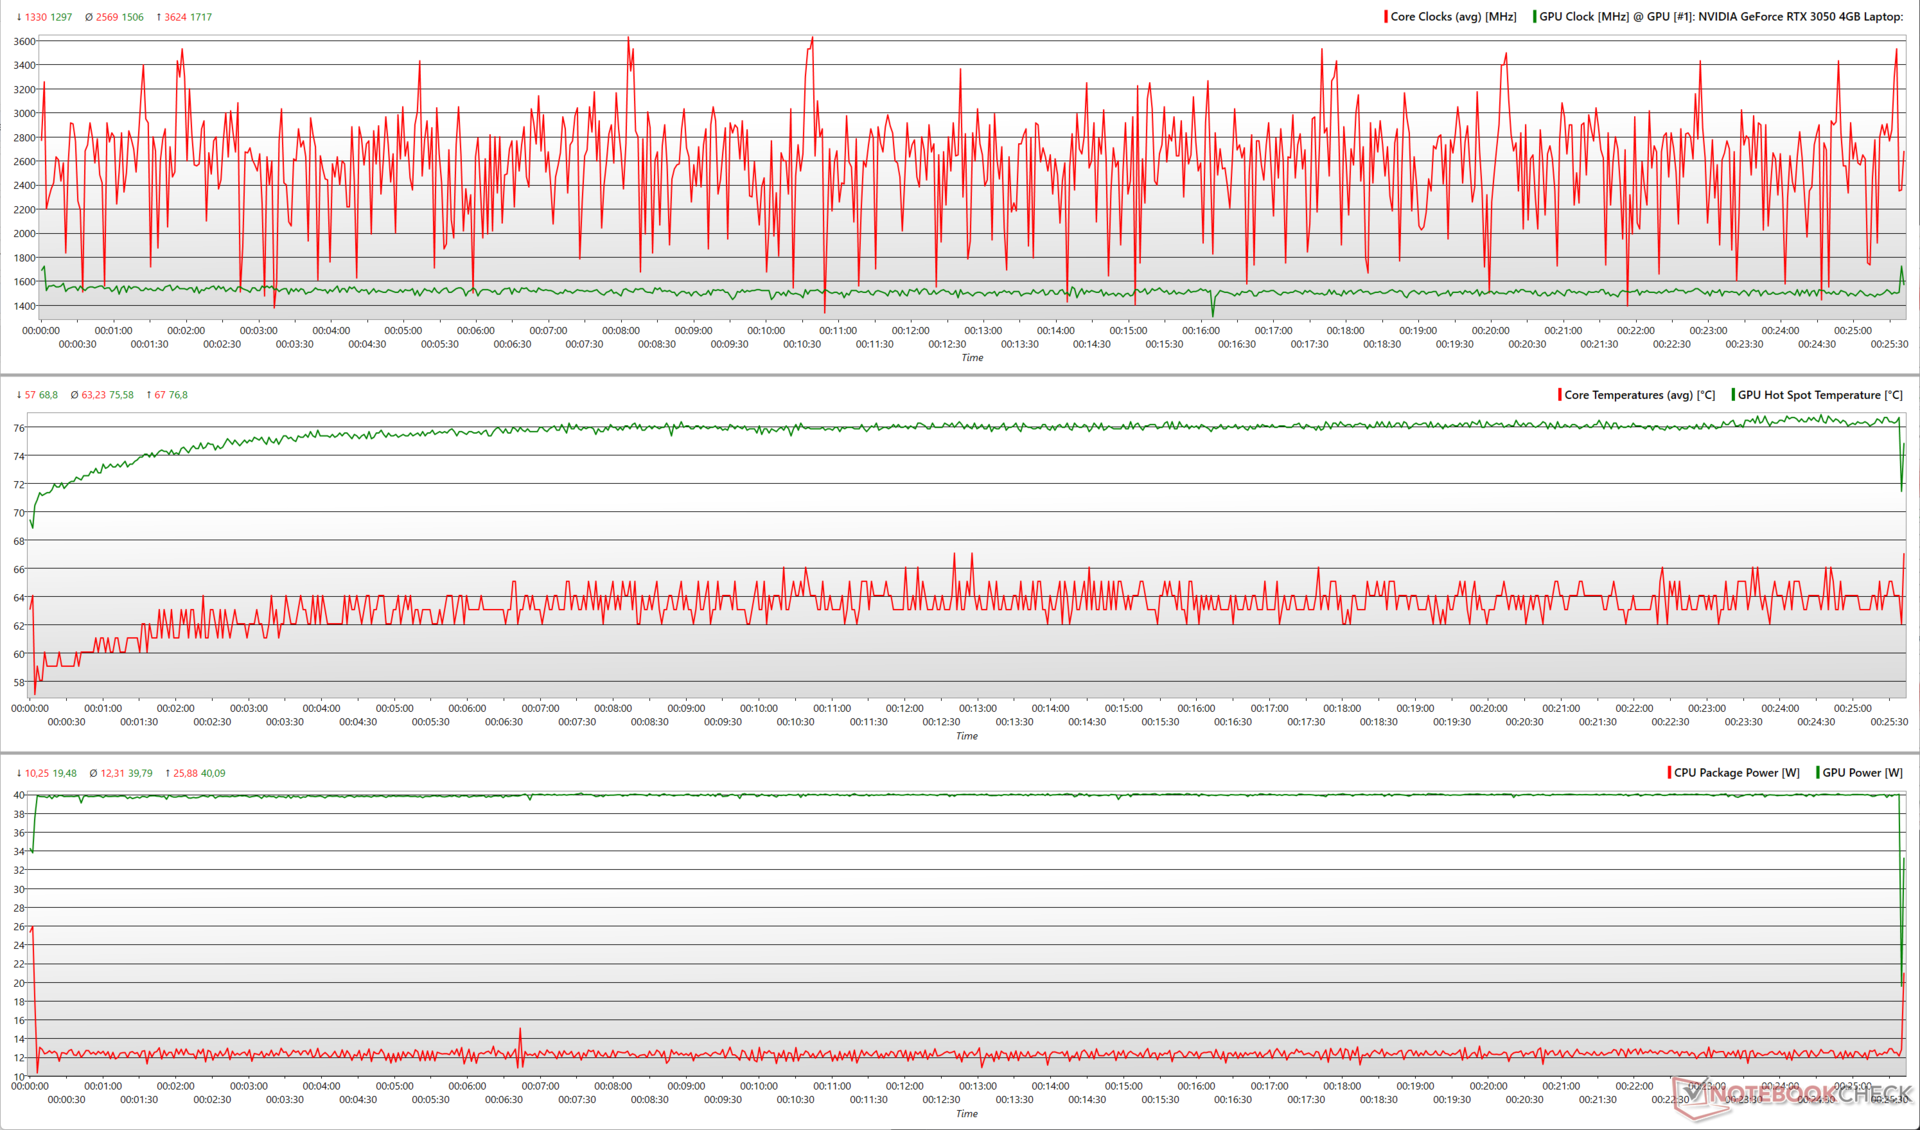
| The Witcher 3 1080p Ultra | 2,56 | 1.506 | 63,2 | 75,6 |
Con Witcher 3 a 1080p Ultra, la RTX 3050 può raggiungere un picco di 1.717 MHz con un consumo di 40 W. Il Core i5-13500H ha una media di 12 W con un clock medio di circa 2,6 GHz.
Secondo Asus, il sistema di raffreddamento del VivoBook 14X può permettersi un TDP combinato di 55 W per la CPU e la GPU. I nostri test di stress confermano questa affermazione, in quanto osserviamo un consumo medio di 56 W durante l'esecuzione di Prime95 + FurMark e 52 W durante lo stress test di The Witcher 3.
Altoparlanti
Con un picco di 70,7 db(A), gli altoparlanti stereo del VivoBook 14X non hanno un volume adeguato. Detto questo, la sintonizzazione Dirac è in grado di offrire una certa quantità di bassi, pur mantenendo medi e alti equilibrati.
Gli utenti possono ottenere un'esperienza audio molto migliore collegando dispositivi audio esterni tramite il jack audio da 3,5 mm o tramite Bluetooth 5.3.
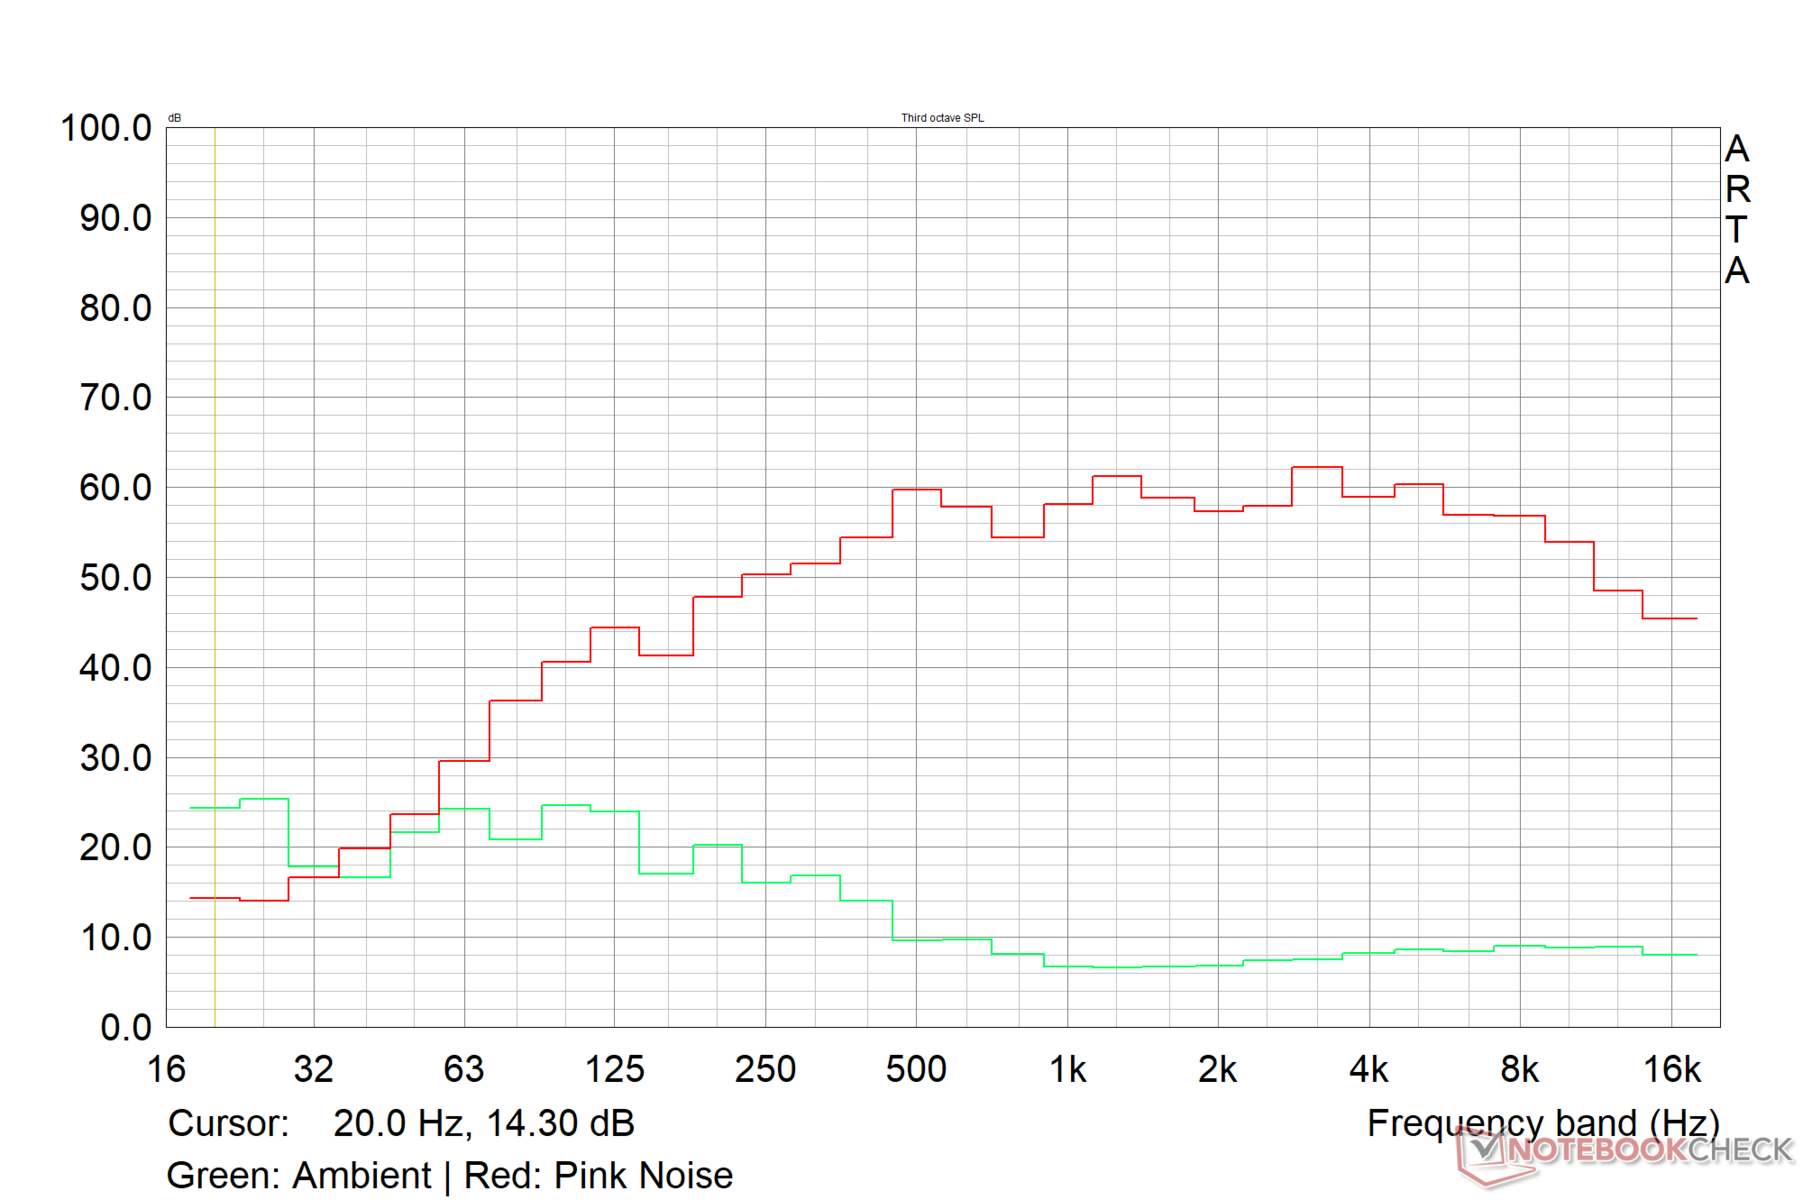
Asus VivoBook 14X K3405 analisi audio
(-) | altoparlanti non molto potenti (70.7 dB)
Bassi 100 - 315 Hz
(±) | bassi ridotti - in media 10.8% inferiori alla media
(±) | la linearità dei bassi è media (7.4% delta rispetto alla precedente frequenza)
Medi 400 - 2000 Hz
(+) | medi bilanciati - solo only 2.1% rispetto alla media
(+) | medi lineari (6.3% delta rispetto alla precedente frequenza)
Alti 2 - 16 kHz
(+) | Alti bilanciati - appena 2.2% dalla media
(+) | alti lineari (4.8% delta rispetto alla precedente frequenza)
Nel complesso 100 - 16.000 Hz
(+) | suono nel complesso lineare (13.2% differenza dalla media)
Rispetto alla stessa classe
» 27% di tutti i dispositivi testati in questa classe è stato migliore, 5% simile, 68% peggiore
» Il migliore ha avuto un delta di 5%, medio di 17%, peggiore di 45%
Rispetto a tutti i dispositivi testati
» 13% di tutti i dispositivi testati in questa classe è stato migliore, 3% similare, 84% peggiore
» Il migliore ha avuto un delta di 4%, medio di 24%, peggiore di 134%
Apple MacBook Pro 16 2021 M1 Pro analisi audio
(+) | gli altoparlanti sono relativamente potenti (84.7 dB)
Bassi 100 - 315 Hz
(+) | bassi buoni - solo 3.8% dalla media
(+) | bassi in lineaa (5.2% delta rispetto alla precedente frequenza)
Medi 400 - 2000 Hz
(+) | medi bilanciati - solo only 1.3% rispetto alla media
(+) | medi lineari (2.1% delta rispetto alla precedente frequenza)
Alti 2 - 16 kHz
(+) | Alti bilanciati - appena 1.9% dalla media
(+) | alti lineari (2.7% delta rispetto alla precedente frequenza)
Nel complesso 100 - 16.000 Hz
(+) | suono nel complesso lineare (4.6% differenza dalla media)
Rispetto alla stessa classe
» 0% di tutti i dispositivi testati in questa classe è stato migliore, 0% simile, 100% peggiore
» Il migliore ha avuto un delta di 5%, medio di 17%, peggiore di 45%
Rispetto a tutti i dispositivi testati
» 0% di tutti i dispositivi testati in questa classe è stato migliore, 0% similare, 100% peggiore
» Il migliore ha avuto un delta di 4%, medio di 24%, peggiore di 134%
Gestione dell'energia: Frugale in idle e sotto carico
Consumo di energia
La combinazione Core i5-13500H e RTX 3050 è piuttosto economica in termini di consumo energetico rispetto alla concorrenza. Il VivoBook 14X OLED è in grado di utilizzare completamente l'alimentatore da 90 W in dotazione sotto carico massimo.
Mentre il Lenovo Slim Pro 7 con unRyzen 7 7735HSe una RTX 3050 da 6 GB mostra un consumo energetico inferiore dell'8% in media, ma presenta consumi più elevati in condizioni di idle, gioco e carico massimo.
| Off / Standby | |
| Idle | |
| Sotto carico |
|
Leggenda:
min: | |
| Asus VivoBook 14X K3405 i5-13500H, GeForce RTX 3050 4GB Laptop GPU, , 2880x1800, 14" | Acer Swift X SFX14-71G i7-13700H, GeForce RTX 4050 Laptop GPU, OLED, 2880x1800, 14.5" | MSI Stealth 14 Studio A13V i7-13700H, GeForce RTX 4050 Laptop GPU, IPS, 2560x1600, 14" | Gigabyte Aero 14 OLED BMF i7-13700H, GeForce RTX 4050 Laptop GPU, OLED, 2880x1800, 14" | Lenovo Slim Pro 7 14ARP8 R7 7735HS, GeForce RTX 3050 6GB Laptop GPU, IPS, 2560x1600, 14.5" | Schenker Vision 14 2022 RTX 3050 Ti i7-12700H, GeForce RTX 3050 Ti Laptop GPU, IPS, 2880x1800, 14" | Media NVIDIA GeForce RTX 3050 4GB Laptop GPU | Media della classe Multimedia | |
|---|---|---|---|---|---|---|---|---|
| Power Consumption | -30% | -100% | -14% | -36% | -26% | -37% | -16% | |
| Idle Minimum * (Watt) | 4.96 | 8.4 -69% | 10.4 -110% | 7.4 -49% | 7.6 -53% | 7.5 -51% | 7.17 ? -45% | 5.64 ? -14% |
| Idle Average * (Watt) | 7.54 | 11.5 -53% | 19.1 -153% | 8.3 -10% | 12.2 -62% | 10.4 -38% | 10.4 ? -38% | 10 ? -33% |
| Idle Maximum * (Watt) | 9.31 | 11.9 -28% | 19.4 -108% | 8.7 7% | 12.8 -37% | 11.4 -22% | 14.8 ? -59% | 12.2 ? -31% |
| Load Average * (Watt) | 83.4 | 84.9 -2% | 95.9 -15% | 76 9% | 76.5 8% | 83.3 -0% | 89.7 ? -8% | 64.8 ? 22% |
| Witcher 3 ultra * (Watt) | 73.3 | 83.6 -14% | 141.6 -93% | 70 5% | 89.5 -22% | 92.7 -26% | ||
| Load Maximum * (Watt) | 91.74 | 104.2 -14% | 203 -121% | 132 -44% | 135.7 -48% | 110.3 -20% | 124.8 ? -36% | 111.7 ? -22% |
* ... Meglio usare valori piccoli
Power Consumption: The Witcher 3 / Stress test
Power Consumption: External monitor
Durata della batteria
La batteria da 63 WHr del VivoBook 14X non offre una longevità straordinaria, ma dovrebbe riuscire a sopportare la maggior parte di una giornata lavorativa standard prima di richiedere una ricarica.
La batteria dura quasi 10,5 ore durante la riproduzione di un video H.264 a 1080p con una luminosità di 150 nits, il che è impressionante. Tuttavia, la durata di gioco del portatile è notevolmente inferiore, con poco più di un'ora.
L'alimentatore in dotazione è in grado di ricaricare la batteria del portatile dallo 0% al 60% in circa 50 minuti.
| Asus VivoBook 14X K3405 i5-13500H, GeForce RTX 3050 4GB Laptop GPU, 63 Wh | Acer Swift X SFX14-71G i7-13700H, GeForce RTX 4050 Laptop GPU, 76 Wh | MSI Stealth 14 Studio A13V i7-13700H, GeForce RTX 4050 Laptop GPU, 72 Wh | Gigabyte Aero 14 OLED BMF i7-13700H, GeForce RTX 4050 Laptop GPU, 63 Wh | Lenovo Slim Pro 7 14ARP8 R7 7735HS, GeForce RTX 3050 6GB Laptop GPU, 73 Wh | Schenker Vision 14 2022 RTX 3050 Ti i7-12700H, GeForce RTX 3050 Ti Laptop GPU, 99.8 Wh | Media della classe Multimedia | |
|---|---|---|---|---|---|---|---|
| Autonomia della batteria | -17% | -17% | 15% | 30% | 41% | 53% | |
| H.264 (h) | 10.4 | 9.5 -9% | 6.6 -37% | 11.1 7% | 16.4 ? 58% | ||
| WiFi v1.3 (h) | 8.1 | 7.7 -5% | 6.3 -22% | 7.6 -6% | 10.5 30% | 10.1 25% | 12 ? 48% |
| Witcher 3 ultra (h) | 1.3 | ||||||
| Load (h) | 1.1 | 0.7 -36% | 1.2 9% | 1.5 36% | 2.1 91% | 1.675 ? 52% | |
| Reader / Idle (h) | 11.3 | 25.2 ? |
Pro
Contro
Verdetto: Laptop multimediale versatile con ampi margini di miglioramento
L'Asus VivoBook 14X K3405 offre i vantaggi in termini di prestazioni ed efficienza del processore Intel Core i5-13500Hin uno chassis elegante e leggero.
Il portatile offre una connettività decente, ma le prestazioni del Wi-Fi 6E devono essere ulteriormente migliorate. Manca anche la Thunderbolt 4.
Asus utilizza un pannello OLED Samsung da 2,8K 90 Hz nel VivoBook 14X che presenta caratteristiche cromatiche eccellenti per i redattori in erba. Il pannello soffre di PWM ai livelli di luminosità più bassi, ma utilizza il DC Dimming per compensare in qualche modo lo sfarfallio a livelli di illuminazione più elevati.
L'Asus VivoBook 14X non grida esattamente potenza e può certamente beneficiare di aggiornamenti della GPU e del raffreddamento, ma è un computer portatile multimediale ben dotato che consente anche di giocare un po'"
Il Core i5-13500H ha avuto alcuni meriti nei nostri test, ma lo chassis e i limiti di raffreddamento del VivoBook 14X non consentono alla CPU di mostrare pienamente i suoi muscoli. Una RTX 4050 da 35 W sarebbe stata la ciliegina sulla torta, ma è probabile che Asus abbia optato per la vetusta RTX 3050 per contenere i costi.
Ci piacerebbe anche vedere Asus passare a un sistema di raffreddamento a doppia ventola nelle prossime iterazioni, dato che la soluzione a singola ventola del VivoBook 14X può raggiungere rapidamente i suoi limiti.
Nonostante queste limitazioni, l'Asus VivoBook 14X rimane un interessante portatile multimediale di fascia medio-alta vicino ai 1.100 euro (sotto i 1.000 euro). Una valida alternativa è il Lenovo Slim Pro 7 che offre un touchscreen IPS da 2,5K e Ryzen 7 7735HS.
Il Gigabyte Aero 14 OLED con RTX 4050 da 35 W e Core i7-13700H offre una configurazione più aggiornata, a patto che siate disposti a pagare il sovrapprezzo.
Prezzo e disponibilità
La combinazione testata di Core i5-13500 e RTX 3050 del VivoBook 14X OLED ha un prezzo di vendita di ₹96.990, e l'unico modo per acquistarlo è il negozio online di Asus India.
Amazon India e Flipkart hanno solo la SKU con Core i5-13500H e RTX 2050, che costa circa ₹82.000. Anche Amazon US e Best Buy US sembrano avere solo le SKU RTX 2050 con pannelli OLED FHD+ per circa 850 dollari.
Asus VivoBook 14X K3405
- 08/07/2023 v7 (old)
Vaidyanathan Subramaniam
Transparency
La selezione dei dispositivi da recensire viene effettuata dalla nostra redazione. Il campione di prova è stato fornito all'autore come prestito dal produttore o dal rivenditore ai fini di questa recensione. L'istituto di credito non ha avuto alcuna influenza su questa recensione, né il produttore ne ha ricevuto una copia prima della pubblicazione. Non vi era alcun obbligo di pubblicare questa recensione. In quanto società mediatica indipendente, Notebookcheck non è soggetta all'autorità di produttori, rivenditori o editori.
Ecco come Notebookcheck esegue i test
Ogni anno, Notebookcheck esamina in modo indipendente centinaia di laptop e smartphone utilizzando procedure standardizzate per garantire che tutti i risultati siano comparabili. Da circa 20 anni sviluppiamo continuamente i nostri metodi di prova e nel frattempo stabiliamo gli standard di settore. Nei nostri laboratori di prova, tecnici ed editori esperti utilizzano apparecchiature di misurazione di alta qualità. Questi test comportano un processo di validazione in più fasi. Il nostro complesso sistema di valutazione si basa su centinaia di misurazioni e parametri di riferimento ben fondati, che mantengono l'obiettività.Price comparison

