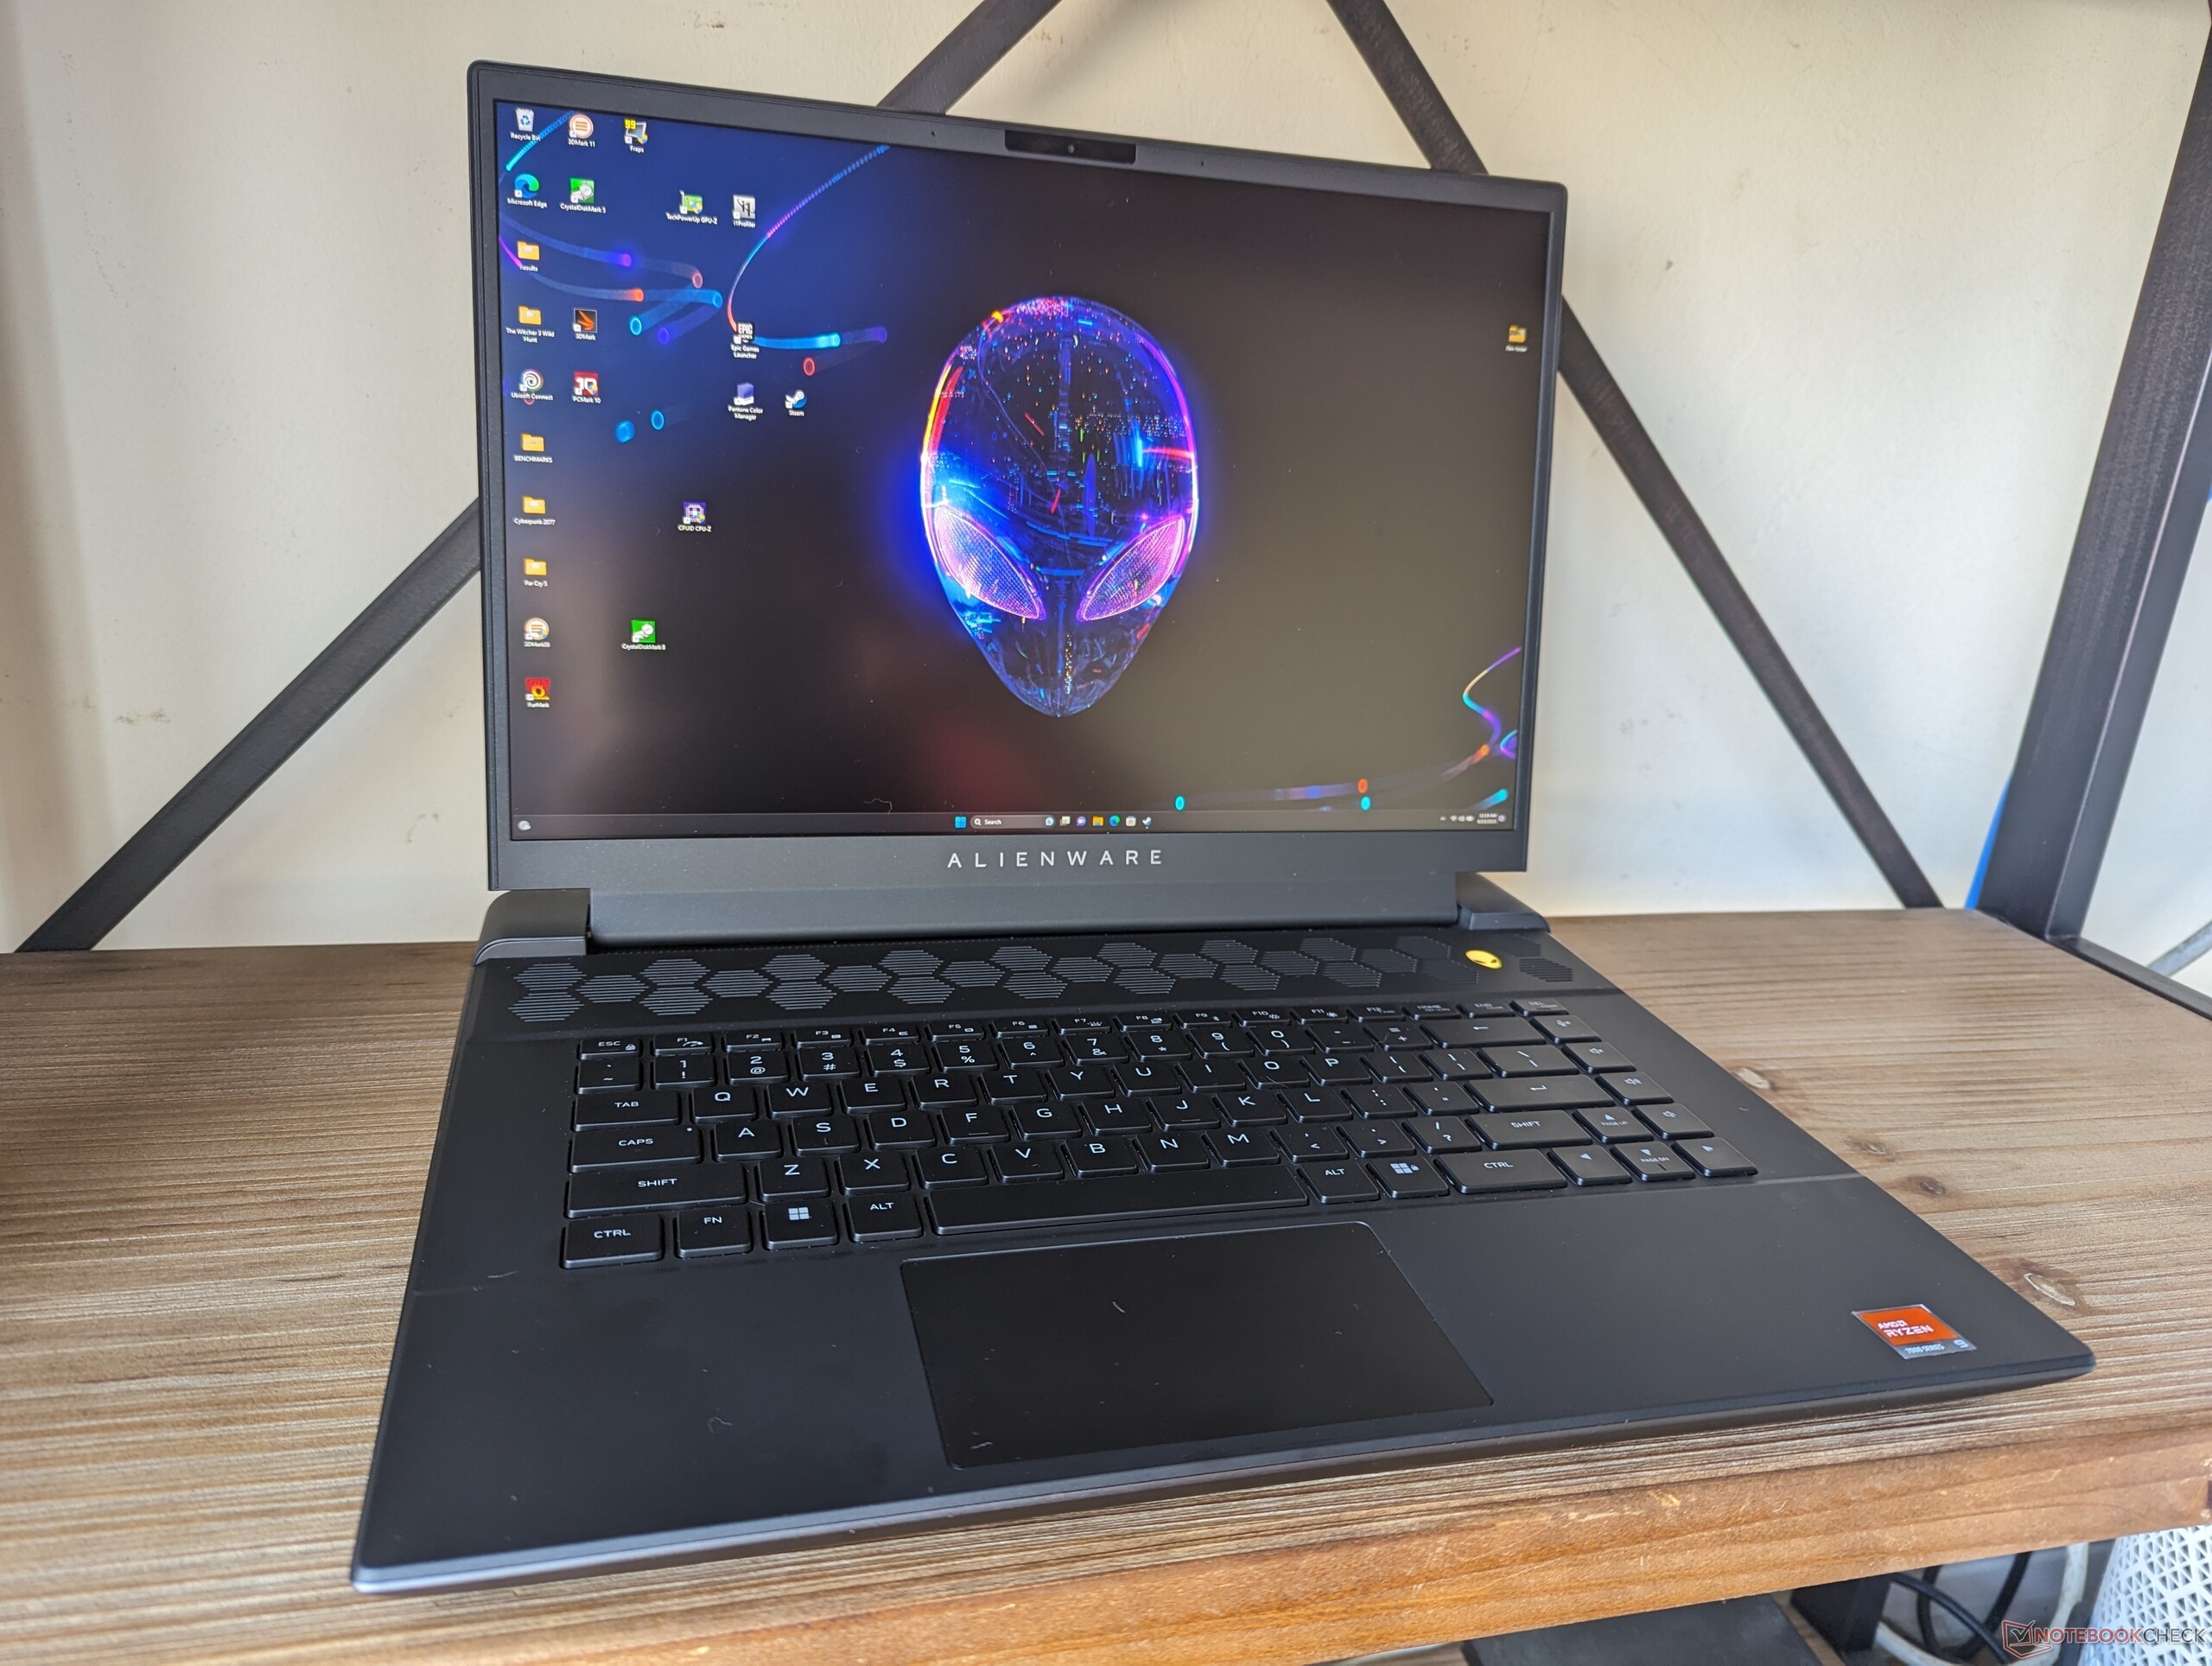
Recensione del portatile Alienware m16 R1: Debutto delle prestazioni dell'AMD Ryzen 9 7845HX

Dopo aver lanciato il modello da 15,6 pollici Alienware m15e 17 pollici Alienware m17e 18 pollici Alienware m18dell è ora pronta a distribuire l'Alienware m16 da 16 pollici, completo delle più recenti GPU Nvidia Ada Lovelace e con la possibilità di scegliere tra i processori Intel 13th gen Raptor Lake o AMD Zen 4. L'Alienware m16 si distingue dal recente Alienware x16 che è un modello ancora più sottile con specifiche e caratteristiche diverse.
La nostra unità di recensione è una configurazione AMD di fascia medio-alta con Ryzen 9 7845HX, GPU GeForce RTX 4080 da 175 W e display IPS da 1600p240 al prezzo di circa 2350 dollari. Le SKU minori sono dotate di CPU Ryzen 7 7745HX e GPU Radeon RX 7600M a 2150 dollari, mentre quelle più costose con Ryzen 9 7945HX e RTX 4090 possono arrivare a oltre 3100 dollari, a seconda delle preferenze per RAM e SSD. Nel frattempo, le versioni Intel sono disponibili con le stesse opzioni di display e GPU Nvidia, ma con il Core i7-13700HX o i9-13900HX.
I concorrenti includono altri portatili da gioco da 16 pollici di punta come il modello HP Omen 16, Lenovo Legion Pro 7 16, Asus ROG Strix G16o il Razer Blade 16.
Altre recensioni Dell:
Potenziali concorrenti a confronto
Punteggio | Data | Modello | Peso | Altezza | Dimensione | Risoluzione | Prezzo |
|---|---|---|---|---|---|---|---|
| 89.2 % v7 (old) | 08/2023 | Alienware m16 R1 AMD R9 7845HX, GeForce RTX 4080 Laptop GPU | 3.1 kg | 25.4 mm | 16.00" | 2560x1600 | |
| 88.4 % v7 (old) | 06/2023 | Alienware x16 R1 i9-13900HK, GeForce RTX 4080 Laptop GPU | 2.6 kg | 18.57 mm | 16.00" | 2560x1600 | |
| 87.9 % v7 (old) | 08/2023 | HP Omen Transcend 16 i9-13900HX, GeForce RTX 4070 Laptop GPU | 2.3 kg | 19.8 mm | 16.00" | 2560x1600 | |
| 88.8 % v7 (old) | 06/2023 | Lenovo Legion Pro 7 RTX4090 i9-13900HX, GeForce RTX 4090 Laptop GPU | 2.7 kg | 26 mm | 16.00" | 2560x1600 | |
| 88.4 % v7 (old) | 03/2023 | Asus ROG Strix G16 G614JZ i9-13980HX, GeForce RTX 4080 Laptop GPU | 2.4 kg | 30.4 mm | 16.00" | 2560x1600 | |
| 91.2 % v7 (old) | 02/2023 | Razer Blade 16 Early 2023 i9-13950HX, GeForce RTX 4080 Laptop GPU | 2.4 kg | 21.99 mm | 16.00" | 2560x1600 |
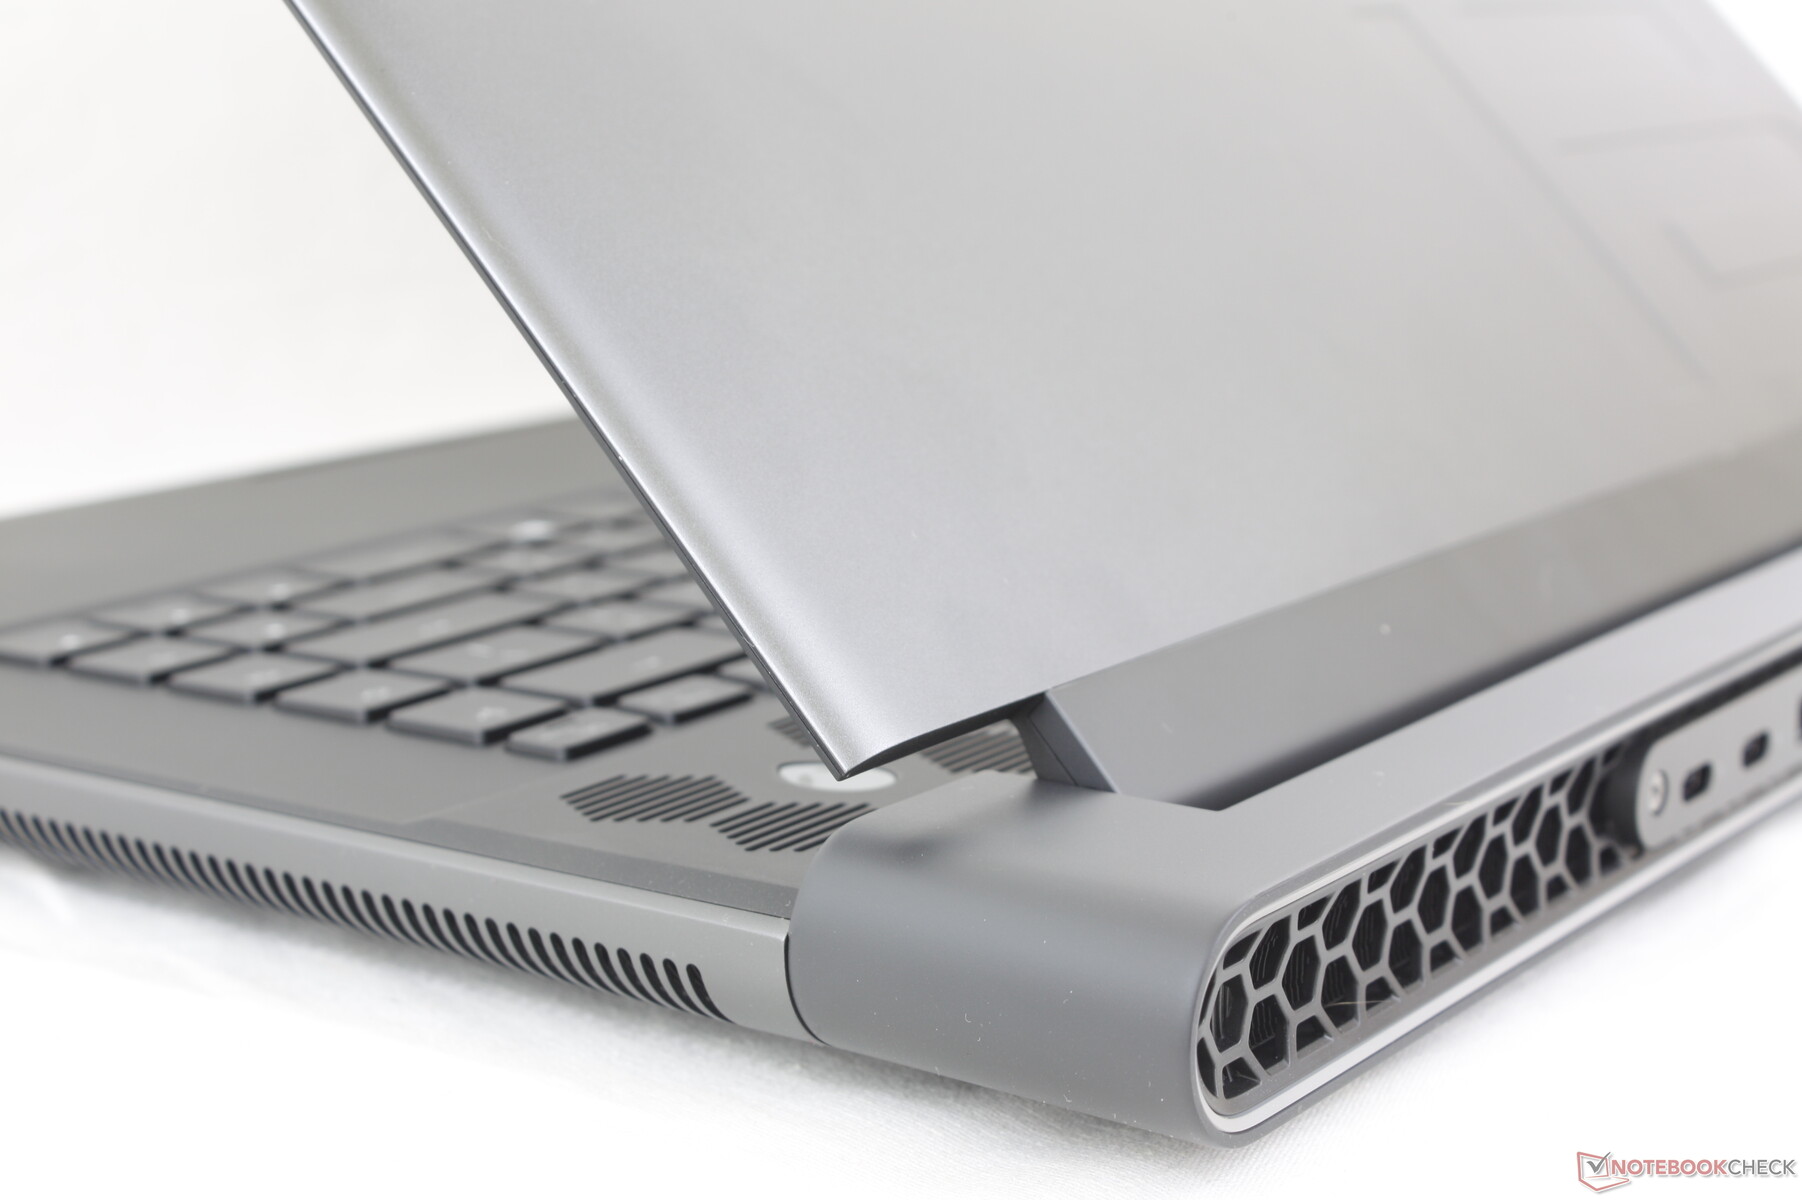
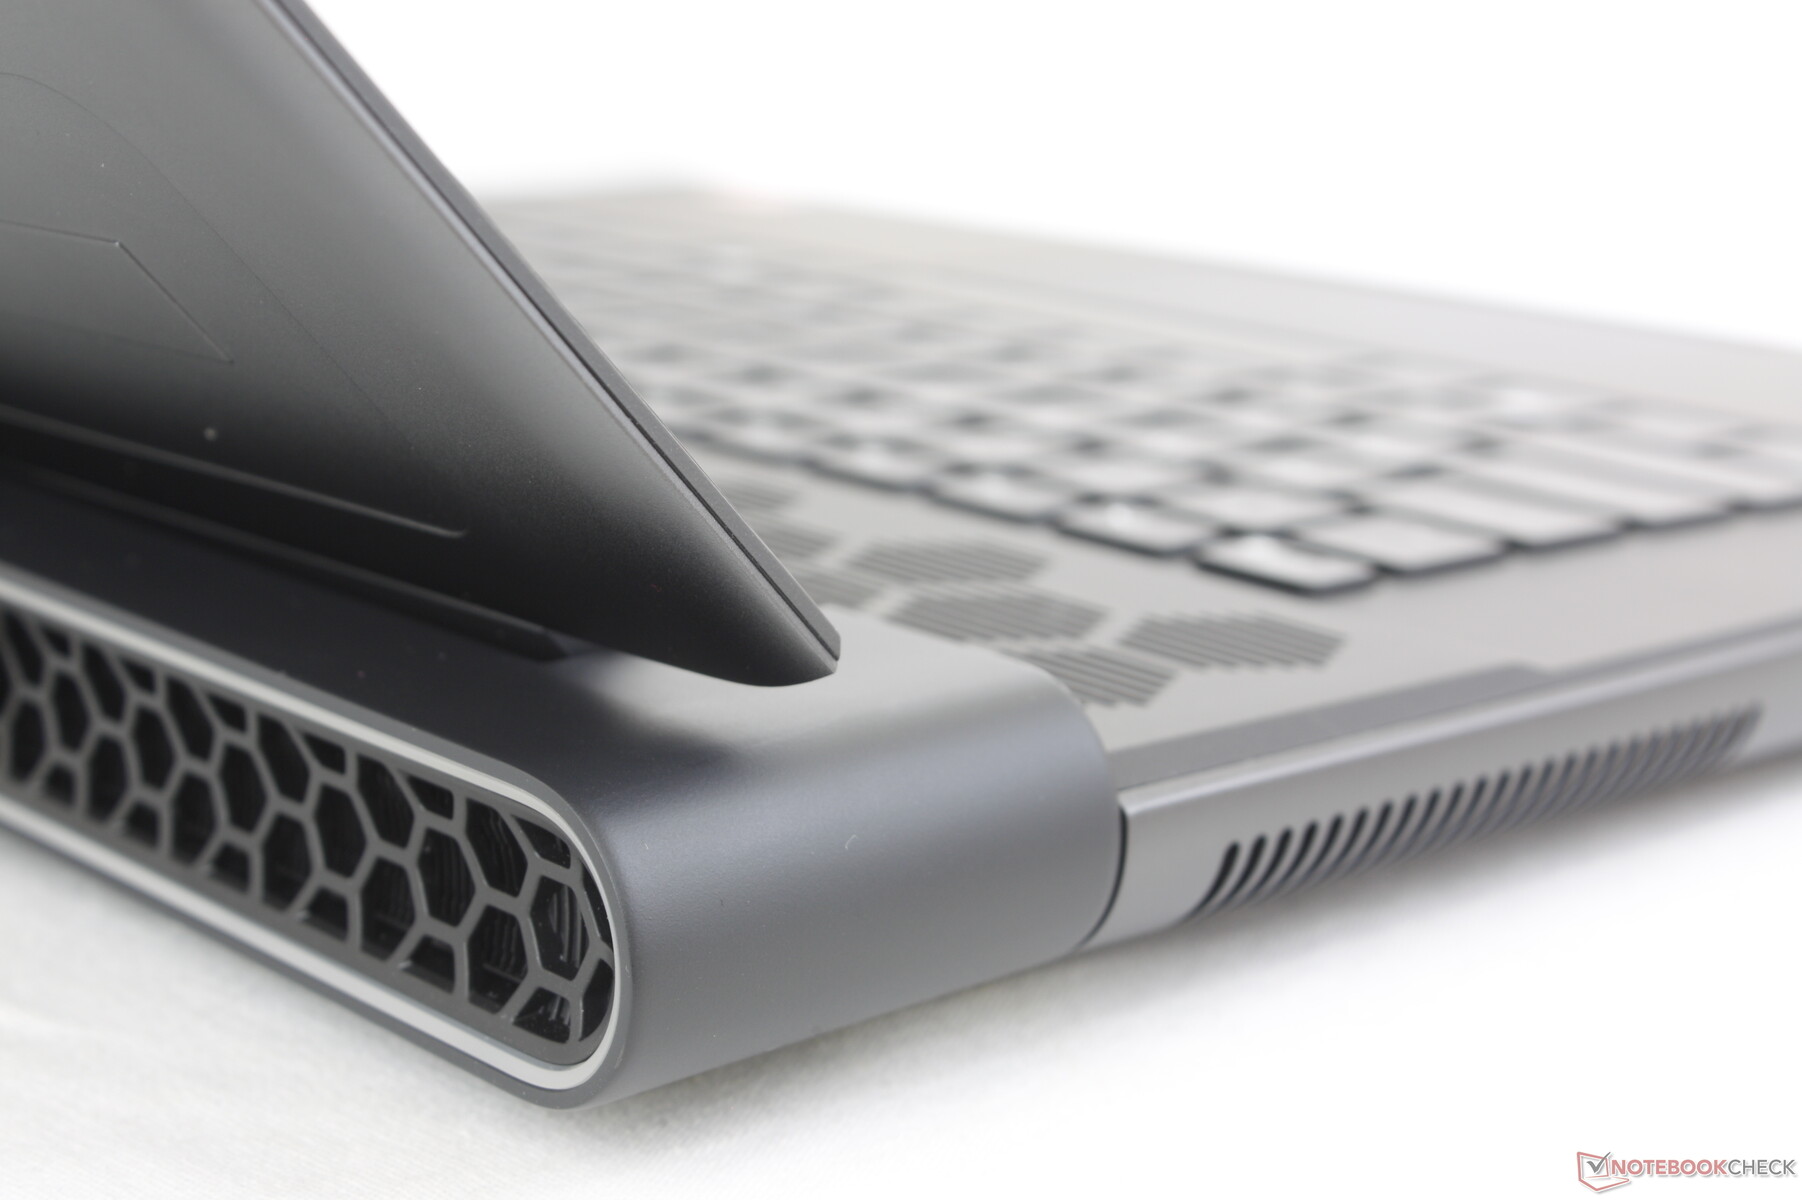
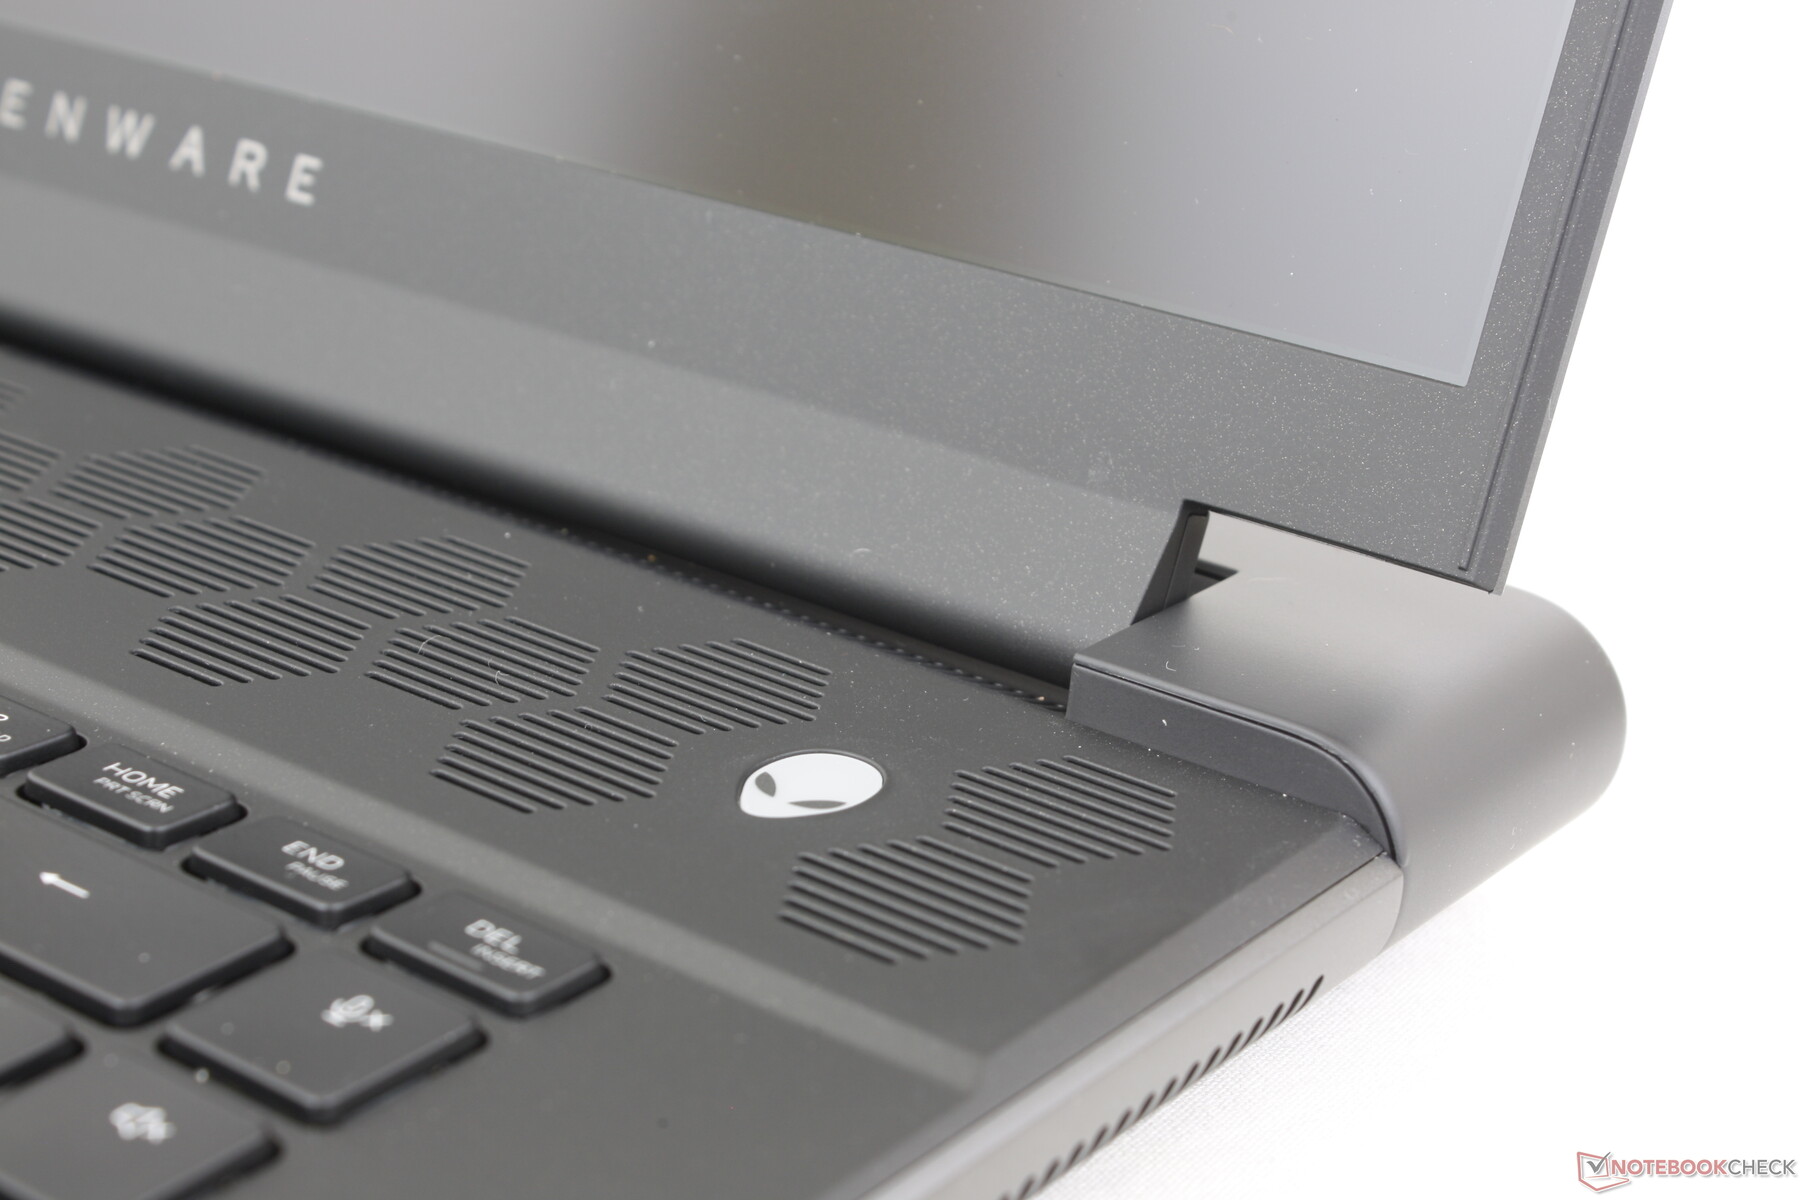
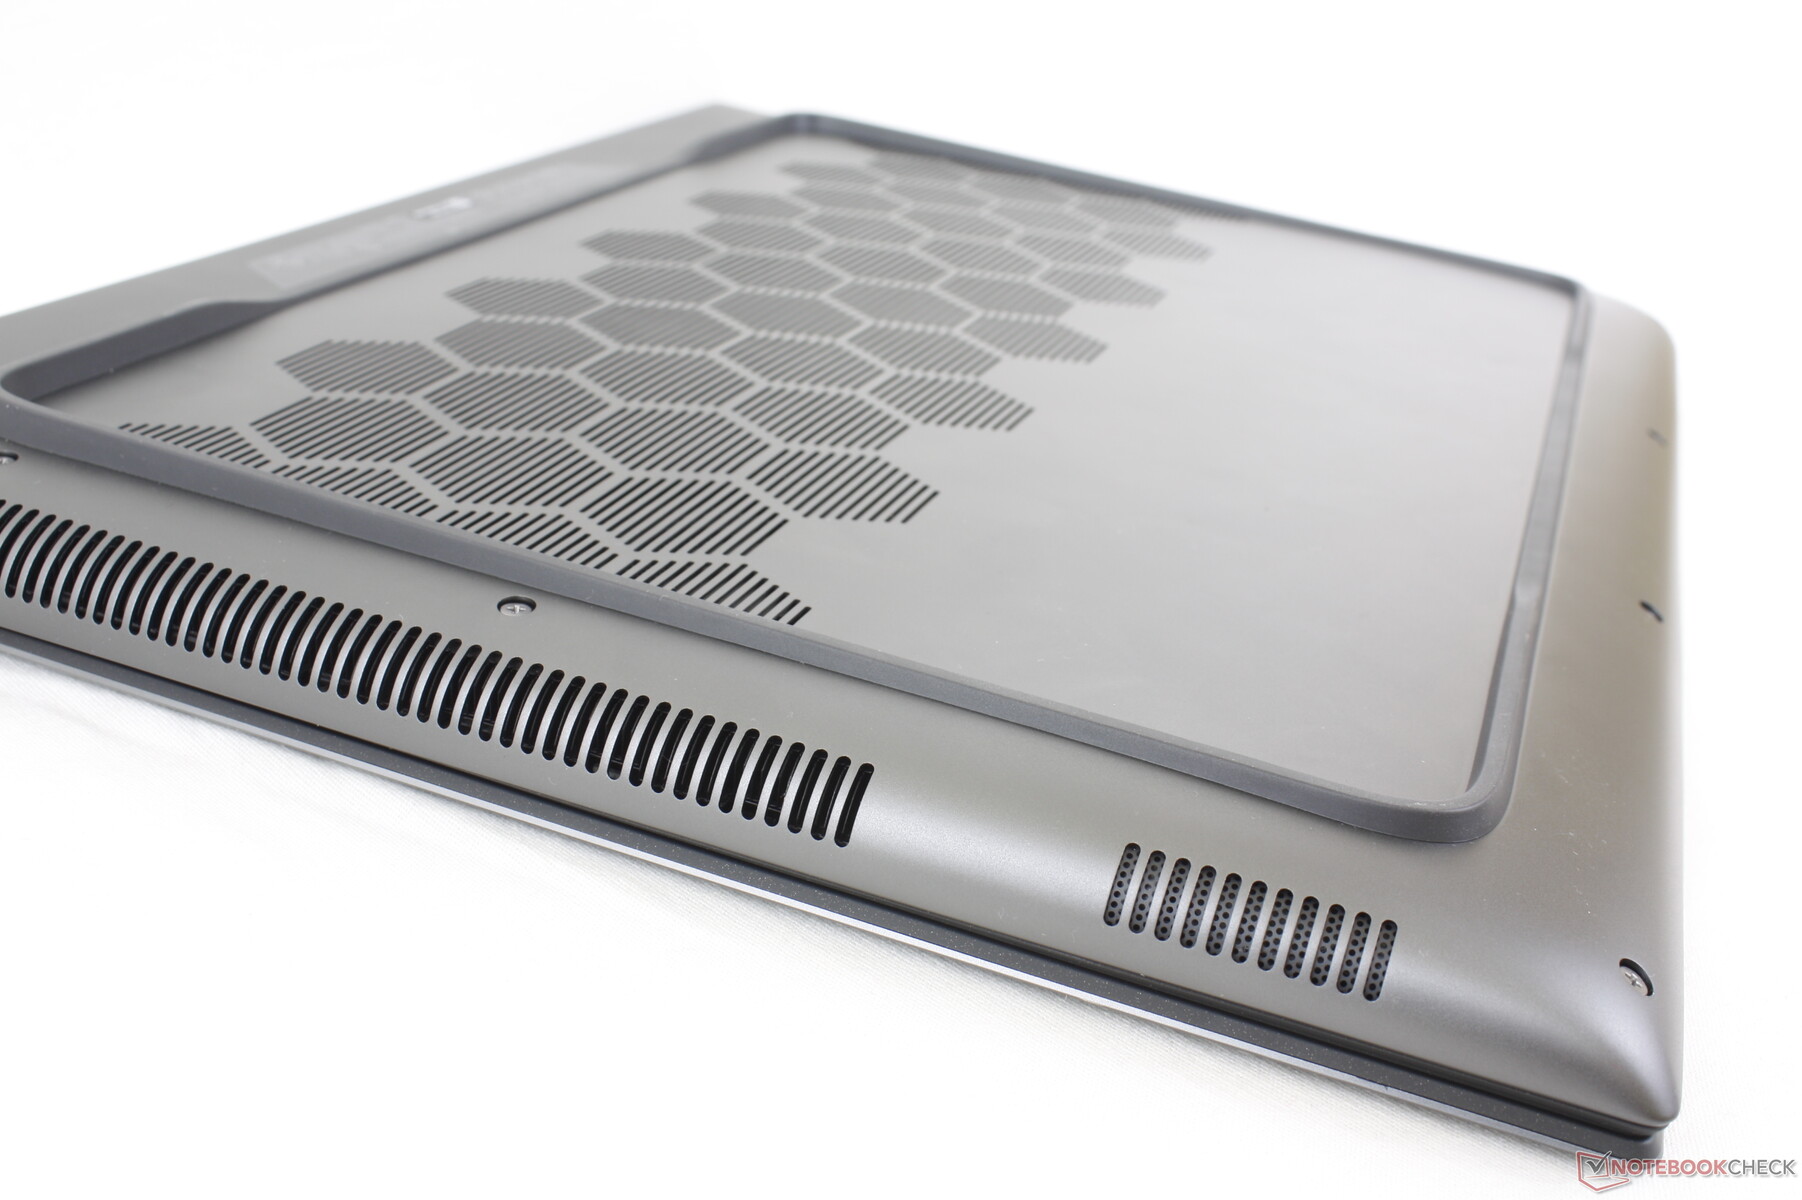
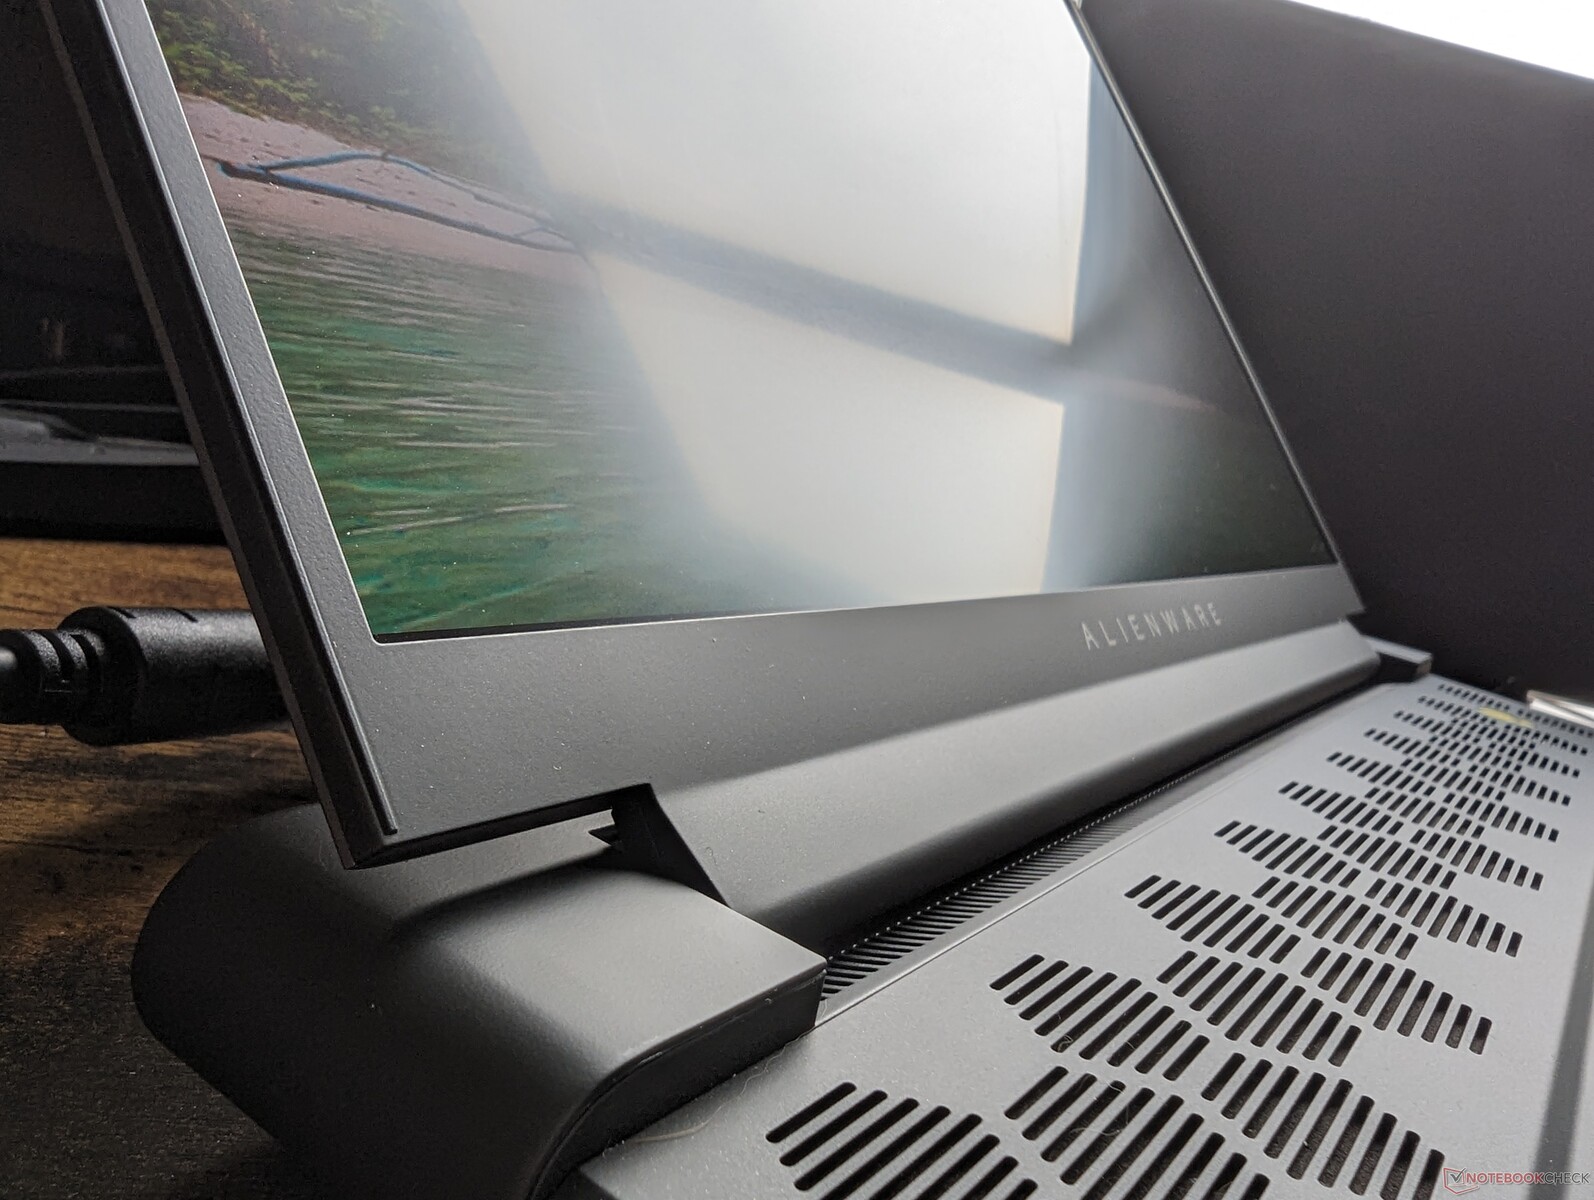
Case - Inconfondibilmente Alienware
Lo chassis è essenzialmente una versione più spessa dell'Alienware x16 R1, in quanto entrambi i modelli si basano sullo stesso design industriale Legend 3.0. Il piede perimetrale gommato, il coperchio esterno in alluminio, le griglie di ventilazione esagonali, l'anello LED posteriore e il piano tastiera nero opaco sono una combinazione che non si vede in nessun modello concorrente. La base, il coperchio e le cerniere sono tutti solidi, senza scricchiolii udibili quando si tenta di ruotarli o piegarli, per una prima impressione più forte rispetto a quella di un Asus TUF Gaming A16 o di Lenovo Legion Pro 7 16.
I palm rest, il clickpad e i tasti della tastiera neri continuano a essere calamite per le impronte digitali. Al momento Dell non offre altre opzioni di colore oltre a Dark Metallic Moon.
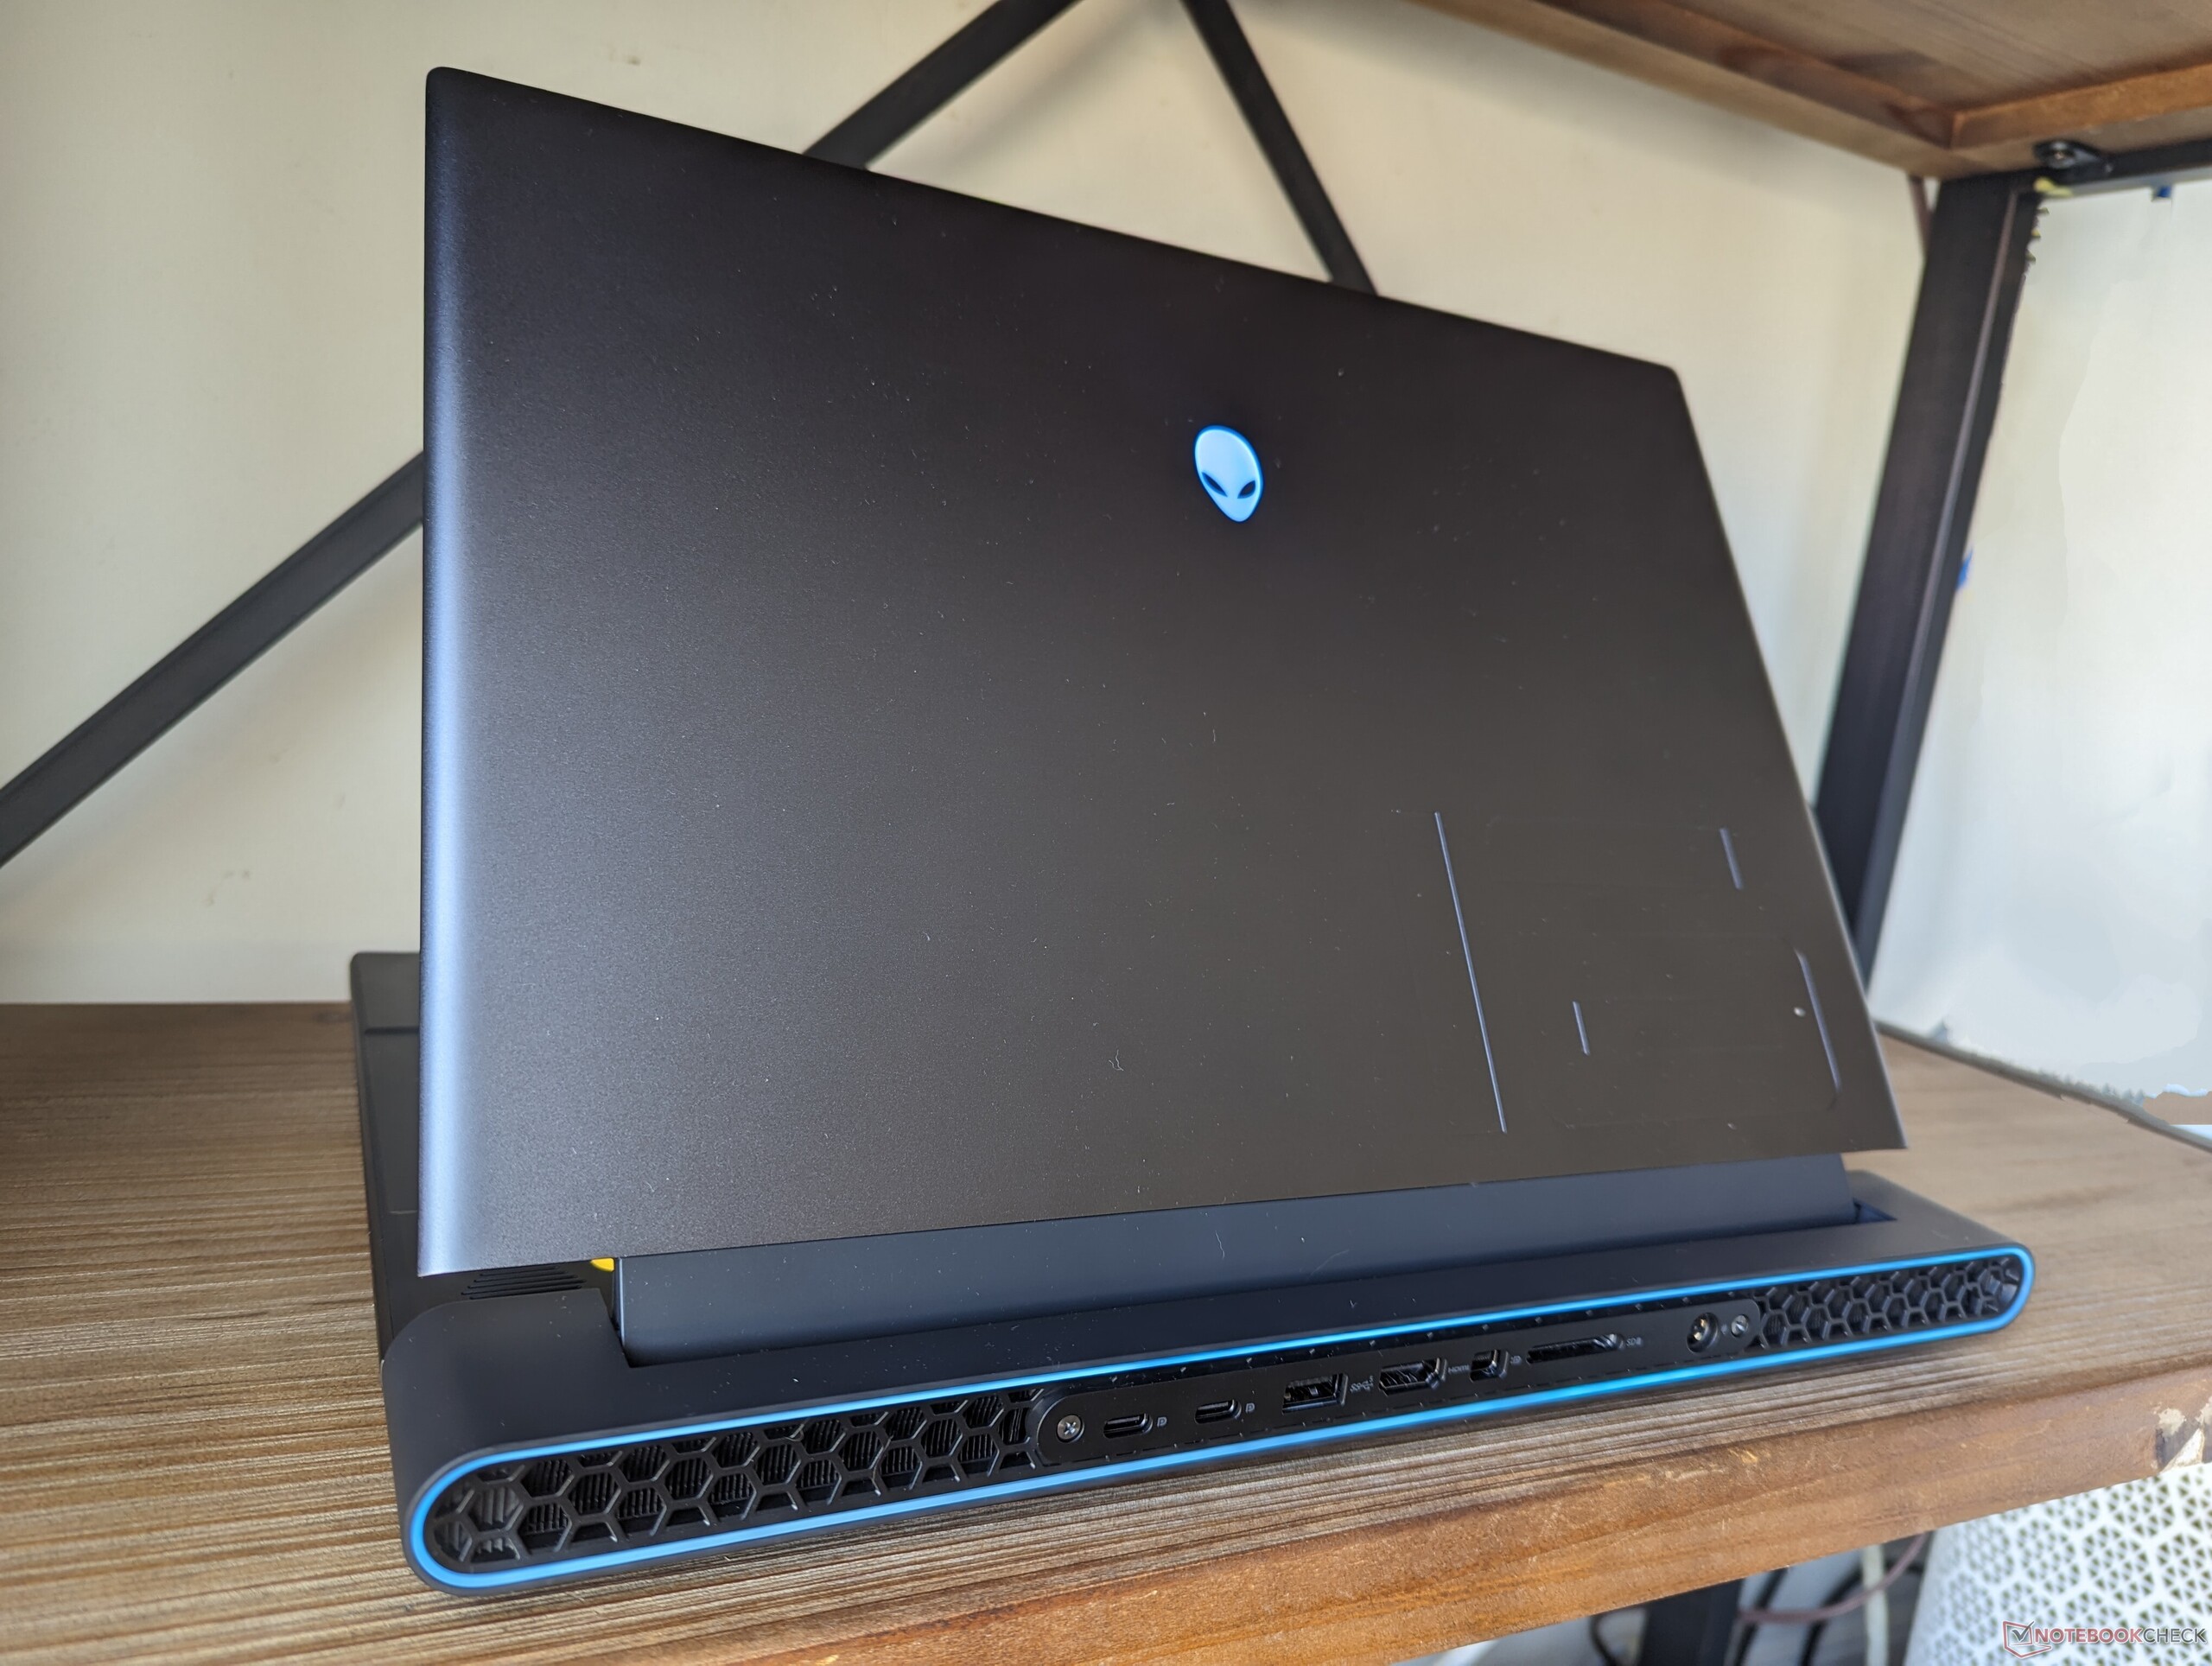
L'Alienware m16 R1 è uno dei portatili da gioco da 16 pollici più pesanti e anche uno dei più grandi in termini di lunghezza e larghezza grazie alla sua parte posteriore estesa. Il suo design denso rende la struttura molto robusta, anche se a scapito della portabilità. Il Legion Pro 7è più leggero di 400 g e ha un ingombro molto più ridotto, pur offrendo CPU di classe HX e GPU di fascia alta simili.
Connettività - Thunderbolt solo per le versioni Intel
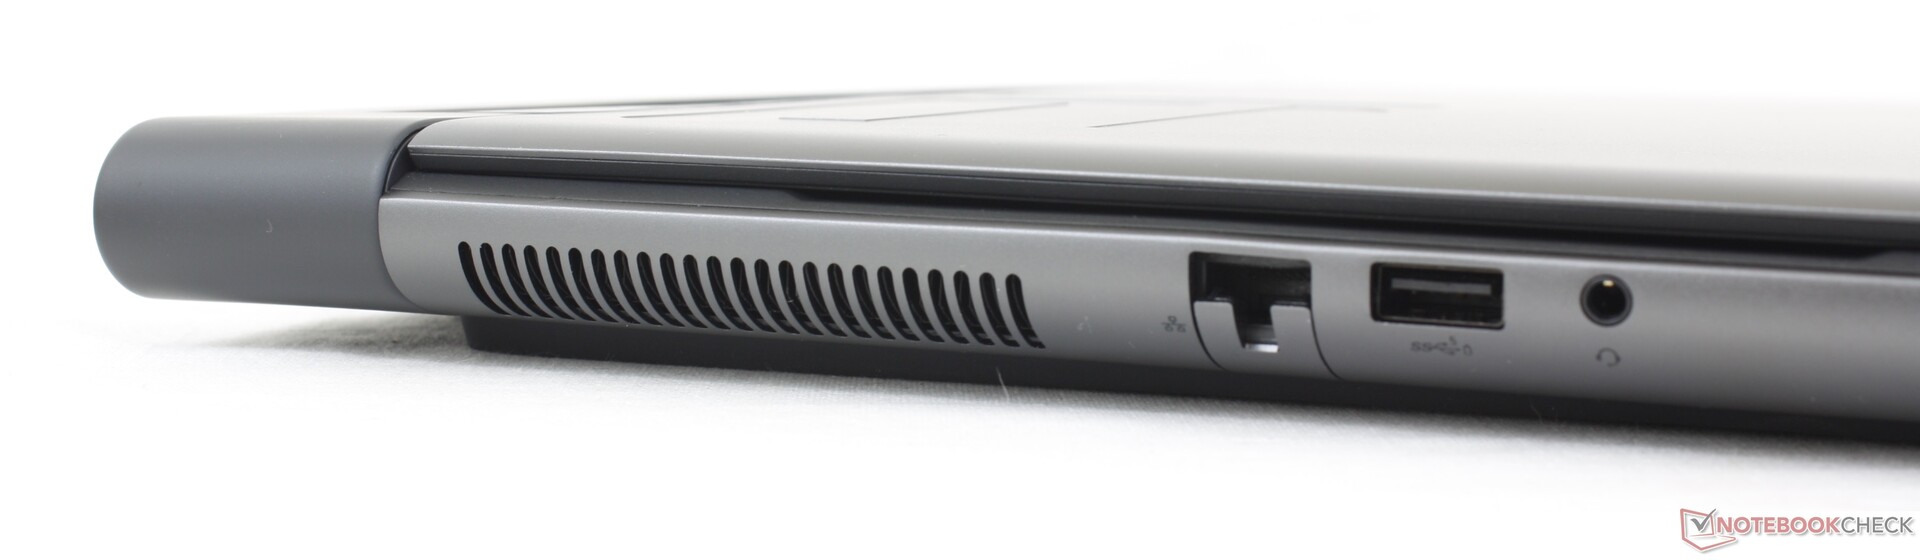
Le opzioni di porta includono tutto ciò che si trova sull'Alienware x16 R1, più RJ-45 e un lettore SD full-size invece di MicroSD. Alcune porte sono state spostate sul bordo sinistro, mentre sull'x16 sono tutte stipate sul retro. Anche la porta mini-DisplayPort è degna di nota, poiché non è comune nei portatili da gioco più recenti.
USB4 e Thunderbolt non sono supportate sul nostro modello AMD.
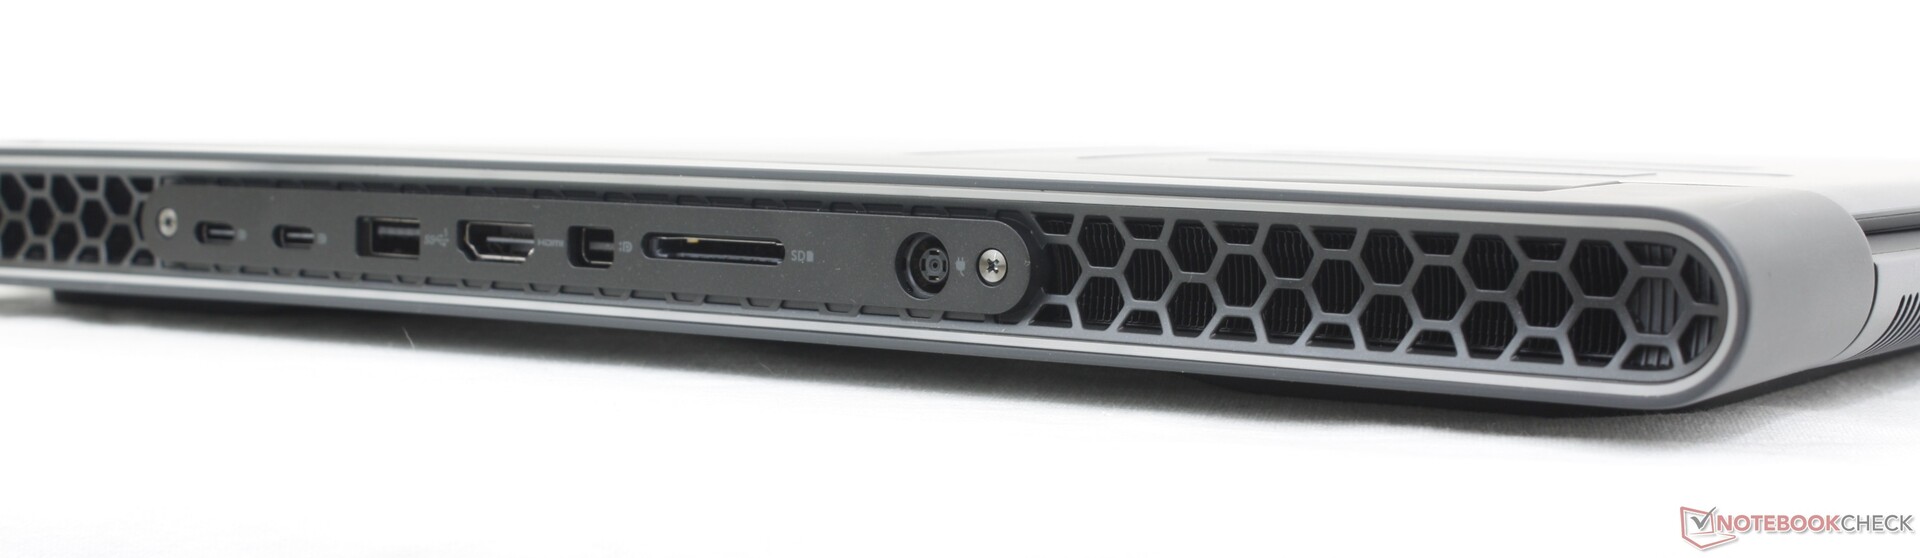
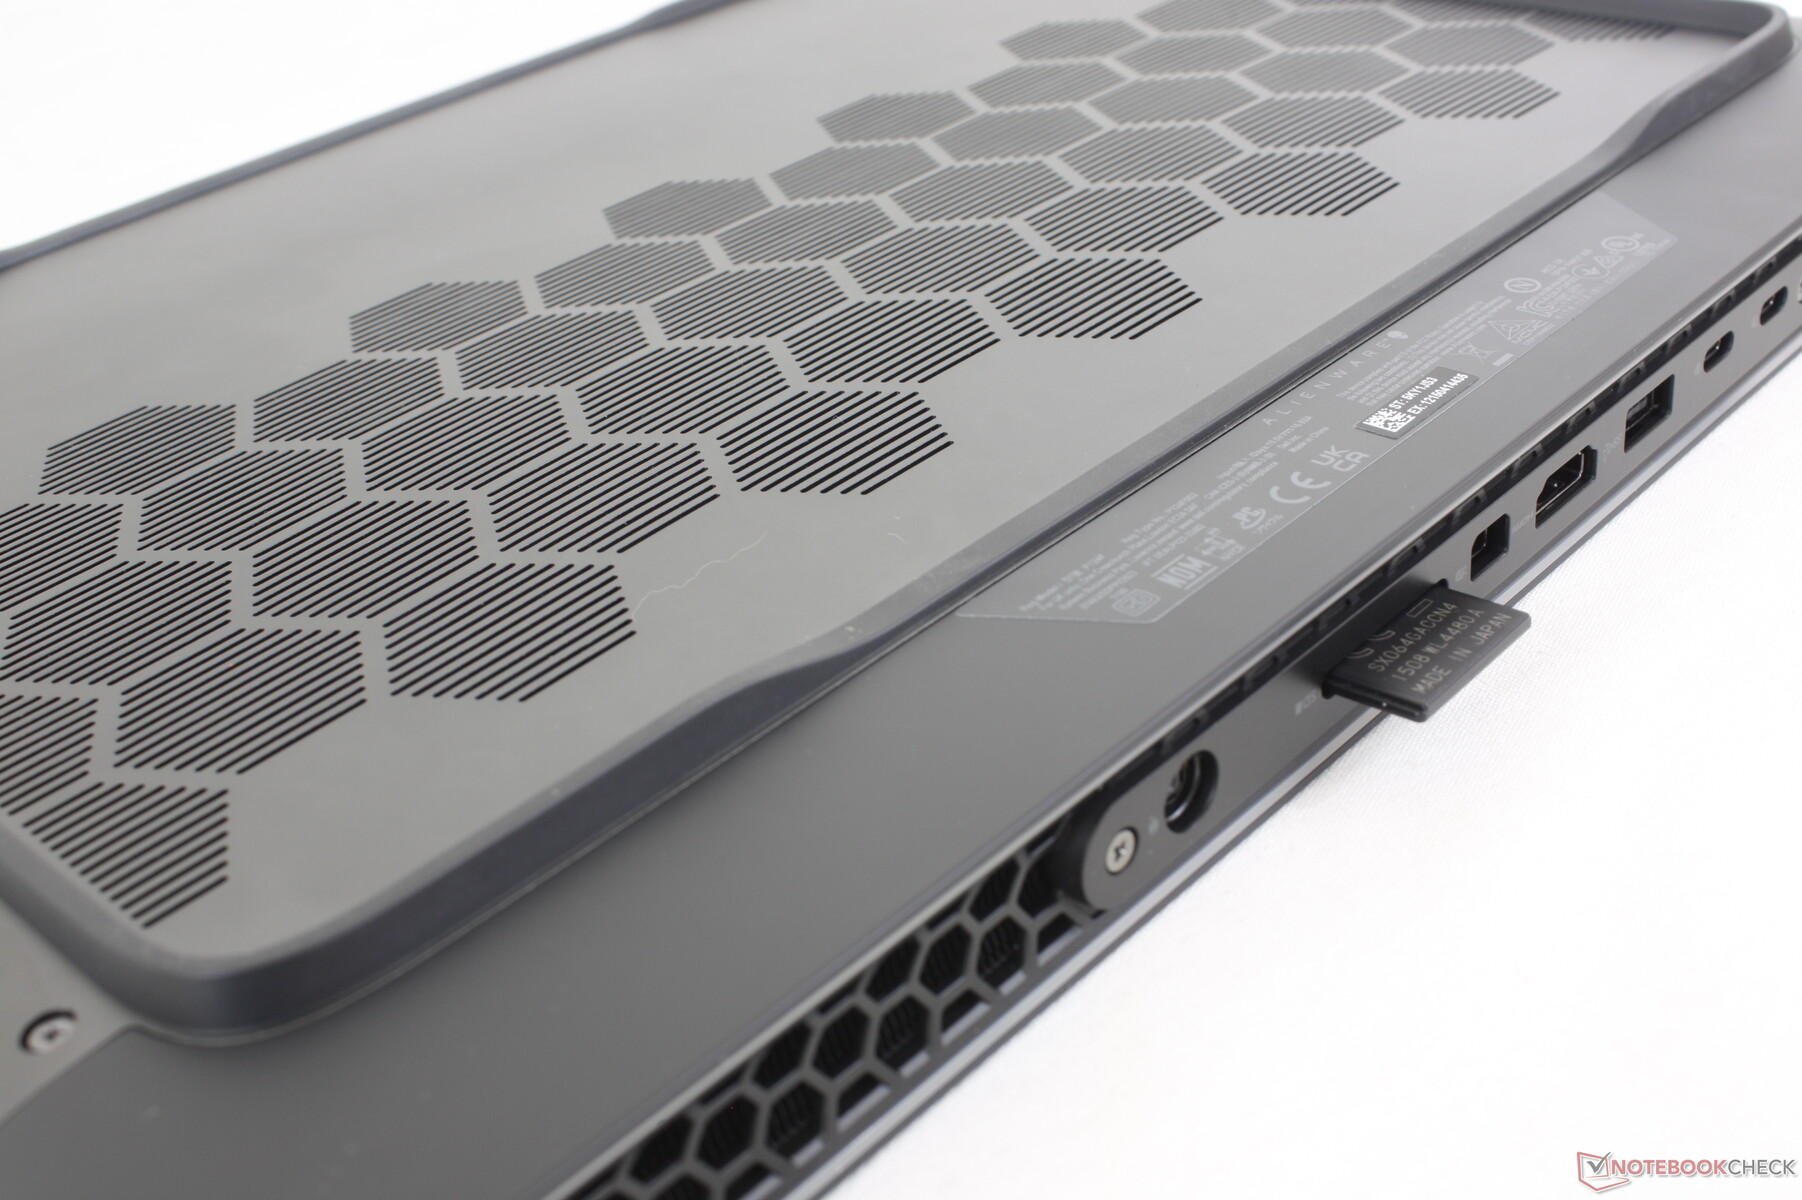
Lettore di schede SD
La velocità di trasferimento dal lettore di schede SD è superiore a quella della maggior parte dei portatili da gioco, il che dovrebbe soddisfare i creatori di contenuti. Lo spostamento di 1 GB di immagini dalla nostra scheda di prova UHS-II al desktop richiede poco più di 5 secondi.
| SD Card Reader | |
| average JPG Copy Test (av. of 3 runs) | |
| Alienware m16 R1 AMD (Toshiba Exceria Pro SDXC 64 GB UHS-II) | |
| Razer Blade 16 Early 2023 (AV PRO microSD 128 GB V60) | |
| Alienware x16 R1 (AV PRO microSD 128 GB V60) | |
| maximum AS SSD Seq Read Test (1GB) | |
| Alienware x16 R1 (AV PRO microSD 128 GB V60) | |
| Alienware m16 R1 AMD (Toshiba Exceria Pro SDXC 64 GB UHS-II) | |
| Razer Blade 16 Early 2023 (AV PRO microSD 128 GB V60) | |
Comunicazione
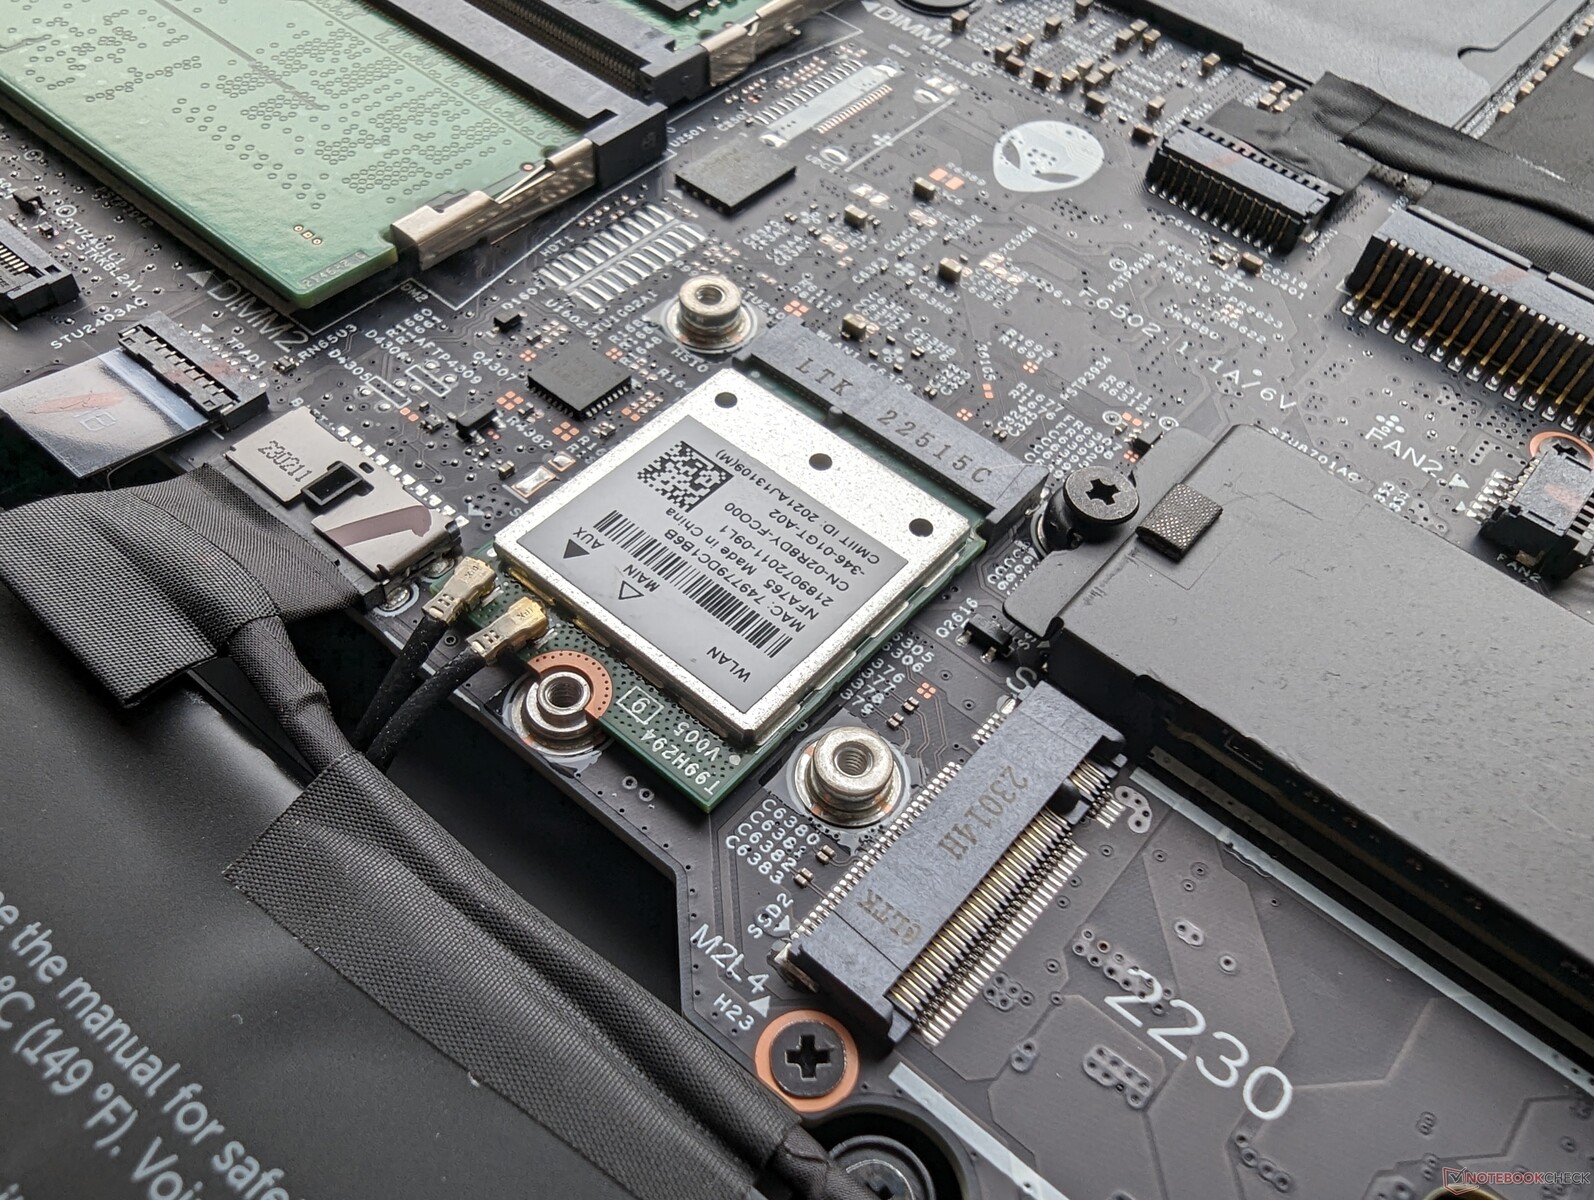
Le SKU AMD sono dotate di Qualcomm WCN685x, mentre le SKU Intel sono dotate di Killer AX1675, ciascuna con connettività Wi-Fi 6E. Le prestazioni sono costanti e affidabili quando vengono accoppiate alla nostra rete a 6 GHz.
| Networking | |
| iperf3 transmit AXE11000 | |
| Lenovo Legion Pro 7 RTX4090 | |
| Asus ROG Strix G16 G614JZ | |
| Alienware m16 R1 AMD | |
| HP Omen Transcend 16 | |
| Razer Blade 16 Early 2023 | |
| Alienware x16 R1 | |
| iperf3 receive AXE11000 | |
| Lenovo Legion Pro 7 RTX4090 | |
| Asus ROG Strix G16 G614JZ | |
| Alienware m16 R1 AMD | |
| HP Omen Transcend 16 | |
| Razer Blade 16 Early 2023 | |
| Alienware x16 R1 | |
| iperf3 transmit AXE11000 6GHz | |
| Alienware m16 R1 AMD | |
| HP Omen Transcend 16 | |
| Razer Blade 16 Early 2023 | |
| Alienware x16 R1 | |
| iperf3 receive AXE11000 6GHz | |
| Alienware m16 R1 AMD | |
| HP Omen Transcend 16 | |
| Razer Blade 16 Early 2023 | |
| Alienware x16 R1 | |
Webcam
È presente una webcam da 2 MP con IR e senza otturatore privacy, come nell'Alienware x16.


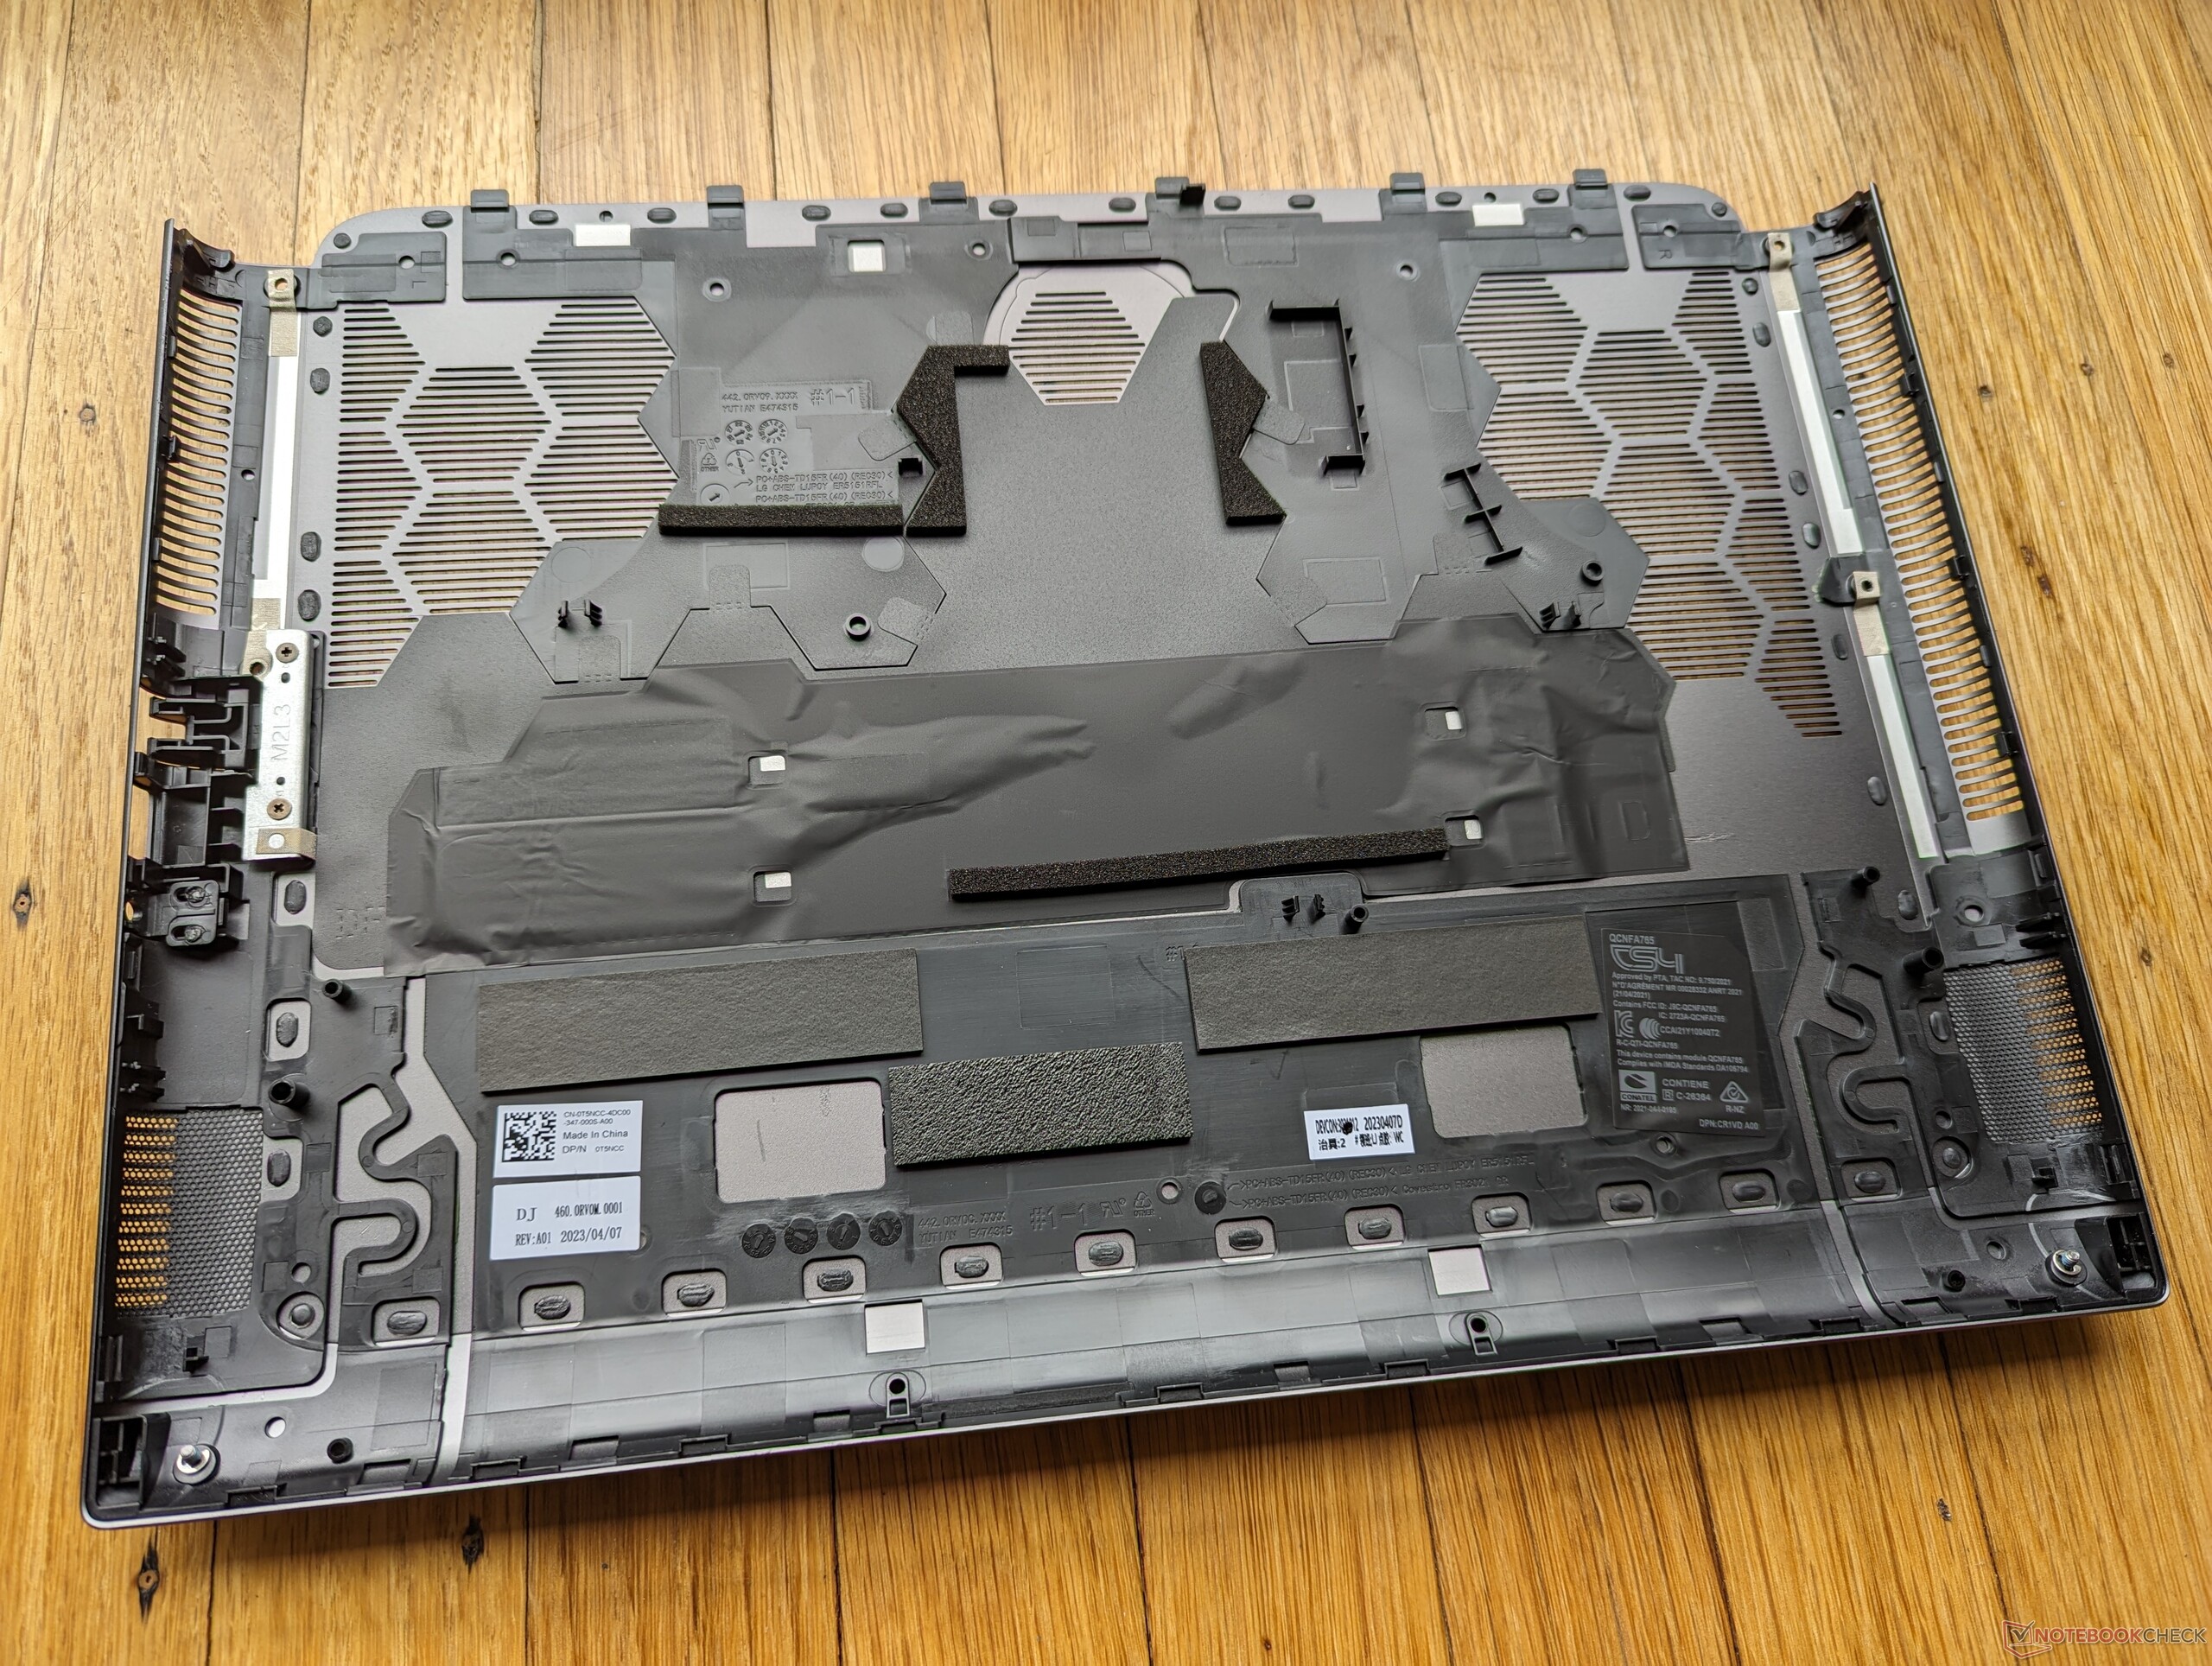
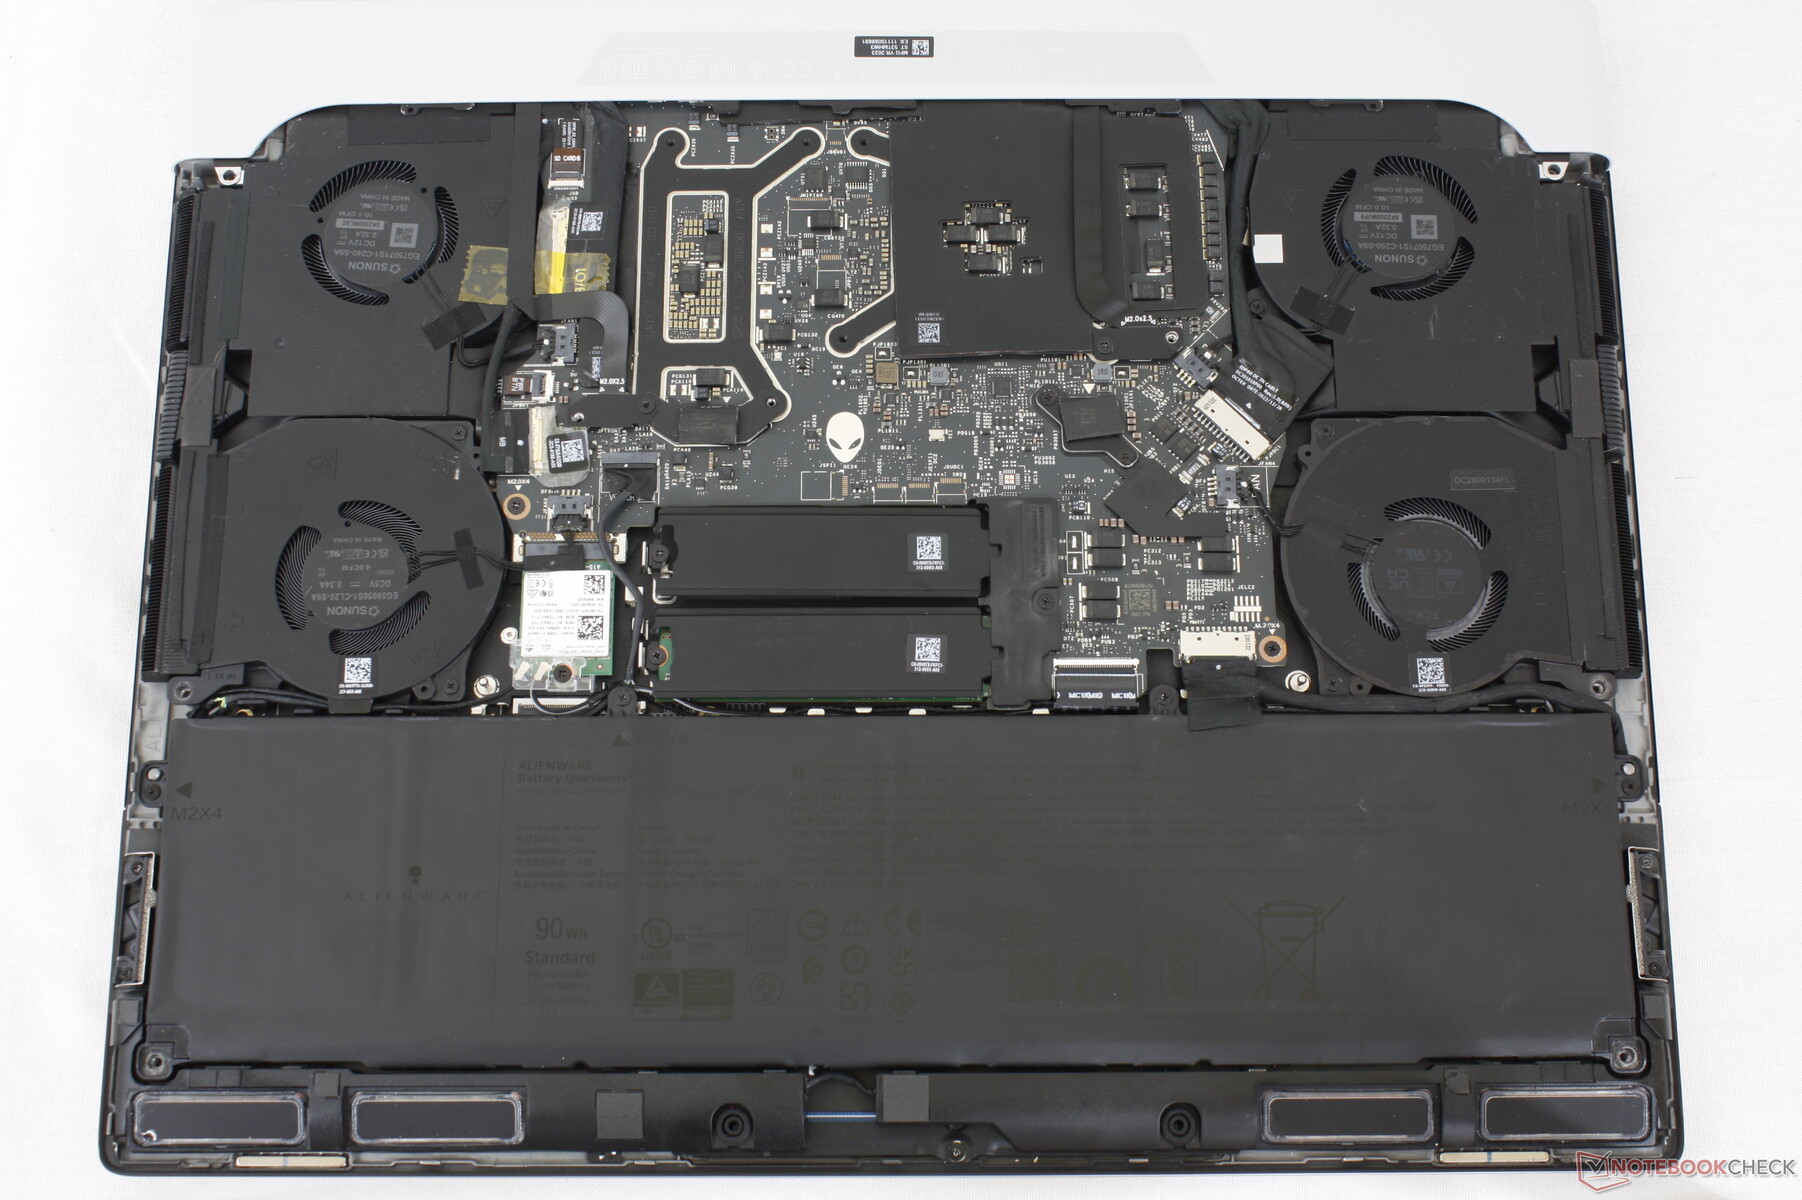
Manutenzione
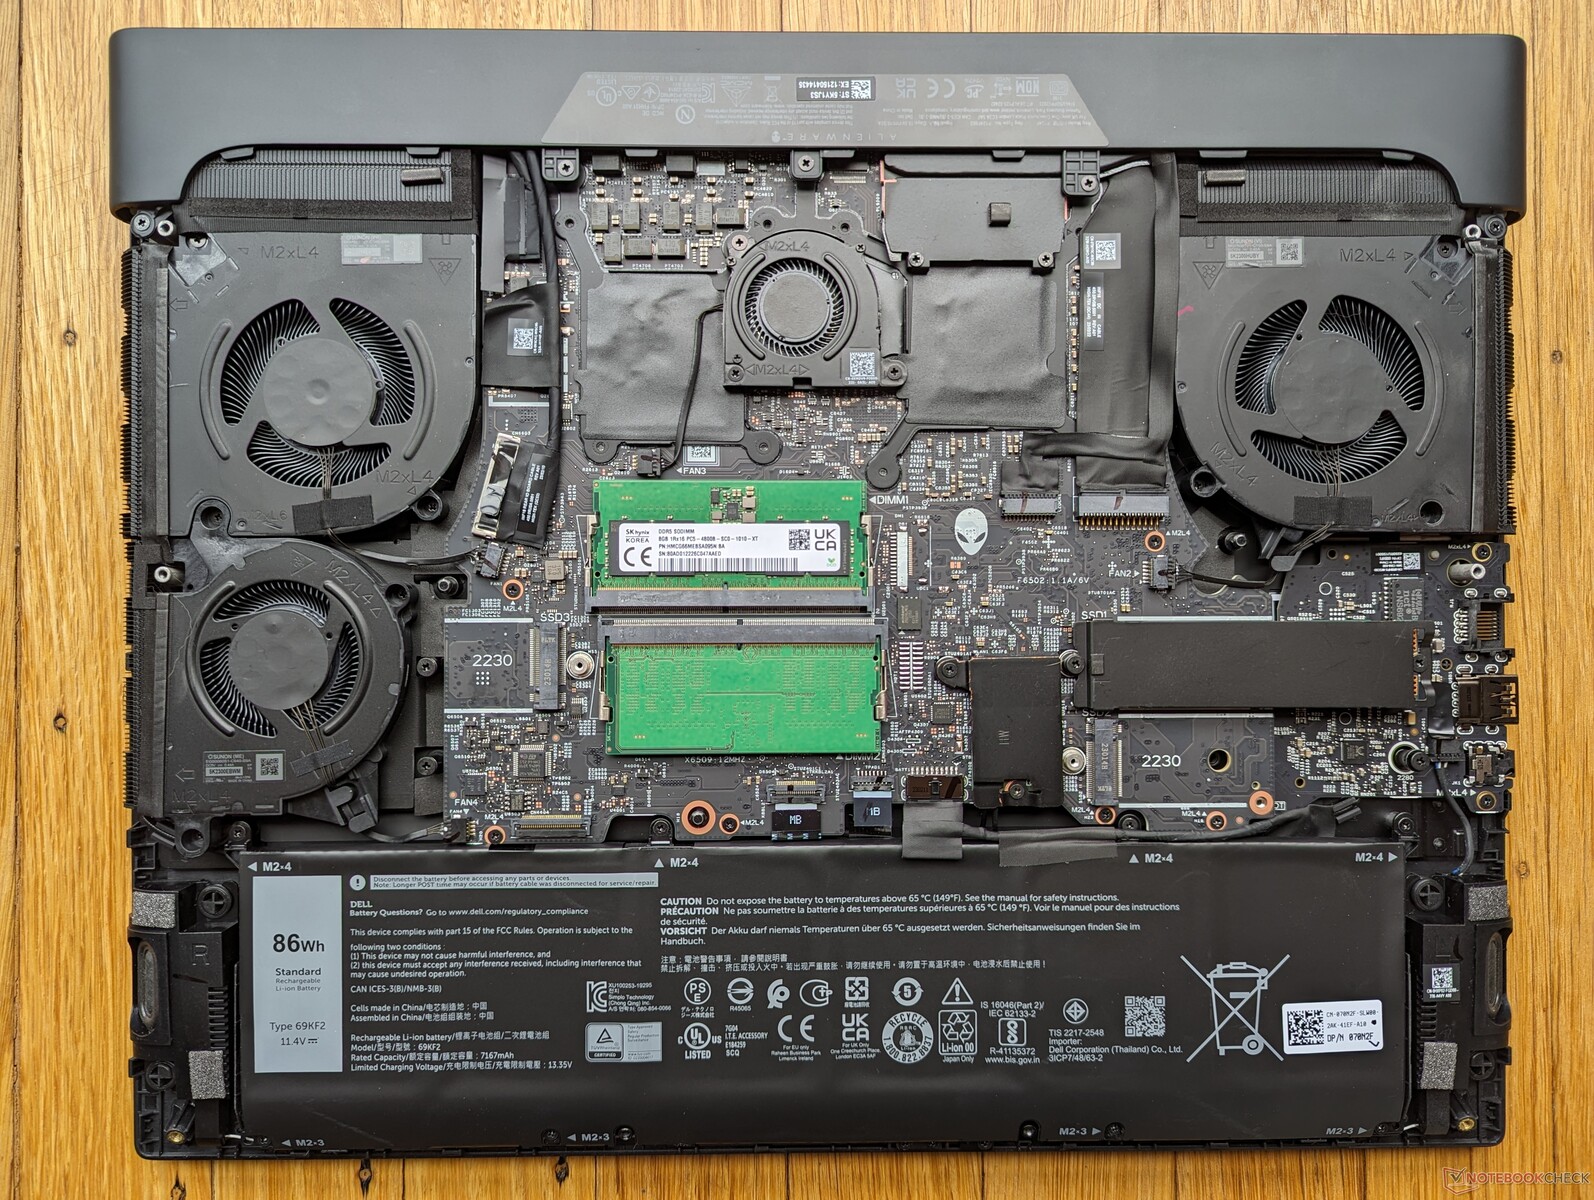
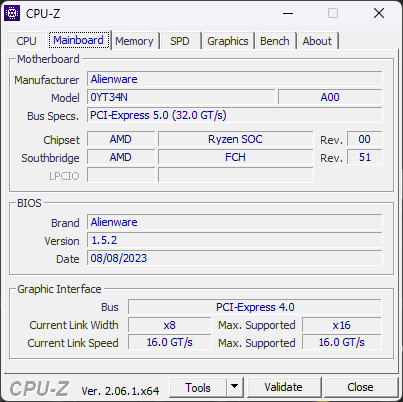
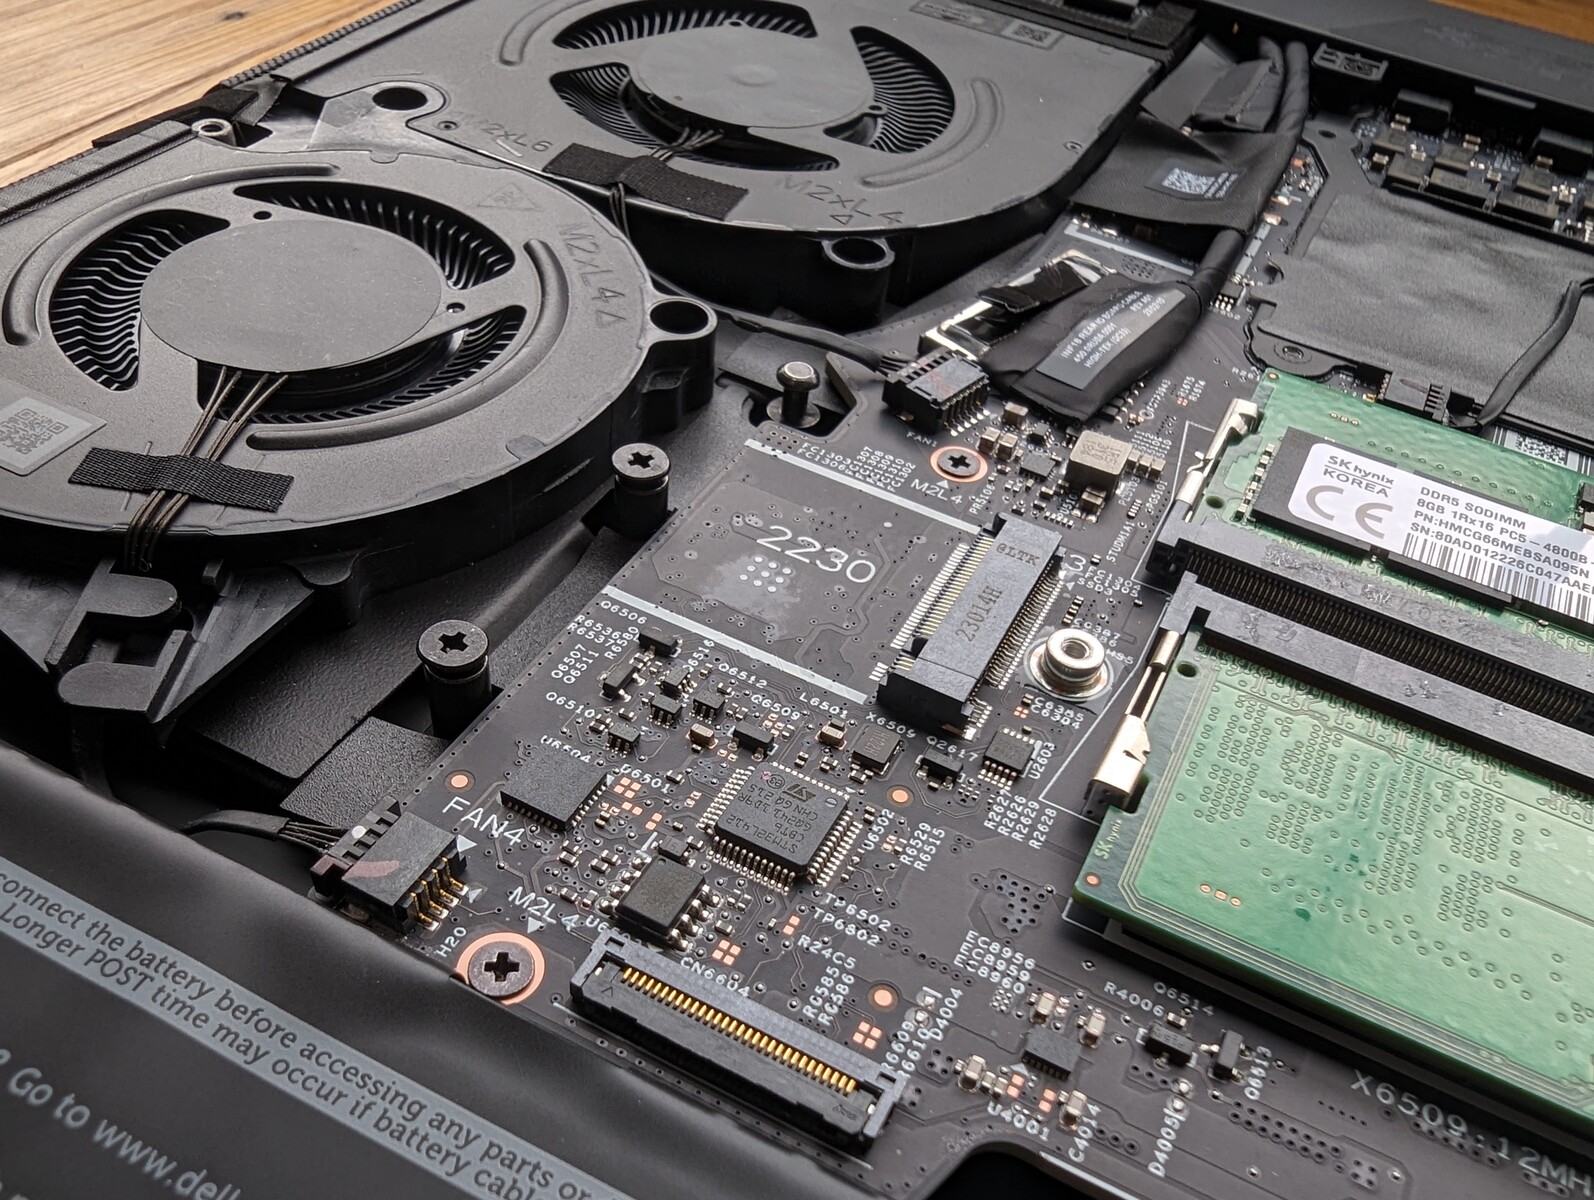
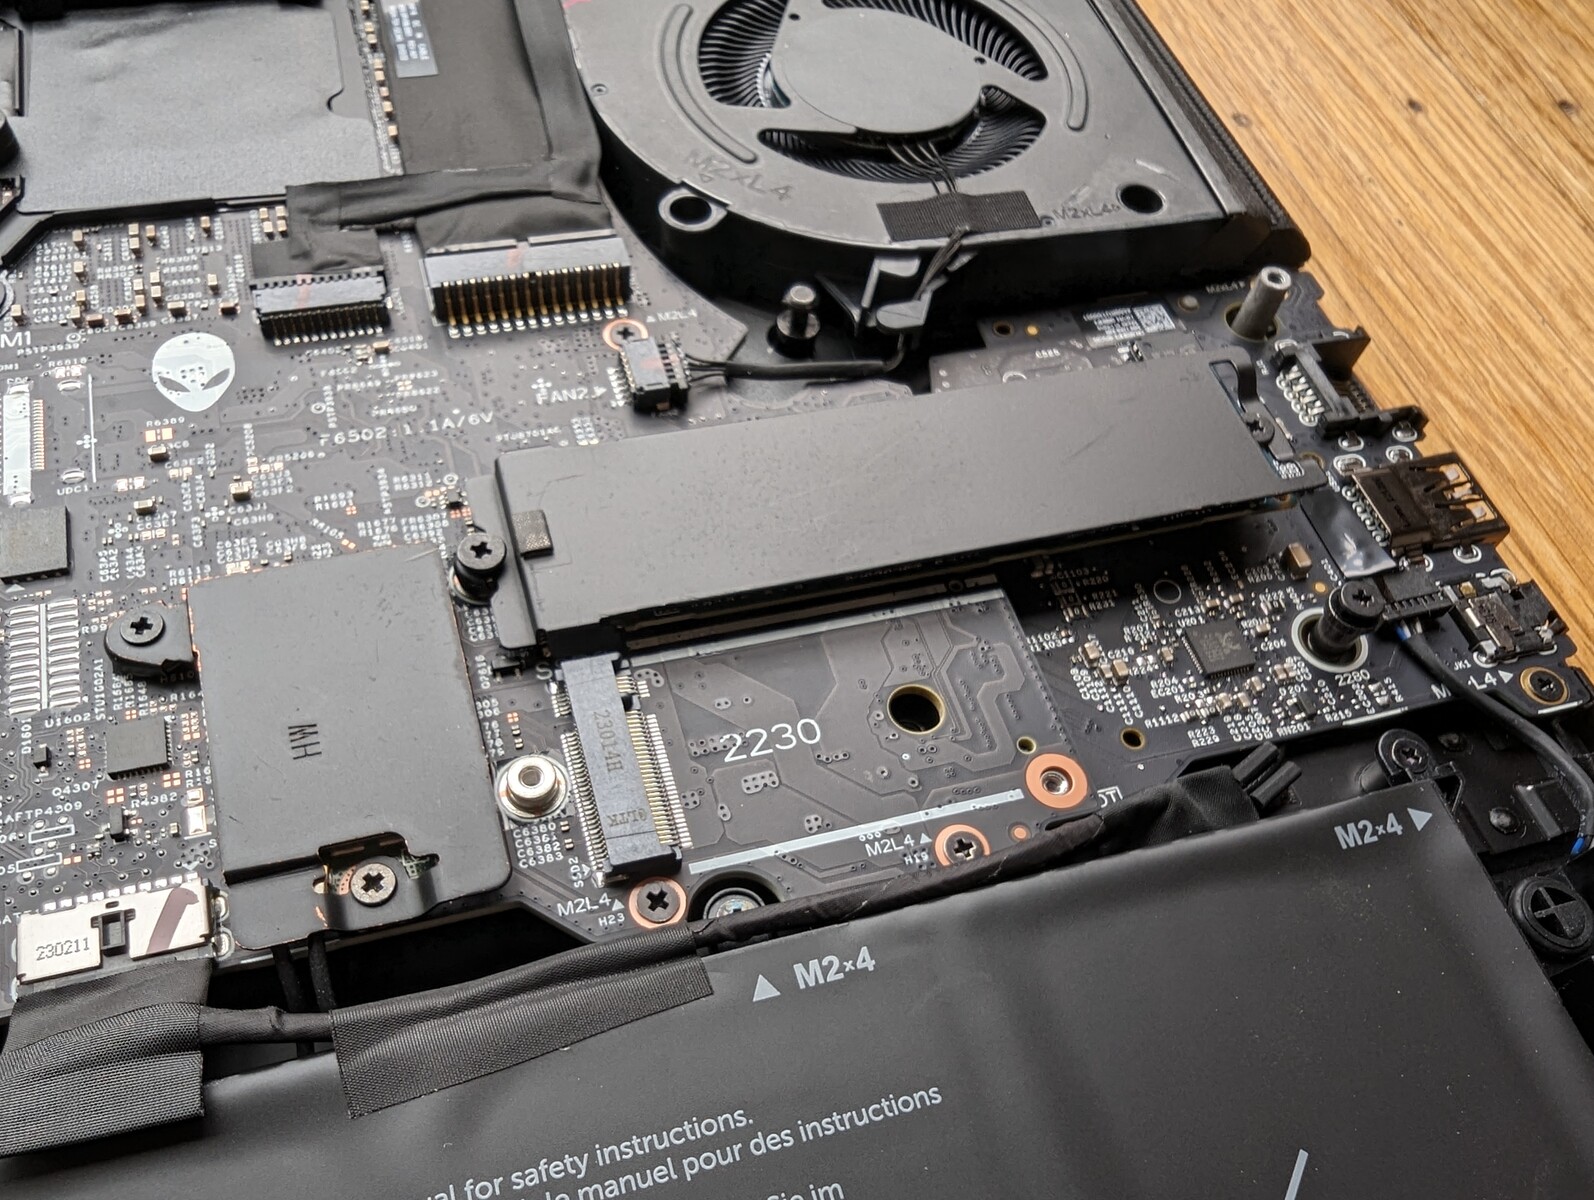
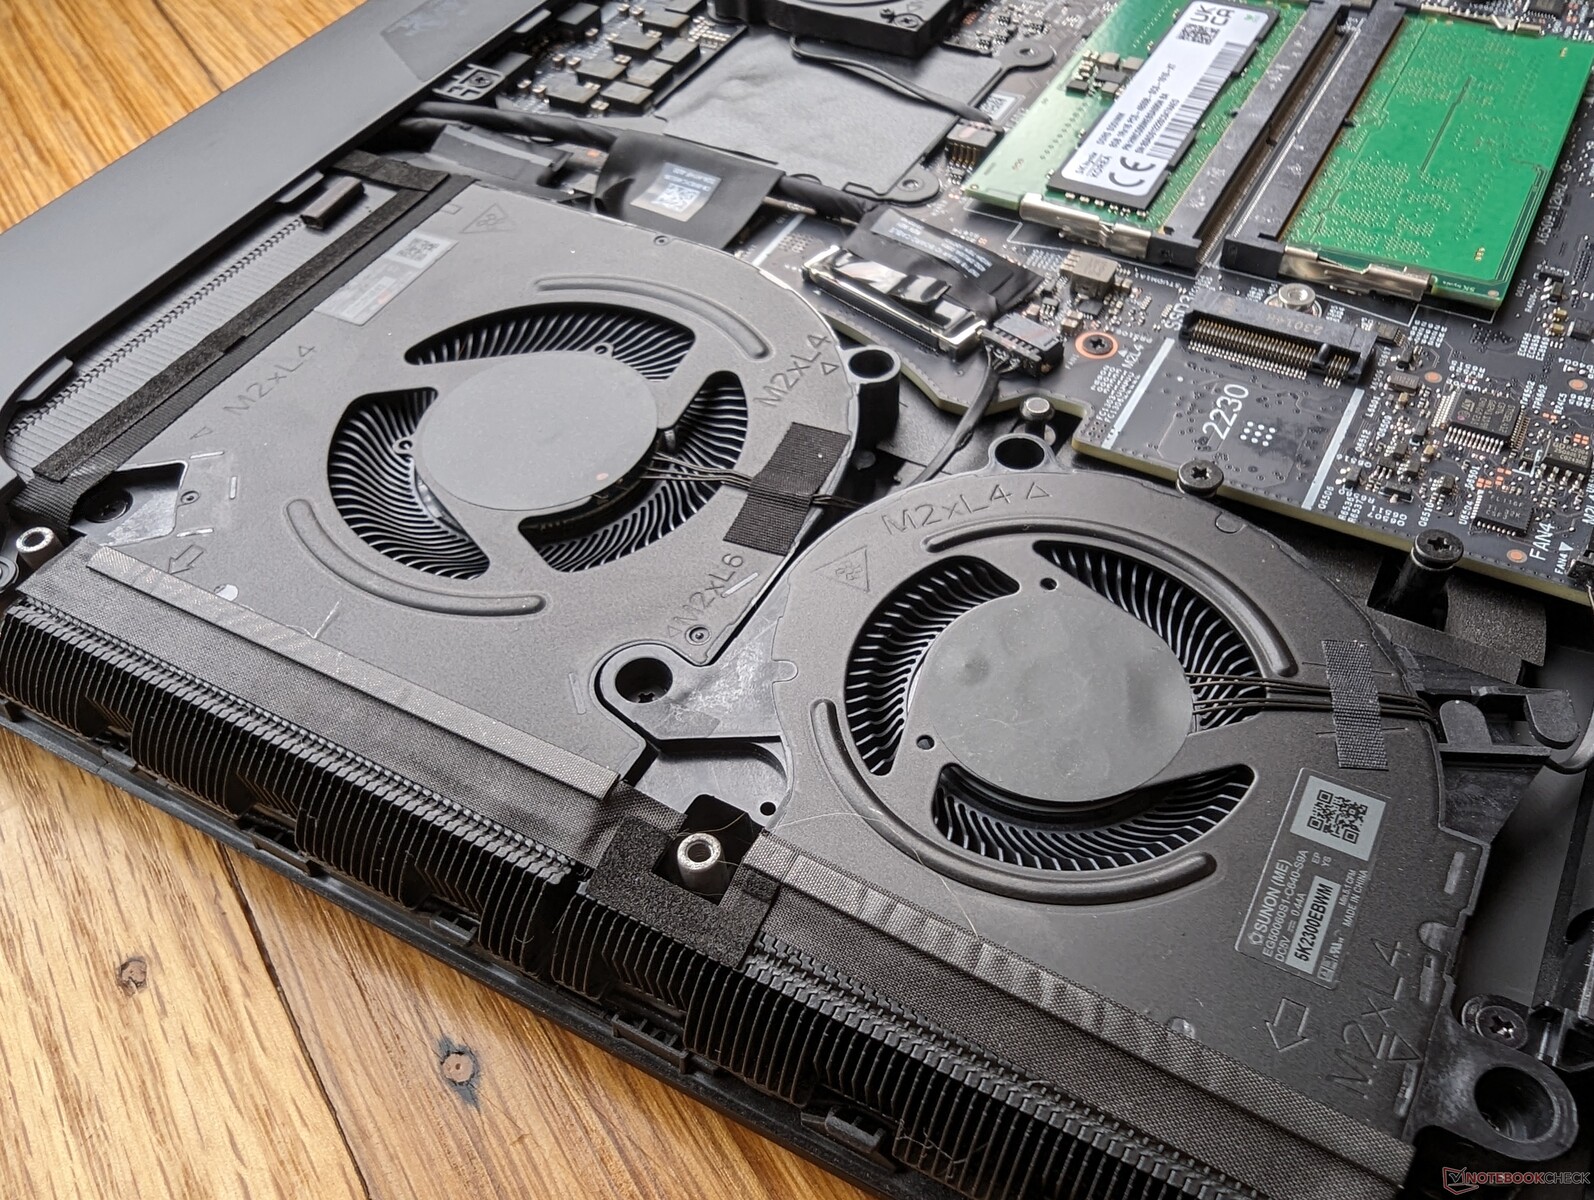
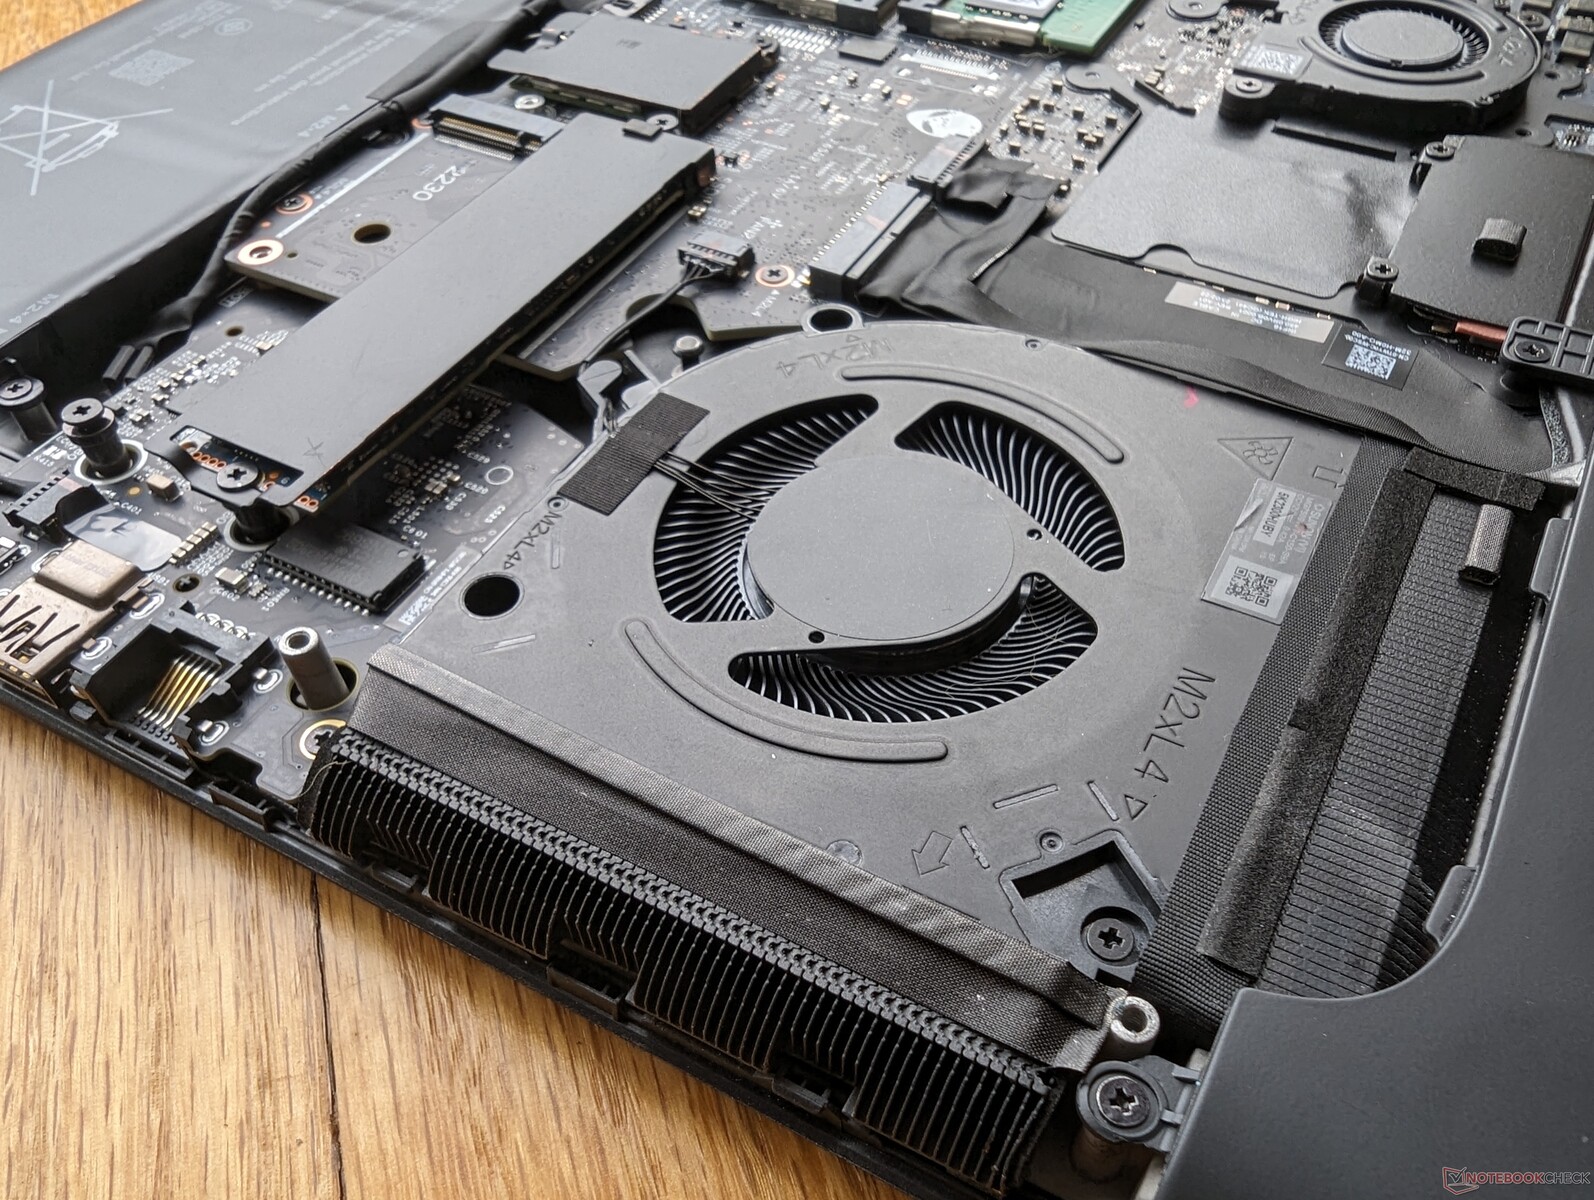
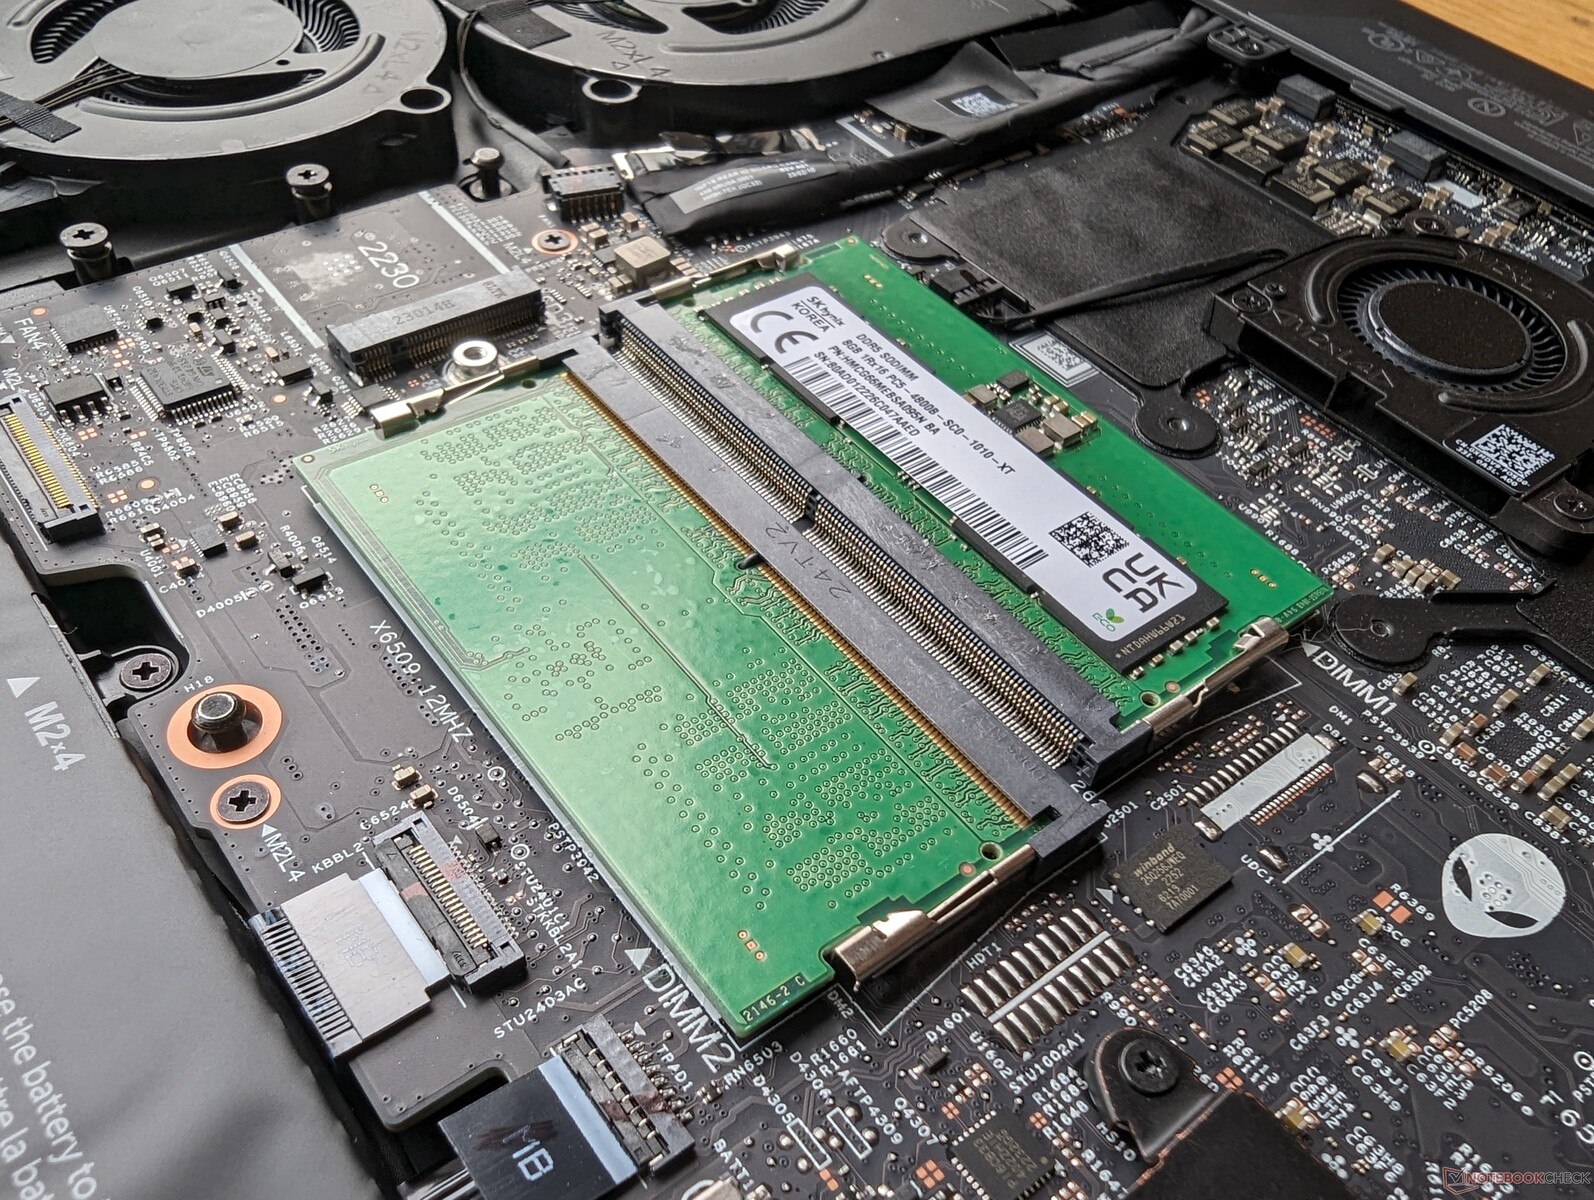
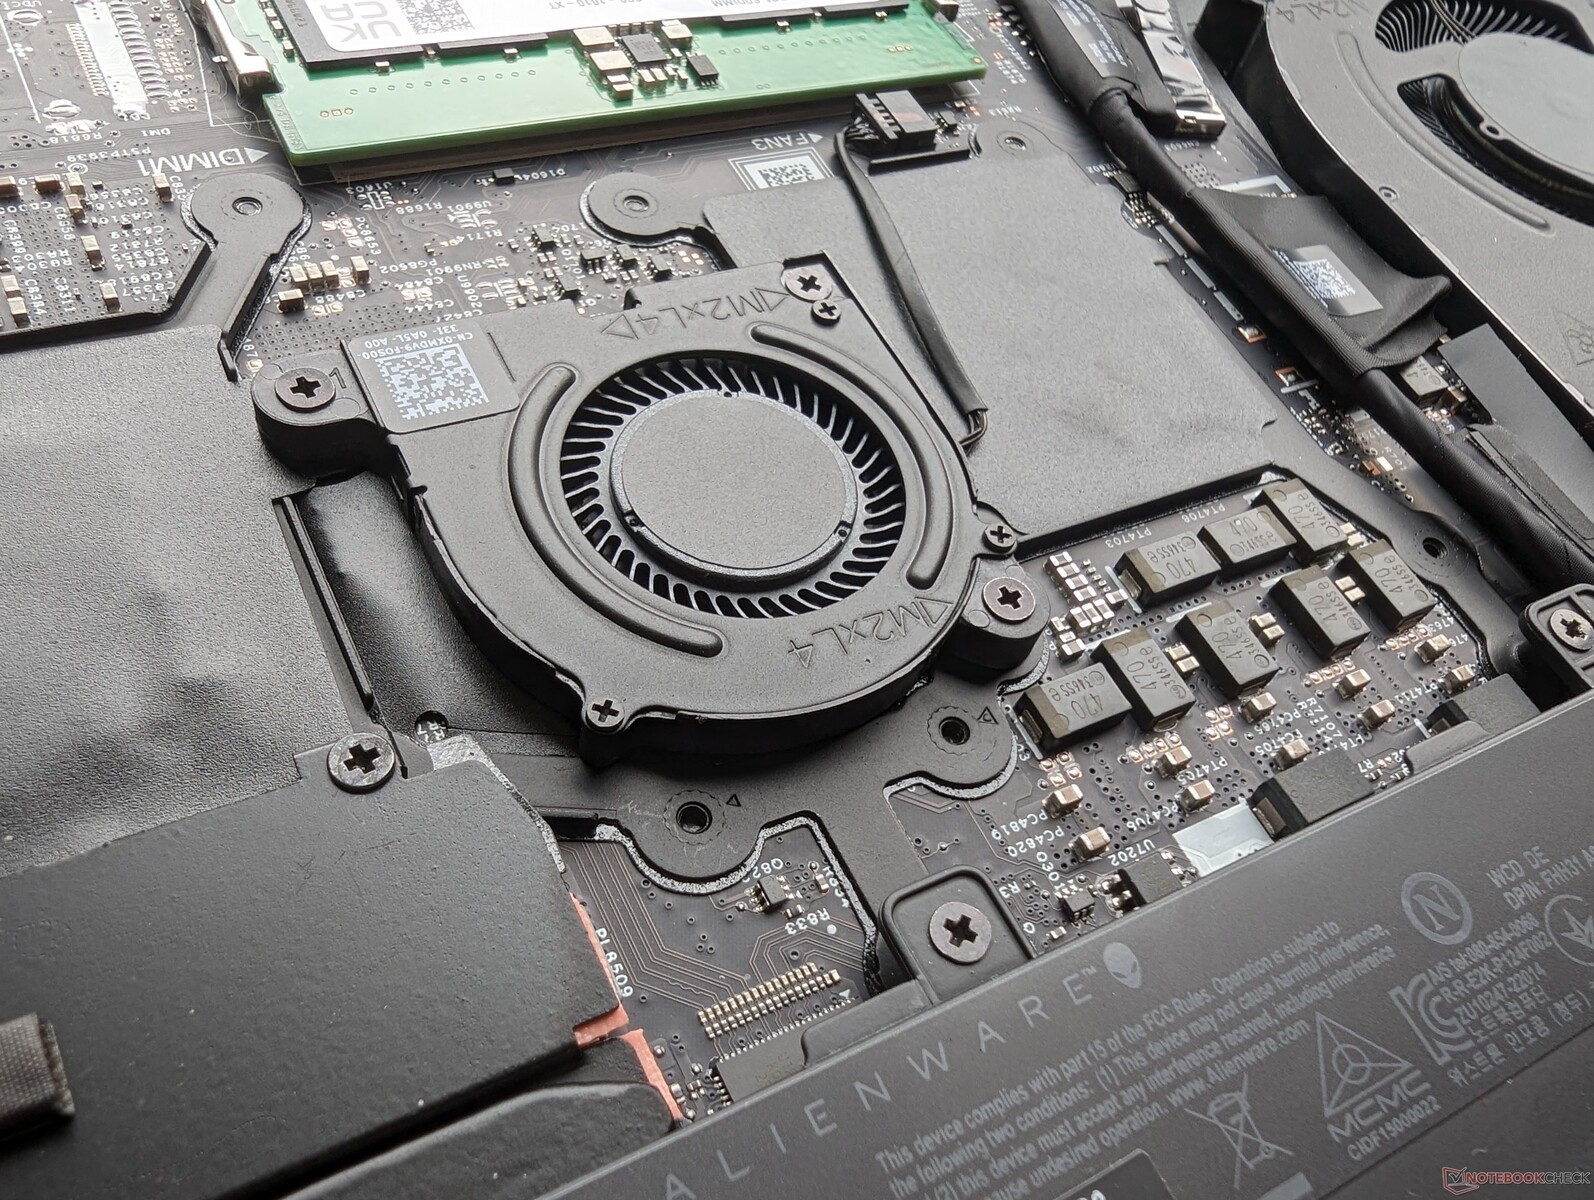
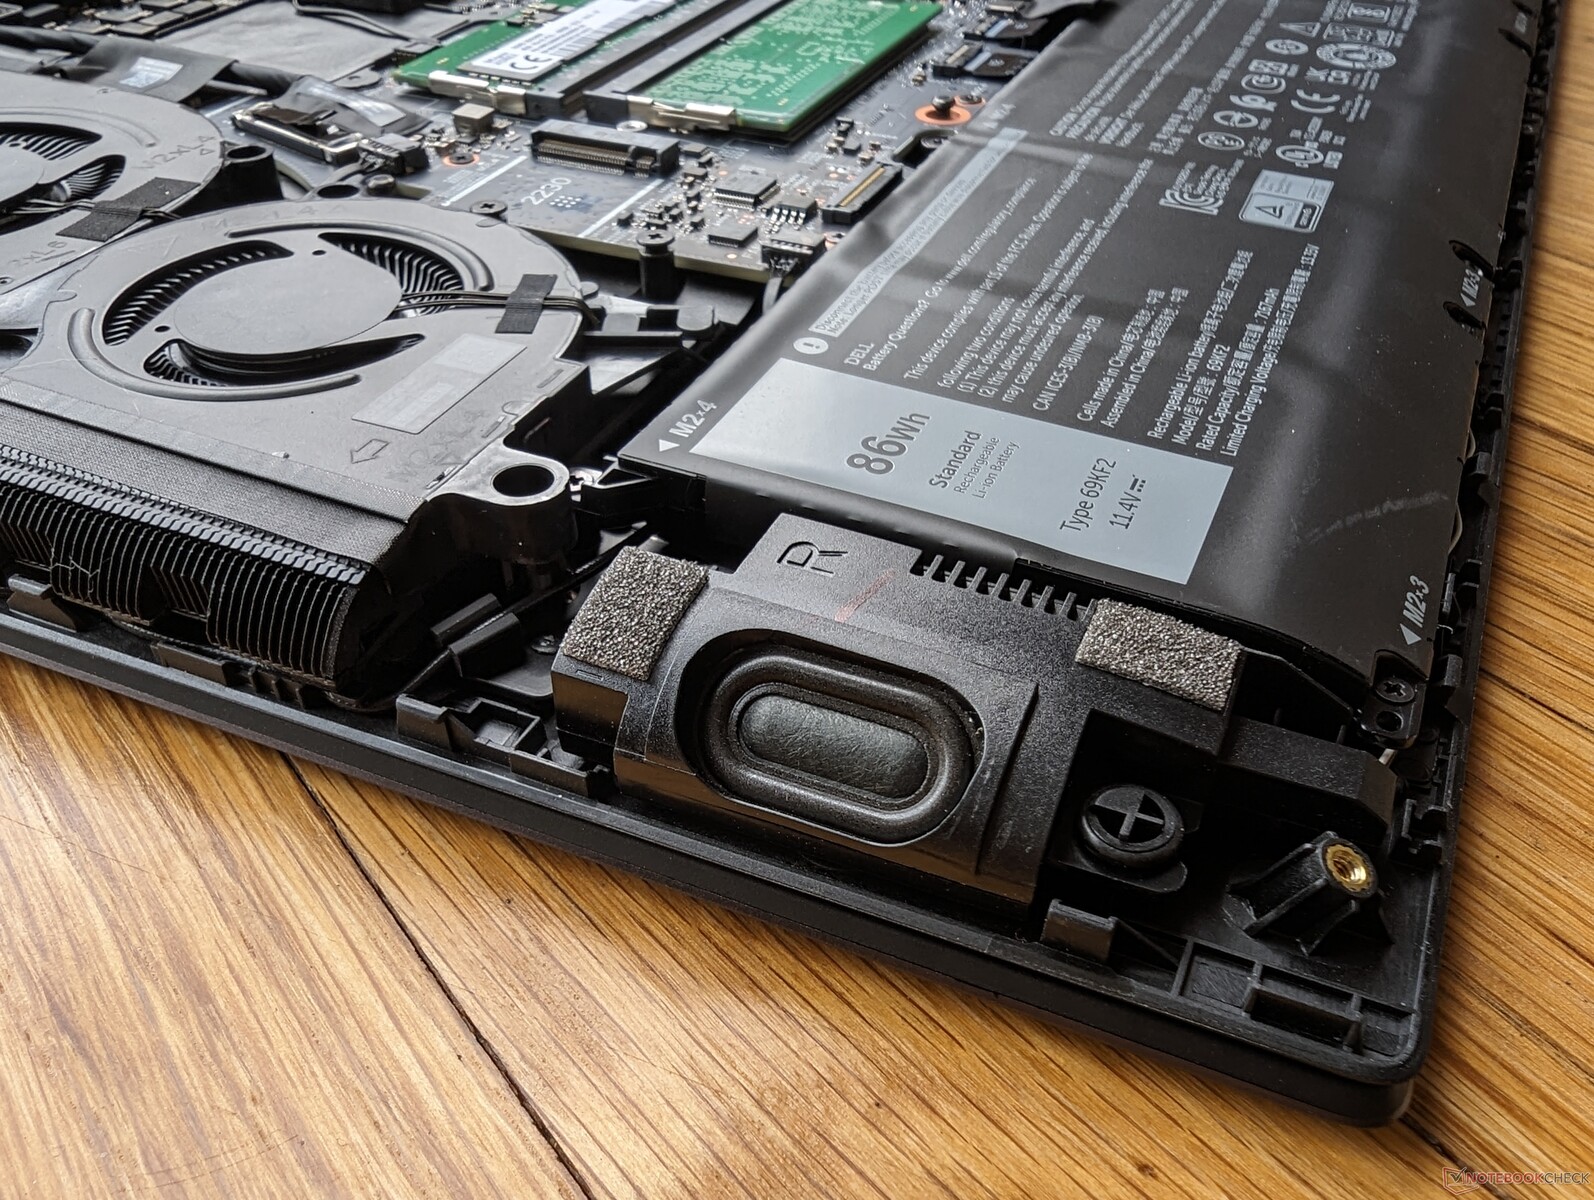
Il pannello inferiore è fissato con 8 viti Phillips per facilitare la manutenzione. Gli utenti hanno accesso diretto a 3 alloggiamenti di archiviazione, 2 slot SODIMM e al modulo WLAN rimovibile. Si noti che la scheda madre è capovolta, il che significa che i processori si trovano sul lato opposto.
Il design della scheda madre è completamente diverso da quello dell'Alienware x16, anche se i due modelli condividono molte caratteristiche esterne. È invece molto simile a quella dell'Alienware m18.
Accessori e garanzia
La confezione di vendita include due adesivi con il logo Alienware, oltre al consueto adattatore CA e alla documentazione cartacea. Se acquistato negli Stati Uniti, il prodotto è coperto da una garanzia limitata di un anno.
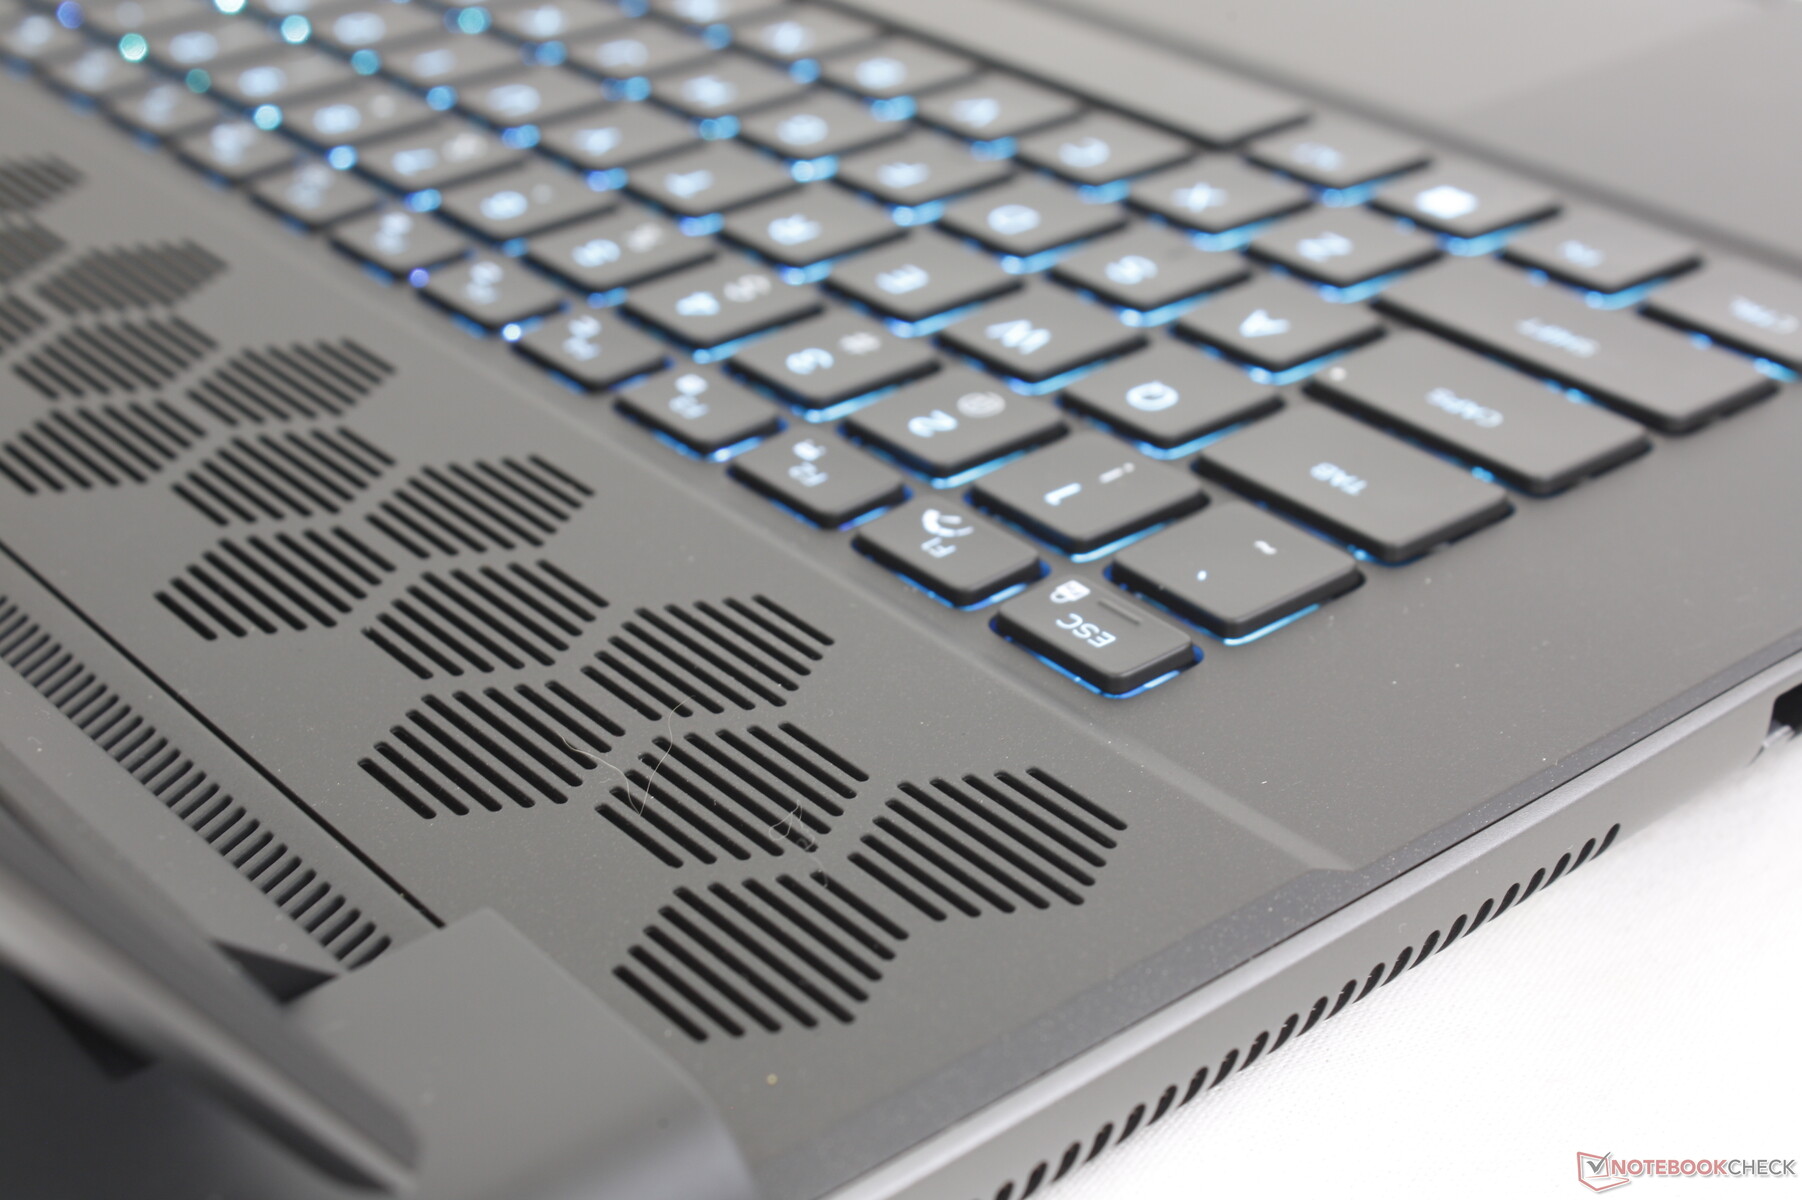
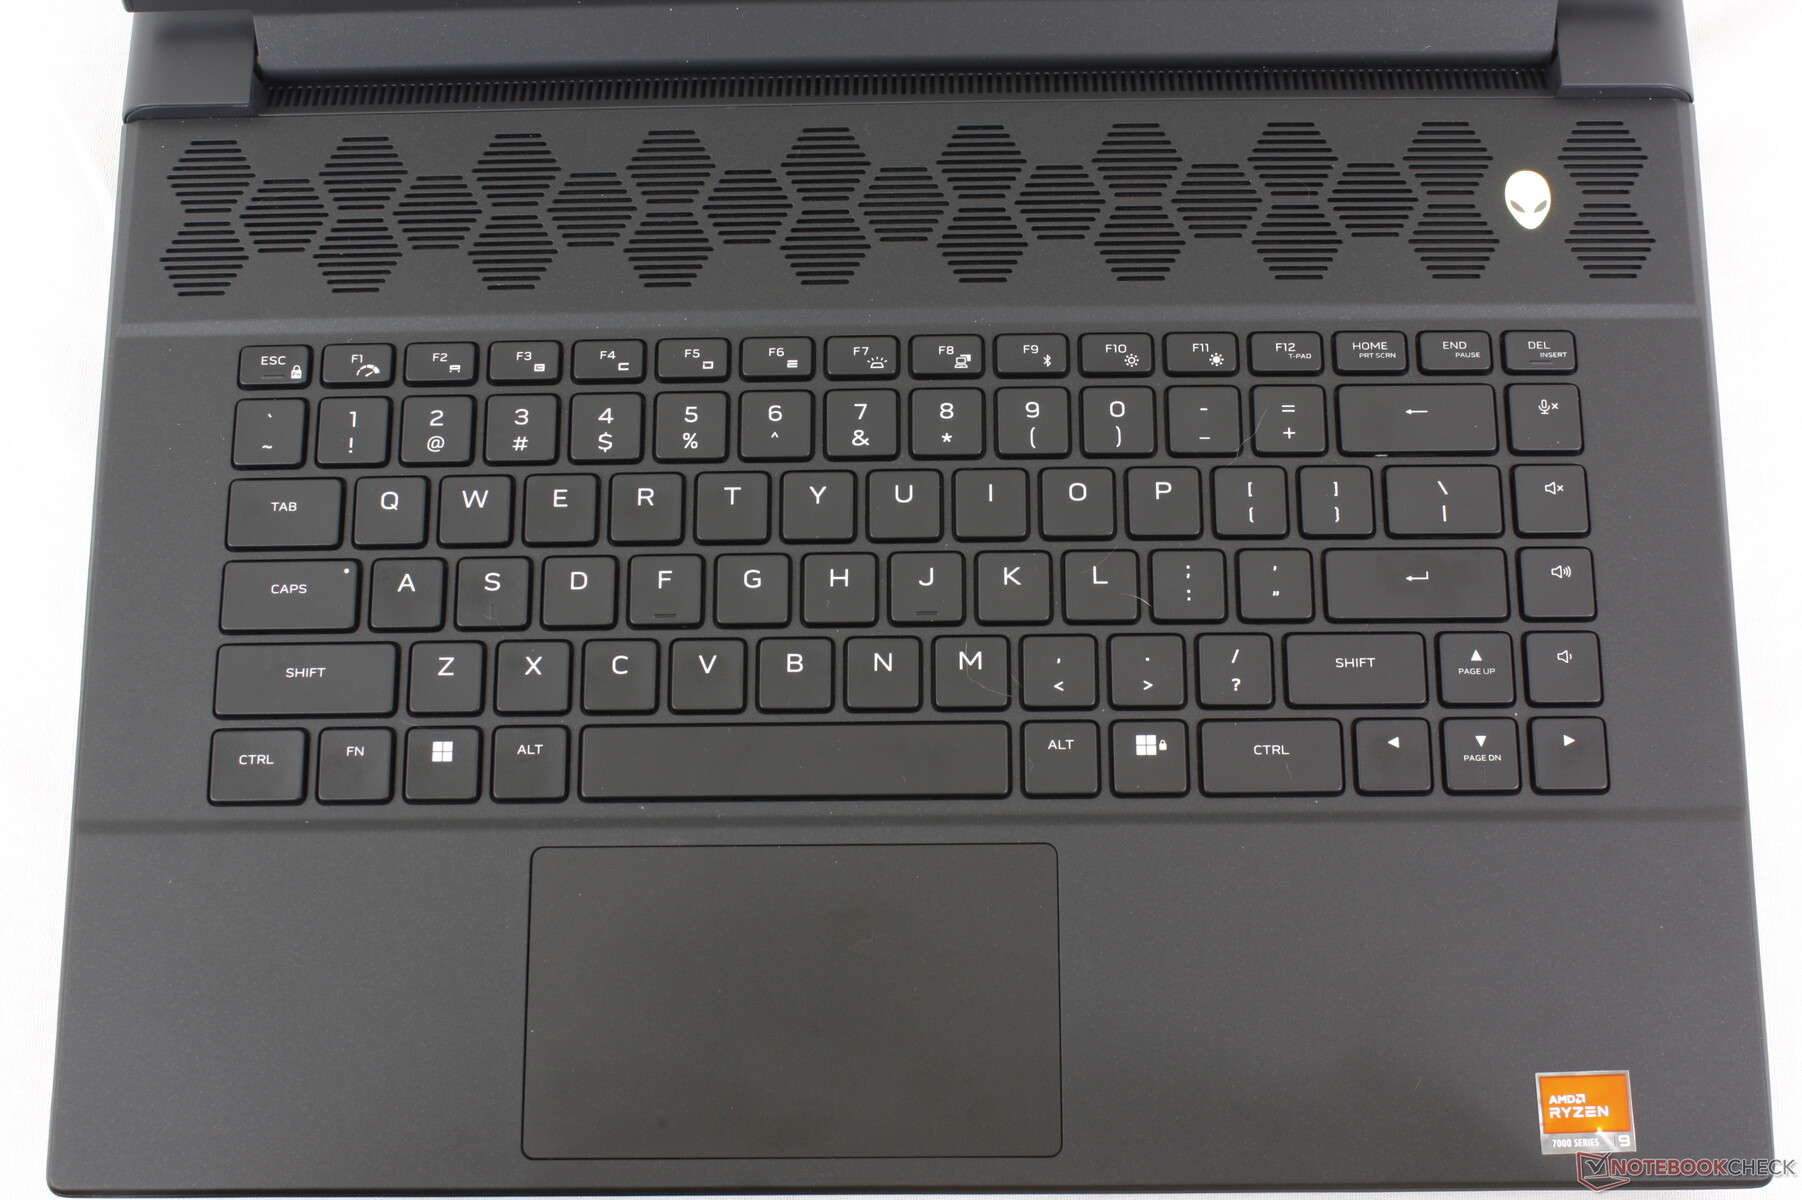
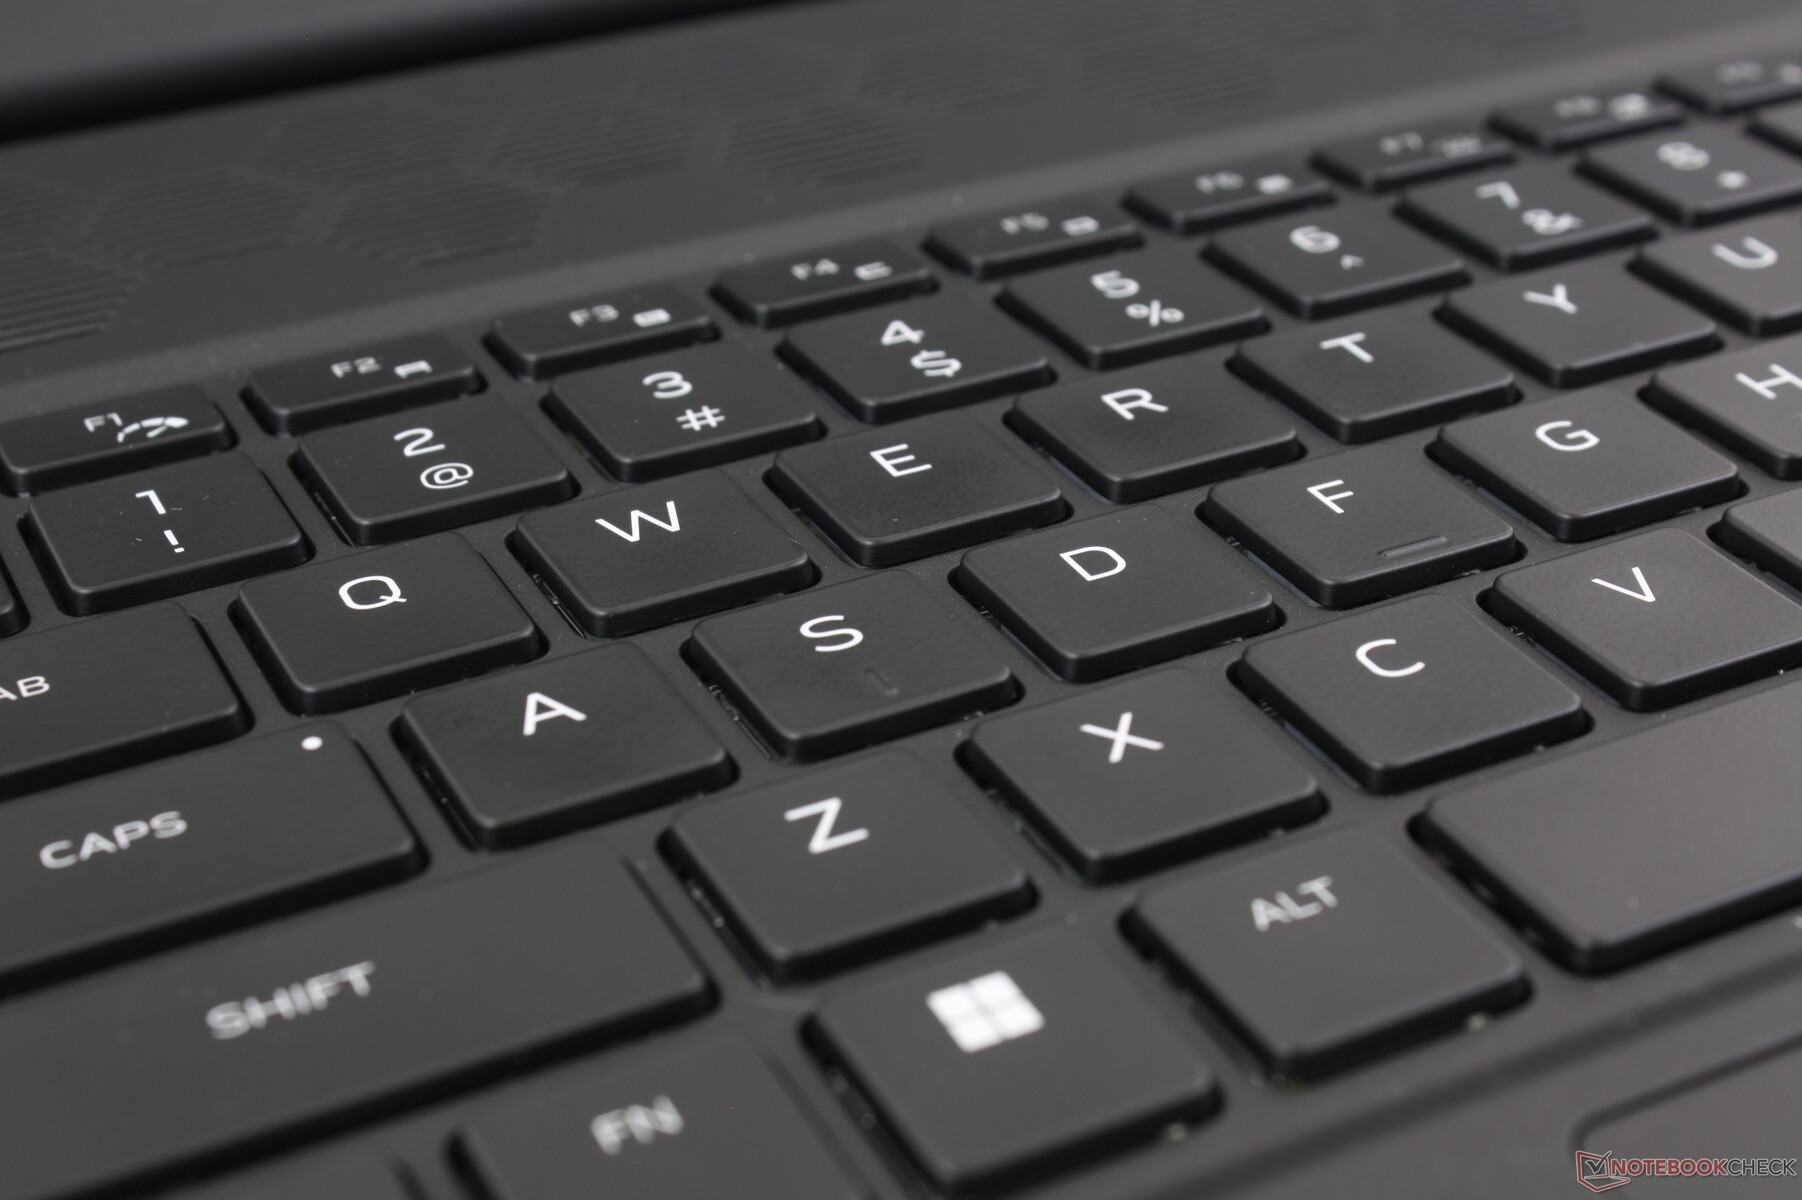
Dispositivi di ingresso - meccanici o standard disponibili
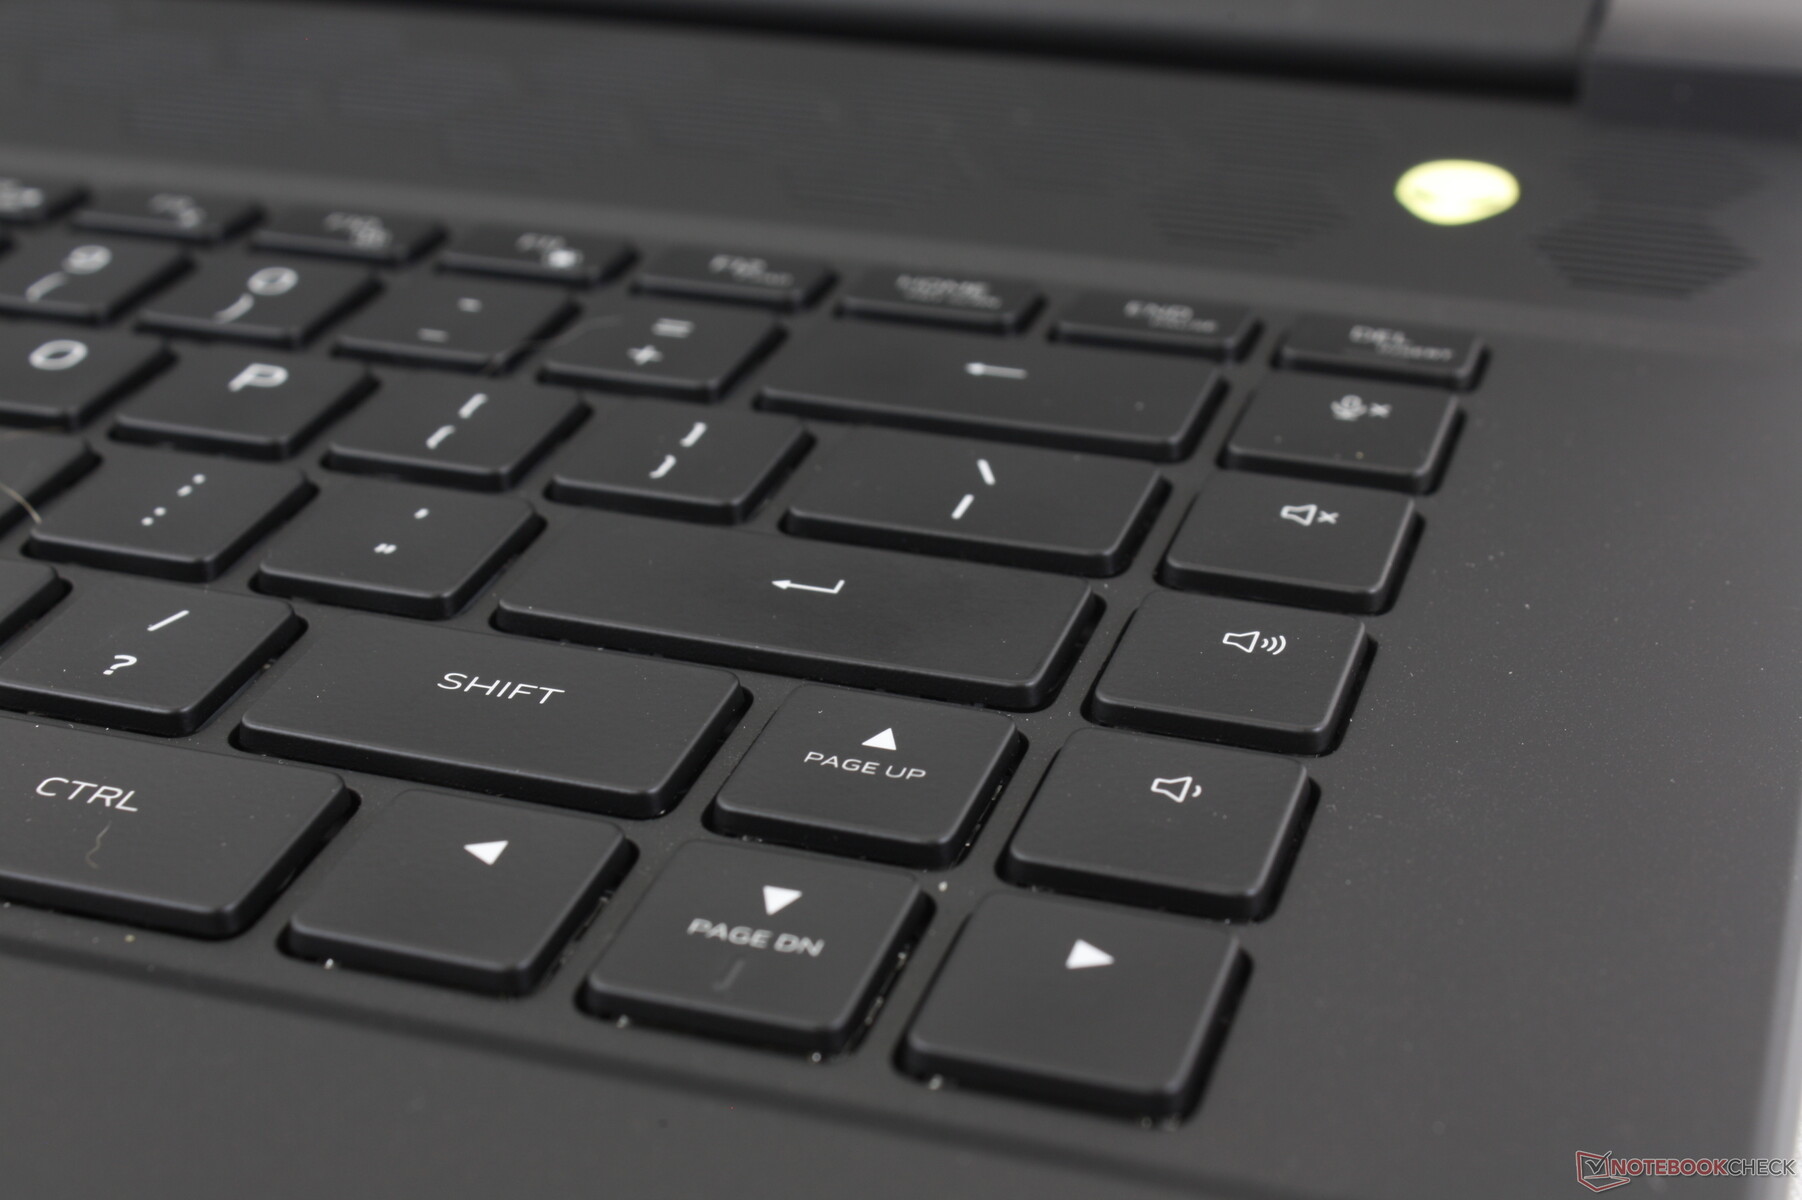
Tastiera
Gli utenti possono configurare una tastiera standard a membrana o una tastiera meccanica CherryMX a bassissimo profilo con illuminazione RGB per tasto. La tastiera CherryMX è stata introdotta un paio di anni fa sul modello Alienware x17 R1 e rimane una delle nostre tastiere preferite su qualsiasi portatile da gioco, grazie al suo feedback cliccabile e alla sua corsa profonda. Lo svantaggio principale, ovviamente, è il rumore acuto e molto forte. Per gli ambienti sensibili al rumore, come biblioteche, aule o dormitori, si consiglia di prendere in considerazione l'opzione della tastiera standard.
La retroilluminazione illumina tutti i tasti e i simboli, mentre non era così nei modelli precedenti non era così nei modelli precedenti.
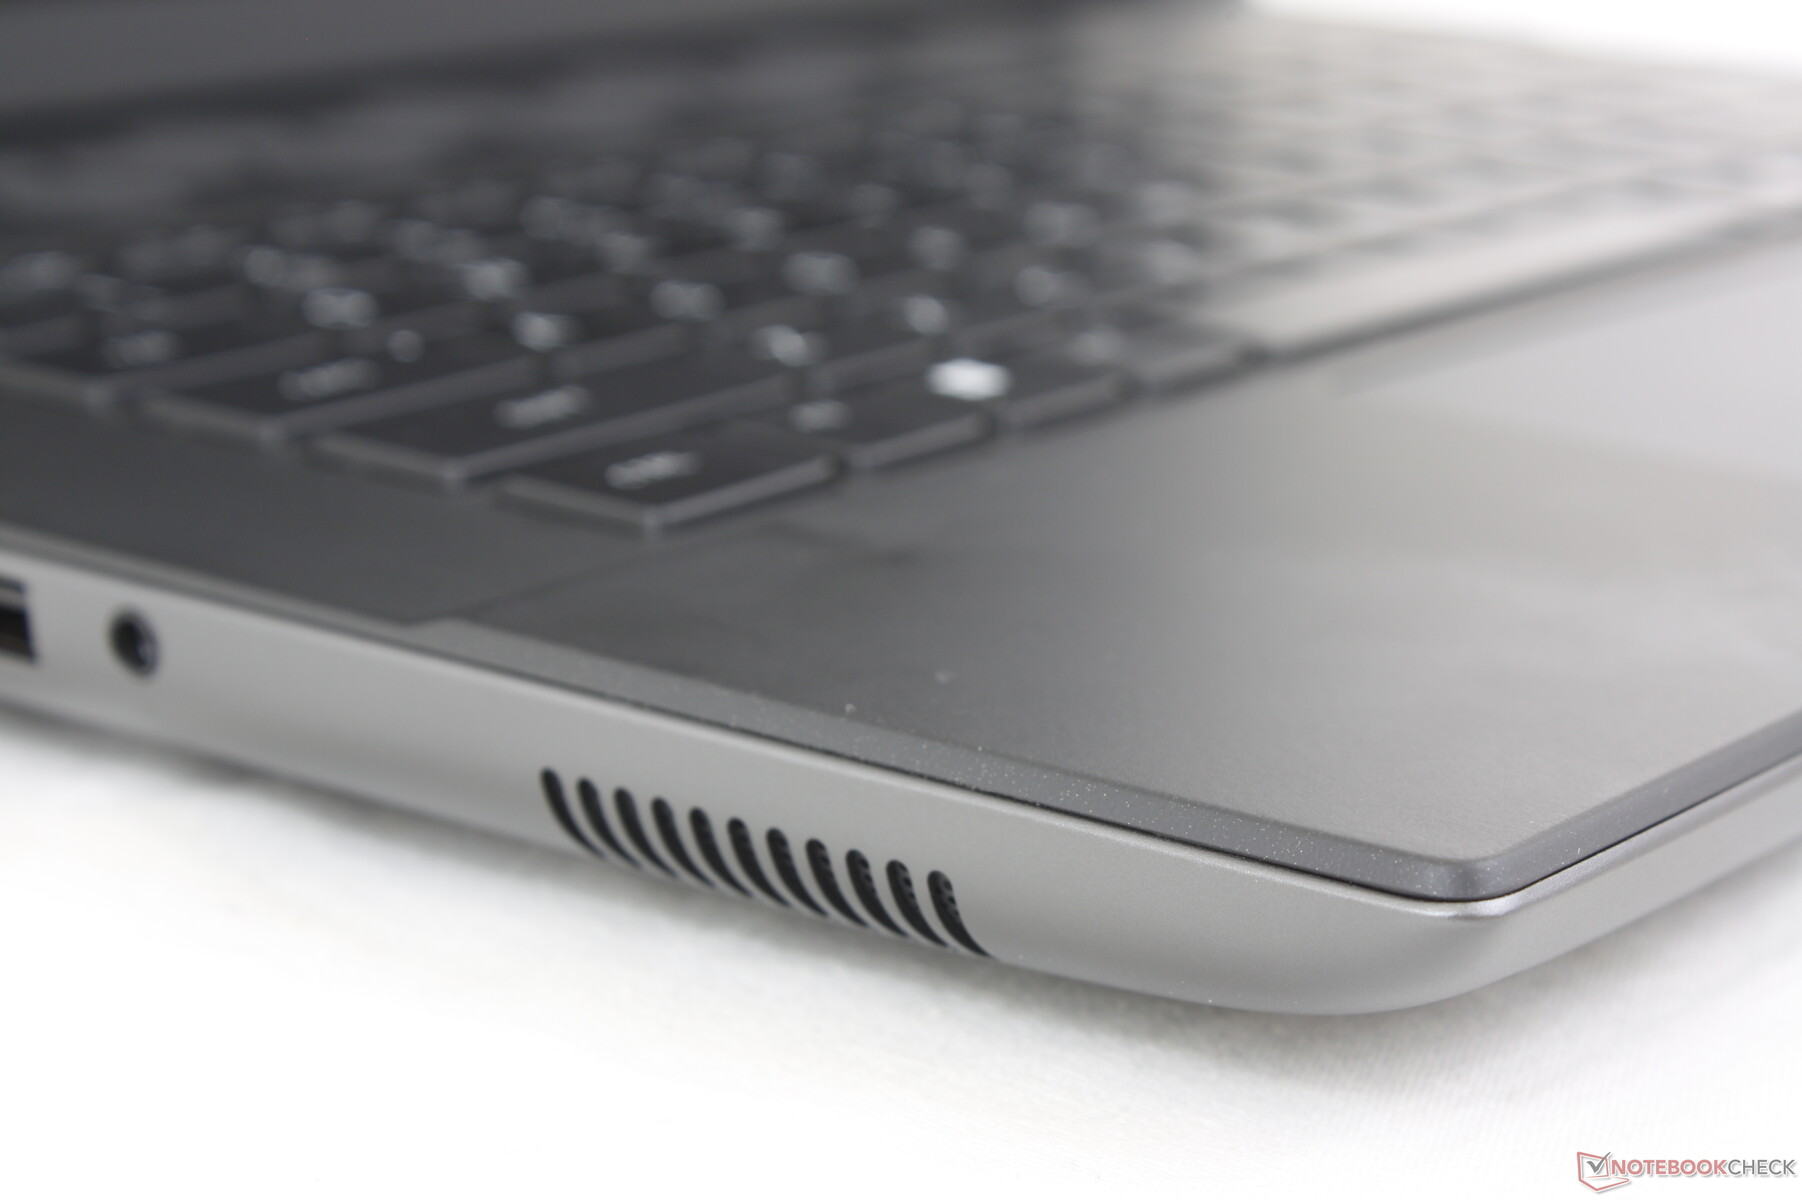
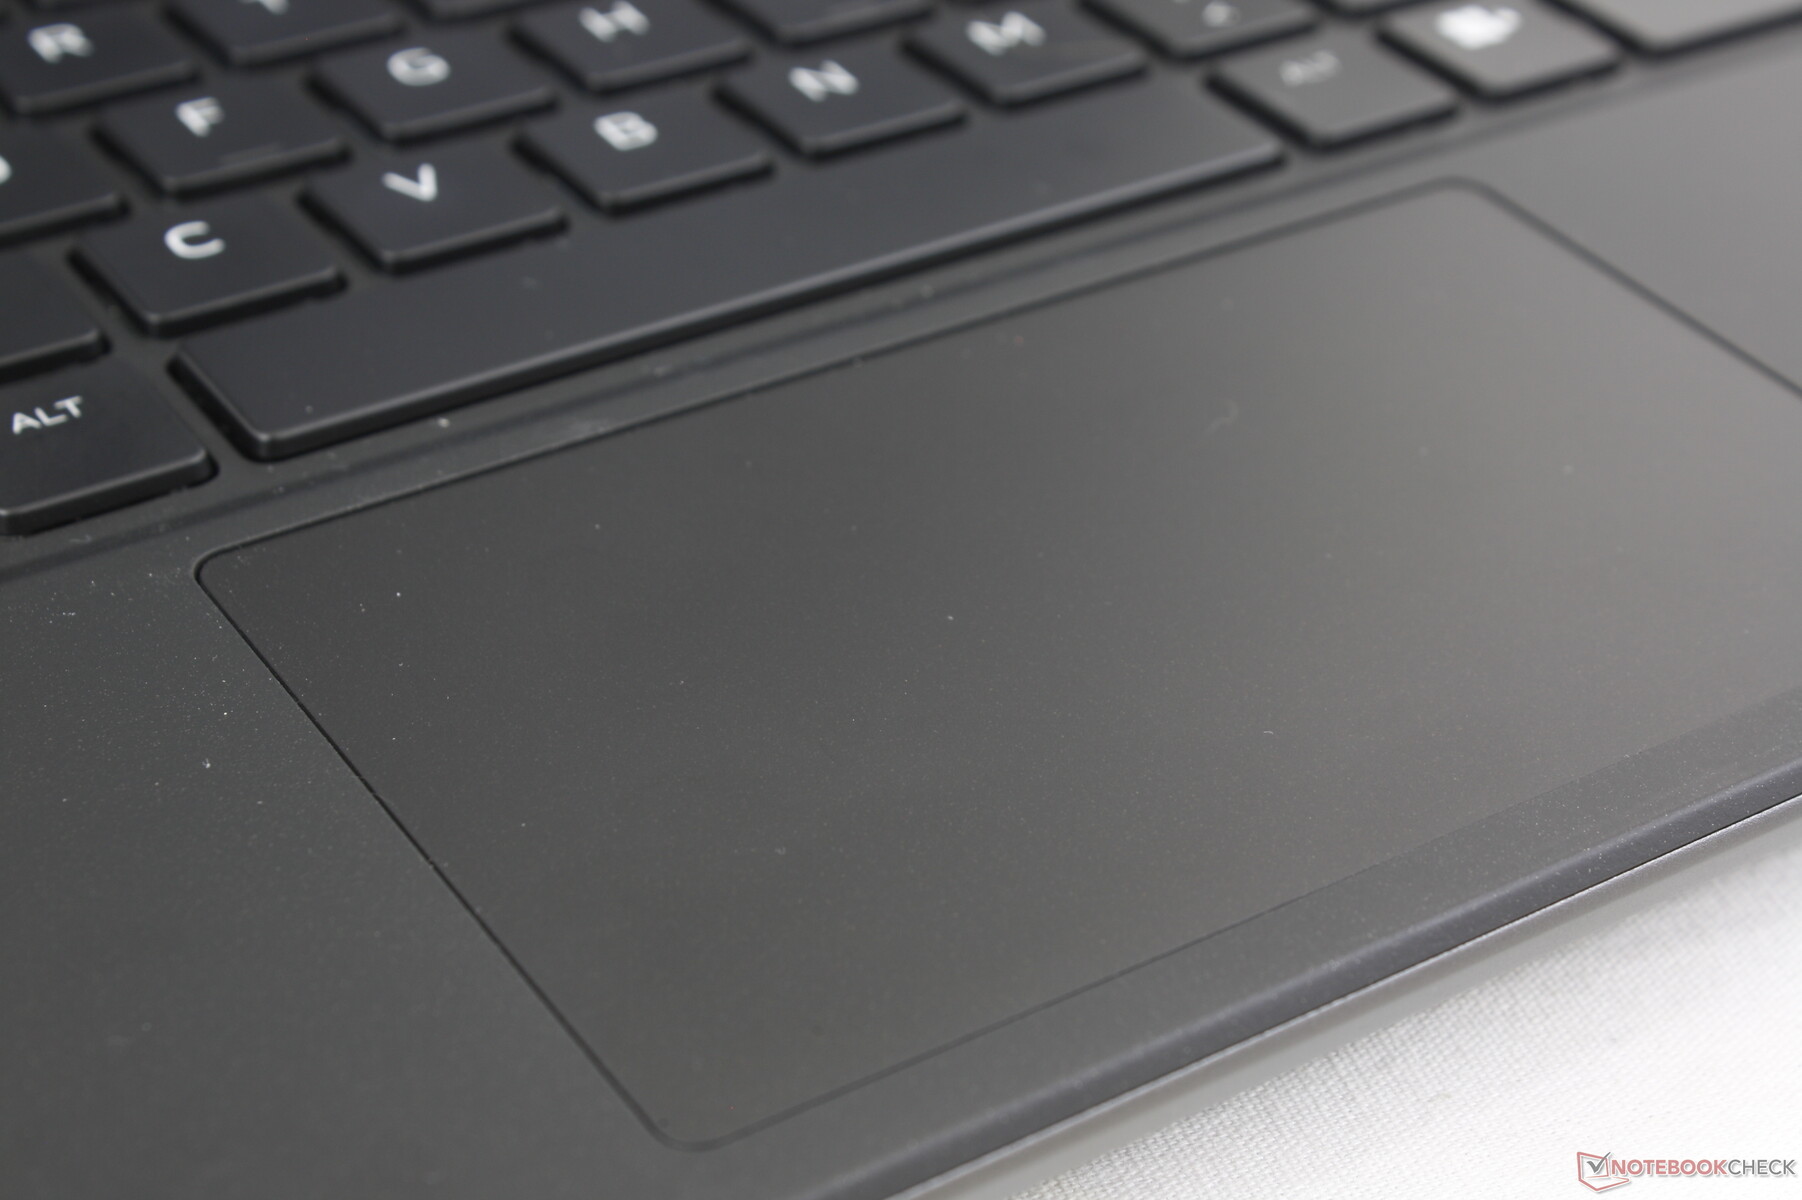
Touchpad
Il clickpad è relativamente piccolo (11,3 x 6,6 cm) poiché gran parte del piano tastiera è occupato dalle ampie griglie di ventilazione. I clickpad dell'HP Omen Transcend 16 HP Omen Transcend 16 e Razer Blade 16, ad esempio, sono più spaziosi, rispettivamente 12,5 x 8 cm e 17 x 9,7 cm. La trazione è comunque fluida, con un feedback deciso e cliccabile quando si preme, nonostante la superficie ristretta.
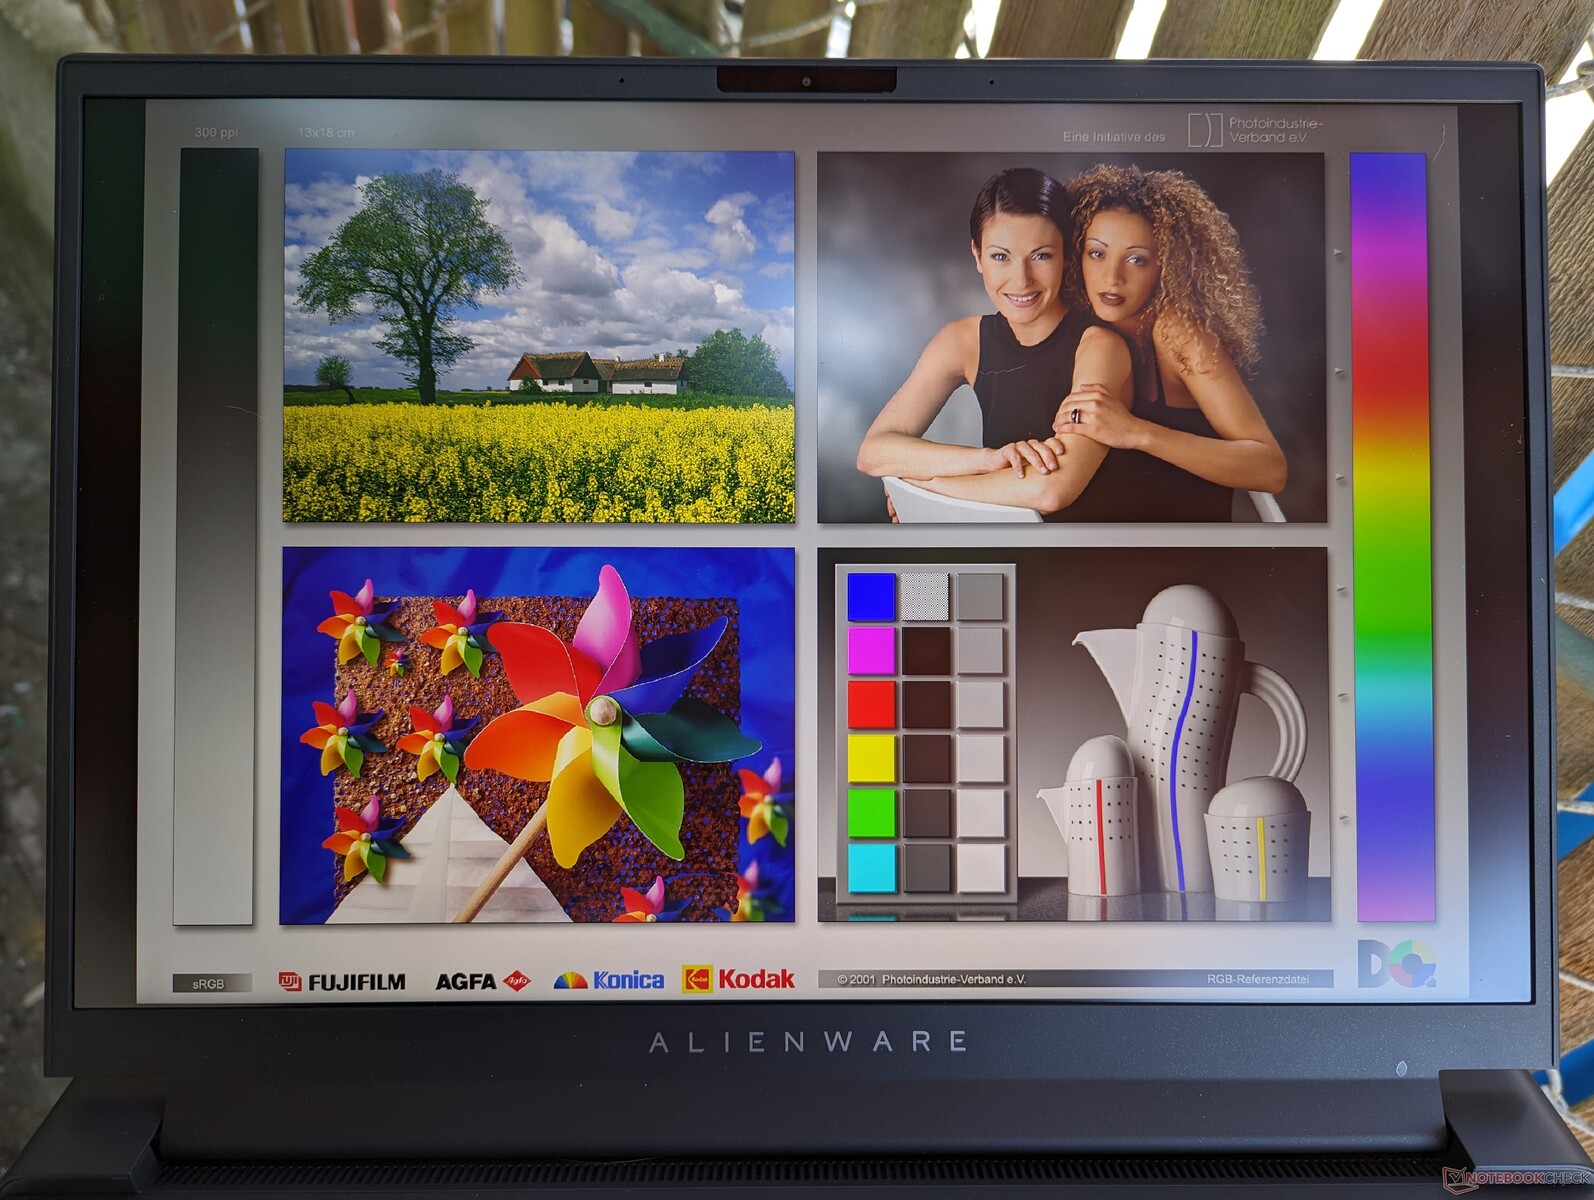
Display
Sono disponibili tre opzioni di visualizzazione:
- 2560 x 1600, 165 Hz, 3 ms, IPS, 100% sRGB
- 2560 x 1600, 240 Hz, 3 ms, IPS, 100% DCI-P3
- 1920 x 1200, 480 Hz, 3 ms, IPS, 100% DCI-P3
La nostra unità è configurata con l'opzione in grassetto qui sopra, che riteniamo sia il punto di forza del modello, in quanto offre colori P3 completi, velocità di aggiornamento rapida e un'alta risoluzione tutto in uno. L'opzione 1200p offre frequenze di aggiornamento ancora più rapide, ma i vantaggi diventano sempre più marginali dopo i 240 Hz.
L'Alienware m16 R1 utilizza lo stesso pannello BOE NE16NZ4 presente nell'Alienware x16 R1.Alienware x16 R1 e quindi l'esperienza visiva è essenzialmente identica tra i due modelli. Questo pannello di fascia alta è adatto sia per il gioco che per la creazione di contenuti, con colori più ampi rispetto al pannello MNG007DA2-3 del Legion Pro 7. Tuttavia, gli schermi del Razer Blade 16 Early 2023 o del Mini-LED HP Omen Transcend 16 sono sensibilmente più luminosi, il che può essere utile per i contenuti HDR.

| |||||||||||||||||||||||||
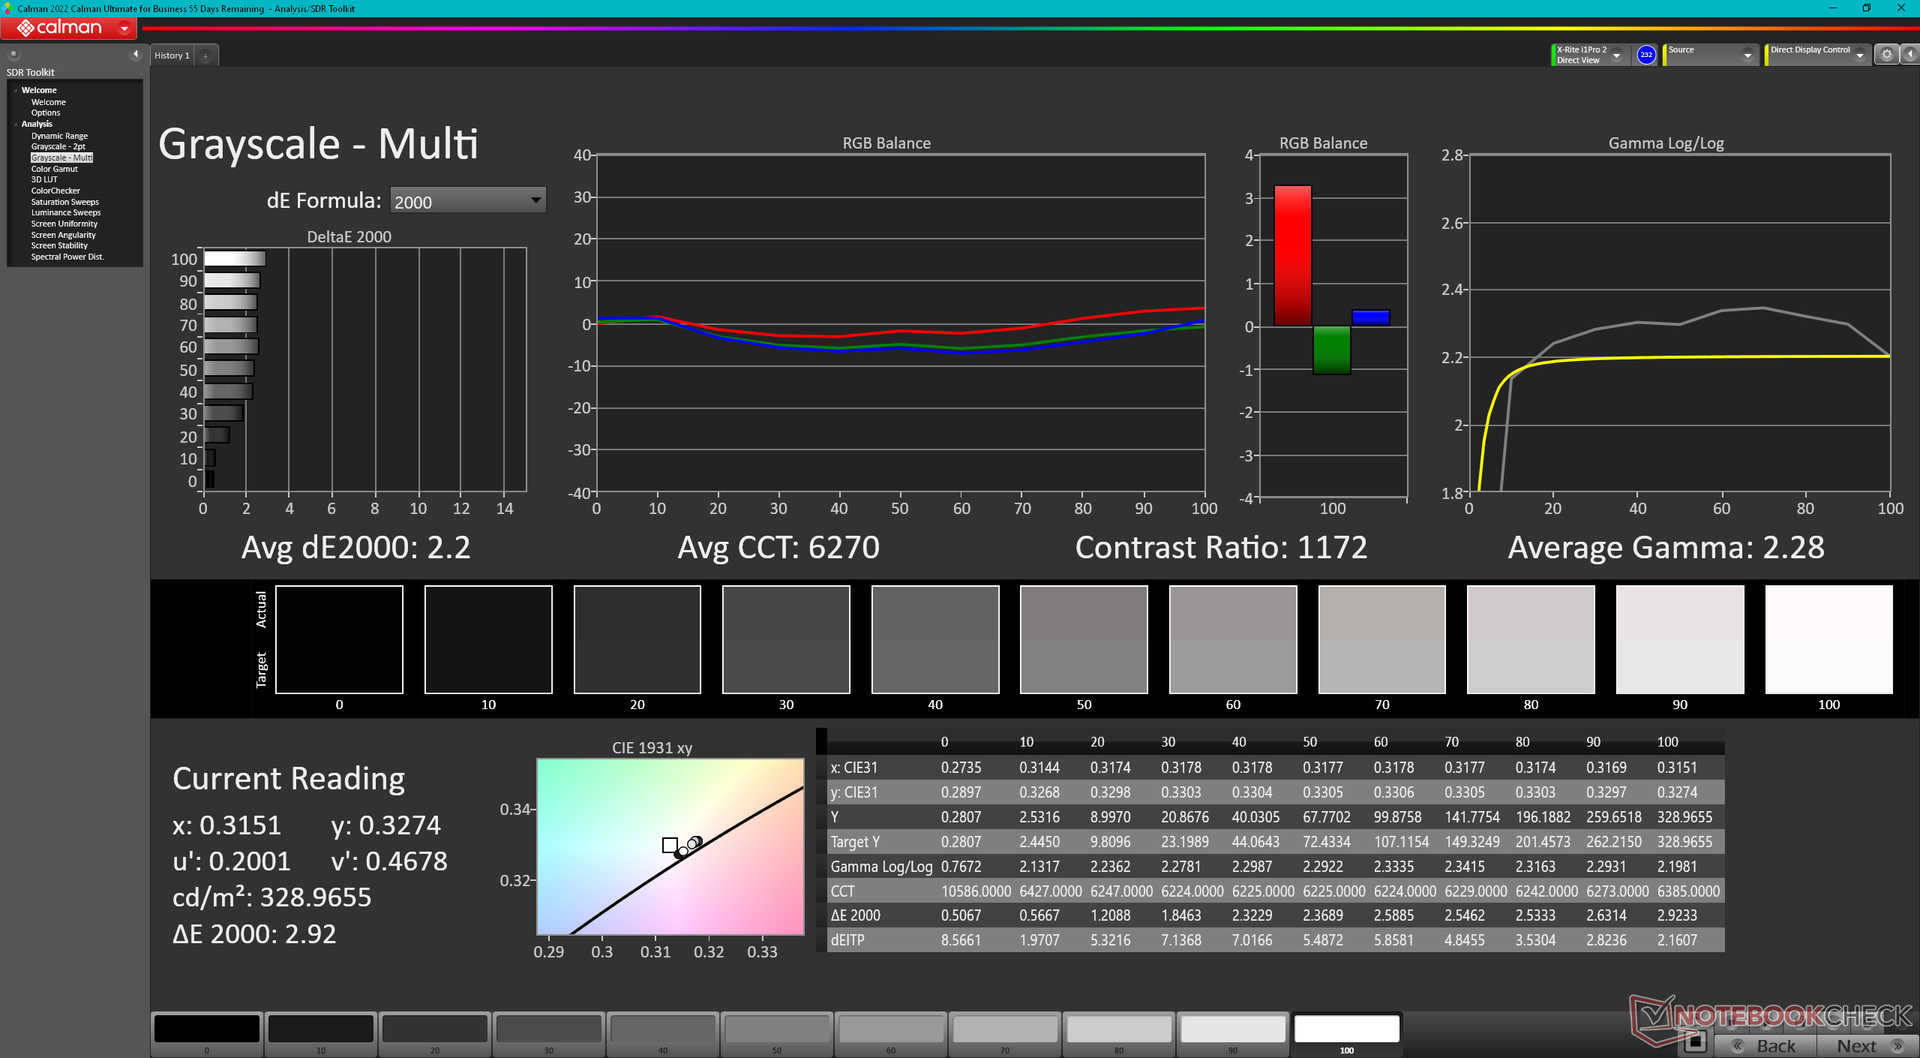
Distribuzione della luminosità: 89 %
Al centro con la batteria: 329 cd/m²
Contrasto: 1028:1 (Nero: 0.32 cd/m²)
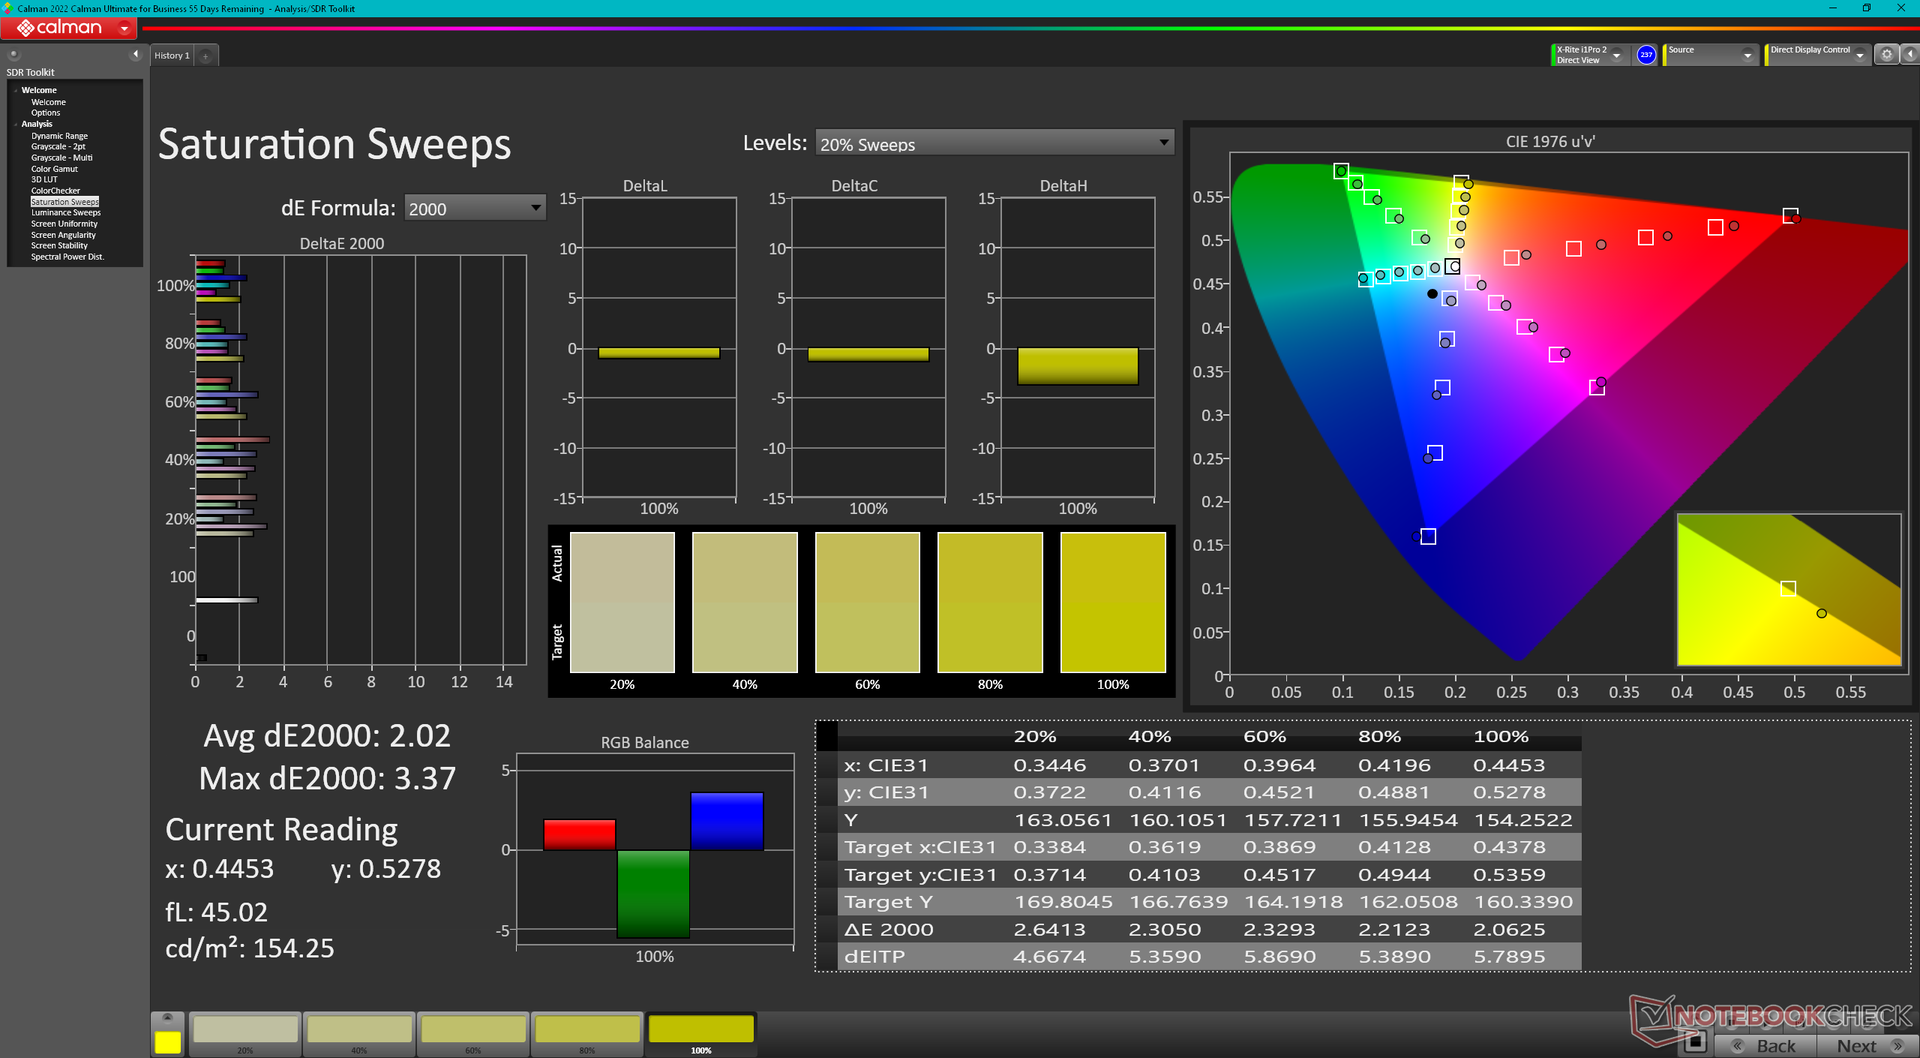
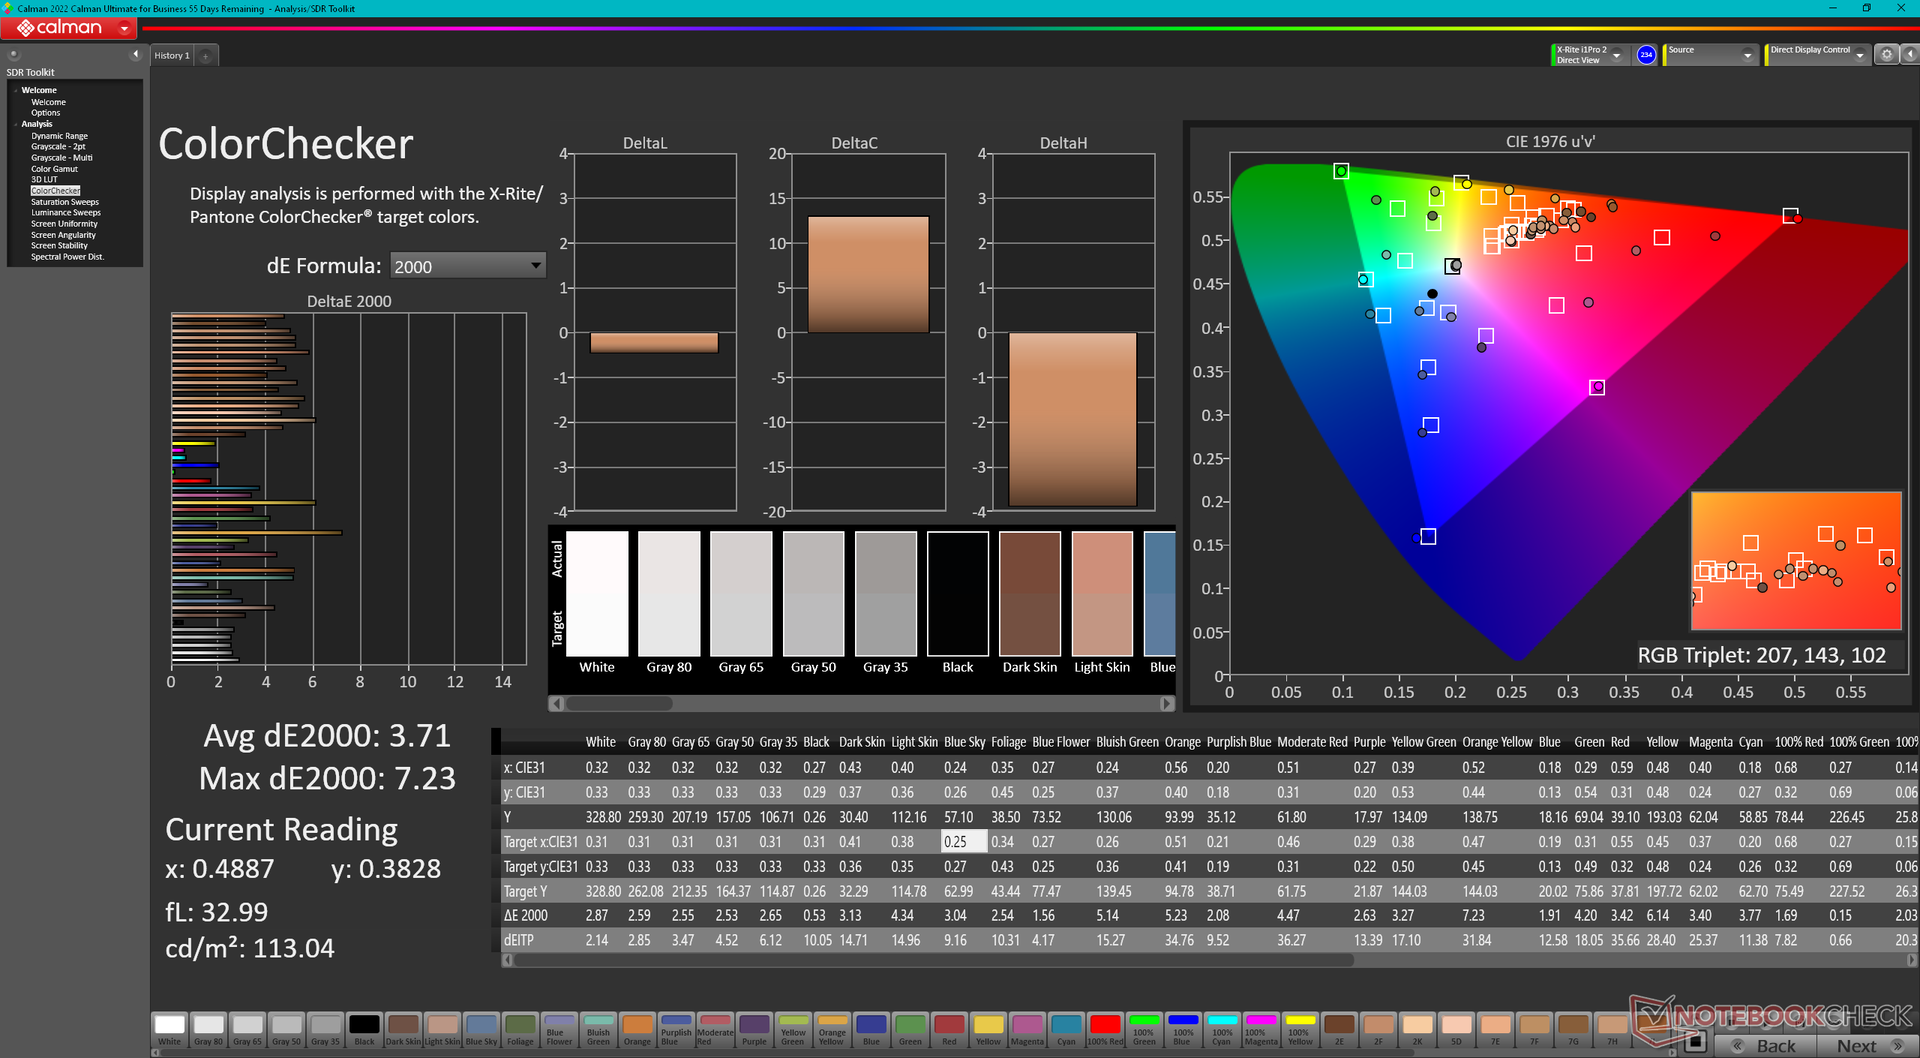
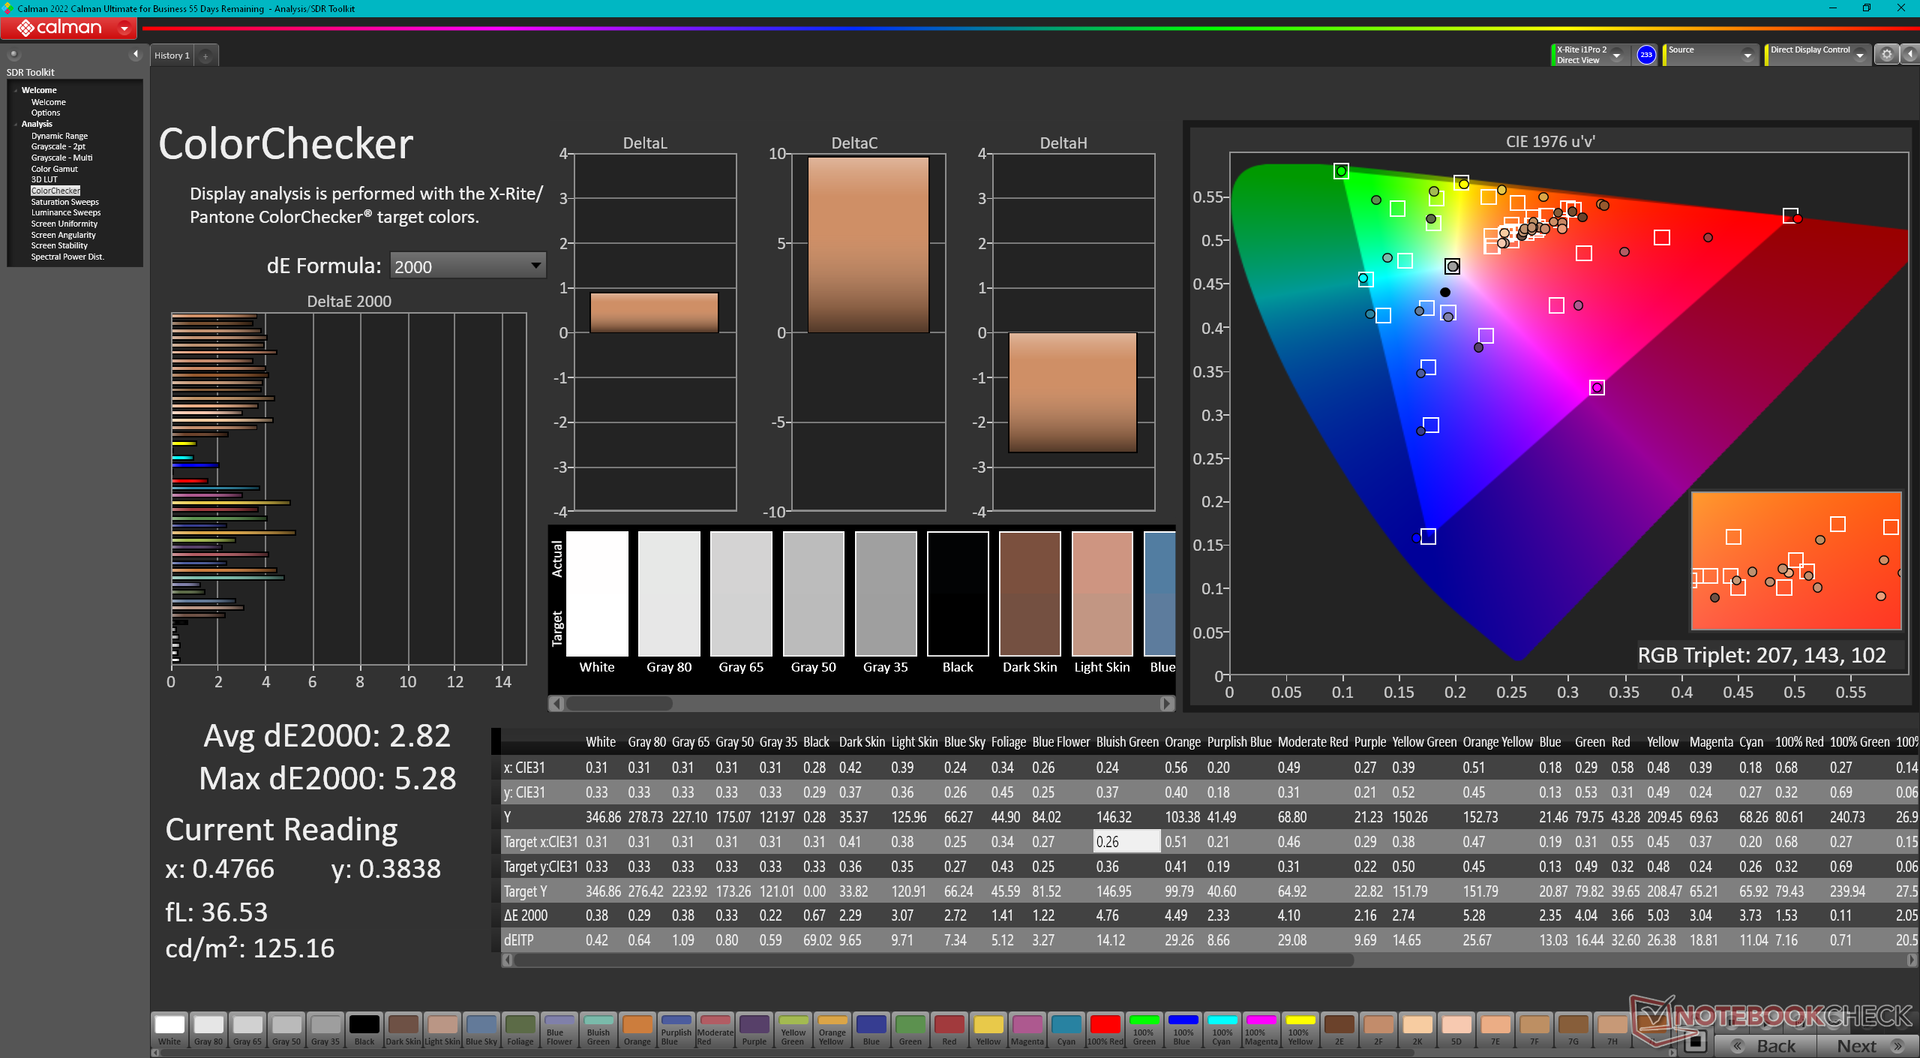
ΔE ColorChecker Calman: 3.71 | ∀{0.5-29.43 Ø4.73}
calibrated: 2.82
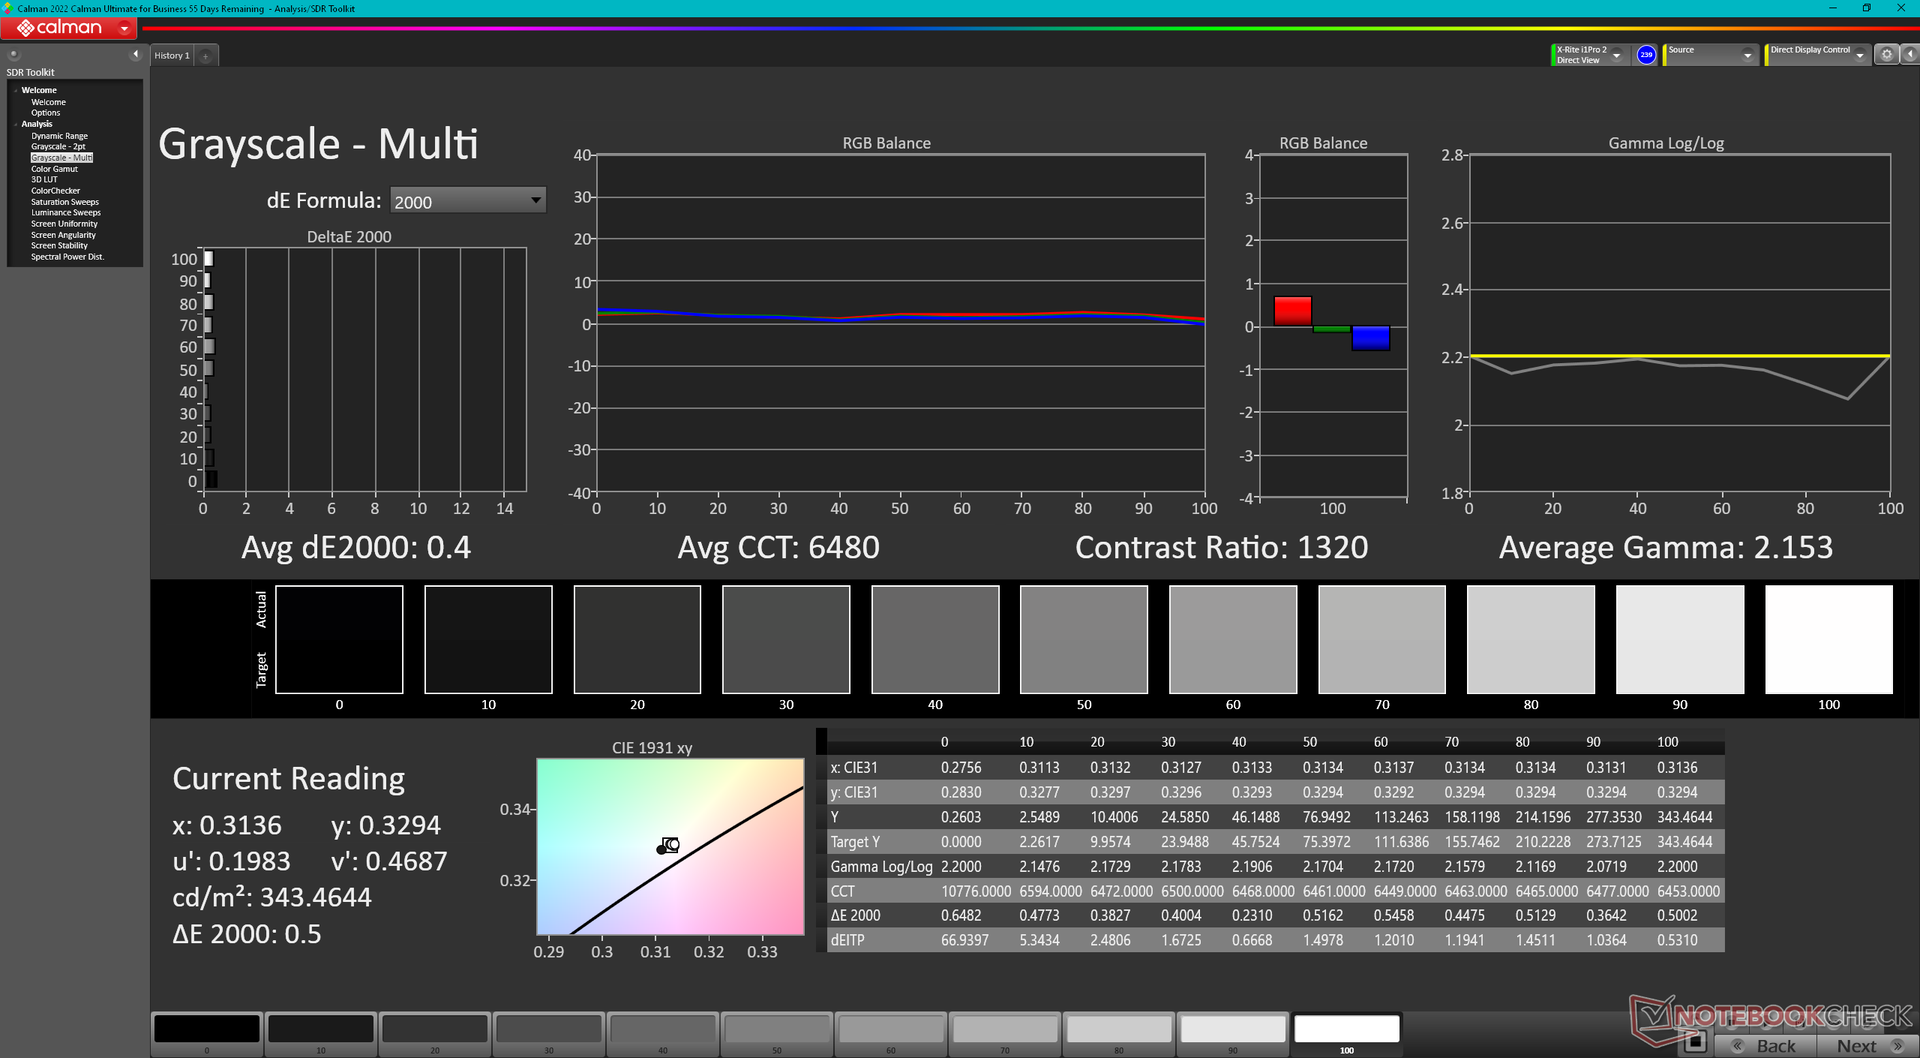
ΔE Greyscale Calman: 2.2 | ∀{0.09-98 Ø4.97}
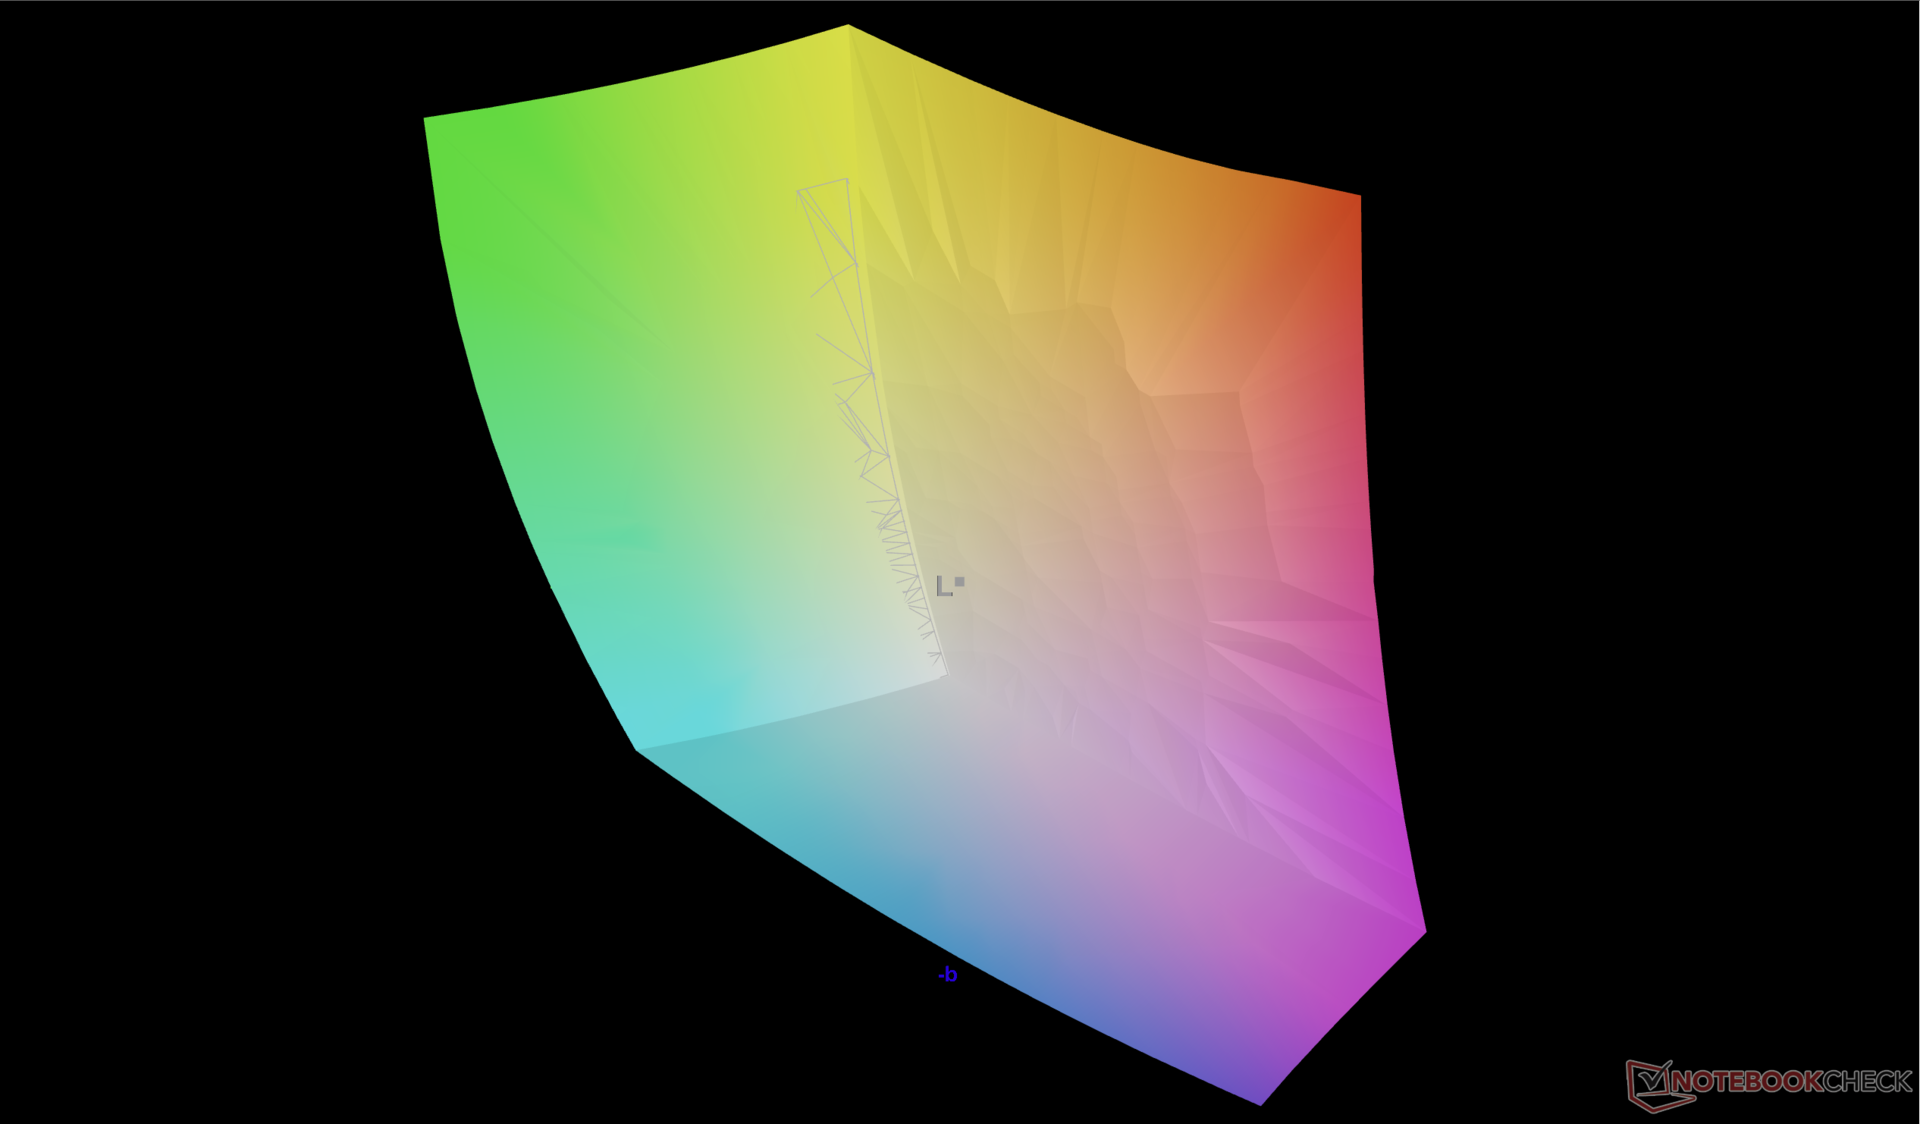
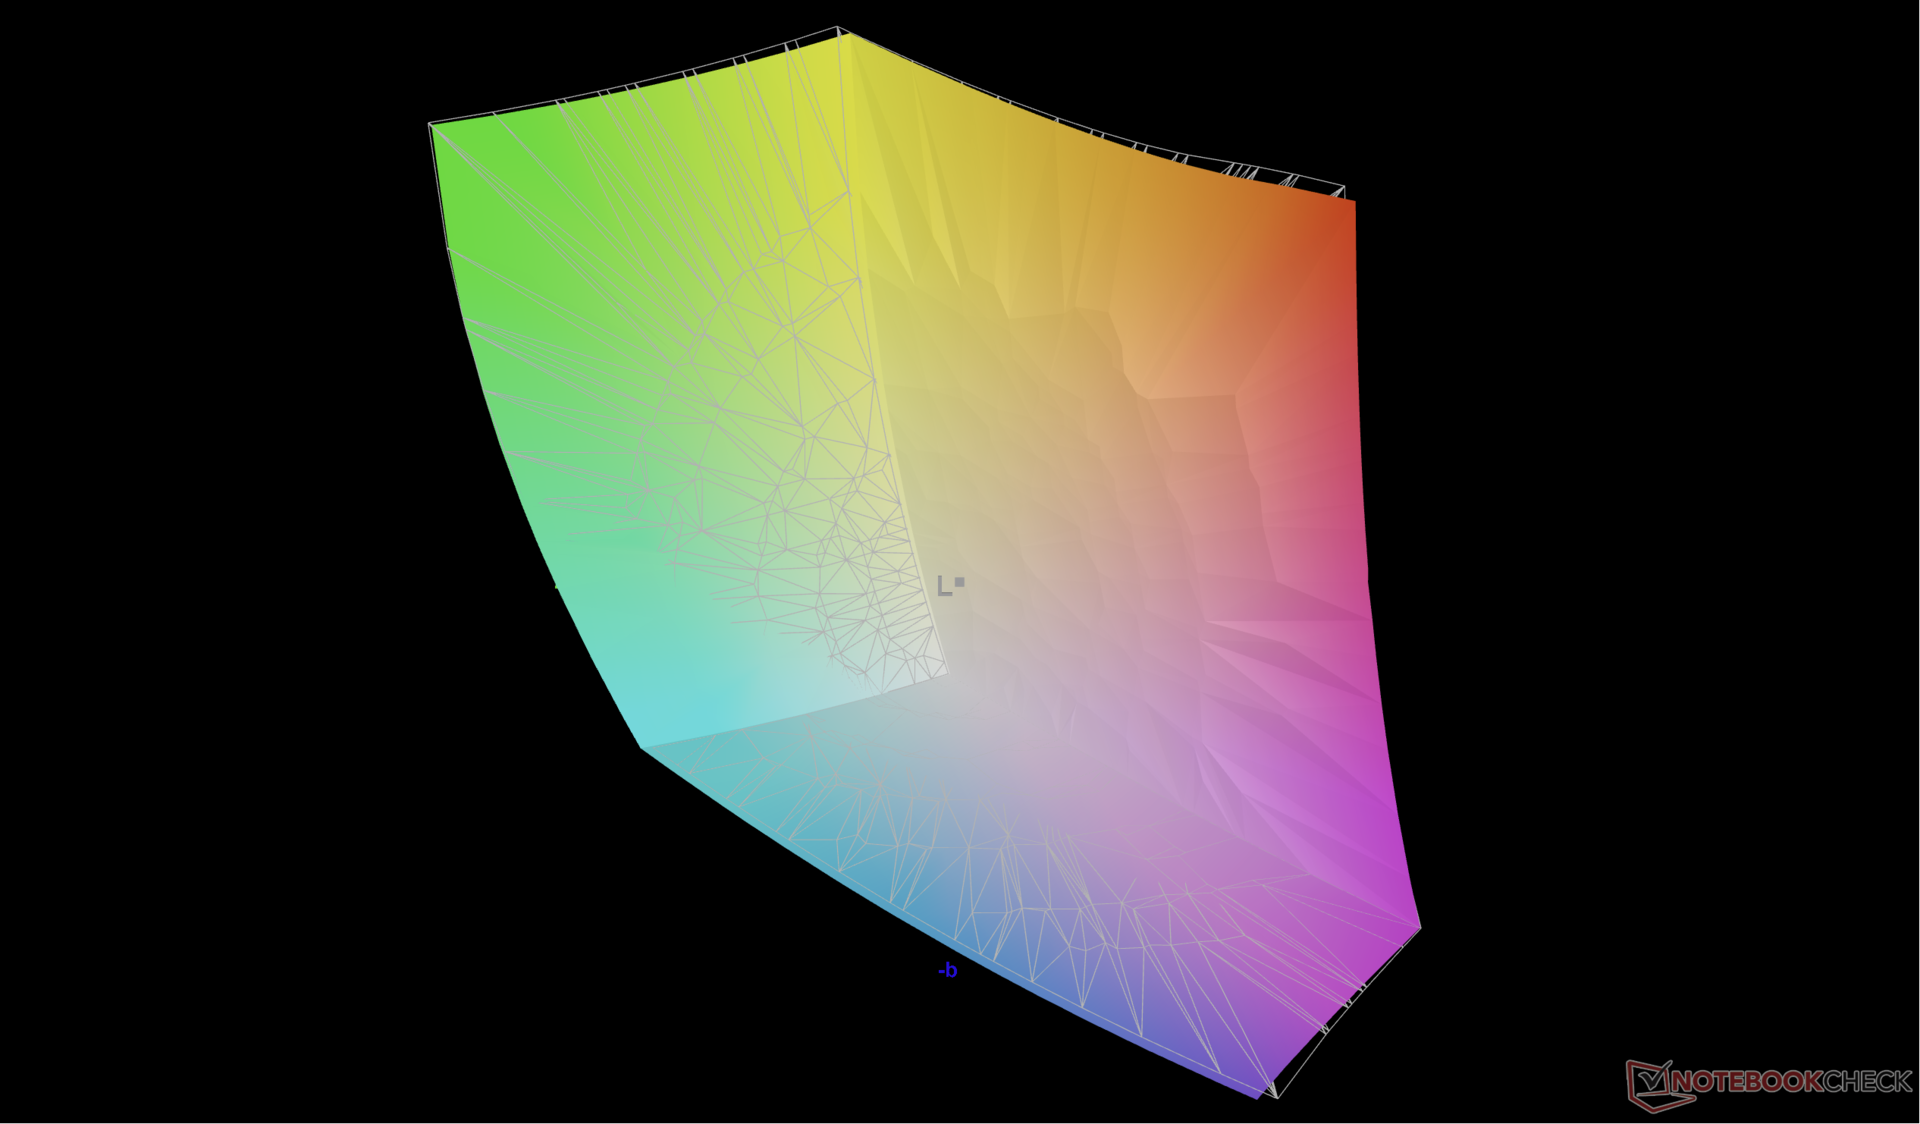
88.9% AdobeRGB 1998 (Argyll 3D)
99.9% sRGB (Argyll 3D)
98.6% Display P3 (Argyll 3D)
Gamma: 2.3
CCT: 6270 K
| Alienware m16 R1 AMD BOE NE16NZ4, IPS, 2560x1600, 16" | Alienware x16 R1 BOE NE16NZ4, IPS, 2560x1600, 16" | HP Omen Transcend 16 AUOA3A6, Mini-LED, 2560x1600, 16" | Lenovo Legion Pro 7 RTX4090 MNG007DA2-3 (CSO1628), IPS, 2560x1600, 16" | Asus ROG Strix G16 G614JZ TL160ADMP03-0, IPS, 2560x1600, 16" | Razer Blade 16 Early 2023 CSOT T3 MNG007DA4-1, IPS, 2560x1600, 16" | |
|---|---|---|---|---|---|---|
| Display | 0% | 0% | -16% | -2% | 0% | |
| Display P3 Coverage (%) | 98.6 | 99.2 1% | 99.2 1% | 69.5 -30% | 97 -2% | 98.5 0% |
| sRGB Coverage (%) | 99.9 | 100 0% | 100 0% | 99.8 0% | 99.9 0% | 100 0% |
| AdobeRGB 1998 Coverage (%) | 88.9 | 88.6 0% | 87.6 -1% | 71.6 -19% | 84.9 -4% | 89.7 1% |
| Response Times | -7% | -316% | -33% | 14% | -31% | |
| Response Time Grey 50% / Grey 80% * (ms) | 5.1 ? | 5.1 ? -0% | 26.4 ? -418% | 10.9 ? -114% | 5.1 ? -0% | 6.6 ? -29% |
| Response Time Black / White * (ms) | 9 ? | 10.3 ? -14% | 28.2 ? -213% | 4.6 ? 49% | 6.6 ? 27% | 12 ? -33% |
| PWM Frequency (Hz) | 3506 ? | |||||
| Screen | 18% | 224% | 23% | 23% | 18% | |
| Brightness middle (cd/m²) | 329 | 302.2 -8% | 791.1 140% | 491 49% | 470 43% | 456.8 39% |
| Brightness (cd/m²) | 317 | 285 -10% | 800 152% | 472 49% | 459 45% | 437 38% |
| Brightness Distribution (%) | 89 | 89 0% | 95 7% | 91 2% | 93 4% | 83 -7% |
| Black Level * (cd/m²) | 0.32 | 0.26 19% | 0.04 87% | 0.4 -25% | 0.42 -31% | 0.35 -9% |
| Contrast (:1) | 1028 | 1162 13% | 19778 1824% | 1228 19% | 1119 9% | 1305 27% |
| Colorchecker dE 2000 * | 3.71 | 1.63 56% | 4.37 -18% | 1.6 57% | 1.86 50% | 3.7 -0% |
| Colorchecker dE 2000 max. * | 7.23 | 4.13 43% | 10.39 -44% | 5.15 29% | 3.87 46% | 6.42 11% |
| Colorchecker dE 2000 calibrated * | 2.82 | 1.17 59% | 1.04 63% | 0.97 66% | 0.93 67% | 0.66 77% |
| Greyscale dE 2000 * | 2.2 | 2.5 -14% | 6.5 -195% | 3 -36% | 2.7 -23% | 2.6 -18% |
| Gamma | 2.3 96% | 2.23 99% | 2.28 96% | 2.211 100% | 2.246 98% | 2.3 96% |
| CCT | 6270 104% | 6590 99% | 6000 108% | 6979 93% | 6711 97% | 6108 106% |
| Media totale (Programma / Settaggio) | 4% /
10% | -31% /
99% | -9% /
7% | 12% /
17% | -4% /
7% |
* ... Meglio usare valori piccoli
Il display è calibrato in modo decente rispetto allo standard P3, con valori medi di deltaE della scala di grigi e del colore rispettivamente di soli 2,2 e 3,71. La calibrazione del display con un colorimetro X-Rite migliorerebbe ulteriormente la scala dei grigi, con un deltaE medio di soli 0,4 e colori complessivamente più accurati. Il nostro profilo ICM calibrato è disponibile gratuitamente per il download.
Tempi di risposta del Display
| ↔ Tempi di risposta dal Nero al Bianco | ||
|---|---|---|
| 9 ms ... aumenta ↗ e diminuisce ↘ combinato | ↗ 4.8 ms Incremento | 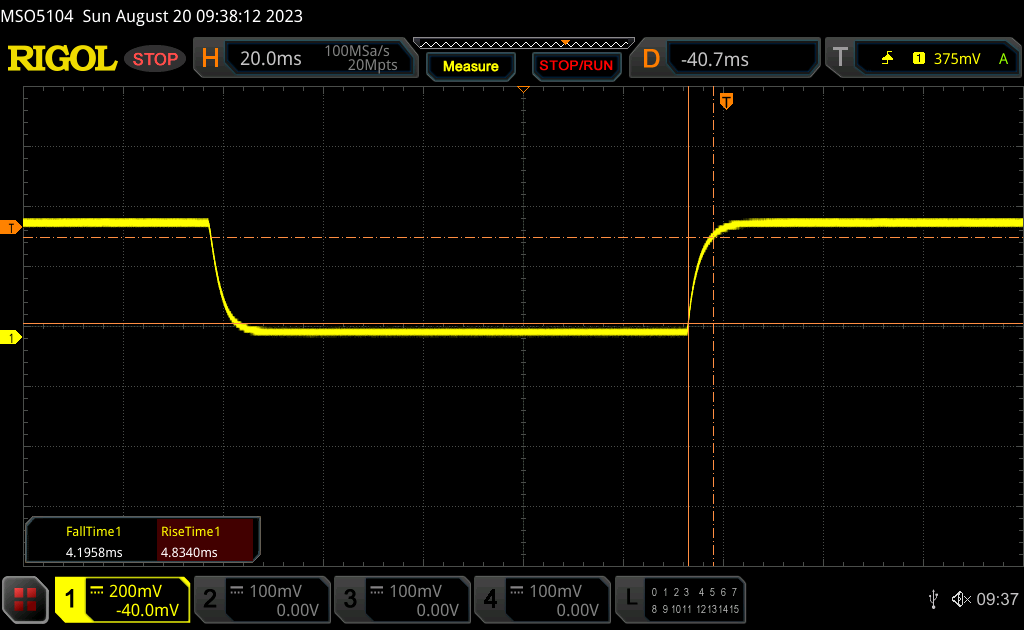 |
| ↘ 4.2 ms Calo | ||
| Lo schermo mostra veloci tempi di risposta durante i nostri tests e dovrebbe esere adatto al gaming In confronto, tutti i dispositivi di test variano da 0.1 (minimo) a 240 (massimo) ms. » 25 % di tutti i dispositivi è migliore. Questo significa che i tempi di risposta rilevati sono migliori rispettto alla media di tutti i dispositivi testati (19.9 ms). | ||
| ↔ Tempo di risposta dal 50% Grigio all'80% Grigio | ||
| 5.1 ms ... aumenta ↗ e diminuisce ↘ combinato | ↗ 2.5 ms Incremento | 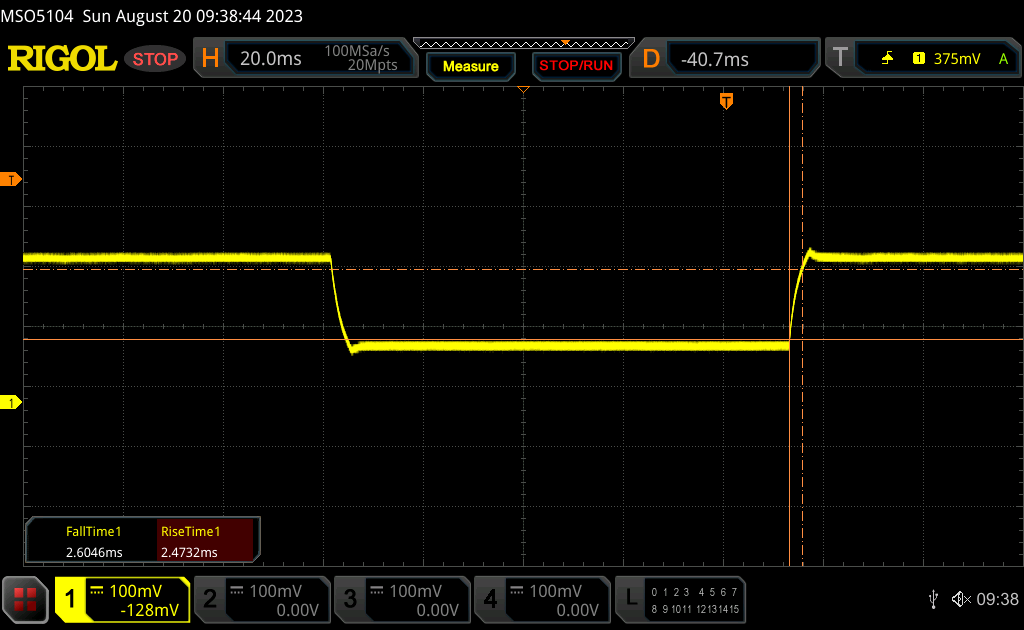 |
| ↘ 2.6 ms Calo | ||
| Lo schermo ha mostrato valori di risposta molto veloci nei nostri tests ed è molto adatto per i gaming veloce. In confronto, tutti i dispositivi di test variano da 0.165 (minimo) a 636 (massimo) ms. » 17 % di tutti i dispositivi è migliore. Questo significa che i tempi di risposta rilevati sono migliori rispettto alla media di tutti i dispositivi testati (31.1 ms). | ||
Sfarfallio dello schermo / PWM (Pulse-Width Modulation)
| flickering dello schermo / PWM non rilevato |  | ||
In confronto: 52 % di tutti i dispositivi testati non utilizza PWM per ridurre la luminosita' del display. Se è rilevato PWM, una media di 7798 (minimo: 5 - massimo: 343500) Hz è stata rilevata. | |||
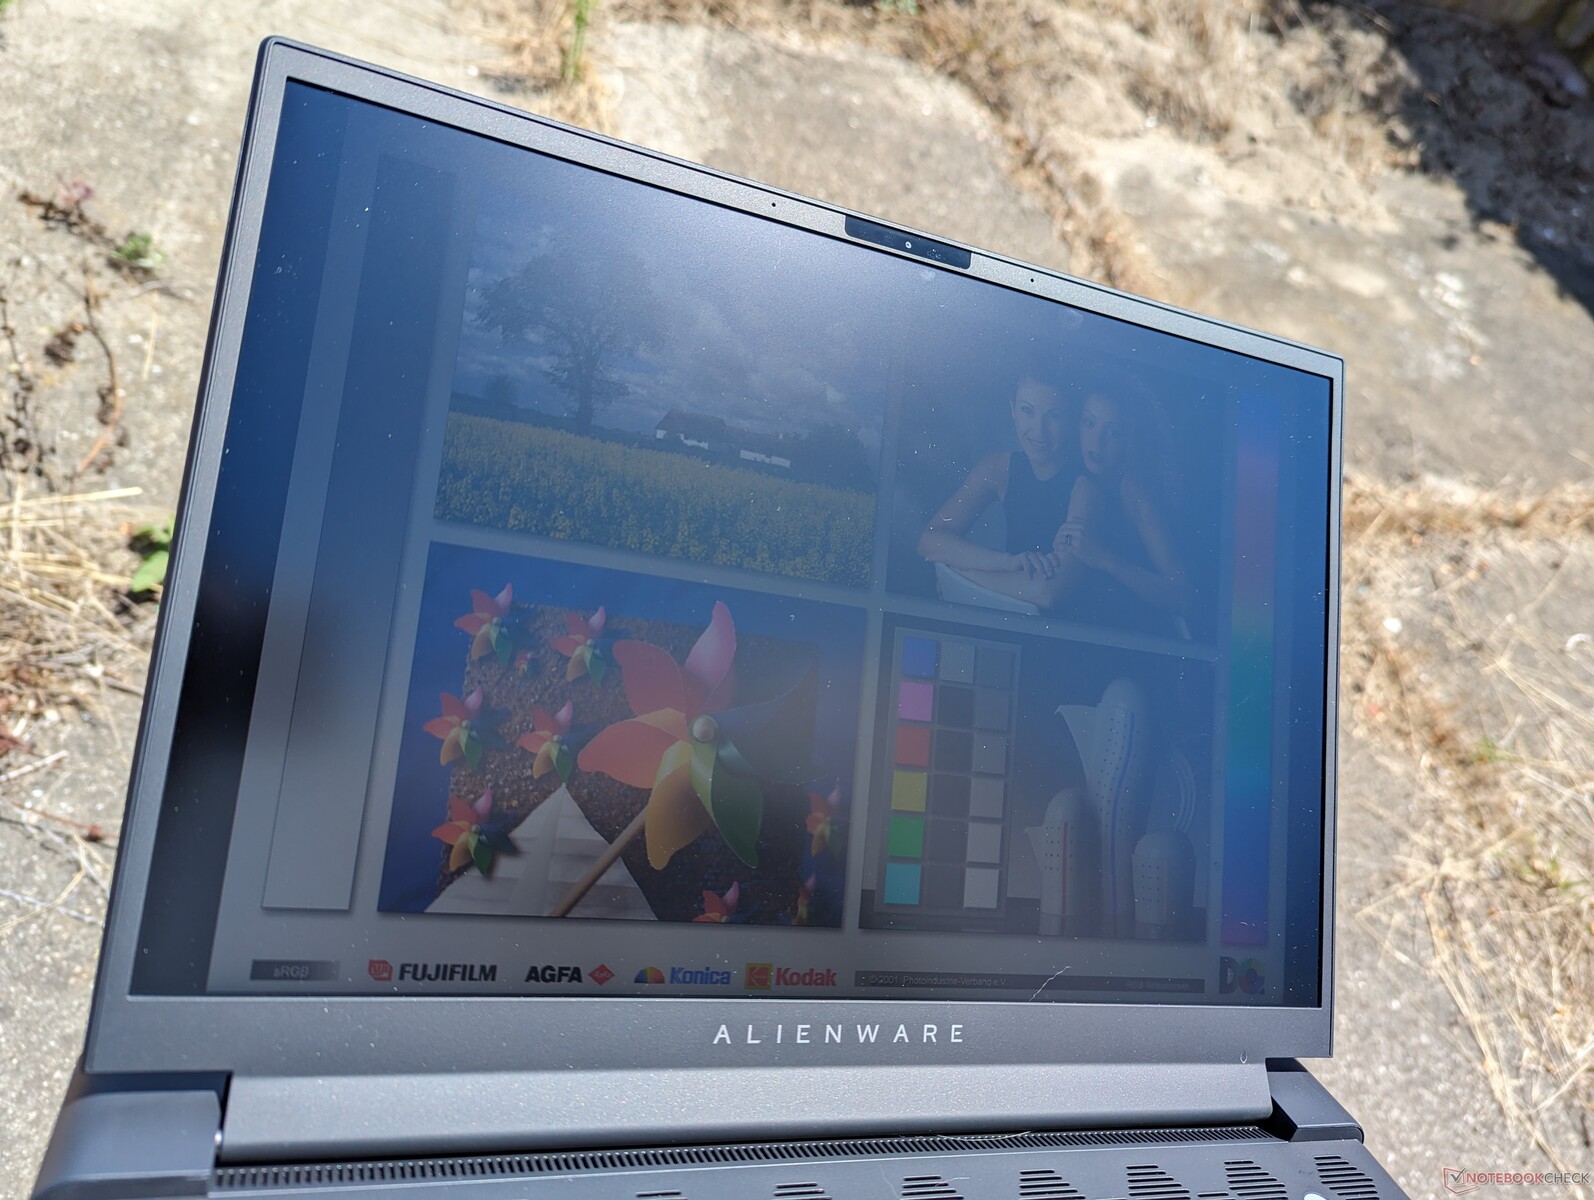
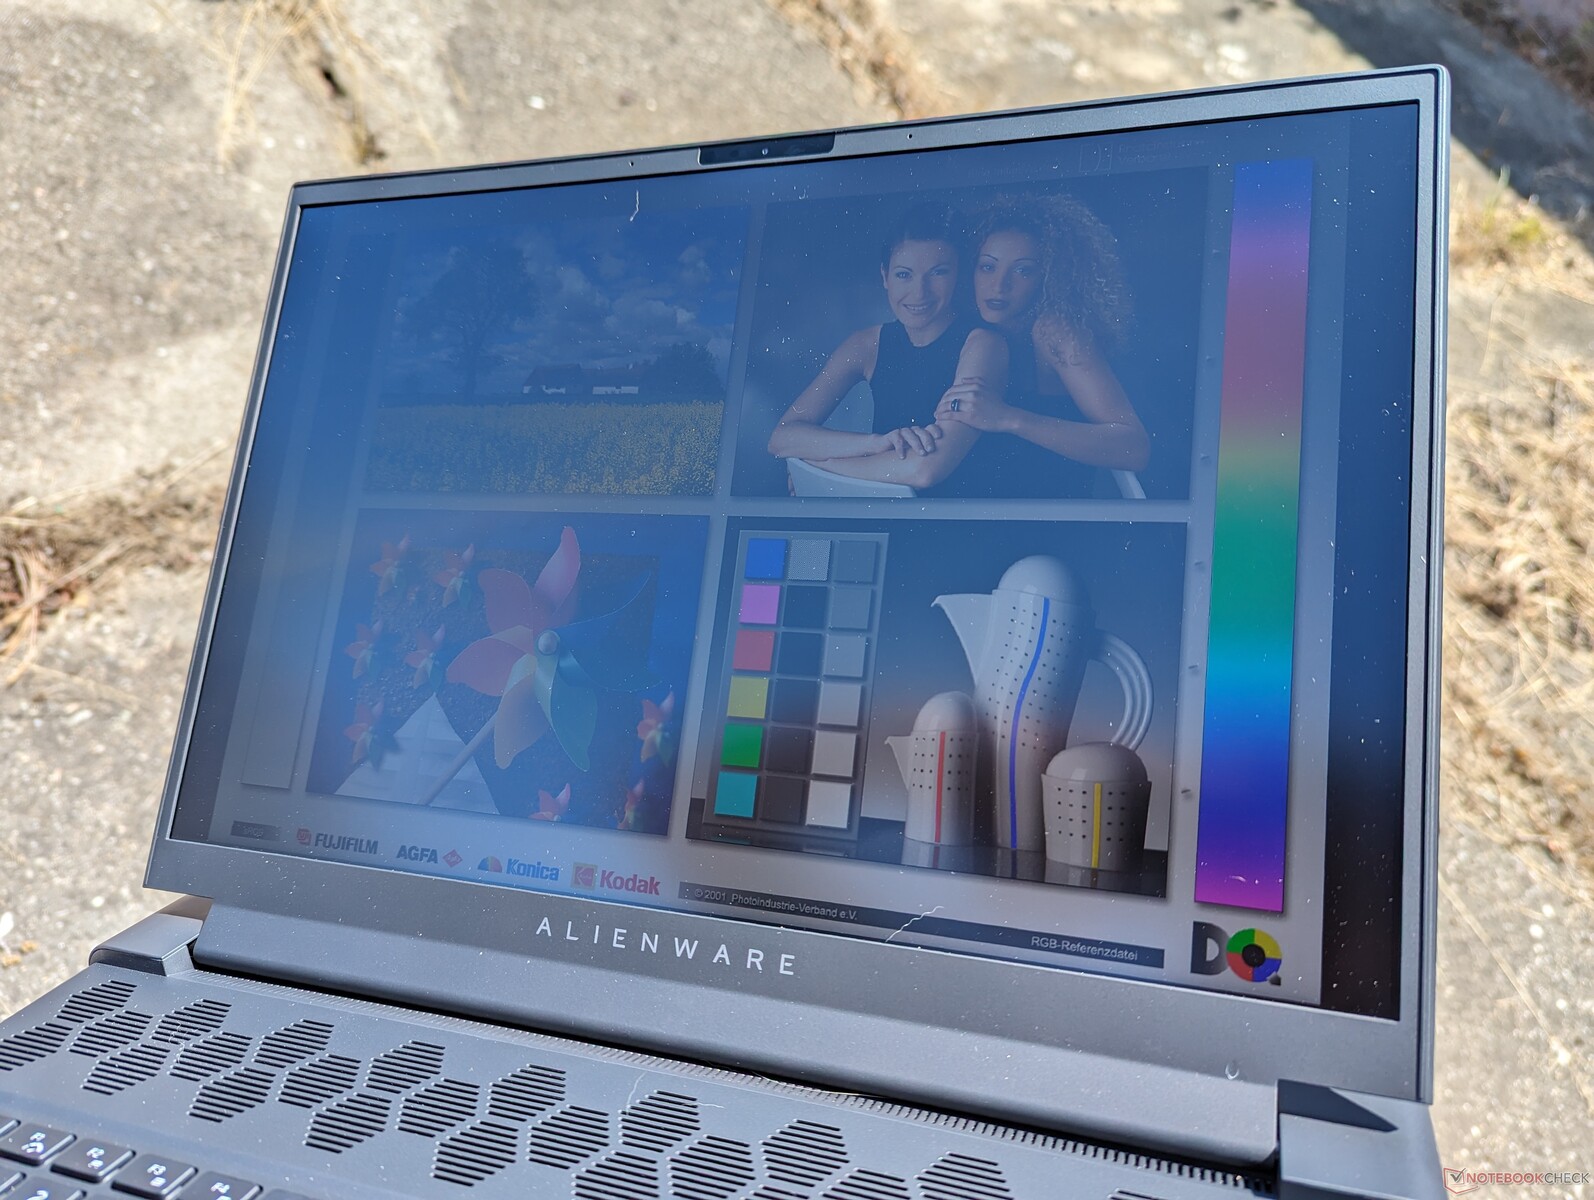
La visibilità all'aperto è discreta solo se all'ombra. L'Omen Transcend 16 e il suo display mini-LED sono due volte più luminosi se la visibilità all'aperto è un problema.
Prestazioni - AMD o Intel?
Condizioni di test
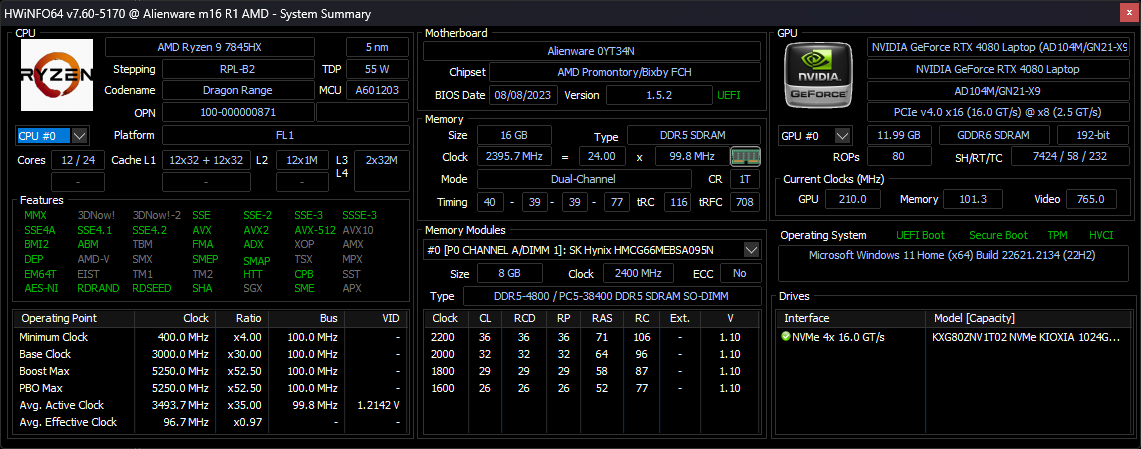
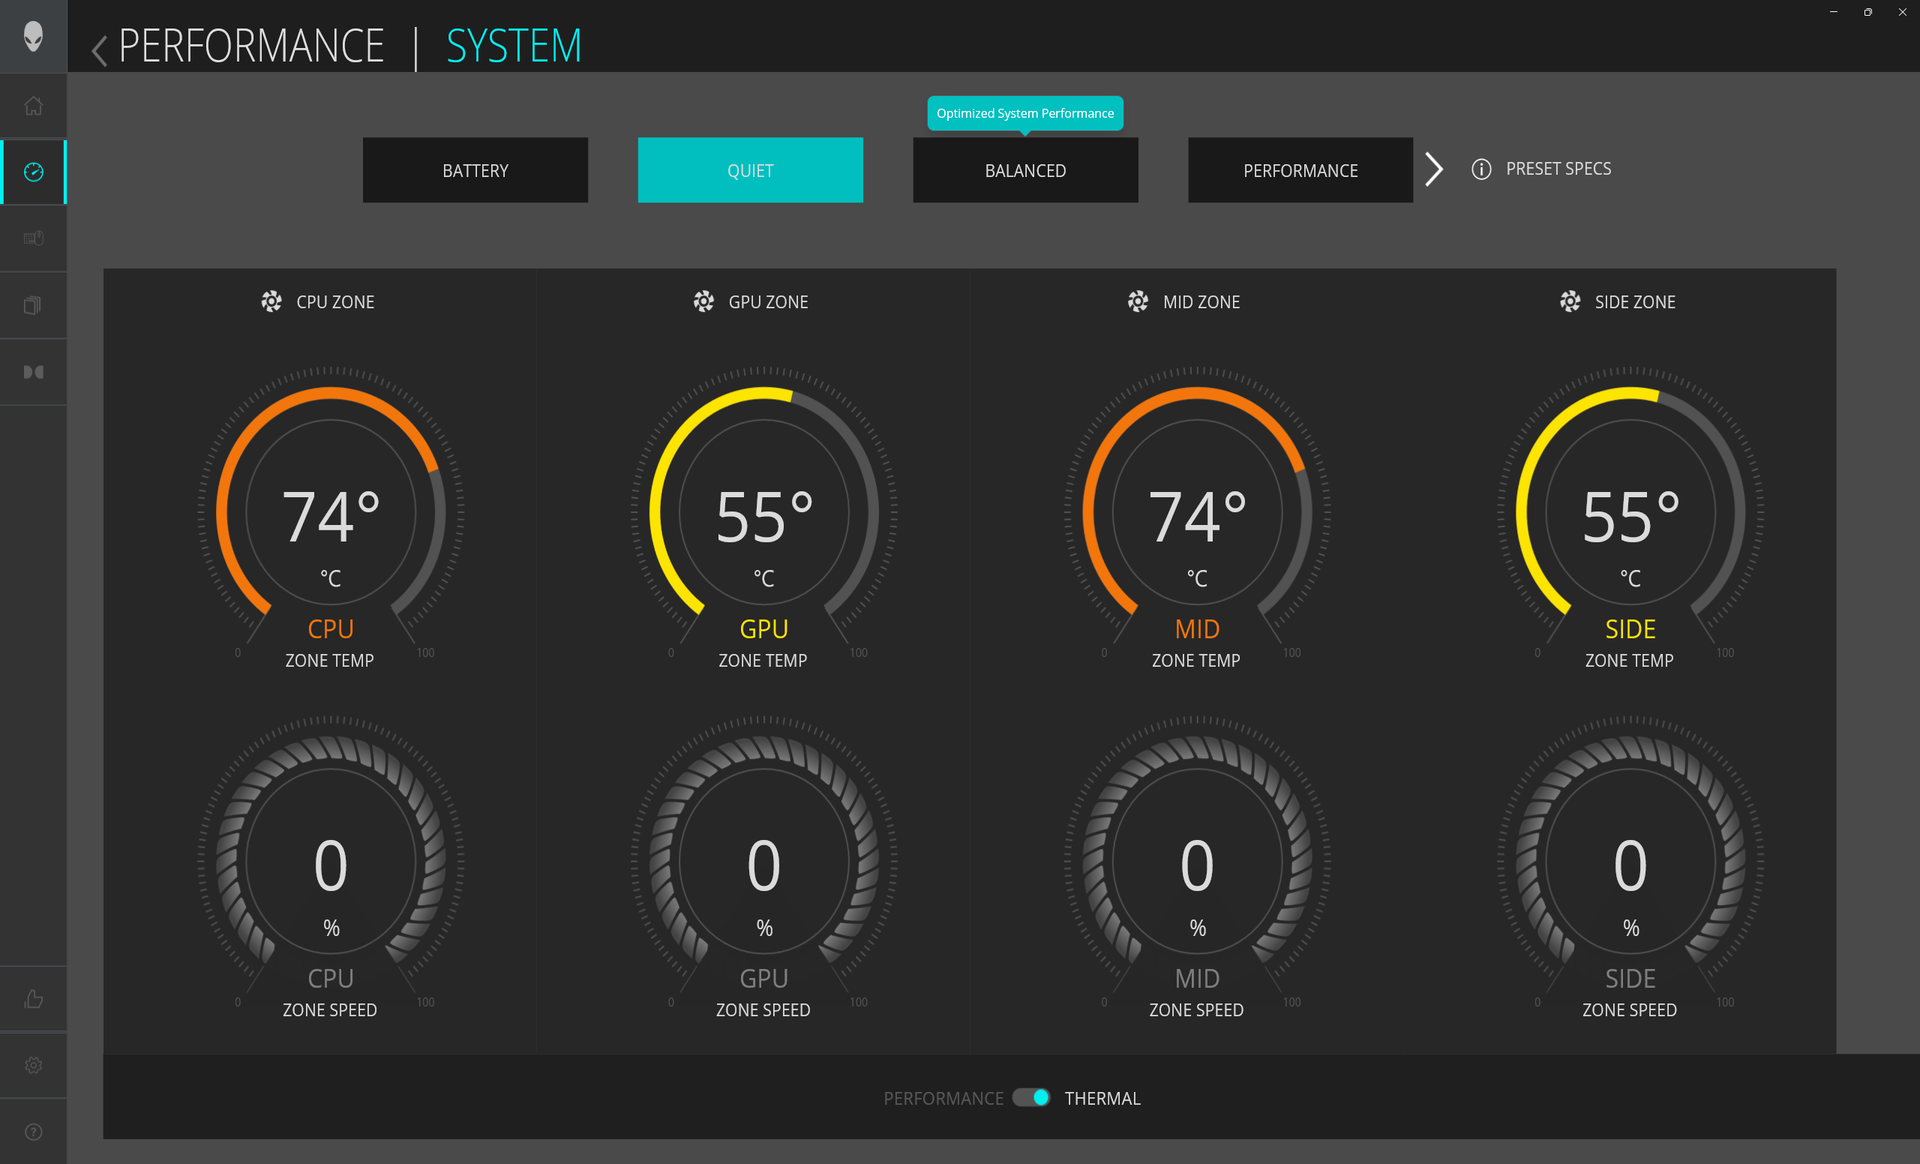
Abbiamo impostato la nostra unità in modalità Overdrive tramite Alienware Command Center e la GPU in modalità dGPU prima di eseguire i benchmark qui sotto. Gli utenti dovrebbero familiarizzare con Command Center, che è l'hub di controllo delle funzioni del sistema relative a prestazioni, parametri vitali e illuminazione. Command Center non deve essere confuso con My Alienware, il software di garanzia e assistenza.
L'Advanced Optimus o MUX è supportato. G-Sync, tuttavia, non è supportato sul display interno per le versioni AMD dell'Alienware m16, poiché questa funzione è attualmente esclusiva delle versioni Intel. Al suo posto è supportato FreeSync.
Processore
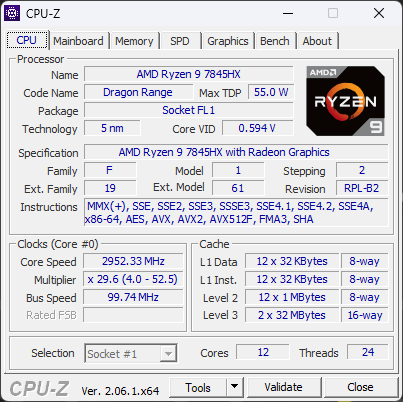
Il Ryzen 9 7845HX ha prestazioni più simili a quelle dell'impressionante Ryzen 9 7945HX che al Ryzen 7 7745HX. Le prestazioni multi-thread sono circa il 20-25% più lente rispetto al Ryzen 9 7945HX o circa il 50% in più rispetto al Ryzen 7 7745HX. La CPU è quindi appena inferiore al concorrente Core i9-13900HX ma ben più avanti del Core i7-13700HX. Il concetto di accontentarsi di prestazioni inferiori della CPU optando per AMD invece che per Intel non si applica a questa generazione.
La sostenibilità delle prestazioni è eccellente, come dimostrano i risultati stabili di Cinebench R15 xT riportati di seguito.
Cinebench R15 Multi Loop
Cinebench R23: Multi Core | Single Core
Cinebench R20: CPU (Multi Core) | CPU (Single Core)
Cinebench R15: CPU Multi 64Bit | CPU Single 64Bit
Blender: v2.79 BMW27 CPU
7-Zip 18.03: 7z b 4 | 7z b 4 -mmt1
Geekbench 5.5: Multi-Core | Single-Core
HWBOT x265 Benchmark v2.2: 4k Preset
LibreOffice : 20 Documents To PDF
R Benchmark 2.5: Overall mean
* ... Meglio usare valori piccoli
AIDA64: FP32 Ray-Trace | FPU Julia | CPU SHA3 | CPU Queen | FPU SinJulia | FPU Mandel | CPU AES | CPU ZLib | FP64 Ray-Trace | CPU PhotoWorxx
| Performance rating | |
| Alienware m16 R1 AMD | |
| Media AMD Ryzen 9 7845HX | |
| Lenovo Legion Pro 7 RTX4090 | |
| Asus ROG Strix G16 G614JZ | |
| HP Omen Transcend 16 | |
| Razer Blade 16 Early 2023 | |
| Alienware x16 R1 | |
| AIDA64 / FP32 Ray-Trace | |
| Alienware m16 R1 AMD | |
| Media AMD Ryzen 9 7845HX (n=1) | |
| Asus ROG Strix G16 G614JZ | |
| Lenovo Legion Pro 7 RTX4090 | |
| Razer Blade 16 Early 2023 | |
| Razer Blade 16 Early 2023 | |
| Razer Blade 16 Early 2023 | |
| HP Omen Transcend 16 | |
| Alienware x16 R1 | |
| AIDA64 / CPU Queen | |
| Alienware m16 R1 AMD | |
| Media AMD Ryzen 9 7845HX (n=1) | |
| Asus ROG Strix G16 G614JZ | |
| Lenovo Legion Pro 7 RTX4090 | |
| Razer Blade 16 Early 2023 | |
| Razer Blade 16 Early 2023 | |
| HP Omen Transcend 16 | |
| Alienware x16 R1 | |
| AIDA64 / FPU SinJulia | |
| Alienware m16 R1 AMD | |
| Media AMD Ryzen 9 7845HX (n=1) | |
| Asus ROG Strix G16 G614JZ | |
| Razer Blade 16 Early 2023 | |
| Razer Blade 16 Early 2023 | |
| Razer Blade 16 Early 2023 | |
| Lenovo Legion Pro 7 RTX4090 | |
| HP Omen Transcend 16 | |
| Alienware x16 R1 | |
| AIDA64 / FPU Mandel | |
| Alienware m16 R1 AMD | |
| Media AMD Ryzen 9 7845HX (n=1) | |
| Lenovo Legion Pro 7 RTX4090 | |
| Asus ROG Strix G16 G614JZ | |
| Razer Blade 16 Early 2023 | |
| Razer Blade 16 Early 2023 | |
| Razer Blade 16 Early 2023 | |
| HP Omen Transcend 16 | |
| Alienware x16 R1 | |
| AIDA64 / FP64 Ray-Trace | |
| Alienware m16 R1 AMD | |
| Media AMD Ryzen 9 7845HX (n=1) | |
| Asus ROG Strix G16 G614JZ | |
| Lenovo Legion Pro 7 RTX4090 | |
| Razer Blade 16 Early 2023 | |
| Razer Blade 16 Early 2023 | |
| Razer Blade 16 Early 2023 | |
| HP Omen Transcend 16 | |
| Alienware x16 R1 | |
| AIDA64 / CPU PhotoWorxx | |
| Razer Blade 16 Early 2023 | |
| Razer Blade 16 Early 2023 | |
| Razer Blade 16 Early 2023 | |
| Lenovo Legion Pro 7 RTX4090 | |
| HP Omen Transcend 16 | |
| Alienware x16 R1 | |
| Asus ROG Strix G16 G614JZ | |
| Alienware m16 R1 AMD | |
| Media AMD Ryzen 9 7845HX (n=1) | |
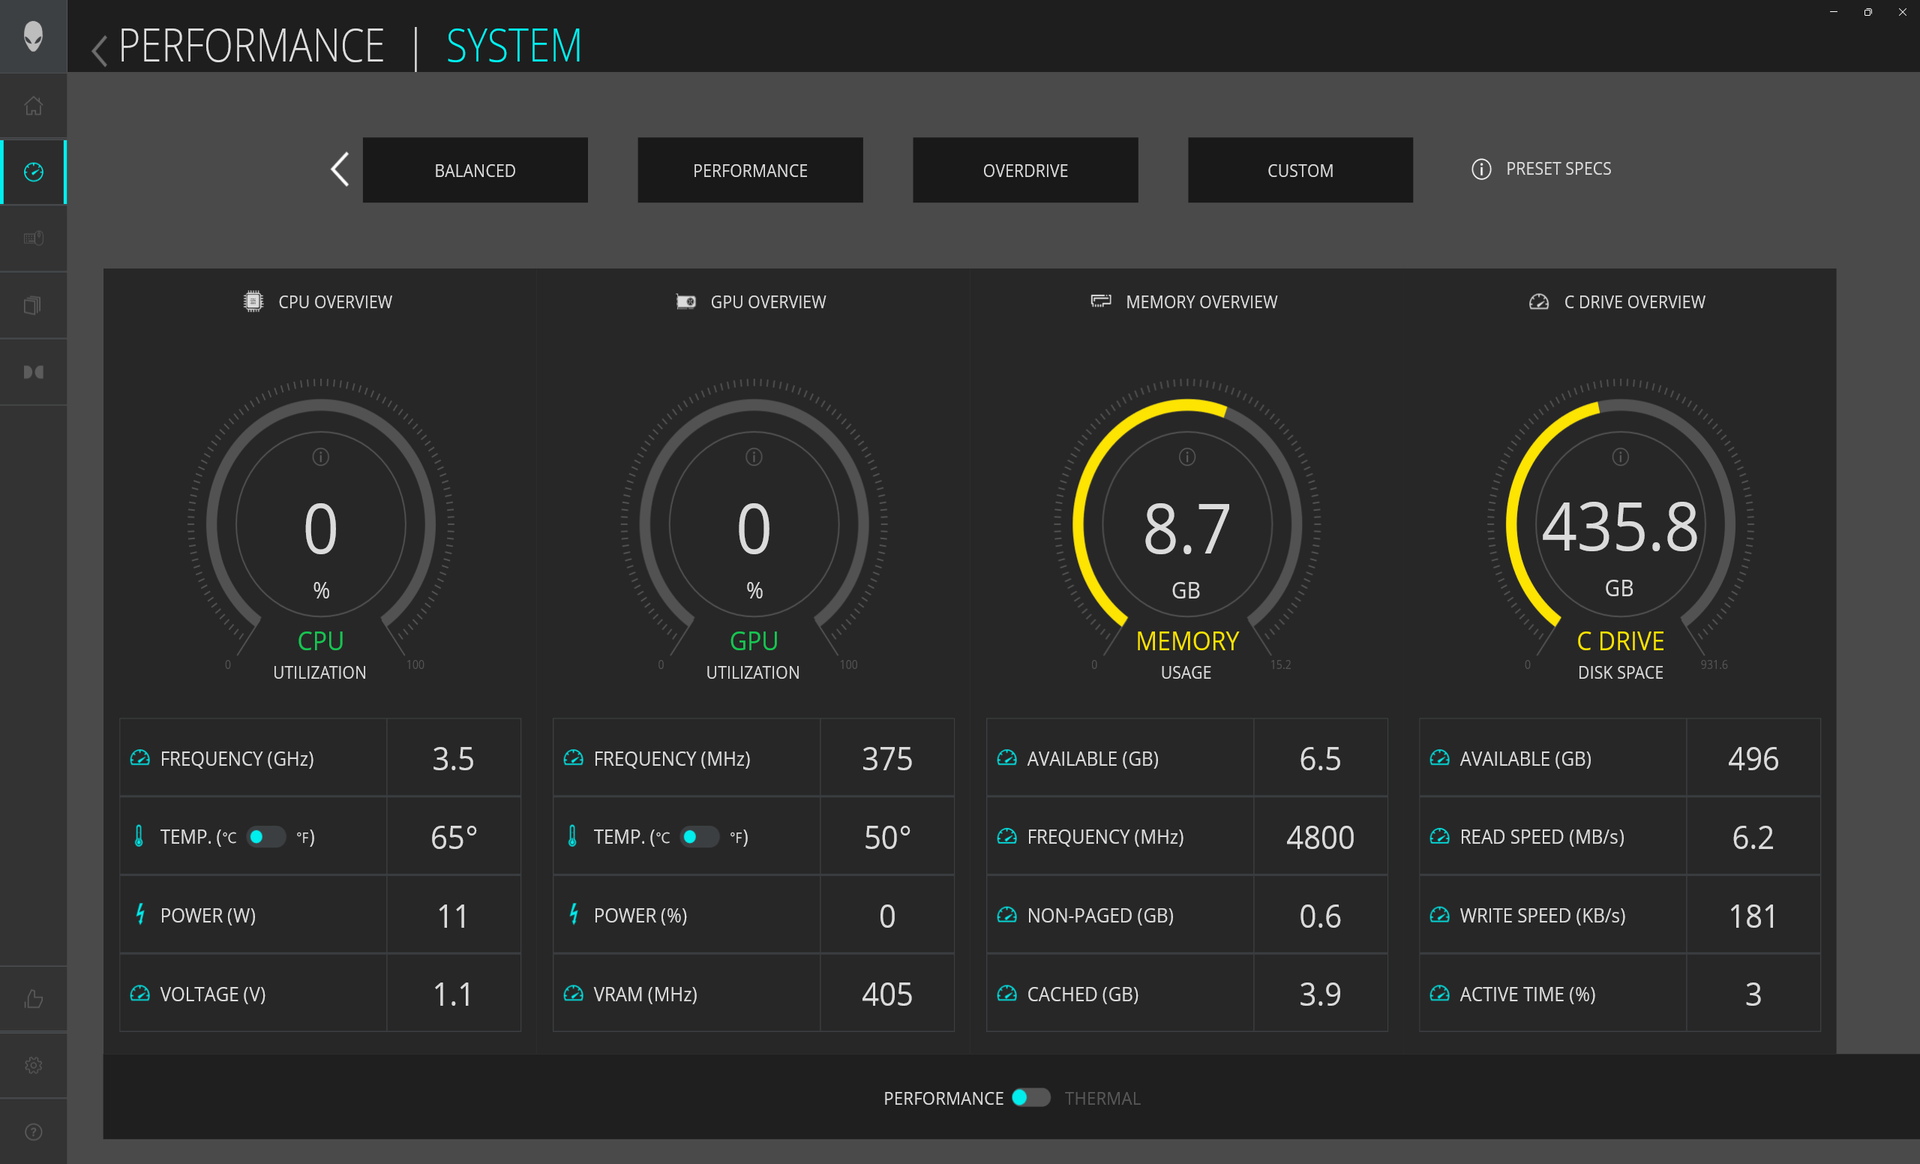
Prestazioni del sistema
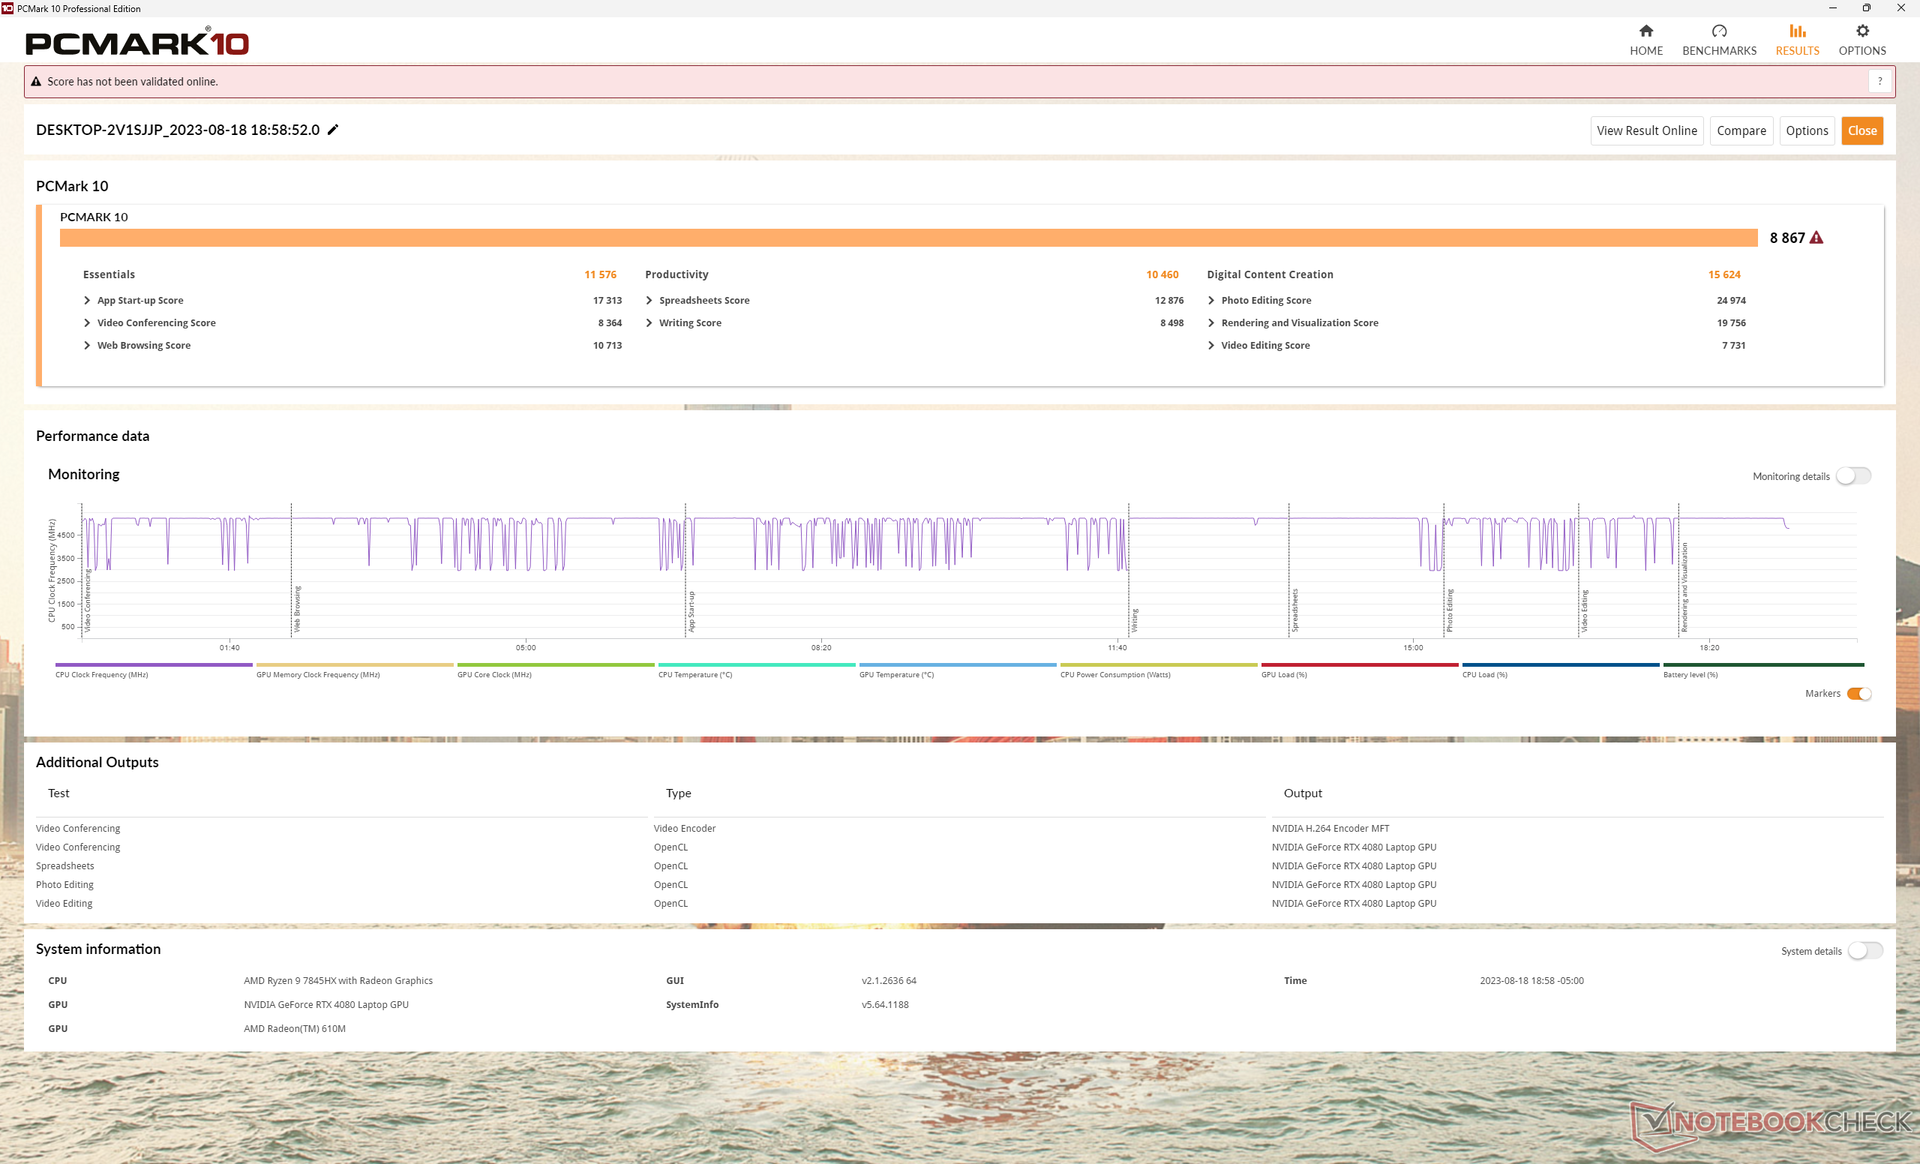
I punteggi di PCMark sono tra i più alti di qualsiasi portatile da gioco. Il margine più ampio è nel sottotest Produttività, che si concentra sulle prestazioni della CPU.
Purtroppo, abbiamo riscontrato diversi problemi di risveglio dal sonno sulla nostra unità di test. Il sistema a volte si riavviava senza motivo quando si apriva il coperchio o mostrava la schermata blu della morte anche dopo aver aggiornato i driver più recenti di Dell e Nvidia al momento della recensione.
CrossMark: Overall | Productivity | Creativity | Responsiveness
| PCMark 10 / Score | |
| Alienware m16 R1 AMD | |
| Media AMD Ryzen 9 7845HX, NVIDIA GeForce RTX 4080 Laptop GPU (n=1) | |
| Alienware x16 R1 | |
| Lenovo Legion Pro 7 RTX4090 | |
| HP Omen Transcend 16 | |
| Razer Blade 16 Early 2023 | |
| Asus ROG Strix G16 G614JZ | |
| PCMark 10 / Essentials | |
| Asus ROG Strix G16 G614JZ | |
| Alienware m16 R1 AMD | |
| Media AMD Ryzen 9 7845HX, NVIDIA GeForce RTX 4080 Laptop GPU (n=1) | |
| HP Omen Transcend 16 | |
| Alienware x16 R1 | |
| Lenovo Legion Pro 7 RTX4090 | |
| Razer Blade 16 Early 2023 | |
| PCMark 10 / Productivity | |
| Alienware m16 R1 AMD | |
| Media AMD Ryzen 9 7845HX, NVIDIA GeForce RTX 4080 Laptop GPU (n=1) | |
| Alienware x16 R1 | |
| HP Omen Transcend 16 | |
| Lenovo Legion Pro 7 RTX4090 | |
| Razer Blade 16 Early 2023 | |
| Asus ROG Strix G16 G614JZ | |
| PCMark 10 / Digital Content Creation | |
| Alienware m16 R1 AMD | |
| Media AMD Ryzen 9 7845HX, NVIDIA GeForce RTX 4080 Laptop GPU (n=1) | |
| Lenovo Legion Pro 7 RTX4090 | |
| Razer Blade 16 Early 2023 | |
| Alienware x16 R1 | |
| HP Omen Transcend 16 | |
| Asus ROG Strix G16 G614JZ | |
| CrossMark / Overall | |
| Asus ROG Strix G16 G614JZ | |
| Alienware m16 R1 AMD | |
| Media AMD Ryzen 9 7845HX, NVIDIA GeForce RTX 4080 Laptop GPU (n=1) | |
| HP Omen Transcend 16 | |
| Alienware x16 R1 | |
| Razer Blade 16 Early 2023 | |
| CrossMark / Productivity | |
| Asus ROG Strix G16 G614JZ | |
| Alienware m16 R1 AMD | |
| Media AMD Ryzen 9 7845HX, NVIDIA GeForce RTX 4080 Laptop GPU (n=1) | |
| Alienware x16 R1 | |
| HP Omen Transcend 16 | |
| Razer Blade 16 Early 2023 | |
| CrossMark / Creativity | |
| Asus ROG Strix G16 G614JZ | |
| HP Omen Transcend 16 | |
| Alienware m16 R1 AMD | |
| Media AMD Ryzen 9 7845HX, NVIDIA GeForce RTX 4080 Laptop GPU (n=1) | |
| Alienware x16 R1 | |
| Razer Blade 16 Early 2023 | |
| CrossMark / Responsiveness | |
| Asus ROG Strix G16 G614JZ | |
| Alienware x16 R1 | |
| Alienware m16 R1 AMD | |
| Media AMD Ryzen 9 7845HX, NVIDIA GeForce RTX 4080 Laptop GPU (n=1) | |
| HP Omen Transcend 16 | |
| Razer Blade 16 Early 2023 | |
| PCMark 10 Score | 8867 punti | |
Aiuto | ||
| AIDA64 / Memory Copy | |
| Razer Blade 16 Early 2023 | |
| Razer Blade 16 Early 2023 | |
| Razer Blade 16 Early 2023 | |
| Lenovo Legion Pro 7 RTX4090 | |
| HP Omen Transcend 16 | |
| Alienware x16 R1 | |
| Asus ROG Strix G16 G614JZ | |
| Alienware m16 R1 AMD | |
| Media AMD Ryzen 9 7845HX (n=1) | |
| AIDA64 / Memory Read | |
| Lenovo Legion Pro 7 RTX4090 | |
| Razer Blade 16 Early 2023 | |
| Razer Blade 16 Early 2023 | |
| Razer Blade 16 Early 2023 | |
| HP Omen Transcend 16 | |
| Asus ROG Strix G16 G614JZ | |
| Alienware x16 R1 | |
| Alienware m16 R1 AMD | |
| Media AMD Ryzen 9 7845HX (n=1) | |
| AIDA64 / Memory Write | |
| Alienware x16 R1 | |
| Razer Blade 16 Early 2023 | |
| Razer Blade 16 Early 2023 | |
| Razer Blade 16 Early 2023 | |
| Lenovo Legion Pro 7 RTX4090 | |
| HP Omen Transcend 16 | |
| Asus ROG Strix G16 G614JZ | |
| Alienware m16 R1 AMD | |
| Media AMD Ryzen 9 7845HX (n=1) | |
| AIDA64 / Memory Latency | |
| Alienware x16 R1 | |
| Razer Blade 16 Early 2023 | |
| Razer Blade 16 Early 2023 | |
| Razer Blade 16 Early 2023 | |
| Alienware m16 R1 AMD | |
| Media AMD Ryzen 9 7845HX (n=1) | |
| HP Omen Transcend 16 | |
| Asus ROG Strix G16 G614JZ | |
| Lenovo Legion Pro 7 RTX4090 | |
* ... Meglio usare valori piccoli
Latenza DPC
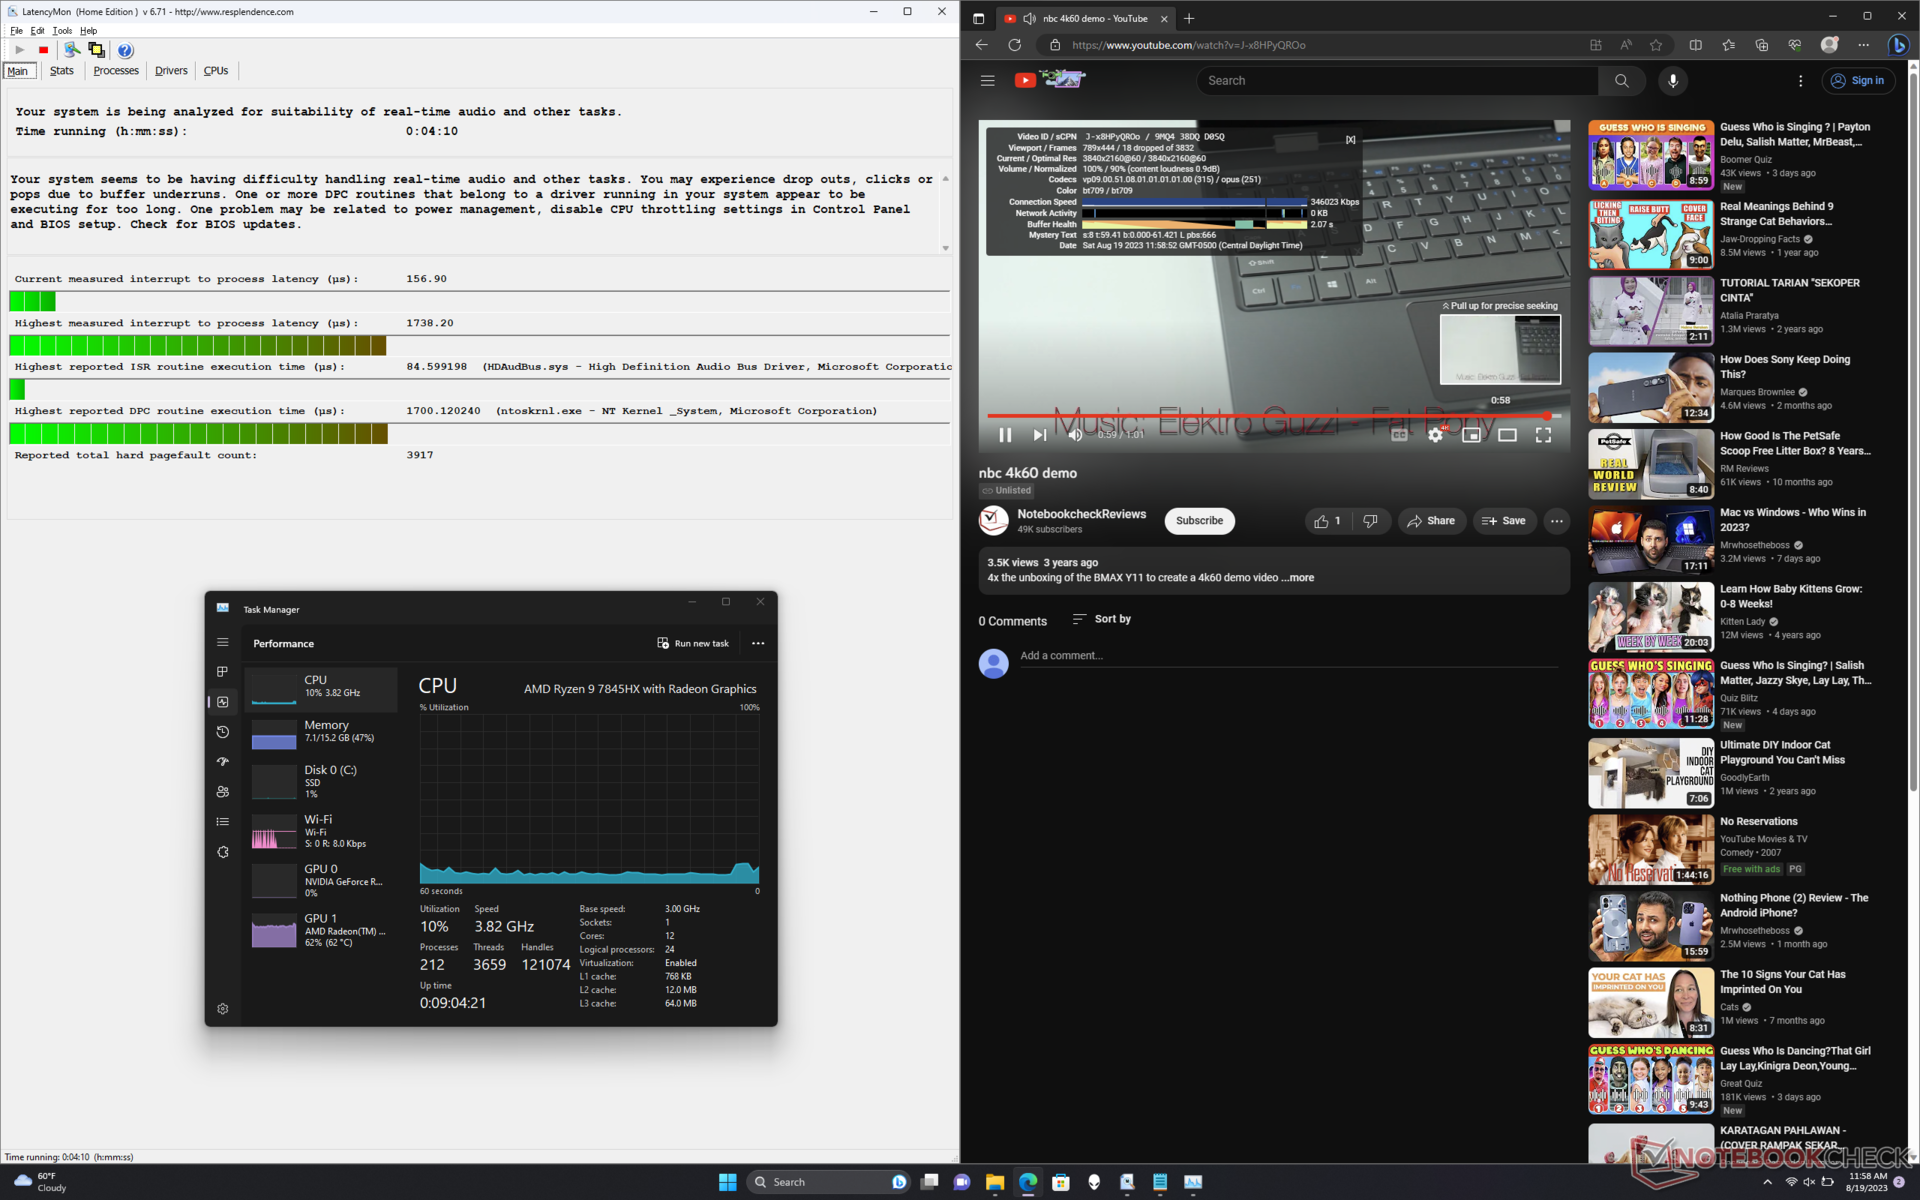
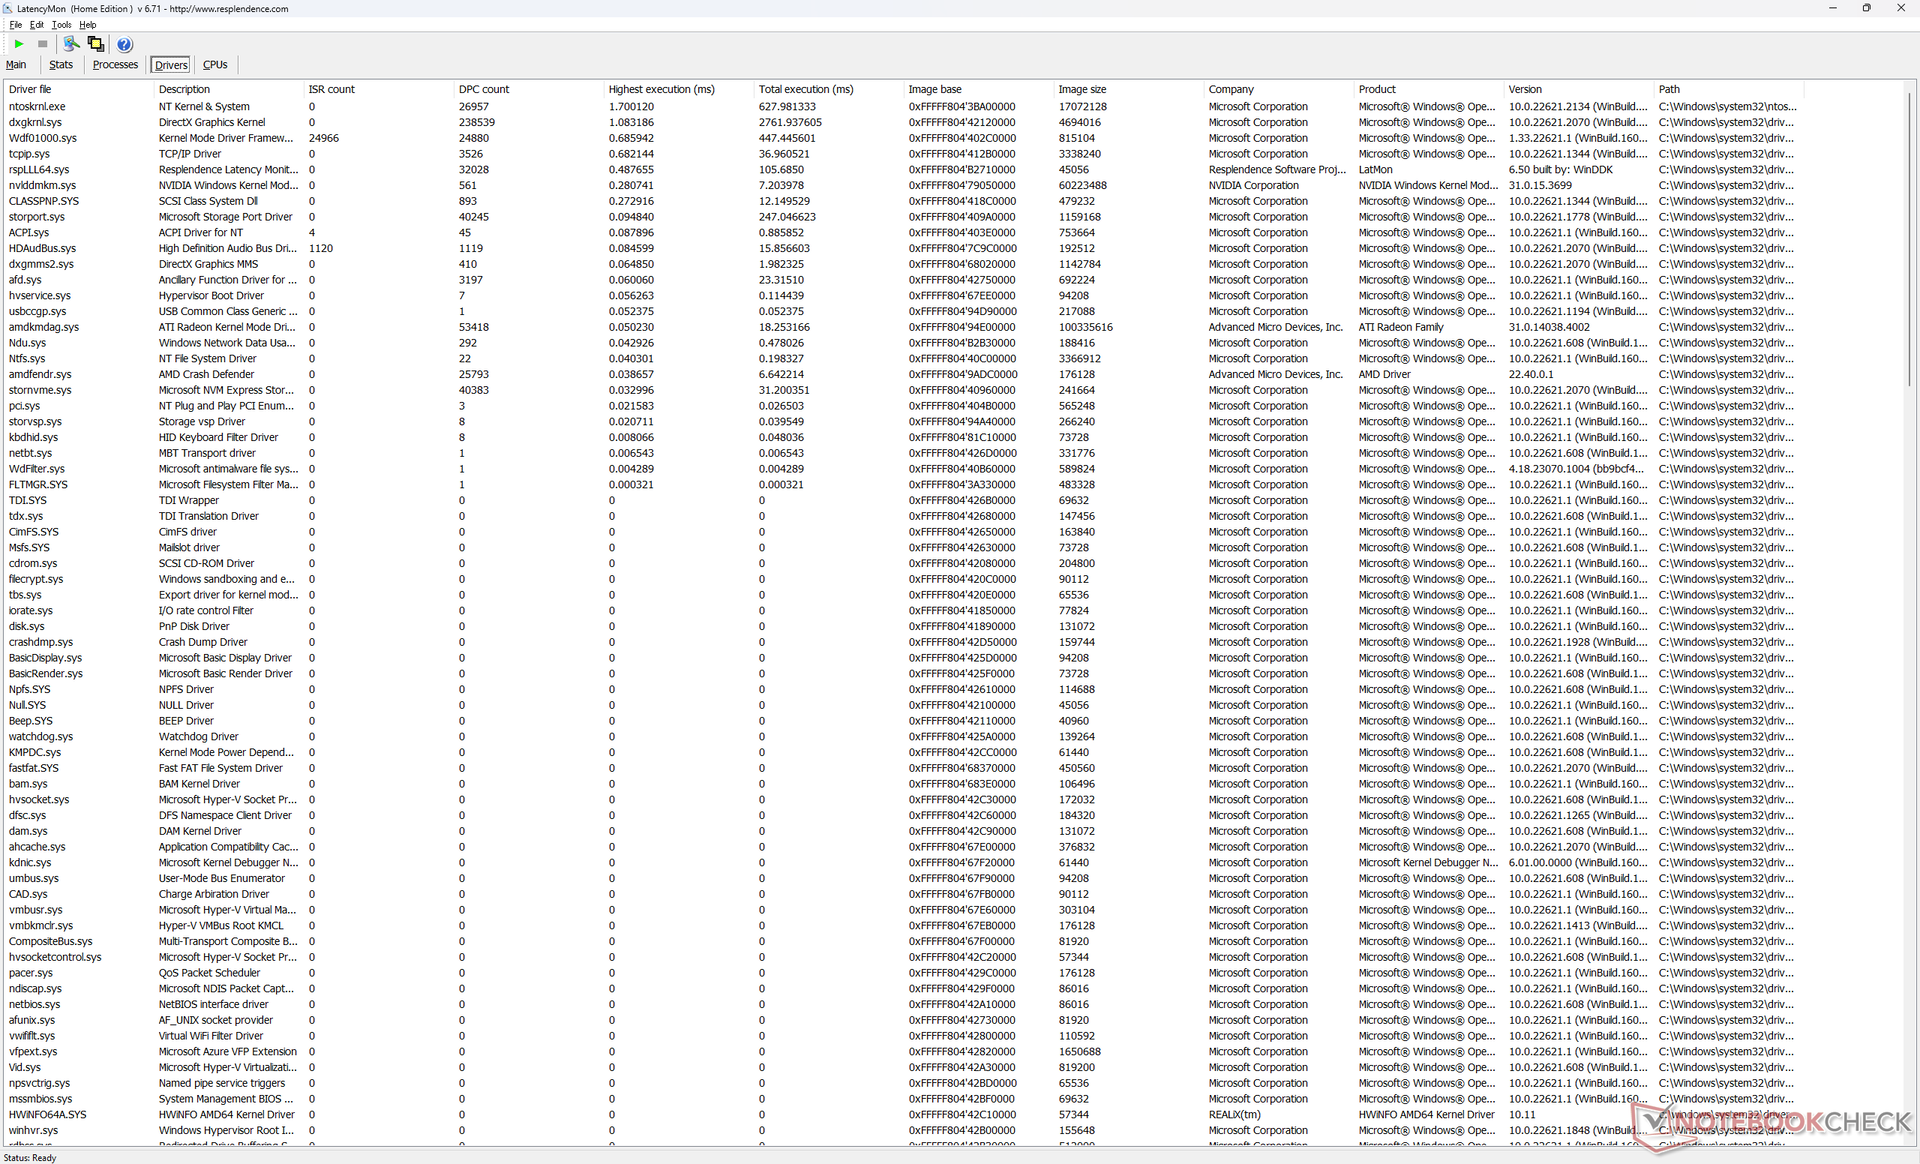
LatencyMon rivela lievi problemi di DPC legati a ntoskrnl.exe. Inoltre, la riproduzione di video 4K a 60 FPS è imperfetta, con 18 fotogrammi caduti registrati durante un test video di un minuto che suggeriscono un potenziale bug nell'accelerazione hardware AMD. I risultati non sono migliorati nemmeno dopo aver ripetuto il test.
| DPC Latencies / LatencyMon - interrupt to process latency (max), Web, Youtube, Prime95 | |
| Lenovo Legion Pro 7 RTX4090 | |
| Asus ROG Strix G16 G614JZ | |
| Razer Blade 16 Early 2023 | |
| Alienware m16 R1 AMD | |
| HP Omen Transcend 16 | |
| Alienware x16 R1 | |
* ... Meglio usare valori piccoli
Dispositivi di archiviazione
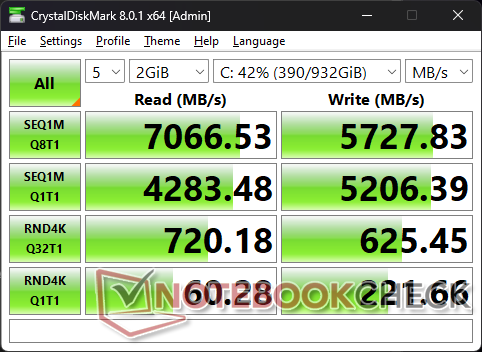
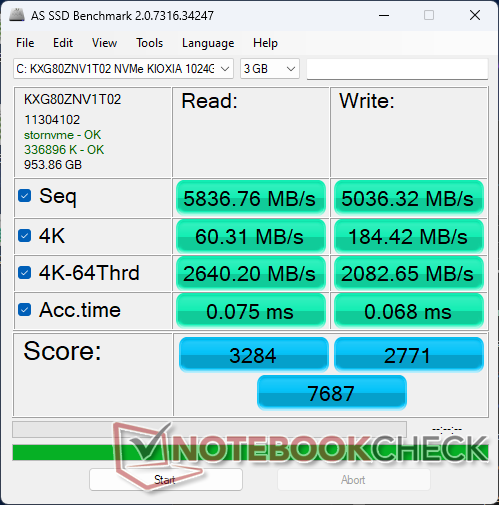
La nostra unità viene fornita con un disco di fascia alta da 1 TB Kioxia KXG80ZNV1T02 che, secondo il produttore, offre velocità di lettura e scrittura sequenziali fino a 7000 MB/s e 5600 MB/s rispettivamente. L'unità è in grado di sostenere velocità di trasferimento massime di oltre 6500 MB/s per periodi prolungati senza problemi di throttling.
È possibile installare fino a tre unità SSD M.2, mentre i modelli Alienware x16 e HP Omen 16 possono supportarne solo fino a due. La terza unità, tuttavia, deve avere una lunghezza di 30 mm.

| Drive Performance rating - Percent | |
| Alienware x16 R1 | |
| Lenovo Legion Pro 7 RTX4090 | |
| Alienware m16 R1 AMD | |
| Razer Blade 16 Early 2023 | |
| HP Omen Transcend 16 | |
| Asus ROG Strix G16 G614JZ | |
* ... Meglio usare valori piccoli
Disk Throttling: DiskSpd Read Loop, Queue Depth 8
Prestazioni della GPU - Grafica TGP da 175 W
Le prestazioni grafiche sono più veloci di circa il 5-10% rispetto alla media dei portatili da gioco del nostro database dotati della stessa GPU RTX 4080 stessa GPU RTX 4080 mentre l'Alienware punta a un TGP relativamente alto, pari a 175 W. In effetti, le prestazioni sono solo del 5% circa più lente rispetto all'Asus Zephyrus Duo 16 con RTX 4090.
L'aggiornamento alla SKU RTX 4090 dovrebbe aumentare le prestazioni di appena il 10% rispetto alla nostra RTX 4080, mentre il downgrade alla SKU RTX 4070 dovrebbe ridurre le prestazioni in modo più significativo, fino al 30-40%, in base al tempo trascorso con la SKU HP Omen Transcend 16. Gli appassionati dovrebbero quindi prendere in considerazione almeno le SKU con RTX 4080.
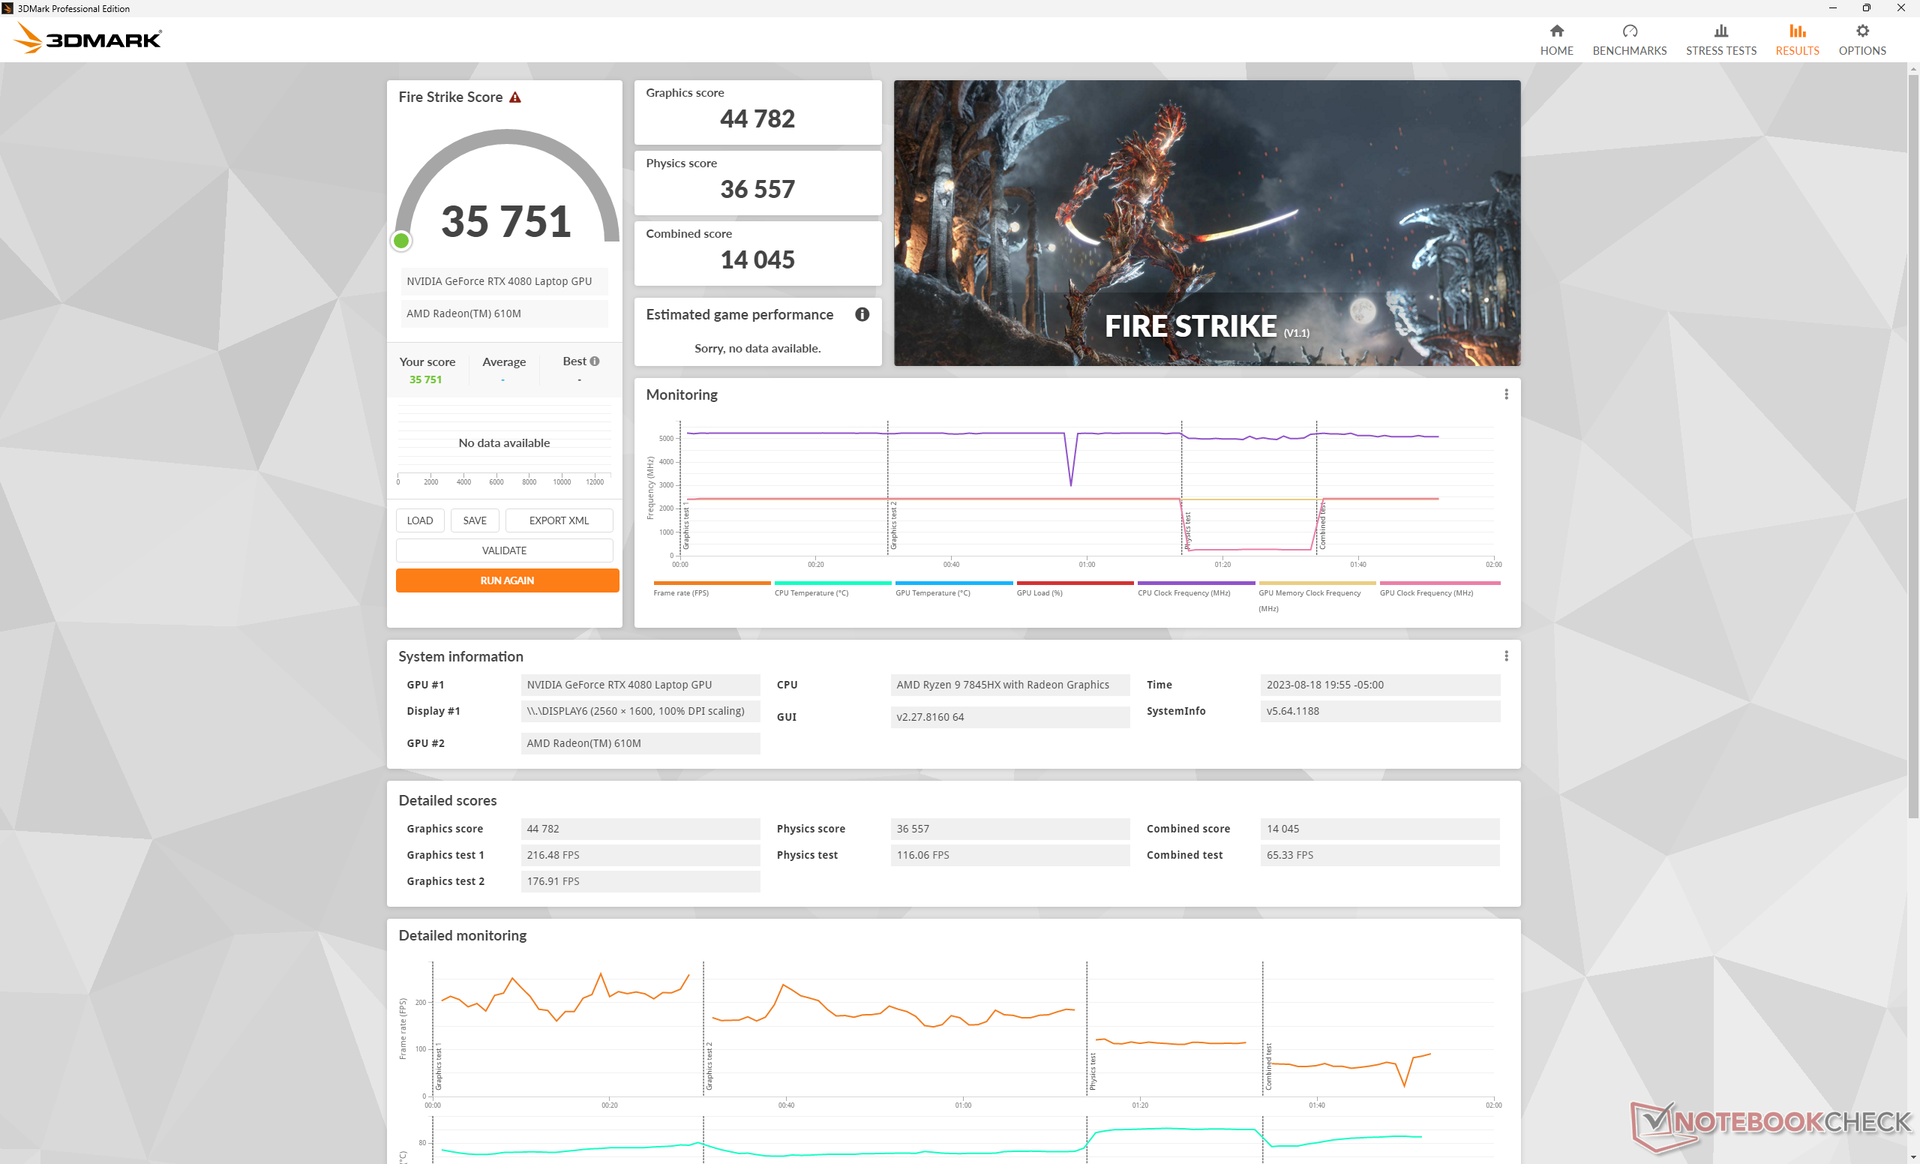
È interessante notare che le differenze di prestazioni tra le modalità Balanced, Performance e Overdrive sono minime, come mostrano i punteggi Fire Strike nella tabella seguente. È importante notare che le modalità differiscono in modo significativo in termini di rumore della ventola.
| Profilo energetico | Punteggio grafico | Punteggio Fisica | Punteggio combinato |
| Potenza della batteria | 22290 (-50%) | 30178 (-17%) | 9109 (-35%) |
| Modalità bilanciata | 43406 (-3%) | 35237 (-4%) | 14721 (+5%) |
| Modalità Performance | 44306 (-1%) | 36106 (-1%) | 13682 (-3%) |
| Modalità Overdrive | 44782 | 36557 | 14045 |

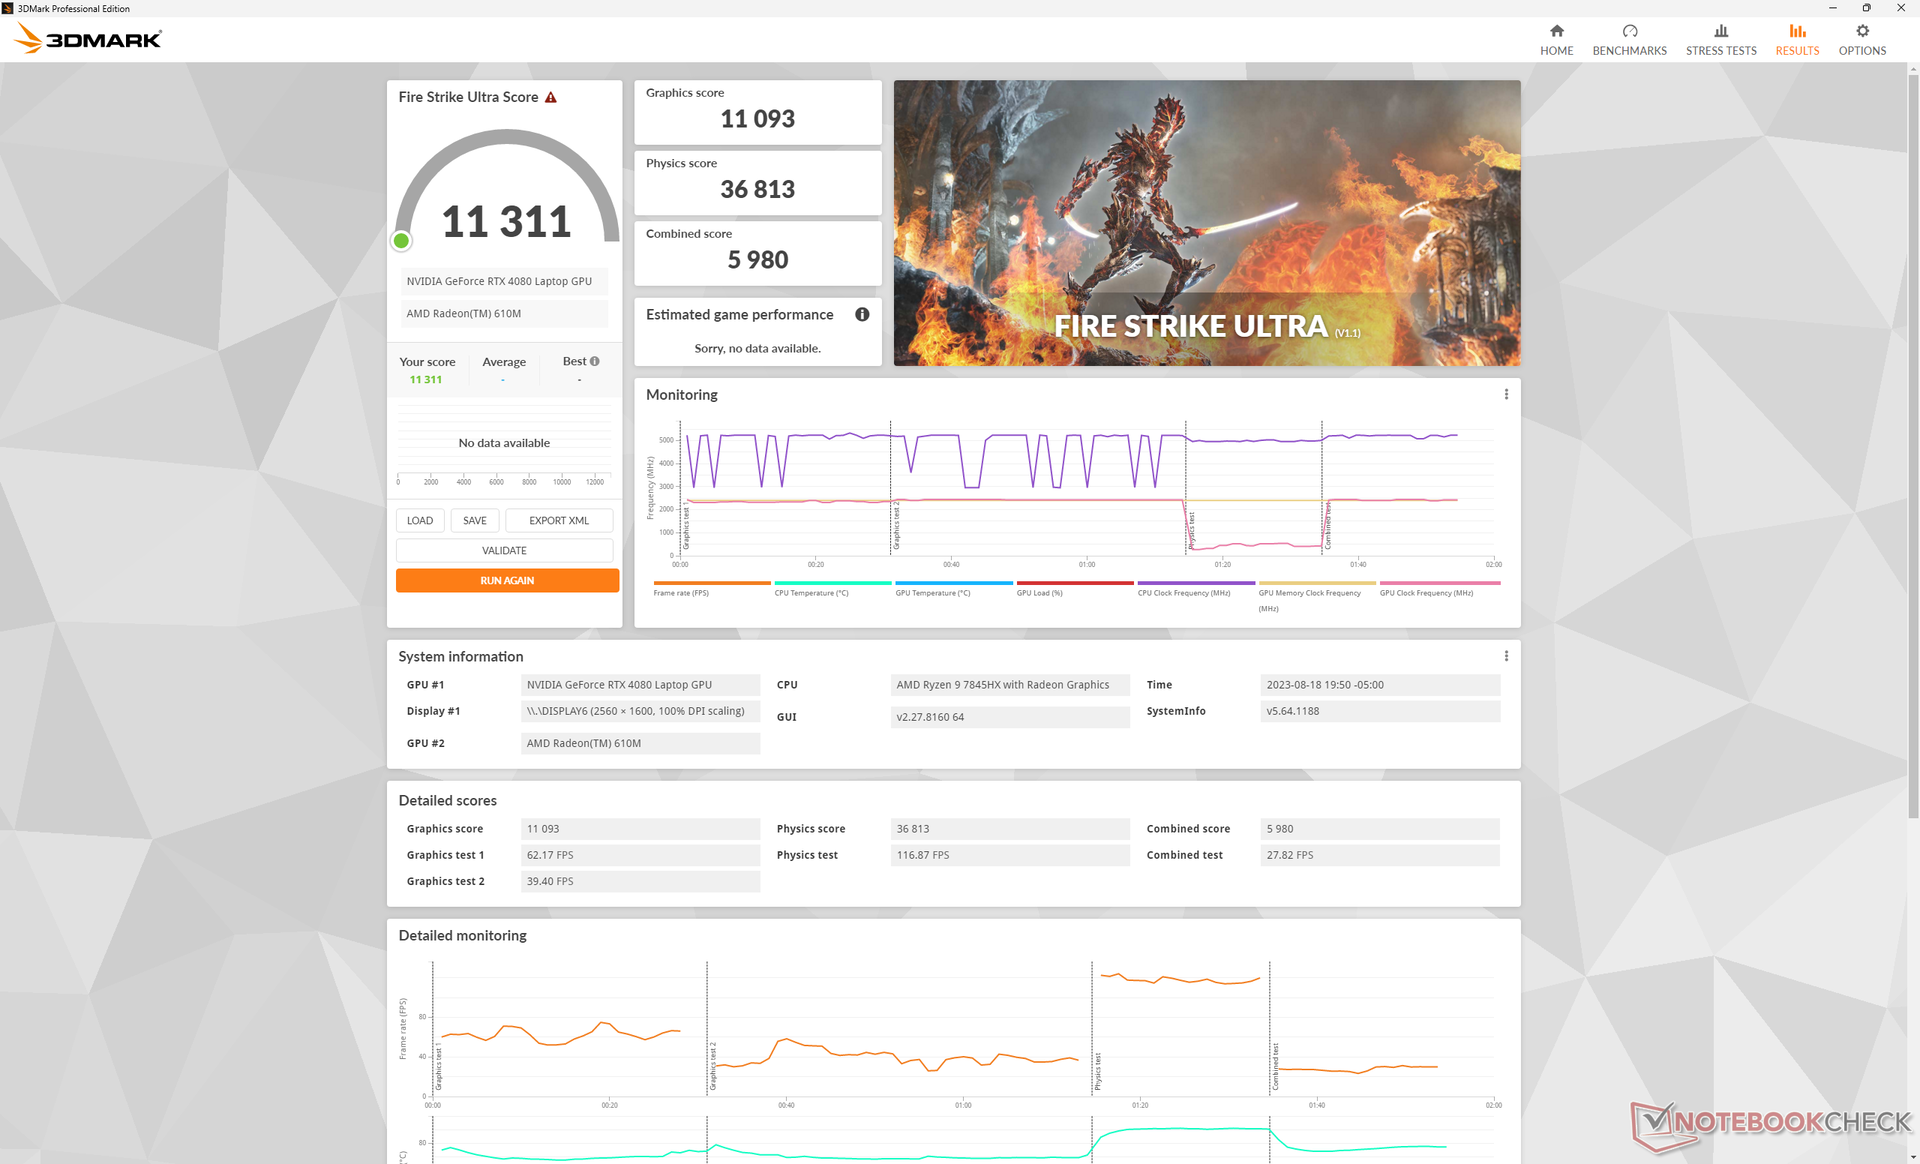
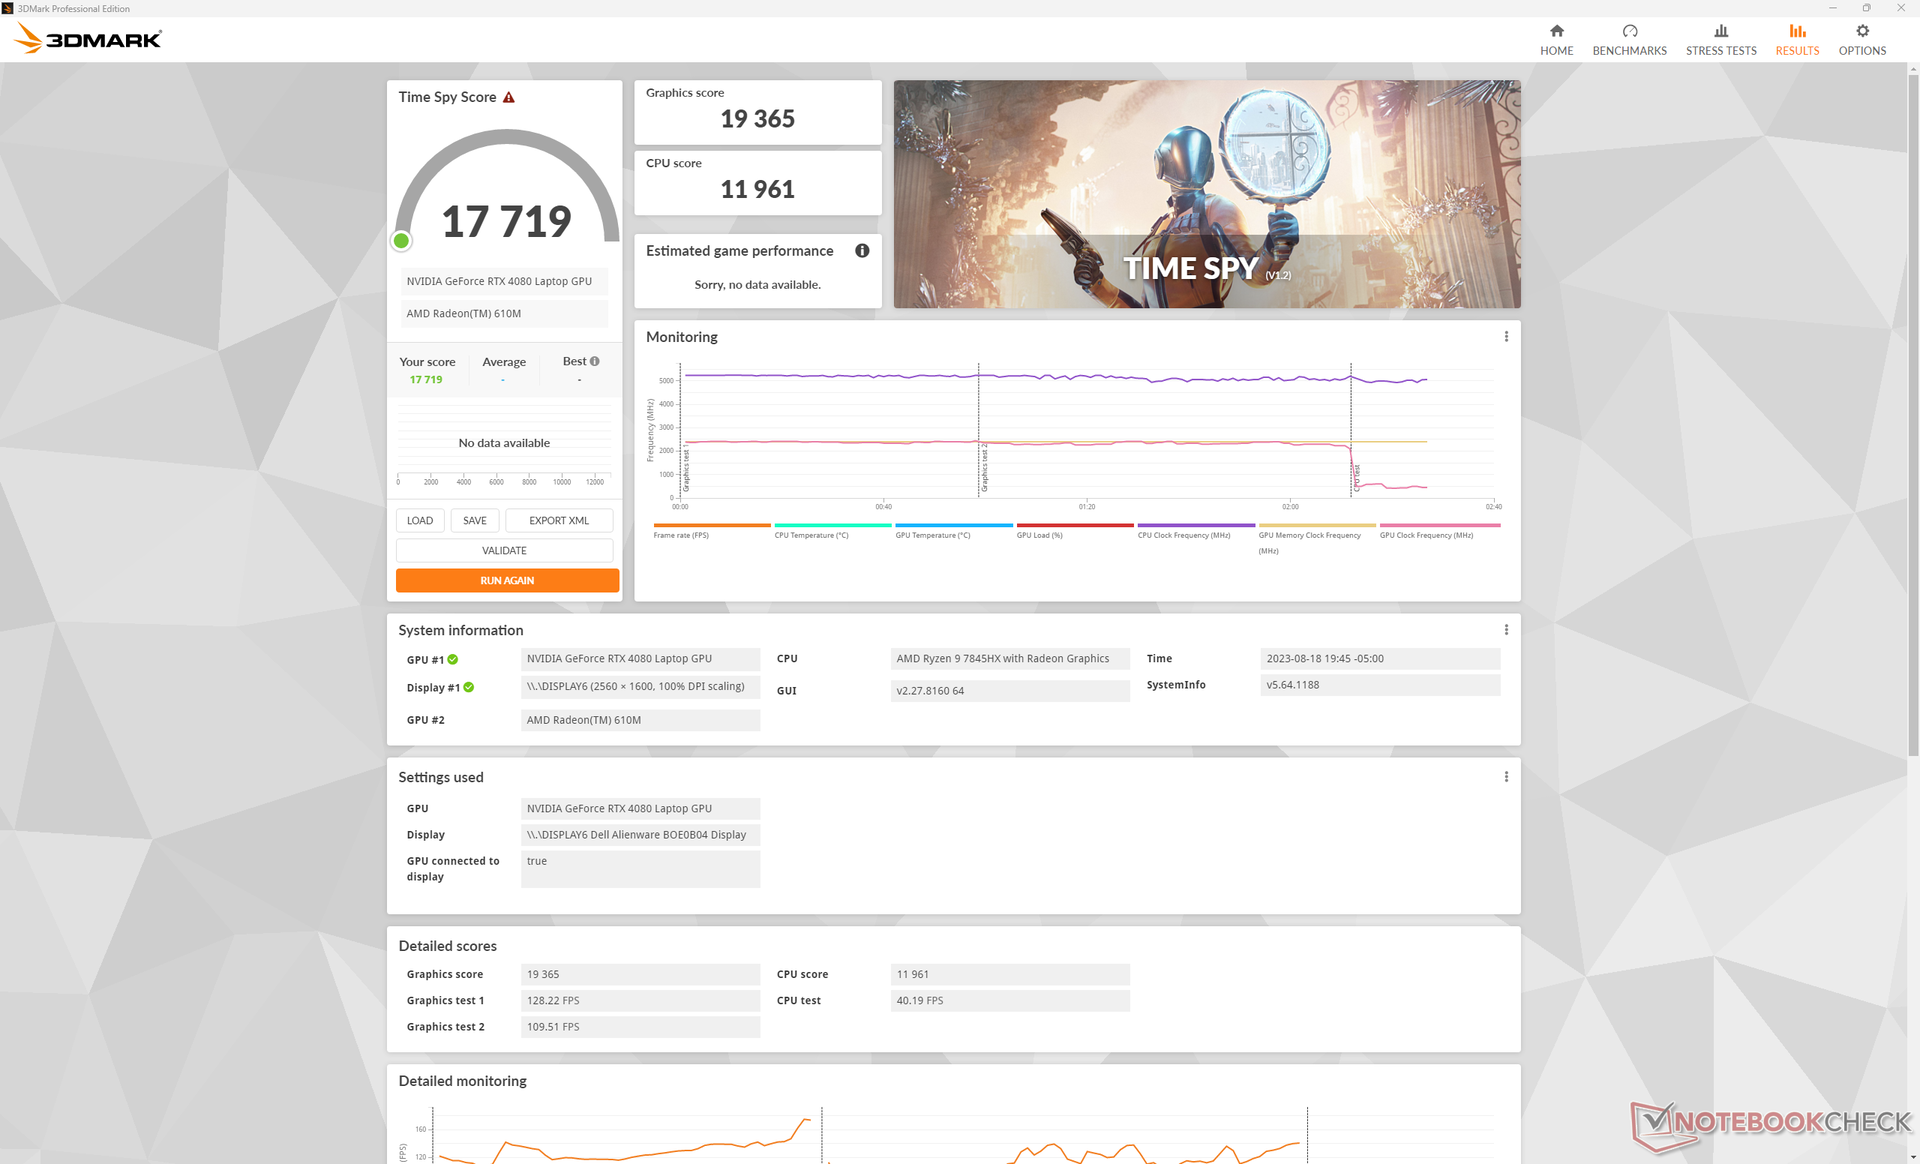
| 3DMark 11 Performance | 40681 punti | |
| 3DMark Fire Strike Score | 35751 punti | |
| 3DMark Time Spy Score | 17719 punti | |
Aiuto | ||
* ... Meglio usare valori piccoli
Prestazioni di gioco
Le prestazioni nei giochi sono eccellenti, con risultati dal 5 al 10% più veloci rispetto ad altri portatili con la stessa GPU RTX 4080, come previsto da 3DMark. I vantaggi si estendono anche alle impostazioni grafiche più basse, il che può aiutare i giocatori che preferiscono massimizzare i frame rate rispetto alla risoluzione. La RTX 4080 mobile è abbastanza potente per giocare a qualsiasi titolo attuale alla risoluzione nativa QHD+ a oltre 60 FPS, anche se è molto più debole di una RTX 4080 desktop rTX 4080 per desktop.
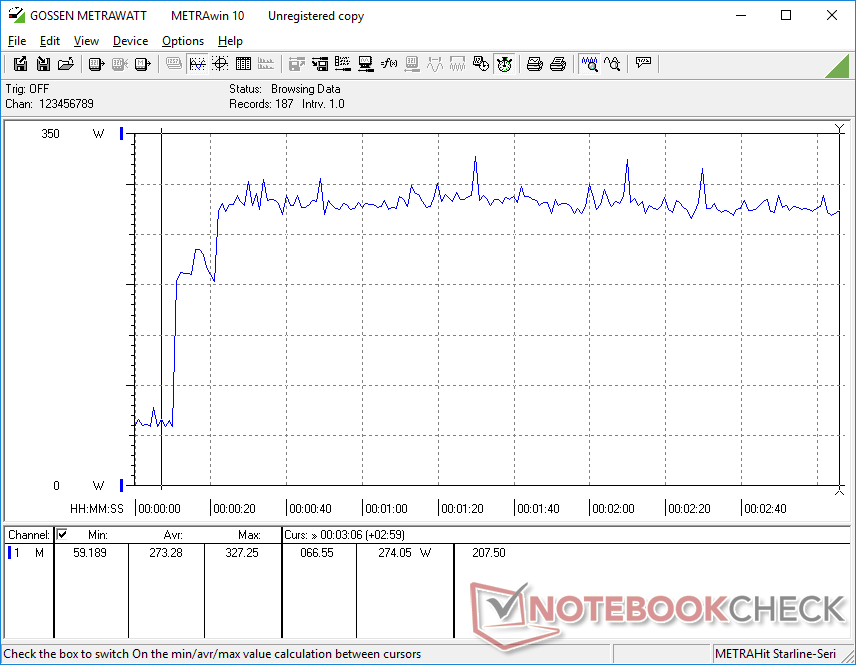
La stabilità delle prestazioni è purtroppo imperfetta. Quando è inattivo su Witcher 3, ad esempio, il frame rate si riduce occasionalmente a 70 FPS prima di risalire a oltre 150 FPS, come mostra il grafico qui sotto. Ciò suggerisce una scarsa ottimizzazione delle risorse in background che potrebbero interrompere l'applicazione in corso.
Witcher 3 FPS Chart
| basso | medio | alto | ultra | QHD | 4K | |
|---|---|---|---|---|---|---|
| The Witcher 3 (2015) | 573.1 | 452.2 | 349.3 | 169.7 | 121.5 | |
| Dota 2 Reborn (2015) | 229 | 191.8 | 180.4 | 164.7 | 161 | |
| Final Fantasy XV Benchmark (2018) | 230 | 218 | 167.6 | 131.6 | 76.1 | |
| X-Plane 11.11 (2018) | 171.1 | 149 | 113.1 | 95 | ||
| Far Cry 5 (2018) | 160 | 145 | 141 | 136 | 131 | 91 |
| Strange Brigade (2018) | 572 | 461 | 400 | 357 | 248 | 123.1 |
| Cyberpunk 2077 1.6 (2022) | 154 | 151.4 | 137.5 | 128.3 | 84.5 | 39.7 |
| Tiny Tina's Wonderlands (2022) | 317.1 | 265.9 | 201.1 | 160.8 | 112.9 | 59 |
| F1 22 (2022) | 323 | 296 | 285 | 124.2 | 78.1 | 39.5 |
| Returnal (2023) | 128 | 122 | 117 | 107 | 80 | 44 |
Emissioni
Rumore di sistema: grandi differenze tra i profili di potenza
Le ventole sono quasi sempre attive a poco meno di 30 dB(A) contro uno sfondo silenzioso di 23 dB(A). Sebbene sia udibile, il rumore è perlomeno costante, in quanto le ventole non aumentano di intensità quando si eseguono carichi non impegnativi come browser o video.
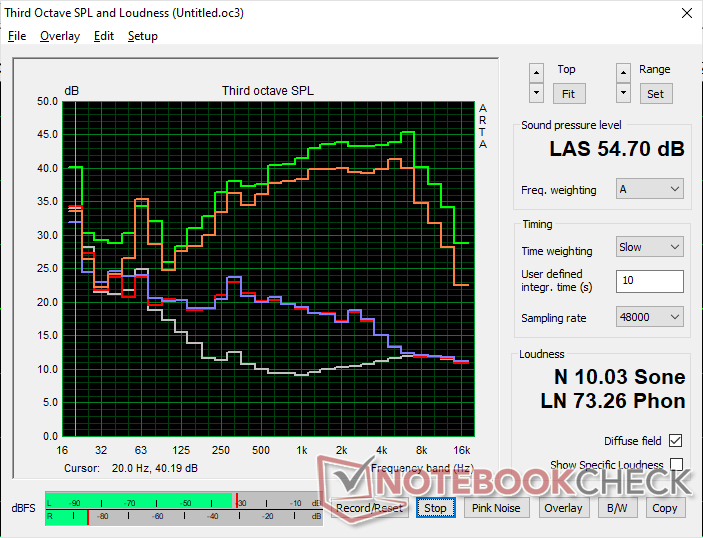
Il rumore della ventola quando si gioca in modalità Balanced, Performance o Overdrive può raggiungere rispettivamente 49,4 dB(A), 51 dB(A) e 54,7 dB(A). Poiché la perdita di prestazioni in modalità Balanced è minima, come già detto, gli utenti potrebbero prendere in considerazione la possibilità di giocare in modalità Balanced invece che in modalità Performance o Overdrive per il rumore della ventola sensibilmente più silenzioso. Altri portatili da gioco da 16 pollici come il Razer Blade 16 o l'Omen Transcend 16 tendono a stabilizzarsi nella fascia più bassa e media dei 50 dB(A) durante l'esecuzione dei giochi.
Rumorosità
| Idle |
| 22.9 / 29.7 / 29.7 dB(A) |
| Sotto carico |
| 29.8 / 54.7 dB(A) |
 | ||
30 dB silenzioso 40 dB(A) udibile 50 dB(A) rumoroso |
||
min: | ||
| Alienware m16 R1 AMD GeForce RTX 4080 Laptop GPU, R9 7845HX, Kioxia XG8 KXG80ZNV1T02 | Alienware x16 R1 GeForce RTX 4080 Laptop GPU, i9-13900HK, SK hynix PC801 HFS001TEJ9X101N | HP Omen Transcend 16 GeForce RTX 4070 Laptop GPU, i9-13900HX, SK hynix PC801 HFS002TEJ9X101N | Lenovo Legion Pro 7 RTX4090 GeForce RTX 4090 Laptop GPU, i9-13900HX, Samsung PM9A1 MZVL21T0HCLR | Asus ROG Strix G16 G614JZ GeForce RTX 4080 Laptop GPU, i9-13980HX, WD PC SN560 SDDPNQE-1T00 | Razer Blade 16 Early 2023 GeForce RTX 4080 Laptop GPU, i9-13950HX, SSSTC CA6-8D1024 | |
|---|---|---|---|---|---|---|
| Noise | 0% | -11% | -17% | -9% | 4% | |
| off /ambiente * (dB) | 22.9 | 22.7 1% | 22.9 -0% | 25 -9% | 25 -9% | 23 -0% |
| Idle Minimum * (dB) | 22.9 | 23.1 -1% | 29.1 -27% | 28 -22% | 26 -14% | 23 -0% |
| Idle Average * (dB) | 29.7 | 25.8 13% | 29.1 2% | 30 -1% | 28 6% | 23 23% |
| Idle Maximum * (dB) | 29.7 | 25.8 13% | 29.1 2% | 38 -28% | 30 -1% | 23.6 21% |
| Load Average * (dB) | 29.8 | 39.3 -32% | 45.7 -53% | 48 -61% | 48 -61% | 39 -31% |
| Witcher 3 ultra * (dB) | 54.7 | 49.9 9% | 54.3 1% | 53 3% | 49 10% | 51.6 6% |
| Load Maximum * (dB) | 54.7 | 54.8 -0% | 54.3 1% | 55 -1% | 52 5% | 51.3 6% |
* ... Meglio usare valori piccoli
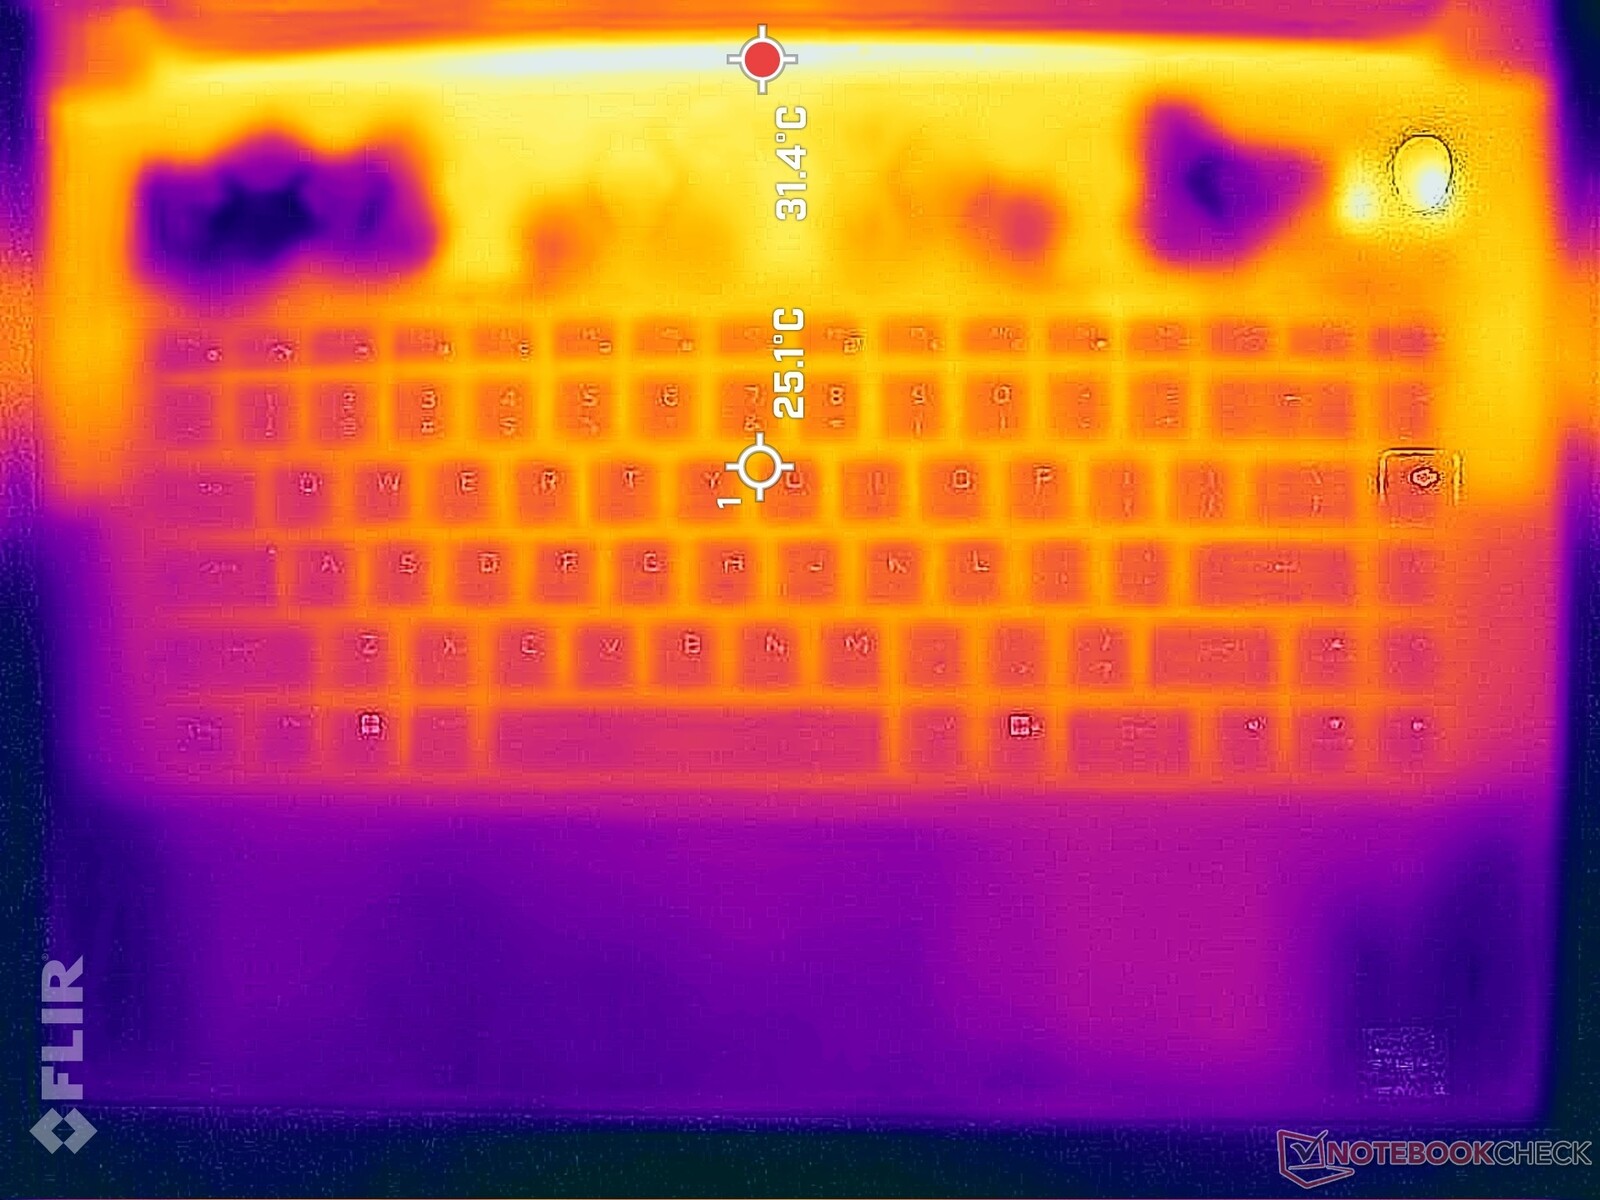
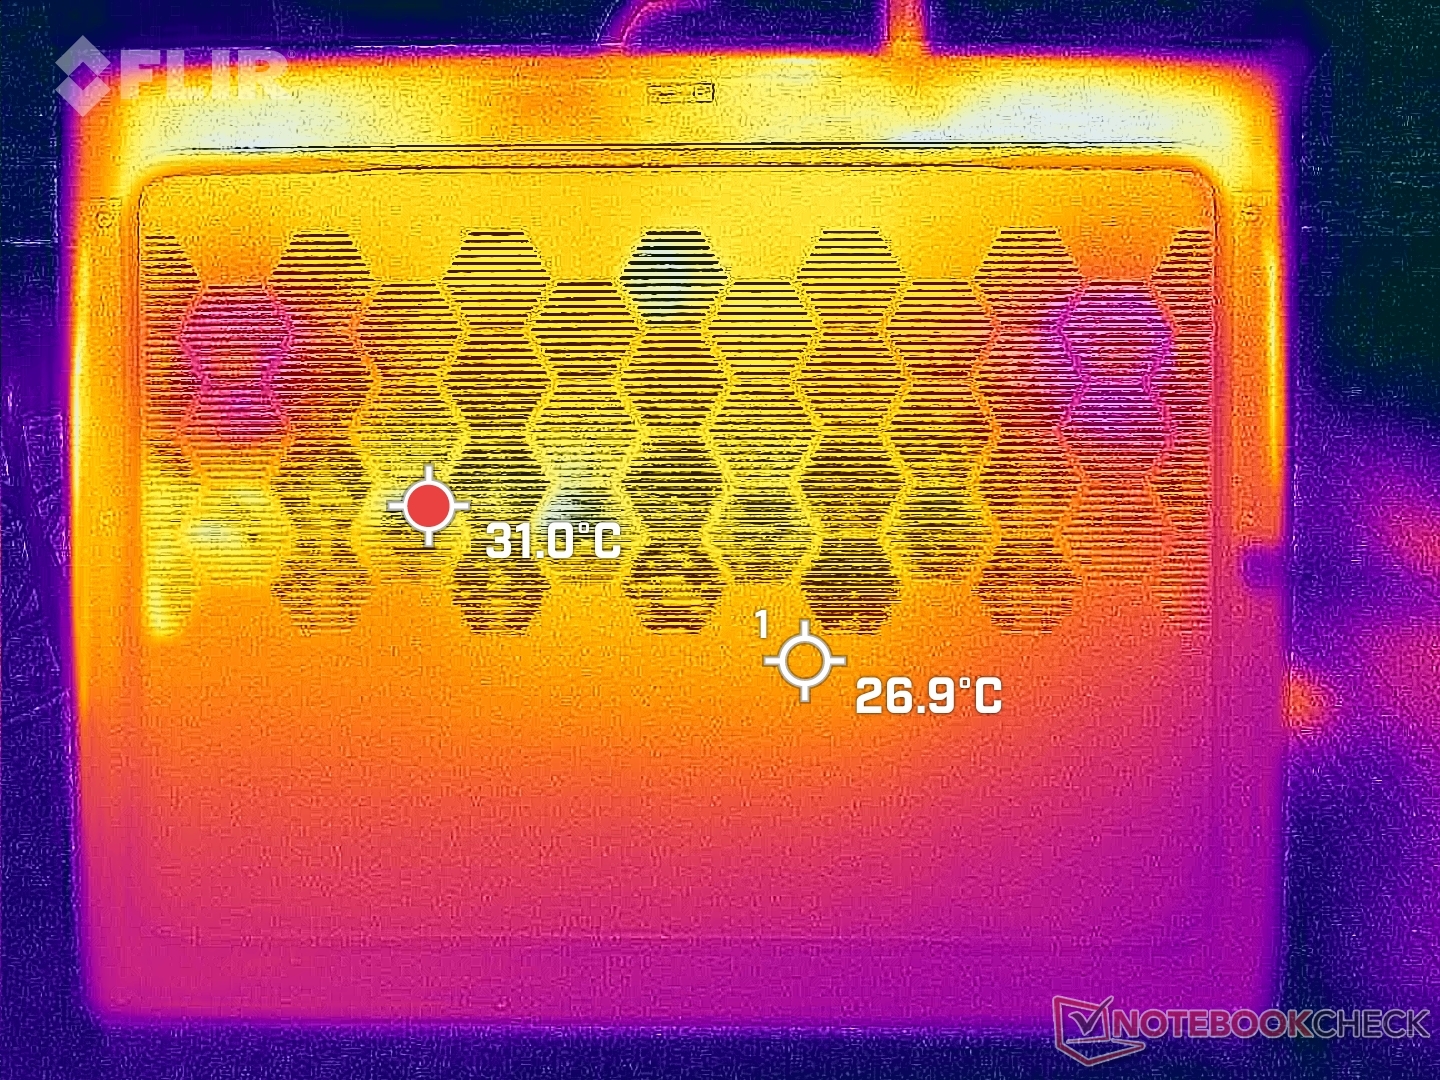
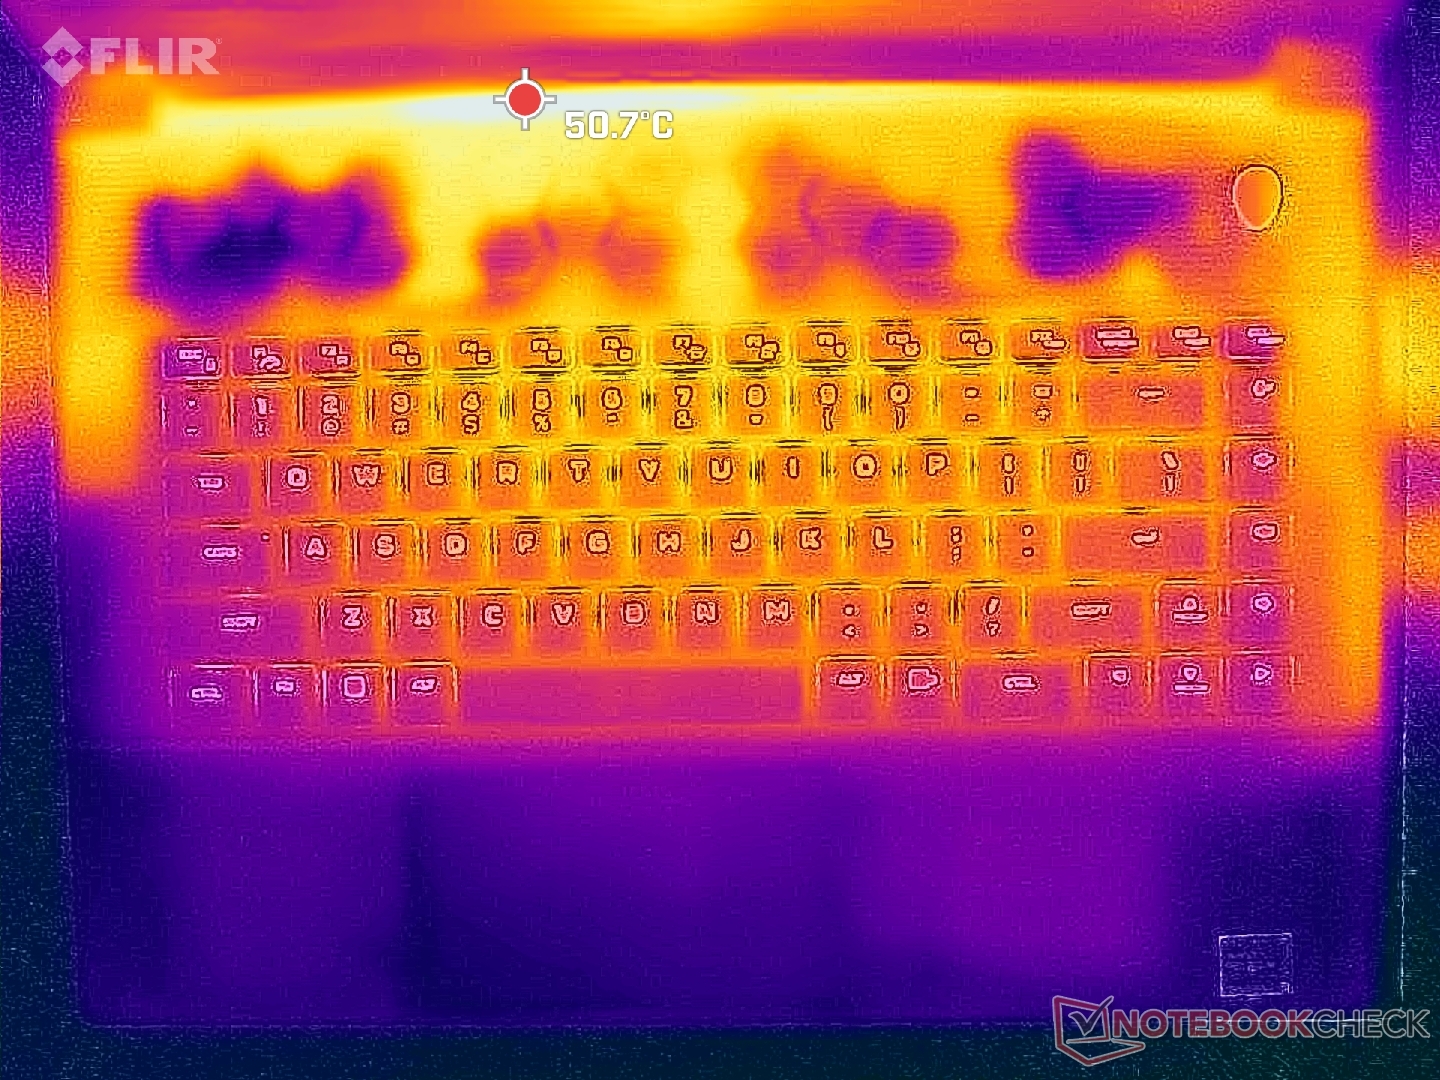
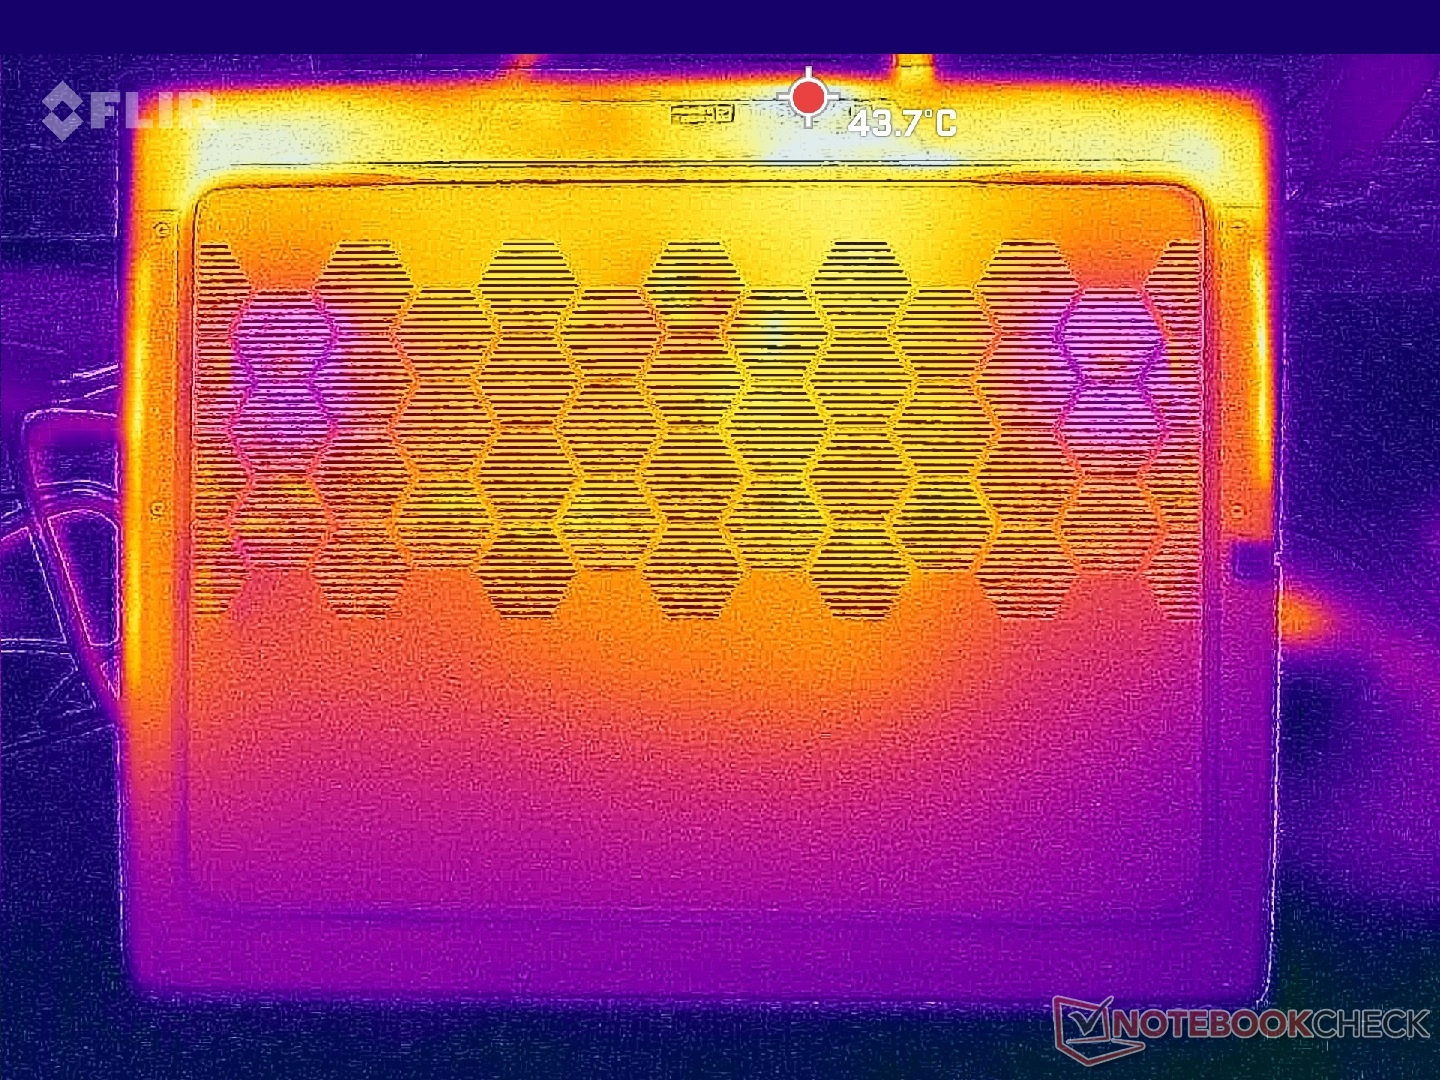
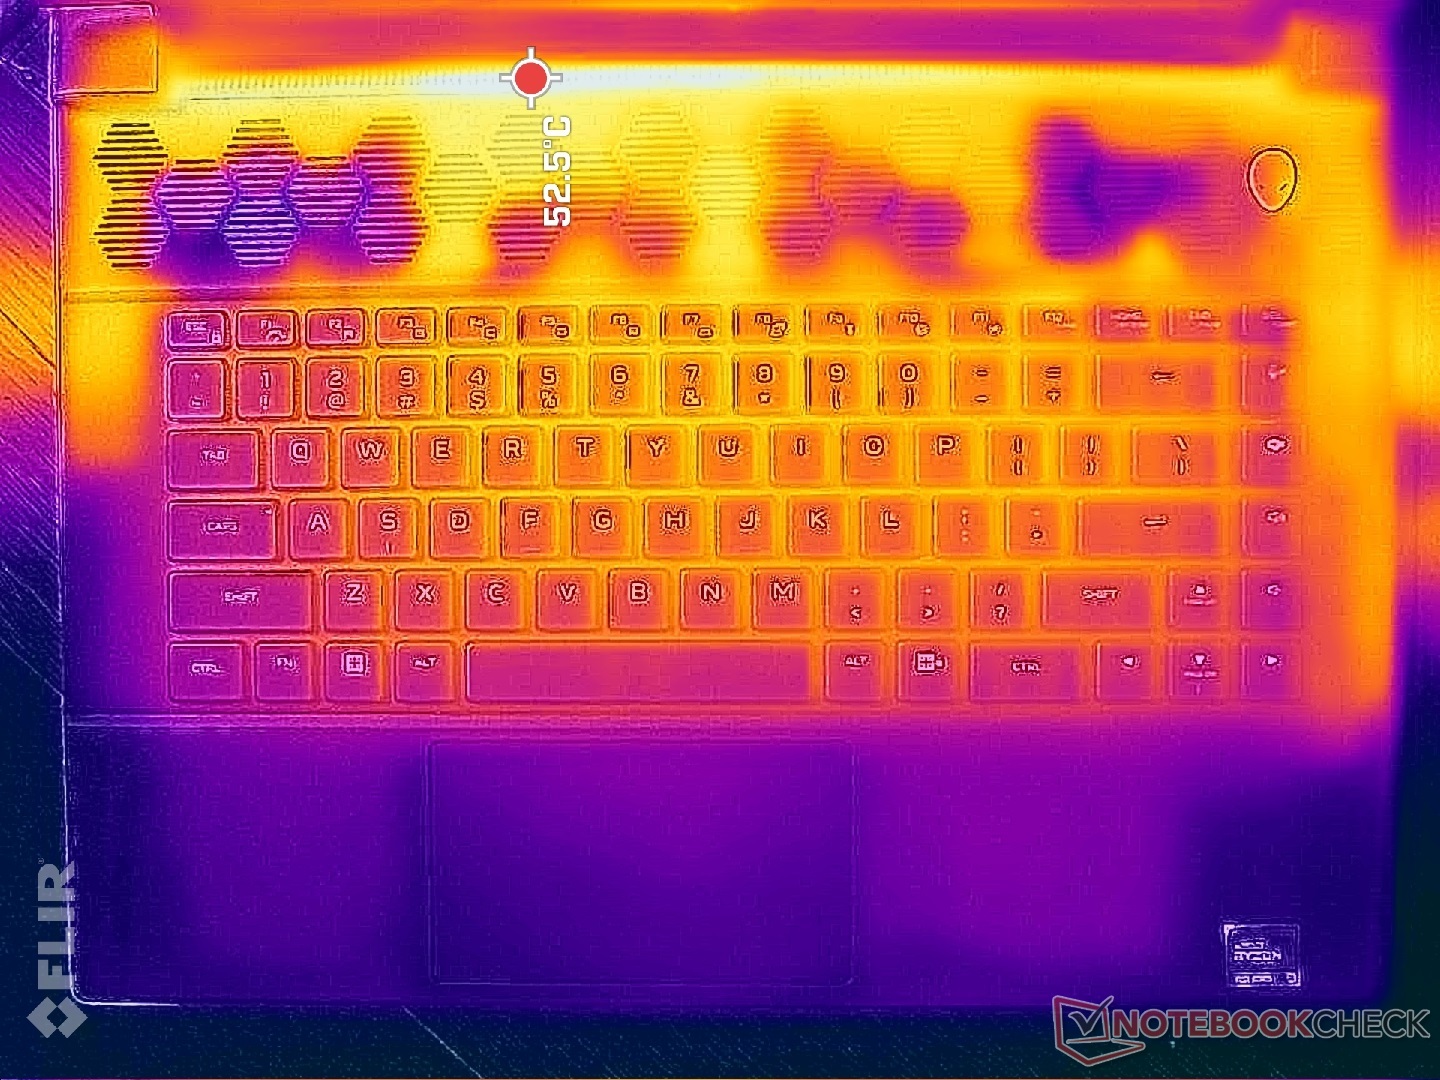
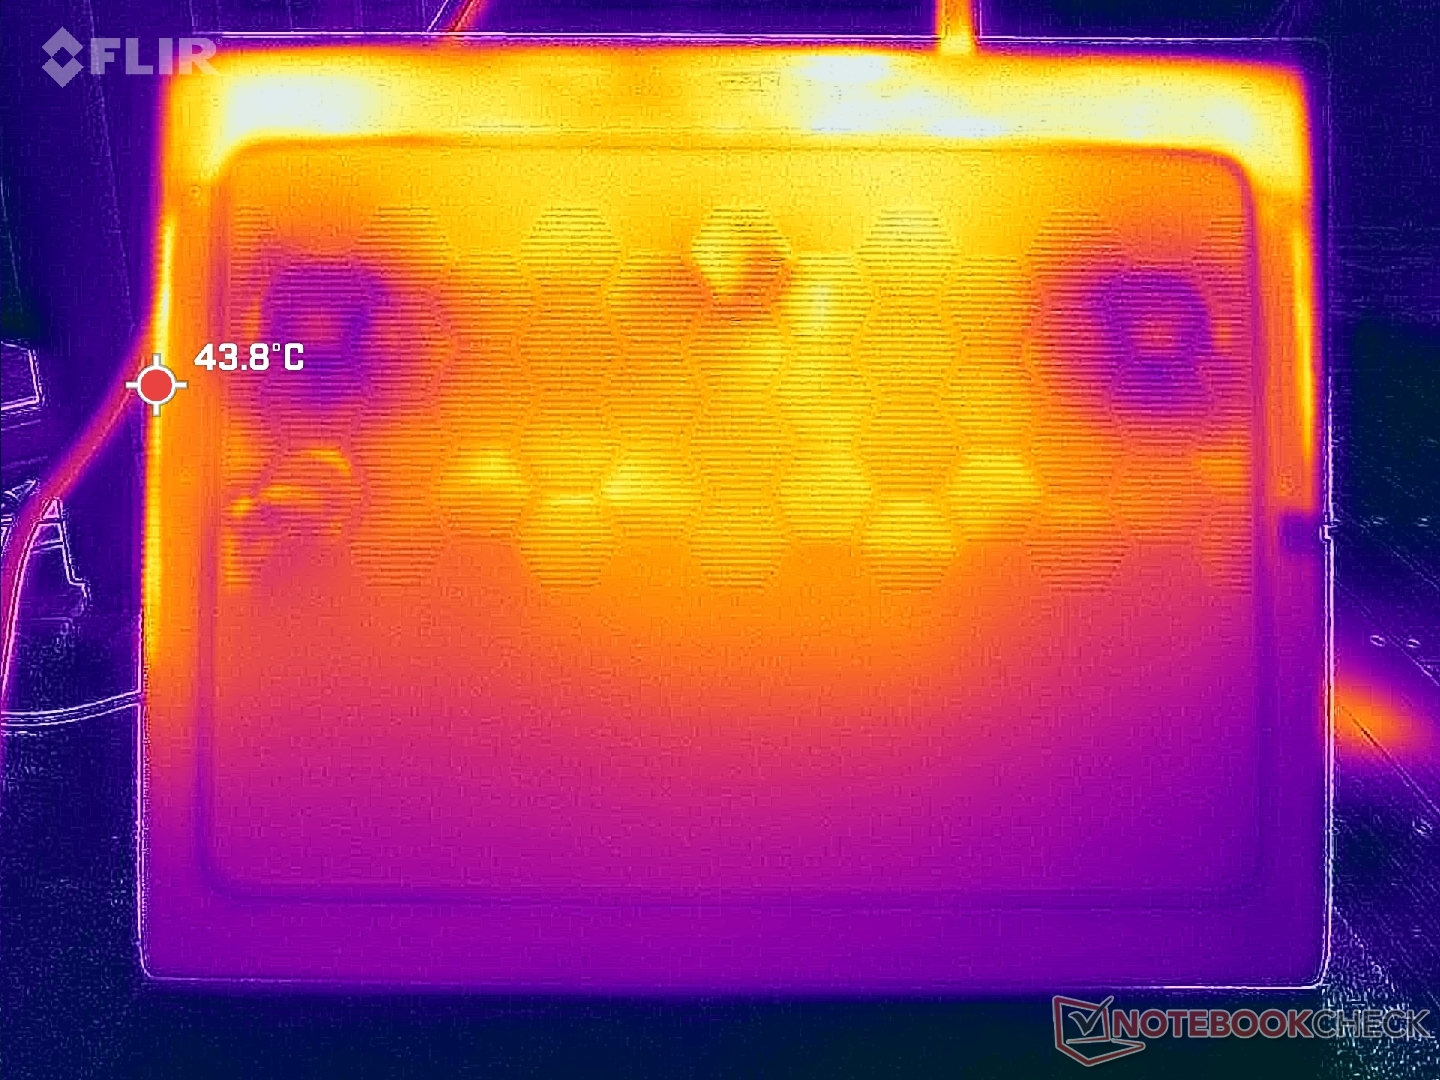
Temperatura
Le temperature della superficie possono essere molto calde, fino a 50 C lungo la parte posteriore. Fortunatamente, le zone dei palmari e della tastiera rimangono più fresche al tatto per un maggiore comfort, grazie anche alle ampie griglie di ventilazione. La parte centrale della tastiera, ad esempio, raggiunge i 42 C quando si gioca, rispetto ai 46 C del Lenovo Legion Pro 7 16.
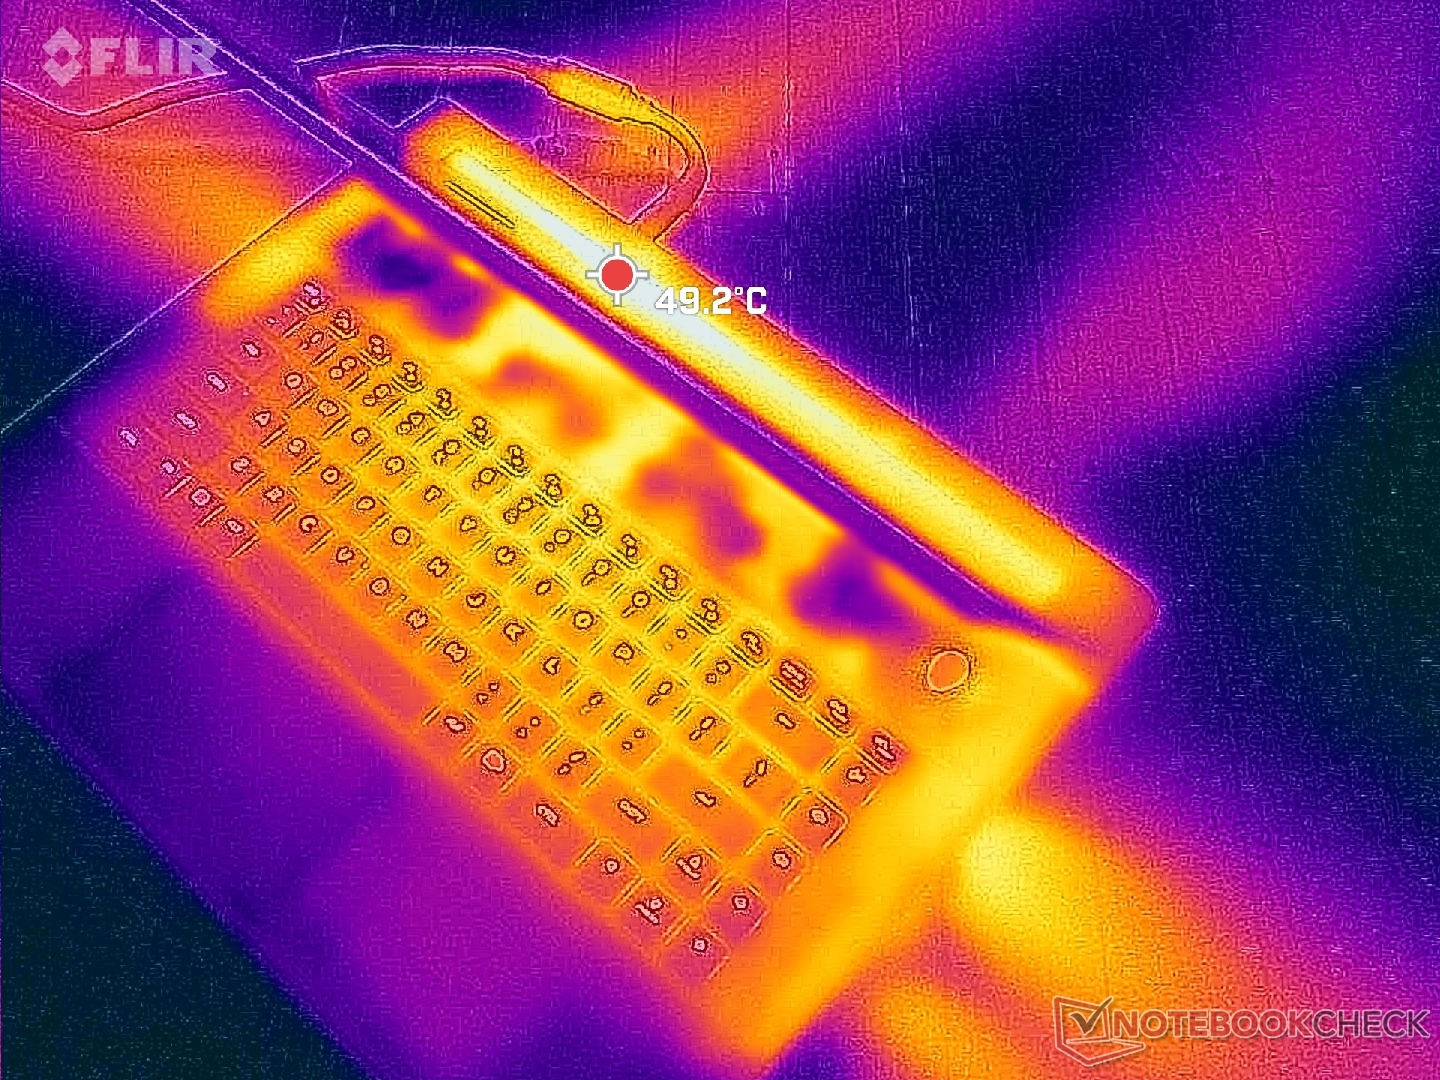
(-) La temperatura massima sul lato superiore è di 48 °C / 118 F, rispetto alla media di 40.4 °C / 105 F, che varia da 21.2 a 68.8 °C per questa classe Gaming.
(+) Il lato inferiore si riscalda fino ad un massimo di 39 °C / 102 F, rispetto alla media di 43.2 °C / 110 F
(±) In idle, la temperatura media del lato superiore è di 32.2 °C / 90 F, rispetto alla media deld ispositivo di 33.9 °C / 93 F.
(-) Riproducendo The Witcher 3, la temperatura media per il lato superiore e' di 38.1 °C / 101 F, rispetto alla media del dispositivo di 33.9 °C / 93 F.
(+) I poggiapolsi e il touchpad sono piu' freddi della temperatura della pelle con un massimo di 30.4 °C / 86.7 F e sono quindi freddi al tatto.
(±) La temperatura media della zona del palmo della mano di dispositivi simili e'stata di 28.8 °C / 83.8 F (-1.6 °C / -2.9 F).
| Alienware m16 R1 AMD AMD Ryzen 9 7845HX, NVIDIA GeForce RTX 4080 Laptop GPU | Alienware x16 R1 Intel Core i9-13900HK, NVIDIA GeForce RTX 4080 Laptop GPU | HP Omen Transcend 16 Intel Core i9-13900HX, NVIDIA GeForce RTX 4070 Laptop GPU | Lenovo Legion Pro 7 RTX4090 Intel Core i9-13900HX, NVIDIA GeForce RTX 4090 Laptop GPU | Asus ROG Strix G16 G614JZ Intel Core i9-13980HX, NVIDIA GeForce RTX 4080 Laptop GPU | Razer Blade 16 Early 2023 Intel Core i9-13950HX, NVIDIA GeForce RTX 4080 Laptop GPU | |
|---|---|---|---|---|---|---|
| Heat | -5% | 1% | -10% | -6% | 12% | |
| Maximum Upper Side * (°C) | 48 | 47.2 2% | 47.4 1% | 53 -10% | 54 -13% | 40 17% |
| Maximum Bottom * (°C) | 39 | 47.8 -23% | 54.4 -39% | 59 -51% | 55 -41% | 37.6 4% |
| Idle Upper Side * (°C) | 37 | 36.8 1% | 28.4 23% | 34 8% | 29 22% | 32.4 12% |
| Idle Bottom * (°C) | 36.2 | 35.8 1% | 29.2 19% | 32 12% | 33 9% | 31.4 13% |
* ... Meglio usare valori piccoli
Stress test
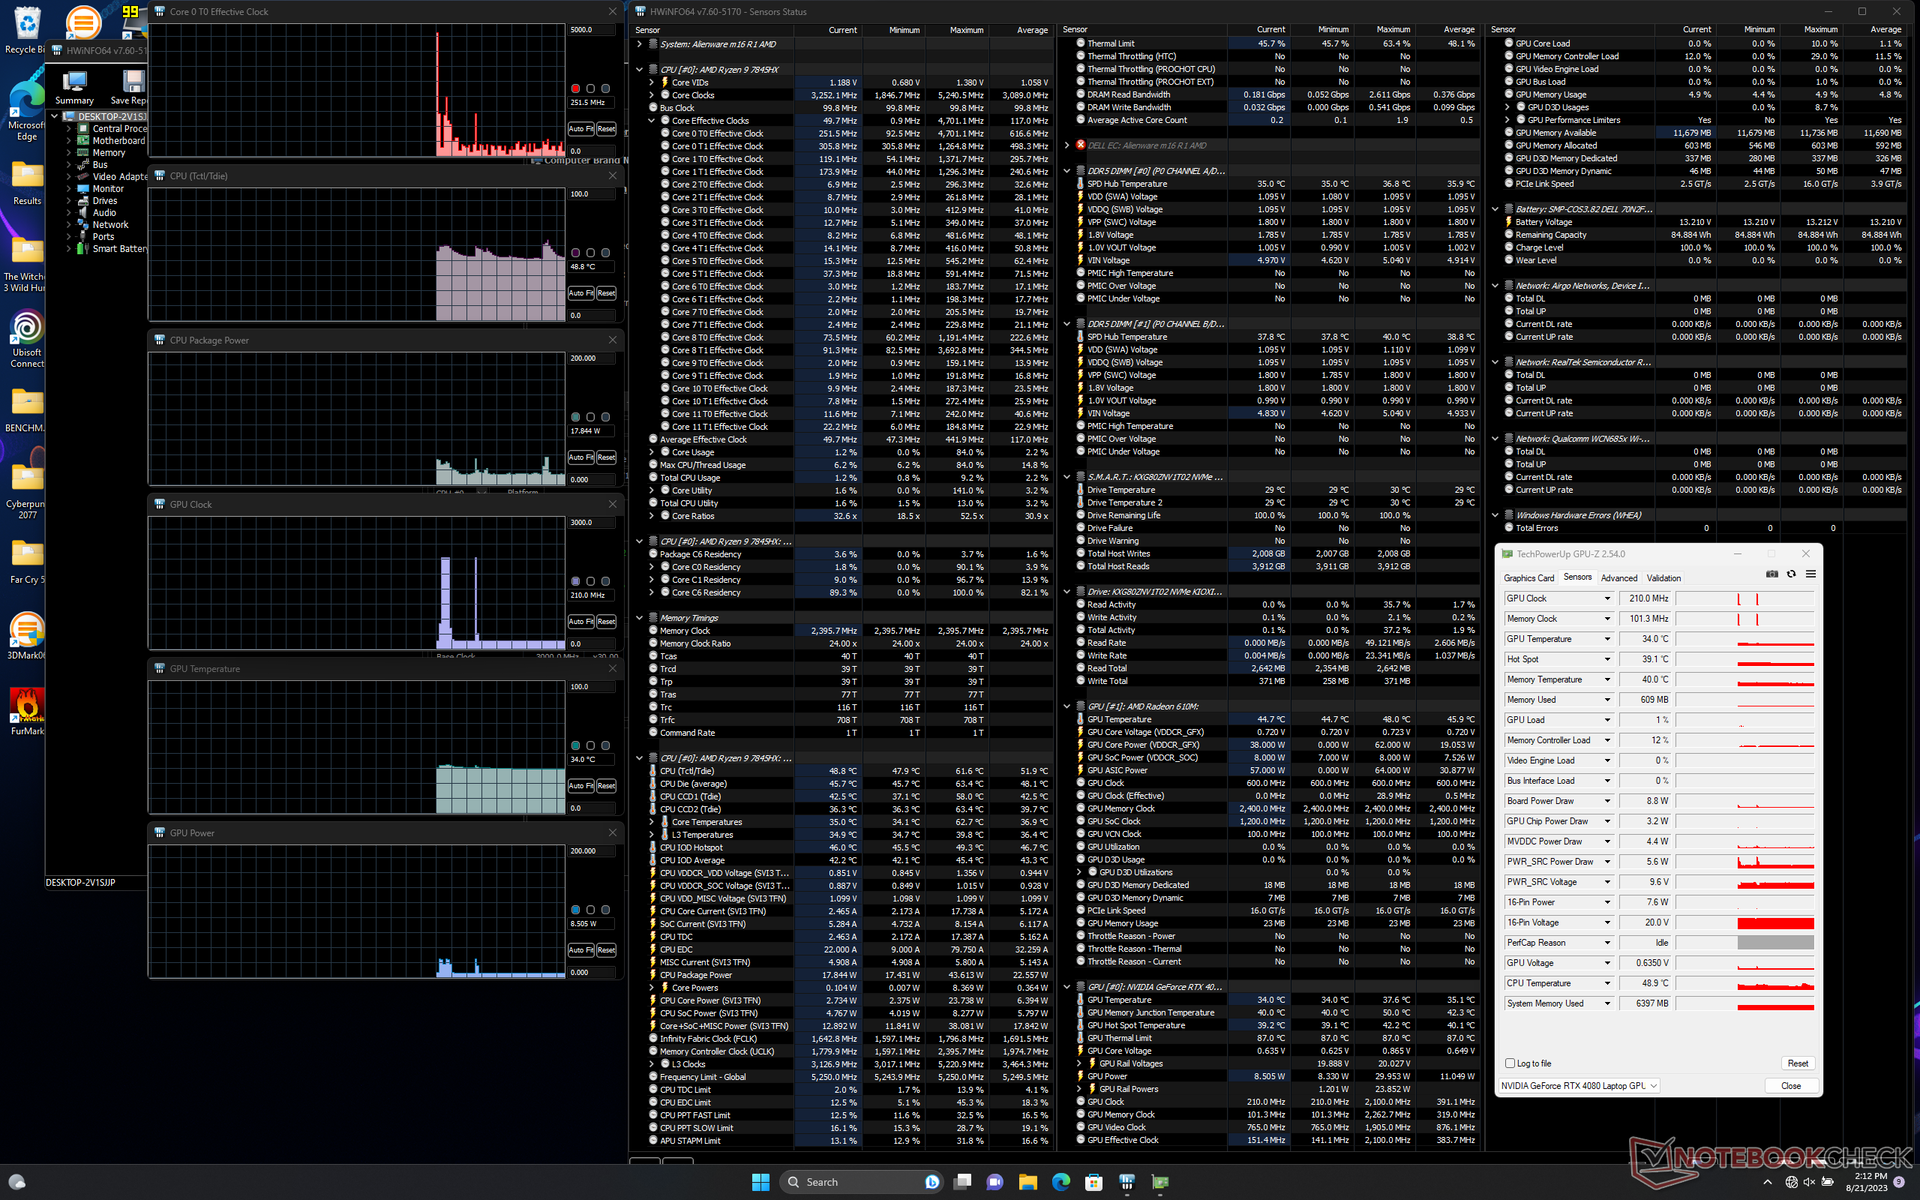
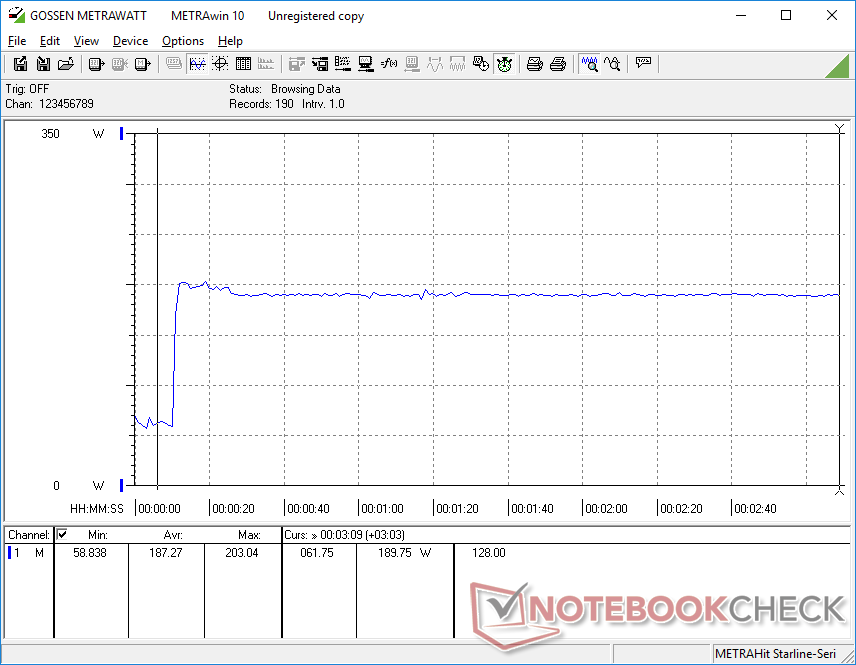
Avviando Prime95 la CPU sale a 5 GHz, 132 W e 99 C per alcuni secondi, prima di stabilizzarsi a 4,6 GHz, 118 W e 85 C.
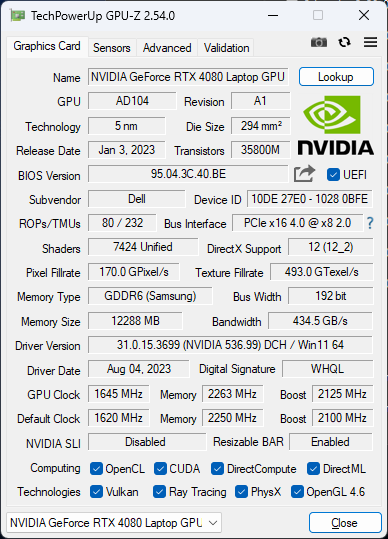
Eseguendo Witcher 3 in modalità Overdrive la GPU si stabilizza a 2430 MHz di clock, 2263 MHz di VRAM e 158 W di assorbimento di potenza della scheda, rispetto a 2415 MHz di clock, 2250 MHz di VRAM e 156 W in modalità Balanced, secondo GPU-Z. Le leggerissime differenze di prestazioni tra le due modalità sono in linea con le osservazioni di Fire Strike menzionate in precedenza. Le temperature del core sarebbero di qualche grado più calde in modalità Balanced rispetto alla modalità Overdrive, poiché le ventole sono sensibilmente più silenziose in modalità Balanced.
Si noti che, sebbene la GPU abbia una potenza nominale di 175 W TGP, siamo riusciti a raggiungere solo 160 W in condizioni di gioco reali.
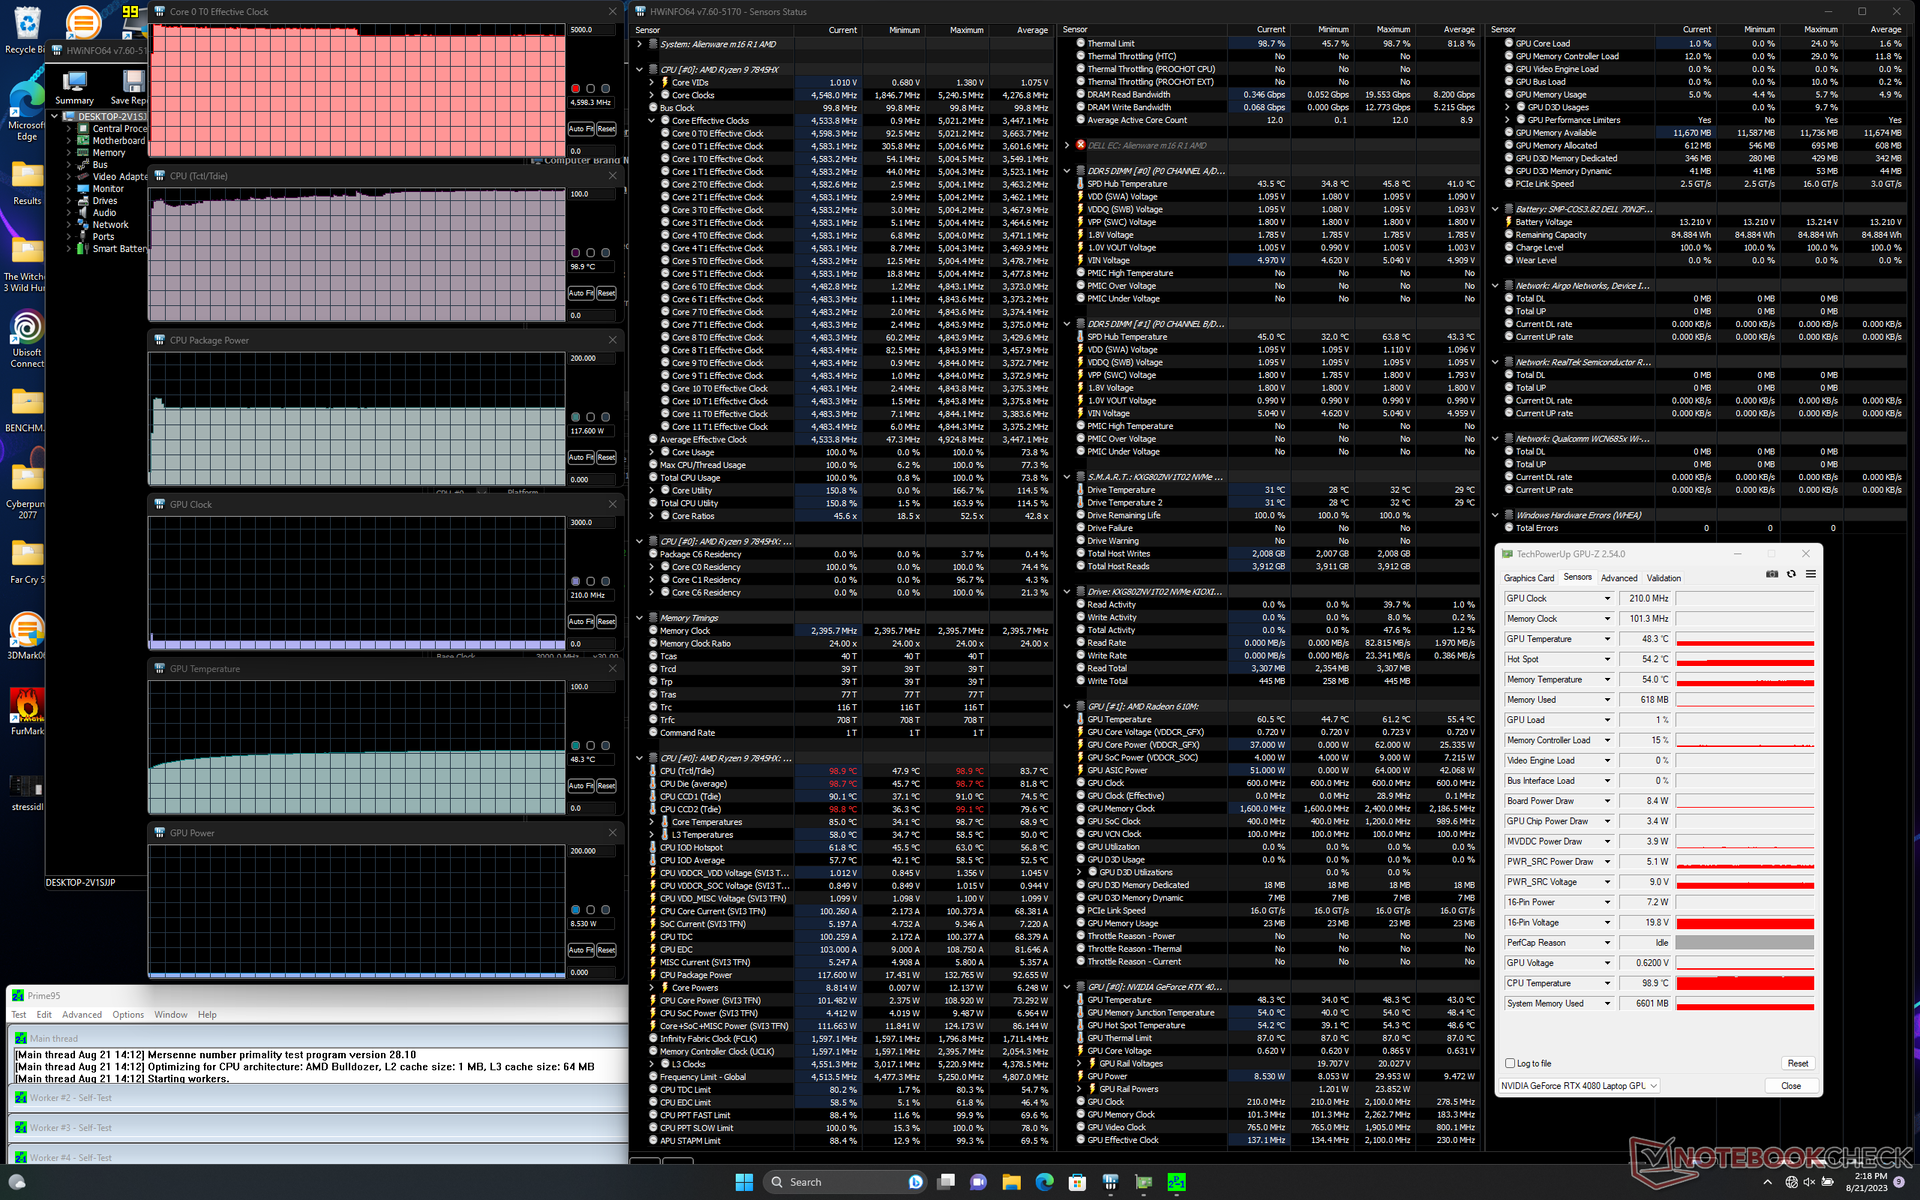
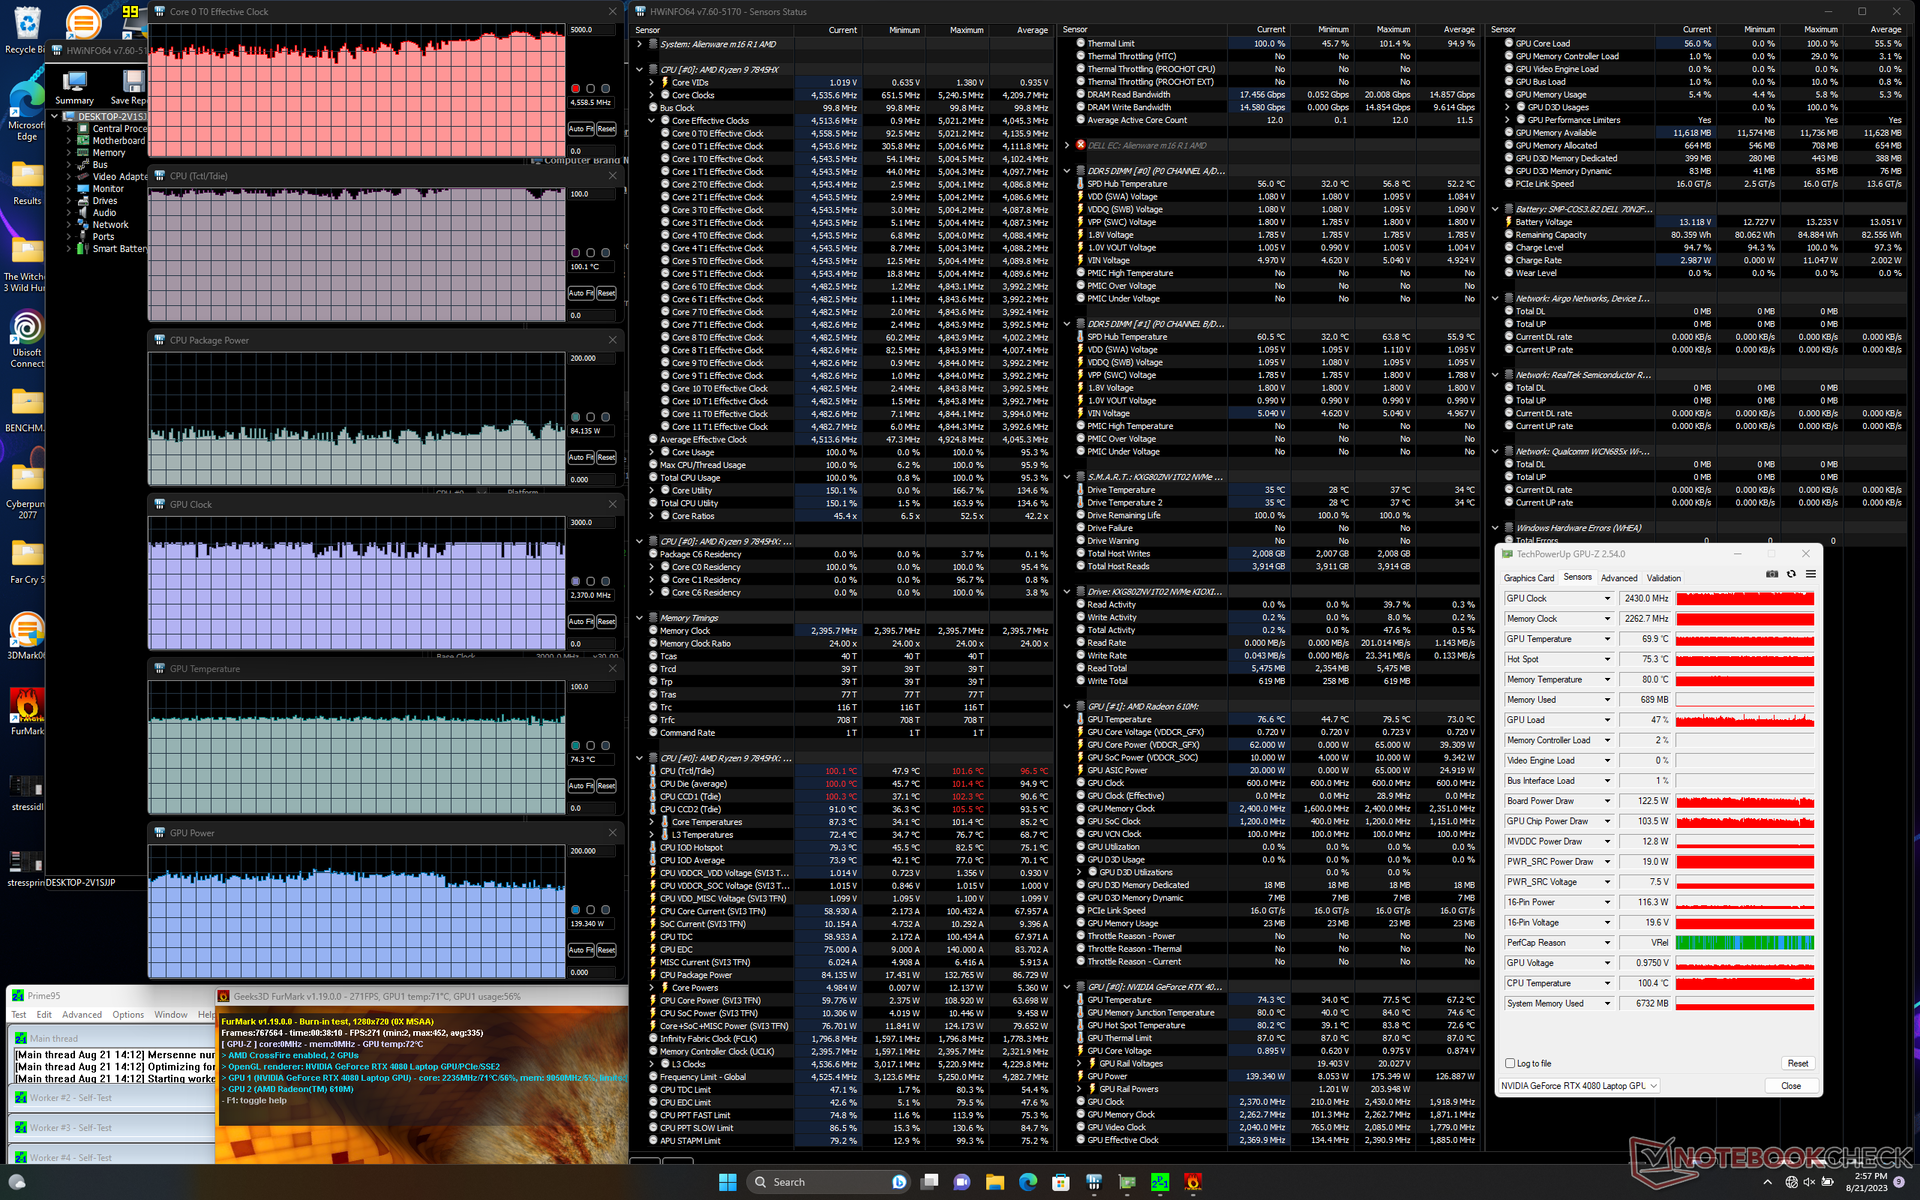
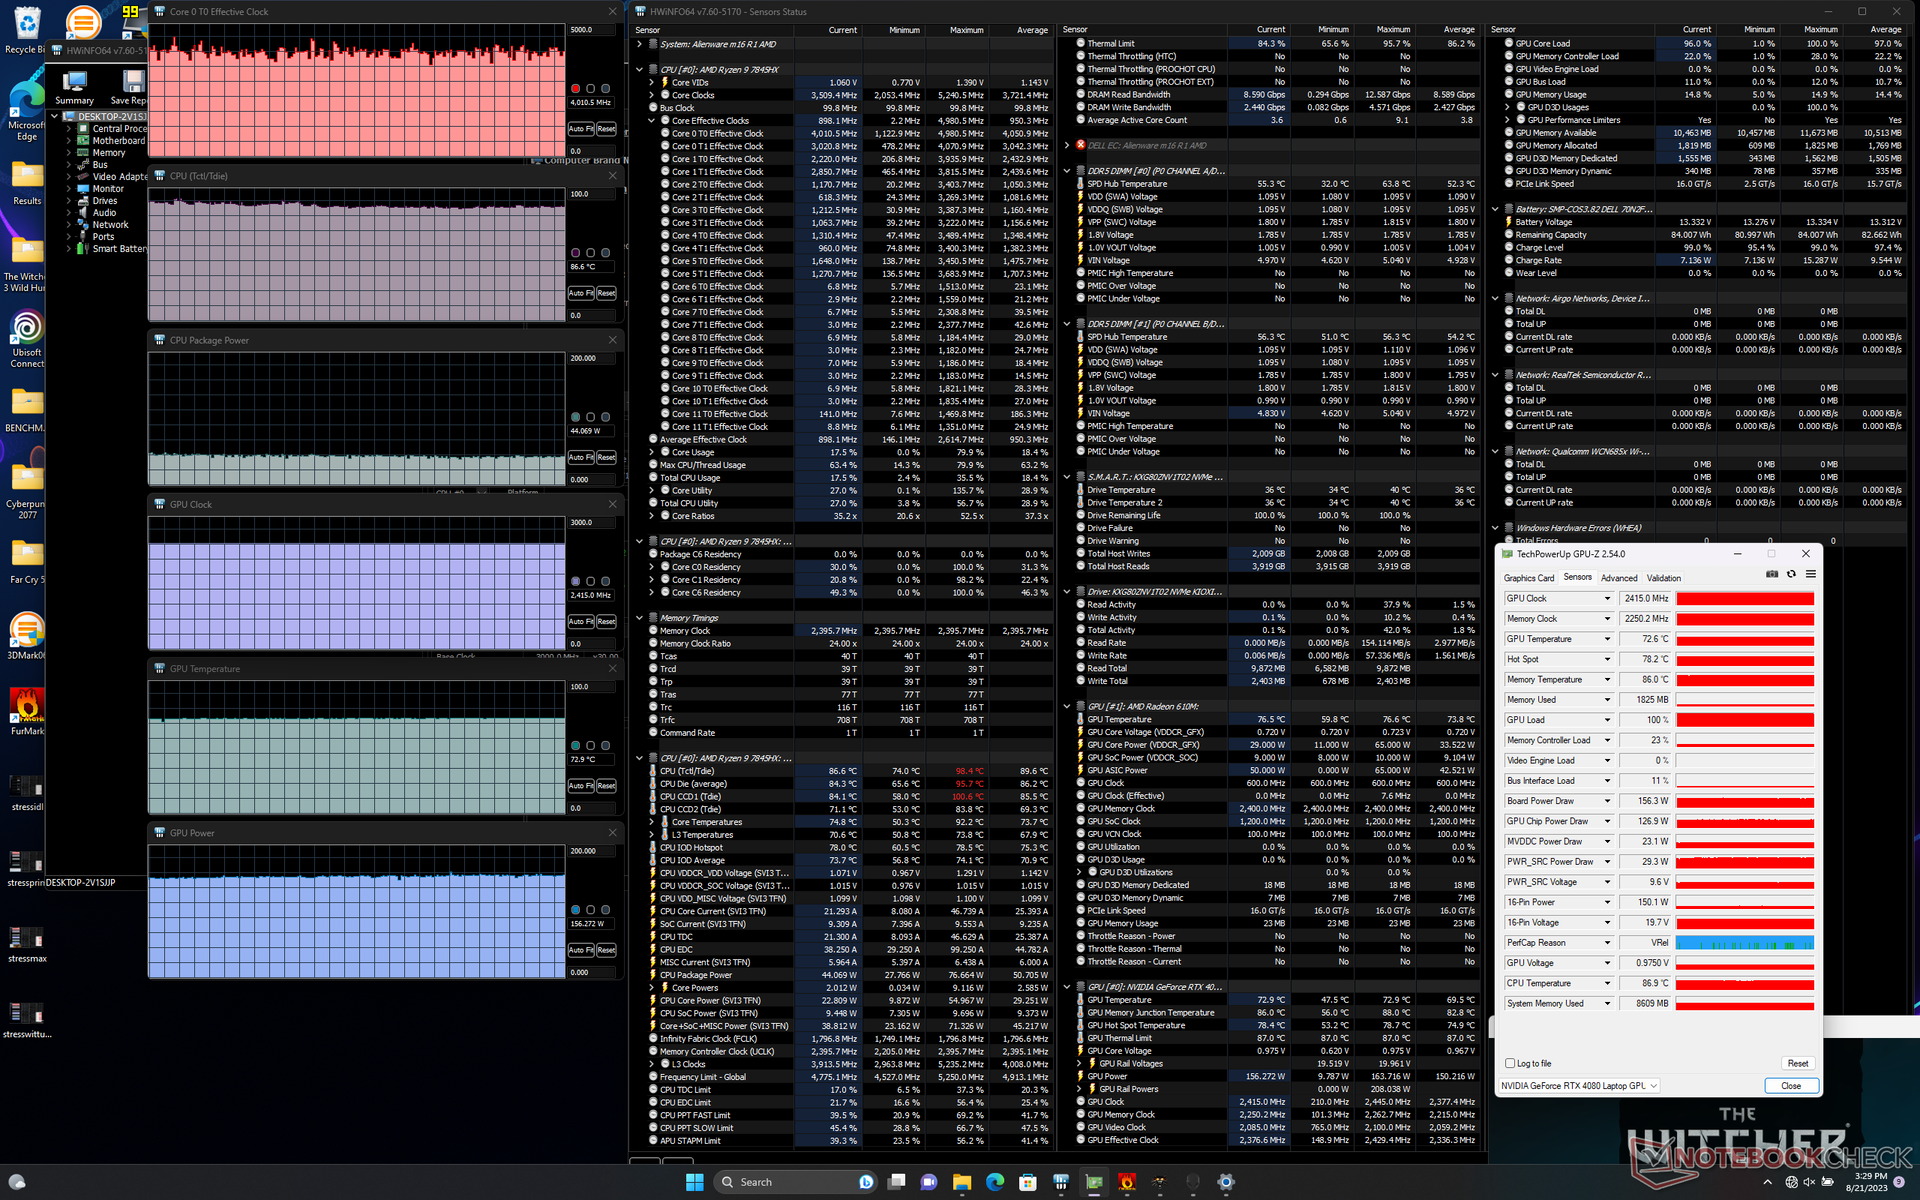
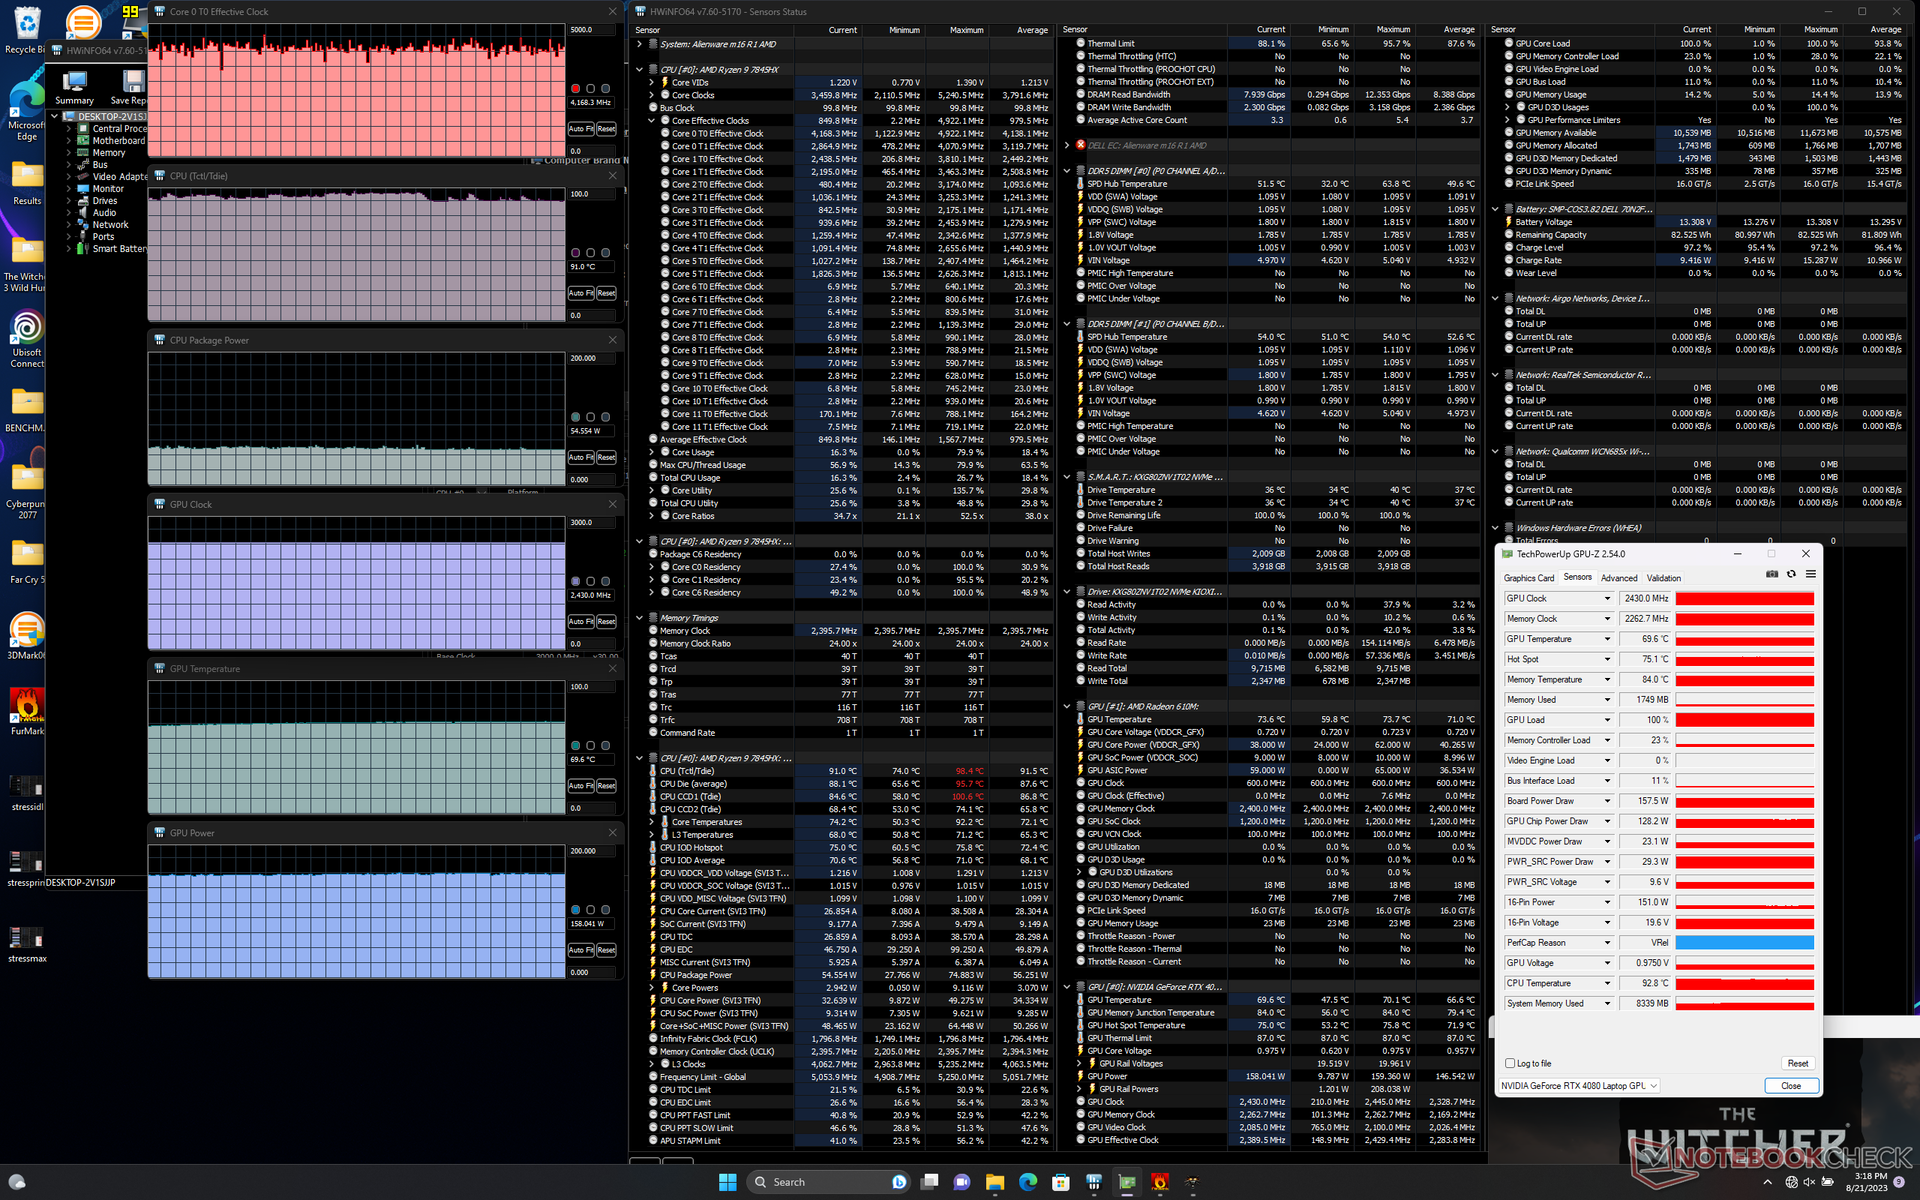
| Clock della CPU (GHz) | Clock della GPU (MHz) | Temperatura media della CPU (°C) | Temperatura media della GPU (°C) | |
| Sistema inattivo | -- | - | 49 | 34 |
| Stress Prime95 | 4,6 | -- | 85 | 49 |
| Prime95 + FurMark Stress | ~4,0 - 4,6 | ~2430 | 87 | 74 |
| Witcher 3 Stress (modalità bilanciata) | ~4,1 | 2415 | 75 | 73 |
| Witcher 3 Stress (modalità Overdrive) | ~4,1 | 2430 | 74 | 70 |
Altoparlanti
Alienware m16 R1 AMD analisi audio
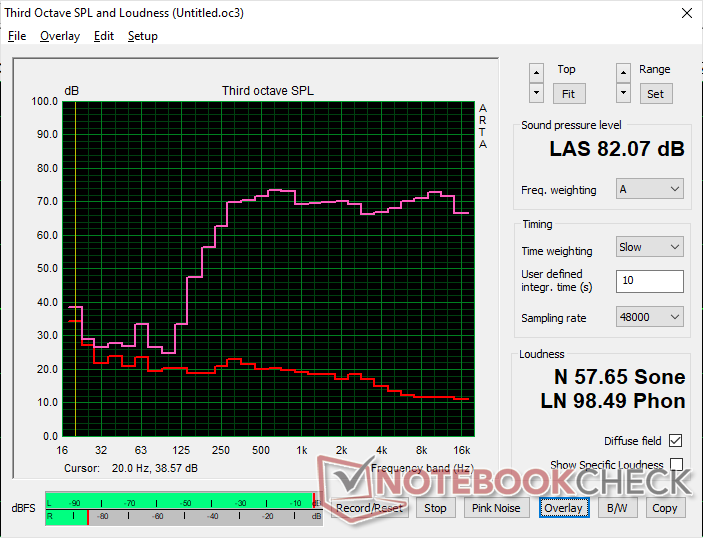
(+) | gli altoparlanti sono relativamente potenti (82.1 dB)
Bassi 100 - 315 Hz
(-) | quasi nessun basso - in media 20.6% inferiori alla media
(-) | bassi non lineari (15.3% delta rispetto alla precedente frequenza)
Medi 400 - 2000 Hz
(+) | medi bilanciati - solo only 1.4% rispetto alla media
(+) | medi lineari (2.1% delta rispetto alla precedente frequenza)
Alti 2 - 16 kHz
(+) | Alti bilanciati - appena 1.9% dalla media
(+) | alti lineari (2.9% delta rispetto alla precedente frequenza)
Nel complesso 100 - 16.000 Hz
(+) | suono nel complesso lineare (13.9% differenza dalla media)
Rispetto alla stessa classe
» 22% di tutti i dispositivi testati in questa classe è stato migliore, 7% simile, 71% peggiore
» Il migliore ha avuto un delta di 6%, medio di 18%, peggiore di 132%
Rispetto a tutti i dispositivi testati
» 16% di tutti i dispositivi testati in questa classe è stato migliore, 4% similare, 80% peggiore
» Il migliore ha avuto un delta di 4%, medio di 24%, peggiore di 134%
Apple MacBook Pro 16 2021 M1 Pro analisi audio
(+) | gli altoparlanti sono relativamente potenti (84.7 dB)
Bassi 100 - 315 Hz
(+) | bassi buoni - solo 3.8% dalla media
(+) | bassi in lineaa (5.2% delta rispetto alla precedente frequenza)
Medi 400 - 2000 Hz
(+) | medi bilanciati - solo only 1.3% rispetto alla media
(+) | medi lineari (2.1% delta rispetto alla precedente frequenza)
Alti 2 - 16 kHz
(+) | Alti bilanciati - appena 1.9% dalla media
(+) | alti lineari (2.7% delta rispetto alla precedente frequenza)
Nel complesso 100 - 16.000 Hz
(+) | suono nel complesso lineare (4.6% differenza dalla media)
Rispetto alla stessa classe
» 0% di tutti i dispositivi testati in questa classe è stato migliore, 0% simile, 100% peggiore
» Il migliore ha avuto un delta di 5%, medio di 17%, peggiore di 45%
Rispetto a tutti i dispositivi testati
» 0% di tutti i dispositivi testati in questa classe è stato migliore, 0% similare, 100% peggiore
» Il migliore ha avuto un delta di 4%, medio di 24%, peggiore di 134%
Gestione dell'energia
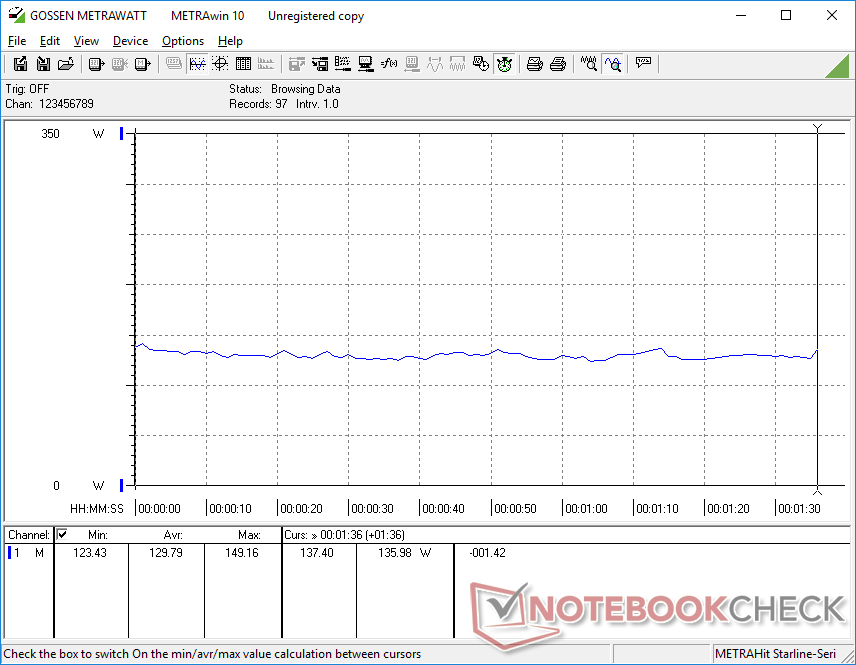
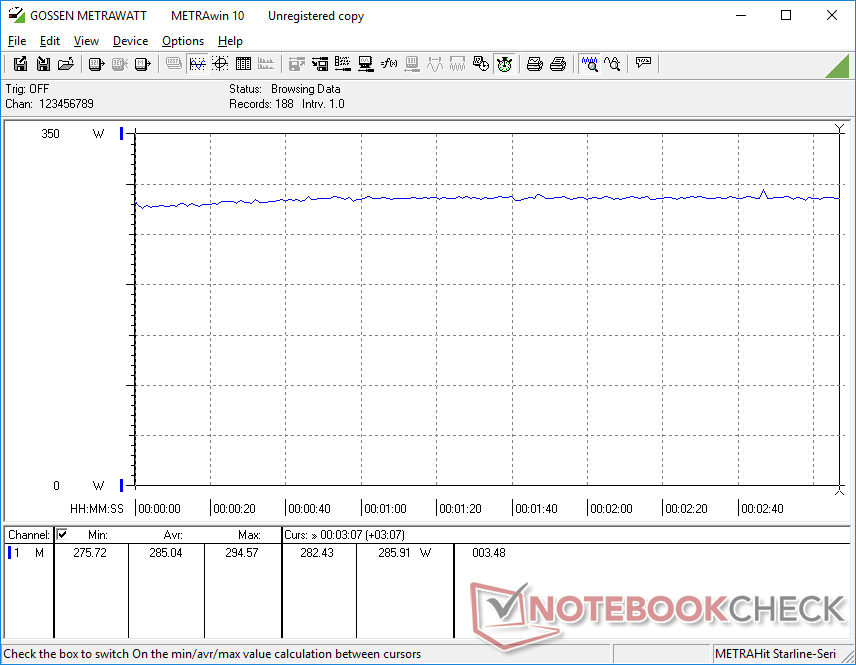
Consumo di energia
I portatili Alienware hanno sempre registrato alcuni dei consumi più elevati e il nostro Alienware m16 R1 non è da meno. Il semplice funzionamento al minimo sul desktop consuma tra i 39 e i 69 W, rispetto a meno della metà del Lenovo Legion Pro 7 o dell'Asus ROG Strix G16. Questi alti livelli di idling sono probabilmente responsabili dei risultati poco soddisfacenti sulla durata della batteria riportati nella prossima sezione.
Il consumo energetico durante il gioco è in media di 285 W, un valore superiore a quello della maggior parte dei portatili da gioco, compreso l'Alienware x16 di Dell.
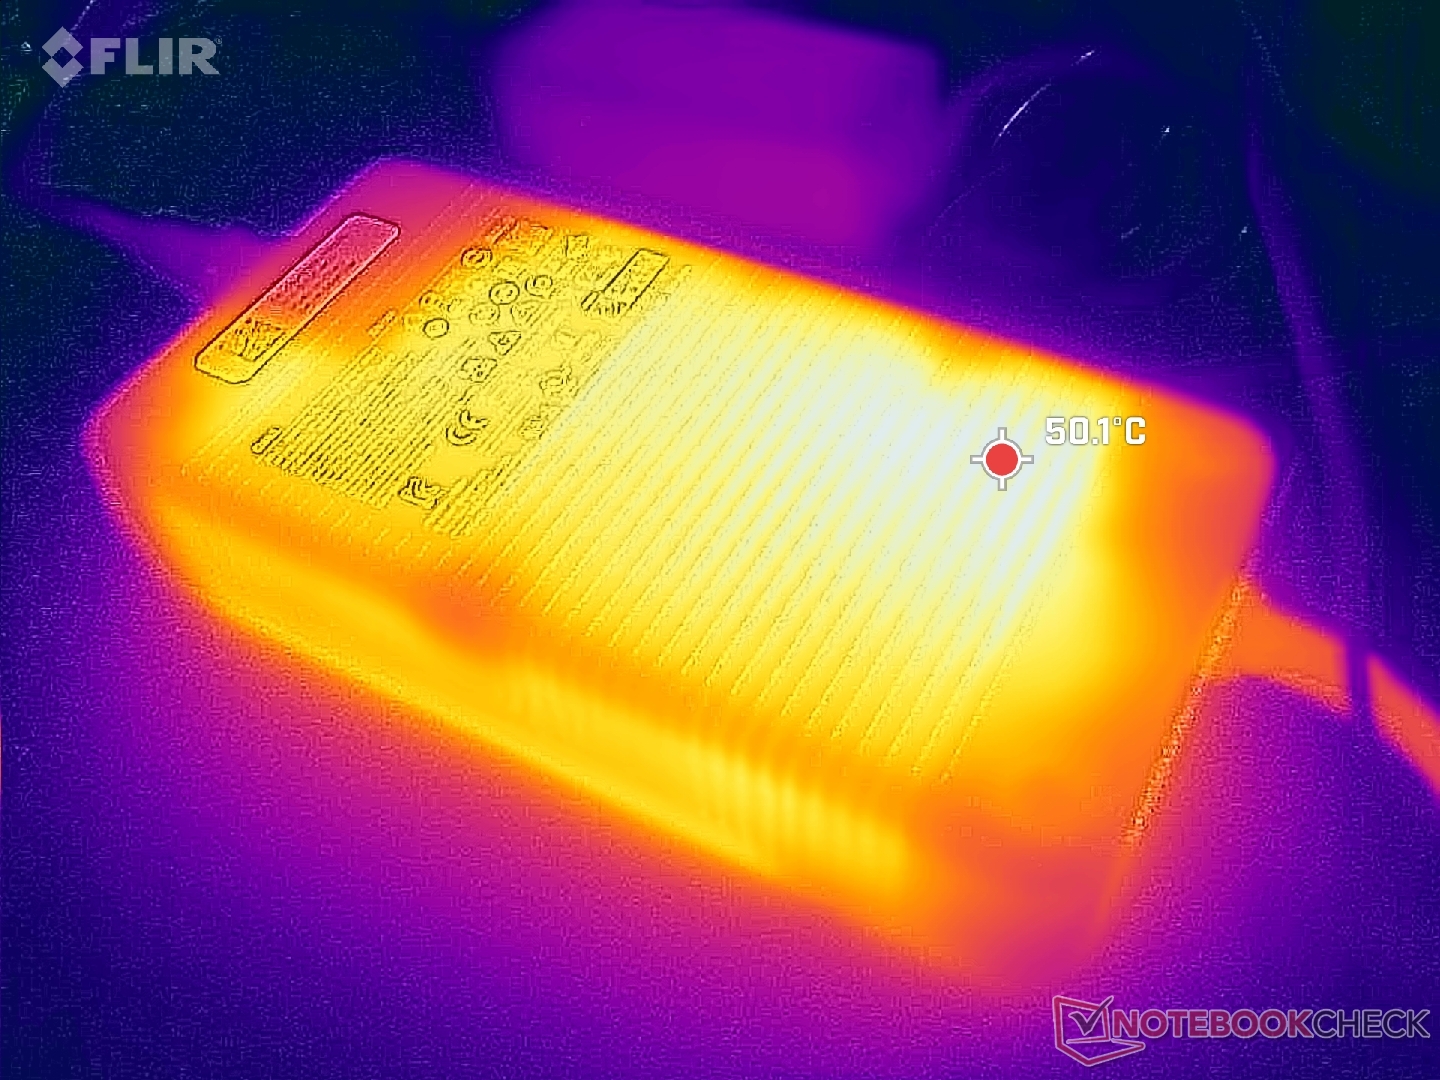
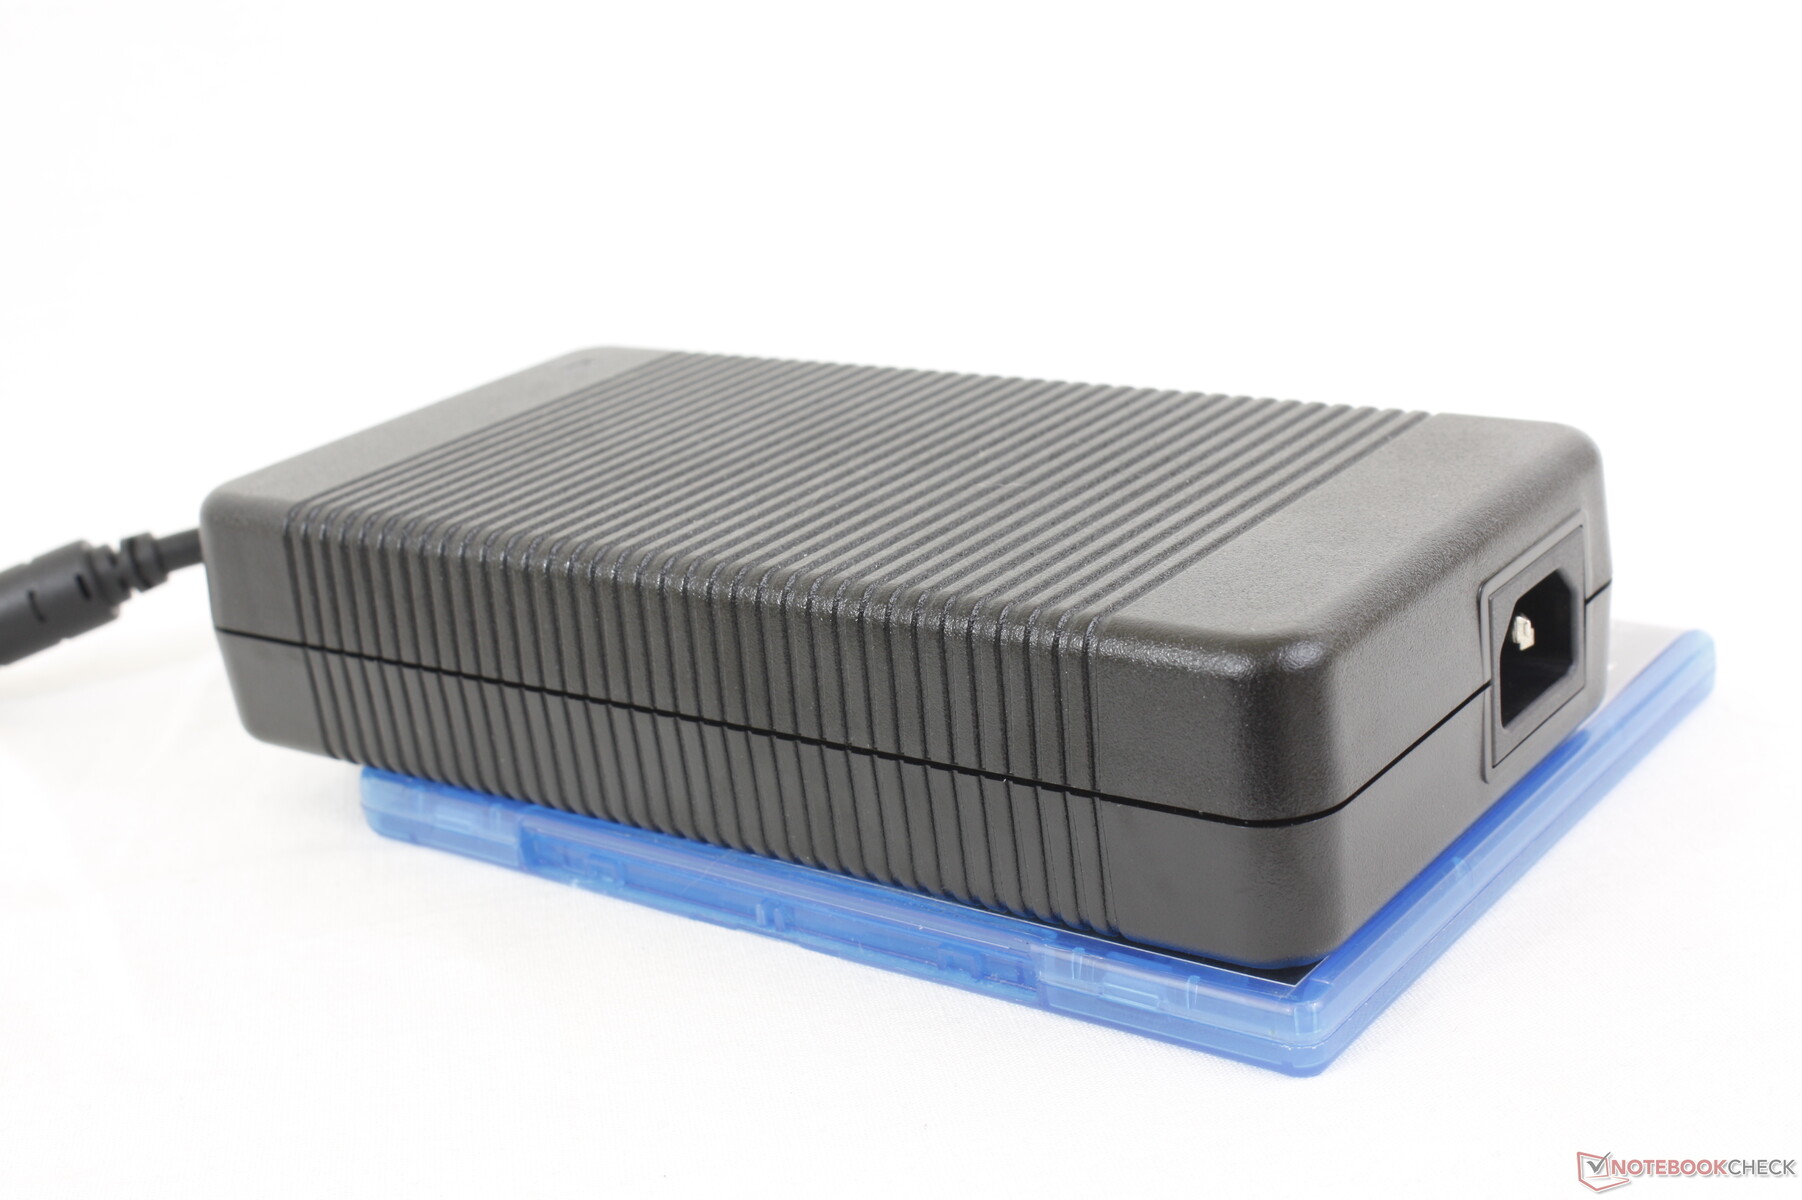
L'adattatore CA da 330 W è grande (~20 x 10 x 4,5 cm) e ingombrante. In confronto, l'adattatore CA GaN da 330 W attualmente in dotazione con gli ultimi portatili Razer è notevolmente più portatile.
| Off / Standby | |
| Idle | |
| Sotto carico |
|
Leggenda:
min: | |
| Alienware m16 R1 AMD R9 7845HX, GeForce RTX 4080 Laptop GPU, Kioxia XG8 KXG80ZNV1T02, IPS, 2560x1600, 16" | Alienware x16 R1 i9-13900HK, GeForce RTX 4080 Laptop GPU, SK hynix PC801 HFS001TEJ9X101N, IPS, 2560x1600, 16" | HP Omen Transcend 16 i9-13900HX, GeForce RTX 4070 Laptop GPU, SK hynix PC801 HFS002TEJ9X101N, Mini-LED, 2560x1600, 16" | Lenovo Legion Pro 7 RTX4090 i9-13900HX, GeForce RTX 4090 Laptop GPU, Samsung PM9A1 MZVL21T0HCLR, IPS, 2560x1600, 16" | Asus ROG Strix G16 G614JZ i9-13980HX, GeForce RTX 4080 Laptop GPU, WD PC SN560 SDDPNQE-1T00, IPS, 2560x1600, 16" | Razer Blade 16 Early 2023 i9-13950HX, GeForce RTX 4080 Laptop GPU, SSSTC CA6-8D1024, IPS, 2560x1600, 16" | |
|---|---|---|---|---|---|---|
| Power Consumption | 21% | 27% | 23% | 35% | 29% | |
| Idle Minimum * (Watt) | 39 | 25.2 35% | 19.2 51% | 20 49% | 10 74% | 15.2 61% |
| Idle Average * (Watt) | 44.6 | 29.9 33% | 22.7 49% | 25 44% | 16 64% | 22.8 49% |
| Idle Maximum * (Watt) | 68.1 | 49.8 27% | 55.4 19% | 35 49% | 27 60% | 49.8 27% |
| Load Average * (Watt) | 129.8 | 105.4 19% | 128.4 1% | 136 -5% | 129 1% | 121.2 7% |
| Witcher 3 ultra * (Watt) | 285 | 263 8% | 206 28% | 282 1% | 247 13% | 242 15% |
| Load Maximum * (Watt) | 327.3 | 313.8 4% | 292 11% | 320 2% | 342 -4% | 273.7 16% |
* ... Meglio usare valori piccoli
Power Consumption Witcher 3 / Stresstest
Power Consumption external Monitor
Durata della batteria
La durata della batteria rimane scarsa, con poco meno di 4 ore di navigazione WLAN nel mondo reale quando si utilizza il profilo di alimentazione Bilanciato con l'iGPU attiva. Abbiamo anche provato a utilizzare il profilo di alimentazione speciale "Batteria" tramite Alienware Command Center e i risultati non sono migliorati. Modelli concorrenti come il Lenovo Legion Pro 7 o l'Asus ROG Strix G16 sono in grado di durare molto di più.
La ricarica da vuoto a pieno regime richiede poco più di 2 ore. Il sistema può essere ricaricato anche tramite USB-C, anche se a un ritmo più lento.
| Alienware m16 R1 AMD R9 7845HX, GeForce RTX 4080 Laptop GPU, 86 Wh | Alienware x16 R1 i9-13900HK, GeForce RTX 4080 Laptop GPU, 90 Wh | HP Omen Transcend 16 i9-13900HX, GeForce RTX 4070 Laptop GPU, 97 Wh | Lenovo Legion Pro 7 RTX4090 i9-13900HX, GeForce RTX 4090 Laptop GPU, 99.9 Wh | Asus ROG Strix G16 G614JZ i9-13980HX, GeForce RTX 4080 Laptop GPU, 90 Wh | Razer Blade 16 Early 2023 i9-13950HX, GeForce RTX 4080 Laptop GPU, 95.2 Wh | |
|---|---|---|---|---|---|---|
| Autonomia della batteria | 13% | 41% | 38% | 100% | 88% | |
| Reader / Idle (h) | 4 | 7.3 83% | 6.3 58% | 8.9 123% | ||
| WiFi v1.3 (h) | 3.7 | 2.5 -32% | 4.2 14% | 5.1 38% | 9.7 162% | 6.1 65% |
| Load (h) | 0.8 | 0.7 -13% | 1.2 50% | 1.1 38% | 1.4 75% |
Pro
Contro
Verdetto - Veloce e ricco di funzioni, ma con necessità di ottimizzazioni
L'Alienware m16 R1 racchiude un'incredibile quantità di potenza e funzionalità per un portatile da 16 pollici. Parliamo di metallo liquido, camera di vapore, quattro ventole, tre alloggiamenti per SSD, tastiera meccanica CherryMX, grafica da 175 W, RAM aggiornabile e persino opzioni per CPU e GPU di Intel e AMD. I modelli da gioco da 16 pollici della concorrenza, come il modello HP Omen Transcend 16, Razer Blade 16o Asus Zephyrus M16 hanno un set di funzionalità relativamente più ridotto e sono generalmente più lenti anche se configurati con la stessa GPU della nostra configurazione di test. Gli ingegneri di Alienware meritano un grande riconoscimento se si considera la densità dell'Alienware m16 R1.
D'altra parte, il lungo elenco di funzionalità integrate può anche giocare a sfavore del portatile, in quanto l'Alienware m16 è sia più pesante che più grande di molte alternative con ampi margini. La durata della batteria, in particolare, ne risente pesantemente, indipendentemente dalle impostazioni del profilo energetico. Se si apprezza la portabilità, è meglio rivolgersi altrove. Inoltre, il modello manca ancora di un paio di funzioni popolari come OLED e mini-LED.
L'Alienware m16 R1 è innegabilmente veloce e ricco di funzioni, con risultati complessivamente superiori alla media. Tuttavia, i vantaggi in termini di prestazioni arrivano al costo di un peso maggiore e di dimensioni più grandi.
I bug riscontrati durante la nostra recensione meritano una menzione. I salti di fotogramma durante la riproduzione di video 4K, i balbettii del frame rate durante i giochi e i problemi di risveglio dal sonno sono spiacevoli da vedere, considerando che Alienware dovrebbe essere un marchio per appassionati. Forse Dell sta facendo il passo più lungo della gamba con le sue numerose configurazioni Intel-Nvidia, AMD-Nvidia e AMD-AMD che possono rendere difficile la risoluzione dei problemi.
Prezzo e disponibilità
Dell sta distribuendo il modello Alienware m16 sia in versione Intel che AMD. La versione AMD parte da 1.700 dollari USA per arrivare a oltre 3.000-4.000 dollari se completamente configurata.
Alienware m16 R1 AMD
- 08/23/2023 v7 (old)
Allen Ngo
Transparency
La selezione dei dispositivi da recensire viene effettuata dalla nostra redazione. Il campione di prova è stato fornito all'autore come prestito dal produttore o dal rivenditore ai fini di questa recensione. L'istituto di credito non ha avuto alcuna influenza su questa recensione, né il produttore ne ha ricevuto una copia prima della pubblicazione. Non vi era alcun obbligo di pubblicare questa recensione. In quanto società mediatica indipendente, Notebookcheck non è soggetta all'autorità di produttori, rivenditori o editori.
Ecco come Notebookcheck esegue i test
Ogni anno, Notebookcheck esamina in modo indipendente centinaia di laptop e smartphone utilizzando procedure standardizzate per garantire che tutti i risultati siano comparabili. Da circa 20 anni sviluppiamo continuamente i nostri metodi di prova e nel frattempo stabiliamo gli standard di settore. Nei nostri laboratori di prova, tecnici ed editori esperti utilizzano apparecchiature di misurazione di alta qualità. Questi test comportano un processo di validazione in più fasi. Il nostro complesso sistema di valutazione si basa su centinaia di misurazioni e parametri di riferimento ben fondati, che mantengono l'obiettività.Price comparison

