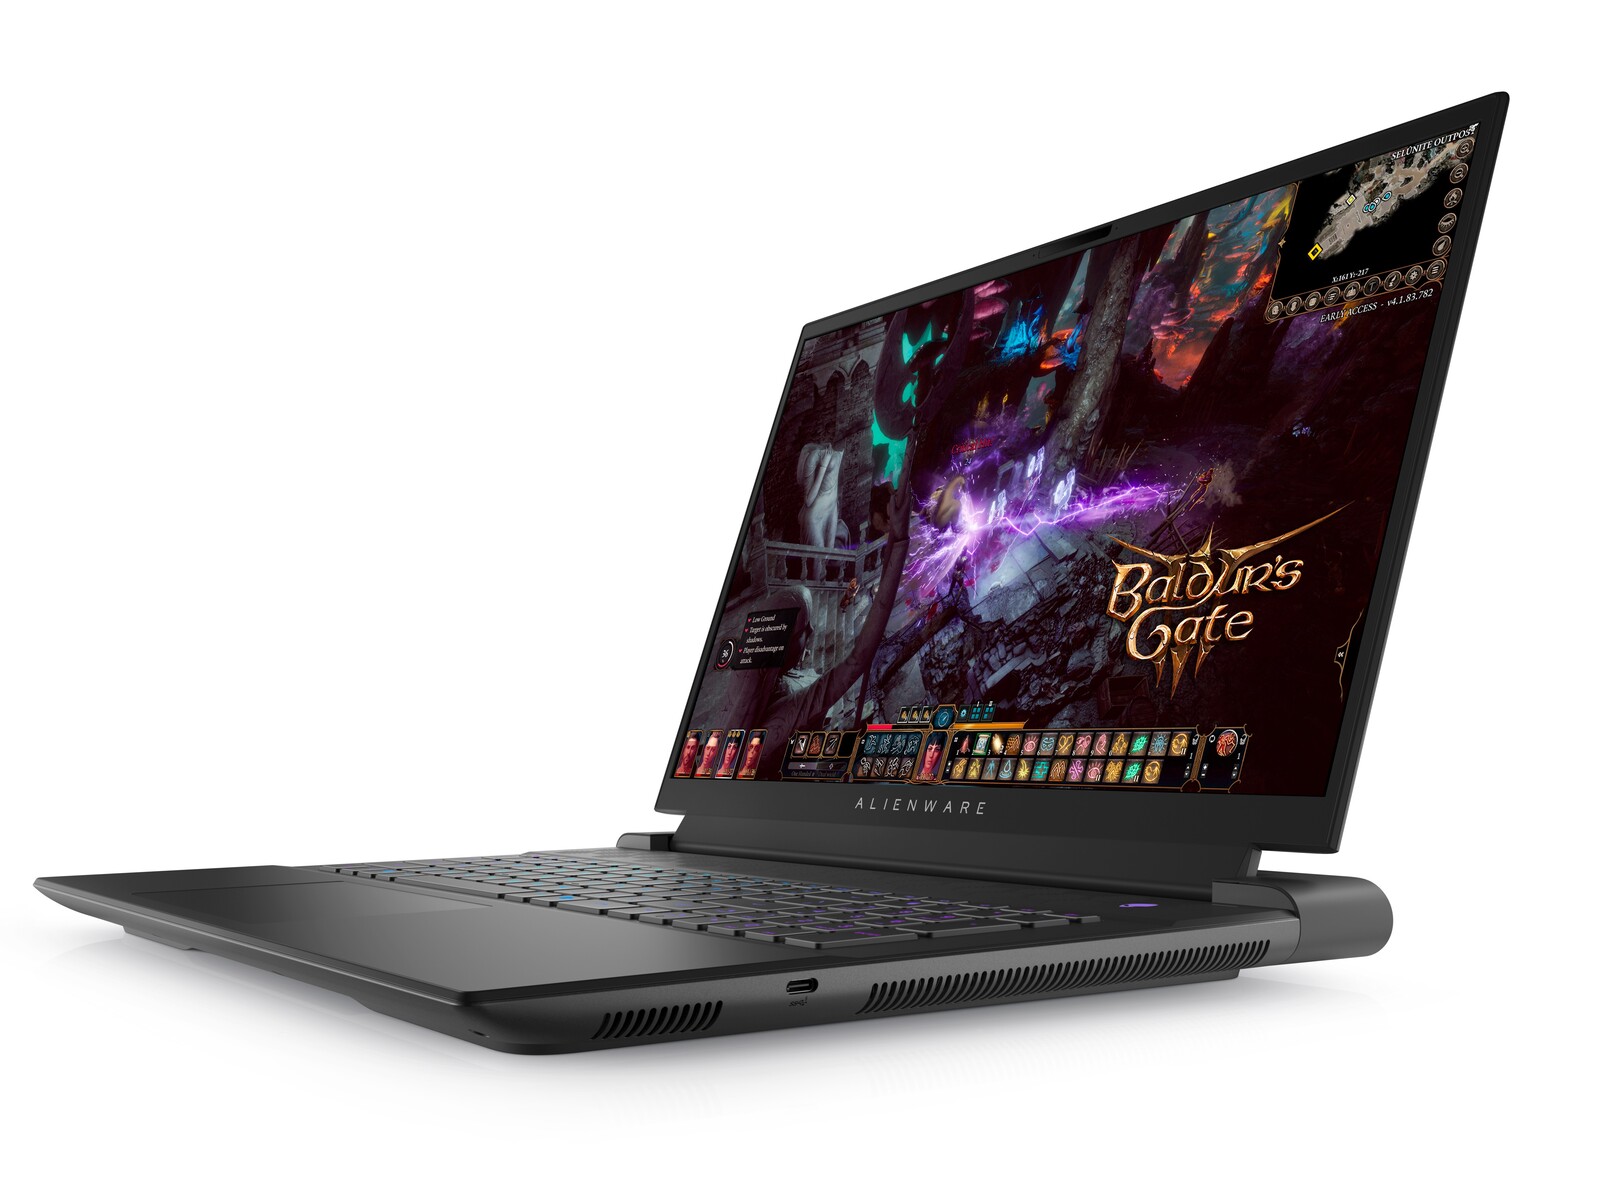
Recensione del portatile Alienware m18 R1: Più grande e più pesante rispetto all'MSI Titan GT77
Presentato all'inizio di quest'anno insieme alla serie mobile Intel Raptor Lake-H e alla serie mobile Ada Lovelace GeForce RTX 40, l'ammiraglia Alienware m18 R1 è il primo modello da 18 pollici della sua famiglia dal 2013. Da allora sono cambiate molte cose, naturalmente, ma i cacciatori di prestazioni che desiderano qualcosa di più grande della solita soluzione da 17 pollici possono trovare molto da apprezzare in un fattore di forma da 18 pollici in cui le caratteristiche e le temperature possono essere massimizzate.
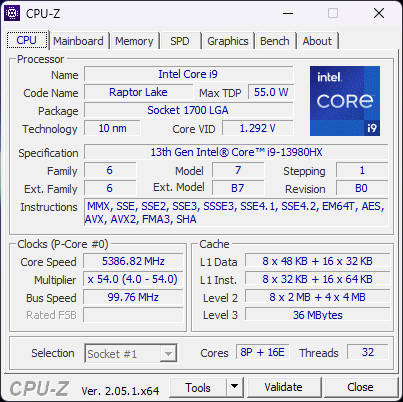
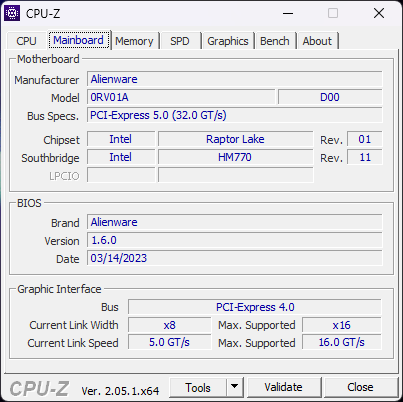
La nostra configurazione in prova è una specifica di fascia alta con CPU Core i9-13980HX di 13a generazione, RTX 4090 da 175 W GeForce, tastiera RGB a membrana e display IPS da 1200p 480 Hz per circa 2900 USD. Altre SKU sono disponibili con RTX 4060, Core i7-13700HX e display 1600p 165 Hz con tastiera meccanica CherryMX a bassissimo profilo. Tutte le configurazioni supportano inoltre G-Sync e colori DCI-P3 completi.
I concorrenti diretti includono altri portatili da gioco da 18 pollici come il Razer Blade 18 oAsus ROG Strix Scar 18. Al momento in cui scriviamo, MSI non ha ancora annunciato un nuovo modello da 18 pollici.
Altre recensioni Dell:
Potenziali concorrenti a confronto
Punteggio | Data | Modello | Peso | Altezza | Dimensione | Risoluzione | Prezzo |
|---|---|---|---|---|---|---|---|
| 90.7 % v7 (old) | 04/2023 | Alienware m18 R1 i9-13980HX, GeForce RTX 4090 Laptop GPU | 3.9 kg | 26.7 mm | 18.00" | 1920x1200 | |
| 91.4 % v7 (old) | 02/2023 | Razer Blade 18 RTX 4070 i9-13950HX, GeForce RTX 4070 Laptop GPU | 3 kg | 21.9 mm | 18.00" | 2560x1600 | |
| 86.6 % v7 (old) | 02/2023 | Asus ROG Strix Scar 18 2023 G834JY-N6005W i9-13980HX, GeForce RTX 4090 Laptop GPU | 3.1 kg | 30.8 mm | 18.00" | 2560x1600 | |
| 88.3 % v7 (old) | 03/2023 | MSI GE78HX 13VH-070US i9-13950HX, GeForce RTX 4080 Laptop GPU | 3 kg | 23 mm | 17.00" | 2560x1600 | |
| 89.9 % v7 (old) | 03/2023 | Eluktronics Mech-17 GP2 i9-13900HX, GeForce RTX 4090 Laptop GPU | 2.9 kg | 27 mm | 17.00" | 2560x1600 | |
| 89 % v7 (old) | 02/2023 | MSI Titan GT77 HX 13VI i9-13950HX, GeForce RTX 4090 Laptop GPU | 3.5 kg | 23 mm | 17.30" | 3840x2160 |
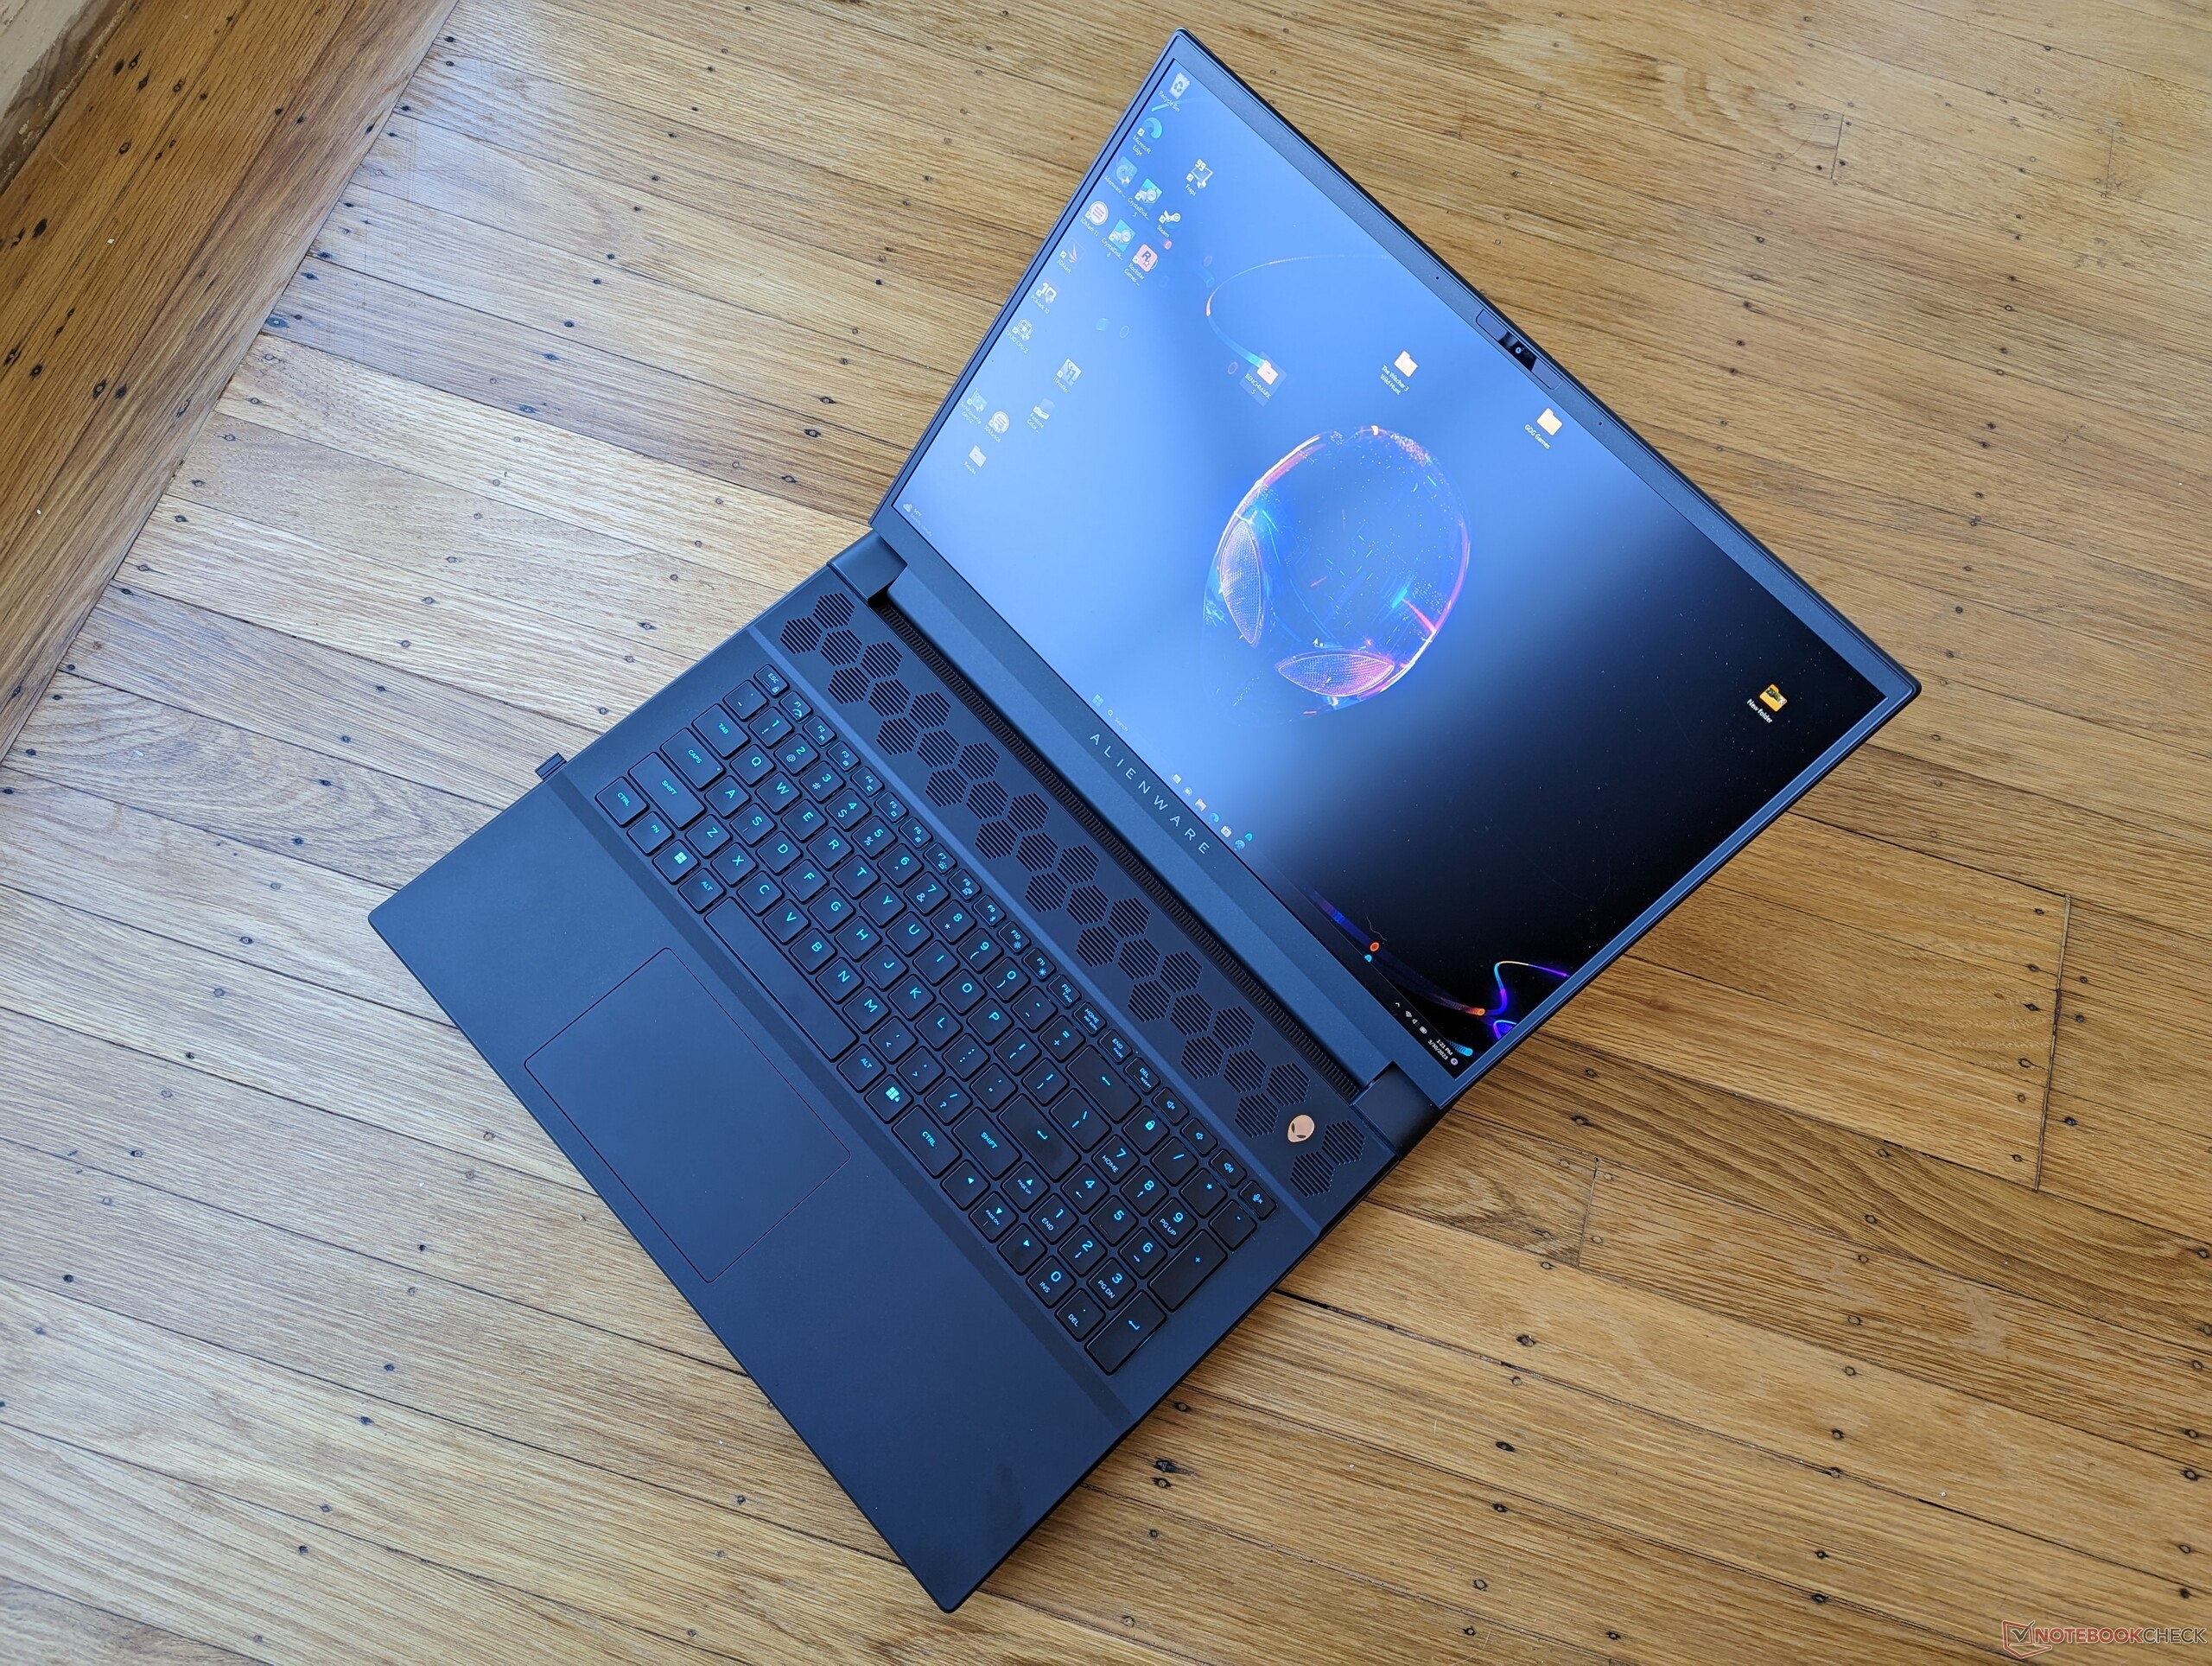
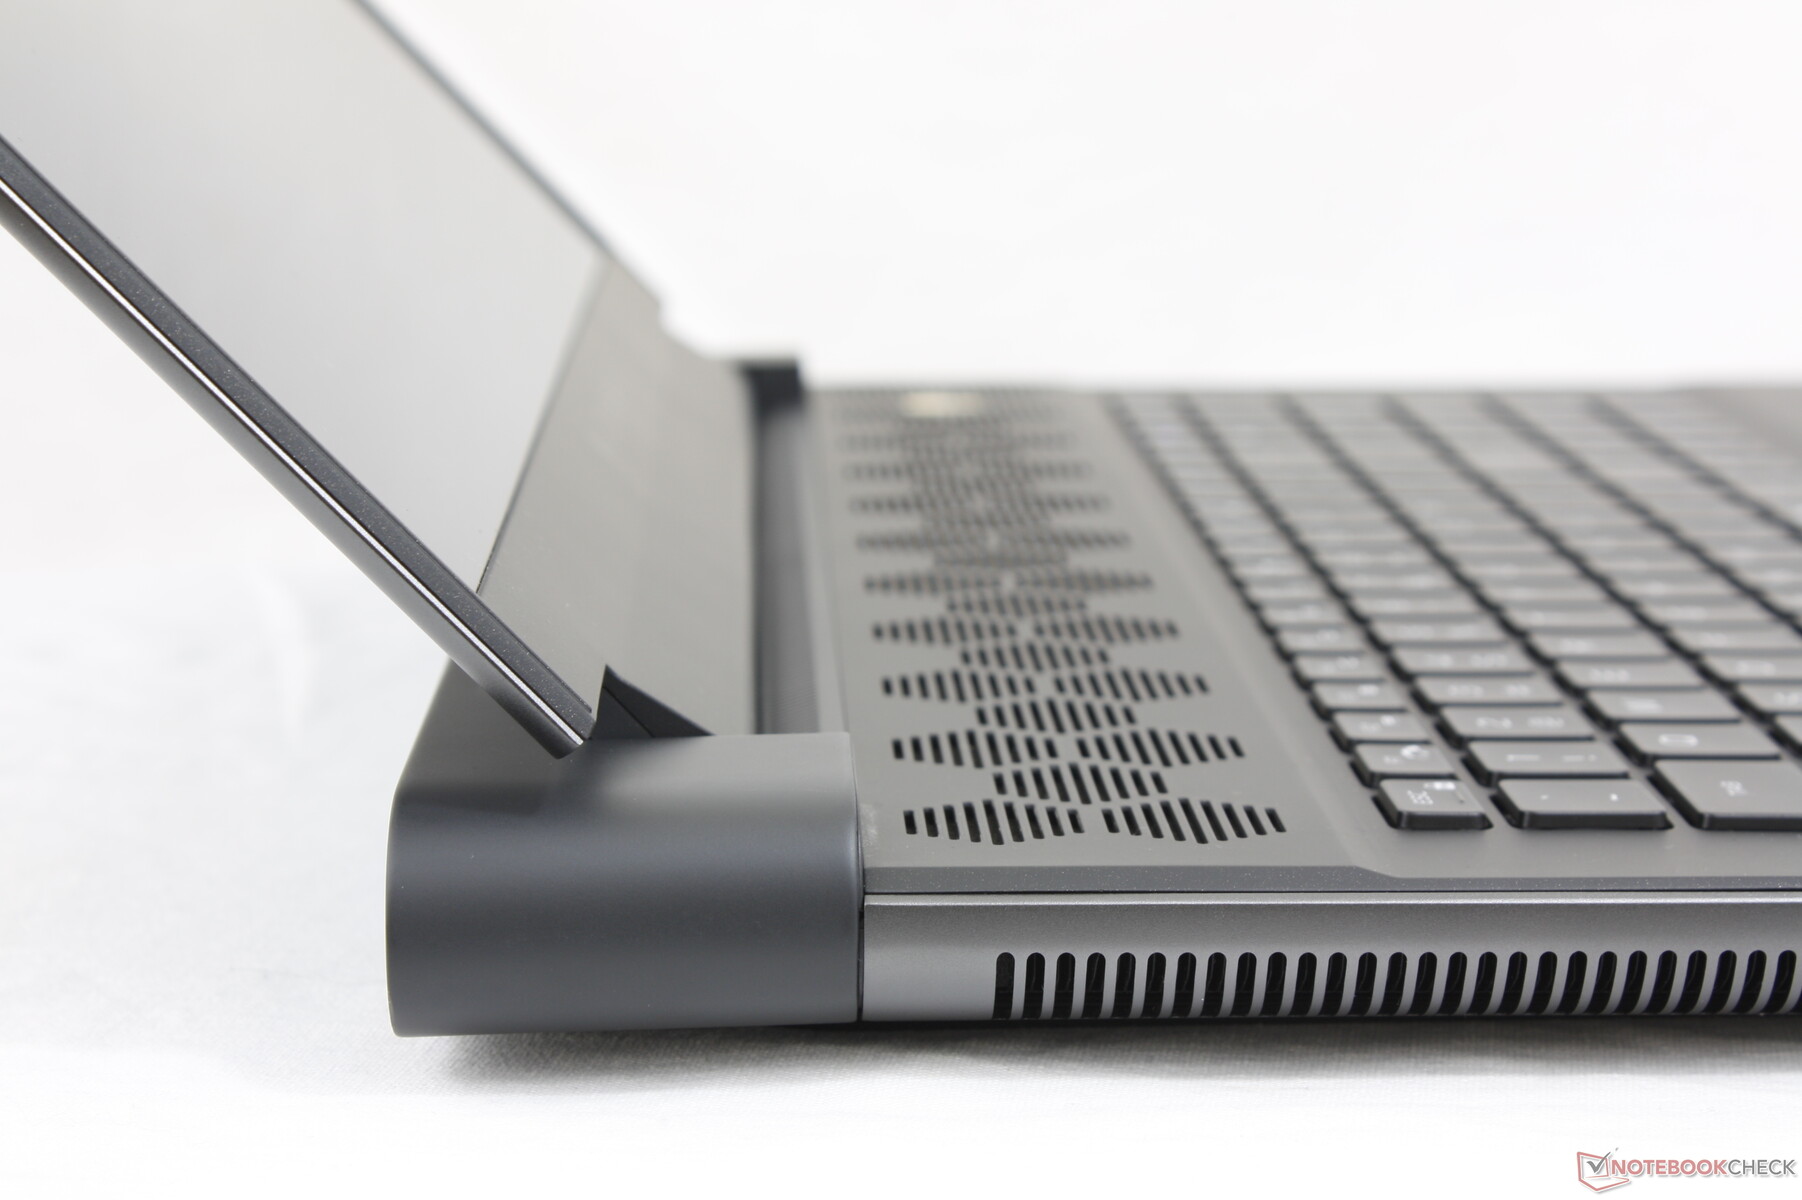
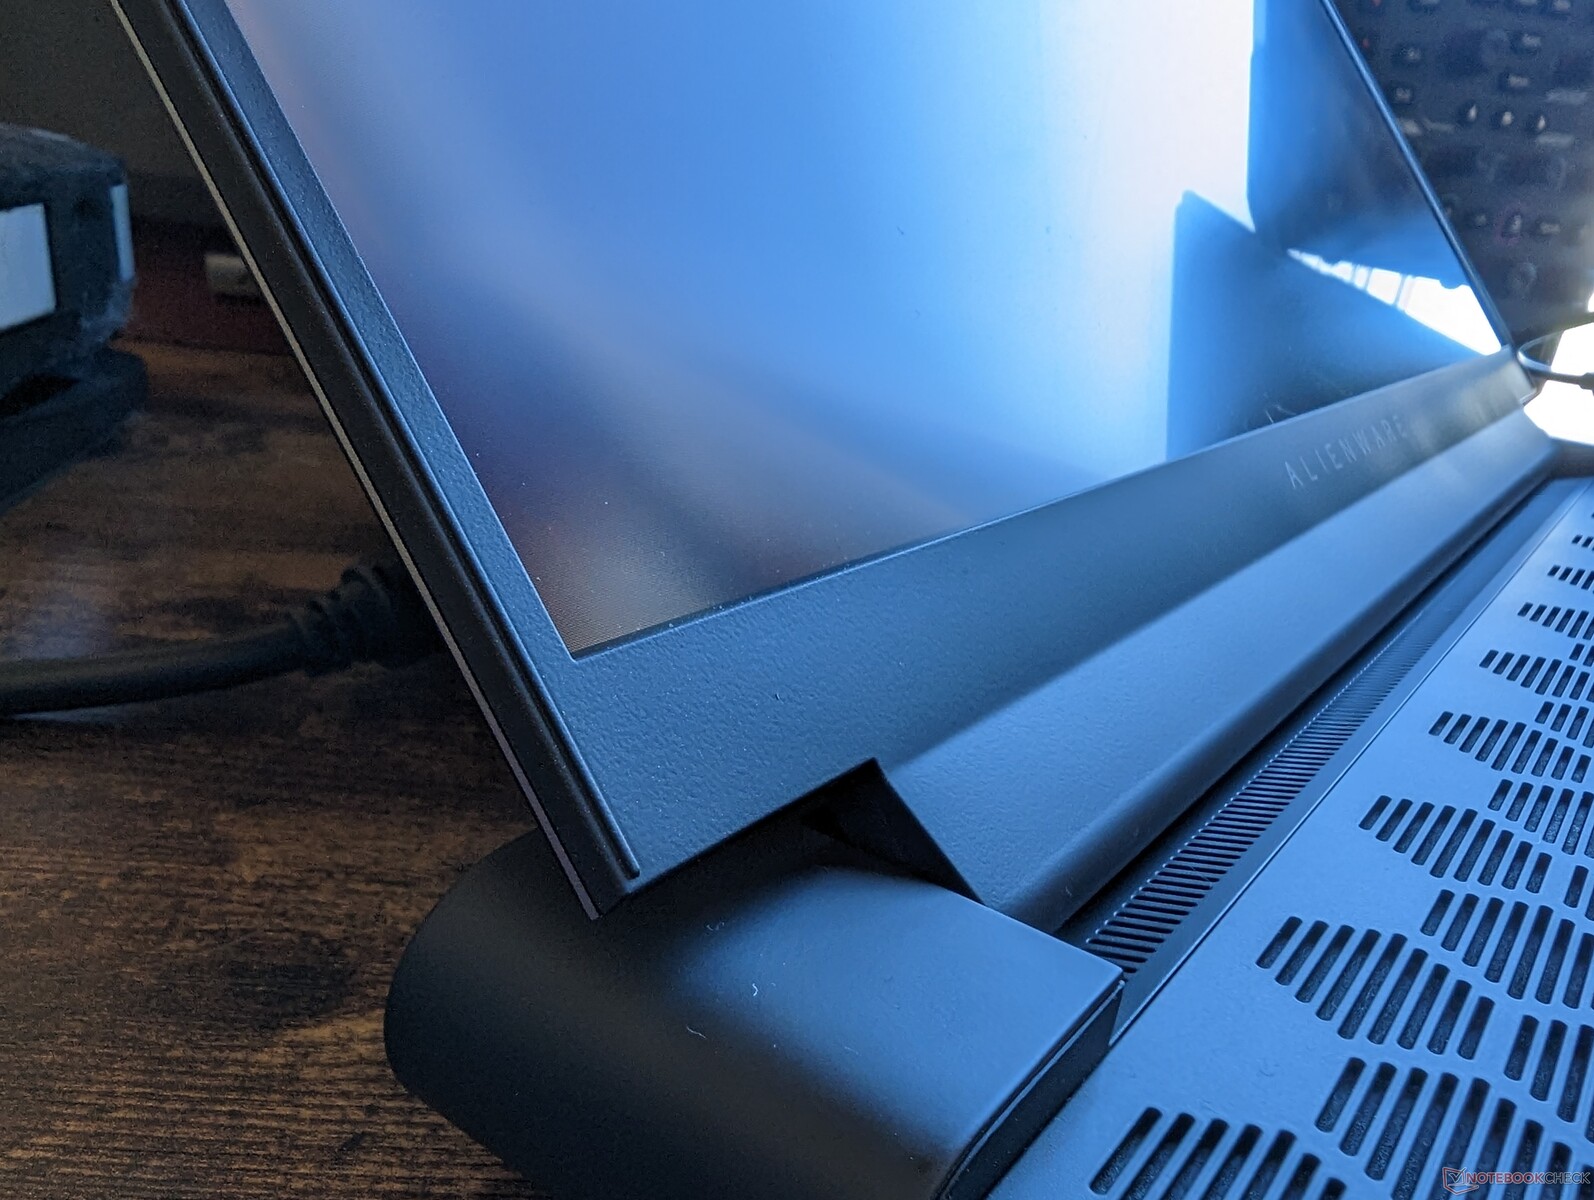
Custodia - Legend 3 Design
Le impressioni sul telaio sono simili a quelle del recente Alienware x17 R2 poiché l'Alienware m18 R1 utilizza materiali simili. La costruzione densa e l'allineamento stretto tra i materiali dimostrano che non è necessario un design unibody come quello del Razer Blade 18 per ottenere una sensazione di alta qualità. Tutti i componenti, dal centro della tastiera al coperchio esterno, sono più solidi e resistenti alle torsioni e agli avvallamenti rispetto a molti altri portatili da gioco, tra cui l'MSI GE78.
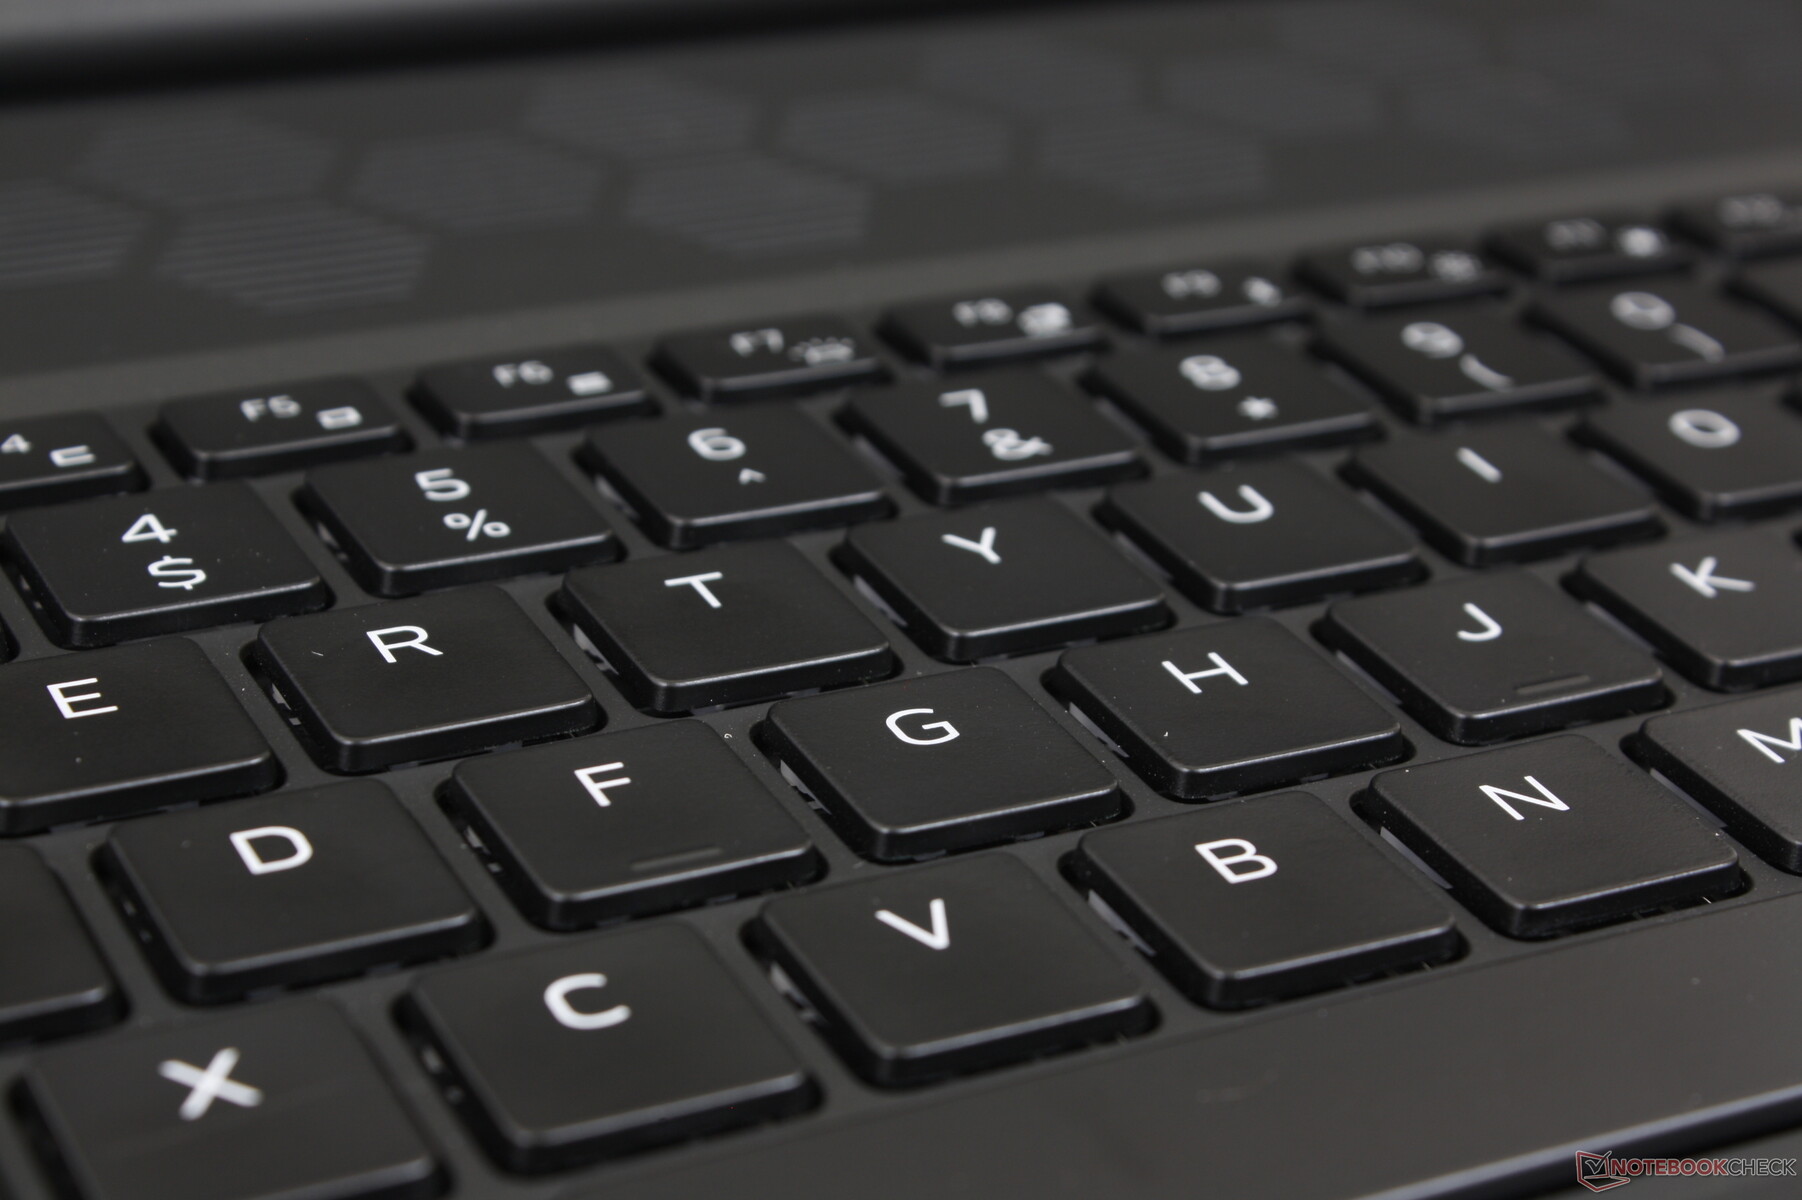
La superficie gommata opaca della tastiera può essere un problema, in quanto con il tempo raccoglie grasso e impronte digitali.
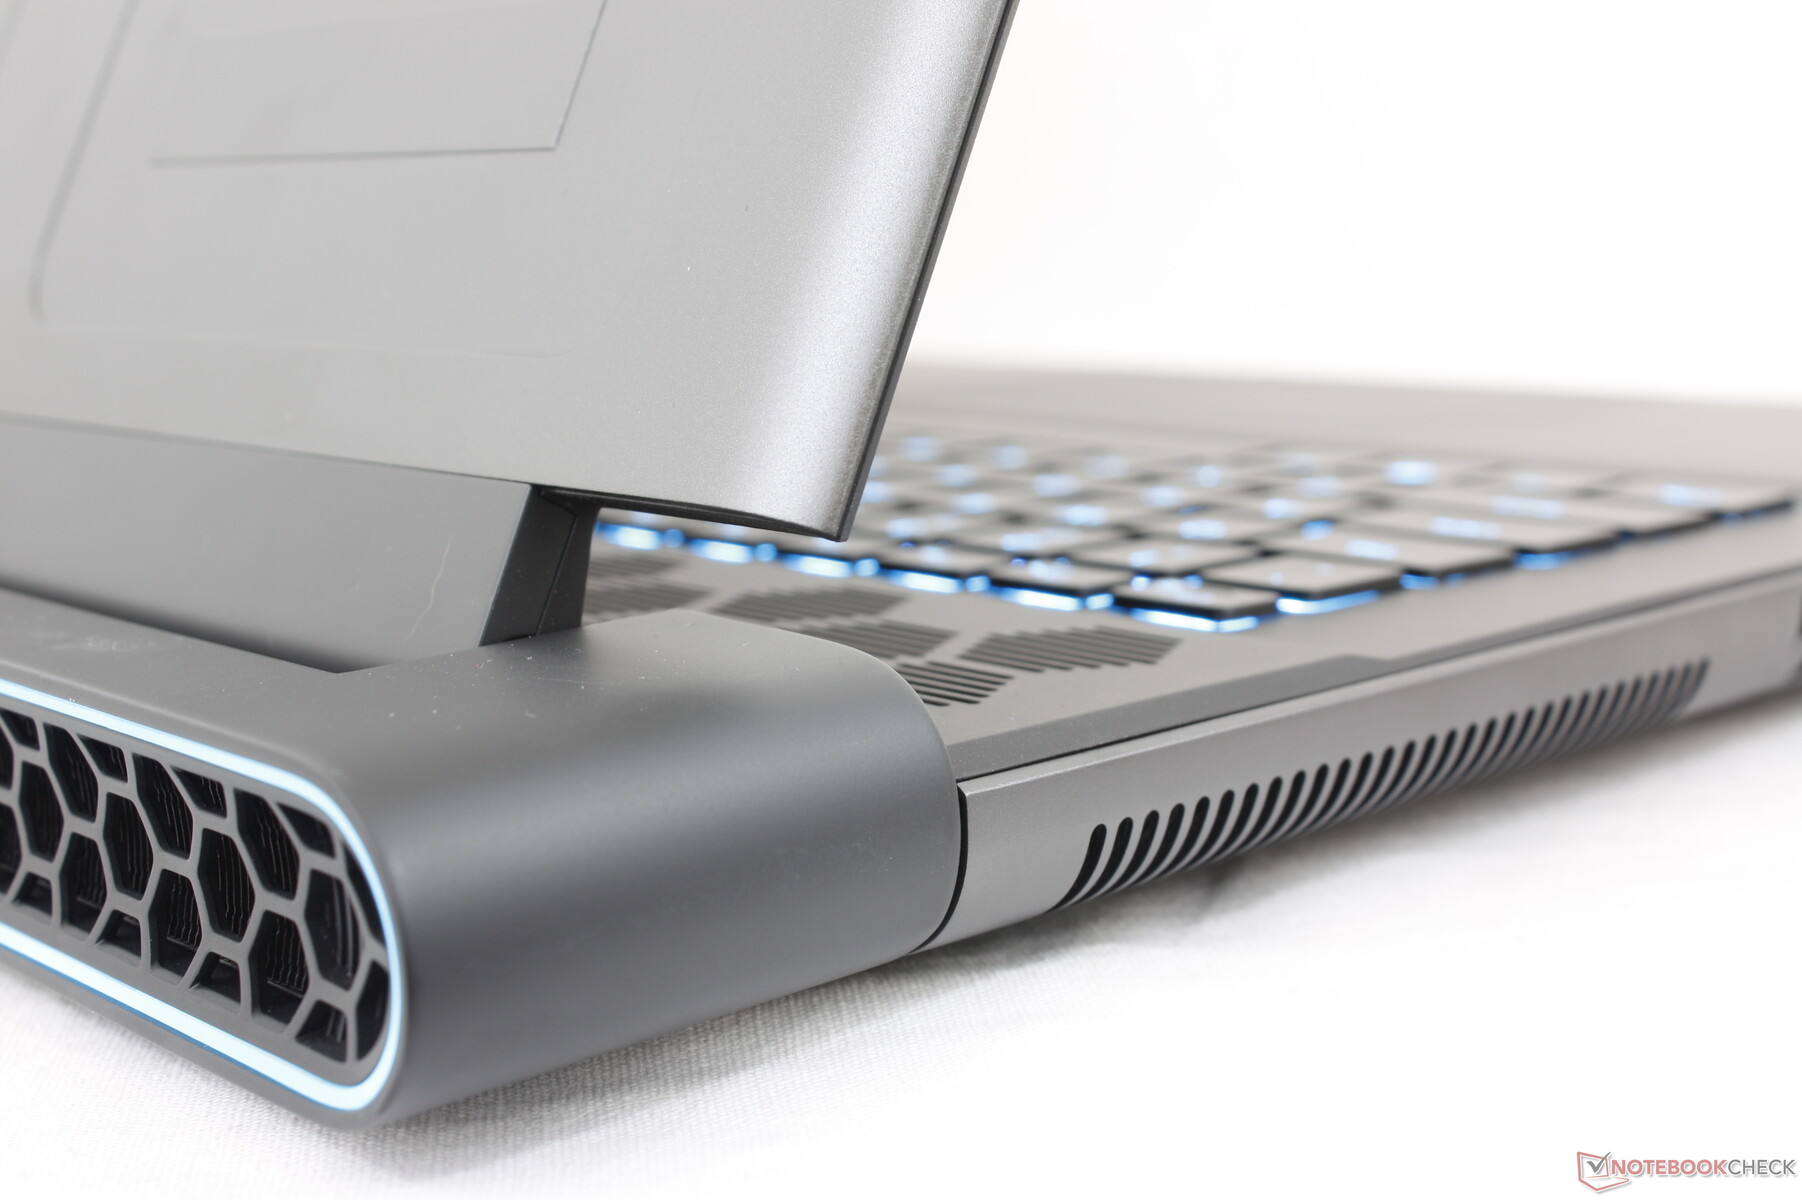
Il modello Alienware è significativamente più pesante del Blade 18 da 18 pollici o delROG Strix Scar 18 di quasi un chilogrammo ciascuno, risultando uno dei portatili più pesanti dell'anno. In effetti, il nostro corriere ha persino commentato quanto fosse pesante la scatola di spedizione rispetto alle sue dimensioni ridotte. Gran parte del peso può essere attribuito alla parte posteriore allungata, al profilo più spesso e al radiatore a camera di vapore, tutti progettati per migliorare il raffreddamento. Se vi interessa il peso del viaggio, allora potreste prendere in considerazione l'MSI Titan GT77 MSI Titan GT77 che è effettivamente più leggero e sottile del nostro Alienware.
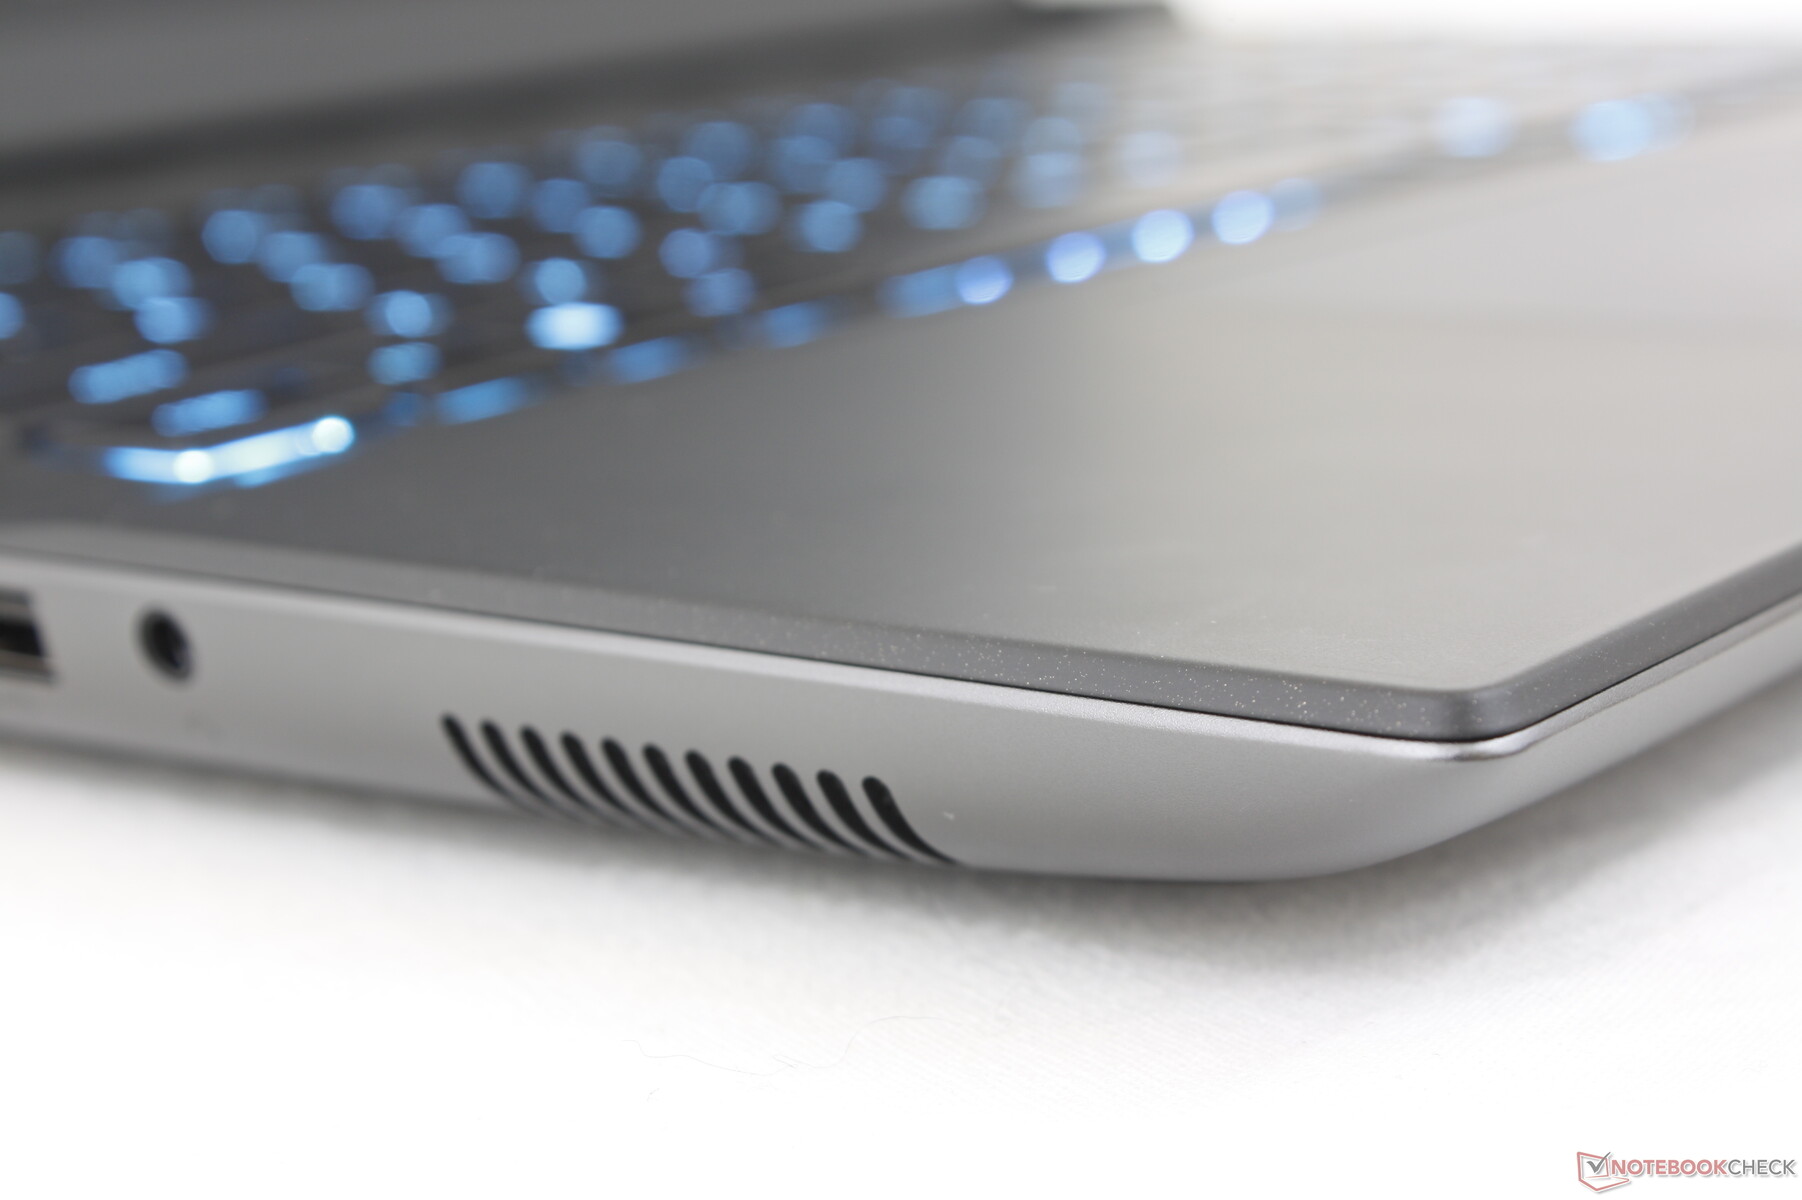
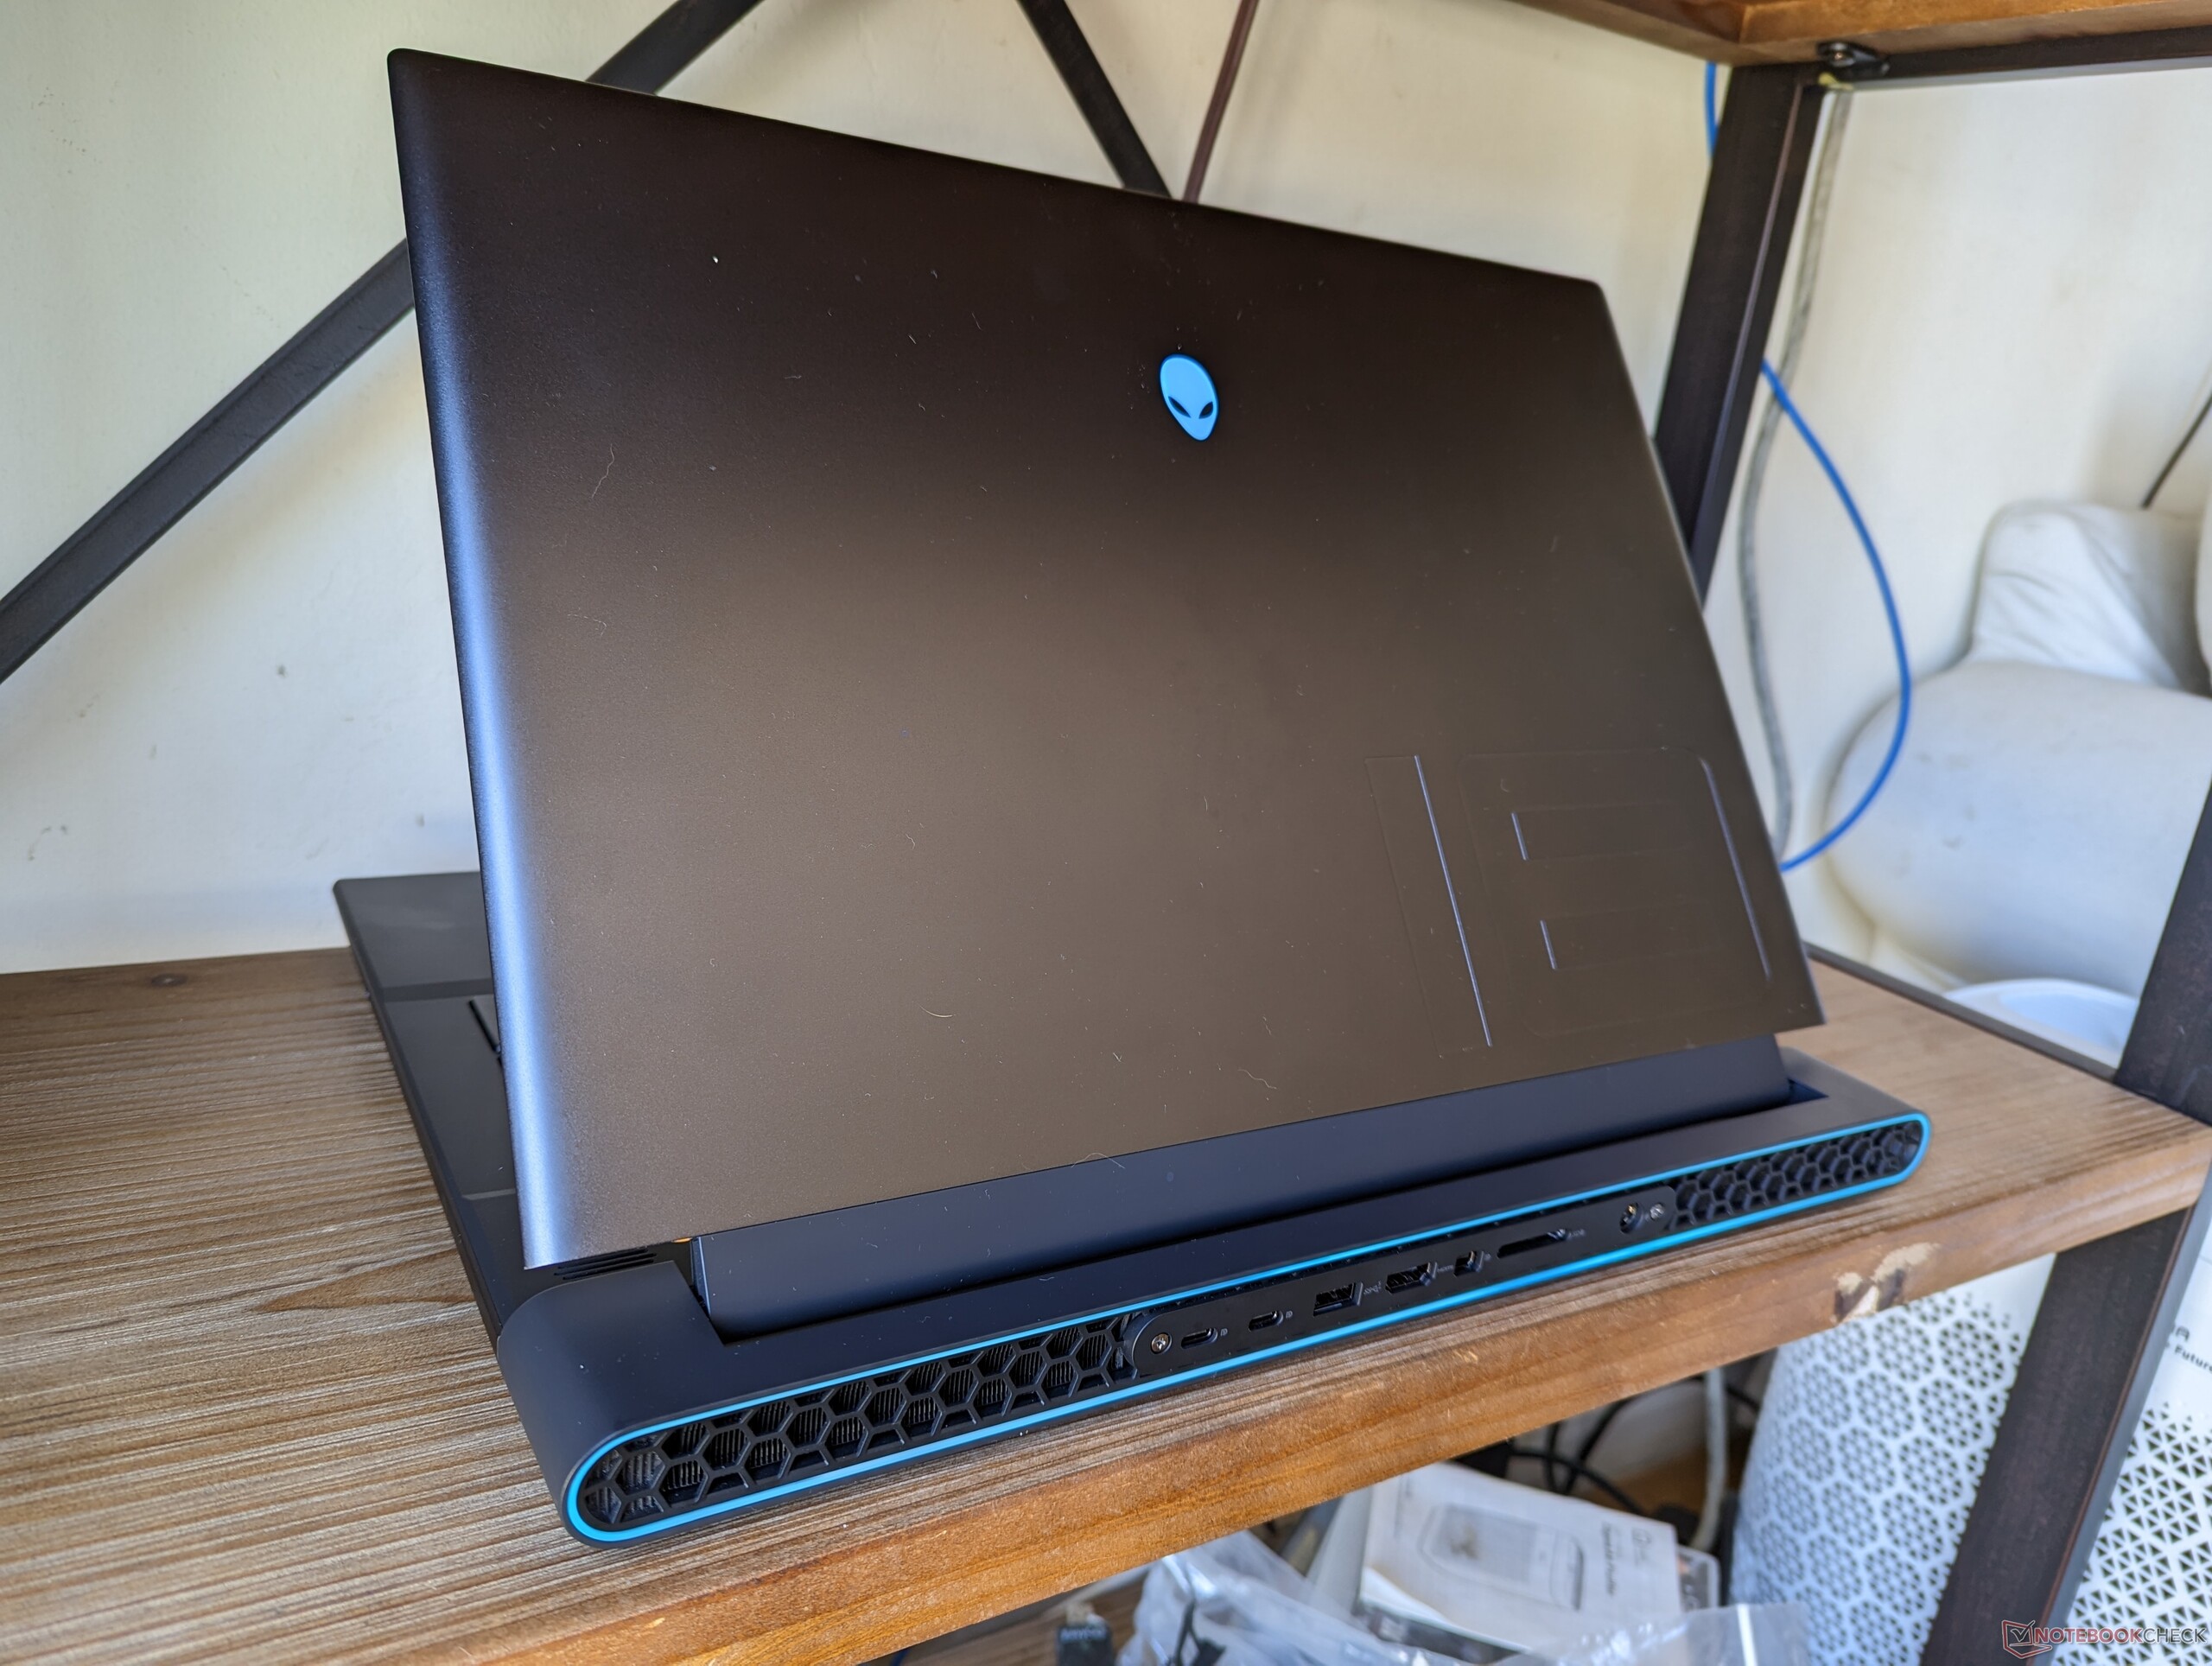
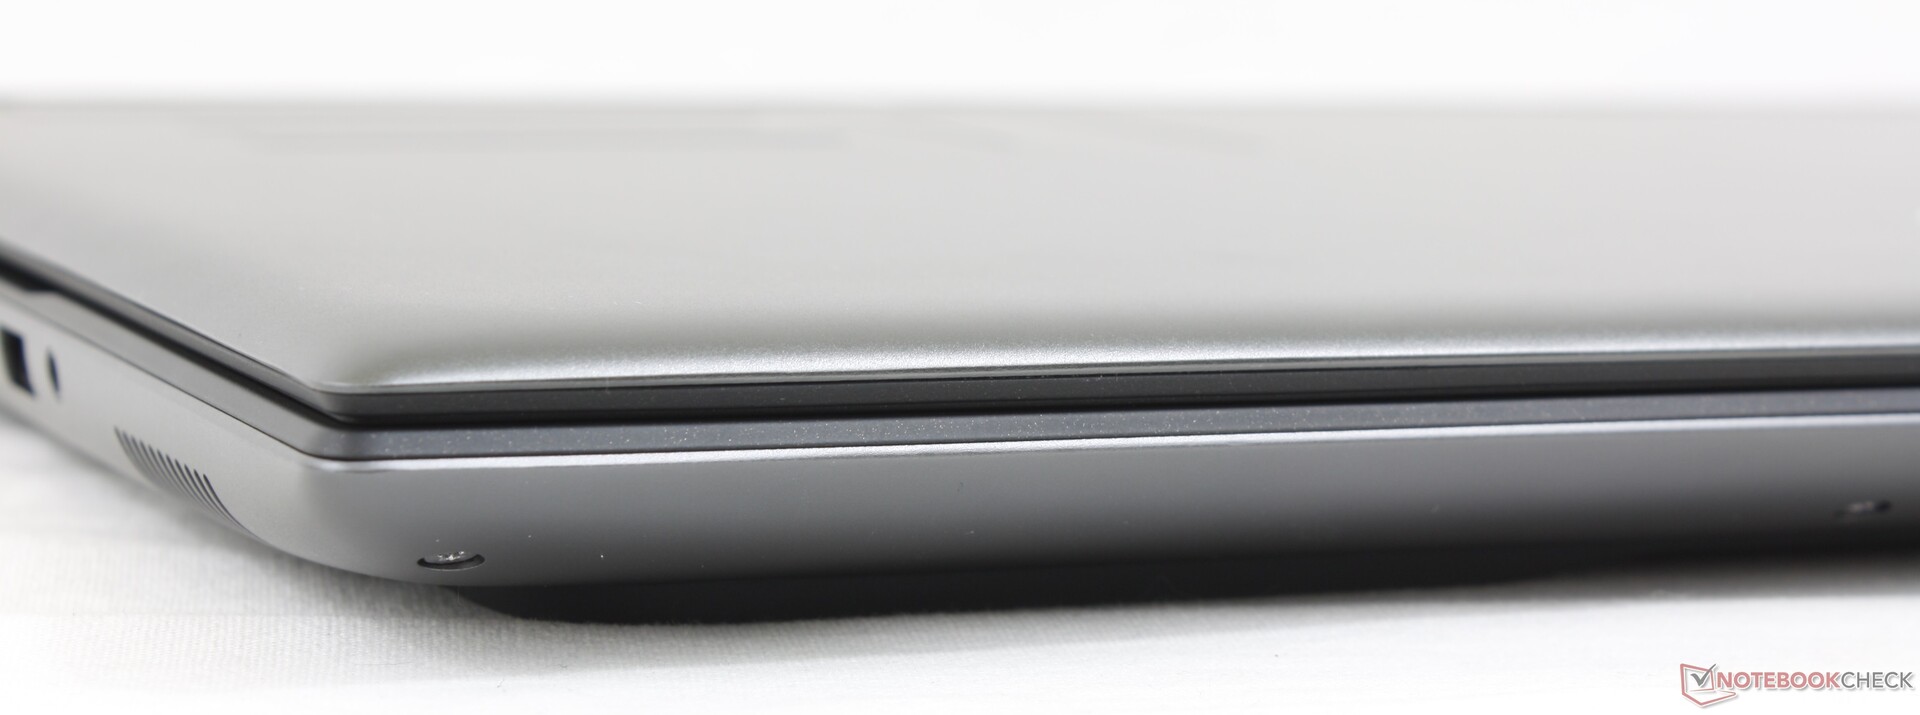
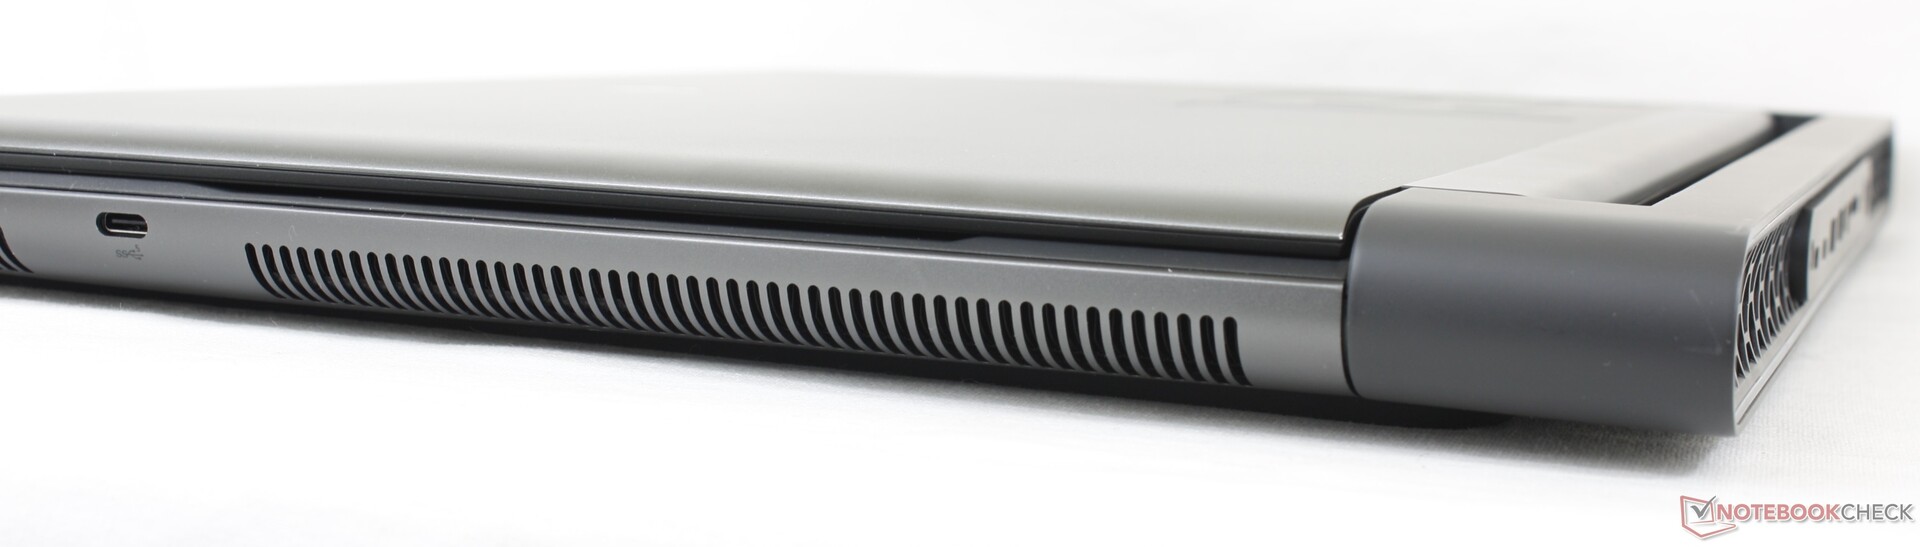
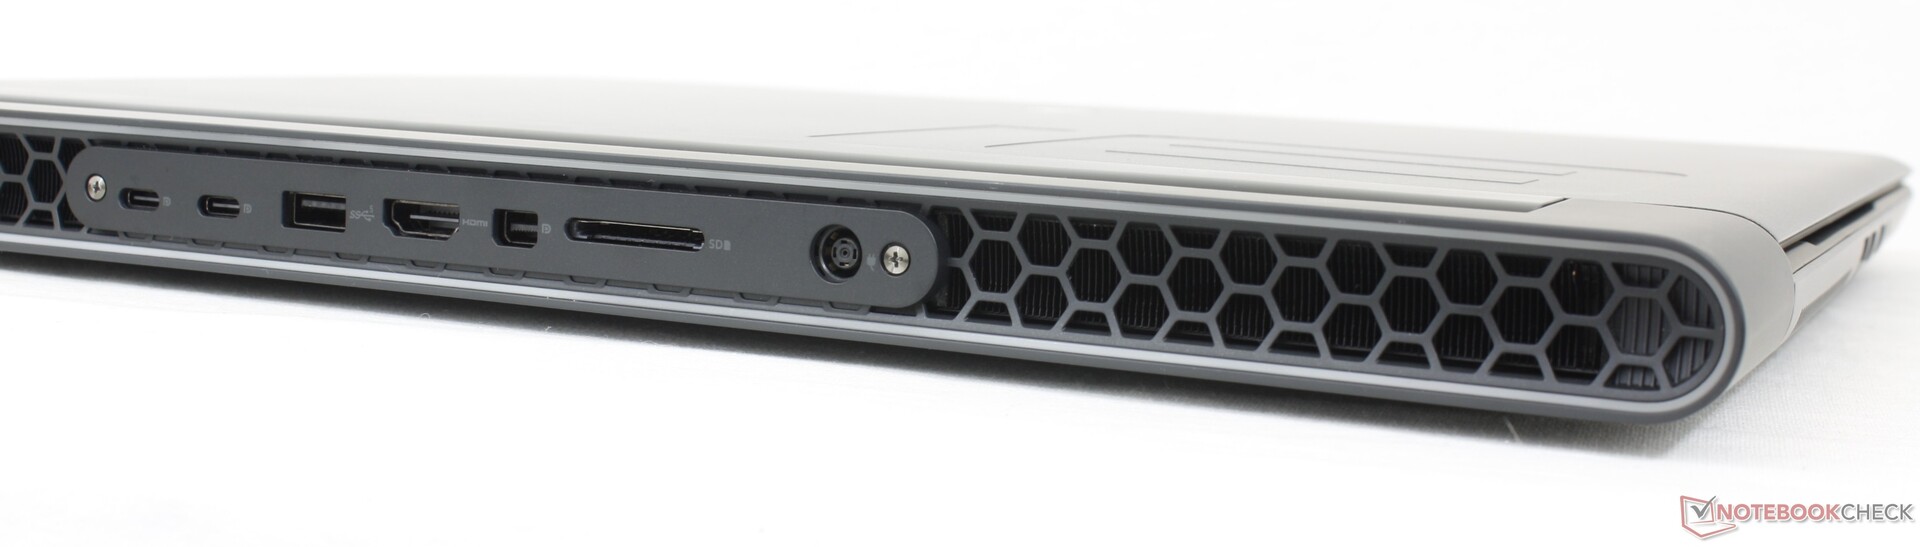
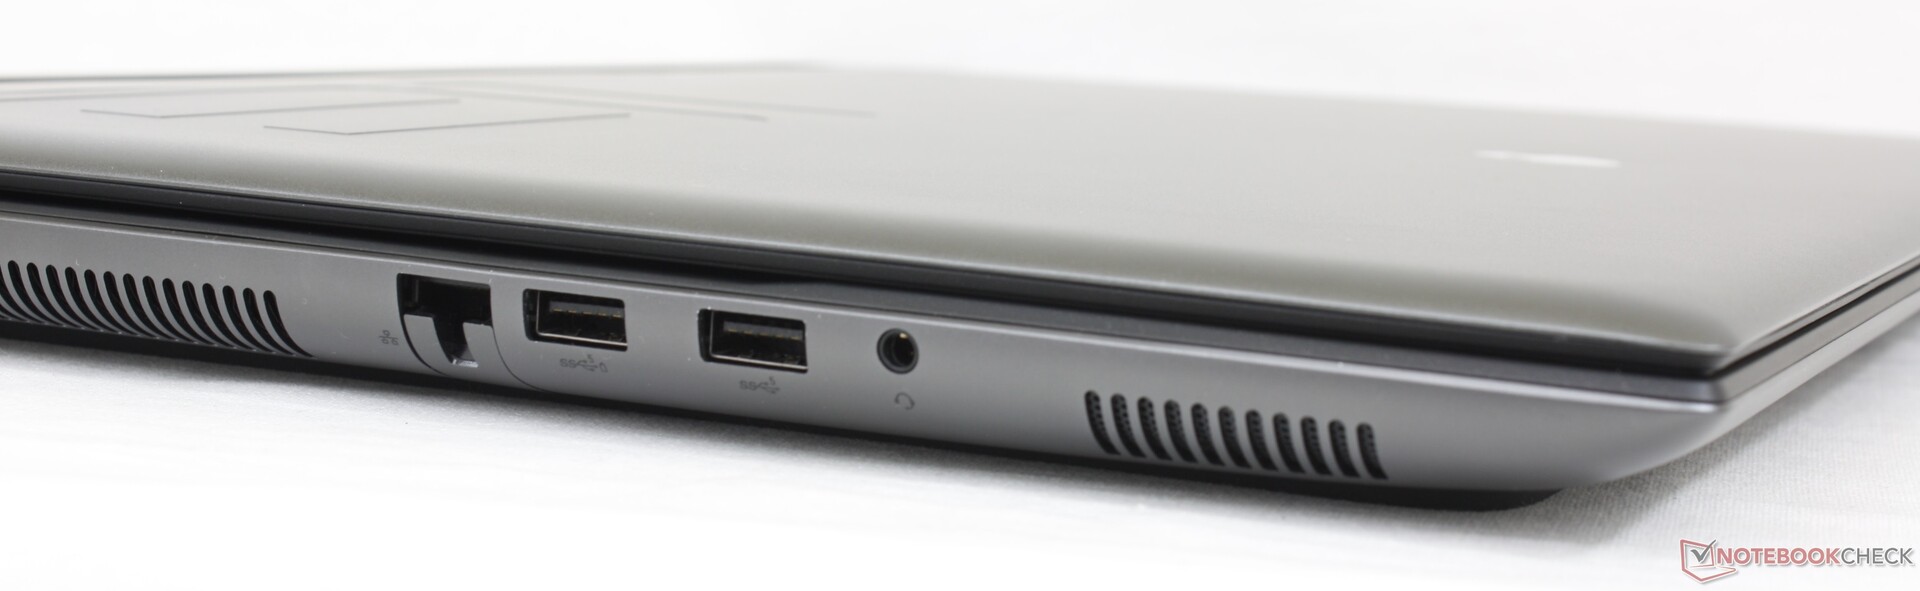
Connettività - Più del solito
L'Alienware dispone di un maggior numero di porte integrate rispetto al Razer Blade 18 o all'Asus ROG Strix Scar 18. Il problema, tuttavia, è che la maggior parte delle porte è strettamente impacchettata lungo il bordo posteriore, il che rende un po' più difficile l'accesso.
I monitor USB-C sono supportati solo dalle due porte USB-C posteriori, mentre la terza porta USB-C lungo il bordo destro non supporta l'uscita video.
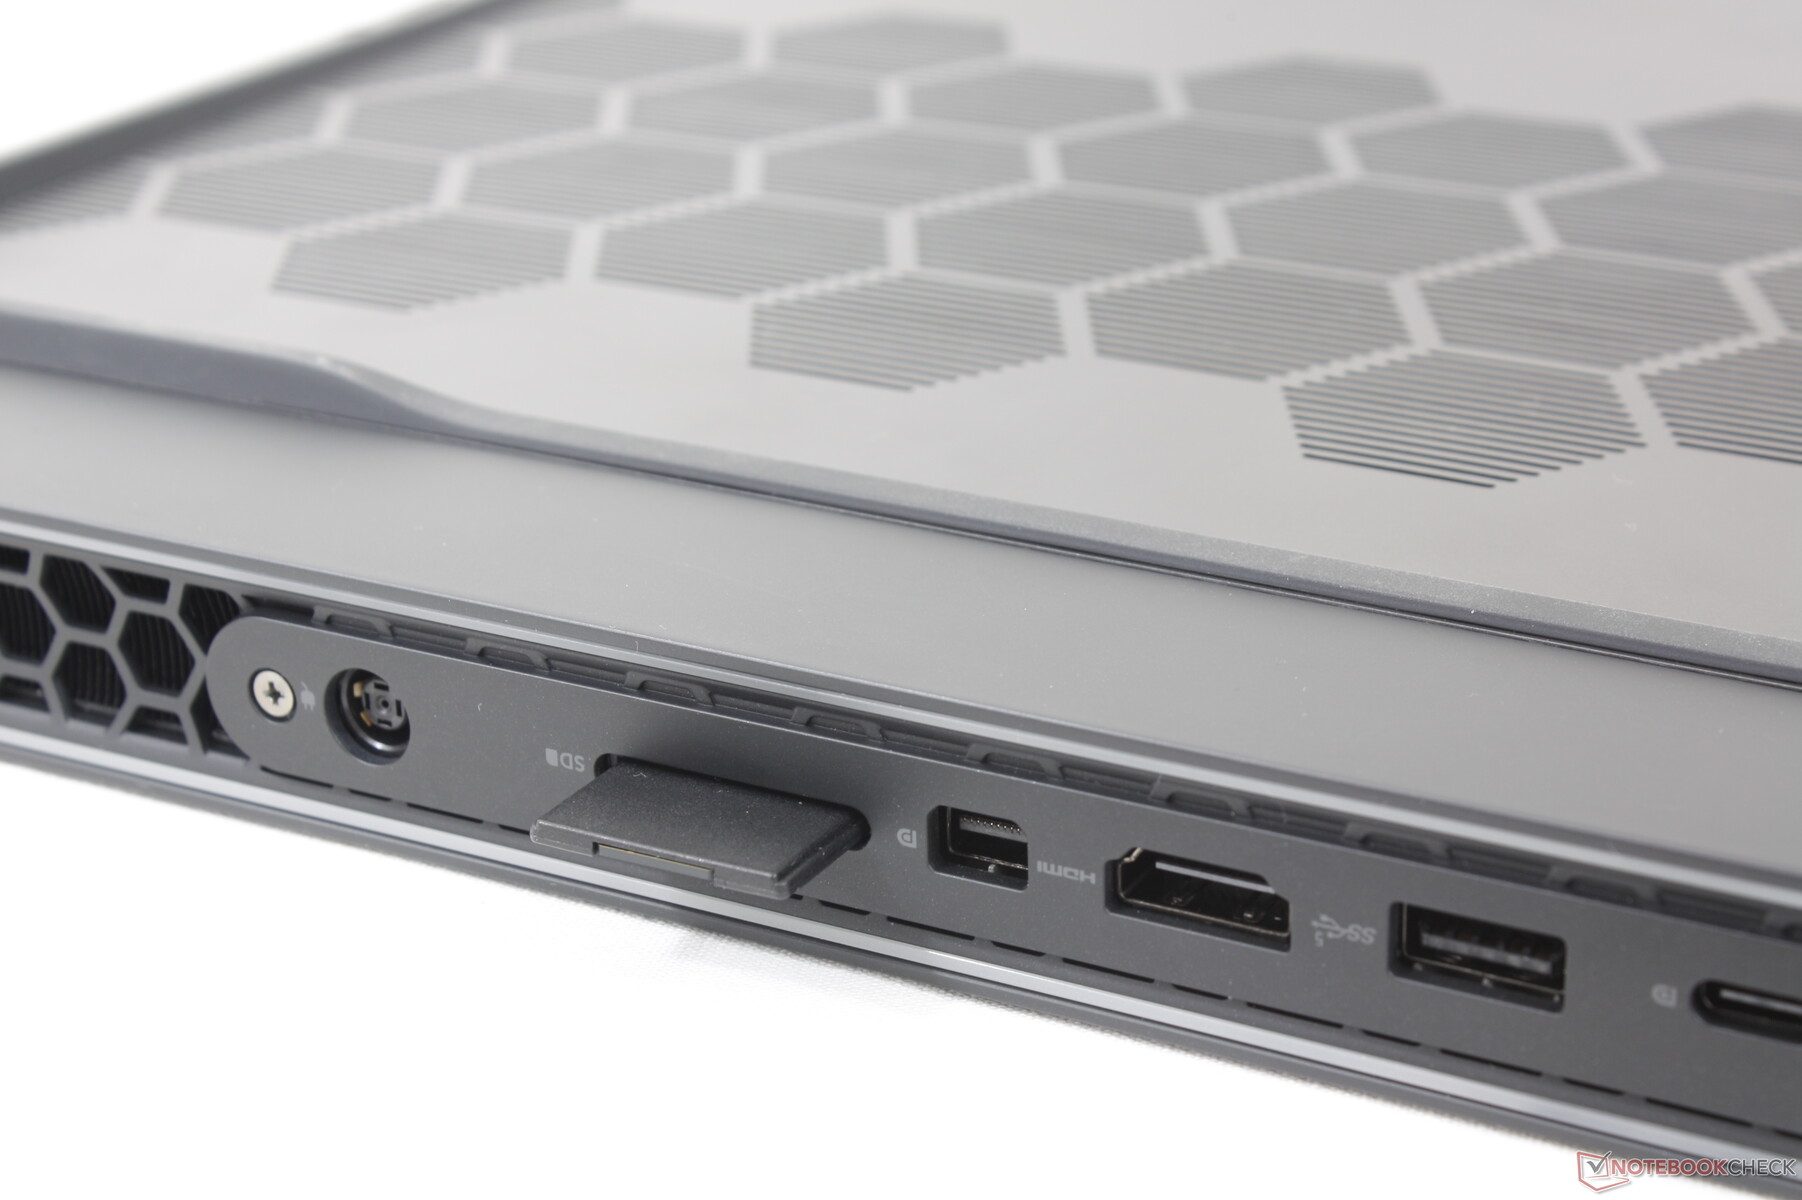
Lettore di schede SD
Il lettore di schede SD integrato si trova sul retro dell'unità, a differenza della maggior parte degli altri portatili. La velocità di trasferimento è comunque molto elevata, oltre due volte superiore a quella dell'MSI Titan GT77 MSI Titan GT77.
| SD Card Reader | |
| average JPG Copy Test (av. of 3 runs) | |
| Razer Blade 18 RTX 4070 (Angelibird AV Pro V60) | |
| Alienware m18 R1 (Angelibird AV Pro V60) | |
| Alienware x17 R2 P48E (AV Pro V60) | |
| MSI Titan GT77 HX 13VI (Angelibird AV Pro V60) | |
| Eluktronics Mech-17 GP2 (Angelibird AV Pro V60) | |
| maximum AS SSD Seq Read Test (1GB) | |
| Alienware x17 R2 P48E (AV Pro V60) | |
| Alienware m18 R1 (Angelibird AV Pro V60) | |
| Razer Blade 18 RTX 4070 (Angelibird AV Pro V60) | |
| Eluktronics Mech-17 GP2 (Angelibird AV Pro V60) | |
| MSI Titan GT77 HX 13VI (Angelibird AV Pro V60) | |
Comunicazione
L'Intel Killer 1675i è dotato di serie di Wi-Fi 6E e Bluetooth 5.2. Killer è una sottomarca di Intel ottimizzata per i portatili da gioco e quindi il Killer 1675i è essenzialmente un Intel AX211. Le prestazioni sono eccellenti e affidabili se abbinate al nostro router di prova Asus AXE11000.
| Networking | |
| iperf3 transmit AX12 | |
| Alienware x17 R2 P48E | |
| iperf3 receive AX12 | |
| Alienware x17 R2 P48E | |
| iperf3 transmit AXE11000 | |
| MSI Titan GT77 HX 13VI | |
| Asus ROG Strix Scar 18 2023 G834JY-N6005W | |
| Eluktronics Mech-17 GP2 | |
| Alienware m18 R1 | |
| Razer Blade 18 RTX 4070 | |
| iperf3 receive AXE11000 | |
| Asus ROG Strix Scar 18 2023 G834JY-N6005W | |
| MSI Titan GT77 HX 13VI | |
| Razer Blade 18 RTX 4070 | |
| Eluktronics Mech-17 GP2 | |
| Alienware m18 R1 | |
| iperf3 transmit AXE11000 6GHz | |
| Alienware m18 R1 | |
| Razer Blade 18 RTX 4070 | |
| iperf3 receive AXE11000 6GHz | |
| Razer Blade 18 RTX 4070 | |
| Alienware m18 R1 | |
Webcam
La webcam da 2 MP è tipica della maggior parte dei portatili di oggi, ma siamo un po' delusi di non vedere un sensore da 5 MP viste le dimensioni dello chassis. L'IR è di serie, mentre l'otturatore della webcam è assente, a differenza di quello del Razer Blade 18.


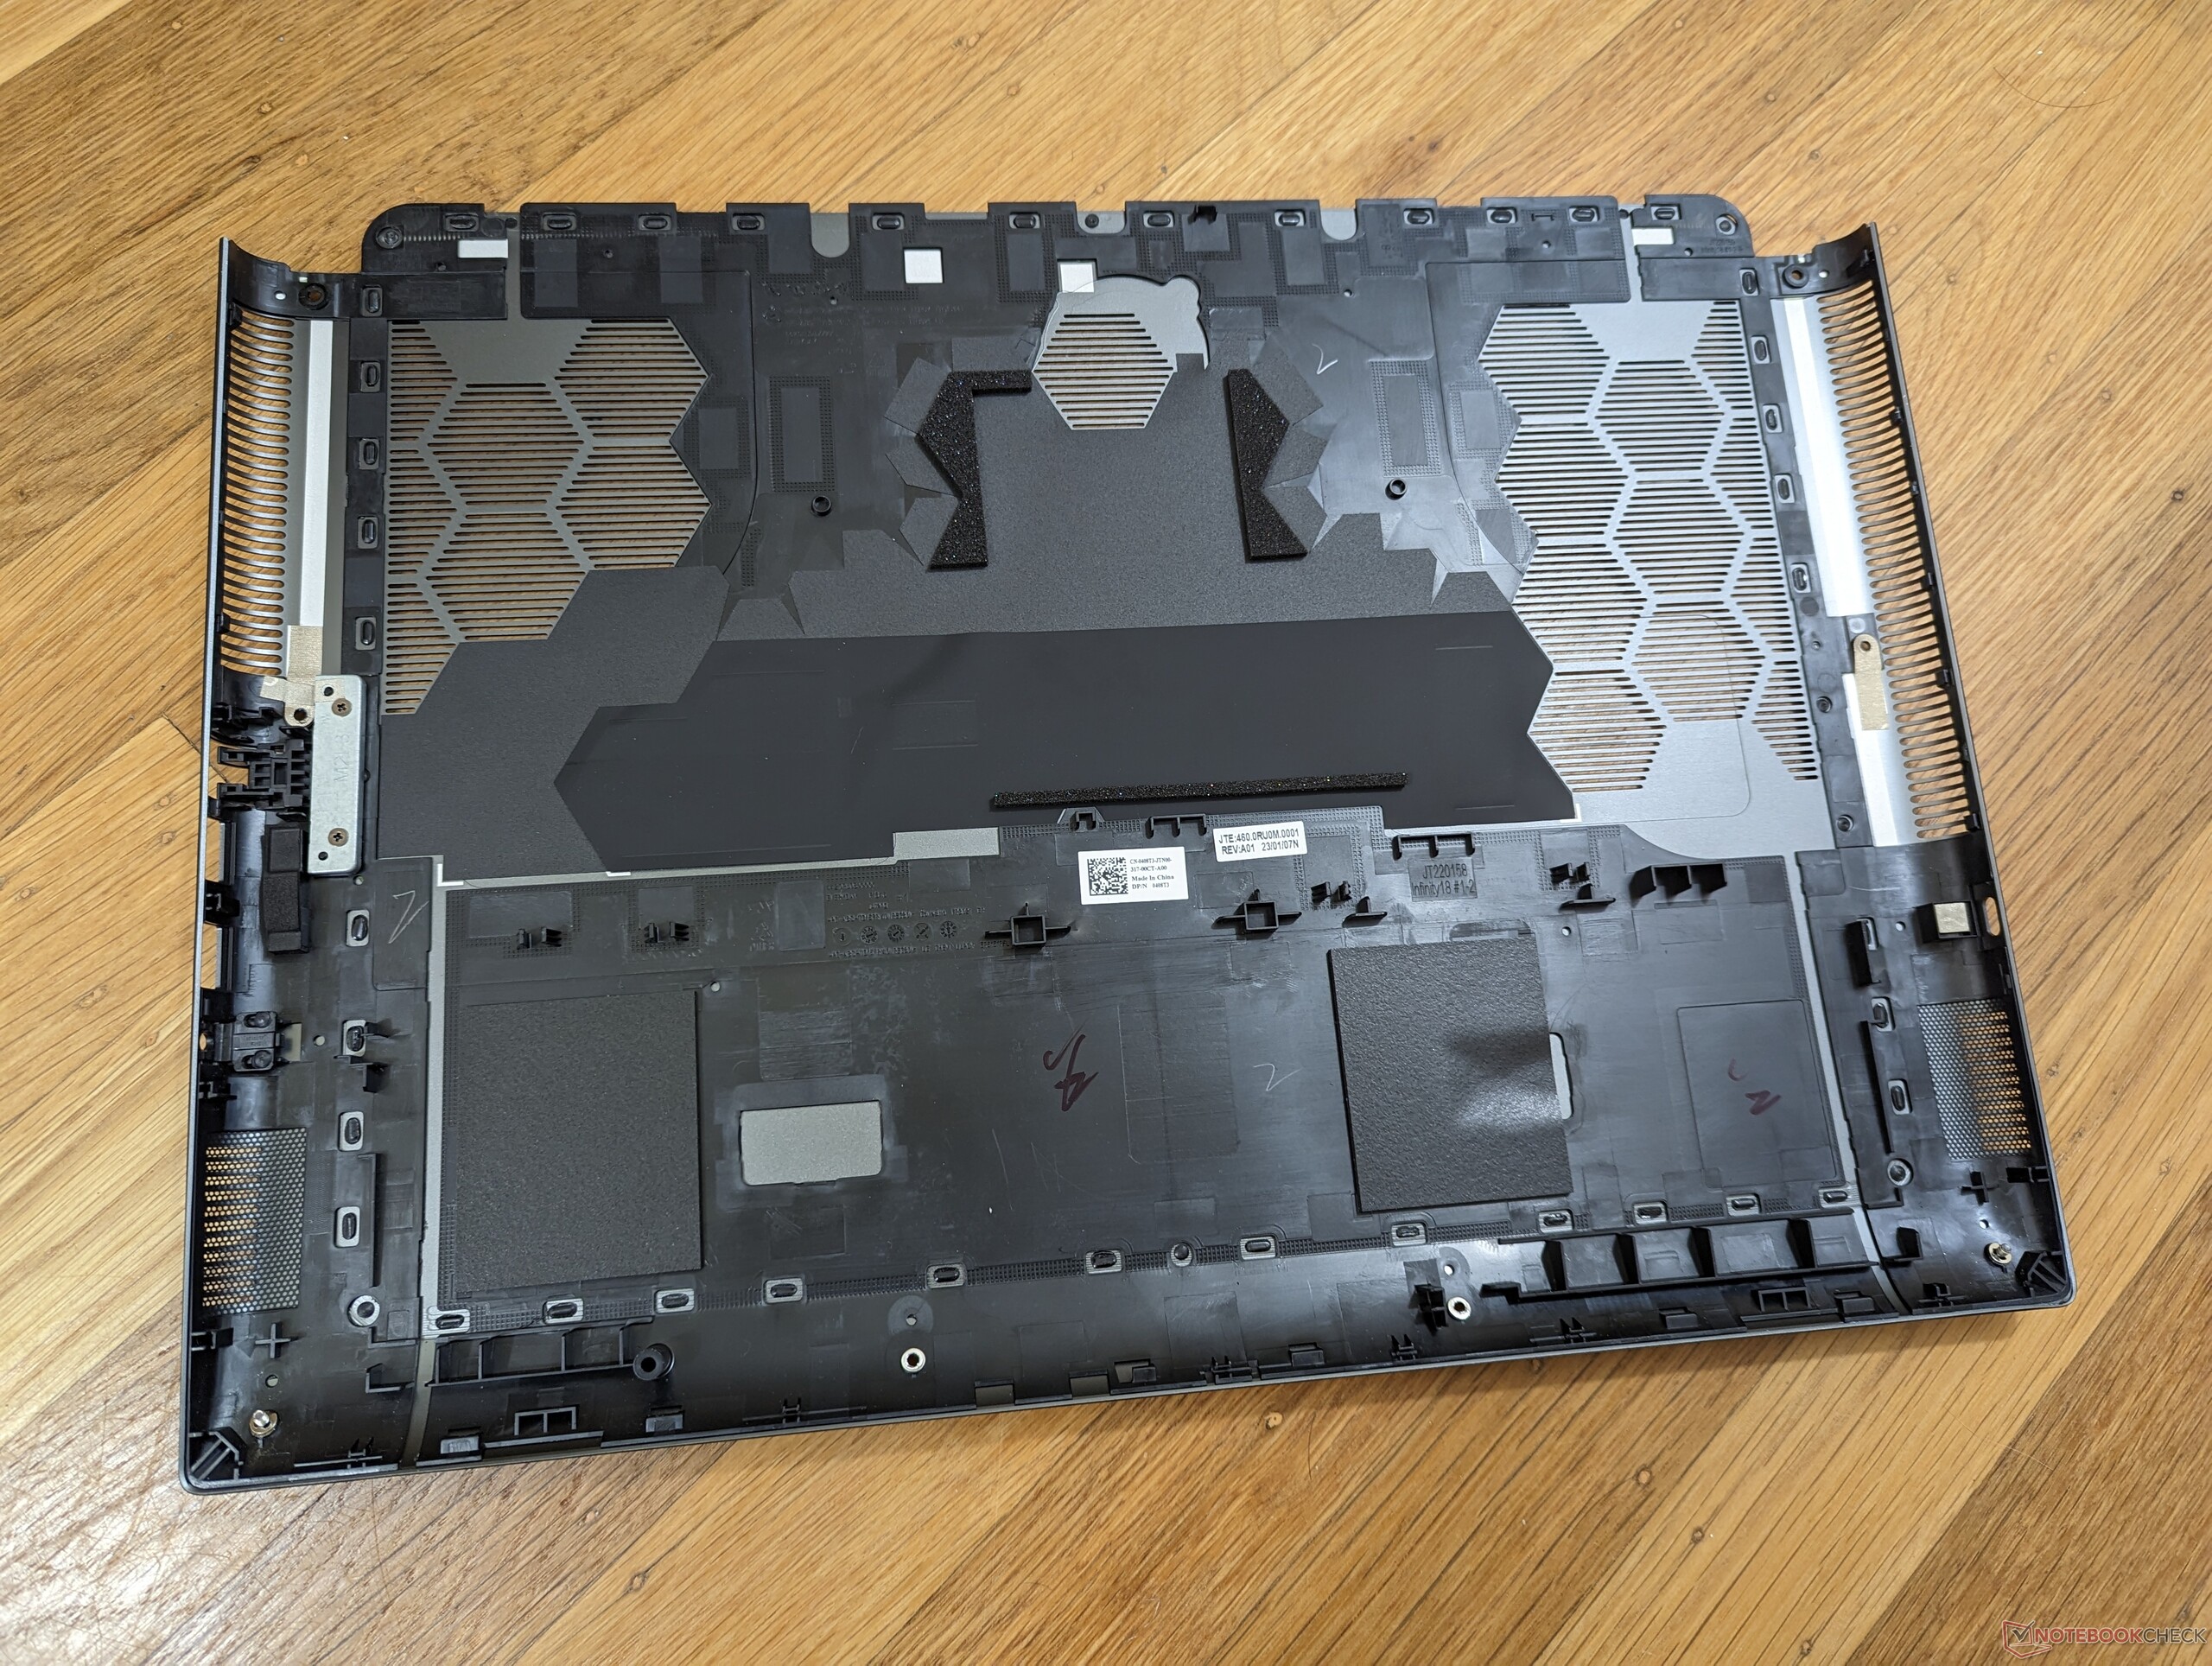
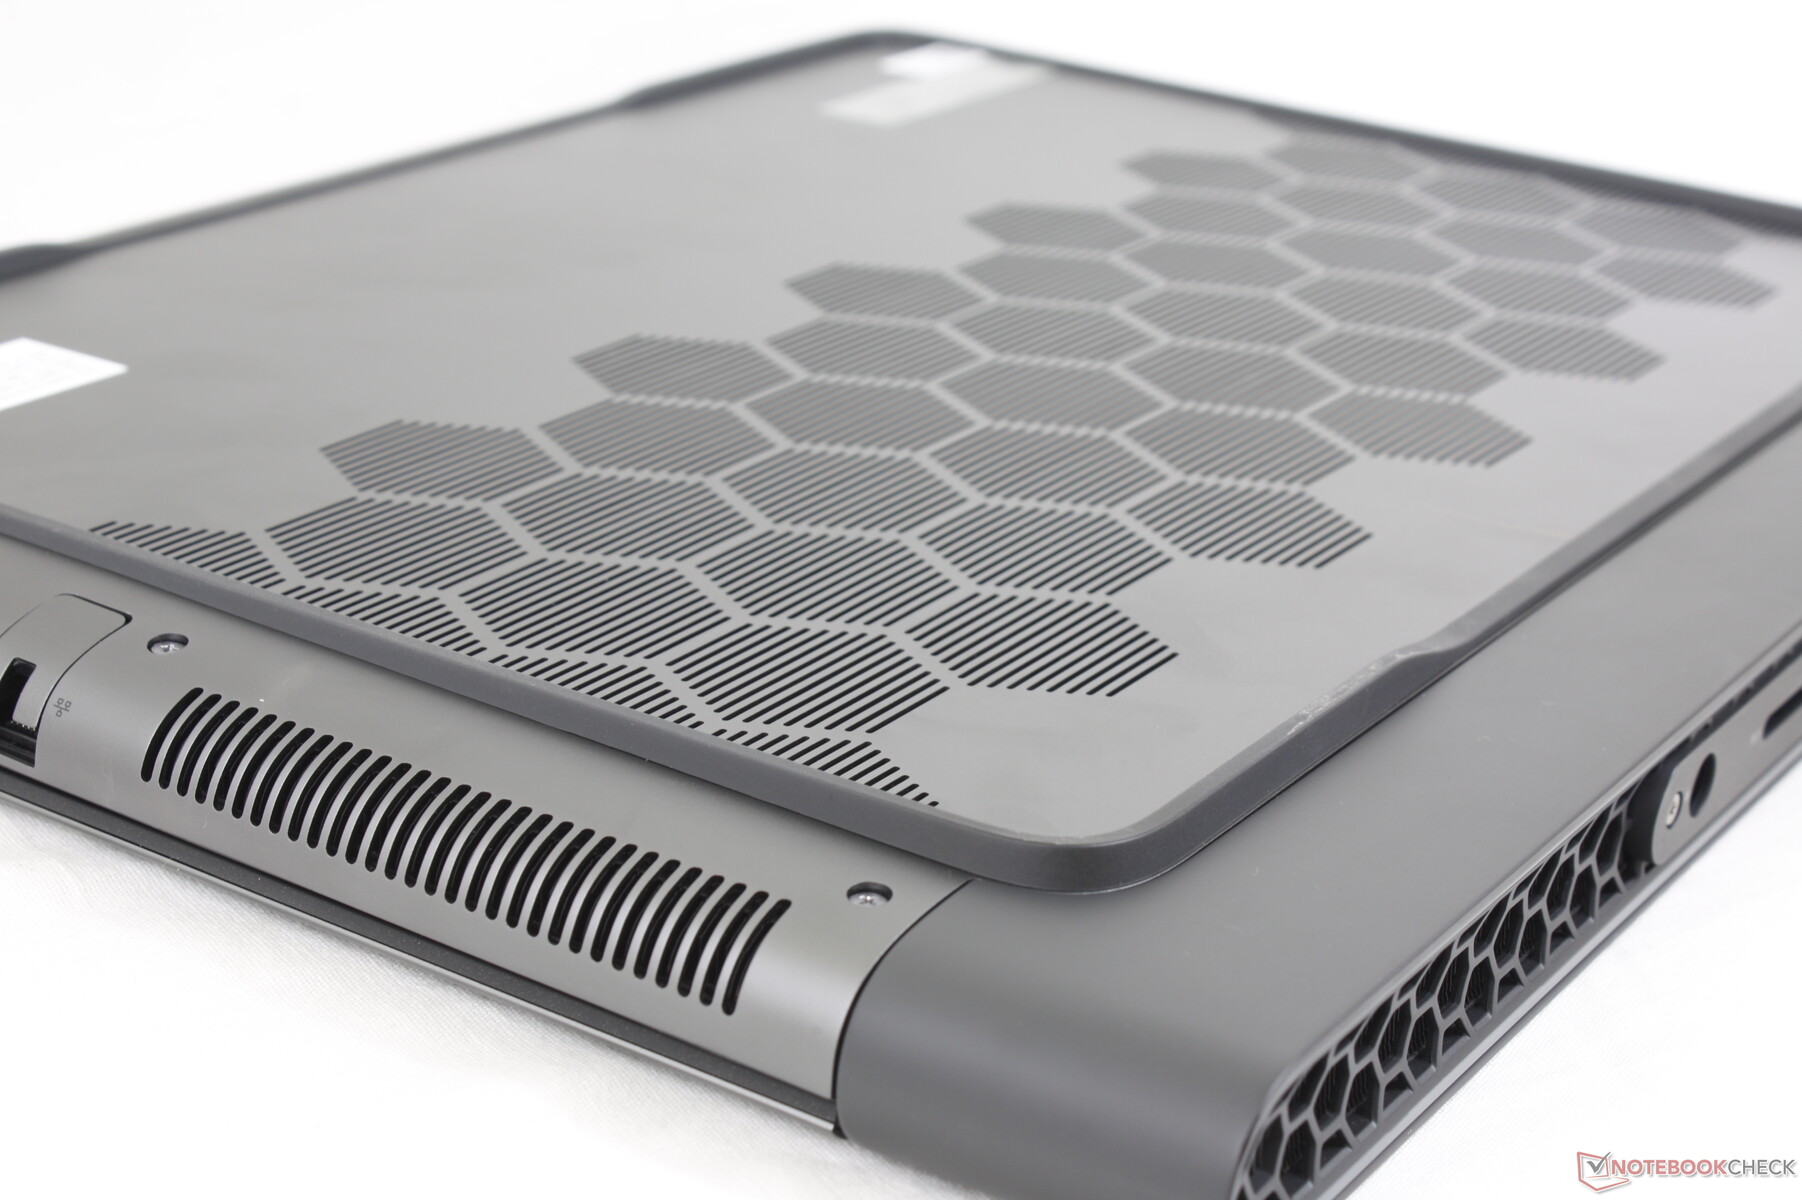
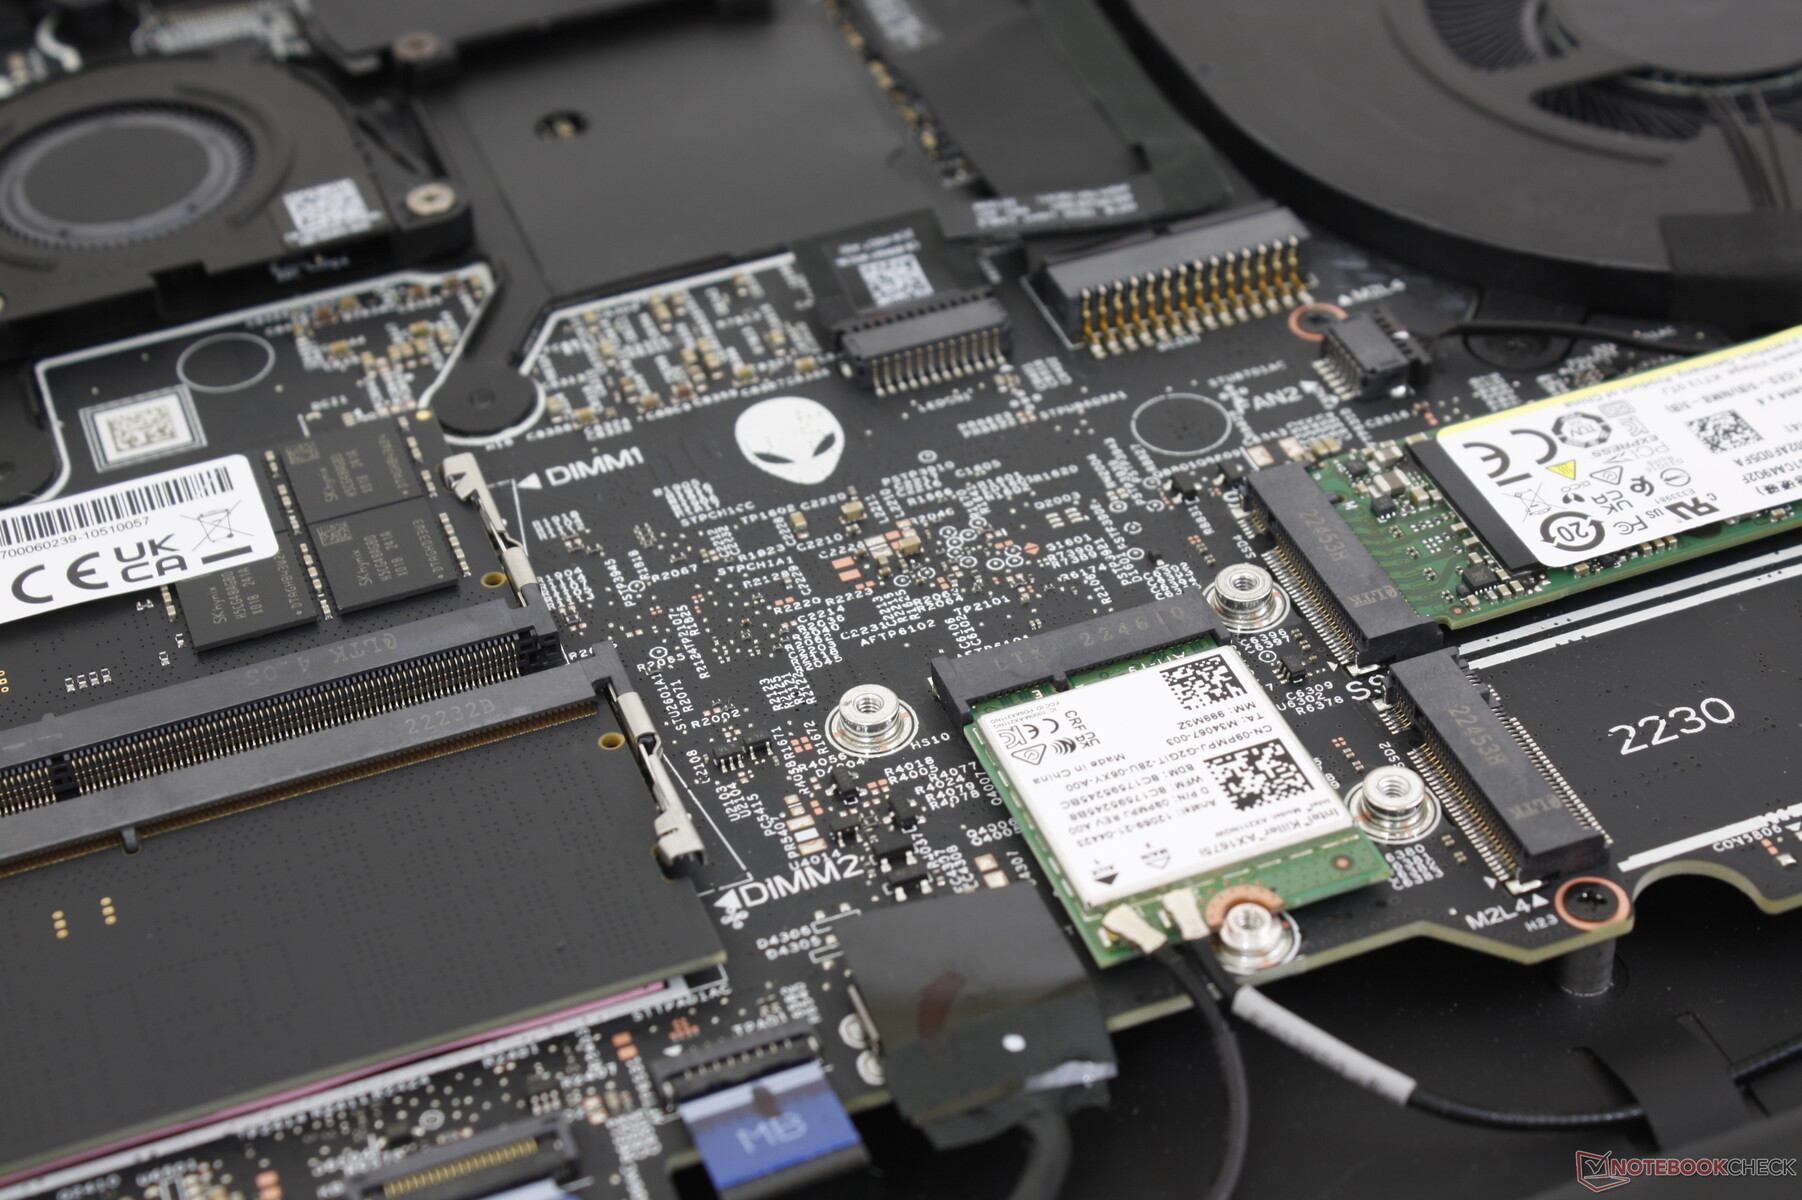
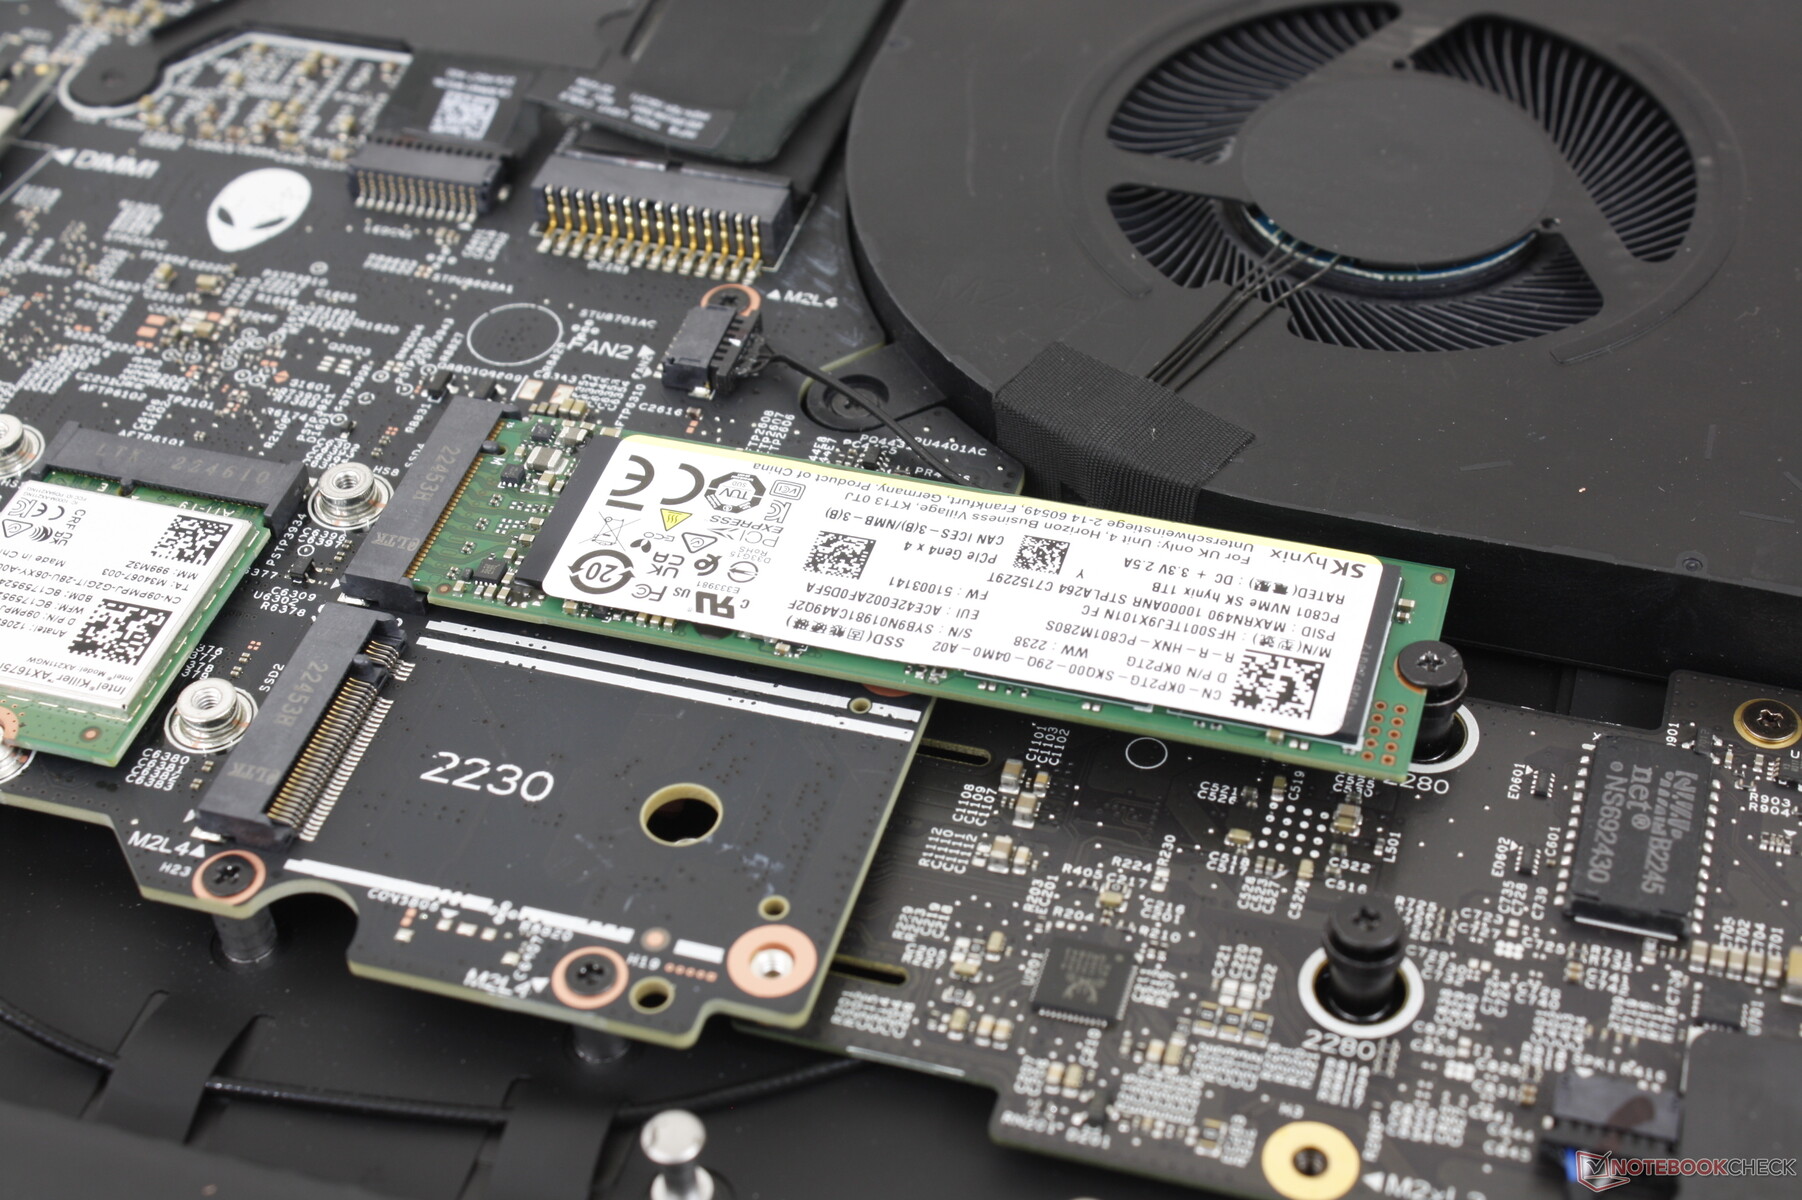
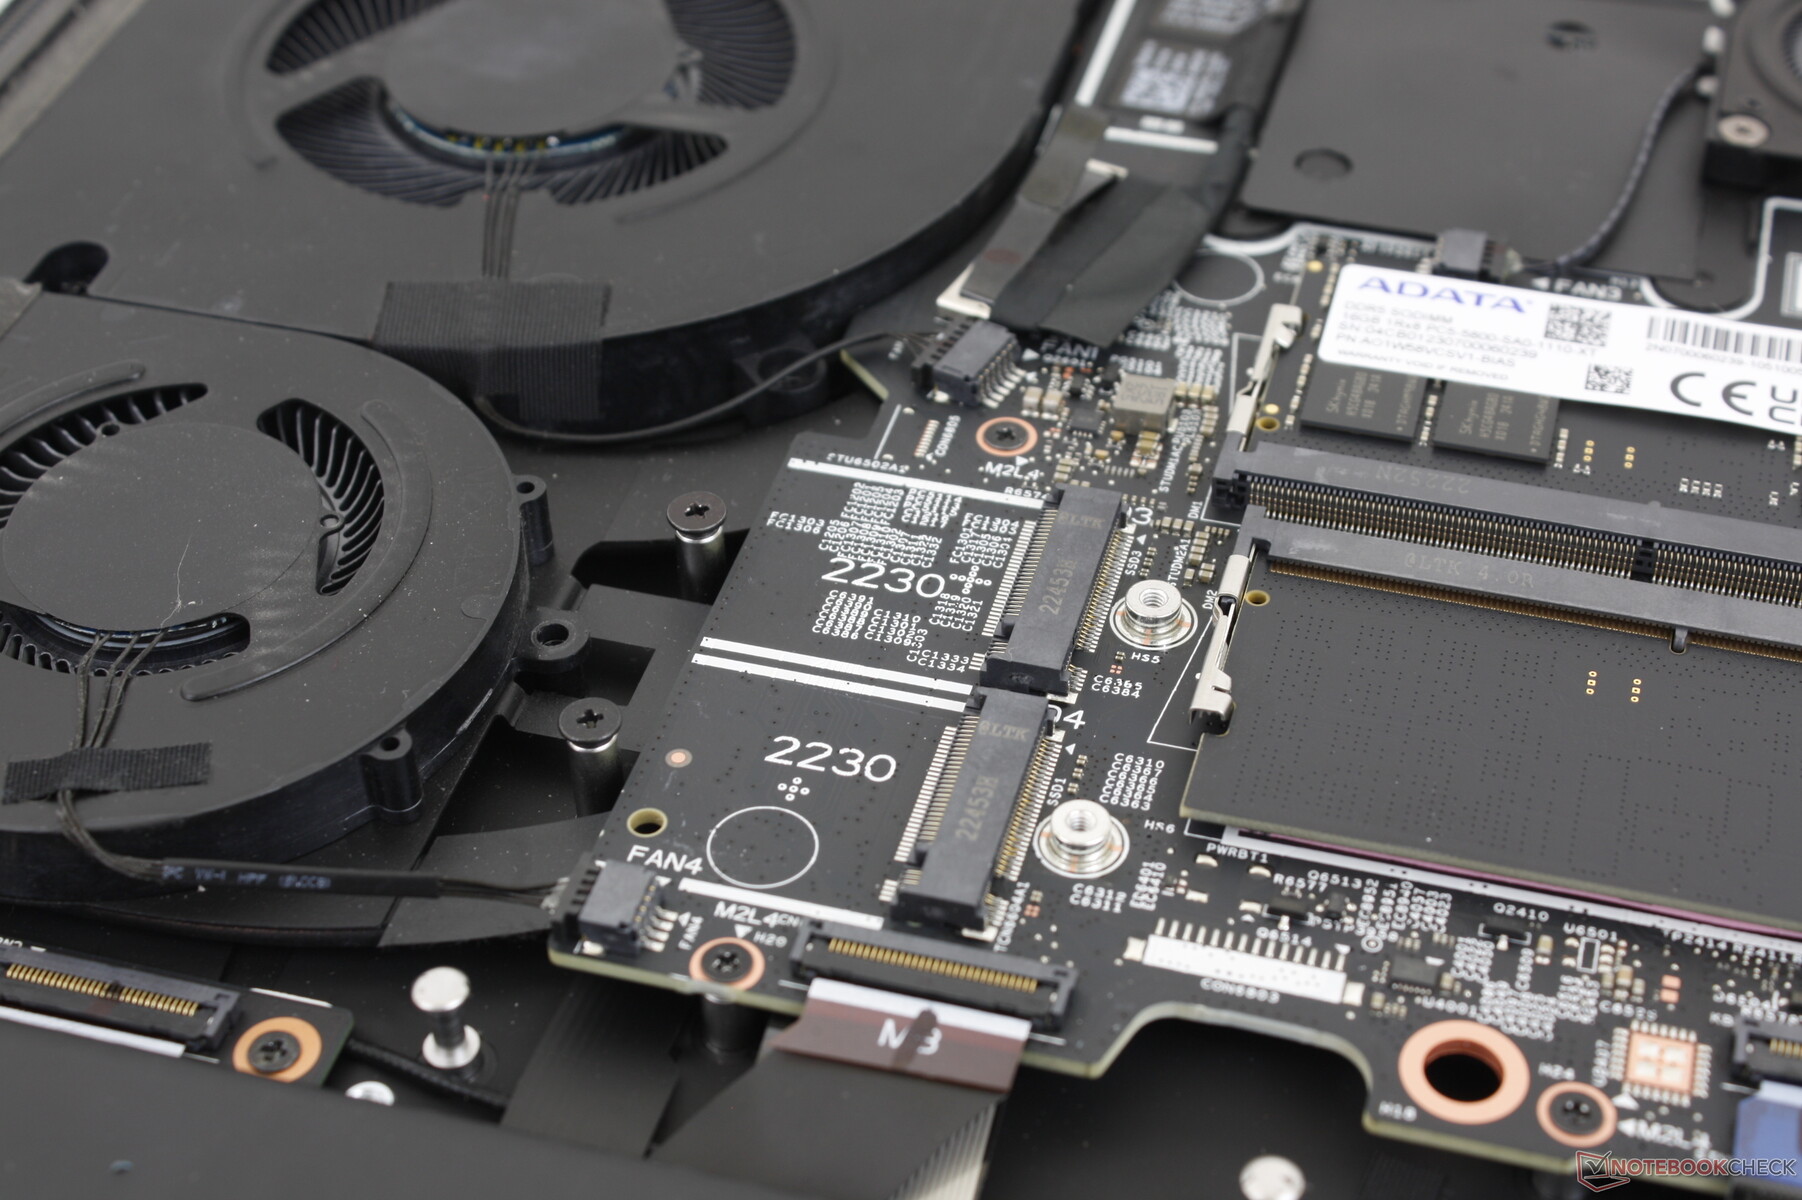
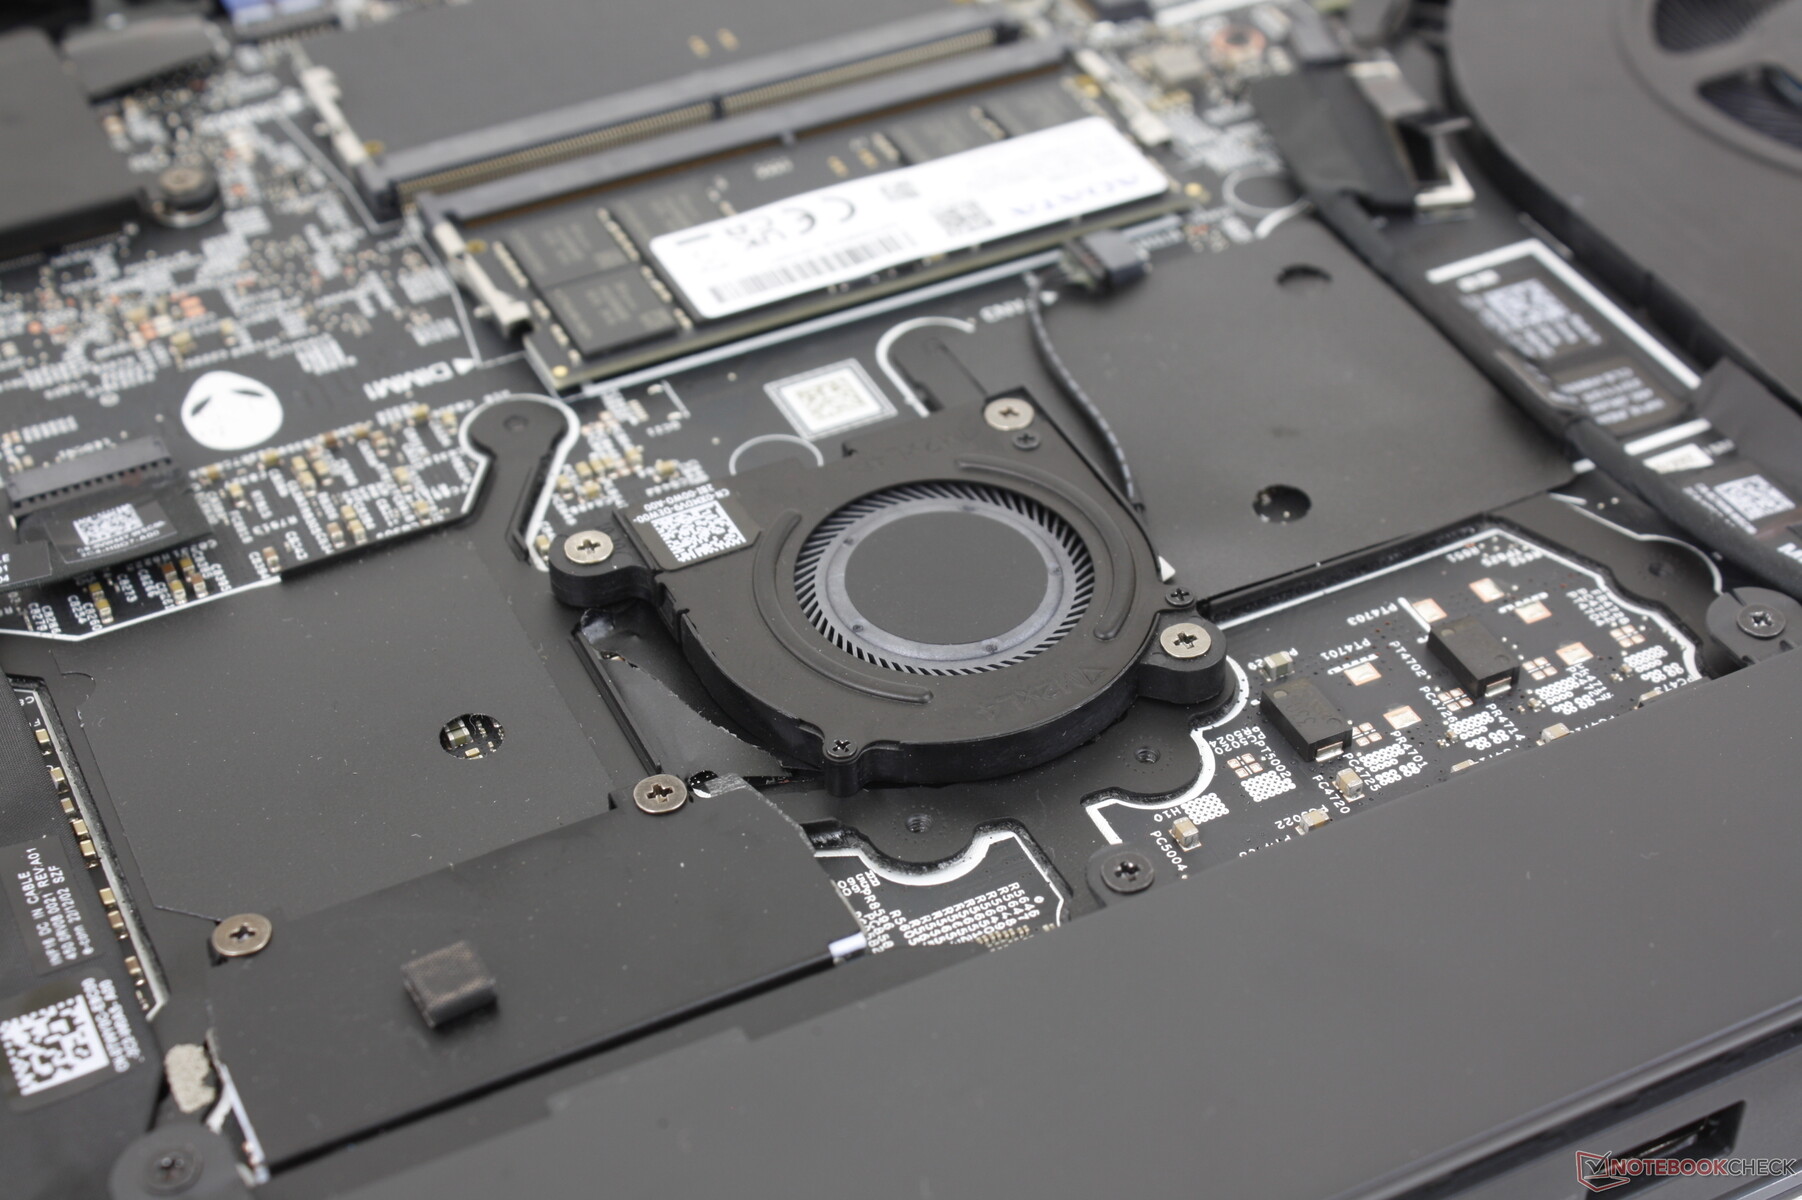
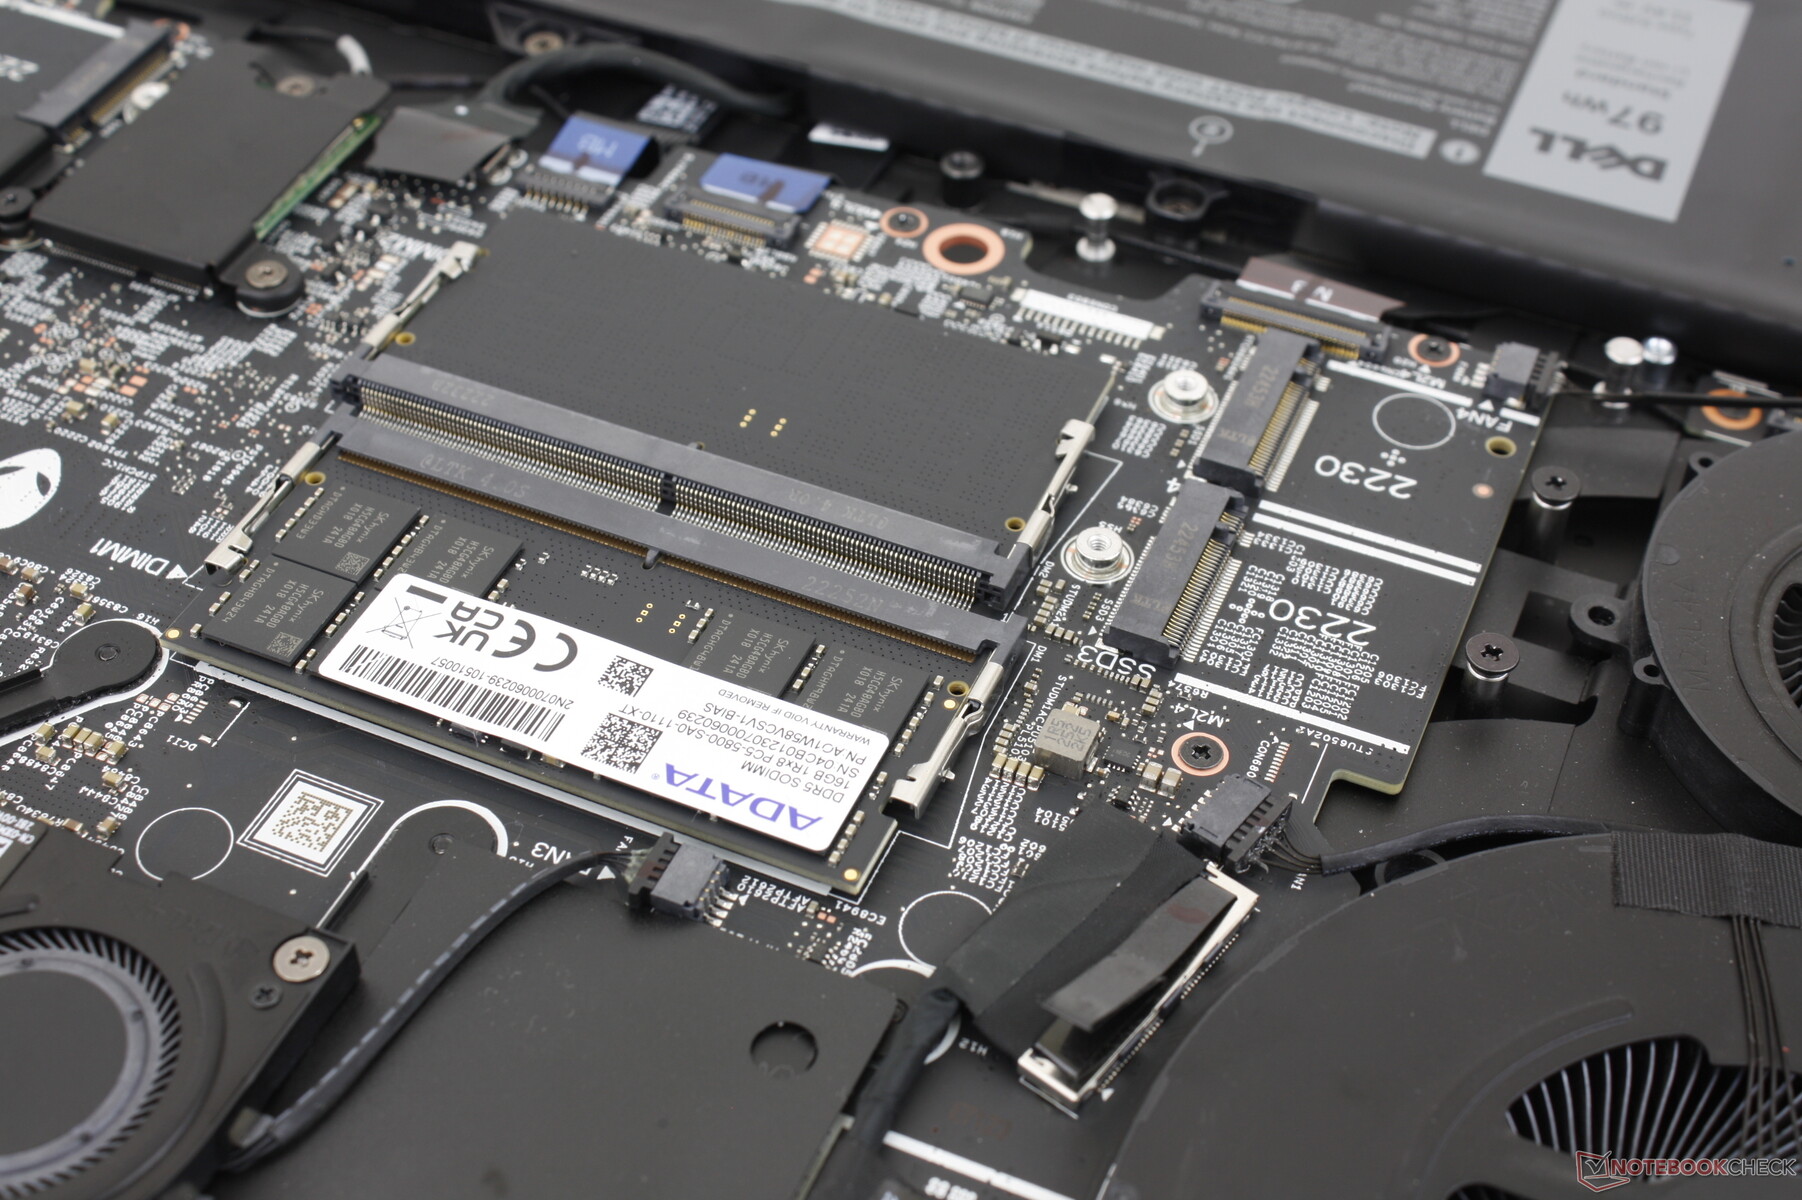
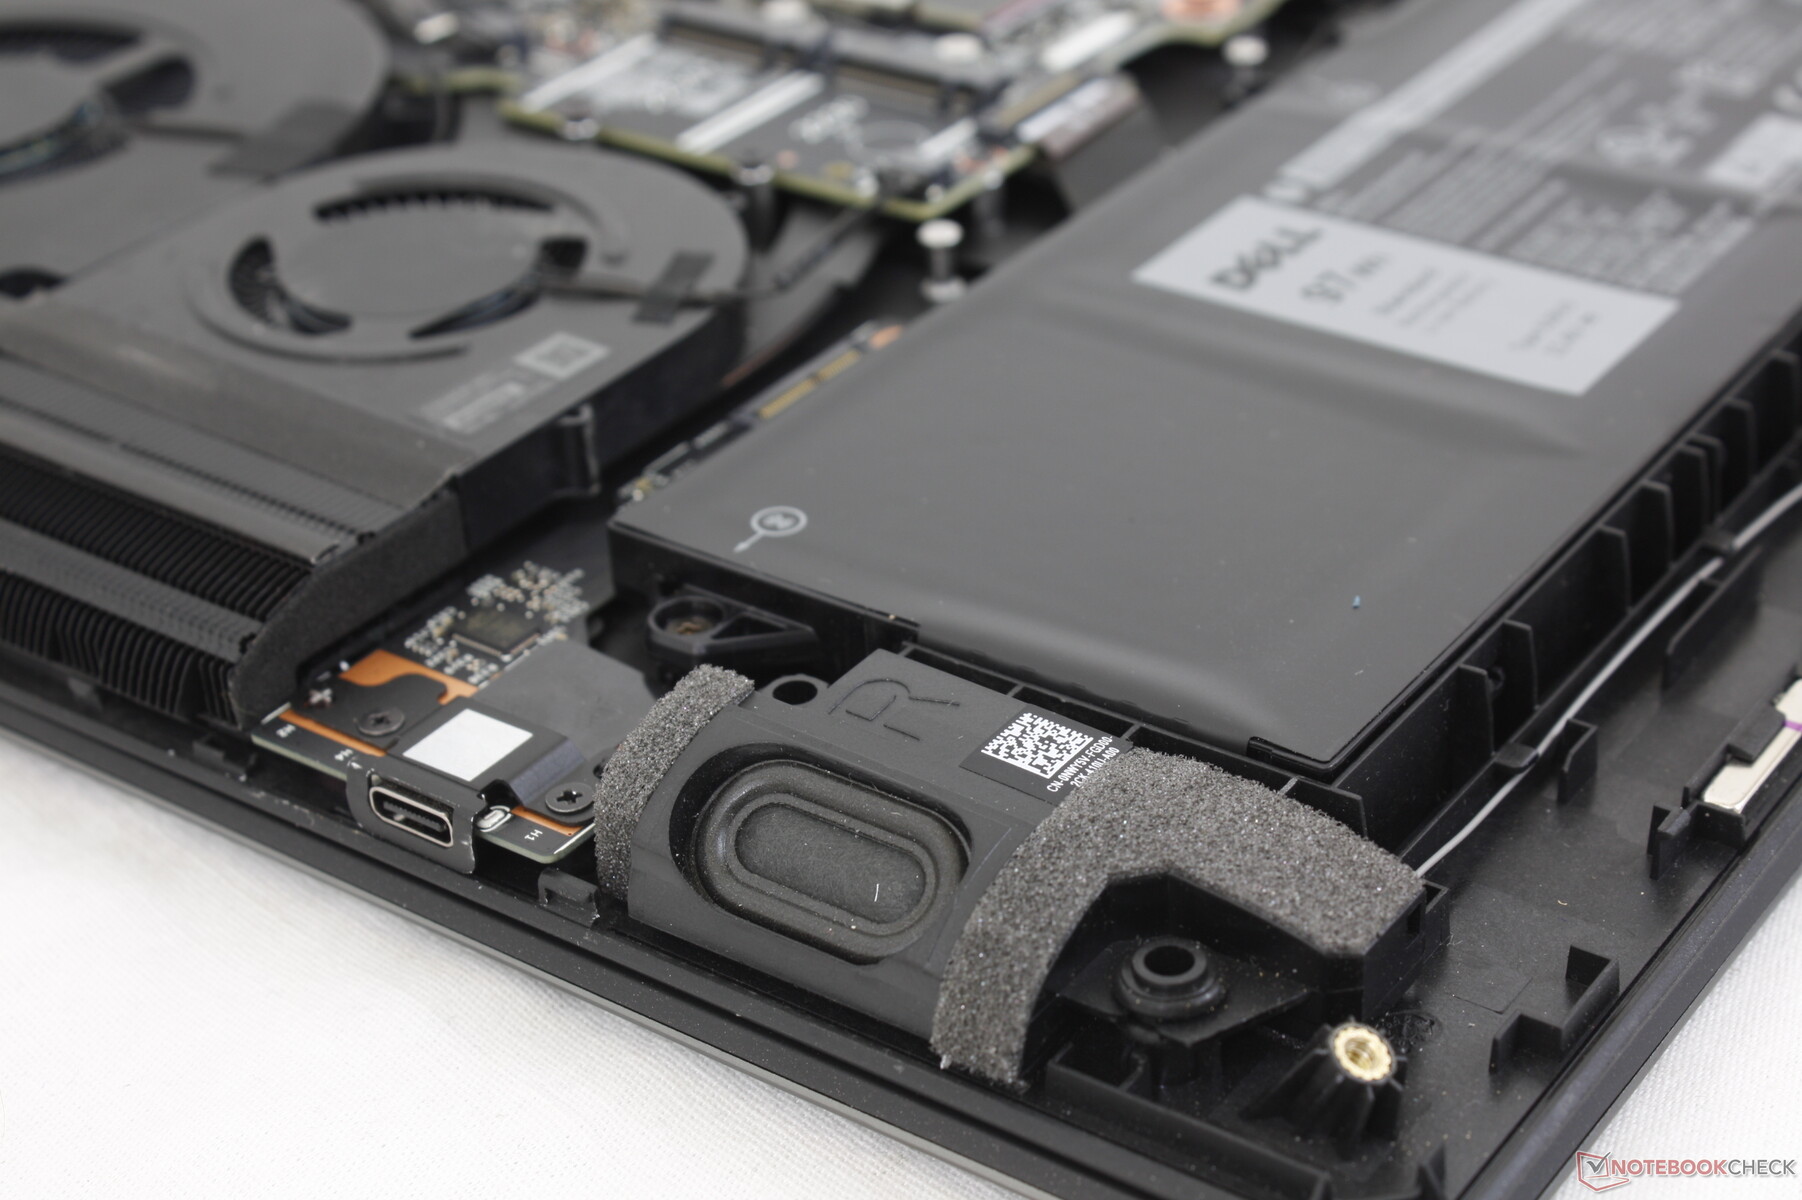
Manutenzione
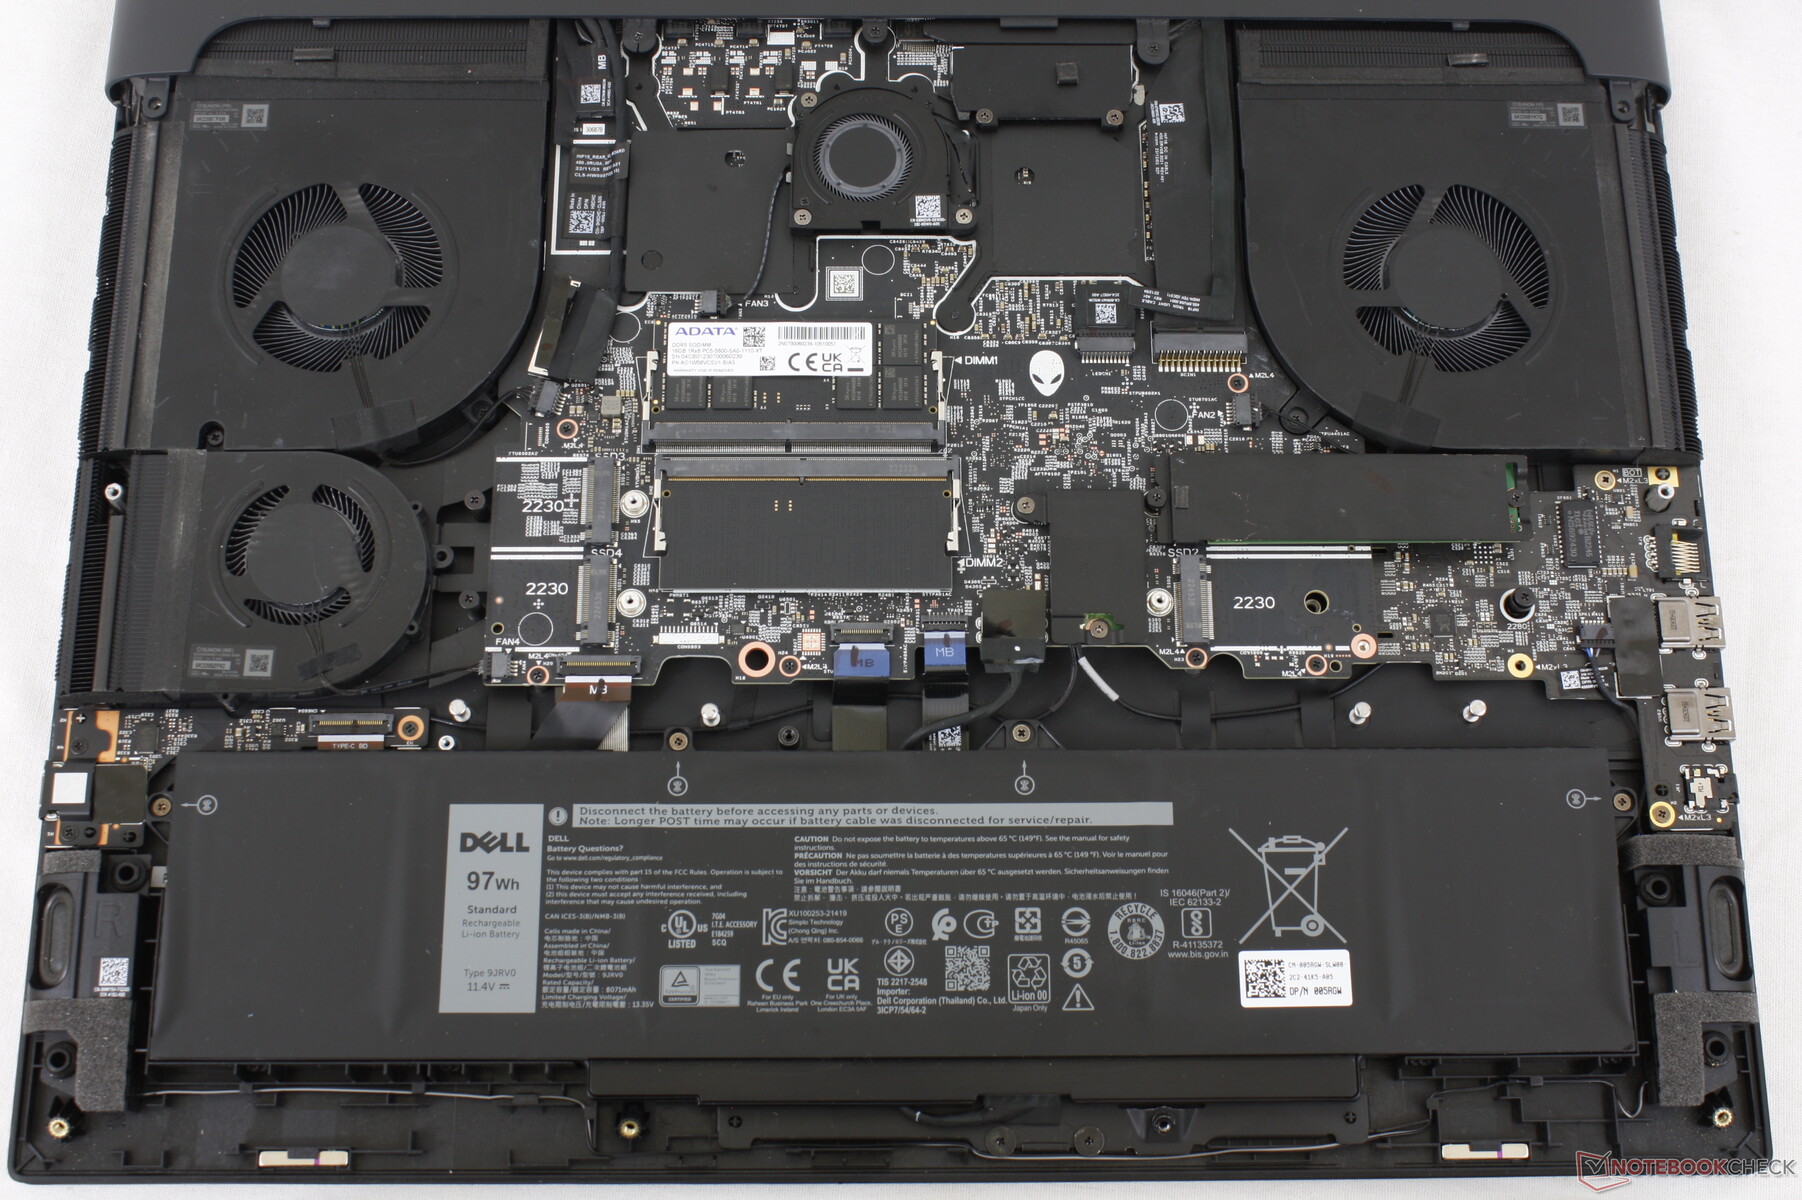
Il pannello inferiore si toglie molto facilmente con un semplice cacciavite Philips. In confronto, il pannello inferiore del nuovo MSI GE78 richiede un maggior numero di operazioni e lo strappo di un adesivo anti-manomissione.
Gli utenti hanno accesso diretto alla batteria, al modulo WLAN rimovibile, a 4 slot SSD M.2 e a 2 slot SODIMM DDR5. Questo è uno dei pochissimi portatili con supporto per quattro unità SSD NVMe interne (2x M.2 2230 + 2x M.2 2280). Sarebbe stato interessante vedere CAMM invece di SODIMM, soprattutto perché Dell ha sostenuto la tecnologia RAM più veloce.
Accessori e garanzia
Nella confezione non ci sono altri extra oltre all'adattatore CA e alla documentazione. Si noti che Dell ha abbandonato la porta docking proprietaria Alienware e quindi la vecchia docking station Alienware eGPU non è più supportata.
La garanzia standard limitata di un anno è valida se acquistata negli Stati Uniti.
Dispositivi di input - Tastiera confortevole, touchpad spugnoso
Tastiera
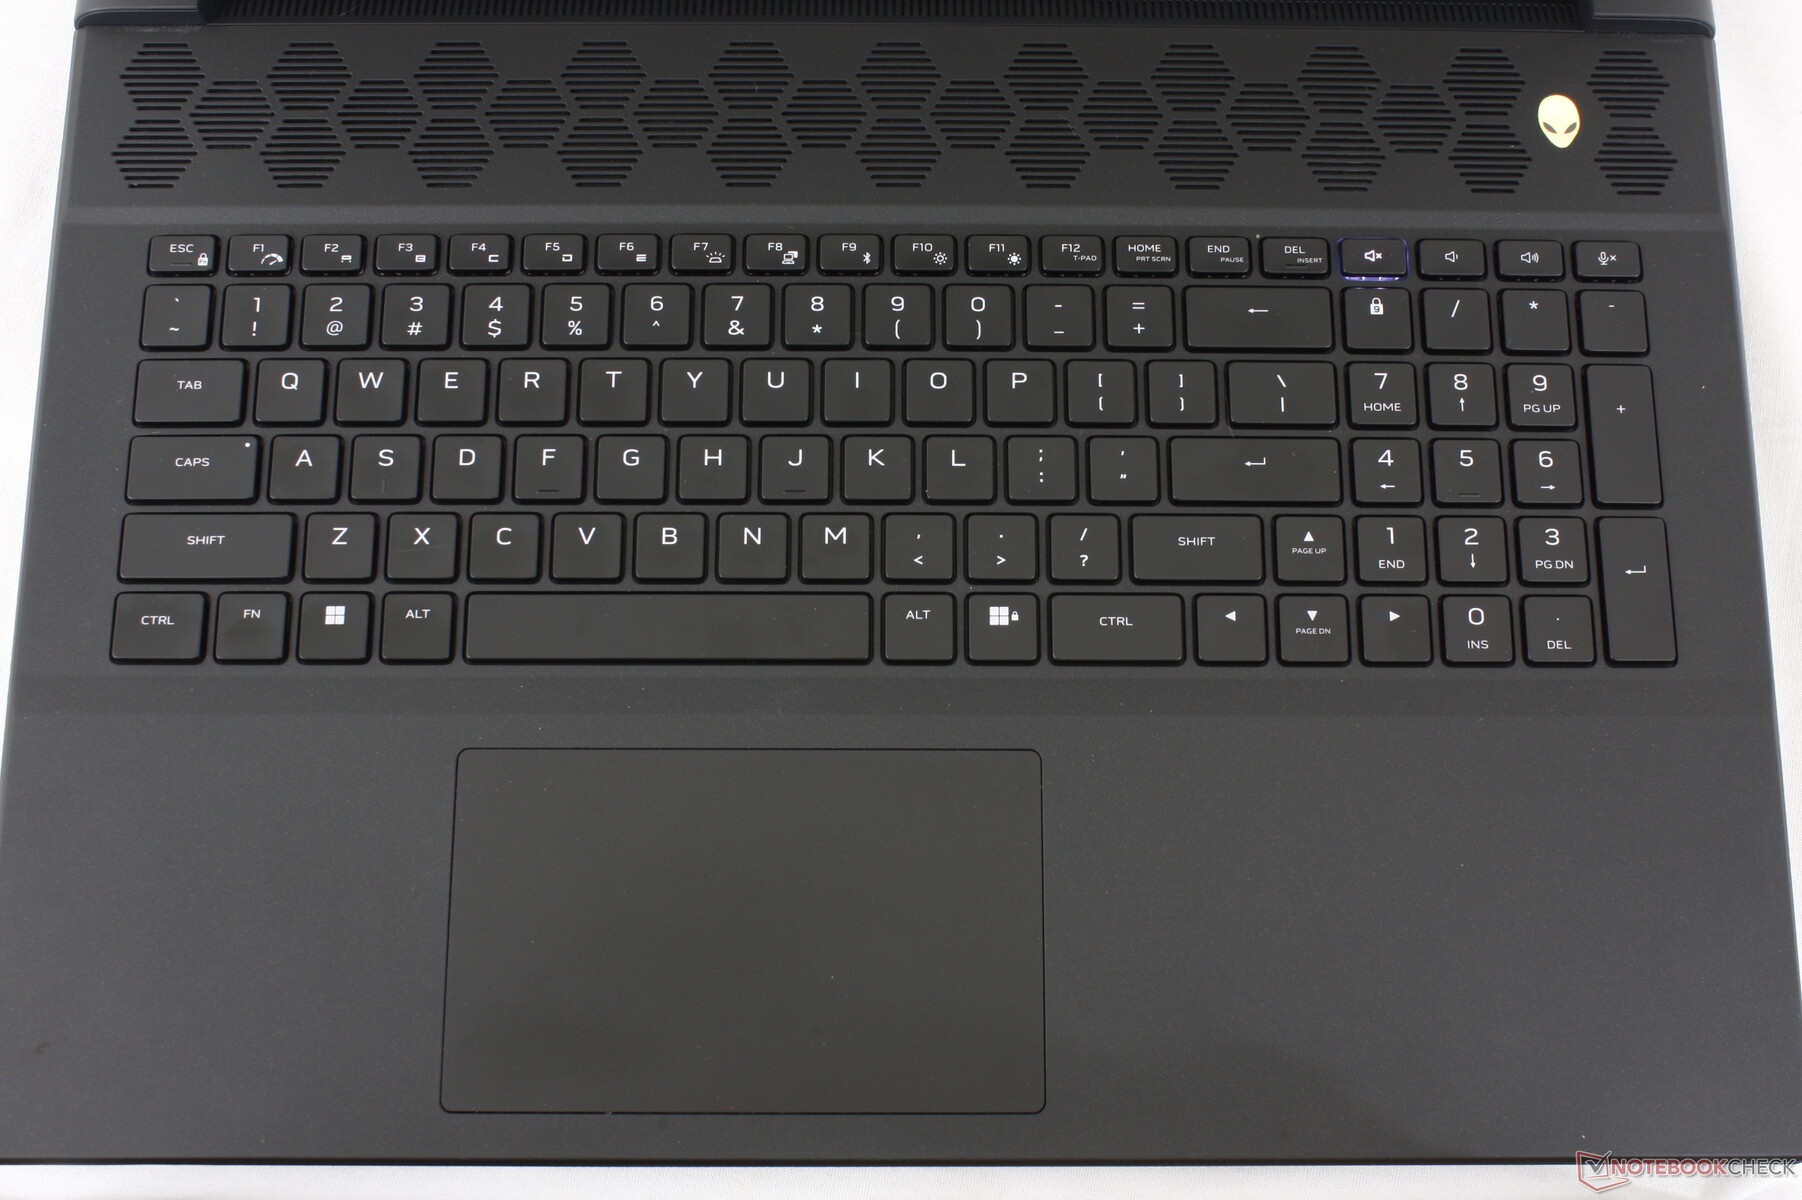
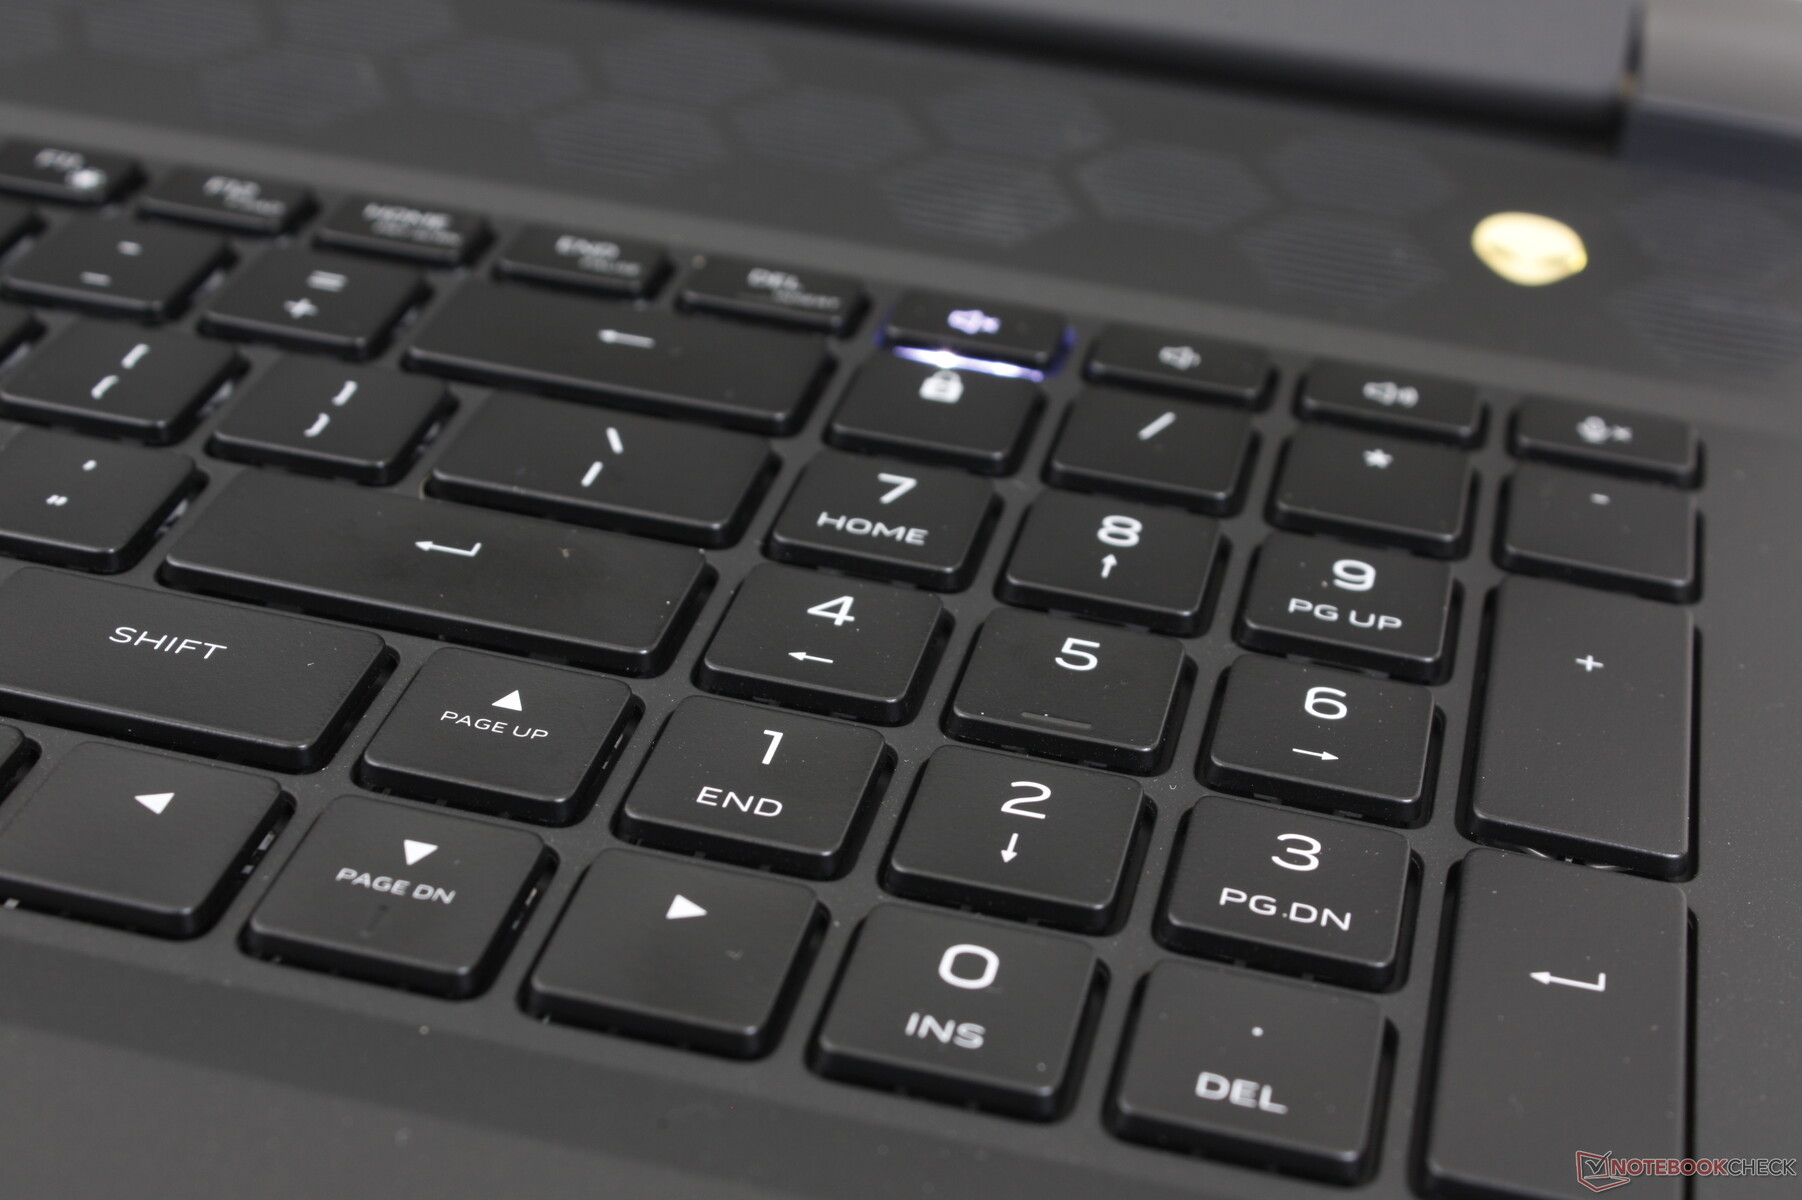
I tasti a membrana della nostra unità sono probabilmente i migliori che abbiamo usato su qualsiasi portatile da gioco. La corsa è più profonda e con un feedback più solido rispetto ai tasti dell'MSI GE78 o del Razer Blade 18. C'è ben poco da lamentarsi della tastiera in termini di comfort.
Gli interruttori meccanici CherryMX opzionali sono probabilmente più cliccabili ma molto più rumorosi. Questi interruttori sono probabilmente gli stessi che Dell offre per le serie Alienware M15 e M17.
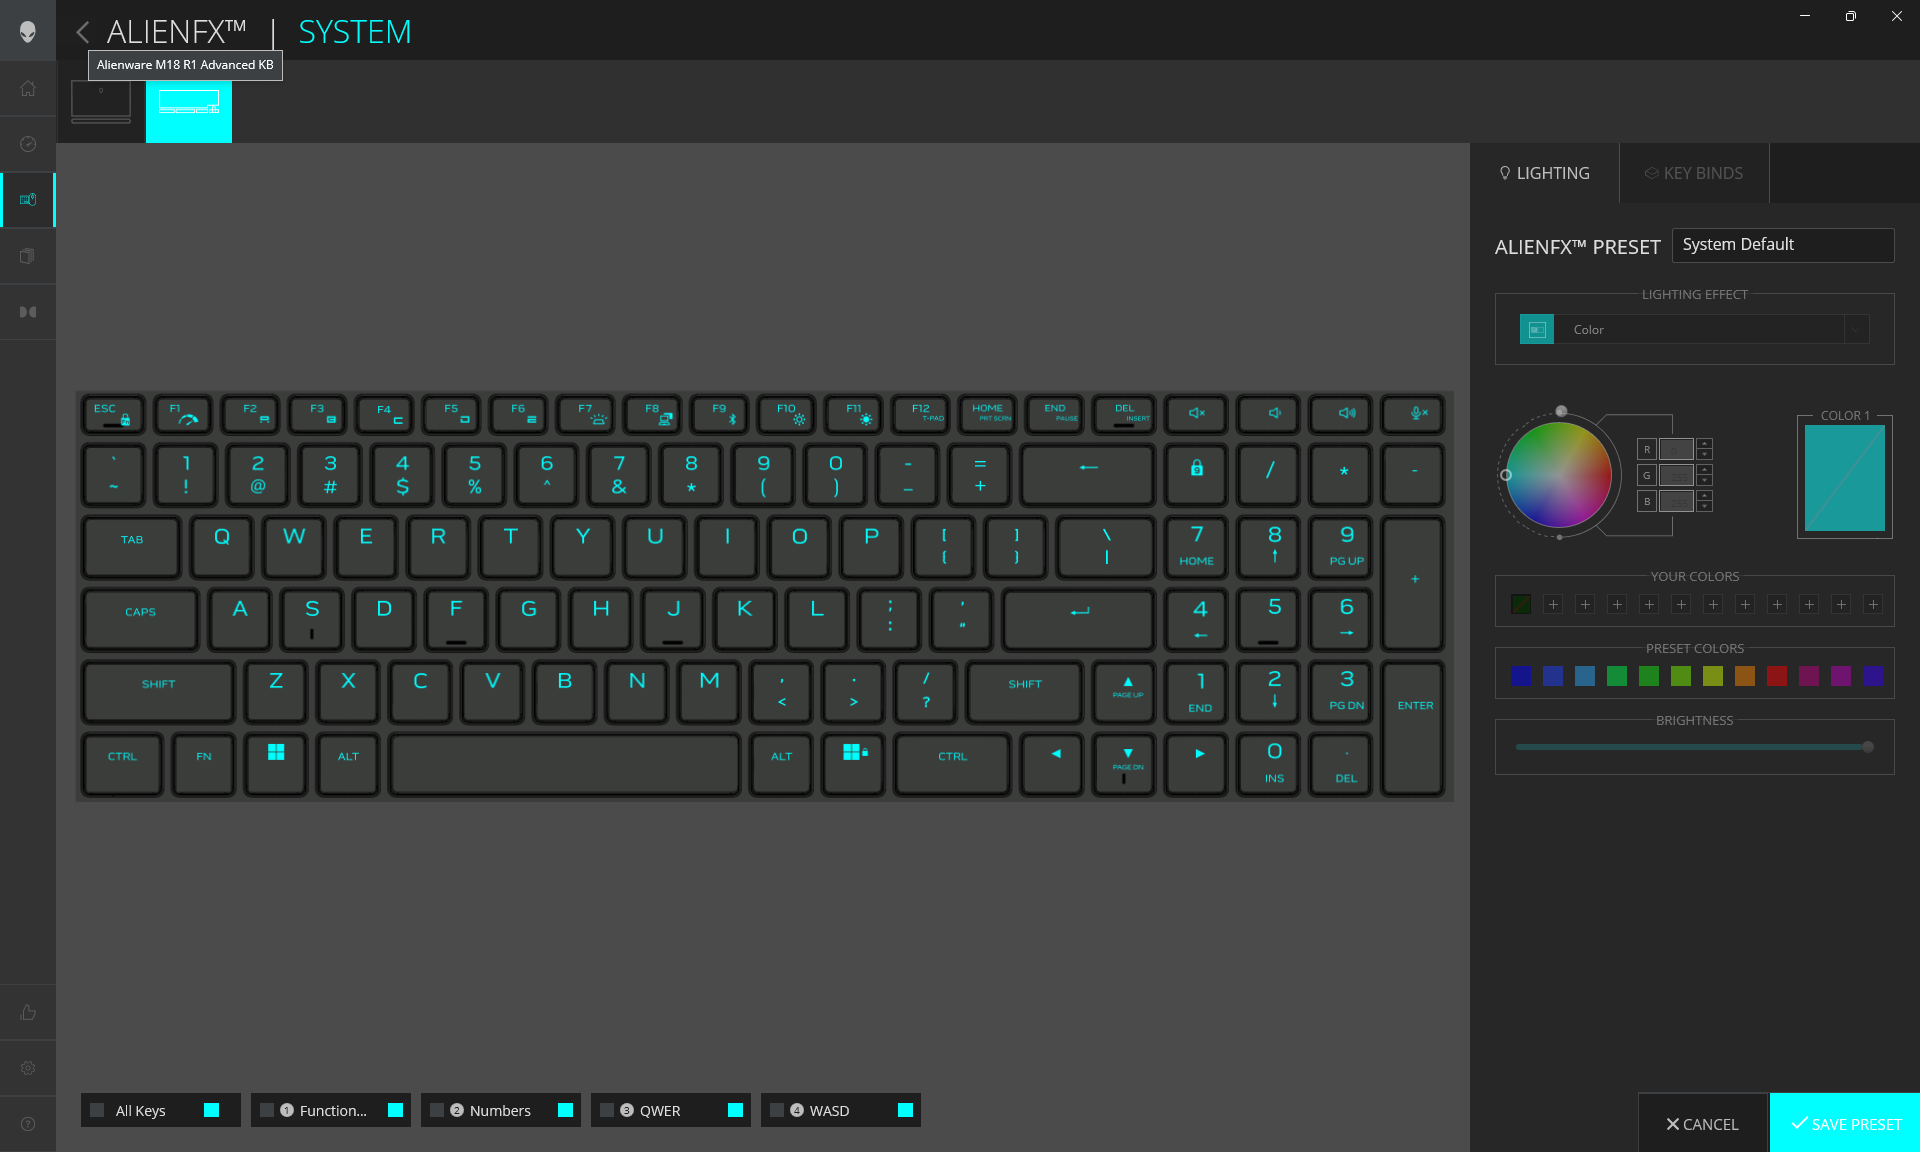
Tutti i simboli dei tasti sono illuminati quando la retroilluminazione è attiva, a differenza dei vecchi modelli Alienware x15/x17 in cui i simboli secondari sono spenti.
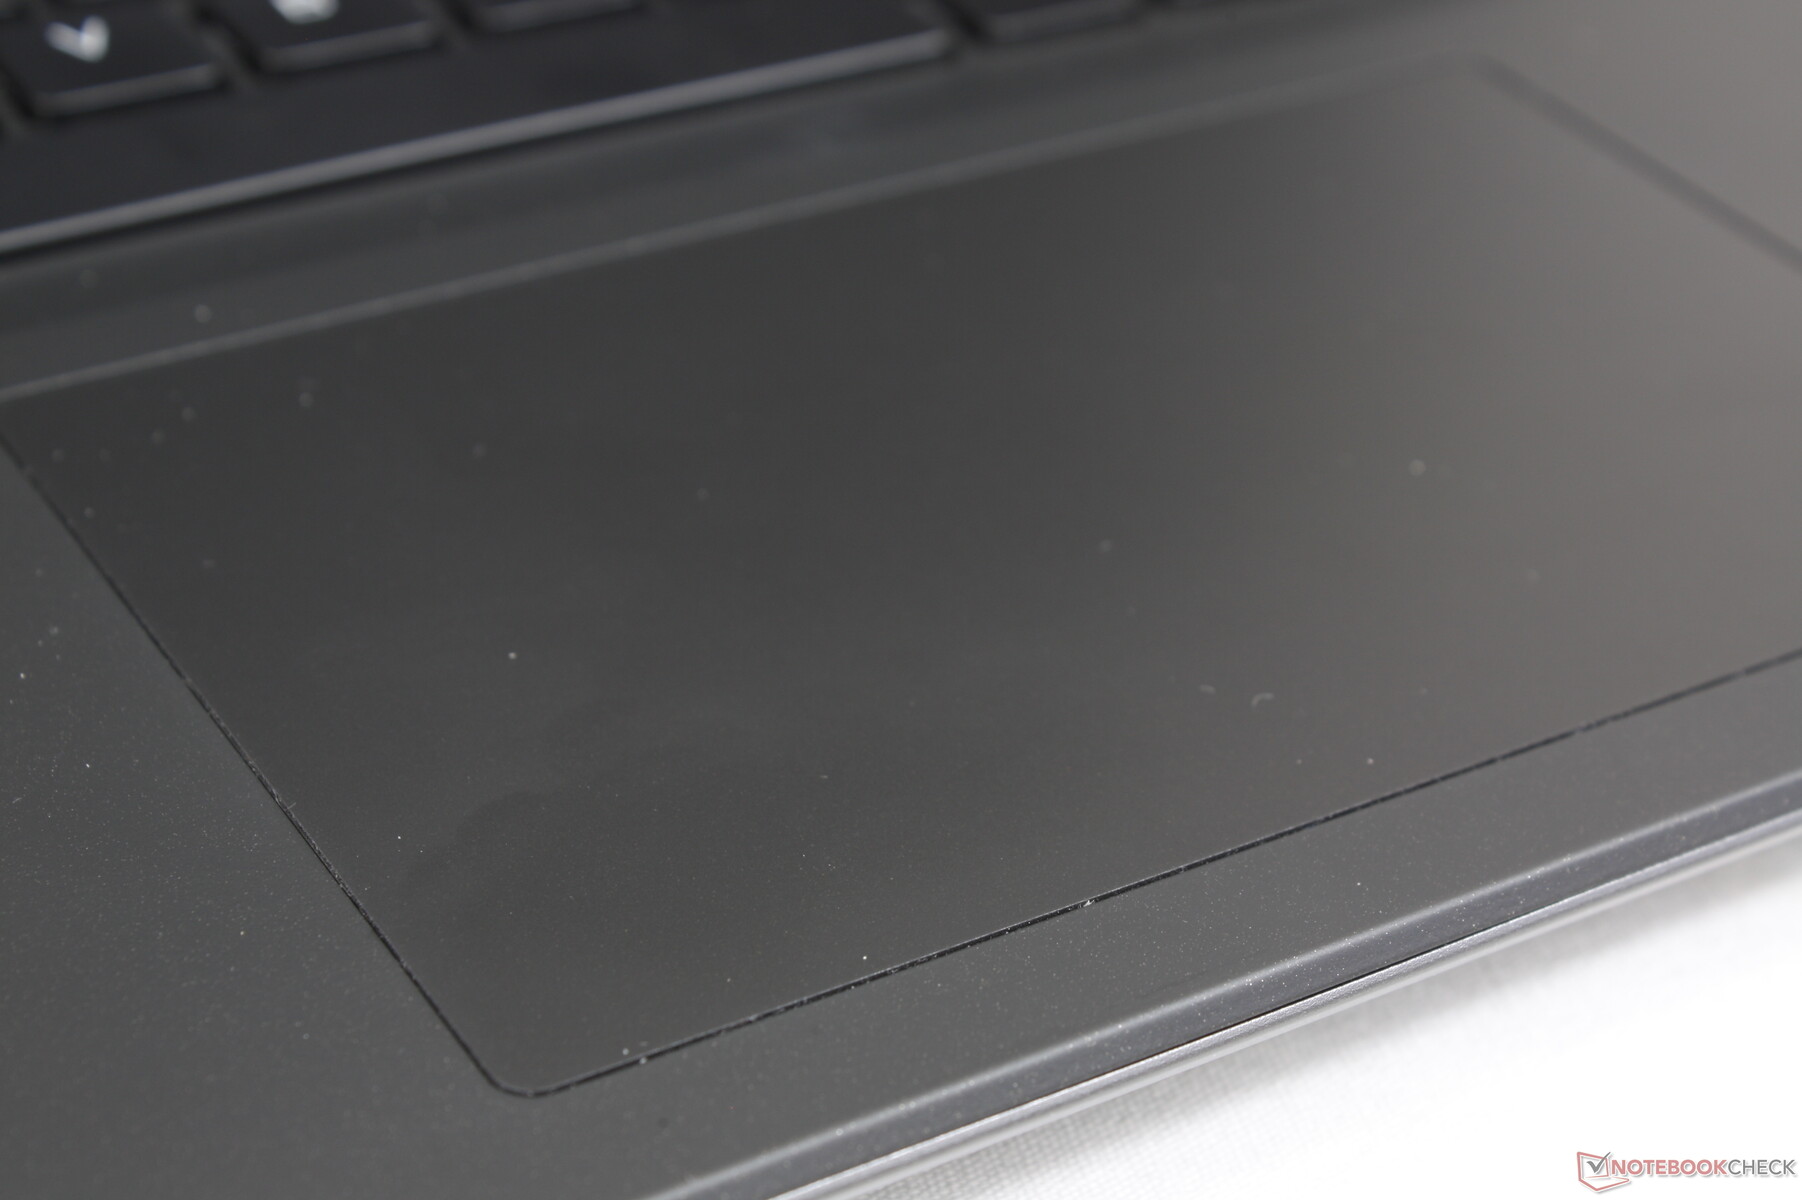
Touchpad
La superficie è quasi identica a quella del clickpad dell' MSI GE78 (13,2 x 8 cm contro 13 x 8,2 cm) nonostante il formato più grande da 18 pollici dell'Alienware. Sebbene la trazione sia fluida, con un minimo di impuntamenti quando si scivola, il feedback quando si fa clic è piuttosto morbido e rende l'esperienza insoddisfacente. Anche il doppio clic può risultare faticoso, poiché ogni clic richiede una forza maggiore da parte del dito rispetto alla maggior parte degli altri computer portatili.
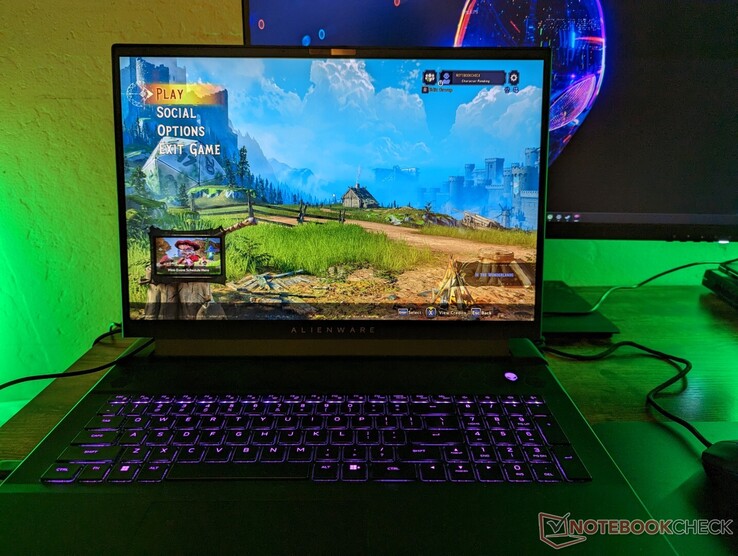
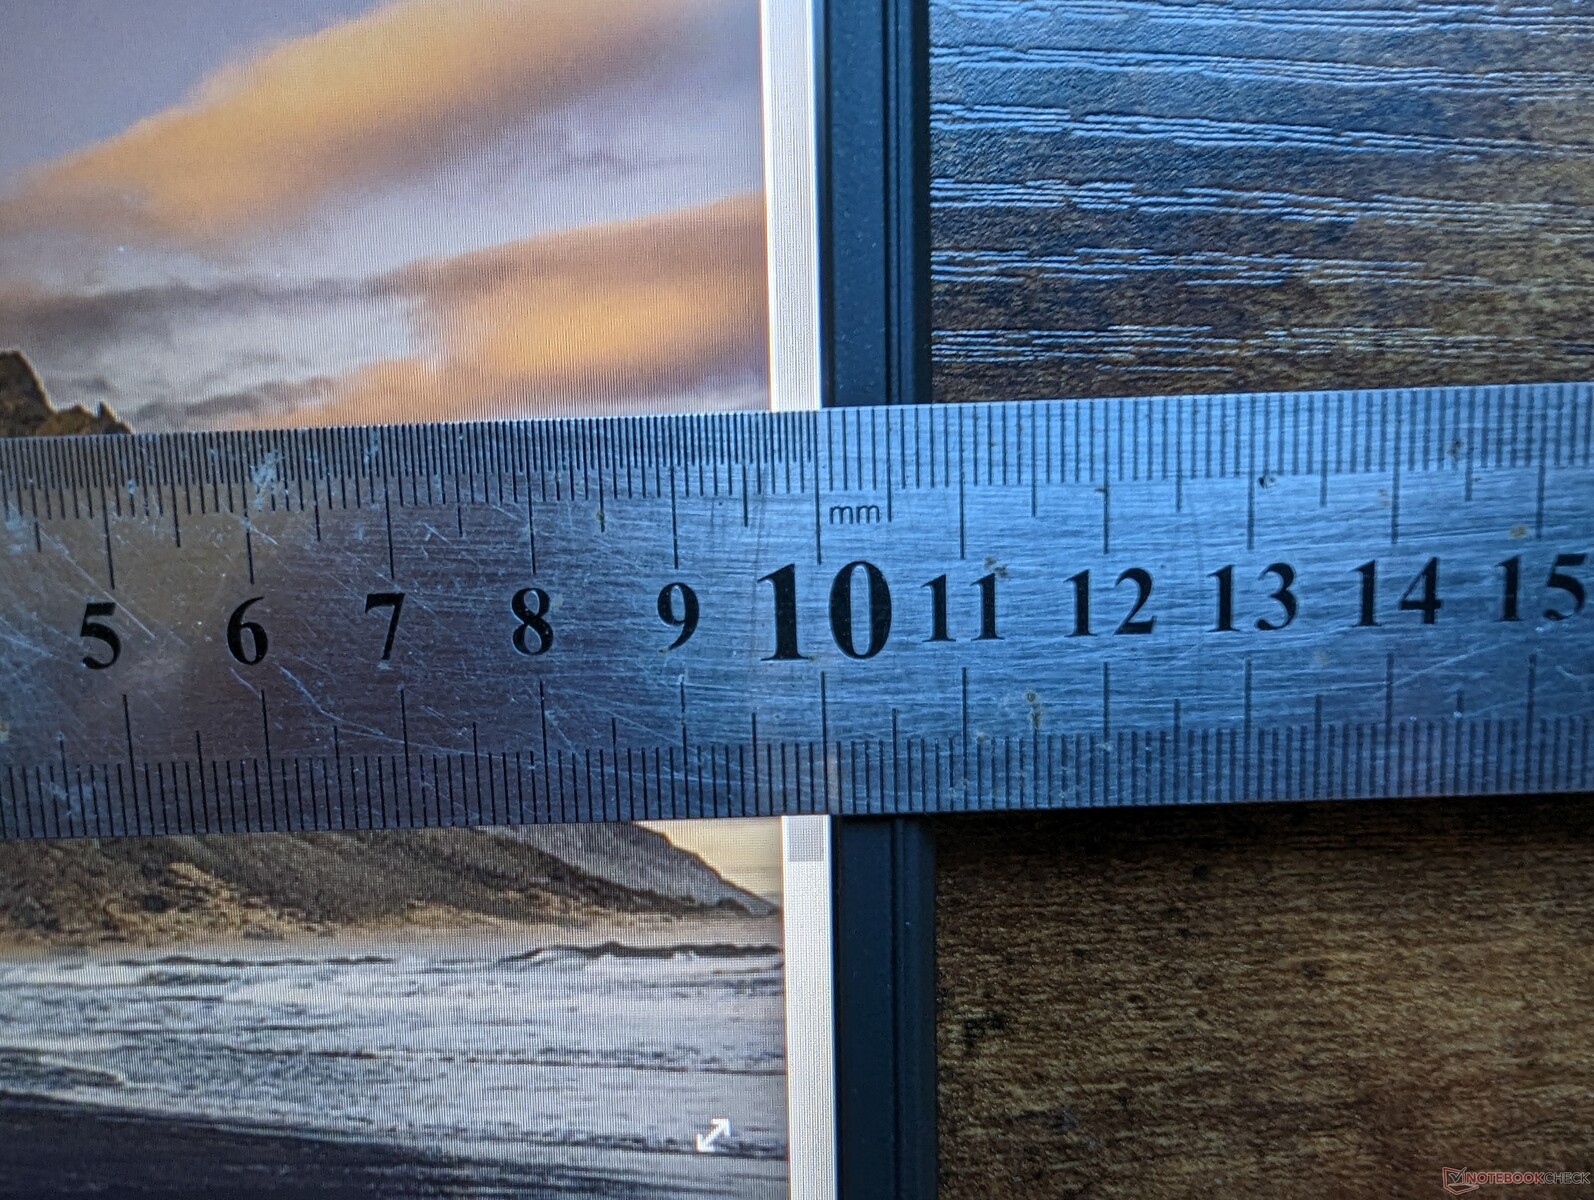
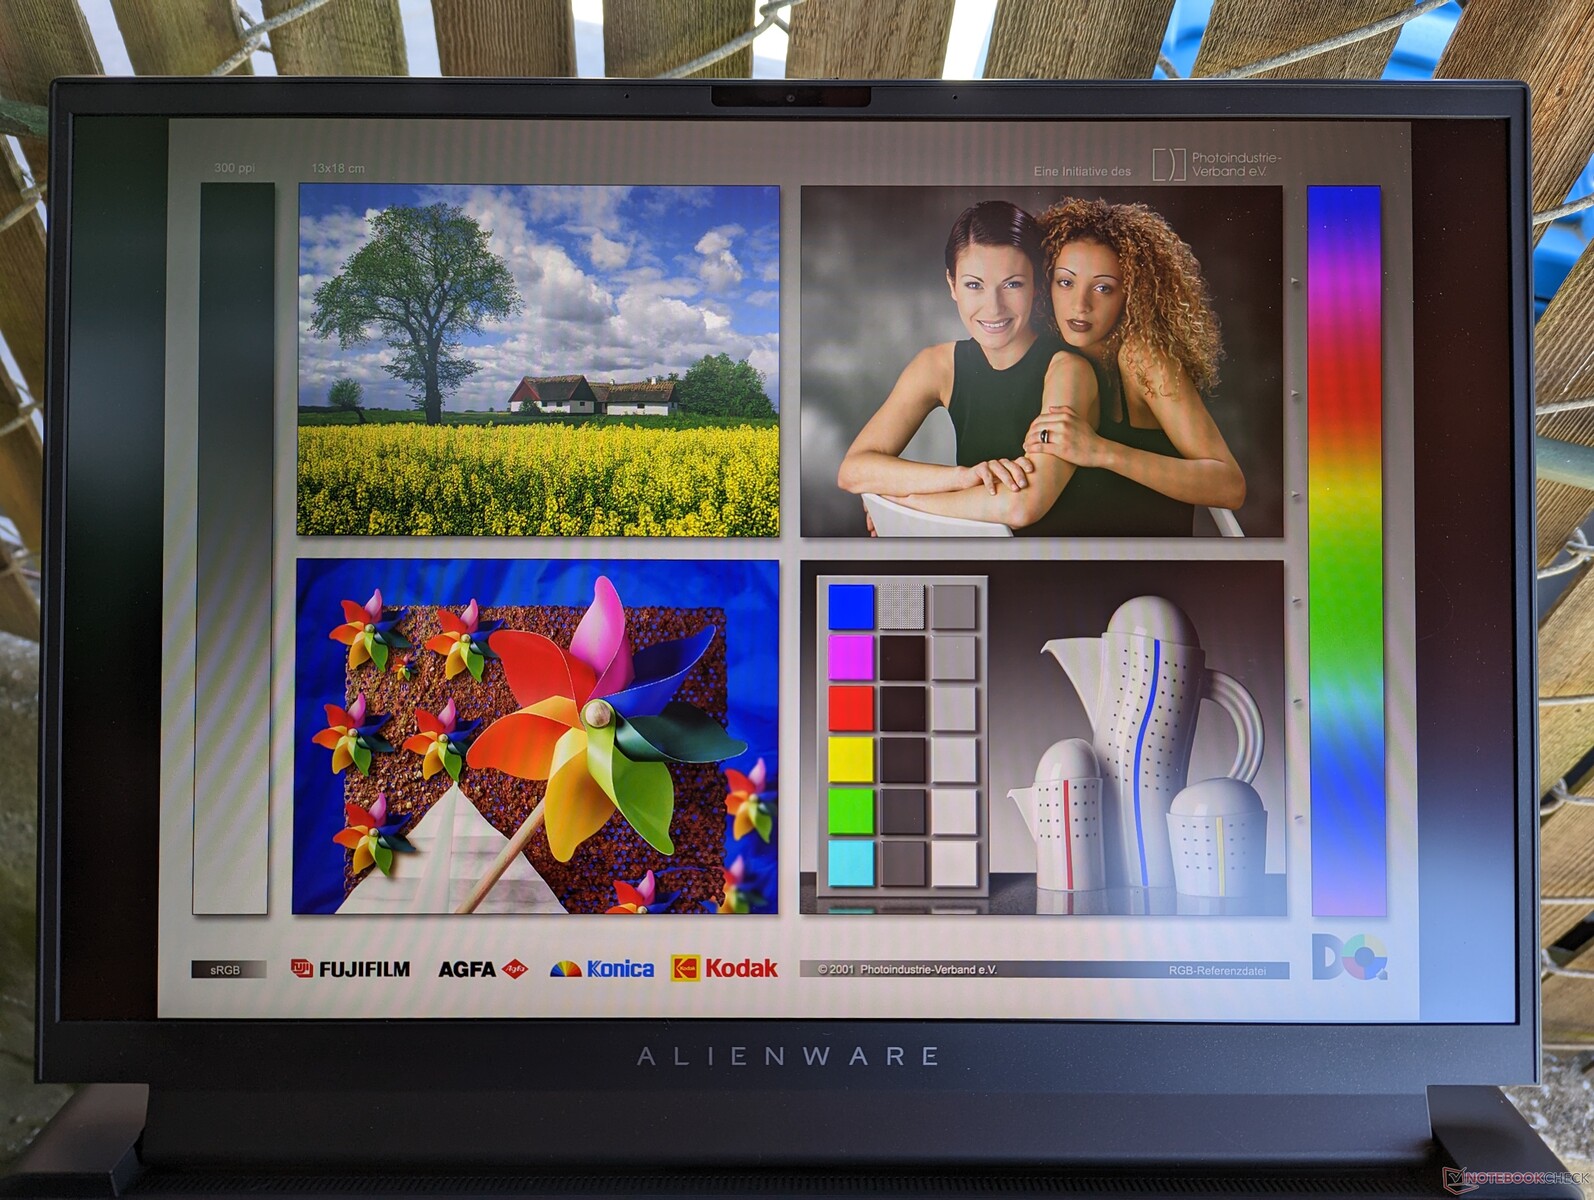
Display - Frequenza di aggiornamento estremamente veloce a 480 Hz
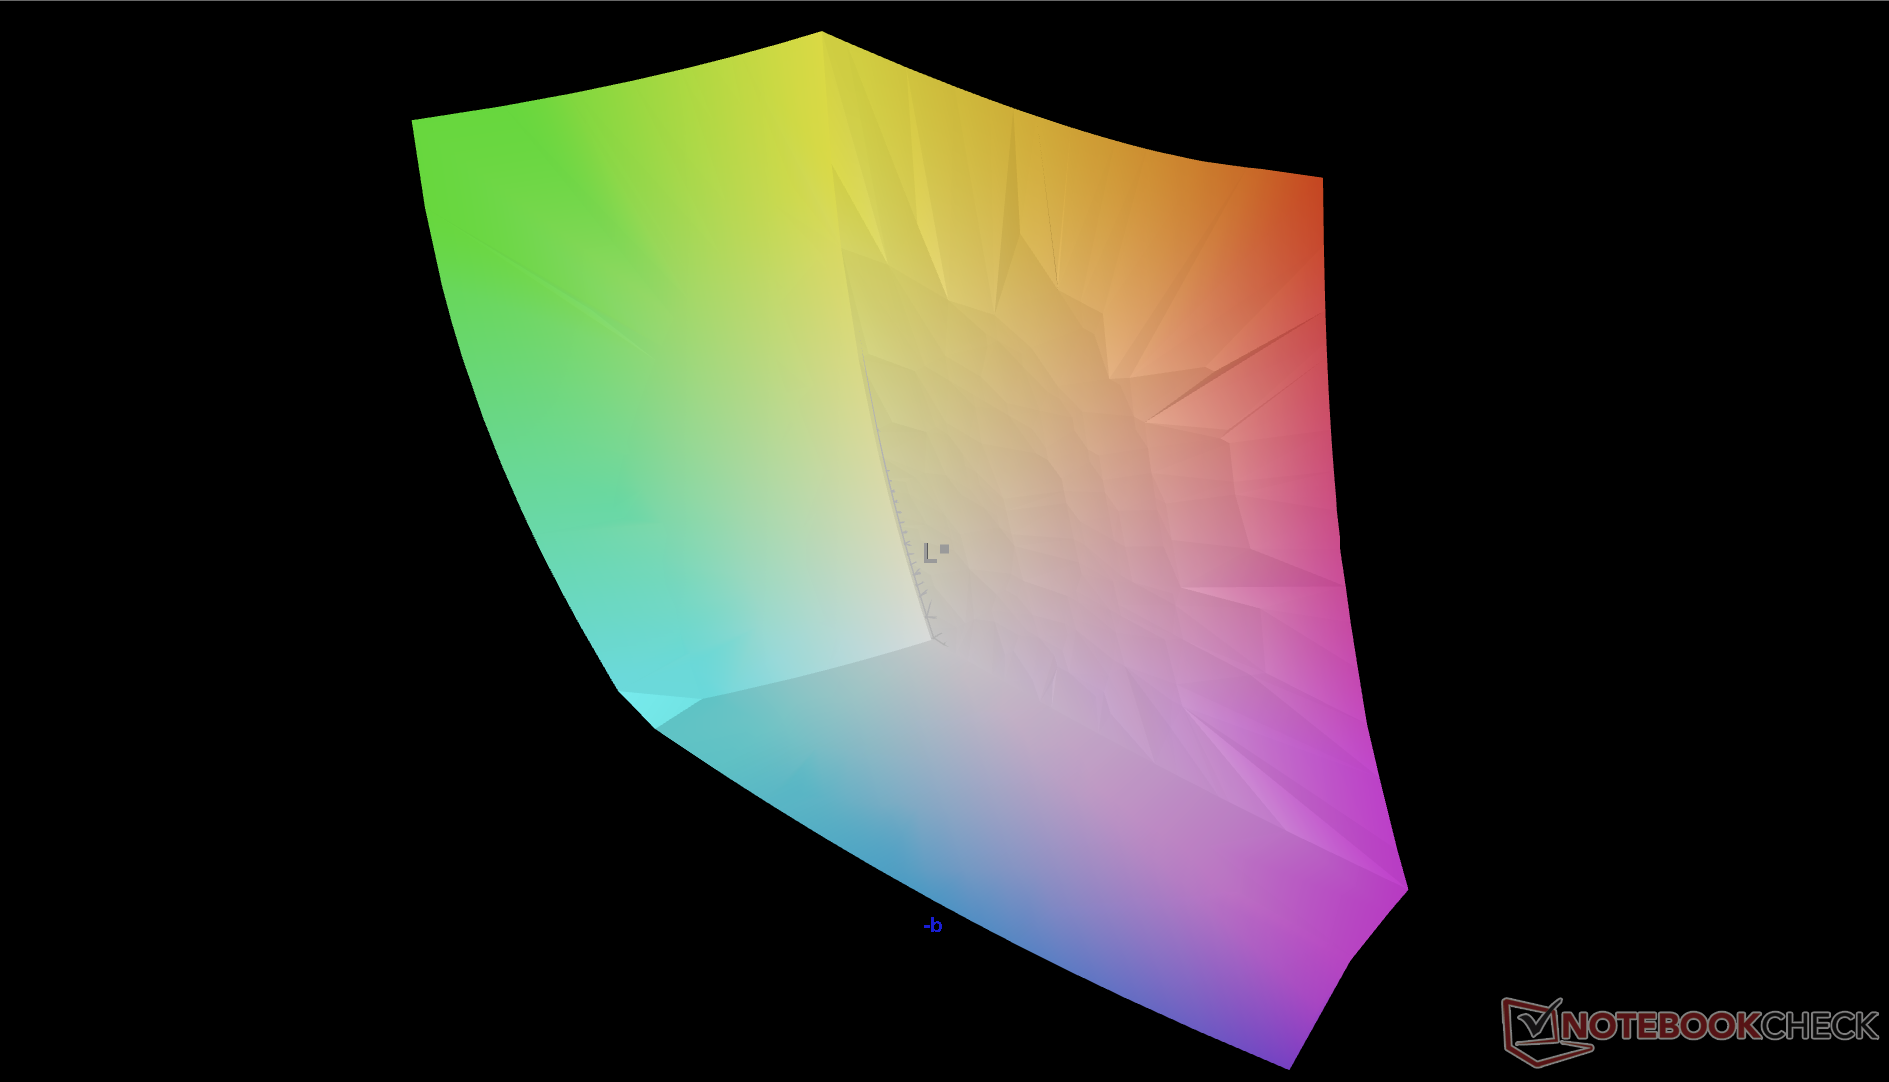
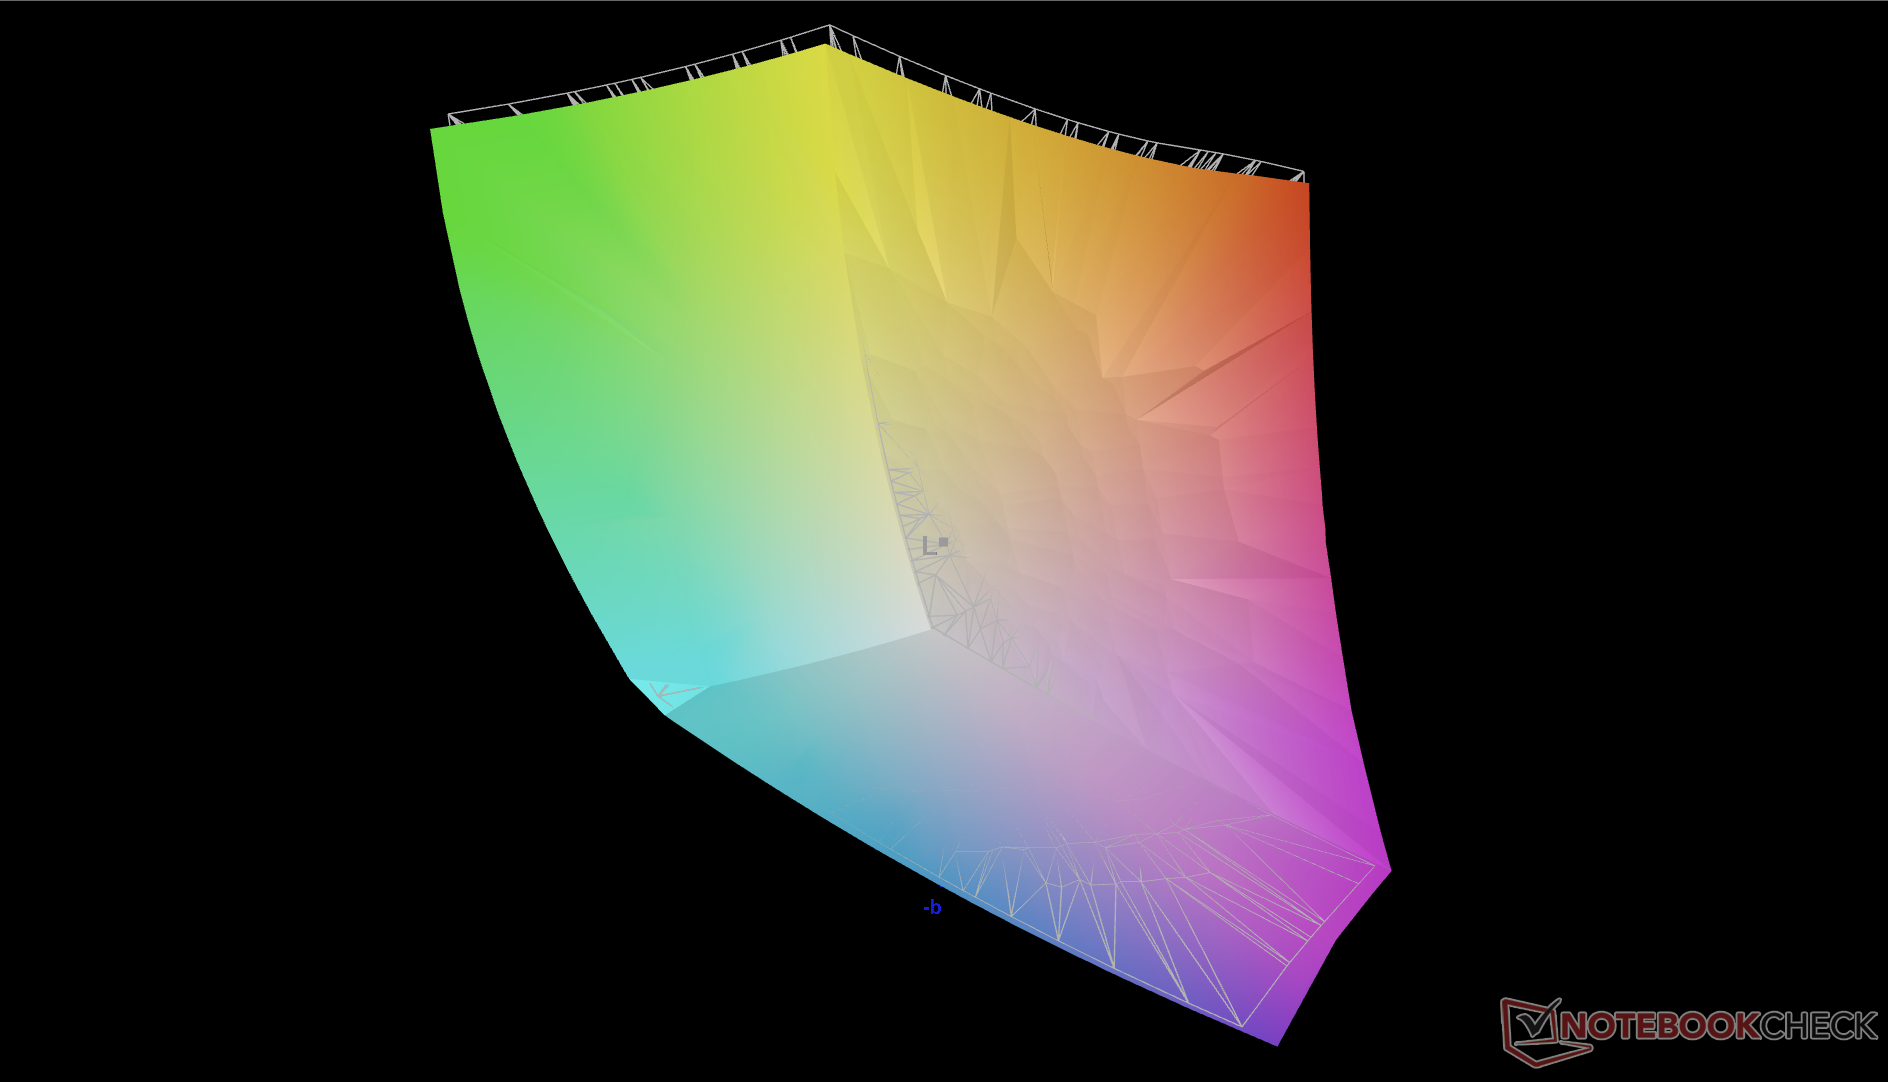
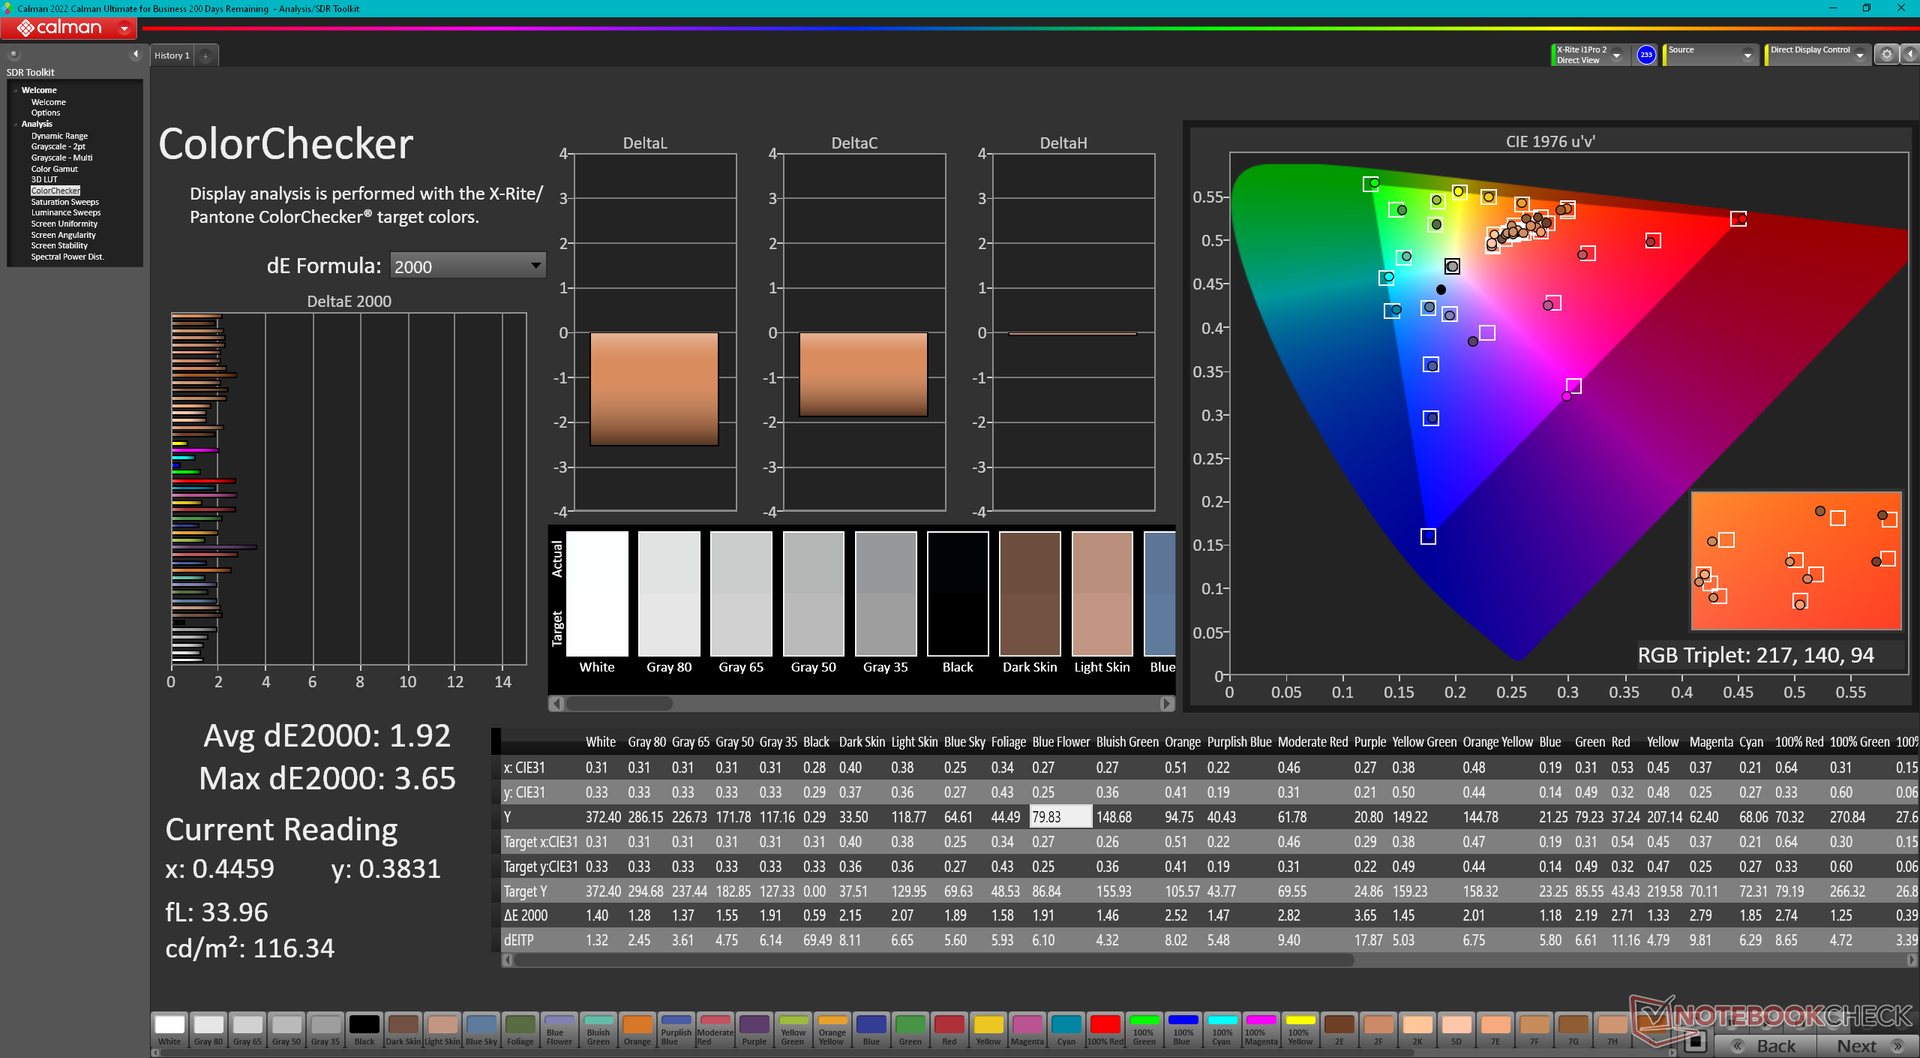
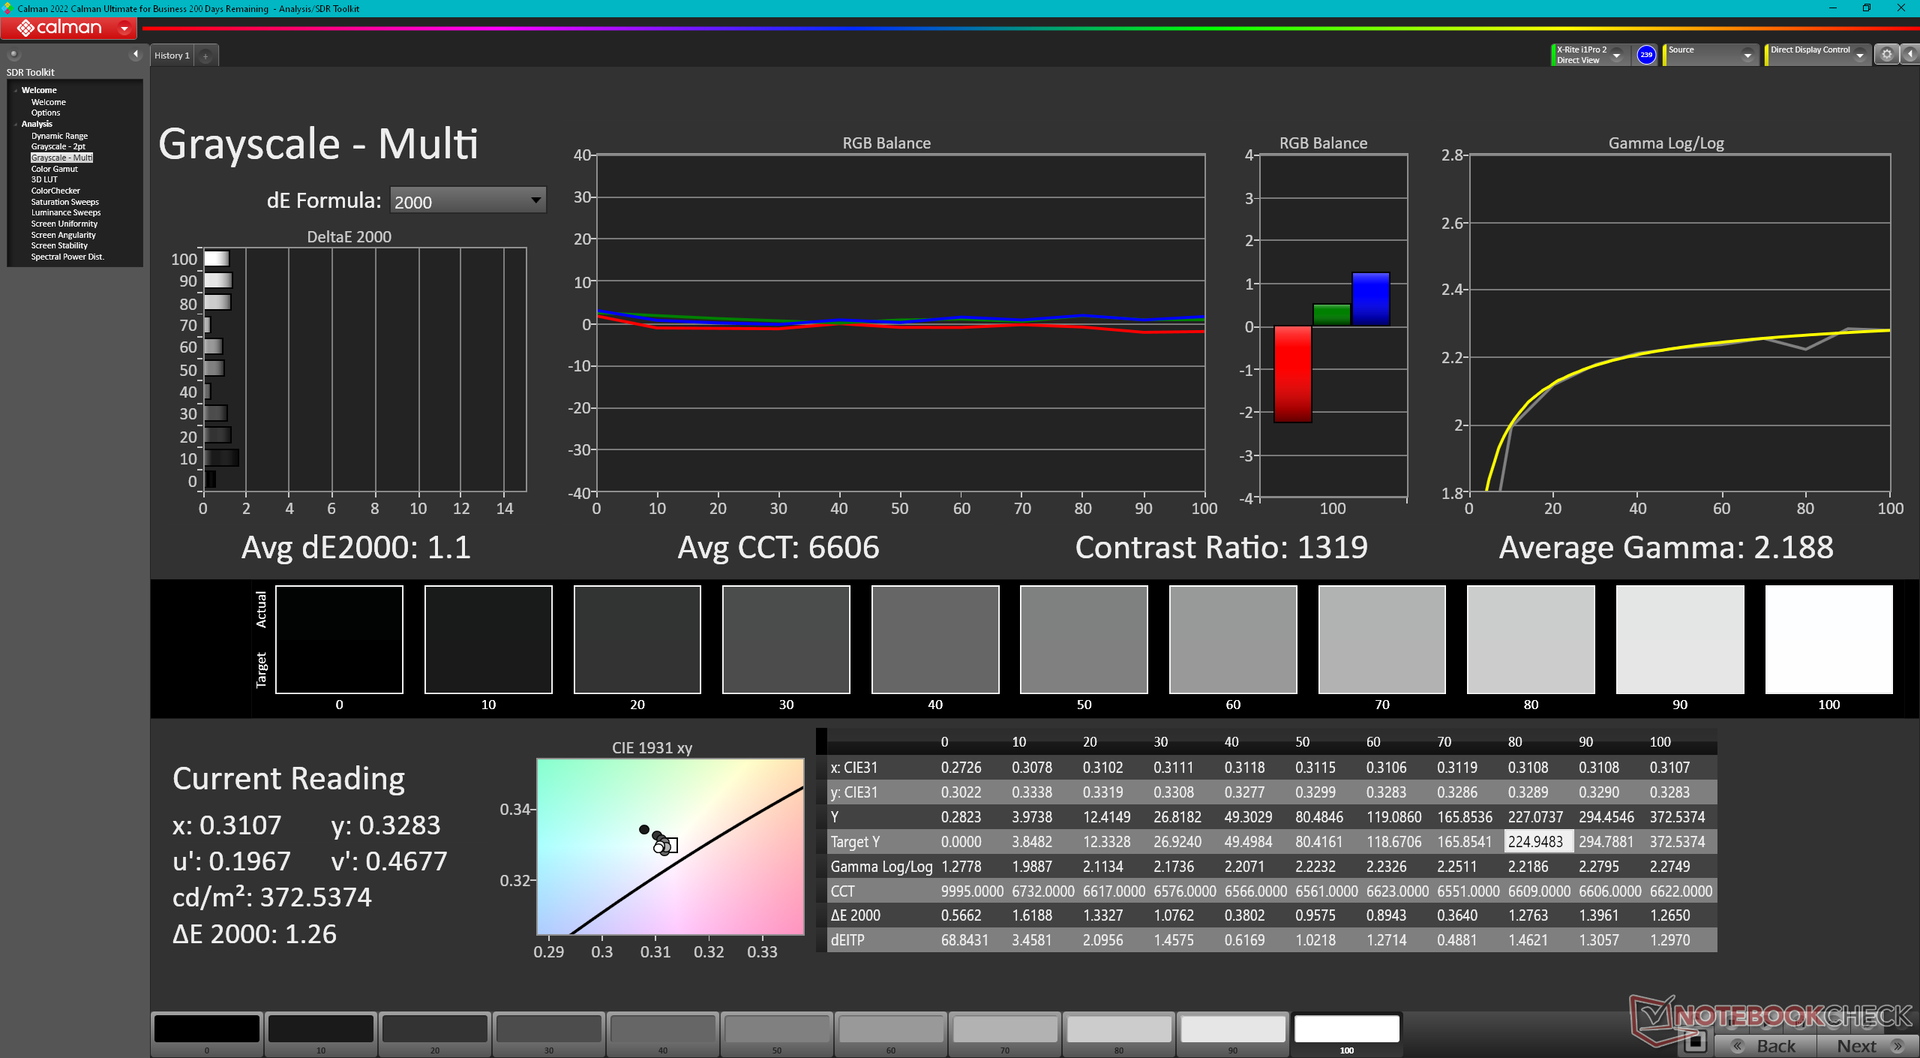
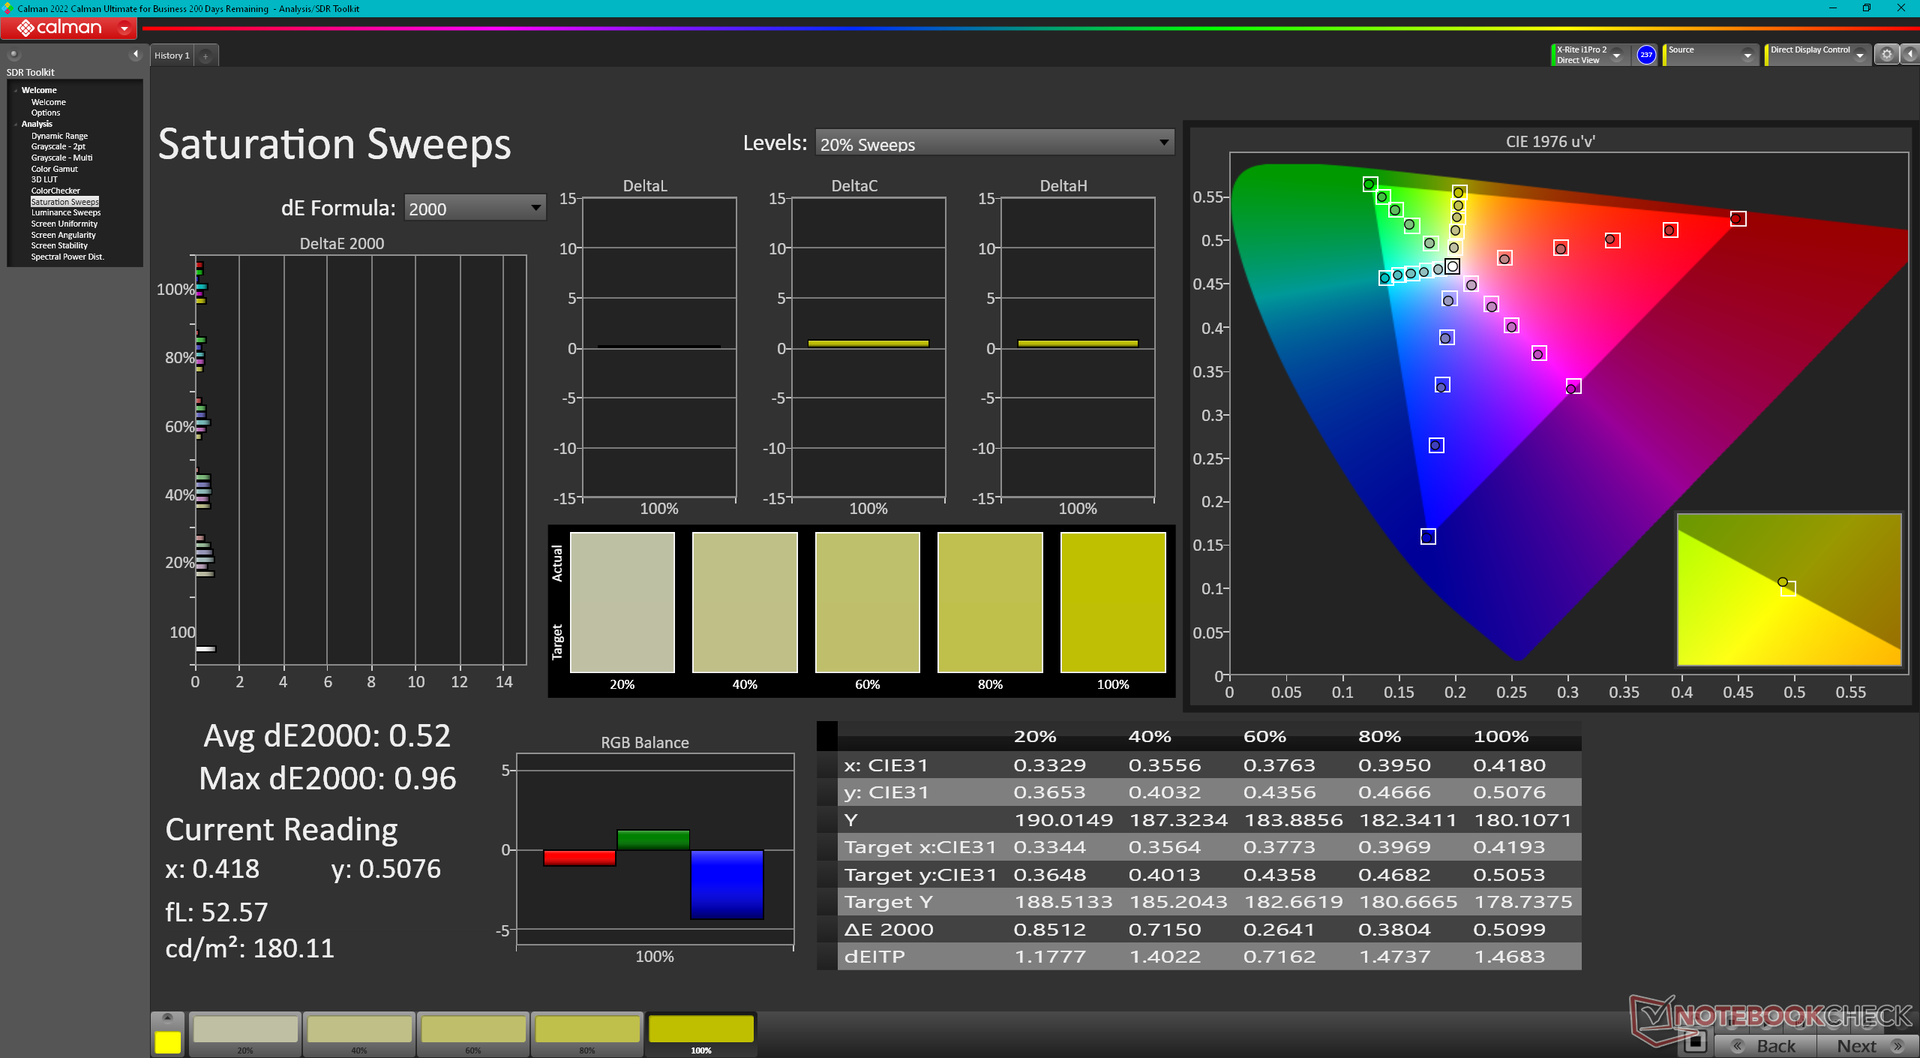
L'Alienware viene fornito con un pannello Chi Mei 180JME da 1200p, a differenza dei pannelli AU Optronics B180QAN01.0 o BOE NE180QDM da 1600p del Razer Blade.Razer Blade 18 e Asus ROG Strix Scar 18, rispettivamente. La caratteristica unica che separa questo pannello Chi Mei dagli altri due è la frequenza di aggiornamento nativa due volte più veloce, pari a 480 Hz anziché 240 Hz. Per il resto, tutti e tre i pannelli condividono coperture cromatiche, tempi di risposta dei pixel e rapporti di contrasto simili. I colori pieni del P3 e la velocità di aggiornamento rendono questo particolare modello Alienware adatto sia al gioco che all'editing grafico.
È disponibile una seconda opzione di display con una risoluzione nativa di 1600p ma una frequenza di aggiornamento inferiore di 165 Hz.
| |||||||||||||||||||||||||
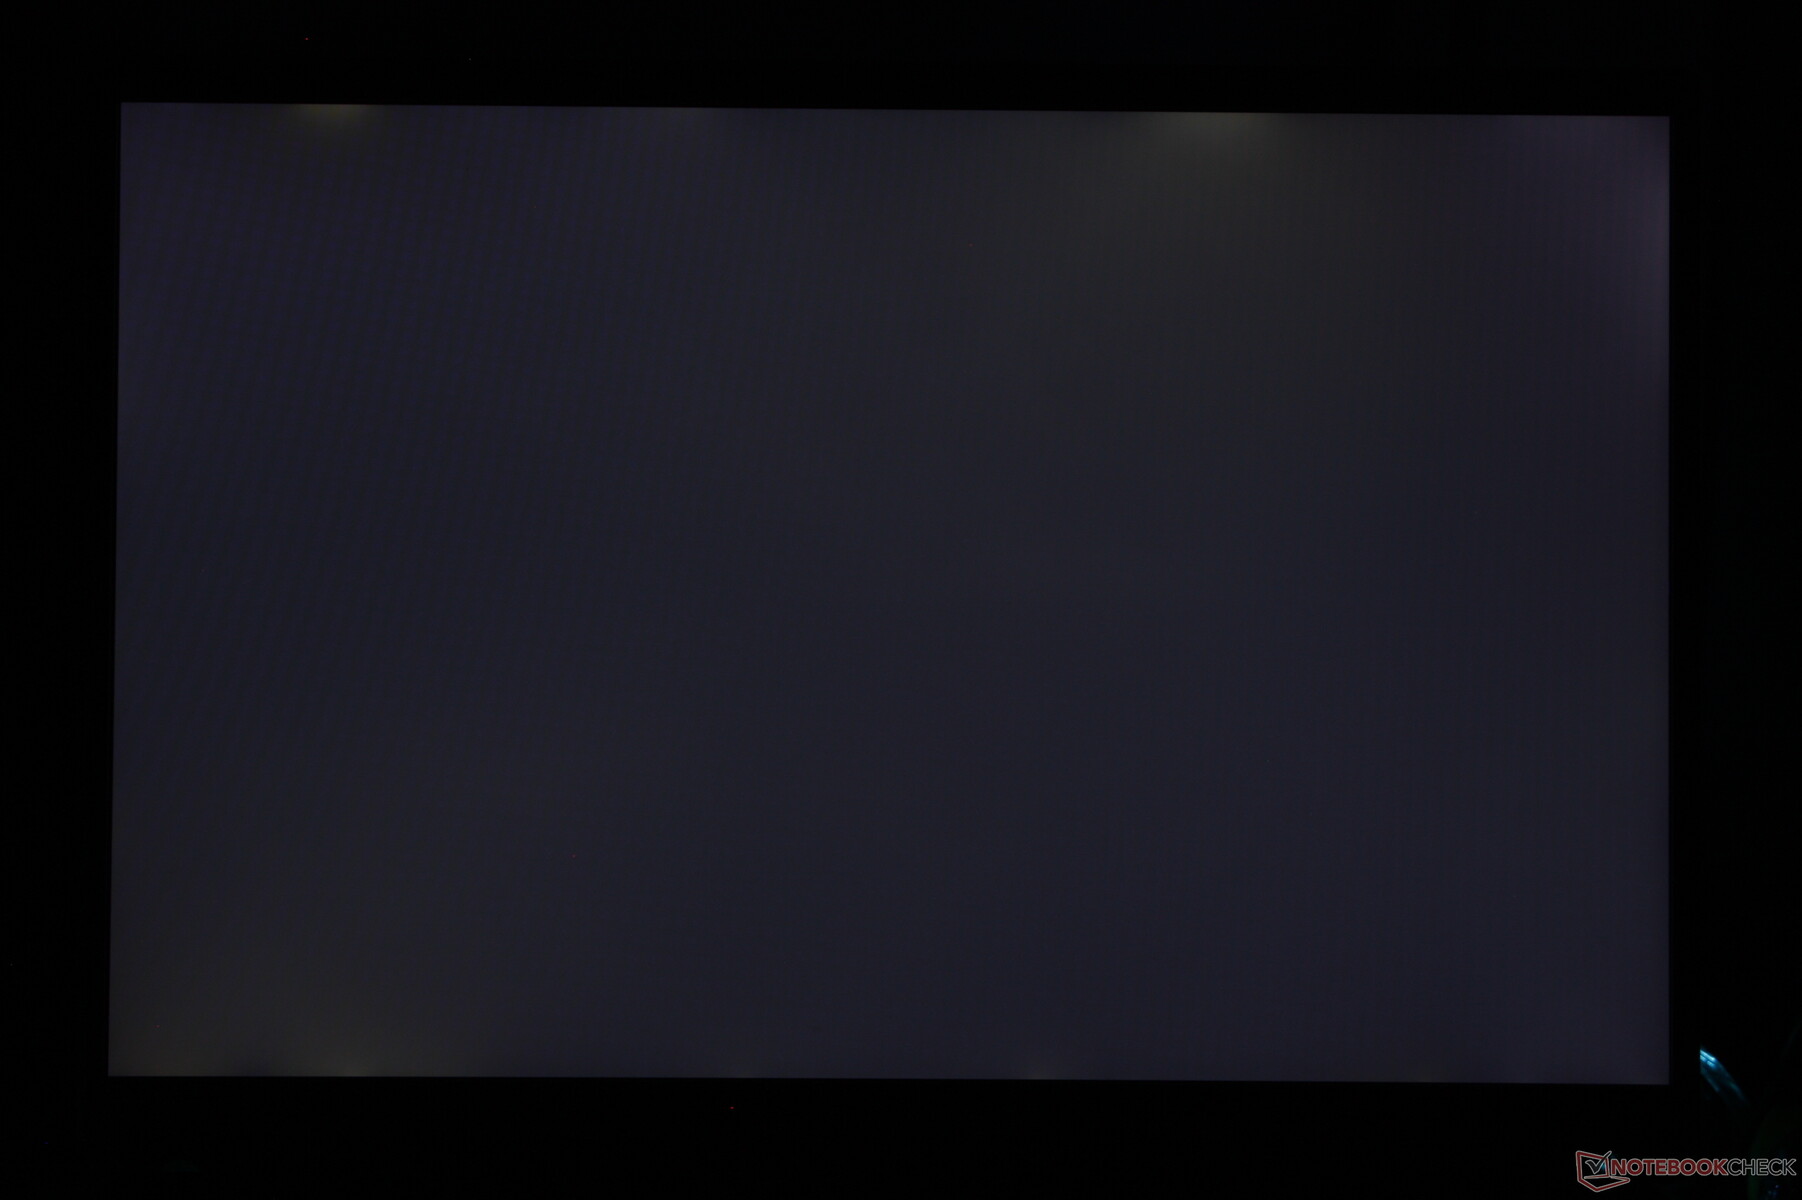
Distribuzione della luminosità: 97 %
Al centro con la batteria: 372.8 cd/m²
Contrasto: 1165:1 (Nero: 0.32 cd/m²)
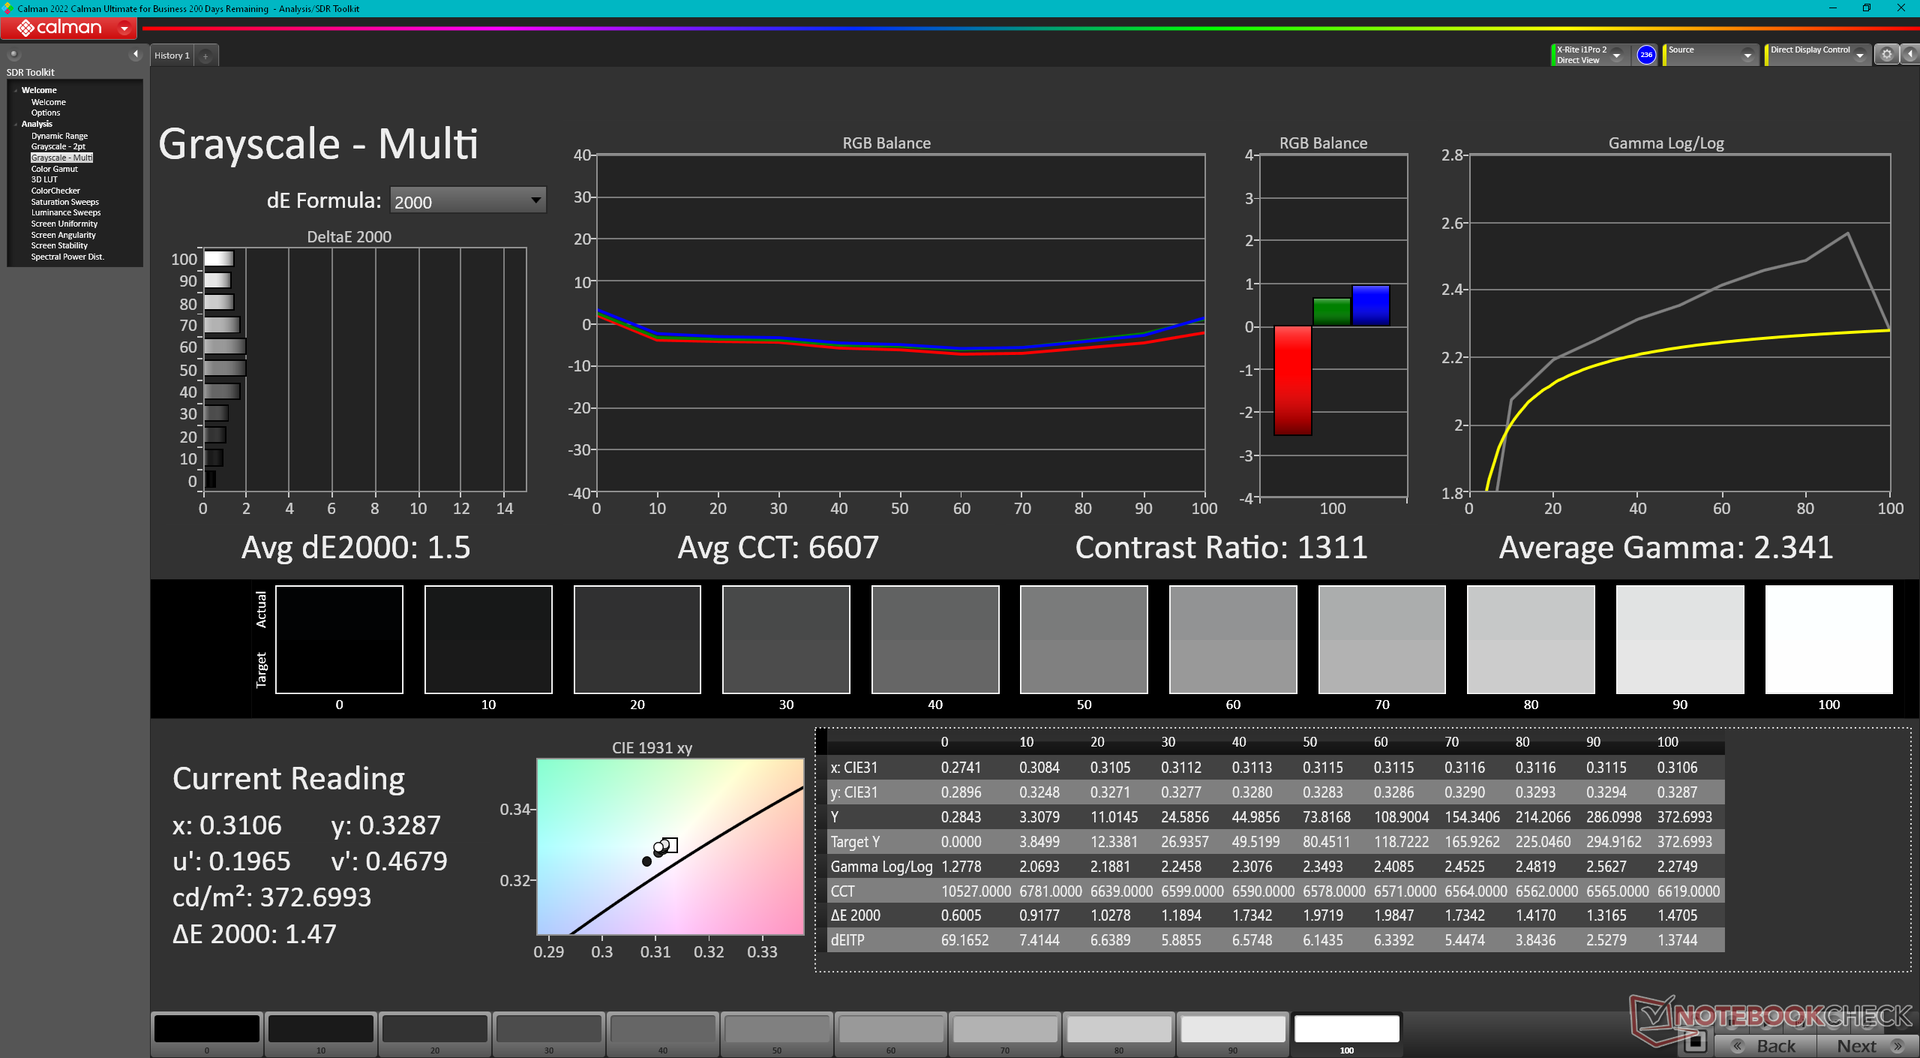
ΔE ColorChecker Calman: 1.92 | ∀{0.5-29.43 Ø4.72}
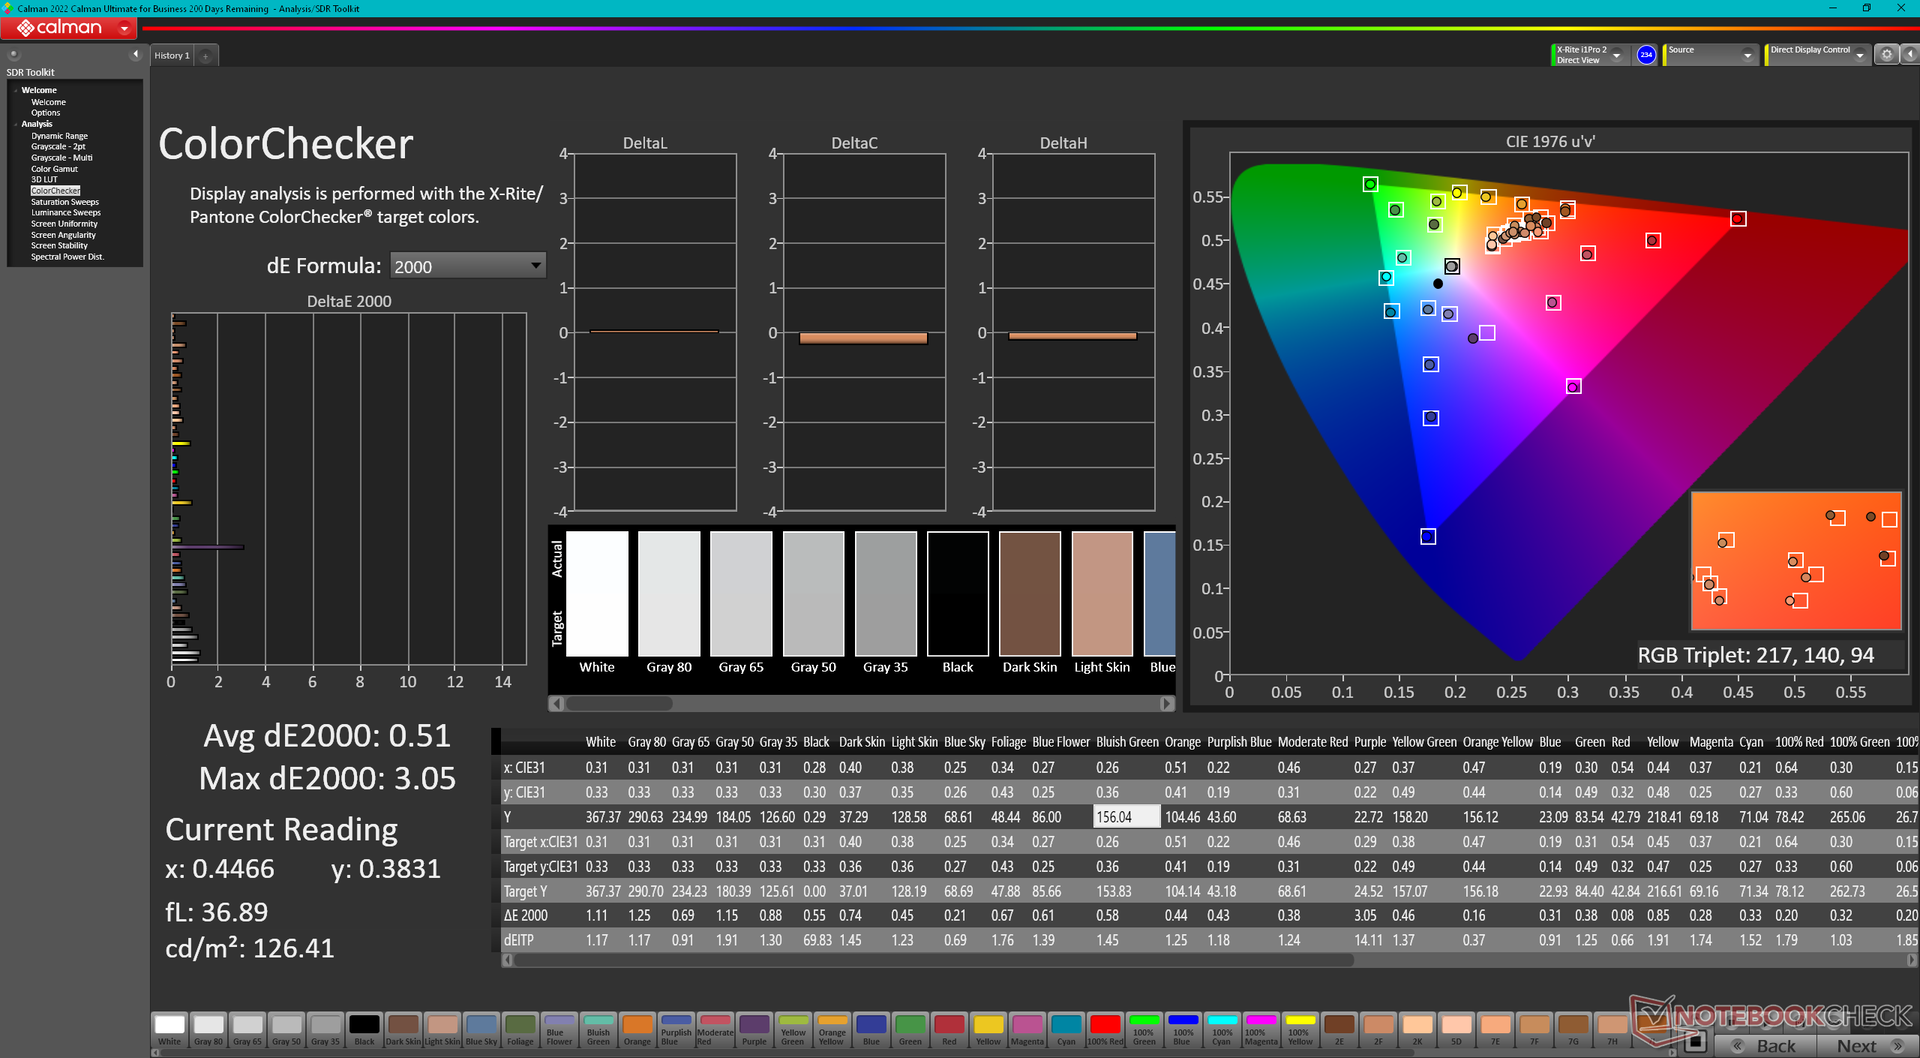
calibrated: 0.51
ΔE Greyscale Calman: 1.5 | ∀{0.09-98 Ø4.97}
89.8% AdobeRGB 1998 (Argyll 3D)
100% sRGB (Argyll 3D)
97.7% Display P3 (Argyll 3D)
Gamma: 2.34
CCT: 6607 K
| Alienware m18 R1 Chi Mei 180JME, IPS, 1920x1200, 18" | Razer Blade 18 RTX 4070 AU Optronics B180QAN01.0, IPS, 2560x1600, 18" | Asus ROG Strix Scar 18 2023 G834JY-N6005W NE180QDM-NZ2, IPS, 2560x1600, 18" | Eluktronics Mech-17 GP2 BOE NE170QDM-NZ1, IPS, 2560x1600, 17" | MSI Titan GT77 HX 13VI B173ZAN06.C, Mini-LED, 3840x2160, 17.3" | Alienware x17 R2 P48E AU Optronics B173HAN, IPS, 1920x1080, 17.3" | |
|---|---|---|---|---|---|---|
| Display | -2% | -2% | -17% | 0% | -10% | |
| Display P3 Coverage (%) | 97.7 | 96.9 -1% | 97.2 -1% | 69.1 -29% | 94.9 -3% | 79.2 -19% |
| sRGB Coverage (%) | 100 | 99.8 0% | 99.9 0% | 99.7 0% | 99.9 0% | 99.8 0% |
| AdobeRGB 1998 Coverage (%) | 89.8 | 85.3 -5% | 84.9 -5% | 69.8 -22% | 92.4 3% | 79.6 -11% |
| Response Times | -11% | -34% | -148% | -675% | -153% | |
| Response Time Grey 50% / Grey 80% * (ms) | 3 ? | 4.2 ? -40% | 5.41 ? -80% | 12 ? -300% | 38.4 ? -1180% | 12.4 ? -313% |
| Response Time Black / White * (ms) | 9.9 ? | 8 ? 19% | 8.62 ? 13% | 9.4 ? 5% | 26.6 ? -169% | 9.2 ? 7% |
| PWM Frequency (Hz) | 2380 ? | |||||
| Screen | -68% | -141% | -17% | 57715% | -48% | |
| Brightness middle (cd/m²) | 372.8 | 549.6 47% | 490 31% | 417.3 12% | 606 63% | 365.4 -2% |
| Brightness (cd/m²) | 367 | 524 43% | 468 28% | 387 5% | 602 64% | 344 -6% |
| Brightness Distribution (%) | 97 | 89 -8% | 86 -11% | 87 -10% | 93 -4% | 85 -12% |
| Black Level * (cd/m²) | 0.32 | 0.53 -66% | 0.54 -69% | 0.42 -31% | 0.0001 100% | 0.29 9% |
| Contrast (:1) | 1165 | 1037 -11% | 907 -22% | 994 -15% | 6060000 520072% | 1260 8% |
| Colorchecker dE 2000 * | 1.92 | 3.32 -73% | 4.97 -159% | 2.14 -11% | 4.8 -150% | 3.17 -65% |
| Colorchecker dE 2000 max. * | 3.65 | 6.63 -82% | 11.02 -202% | 4.09 -12% | 8.2 -125% | 7.69 -111% |
| Colorchecker dE 2000 calibrated * | 0.51 | 2.7 -429% | 2.97 -482% | 0.42 18% | 1.8 -253% | 0.51 -0% |
| Greyscale dE 2000 * | 1.5 | 2 -33% | 7.2 -380% | 3.1 -107% | 6.5 -333% | 5.3 -253% |
| Gamma | 2.34 94% | 2.29 96% | 2.161 102% | 2.19 100% | 2.63 84% | 2.18 101% |
| CCT | 6607 98% | 6319 103% | 6515 100% | 6040 108% | 6596 99% | 5879 111% |
| Media totale (Programma / Settaggio) | -27% /
-46% | -59% /
-96% | -61% /
-36% | 19013% /
37006% | -70% /
-55% |
* ... Meglio usare valori piccoli
Il display viene fornito pre-calibrato per ottenere colori e scala di grigi accurati. Un'ulteriore calibrazione del pannello non migliorerebbe in modo significativo i valori medi deltaE e quindi non è necessaria una calibrazione da parte dell'utente finale.

Tempi di risposta del Display
| ↔ Tempi di risposta dal Nero al Bianco | ||
|---|---|---|
| 9.9 ms ... aumenta ↗ e diminuisce ↘ combinato | ↗ 5.4 ms Incremento | 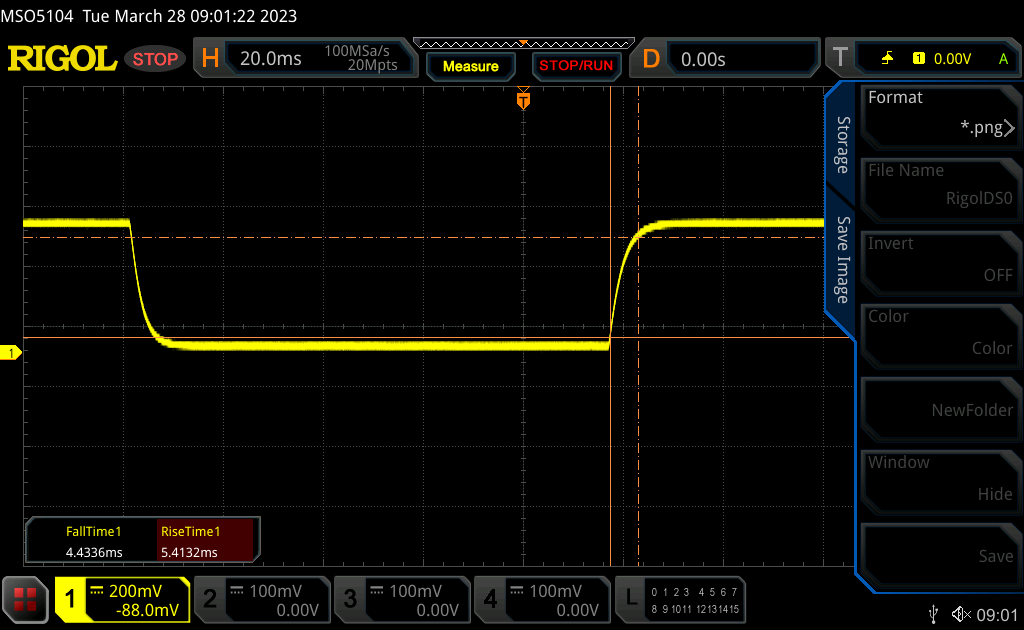 |
| ↘ 4.5 ms Calo | ||
| Lo schermo mostra veloci tempi di risposta durante i nostri tests e dovrebbe esere adatto al gaming In confronto, tutti i dispositivi di test variano da 0.1 (minimo) a 240 (massimo) ms. » 27 % di tutti i dispositivi è migliore. Questo significa che i tempi di risposta rilevati sono migliori rispettto alla media di tutti i dispositivi testati (19.8 ms). | ||
| ↔ Tempo di risposta dal 50% Grigio all'80% Grigio | ||
| 3 ms ... aumenta ↗ e diminuisce ↘ combinato | ↗ 1.5 ms Incremento | 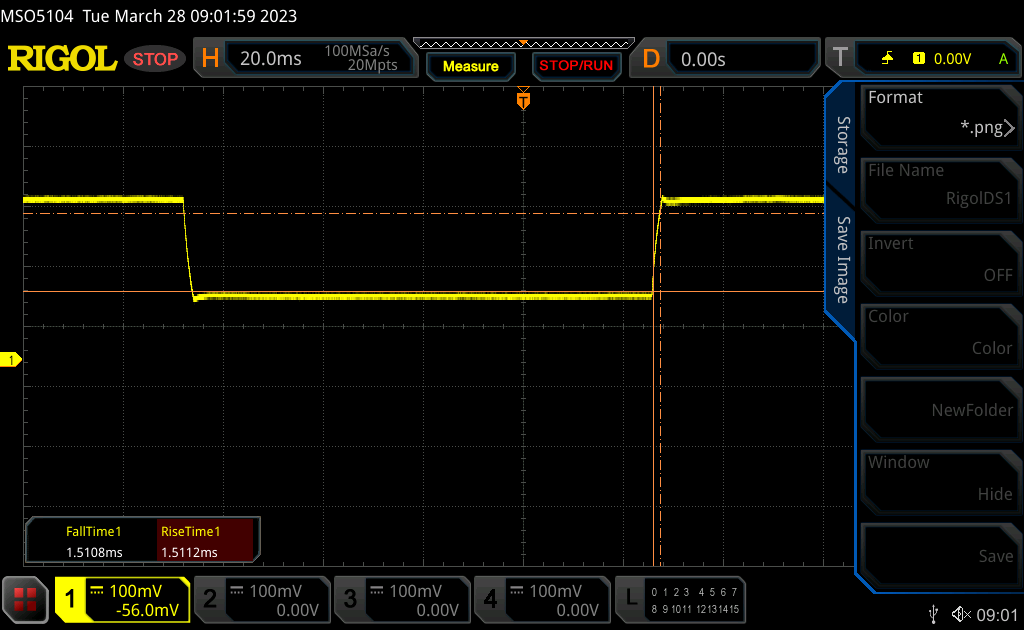 |
| ↘ 1.5 ms Calo | ||
| Lo schermo ha mostrato valori di risposta molto veloci nei nostri tests ed è molto adatto per i gaming veloce. In confronto, tutti i dispositivi di test variano da 0.165 (minimo) a 636 (massimo) ms. » 13 % di tutti i dispositivi è migliore. Questo significa che i tempi di risposta rilevati sono migliori rispettto alla media di tutti i dispositivi testati (31 ms). | ||
Sfarfallio dello schermo / PWM (Pulse-Width Modulation)
| flickering dello schermo / PWM non rilevato | 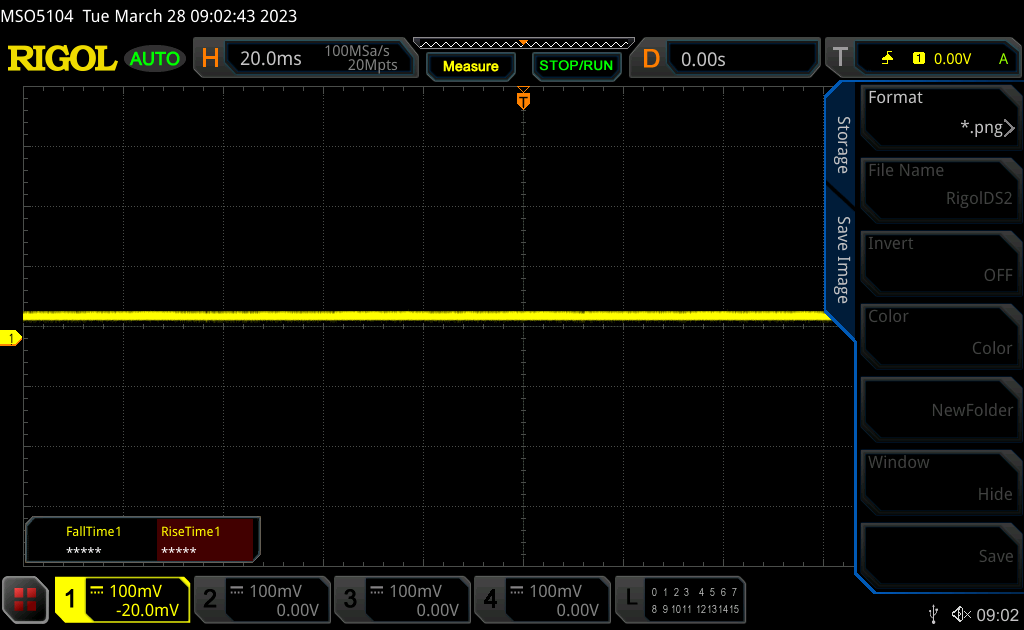 | ||
In confronto: 52 % di tutti i dispositivi testati non utilizza PWM per ridurre la luminosita' del display. Se è rilevato PWM, una media di 7778 (minimo: 5 - massimo: 343500) Hz è stata rilevata. | |||
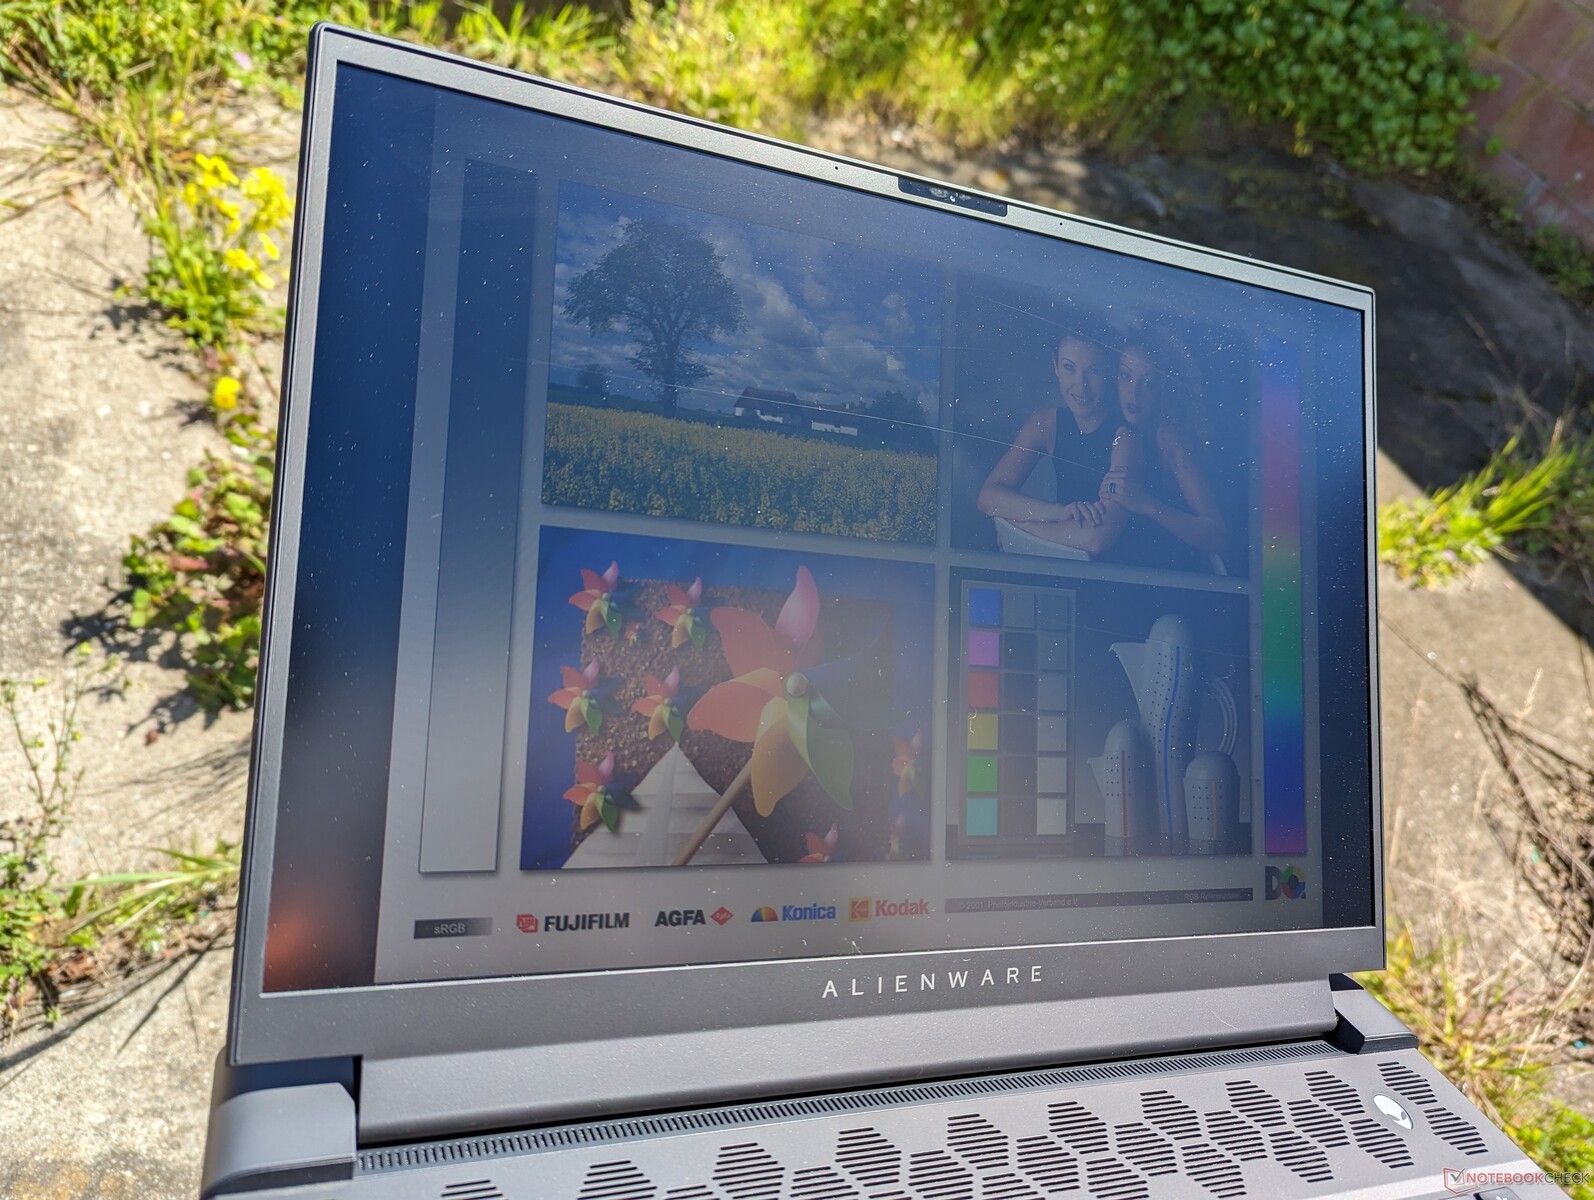
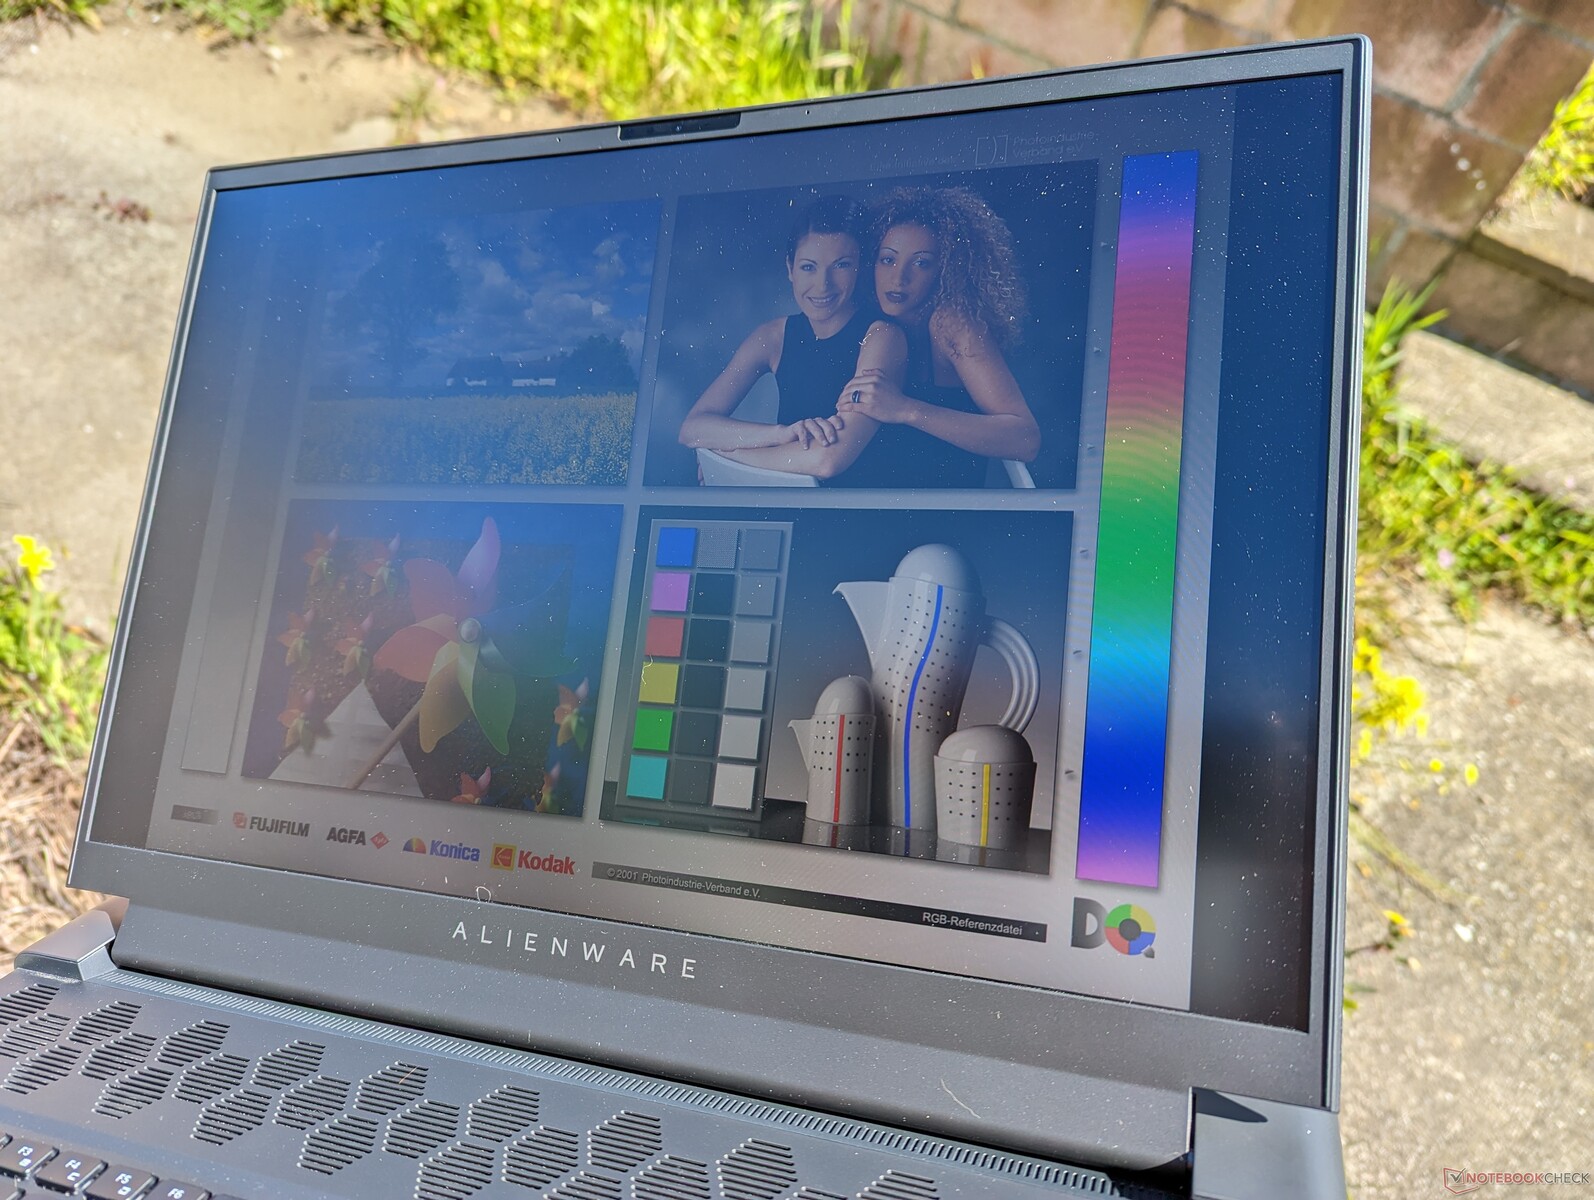
La visibilità all'aperto è nella media per la categoria, dato che gli schermi della maggior parte dei portatili da gioco si aggirano in genere tra i 300 e i 400 nits. Tuttavia, l'enorme peso dell'Alienware scoraggia l'uso all'aperto. Il Blade 18 e il Titan GT77 sono più luminosi e garantiscono una migliore visibilità all'aperto.
Prestazioni - Intel 13th Gen + Nvidia Ada Lovelace
Condizioni di test
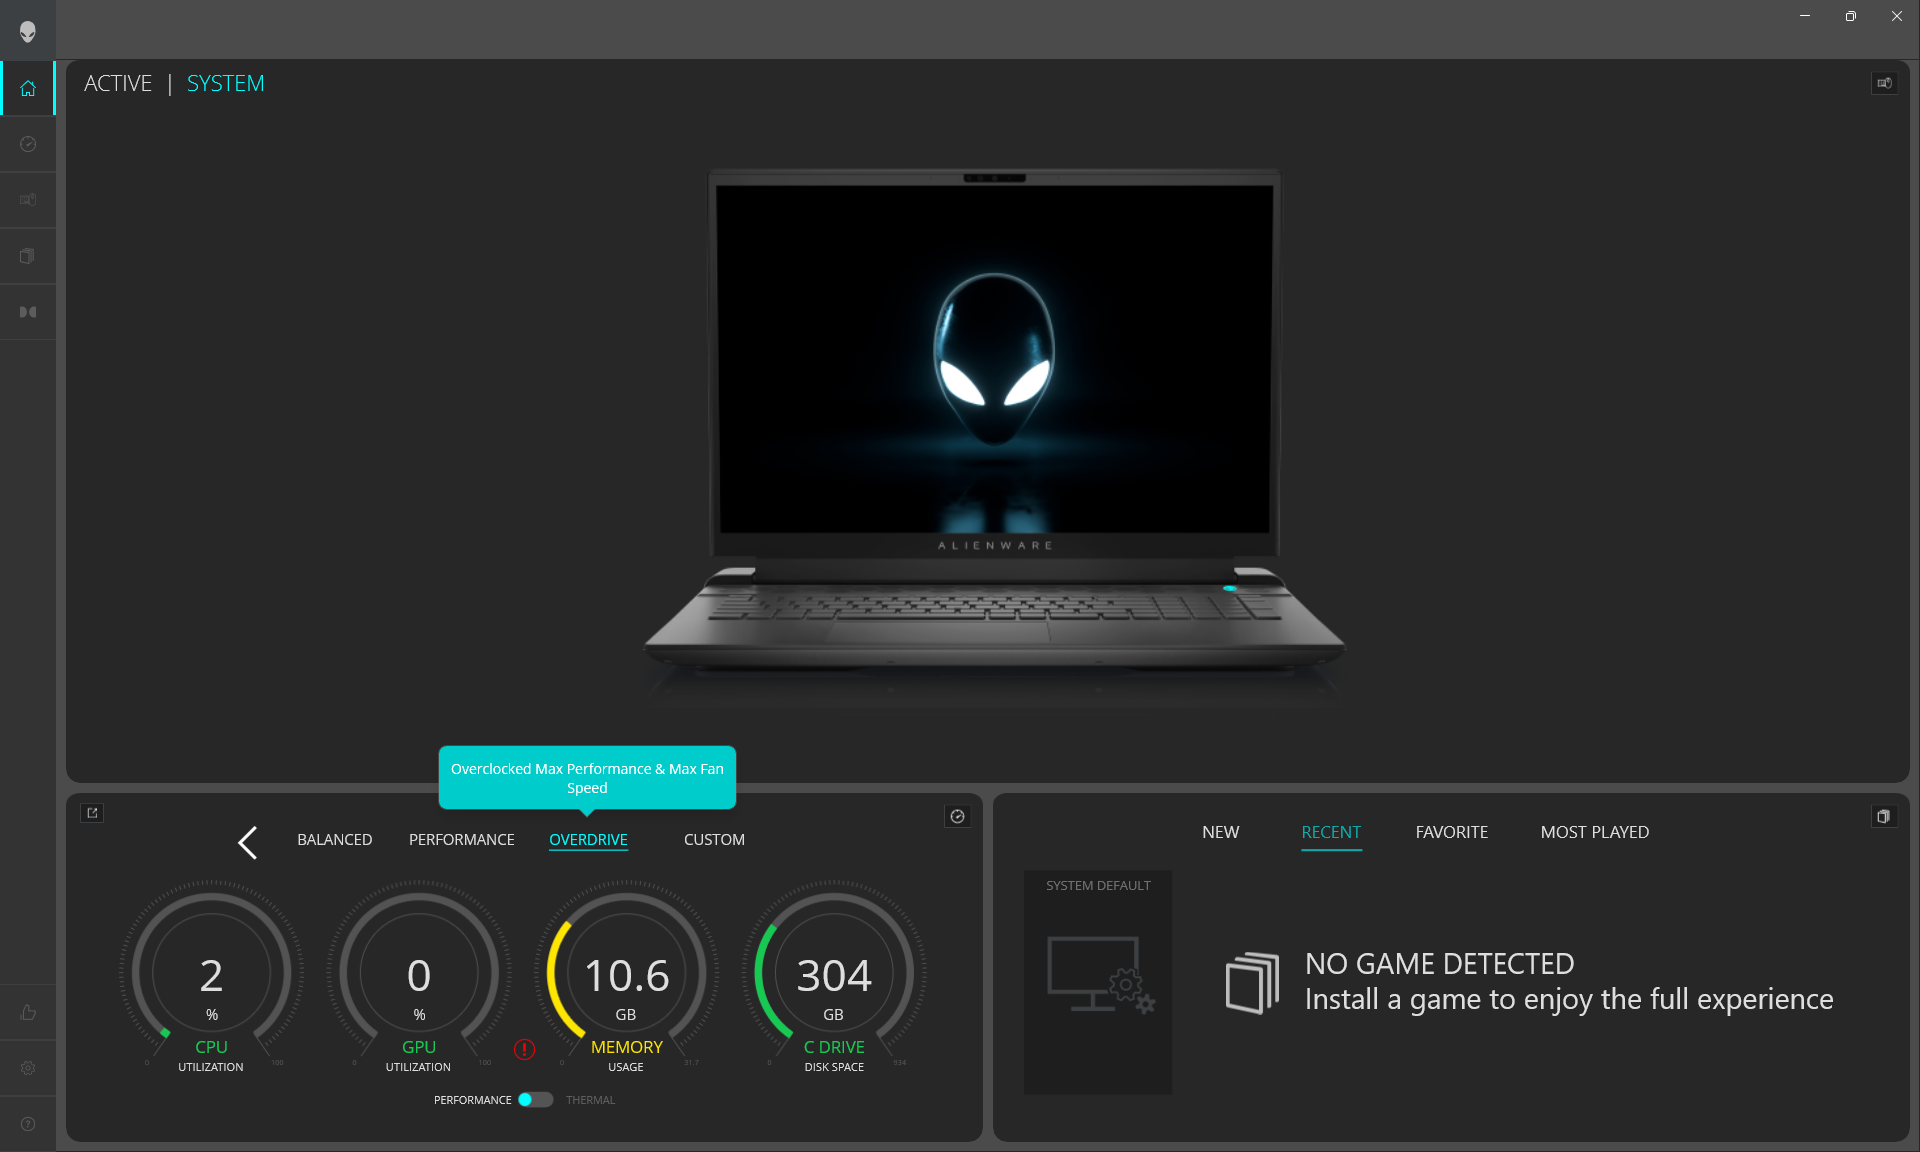
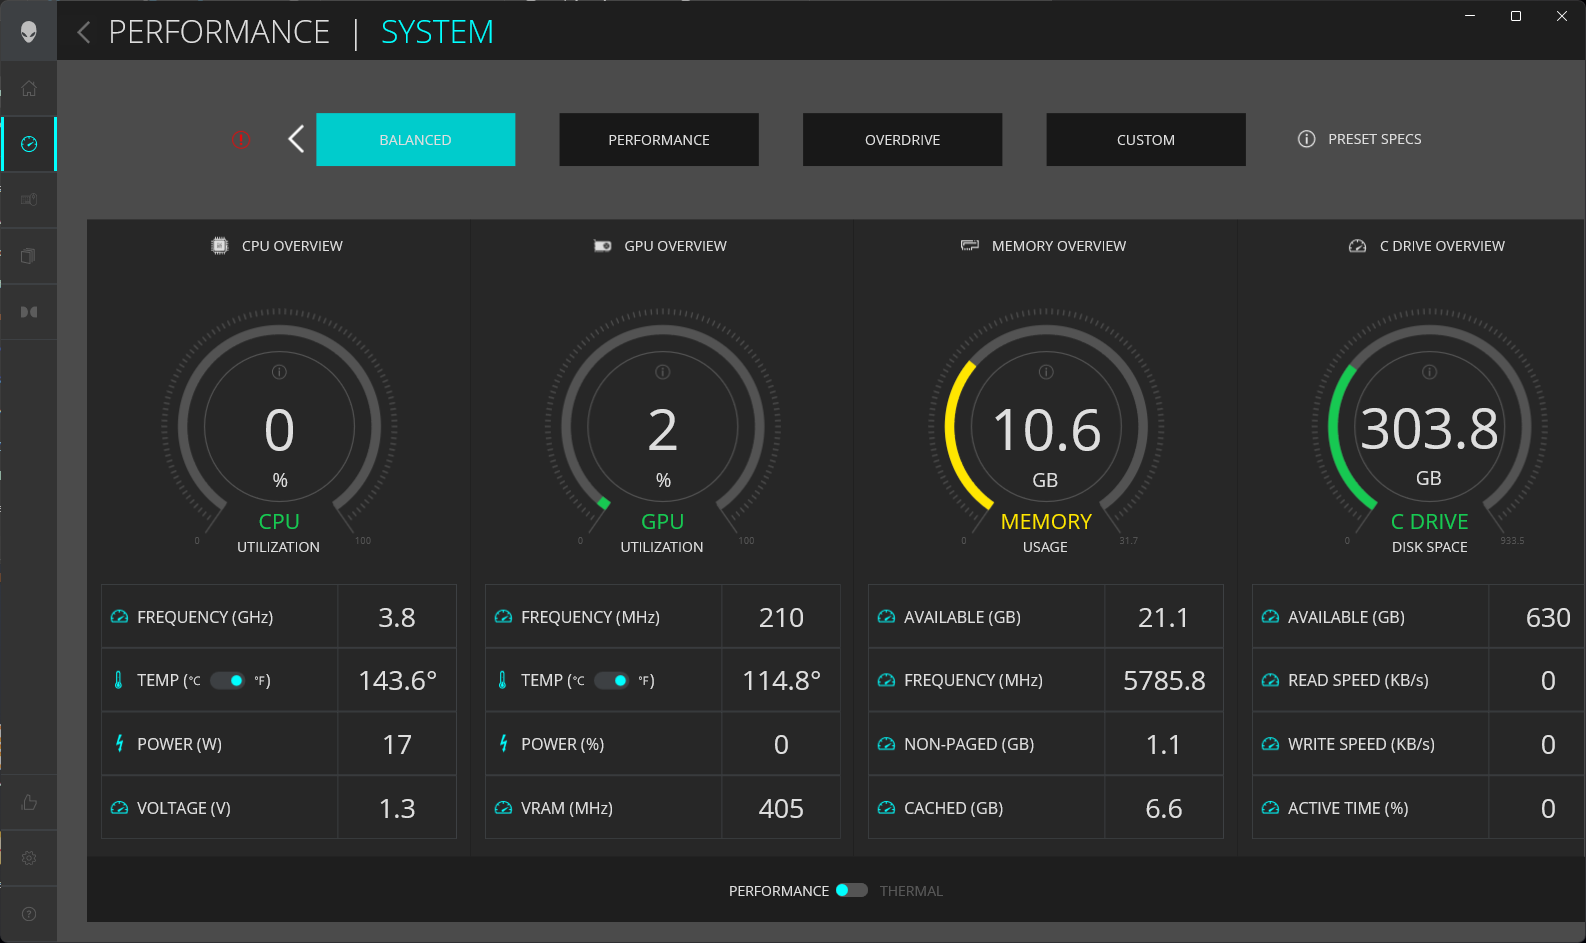
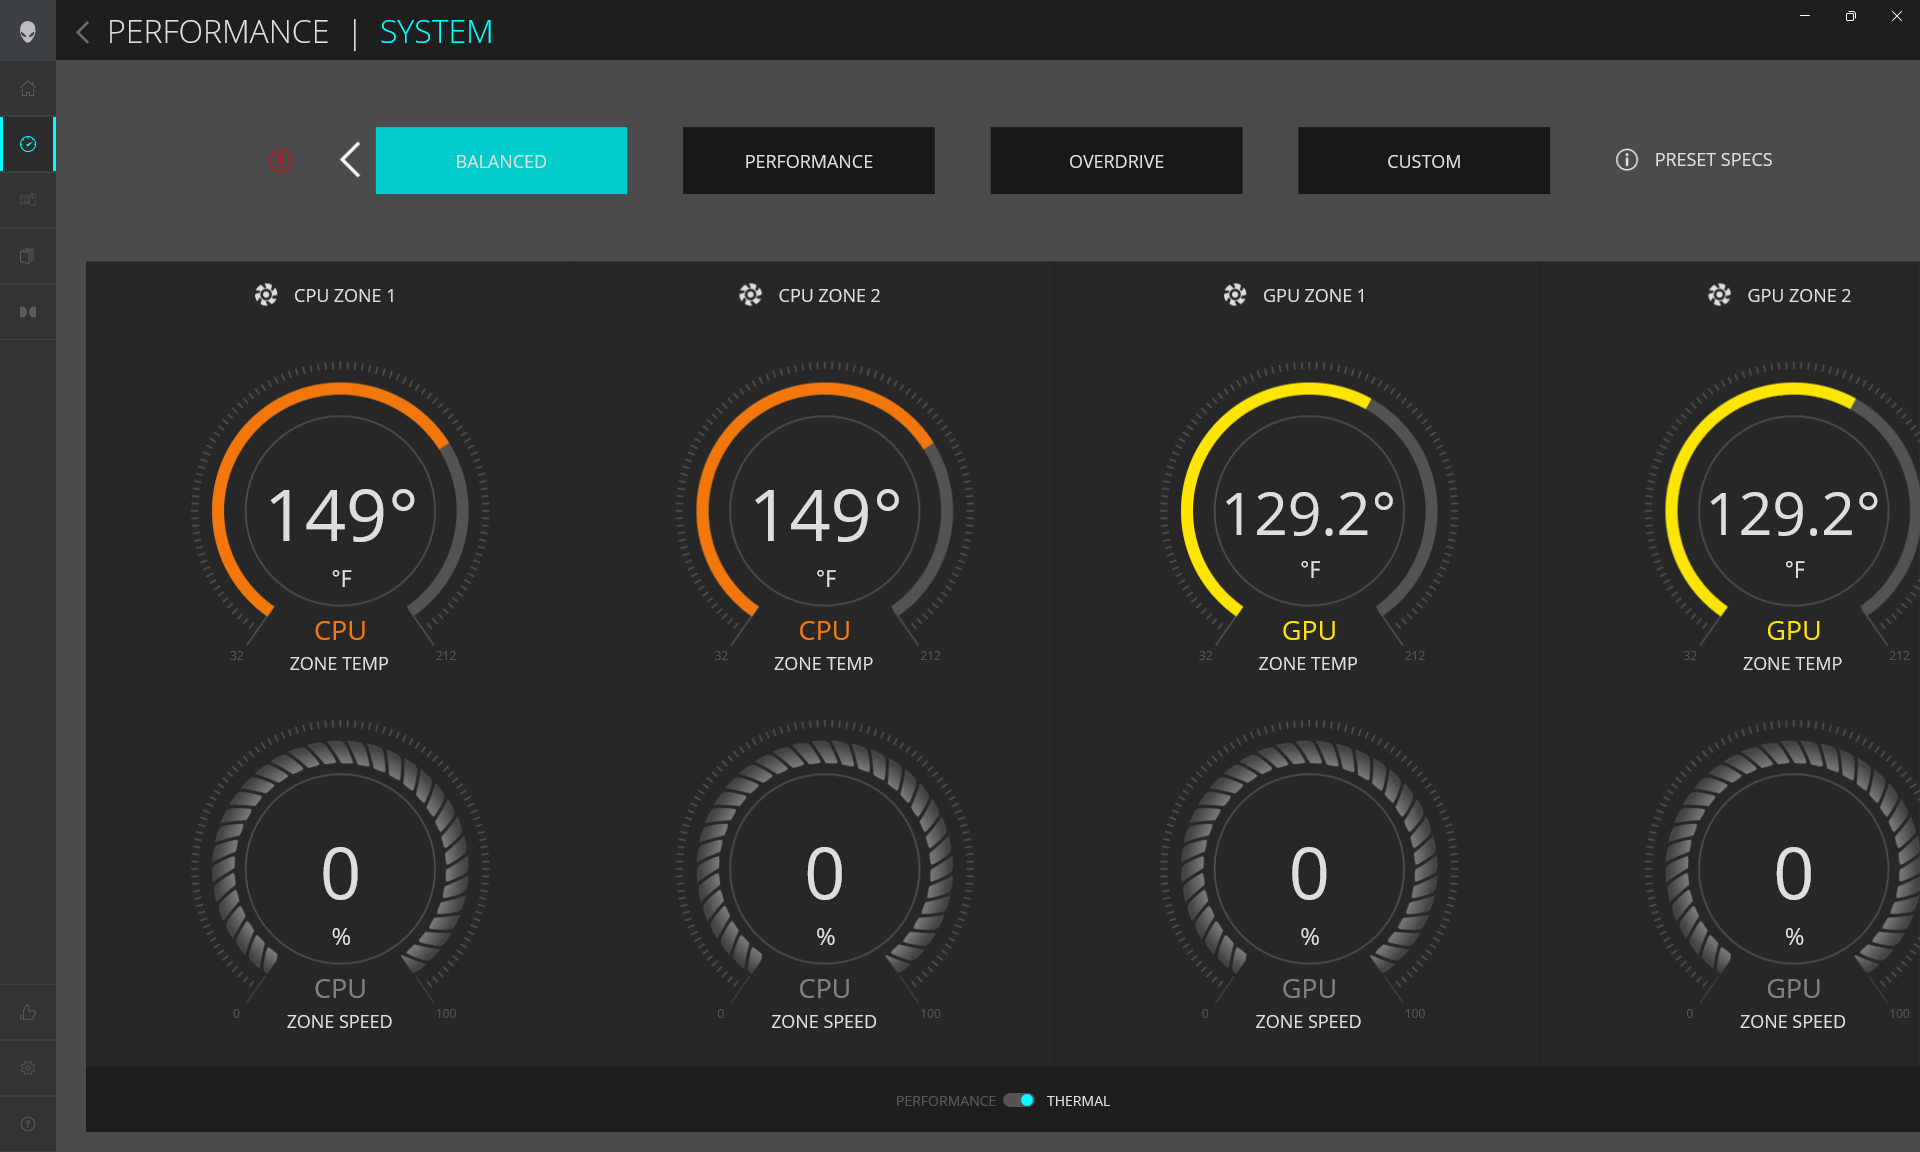
Abbiamo impostato la nostra unità sulla modalità Performance tramite Windows, sulla modalità GPU discreta tramite il pannello di controllo Nvidia e sulla modalità Overdrive tramite l'Alienware Command Center prima di eseguire i benchmark qui sotto. Quest'anno Dell ha completamente rinnovato il software del Command Center, rendendolo più facile da usare e con caratteri di dimensioni maggiori rispetto al passato. Tuttavia, il caricamento è ancora molto lento, soprattutto se confrontato con il più veloce MSI Center o con gli equivalenti Schenker Control Center.
Abbiamo riscontrato un paio di bug con l'Alienware Command Center che vale la pena menzionare anche dopo l'aggiornamento all'ultima versione al momento in cui scriviamo. In primo luogo, il software non si carica se è collegato un monitor esterno. In secondo luogo, le ventole interne a volte continuano a girare molto rumorosamente anche quando il sistema è a riposo o in ibernazione in modalità Performance o Overdrive.
L'Advanced Optimus è supportato, il che significa che gli utenti possono passare dalla modalità GPU discreta a quella Optimus tramite il pannello di controllo Nvidia senza dover riavviare il sistema. G-Sync è disponibile solo in modalità dGPU, mentre Optimus si attiva automaticamente se è collegato un monitor esterno.
Processore
Le prestazioni del processore sono tra le più veloci di qualsiasi CPU mobile attualmente sul mercato. Gli utenti possono aspettarsi guadagni in single-thread e multi-thread di circa il 10% e il 75%, rispettivamente, rispetto al Core i9-12900HK di 12a generazione.Core i9-12900HK nel vecchio Alienware x17 R2. Il principale concorrente Zen 4 di AMD, ilRyzen 9 7945HX è inferiore nei carichi a thread singolo di circa il 10-15%.
Nonostante l'enorme salto di prestazioni rispetto ad Alder Lake-H, il divario di prestazioni tra ilCore i9-13900HX,Core i9-13950HXeCore i9-13980HX sono molto ridotti, al di sotto del 5%. Pertanto, se si ha la possibilità di scegliere tra le tre CPU, si potrebbe risparmiare un po' di soldi optando per il più "lento" i9-13900HX.
L'opzione di CPU più bassa disponibile è il Core i7-13700HX che è più lento del nostro i9-13980HX di circa il 33%.
Cinebench R15 Multi Loop
Cinebench R23: Multi Core | Single Core
Cinebench R20: CPU (Multi Core) | CPU (Single Core)
Cinebench R15: CPU Multi 64Bit | CPU Single 64Bit
Blender: v2.79 BMW27 CPU
7-Zip 18.03: 7z b 4 | 7z b 4 -mmt1
Geekbench 5.5: Multi-Core | Single-Core
HWBOT x265 Benchmark v2.2: 4k Preset
LibreOffice : 20 Documents To PDF
R Benchmark 2.5: Overall mean
* ... Meglio usare valori piccoli
AIDA64: FP32 Ray-Trace | FPU Julia | CPU SHA3 | CPU Queen | FPU SinJulia | FPU Mandel | CPU AES | CPU ZLib | FP64 Ray-Trace | CPU PhotoWorxx
| Performance rating | |
| Alienware m18 R1 | |
| Eluktronics Mech-17 GP2 | |
| MSI Titan GT77 HX 13VI | |
| Asus ROG Strix Scar 18 2023 G834JY-N6005W | |
| Media Intel Core i9-13980HX | |
| Razer Blade 18 RTX 4070 | |
| Alienware x17 R2 P48E | |
| AIDA64 / FP32 Ray-Trace | |
| Alienware m18 R1 | |
| MSI Titan GT77 HX 13VI | |
| Asus ROG Strix Scar 18 2023 G834JY-N6005W | |
| Eluktronics Mech-17 GP2 | |
| Media Intel Core i9-13980HX (21332 - 29553, n=9) | |
| Razer Blade 18 RTX 4070 | |
| Alienware x17 R2 P48E | |
| AIDA64 / FPU Julia | |
| Alienware m18 R1 | |
| MSI Titan GT77 HX 13VI | |
| Asus ROG Strix Scar 18 2023 G834JY-N6005W | |
| Media Intel Core i9-13980HX (108001 - 148168, n=9) | |
| Eluktronics Mech-17 GP2 | |
| Razer Blade 18 RTX 4070 | |
| Alienware x17 R2 P48E | |
| AIDA64 / CPU SHA3 | |
| Alienware m18 R1 | |
| MSI Titan GT77 HX 13VI | |
| Eluktronics Mech-17 GP2 | |
| Asus ROG Strix Scar 18 2023 G834JY-N6005W | |
| Media Intel Core i9-13980HX (5264 - 7142, n=9) | |
| Razer Blade 18 RTX 4070 | |
| Alienware x17 R2 P48E | |
| AIDA64 / CPU Queen | |
| Alienware m18 R1 | |
| Asus ROG Strix Scar 18 2023 G834JY-N6005W | |
| Eluktronics Mech-17 GP2 | |
| MSI Titan GT77 HX 13VI | |
| Media Intel Core i9-13980HX (126758 - 143409, n=9) | |
| Razer Blade 18 RTX 4070 | |
| Alienware x17 R2 P48E | |
| AIDA64 / FPU SinJulia | |
| Eluktronics Mech-17 GP2 | |
| Asus ROG Strix Scar 18 2023 G834JY-N6005W | |
| MSI Titan GT77 HX 13VI | |
| Alienware m18 R1 | |
| Media Intel Core i9-13980HX (13785 - 17117, n=9) | |
| Razer Blade 18 RTX 4070 | |
| Alienware x17 R2 P48E | |
| AIDA64 / FPU Mandel | |
| Alienware m18 R1 | |
| MSI Titan GT77 HX 13VI | |
| Asus ROG Strix Scar 18 2023 G834JY-N6005W | |
| Eluktronics Mech-17 GP2 | |
| Media Intel Core i9-13980HX (53398 - 73758, n=9) | |
| Razer Blade 18 RTX 4070 | |
| Alienware x17 R2 P48E | |
| AIDA64 / CPU AES | |
| Eluktronics Mech-17 GP2 | |
| MSI Titan GT77 HX 13VI | |
| Alienware m18 R1 | |
| Asus ROG Strix Scar 18 2023 G834JY-N6005W | |
| Media Intel Core i9-13980HX (105169 - 136520, n=9) | |
| Razer Blade 18 RTX 4070 | |
| Alienware x17 R2 P48E | |
| AIDA64 / CPU ZLib | |
| MSI Titan GT77 HX 13VI | |
| Asus ROG Strix Scar 18 2023 G834JY-N6005W | |
| Alienware m18 R1 | |
| Eluktronics Mech-17 GP2 | |
| Media Intel Core i9-13980HX (1513 - 2039, n=9) | |
| Razer Blade 18 RTX 4070 | |
| Alienware x17 R2 P48E | |
| AIDA64 / FP64 Ray-Trace | |
| Alienware m18 R1 | |
| MSI Titan GT77 HX 13VI | |
| Asus ROG Strix Scar 18 2023 G834JY-N6005W | |
| Eluktronics Mech-17 GP2 | |
| Media Intel Core i9-13980HX (11431 - 16325, n=9) | |
| Razer Blade 18 RTX 4070 | |
| Alienware x17 R2 P48E | |
| AIDA64 / CPU PhotoWorxx | |
| Alienware m18 R1 | |
| Razer Blade 18 RTX 4070 | |
| Media Intel Core i9-13980HX (37069 - 52949, n=9) | |
| Eluktronics Mech-17 GP2 | |
| Asus ROG Strix Scar 18 2023 G834JY-N6005W | |
| MSI Titan GT77 HX 13VI | |
| Alienware x17 R2 P48E | |
Prestazioni del sistema
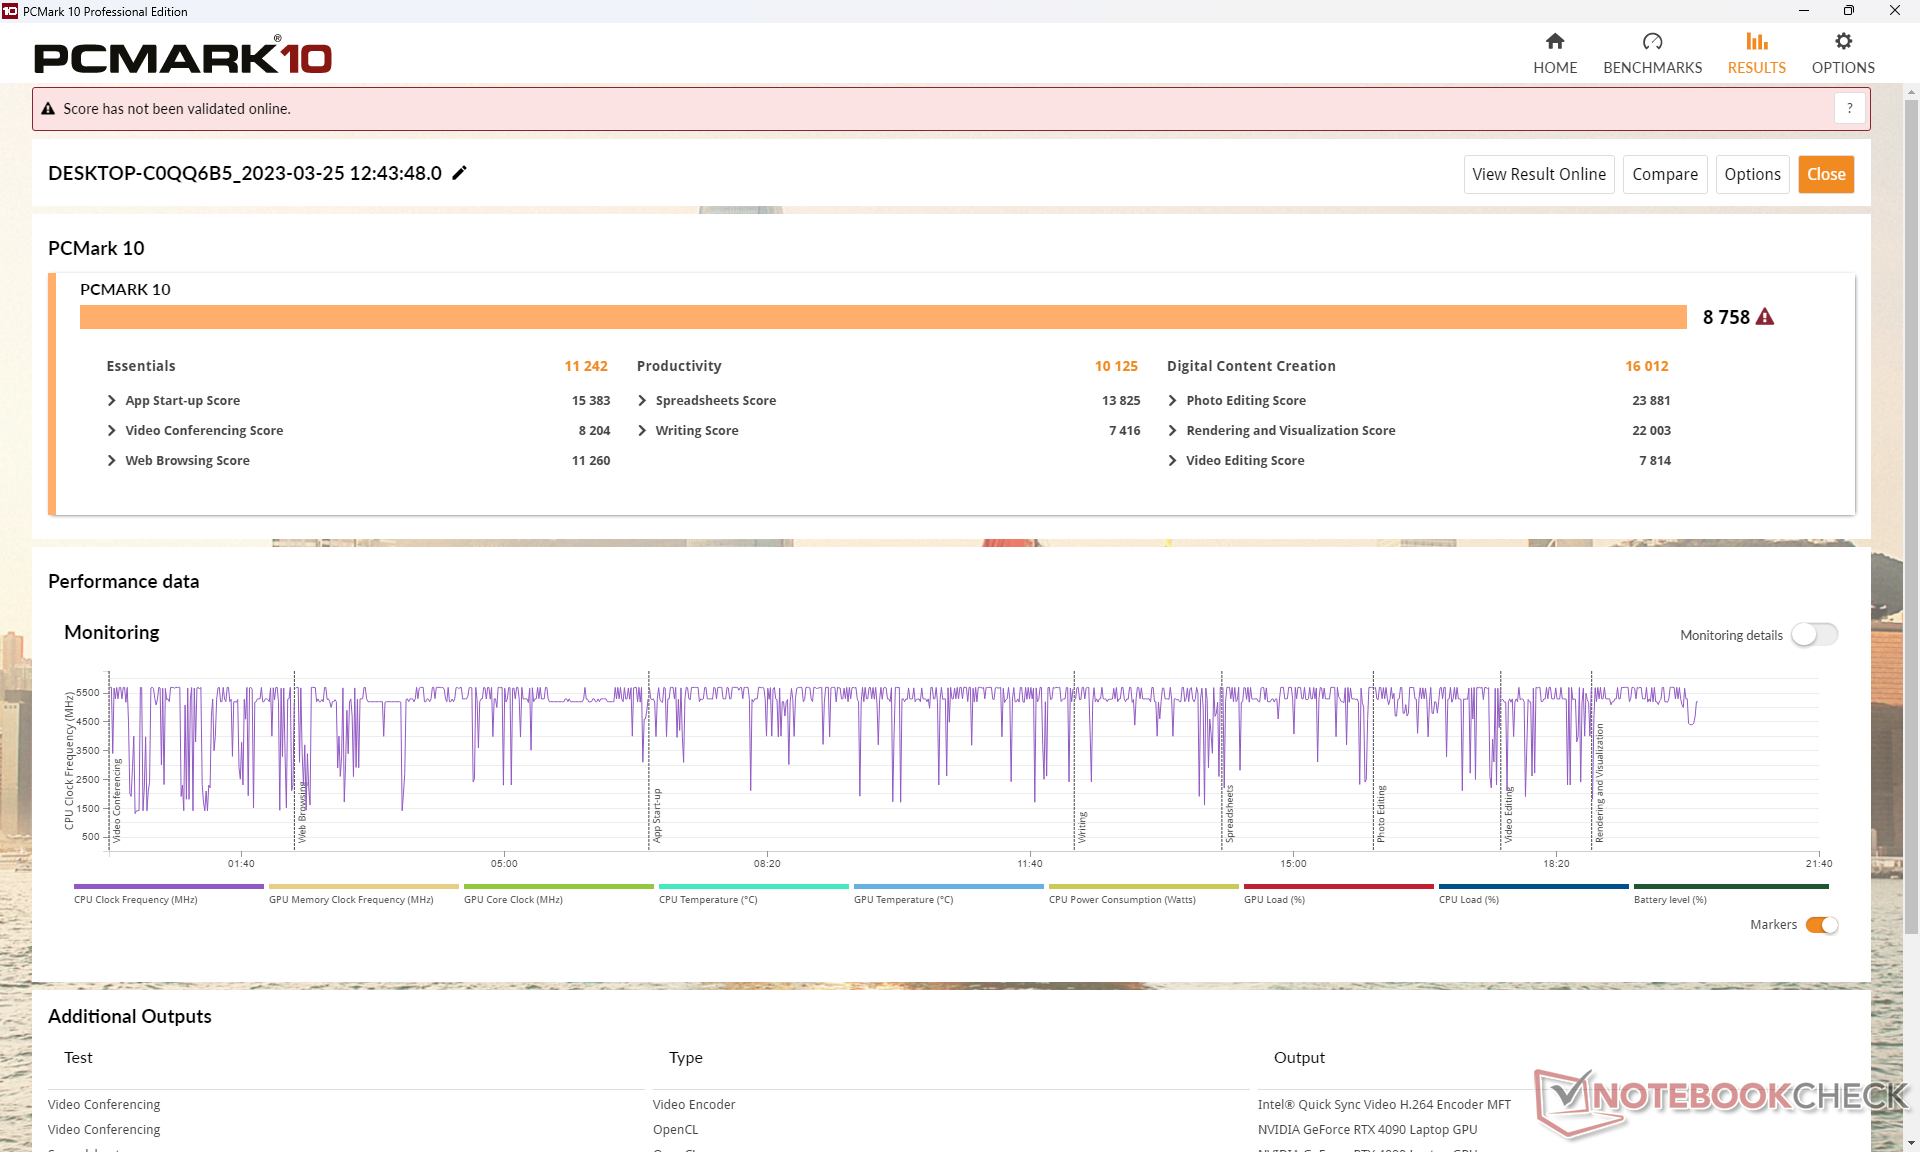
I punteggi di PCMark 10 sono paragonabili a quelli di altri portatili da gioco di punta con CPU Intel di 13a generazione e GPU GeForce 40 simili, come l'Asus ROG Strix Scar 18 o MSI Titan GT77 HX. Il nostro Alienware riesce anche a battere il più vecchio Alienware x17 R2 che utilizza due SSD Samsung PM9A1 in RAID 0.
CrossMark: Overall | Productivity | Creativity | Responsiveness
| PCMark 10 / Score | |
| Eluktronics Mech-17 GP2 | |
| MSI Titan GT77 HX 13VI | |
| Media Intel Core i9-13980HX, NVIDIA GeForce RTX 4090 Laptop GPU (8650 - 9068, n=4) | |
| Asus ROG Strix Scar 18 2023 G834JY-N6005W | |
| Alienware m18 R1 | |
| Alienware x17 R2 P48E | |
| Razer Blade 18 RTX 4070 | |
| PCMark 10 / Essentials | |
| Eluktronics Mech-17 GP2 | |
| MSI Titan GT77 HX 13VI | |
| Razer Blade 18 RTX 4070 | |
| Media Intel Core i9-13980HX, NVIDIA GeForce RTX 4090 Laptop GPU (11215 - 11644, n=3) | |
| Alienware m18 R1 | |
| Alienware x17 R2 P48E | |
| PCMark 10 / Productivity | |
| Eluktronics Mech-17 GP2 | |
| Media Intel Core i9-13980HX, NVIDIA GeForce RTX 4090 Laptop GPU (10125 - 11067, n=3) | |
| Alienware x17 R2 P48E | |
| Alienware m18 R1 | |
| MSI Titan GT77 HX 13VI | |
| Razer Blade 18 RTX 4070 | |
| PCMark 10 / Digital Content Creation | |
| MSI Titan GT77 HX 13VI | |
| Alienware m18 R1 | |
| Media Intel Core i9-13980HX, NVIDIA GeForce RTX 4090 Laptop GPU (15052 - 16012, n=3) | |
| Eluktronics Mech-17 GP2 | |
| Alienware x17 R2 P48E | |
| Razer Blade 18 RTX 4070 | |
| CrossMark / Overall | |
| Eluktronics Mech-17 GP2 | |
| Alienware m18 R1 | |
| MSI Titan GT77 HX 13VI | |
| Razer Blade 18 RTX 4070 | |
| Asus ROG Strix Scar 18 2023 G834JY-N6005W | |
| Media Intel Core i9-13980HX, NVIDIA GeForce RTX 4090 Laptop GPU (1935 - 2176, n=4) | |
| Alienware x17 R2 P48E | |
| CrossMark / Productivity | |
| Eluktronics Mech-17 GP2 | |
| Alienware m18 R1 | |
| MSI Titan GT77 HX 13VI | |
| Razer Blade 18 RTX 4070 | |
| Asus ROG Strix Scar 18 2023 G834JY-N6005W | |
| Media Intel Core i9-13980HX, NVIDIA GeForce RTX 4090 Laptop GPU (1764 - 2005, n=4) | |
| Alienware x17 R2 P48E | |
| CrossMark / Creativity | |
| Eluktronics Mech-17 GP2 | |
| Alienware m18 R1 | |
| Asus ROG Strix Scar 18 2023 G834JY-N6005W | |
| MSI Titan GT77 HX 13VI | |
| Media Intel Core i9-13980HX, NVIDIA GeForce RTX 4090 Laptop GPU (2267 - 2469, n=4) | |
| Razer Blade 18 RTX 4070 | |
| Alienware x17 R2 P48E | |
| CrossMark / Responsiveness | |
| Alienware m18 R1 | |
| Razer Blade 18 RTX 4070 | |
| MSI Titan GT77 HX 13VI | |
| Eluktronics Mech-17 GP2 | |
| Media Intel Core i9-13980HX, NVIDIA GeForce RTX 4090 Laptop GPU (1556 - 1904, n=4) | |
| Alienware x17 R2 P48E | |
| Asus ROG Strix Scar 18 2023 G834JY-N6005W | |
| PCMark 10 Score | 8758 punti | |
Aiuto | ||
| AIDA64 / Memory Copy | |
| Alienware m18 R1 | |
| Razer Blade 18 RTX 4070 | |
| Media Intel Core i9-13980HX (62189 - 80776, n=9) | |
| Eluktronics Mech-17 GP2 | |
| Asus ROG Strix Scar 18 2023 G834JY-N6005W | |
| MSI Titan GT77 HX 13VI | |
| Alienware x17 R2 P48E | |
| AIDA64 / Memory Read | |
| Alienware m18 R1 | |
| Razer Blade 18 RTX 4070 | |
| Media Intel Core i9-13980HX (62624 - 89096, n=9) | |
| Eluktronics Mech-17 GP2 | |
| Asus ROG Strix Scar 18 2023 G834JY-N6005W | |
| MSI Titan GT77 HX 13VI | |
| Alienware x17 R2 P48E | |
| AIDA64 / Memory Write | |
| Alienware m18 R1 | |
| Razer Blade 18 RTX 4070 | |
| Media Intel Core i9-13980HX (59912 - 79917, n=9) | |
| Eluktronics Mech-17 GP2 | |
| Asus ROG Strix Scar 18 2023 G834JY-N6005W | |
| MSI Titan GT77 HX 13VI | |
| Alienware x17 R2 P48E | |
| AIDA64 / Memory Latency | |
| Alienware x17 R2 P48E | |
| MSI Titan GT77 HX 13VI | |
| Asus ROG Strix Scar 18 2023 G834JY-N6005W | |
| Eluktronics Mech-17 GP2 | |
| Media Intel Core i9-13980HX (79.4 - 93.2, n=9) | |
| Razer Blade 18 RTX 4070 | |
| Alienware m18 R1 | |
* ... Meglio usare valori piccoli
Latenza DPC
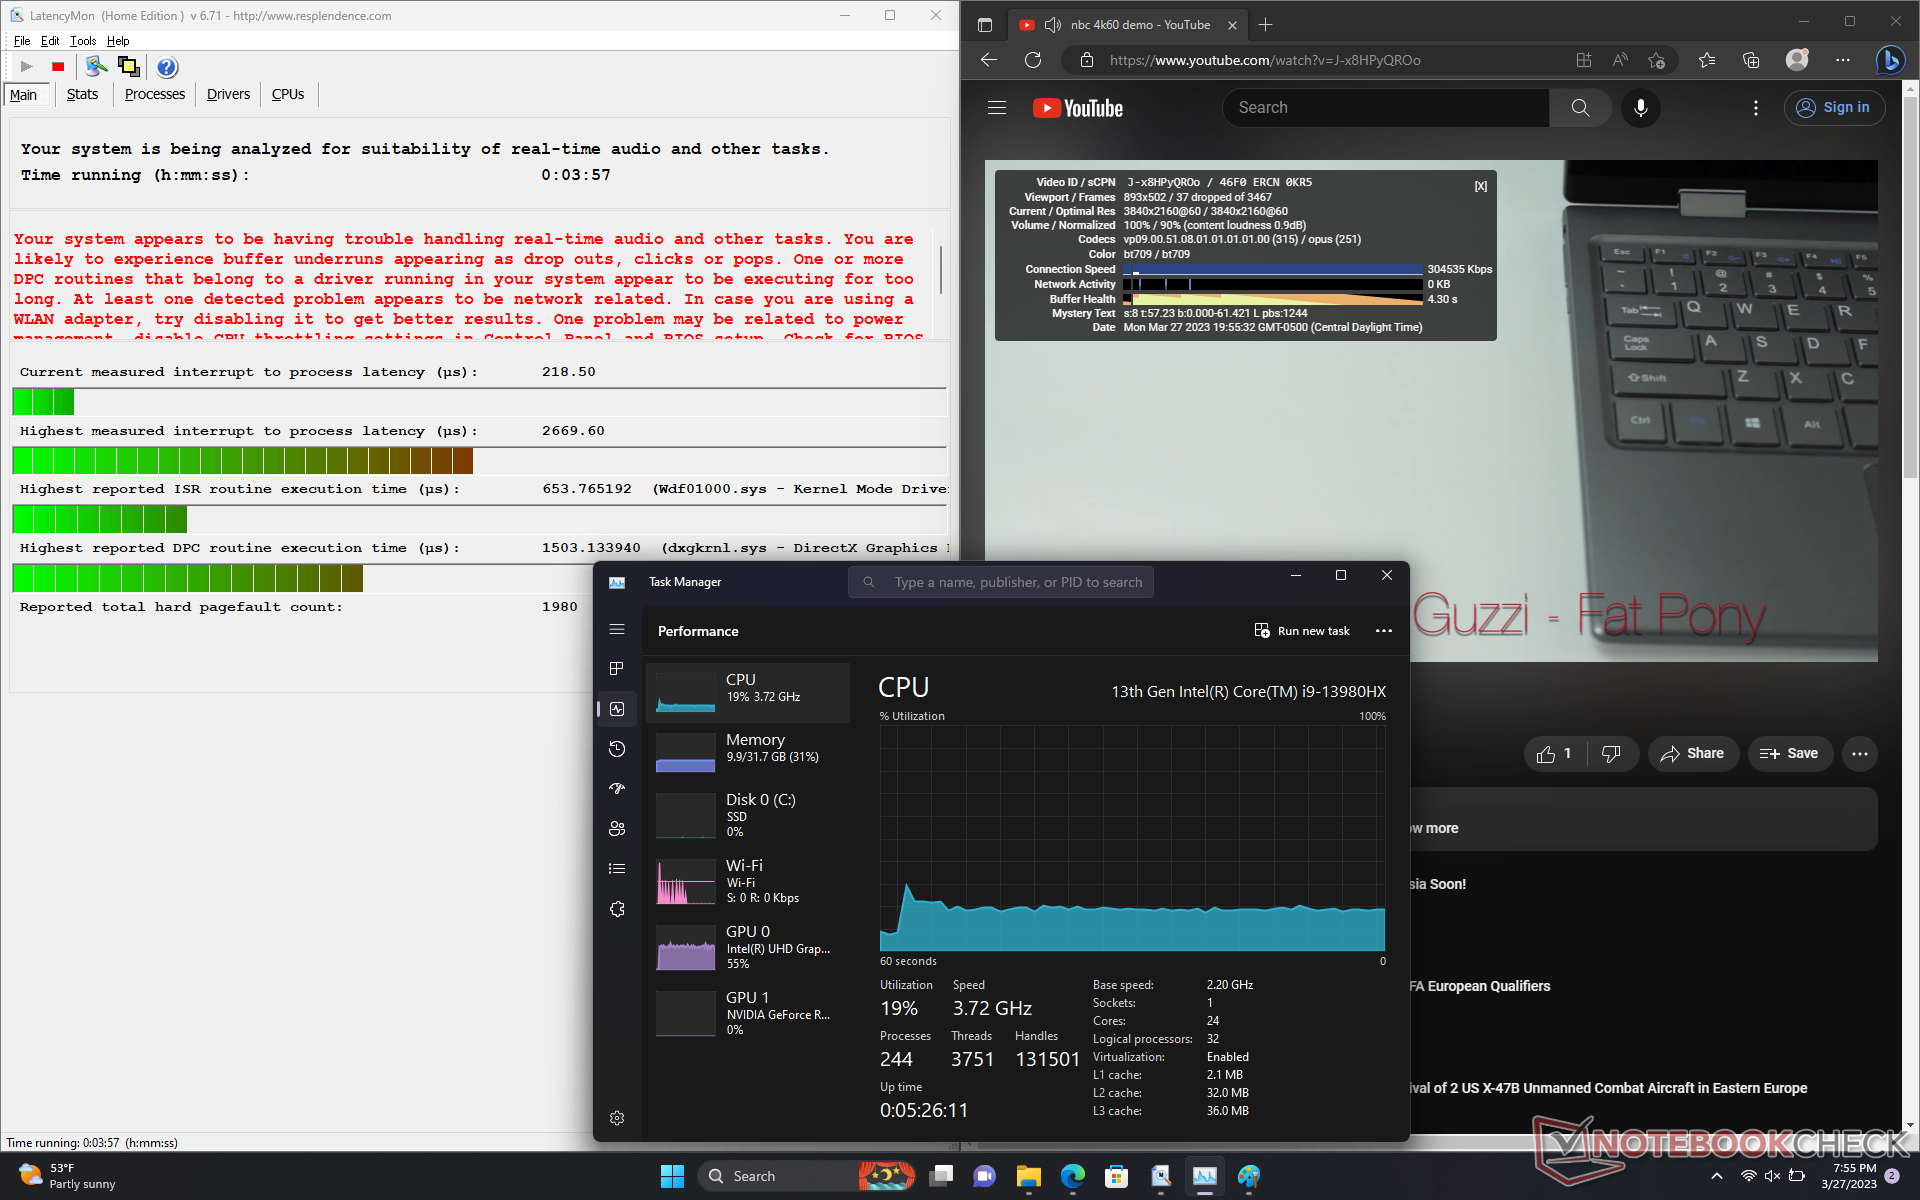
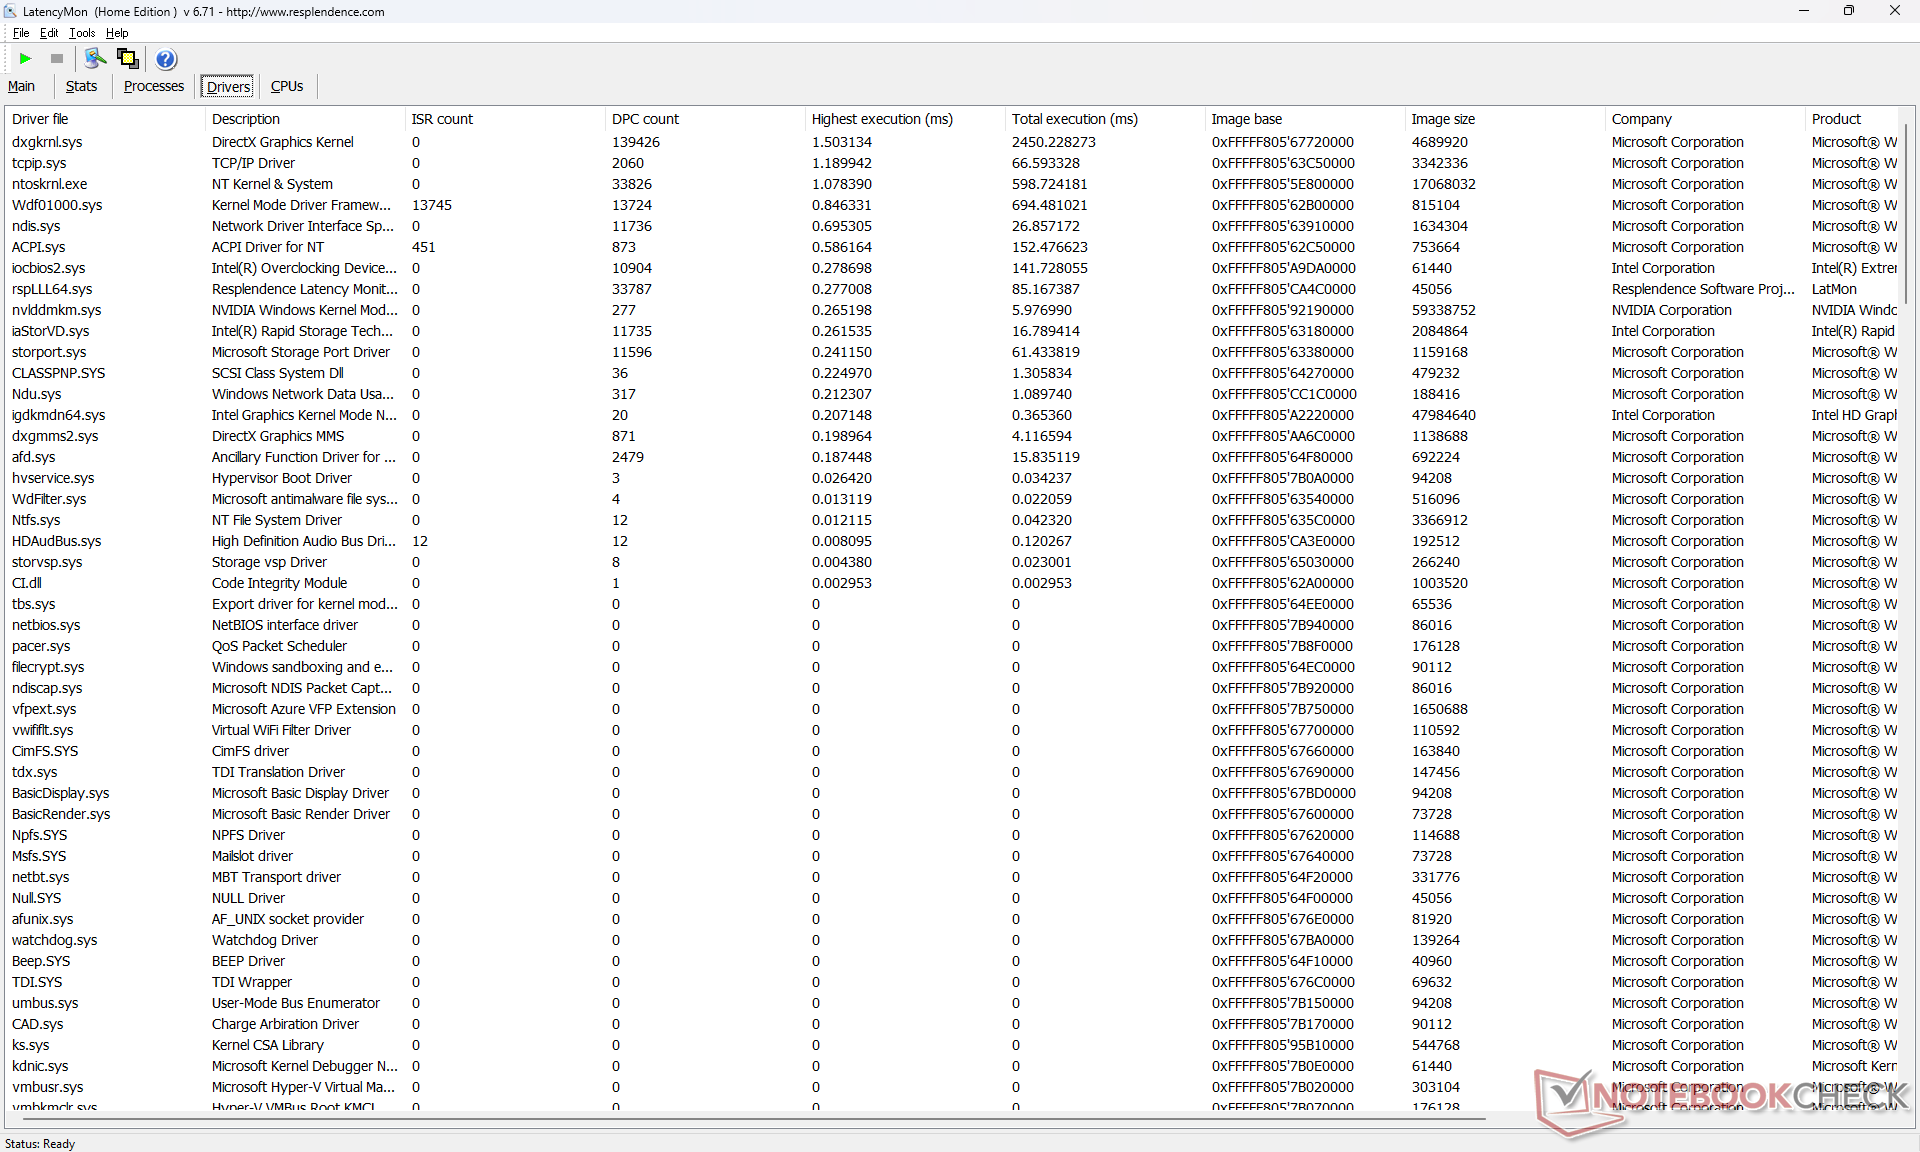
LatencyMon rivela problemi di DPC quando si aprono più schede del browser della nostra homepage. Inoltre, il sistema ha problemi con la riproduzione di contenuti video 4K, in quanto abbiamo registrato 37 fotogrammi interrotti durante il nostro video di prova della durata di un minuto, anche dopo aver ripetuto i test. Anche l'utilizzo della CPU e dell'iGPU è insolitamente elevato, rispettivamente del 19% e del 55%. Queste osservazioni suggeriscono una cattiva gestione dei processi in background che possono avere un impatto sull'attività a fuoco.
Per quanto riguarda il driver grafico 531.29, Nvidia ha riconosciuto un bug legato a un aumento della latenza DPC. Si spera che la soluzione arrivi presto.
| DPC Latencies / LatencyMon - interrupt to process latency (max), Web, Youtube, Prime95 | |
| MSI Titan GT77 HX 13VI | |
| Alienware m18 R1 | |
| Razer Blade 18 RTX 4070 | |
| Alienware x17 R2 P48E | |
| Asus ROG Strix Scar 18 2023 G834JY-N6005W | |
| Eluktronics Mech-17 GP2 | |
* ... Meglio usare valori piccoli
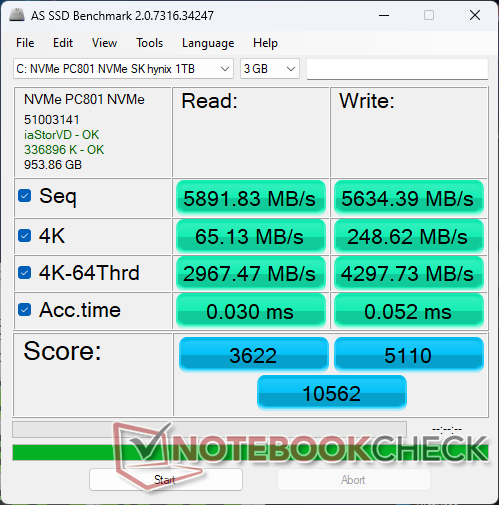
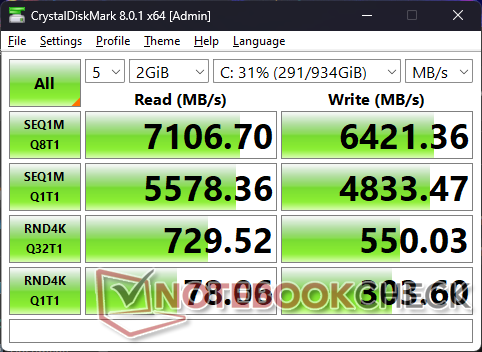
Dispositivi di archiviazione - Quattro unità M.2 in totale
La nostra unità è configurata con un SK Hynix PC801 PCIe4 x4 NVMe per velocità di lettura e scrittura sequenziali fino a 7000 MB/s e 6500 MB/s, rispettivamente. Le prestazioni sono competitive rispetto alla serie PMA1 di Samsung e la nostra unità non ha problemi a mantenere le velocità massime senza alcun throttling.
L'Alienware non supporta le unità SSD PCIe5 NVMe, a differenza delle serie MSI GE78 o GT77. Tuttavia, supporta un numero maggiore di unità SSD interne rispetto alla maggior parte degli altri portatili.

| Drive Performance rating - Percent | |
| Alienware m18 R1 | |
| MSI Titan GT77 HX 13VI | |
| Razer Blade 18 RTX 4070 | |
| Alienware x17 R2 P48E | |
| Asus ROG Strix Scar 18 2023 G834JY-N6005W | |
| Eluktronics Mech-17 GP2 | |
* ... Meglio usare valori piccoli
Disk Throttling: DiskSpd Read Loop, Queue Depth 8
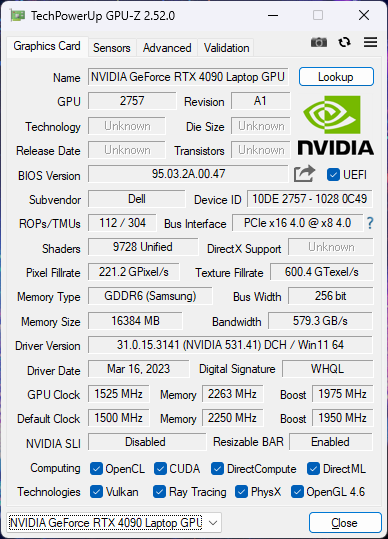
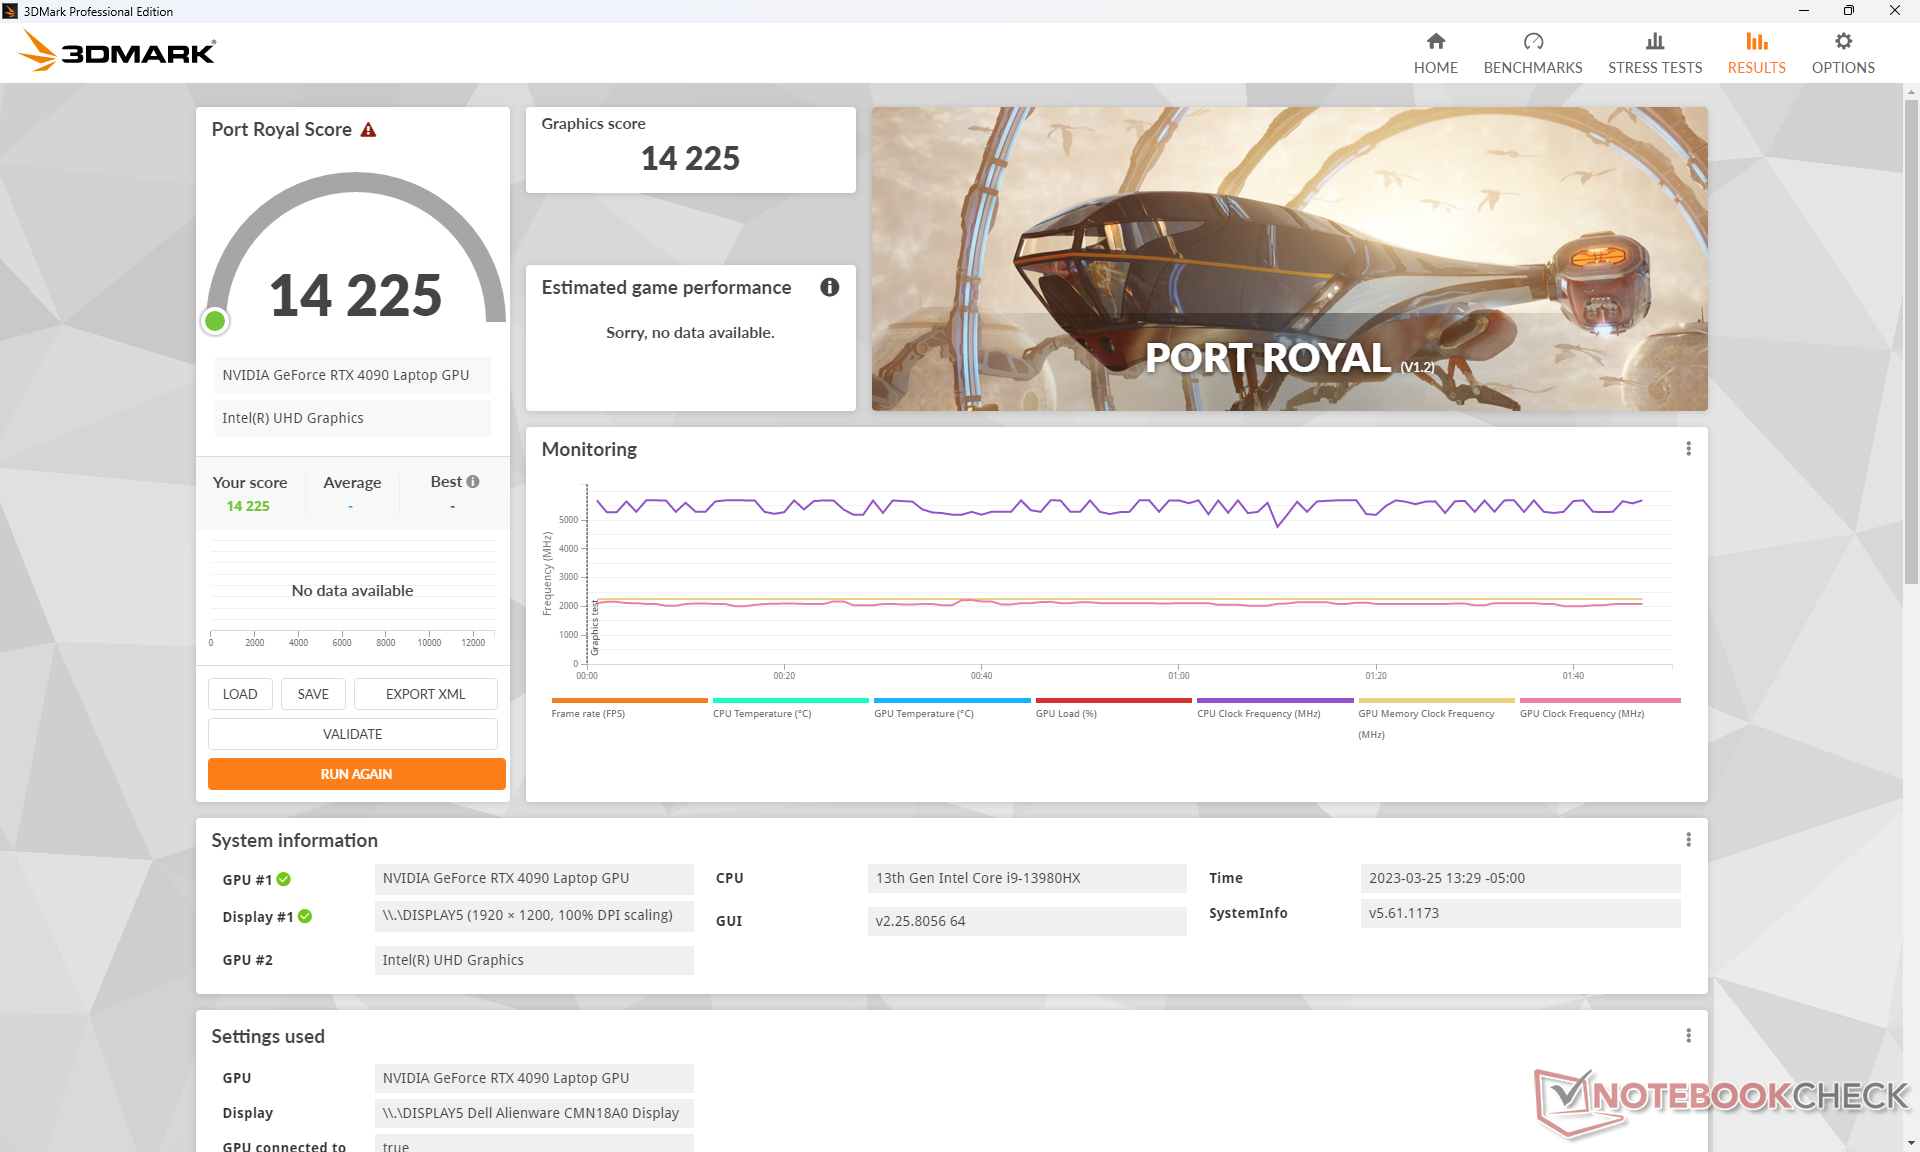
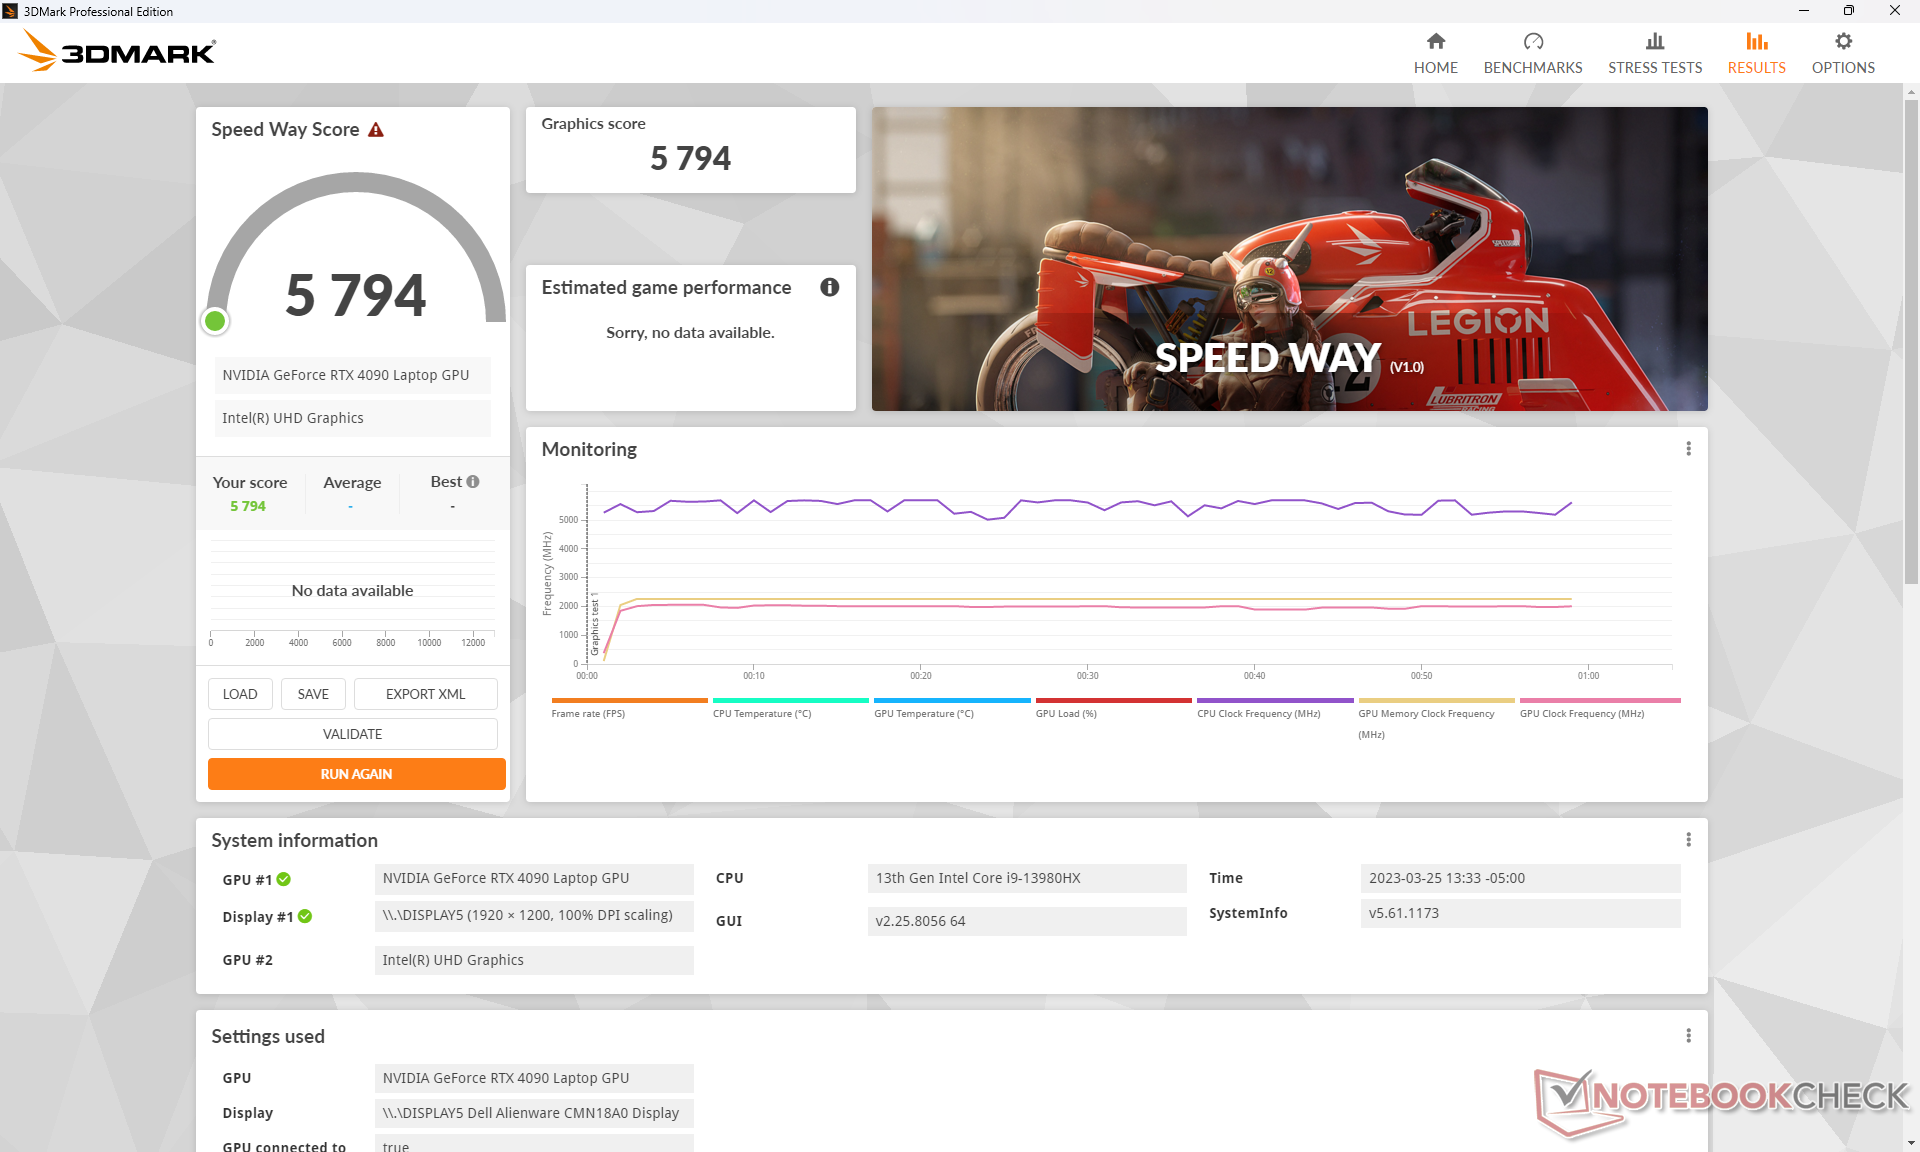
Prestazioni della GPU - 175 W GeForce RTX 4090
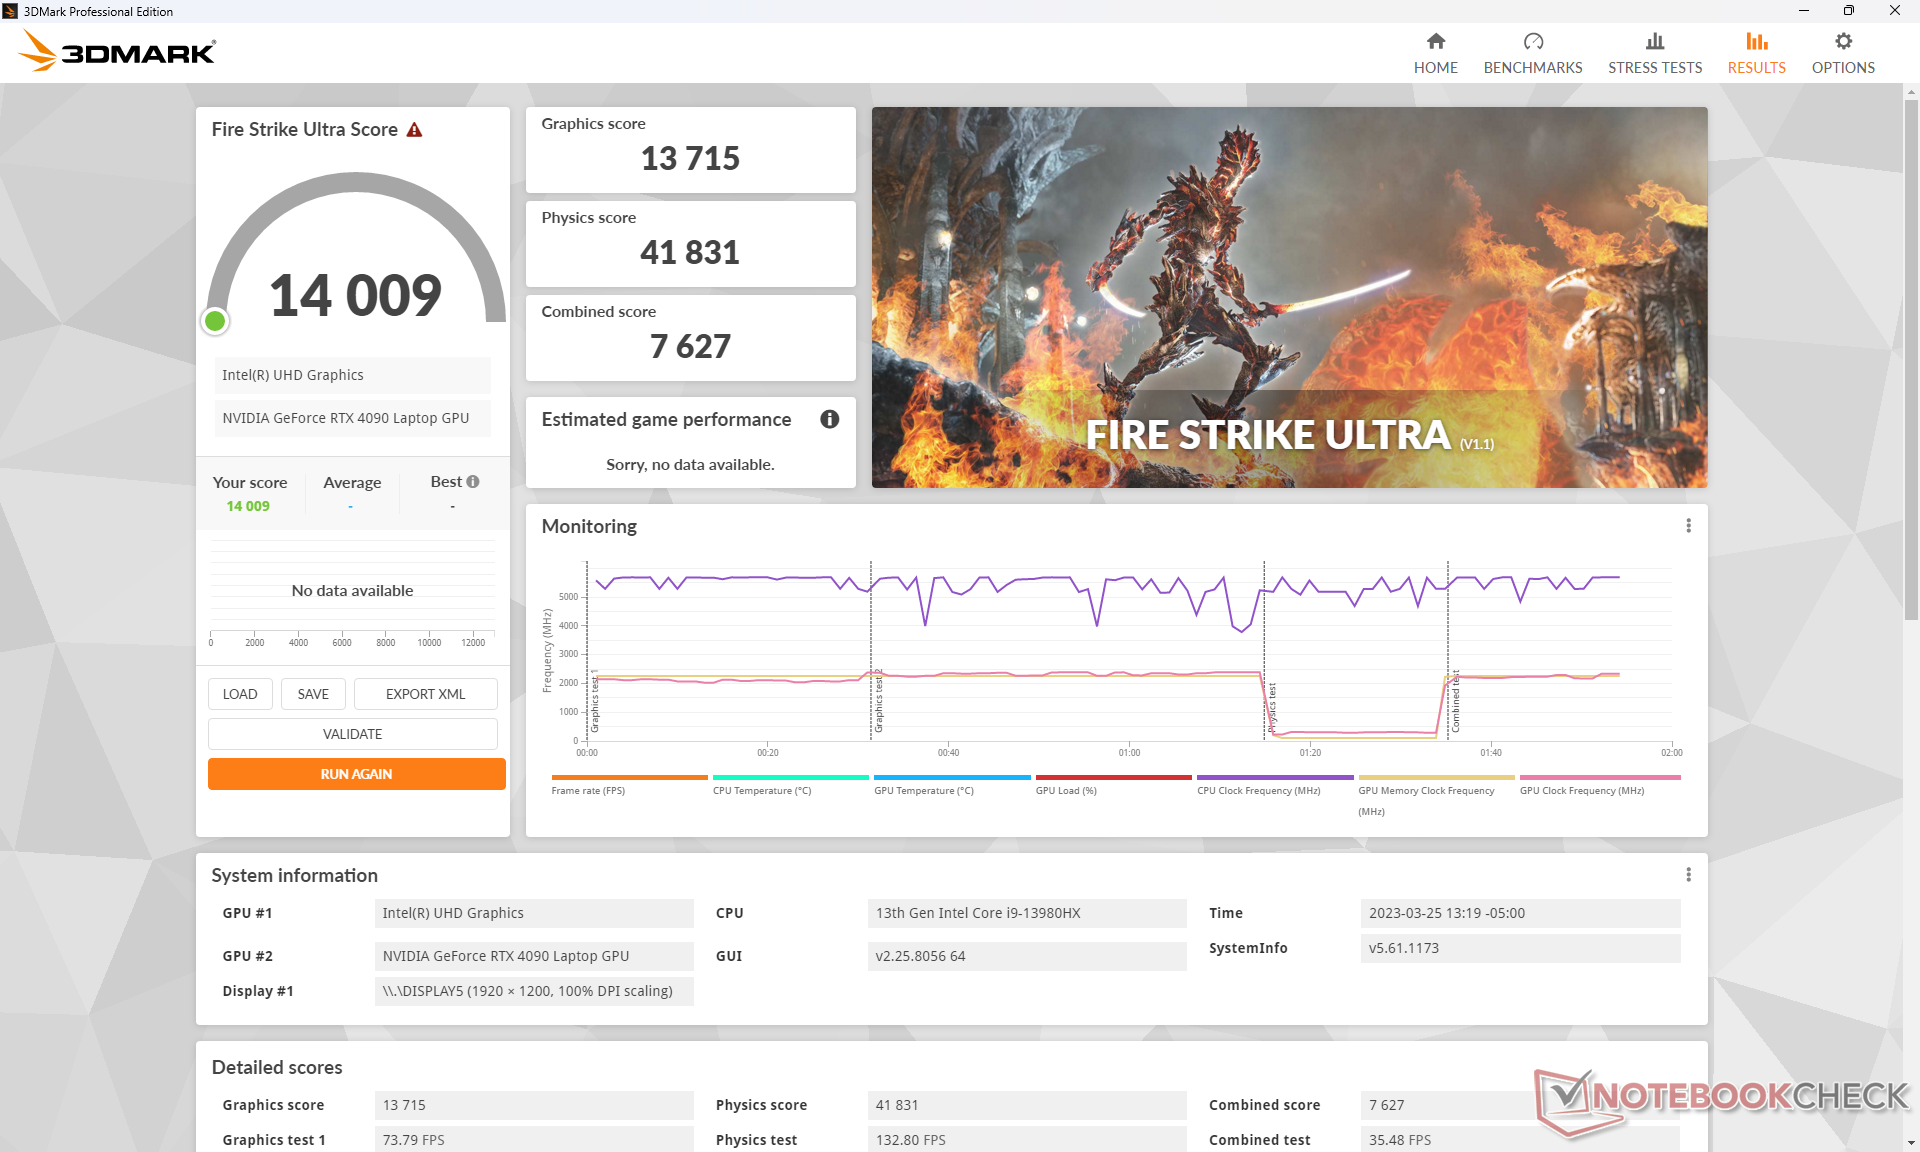
Le prestazioni grafiche complessive della mobile GeForce RTX 4090 è molto simile a quella della desktop GeForce RTX 4070. Offre prestazioni sufficienti per giocare a qualsiasi gioco attuale a impostazioni 4K Ultra, incluso F1 22. Se il ray-tracing è abilitato, tuttavia, si raccomanda di abilitare il DLSS o la generazione di fotogrammi, se supportati, per mantenere i frame rate a galla.
Rispetto all'ultima generazione di rTX 3080 Ti, la RTX 4090 mobile offre prestazioni più elevate del 40-70%, pur mantenendo un consumo energetico simile a 175 W.
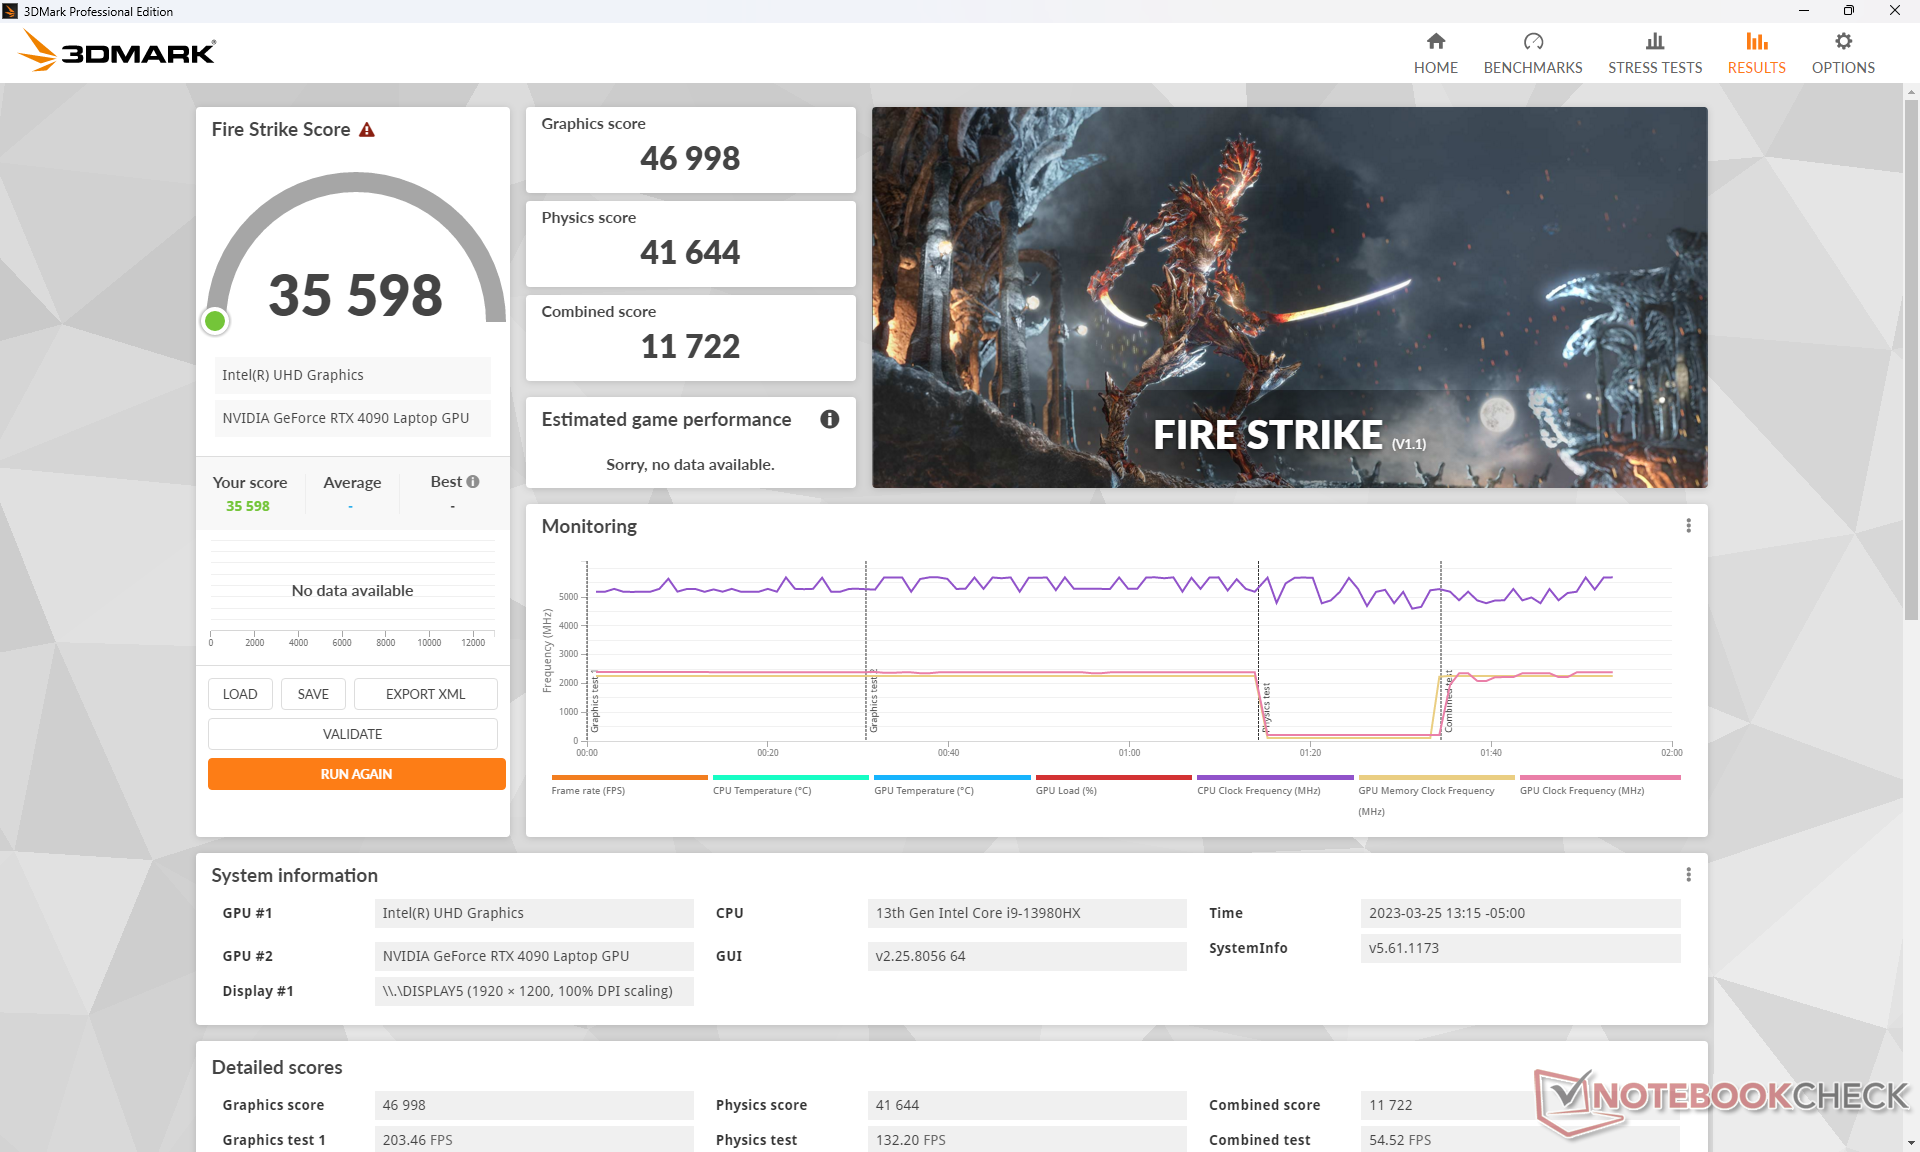
L'esecuzione di Fire Strike in modalità Overdrive non mostra grandi vantaggi rispetto alla più silenziosa modalità Performance, dato che i punteggi finali sono quasi identici. Ripetendo il test in modalità Balanced, tuttavia, si otterrebbe un calo del 5% e del 9% nelle prestazioni di GPU e CPU, rispettivamente.
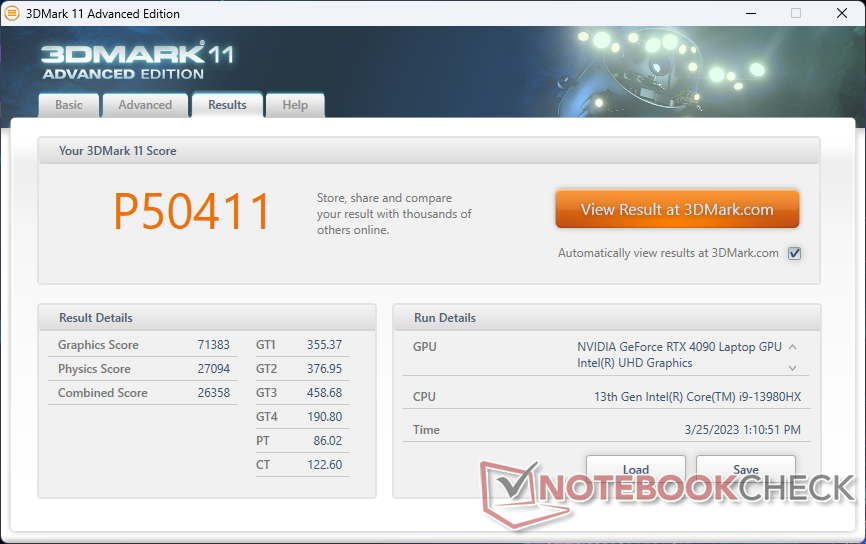
| 3DMark 11 Performance | 50411 punti | |
| 3DMark Fire Strike Score | 35598 punti | |
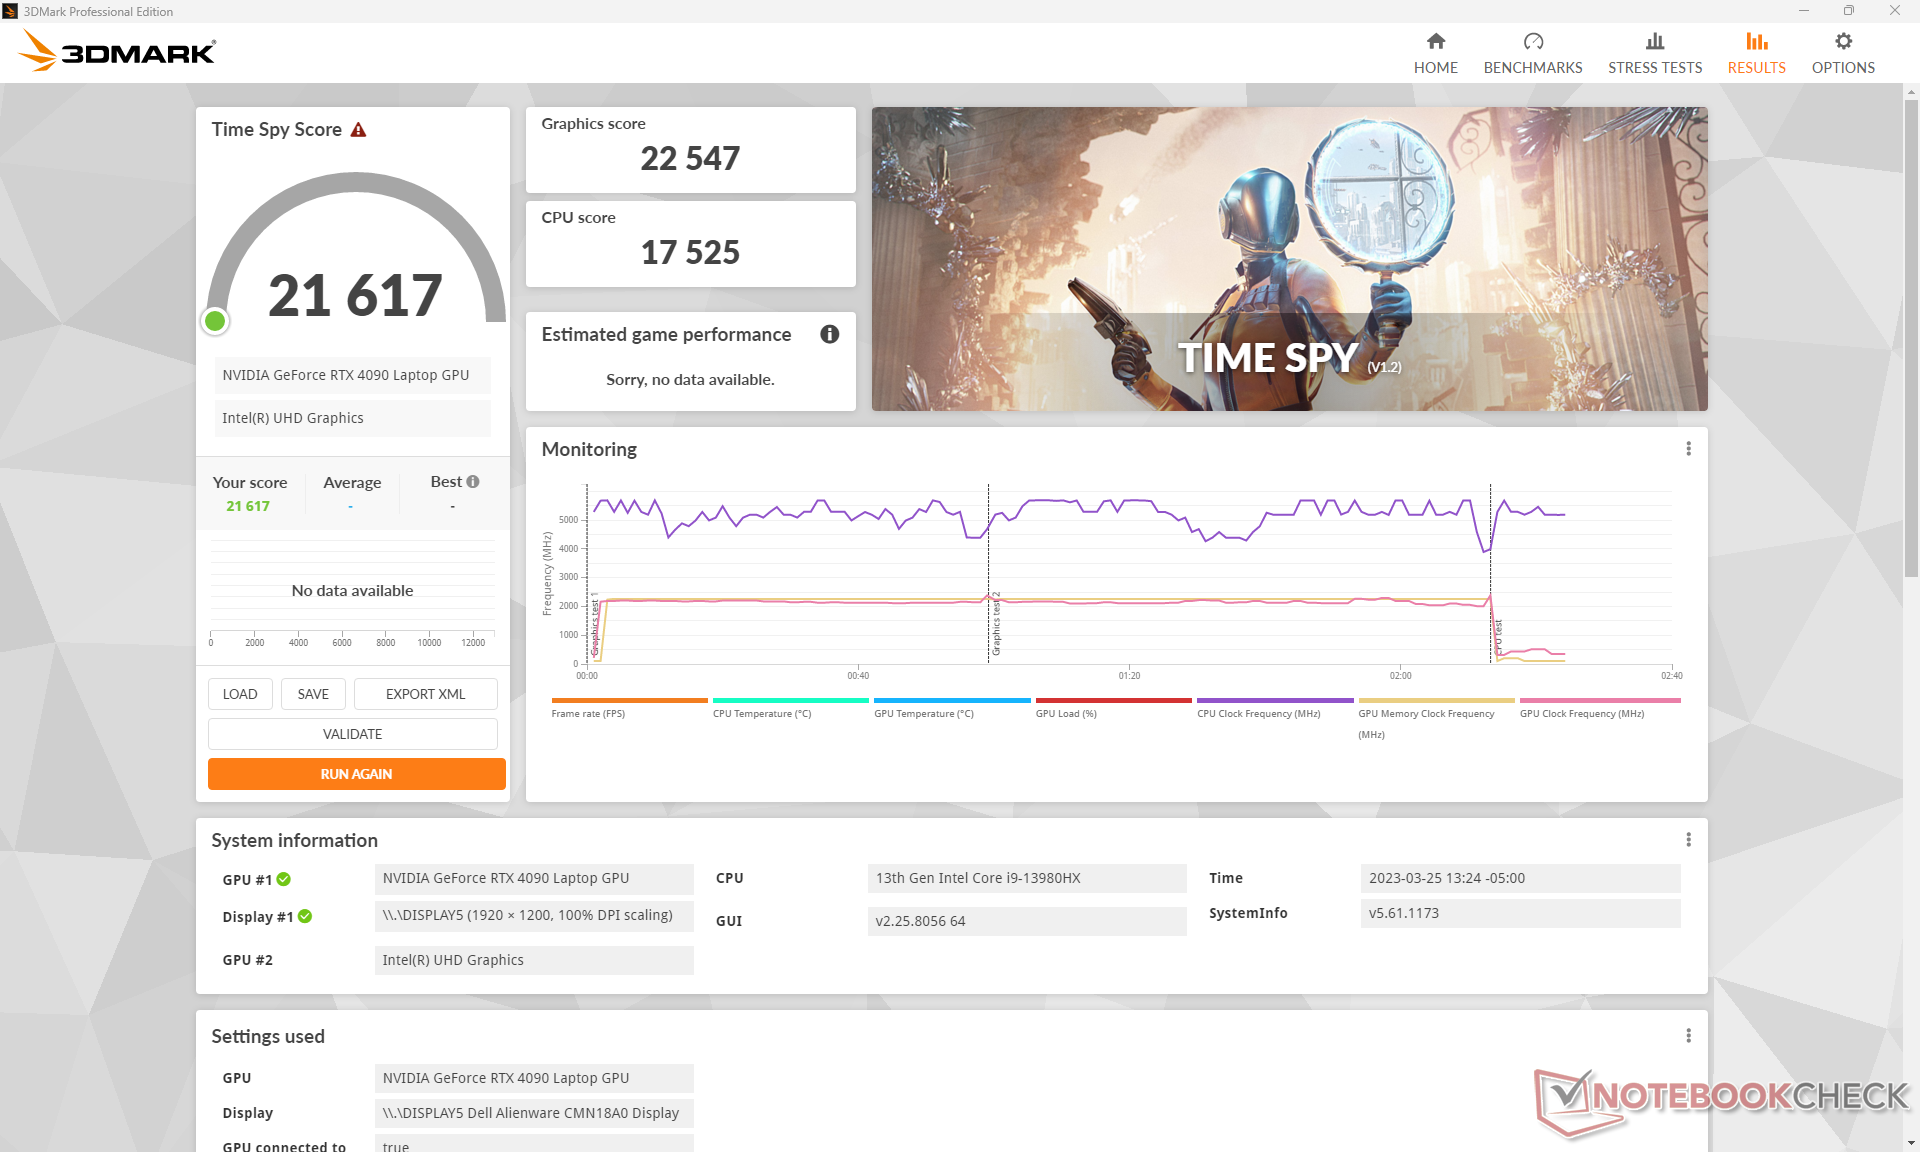
| 3DMark Time Spy Score | 21617 punti | |
Aiuto | ||
* ... Meglio usare valori piccoli
Witcher 3 FPS Chart
| basso | medio | alto | ultra | QHD | 4K | |
|---|---|---|---|---|---|---|
| GTA V (2015) | 186.7 | 185.3 | 184.5 | 149 | 145.5 | 176.4 |
| The Witcher 3 (2015) | 649.2 | 563.8 | 441.6 | 213.9 | 165.6 | |
| Dota 2 Reborn (2015) | 251 | 220 | 210 | 194.2 | 190.2 | |
| Final Fantasy XV Benchmark (2018) | 231 | 227 | 194.8 | 159.5 | 92.6 | |
| X-Plane 11.11 (2018) | 210 | 187.1 | 143.5 | 124 | ||
| Strange Brigade (2018) | 475 | 388 | 388 | 373 | 308 | 159.8 |
| Cyberpunk 2077 1.6 (2022) | 157.2 | 151.8 | 148.2 | 127.92 | 102.16 | 49.99 |
| Tiny Tina's Wonderlands (2022) | 359.1 | 301.8 | 232.5 | 187.7 | 133.8 | 71.3 |
| F1 22 (2022) | 336 | 320 | 318 | 144.7 | 92.2 | 45.5 |
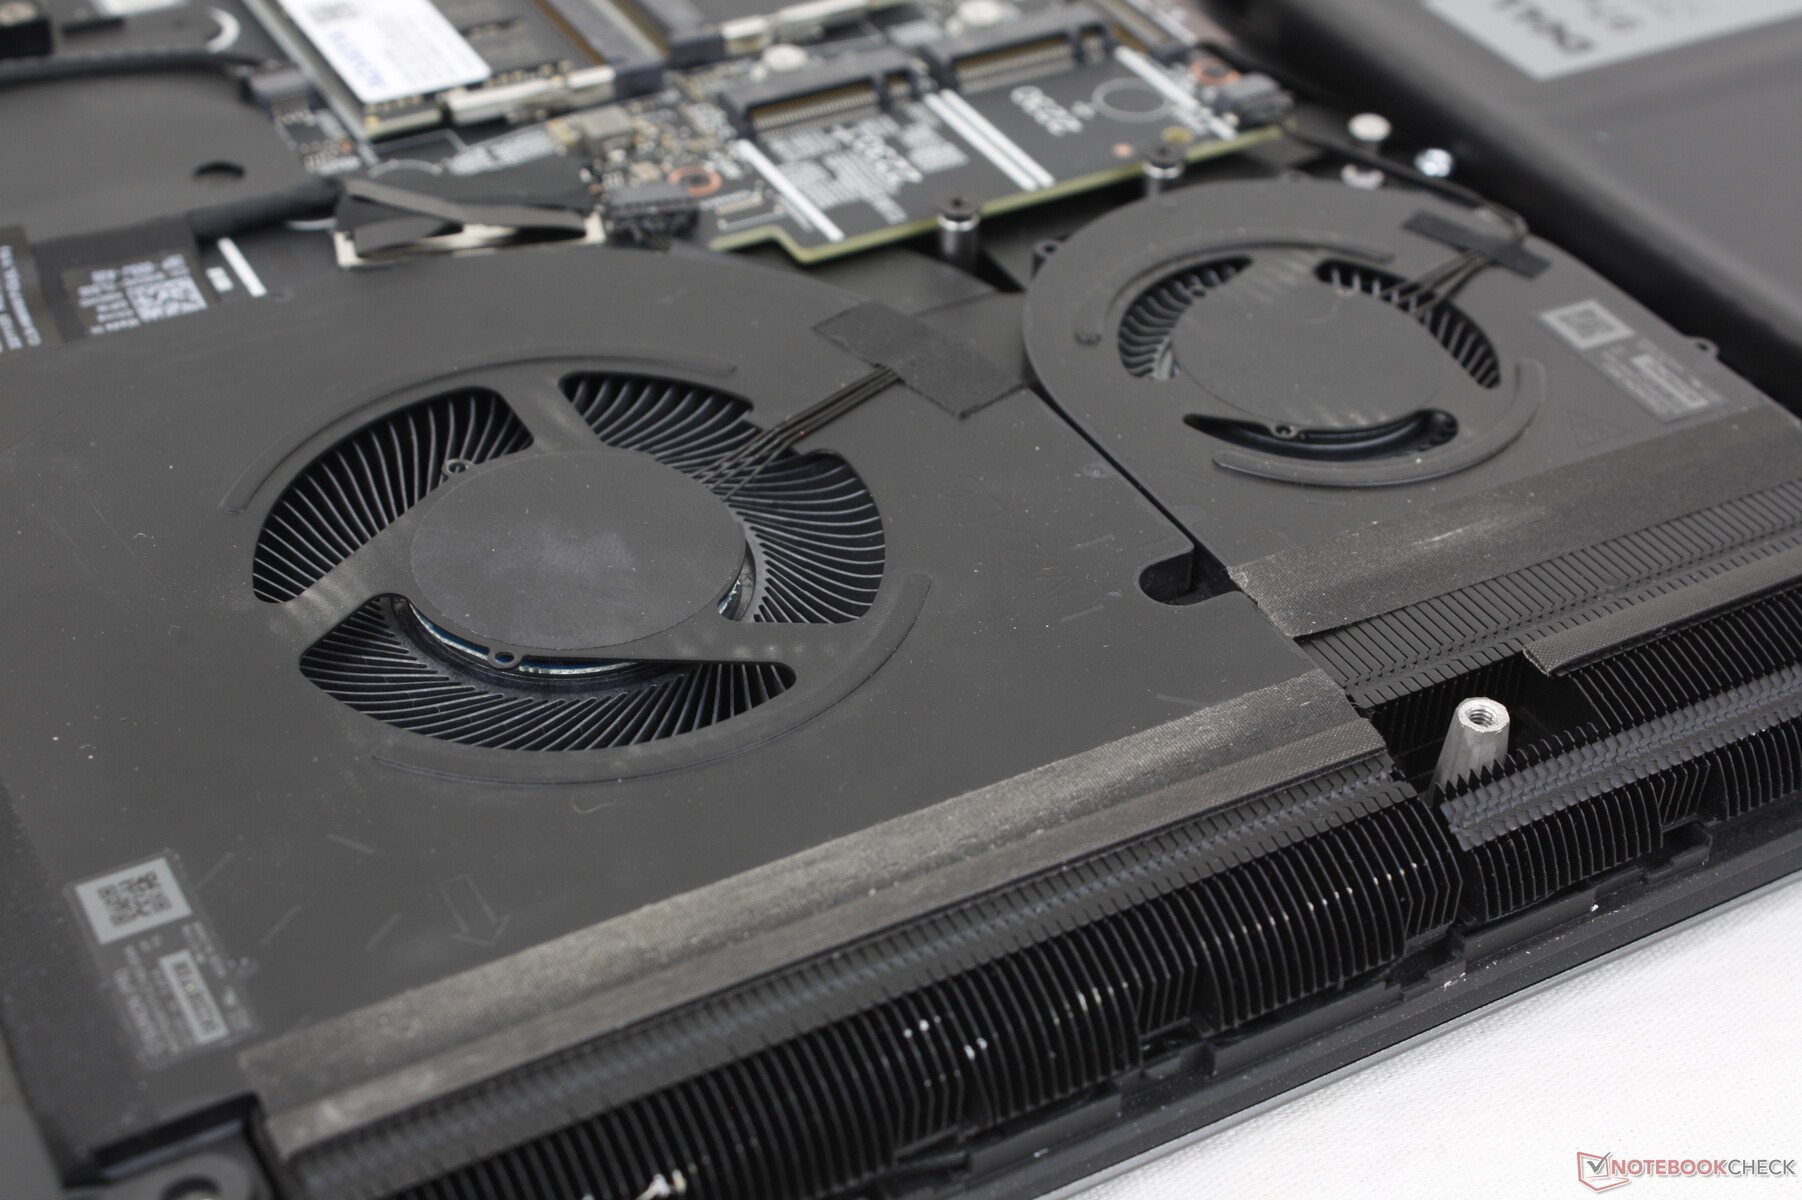
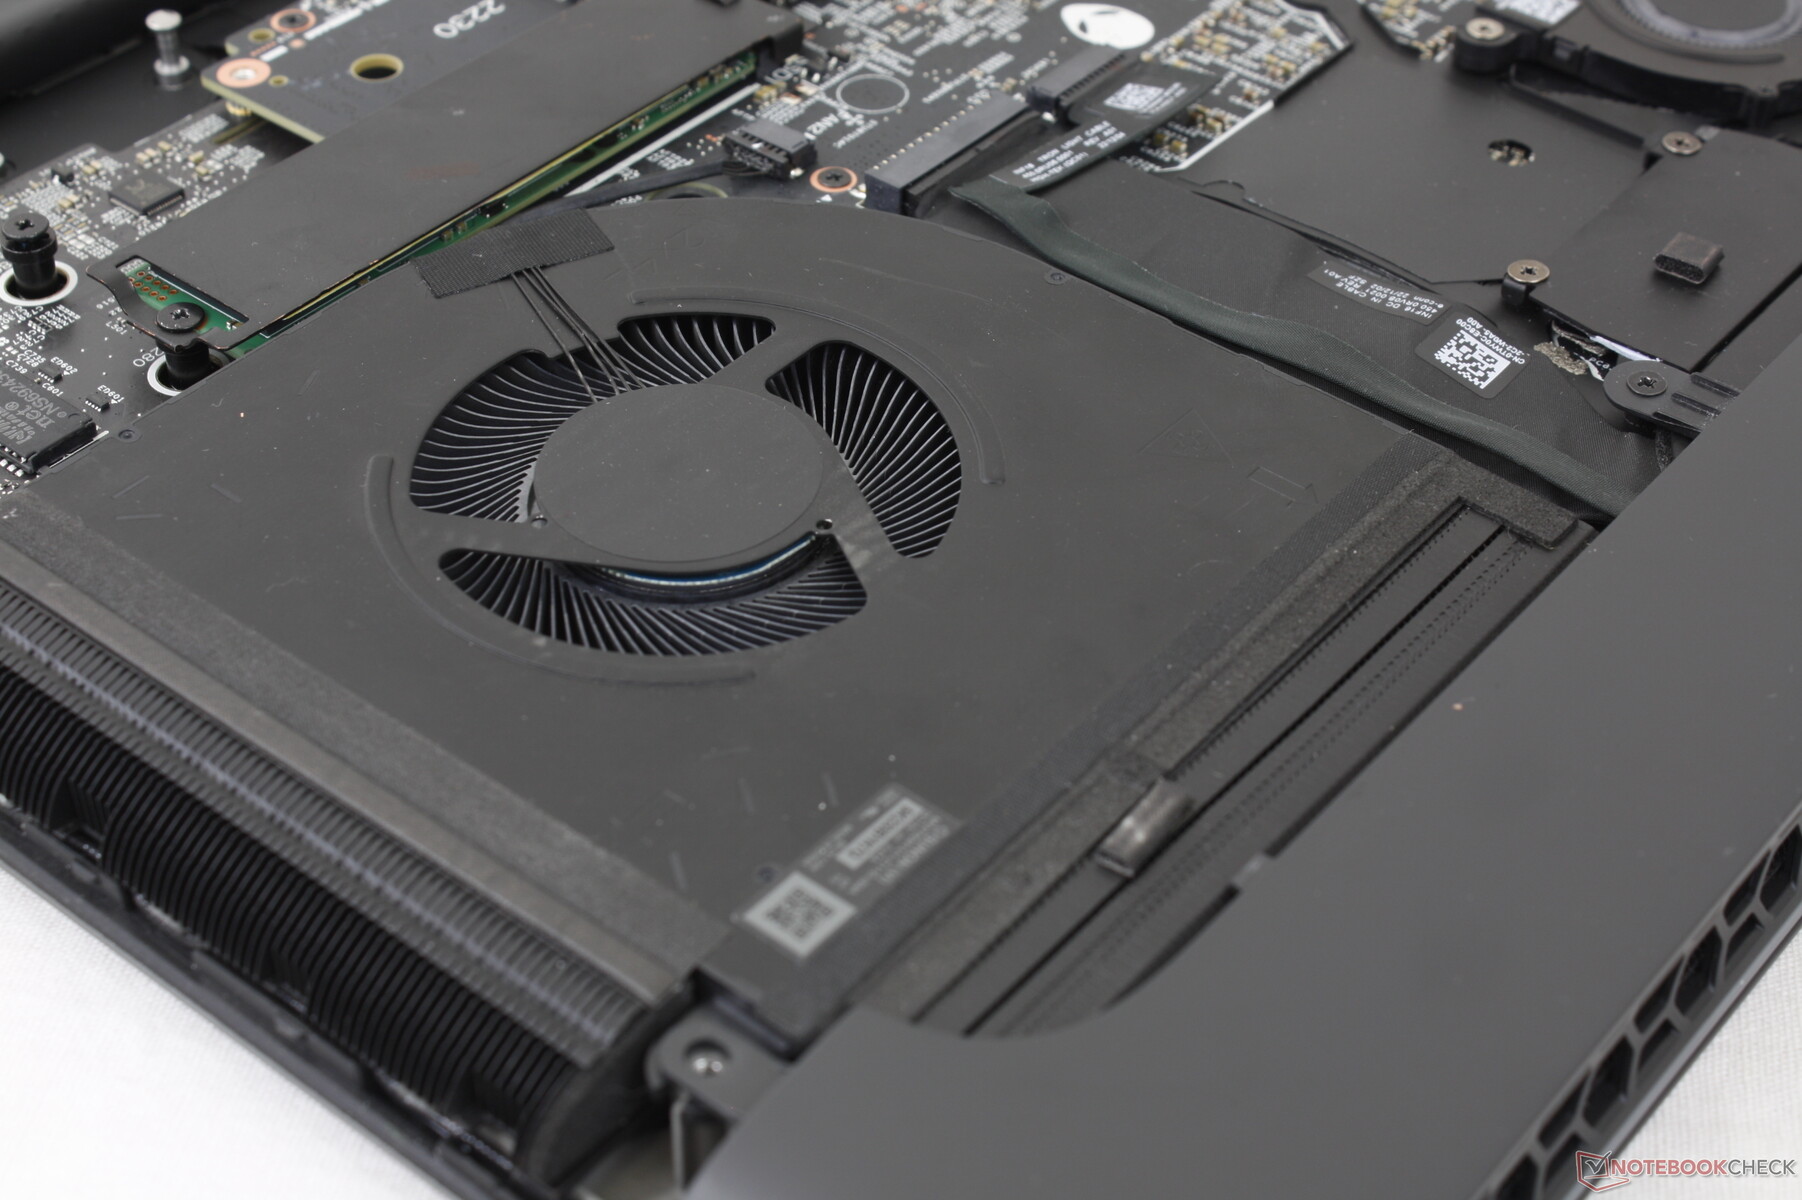
Emissioni - Quattro fan di Fast & Furious
Rumore del sistema
Se pensavate che un portatile con quattro ventole fosse rumoroso, avreste... beh, assolutamente ragione. Giocando in modalità Performance, il rumore delle ventole è di 51 dB(A), simile a quello dell'Eluktronics Mech-17 GP2.Eluktronics Mech-17 GP2 ma più rumoroso del Razer Blade 18. Se si gioca in modalità Overdrive, il rumore della ventola è ancora più forte, quasi 57 dB(A). Se si superano i 50 dB(A), è necessario un paio di buone cuffie per attenuare il fruscio delle ventole. Tenete presente che la modalità Overdrive non è necessaria per la maggior parte dei giochi, come dimostra la sezione Stress Test che segue.
Fortunatamente, il sistema è più silenzioso durante i carichi più bassi, in quanto le ventole non pulsano quando sono impostate su profili più bassi. In questo modo è possibile navigare sul web o riprodurre contenuti video in streaming con livelli di rumore confortevoli.
Rumorosità
| Idle |
| 23 / 23 / 23 dB(A) |
| Sotto carico |
| 35.6 / 56.7 dB(A) |
 | ||
30 dB silenzioso 40 dB(A) udibile 50 dB(A) rumoroso |
||
min: | ||
| Alienware m18 R1 GeForce RTX 4090 Laptop GPU, i9-13980HX, SK hynix PC801 HFS001TEJ9X101N | Razer Blade 18 RTX 4070 GeForce RTX 4070 Laptop GPU, i9-13950HX, SSSTC CA6-8D1024 | Asus ROG Strix Scar 18 2023 G834JY-N6005W GeForce RTX 4090 Laptop GPU, i9-13980HX, 2x Samsung PM9A1 MZVL21T0HCLR (RAID 0) | Eluktronics Mech-17 GP2 GeForce RTX 4090 Laptop GPU, i9-13900HX, Samsung PM9A1 MZVL21T0HCLR | MSI Titan GT77 HX 13VI GeForce RTX 4090 Laptop GPU, i9-13950HX, Samsung PM9A1 MZVL22T0HBLB | Alienware x17 R2 P48E GeForce RTX 3080 Ti Laptop GPU, i9-12900HK, 2x Samsung PM9A1 1TB (RAID 0) | |
|---|---|---|---|---|---|---|
| Noise | -3% | -15% | -13% | -20% | 2% | |
| off /ambiente * (dB) | 22.8 | 23.5 -3% | 23.9 -5% | 25.2 -11% | 24.6 -8% | 22.7 -0% |
| Idle Minimum * (dB) | 23 | 23.8 -3% | 23.9 -4% | 28 -22% | 29.2 -27% | 23.1 -0% |
| Idle Average * (dB) | 23 | 23.8 -3% | 32.6 -42% | 28 -22% | 29.2 -27% | 23.1 -0% |
| Idle Maximum * (dB) | 23 | 26.8 -17% | 32.6 -42% | 30.4 -32% | 29.2 -27% | 23.1 -0% |
| Load Average * (dB) | 35.6 | 37.3 -5% | 35.9 -1% | 41 -15% | 50.7 -42% | 31.9 10% |
| Witcher 3 ultra * (dB) | 51.3 | 48 6% | 50.7 1% | 53.3 -4% | 52.5 -2% | |
| Load Maximum * (dB) | 56.7 | 53.5 6% | 55.8 2% | 52.6 7% | 61 -8% | 52.5 7% |
* ... Meglio usare valori piccoli
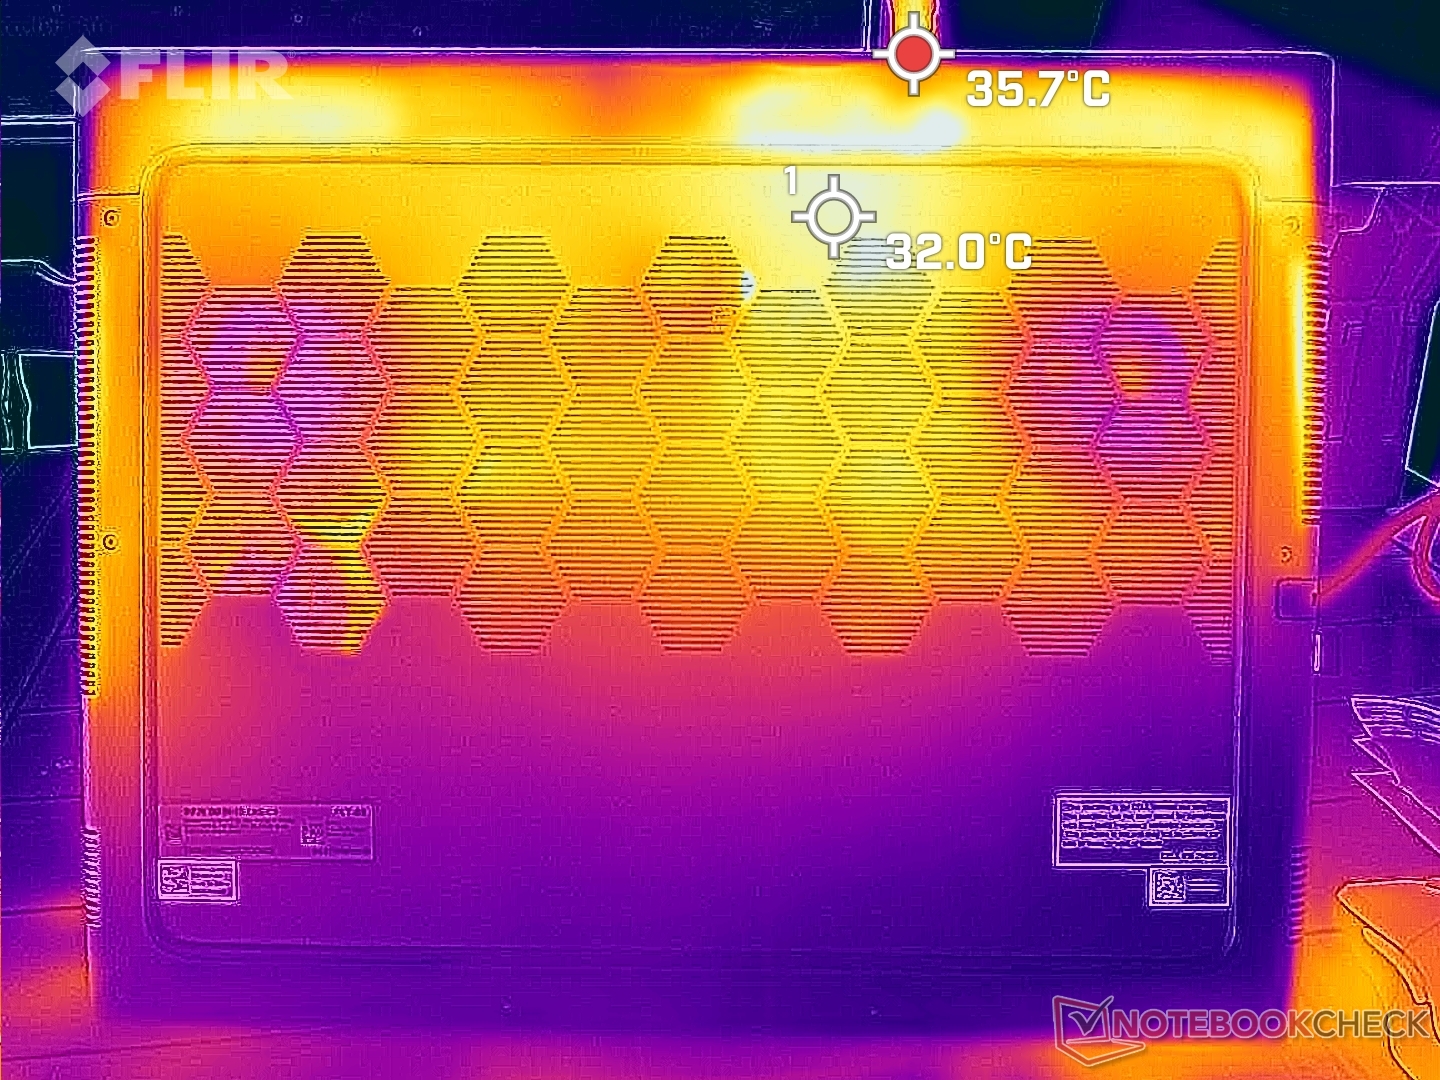
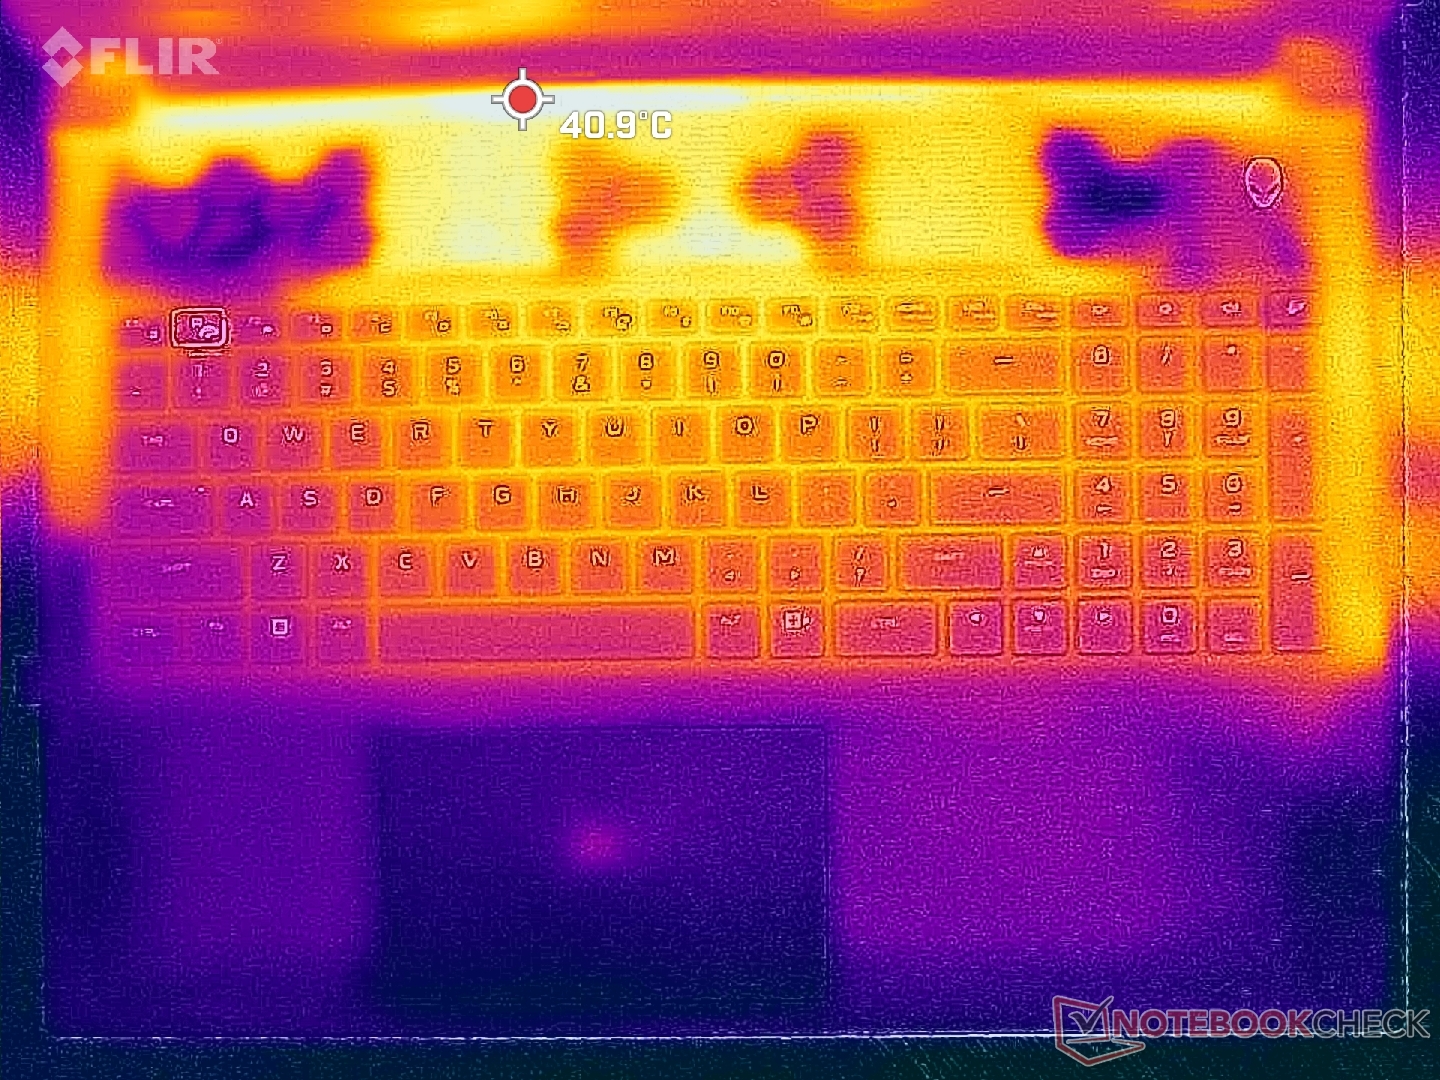
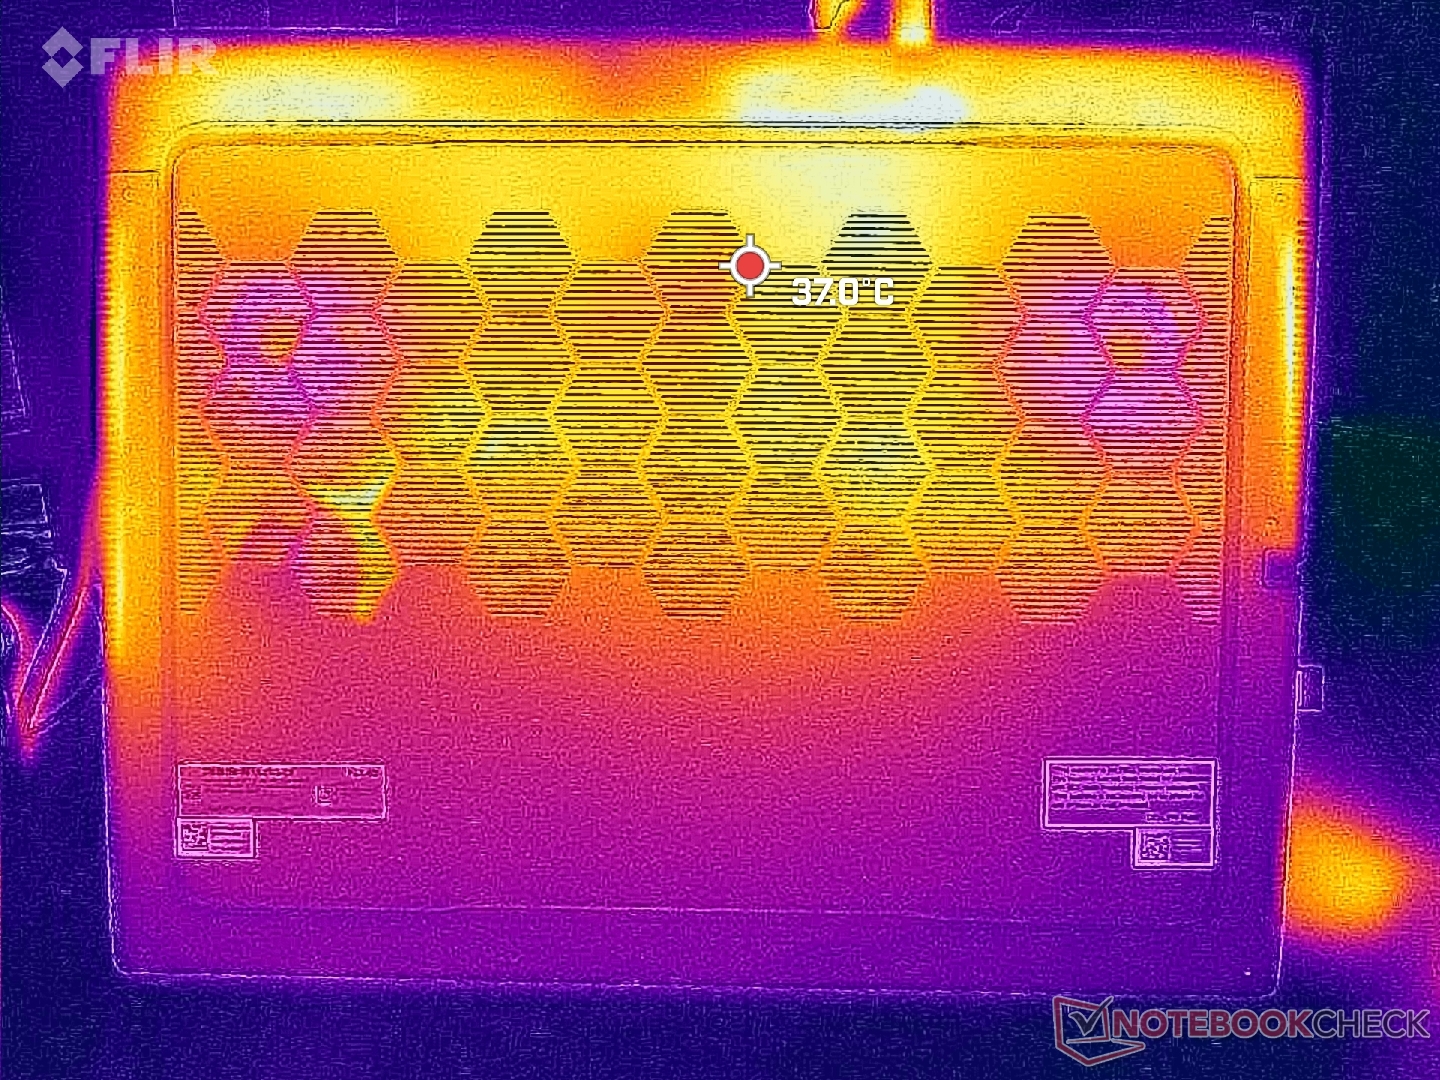
Temperatura
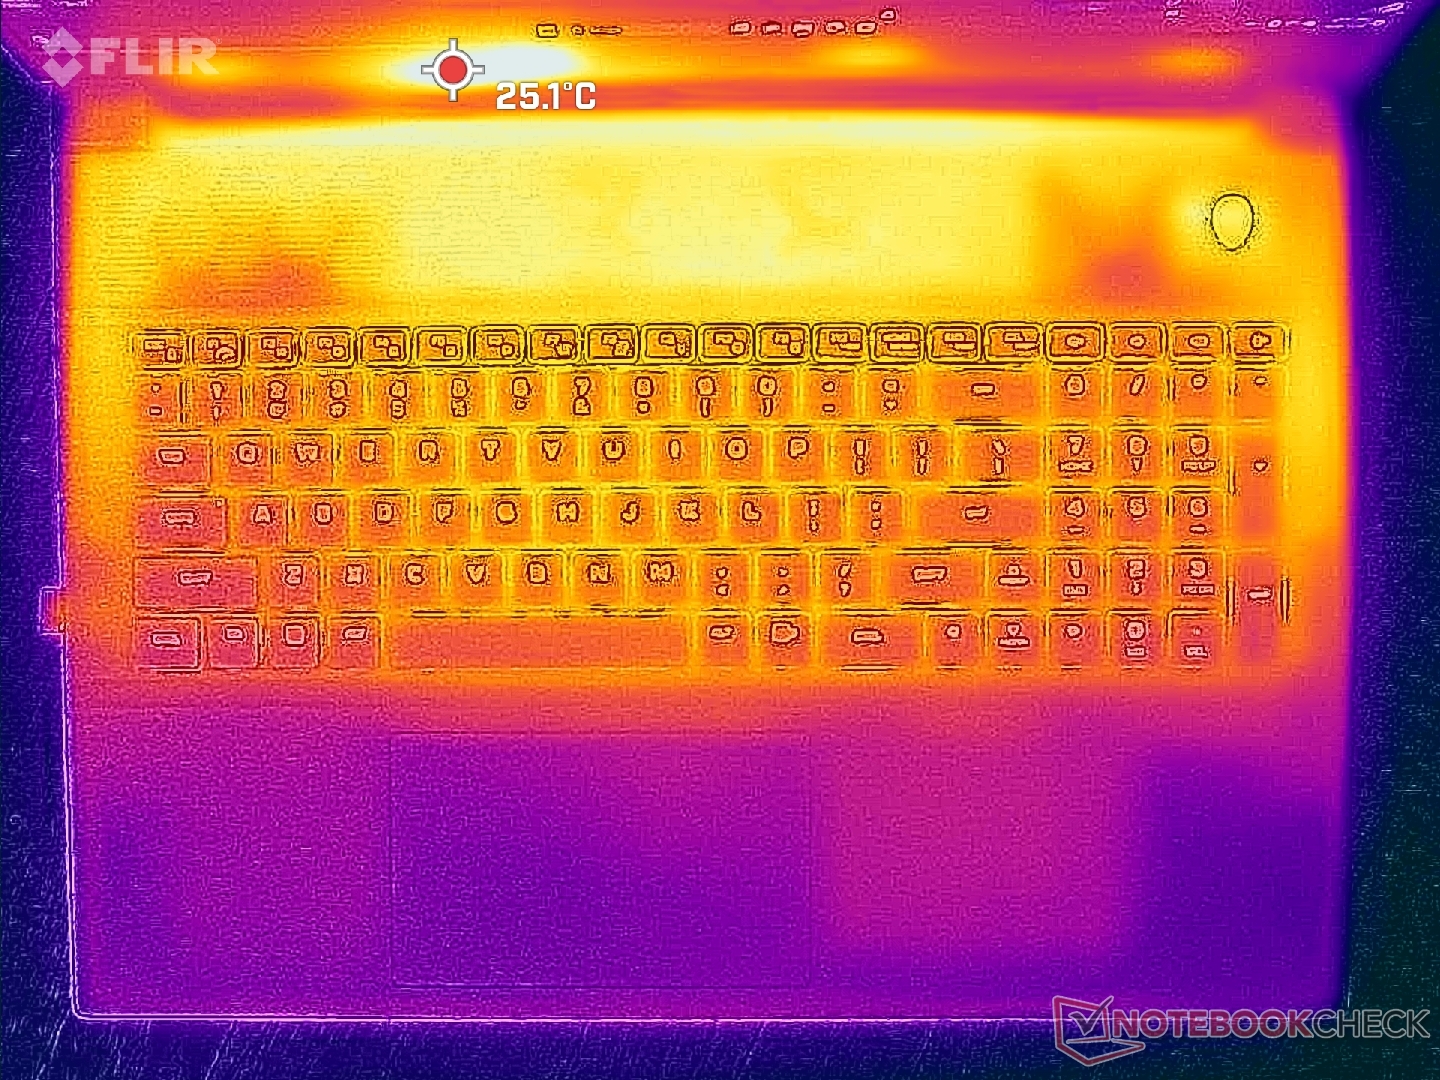
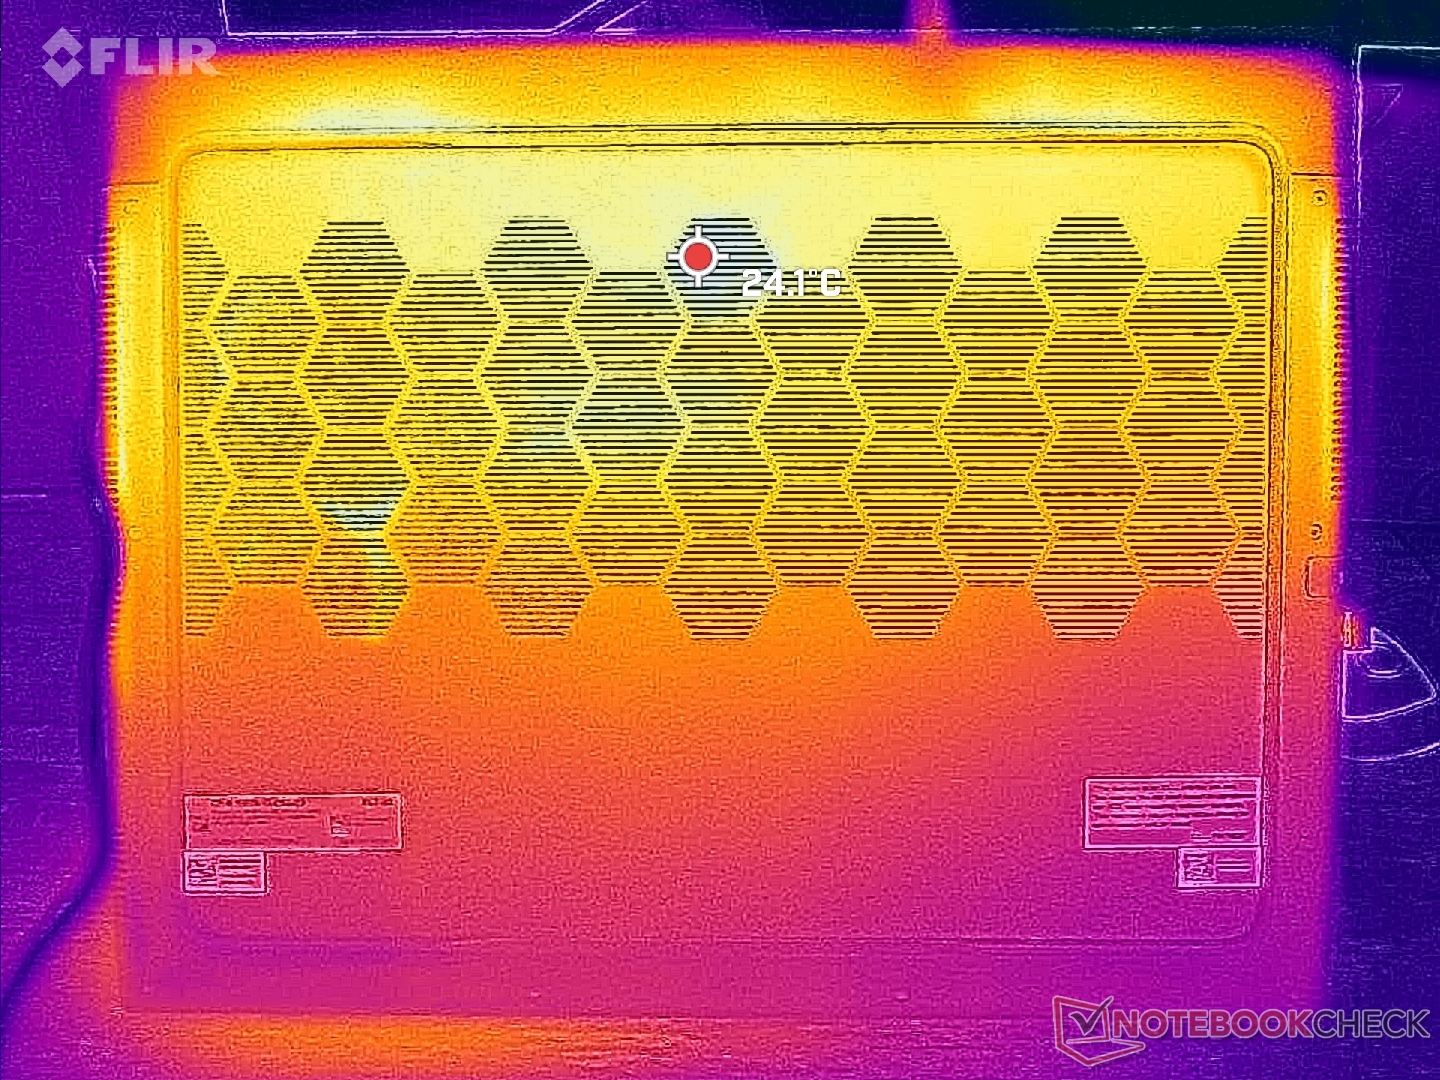
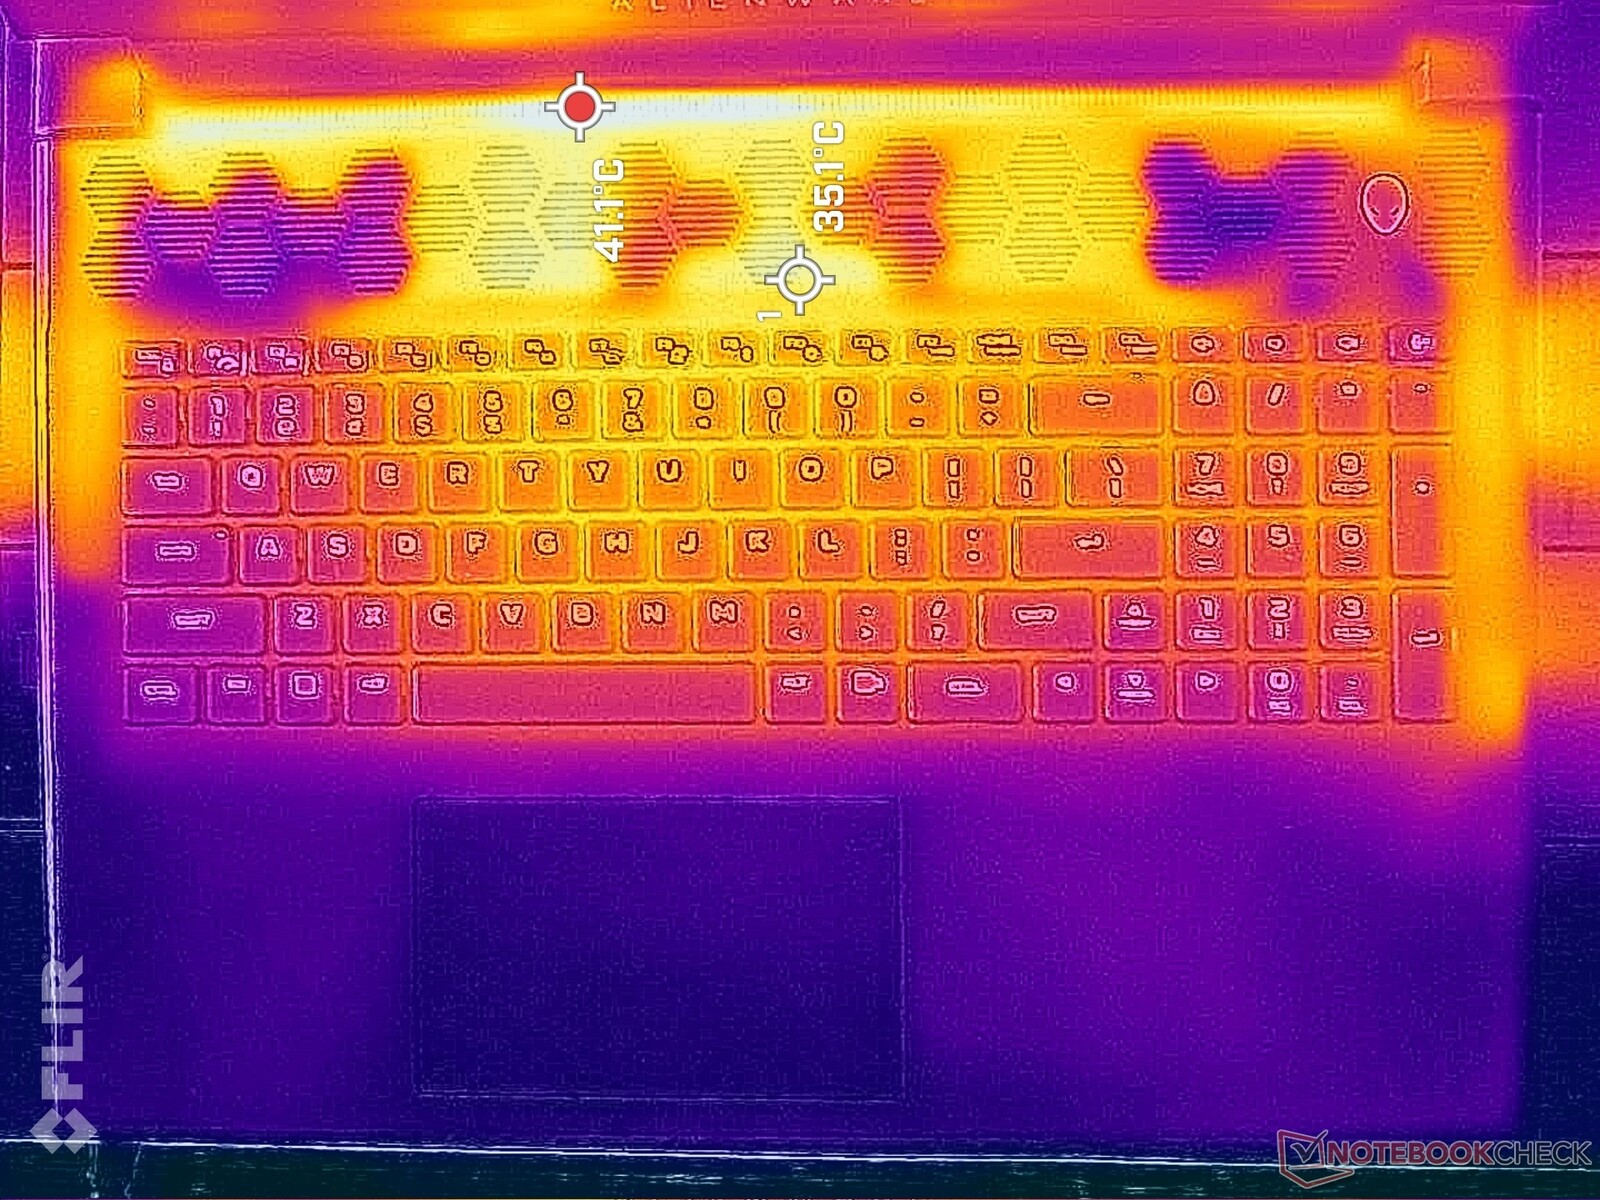
Le temperature di superficie non sono un problema, anche grazie alle ampie griglie di ventilazione presenti su quasi tutti i lati dell'ampio chassis. I punti più caldi si trovano lungo la parte posteriore, lontano dai tasti della tastiera e dai poggiapolsi per mantenere le mani comode.
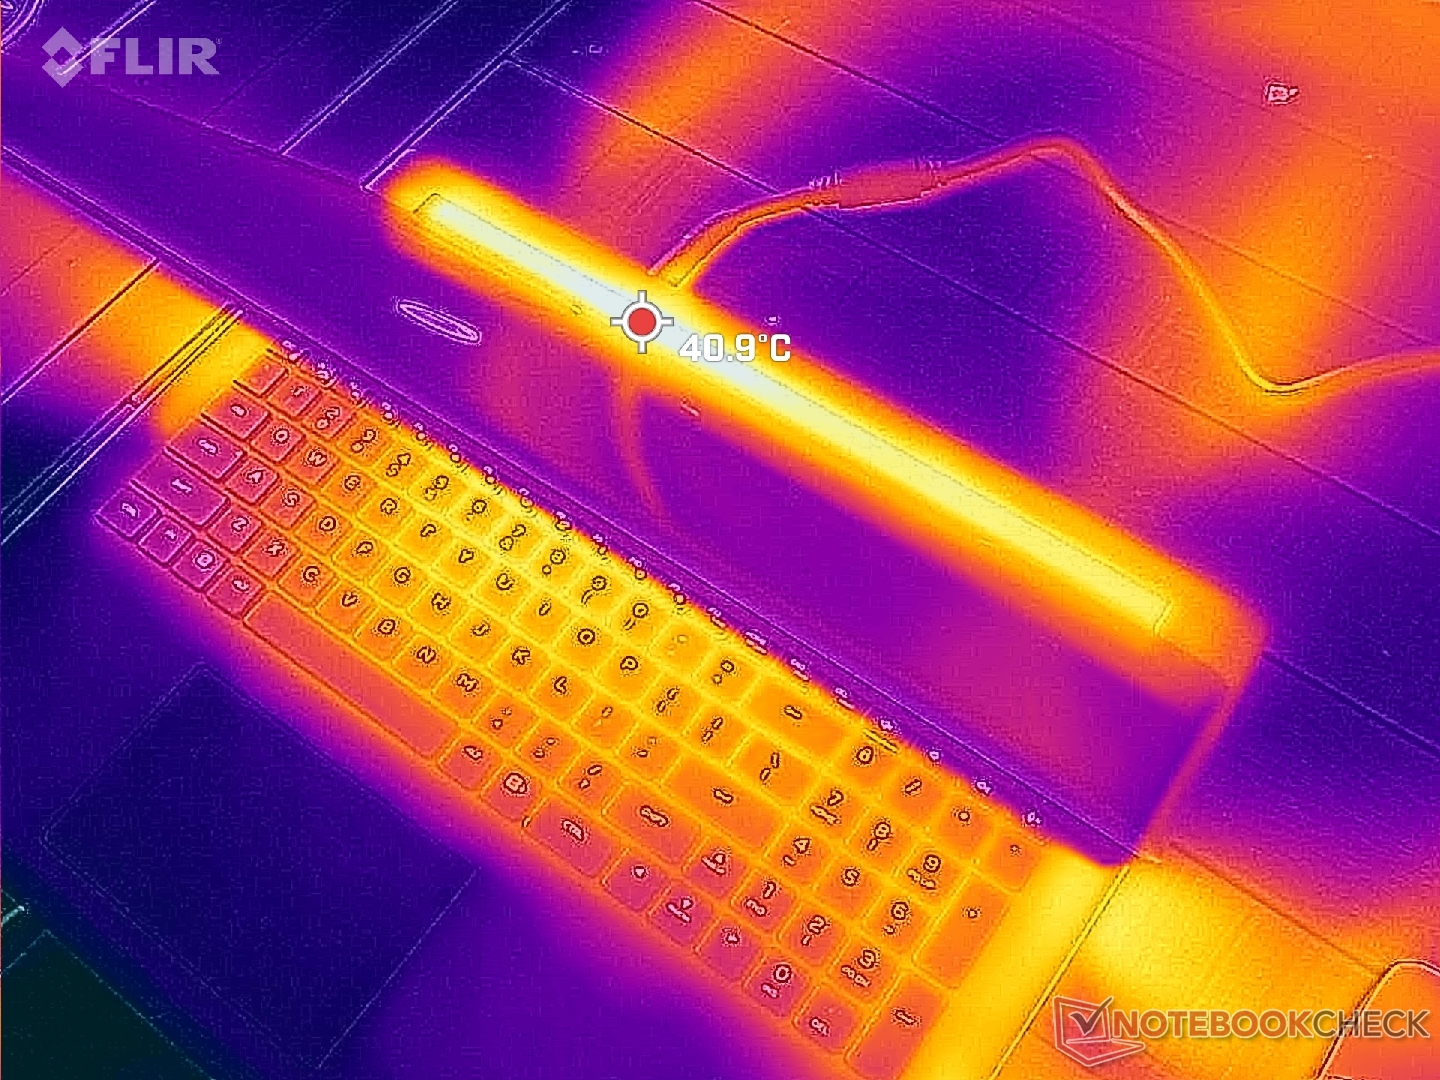
(+) La temperatura massima sul lato superiore è di 39 °C / 102 F, rispetto alla media di 40.4 °C / 105 F, che varia da 21.2 a 68.8 °C per questa classe Gaming.
(+) Il lato inferiore si riscalda fino ad un massimo di 36.4 °C / 98 F, rispetto alla media di 43.2 °C / 110 F
(+) In idle, la temperatura media del lato superiore è di 25.2 °C / 77 F, rispetto alla media deld ispositivo di 33.9 °C / 93 F.
(+) Riproducendo The Witcher 3, la temperatura media per il lato superiore e' di 29.8 °C / 86 F, rispetto alla media del dispositivo di 33.9 °C / 93 F.
(+) I poggiapolsi e il touchpad sono piu' freddi della temperatura della pelle con un massimo di 23.8 °C / 74.8 F e sono quindi freddi al tatto.
(+) La temperatura media della zona del palmo della mano di dispositivi simili e'stata di 28.8 °C / 83.8 F (+5 °C / 9 F).
| Alienware m18 R1 Intel Core i9-13980HX, NVIDIA GeForce RTX 4090 Laptop GPU | Razer Blade 18 RTX 4070 Intel Core i9-13950HX, NVIDIA GeForce RTX 4070 Laptop GPU | Asus ROG Strix Scar 18 2023 G834JY-N6005W Intel Core i9-13980HX, NVIDIA GeForce RTX 4090 Laptop GPU | Eluktronics Mech-17 GP2 Intel Core i9-13900HX, NVIDIA GeForce RTX 4090 Laptop GPU | MSI Titan GT77 HX 13VI Intel Core i9-13950HX, NVIDIA GeForce RTX 4090 Laptop GPU | Alienware x17 R2 P48E Intel Core i9-12900HK, NVIDIA GeForce RTX 3080 Ti Laptop GPU | |
|---|---|---|---|---|---|---|
| Heat | -7% | -20% | -9% | -4% | -15% | |
| Maximum Upper Side * (°C) | 39 | 39.2 -1% | 54 -38% | 39 -0% | 40.6 -4% | 49.6 -27% |
| Maximum Bottom * (°C) | 36.4 | 35.6 2% | 46 -26% | 44 -21% | 41.1 -13% | 42.4 -16% |
| Idle Upper Side * (°C) | 29.2 | 31.8 -9% | 30 -3% | 31 -6% | 26.2 10% | 29.2 -0% |
| Idle Bottom * (°C) | 27.8 | 33.2 -19% | 31 -12% | 29.8 -7% | 30.3 -9% | 32 -15% |
* ... Meglio usare valori piccoli
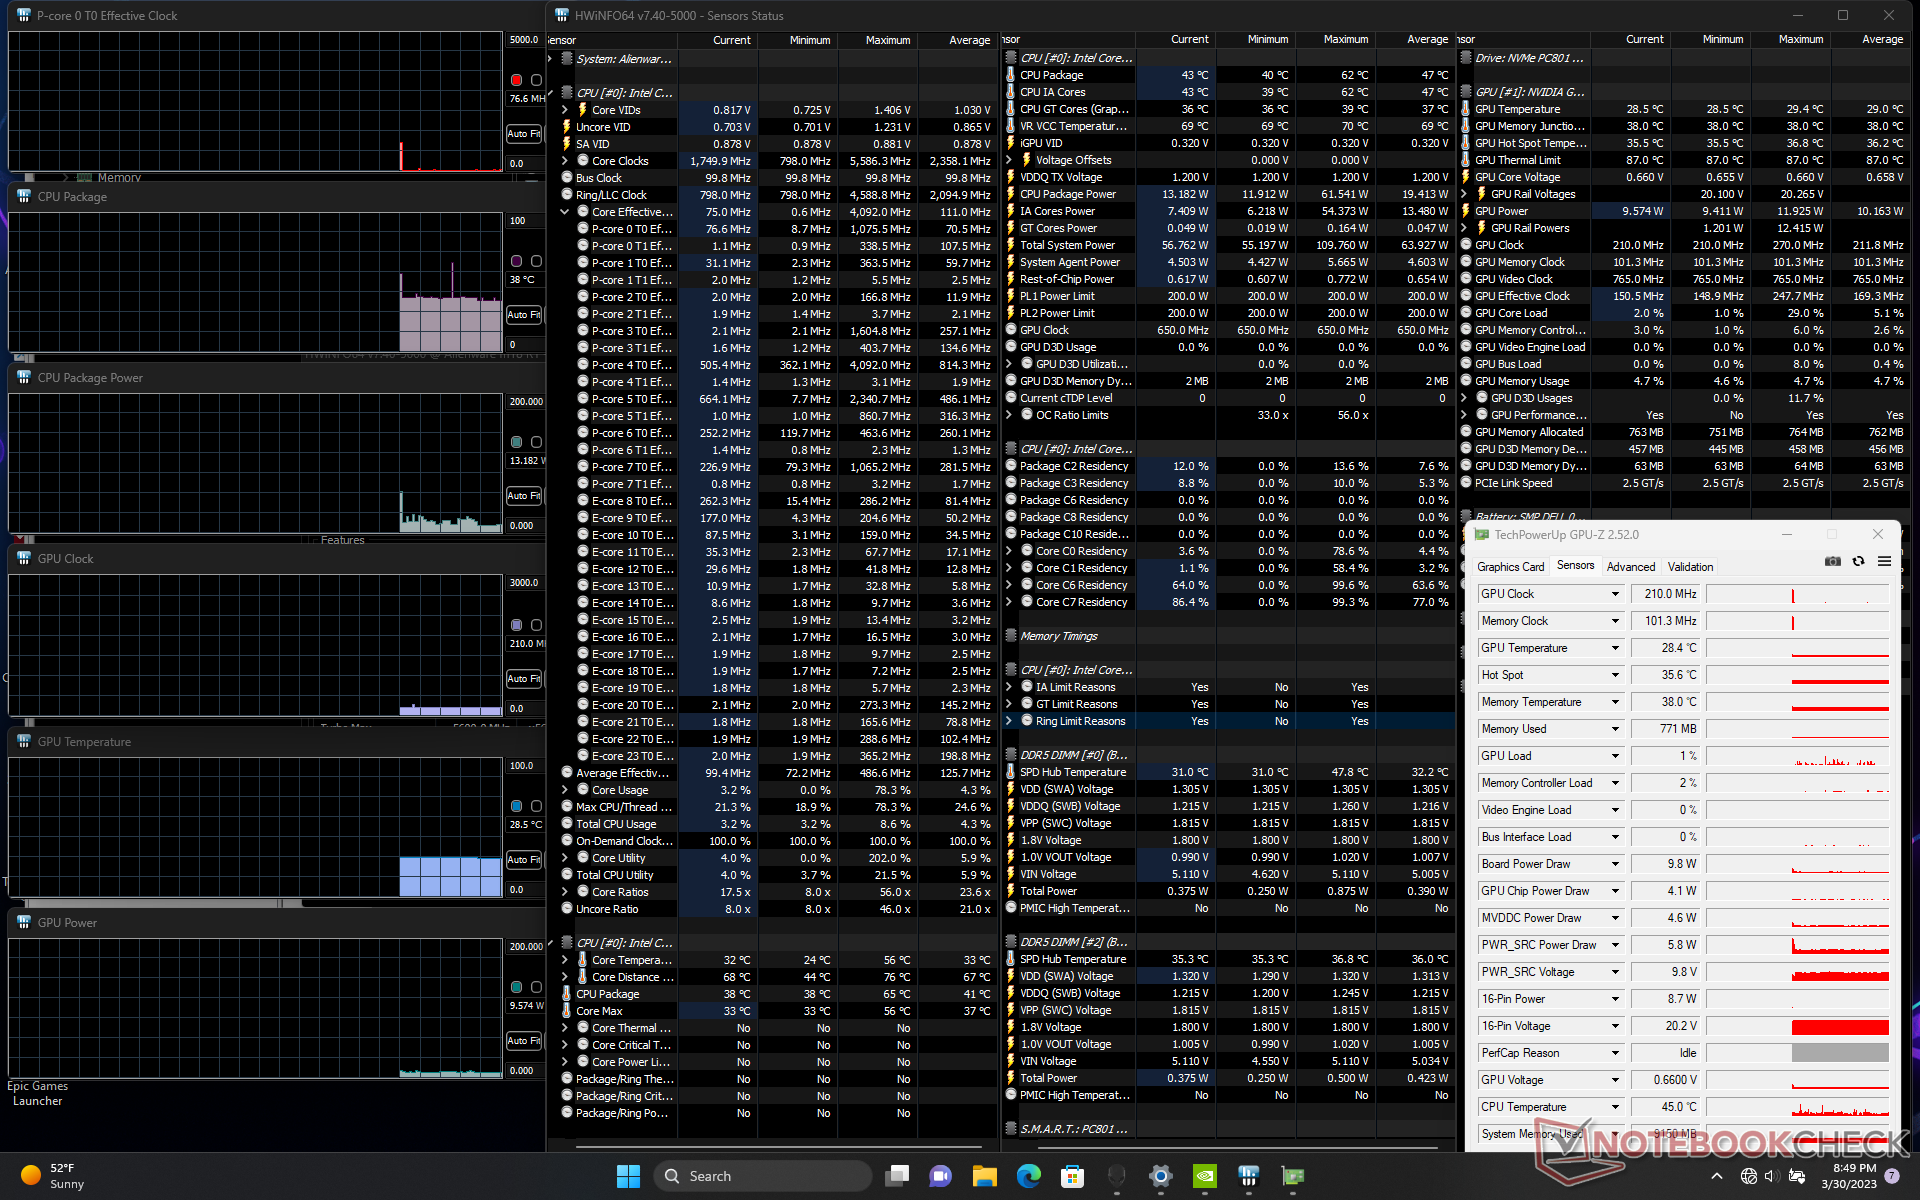
Stress test
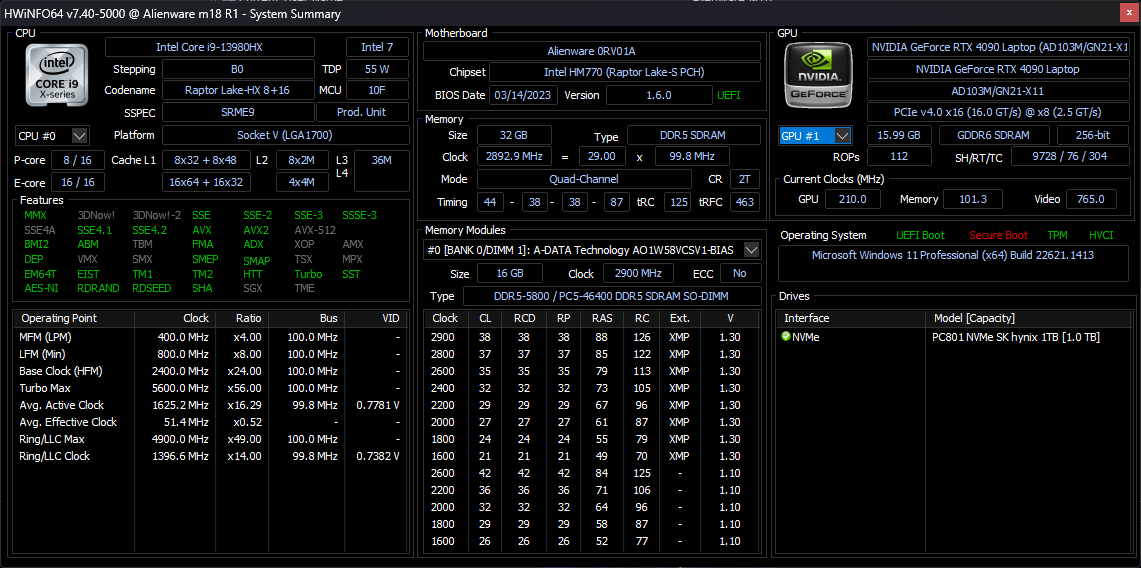
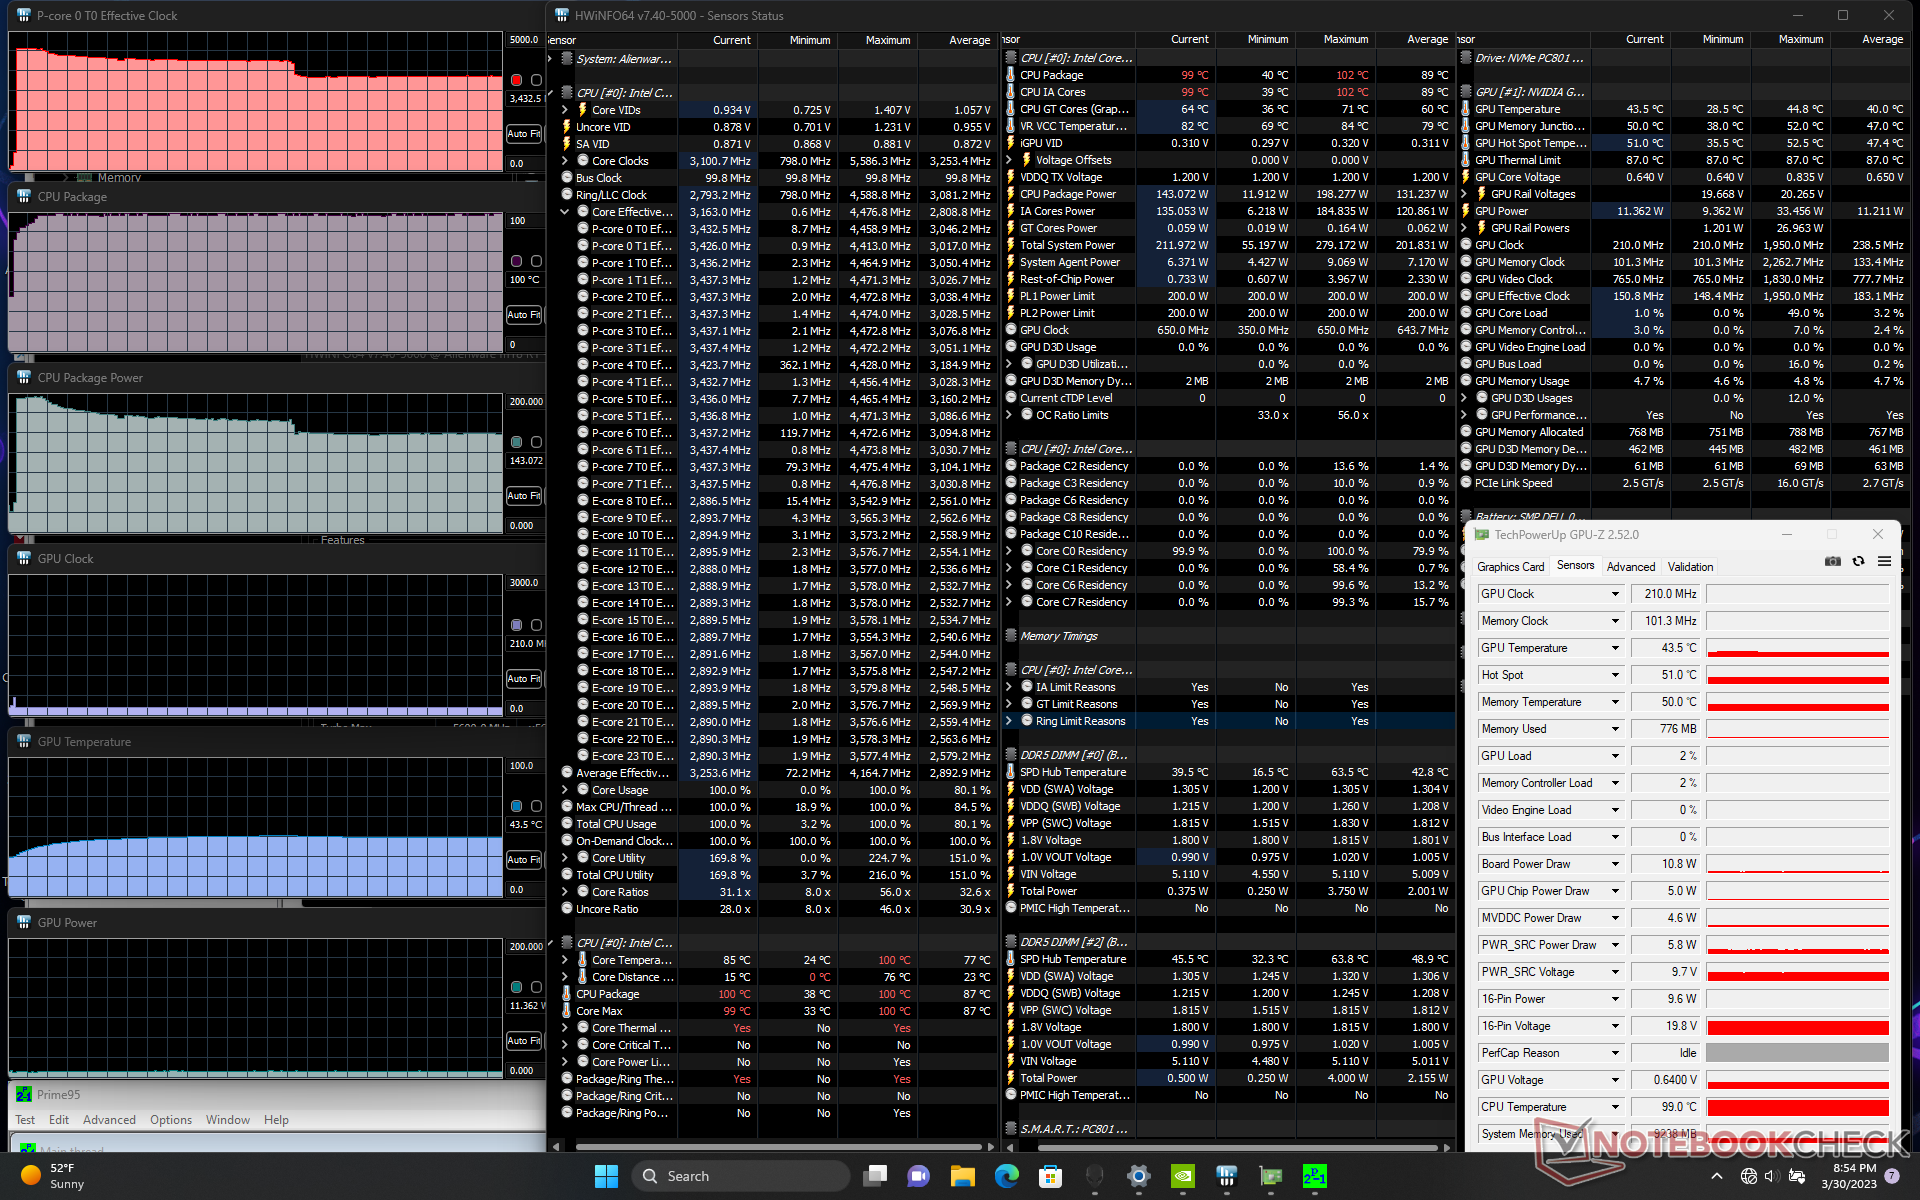
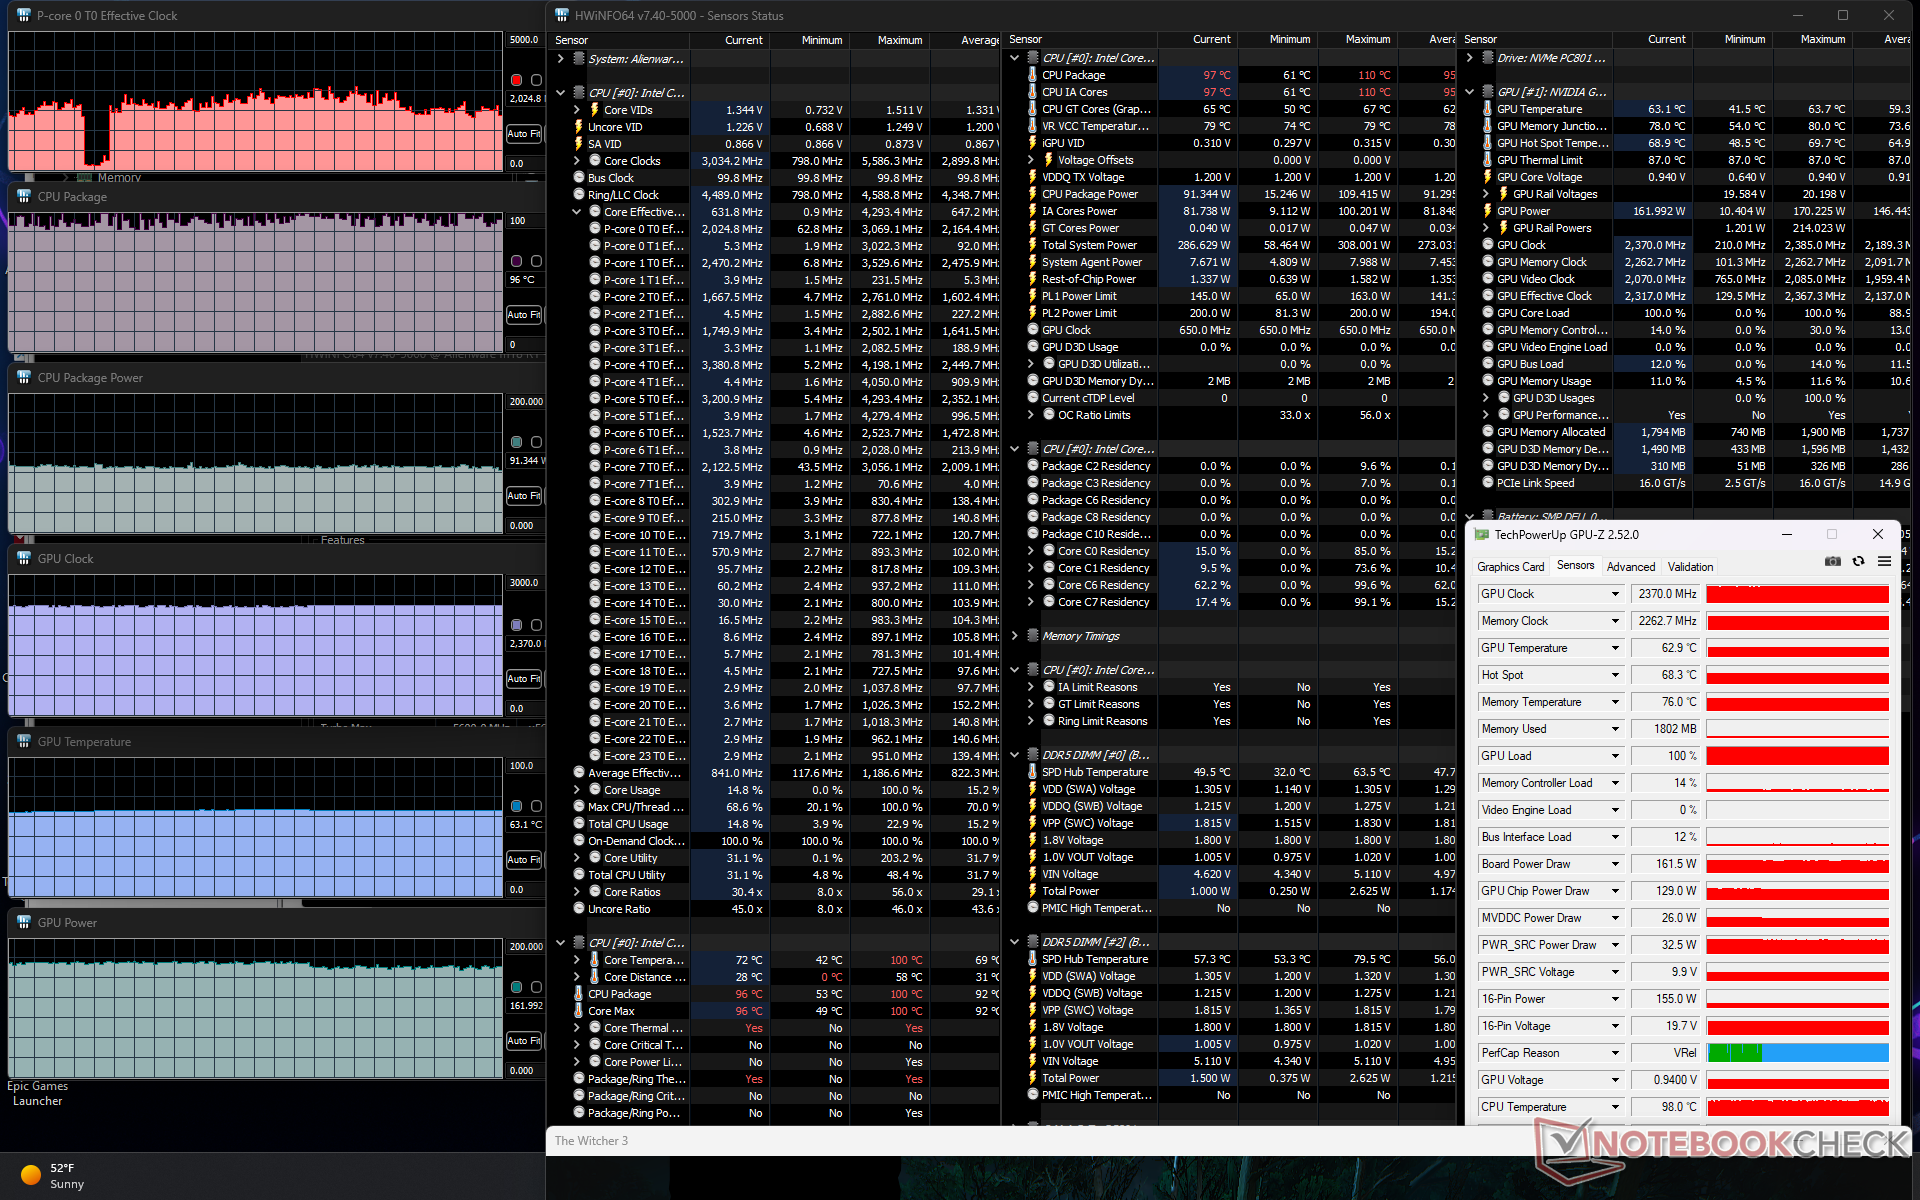
Quando si esegue Prime95 per stressare la CPU, le frequenze di clock e l'assorbimento di potenza della scheda raggiungono rispettivamente i 4,5 GHz e i 198 W, con una durata di pochi secondi o fino a quando la temperatura del nucleo raggiunge i 99 C. Successivamente, la CPU scende a 4,2 GHz e 175 W per i minuti successivi, prima di stabilizzarsi a 3,4 GHz, 143 W e 99 C. Il Turbo Boost massimo non è quindi sostenibile, indipendentemente dalla modalità di alimentazione. Anche le temperature della CPU sono estreme, persino per un portatile da gioco.
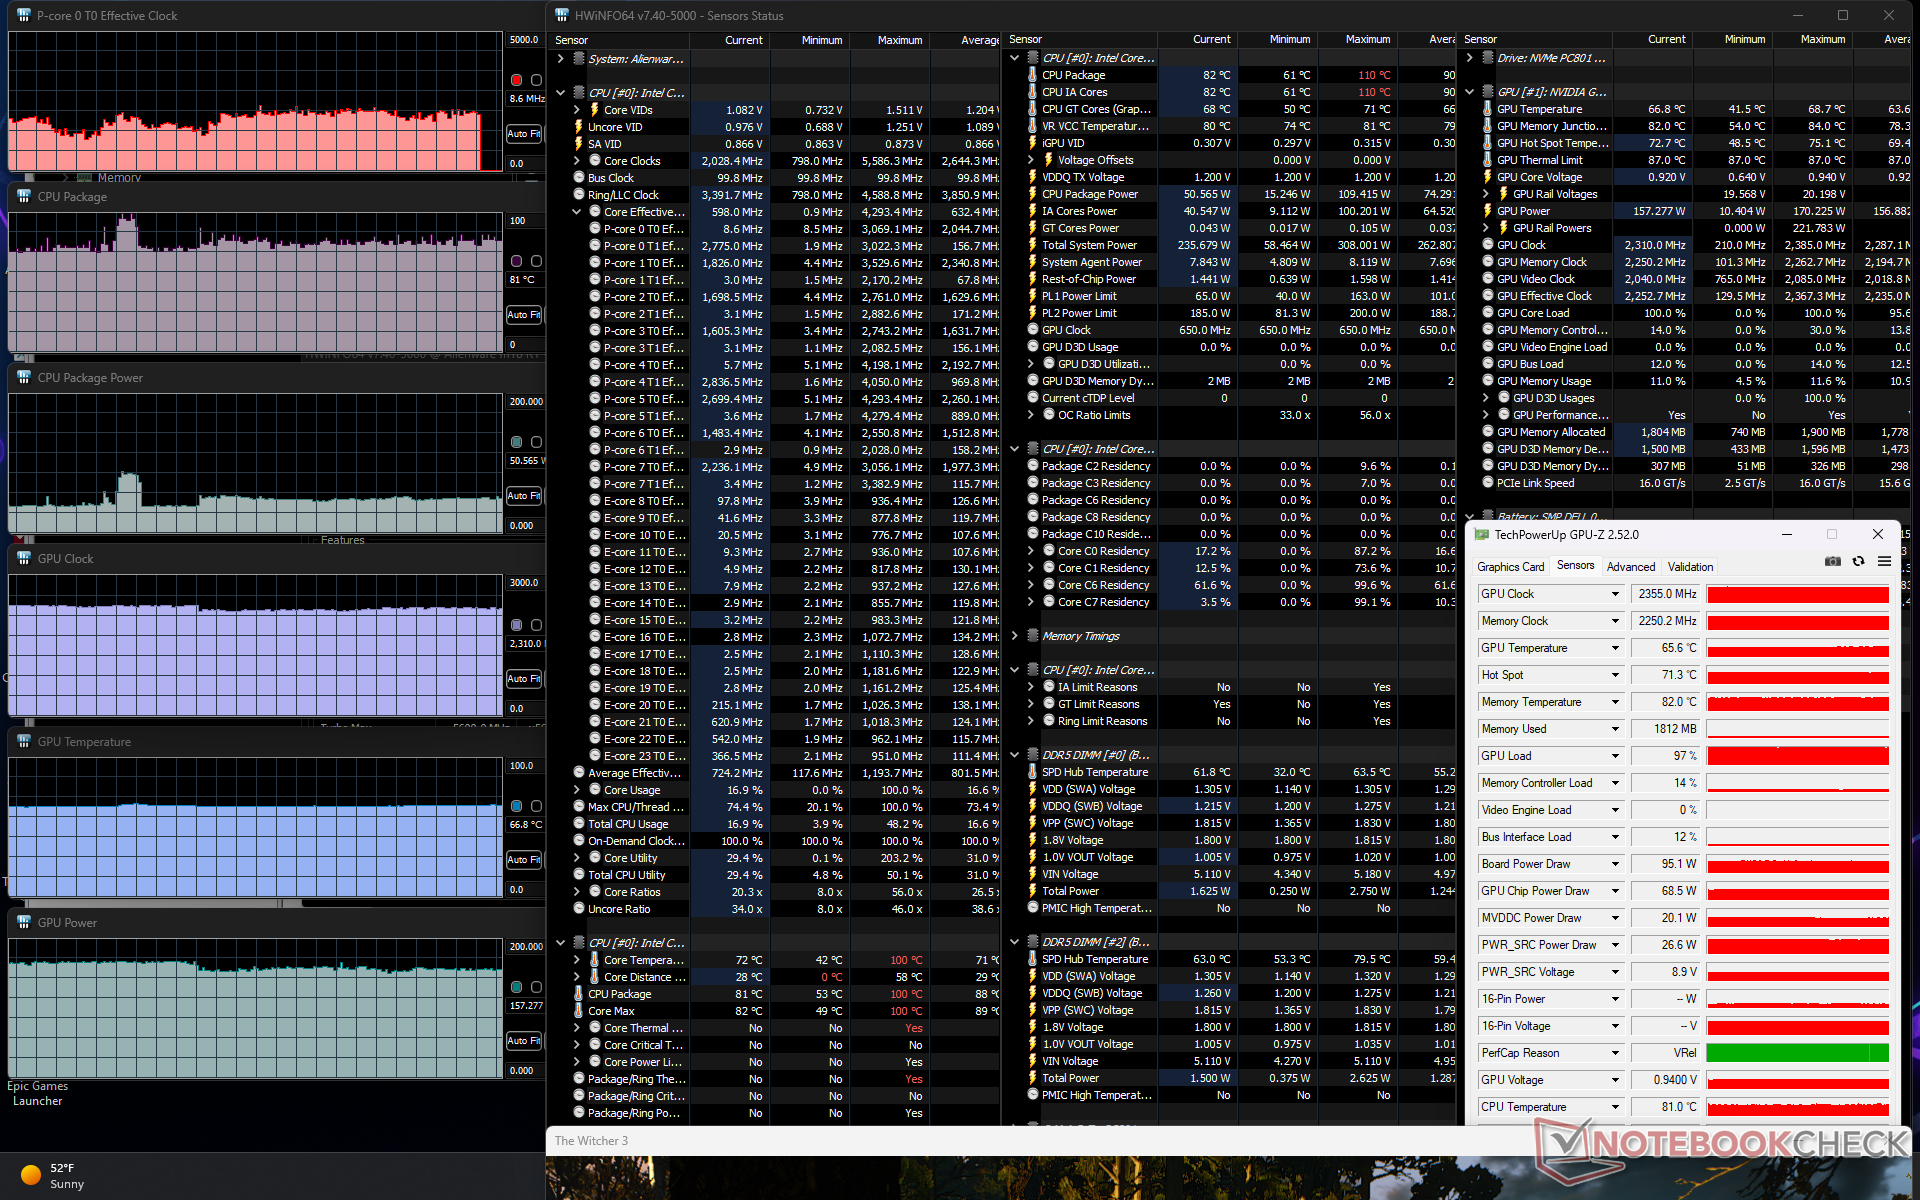
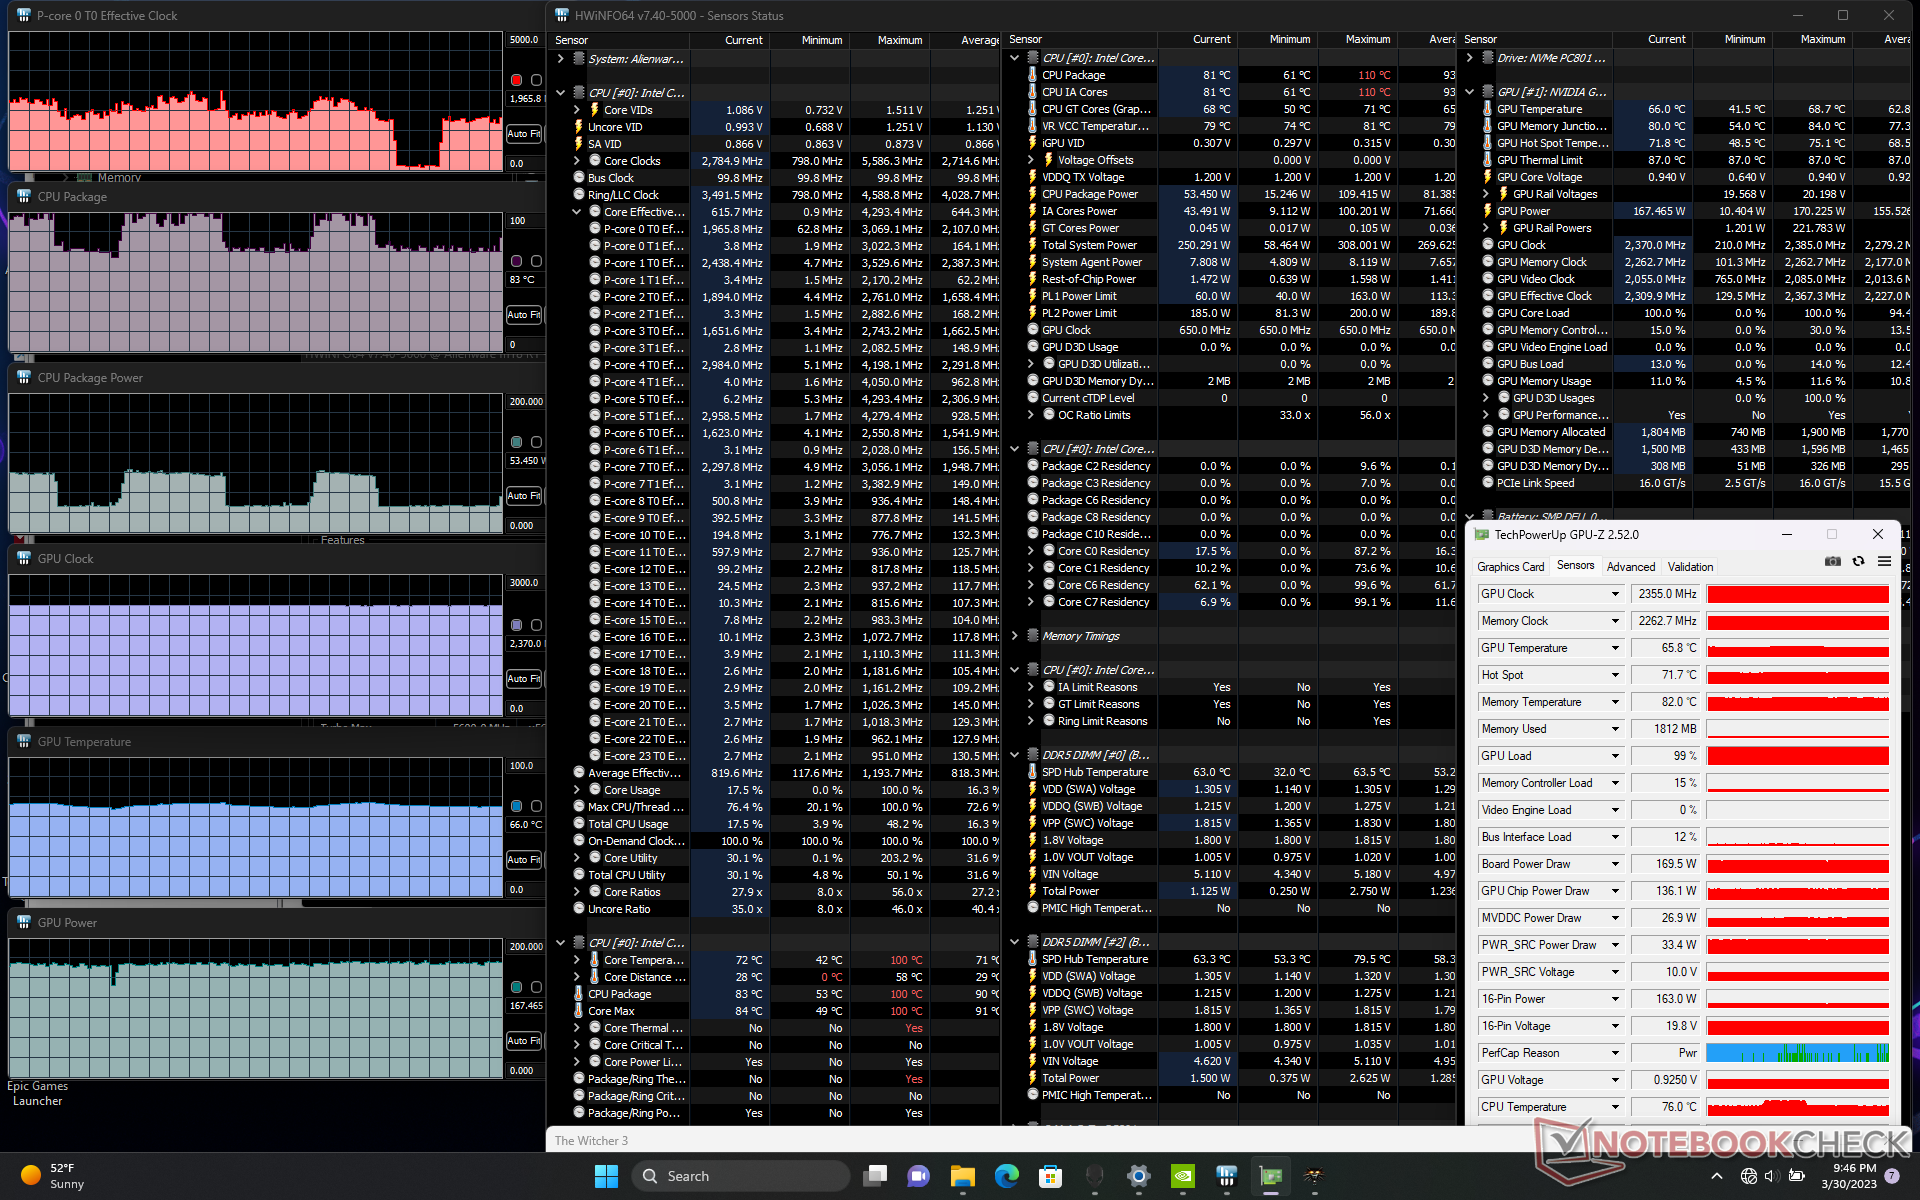
La frequenza di clock della GPU, la temperatura e l'assorbimento di potenza della scheda si stabilizzano rispettivamente a 2370 MHz, 63 C e 162 W quando si utilizza la modalità Overdrive Witcher 3 in modalità Overdrive. Si noti che le prestazioni della GPU non vengono influenzate quando si utilizza la modalità Performance, più silenziosa, il che è in linea con le osservazioni di Fire Strike riportate in precedenza. È invece la CPU a subire un leggero calo delle prestazioni. Dal momento che la maggior parte dei giochi è legata alla GPU, consigliamo di giocare in modalità Performance piuttosto che nella più rumorosa modalità Overdrive se il rumore della ventola è un problema.
Il funzionamento a batteria limita le prestazioni come previsto. Un test di Fire Strike a batteria restituisce punteggi di Fisica e Grafica rispettivamente di 25319 e 18778 punti, rispetto a 41644 e 46998 punti con l'alimentazione di rete.
| Clock della CPU (GHz) | Clock della GPU (MHz) | Temperatura media della CPU (°C) | Temperatura media della GPU (°C) | |
| Sistema inattivo | -- | -- | 38 | 29 |
| Stress Prime95 | 3,4 | -- | 100 | 44 |
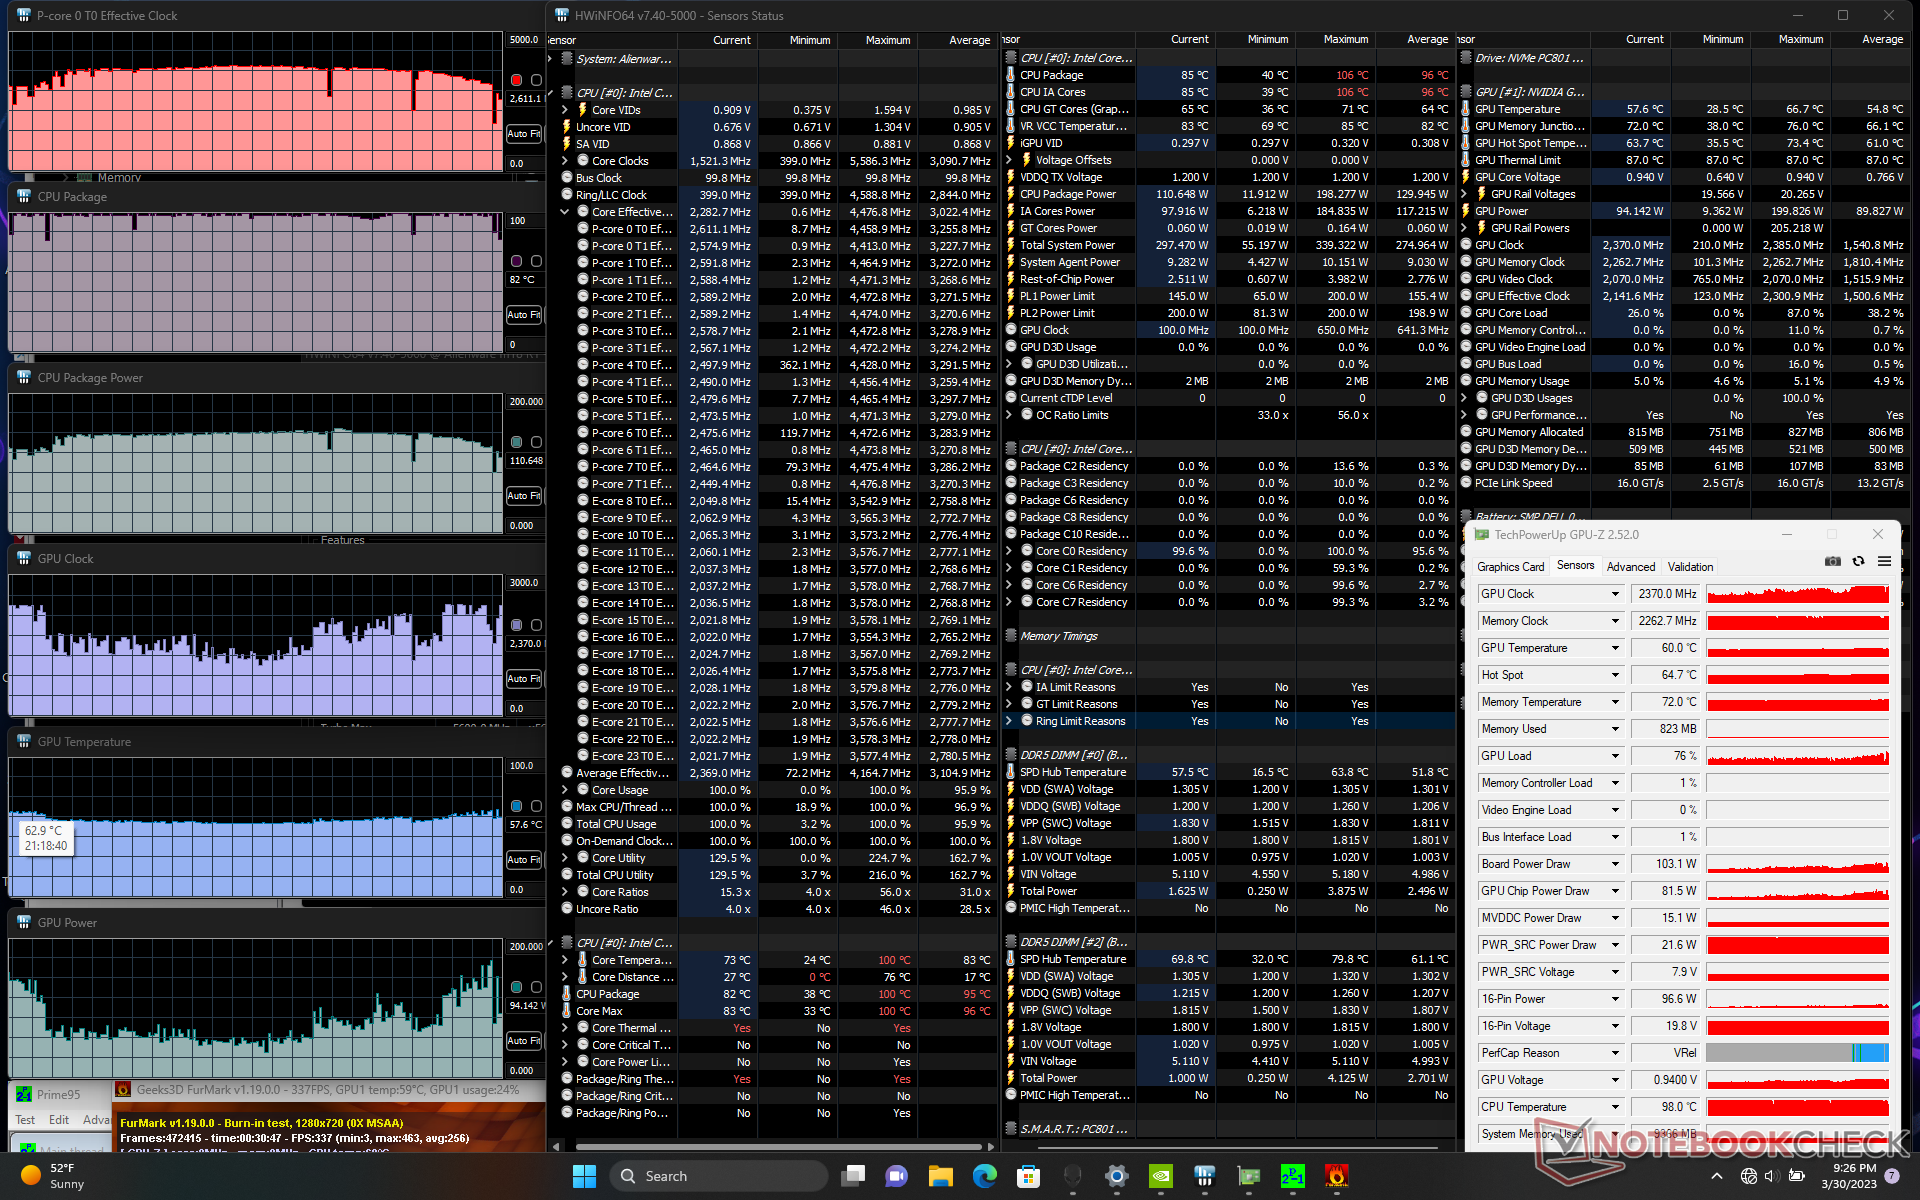
| Prime95 + FurMark Stress | 2.6+ | 1070 - 2370 | 82 - 100 | 57 |
| Witcher 3 Stress (modalità Overdrive) | ~2.0+ | 2370 | 96 | 63 |
| Witcher 3 Stress (modalità Performance) | ~1.8+ | 2370 | 81 | 66 |
| Witcher 3 Stress (modalità Bilanciata) | ~1,8 | 2310 | 81 | 67 |
Altoparlanti
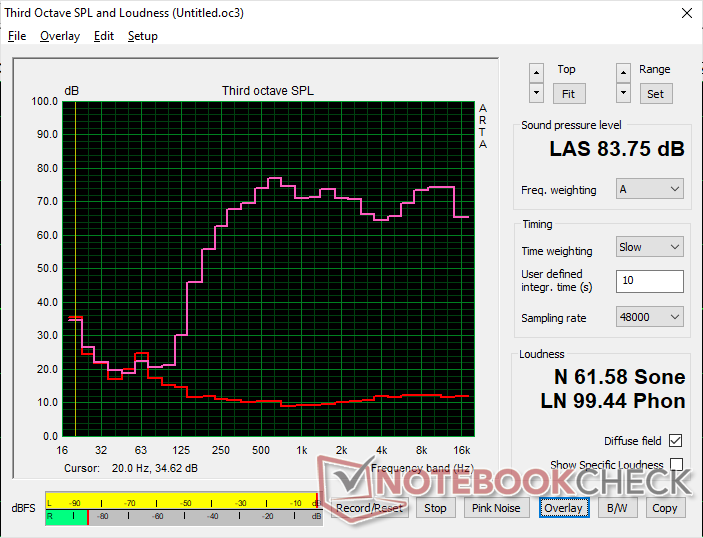
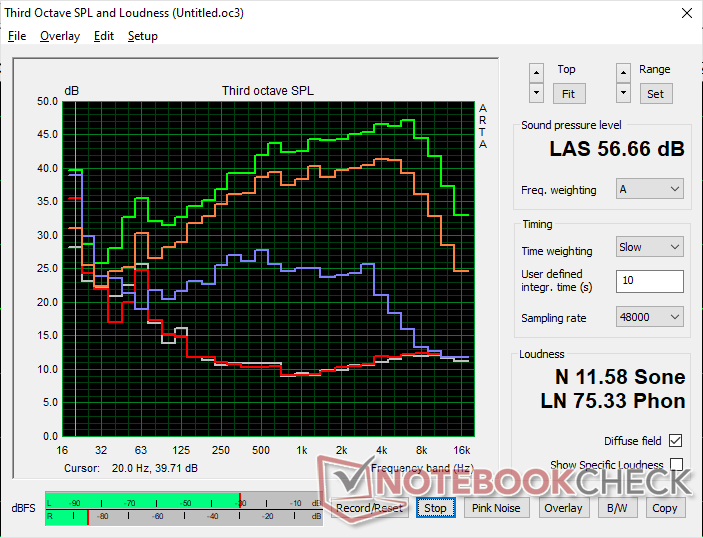
Alienware m18 R1 analisi audio
(+) | gli altoparlanti sono relativamente potenti (83.8 dB)
Bassi 100 - 315 Hz
(-) | quasi nessun basso - in media 22.4% inferiori alla media
(±) | la linearità dei bassi è media (13.4% delta rispetto alla precedente frequenza)
Medi 400 - 2000 Hz
(+) | medi bilanciati - solo only 3.2% rispetto alla media
(+) | medi lineari (4.4% delta rispetto alla precedente frequenza)
Alti 2 - 16 kHz
(+) | Alti bilanciati - appena 3.2% dalla media
(+) | alti lineari (4% delta rispetto alla precedente frequenza)
Nel complesso 100 - 16.000 Hz
(+) | suono nel complesso lineare (14.6% differenza dalla media)
Rispetto alla stessa classe
» 28% di tutti i dispositivi testati in questa classe è stato migliore, 7% simile, 65% peggiore
» Il migliore ha avuto un delta di 6%, medio di 18%, peggiore di 132%
Rispetto a tutti i dispositivi testati
» 19% di tutti i dispositivi testati in questa classe è stato migliore, 4% similare, 77% peggiore
» Il migliore ha avuto un delta di 4%, medio di 24%, peggiore di 134%
Apple MacBook Pro 16 2021 M1 Pro analisi audio
(+) | gli altoparlanti sono relativamente potenti (84.7 dB)
Bassi 100 - 315 Hz
(+) | bassi buoni - solo 3.8% dalla media
(+) | bassi in lineaa (5.2% delta rispetto alla precedente frequenza)
Medi 400 - 2000 Hz
(+) | medi bilanciati - solo only 1.3% rispetto alla media
(+) | medi lineari (2.1% delta rispetto alla precedente frequenza)
Alti 2 - 16 kHz
(+) | Alti bilanciati - appena 1.9% dalla media
(+) | alti lineari (2.7% delta rispetto alla precedente frequenza)
Nel complesso 100 - 16.000 Hz
(+) | suono nel complesso lineare (4.6% differenza dalla media)
Rispetto alla stessa classe
» 0% di tutti i dispositivi testati in questa classe è stato migliore, 0% simile, 100% peggiore
» Il migliore ha avuto un delta di 5%, medio di 17%, peggiore di 45%
Rispetto a tutti i dispositivi testati
» 0% di tutti i dispositivi testati in questa classe è stato migliore, 0% similare, 100% peggiore
» Il migliore ha avuto un delta di 4%, medio di 24%, peggiore di 134%
Gestione dell'energia - Oltre 300 W quando si gioca
Consumo di energia
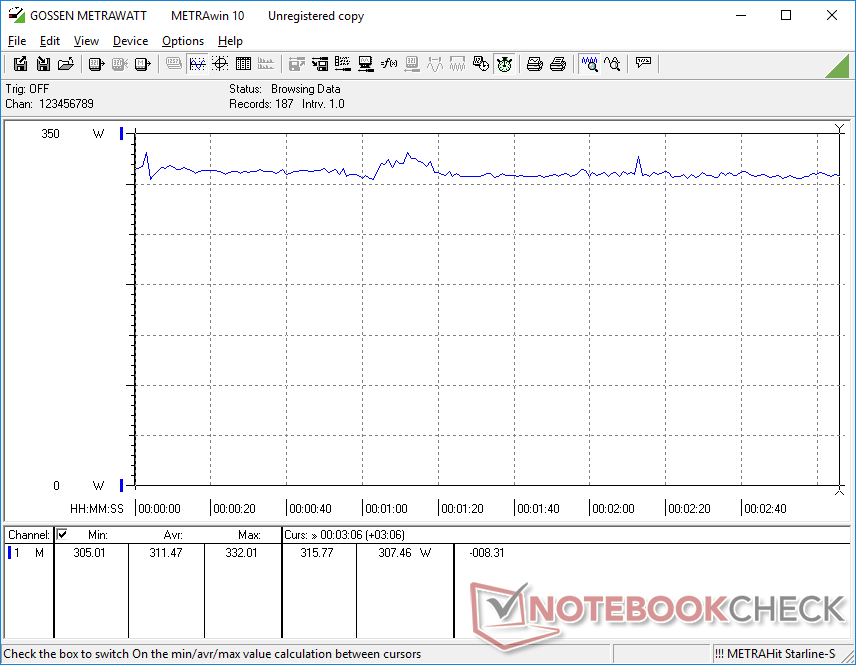
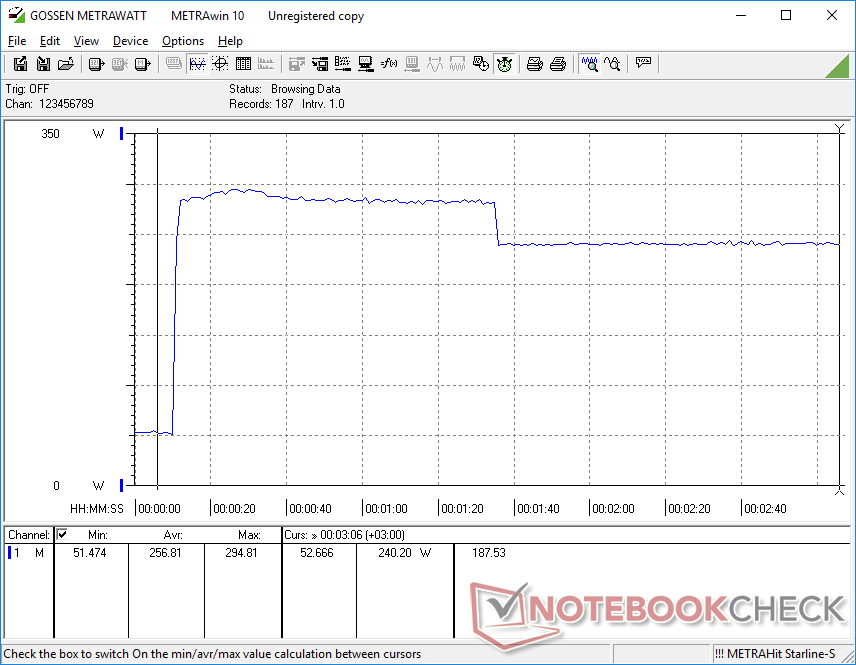
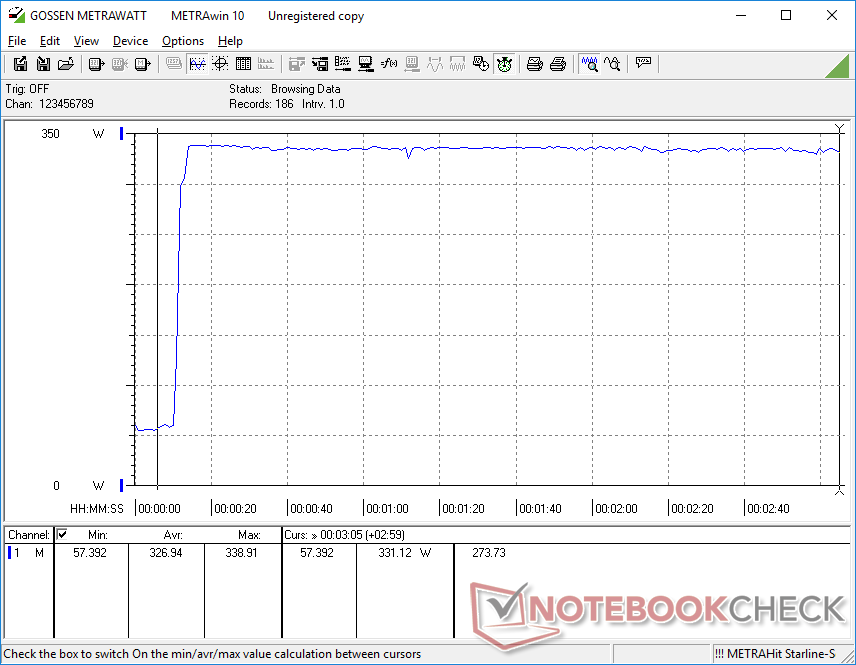
Il sistema è sorprendentemente molto esigente anche quando non si eseguono applicazioni. Siamo riusciti a registrare un minimo di 21 W quando è al minimo in modalità Risparmio energetico, modalità Optimus e con l'impostazione di luminosità più bassa. Il funzionamento al minimo in modalità Performance o Turbo aumenterebbe il consumo di oltre 2 volte, per cui si consiglia di evitare le impostazioni di profilo più elevato se non è necessaria la potenza extra.
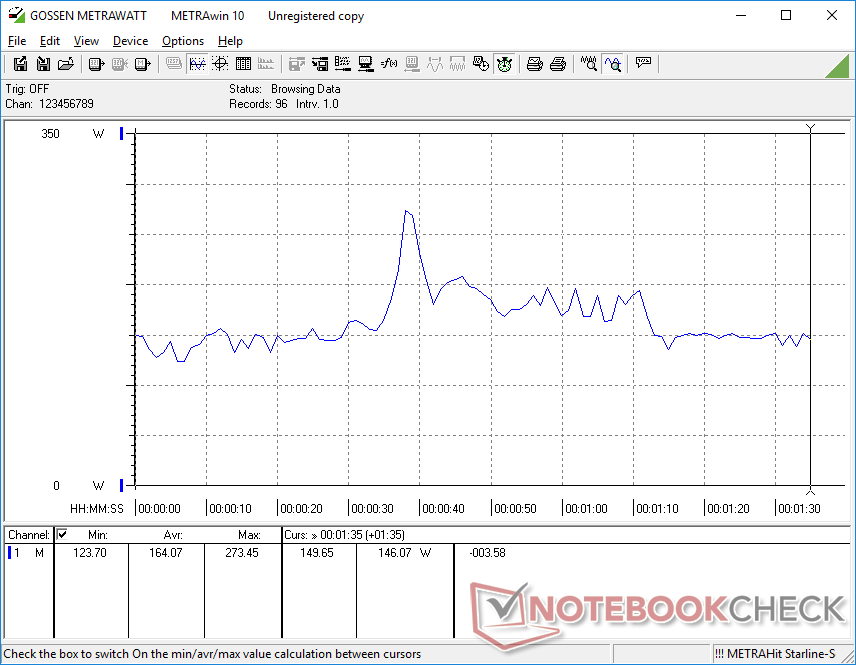
Eseguendo Witcher 3 per rappresentare i carichi di gioco tipici consumerebbe 311 W, ovvero oltre 50 W in più rispetto al modello RTX 3080 Ti dello scorso anno Alienware x17 R2. Quindi, anche se le prestazioni sono più veloci da una generazione all'altra, gli utenti dovranno pagare per questo con bollette più alte a causa della CPU più esigente.
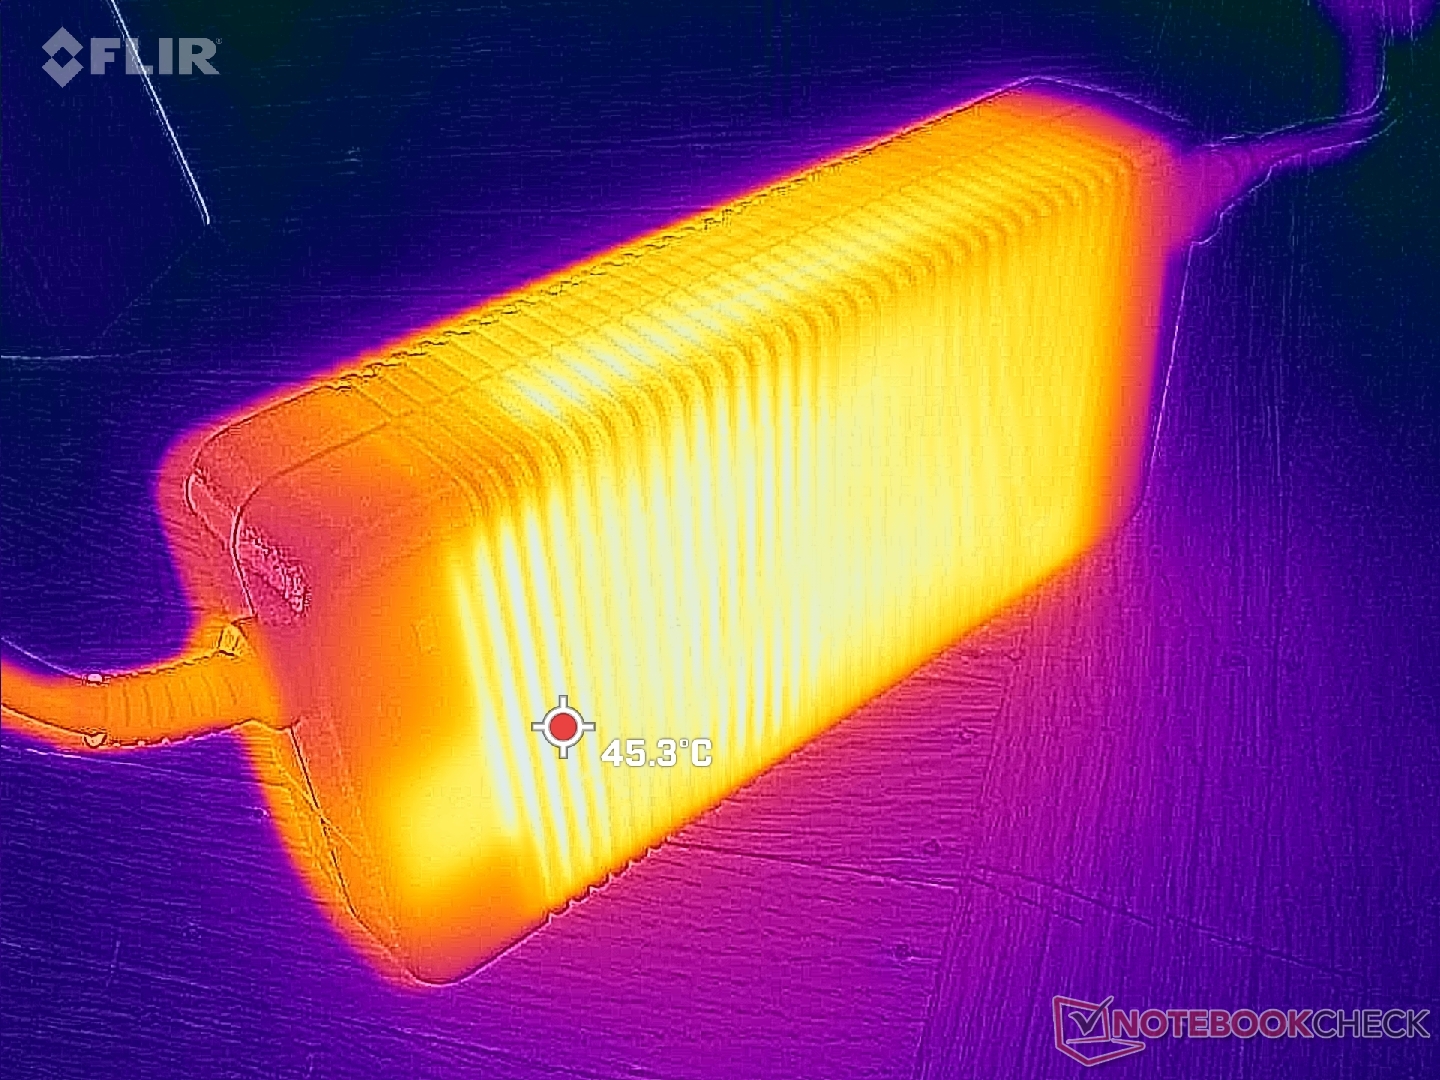
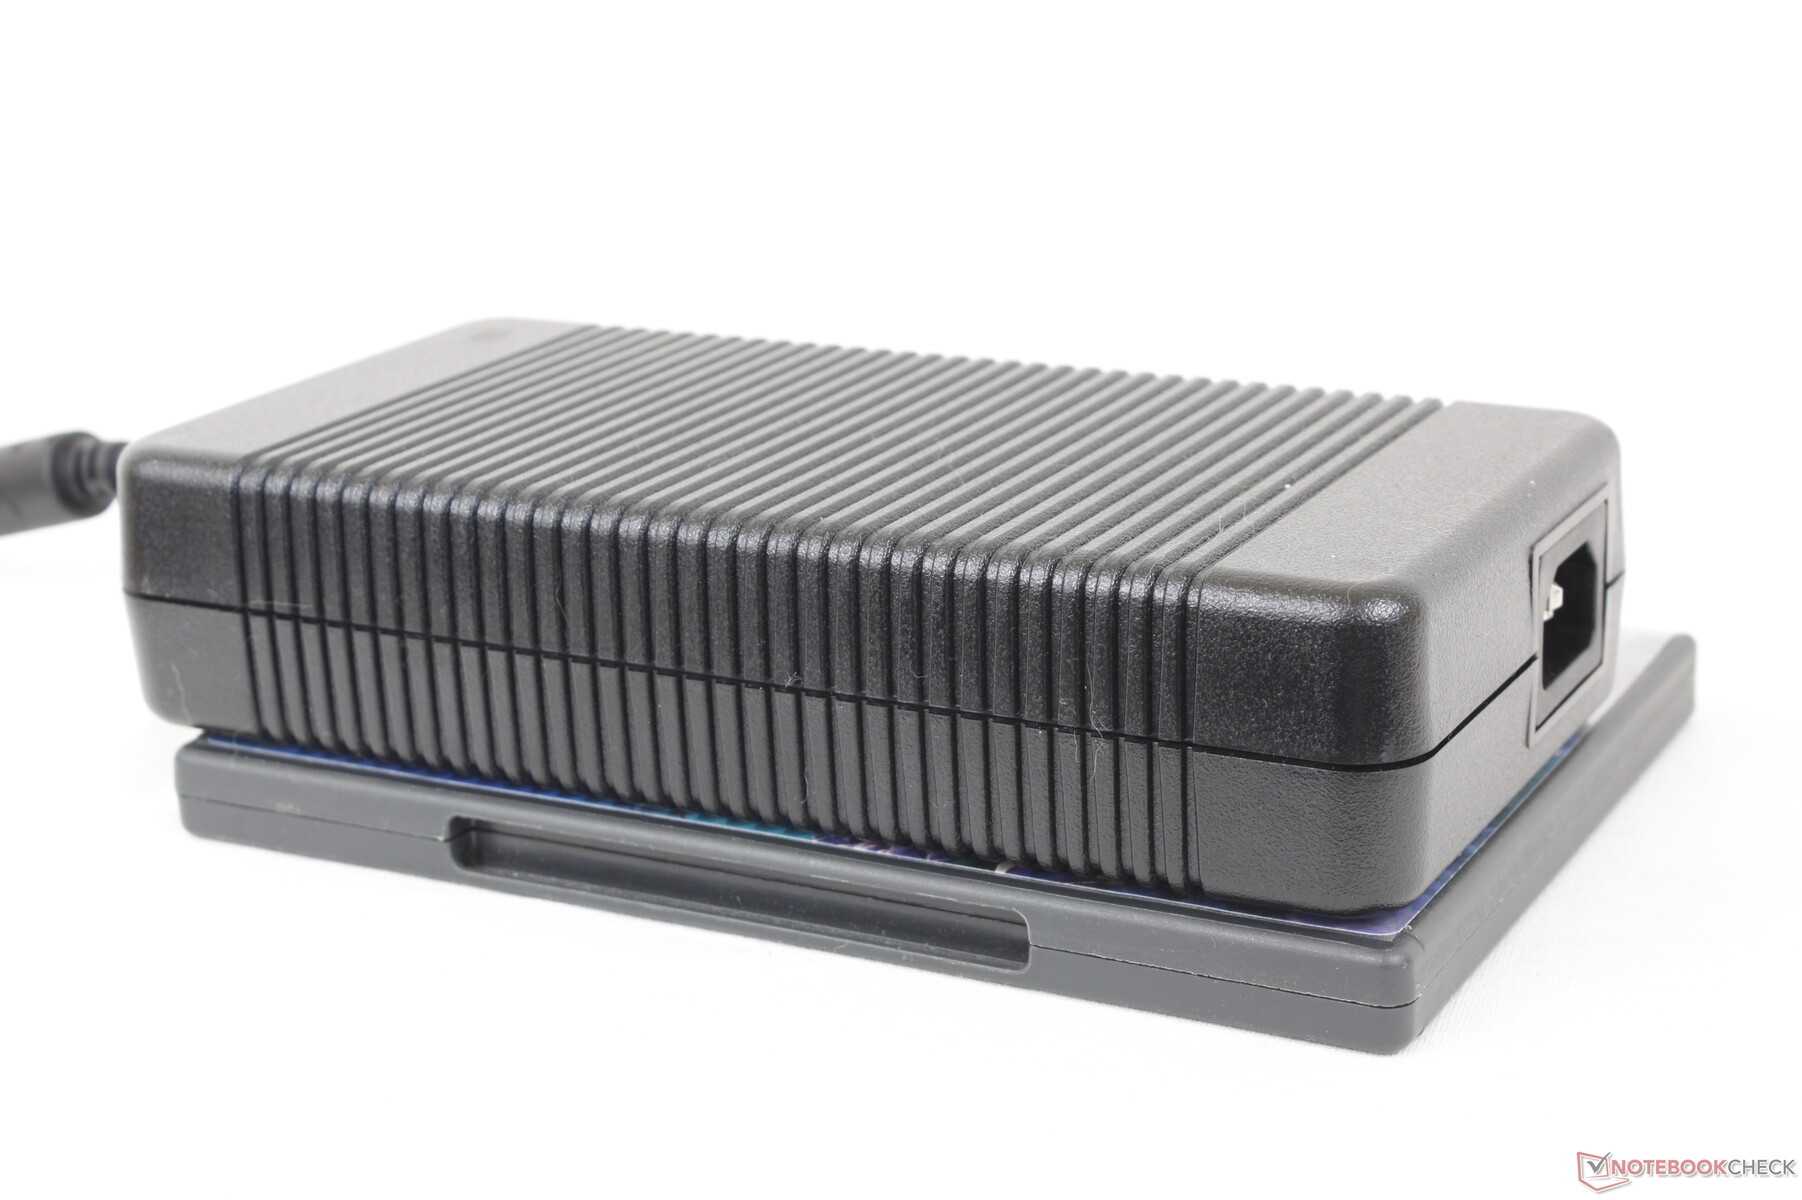
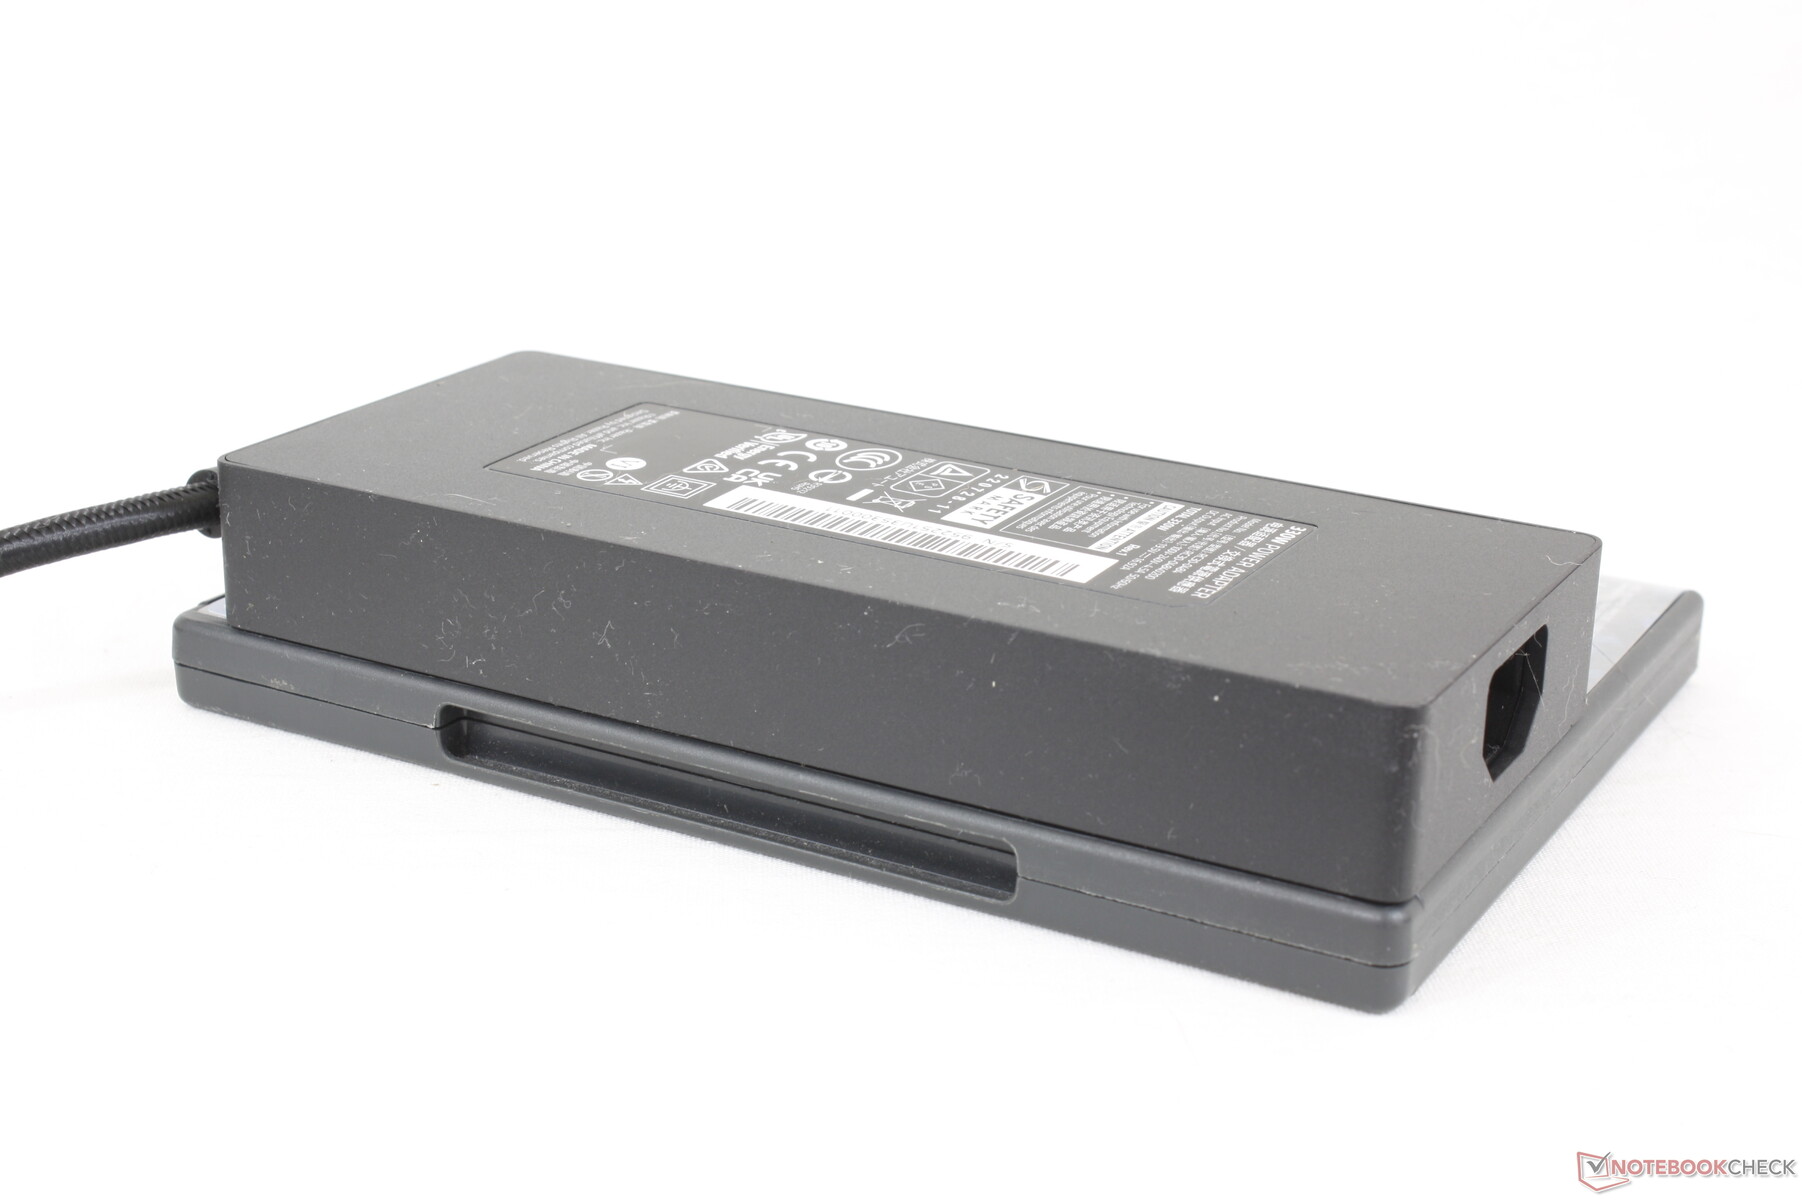
Siamo riusciti a registrare un consumo massimo di 339 W quando sia la CPU che la GPU sono al 100% di utilizzo. L'ingombrante adattatore CA (~19,5 x 9,8 x 4 cm) è dimensionato per 330 W e quindi la nostra unità completamente configurata sta sfruttando al massimo la potenza disponibile. Tenete presente che la velocità di carica della batteria del portatile rallenta quando si gioca. Infatti, possiamo osservare che la batteria scende dal 100% al 91% quando si eseguono contemporaneamente carichi estremamente impegnativi come Prime95 e FurMark.
| Off / Standby | |
| Idle | |
| Sotto carico |
|
Leggenda:
min: | |
| Alienware m18 R1 i9-13980HX, GeForce RTX 4090 Laptop GPU, SK hynix PC801 HFS001TEJ9X101N, IPS, 1920x1200, 18" | Razer Blade 18 RTX 4070 i9-13950HX, GeForce RTX 4070 Laptop GPU, SSSTC CA6-8D1024, IPS, 2560x1600, 18" | Asus ROG Strix Scar 18 2023 G834JY-N6005W i9-13980HX, GeForce RTX 4090 Laptop GPU, 2x Samsung PM9A1 MZVL21T0HCLR (RAID 0), IPS, 2560x1600, 18" | MSI GE78HX 13VH-070US i9-13950HX, GeForce RTX 4080 Laptop GPU, Samsung PM9A1 MZVL22T0HBLB, IPS, 2560x1600, 17" | Eluktronics Mech-17 GP2 i9-13900HX, GeForce RTX 4090 Laptop GPU, Samsung PM9A1 MZVL21T0HCLR, IPS, 2560x1600, 17" | MSI Titan GT77 HX 13VI i9-13950HX, GeForce RTX 4090 Laptop GPU, Samsung PM9A1 MZVL22T0HBLB, Mini-LED, 3840x2160, 17.3" | |
|---|---|---|---|---|---|---|
| Power Consumption | 7% | 11% | 20% | 21% | 20% | |
| Idle Minimum * (Watt) | 21.6 | 24.5 -13% | 17.3 20% | 16.1 25% | 14 35% | 14 35% |
| Idle Average * (Watt) | 25.2 | 34.1 -35% | 27 -7% | 24 5% | 19.3 23% | 21.6 14% |
| Idle Maximum * (Watt) | 56.7 | 47.7 16% | 46 19% | 34 40% | 36.8 35% | 24.8 56% |
| Load Average * (Watt) | 164.1 | 140 15% | 133 19% | 123.6 25% | 117.2 29% | 122.5 25% |
| Witcher 3 ultra * (Watt) | 311 | 202 35% | 286 8% | 304 2% | 265 15% | |
| Load Maximum * (Watt) | 338.9 | 261 23% | 329 3% | 285.7 16% | 342.5 -1% | 418 -23% |
* ... Meglio usare valori piccoli
Power Consumption Witcher 3 / Stresstest
Power Consumption external Monitor
Durata della batteria: non terribile per le dimensioni
La durata della batteria non è mai stata un punto di forza della serie Alienware. L'Alienware x17 R2 dell'anno scorso, ad esempio, durava solo un paio d'ore anche quando si navigava sul web. L'Alienware m18 include una batteria di maggiore capacità (97 Wh rispetto a 87 Wh) con una migliore gestione dell'energia per una durata di navigazione sensibilmente più lunga, di circa 4 ore. Non è certo una durata pari a quella di un tipico Ultrabook, ma non è male per un portatile da gioco così grande.
La ricarica da vuoto a pieno richiede circa 2 ore con l'adattatore CA in dotazione. I caricatori USB-C non sono supportati, il che è un peccato perché significa che si è legati all'enorme adattatore CA da 330 W ovunque si vada.
| Alienware m18 R1 i9-13980HX, GeForce RTX 4090 Laptop GPU, 97 Wh | Razer Blade 18 RTX 4070 i9-13950HX, GeForce RTX 4070 Laptop GPU, 91.7 Wh | Asus ROG Strix Scar 18 2023 G834JY-N6005W i9-13980HX, GeForce RTX 4090 Laptop GPU, 90 Wh | Eluktronics Mech-17 GP2 i9-13900HX, GeForce RTX 4090 Laptop GPU, 99 Wh | MSI Titan GT77 HX 13VI i9-13950HX, GeForce RTX 4090 Laptop GPU, 99.9 Wh | Alienware x17 R2 P48E i9-12900HK, GeForce RTX 3080 Ti Laptop GPU, 87 Wh | |
|---|---|---|---|---|---|---|
| Autonomia della batteria | 35% | 47% | 19% | 62% | -23% | |
| Reader / Idle (h) | 5.6 | 7 25% | 3.9 -30% | |||
| WiFi v1.3 (h) | 4.3 | 4 -7% | 7.1 65% | 5.1 19% | 5.3 23% | 2 -53% |
| Load (h) | 0.7 | 1.3 86% | 0.9 29% | 1.4 100% | 0.8 14% | |
| H.264 (h) | 7 | 6 | ||||
| Witcher 3 ultra (h) | 0.9 |
Pro
Contro
Verdetto - Nove chili di pura potenza
I portatili Alienware hanno sempre avuto la mentalità del "rendimento a tutti i costi" e l'Alienware m18 R1 non fa eccezione. Questa macchina non ha paura di essere uno dei portatili più grandi, più pesanti o addirittura più rumorosi del mercato se questo significa che può spremere un po' più di prestazioni dalla CPU e dalla GPU o incorporare più funzioni che i giocatori più accaniti potrebbero apprezzare. Gli utenti che intendono sfruttare le 4 unità SSD M.2, le vaste opzioni di porte, il tastierino numerico integrato e la veloce frequenza di aggiornamento a 480 Hz e che non si preoccupano del peso ingombrante o dell'enorme adattatore CA avranno molto altro da apprezzare dell'Alienware m18 R1.
Se volete massimizzare le prestazioni e le funzionalità anche se questo significa un portatile molto più pesante e grande, allora l'Alienware m18 R1 fa per voi.
Se le caratteristiche ausiliarie di cui sopra non vi entusiasmano, potete ottenere quasi le stesse prestazioni di base con il Razer Blade 18 R1, notevolmente più leggero Razer Blade 18 o Asus ROG Strix 18. Ci piacerebbe anche vedere dei miglioramenti al nuovo software Alienware Command Center, che a volte si carica in modo insolitamente lento.
Prezzo e disponibilità
L'Alienware m18 R1 viene ora spedito direttamente da Dell a partire da 2100 dollari per la configurazione Core i7/RTX 4060 fino a oltre 5000 dollari se completamente configurato. La nostra unità recensita viene venduta a circa 3700 dollari. Al momento in cui scriviamo, il modello non è ancora disponibile presso i principali rivenditori.
Alienware m18 R1
- 04/01/2023 v7 (old)
Allen Ngo
Transparency
La selezione dei dispositivi da recensire viene effettuata dalla nostra redazione. Il campione di prova è stato fornito all'autore come prestito dal produttore o dal rivenditore ai fini di questa recensione. L'istituto di credito non ha avuto alcuna influenza su questa recensione, né il produttore ne ha ricevuto una copia prima della pubblicazione. Non vi era alcun obbligo di pubblicare questa recensione. In quanto società mediatica indipendente, Notebookcheck non è soggetta all'autorità di produttori, rivenditori o editori.
Ecco come Notebookcheck esegue i test
Ogni anno, Notebookcheck esamina in modo indipendente centinaia di laptop e smartphone utilizzando procedure standardizzate per garantire che tutti i risultati siano comparabili. Da circa 20 anni sviluppiamo continuamente i nostri metodi di prova e nel frattempo stabiliamo gli standard di settore. Nei nostri laboratori di prova, tecnici ed editori esperti utilizzano apparecchiature di misurazione di alta qualità. Questi test comportano un processo di validazione in più fasi. Il nostro complesso sistema di valutazione si basa su centinaia di misurazioni e parametri di riferimento ben fondati, che mantengono l'obiettività.Price comparison

