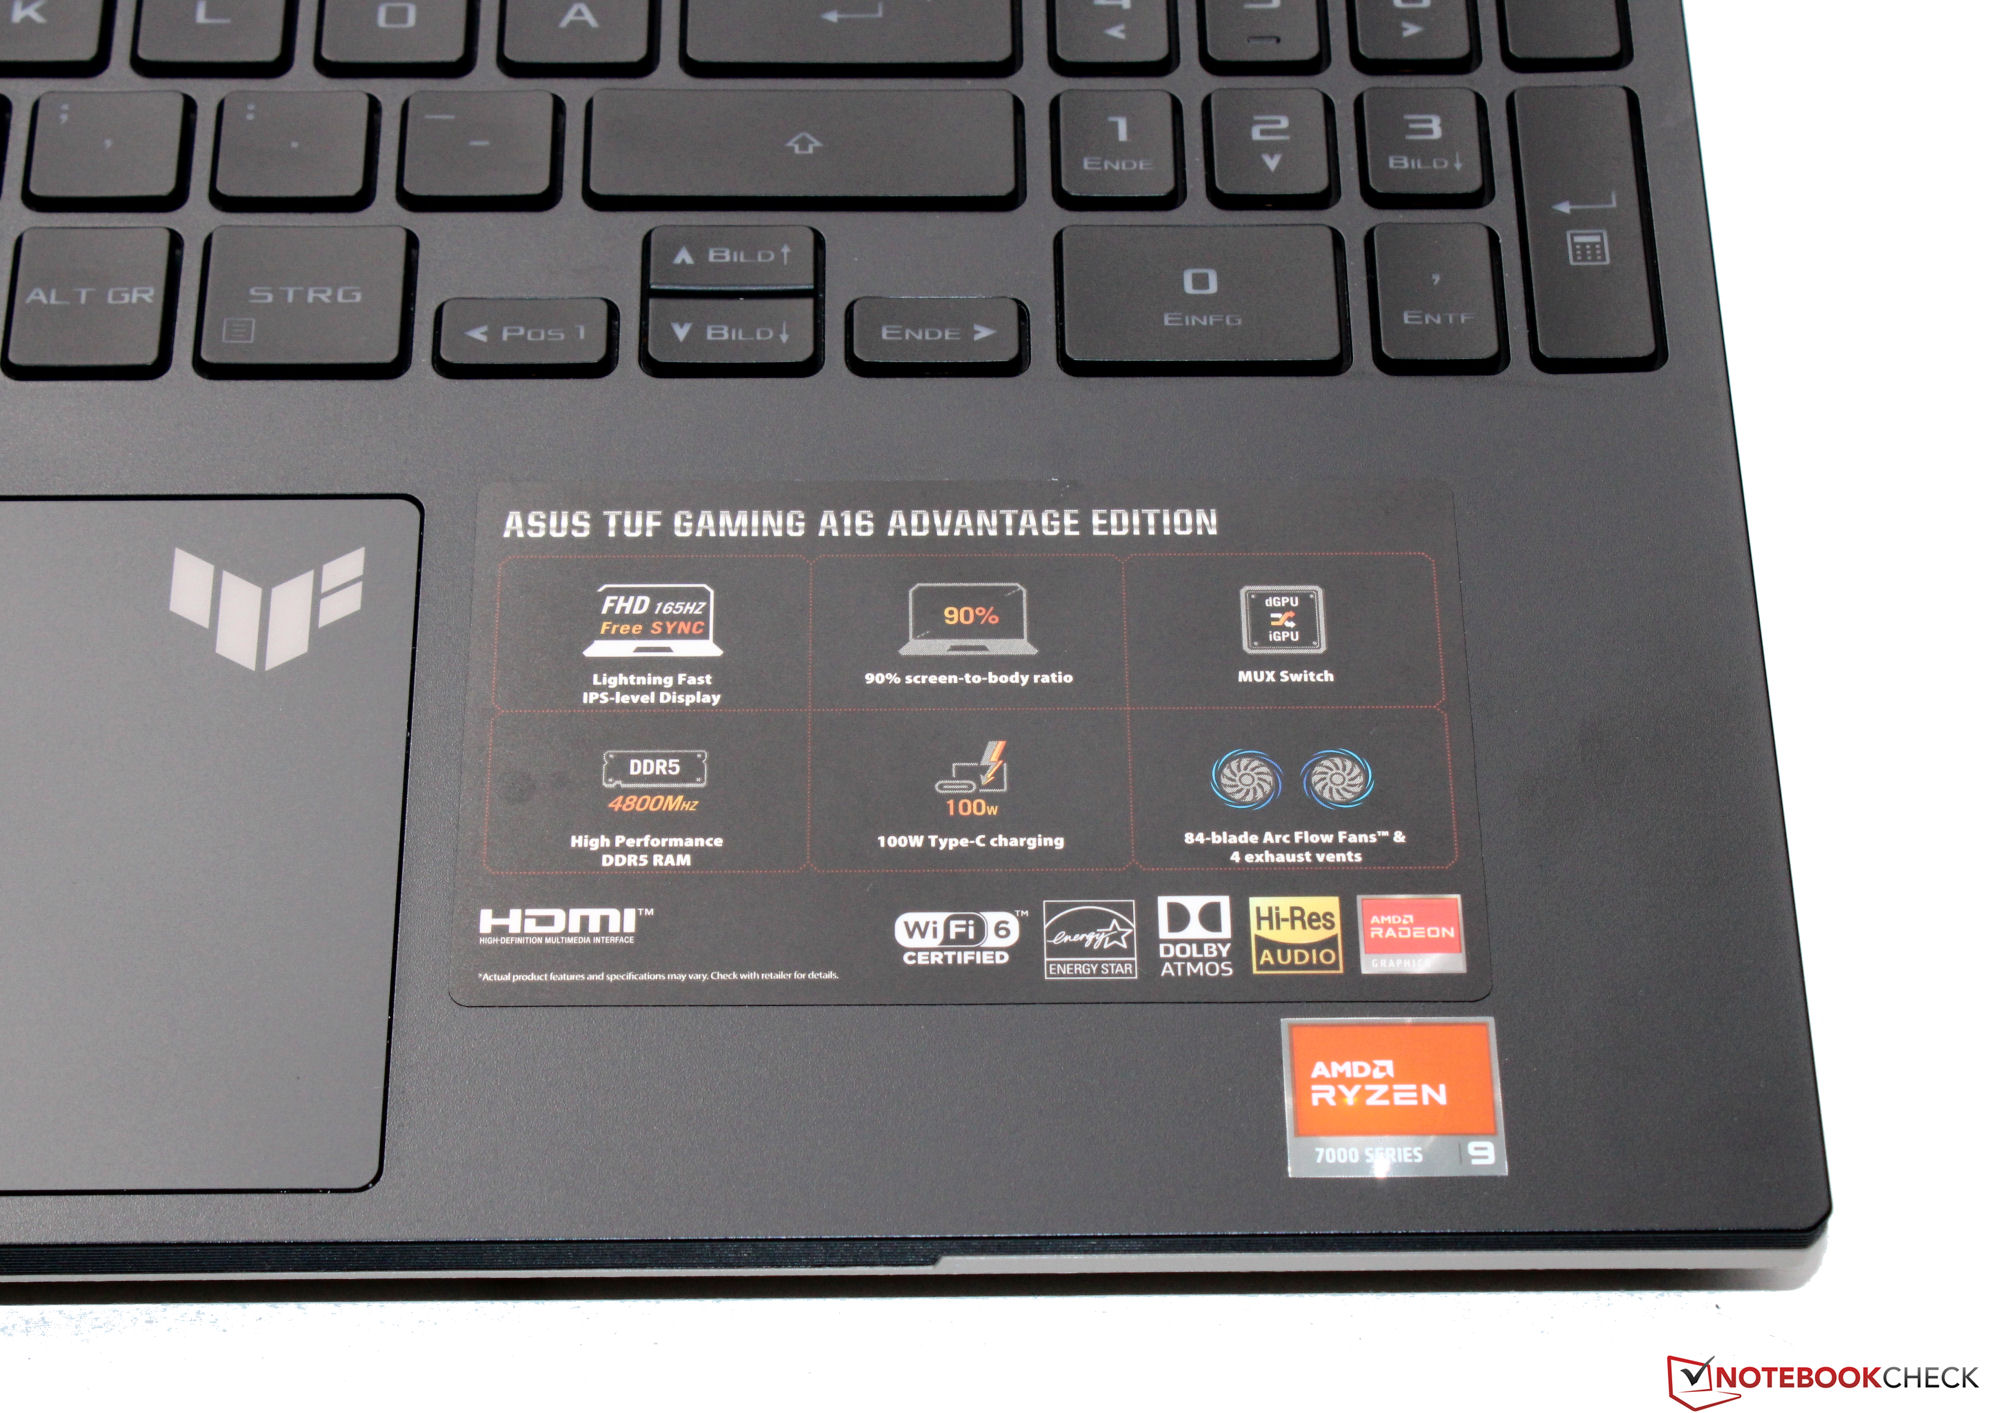
Recensione dell'Asus TUF Gaming A16 Advantage Edition FA617XS: Il portatile AMD con autonomia fino a 20 ore
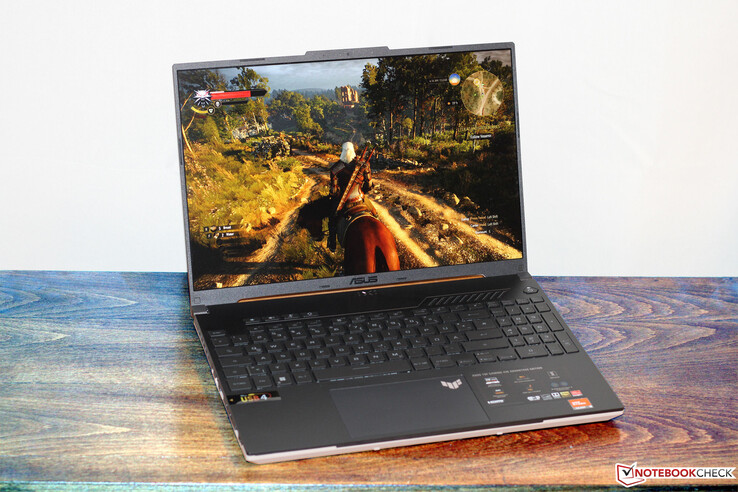
L'Asus TUF Gaming A16 Advantage Edition, un portatile da gioco di fascia media, si affida all'hardware AMD: ARyzen-9-7940HSeRadeon-RX-7600SgPU alimentano il dispositivo. I concorrenti includono ilLenovo Legion Pro 5 16IRX8, ilMSI Katana 15 B12VEK, ilMedion Erazer Defender P40e il Gigabyte G5 KE.
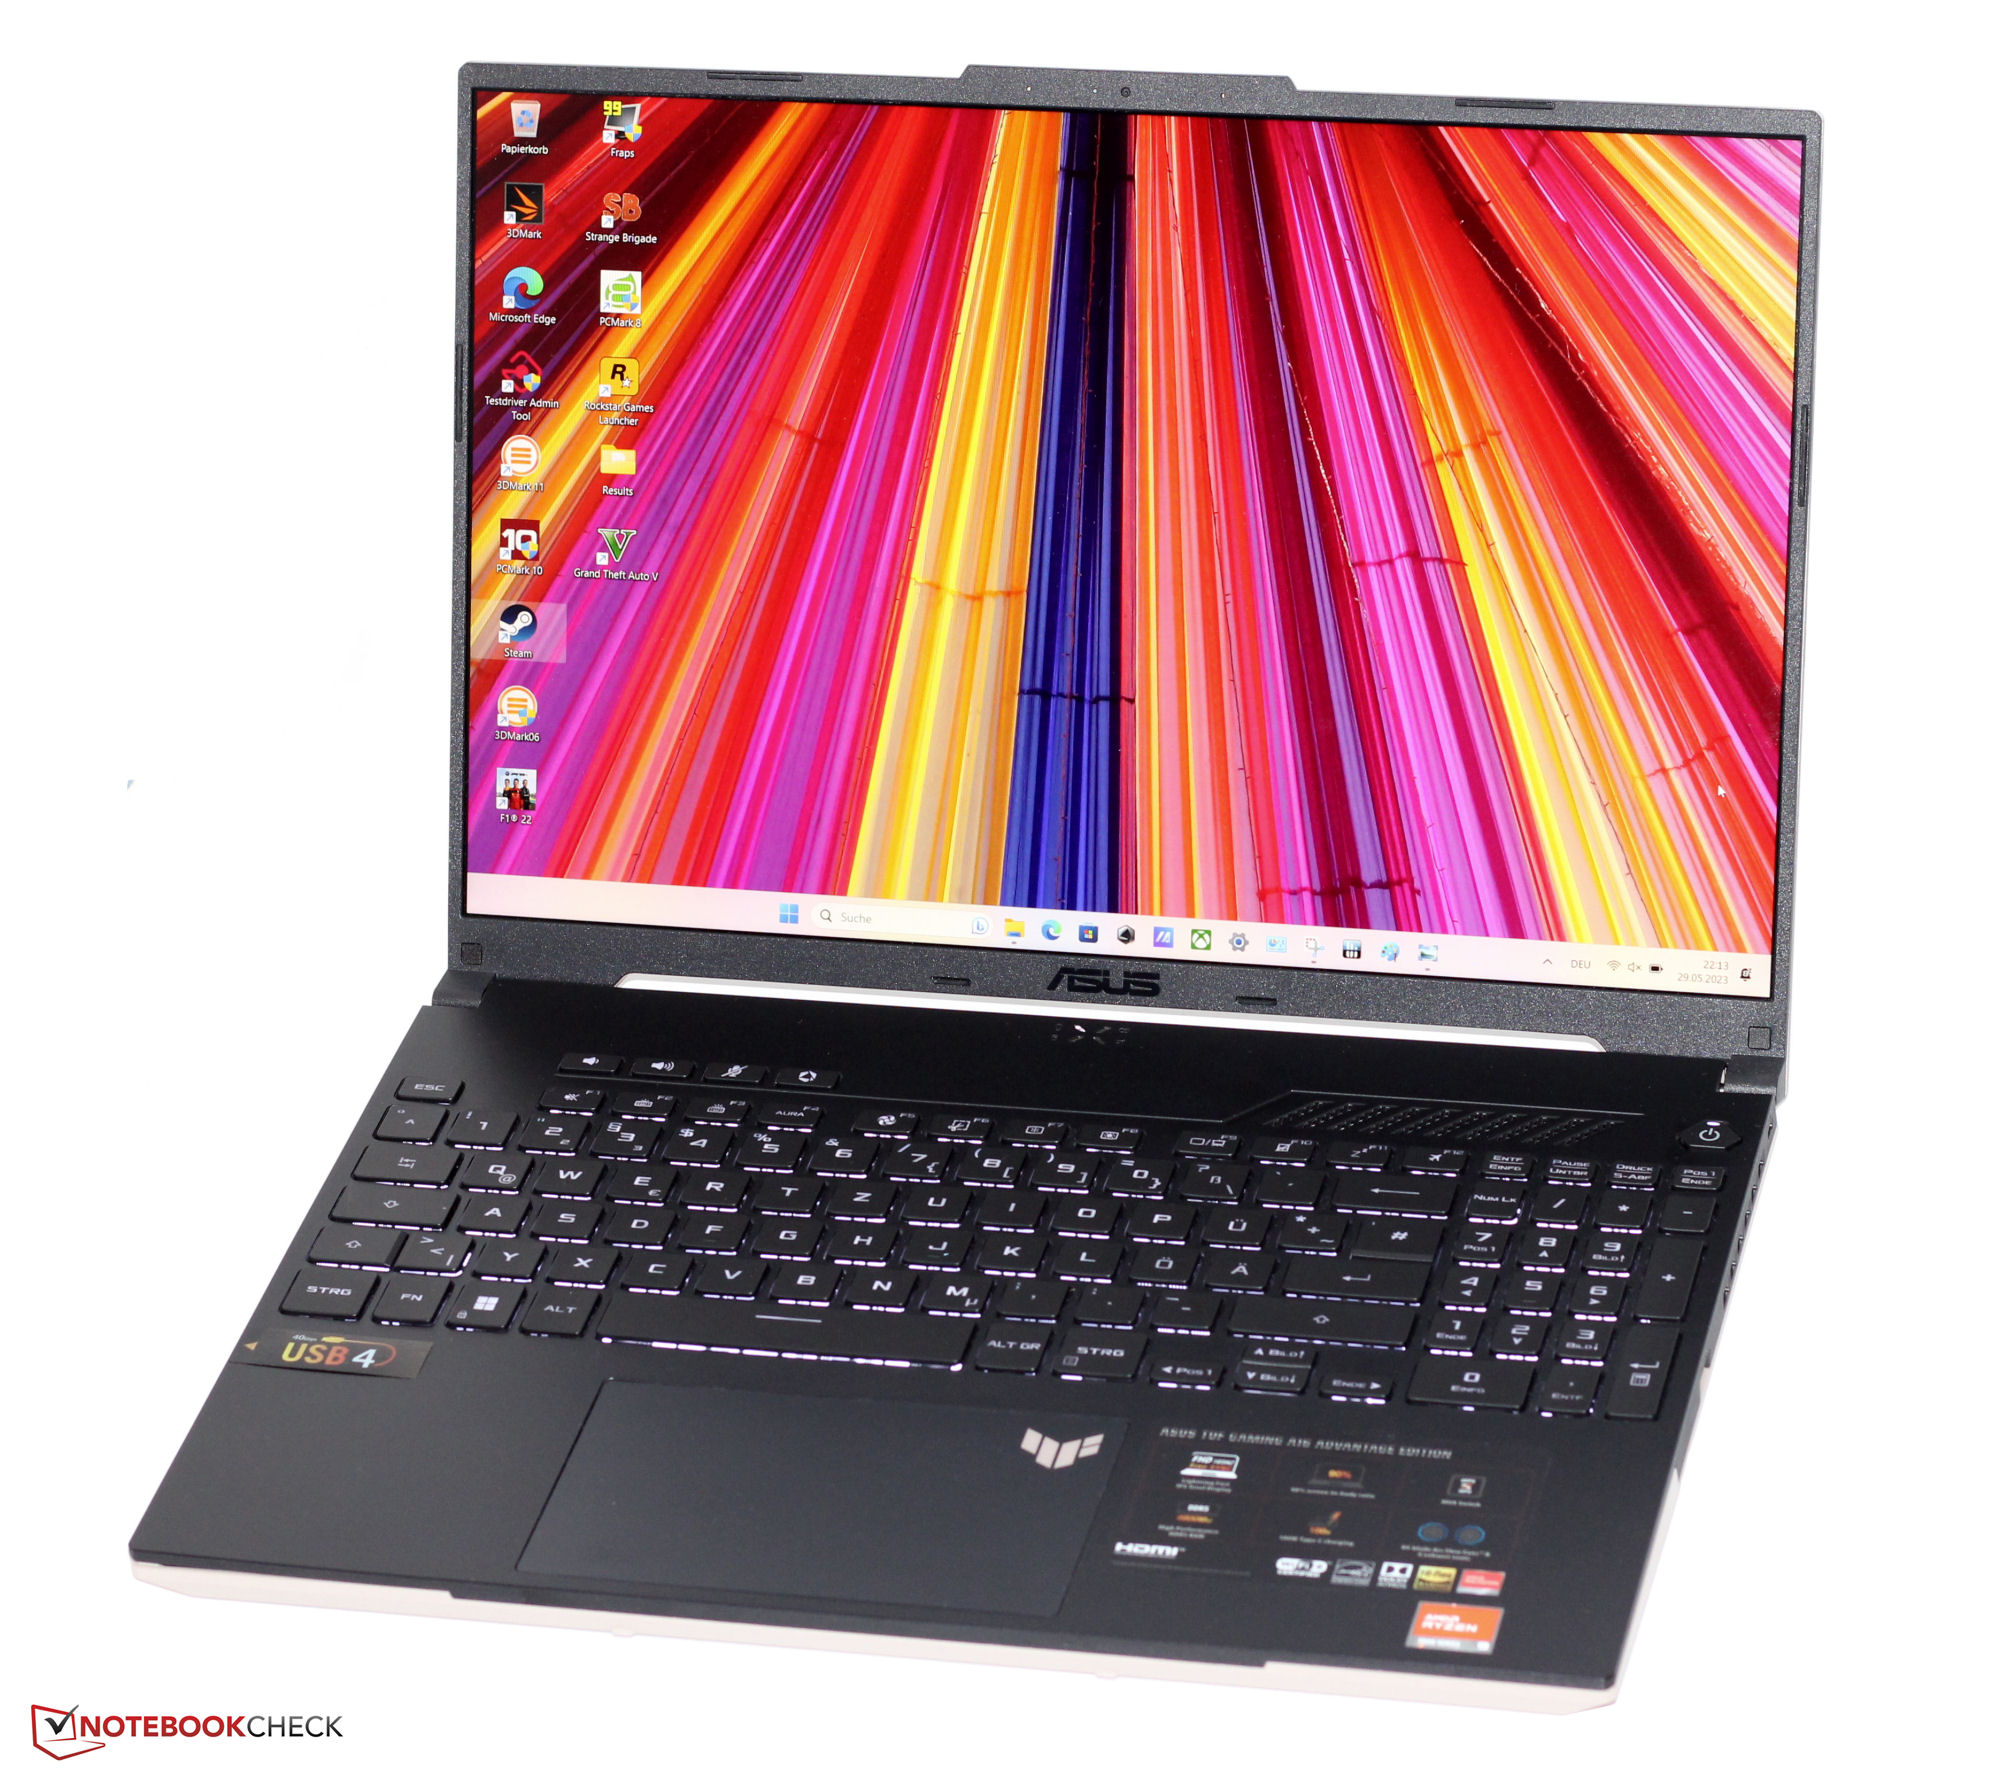
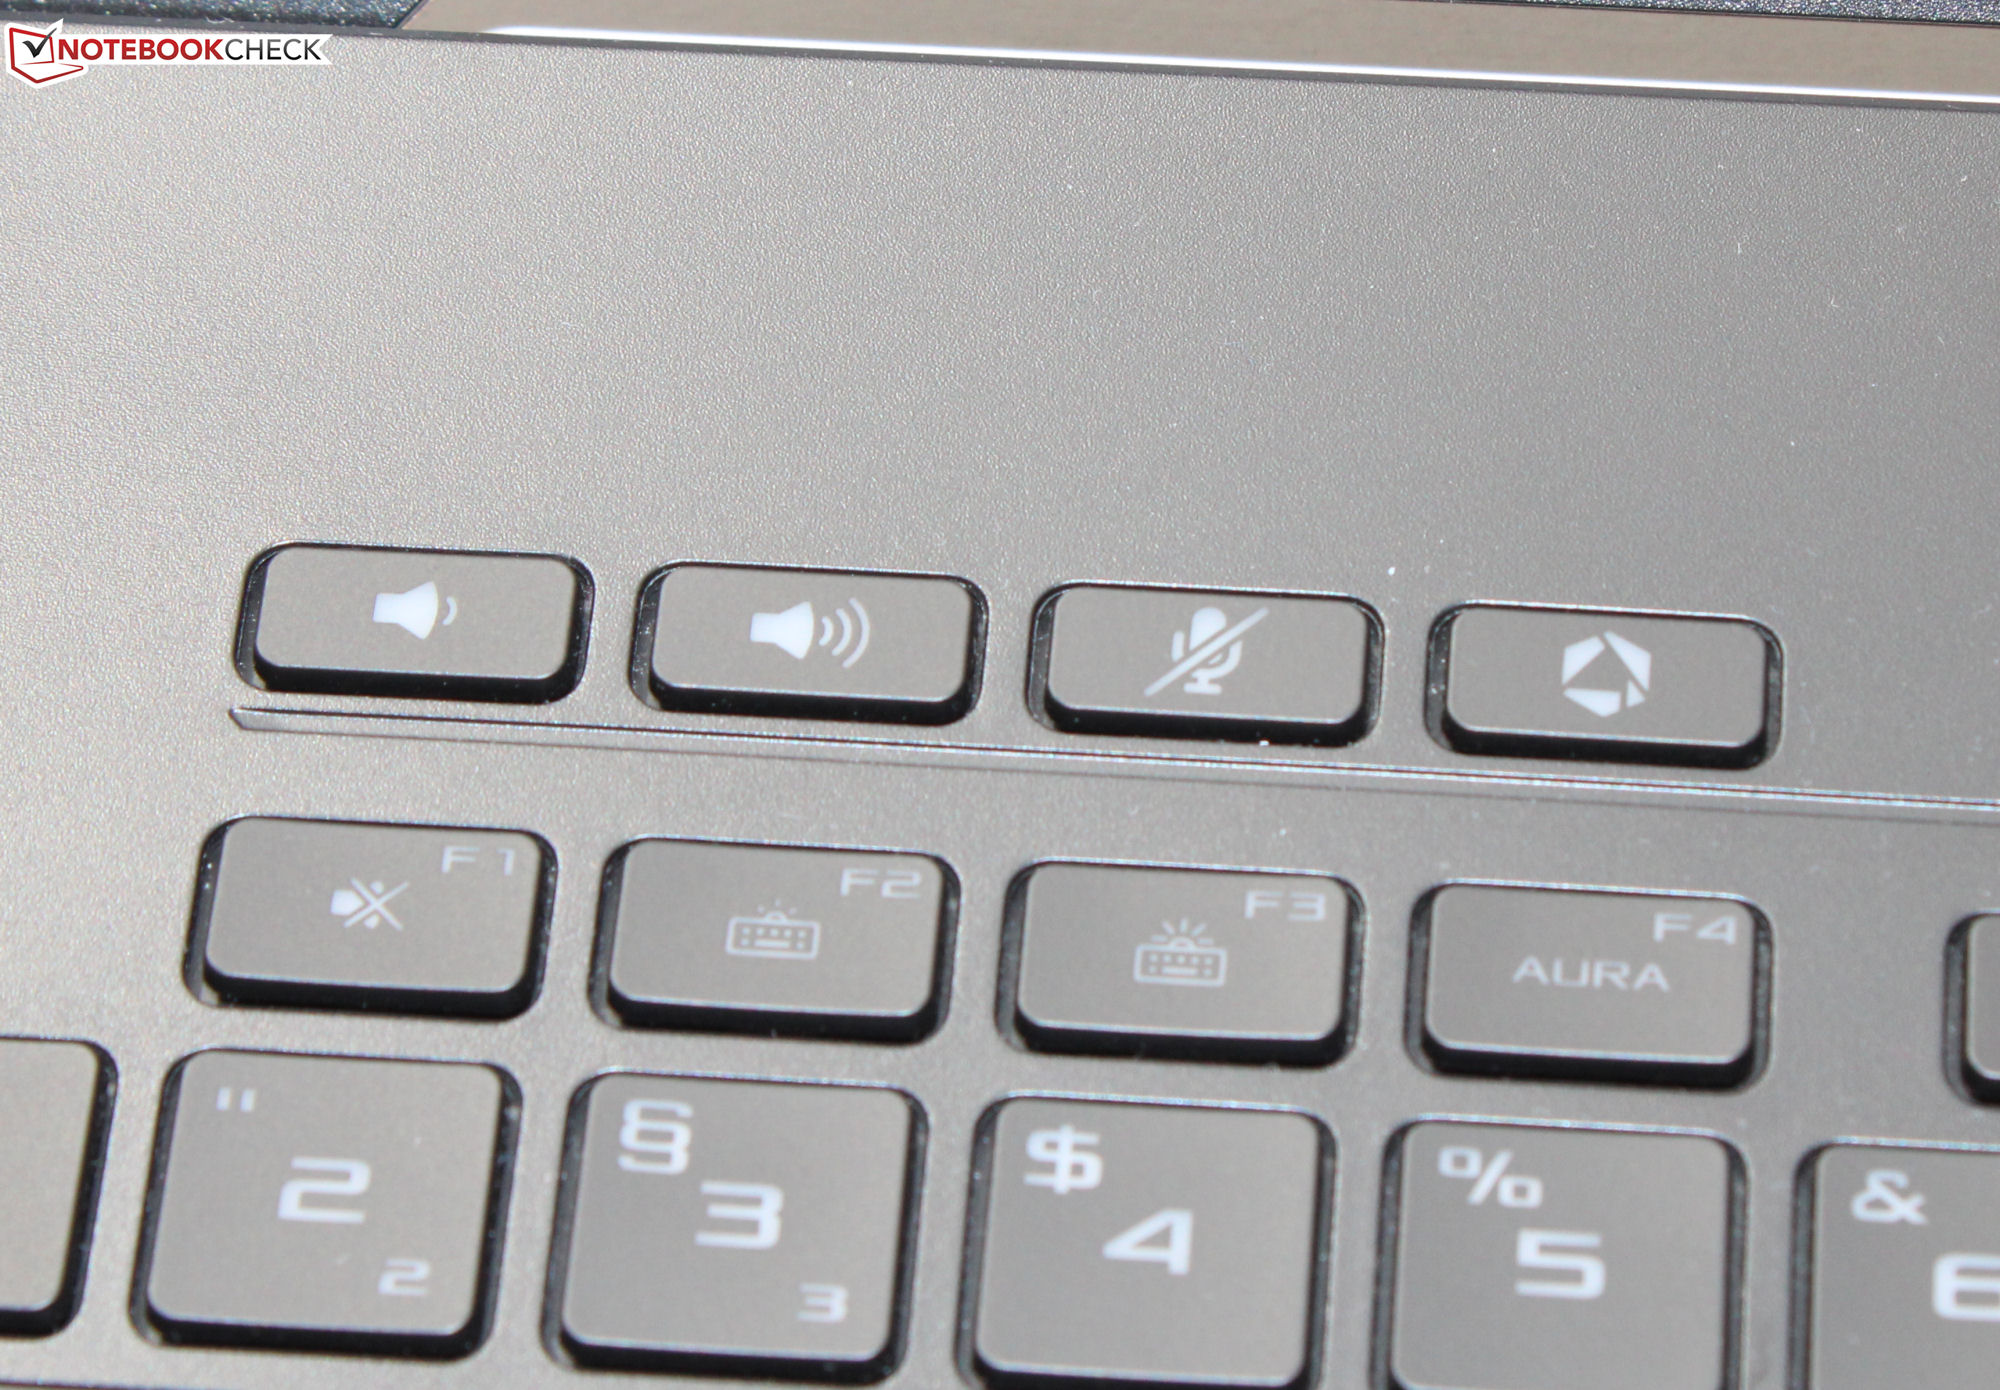
Per informazioni più dettagliate sul case, la connettività e i dispositivi di input del portatile, date un'occhiata alla nostra recensione del modello gemello dell'A16, identico a ,.
Potenziali concorrenti a confronto
Punteggio | Data | Modello | Peso | Altezza | Dimensione | Risoluzione | Prezzo |
|---|---|---|---|---|---|---|---|
| 86.9 % v7 (old) | 06/2023 | Asus TUF Gaming A16 FA617XS R9 7940HS, Radeon RX 7600S | 2.2 kg | 22.1 mm | 16.00" | 1920x1200 | |
| 87.9 % v7 (old) | 05/2023 | Lenovo Legion Pro 5 16IRX8 i7-13700HX, GeForce RTX 4060 Laptop GPU | 2.5 kg | 26.8 mm | 16.00" | 2560x1600 | |
| 82.9 % v7 (old) | 03/2023 | MSI Katana 15 B12VEK i7-12650H, GeForce RTX 4050 Laptop GPU | 2.3 kg | 24.9 mm | 15.60" | 1920x1080 | |
| 84.6 % v7 (old) | 05/2023 | Medion Erazer Defender P40 i7-13700HX, GeForce RTX 4060 Laptop GPU | 2.9 kg | 33 mm | 17.30" | 2560x1440 | |
| 81.8 % v7 (old) | 04/2023 | Gigabyte G5 KE i5-12500H, GeForce RTX 3060 Laptop GPU | 2 kg | 23.9 mm | 15.60" | 1920x1080 |
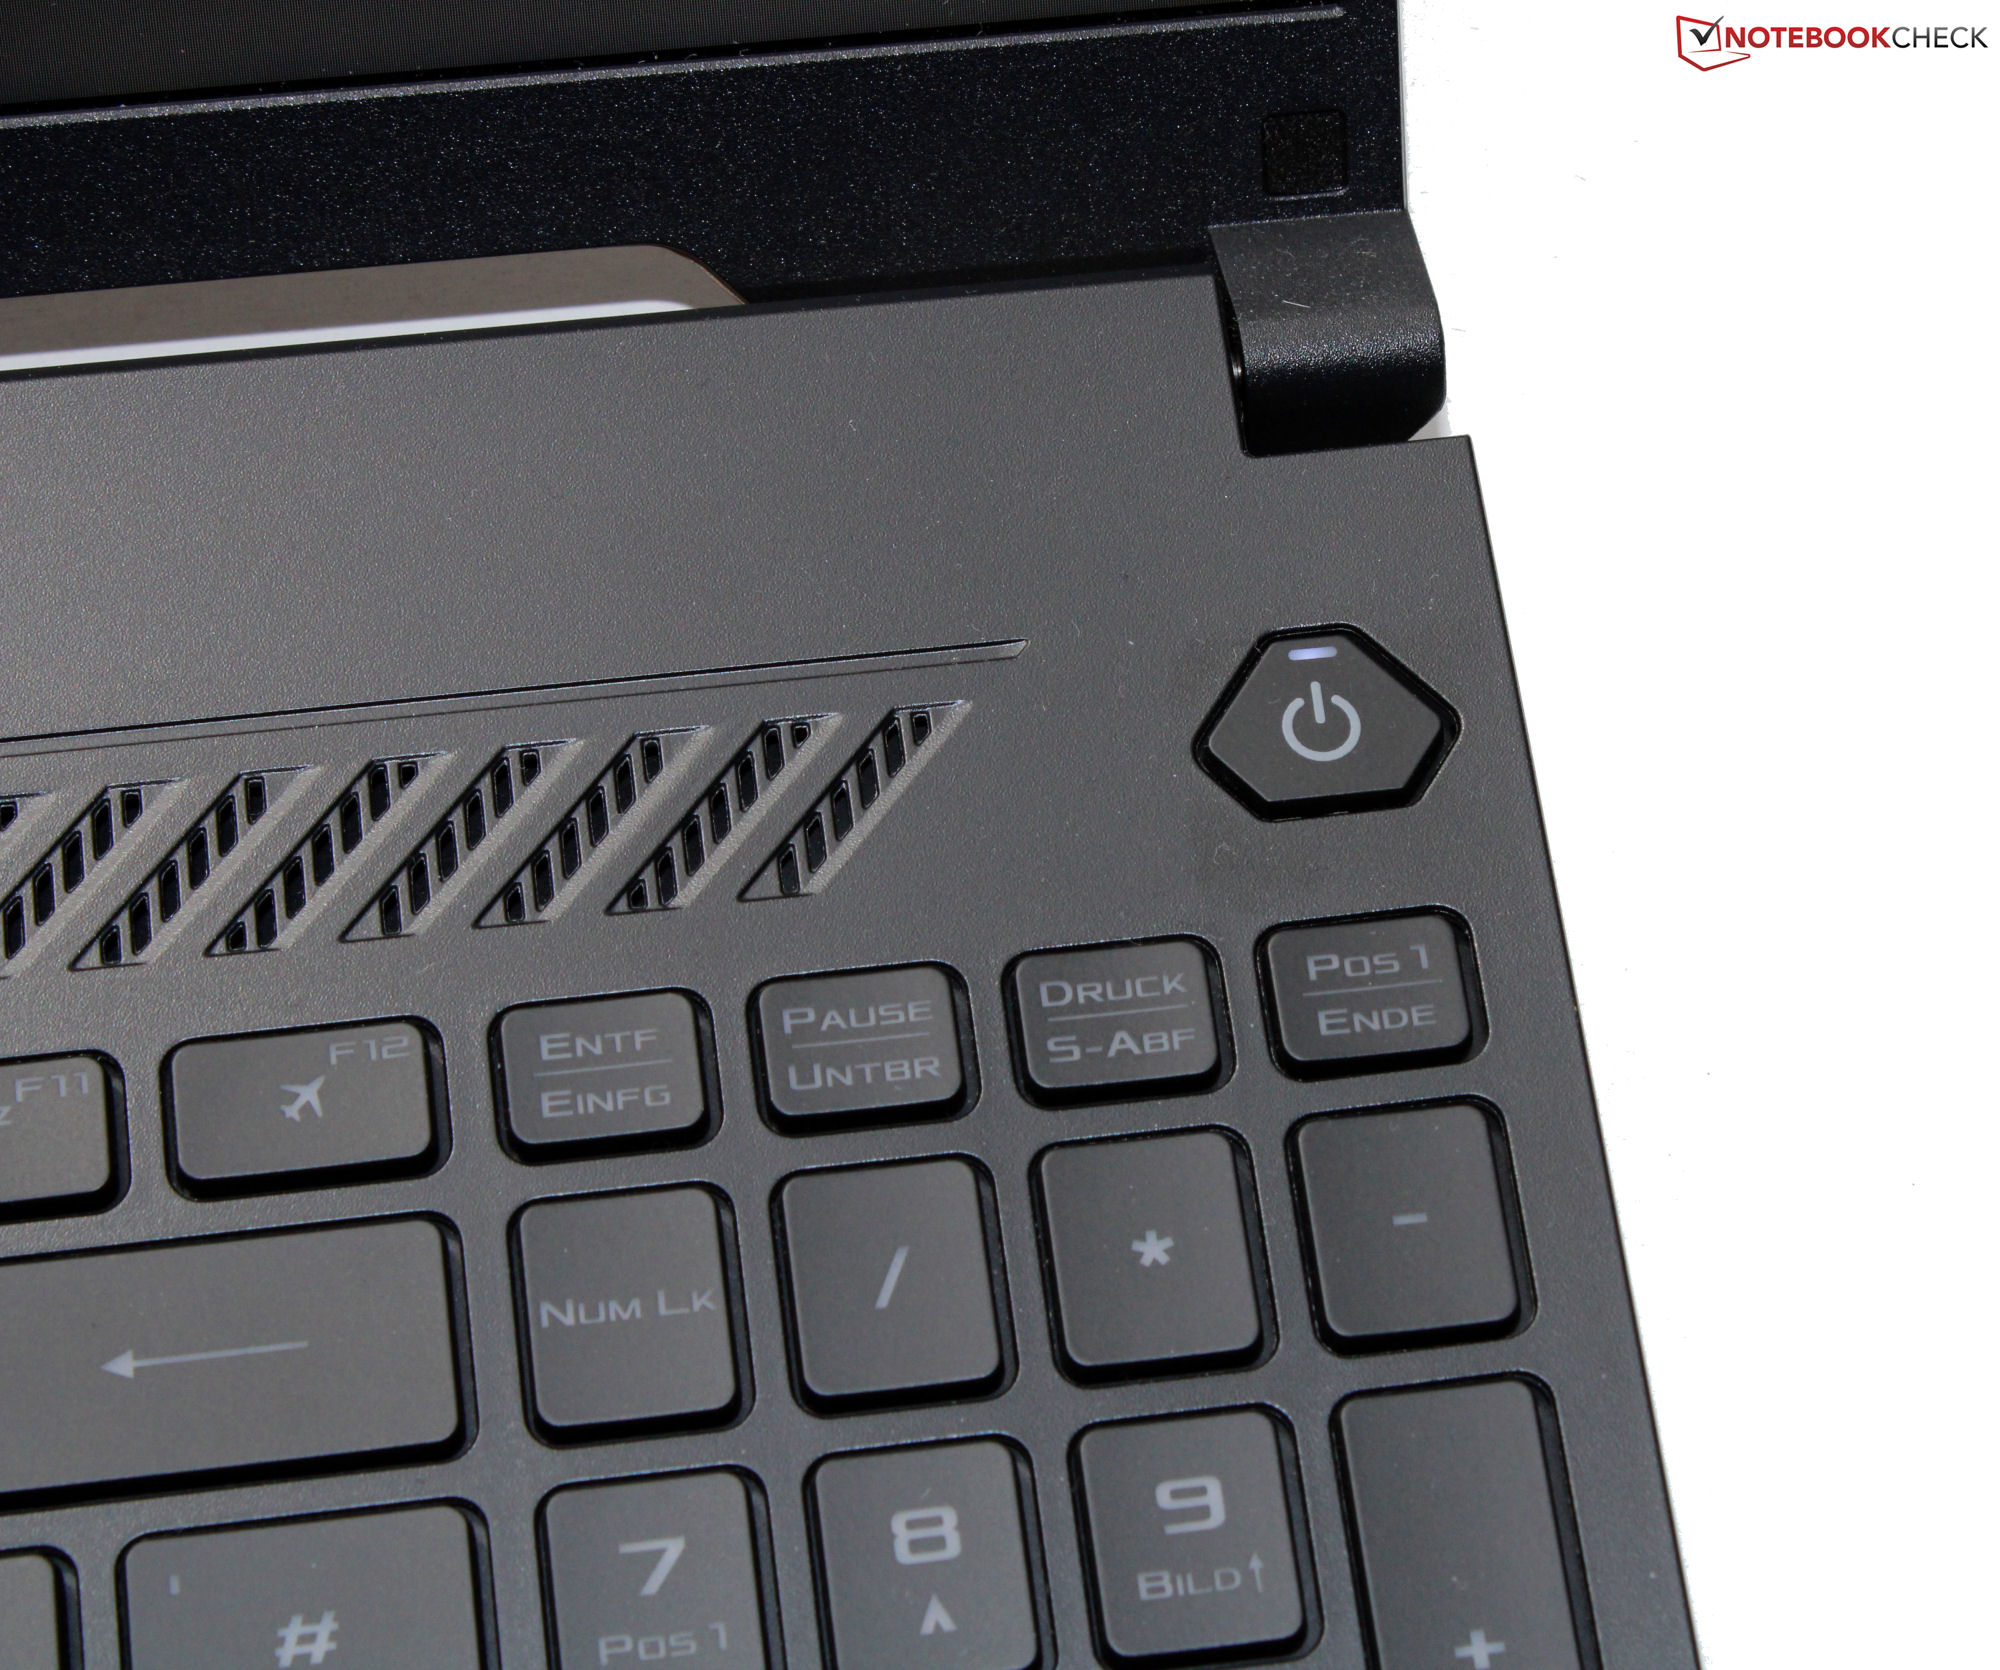
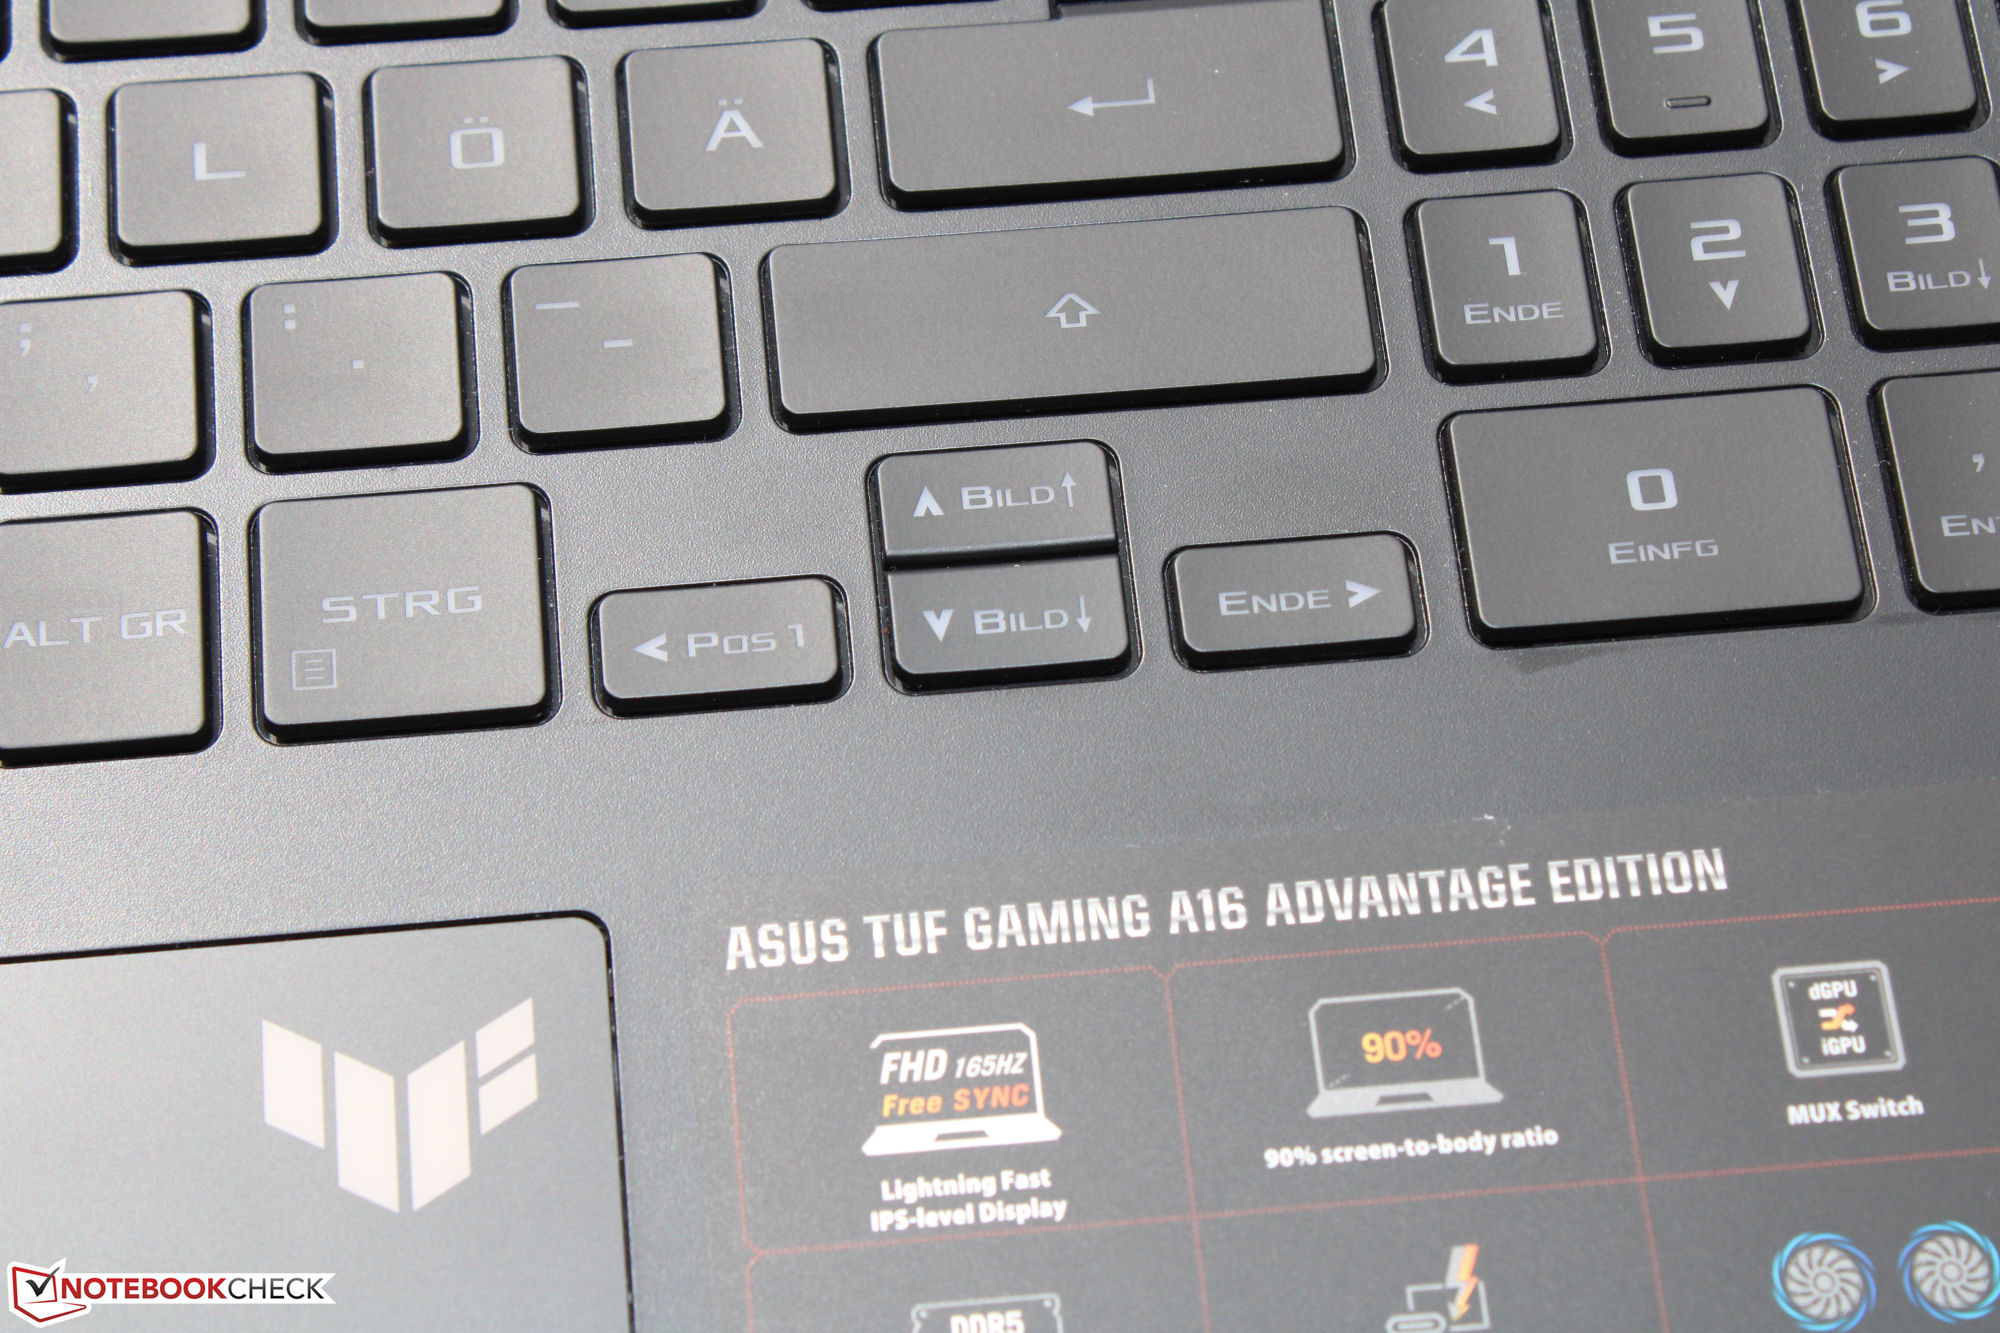
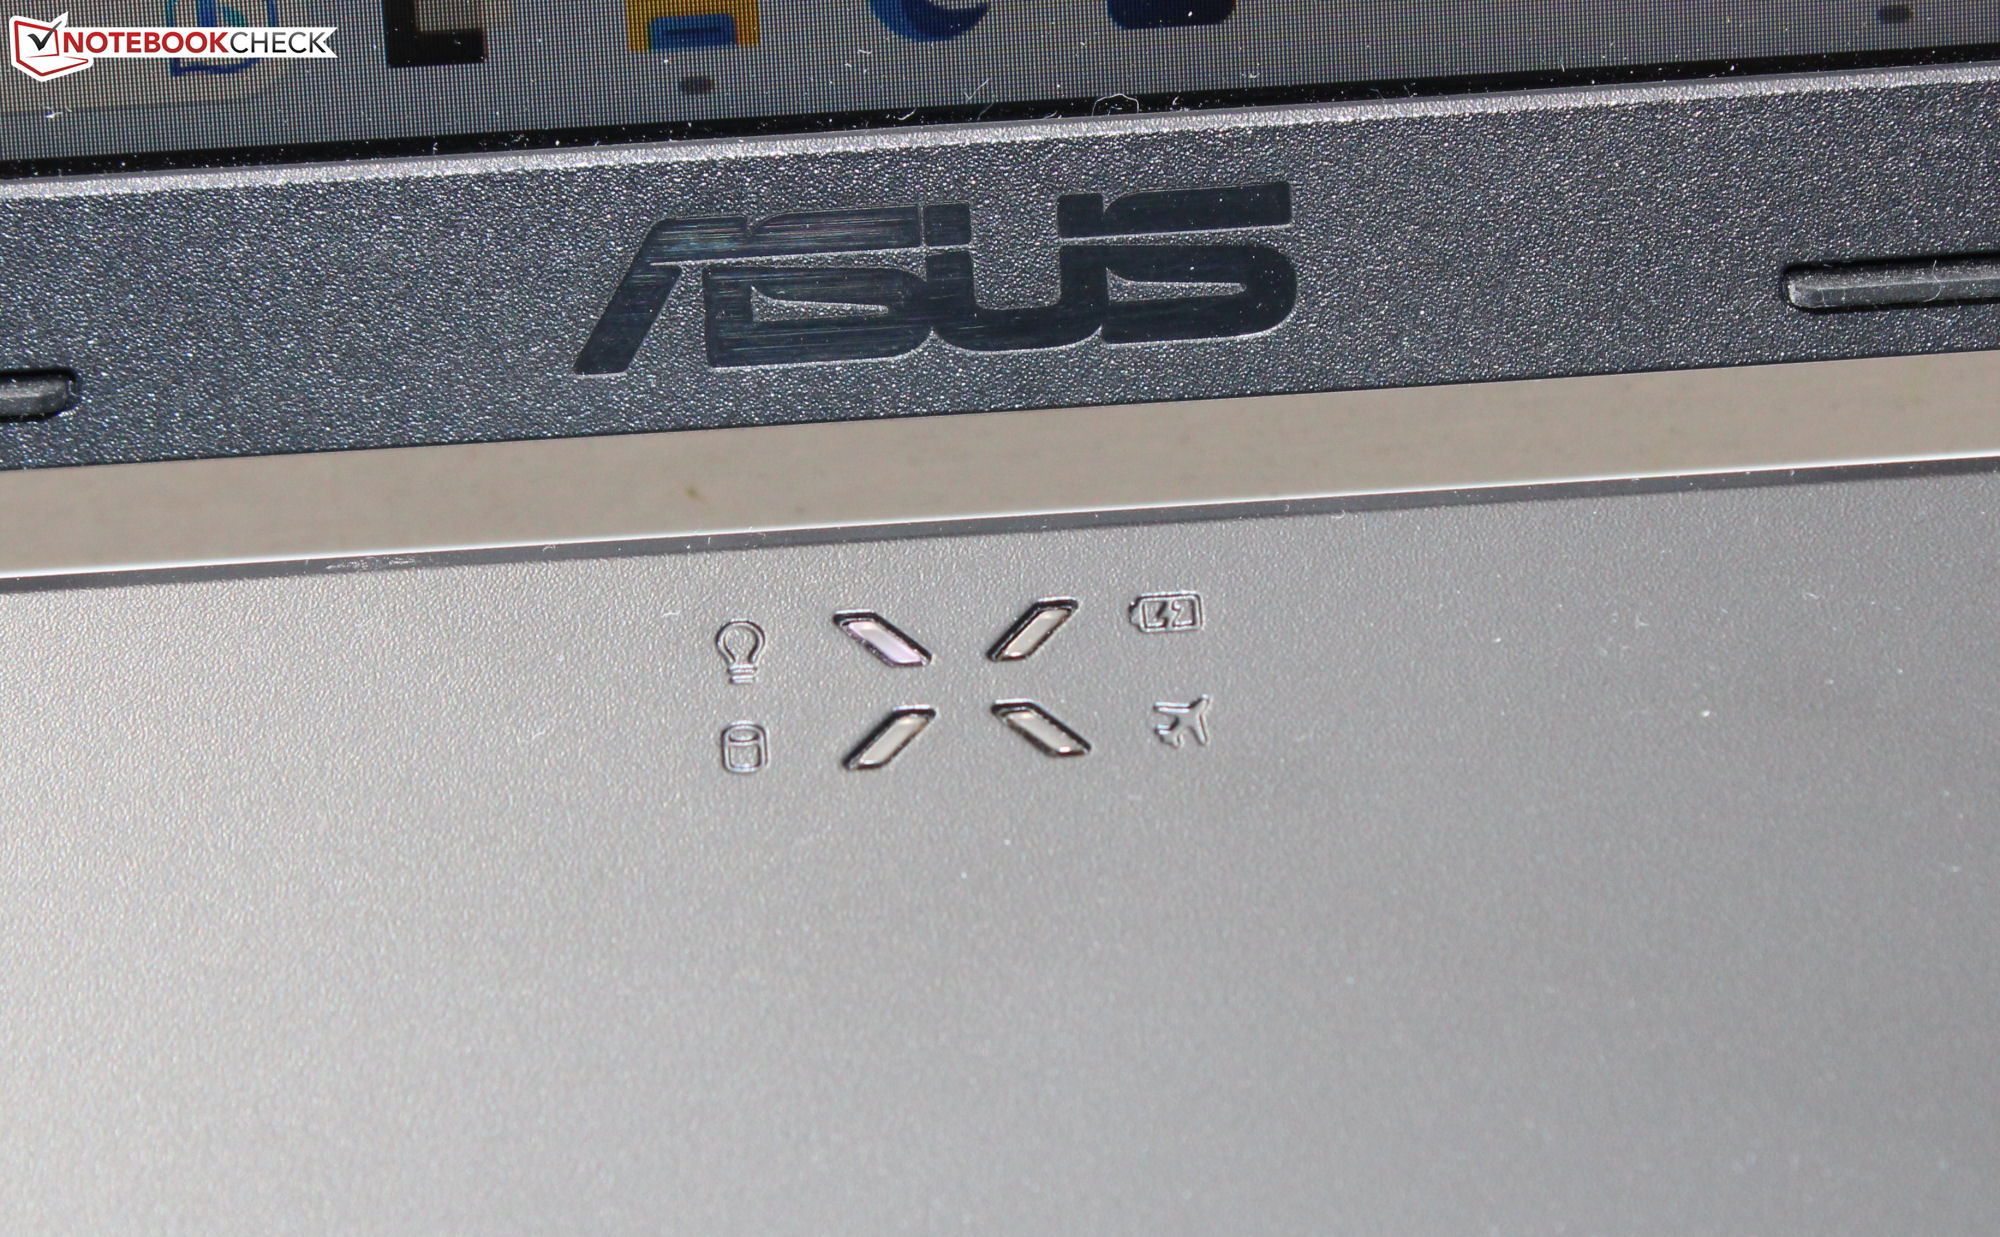
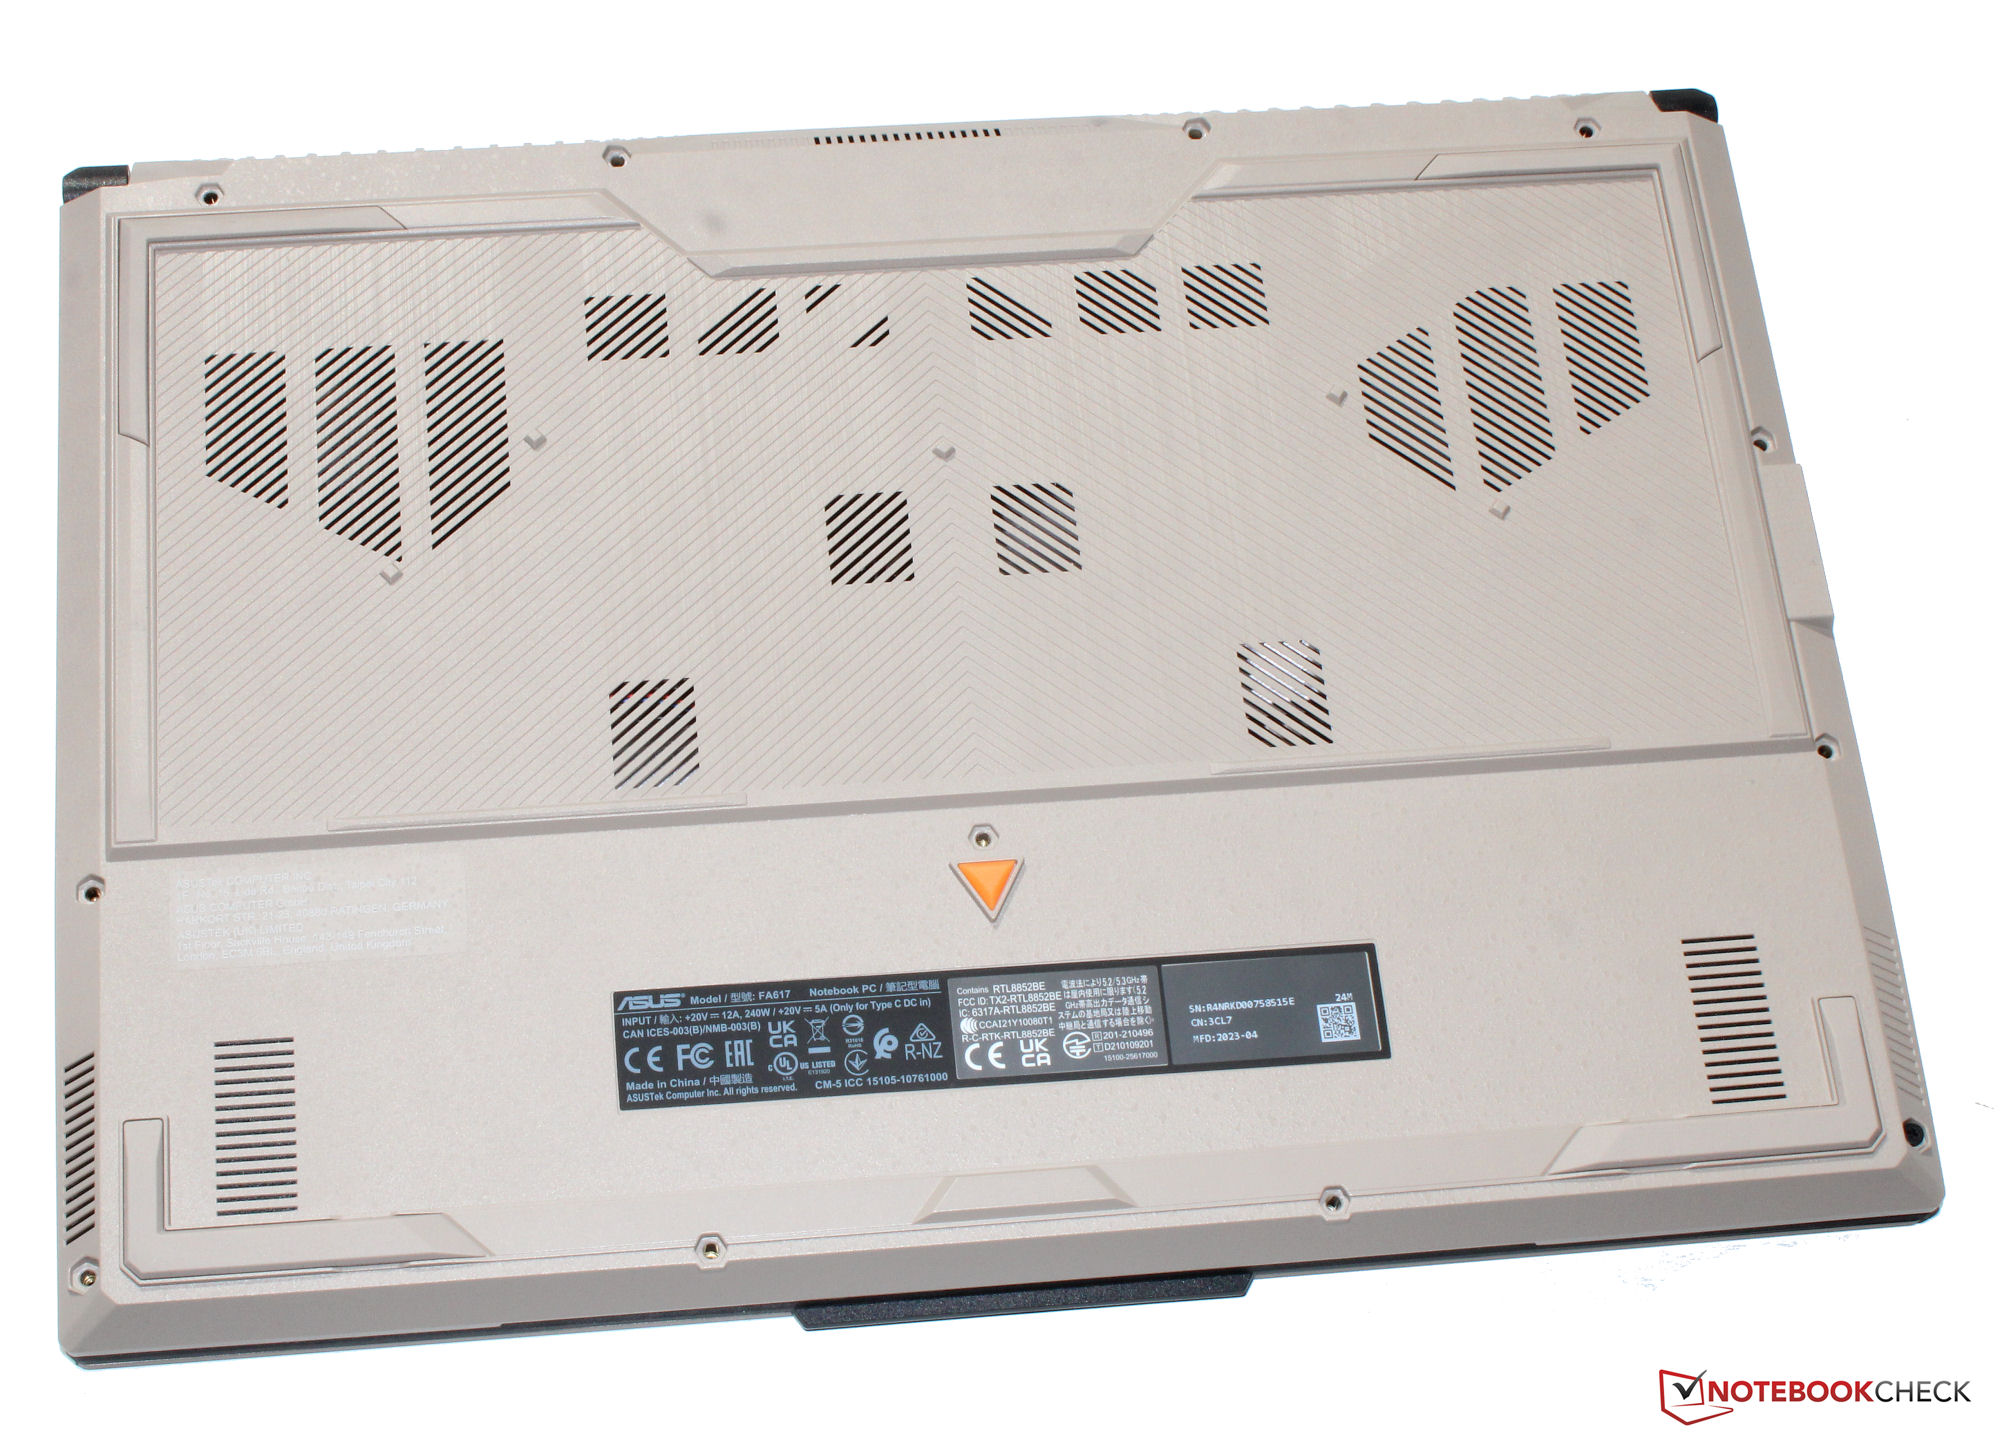
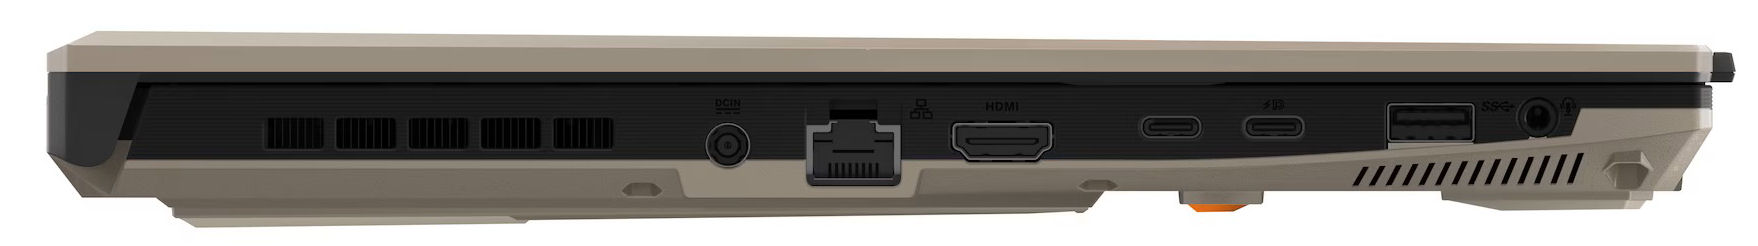
Custodia e connettività: piccole modifiche rispetto al modello gemello
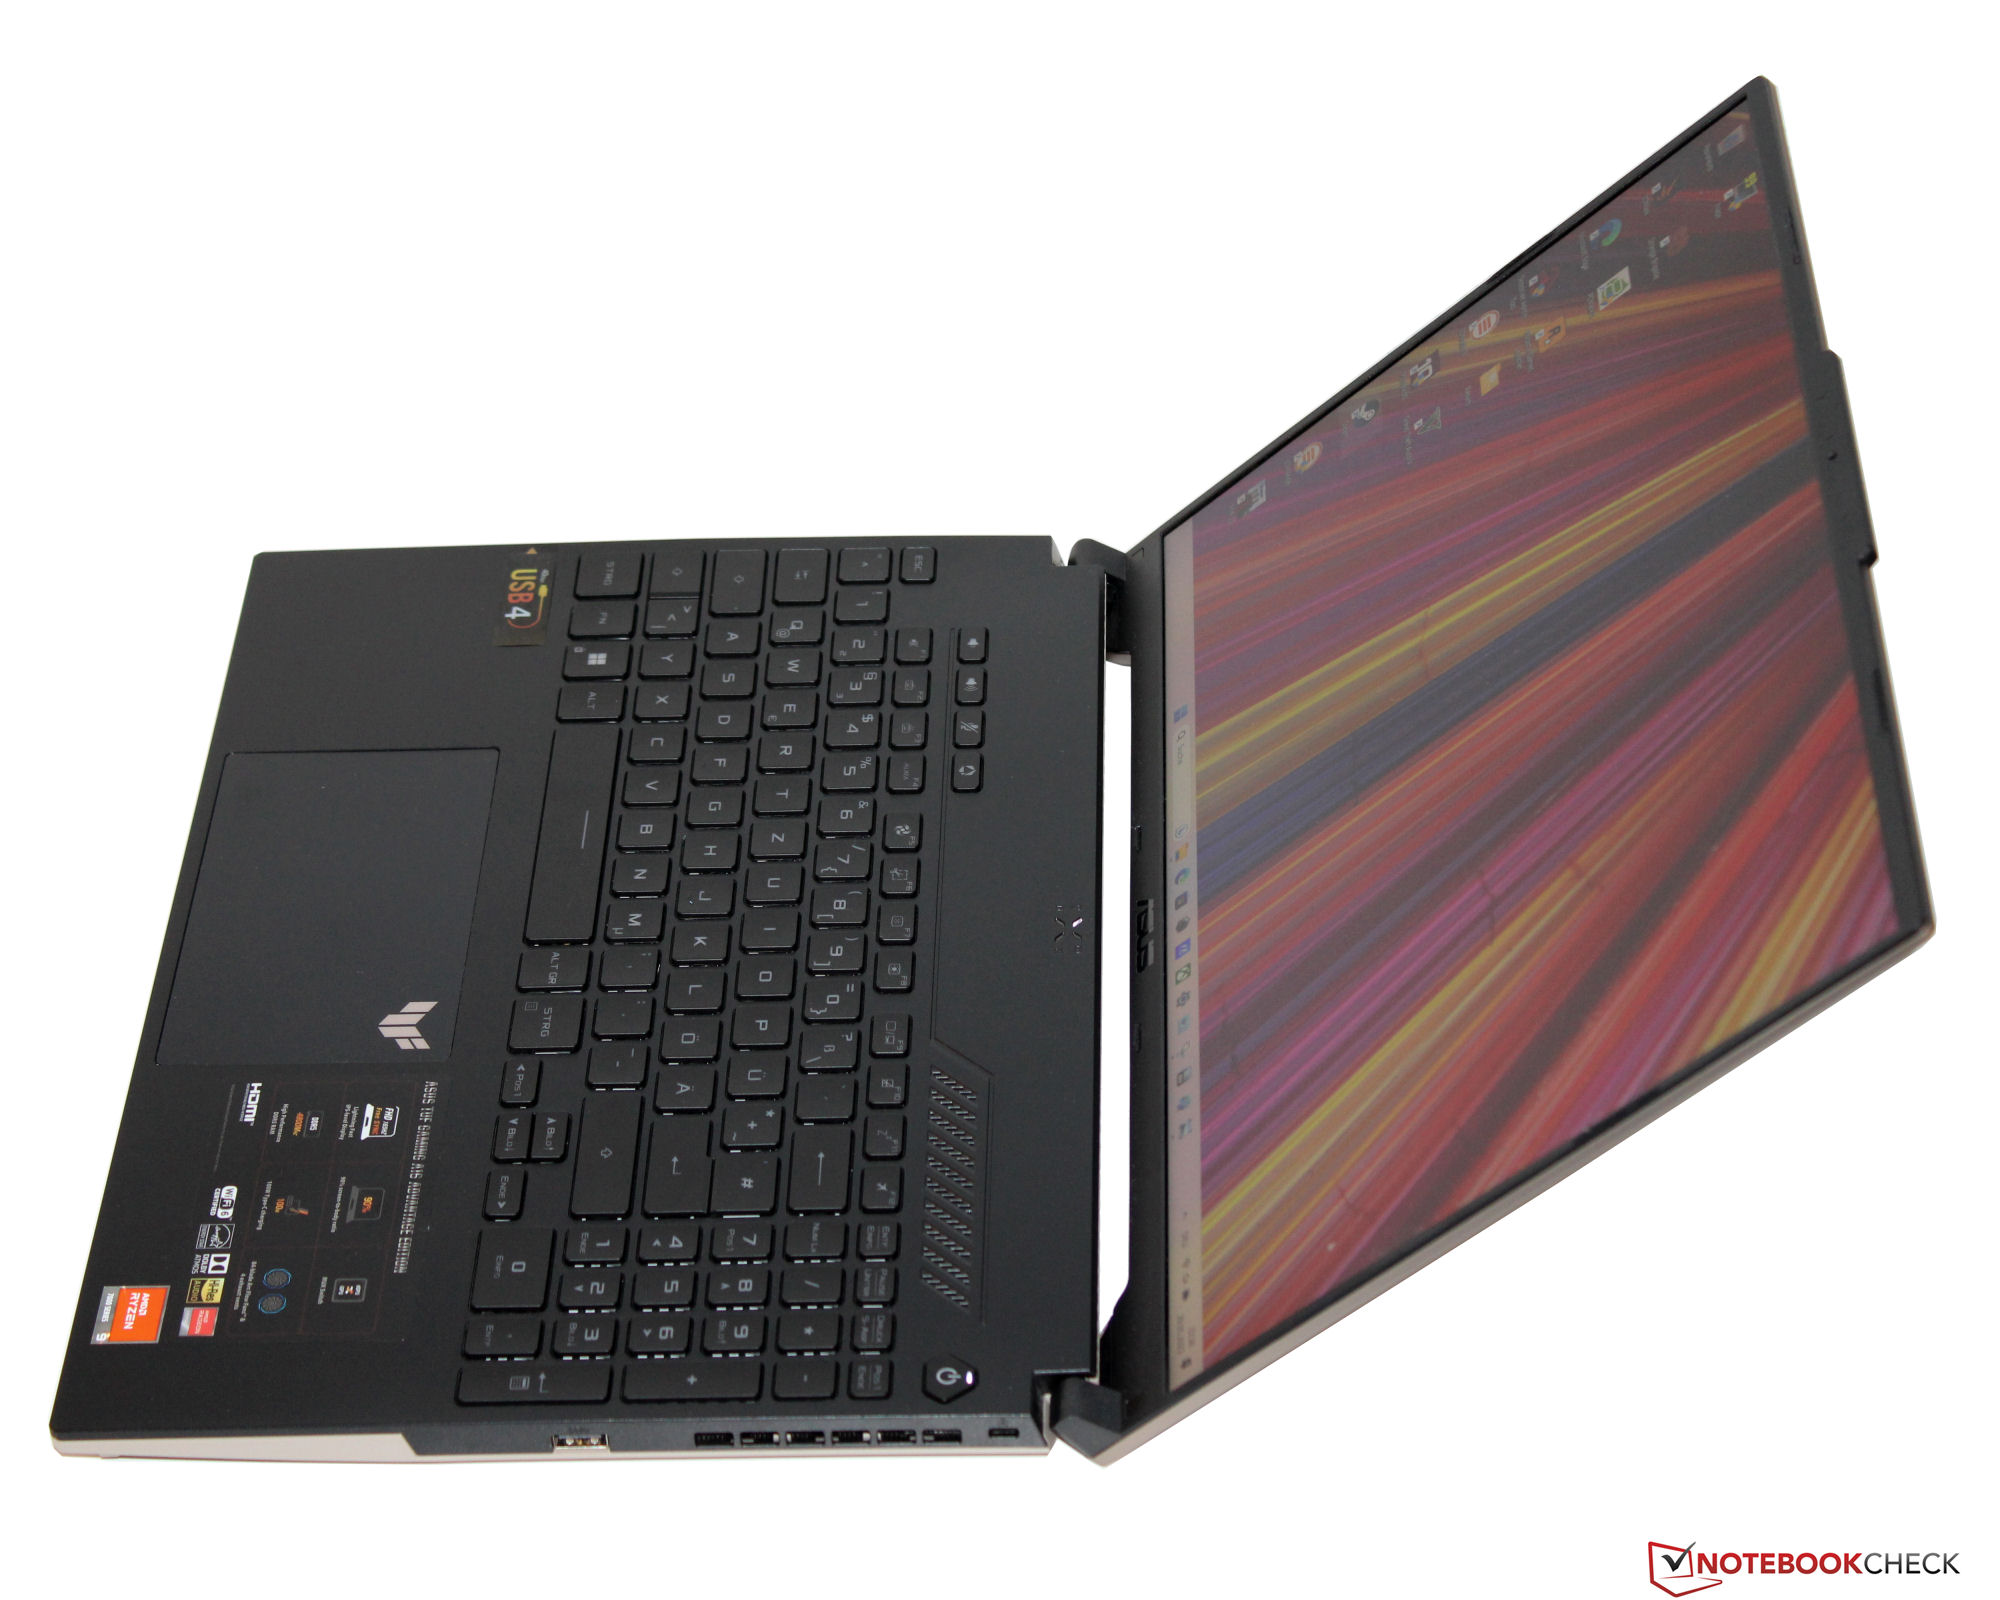
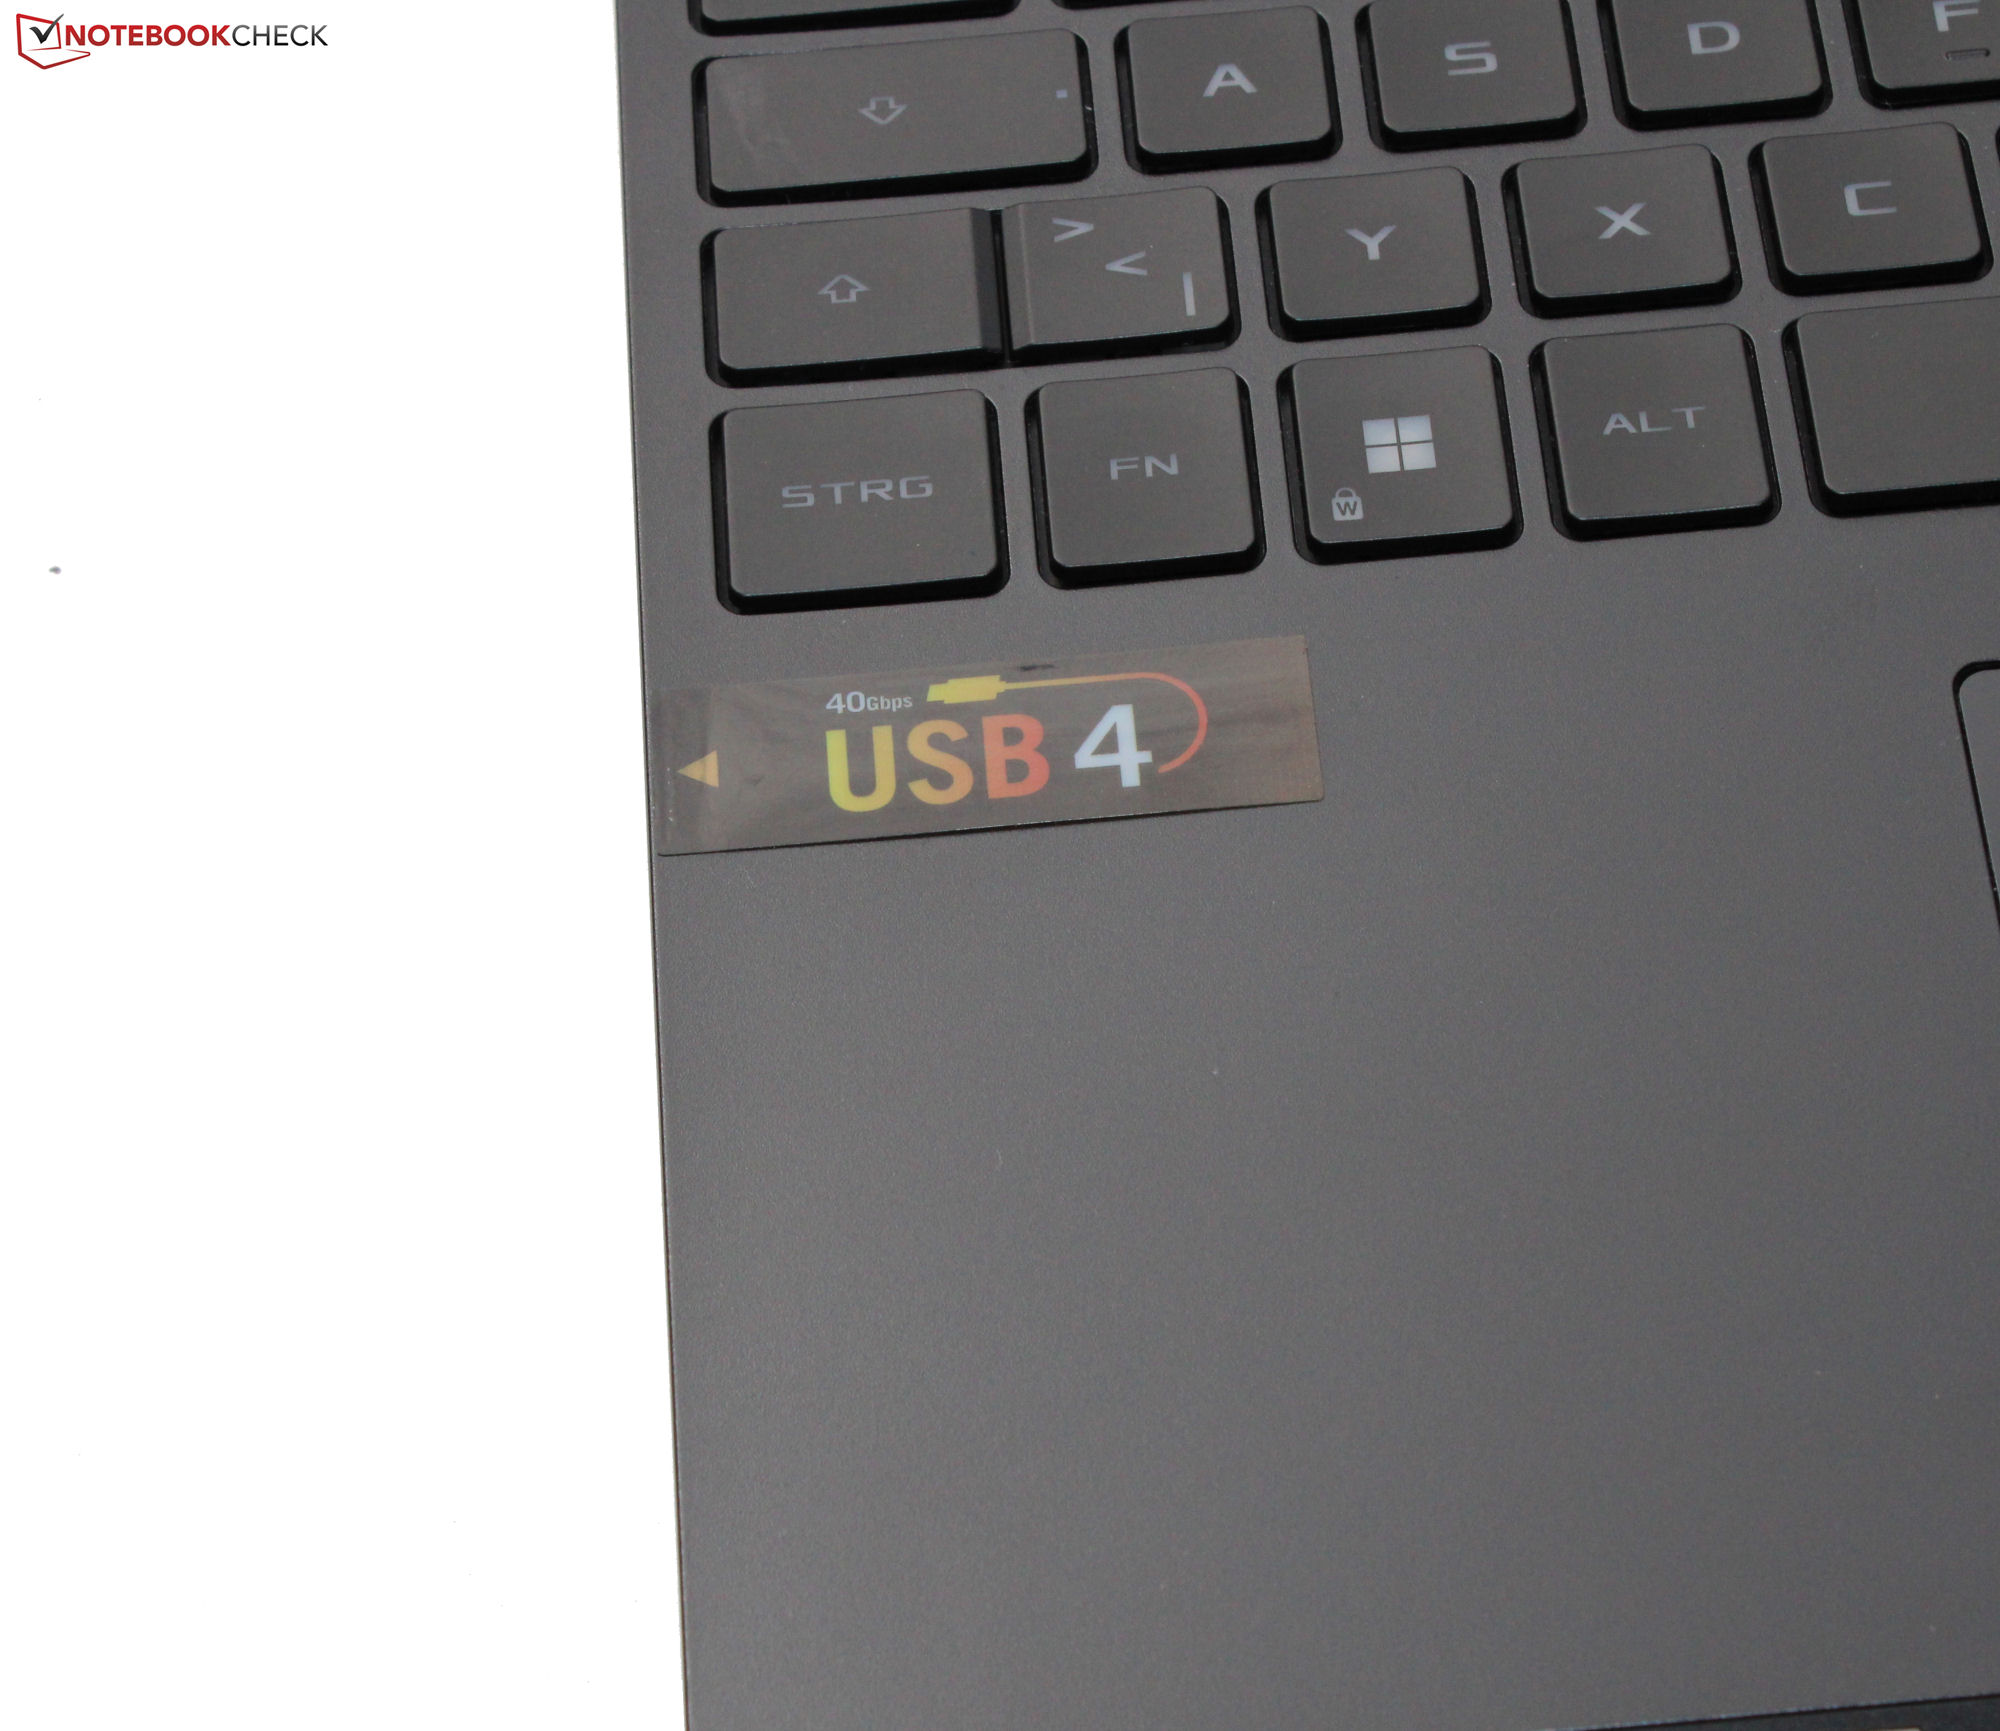
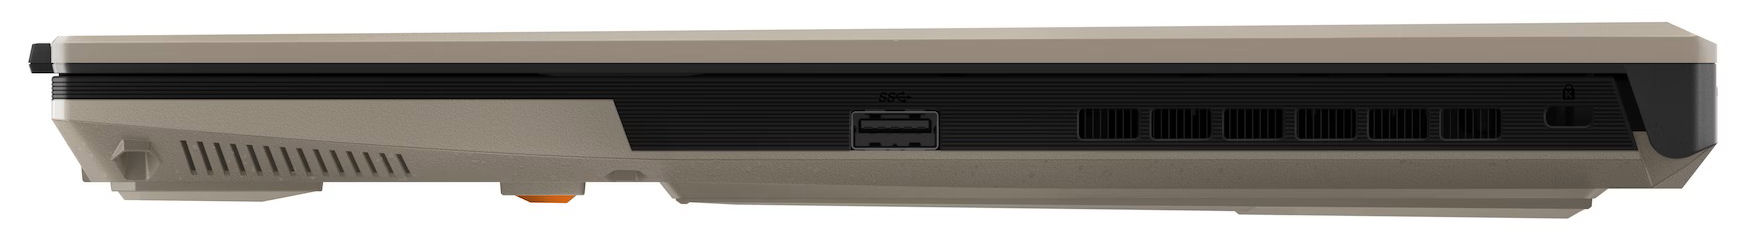
Rispetto al modello modello gemello con laa16 ha una cassa bicolore rispetto a quella nera della sorella. Il retro del coperchio e il fondo della custodia sono di colore sabbia ("Sandstorm"). Anche le opzioni di connettività sono leggermente diverse: Una delle due porte USB-C è stata aggiornata allo standard USB-4.


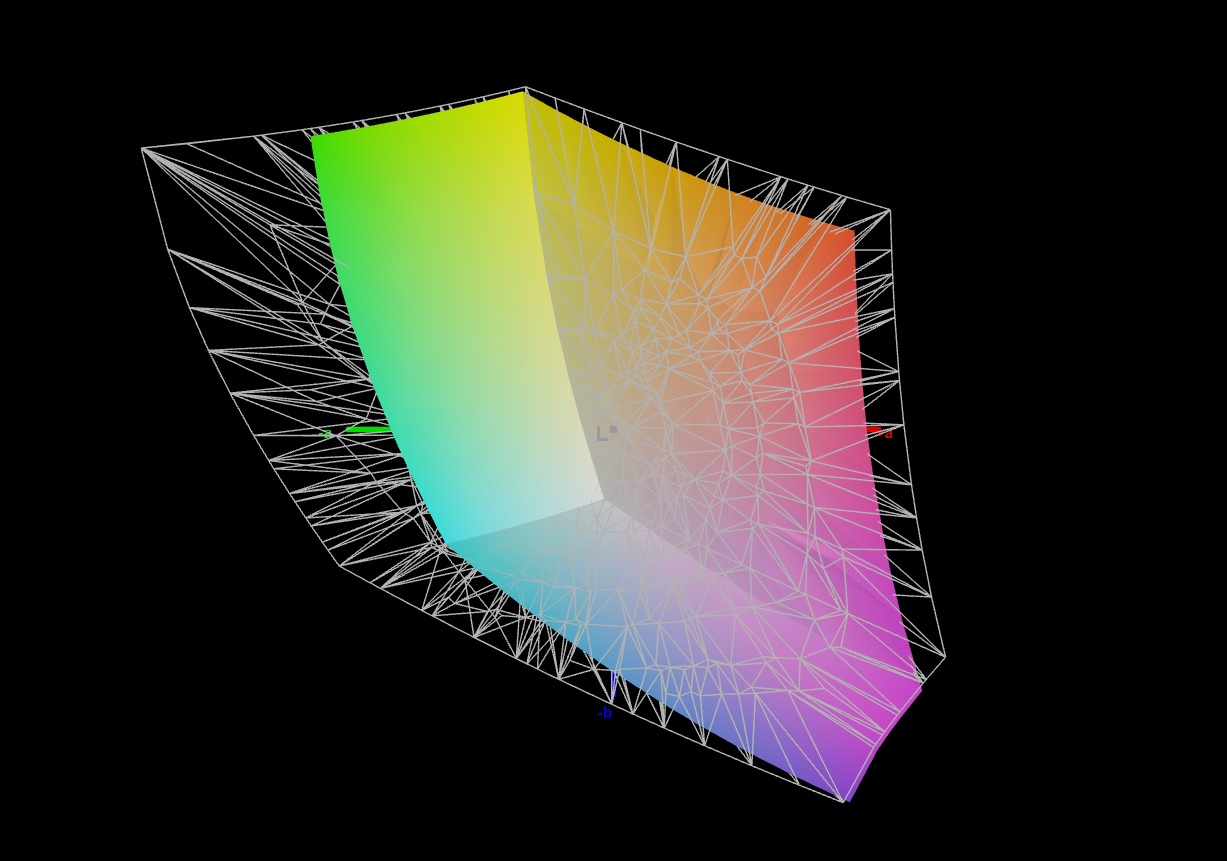
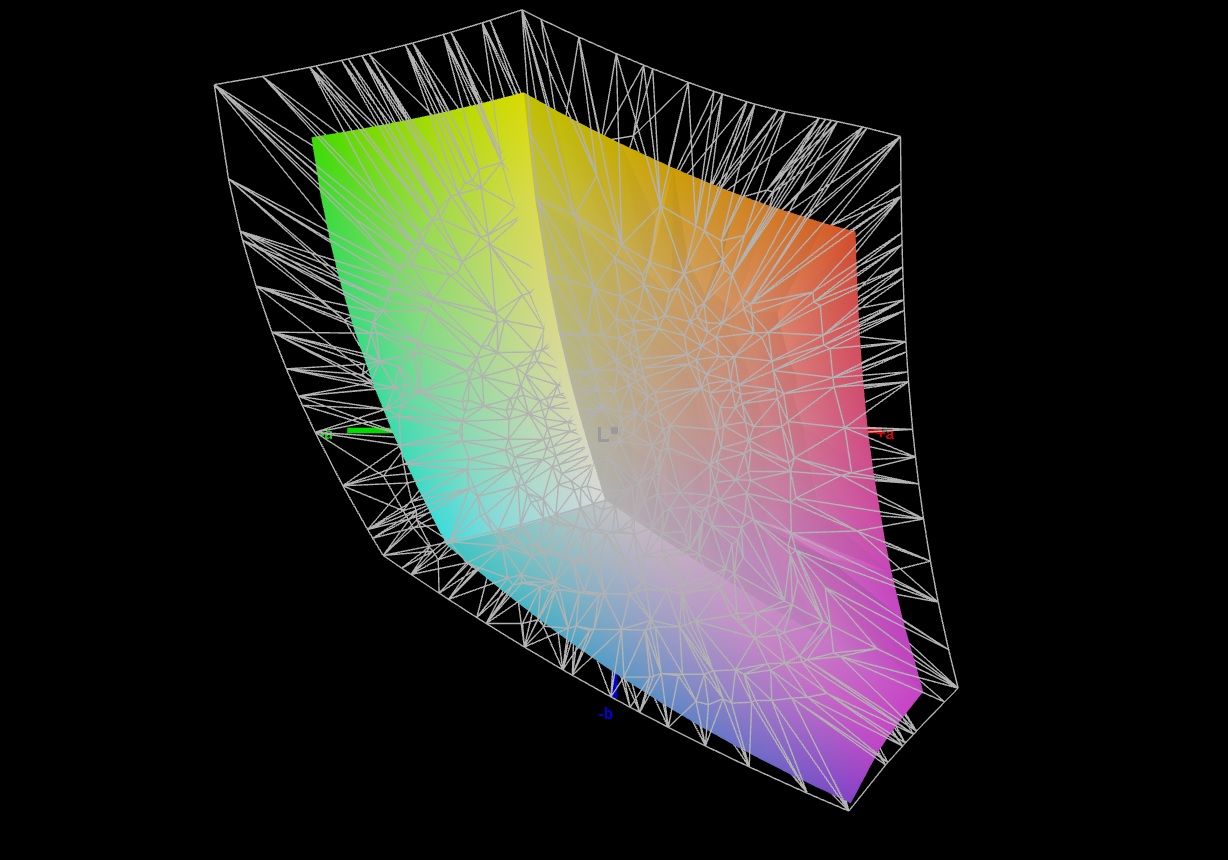
Display - Pannello 16:10 con copertura sRGB
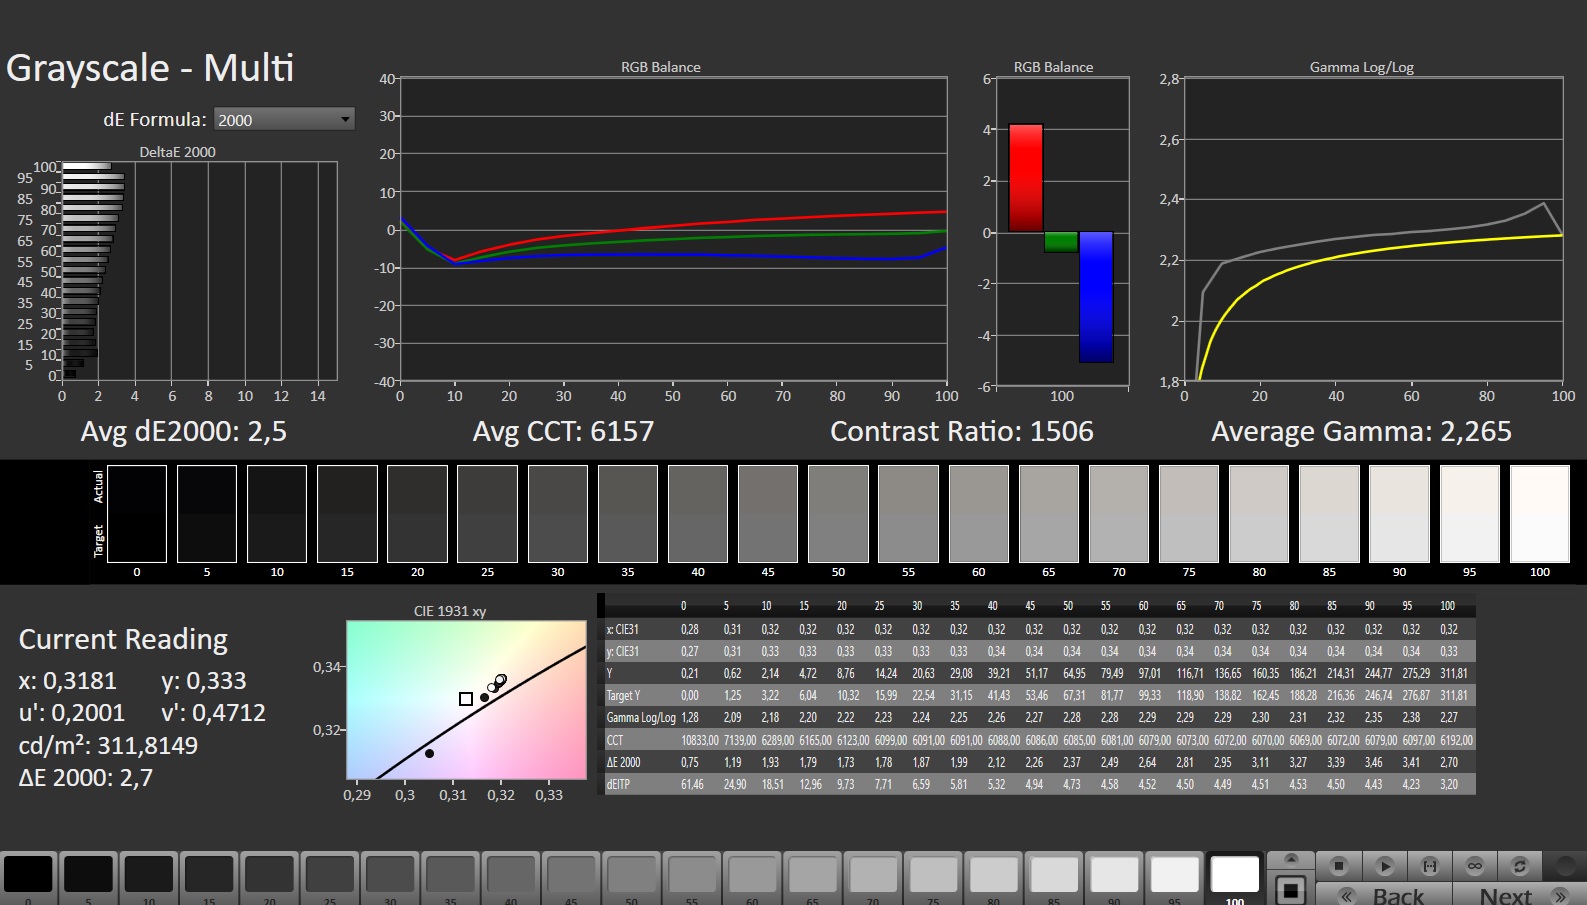
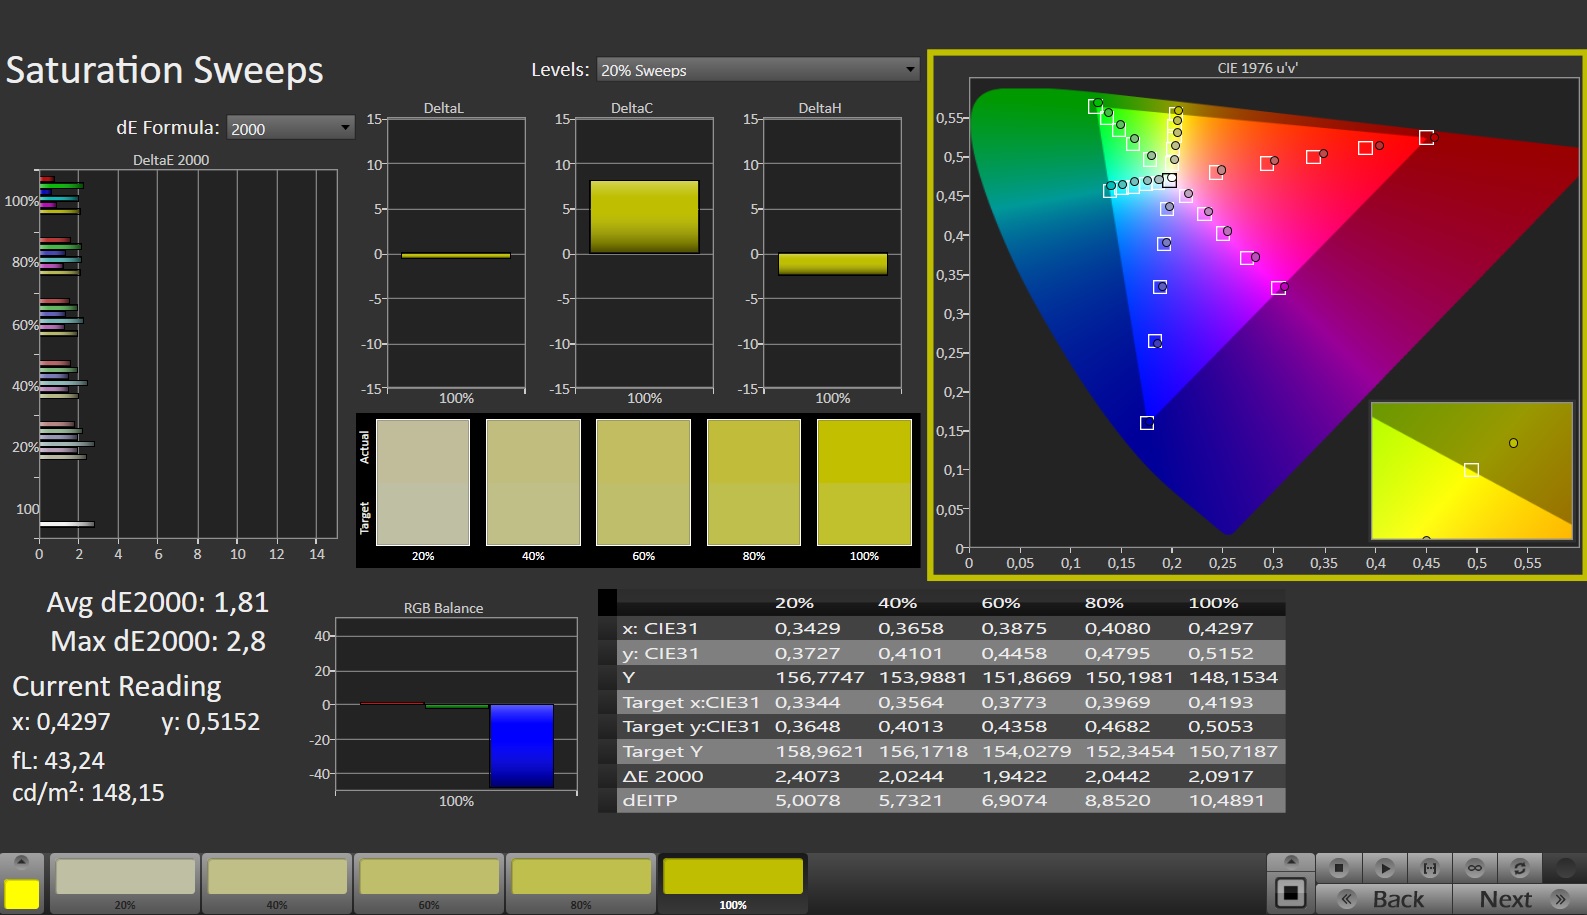
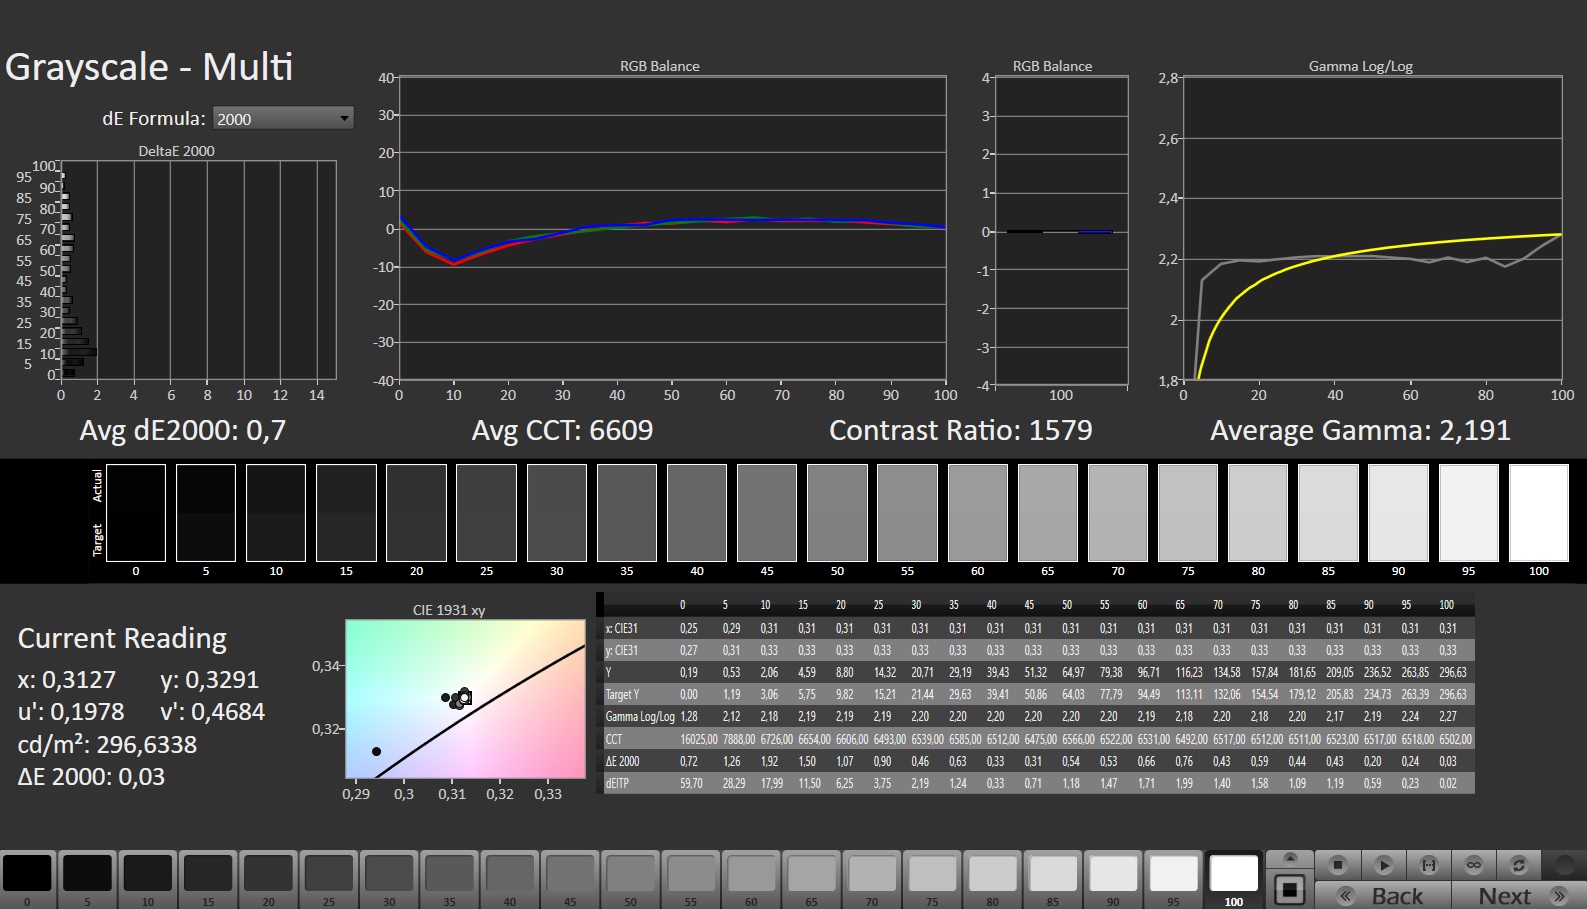
L'A16 è dotato dello stesso pannello a 165 Hz che si trova sul modello gemello modello gemello. Il suo display opaco da 16 pollici (1.920 x 1.200 pixel, IPS) ha un formato 16:10 e guadagna punti grazie al supporto FreeSync, alla mancanza di sfarfallio PWM e alla velocità di reazione. Il contrasto è accettabile, ma la luminosità potrebbe essere migliorata.
| |||||||||||||||||||||||||
Distribuzione della luminosità: 94 %
Al centro con la batteria: 301 cd/m²
Contrasto: 1433:1 (Nero: 0.21 cd/m²)
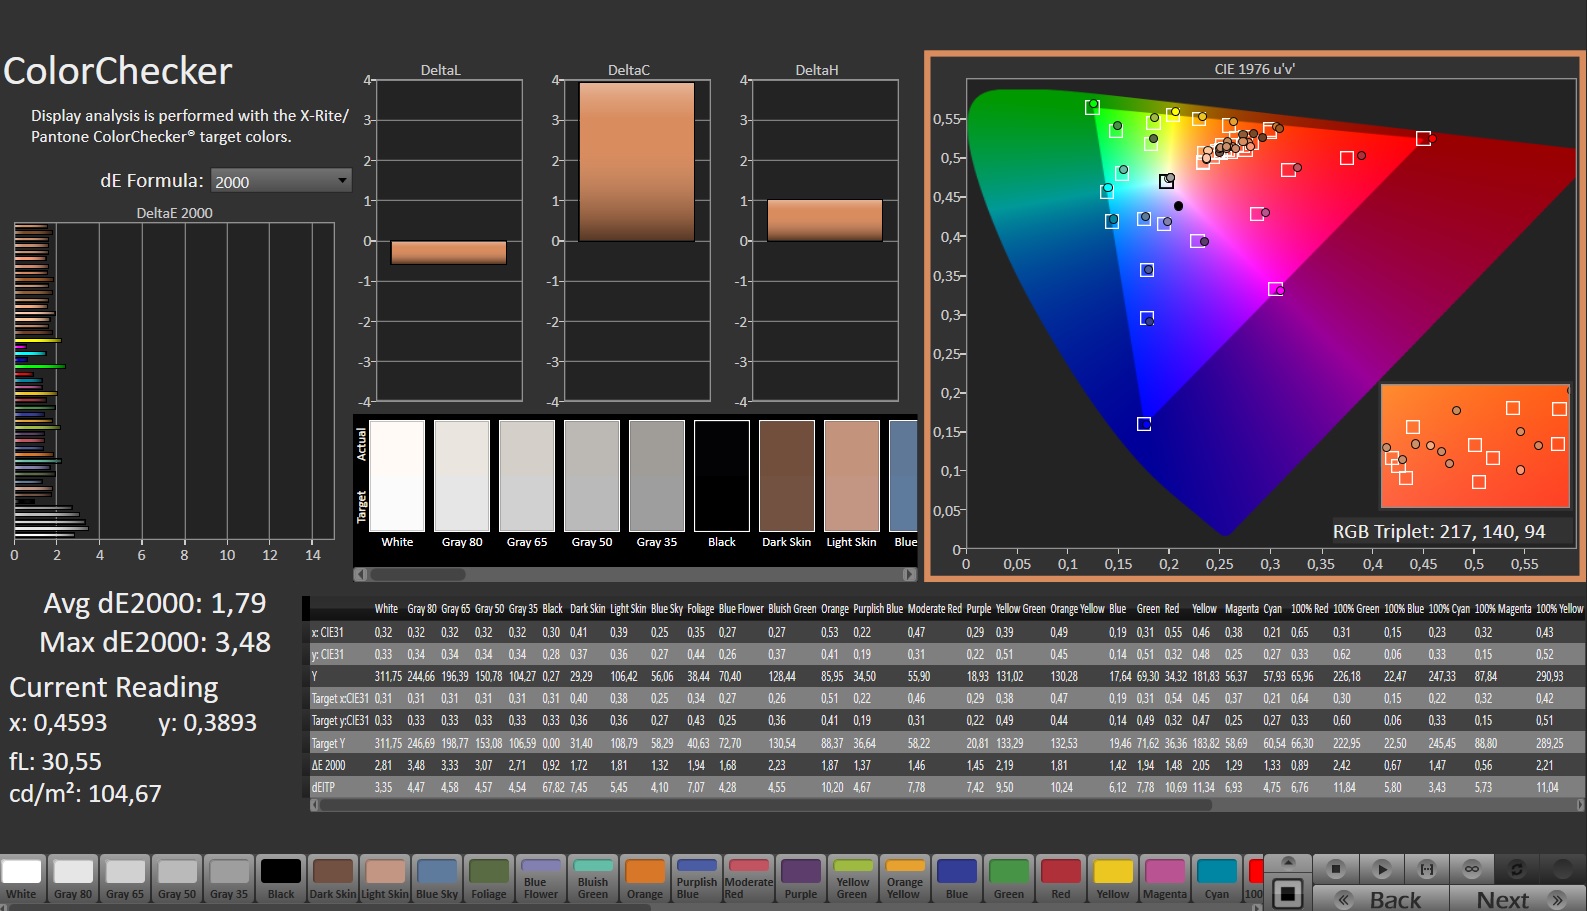
ΔE ColorChecker Calman: 1.79 | ∀{0.5-29.43 Ø4.71}
calibrated: 1.2
ΔE Greyscale Calman: 2.5 | ∀{0.09-98 Ø4.96}
70.7% AdobeRGB 1998 (Argyll 3D)
97.3% sRGB (Argyll 3D)
69.3% Display P3 (Argyll 3D)
Gamma: 2.265
CCT: 6157 K
| Asus TUF Gaming A16 FA617XS BOE NE160WUM-NX2, IPS, 1920x1200, 16" | Lenovo Legion Pro 5 16IRX8 AU Optronics B160QAN03.1, IPS, 2560x1600, 16" | MSI Katana 15 B12VEK AUOAF90 (B156HAN08.4), IPS, 1920x1080, 15.6" | Medion Erazer Defender P40 BOE CQ NE173QHM-NZ3, IPS, 2560x1440, 17.3" | Gigabyte G5 KE Chi Mei N156HRA-EA1, IPS, 1920x1080, 15.6" | Asus TUF Gaming A16 FA617 NE160WUM-NX2 (BOE0B33), IPS-Level, 1920x1200, 16" | |
|---|---|---|---|---|---|---|
| Display | 3% | -44% | -0% | -39% | 0% | |
| Display P3 Coverage (%) | 69.3 | 71.2 3% | 38.1 -45% | 68.3 -1% | 40.7 -41% | 69.4 0% |
| sRGB Coverage (%) | 97.3 | 98.8 2% | 56.8 -42% | 98.1 1% | 61 -37% | 97.8 1% |
| AdobeRGB 1998 Coverage (%) | 70.7 | 73.3 4% | 39.3 -44% | 69.8 -1% | 42.1 -40% | 70.9 0% |
| Response Times | 2% | -159% | 10% | -79% | -5% | |
| Response Time Grey 50% / Grey 80% * (ms) | 15.6 ? | 14.5 ? 7% | 38.8 ? -149% | 14.6 ? 6% | 26.64 ? -71% | 17 ? -9% |
| Response Time Black / White * (ms) | 10 ? | 10.4 ? -4% | 26.8 ? -168% | 8.7 ? 13% | 18.65 ? -86% | 10.1 ? -1% |
| PWM Frequency (Hz) | ||||||
| Screen | 5% | -115% | 7% | -113% | 4% | |
| Brightness middle (cd/m²) | 301 | 405.7 35% | 261 -13% | 364 21% | 269 -11% | 308 2% |
| Brightness (cd/m²) | 294 | 368 25% | 258 -12% | 343 17% | 248 -16% | 293 0% |
| Brightness Distribution (%) | 94 | 87 -7% | 92 -2% | 86 -9% | 85 -10% | 90 -4% |
| Black Level * (cd/m²) | 0.21 | 0.38 -81% | 0.19 10% | 0.28 -33% | 0.5 -138% | 0.23 -10% |
| Contrast (:1) | 1433 | 1068 -25% | 1374 -4% | 1300 -9% | 538 -62% | 1339 -7% |
| Colorchecker dE 2000 * | 1.79 | 1.65 8% | 5.57 -211% | 1.67 7% | 4.54 -154% | 1.47 18% |
| Colorchecker dE 2000 max. * | 3.48 | 4.2 -21% | 20.6 -492% | 2.78 20% | 17.28 -397% | 2.98 14% |
| Colorchecker dE 2000 calibrated * | 1.2 | 0.53 56% | 4.63 -286% | 1.14 5% | 3.34 -178% | 1.02 15% |
| Greyscale dE 2000 * | 2.5 | 1.2 52% | 3.19 -28% | 1.4 44% | 3.8 -52% | 2.2 12% |
| Gamma | 2.265 97% | 2.3 96% | 2.45 90% | 2.091 105% | 2.17 101% | 2.228 99% |
| CCT | 6157 106% | 6453 101% | 6146 106% | 6568 99% | 7408 88% | 6228 104% |
| Media totale (Programma / Settaggio) | 3% /
4% | -106% /
-106% | 6% /
6% | -77% /
-92% | -0% /
2% |
* ... Meglio usare valori piccoli
Ex funziona, lo schermo presenta una buona rappresentazione dei colori: Una deviazione di circa 1,8 è accettabile (DeltaE < 3). La calibrazione abbassa questo tasso a 1,2 e porta a toni di grigio più equilibrati. Il pannello è in grado di rappresentare l'intero spazio colore sRGB, ma non gli spazi AdobeRGB e DCI P3. Questo è simile alla maggior parte dei display della concorrenza.
Tempi di risposta del Display
| ↔ Tempi di risposta dal Nero al Bianco | ||
|---|---|---|
| 10 ms ... aumenta ↗ e diminuisce ↘ combinato | ↗ 5.7 ms Incremento | 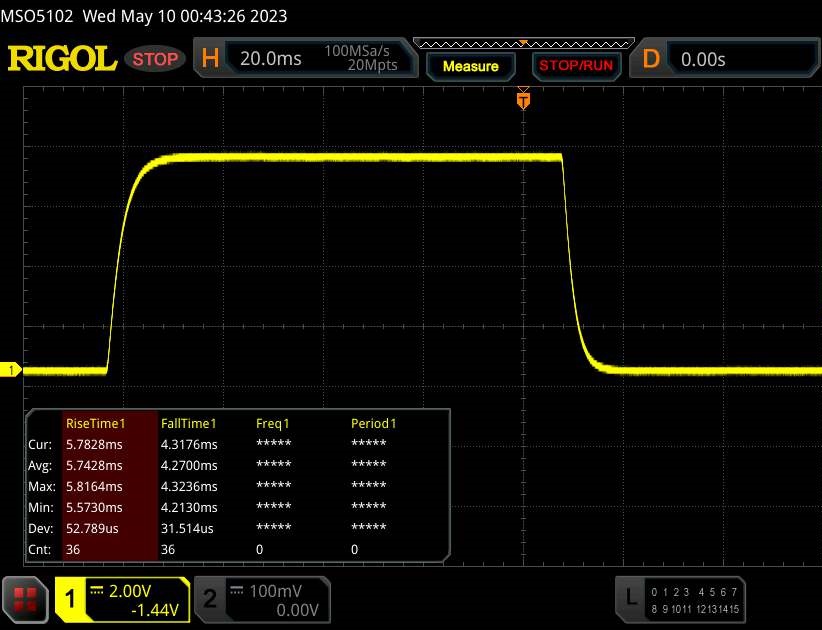 |
| ↘ 4.3 ms Calo | ||
| Lo schermo mostra buoni tempi di risposta durante i nostri tests, ma potrebbe essere troppo lento per i gamers competitivi. In confronto, tutti i dispositivi di test variano da 0.1 (minimo) a 240 (massimo) ms. » 27 % di tutti i dispositivi è migliore. Questo significa che i tempi di risposta rilevati sono migliori rispettto alla media di tutti i dispositivi testati (19.8 ms). | ||
| ↔ Tempo di risposta dal 50% Grigio all'80% Grigio | ||
| 15.6 ms ... aumenta ↗ e diminuisce ↘ combinato | ↗ 7.3 ms Incremento | 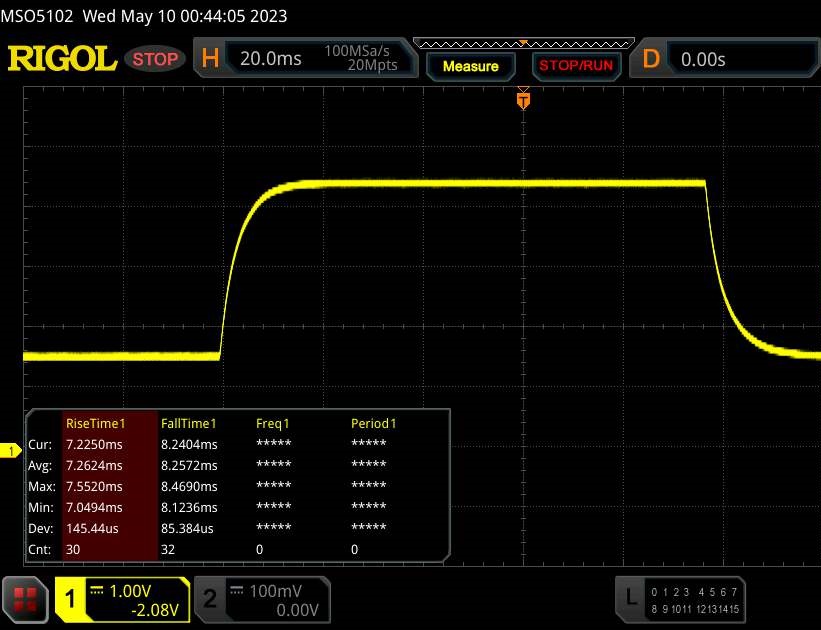 |
| ↘ 8.3 ms Calo | ||
| Lo schermo mostra buoni tempi di risposta durante i nostri tests, ma potrebbe essere troppo lento per i gamers competitivi. In confronto, tutti i dispositivi di test variano da 0.165 (minimo) a 636 (massimo) ms. » 30 % di tutti i dispositivi è migliore. Questo significa che i tempi di risposta rilevati sono migliori rispettto alla media di tutti i dispositivi testati (31 ms). | ||
Sfarfallio dello schermo / PWM (Pulse-Width Modulation)
| flickering dello schermo / PWM non rilevato |  | ||
In confronto: 52 % di tutti i dispositivi testati non utilizza PWM per ridurre la luminosita' del display. Se è rilevato PWM, una media di 7747 (minimo: 5 - massimo: 343500) Hz è stata rilevata. | |||
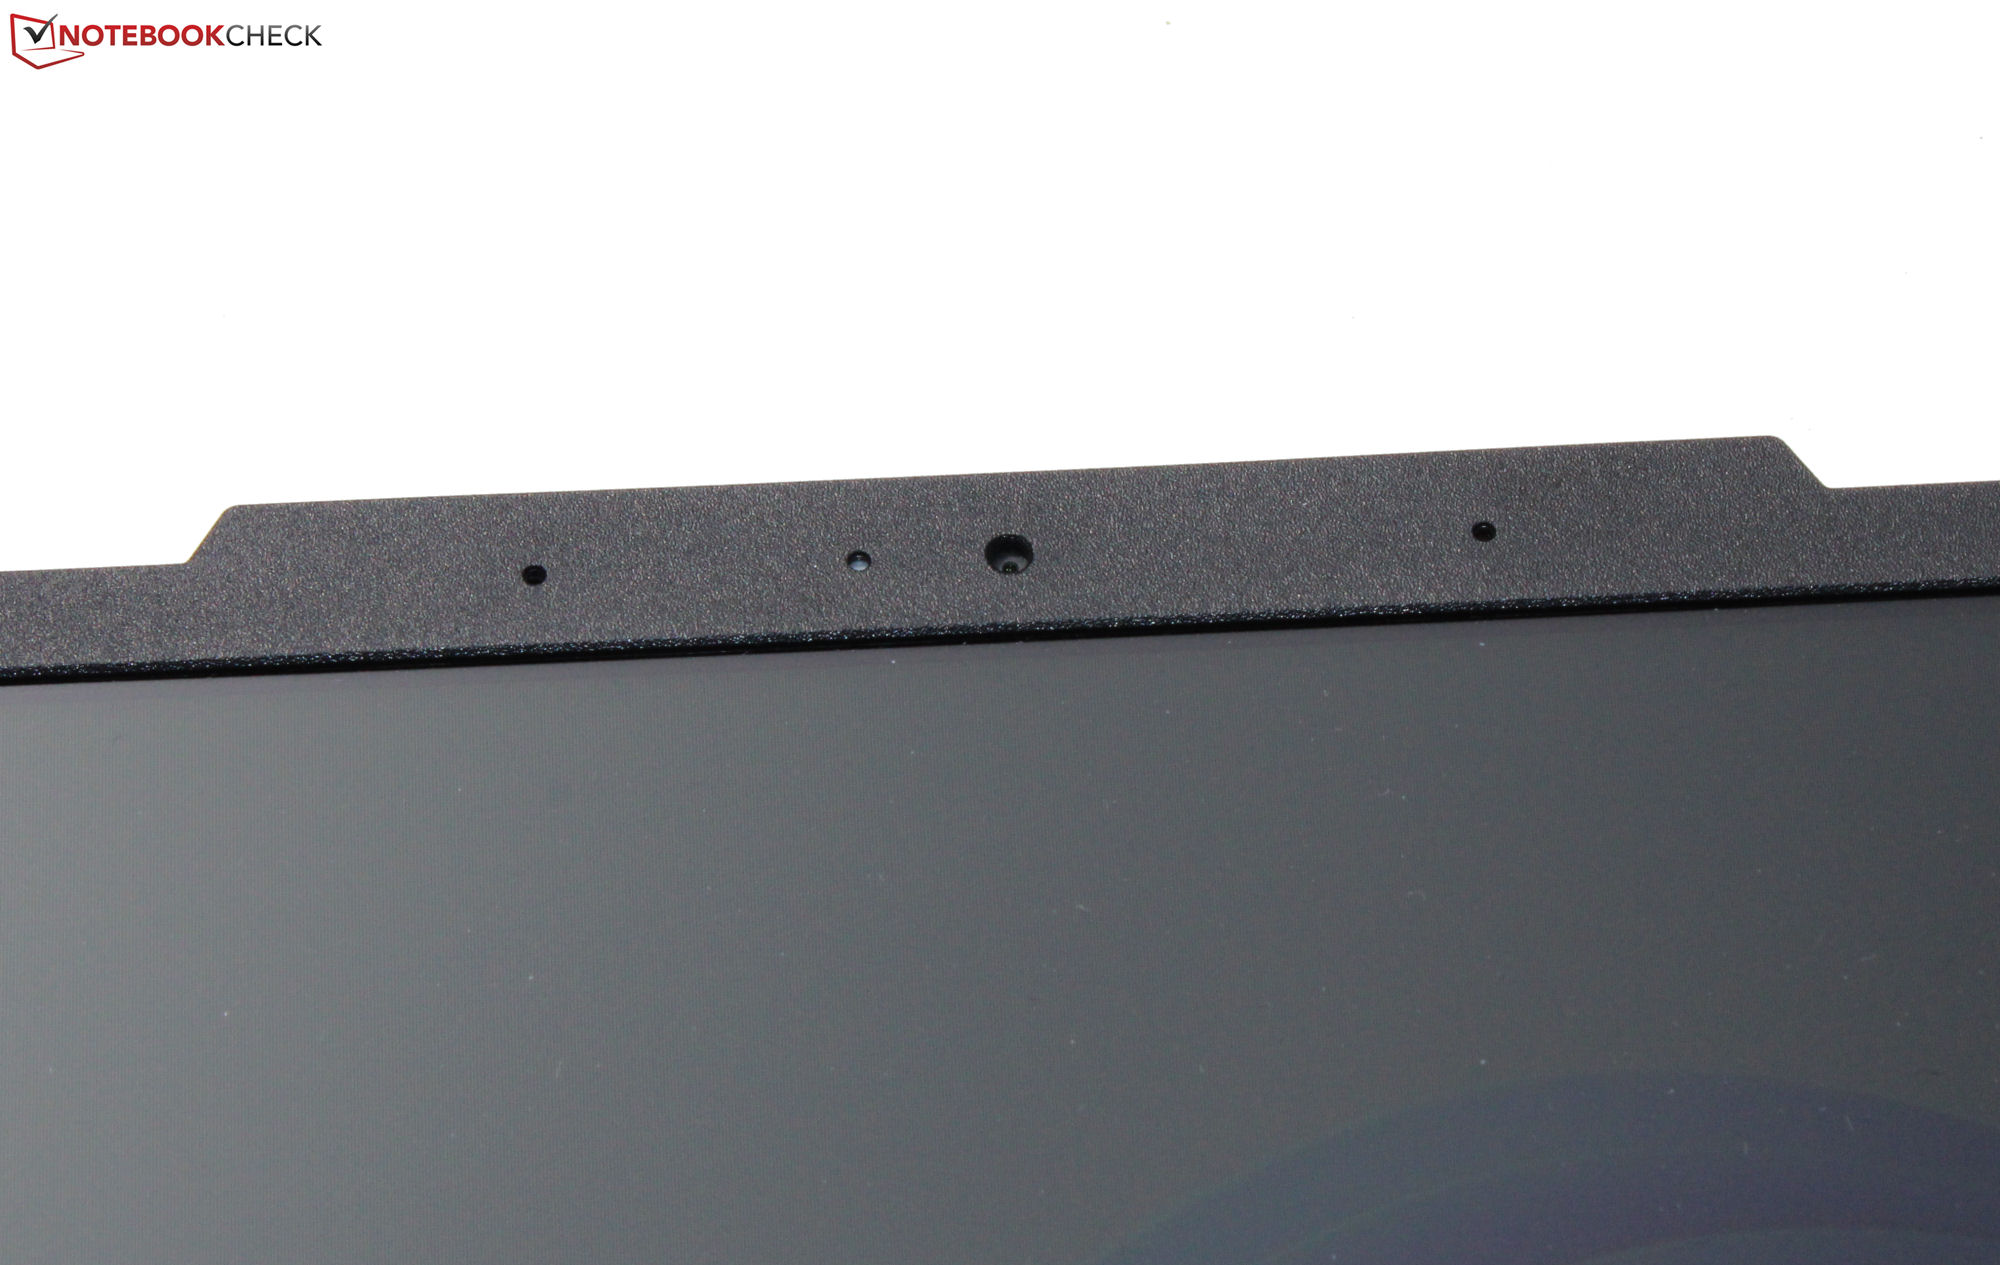
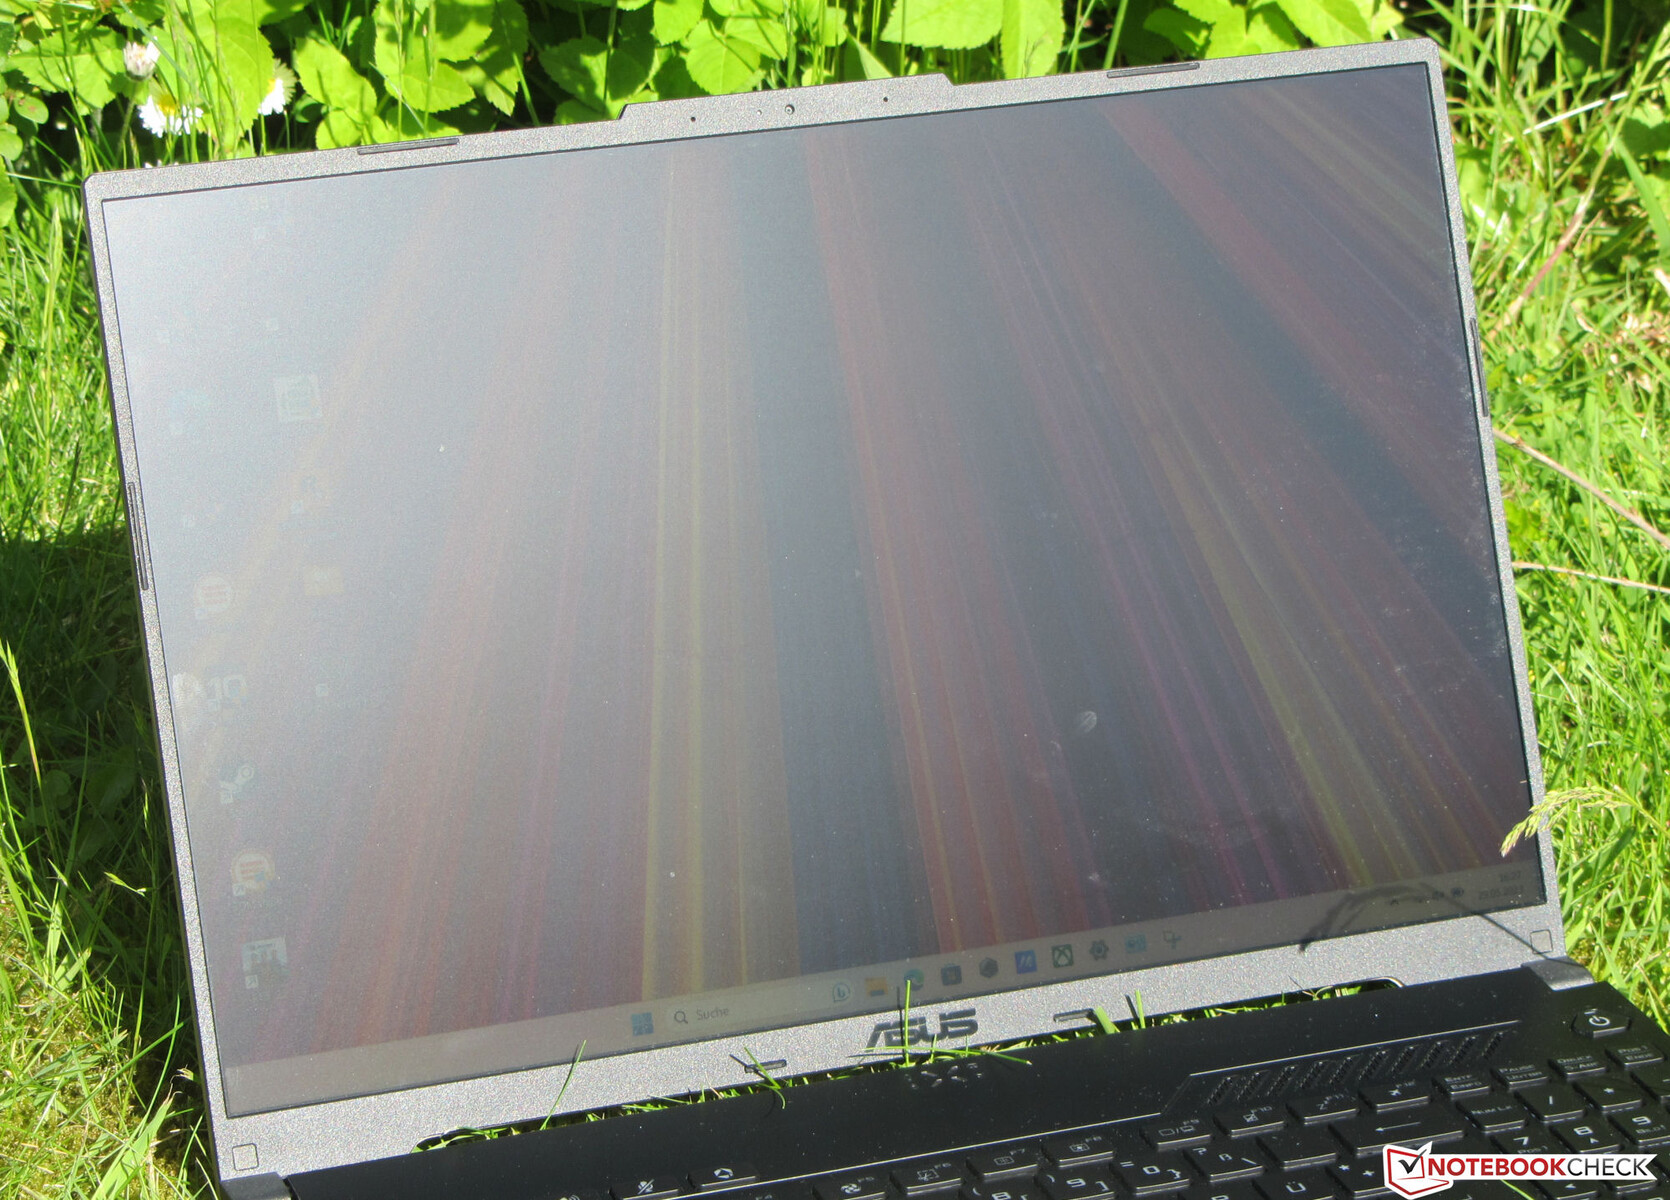
Il pannello IPS del portatile, stabile nell'angolo di visione, rimane leggibile da ogni angolazione. È possibile visualizzare il pannello anche all'esterno, purché il sole non sia troppo forte.

Prestazioni - Asus utilizza la potenza di AMD
L'Asus TUF Gaming A16 Advantage Edition FA617XS è un portatile da gioco di fascia media. L'hardware AMD fornisce la potenza di calcolo necessaria. Il modello attuale può essere acquistato a circa 1.700 dollari.
Condizioni di test
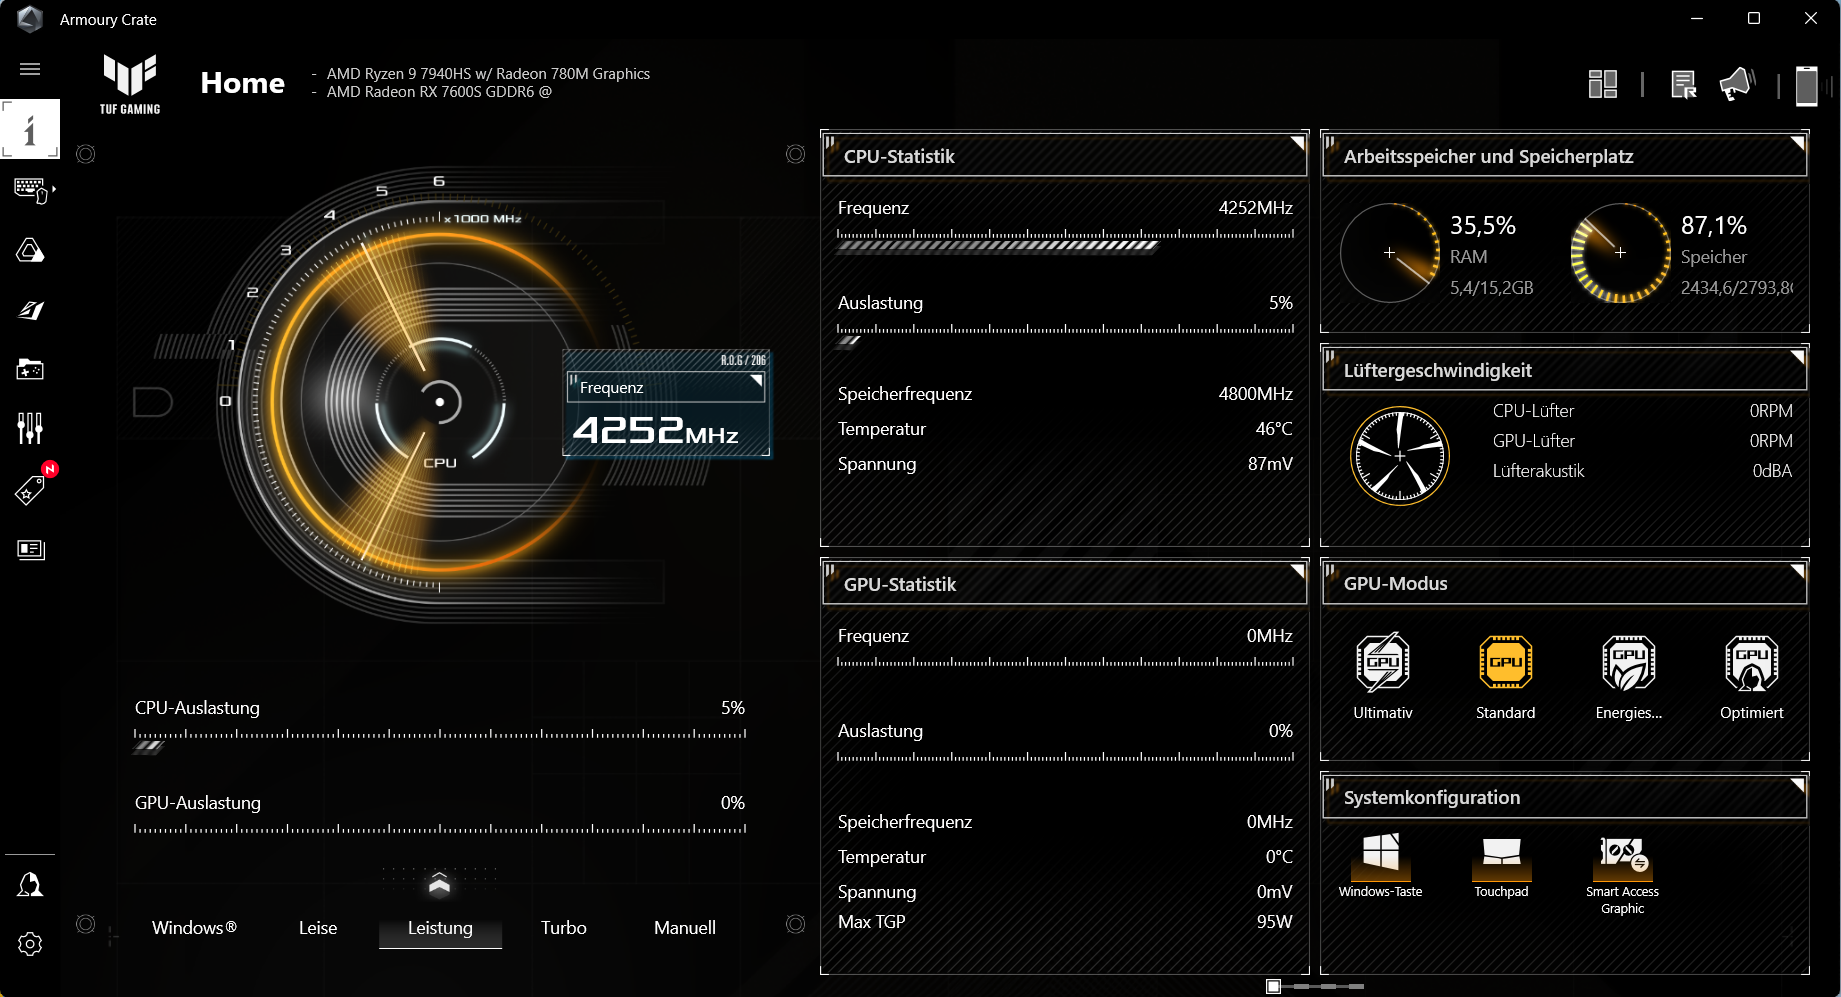
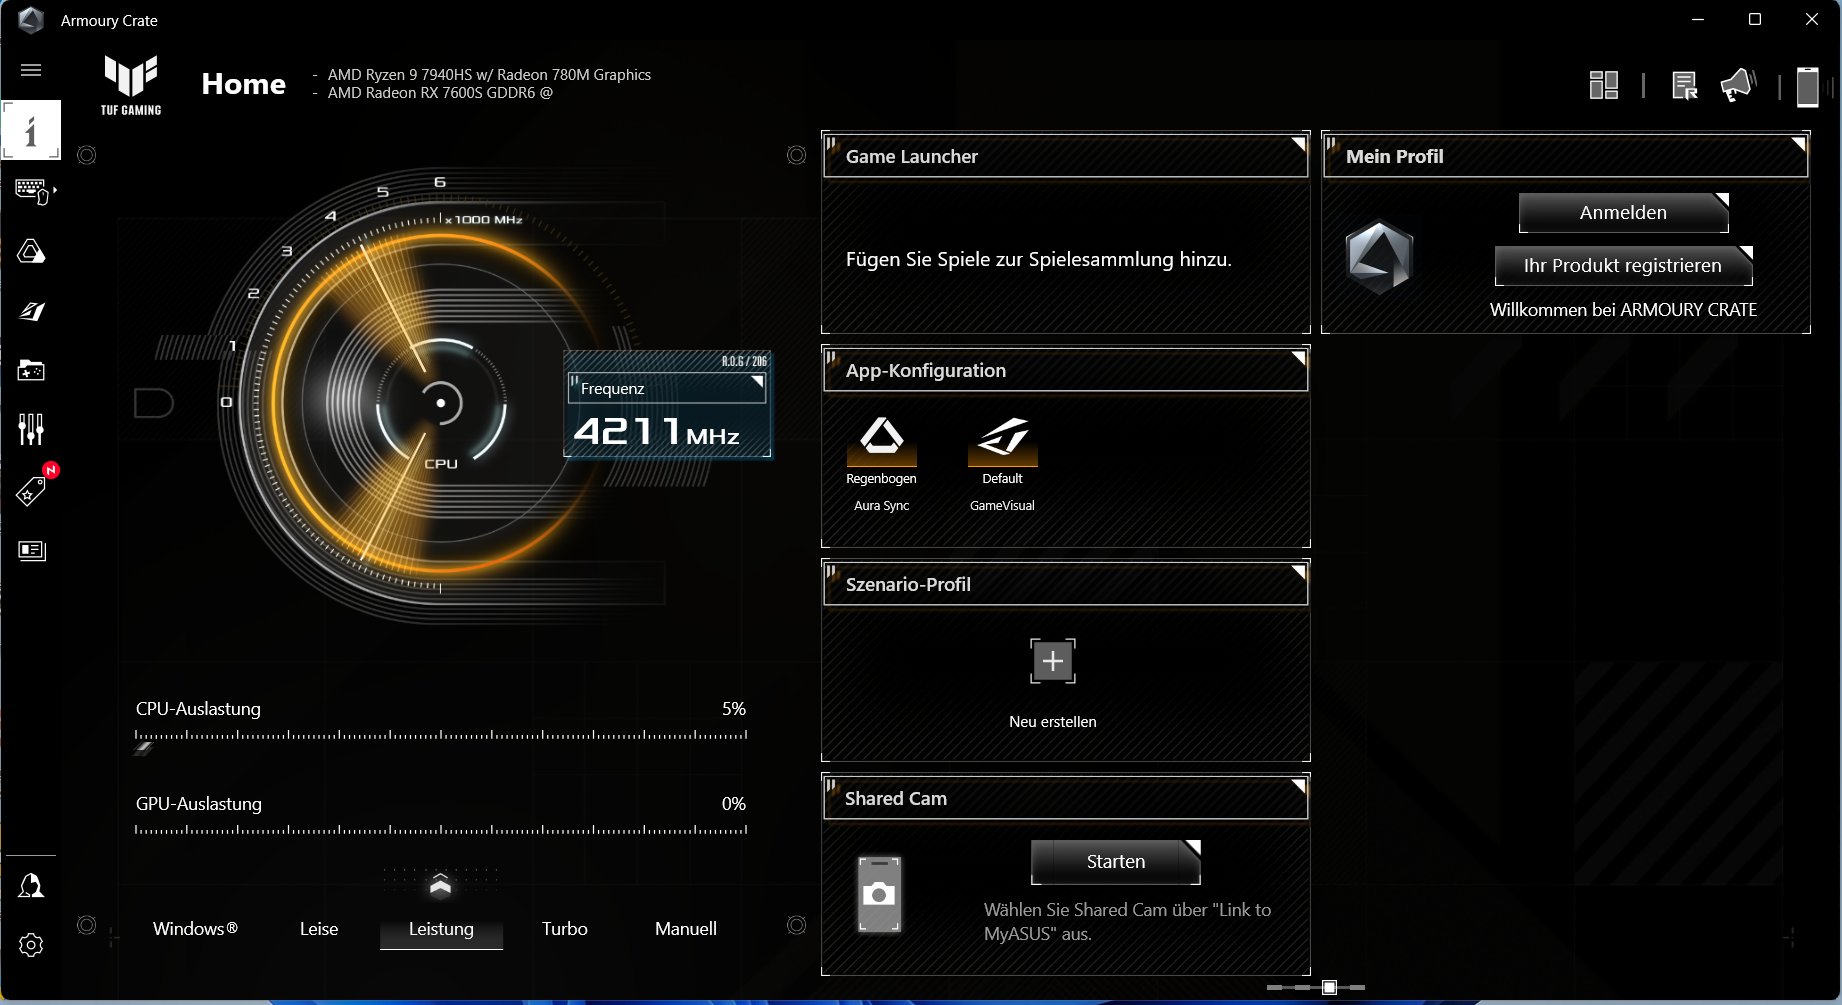
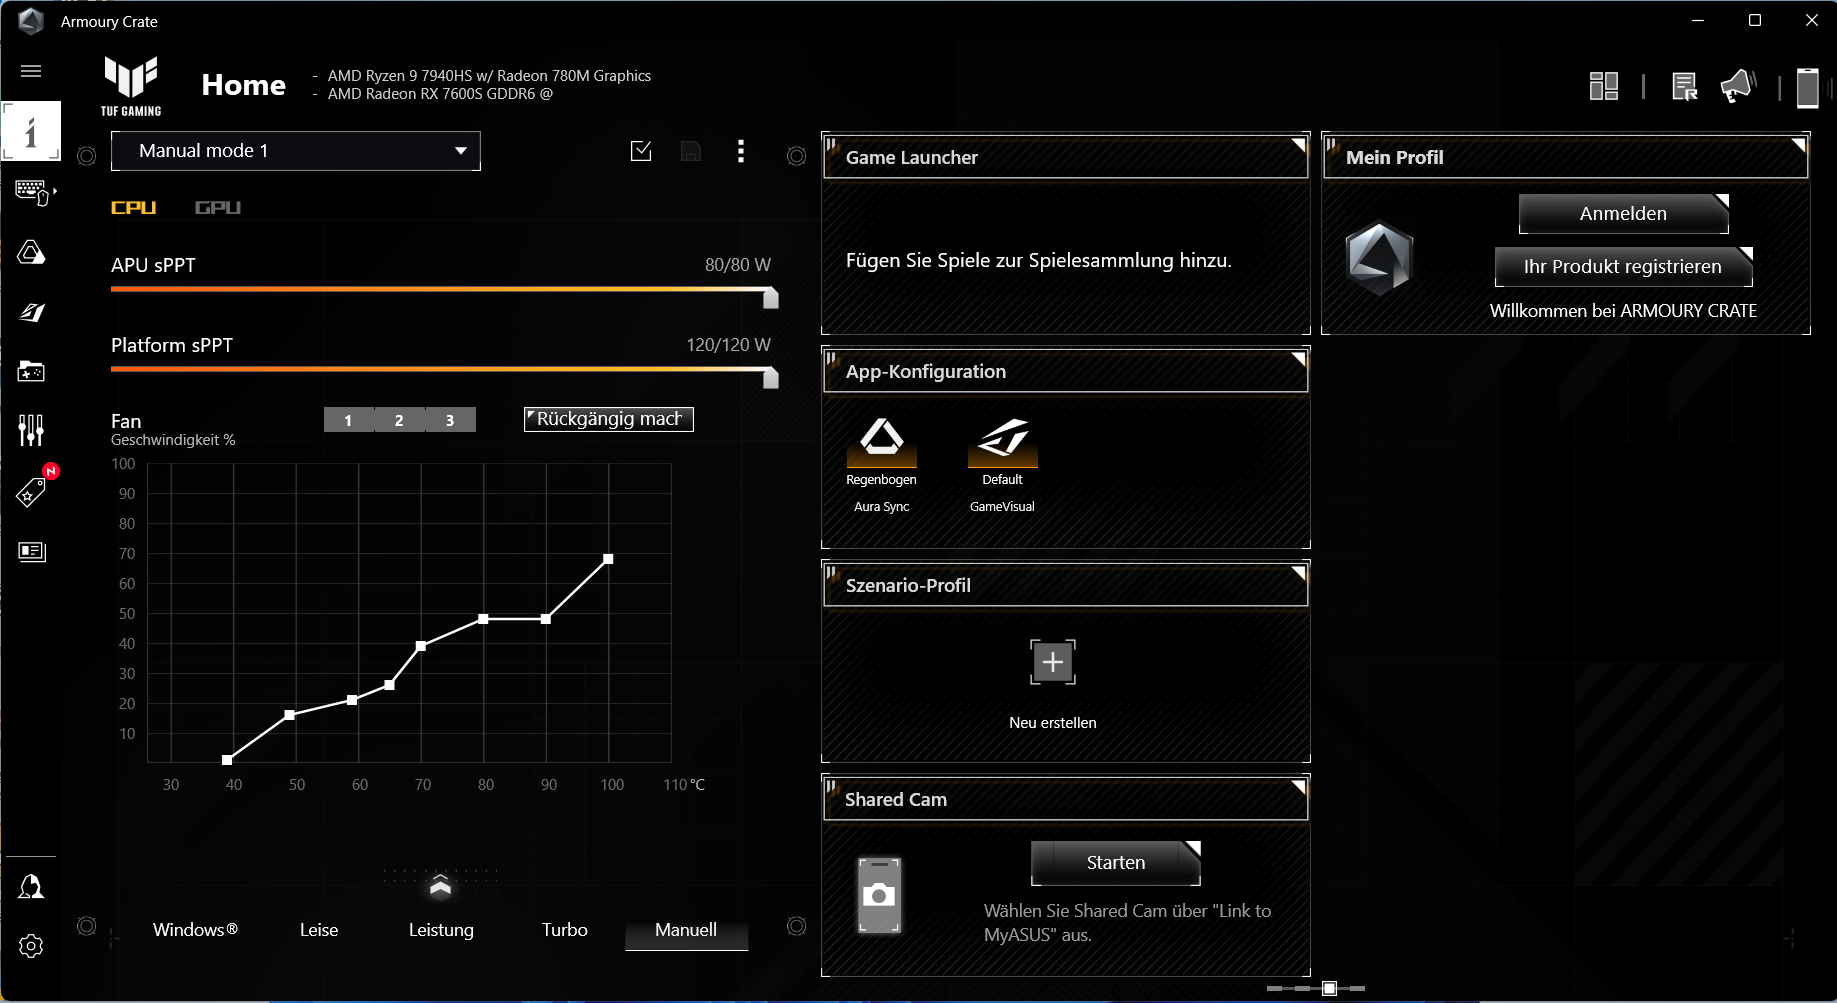
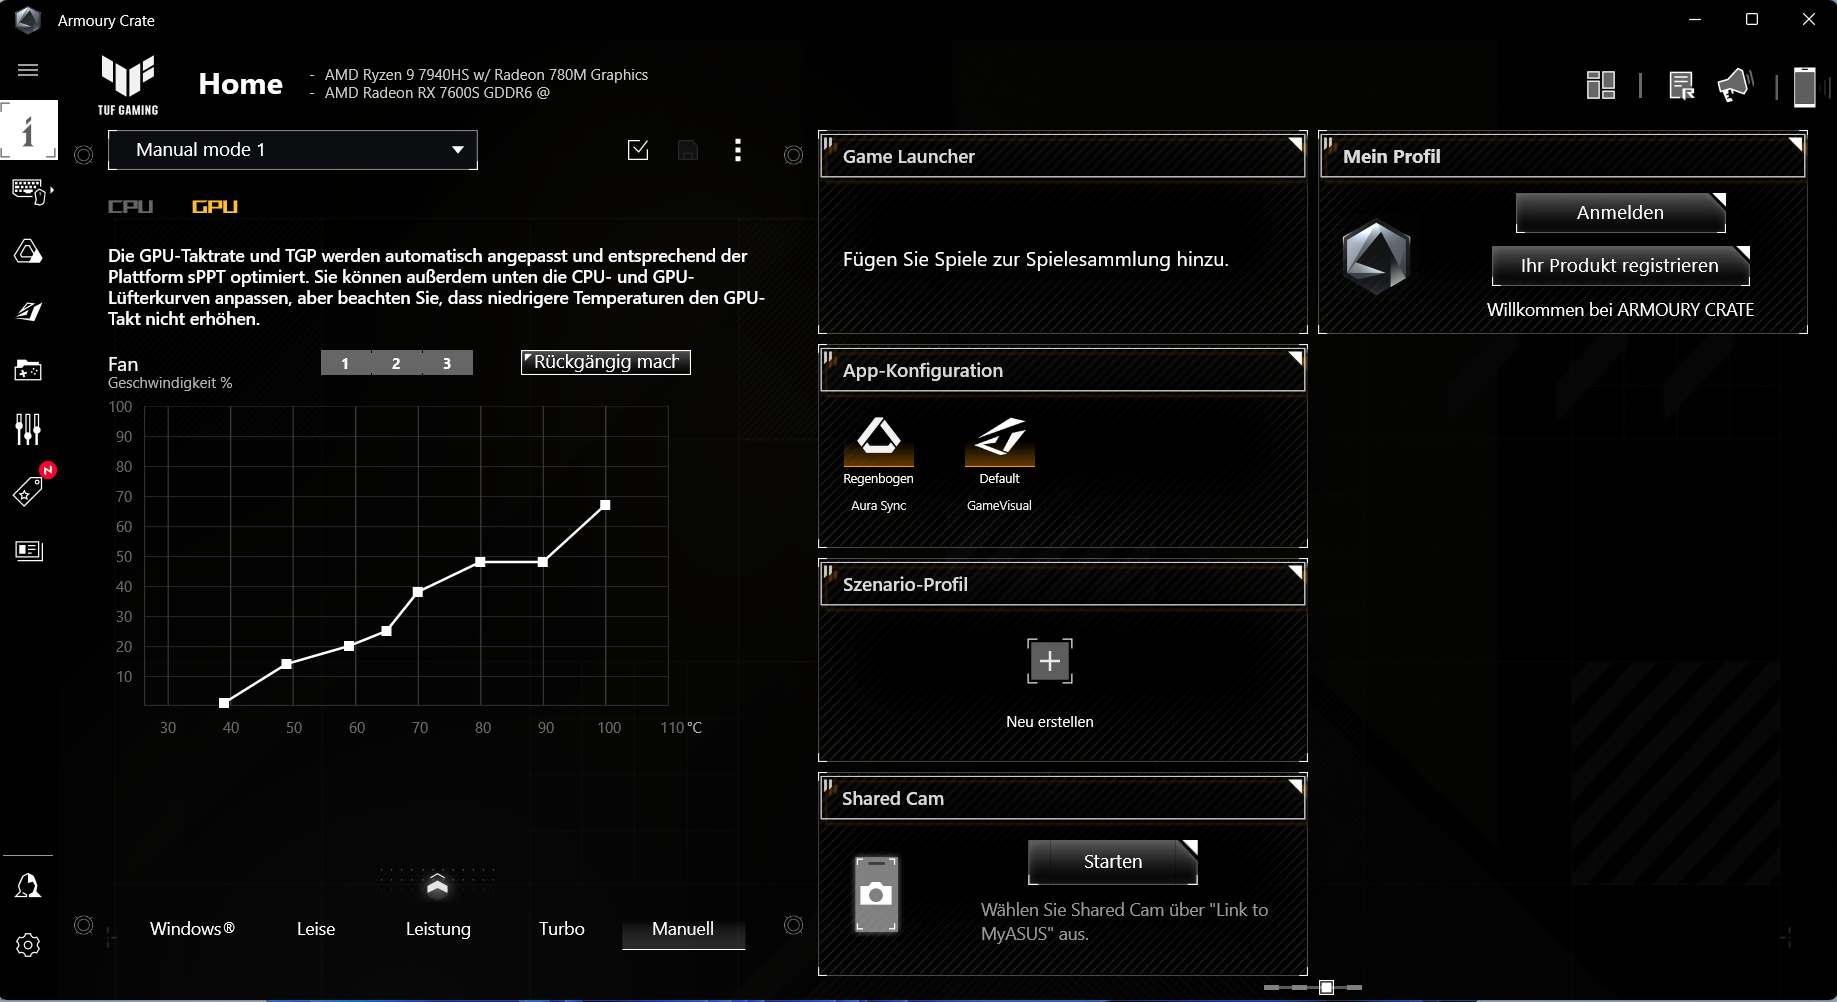
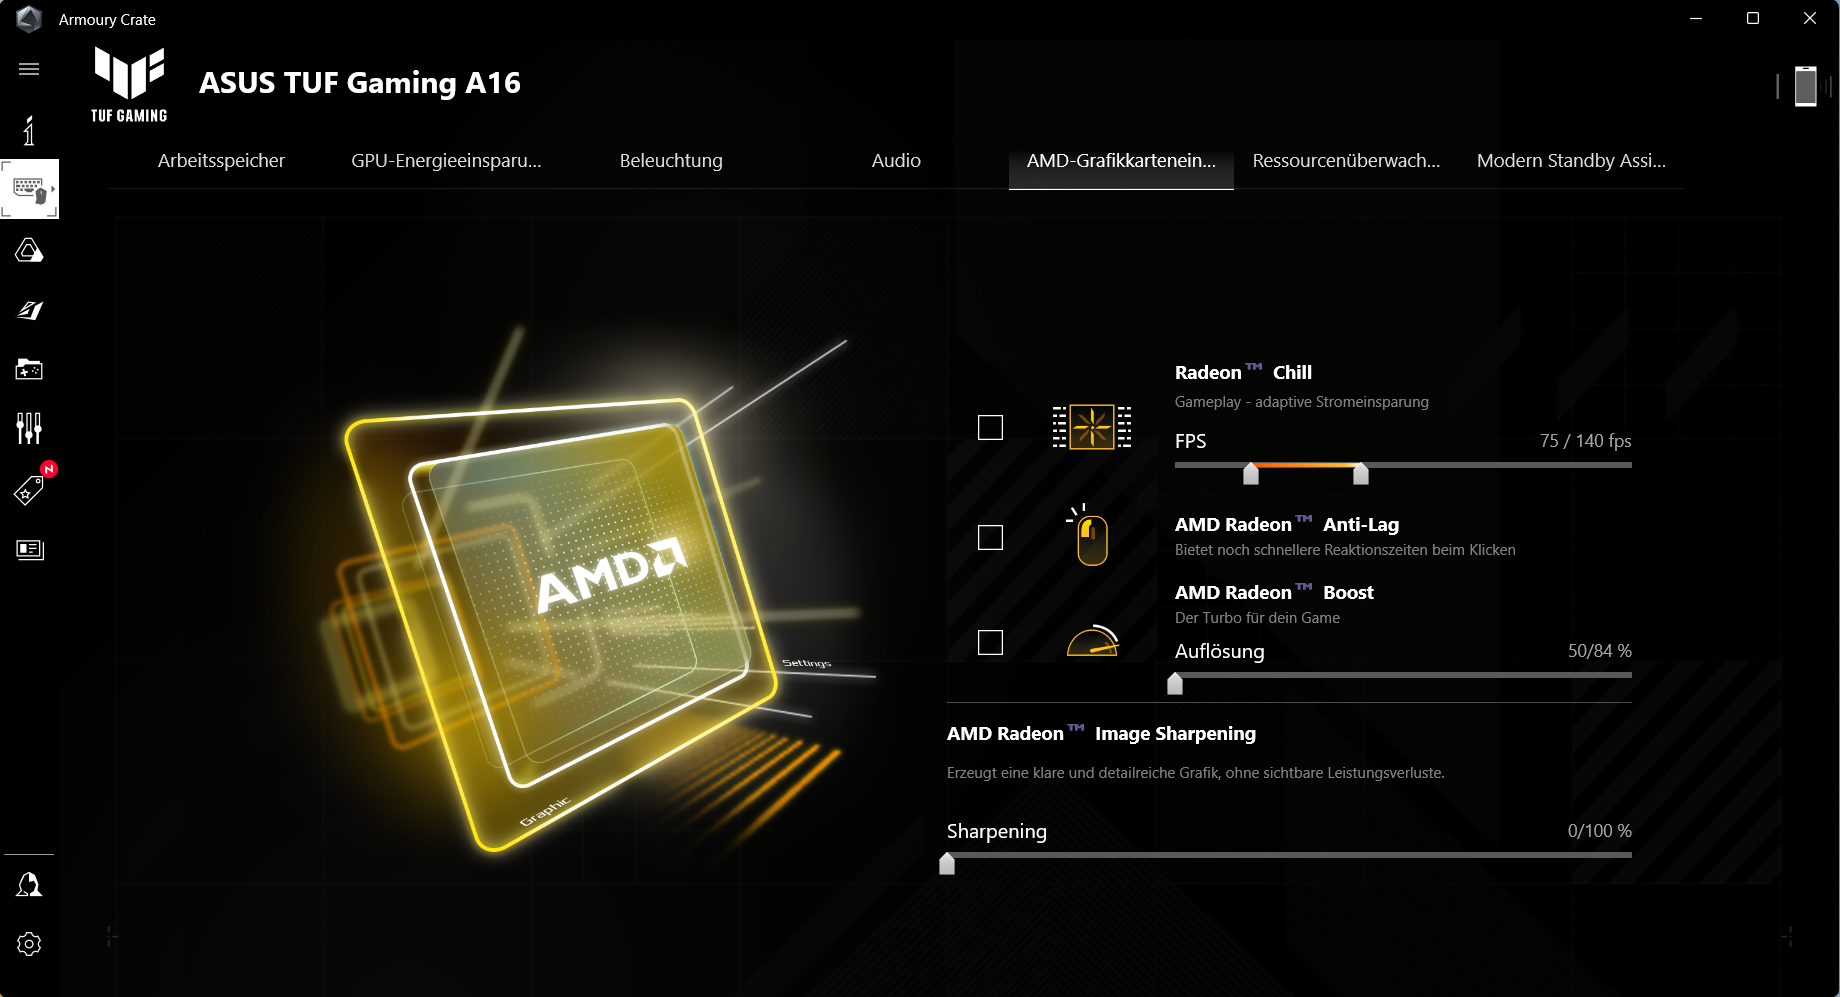
Con la combinazione di tasti "Fn" + "F5" è possibile passare dai tre profili di prestazioni specifici del produttore (vedi tabella). Sono stati utilizzati i profili "Performance" (benchmark) e "Quiet" (test della batteria). La modalità GPU è stata impostata su "Standard" (= grafica switching). Il centro di controllo del notebook ("Armoury Crate") consente di creare profili individuali ("Manual"), che includono l'impostazione delle curve PPT e della ventola.
| Turbo | Prestazioni | Silenzioso | |
|---|---|---|---|
| Limite di potenza 1 (HWInfo) | 120 watt | 105 watt | 75 watt |
| Limite di potenza 2 (HWInfo) | 144 watt | 114 watt | 90 watt |
| Rumore (Wichter 3) | 53 dB(A) | 51 dB(A) | 46 dB(A) |
| Prestazioni (Witcher 3) | ~100 fps | ~100 fps | ~94 fps |
Processore
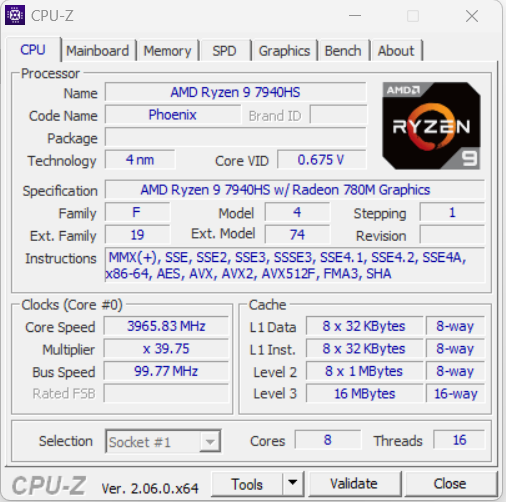
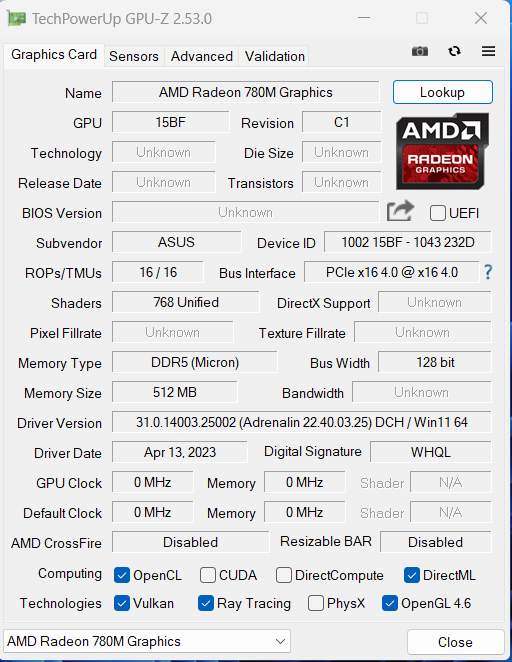
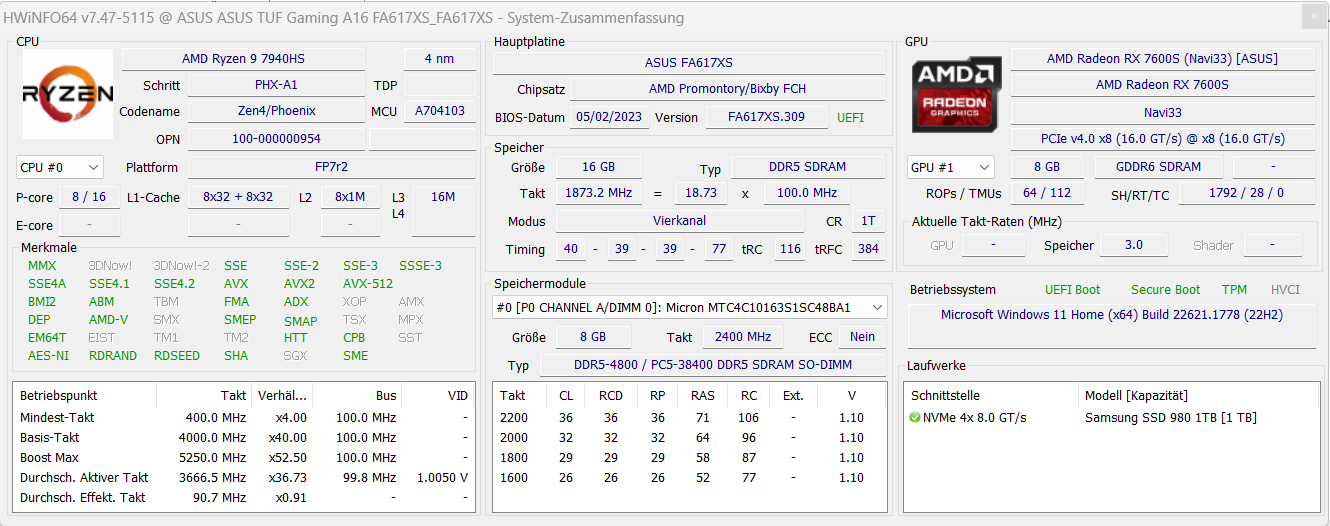
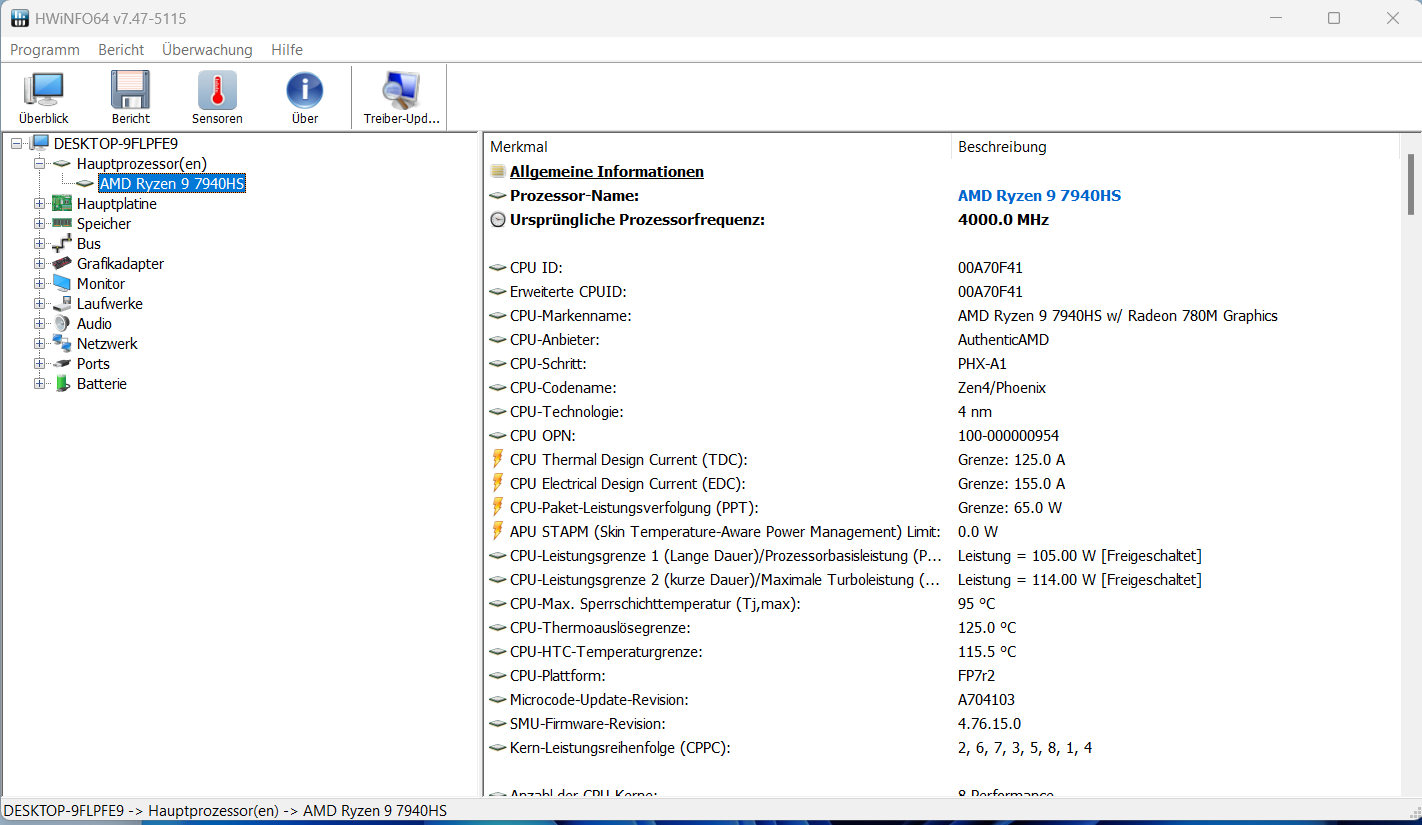
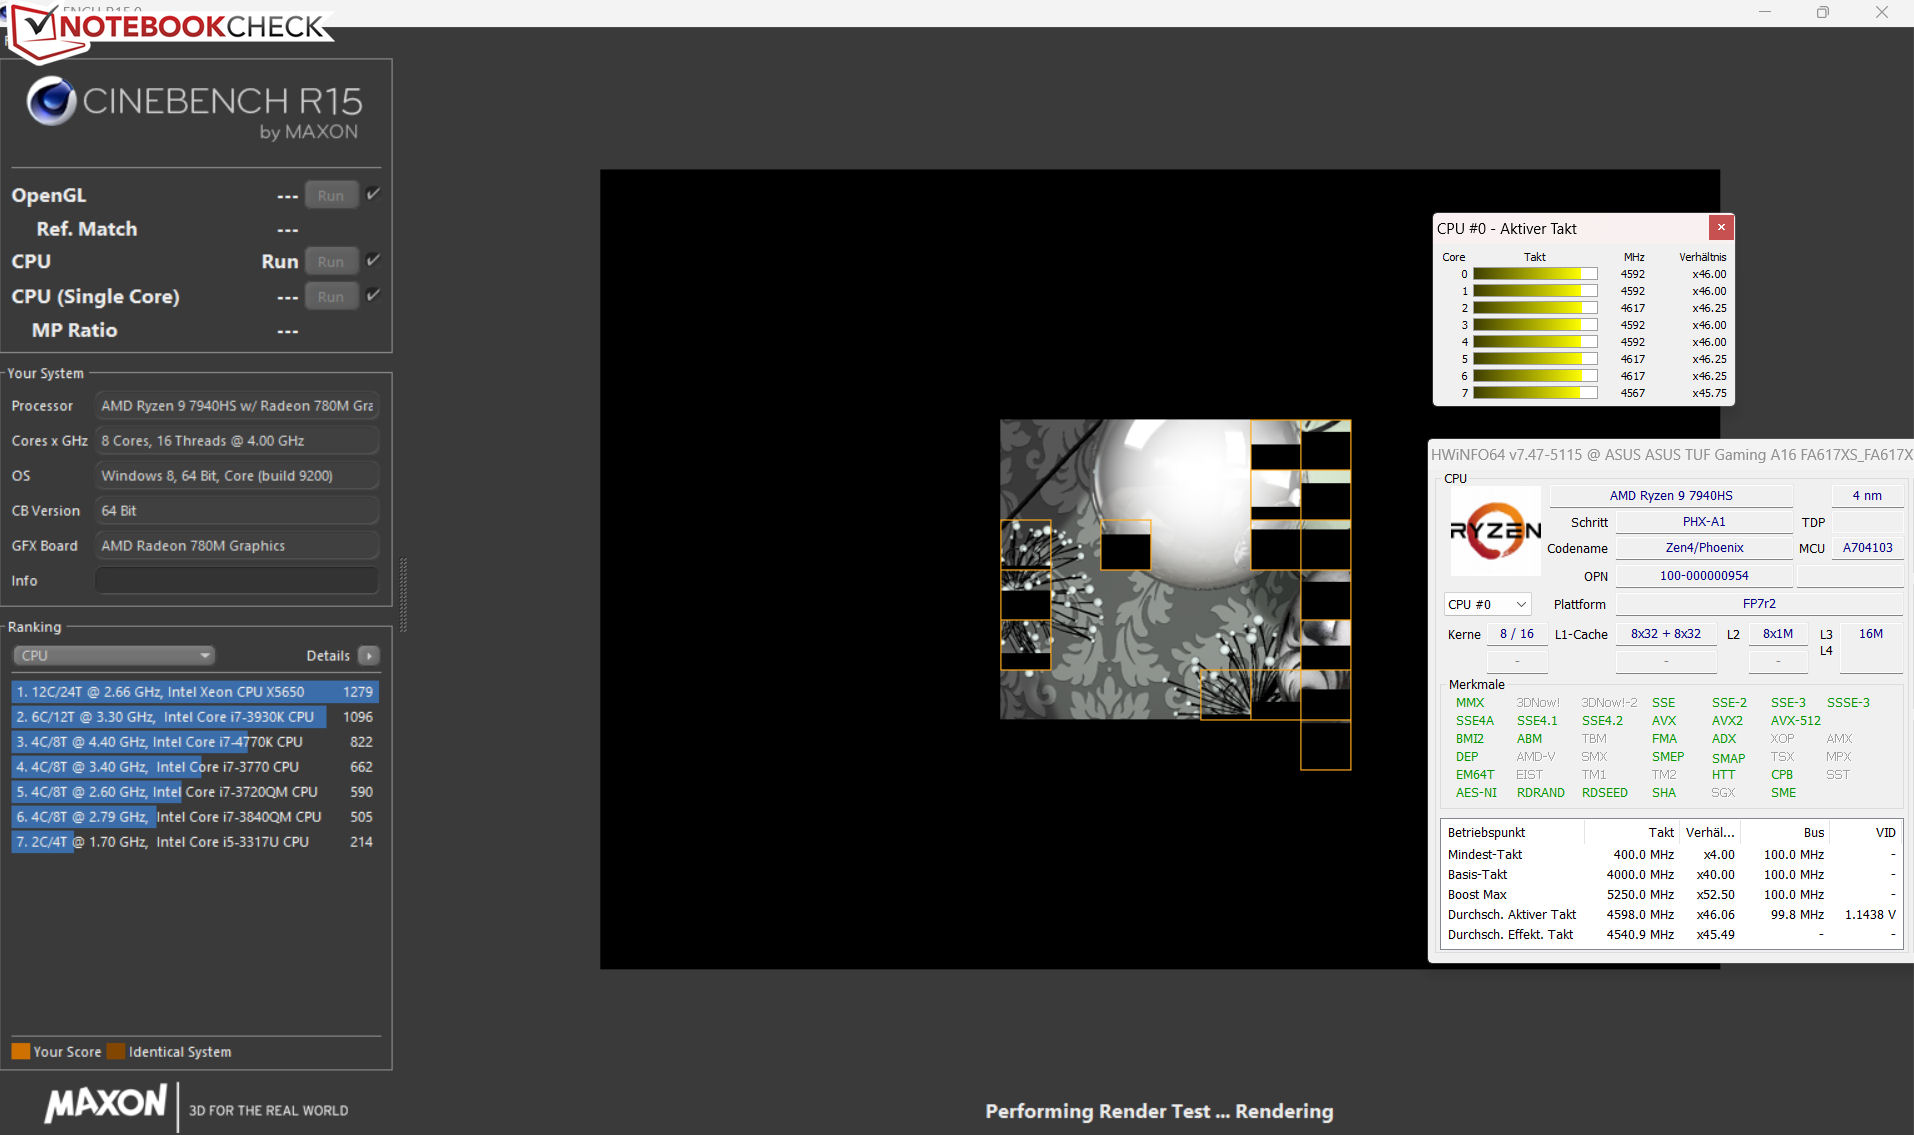
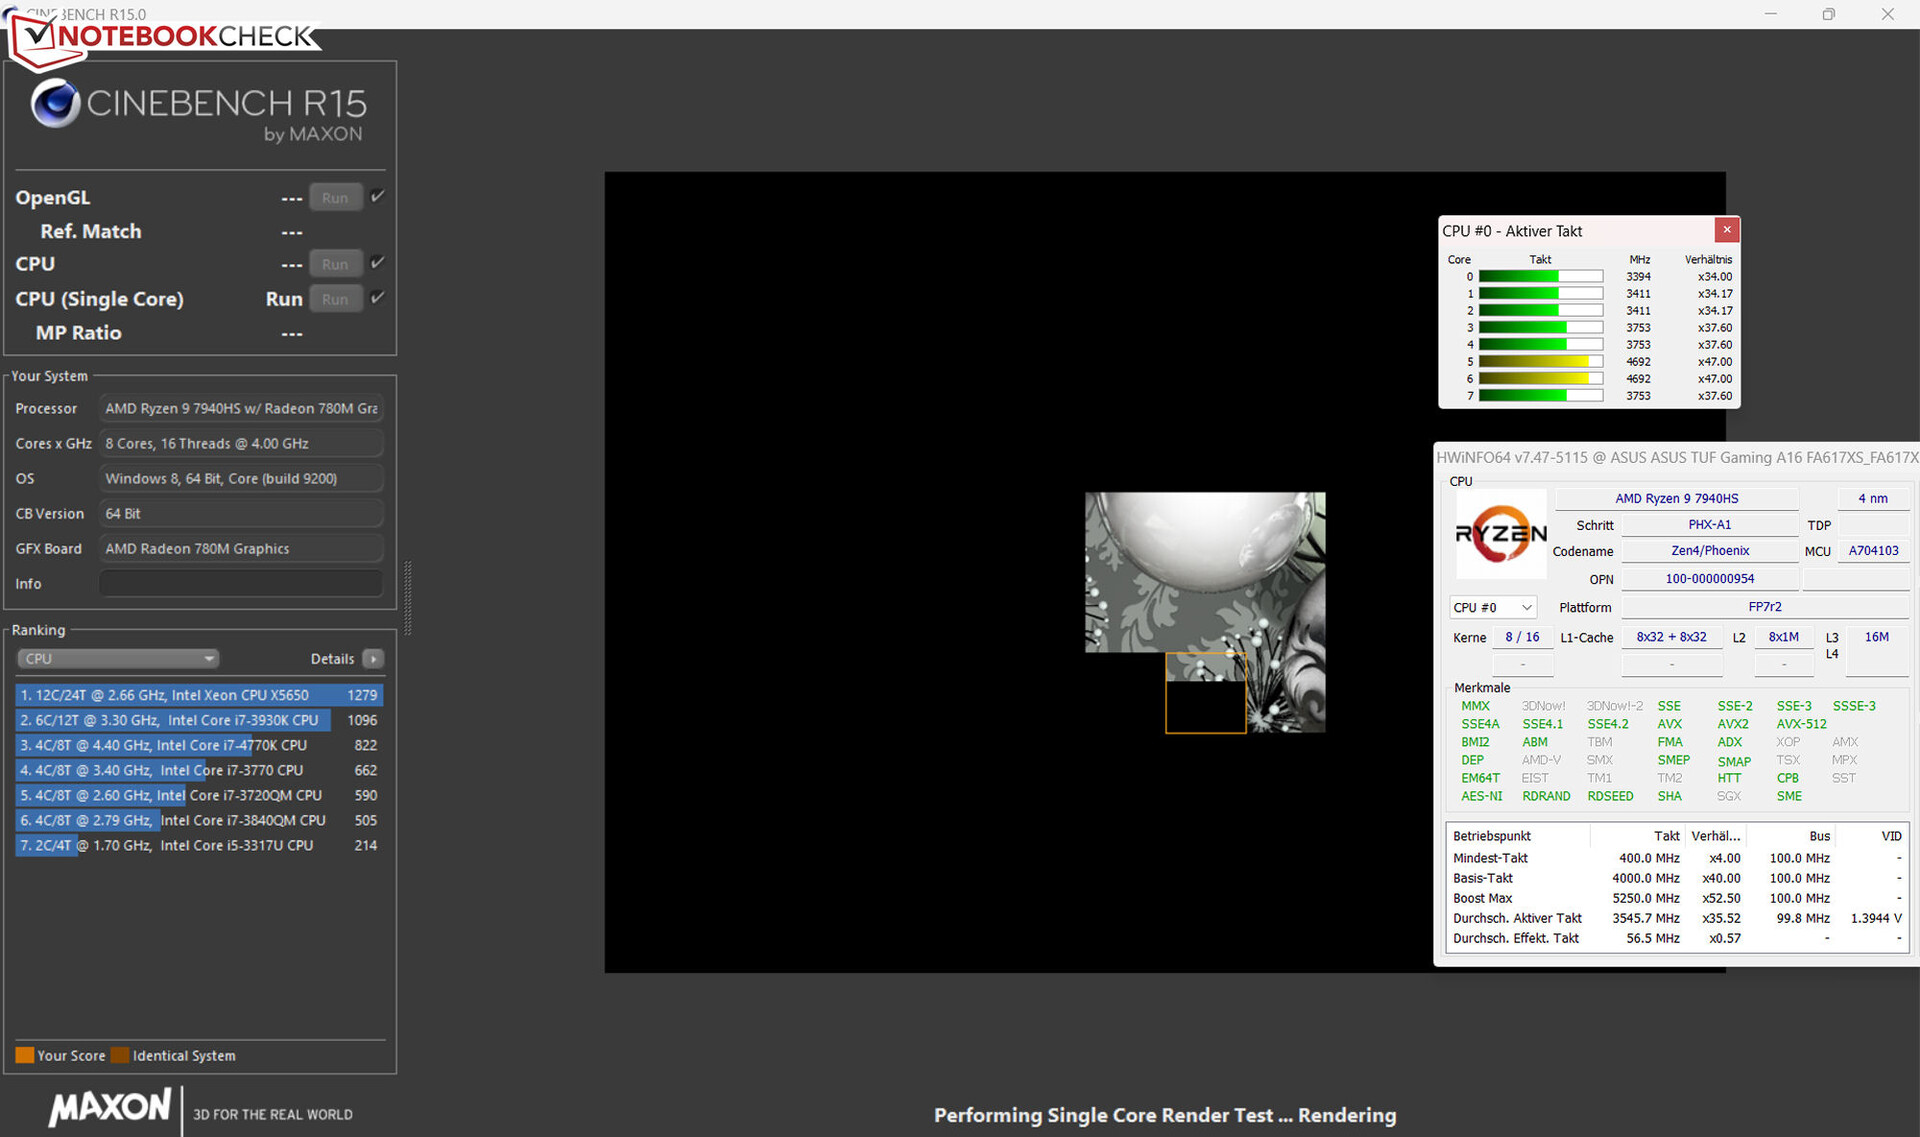
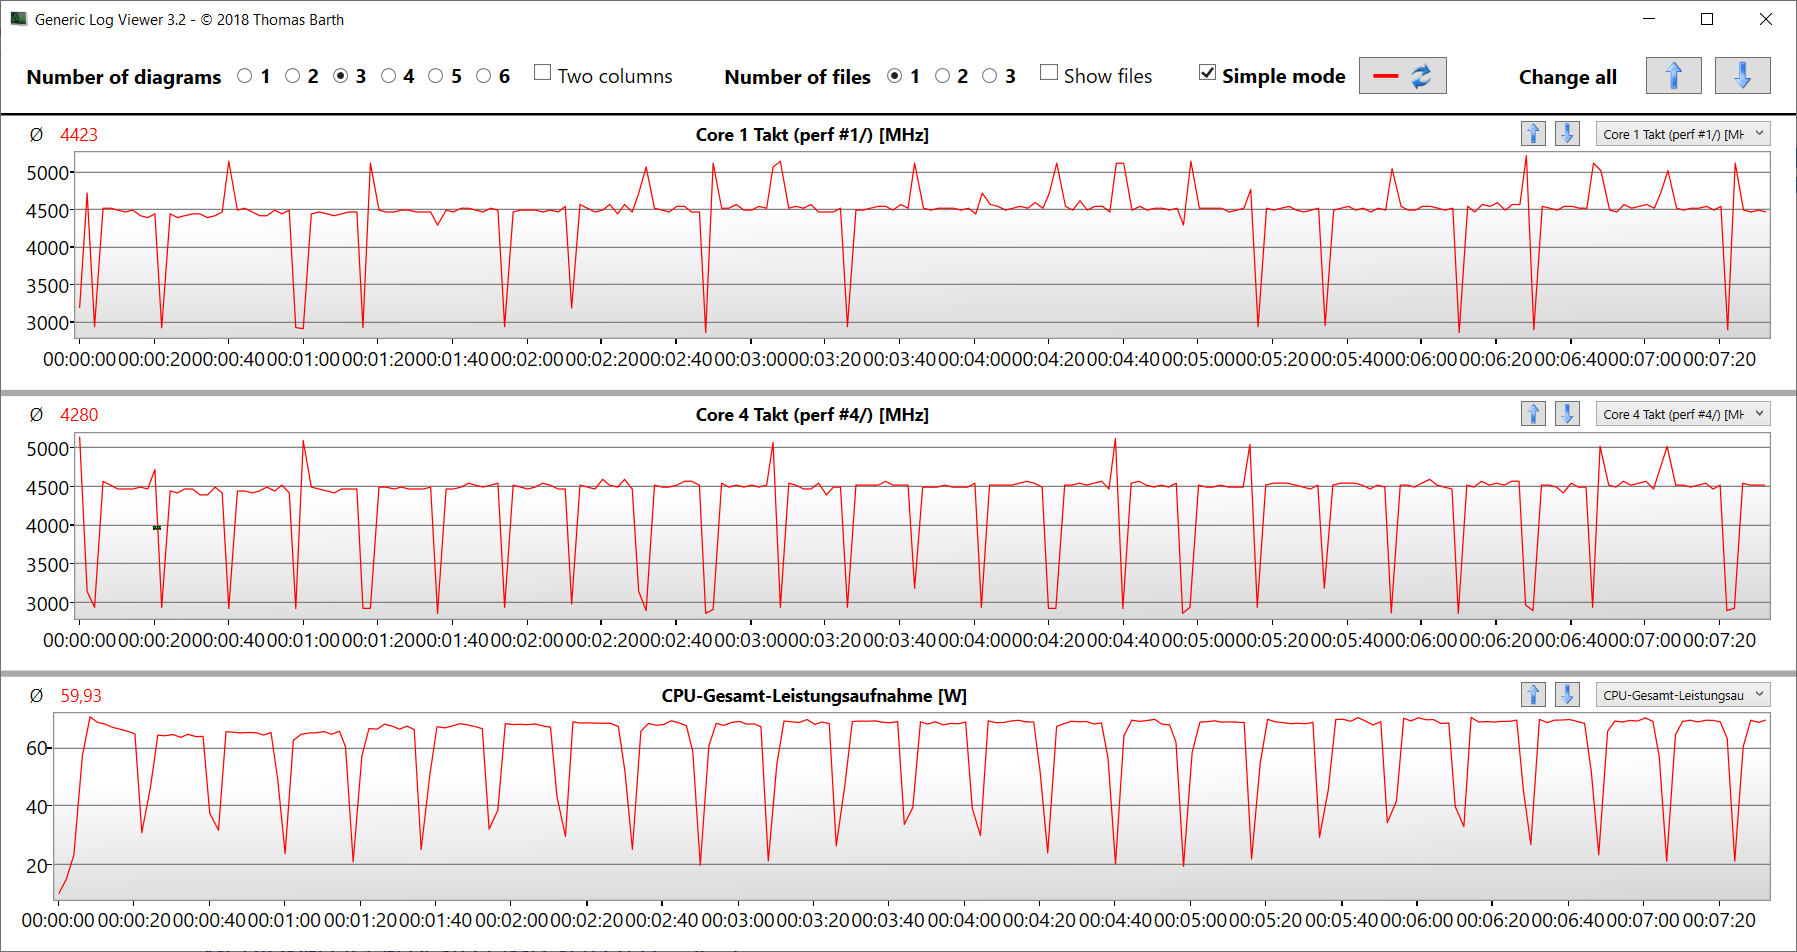
La parte della CPU delRyzen-9-7940HS-APU (Phoenix, Zen 4) è dotata di otto core di elaborazione con 16 thread. La frequenza di clock di base di 4 GHz può essere aumentata fino a 5,25 GHz (un core). I risultati dei nostri benchmark misurati sono più o meno gli stessi dei laptop 7940HS testati in precedenza. L'utilizzo del profilo "Turbo" porta a prestazioni leggermente migliori (4-5%).
Il modello gemello Recensione dell'Asus TUF Gaming A16 Advantage Edition: Notebook AMD sotto l'egida del 7 Ryzen-7-7735HS-APU (Rembrandt R, Zen 3+) è chiaramente battuto dal Ryzen 9, anche con lo stesso numero di core e gli stessi limiti di potenza. Grazie alla sua migliore architettura e alle frequenze di clock più elevate, le sue prestazioni per watt sono maggiori.
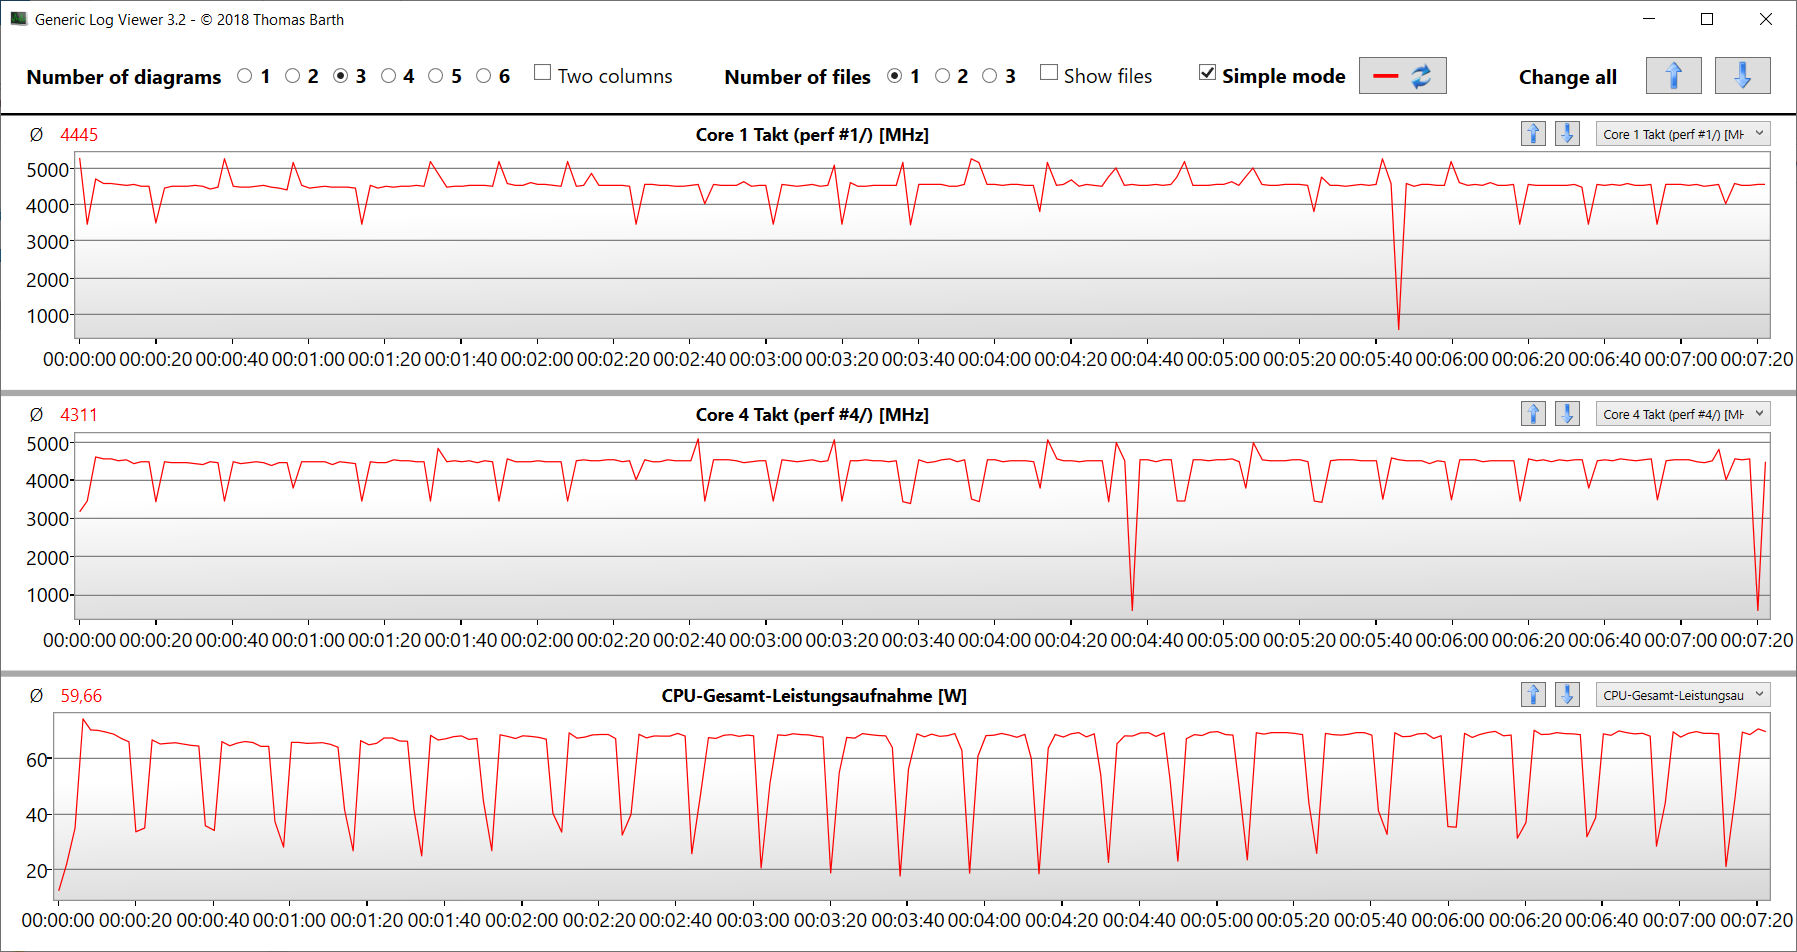
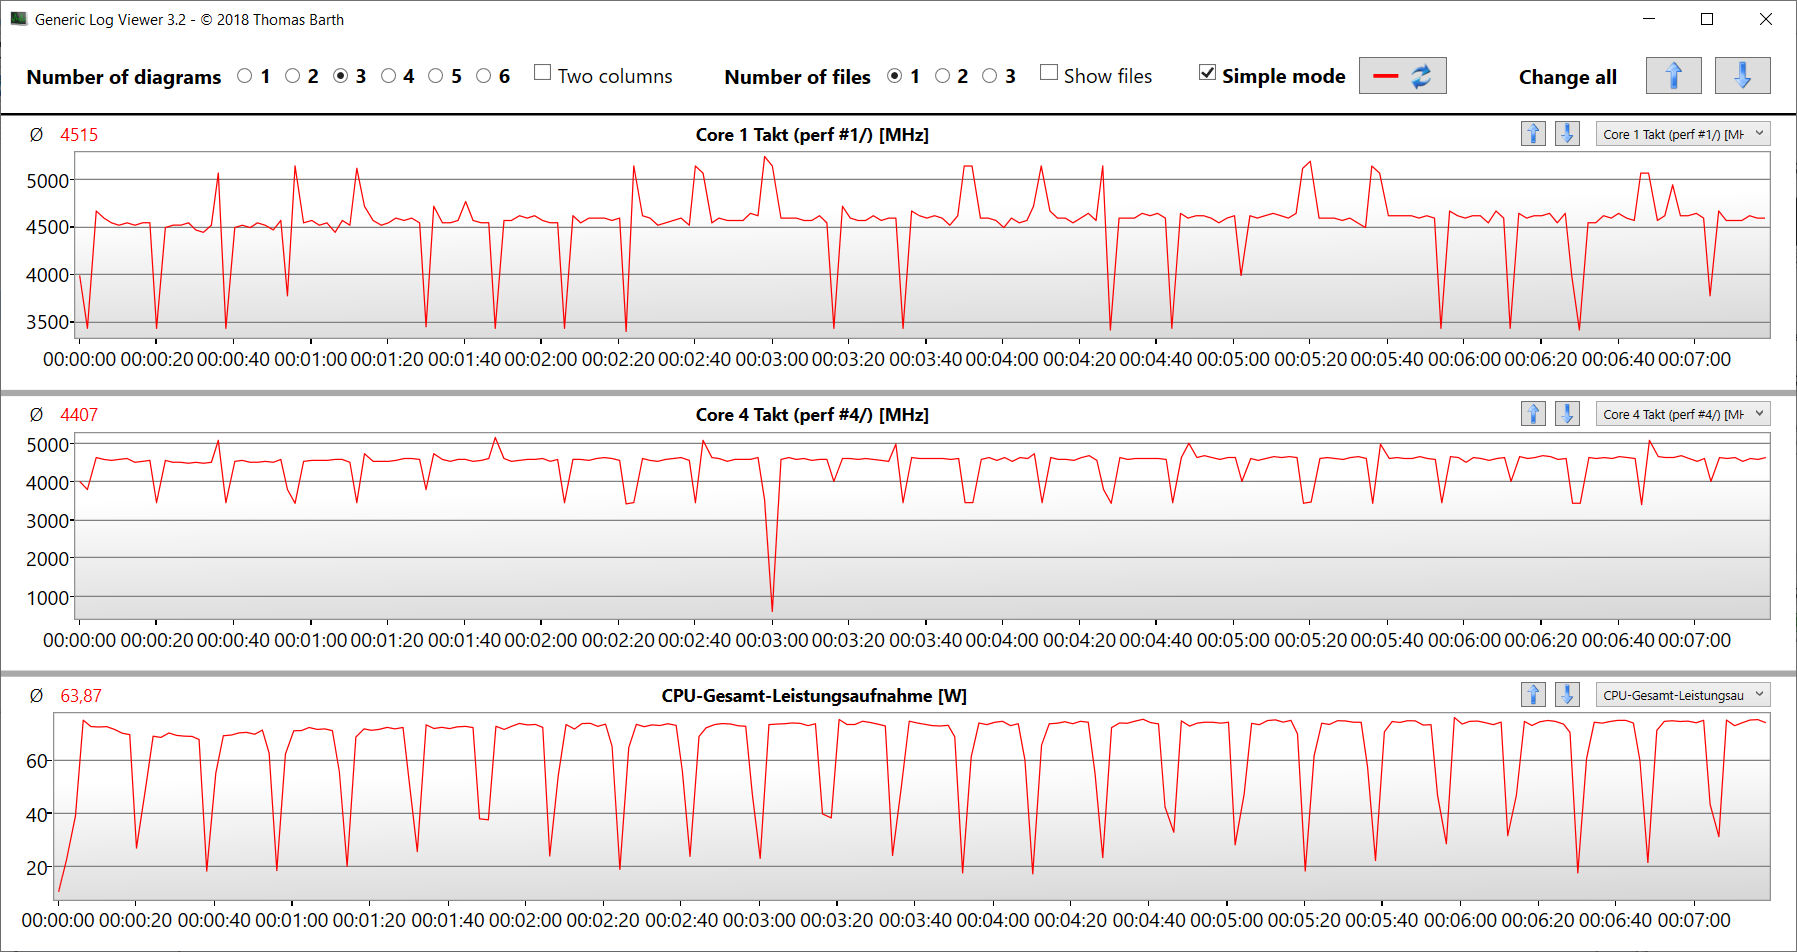
Il test del ciclo CB15 lo dimostra: Il carico continuo di multi-thread porta la CPU a lavorare con velocità di clock turbo costantemente elevate, indipendentemente dal profilo di prestazioni scelto.
Nota bene: informazioni dettagliate sull'APU installata e sulla sua architettura possono essere lette nel nostro articolo di analisiZen4.
Cinebench R15 multi continuous test
* ... Meglio usare valori piccoli
AIDA64: FP32 Ray-Trace | FPU Julia | CPU SHA3 | CPU Queen | FPU SinJulia | FPU Mandel | CPU AES | CPU ZLib | FP64 Ray-Trace | CPU PhotoWorxx
| Performance rating | |
| Media della classe Gaming | |
| Media AMD Ryzen 9 7940HS | |
| Asus TUF Gaming A16 FA617XS | |
| Lenovo Legion Pro 5 16IRX8 | |
| Asus TUF Gaming A16 FA617 | |
| Medion Erazer Defender P40 | |
| MSI Katana 15 B12VEK | |
| Gigabyte G5 KE | |
| AIDA64 / FP32 Ray-Trace | |
| Media della classe Gaming (10227 - 85542, n=105, ultimi 2 anni) | |
| Asus TUF Gaming A16 FA617XS (v6.75.6100) | |
| Media AMD Ryzen 9 7940HS (25226 - 29109, n=10) | |
| Lenovo Legion Pro 5 16IRX8 (v6.85.6300) | |
| Asus TUF Gaming A16 FA617 (v6.85.6300) | |
| MSI Katana 15 B12VEK (v6.85.6300) | |
| Medion Erazer Defender P40 (v6.75.6100) | |
| Gigabyte G5 KE (v6.75.6100) | |
| AIDA64 / FPU Julia | |
| Media della classe Gaming (51376 - 238426, n=105, ultimi 2 anni) | |
| Asus TUF Gaming A16 FA617XS (v6.75.6100) | |
| Media AMD Ryzen 9 7940HS (106512 - 123214, n=10) | |
| Lenovo Legion Pro 5 16IRX8 (v6.85.6300) | |
| Asus TUF Gaming A16 FA617 (v6.85.6300) | |
| Medion Erazer Defender P40 (v6.75.6100) | |
| MSI Katana 15 B12VEK (v6.85.6300) | |
| Gigabyte G5 KE (v6.75.6100) | |
| AIDA64 / CPU SHA3 | |
| Media della classe Gaming (2180 - 10115, n=105, ultimi 2 anni) | |
| Media AMD Ryzen 9 7940HS (4566 - 5119, n=10) | |
| Lenovo Legion Pro 5 16IRX8 (v6.85.6300) | |
| Asus TUF Gaming A16 FA617XS (v6.75.6100) | |
| Asus TUF Gaming A16 FA617 (v6.85.6300) | |
| Medion Erazer Defender P40 (v6.75.6100) | |
| MSI Katana 15 B12VEK (v6.85.6300) | |
| Gigabyte G5 KE (v6.75.6100) | |
| AIDA64 / CPU Queen | |
| Asus TUF Gaming A16 FA617XS (v6.75.6100) | |
| Media AMD Ryzen 9 7940HS (118174 - 124783, n=10) | |
| Media della classe Gaming (49785 - 173351, n=90, ultimi 2 anni) | |
| Lenovo Legion Pro 5 16IRX8 (v6.85.6300) | |
| Medion Erazer Defender P40 (v6.75.6100) | |
| Asus TUF Gaming A16 FA617 (v6.85.6300) | |
| MSI Katana 15 B12VEK (v6.85.6300) | |
| Gigabyte G5 KE (v6.75.6100) | |
| AIDA64 / FPU SinJulia | |
| Asus TUF Gaming A16 FA617XS (v6.75.6100) | |
| Media AMD Ryzen 9 7940HS (14663 - 15551, n=10) | |
| Media della classe Gaming (4424 - 33636, n=105, ultimi 2 anni) | |
| Lenovo Legion Pro 5 16IRX8 (v6.85.6300) | |
| Asus TUF Gaming A16 FA617 (v6.85.6300) | |
| Medion Erazer Defender P40 (v6.75.6100) | |
| MSI Katana 15 B12VEK (v6.85.6300) | |
| Gigabyte G5 KE (v6.75.6100) | |
| AIDA64 / FPU Mandel | |
| Media della classe Gaming (25115 - 128721, n=105, ultimi 2 anni) | |
| Asus TUF Gaming A16 FA617XS (v6.75.6100) | |
| Media AMD Ryzen 9 7940HS (56839 - 66238, n=10) | |
| Asus TUF Gaming A16 FA617 (v6.85.6300) | |
| Lenovo Legion Pro 5 16IRX8 (v6.85.6300) | |
| Medion Erazer Defender P40 (v6.75.6100) | |
| MSI Katana 15 B12VEK (v6.85.6300) | |
| Gigabyte G5 KE (v6.75.6100) | |
| AIDA64 / CPU AES | |
| Media AMD Ryzen 9 7940HS (86309 - 171350, n=10) | |
| Gigabyte G5 KE (v6.75.6100) | |
| Media della classe Gaming (39258 - 247074, n=105, ultimi 2 anni) | |
| Lenovo Legion Pro 5 16IRX8 (v6.85.6300) | |
| Asus TUF Gaming A16 FA617XS (v6.75.6100) | |
| Medion Erazer Defender P40 (v6.75.6100) | |
| MSI Katana 15 B12VEK (v6.85.6300) | |
| Asus TUF Gaming A16 FA617 (v6.85.6300) | |
| AIDA64 / CPU ZLib | |
| Media della classe Gaming (574 - 2531, n=105, ultimi 2 anni) | |
| Lenovo Legion Pro 5 16IRX8 (v6.85.6300) | |
| Asus TUF Gaming A16 FA617XS (v6.75.6100) | |
| Media AMD Ryzen 9 7940HS (866 - 1152, n=10) | |
| Medion Erazer Defender P40 (v6.75.6100) | |
| Gigabyte G5 KE (v6.75.6100) | |
| Asus TUF Gaming A16 FA617 (v6.85.6300) | |
| MSI Katana 15 B12VEK (v6.85.6300) | |
| AIDA64 / FP64 Ray-Trace | |
| Media della classe Gaming (5509 - 45446, n=105, ultimi 2 anni) | |
| Asus TUF Gaming A16 FA617XS (v6.75.6100) | |
| Media AMD Ryzen 9 7940HS (13175 - 15675, n=10) | |
| Lenovo Legion Pro 5 16IRX8 (v6.85.6300) | |
| Asus TUF Gaming A16 FA617 (v6.85.6300) | |
| MSI Katana 15 B12VEK (v6.85.6300) | |
| Medion Erazer Defender P40 (v6.75.6100) | |
| Gigabyte G5 KE (v6.75.6100) | |
| AIDA64 / CPU PhotoWorxx | |
| Media della classe Gaming (12271 - 89891, n=105, ultimi 2 anni) | |
| MSI Katana 15 B12VEK (v6.85.6300) | |
| Lenovo Legion Pro 5 16IRX8 (v6.85.6300) | |
| Medion Erazer Defender P40 (v6.75.6100) | |
| Media AMD Ryzen 9 7940HS (22477 - 41567, n=10) | |
| Asus TUF Gaming A16 FA617XS (v6.75.6100) | |
| Gigabyte G5 KE (v6.75.6100) | |
| Asus TUF Gaming A16 FA617 (v6.85.6300) | |
Prestazioni del sistema
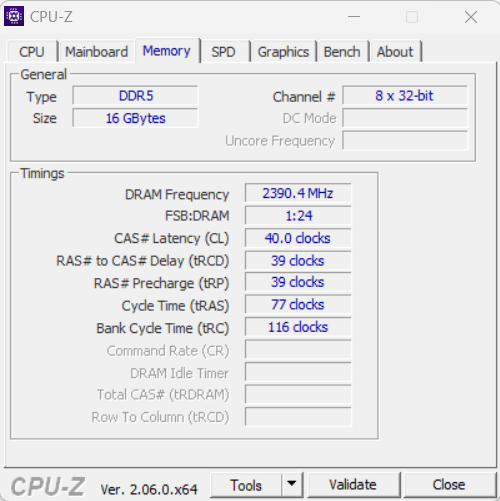
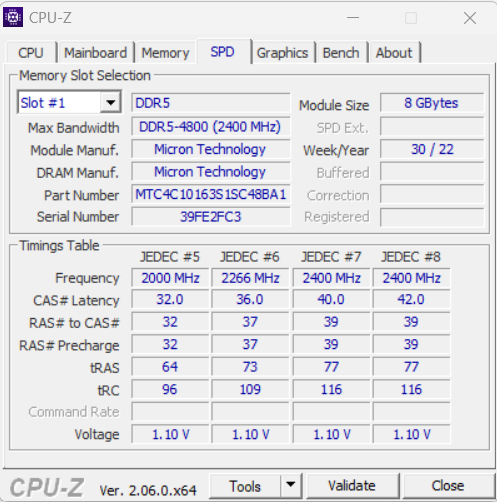
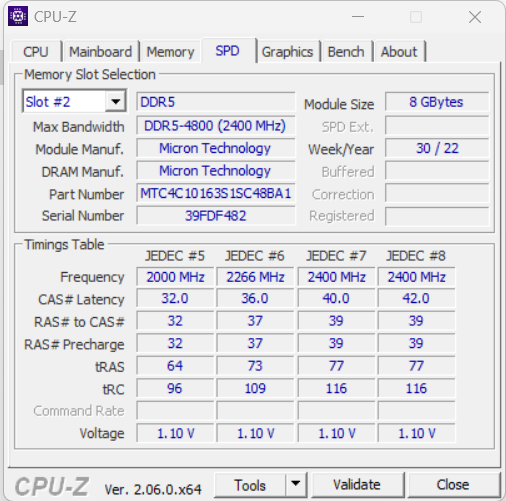
Il sistema funziona in modo fluido e fornisce prestazioni sufficienti per le aree di utilizzo più impegnative, come il rendering, l'editing video e il gioco - i buoni risultati di PCMark lo confermano. Le velocità di trasferimento della RAM sono nella norma per una RAM DDR5 4800. È importante notare che il passaggio automatico tra dGPU e iGPU (Smart Access Graphic) richiede sempre uno o due secondi. Durante questo tempo, il sistema si blocca.
CrossMark: Overall | Productivity | Creativity | Responsiveness
| PCMark 10 / Score | |
| Media della classe Gaming (5828 - 12414, n=93, ultimi 2 anni) | |
| Asus TUF Gaming A16 FA617XS | |
| Media AMD Ryzen 9 7940HS, AMD Radeon RX 7600S (n=1) | |
| Lenovo Legion Pro 5 16IRX8 | |
| Asus TUF Gaming A16 FA617 | |
| Gigabyte G5 KE | |
| Medion Erazer Defender P40 | |
| MSI Katana 15 B12VEK | |
| PCMark 10 / Essentials | |
| Gigabyte G5 KE | |
| Lenovo Legion Pro 5 16IRX8 | |
| Asus TUF Gaming A16 FA617XS | |
| Media AMD Ryzen 9 7940HS, AMD Radeon RX 7600S (n=1) | |
| Media della classe Gaming (8810 - 11935, n=97, ultimi 2 anni) | |
| Asus TUF Gaming A16 FA617 | |
| MSI Katana 15 B12VEK | |
| Medion Erazer Defender P40 | |
| PCMark 10 / Productivity | |
| Media della classe Gaming (6845 - 25323, n=95, ultimi 2 anni) | |
| Asus TUF Gaming A16 FA617XS | |
| Media AMD Ryzen 9 7940HS, AMD Radeon RX 7600S (n=1) | |
| Medion Erazer Defender P40 | |
| MSI Katana 15 B12VEK | |
| Gigabyte G5 KE | |
| Asus TUF Gaming A16 FA617 | |
| Lenovo Legion Pro 5 16IRX8 | |
| PCMark 10 / Digital Content Creation | |
| Media della classe Gaming (7602 - 19954, n=95, ultimi 2 anni) | |
| Lenovo Legion Pro 5 16IRX8 | |
| Asus TUF Gaming A16 FA617XS | |
| Media AMD Ryzen 9 7940HS, AMD Radeon RX 7600S (n=1) | |
| Asus TUF Gaming A16 FA617 | |
| Gigabyte G5 KE | |
| Medion Erazer Defender P40 | |
| MSI Katana 15 B12VEK | |
| CrossMark / Overall | |
| Media della classe Gaming (1366 - 2409, n=94, ultimi 2 anni) | |
| Medion Erazer Defender P40 | |
| Asus TUF Gaming A16 FA617XS | |
| Media AMD Ryzen 9 7940HS, AMD Radeon RX 7600S (n=1) | |
| Gigabyte G5 KE | |
| MSI Katana 15 B12VEK | |
| Lenovo Legion Pro 5 16IRX8 | |
| CrossMark / Productivity | |
| Media della classe Gaming (1386 - 2254, n=94, ultimi 2 anni) | |
| Gigabyte G5 KE | |
| Asus TUF Gaming A16 FA617XS | |
| Media AMD Ryzen 9 7940HS, AMD Radeon RX 7600S (n=1) | |
| MSI Katana 15 B12VEK | |
| Medion Erazer Defender P40 | |
| Lenovo Legion Pro 5 16IRX8 | |
| CrossMark / Creativity | |
| Media della classe Gaming (1343 - 2786, n=94, ultimi 2 anni) | |
| Medion Erazer Defender P40 | |
| Asus TUF Gaming A16 FA617XS | |
| Media AMD Ryzen 9 7940HS, AMD Radeon RX 7600S (n=1) | |
| MSI Katana 15 B12VEK | |
| Gigabyte G5 KE | |
| Lenovo Legion Pro 5 16IRX8 | |
| CrossMark / Responsiveness | |
| Gigabyte G5 KE | |
| Media della classe Gaming (1226 - 2334, n=94, ultimi 2 anni) | |
| Lenovo Legion Pro 5 16IRX8 | |
| Medion Erazer Defender P40 | |
| MSI Katana 15 B12VEK | |
| Asus TUF Gaming A16 FA617XS | |
| Media AMD Ryzen 9 7940HS, AMD Radeon RX 7600S (n=1) | |
| PCMark 8 Home Score Accelerated v2 | 5937 punti | |
| PCMark 8 Work Score Accelerated v2 | 6458 punti | |
| PCMark 10 Score | 7927 punti | |
Aiuto | ||
| AIDA64 / Memory Copy | |
| Media della classe Gaming (21750 - 129946, n=105, ultimi 2 anni) | |
| Media AMD Ryzen 9 7940HS (35327 - 78739, n=10) | |
| Asus TUF Gaming A16 FA617XS | |
| Lenovo Legion Pro 5 16IRX8 | |
| Medion Erazer Defender P40 | |
| MSI Katana 15 B12VEK | |
| Asus TUF Gaming A16 FA617 | |
| Gigabyte G5 KE | |
| AIDA64 / Memory Read | |
| Media della classe Gaming (22956 - 118858, n=105, ultimi 2 anni) | |
| Lenovo Legion Pro 5 16IRX8 | |
| Medion Erazer Defender P40 | |
| MSI Katana 15 B12VEK | |
| Asus TUF Gaming A16 FA617XS | |
| Media AMD Ryzen 9 7940HS (30769 - 61836, n=10) | |
| Asus TUF Gaming A16 FA617 | |
| Gigabyte G5 KE | |
| AIDA64 / Memory Write | |
| Media AMD Ryzen 9 7940HS (42217 - 91567, n=10) | |
| Media della classe Gaming (22297 - 135096, n=105, ultimi 2 anni) | |
| Asus TUF Gaming A16 FA617XS | |
| Lenovo Legion Pro 5 16IRX8 | |
| Medion Erazer Defender P40 | |
| MSI Katana 15 B12VEK | |
| Asus TUF Gaming A16 FA617 | |
| Gigabyte G5 KE | |
| AIDA64 / Memory Latency | |
| Media della classe Gaming (75.3 - 259, n=105, ultimi 2 anni) | |
| Gigabyte G5 KE | |
| MSI Katana 15 B12VEK | |
| Medion Erazer Defender P40 | |
| Media AMD Ryzen 9 7940HS (87.6 - 111.1, n=10) | |
| Asus TUF Gaming A16 FA617XS | |
| Asus TUF Gaming A16 FA617 | |
| Lenovo Legion Pro 5 16IRX8 | |
* ... Meglio usare valori piccoli
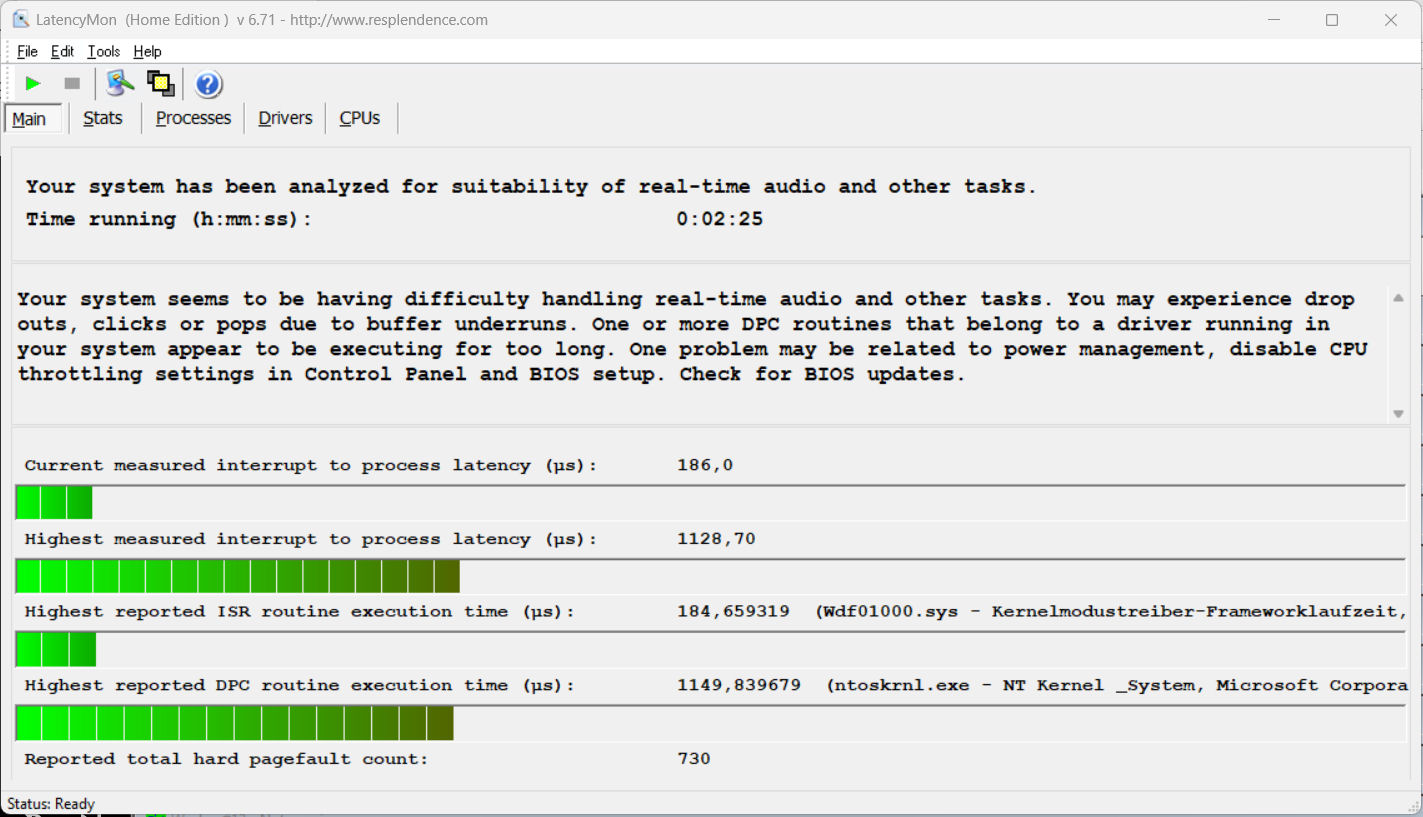
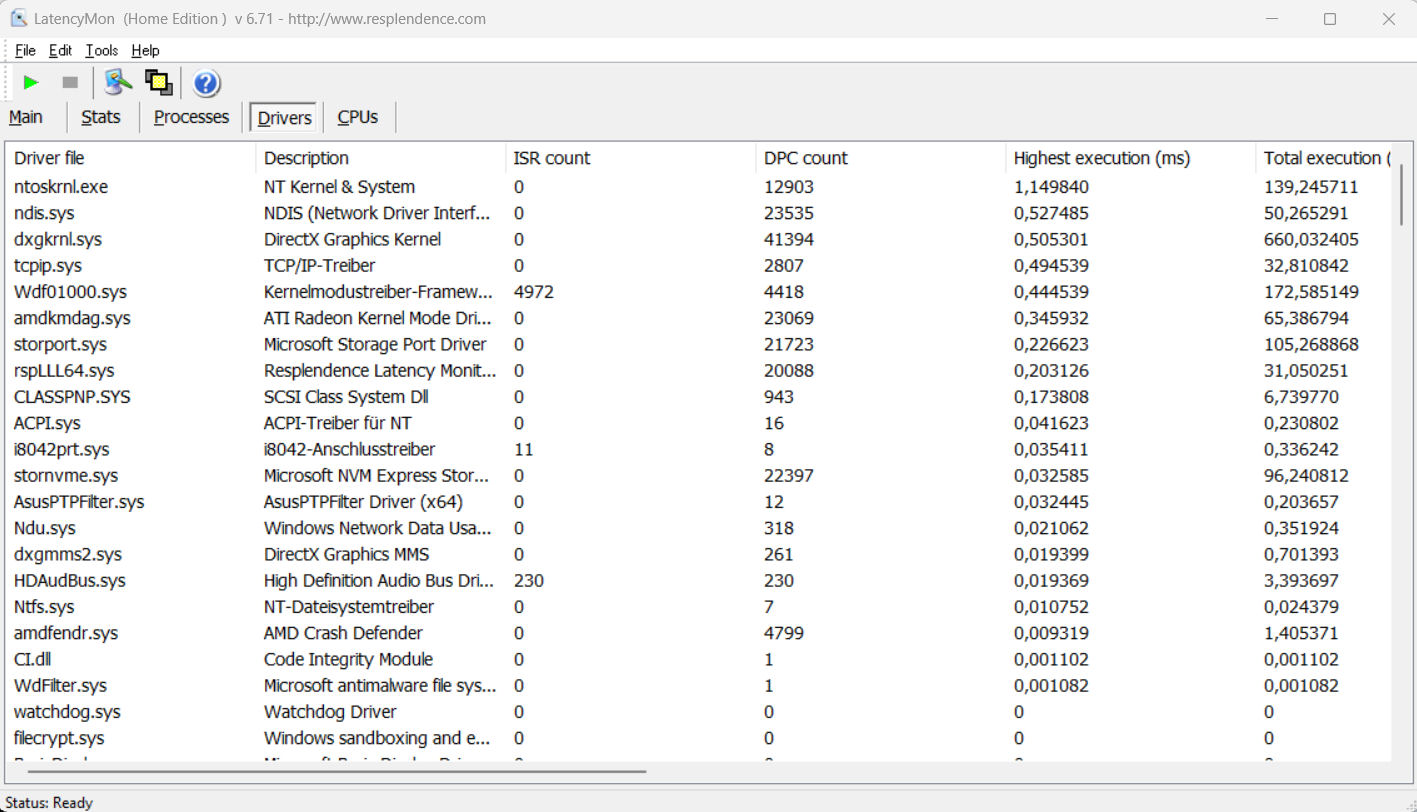
Latenza DPC
Il test standardizzato di monitoraggio della latenza (navigazione web, riproduzione video 4k, Prime95 ad alto carico) ha rivelato alcune anomalie. Il sistema non sembra essere adatto all'editing video e audio in tempo reale. I futuri aggiornamenti del software potrebbero portare a miglioramenti o addirittura a peggioramenti.
| DPC Latencies / LatencyMon - interrupt to process latency (max), Web, Youtube, Prime95 | |
| MSI Katana 15 B12VEK | |
| Medion Erazer Defender P40 | |
| Asus TUF Gaming A16 FA617XS | |
| Gigabyte G5 KE | |
| Lenovo Legion Pro 5 16IRX8 | |
| Asus TUF Gaming A16 FA617 | |
* ... Meglio usare valori piccoli
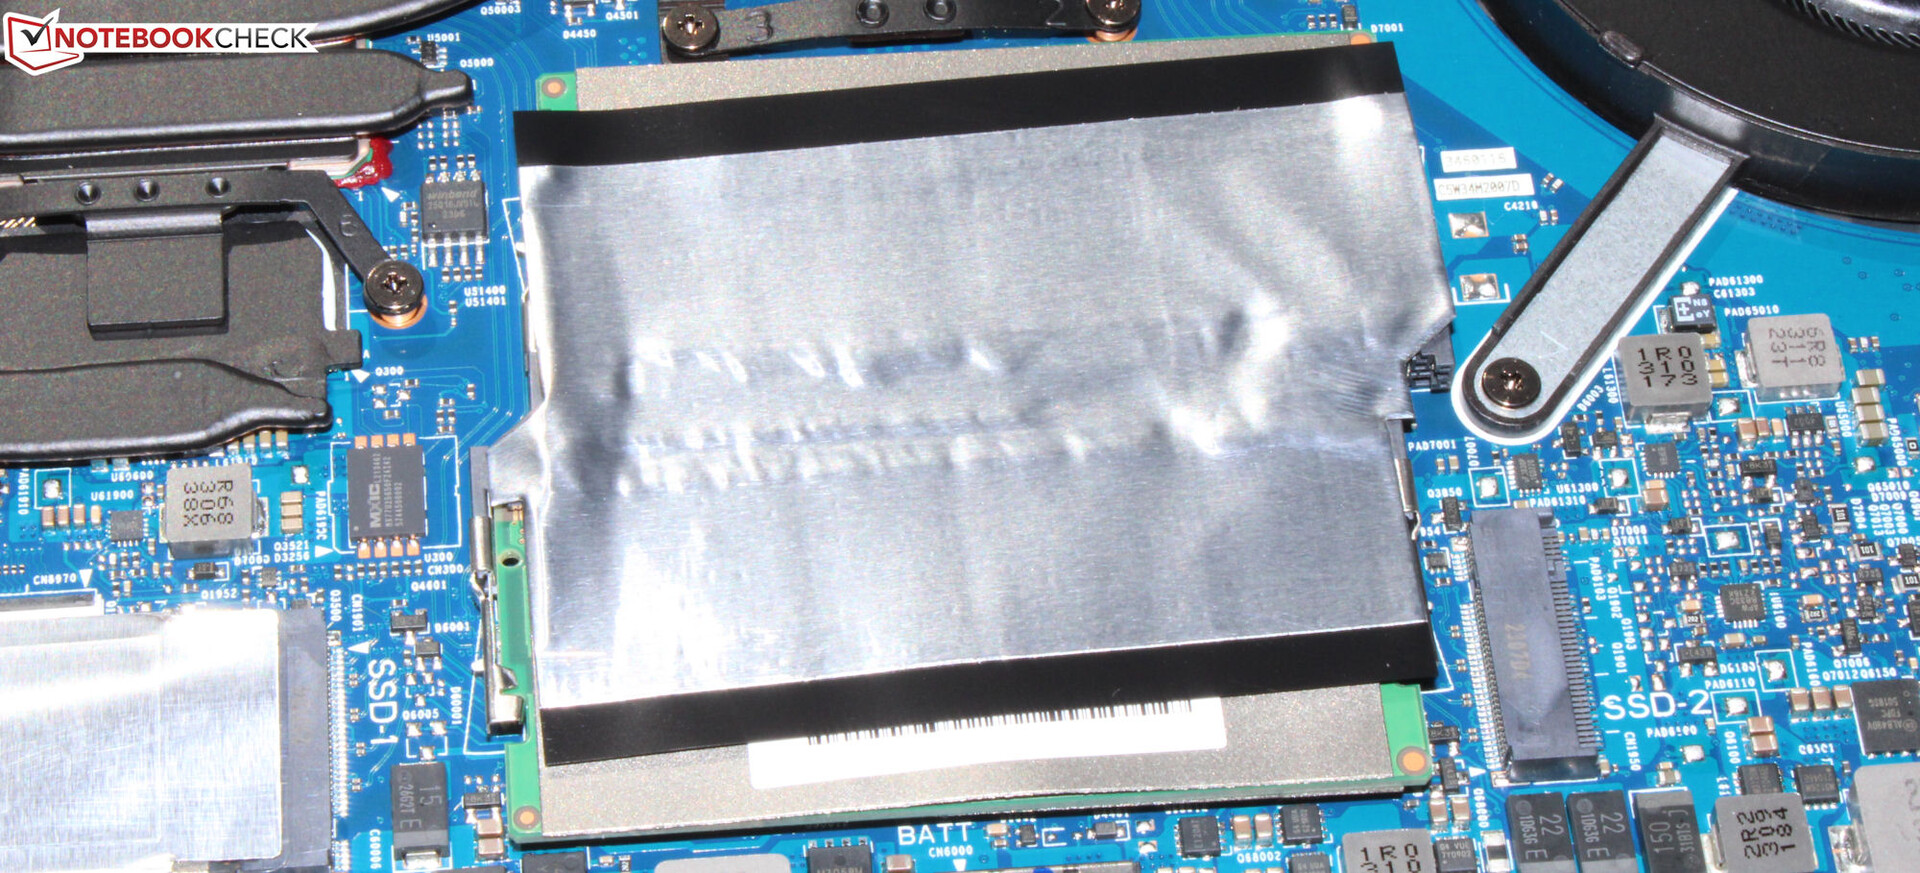
Dispositivi di archiviazione
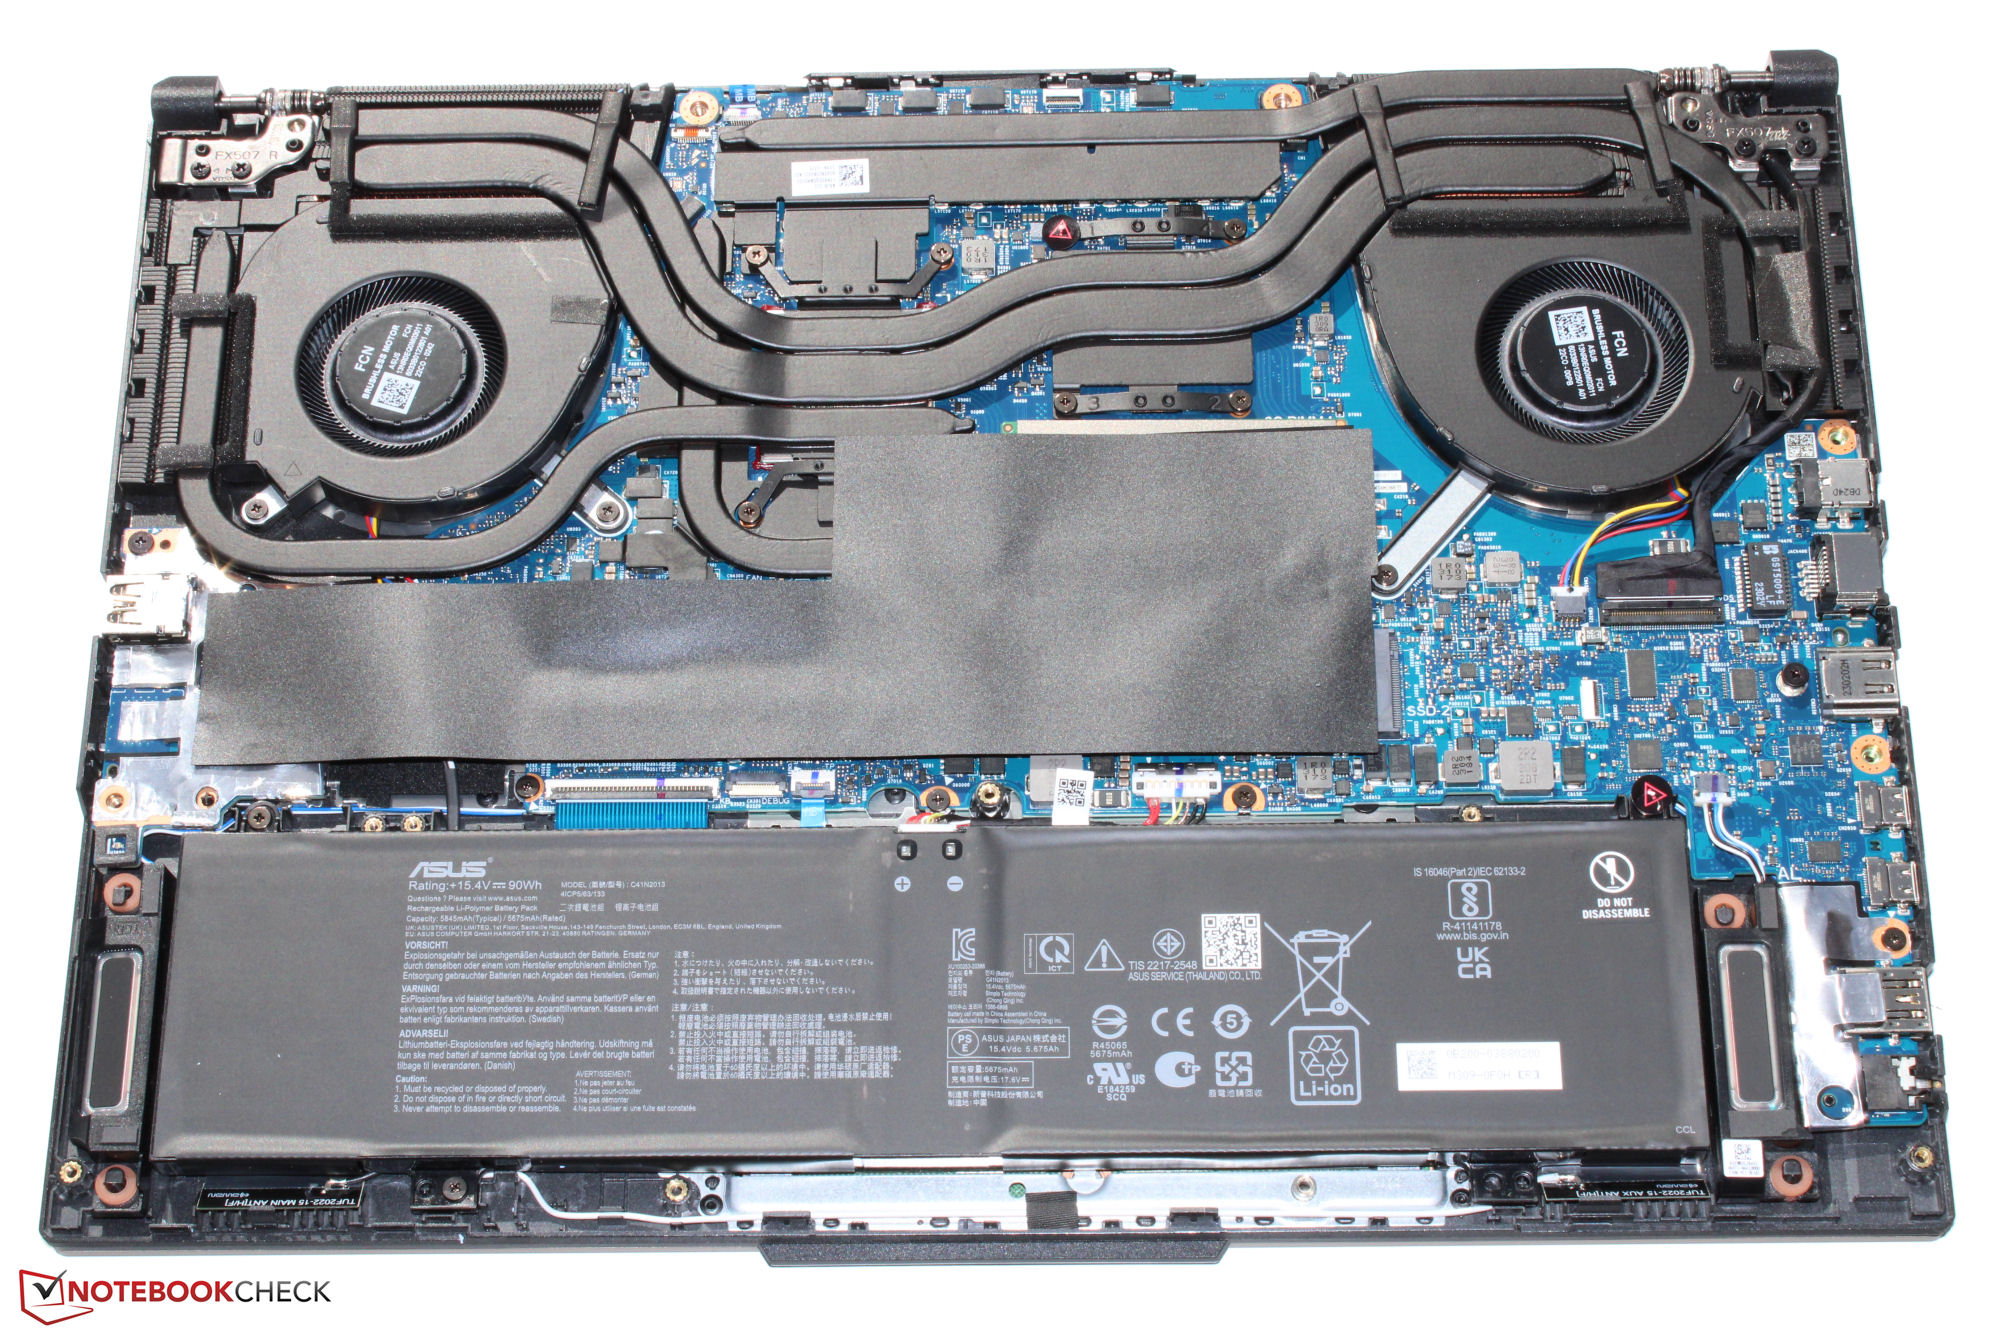
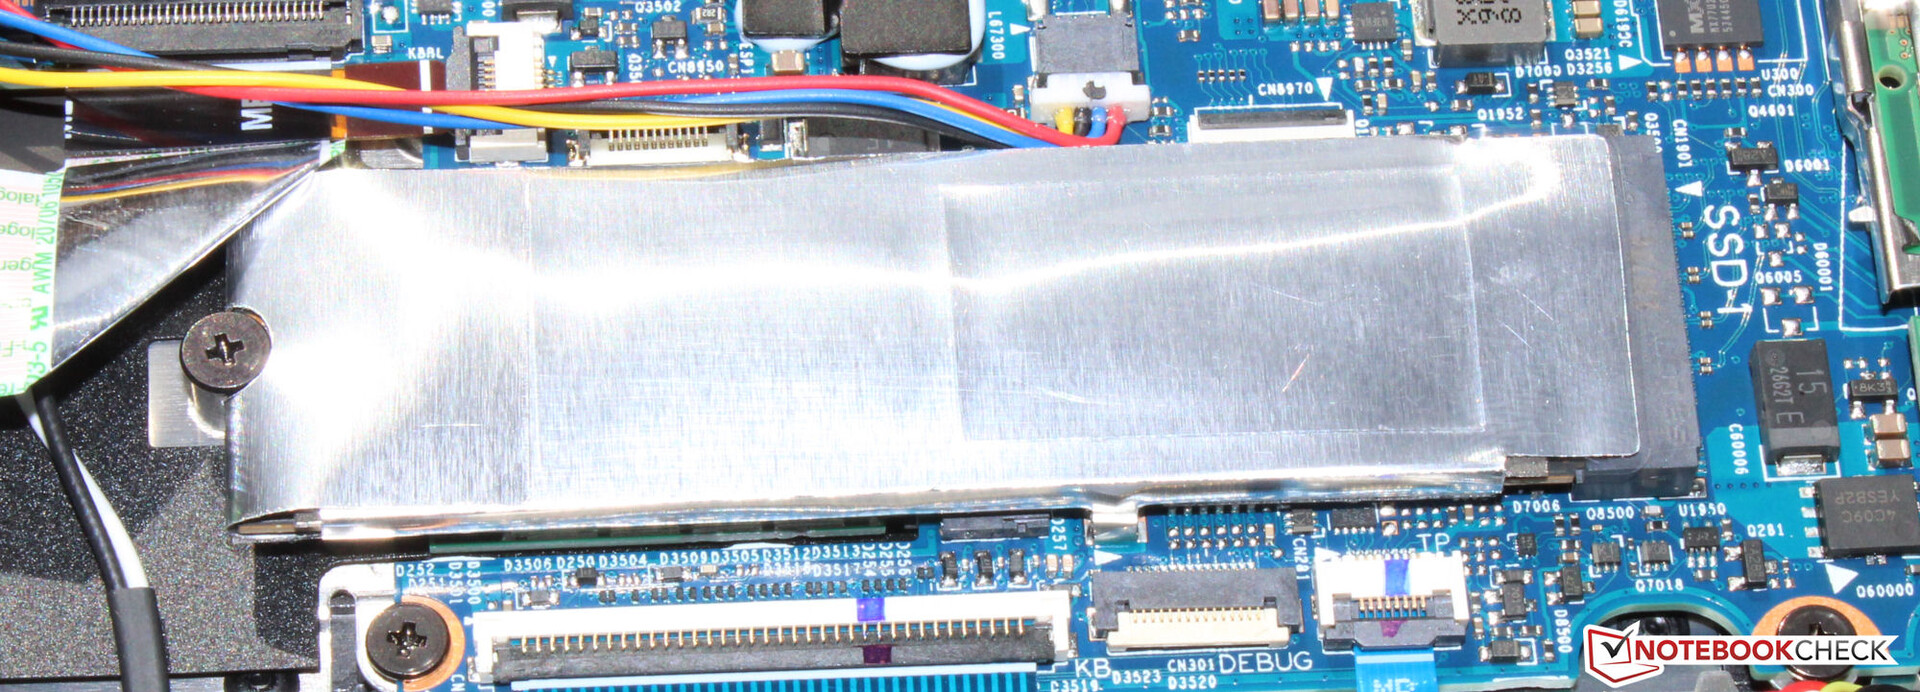
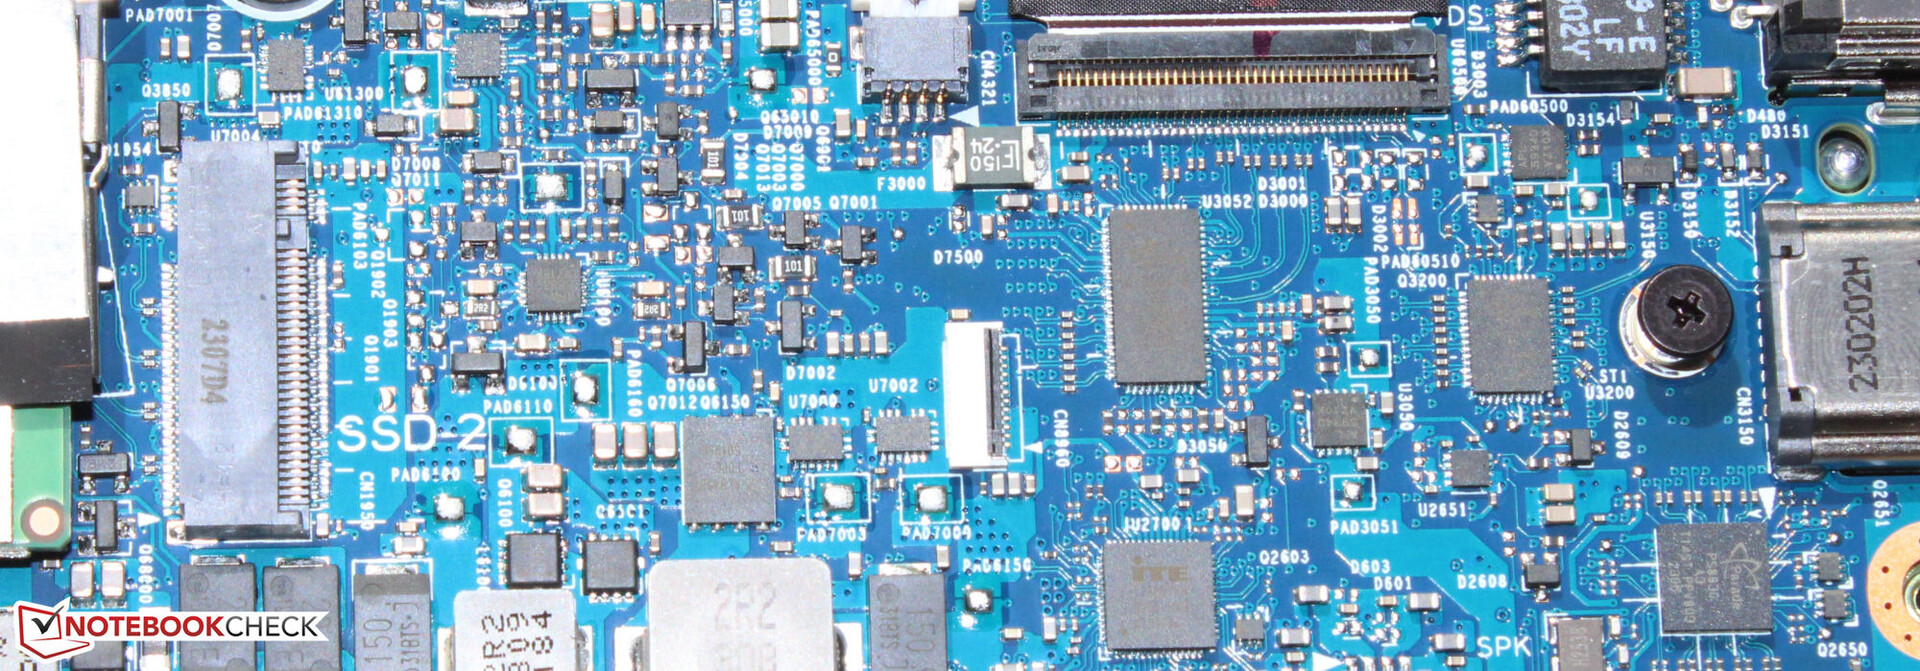
Asus ha dotato l'A16 di un'unità SSD da 512 GB (PCIe 4, M.2-2280) di Micron - uno spazio di archiviazione (troppo) ridotto per un notebook da gioco. Offre una velocità di trasferimento dati decente, ma non è uno dei modelli migliori tra tutte le unità SSD disponibili. Soprattutto le velocità di scrittura sono molto inferiori alle possibilità attuali.

* ... Meglio usare valori piccoli
reading continuous performance: DiskSpd Read Loop, Queue Depth 8
Scheda grafica
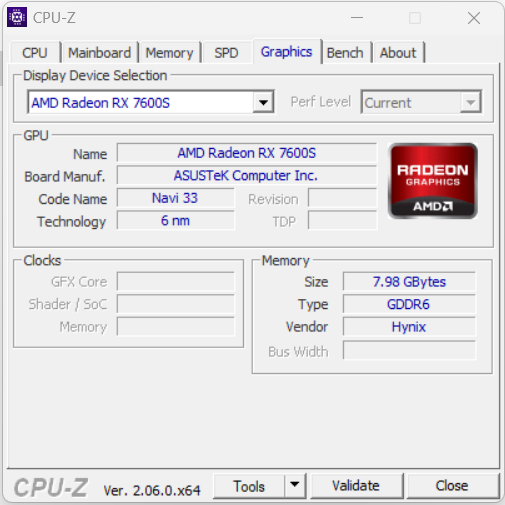
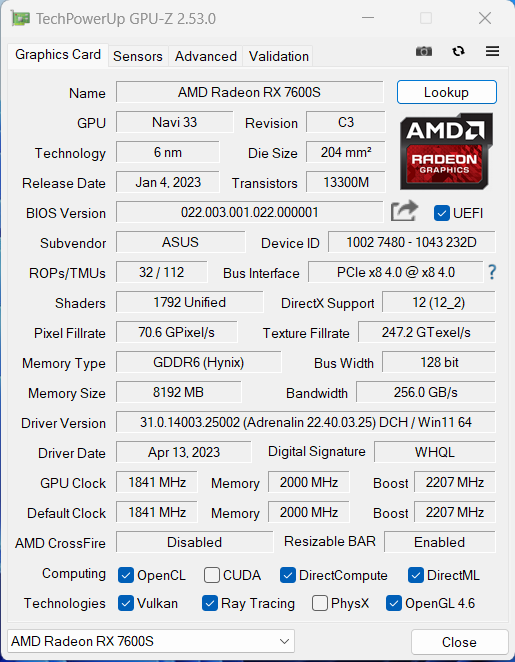
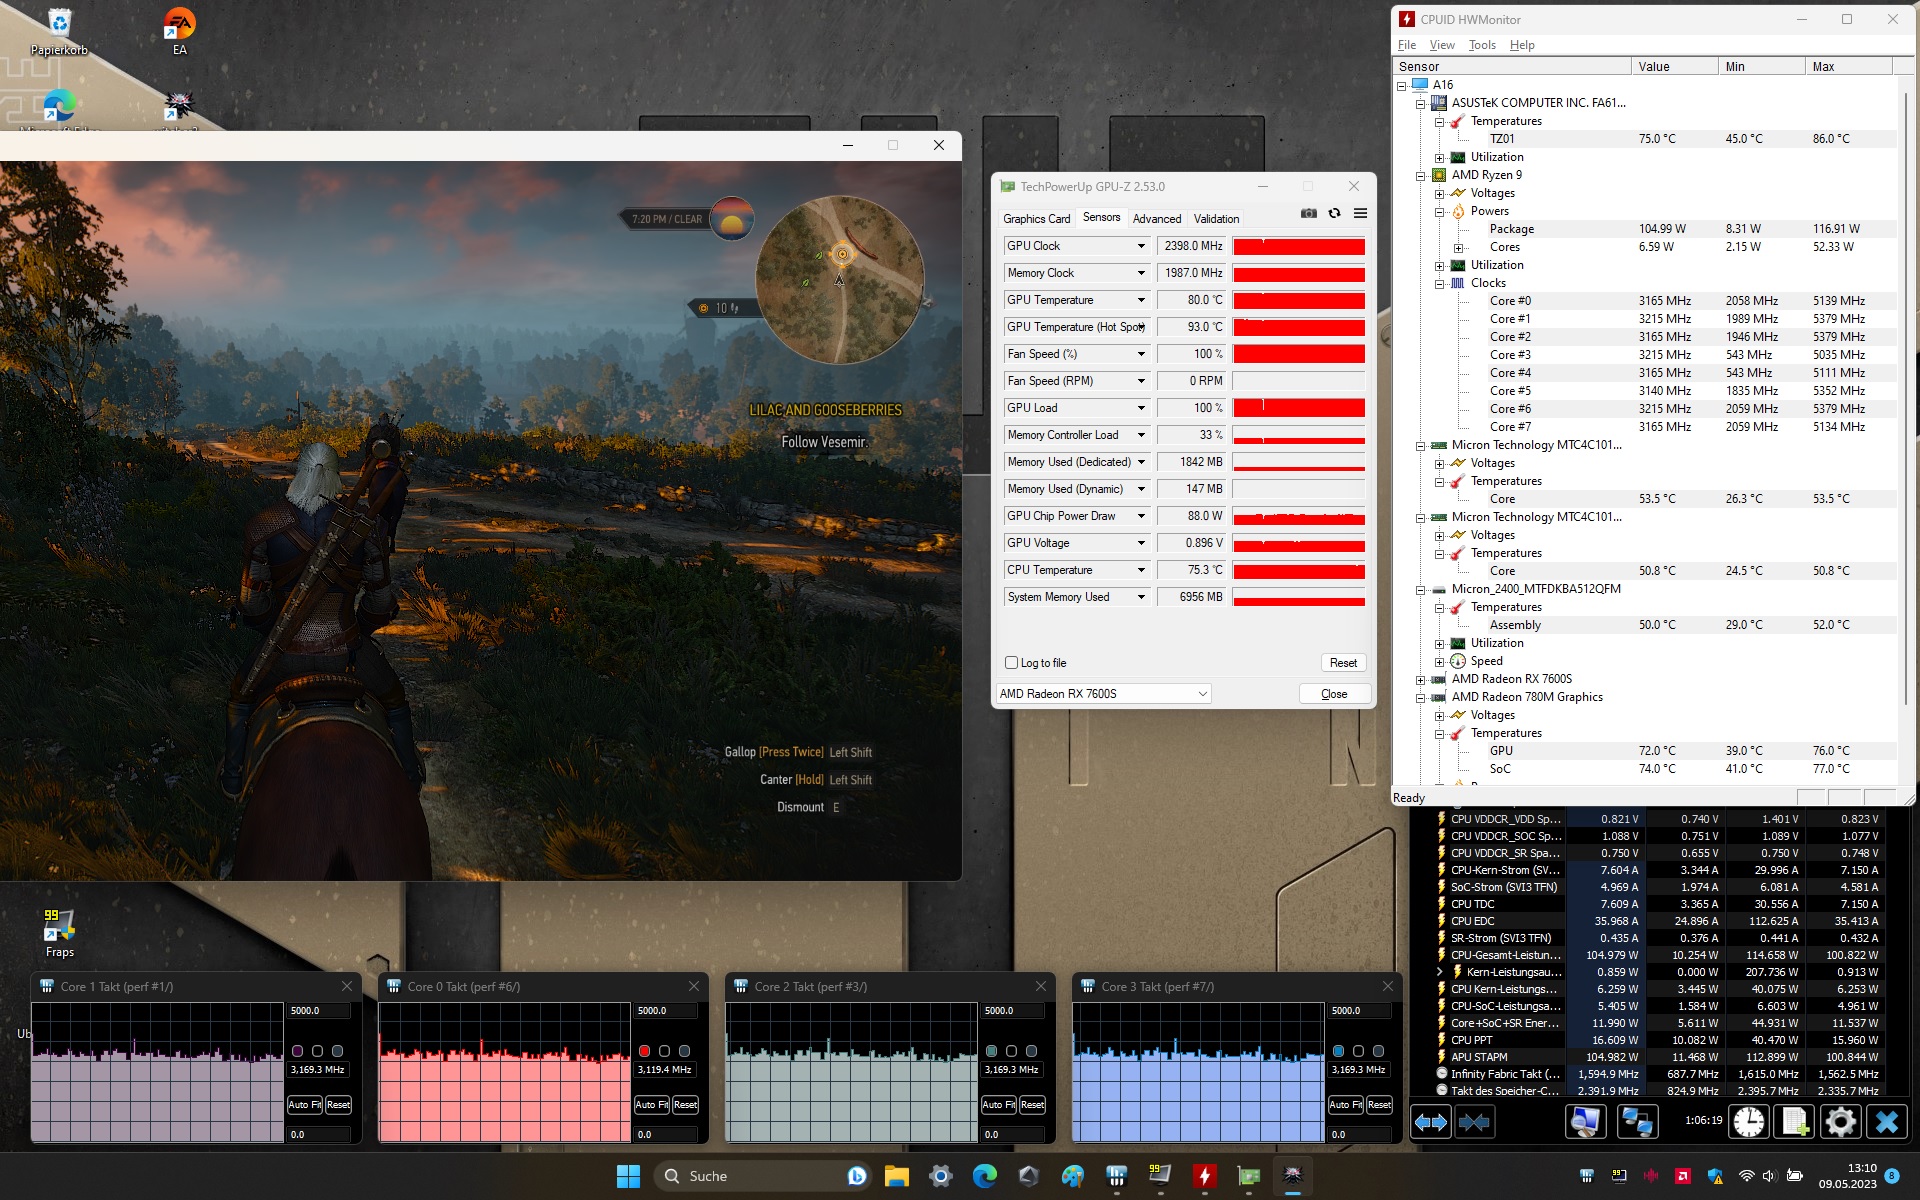
La Radeon RX 7600S di AMDdispone di 1.792 shader, un bus largo 128 bit e una veloce memoria GDDR6 (8.192 MB). Secondo il test, il suo TGP massimo (95 watt) non viene utilizzato al massimo del suo potenziale Witcher 3 test. I risultati dei benchmark sono esattamente quelli attesi e l'uso del profilo "Turbo" non porta ad alcun miglioramento delle prestazioni.
I concorrenti della GPU di fascia media possono essere trovati nei modelli GeForce RTX 4060,RTX 4050e RTX 3060(= TGP massimo). Sebbene non riesca a tenere il passo con la RTX 4060, nei benchmark 3DMark ha comunque fatto meglio di entrambi i modelli GeForce. Nell'uso pratico del gioco, non siamo riusciti a ottenere un quadro coerente: A seconda del gioco, a volte una GPU ha fatto meglio, a volte l'altra, almeno nei giochi che abbiamo testato.


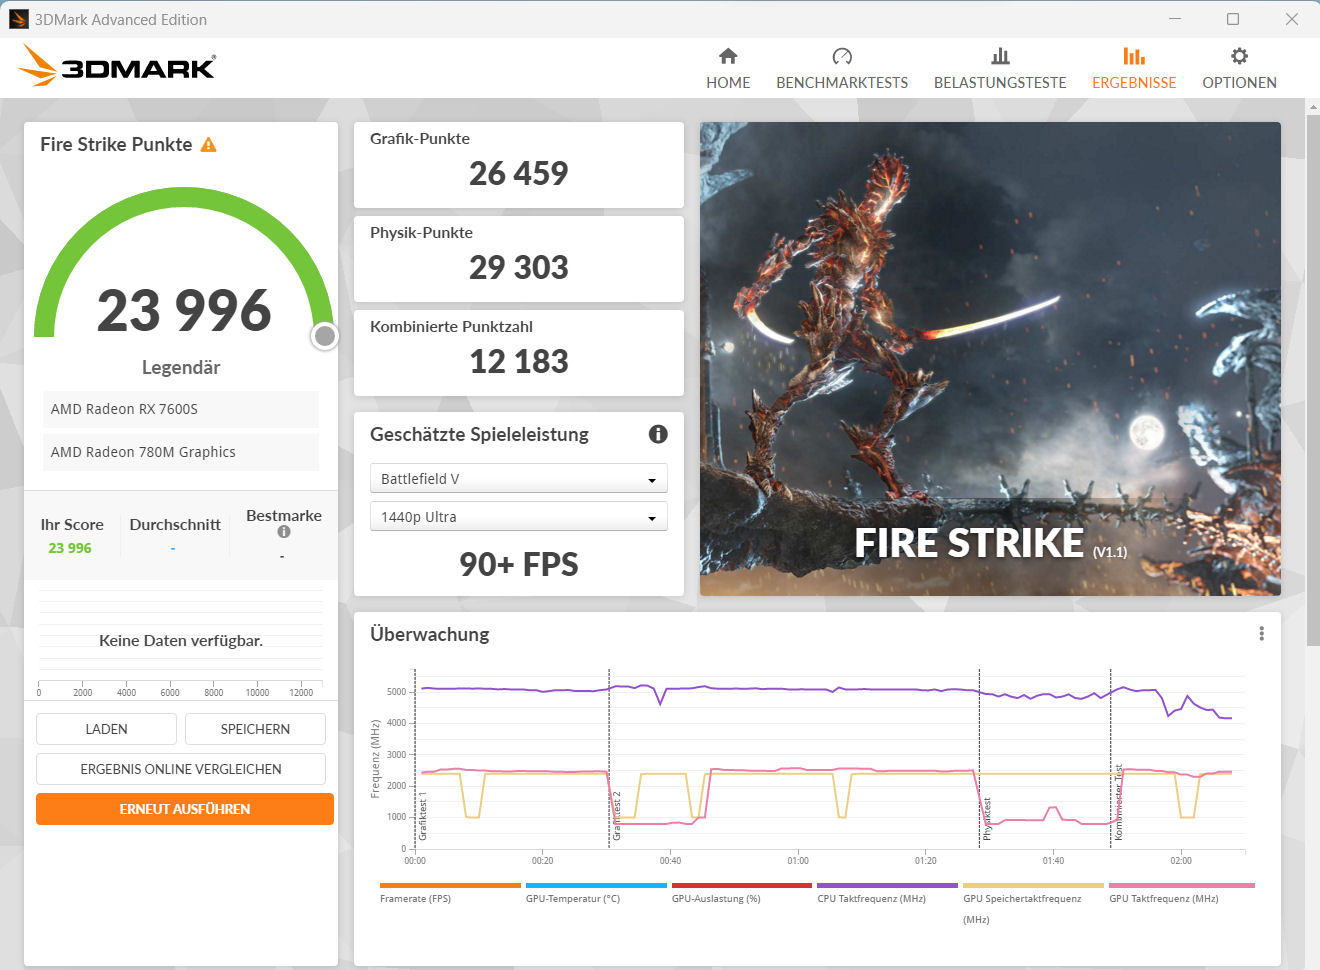

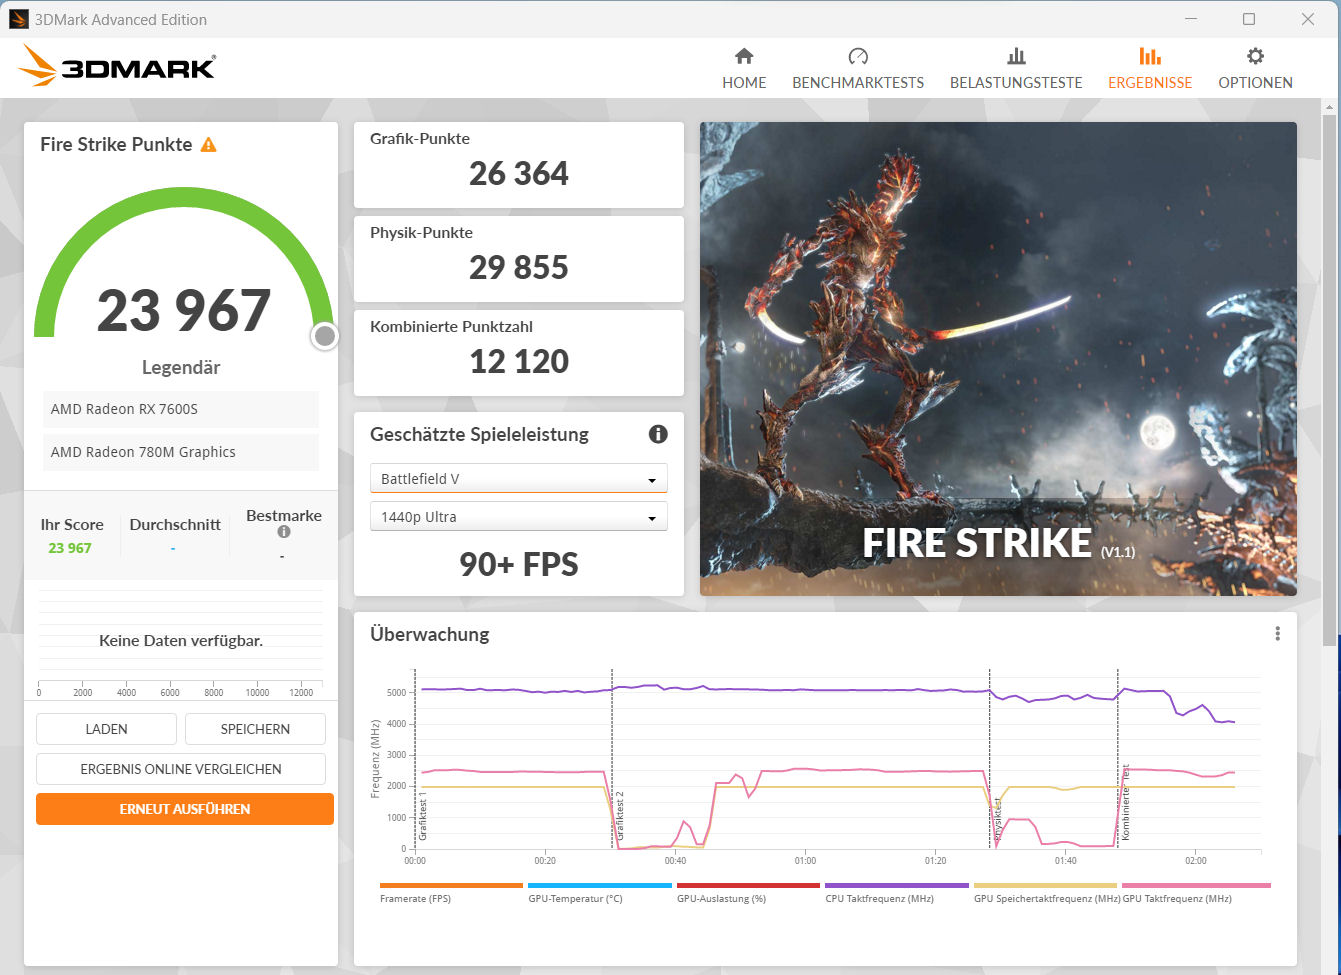
| 3DMark 06 Standard Score | 55435 punti | |
| 3DMark 11 Performance | 28721 punti | |
| 3DMark Cloud Gate Standard Score | 64441 punti | |
| 3DMark Fire Strike Score | 23346 punti | |
| 3DMark Time Spy Score | 9530 punti | |
Aiuto | ||
| V-Ray 5 Benchmark | |
| GPU RTX | |
| Media della classe Gaming (1146 - 4363, n=33, ultimi 2 anni) | |
| Lenovo Legion Pro 5 16IRX8 (5.0.1) | |
| Medion Erazer Defender P40 (5.0.1) | |
| Gigabyte G7 KE (5.0.1) | |
| GPU CUDA | |
| Media della classe Gaming (887 - 3288, n=33, ultimi 2 anni) | |
| Lenovo Legion Pro 5 16IRX8 (5.0.1) | |
| Medion Erazer Defender P40 (5.0.1) | |
| Gigabyte G7 KE (5.0.1) | |
| Asus TUF Gaming A16 FA617XS (5.0.1) | |
| Media AMD Radeon RX 7600S (n=1) | |
| CPU | |
| Media della classe Gaming (5864 - 30302, n=32, ultimi 2 anni) | |
| Lenovo Legion Pro 5 16IRX8 (5.0.1) | |
| Medion Erazer Defender P40 (5.0.1) | |
| Asus TUF Gaming A16 FA617XS (5.0.1) | |
| Media AMD Radeon RX 7600S (n=1) | |
| Gigabyte G7 KE (5.0.1) | |
| V-Ray Benchmark Next 4.10 | |
| GPU | |
| Media della classe Gaming (427 - 1627, n=99, ultimi 2 anni) | |
| Medion Erazer Defender P40 (v4.10.07 ) | |
| MSI Katana 15 B12VEK (v4.10.07 ) | |
| Gigabyte G5 KE (v4.10.07 ) | |
| Gigabyte G7 KE (v4.10.07 ) | |
| Asus TUF Gaming A16 FA617XS (v4.10.07 ) | |
| Media AMD Radeon RX 7600S (83 - 96, n=2) | |
| Asus TUF Gaming A16 FA617 (v4.10.07 ) | |
| CPU | |
| Media della classe Gaming (10048 - 45327, n=97, ultimi 2 anni) | |
| Medion Erazer Defender P40 (v4.10.07 ) | |
| Asus TUF Gaming A16 FA617XS (v4.10.07 ) | |
| Media AMD Radeon RX 7600S (14759 - 17623, n=2) | |
| Asus TUF Gaming A16 FA617 (v4.10.07 ) | |
| Gigabyte G7 KE (v4.10.07 ) | |
| Gigabyte G5 KE (v4.10.07 ) | |
| MSI Katana 15 B12VEK (v4.10.07 ) | |
Prestazioni di gioco
L'FA617 è progettato per i giochi con impostazioni elevate o massime. È possibile utilizzare la risoluzione a schermo intero (1.920 x 1.200 pixel). Risoluzioni più elevate sono utilizzabili quando è collegato un display corrispondente, con impostazioni parzialmente ridotte. Il profilo "Turbo" non aumenta il frame rate.
| The Witcher 3 - 1920x1080 Ultra Graphics & Postprocessing (HBAO+) | |
| Media della classe Gaming (104.7 - 240, n=6, ultimi 2 anni) | |
| Lenovo Legion Pro 5 16IRX8 | |
| Medion Erazer Defender P40 | |
| Asus TUF Gaming A16 FA617XS (neu) | |
| Media AMD Radeon RX 7600S (91 - 98.1, n=2) | |
| Asus TUF Gaming A16 FA617 | |
| Gigabyte G5 KE | |
| MSI Katana 15 B12VEK | |
| Final Fantasy XV Benchmark - 1920x1080 High Quality | |
| Media della classe Gaming (41 - 215, n=95, ultimi 2 anni) | |
| Lenovo Legion Pro 5 16IRX8 (1.3) | |
| Medion Erazer Defender P40 (1.3) | |
| Gigabyte G5 KE (1.3) | |
| Asus TUF Gaming A16 FA617XS (1.3) | |
| MSI Katana 15 B12VEK (1.3) | |
| Media AMD Radeon RX 7600S (78.2 - 85.2, n=2) | |
| Asus TUF Gaming A16 FA617 (1.3) | |
| Strange Brigade - 1920x1080 ultra AA:ultra AF:16 | |
| Media della classe Gaming (76.3 - 456, n=86, ultimi 2 anni) | |
| Medion Erazer Defender P40 (1.47.22.14 D3D12) | |
| Asus TUF Gaming A16 FA617XS (1.47.22.14 D3D12) | |
| Media AMD Radeon RX 7600S (162.7 - 163.3, n=2) | |
| Asus TUF Gaming A16 FA617 (1.47.22.14 D3D12) | |
| Gigabyte G5 KE (1.47.22.14 D3D12) | |
| MSI Katana 15 B12VEK (1.47.22.14 D3D12) | |
| Returnal | |
| 1920x1080 Epic Preset | |
| Lenovo Legion Pro 5 16IRX8 | |
| Asus TUF Gaming A16 FA617XS | |
| Media AMD Radeon RX 7600S (n=1) | |
| 1920x1080 Epic Preset + Epic Ray-Tracing | |
| Asus TUF Gaming A16 FA617XS | |
| Media AMD Radeon RX 7600S (n=1) | |
| Atomic Heart - 1920x1080 Atomic Preset | |
| Asus TUF Gaming A16 FA617XS | |
| Media AMD Radeon RX 7600S (n=1) | |
| Sons of the Forest - 1920x1080 Ultra Preset AA:T | |
| Asus TUF Gaming A16 FA617XS | |
| Media AMD Radeon RX 7600S (n=1) | |
| Resident Evil 4 Remake - 1920x1080 Max Preset | |
| Medion Erazer Defender P40 | |
| Asus TUF Gaming A16 FA617XS | |
| Media AMD Radeon RX 7600S (n=1) | |
| The Last of Us - 1920x1080 Ultra Preset | |
| Asus TUF Gaming A16 FA617XS | |
| Media AMD Radeon RX 7600S (n=1) | |
| Hogwarts Legacy | |
| 1920x1080 Ultra Preset AA:High T | |
| Media della classe Gaming (n=1ultimi 2 anni) | |
| Asus TUF Gaming A16 FA617XS | |
| Media AMD Radeon RX 7600S (n=1) | |
| 1920x1080 Ultra Preset + Full Ray Tracing AA:High T | |
| Asus TUF Gaming A16 FA617XS | |
| Media AMD Radeon RX 7600S (n=1) | |
| Company of Heroes 3 - 1920x1080 Maximum Settings | |
| Asus TUF Gaming A16 FA617XS | |
| Media AMD Radeon RX 7600S (n=1) | |
| Dead Island 2 - 1920x1080 Ultra Preset AA:High T | |
| Medion Erazer Defender P40 | |
| Asus TUF Gaming A16 FA617XS | |
| Media AMD Radeon RX 7600S (n=1) | |
| Flight Simulator 2020 - 1920x1080 Ultra AA:TAA AF:16x | |
| Asus TUF Gaming A16 FA617XS | |
| Media AMD Radeon RX 7600S (n=1) | |
| Far Cry 6 | |
| 1920x1080 Ultra Graphics Quality + HD Textures AA:T | |
| Media della classe Gaming (n=1ultimi 2 anni) | |
| Asus TUF Gaming A16 FA617XS | |
| Media AMD Radeon RX 7600S (n=1) | |
| 1920x1080 Ultra Graphics Quality + HD Textures + DXR AA:T | |
| Media della classe Gaming (n=1ultimi 2 anni) | |
| Asus TUF Gaming A16 FA617XS | |
| Media AMD Radeon RX 7600S (n=1) | |
Per verificare se la frequenza dei fotogrammi rimane sostanzialmente costante per un periodo più lungo, abbiamo eseguito il gioco The Witcher 3 per circa 60 minuti con risoluzione Full HD e impostazioni di qualità massime. Il personaggio del gioco non è stato spostato. Non è stato notato alcun calo delle prestazioni.
Witcher 3 FPS diagram
| basso | medio | alto | ultra | |
|---|---|---|---|---|
| GTA V (2015) | 184.7 | 171.7 | 92.9 | |
| The Witcher 3 (2015) | 382 | 166.5 | 98.1 | |
| Dota 2 Reborn (2015) | 157.5 | 143.1 | 132.2 | 121.6 |
| Final Fantasy XV Benchmark (2018) | 215 | 117.2 | 85.2 | |
| X-Plane 11.11 (2018) | 85.1 | 72 | 57.3 | |
| Far Cry 5 (2018) | 135 | 120 | 115 | 108 |
| Strange Brigade (2018) | 440 | 228 | 190.8 | 163.3 |
| Metro Exodus (2019) | 187.3 | 116.5 | ||
| The Division 2 (2019) | 232 | 167 | 131 | 95 |
| Control (2019) | 235 | 116.6 | 83.5 | |
| Doom Eternal (2020) | 376 | 209 | 184.3 | 179 |
| Gears Tactics (2020) | 381.4 | 216.1 | 138.1 | 95.4 |
| Death Stranding (2020) | 189.5 | 144.1 | 133.6 | 129.6 |
| Flight Simulator 2020 (2020) | 134.9 | 85.5 | 60.1 | 42.7 |
| Crysis Remastered (2020) | 294 | 190.9 | 90.6 | 38.6 |
| Watch Dogs Legion (2020) | 122.6 | 118.5 | 106.6 | 69.5 |
| Assassin´s Creed Valhalla (2020) | 203 | 124 | 102 | 88 |
| Hitman 3 (2021) | 270 | 178.2 | 157.4 | 145.7 |
| Far Cry 6 (2021) | 151 | 133 | 119 | 104.7 |
| Forza Horizon 5 (2021) | 197 | 144 | 135 | 74 |
| GRID Legends (2022) | 214.9 | 182.8 | 156.5 | 129.3 |
| Tiny Tina's Wonderlands (2022) | 198.1 | 156.8 | 105.7 | 82.2 |
| F1 22 (2022) | 263 | 244 | 190 | 50.5 |
| A Plague Tale Requiem (2022) | 98.2 | 78 | 66.1 | 55.4 |
| Hogwarts Legacy (2023) | 118.4 | 88.7 | 72 | 55.4 |
| Returnal (2023) | 91 | 88 | 78 | 67 |
| Atomic Heart (2023) | 167.1 | 125.5 | 71.6 | 56.6 |
| Company of Heroes 3 (2023) | 143.4 | 125.9 | 97.4 | 97.2 |
| Sons of the Forest (2023) | 93.2 | 81.4 | 78 | 76.7 |
| Resident Evil 4 Remake (2023) | 107.4 | 83.2 | 78.9 | 52.3 |
| The Last of Us (2023) | 81.4 | 67.6 | 60.2 | 51.5 |
| Dead Island 2 (2023) | 201 | 168.1 | 122.7 | 113.1 |
Emissioni - Il FA617XS può essere piuttosto rumoroso
Emissioni acustiche
Nell'uso quotidiano (ufficio, internet, ecc.), l'A16 funziona in genere in modo silenzioso, spesso silenzioso, indipendentemente dal profilo selezionato. Il livello di pressione sonora può salire fino a 53 dB(A) ("Turbo") o 51 dB(A) ("Performance") in modalità gioco. Utilizzando il profilo "Quiet" è possibile ottenere emissioni acustiche complessivamente inferiori. La potenza di calcolo viene ridotta solo in minima parte.
Rumorosità
| Idle |
| 25 / 26 / 28 dB(A) |
| Sotto carico |
| 43 / 53 dB(A) |
 | ||
30 dB silenzioso 40 dB(A) udibile 50 dB(A) rumoroso |
||
min: | ||
| Asus TUF Gaming A16 FA617XS R9 7940HS, Radeon RX 7600S | Lenovo Legion Pro 5 16IRX8 i7-13700HX, GeForce RTX 4060 Laptop GPU | MSI Katana 15 B12VEK i7-12650H, GeForce RTX 4050 Laptop GPU | Medion Erazer Defender P40 i7-13700HX, GeForce RTX 4060 Laptop GPU | Gigabyte G5 KE i5-12500H, GeForce RTX 3060 Laptop GPU | Asus TUF Gaming A16 FA617 R7 7735HS, Radeon RX 7600S | |
|---|---|---|---|---|---|---|
| Noise | 8% | 7% | -11% | -11% | 3% | |
| off /ambiente * (dB) | 25 | 23 8% | 24 4% | 25 -0% | 19.52 22% | 24 4% |
| Idle Minimum * (dB) | 25 | 23.1 8% | 24 4% | 26 -4% | 31.05 -24% | 24 4% |
| Idle Average * (dB) | 26 | 23.1 11% | 24 8% | 27 -4% | 31.05 -19% | 25 4% |
| Idle Maximum * (dB) | 28 | 26.6 5% | 24 14% | 32 -14% | 31.05 -11% | 28 -0% |
| Load Average * (dB) | 43 | 34.7 19% | 37.71 12% | 53 -23% | 55.66 -29% | 42 2% |
| Witcher 3 ultra * (dB) | 51 | 47.6 7% | 45.75 10% | 56 -10% | 55.7 -9% | 50 2% |
| Load Maximum * (dB) | 53 | 54.8 -3% | 54.55 -3% | 64 -21% | 55.51 -5% | 50 6% |
* ... Meglio usare valori piccoli
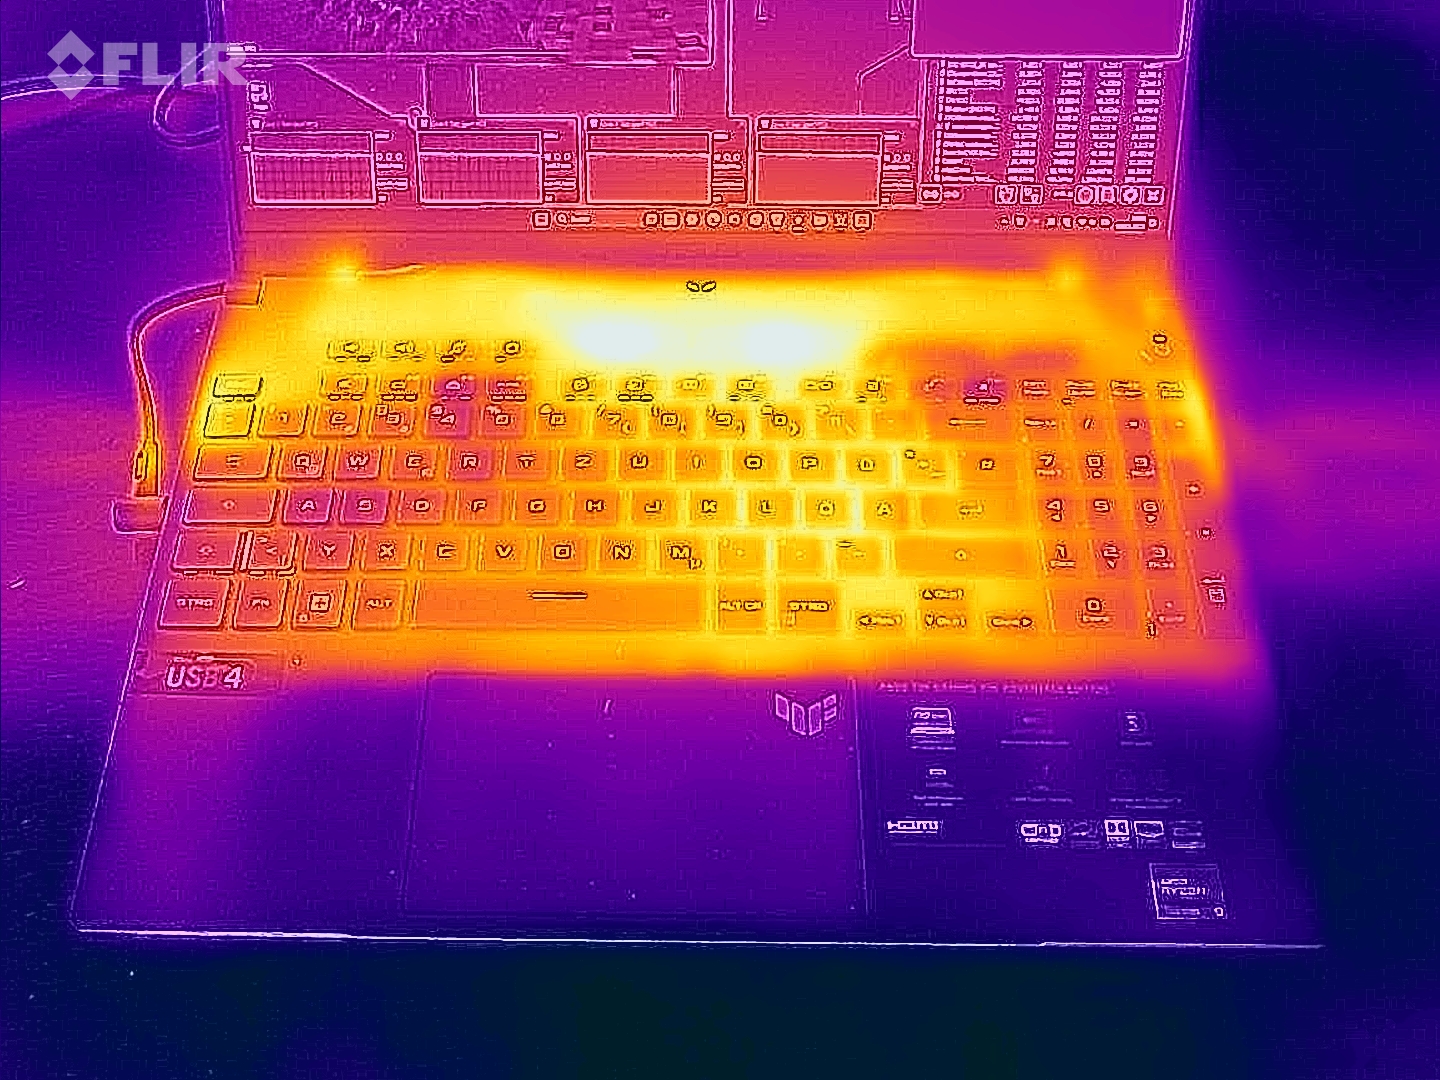
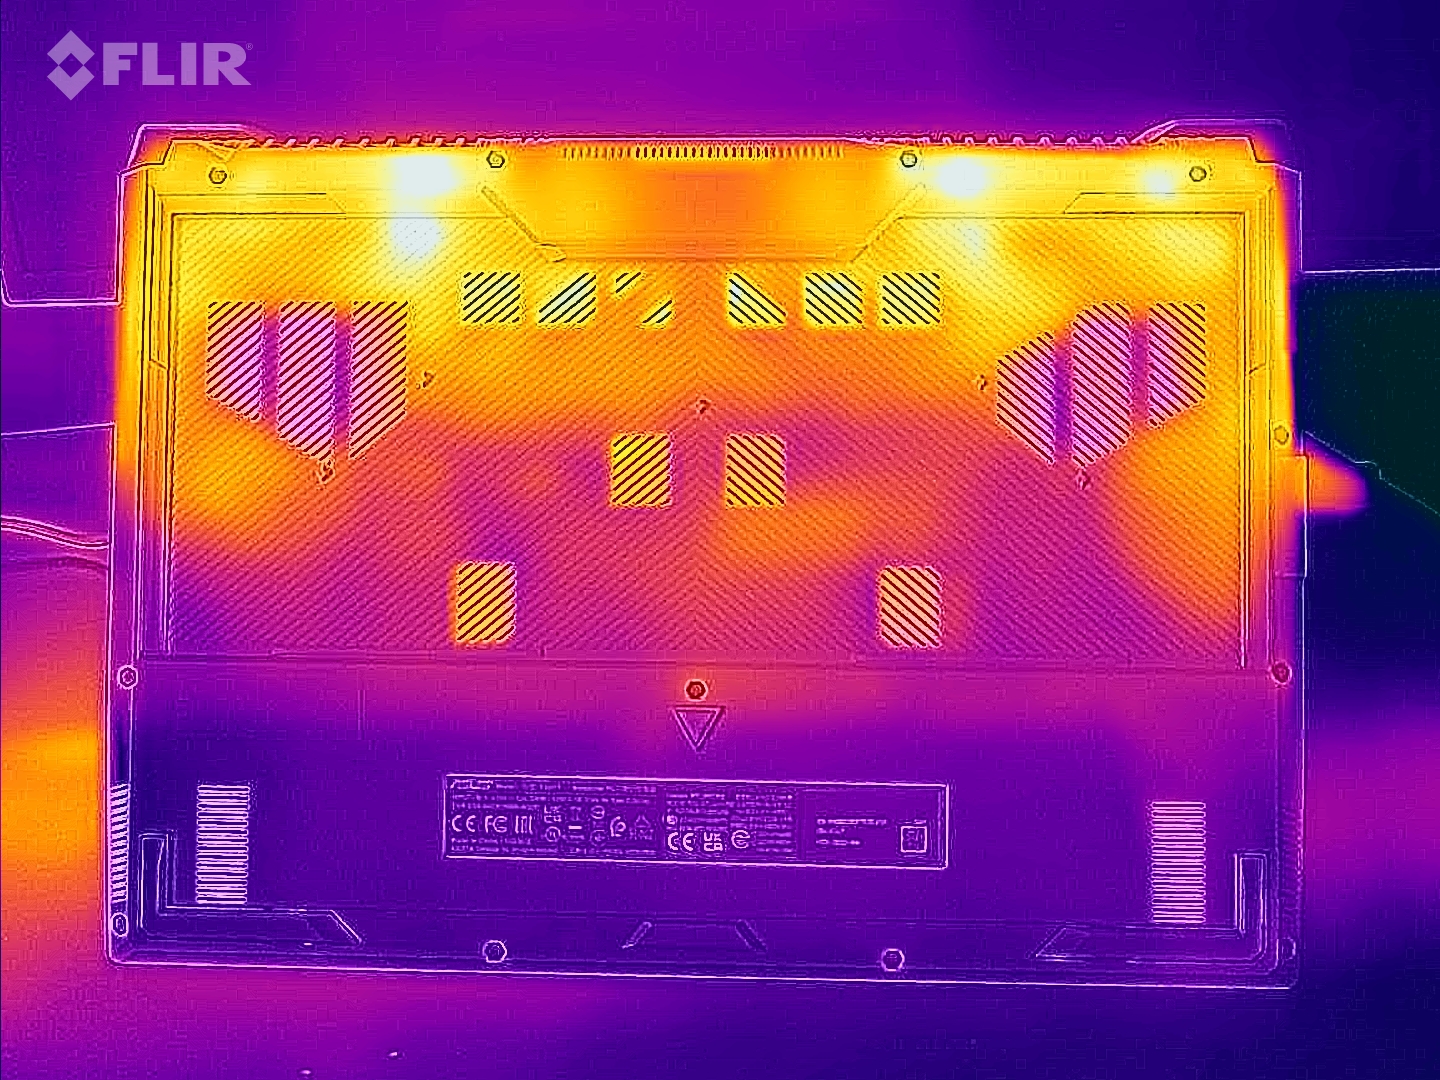
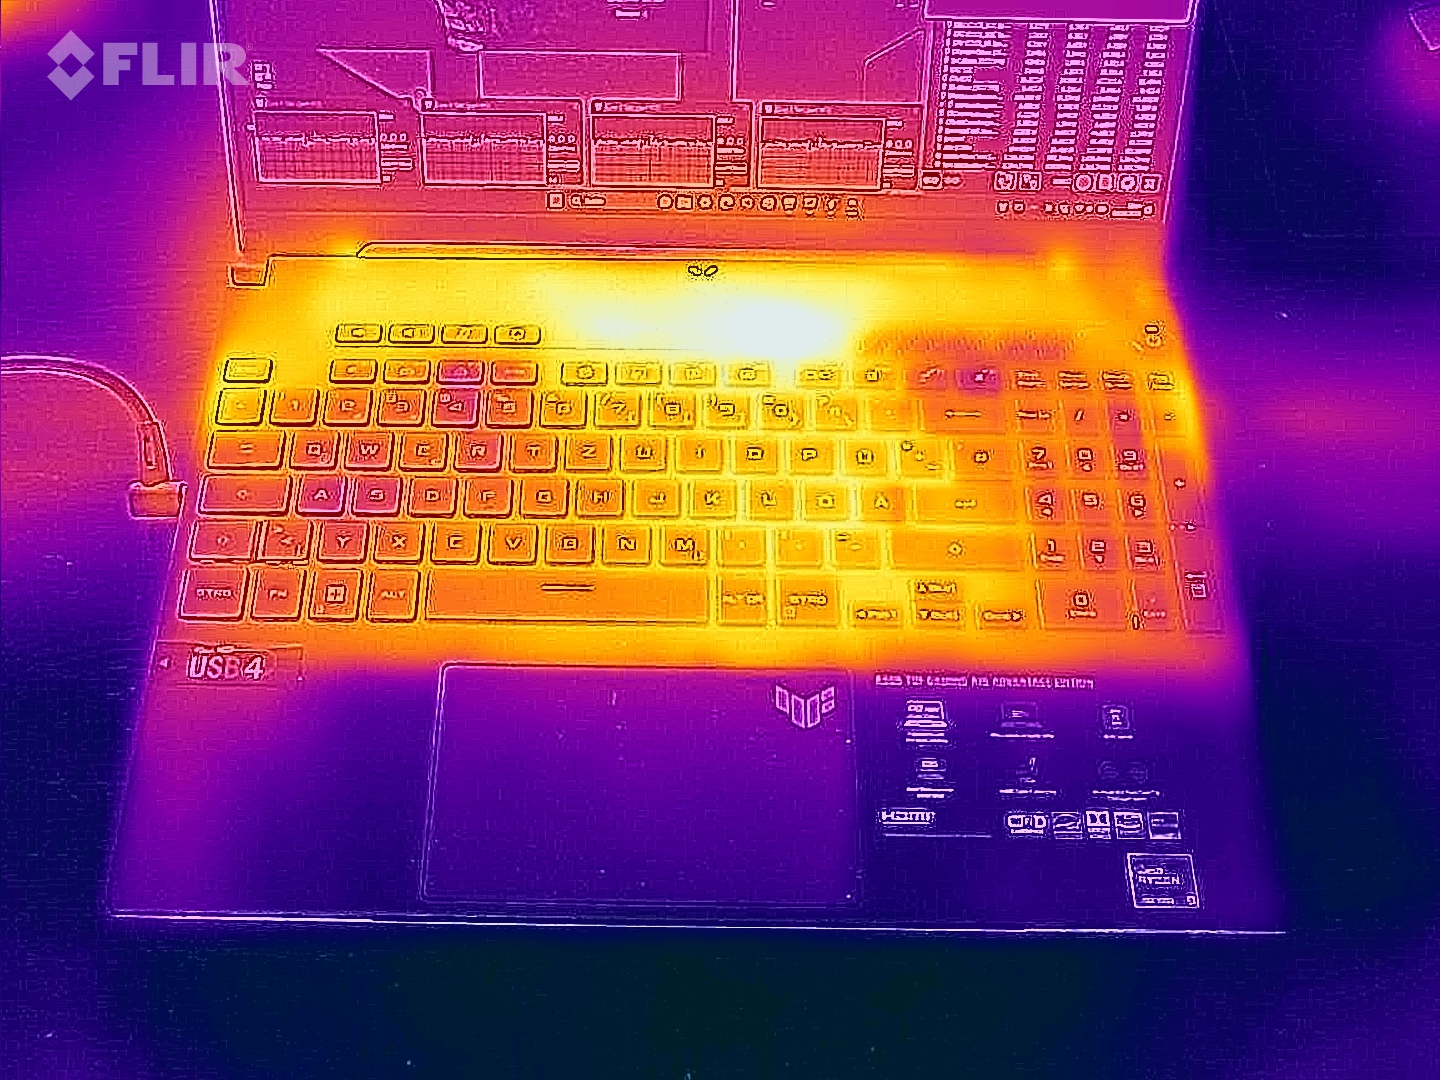
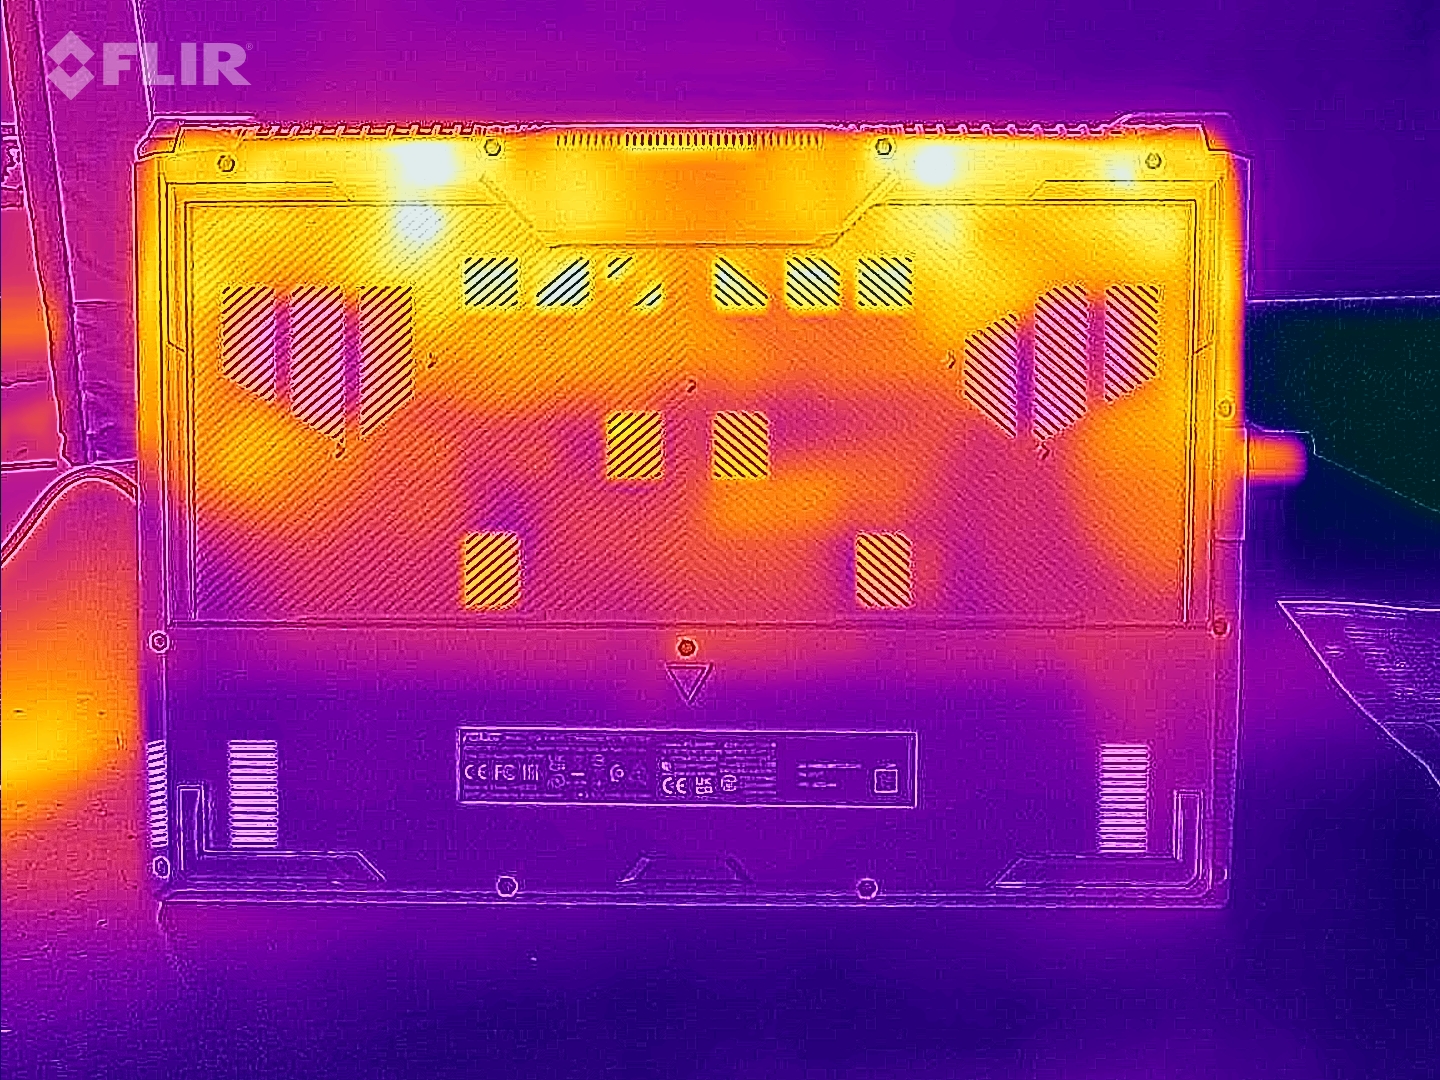
Temperatura
Il notebook si riscalda sensibilmente sotto carico, ma non eccessivamente. Nell'uso quotidiano le temperature rientrano nella zona verde. Quest'ultimo non era il caso del modello gemello- si presume un errore/difetto del dispositivo.
(-) La temperatura massima sul lato superiore è di 53 °C / 127 F, rispetto alla media di 40.4 °C / 105 F, che varia da 21.2 a 68.8 °C per questa classe Gaming.
(-) Il lato inferiore si riscalda fino ad un massimo di 48 °C / 118 F, rispetto alla media di 43.2 °C / 110 F
(+) In idle, la temperatura media del lato superiore è di 28.8 °C / 84 F, rispetto alla media deld ispositivo di 33.9 °C / 93 F.
(-) Riproducendo The Witcher 3, la temperatura media per il lato superiore e' di 40 °C / 104 F, rispetto alla media del dispositivo di 33.9 °C / 93 F.
(±) I poggiapolsi e il touchpad possono diventare molto caldi al tatto con un massimo di 38 °C / 100.4 F.
(-) La temperatura media della zona del palmo della mano di dispositivi simili e'stata di 28.8 °C / 83.8 F (-9.2 °C / -16.6 F).
| Asus TUF Gaming A16 FA617XS AMD Ryzen 9 7940HS, AMD Radeon RX 7600S | Lenovo Legion Pro 5 16IRX8 Intel Core i7-13700HX, NVIDIA GeForce RTX 4060 Laptop GPU | MSI Katana 15 B12VEK Intel Core i7-12650H, NVIDIA GeForce RTX 4050 Laptop GPU | Medion Erazer Defender P40 Intel Core i7-13700HX, NVIDIA GeForce RTX 4060 Laptop GPU | Gigabyte G5 KE Intel Core i5-12500H, NVIDIA GeForce RTX 3060 Laptop GPU | Asus TUF Gaming A16 FA617 AMD Ryzen 7 7735HS, AMD Radeon RX 7600S | |
|---|---|---|---|---|---|---|
| Heat | 1% | -8% | 9% | -14% | -17% | |
| Maximum Upper Side * (°C) | 53 | 42.8 19% | 47 11% | 42 21% | 52.6 1% | 54 -2% |
| Maximum Bottom * (°C) | 48 | 50 -4% | 48 -0% | 45 6% | 62.4 -30% | 47 2% |
| Idle Upper Side * (°C) | 30 | 29.6 1% | 35 -17% | 28 7% | 33.6 -12% | 40 -33% |
| Idle Bottom * (°C) | 30 | 34 -13% | 38 -27% | 30 -0% | 34.8 -16% | 40 -33% |
* ... Meglio usare valori piccoli
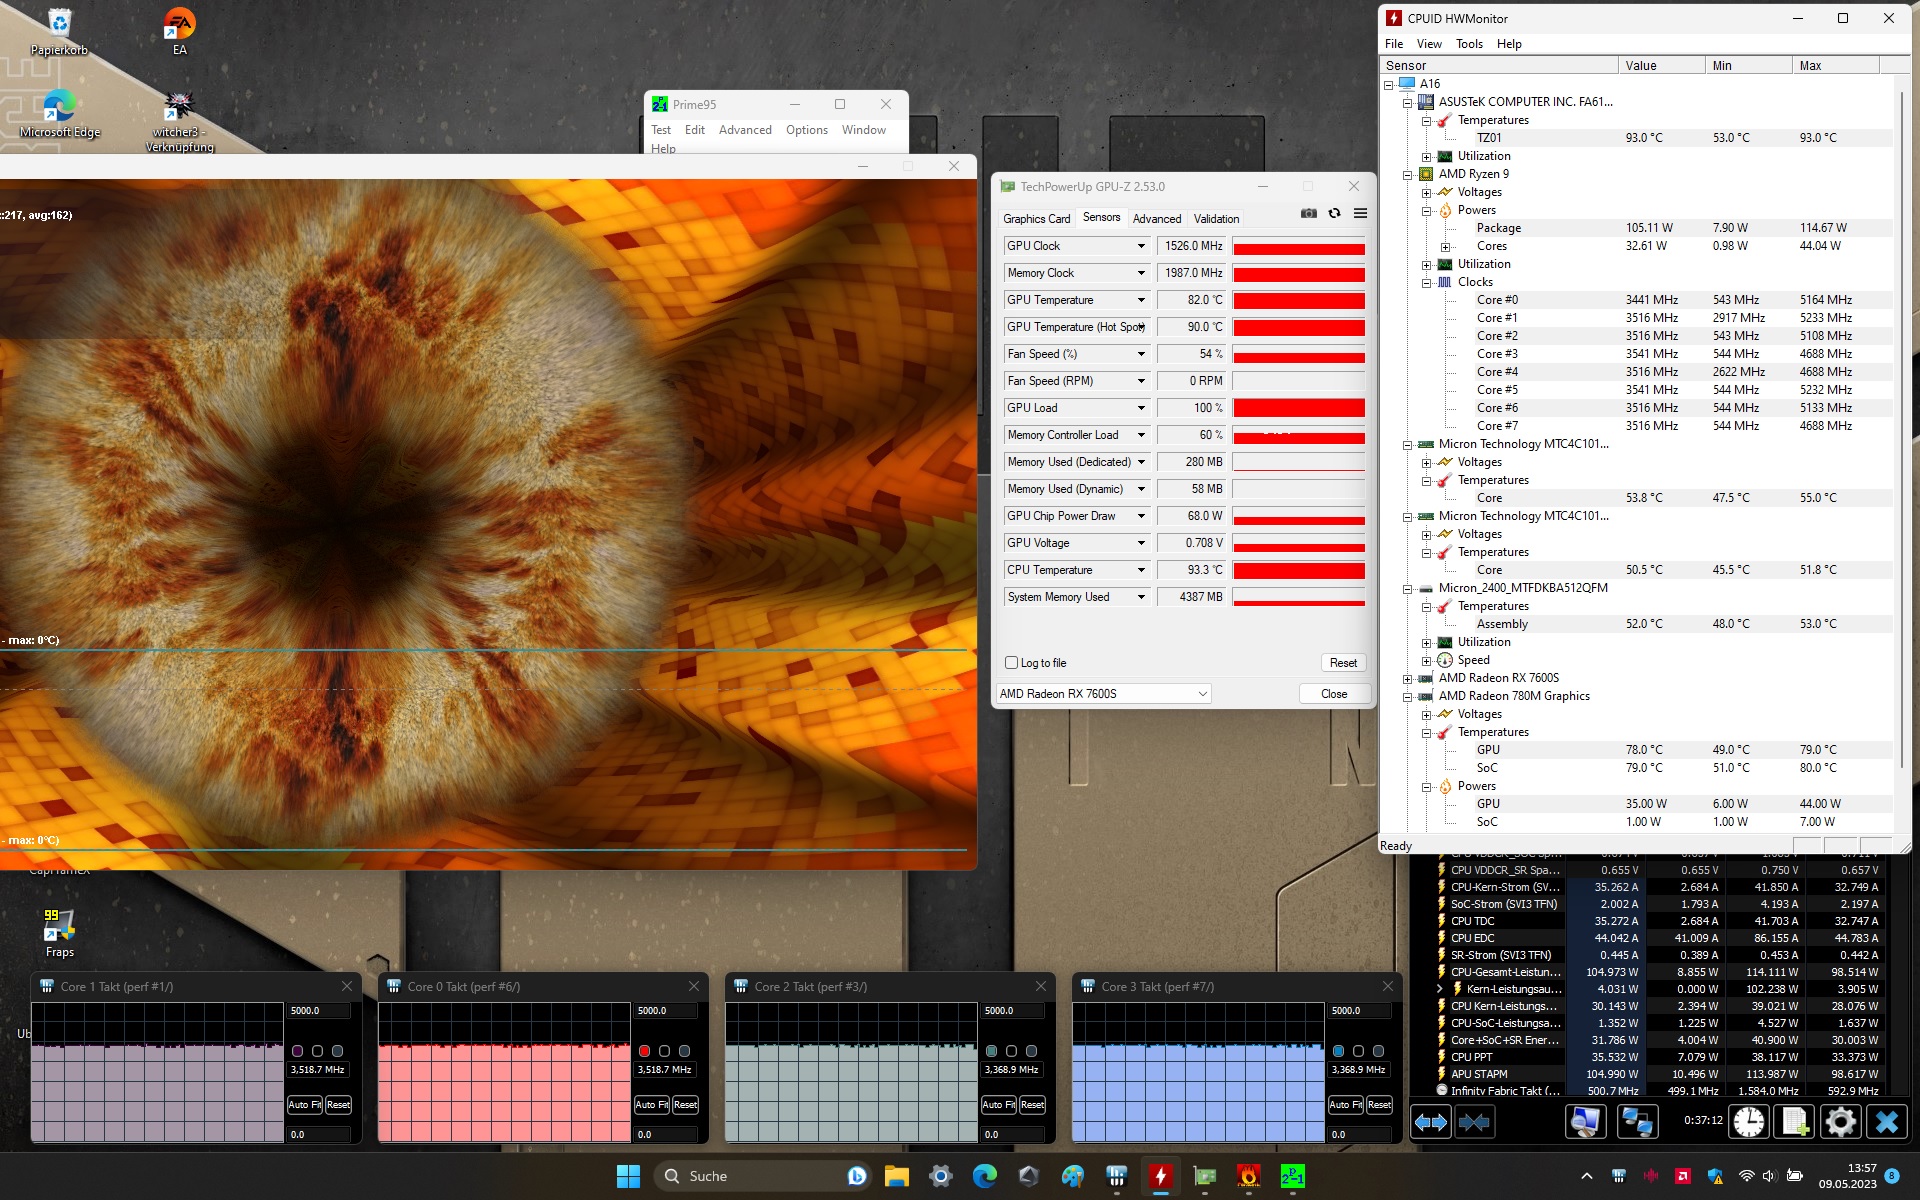
Test da sforzo
Lo stress test (Prime95 e Furmark in funzionamento continuo) simula uno scenario estremo per testare la stabilità del sistema a pieno carico. La CPU (da 3,4 a 3,5 GHz) e la GPU (~1.500 MHz) hanno eseguito il test con velocità di clock inferiori ai rispettivi clock di base.
Altoparlanti
Gli altoparlanti stereo producono un suono complessivamente decente.
Asus TUF Gaming A16 FA617XS analisi audio
(±) | potenza degli altiparlanti media ma buona (79 dB)
Bassi 100 - 315 Hz
(±) | bassi ridotti - in media 11.6% inferiori alla media
(±) | la linearità dei bassi è media (7% delta rispetto alla precedente frequenza)
Medi 400 - 2000 Hz
(±) | medi elevati - circa 5.7% superiore alla media
(+) | medi lineari (3.8% delta rispetto alla precedente frequenza)
Alti 2 - 16 kHz
(+) | Alti bilanciati - appena 2.6% dalla media
(+) | alti lineari (6.5% delta rispetto alla precedente frequenza)
Nel complesso 100 - 16.000 Hz
(±) | la linearità complessiva del suono è media (15.4% di differenza rispetto alla media
Rispetto alla stessa classe
» 34% di tutti i dispositivi testati in questa classe è stato migliore, 7% simile, 59% peggiore
» Il migliore ha avuto un delta di 6%, medio di 18%, peggiore di 132%
Rispetto a tutti i dispositivi testati
» 23% di tutti i dispositivi testati in questa classe è stato migliore, 4% similare, 73% peggiore
» Il migliore ha avuto un delta di 4%, medio di 23%, peggiore di 134%
Lenovo Legion Pro 5 16IRX8 analisi audio
(±) | potenza degli altiparlanti media ma buona (72.7 dB)
Bassi 100 - 315 Hz
(-) | quasi nessun basso - in media 23.7% inferiori alla media
(±) | la linearità dei bassi è media (10.7% delta rispetto alla precedente frequenza)
Medi 400 - 2000 Hz
(+) | medi bilanciati - solo only 3.8% rispetto alla media
(±) | linearità dei medi adeguata (7.1% delta rispetto alla precedente frequenza)
Alti 2 - 16 kHz
(+) | Alti bilanciati - appena 3.7% dalla media
(+) | alti lineari (6.7% delta rispetto alla precedente frequenza)
Nel complesso 100 - 16.000 Hz
(±) | la linearità complessiva del suono è media (21.9% di differenza rispetto alla media
Rispetto alla stessa classe
» 79% di tutti i dispositivi testati in questa classe è stato migliore, 6% simile, 16% peggiore
» Il migliore ha avuto un delta di 6%, medio di 18%, peggiore di 132%
Rispetto a tutti i dispositivi testati
» 63% di tutti i dispositivi testati in questa classe è stato migliore, 7% similare, 30% peggiore
» Il migliore ha avuto un delta di 4%, medio di 23%, peggiore di 134%
Gestione dell'energia - Il portatile da gioco con ottimi tempi di esecuzione
Consumo di energia
Non ci sono anomalie in termini di consumo energetico. I tassi sono nella norma per l'hardware installato. Lo stress test e il Witcher 3 test sono stati eseguiti con un consumo energetico costante. L'alimentatore (240 watt) è più che sufficiente.
| Off / Standby | |
| Idle | |
| Sotto carico |
|
Leggenda:
min: | |
| Asus TUF Gaming A16 FA617XS R9 7940HS, Radeon RX 7600S | Lenovo Legion Pro 5 16IRX8 i7-13700HX, GeForce RTX 4060 Laptop GPU | MSI Katana 15 B12VEK i7-12650H, GeForce RTX 4050 Laptop GPU | Medion Erazer Defender P40 i7-13700HX, GeForce RTX 4060 Laptop GPU | Gigabyte G5 KE i5-12500H, GeForce RTX 3060 Laptop GPU | Asus TUF Gaming A16 FA617 R7 7735HS, Radeon RX 7600S | Media AMD Radeon RX 7600S | Media della classe Gaming | |
|---|---|---|---|---|---|---|---|---|
| Power Consumption | -107% | 2% | -25% | -16% | -7% | -4% | -63% | |
| Idle Minimum * (Watt) | 7 | 24.5 -250% | 8.5 -21% | 8 -14% | 7.66 -9% | 8 -14% | 7.5 ? -7% | 13 ? -86% |
| Idle Average * (Watt) | 10 | 29.2 -192% | 10.2 -2% | 12 -20% | 10.3 -3% | 11 -10% | 10.5 ? -5% | 18.7 ? -87% |
| Idle Maximum * (Watt) | 15 | 34.3 -129% | 11.3 25% | 18 -20% | 16.05 -7% | 16 -7% | 15.5 ? -3% | 24.3 ? -62% |
| Load Average * (Watt) | 86 | 98.7 -15% | 84 2% | 101 -17% | 115.8 -35% | 97 -13% | 91.5 ? -6% | 110.2 ? -28% |
| Witcher 3 ultra * (Watt) | 160.6 | 178.6 -11% | 128 20% | 180.8 -13% | 168.7 -5% | 161.5 -1% | ||
| Load Maximum * (Watt) | 172 | 249.6 -45% | 189 -10% | 284 -65% | 234.6 -36% | 168 2% | 170 ? 1% | 258 ? -50% |
* ... Meglio usare valori piccoli
power consumption Witcher 3 / stress test
power consumption with external monitor
Durata della batteria
Il dispositivo da 16 pollici ha raggiunto tempi di esecuzione di 12:25 ore e 12:26 ore rispettivamente nel nostro test WLAN (richiamo di siti web tramite uno script) e nel test video (breve film Big Buck Bunny (codifica H.264, FHD) in loop). Durante entrambi i test, le funzioni di risparmio energetico del portatile erano disattivate e la luminosità del display era impostata a circa 150 cd/m². Anche i moduli wireless sono stati disattivati per il test video
L'FA617 ha fornito tempi di esecuzione eccellenti e ha lasciato la concorrenza nella polvere. La combinazione di un'APU parsimoniosa e di una batteria di grande capacità si è rivelata vincente.
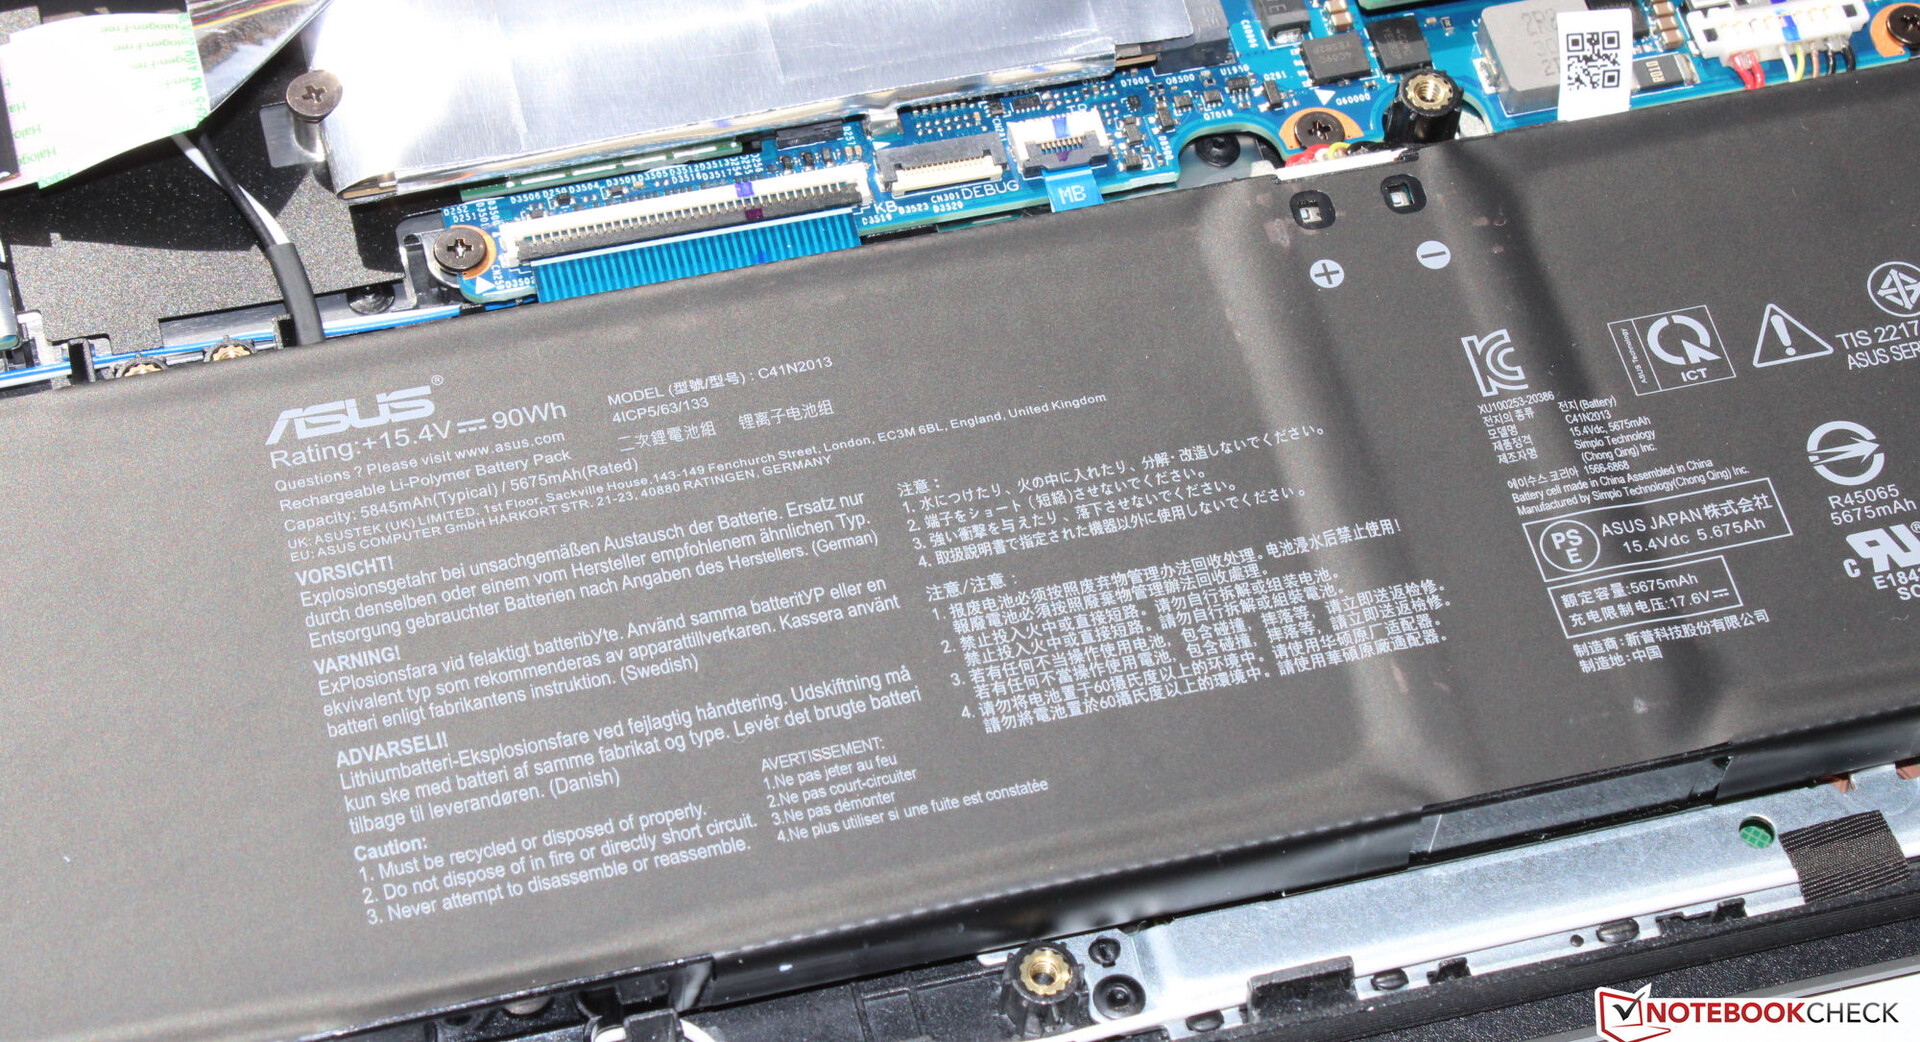
| Asus TUF Gaming A16 FA617XS R9 7940HS, Radeon RX 7600S, 90 Wh | Lenovo Legion Pro 5 16IRX8 i7-13700HX, GeForce RTX 4060 Laptop GPU, 80 Wh | MSI Katana 15 B12VEK i7-12650H, GeForce RTX 4050 Laptop GPU, 53.5 Wh | Medion Erazer Defender P40 i7-13700HX, GeForce RTX 4060 Laptop GPU, 73 Wh | Gigabyte G5 KE i5-12500H, GeForce RTX 3060 Laptop GPU, 54 Wh | Asus TUF Gaming A16 FA617 R7 7735HS, Radeon RX 7600S, 90 Wh | Media della classe Gaming | |
|---|---|---|---|---|---|---|---|
| Autonomia della batteria | -54% | -21% | -29% | -42% | 22% | -16% | |
| Reader / Idle (h) | 20.3 | 6.7 -67% | 8.8 -57% | 20.2 0% | 8.71 ? -57% | ||
| H.264 (h) | 12.4 | 4.4 -65% | 5.7 -54% | 2.2 -82% | 8.64 ? -30% | ||
| WiFi v1.3 (h) | 12.4 | 3.4 -73% | 4.3 -65% | 6.2 -50% | 5.7 -54% | 12.1 -2% | 7.11 ? -43% |
| Load (h) | 0.9 | 0.7 -22% | 1.5 67% | 1.3 44% | 1 11% | 1.5 67% | 1.502 ? 67% |
| Witcher 3 ultra (h) | 1.3 |
Pro
Contro
Verdetto - Il portatile Asus con (troppo) poco spazio di archiviazione
L'A16 è stato progettato per i giochi WUXGA con impostazioni elevate o massime, ma dovrebbe essere utile in molti altri campi come l'editing video e il rendering. Un team AMD composto da unRyzen 9 7940HSeRadeon RX 7600Sfornisce al portatile le prestazioni necessarie. Entrambi i componenti funzionano con velocità di clock costantemente elevate.
L'Asus TUF Gaming A16 Advantage Edition è un portatile da gioco di fascia media ben assortito, la cui impressionante autonomia della batteria è il suo fiore all'occhiello.
Rispetto alRyzen-7-7735HSryzen-7-7735HS che si trova nel modellomodello gemellola 7940HS-APU offre prestazioni della CPU nettamente superiori, pur avendo lo stesso numero di core e gli stessi limiti di potenza. In questo caso, l'architettura moderna (Zen 4 contro Zen 3+) e le frequenze di clock più elevate si fanno notare.
Gli straordinari tempi di esecuzione del dispositivo sono certamente il suo punto di forza: le misure pratiche di circa 12,5 ore non sono generalmente raggiunte da molti altri portatili da ufficio. Un aspetto positivo: La batteria può essere ricaricata con un alimentatore USB-C (min. 65 watt, 20 V) - una porta USB-C supporta Power Delivery. L'alimentatore proprietario non deve necessariamente essere portato con sé.
Il display IPS installato (16 pollici, 1.920 x 1.200 pixel) ha un rapporto di lavoro di 16:10 e in generale ci ha lasciato una buona impressione - se non altro, la luminosità potrebbe essere un po' più forte. L'unità SSD installata di base sarebbe perfettamente adatta a un semplice portatile da ufficio, ma non a un portatile da gioco da 1.700 dollari. Lo spazio di archiviazione offerto (512 GB) e i dati non sono all'altezza delle esigenze degli utenti né delle loro aspettative.
IlLegion Pro 5 16IRX8potrebbe essere un'alternativa adeguata. Offre prestazioni migliori e uno schermo più luminoso rispetto all'A16, ma chiaramente non ha gli stessi tempi di esecuzione impressionanti. IlGigabyte G5 KEpotrebbe essere una buona alternativa economica: Si ottiene un livello simile di prestazioni grafiche a un prezzo molto inferiore. Tuttavia: Questo portatile non viene fornito con un sistema operativo Windows preinstallato.
Prezzo e disponibilità
La versione dell'A16 con 16 GB di RAM e un SSD da 512 GB può essere acquistata sul sito di Asus per circa 1.371 dollari.
Asus TUF Gaming A16 FA617XS
- 06/05/2023 v7 (old)
Sascha Mölck
Transparency
La selezione dei dispositivi da recensire viene effettuata dalla nostra redazione. Il campione di prova è stato fornito all'autore come prestito dal produttore o dal rivenditore ai fini di questa recensione. L'istituto di credito non ha avuto alcuna influenza su questa recensione, né il produttore ne ha ricevuto una copia prima della pubblicazione. Non vi era alcun obbligo di pubblicare questa recensione. In quanto società mediatica indipendente, Notebookcheck non è soggetta all'autorità di produttori, rivenditori o editori.
Ecco come Notebookcheck esegue i test
Ogni anno, Notebookcheck esamina in modo indipendente centinaia di laptop e smartphone utilizzando procedure standardizzate per garantire che tutti i risultati siano comparabili. Da circa 20 anni sviluppiamo continuamente i nostri metodi di prova e nel frattempo stabiliamo gli standard di settore. Nei nostri laboratori di prova, tecnici ed editori esperti utilizzano apparecchiature di misurazione di alta qualità. Questi test comportano un processo di validazione in più fasi. Il nostro complesso sistema di valutazione si basa su centinaia di misurazioni e parametri di riferimento ben fondati, che mantengono l'obiettività.Price comparison

