Recensione del portatile MSI Katana 15: Gamer economico con RTX 4050 e CPU Alder Lake

MSI ha una linea di computer portatili che visivamente sembrano molto simili. L'anno scorso abbiamo recensito il quasi-predecessore da 15,6 pollici, l'MSI Katana GF66 12UGSma il Pulse GL66o MSI Sword hanno lo stesso aspetto. La nostra attuale configurazione di recensione è interessante perché MSI ha deciso di combinare un "vecchio" processore Alder Lake con la nuova RTX 4050 per essere tra i primi a rilasciare un portatile da gioco con una scheda RTX 40xx. Il nome è Katana 15 B12, mentre il Katana 15 B13 ha già un processore Intel Gen13 e una RTX 40xx. Daremo un'occhiata al confronto tra le due generazioni di CPU/GPU nel nostro modello B12.
Poiché il Katana 15 è uno dei primi portatili con RTX 4050 a essere recensito, ci rifacciamo in gran parte alla generazione precedente per i videogiocatori di fascia media e entry-level con laRTX 3060come termine di paragone. Questi includono il Lenovo Legion 5, il Schenker XMG Core 15, il MSI Pulse GL66 e l' Asus TUF Gaming F15il predecessore è incluso per il confronto, ma i lettori dovrebbero notare che era equipaggiato con la più potente RTX 3070 Ti.
Potenziali concorrenti a confronto
Punteggio | Data | Modello | Peso | Altezza | Dimensione | Risoluzione | Prezzo |
|---|---|---|---|---|---|---|---|
| 82.9 % v7 (old) | 03/2023 | MSI Katana 15 B12VEK i7-12650H, GeForce RTX 4050 Laptop GPU | 2.3 kg | 24.9 mm | 15.60" | 1920x1080 | |
| 80.3 % v7 (old) | 06/2022 | MSI Katana GF66 12UGS i7-12700H, GeForce RTX 3070 Ti Laptop GPU | 2.3 kg | 27.5 mm | 15.60" | 1920x1080 | |
| 80.7 % v7 (old) | 04/2022 | MSI Pulse GL66 12UEK i9-12900H, GeForce RTX 3060 Laptop GPU | 2.3 kg | 25 mm | 15.60" | 1920x1080 | |
| 87.5 % v7 (old) | 11/2022 | Lenovo Legion 5 15IAH7H 82RB i7-12700H, GeForce RTX 3060 Laptop GPU | 2.4 kg | 19.99 mm | 15.60" | 1920x1080 | |
| 87.2 % v7 (old) | 03/2022 | Asus TUF Gaming F15 FX507ZM i7-12700H, GeForce RTX 3060 Laptop GPU | 2.1 kg | 24.95 mm | 15.60" | 1920x1080 | |
| 87.9 % v7 (old) | 01/2023 | Schenker XMG Core 15 (M22) R7 6800H, GeForce RTX 3060 Laptop GPU | 2.1 kg | 23 mm | 15.60" | 2560x1440 |
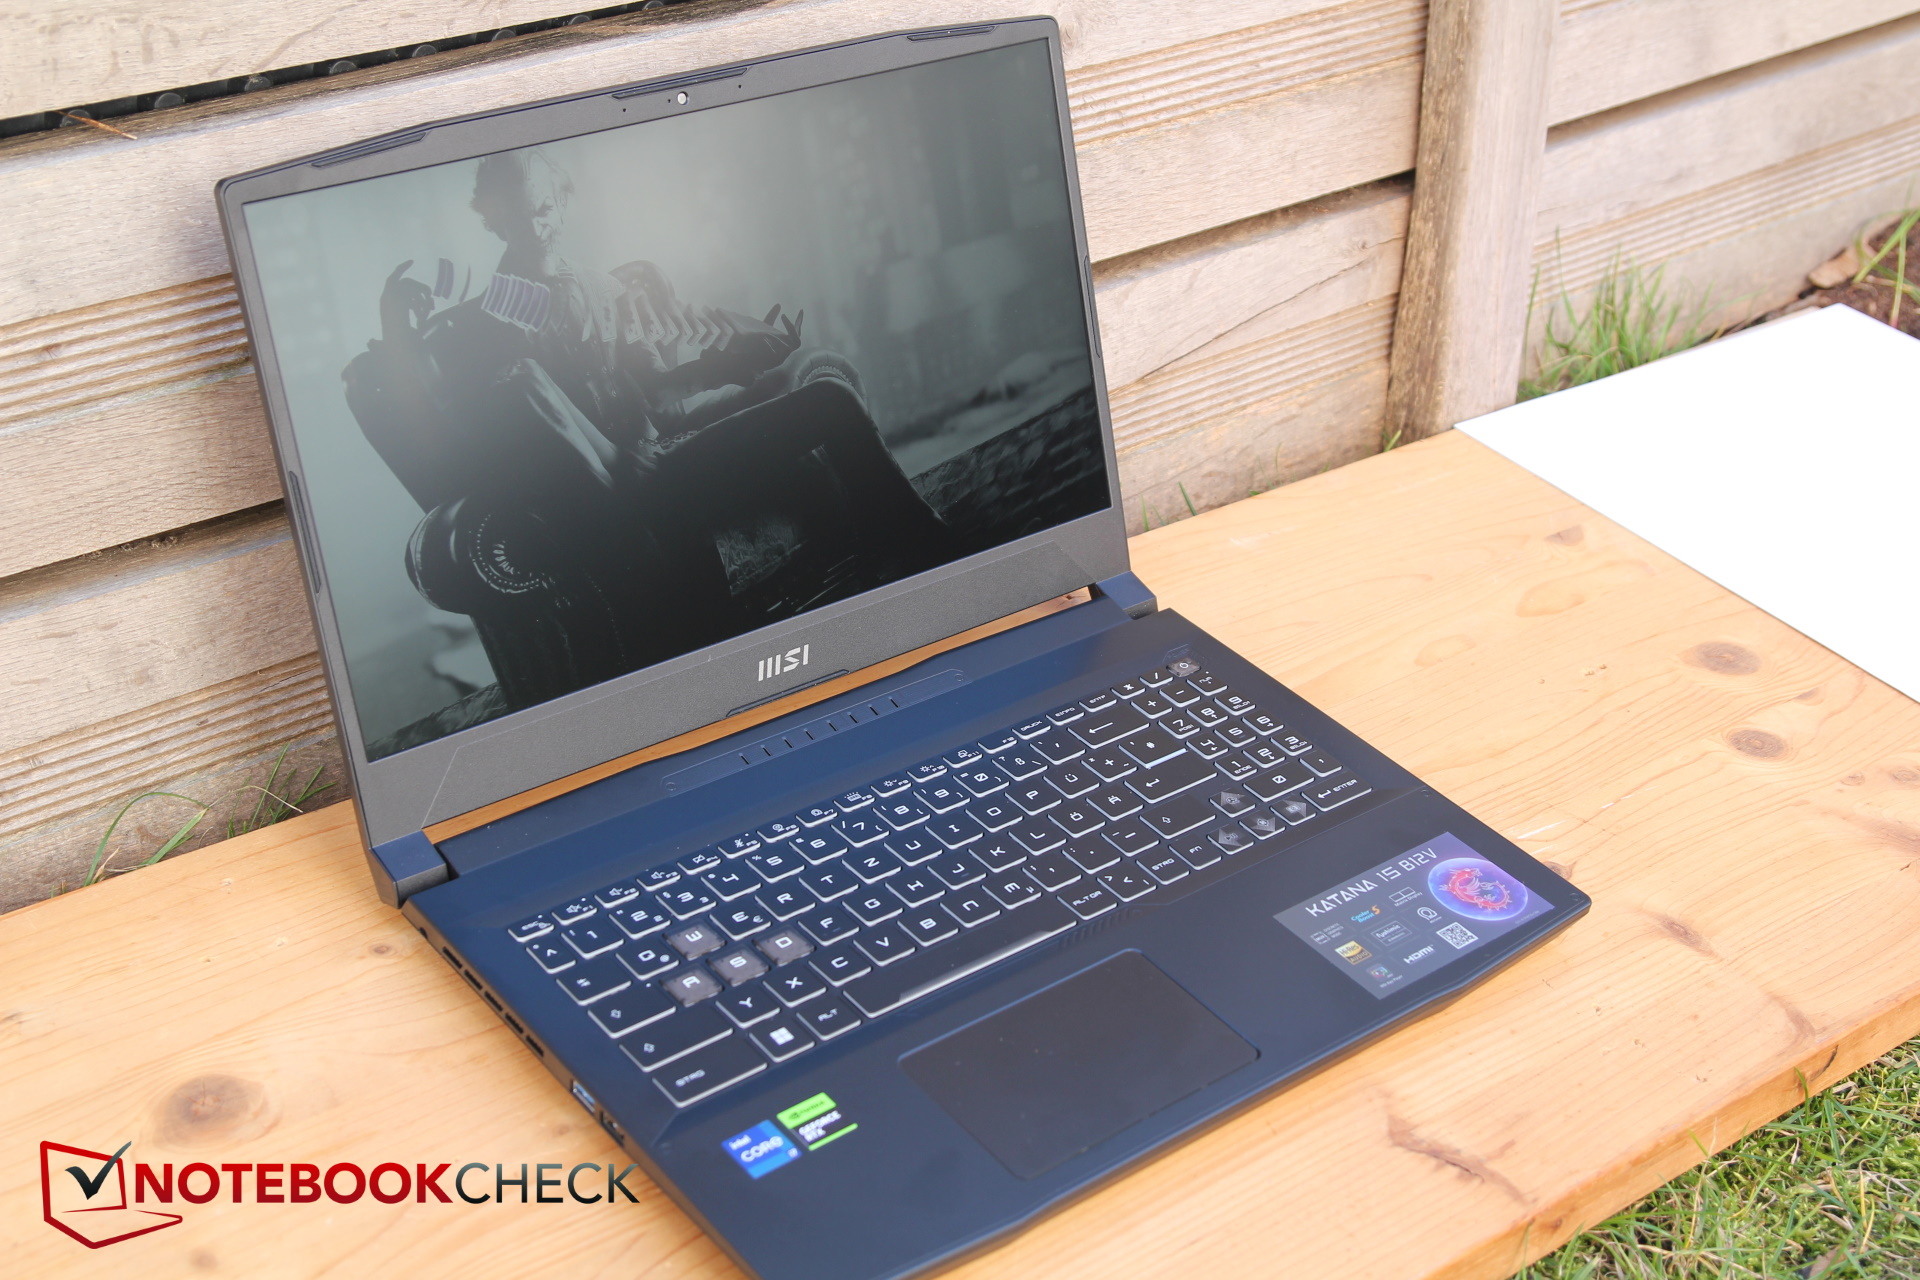
Custodia - Katana di plastica
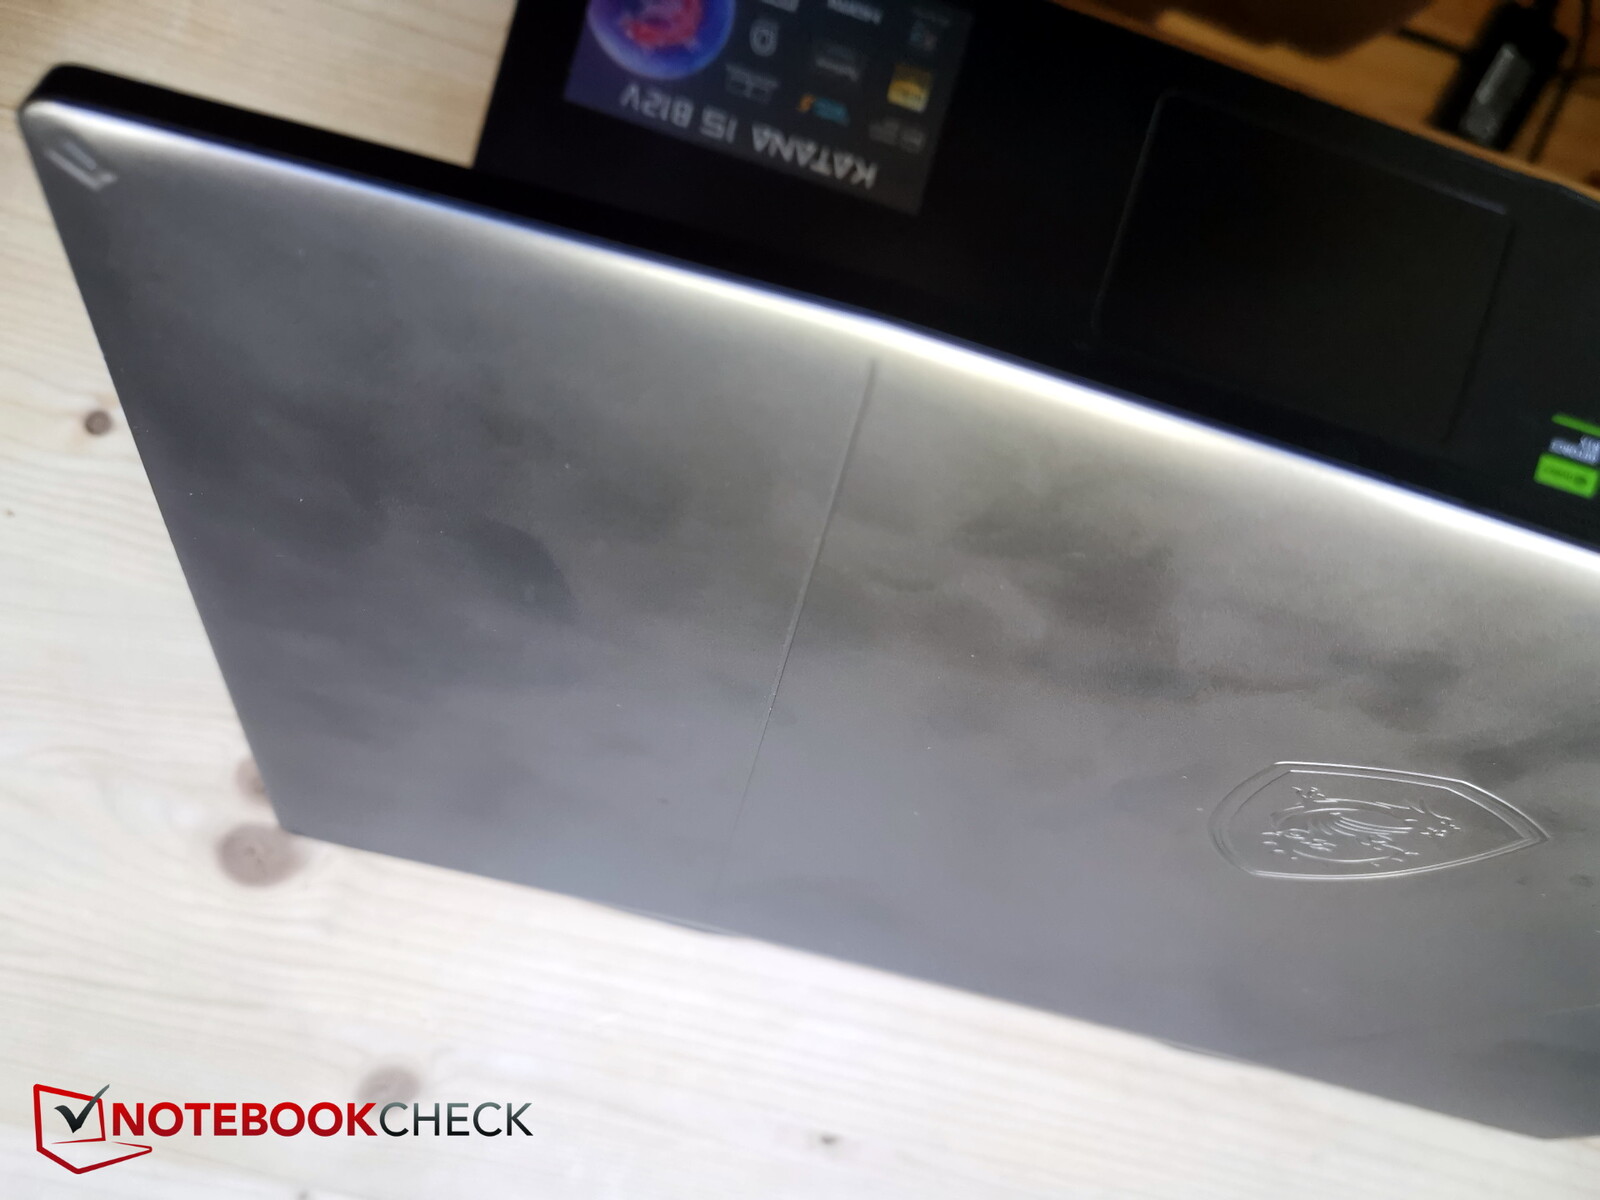
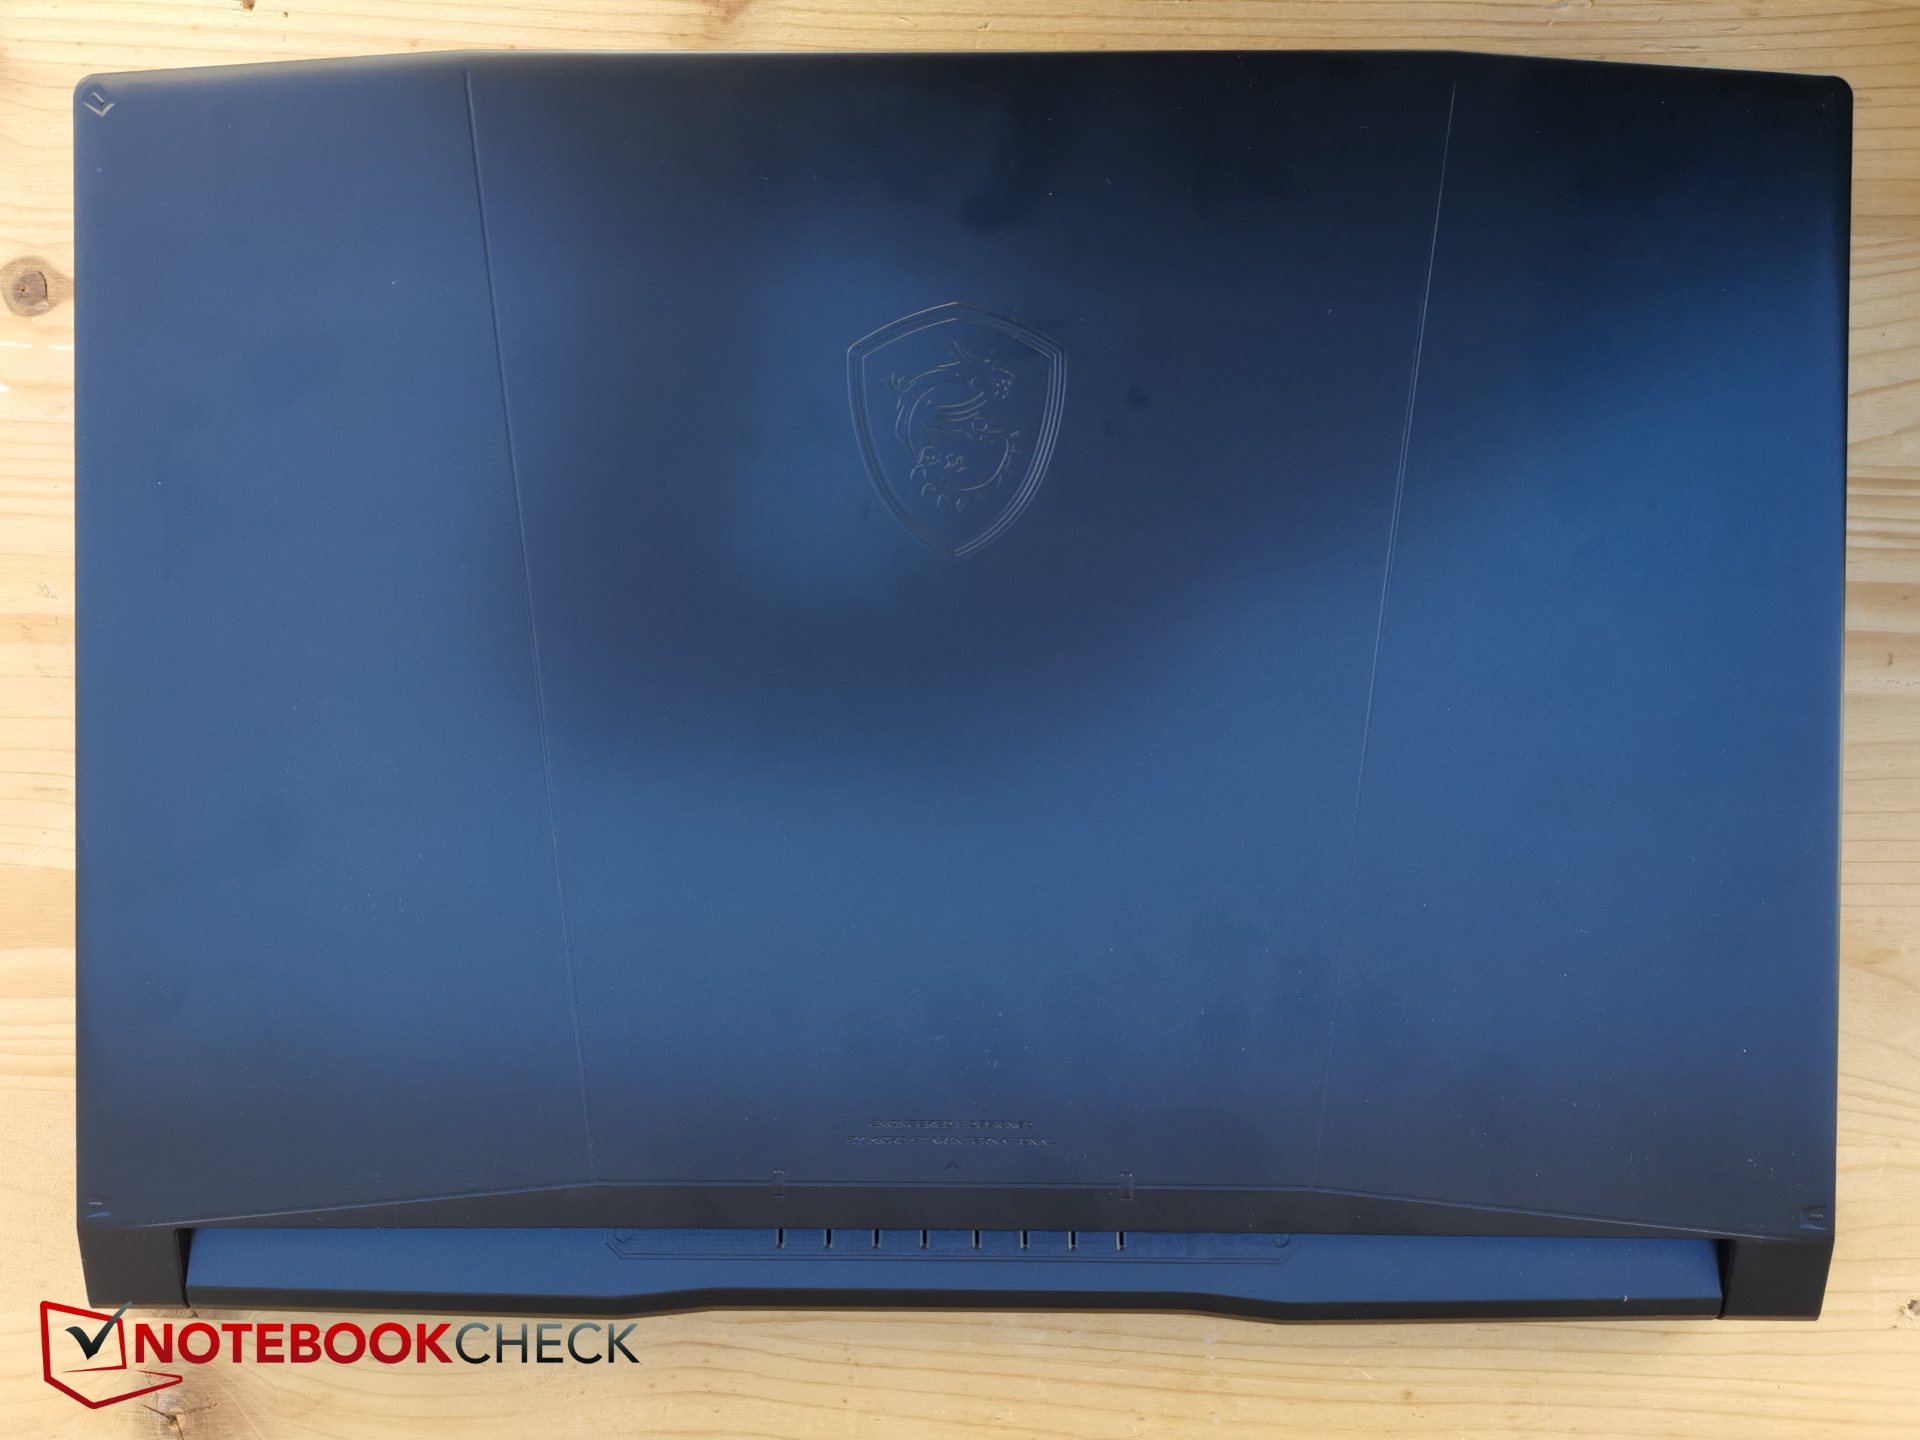
Il case del Katana 15 è realizzato interamente in plastica, anche se i materiali della superficie liscia del coperchio del display e della base appaiono quasi come metallo. I lati mostrano un motivo nero e grigio. Sfortunatamente, il case si dimostra anche molto sensibile alle impronte digitali
L'angolo di apertura è di 180 gradi. Accanto al logo, alcune linee e fustelle decorano la superficie nera lucida del coperchio. Il display oscilla più a lungo del solito dopo l'apertura o la regolazione dell'angolo
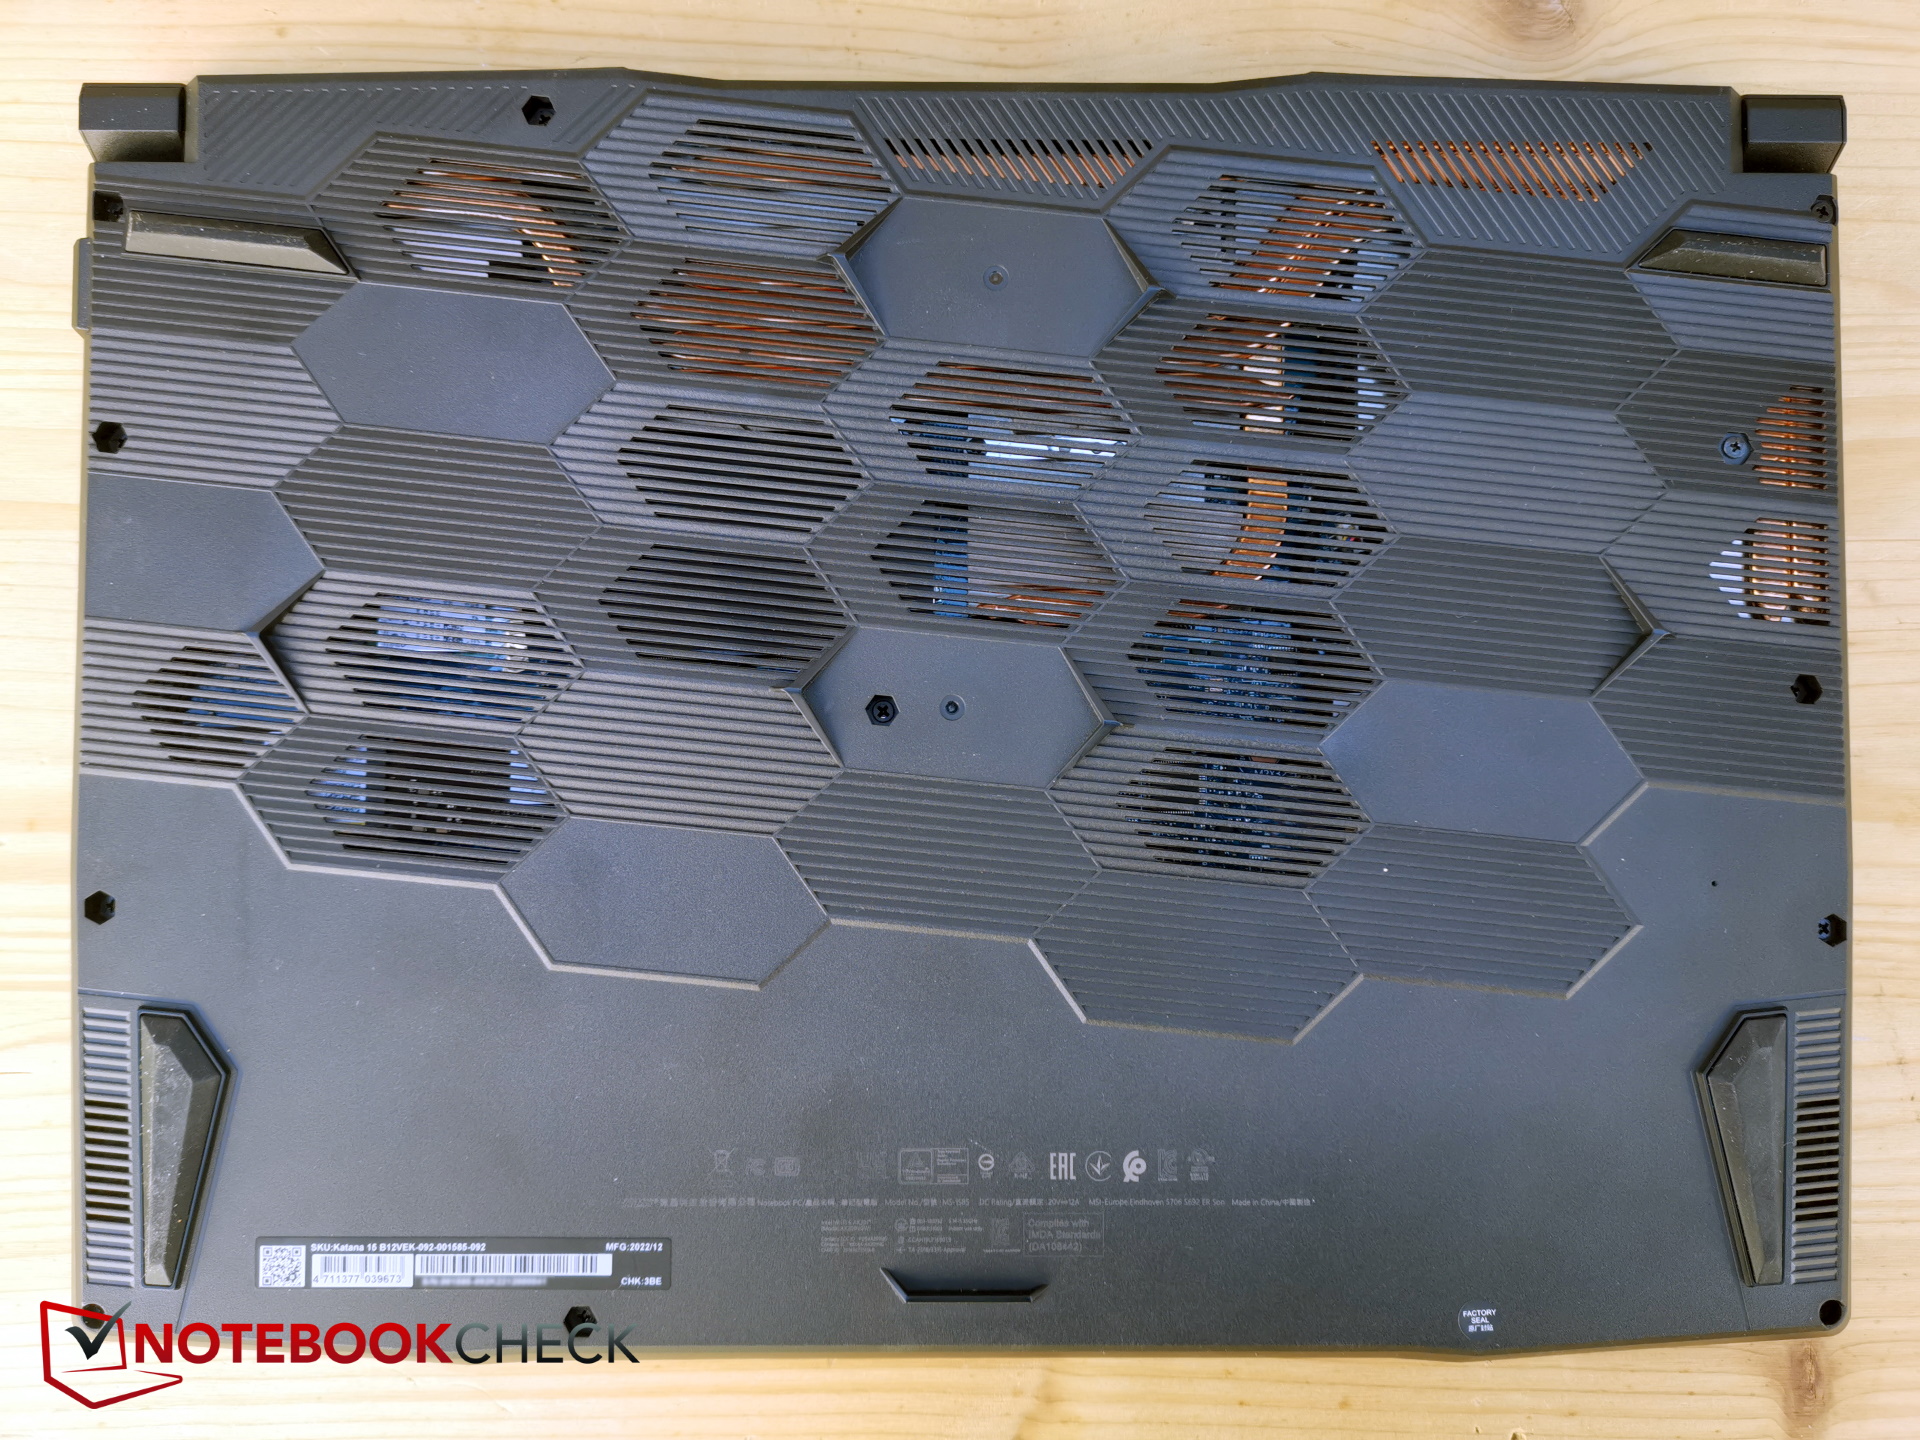
La parte inferiore è realizzata in plastica più morbida. La base è relativamente resistente alla torsione, ma emette alcuni suoni di scricchiolio. Al contrario, il coperchio è molto più facile da piegare ed emette un suono scricchiolante. I bordi del display sono stretti ai lati, ma piuttosto larghi in alto e in basso per gli standard odierni.
La Katana 15 2023 è leggermente più sottile della Katana GF66 dello scorso anno Katana GF66ed eredita le dimensioni e il peso del Pulse GL66il Legion 5 è ancora più sottile, ma anche il Core 15 lo è, anche se in misura minima.
Attrezzatura - Ultima generazione
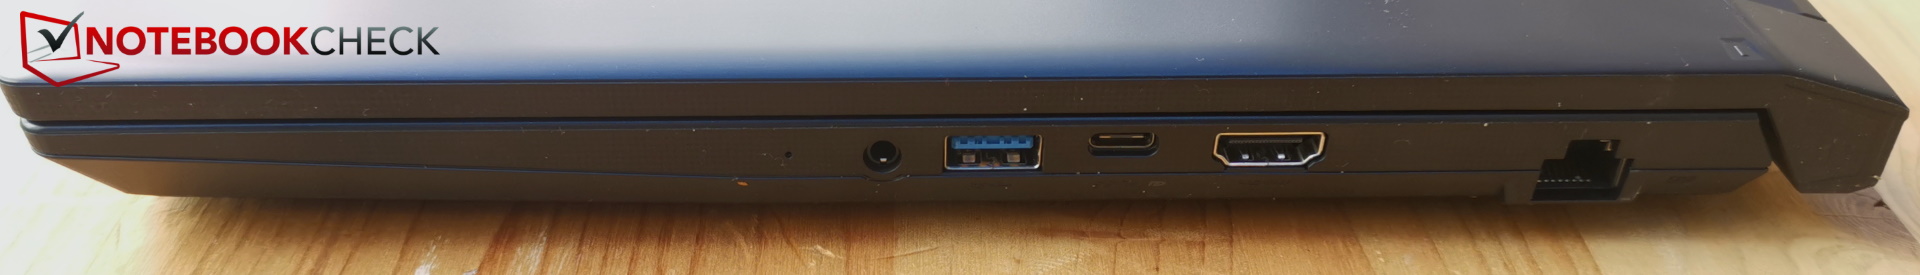
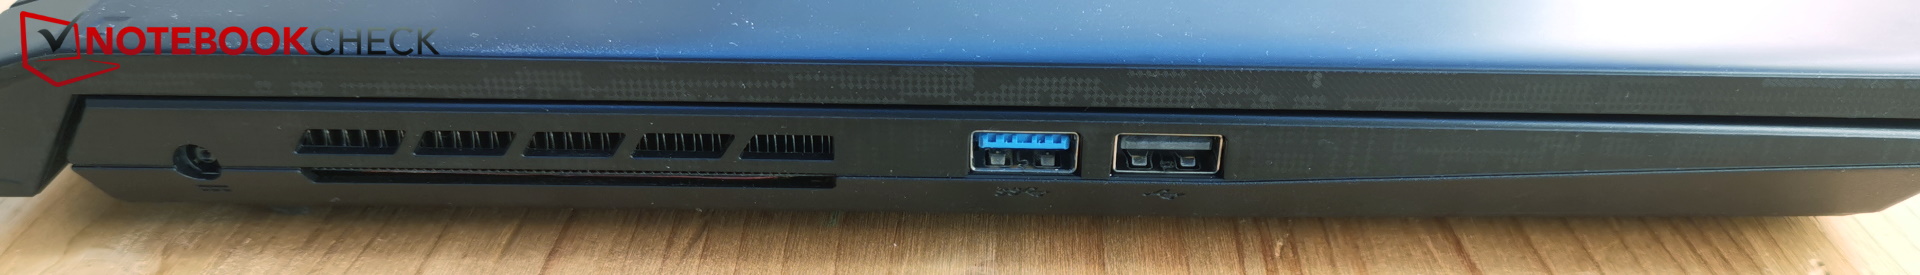
La disposizione delle porte è la stessa per tutti e tre i modelli MSI. Infatti, una delle tre porte USB-A è ancora di tipo 2.0, che non appartiene all'era attuale. Lo stesso vale per l'unico slot USB-C, che non supporta Thunderbolt e offre solo velocità 3.0.
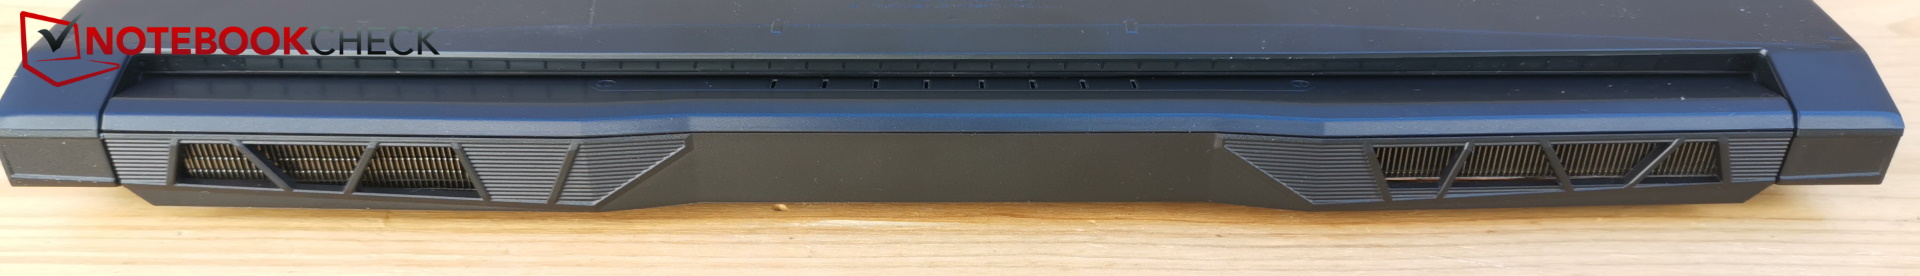
Manca un lettore SD, ma almeno sono presenti LAN e HDMI. Il jack per le cuffie è insolitamente posizionato sul lato destro, proprio come la porta HDMI, ed entrambi possono interferire con la mano del mouse. Nonostante lo spazio sufficiente, non ci sono porte sul retro.
Comunicazione
MSI ha installato il modulo WLAN Intel Wi-Fi 6 AX201, che non supporta ancora il Wi-Fi 6E, quindi la connessione alla rete a 6 GHz non è attualmente possibile. Tuttavia, funziona nella gamma dei 5 GHz (e naturalmente dei 2,4 GHz) ed è ancora abbastanza veloce.
Webcam
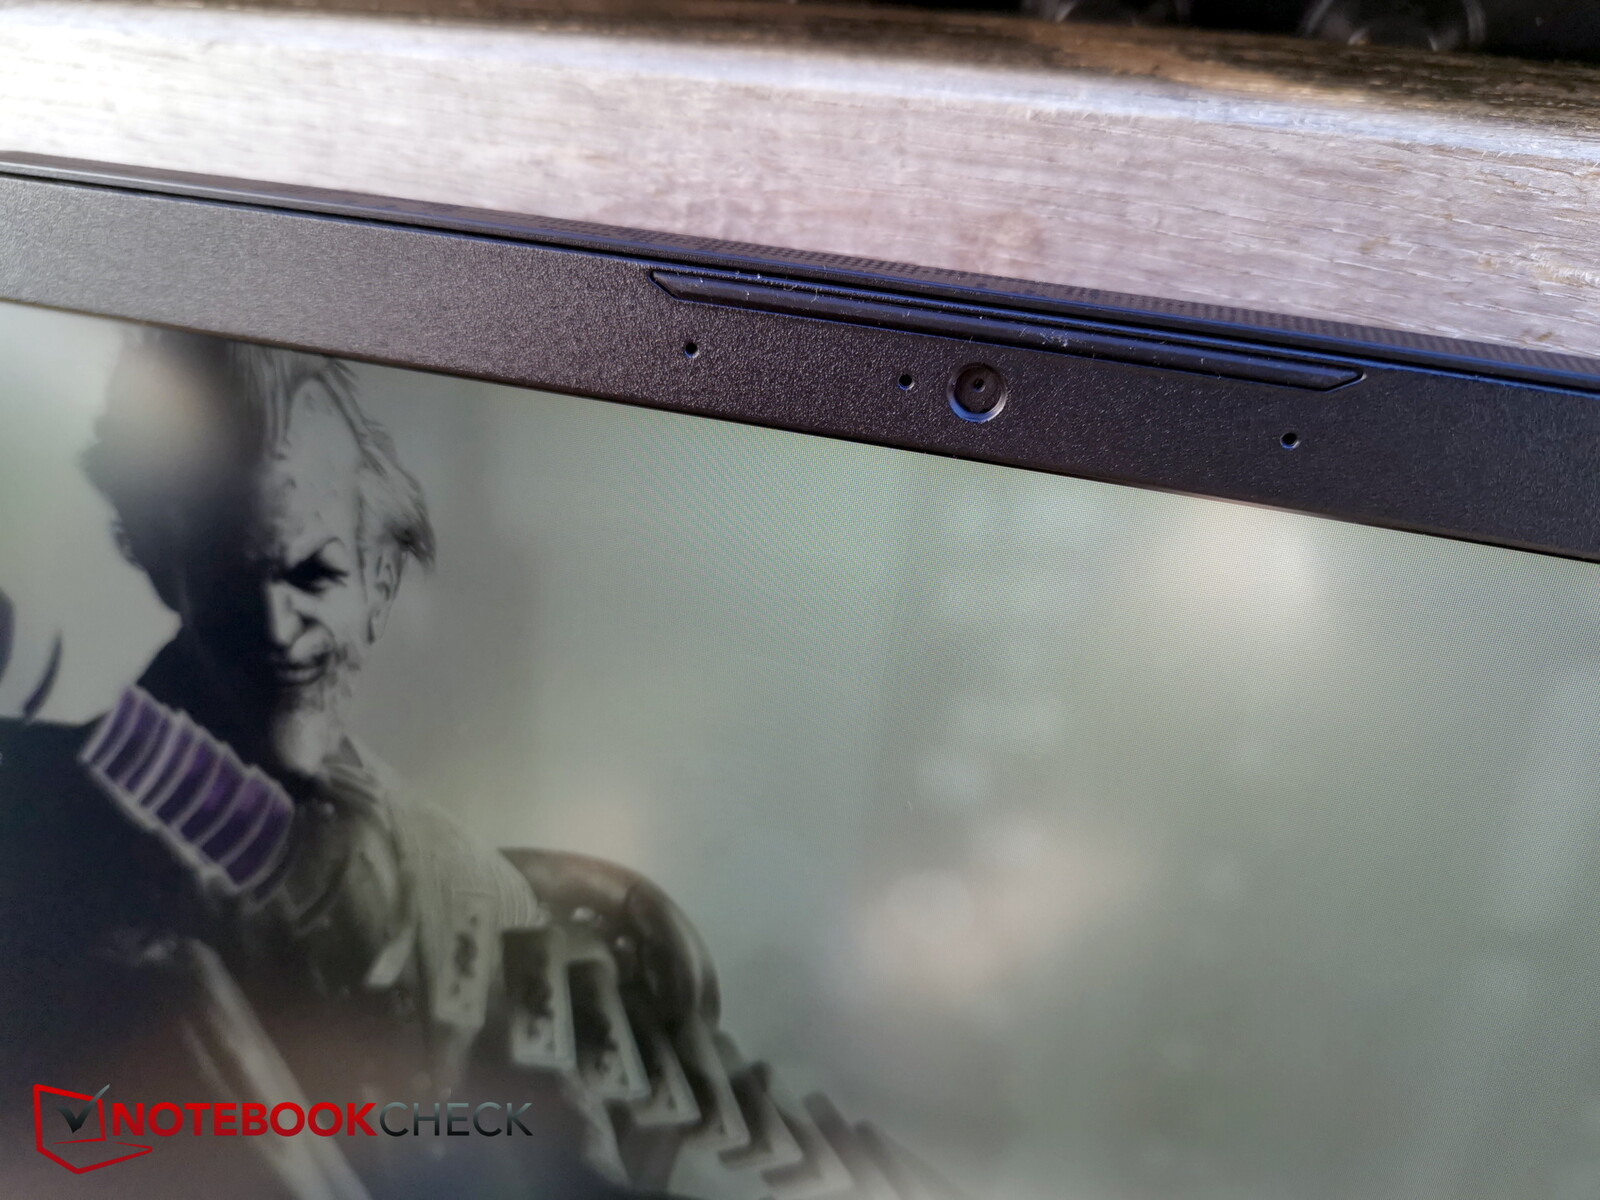
Anche la webcam è di ultima generazione con una risoluzione di 720p. Anche il più recente B13 ha ancora una fotocamera a 720p. Questa può essere attivata e disattivata tramite fn+F6.
Le deviazioni del colore sono generalmente piuttosto elevate e la qualità dell'immagine è piuttosto subottimale.


Sicurezza
Il TPM è presente a bordo, ma manca lo slot Kensington. Non è presente nemmeno un sensore di impronte digitali.
Accessori e garanzia
I computer portatili economici di solito non sono dotati di alcun extra. Questo è anche il caso del Katana 15.
MSI offre una garanzia di 24 mesi e un servizio di ritiro e restituzione incluso.
Manutenzione
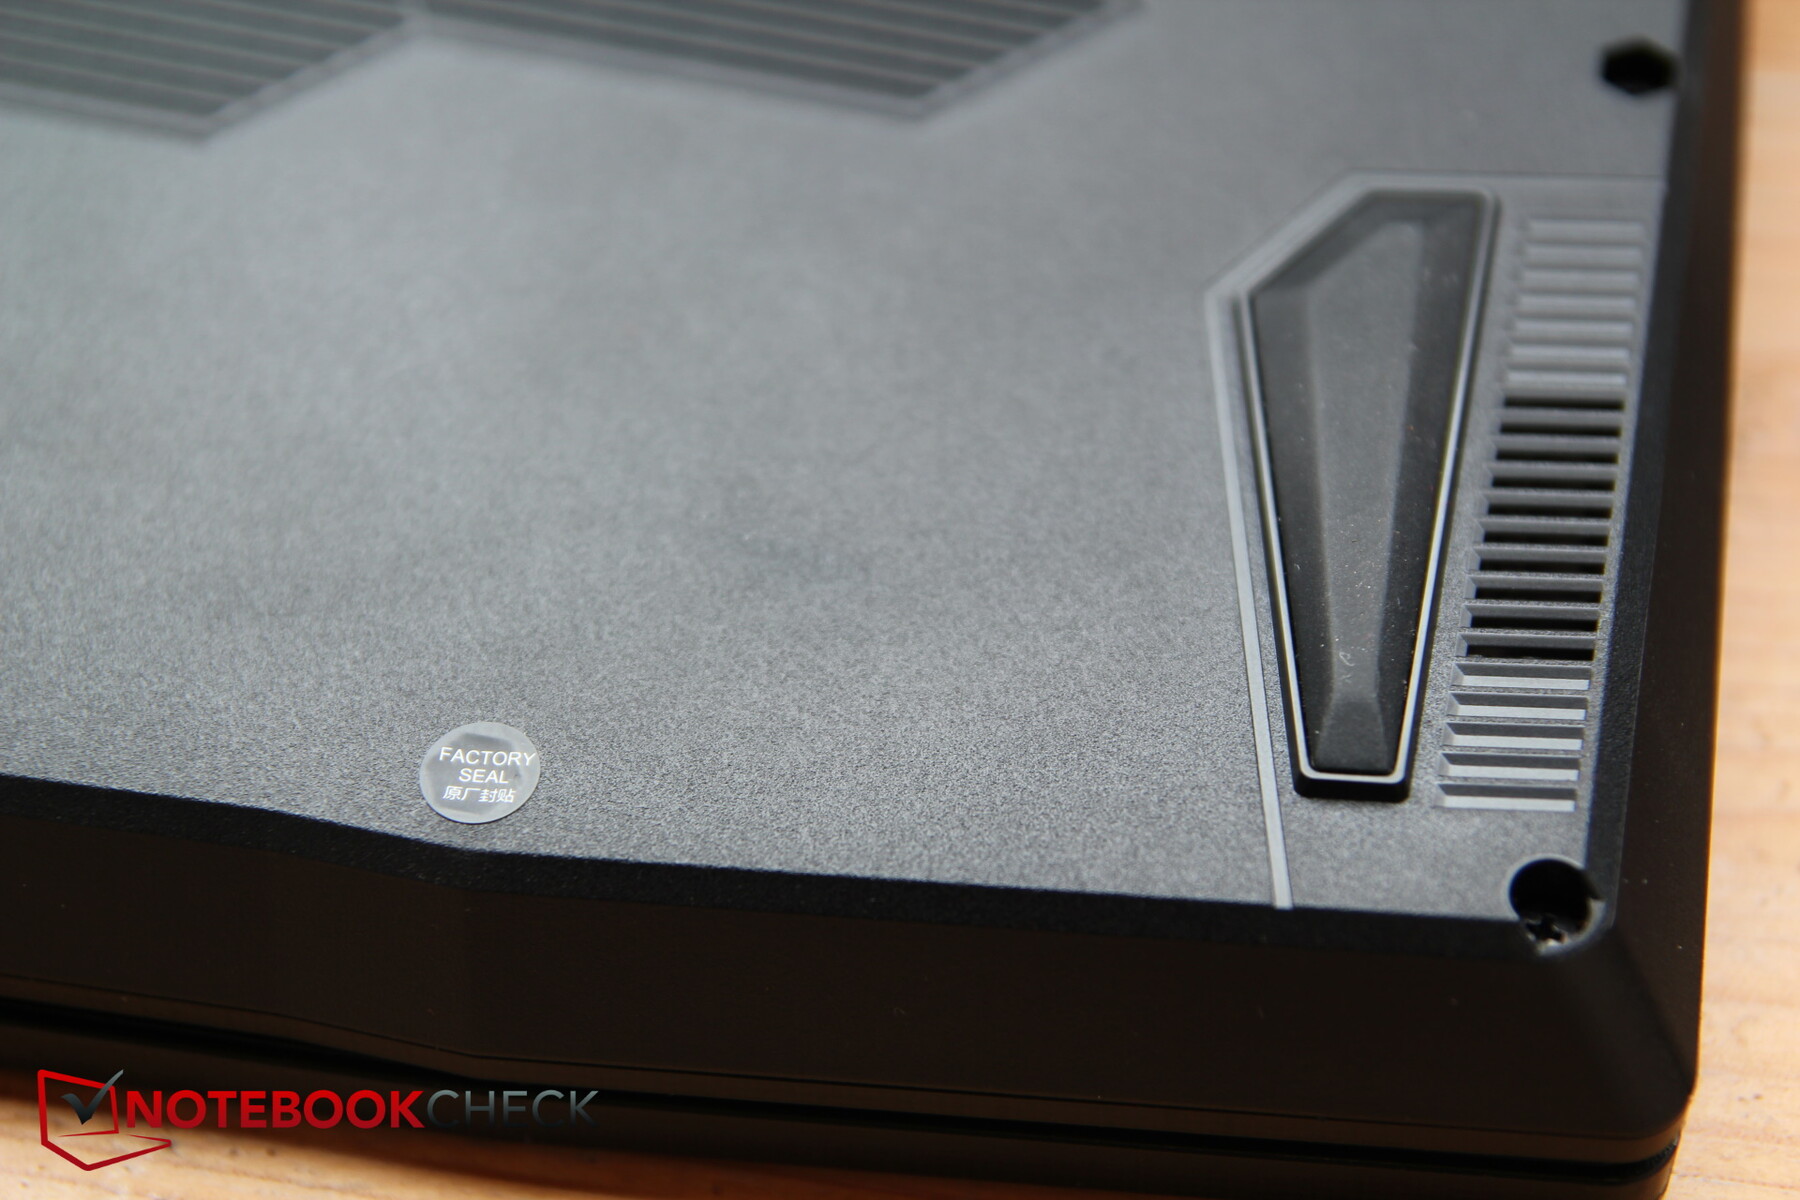
Sfortunatamente, MSI utilizza un adesivo per determinare se gli utenti hanno già aperto il dispositivo. Poiché il nostro modello di prova proviene da Cyberport, ci siamo astenuti dall'aprirlo per non danneggiare il dispositivo in prestito.
Secondo MSI, il dispositivo può anche essere aperto dal proprietario per scopi di manutenzione. A condizione che ciò avvenga in modo "professionale", la garanzia del dispositivo rimane inalterata.
Dispositivi di input - Tastiera decente, piccolo touchpad
Tastiera
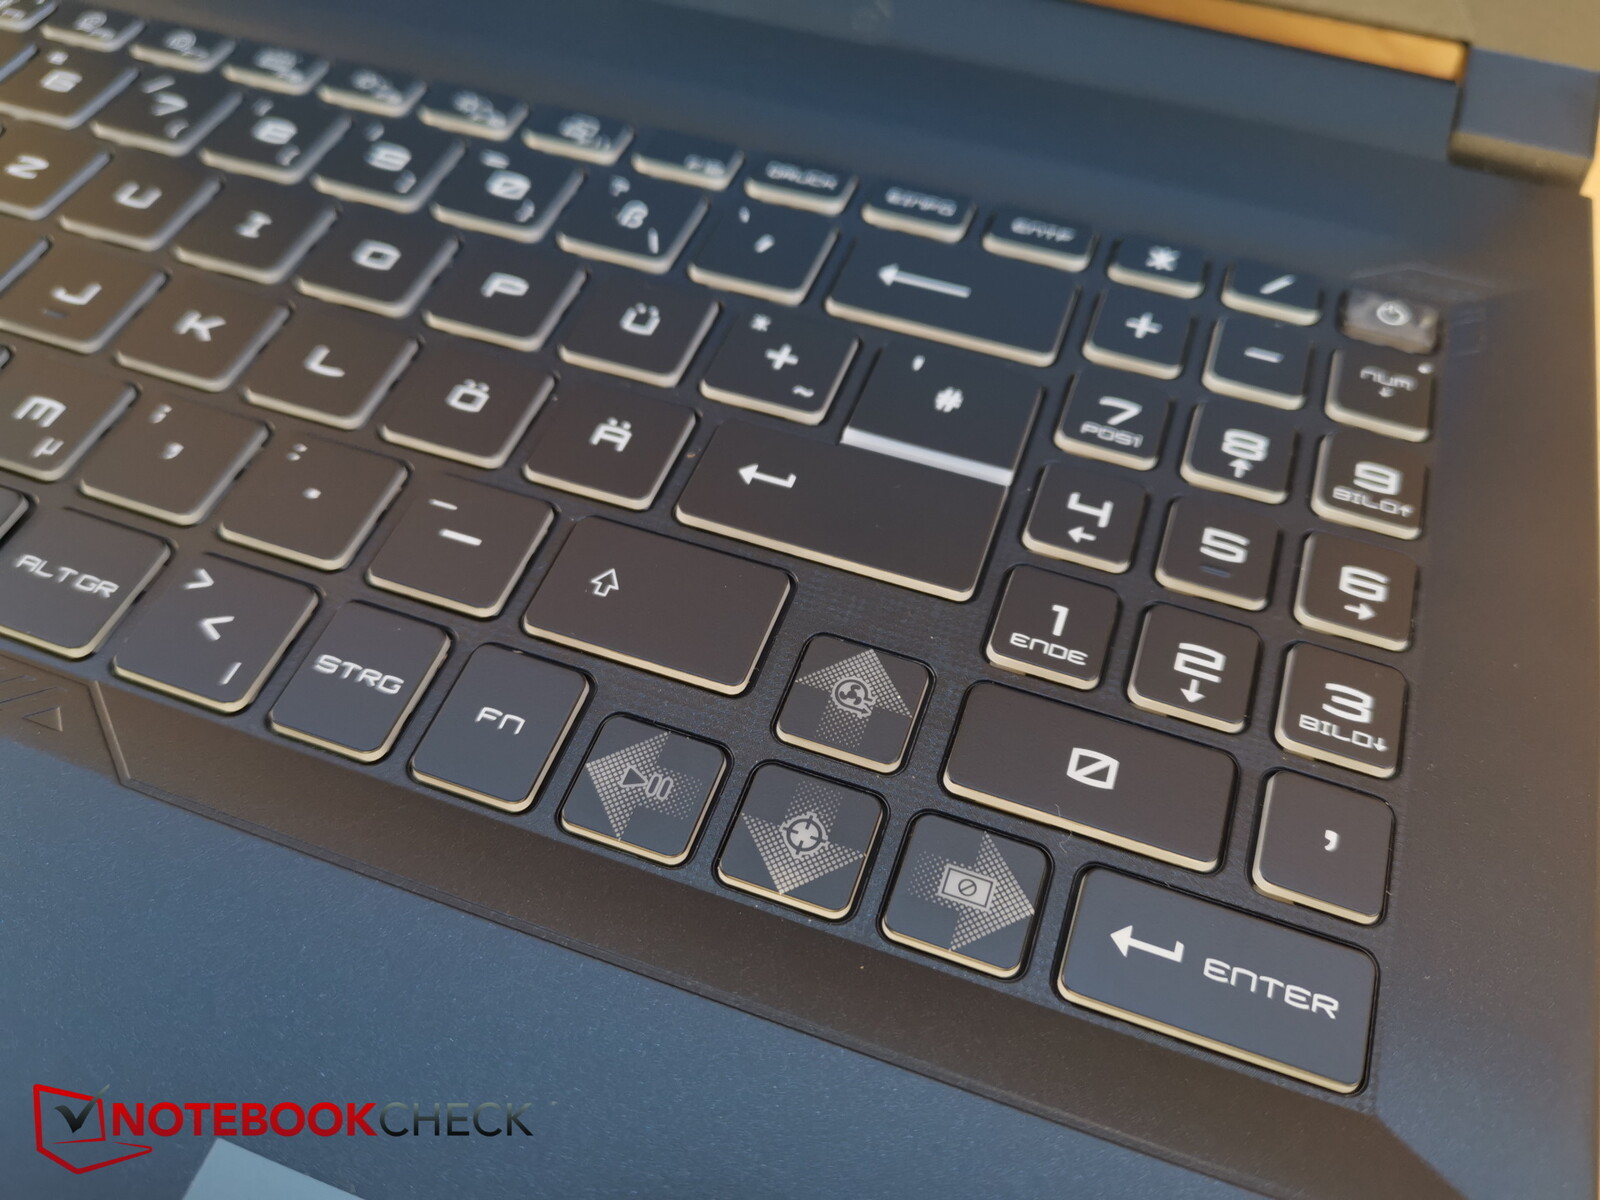
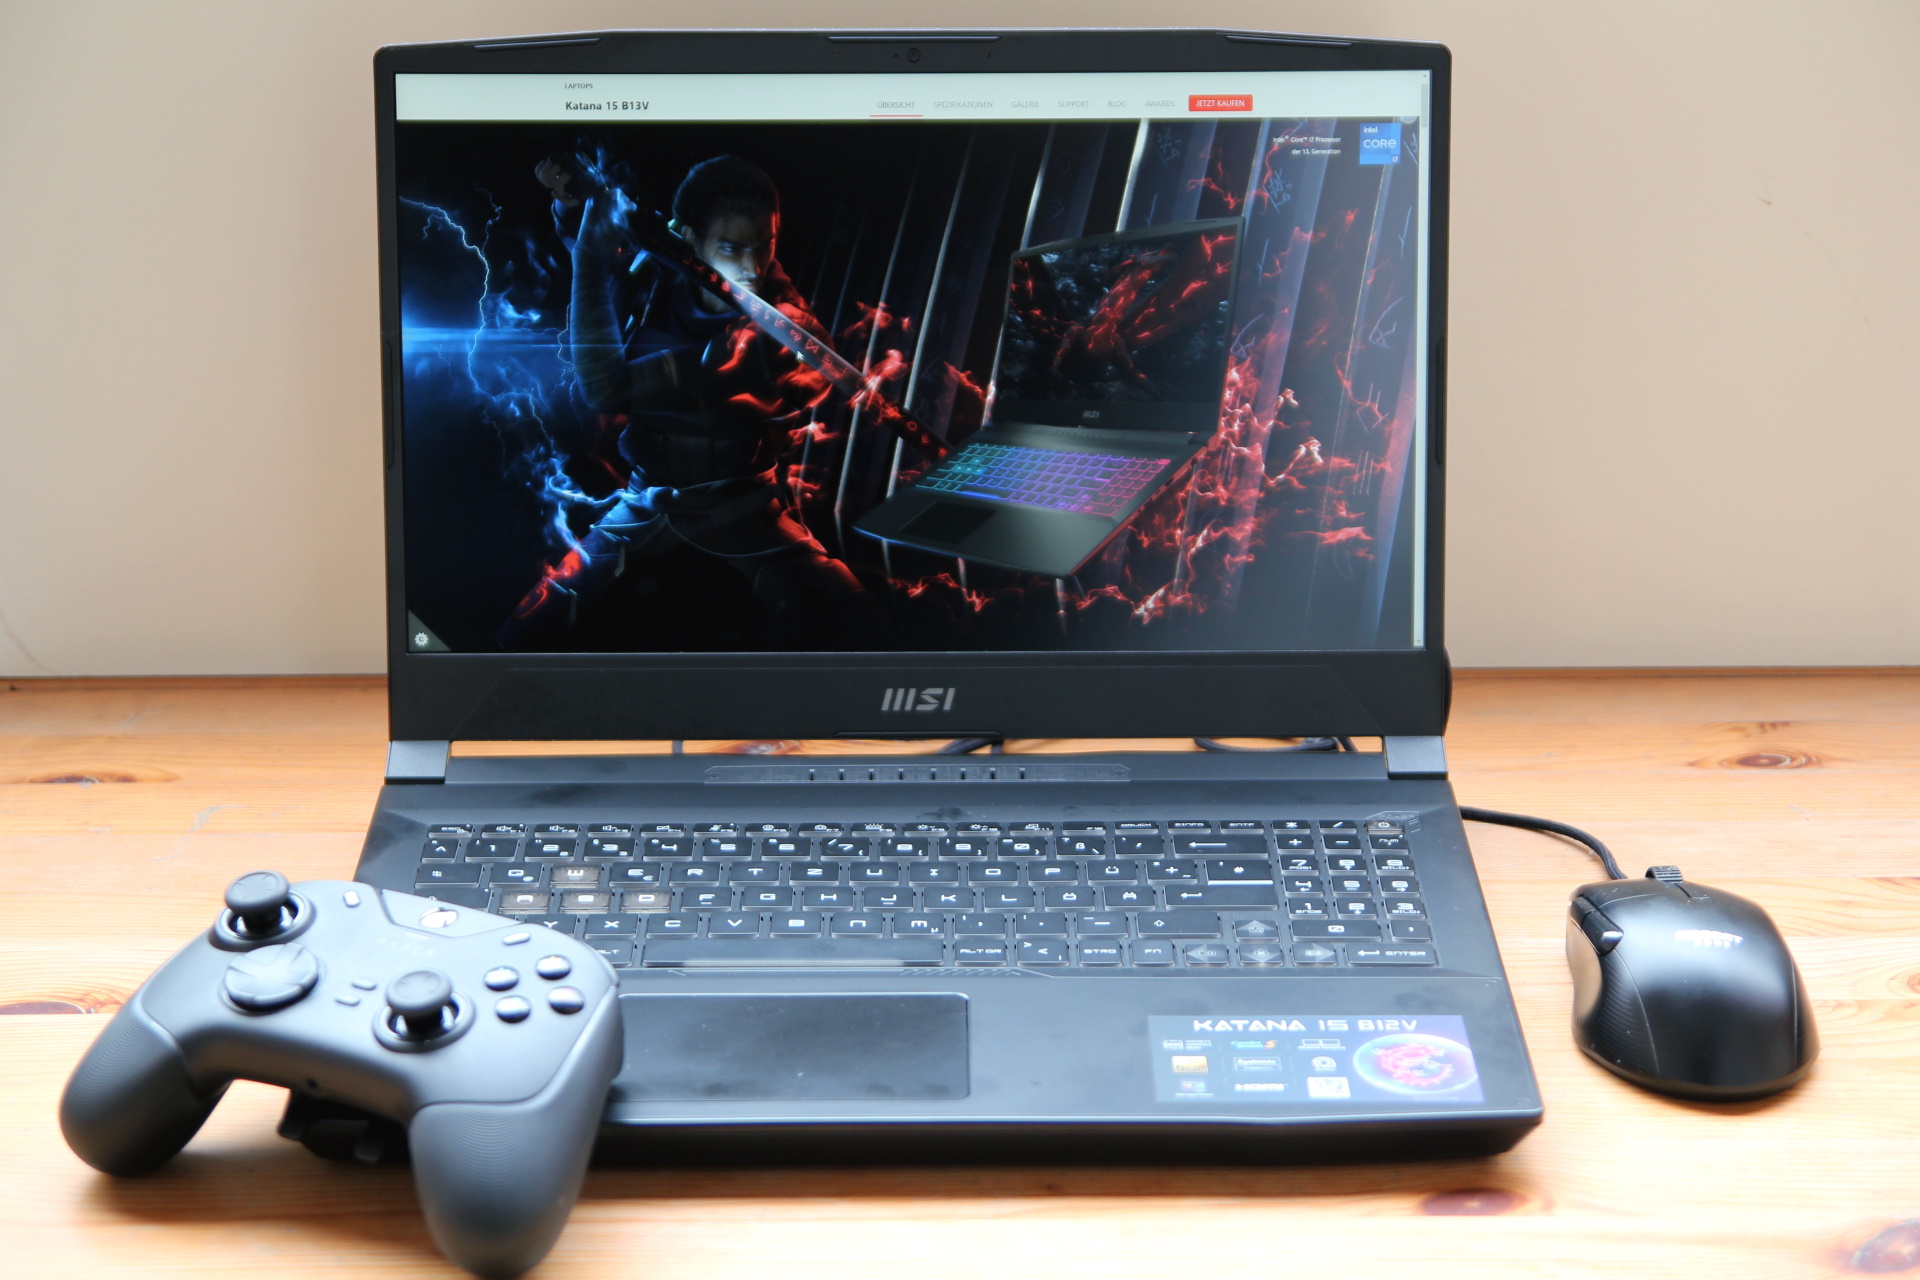
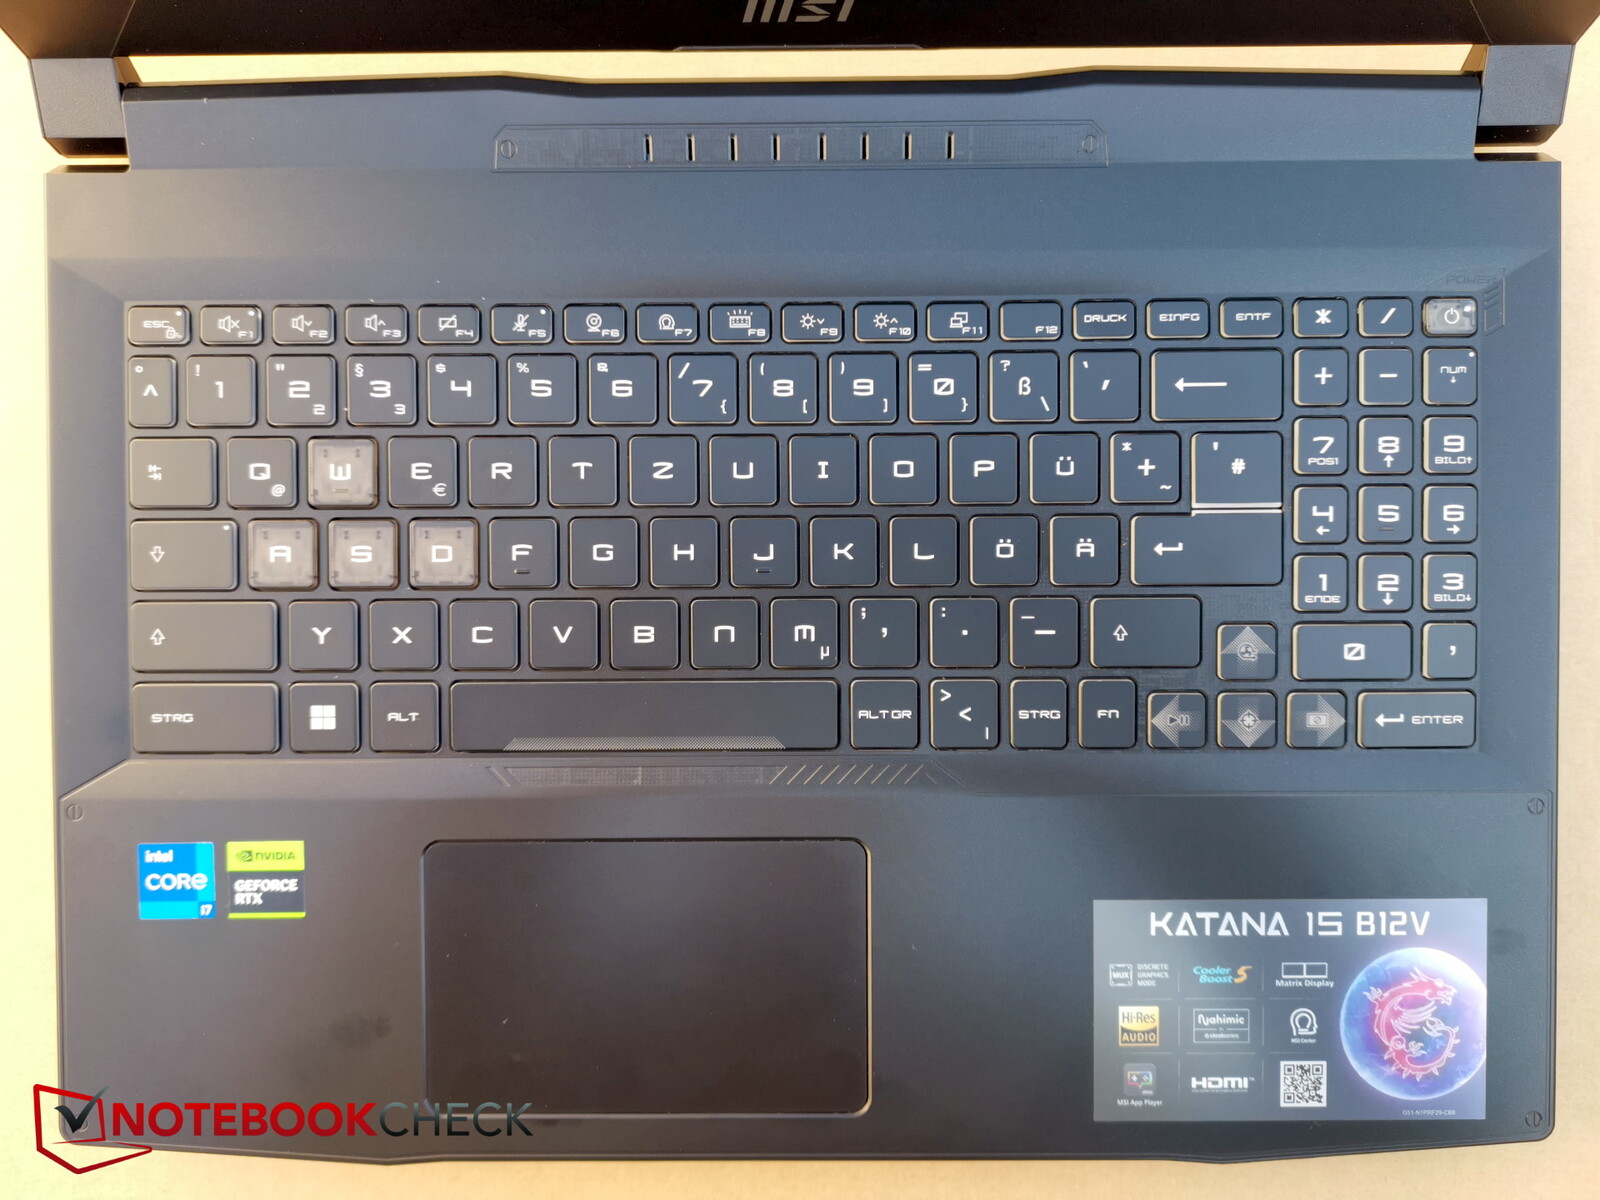
Il layout è molto simile a quello di tutti i modelli Katana: sembra molto ordinato, ma il tastierino numerico sul lato destro sembra mal inserito, ma almeno è presente.
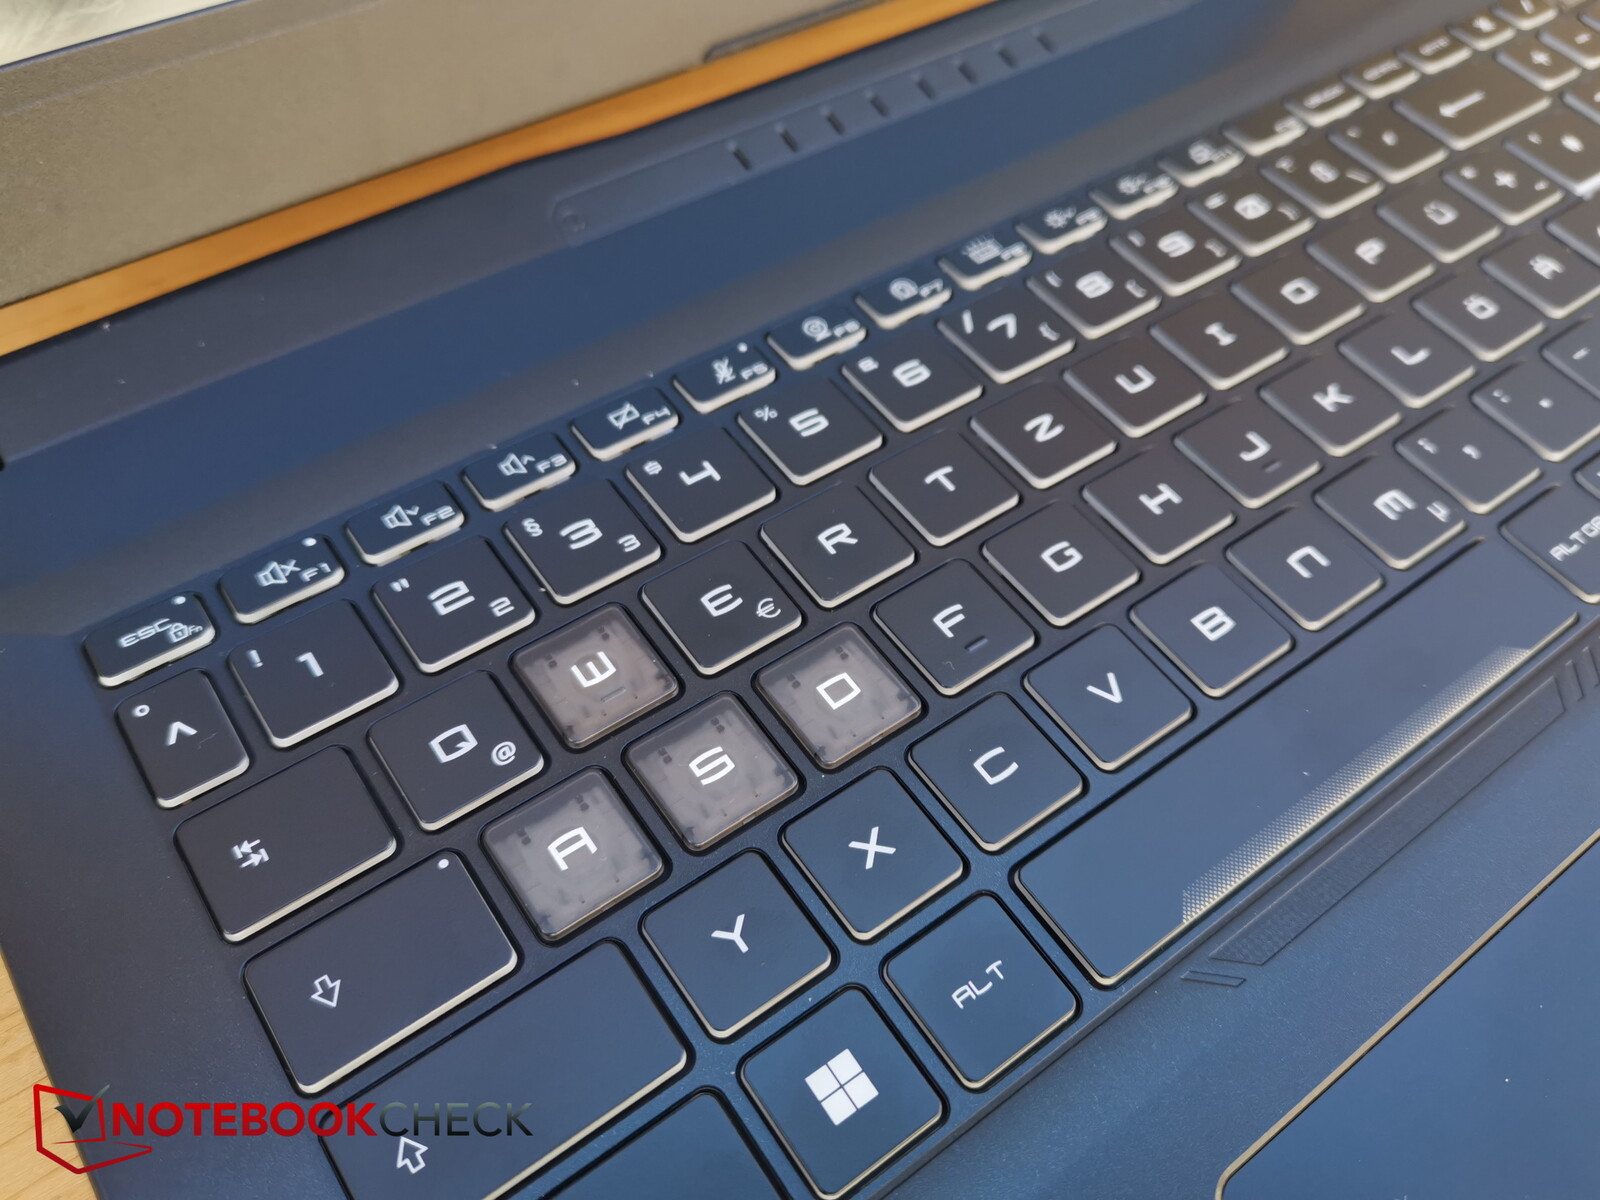
I tasti freccia intermedi non sono dimezzati in altezza, come spesso accade, ma sono leggermente più piccoli in lunghezza e altezza. I tasti WASD sono trasparenti e quindi spiccano per il loro colore. Anche i tasti F e speciale sono molto piccoli.
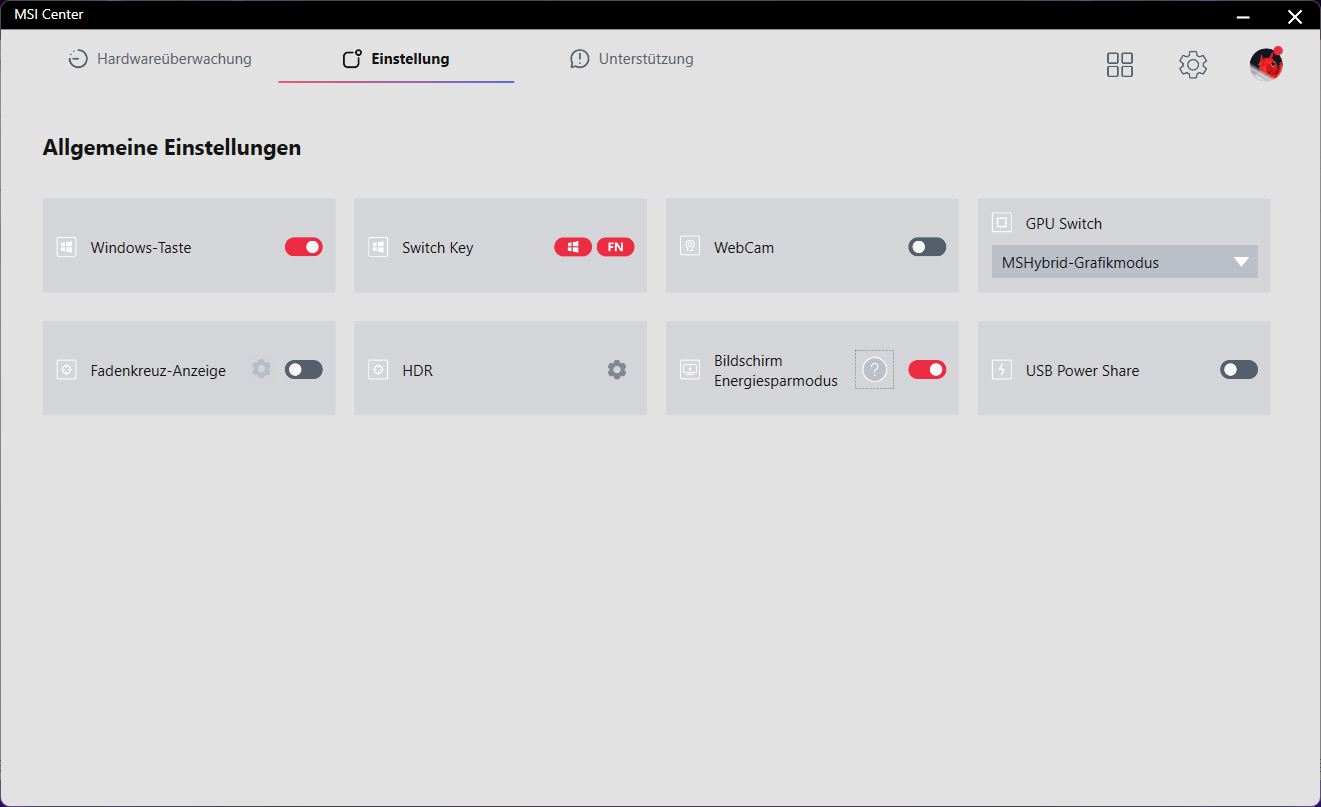
Purtroppo MSI ha nuovamente spostato il tasto fn a destra della barra spaziatrice, il che richiede un po' di tempo per abituarsi. È strano che MSI continui a seguire la propria strada. Se necessario, è possibile scambiare le funzioni dei tasti fn e Windows, ma poi si presenta lo stesso problema con il tasto Windows, che si trova a destra al posto del tasto fn.
La corsa dei tasti è piuttosto breve, ma il feedback è chiaramente percepibile, tanto che la digitazione sembra abbastanza veloce. Il rumore dei tasti è moderato e la base rimane stabile e non si piega durante la digitazione.
La retroilluminazione della tastiera offre quattro zone, ognuna con quattro livelli di luminosità regolabile.
Touchpad
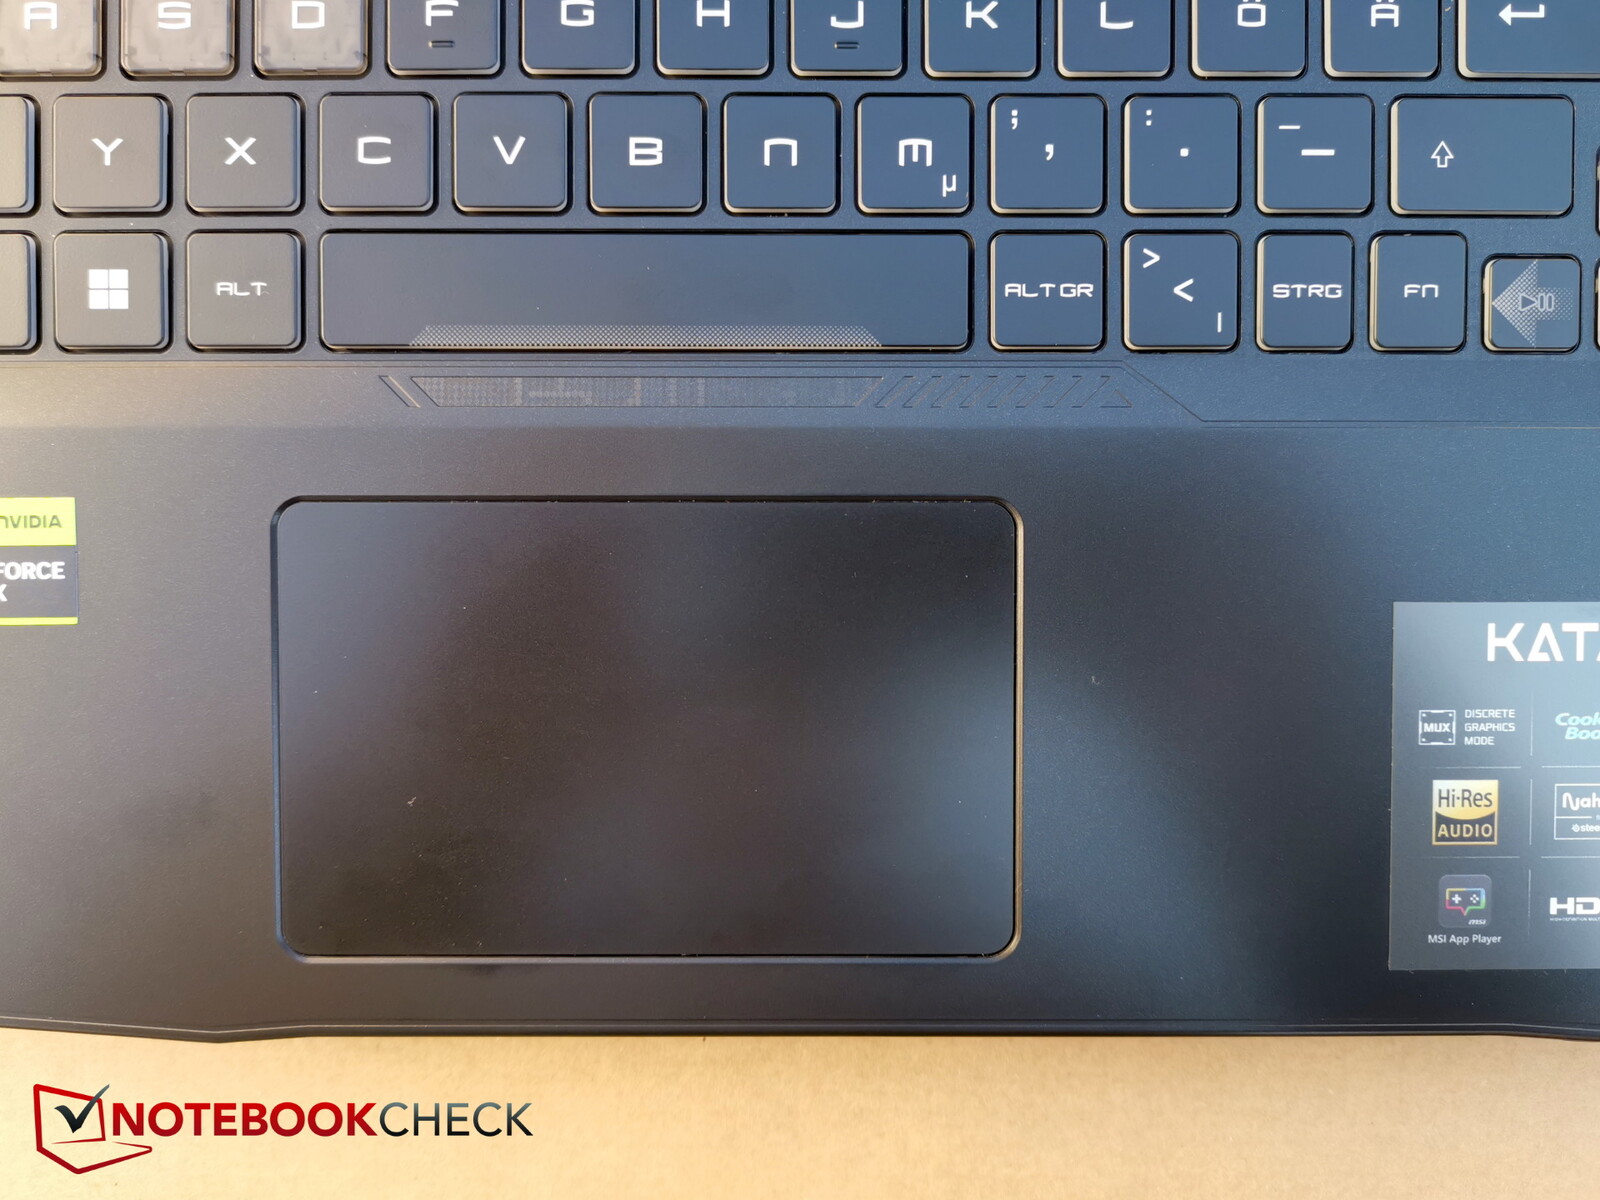
Il Katana 15 ha uno dei touchpad più piccoli del mercato. Ha un aspetto un po' retrò. Certo, i giocatori di solito collegano un mouse in ogni caso, ma un touchpad più grande è semplicemente più comodo per l'uso in movimento
Il touchpad si trova proprio sotto la barra spaziatrice e quindi molto a sinistra nel layout. Un posizionamento leggermente più centrale sarebbe stato più vantaggioso
I clic dei tasti integrati sono un po' più rumorosi e non sembrano di alta qualità, ma reagiscono in modo affidabile e preciso.
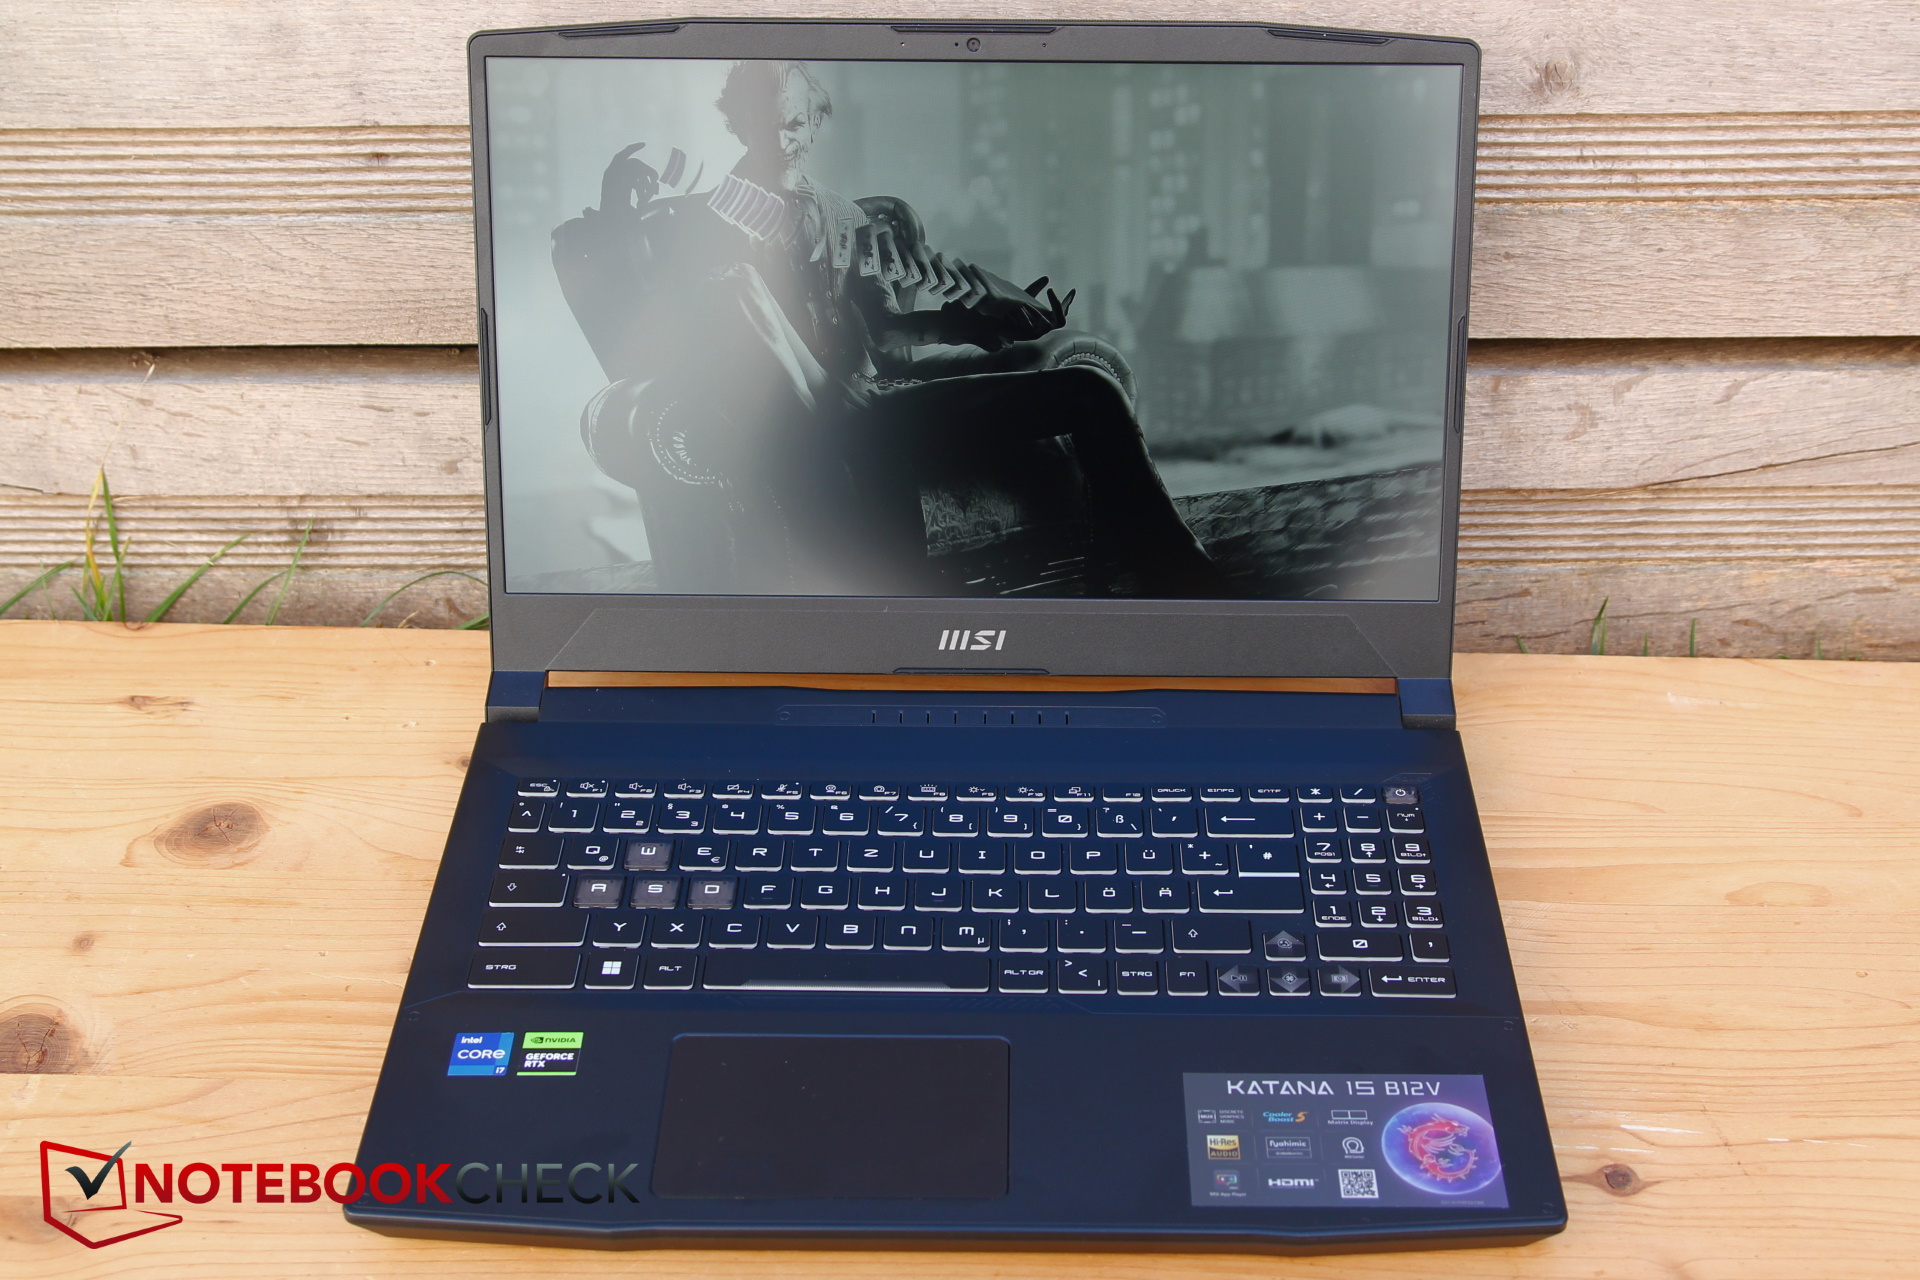
Display - 250 nits e 57% sRGB sono valori di budget

MSI continua a utilizzare un display Full HD per il Katana, mentre molti concorrenti utilizzano già un display QHD o superiore. Questo non è necessariamente un problema, poiché la risoluzione e i 144 Hz dovrebbero adattarsi bene alla RTX 4050. Finora non sembrano esserci opzioni di visualizzazione alternative per il B13. In definitiva, si tratta dello stesso pannello presente su Katana GF66 e Pulse GL66.
Sfortunatamente, la luminosità media di 258 nit è piuttosto inferiore alla media di questi tempi, dato che la maggior parte dei portatili concorrenti offre display più luminosi. Almeno l'illuminazione del 92% è abbastanza uniforme e la luminosità diminuisce un po' verso la parte inferiore destra
I tempi di risposta sono piuttosto subottimali o mediocri per un giocatore. Almeno il PWM non è un problema nel nostro modello. Il bleeding dello schermo è solo lieve e non si nota nella maggior parte delle situazioni.
| |||||||||||||||||||||||||
Distribuzione della luminosità: 92 %
Al centro con la batteria: 257 cd/m²
Contrasto: 1374:1 (Nero: 0.19 cd/m²)
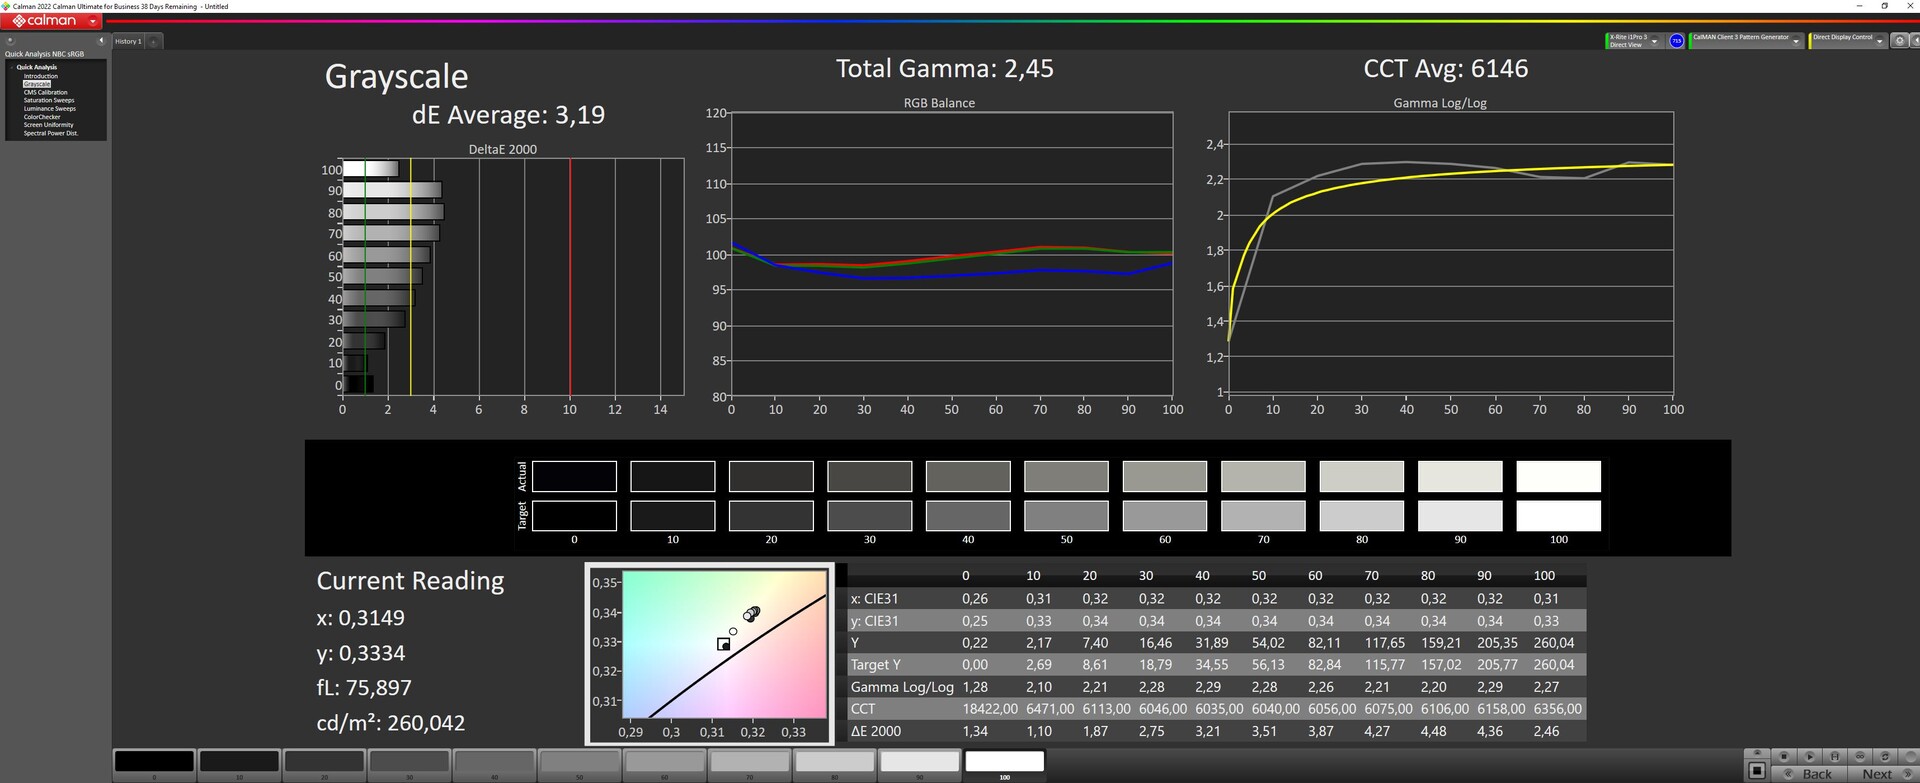
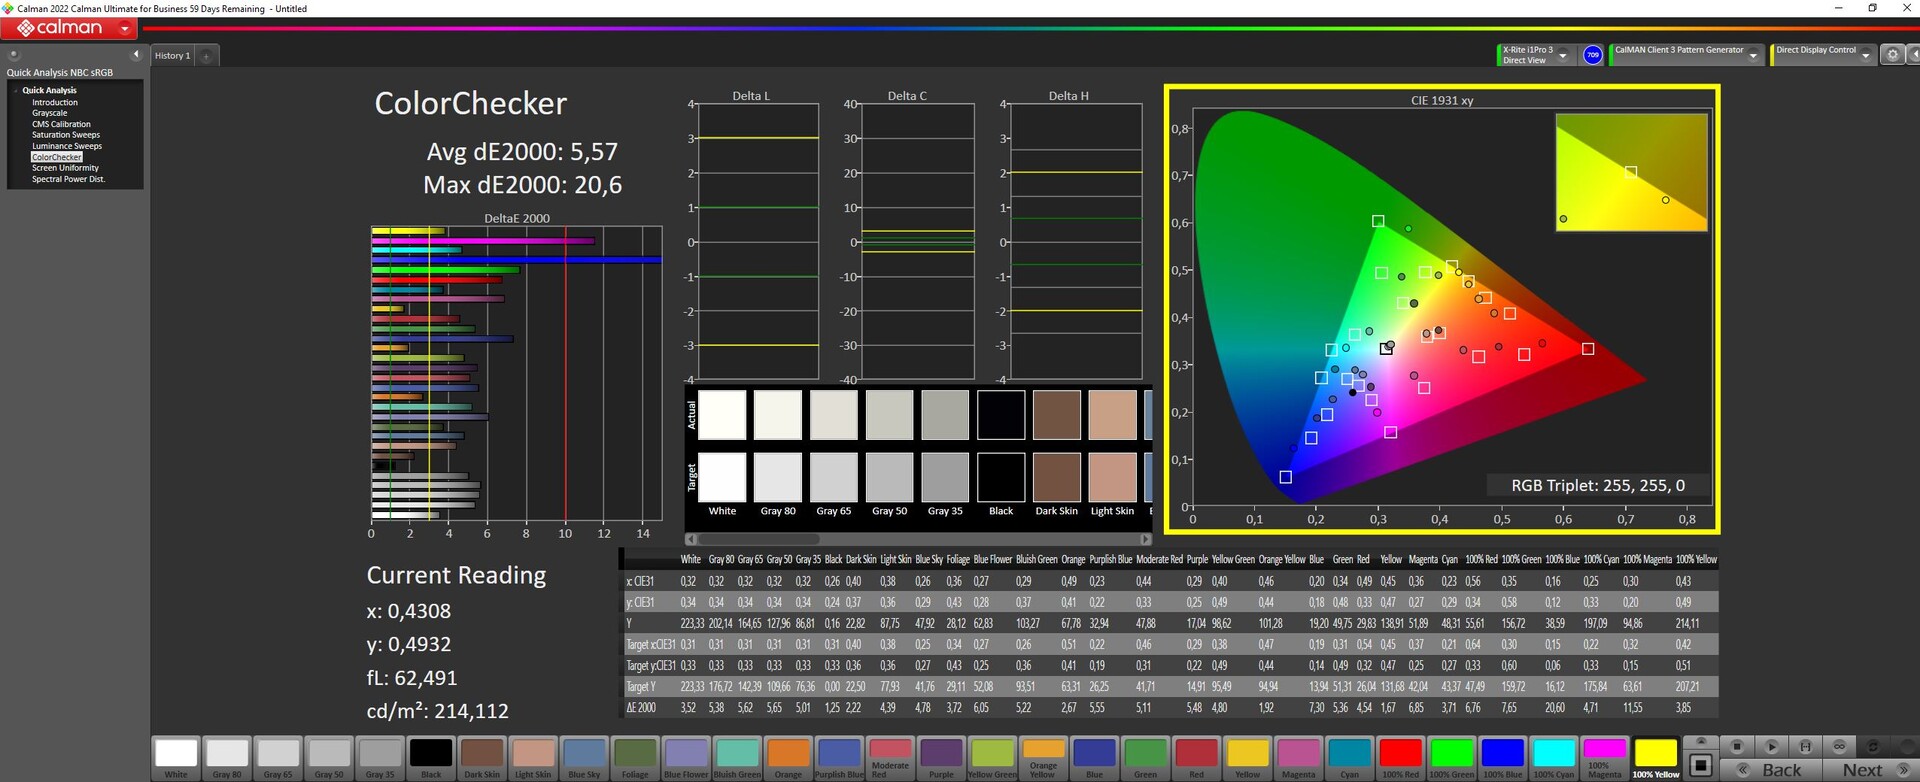
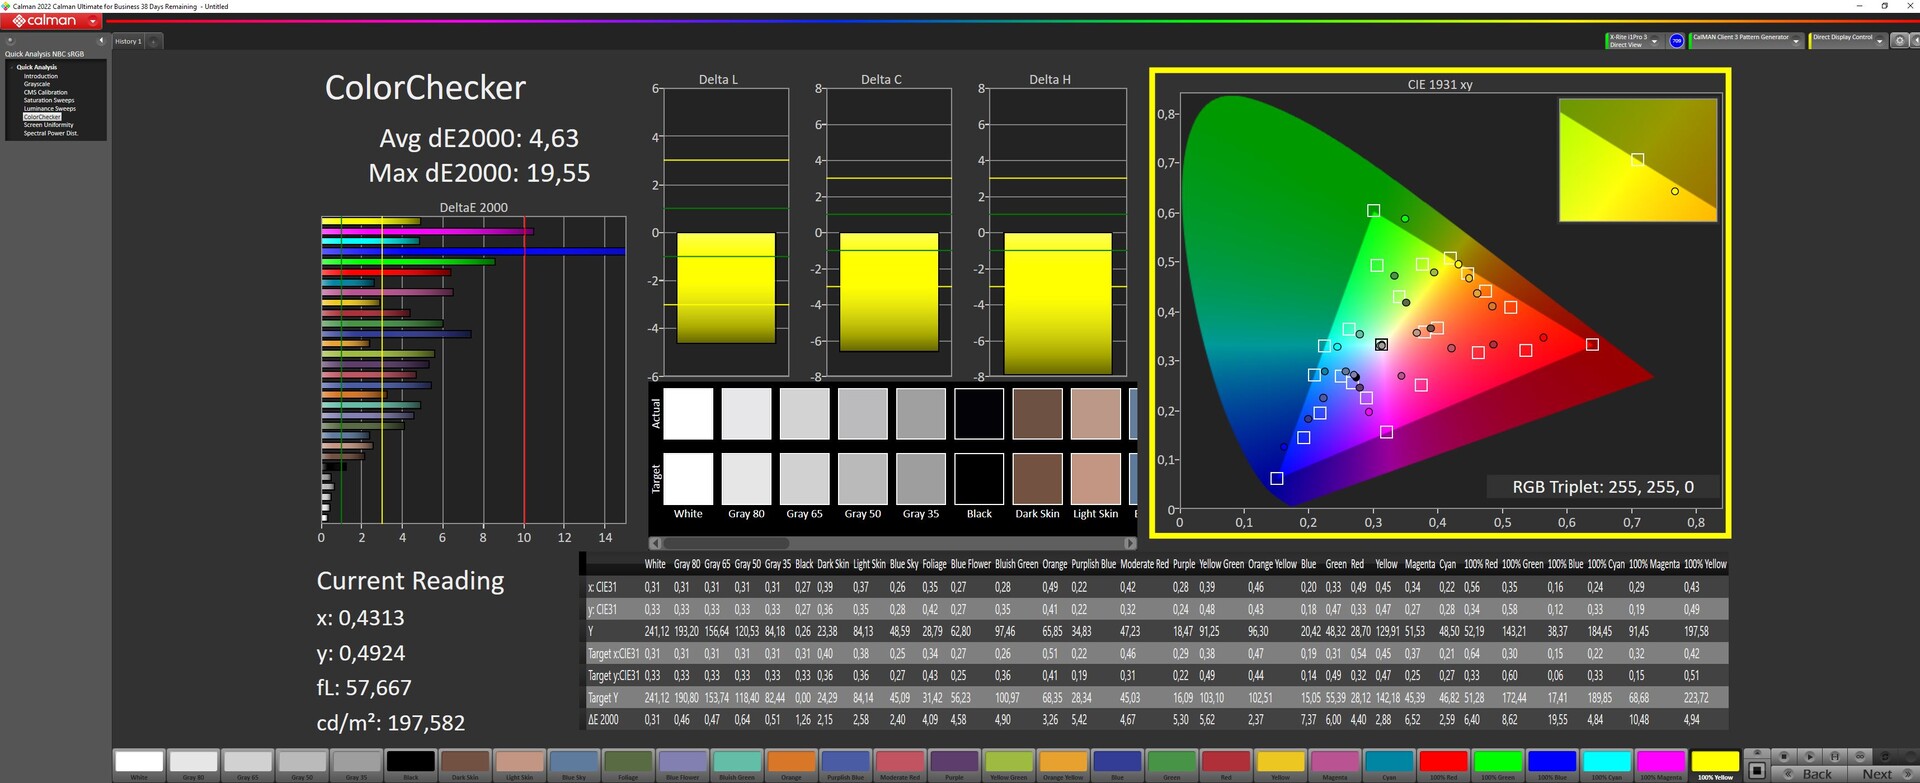
ΔE ColorChecker Calman: 5.57 | ∀{0.5-29.43 Ø4.73}
calibrated: 4.63
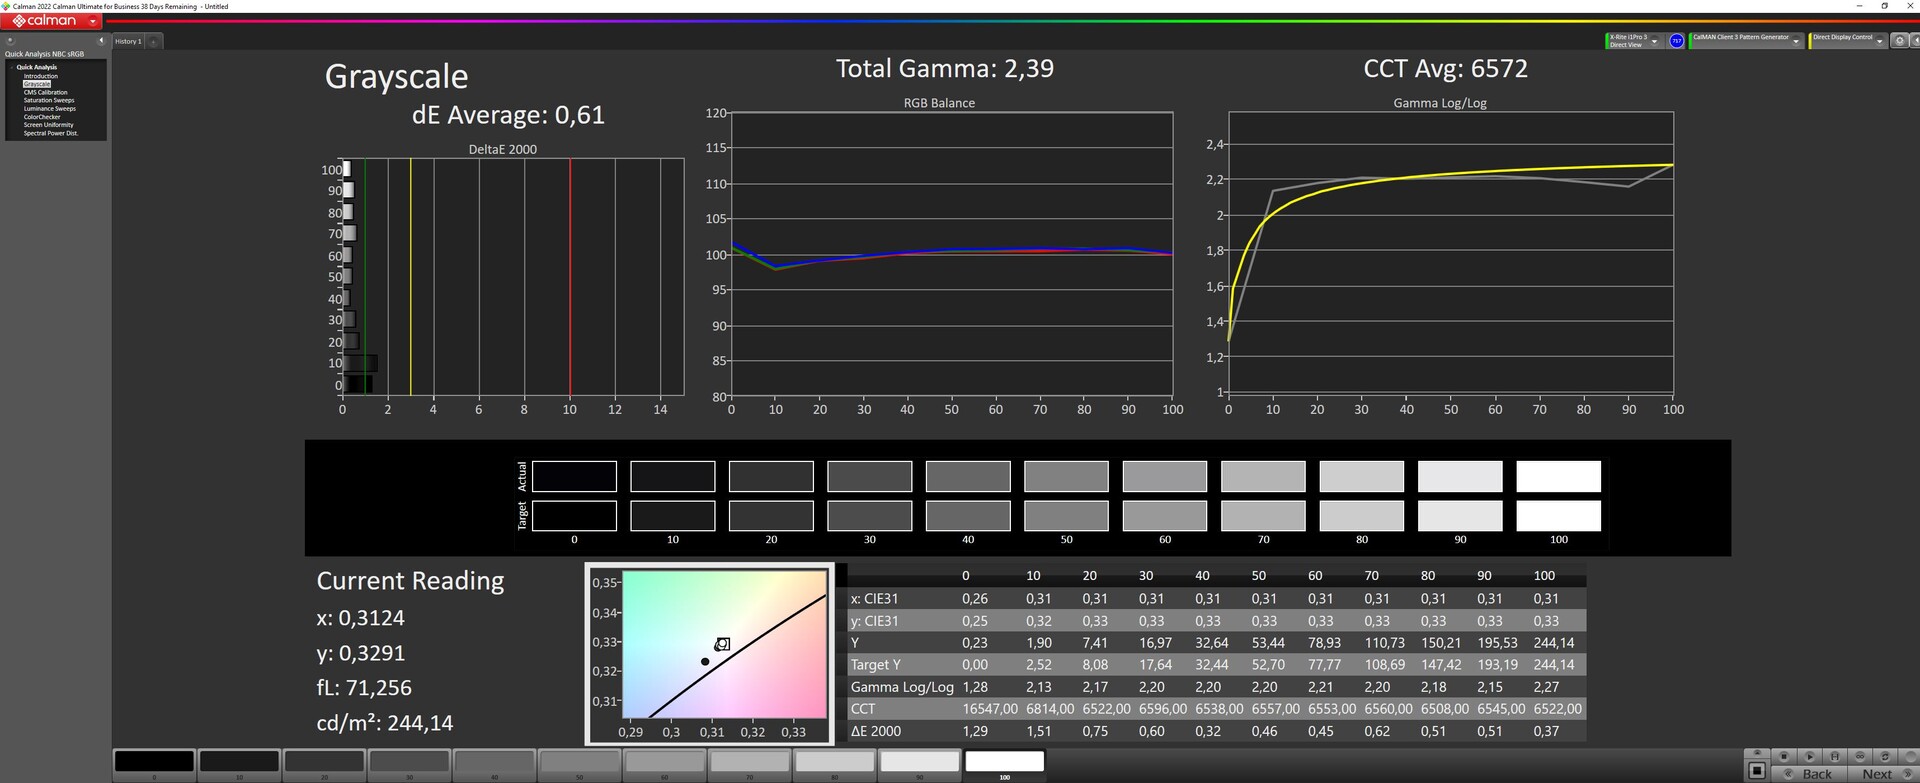
ΔE Greyscale Calman: 3.19 | ∀{0.09-98 Ø4.97}
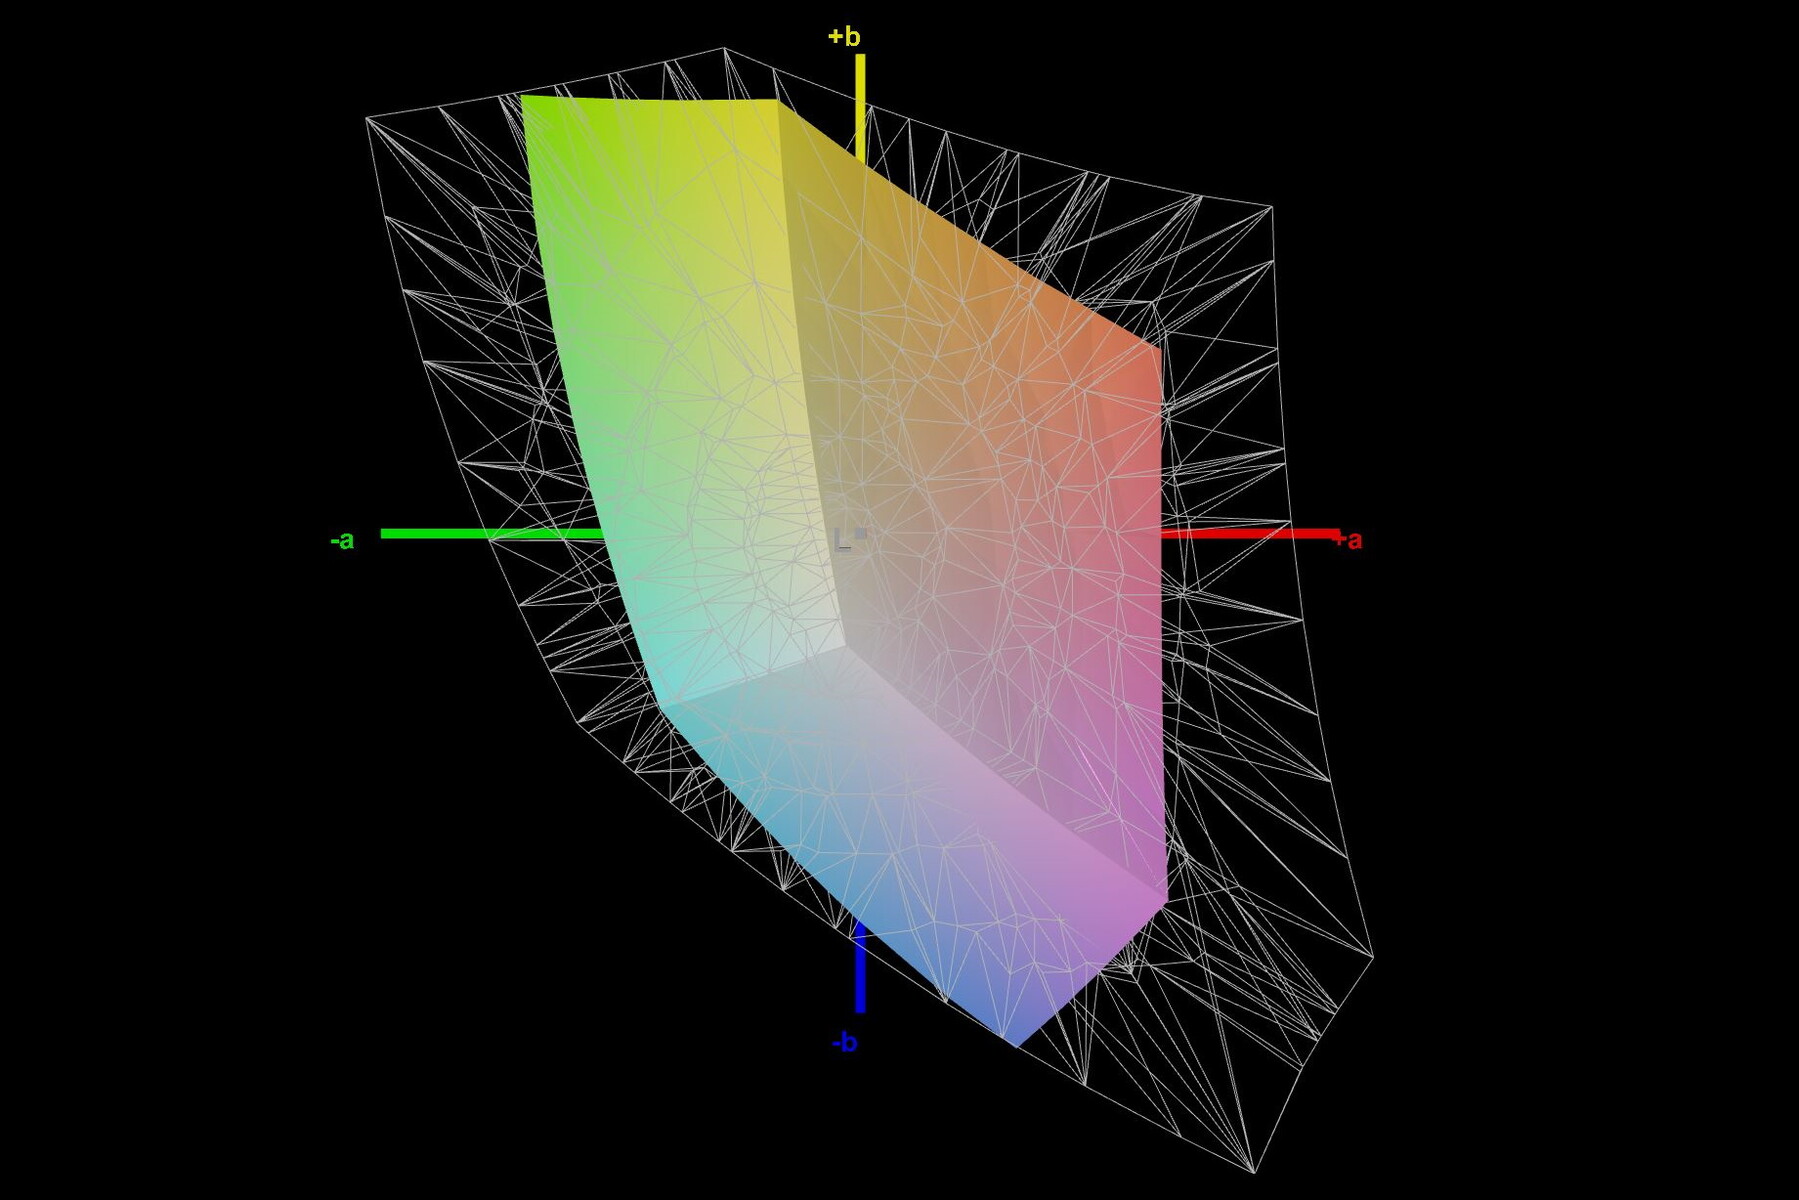
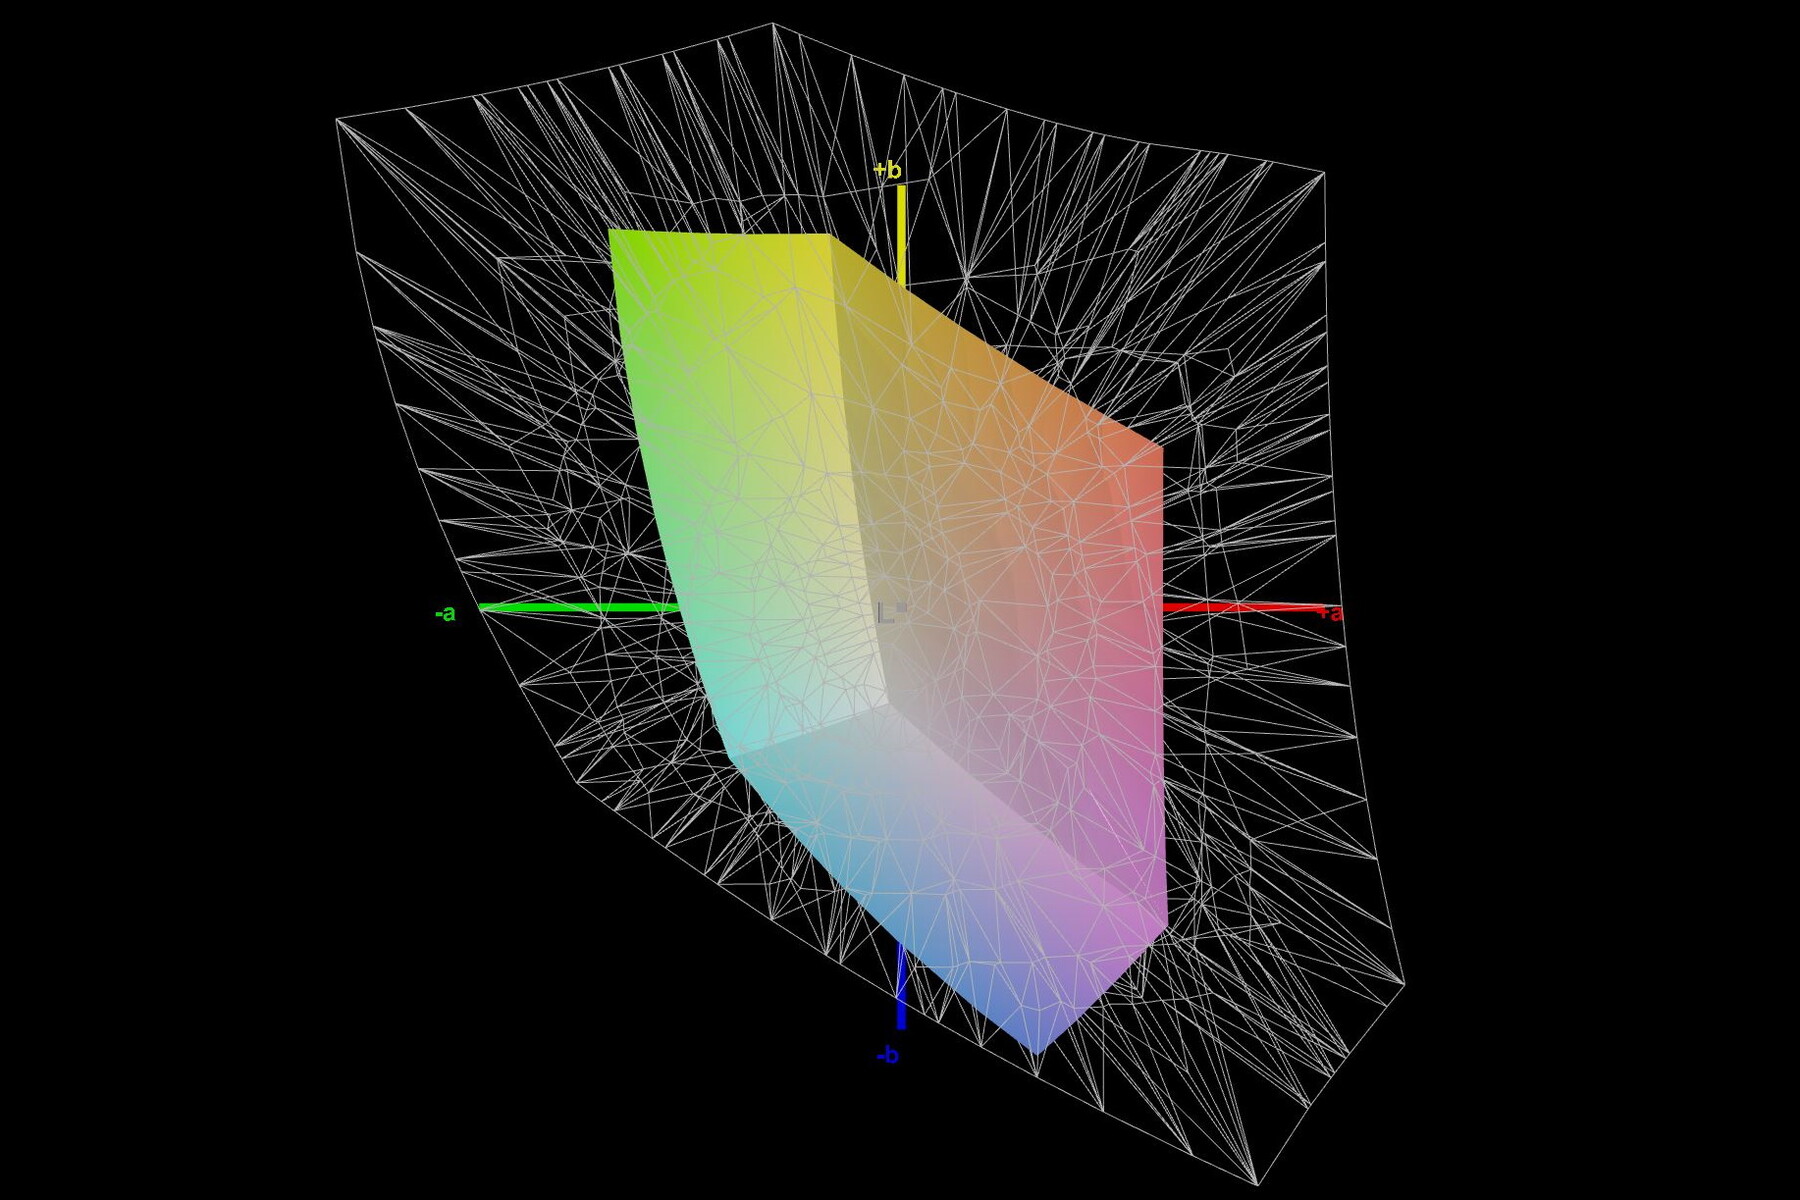
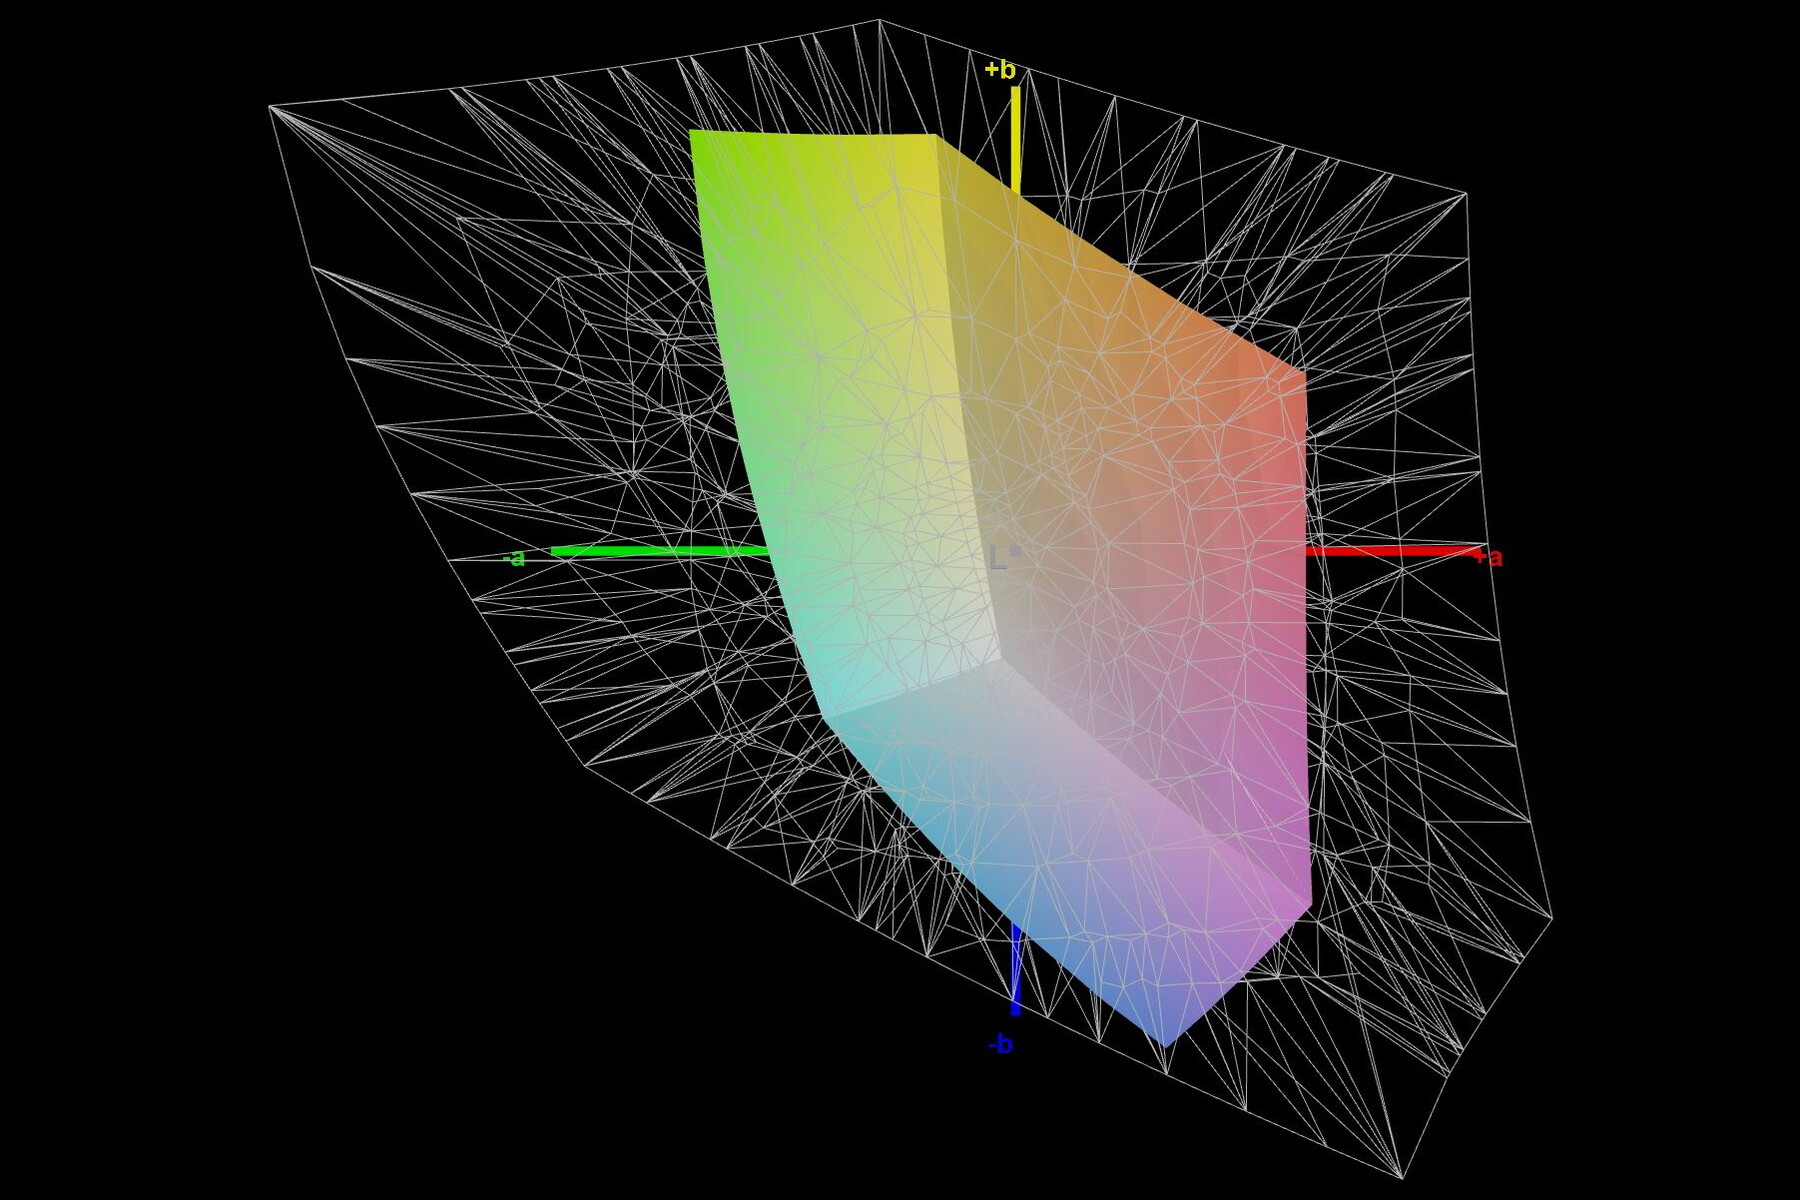
39.3% AdobeRGB 1998 (Argyll 3D)
56.8% sRGB (Argyll 3D)
38.1% Display P3 (Argyll 3D)
Gamma: 2.45
CCT: 6146 K
| MSI Katana 15 B12VEK AUOAF90 (B156HAN08.4), IPS, 1920x1080, 15.6" | MSI Katana GF66 12UGS AU Optronics AUOAF90, IPS, 1920x1080, 15.6" | MSI Pulse GL66 12UEK AU Optronics B156HAN08.4 (AUOAF90), IPS, 1920x1080, 15.6" | Lenovo Legion 5 15IAH7H 82RB CSOT MNF601CA1-3, IPS, 1920x1080, 15.6" | Asus TUF Gaming F15 FX507ZM TL156VDXP0101, IPS, 1920x1080, 15.6" | Schenker XMG Core 15 (M22) CSOT MNF601CA1-1, IPS, 2560x1440, 15.6" | |
|---|---|---|---|---|---|---|
| Display | 3% | 3% | 78% | 73% | 78% | |
| Display P3 Coverage (%) | 38.1 | 39.1 3% | 39 2% | 69.1 81% | 66.4 74% | 68.8 81% |
| sRGB Coverage (%) | 56.8 | 58.3 3% | 58.4 3% | 99.5 75% | 97 71% | 99.3 75% |
| AdobeRGB 1998 Coverage (%) | 39.3 | 40.4 3% | 40.3 3% | 70 78% | 68.5 74% | 69.9 78% |
| Response Times | -5% | -2% | 59% | 69% | 66% | |
| Response Time Grey 50% / Grey 80% * (ms) | 38.8 ? | 40 ? -3% | 38.8 ? -0% | 14.8 ? 62% | 5.6 ? 86% | 16 ? 59% |
| Response Time Black / White * (ms) | 26.8 ? | 28.4 ? -6% | 28 ? -4% | 12 ? 55% | 12.8 ? 52% | 7.6 ? 72% |
| PWM Frequency (Hz) | ||||||
| Screen | 1% | 29% | 1% | 26% | 15% | |
| Brightness middle (cd/m²) | 261 | 227 -13% | 248 -5% | 363.5 39% | 353.7 36% | 378 45% |
| Brightness (cd/m²) | 258 | 225 -13% | 245 -5% | 350 36% | 340 32% | 371 44% |
| Brightness Distribution (%) | 92 | 90 -2% | 86 -7% | 89 -3% | 89 -3% | 93 1% |
| Black Level * (cd/m²) | 0.19 | 0.21 -11% | 0.13 32% | 0.39 -105% | 0.34 -79% | 0.33 -74% |
| Contrast (:1) | 1374 | 1081 -21% | 1908 39% | 932 -32% | 1040 -24% | 1145 -17% |
| Colorchecker dE 2000 * | 5.57 | 4.19 25% | 3.14 44% | 3.68 34% | 1.74 69% | 2.84 49% |
| Colorchecker dE 2000 max. * | 20.6 | 17.45 15% | 5.82 72% | 8.92 57% | 3.63 82% | 5.51 73% |
| Colorchecker dE 2000 calibrated * | 4.63 | 3.81 18% | 3.14 32% | 0.53 89% | 0.5 89% | 2.75 41% |
| Greyscale dE 2000 * | 3.19 | 2.7 15% | 1.2 62% | 6.5 -104% | 2.1 34% | 4.08 -28% |
| Gamma | 2.45 90% | 2.208 100% | 2.49 88% | 2.2 100% | 2.3 96% | 2.4 92% |
| CCT | 6146 106% | 6176 105% | 6468 100% | 5995 108% | 6257 104% | 5841 111% |
| Media totale (Programma / Settaggio) | -0% /
1% | 10% /
19% | 46% /
26% | 56% /
42% | 53% /
36% |
* ... Meglio usare valori piccoli
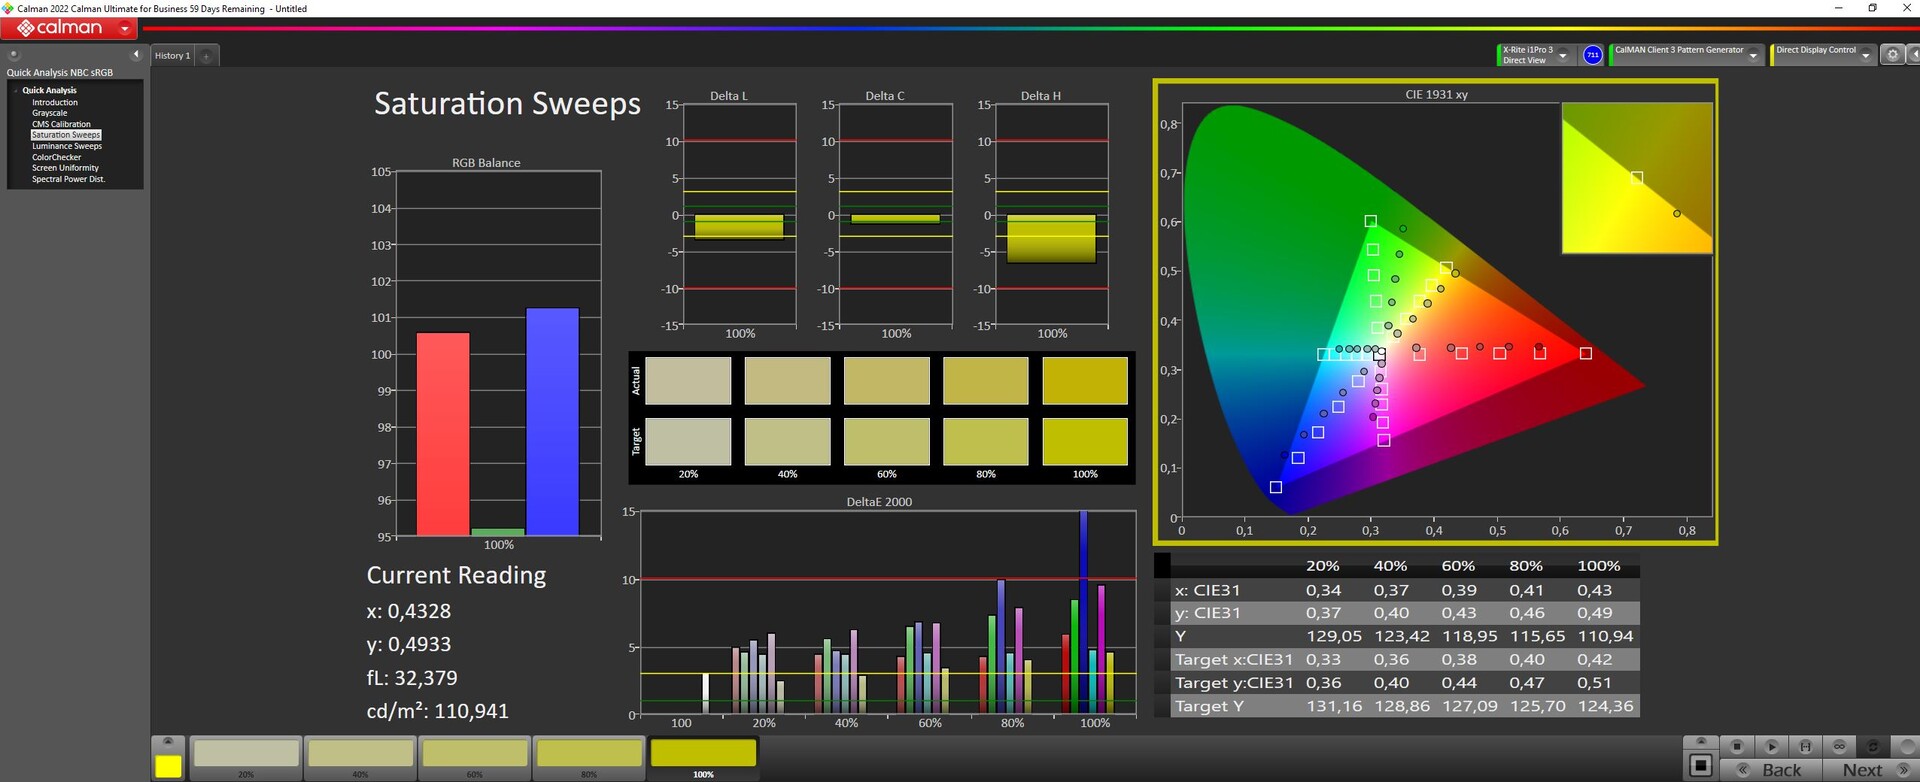
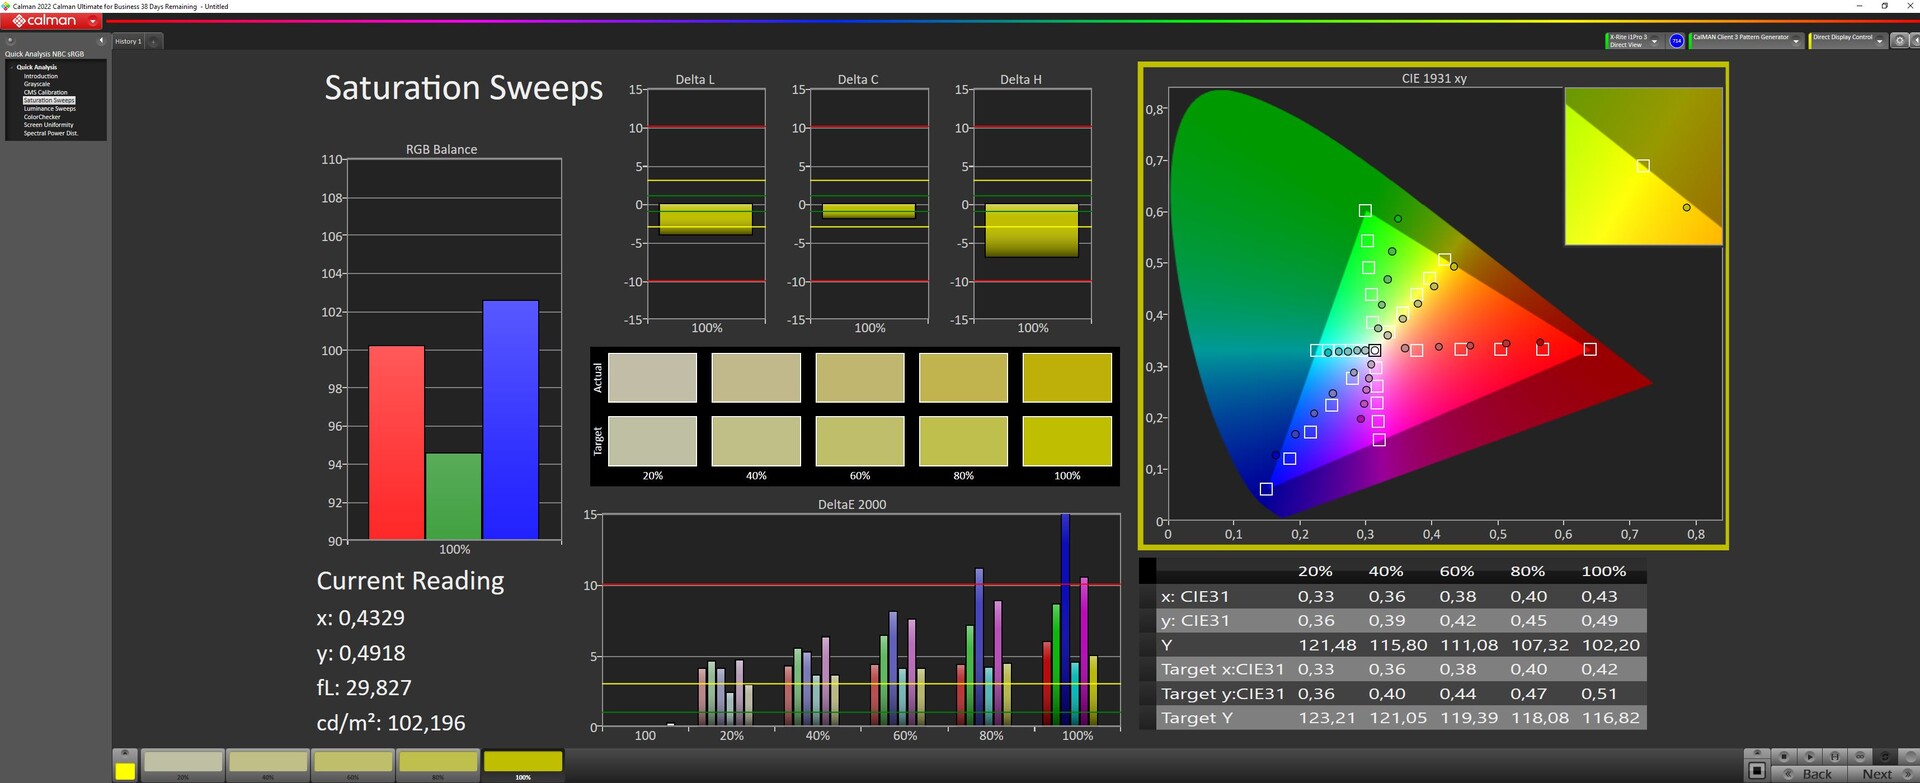
Il produttore non fornisce informazioni sulla copertura dello spazio colore. Abbiamo misurato poco meno del 57% in sRGB e circa il 39% in AdobeRGB e DisplayP3. Anche in questo caso, il carattere economico del Katana 15 è evidente; la concorrenza offre una maggiore copertura dello spazio colore.
Il display non è ben regolato dalla fabbrica. In questo caso abbiamo misurato solo rispetto allo standard sRGB. Riducendo la luminosità si abbassa solo leggermente il valore DeltaE per i livelli di grigio, ma rimane comunque appena sotto il valore 3. Tuttavia, il Calman ColorChecker mostra deviazioni cromatiche elevate.
La calibrazione manuale riduce le deviazioni della scala di grigi a un buon 0,61, ma il valore DeltaE di 4,63 del ColorChecker rimane troppo alto. Il display non sembra essere in grado di fare di più. Il nostro profilo colore icc calibrato può essere scaricato qui sopra.
Tempi di risposta del Display
| ↔ Tempi di risposta dal Nero al Bianco | ||
|---|---|---|
| 26.8 ms ... aumenta ↗ e diminuisce ↘ combinato | ↗ 14.2 ms Incremento | 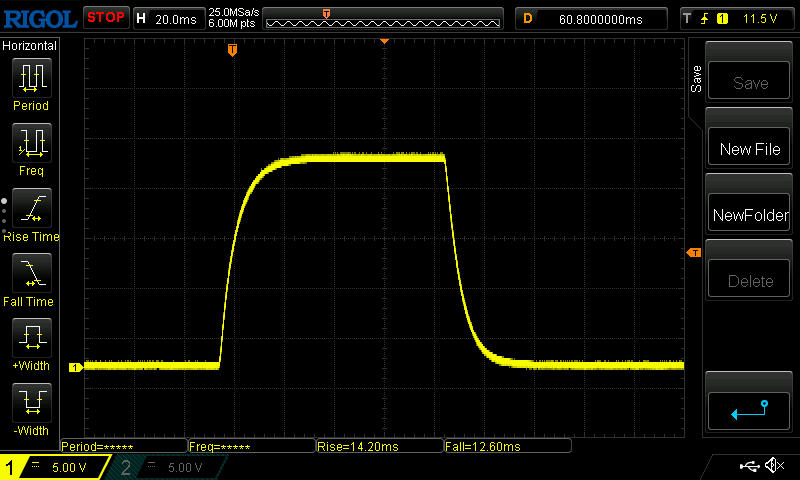 |
| ↘ 12.6 ms Calo | ||
| Lo schermo mostra tempi di risposta relativamente lenti nei nostri tests e potrebbe essere troppo lento per i gamers. In confronto, tutti i dispositivi di test variano da 0.1 (minimo) a 240 (massimo) ms. » 67 % di tutti i dispositivi è migliore. Questo significa che i tempi di risposta rilevati sono peggiori rispetto alla media di tutti i dispositivi testati (19.9 ms). | ||
| ↔ Tempo di risposta dal 50% Grigio all'80% Grigio | ||
| 38.8 ms ... aumenta ↗ e diminuisce ↘ combinato | ↗ 18.6 ms Incremento | 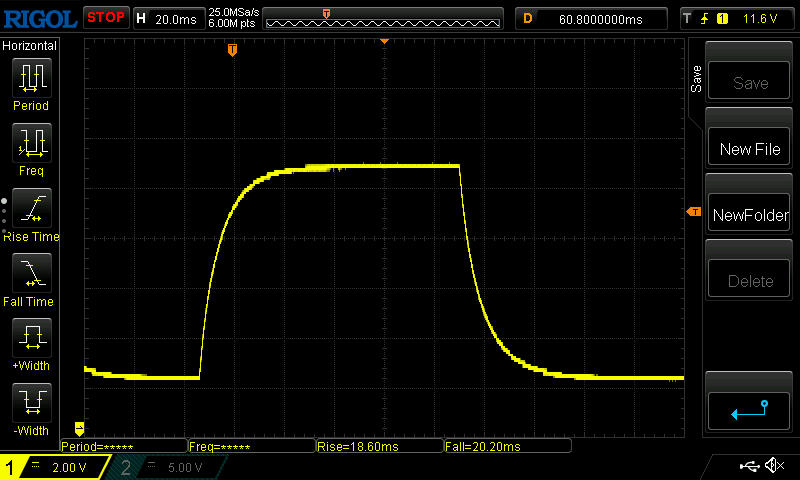 |
| ↘ 20.2 ms Calo | ||
| Lo schermo mostra tempi di risposta lenti nei nostri tests e sarà insoddisfacente per i gamers. In confronto, tutti i dispositivi di test variano da 0.165 (minimo) a 636 (massimo) ms. » 58 % di tutti i dispositivi è migliore. Questo significa che i tempi di risposta rilevati sono peggiori rispetto alla media di tutti i dispositivi testati (31.1 ms). | ||
Sfarfallio dello schermo / PWM (Pulse-Width Modulation)
| flickering dello schermo / PWM non rilevato | 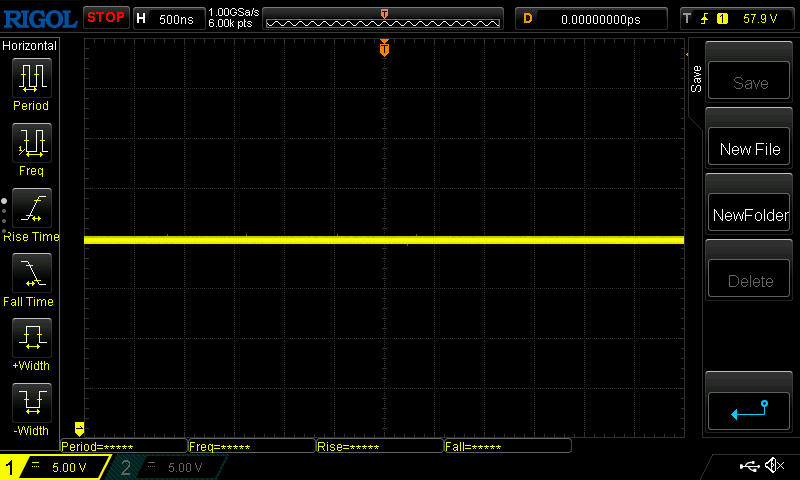 | ||
In confronto: 52 % di tutti i dispositivi testati non utilizza PWM per ridurre la luminosita' del display. Se è rilevato PWM, una media di 7801 (minimo: 5 - massimo: 343500) Hz è stata rilevata. | |||
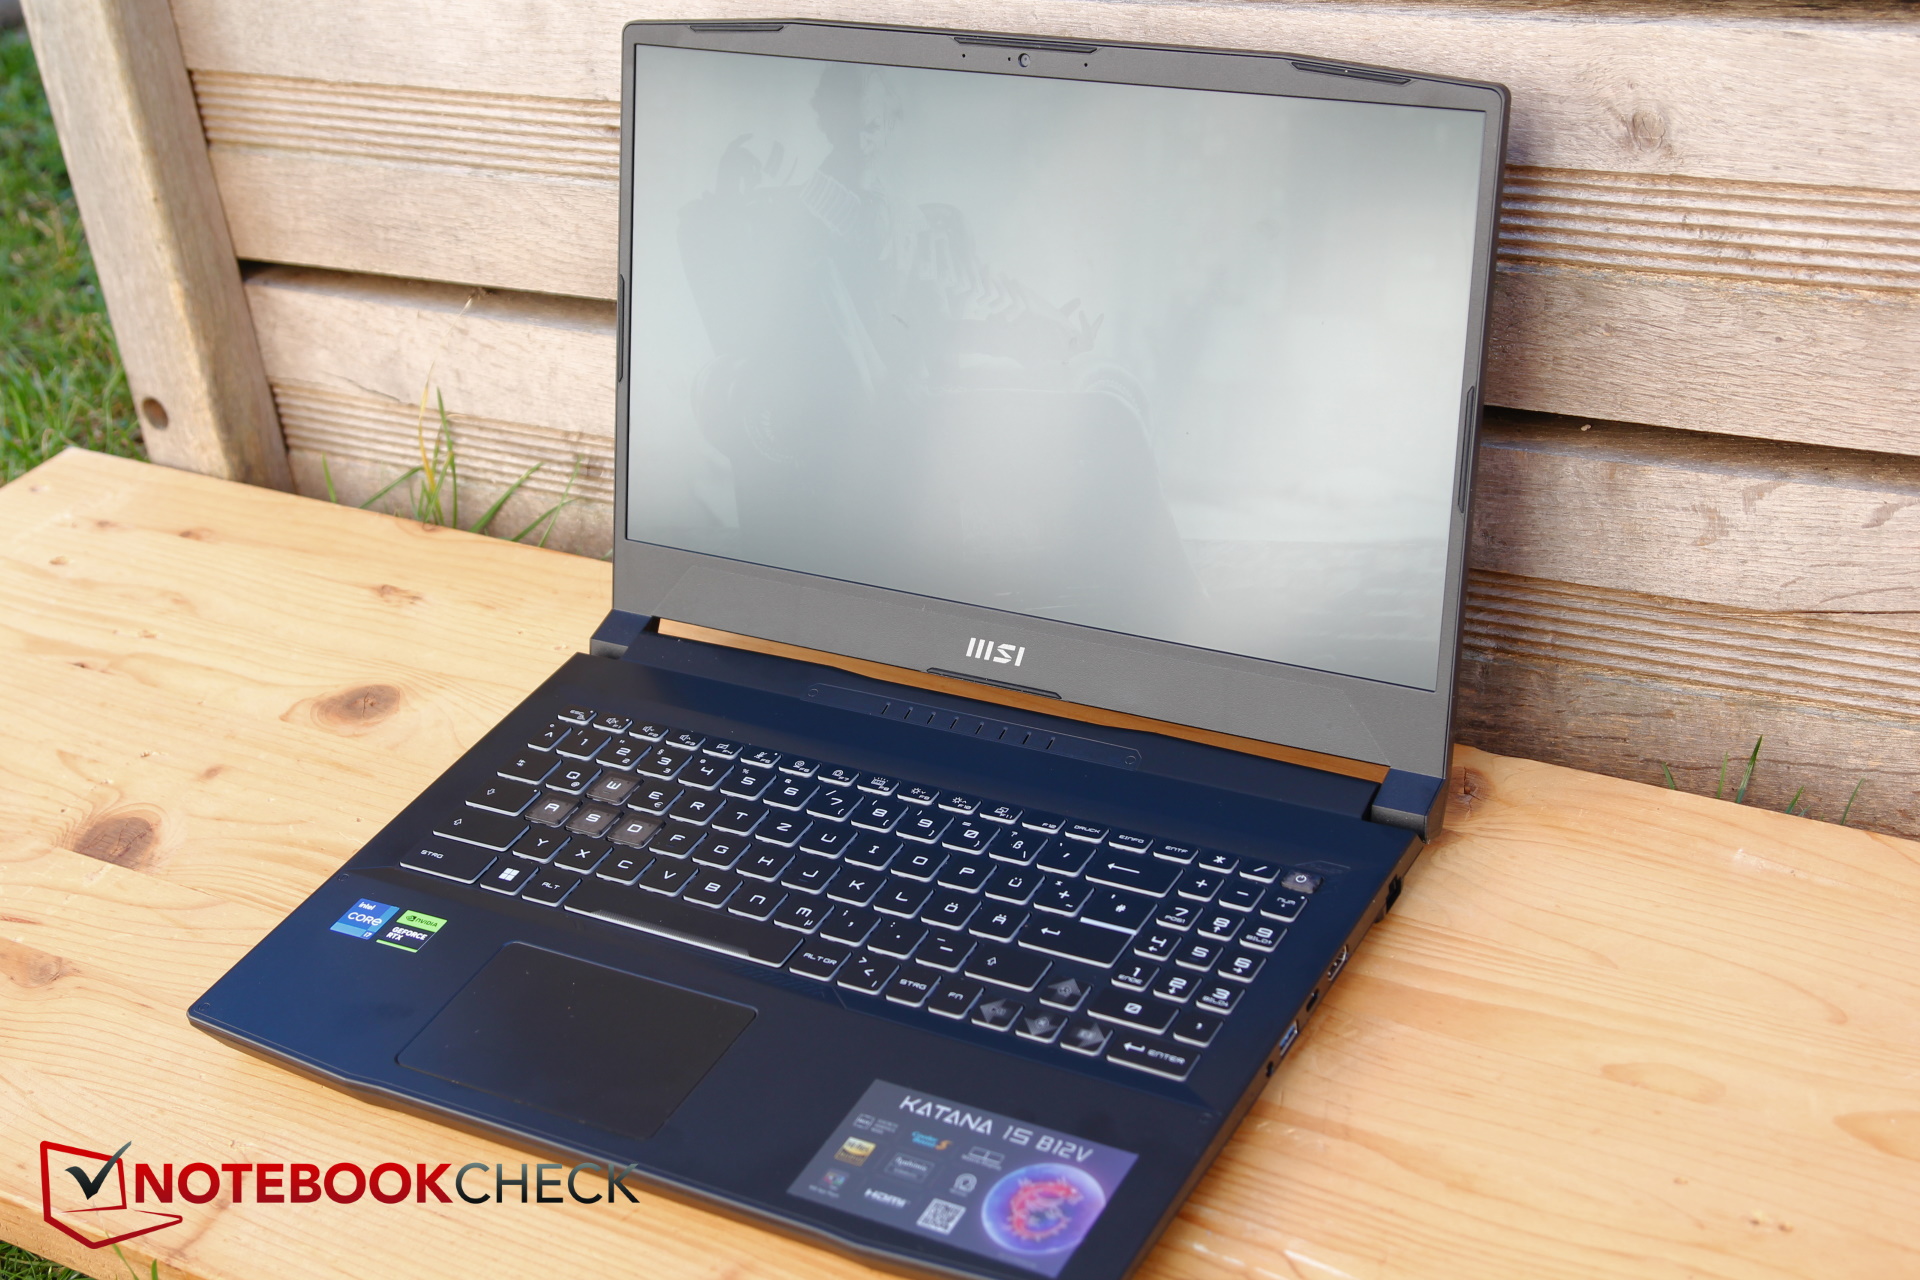
La superficie opaca filtra i riflessi aggressivi all'esterno. Tuttavia, la scarsa luminosità del pannello richiede un posto all'ombra.
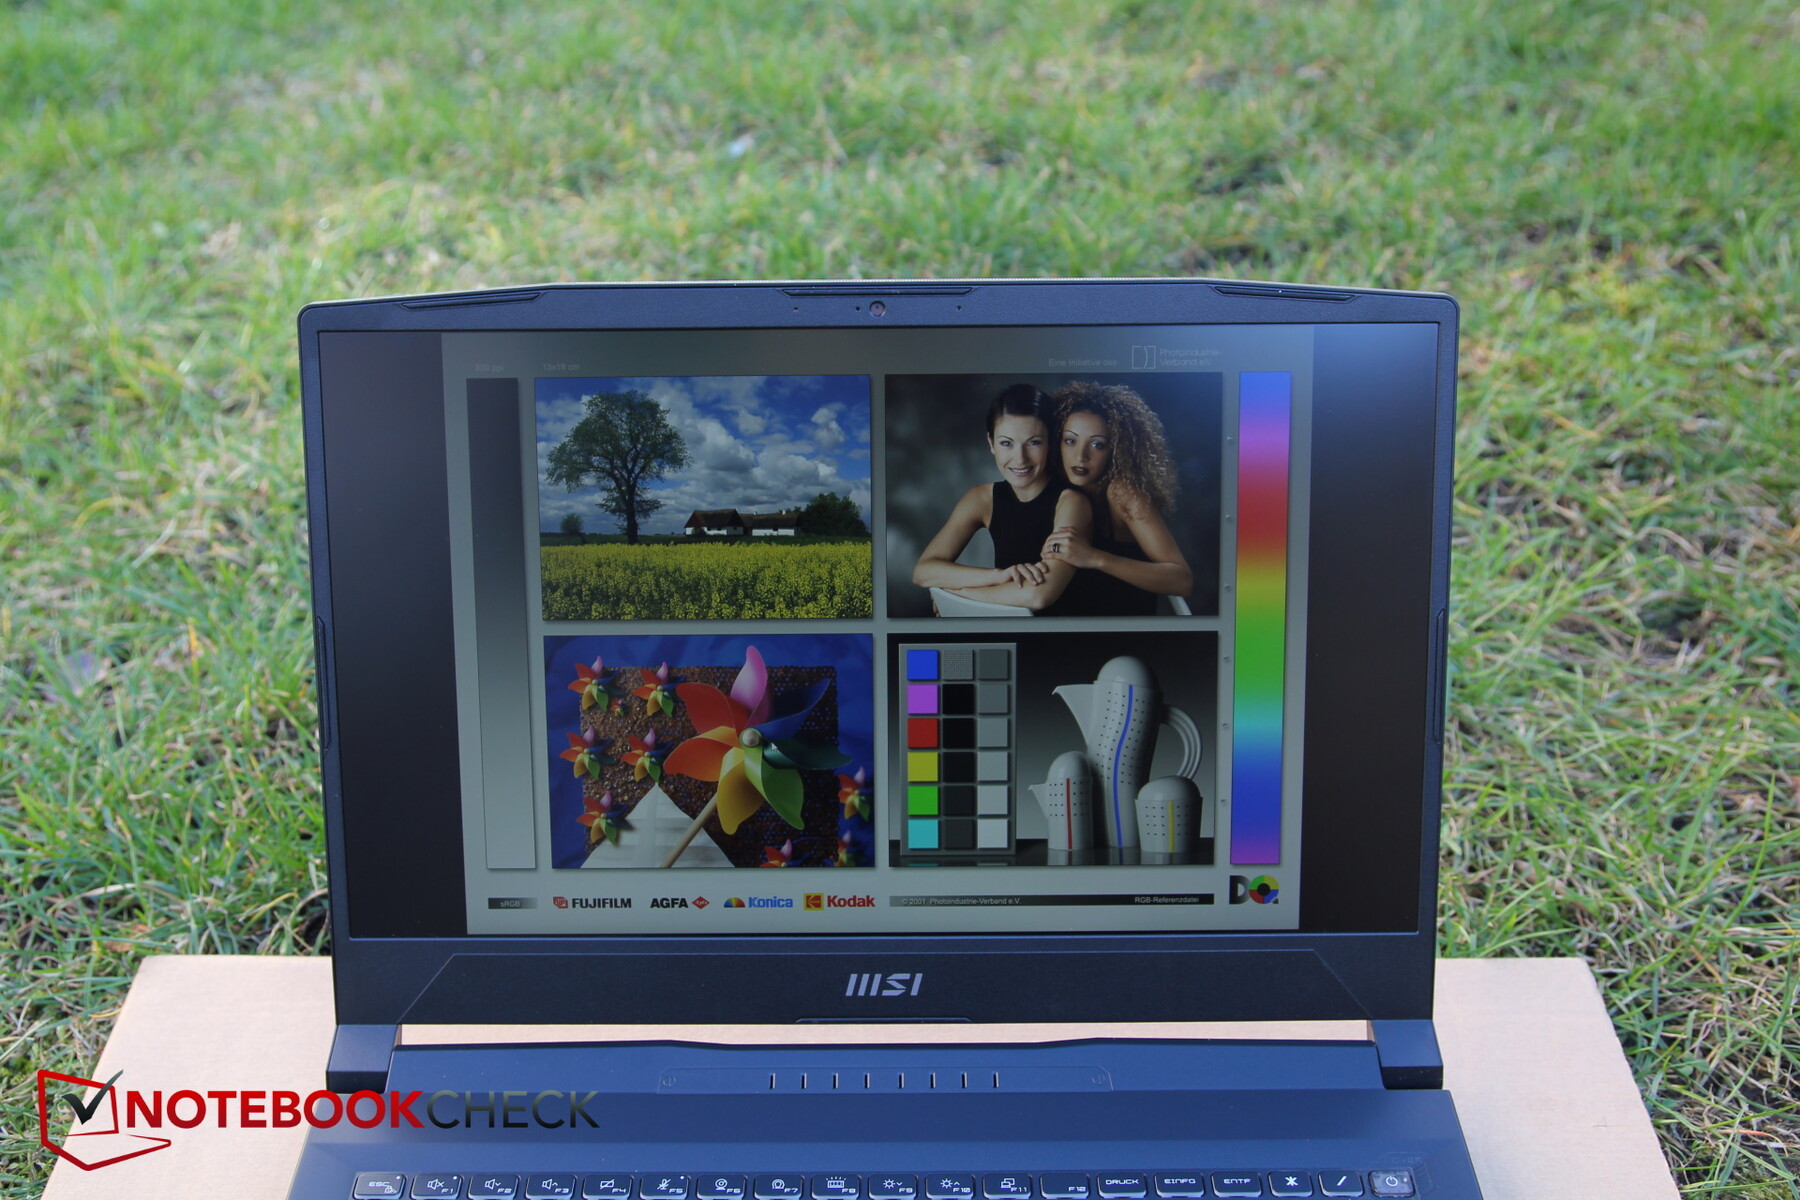
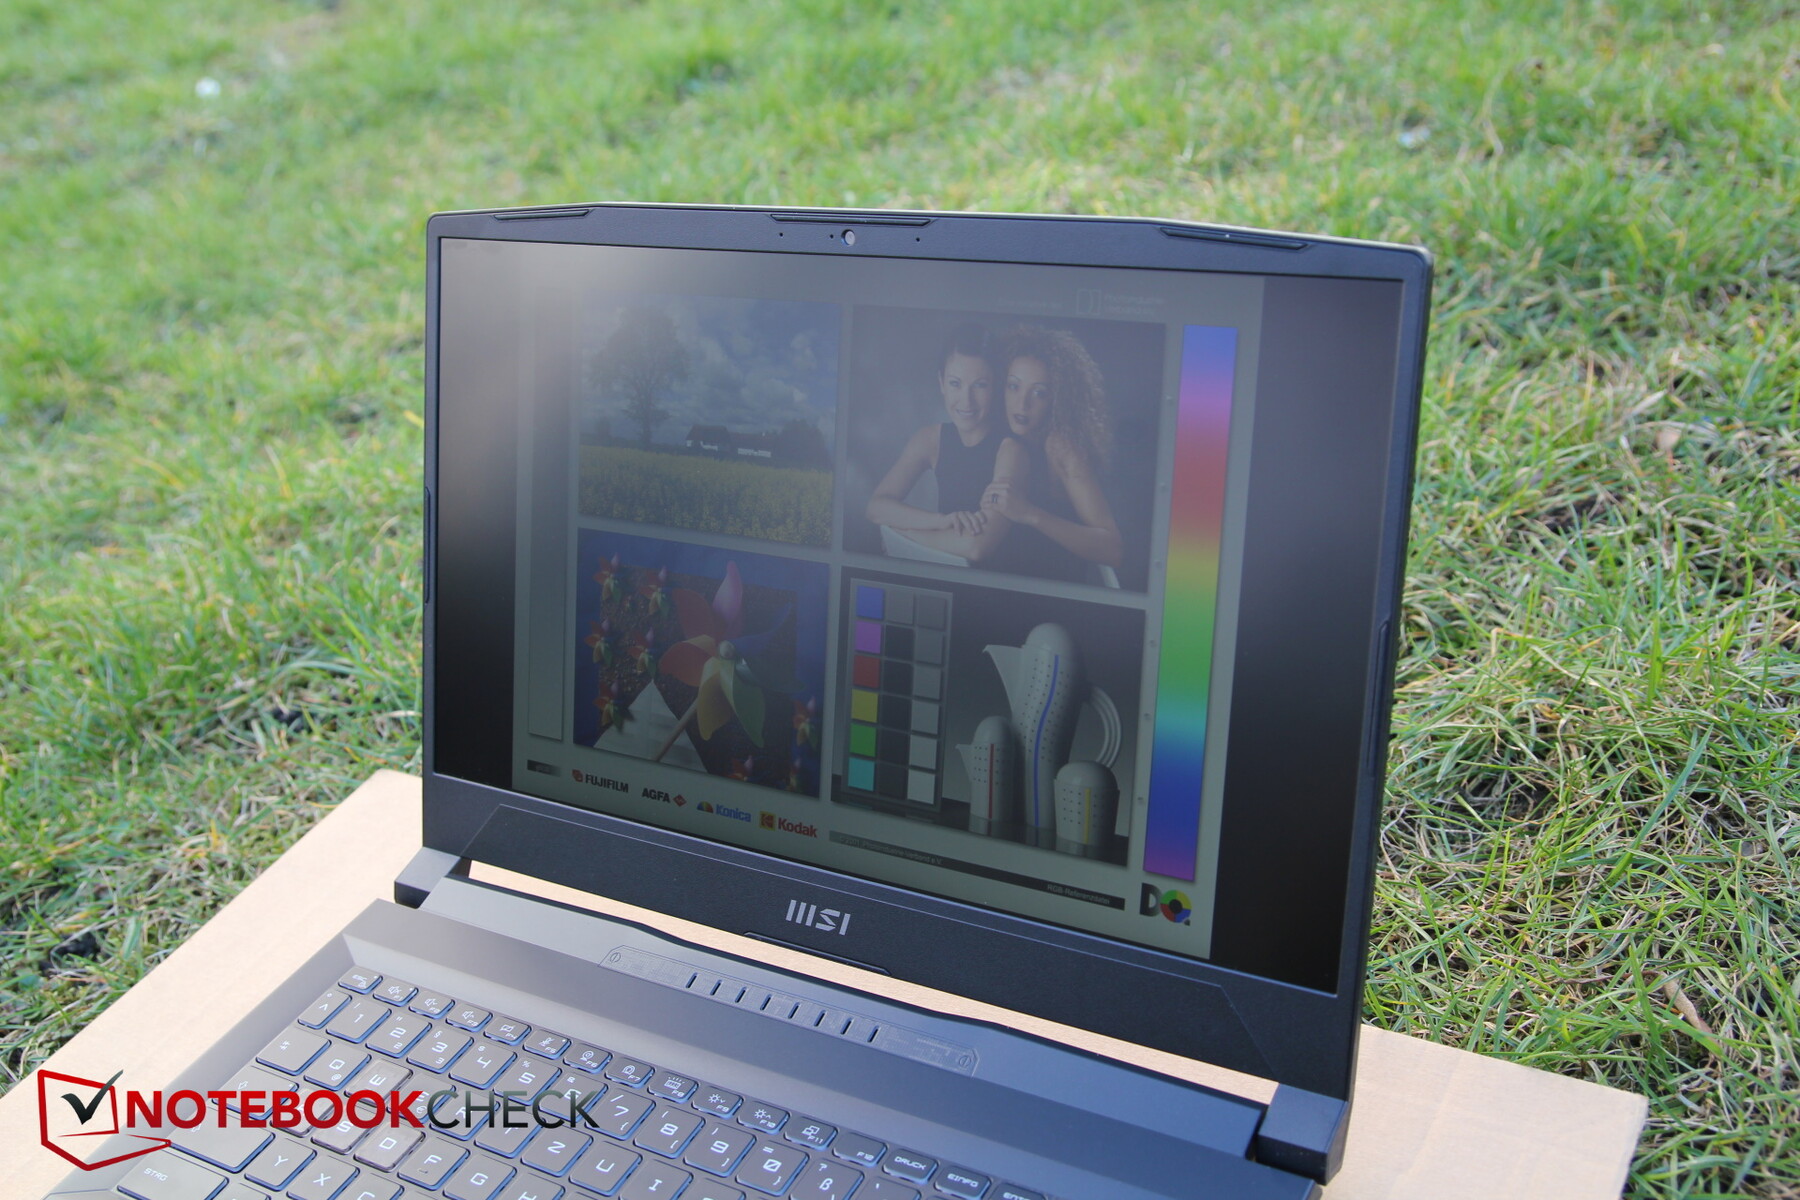
La stabilità dell'angolo di visione è buona. Il calo di luminosità è visibile solo ad angoli di visione estremi.

Prestazioni - Katana 15 al livello della RTX 3060
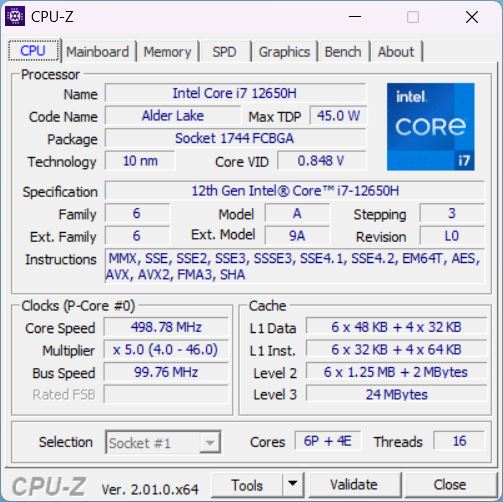
L'MSI Katana 15 è pubblicizzato come un portatile da gioco, e anche se il suoCore i7-12650Happartenga alla serie Alder Lake dello scorso anno, fa sicuramente parte della fascia bassa.
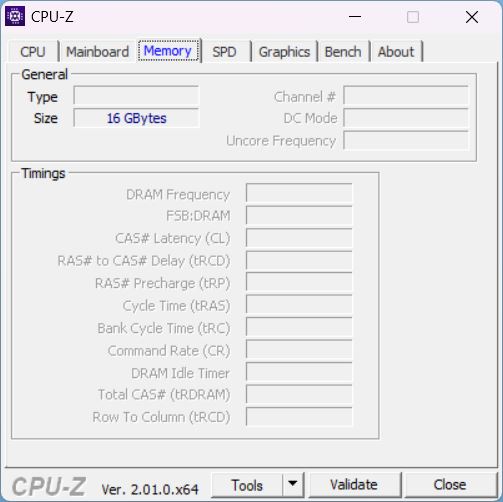
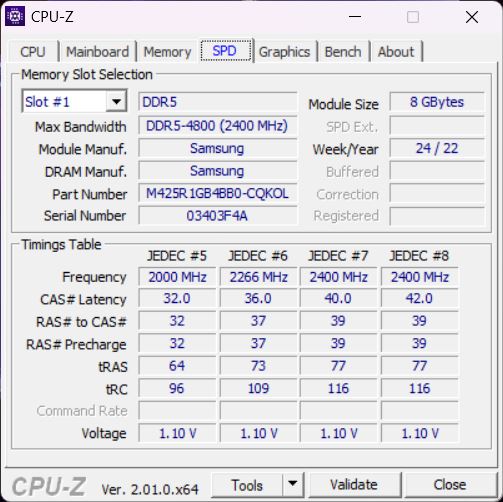
La CPU è abbinata a unaNvidia RTX 4050, la scheda entry-level tra i nuovi modelli RTX 40xx. Nel Katana, può consumare fino a 105 W. 16 GB di RAM sono lo standard (inferiore) per un giocatore al giorno d'oggi.
Condizioni di test
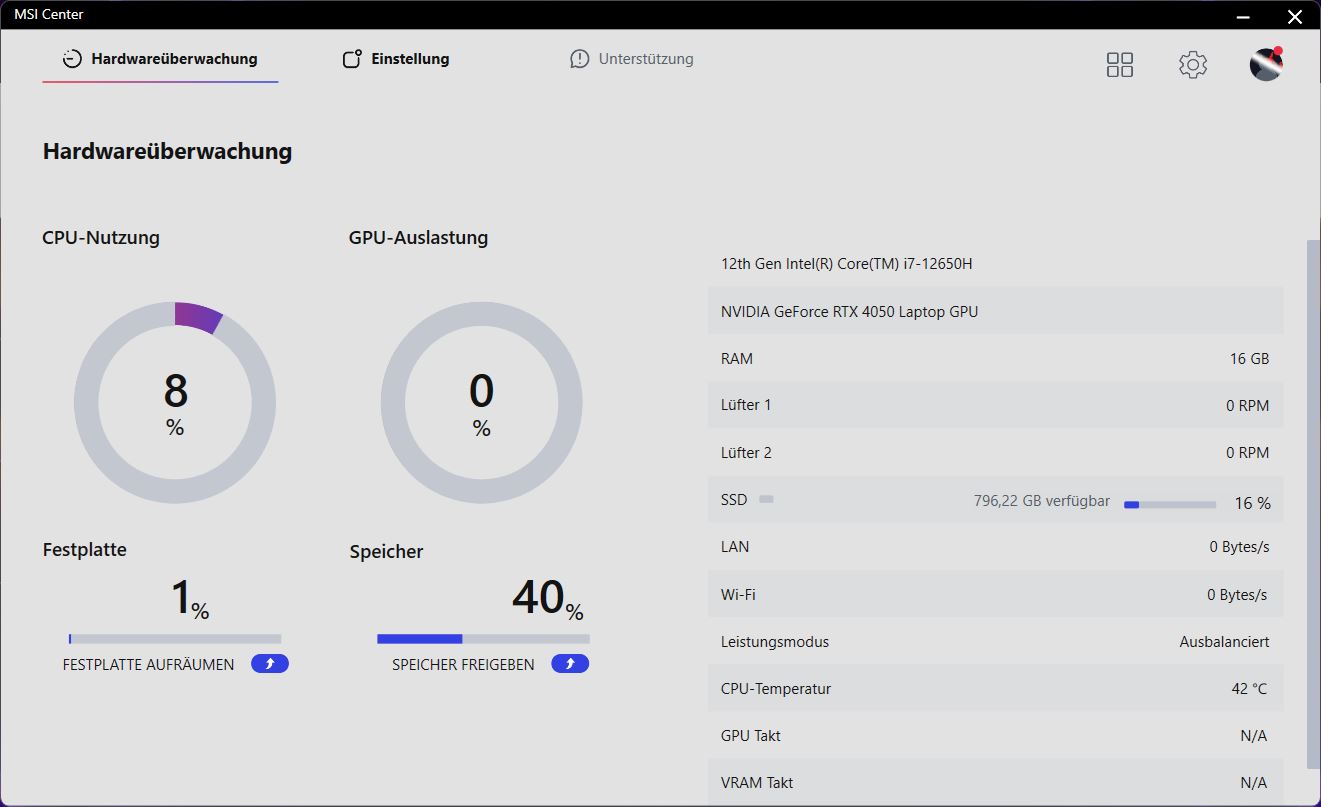
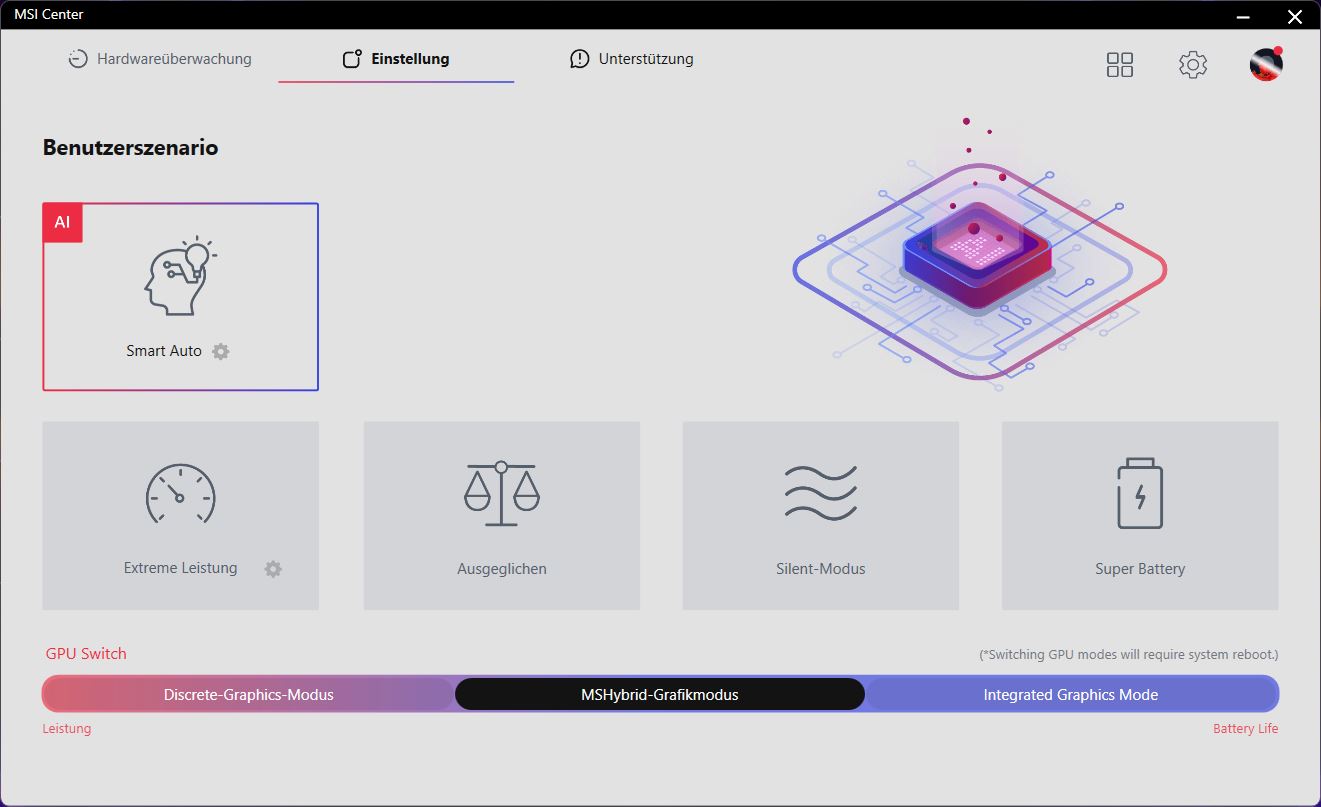
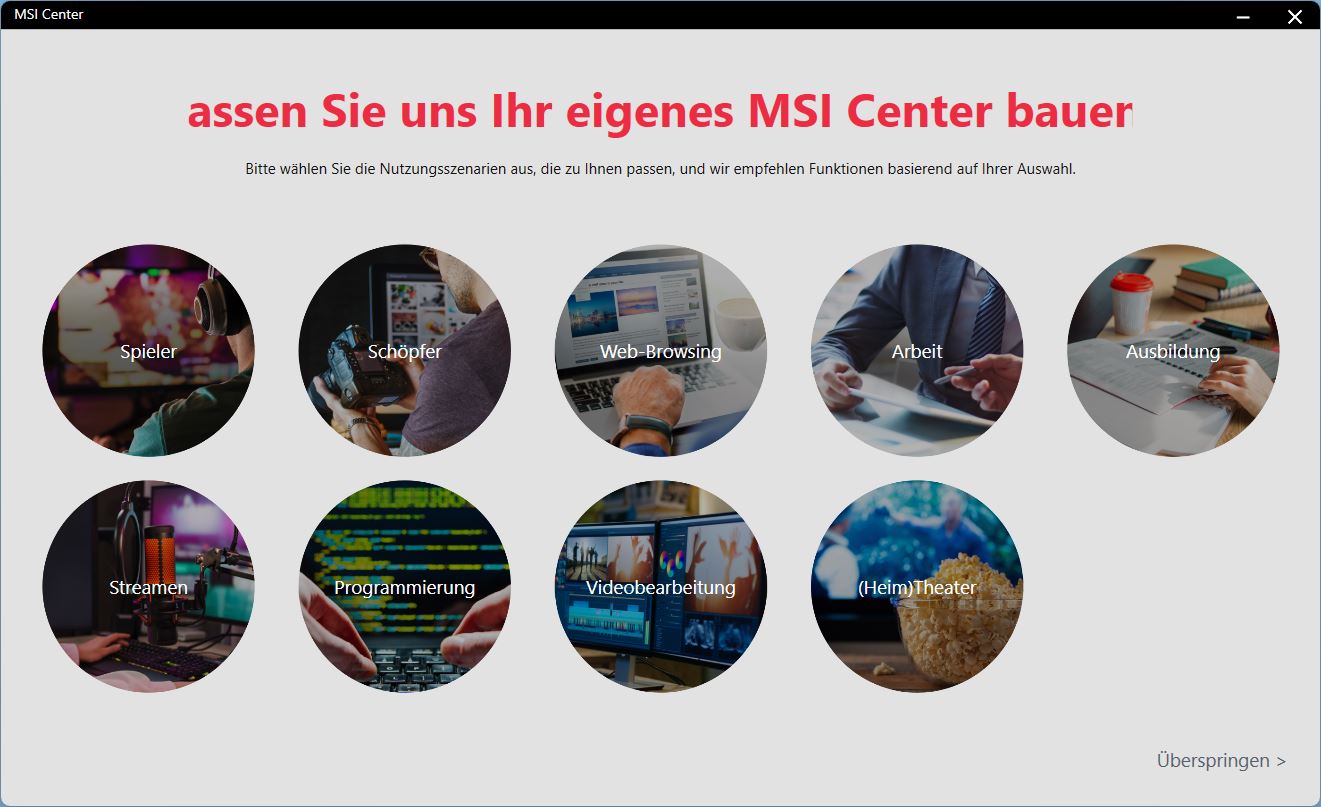
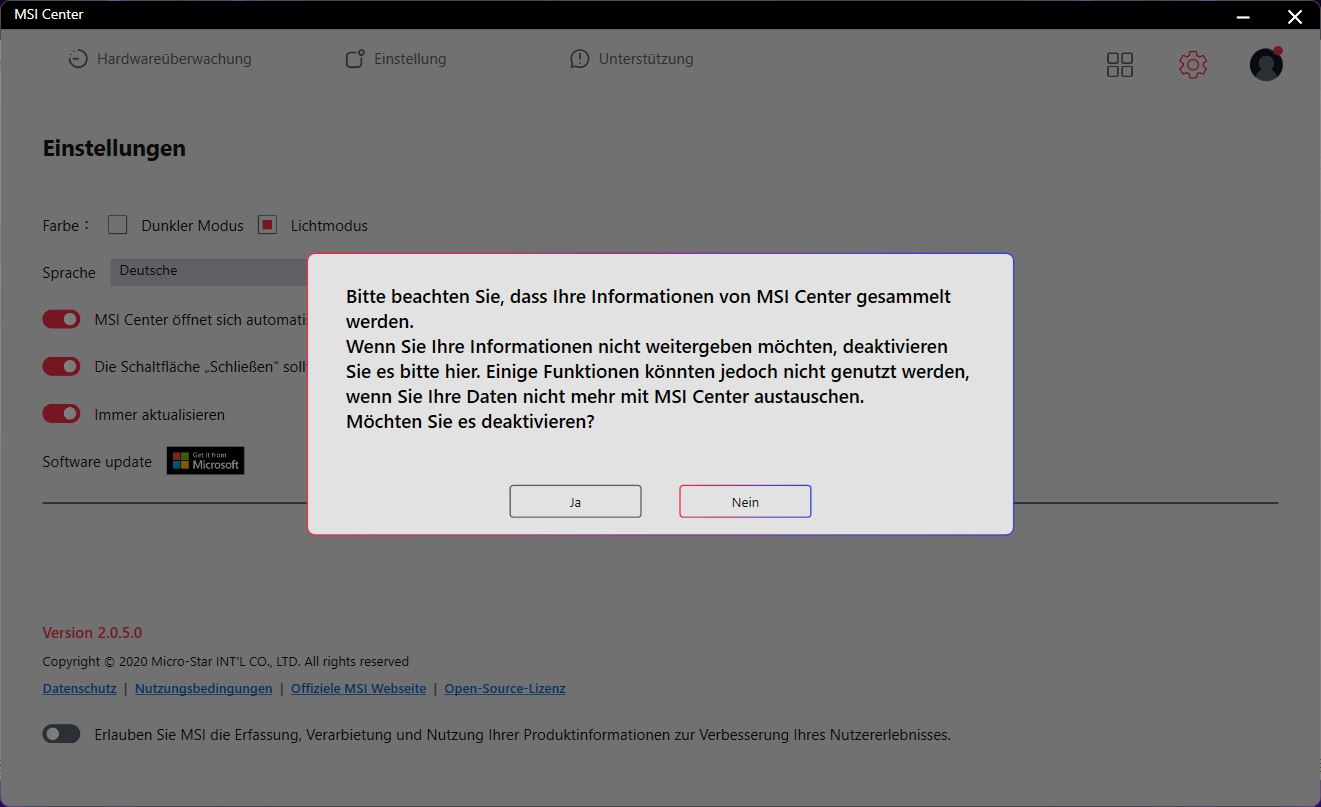
L'MSI Center è il centro di controllo, che il produttore utilizza ovviamente per raccogliere vari tipi di dati. Tra le altre cose, qui si regolano le impostazioni delle prestazioni. La modalità AI è preimpostata di default e regola automaticamente i valori delle prestazioni in base al carico applicato. Ci siamo fidati della competenza dell'AI e abbiamo eseguito tutti i benchmark in questa modalità.
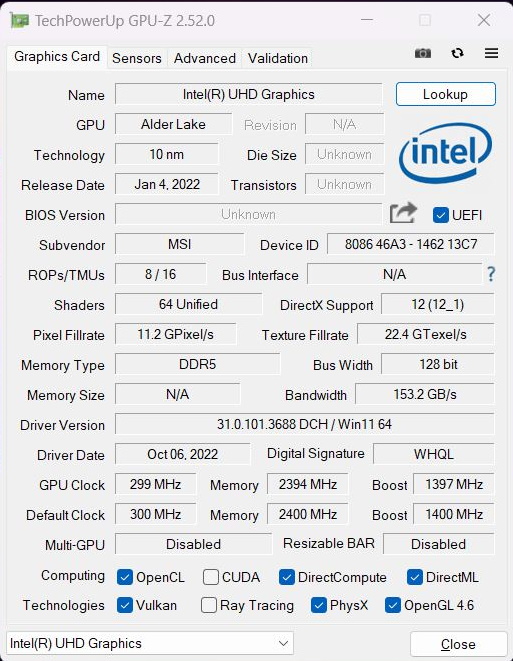
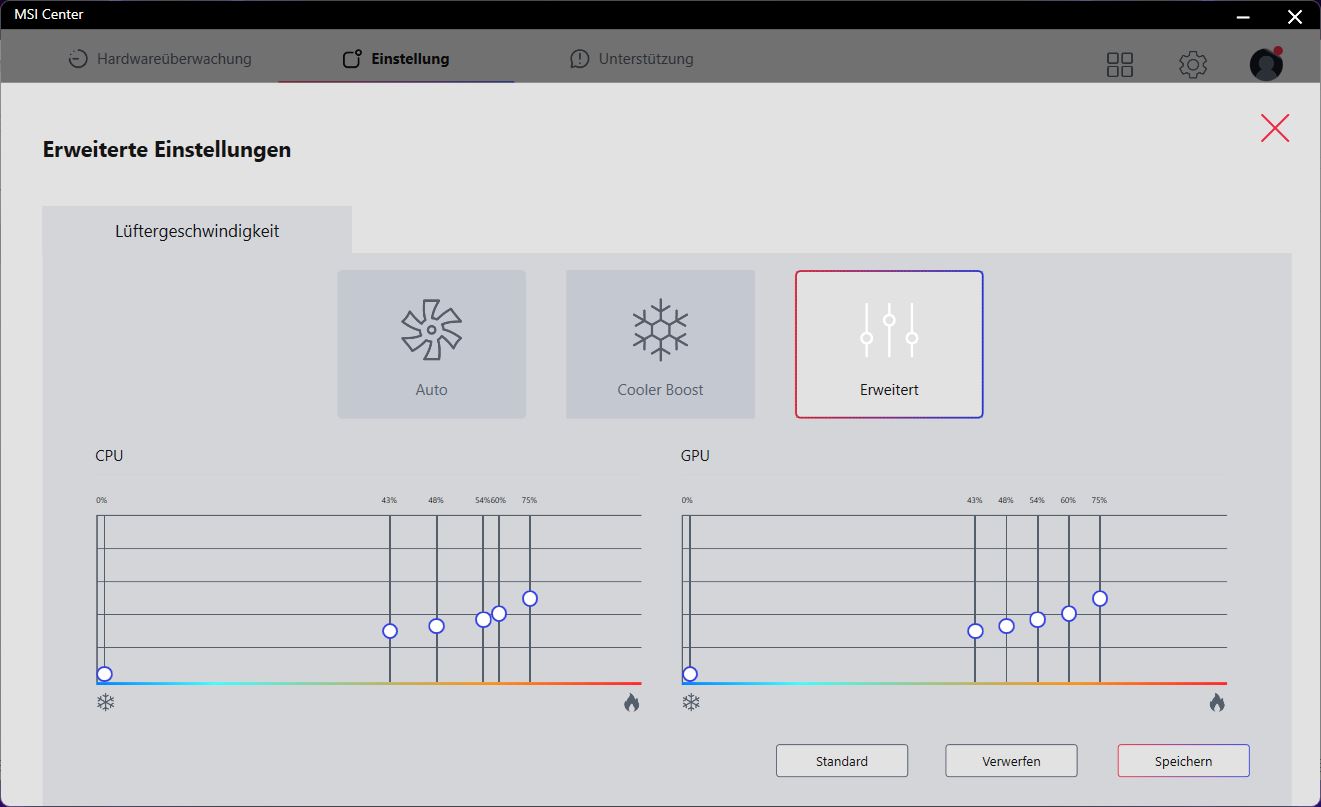
Oltre alle prestazioni, nel Centro MSI è possibile regolare altre impostazioni. Ad esempio, è possibile scambiare le funzioni dei tasti fn e Windows, regolare manualmente le curve delle ventole in modalità Extreme Performance o commutare iGPU e dGPU. Lo strumento ha problemi con alcune risoluzioni
Nella maggior parte dei casi è stata attivata la modalità ibrida GPU in MSI Center, che passa automaticamente da iGPU a dGPU. Tuttavia, questa modalità non ha funzionato in modo affidabile nei nostri benchmark. Ad esempio, abbiamo dovuto attivare manualmente la dGPU per Blender perché il test veniva eseguito automaticamente solo con la iGPU e produceva risultati molto scarsi.
Processore
A differenza del comunemente usatoi7-12700Hl'i7-12650H i7-12650H ha solo 4 degli 8 core E, ma i 6 core P sono gli stessi. Questi ultimi hanno un clock fino a 4,7 GHz. La CPU appartiene alla fascia bassa dell'ultima generazione Intel. In alternativa, è disponibile anche il Katana 15 B13 con una CPU Gen13 di Intel, il cui prezzo sarà probabilmente più elevato.
Nel ciclo Cinebench, osserviamo un piccolo calo delle prestazioni nei primi due cicli. In seguito, le prestazioni sono sostanzialmente costanti, ma non eccessivamente elevate. Il nostro Katana è in svantaggio rispetto alla concorrenza con l'i7-12700H, ed è battuto anche dal Ryzen 7 6800H.
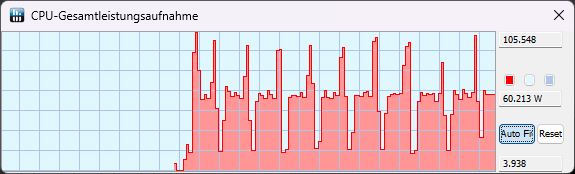
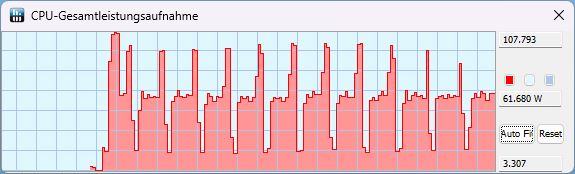
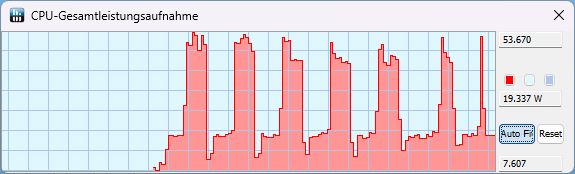
Il TDP rimane pressoché invariato sia in modalità KI che Extreme: abbiamo misurato circa 105 W all'inizio e alla fine di un'esecuzione, rispettivamente, e il consumo energetico scende a 60 W nel corso dell'esecuzione. In modalità batteria, il picco è di soli 53 W, altrimenti sono disponibili solo 19 W
Nel complesso, le prestazioni della CPU sono al livello previsto, ma le prestazioni single-core del Katana sono un po' più deboli.
Cinebench R15 Multi Sustained Load
Cinebench R23: Multi Core | Single Core
Cinebench R20: CPU (Multi Core) | CPU (Single Core)
Cinebench R15: CPU Multi 64Bit | CPU Single 64Bit
Blender: v2.79 BMW27 CPU
7-Zip 18.03: 7z b 4 | 7z b 4 -mmt1
Geekbench 5.5: Multi-Core | Single-Core
HWBOT x265 Benchmark v2.2: 4k Preset
LibreOffice : 20 Documents To PDF
R Benchmark 2.5: Overall mean
| CPU Performance rating | |
| Media della classe Gaming | |
| Lenovo Legion 5 15IAH7H 82RB | |
| MSI Pulse GL66 12UEK | |
| Asus TUF Gaming F15 FX507ZM | |
| MSI Katana GF66 12UGS | |
| MSI Katana 15 B12VEK | |
| Schenker XMG Core 15 (M22) | |
| Media Intel Core i7-12650H | |
| Cinebench R23 / Multi Core | |
| Media della classe Gaming (10488 - 40970, n=113, ultimi 2 anni) | |
| Lenovo Legion 5 15IAH7H 82RB | |
| Asus TUF Gaming F15 FX507ZM | |
| MSI Pulse GL66 12UEK | |
| MSI Katana GF66 12UGS | |
| MSI Katana 15 B12VEK | |
| Schenker XMG Core 15 (M22) | |
| Media Intel Core i7-12650H (5362 - 15537, n=14) | |
| Cinebench R23 / Single Core | |
| Media della classe Gaming (1166 - 2356, n=113, ultimi 2 anni) | |
| MSI Pulse GL66 12UEK | |
| MSI Katana GF66 12UGS | |
| Lenovo Legion 5 15IAH7H 82RB | |
| Asus TUF Gaming F15 FX507ZM | |
| Media Intel Core i7-12650H (1428 - 1808, n=14) | |
| MSI Katana 15 B12VEK | |
| Schenker XMG Core 15 (M22) | |
| Cinebench R20 / CPU (Multi Core) | |
| Media della classe Gaming (4029 - 16108, n=112, ultimi 2 anni) | |
| Lenovo Legion 5 15IAH7H 82RB | |
| Asus TUF Gaming F15 FX507ZM | |
| MSI Pulse GL66 12UEK | |
| MSI Katana GF66 12UGS | |
| MSI Katana 15 B12VEK | |
| Schenker XMG Core 15 (M22) | |
| Media Intel Core i7-12650H (2106 - 6009, n=14) | |
| Cinebench R20 / CPU (Single Core) | |
| Media della classe Gaming (442 - 895, n=112, ultimi 2 anni) | |
| MSI Pulse GL66 12UEK | |
| MSI Katana GF66 12UGS | |
| Lenovo Legion 5 15IAH7H 82RB | |
| Asus TUF Gaming F15 FX507ZM | |
| Media Intel Core i7-12650H (552 - 696, n=14) | |
| MSI Katana 15 B12VEK | |
| Schenker XMG Core 15 (M22) | |
| Cinebench R15 / CPU Multi 64Bit | |
| Media della classe Gaming (1578 - 6271, n=113, ultimi 2 anni) | |
| Lenovo Legion 5 15IAH7H 82RB | |
| Asus TUF Gaming F15 FX507ZM | |
| MSI Pulse GL66 12UEK | |
| MSI Katana GF66 12UGS | |
| MSI Katana GF66 12UGS | |
| Schenker XMG Core 15 (M22) | |
| MSI Katana 15 B12VEK | |
| Media Intel Core i7-12650H (753 - 2253, n=14) | |
| Cinebench R15 / CPU Single 64Bit | |
| Media della classe Gaming (188.8 - 343, n=112, ultimi 2 anni) | |
| MSI Pulse GL66 12UEK | |
| MSI Katana GF66 12UGS | |
| MSI Katana GF66 12UGS | |
| Lenovo Legion 5 15IAH7H 82RB | |
| Asus TUF Gaming F15 FX507ZM | |
| Schenker XMG Core 15 (M22) | |
| MSI Katana 15 B12VEK | |
| Media Intel Core i7-12650H (206 - 261, n=14) | |
| Blender / v2.79 BMW27 CPU | |
| Media Intel Core i7-12650H (222 - 553, n=15) | |
| MSI Katana GF66 12UGS | |
| MSI Katana 15 B12VEK | |
| Schenker XMG Core 15 (M22) | |
| MSI Pulse GL66 12UEK | |
| Asus TUF Gaming F15 FX507ZM | |
| Lenovo Legion 5 15IAH7H 82RB | |
| Media della classe Gaming (80 - 330, n=110, ultimi 2 anni) | |
| 7-Zip 18.03 / 7z b 4 | |
| Media della classe Gaming (33491 - 148086, n=111, ultimi 2 anni) | |
| Lenovo Legion 5 15IAH7H 82RB | |
| Asus TUF Gaming F15 FX507ZM | |
| MSI Pulse GL66 12UEK | |
| Schenker XMG Core 15 (M22) | |
| MSI Katana 15 B12VEK | |
| MSI Katana GF66 12UGS | |
| Media Intel Core i7-12650H (27053 - 59034, n=14) | |
| 7-Zip 18.03 / 7z b 4 -mmt1 | |
| Media della classe Gaming (4199 - 7436, n=111, ultimi 2 anni) | |
| MSI Pulse GL66 12UEK | |
| MSI Katana GF66 12UGS | |
| Lenovo Legion 5 15IAH7H 82RB | |
| Schenker XMG Core 15 (M22) | |
| Media Intel Core i7-12650H (5265 - 6116, n=14) | |
| MSI Katana 15 B12VEK | |
| Asus TUF Gaming F15 FX507ZM | |
| Geekbench 5.5 / Multi-Core | |
| Media della classe Gaming (6460 - 27010, n=111, ultimi 2 anni) | |
| Lenovo Legion 5 15IAH7H 82RB | |
| Asus TUF Gaming F15 FX507ZM | |
| MSI Pulse GL66 12UEK | |
| MSI Katana GF66 12UGS | |
| MSI Katana 15 B12VEK | |
| Schenker XMG Core 15 (M22) | |
| Media Intel Core i7-12650H (6478 - 11284, n=16) | |
| Geekbench 5.5 / Single-Core | |
| Media della classe Gaming (986 - 2474, n=111, ultimi 2 anni) | |
| MSI Pulse GL66 12UEK | |
| MSI Katana GF66 12UGS | |
| Lenovo Legion 5 15IAH7H 82RB | |
| Asus TUF Gaming F15 FX507ZM | |
| Media Intel Core i7-12650H (1590 - 1797, n=16) | |
| MSI Katana 15 B12VEK | |
| Schenker XMG Core 15 (M22) | |
| HWBOT x265 Benchmark v2.2 / 4k Preset | |
| Media della classe Gaming (11.5 - 44.3, n=111, ultimi 2 anni) | |
| Lenovo Legion 5 15IAH7H 82RB | |
| Asus TUF Gaming F15 FX507ZM | |
| MSI Pulse GL66 12UEK | |
| Schenker XMG Core 15 (M22) | |
| MSI Katana 15 B12VEK | |
| Media Intel Core i7-12650H (6.62 - 17.4, n=16) | |
| MSI Katana GF66 12UGS | |
| LibreOffice / 20 Documents To PDF | |
| Schenker XMG Core 15 (M22) | |
| Asus TUF Gaming F15 FX507ZM | |
| Media della classe Gaming (19 - 88.8, n=111, ultimi 2 anni) | |
| MSI Katana 15 B12VEK | |
| Media Intel Core i7-12650H (35.1 - 58.5, n=14) | |
| MSI Pulse GL66 12UEK | |
| Lenovo Legion 5 15IAH7H 82RB | |
| MSI Katana GF66 12UGS | |
| R Benchmark 2.5 / Overall mean | |
| MSI Katana 15 B12VEK | |
| Schenker XMG Core 15 (M22) | |
| Media Intel Core i7-12650H (0.4584 - 0.515, n=14) | |
| Asus TUF Gaming F15 FX507ZM | |
| Lenovo Legion 5 15IAH7H 82RB | |
| MSI Katana GF66 12UGS | |
| Media della classe Gaming (0.3439 - 0.759, n=112, ultimi 2 anni) | |
| MSI Pulse GL66 12UEK | |
* ... Meglio usare valori piccoli
AIDA64: FP32 Ray-Trace | FPU Julia | CPU SHA3 | CPU Queen | FPU SinJulia | FPU Mandel | CPU AES | CPU ZLib | FP64 Ray-Trace | CPU PhotoWorxx
| Performance rating | |
| Media della classe Gaming | |
| Lenovo Legion 5 15IAH7H 82RB | |
| Schenker XMG Core 15 (M22) | |
| MSI Katana 15 B12VEK | |
| MSI Pulse GL66 12UEK | |
| Asus TUF Gaming F15 FX507ZM | |
| MSI Katana GF66 12UGS | |
| Media Intel Core i7-12650H | |
| AIDA64 / FP32 Ray-Trace | |
| Media della classe Gaming (10227 - 85542, n=110, ultimi 2 anni) | |
| Lenovo Legion 5 15IAH7H 82RB | |
| Schenker XMG Core 15 (M22) | |
| MSI Katana 15 B12VEK | |
| Media Intel Core i7-12650H (5422 - 15620, n=14) | |
| Asus TUF Gaming F15 FX507ZM | |
| MSI Pulse GL66 12UEK | |
| MSI Katana GF66 12UGS | |
| AIDA64 / FPU Julia | |
| Media della classe Gaming (51376 - 238426, n=110, ultimi 2 anni) | |
| Schenker XMG Core 15 (M22) | |
| Lenovo Legion 5 15IAH7H 82RB | |
| MSI Katana 15 B12VEK | |
| Media Intel Core i7-12650H (26386 - 76434, n=14) | |
| Asus TUF Gaming F15 FX507ZM | |
| MSI Pulse GL66 12UEK | |
| MSI Katana GF66 12UGS | |
| AIDA64 / CPU SHA3 | |
| Media della classe Gaming (2180 - 9817, n=110, ultimi 2 anni) | |
| Lenovo Legion 5 15IAH7H 82RB | |
| Schenker XMG Core 15 (M22) | |
| Asus TUF Gaming F15 FX507ZM | |
| MSI Katana 15 B12VEK | |
| MSI Pulse GL66 12UEK | |
| MSI Katana GF66 12UGS | |
| Media Intel Core i7-12650H (1479 - 3244, n=14) | |
| AIDA64 / CPU Queen | |
| Media della classe Gaming (49785 - 173351, n=101, ultimi 2 anni) | |
| MSI Pulse GL66 12UEK | |
| Lenovo Legion 5 15IAH7H 82RB | |
| MSI Katana GF66 12UGS | |
| Asus TUF Gaming F15 FX507ZM | |
| Schenker XMG Core 15 (M22) | |
| MSI Katana 15 B12VEK | |
| Media Intel Core i7-12650H (59278 - 89537, n=14) | |
| AIDA64 / FPU SinJulia | |
| Media della classe Gaming (4424 - 33636, n=110, ultimi 2 anni) | |
| Schenker XMG Core 15 (M22) | |
| Lenovo Legion 5 15IAH7H 82RB | |
| MSI Pulse GL66 12UEK | |
| Asus TUF Gaming F15 FX507ZM | |
| MSI Katana GF66 12UGS | |
| MSI Katana 15 B12VEK | |
| Media Intel Core i7-12650H (4690 - 8726, n=14) | |
| AIDA64 / FPU Mandel | |
| Media della classe Gaming (25115 - 128721, n=110, ultimi 2 anni) | |
| Schenker XMG Core 15 (M22) | |
| Lenovo Legion 5 15IAH7H 82RB | |
| MSI Katana 15 B12VEK | |
| Media Intel Core i7-12650H (15001 - 37738, n=14) | |
| Asus TUF Gaming F15 FX507ZM | |
| MSI Pulse GL66 12UEK | |
| MSI Katana GF66 12UGS | |
| AIDA64 / CPU AES | |
| Lenovo Legion 5 15IAH7H 82RB | |
| Media della classe Gaming (39258 - 247074, n=110, ultimi 2 anni) | |
| MSI Pulse GL66 12UEK | |
| MSI Katana GF66 12UGS | |
| Schenker XMG Core 15 (M22) | |
| MSI Katana 15 B12VEK | |
| Asus TUF Gaming F15 FX507ZM | |
| Media Intel Core i7-12650H (32702 - 92530, n=14) | |
| AIDA64 / CPU ZLib | |
| Media della classe Gaming (574 - 2531, n=110, ultimi 2 anni) | |
| Asus TUF Gaming F15 FX507ZM | |
| Lenovo Legion 5 15IAH7H 82RB | |
| MSI Pulse GL66 12UEK | |
| MSI Katana GF66 12UGS | |
| Schenker XMG Core 15 (M22) | |
| MSI Katana 15 B12VEK | |
| Media Intel Core i7-12650H (443 - 891, n=14) | |
| AIDA64 / FP64 Ray-Trace | |
| Media della classe Gaming (5509 - 45446, n=110, ultimi 2 anni) | |
| Lenovo Legion 5 15IAH7H 82RB | |
| Schenker XMG Core 15 (M22) | |
| MSI Katana 15 B12VEK | |
| Media Intel Core i7-12650H (3096 - 8448, n=14) | |
| Asus TUF Gaming F15 FX507ZM | |
| MSI Pulse GL66 12UEK | |
| MSI Katana GF66 12UGS | |
| AIDA64 / CPU PhotoWorxx | |
| Media della classe Gaming (12271 - 89891, n=110, ultimi 2 anni) | |
| MSI Katana 15 B12VEK | |
| Lenovo Legion 5 15IAH7H 82RB | |
| Asus TUF Gaming F15 FX507ZM | |
| Media Intel Core i7-12650H (22046 - 44164, n=14) | |
| Schenker XMG Core 15 (M22) | |
| MSI Katana GF66 12UGS | |
| MSI Pulse GL66 12UEK | |
Prestazioni del sistema
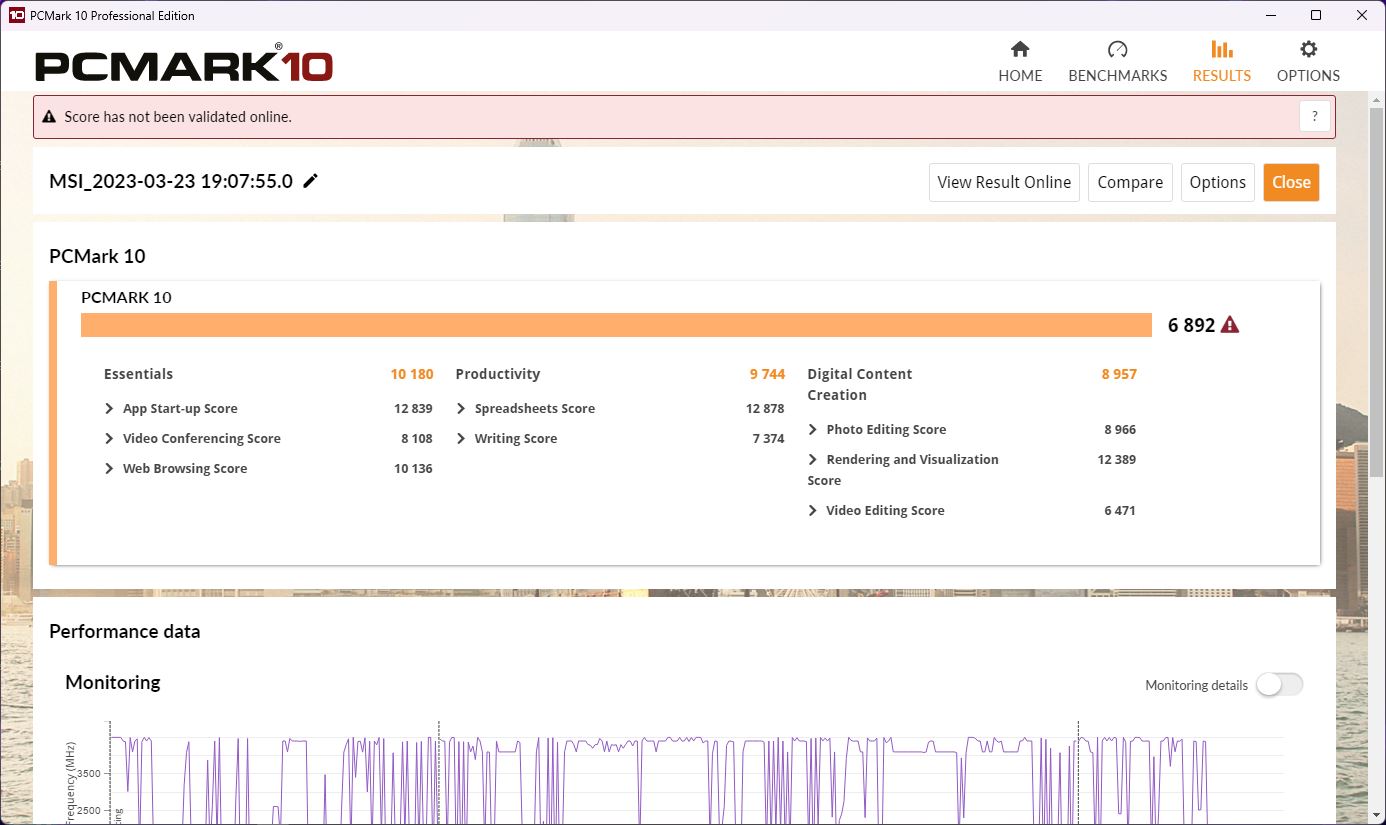
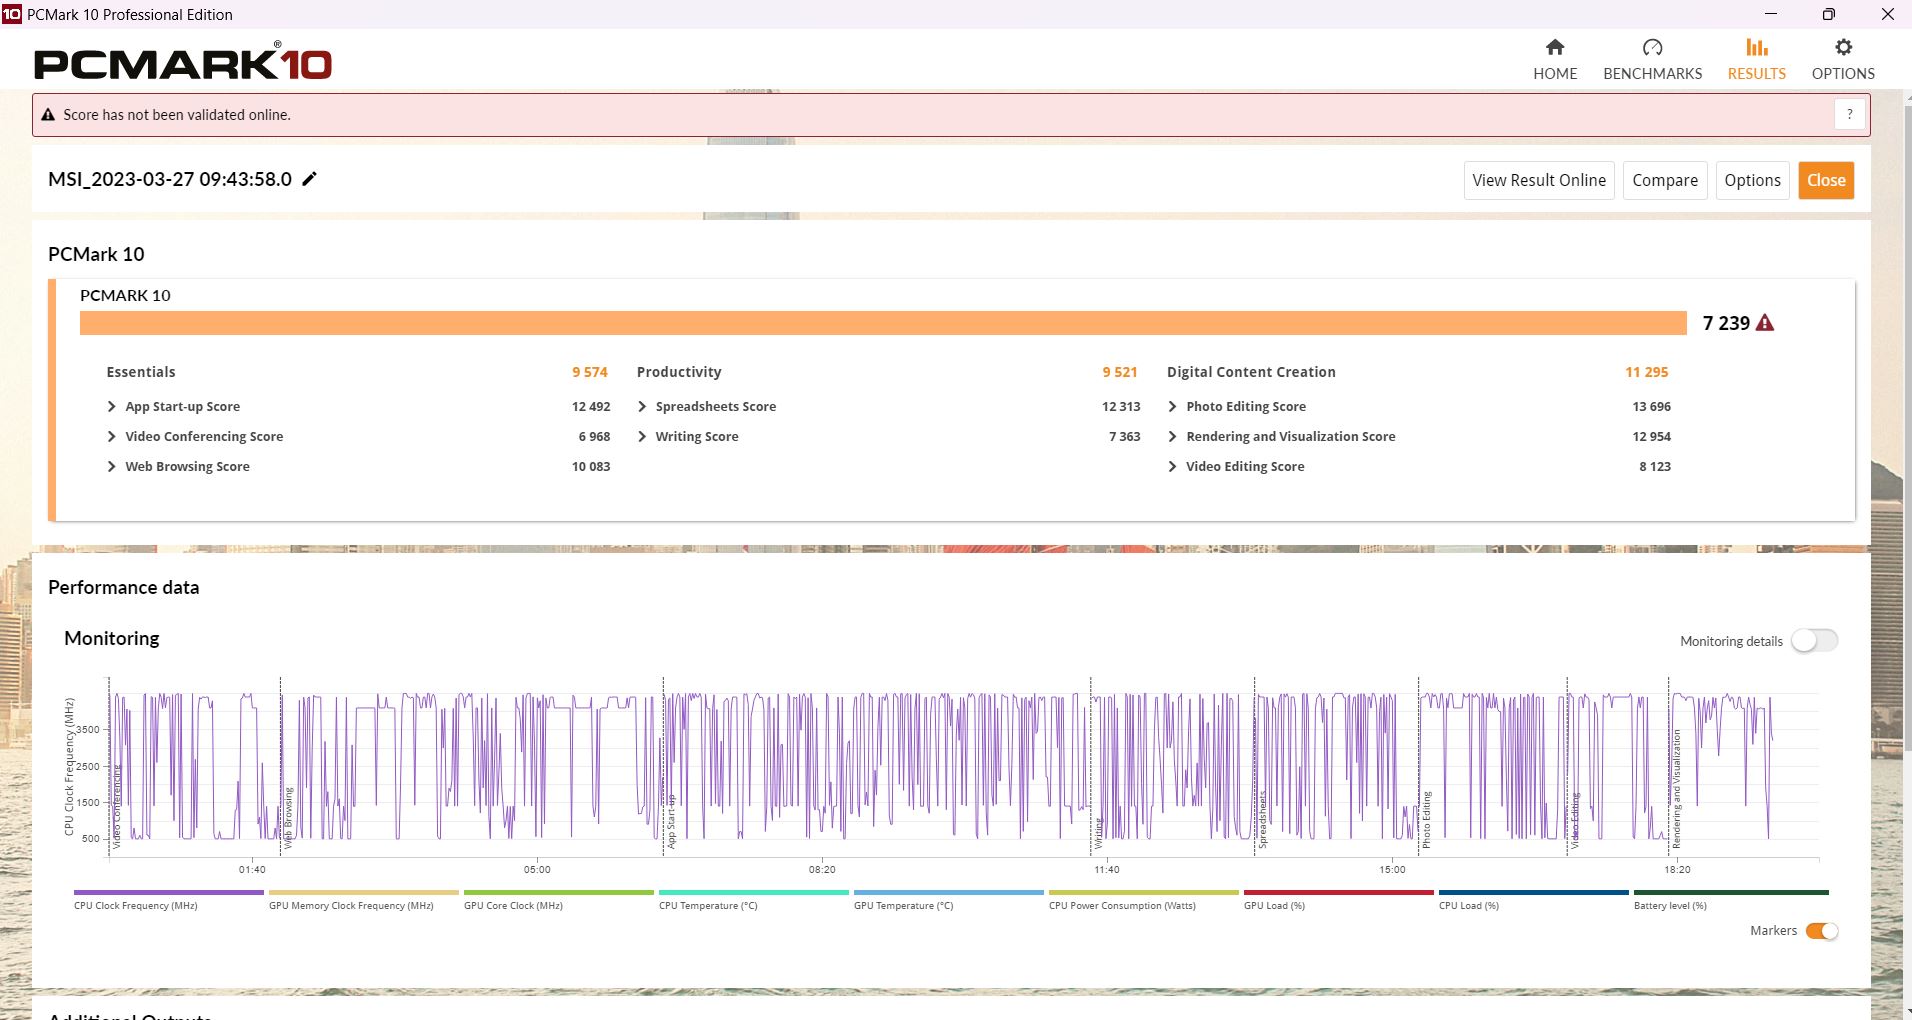
Non sorprende che la Katana non riesca a distinguersi dai suoi modelli gemelliGF66 o GL66 in termini di prestazioni di sistema. In confronto, ottiene un punteggio piuttosto basso. Il punteggio è migliore con la dGPU attivata manualmente, ma non in tutti i subtest.
CrossMark: Overall | Productivity | Creativity | Responsiveness
| PCMark 10 / Score | |
| Media della classe Gaming (5828 - 11574, n=96, ultimi 2 anni) | |
| Lenovo Legion 5 15IAH7H 82RB | |
| MSI Katana GF66 12UGS | |
| Asus TUF Gaming F15 FX507ZM | |
| Schenker XMG Core 15 (M22) | |
| MSI Pulse GL66 12UEK | |
| MSI Katana 15 B12VEK | |
| Media Intel Core i7-12650H, NVIDIA GeForce RTX 4050 Laptop GPU (n=1) | |
| PCMark 10 / Essentials | |
| Lenovo Legion 5 15IAH7H 82RB | |
| Schenker XMG Core 15 (M22) | |
| Media della classe Gaming (8810 - 12600, n=100, ultimi 2 anni) | |
| Asus TUF Gaming F15 FX507ZM | |
| MSI Pulse GL66 12UEK | |
| MSI Katana GF66 12UGS | |
| MSI Katana 15 B12VEK | |
| Media Intel Core i7-12650H, NVIDIA GeForce RTX 4050 Laptop GPU (n=1) | |
| PCMark 10 / Productivity | |
| Media della classe Gaming (6845 - 18766, n=98, ultimi 2 anni) | |
| Lenovo Legion 5 15IAH7H 82RB | |
| MSI Katana GF66 12UGS | |
| MSI Pulse GL66 12UEK | |
| MSI Katana 15 B12VEK | |
| Media Intel Core i7-12650H, NVIDIA GeForce RTX 4050 Laptop GPU (n=1) | |
| Schenker XMG Core 15 (M22) | |
| Asus TUF Gaming F15 FX507ZM | |
| PCMark 10 / Digital Content Creation | |
| Media della classe Gaming (7602 - 19657, n=98, ultimi 2 anni) | |
| Lenovo Legion 5 15IAH7H 82RB | |
| Asus TUF Gaming F15 FX507ZM | |
| MSI Katana GF66 12UGS | |
| Schenker XMG Core 15 (M22) | |
| MSI Pulse GL66 12UEK | |
| MSI Katana 15 B12VEK | |
| Media Intel Core i7-12650H, NVIDIA GeForce RTX 4050 Laptop GPU (n=1) | |
| CrossMark / Overall | |
| MSI Pulse GL66 12UEK | |
| Lenovo Legion 5 15IAH7H 82RB | |
| Media della classe Gaming (1366 - 2409, n=98, ultimi 2 anni) | |
| MSI Katana GF66 12UGS | |
| MSI Katana 15 B12VEK | |
| Media Intel Core i7-12650H, NVIDIA GeForce RTX 4050 Laptop GPU (n=1) | |
| Schenker XMG Core 15 (M22) | |
| CrossMark / Productivity | |
| MSI Pulse GL66 12UEK | |
| Lenovo Legion 5 15IAH7H 82RB | |
| MSI Katana GF66 12UGS | |
| Media della classe Gaming (1386 - 2254, n=98, ultimi 2 anni) | |
| MSI Katana 15 B12VEK | |
| Media Intel Core i7-12650H, NVIDIA GeForce RTX 4050 Laptop GPU (n=1) | |
| Schenker XMG Core 15 (M22) | |
| CrossMark / Creativity | |
| Media della classe Gaming (1343 - 2729, n=98, ultimi 2 anni) | |
| MSI Pulse GL66 12UEK | |
| Lenovo Legion 5 15IAH7H 82RB | |
| MSI Katana GF66 12UGS | |
| MSI Katana 15 B12VEK | |
| Media Intel Core i7-12650H, NVIDIA GeForce RTX 4050 Laptop GPU (n=1) | |
| Schenker XMG Core 15 (M22) | |
| CrossMark / Responsiveness | |
| MSI Pulse GL66 12UEK | |
| Lenovo Legion 5 15IAH7H 82RB | |
| MSI Katana GF66 12UGS | |
| Media della classe Gaming (1226 - 2334, n=98, ultimi 2 anni) | |
| MSI Katana 15 B12VEK | |
| Media Intel Core i7-12650H, NVIDIA GeForce RTX 4050 Laptop GPU (n=1) | |
| Schenker XMG Core 15 (M22) | |
| PCMark 10 Score | 6892 punti | |
Aiuto | ||
| AIDA64 / Memory Copy | |
| Media della classe Gaming (21750 - 129946, n=110, ultimi 2 anni) | |
| MSI Katana 15 B12VEK | |
| Asus TUF Gaming F15 FX507ZM | |
| Lenovo Legion 5 15IAH7H 82RB | |
| Media Intel Core i7-12650H (43261 - 69735, n=14) | |
| Schenker XMG Core 15 (M22) | |
| MSI Katana GF66 12UGS | |
| MSI Pulse GL66 12UEK | |
| AIDA64 / Memory Read | |
| Media della classe Gaming (22956 - 118858, n=110, ultimi 2 anni) | |
| MSI Katana 15 B12VEK | |
| Lenovo Legion 5 15IAH7H 82RB | |
| Asus TUF Gaming F15 FX507ZM | |
| Media Intel Core i7-12650H (47313 - 67412, n=14) | |
| Schenker XMG Core 15 (M22) | |
| MSI Pulse GL66 12UEK | |
| MSI Katana GF66 12UGS | |
| AIDA64 / Memory Write | |
| Media della classe Gaming (22297 - 135096, n=110, ultimi 2 anni) | |
| Lenovo Legion 5 15IAH7H 82RB | |
| Asus TUF Gaming F15 FX507ZM | |
| MSI Katana 15 B12VEK | |
| Schenker XMG Core 15 (M22) | |
| Media Intel Core i7-12650H (45617 - 59361, n=14) | |
| MSI Katana GF66 12UGS | |
| MSI Pulse GL66 12UEK | |
| AIDA64 / Memory Latency | |
| Media della classe Gaming (75.3 - 259, n=110, ultimi 2 anni) | |
| Lenovo Legion 5 15IAH7H 82RB | |
| MSI Katana GF66 12UGS | |
| MSI Katana 15 B12VEK | |
| MSI Pulse GL66 12UEK | |
| Schenker XMG Core 15 (M22) | |
| Media Intel Core i7-12650H (71.6 - 103.9, n=14) | |
| Asus TUF Gaming F15 FX507ZM | |
* ... Meglio usare valori piccoli
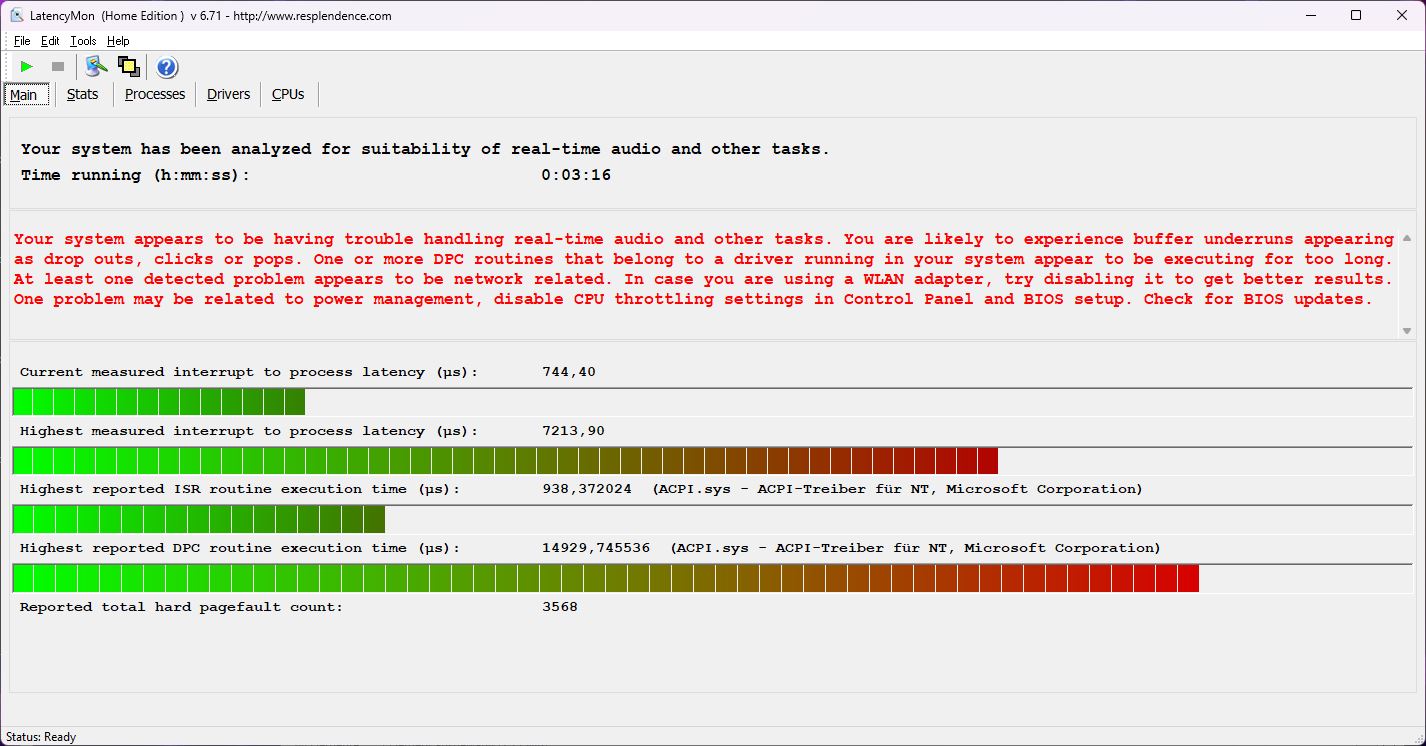
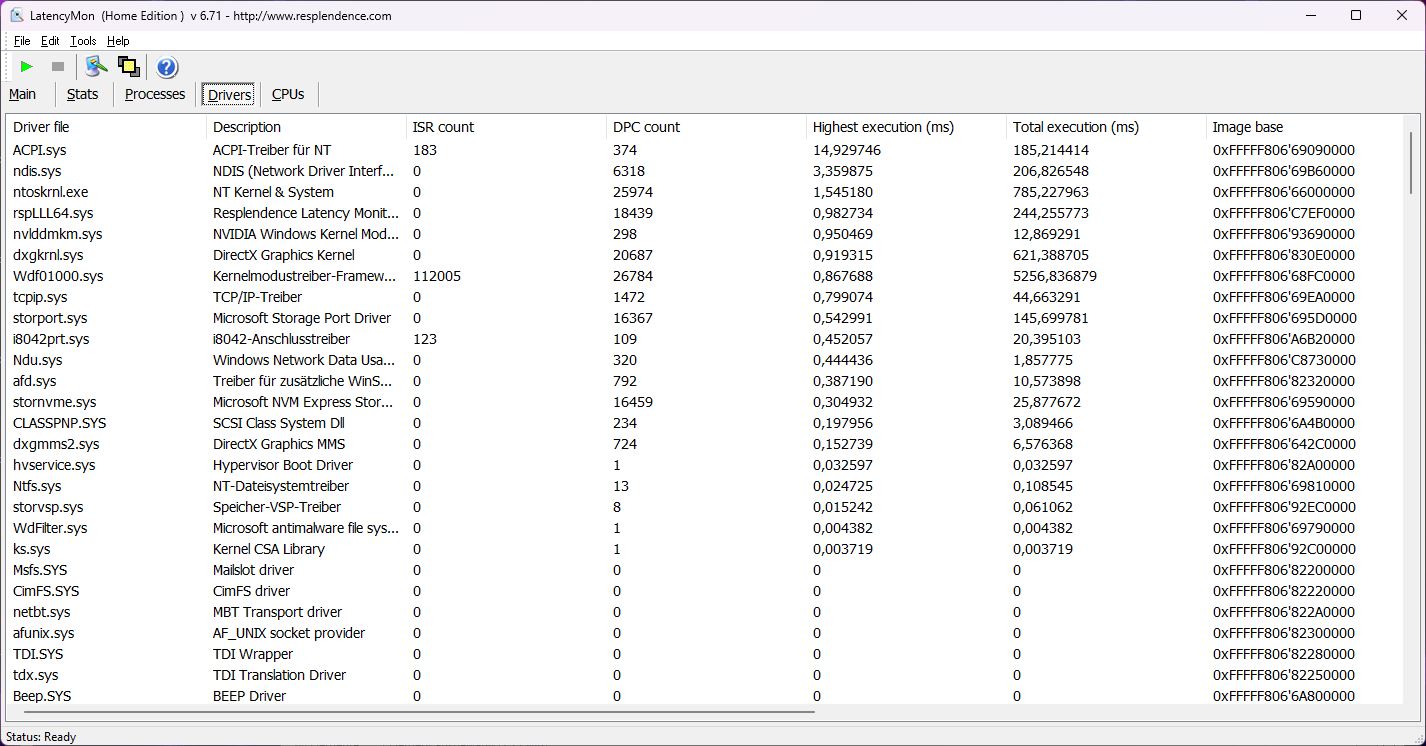
Latenza DPC
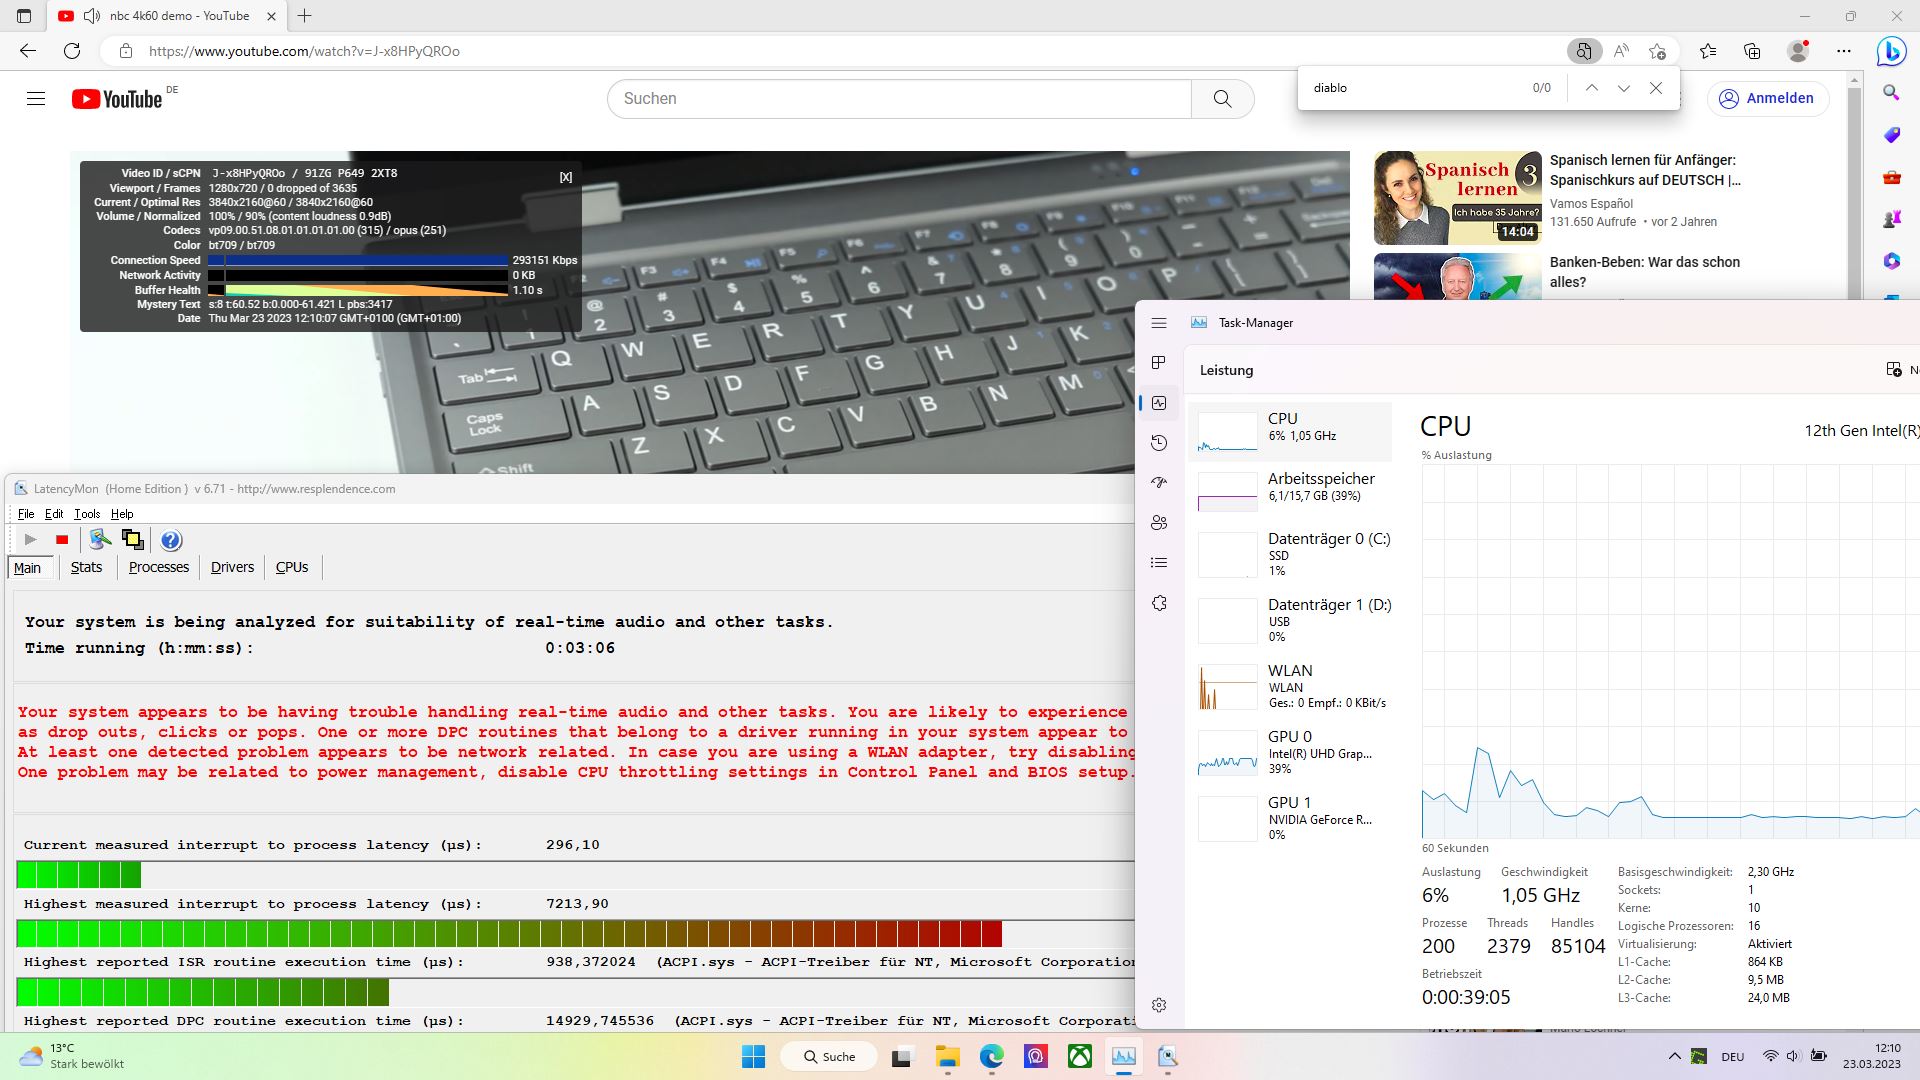
Attualmente, i driver Nvidia per i laptop con scheda RTX 40xx presentano ancora latenze molto elevate sotto LatencyMon e la nostra Katana non fa eccezione. Le prime latenze si verificano subito dopo l'avvio dello strumento. L'apertura di diverse schede del browser e la riproduzione del nostro video di YouTube a 4K/60 fps fanno salire bruscamente il valore. Ma non ci sono stati fotogrammi saltati.
| DPC Latencies / LatencyMon - interrupt to process latency (max), Web, Youtube, Prime95 | |
| MSI Katana 15 B12VEK | |
| Schenker XMG Core 15 (M22) | |
| MSI Pulse GL66 12UEK | |
| Lenovo Legion 5 15IAH7H 82RB | |
| Asus TUF Gaming F15 FX507ZM | |
| MSI Katana GF66 12UGS | |
* ... Meglio usare valori piccoli
Dispositivi di archiviazione
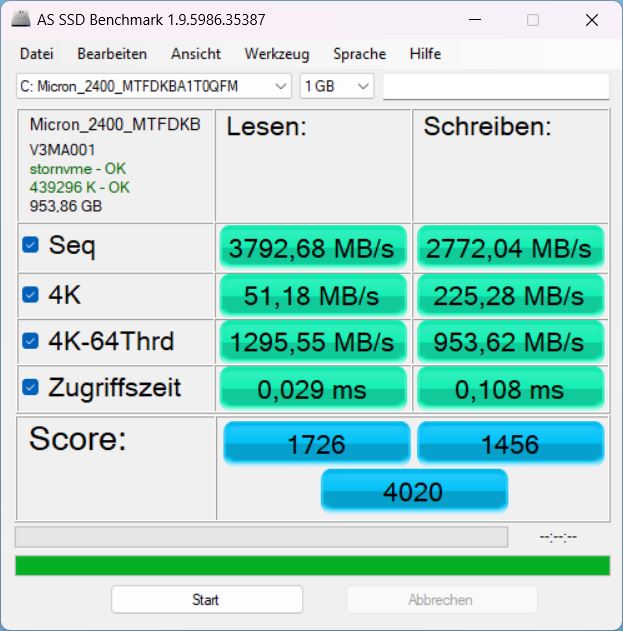
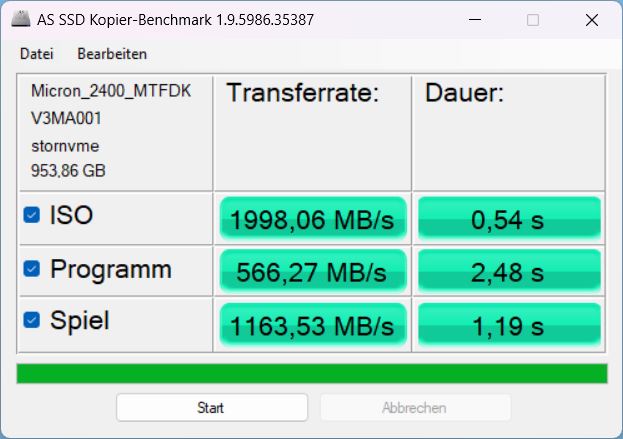
Un SSD PCIe 4.0 x4 NVMe da 1 TB di Micron funge da dispositivo di archiviazione principale. Nel Katana, non sfrutta appieno il suo potenziale prestazionale e si colloca ben al di sotto dei modelli Micron 2450 nelKatana GF66 o nel modello Pulse GL66.
Almeno le sue prestazioni sono relativamente costanti e diminuiscono solo in minima parte dopo lunghi periodi di tempo. Potete trovare maggiori informazioni su questo modello nella nostra Elenco dei bestseller SSD.

* ... Meglio usare valori piccoli
Sustained Read Performance: DiskSpd Read Loop, Queue Depth 8
Scheda grafica
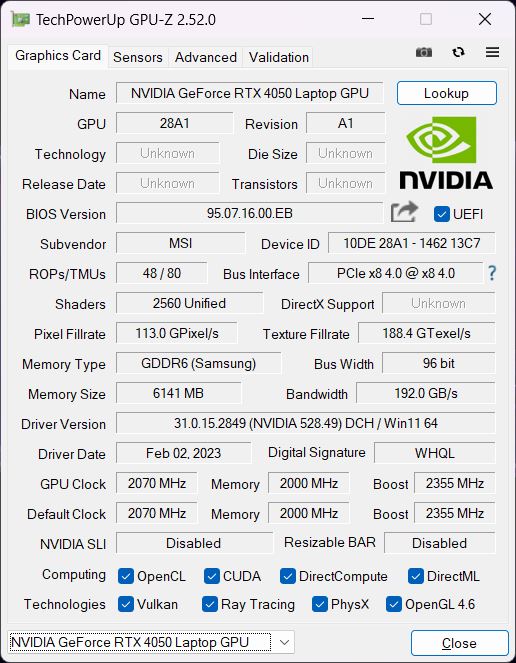
La Nvidia Geforce RTX 4050è la scheda di base della nuova generazione RTX 40xx. Le sue prestazioni dovrebbero essere all'incirca pari a quelle di una vecchia RTX 3060a seconda del TGP selezionato (in questo caso 105 W), anche se gli attuali benchmark suggeriscono che la scheda difficilmente beneficia di una potenza superiore a 100 W.
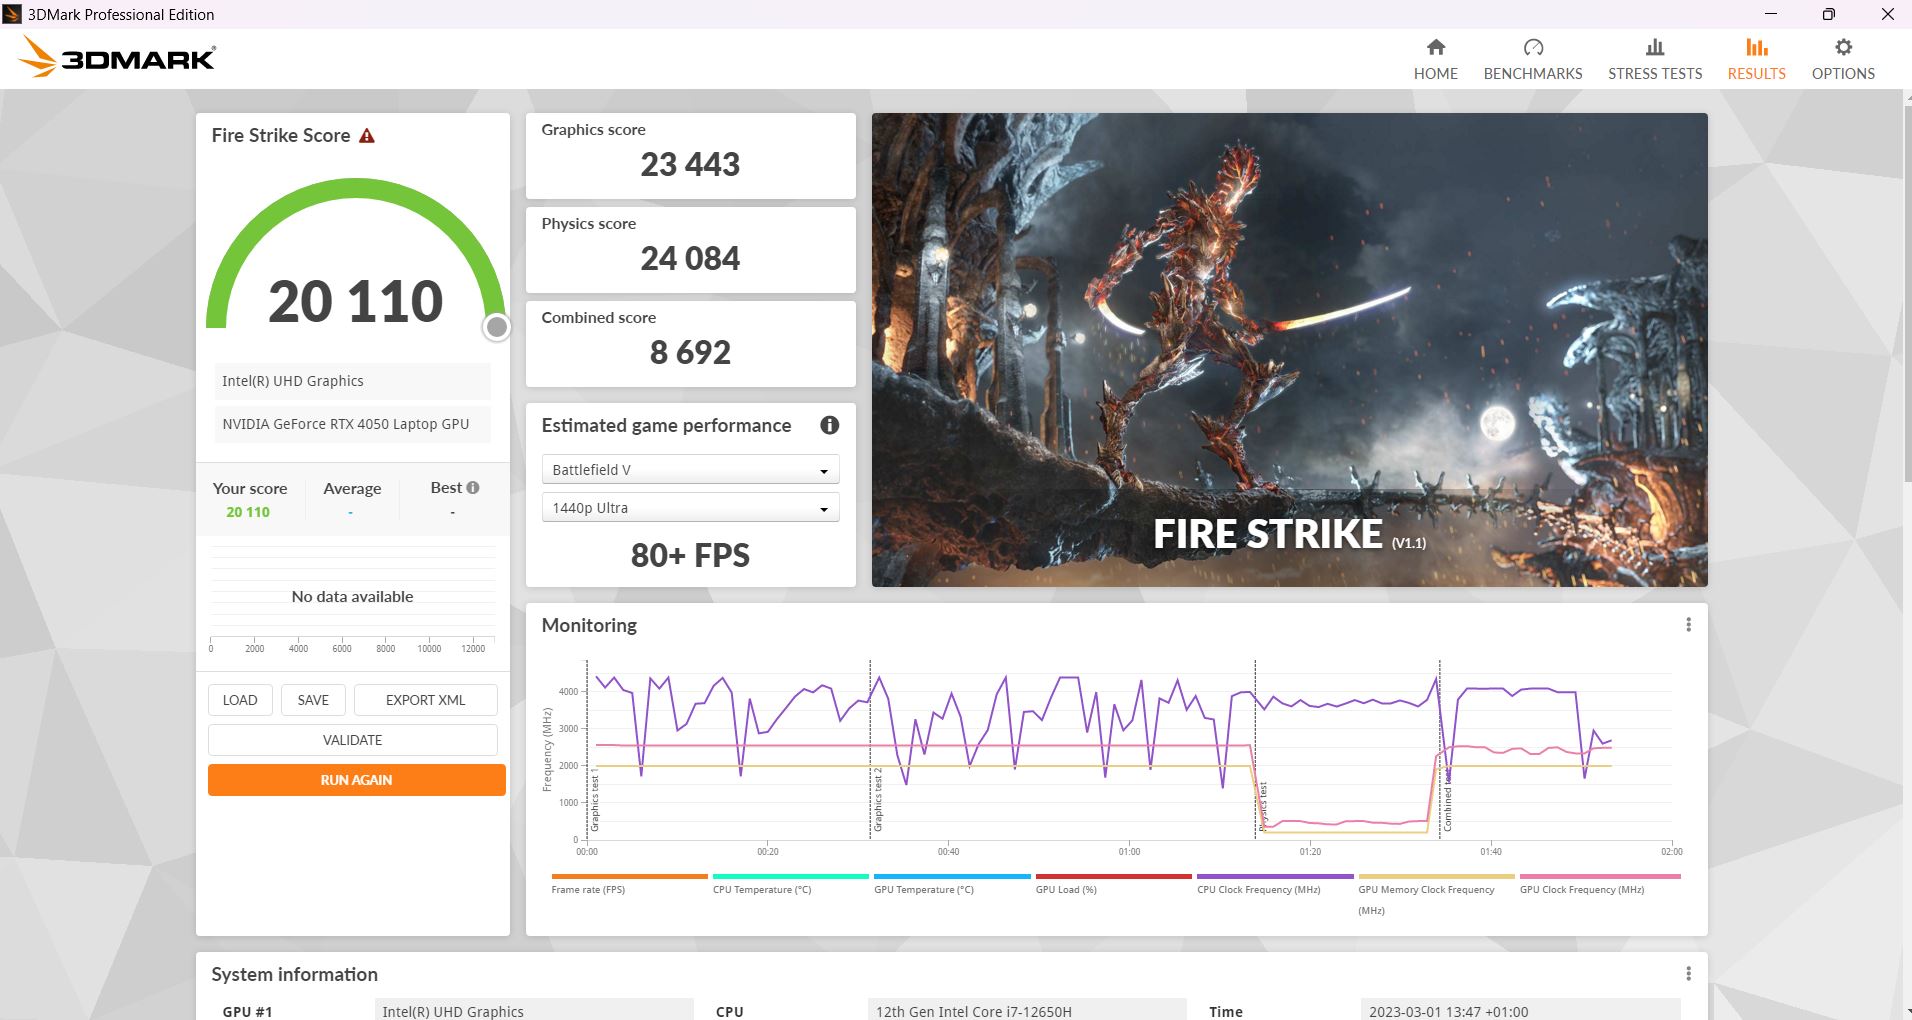
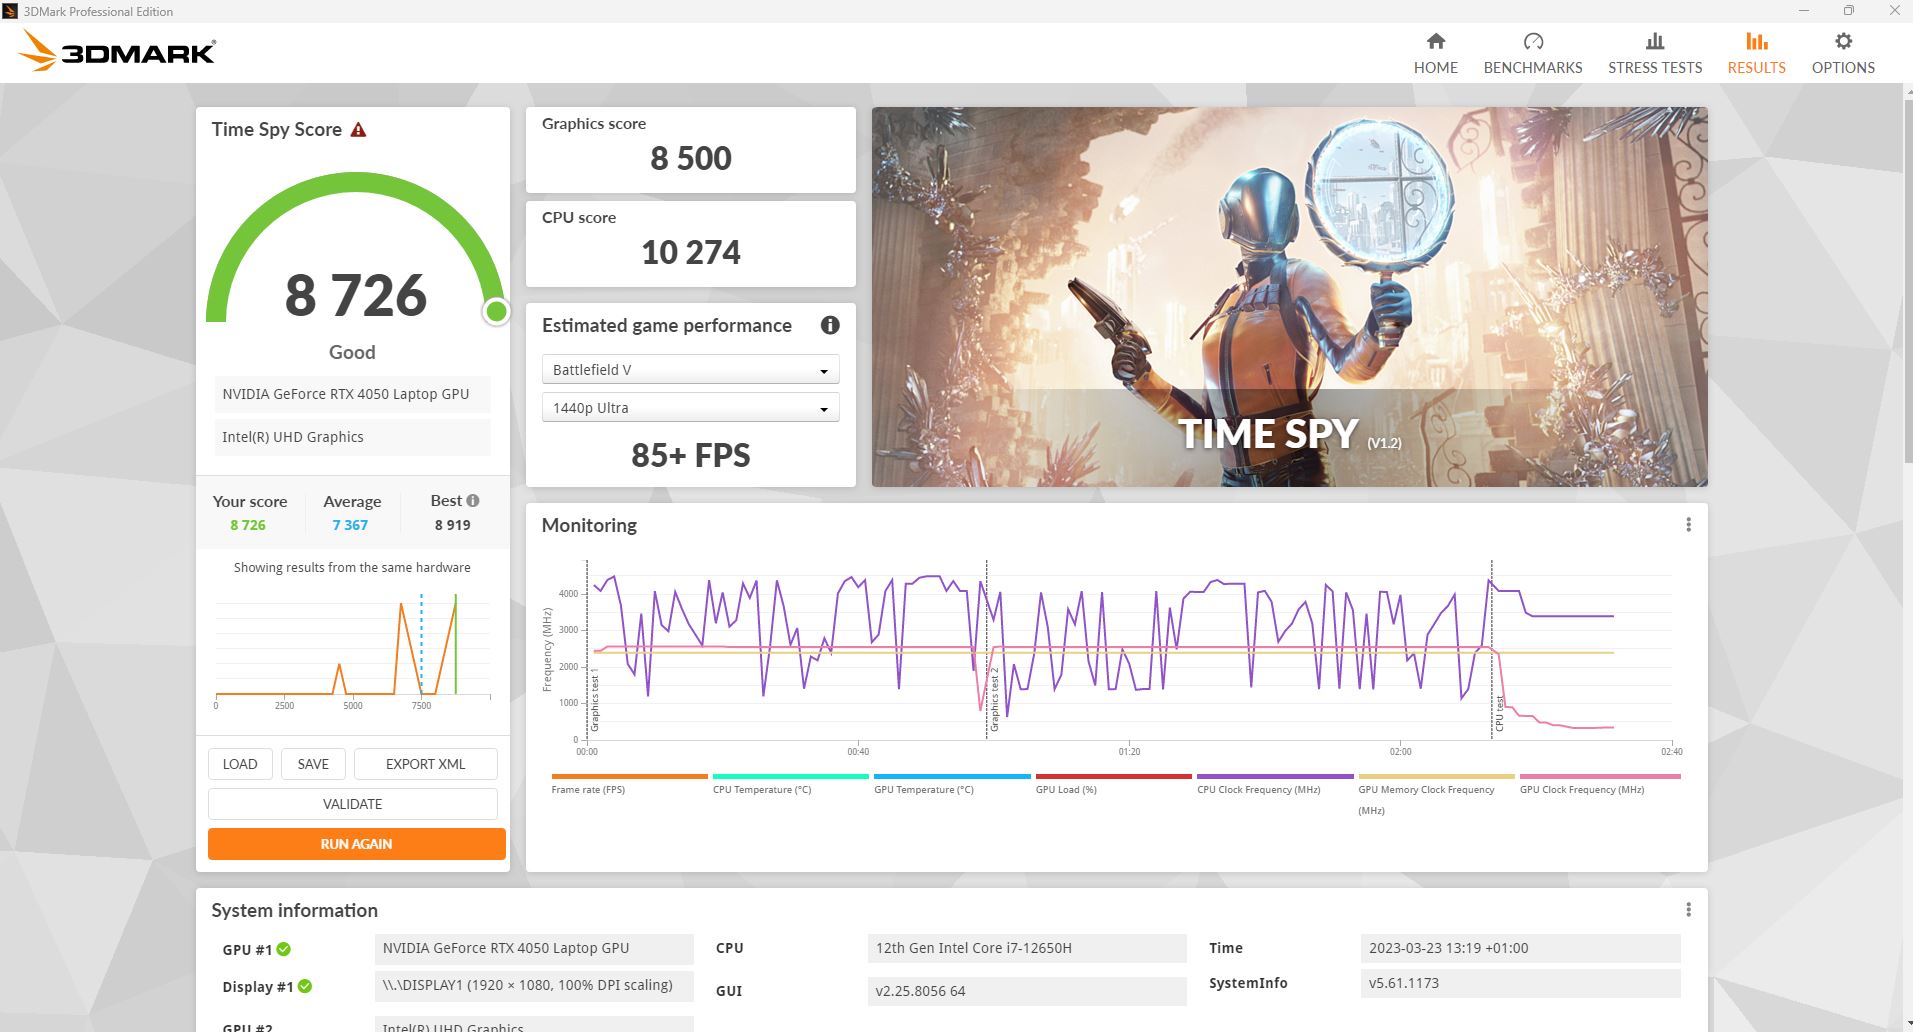
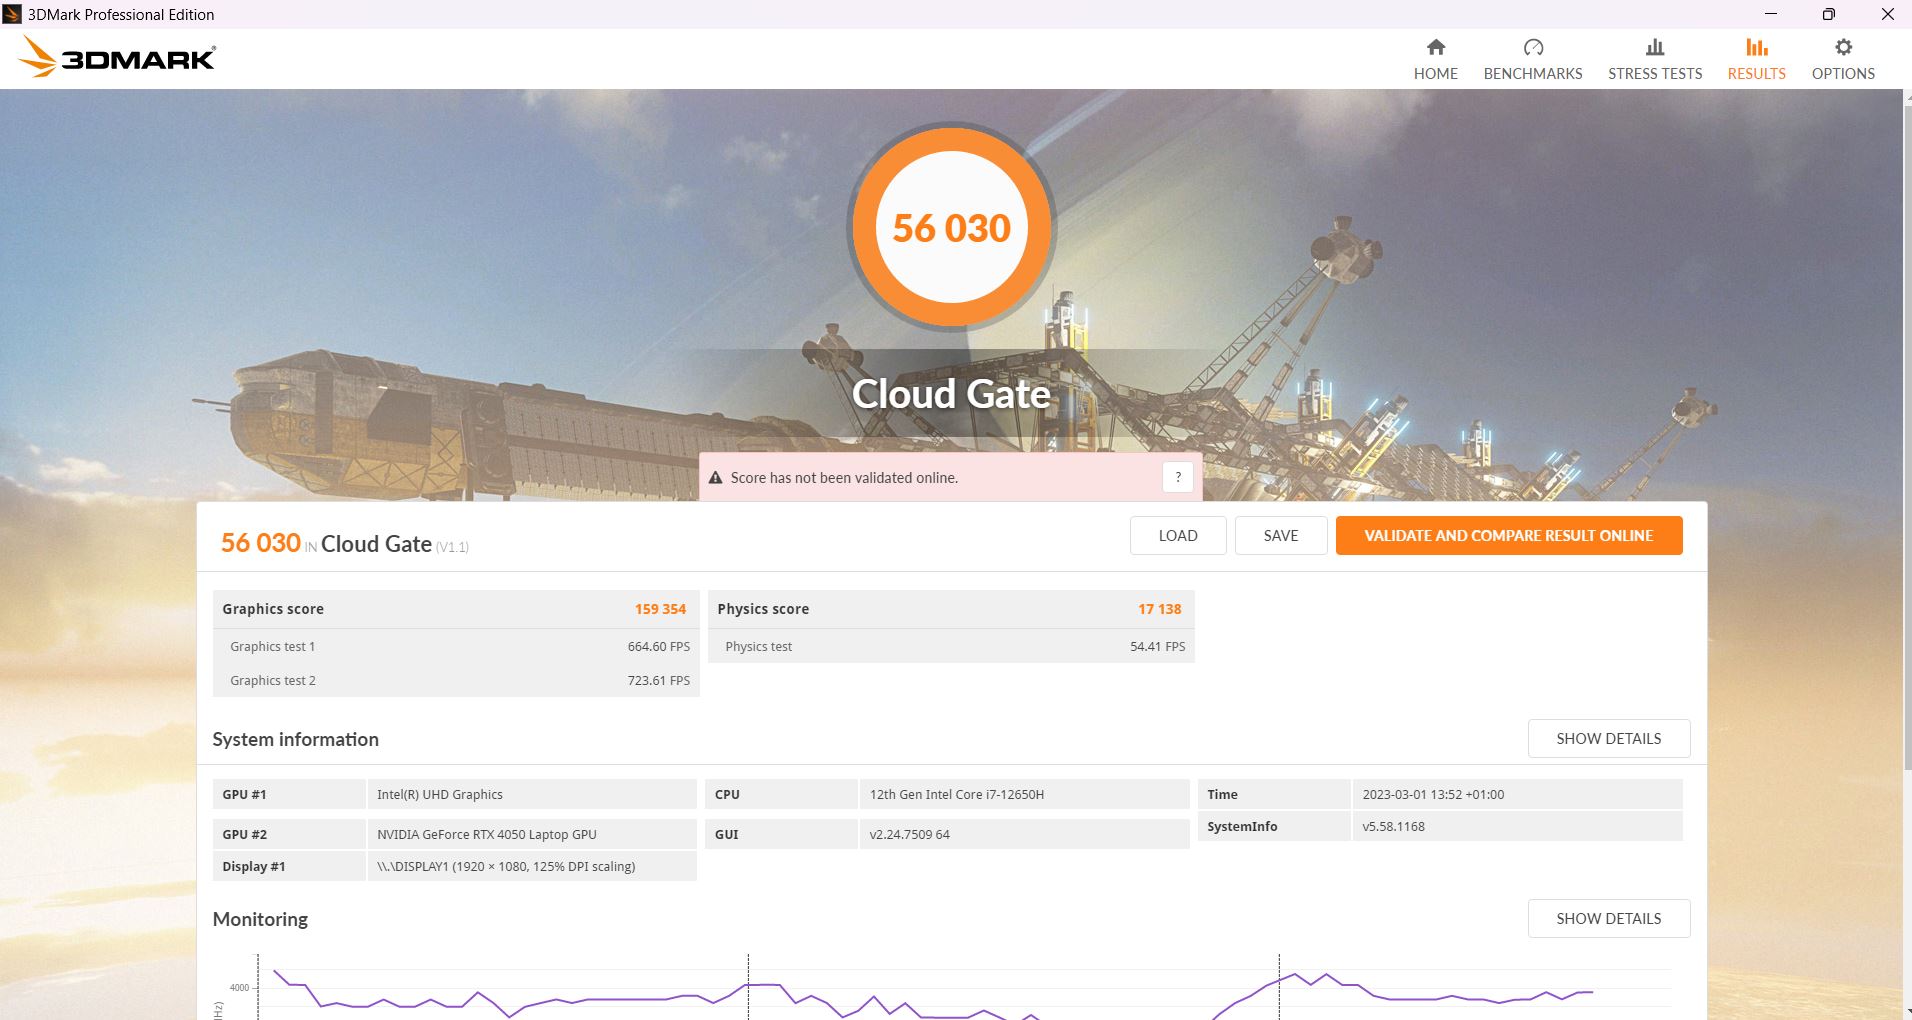
Nel 3DMarks sintetico, la GPU si comporta praticamente al livello previsto ed è appena davanti alla RTX 3060 dello scorso anno. LaKatana GF66 con la RTX 3070 Tiè in vantaggio solo di circa il 10%.
Lontano dalla presa di corrente, ovviamente, le prestazioni soffrono. In un'altra prova su Fire Strike in modalità batteria, la Katana ha ottenuto solo 14.446 punti grafici invece dei 23.443 punti di quando è collegata alla presa di corrente.
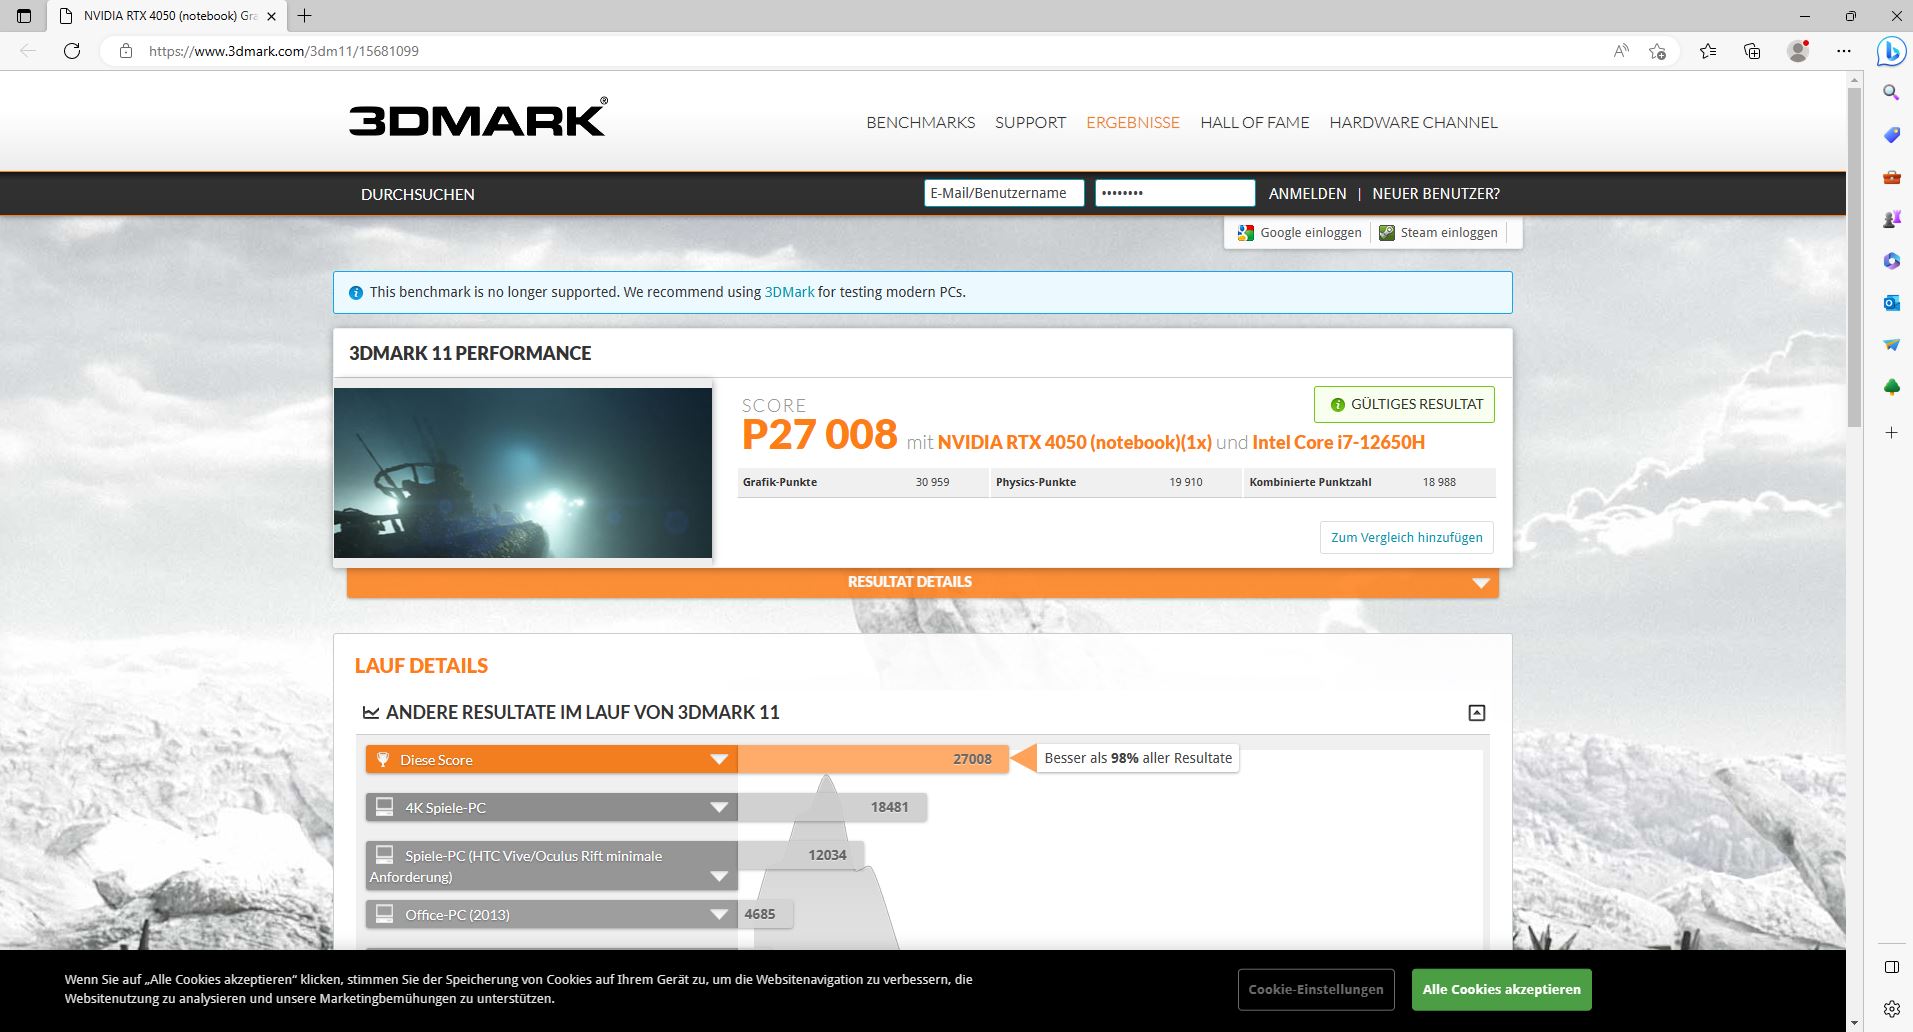
| 3DMark 11 Performance | 27008 punti | |
| 3DMark Cloud Gate Standard Score | 56030 punti | |
| 3DMark Fire Strike Score | 20110 punti | |
| 3DMark Time Spy Score | 8726 punti | |
Aiuto | ||
* ... Meglio usare valori piccoli
Prestazioni di gioco
Nei benchmark di gioco, il Katana 15 tende ad assumere una posizione inferiore rispetto alla concorrenza diretta. Solo ilXMG Core 15 con la sua RTX 3060è leggermente più lento, mentre il Pulse GL66 con RTX 3060 è più o meno altrettanto veloce. Il Legion 5 in particolare, sempre con una RTX 3060, è sensibilmente più veloce.
In Far Cry 5, invece, la Katana è addirittura leggermente superiore alla concorrenza. Quindi dipende molto anche dal gioco a cui si gioca.
| The Witcher 3 - 1920x1080 Ultra Graphics & Postprocessing (HBAO+) | |
| Media della classe Gaming (95 - 240, n=8, ultimi 2 anni) | |
| MSI Katana GF66 12UGS | |
| Asus TUF Gaming F15 FX507ZM | |
| Lenovo Legion 5 15IAH7H 82RB | |
| MSI Katana 15 B12VEK | |
| Schenker XMG Core 15 (M22) | |
| MSI Pulse GL66 12UEK | |
| GTA V - 1920x1080 Highest AA:4xMSAA + FX AF:16x | |
| Media della classe Gaming (48.3 - 186.9, n=103, ultimi 2 anni) | |
| Lenovo Legion 5 15IAH7H 82RB | |
| MSI Katana GF66 12UGS | |
| Asus TUF Gaming F15 FX507ZM | |
| Schenker XMG Core 15 (M22) | |
| MSI Katana 15 B12VEK | |
| Final Fantasy XV Benchmark - 1920x1080 High Quality | |
| Media della classe Gaming (41 - 215, n=104, ultimi 2 anni) | |
| Lenovo Legion 5 15IAH7H 82RB | |
| Asus TUF Gaming F15 FX507ZM | |
| Schenker XMG Core 15 (M22) | |
| MSI Katana GF66 12UGS | |
| MSI Katana 15 B12VEK | |
| Strange Brigade - 1920x1080 ultra AA:ultra AF:16 | |
| Media della classe Gaming (76.3 - 456, n=94, ultimi 2 anni) | |
| MSI Katana GF66 12UGS | |
| Lenovo Legion 5 15IAH7H 82RB | |
| Asus TUF Gaming F15 FX507ZM | |
| Schenker XMG Core 15 (M22) | |
| MSI Katana 15 B12VEK | |
| Dota 2 Reborn - 1920x1080 ultra (3/3) best looking | |
| Lenovo Legion 5 15IAH7H 82RB | |
| Media della classe Gaming (84.8 - 248, n=113, ultimi 2 anni) | |
| Asus TUF Gaming F15 FX507ZM | |
| MSI Pulse GL66 12UEK | |
| MSI Katana 15 B12VEK | |
| MSI Katana GF66 12UGS | |
| Schenker XMG Core 15 (M22) | |
È disponibile un interruttore MUX che consente di scegliere la iGPU o la dGPU nell'MSI Center, il che comporta sempre un riavvio.
Il frame rate di Witcher 3 rimane stabile all'interno delle solite fluttuazioni (ciclo giorno/notte nel gioco). Ma i portatili della concorrenza sono spesso leggermente più veloci, anche quelli con RTX 3060.
La frequenza di clock della GPU è abbastanza stabile a 2,4 GHz e anche il clock della memoria è costante a 2 GHz. Le temperature della GPU non superano i 76 °C e si aggirano in media intorno ai 75 °C. Il consumo energetico medio di 76 W è ben lontano dai 105 W specificati.
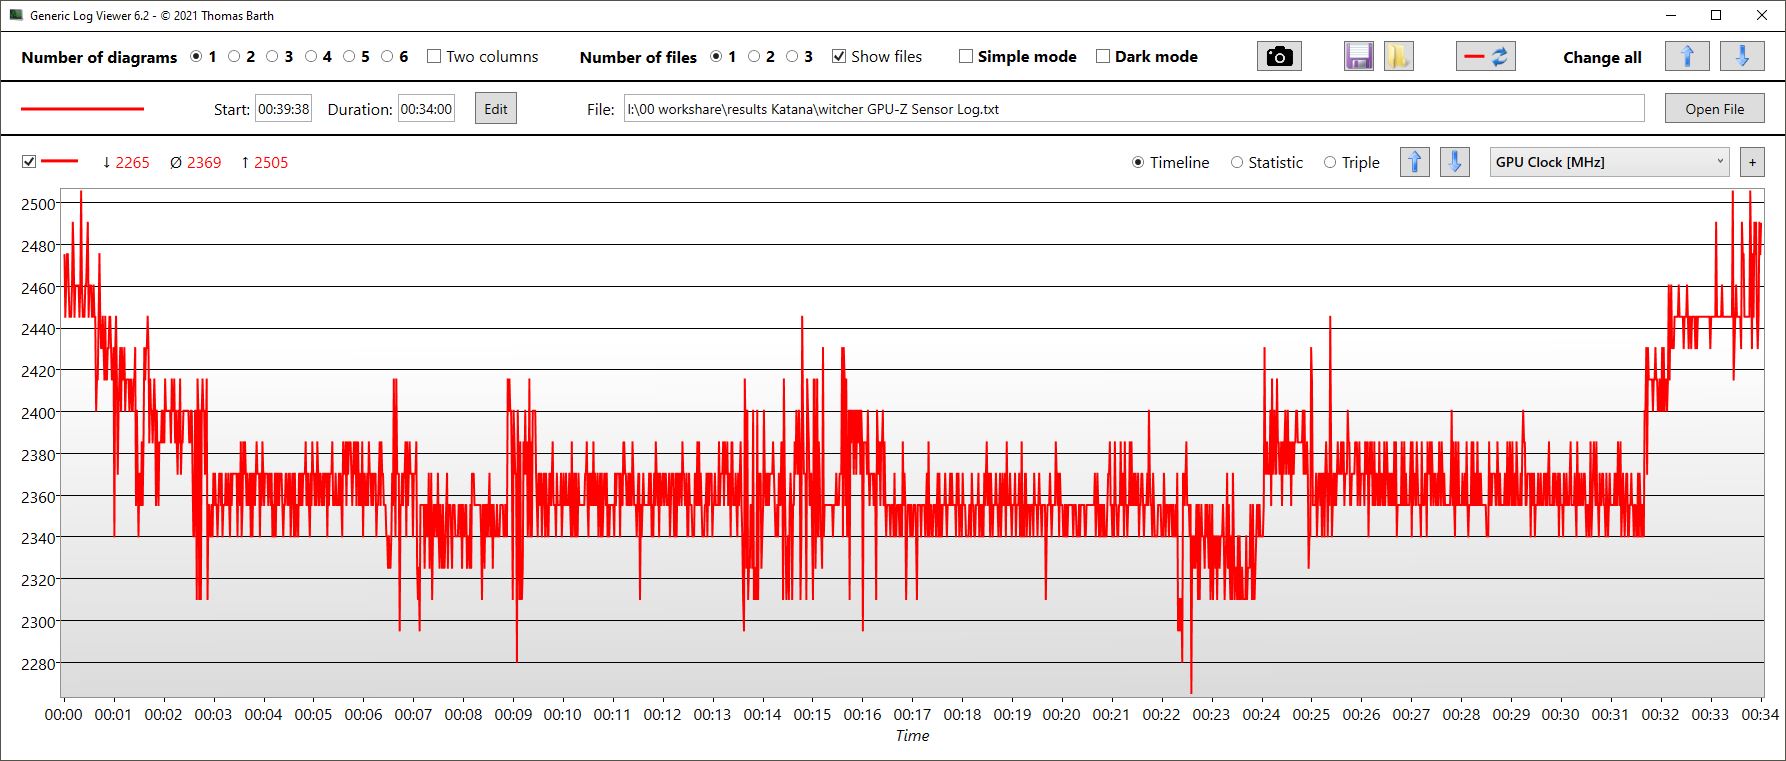
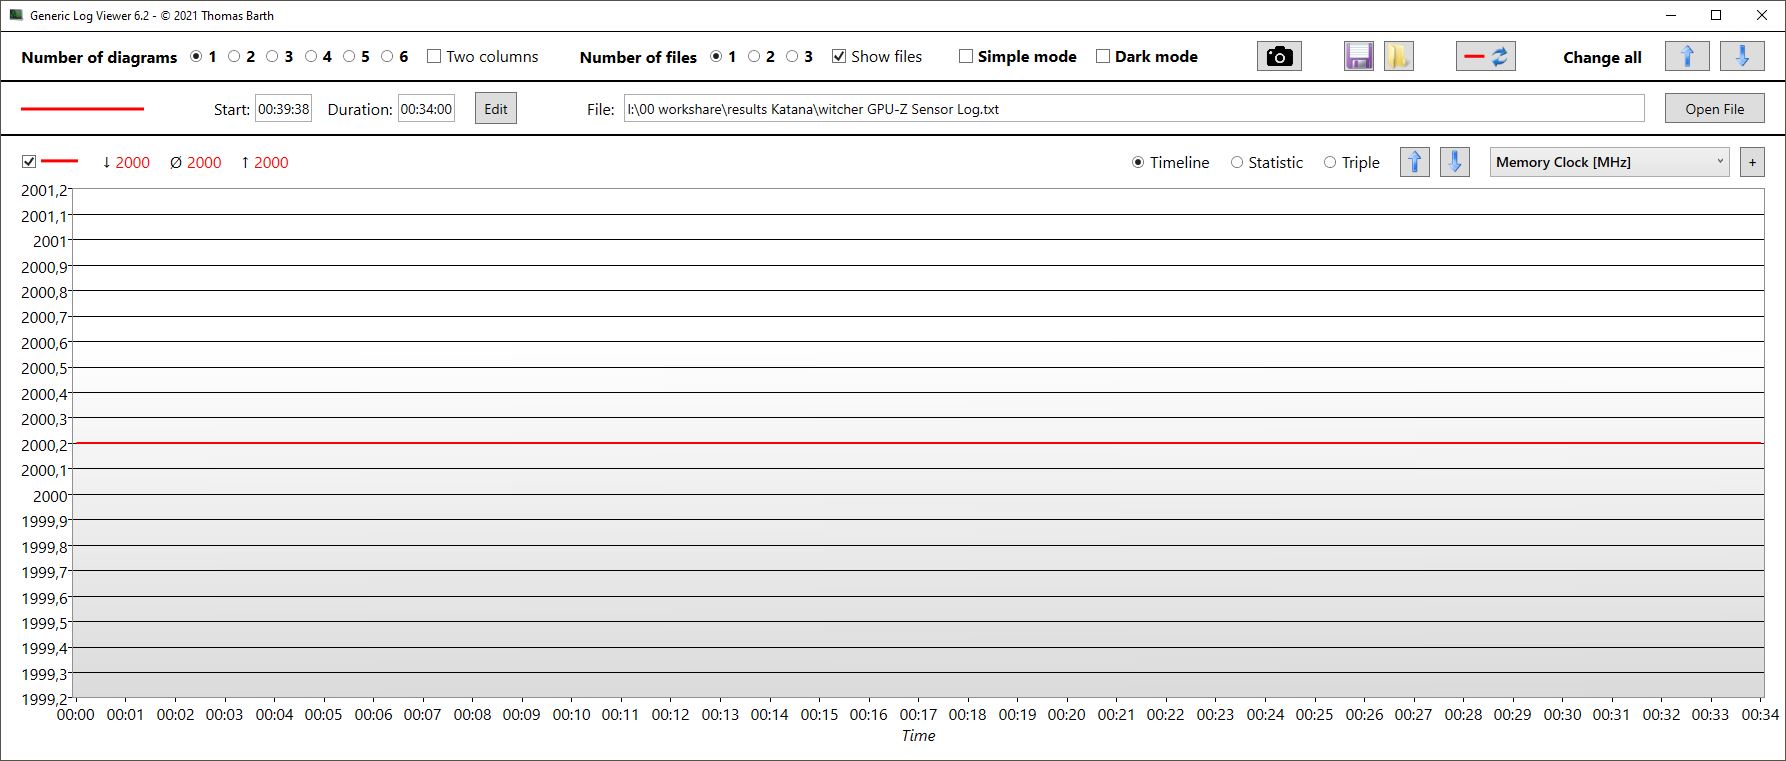
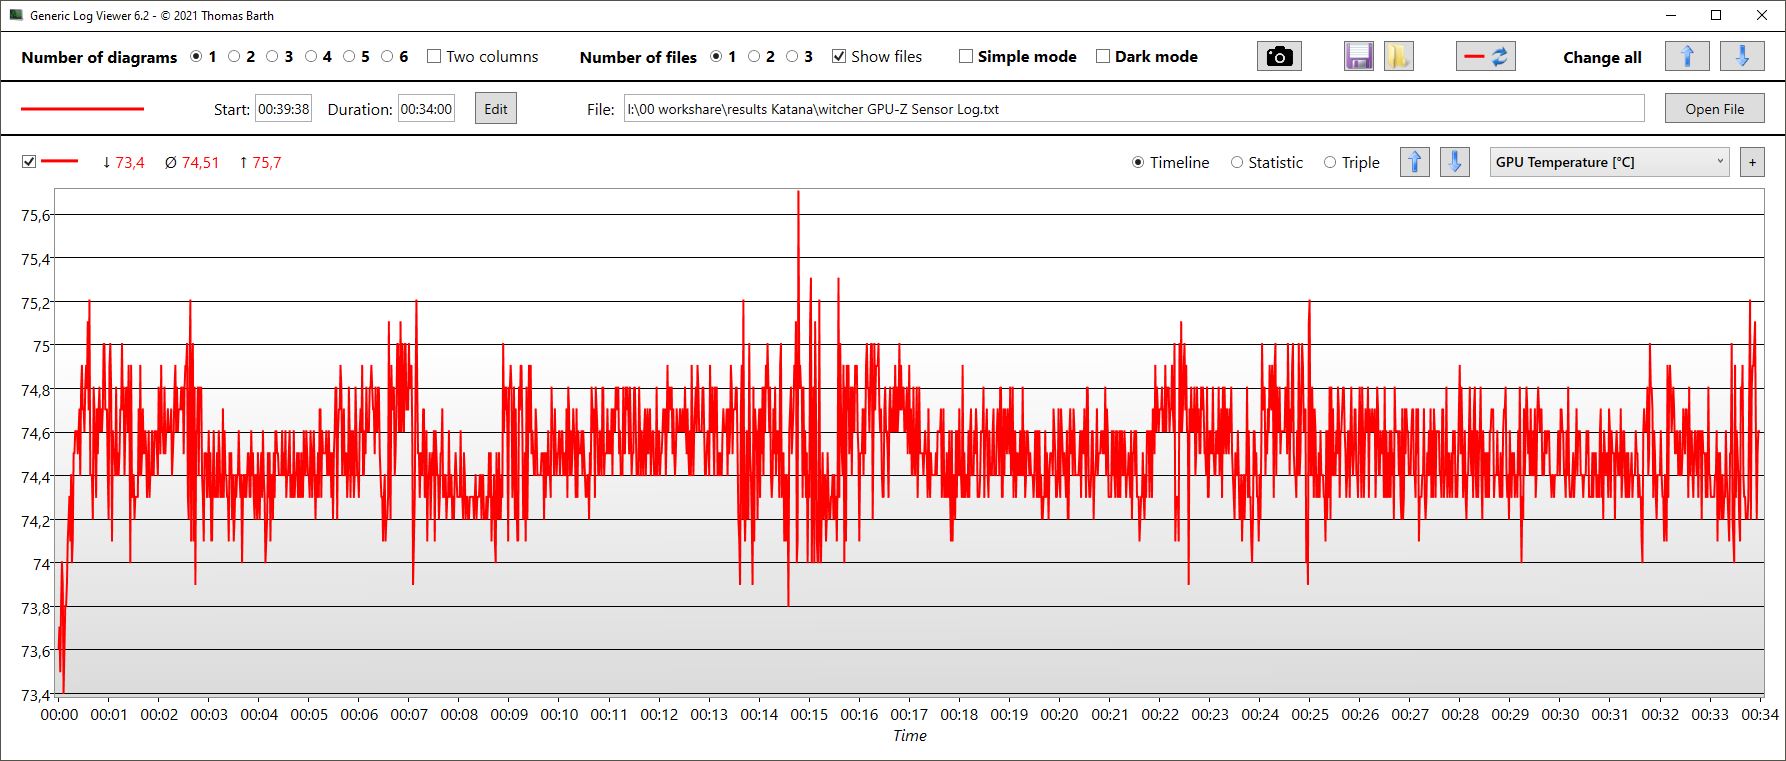
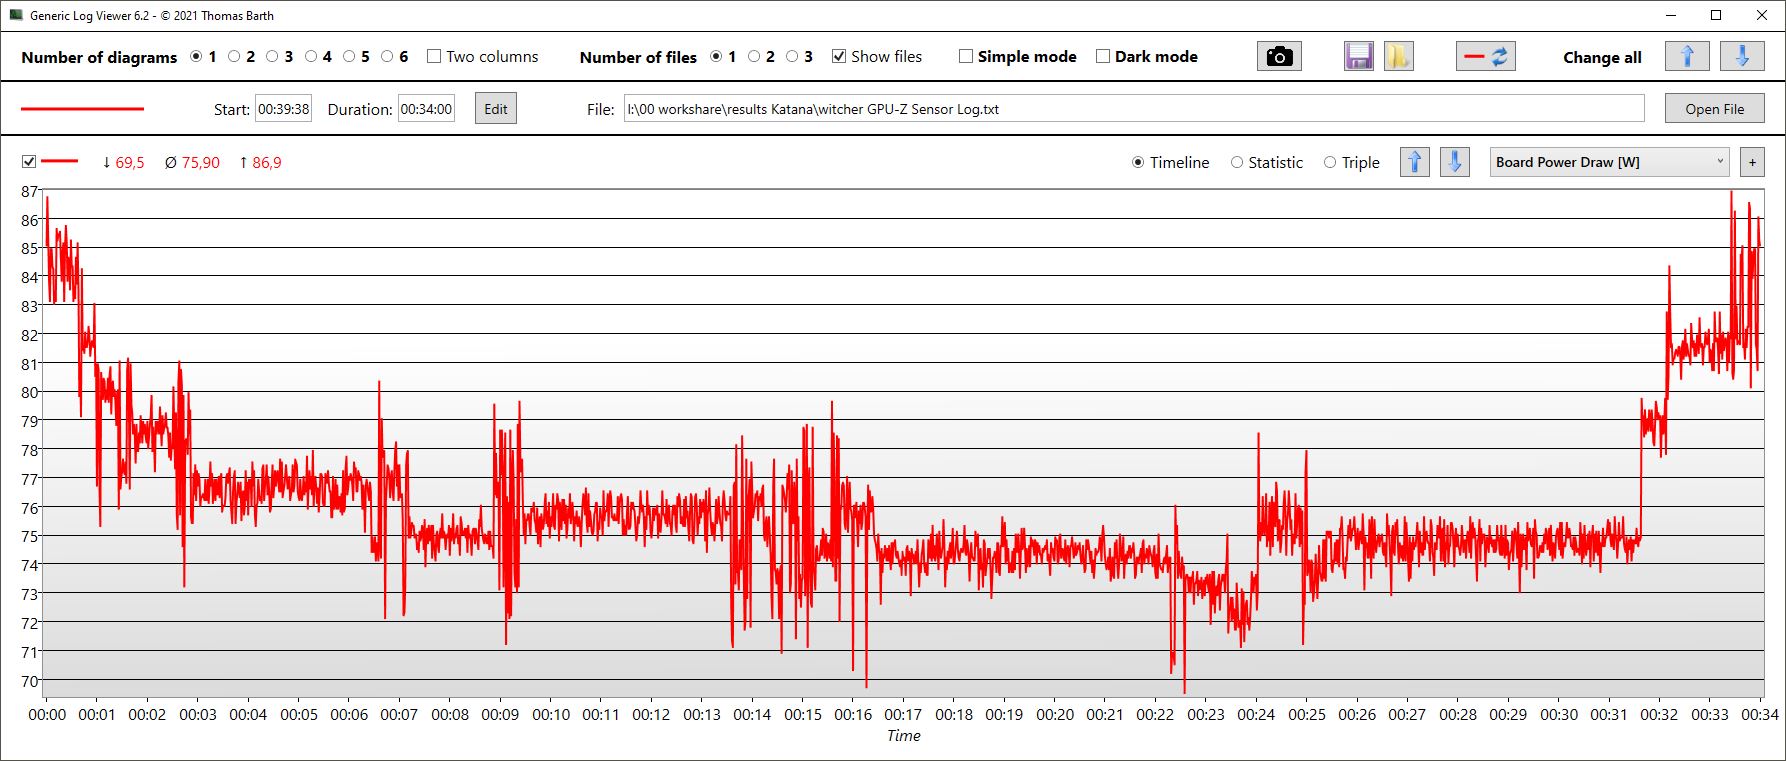
Witcher 3 FPS Chart
| basso | medio | alto | ultra | |
|---|---|---|---|---|
| GTA V (2015) | 183.5 | 176.6 | 172.7 | 92.2 |
| The Witcher 3 (2015) | 395 | 293 | 161 | 83 |
| Dota 2 Reborn (2015) | 175.1 | 158.1 | 150.5 | 142.5 |
| Final Fantasy XV Benchmark (2018) | 188 | 120.7 | 82.8 | |
| X-Plane 11.11 (2018) | 139.9 | 122.4 | 97 | |
| Far Cry 5 (2018) | 170 | 135 | 126 | 119 |
| Strange Brigade (2018) | 214 | 173 | 148.7 | |
| Dying Light 2 (2022) | 122.1 | 75.2 | 62.4 |
Emissioni - Nella tranquillità risiede il potere della spada
Rumore
Quando sono inattive sul desktop, le ventole sono per lo più silenziose, anche in modalità Extreme Performance, il che è insolito. Anche in 3DMark06, le ventole si avviano relativamente tardi e raggiungono solo 37,7 dB alla fine del primo scenario di benchmark. Solo il Legion 5è più silenzioso, il Asus TUF Gaming è altrettanto silenzioso, mentre i modelli gemelli e l' XMG Core sono più rumorosi.
Lo sviluppo moderato del rumore è evidente anche nel gioco (modalità AI), e il Katana diventa rumoroso solo durante lo stress combinato CPU/GPU.
Rumorosità
| Idle |
| 24 / 24 / 24 dB(A) |
| Sotto carico |
| 37.71 / 54.55 dB(A) |
 | ||
30 dB silenzioso 40 dB(A) udibile 50 dB(A) rumoroso |
||
min: | ||
| MSI Katana 15 B12VEK GeForce RTX 4050 Laptop GPU, i7-12650H, Micron 2400 MTFDKBA1T0QFM | MSI Katana GF66 12UGS GeForce RTX 3070 Ti Laptop GPU, i7-12700H, Micron 2450 1TB MTFDKBA1T0TFK | MSI Pulse GL66 12UEK GeForce RTX 3060 Laptop GPU, i9-12900H, Micron 2450 512GB MTFDKBA512TFK | Lenovo Legion 5 15IAH7H 82RB GeForce RTX 3060 Laptop GPU, i7-12700H | Asus TUF Gaming F15 FX507ZM GeForce RTX 3060 Laptop GPU, i7-12700H, SK Hynix HFM001TD3JX013N | Schenker XMG Core 15 (M22) GeForce RTX 3060 Laptop GPU, R7 6800H, Samsung SSD 980 Pro 1TB MZ-V8P1T0BW | |
|---|---|---|---|---|---|---|
| Noise | -9% | -11% | 1% | -3% | -2% | |
| off /ambiente * (dB) | 24 | 26 -8% | 23 4% | 23.3 3% | 23.2 3% | 23 4% |
| Idle Minimum * (dB) | 24 | 27 -13% | 23 4% | 23.5 2% | 23.6 2% | 23 4% |
| Idle Average * (dB) | 24 | 28 -17% | 27 -13% | 23.5 2% | 23.6 2% | 23 4% |
| Idle Maximum * (dB) | 24 | 31 -29% | 27 -13% | 26.8 -12% | 25.4 -6% | 23 4% |
| Load Average * (dB) | 37.71 | 44 -17% | 48.2 -28% | 29.3 22% | 38 -1% | 42.41 -12% |
| Witcher 3 ultra * (dB) | 45.75 | 44 4% | 56.9 -24% | 51.4 -12% | 54.1 -18% | 54.71 -20% |
| Load Maximum * (dB) | 54.55 | 45 18% | 56.94 -4% | 53 3% | 57.2 -5% | 55.05 -1% |
* ... Meglio usare valori piccoli
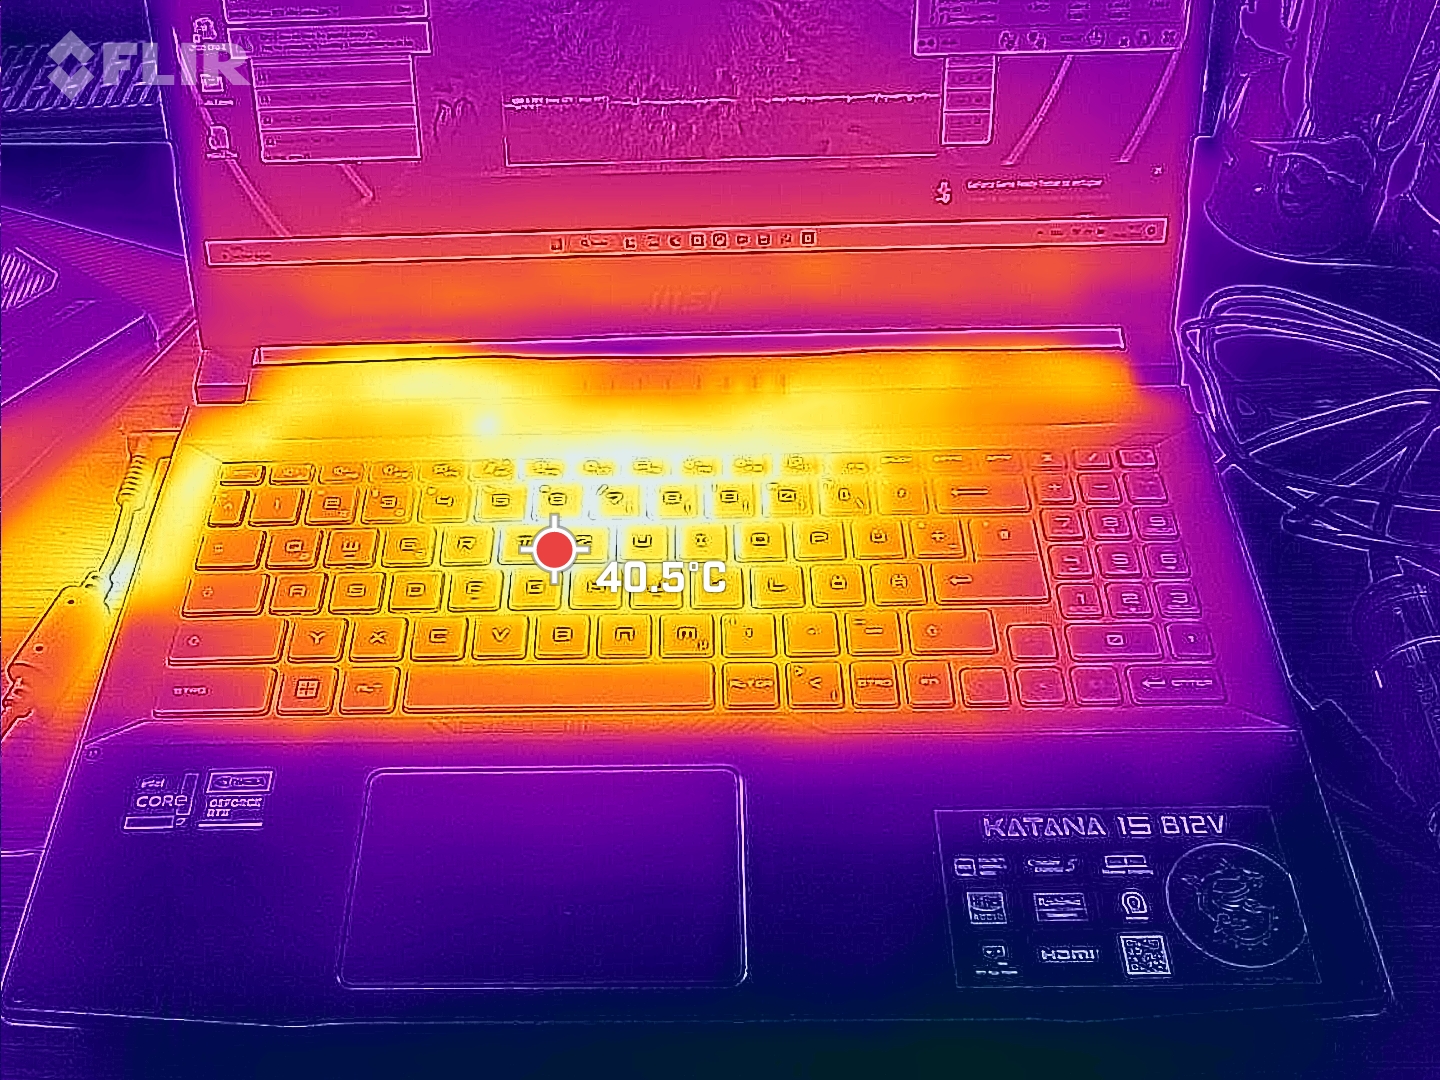
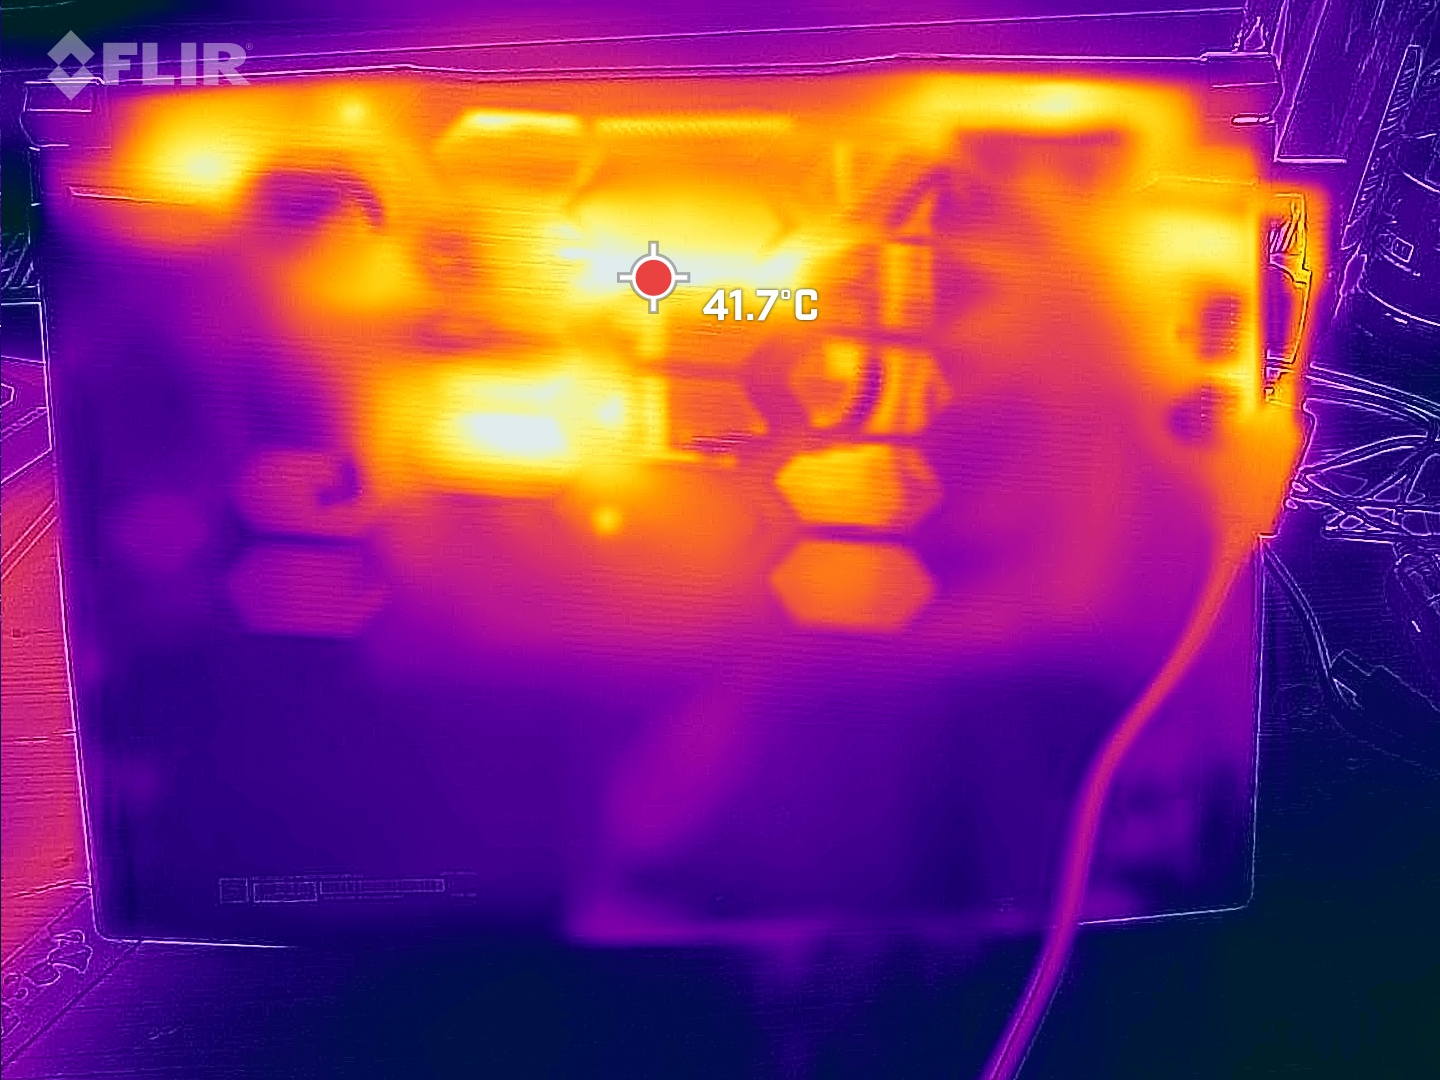
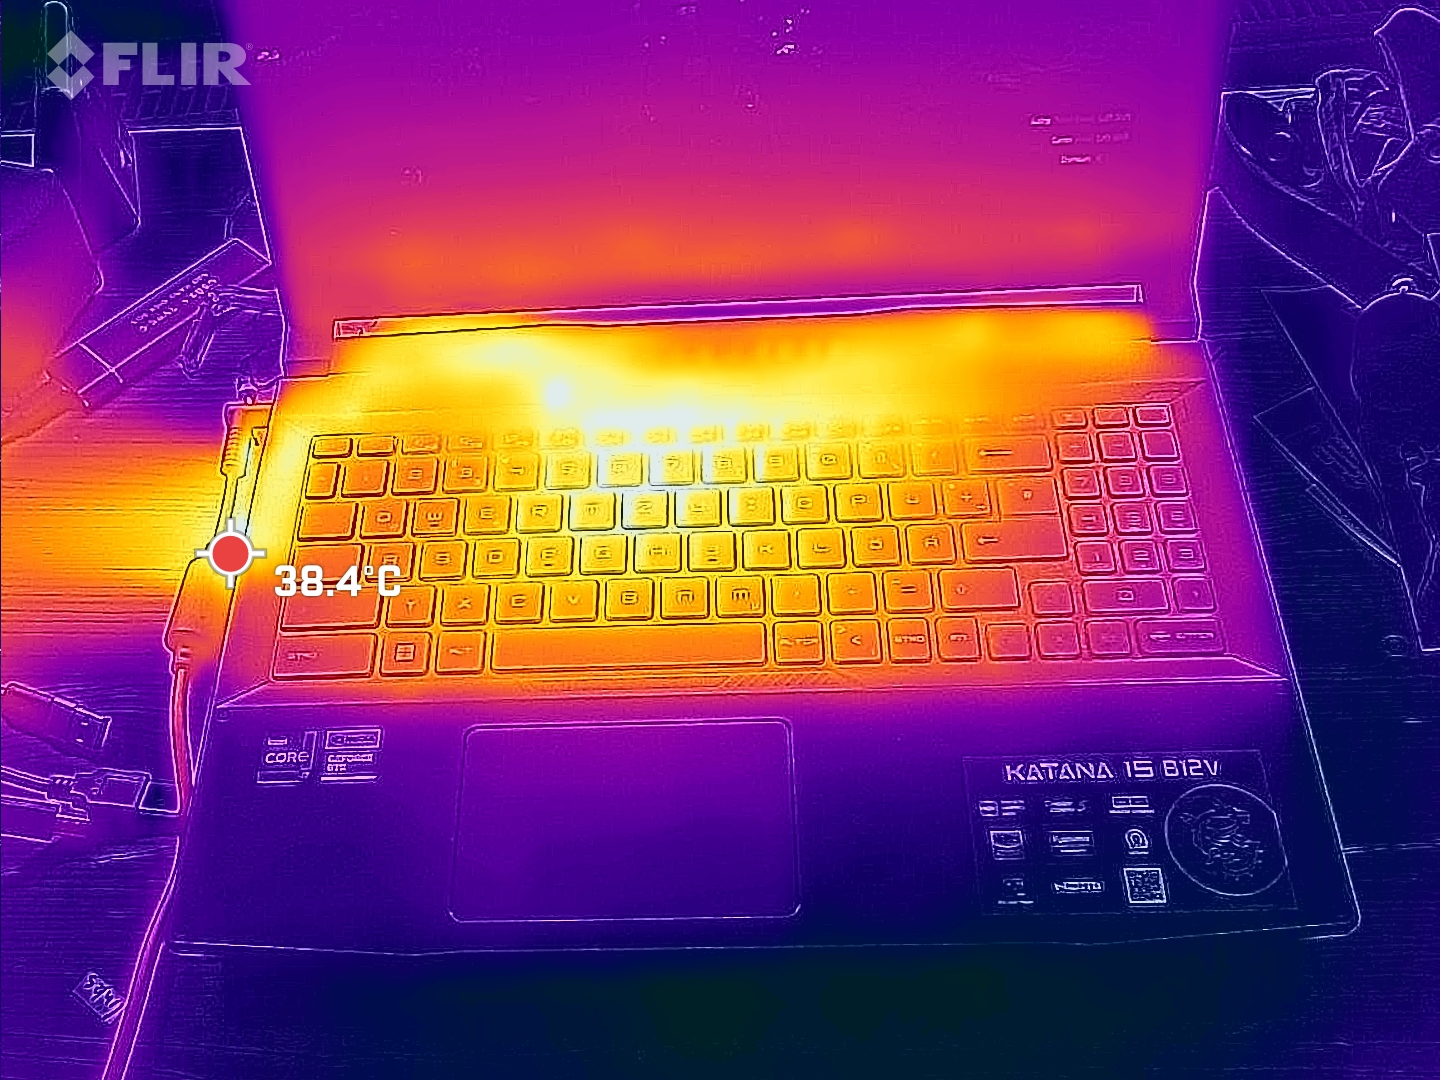
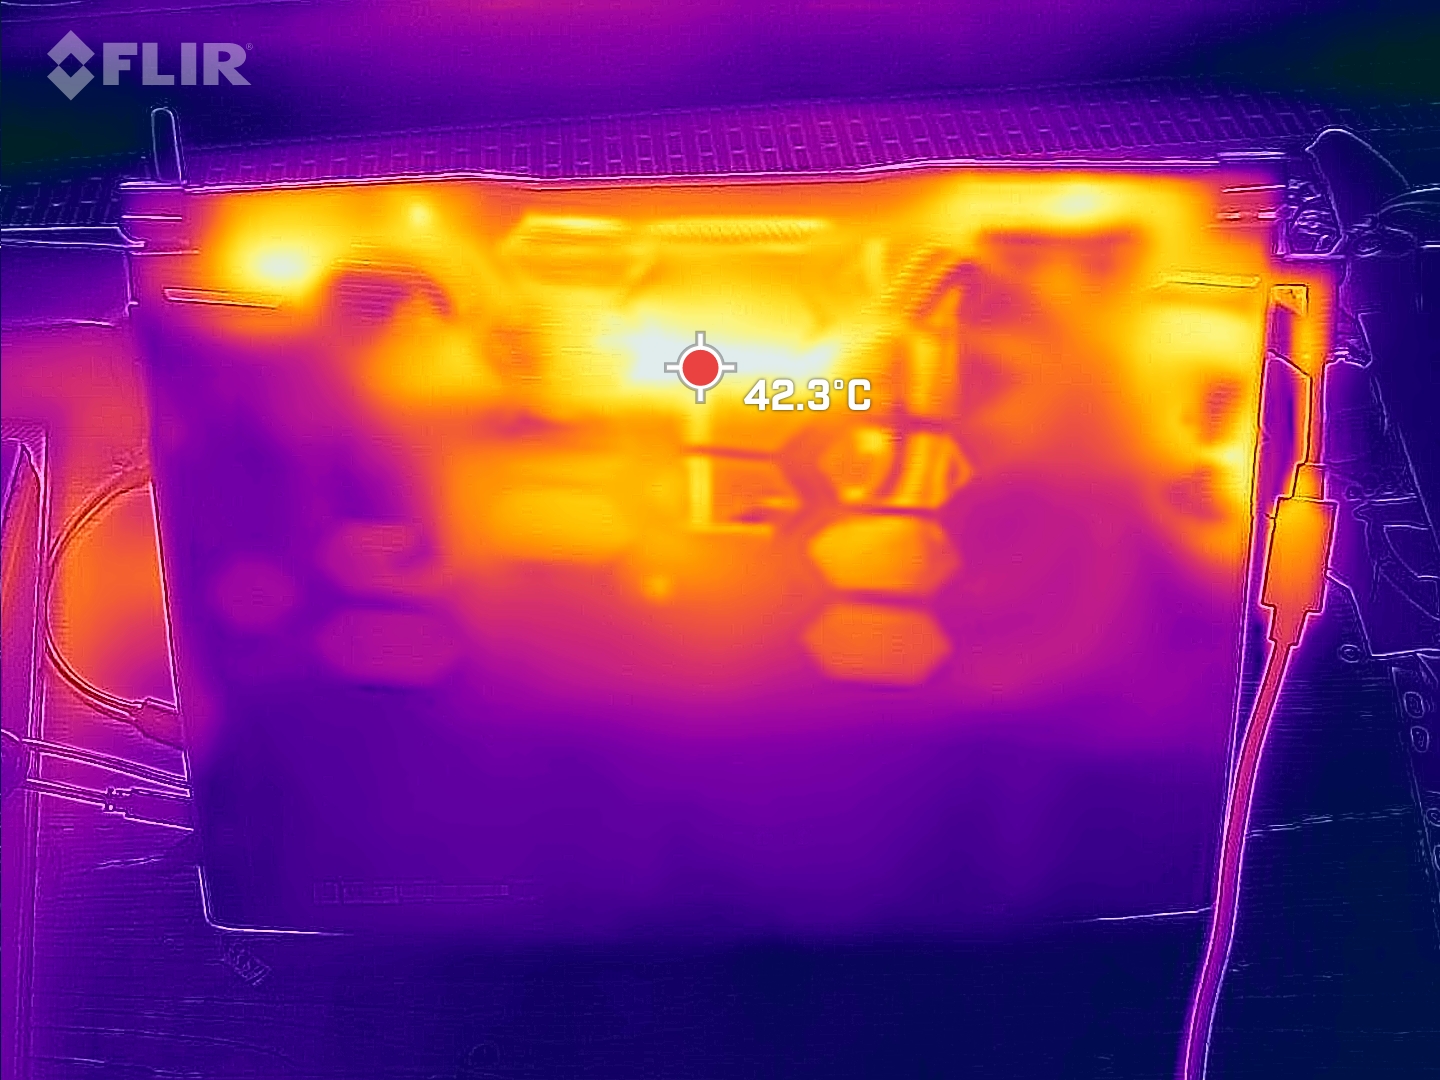
Temperatura
I punti caldi si trovano a poco meno di 50 °C al centro, verso la parte posteriore. I poggiapolsi rimangono sempre freschi, ma i tasti WASD possono riscaldarsi in modo un po' fastidioso sotto forte stress.
(-) La temperatura massima sul lato superiore è di 47 °C / 117 F, rispetto alla media di 40.4 °C / 105 F, che varia da 21.2 a 68.8 °C per questa classe Gaming.
(-) Il lato inferiore si riscalda fino ad un massimo di 48 °C / 118 F, rispetto alla media di 43.2 °C / 110 F
(+) In idle, la temperatura media del lato superiore è di 29 °C / 84 F, rispetto alla media deld ispositivo di 33.9 °C / 93 F.
(±) Riproducendo The Witcher 3, la temperatura media per il lato superiore e' di 35 °C / 95 F, rispetto alla media del dispositivo di 33.9 °C / 93 F.
(+) I poggiapolsi e il touchpad sono piu' freddi della temperatura della pelle con un massimo di 23 °C / 73.4 F e sono quindi freddi al tatto.
(+) La temperatura media della zona del palmo della mano di dispositivi simili e'stata di 28.8 °C / 83.8 F (+5.8 °C / 10.4 F).
| MSI Katana 15 B12VEK Intel Core i7-12650H, NVIDIA GeForce RTX 4050 Laptop GPU | MSI Katana GF66 12UGS Intel Core i7-12700H, NVIDIA GeForce RTX 3070 Ti Laptop GPU | MSI Pulse GL66 12UEK Intel Core i9-12900H, NVIDIA GeForce RTX 3060 Laptop GPU | Lenovo Legion 5 15IAH7H 82RB Intel Core i7-12700H, NVIDIA GeForce RTX 3060 Laptop GPU | Asus TUF Gaming F15 FX507ZM Intel Core i7-12700H, NVIDIA GeForce RTX 3060 Laptop GPU | Schenker XMG Core 15 (M22) AMD Ryzen 7 6800H, NVIDIA GeForce RTX 3060 Laptop GPU | |
|---|---|---|---|---|---|---|
| Heat | -17% | -2% | 16% | -2% | 6% | |
| Maximum Upper Side * (°C) | 47 | 61 -30% | 50 -6% | 37.8 20% | 44.4 6% | 48 -2% |
| Maximum Bottom * (°C) | 48 | 55 -15% | 47 2% | 51 -6% | 48.8 -2% | 51 -6% |
| Idle Upper Side * (°C) | 35 | 43 -23% | 36 -3% | 25.8 26% | 37.8 -8% | 28 20% |
| Idle Bottom * (°C) | 38 | 38 -0% | 38 -0% | 28.8 24% | 39.6 -4% | 33 13% |
* ... Meglio usare valori piccoli
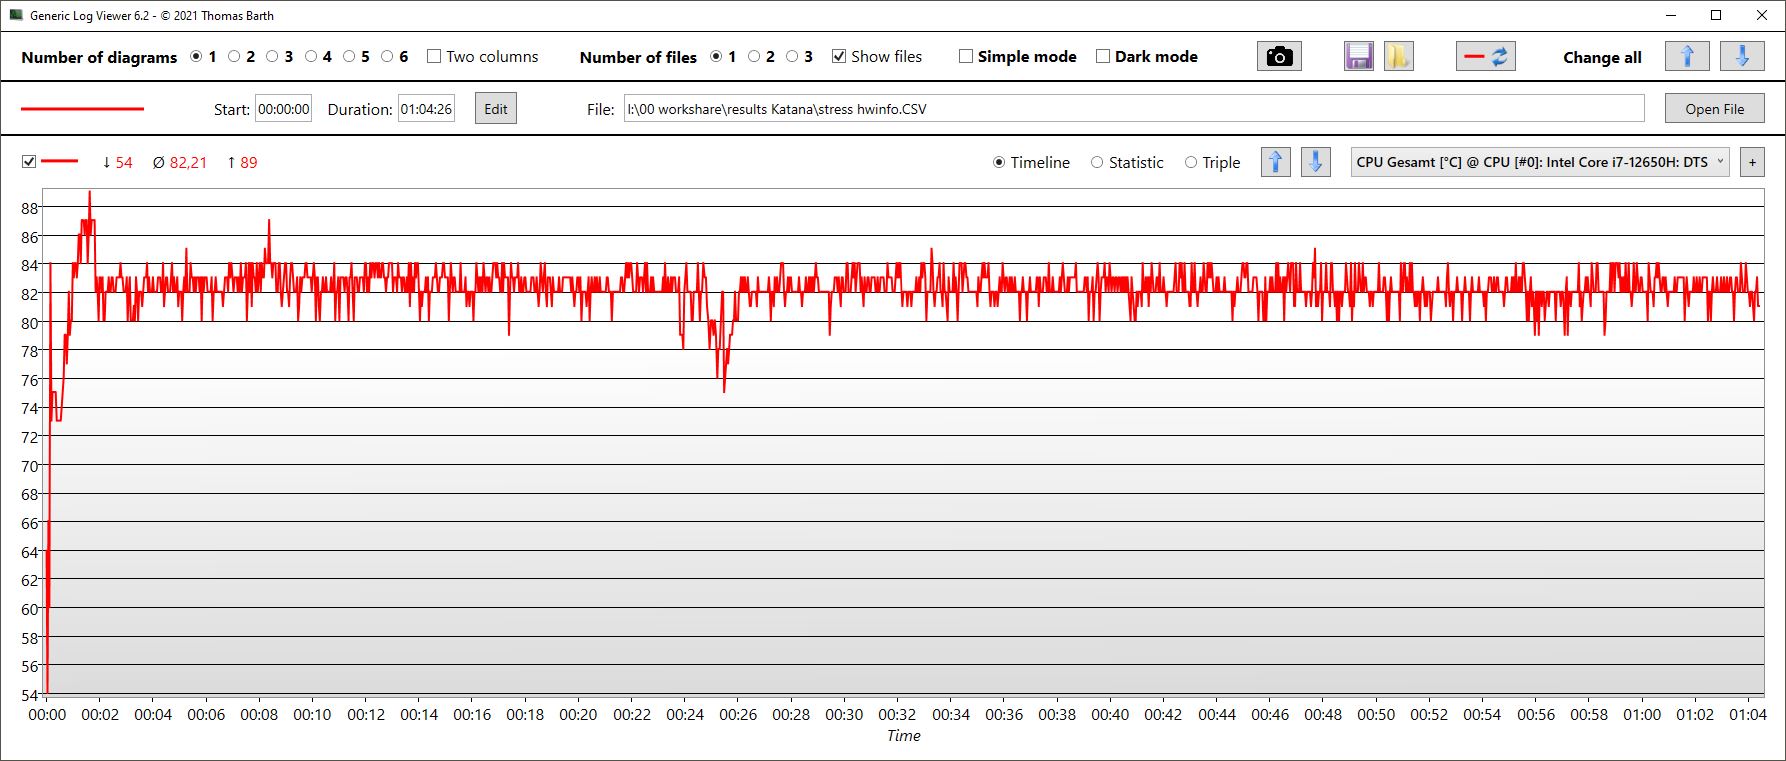
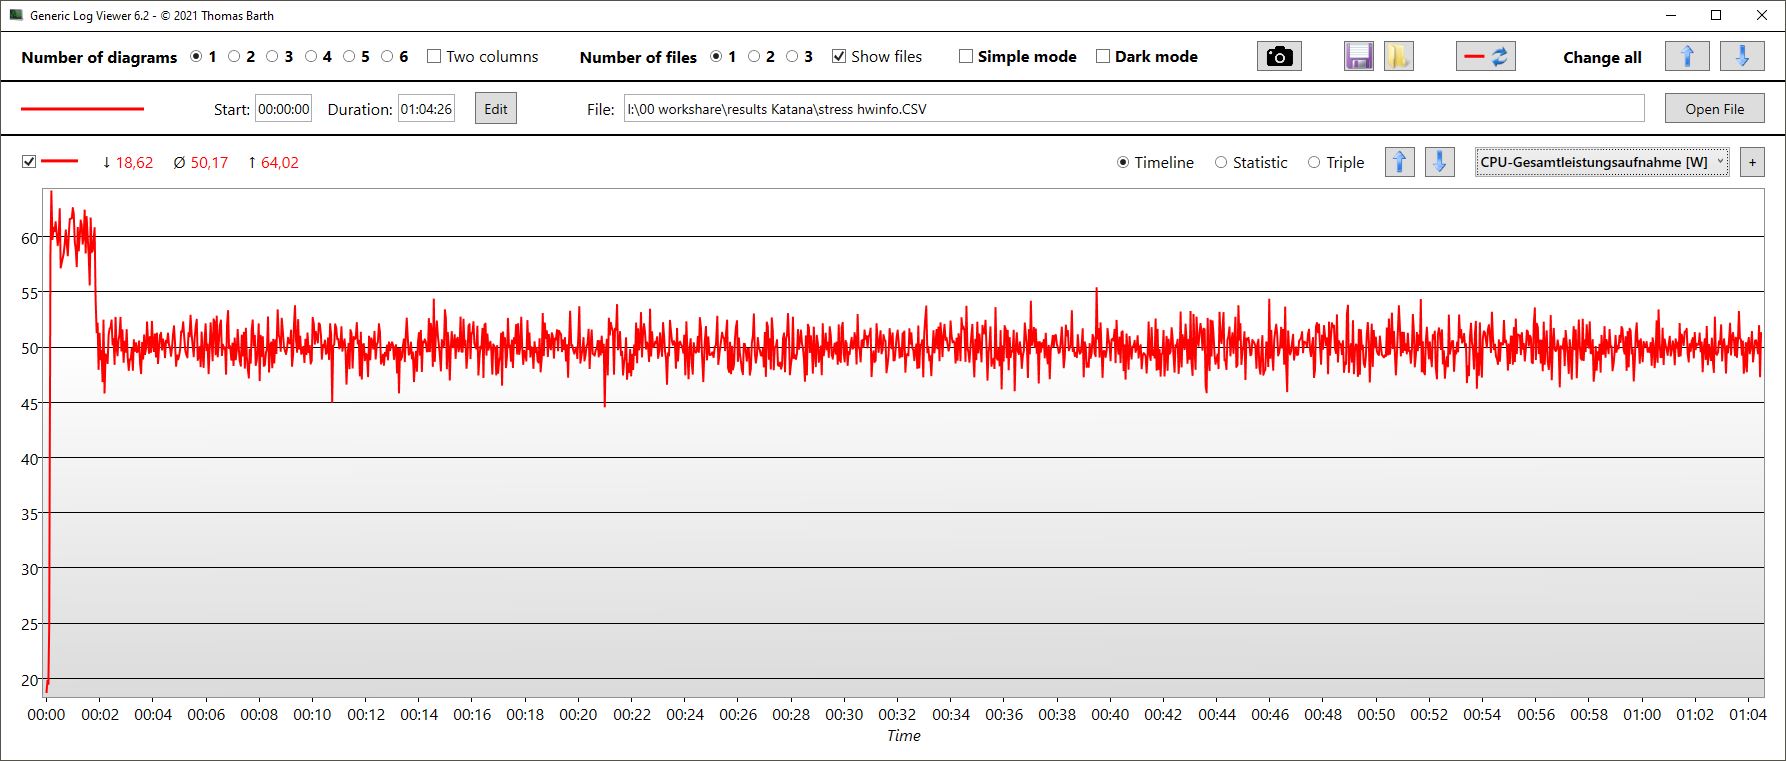
Stress test
I core iniziano il nostro stress test a 3,1 GHz molto brevemente. Dopo pochi secondi, le temperature dei core salgono a 89 °C, dopodiché le frequenze di clock scendono e raggiungono una media stabile di 2,5 GHz. Il consumo energetico è in media di 50 W. Le temperature si stabilizzano a circa 82 °C
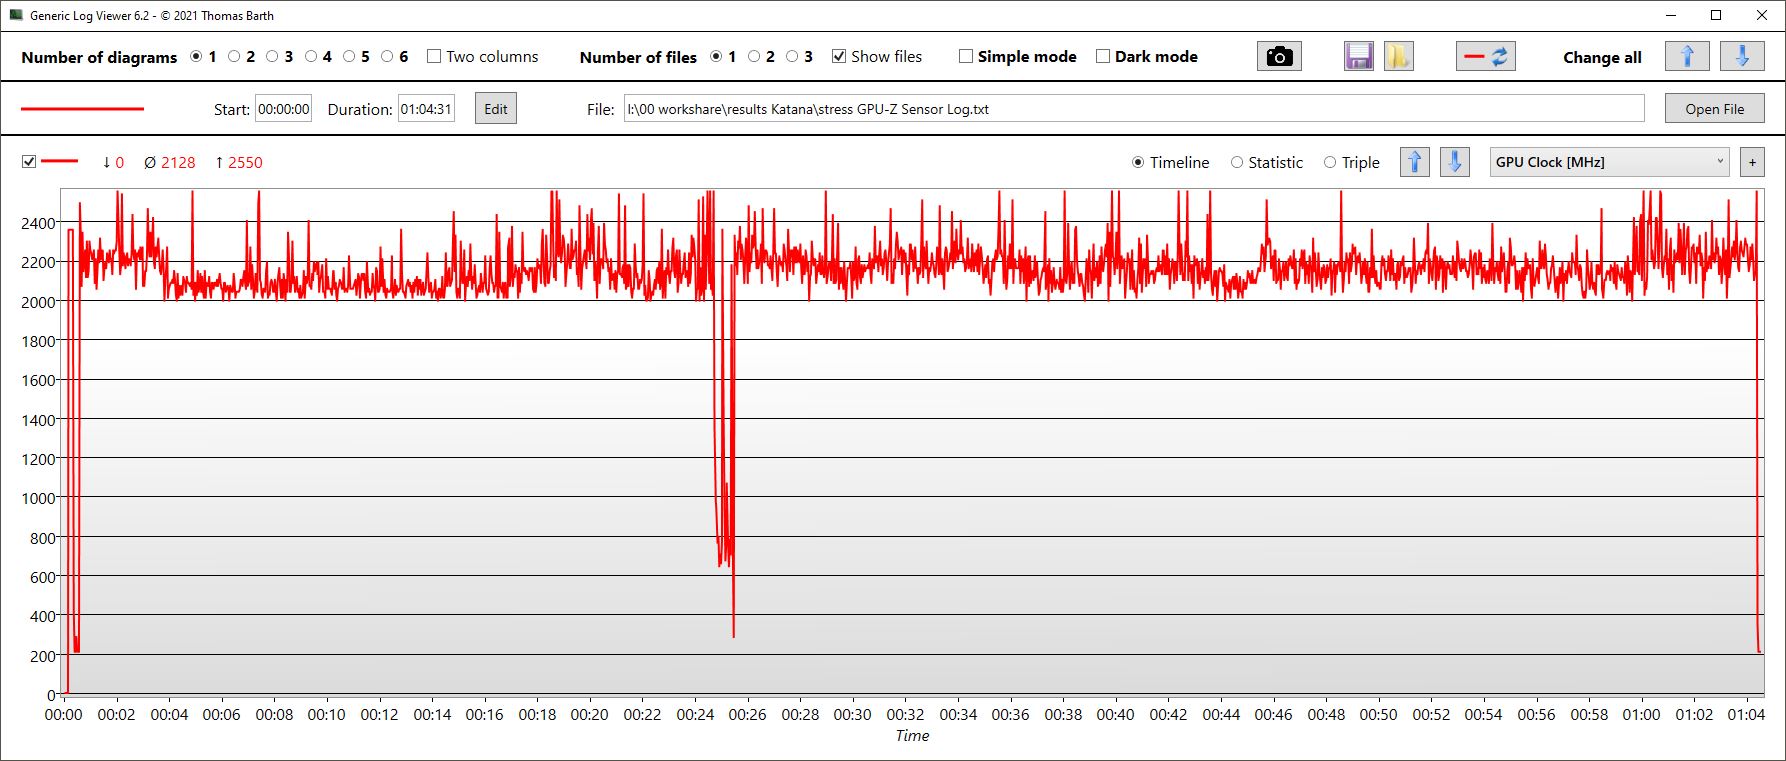
Il clock della GPU oscilla tra 2 e 2,5 GHz. Si raggiungono temperature medie di 75 °C, mentre il consumo energetico è di soli 62 W.
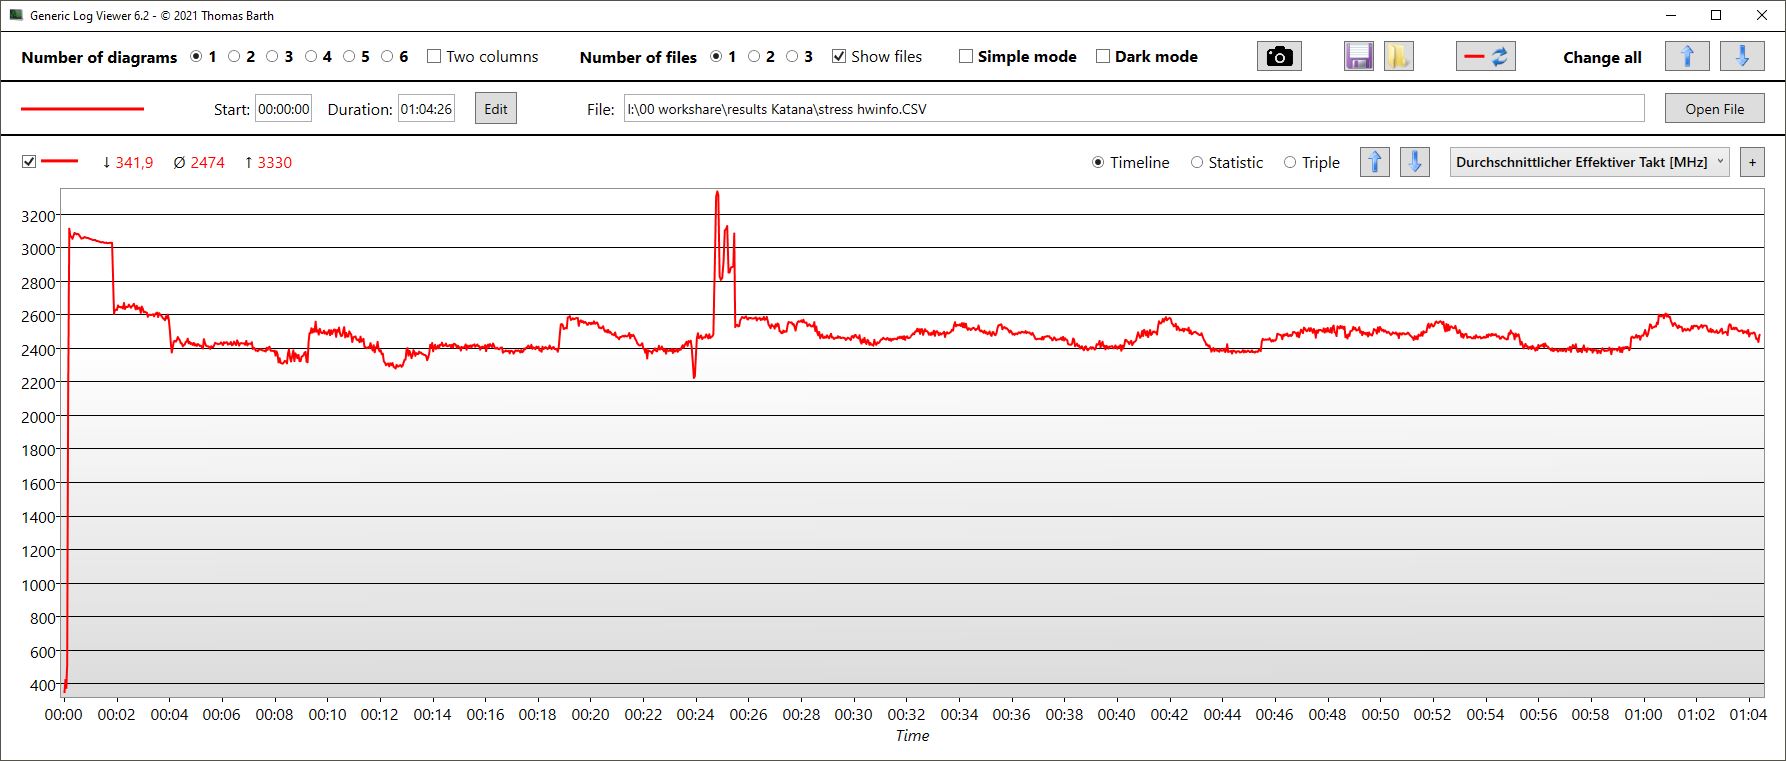
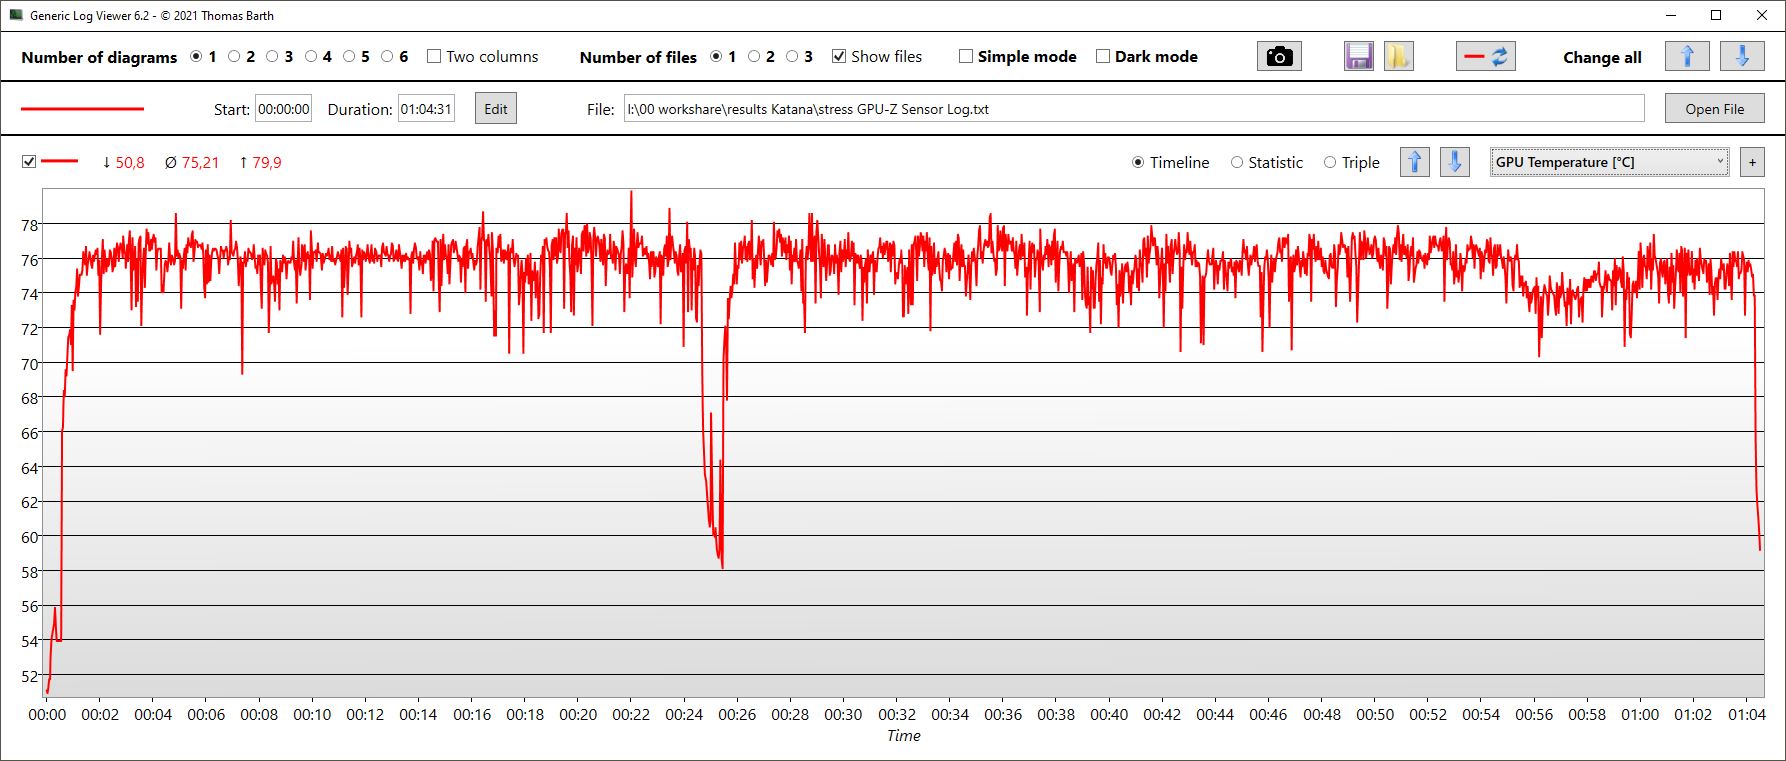
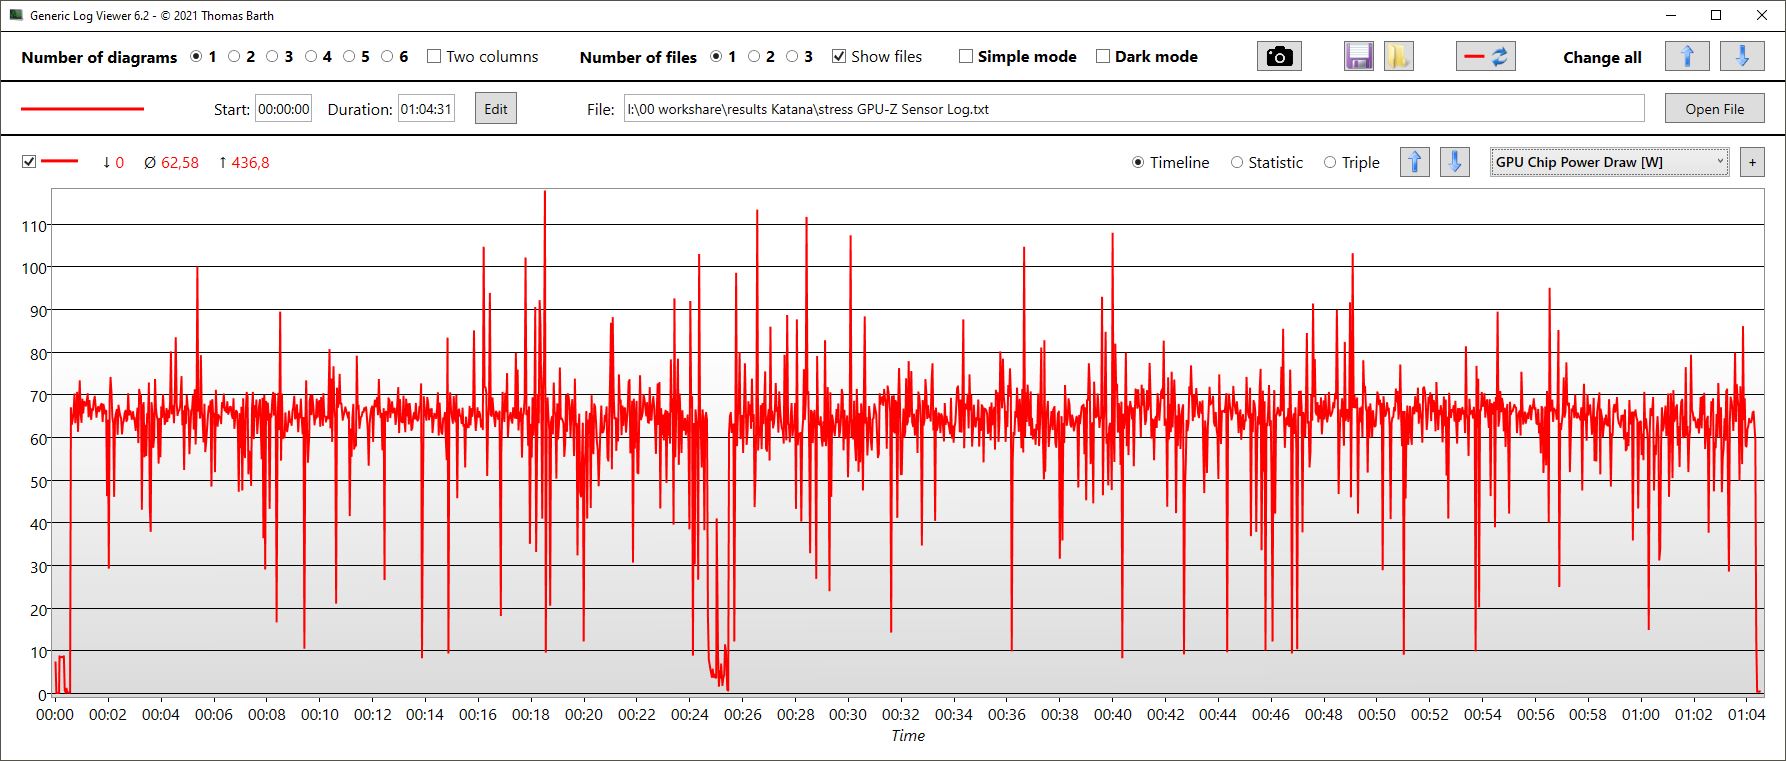
| Clock della CPU (GHz) | Clock della GPU (MHz) | Temperatura media della CPU (°C) | Temperatura media della GPU (°C) | |
| Prime95 + FurMark Stress | 2,5 | 2.121 | 82 | 75 |
| Witcher 3 Stress | 0,6 | 2,400 | 75 | 75 |
Altoparlanti
Gli altoparlanti stereo offrono medi e alti equilibrati, ma bassi quasi inesistenti e volume medio al massimo. Il jack per le cuffie è ideale per i dispositivi analogici.
MSI Katana 15 B12VEK analisi audio
(±) | potenza degli altiparlanti media ma buona (75.69 dB)
Bassi 100 - 315 Hz
(-) | quasi nessun basso - in media 21.5% inferiori alla media
(±) | la linearità dei bassi è media (8.8% delta rispetto alla precedente frequenza)
Medi 400 - 2000 Hz
(+) | medi bilanciati - solo only 4.1% rispetto alla media
(+) | medi lineari (4.8% delta rispetto alla precedente frequenza)
Alti 2 - 16 kHz
(+) | Alti bilanciati - appena 2.3% dalla media
(+) | alti lineari (4% delta rispetto alla precedente frequenza)
Nel complesso 100 - 16.000 Hz
(±) | la linearità complessiva del suono è media (17.3% di differenza rispetto alla media
Rispetto alla stessa classe
» 47% di tutti i dispositivi testati in questa classe è stato migliore, 12% simile, 41% peggiore
» Il migliore ha avuto un delta di 6%, medio di 18%, peggiore di 132%
Rispetto a tutti i dispositivi testati
» 32% di tutti i dispositivi testati in questa classe è stato migliore, 8% similare, 59% peggiore
» Il migliore ha avuto un delta di 4%, medio di 24%, peggiore di 134%
Lenovo Legion 5 15IAH7H 82RB analisi audio
(+) | gli altoparlanti sono relativamente potenti (83.3 dB)
Bassi 100 - 315 Hz
(-) | quasi nessun basso - in media 28.2% inferiori alla media
(±) | la linearità dei bassi è media (12.9% delta rispetto alla precedente frequenza)
Medi 400 - 2000 Hz
(±) | medi elevati - circa 5.7% superiore alla media
(±) | linearità dei medi adeguata (7.4% delta rispetto alla precedente frequenza)
Alti 2 - 16 kHz
(+) | Alti bilanciati - appena 3.3% dalla media
(+) | alti lineari (6.4% delta rispetto alla precedente frequenza)
Nel complesso 100 - 16.000 Hz
(±) | la linearità complessiva del suono è media (23.6% di differenza rispetto alla media
Rispetto alla stessa classe
» 86% di tutti i dispositivi testati in questa classe è stato migliore, 4% simile, 10% peggiore
» Il migliore ha avuto un delta di 6%, medio di 18%, peggiore di 132%
Rispetto a tutti i dispositivi testati
» 71% di tutti i dispositivi testati in questa classe è stato migliore, 6% similare, 23% peggiore
» Il migliore ha avuto un delta di 4%, medio di 24%, peggiore di 134%
Gestione dell'alimentazione - RTX 4050 efficiente in MSI Katana
Consumo di energia
In termini di consumo energetico, il nuovo Katana 15 è più economico della concorrenza con una GPU di ultima generazione. Il nostro modello di prova ha buoni tassi di consumo quando è al minimo e rimane tale anche durante i giochi o sotto forte stress. Sebbene anche le prestazioni 3D siano leggermente inferiori, la differenza di consumo è molto maggiore rispetto alla differenza di prestazioni.
Ad esempio, sia il Legion 5 che il XMG Core 15 fino al Asus TUF Gaming F15 consumano quasi il 50% in più quando si gioca con Witcher 3 rispetto al nostro Katana 15! Ma anche la Katana GF66 con la sua RTX 3070 Ti consuma solo il 16% in più durante il gioco.
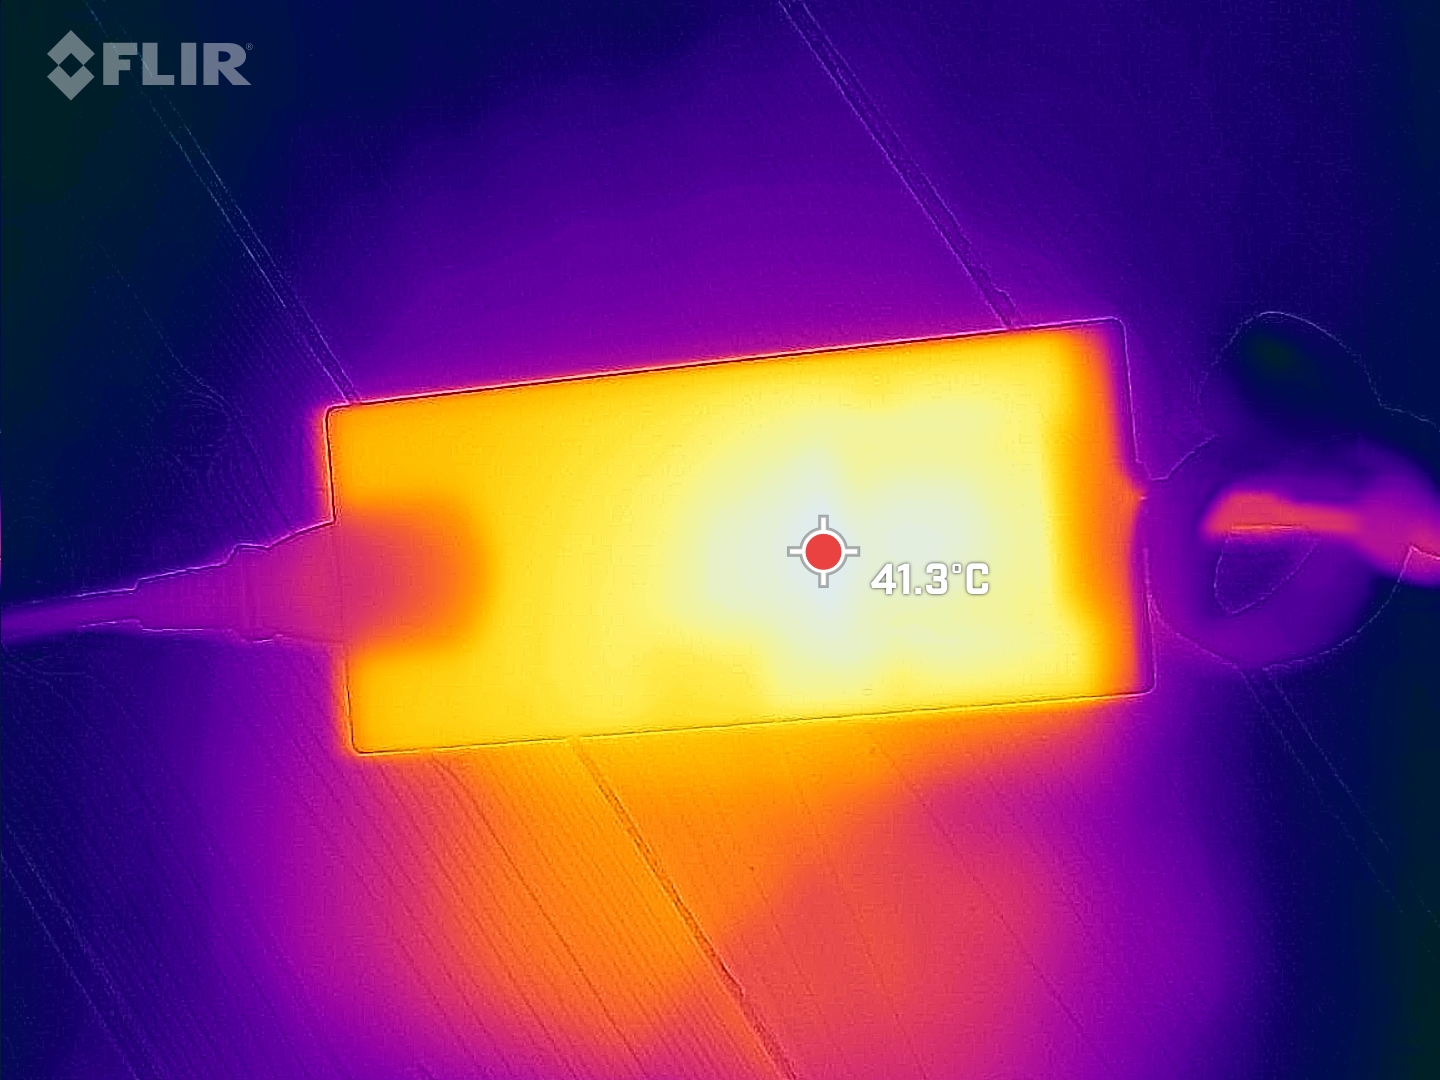
Abbiamo misurato un consumo massimo a breve termine di 189 W. L'alimentatore standard Chicony, progettato per 240 W, dovrebbe essere in grado di gestirlo molto bene.
| Off / Standby | |
| Idle | |
| Sotto carico |
|
Leggenda:
min: | |
| MSI Katana 15 B12VEK i7-12650H, GeForce RTX 4050 Laptop GPU, Micron 2400 MTFDKBA1T0QFM, IPS, 1920x1080, 15.6" | MSI Katana GF66 12UGS i7-12700H, GeForce RTX 3070 Ti Laptop GPU, Micron 2450 1TB MTFDKBA1T0TFK, IPS, 1920x1080, 15.6" | MSI Pulse GL66 12UEK i9-12900H, GeForce RTX 3060 Laptop GPU, Micron 2450 512GB MTFDKBA512TFK, IPS, 1920x1080, 15.6" | Lenovo Legion 5 15IAH7H 82RB i7-12700H, GeForce RTX 3060 Laptop GPU, , IPS, 1920x1080, 15.6" | Asus TUF Gaming F15 FX507ZM i7-12700H, GeForce RTX 3060 Laptop GPU, SK Hynix HFM001TD3JX013N, IPS, 1920x1080, 15.6" | Schenker XMG Core 15 (M22) R7 6800H, GeForce RTX 3060 Laptop GPU, Samsung SSD 980 Pro 1TB MZ-V8P1T0BW, IPS, 2560x1440, 15.6" | Media NVIDIA GeForce RTX 4050 Laptop GPU | Media della classe Gaming | |
|---|---|---|---|---|---|---|---|---|
| Power Consumption | -26% | -6% | -121% | -34% | -34% | -30% | -64% | |
| Idle Minimum * (Watt) | 8.5 | 9 -6% | 7 18% | 19.8 -133% | 6.3 26% | 11.8 -39% | 9.95 ? -17% | 13.3 ? -56% |
| Idle Average * (Watt) | 10.2 | 13 -27% | 13 -27% | 26.2 -157% | 9.8 4% | 14.7 -44% | 15.8 ? -55% | 19 ? -86% |
| Idle Maximum * (Watt) | 11.3 | 20 -77% | 13.7 -21% | 48.2 -327% | 26.5 -135% | 15 -33% | 20.1 ? -78% | 24.5 ? -117% |
| Load Average * (Watt) | 84 | 100 -19% | 48.4 42% | 102.9 -23% | 103.8 -24% | 100 -19% | 88 ? -5% | 108.1 ? -29% |
| Witcher 3 ultra * (Watt) | 128 | 149 -16% | 148 -16% | 186.7 -46% | 189 -48% | 184 -44% | ||
| Load Maximum * (Watt) | 189 | 212 -12% | 244 -29% | 268 -42% | 241.9 -28% | 237 -25% | 176.3 ? 7% | 254 ? -34% |
* ... Meglio usare valori piccoli
Power Consumption Witcher 3 / Stresstest
Power Consumption with an External Monitor
Durata della batteria
In quale altro punto i computer portatili economici consentono di risparmiare? Esatto, la batteria. Il modello del Katana 15 ha solo 53 Wh, che è lo standard del Katana o del Pulse. Il resto della concorrenza ha batterie da 62 a 90 Wh. Di conseguenza, i tempi di autonomia sono piuttosto mediocri, nonostante l'efficienza energetica relativamente buona.
Una serata al cinema può essere programmata per circa 4 ore e 20 minuti. Il nostro test WLAN ha dato risultati significativamente diversi, a seconda della modalità selezionata. In modalità Bilanciata alla massima luminosità (258 nits), la batteria dura solo 2 ore e 20 minuti. In modalità Power Saver a 150 nits, invece, abbiamo misurato circa lo stesso tempo del test video.
| MSI Katana 15 B12VEK i7-12650H, GeForce RTX 4050 Laptop GPU, 53.5 Wh | MSI Katana GF66 12UGS i7-12700H, GeForce RTX 3070 Ti Laptop GPU, 52 Wh | MSI Pulse GL66 12UEK i9-12900H, GeForce RTX 3060 Laptop GPU, 53.5 Wh | Lenovo Legion 5 15IAH7H 82RB i7-12700H, GeForce RTX 3060 Laptop GPU, 80 Wh | Asus TUF Gaming F15 FX507ZM i7-12700H, GeForce RTX 3060 Laptop GPU, 90 Wh | Schenker XMG Core 15 (M22) R7 6800H, GeForce RTX 3060 Laptop GPU, 62 Wh | Media della classe Gaming | |
|---|---|---|---|---|---|---|---|
| Autonomia della batteria | -26% | 9% | -6% | -8% | 27% | 50% | |
| H.264 (h) | 4.4 | 4 -9% | 8.26 ? 88% | ||||
| WiFi v1.3 (h) | 4.3 | 2.4 -44% | 5 16% | 4.8 12% | 7.8 81% | 7.01 ? 63% | |
| Load (h) | 1.5 | 1.4 -7% | 1.9 27% | 1.1 -27% | 1.1 -27% | 1.1 -27% | 1.47 ? -2% |
| Reader / Idle (h) | 8.1 | 15.8 | 8.71 ? |
Pro
Contro
Verdetto - La RTX 4050 economica è ancora troppo costosa
L'MSI Katana 15 B12 combina una CPU Gen12 con una RTX 4050che in realtà non è una cattiva idea per i giocatori con un budget limitato. La CPU è tutt'altro che male e la GPU del Katana 15 si dimostra significativamente più efficiente rispetto ai modelli dello scorso anno.
Tuttavia, il nostro principale punto di critica per i giocatori con un budget limitato è il prezzo: mentre è possibile trovare laptop economici con RTX 3060 a partire da circa 800 dollari, qui si pagano ben 1.499,99 dollari! I vantaggi in termini di efficienza della RTX 4050 non giustificano questo sovrapprezzo. Tanto più che quasi tutti gli altri componenti del Katana 15 sono chiaramente di classe economica, dalle porte parzialmente obsolete al display Full HD piuttosto scuro, fino alla batteria relativamente piccola. A questo si aggiunge il fatto che le prestazioni del portatile tendono a rimanere indietro rispetto alla maggior parte dei giocatori con RTX 3060 e la RTX 4050 manca chiaramente il suo obiettivo di TGP di 105.
L'MSI Katana 15 B12 combina una buona CPU di ultima generazione con una RTX 4050 attuale, ma non riesce a stabilire un prezzo ragionevole per i molti componenti economici. Al momento, il Katana 15 è semplicemente troppo costoso.
Dopotutto, ci sono molte alternative. Se si desiderano maggiori prestazioni e meno componenti economici a prezzi ancora più bassi, la scelta migliore è quella di Lenovo 5 con i suoi componenti economici Lenovo Legion 5 con la sua RTX 3060. Ma anche la maggior parte degli altri gamer RTX 3060 dovrebbero essere più economici, meglio equipaggiati e soprattutto più veloci.
Prezzo e disponibilità
Sul webstore ufficiale di MSI US, il Katana 15 B12VGK-082 ha un prezzo di 1.499,99 dollari. Gli acquirenti interessati (a seconda del luogo) possono trovare lo stesso modello a prezzi più convenienti altrove su rivenditori come Amazon.
MSI Katana 15 B12VEK
- 03/28/2023 v7 (old)
Christian Hintze
Transparency
La selezione dei dispositivi da recensire viene effettuata dalla nostra redazione. Il campione di prova è stato fornito all'autore come prestito dal produttore o dal rivenditore ai fini di questa recensione. L'istituto di credito non ha avuto alcuna influenza su questa recensione, né il produttore ne ha ricevuto una copia prima della pubblicazione. Non vi era alcun obbligo di pubblicare questa recensione. In quanto società mediatica indipendente, Notebookcheck non è soggetta all'autorità di produttori, rivenditori o editori.
Ecco come Notebookcheck esegue i test
Ogni anno, Notebookcheck esamina in modo indipendente centinaia di laptop e smartphone utilizzando procedure standardizzate per garantire che tutti i risultati siano comparabili. Da circa 20 anni sviluppiamo continuamente i nostri metodi di prova e nel frattempo stabiliamo gli standard di settore. Nei nostri laboratori di prova, tecnici ed editori esperti utilizzano apparecchiature di misurazione di alta qualità. Questi test comportano un processo di validazione in più fasi. Il nostro complesso sistema di valutazione si basa su centinaia di misurazioni e parametri di riferimento ben fondati, che mantengono l'obiettività.Price comparison

