Recensioni per il Intel Core i7-12650H processore
Recensione del mini PC Nipogi AD08: L'elegante PC con un Intel Core i7-12650H presenta un design mini-tower e tre modalità di alimentazione
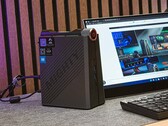
NiPoGi ha dotato il suo AD08 di un Intel Core i7-12650H che offre prestazioni sufficienti per affrontare le attività quotidiane in ufficio. Essendo un PC da gioco compatto in formato tower, il produttore ha scelto una strada leggermente diversa per quanto riguarda il suo design. In questa recensione, può leggere quali sono i vantaggi che ne derivano e come si comporta NiPoGi AD08 rispetto ai mini PC con equipaggiamento simile.
Intel Core i7-12650H, UHD Graphics 64EUs, 878 grRecensione del mini PC Nipogi AD08: L'elegante PC con un Intel Core i7-12650H presenta un design mini-tower e tre modalità di alimentazione
NiPoGi ha dotato il suo AD08 di un Intel Core i7-12650H che offre prestazioni sufficienti per affrontare le attività quotidiane in ufficio. Essendo un PC da gioco compatto in formato tower, il produttore ha scelto una strada leggermente diversa per quanto riguarda il suo design. In questa recensione, può leggere quali sono i vantaggi che ne derivano e come si comporta NiPoGi AD08 rispetto ai mini PC con equipaggiamento simile.
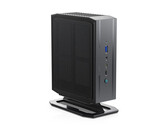
Intel Core i7-12650H, UHD Graphics 64EUs, 878 grRecensione del Minisforum Neptune Series HN2673: Il mini PC con un Core i7-12650H e un Arc A730M in un case attraente
Minisforum è uno dei pochi produttori che ha osato ospitare una scheda grafica Intel attuale come scheda grafica dedicata all'interno di un mini PC. La serie Neptune HN2673 riunisce l'Intel Arc A730M e l'Intel Core i7-12650H. In questa recensione abbiamo riassunto gli aspetti più importanti, includendo una serie di benchmark e misurazioni.
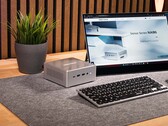
Intel Core i7-12650H, A730M, 1.7 kgRecensione del Minisforum Venus Series NAB6: L'elegante mini PC con il veloce Intel Core i7-12650H e il raffreddamento attivo dell'SSD!
Minisforum ha ampliato la propria gamma di prodotti della serie Venus con il rilascio dell'elegante mini PC NAB6. Basato su un Intel Core i7-12650H, il NAB6 è ben preparato per molti usi diversi. Il suo prezzo è accettabile, ma è probabile che si debbano accettare alcuni compromessi. Di quali compromessi si tratti esattamente si parlerà nella nostra recensione dettagliata.
Intel Core i7-12650H, UHD Graphics 64EUs, 616 grMSI Cyborg 15 A12VF: NVIDIA GeForce RTX 4060 Laptop GPU, 15.60", 2 kg
recensione » Recensione dell'MSI Cyborg 15 A12VF: gaming Laptop con RTX 4060 a bassa potenza
MSI Katana 15 B12VEK: NVIDIA GeForce RTX 4050 Laptop GPU, 15.60", 2.3 kg
recensione » Recensione del portatile MSI Katana 15: Gamer economico con RTX 4050 e CPU Alder Lake
Asus TUF Dash F15 FX517ZC: NVIDIA GeForce RTX 3050 4GB Laptop GPU, 15.60", 1.9 kg
recensione » Recensione del portatile Asus TUF Dash F15 FX517ZC: 1440p, 165 Hz e colori P3 completi per meno di 1000 dollari
Asus TUF Dash F15 FX517ZR: NVIDIA GeForce RTX 3070 Laptop GPU, 15.60", 2 kg
recensione » Recensione dell'Asus TUF Dash F15 FX517ZR: Laptop con Mobile RTX 3070 e durata della batteria accettabile
Acer Aspire 7 A715-76G, i7-12650H RTX 3050: NVIDIA GeForce RTX 3050 4GB Laptop GPU, 15.60", 2.1 kg
Recensioni esterne » Acer Aspire 7 A715-76G, i7-12650H RTX 3050
Acer Aspire 5 A515-57, i7-12650H: Intel UHD Graphics 64EUs (Alder Lake 12th Gen), 15.60", 1.8 kg
Recensioni esterne » Acer Aspire 5 A515-57, i7-12650H
HP Victus 15-fa1: NVIDIA GeForce RTX 4050 Laptop GPU, 15.60", 2.3 kg
Recensioni esterne » HP Victus 15-fa1
Medion Erazer Deputy P60: NVIDIA GeForce RTX 4070 Laptop GPU, 15.60", 2.1 kg
Recensioni esterne » Medion Erazer Deputy P60
MSI Thin 15 B12UC: NVIDIA GeForce RTX 3050 6GB Laptop GPU, 15.60", 1.9 kg
Recensioni esterne » MSI Thin 15 B12UC
Acer Nitro 5 AN515-58, i7-12650H RTX 4050: NVIDIA GeForce RTX 4050 Laptop GPU, 15.60", 2.5 kg
Recensioni esterne » Acer Nitro 5 AN515-58, i7-12650H RTX 4050
MSI GF63 Thin 12UCX: NVIDIA GeForce RTX 2050 Mobile, 15.60", 1.9 kg
Recensioni esterne » MSI GF63 Thin 12UCX
Asus VivoBook 16X K3605ZF: NVIDIA GeForce RTX 2050 Mobile, 16.00", 1.8 kg
Recensioni esterne » Asus VivoBook 16X K3605ZF
MSI Katana GF66 12UCK: NVIDIA GeForce RTX 3050 4GB Laptop GPU, 15.60", 2.3 kg
Recensioni esterne » MSI Katana GF66 12UCK
Asus Vivobook Pro 15 K6501ZM: NVIDIA GeForce RTX 3060 Laptop GPU, 15.60", 2.1 kg
Recensioni esterne » Asus Vivobook Pro 15 K6501ZM
Asus Vivobook 16X K3605ZC: NVIDIA GeForce RTX 3050 4GB Laptop GPU, 16.00", 1.8 kg
Recensioni esterne » Asus Vivobook 16X K3605ZC
Asus Vivobook 16X K3605ZU: NVIDIA GeForce RTX 4050 Laptop GPU, 16.00", 1.8 kg
Recensioni esterne » Asus Vivobook 16X K3605ZU
MSI Crosshair 15 C12VF: NVIDIA GeForce RTX 4060, 15.60", 2.3 kg
Recensioni esterne » MSI Crosshair 15 C12VF
MSI Katana 15 B12VGK: NVIDIA GeForce RTX 4070 Laptop GPU, 15.60", 2.3 kg
Recensioni esterne » MSI Katana 15 B12VGK
MSI Crosshair 15 C12VG: NVIDIA GeForce RTX 4070 Laptop GPU, 15.60", 2.3 kg
Recensioni esterne » MSI Crosshair 15 C12VG
MSI Katana GF66 12UE: NVIDIA GeForce RTX 3060 Laptop GPU, 15.60", 2.3 kg
Recensioni esterne » MSI Katana GF66 12UE
Asus VivoBook Pro 16 K6602ZC, i7-12650H: NVIDIA GeForce RTX 3050 4GB Laptop GPU, 16.00", 1.7 kg
Recensioni esterne » Asus VivoBook Pro 16 K6602ZC, i7-12650H
MSI Katana 17 B12VFK: NVIDIA GeForce RTX 4060 Laptop GPU, 17.30", 2.6 kg
Recensioni esterne » MSI Katana 17 B12VFK
MSI Cyborg 15 A12VE, i7-12650H: NVIDIA GeForce RTX 4050 Laptop GPU, 15.60", 2 kg
Recensioni esterne » MSI Cyborg 15 A12VE, i7-12650H
MSI Cyborg 15 A12VF: NVIDIA GeForce RTX 4060 Laptop GPU, 15.60", 2 kg
Recensioni esterne » MSI Cyborg 15 A12VF
MSI Cyborg 15 A12VE: NVIDIA GeForce RTX 4050 Laptop GPU, 15.60", 2 kg
Recensioni esterne » MSI Cyborg 15 A12VE
Lenovo IdeaPad Gaming 3 16IAH7: NVIDIA GeForce RTX 3060 Laptop GPU, 16.00", 2.6 kg
Recensioni esterne » Lenovo IdeaPad Gaming 3 16IAH7
MSI GF63 Thin 12VE-066US: NVIDIA GeForce RTX 4050 Laptop GPU, 15.60", 1.9 kg
Recensioni esterne » MSI GF63 Thin 12VE-066US
MSI Sword 15 A12UE: NVIDIA GeForce RTX 3060 Laptop GPU, 15.60", 2.3 kg
Recensioni esterne » MSI Sword 15 A12UE
MSI Katana GF66 12UD-436: NVIDIA GeForce RTX 3050 Ti Laptop GPU, 15.60", 2.3 kg
Recensioni esterne » MSI Katana GF66 12UD-436
MSI Katana 15 B12VEK: NVIDIA GeForce RTX 4050 Laptop GPU, 15.60", 2.3 kg
Recensioni esterne » MSI Katana 15 B12VEK
Asus Vivobook Pro 16X N7601ZM-MQ712WS: NVIDIA GeForce RTX 3060 Laptop GPU, 16.00", 2.3 kg
Recensioni esterne » Asus Vivobook Pro 16X N7601ZM-MQ712WS
Asus TUF Gaming F15 FX507ZR, i7-12650H: NVIDIA GeForce RTX 3070 Laptop GPU, 15.60", 2.2 kg
Recensioni esterne » Asus TUF Gaming F15 FX507ZR, i7-12650H
MSI Creator M16 A12UEV-468: NVIDIA GeForce RTX 3060 Laptop GPU, 16.00", 2.3 kg
Recensioni esterne » MSI Creator M16 A12UEV-468
Asus TUF Dash F15 FX517ZR: NVIDIA GeForce RTX 3070 Laptop GPU, 15.60", 2 kg
Recensioni esterne » Asus TUF Dash F15 FX517ZR
Acer Swift 3 SF314-71-79ZW: Intel UHD Graphics 64EUs (Alder Lake 12th Gen), 14.00", 1.4 kg
Recensioni esterne » Acer Swift 3 SF314-71-79ZW
Lenovo IdeaPad Gaming 3 15IAH7, i7-12650H RTX 3050 Ti: NVIDIA GeForce RTX 3050 Ti Laptop GPU, 15.60", 2.3 kg
Recensioni esterne » Lenovo IdeaPad Gaming 3 15IAH7, i7-12650H RTX 3050 Ti
Asus TUF Dash F15 FX517ZE: NVIDIA GeForce RTX 3050 Ti Laptop GPU, 15.60", 2 kg
Recensioni esterne » Asus TUF Dash F15 FX517ZE
Asus TUF Dash 15 FX517ZM-AS73: NVIDIA GeForce RTX 3060 Laptop GPU, 15.60", 2 kg
Recensioni esterne » Asus TUF Dash 15 FX517ZM-AS73
Xiaomi RedmiBook Pro 15 2022, i7 RTX 2050: NVIDIA GeForce RTX 2050 Mobile, 15.60", 1.8 kg
Recensioni esterne » Xiaomi RedmiBook Pro 15 2022, i7 RTX 2050
Asus TUF Dash F15 FX517ZC: NVIDIA GeForce RTX 3050 4GB Laptop GPU, 15.60", 1.9 kg
Recensioni esterne » Asus TUF Dash F15 FX517ZC
Asus ROG Zephyrus M16 GU603ZM, i7-12650H RTX 3060: NVIDIA GeForce RTX 3060 Laptop GPU, 16.10", 1.9 kg
Recensioni esterne » Asus ROG Zephyrus M16 GU603ZM, i7-12650H RTX 3060
Xiaomi RedmiBook Pro 15 2022, i7 RTX 2050: NVIDIA GeForce RTX 2050 Mobile, 15.60", 1.8 kg
» Xiaomi rinnova il RedmiBook Pro 15 2022 con una CPU più potente e una riduzione del prezzo
Asus TUF Dash F15 FX517ZC: NVIDIA GeForce RTX 3050 4GB Laptop GPU, 15.60", 1.9 kg
» Una delle migliori configurazioni di Asus TUF Gaming F15 con display da 1440p 165 Hz è troppo difficile da trovare