

Recensione di BMAX B7 Power: Un mini PC frugale con Intel Core i7 per 400 dollari
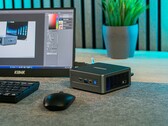
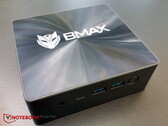
Dato che Intel non produce più mini PC, altri produttori hanno colmato rapidamente il vuoto. BMAX è un produttore cinese che offre prezzi bassi. Il suo modello top di gamma, il B7 Power, offre un Intel Core i7-11390H, ventole silenziose ed è adatto al lavoro d'ufficio. In questa recensione abbiamo analizzato da vicino le prestazioni del Mini PC nell'uso quotidiano e come si è comportato nei nostri test.
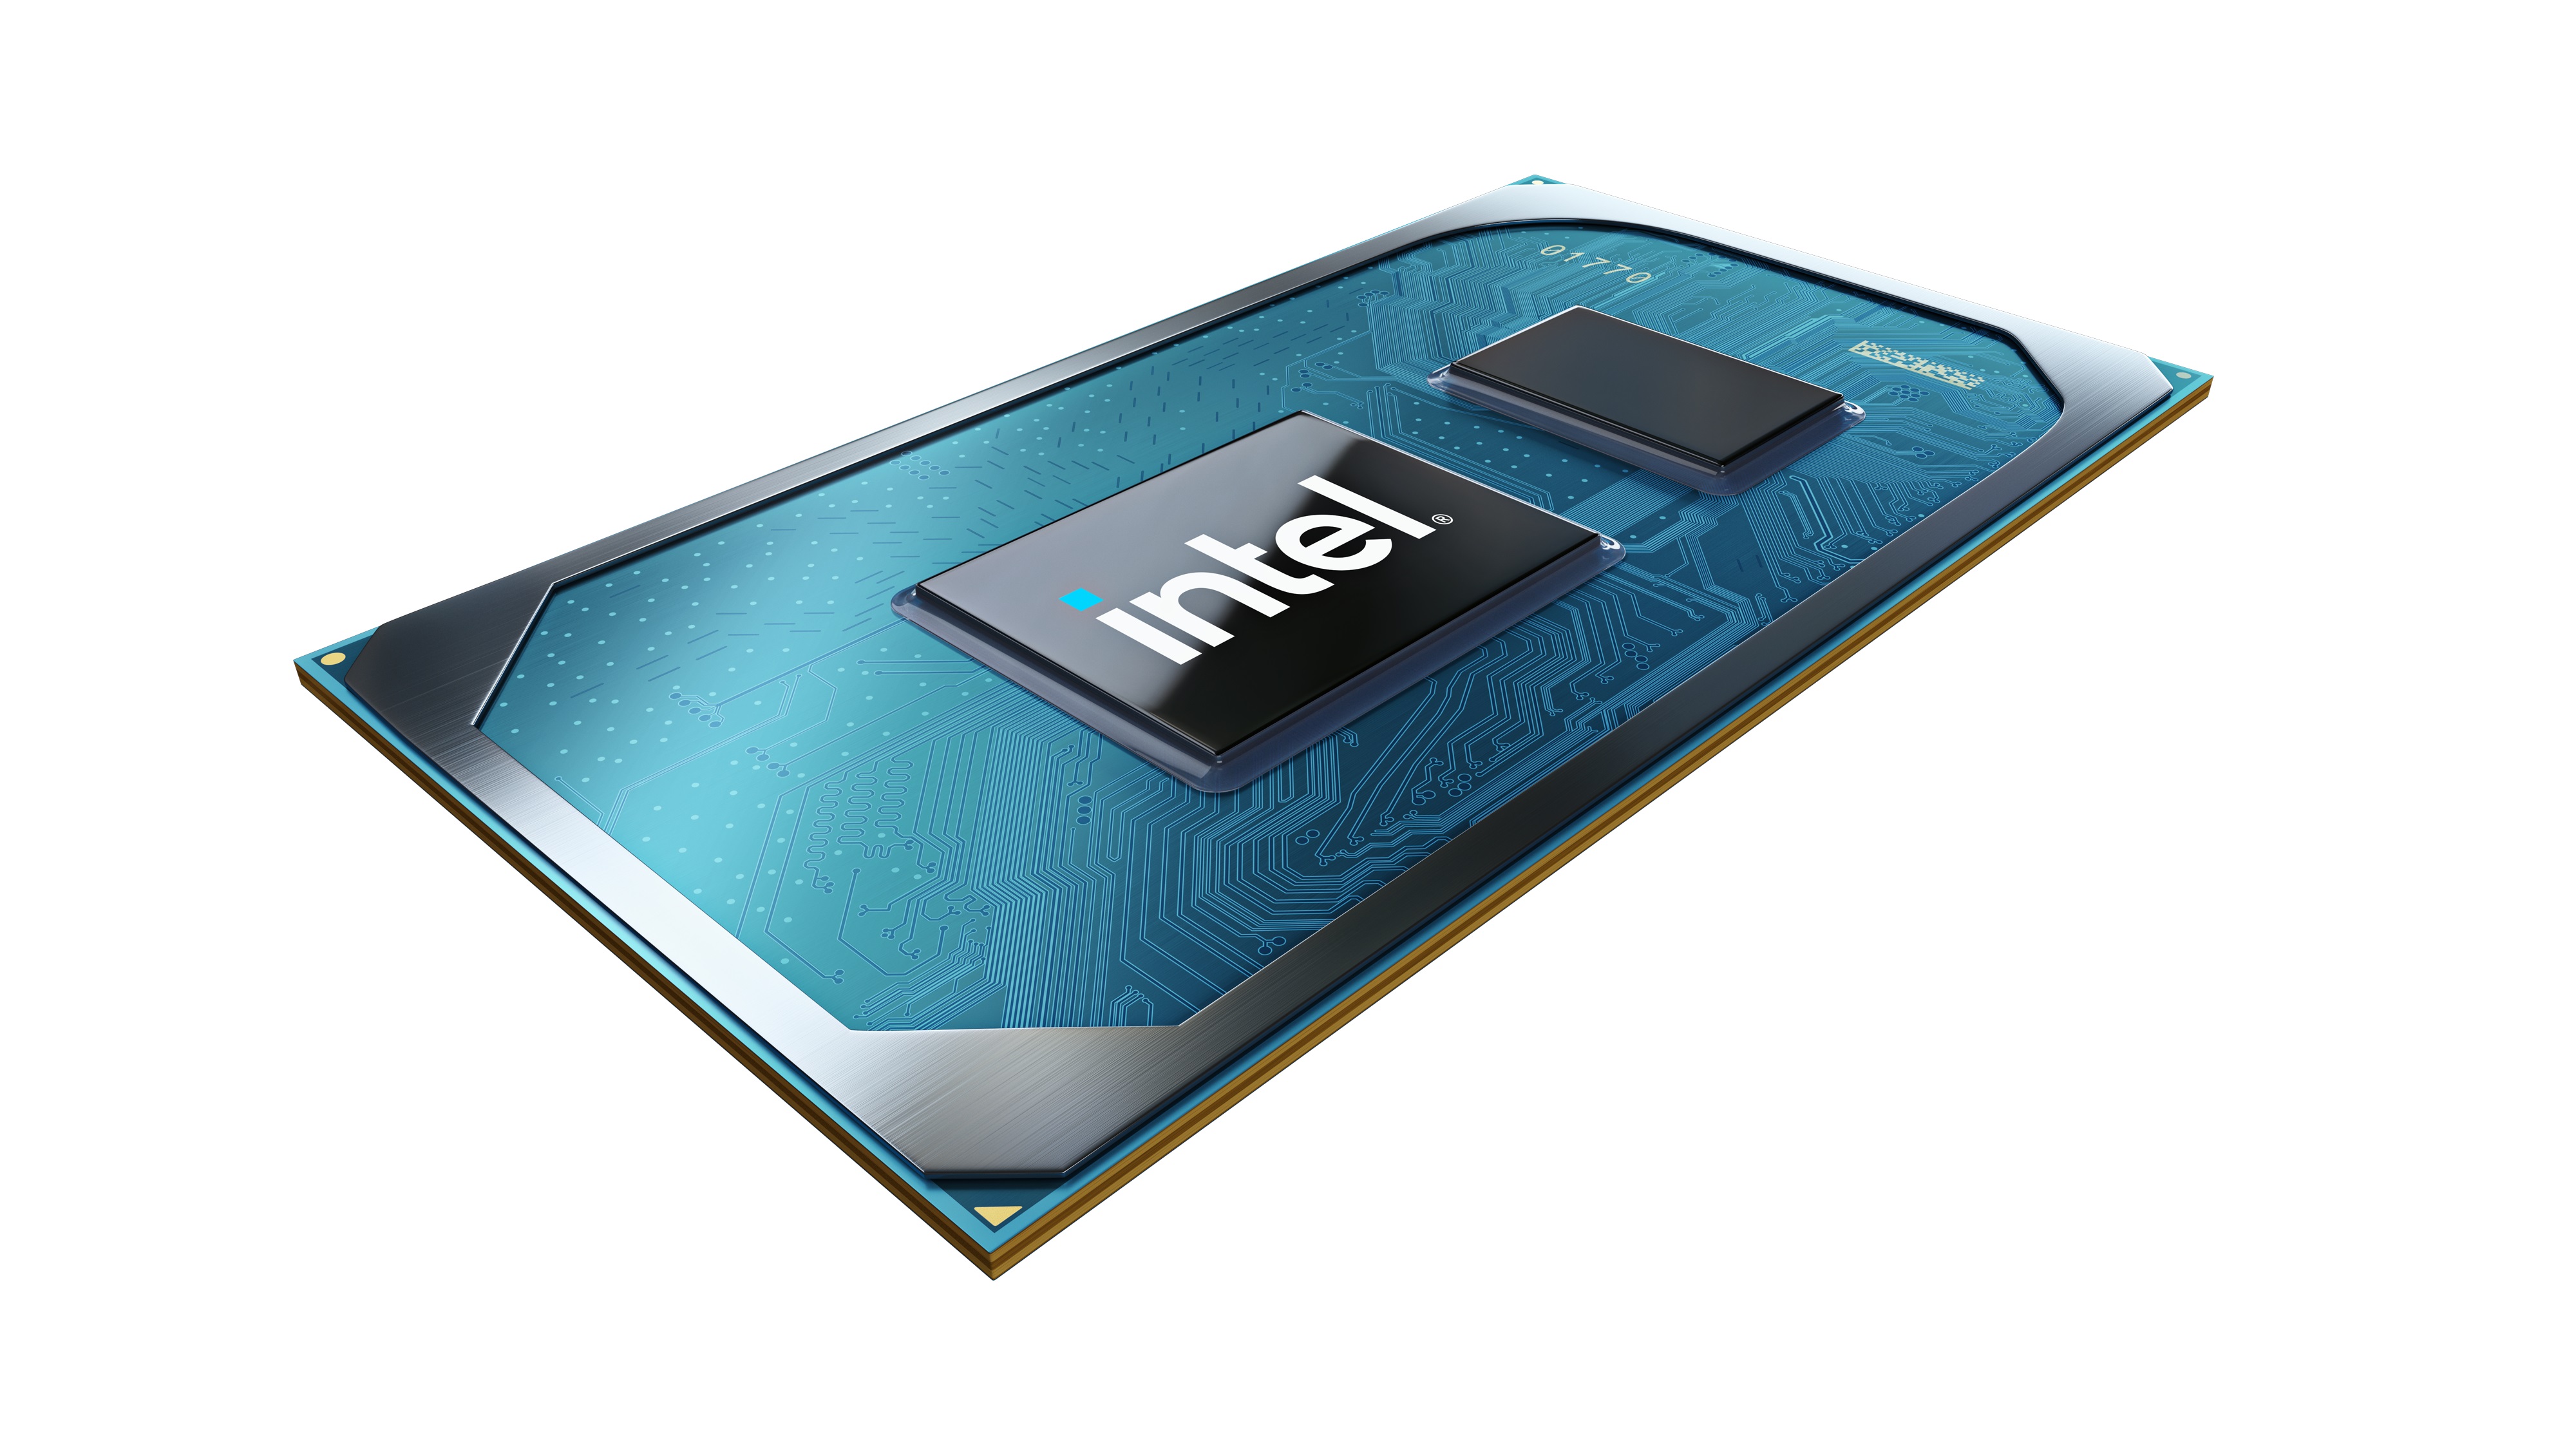
Intel Core i7-11390H, Iris Xe G7 96EUs, 363 gr