AMD Ryzen 5 3550H

L'AMD Ryzen 5 3550H è un SoC mobile che è stato annunciato nel gennaio 2019. Combina quattro core Zen+ (8 fili) con clock a 2,1 - 3,7 GHz con una scheda grafica Radeon RX Vega 8 con 8 CU (512 Shaders) con clock fino a 1400 MHz. Rispetto all'analoga Ryzen 5 3500U, la 3550H offre un TDP più alto di 20 Watt e quindi una migliore prestazione sotto lunghi periodi di carico. Il controllore di memoria integrato a doppio canale supporta fino a DDR4-2400 memoria. Poiché le caratteristiche delle APU Picasso sono le stesse rispetto ai predecessori di Raven Ridge, segnaliamo il nostro articolo di lancio di Raven Ridge.
Le SoC Picasso utilizzano la microarchitettura Zen+ con lievi miglioramenti che dovrebbero portare ad un miglioramento del 3% di IPS (performance per clock). Inoltre, il processo a 12 nm permette di aumentare la velocità di clock a consumi energetici simili.
AMD afferma che le APU Picasso sono circa l'8% più veloci delle precedenti. Compreso il TDP da 35 Watt, il 3550H dovrebbe essere un processore di fascia media capace per computer portatili, compresi i portatili da gioco. Le prestazioni dovrebbero essere comprese tra un Ryzen 5 2500U e un Ryzen 7 2700U.
| Nome in codice | Picasso-U (Zen+) | ||||||||||||||||||||||||
| Serie | AMD Picasso (Ryzen 3000 APU) | ||||||||||||||||||||||||
Serie: Picasso (Ryzen 3000 APU) Picasso-U (Zen+)
| |||||||||||||||||||||||||
| Clock Rate | 2100 - 3700 MHz | ||||||||||||||||||||||||
| Level 1 Cache | 384 KB | ||||||||||||||||||||||||
| Level 2 Cache | 2 MB | ||||||||||||||||||||||||
| Level 3 Cache | 4 MB | ||||||||||||||||||||||||
| Numero di Cores / Threads | 4 / 8 | ||||||||||||||||||||||||
| Consumo energetico (TDP = Thermal Design Power) | 35 Watt | ||||||||||||||||||||||||
| Transistor Count | 4500 Milioni | ||||||||||||||||||||||||
| Tecnologia del produttore | 12 nm | ||||||||||||||||||||||||
| Temperatura massima | 105 °C | ||||||||||||||||||||||||
| Socket | FP5 | ||||||||||||||||||||||||
| Features | DDR4-2400 RAM, PCIe 3, MMX (+), SSE, SSE2, SSE3, SSSE3, SSE4.1, SSE4.2, SSE4A, AES, AVX, AVX2, FMA3, SHA | ||||||||||||||||||||||||
| GPU | AMD Radeon RX Vega 8 (Ryzen 2000/3000) ( - 1200 MHz) | ||||||||||||||||||||||||
| 64 Bit | Supporto 64 Bit | ||||||||||||||||||||||||
| Architecture | x86 | ||||||||||||||||||||||||
| Data di annuncio | 01/06/2019 | ||||||||||||||||||||||||
| Collegamento Prodotto (esterno) | www.amd.com | ||||||||||||||||||||||||
Benchmark
* Numeri più piccoli rappresentano prestazioni supeiori
Recensioni per il AMD Ryzen 5 3550H processore


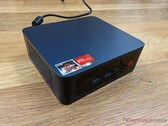
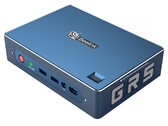
Recensione del Mini Desktop Beelink GT-R

Recensione del Laptop HP Pavilion Gaming 15: economico dispsitivo gaming con una buona autonomia

Recensione del Laptop Lenovo IdeaPad S540-13API Laptop: Un sottile compagno Ryzen con ampia autonomia

Recensione del Computer Portatile Asus TUF Gaming FX705DT (Ryzen 5 3550H, GTX 1650, SSD, FHD)
Asus TUF FX705DY-AU072 : AMD Radeon RX 560X (Laptop), 17.30", 2.7 kg
recensione » Recensione del Computer Portatile ASUS TUF Gaming FX705DY (Ryzen 5 3550H, Radeon RX 560X, SSD, FHD)
Asus TUF FX505DY: AMD Radeon RX 560X (Laptop), 15.60", 2.2 kg
recensione » Recensione del Portatile Asus TUF FX505DY (Ryzen 5 3550H, Radeon RX 560X)
Acer Nitro 5 AN515-43-R6BW: NVIDIA GeForce GTX 1650 Mobile, 15.60", 2.3 kg
Recensioni esterne » Acer Nitro 5 AN515-43-R6BW
MSI Alpha 15 A3DC-250XES: AMD Radeon RX 5300M, 15.60"
Recensioni esterne » MSI Alpha 15 A3DC-250XES
Acer Aspire 7 A715-41G-R8MJ: NVIDIA GeForce GTX 1650 Mobile, 15.60", 2.2 kg
Recensioni esterne » Acer Aspire 7 A715-41G-R8MJ
Acer Aspire 7 A715-41G-R5LR: NVIDIA GeForce GTX 1650 Mobile, 15.60", 2.4 kg
Recensioni esterne » Acer Aspire 7 A715-41G-R5LR
Lenovo IdeaPad S540-13API: AMD Radeon RX Vega 8 (Ryzen 2000/3000), 13.30", 1.3 kg
Recensioni esterne » Lenovo IdeaPad S540-13API
Honor MagicBook Pro HLY-19R: AMD Radeon RX Vega 8 (Ryzen 2000/3000), 16.10", 1.7 kg
Recensioni esterne » Honor MagicBook Pro HLY-19R
Asus TUF FX505DT-BQ051: NVIDIA GeForce GTX 1650 Mobile, 15.60", 2.2 kg
Recensioni esterne » Asus TUF FX505DT-BQ051
HP Pavilion Gaming 15-ec0005ns: NVIDIA GeForce GTX 1050 Mobile, 15.60", 2.3 kg
Recensioni esterne » HP Pavilion Gaming 15-ec0005ns
Acer Nitro 5 AN515-43-R84P: NVIDIA GeForce GTX 1650 Mobile, 15.60"
Recensioni esterne » Acer Nitro 5 AN515-43-R84P
HP Pavilion Gaming 15-ec0006ns: NVIDIA GeForce GTX 1050 Mobile, 15.60", 2.3 kg
Recensioni esterne » HP Pavilion Gaming 15-ec0006ns
HP Pavilion Gaming 15-ec0009ns: NVIDIA GeForce GTX 1050 Mobile, 15.60", 2 kg
Recensioni esterne » HP Pavilion Gaming 15-ec0009ns
Acer Aspire Nitro 5 AN515-43-R4N0: AMD Radeon RX 560X (Laptop), 15.60", 2.3 kg
Recensioni esterne » Acer Aspire Nitro 5 AN515-43-R4N0
Acer Nitro 5 AN515-43-R1BL: AMD Radeon RX 560X (Laptop), 15.60", 2.7 kg
Recensioni esterne » Acer Nitro 5 AN515-43-R1BL
Asus TUF FX505DY-BQ024: AMD Radeon RX 560X (Laptop), 15.60", 2.2 kg
Recensioni esterne » Asus TUF FX505DY-BQ024
HP Pavilion Gaming 15-ec0010nr: NVIDIA GeForce GTX 1050 Mobile, 15.60", 2.3 kg
Recensioni esterne » HP Pavilion Gaming 15-ec0010nr
Asus TUF FX505DD-BQ114: NVIDIA GeForce GTX 1050 Max-Q, 15.60", 2.2 kg
Recensioni esterne » Asus TUF FX505DD-BQ114
Asus TUF FX705DY-AU017T: AMD Radeon RX 560X (Laptop), 17.30", 2.7 kg
Recensioni esterne » Asus TUF FX705DY-AU017T
Asus TUF FX505DY-AL007T: AMD Radeon RX 560X (Laptop), 15.60", 2.2 kg
Recensioni esterne » Asus TUF FX505DY-AL007T
Asus TUF FX705DY-AU072 : AMD Radeon RX 560X (Laptop), 17.30", 2.7 kg
Recensioni esterne » Asus TUF FX705DY-AU072
Asus TUF FX505DY-AL016T: AMD Radeon RX 560X (Laptop), 15.60", 2.2 kg
Recensioni esterne » Asus TUF FX505DY-AL016T
Asus TUF FX505DY: AMD Radeon RX 560X (Laptop), 15.60", 2.2 kg
Recensioni esterne » Asus TUF FX505DY


