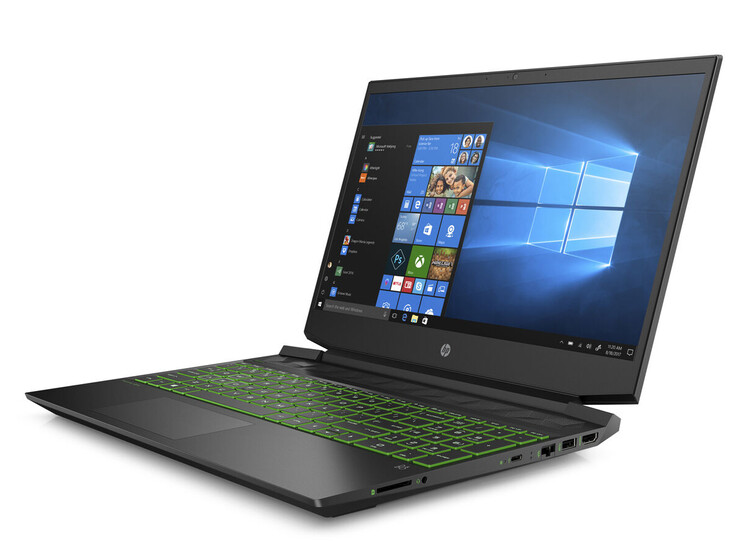
Recensione del Laptop HP Pavilion Gaming 15: economico dispsitivo gaming con una buona autonomia
Punteggio | Data | Modello | Peso | Altezza | Dimensione | Risoluzione | Prezzo |
|---|---|---|---|---|---|---|---|
| 75.4 % v7 (old) | 03/2020 | HP Pavilion Gaming 15-ec0002ng R5 3550H, GeForce GTX 1050 Mobile | 2.3 kg | 23.5 mm | 15.60" | 1920x1080 | |
| 79.5 % v6 (old) | 03/2019 | Asus TUF FX505DY R5 3550H, Radeon RX 560X (Laptop) | 2.2 kg | 26.8 mm | 15.60" | 1920x1080 | |
| 77 % v7 (old) | 10/2019 | Lenovo IdeaPad L340-15IRH 81LK00BMGE i5-9300H, GeForce GTX 1650 Mobile | 2.1 kg | 23.9 mm | 15.60" | 1920x1080 | |
| 79.3 % v7 (old) | 10/2019 | Dell G3 3590 i5-9300H, GeForce GTX 1650 Mobile | 2.5 kg | 21.6 mm | 15.60" | 1920x1080 | |
| 77.6 % v7 (old) | 01/2020 | MSI GF63 Thin 9SC i5-9300H, GeForce GTX 1650 Max-Q | 1.8 kg | 22 mm | 15.60" | 1920x1080 |
I nostri Top 10
» Top 10 Portatili Multimedia
» Top 10 Portatili Gaming
» Top 10 Portatili Gaming Leggeri
» Top 10 Portatili da Ufficio e Business economici
» Top 10 Portatili Premium da Ufficio/Business
» Top 10 Portatili sotto i 300 Euro
» Top 10 Portatili sotto i 500 Euro
» Top 10 dei Portatili Workstation
» Top 10 Subnotebooks
» Top 10 Ultrabooks
» Top 10 Convertibili
» Top 10 Tablets
» Top 10 Tablets Windows
» Top 10 Smartphones
Confronto Dimensioni
Porte disponibili
| SD Card Reader | |
| average JPG Copy Test (av. of 3 runs) | |
| Media della classe Gaming (20 - 210, n=65, ultimi 2 anni) | |
| HP Pavilion Gaming 15-ec0017ng (Toshiba Exceria Pro SDXC 64 GB UHS-II) | |
| HP Pavilion Gaming 15-ec0002ng (Toshiba Exceria Pro SDXC 64 GB UHS-II) | |
| Dell G3 3590 (Toshiba Exceria Pro SDXC 64 GB UHS-II) | |
| maximum AS SSD Seq Read Test (1GB) | |
| Media della classe Gaming (25.5 - 261, n=62, ultimi 2 anni) | |
| HP Pavilion Gaming 15-ec0017ng (Toshiba Exceria Pro SDXC 64 GB UHS-II) | |
| HP Pavilion Gaming 15-ec0002ng (Toshiba Exceria Pro SDXC 64 GB UHS-II) | |
| Dell G3 3590 (Toshiba Exceria Pro SDXC 64 GB UHS-II) | |
| |||||||||||||||||||||||||
Distribuzione della luminosità: 82 %
Al centro con la batteria: 233 cd/m²
Contrasto: 575:1 (Nero: 0.405 cd/m²)
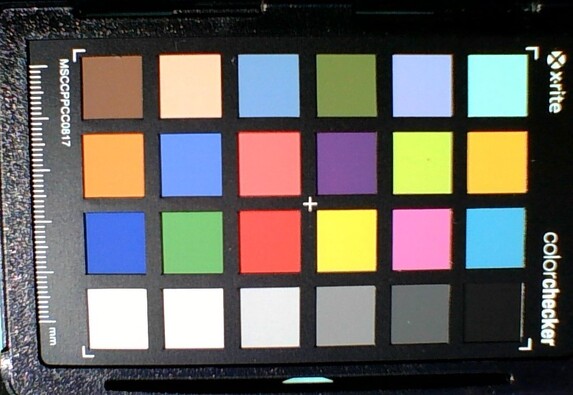
ΔE ColorChecker Calman: 8.22 | ∀{0.5-29.43 Ø4.77}
ΔE Greyscale Calman: 10.13 | ∀{0.09-98 Ø5}
62% sRGB (Argyll 1.6.3 3D)
39% AdobeRGB 1998 (Argyll 1.6.3 3D)
42.62% AdobeRGB 1998 (Argyll 3D)
61.8% sRGB (Argyll 3D)
41.22% Display P3 (Argyll 3D)
Gamma: 2.27
CCT: 11323 K
| HP Pavilion Gaming 15-ec0002ng TN LED, 1920x1080, 15.6" | HP Pavilion Gaming 15-ec0017ng IPS, 1920x1080, 15.6" | Asus TUF FX505DY IPS, 1920x1080, 15.6" | Lenovo IdeaPad L340-15IRH 81LK00BMGE IPS, 1920x1080, 15.6" | Dell G3 3590 IPS, 1920x1080, 15.6" | MSI GF63 Thin 9SC IPS, 1920x1080, 15.6" | |
|---|---|---|---|---|---|---|
| Display | 49% | -3% | 4% | -3% | -8% | |
| Display P3 Coverage (%) | 41.22 | 62.8 52% | 40.04 -3% | 42.81 4% | 40.13 -3% | 37.76 -8% |
| sRGB Coverage (%) | 61.8 | 89.2 44% | 60.2 -3% | 63.8 3% | 59.8 -3% | 56.5 -9% |
| AdobeRGB 1998 Coverage (%) | 42.62 | 63.8 50% | 41.4 -3% | 44.31 4% | 41.47 -3% | 39.01 -8% |
| Response Times | -42% | -54% | -55% | -61% | -57% | |
| Response Time Grey 50% / Grey 80% * (ms) | 44 ? | 40 ? 9% | 44.8 ? -2% | 45.6 ? -4% | 46 ? -5% | 44.8 ? -2% |
| Response Time Black / White * (ms) | 15 ? | 29 ? -93% | 30.8 ? -105% | 30.8 ? -105% | 32.4 ? -116% | 31.6 ? -111% |
| PWM Frequency (Hz) | 250 ? | 20830 ? | 25910 ? | 200 ? | ||
| Screen | 47% | 21% | 35% | 26% | 34% | |
| Brightness middle (cd/m²) | 233 | 302 30% | 211.5 -9% | 275 18% | 276.2 19% | 260 12% |
| Brightness (cd/m²) | 211 | 291 38% | 200 -5% | 253 20% | 261 24% | 249 18% |
| Brightness Distribution (%) | 82 | 84 2% | 82 0% | 83 1% | 86 5% | 92 12% |
| Black Level * (cd/m²) | 0.405 | 0.25 38% | 0.23 43% | 0.18 56% | 0.24 41% | 0.23 43% |
| Contrast (:1) | 575 | 1208 110% | 920 60% | 1528 166% | 1151 100% | 1130 97% |
| Colorchecker dE 2000 * | 8.22 | 4.84 41% | 3.92 52% | 5.4 34% | 5.56 32% | 4.1 50% |
| Colorchecker dE 2000 max. * | 18.6 | 8.18 56% | 17.63 5% | 21.3 -15% | 23.45 -26% | 7.93 57% |
| Greyscale dE 2000 * | 10.13 | 4.31 57% | 3.1 69% | 3.7 63% | 2.8 72% | 2.83 72% |
| Gamma | 2.27 97% | 2.56 86% | 2.23 99% | 2.12 104% | 2.37 93% | 2.53 87% |
| CCT | 11323 57% | 7318 89% | 6578 99% | 6376 102% | 6710 97% | 6158 106% |
| Color Space (Percent of AdobeRGB 1998) (%) | 39 | 58 49% | 38.1 -2% | 40.8 5% | 37.8 -3% | 36 -8% |
| Color Space (Percent of sRGB) (%) | 62 | 89 44% | 60 -3% | 63.6 3% | 59 -5% | 56 -10% |
| Colorchecker dE 2000 calibrated * | 2.63 | 4.16 | 4.4 | 5.23 | 3.56 | |
| Media totale (Programma / Settaggio) | 18% /
35% | -12% /
6% | -5% /
17% | -13% /
9% | -10% /
14% |
* ... Meglio usare valori piccoli
Tempi di risposta del Display
| ↔ Tempi di risposta dal Nero al Bianco | ||
|---|---|---|
| 15 ms ... aumenta ↗ e diminuisce ↘ combinato | ↗ 11 ms Incremento | |
| ↘ 4 ms Calo | ||
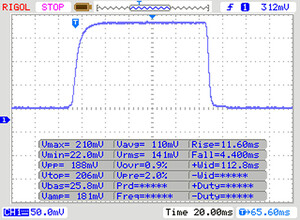
| Lo schermo mostra buoni tempi di risposta durante i nostri tests, ma potrebbe essere troppo lento per i gamers competitivi. In confronto, tutti i dispositivi di test variano da 0.1 (minimo) a 240 (massimo) ms. » 35 % di tutti i dispositivi è migliore. Questo significa che i tempi di risposta rilevati sono migliori rispettto alla media di tutti i dispositivi testati (20.1 ms). | ||
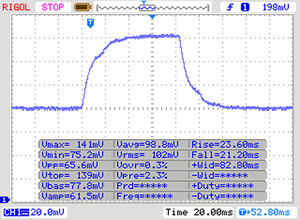
| ↔ Tempo di risposta dal 50% Grigio all'80% Grigio | ||
| 44 ms ... aumenta ↗ e diminuisce ↘ combinato | ↗ 23 ms Incremento | |
| ↘ 21 ms Calo | ||
| Lo schermo mostra tempi di risposta lenti nei nostri tests e sarà insoddisfacente per i gamers. In confronto, tutti i dispositivi di test variano da 0.165 (minimo) a 636 (massimo) ms. » 73 % di tutti i dispositivi è migliore. Questo significa che i tempi di risposta rilevati sono peggiori rispetto alla media di tutti i dispositivi testati (31.5 ms). | ||
Sfarfallio dello schermo / PWM (Pulse-Width Modulation)
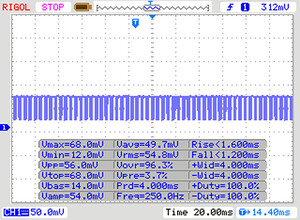
| flickering dello schermo / PWM rilevato | 250 Hz | ≤ 30 % settaggio luminosita' | |
Il display sfarfalla a 250 Hz (Probabilmente a causa dell'uso di PWM) Flickering rilevato ad una luminosita' di 30 % o inferiore. Non dovrebbe verificarsi flickering o PWM sopra questo valore di luminosita'. La frequenza di 250 Hz è relativamente bassa, quindi gli utenti sensibili potrebbero notare il flickering ed accusare stanchezza agli occhi a questo livello di luminosità e a livelli inferiori. In confronto: 53 % di tutti i dispositivi testati non utilizza PWM per ridurre la luminosita' del display. Se è rilevato PWM, una media di 8042 (minimo: 5 - massimo: 343500) Hz è stata rilevata. | |||
| Geekbench 3 | |
| 32 Bit Multi-Core Score | |
| HP Pavilion Gaming 15-ec0002ng | |
| HP Pavilion Gaming 15-ec0017ng | |
| Media AMD Ryzen 5 3550H (13474 - 15114, n=3) | |
| 32 Bit Single-Core Score | |
| HP Pavilion Gaming 15-ec0017ng | |
| HP Pavilion Gaming 15-ec0002ng | |
| Media AMD Ryzen 5 3550H (3348 - 3558, n=3) | |
| Mozilla Kraken 1.1 - Total | |
| Lenovo IdeaPad L340-15IRH 81LK00BMGE | |
| HP Pavilion Gaming 15-ec0002ng (Edge 44) | |
| Asus TUF FX505DY (Edge 44.17763.1.0) | |
| HP Pavilion Gaming 15-ec0017ng (Edge 44) | |
| Media AMD Ryzen 5 3550H (1042 - 1229, n=8) | |
| Dell G3 3590 (Edge 44.18362.387.0) | |
| Media della classe Gaming (397 - 674, n=126, ultimi 2 anni) | |
| Octane V2 - Total Score | |
| Media della classe Gaming (87588 - 139447, n=38, ultimi 2 anni) | |
| Dell G3 3590 (Edge 44.18362.387.0) | |
| HP Pavilion Gaming 15-ec0017ng (Edge 44) | |
| HP Pavilion Gaming 15-ec0002ng (Edge 44) | |
| Media AMD Ryzen 5 3550H (28324 - 29361, n=4) | |
| Asus TUF FX505DY (Edge 44.17763.1.0) | |
| Lenovo IdeaPad L340-15IRH 81LK00BMGE | |
| JetStream 1.1 - Total Score | |
| Media della classe Gaming (515 - 669, n=12, ultimi 2 anni) | |
| Dell G3 3590 (Edge 44.18362.387.0) | |
| HP Pavilion Gaming 15-ec0017ng (Edge 44) | |
| Asus TUF FX505DY (Edge 44.17763.1.0) | |
| HP Pavilion Gaming 15-ec0002ng (Edge 44) | |
| Media AMD Ryzen 5 3550H (190.9 - 210, n=4) | |
| Lenovo IdeaPad L340-15IRH 81LK00BMGE | |
* ... Meglio usare valori piccoli
| PCMark 8 Home Score Accelerated v2 | 2832 punti | |
| PCMark 8 Creative Score Accelerated v2 | 3826 punti | |
| PCMark 8 Work Score Accelerated v2 | 4797 punti | |
| PCMark 10 Score | 3952 punti | |
Aiuto | ||
| HP Pavilion Gaming 15-ec0002ng Intel SSD 660p SSDPEKNW512G8 | HP Pavilion Gaming 15-ec0017ng WDC PC SN720 SDAPNTW-256G | Asus TUF FX505DY WDC PC SN520 SDAPNUW-256G | Lenovo IdeaPad L340-15IRH 81LK00BMGE WDC PC SN520 SDAPMUW-512 | MSI GF63 Thin 9SC Toshiba KBG30ZMV512G | Media Intel SSD 660p SSDPEKNW512G8 | Media della classe Gaming | |
|---|---|---|---|---|---|---|---|
| CrystalDiskMark 5.2 / 6 | 25% | 0% | -1% | -24% | 5% | 179% | |
| Write 4K (MB/s) | 136.9 | 148 8% | 129.8 -5% | 103.6 -24% | 80.6 -41% | 136 ? -1% | 200 ? 46% |
| Read 4K (MB/s) | 57 | 43.73 -23% | 45.19 -21% | 39.91 -30% | 41.82 -27% | 55.2 ? -3% | 75 ? 32% |
| Write Seq (MB/s) | 968 | 1617 67% | 1302 35% | 1160 20% | 597 -38% | 926 ? -4% | 3777 ? 290% |
| Read Seq (MB/s) | 1631 | 1753 7% | 1373 -16% | 990 -39% | 963 -41% | 1523 ? -7% | 3579 ? 119% |
| Write 4K Q32T1 (MB/s) | 237 | 246.3 4% | 207.6 -12% | 283.4 20% | 188.8 -20% | 380 ? 60% | 577 ? 143% |
| Read 4K Q32T1 (MB/s) | 337.1 | 368 9% | 311.9 -7% | 344.5 2% | 403.7 20% | 334 ? -1% | 697 ? 107% |
| Write Seq Q32T1 (MB/s) | 963 | 1618 68% | 1302 35% | 1455 51% | 689 -28% | 987 ? 2% | 5126 ? 432% |
| Read Seq Q32T1 (MB/s) | 1863 | 3027 62% | 1734 -7% | 1690 -9% | 1583 -15% | 1744 ? -6% | 6808 ? 265% |
| 3DMark 11 Performance | 8458 punti | |
| 3DMark Ice Storm Standard Score | 71886 punti | |
| 3DMark Cloud Gate Standard Score | 20800 punti | |
| 3DMark Fire Strike Score | 5862 punti | |
| 3DMark Time Spy Score | 2258 punti | |
Aiuto | ||
| BioShock Infinite - 1920x1080 Ultra Preset, DX11 (DDOF) | |
| HP Pavilion Gaming 15-ec0017ng | |
| Dell G3 3590 | |
| Lenovo IdeaPad L340-15IRH 81LK00BMGE | |
| Media NVIDIA GeForce GTX 1050 Mobile (48.6 - 67.5, n=35) | |
| HP Pavilion Gaming 15-ec0002ng | |
| Asus TUF FX505DY | |
| The Witcher 3 - 1920x1080 High Graphics & Postprocessing (Nvidia HairWorks Off) | |
| Media della classe Gaming (138 - 424, n=26, ultimi 2 anni) | |
| HP Pavilion Gaming 15-ec0017ng | |
| Dell G3 3590 | |
| MSI GF63 Thin 9SC | |
| HP Pavilion Gaming 15-ec0002ng | |
| Asus TUF FX505DY | |
| Media NVIDIA GeForce GTX 1050 Mobile (29.1 - 43, n=29) | |
| FIFA 20 - 1920x1080 Ultra Preset AA:4xMS | |
| HP Pavilion Gaming 15-ec0017ng | |
| MSI GF63 Thin 9SC | |
| Media NVIDIA GeForce GTX 1050 Mobile (99 - 108, n=3) | |
| HP Pavilion Gaming 15-ec0002ng | |
| Need for Speed Heat - 1920x1080 Medium Preset | |
| MSI GF63 Thin 9SC | |
| HP Pavilion Gaming 15-ec0002ng | |
| Media NVIDIA GeForce GTX 1050 Mobile (36.8 - 39.7, n=2) | |
| Metro Exodus - 1280x720 Low Quality AF:4x | |
| HP Pavilion Gaming 15-ec0017ng | |
| MSI GF63 Thin 9SC | |
| HP Pavilion Gaming 15-ec0002ng | |
| Media NVIDIA GeForce GTX 1050 Mobile (45.1 - 60.4, n=3) | |
| basso | medio | alto | ultra | |
|---|---|---|---|---|
| BioShock Infinite (2013) | 202.4 | 162.2 | 146.2 | 61.4 |
| The Witcher 3 (2015) | 118.3 | 73.1 | 42.1 | 24.3 |
| World of Warships (2015) | 128.1 | 107.6 | 92 | 83.1 |
| Rainbow Six Siege (2015) | 171.8 | 139.6 | 88.7 | 75.9 |
| For Honor (2017) | 137 | 56.8 | 54.1 | 43 |
| Ghost Recon Wildlands (2017) | 80.8 | 39.5 | 37.5 | 19.4 |
| X-Plane 11.11 (2018) | 59.1 | 51.9 | 44.6 | |
| Far Cry 5 (2018) | 67 | 42 | 39 | 37 |
| Shadow of the Tomb Raider (2018) | 64 | 35 | 33 | 29 |
| Assassin´s Creed Odyssey (2018) | 55 | 38 | 29 | 17 |
| Battlefield V (2018) | 84.4 | 52.6 | 45.5 | 38.4 |
| Farming Simulator 19 (2018) | 133.2 | 100.3 | 75.9 | 55.3 |
| Apex Legends (2019) | 124.1 | 53.2 | 42.5 | 39.1 |
| Metro Exodus (2019) | 60.4 | 28.4 | 21.9 | 17.4 |
| Anthem (2019) | 45.9 | 31.1 | 28.8 | 24 |
| Dirt Rally 2.0 (2019) | 142.5 | 62.2 | 51.7 | 28.3 |
| The Division 2 (2019) | 83 | 41 | 32 | 23 |
| Anno 1800 (2019) | 54.9 | 46.1 | 30.9 | 16.2 |
| Rage 2 (2019) | 79.9 | 34.1 | 27.8 | 28.2 |
| Total War: Three Kingdoms (2019) | 117.4 | 43.2 | 25.5 | 15.3 |
| F1 2019 (2019) | 128 | 71 | 61 | 53 |
| Control (2019) | 78.6 | 26.3 | 19.1 | |
| Borderlands 3 (2019) | 79.3 | 40.2 | 26 | 19.3 |
| FIFA 20 (2019) | 134.9 | 115.6 | 110.5 | 100.5 |
| Ghost Recon Breakpoint (2019) | 61 | 35 | 31 | 4 |
| GRID 2019 (2019) | 93.7 | 50.1 | 40.9 | 13.7 |
| Call of Duty Modern Warfare 2019 (2019) | 66.8 | 40.7 | 36.2 | 29.8 |
| Need for Speed Heat (2019) | 57.2 | 39.7 | 33.9 | 32.6 |
| Star Wars Jedi Fallen Order (2019) | 47.8 | 39.6 | 34.5 | |
| Red Dead Redemption 2 (2019) | 51.8 | 28.1 | 17 | |
| Hunt Showdown (2020) | 89.7 | 36.3 | 27.9 |
Rumorosità
| Idle |
| 30.3 / 30.3 / 31 dB(A) |
| Sotto carico |
| 39.3 / 43.3 dB(A) |
 | ||
30 dB silenzioso 40 dB(A) udibile 50 dB(A) rumoroso |
||
min: | ||
(±) La temperatura massima sul lato superiore è di 41 °C / 106 F, rispetto alla media di 40.4 °C / 105 F, che varia da 21.2 a 68.8 °C per questa classe Gaming.
(+) Il lato inferiore si riscalda fino ad un massimo di 39.1 °C / 102 F, rispetto alla media di 43.3 °C / 110 F
(+) In idle, la temperatura media del lato superiore è di 24.2 °C / 76 F, rispetto alla media deld ispositivo di 33.9 °C / 93 F.
(+) Riproducendo The Witcher 3, la temperatura media per il lato superiore e' di 29.1 °C / 84 F, rispetto alla media del dispositivo di 33.9 °C / 93 F.
(+) I poggiapolsi e il touchpad sono piu' freddi della temperatura della pelle con un massimo di 31.6 °C / 88.9 F e sono quindi freddi al tatto.
(-) La temperatura media della zona del palmo della mano di dispositivi simili e'stata di 28.8 °C / 83.8 F (-2.8 °C / -5.1 F).
HP Pavilion Gaming 15-ec0002ng analisi audio
(-) | altoparlanti non molto potenti (66.3 dB)
Bassi 100 - 315 Hz
(-) | quasi nessun basso - in media 23.9% inferiori alla media
(±) | la linearità dei bassi è media (10% delta rispetto alla precedente frequenza)
Medi 400 - 2000 Hz
(+) | medi bilanciati - solo only 4% rispetto alla media
(±) | linearità dei medi adeguata (10.4% delta rispetto alla precedente frequenza)
Alti 2 - 16 kHz
(±) | alti elevati - circa 6.8% superiori alla media
(±) | la linearità degli alti è media (7.7% delta rispetto alla precedente frequenza)
Nel complesso 100 - 16.000 Hz
(±) | la linearità complessiva del suono è media (29.7% di differenza rispetto alla media
Rispetto alla stessa classe
» 95% di tutti i dispositivi testati in questa classe è stato migliore, 2% simile, 3% peggiore
» Il migliore ha avuto un delta di 6%, medio di 18%, peggiore di 132%
Rispetto a tutti i dispositivi testati
» 88% di tutti i dispositivi testati in questa classe è stato migliore, 3% similare, 10% peggiore
» Il migliore ha avuto un delta di 4%, medio di 24%, peggiore di 134%
| Off / Standby | |
| Idle | |
| Sotto carico |
|
Leggenda:
min: | |
Pro
Contro
Con un prezzo di ~$699, il Pavilion Gaming 15 è uno dei portatili da gioco più economici. Qui, l'APU Ryzen 5 3550H e la GPU GeForce GTX 1050 permettono un'esperienza di gioco senza problemi. Detto questo, l'hardware fatica a raggiungere risoluzioni o impostazioni di qualità grafica più alte.
Questo economico laptop da gioco Pavilion Gaming Pavilion 15-ec0002ng è un pacchetto ben realizzato da Hewlett Packard.
Il case in plastica manca di rigidità, anche se la qualità di costruzione è complessivamente buona. Non è disponibile un portello per la manutenzione. Occorre rimuovere la piastra inferiore per aggiornare o sostituire i componenti (SSD, RAM, seconda unità di archiviazione, modulo Wi-Fi) - questo compito può essere svolto con relativa facilità. La tastiera chiclet (retroilluminazione verde a due passi) si è dimostrata adatta all'uso quotidiano.
Il prezzo relativamente basso si manifesta nella qualità del display. Il modello Full HD opaco offre solo un basso rapporto di contrasto, luminosità e angoli di visualizzazione ristretti. Anche la precisione del colore è poco brillante.
Al contrario, l'ottima durata della batteria è una gradita sorpresa. Nel nostro test Wi-Fi, il padiglione dura 8:25 h - più di molti portatili da ufficio.
HP Pavilion Gaming 15-ec0002ng
- 03/24/2020 v7 (old)
Sascha Mölck


