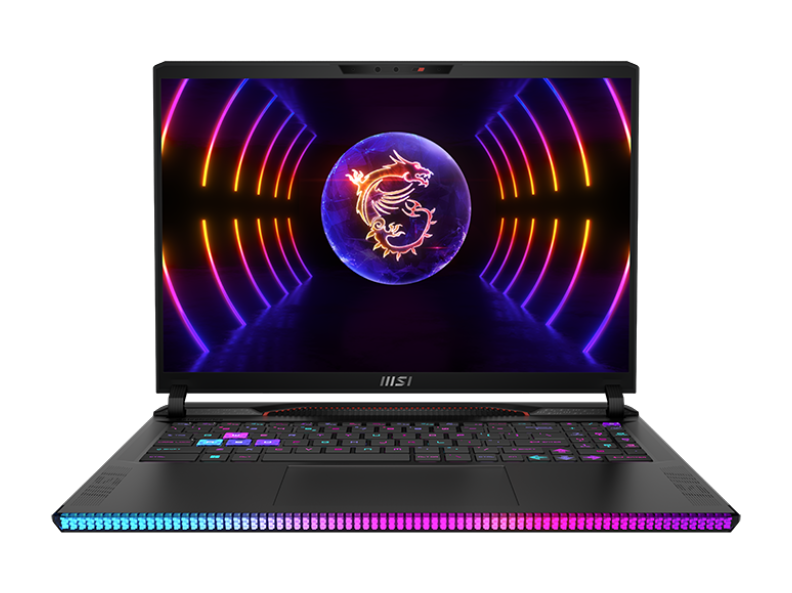
Recensione del portatile MSI Raider GE68 HX 13VF: Un cambiamento completo del design

Il GE68HX succede direttamente al GE67HX dello scorso anno, con interni rinnovati e un nuovo design dello chassis. Oltre alle attese CPU Raptor Lake-HX di 13a generazione e alle GPU Nvidia Ada Lovelace, che sostituiscono le vecchie opzioni Alder Lake-HX e Ampere di 12a generazione, il nuovo modello offre anche uno schermo più grande da 16:10 a 16 pollici, rispetto al rapporto di aspetto 16:9 da 15,6 pollici.
L'unità in esame è la configurazione base con Core i7-13950HX, RTX 4060 da 140 W GeForce e display IPS da 1080p 144 Hz, al prezzo di circa 1700 dollari USA o 1300 dollari se in offerta. Le SKU di fascia più alta includono il Core i9-13980HX, RTX 4090 e display 1440p 240 Hz per oltre 3500 dollari.
I concorrenti del GE68HX includono altri portatili da gioco da 16 pollici di fascia alta come il modello HP Omen 16,Alienware m16 R1, Lenovo Legion Slim 7i 16 Gen 8o il Asus ROG Zephyrus M16.
Altre recensioni di MSI:
Potenziali concorrenti a confronto
Punteggio | Data | Modello | Peso | Altezza | Dimensione | Risoluzione | Prezzo |
|---|---|---|---|---|---|---|---|
| 86.9 % v7 (old) | 10/2023 | MSI Raider GE68HX 13VF i9-13950HX, GeForce RTX 4060 Laptop GPU | 2.7 kg | 27.9 mm | 16.00" | 1900x1200 | |
| 87.7 % v7 (old) | 07/2022 | MSI GE67 HX 12UGS i7-12800HX, GeForce RTX 3070 Ti Laptop GPU | 2.5 kg | 23.4 mm | 15.60" | 1920x1080 | |
| 86.6 % v7 (old) | 09/2023 | HP Omen 16-xf0376ng R7 7840HS, GeForce RTX 4070 Laptop GPU | 2.4 kg | 23.5 mm | 16.10" | 1920x1080 | |
| 89.2 % v7 (old) | 08/2023 | Alienware m16 R1 AMD R9 7845HX, GeForce RTX 4080 Laptop GPU | 3.1 kg | 25.4 mm | 16.00" | 2560x1600 | |
| 90 % v7 (old) | 07/2023 | Lenovo Legion Slim 7i 16 Gen 8 i9-13900H, GeForce RTX 4070 Laptop GPU | 2.1 kg | 19.9 mm | 16.00" | 2560x1600 | |
| 89.4 % v7 (old) | 03/2023 | Asus ROG Zephyrus M16 GU604VY-NM042X i9-13900H, GeForce RTX 4090 Laptop GPU | 2.3 kg | 22.9 mm | 16.00" | 2560x1600 |
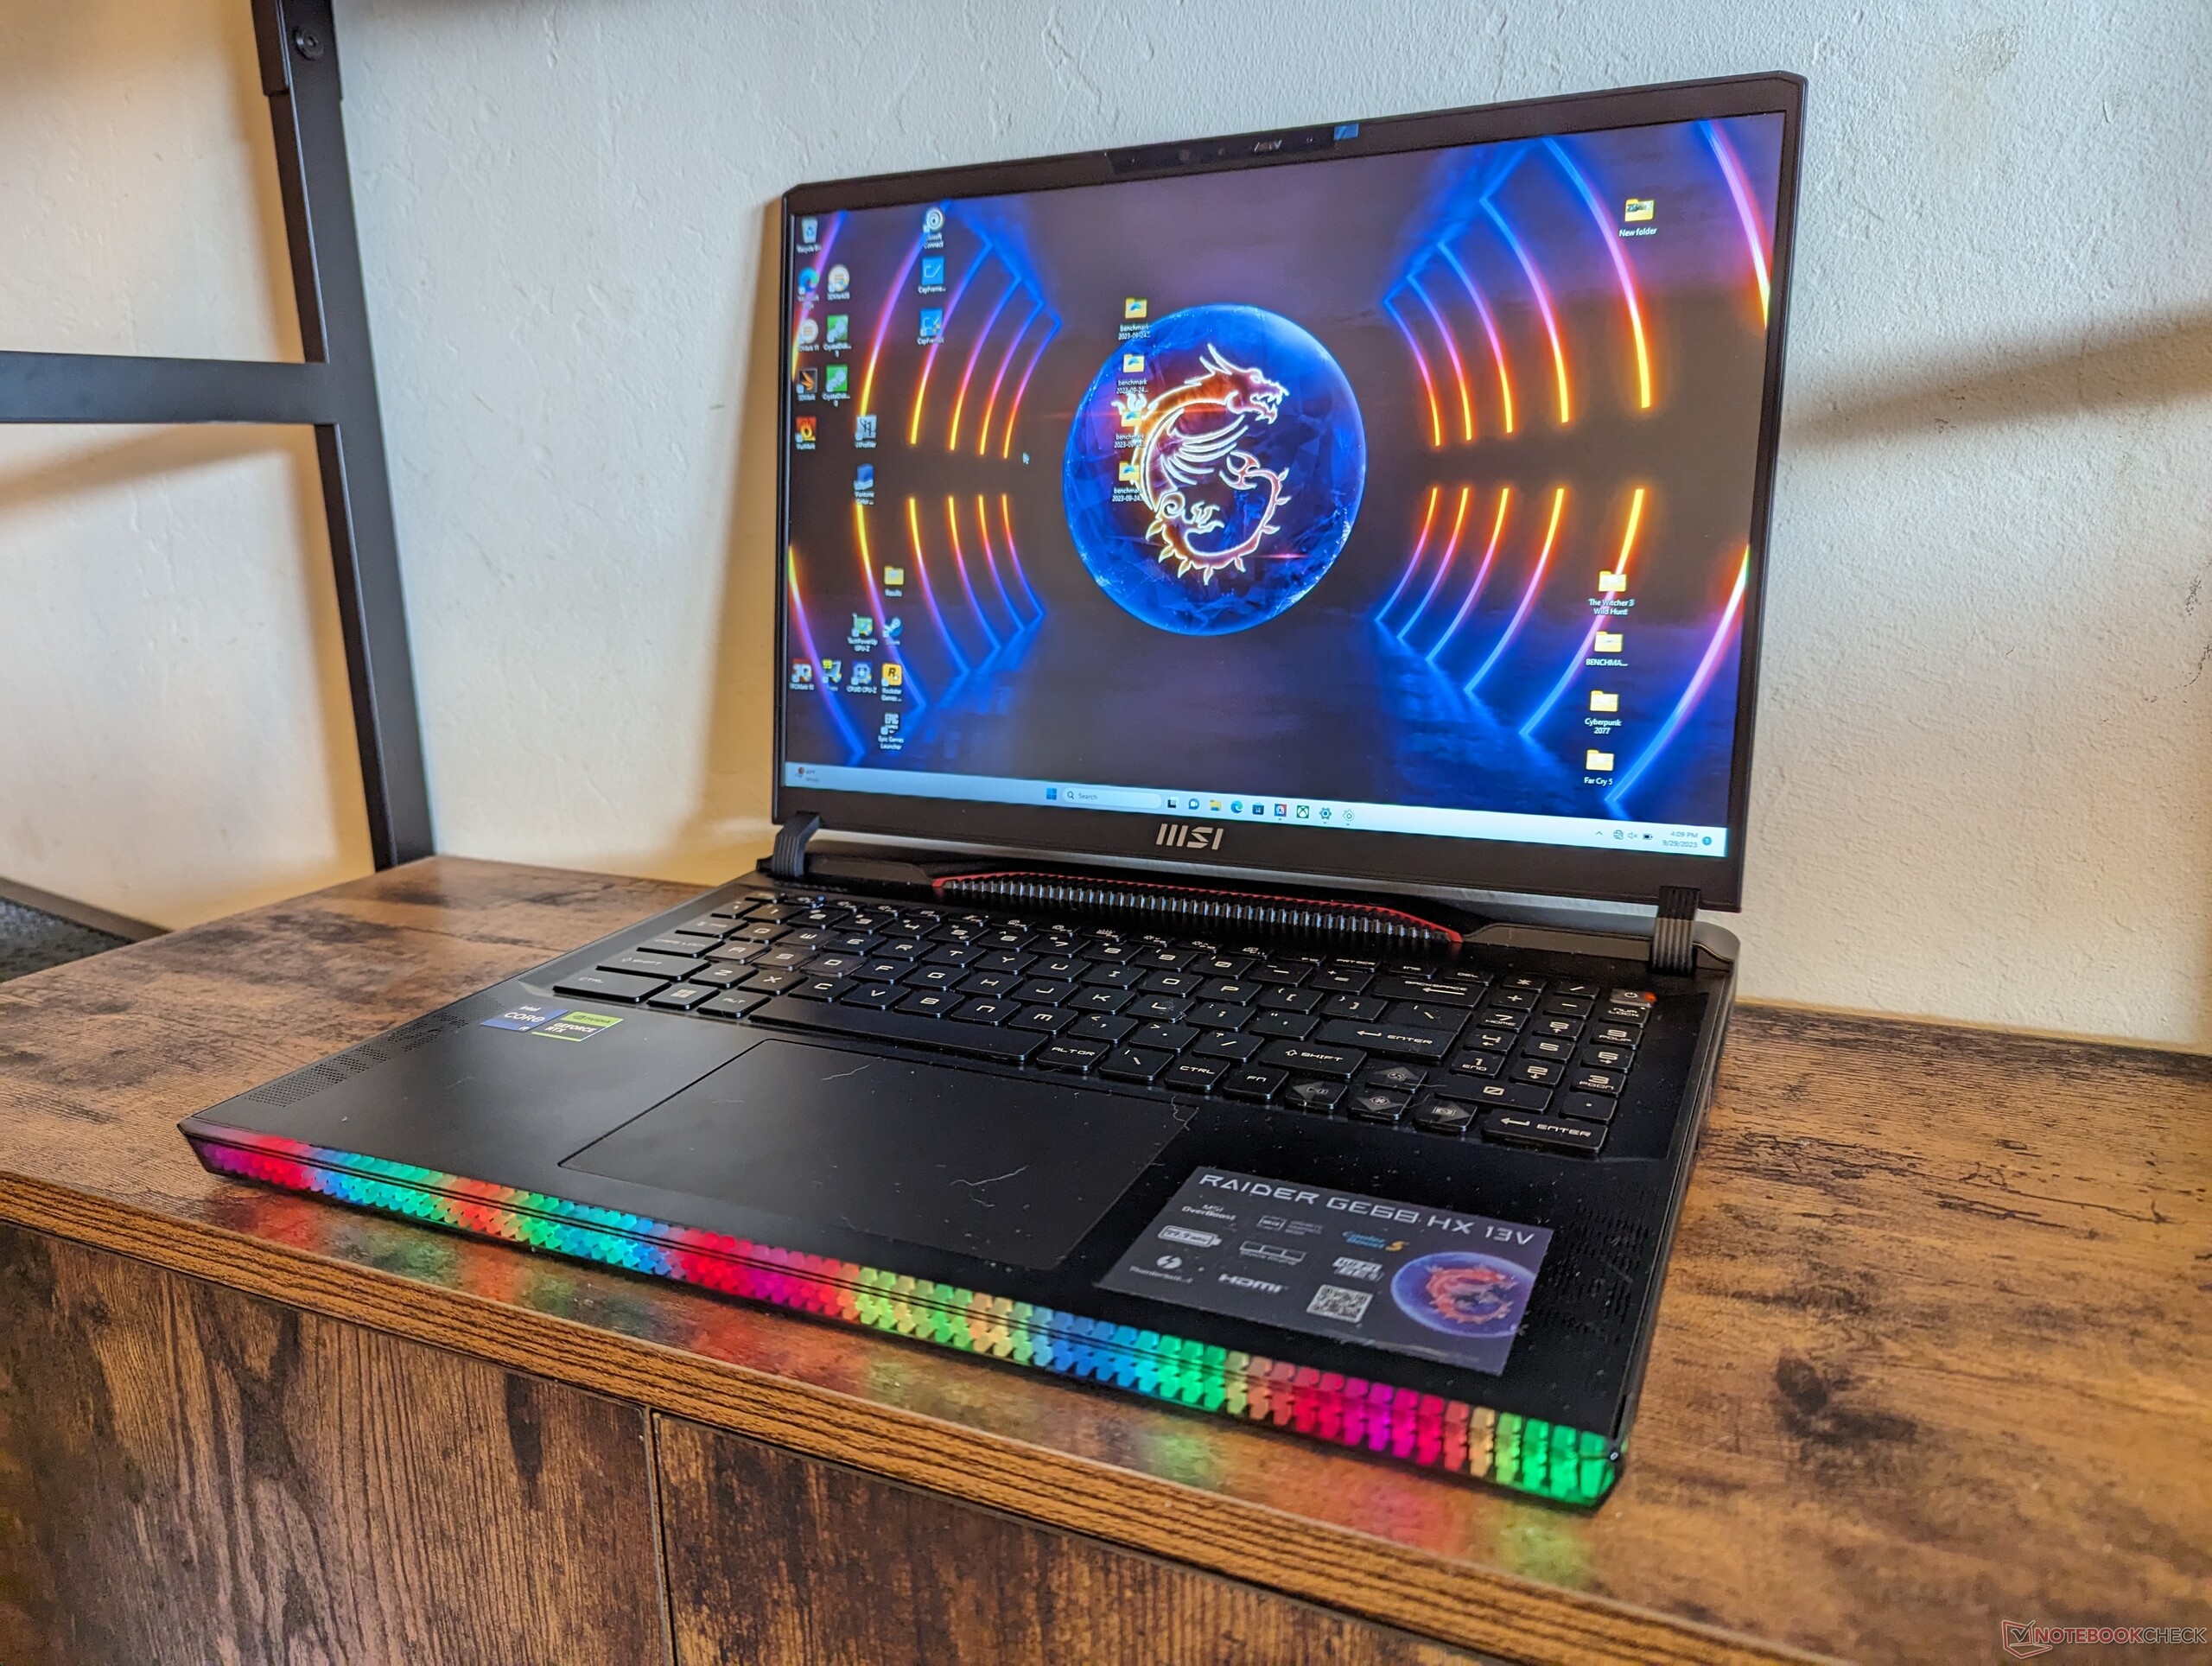
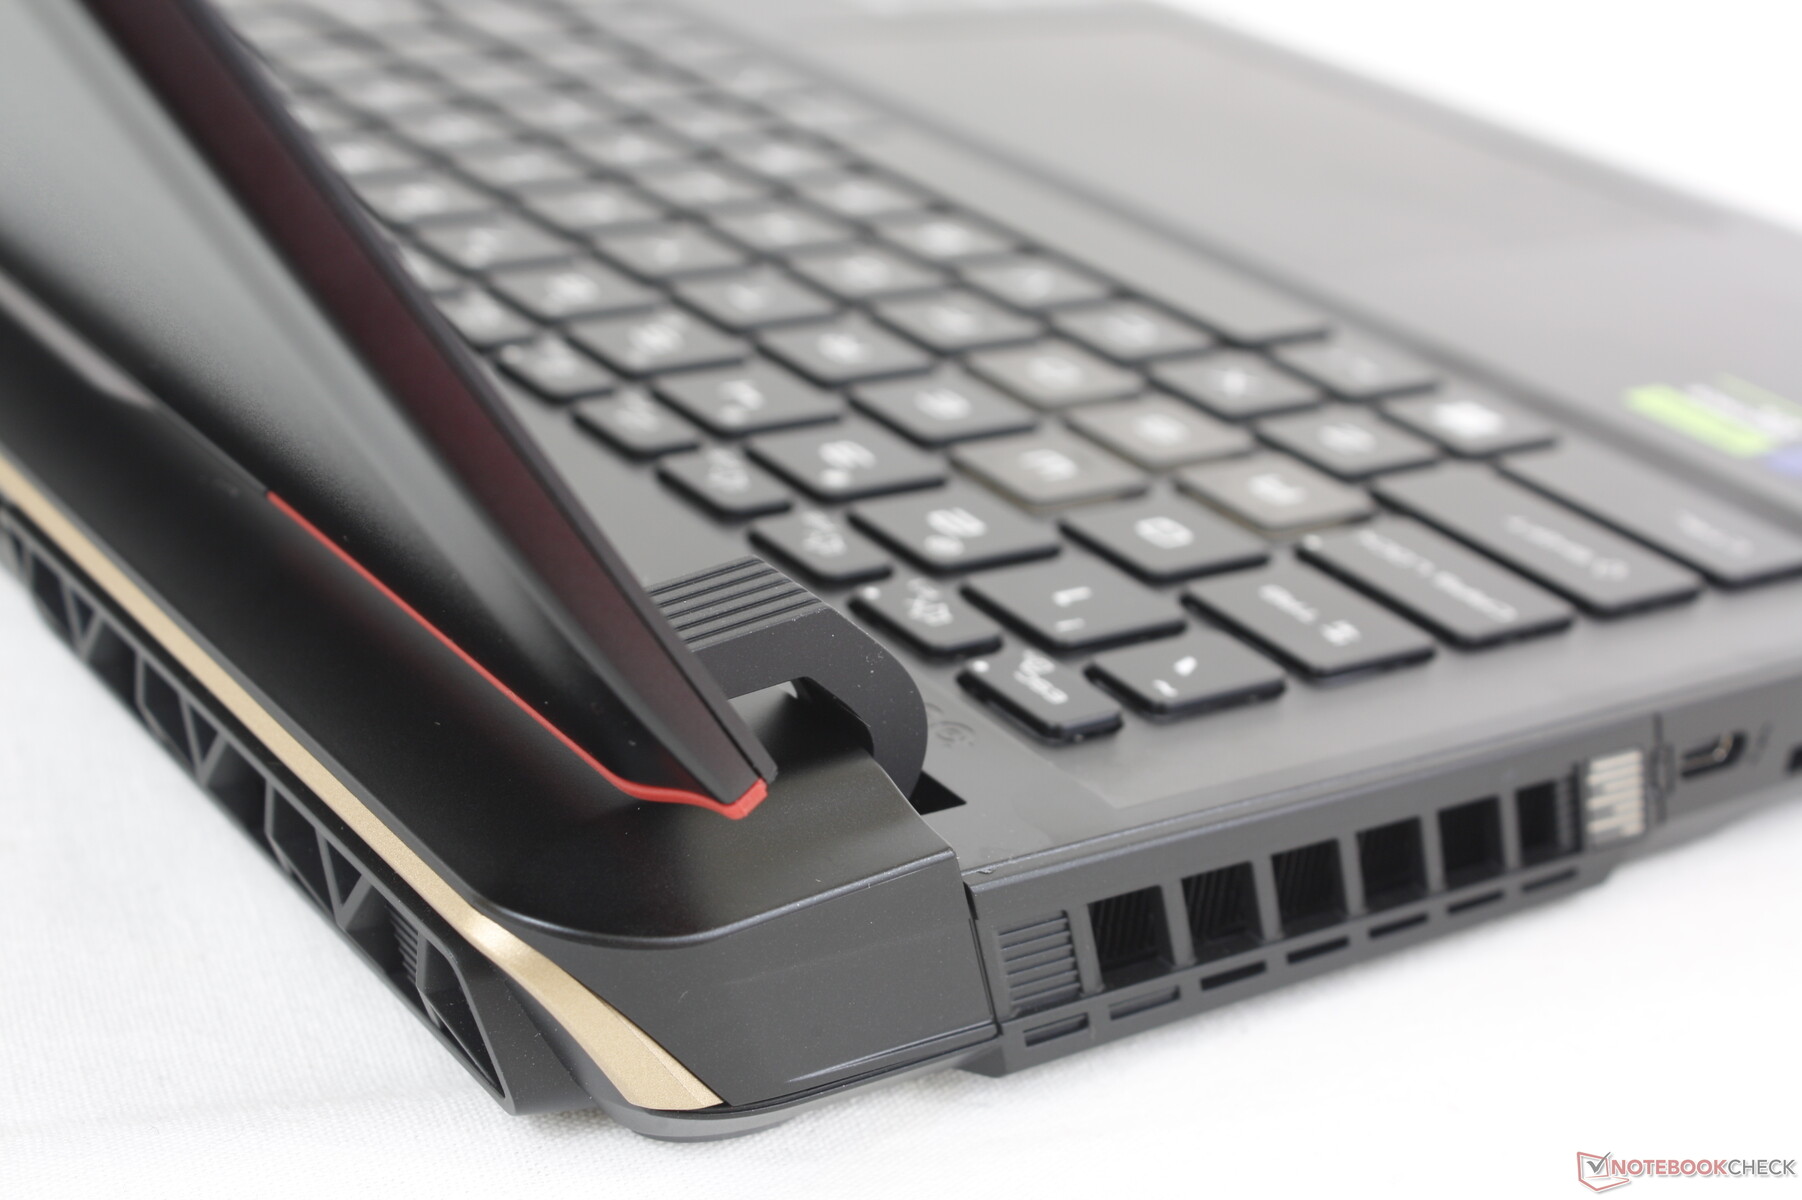
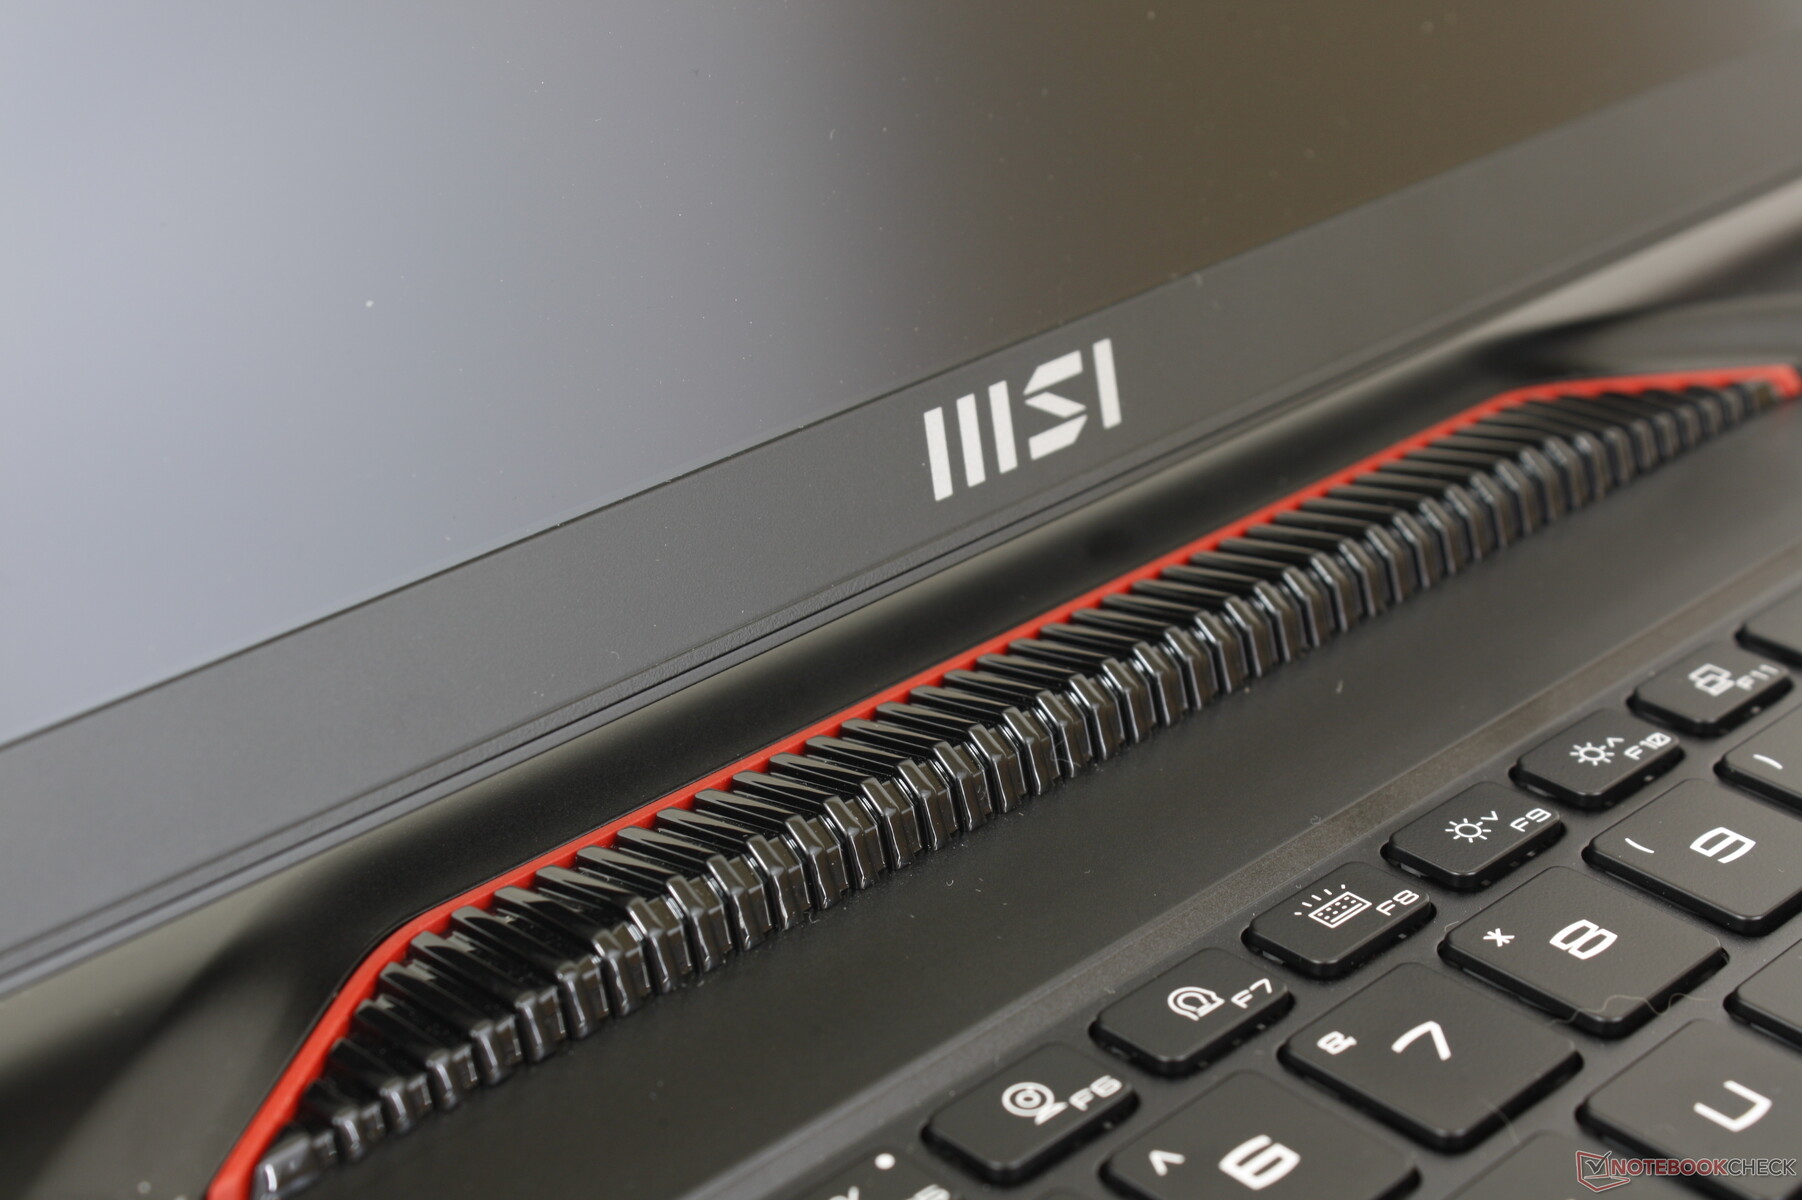
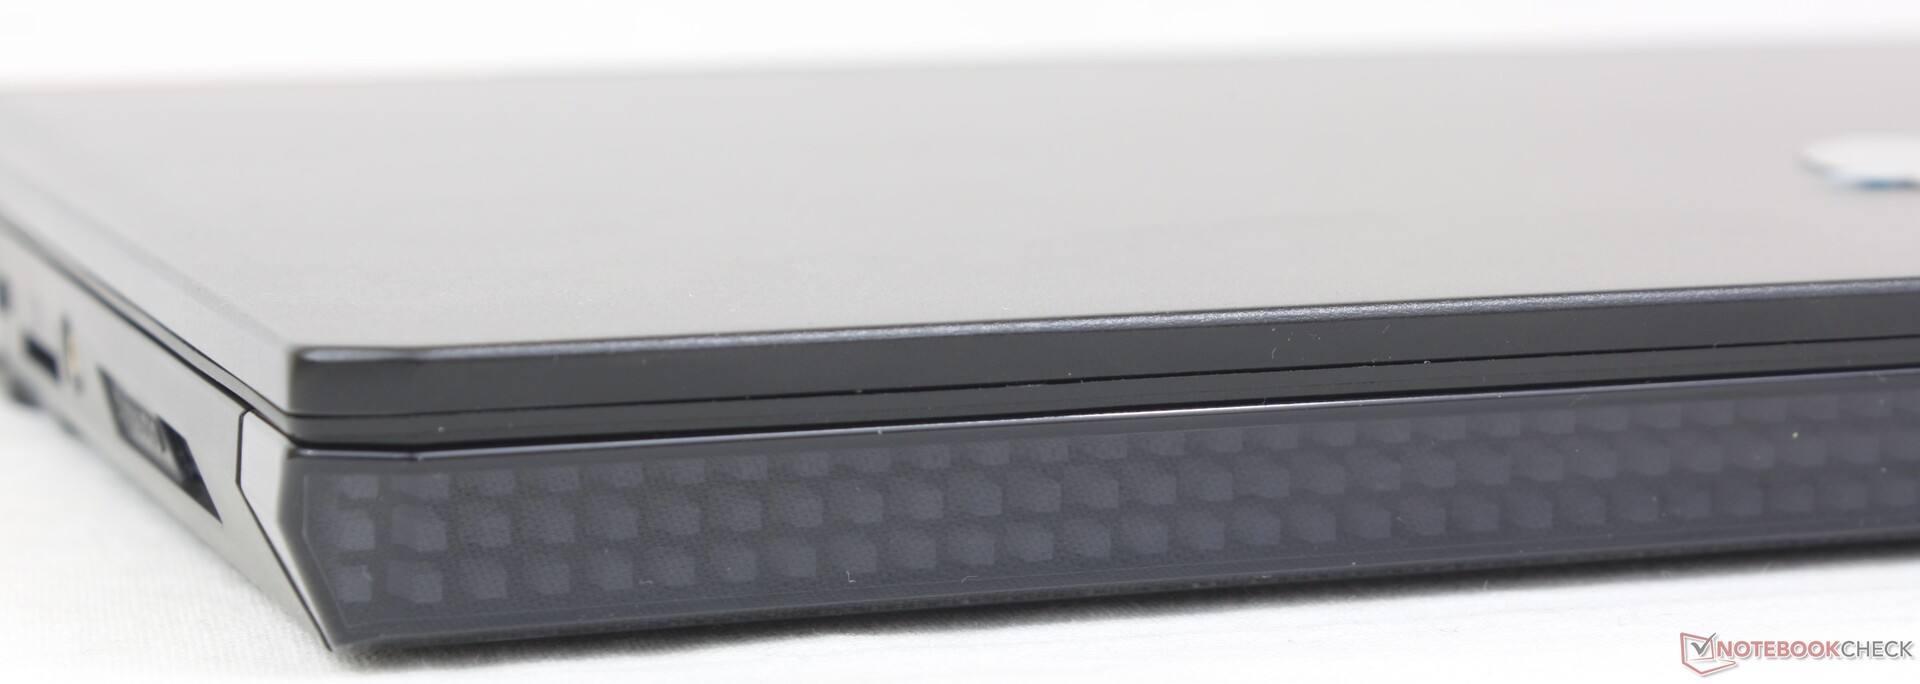
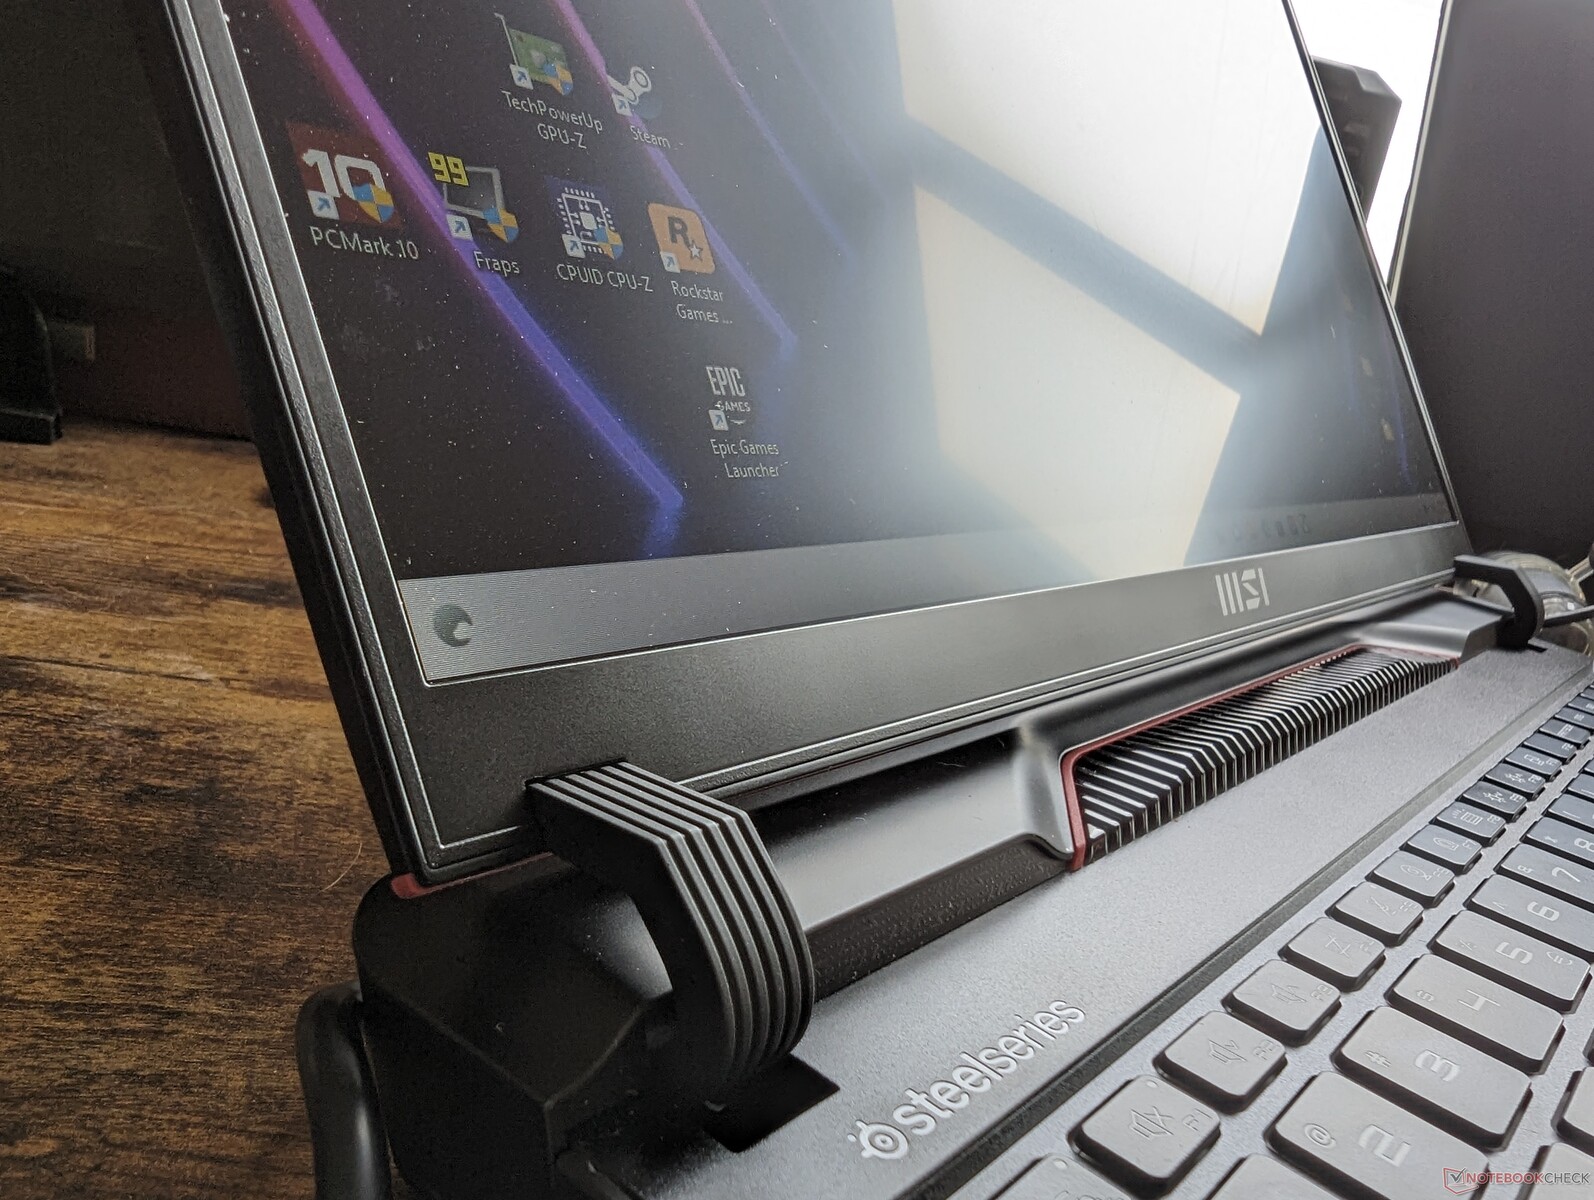
Il caso - Più grande di prima
Il telaio può essere meglio descritto come una versione più piccola del 17 pollici Raider GE78HX da 17 pollici. La barra di pixel a LED sulla parte anteriore sostituisce l'illuminazione continua del modello dello scorso anno, mentre la parte posteriore è ora più stilizzata con finiture dorate, rosse e lucide. Uno degli obiettivi di MSI quest'anno era quello di creare design di laptop più interessanti dal punto di vista visivo, invece del sempre più comune nero e minimalista. Il produttore è riuscito in questo intento, poiché il design del GE68HX è sicuramente inconfondibile e molto diverso da quello di altri portatili da gioco della concorrenza.
La rigidità del telaio è eccellente nonostante tutte le curve e i pezzi che compongono lo scheletro non unibody. Se si esercita una pressione al centro della tastiera o si tenta di ruotare gli angoli, la flessione è minima e non si avvertono scricchiolii. Rispetto al GE67HX dello scorso anno, apprezziamo in particolare le cerniere più grandi e robuste, che garantiscono una maggiore longevità.
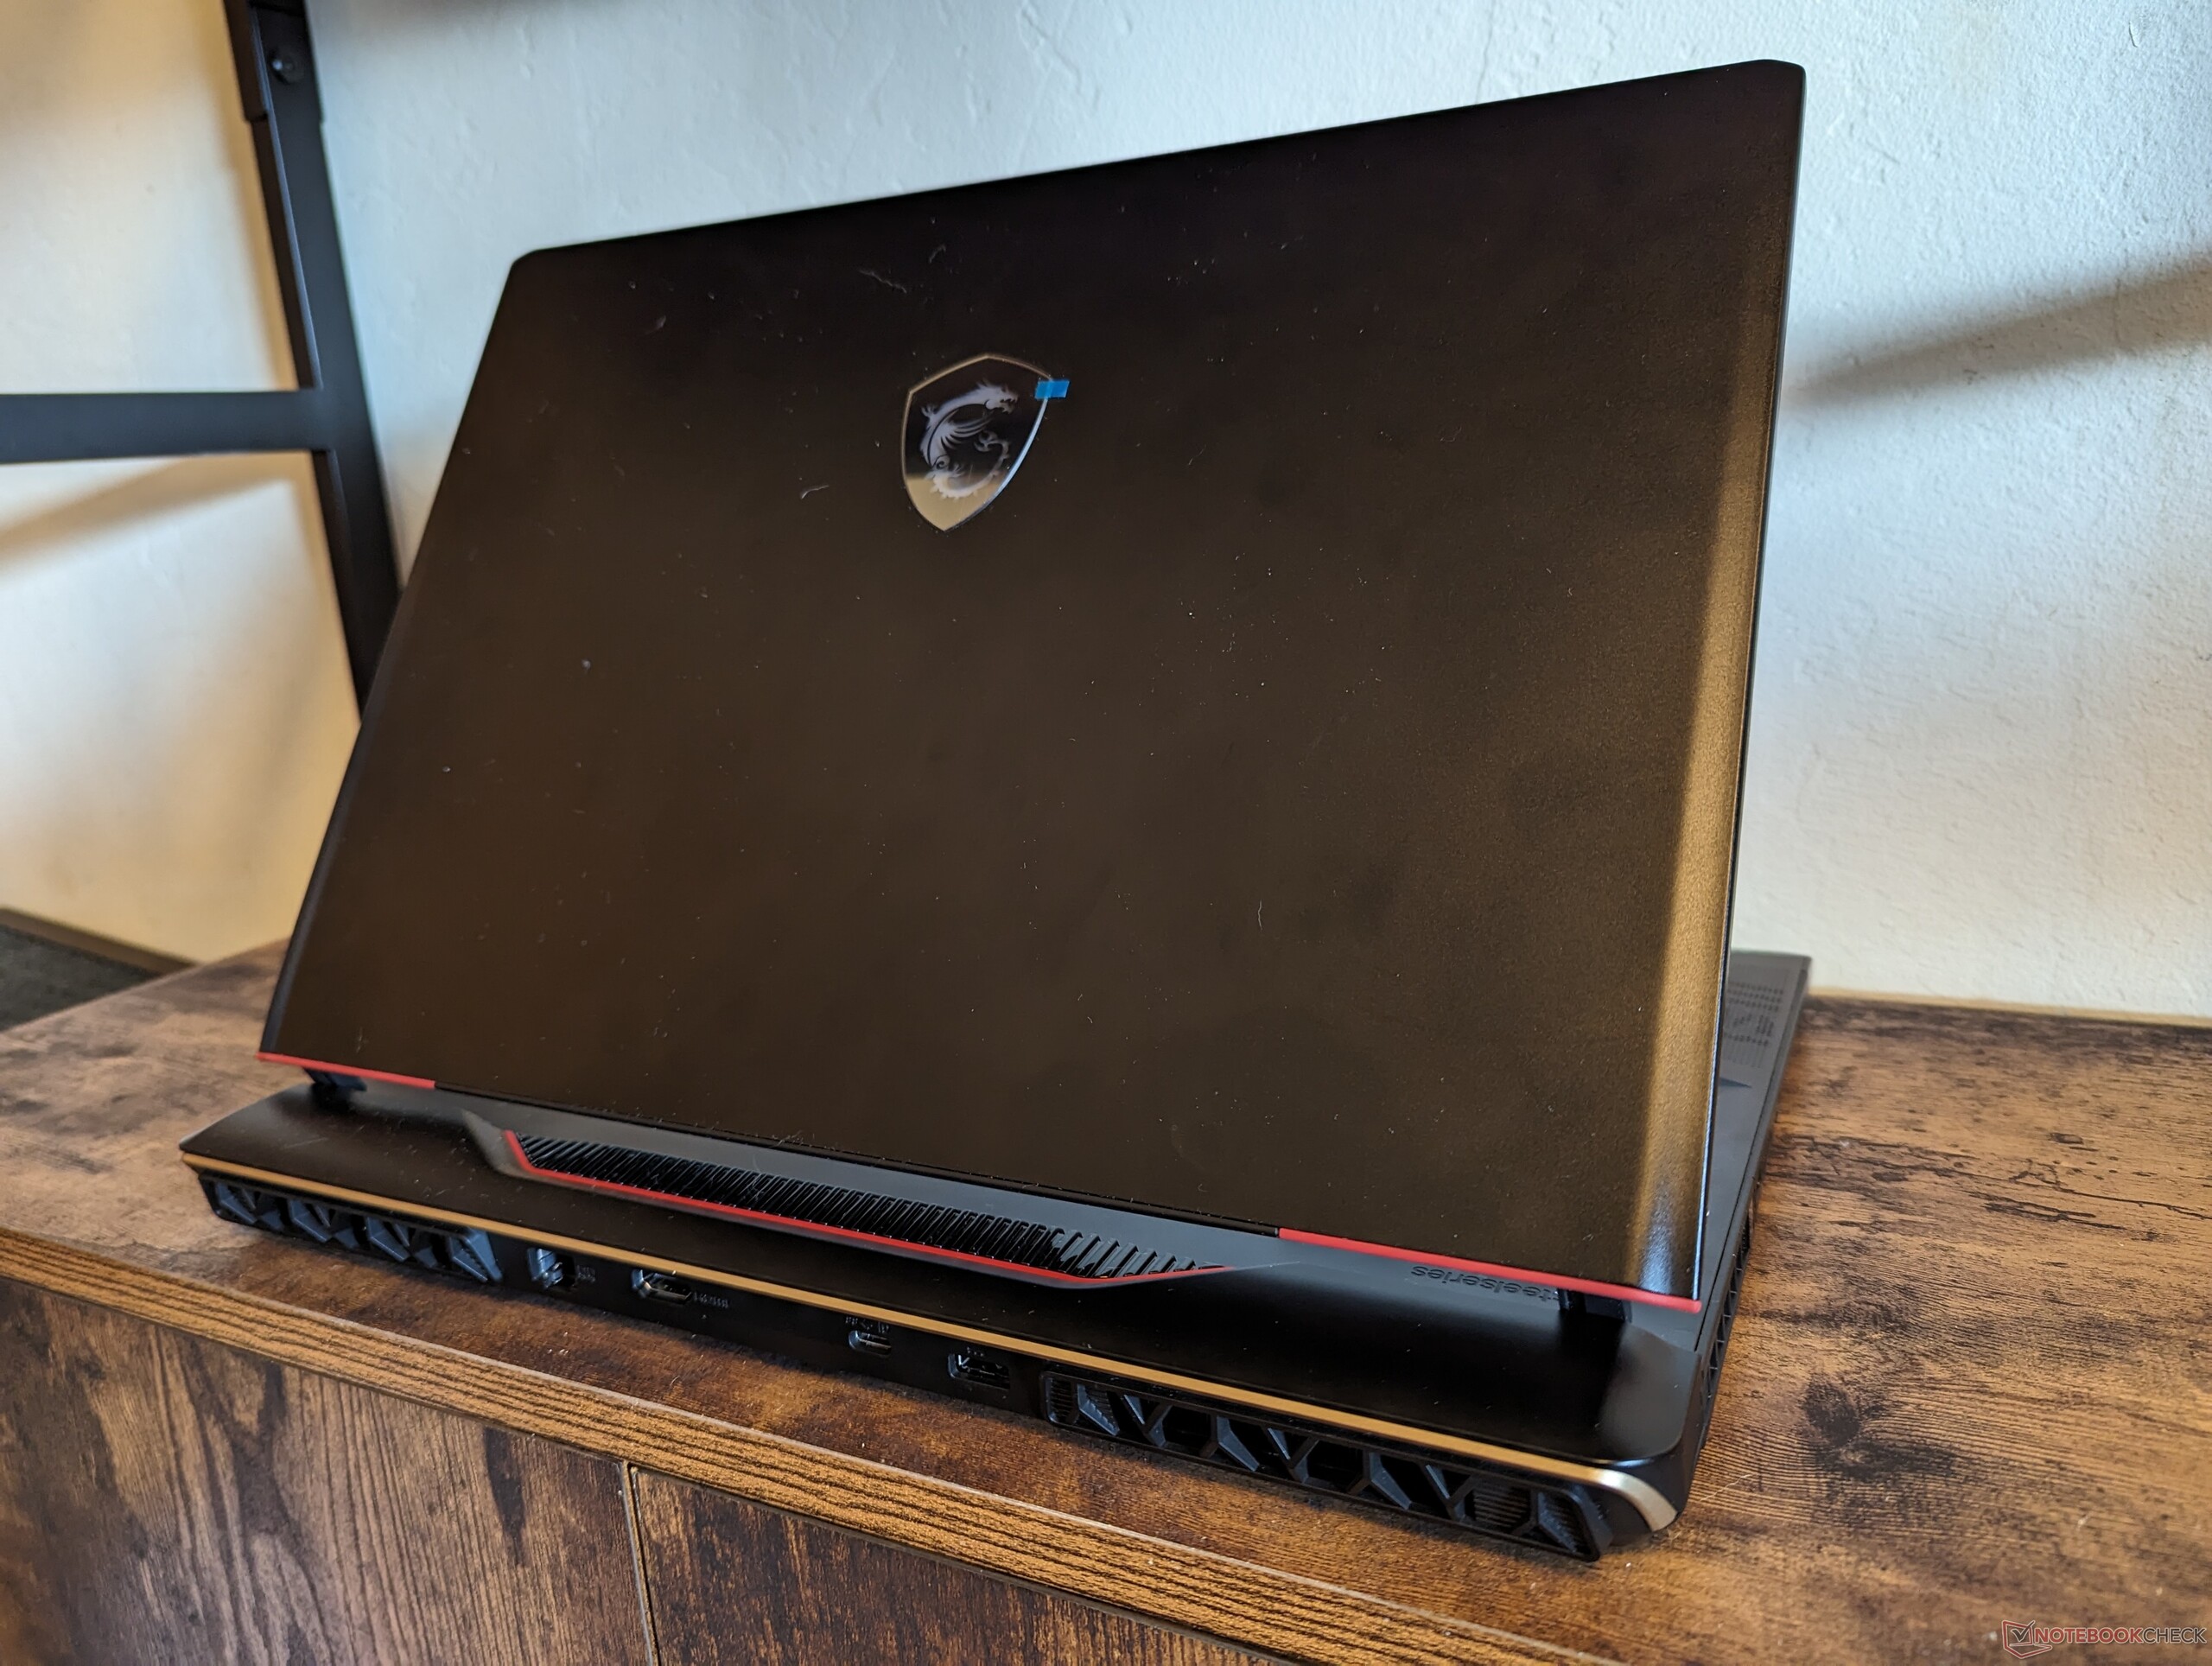
Il nuovo modello è più grande e più pesante del precedente GE67HX, come dimostra la nostra tabella di confronto delle dimensioni qui sotto. In effetti, il GE68HX è uno dei portatili da gioco da 16 pollici più grandi e pesanti disponibili sul mercato.
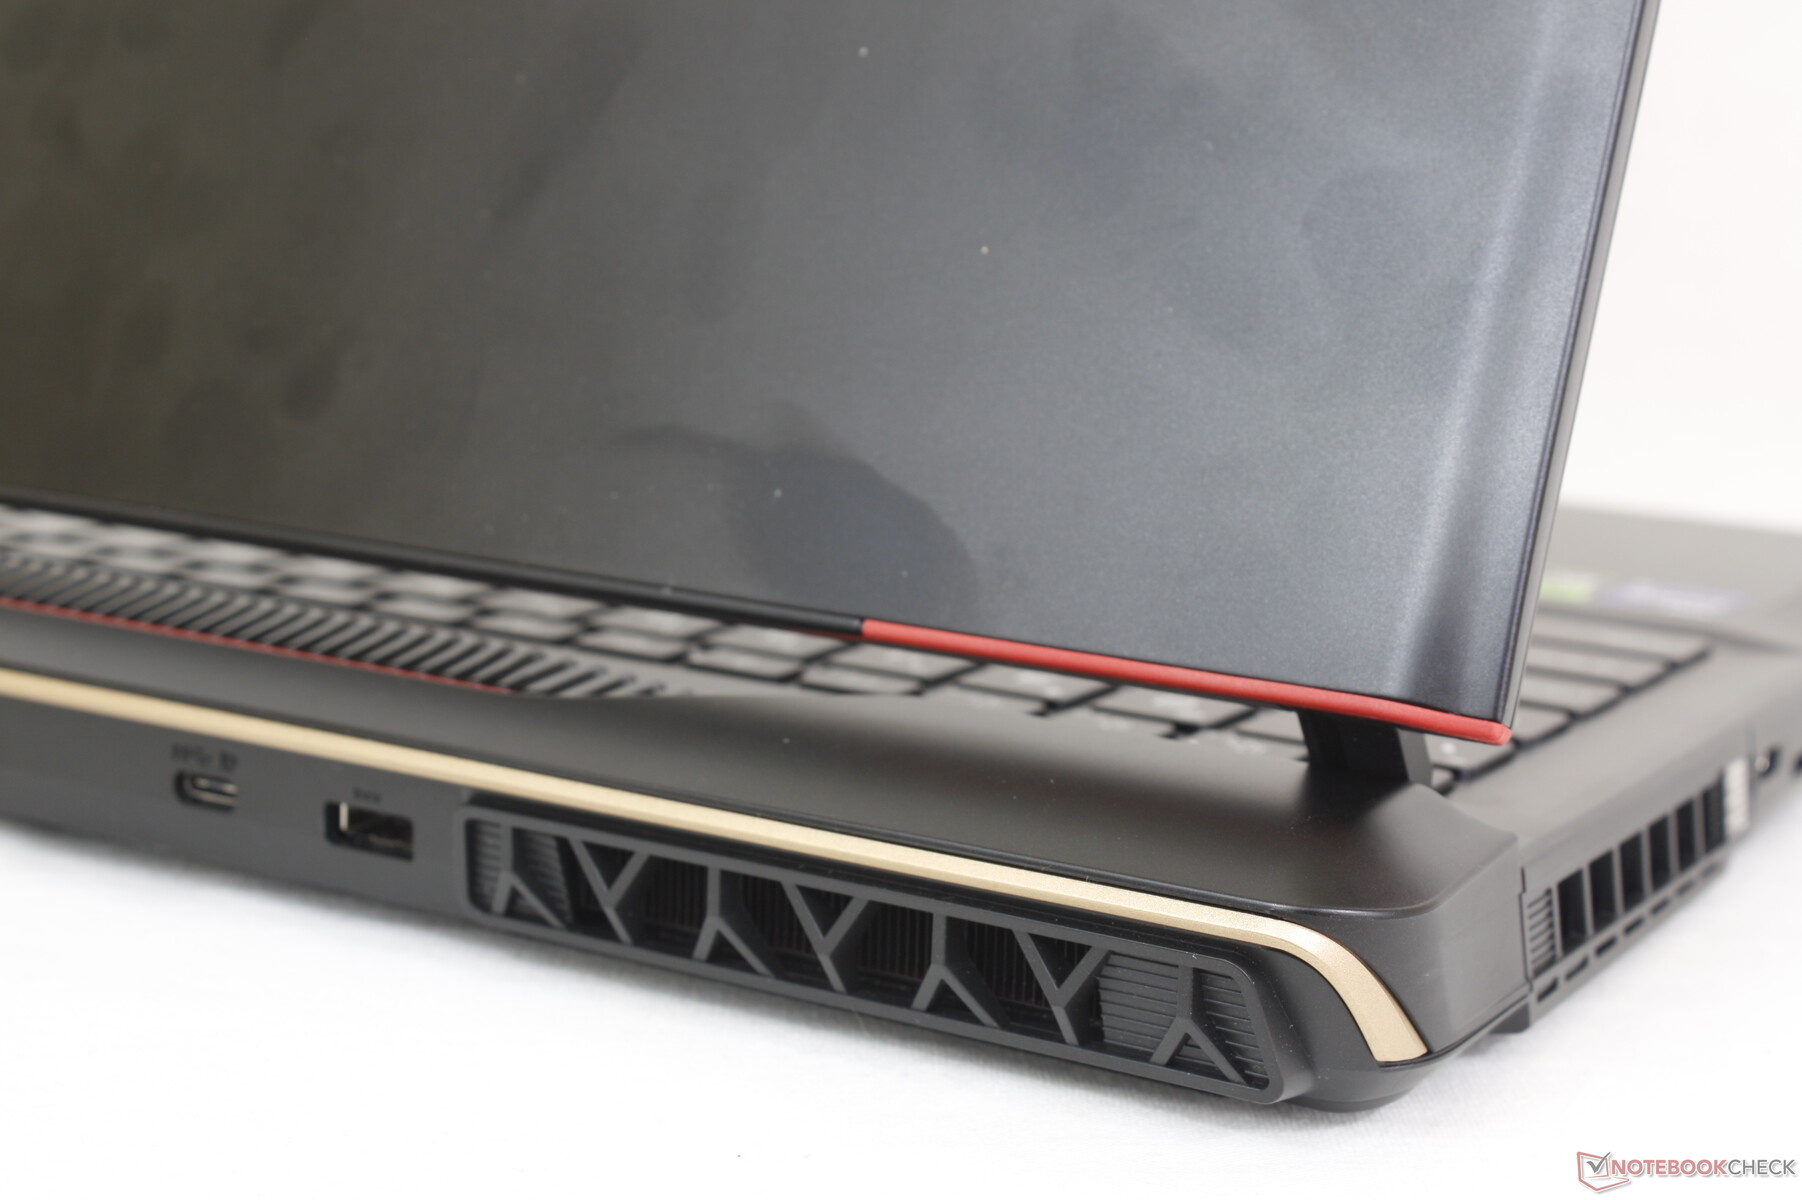
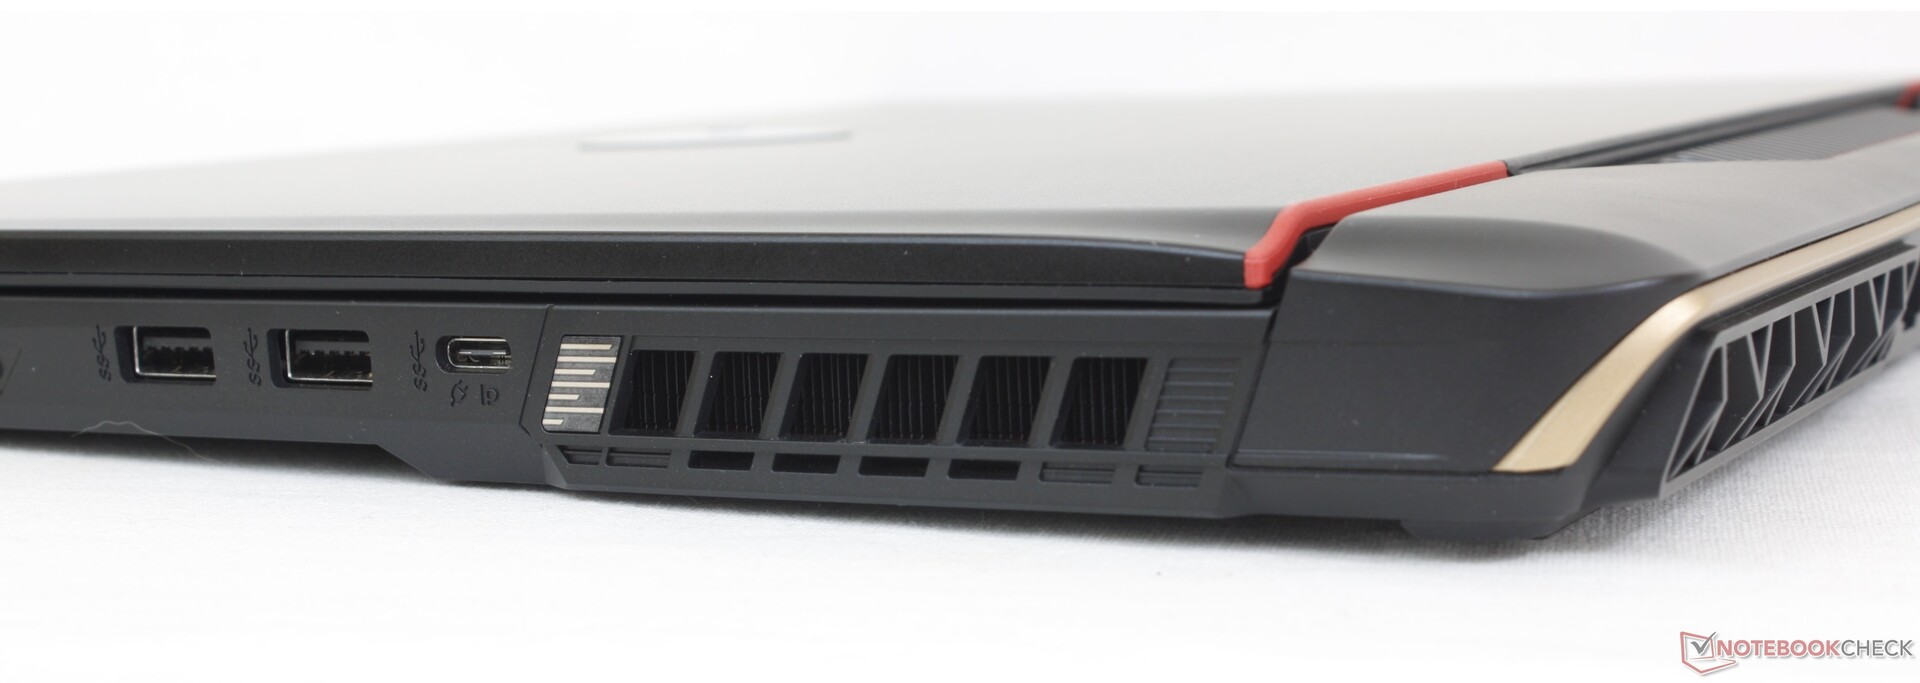
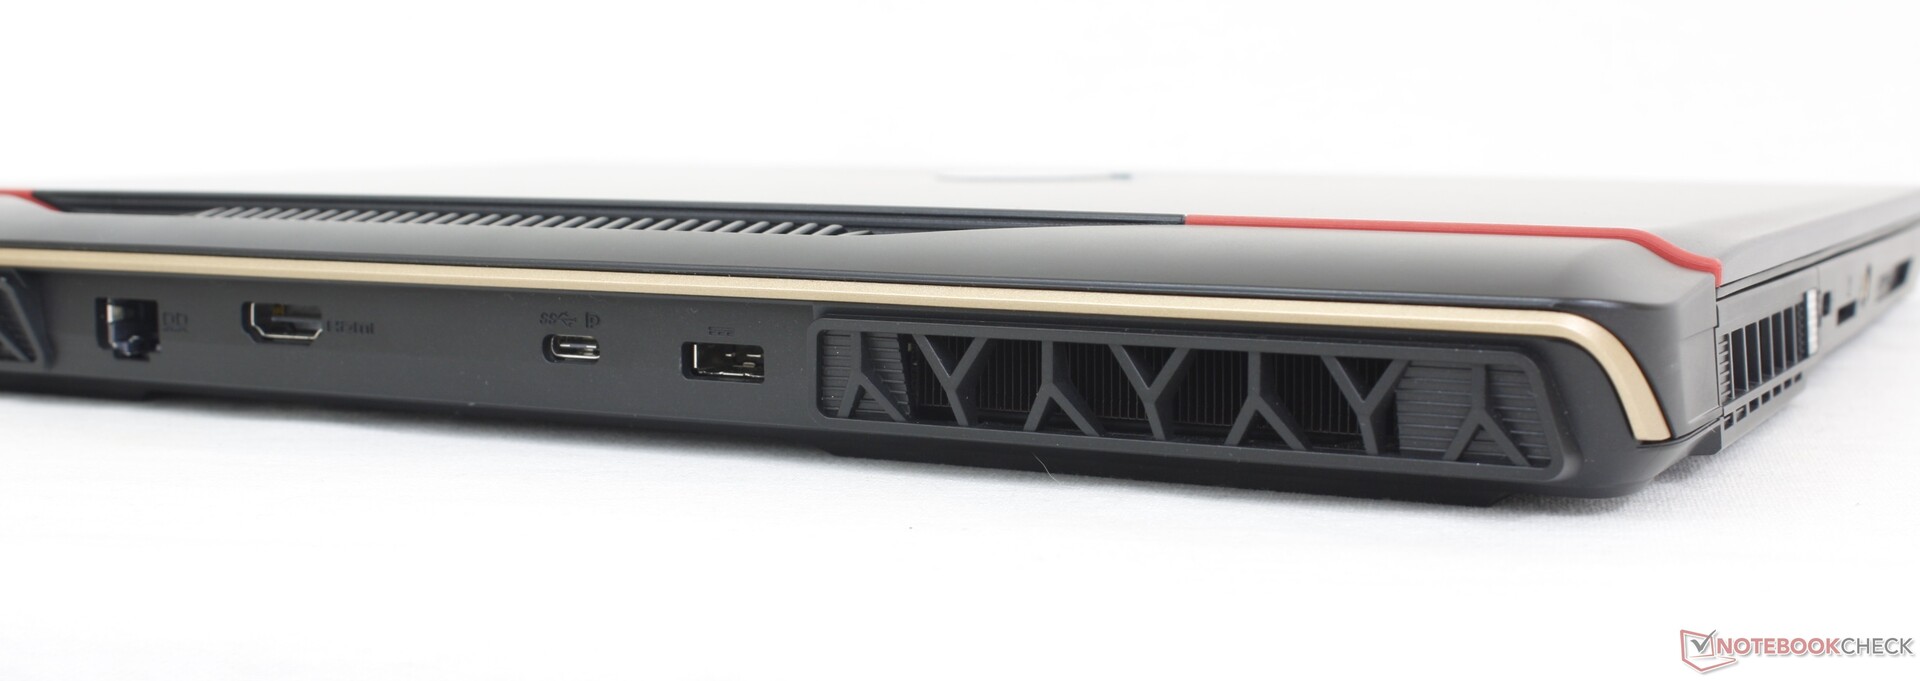
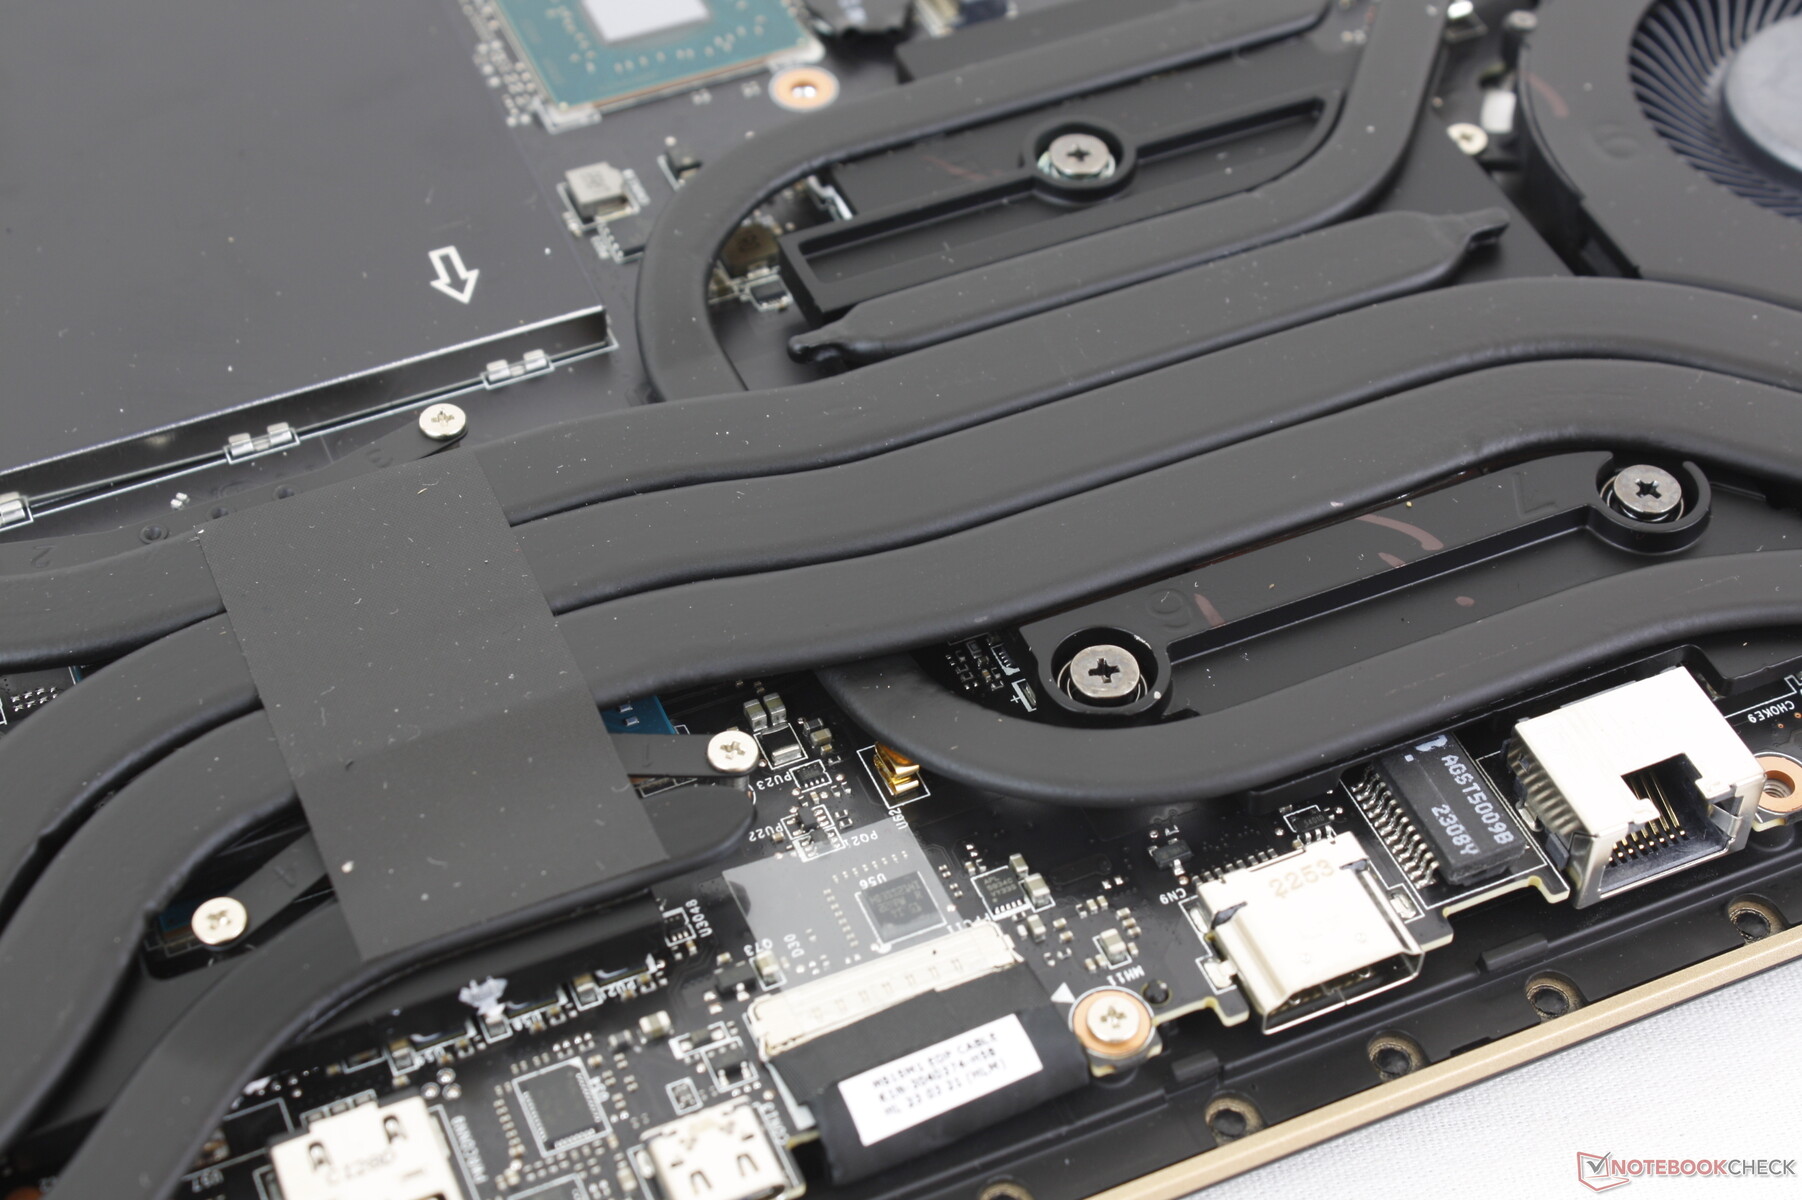
Connettività
Le opzioni delle porte sono leggermente cambiate rispetto all'anno scorso GE67HX. Mentre il GE67HX disponeva di 3x porte USB-A e 2x porte USB-C, il GE68HX è dotato di 2x porte USB-A e 3x porte USB-C. Tutte e tre le porte USB-C supportano la Displayport, ma solo quella lungo il bordo sinistro è compatibile con la Thunderbolt 4.
Stranamente, MSI ha scelto di eliminare il lucchetto Kensington dal design di quest'anno. Non c'è nemmeno la porta mini-DisplayPort, a differenza di quanto accadeva con l'Alienware m16 R1.Alienware m16 R1.
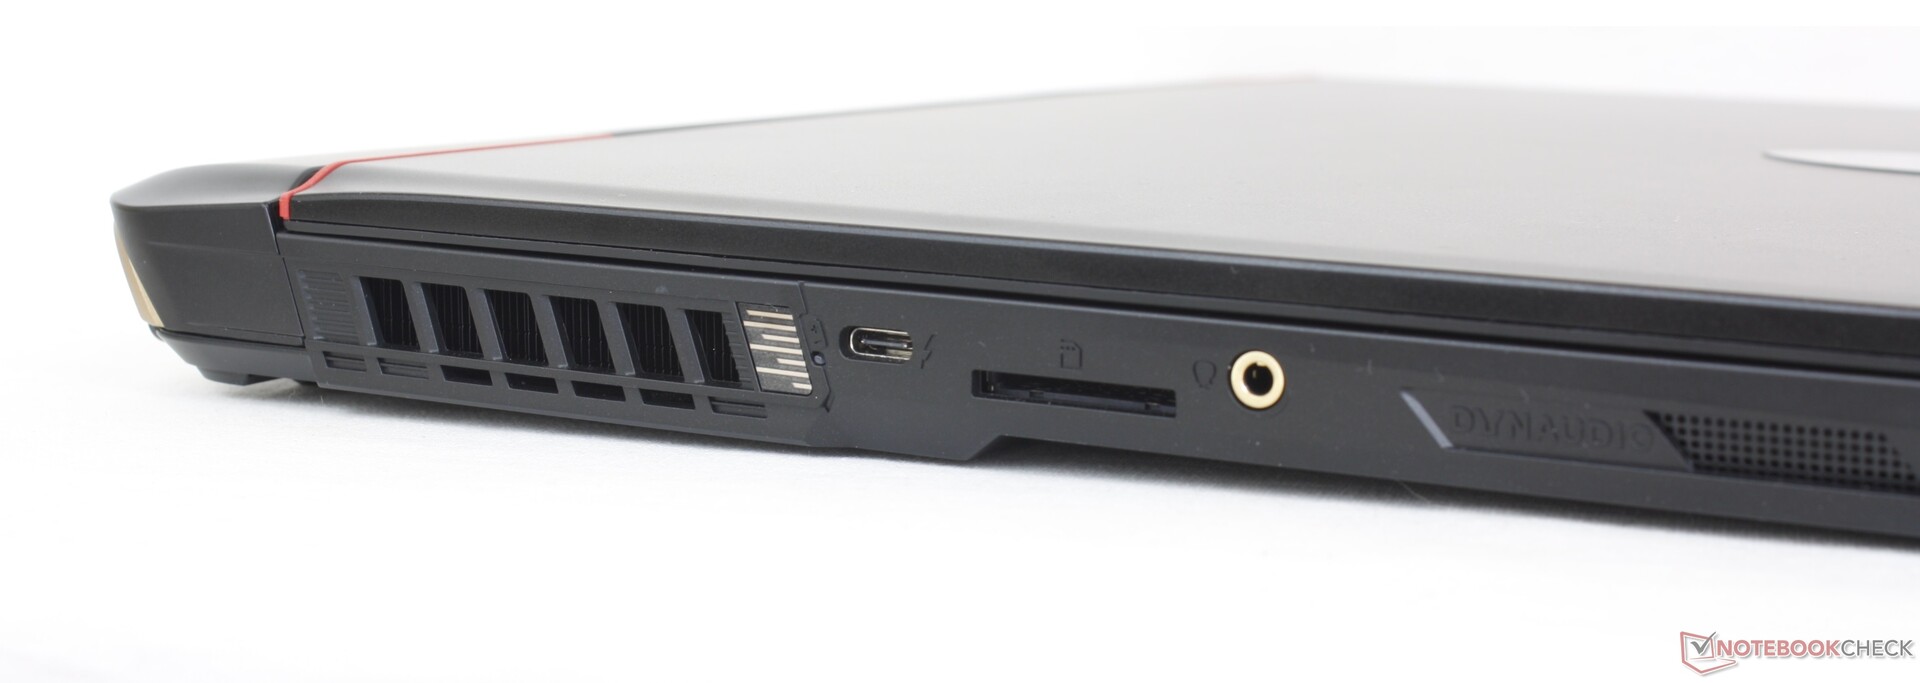
Lettore di schede SD
Il lettore di schede SD integrato è un po' lento per quello che dovrebbe essere un modello da gioco di fascia medio-alta. Il trasferimento di 1 GB di immagini dalla nostra scheda di prova UHS-II al desktop ha richiesto poco più di 12 secondi, mentre lo stesso test sull' Alienware m16 R1 sarebbe stato due volte più veloce.
| SD Card Reader | |
| average JPG Copy Test (av. of 3 runs) | |
| Alienware m16 R1 AMD (Toshiba Exceria Pro SDXC 64 GB UHS-II) | |
| Asus ROG Zephyrus M16 GU604VY-NM042X | |
| Lenovo Legion Slim 7i 16 Gen 8 (Toshiba Exceria Pro SDXC 64 GB UHS-II) | |
| MSI GE67 HX 12UGS (Toshiba Exceria Pro SDXC 64 GB UHS-II) | |
| MSI Raider GE68HX 13VF (Toshiba Exceria Pro SDXC 64 GB UHS-II) | |
| maximum AS SSD Seq Read Test (1GB) | |
| Alienware m16 R1 AMD (Toshiba Exceria Pro SDXC 64 GB UHS-II) | |
| Asus ROG Zephyrus M16 GU604VY-NM042X | |
| Lenovo Legion Slim 7i 16 Gen 8 (Toshiba Exceria Pro SDXC 64 GB UHS-II) | |
| MSI Raider GE68HX 13VF (Toshiba Exceria Pro SDXC 64 GB UHS-II) | |
| MSI GE67 HX 12UGS (Toshiba Exceria Pro SDXC 64 GB UHS-II) | |
Comunicazione
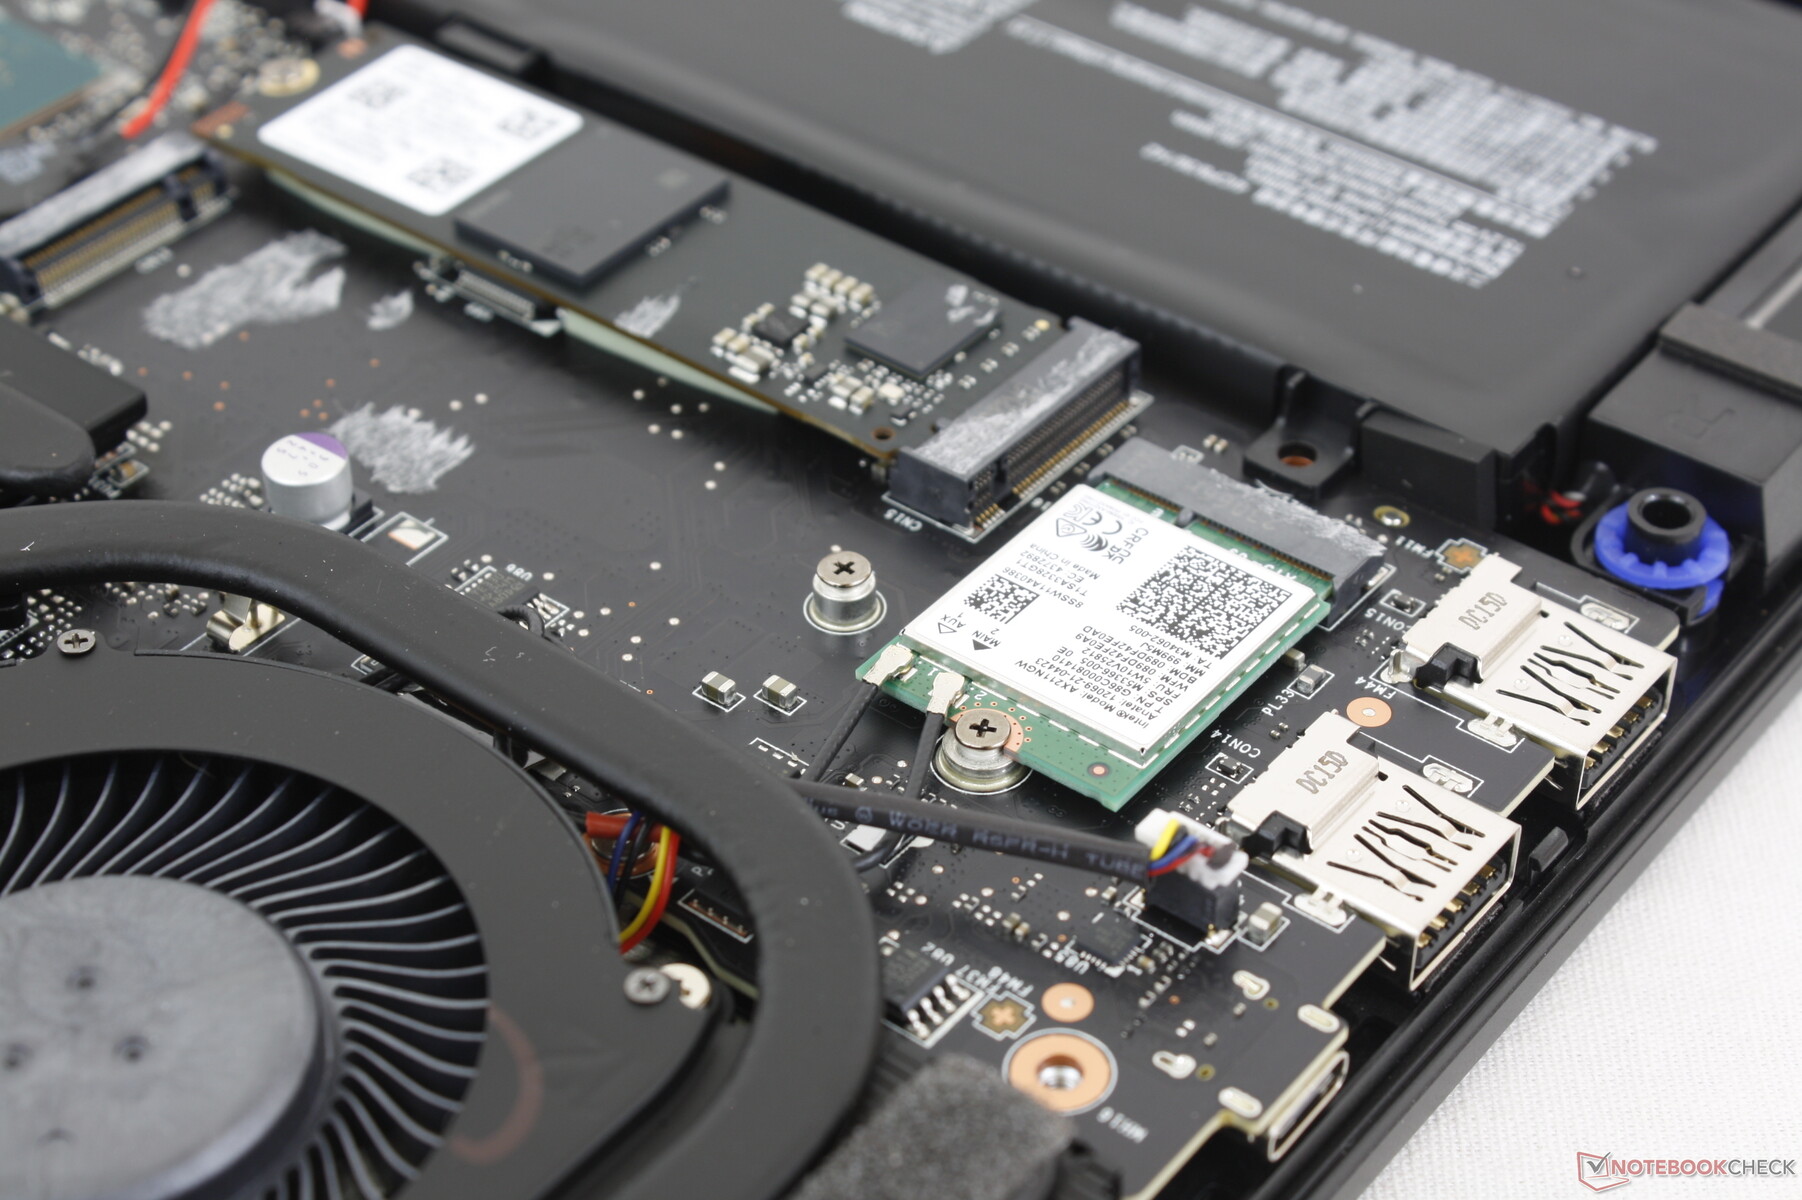
Un Intel AX211 è fornito di serie per il supporto Wi-Fi 6E e Bluetooth 5.3. Non abbiamo riscontrato problemi di connettività quando siamo stati accoppiati alla nostra rete di test AXE11000 a 6 GHz.
| Networking | |
| iperf3 transmit AXE11000 | |
| Alienware m16 R1 AMD | |
| MSI Raider GE68HX 13VF | |
| HP Omen 16-xf0376ng | |
| Lenovo Legion Slim 7i 16 Gen 8 | |
| iperf3 receive AXE11000 | |
| HP Omen 16-xf0376ng | |
| Alienware m16 R1 AMD | |
| Lenovo Legion Slim 7i 16 Gen 8 | |
| MSI Raider GE68HX 13VF | |
| iperf3 transmit AXE11000 6GHz | |
| Alienware m16 R1 AMD | |
| Asus ROG Zephyrus M16 GU604VY-NM042X | |
| Lenovo Legion Slim 7i 16 Gen 8 | |
| MSI Raider GE68HX 13VF | |
| MSI GE67 HX 12UGS | |
| iperf3 receive AXE11000 6GHz | |
| Asus ROG Zephyrus M16 GU604VY-NM042X | |
| Alienware m16 R1 AMD | |
| Lenovo Legion Slim 7i 16 Gen 8 | |
| MSI Raider GE68HX 13VF | |
| MSI GE67 HX 12UGS | |
Webcam
Mentre la qualità di 2 MP non è cambiata, ci sono ancora un paio di differenze che riguardano la webcam. L'otturatore, ad esempio, è ora un cursore fisico accanto all'obiettivo invece di un interruttore elettronico sulla tastiera. Inoltre, è stato integrato un sensore IR per il supporto di Hello.


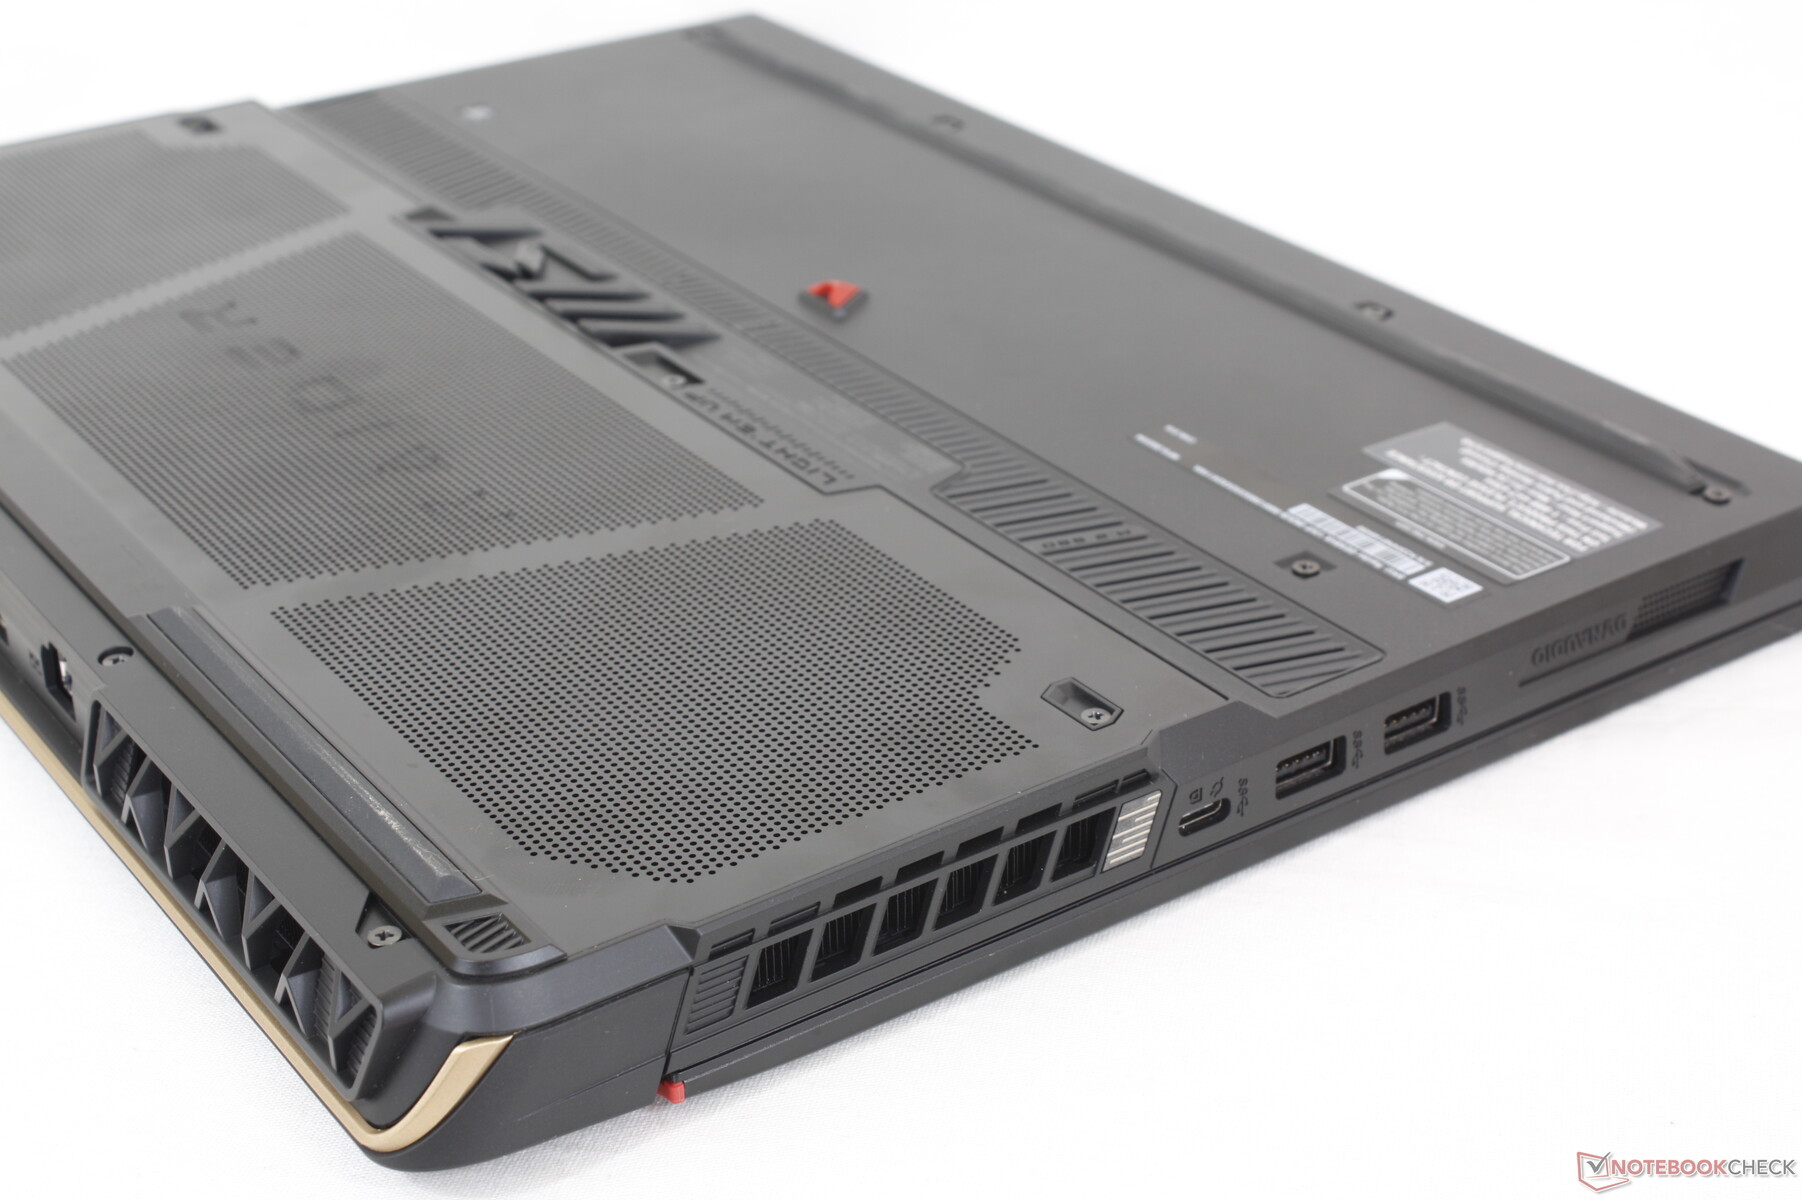
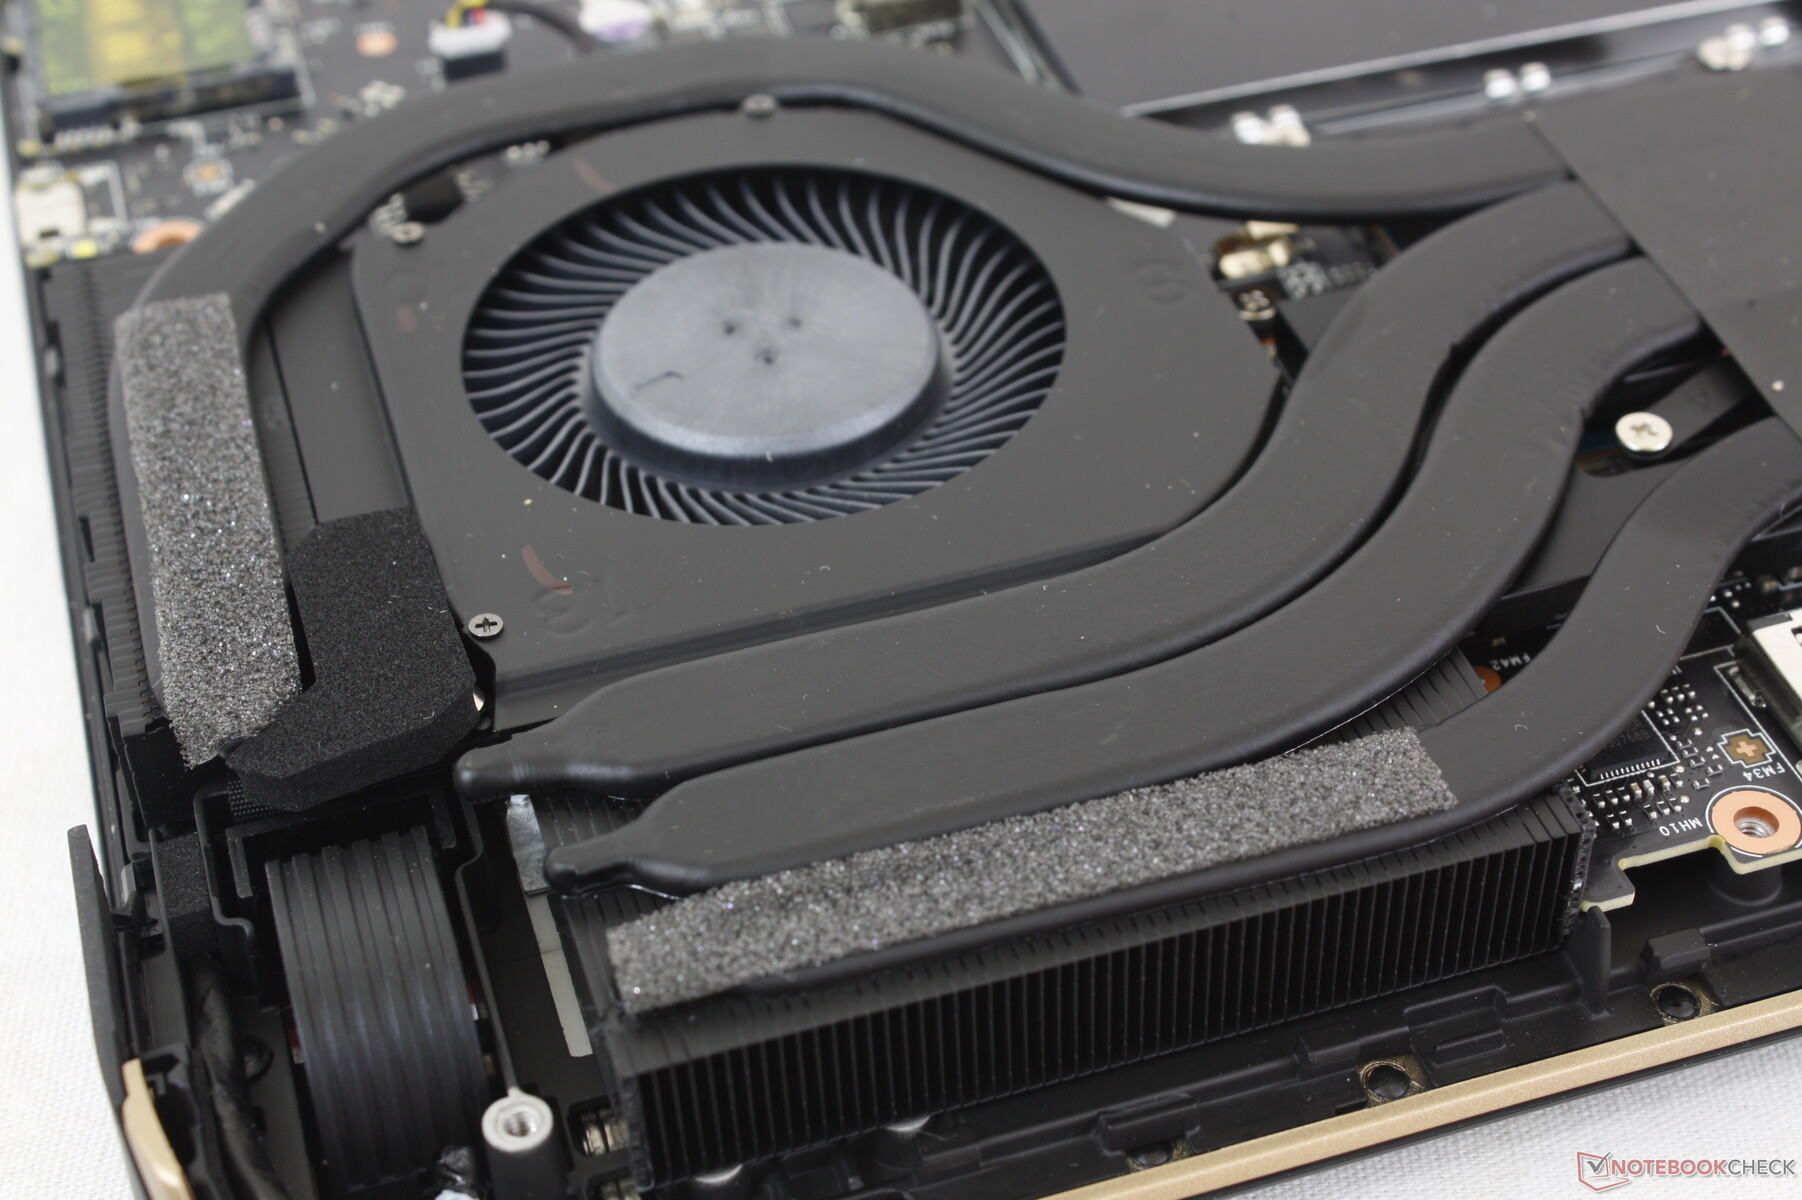
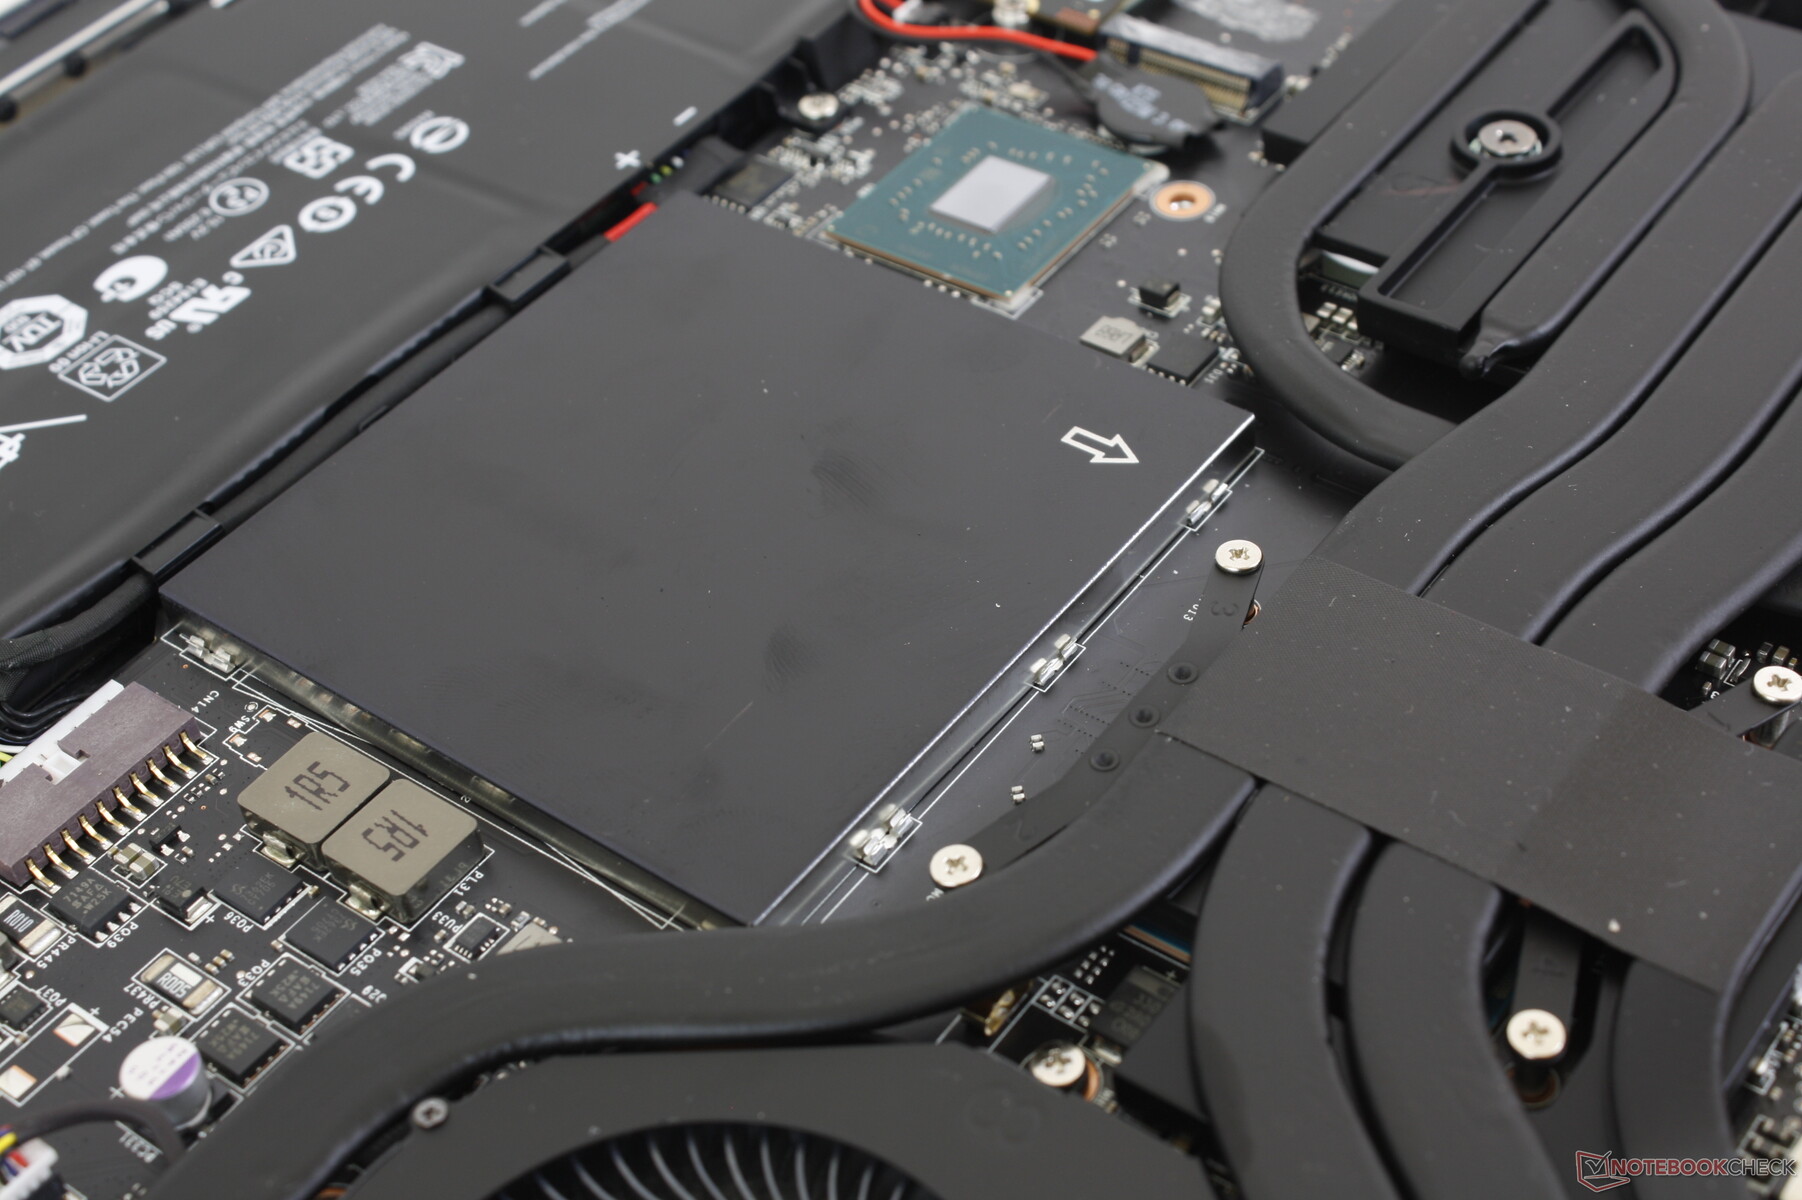
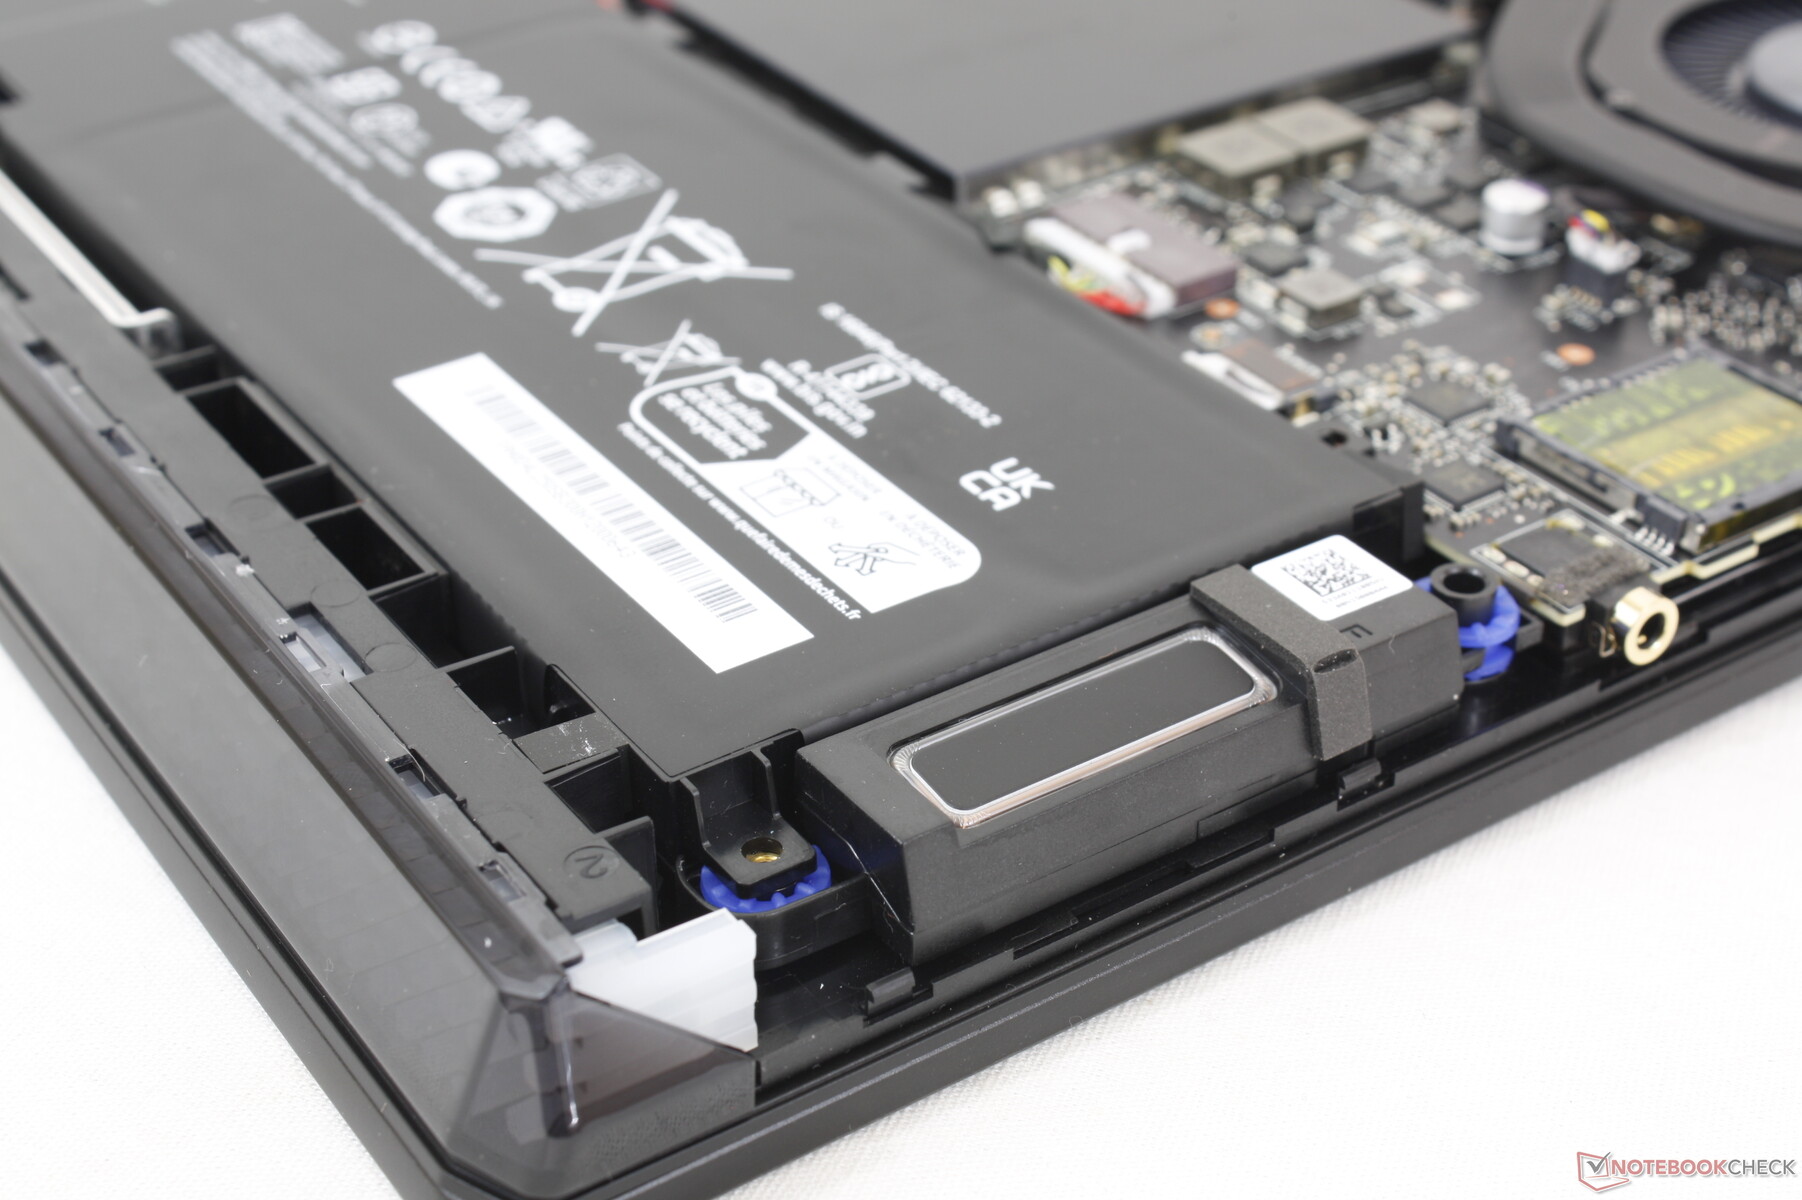
Manutenzione
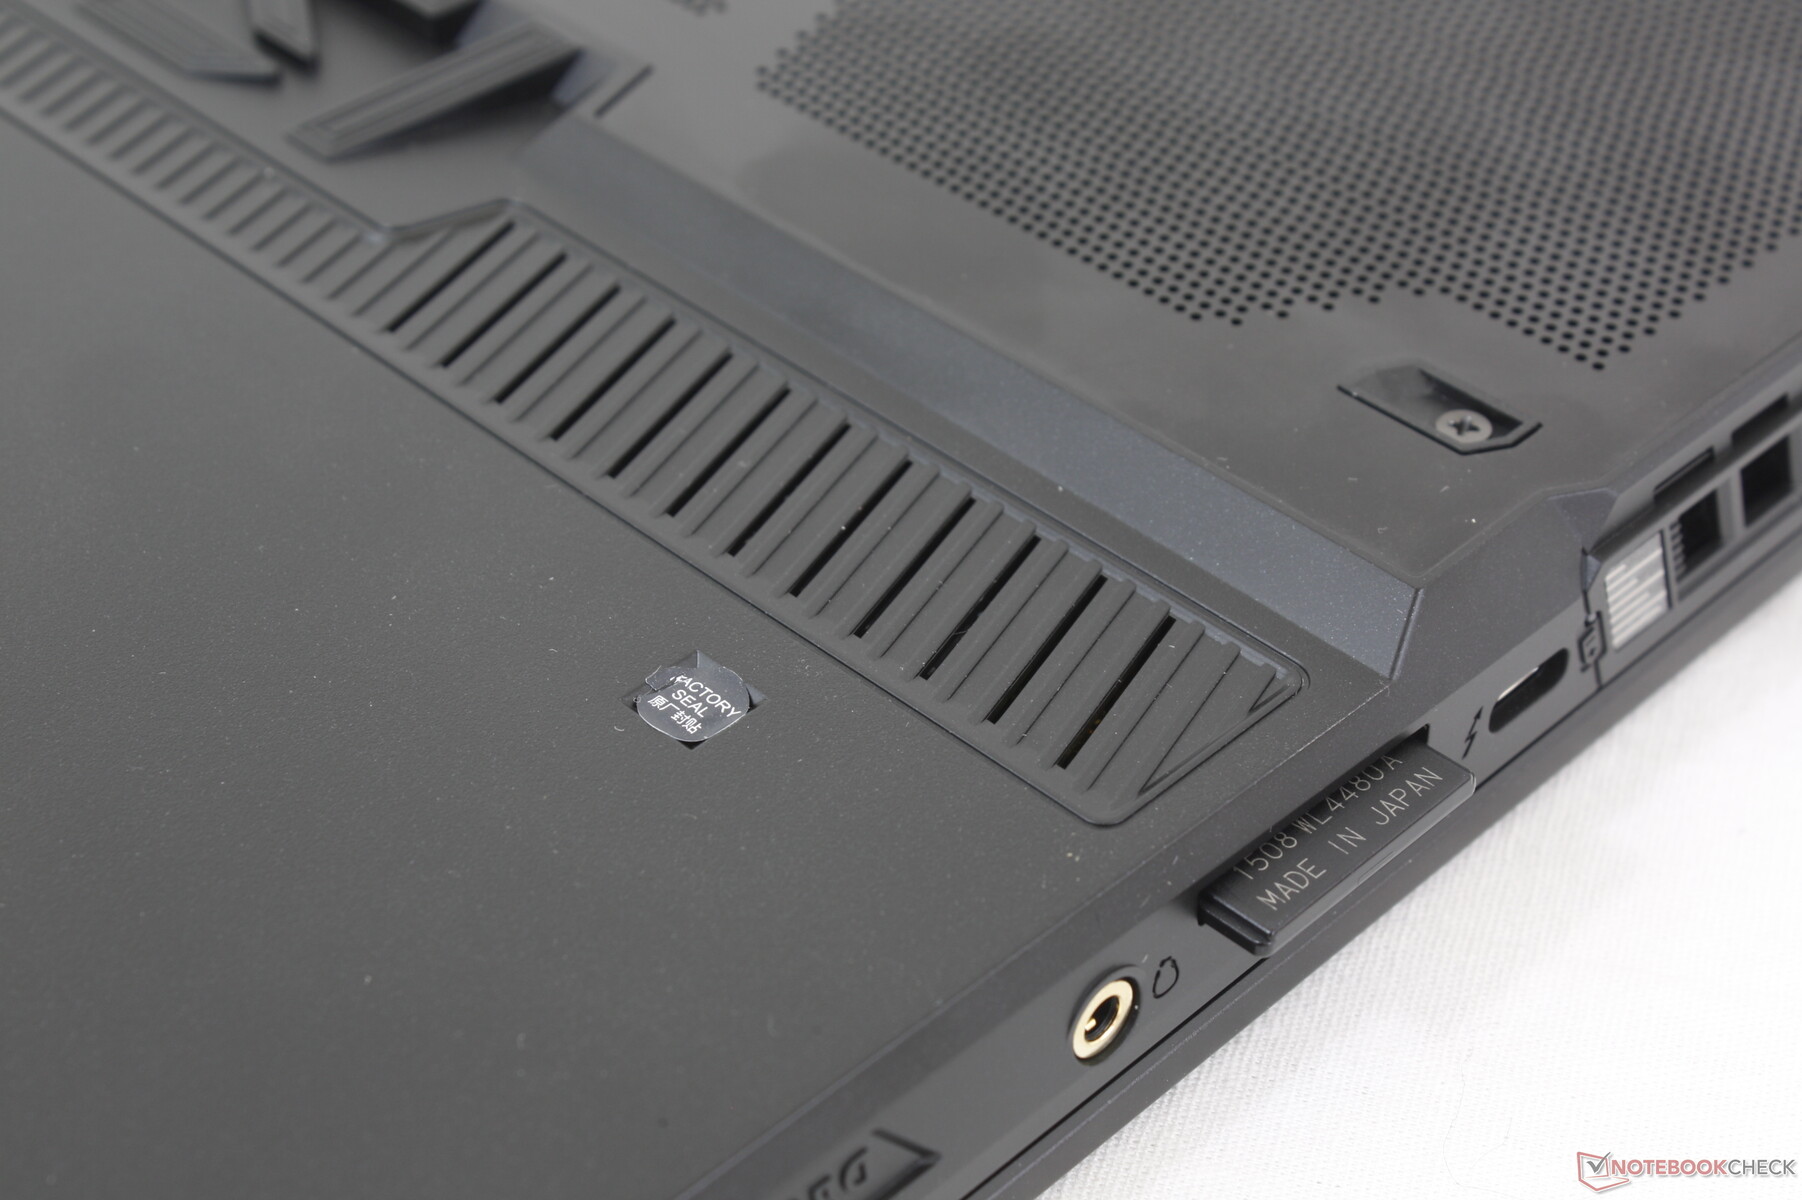
Purtroppo i portatili MSI sono sempre più difficili da riparare. Il pannello inferiore è fissato da 13 viti Phillips, una delle quali si nasconde dietro un adesivo anti-manomissione per scoraggiare la manutenzione da parte dell'utente finale. Il problema principale è che i ganci di plastica lungo i bordi del pannello sono angolati e strettamente agganciati alla base, soprattutto nella parte posteriore. Questi ganci sono difficili da staccare e ancor più da reinstallare.
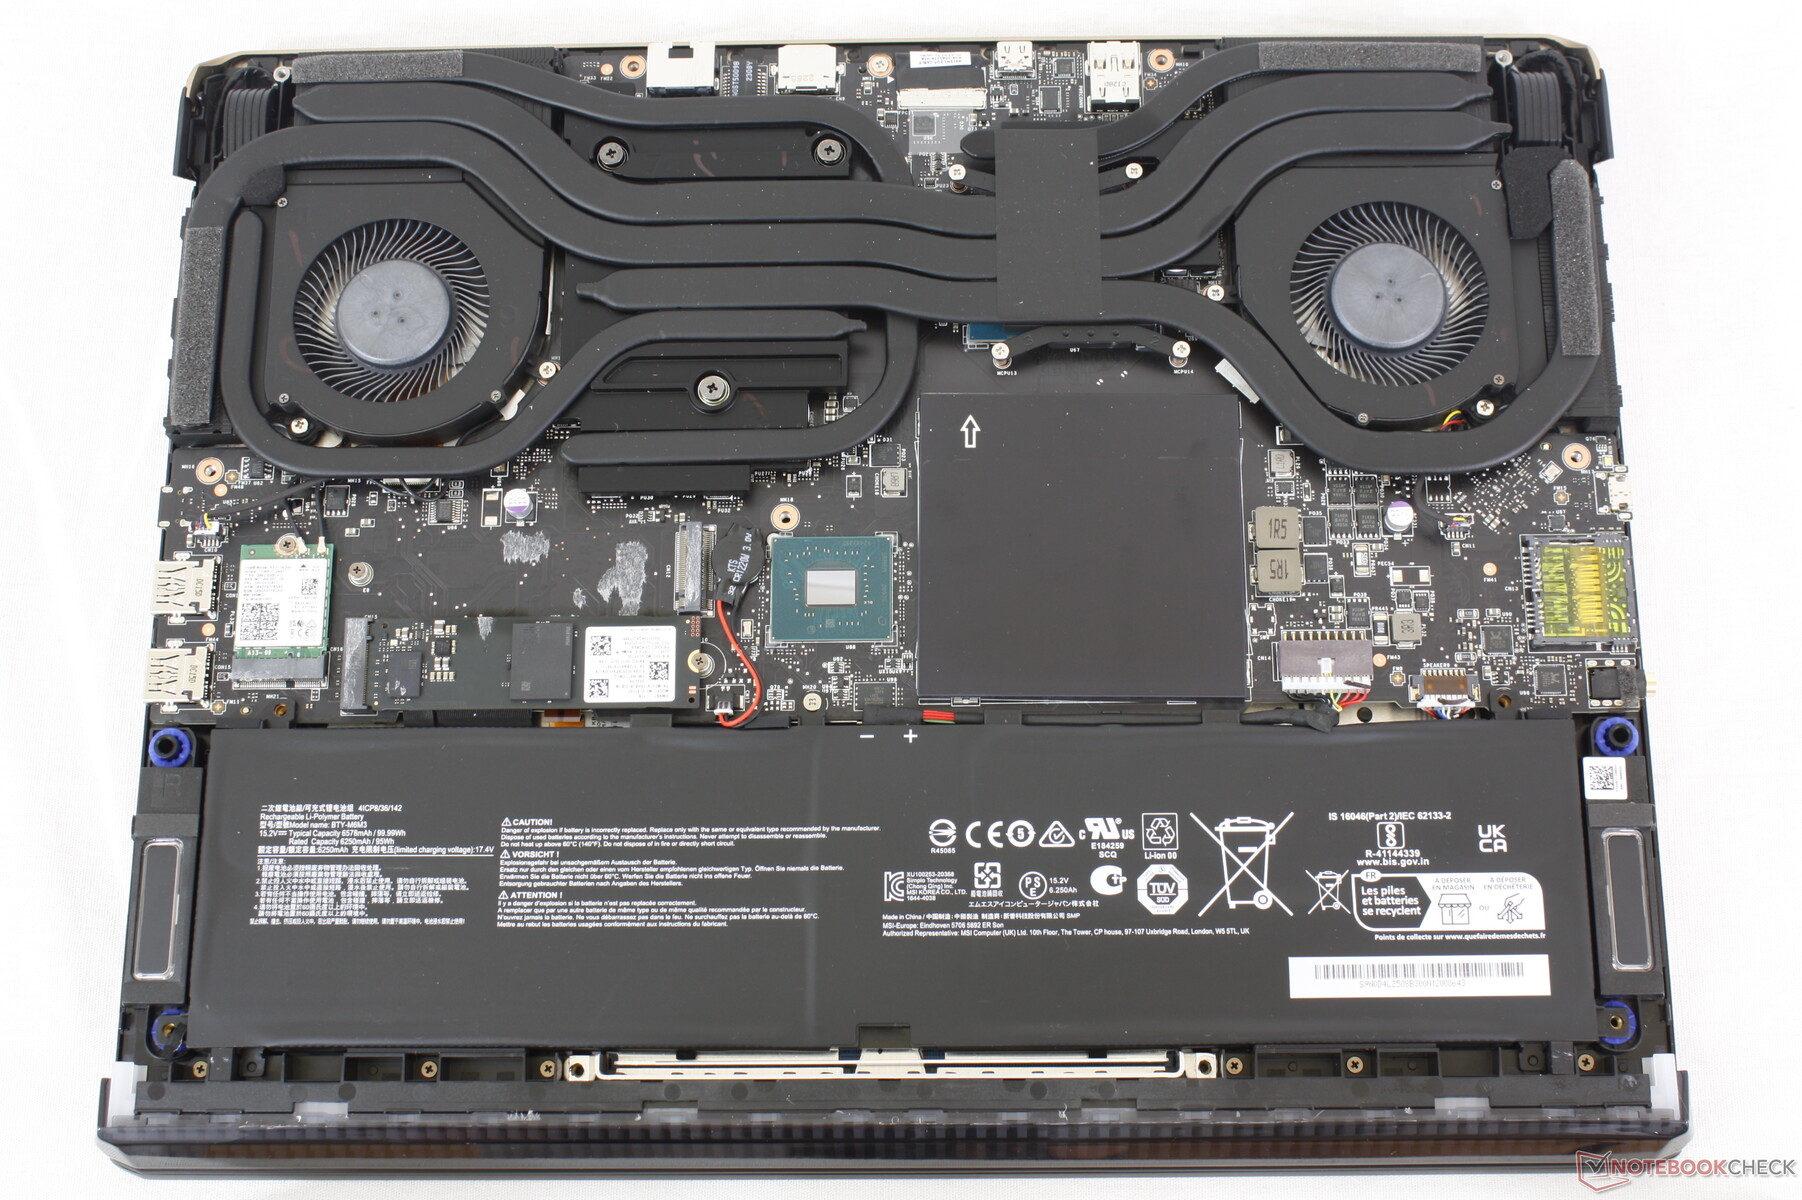
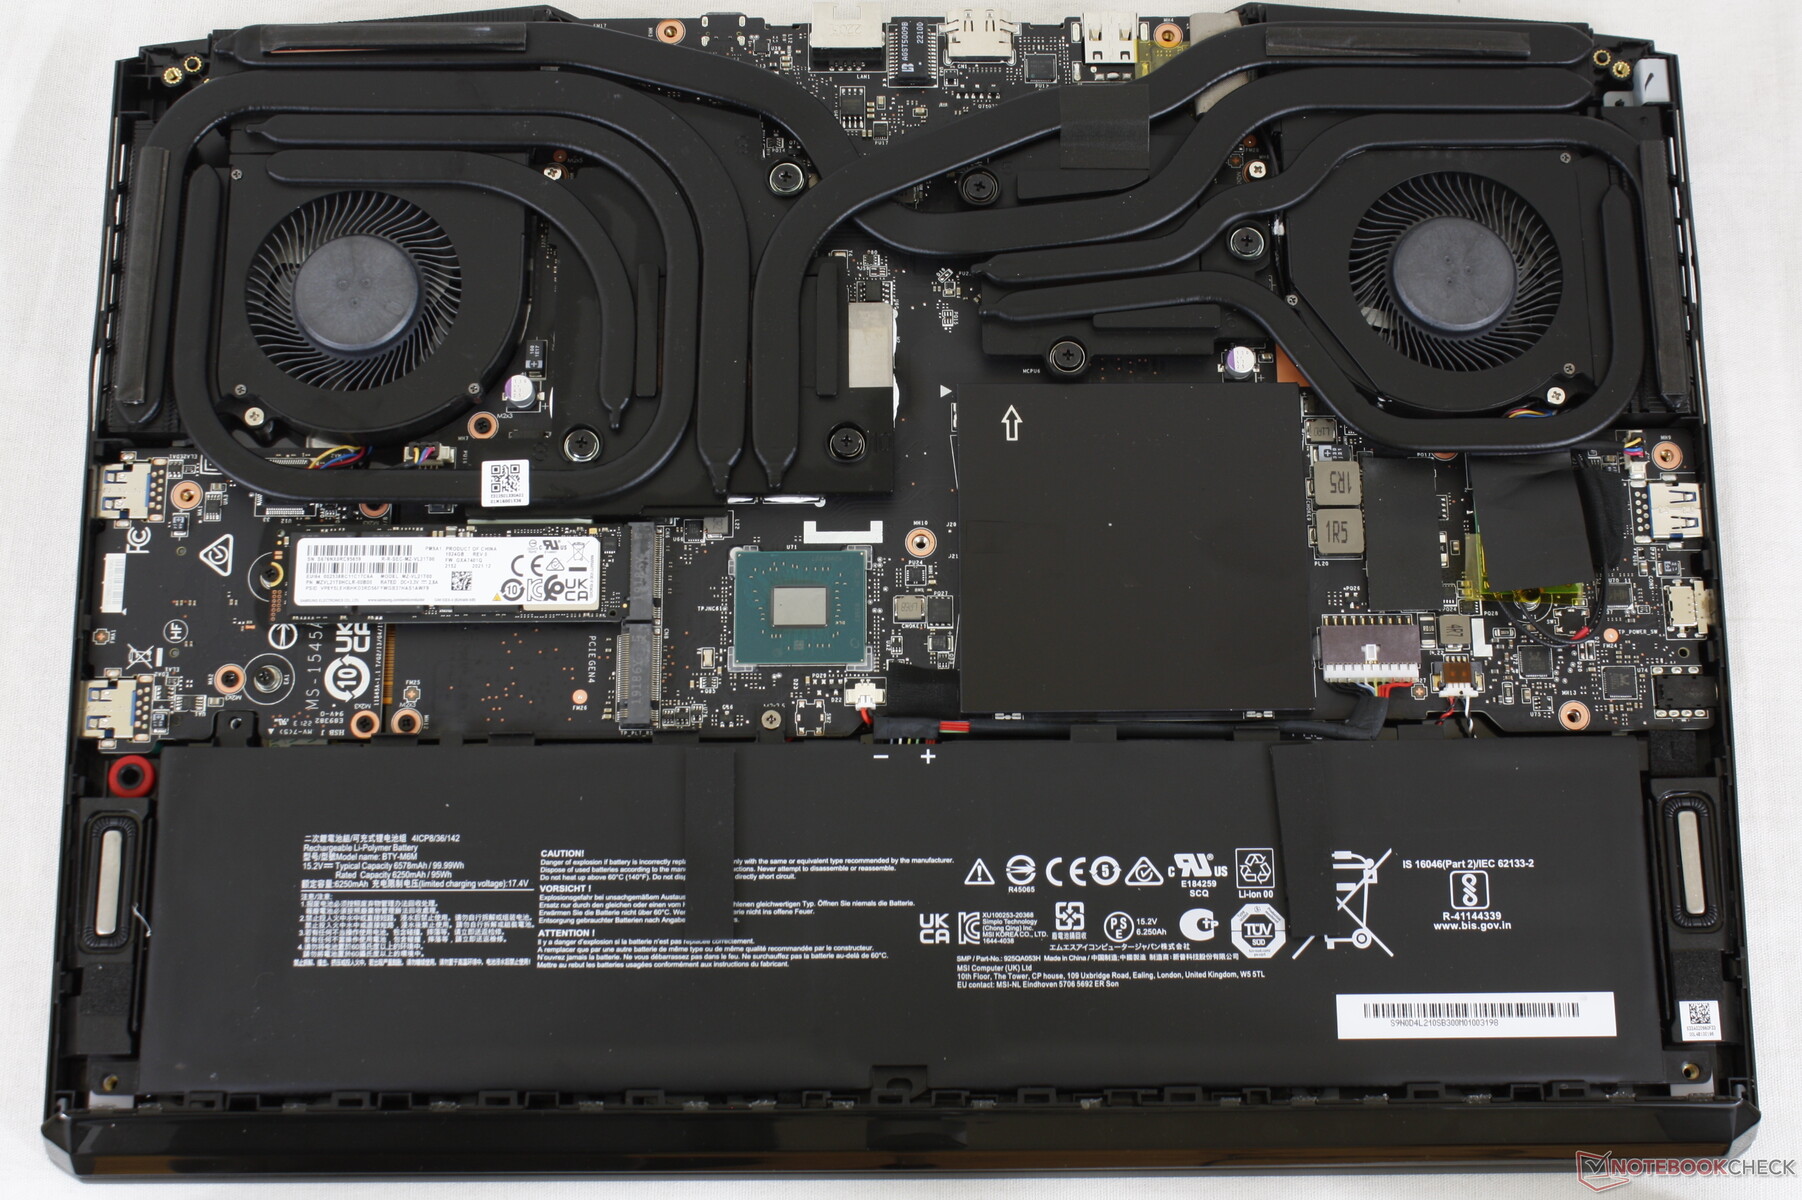
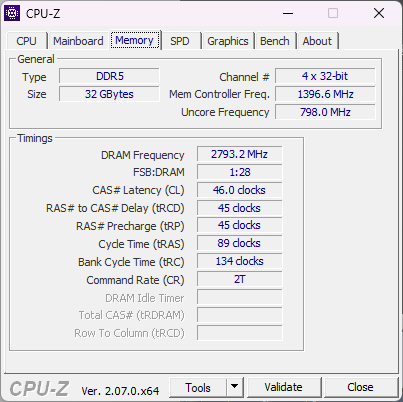
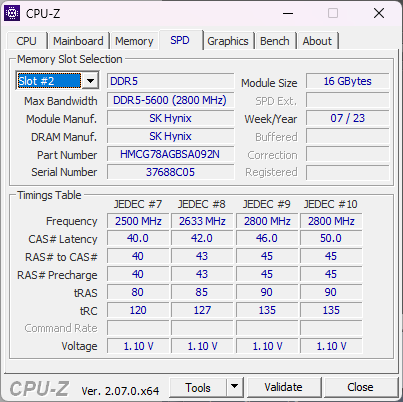
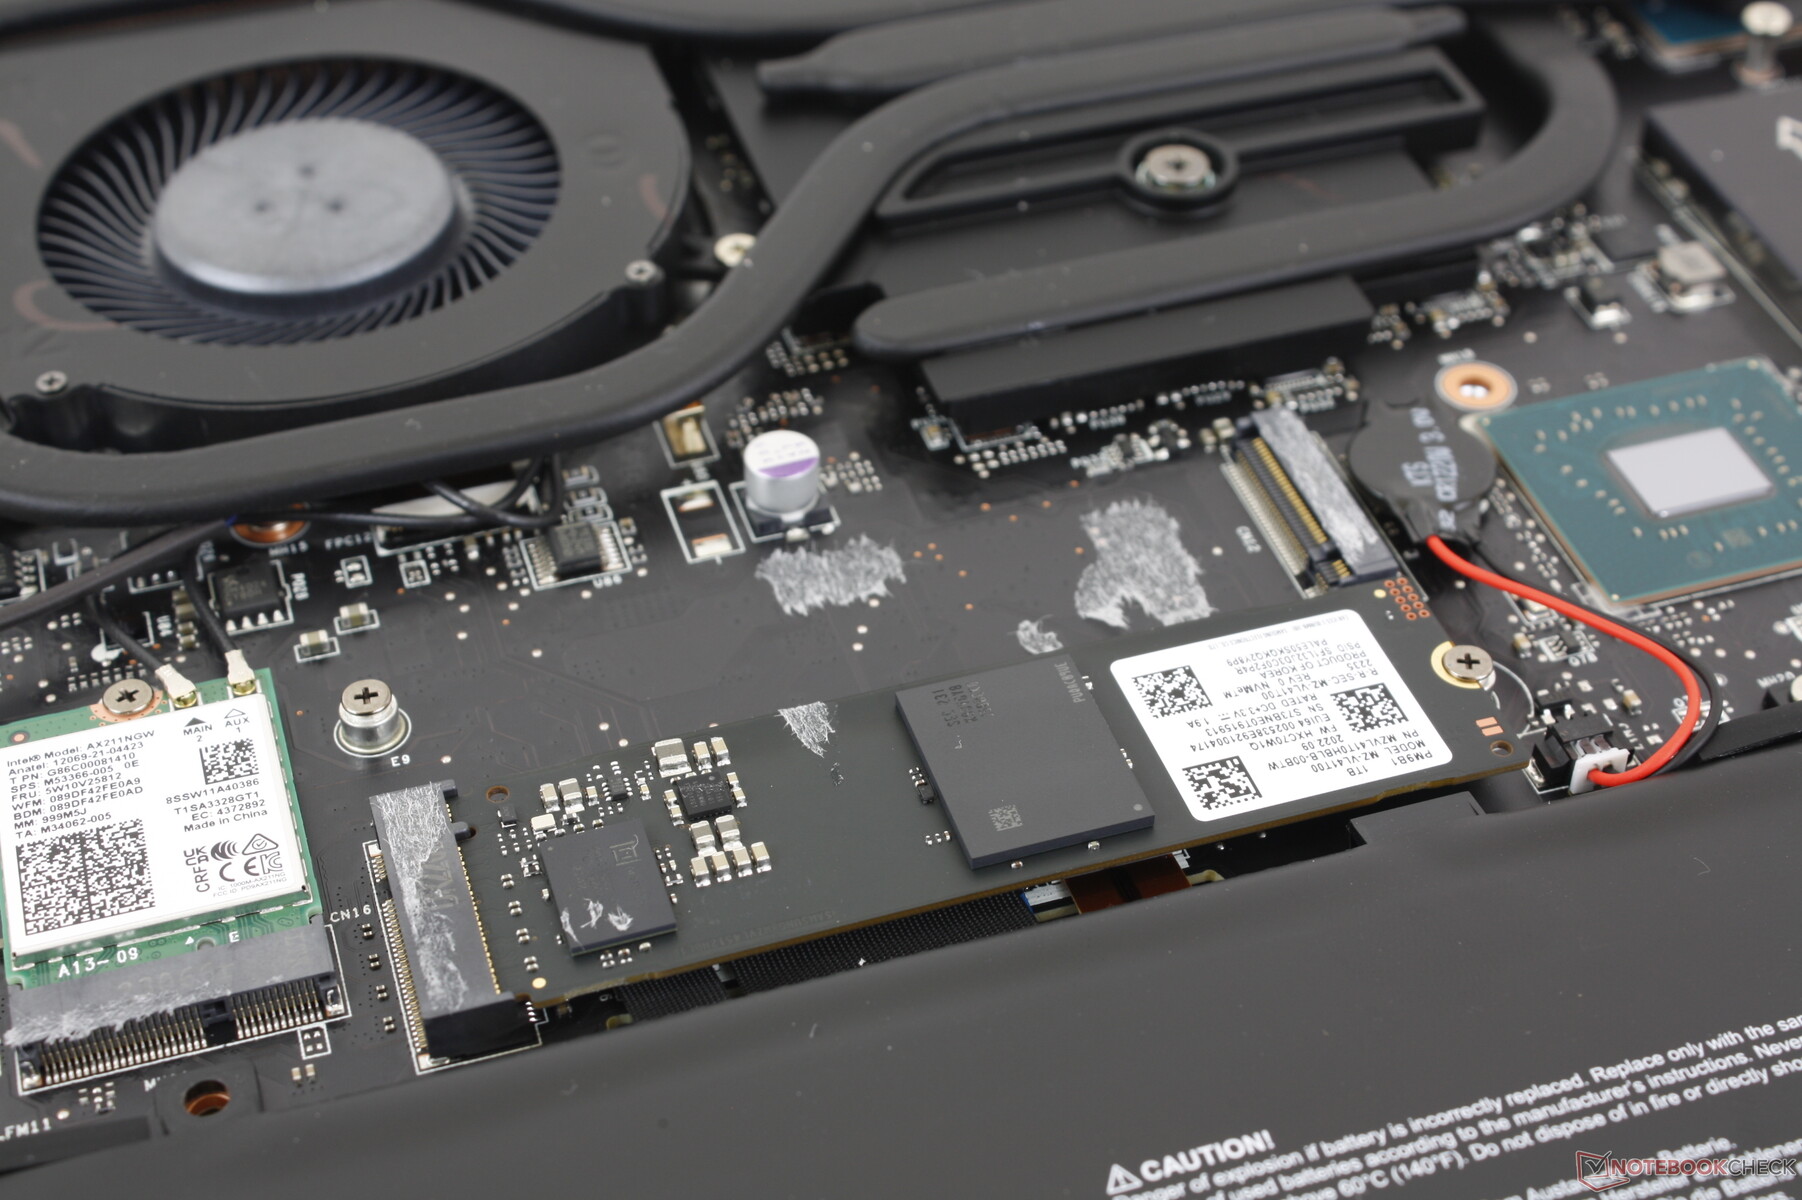
Gli utenti hanno accesso diretto ai due alloggiamenti M.2 2280, ai due slot SODIMM DDR5, al modulo WLAN e alla batteria.
Accessori e garanzia
La confezione di vendita comprende un panno per la pulizia, oltre all'adattatore CA e alla documentazione. La garanzia limitata del produttore è di un anno se acquistata negli Stati Uniti.
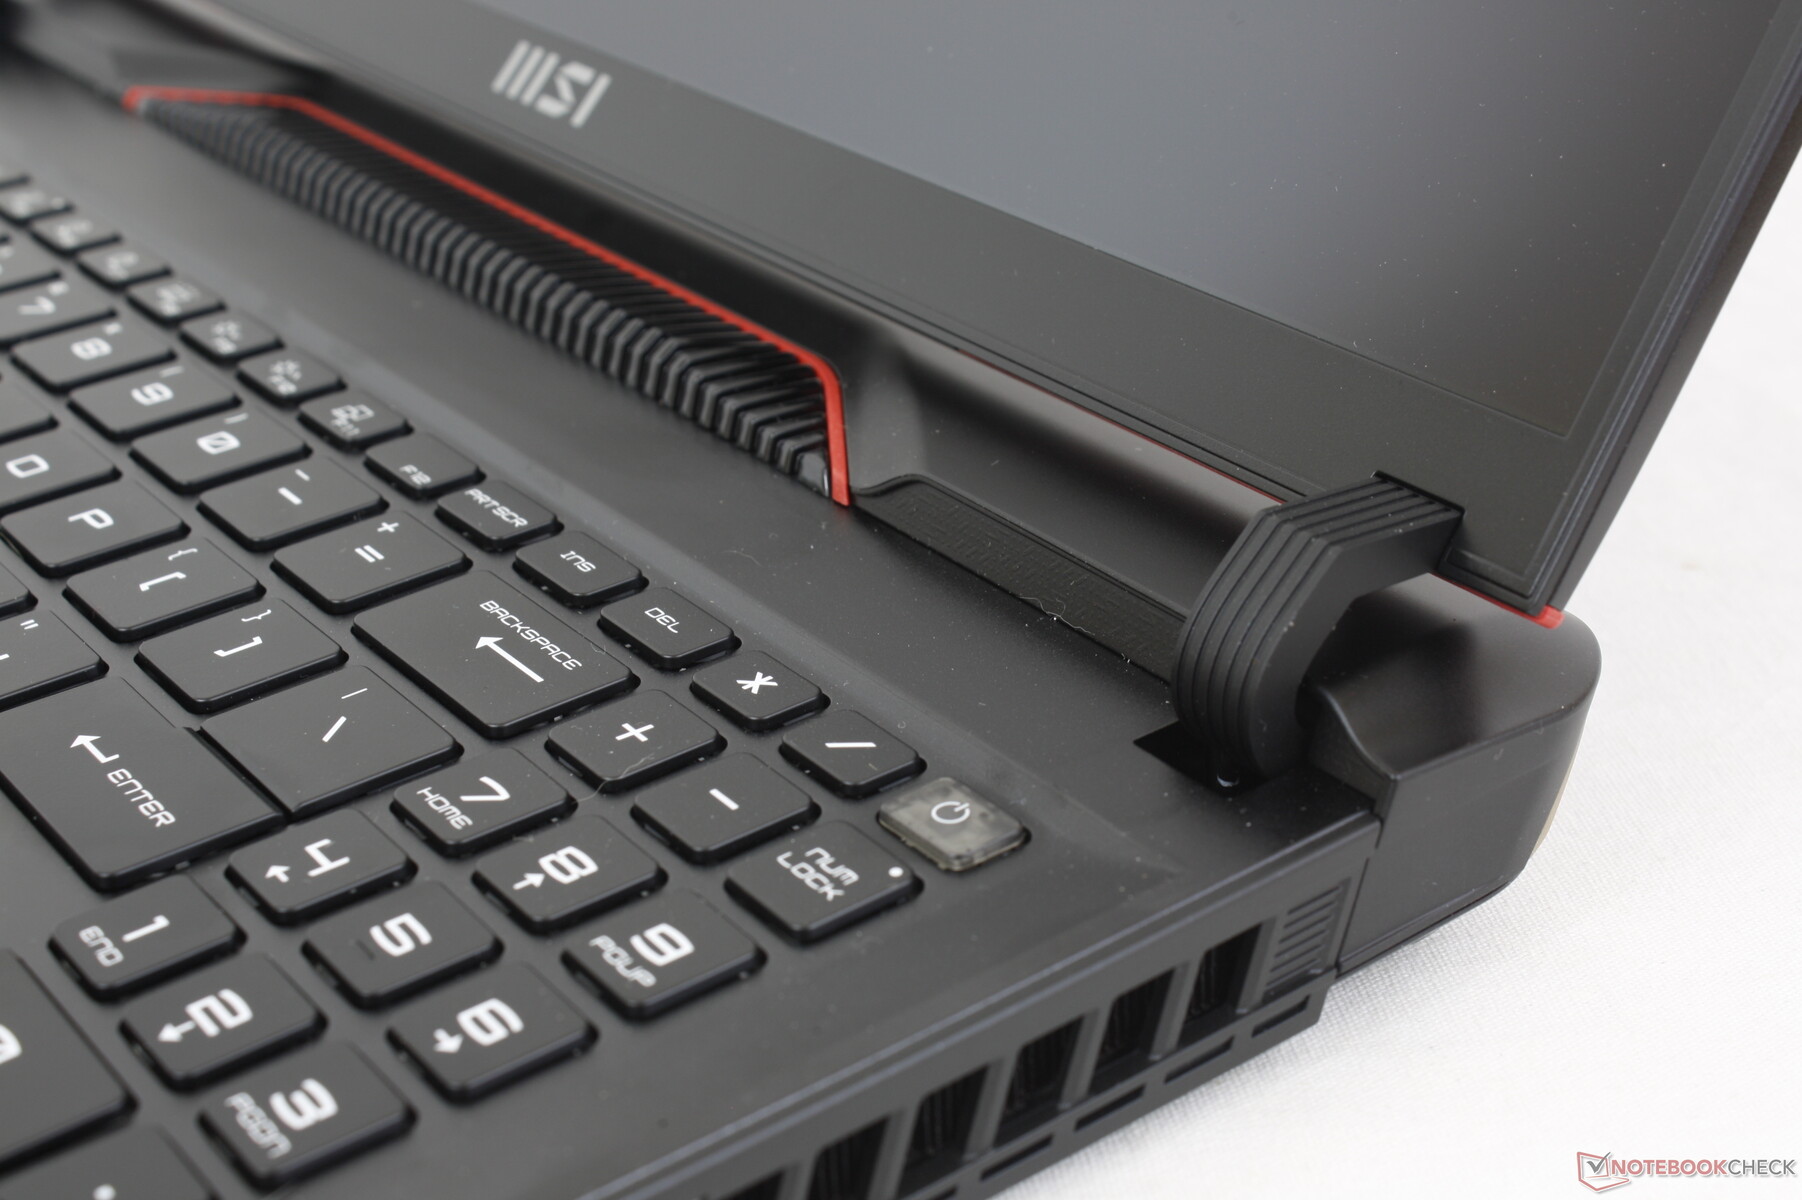
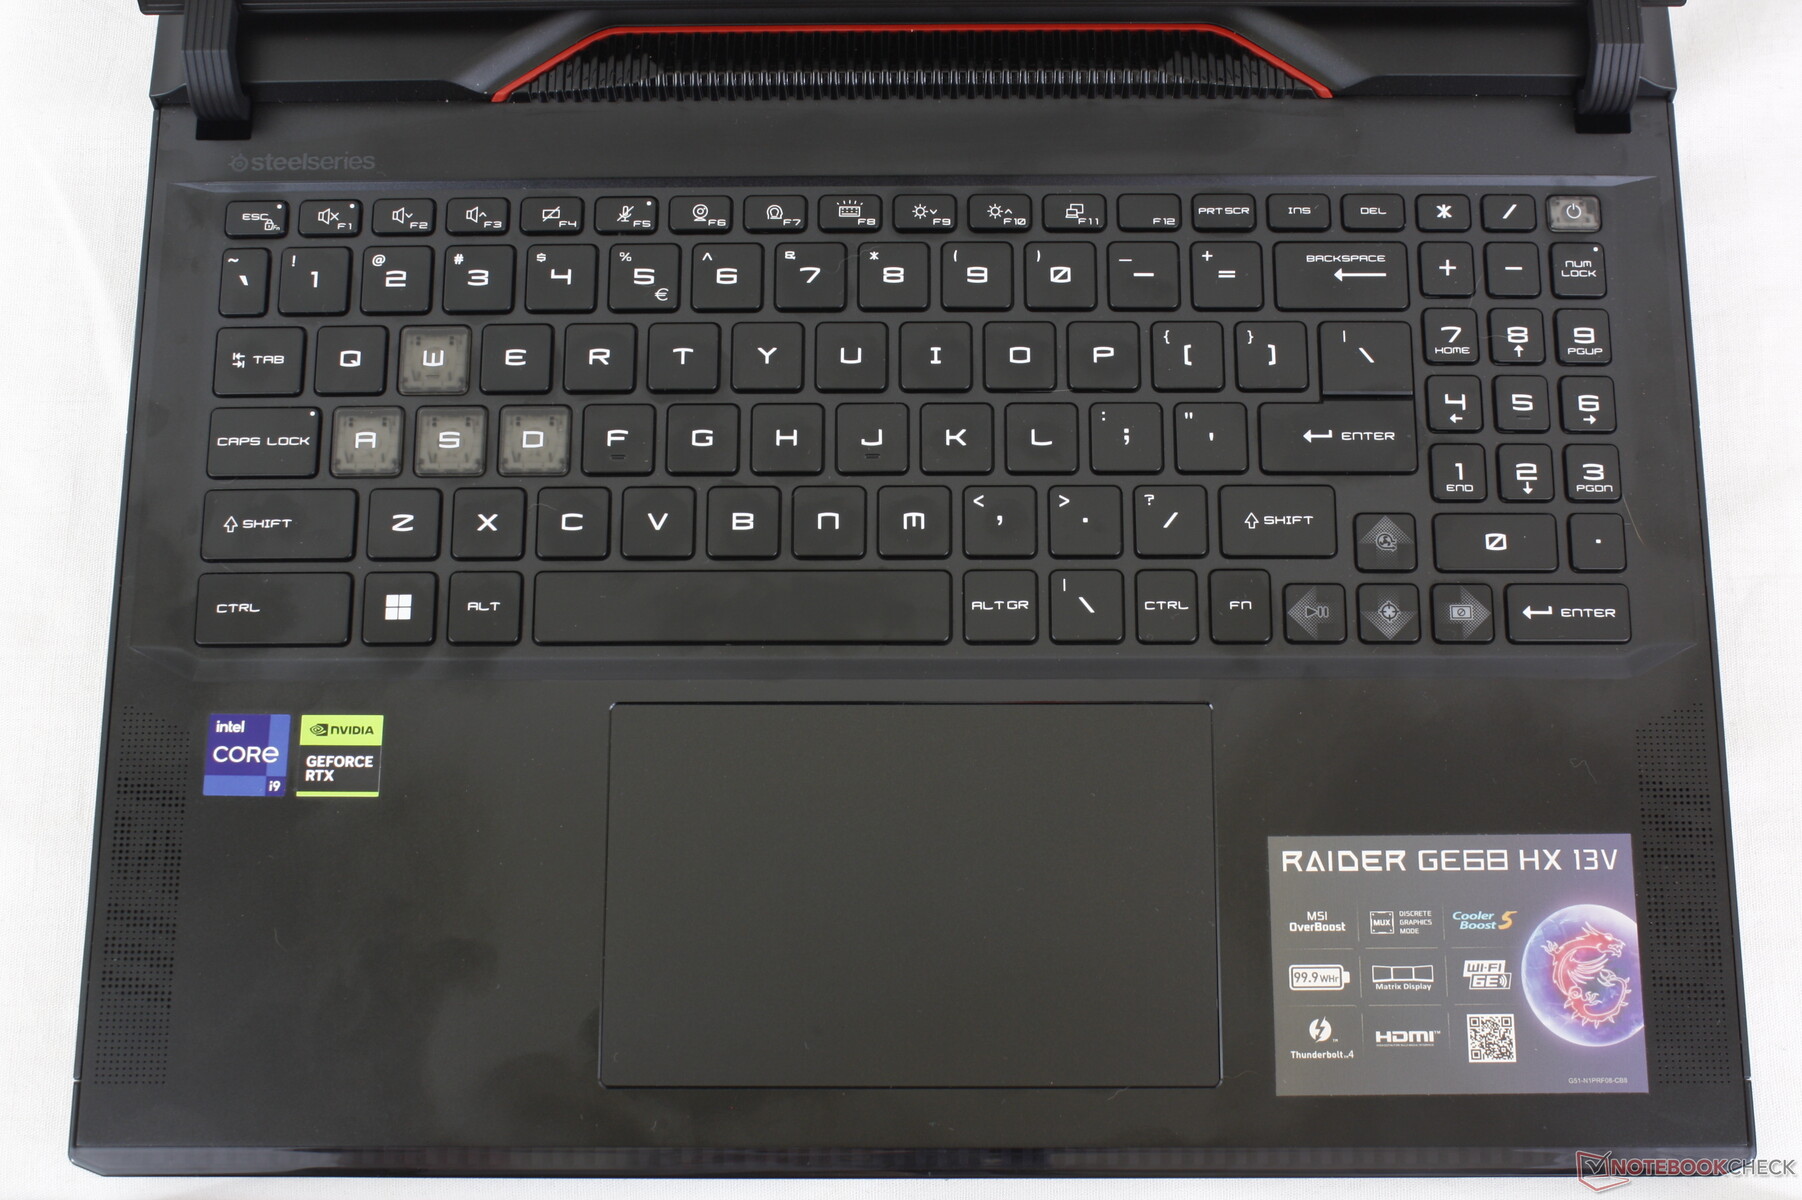
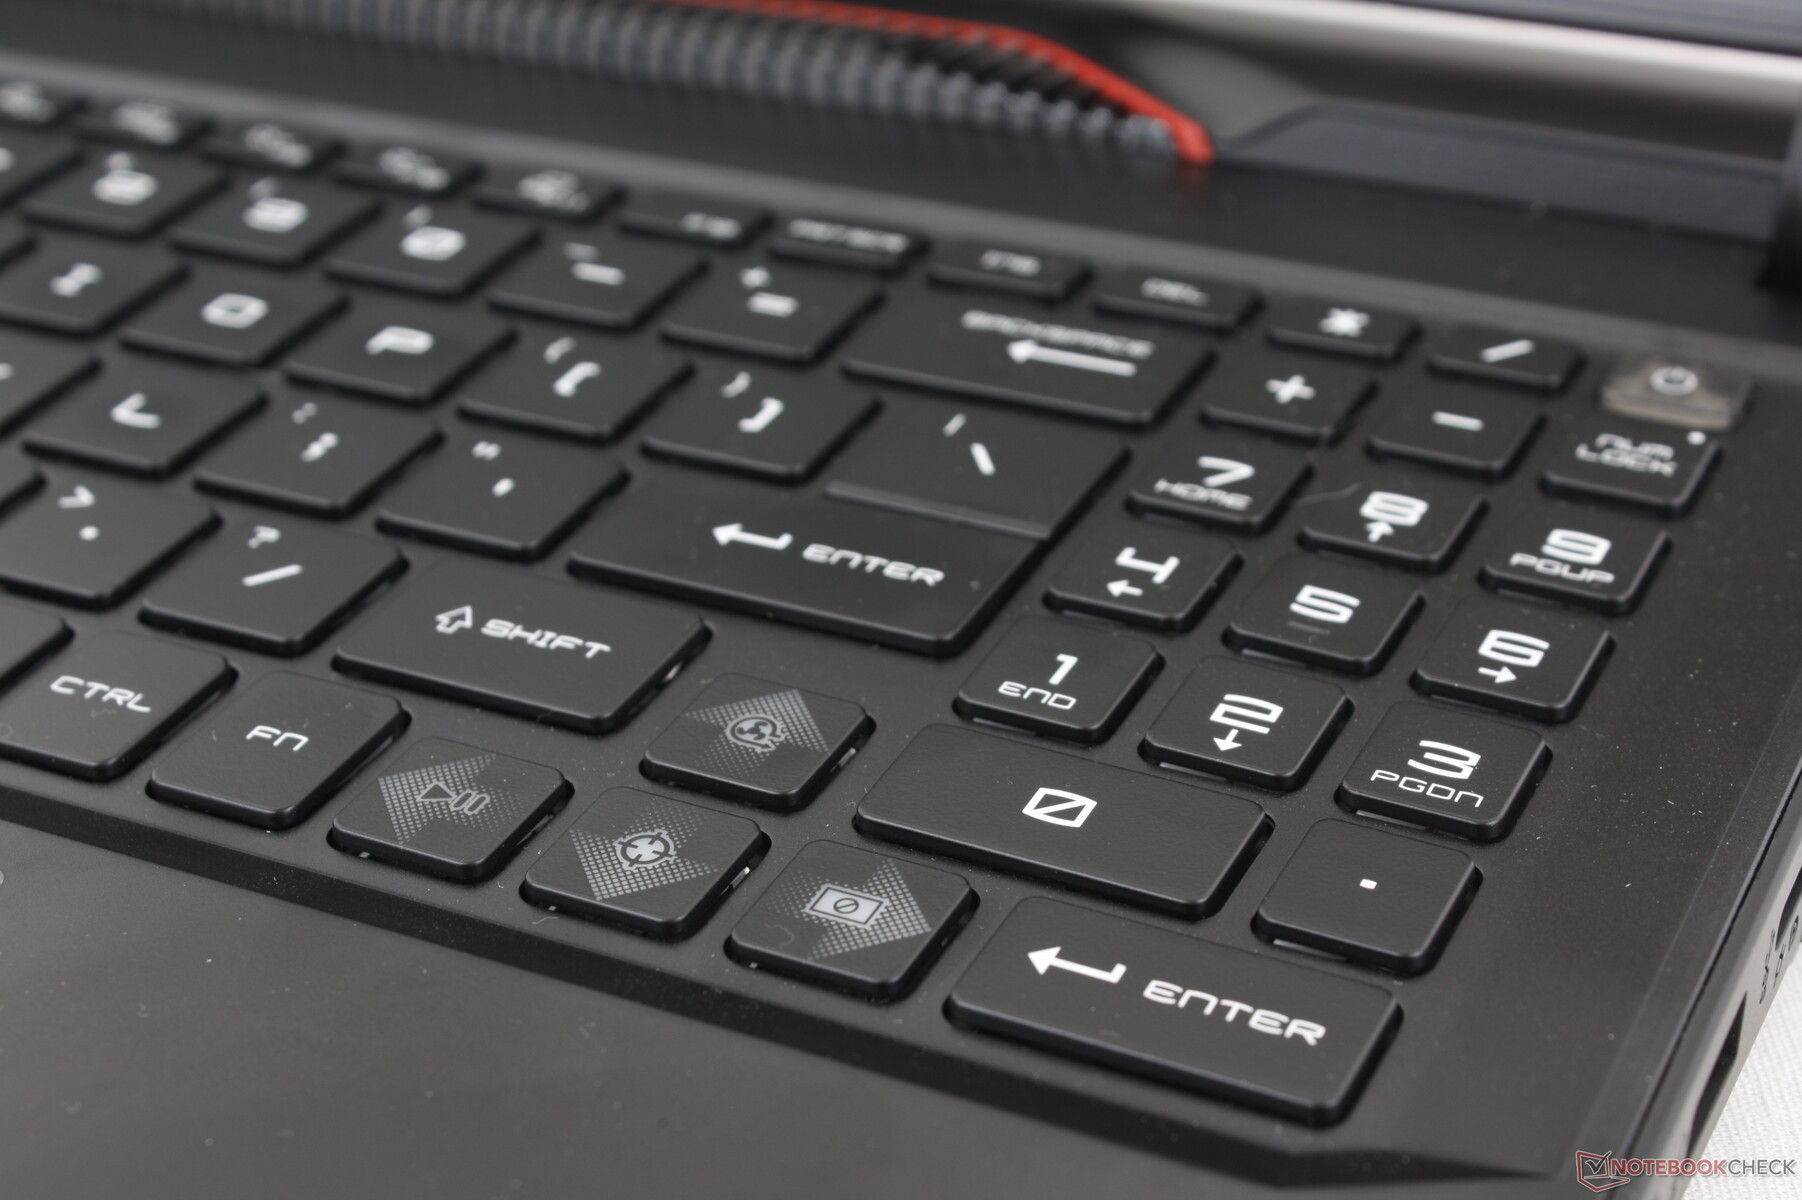
Dispositivi di input - Clickpad più grande e nuovo Numpad
Tastiera
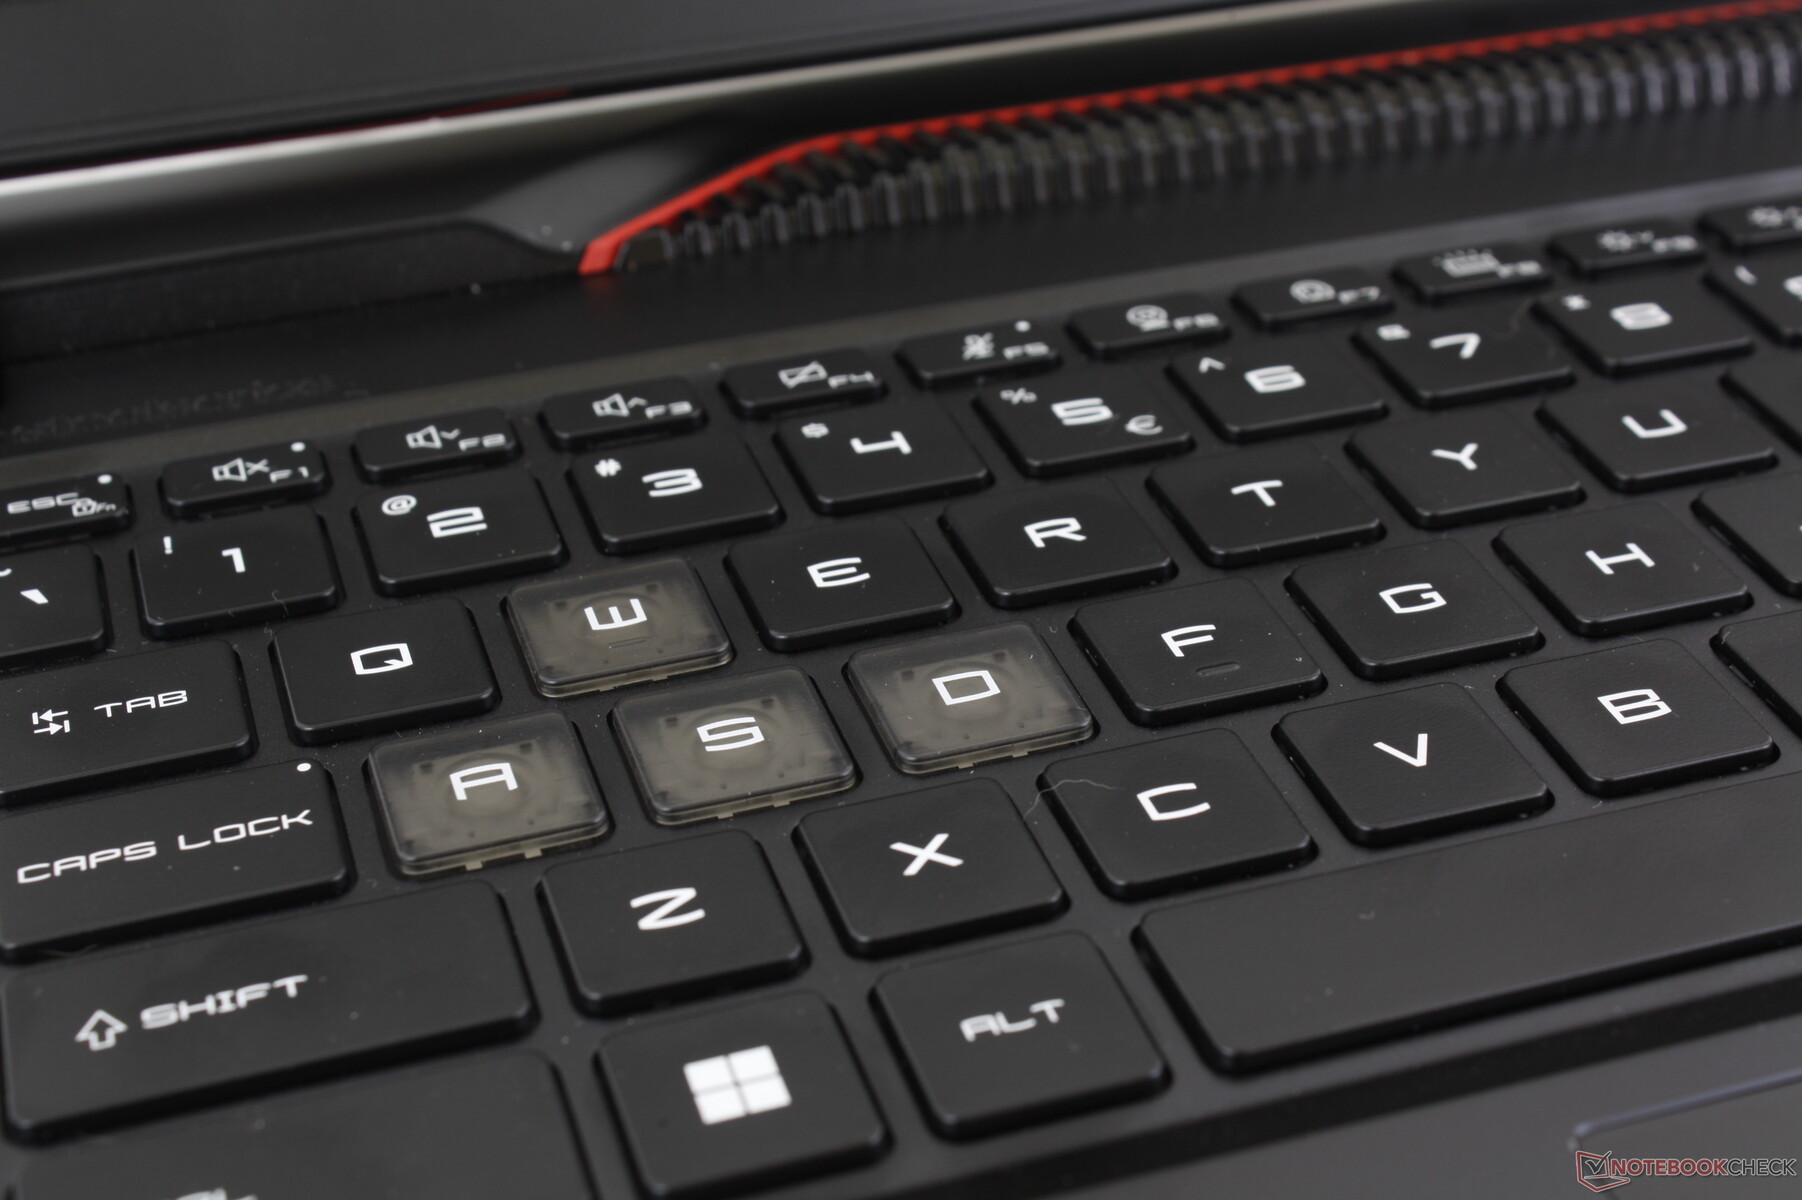
MSI ha rinnovato il layout della tastiera rispetto al modello GE67HX. Ora è presente un tastierino numerico integrato, mentre i tasti Ctrl e Fn non sono più scomodamente schiacciati tra loro. Purtroppo, i tasti freccia sono stati ridotti di dimensioni per fare spazio al nuovo tastierino numerico.
Per il resto, il feedback dei tasti è eccellente, con una risposta ferma e uniforme tra i principali tasti QWERTY. I tasti Spazio e Invio, in particolare, sono notevolmente più rumorosi per una sensazione più soddisfacente.
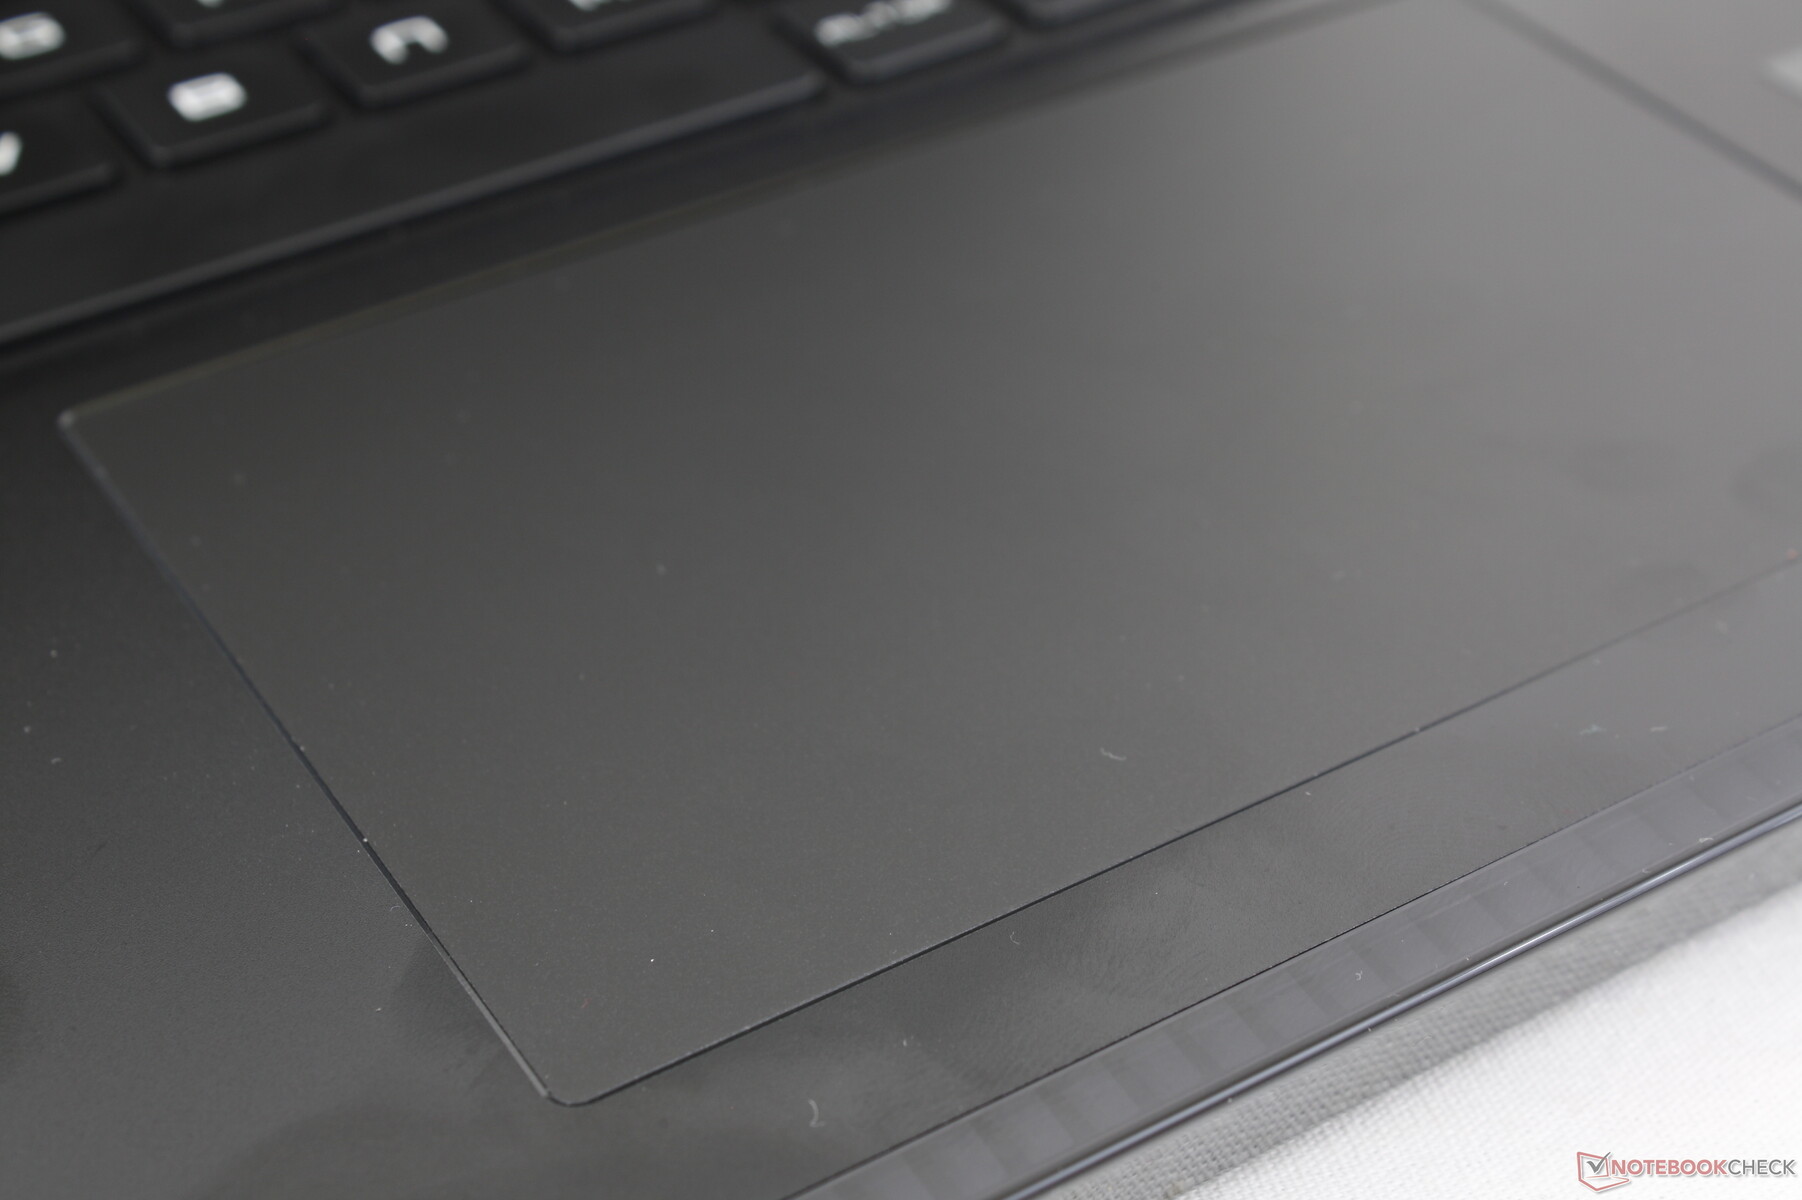
Touchpad
Le dimensioni del clickpad sono aumentate in modo significativo, passando da soli 10,5 x 6,5 cm sul modello GE67HX a 13 x 8,3 cm sul GE68HX. Lo scorrimento è molto fluido e reattivo, quasi privo di impuntamenti anche quando ci si muove a velocità ridotta. Anche il clic è soddisfacente, ma il feedback non è perfettamente uniforme, in quanto si sente un clic più forte quando si preme al centro, mentre gli angoli inferiori sono più spugnosi.
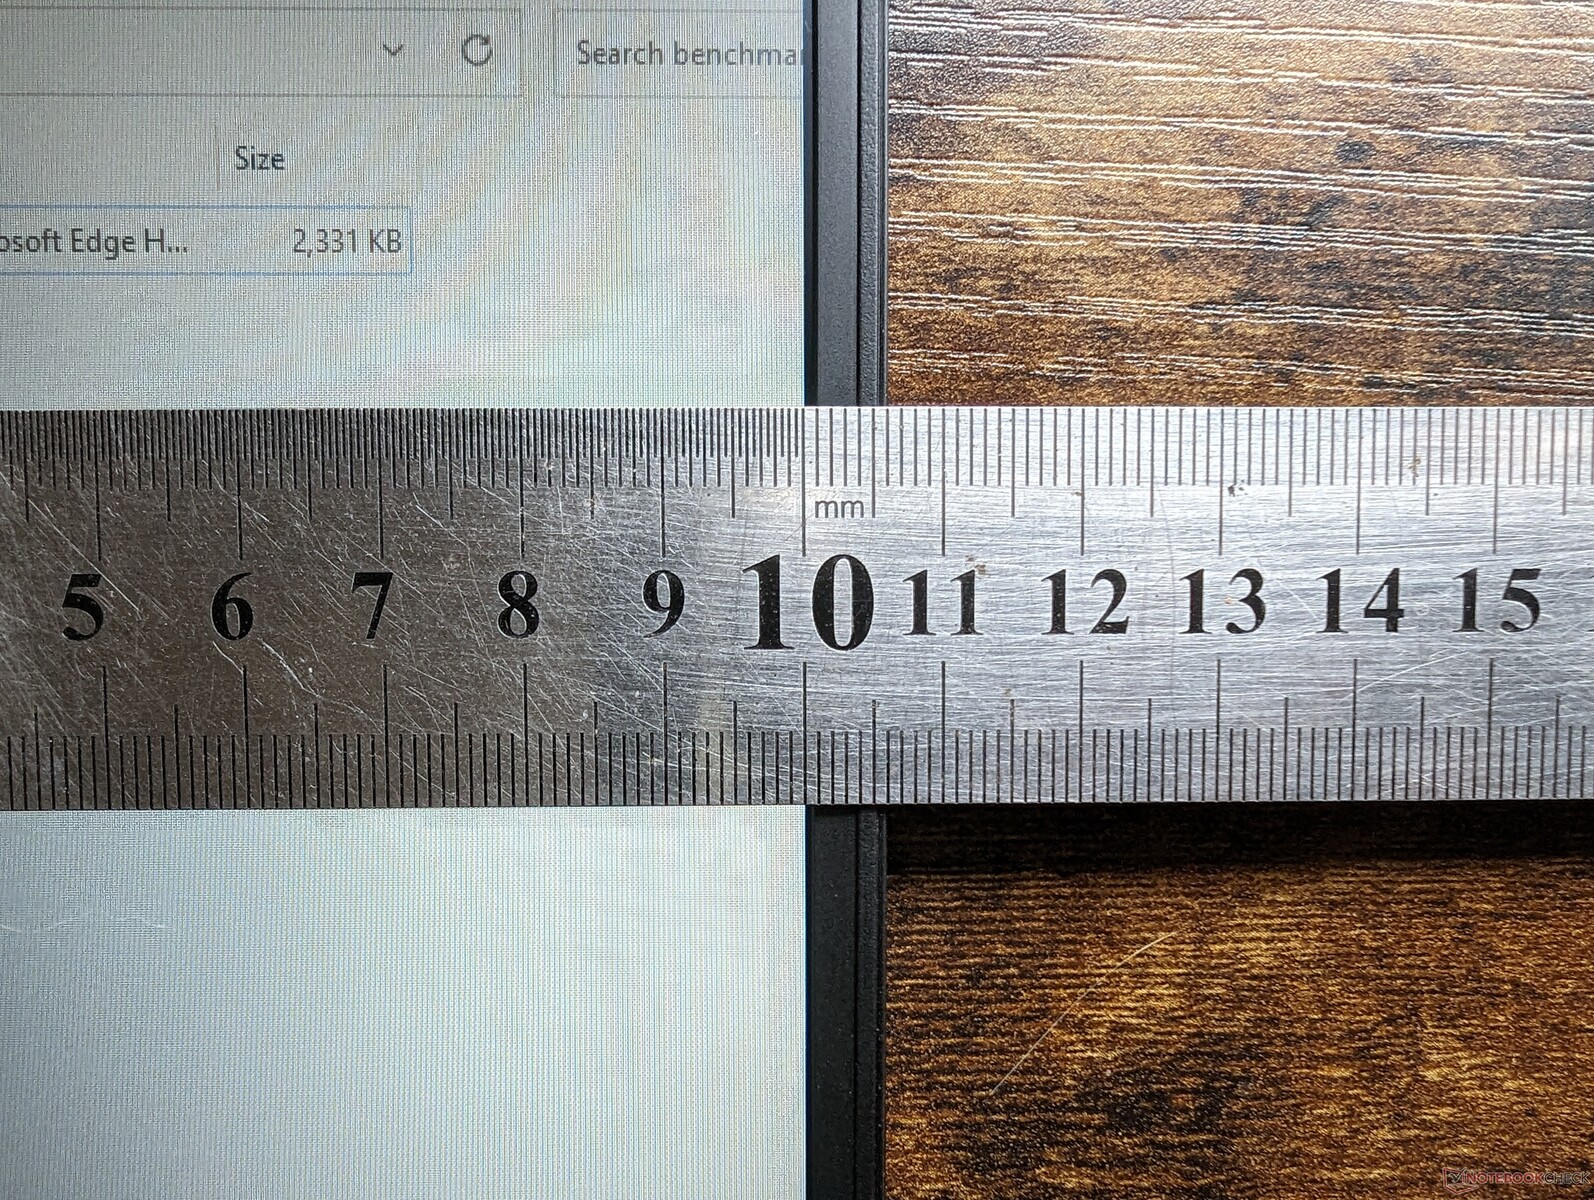
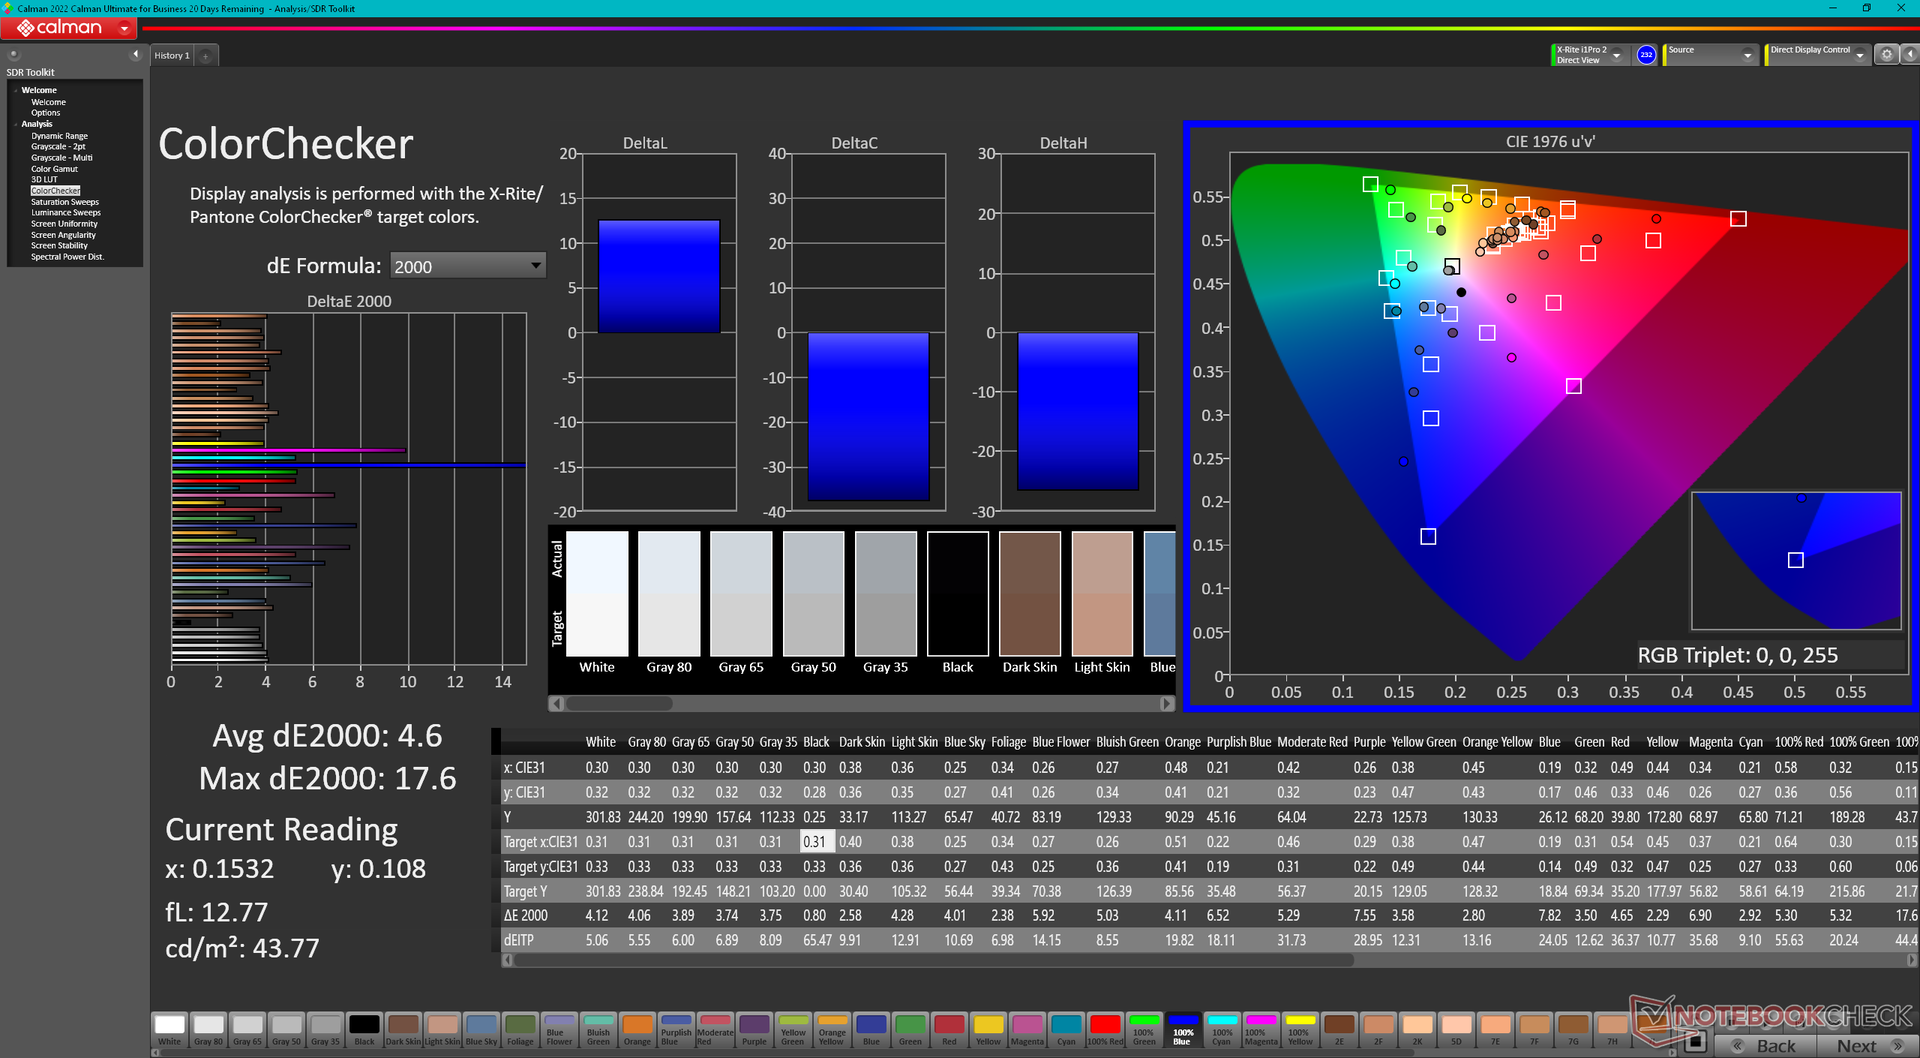
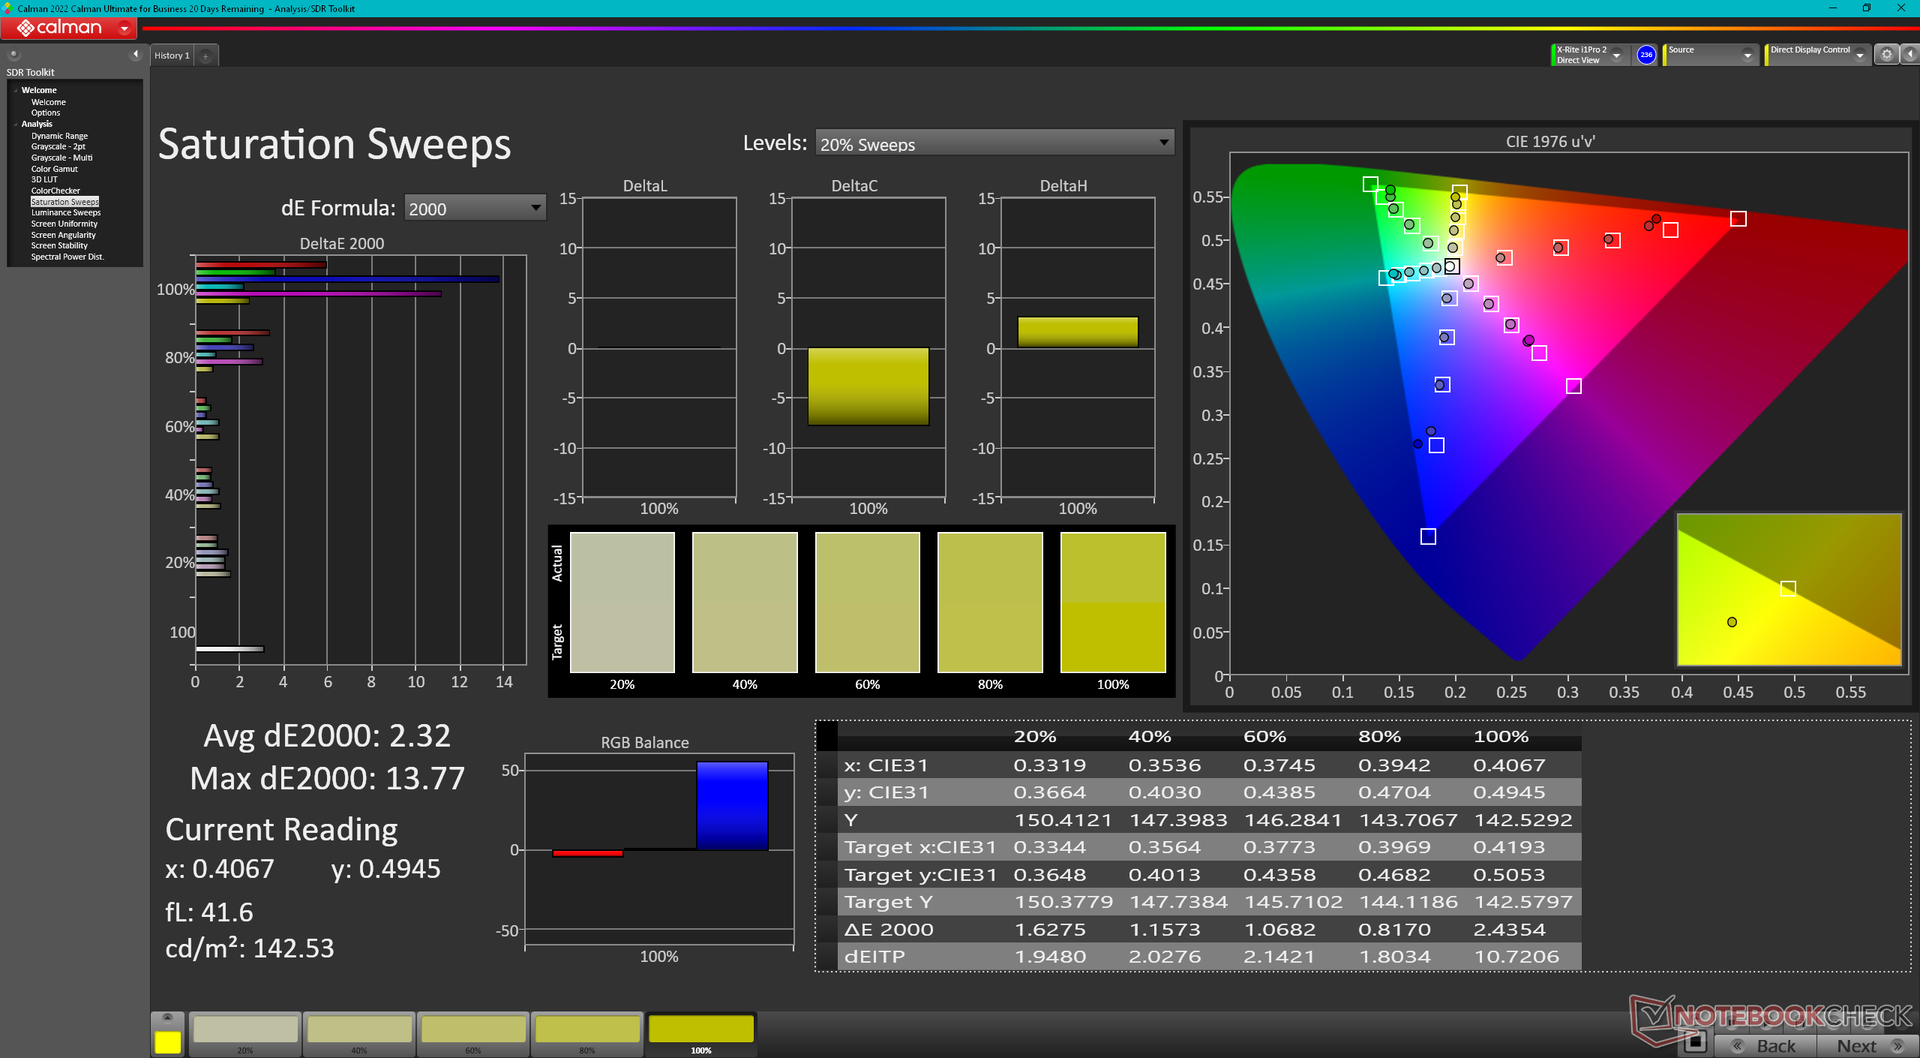
Display - Colori scadenti
Il Raider GE68HX viene fornito con due diverse opzioni di pannello. La nostra specifica unità in prova è dotata dell'opzione in grassetto qui sotto:
- 2560 x 1600, 240 Hz, 100% DCI-P3, 3 ms, IPS
- 1920 x 1200, 144 Hz, 60% sRGB, 11 ms, IPS
L'opzione più economica a 144 Hz non è consigliata a causa della copertura cromatica più ristretta e dei tempi di risposta più lenti, con un effetto ghosting più evidente. I colori meno intensi sono difficili da ignorare anche se non si fa molto editing grafico. Questo pannello è più adatto ai portatili da gioco più economici, come il modello MSI Pulse 17 dove le gamme cromatiche ristrette sono comuni.
G-Sync è notevolmente assente in tutte le configurazioni attuali del GE68HX.
| |||||||||||||||||||||||||
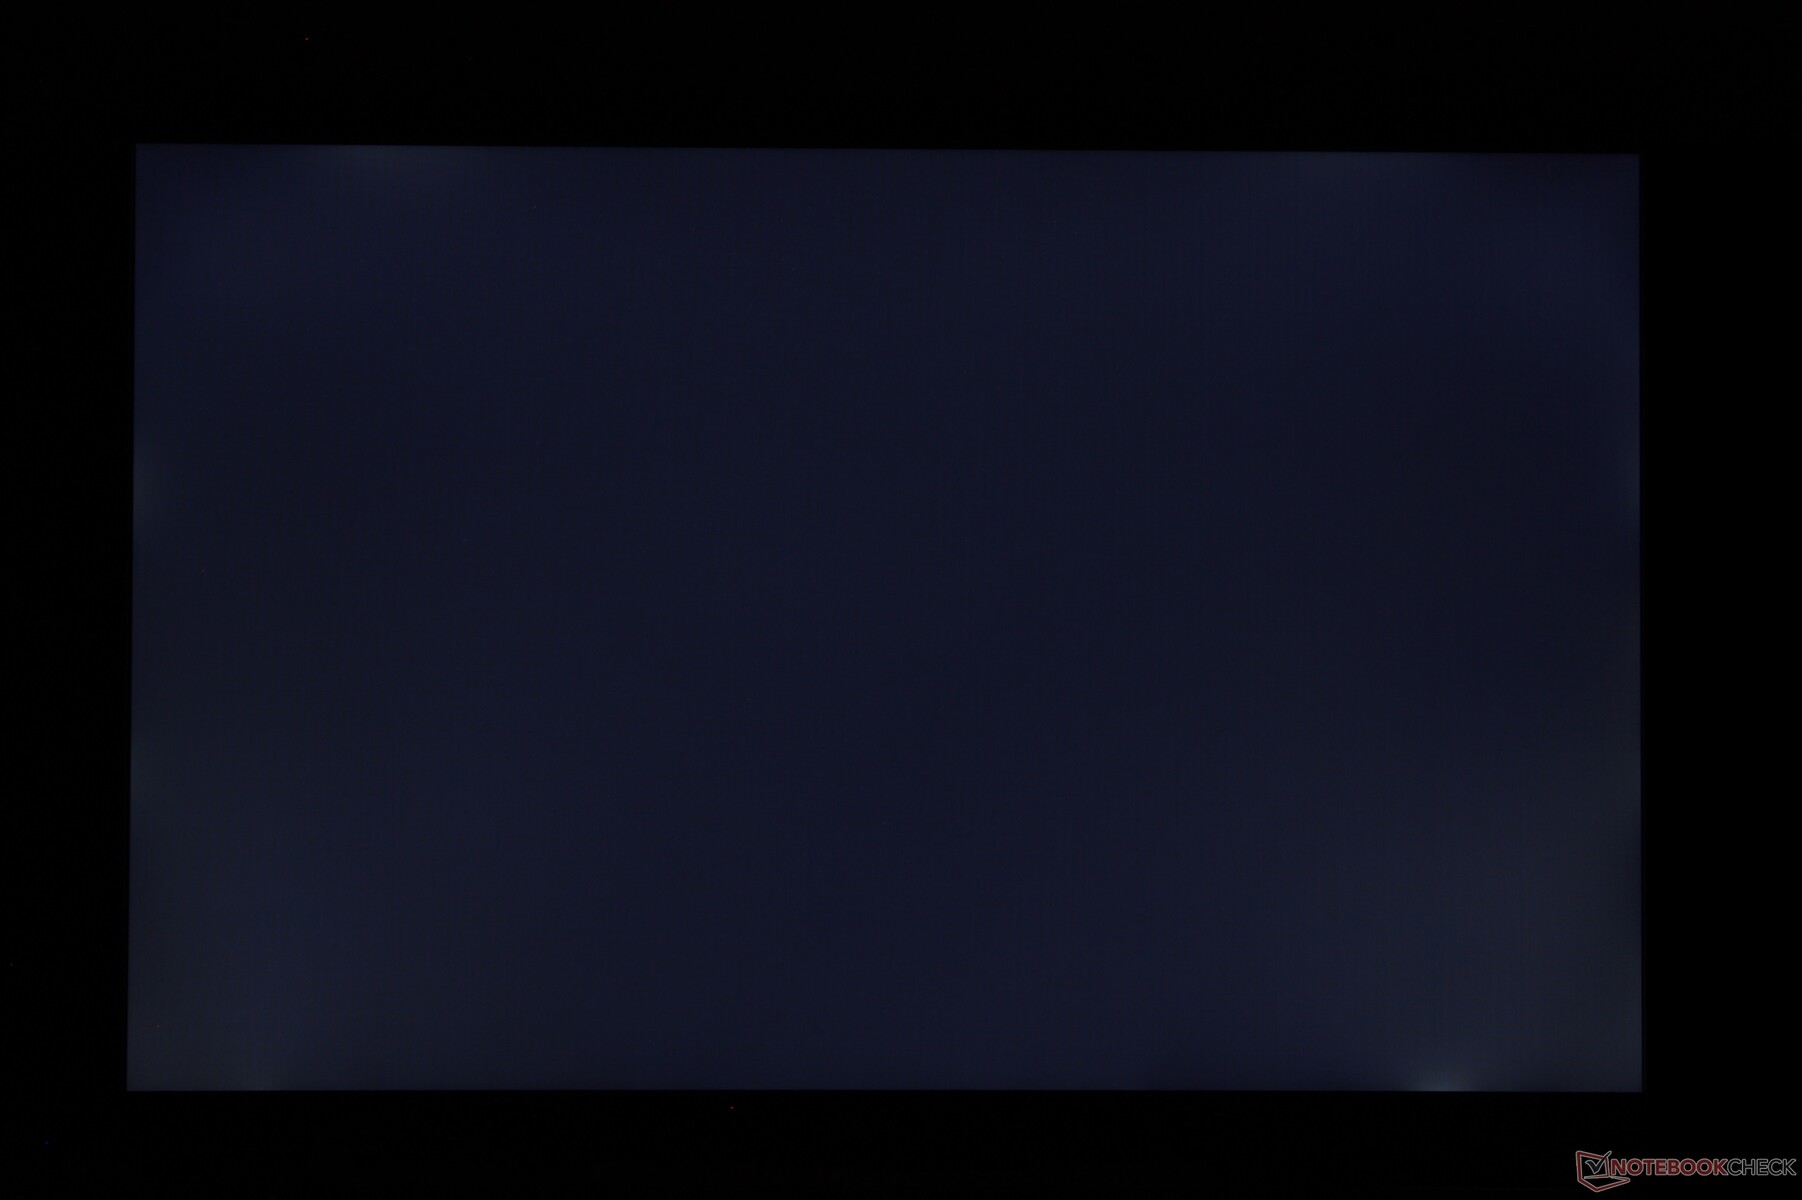
Distribuzione della luminosità: 93 %
Al centro con la batteria: 300.9 cd/m²
Contrasto: 971:1 (Nero: 0.31 cd/m²)
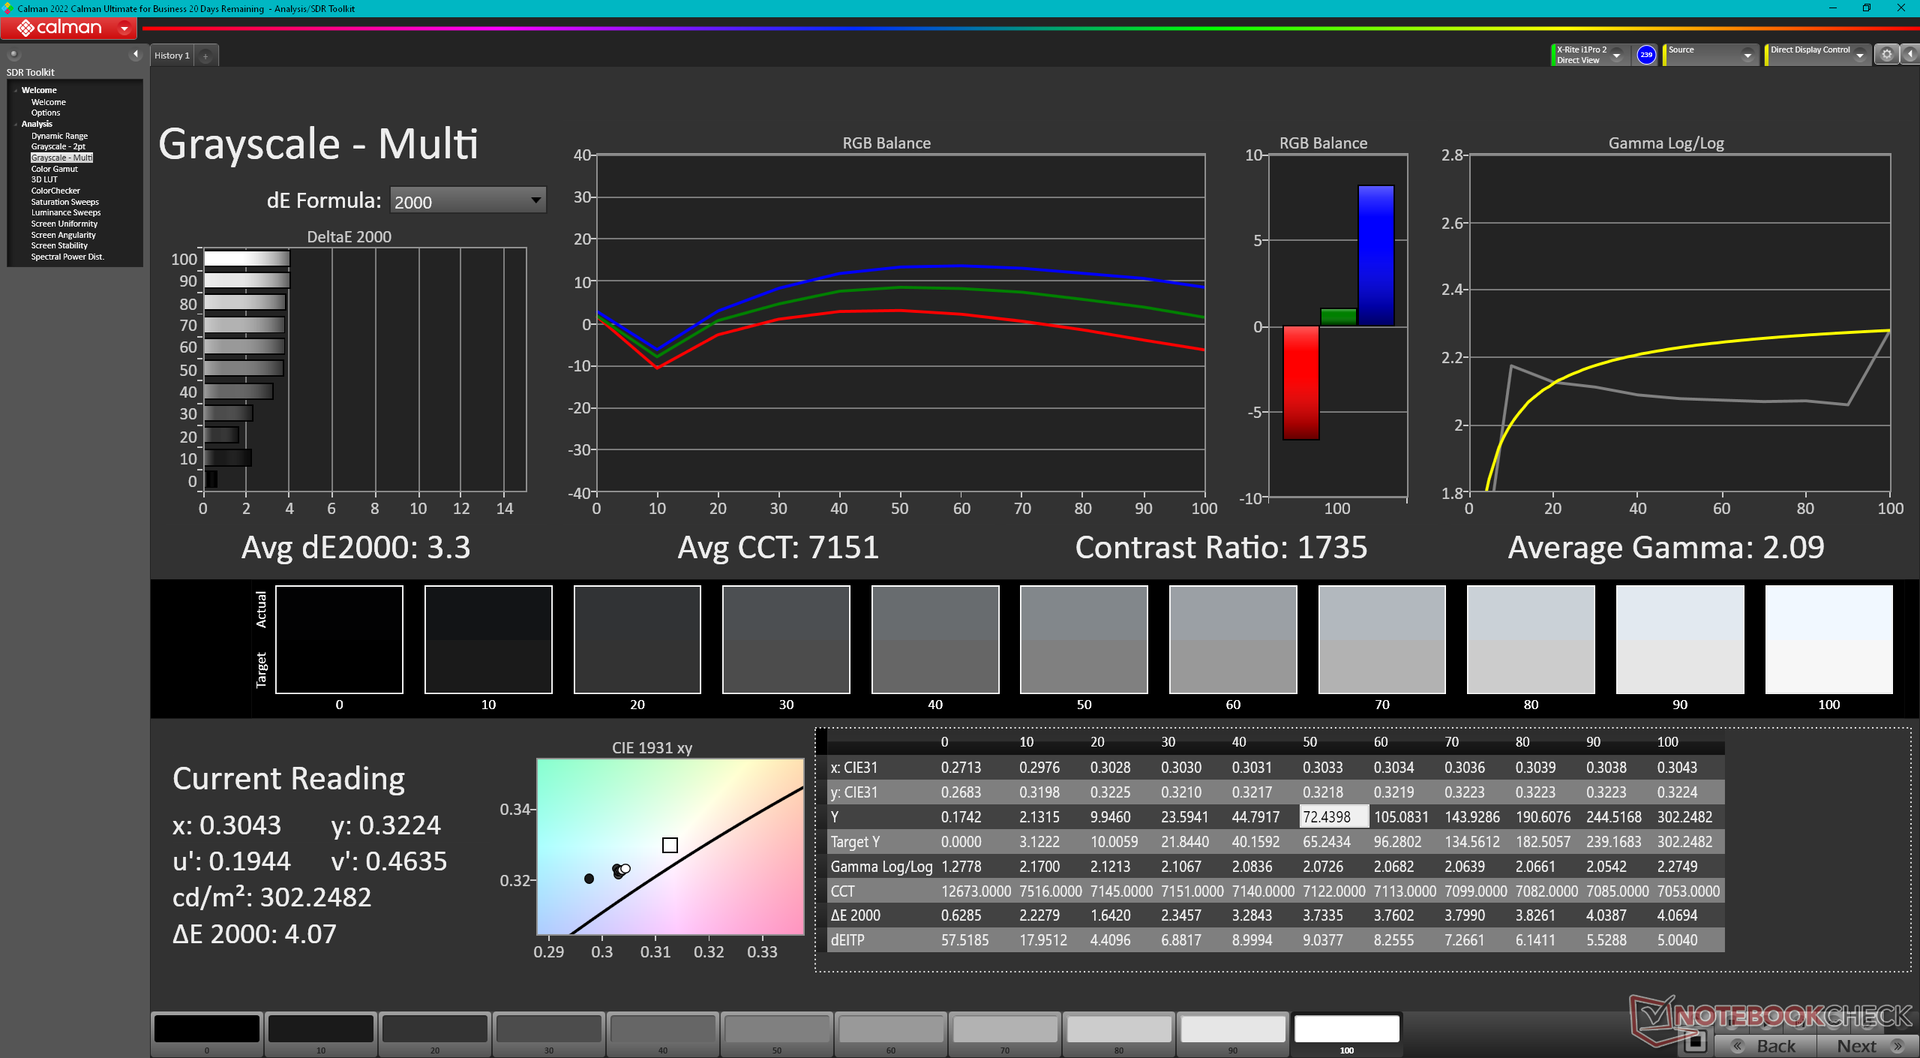
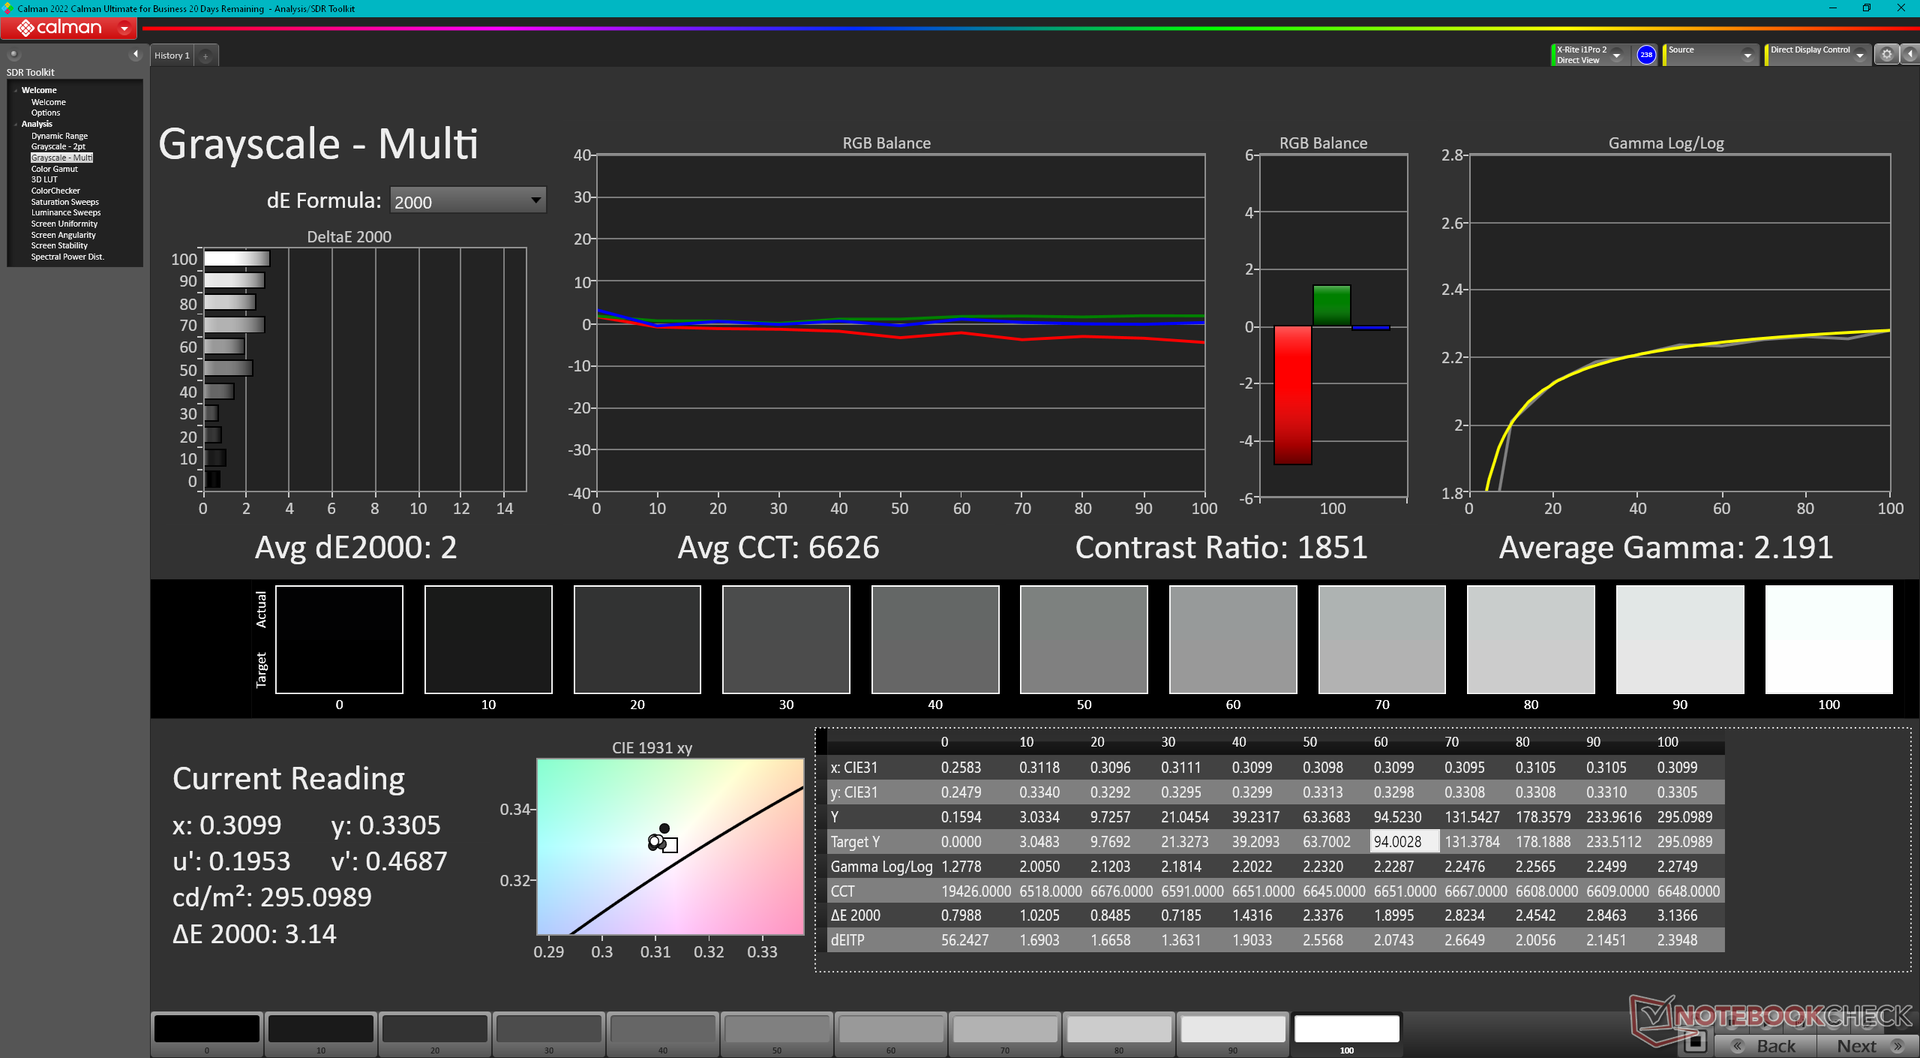
ΔE ColorChecker Calman: 4.6 | ∀{0.5-29.43 Ø4.72}
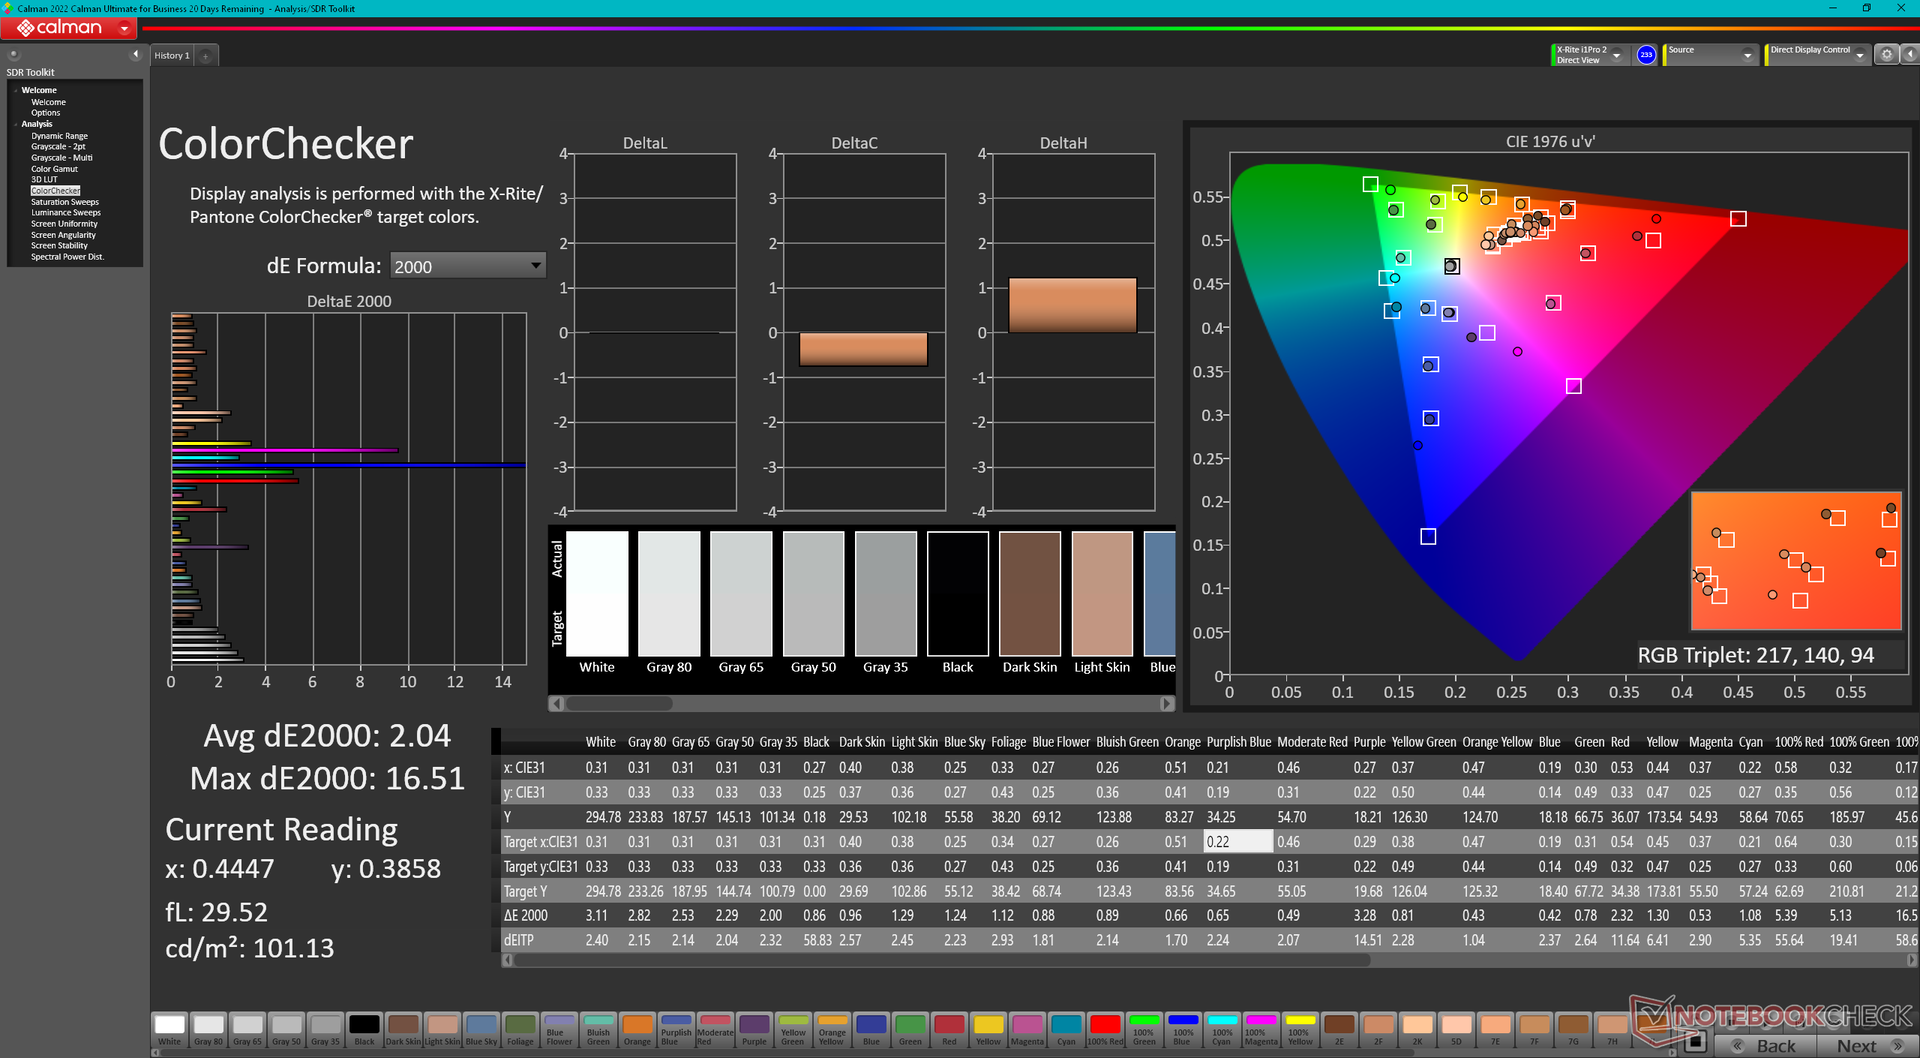
calibrated: 2.04
ΔE Greyscale Calman: 3.3 | ∀{0.09-98 Ø4.97}
43% AdobeRGB 1998 (Argyll 3D)
62.2% sRGB (Argyll 3D)
41.6% Display P3 (Argyll 3D)
Gamma: 2.09
CCT: 7151 K
| MSI Raider GE68HX 13VF Chi Mei N160JME-GTK, IPS, 1900x1200, 16" | MSI GE67 HX 12UGS Samsung ATNA562P02-0, OLED, 1920x1080, 15.6" | HP Omen 16-xf0376ng BOE0B81, IPS, 1920x1080, 16.1" | Alienware m16 R1 AMD BOE NE16NZ4, IPS, 2560x1600, 16" | Lenovo Legion Slim 7i 16 Gen 8 CSOT T3 MNG007DA2-3, IPS, 2560x1600, 16" | Asus ROG Zephyrus M16 GU604VY-NM042X BOE0B74 (NE160QDM-NM4, IPS, 2560x1600, 16" | |
|---|---|---|---|---|---|---|
| Display | 64% | 67% | 102% | 66% | 103% | |
| Display P3 Coverage (%) | 41.6 | 71.7 72% | 72.1 73% | 98.6 137% | 70.4 69% | 99.33 139% |
| sRGB Coverage (%) | 62.2 | 89.7 44% | 99.6 60% | 99.9 61% | 99.4 60% | 99.9 61% |
| AdobeRGB 1998 Coverage (%) | 43 | 75.2 75% | 72.3 68% | 88.9 107% | 72.5 69% | 90.01 109% |
| Response Times | 99% | 50% | 67% | 47% | -108% | |
| Response Time Grey 50% / Grey 80% * (ms) | 17.3 ? | 0.25 ? 99% | 12.3 ? 29% | 5.1 ? 71% | 12 ? 31% | 50.8 ? -194% |
| Response Time Black / White * (ms) | 24.2 ? | 0.4 ? 98% | 7.2 ? 70% | 9 ? 63% | 8.9 ? 63% | 29.6 ? -22% |
| PWM Frequency (Hz) | 480.4 ? | 12000 | ||||
| Screen | 17% | 10% | 10% | 34% | 297% | |
| Brightness middle (cd/m²) | 300.9 | 356.1 18% | 350 16% | 329 9% | 474.6 58% | 634 111% |
| Brightness (cd/m²) | 302 | 358 19% | 338 12% | 317 5% | 445 47% | 627 108% |
| Brightness Distribution (%) | 93 | 99 6% | 91 -2% | 89 -4% | 86 -8% | 92 -1% |
| Black Level * (cd/m²) | 0.31 | 0.35 -13% | 0.32 -3% | 0.39 -26% | 0.03 90% | |
| Contrast (:1) | 971 | 1000 3% | 1028 6% | 1217 25% | 21133 2076% | |
| Colorchecker dE 2000 * | 4.6 | 4.83 -5% | 3.29 28% | 3.71 19% | 2.12 54% | 0.89 81% |
| Colorchecker dE 2000 max. * | 17.6 | 7.94 55% | 8.47 52% | 7.23 59% | 4.73 73% | 1.79 90% |
| Colorchecker dE 2000 calibrated * | 2.04 | 2.23 -9% | 2.82 -38% | 0.57 72% | 0.91 55% | |
| Greyscale dE 2000 * | 3.3 | 3.1 6% | 3.2 3% | 2.2 33% | 2.8 15% | 1.13 66% |
| Gamma | 2.09 105% | 2.2 100% | 2.131 103% | 2.3 96% | 2.22 99% | 2.47 89% |
| CCT | 7151 91% | 5938 109% | 6317 103% | 6270 104% | 6542 99% | 6497 100% |
| Media totale (Programma / Settaggio) | 60% /
44% | 42% /
28% | 60% /
38% | 49% /
43% | 97% /
198% |
* ... Meglio usare valori piccoli
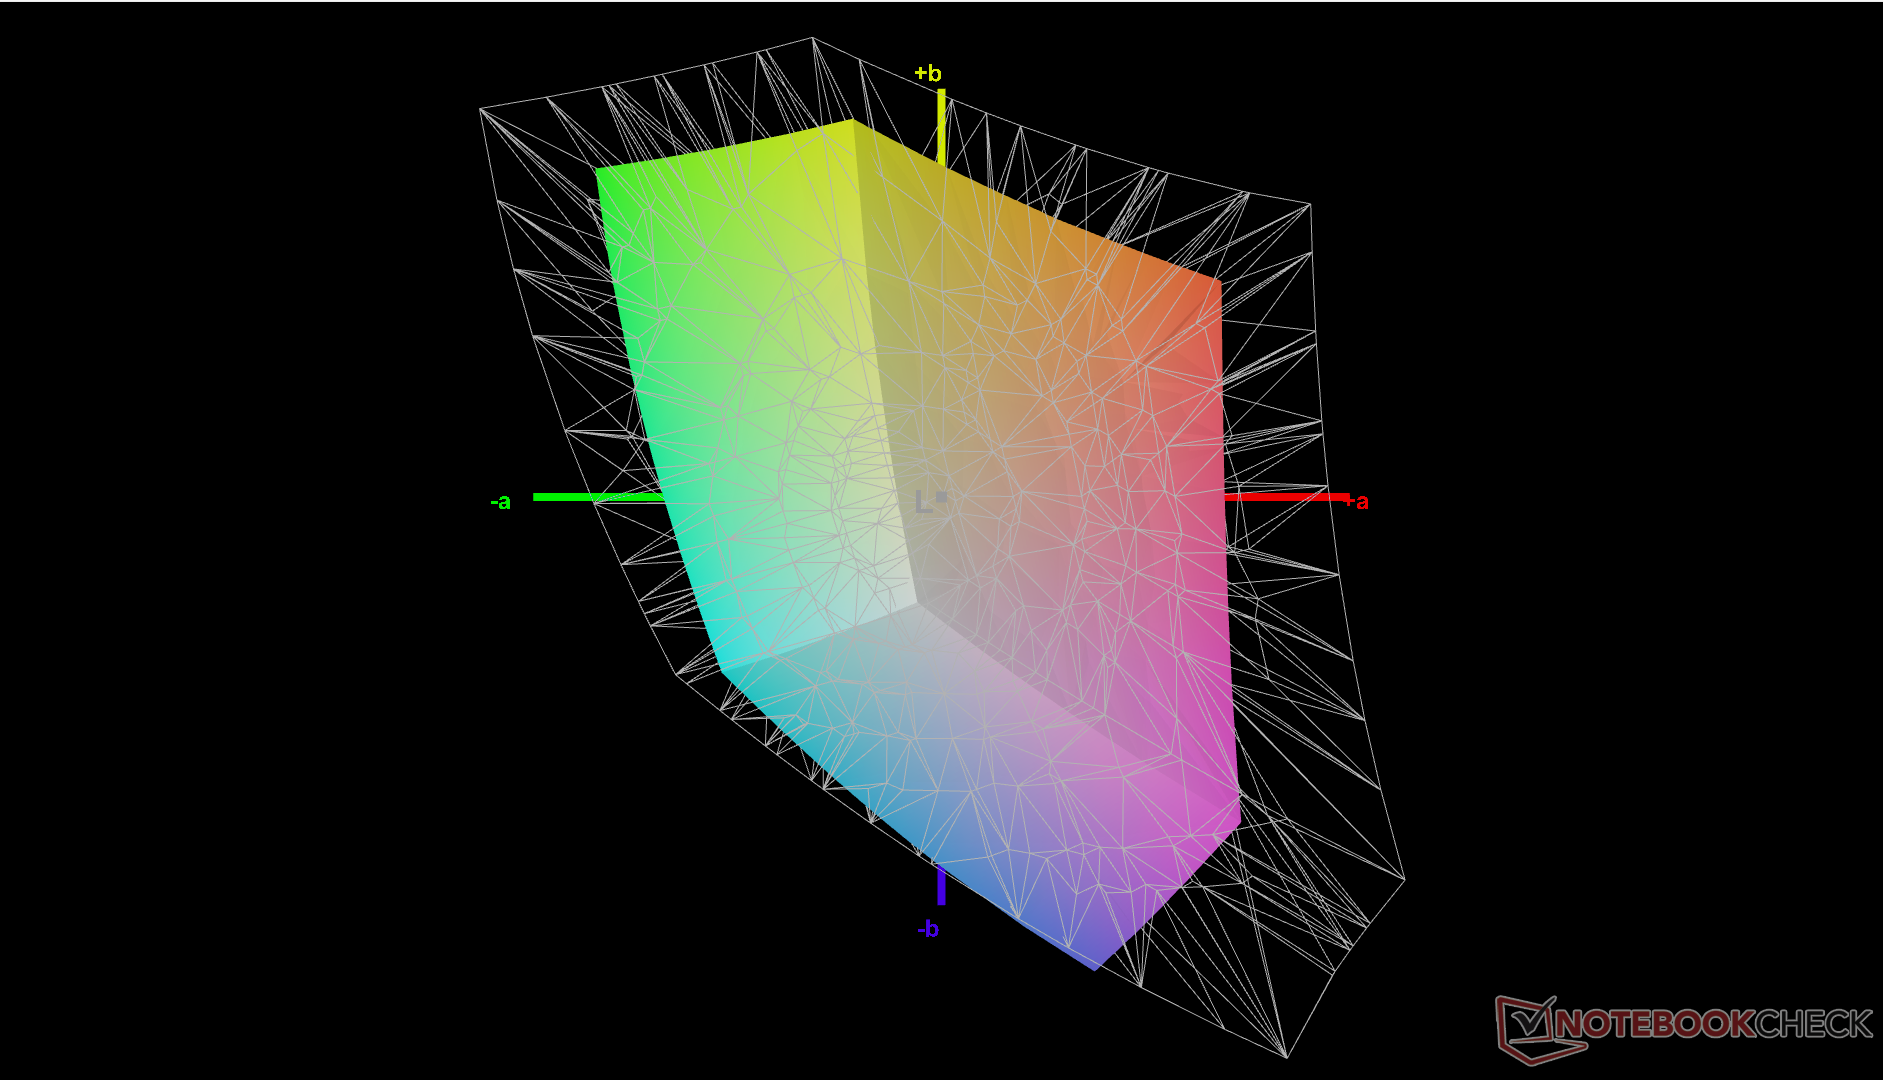
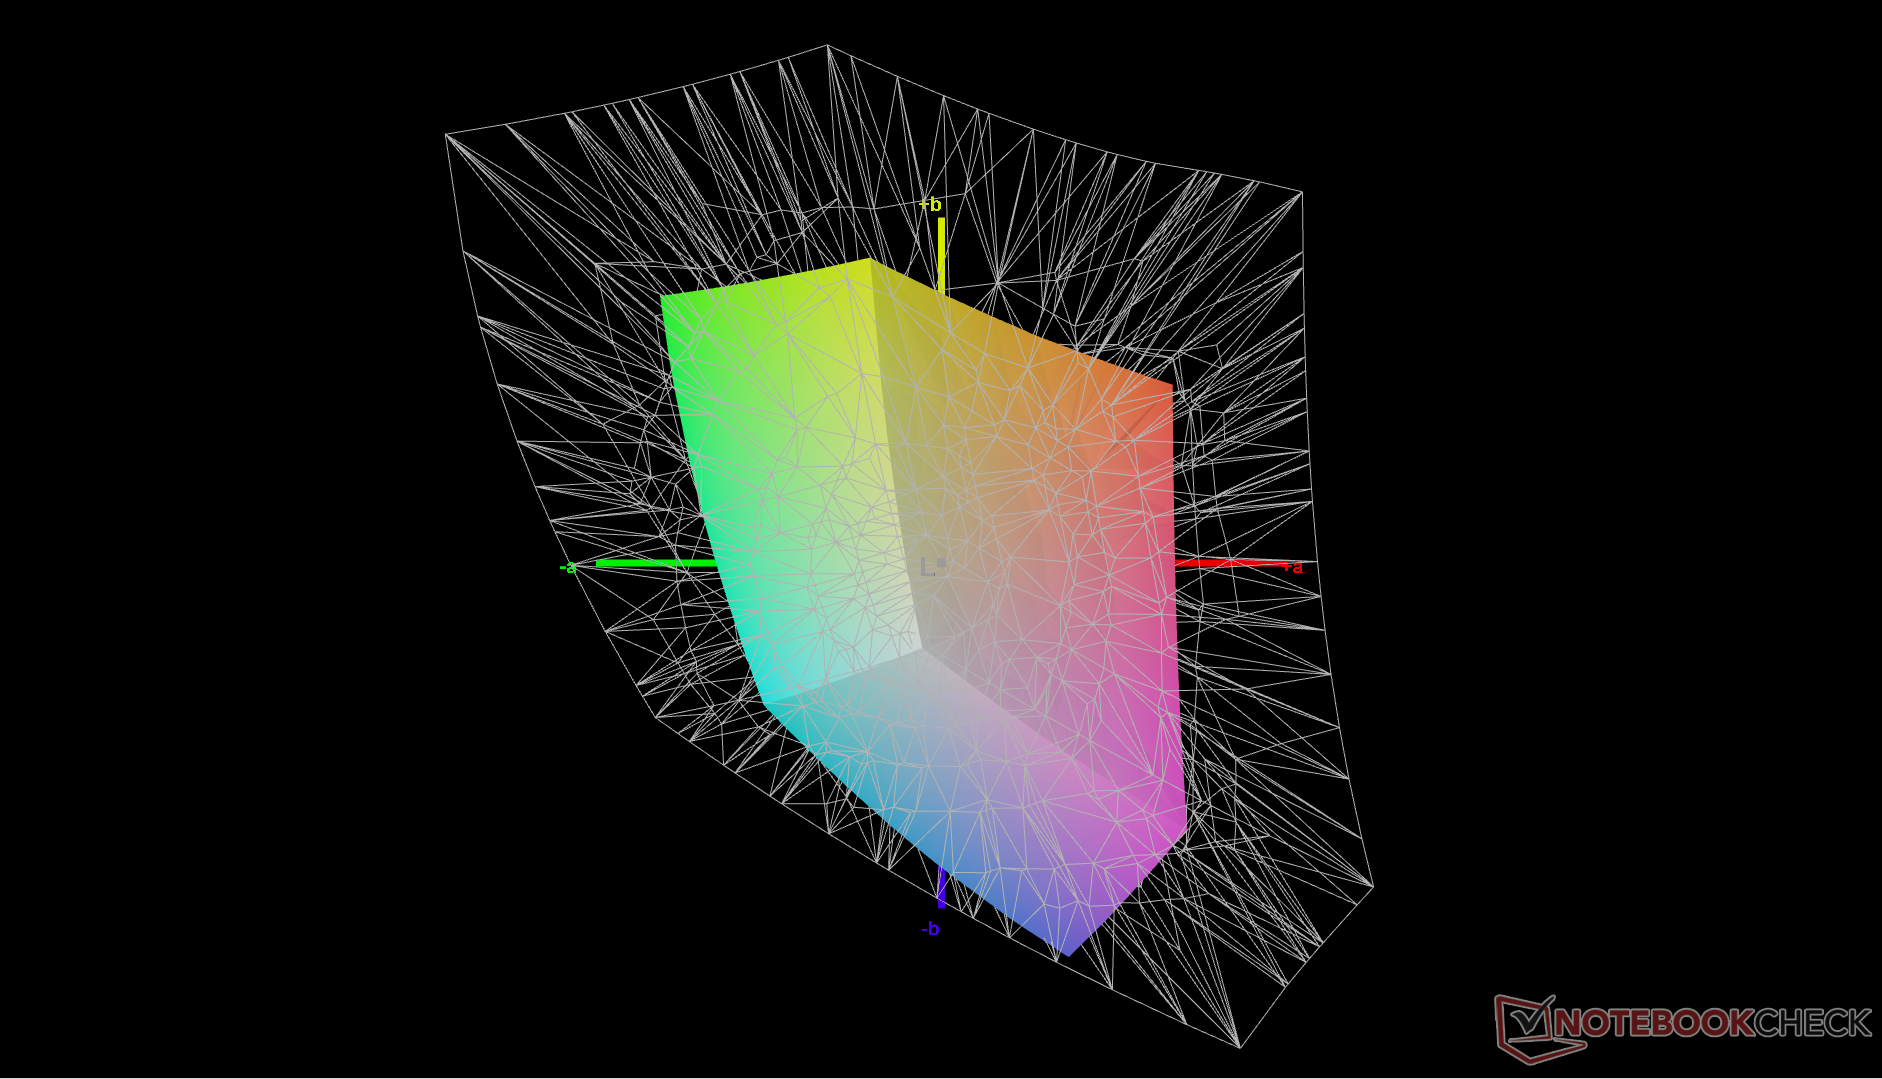
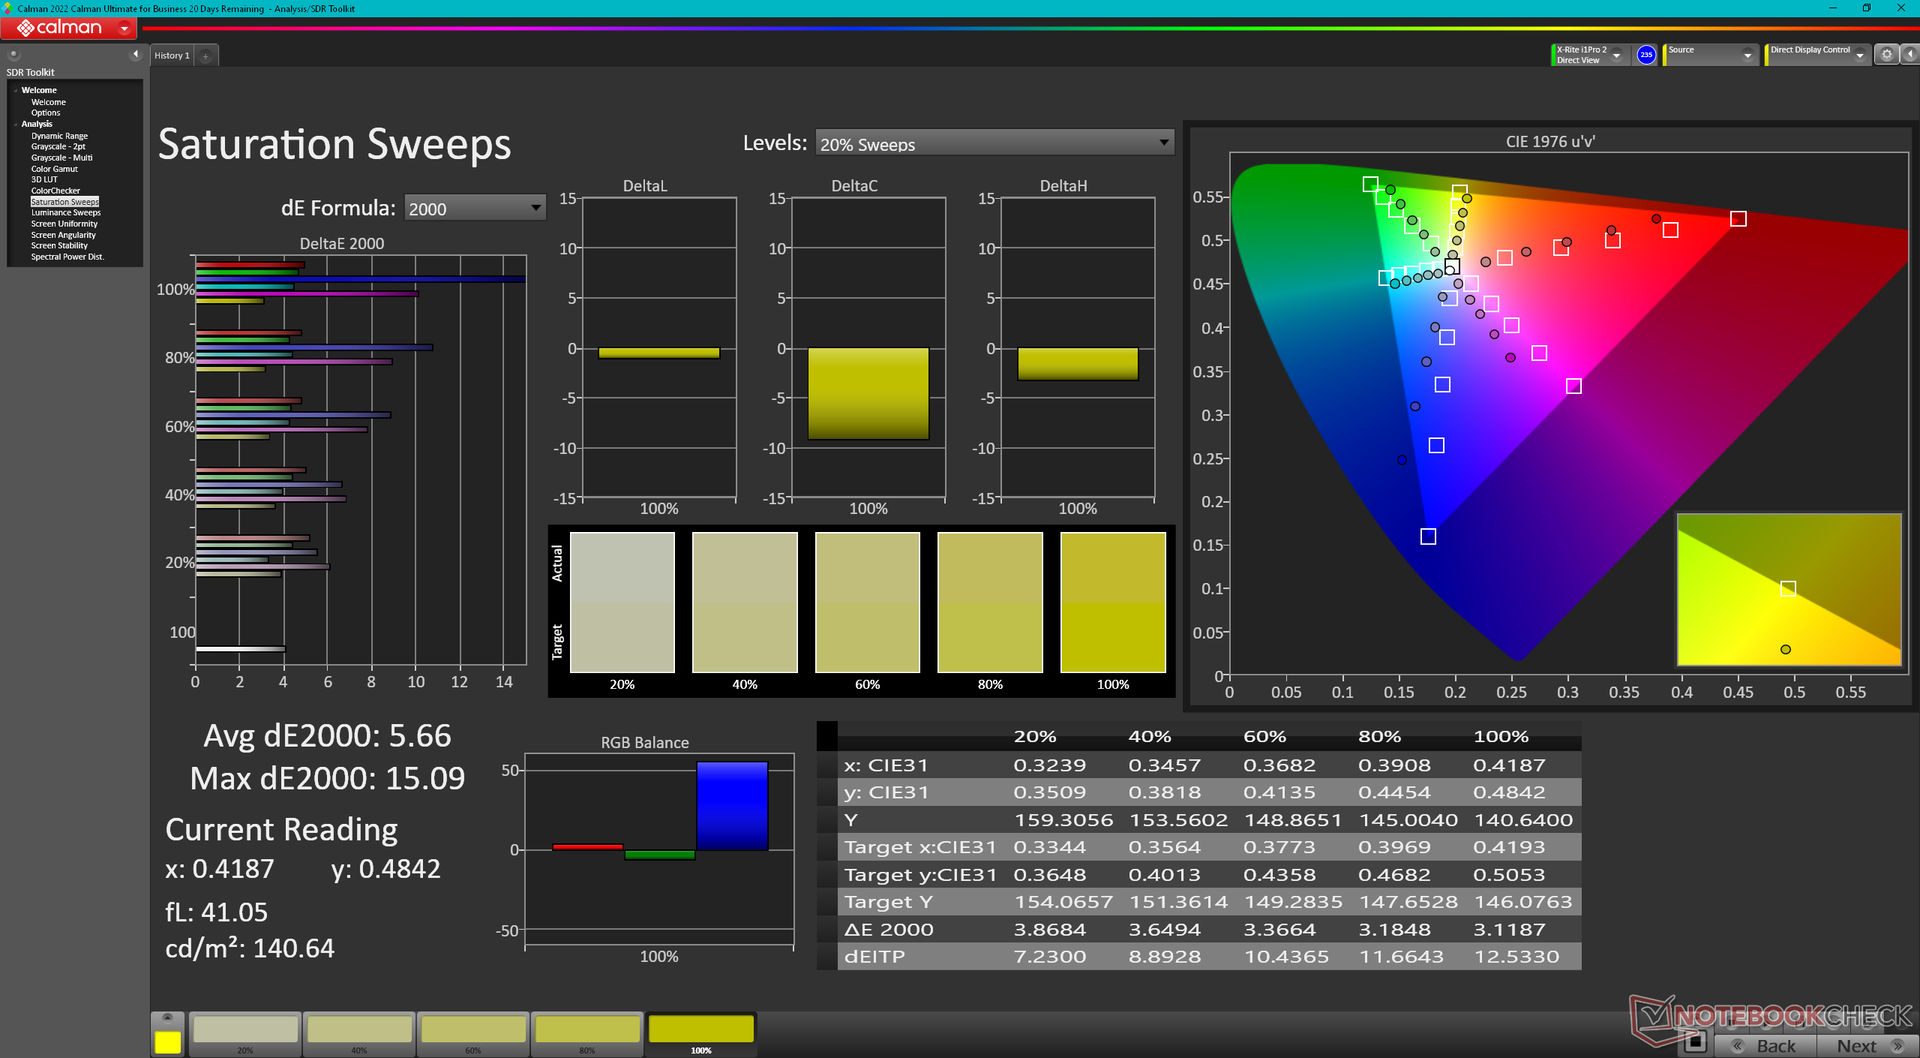
Il display non viene fornito pre-calibrato, ma l'accuratezza media dei colori non è male, tutto sommato. La calibrazione del pannello con un colorimetro X-Rite ha migliorato i valori medi del DeltaE della scala di grigi e del colore da 3,3 e 4,6 a soli 2 e 2,04, rispettivamente. I colori diventano comunque sempre più imprecisi a livelli di saturazione più elevati, indipendentemente dalla calibrazione, a causa dello spazio colore limitato del pannello. Il blu è forse il peggior colpevole, in quanto appare leggermente violetto. Il nostro profilo ICM è disponibile per il download gratuito.
Tempi di risposta del Display
| ↔ Tempi di risposta dal Nero al Bianco | ||
|---|---|---|
| 24.2 ms ... aumenta ↗ e diminuisce ↘ combinato | ↗ 10.6 ms Incremento | 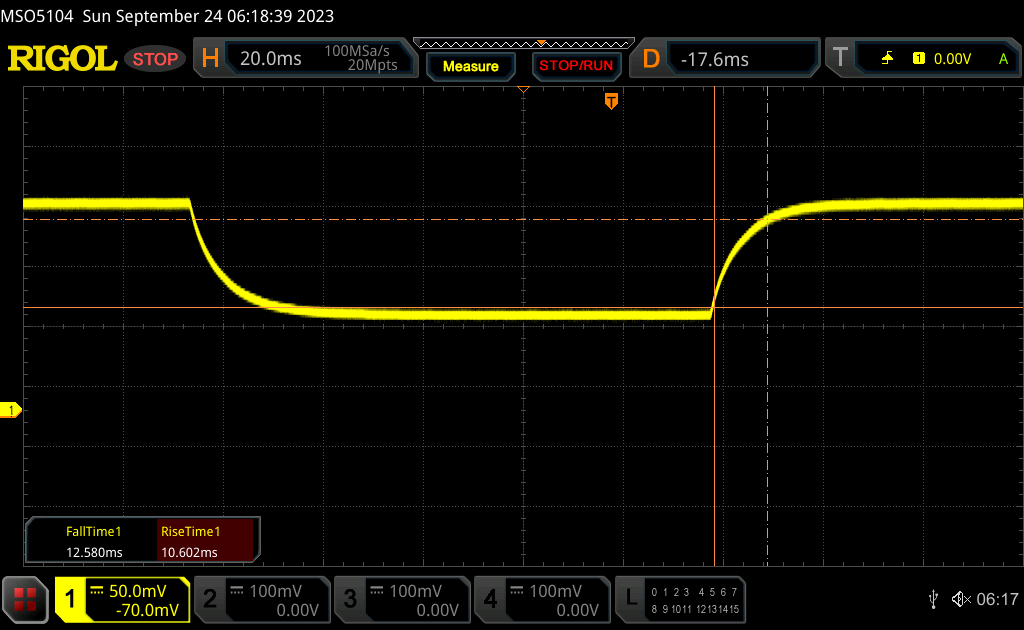 |
| ↘ 12.6 ms Calo | ||
| Lo schermo mostra buoni tempi di risposta durante i nostri tests, ma potrebbe essere troppo lento per i gamers competitivi. In confronto, tutti i dispositivi di test variano da 0.1 (minimo) a 240 (massimo) ms. » 57 % di tutti i dispositivi è migliore. Questo significa che i tempi di risposta rilevati sono peggiori rispetto alla media di tutti i dispositivi testati (19.8 ms). | ||
| ↔ Tempo di risposta dal 50% Grigio all'80% Grigio | ||
| 17.3 ms ... aumenta ↗ e diminuisce ↘ combinato | ↗ 9.4 ms Incremento | 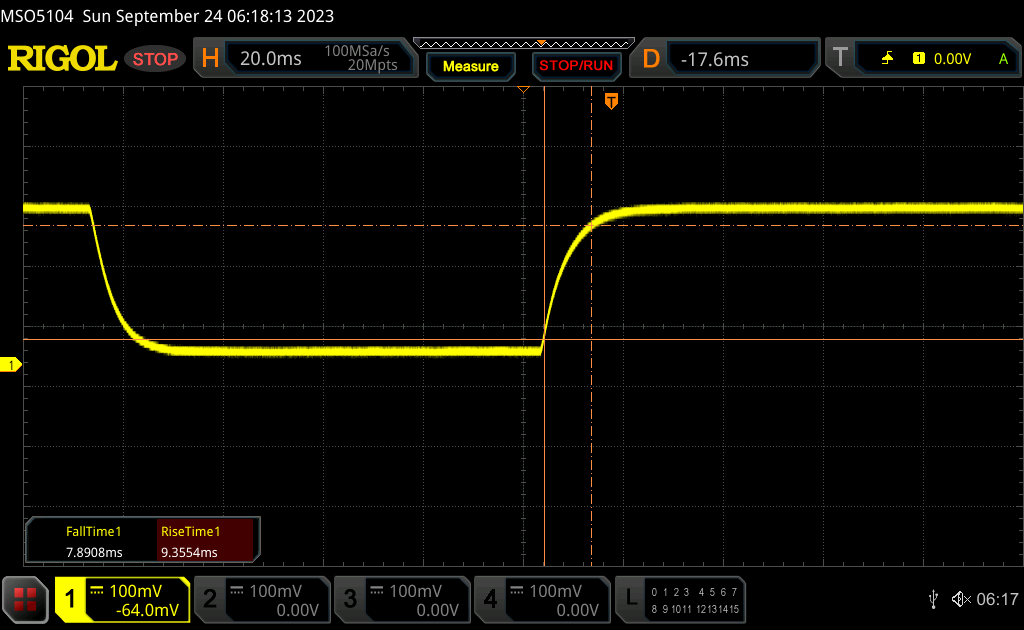 |
| ↘ 7.9 ms Calo | ||
| Lo schermo mostra buoni tempi di risposta durante i nostri tests, ma potrebbe essere troppo lento per i gamers competitivi. In confronto, tutti i dispositivi di test variano da 0.165 (minimo) a 636 (massimo) ms. » 31 % di tutti i dispositivi è migliore. Questo significa che i tempi di risposta rilevati sono migliori rispettto alla media di tutti i dispositivi testati (31 ms). | ||
Sfarfallio dello schermo / PWM (Pulse-Width Modulation)
| flickering dello schermo / PWM non rilevato |  | ||
In confronto: 52 % di tutti i dispositivi testati non utilizza PWM per ridurre la luminosita' del display. Se è rilevato PWM, una media di 7763 (minimo: 5 - massimo: 343500) Hz è stata rilevata. | |||
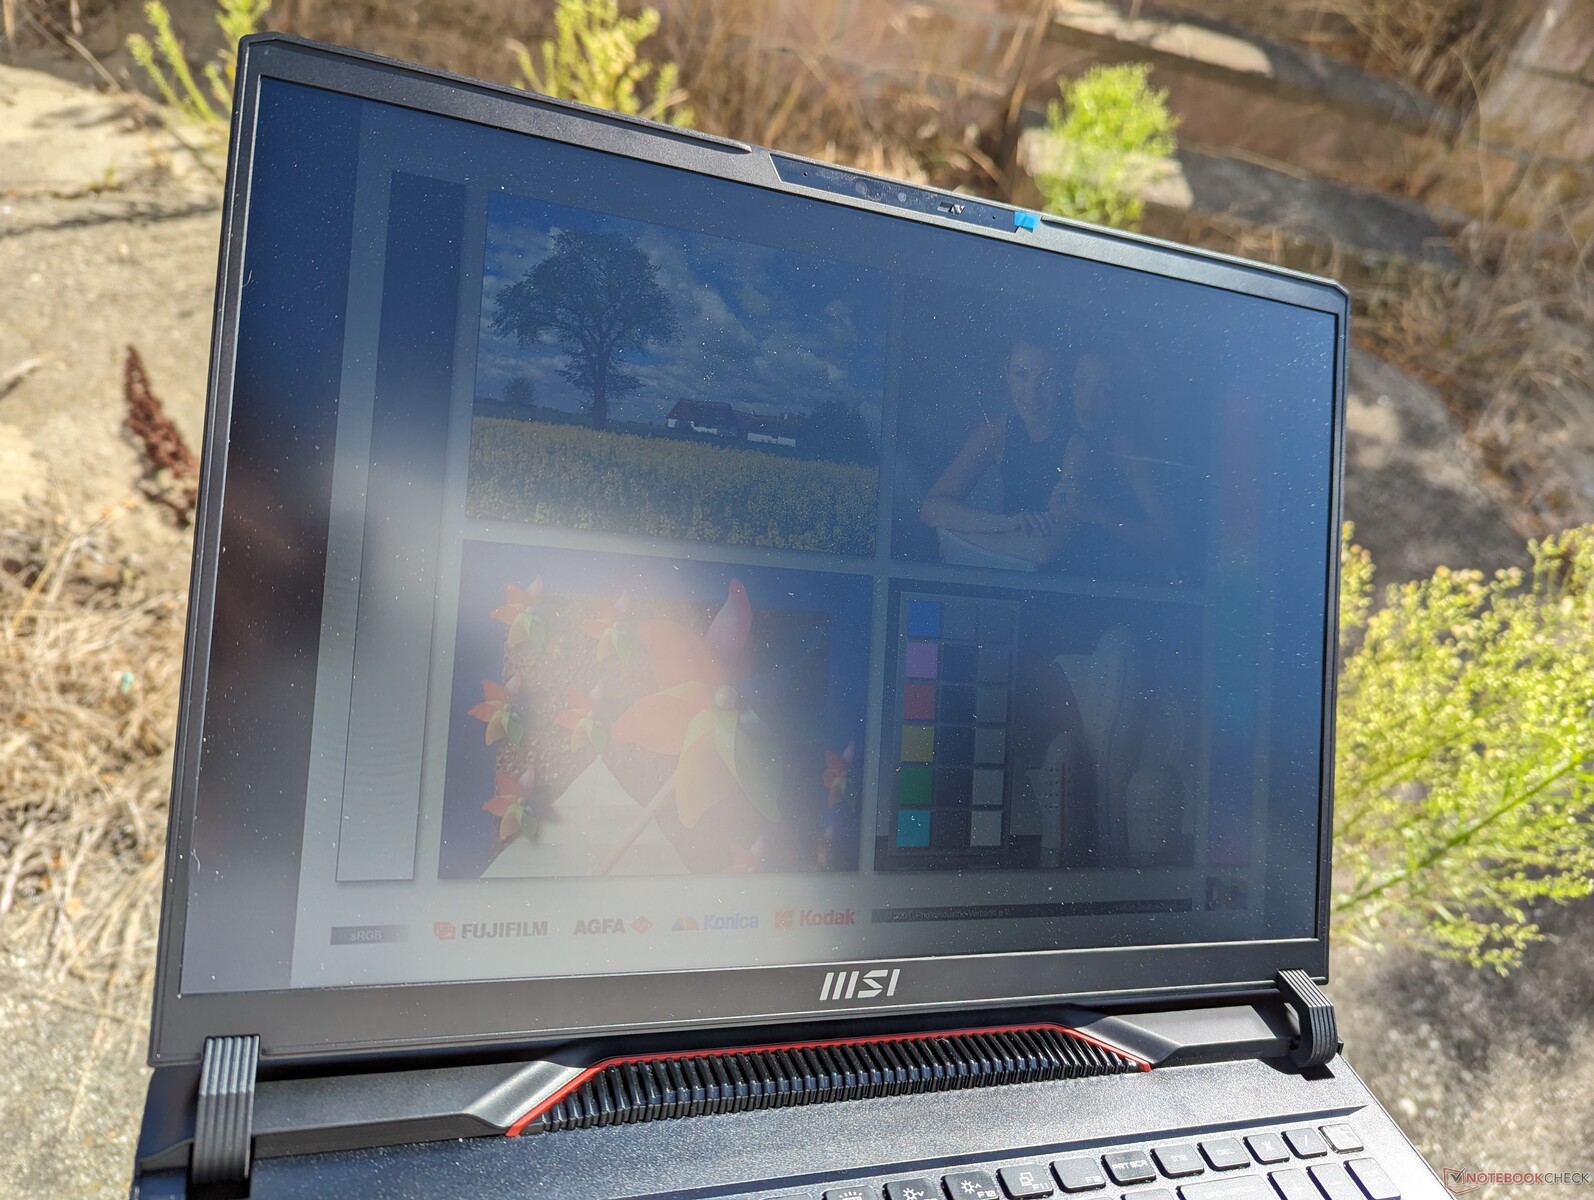
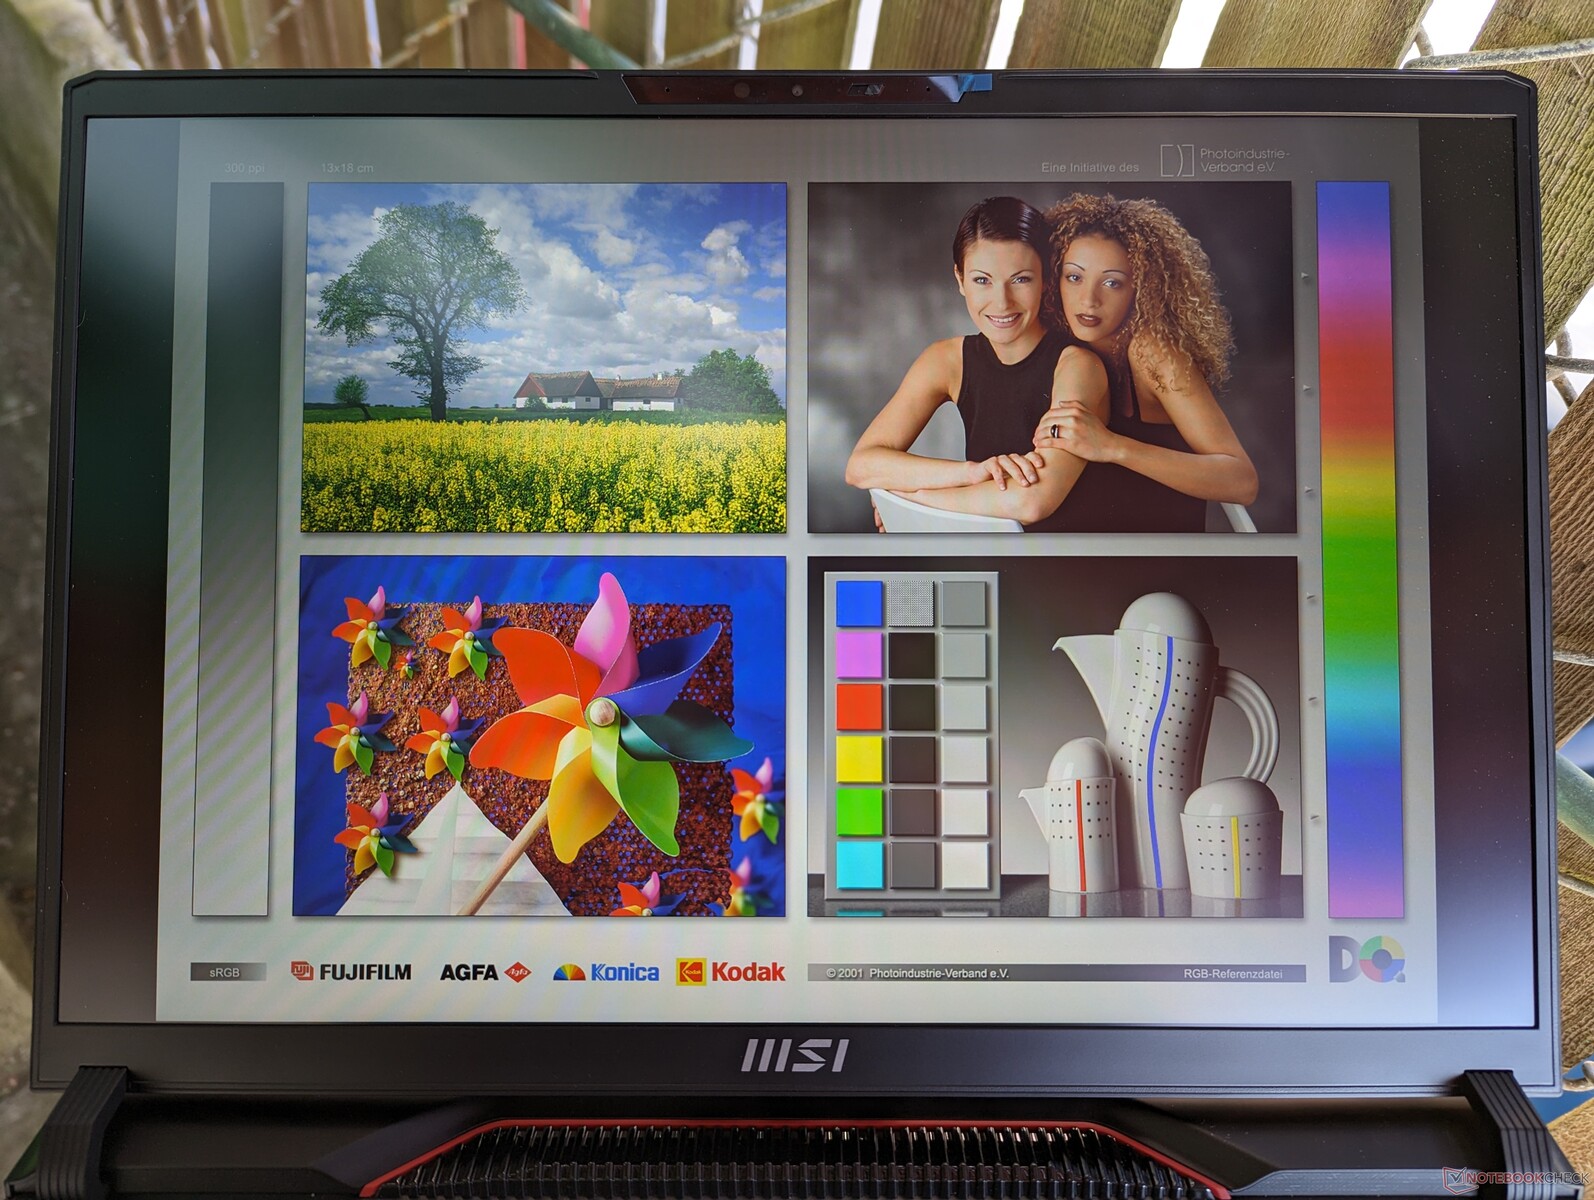
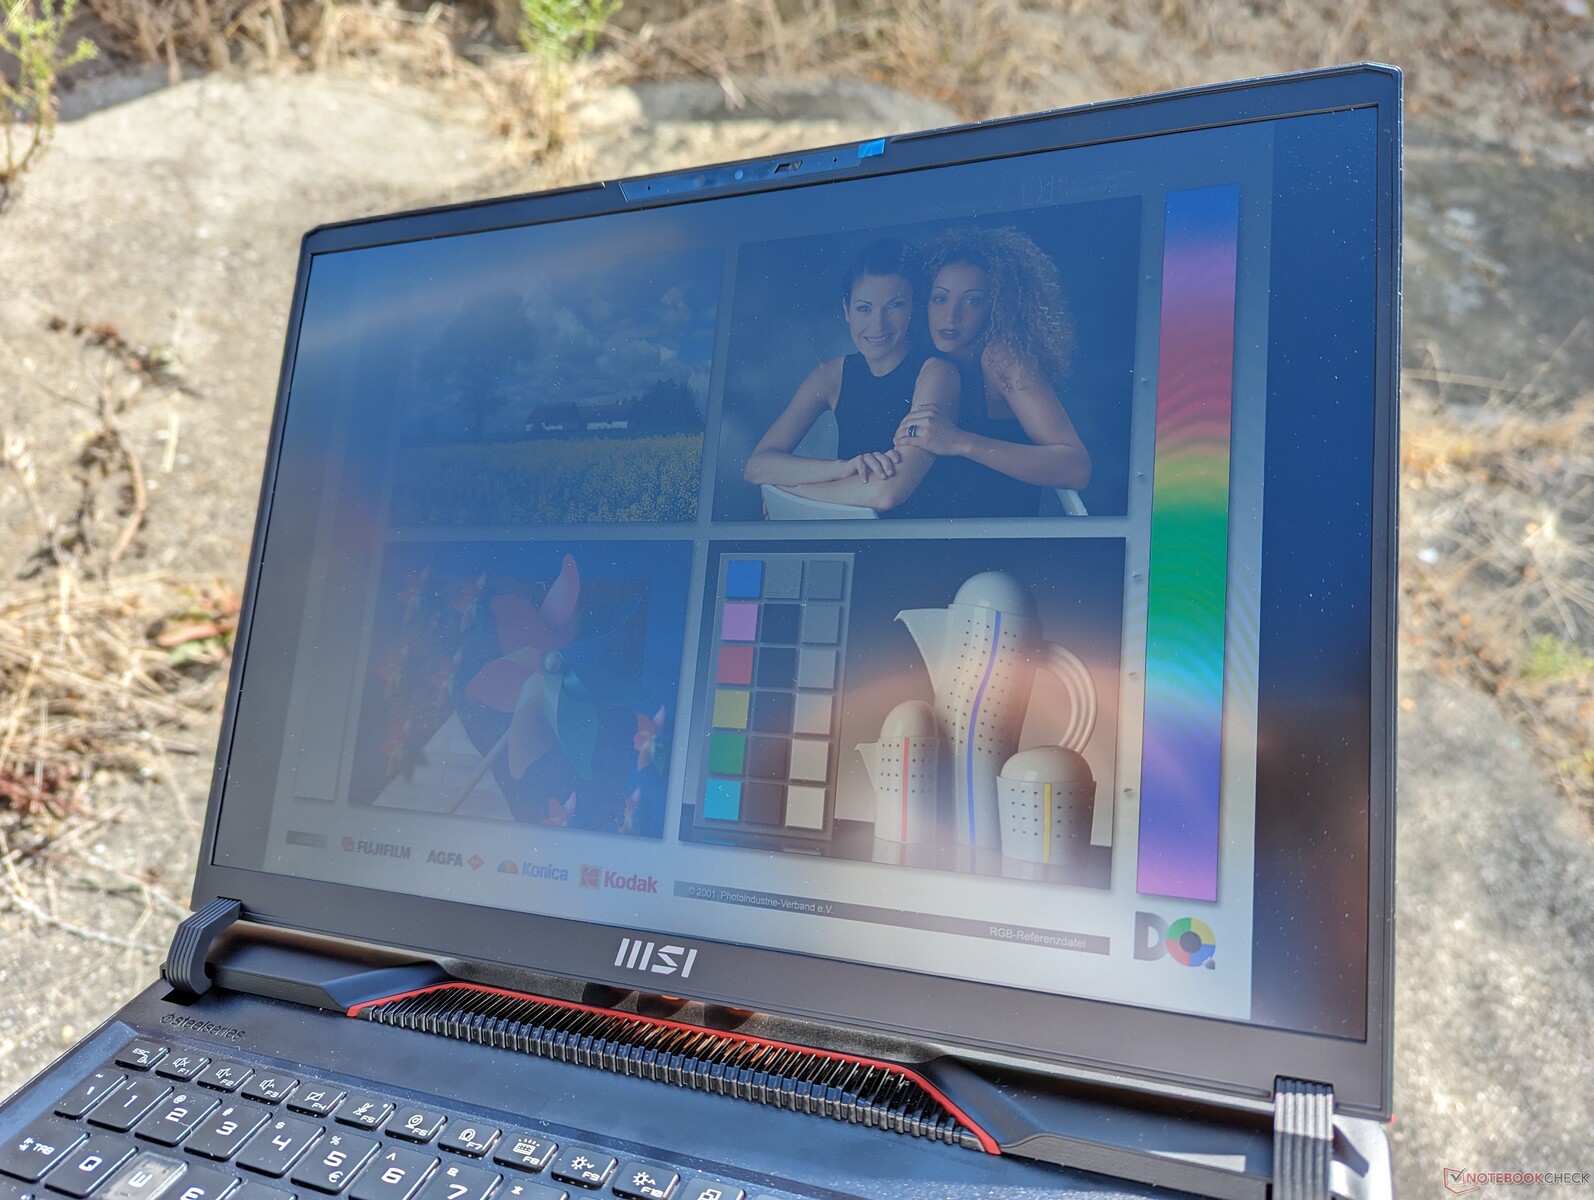
La luminosità massima di 300 nit è tipica della maggior parte dei portatili da gioco. La luce diretta del sole deve essere evitata, altrimenti i colori si sbiadiscono. Per una migliore visibilità all'aperto, gli utenti potrebbero prendere in considerazione lo Zephyrus M16 e il suo display due volte più luminoso.
Prestazioni - Impressionante incremento anno su anno
Condizioni di test
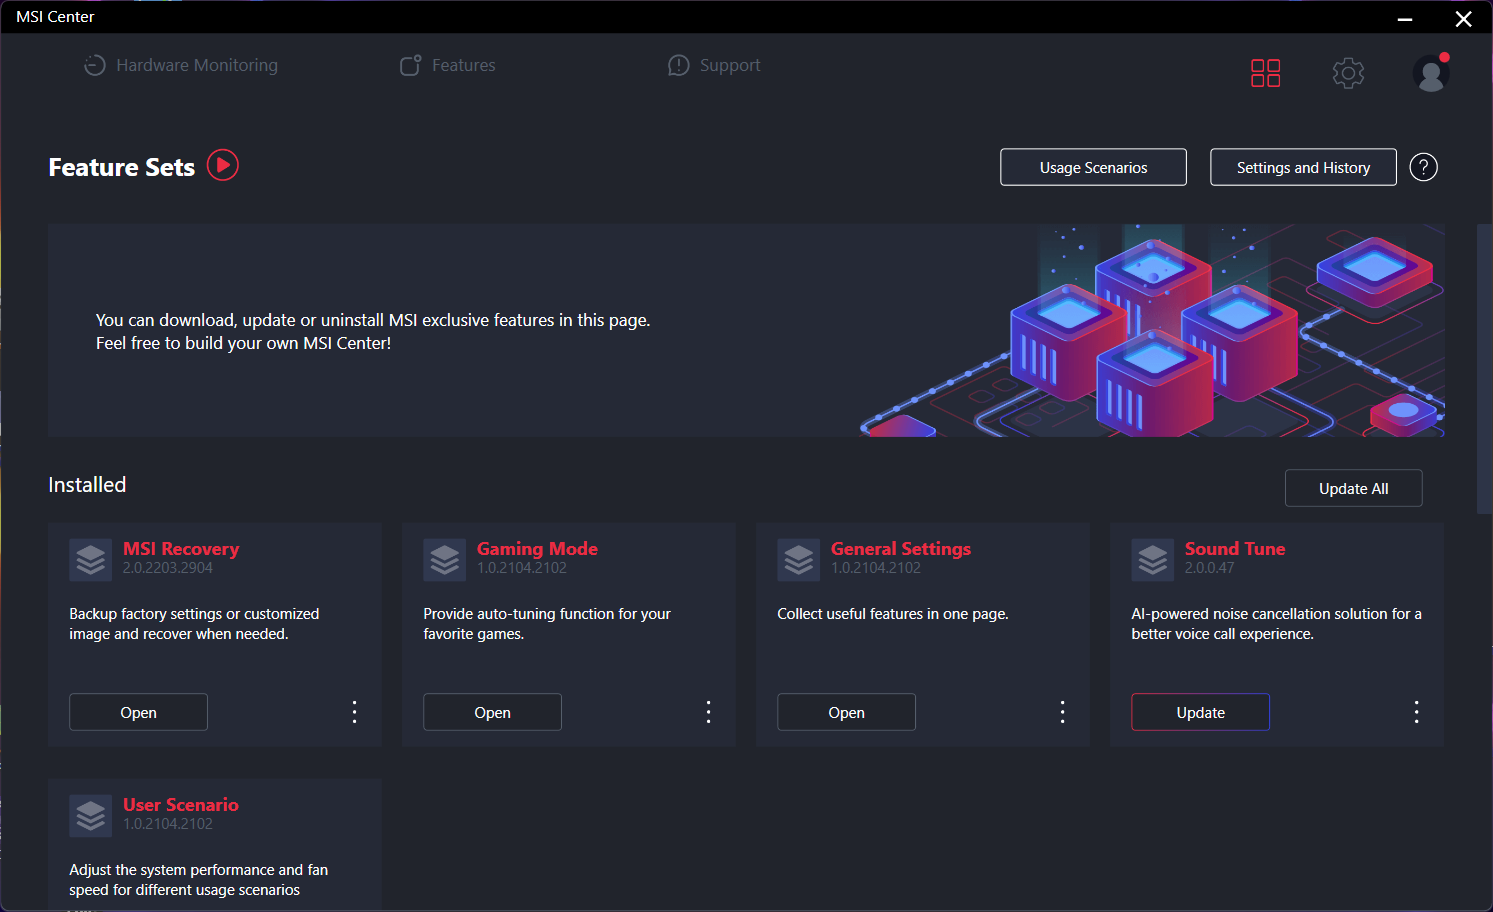
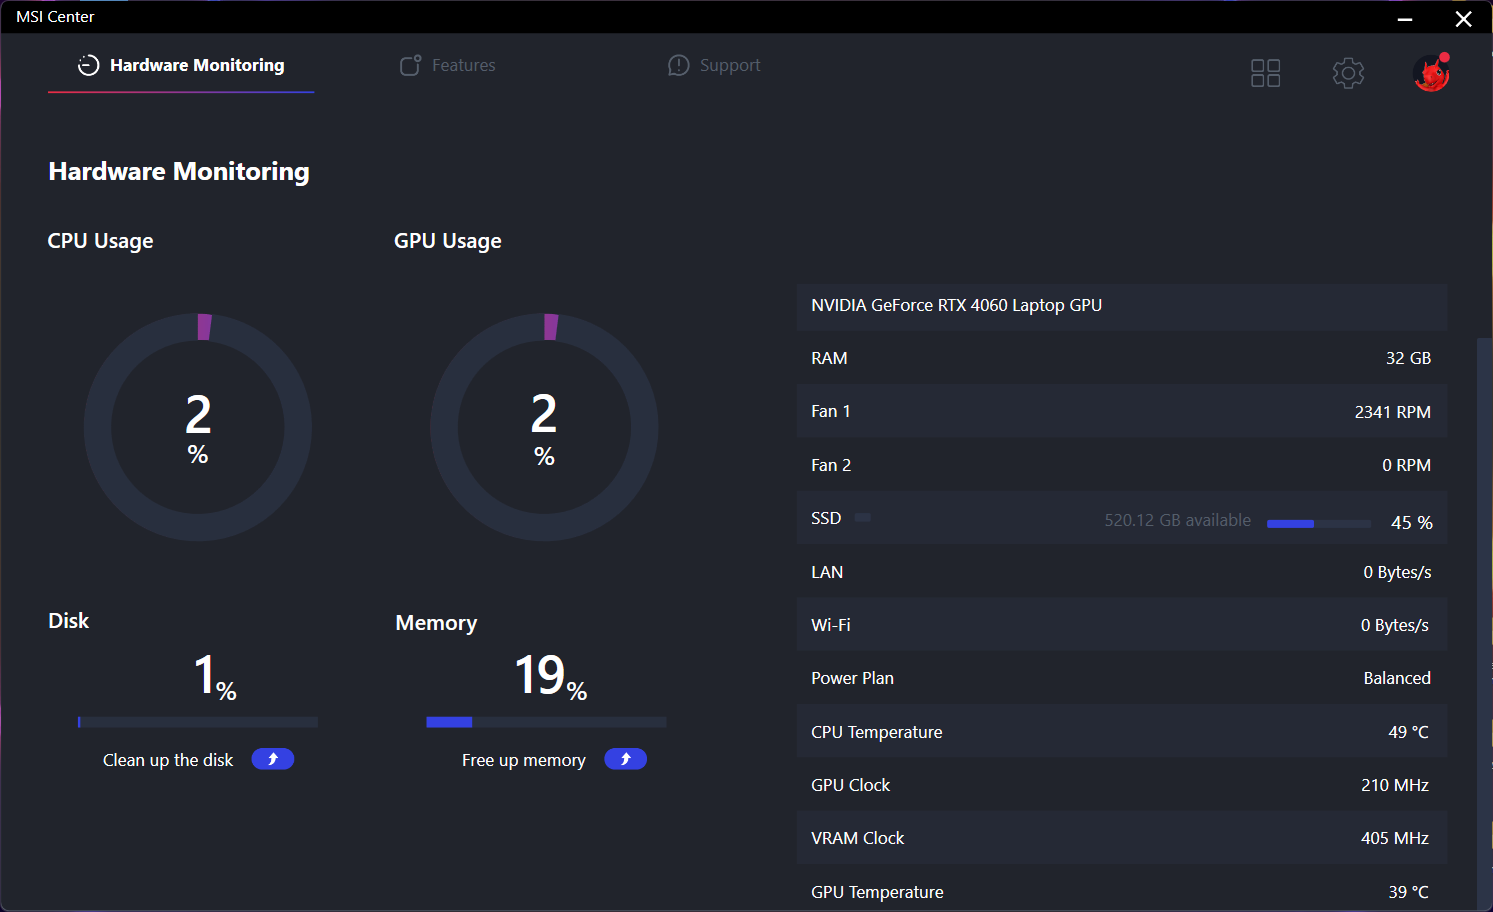
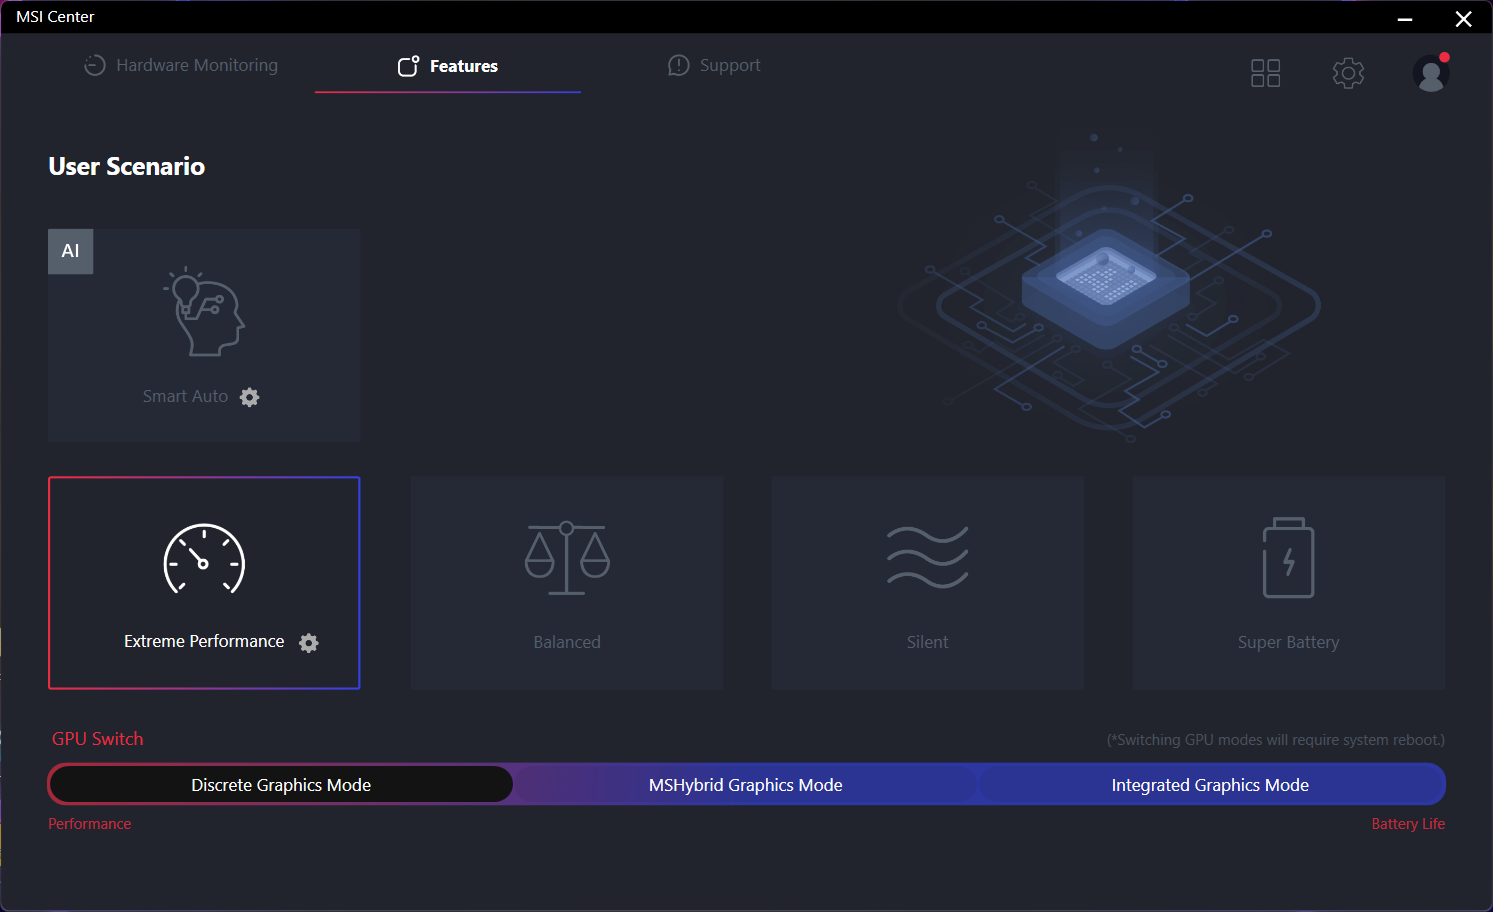
Abbiamo impostato Windows in modalità Performance e MSI Center sia in modalità Extreme Performance che in modalità dGPU prima di eseguire i benchmark qui sotto. MSI Center è l'hub di controllo per gli aggiornamenti del sistema, i dati vitali, i profili energetici, le modalità GPU e altro ancora. Tuttavia, le impostazioni RGB sono gestite da un'applicazione separata chiamata SteelSeries GG.
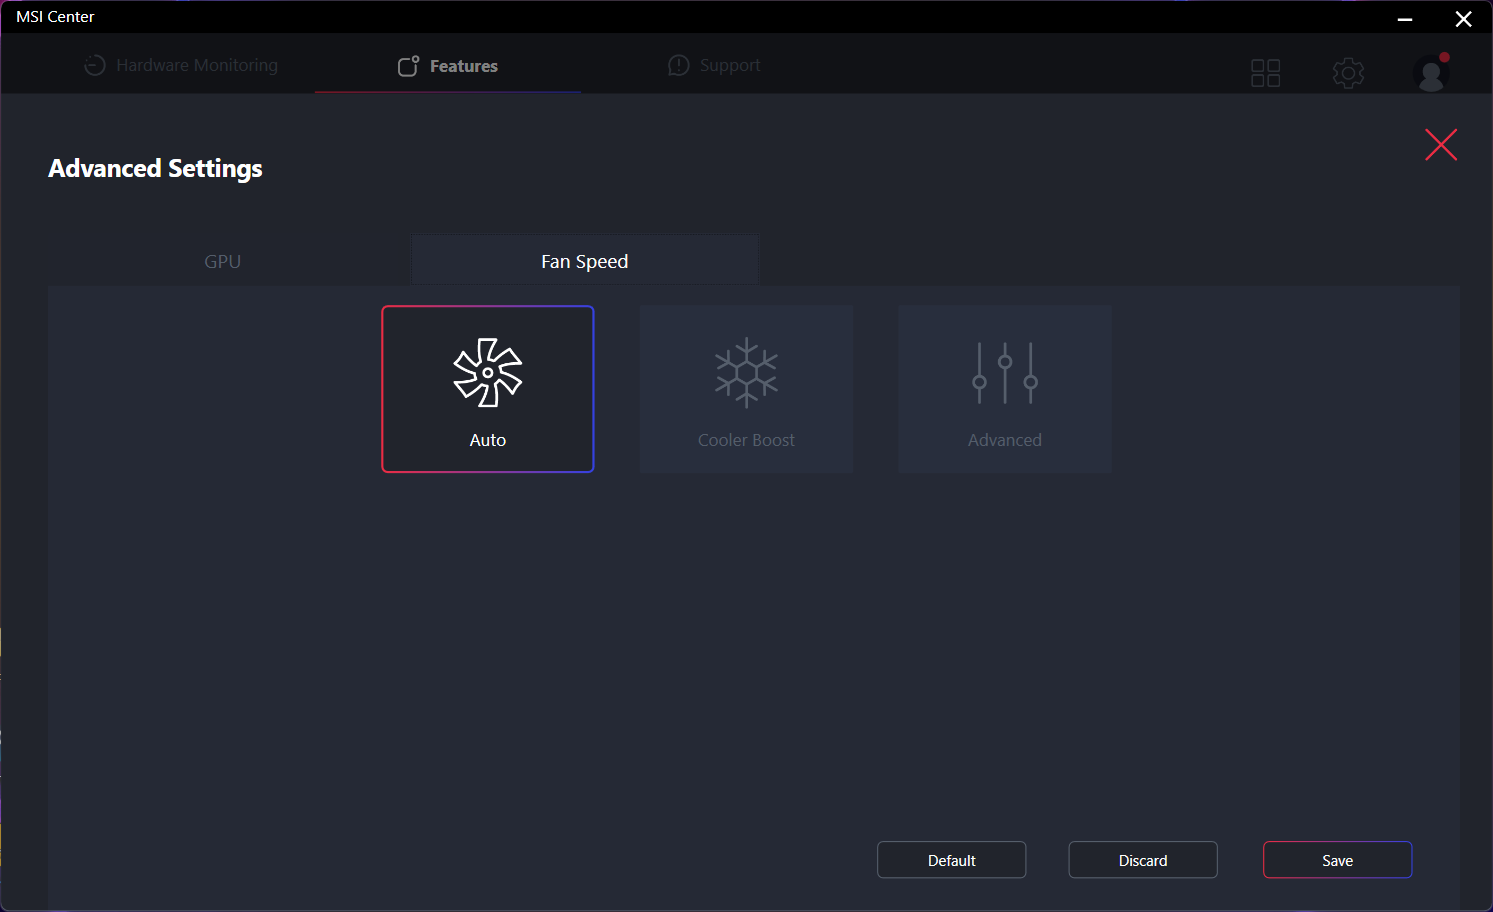
Cooler Boost è un'impostazione del sottomenu della modalità Extreme Performance. Abilitandola, le ventole interne funzionano al massimo dei giri, indipendentemente dal carico sullo schermo.
La configurazione RTX 4060 supporta MUX ma non Advanced Optimus, il che significa che è necessario un riavvio quando si passa dalle modalità dGPU, MSHybrid e iGPU.
Processore
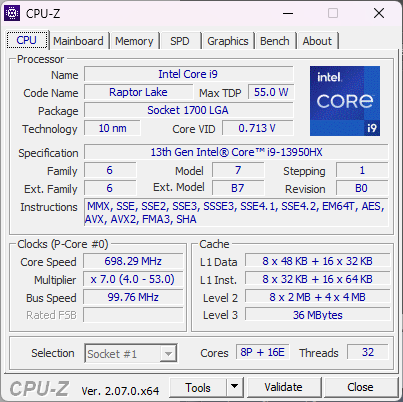
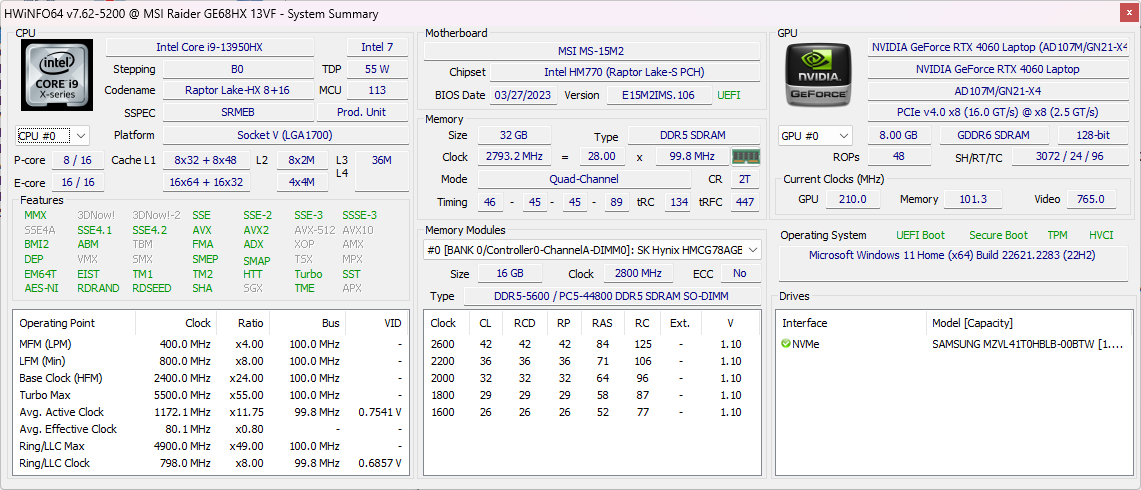
Le prestazioni della CPU e la stabilità della frequenza di clock sono eccellenti, con risultati superiori del 5-10% rispetto alla media delle CPU Core i93950X.Core i9-13950HX nel nostro database o quasi due volte più veloce del Core i7-13700H comunemente presente nella maggior parte degli altri portatili da gioco. Si tratta di una delle CPU mobili più veloci al momento sul mercato e compete con lo Zen 4 Ryzen 9 7945HX per i primi tre posti.
Passare al più costoso Core i9-13980HX dovrebbe aumentare le prestazioni solo del 5% circa, in base a quanto abbiamo visto con l'Alienware m18 R1. I vantaggi sono così marginali che consigliamo di rimanere con il Core i9-13950HX per risparmiare qualche centinaio di dollari.
Cinebench R15 Multi Loop
Cinebench R23: Multi Core | Single Core
Cinebench R20: CPU (Multi Core) | CPU (Single Core)
Cinebench R15: CPU Multi 64Bit | CPU Single 64Bit
Blender: v2.79 BMW27 CPU
7-Zip 18.03: 7z b 4 | 7z b 4 -mmt1
Geekbench 5.5: Multi-Core | Single-Core
HWBOT x265 Benchmark v2.2: 4k Preset
LibreOffice : 20 Documents To PDF
R Benchmark 2.5: Overall mean
* ... Meglio usare valori piccoli
AIDA64: FP32 Ray-Trace | FPU Julia | CPU SHA3 | CPU Queen | FPU SinJulia | FPU Mandel | CPU AES | CPU ZLib | FP64 Ray-Trace | CPU PhotoWorxx
| Performance rating | |
| Alienware m16 R1 AMD | |
| MSI Raider GE68HX 13VF | |
| Media Intel Core i9-13950HX | |
| HP Omen 16-xf0376ng | |
| Asus ROG Zephyrus M16 GU604VY-NM042X | |
| Lenovo Legion Slim 7i 16 Gen 8 | |
| MSI GE67 HX 12UGS | |
| AIDA64 / FP32 Ray-Trace | |
| Alienware m16 R1 AMD | |
| MSI Raider GE68HX 13VF | |
| HP Omen 16-xf0376ng | |
| Media Intel Core i9-13950HX (17993 - 28957, n=9) | |
| Asus ROG Zephyrus M16 GU604VY-NM042X | |
| Lenovo Legion Slim 7i 16 Gen 8 | |
| MSI GE67 HX 12UGS | |
| AIDA64 / FPU Julia | |
| Alienware m16 R1 AMD | |
| MSI Raider GE68HX 13VF | |
| Media Intel Core i9-13950HX (89362 - 144303, n=9) | |
| HP Omen 16-xf0376ng | |
| Asus ROG Zephyrus M16 GU604VY-NM042X | |
| Lenovo Legion Slim 7i 16 Gen 8 | |
| MSI GE67 HX 12UGS | |
| AIDA64 / CPU SHA3 | |
| Alienware m16 R1 AMD | |
| MSI Raider GE68HX 13VF | |
| Media Intel Core i9-13950HX (4518 - 7093, n=9) | |
| HP Omen 16-xf0376ng | |
| Asus ROG Zephyrus M16 GU604VY-NM042X | |
| MSI GE67 HX 12UGS | |
| Lenovo Legion Slim 7i 16 Gen 8 | |
| AIDA64 / CPU Queen | |
| Alienware m16 R1 AMD | |
| MSI Raider GE68HX 13VF | |
| Media Intel Core i9-13950HX (131931 - 140103, n=8) | |
| Lenovo Legion Slim 7i 16 Gen 8 | |
| Asus ROG Zephyrus M16 GU604VY-NM042X | |
| HP Omen 16-xf0376ng | |
| MSI GE67 HX 12UGS | |
| AIDA64 / FPU SinJulia | |
| Alienware m16 R1 AMD | |
| MSI Raider GE68HX 13VF | |
| HP Omen 16-xf0376ng | |
| Media Intel Core i9-13950HX (12318 - 17057, n=9) | |
| MSI GE67 HX 12UGS | |
| Asus ROG Zephyrus M16 GU604VY-NM042X | |
| Lenovo Legion Slim 7i 16 Gen 8 | |
| AIDA64 / FPU Mandel | |
| Alienware m16 R1 AMD | |
| MSI Raider GE68HX 13VF | |
| HP Omen 16-xf0376ng | |
| Media Intel Core i9-13950HX (44372 - 71038, n=9) | |
| Asus ROG Zephyrus M16 GU604VY-NM042X | |
| Lenovo Legion Slim 7i 16 Gen 8 | |
| MSI GE67 HX 12UGS | |
| AIDA64 / CPU AES | |
| Media Intel Core i9-13950HX (99981 - 204491, n=9) | |
| MSI Raider GE68HX 13VF | |
| MSI GE67 HX 12UGS | |
| Alienware m16 R1 AMD | |
| Asus ROG Zephyrus M16 GU604VY-NM042X | |
| Lenovo Legion Slim 7i 16 Gen 8 | |
| HP Omen 16-xf0376ng | |
| AIDA64 / CPU ZLib | |
| MSI Raider GE68HX 13VF | |
| Alienware m16 R1 AMD | |
| Media Intel Core i9-13950HX (1263 - 2069, n=9) | |
| MSI GE67 HX 12UGS | |
| Lenovo Legion Slim 7i 16 Gen 8 | |
| Asus ROG Zephyrus M16 GU604VY-NM042X | |
| HP Omen 16-xf0376ng | |
| AIDA64 / FP64 Ray-Trace | |
| Alienware m16 R1 AMD | |
| MSI Raider GE68HX 13VF | |
| HP Omen 16-xf0376ng | |
| Media Intel Core i9-13950HX (9649 - 15573, n=9) | |
| Asus ROG Zephyrus M16 GU604VY-NM042X | |
| Lenovo Legion Slim 7i 16 Gen 8 | |
| MSI GE67 HX 12UGS | |
| AIDA64 / CPU PhotoWorxx | |
| MSI Raider GE68HX 13VF | |
| Asus ROG Zephyrus M16 GU604VY-NM042X | |
| Media Intel Core i9-13950HX (40233 - 50864, n=9) | |
| HP Omen 16-xf0376ng | |
| MSI GE67 HX 12UGS | |
| Alienware m16 R1 AMD | |
| Lenovo Legion Slim 7i 16 Gen 8 | |
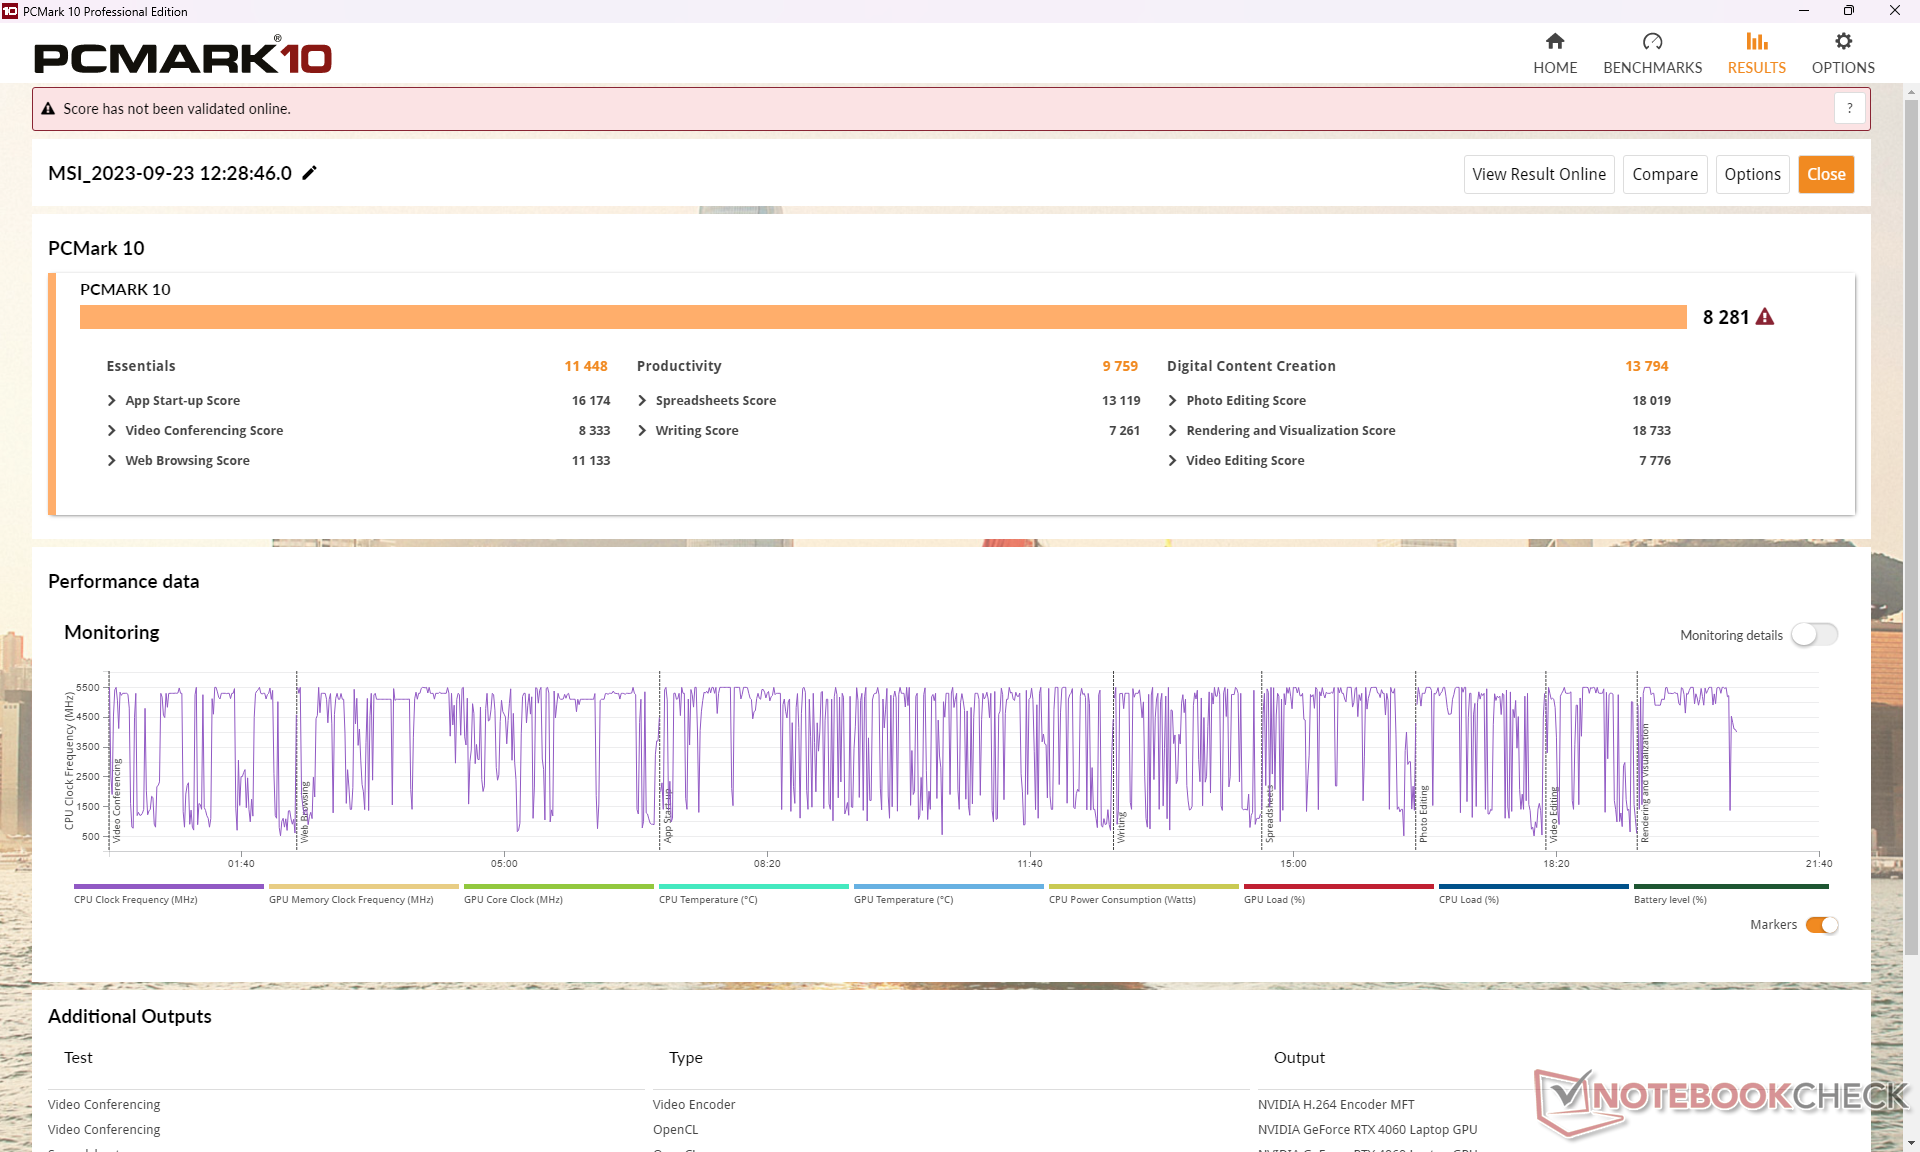
Prestazioni del sistema
I benchmark di PCMark sono paragonabili a quelli di altri portatili da gioco da 16 pollici come l'Alienware m16 R1 o il Lenovo Slim 7i Lenovo Legion Slim 7i 16 di pochi punti percentuali. Durante i test non abbiamo riscontrato problemi di risveglio dal sonno o altri problemi degni di nota con la nostra unità di prova.
CrossMark: Overall | Productivity | Creativity | Responsiveness
| PCMark 10 / Score | |
| Alienware m16 R1 AMD | |
| Lenovo Legion Slim 7i 16 Gen 8 | |
| MSI Raider GE68HX 13VF | |
| Media Intel Core i9-13950HX, NVIDIA GeForce RTX 4060 Laptop GPU (n=1) | |
| Asus ROG Zephyrus M16 GU604VY-NM042X | |
| HP Omen 16-xf0376ng | |
| MSI GE67 HX 12UGS | |
| PCMark 10 / Essentials | |
| Asus ROG Zephyrus M16 GU604VY-NM042X | |
| Alienware m16 R1 AMD | |
| MSI Raider GE68HX 13VF | |
| Media Intel Core i9-13950HX, NVIDIA GeForce RTX 4060 Laptop GPU (n=1) | |
| Lenovo Legion Slim 7i 16 Gen 8 | |
| HP Omen 16-xf0376ng | |
| MSI GE67 HX 12UGS | |
| PCMark 10 / Productivity | |
| Asus ROG Zephyrus M16 GU604VY-NM042X | |
| Lenovo Legion Slim 7i 16 Gen 8 | |
| Alienware m16 R1 AMD | |
| HP Omen 16-xf0376ng | |
| MSI GE67 HX 12UGS | |
| MSI Raider GE68HX 13VF | |
| Media Intel Core i9-13950HX, NVIDIA GeForce RTX 4060 Laptop GPU (n=1) | |
| PCMark 10 / Digital Content Creation | |
| Alienware m16 R1 AMD | |
| MSI Raider GE68HX 13VF | |
| Media Intel Core i9-13950HX, NVIDIA GeForce RTX 4060 Laptop GPU (n=1) | |
| Lenovo Legion Slim 7i 16 Gen 8 | |
| HP Omen 16-xf0376ng | |
| MSI GE67 HX 12UGS | |
| Asus ROG Zephyrus M16 GU604VY-NM042X | |
| CrossMark / Overall | |
| Alienware m16 R1 AMD | |
| Lenovo Legion Slim 7i 16 Gen 8 | |
| MSI GE67 HX 12UGS | |
| Asus ROG Zephyrus M16 GU604VY-NM042X | |
| MSI Raider GE68HX 13VF | |
| Media Intel Core i9-13950HX, NVIDIA GeForce RTX 4060 Laptop GPU (n=1) | |
| CrossMark / Productivity | |
| Lenovo Legion Slim 7i 16 Gen 8 | |
| Alienware m16 R1 AMD | |
| MSI GE67 HX 12UGS | |
| Asus ROG Zephyrus M16 GU604VY-NM042X | |
| MSI Raider GE68HX 13VF | |
| Media Intel Core i9-13950HX, NVIDIA GeForce RTX 4060 Laptop GPU (n=1) | |
| CrossMark / Creativity | |
| MSI Raider GE68HX 13VF | |
| Media Intel Core i9-13950HX, NVIDIA GeForce RTX 4060 Laptop GPU (n=1) | |
| Asus ROG Zephyrus M16 GU604VY-NM042X | |
| Alienware m16 R1 AMD | |
| MSI GE67 HX 12UGS | |
| Lenovo Legion Slim 7i 16 Gen 8 | |
| CrossMark / Responsiveness | |
| MSI GE67 HX 12UGS | |
| Lenovo Legion Slim 7i 16 Gen 8 | |
| Alienware m16 R1 AMD | |
| Asus ROG Zephyrus M16 GU604VY-NM042X | |
| MSI Raider GE68HX 13VF | |
| Media Intel Core i9-13950HX, NVIDIA GeForce RTX 4060 Laptop GPU (n=1) | |
| PCMark 10 Score | 8281 punti | |
Aiuto | ||
| AIDA64 / Memory Copy | |
| MSI Raider GE68HX 13VF | |
| Media Intel Core i9-13950HX (61938 - 78813, n=9) | |
| Asus ROG Zephyrus M16 GU604VY-NM042X | |
| HP Omen 16-xf0376ng | |
| MSI GE67 HX 12UGS | |
| Alienware m16 R1 AMD | |
| Lenovo Legion Slim 7i 16 Gen 8 | |
| AIDA64 / Memory Read | |
| MSI Raider GE68HX 13VF | |
| Media Intel Core i9-13950HX (62368 - 86831, n=9) | |
| Asus ROG Zephyrus M16 GU604VY-NM042X | |
| HP Omen 16-xf0376ng | |
| MSI GE67 HX 12UGS | |
| Alienware m16 R1 AMD | |
| Lenovo Legion Slim 7i 16 Gen 8 | |
| AIDA64 / Memory Write | |
| HP Omen 16-xf0376ng | |
| MSI Raider GE68HX 13VF | |
| Media Intel Core i9-13950HX (59501 - 80441, n=9) | |
| Asus ROG Zephyrus M16 GU604VY-NM042X | |
| MSI GE67 HX 12UGS | |
| Alienware m16 R1 AMD | |
| Lenovo Legion Slim 7i 16 Gen 8 | |
| AIDA64 / Memory Latency | |
| MSI GE67 HX 12UGS | |
| Alienware m16 R1 AMD | |
| HP Omen 16-xf0376ng | |
| Media Intel Core i9-13950HX (84.4 - 99.5, n=9) | |
| Asus ROG Zephyrus M16 GU604VY-NM042X | |
| MSI Raider GE68HX 13VF | |
| Lenovo Legion Slim 7i 16 Gen 8 | |
* ... Meglio usare valori piccoli
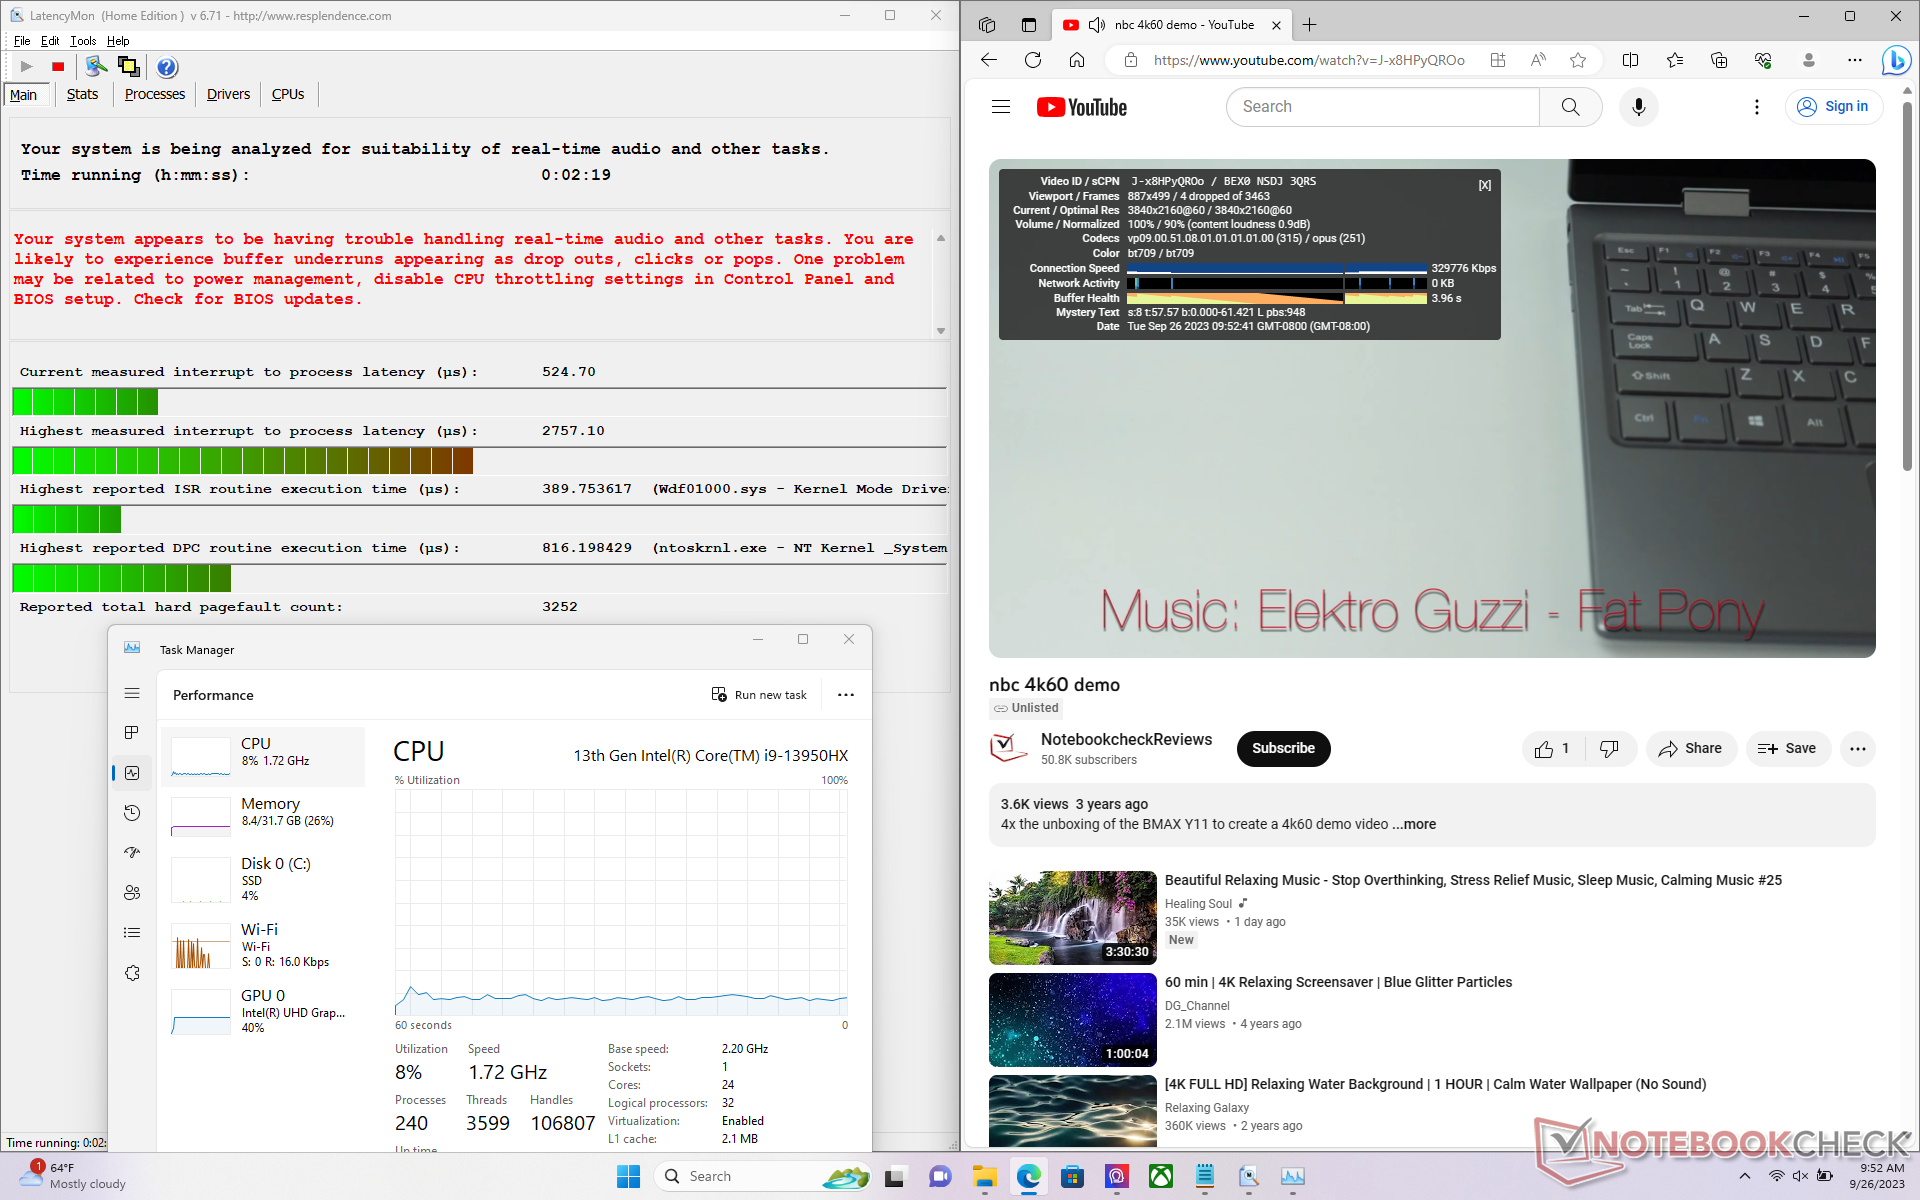
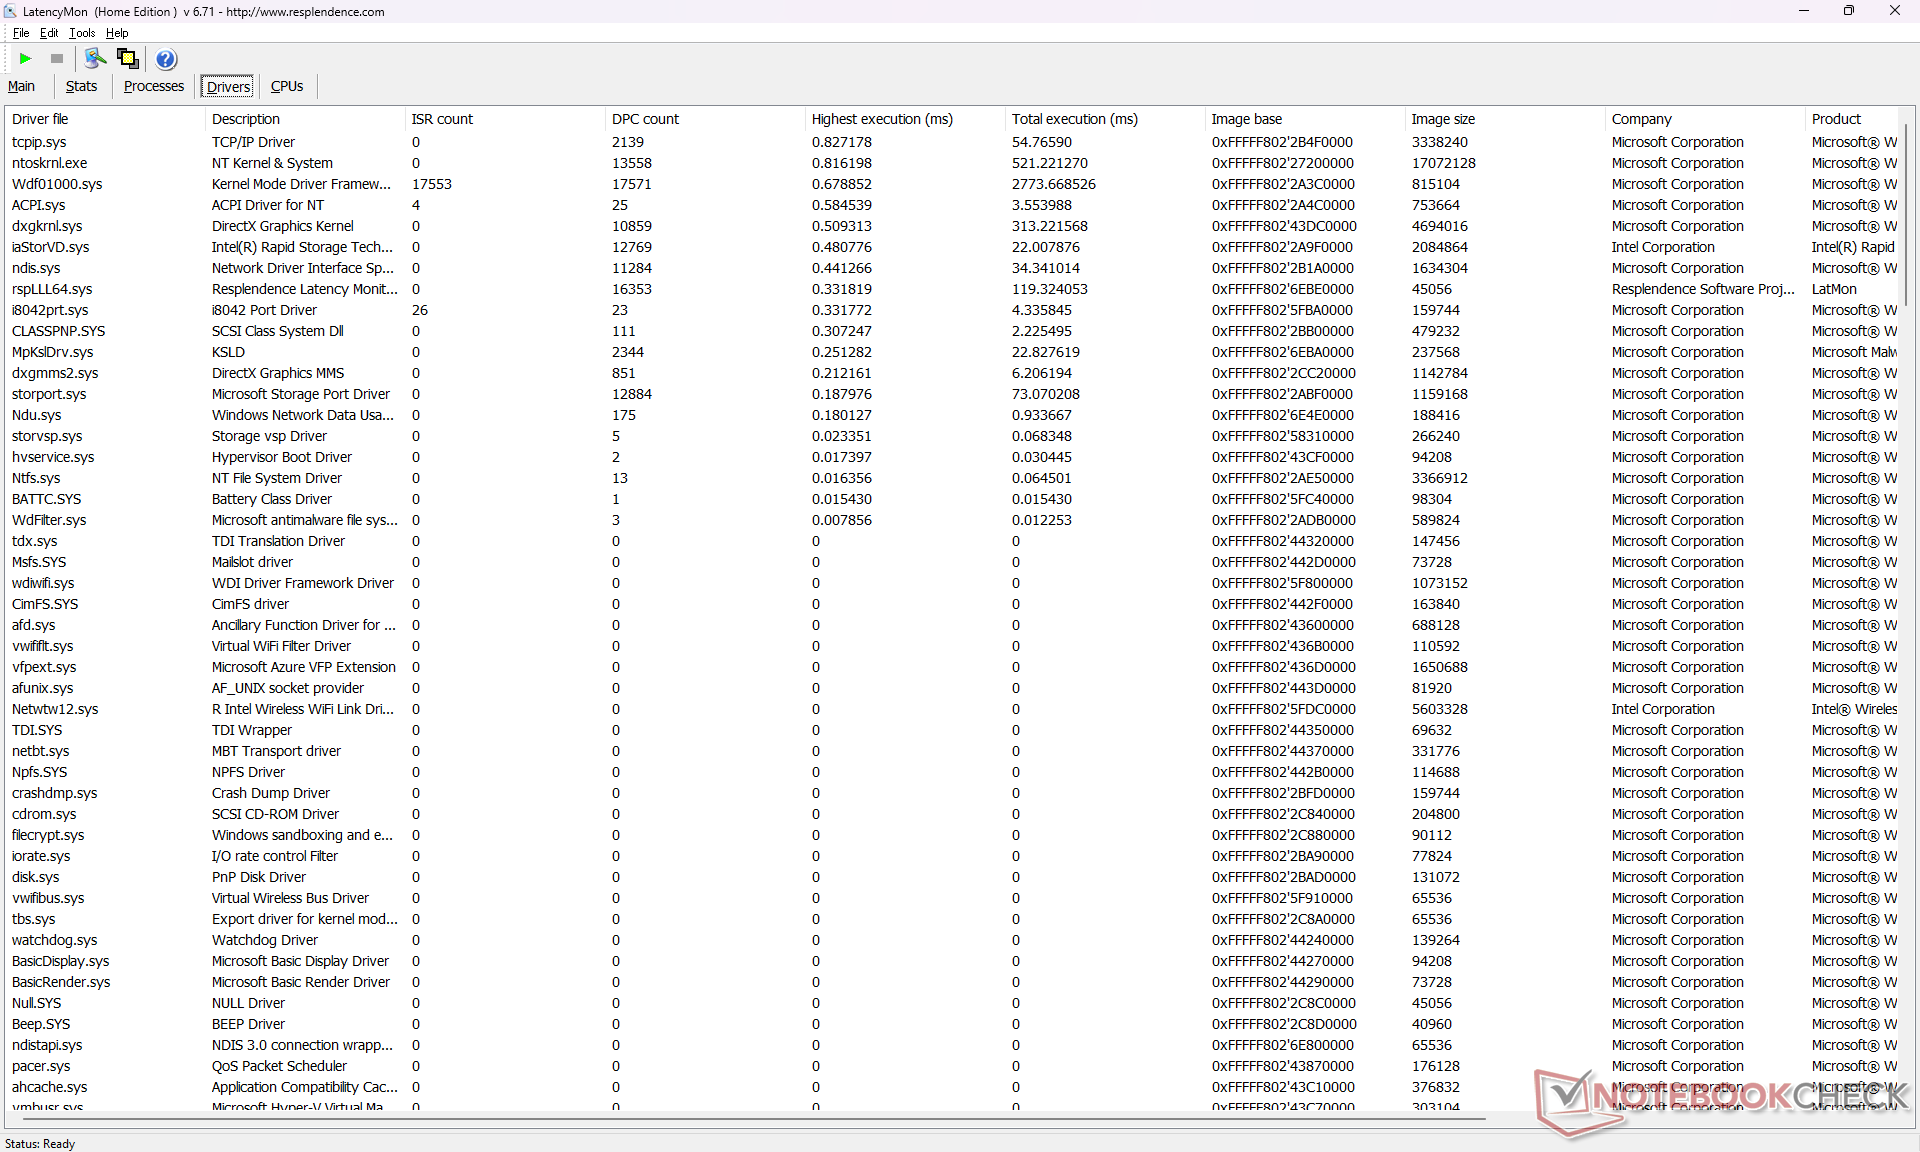
Latenza DPC
LatencyMon rivela problemi di DPC quando si aprono più schede del browser della nostra homepage. la riproduzione di video 4K a 60 FPS è imperfetta, con 4 fotogrammi caduti registrati in una finestra di 60 secondi.
| DPC Latencies / LatencyMon - interrupt to process latency (max), Web, Youtube, Prime95 | |
| Lenovo Legion Slim 7i 16 Gen 8 | |
| Asus ROG Zephyrus M16 GU604VY-NM042X | |
| MSI Raider GE68HX 13VF | |
| HP Omen 16-xf0376ng | |
| Alienware m16 R1 AMD | |
| MSI GE67 HX 12UGS | |
* ... Meglio usare valori piccoli
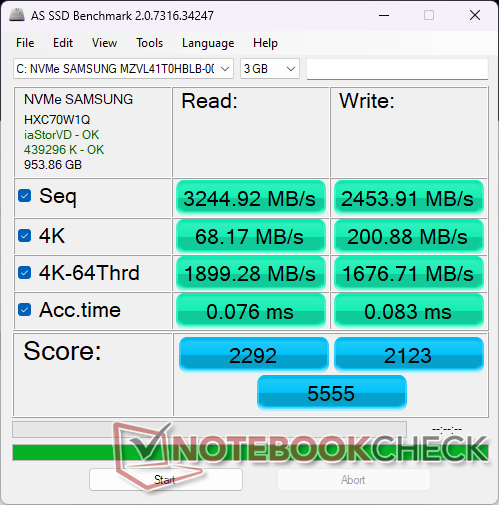
Dispositivi di archiviazione
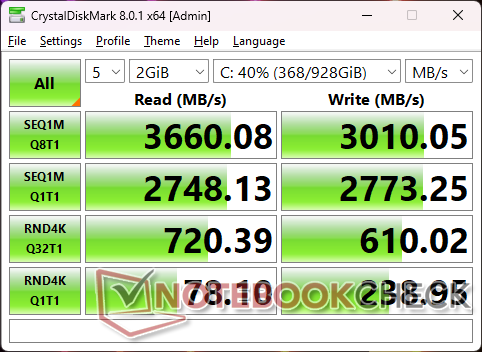
La nostra unità viene fornita con il modello più economico da 1 TB Samsung PM9B1 invece del più costoso Samsung PM9A1, probabilmente per risparmiare sui costi. Il PM9B1 è quasi la metà più veloce, con velocità di lettura sequenziale massima di circa 3600 MB/s rispetto ai circa 7000 MB/s del PM9A1. Le prestazioni dell'SSD sono comunque stabili, senza throttling.

| Drive Performance rating - Percent | |
| MSI GE67 HX 12UGS | |
| Lenovo Legion Slim 7i 16 Gen 8 | |
| Alienware m16 R1 AMD | |
| Asus ROG Zephyrus M16 GU604VY-NM042X | |
| HP Omen 16-xf0376ng | |
| MSI Raider GE68HX 13VF -11! | |
* ... Meglio usare valori piccoli
Disk Throttling: DiskSpd Read Loop, Queue Depth 8
Prestazioni della GPU
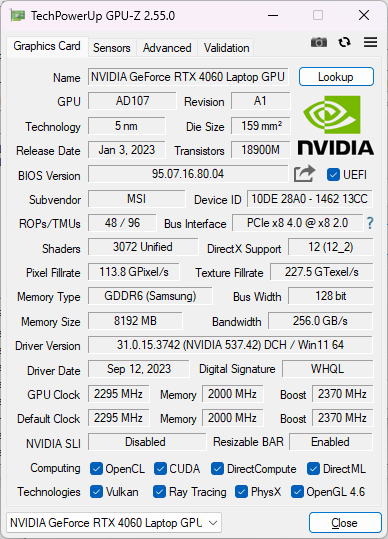
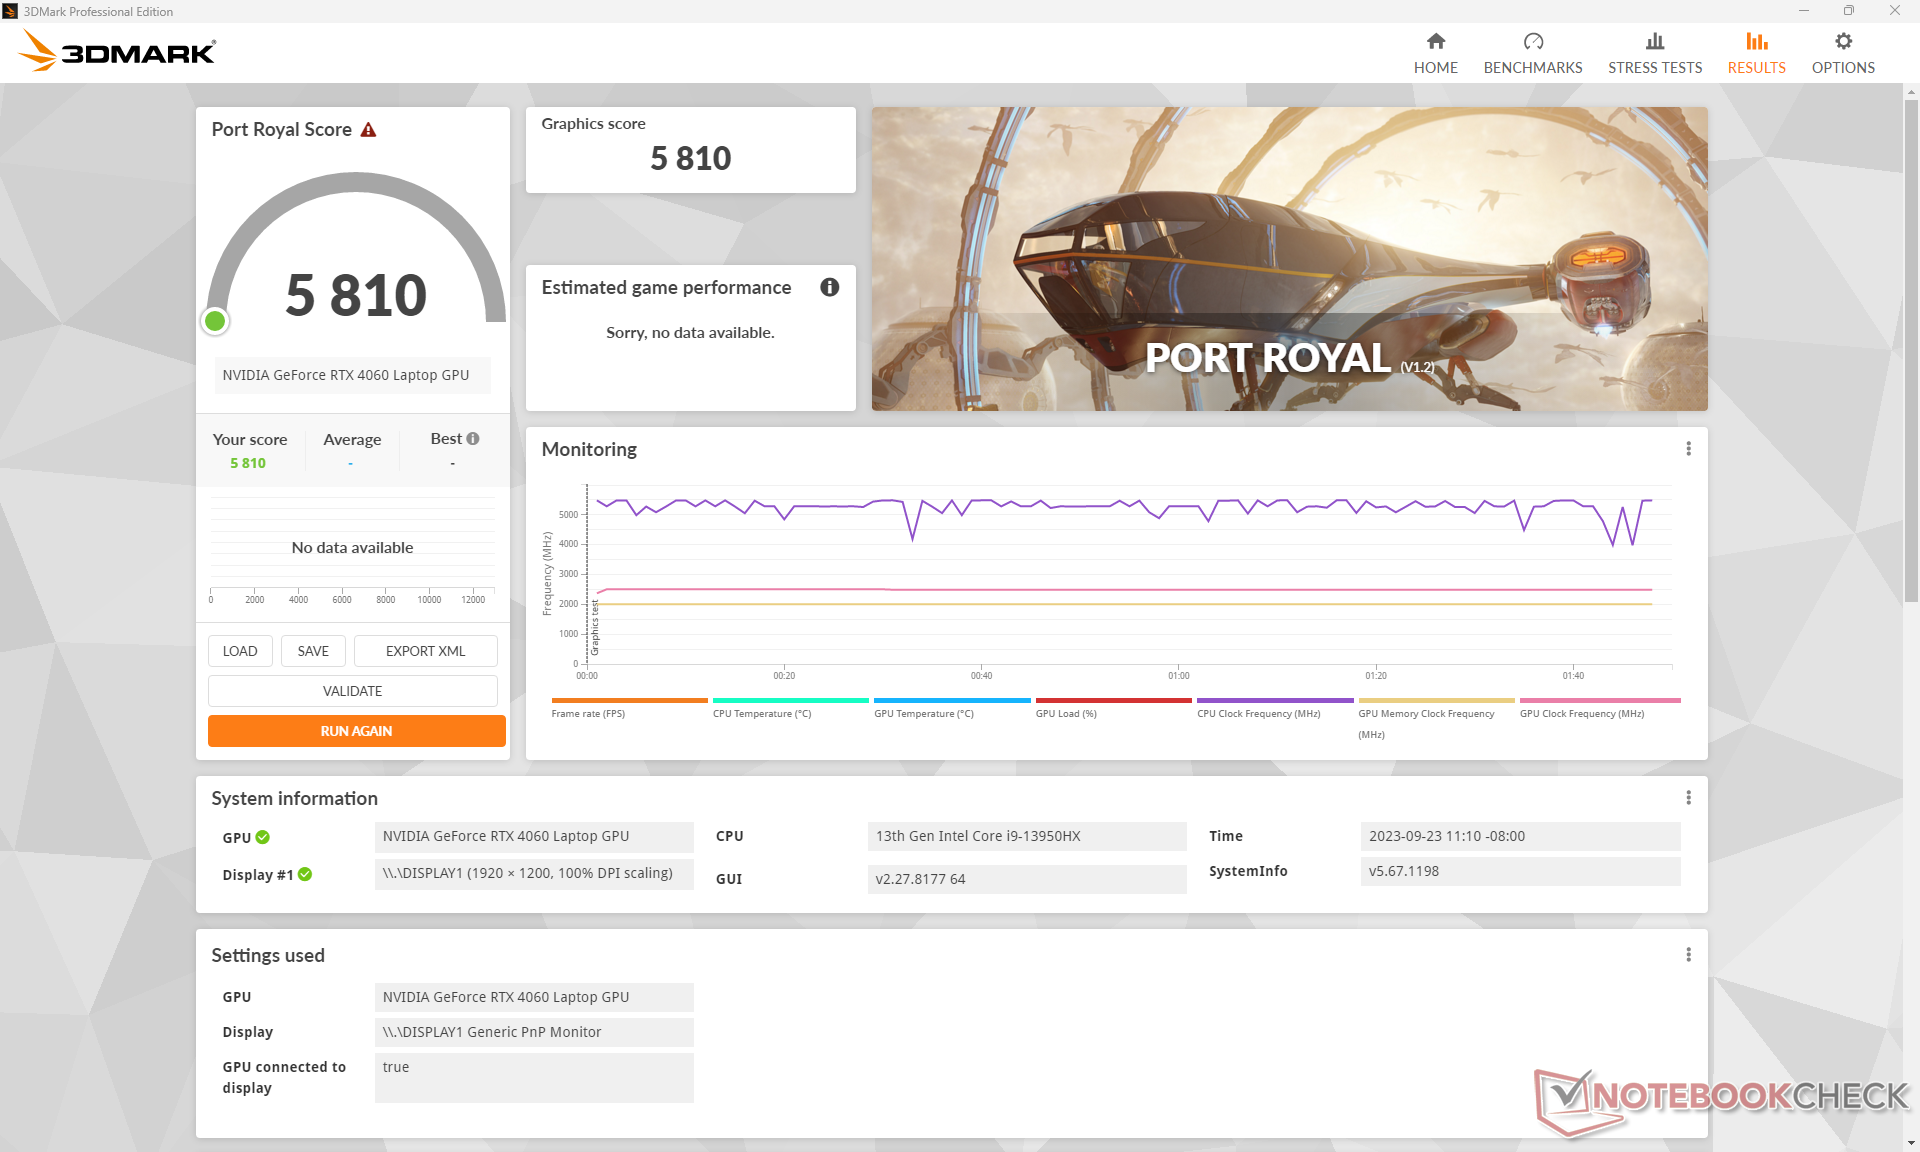
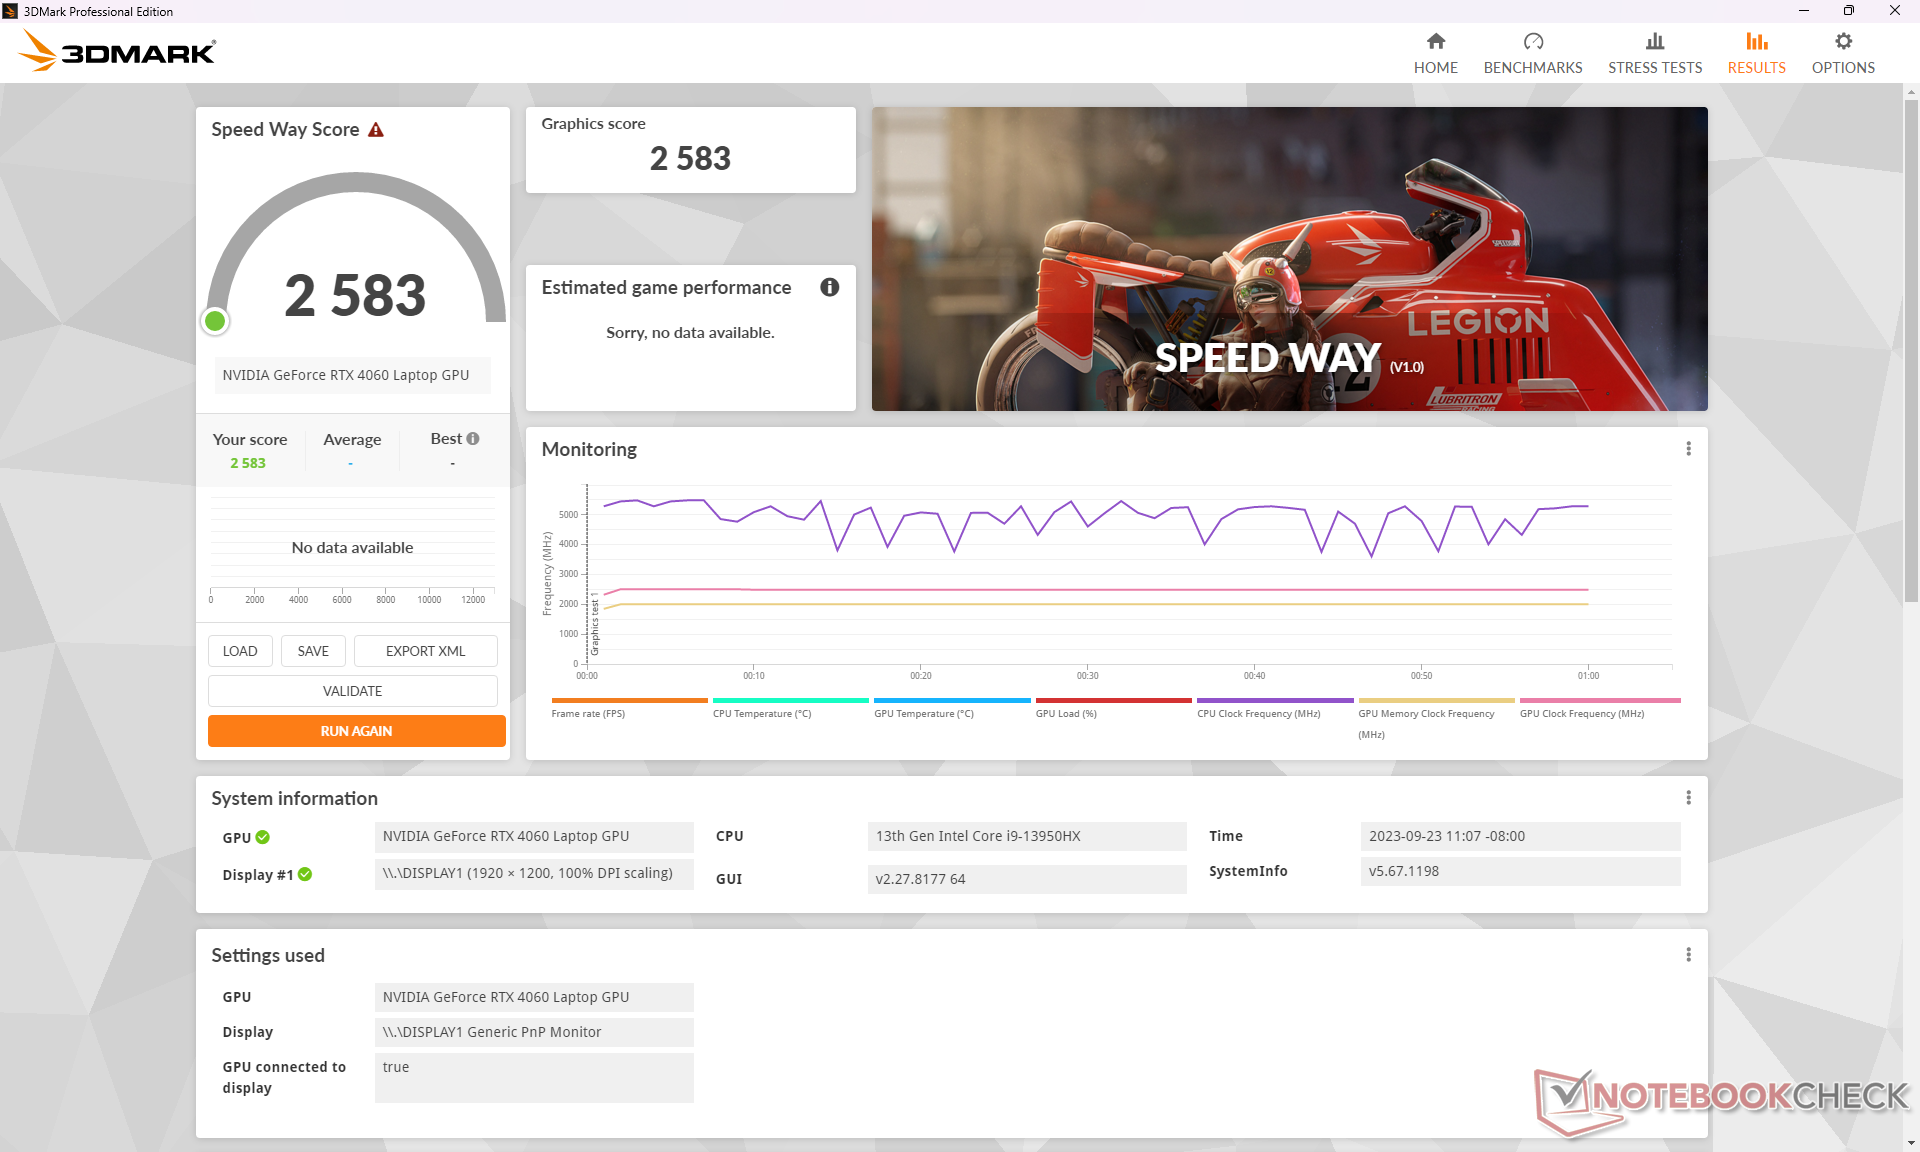
La nostra RTX 4060 si comporta bene con risultati appena superiori alla media dei portatili da gioco del nostro database dotati della stessa GPU. L'aggiornamento alla RTX 4070, 4080 o 4090 dovrebbe aumentare le prestazioni rispettivamente del 10-20%, 60-80% e 80-100% rispetto alla RTX 4060. Il divario di prestazioni è maggiore tra le RTX 4070 e 4080.
Purtroppo MSI ha programmato MSI Center per passare automaticamente alla modalità Extreme Performance ogni volta che rileva che 3DMark è in esecuzione e non c'è un modo semplice per disabilitarlo. Lo riteniamo frustrante perché toglie il controllo all'utente finale. La commutazione automatica non si verifica durante l'esecuzione di giochi.
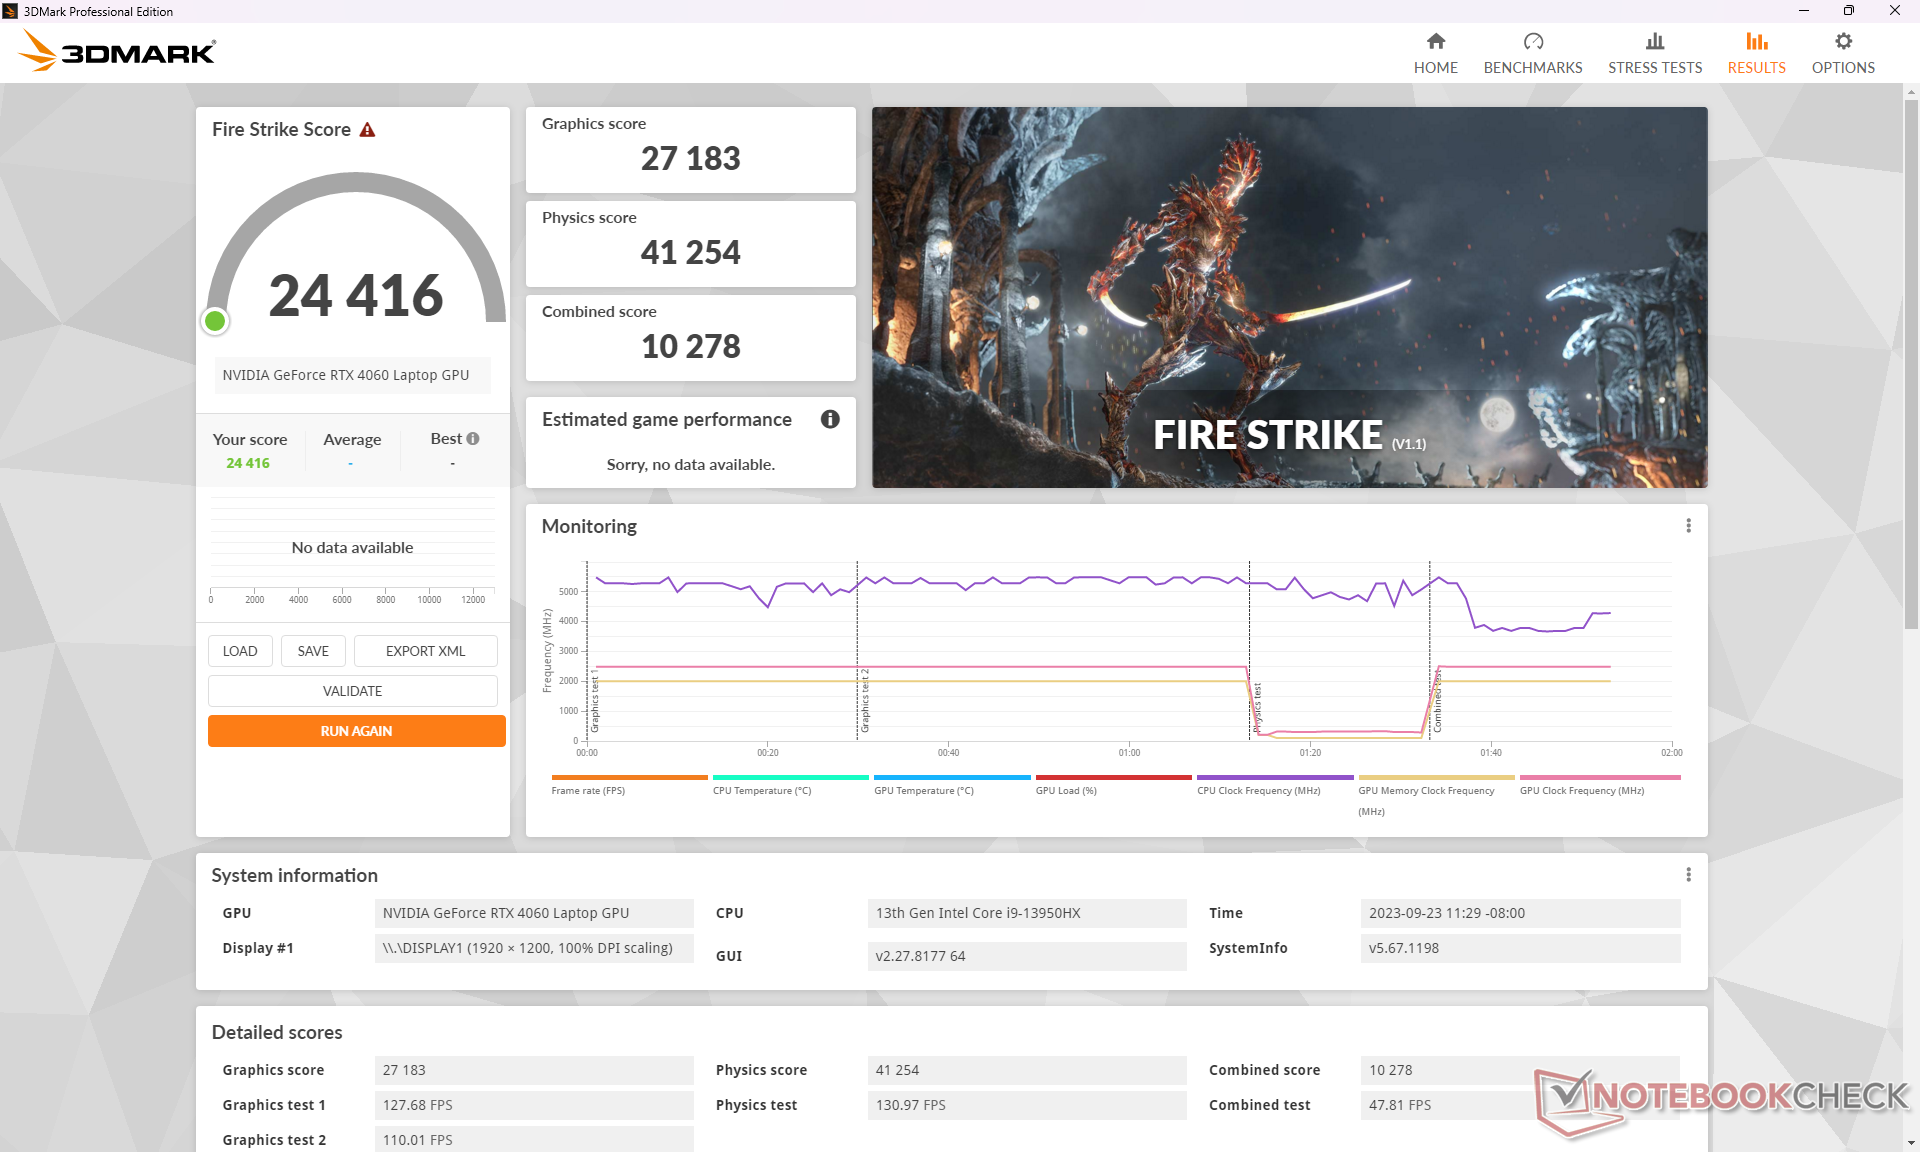
L'attivazione di Cooler Boost non sembra avere un impatto significativo sulle prestazioni della CPU o della GPU, come dimostrano i risultati di Fire Strike. Pertanto, la funzione non è fondamentale per ottenere le massime prestazioni ed è consigliata solo se si desiderano temperature di esercizio più basse.
| Profilo energetico | Fire Strike Grafica | Fire Strike Fisica | Punteggio combinato |
| Modalità prestazioni estreme (Cooler Boost attivato) | 27127 | 41525 | 11480 |
| Modalità prestazioni estreme (Cooler Boost disattivato) | 27183 (0%) | 41254 (-1%) | 10278 (-10%) |
| Potenza della batteria | 19528 (-28%) | 18623 (-55%) | 5986 (-48%) |
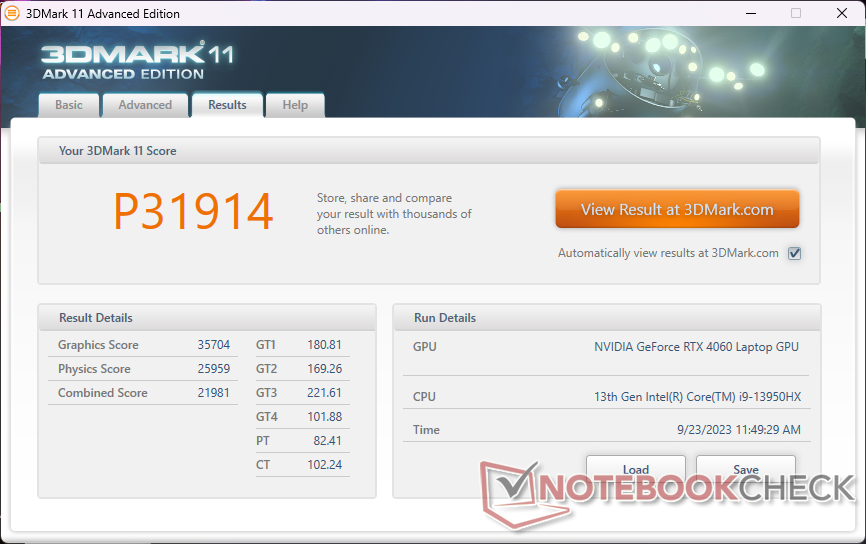
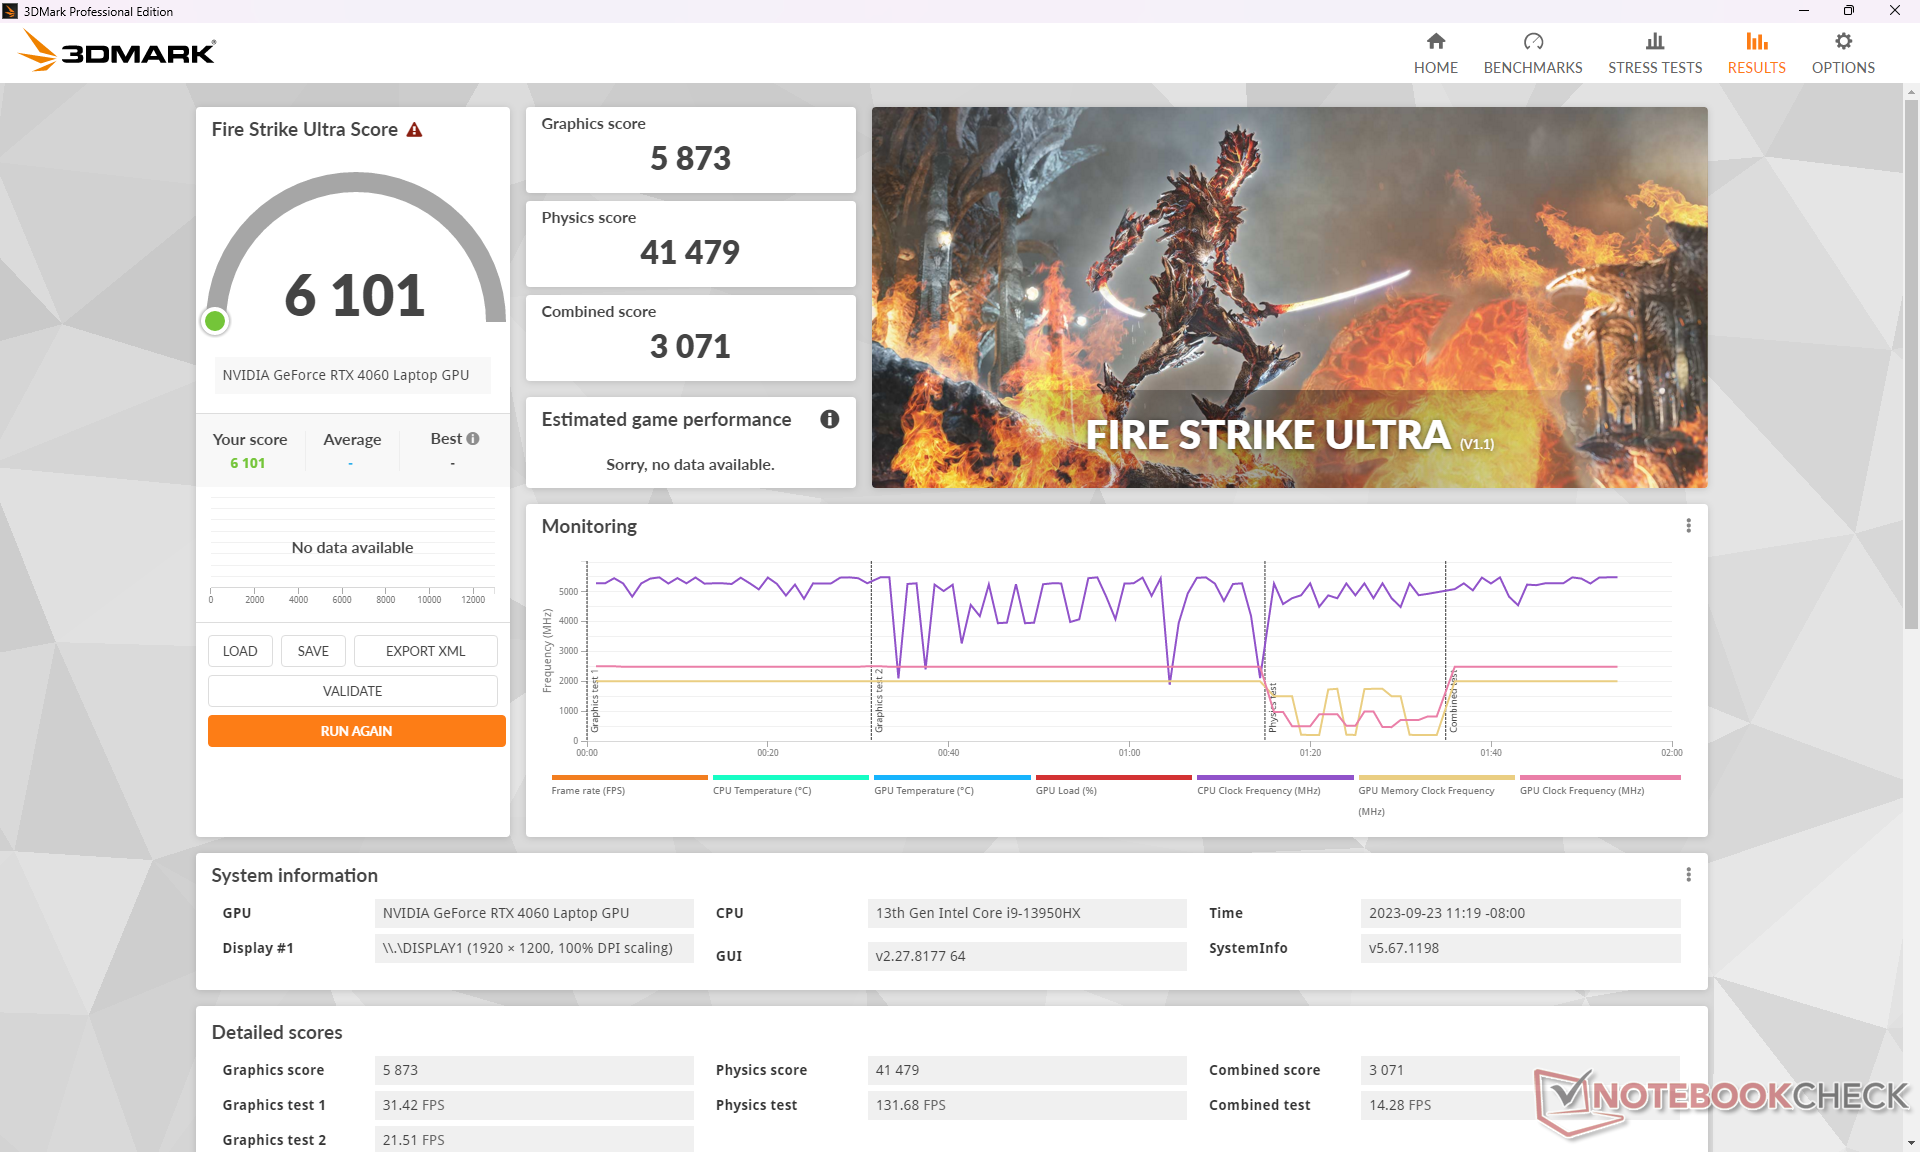
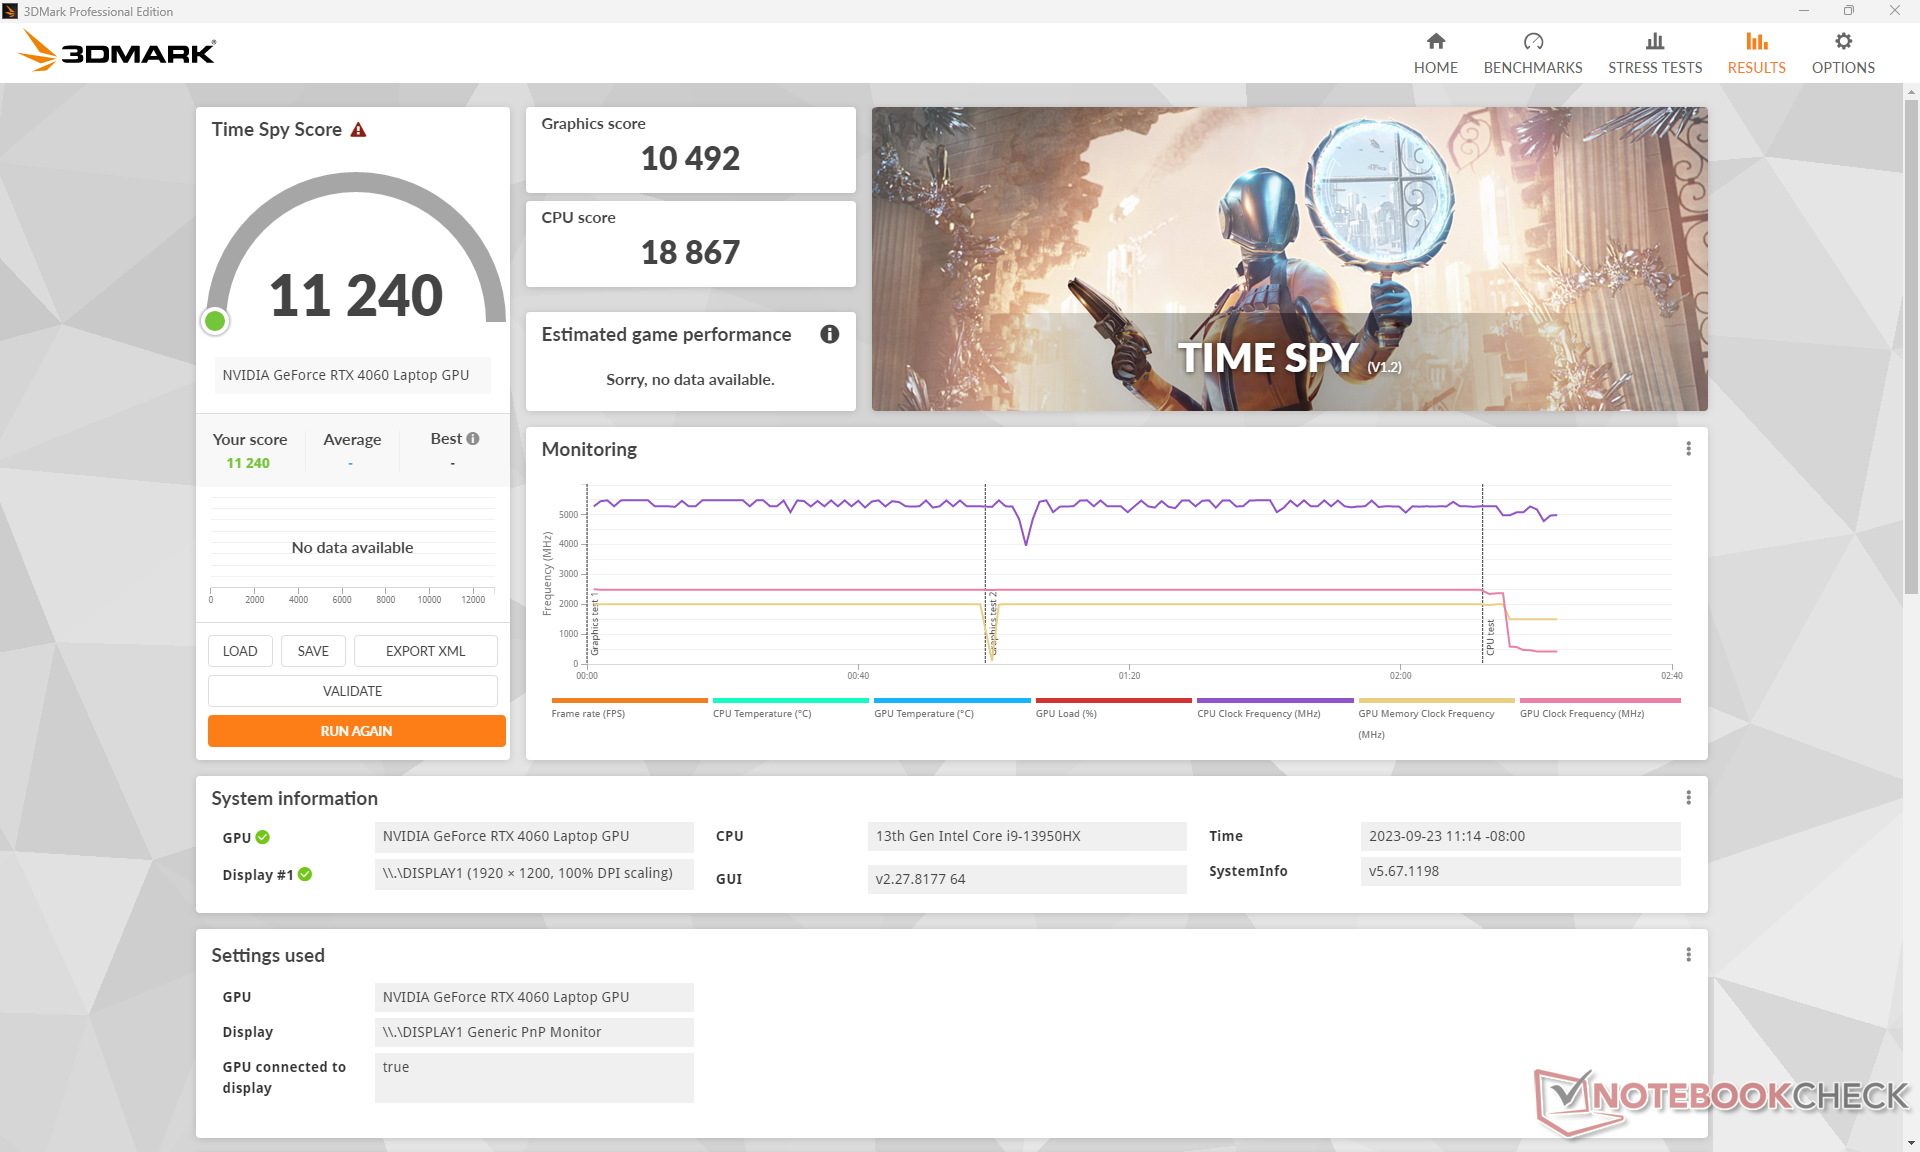
| 3DMark 11 Performance | 31914 punti | |
| 3DMark Fire Strike Score | 24416 punti | |
| 3DMark Time Spy Score | 11240 punti | |
Aiuto | ||
* ... Meglio usare valori piccoli
Prestazioni di gioco
Come la RTX 2060 e RTX 3060 prima di lei, la RTX 4060 è perfetta per i giochi a 1080p60. Tutti i giochi testati funzionano molto bene con impostazioni massime a 1080p, ma i giochi più recenti e impegnativi come Ratchet and Clank Rift Apart tendono a scendere sotto i 60 FPS. In questi casi si consigliano impostazioni più basse o DLSS, soprattutto perché il display principale non supporta il G-Sync.
| Tiny Tina's Wonderlands | |
| 1920x1080 Low Preset (DX12) | |
| Alienware m16 R1 AMD | |
| Lenovo Legion Slim 7i 16 Gen 8 | |
| MSI Raider GE68HX 13VF | |
| Media NVIDIA GeForce RTX 4060 Laptop GPU (164.4 - 235, n=9) | |
| 1920x1080 Medium Preset (DX12) | |
| Alienware m16 R1 AMD | |
| Lenovo Legion Slim 7i 16 Gen 8 | |
| MSI Raider GE68HX 13VF | |
| Media NVIDIA GeForce RTX 4060 Laptop GPU (116 - 192.3, n=9) | |
| 1920x1080 High Preset (DX12) | |
| Alienware m16 R1 AMD | |
| Lenovo Legion Slim 7i 16 Gen 8 | |
| MSI Raider GE68HX 13VF | |
| Media NVIDIA GeForce RTX 4060 Laptop GPU (86.6 - 121.2, n=10) | |
| 1920x1080 Badass Preset (DX12) | |
| Asus Zephyrus Duo 16 GX650PY-NM006W | |
| Alienware m16 R1 AMD | |
| Lenovo Legion Slim 7i 16 Gen 8 | |
| MSI Raider GE68HX 13VF | |
| Media NVIDIA GeForce RTX 4060 Laptop GPU (67.5 - 92.7, n=11) | |
| Ratchet & Clank Rift Apart | |
| 1920x1080 Low Preset | |
| Media NVIDIA GeForce RTX 4060 Laptop GPU (84.7 - 86, n=3) | |
| MSI Raider GE68HX 13VF | |
| 1920x1080 Medium Preset AA:T | |
| MSI Raider GE68HX 13VF | |
| Media NVIDIA GeForce RTX 4060 Laptop GPU (73.4 - 75, n=4) | |
| 1920x1080 High Preset AA:T | |
| Media NVIDIA GeForce RTX 4060 Laptop GPU (59 - 60.6, n=4) | |
| MSI Raider GE68HX 13VF | |
| 1920x1080 Very High Preset AA:T | |
| Media NVIDIA GeForce RTX 4060 Laptop GPU (51.6 - 54.8, n=4) | |
| MSI Raider GE68HX 13VF | |
Witcher 3 FPS Chart
| basso | medio | alto | ultra | |
|---|---|---|---|---|
| The Witcher 3 (2015) | 556.3 | 364.9 | 213.1 | 103.5 |
| Dota 2 Reborn (2015) | 232 | 207 | 199 | 182.2 |
| Final Fantasy XV Benchmark (2018) | 223 | 151.3 | 103.2 | |
| X-Plane 11.11 (2018) | 209 | 184 | 141.1 | |
| Far Cry 5 (2018) | 191 | 158 | 147 | 138 |
| Strange Brigade (2018) | 487 | 291 | 232 | 194 |
| Cyberpunk 2077 1.6 (2022) | 129.1 | 103 | 88.3 | 80.4 |
| Tiny Tina's Wonderlands (2022) | 233.9 | 184.6 | 116.5 | 88.3 |
| F1 22 (2022) | 288 | 271 | 206 | 65.5 |
| Ratchet & Clank Rift Apart (2023) | 84.7 | 75 | 59 | 51.6 |
Emissioni
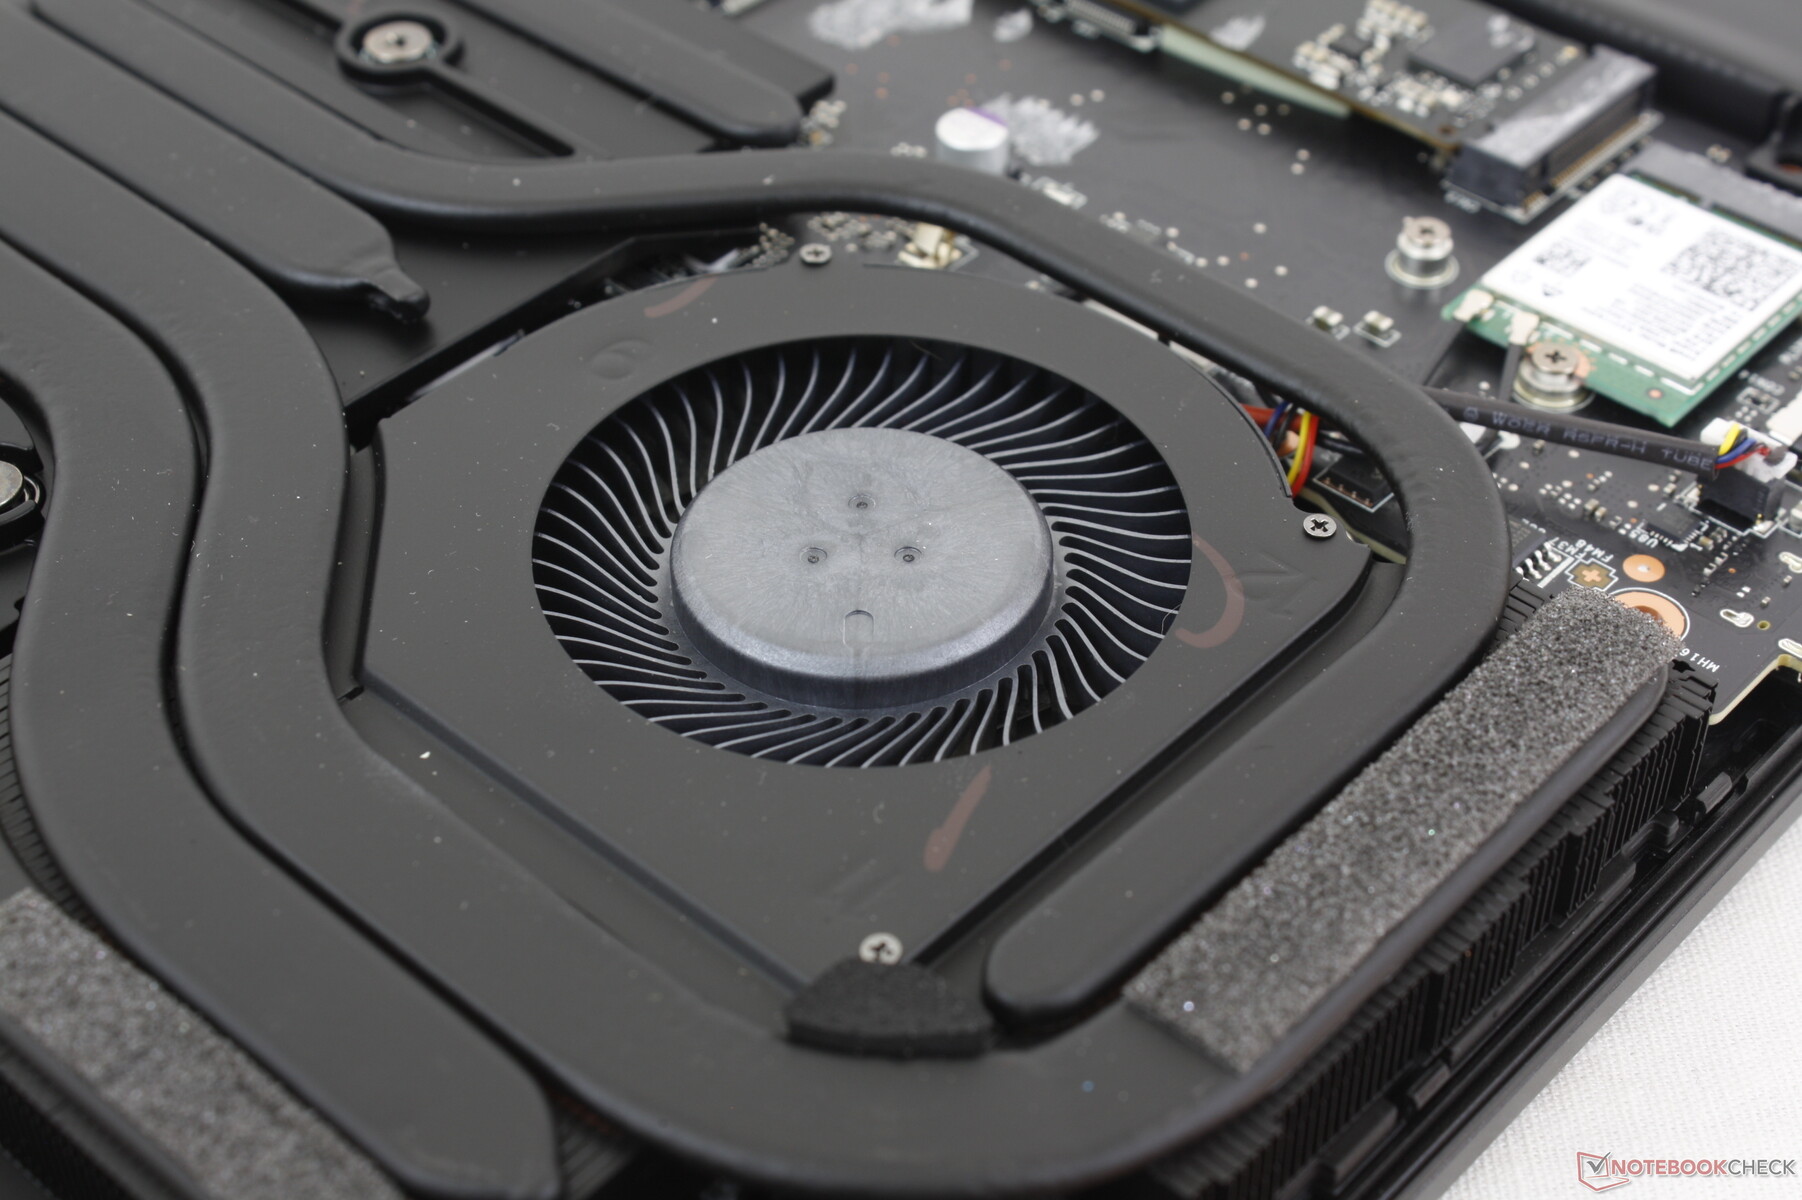
Rumore del sistema - La modalità bilanciata è consigliata per la maggior parte degli scenari
La rumorosità della ventola è un misto. Le due ventole sono molto sensibili ai carichi sullo schermo, il che significa che aumentano bruscamente e rapidamente quando si lanciano semplicemente le applicazioni o si naviga sul web, anche quando è impostato il profilo energetico Bilanciato. Il rumore delle ventole è udibile anche in modalità silenziosa, ma le pulsazioni sono molto meno frequenti. In generale, gli utenti possono aspettarsi un livello di rumore compreso tra 25 e 38 dB(A) durante la navigazione o lo streaming video, anche se in modalità silenziosa.
Il rumore della ventola durante i giochi può variare notevolmente a seconda del profilo energetico selezionato. Eseguendo Witcher 3 in modalità Balanced o Extreme Performance si ottiene un livello di rumore rispettivamente di 46,2 dB(A) o 57 dB(A). Se si attiva il Cooler Boost, il massimo balza a 60,1 dB(A), risultando uno dei portatili da gioco da 16 pollici più rumorosi. Fortunatamente, la perdita di prestazioni grafiche quando si gioca in modalità Bilanciata è molto marginale e quindi le impostazioni Extreme Performance e Cooler Boost sono consigliate solo se si desidera temperature di funzionamento più basse o se si esegue l'overclocking manuale della GPU.
Rumorosità
| Idle |
| 25 / 31.3 / 37.5 dB(A) |
| Sotto carico |
| 44 / 60.1 dB(A) |
 | ||
30 dB silenzioso 40 dB(A) udibile 50 dB(A) rumoroso |
||
min: | ||
| MSI Raider GE68HX 13VF GeForce RTX 4060 Laptop GPU, i9-13950HX, Samsung PM9B1 1024GB MZVL41T0HBLB | MSI GE67 HX 12UGS GeForce RTX 3070 Ti Laptop GPU, i7-12800HX, Samsung PM9A1 MZVL21T0HCLR | HP Omen 16-xf0376ng GeForce RTX 4070 Laptop GPU, R7 7840HS, WDC PC SN810 512GB | Alienware m16 R1 AMD GeForce RTX 4080 Laptop GPU, R9 7845HX, Kioxia XG8 KXG80ZNV1T02 | Lenovo Legion Slim 7i 16 Gen 8 GeForce RTX 4070 Laptop GPU, i9-13900H, Samsung PM9A1 MZVL21T0HCLR | Asus ROG Zephyrus M16 GU604VY-NM042X GeForce RTX 4090 Laptop GPU, i9-13900H, Samsung PM9A1 MZVL22T0HBLB | |
|---|---|---|---|---|---|---|
| Noise | 12% | 9% | 12% | 16% | 5% | |
| off /ambiente * (dB) | 23.3 | 22.7 3% | 24 -3% | 22.9 2% | 22.8 2% | 24 -3% |
| Idle Minimum * (dB) | 25 | 22.9 8% | 25 -0% | 22.9 8% | 23.6 6% | 24 4% |
| Idle Average * (dB) | 31.3 | 22.9 27% | 29 7% | 29.7 5% | 23.6 25% | 29.96 4% |
| Idle Maximum * (dB) | 37.5 | 22.9 39% | 32 15% | 29.7 21% | 25.7 31% | 34.27 9% |
| Load Average * (dB) | 44 | 44.4 -1% | 44 -0% | 29.8 32% | 27.6 37% | 35.89 18% |
| Witcher 3 ultra * (dB) | 57 | 55.7 2% | 44 23% | 54.7 4% | 54.4 5% | 57.5 -1% |
| Load Maximum * (dB) | 60.1 | 57.4 4% | 46 23% | 54.7 9% | 54.4 9% | 57.54 4% |
* ... Meglio usare valori piccoli
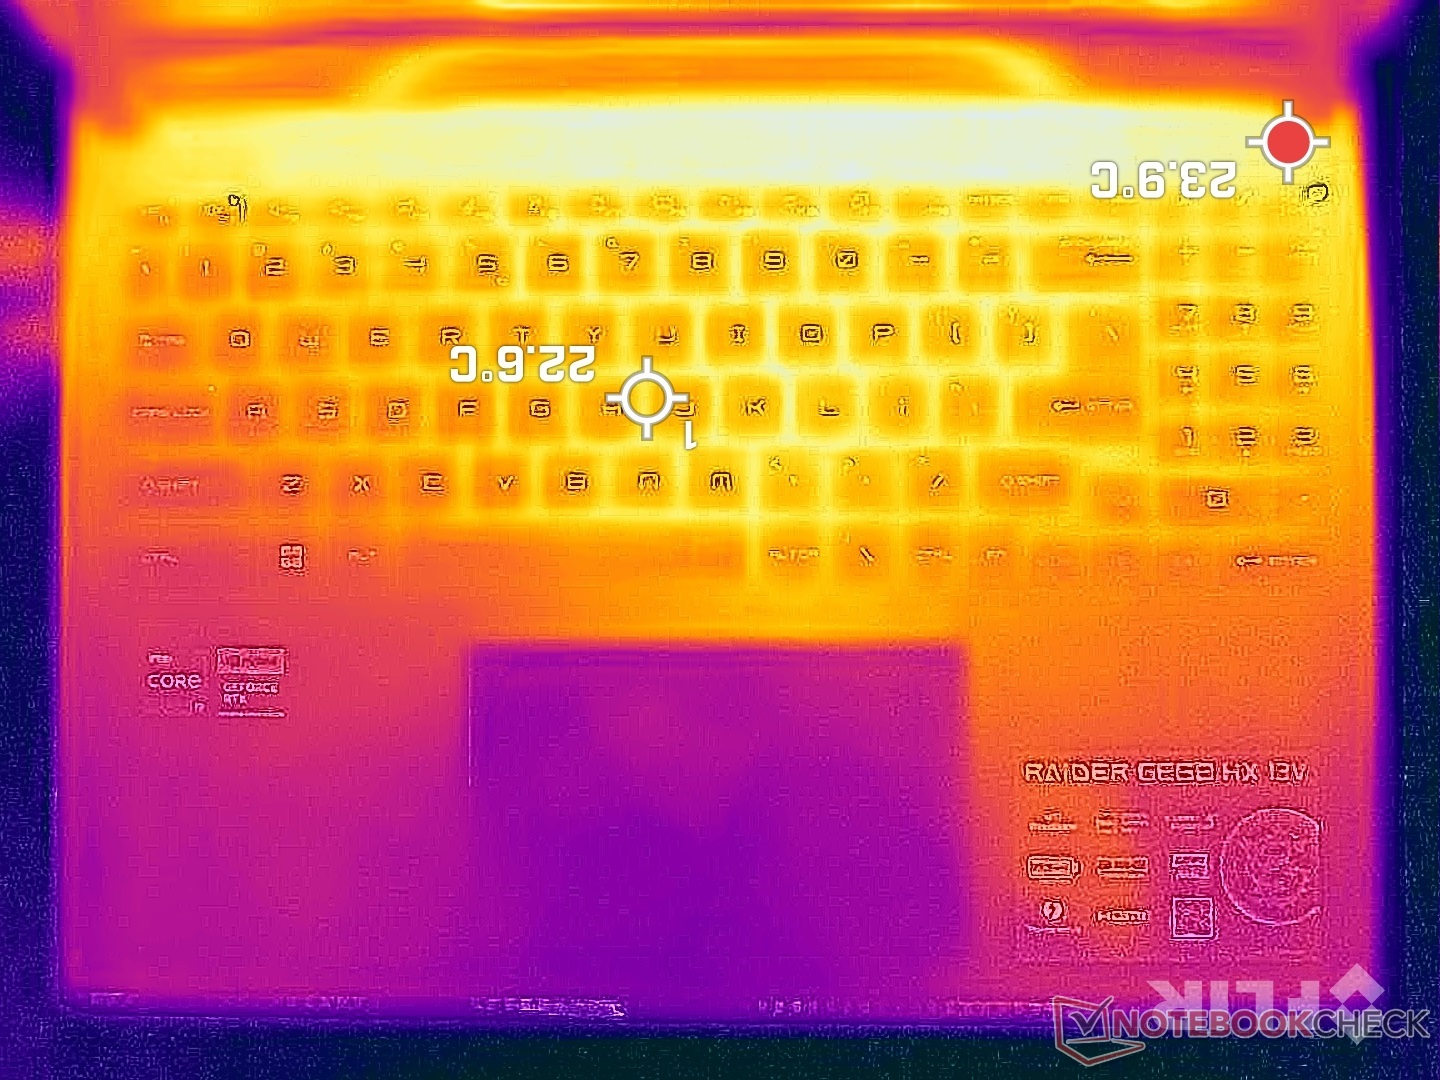
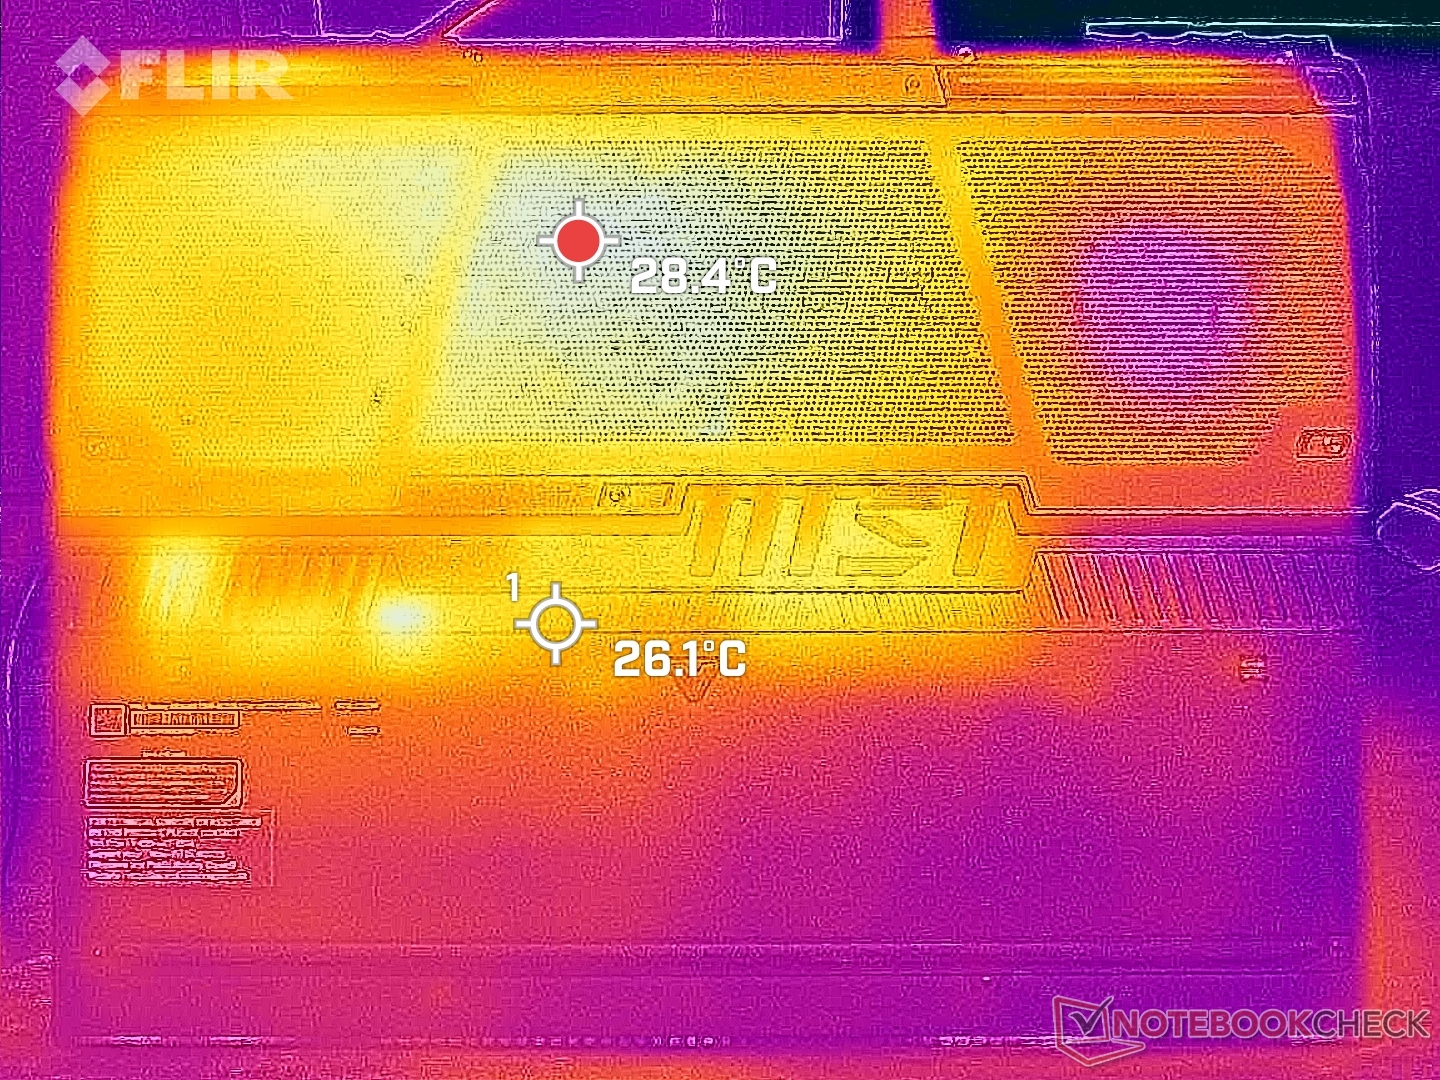
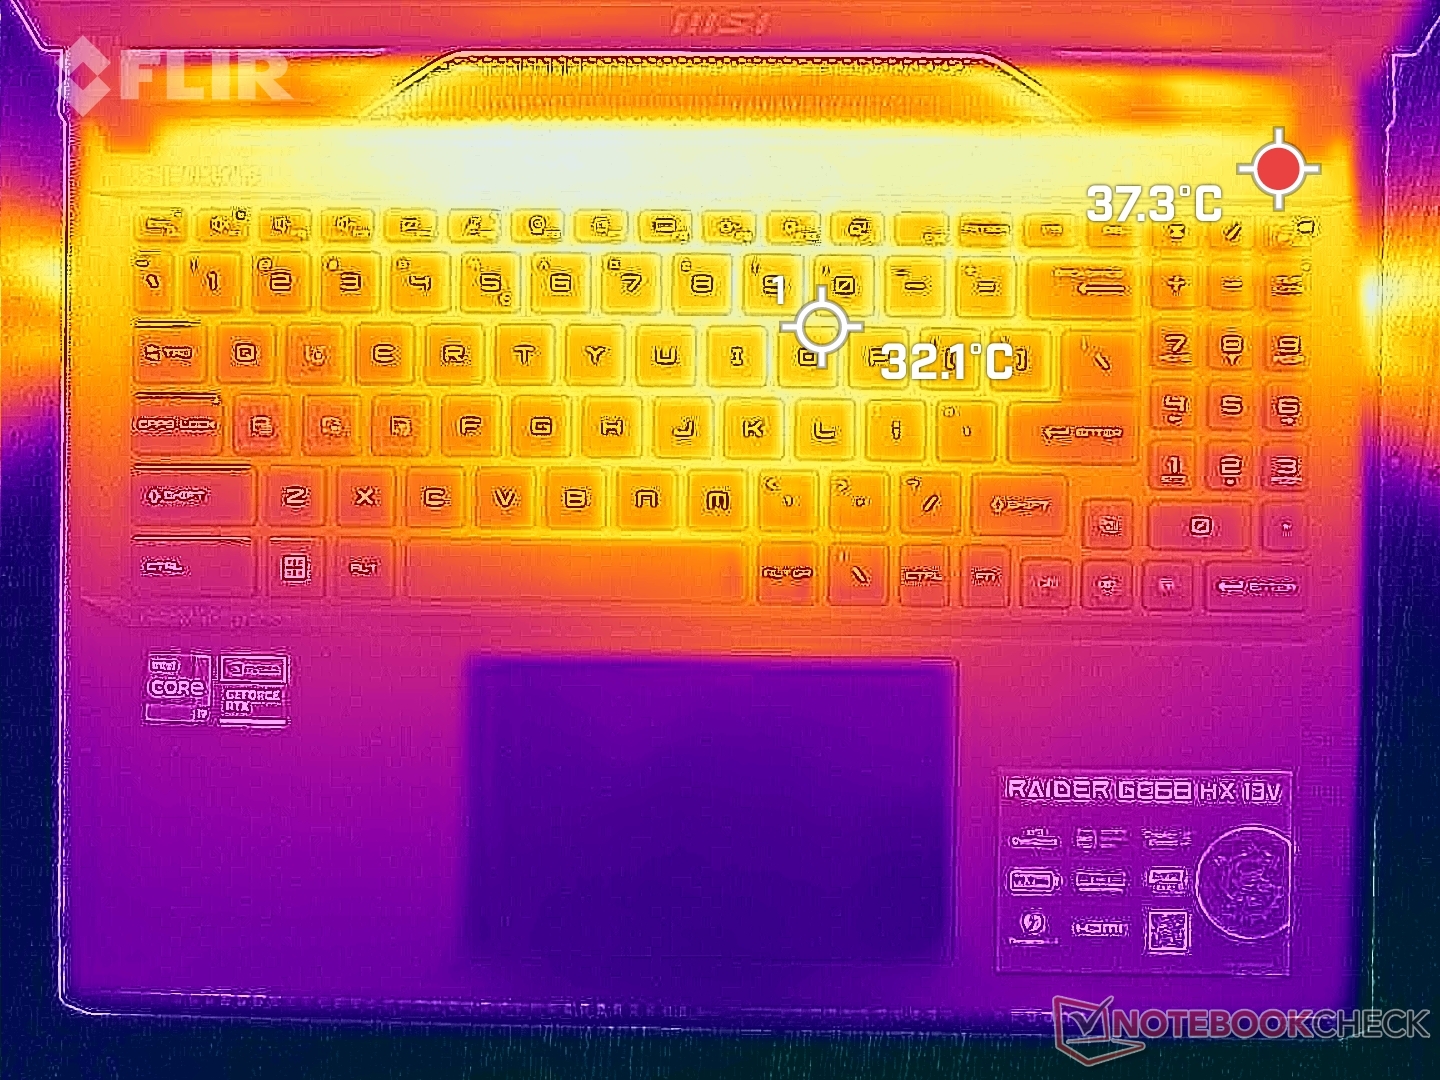
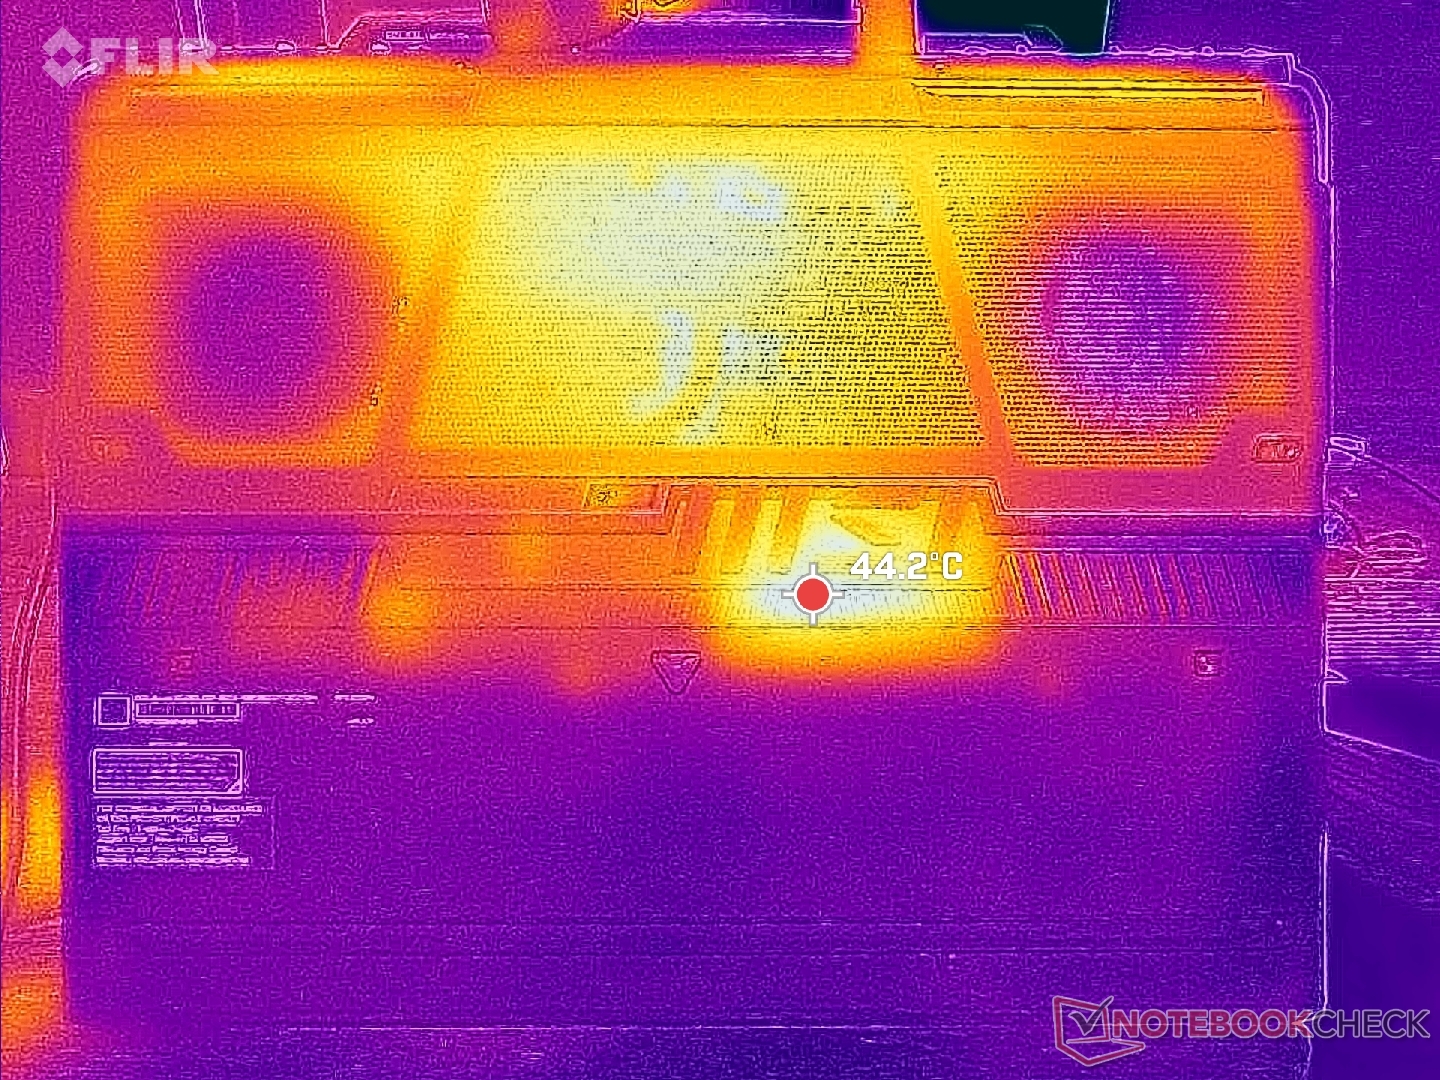
Temperatura
L'andamento della temperatura di superficie è simmetrico grazie alla progettazione della soluzione di raffreddamento. Il centro della tastiera può raggiungere i 40 C, una temperatura molto più bassa di quella registrata su HP Omen 16 o Slim 7i 16 G8 Legion Slim 7i 16 G8 dove i punti caldi possono raggiungere i 45-50 C ciascuno. Le ventole generalmente più rumorose e la struttura più spessa del GE68HX giocano a favore di MSI da questo punto di vista.
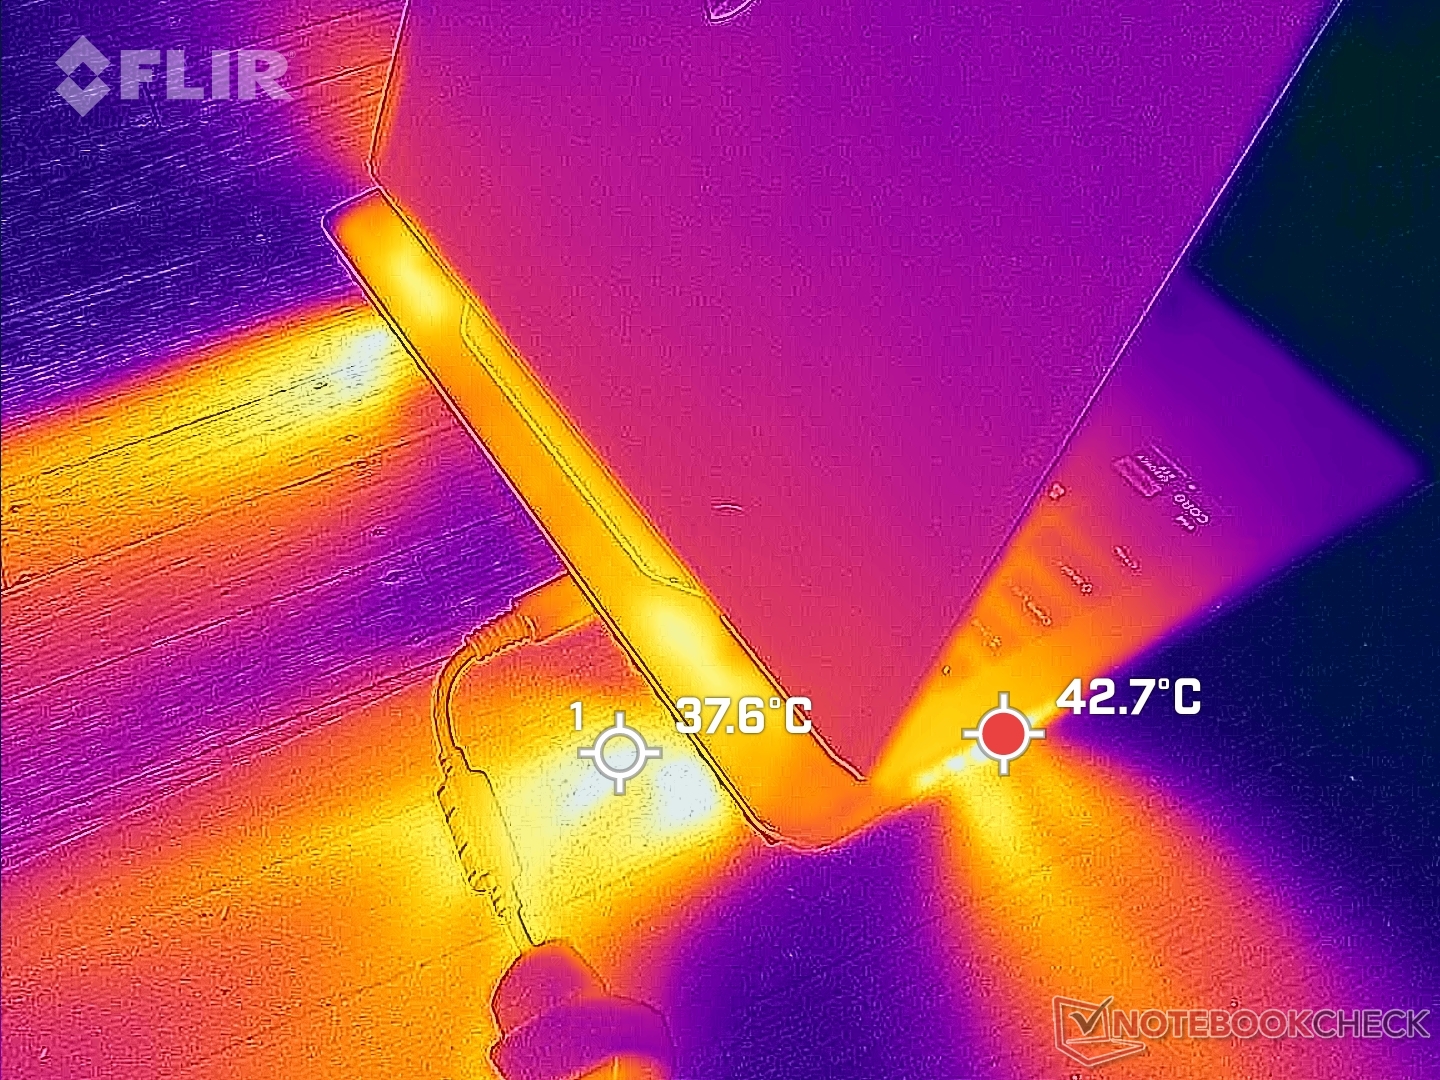
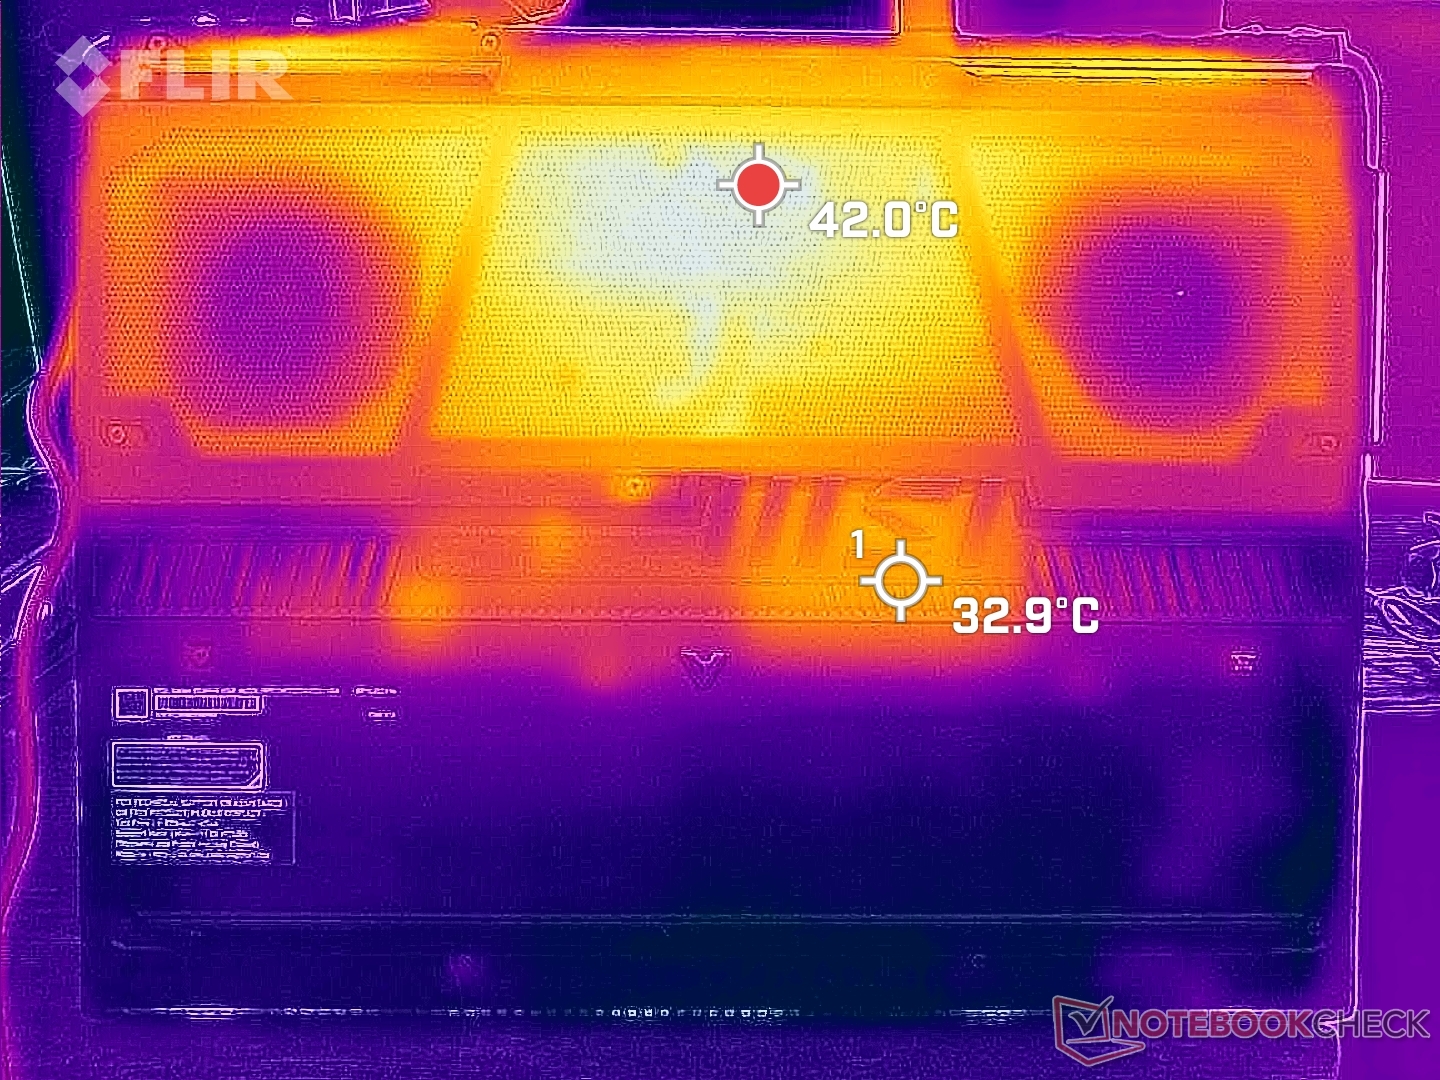
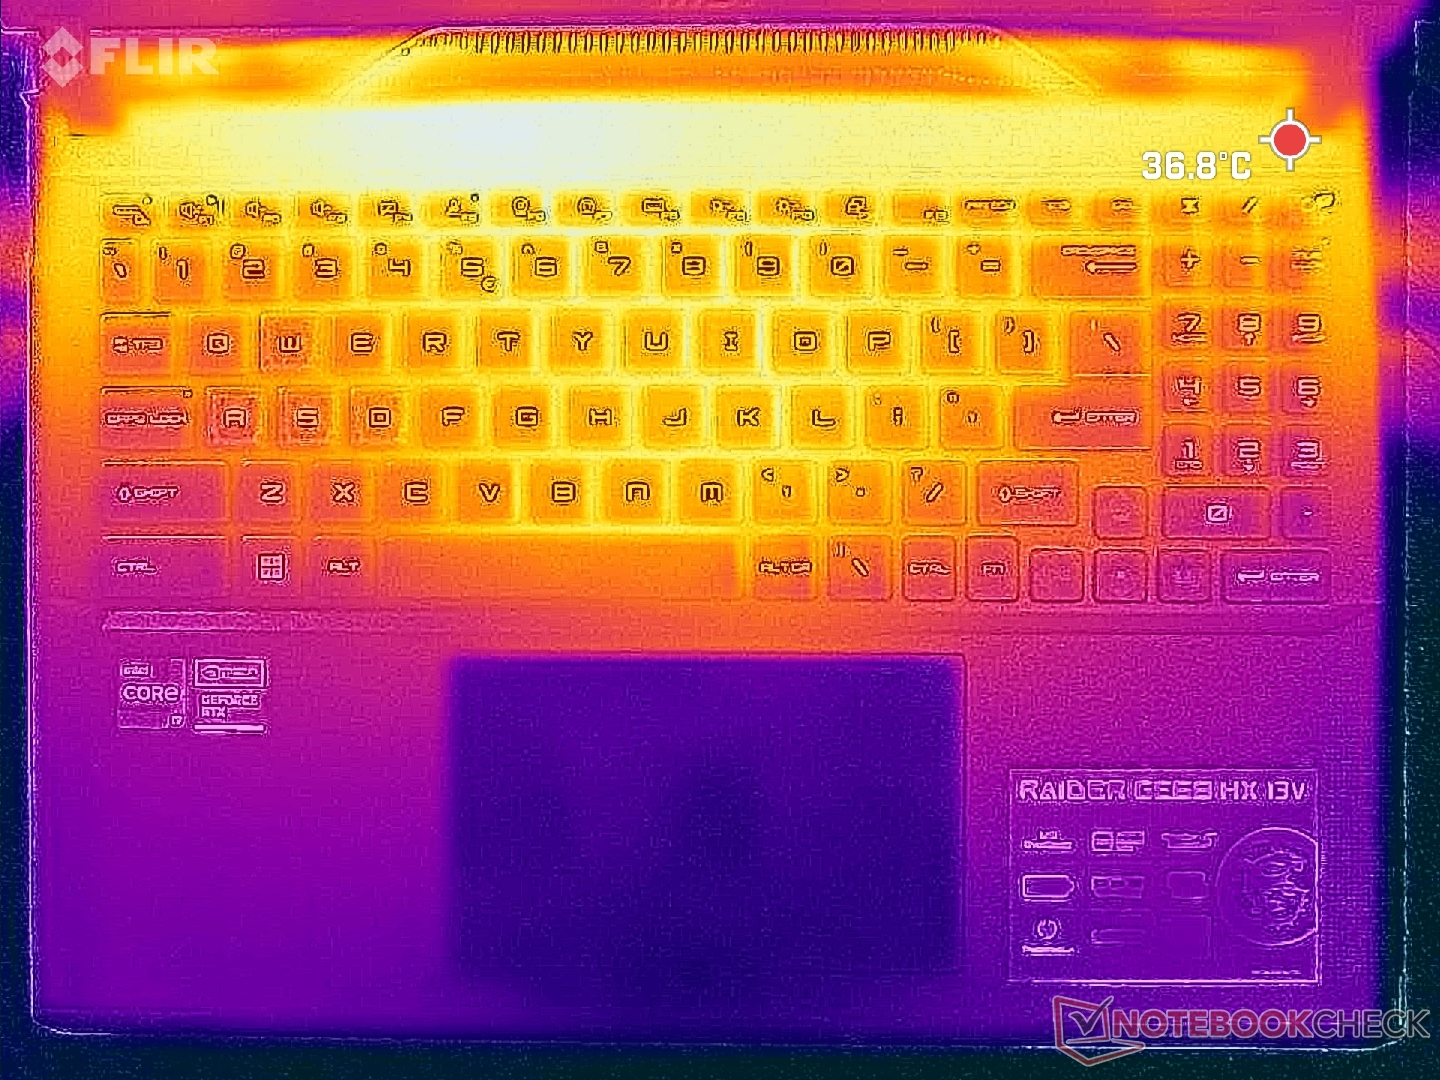
(±) La temperatura massima sul lato superiore è di 41.4 °C / 107 F, rispetto alla media di 40.4 °C / 105 F, che varia da 21.2 a 68.8 °C per questa classe Gaming.
(-) Il lato inferiore si riscalda fino ad un massimo di 45.4 °C / 114 F, rispetto alla media di 43.2 °C / 110 F
(+) In idle, la temperatura media del lato superiore è di 27.7 °C / 82 F, rispetto alla media deld ispositivo di 33.9 °C / 93 F.
(±) Riproducendo The Witcher 3, la temperatura media per il lato superiore e' di 34 °C / 93 F, rispetto alla media del dispositivo di 33.9 °C / 93 F.
(+) I poggiapolsi e il touchpad sono piu' freddi della temperatura della pelle con un massimo di 29.6 °C / 85.3 F e sono quindi freddi al tatto.
(±) La temperatura media della zona del palmo della mano di dispositivi simili e'stata di 28.8 °C / 83.8 F (-0.8 °C / -1.5 F).
| MSI Raider GE68HX 13VF Intel Core i9-13950HX, NVIDIA GeForce RTX 4060 Laptop GPU | MSI GE67 HX 12UGS Intel Core i7-12800HX, NVIDIA GeForce RTX 3070 Ti Laptop GPU | HP Omen 16-xf0376ng AMD Ryzen 7 7840HS, NVIDIA GeForce RTX 4070 Laptop GPU | Alienware m16 R1 AMD AMD Ryzen 9 7845HX, NVIDIA GeForce RTX 4080 Laptop GPU | Lenovo Legion Slim 7i 16 Gen 8 Intel Core i9-13900H, NVIDIA GeForce RTX 4070 Laptop GPU | Asus ROG Zephyrus M16 GU604VY-NM042X Intel Core i9-13900H, NVIDIA GeForce RTX 4090 Laptop GPU | |
|---|---|---|---|---|---|---|
| Heat | 9% | -12% | -10% | -6% | -6% | |
| Maximum Upper Side * (°C) | 41.4 | 34.4 17% | 49 -18% | 48 -16% | 49.8 -20% | 50 -21% |
| Maximum Bottom * (°C) | 45.4 | 42 7% | 57 -26% | 39 14% | 48.8 -7% | 58 -28% |
| Idle Upper Side * (°C) | 29.8 | 24 19% | 31 -4% | 37 -24% | 29.4 1% | 26 13% |
| Idle Bottom * (°C) | 31.4 | 33.2 -6% | 31 1% | 36.2 -15% | 30 4% | 28 11% |
* ... Meglio usare valori piccoli
Stress test
La CPU ha raggiunto i 4,1 GHz e i 183 W all'avvio dello stress Prime95, prima di stabilizzarsi a 3,6 GHz, 134 W e 93 C pochi secondi dopo. Ripetendo questo test sul modello dell'anno scorso con il vecchio Core i7-12800HX di 12a generazione, la potenza del pacchetto CPU sarebbe stata molto più bassa, appena 55 W, a dimostrazione di quanto la nuova CPU di 13a generazione possa essere più esigente.
La frequenza di clock e la temperatura della GPU si stabilizzerebbero a 2475 MHz e 84 C quando si lavora in modalità bilanciata Witcher 3 in modalità bilanciata. È interessante notare che la frequenza di clock aumenta solo marginalmente a 2490 MHz se si utilizza la modalità Extreme Performance, mentre la temperatura della GPU diminuisce in modo più significativo a 70 C o addirittura a soli 63 C se Cooler Boost è attivo, come mostrano gli screenshot e la tabella qui sotto. Anche la maggior parte degli altri portatili da gioco MSI presenta risultati simili. Si consiglia quindi di giocare in modalità Bilanciata, in quanto l'impatto sulle prestazioni della GPU è molto marginale rispetto alle immense differenze di rumore della ventola tra i profili energetici preimpostati. Le differenze di prestazioni tra le modalità Balanced e Performance sono di solito più significative su altri portatili da gioco, come la serie Asus Zephyrus.
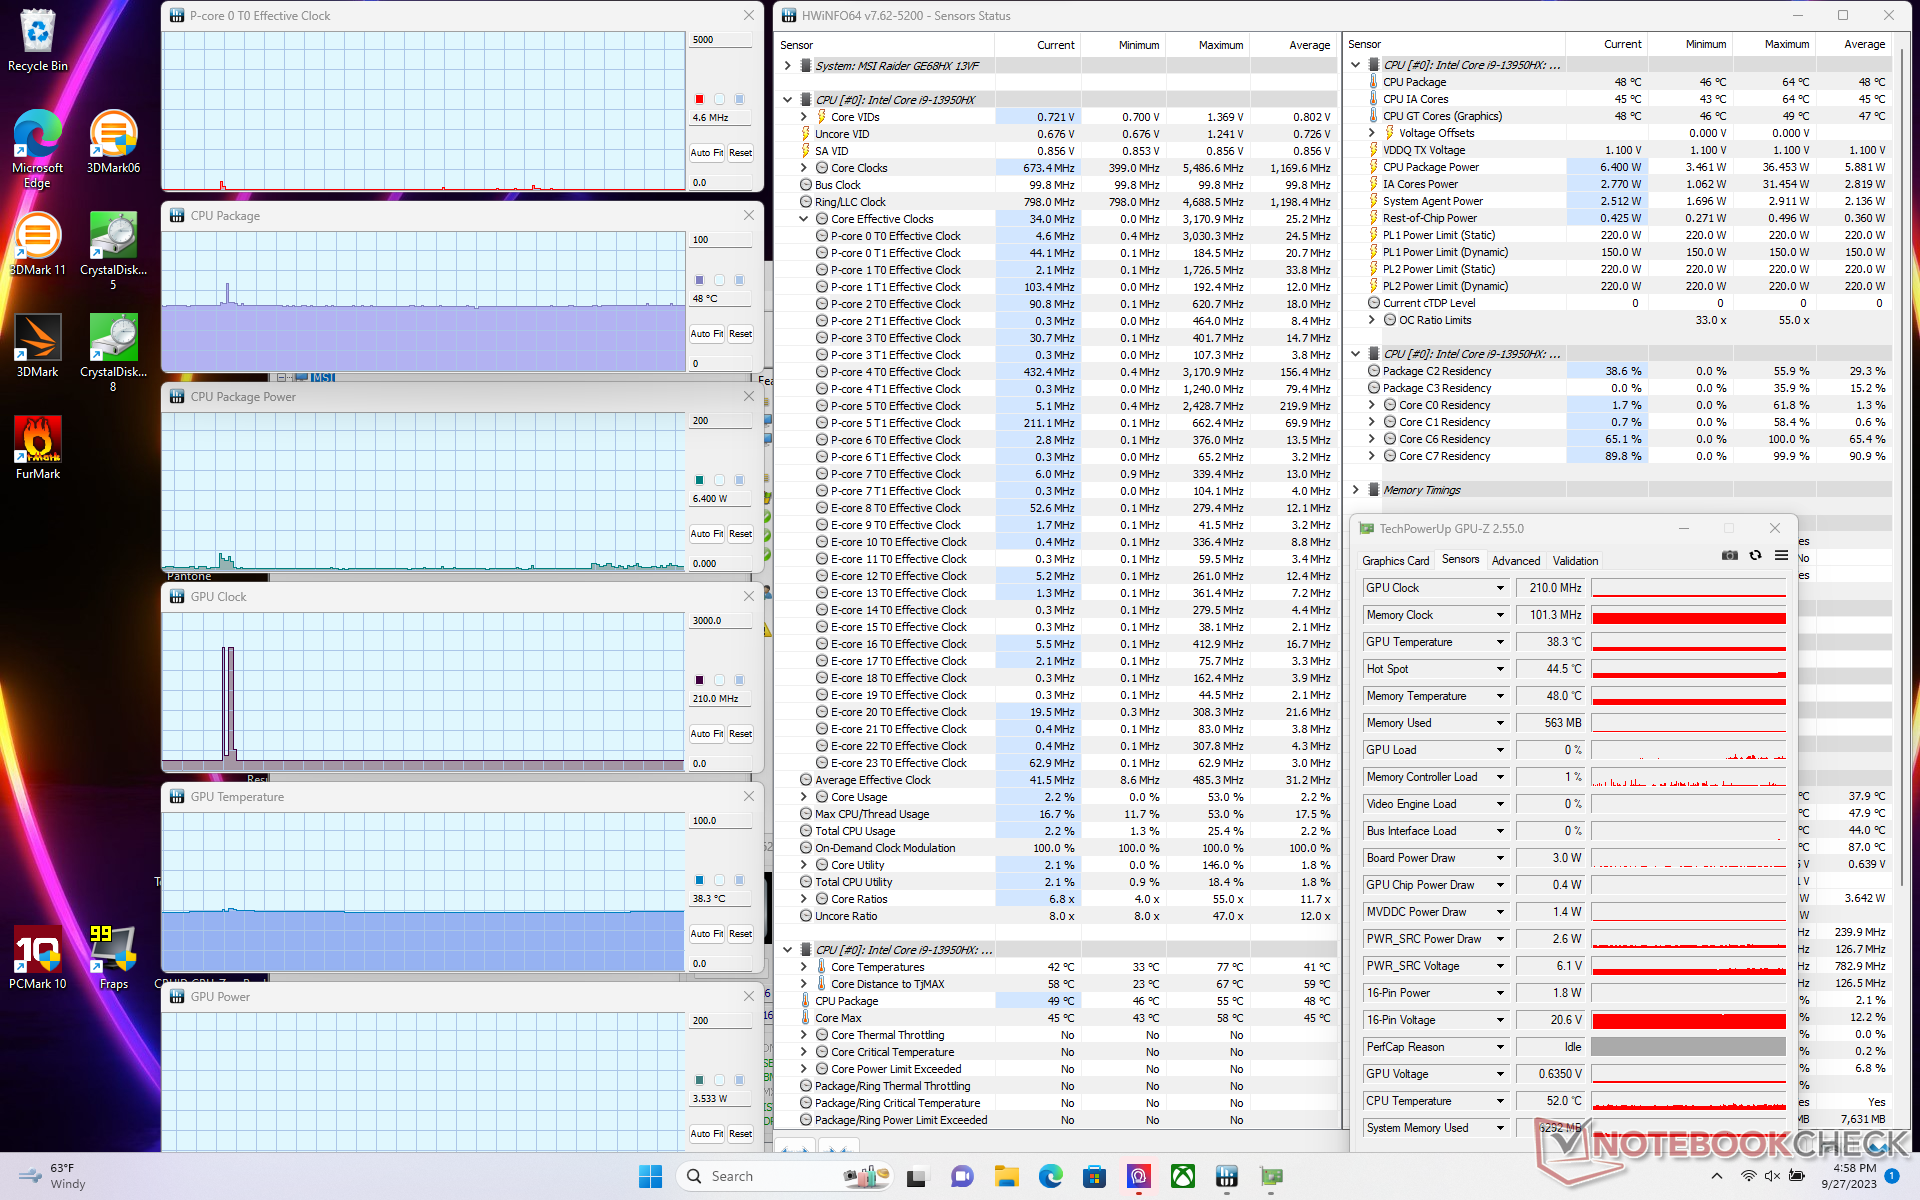
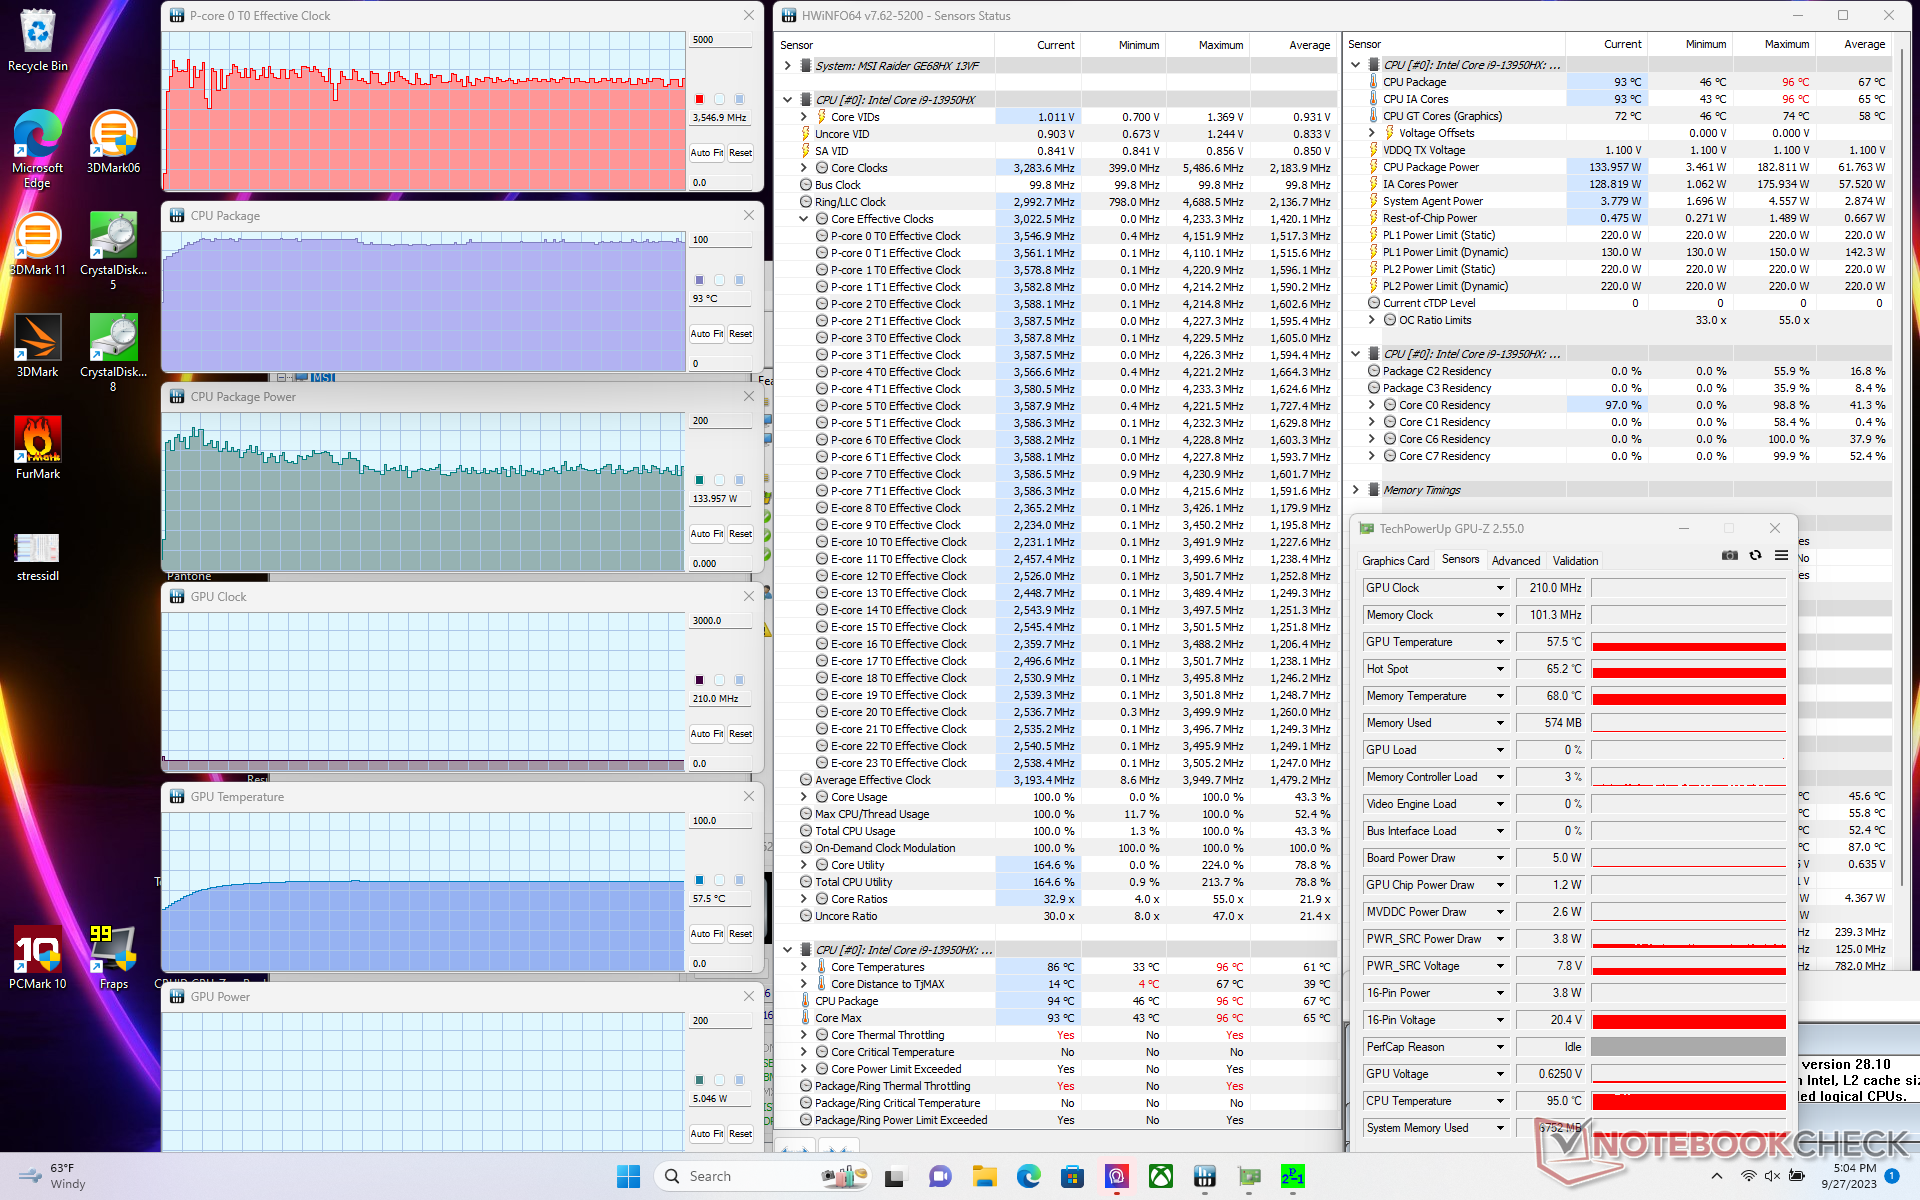
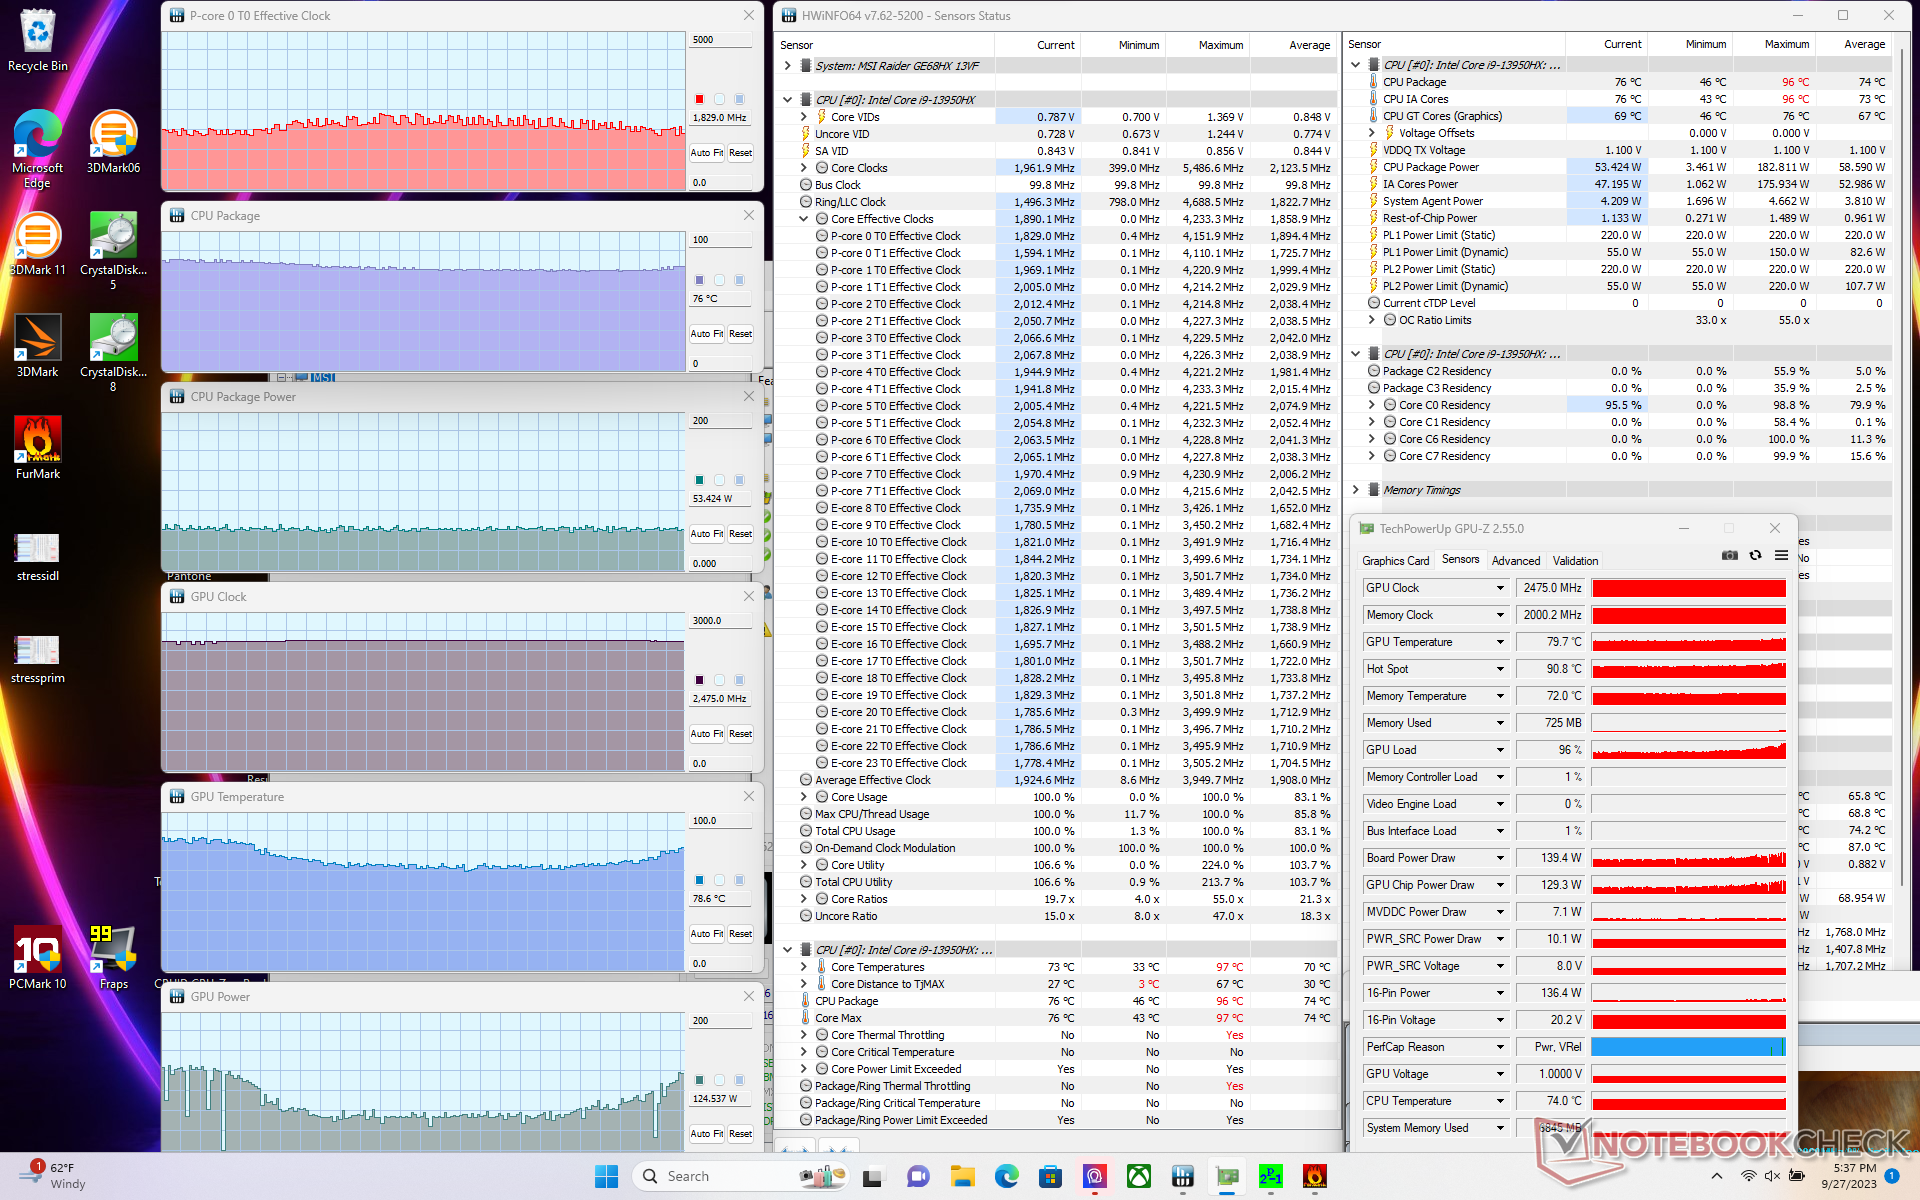
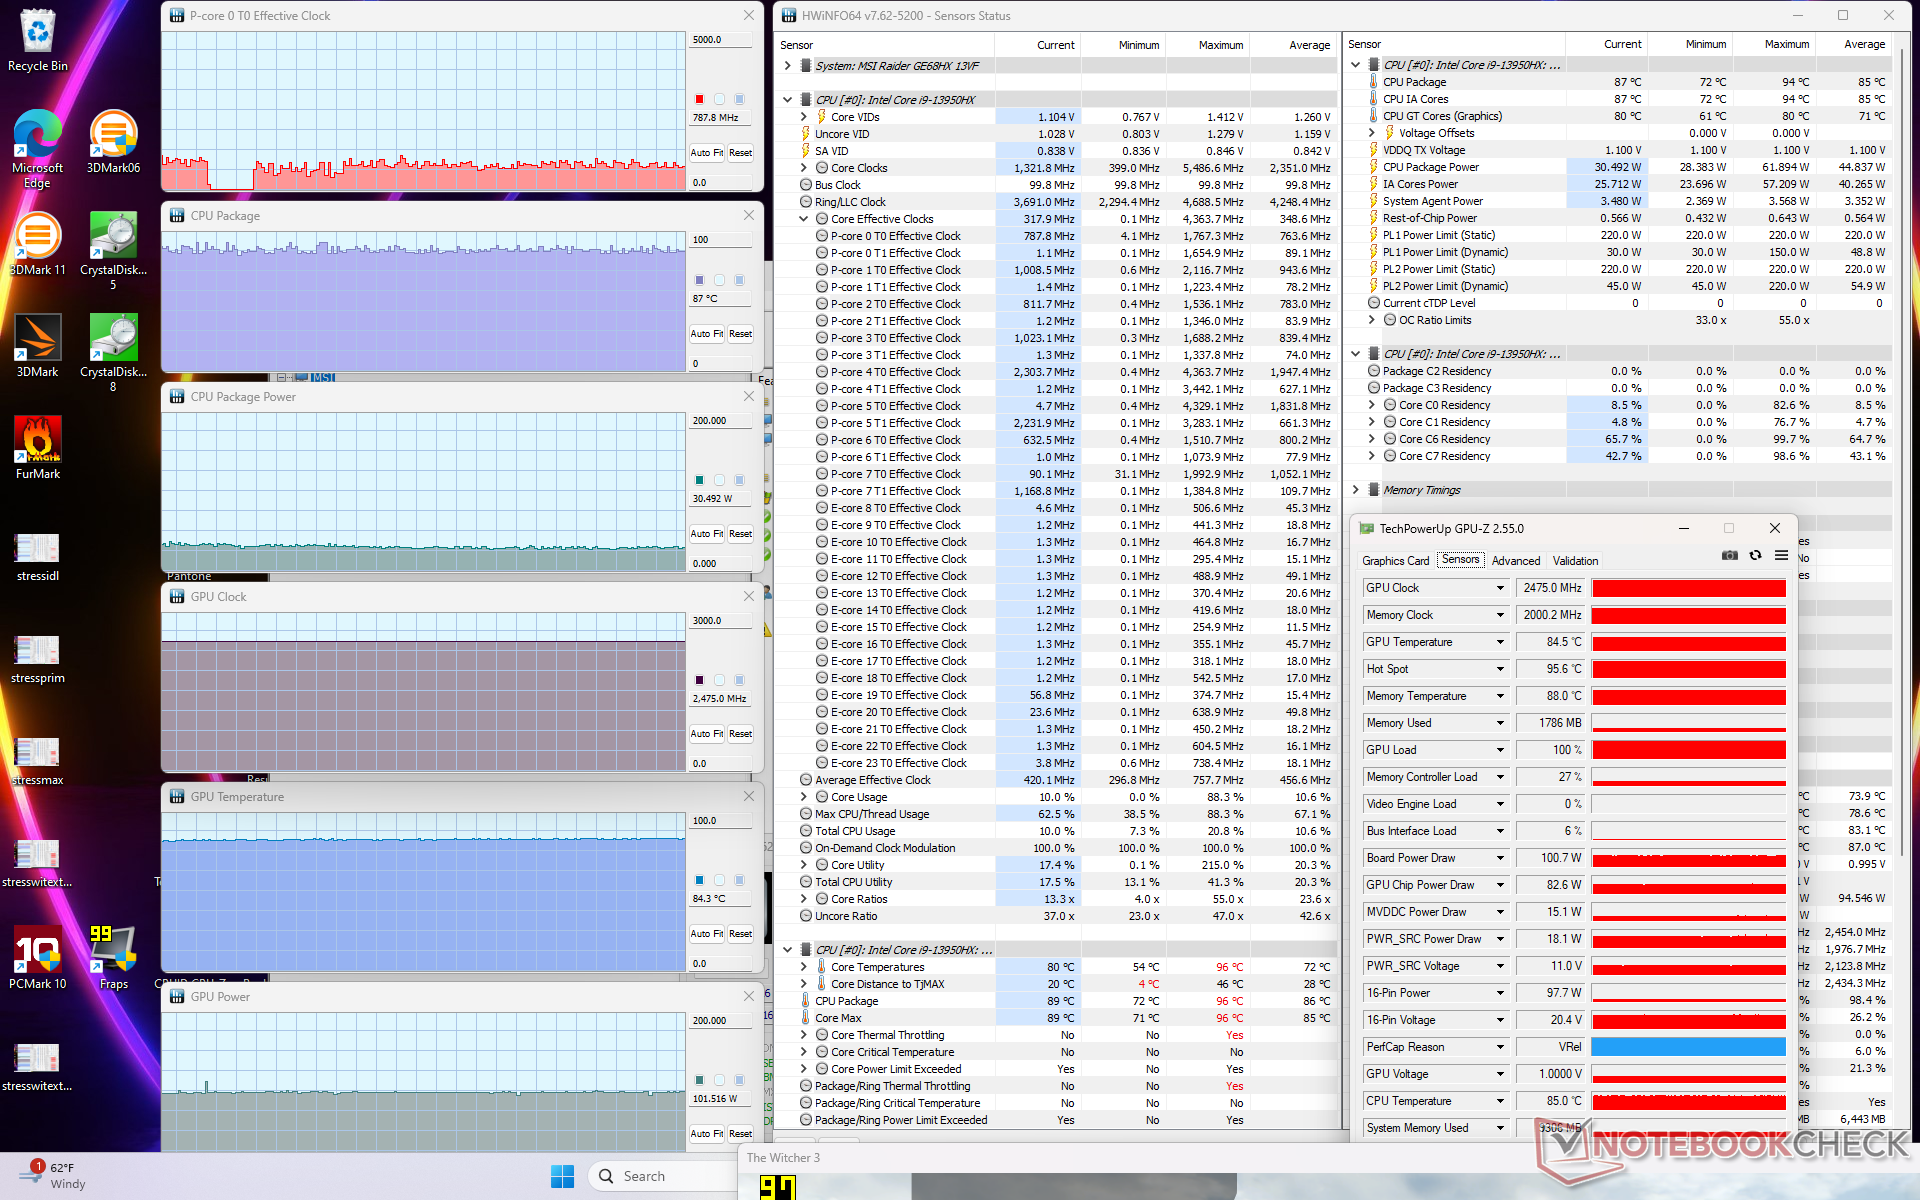
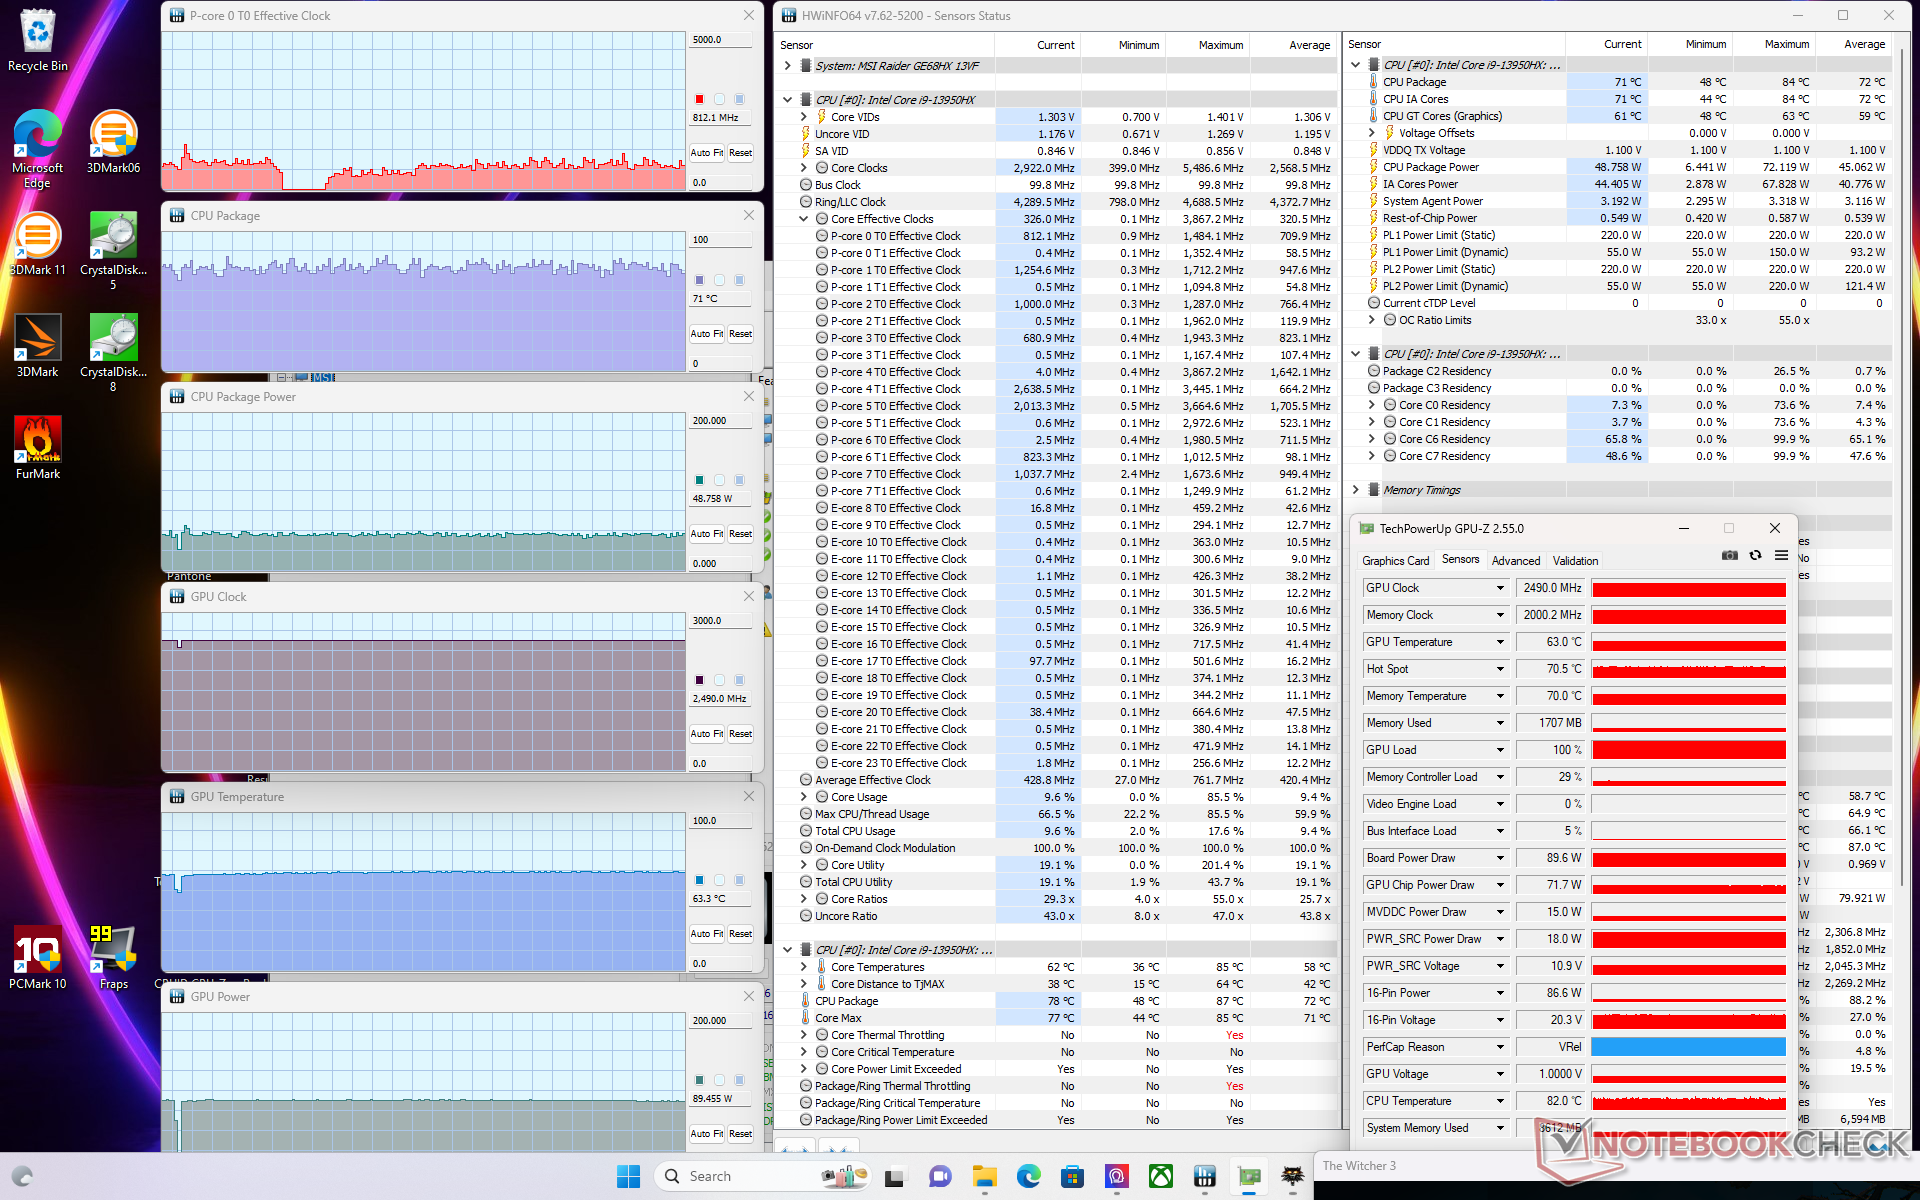
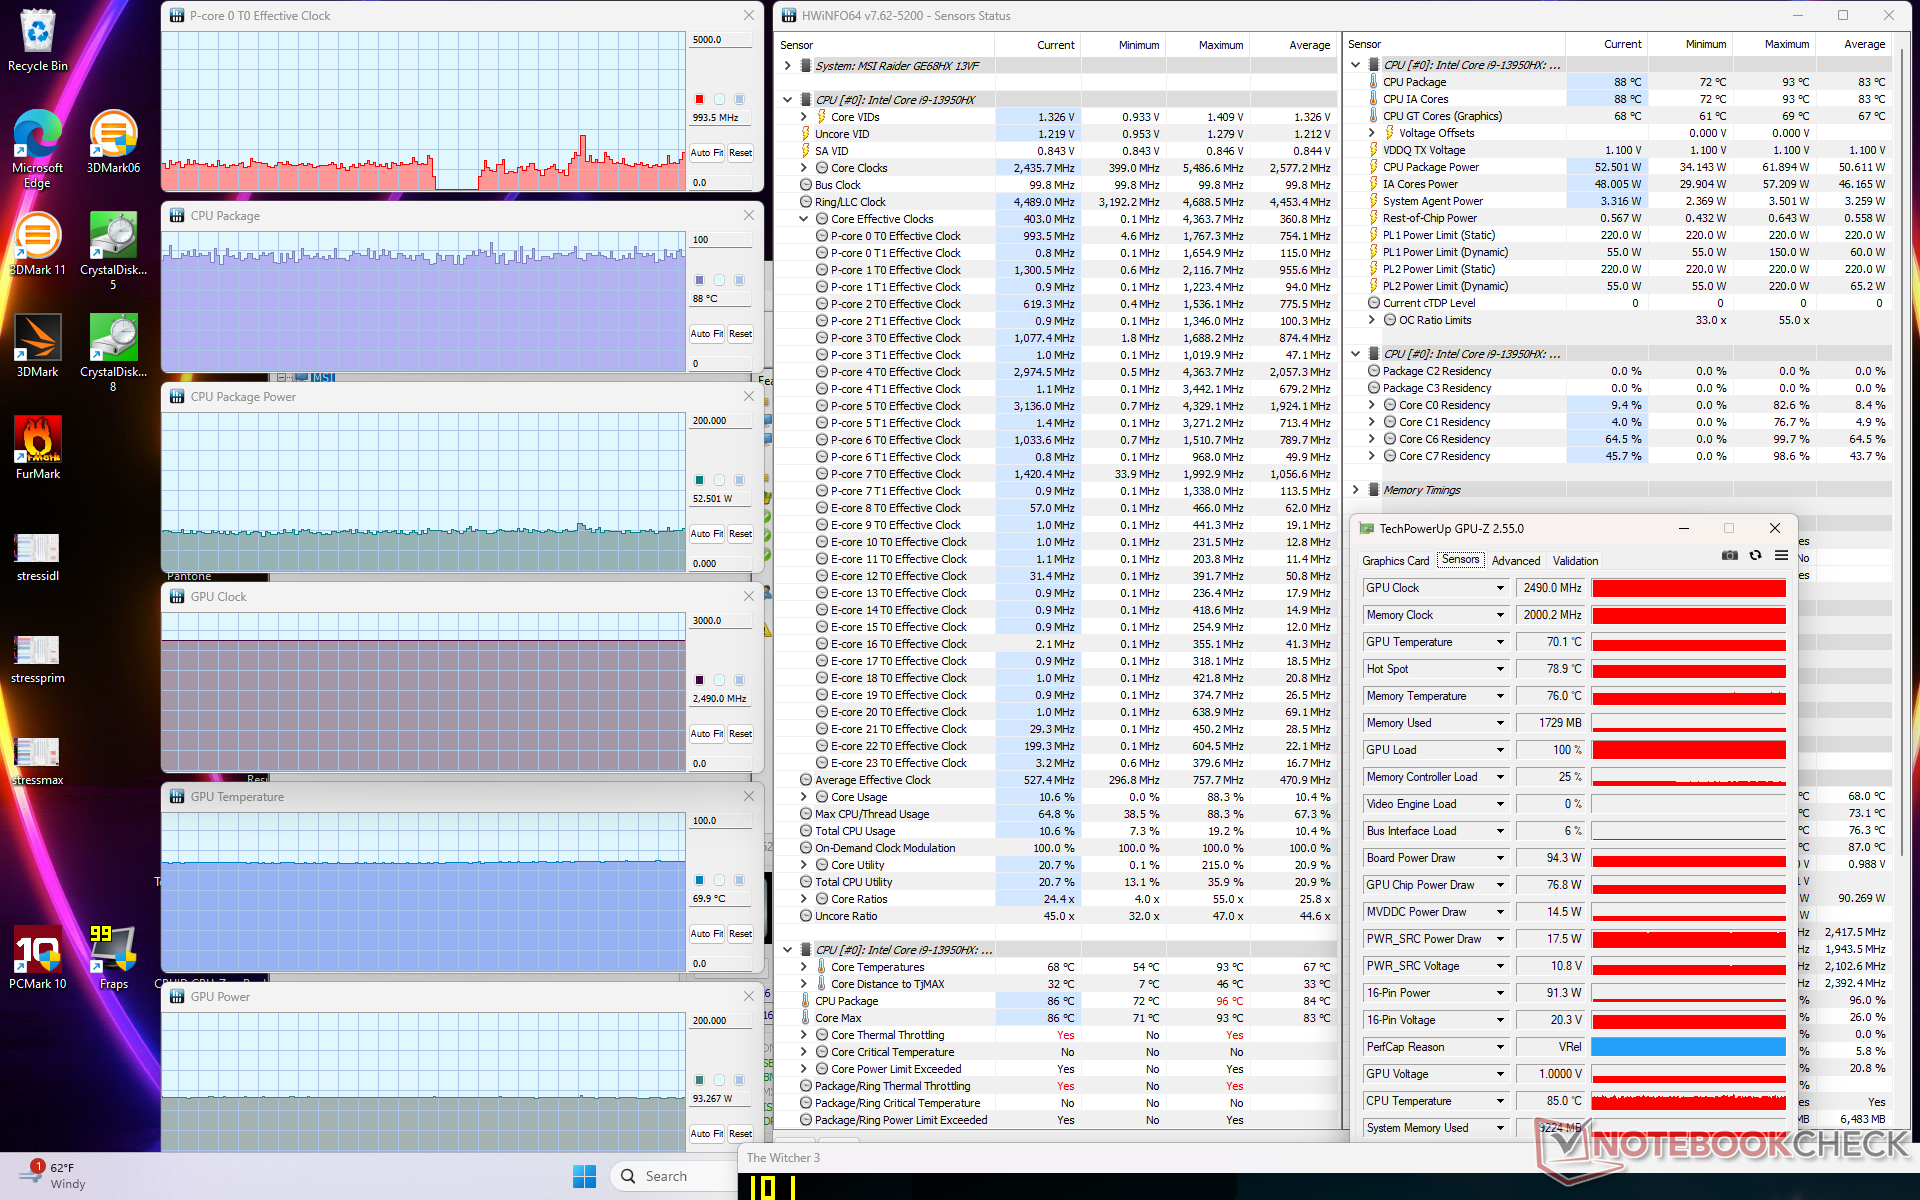
| Clock della CPU (GHz) | Clock della GPU (MHz) | Temperatura media della CPU (°C) | Temperatura media della GPU (°C) | |
| Sistema inattivo | -- | -- | 48 | 38 |
| Stress Prime95 (modalità Extreme Performance con Cooler Boost disattivato) | ~3,6 | -- | 93 | 58 |
| Prime95 + FurMark Stress (modalità Extreme Performance con Cooler Boost disattivato) | ~1,9 | 2475 | 73 - 78 | 63 - 81 |
| Witcher 3 Stress (modalità bilanciata) | ~0,8 | 2475 | 87 | 84 |
| Witcher 3 Stress (modalità Extreme Performance con Cooler Boost disattivato) | ~0,8 | 2490 | 88 | 70 |
| Witcher 3 Stress (modalità Extreme Performance con Cooler Boost attivato) | ~0,8 | 2490 | 71 | 63 |
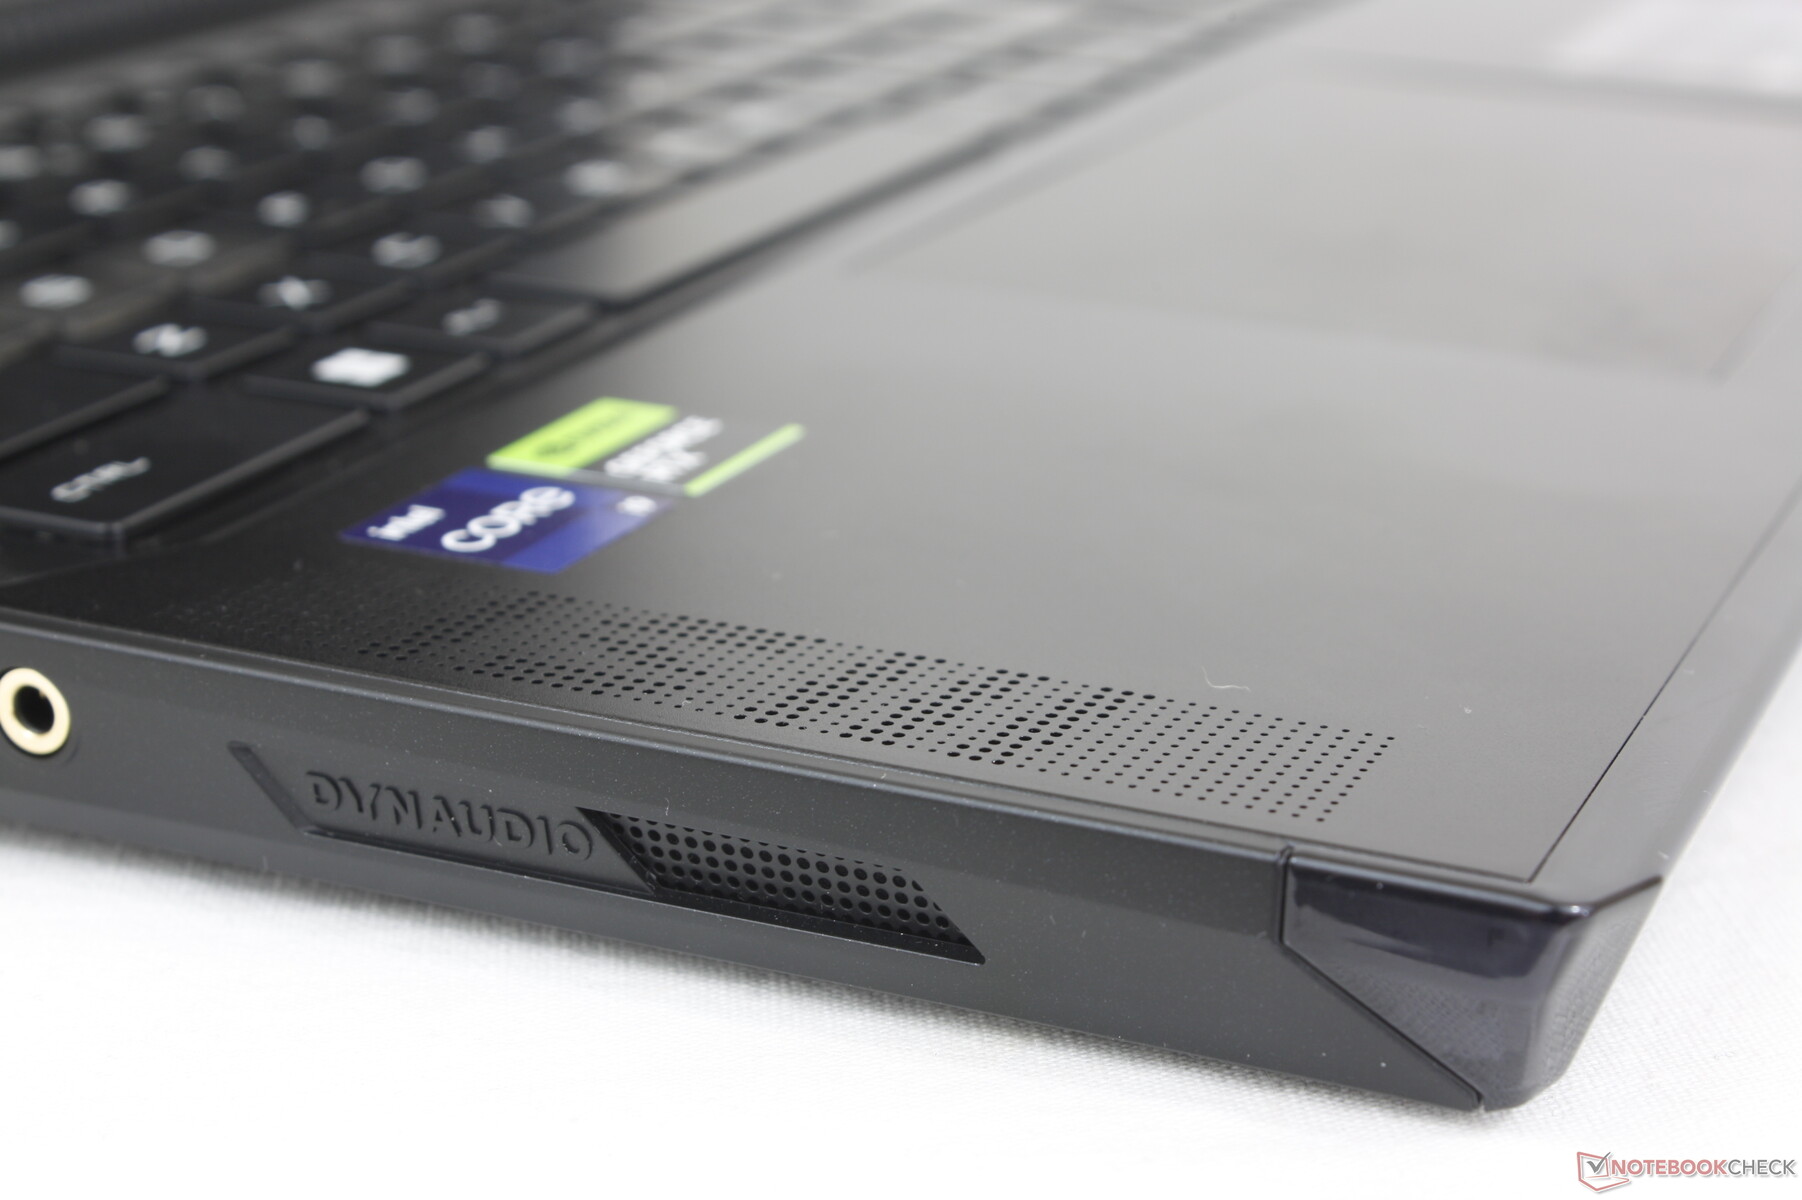
Altoparlanti
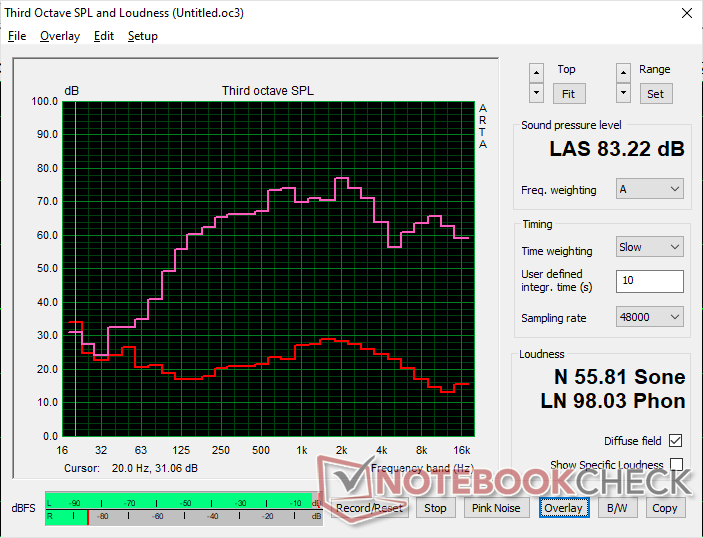
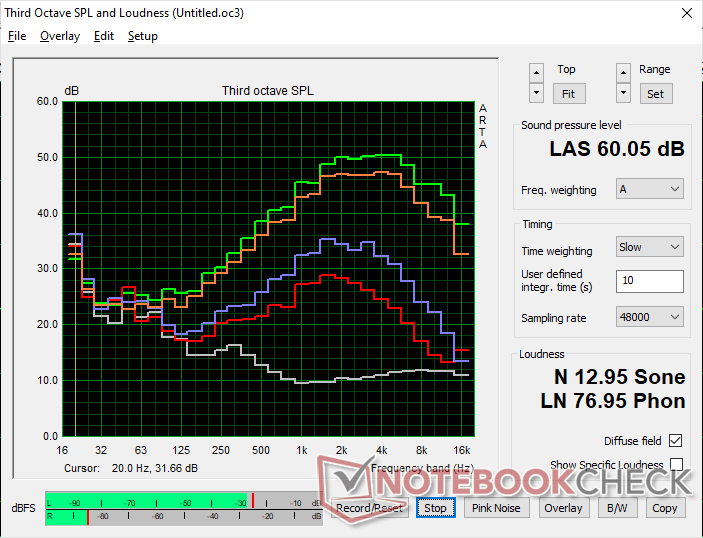
MSI Raider GE68HX 13VF analisi audio
(+) | gli altoparlanti sono relativamente potenti (83.2 dB)
Bassi 100 - 315 Hz
(±) | bassi ridotti - in media 6% inferiori alla media
(±) | la linearità dei bassi è media (9.5% delta rispetto alla precedente frequenza)
Medi 400 - 2000 Hz
(±) | medi elevati - circa 5.6% superiore alla media
(+) | medi lineari (5.8% delta rispetto alla precedente frequenza)
Alti 2 - 16 kHz
(+) | Alti bilanciati - appena 4.5% dalla media
(±) | la linearità degli alti è media (9.5% delta rispetto alla precedente frequenza)
Nel complesso 100 - 16.000 Hz
(+) | suono nel complesso lineare (13.3% differenza dalla media)
Rispetto alla stessa classe
» 19% di tutti i dispositivi testati in questa classe è stato migliore, 5% simile, 76% peggiore
» Il migliore ha avuto un delta di 6%, medio di 18%, peggiore di 132%
Rispetto a tutti i dispositivi testati
» 14% di tutti i dispositivi testati in questa classe è stato migliore, 3% similare, 83% peggiore
» Il migliore ha avuto un delta di 4%, medio di 23%, peggiore di 134%
Apple MacBook Pro 16 2021 M1 Pro analisi audio
(+) | gli altoparlanti sono relativamente potenti (84.7 dB)
Bassi 100 - 315 Hz
(+) | bassi buoni - solo 3.8% dalla media
(+) | bassi in lineaa (5.2% delta rispetto alla precedente frequenza)
Medi 400 - 2000 Hz
(+) | medi bilanciati - solo only 1.3% rispetto alla media
(+) | medi lineari (2.1% delta rispetto alla precedente frequenza)
Alti 2 - 16 kHz
(+) | Alti bilanciati - appena 1.9% dalla media
(+) | alti lineari (2.7% delta rispetto alla precedente frequenza)
Nel complesso 100 - 16.000 Hz
(+) | suono nel complesso lineare (4.6% differenza dalla media)
Rispetto alla stessa classe
» 0% di tutti i dispositivi testati in questa classe è stato migliore, 0% simile, 100% peggiore
» Il migliore ha avuto un delta di 5%, medio di 17%, peggiore di 45%
Rispetto a tutti i dispositivi testati
» 0% di tutti i dispositivi testati in questa classe è stato migliore, 0% similare, 100% peggiore
» Il migliore ha avuto un delta di 4%, medio di 23%, peggiore di 134%
Gestione dell'energia: prestazioni più elevate, consumi più elevati
Consumo di energia
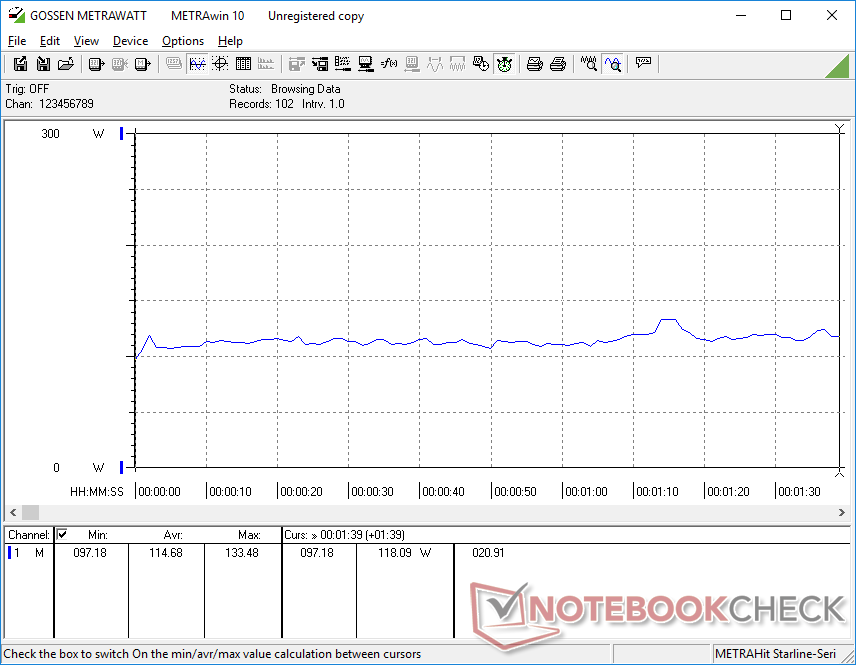
Il consumo energetico al minimo sul desktop è circa lo stesso del modello dell'anno scorso. Il funzionamento al minimo in modalità iGPU con i LED spenti consente di risparmiare fino a 8 W rispetto al funzionamento al minimo in modalità dGPU con i LED anteriori attivi.
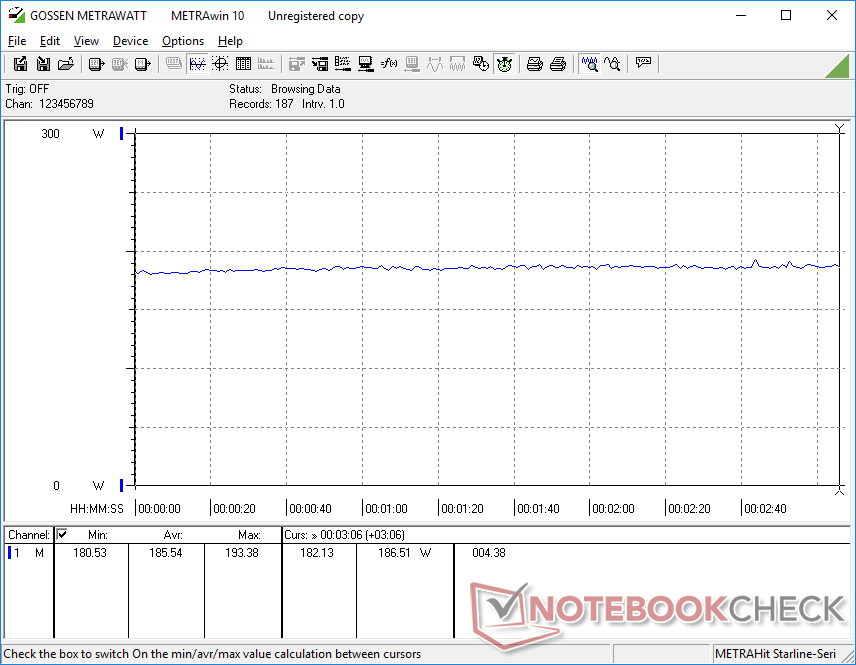
Il funzionamento Witcher 3 richiederebbe il 22% di energia in meno rispetto al GE67HX alimentato con RTX 3070 Ti dello scorso anno, il che è correlato alle prestazioni grafiche grezze più lente del 10-15% della nostra RTX 4060. Al contrario, l'esecuzione di Prime95 richiederebbe il 21% di energia in più rispetto a prima, per un aumento del 35-40% delle prestazioni multi-thread.
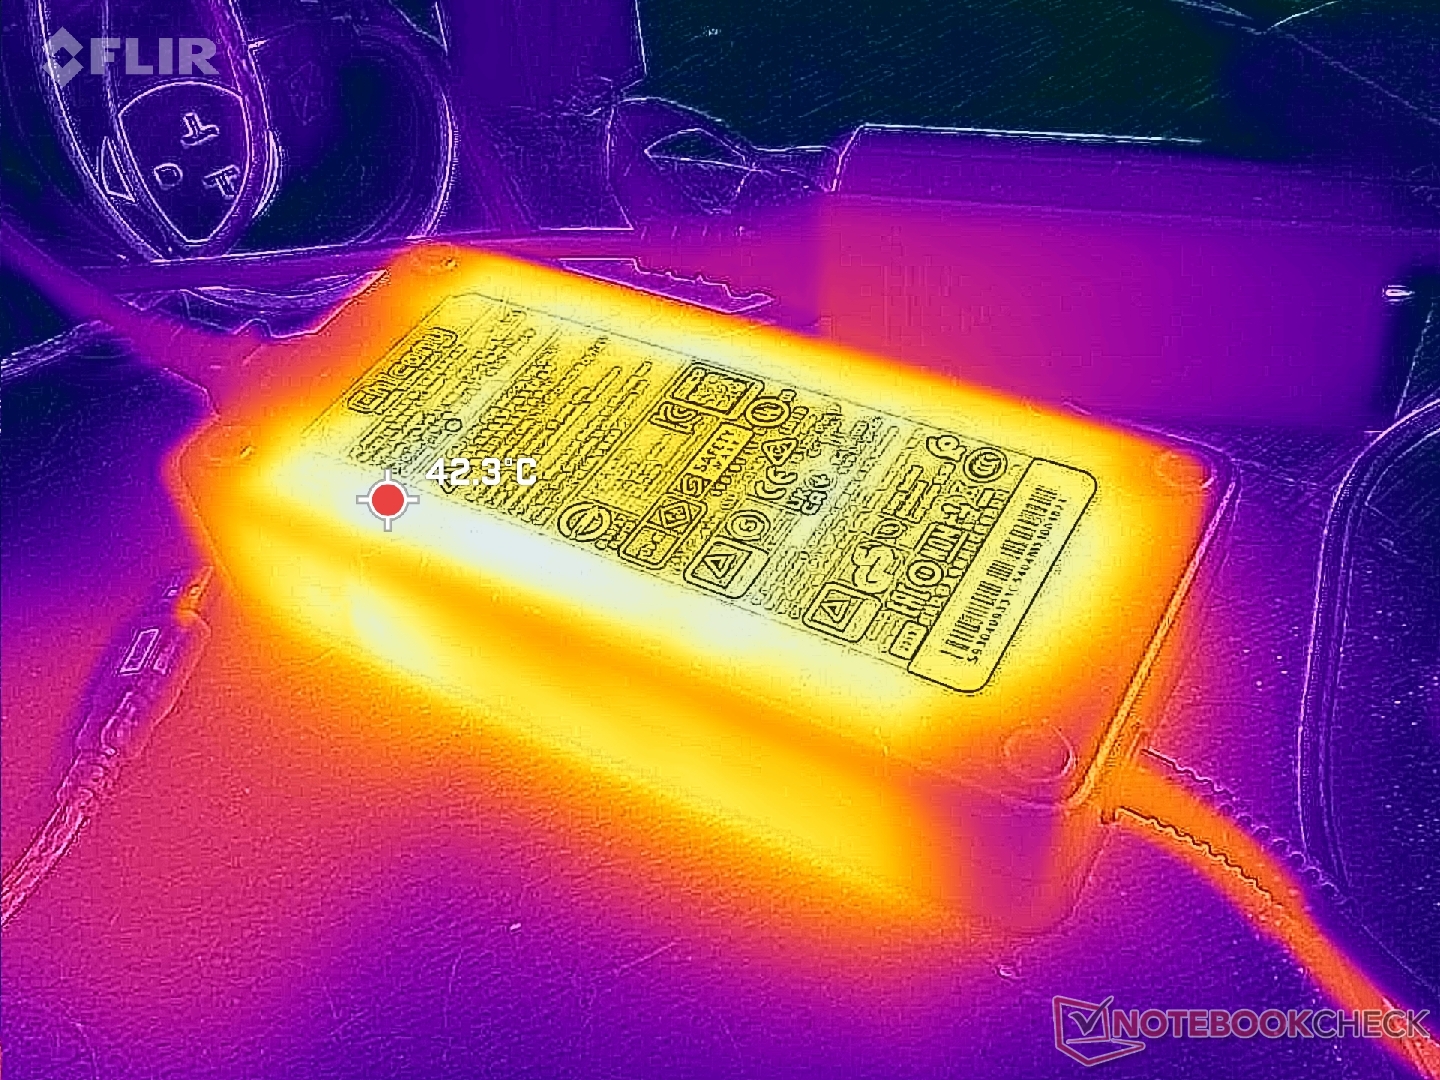
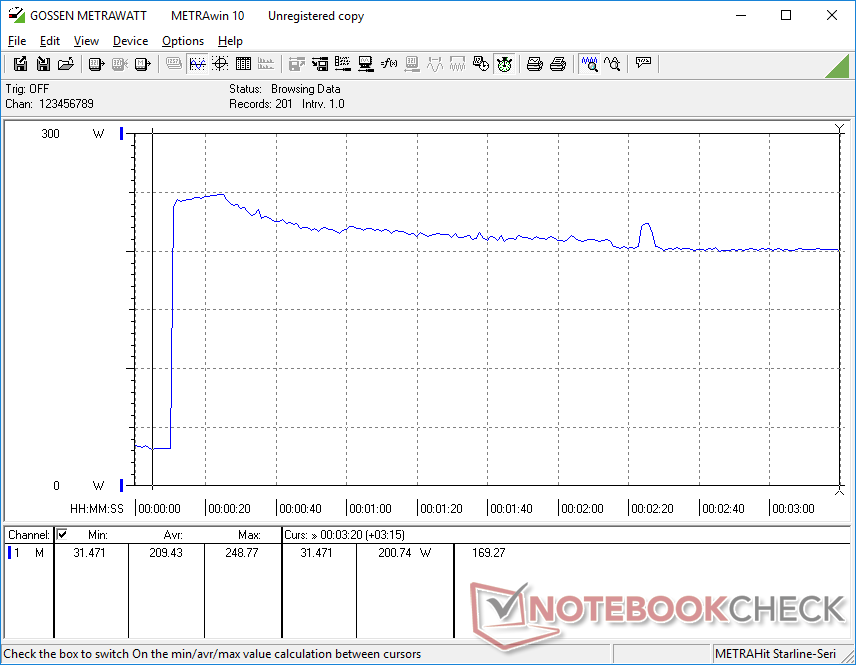
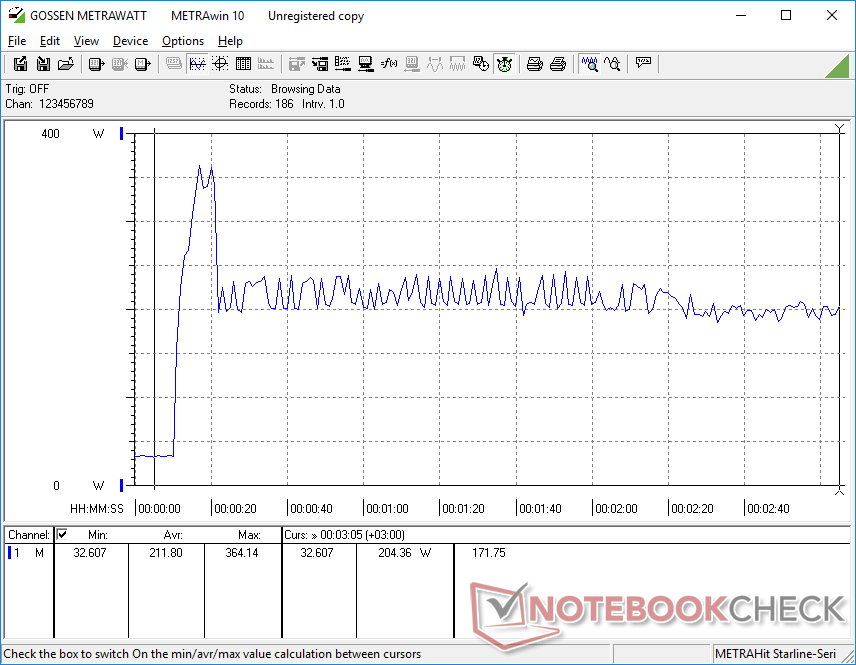
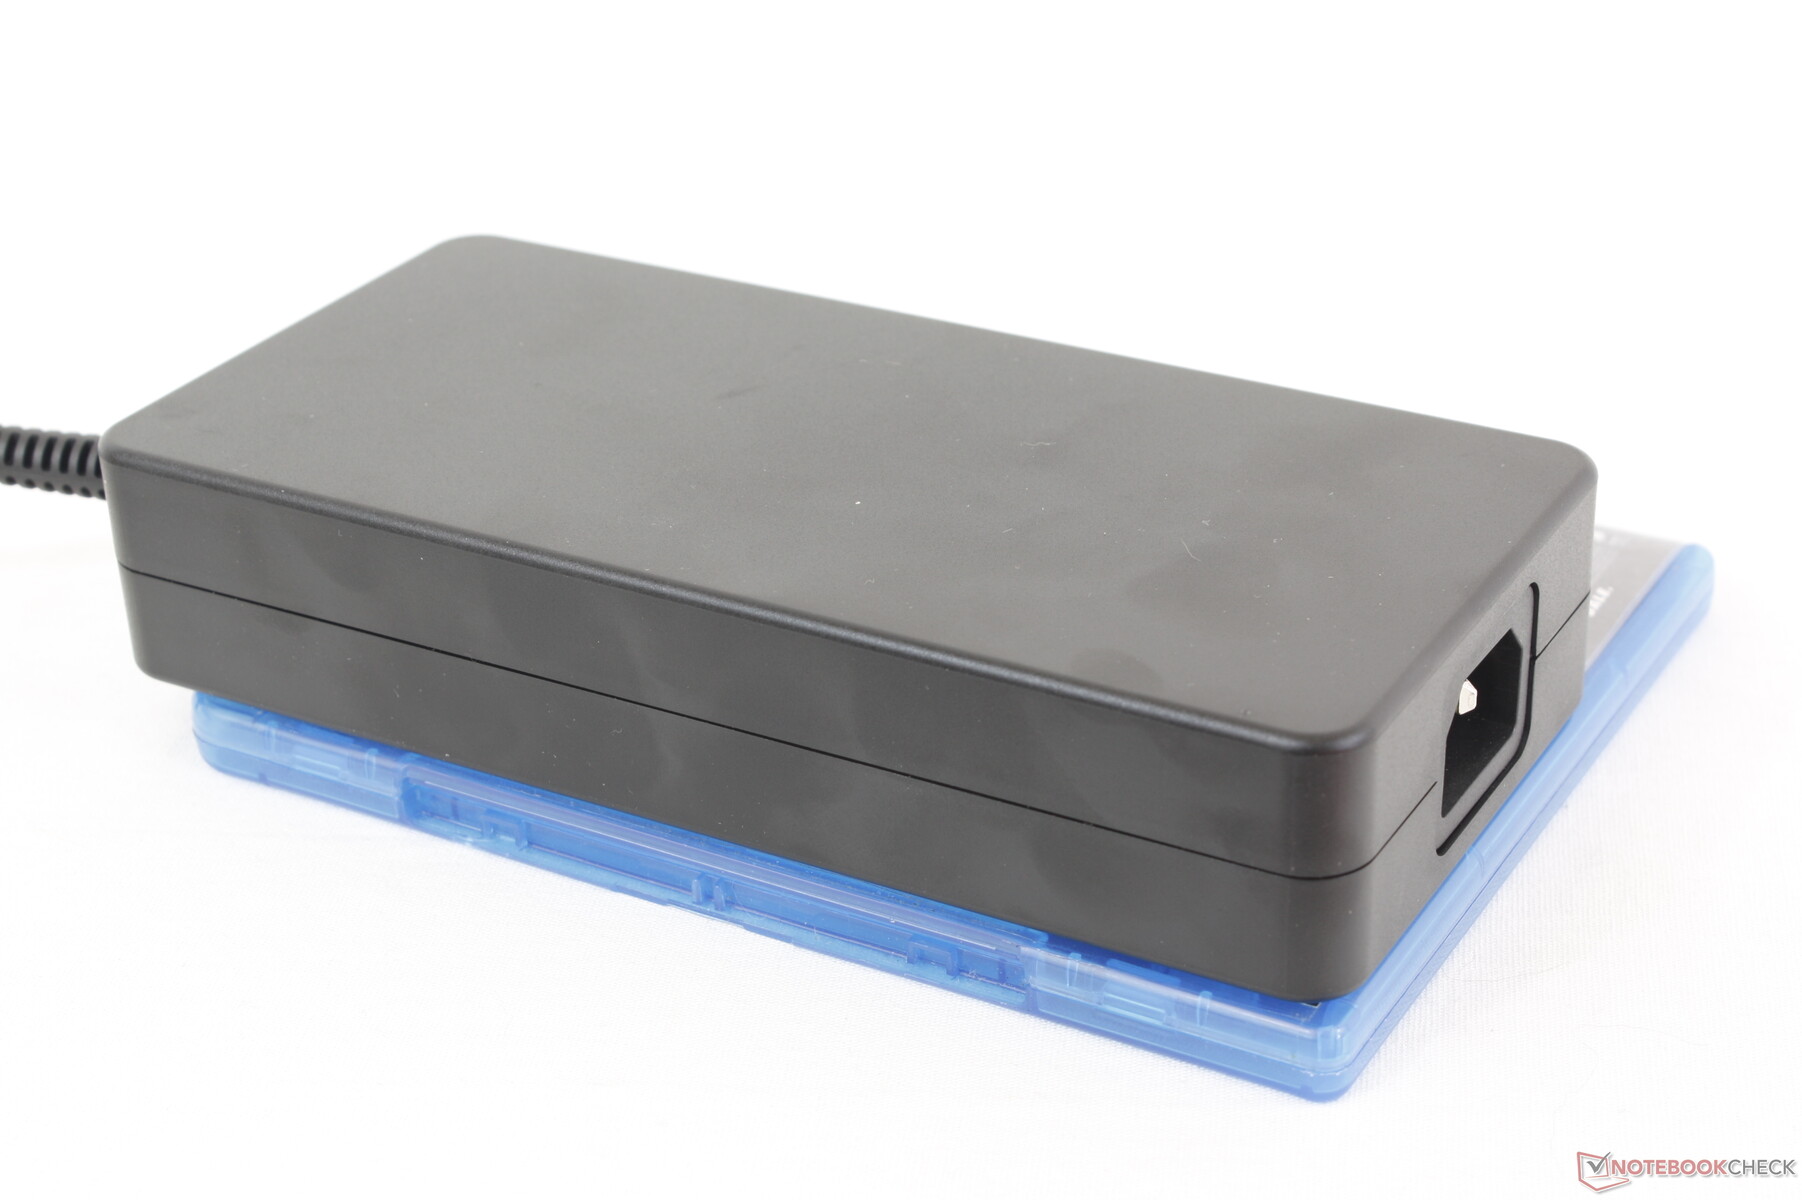
Siamo riusciti a registrare un consumo massimo temporaneo di 365 W dall'adattatore CA da 280 W di grandi dimensioni (~18 x 8,5 x 3,5 cm) all'avvio di Prime95 e FurMark. Questo valore scendeva e si stabilizzava a circa 204 W dopo pochi secondi, come mostrato dai grafici seguenti. MSI non ha ancora adottato la ricarica GaN, a differenza degli ultimi portatili Razer Blade.
| Off / Standby | |
| Idle | |
| Sotto carico |
|
Leggenda:
min: | |
| MSI Raider GE68HX 13VF i9-13950HX, GeForce RTX 4060 Laptop GPU, Samsung PM9B1 1024GB MZVL41T0HBLB, IPS, 1900x1200, 16" | MSI GE67 HX 12UGS i7-12800HX, GeForce RTX 3070 Ti Laptop GPU, Samsung PM9A1 MZVL21T0HCLR, OLED, 1920x1080, 15.6" | HP Omen 16-xf0376ng R7 7840HS, GeForce RTX 4070 Laptop GPU, WDC PC SN810 512GB, IPS, 1920x1080, 16.1" | Alienware m16 R1 AMD R9 7845HX, GeForce RTX 4080 Laptop GPU, Kioxia XG8 KXG80ZNV1T02, IPS, 2560x1600, 16" | Lenovo Legion Slim 7i 16 Gen 8 i9-13900H, GeForce RTX 4070 Laptop GPU, Samsung PM9A1 MZVL21T0HCLR, IPS, 2560x1600, 16" | Asus ROG Zephyrus M16 GU604VY-NM042X i9-13900H, GeForce RTX 4090 Laptop GPU, Samsung PM9A1 MZVL22T0HBLB, IPS, 2560x1600, 16" | |
|---|---|---|---|---|---|---|
| Power Consumption | 1% | 34% | -81% | -12% | -4% | |
| Idle Minimum * (Watt) | 15.8 | 16.1 -2% | 9 43% | 39 -147% | 22 -39% | 20 -27% |
| Idle Average * (Watt) | 19.4 | 17.1 12% | 14 28% | 44.6 -130% | 29 -49% | 24 -24% |
| Idle Maximum * (Watt) | 27.3 | 26.6 3% | 20 27% | 68.1 -149% | 39.5 -45% | 25 8% |
| Load Average * (Watt) | 114.7 | 116.3 -1% | 84 27% | 129.8 -13% | 98.7 14% | 107 7% |
| Witcher 3 ultra * (Watt) | 185.5 | 237 -28% | 140.9 24% | 285 -54% | 171.8 7% | 208 -12% |
| Load Maximum * (Watt) | 364.2 | 291.1 20% | 176 52% | 327.3 10% | 213.2 41% | 267 27% |
* ... Meglio usare valori piccoli
Power Consumption Witcher 3 / Stresstest
Power Consumption external Monitor
Durata della batteria
La capacità della batteria è la più alta possibile: 99,9 Wh. I tempi di esecuzione sono molto buoni per un portatile da gioco da 16 pollici, con poco più di 6,5 ore di navigazione WLAN nel mondo reale con il profilo energetico Bilanciato e la iGPU attiva. Questo è uno dei portatili da gioco da 16 pollici più longevi che abbiamo testato finora.
Purtroppo, la ricarica da vuoto a pieno regime è relativamente lenta: 2,5 ore rispetto alle 1,5 ore della maggior parte degli altri portatili. Inoltre, nessuno dei nostri adattatori CA USB-C è stato in grado di caricare il laptop attraverso una delle tre porte USB-C, nonostante MSI pubblicizzi Power Delivery.
| MSI Raider GE68HX 13VF i9-13950HX, GeForce RTX 4060 Laptop GPU, 99.9 Wh | MSI GE67 HX 12UGS i7-12800HX, GeForce RTX 3070 Ti Laptop GPU, 99.9 Wh | HP Omen 16-xf0376ng R7 7840HS, GeForce RTX 4070 Laptop GPU, 83 Wh | Alienware m16 R1 AMD R9 7845HX, GeForce RTX 4080 Laptop GPU, 86 Wh | Lenovo Legion Slim 7i 16 Gen 8 i9-13900H, GeForce RTX 4070 Laptop GPU, 99.9 Wh | Asus ROG Zephyrus M16 GU604VY-NM042X i9-13900H, GeForce RTX 4090 Laptop GPU, 90 Wh | |
|---|---|---|---|---|---|---|
| Autonomia della batteria | -2% | -16% | -52% | -42% | 12% | |
| Reader / Idle (h) | 8.8 | 8.4 -5% | 4 -55% | 5.1 -42% | ||
| WiFi v1.3 (h) | 6.8 | 5.6 -18% | 5.7 -16% | 3.7 -46% | 4.4 -35% | 4.3 -37% |
| Load (h) | 1.8 | 2.1 17% | 0.8 -56% | 0.9 -50% | 2.9 61% | |
| H.264 (h) | 4.8 |
Pro
Contro
Verdetto - Non male, ma manca il bersaglio
Pur apprezzando il fatto che il produttore abbia scelto una direzione diversa per il design dei suoi portatili da gioco, crediamo fermamente che i cambiamenti non debbano andare a scapito della facilità di manutenzione per l'utente finale. Il GE68HX è più difficile da aprire rispetto al design dell'anno scorso e questo può essere particolarmente problematico per un portatile da gioco in cui è più probabile che i proprietari aggiungano autonomamente RAM e memoria. In secondo luogo, il nuovo design è notevolmente più spesso e più pesante rispetto all'aspetto più "pulito" del GE67HX, il che potrebbe non piacere a molti utenti.
Il nuovo chassis offre comunque una serie di vantaggi. In primo luogo, le cerniere sono più robuste di prima, mentre il resto dello chassis è altrettanto resistente. In secondo luogo, le temperature dei core sono più basse rispetto al GE67HX, per un migliore potenziale di overclocking. Le prestazioni sono persino leggermente più veloci del previsto con il profilo di alimentazione e le impostazioni predefinite. Infine, alcuni utenti potrebbero apprezzare il clickpad più grande e il nuovo tastierino numerico per applicazioni diverse dal gioco.
Le prestazioni e le temperature traggono vantaggio dal design dello chassis più spesso, ma non tutti saranno contenti del peso maggiore, della manutenzione più difficile e delle opzioni di display di fascia bassa, considerando l'elevato prezzo di partenza.
A partire da 1.700 dollari, tuttavia, i tagli ai colori del display, al G-Sync e alle prestazioni dell'SSD non sembrano necessari per un modello della serie GE di fascia alta. Tali compromessi sono più prevedibili per i modelli della serie MSI Sword o Katana di fascia bassa. Il produttore è rimasto indietro anche nella tecnologia di ricarica; i caricabatterie GaN di Razer, più piccoli e più portatili, sono in grado di erogare altrettanta potenza, mentre il supporto di ricarica USB-C sul GE68HX sembra inaffidabile.
Alternative come ilLenovo Legion Slim 7i 16 Gen 8, Asus ROG Zephyrus M16, o Razer Blade 16 non sempre offrono CPU Core-HX, ma sono molto più portatili e offrono opzioni grafiche simili e display migliori.
Prezzo e disponibilità
MSI Raider GE68HX è ora ampiamente disponibile a partire da 1900 dollari su Amazon, , Newegg e Best Buye Best Buy per la nostra configurazione Core i7/RTX 4060/FHD+, fino a oltre 4000 dollari per la configurazione completa con Core i9/RTX 4090/QHD+.
MSI Raider GE68HX 13VF
- 09/30/2023 v7 (old)
Allen Ngo
Transparency
La selezione dei dispositivi da recensire viene effettuata dalla nostra redazione. Il campione di prova è stato acquistato gratuitamente dall'autore a proprie spese. L'istituto di credito non ha avuto alcuna influenza su questa recensione, né il produttore ne ha ricevuto una copia prima della pubblicazione. Non vi era alcun obbligo di pubblicare questa recensione. In quanto società mediatica indipendente, Notebookcheck non è soggetta all'autorità di produttori, rivenditori o editori.
Ecco come Notebookcheck esegue i test
Ogni anno, Notebookcheck esamina in modo indipendente centinaia di laptop e smartphone utilizzando procedure standardizzate per garantire che tutti i risultati siano comparabili. Da circa 20 anni sviluppiamo continuamente i nostri metodi di prova e nel frattempo stabiliamo gli standard di settore. Nei nostri laboratori di prova, tecnici ed editori esperti utilizzano apparecchiature di misurazione di alta qualità. Questi test comportano un processo di validazione in più fasi. Il nostro complesso sistema di valutazione si basa su centinaia di misurazioni e parametri di riferimento ben fondati, che mantengono l'obiettività.Price comparison

