Recensione del Legion 9i Gen 8 16IRX8: Il computer portatile gaming più ambizioso di Lenovo

Presentato solo poche settimane fa all'IFA 2023Legion 9i 16 è il modello Legion di fascia più alta disponibile, superando la serie Legion 5 di fascia media e la serie Legion 7 di fascia medio-alta. Si tratta del primo prodotto Legion 9 in diversi anni, dopo il mediocre Legion Y920 nel 2017. L'ultimo modello si distingue per il display mini-LED e per i termici di raffreddamento a liquido integrati.
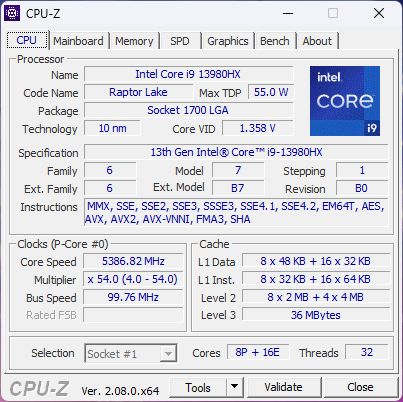
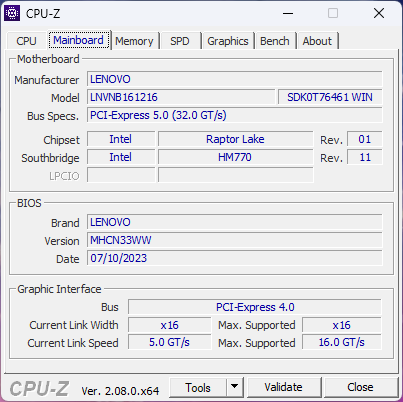
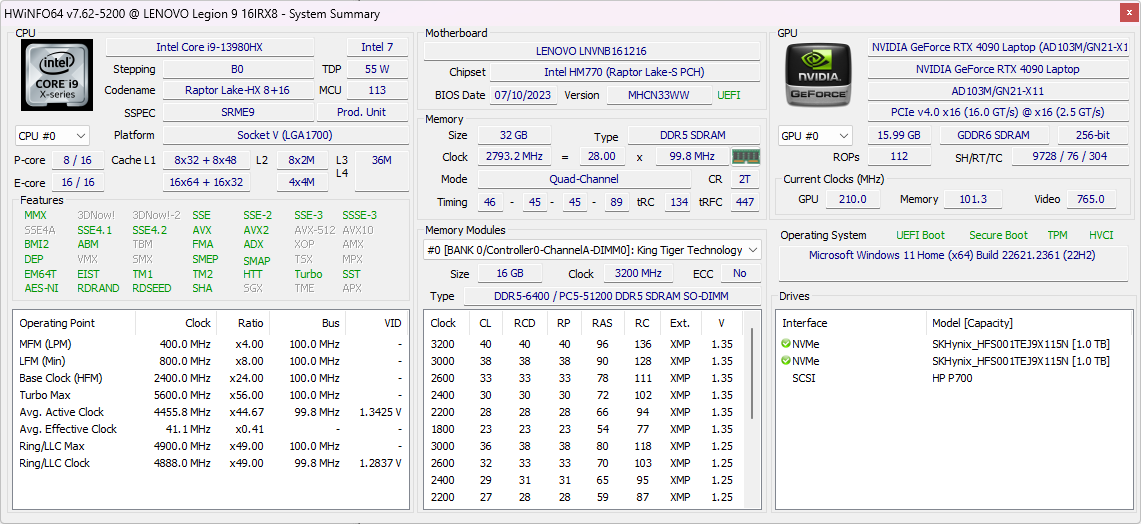
La nostra unità in recensione è stata configurata con tutto il necessario per includere una CPU Core i9-13980HX di 13a generazione, una GPU RTX 4090 da 175 W GeForce, un'unità SSD NVMe PCIe4 x4 da 1 TB in RAID 0 e un display mini-LED da 3.2K (3200 x 2000) a 165 Hz con colori DCI-P3 per un prezzo al dettaglio di poco inferiore a 4000 dollari. Tutte le opzioni al momento vengono fornite con la stessa CPU Core i9 e lo stesso display mini-LED, mentre solo la GPU può essere configurata fino alla RTX 4080.
Le alternative a Legion 9i 16 includono altri portatili da gioco da 16 pollici come il Razer Blade 16, Asus ROG Strix G16, HP Omen Transcend 16e il Alienware x16 R1.
Altre recensioni di Lenovo:
Potenziali concorrenti a confronto
Punteggio | Data | Modello | Peso | Altezza | Dimensione | Risoluzione | Prezzo |
|---|---|---|---|---|---|---|---|
| 90.2 % v7 (old) | 10/2023 | Lenovo Legion 9 16IRX8 i9-13980HX, GeForce RTX 4090 Laptop GPU | 2.6 kg | 22.7 mm | 16.00" | 3200x2000 | |
| 87.7 % v7 (old) | 08/2023 | Lenovo Legion Slim 5 16APH8 R7 7840HS, GeForce RTX 4060 Laptop GPU | 2.4 kg | 25.2 mm | 16.00" | 2560x1600 | |
| 89.8 % v7 (old) | 03/2023 | Razer Blade 16 Early 2023 RTX 4090 i9-13950HX, GeForce RTX 4090 Laptop GPU | 2.5 kg | 21.99 mm | 16.00" | 3840x2400 | |
| 88.4 % v7 (old) | 03/2023 | Asus ROG Strix G16 G614JZ i9-13980HX, GeForce RTX 4080 Laptop GPU | 2.4 kg | 30.4 mm | 16.00" | 2560x1600 | |
| 87.9 % v7 (old) | 08/2023 | HP Omen Transcend 16 i9-13900HX, GeForce RTX 4070 Laptop GPU | 2.3 kg | 19.8 mm | 16.00" | 2560x1600 | |
| 88.4 % v7 (old) | 06/2023 | Alienware x16 R1 i9-13900HK, GeForce RTX 4080 Laptop GPU | 2.6 kg | 18.57 mm | 16.00" | 2560x1600 |
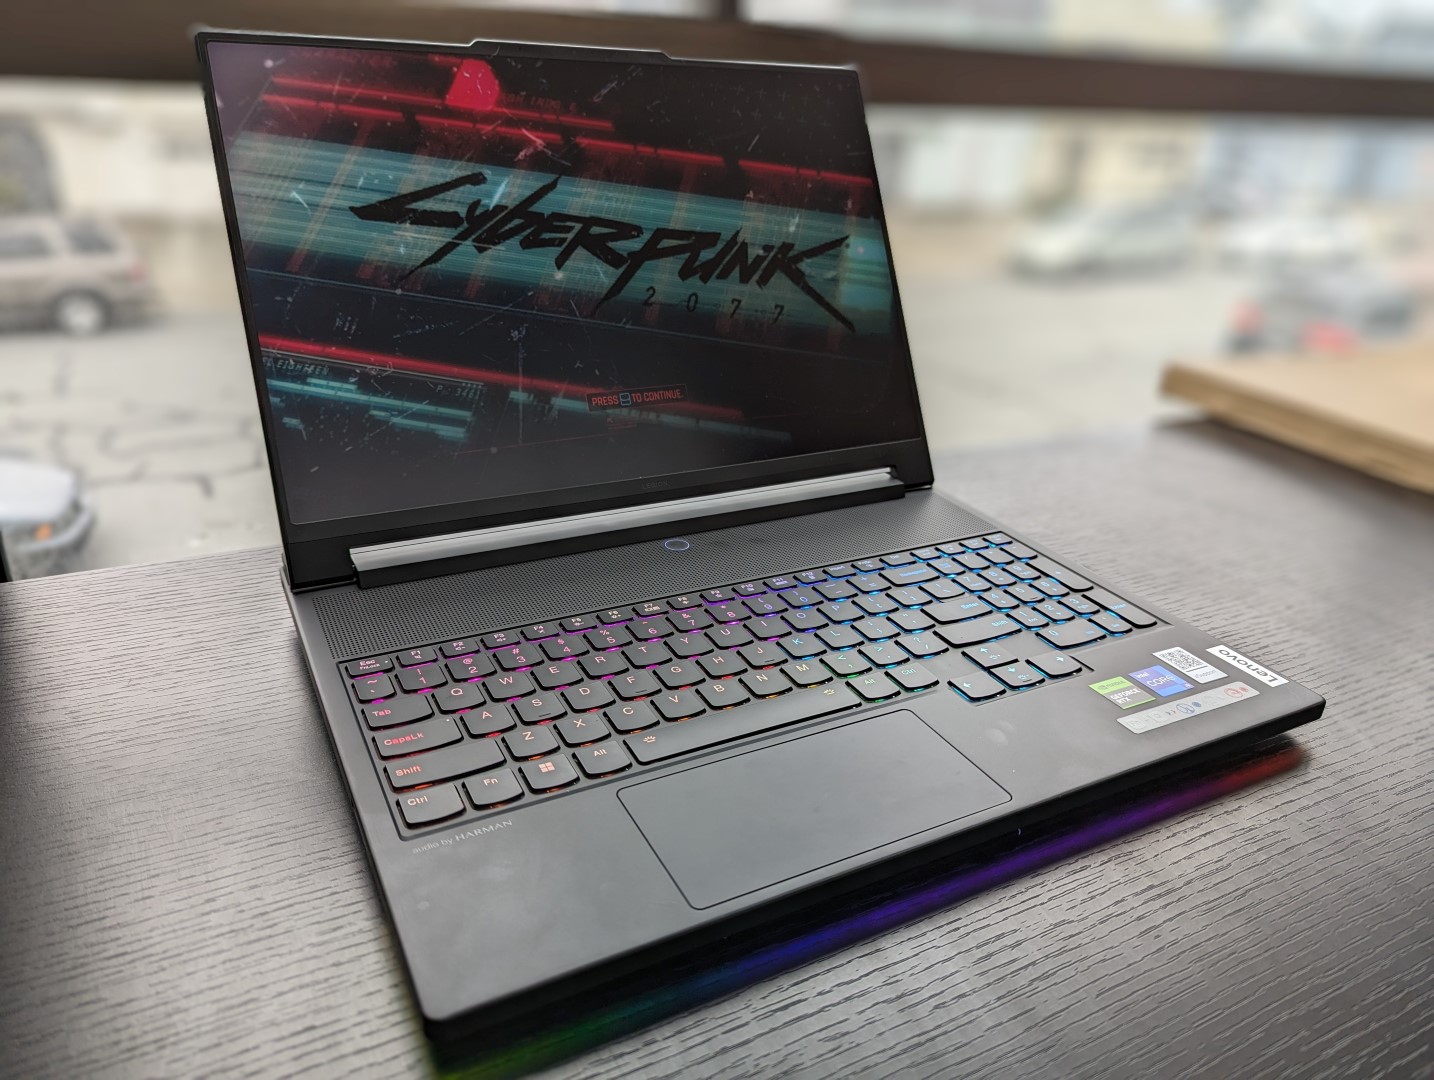
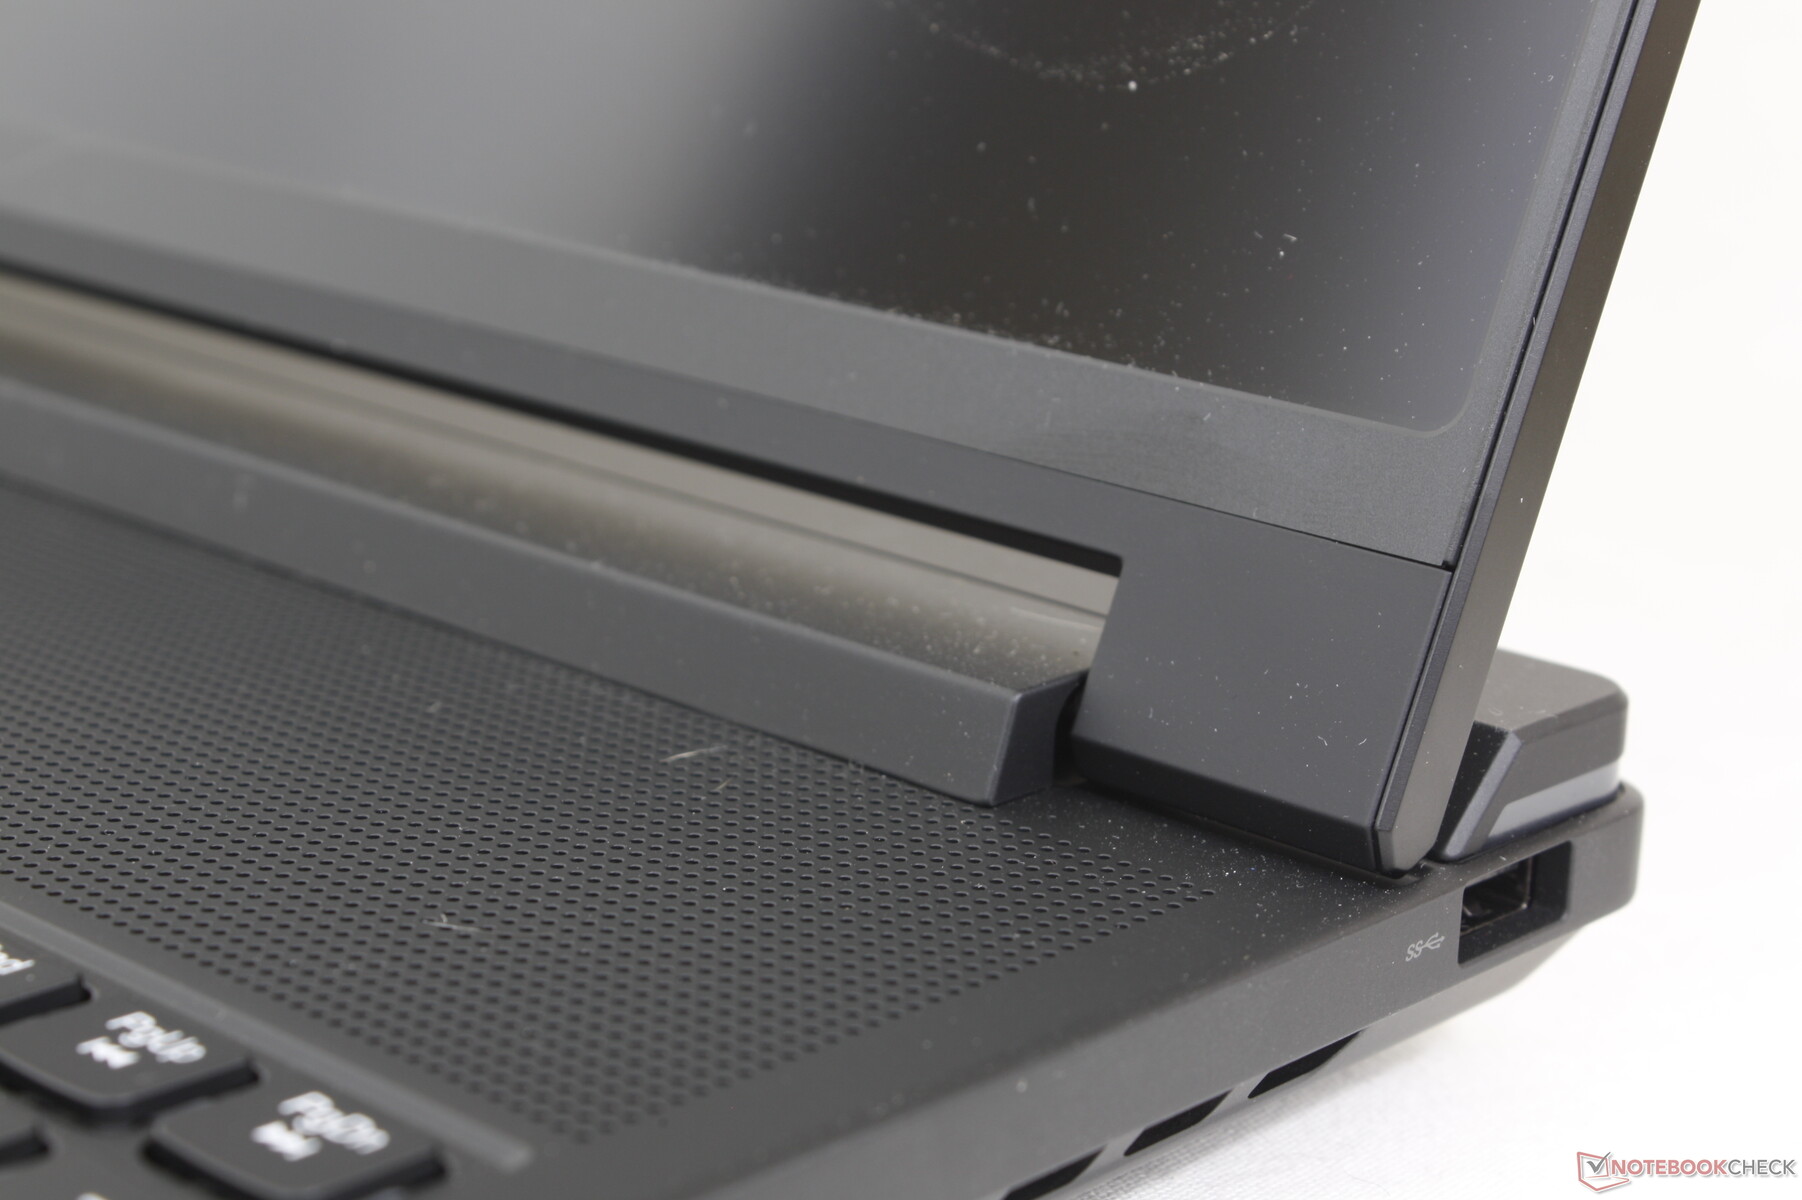
Caso - Un design evoluto Legion
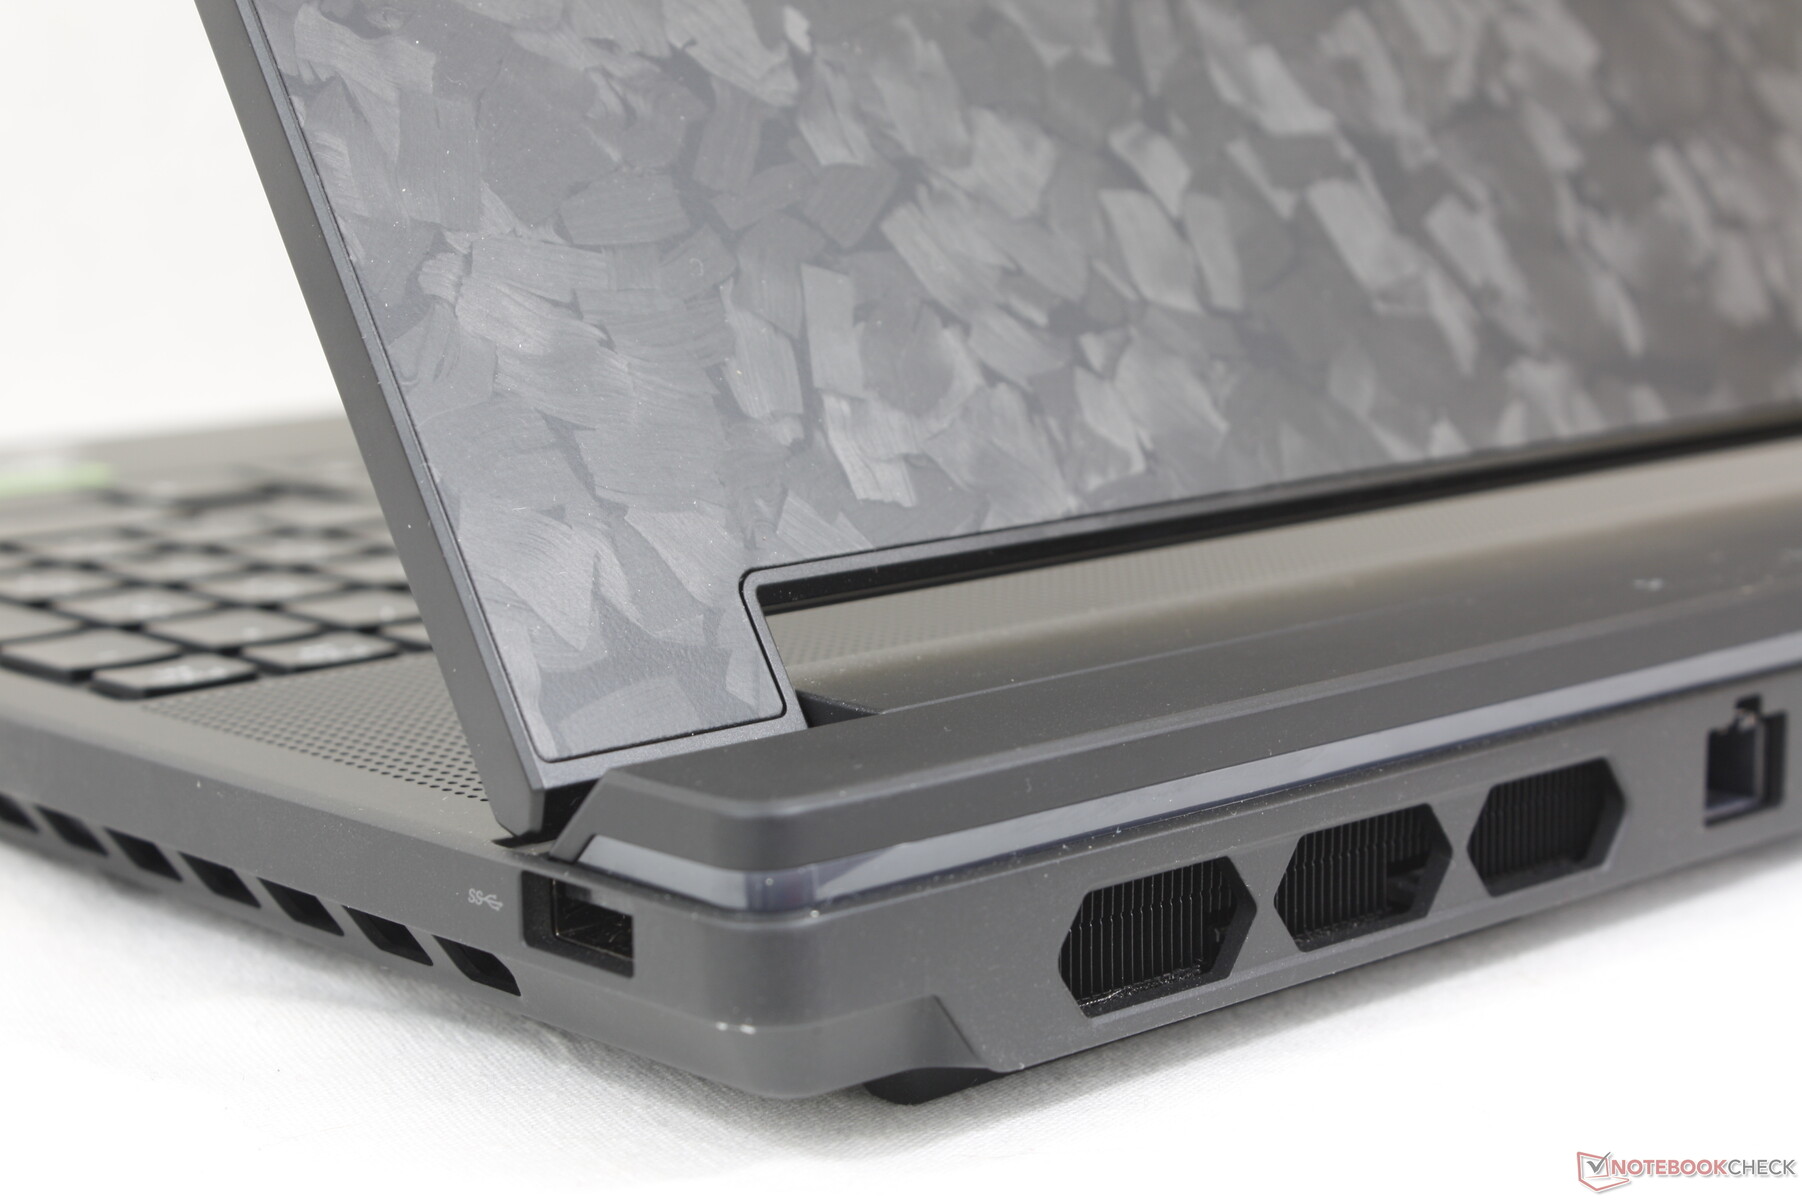
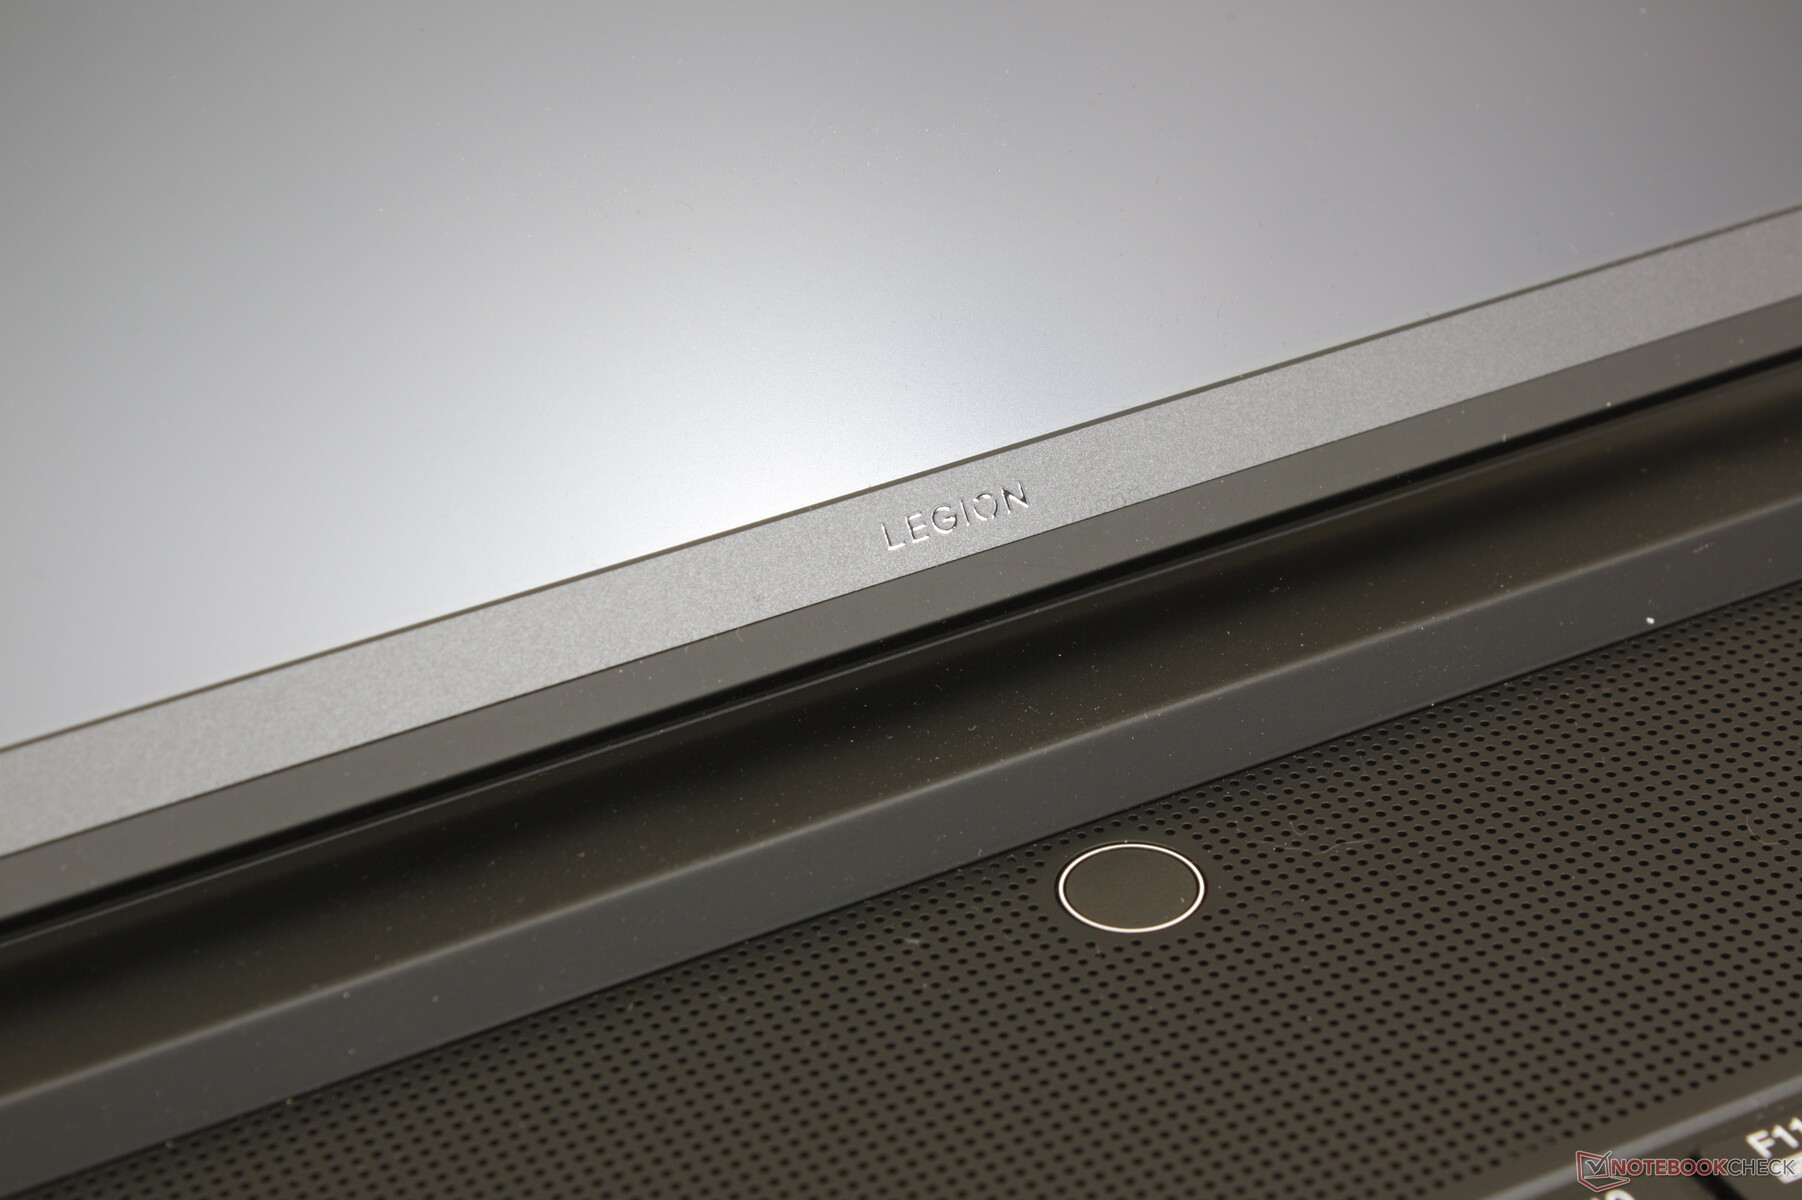
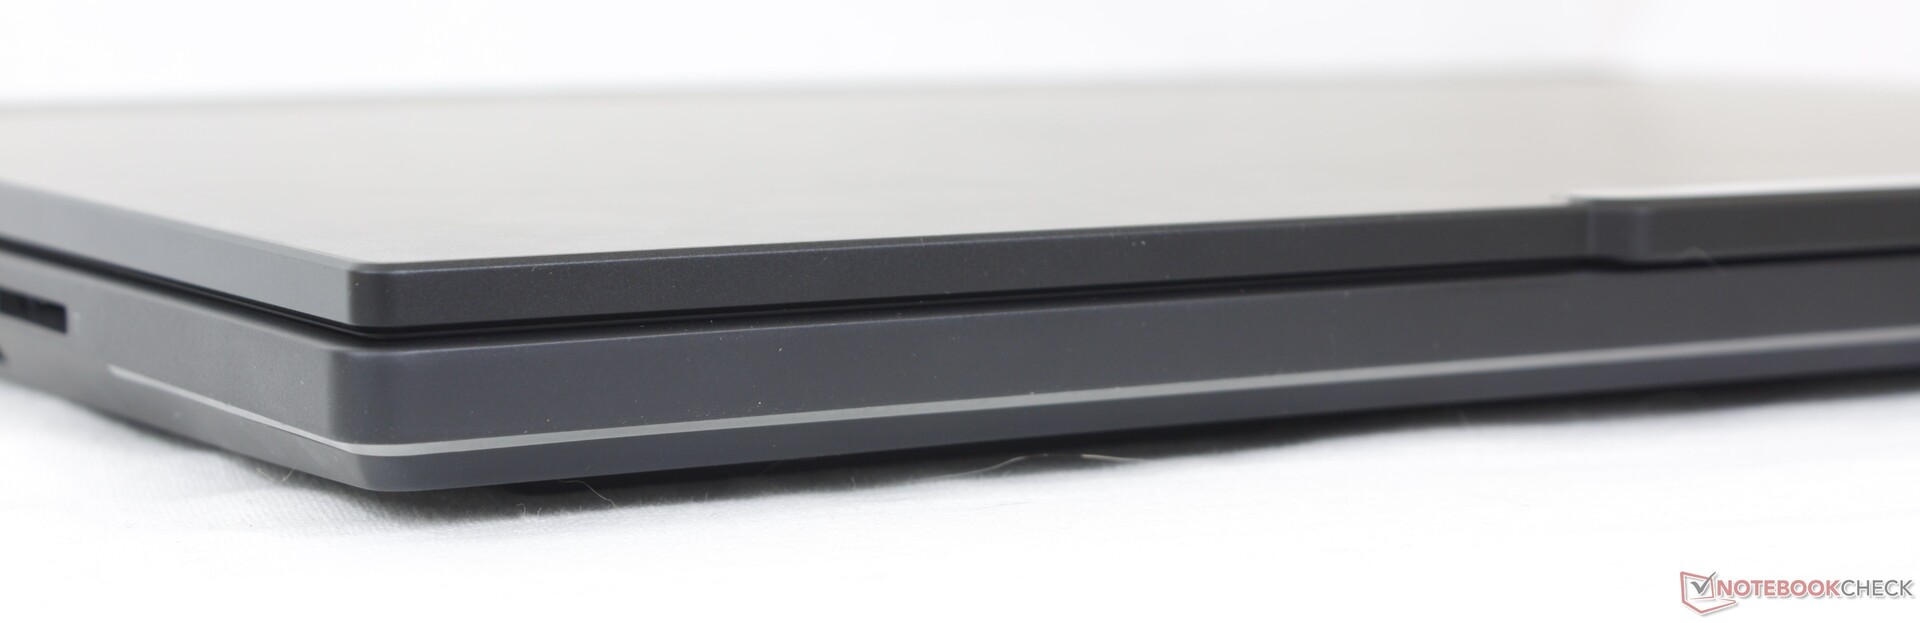
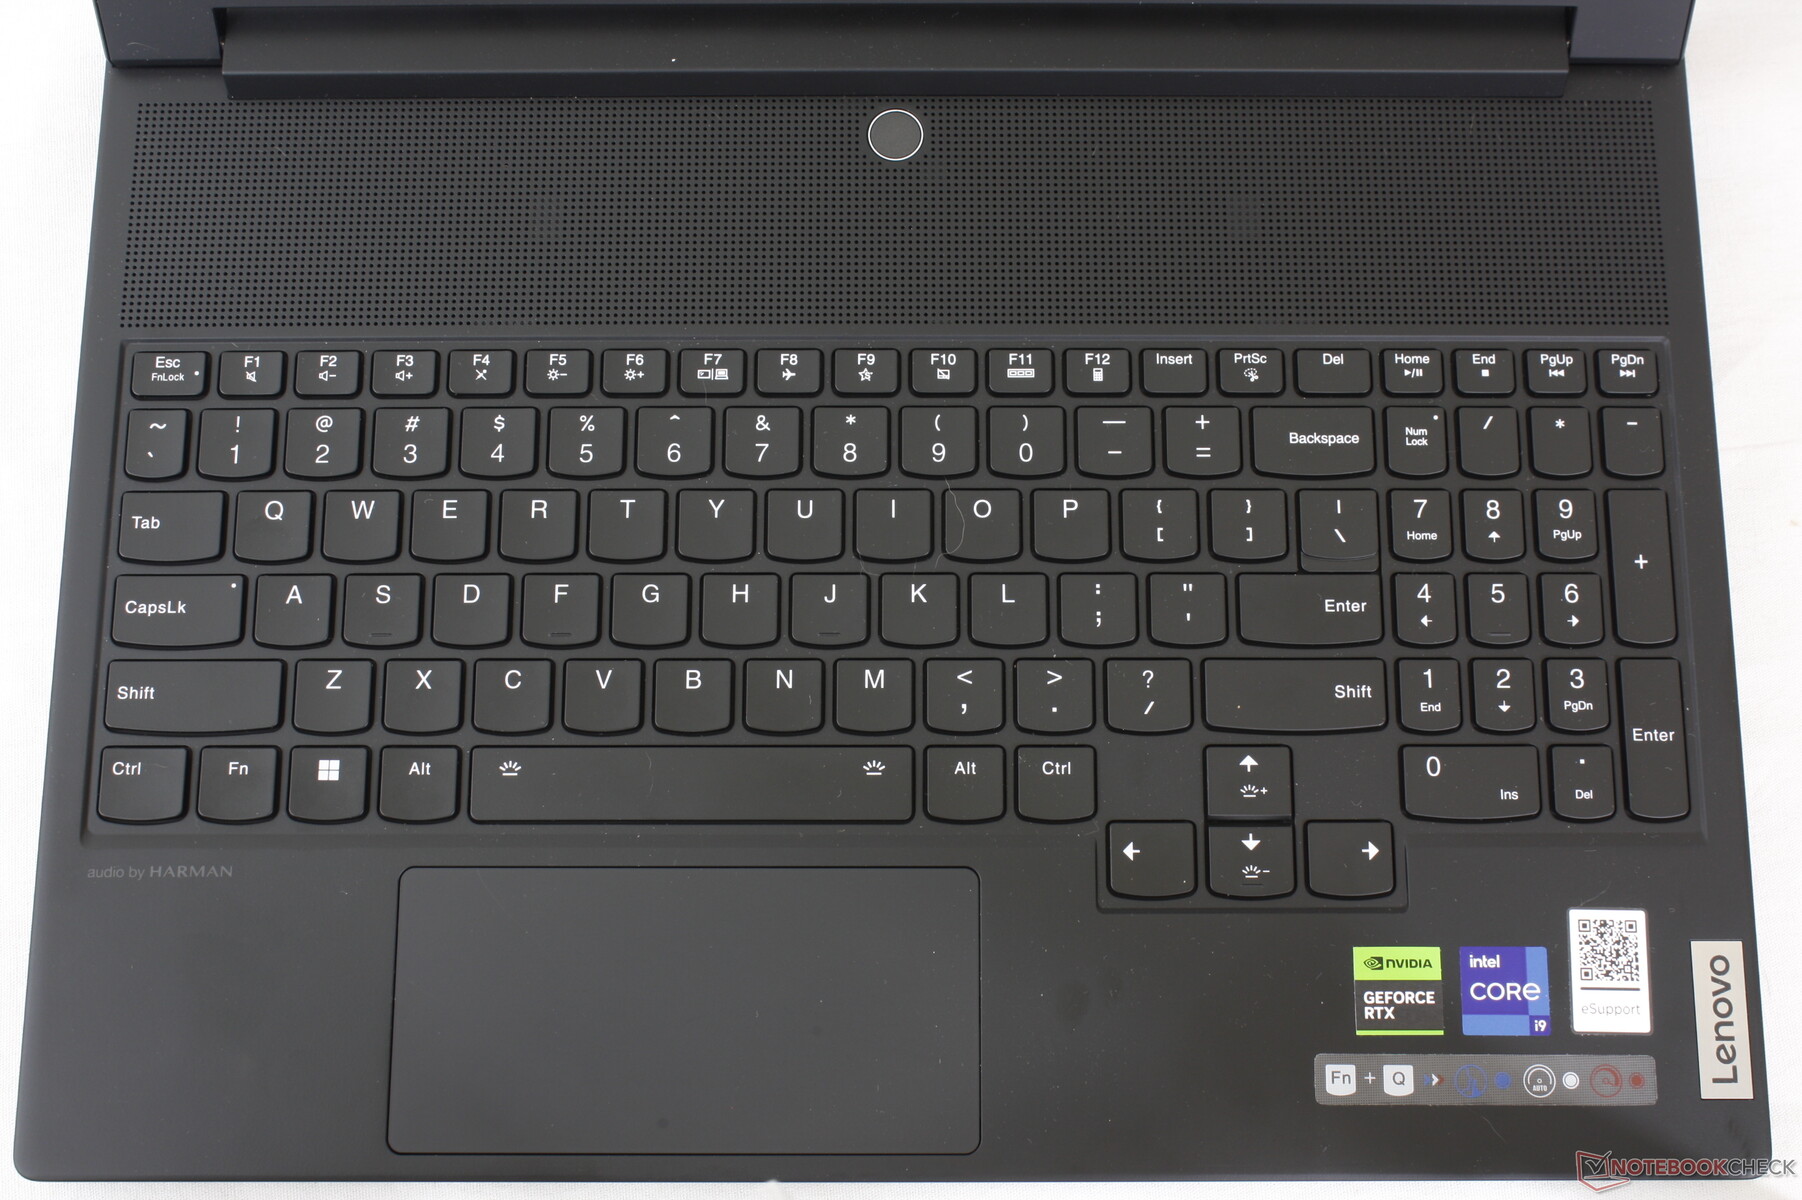
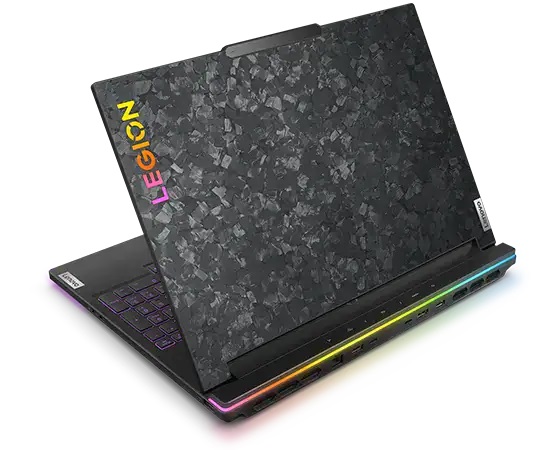
Legion 9i 16 utilizza materiali in magnesio opaco simili a quelli della Legion serie 7, ma sono visivamente molto diversi. Innanzitutto, la tastiera è stata spostata in avanti per essere più vicina all'utente, come Asus Zephyrus S GX531 per fare spazio a più griglie di ventilazione e a una soluzione di raffreddamento più grande. In secondo luogo, un esclusivo motivo di avvolgimento in carbonio intorno al coperchio esterno aiuta a ridurre l'accumulo di impronte digitali, contribuendo al contempo all'estetica da gamer. Infine, la parte posteriore sporgente si è ispessita per accogliere meglio tutte le modifiche interne e l'hardware più esigente.
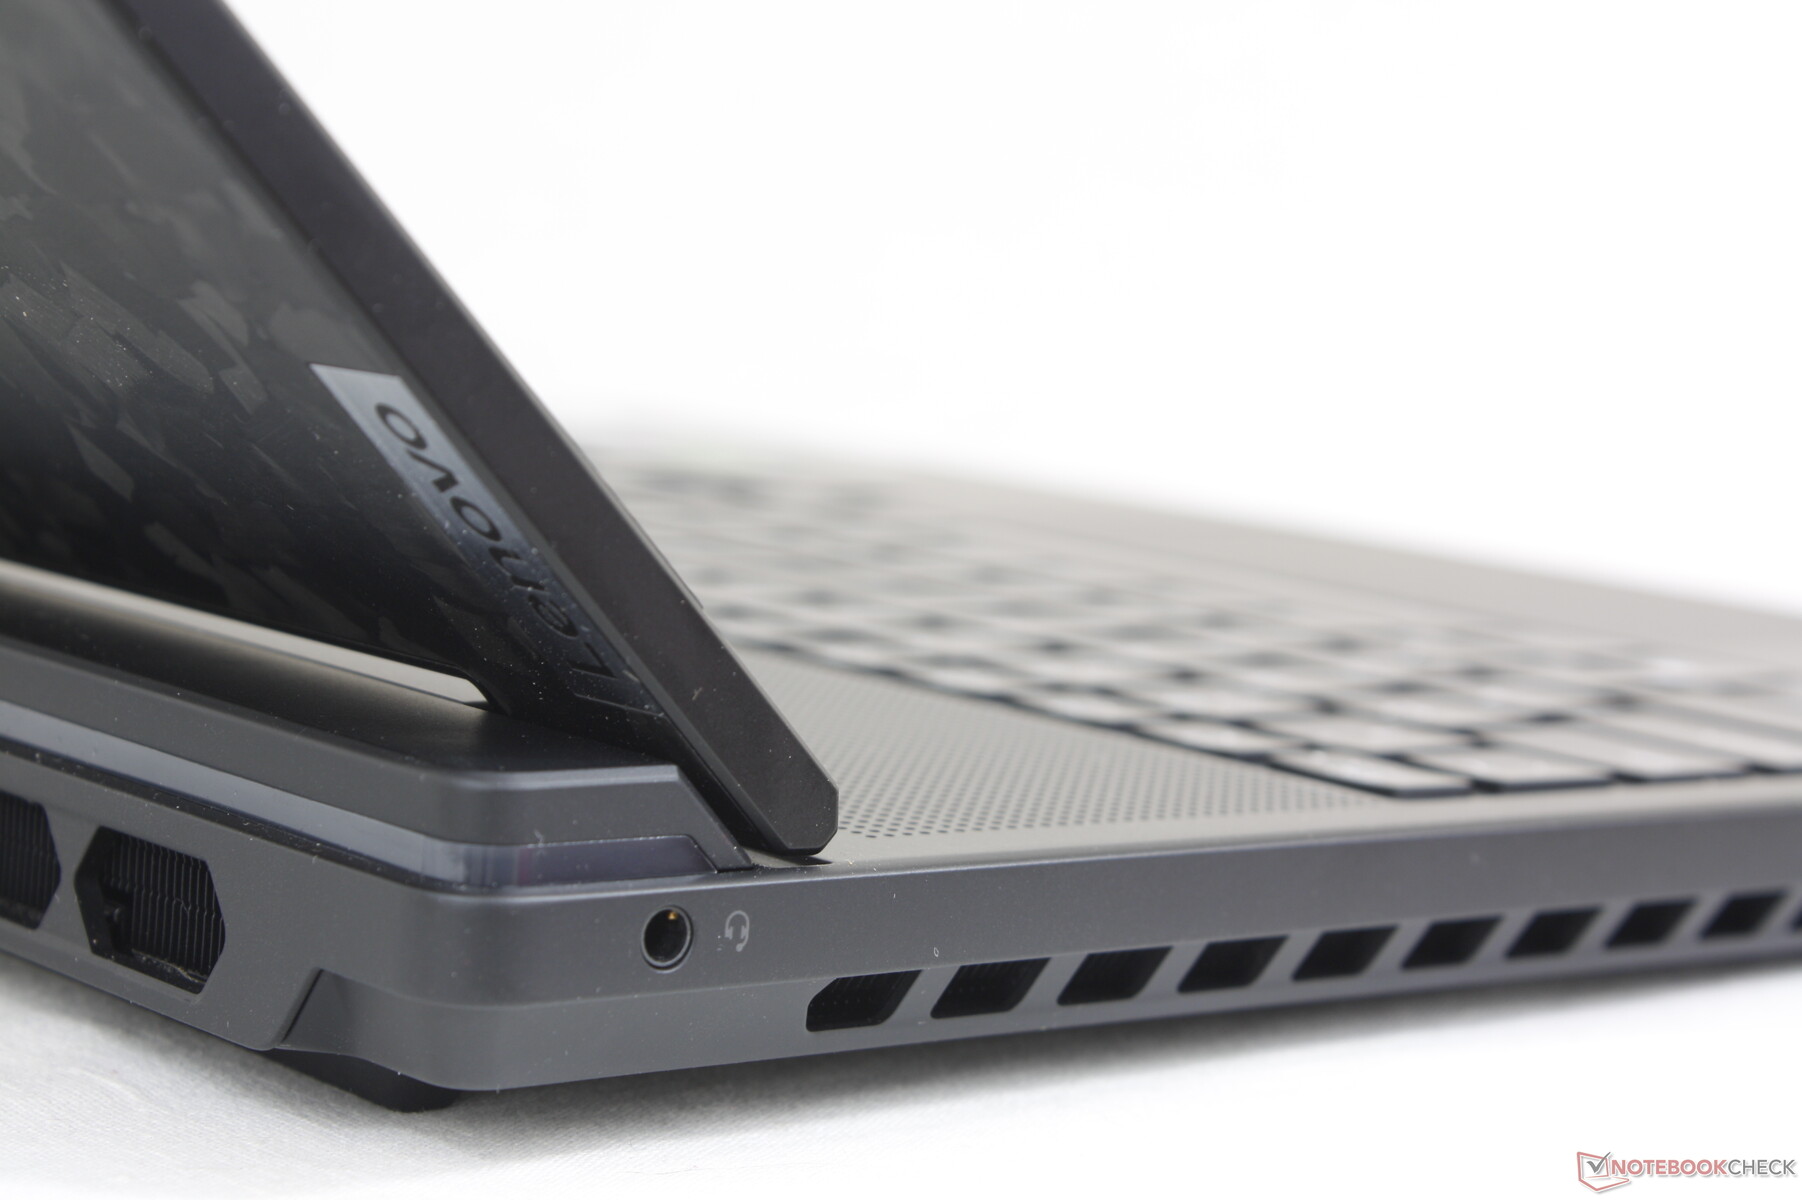
La qualità del telaio è eccellente, con solo un po' di cedimento quando si cerca di ruotare il coperchio o di premere il centro della tastiera o i poggiapolsi. Non si sente né meglio né peggio rispetto a
Legion 7 16 o a Alienware x16 R1 in termini di rigidità, soprattutto perché hanno tutti lo stesso peso. Tuttavia, le cerniere rimangono relativamente piccole rispetto alle cerniere molto più grandi della serie Serie Asus Strix o del recenteMSI Raider GE68. Possono essere soddisfacenti quando sono nuove, ma solo il tempo ci dirà quanto saranno valide nel lungo periodo.
La parte posteriore allungata e gli esigenti interni Core i9/RTX 4090 hanno portato a uno chassis più grande e più spesso rispetto a Legion 7 16. Le differenze sono evidenti, poiché 9i 16 è più grande di molti altri portatili da gioco da 16 pollici, come ROG Strix G16. Le differenze sono evidenti, poiché Legion 9i 16 è più grande di molti altri computer portatili da gioco da 16 pollici, come ROG Strix G16, Blade 16o Omen Transcend 16. A questo proposito, le prestazioni elevate e le funzioni avanzate vanno a scapito della portabilità.
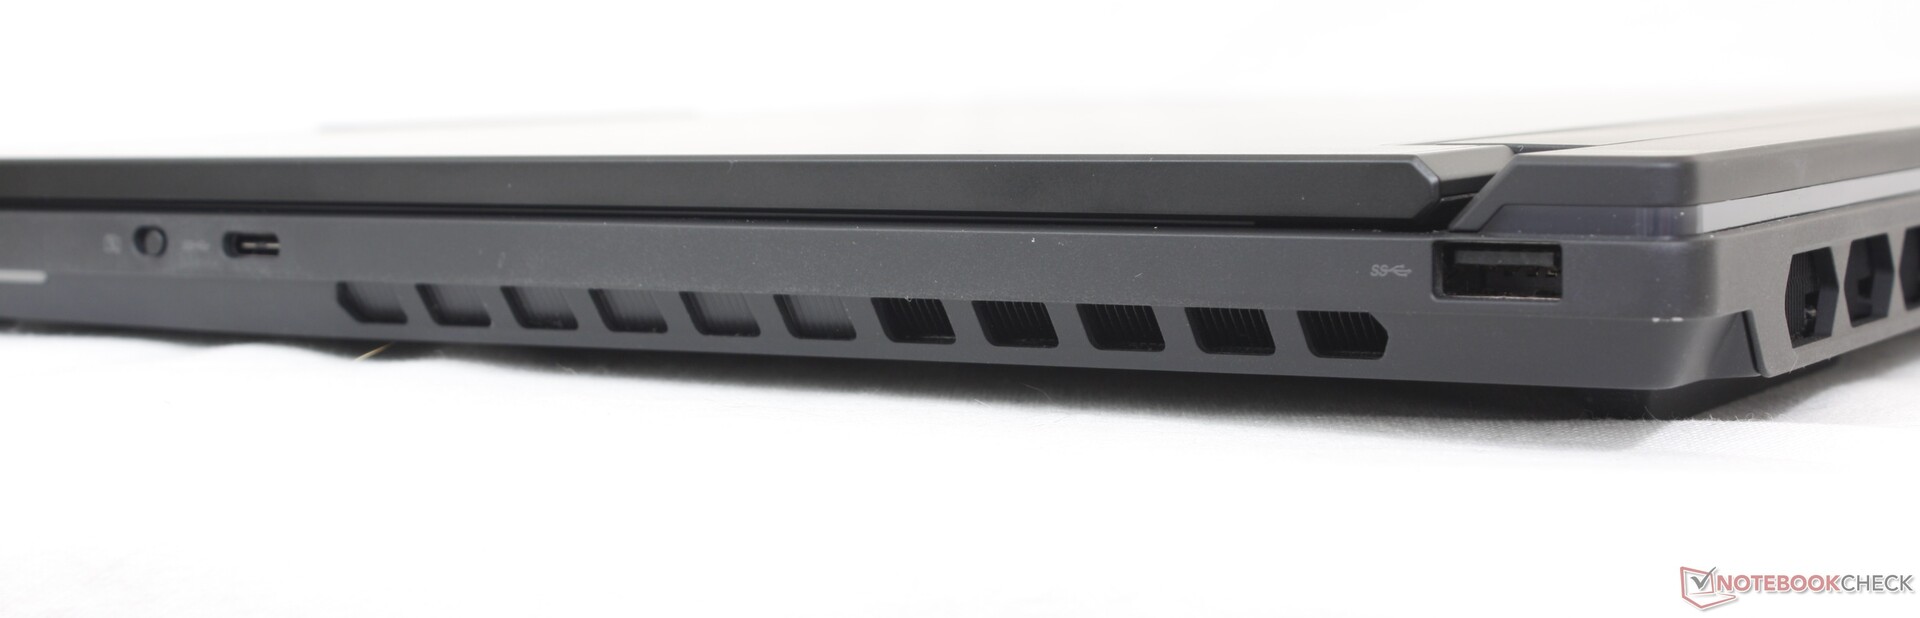
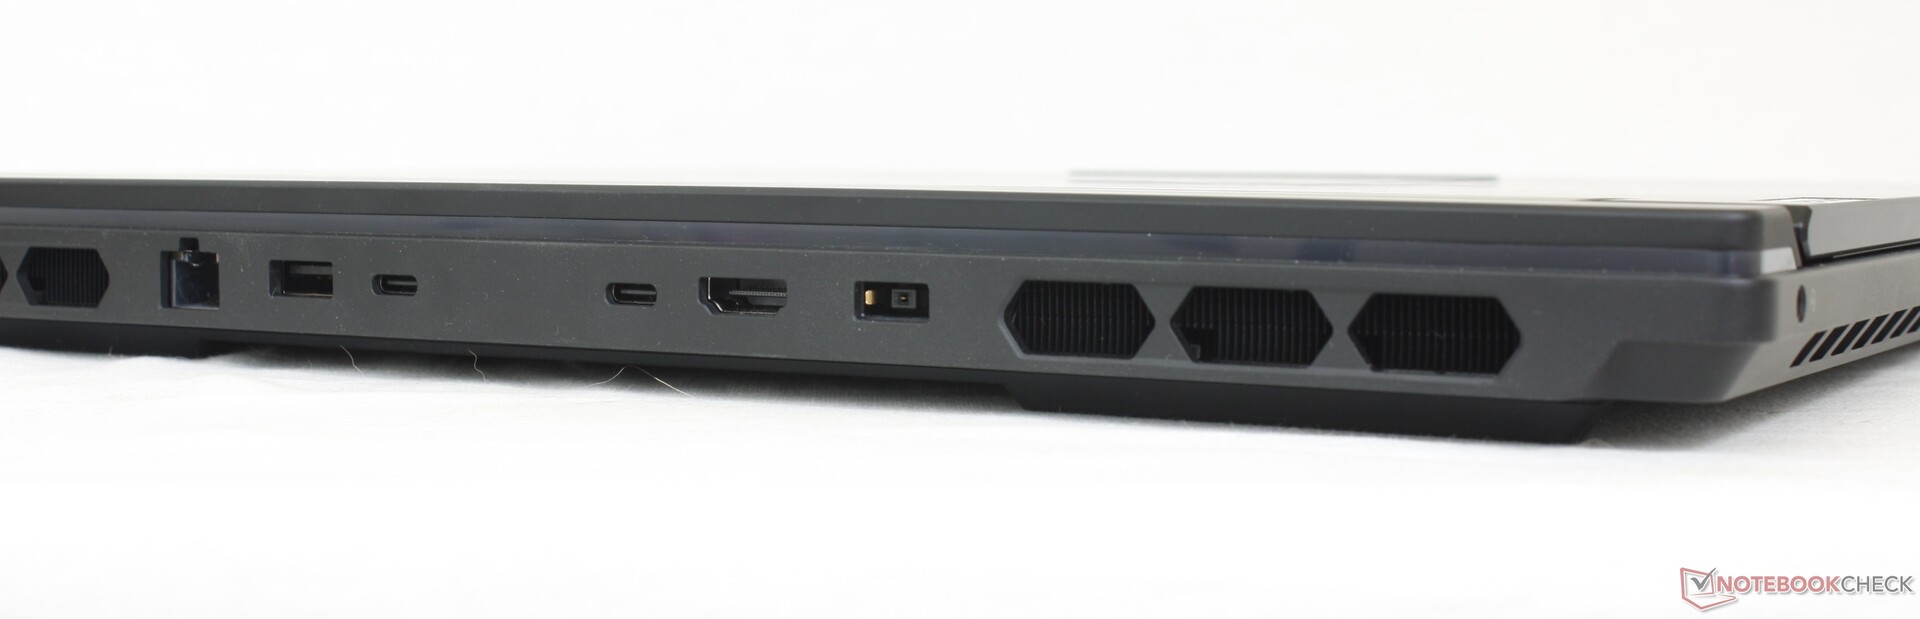
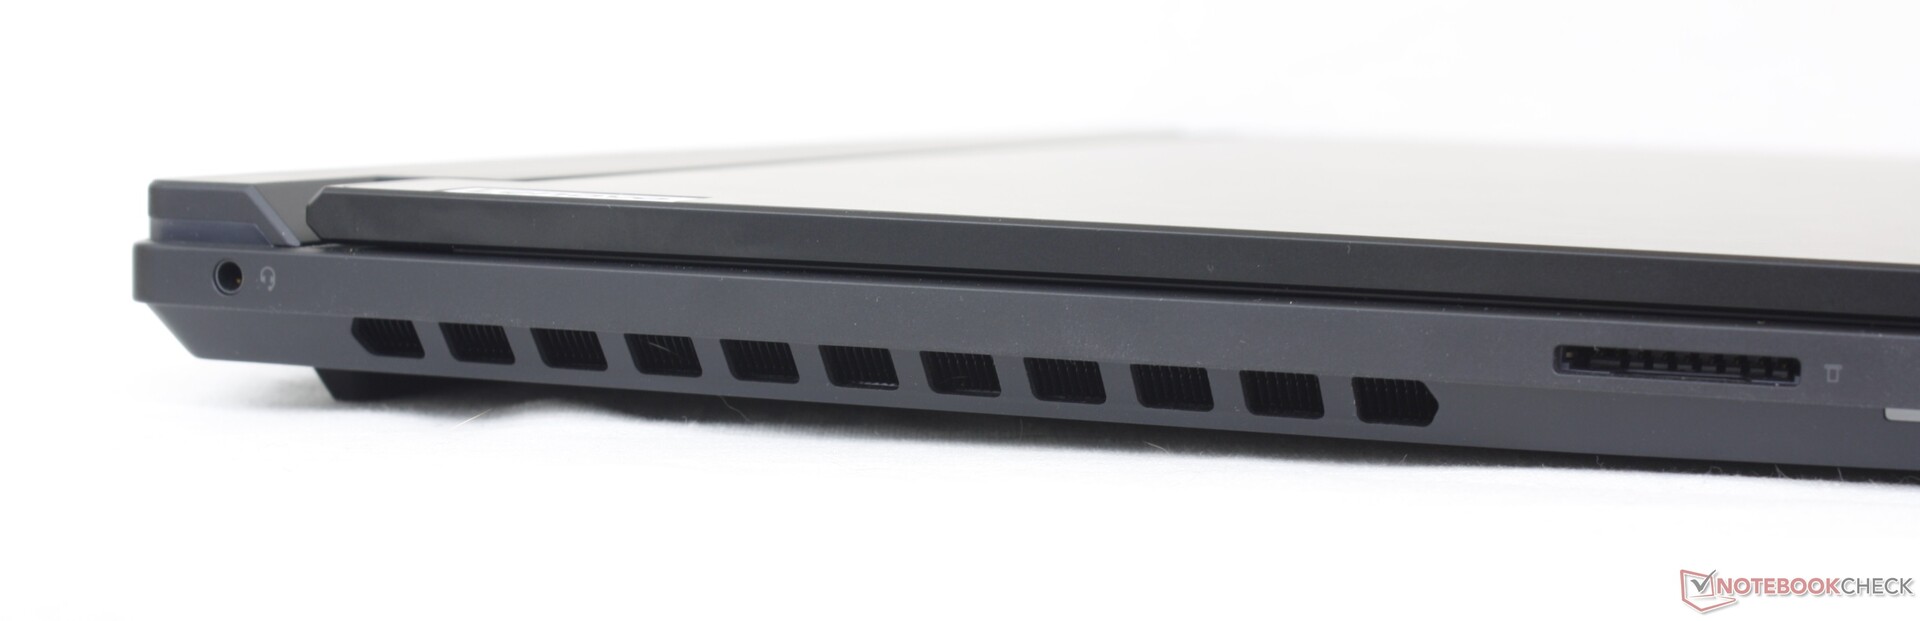
Connettività - Tante cose da scegliere
Le porte sono abbondanti e la maggior parte di esse si trova sul retro anziché sui lati. A differenza delle porte posteriori di Alienware X16 R1, tuttavia, le porte di Lenovo sono etichettate individualmente con indicatori LED per facilitare l'accesso.
Solo le due porte USB-C posteriori possono essere utilizzate per monitor esterni o per ricaricare il portatile tramite Power Delivery. La terza porta USB-C lungo il bordo destro è riservata ai dati e alla ricarica di dispositivi esterni.
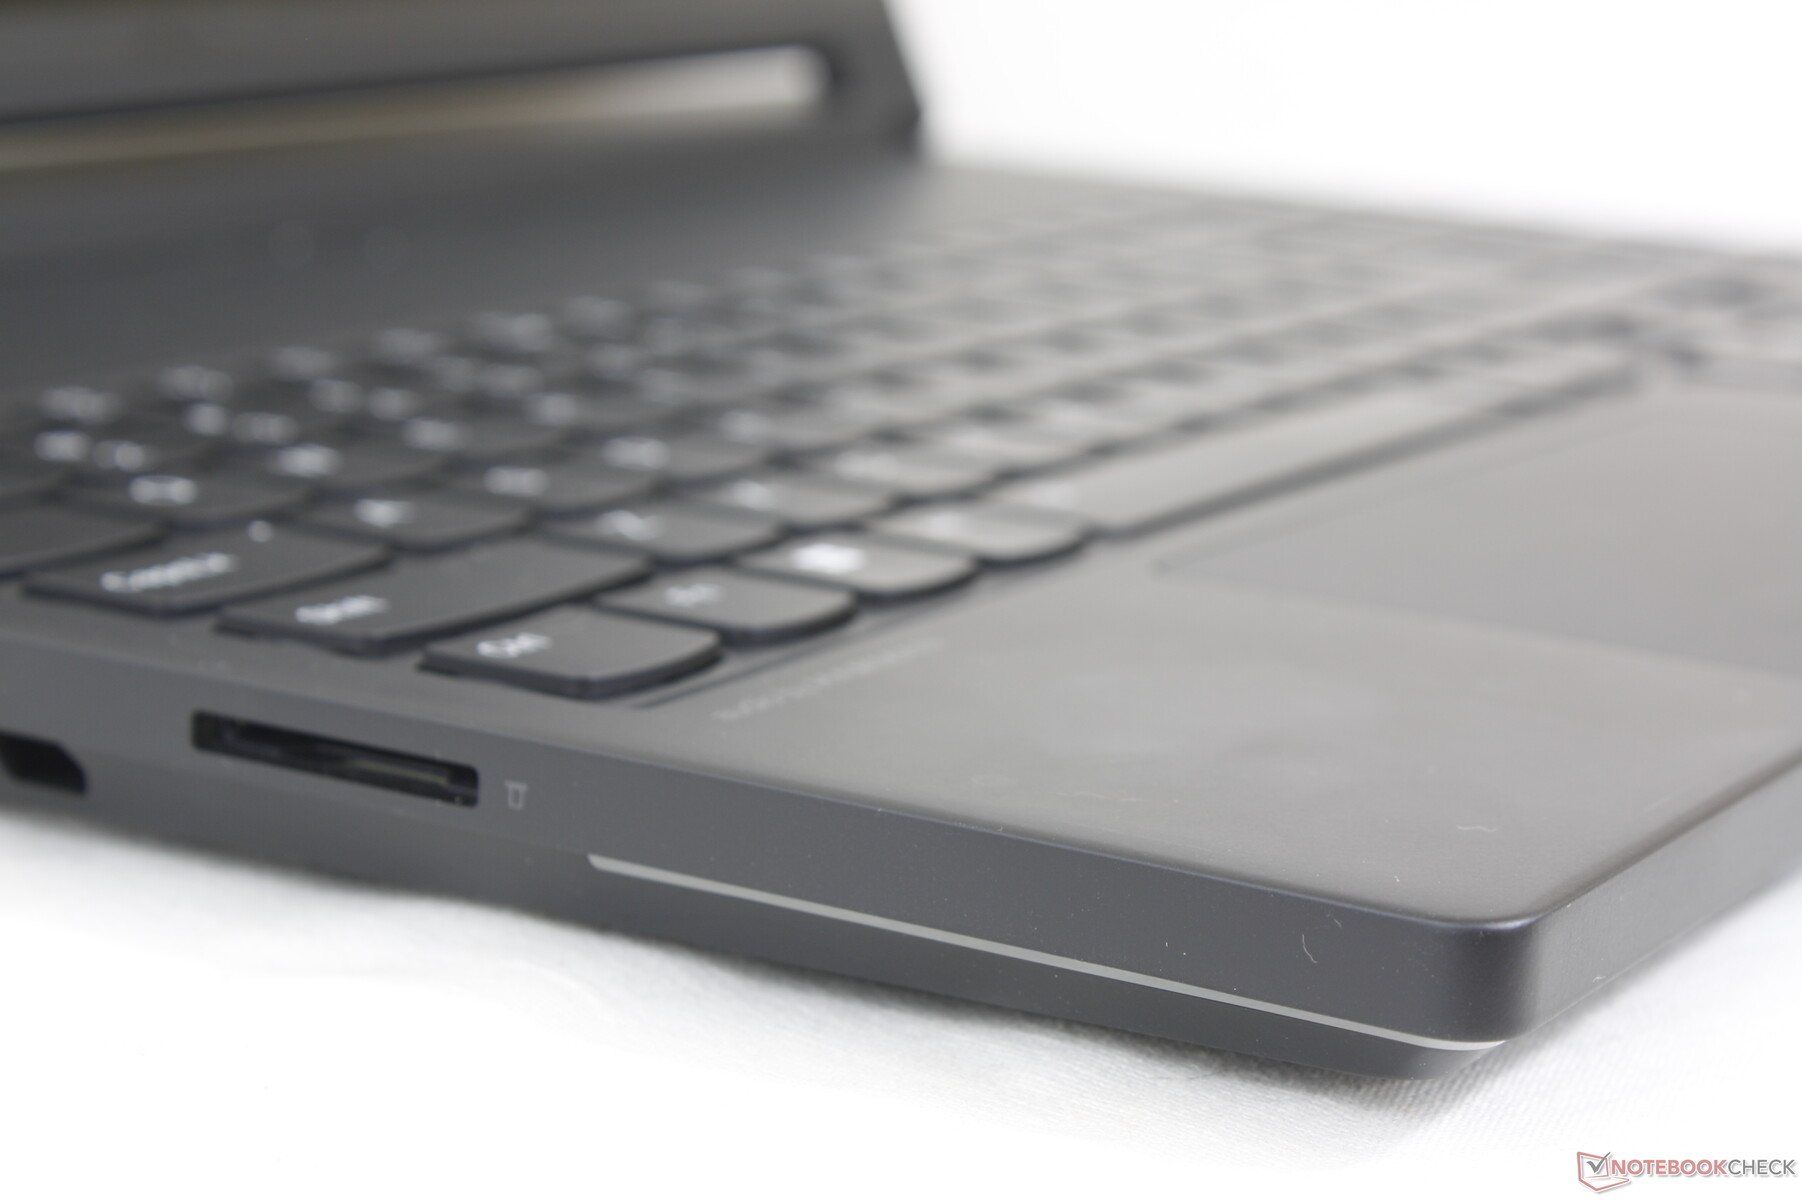
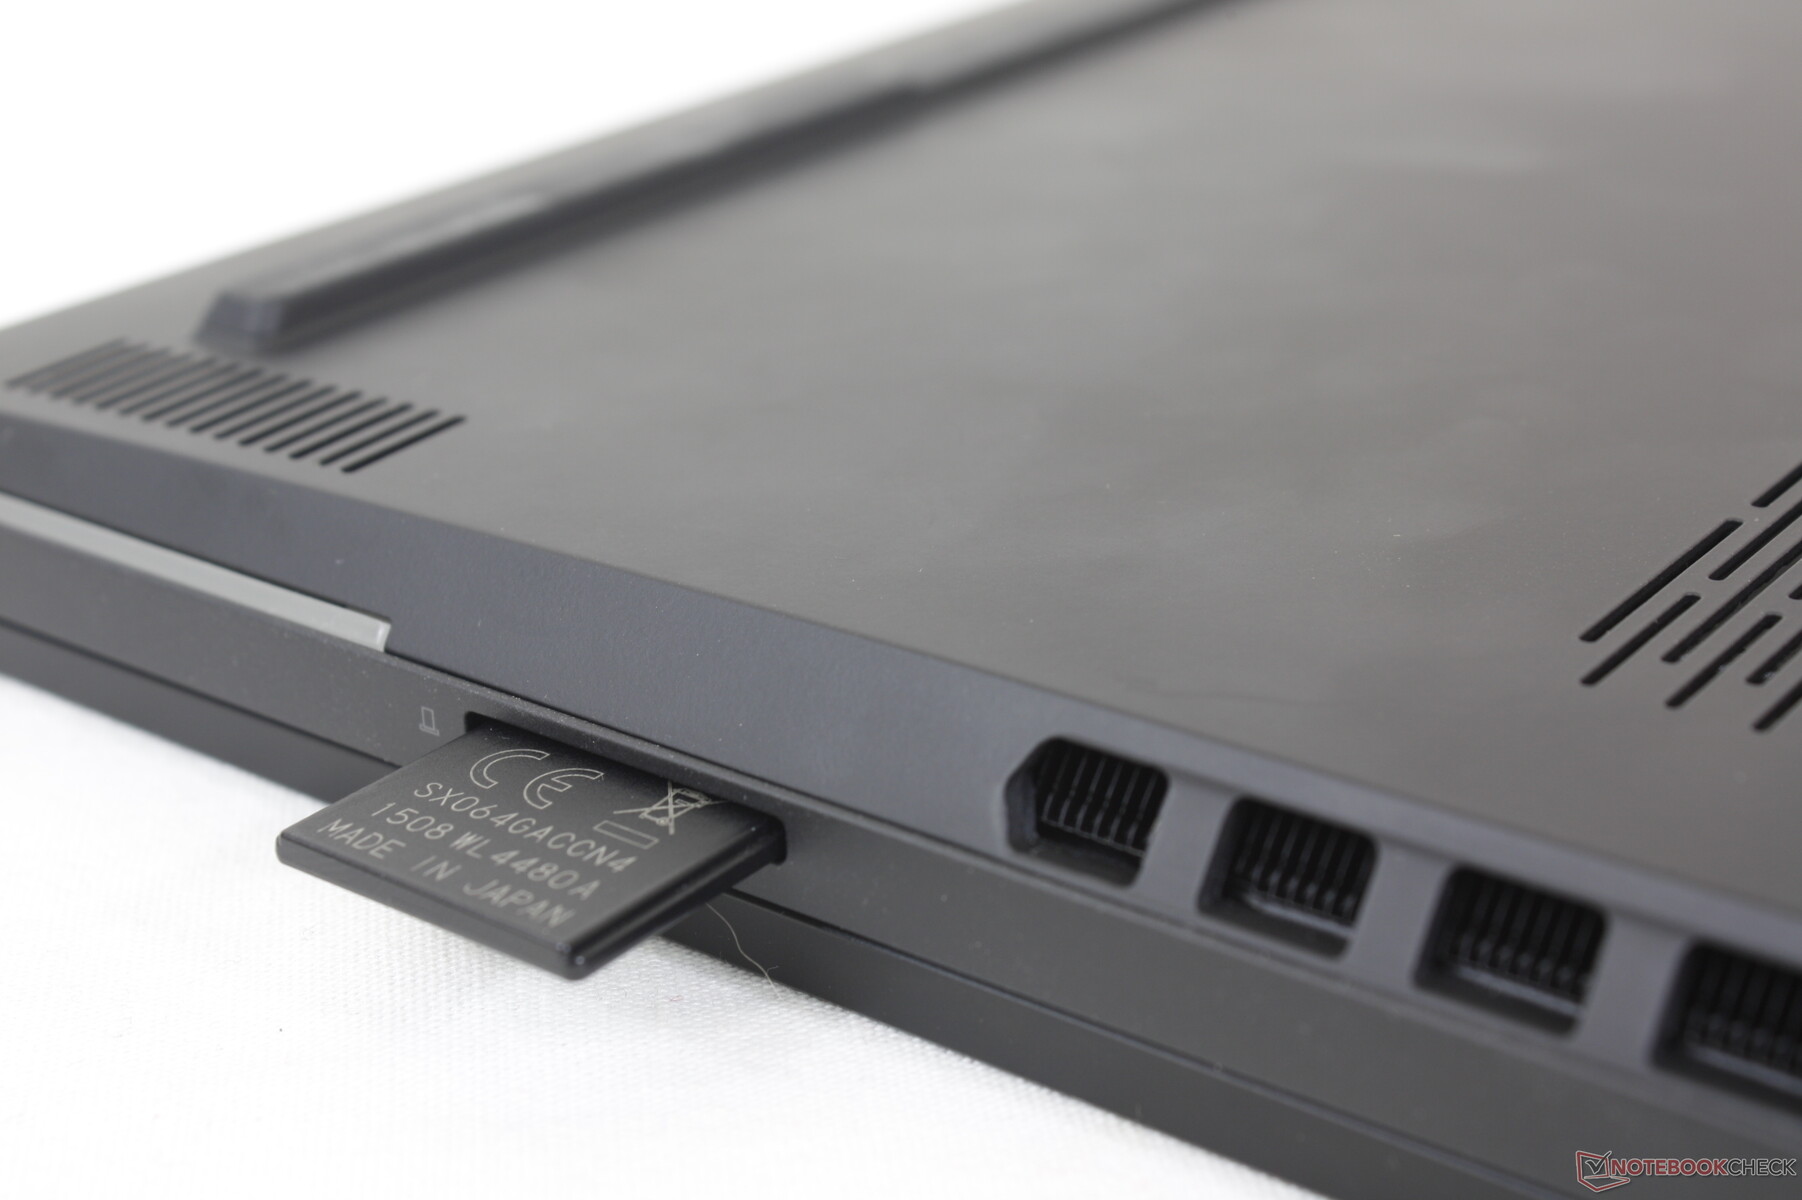
Lettore di schede SD
Il lettore SD integrato è un'intenzione per attirare i creatori di contenuti tanto quanto i giocatori hardcore su Legion 9i. Tuttavia, la velocità di trasferimento non è molto elevata, meno della metà di quella del lettore SD del Razer Blade 16i.Razer Blade 16.
| SD Card Reader | |
| average JPG Copy Test (av. of 3 runs) | |
| Razer Blade 16 Early 2023 RTX 4090 (Angelbird AV PRO 128 GB V60) | |
| Lenovo Legion 9 16IRX8 (Toshiba Exceria Pro SDXC 64 GB UHS-II) | |
| Alienware x16 R1 (AV PRO microSD 128 GB V60) | |
| Lenovo Legion Slim 5 16APH8 (PNY EliteX-Pro60 V60 256 GB) | |
| maximum AS SSD Seq Read Test (1GB) | |
| Alienware x16 R1 (AV PRO microSD 128 GB V60) | |
| Razer Blade 16 Early 2023 RTX 4090 (Angelbird AV PRO 128 GB V60) | |
| Lenovo Legion 9 16IRX8 (Toshiba Exceria Pro SDXC 64 GB UHS-II) | |
| Lenovo Legion Slim 5 16APH8 (PNY EliteX-Pro60 V60 256 GB) | |
Comunicazione
Il Killer AX1675i viene fornito di serie, che è il marchio di gioco per il normale AX211. Il Wi-Fi 6E e il Bluetooth 5.3 sono supportati e non abbiamo riscontrato problemi di connettività quando siamo stati accoppiati alla nostra rete Asus AXE11000 a 6 GHz.
Webcam
La webcam da 2 MP è standard per la categoria dei portatili da gioco. Sebbene sia presente un interruttore di spegnimento della telecamera integrato, non c'è un sensore IR.

")
")
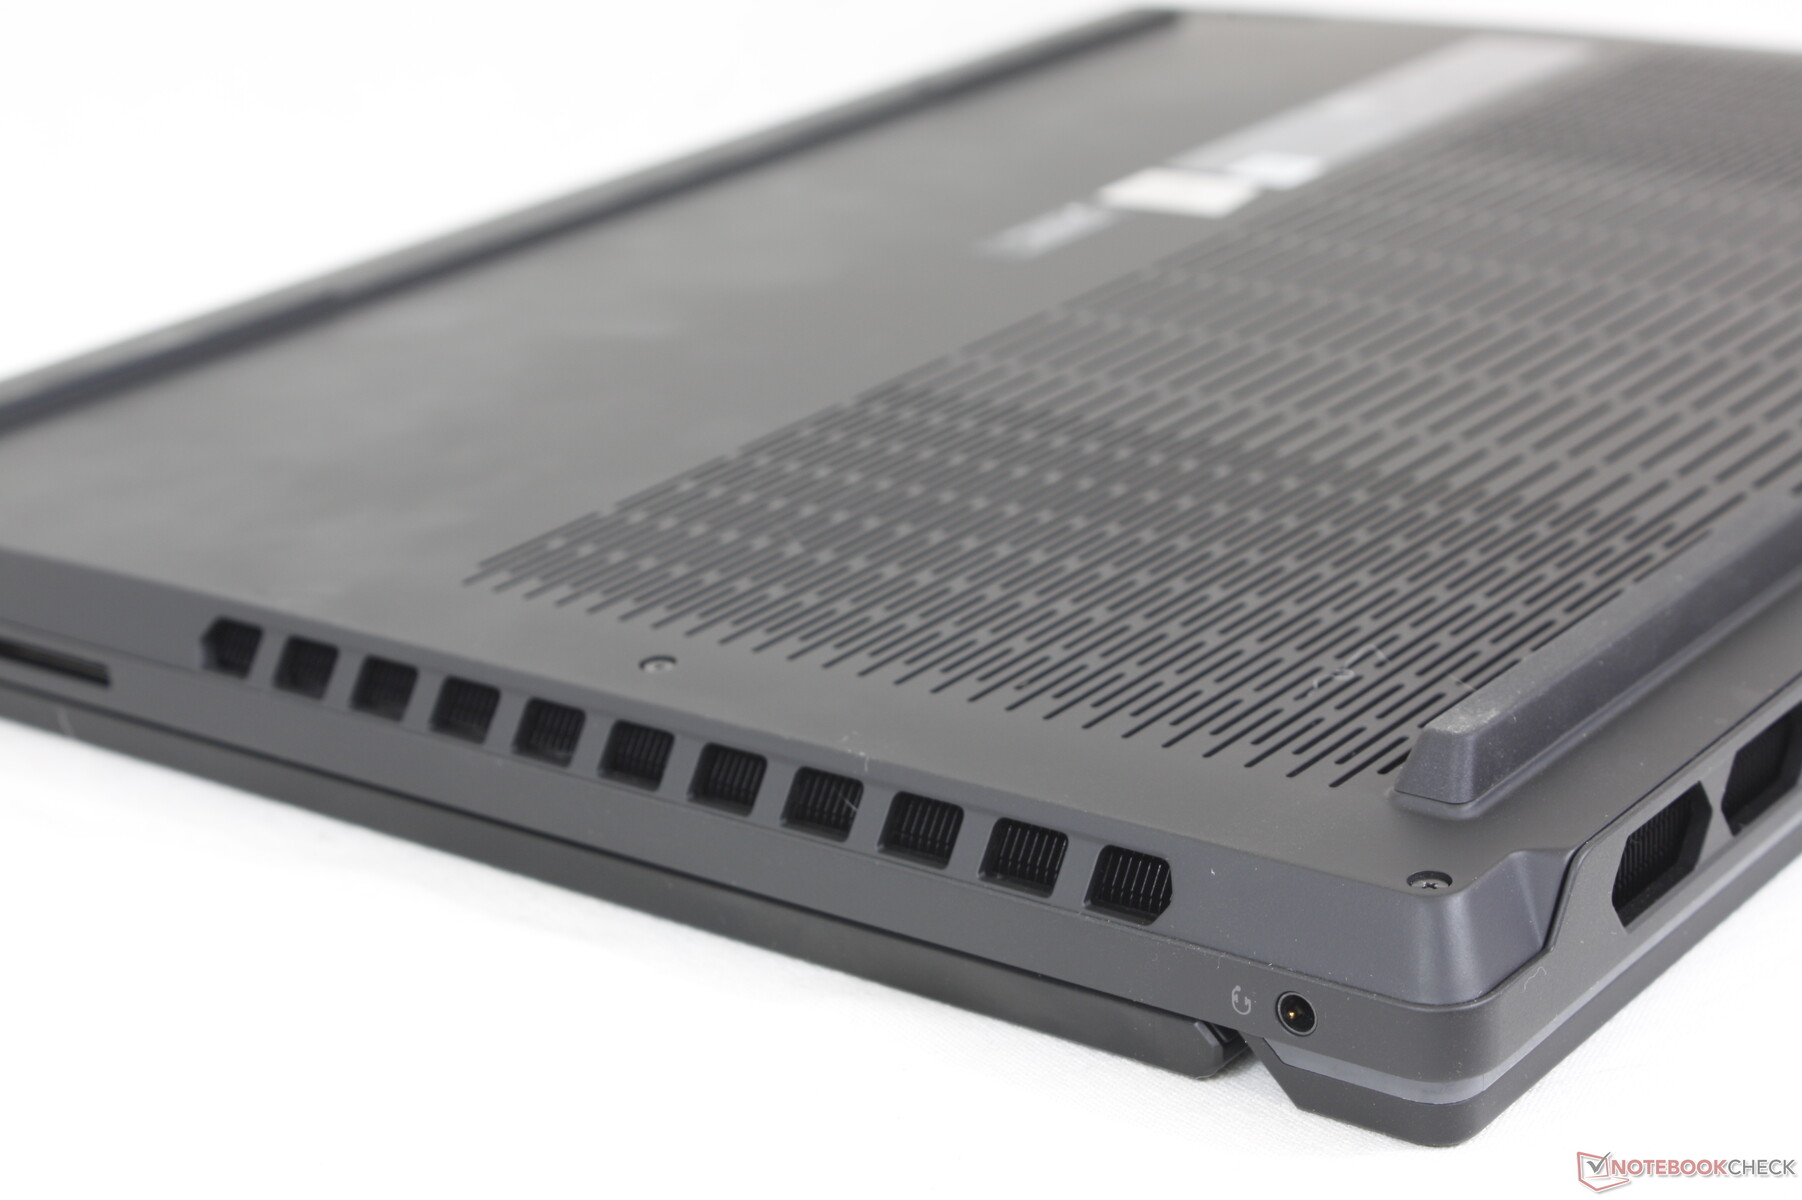
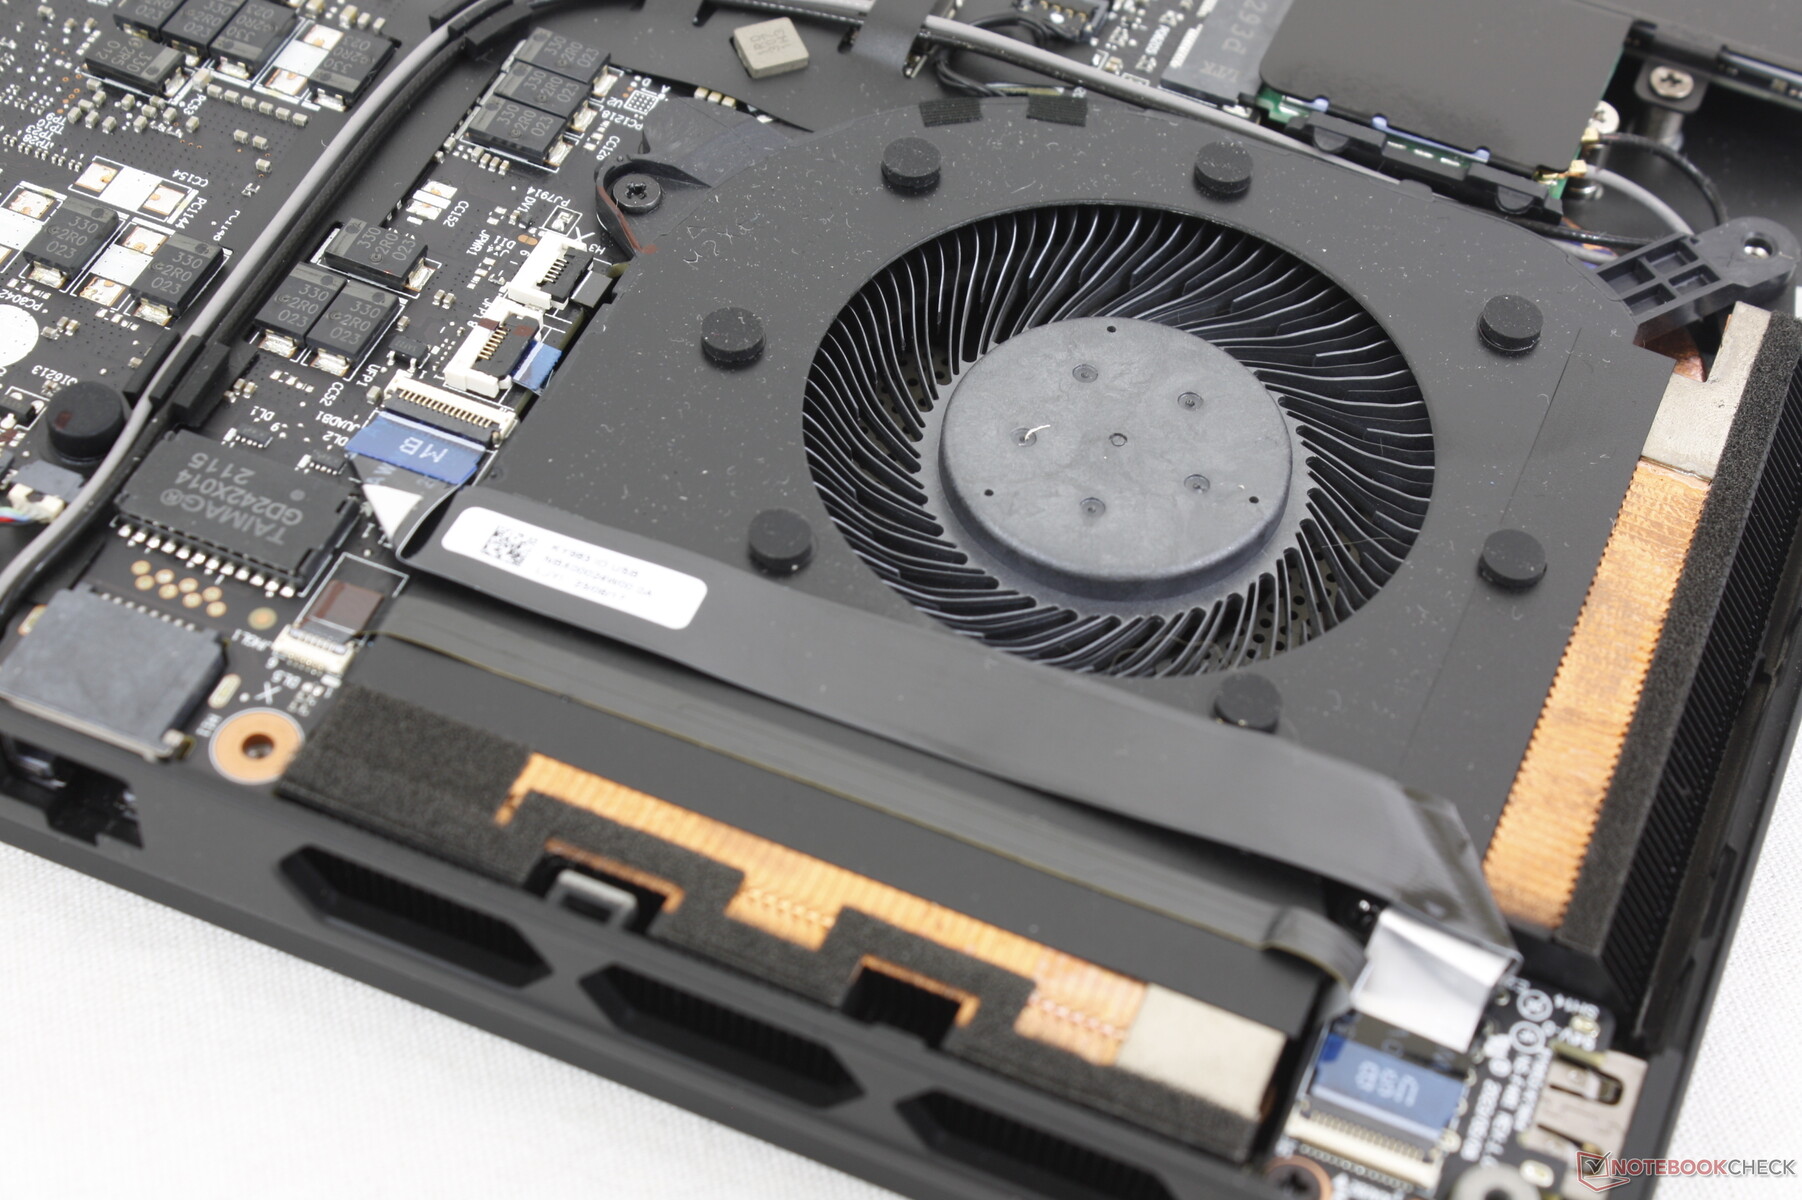
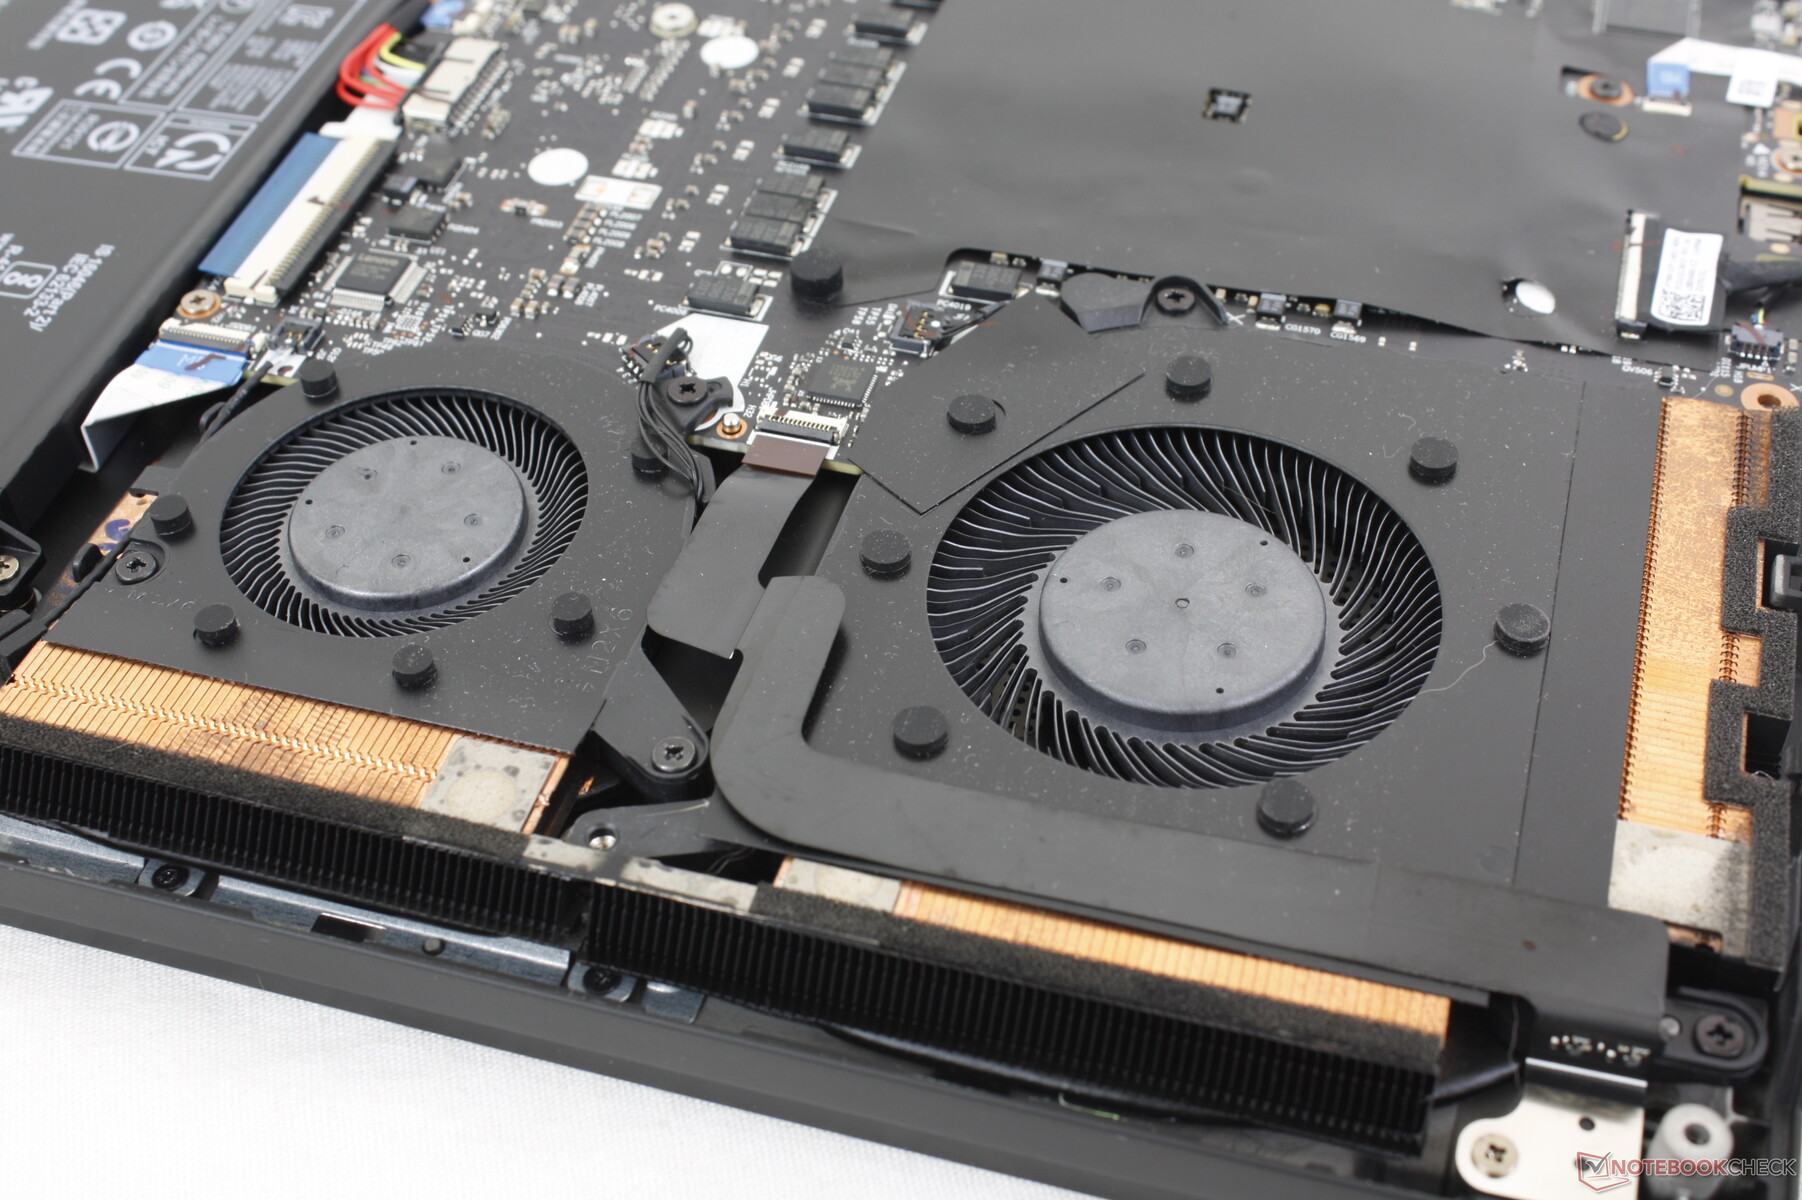
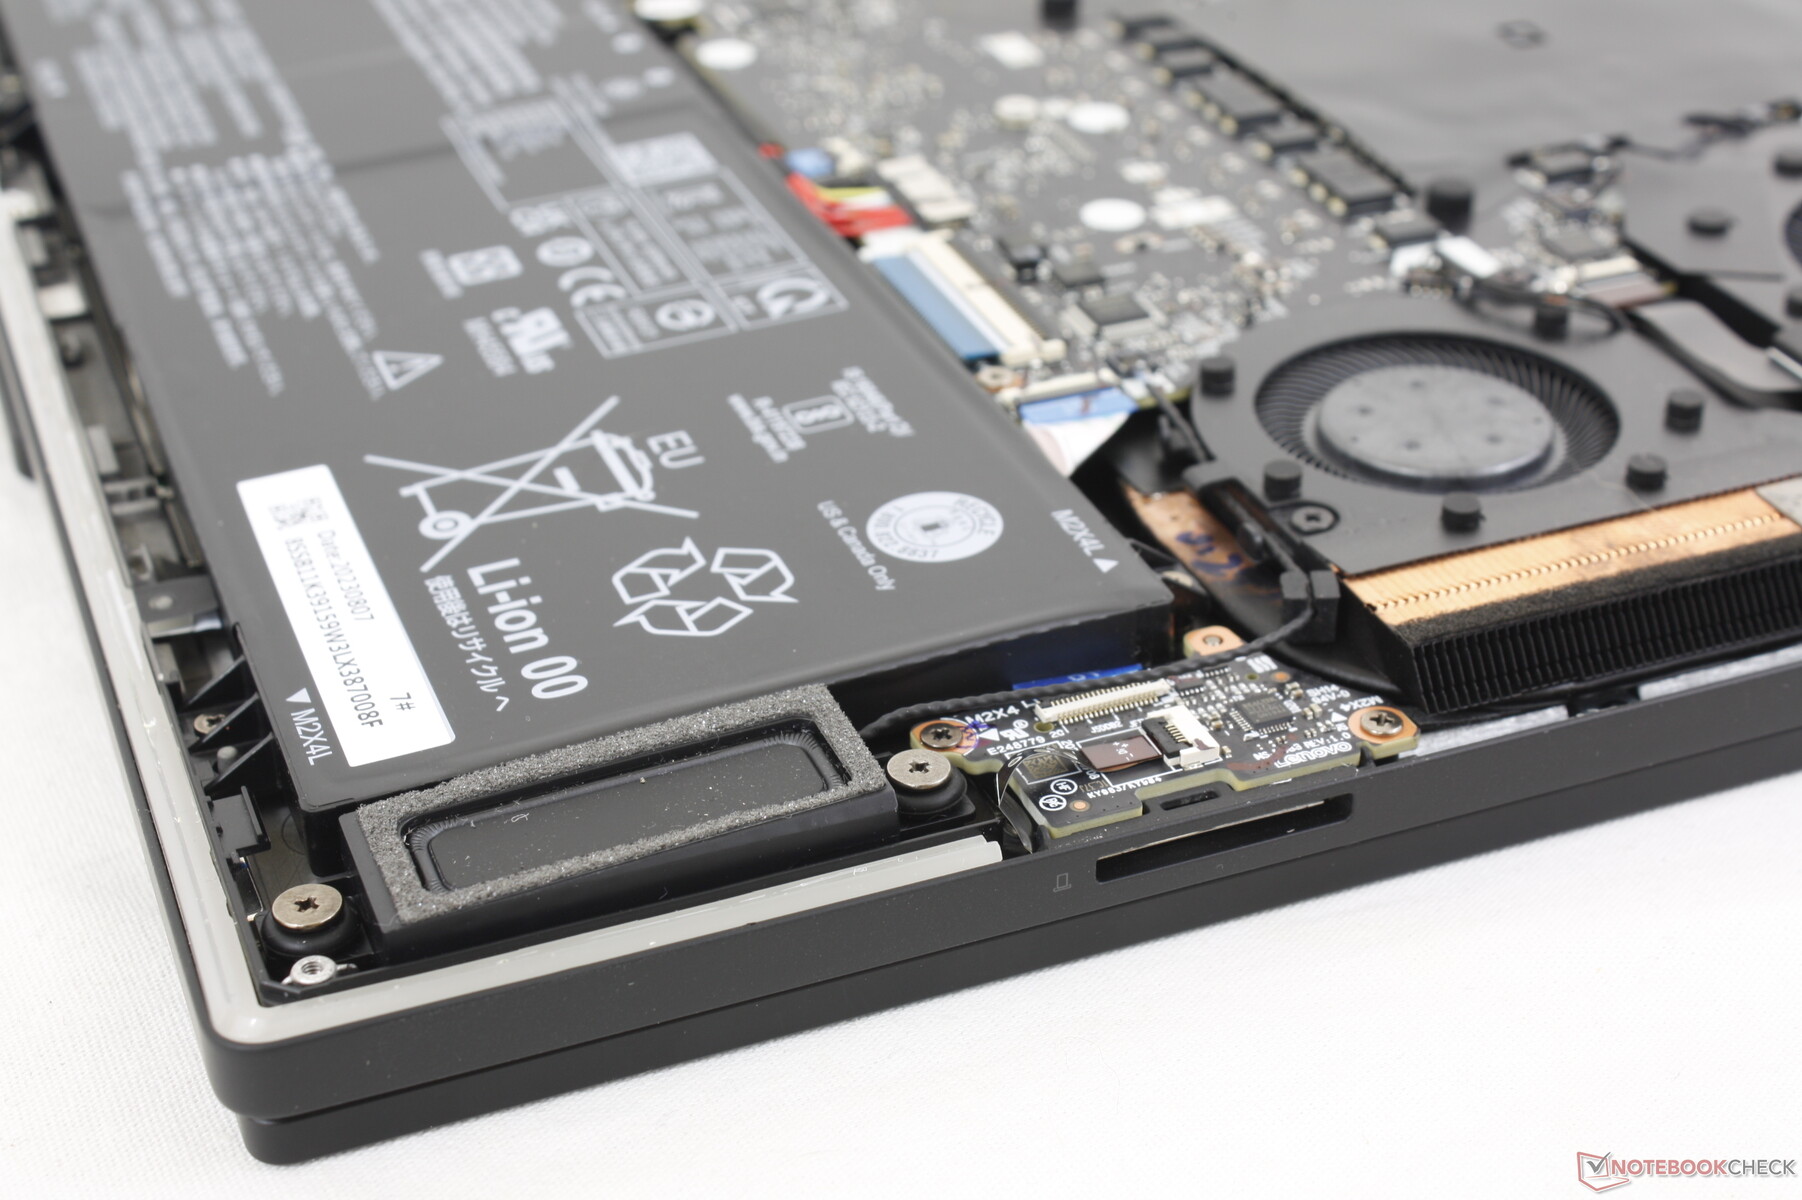
Manutenzione
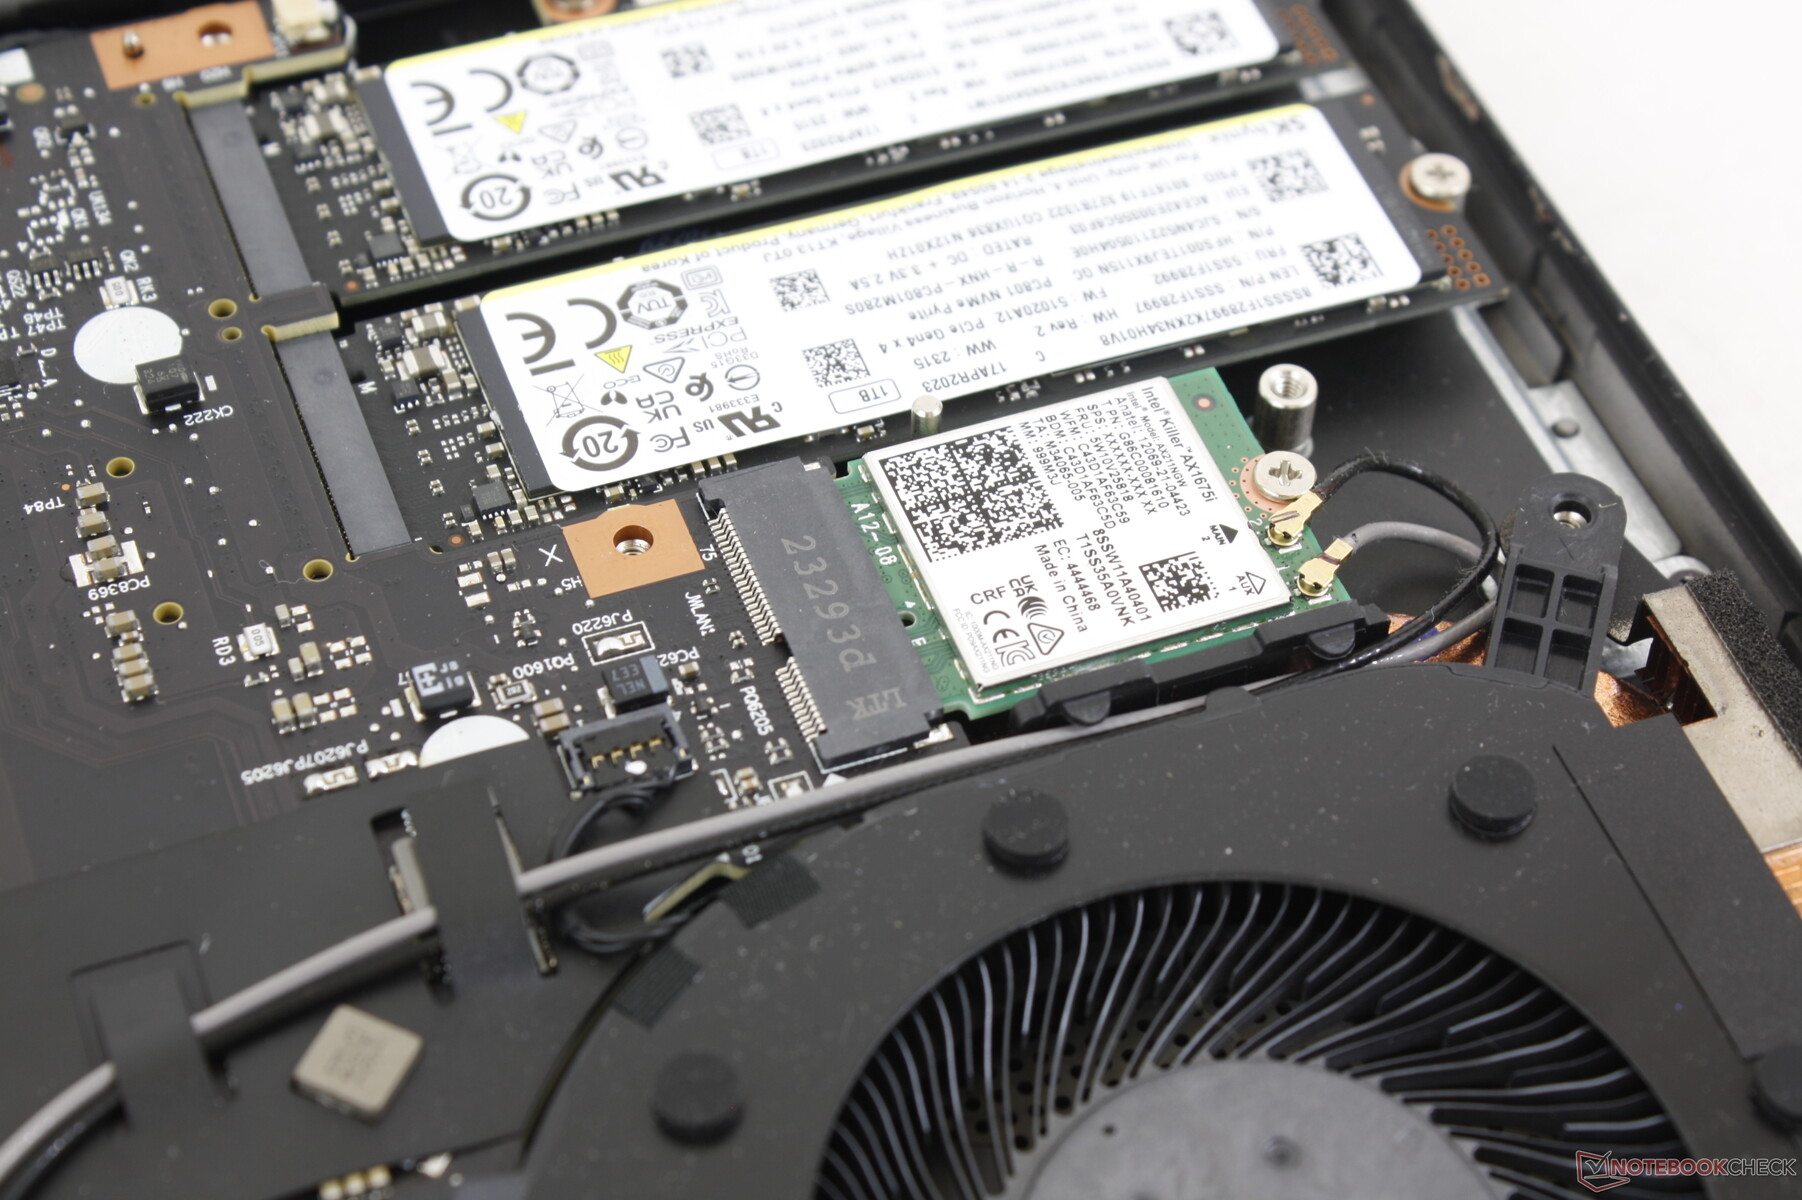
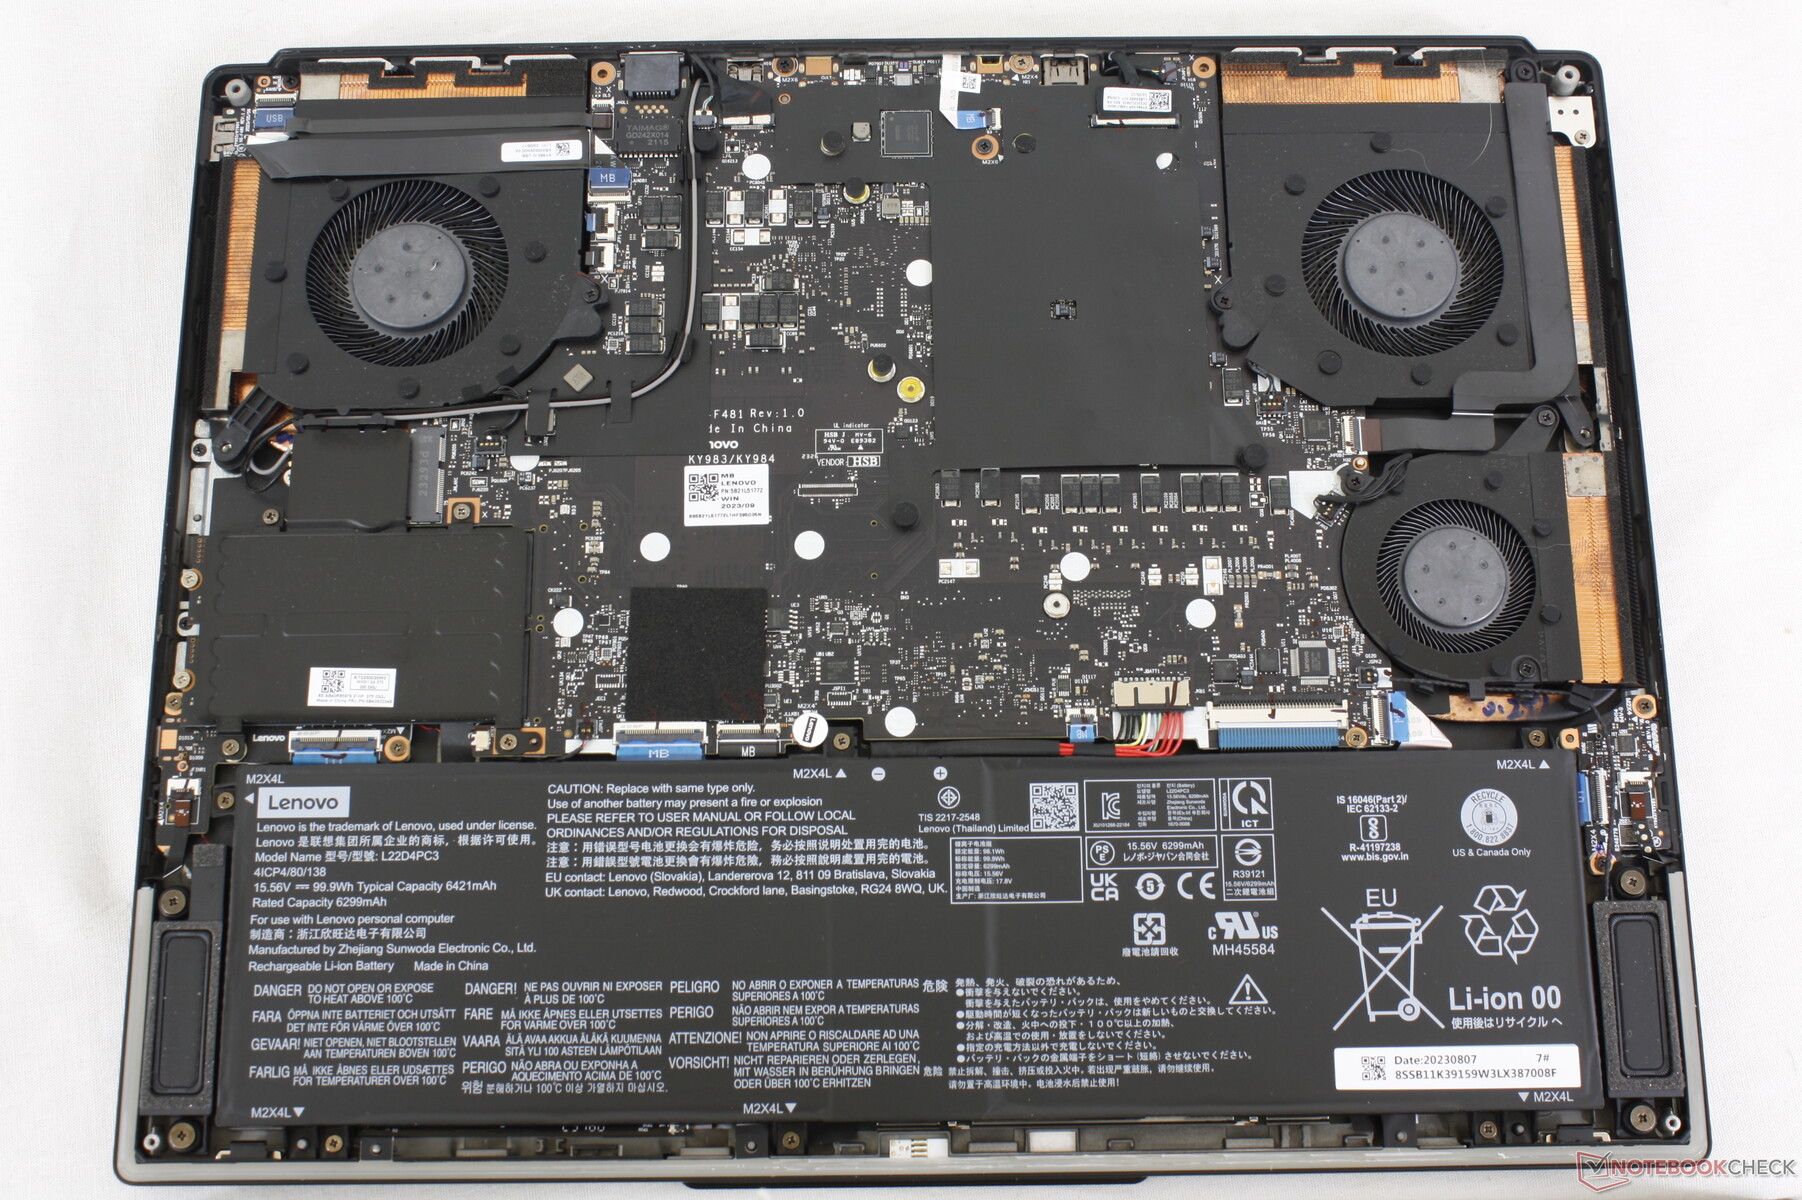
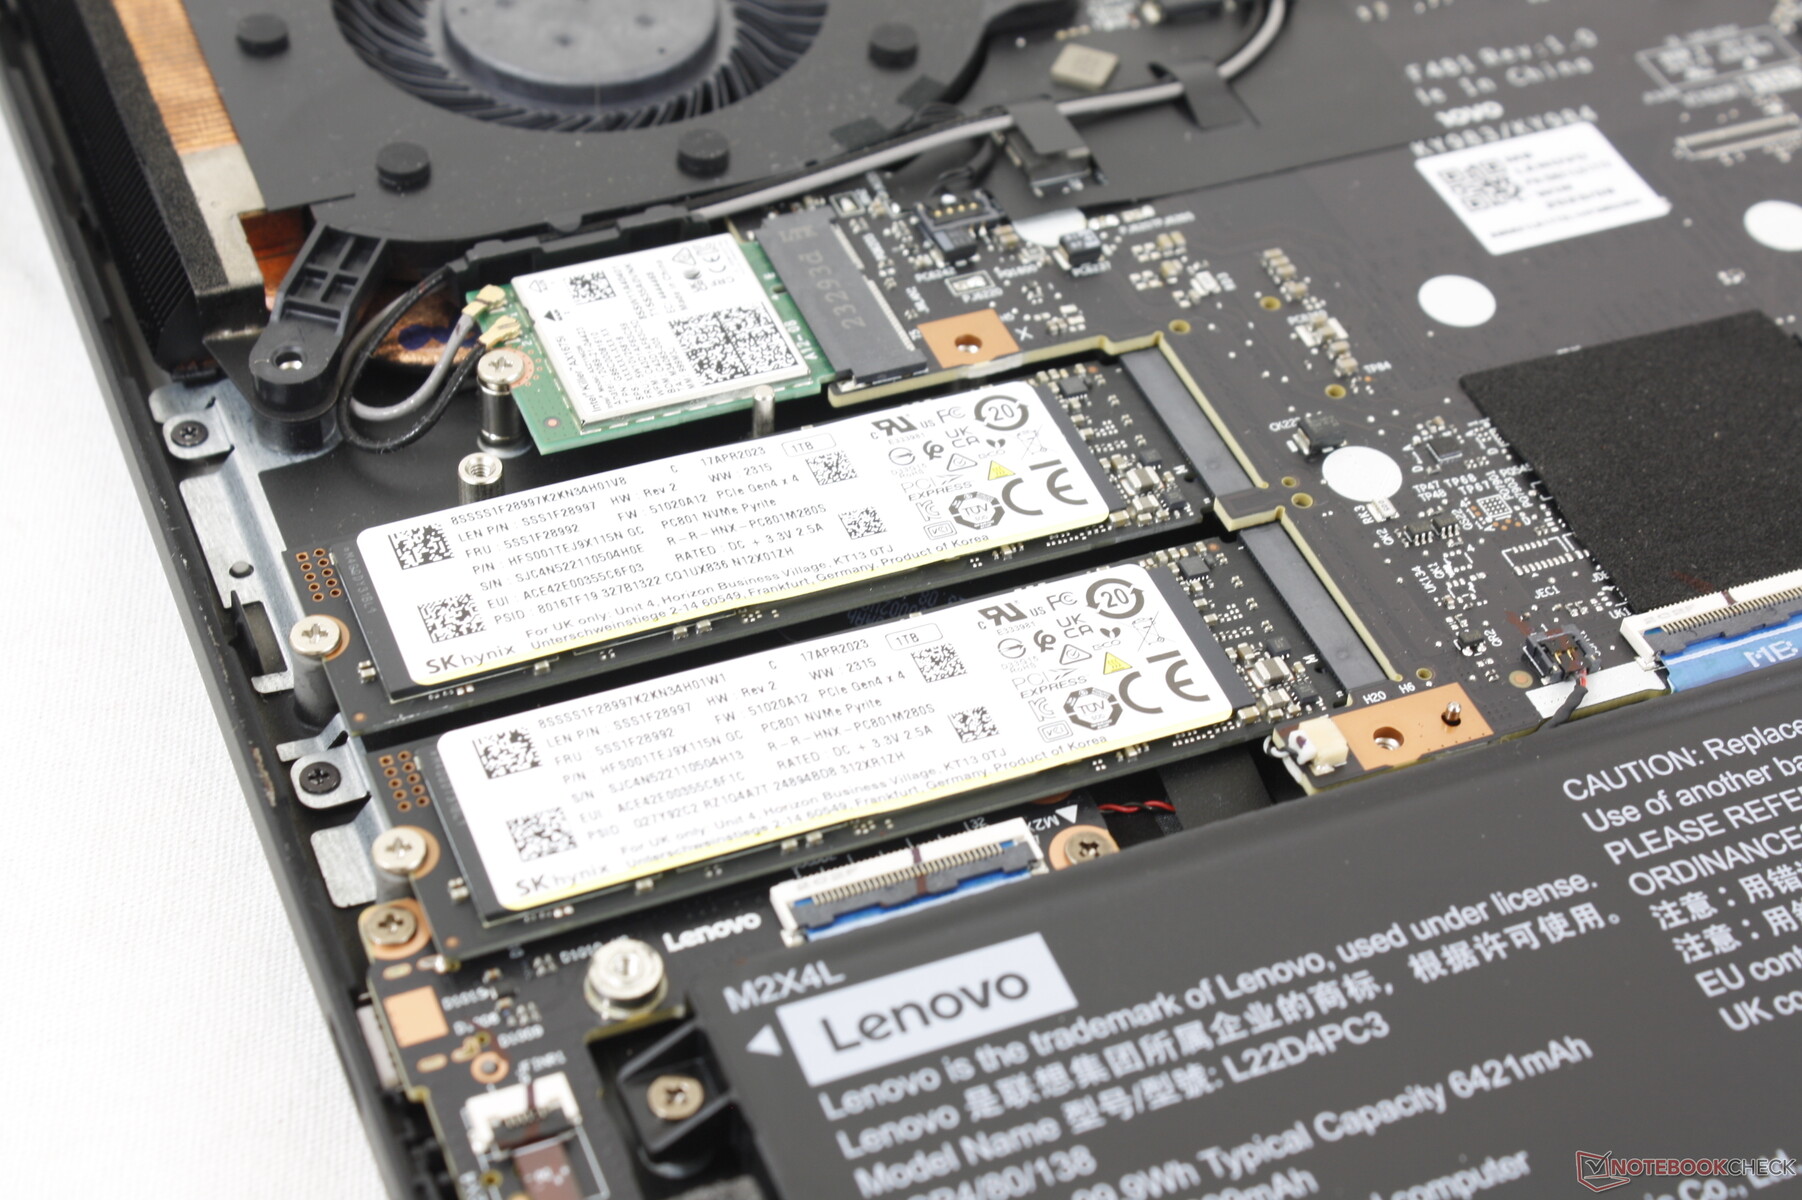
Il pannello inferiore è fissato da 8 viti Phillips per una rimozione relativamente facile. A differenza della maggior parte degli altri computer portatili, la scheda madre di Legion 9 16 è capovolta e quindi è necessario un ulteriore smontaggio per accedere ai moduli RAM della soluzione di raffreddamento. Almeno i due slot per SSD M.2 2280 sono facilmente accessibili.
Accessori e garanzia
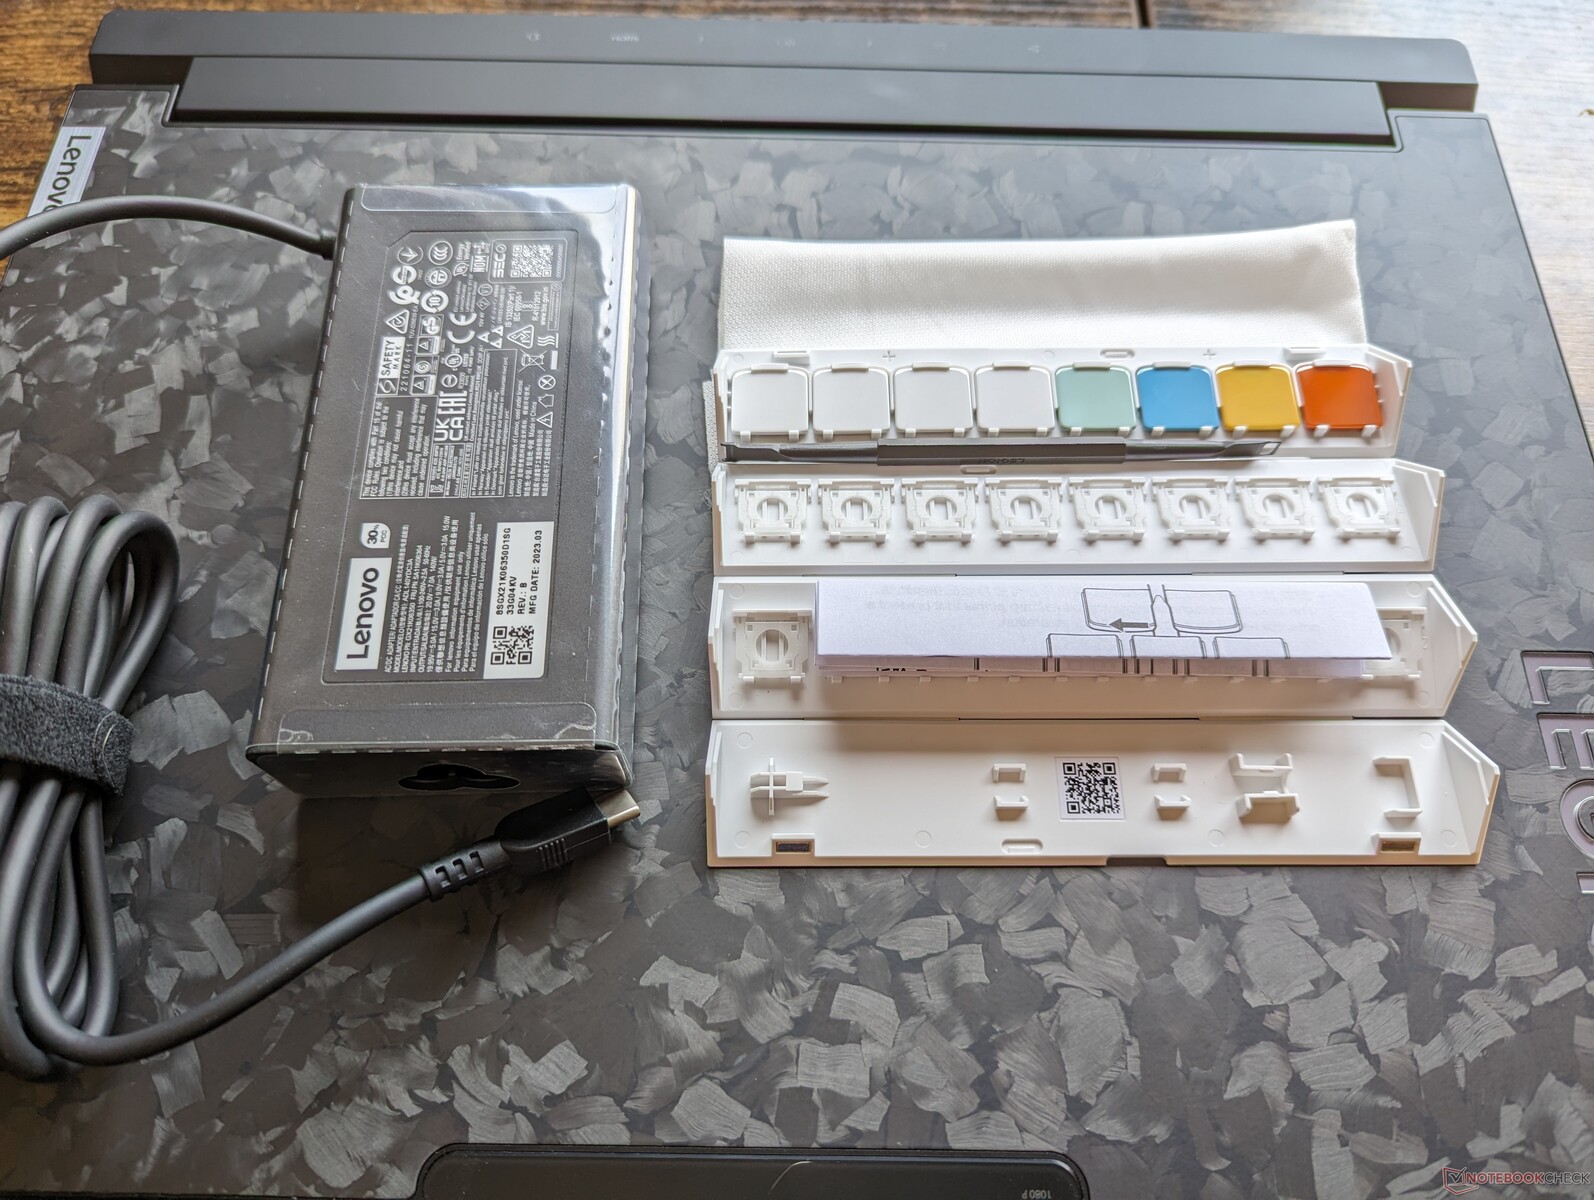
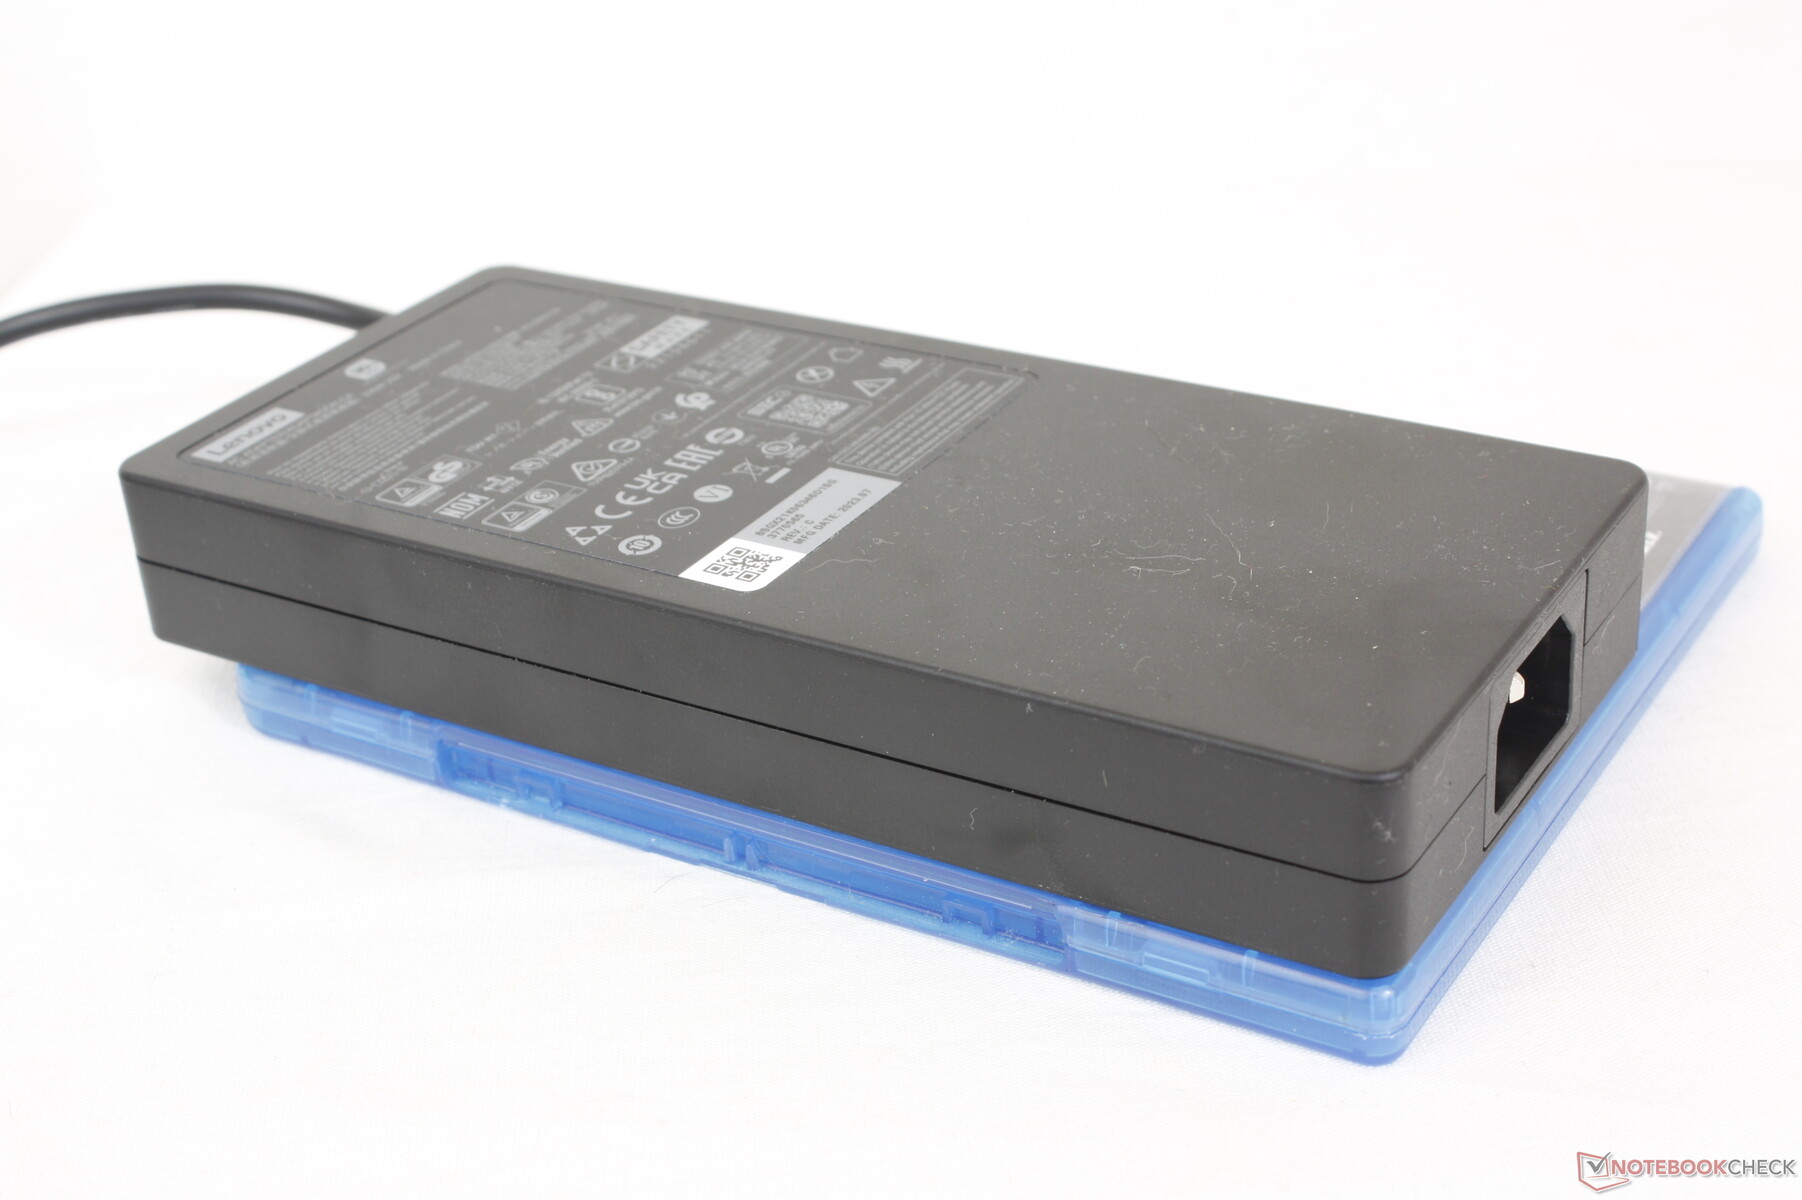
Oltre al consueto adattatore CA proprietario e alla documentazione, la confezione di vendita include anche un pratico adattatore universale USB-C da 140 W, che può essere utilizzato per ricaricare questo laptop e la maggior parte degli altri dispositivi USB-C, e 8 keycaps.
Se acquistato negli Stati Uniti, si applica la garanzia limitata standard di un anno del produttore.
Dispositivi di input - Tastiera comoda con Clickpad angusto
Tastiera
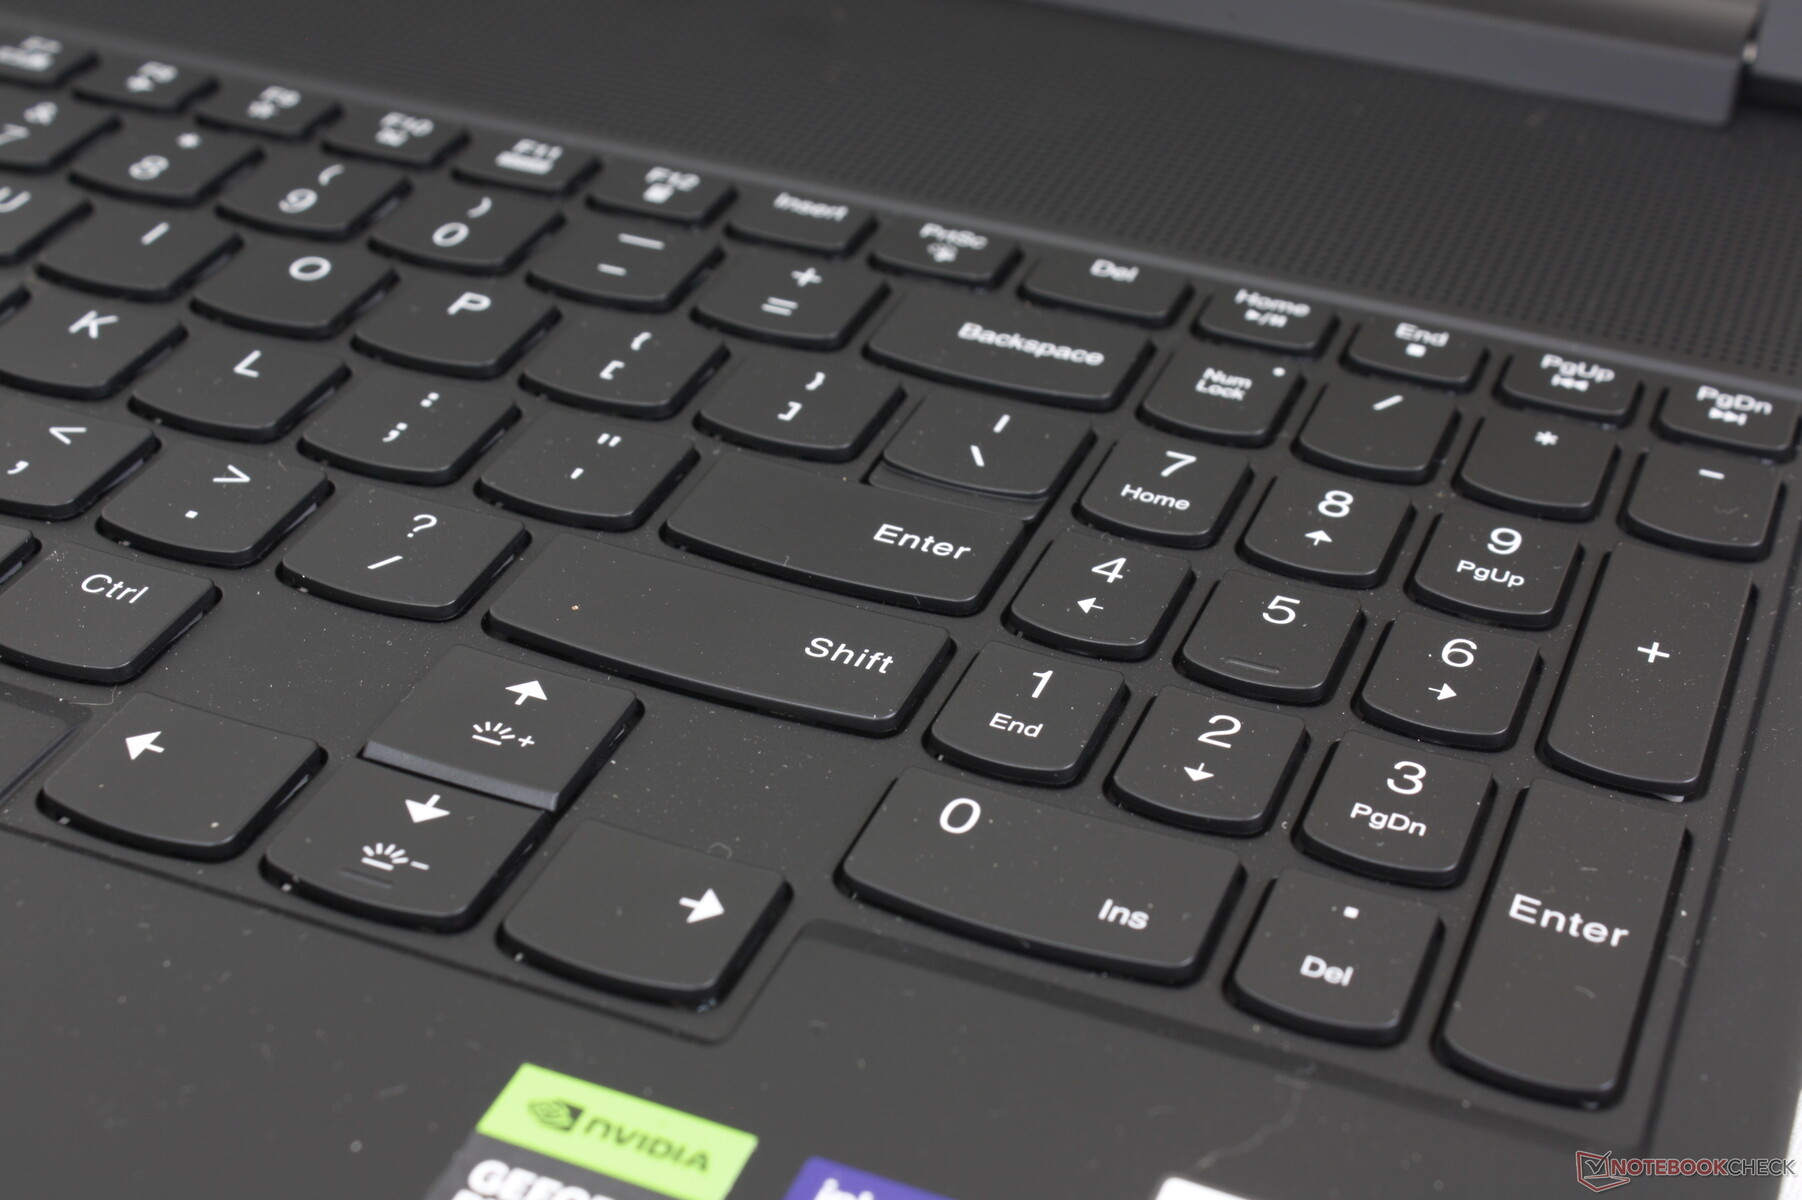
La tastiera TrueStrike offre una corsa dei tasti di 1,5 mm, leggermente più profonda rispetto ai tasti della maggior parte degli Ultrabook. Il feedback è sorprendentemente nitido e confortevole per i tasti a membrana, a dimostrazione del fatto che non sono necessari interruttori meccanici di lusso per una buona esperienza di digitazione. I tasti fissi sono più rumorosi rispetto a quelli del Blade 16 o del Asus Zephyrus M16 ma sicuramente non sono così rumorosi come i tasti meccanici di modelli come Schenker XMG Neo 15 o Alienware m18.
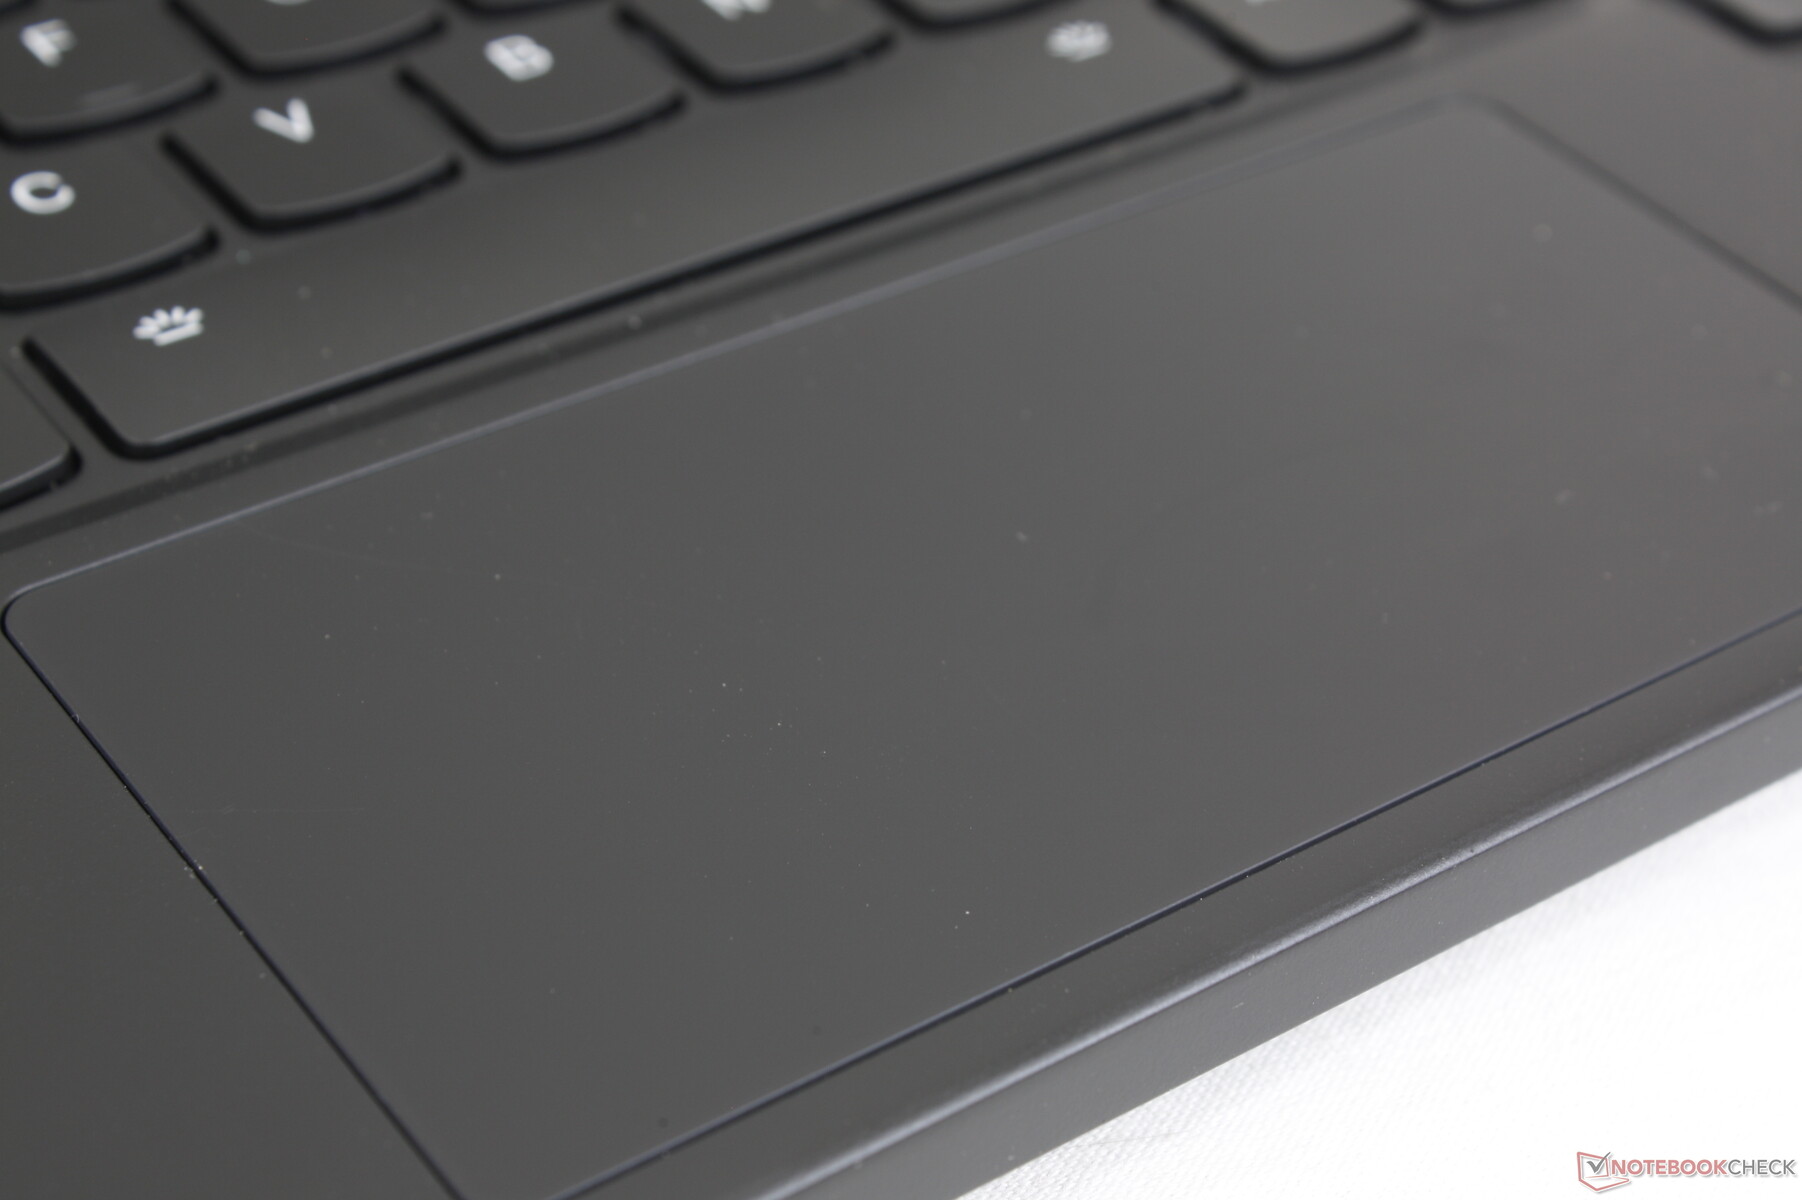
Touchpad
Il clickpad è stato ridotto a soli (12 x 5,9 cm) a causa del posizionamento della tastiera. Di conseguenza, i movimenti verticali del cursore sull'alto schermo 16:10 risultano angusti, soprattutto se paragonati ai portatili da gioco con clickpad molto più grandi, come il modello Razer Blade 16lenovo punta sul fatto che i giocatori utilizzino i propri mouse USB o Bluetooth per la maggior parte degli scenari.
Lo scorrimento e il clic sono comunque fluidi e con un clic soddisfacente, nonostante la superficie ridotta. Tuttavia, i movimenti del cursore si bloccavano occasionalmente sulla nostra unità quando si utilizzava il clickpad, mentre lo stesso problema non si verificava quando si utilizzava un mouse esterno. Consigliamo di controllare due volte il clickpad al momento dell'acquisto, per assicurarsi che sia privo di difetti.

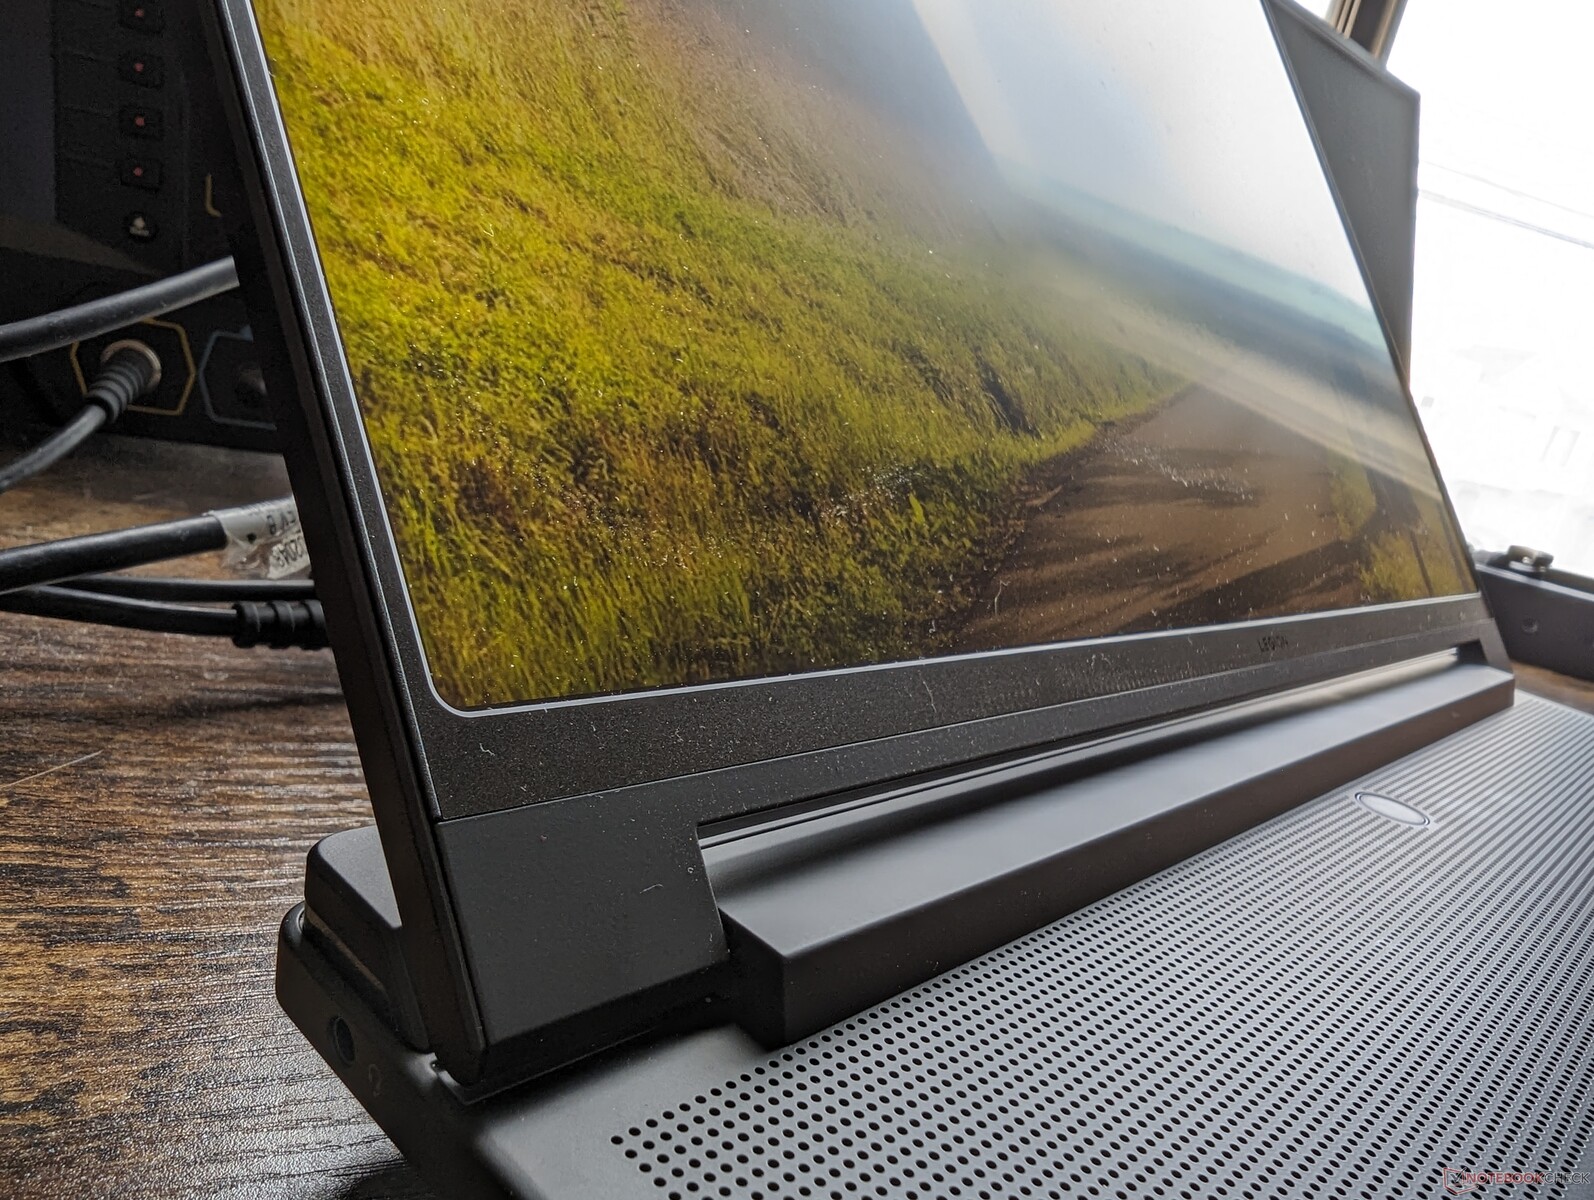
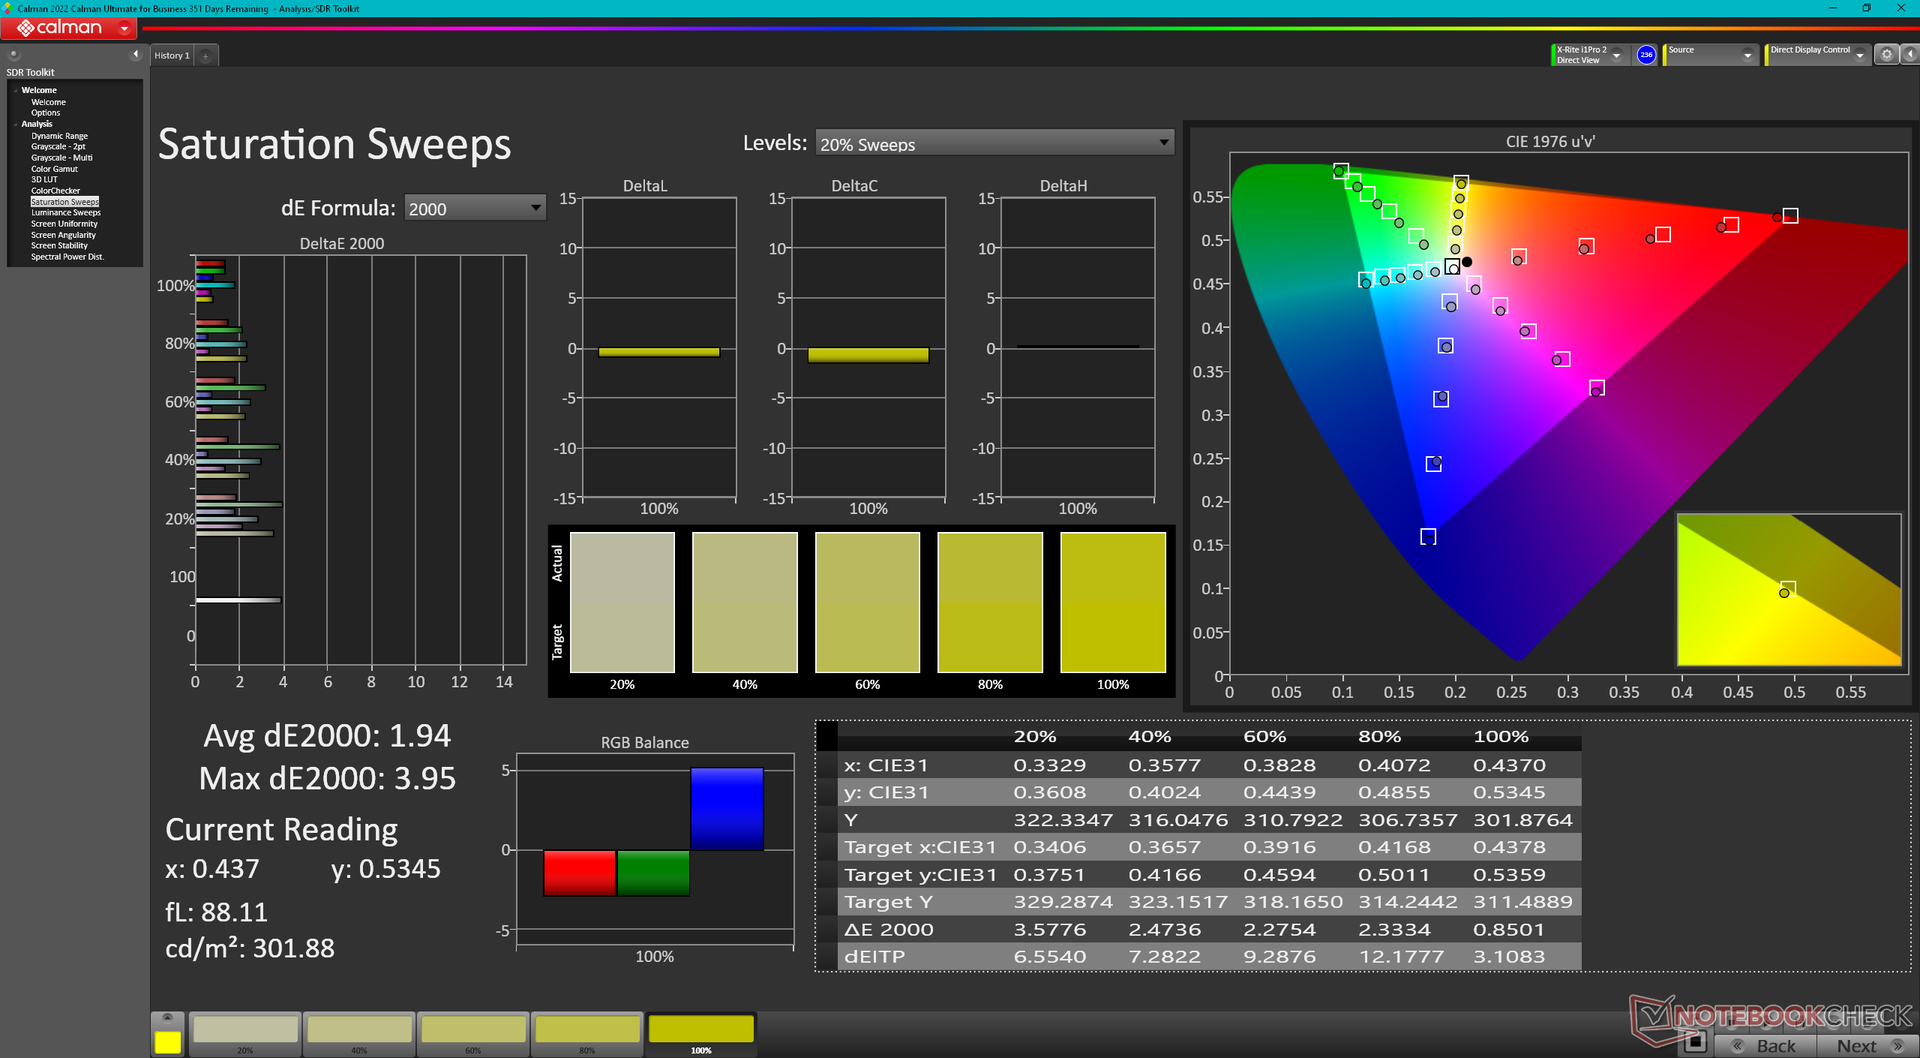
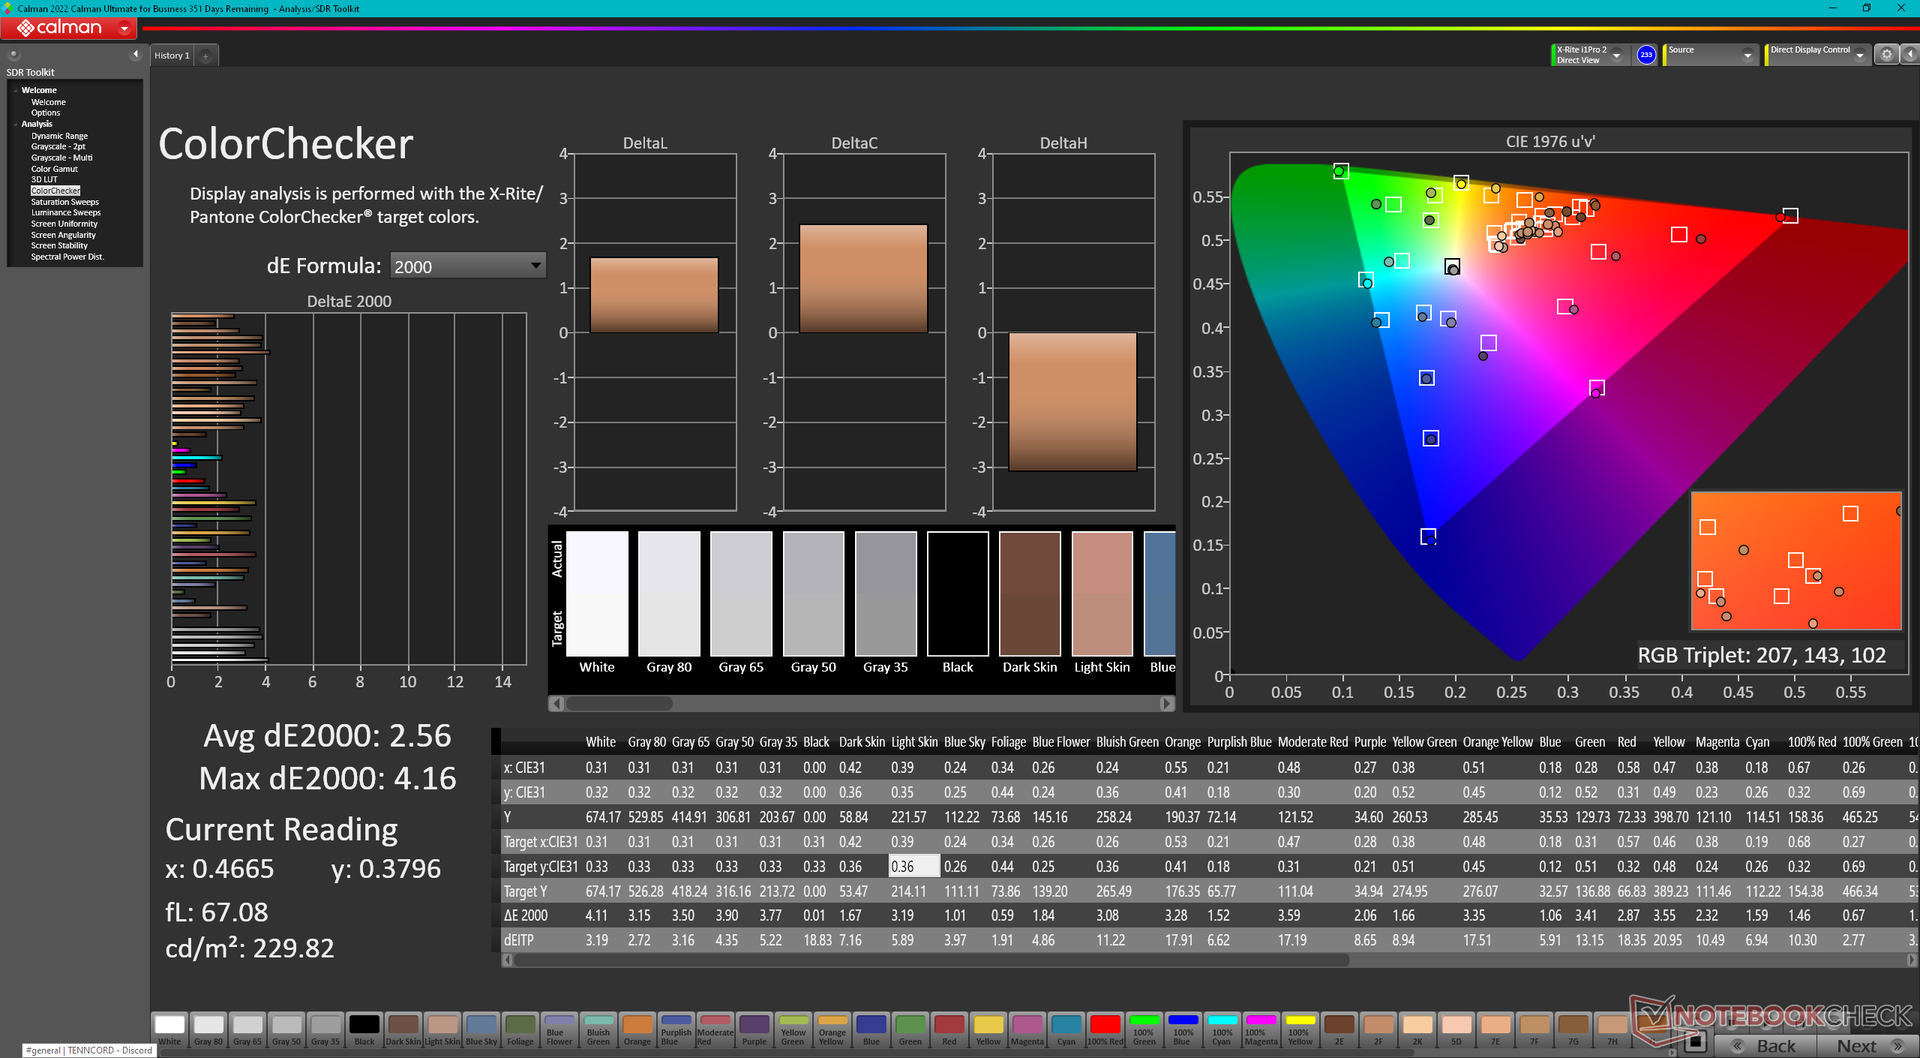
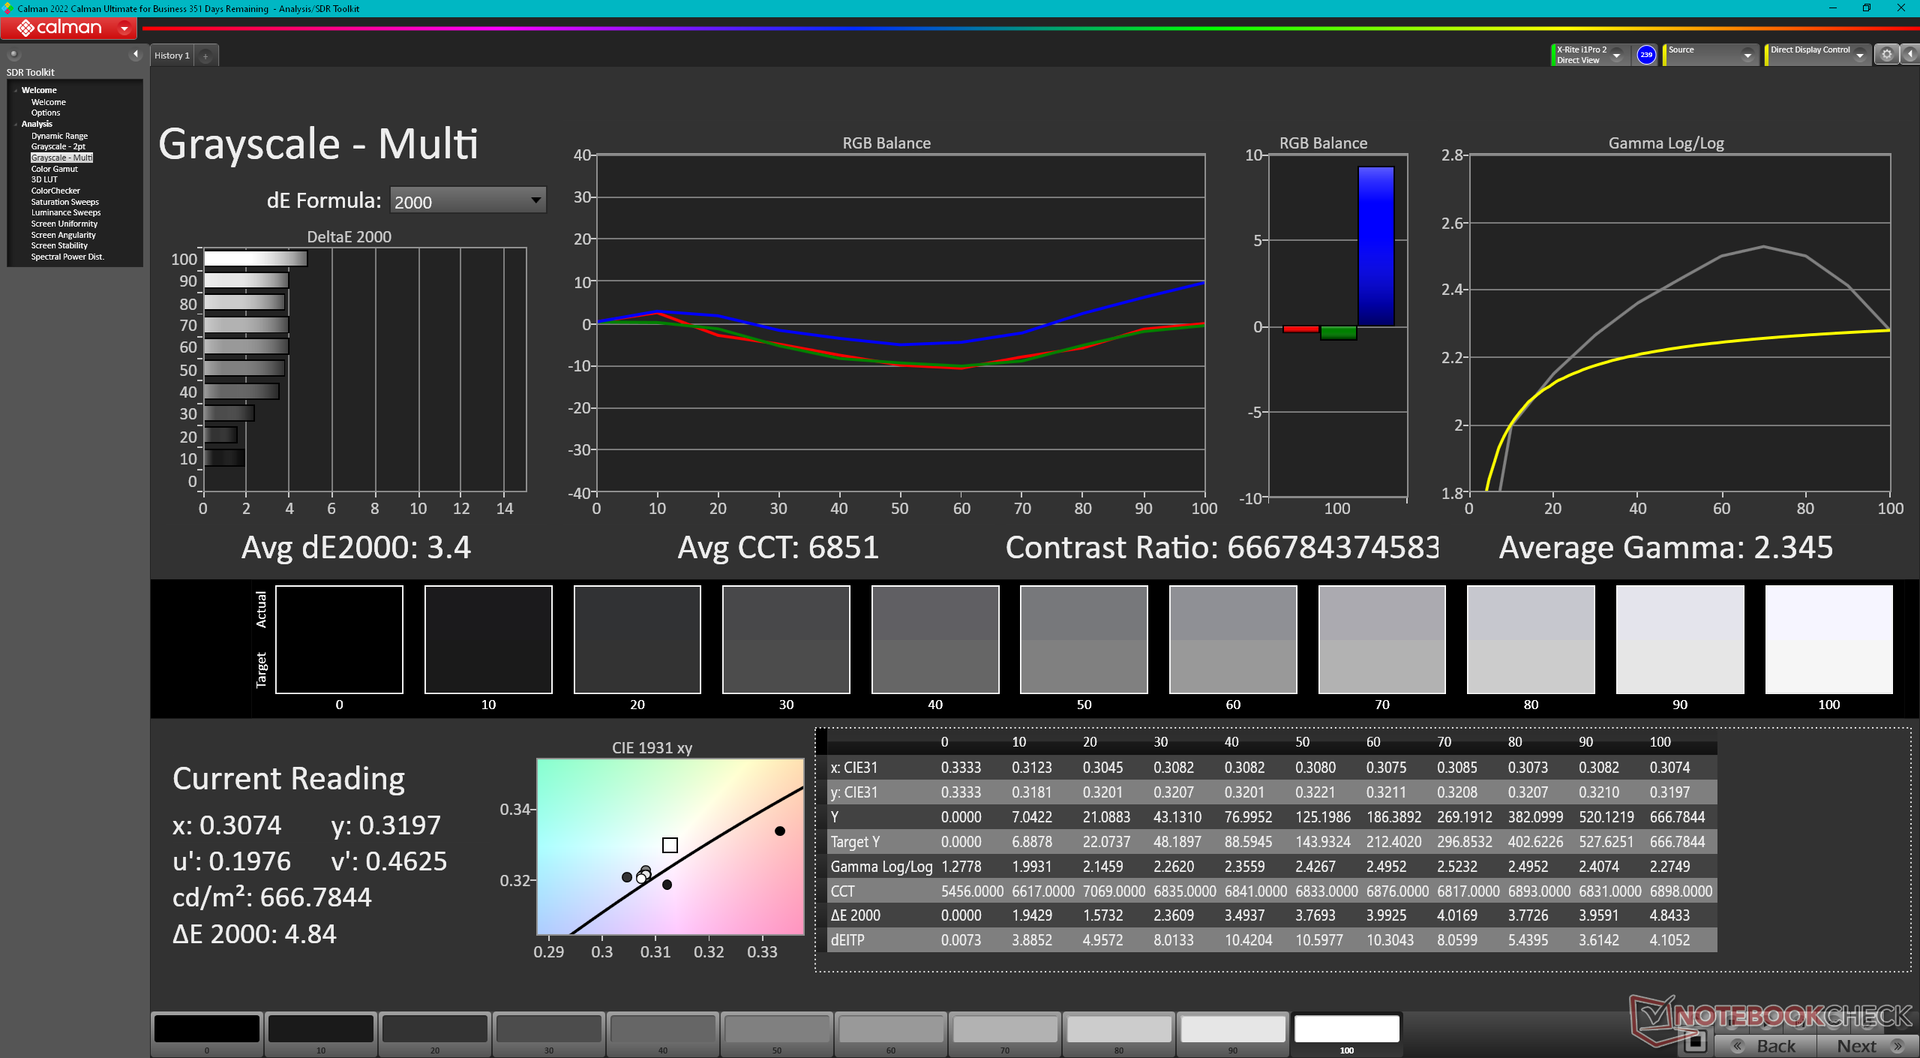
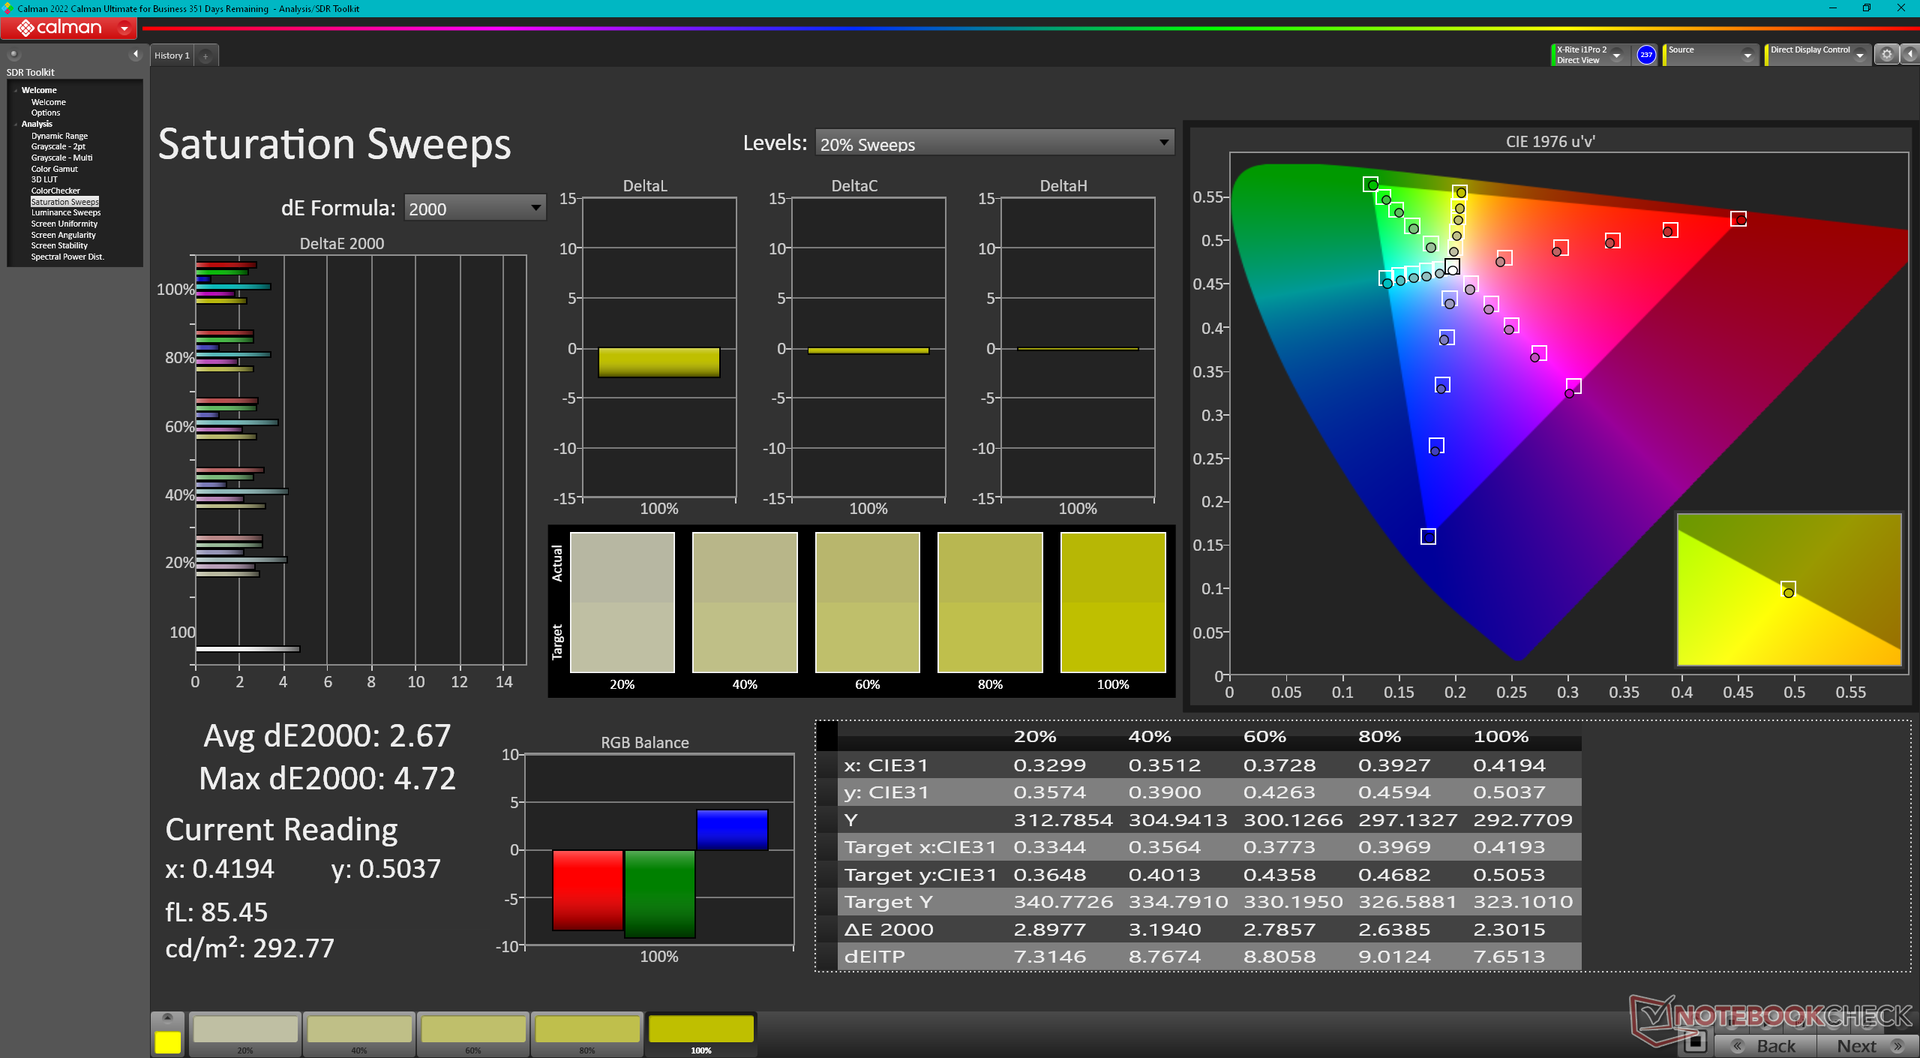
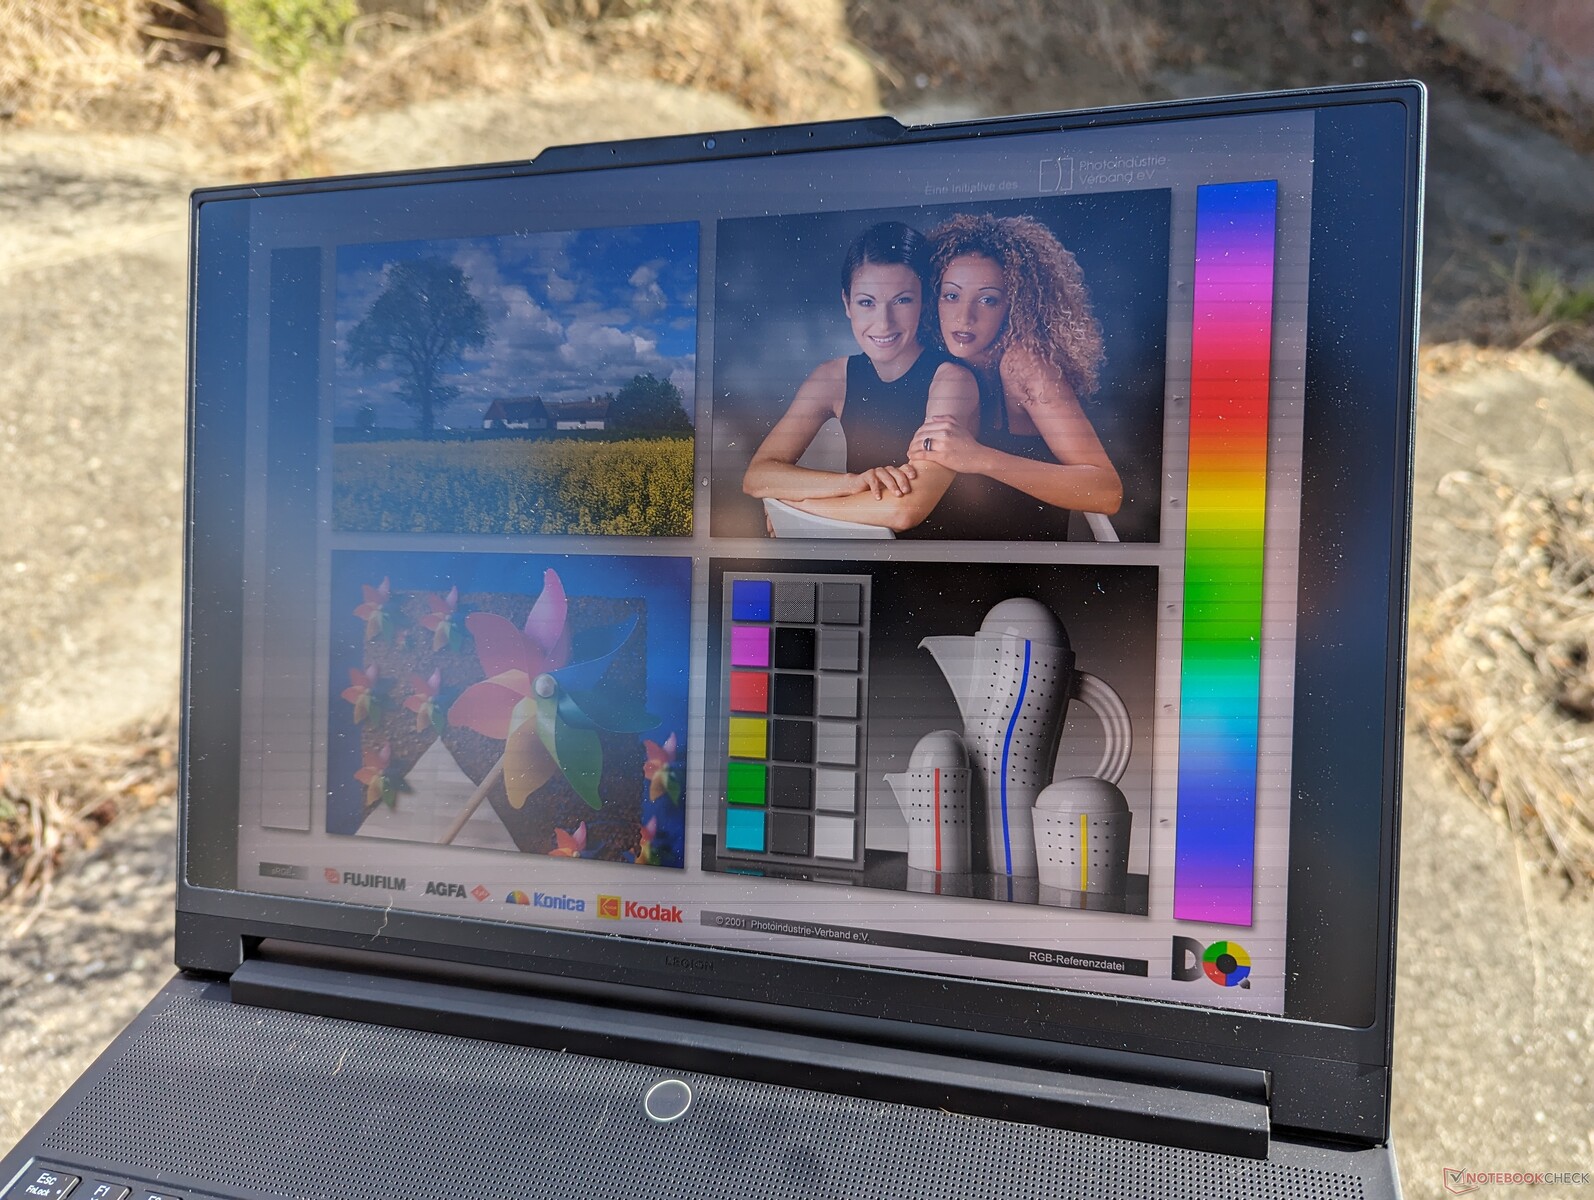
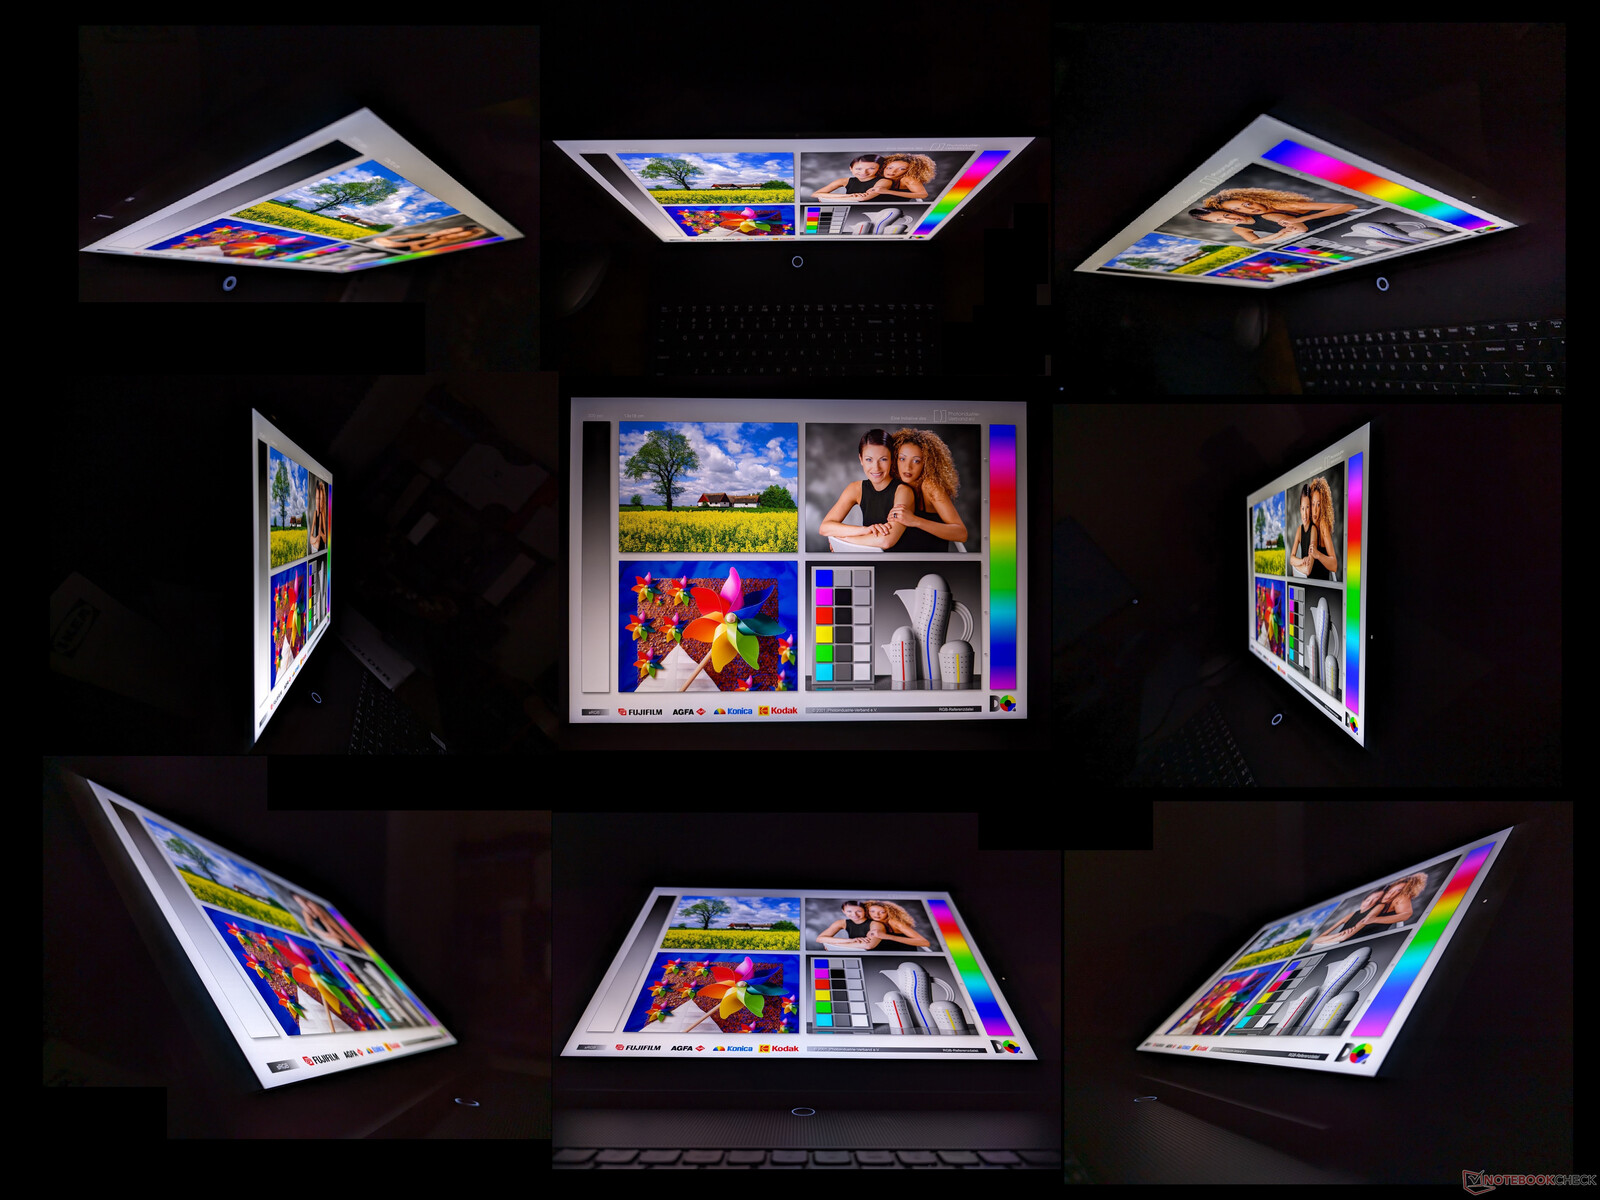
Display - L'attrazione principale

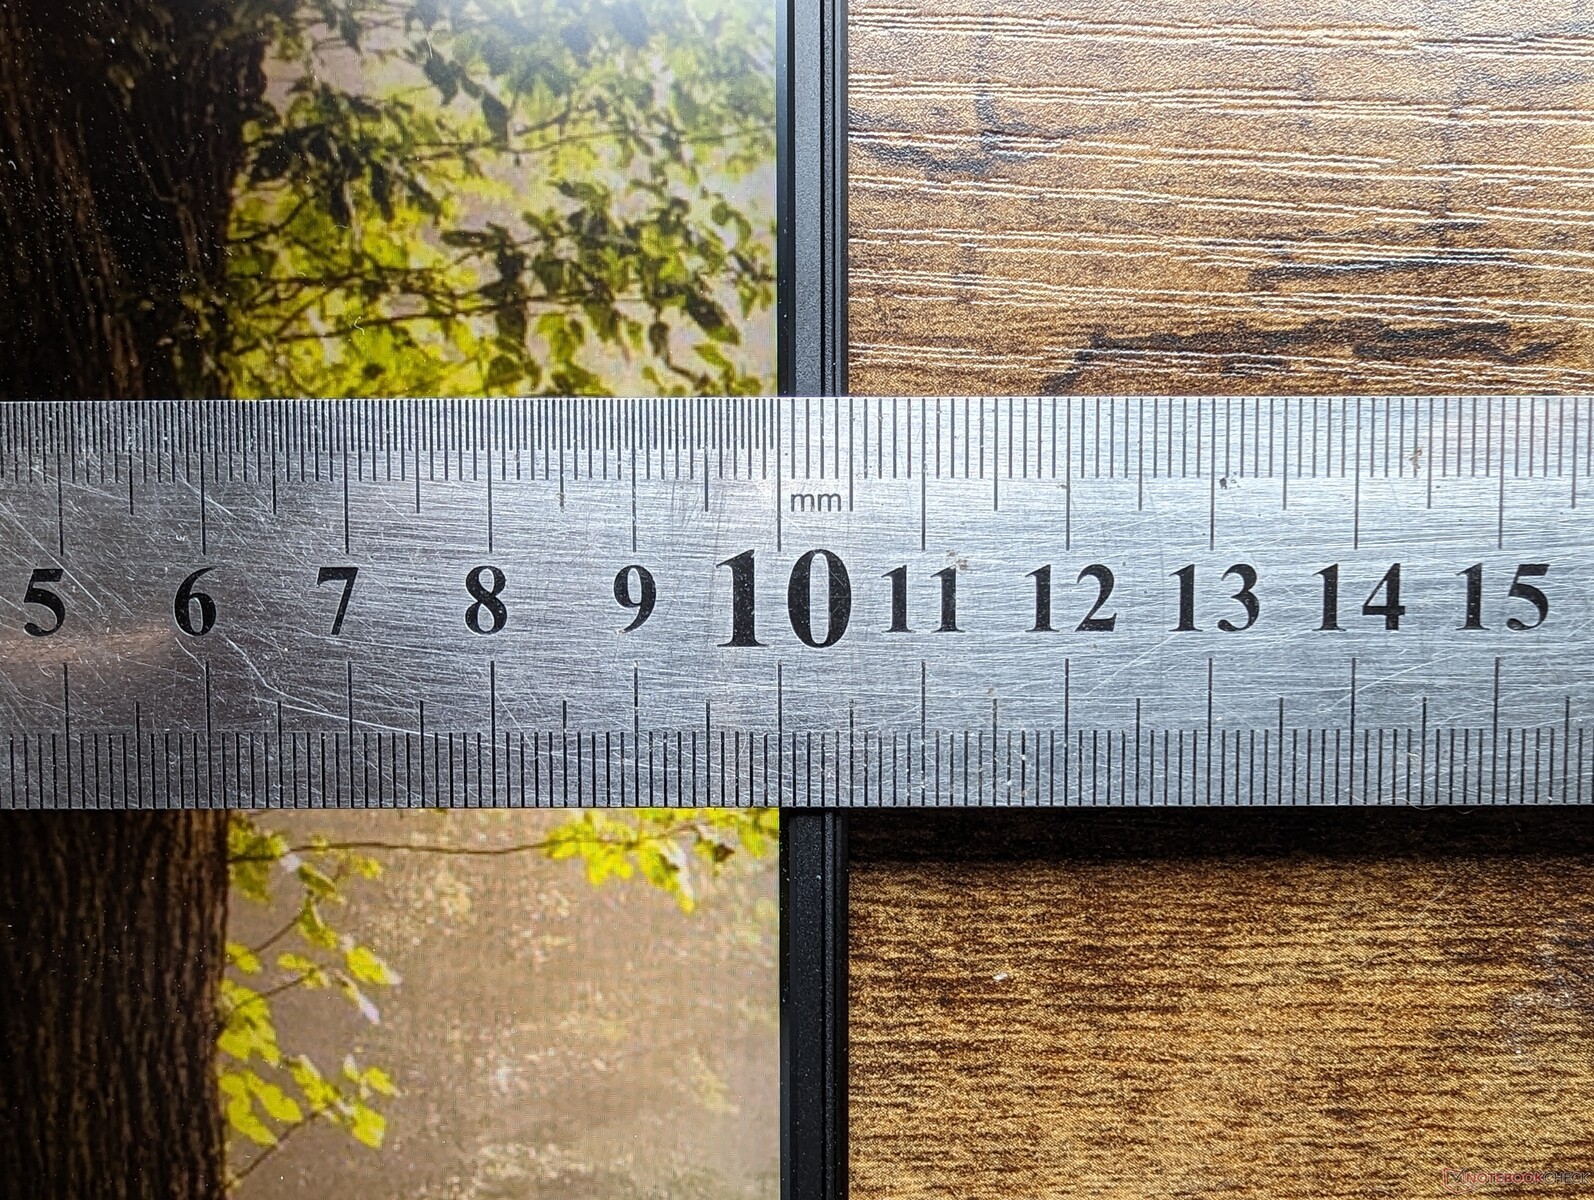
Rispetto ai tradizionali IPS e OLED, il mini-LED offre livelli di nero superiori ai primi e livelli di luminosità massima ancora più elevati dei secondi, per un supporto HDR complessivamente migliore. In questo caso, Lenovo pubblicizza una luminosità massima di 1200 nits per il supporto HDR1000, che è raro vedere sui display dei computer portatili. Siamo in grado di confermare una luminosità massima reale di 1025 nits quando è attiva la modalità HDR o di 675 nits quando si visualizzano contenuti SDR. La maggior parte dei pannelli IPS e OLED sui portatili da gioco si aggirano in genere tra i 300 e i 500 nits in confronto. Pertanto, vorrà riprodurre i contenuti in modalità HDR quando possibile, per sfruttare meglio i vantaggi del mini-LED.
Oltre ai livelli di luminosità molto elevati, il pannello presenta anche G-Sync, colori completi DCI-P3, velocità di aggiornamento di 165 Hz e tempi di risposta rapidi per essere adatto sia alla creazione di contenuti che ai giochi.
| |||||||||||||||||||||||||
Distribuzione della luminosità: 96 %
Al centro con la batteria: 674.9 cd/m²
Contrasto: 16873:1 (Nero: 0.04 cd/m²)
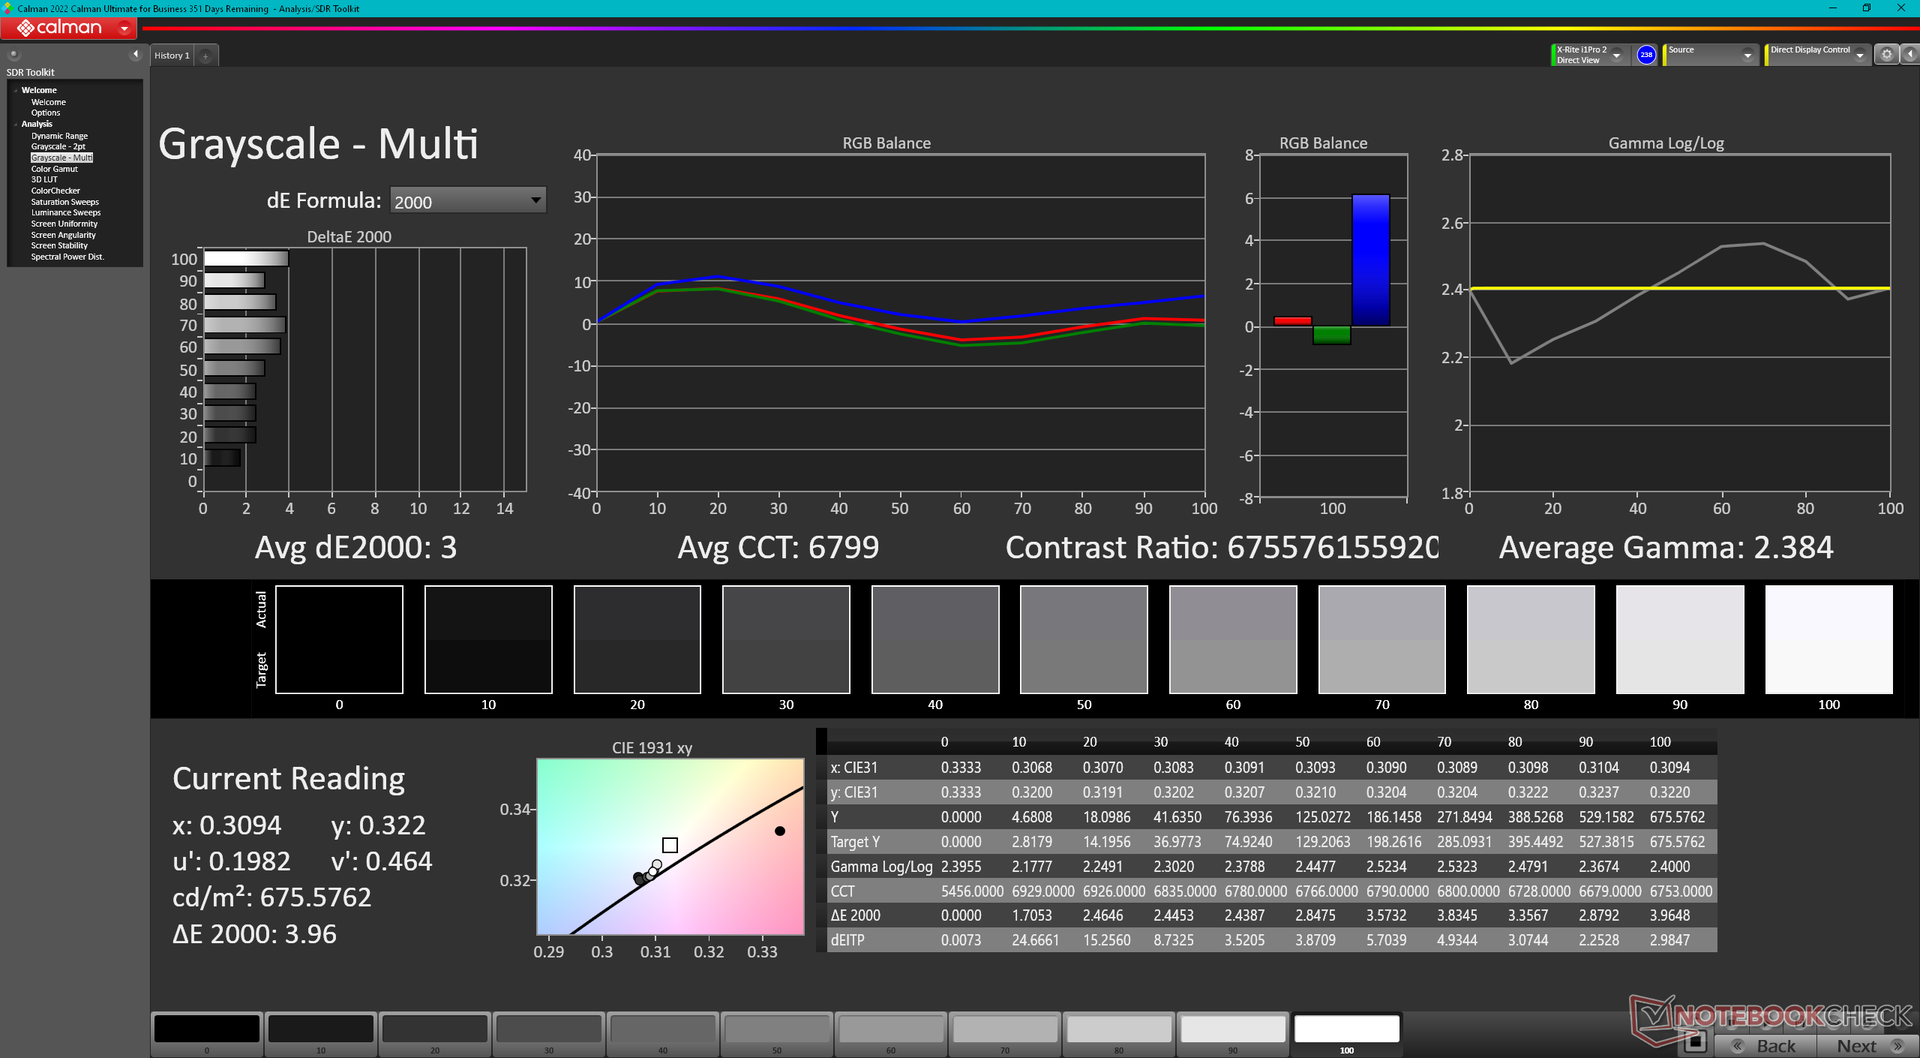
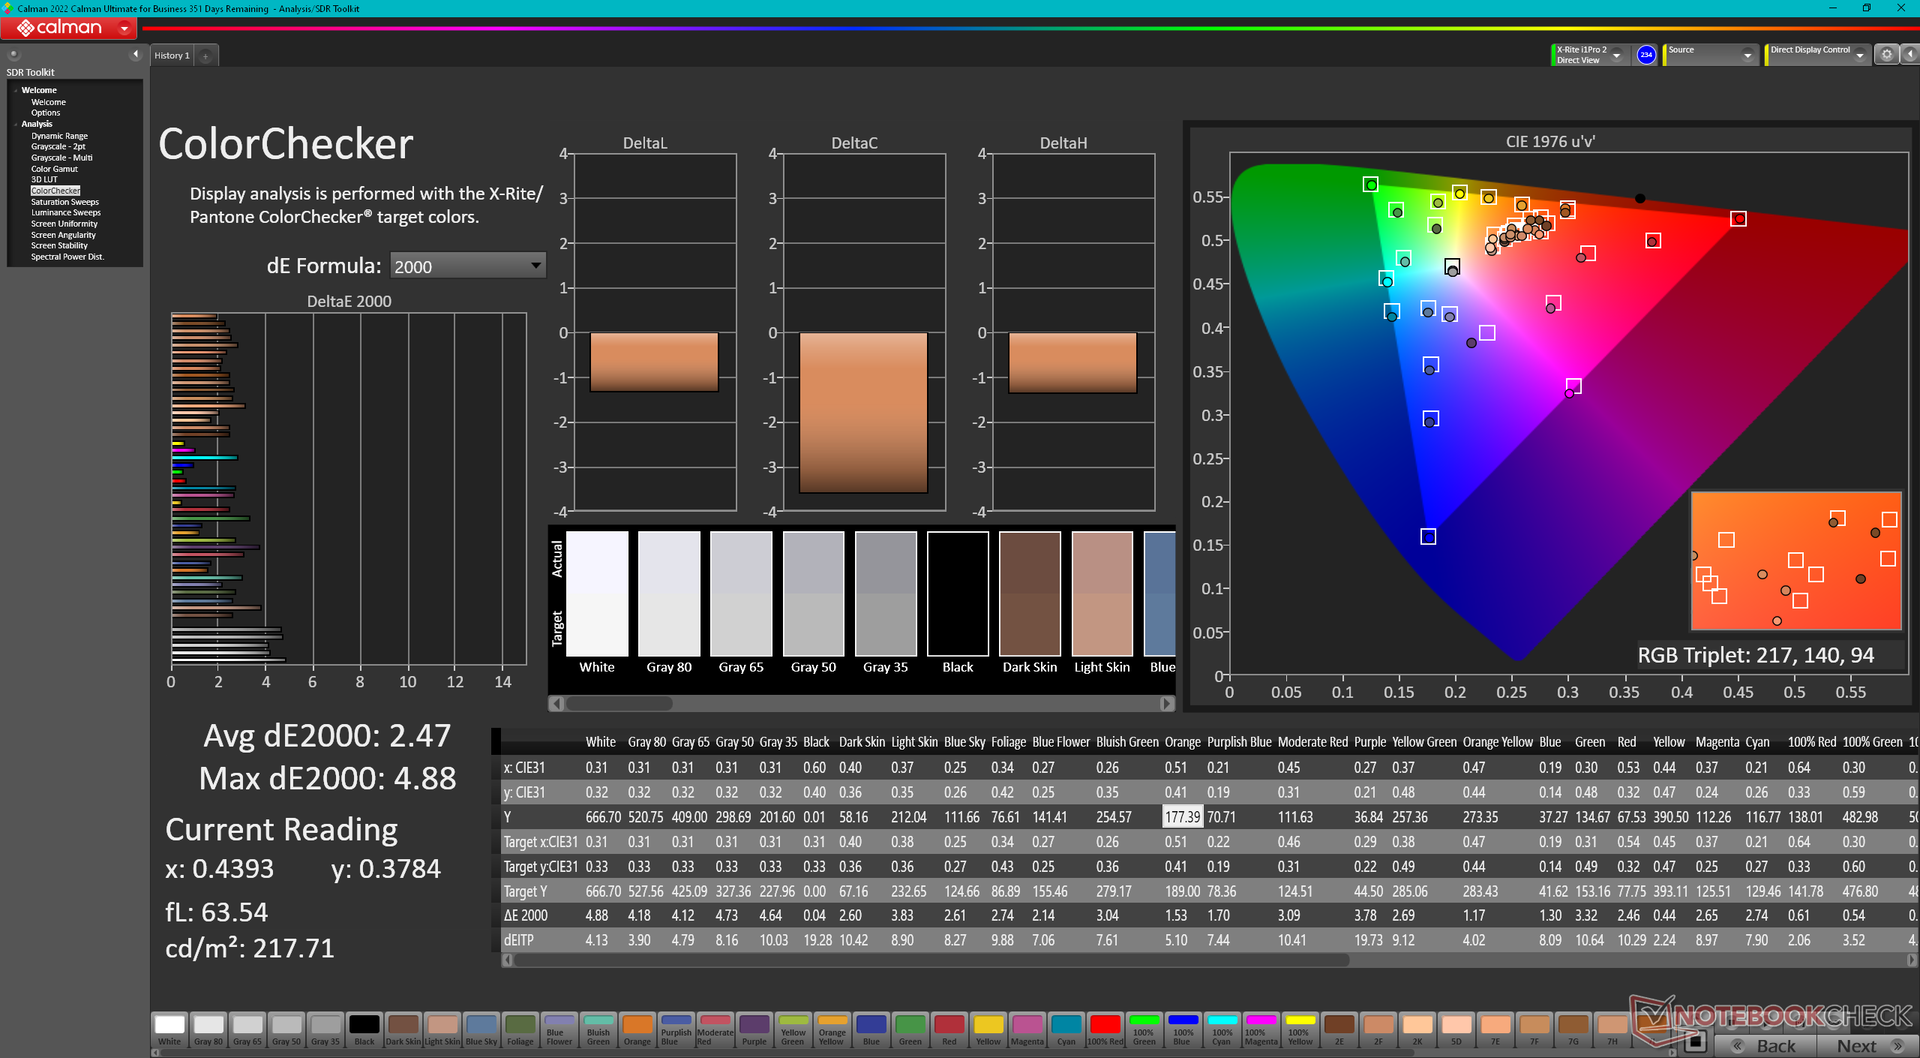
ΔE ColorChecker Calman: 2.56 | ∀{0.5-29.43 Ø4.71}
calibrated: 2.47
ΔE Greyscale Calman: 3 | ∀{0.09-98 Ø4.96}
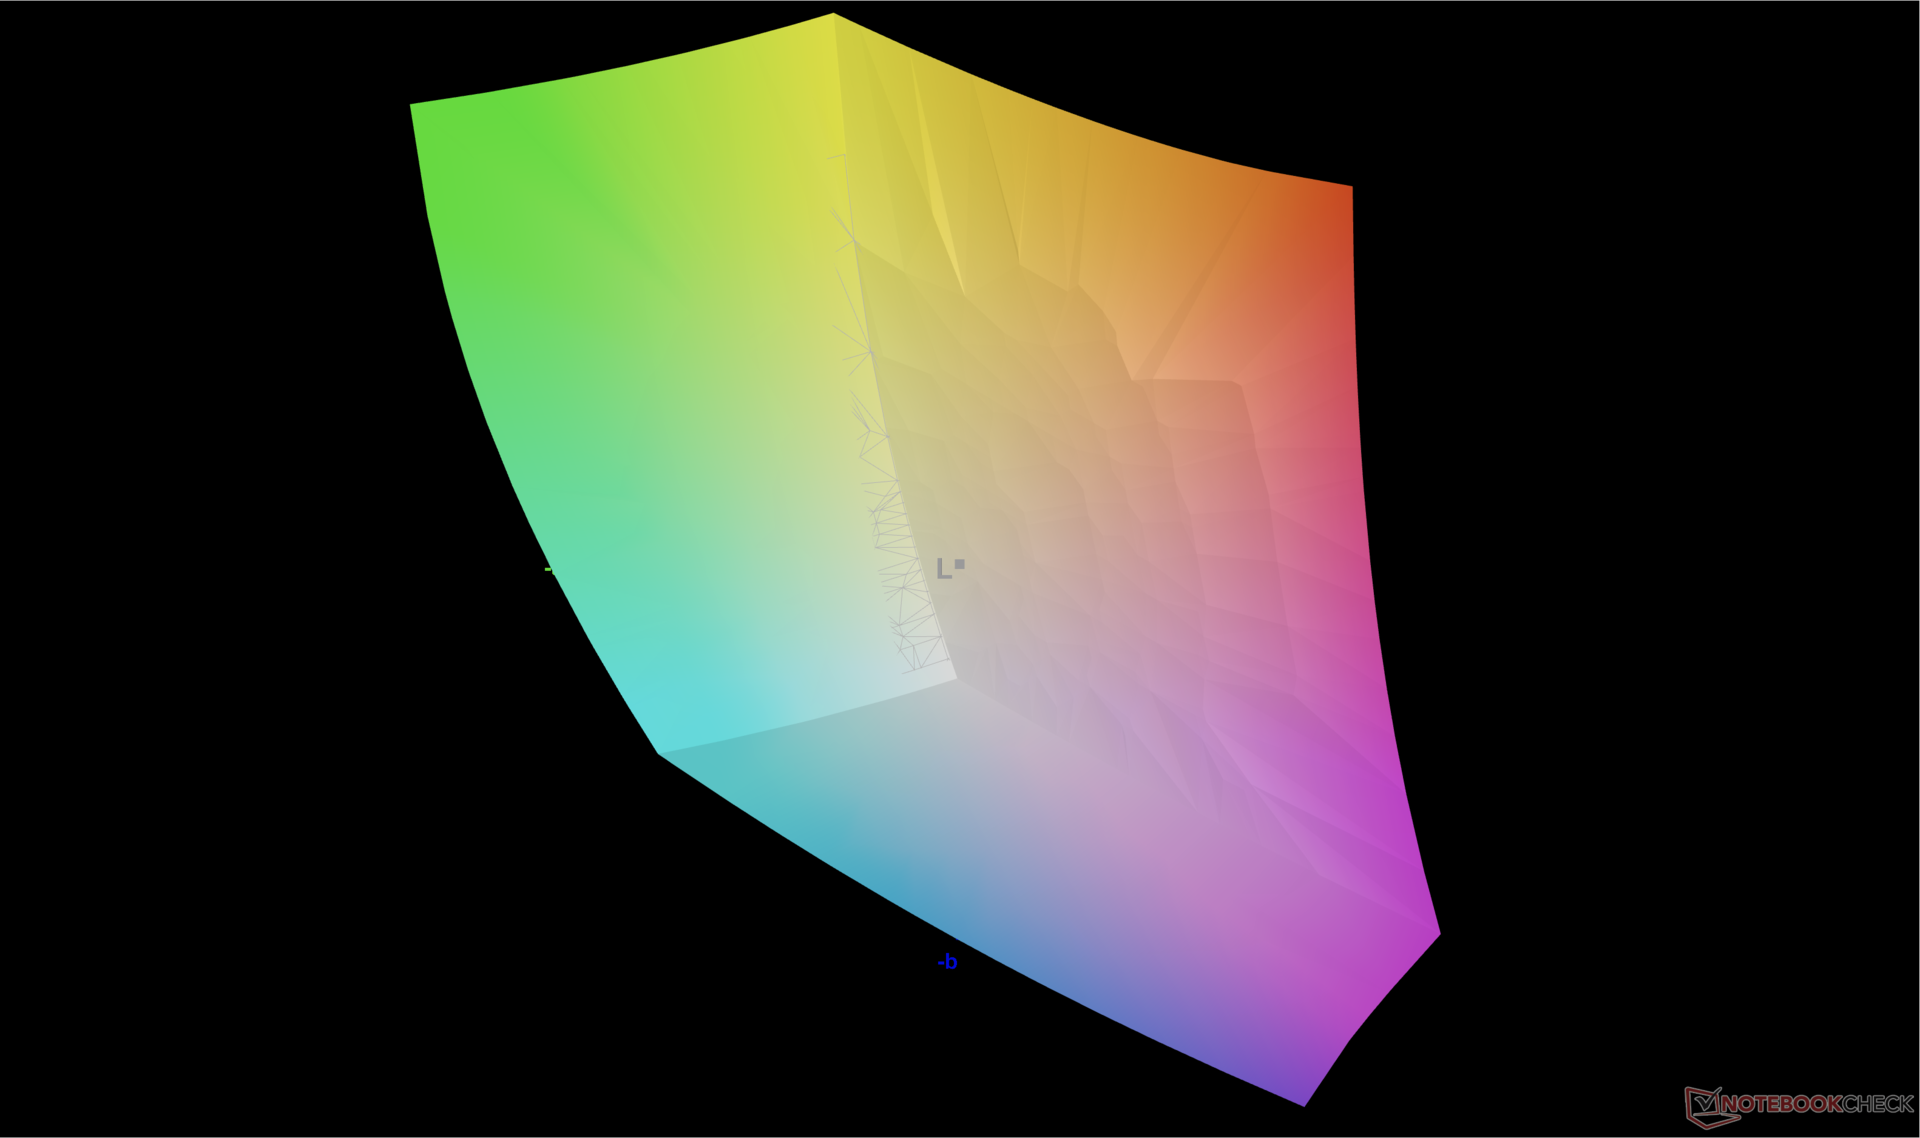
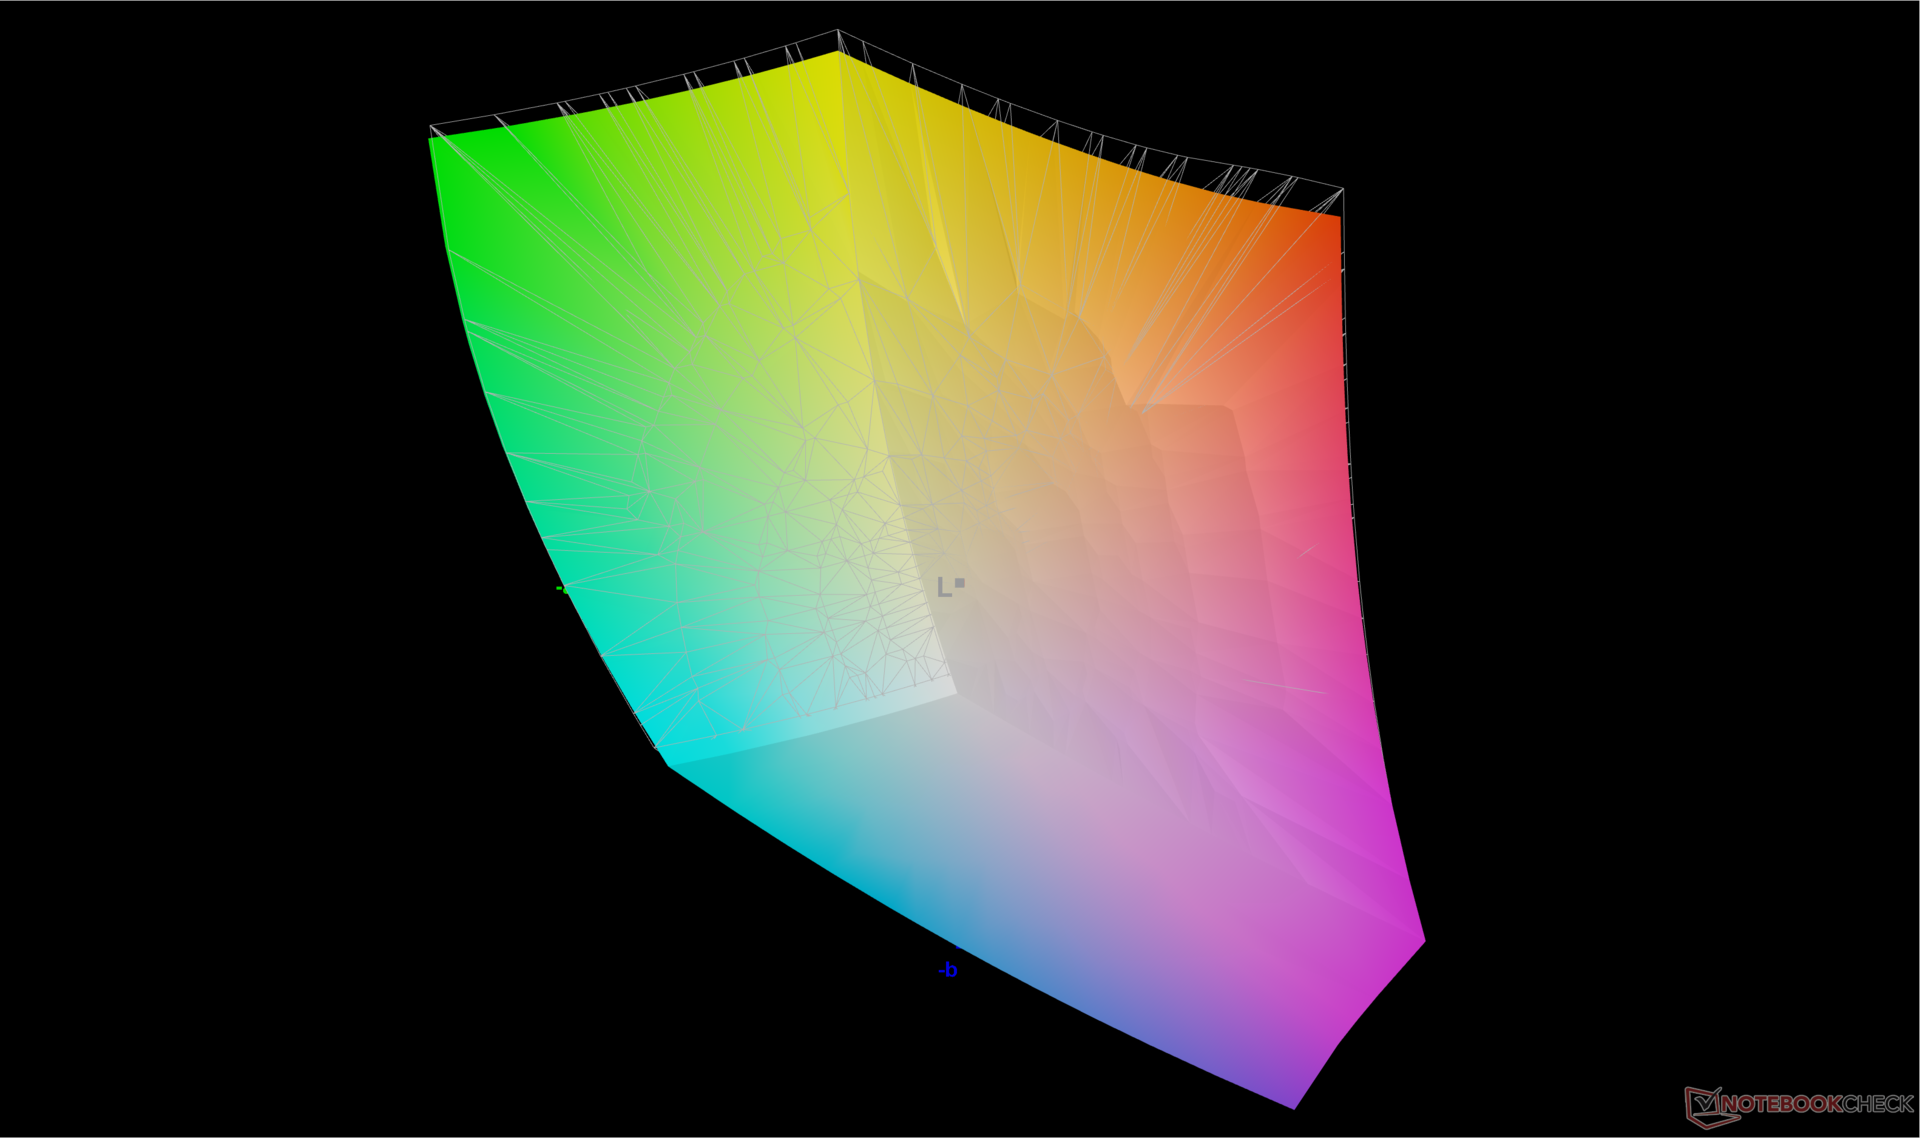
87% AdobeRGB 1998 (Argyll 3D)
99.9% sRGB (Argyll 3D)
97.2% Display P3 (Argyll 3D)
Gamma: 2.38
CCT: 6799 K
| Lenovo Legion 9 16IRX8 CSOT T3 MNG007ZA2-2, Mini-LED, 3200x2000, 16" | Lenovo Legion Slim 5 16APH8 BOE NJ NE160QDM-NYC, IPS, 2560x1600, 16" | Razer Blade 16 Early 2023 RTX 4090 AUO B160ZAN01.U, mini-LED, 3840x2400, 16" | Asus ROG Strix G16 G614JZ TL160ADMP03-0, IPS, 2560x1600, 16" | HP Omen Transcend 16 AUOA3A6, Mini-LED, 2560x1600, 16" | Alienware x16 R1 BOE NE16NZ4, IPS, 2560x1600, 16" | |
|---|---|---|---|---|---|---|
| Display | -16% | 2% | -1% | 1% | 1% | |
| Display P3 Coverage (%) | 97.2 | 69.3 -29% | 99.9 3% | 97 0% | 99.2 2% | 99.2 2% |
| sRGB Coverage (%) | 99.9 | 100 0% | 100 0% | 99.9 0% | 100 0% | 100 0% |
| AdobeRGB 1998 Coverage (%) | 87 | 70 -20% | 90.9 4% | 84.9 -2% | 87.6 1% | 88.6 2% |
| Response Times | 27% | -206% | 53% | -121% | 37% | |
| Response Time Grey 50% / Grey 80% * (ms) | 13.3 ? | 10.7 ? 20% | 10.2 ? 23% | 5.1 ? 62% | 26.4 ? -98% | 5.1 ? 62% |
| Response Time Black / White * (ms) | 11.6 ? | 7.8 ? 33% | 62.04 ? -435% | 6.6 ? 43% | 28.2 ? -143% | 10.3 ? 11% |
| PWM Frequency (Hz) | 4742 | 2420 ? | 3506 ? | |||
| Screen | -109% | 62% | -111% | -26% | -73% | |
| Brightness middle (cd/m²) | 674.9 | 371.6 -45% | 730 8% | 470 -30% | 791.1 17% | 302.2 -55% |
| Brightness (cd/m²) | 682 | 343 -50% | 729 7% | 459 -33% | 800 17% | 285 -58% |
| Brightness Distribution (%) | 96 | 84 -12% | 94 -2% | 93 -3% | 95 -1% | 89 -7% |
| Black Level * (cd/m²) | 0.04 | 0.44 -1000% | 0.0045 89% | 0.42 -950% | 0.04 -0% | 0.26 -550% |
| Contrast (:1) | 16873 | 845 -95% | 162222 861% | 1119 -93% | 19778 17% | 1162 -93% |
| Colorchecker dE 2000 * | 2.56 | 1.52 41% | 5.65 -121% | 1.86 27% | 4.37 -71% | 1.63 36% |
| Colorchecker dE 2000 max. * | 4.16 | 2.68 36% | 10.11 -143% | 3.87 7% | 10.39 -150% | 4.13 1% |
| Colorchecker dE 2000 calibrated * | 2.47 | 0.33 87% | 1.85 25% | 0.93 62% | 1.04 58% | 1.17 53% |
| Greyscale dE 2000 * | 3 | 1.2 60% | 8.1 -170% | 2.7 10% | 6.5 -117% | 2.5 17% |
| Gamma | 2.38 92% | 2.1 105% | 1.98 111% | 2.246 98% | 2.28 96% | 2.23 99% |
| CCT | 6799 96% | 6503 100% | 5874 111% | 6711 97% | 6000 108% | 6590 99% |
| Media totale (Programma / Settaggio) | -33% /
-70% | -47% /
11% | -20% /
-64% | -49% /
-33% | -12% /
-41% |
* ... Meglio usare valori piccoli
Il display è ben calibrato rispetto allo standard P3, con valori DeltaE medi della scala di grigi e del colore di appena 3 e 2,56, rispettivamente.
Tempi di risposta del Display
| ↔ Tempi di risposta dal Nero al Bianco | ||
|---|---|---|
| 11.6 ms ... aumenta ↗ e diminuisce ↘ combinato | ↗ 5.1 ms Incremento | 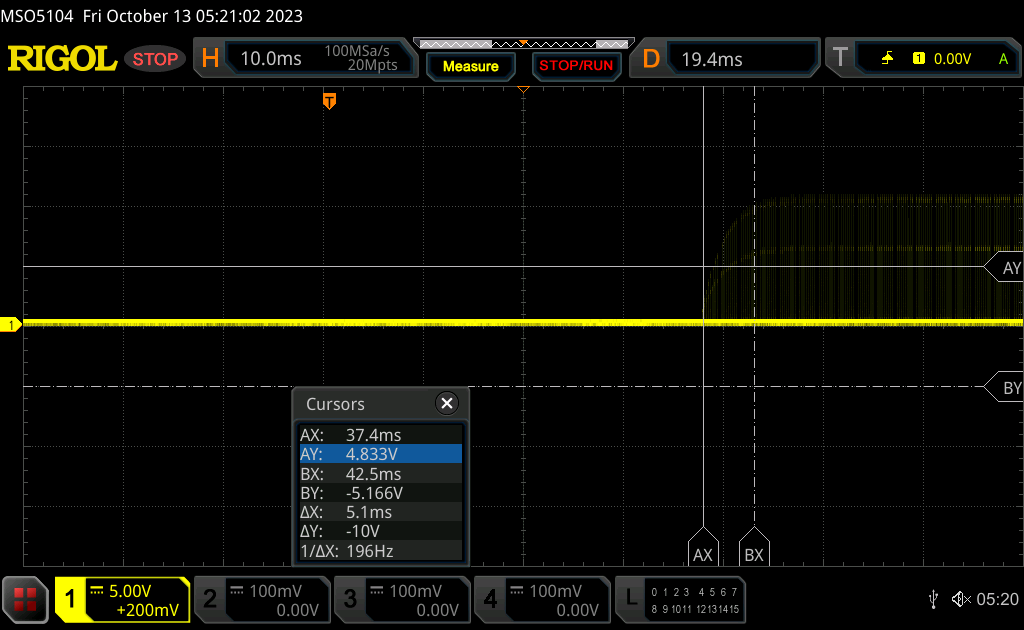 |
| ↘ 6.5 ms Calo | ||
| Lo schermo mostra buoni tempi di risposta durante i nostri tests, ma potrebbe essere troppo lento per i gamers competitivi. In confronto, tutti i dispositivi di test variano da 0.1 (minimo) a 240 (massimo) ms. » 31 % di tutti i dispositivi è migliore. Questo significa che i tempi di risposta rilevati sono migliori rispettto alla media di tutti i dispositivi testati (19.8 ms). | ||
| ↔ Tempo di risposta dal 50% Grigio all'80% Grigio | ||
| 13.3 ms ... aumenta ↗ e diminuisce ↘ combinato | ↗ 5.7 ms Incremento | 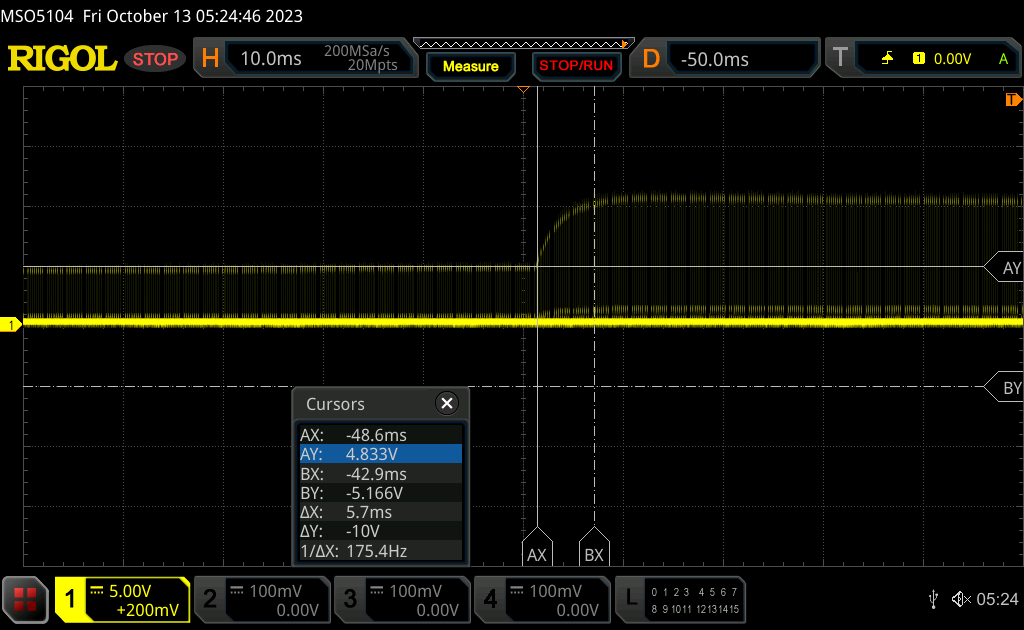 |
| ↘ 7.6 ms Calo | ||
| Lo schermo mostra buoni tempi di risposta durante i nostri tests, ma potrebbe essere troppo lento per i gamers competitivi. In confronto, tutti i dispositivi di test variano da 0.165 (minimo) a 636 (massimo) ms. » 27 % di tutti i dispositivi è migliore. Questo significa che i tempi di risposta rilevati sono migliori rispettto alla media di tutti i dispositivi testati (30.9 ms). | ||
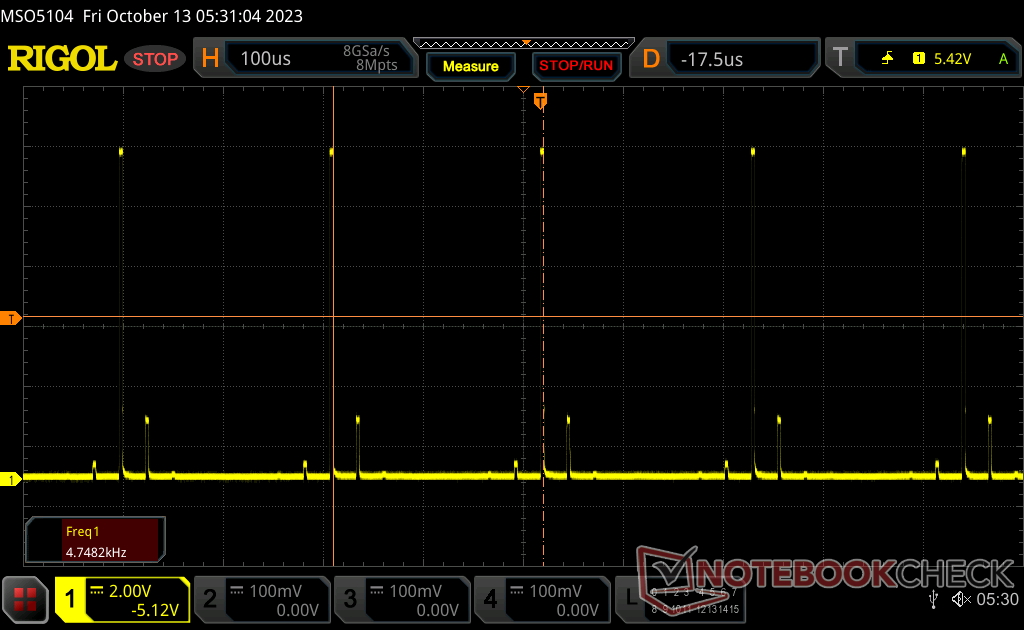
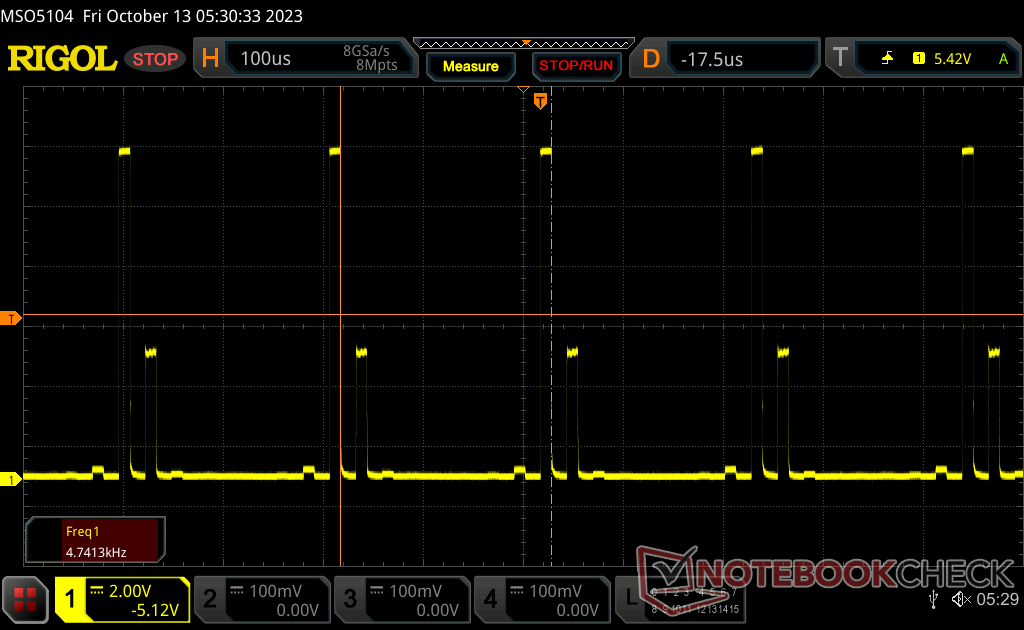
Sfarfallio dello schermo / PWM (Pulse-Width Modulation)
| flickering dello schermo / PWM rilevato | 4742 Hz | 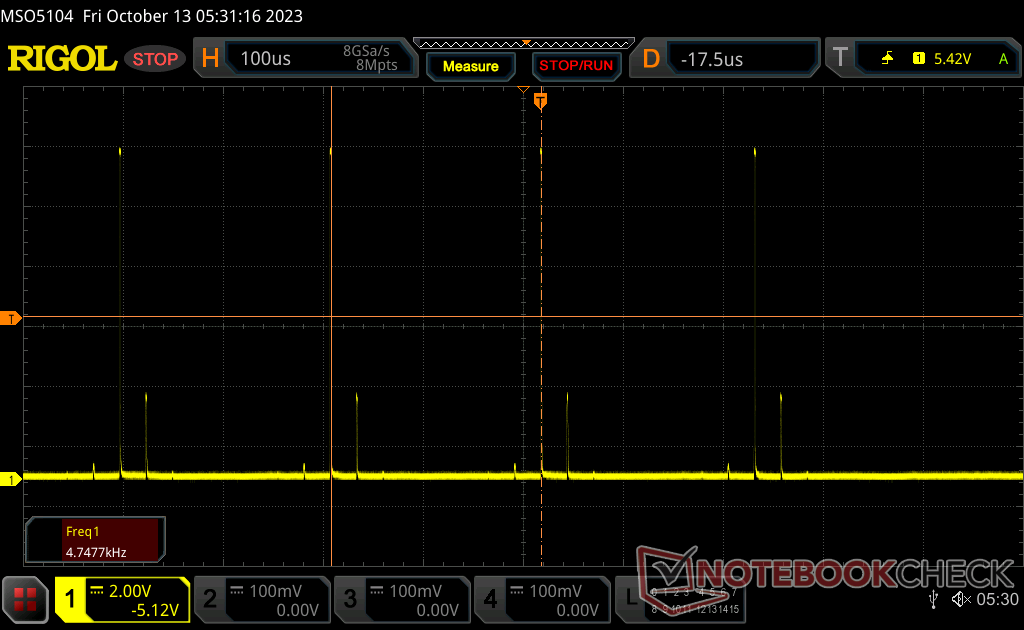 | |
Il display sfarfalla a 4742 Hz (Probabilmente a causa dell'uso di PWM) . La frequenza di 4742 Hz è abbastanza alta, quindi la maggioranza degli utenti sensibili al PWM non dovrebbero notare alcun flickering. In confronto: 52 % di tutti i dispositivi testati non utilizza PWM per ridurre la luminosita' del display. Se è rilevato PWM, una media di 7748 (minimo: 5 - massimo: 343500) Hz è stata rilevata. | |||
Lo sfarfallio è presente a tutti i livelli di luminosità con una frequenza costante di 4752 Hz.


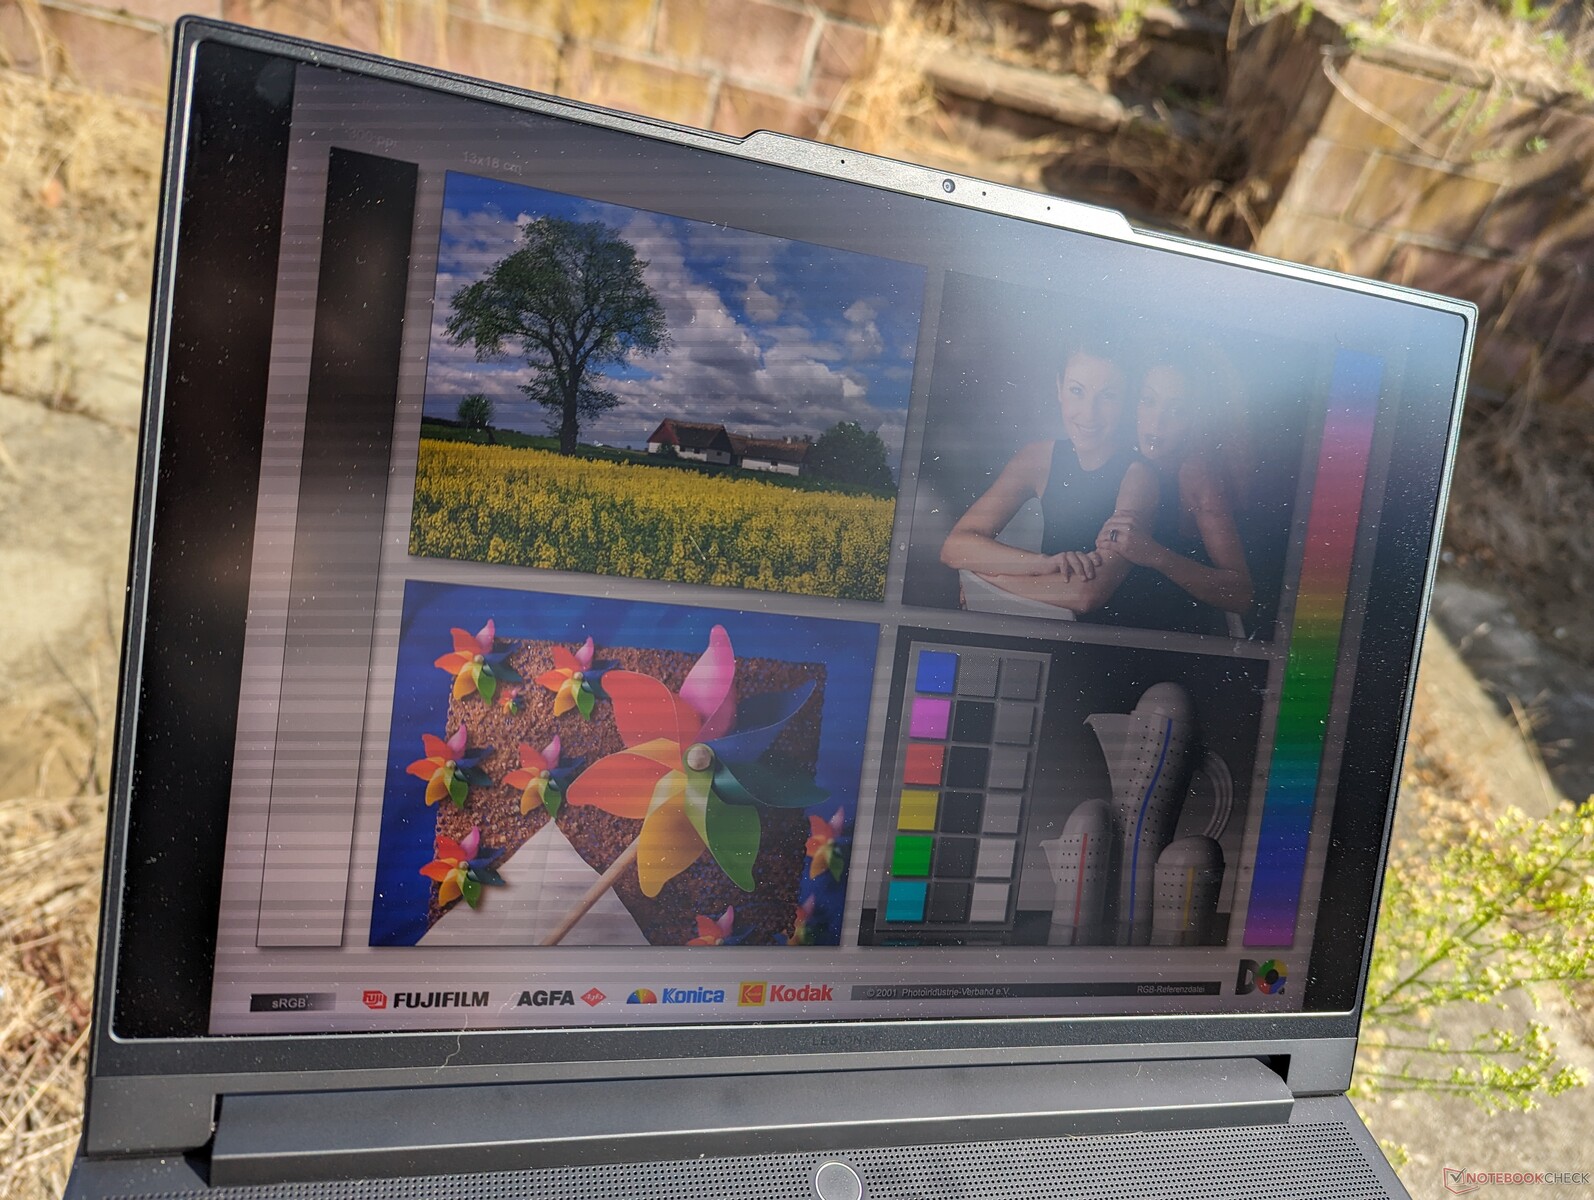
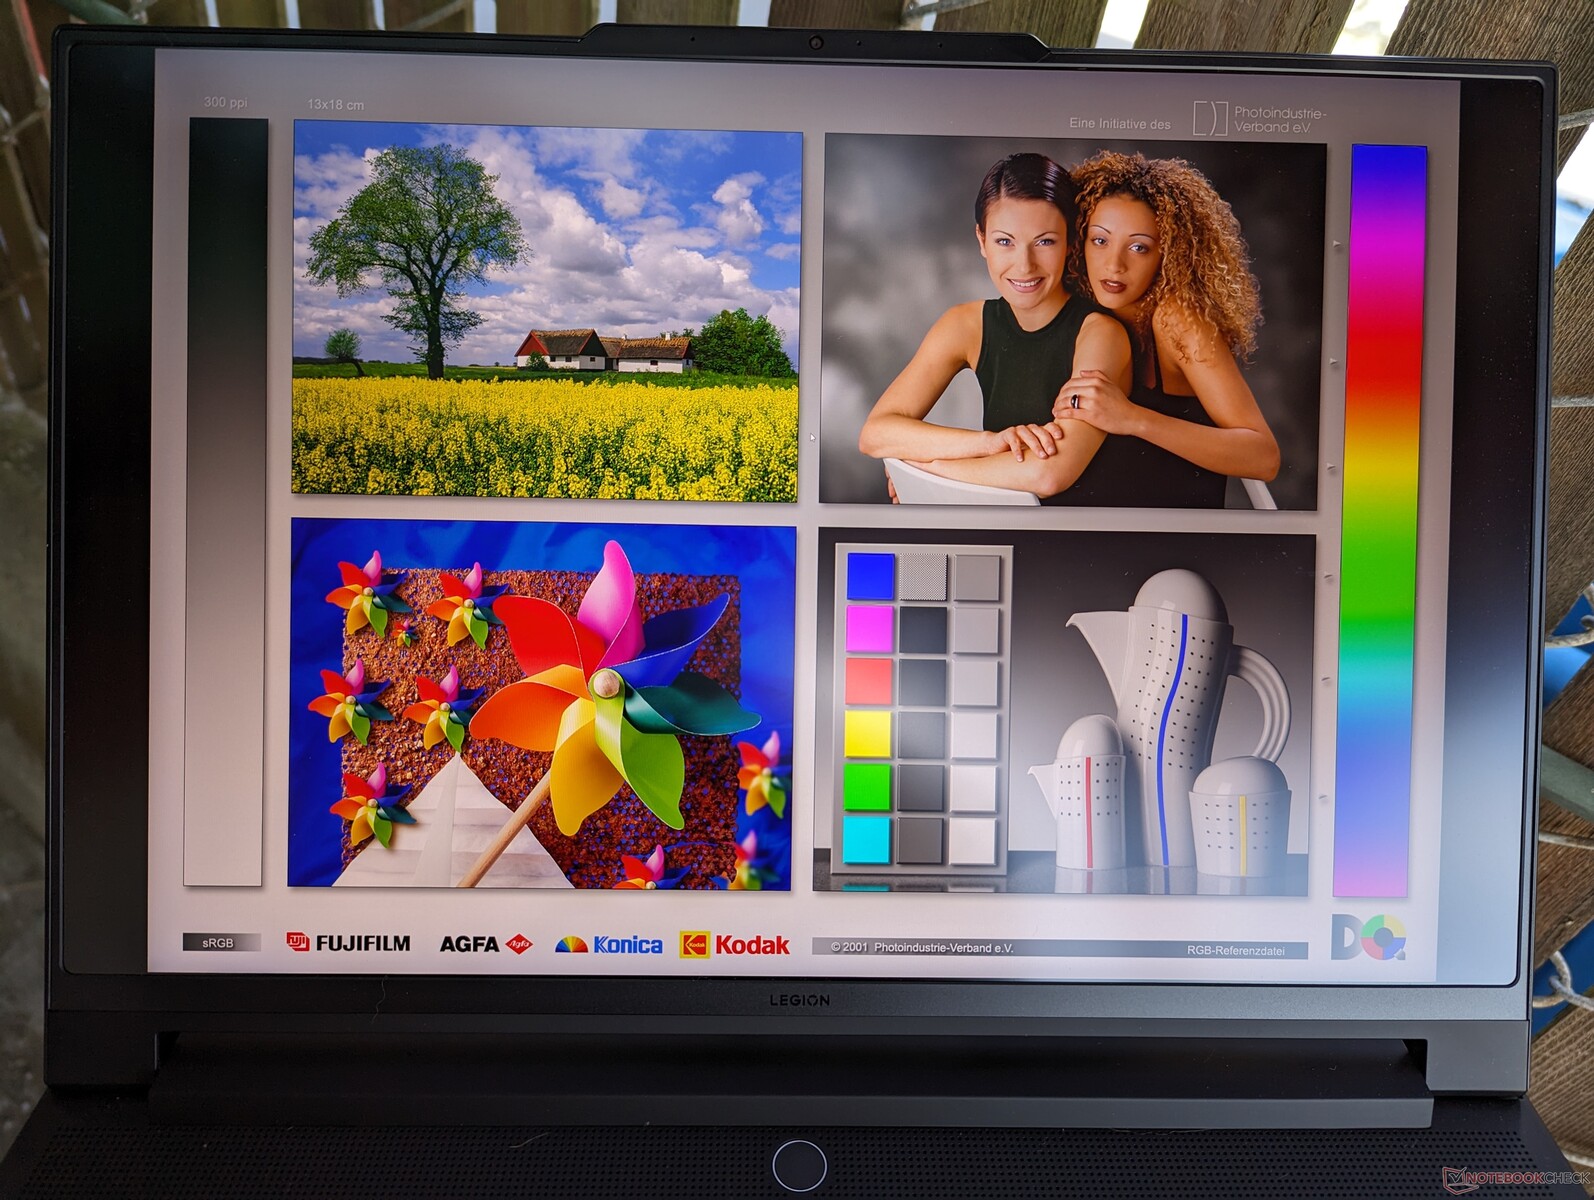
La visibilità all'aperto è eccellente per un portatile da gioco, grazie alla già citata elevata luminosità massima del mini-LED. Tuttavia, il peso elevato e la breve durata della batteria del sistema limitano ancora il portatile a scenari prevalentemente interni.
Prestazioni - Nessun Core i7 ammesso
Condizioni del test
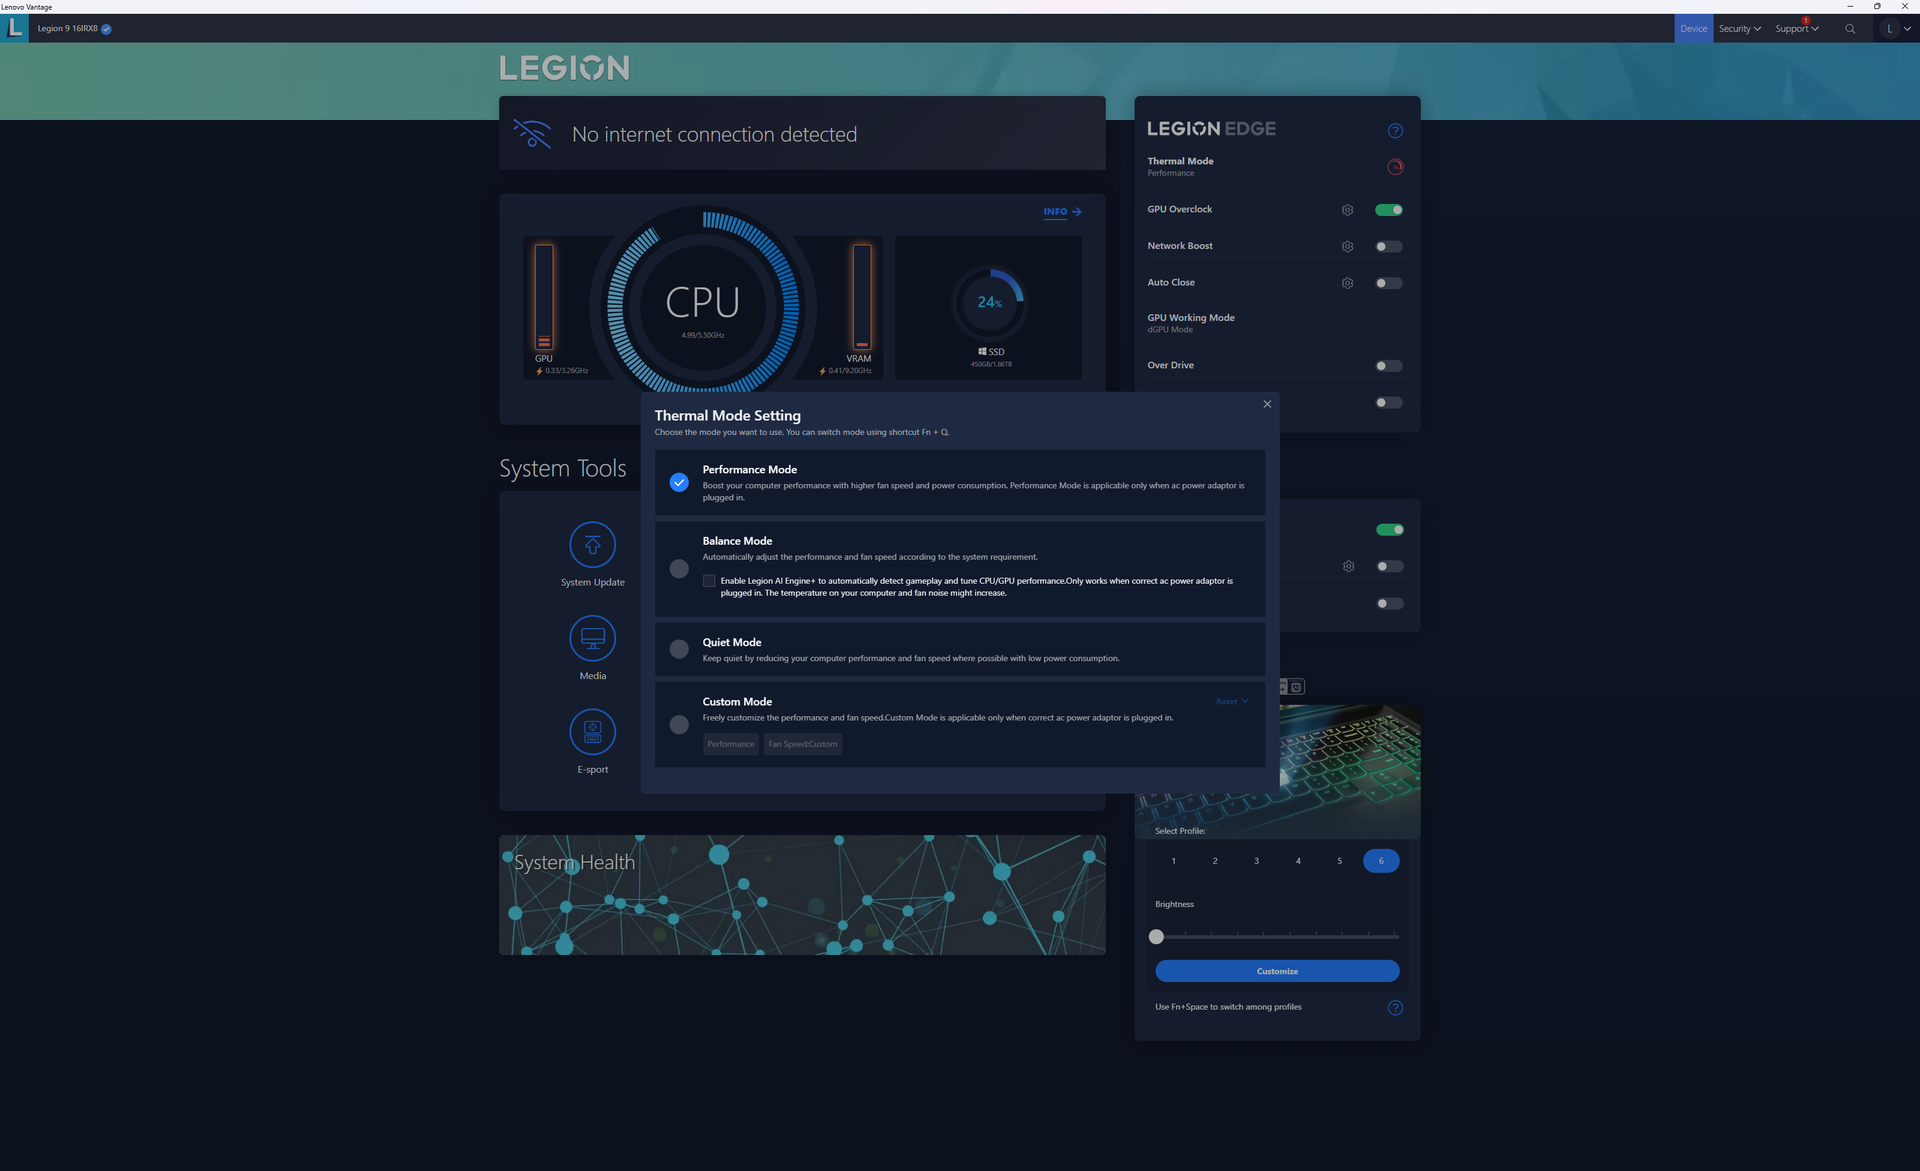
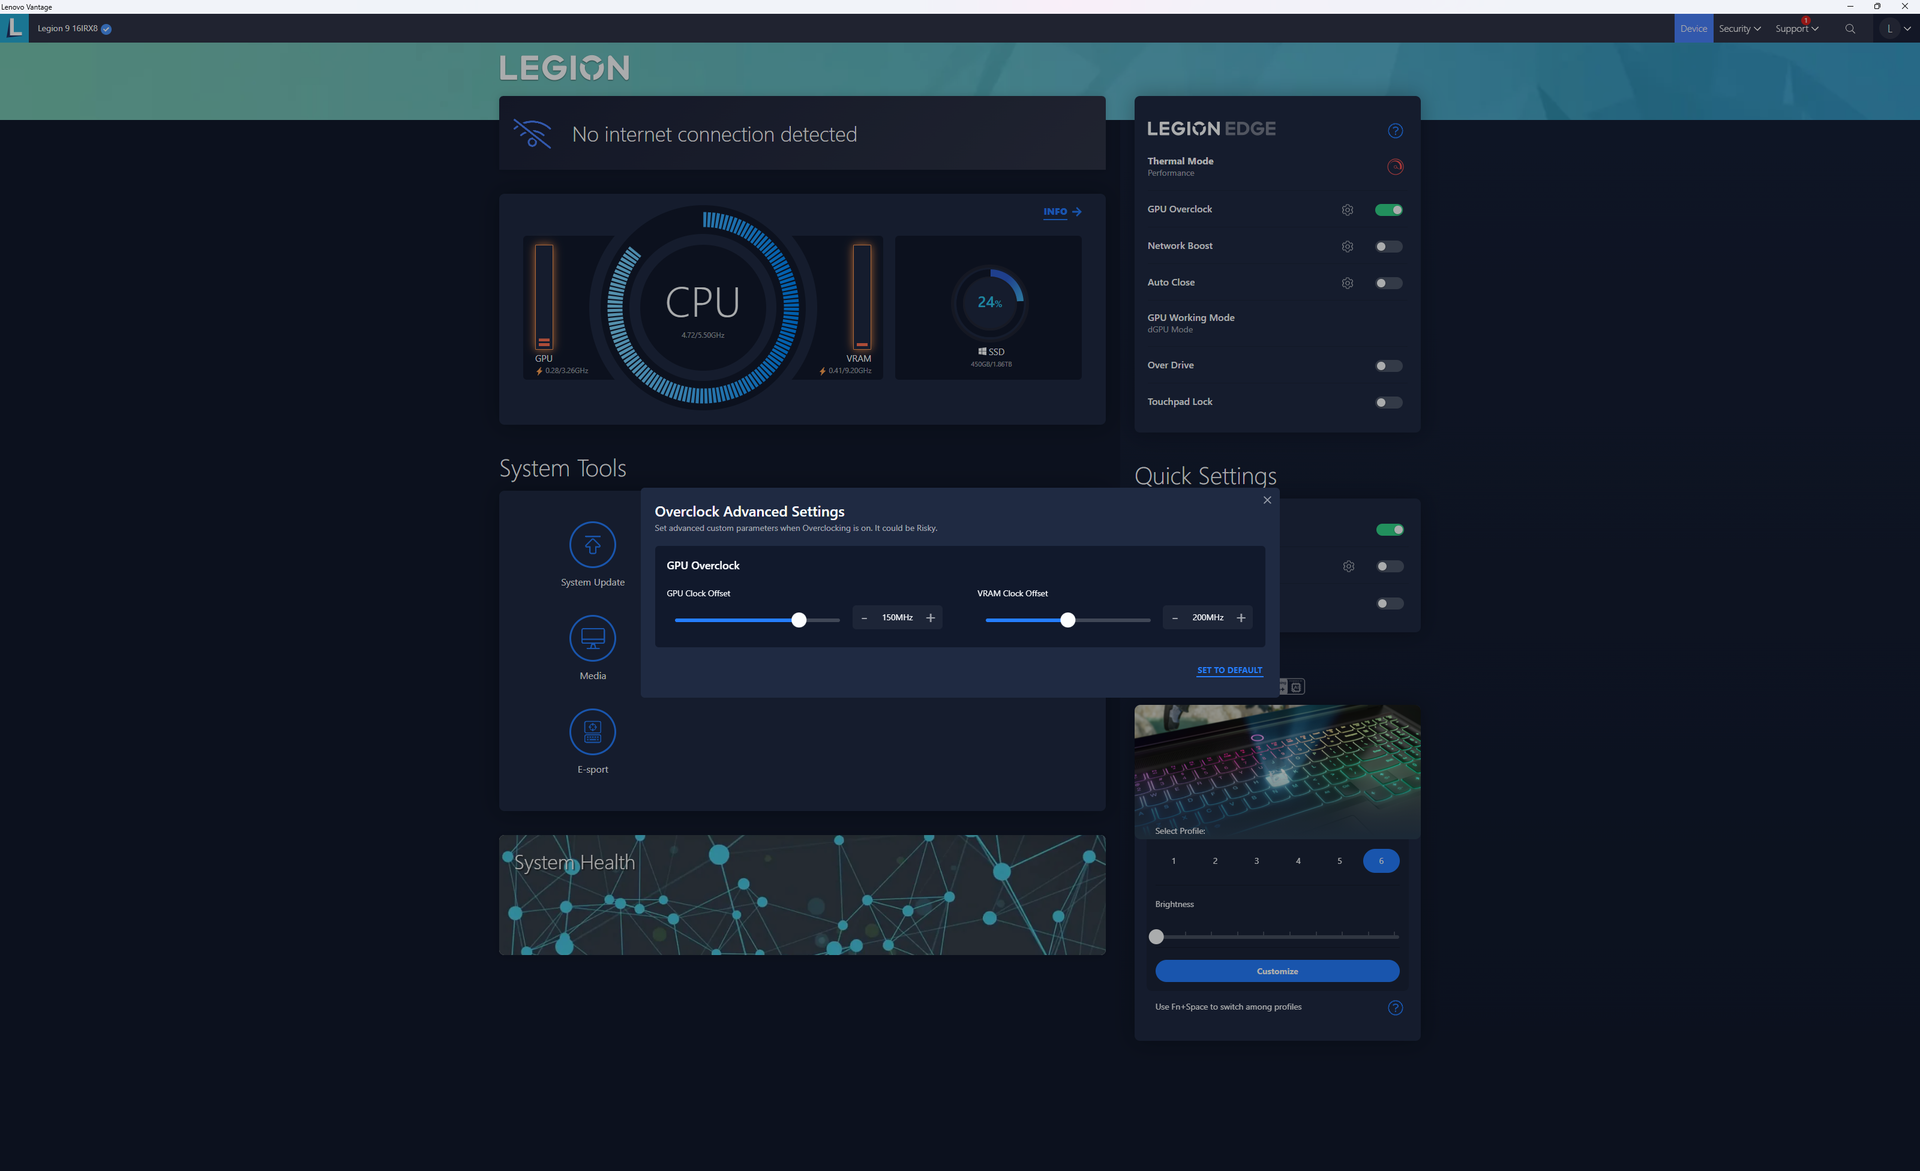
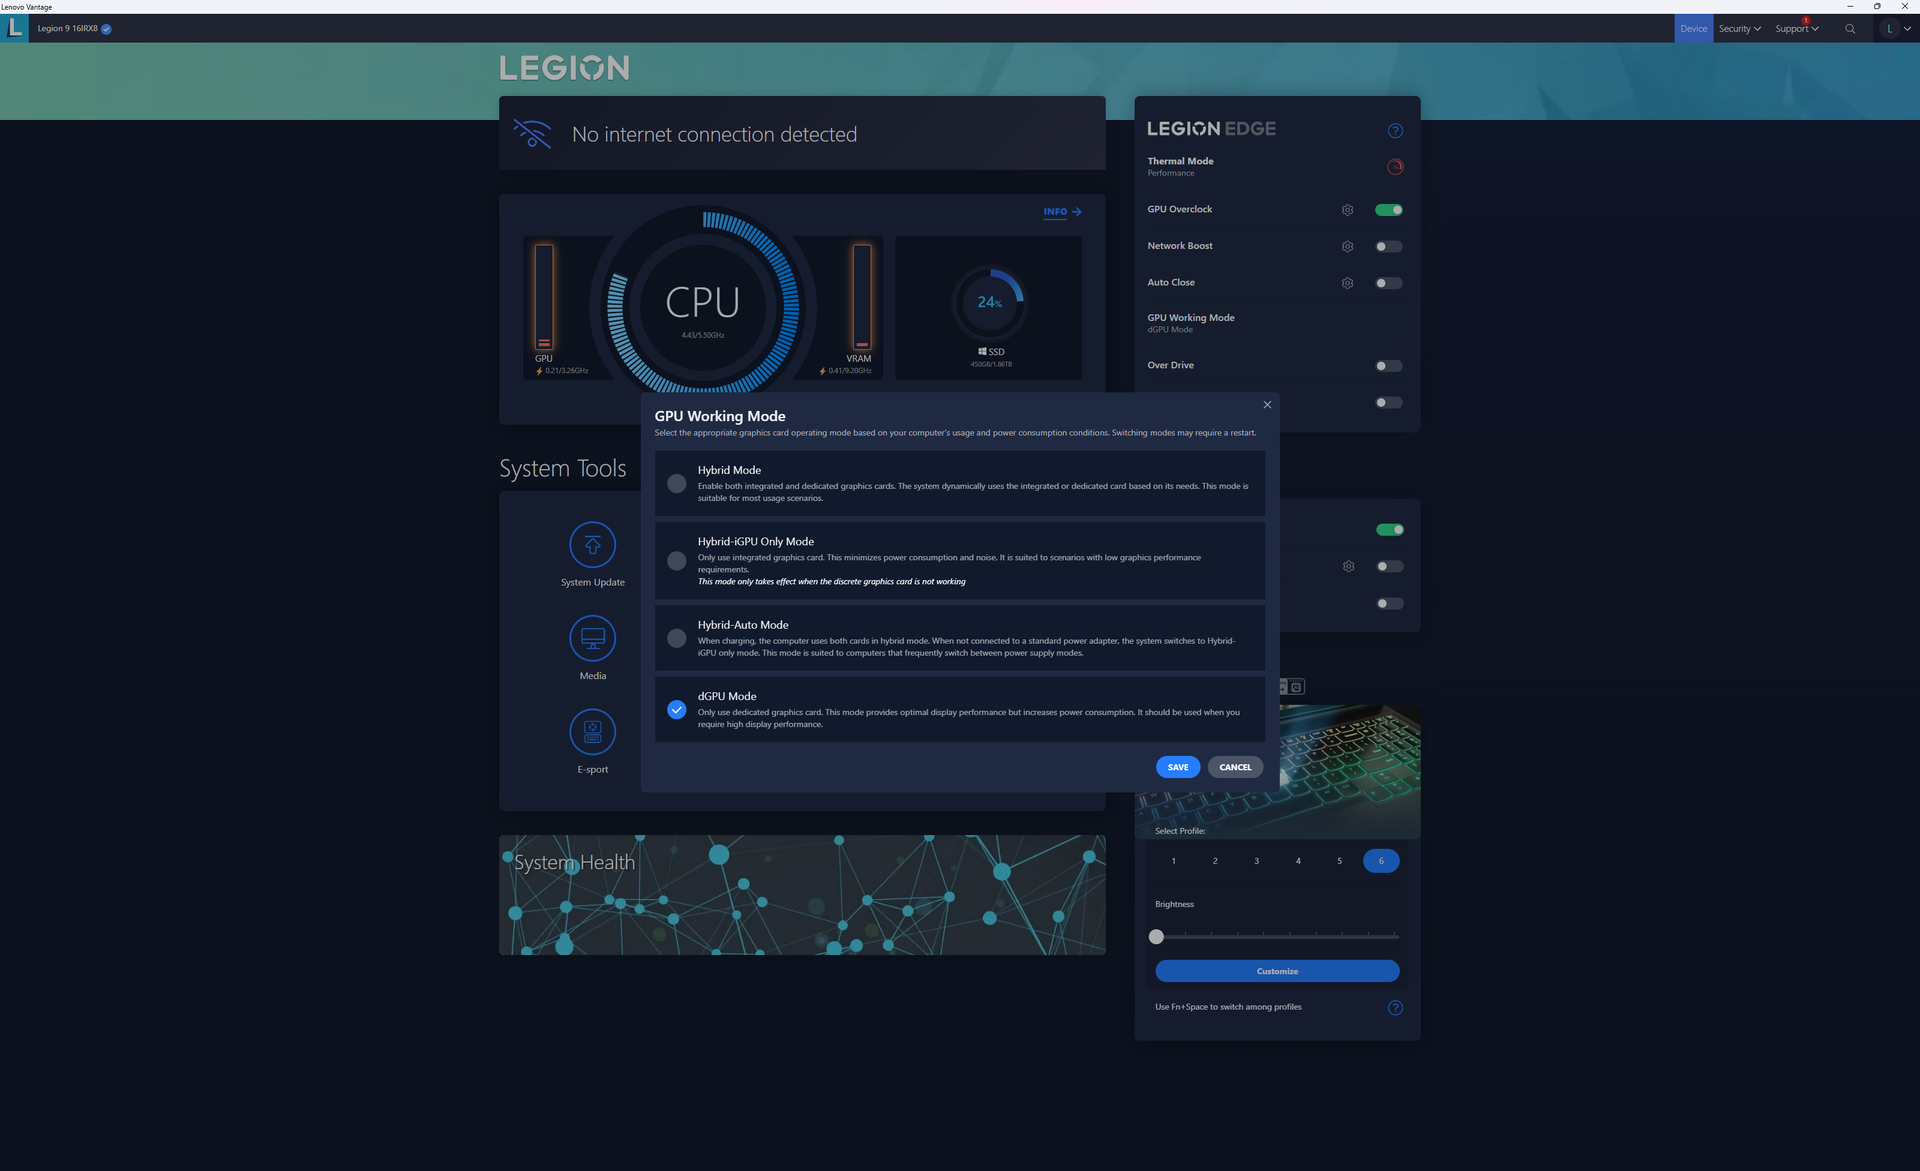
Abbiamo impostato la nostra unità in modalità Performance e dGPU tramite Lenovo Vantage prima di eseguire i benchmark qui sotto. Anche l'overclock della GPU è abilitato per impostazione predefinita a +150 MHz per la GPU e +200 MHz per la VRAM, come su altri modelli di fascia alta Legion. Si raccomanda ai proprietari di familiarizzare con Vantage per regolare i profili di alimentazione e altre impostazioni ausiliarie.
Optimus avanzato, MUX e G-Sync sono tutti supportati, a differenza di quanto accade sui recenti modelli di Legion Slim 5 14.
Processore
Le prestazioni della CPU sono eccellenti, con risultati che sono circa l'80-90 percento più veloci nei carichi di lavoro multi-threaded rispetto al comune Core i7-13700H. Il Core i9-13980HX è una delle CPU mobili più veloci di Intel al momento, ma è ancora indietro rispetto al concorrenteRyzen 9 7945HX nella maggior parte dei benchmark multi-thread di circa il 10%.
Le prestazioni sono più veloci solo del 5 percento rispetto al Core i9-13950HX in base al tempo trascorso con il Razer Blade 16 2023. Purtroppo, Lenovo non offre altre opzioni di CPU oltre al Core i9-13980HX per chi volesse risparmiare qualche centinaio di dollari.
Cinebench R15 Multi Loop
Cinebench R23: Multi Core | Single Core
Cinebench R20: CPU (Multi Core) | CPU (Single Core)
Cinebench R15: CPU Multi 64Bit | CPU Single 64Bit
Blender: v2.79 BMW27 CPU
7-Zip 18.03: 7z b 4 | 7z b 4 -mmt1
Geekbench 5.5: Multi-Core | Single-Core
HWBOT x265 Benchmark v2.2: 4k Preset
LibreOffice : 20 Documents To PDF
R Benchmark 2.5: Overall mean
* ... Meglio usare valori piccoli
AIDA64: FP32 Ray-Trace | FPU Julia | CPU SHA3 | CPU Queen | FPU SinJulia | FPU Mandel | CPU AES | CPU ZLib | FP64 Ray-Trace | CPU PhotoWorxx
| Performance rating | |
| Lenovo Legion 9 16IRX8 | |
| Media Intel Core i9-13980HX | |
| Asus ROG Strix G16 G614JZ | |
| HP Omen Transcend 16 | |
| Razer Blade 16 Early 2023 RTX 4090 | |
| Lenovo Legion Slim 5 16APH8 | |
| Alienware x16 R1 | |
| AIDA64 / FP32 Ray-Trace | |
| Lenovo Legion Slim 5 16APH8 | |
| Asus ROG Strix G16 G614JZ | |
| Lenovo Legion 9 16IRX8 | |
| Media Intel Core i9-13980HX (21332 - 29553, n=9) | |
| HP Omen Transcend 16 | |
| Alienware x16 R1 | |
| Razer Blade 16 Early 2023 RTX 4090 | |
| AIDA64 / FPU Julia | |
| Lenovo Legion 9 16IRX8 | |
| Media Intel Core i9-13980HX (108001 - 148168, n=9) | |
| Asus ROG Strix G16 G614JZ | |
| Lenovo Legion Slim 5 16APH8 | |
| HP Omen Transcend 16 | |
| Razer Blade 16 Early 2023 RTX 4090 | |
| Alienware x16 R1 | |
| AIDA64 / CPU SHA3 | |
| Lenovo Legion 9 16IRX8 | |
| Asus ROG Strix G16 G614JZ | |
| Media Intel Core i9-13980HX (5264 - 7142, n=9) | |
| Razer Blade 16 Early 2023 RTX 4090 | |
| HP Omen Transcend 16 | |
| Lenovo Legion Slim 5 16APH8 | |
| Alienware x16 R1 | |
| AIDA64 / CPU Queen | |
| Asus ROG Strix G16 G614JZ | |
| Media Intel Core i9-13980HX (126758 - 143409, n=9) | |
| Razer Blade 16 Early 2023 RTX 4090 | |
| Lenovo Legion 9 16IRX8 | |
| HP Omen Transcend 16 | |
| Lenovo Legion Slim 5 16APH8 | |
| Alienware x16 R1 | |
| AIDA64 / FPU SinJulia | |
| Asus ROG Strix G16 G614JZ | |
| Media Intel Core i9-13980HX (13785 - 17117, n=9) | |
| Lenovo Legion 9 16IRX8 | |
| Lenovo Legion Slim 5 16APH8 | |
| HP Omen Transcend 16 | |
| Razer Blade 16 Early 2023 RTX 4090 | |
| Alienware x16 R1 | |
| AIDA64 / FPU Mandel | |
| Lenovo Legion 9 16IRX8 | |
| Media Intel Core i9-13980HX (53398 - 73758, n=9) | |
| Asus ROG Strix G16 G614JZ | |
| Lenovo Legion Slim 5 16APH8 | |
| HP Omen Transcend 16 | |
| Razer Blade 16 Early 2023 RTX 4090 | |
| Alienware x16 R1 | |
| AIDA64 / CPU AES | |
| Razer Blade 16 Early 2023 RTX 4090 | |
| Asus ROG Strix G16 G614JZ | |
| Lenovo Legion 9 16IRX8 | |
| Media Intel Core i9-13980HX (105169 - 136520, n=9) | |
| HP Omen Transcend 16 | |
| Alienware x16 R1 | |
| Lenovo Legion Slim 5 16APH8 | |
| AIDA64 / CPU ZLib | |
| Lenovo Legion 9 16IRX8 | |
| Asus ROG Strix G16 G614JZ | |
| Media Intel Core i9-13980HX (1513 - 2039, n=9) | |
| Razer Blade 16 Early 2023 RTX 4090 | |
| HP Omen Transcend 16 | |
| Alienware x16 R1 | |
| Lenovo Legion Slim 5 16APH8 | |
| AIDA64 / FP64 Ray-Trace | |
| Lenovo Legion Slim 5 16APH8 | |
| Lenovo Legion 9 16IRX8 | |
| Asus ROG Strix G16 G614JZ | |
| Media Intel Core i9-13980HX (11431 - 16325, n=9) | |
| HP Omen Transcend 16 | |
| Alienware x16 R1 | |
| Razer Blade 16 Early 2023 RTX 4090 | |
| AIDA64 / CPU PhotoWorxx | |
| Razer Blade 16 Early 2023 RTX 4090 | |
| Lenovo Legion 9 16IRX8 | |
| HP Omen Transcend 16 | |
| Alienware x16 R1 | |
| Media Intel Core i9-13980HX (37069 - 52949, n=9) | |
| Asus ROG Strix G16 G614JZ | |
| Lenovo Legion Slim 5 16APH8 | |
Prestazioni del sistema
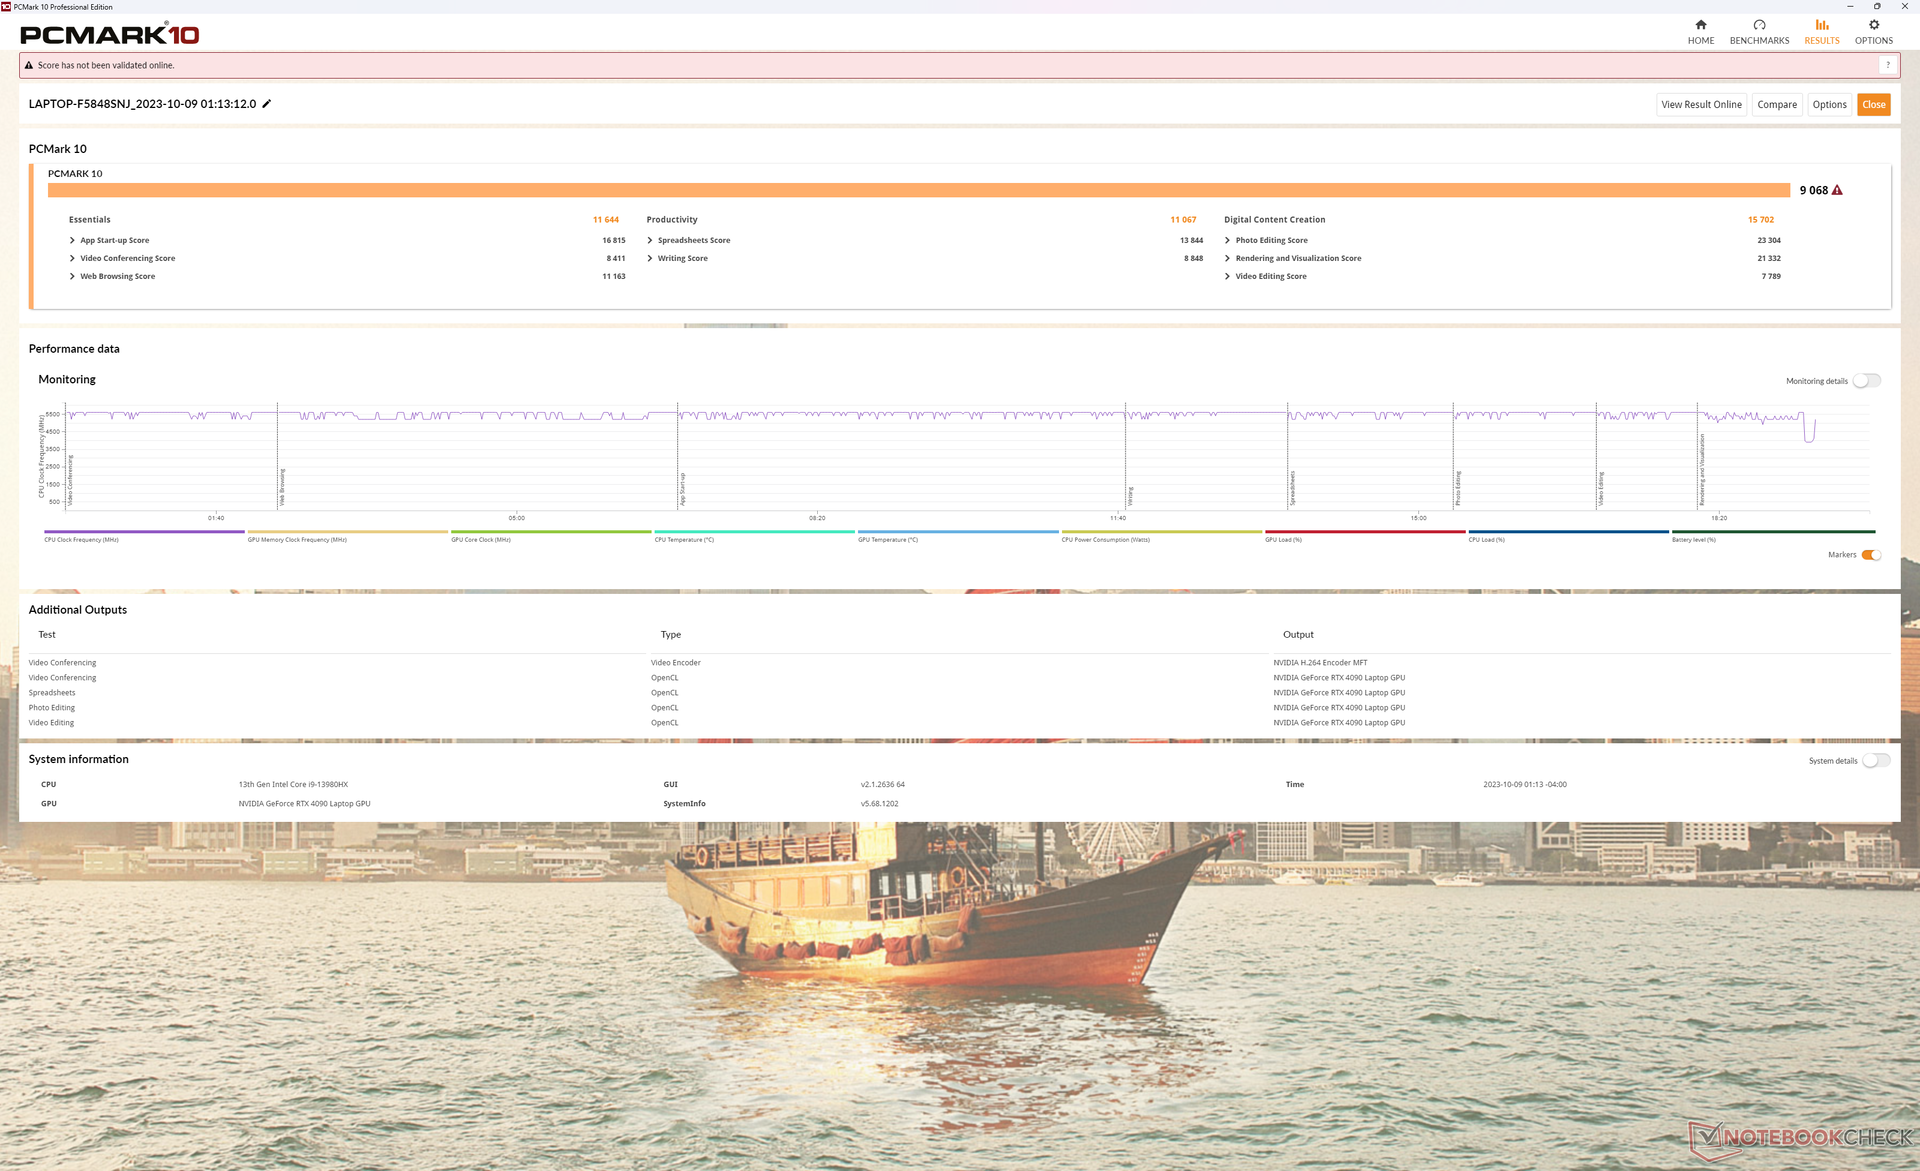
I punteggi di PCMark sono tra i più alti di qualsiasi portatile da gioco, indipendentemente dalle dimensioni, grazie soprattutto alla CPU Core HX di 13a generazione, alla GPU RTX 4090 e soprattutto alla configurazione RAID 0 PCIe4 x4. Ciononostante, abbiamo riscontrato problemi di risveglio dal sonno, in cui lo schermo a volte rimaneva vuoto e "congelato" per periodi di tempo insolitamente lunghi. Sospettiamo che questo possa essere dovuto al modo in cui il modello si destreggia tra le diverse modalità della GPU.
CrossMark: Overall | Productivity | Creativity | Responsiveness
| PCMark 10 / Score | |
| Lenovo Legion 9 16IRX8 | |
| Media Intel Core i9-13980HX, NVIDIA GeForce RTX 4090 Laptop GPU (8650 - 9068, n=4) | |
| Alienware x16 R1 | |
| HP Omen Transcend 16 | |
| Lenovo Legion Slim 5 16APH8 | |
| Razer Blade 16 Early 2023 RTX 4090 | |
| Asus ROG Strix G16 G614JZ | |
| PCMark 10 / Essentials | |
| Asus ROG Strix G16 G614JZ | |
| Lenovo Legion 9 16IRX8 | |
| Media Intel Core i9-13980HX, NVIDIA GeForce RTX 4090 Laptop GPU (11215 - 11644, n=3) | |
| HP Omen Transcend 16 | |
| Lenovo Legion Slim 5 16APH8 | |
| Alienware x16 R1 | |
| Razer Blade 16 Early 2023 RTX 4090 | |
| PCMark 10 / Productivity | |
| Lenovo Legion 9 16IRX8 | |
| Media Intel Core i9-13980HX, NVIDIA GeForce RTX 4090 Laptop GPU (10125 - 11067, n=3) | |
| Lenovo Legion Slim 5 16APH8 | |
| Alienware x16 R1 | |
| HP Omen Transcend 16 | |
| Razer Blade 16 Early 2023 RTX 4090 | |
| Asus ROG Strix G16 G614JZ | |
| PCMark 10 / Digital Content Creation | |
| Lenovo Legion 9 16IRX8 | |
| Media Intel Core i9-13980HX, NVIDIA GeForce RTX 4090 Laptop GPU (15052 - 16012, n=3) | |
| Alienware x16 R1 | |
| HP Omen Transcend 16 | |
| Razer Blade 16 Early 2023 RTX 4090 | |
| Lenovo Legion Slim 5 16APH8 | |
| Asus ROG Strix G16 G614JZ | |
| CrossMark / Overall | |
| Asus ROG Strix G16 G614JZ | |
| Media Intel Core i9-13980HX, NVIDIA GeForce RTX 4090 Laptop GPU (1935 - 2176, n=4) | |
| Razer Blade 16 Early 2023 RTX 4090 | |
| HP Omen Transcend 16 | |
| Alienware x16 R1 | |
| Lenovo Legion 9 16IRX8 | |
| Lenovo Legion Slim 5 16APH8 | |
| CrossMark / Productivity | |
| Asus ROG Strix G16 G614JZ | |
| Razer Blade 16 Early 2023 RTX 4090 | |
| Media Intel Core i9-13980HX, NVIDIA GeForce RTX 4090 Laptop GPU (1764 - 2005, n=4) | |
| Alienware x16 R1 | |
| HP Omen Transcend 16 | |
| Lenovo Legion 9 16IRX8 | |
| Lenovo Legion Slim 5 16APH8 | |
| CrossMark / Creativity | |
| Asus ROG Strix G16 G614JZ | |
| Media Intel Core i9-13980HX, NVIDIA GeForce RTX 4090 Laptop GPU (2267 - 2469, n=4) | |
| HP Omen Transcend 16 | |
| Lenovo Legion 9 16IRX8 | |
| Razer Blade 16 Early 2023 RTX 4090 | |
| Alienware x16 R1 | |
| Lenovo Legion Slim 5 16APH8 | |
| CrossMark / Responsiveness | |
| Asus ROG Strix G16 G614JZ | |
| Alienware x16 R1 | |
| Razer Blade 16 Early 2023 RTX 4090 | |
| Media Intel Core i9-13980HX, NVIDIA GeForce RTX 4090 Laptop GPU (1556 - 1904, n=4) | |
| Lenovo Legion 9 16IRX8 | |
| HP Omen Transcend 16 | |
| Lenovo Legion Slim 5 16APH8 | |
| PCMark 10 Score | 9068 punti | |
Aiuto | ||
| AIDA64 / Memory Copy | |
| Razer Blade 16 Early 2023 RTX 4090 | |
| Lenovo Legion 9 16IRX8 | |
| HP Omen Transcend 16 | |
| Alienware x16 R1 | |
| Media Intel Core i9-13980HX (62189 - 80776, n=9) | |
| Lenovo Legion Slim 5 16APH8 | |
| Asus ROG Strix G16 G614JZ | |
| AIDA64 / Memory Read | |
| Lenovo Legion 9 16IRX8 | |
| Razer Blade 16 Early 2023 RTX 4090 | |
| HP Omen Transcend 16 | |
| Media Intel Core i9-13980HX (62624 - 89096, n=9) | |
| Asus ROG Strix G16 G614JZ | |
| Alienware x16 R1 | |
| Lenovo Legion Slim 5 16APH8 | |
| AIDA64 / Memory Write | |
| Alienware x16 R1 | |
| Lenovo Legion Slim 5 16APH8 | |
| Razer Blade 16 Early 2023 RTX 4090 | |
| Lenovo Legion 9 16IRX8 | |
| HP Omen Transcend 16 | |
| Media Intel Core i9-13980HX (59912 - 79917, n=9) | |
| Asus ROG Strix G16 G614JZ | |
| AIDA64 / Memory Latency | |
| Alienware x16 R1 | |
| Lenovo Legion Slim 5 16APH8 | |
| HP Omen Transcend 16 | |
| Asus ROG Strix G16 G614JZ | |
| Media Intel Core i9-13980HX (79.4 - 93.2, n=9) | |
| Razer Blade 16 Early 2023 RTX 4090 | |
| Lenovo Legion 9 16IRX8 | |
* ... Meglio usare valori piccoli
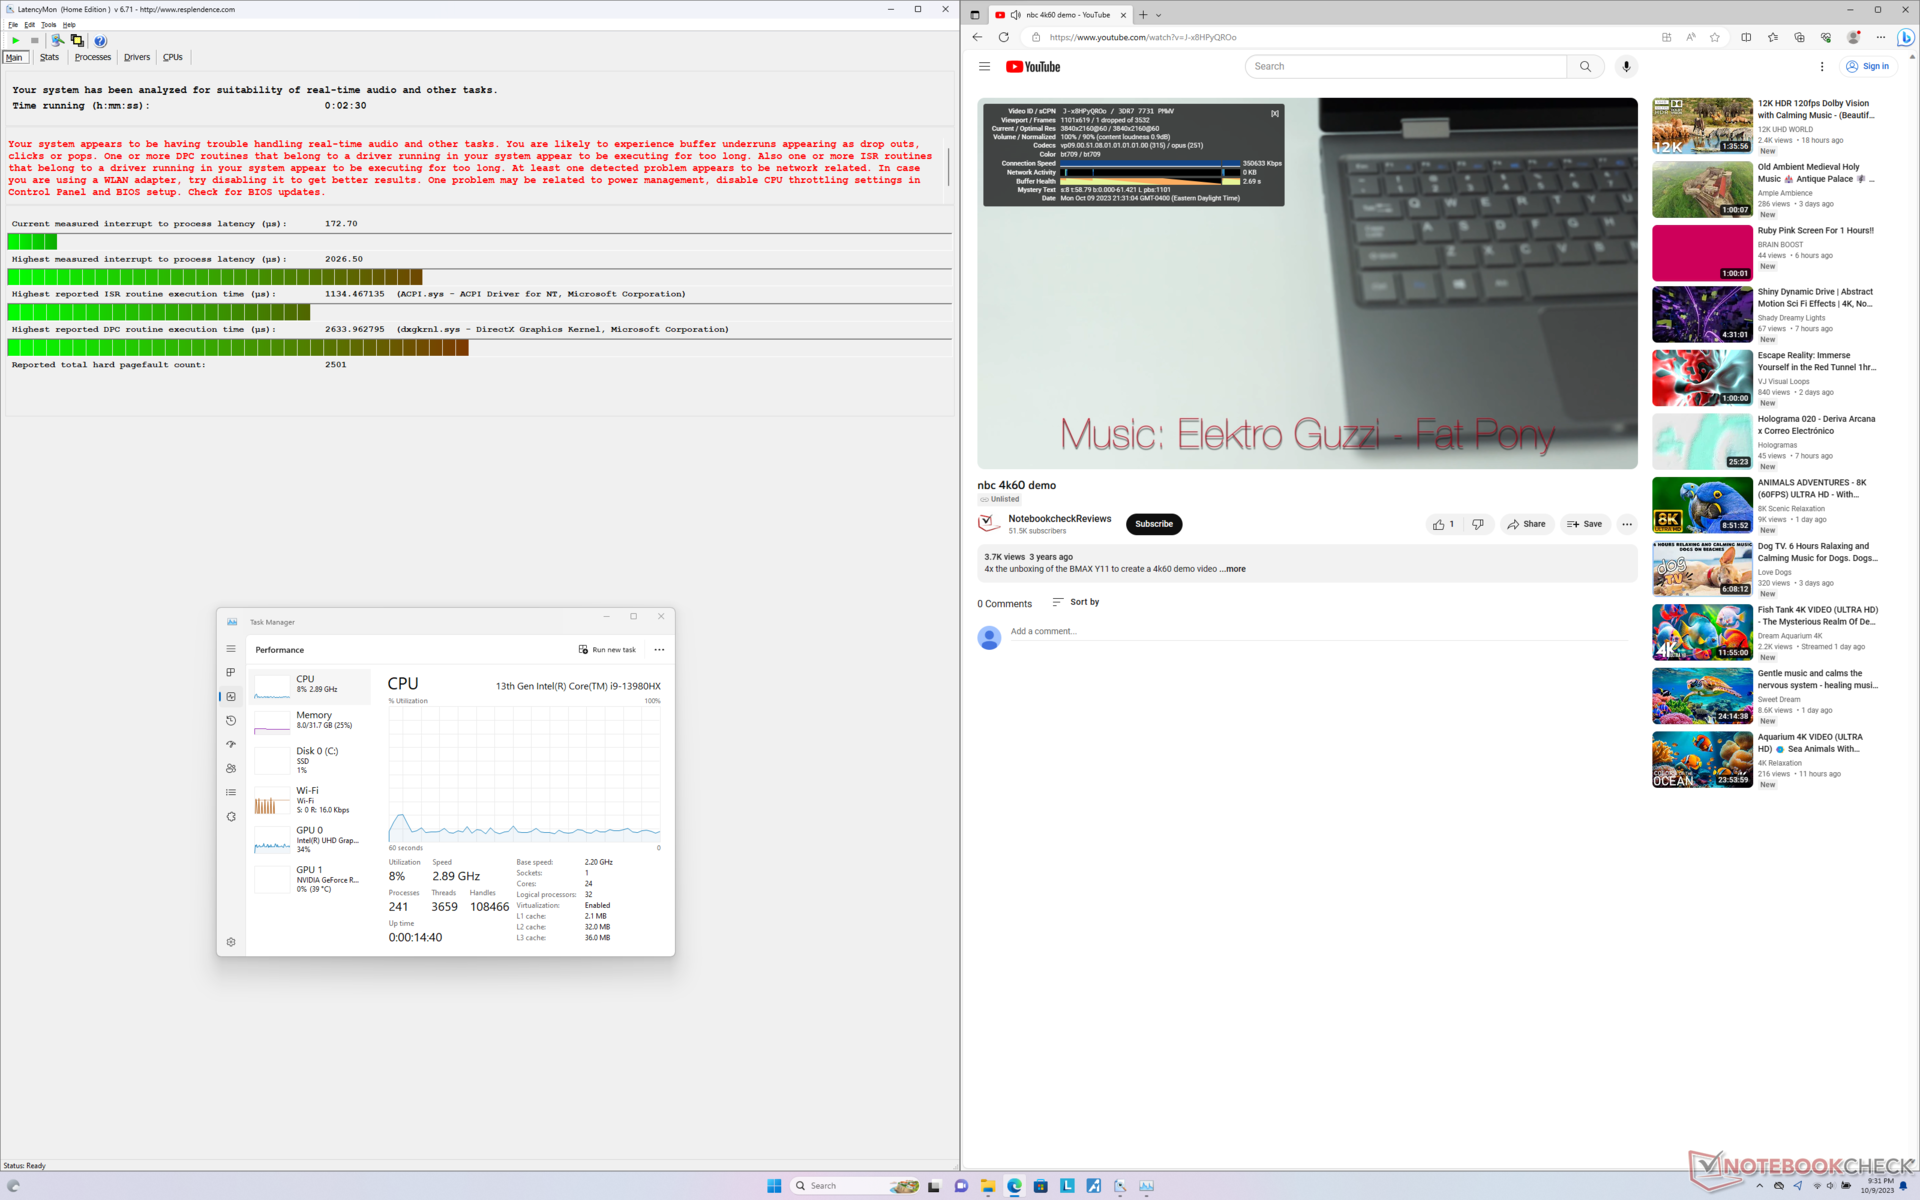
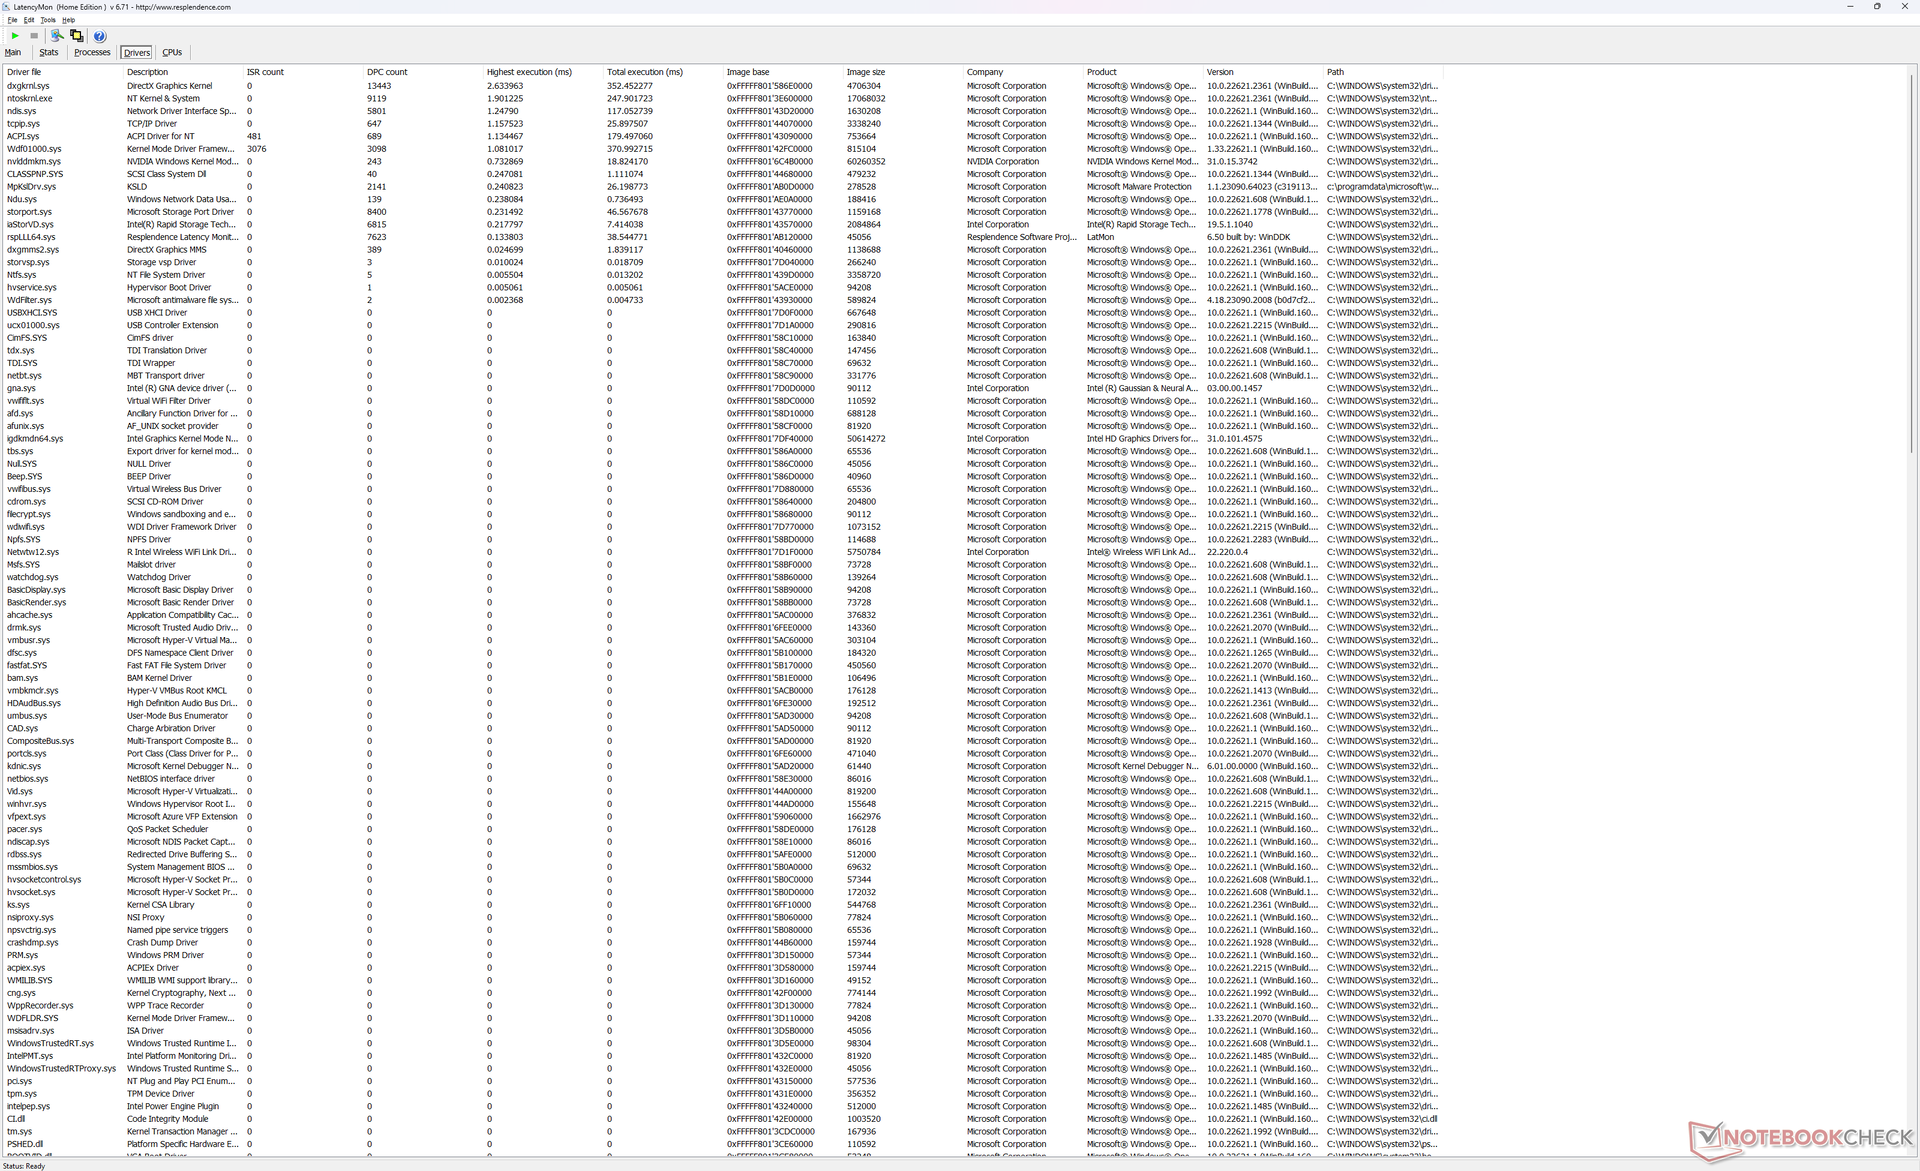
Latenza DPC
LatencyMon rivela problemi di DPC quando si aprono più schede del browser della nostra homepage. la riproduzione di video 4K a 60 FPS è quasi perfetta, con un solo fotogramma perso registrato durante un intervallo di un minuto.
| DPC Latencies / LatencyMon - interrupt to process latency (max), Web, Youtube, Prime95 | |
| Razer Blade 16 Early 2023 RTX 4090 | |
| Razer Blade 16 Early 2023 RTX 4090 | |
| Asus ROG Strix G16 G614JZ | |
| Lenovo Legion 9 16IRX8 | |
| HP Omen Transcend 16 | |
| Alienware x16 R1 | |
| Lenovo Legion Slim 5 16APH8 | |
* ... Meglio usare valori piccoli
Dispositivi di archiviazione
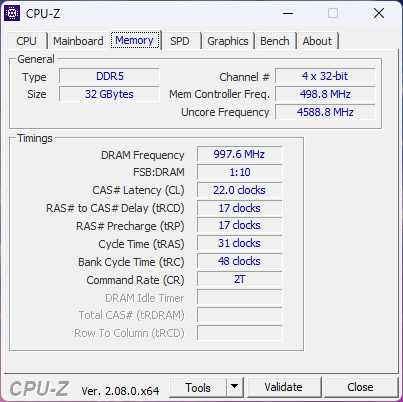
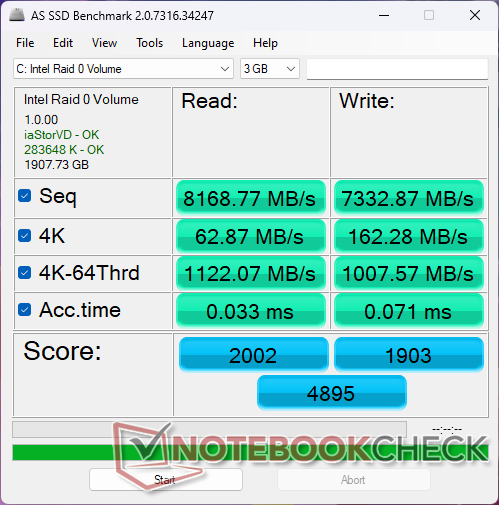
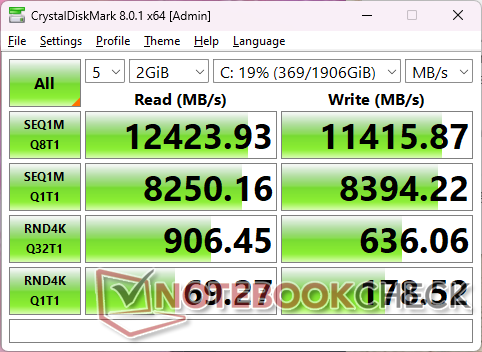
La nostra unità è configurata con due SK hynix HFS001TEJ9X115N PCIe4 x4 NVMe in configurazione RAID 0 per velocità di lettura e scrittura sequenziali incredibilmente elevate, rispettivamente di oltre 12000 MB/s e 11000 MB/s. Purtroppo, le unità sono soggette a throttling quando funzionano a velocità così elevate per periodi prolungati. I risultati del nostro test in loop DiskSpd qui sotto mostrano che le velocità di lettura di una delle unità scendono a circa 4600 MB/s dopo circa 4 minuti.

| Drive Performance rating - Percent | |
| Alienware x16 R1 | |
| Lenovo Legion 9 16IRX8 | |
| Razer Blade 16 Early 2023 RTX 4090 | |
| Asus ROG Strix G16 G614JZ | |
| HP Omen Transcend 16 | |
| Lenovo Legion Slim 5 16APH8 | |
* ... Meglio usare valori piccoli
Disk Throttling: DiskSpd Read Loop, Queue Depth 8
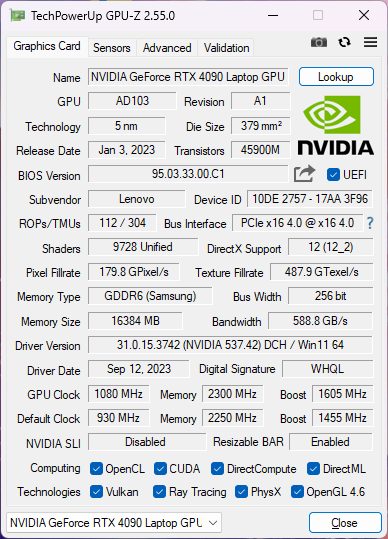
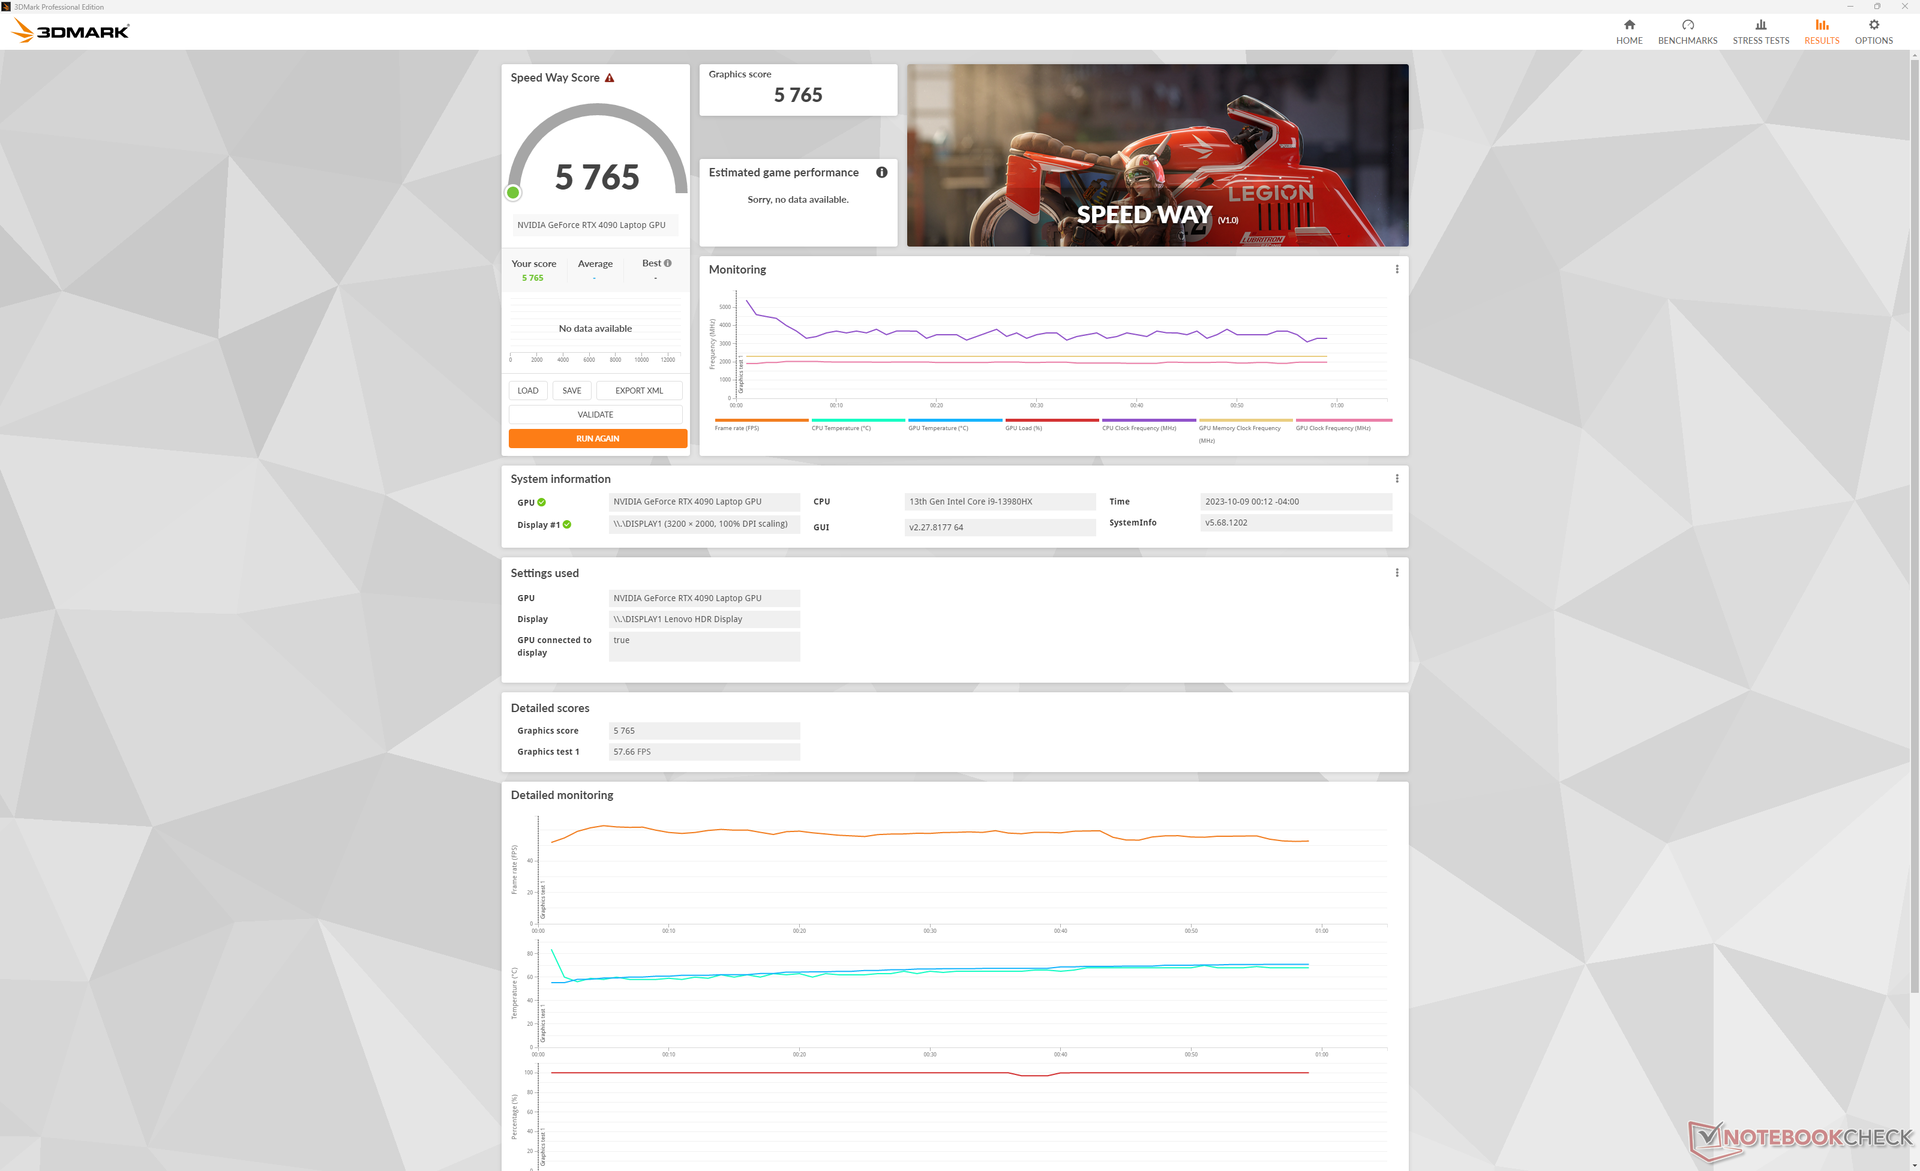
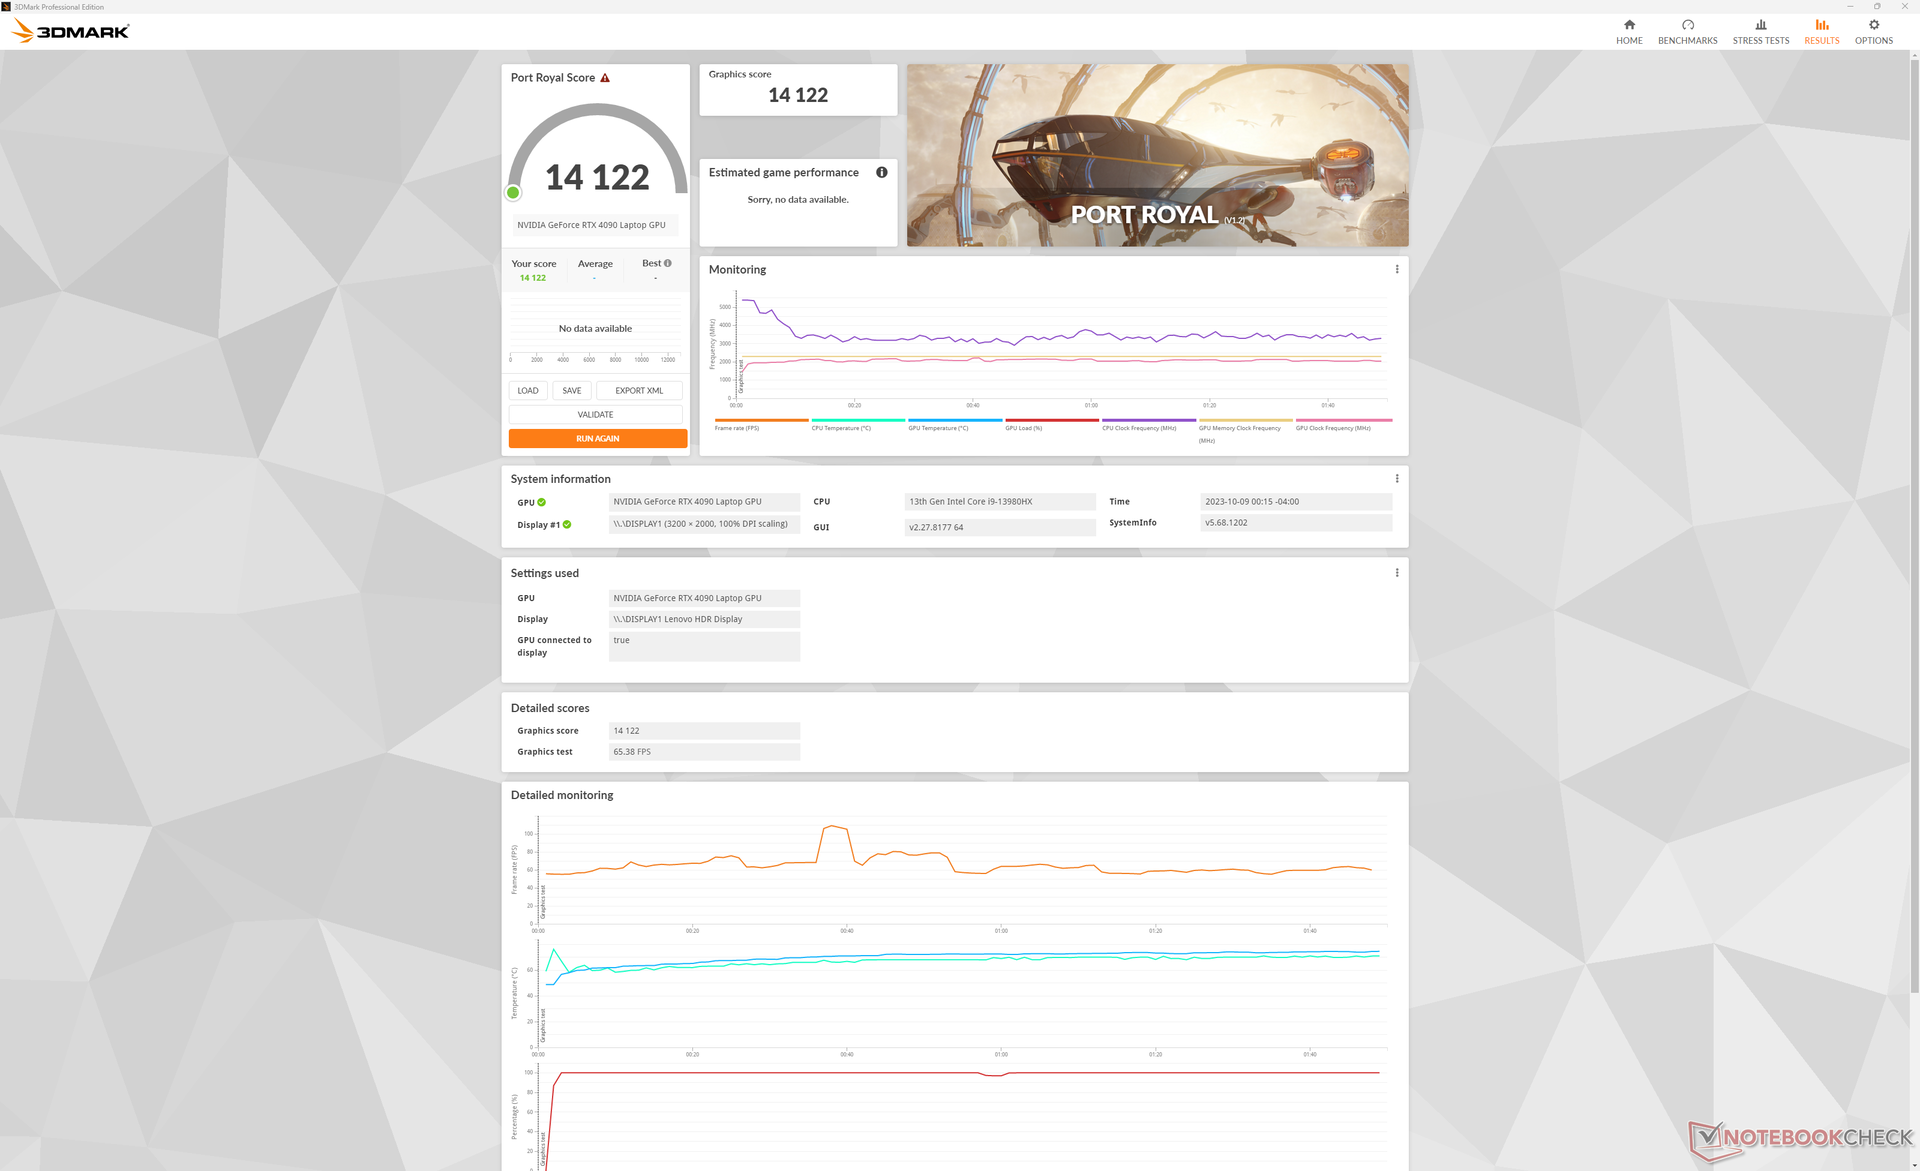
Prestazioni della GPU - Grafica TGP da 175 W
I nostri 175 W mobile GeForce RTX 4090 ha prestazioni inferiori di appena 1 o 2 punti percentuali rispetto al laptop medio del nostro database con la stessa GPU. I risultati sono impressionanti se si considera quanto possono essere grandi alcuni laptop RTX 4090, come ad esempio il modelloMSI Raider GE78 HX 13VI.
Se si guarda al quadro generale, la RTX 4090 mobile è circa il 40 percento più lenta di una RTX 4090 desktop "vera e propria" desktop RTX 4090. In effetti, offre solo vantaggi modesti, dal 5 al 10 percento, rispetto alla RTX 4080 mobile configurazione mobile RTX 4080 configurazione.
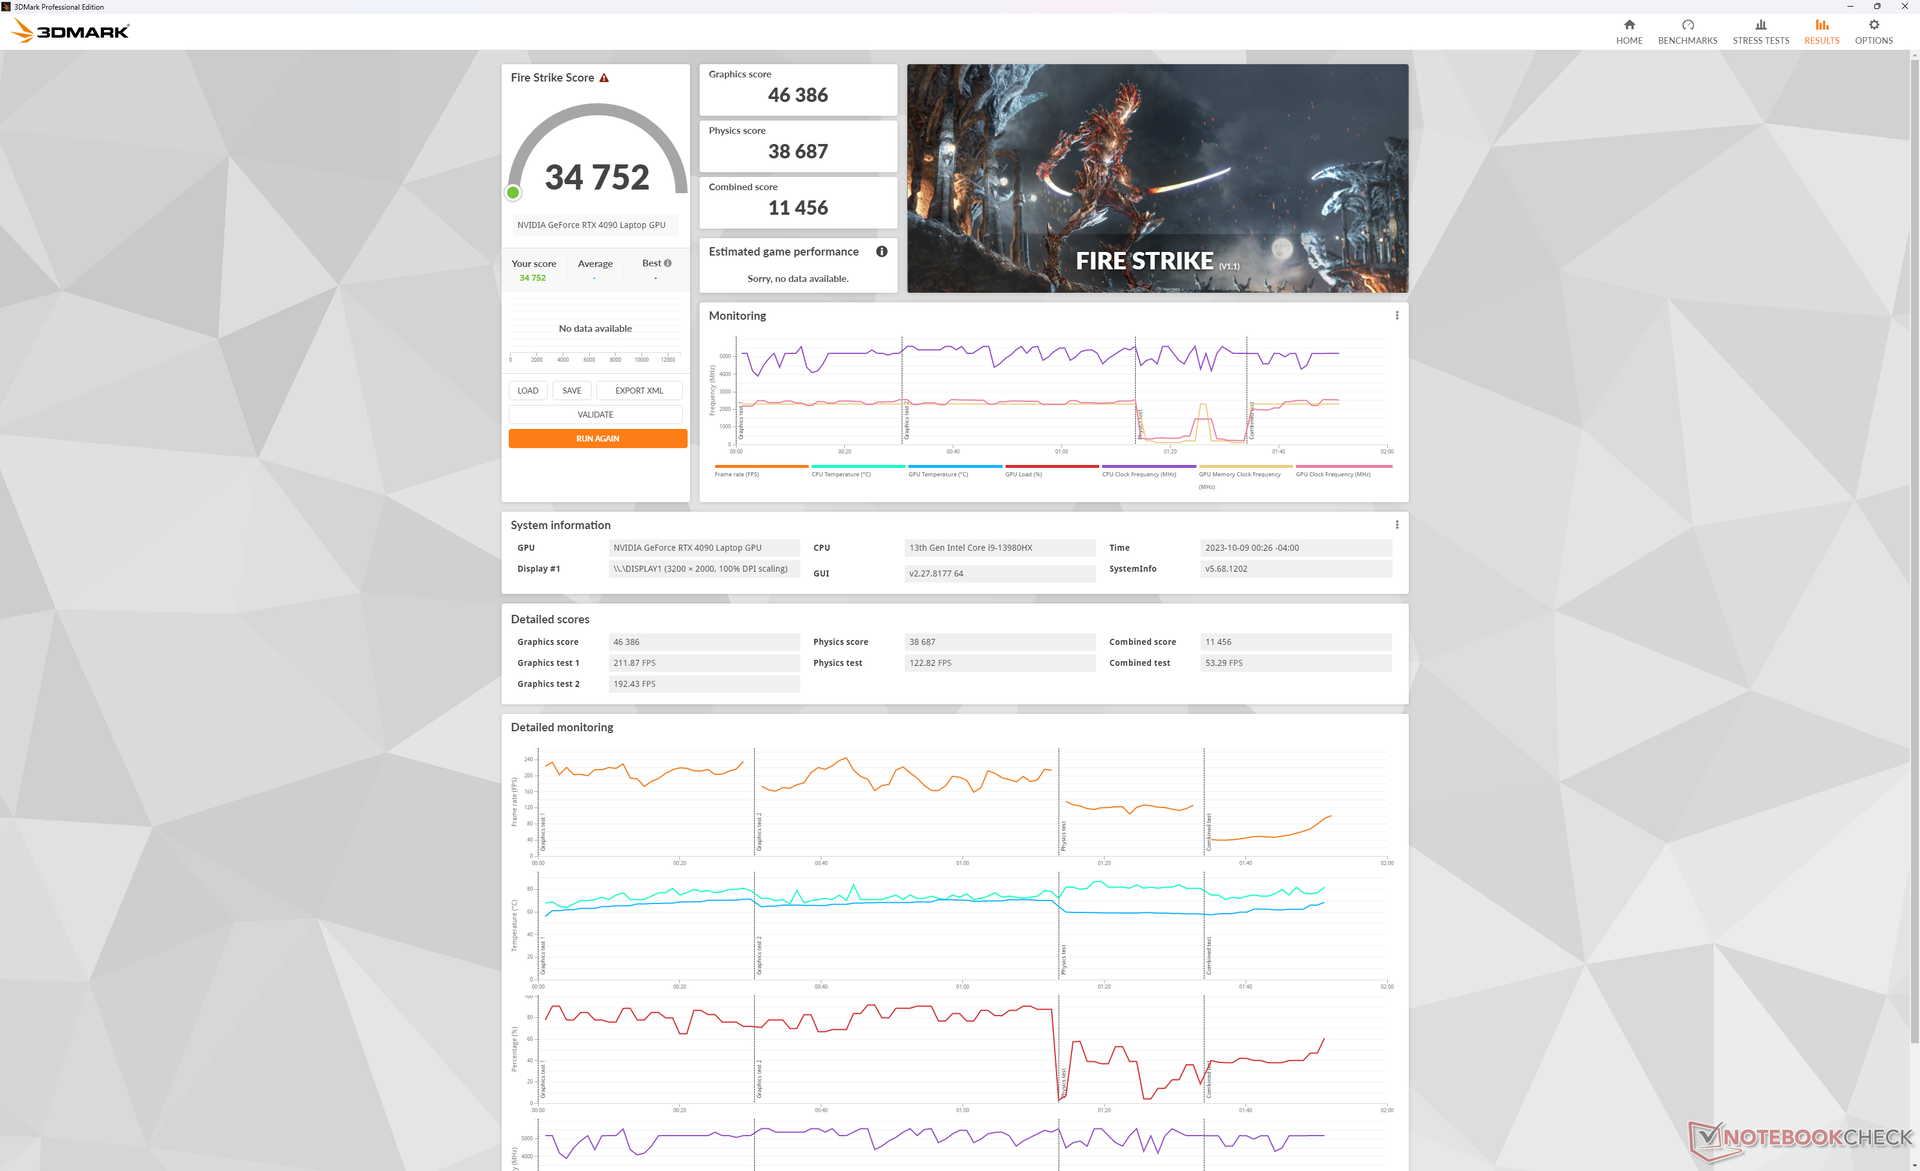
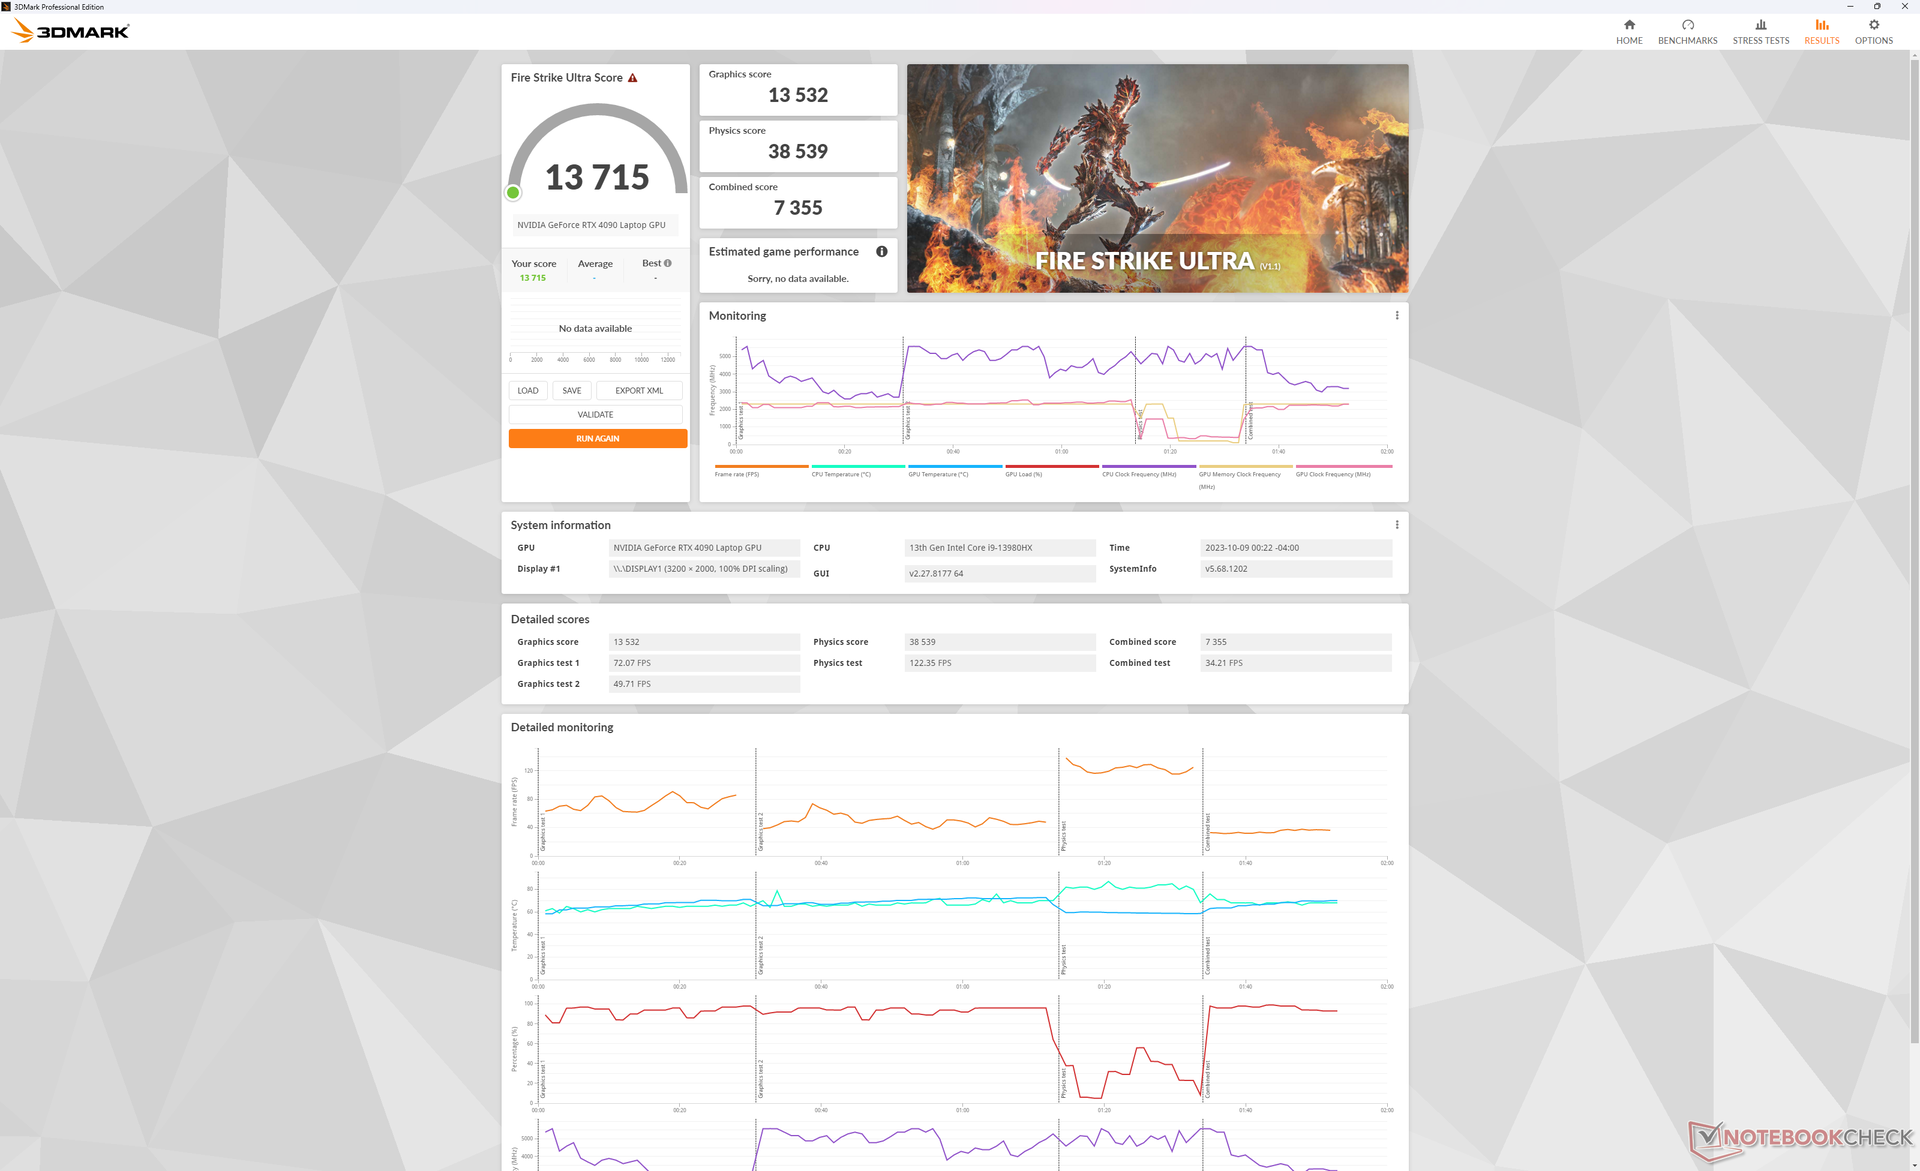
L'esecuzione con il profilo energetico Bilanciato con l'overclocking disattivato ridurrebbe le prestazioni grafiche di circa il 17%, secondo la nostra tabella dei risultati Fire Strike qui sotto.
| Profilo energetico | Punteggio grafico | Punteggio di fisica | Punteggio combinato |
| Modalità Prestazioni | 46386 | 38687 | 11456 |
| Modalità Bilanciata (con Overclock GPU disattivato) | 38285 (-17%) | 39020 (-0%) | 12715 (-0%) |
| Alimentazione a batteria | 22176 (-52%) | 21072 (-46%) | 6306 (-45%) |
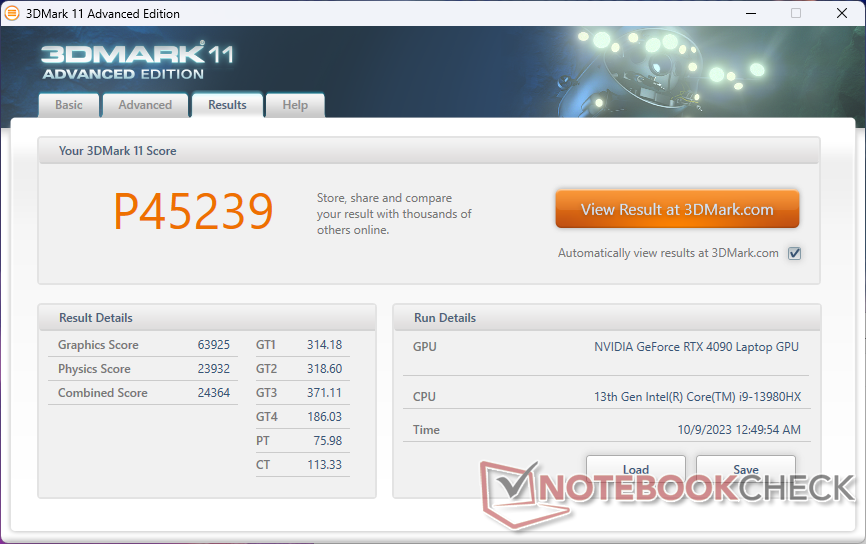
| 3DMark 11 Performance | 45239 punti | |
| 3DMark Fire Strike Score | 34752 punti | |
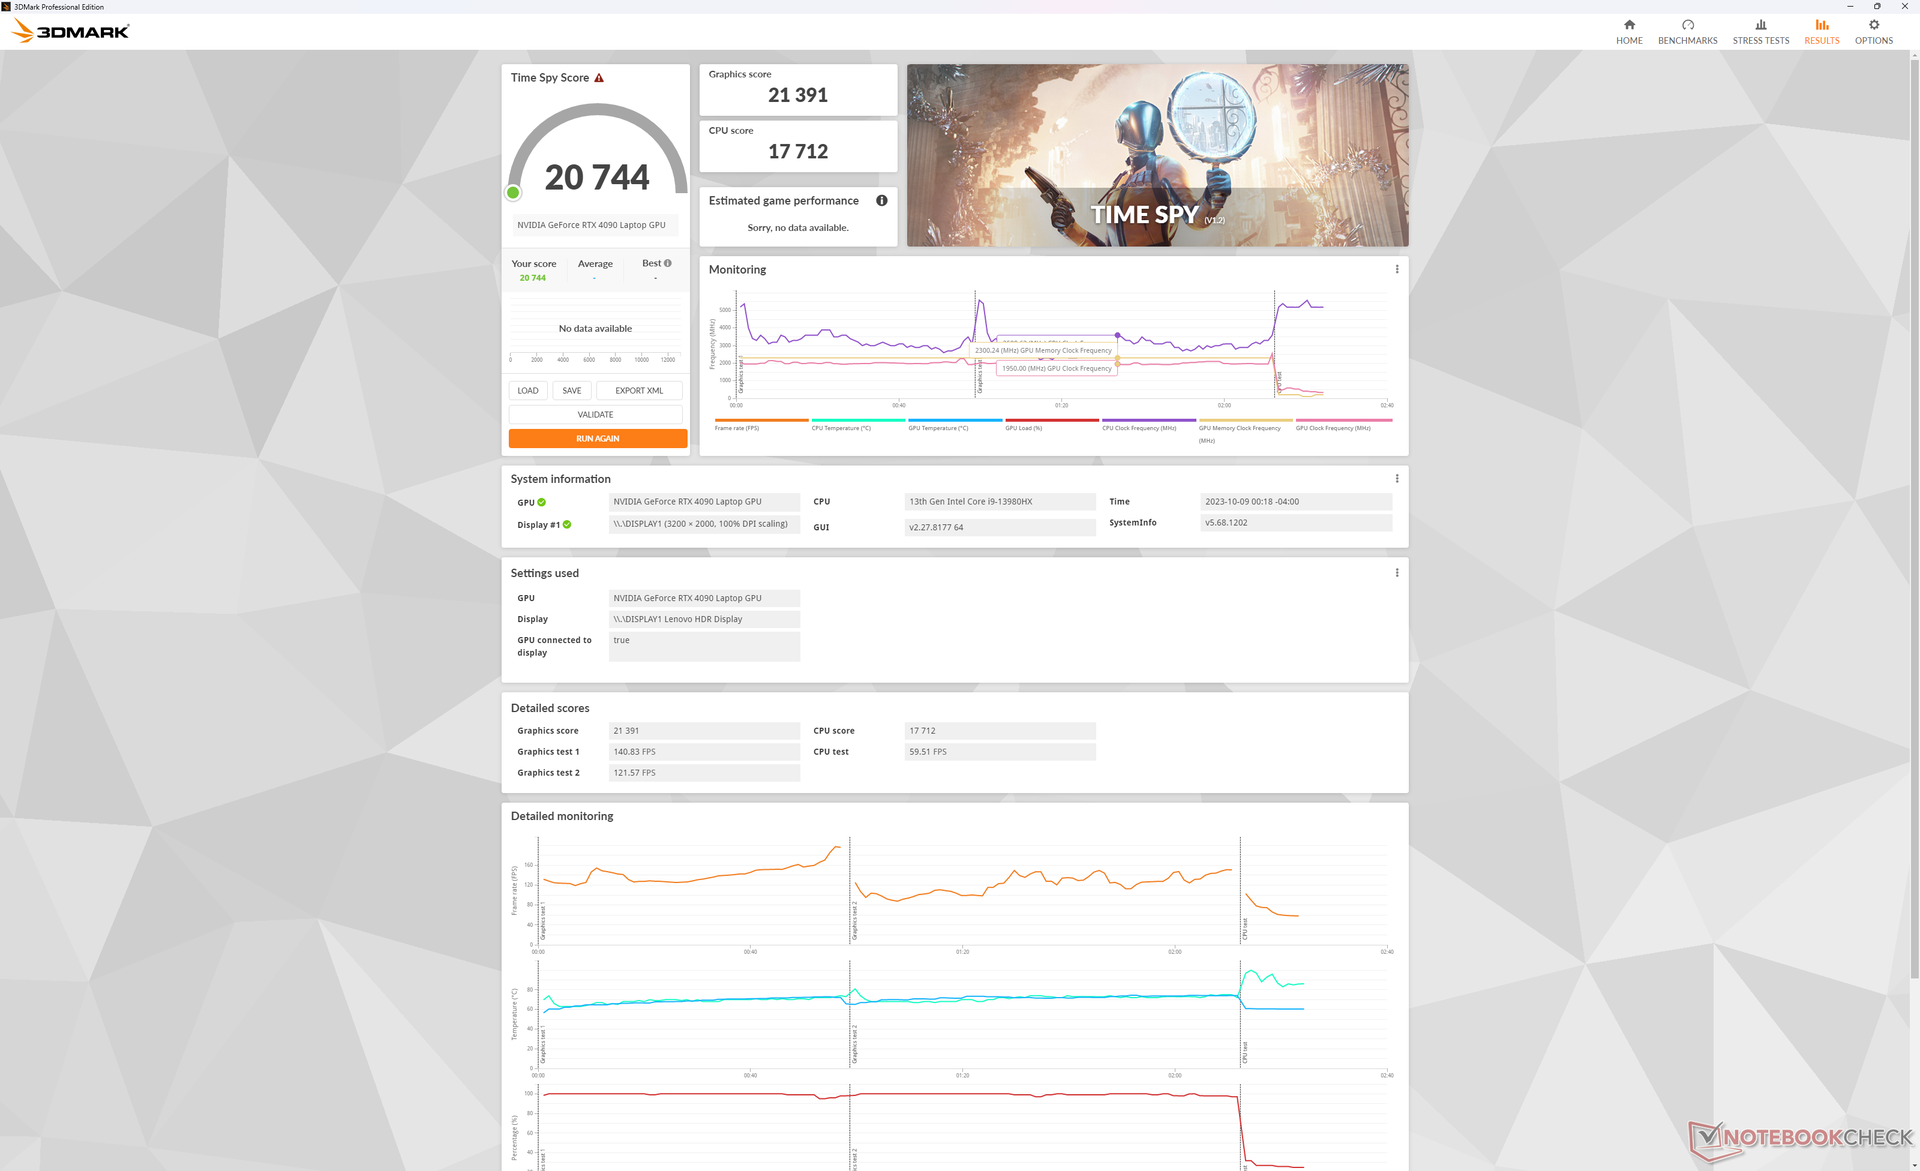
| 3DMark Time Spy Score | 20744 punti | |
Aiuto | ||
* ... Meglio usare valori piccoli
Prestazioni di gioco
Tutti i giochi girano molto bene in QHD o superiore, compresi titoli impegnativi come Cyberpunk 2077 o Ratchet and Clank. Si noti che il G-Sync può essere abilitato solo se impostato sulla modalità dGPU, altrimenti è disabilitato se si utilizza la modalità grafica ibrida o integrata.
| Ratchet & Clank Rift Apart | |
| 1920x1080 Low Preset | |
| Lenovo Legion 9 16IRX8 | |
| Media NVIDIA GeForce RTX 4090 Laptop GPU (n=1) | |
| MSI Raider GE68HX 13VF | |
| 1920x1080 Medium Preset AA:T | |
| Media NVIDIA GeForce RTX 4090 Laptop GPU (155.6 - 161.8, n=2) | |
| Lenovo Legion 9 16IRX8 | |
| MSI Raider GE68HX 13VF | |
| 1920x1080 High Preset AA:T | |
| Media NVIDIA GeForce RTX 4090 Laptop GPU (135.4 - 136.6, n=2) | |
| Lenovo Legion 9 16IRX8 | |
| MSI Raider GE68HX 13VF | |
| 1920x1080 Very High Preset AA:T | |
| Media NVIDIA GeForce RTX 4090 Laptop GPU (111.1 - 115.4, n=2) | |
| Lenovo Legion 9 16IRX8 | |
| MSI Raider GE68HX 13VF | |
| 2560x1440 Very High Preset AA:T | |
| Media NVIDIA GeForce RTX 4090 Laptop GPU (98.7 - 107.1, n=2) | |
| Lenovo Legion 9 16IRX8 | |
Witcher 3 FPS Chart
| basso | medio | alto | ultra | QHD | |
|---|---|---|---|---|---|
| GTA V (2015) | 187.1 | 186.3 | 184.8 | 150.7 | 145.3 |
| The Witcher 3 (2015) | 671.8 | 569 | 408.2 | 208.7 | 165 |
| Dota 2 Reborn (2015) | 244 | 217 | 208 | 193.1 | |
| Final Fantasy XV Benchmark (2018) | 231 | 207 | 181.3 | 158.4 | |
| X-Plane 11.11 (2018) | 214 | 185.9 | 140.1 | ||
| Far Cry 5 (2018) | 195 | 176 | 167 | 158 | 157 |
| Strange Brigade (2018) | 487 | 409 | 390 | 387 | 312 |
| Cyberpunk 2077 1.6 (2022) | 146.9 | 142.9 | 129.5 | 131.4 | 98.8 |
| Tiny Tina's Wonderlands (2022) | 377.6 | 290.4 | 226.2 | 186.4 | 137.8 |
| F1 22 (2022) | 336 | 333 | 286 | 130.8 | 90.9 |
| Ratchet & Clank Rift Apart (2023) | 163.4 | 155.6 | 135.4 | 111.1 | 98.7 |
| Cyberpunk 2077 (2023) | 131.22 | 89.55 | |||
| Alan Wake 2 (2023) | 121.1 | 83.7 | |||
| Avatar Frontiers of Pandora (2023) | 100 | 69 |
Emissioni
Rumore del sistema
Le ventole non sono quasi mai al minimo e quindi bisogna sempre aspettarsi un po' di rumore. Tendono a oscillare intorno ai 30,4 dB(A) contro uno sfondo silenzioso di 23,7 dB(A) quando si sottopone ai carichi più comuni, come la navigazione web o lo streaming video, anche quando è impostata la modalità Quiet. Questo intervallo è tipico della maggior parte degli altri computer portatili da gioco in condizioni simili, ma Legion 9i 16 non pulsa così frequentemente, a condizione che si utilizzi la modalità iGPU Bilanciata o inferiore.
Il rumore della ventola aumenta in modo significativo fino a 52,2 dB(A) quando si gioca in modalità Performance, che è l'intervallo previsto per i portatili da gioco di fascia alta. Il rumore diminuisce leggermente a 49,5 dB(A) se invece gioca in modalità Bilanciata, ma tenga presente il deficit grafico del 17% rispetto alla modalità Prestazioni, come indicato sopra. In entrambi i casi, si consiglia di usare le cuffie quando si gioca.
Rumorosità
| Idle |
| 24 / 24 / 30.4 dB(A) |
| Sotto carico |
| 30.4 / 54.9 dB(A) |
 | ||
30 dB silenzioso 40 dB(A) udibile 50 dB(A) rumoroso |
||
min: | ||
| Lenovo Legion 9 16IRX8 GeForce RTX 4090 Laptop GPU, i9-13980HX, 2x SK Hynix HFS001TEJ9X115N (RAID 0) | Lenovo Legion Slim 5 16APH8 GeForce RTX 4060 Laptop GPU, R7 7840HS, SK hynix PC801 HFS512GEJ9X115N | Razer Blade 16 Early 2023 RTX 4090 GeForce RTX 4090 Laptop GPU, i9-13950HX, SSSTC CA6-8D1024 | Asus ROG Strix G16 G614JZ GeForce RTX 4080 Laptop GPU, i9-13980HX, WD PC SN560 SDDPNQE-1T00 | HP Omen Transcend 16 GeForce RTX 4070 Laptop GPU, i9-13900HX, SK hynix PC801 HFS002TEJ9X101N | Alienware x16 R1 GeForce RTX 4080 Laptop GPU, i9-13900HK, SK hynix PC801 HFS001TEJ9X101N | |
|---|---|---|---|---|---|---|
| Noise | 1% | 3% | -11% | -13% | -1% | |
| off /ambiente * (dB) | 23.7 | 22.9 3% | 20.84 12% | 25 -5% | 22.9 3% | 22.7 4% |
| Idle Minimum * (dB) | 24 | 23.1 4% | 23.65 1% | 26 -8% | 29.1 -21% | 23.1 4% |
| Idle Average * (dB) | 24 | 23.1 4% | 23.65 1% | 28 -17% | 29.1 -21% | 25.8 -8% |
| Idle Maximum * (dB) | 30.4 | 27.7 9% | 23.65 22% | 30 1% | 29.1 4% | 25.8 15% |
| Load Average * (dB) | 30.4 | 33.3 -10% | 43.35 -43% | 48 -58% | 45.7 -50% | 39.3 -29% |
| Witcher 3 ultra * (dB) | 52.2 | 54 -3% | 46.7 11% | 49 6% | 54.3 -4% | 49.9 4% |
| Load Maximum * (dB) | 54.9 | 54 2% | 46.72 15% | 52 5% | 54.3 1% | 54.8 -0% |
* ... Meglio usare valori piccoli
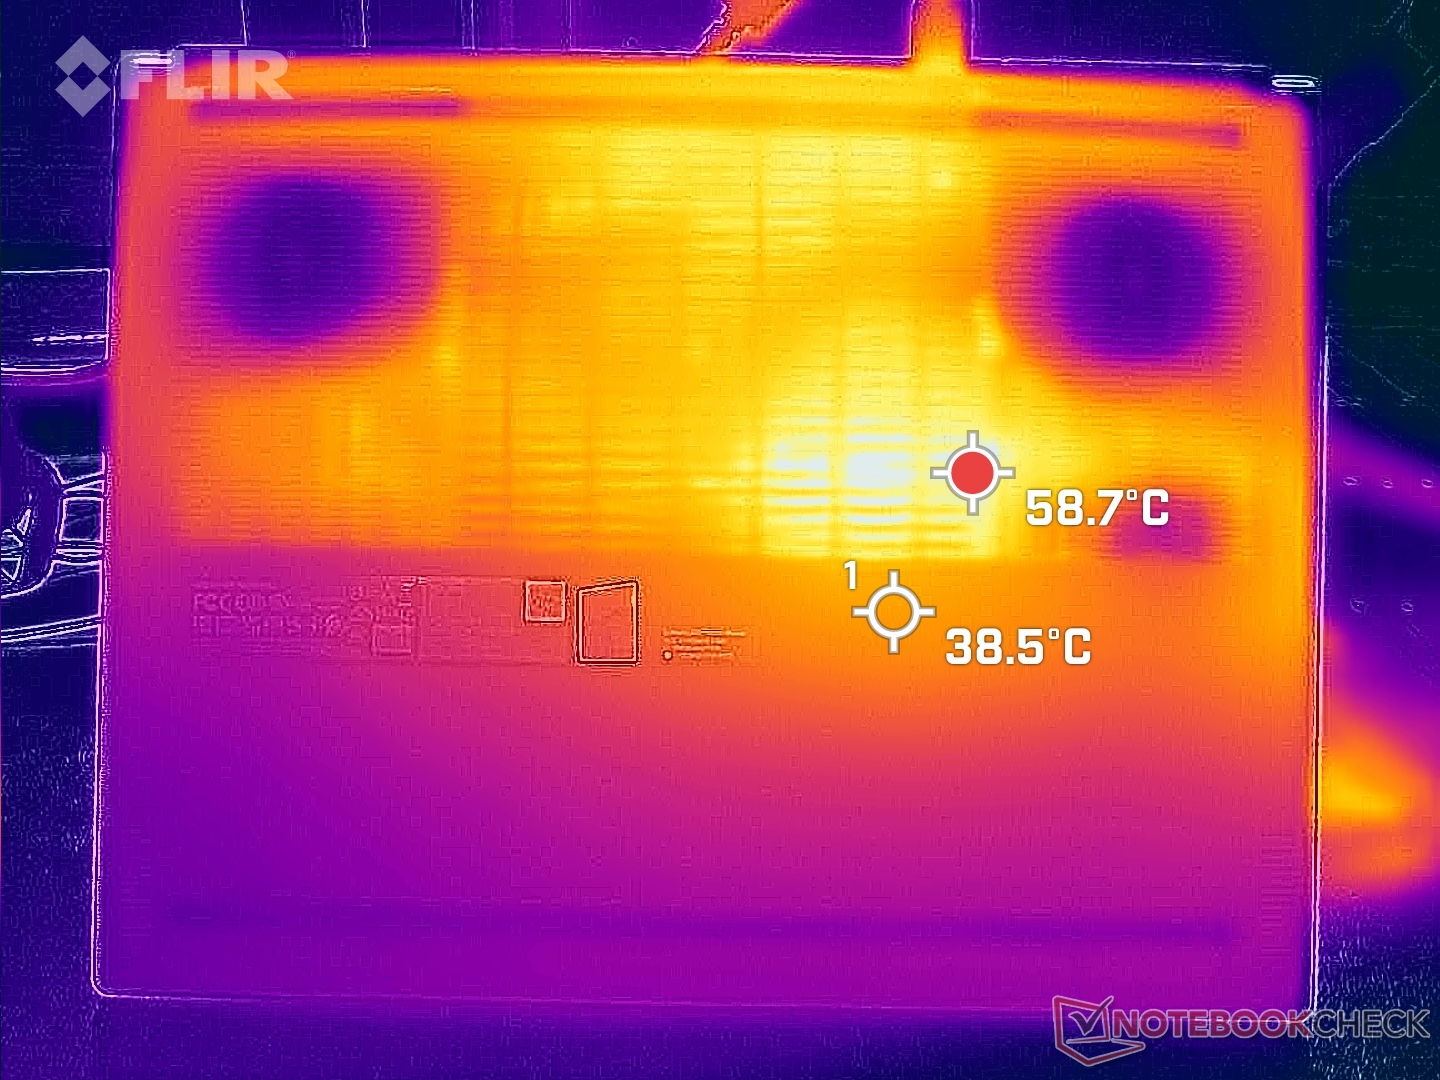
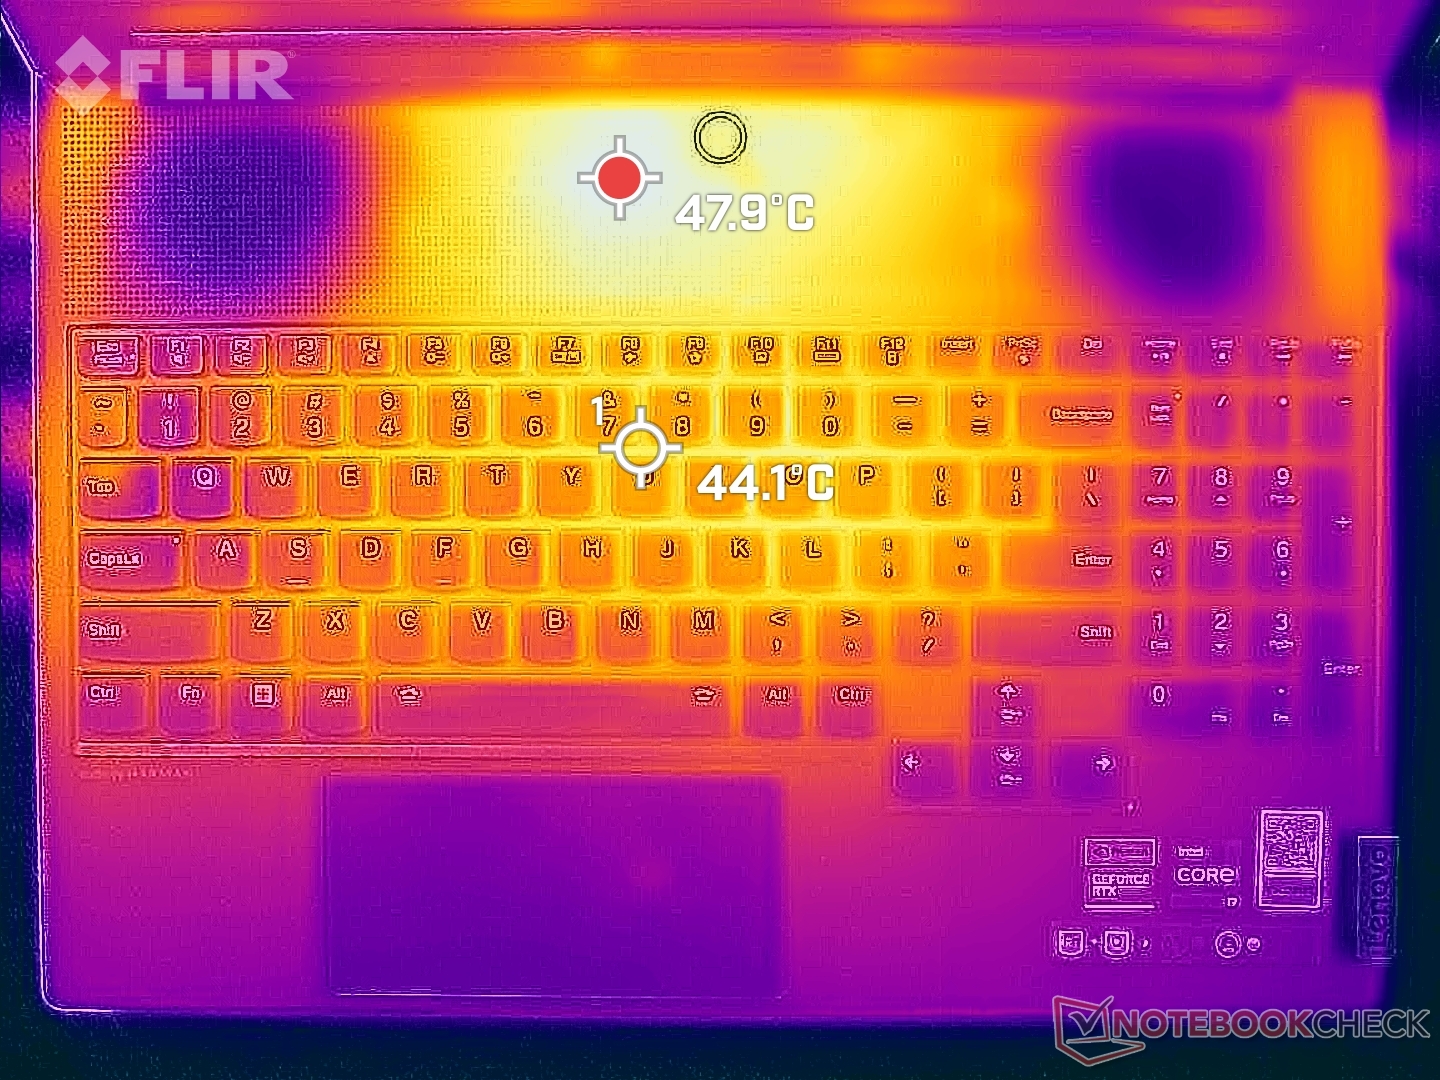
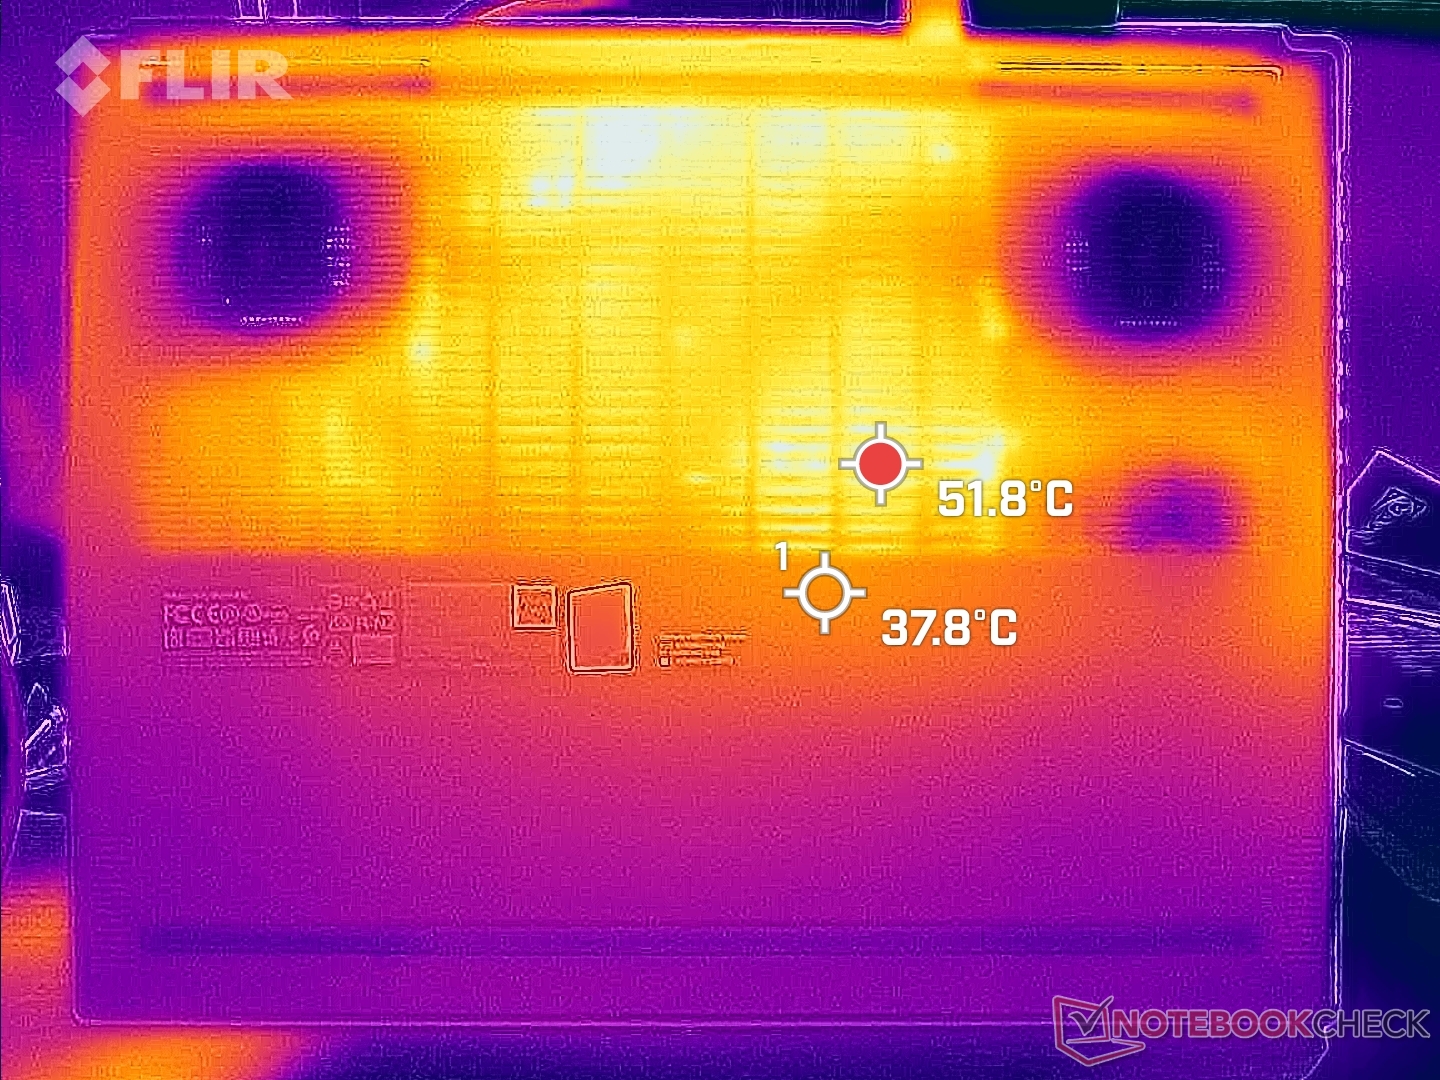
Temperatura
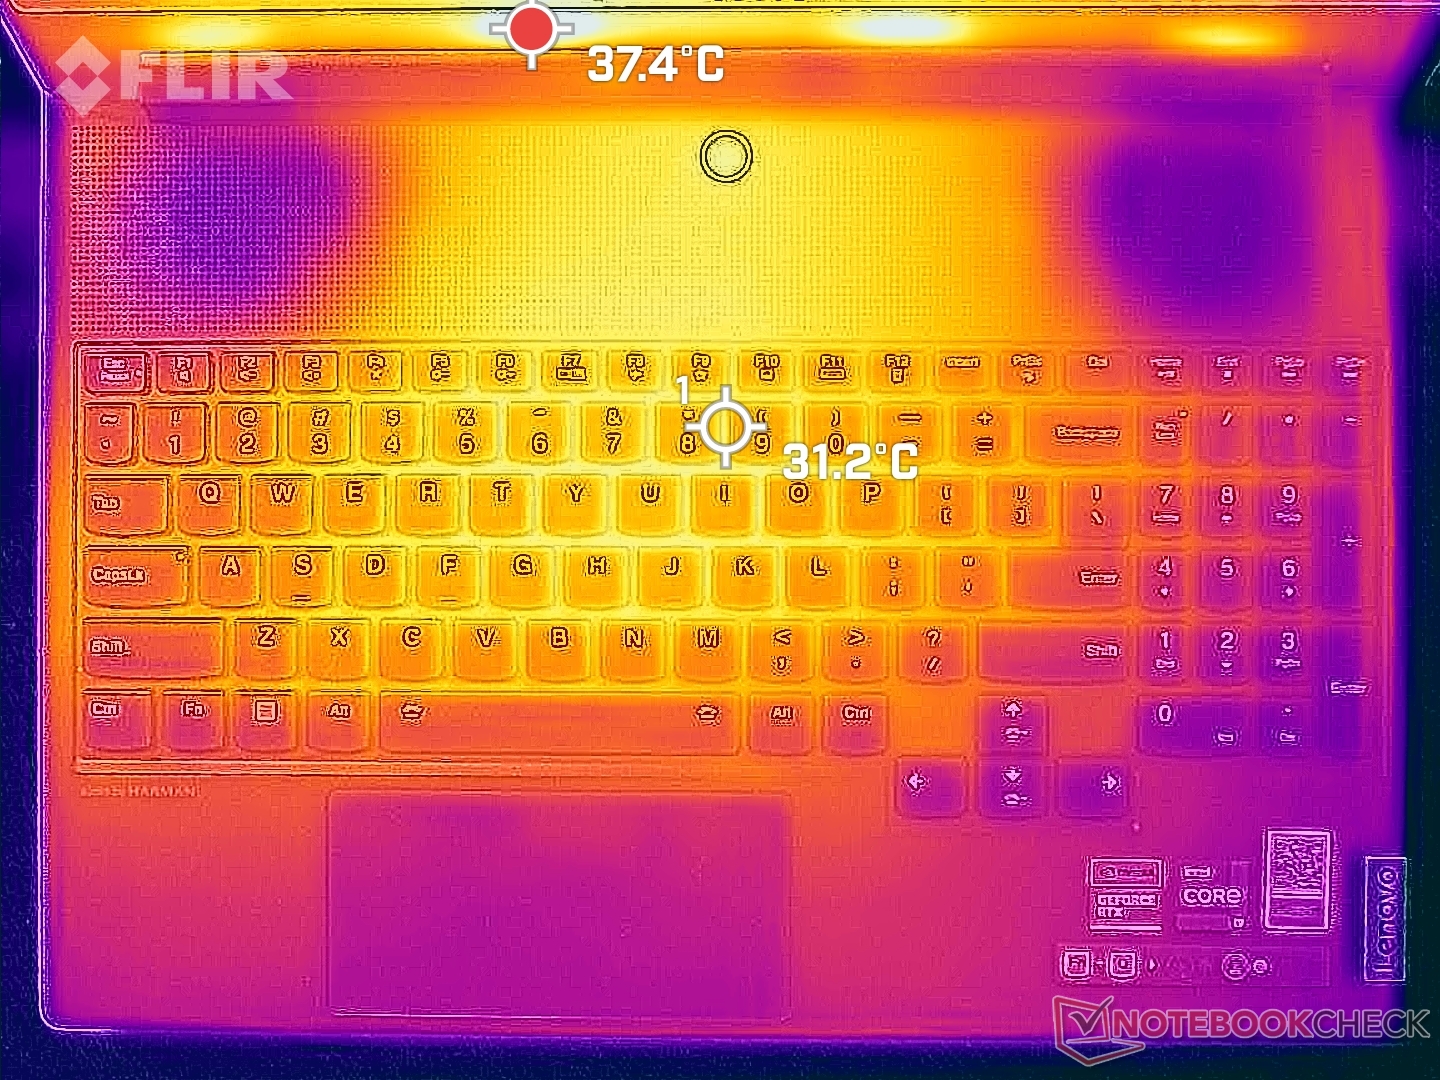
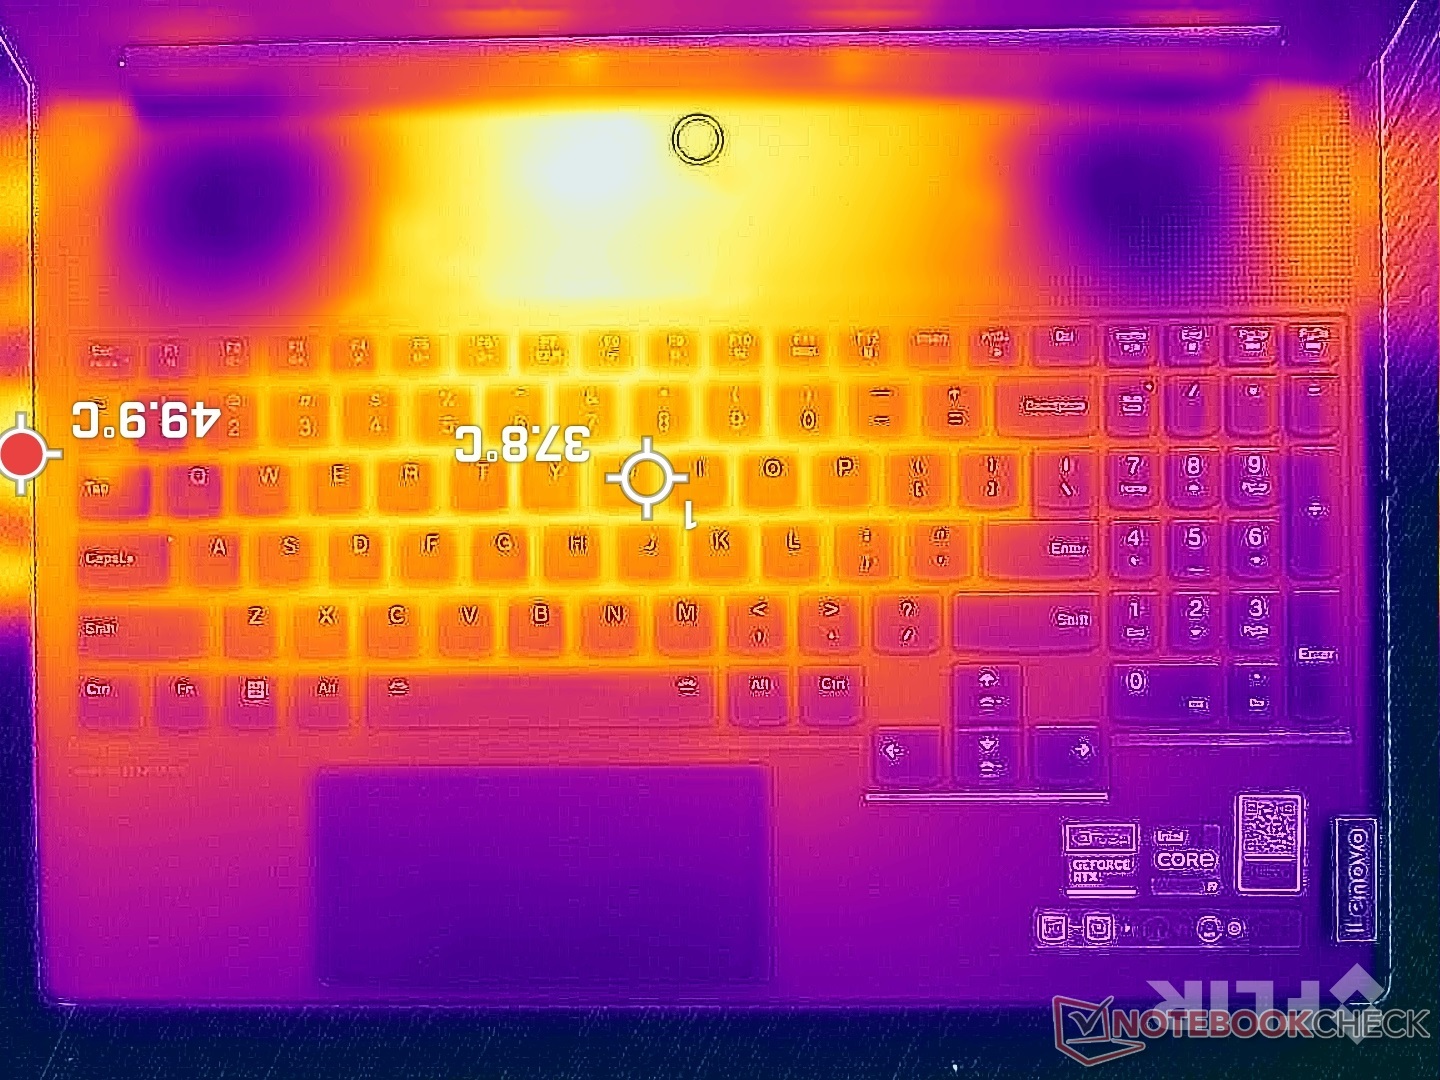
Le temperature della superficie sono piuttosto calde, nonostante le termiche avanzate. Durante il gioco, i tasti WASD e il centro della tastiera possono raggiungere i 42 C e i 46 C, rispettivamente, il che è leggermente più caldo di quello che abbiamo osservato su Alienware x16 R1. Molti altri portatili da gioco, come Razer Blade 16, aspirano l'aria fresca dai tasti WASD per mantenere fresca quella parte della tastiera, per un gioco più confortevole, ma questo non è il caso del nostro design Legion 9 16, come mostrano le mappe di temperatura qui sotto.
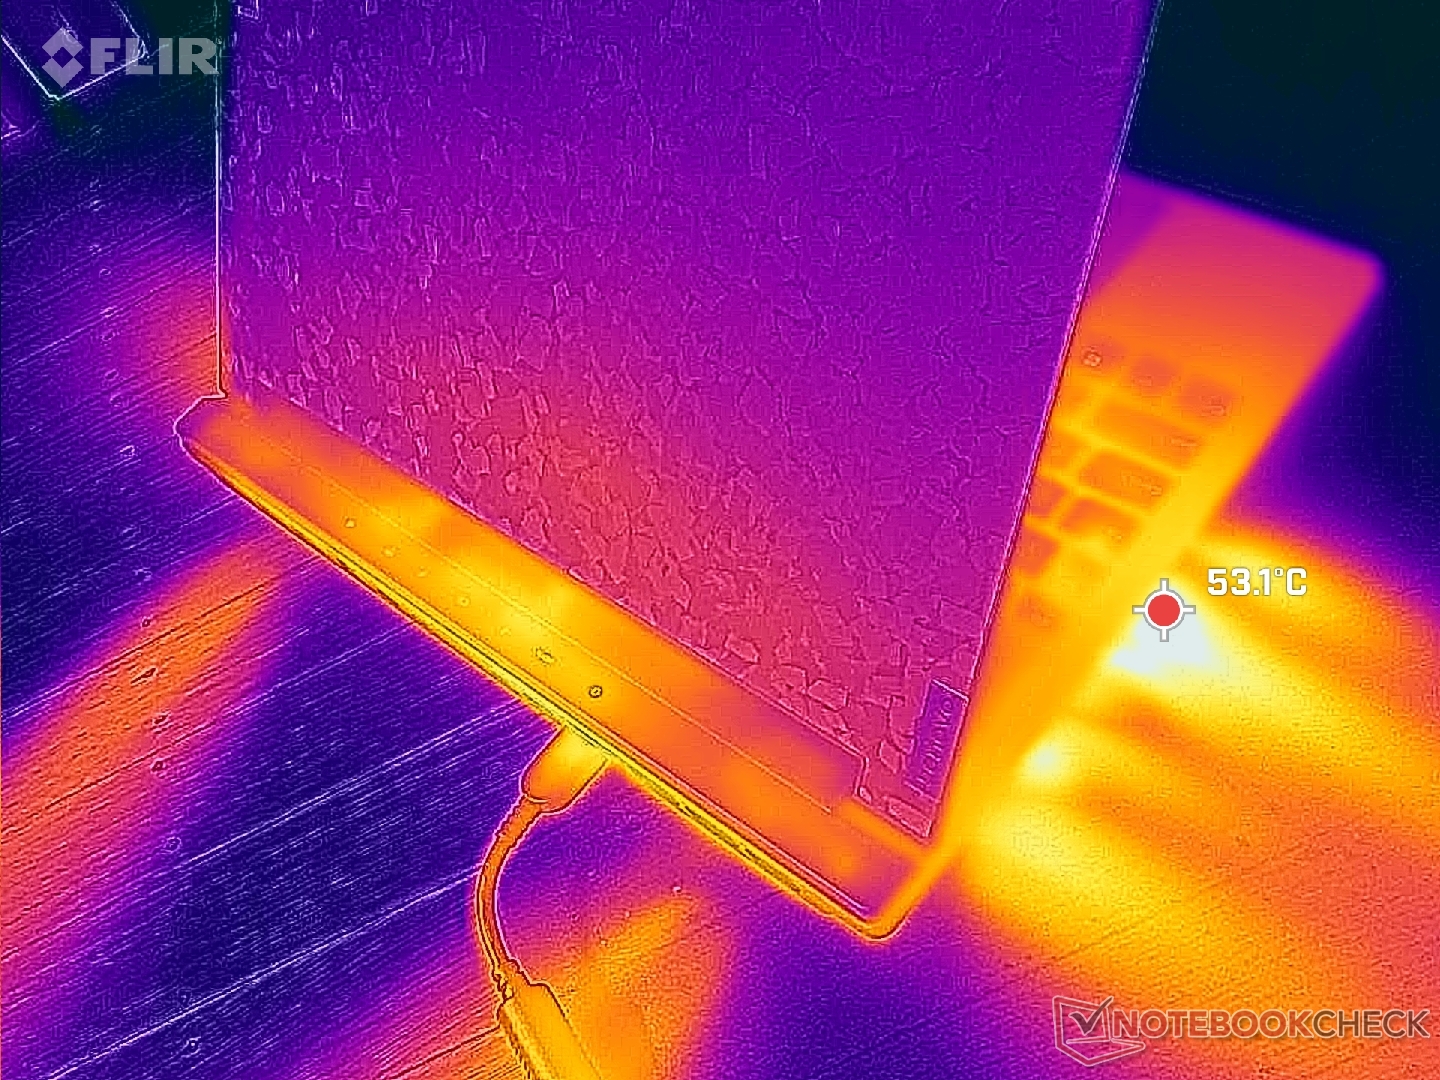
(-) La temperatura massima sul lato superiore è di 49.6 °C / 121 F, rispetto alla media di 40.4 °C / 105 F, che varia da 21.2 a 68.8 °C per questa classe Gaming.
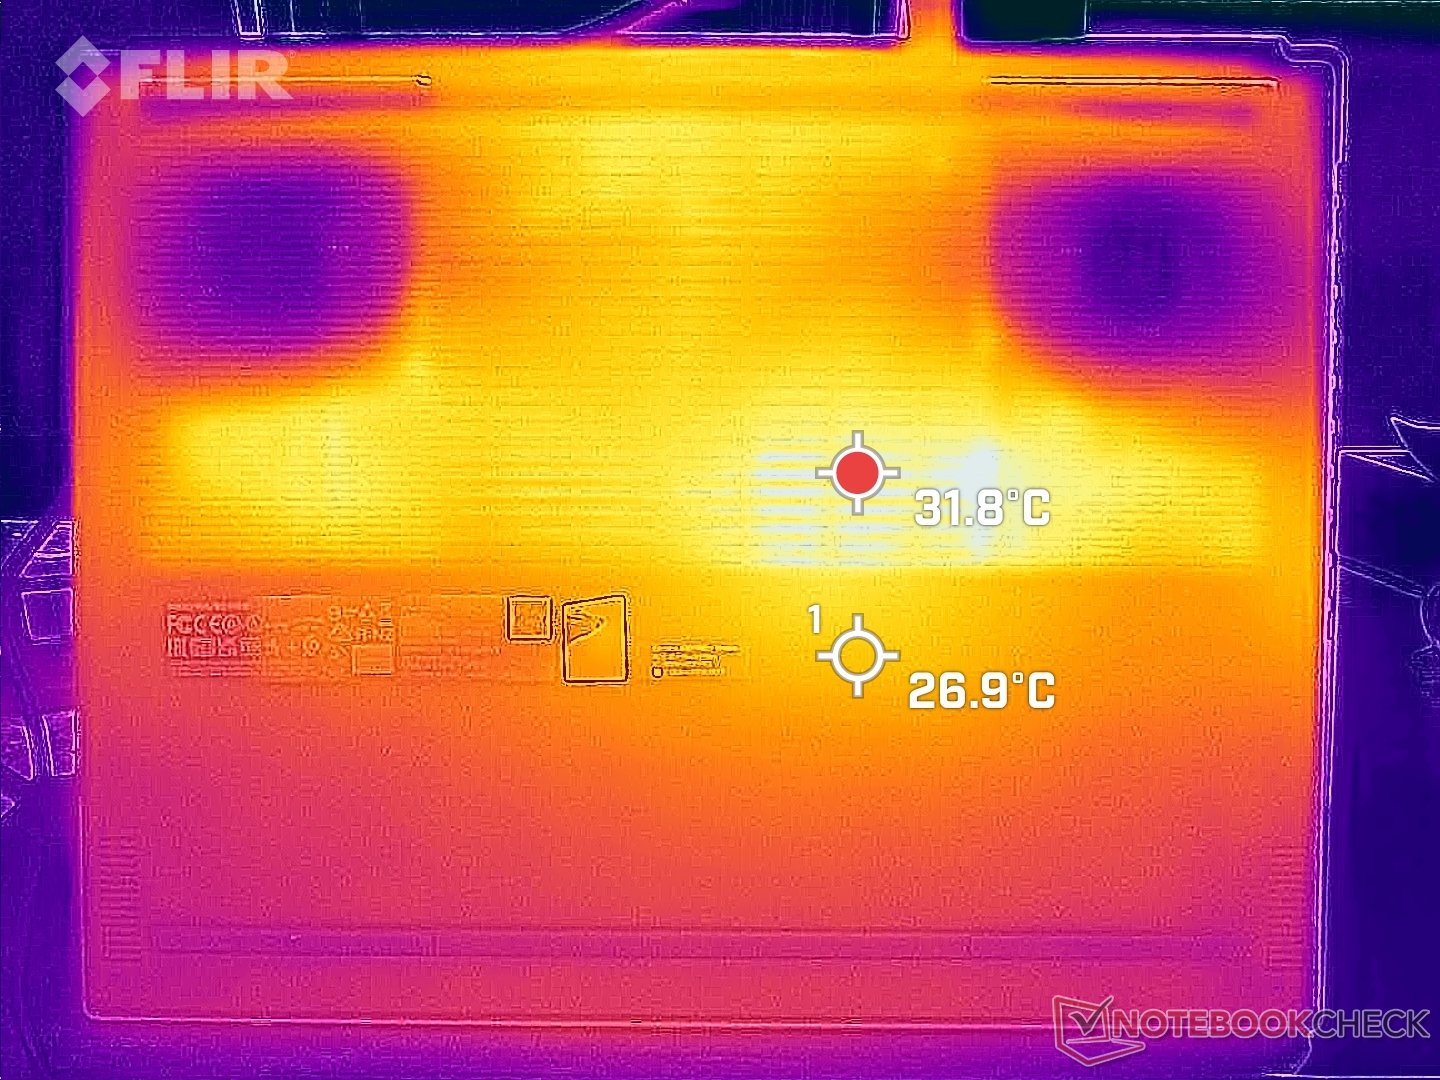
(-) Il lato inferiore si riscalda fino ad un massimo di 48.6 °C / 119 F, rispetto alla media di 43.2 °C / 110 F
(+) In idle, la temperatura media del lato superiore è di 30 °C / 86 F, rispetto alla media deld ispositivo di 33.9 °C / 93 F.
(-) Riproducendo The Witcher 3, la temperatura media per il lato superiore e' di 38.1 °C / 101 F, rispetto alla media del dispositivo di 33.9 °C / 93 F.
(+) I poggiapolsi e il touchpad raggiungono la temperatura massima della pelle (33.6 °C / 92.5 F) e quindi non sono caldi.
(-) La temperatura media della zona del palmo della mano di dispositivi simili e'stata di 28.8 °C / 83.8 F (-4.8 °C / -8.7 F).
| Lenovo Legion 9 16IRX8 Intel Core i9-13980HX, NVIDIA GeForce RTX 4090 Laptop GPU | Lenovo Legion Slim 5 16APH8 AMD Ryzen 7 7840HS, NVIDIA GeForce RTX 4060 Laptop GPU | Razer Blade 16 Early 2023 RTX 4090 Intel Core i9-13950HX, NVIDIA GeForce RTX 4090 Laptop GPU | Asus ROG Strix G16 G614JZ Intel Core i9-13980HX, NVIDIA GeForce RTX 4080 Laptop GPU | HP Omen Transcend 16 Intel Core i9-13900HX, NVIDIA GeForce RTX 4070 Laptop GPU | Alienware x16 R1 Intel Core i9-13900HK, NVIDIA GeForce RTX 4080 Laptop GPU | |
|---|---|---|---|---|---|---|
| Heat | 18% | 2% | -1% | 5% | -2% | |
| Maximum Upper Side * (°C) | 49.6 | 40.6 18% | 52 -5% | 54 -9% | 47.4 4% | 47.2 5% |
| Maximum Bottom * (°C) | 48.6 | 42 14% | 47.6 2% | 55 -13% | 54.4 -12% | 47.8 2% |
| Idle Upper Side * (°C) | 33.2 | 27.8 16% | 33 1% | 29 13% | 28.4 14% | 36.8 -11% |
| Idle Bottom * (°C) | 34.2 | 26.6 22% | 30.6 11% | 33 4% | 29.2 15% | 35.8 -5% |
* ... Meglio usare valori piccoli
Test da sforzo
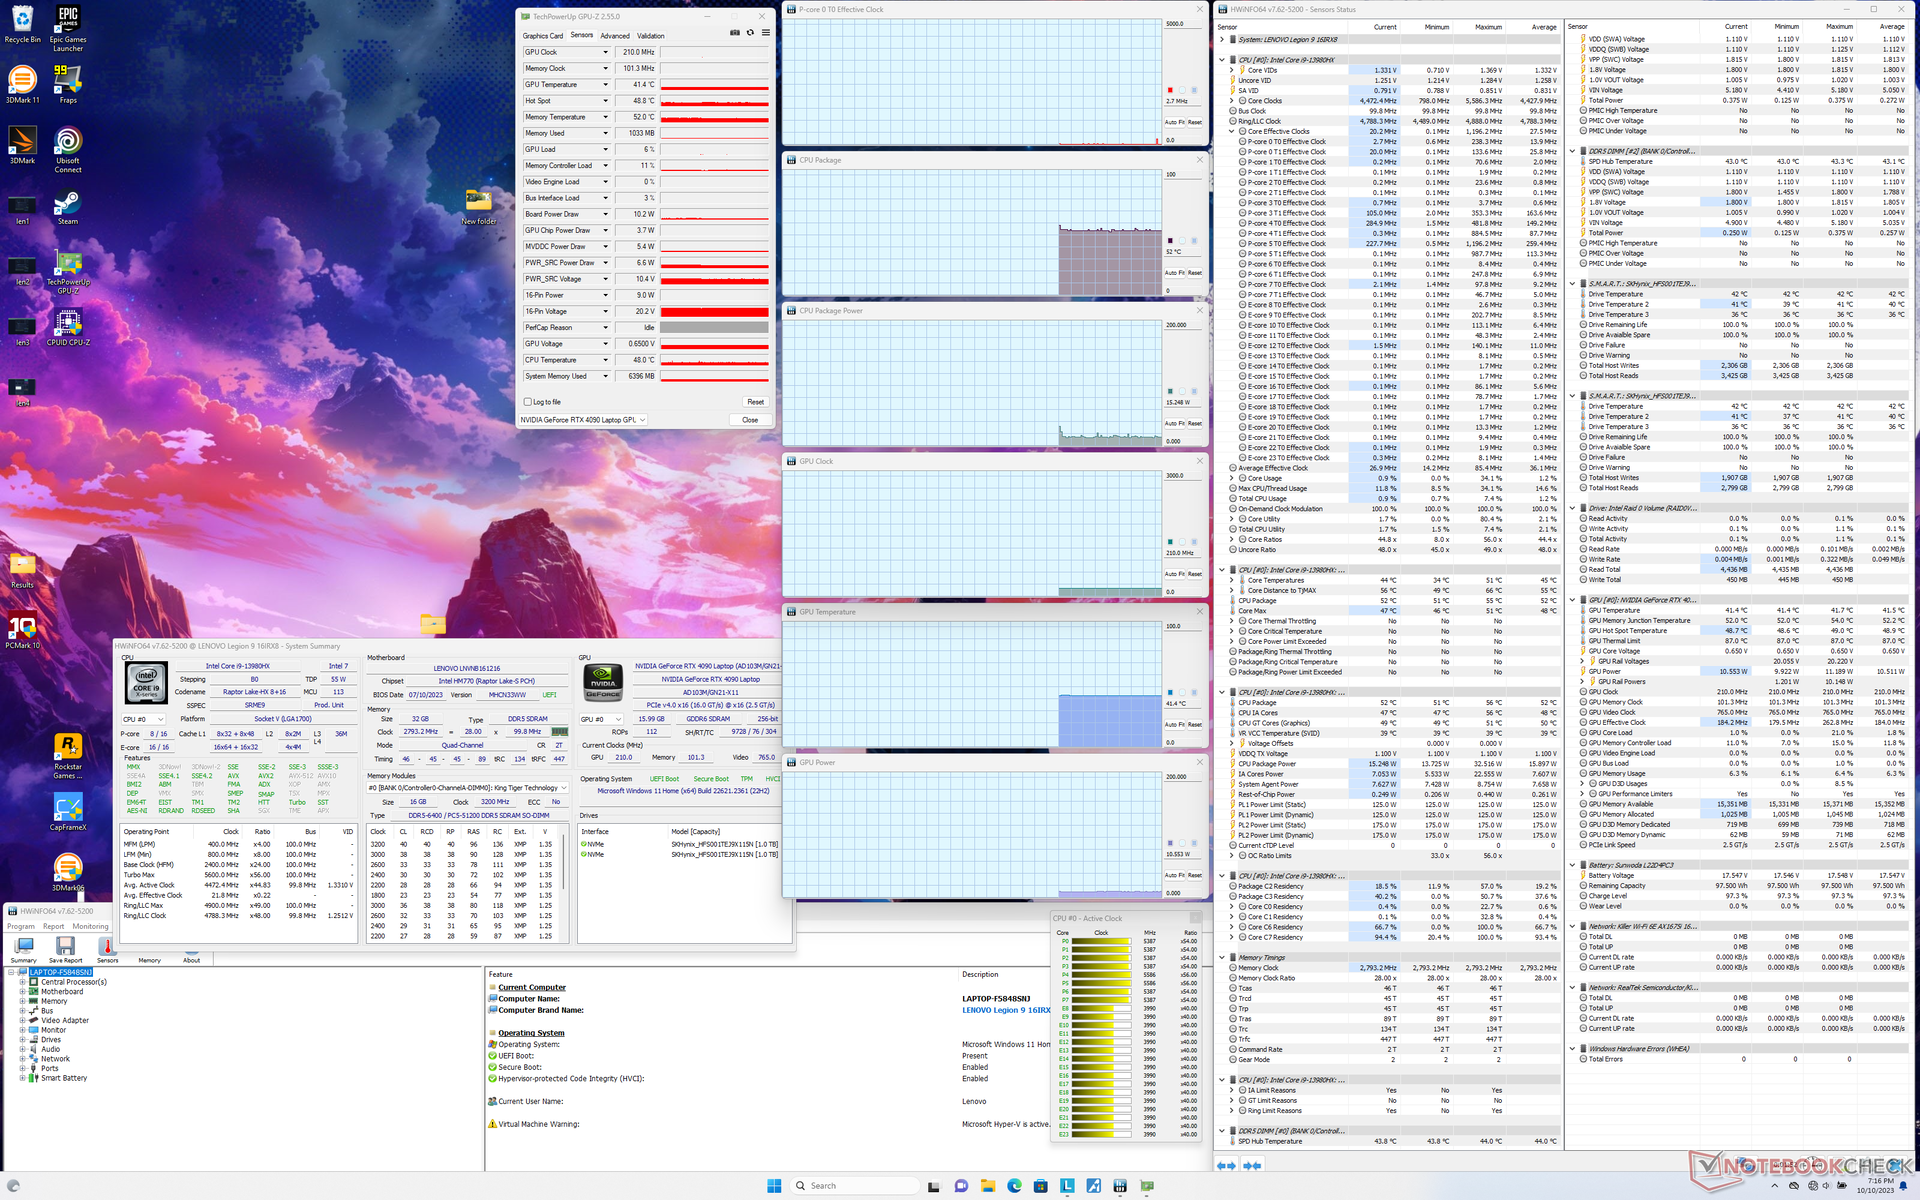
Le velocità di clock della CPU e l'assorbimento di potenza della scheda all'avvio dello stress Prime95 hanno raggiunto un picco di 3,6 GHz e 138 W, rispettivamente, prima di scendere e stabilizzarsi a 3,0 GHz e 125 W dopo circa un minuto di test. La temperatura del core si stabilizzava a 83 C, rispetto ai 100 C del più grande Alienware m18 R1 equipaggiato con lo stesso Core i9-13980HX.
Le prestazioni della GPU dipendono fortemente dal profilo energetico selezionato, come indicato in precedenza nella sezione Prestazioni della GPU. Quando si esegue Witcher 3 in modalità Performance, ad esempio, la GPU Nvidia si stabilizzerebbe a 2265 MHz e 160 W rispetto ai soli 1650 MHz e 104 W della modalità Bilanciata con Overclock GPU disattivato. La temperatura della GPU si stabilizzerebbe a 78 C rispetto ai 71 C del Blade 16 con la stessa GPU RTX 4090.
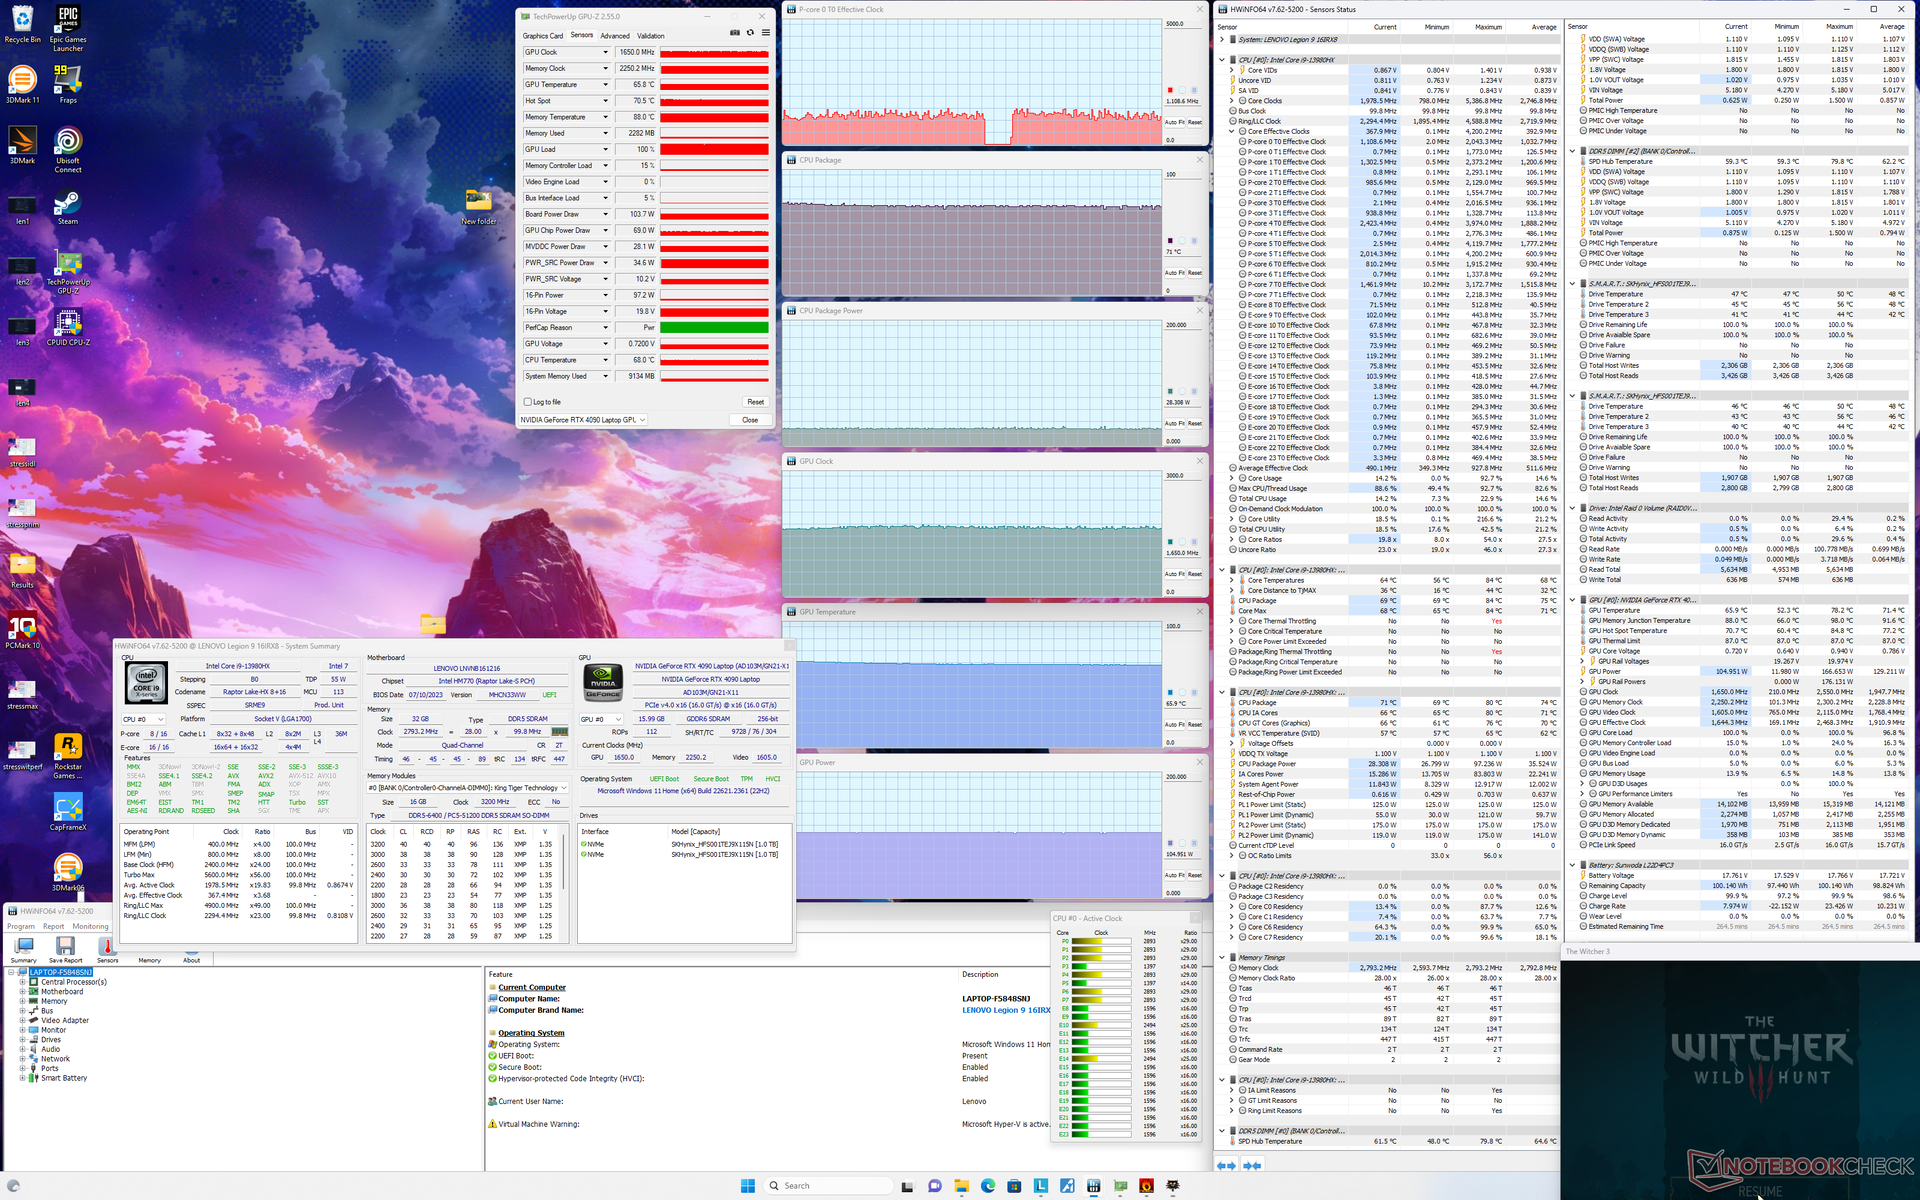
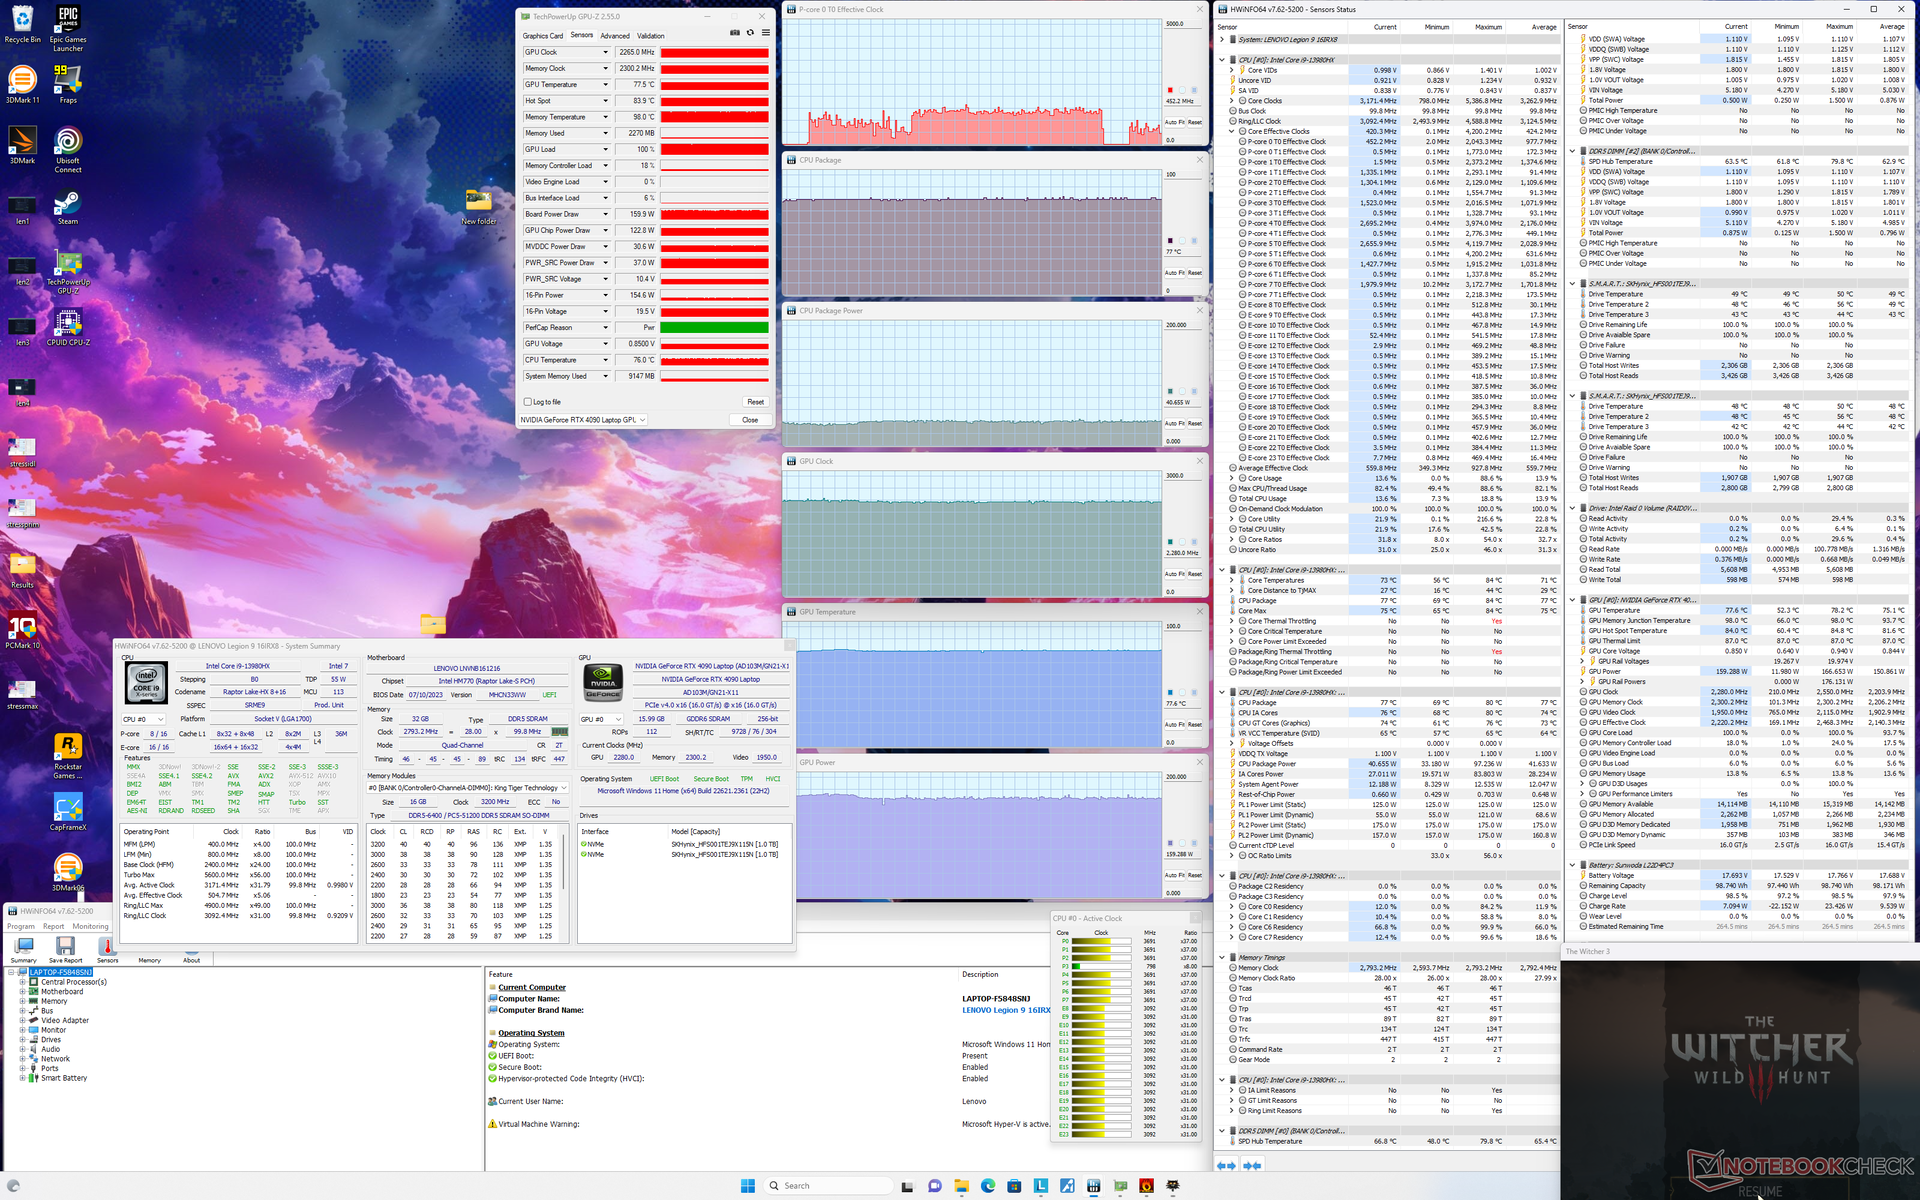
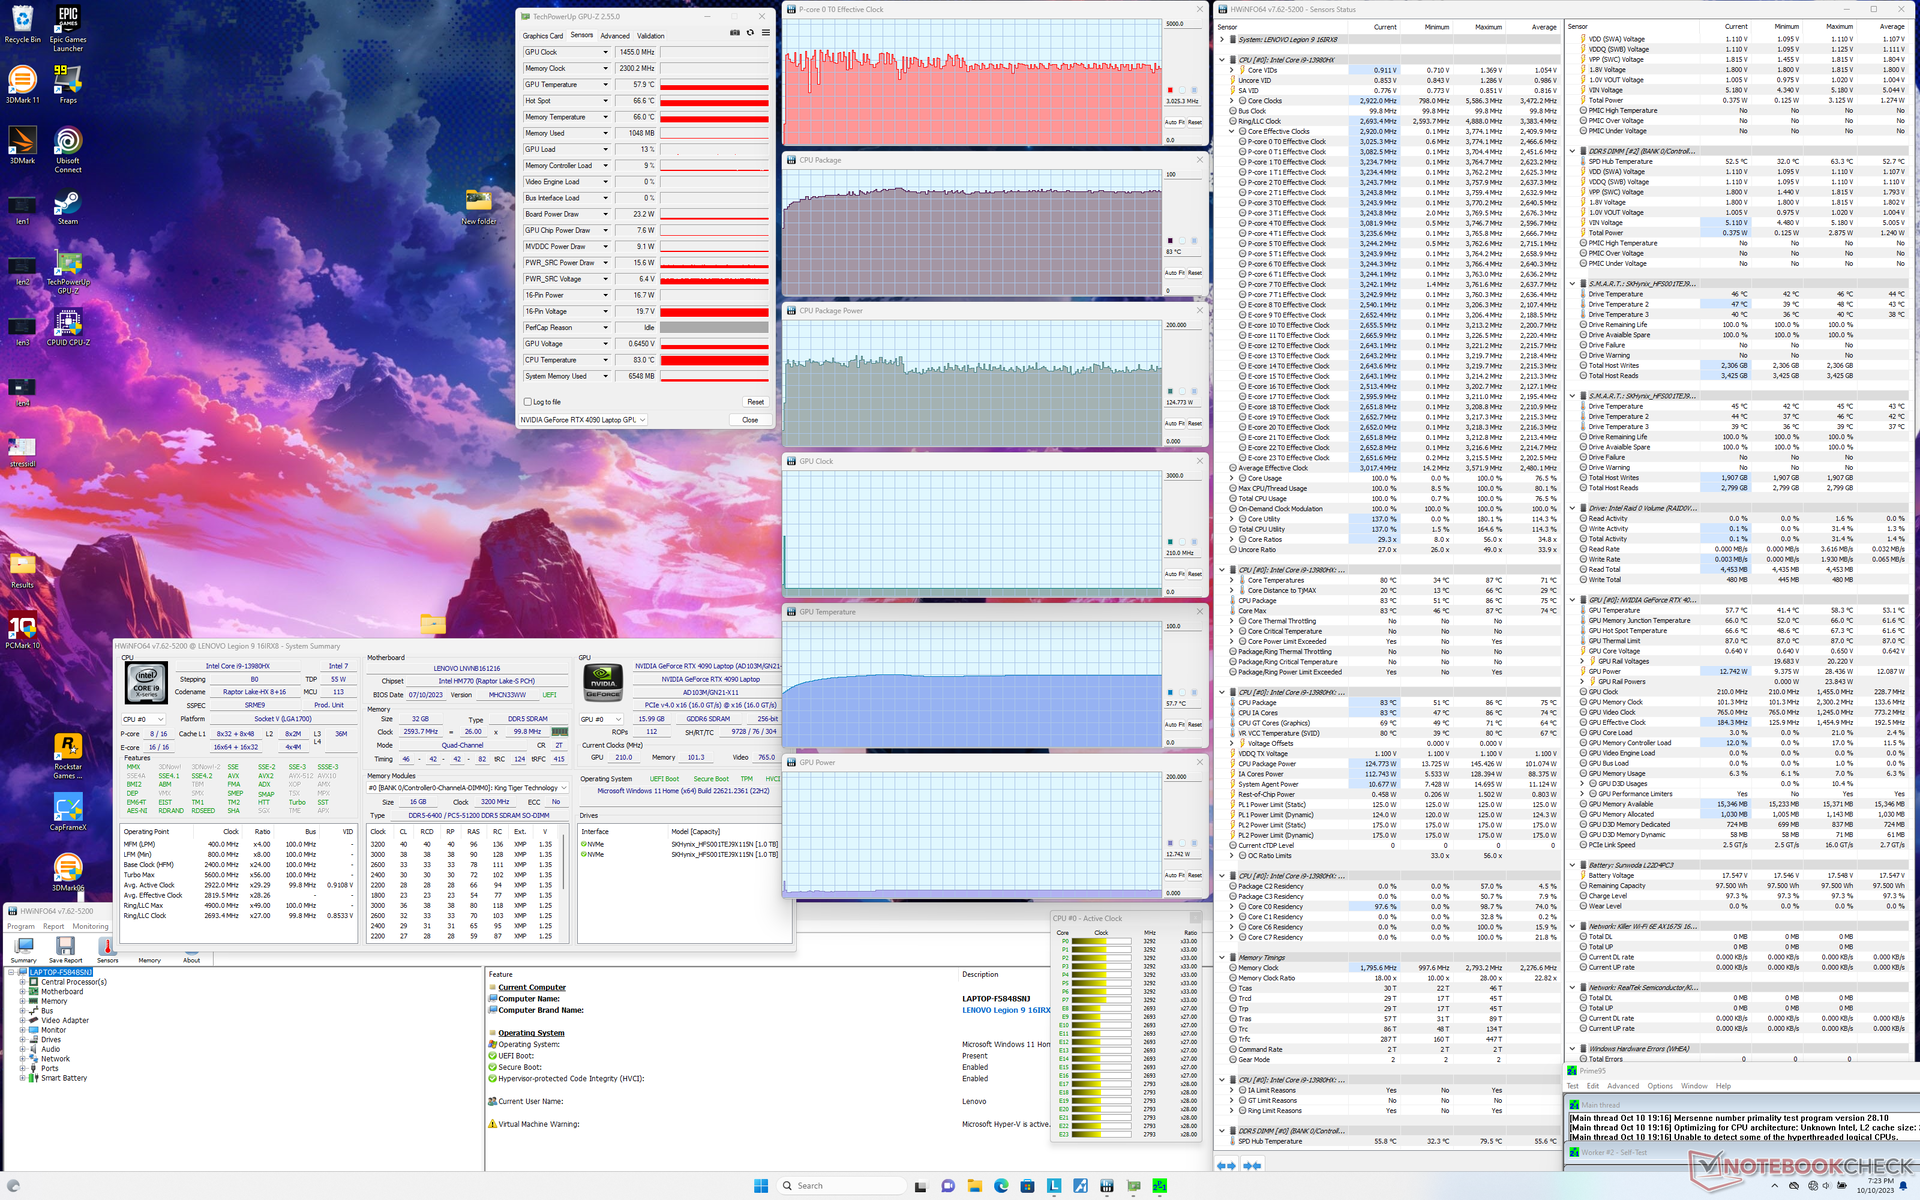
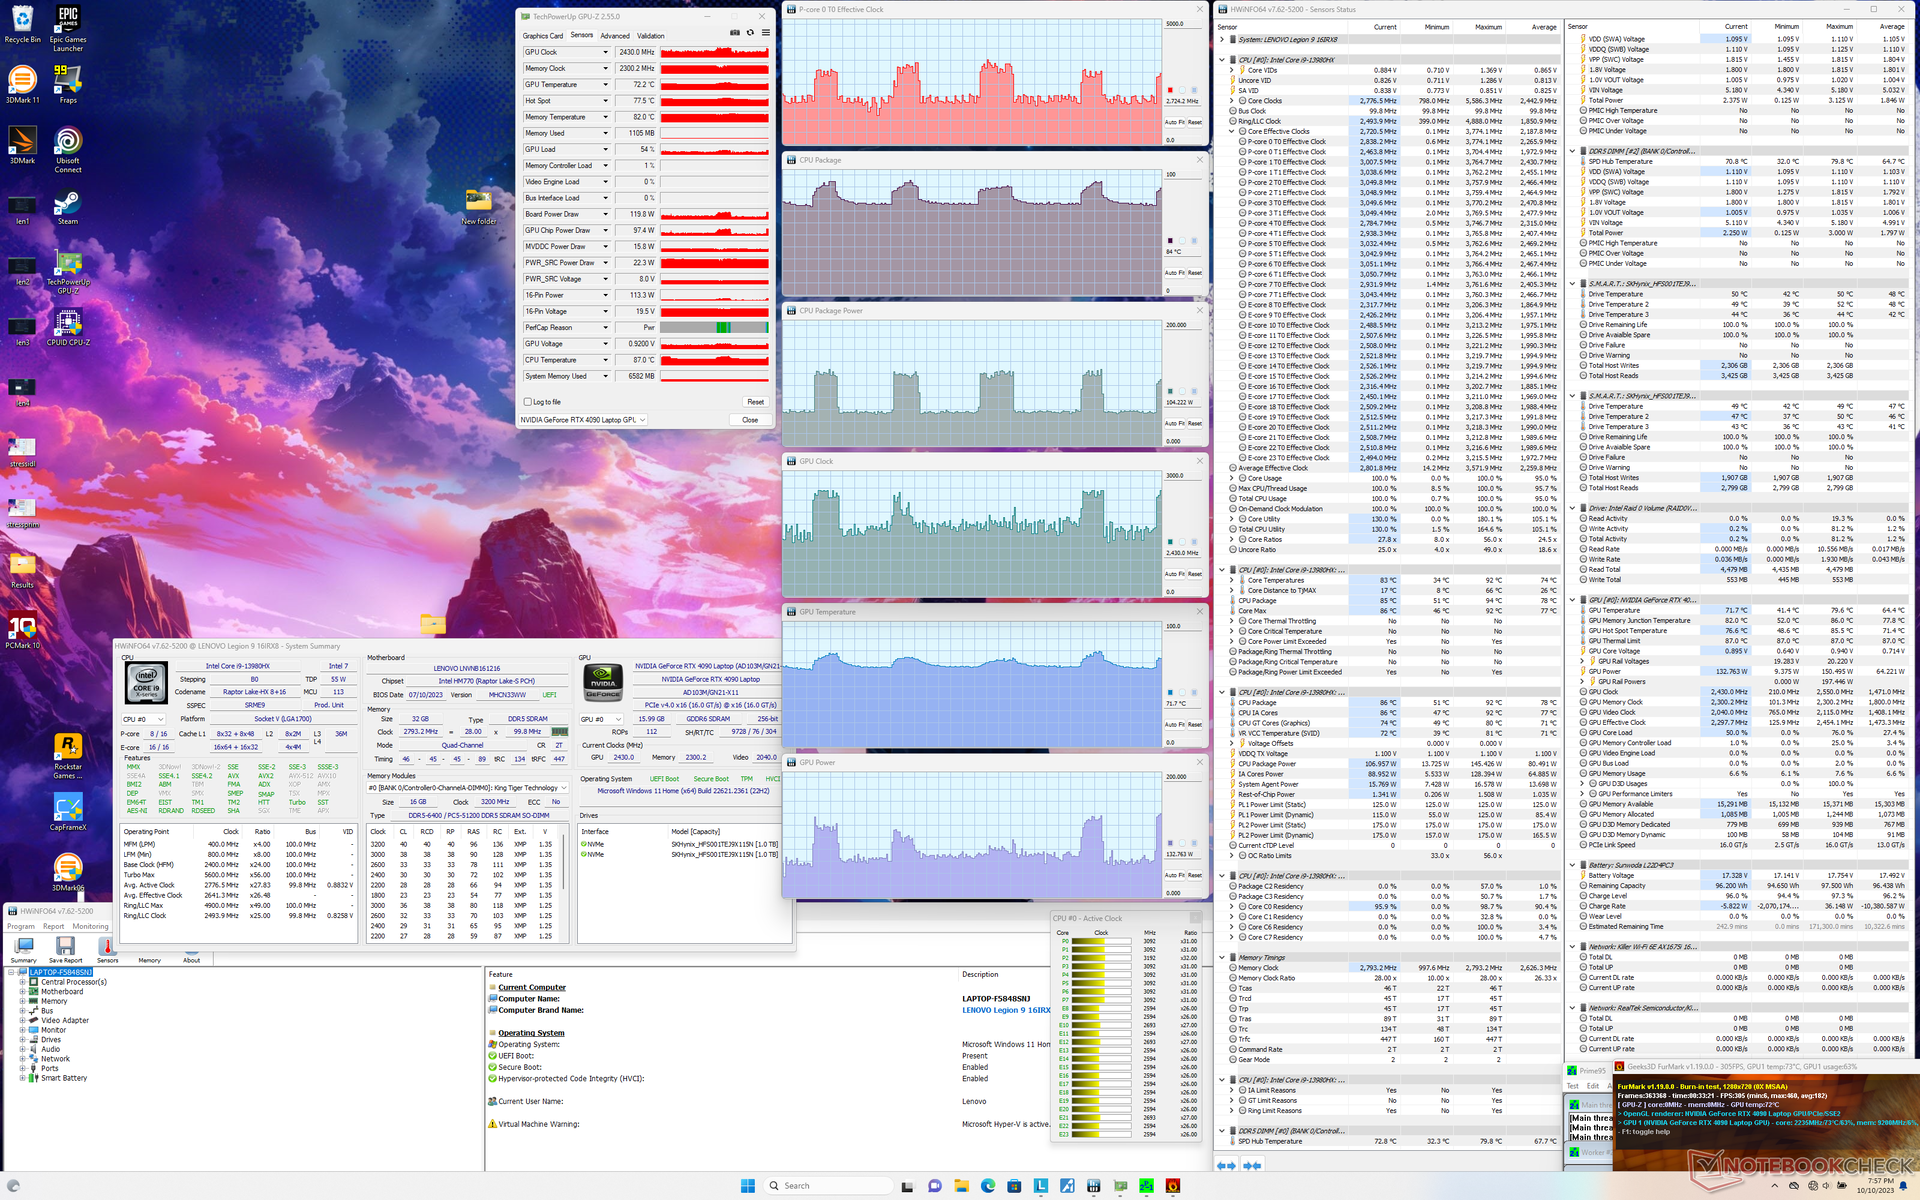
| Clock della CPU (GHz) | Clock della GPU (MHz) | Temperatura media della CPU (°C) | Temperatura media della GPU (°C) | |
| Sistema inattivo | -- | -- | 52 | 41 |
| Stress Prime95 | 3.0 | -- | 83 | 58 |
| Prime95 + FurMark Stress | 1,6 - 3,4 | 1365 - 2535 | 74 - 86 | 72 - 78 |
| Witcher 3 Stress (modalità Bilanciata con Overclock GPU disattivato) | ~1,1 | 1650 | 71 | 66 |
| Witcher 3 Stress (modalità Performance) | ~1,1 | 2265 | 77 | 78 |
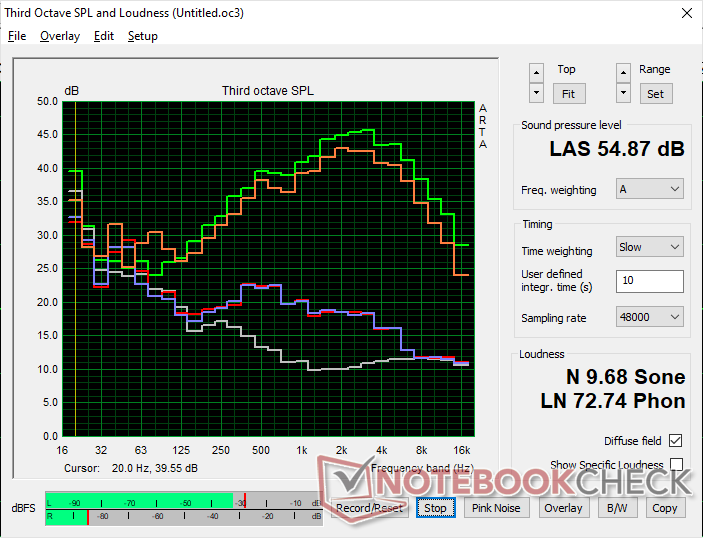
Altoparlanti
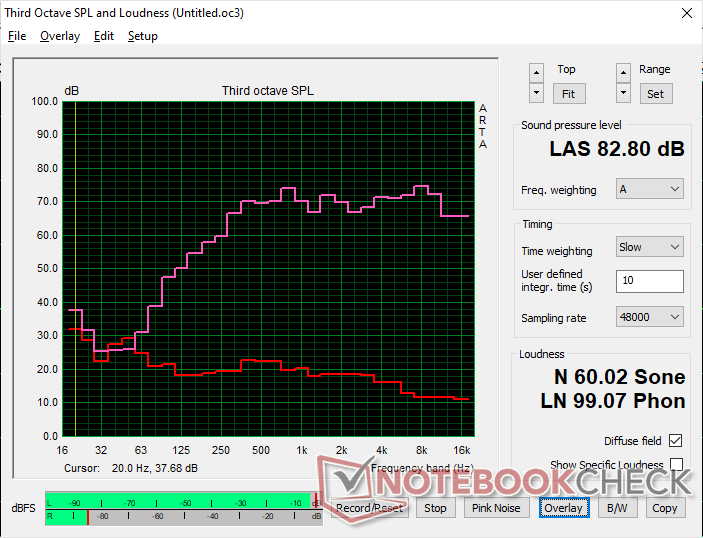
Lenovo Legion 9 16IRX8 analisi audio
(+) | gli altoparlanti sono relativamente potenti (82.8 dB)
Bassi 100 - 315 Hz
(±) | bassi ridotti - in media 13.5% inferiori alla media
(±) | la linearità dei bassi è media (9% delta rispetto alla precedente frequenza)
Medi 400 - 2000 Hz
(+) | medi bilanciati - solo only 1.5% rispetto alla media
(+) | medi lineari (5.7% delta rispetto alla precedente frequenza)
Alti 2 - 16 kHz
(+) | Alti bilanciati - appena 2.4% dalla media
(+) | alti lineari (3.7% delta rispetto alla precedente frequenza)
Nel complesso 100 - 16.000 Hz
(+) | suono nel complesso lineare (11% differenza dalla media)
Rispetto alla stessa classe
» 7% di tutti i dispositivi testati in questa classe è stato migliore, 3% simile, 89% peggiore
» Il migliore ha avuto un delta di 6%, medio di 18%, peggiore di 132%
Rispetto a tutti i dispositivi testati
» 6% di tutti i dispositivi testati in questa classe è stato migliore, 2% similare, 92% peggiore
» Il migliore ha avuto un delta di 4%, medio di 23%, peggiore di 134%
Apple MacBook Pro 16 2021 M1 Pro analisi audio
(+) | gli altoparlanti sono relativamente potenti (84.7 dB)
Bassi 100 - 315 Hz
(+) | bassi buoni - solo 3.8% dalla media
(+) | bassi in lineaa (5.2% delta rispetto alla precedente frequenza)
Medi 400 - 2000 Hz
(+) | medi bilanciati - solo only 1.3% rispetto alla media
(+) | medi lineari (2.1% delta rispetto alla precedente frequenza)
Alti 2 - 16 kHz
(+) | Alti bilanciati - appena 1.9% dalla media
(+) | alti lineari (2.7% delta rispetto alla precedente frequenza)
Nel complesso 100 - 16.000 Hz
(+) | suono nel complesso lineare (4.6% differenza dalla media)
Rispetto alla stessa classe
» 0% di tutti i dispositivi testati in questa classe è stato migliore, 0% simile, 100% peggiore
» Il migliore ha avuto un delta di 5%, medio di 17%, peggiore di 45%
Rispetto a tutti i dispositivi testati
» 0% di tutti i dispositivi testati in questa classe è stato migliore, 0% similare, 100% peggiore
» Il migliore ha avuto un delta di 4%, medio di 23%, peggiore di 134%
Gestione dell'energia
Consumo di energia
Il consumo di energia è molto elevato, indipendentemente dall'impostazione energetica. L'inattività su desktop in modalità iGPU Power Saver e con l'impostazione di luminosità minima richiederebbe comunque 32 W, rispetto ai soli 9-10 W di Legion Slim 5 16 o Asus ROG Strix G16 ciascuno con pannelli IPS. Il consumo dipende anche non solo dalla luminosità, ma anche dal colore, come nel caso di un pannello OLED. Uno schermo completamente bianco sul nostro Legion 9i 16, ad esempio, richiederebbe circa 13 W in più rispetto a uno schermo completamente nero, anche se con l'impostazione di luminosità massima per entrambi i colori. I pannelli IPS richiederebbero al massimo pochi watt, indipendentemente dal colore in confronto.
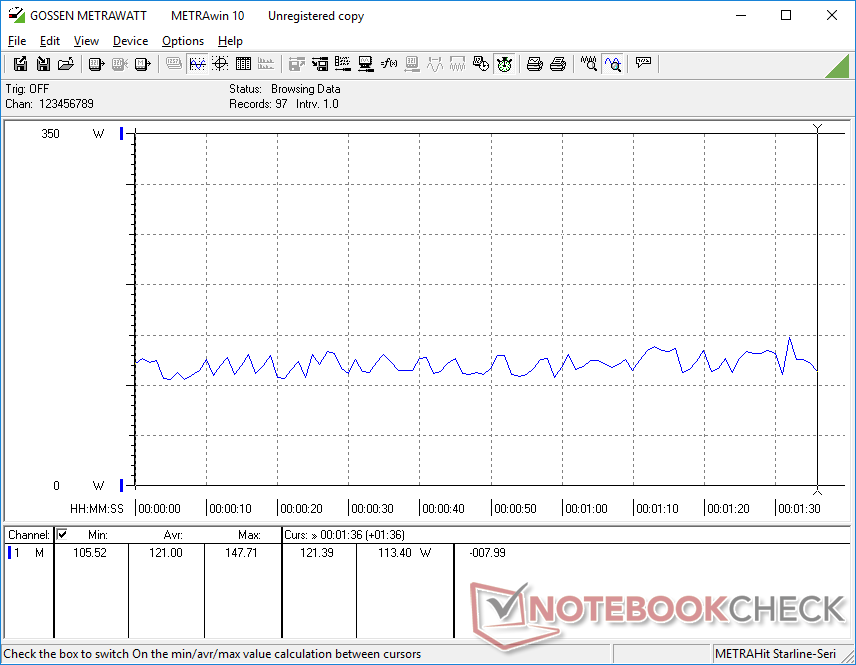
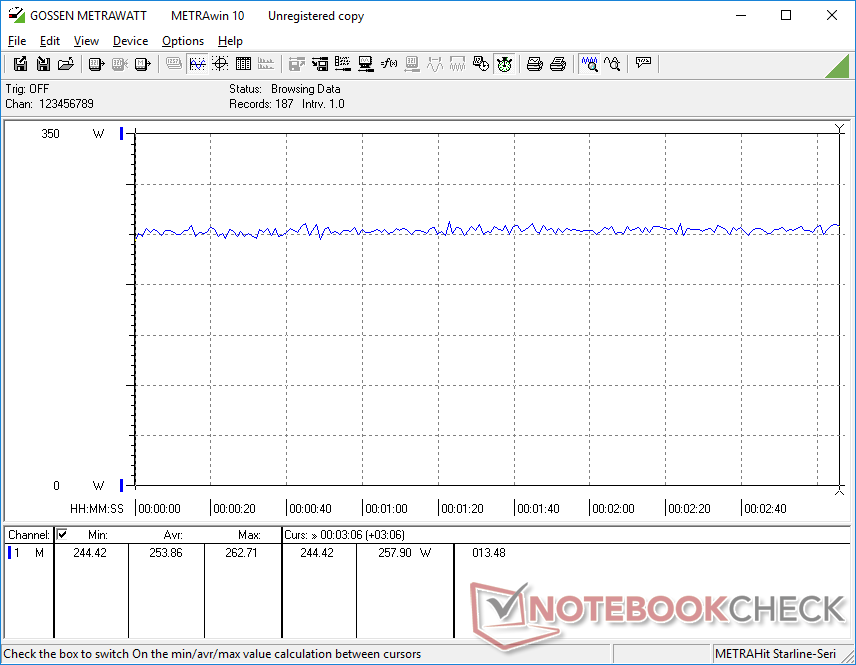
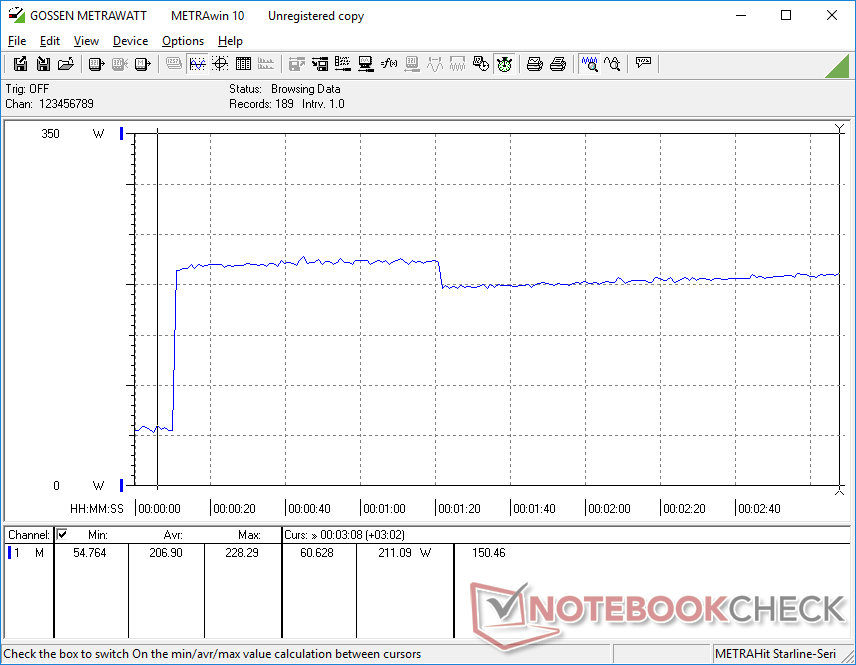
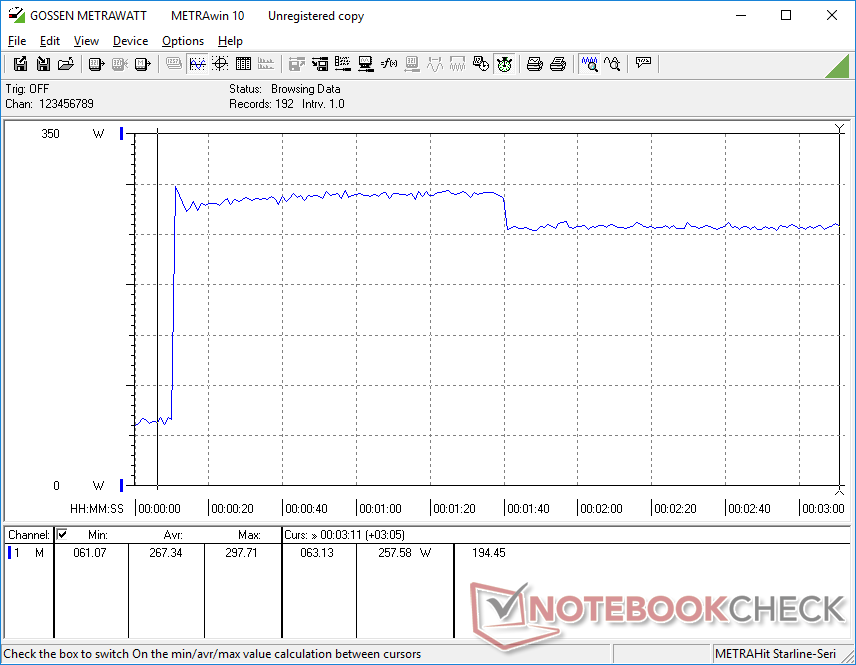
L'esecuzione di Prime95 su un monitor esterno mostra livelli di consumo molto simili tra la nostra unità Lenovo e il Asus ROG Strix Scar 17 alimentato dal concorrente Ryzen 9 7945HX, come mostrano i grafici di confronto qui sotto. Le prestazioni per watt sono comunque a favore di AMD, poiché il Ryzen 9 7945HX supera il nostro Core i9-13980HX nei carichi di lavoro multi-threaded, nonostante le richieste di energia simili.
Il consumo durante il gioco è leggermente superiore, di circa il 10 percento, rispetto all' Asus ROG Strix Scar 17 SE con la vecchia RTX 3080 Ti. Tuttavia, l'aumento del 40-75 percento delle prestazioni grafiche con la nostra RTX 4090 compensa ampiamente il minore aumento dei consumi. Le altissime prestazioni per watt della serie mobile Ada Lovelace sono impressionanti e non sono seconde a nessuno al momento.
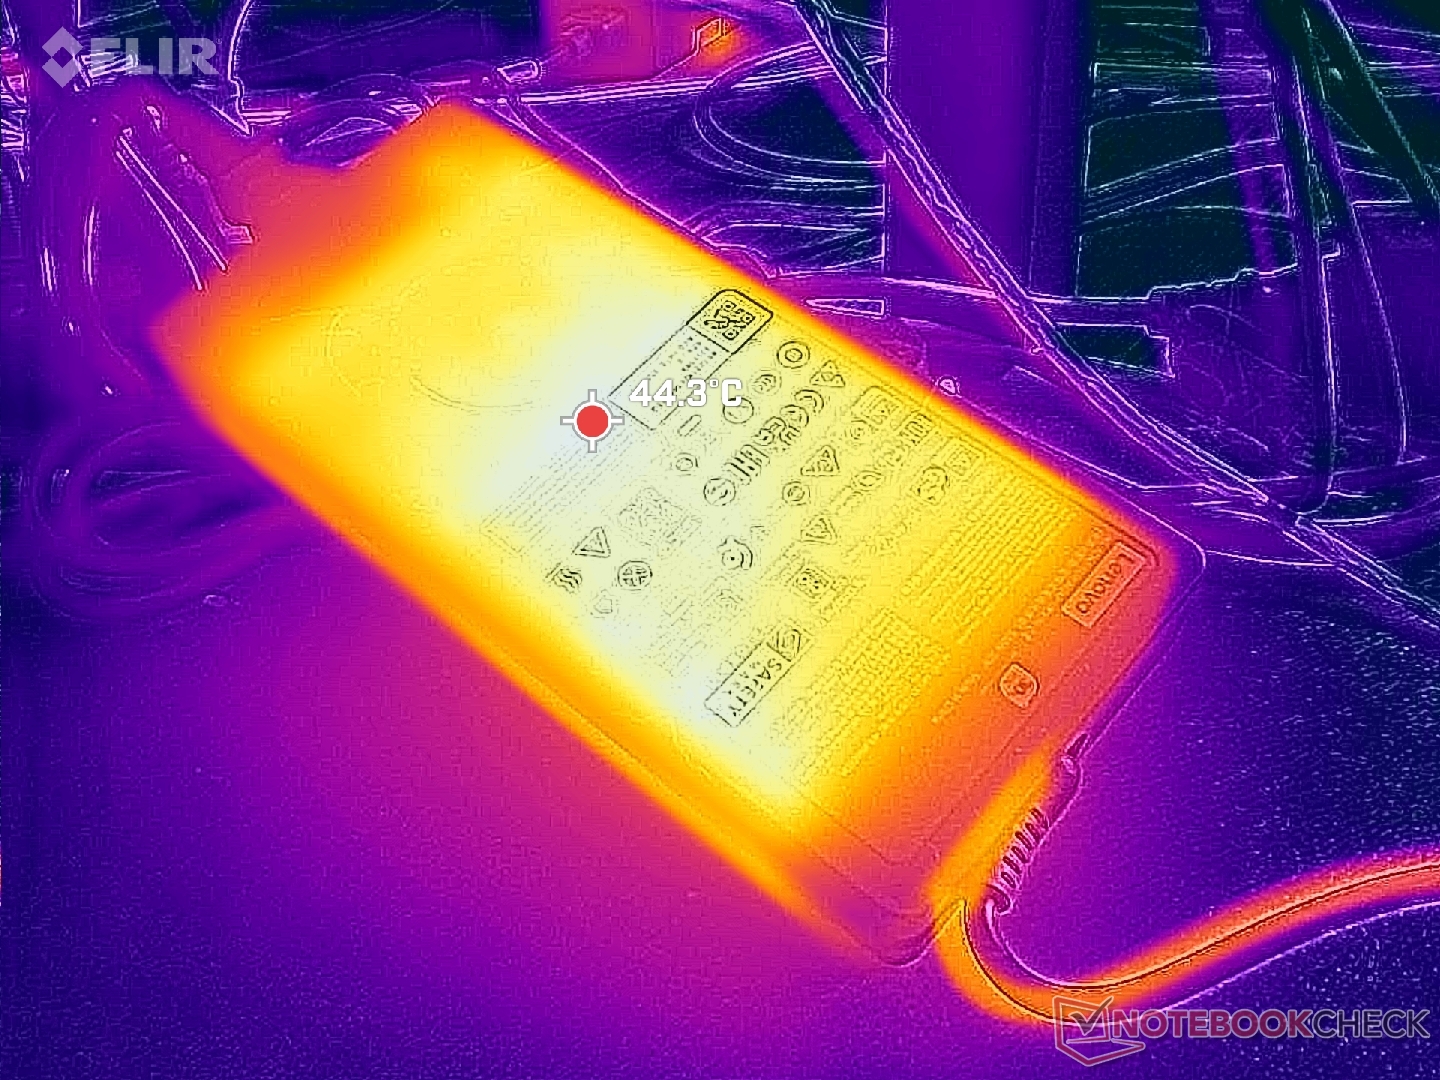
Siamo in grado di misurare un consumo massimo di 298 W dall'adattatore CA medio-grande (18,5 x 2,6 x 8,3 cm) da 330 W quando sia la CPU che la GPU sono utilizzate al 100 percento. Questo tasso è solo temporaneo a causa delle limitazioni termiche.
| Off / Standby | |
| Idle | |
| Sotto carico |
|
Leggenda:
min: | |
| Lenovo Legion 9 16IRX8 i9-13980HX, GeForce RTX 4090 Laptop GPU, 2x SK Hynix HFS001TEJ9X115N (RAID 0), Mini-LED, 3200x2000, 16" | Lenovo Legion Slim 5 16APH8 R7 7840HS, GeForce RTX 4060 Laptop GPU, SK hynix PC801 HFS512GEJ9X115N, IPS, 2560x1600, 16" | Razer Blade 16 Early 2023 RTX 4090 i9-13950HX, GeForce RTX 4090 Laptop GPU, SSSTC CA6-8D1024, mini-LED, 3840x2400, 16" | Asus ROG Strix G16 G614JZ i9-13980HX, GeForce RTX 4080 Laptop GPU, WD PC SN560 SDDPNQE-1T00, IPS, 2560x1600, 16" | HP Omen Transcend 16 i9-13900HX, GeForce RTX 4070 Laptop GPU, SK hynix PC801 HFS002TEJ9X101N, Mini-LED, 2560x1600, 16" | Alienware x16 R1 i9-13900HK, GeForce RTX 4080 Laptop GPU, SK hynix PC801 HFS001TEJ9X101N, IPS, 2560x1600, 16" | |
|---|---|---|---|---|---|---|
| Power Consumption | 53% | 9% | 28% | 18% | 12% | |
| Idle Minimum * (Watt) | 32.3 | 9.4 71% | 27.5 15% | 10 69% | 19.2 41% | 25.2 22% |
| Idle Average * (Watt) | 42.6 | 15.5 64% | 34.4 19% | 16 62% | 22.7 47% | 29.9 30% |
| Idle Maximum * (Watt) | 57.9 | 24.4 58% | 35.4 39% | 27 53% | 55.4 4% | 49.8 14% |
| Load Average * (Watt) | 121 | 74.1 39% | 147.8 -22% | 129 -7% | 128.4 -6% | 105.4 13% |
| Witcher 3 ultra * (Watt) | 254 | 112.9 56% | 256 -1% | 247 3% | 206 19% | 263 -4% |
| Load Maximum * (Watt) | 297.7 | 206.5 31% | 286.7 4% | 342 -15% | 292 2% | 313.8 -5% |
* ... Meglio usare valori piccoli
Power Consumption Witcher 3 / Stresstest
Power Consumption external Monitor
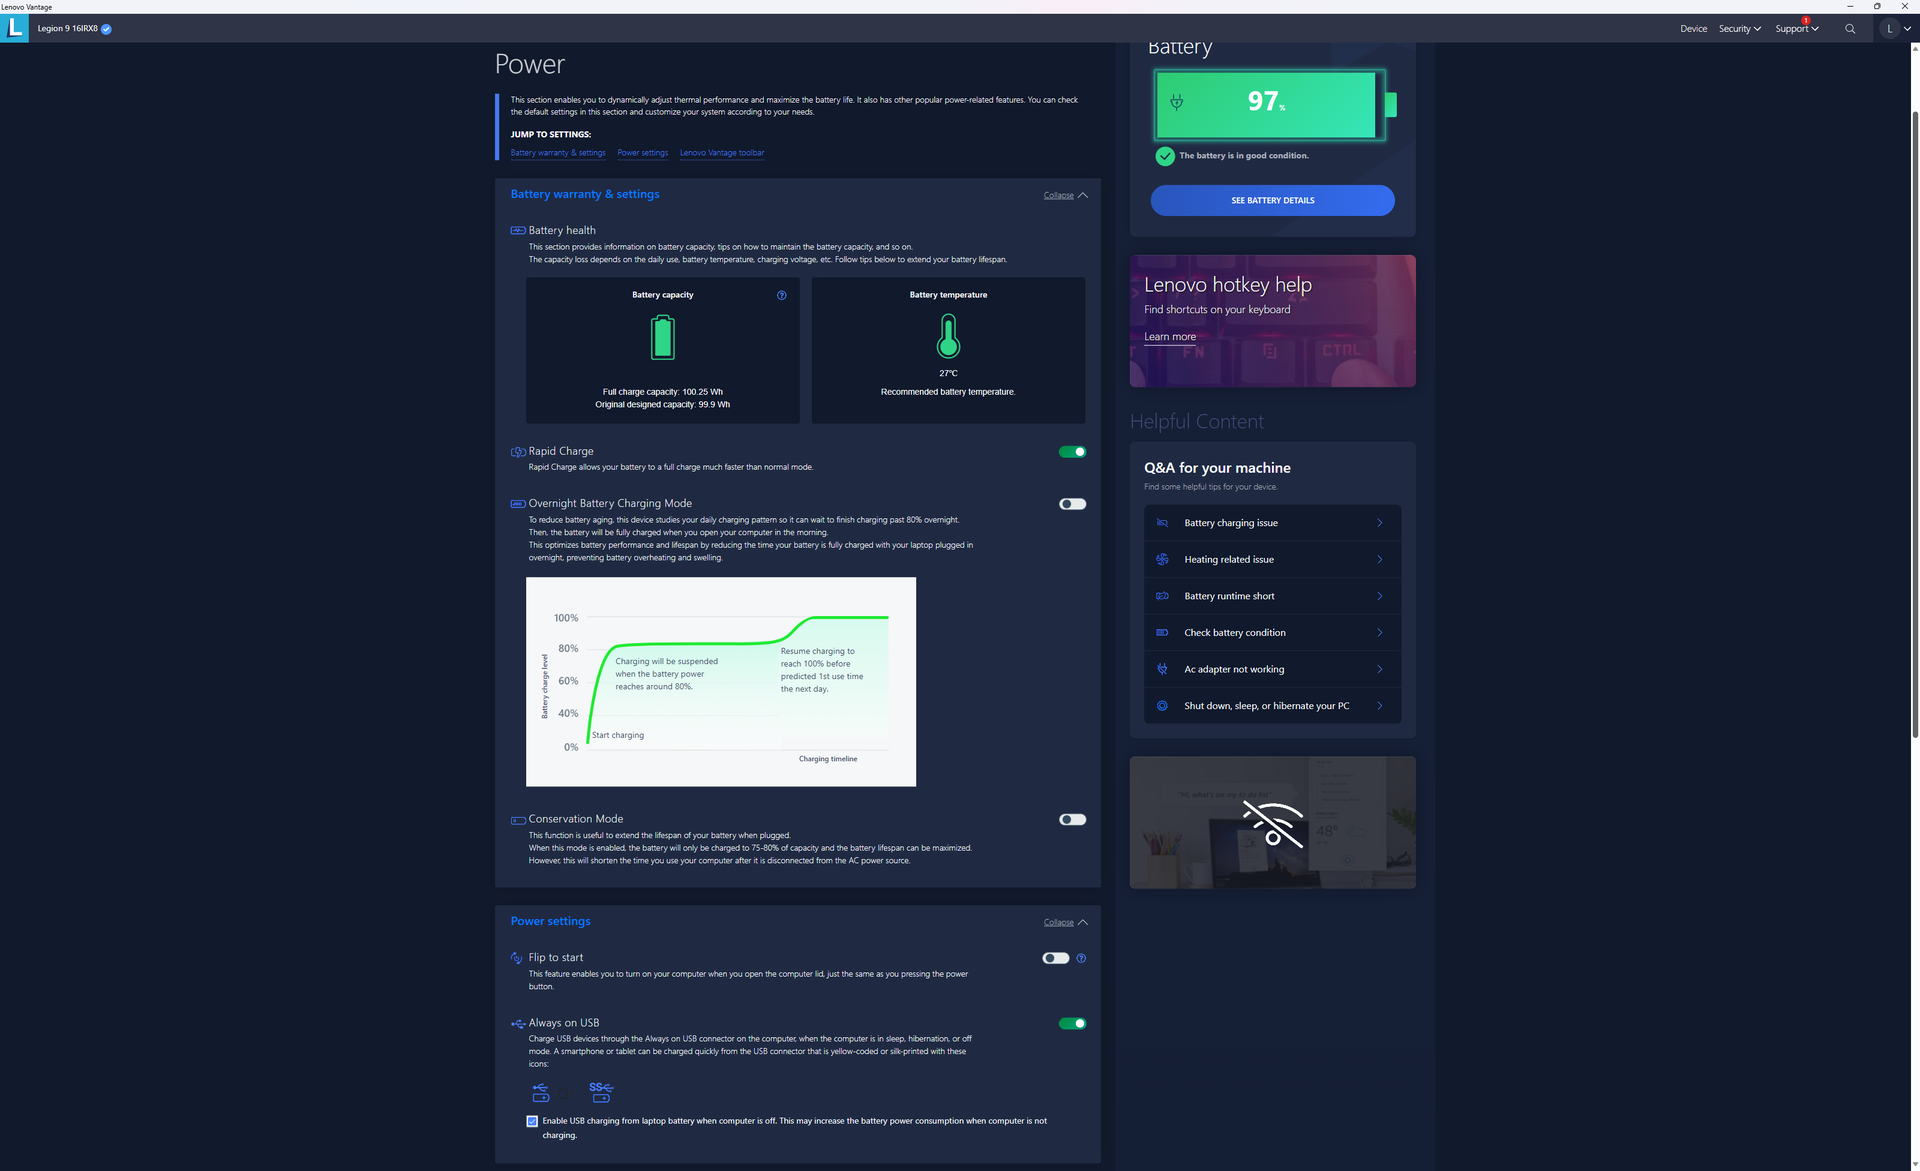
Durata della batteria
I tempi di esecuzione sono scarsi, il che è in relazione con i nostri numeri di consumo energetico elevati di cui sopra. Siamo riusciti a navigare sul web solo per 160 minuti, anche quando abbiamo impostato la modalità iGPU bilanciata. Altri computer portatili mini-LED, come l'HP Omen Transcend 16mostrano anch'essi tempi di autonomia molto brevi, nonostante le loro grandi batterie da oltre 90 Wh.
La ricarica è perlomeno molto rapida, circa un'ora quando si attiva la carica rapida di Lenovo, rispetto ai 90 minuti o più della maggior parte degli altri portatili da gioco. Anche gli adattatori USB-C di terze parti possono ricaricare il sistema, anche se a un ritmo più lento e con una compatibilità non garantita.
| Lenovo Legion 9 16IRX8 i9-13980HX, GeForce RTX 4090 Laptop GPU, 99.9 Wh | Lenovo Legion Slim 5 16APH8 R7 7840HS, GeForce RTX 4060 Laptop GPU, 80 Wh | Razer Blade 16 Early 2023 RTX 4090 i9-13950HX, GeForce RTX 4090 Laptop GPU, 95.2 Wh | Asus ROG Strix G16 G614JZ i9-13980HX, GeForce RTX 4080 Laptop GPU, 90 Wh | HP Omen Transcend 16 i9-13900HX, GeForce RTX 4070 Laptop GPU, 97 Wh | Alienware x16 R1 i9-13900HK, GeForce RTX 4080 Laptop GPU, 90 Wh | |
|---|---|---|---|---|---|---|
| Autonomia della batteria | 86% | 78% | 135% | 23% | -9% | |
| Reader / Idle (h) | 6.7 | 11.7 75% | 6.3 -6% | 7.3 9% | ||
| WiFi v1.3 (h) | 2.7 | 7.1 163% | 5.8 115% | 9.7 259% | 4.2 56% | 2.5 -7% |
| Load (h) | 1 | 1.2 20% | 1.4 40% | 1.1 10% | 1.2 20% | 0.7 -30% |
| H.264 (h) | 8.4 | |||||
| Witcher 3 ultra (h) | 1.6 |
Pro
Contro
Verdetto - Il miglior Legion che il denaro possa comprare
Se è alla ricerca di una CPU Core i9, di una GPU RTX 4090 e di un display mini-LED, allora Legion 9i 16 è assolutamente da prendere in considerazione. Se confrontato con altri portatili da gioco mini-LED come il modello HP Omen Transcend 16, Razer Blade 16o l' Asus Zephyrus M16lenovo offre una grafica più veloce rispetto all'HP, prezzi più bassi rispetto al Razer e una risoluzione nativa più elevata rispetto all'Asus. Inchioda sia le specifiche che il design fisico per essere un salutare passo avanti rispetto alla già ottima Legion Serie Pro 7.
Tutti gli aggiornamenti hanno naturalmente portato ad uno chassis più grande e più pesante. Se desidera le caratteristiche della CPU e del display di Lenovo, ma in un fattore di forma più portatile, allora il Blade 16, più costoso, potrebbe valere la pena. Il raffreddamento a liquido integrato sembra interessante sulla carta, ma non sembra aver reso il design più leggero, più silenzioso o più fresco. Si aspetti che il Lenovo funzioni in modo rumoroso come la maggior parte degli altri computer portatili da gioco della stessa categoria di dimensioni.
Legion 9i 16 ha tutte le specifiche di lusso e un nuovo look che gli appassionati possono apprezzare, a patto che si possa ignorare la breve durata della batteria e il telaio relativamente grande.
Se vuole Legion 9 16, deve davvero desiderare il mini-LED, in quanto non offre altre opzioni di visualizzazione, nel bene e nel male. Mini-LED dà il meglio di sé quando si attiva l'HDR per sfruttare la sua luminosità massima di 1000 nit. Altrimenti, il pannello è molto esigente per la batteria e non offre altri vantaggi importanti rispetto a pannelli meno costosi come IPS o OLED.
Prezzo e disponibilità
Lenovo sta spedendo il modello Legion 9i Gen 8 a partire da 3420 dollari se configurato con GeForce RTX 4080 fino a 4000 dollari se completamente configurato con RTX 4090 e storage aggiuntivo.
Lenovo Legion 9 16IRX8
- 10/15/2023 v7 (old)
Allen Ngo
Transparency
La selezione dei dispositivi da recensire viene effettuata dalla nostra redazione. Il campione di prova è stato fornito all'autore come prestito dal produttore o dal rivenditore ai fini di questa recensione. L'istituto di credito non ha avuto alcuna influenza su questa recensione, né il produttore ne ha ricevuto una copia prima della pubblicazione. Non vi era alcun obbligo di pubblicare questa recensione. In quanto società mediatica indipendente, Notebookcheck non è soggetta all'autorità di produttori, rivenditori o editori.
Ecco come Notebookcheck esegue i test
Ogni anno, Notebookcheck esamina in modo indipendente centinaia di laptop e smartphone utilizzando procedure standardizzate per garantire che tutti i risultati siano comparabili. Da circa 20 anni sviluppiamo continuamente i nostri metodi di prova e nel frattempo stabiliamo gli standard di settore. Nei nostri laboratori di prova, tecnici ed editori esperti utilizzano apparecchiature di misurazione di alta qualità. Questi test comportano un processo di validazione in più fasi. Il nostro complesso sistema di valutazione si basa su centinaia di misurazioni e parametri di riferimento ben fondati, che mantengono l'obiettività.Price comparison

