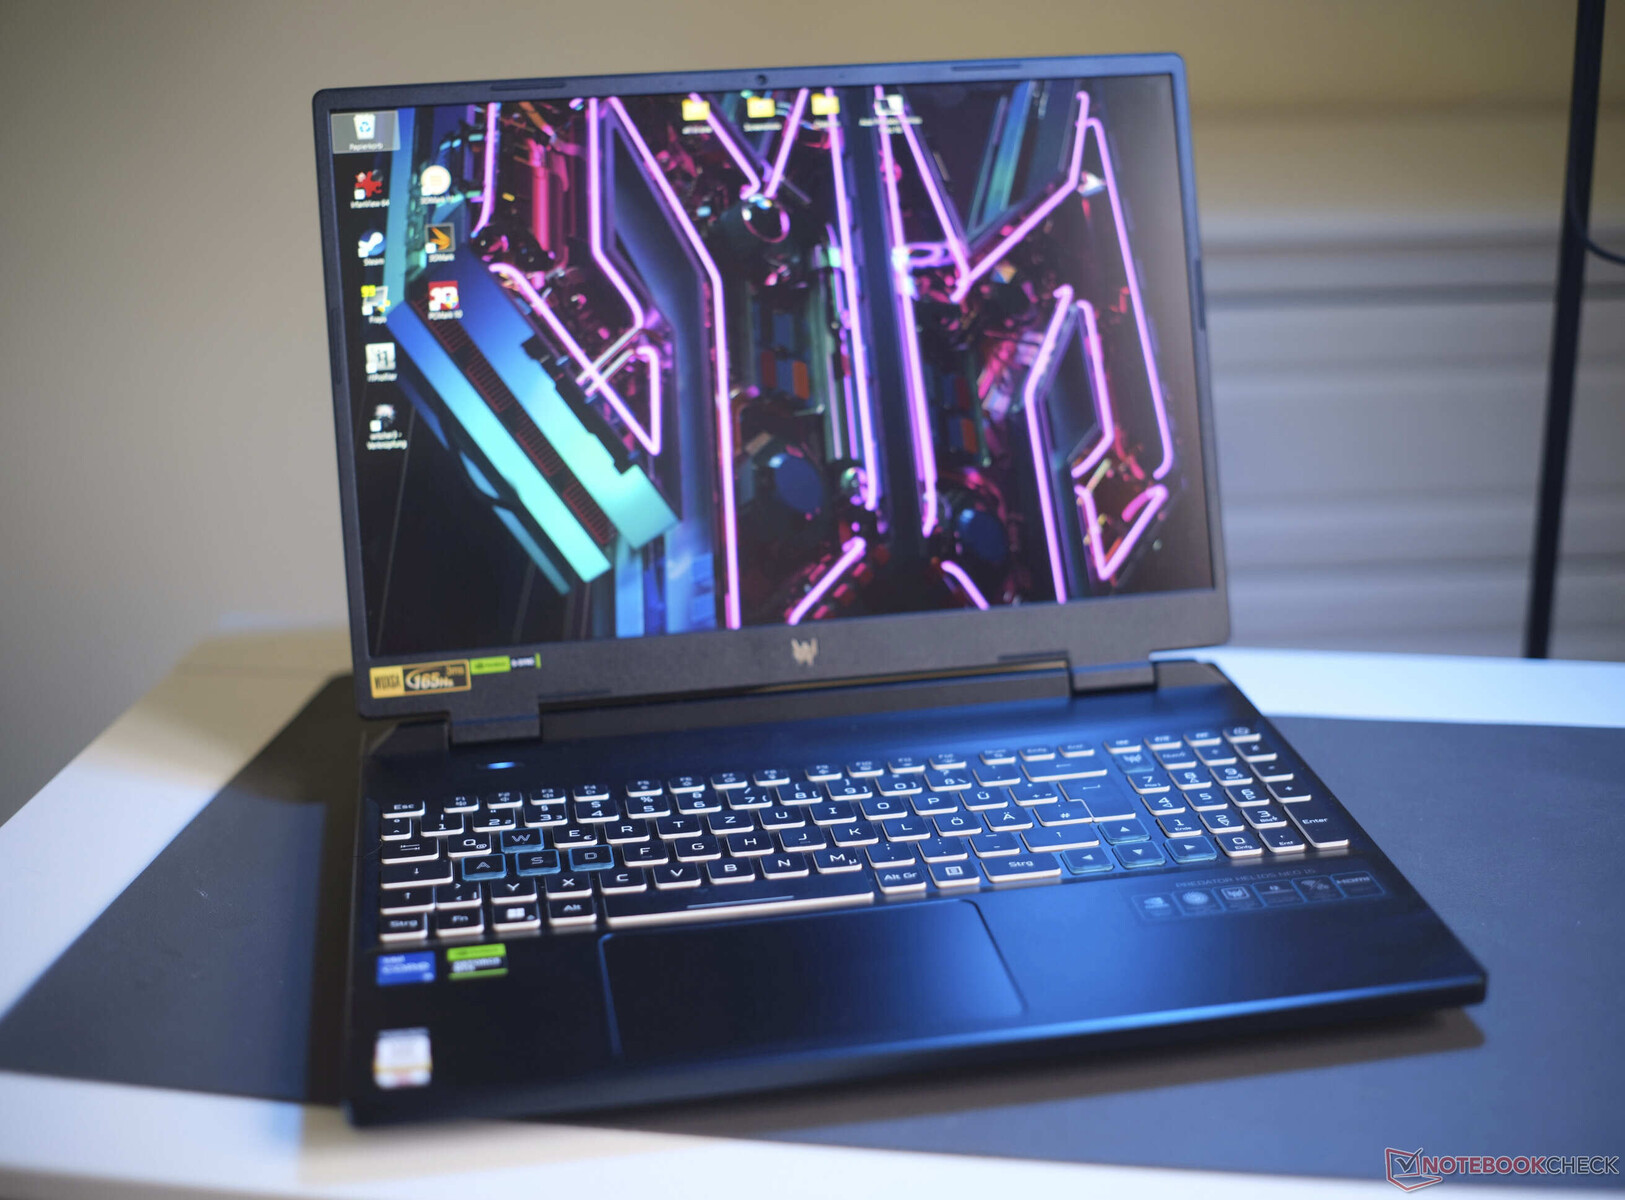
Recensione del computer portatile Predator Helios Neo 16: Acer ha creato una chimera gaming

In linea di principio, il Predator Helios Neo 16 di Acer, un computer portatile da gioco di fascia media, è una versione più sottile delPredator Helios 16(Non-Neo). Sono state mantenute alcune caratteristiche del modello Helio classico, il che significa che può distinguersi dalla serie Nitro di Acer serie Nitro entry-level di Acer.
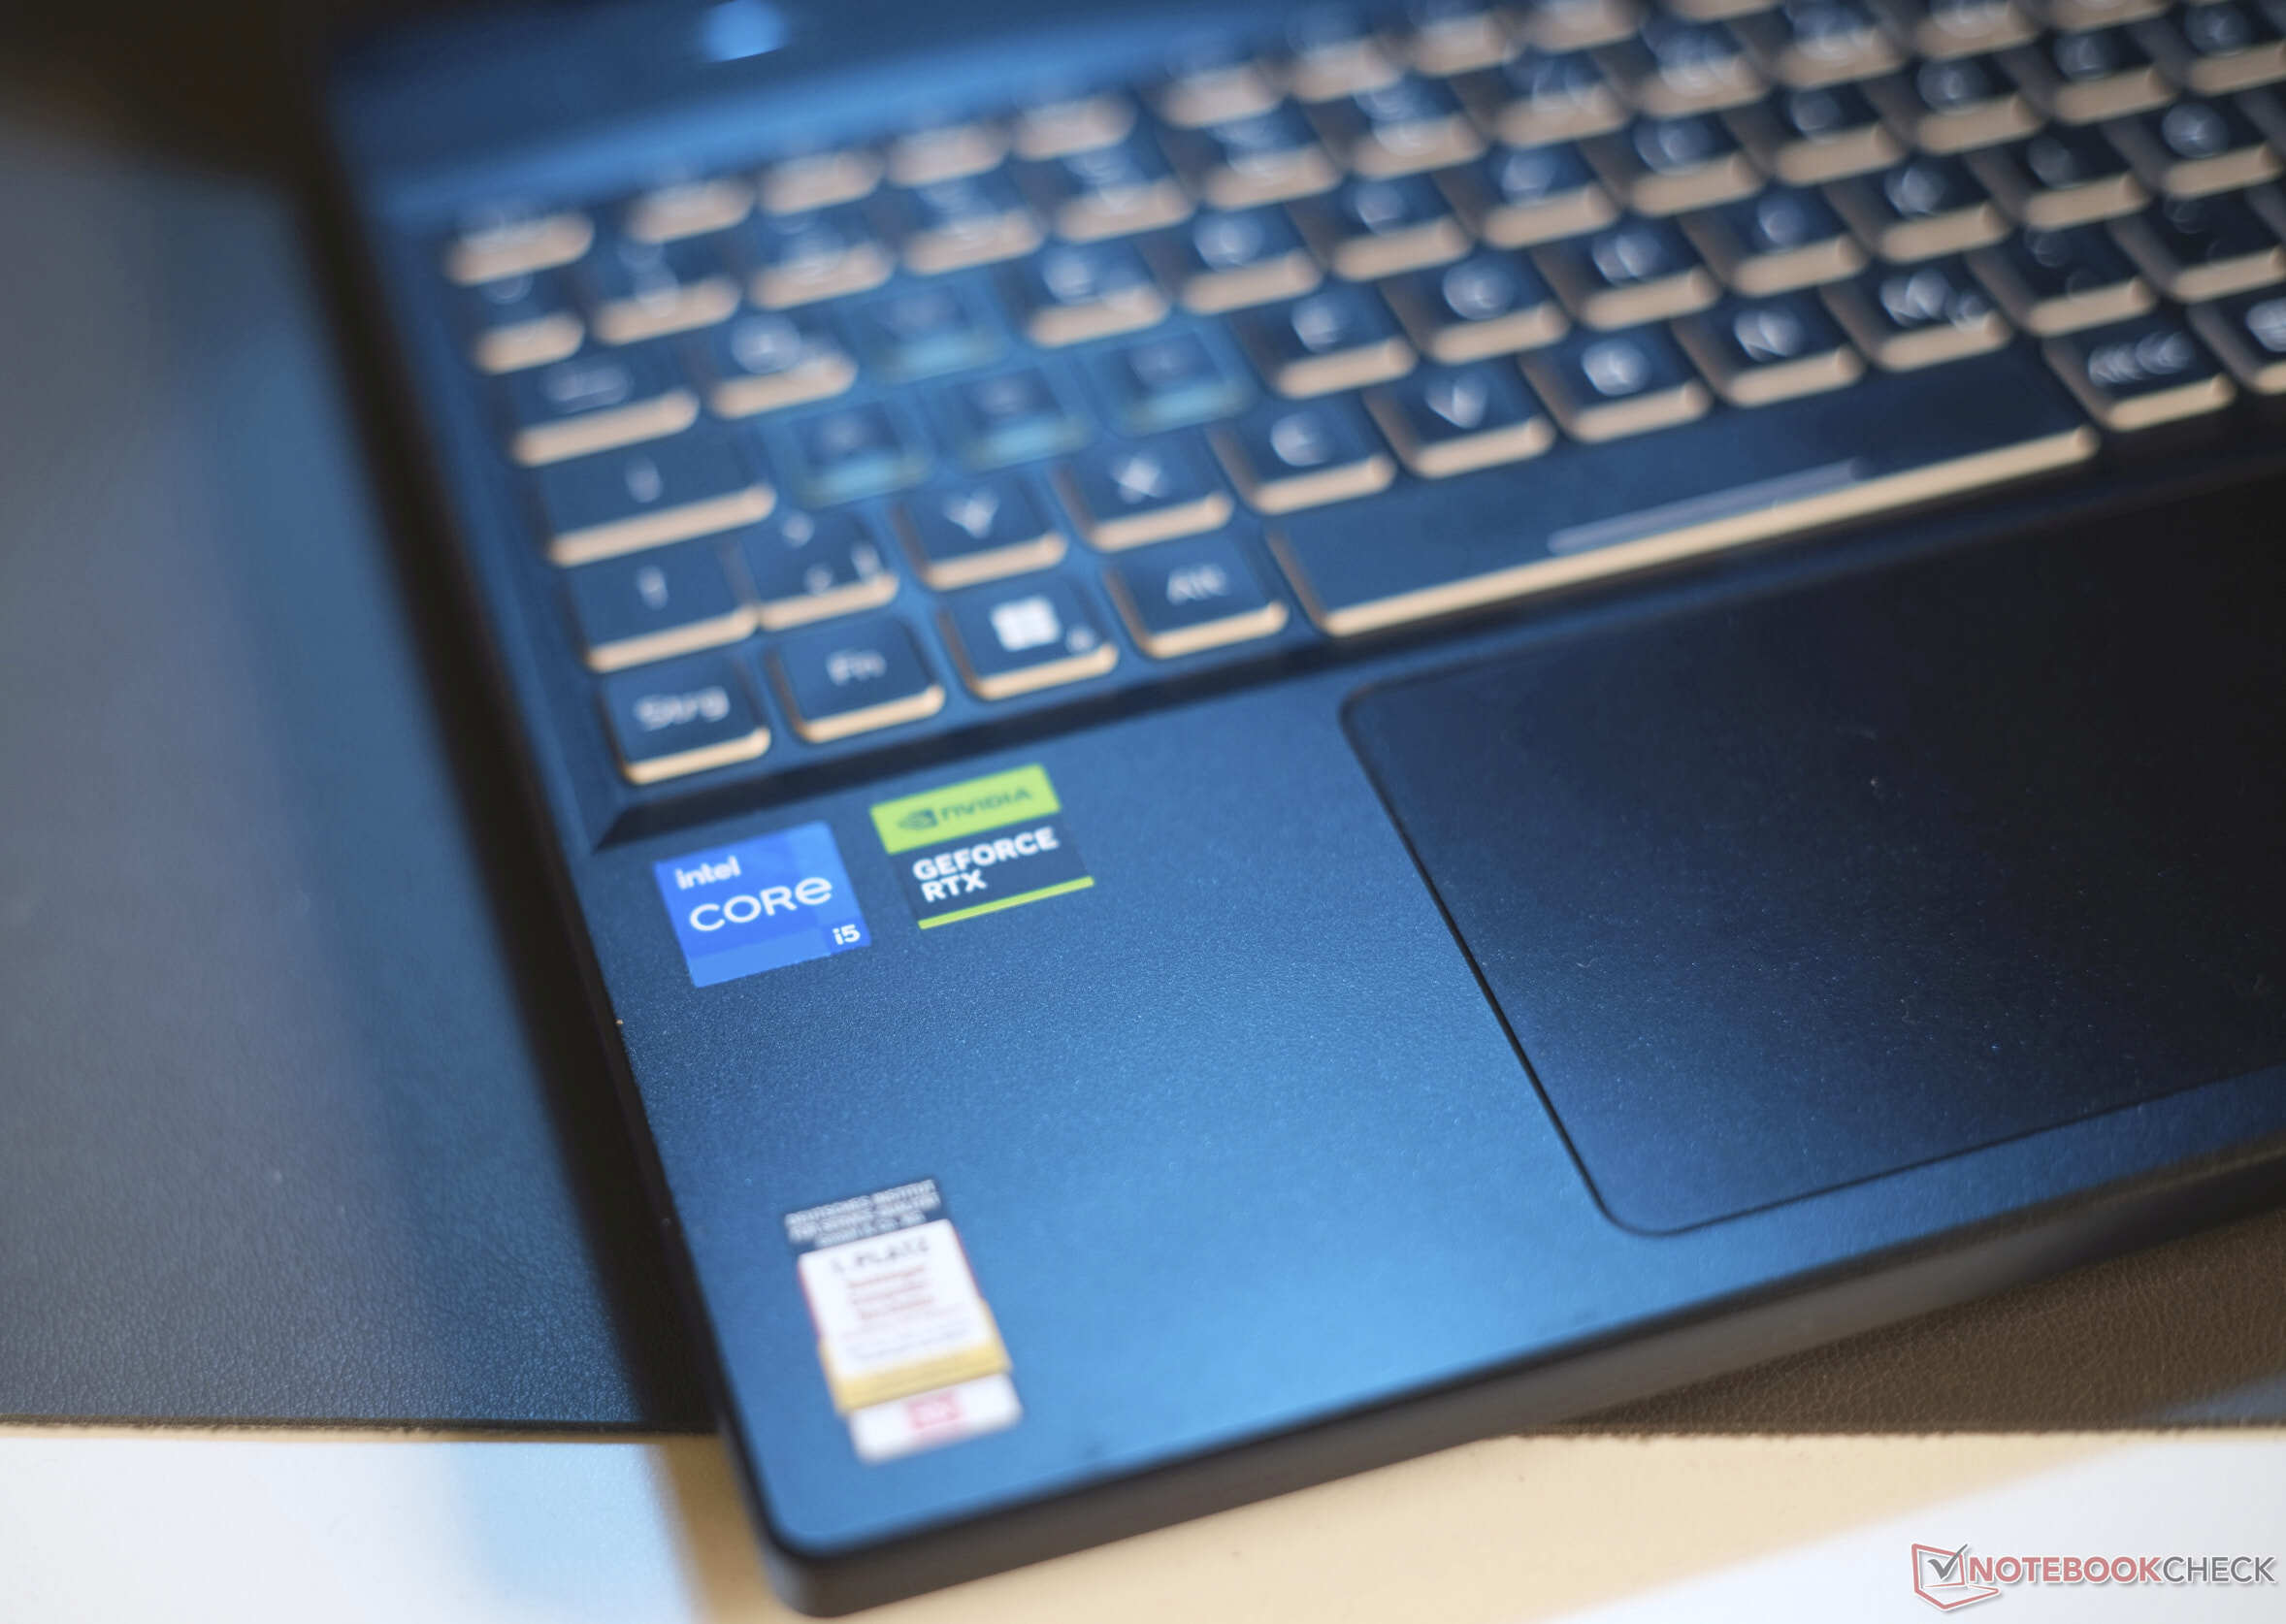
Tuttavia, alcuni dei suoi aspetti possono essere classificati come caratteristiche entry-level, come ad esempio la RTX 4050 installata - ad un prezzo di 1.069 dollari, questo è un po' discutibile. Tuttavia, l'Intel Core i5-13500HX del portatile è una potente CPU di classe desktop che consuma 55 watt. Questa e alcune altre caratteristiche non si trovano normalmente nei veri computer portatili economici. Inoltre, esistono varianti con RTX 4060 o RTX 4070.
Nel corso di questa recensione, analizzeremo se tutto questo è sufficiente a far valere il prezzo del laptop. Il suo principale concorrente è Legion Pro 5 di Lenovo, ma tra gli altri concorrenti si annoverano anche Victus 16 di HP, Apex 15 di XMG e Dell G15.
Potenziali concorrenti a confronto
Punteggio | Data | Modello | Peso | Altezza | Dimensione | Risoluzione | Prezzo |
|---|---|---|---|---|---|---|---|
| 86.6 % v7 (old) | 11/2023 | Acer Predator Helios Neo 16 NH.QLTEG.002 i5-13500HX, GeForce RTX 4050 Laptop GPU | 2.6 kg | 28.25 mm | 16.00" | 1920x1200 | |
| 89 % v7 (old) | 08/2023 | Lenovo Legion Pro 5 16ARX8 (R5 7645HX, RTX 4050) R5 7645HX, GeForce RTX 4050 Laptop GPU | 2.5 kg | 27.3 mm | 16.00" | 2560x1600 | |
| 87.3 % v7 (old) | 09/2023 | Lenovo LOQ 16IRH8 i7-13620H, GeForce RTX 4060 Laptop GPU | 2.7 kg | 25.9 mm | 16.00" | 2560x1600 | |
| 86.2 % v7 (old) | 10/2023 | Schenker XMG Apex 15 (Late 23) R7 7840HS, GeForce RTX 4050 Laptop GPU | 2.2 kg | 26.7 mm | 15.60" | 2560x1440 | |
| 85.6 % v7 (old) | 09/2023 | HP Victus 16-r0076TX i5-13500HX, GeForce RTX 4050 Laptop GPU | 2.3 kg | 22.9 mm | 16.10" | 1920x1080 | |
| 84.2 % v7 (old) | 06/2023 | Dell G15 5530 i7-13650HX, GeForce RTX 4060 Laptop GPU | 3 kg | 26.95 mm | 15.60" | 1920x1080 |
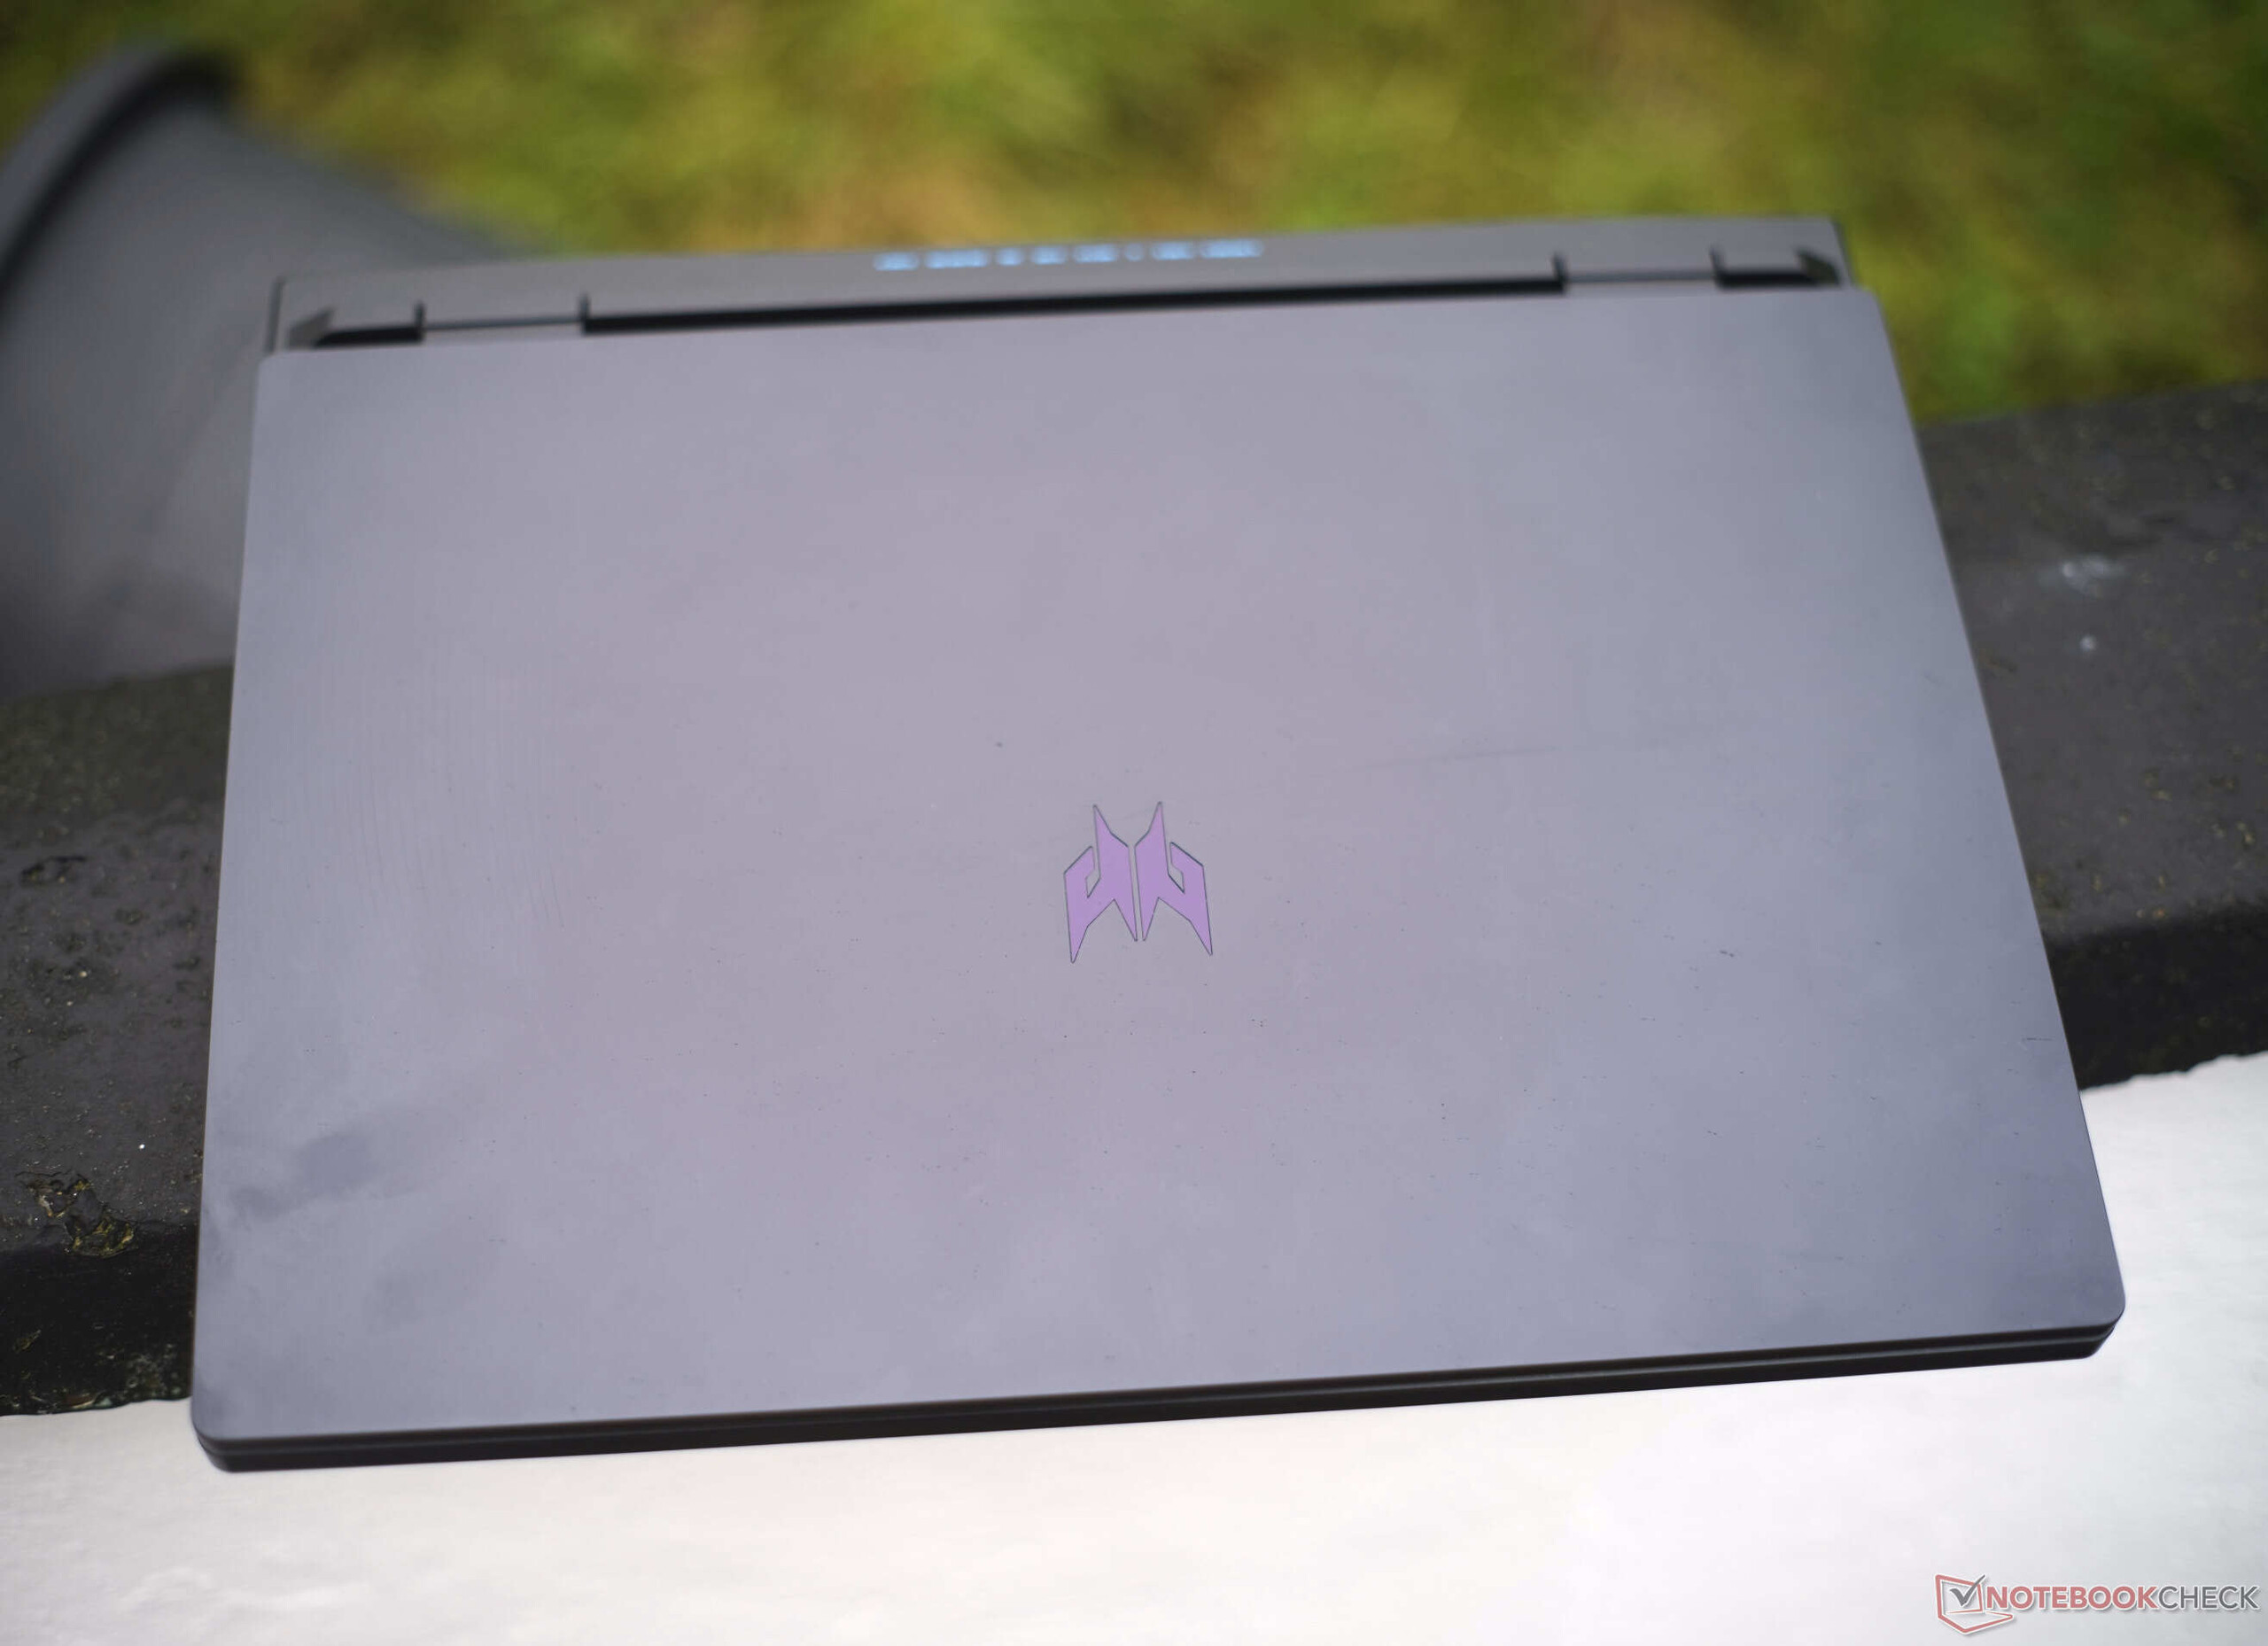
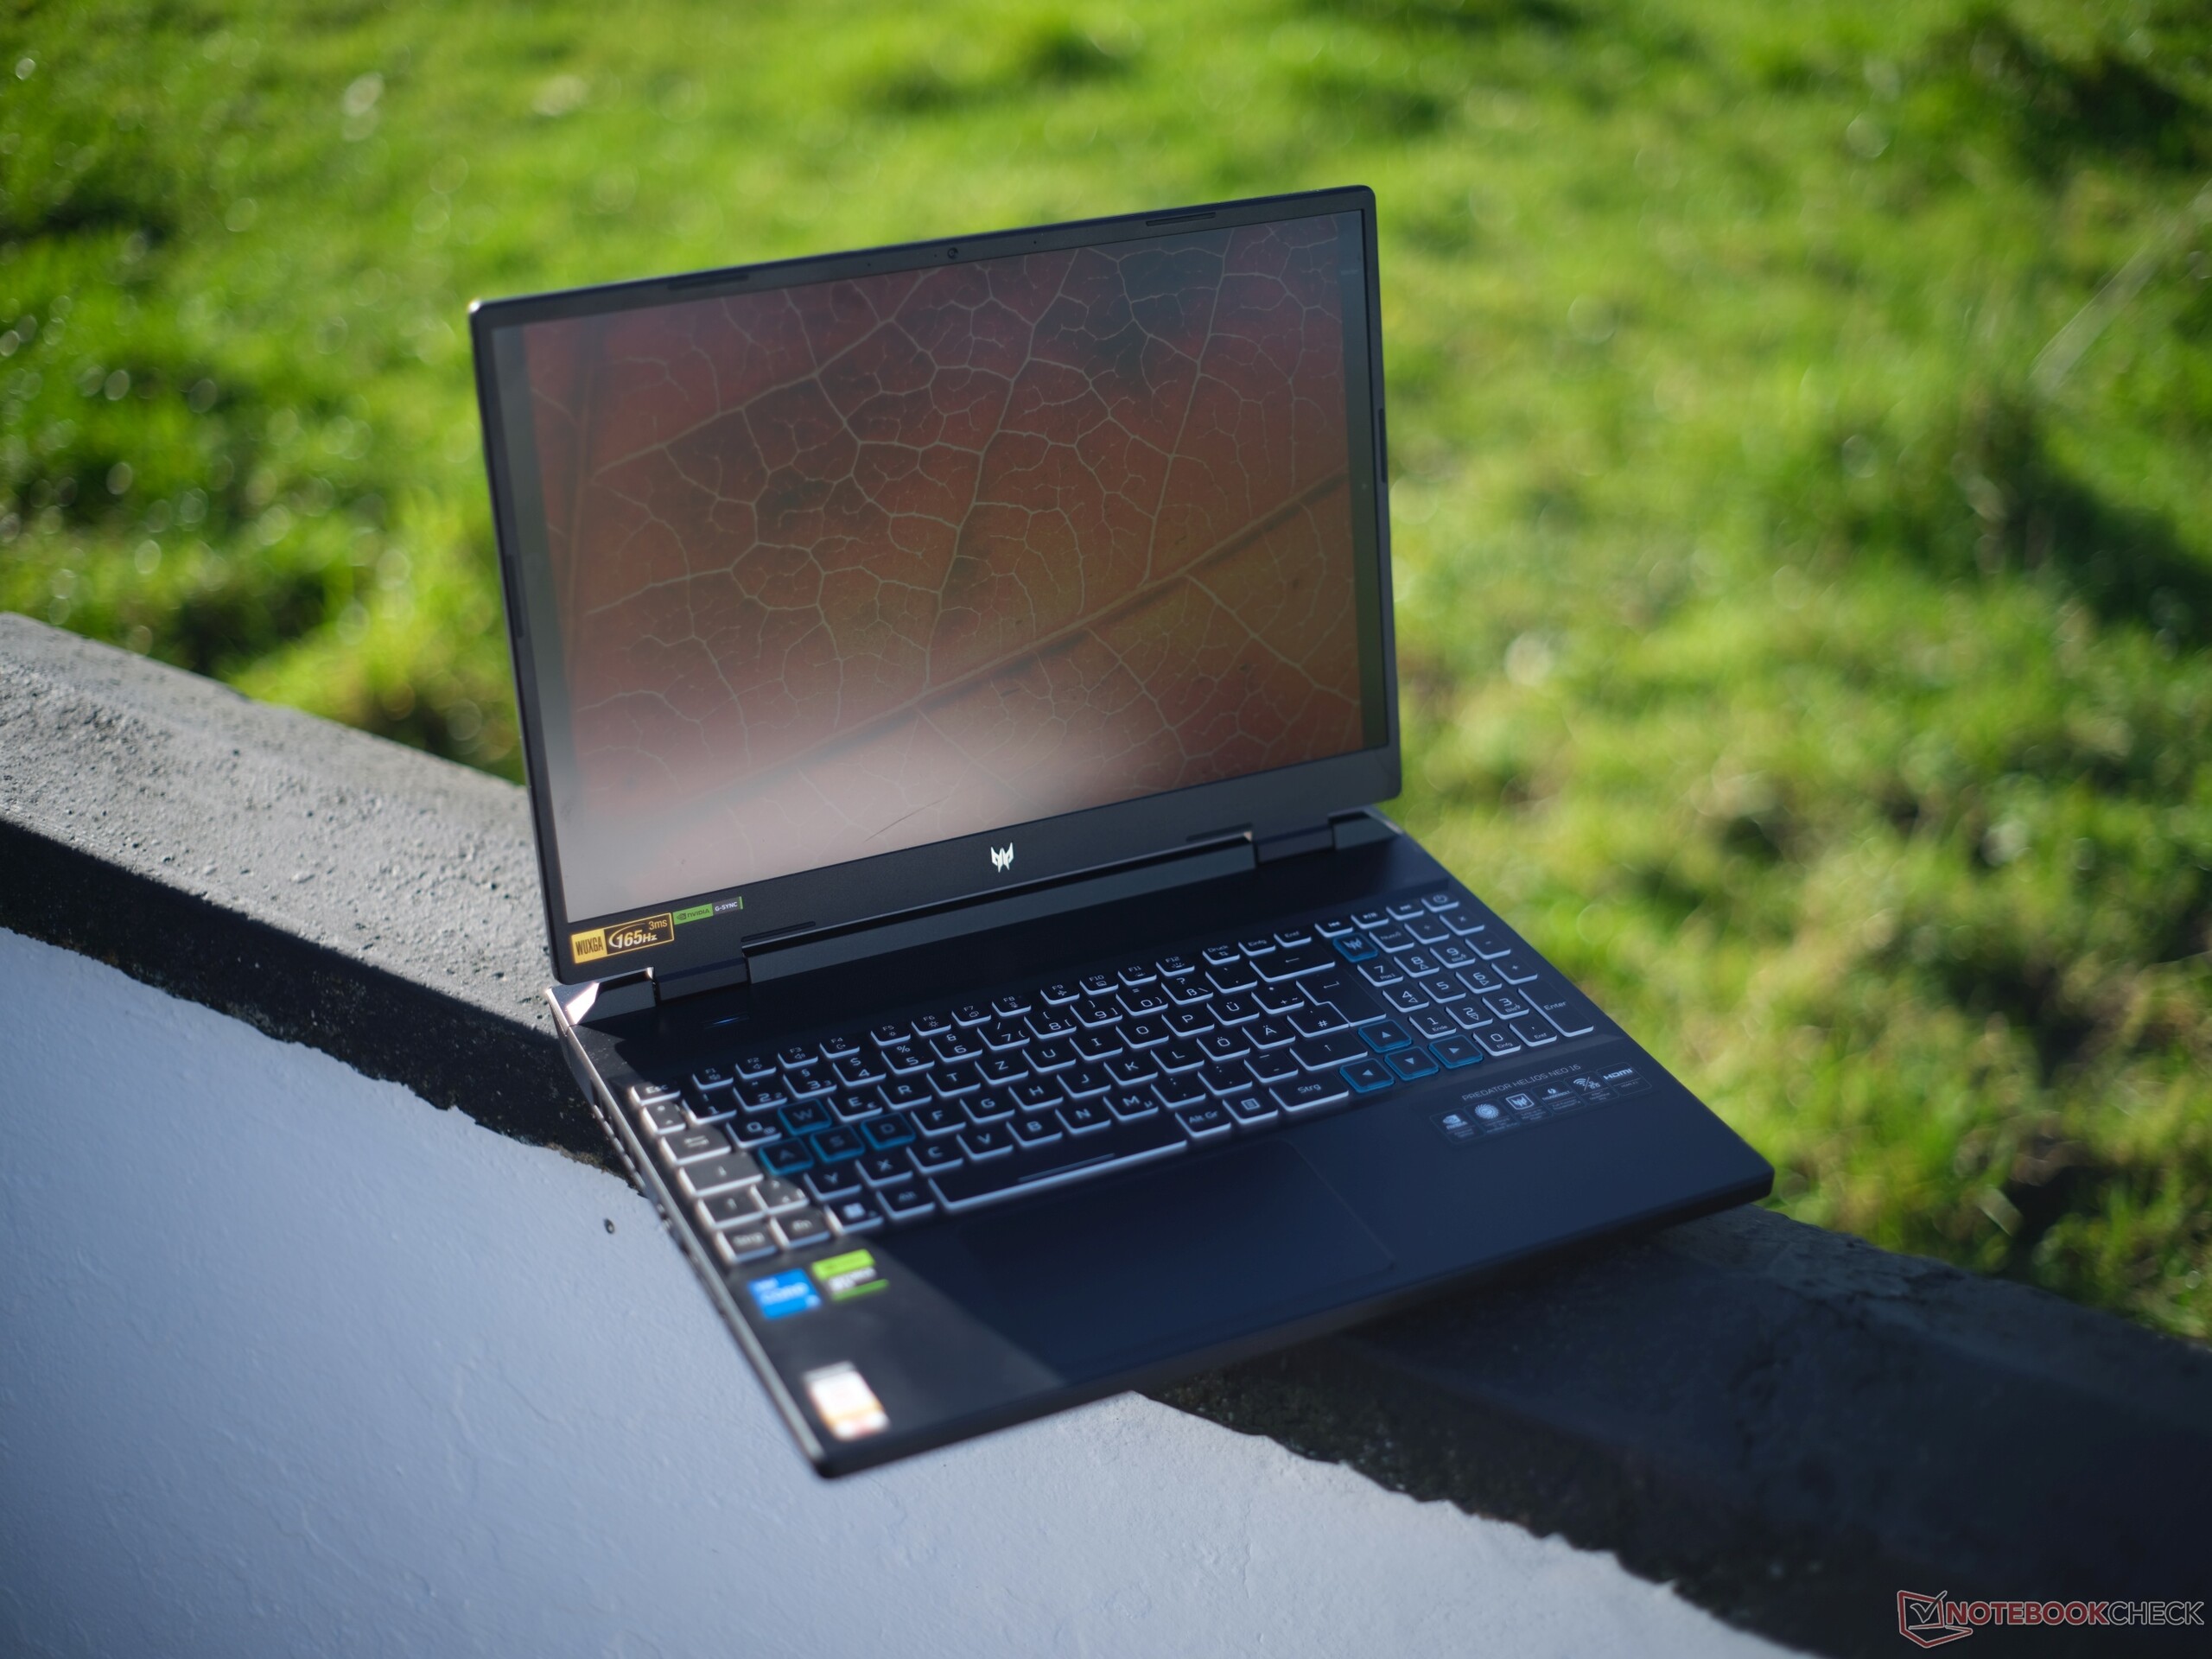
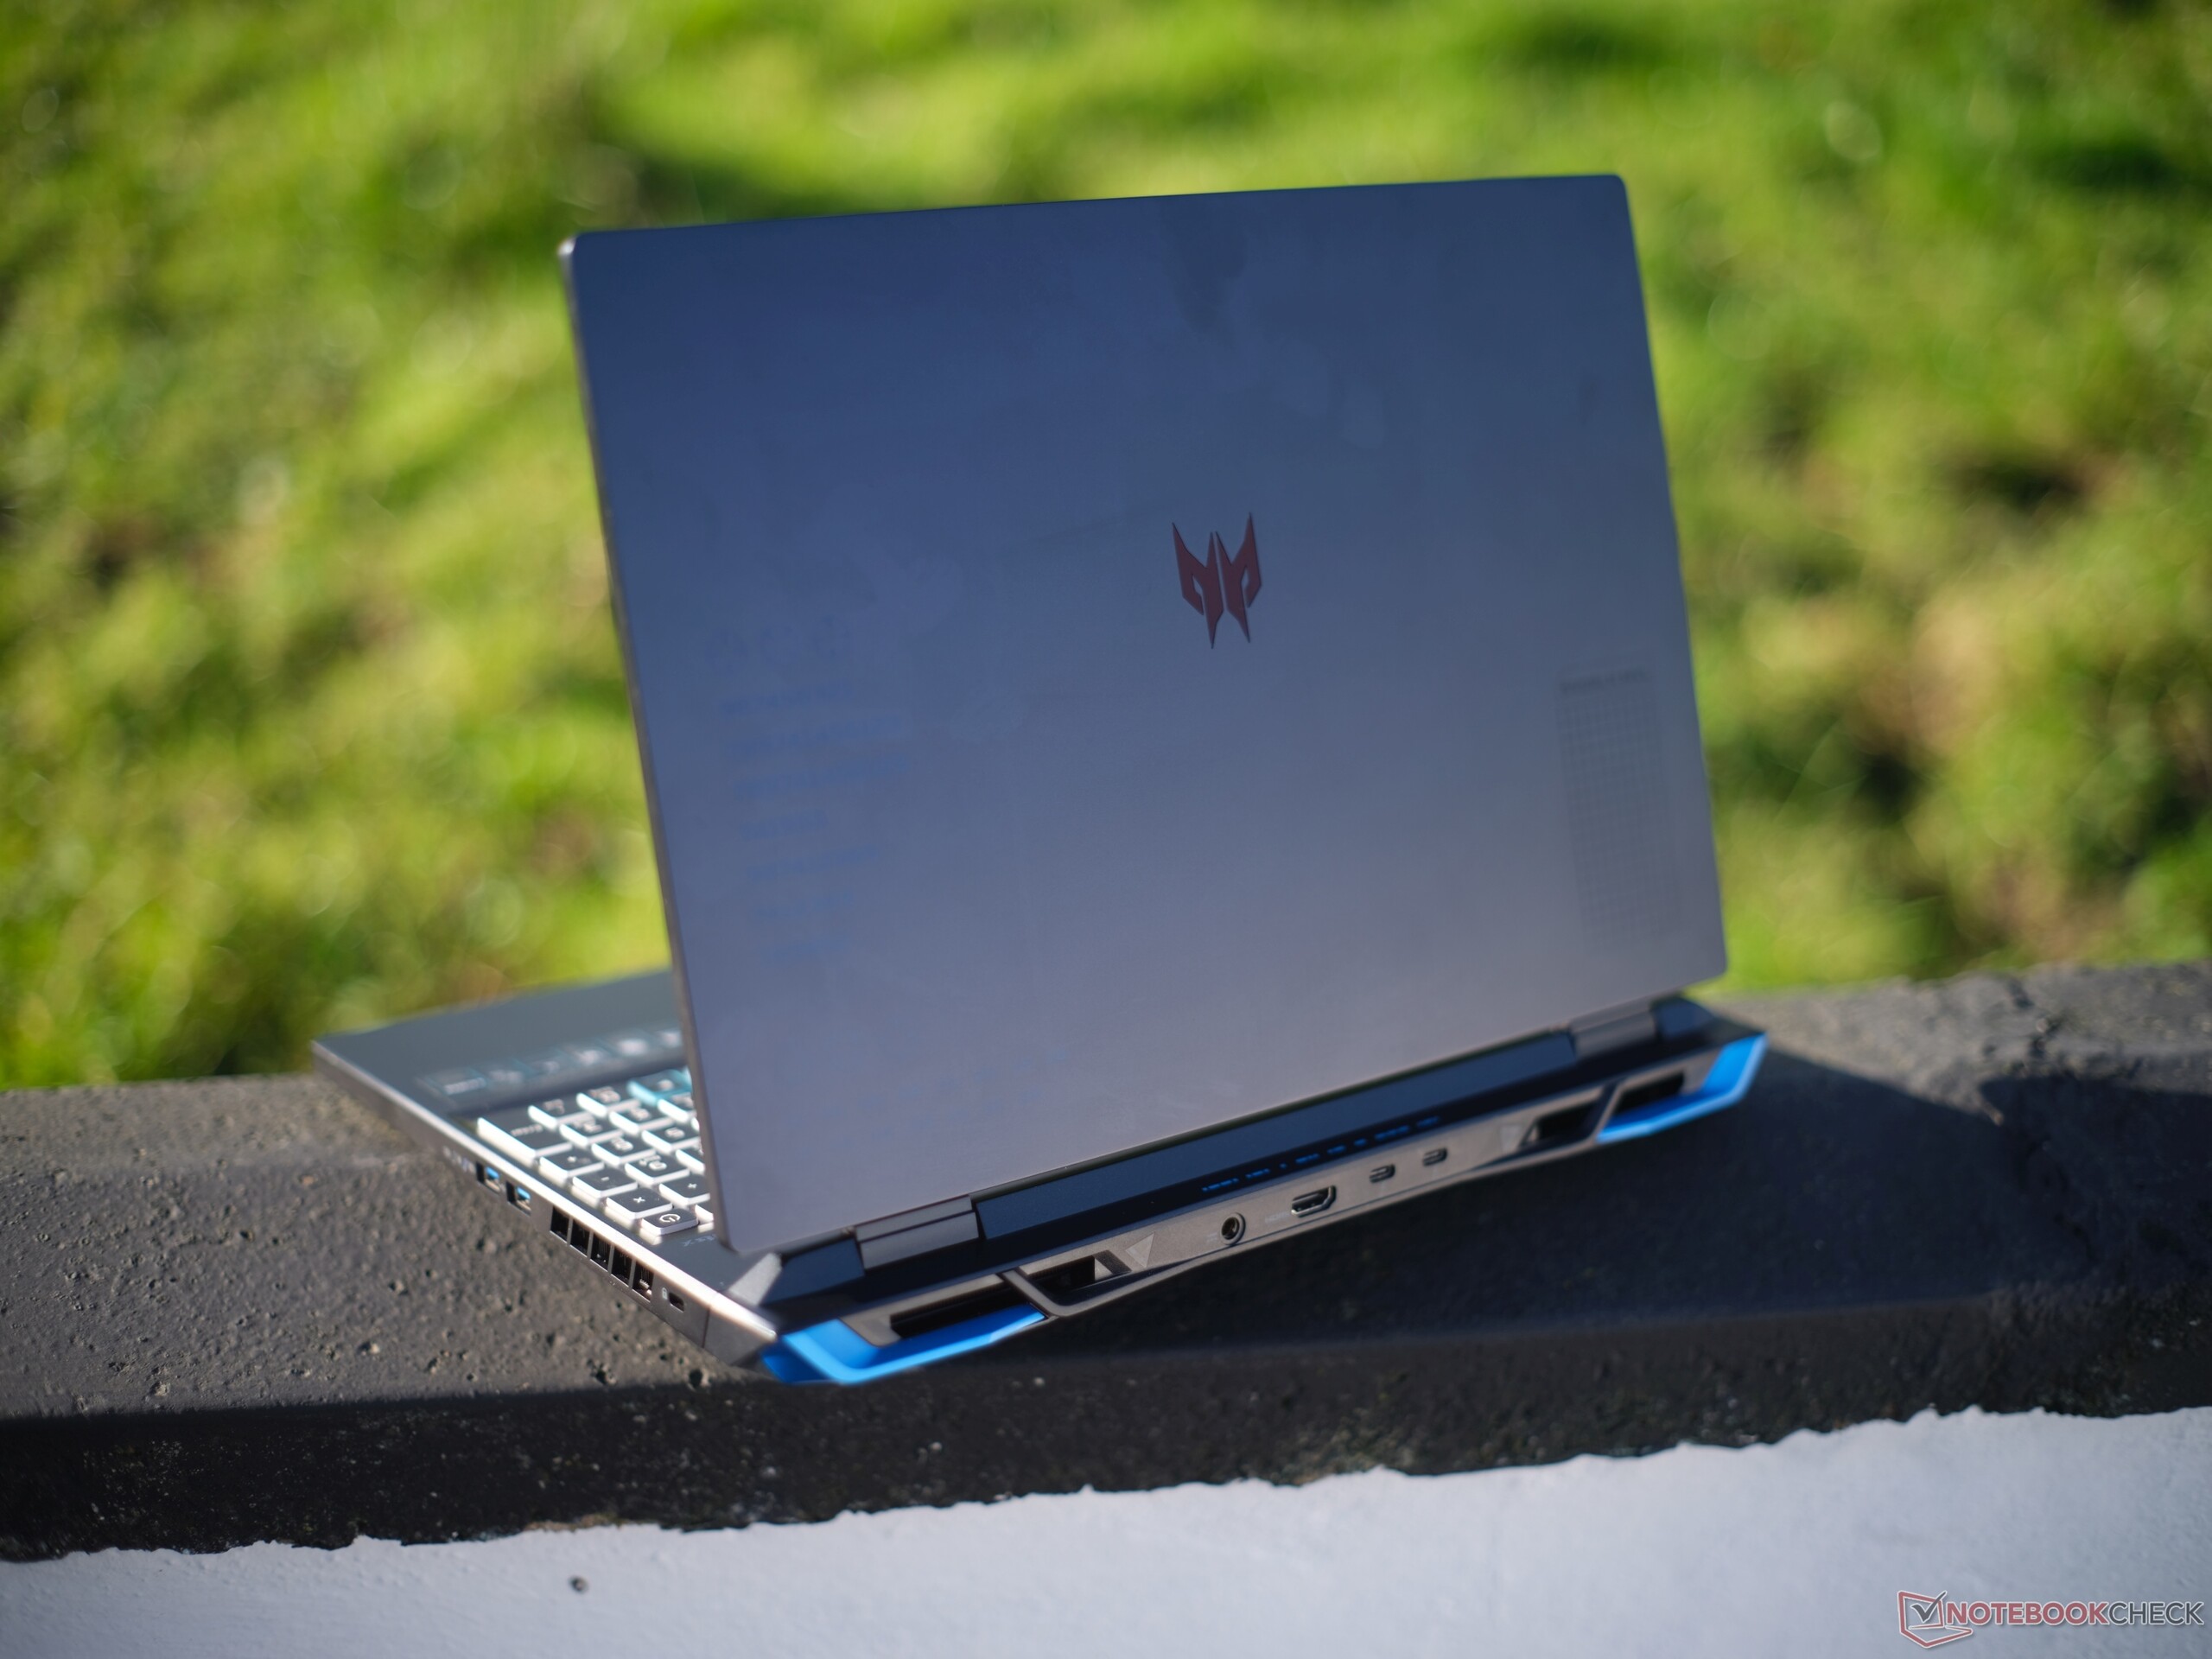
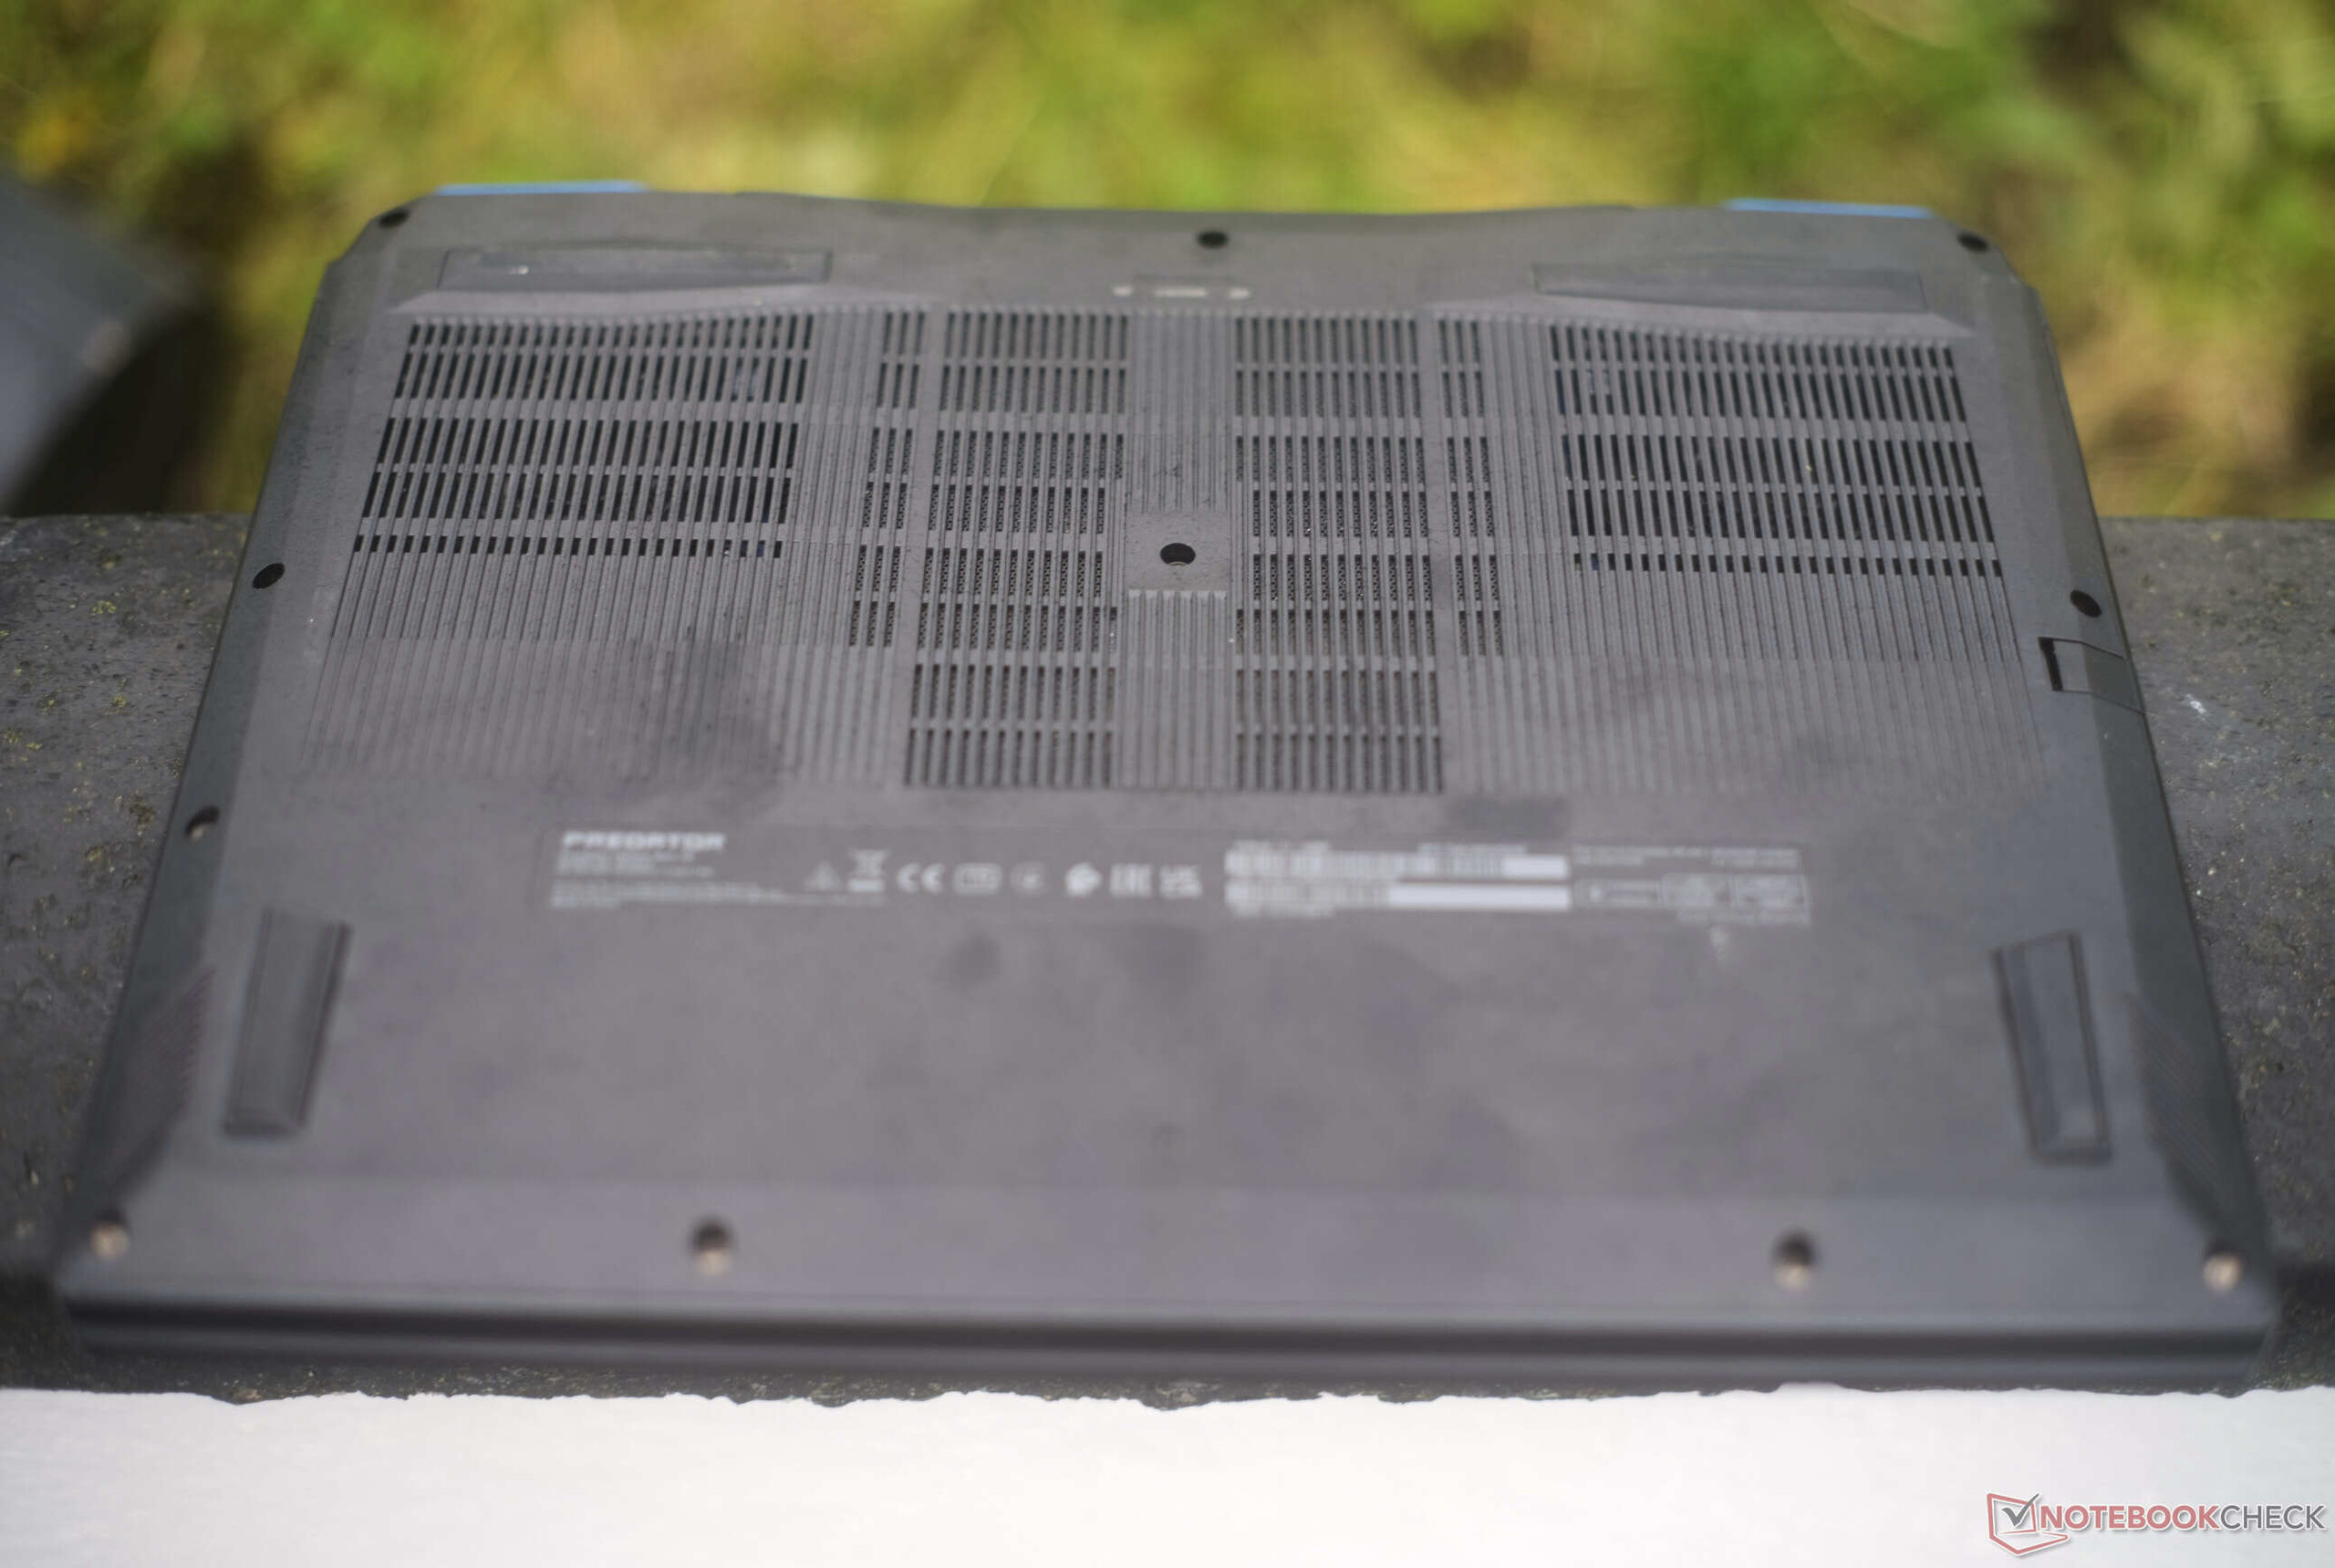
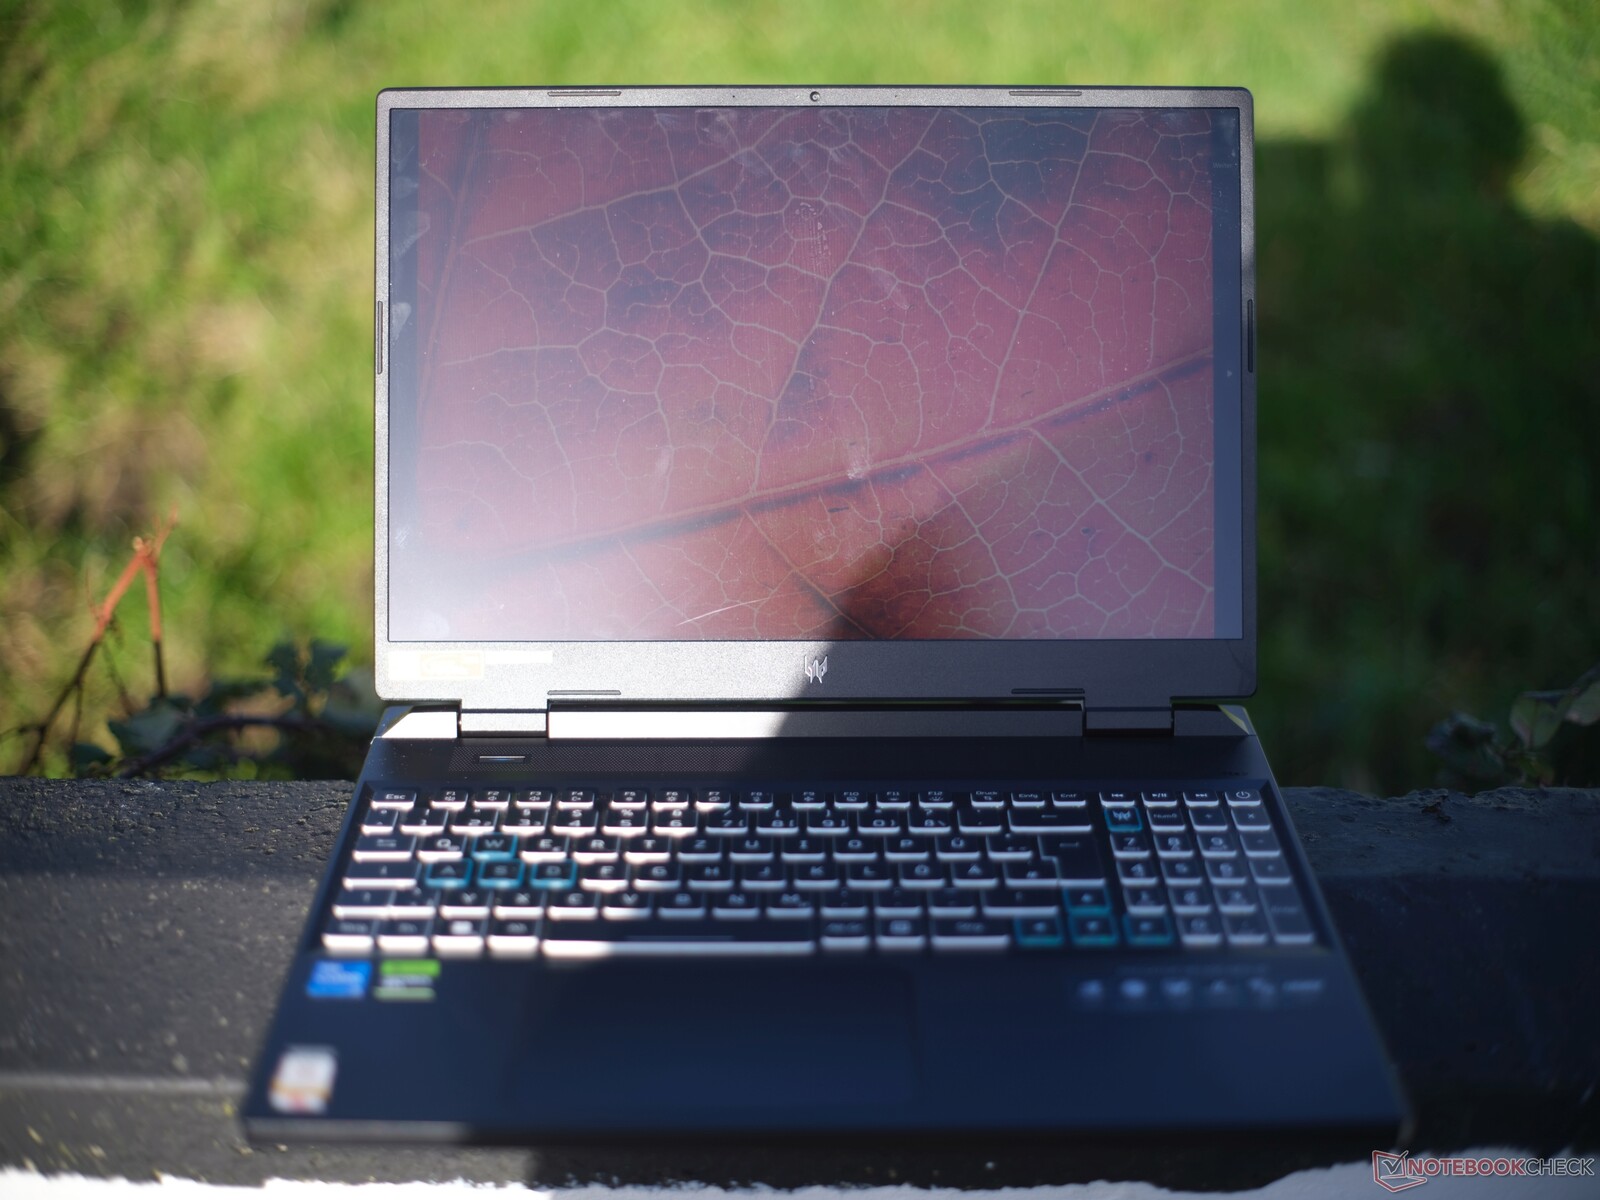
Custodia: Helios Neo 16 si distingue per la sua robustezza e il suo aspetto
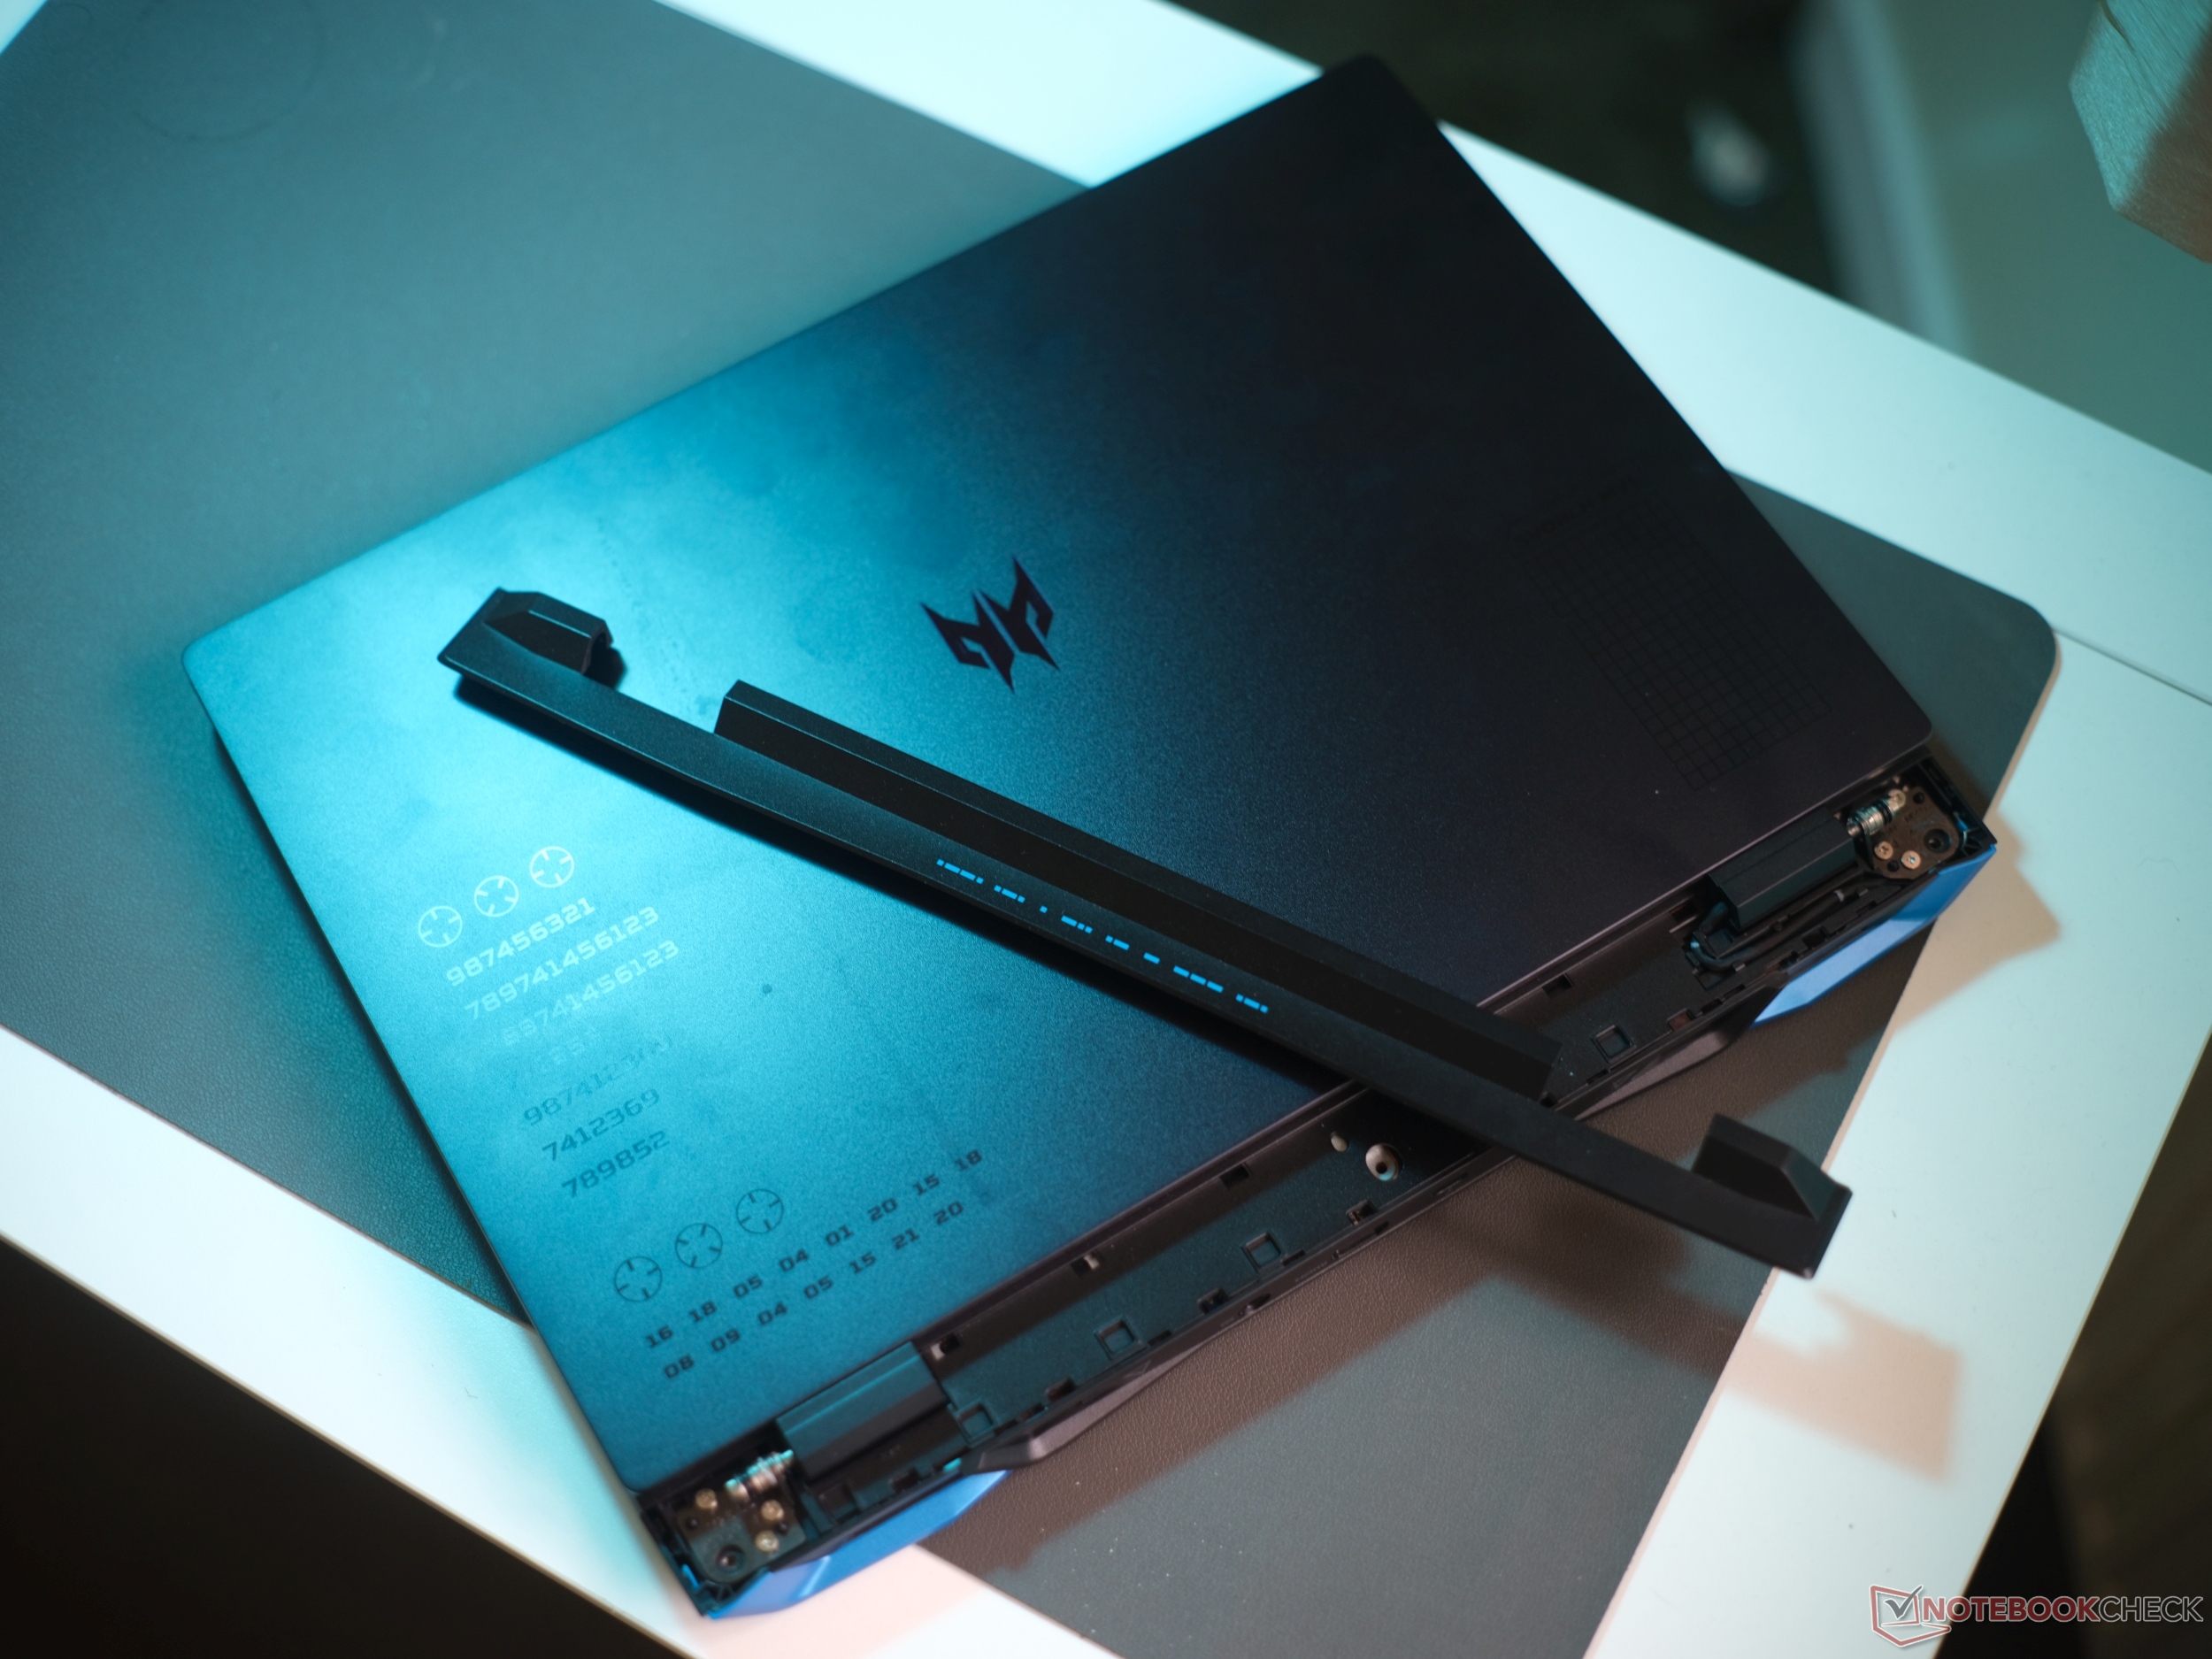
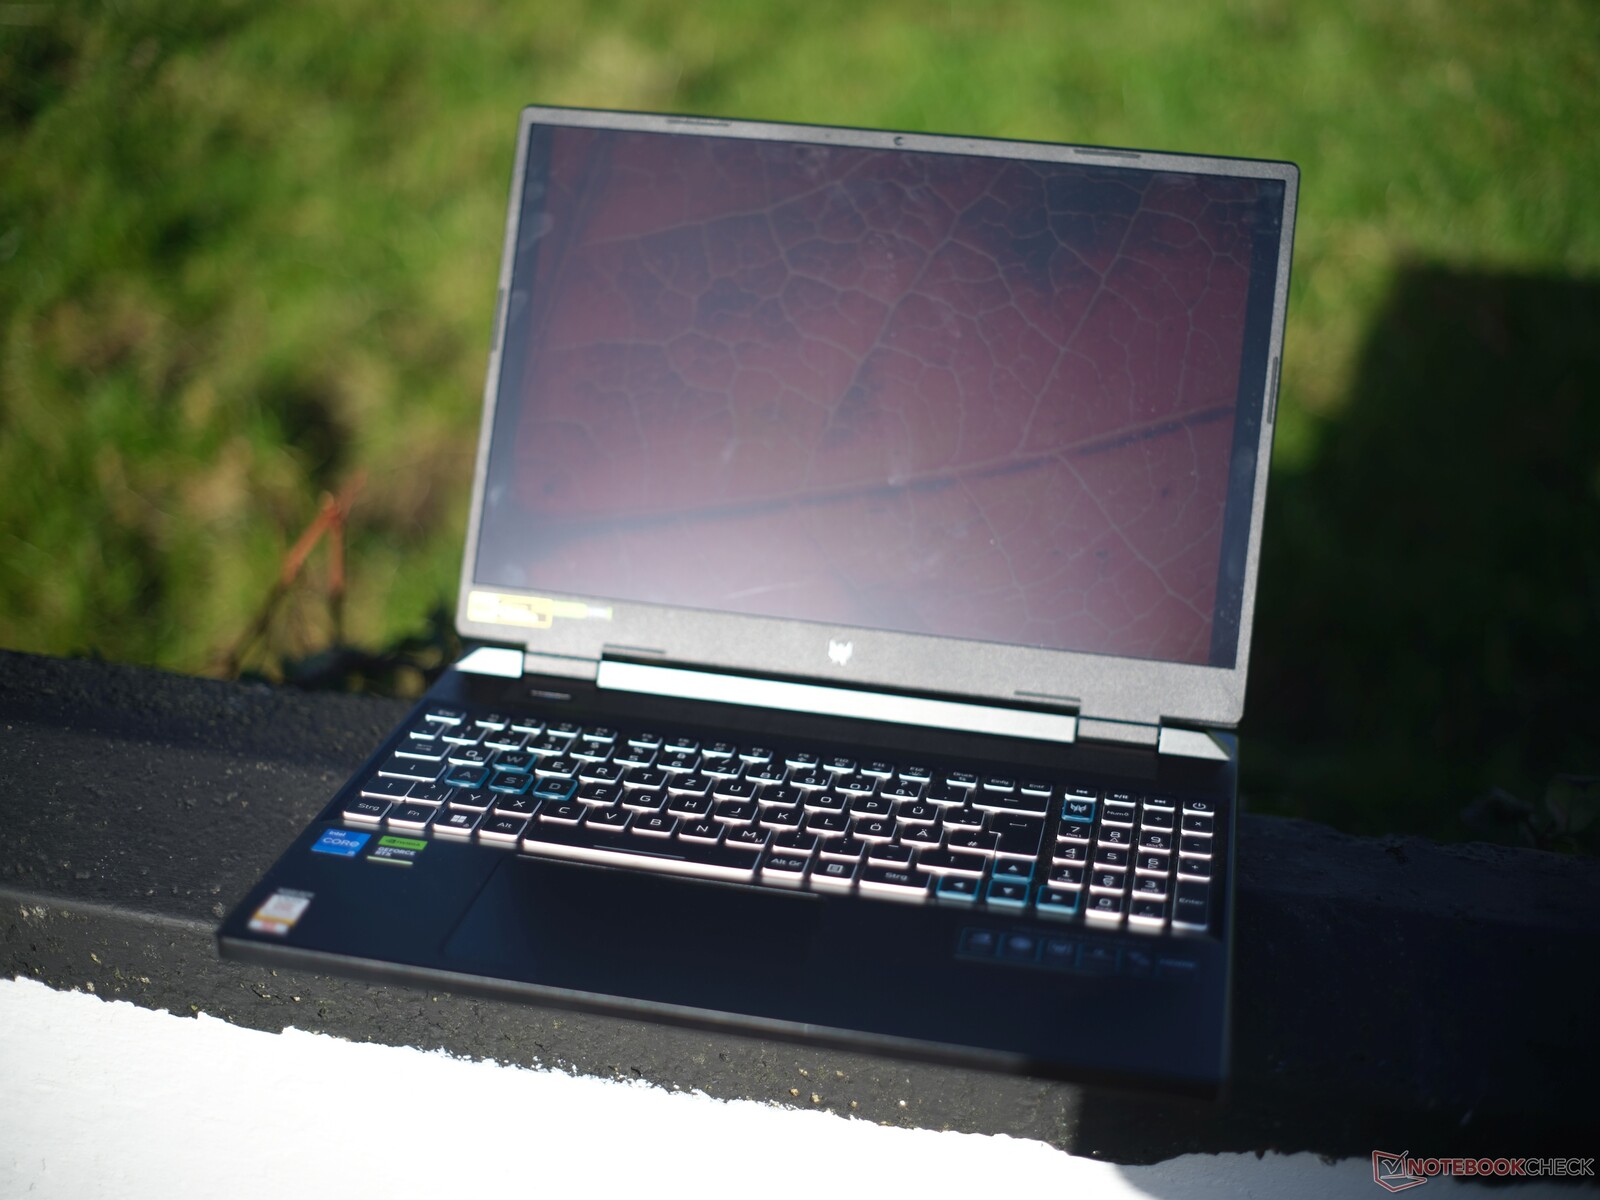
La stabilità del case di Predator Helios Neo è ottima, il che lo distingue da molti giocatori economici. Il coperchio in almuninum e l'unità di base in plastica sono di un nero profondo (Obsidian Black) con un sottile luccichio blu scuro.
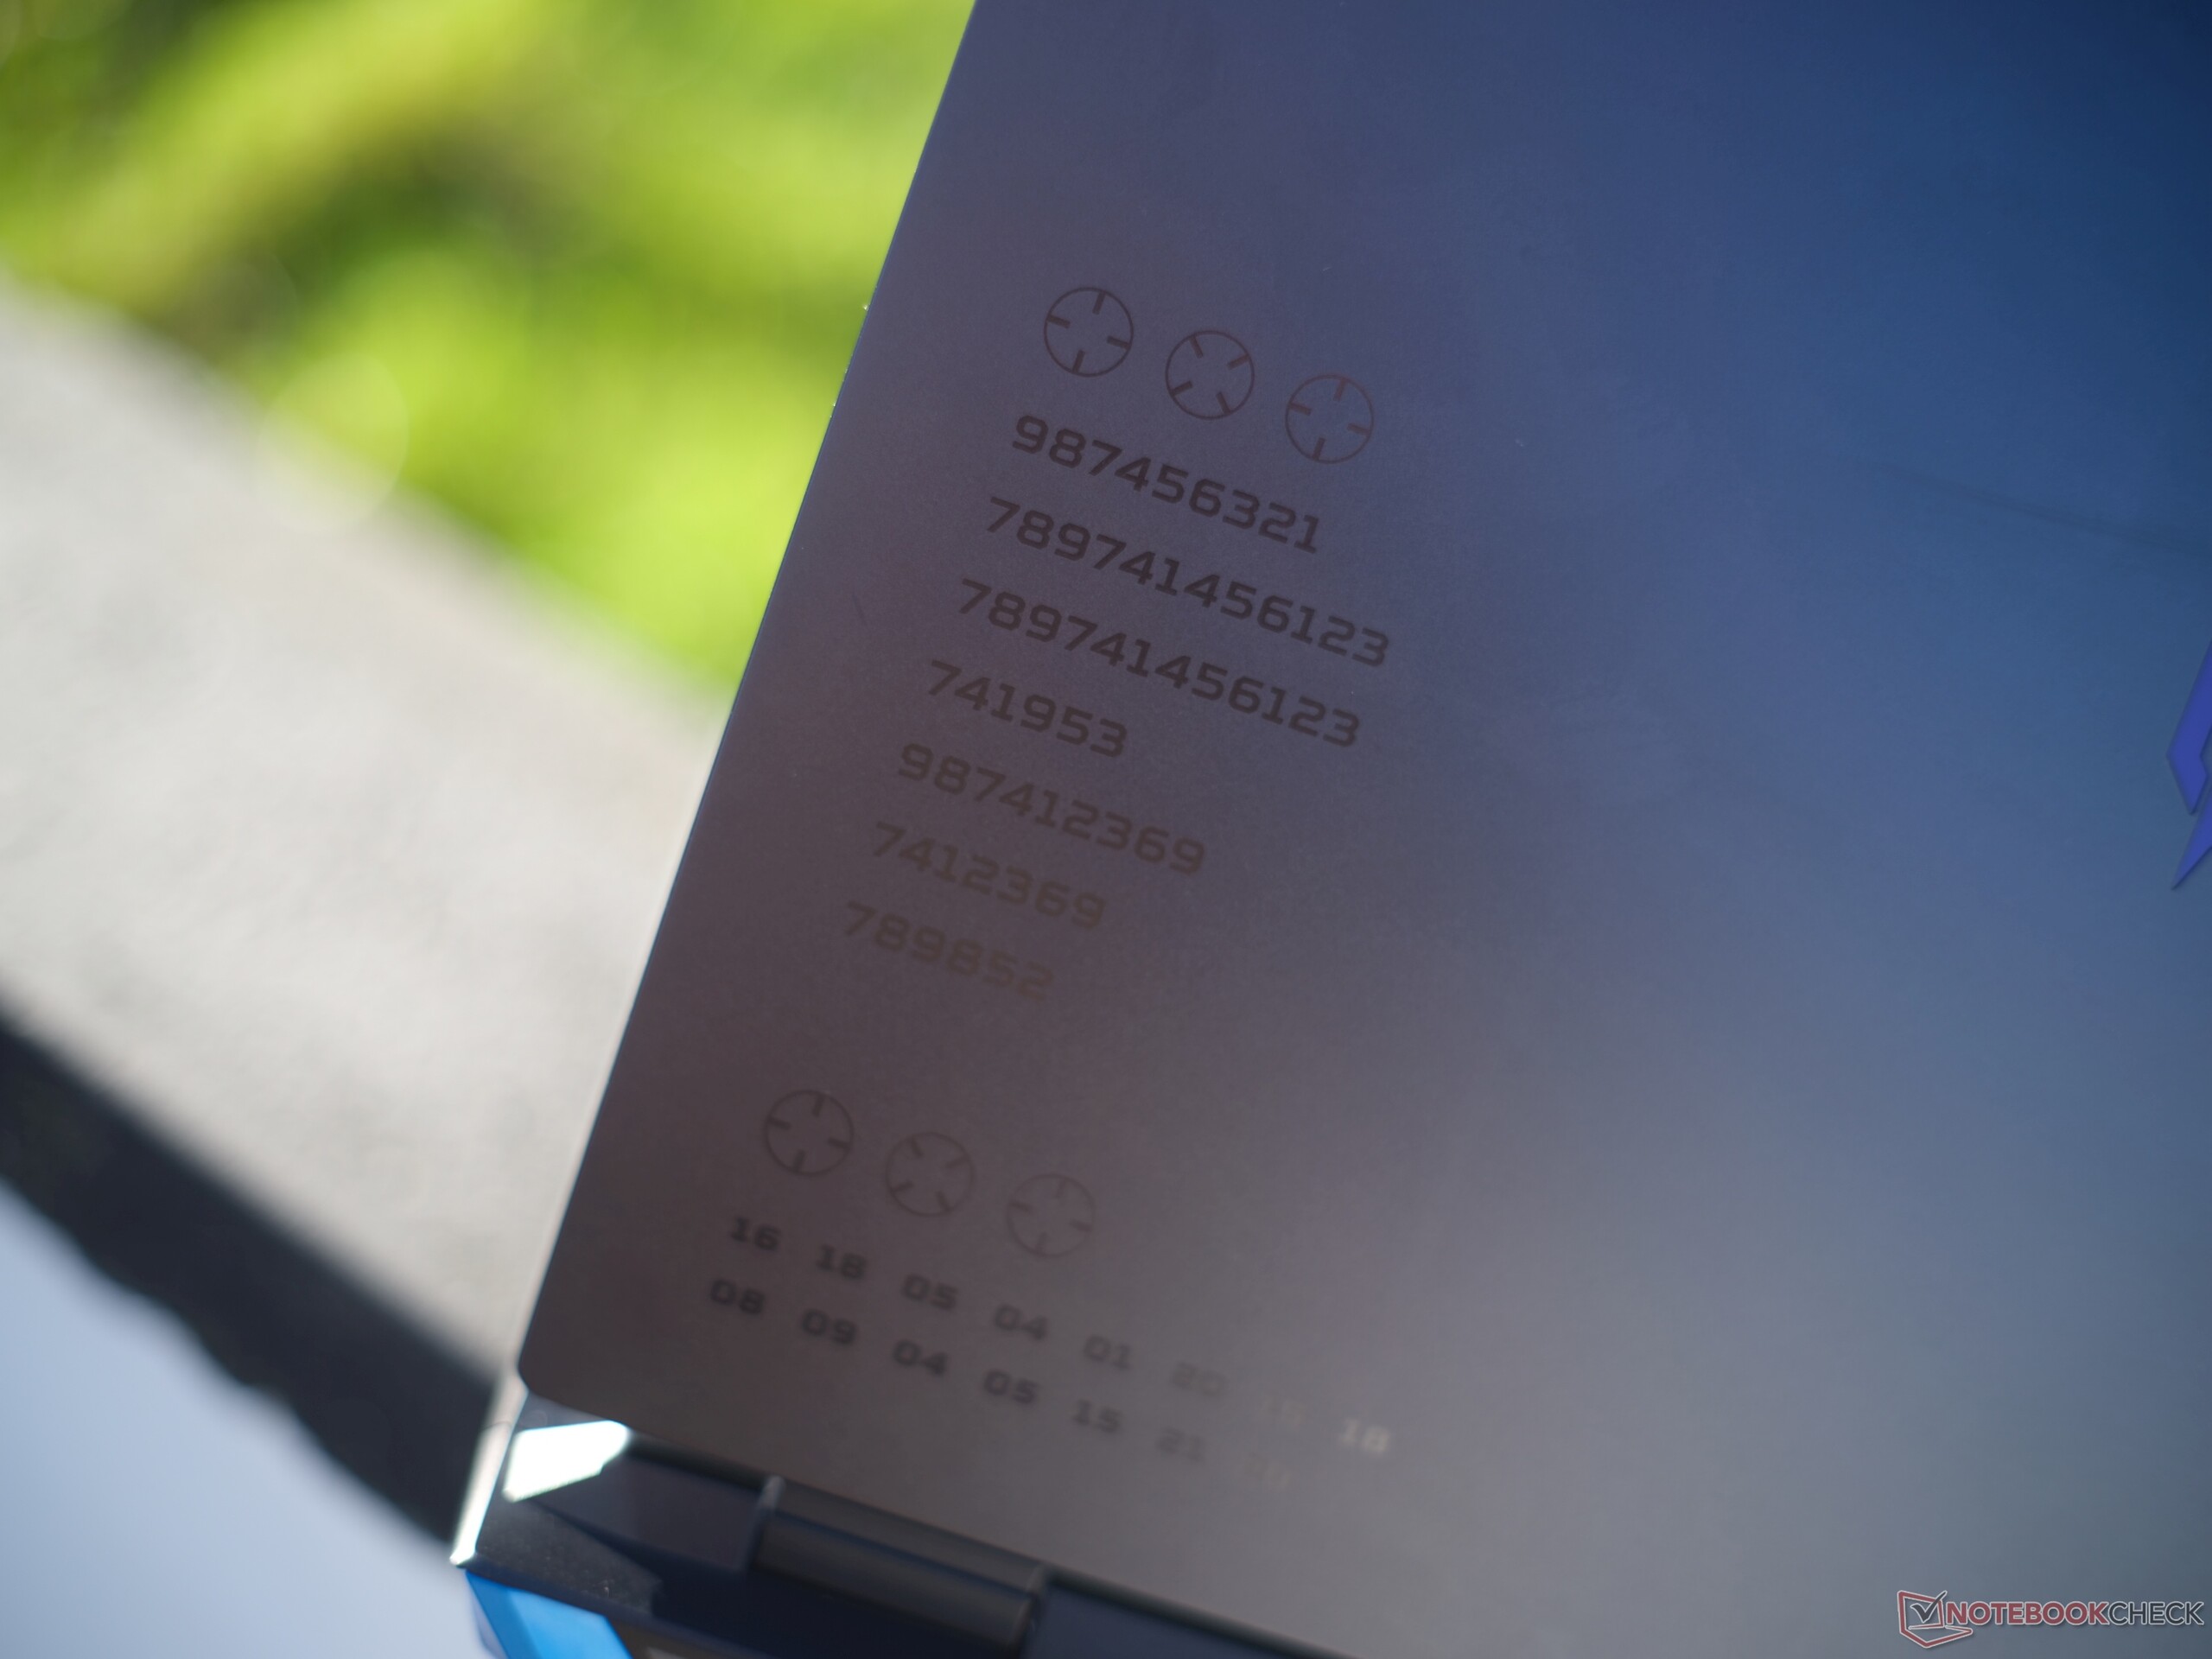
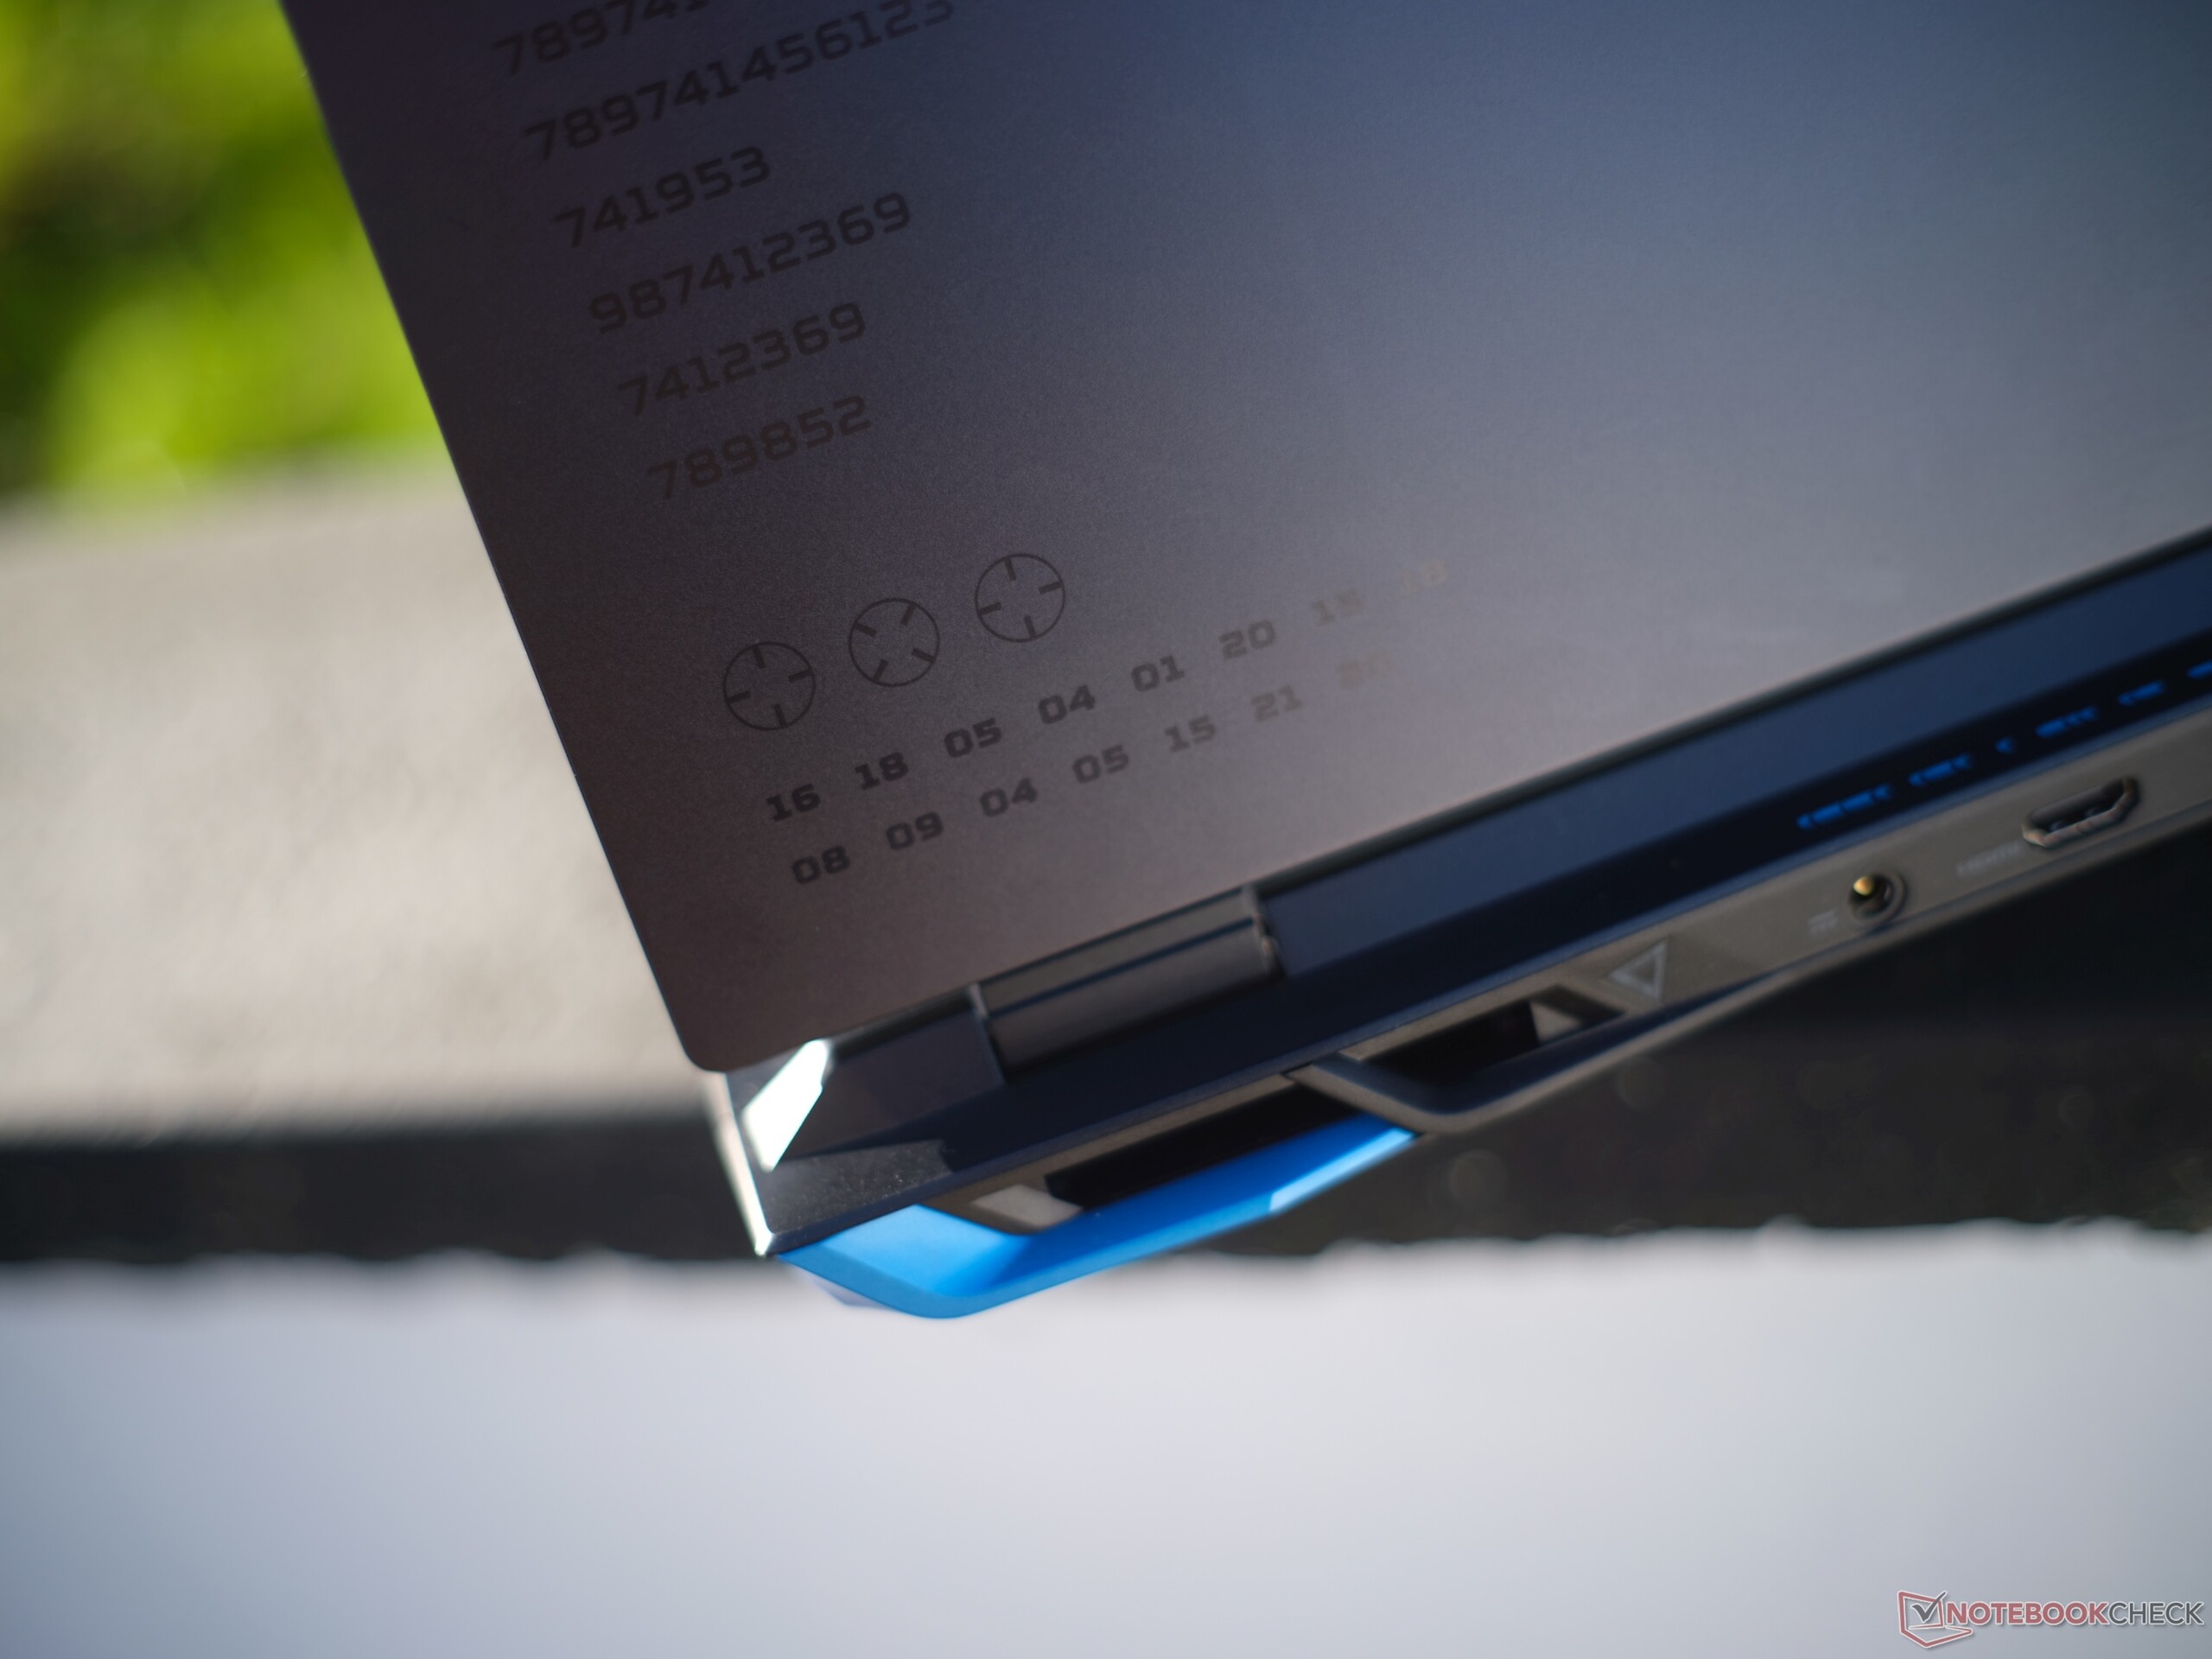
Ci sono alcuni elementi incisi sul coperchio che, insieme alle griglie blu della ventola sul retro, conferiscono al dispositivo un aspetto interessante, ma anche un "effetto stealth" inferiore. Uno svantaggio evidente è la capacità delle sue superfici di attirare le impronte digitali.
Il coperchio può essere aperto con una sola mano e fino a un massimo di ~150° - allo stesso tempo, le cerniere sono abbastanza rigide, il che significa che difficilmente traballa quando lo si posiziona. Sfortunatamente, può essere attorcigliato abbastanza facilmente (anche se questo non porta a errori di immagine), ma a sua volta, l'unità base è molto stabile. Nel complesso, Helios Neo 16 ci ha lasciato un'impressione da buona a molto buona, come la variante non-Neo. L'unica differenza è che questo modello non presenta un retro illuminato o una griglia di raffreddamento sostituibile.
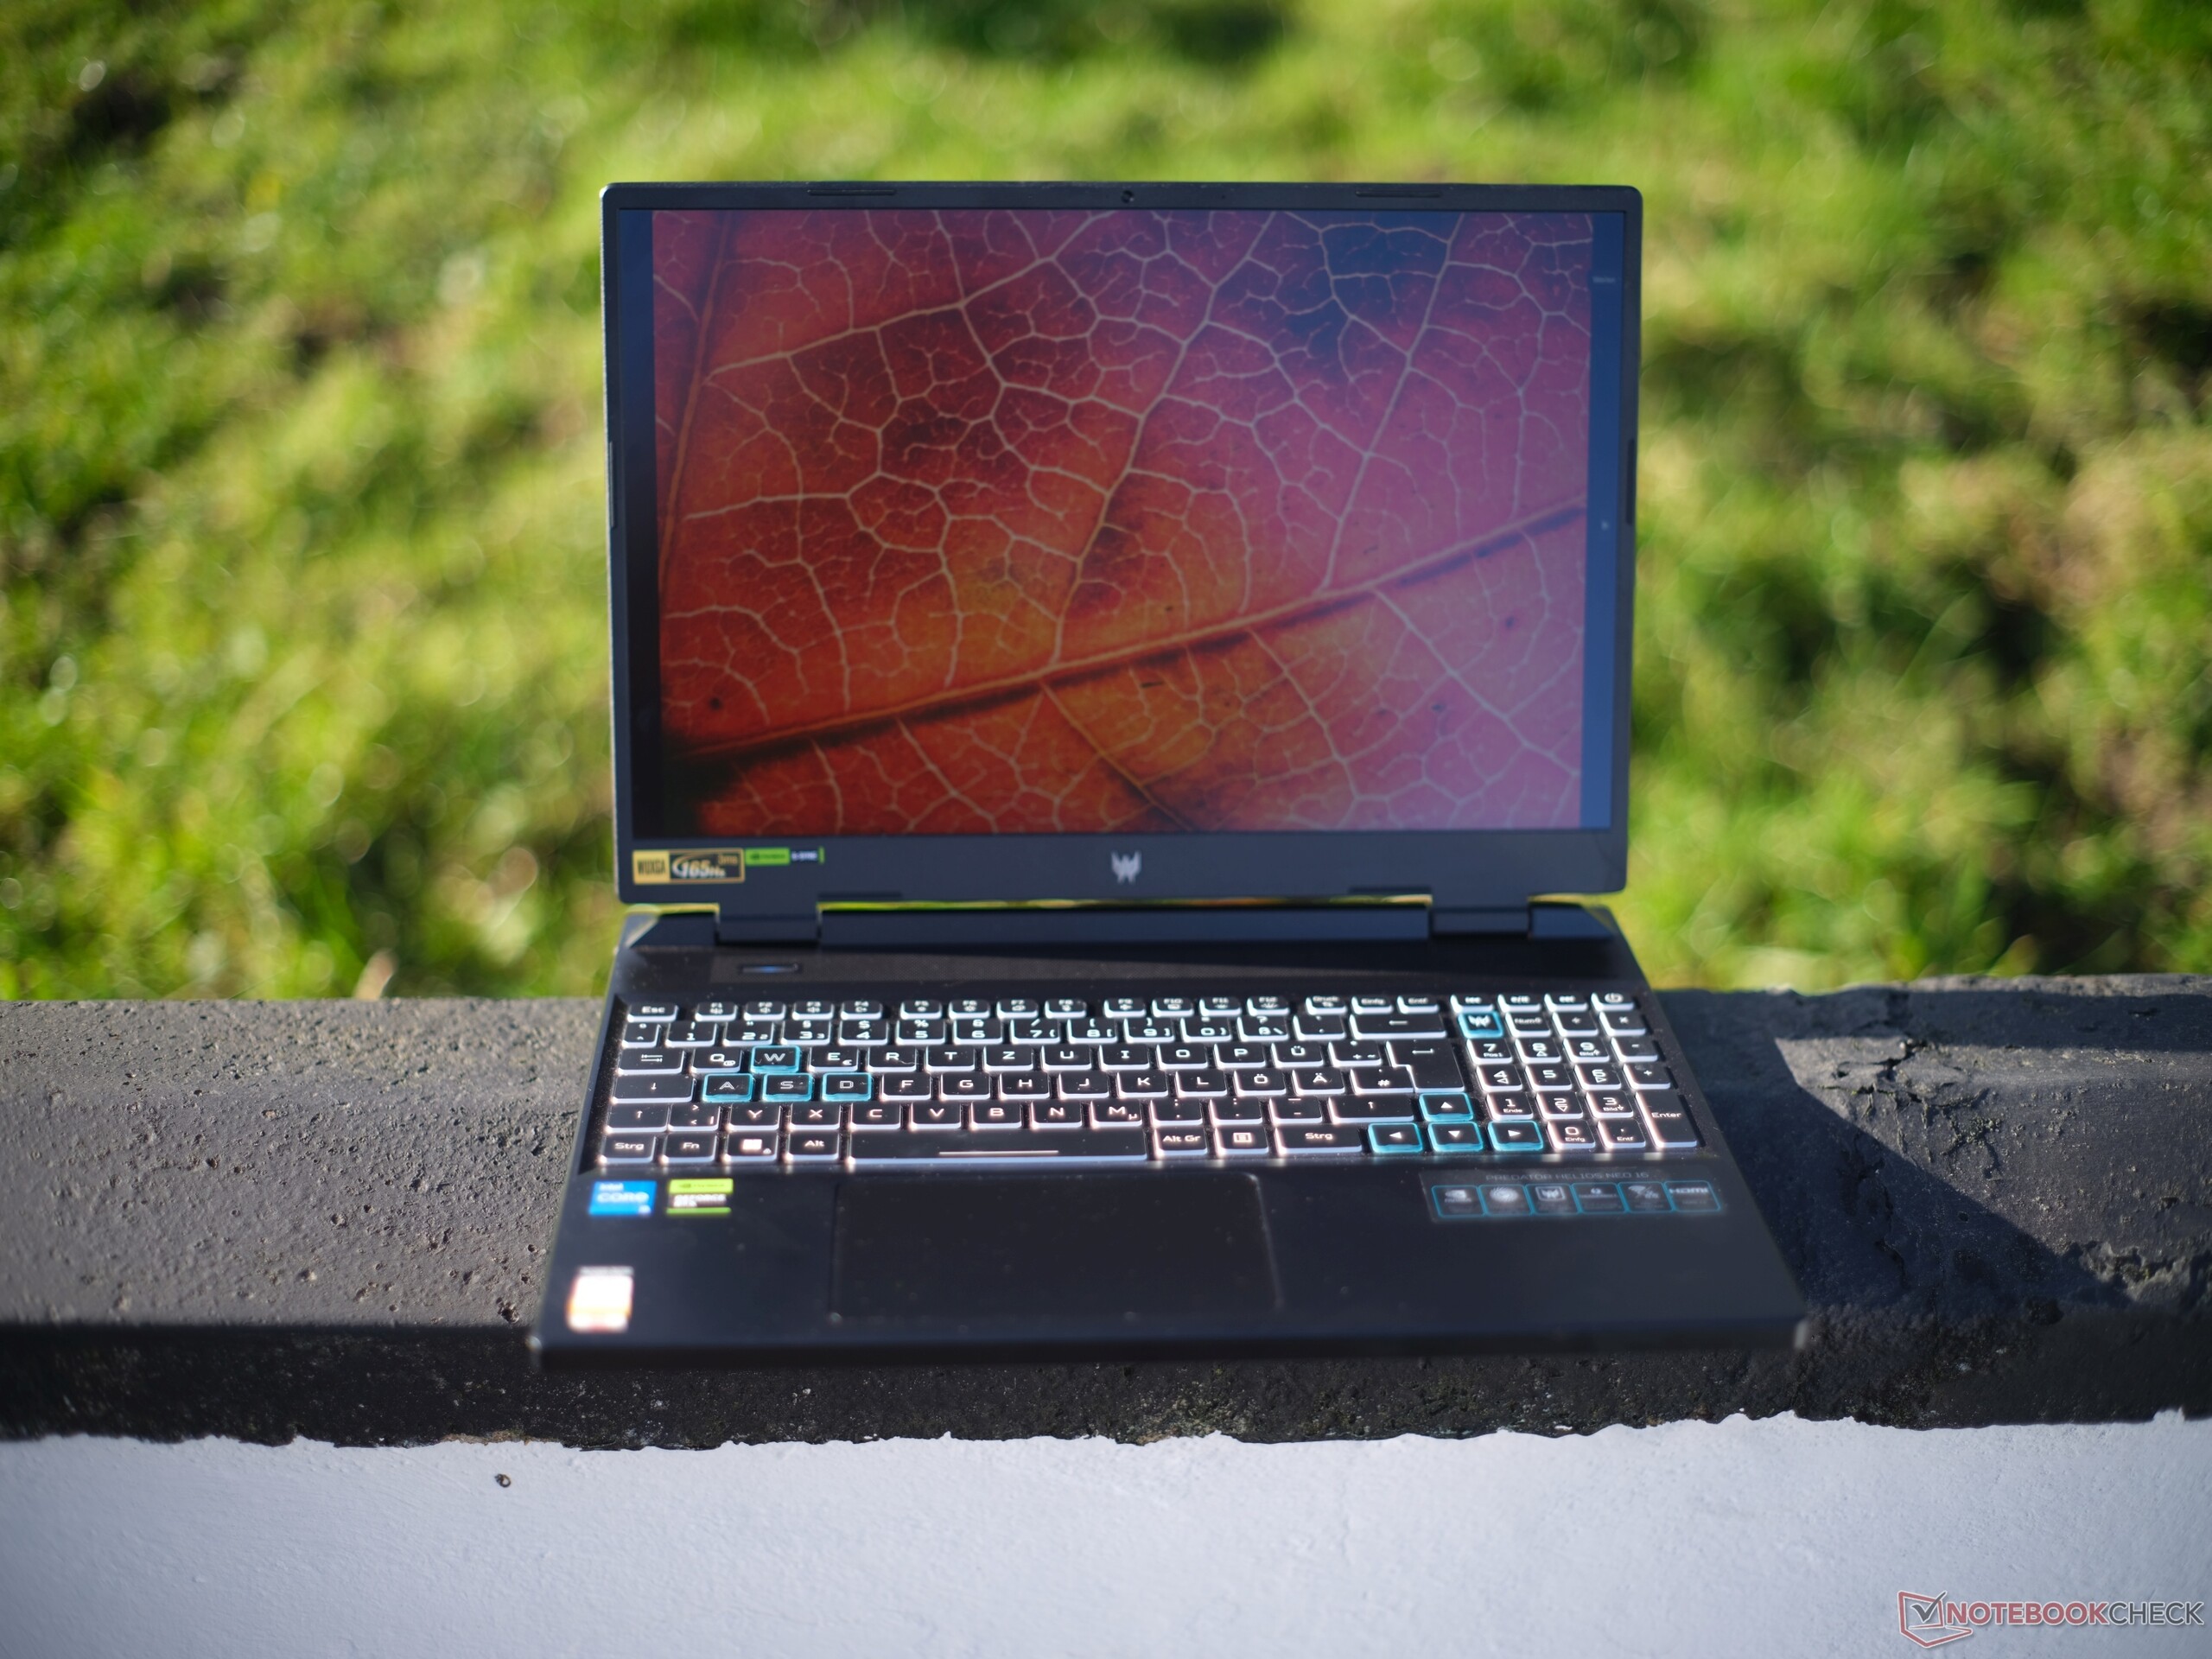
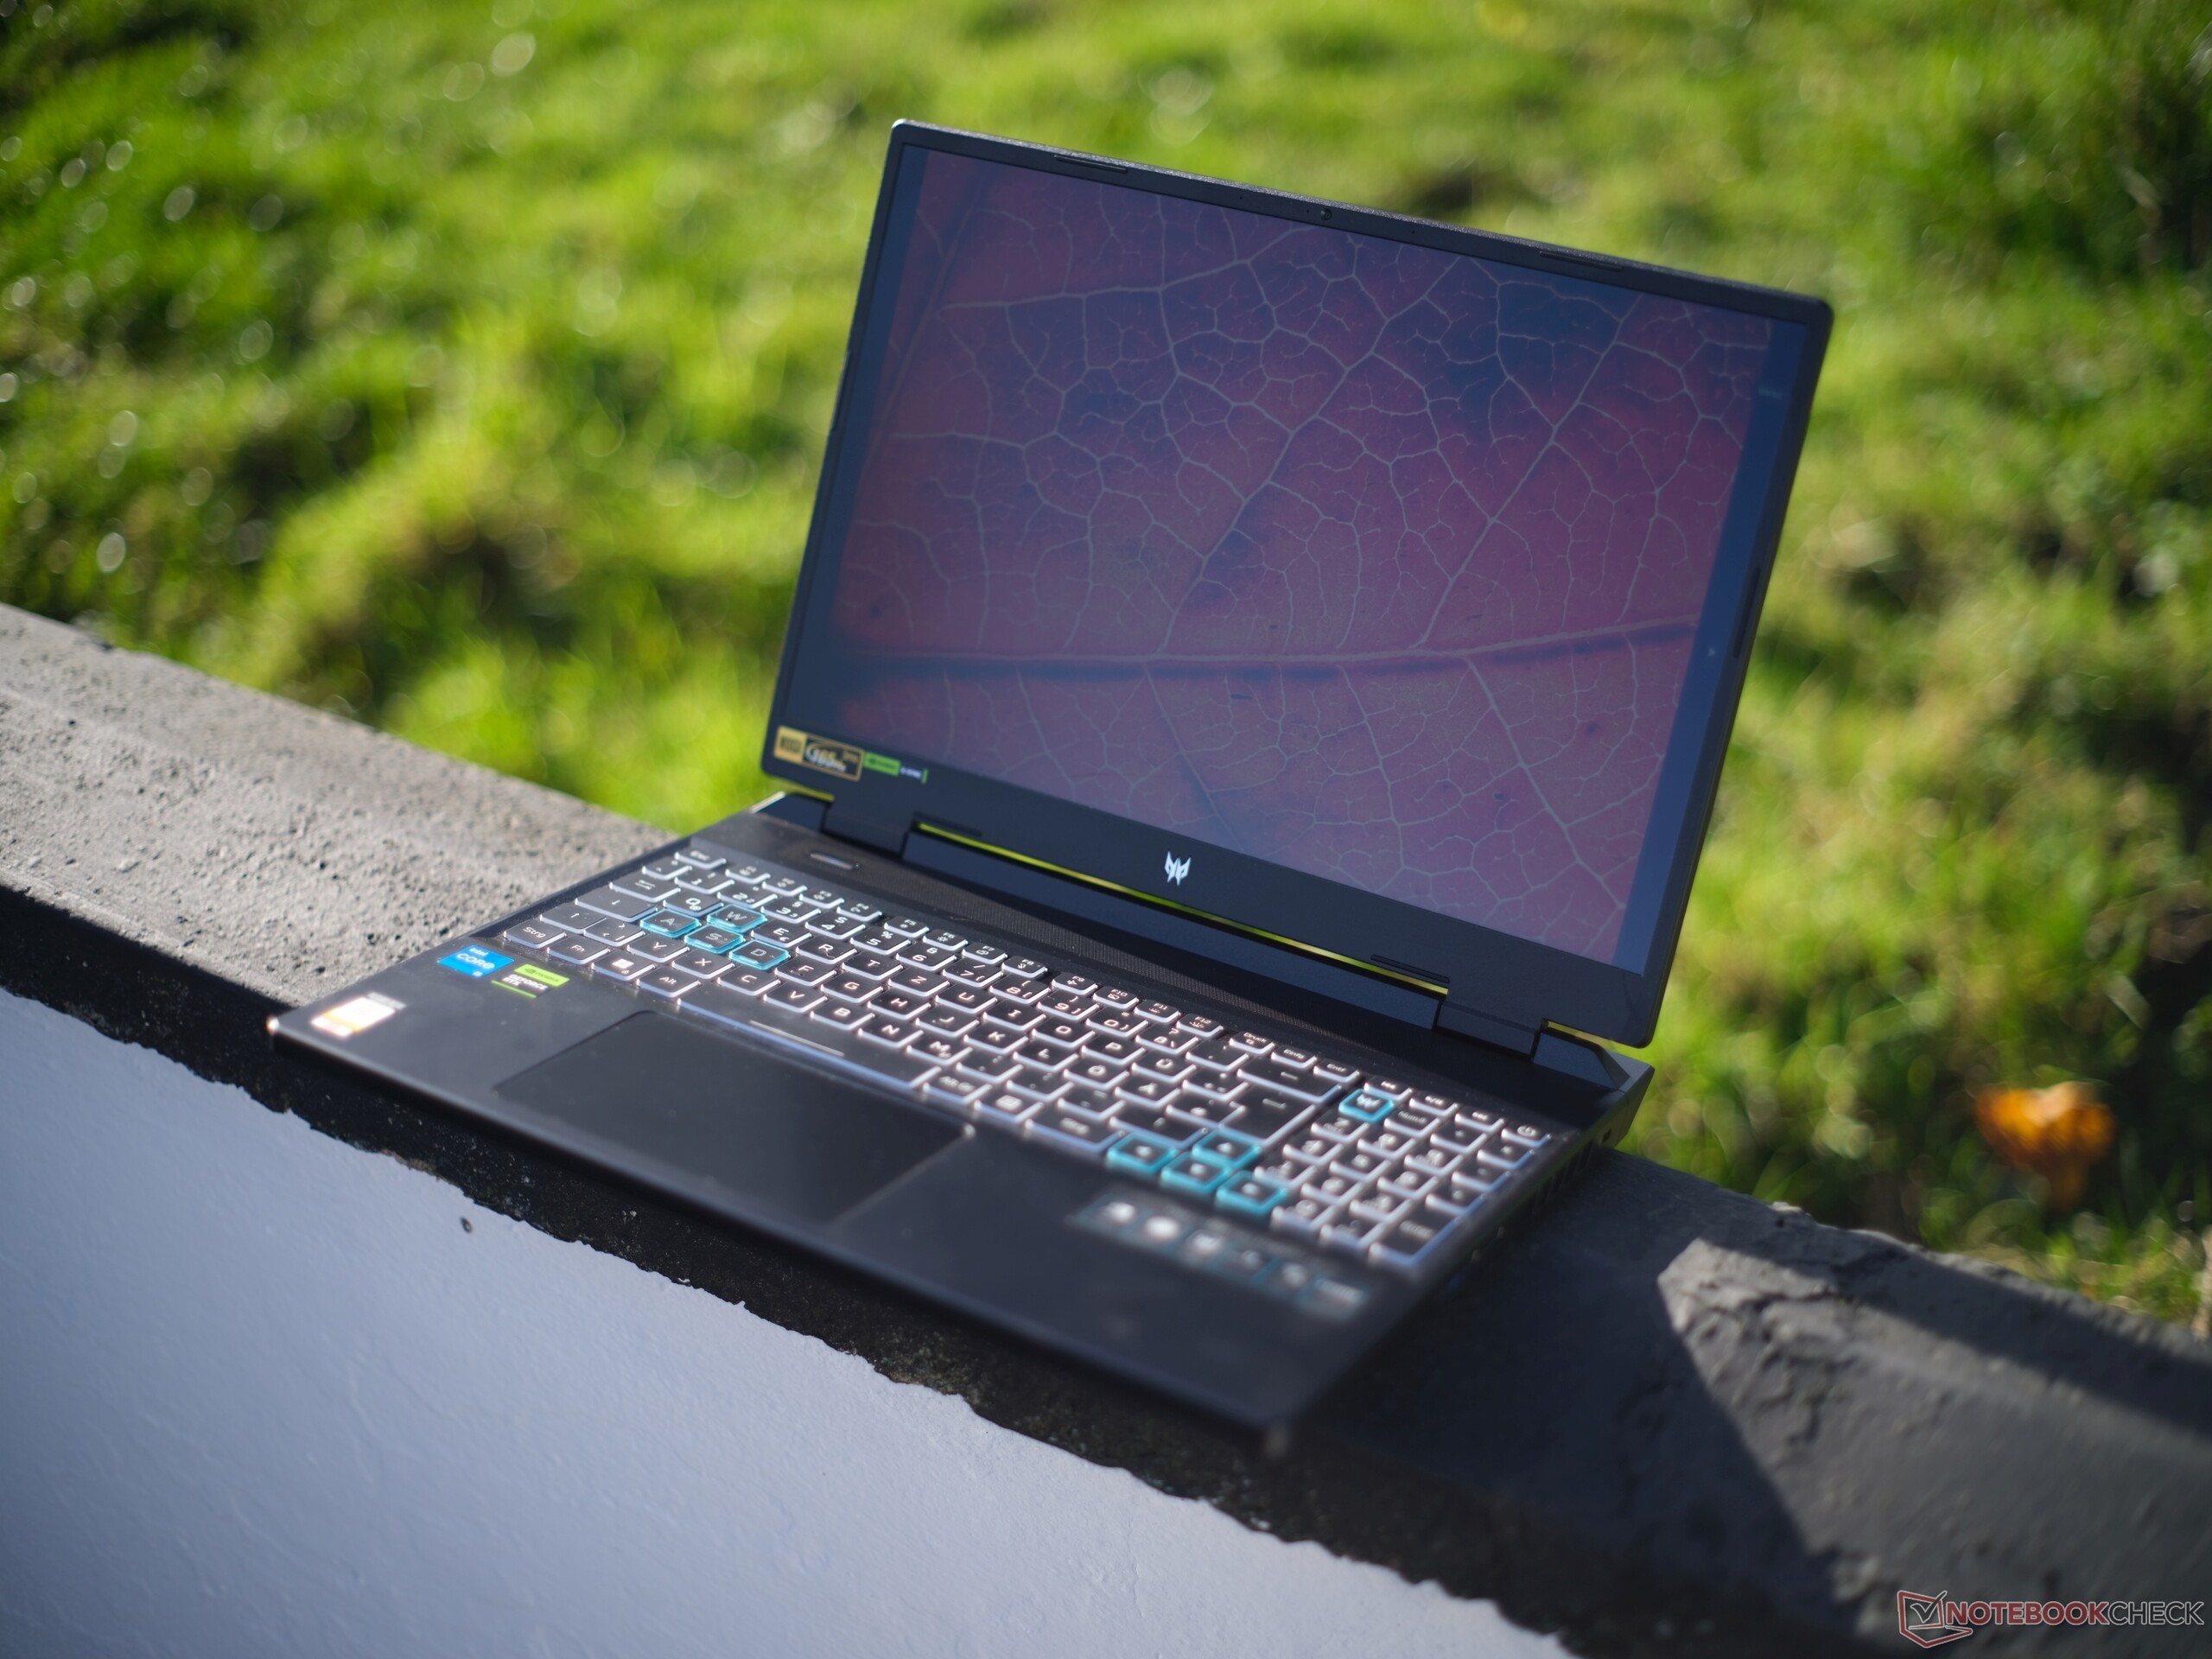
Con un peso di 2,6 kg e uno spessore di 28,25 mm, Helios Neo è nella media per un portatile da gioco da 16 pollici. Nel nostro campo di confronto, solo ilHP Victus 16ha valori inferiori, con un peso di 2,3 kg e uno spessore di 22,9 mm. Anche il modello XMG Apex 15 da 15,6 pollici è leggermente più leggero.
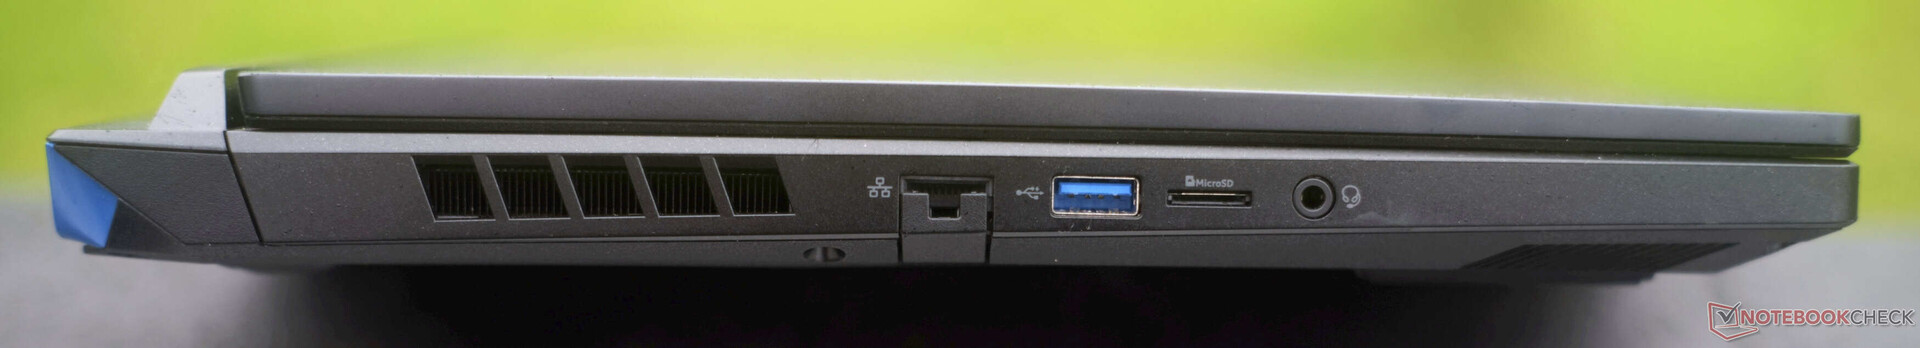
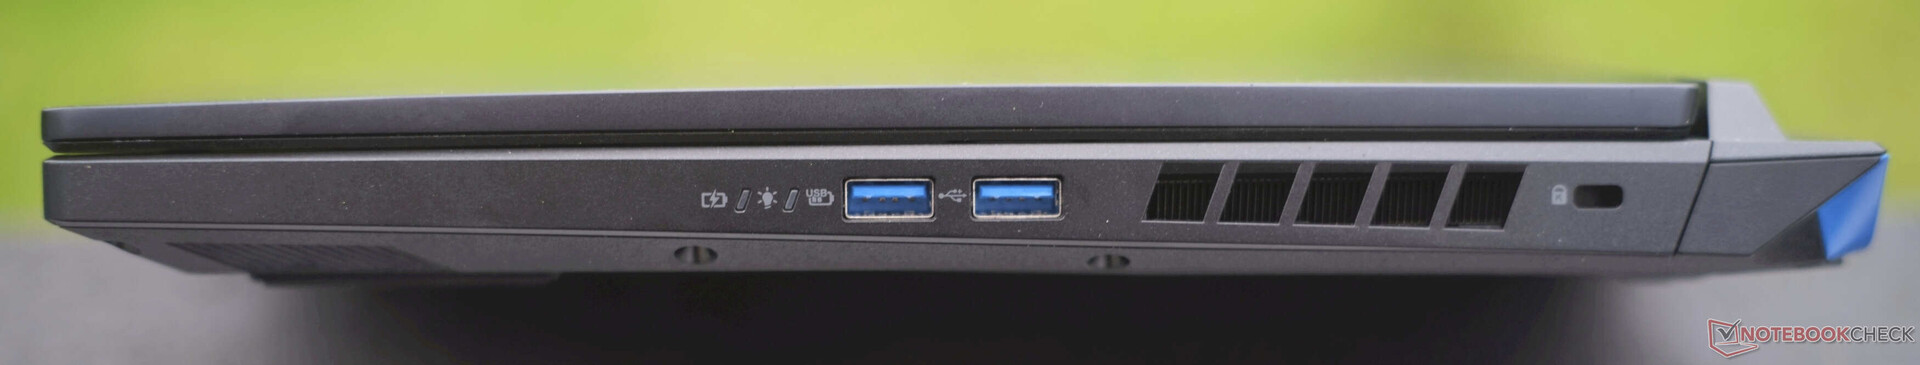
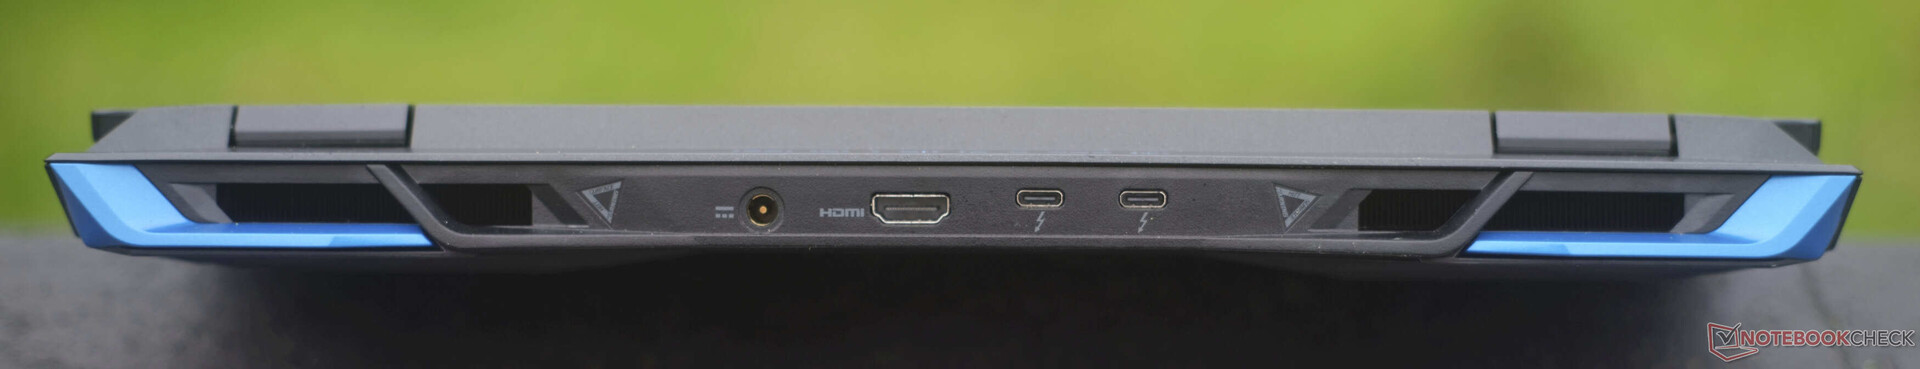
Connettività: Molte connessioni, ma WiFi e Power Delivery sono lenti
Il portatile da gioco di Acer presenta 1x USB-A 3.1 (5 GBit/s), 2x USB-A 3.2 (10 GBit/s), oltre a 2x Thunderbolt 4 con DisplayPort 1.4 e Power Delivery (65 watt) sul retro. Sul retro sono presenti una Gigabit-RJ45, un lettore di schede microSD, un jack audio da 3,5 mm, un lucchetto Kensington, una connessione di alimentazione e una porta HDMI 2.1 collegata direttamente alla dGPU, che supporta 4K a 120 Hz con G-Sync simultaneo.
In definitiva, Predator Helios Neo non presenta alcuno svantaggio rispetto al fratello più costoso ,, ad eccezione delle prestazioni PD inferiori.
Lettore di schede SD
Le velocità di trasferimento del lettore di schede microSD sono nella media quando viene utilizzato con la nostra scheda di riferimento AV PRO microSD 128 GB V60. IlLegion Slim 5,Acer Nitro 16,XMG Focus 15eGigabyte G5tutti leggono e copiano i dati con velocità di trasferimento simili. Tuttavia,Apex 15 di XMG è più del doppio più lento, mentreM16 R1 di Alienware è due volte più veloce.
| SD Card Reader | |
| average JPG Copy Test (av. of 3 runs) | |
| Alienware m16 R1 Intel (AV PRO microSD 128 GB V60) | |
| Media della classe Gaming (20.9 - 210, n=54, ultimi 2 anni) | |
| Lenovo Legion Slim 5 14APH8 (Toshiba Exceria Pro SDXC 64 GB UHS-II) | |
| Acer Nitro 16 AN16-41-R7YE (AV PRO microSD 128 GB V60) | |
| Acer Predator Helios Neo 16 NH.QLTEG.002 | |
| Gigabyte G5 KF | |
| Schenker XMG Apex 15 (Late 23) (AV PRO microSD 128 GB V60) | |
| maximum AS SSD Seq Read Test (1GB) | |
| Alienware m16 R1 Intel (AV PRO microSD 128 GB V60) | |
| Media della classe Gaming (25.5 - 261, n=51, ultimi 2 anni) | |
| Schenker XMG Focus 15 (E23) | |
| Gigabyte G5 KF | |
| Acer Predator Helios Neo 16 NH.QLTEG.002 | |
| Acer Nitro 16 AN16-41-R7YE (AV PRO microSD 128 GB V60) | |
| Lenovo Legion Slim 5 14APH8 (Toshiba Exceria Pro SDXC 64 GB UHS-II) | |
| Schenker XMG Apex 15 (Late 23) (AV PRO microSD 128 GB V60) | |
Comunicazione
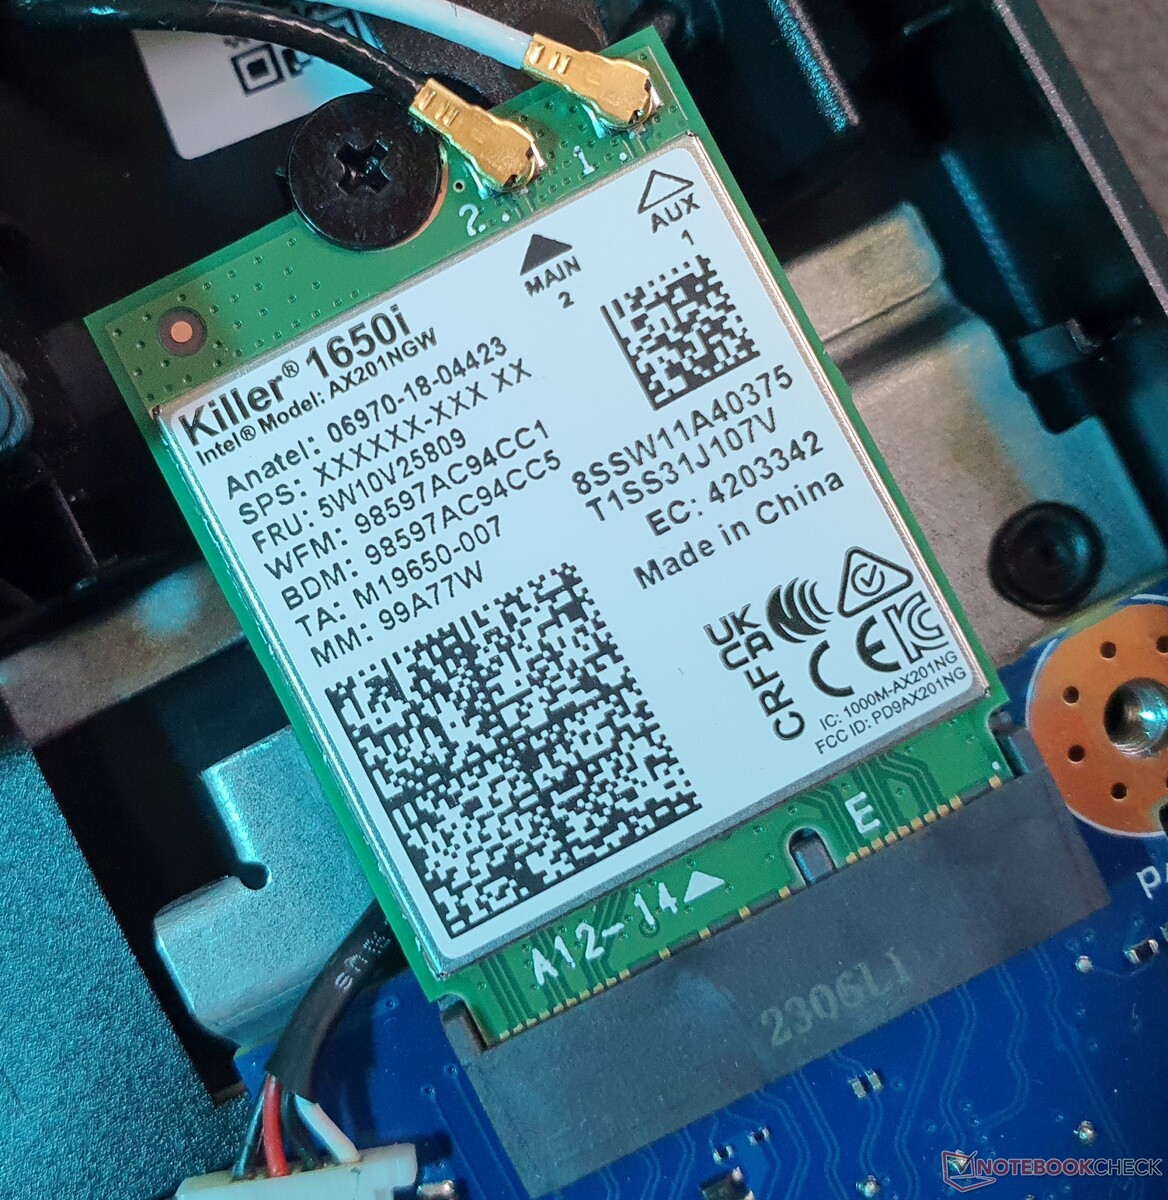
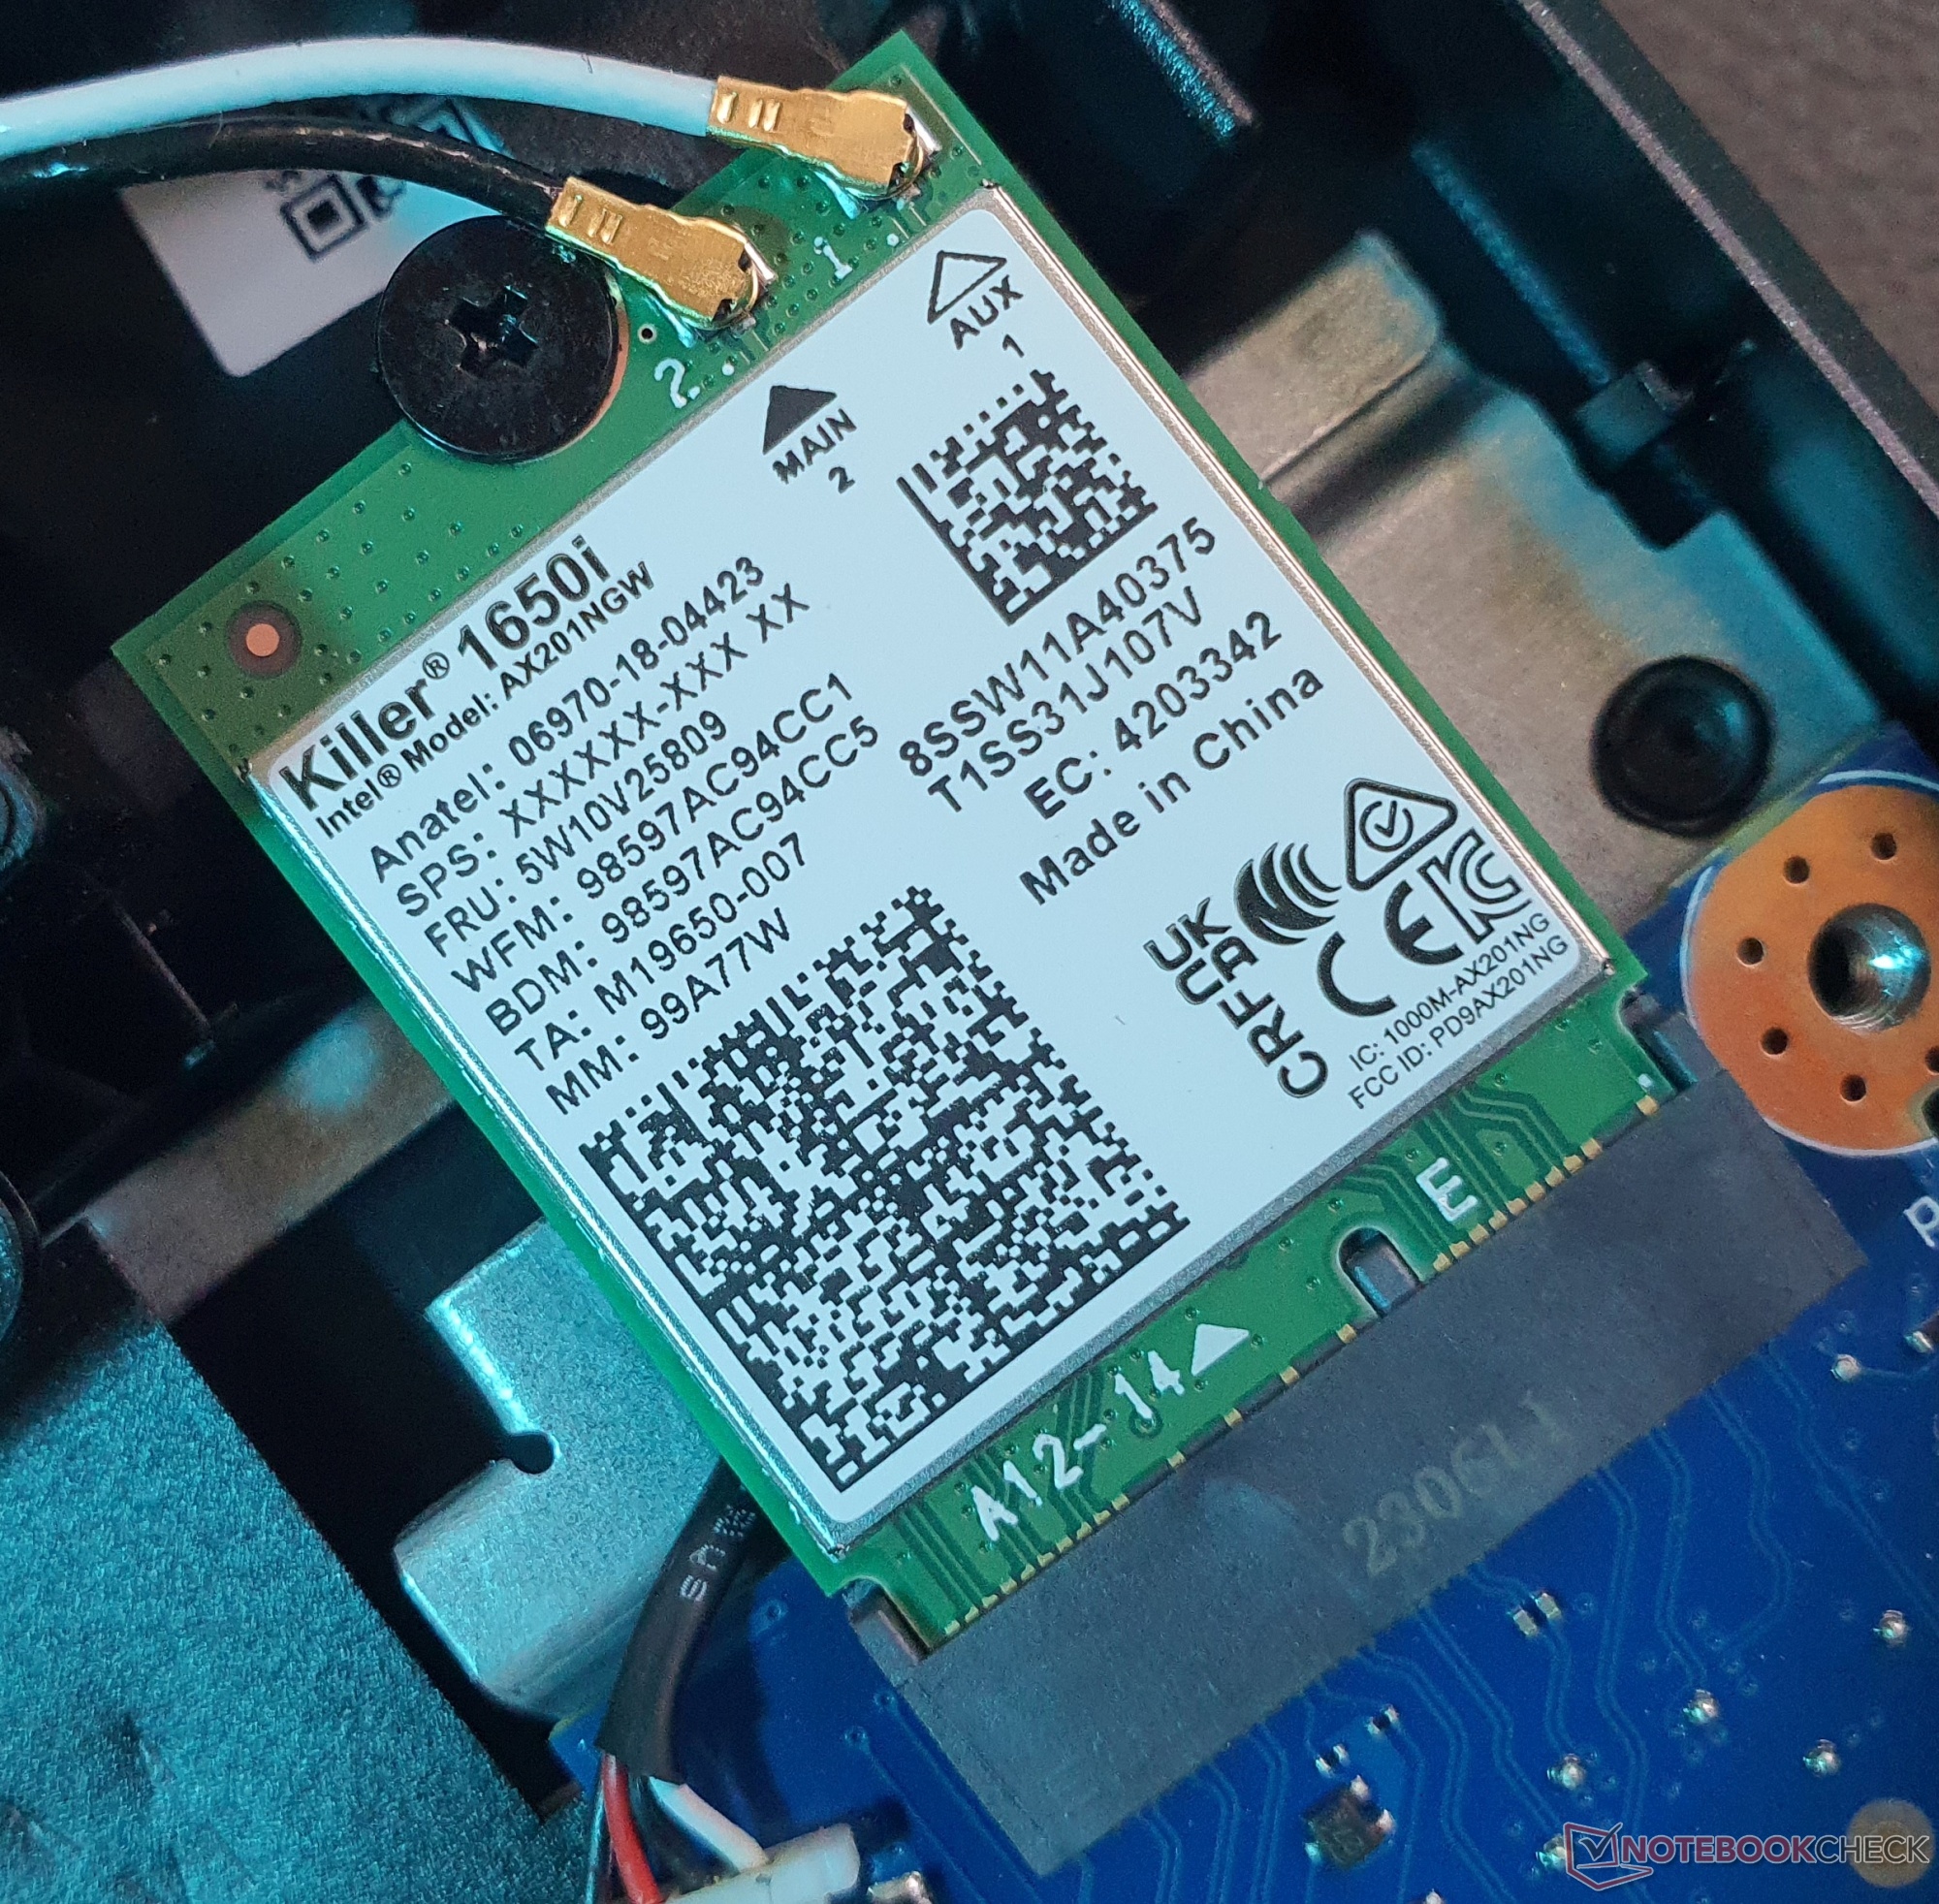
Il modulo WLAN Intel Killer AX1650i installato sul portatile corrisponde al vecchio standard WiFi 6 e, con una velocità di trasferimento di ~900 MBit/s, si colloca su un livello di lentezza simile a quello del chip Realtek all'interno del Lenovo LOQ 16.
Il modulo Helios 16invece, raggiunge fino a 1,6 GBit/s utilizzando l'Intel Killer AX1675i (WiFi 6E), mentre il modelloLegion Pro 5 16 si è classificato per poco in cima al nostro campo di confronto. Il controller Gigabit Killer E2600 di Intel si occupa delle connessioni cablate, mentre è presente anche il Bluetooth 5.2.
Webcam


In contrasto con il Predator Helios 16acer ha installato solo una webcam da 720p nel Neo, il che ci sembra un vero peccato considerando il suo prezzo. Di conseguenza, la qualità dell'immagine lascia molto a desiderare anche in condizioni ottimali. Anche Windows Hello non è incluso. Tuttavia, i microfoni a doppio array offrono una qualità audio decente.


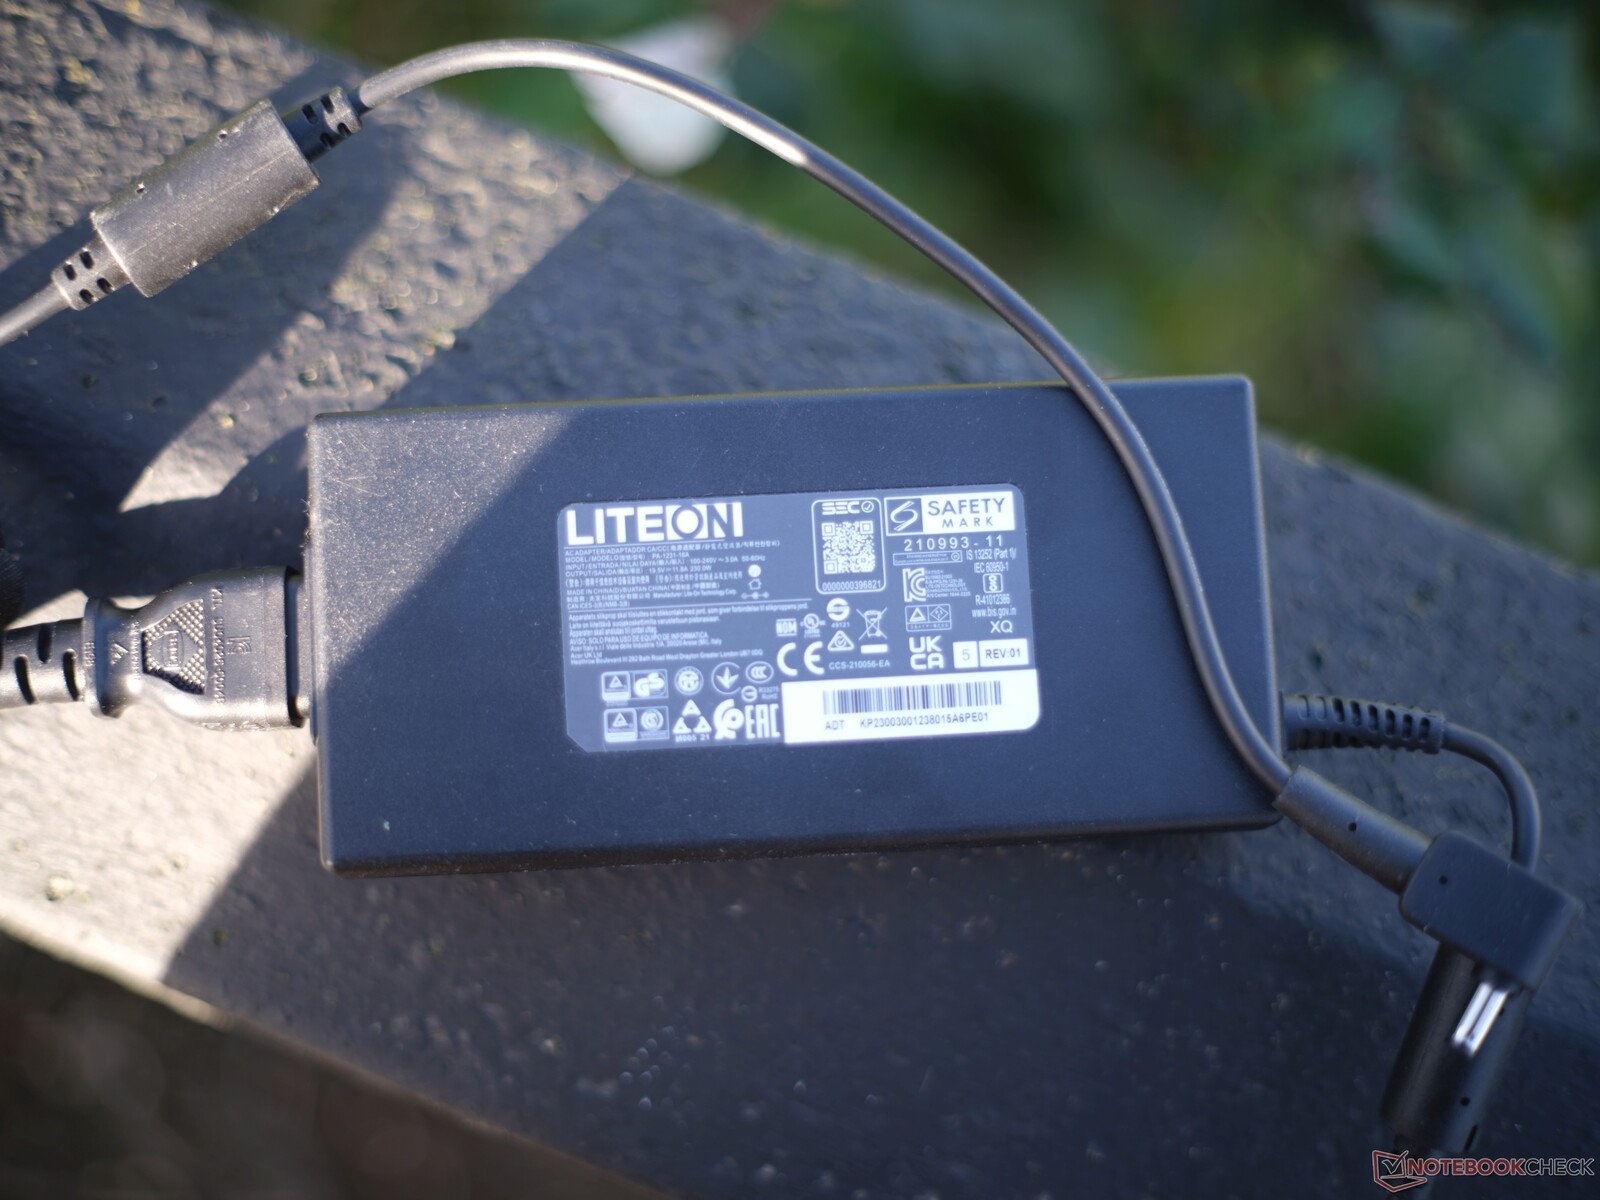
Accessori
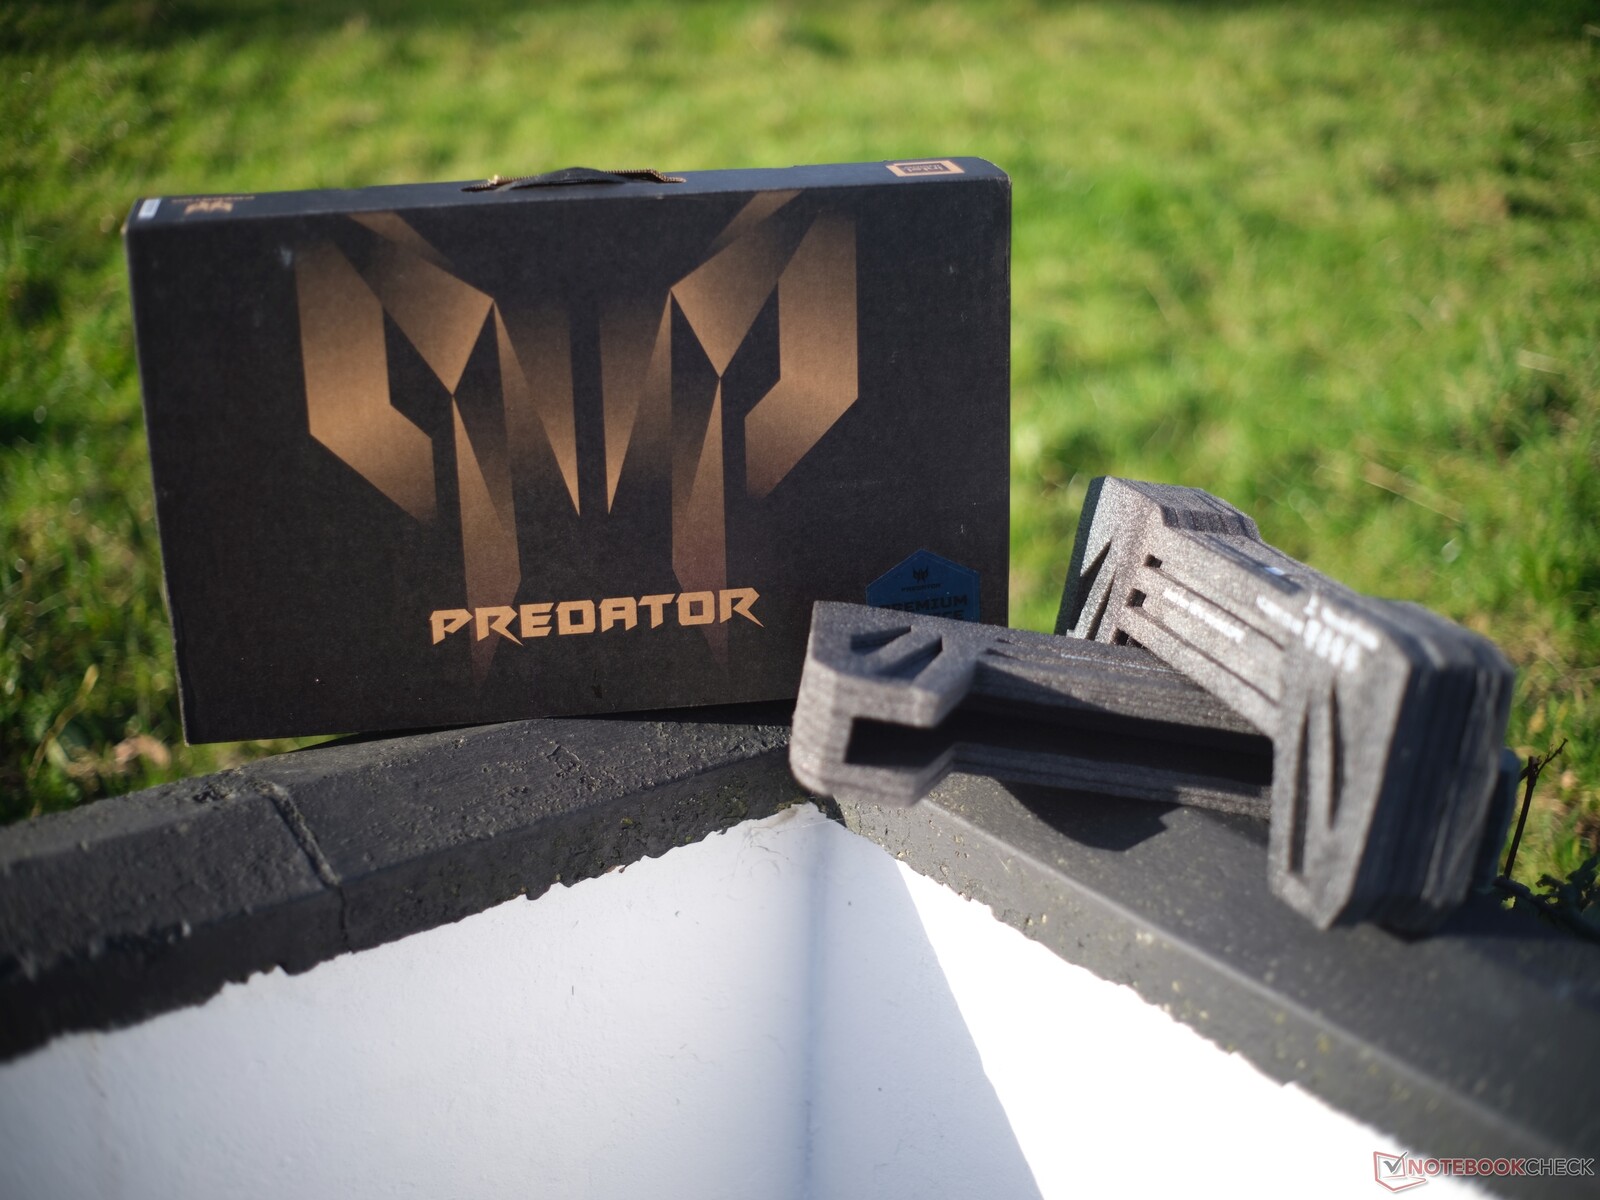
A parte il dispositivo stesso, la fornitura del portatile comprende solo un alimentatore da 230 watt. In generale, ci sarebbe piaciuto vedere un imballaggio più ecologico, senza plastica, anche se i materiali utilizzati sono almeno riciclati.
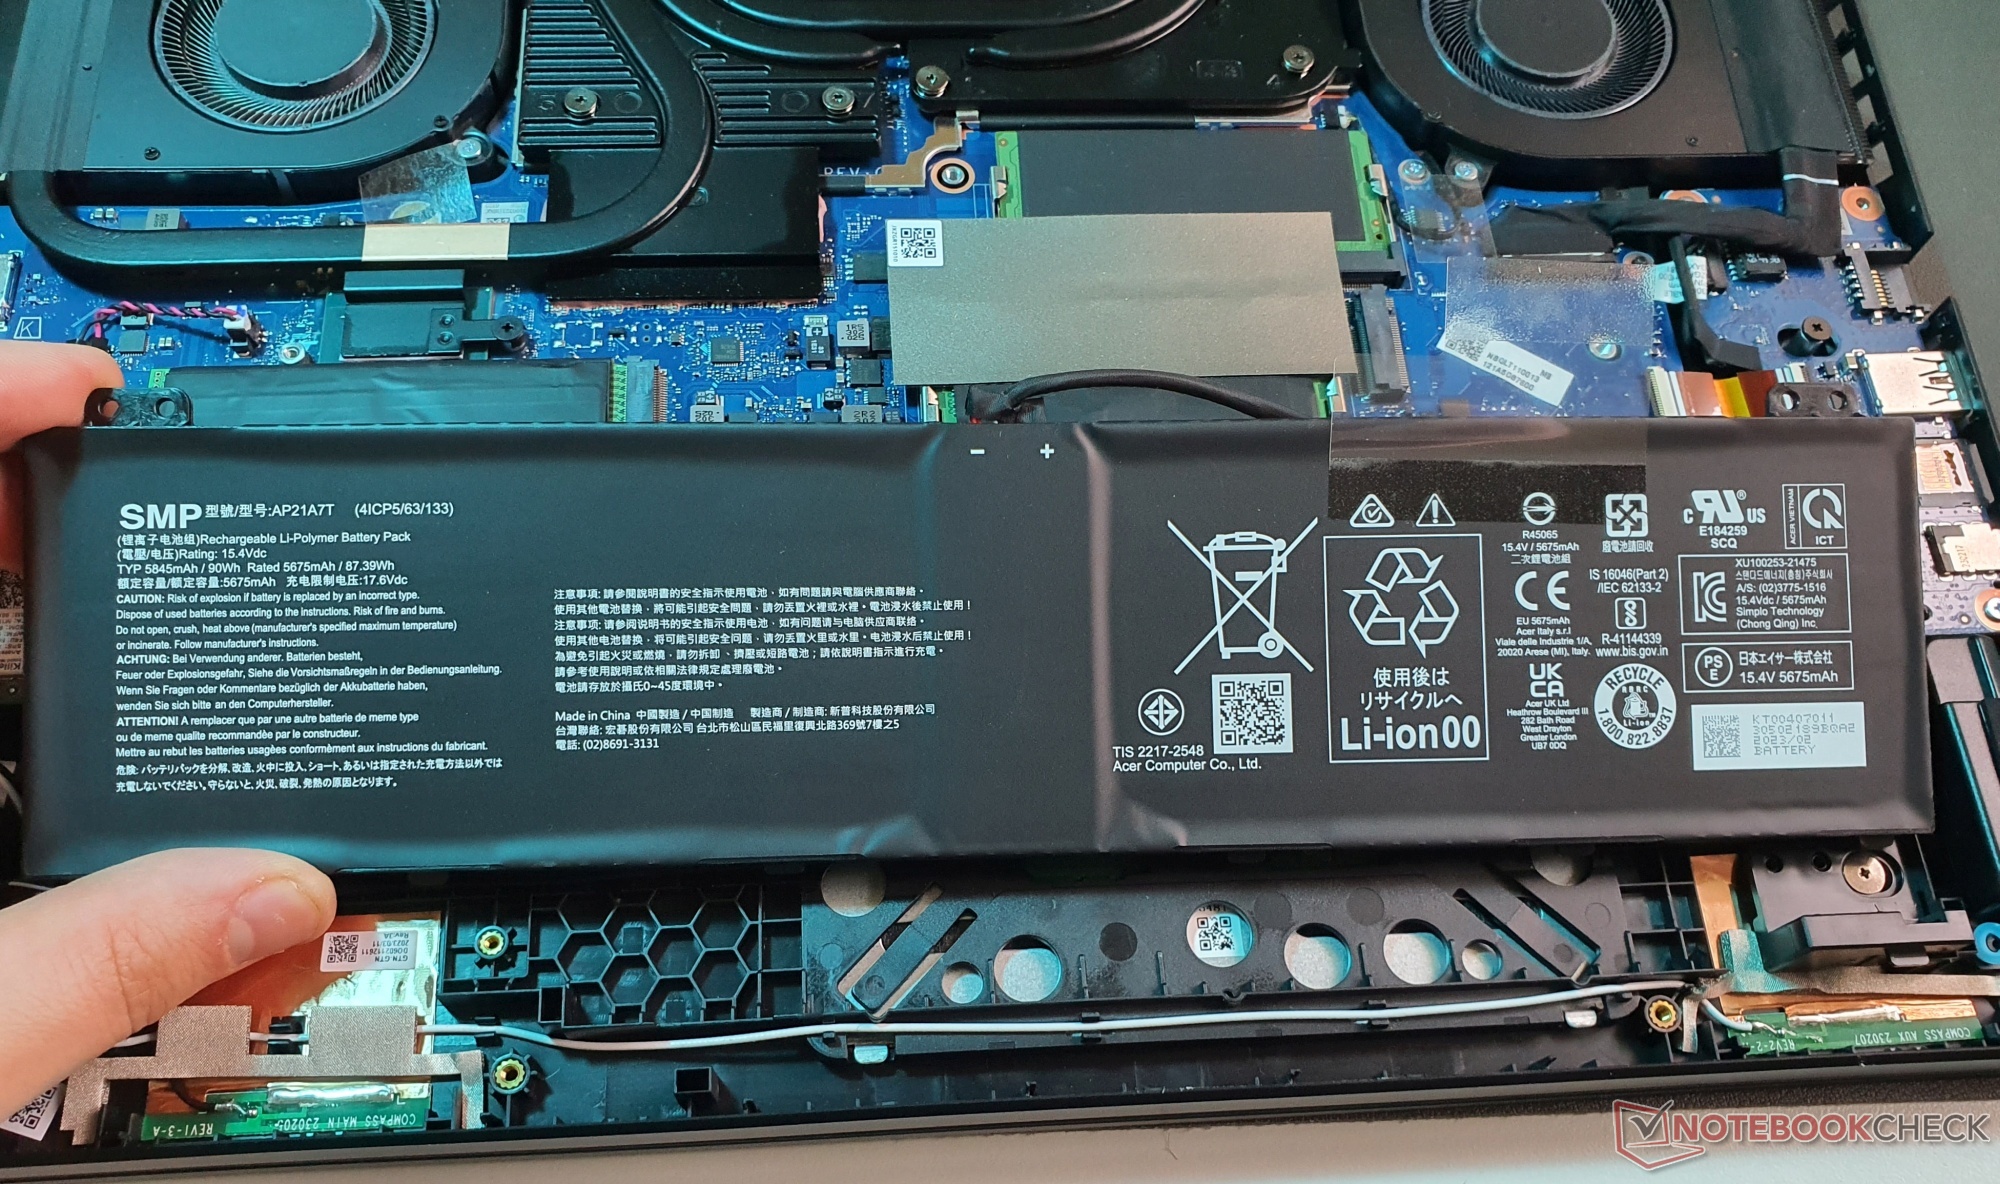
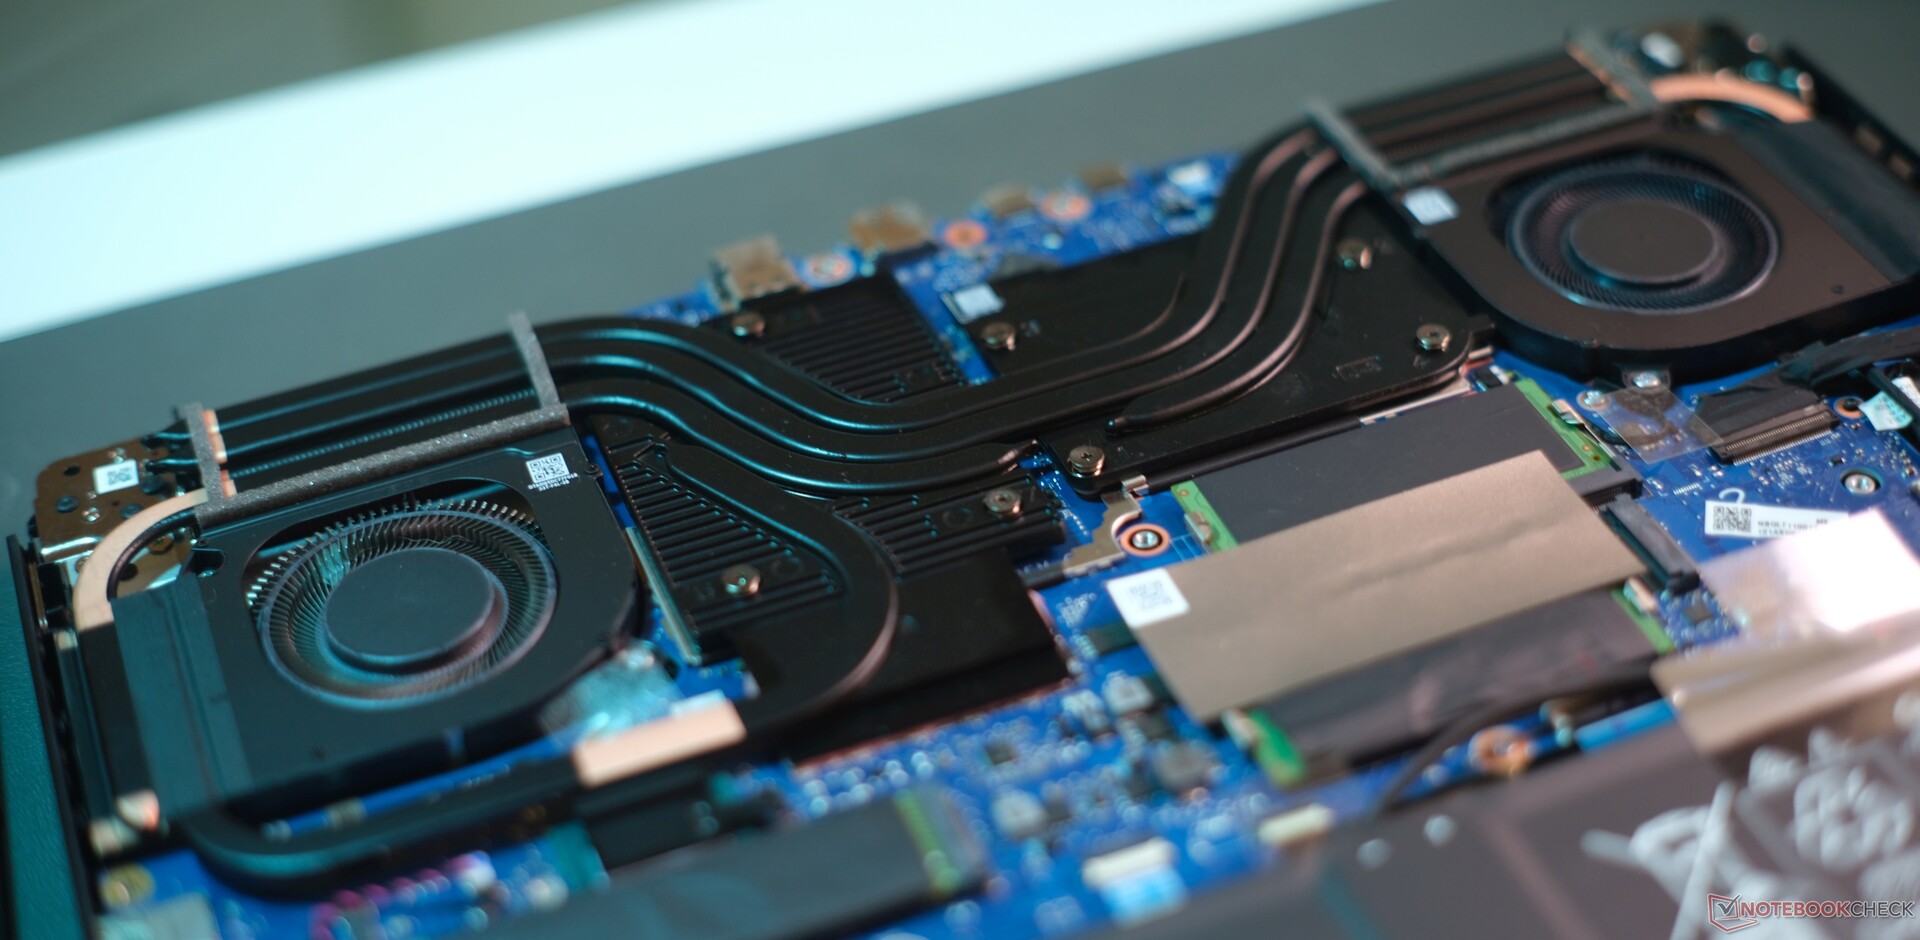
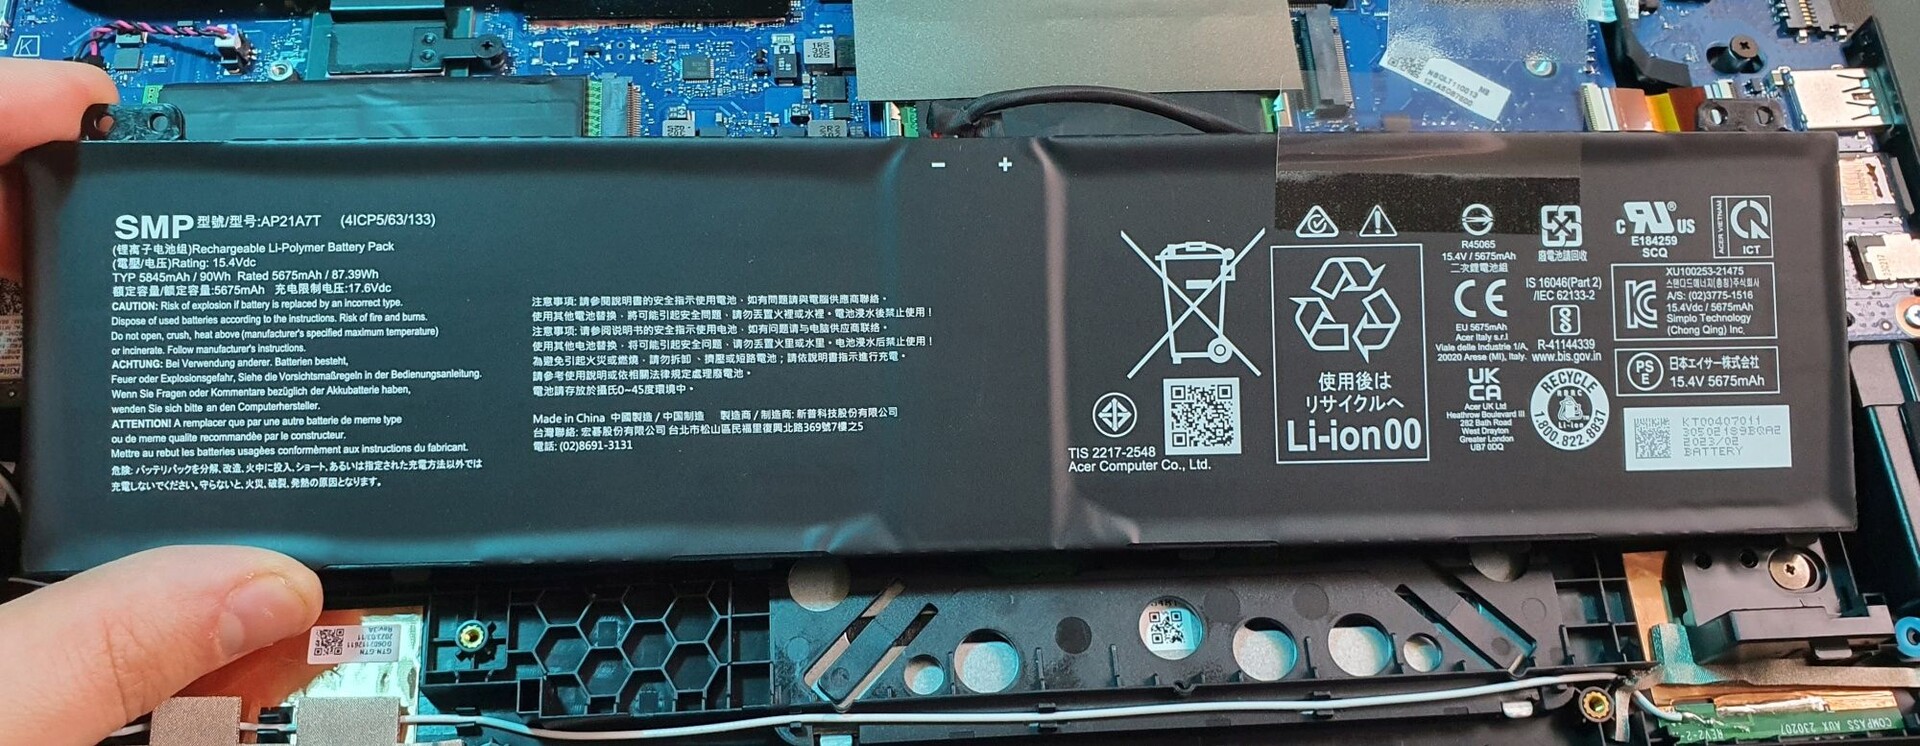
Manutenzione
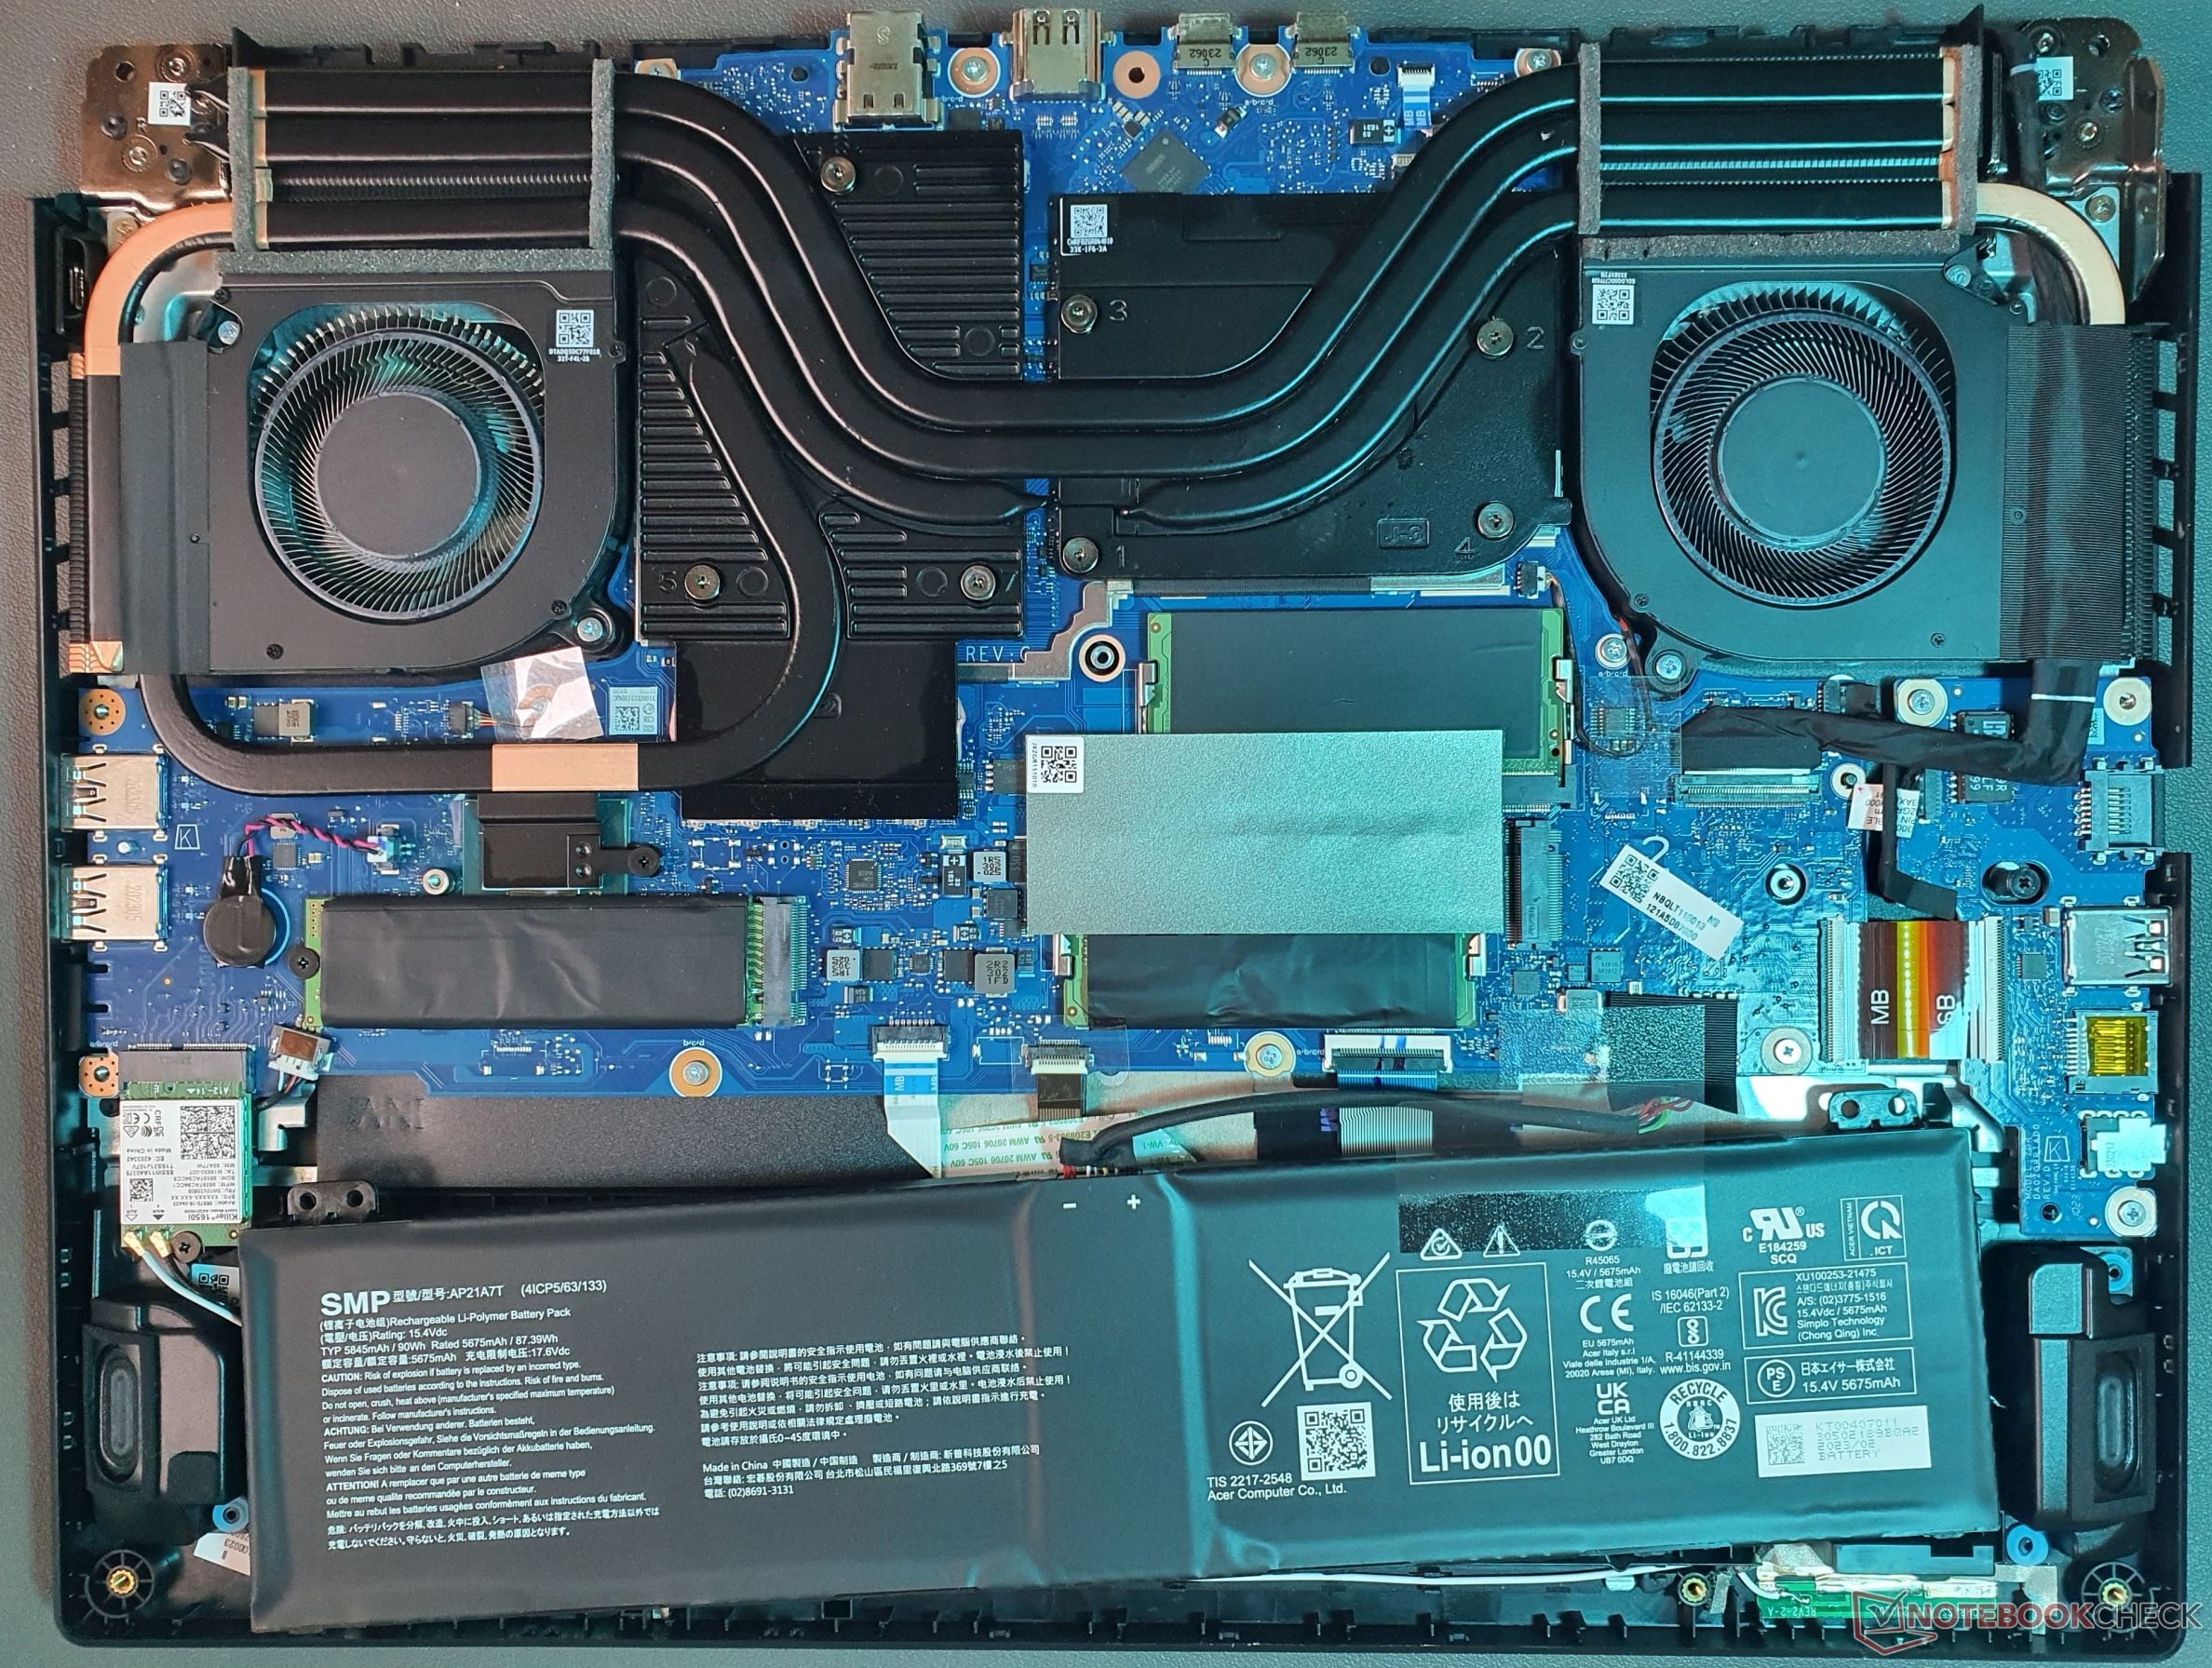
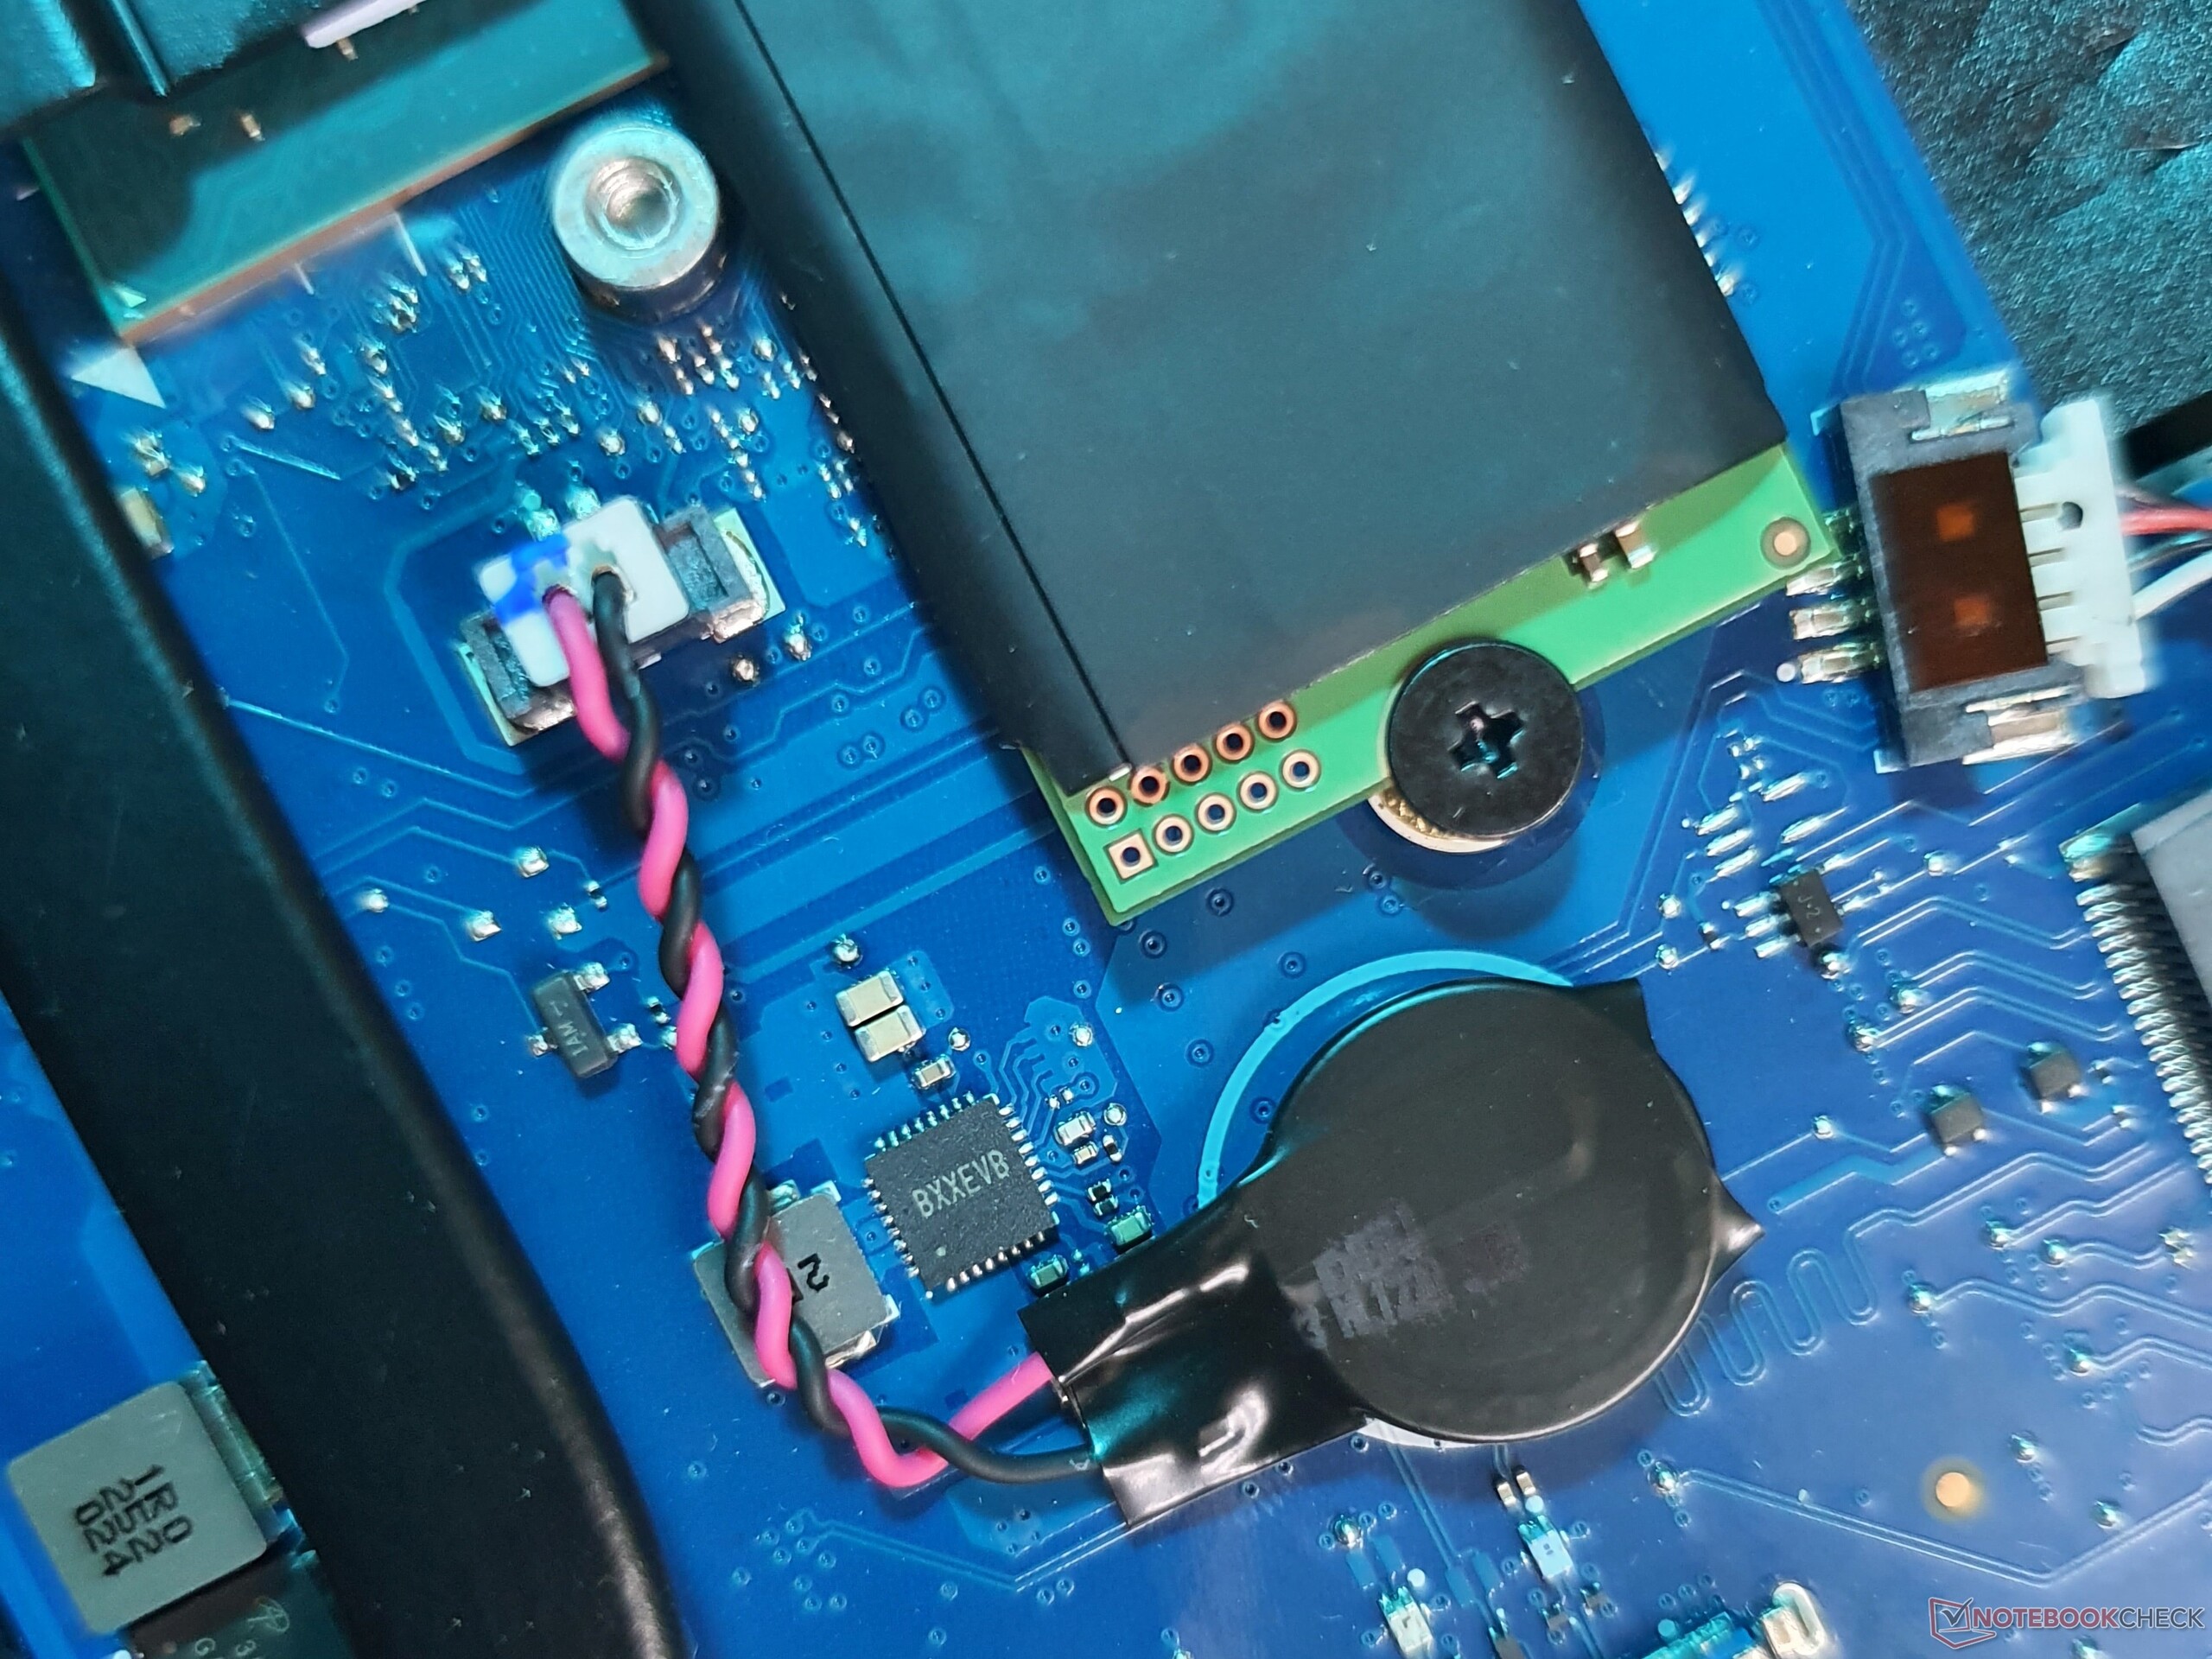
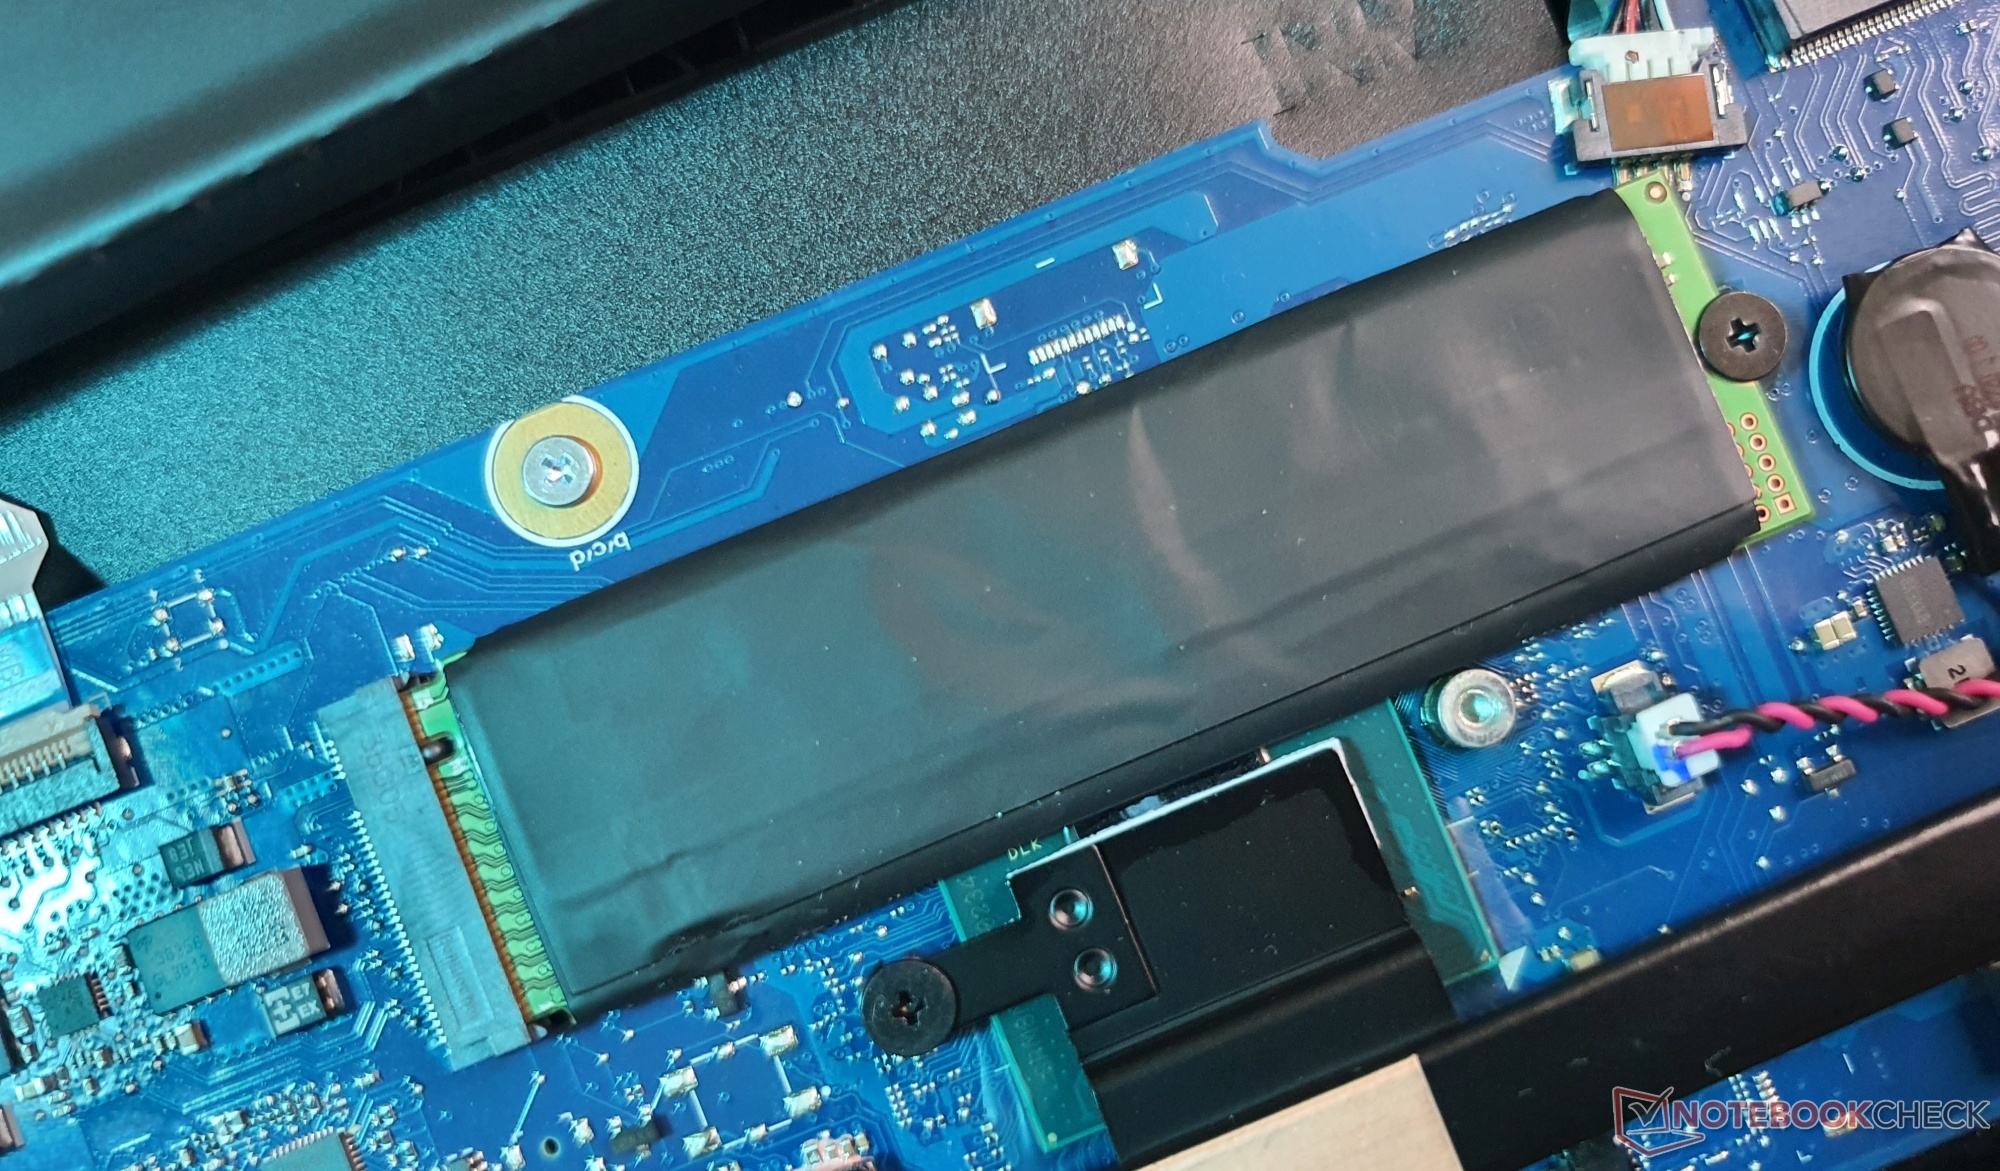
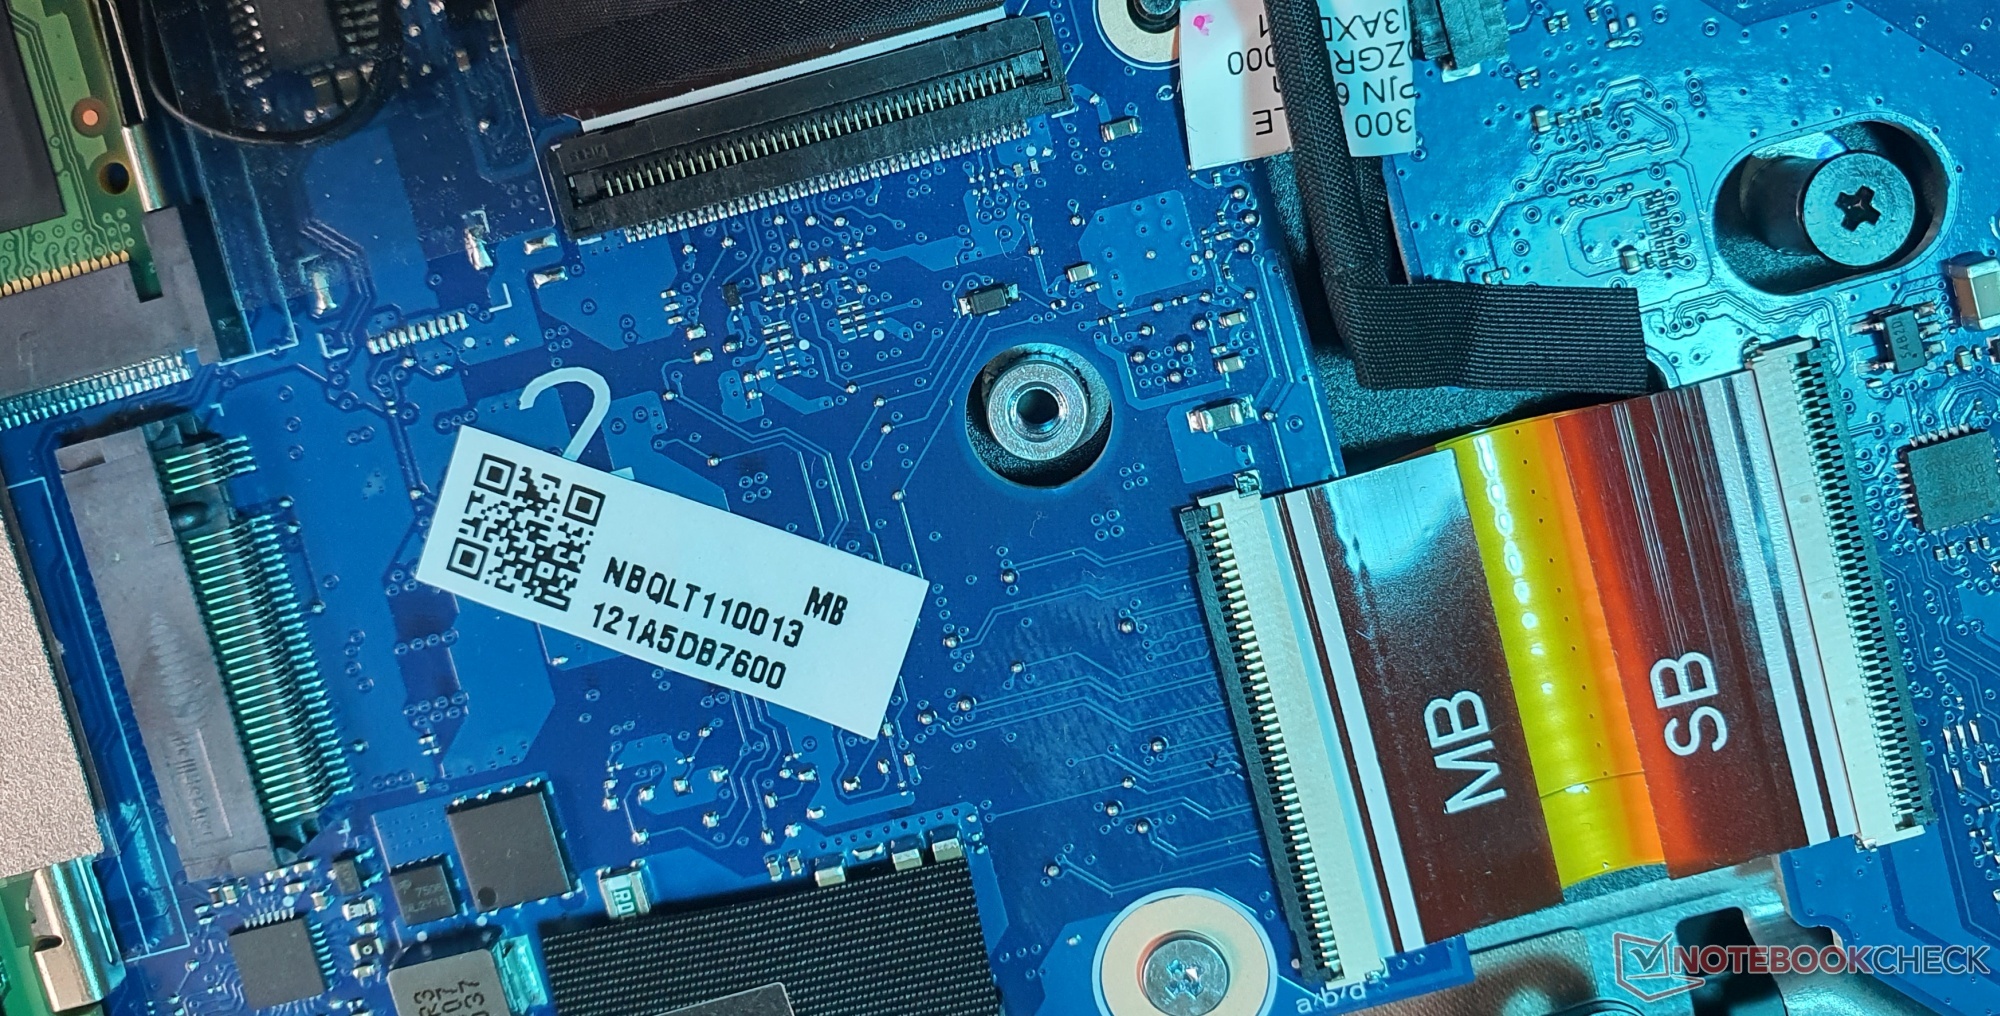
Dopo aver rimosso undici viti Phillips, è possibile accedere facilmente all'interno del case. Ci sono due banchi di memoria e due slot M.2-2280, che supportano anche gli SSD montati su entrambi i lati. È inoltre possibile sostituire il chip WiFi e la batteria del BIOS. La batteria è tenuta in posizione dalle viti del case e dal guscio inferiore, per cui inizialmente sembra che sia sciolta nel case.
Garanzia
Acer offre al computer portatile una garanzia limitata di un anno, con piani di assistenza estesi disponibili su Acer Care Plus.
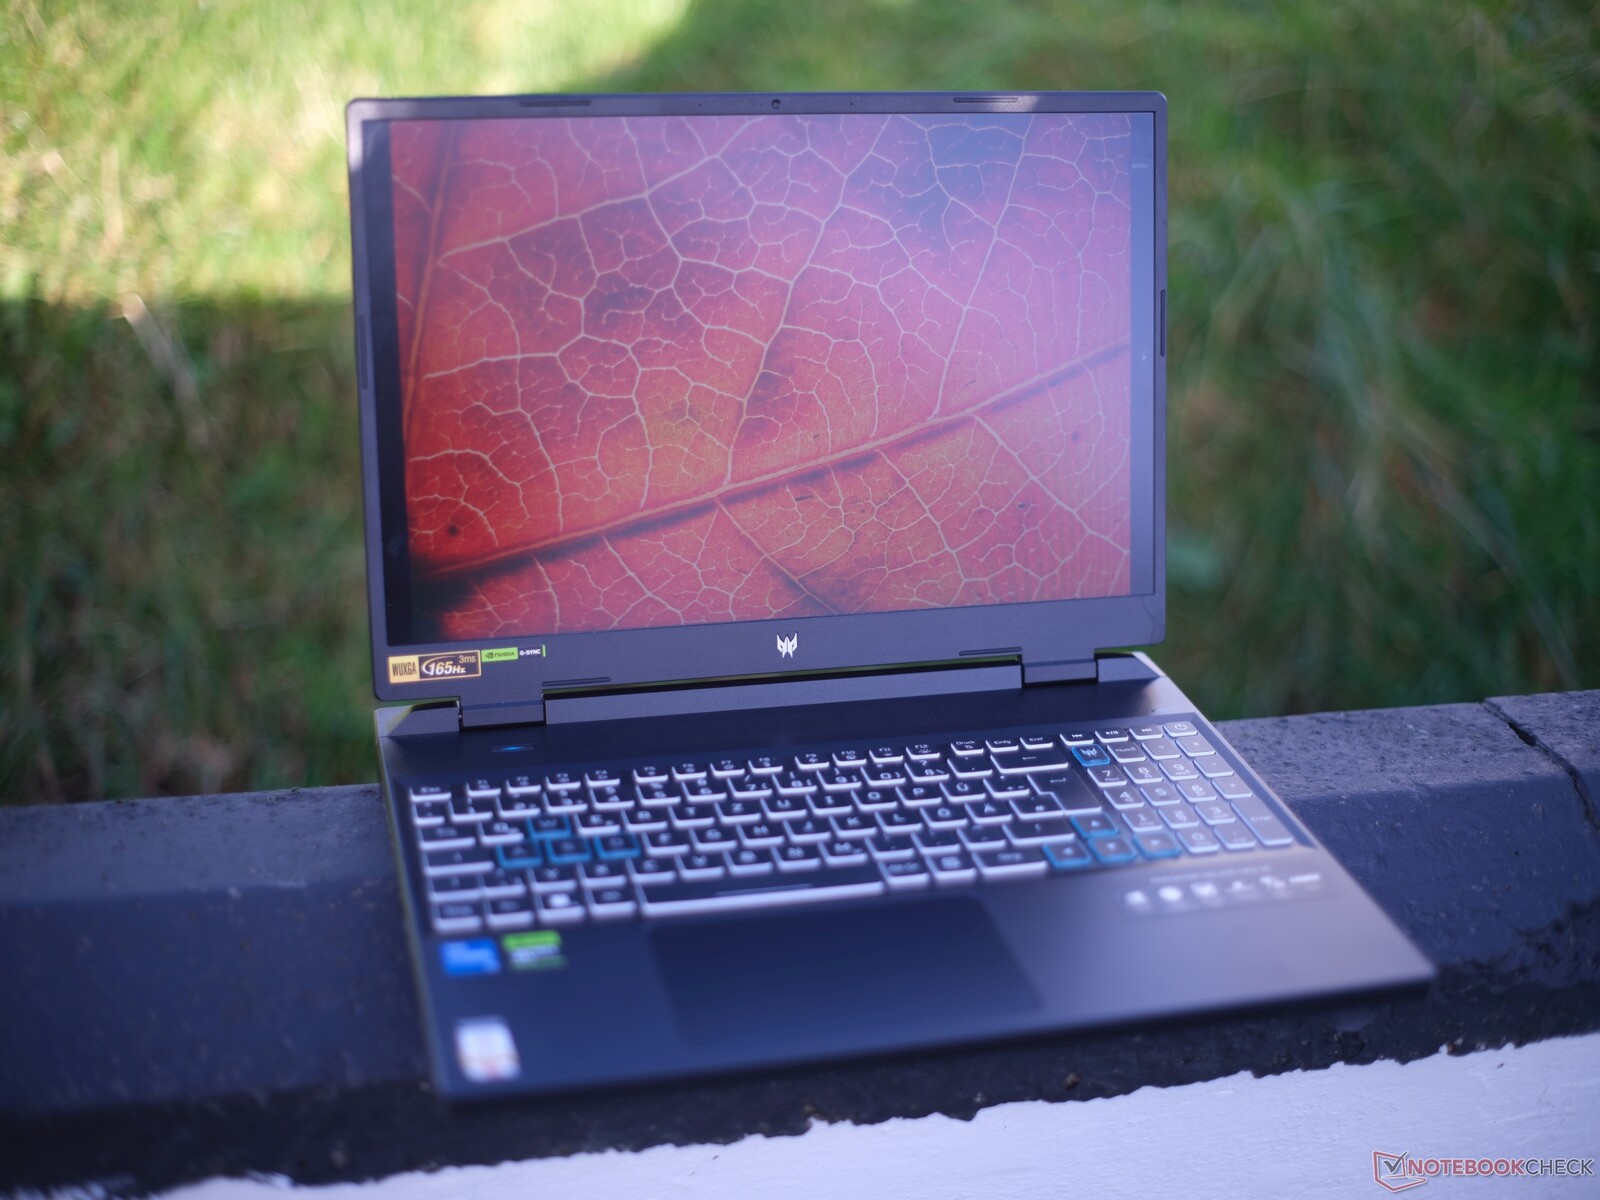
Input devices: Solid standard features with four-zone RGB lighting
Tastiera
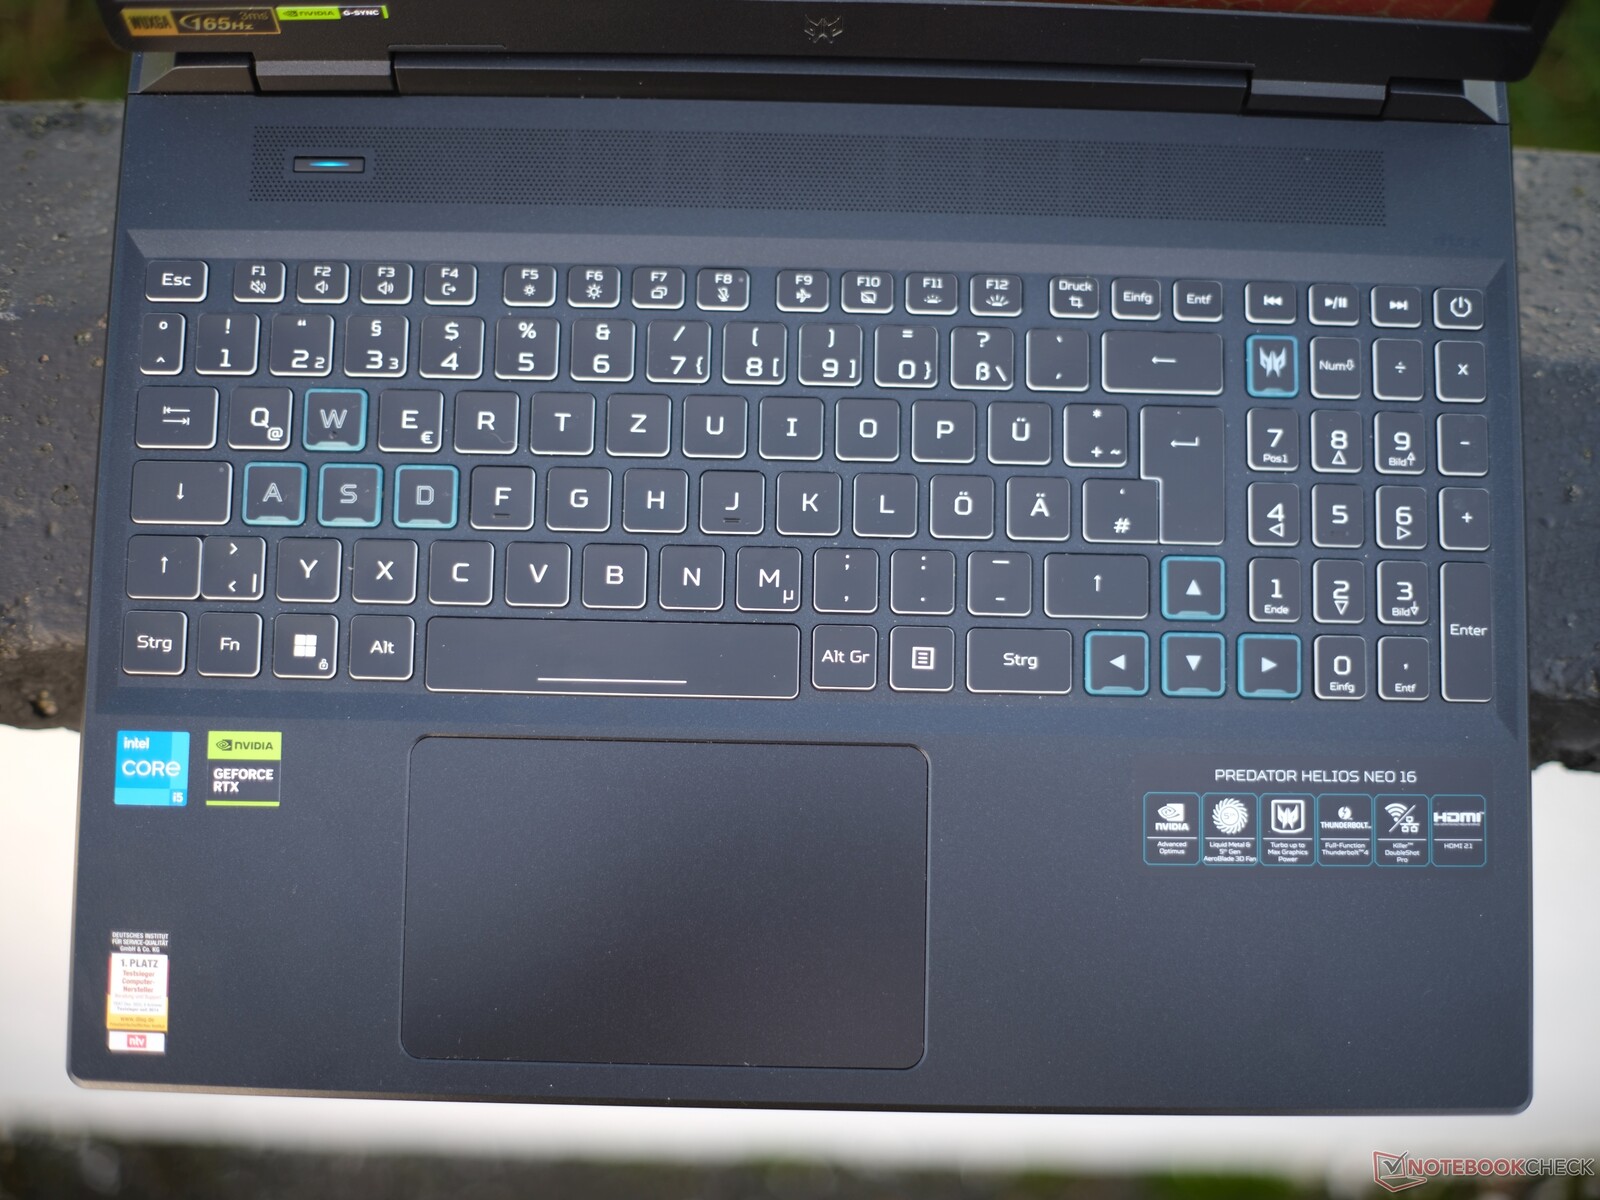
Acer ha installato in questo dispositivo una tastiera chiclet a 6 file con tasti e spaziatura sufficientemente grandi. Non ha quasi nulla in comune con la tastiera di Helios 16, ma è simile nella meccanica e nell'aspetto alle tastiere di molti computer portatili da gioco economici, come ad esempio il modelloXMG Apex 15,Gigabyte G5oI computer portatili da gioco Captiva Advanced. È esattamente la stessa cosa che si trova sul Acer Nitro 16.
Il generoso sollevamento dei tasti di 1,5 mm è accompagnato da un punto di pressione chiaramente percepibile. Tuttavia, la resistenza dei tasti avrebbe potuto essere un po' più chiara. La tastiera si deforma leggermente durante la digitazione (che, tra l'altro, è molto silenziosa), ma non è un problema nell'uso quotidiano. Il layout è piuttosto gradevole, ma il tasto shift destro è un po' troppo piccolo perché i tasti freccia sono di dimensioni normali, mentre il tasto shift sinistro è ancora più piccolo.
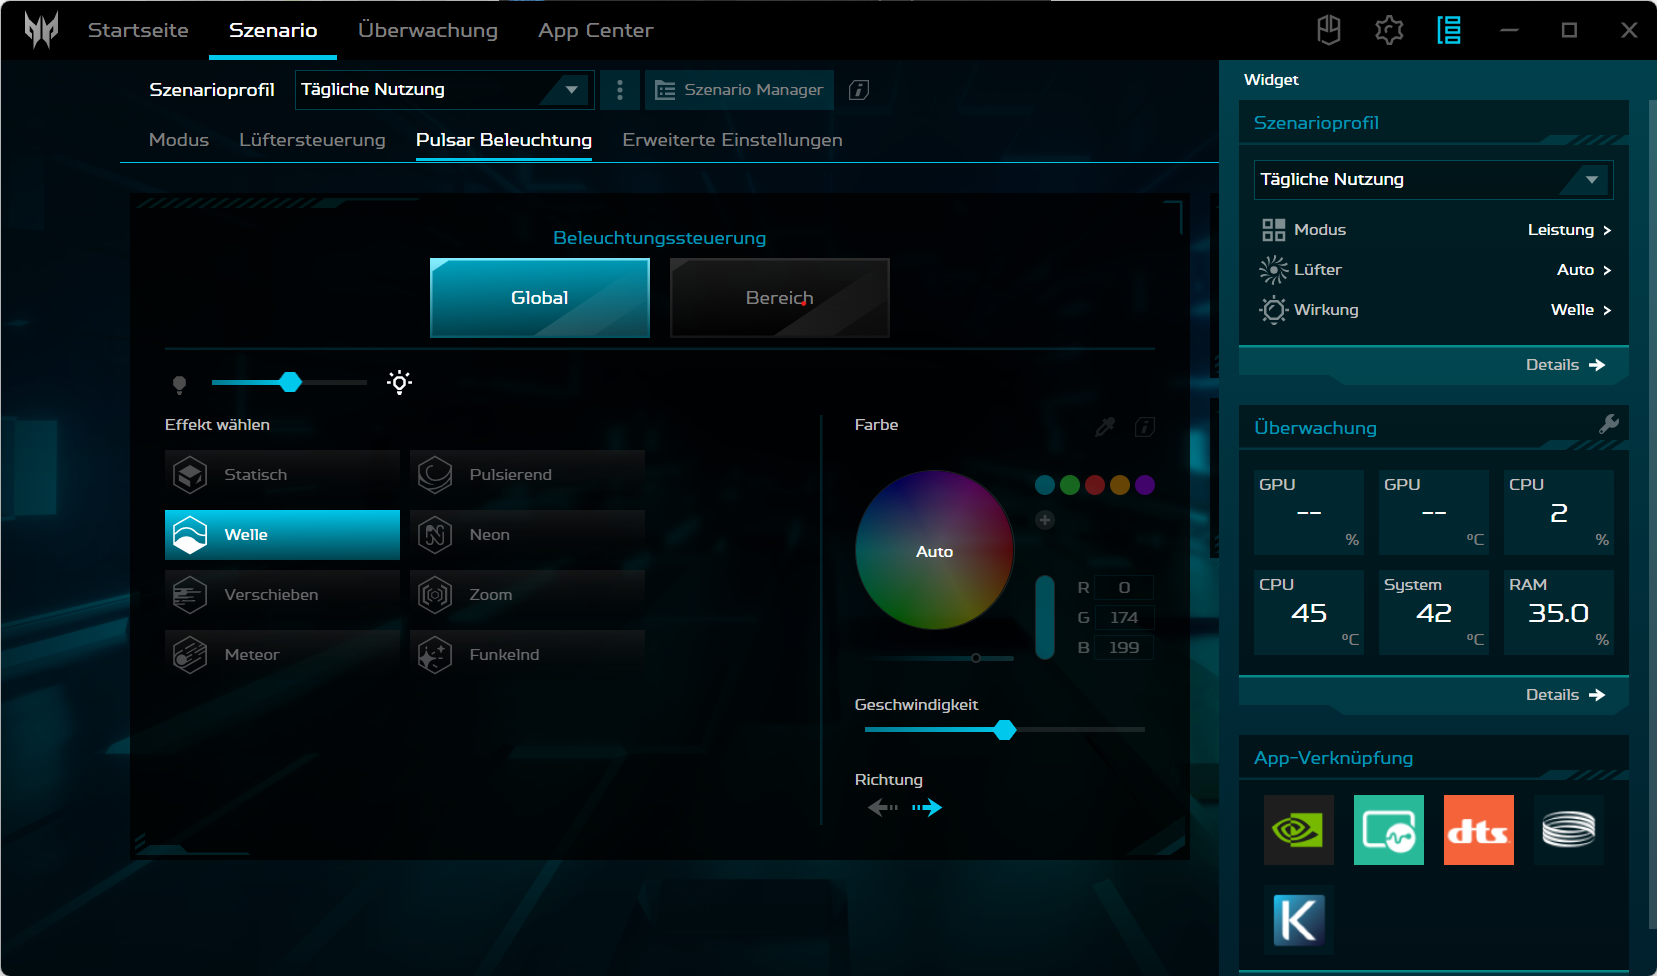
Acer ha dotato questa tastiera di un'illuminazione RGB a quattro zone con quattro livelli di intensità, mentre la versione non-Neo ha un'illuminazione micro-LED particolarmente uniforme. Mentre il pulsante con il logo sul tastierino numerico lancia l'applicazione Predator Sense, il pulsante illuminato in modo permanente in alto a sinistra viene utilizzato per passare da una modalità all'altra.
Touchpad
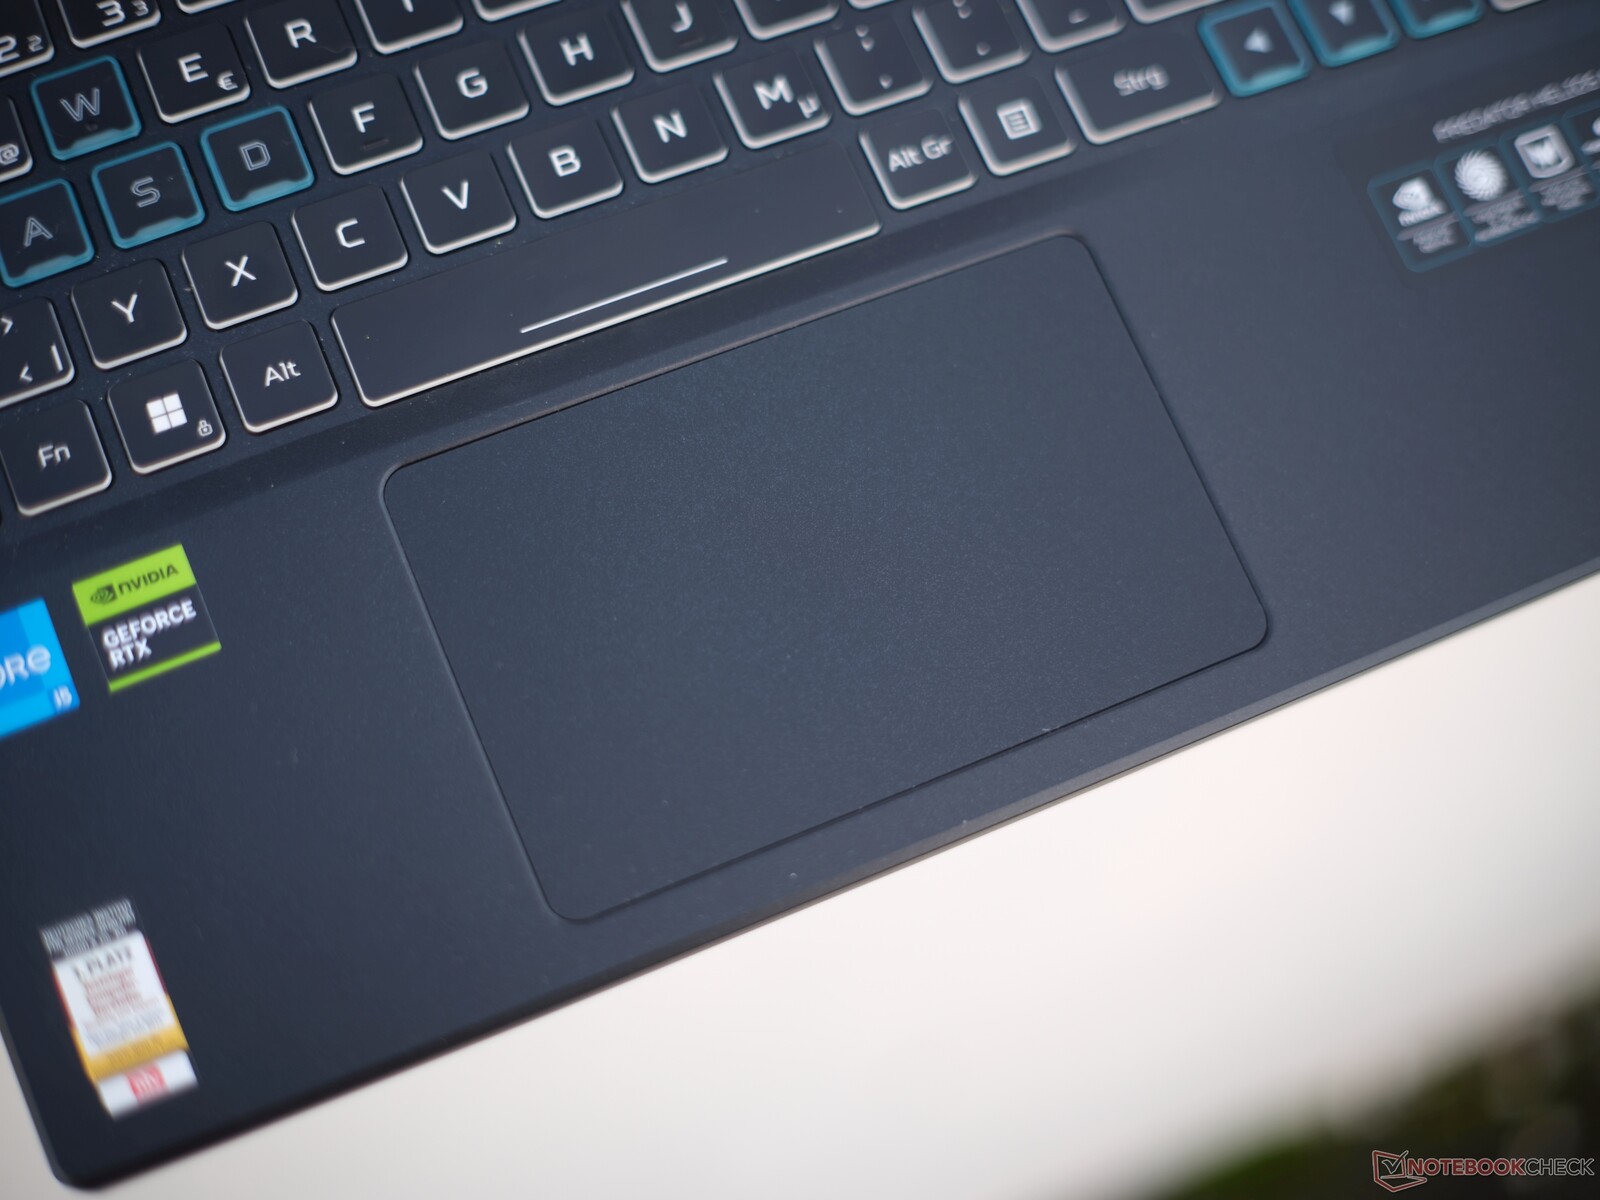
Il touchpad da 12,6 x 8,3 mm funziona in modo molto preciso ed è piacevole e fluido, sebbene sia realizzato in plastica e non in vetro come quello diHelios 16helios 16. È facile scorrere ed eseguire gesti multi-touch. I pulsanti a scatto integrati hanno un'elevazione breve e un clic soddisfacente.
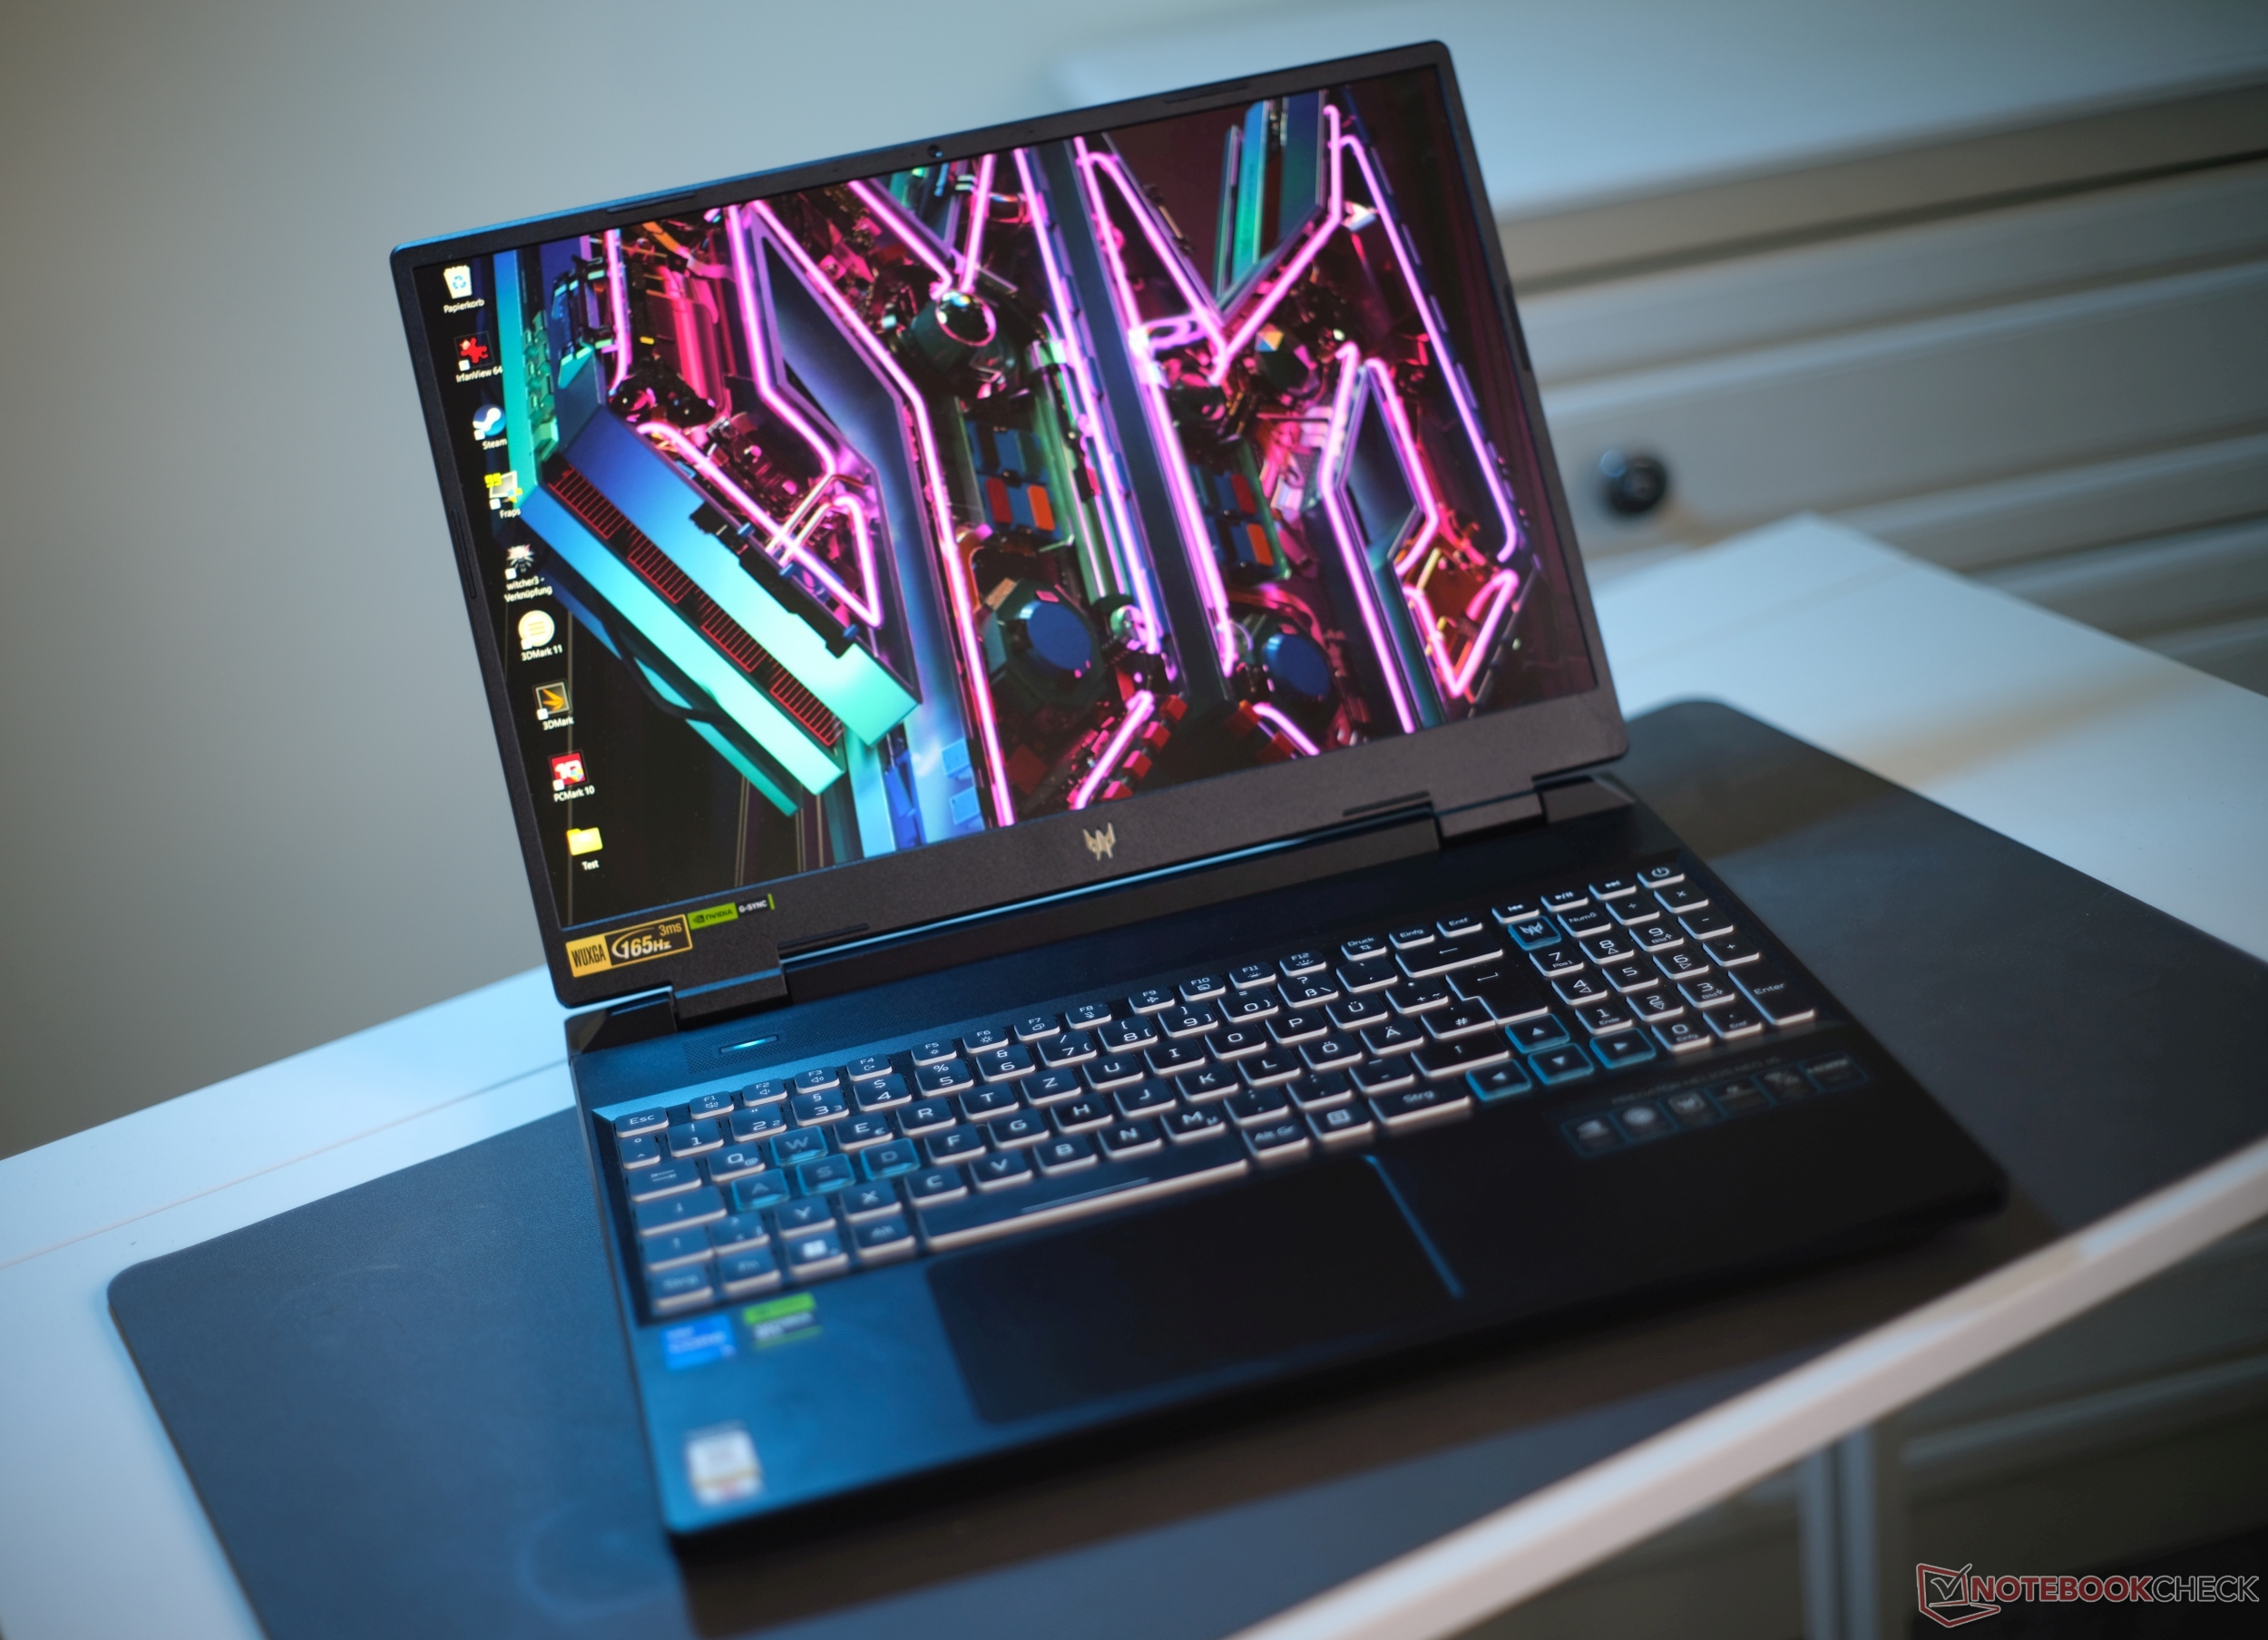
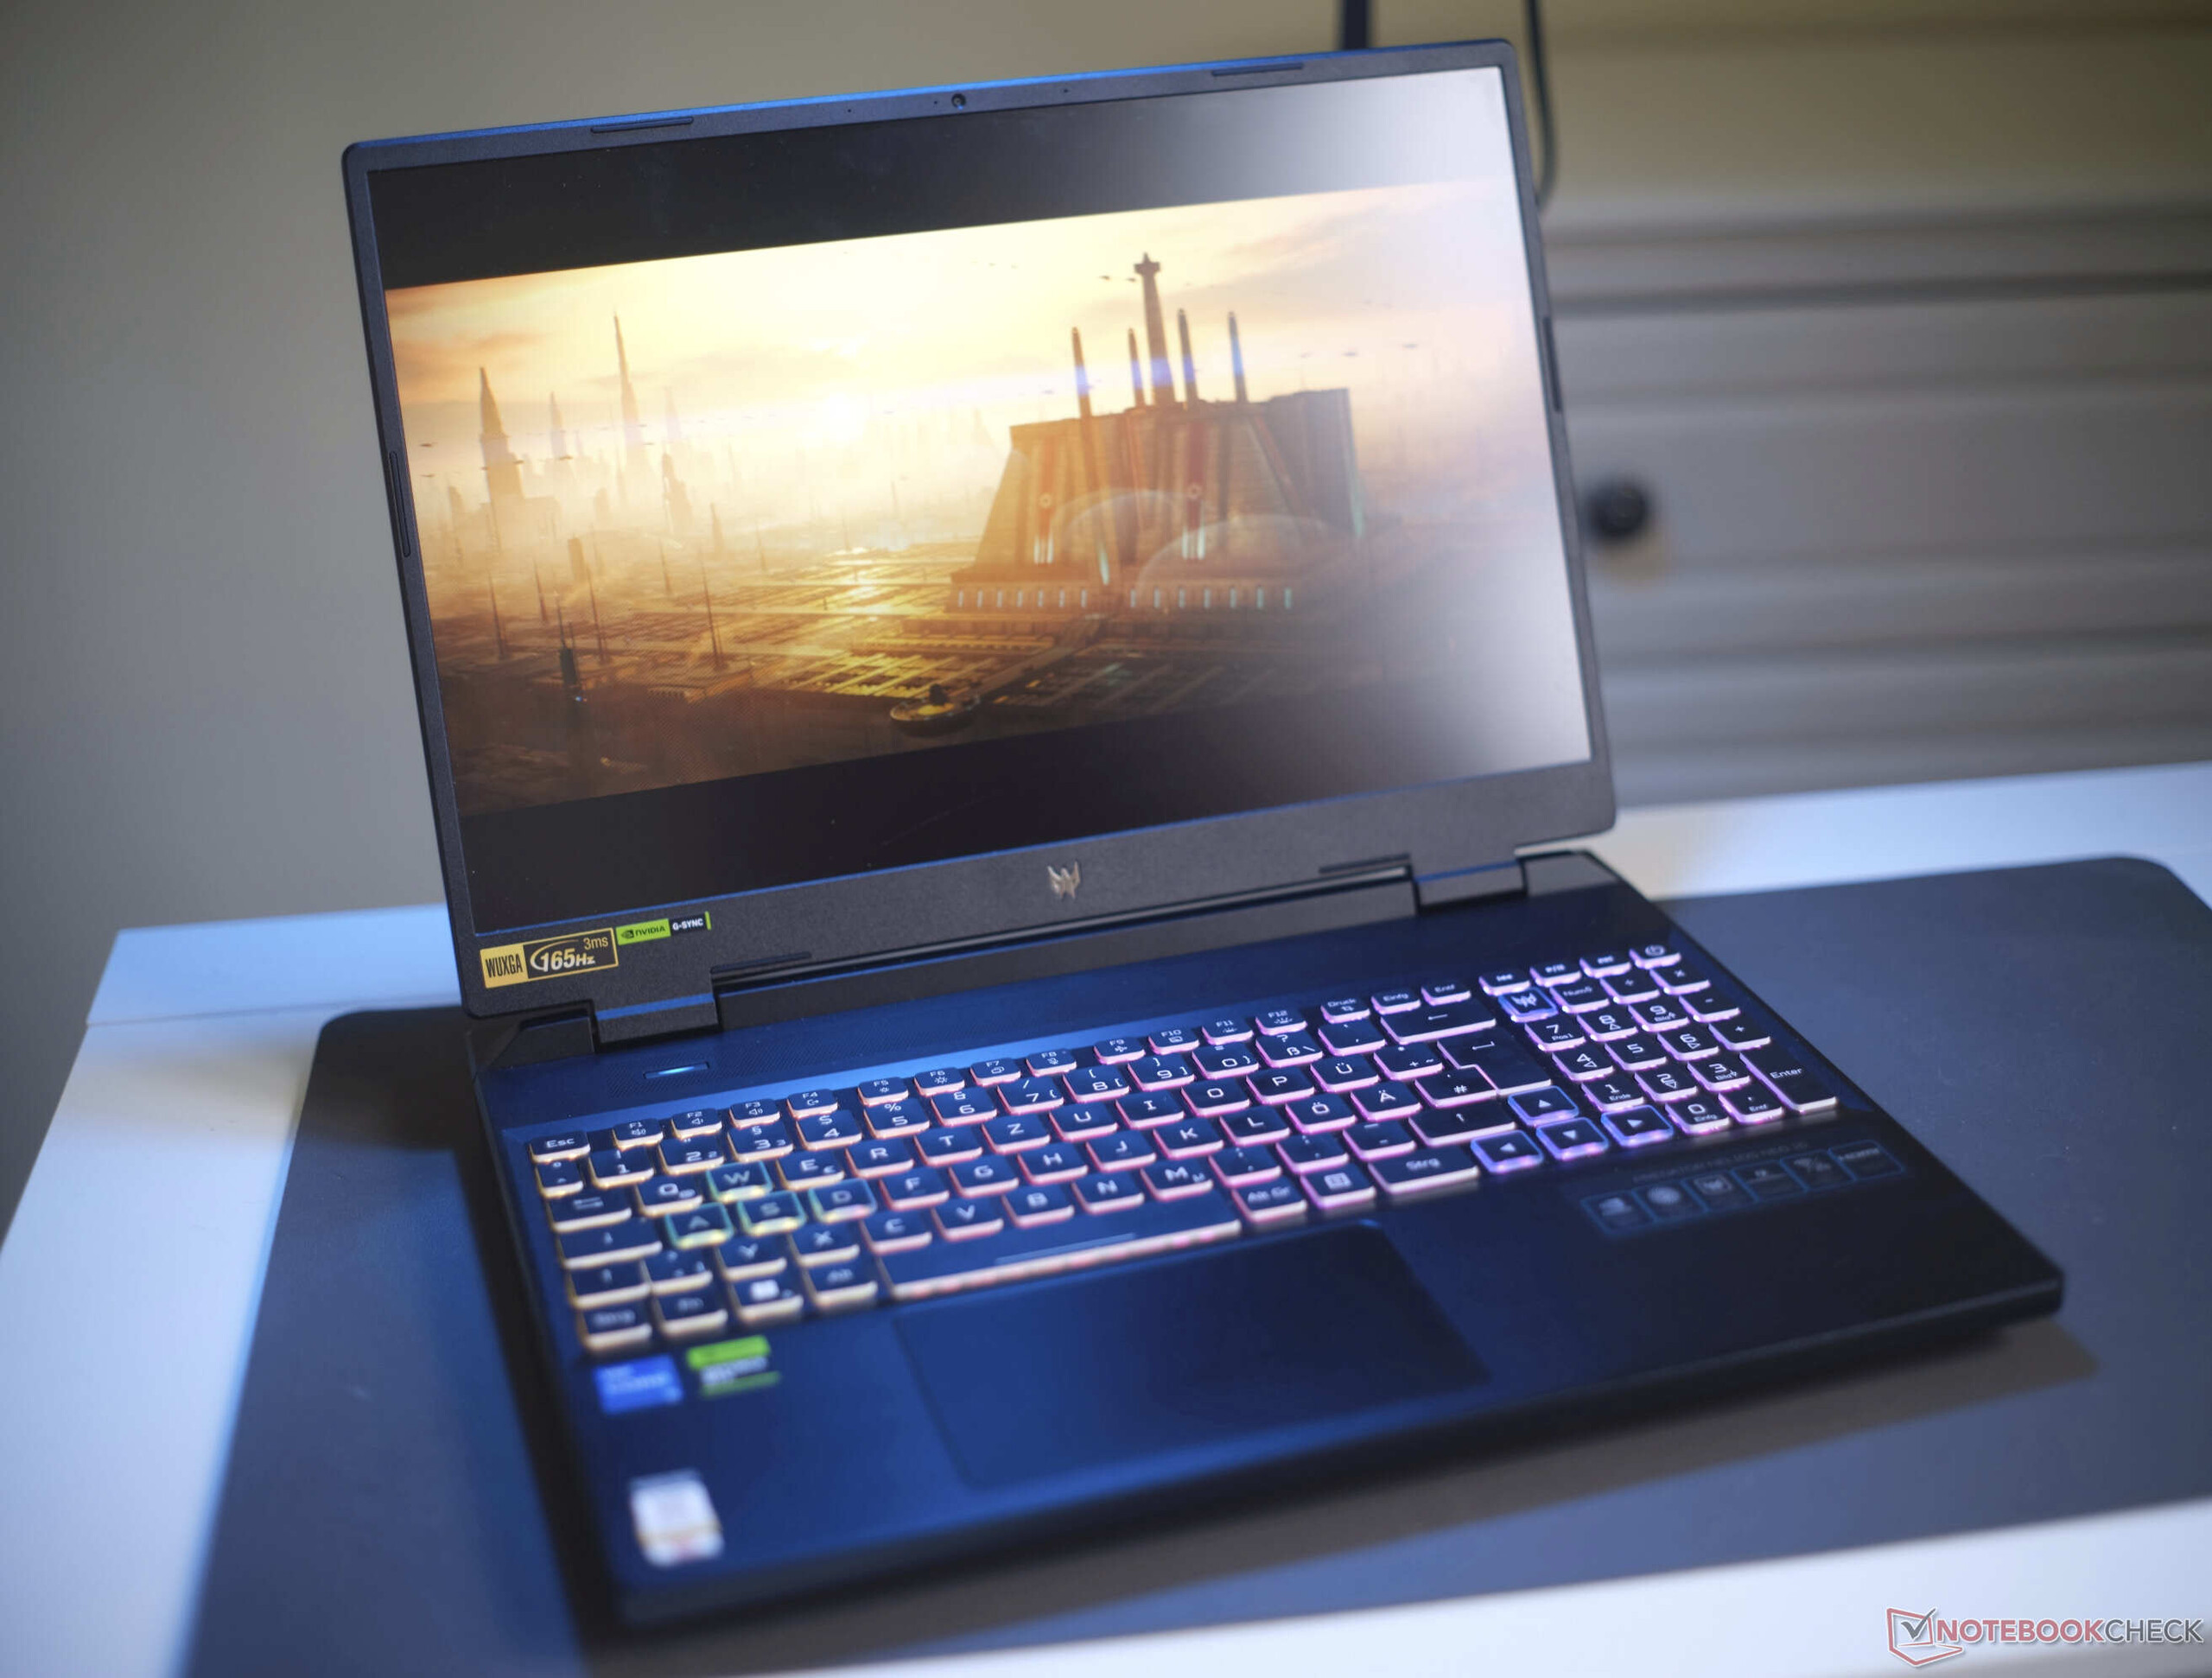
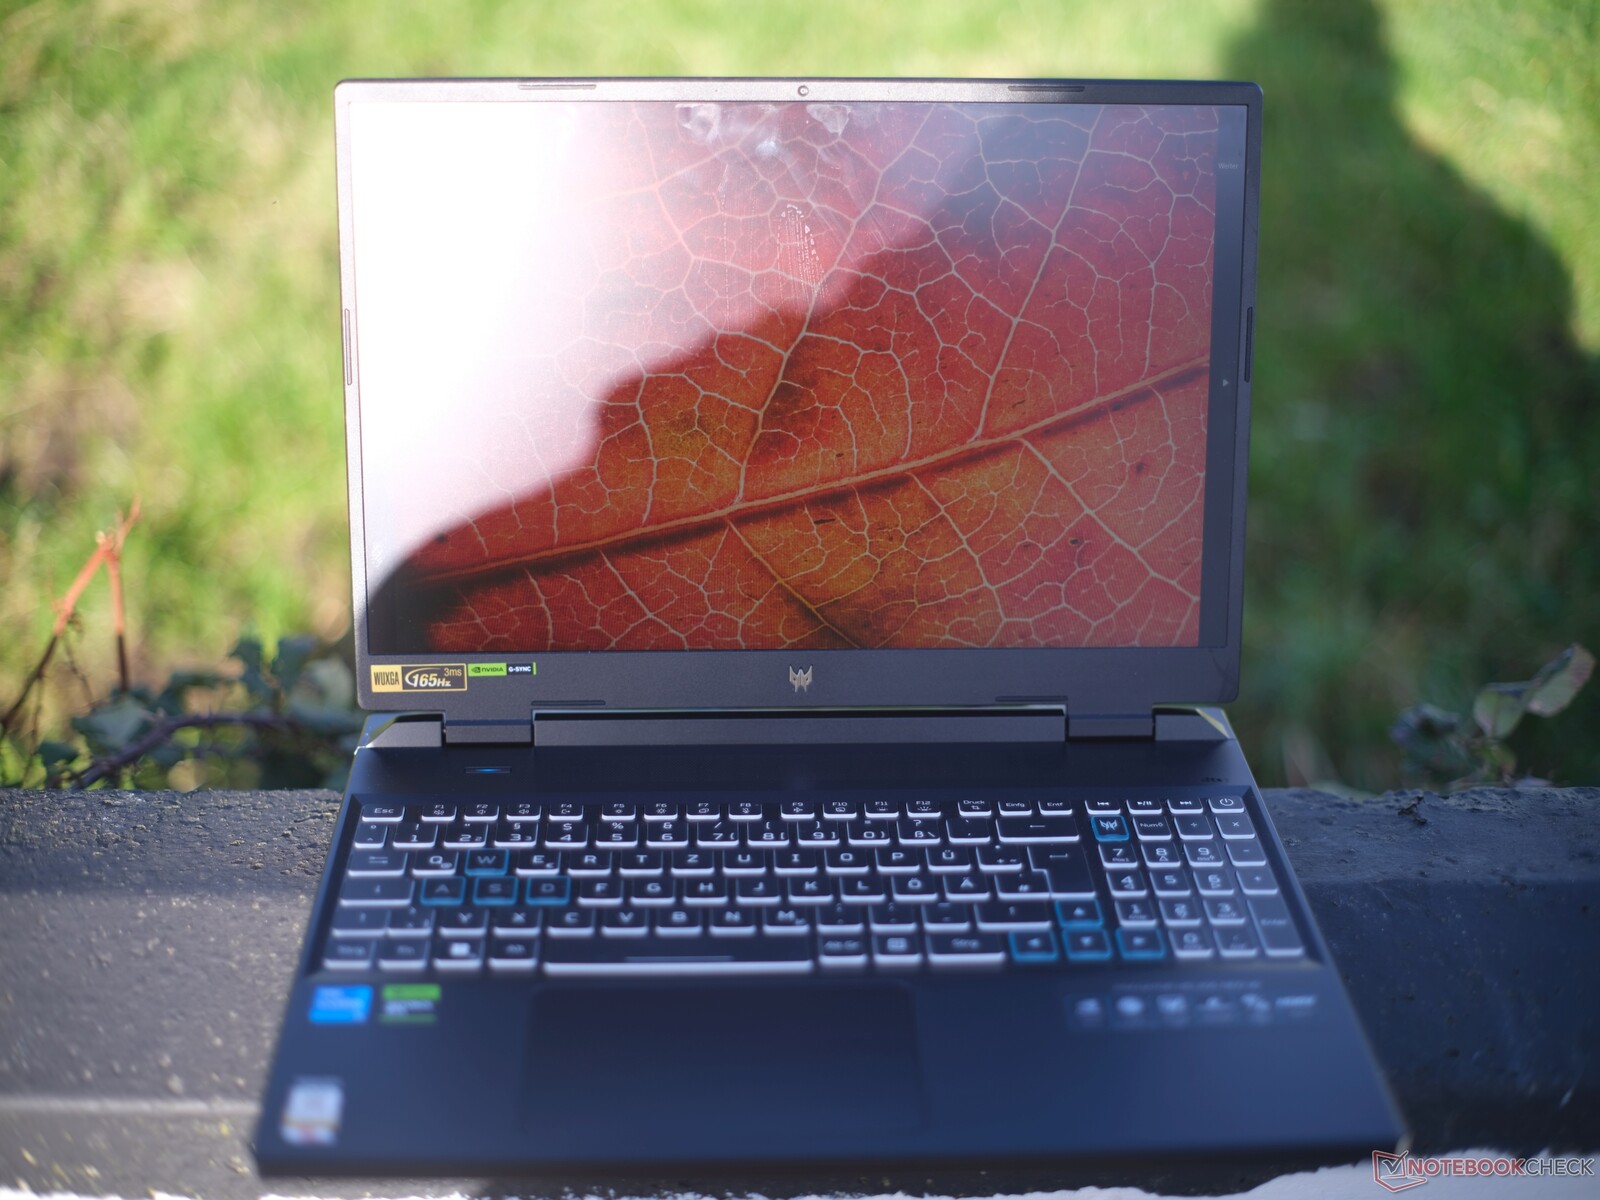
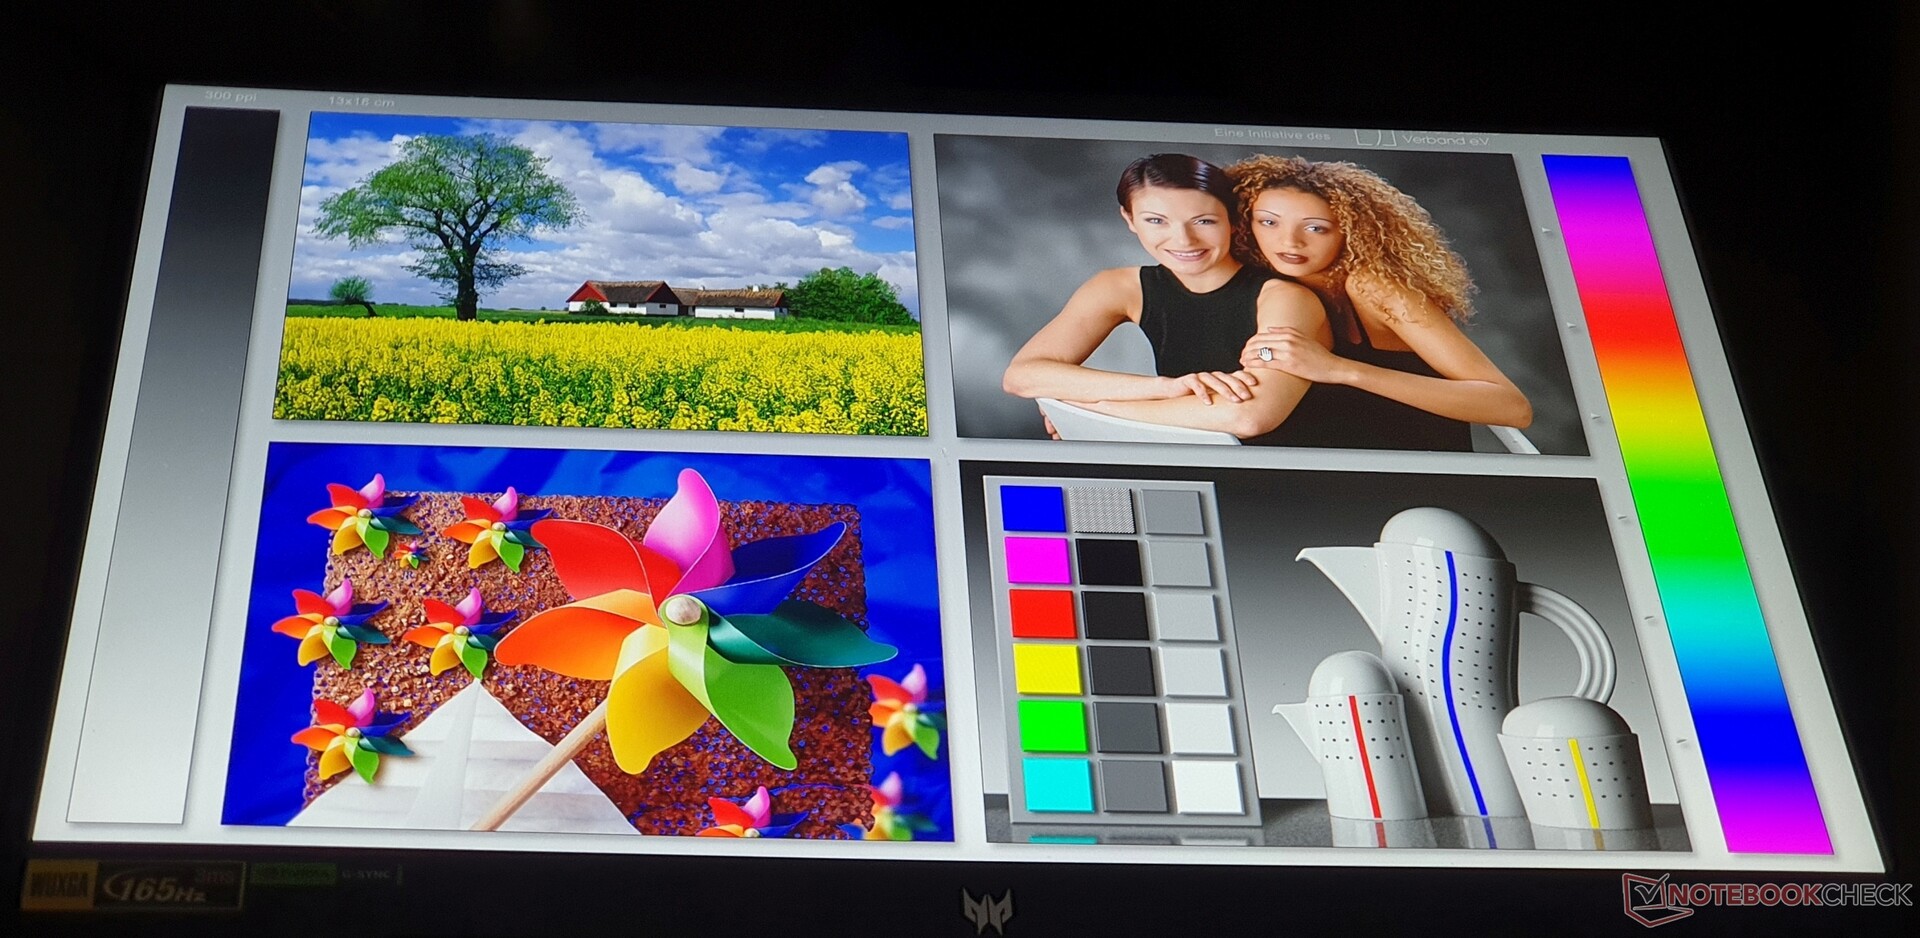
Display: Helios Neo 16 è ben equipaggiato per i giochi in Full HD
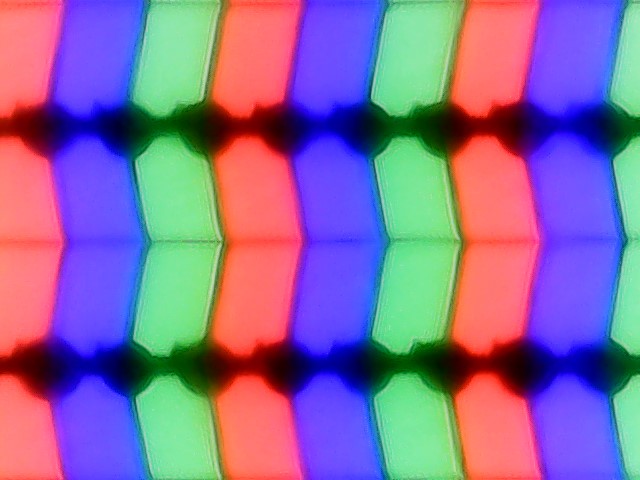
Il nostro dispositivo di prova è dotato di un display opaco WUXGA IPS (FHD+) con un rapporto d'aspetto di 16:10, mentre altre varianti offrono un'opzione QHD. Entrambi i pannelli hanno una frequenza di aggiornamento di 165 Hz.
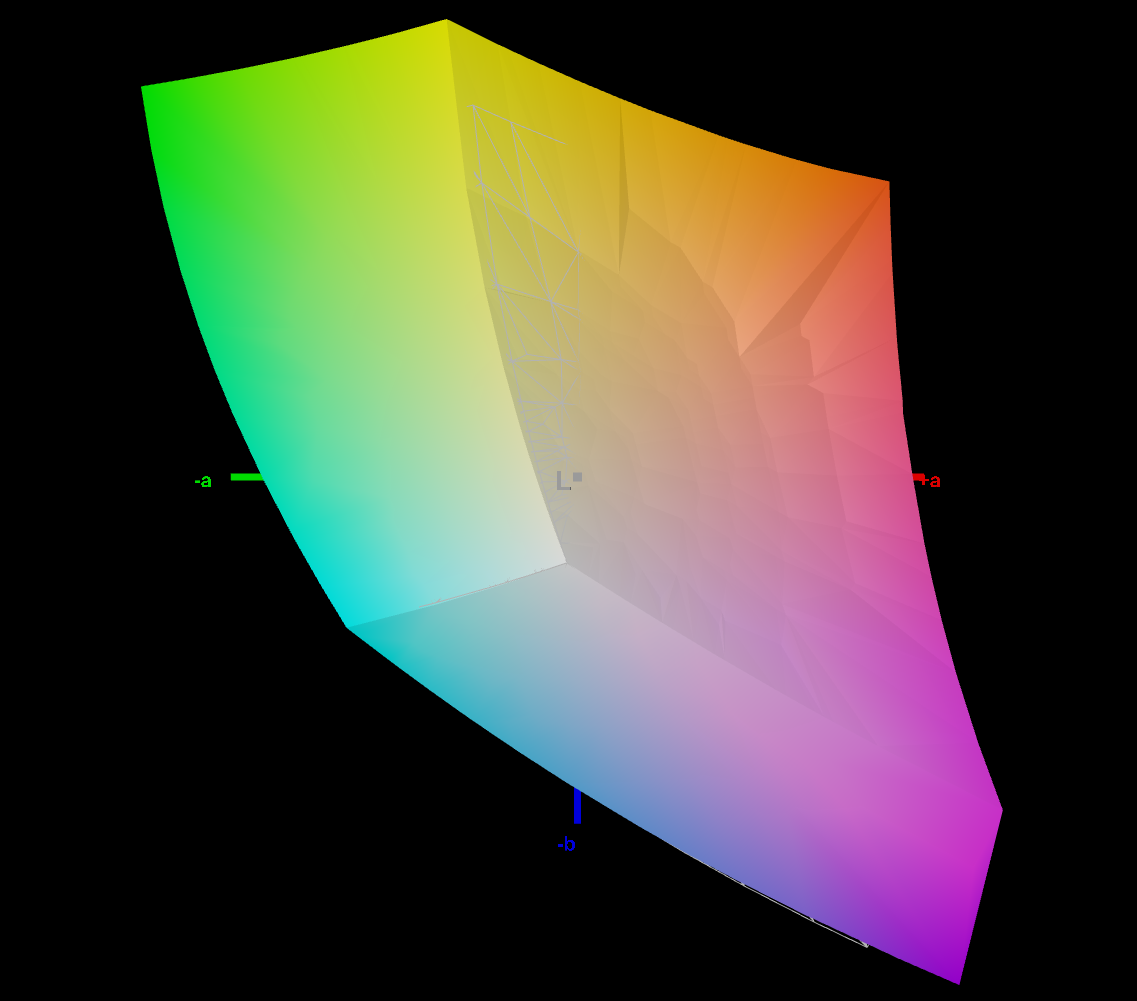
A differenza del Predator Helios 16, l'opzione QHD non copre lo spazio colore DCI-P3, ma è invece limitata al 100% sRGB come la variante FHD+ che abbiamo testato. 373 cd/m² sono sufficientemente luminosi - nel nostro campo di confronto, solo ilLegion Pro 5 brilla di più con 516 cd/m², e in più offre anche una risoluzione più elevata a un prezzo simile (come i modelliLOQ 16 e il XMG Apex 15).
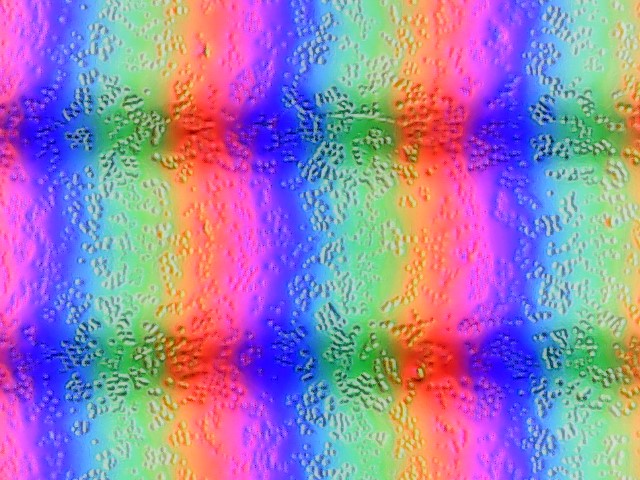
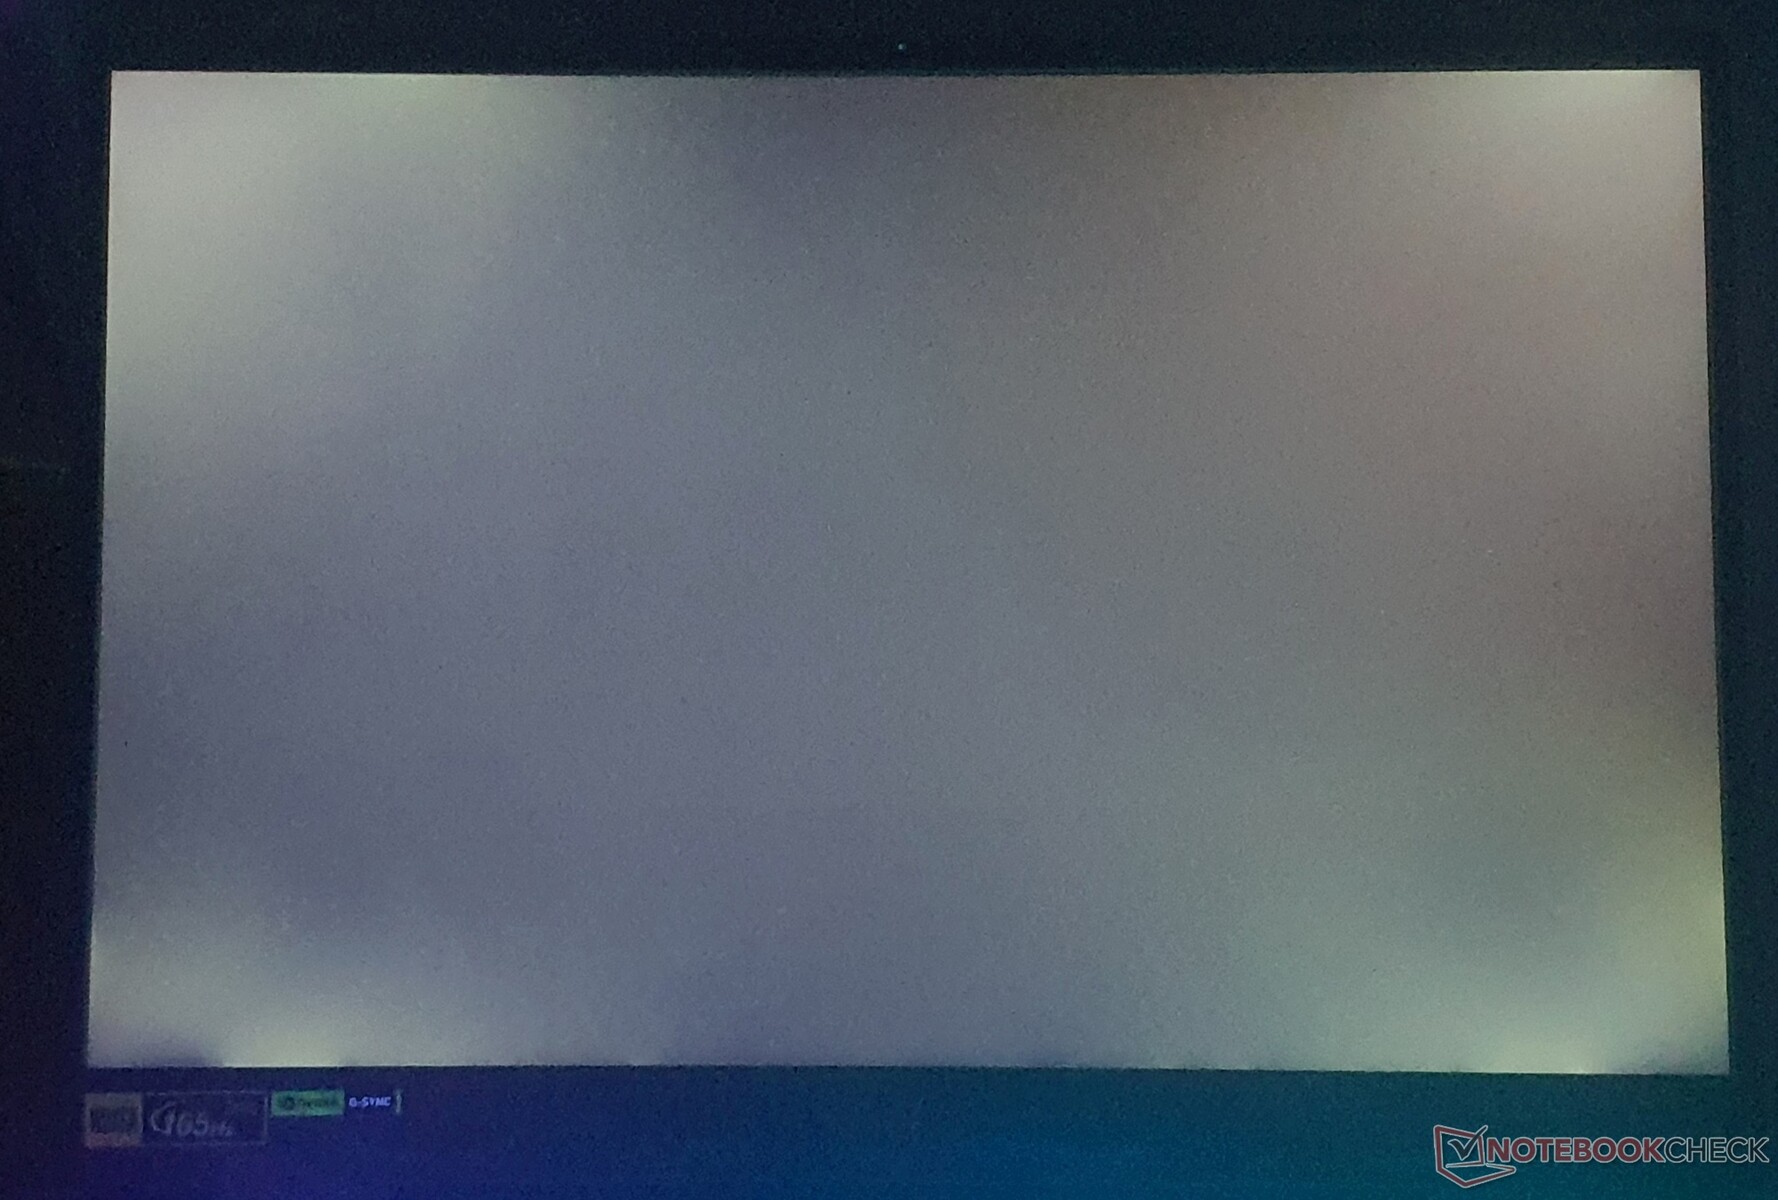
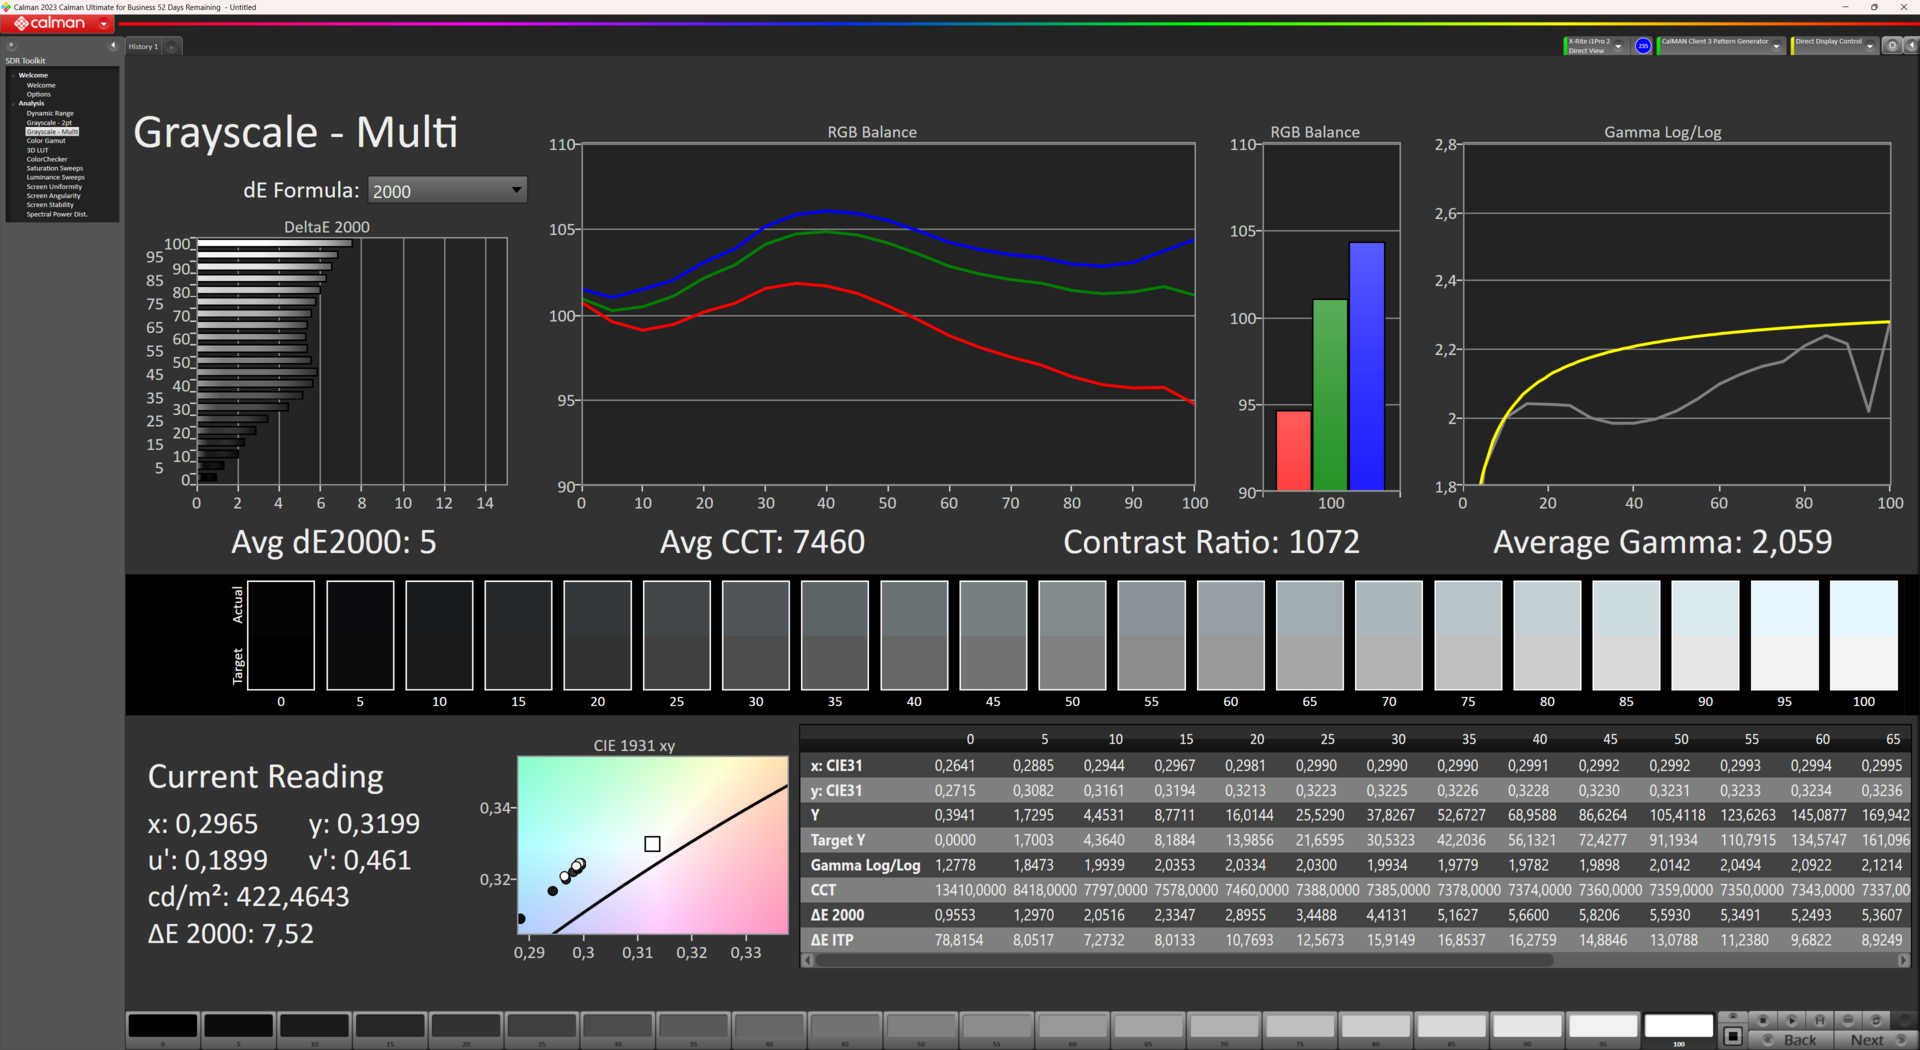
Ha raggiunto livelli medi di contrasto di 1.025:1, mentre la sua illuminazione dell'86% non è terribilmente uniforme e abbiamo notato alcuni aloni chiaramente visibili. Il PWM, che può potenzialmente causare fastidi agli occhi o mal di testa, almeno non è utilizzato su questo dispositivo.
I tempi di risposta dello schermo, pari a 8 ms (da grigio a grigio) e 8 ms (da nero a bianco), sono brevi - solo lo schermo diDell G15 5530 si distingue con tempi di risposta di soli 3,4 ms (da grigio a grigio). È supportato anche Nvidia G-Sync. Nel complesso, il display appare piacevole e colorato, probabilmente grazie alla copertura dello spazio colore DCI-P3 di almeno l'80%.
| |||||||||||||||||||||||||
Distribuzione della luminosità: 86 %
Al centro con la batteria: 422.2 cd/m²
Contrasto: 1025:1 (Nero: 0.41 cd/m²)
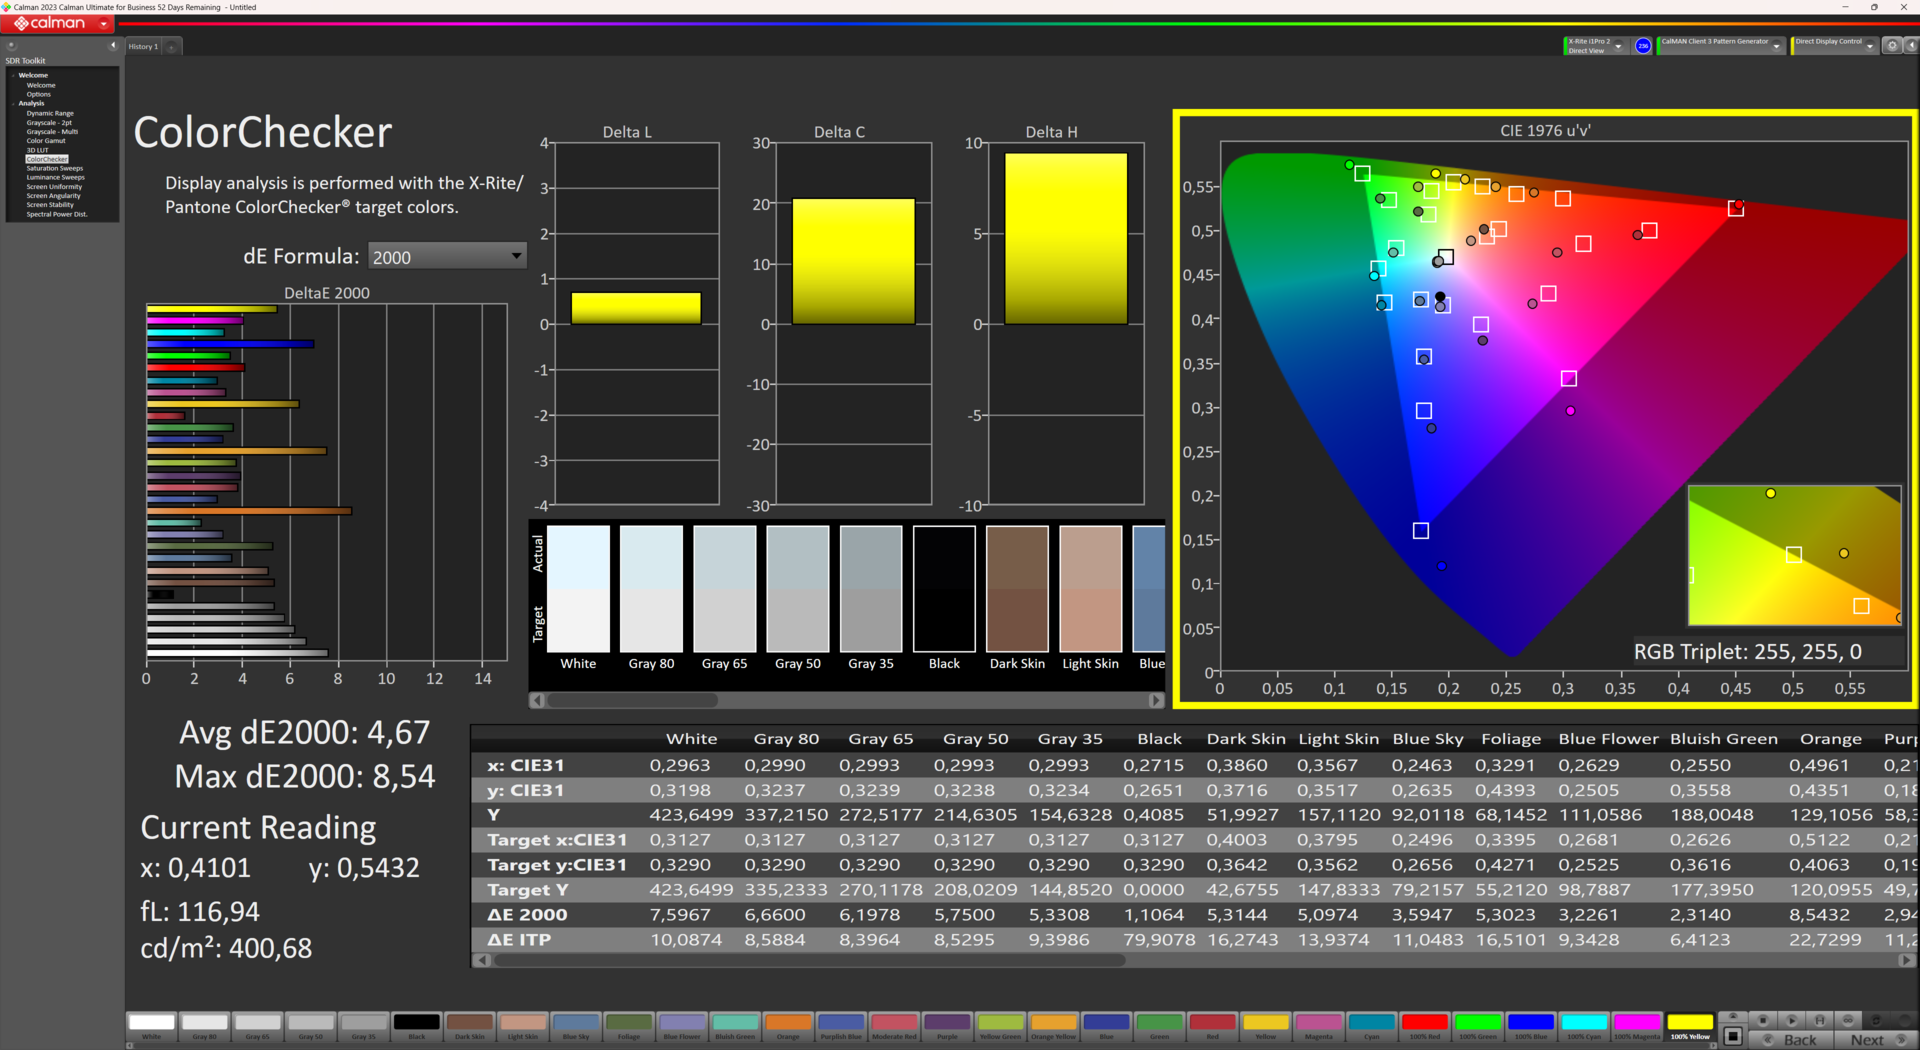
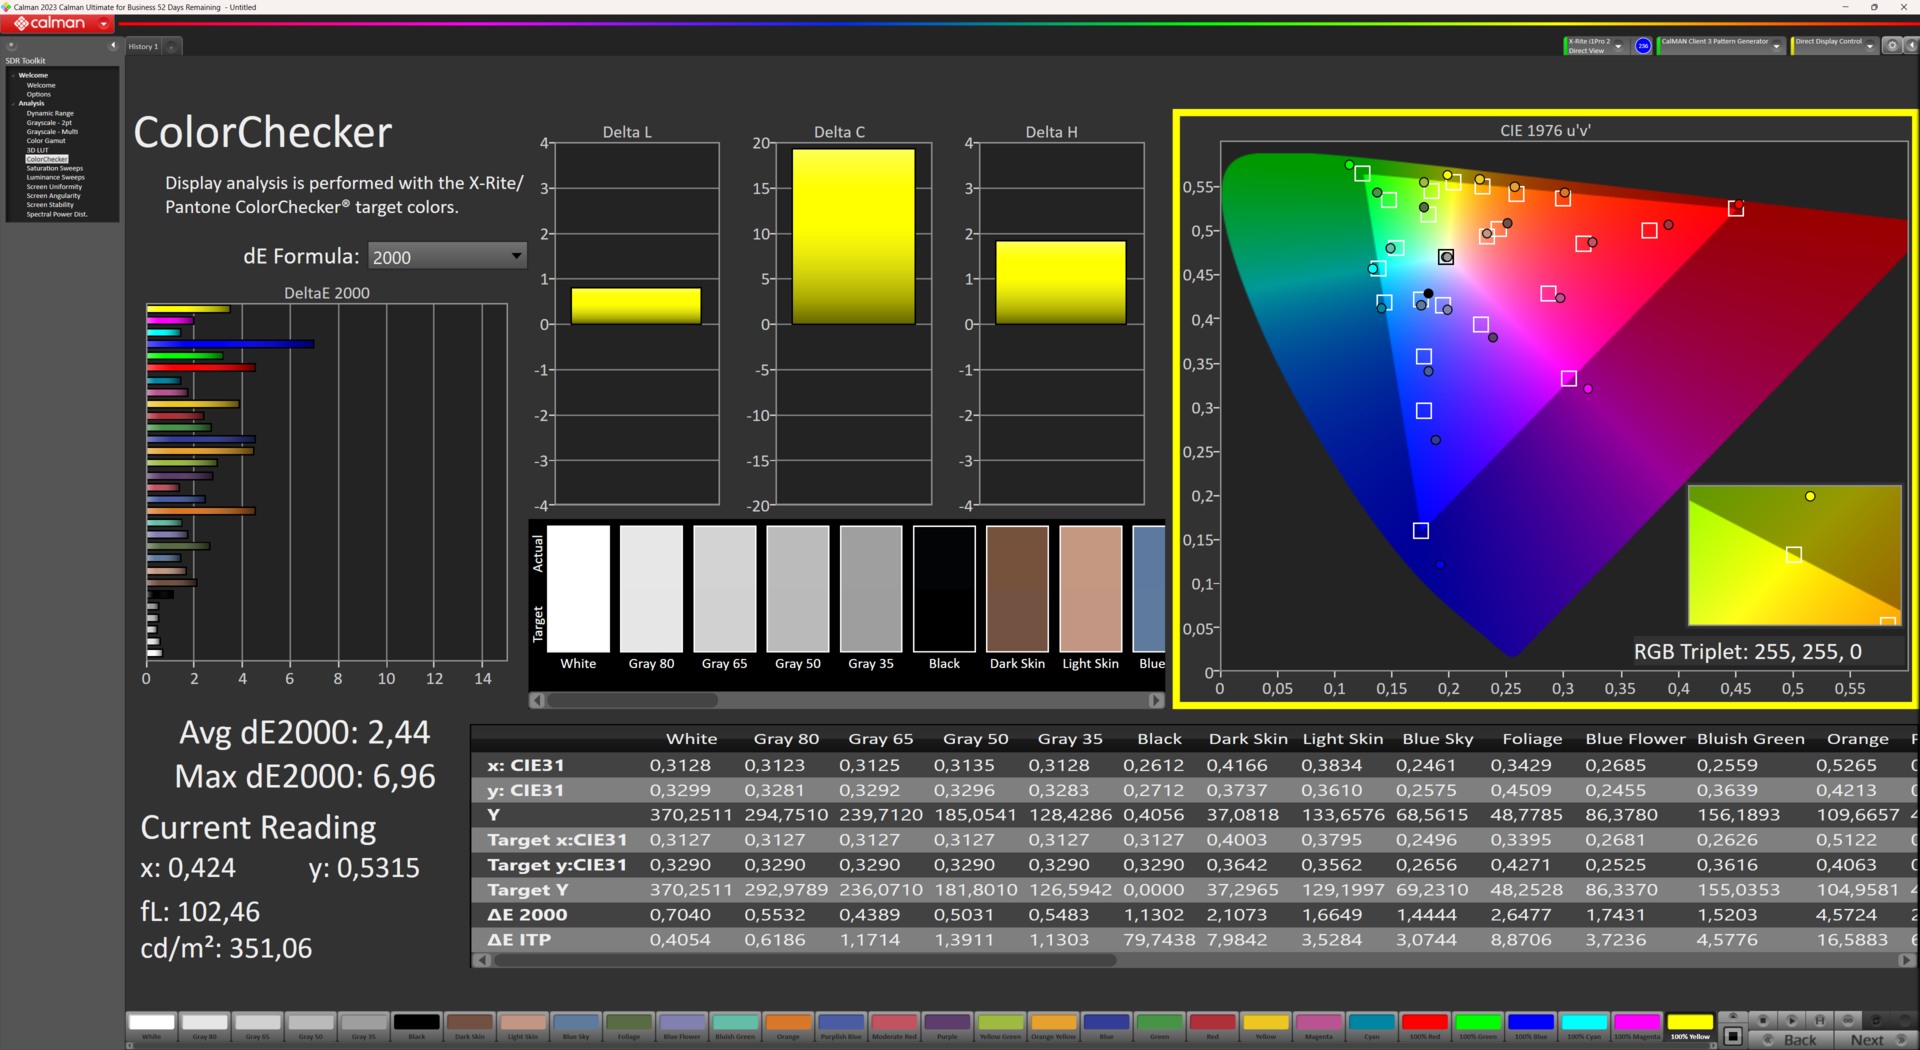
ΔE ColorChecker Calman: 4.67 | ∀{0.5-29.43 Ø4.71}
calibrated: 2.44
ΔE Greyscale Calman: 7.52 | ∀{0.09-98 Ø4.96}
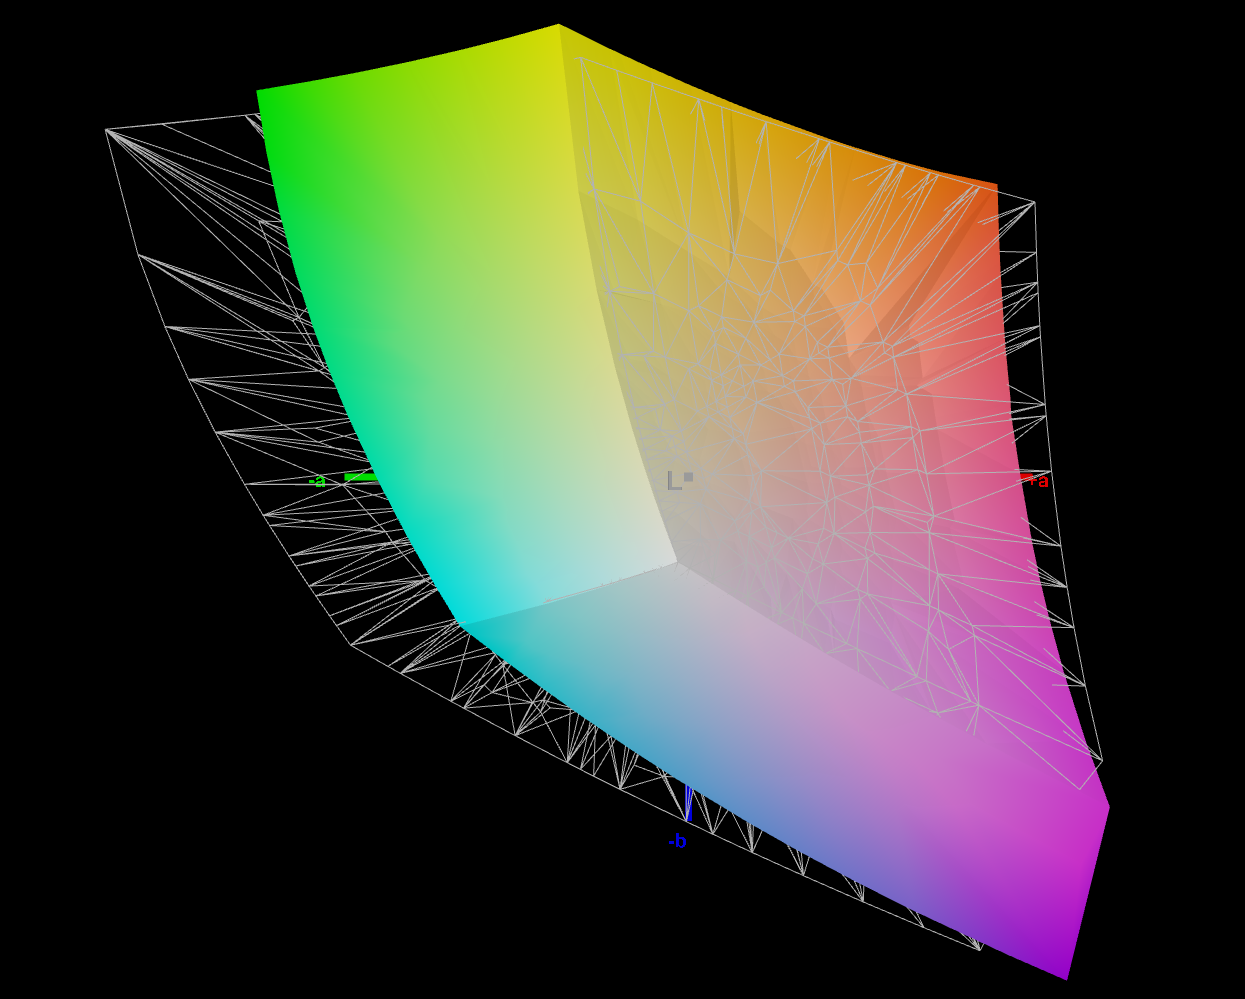
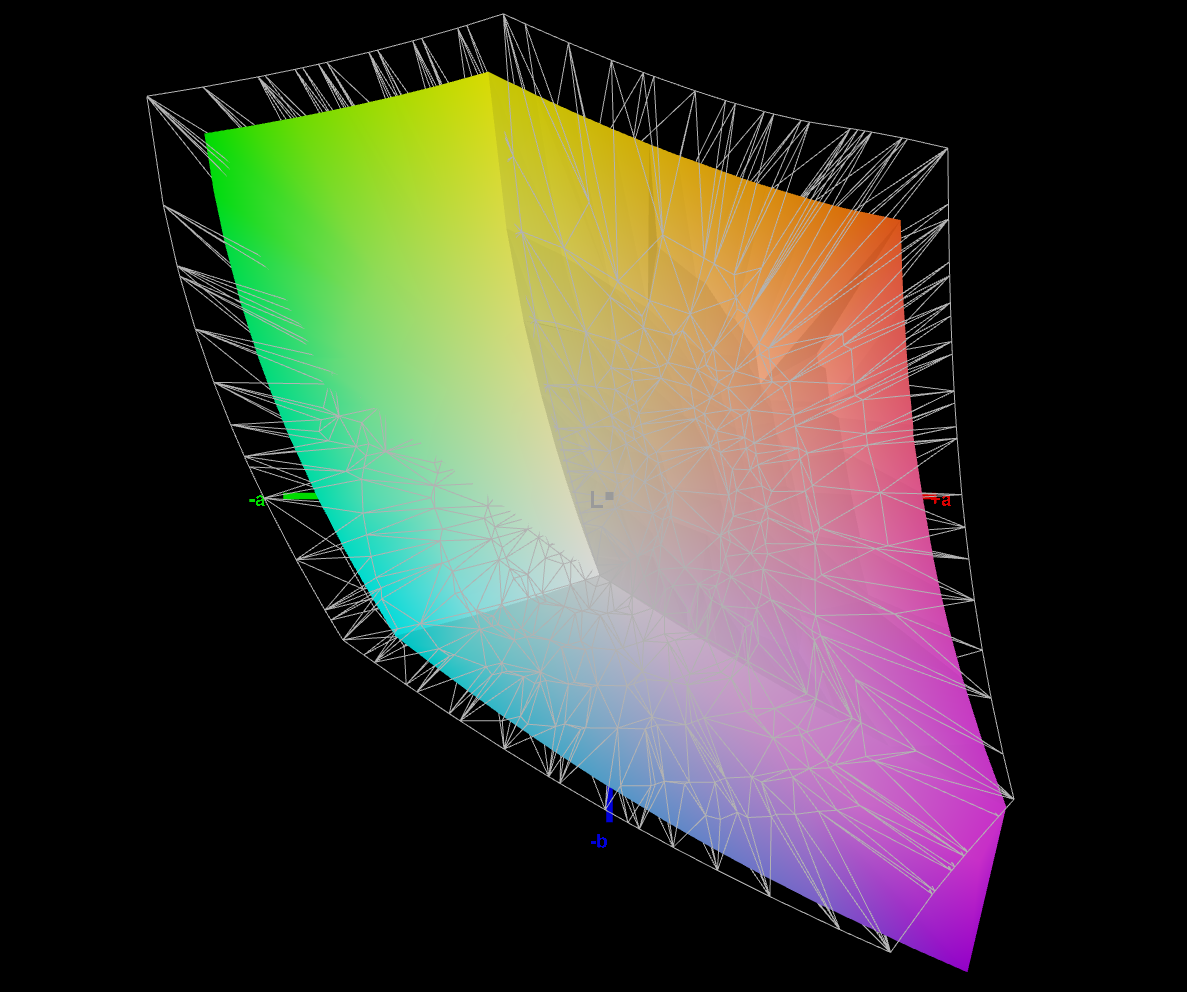
71.36% AdobeRGB 1998 (Argyll 3D)
99.16% sRGB (Argyll 3D)
79.56% Display P3 (Argyll 3D)
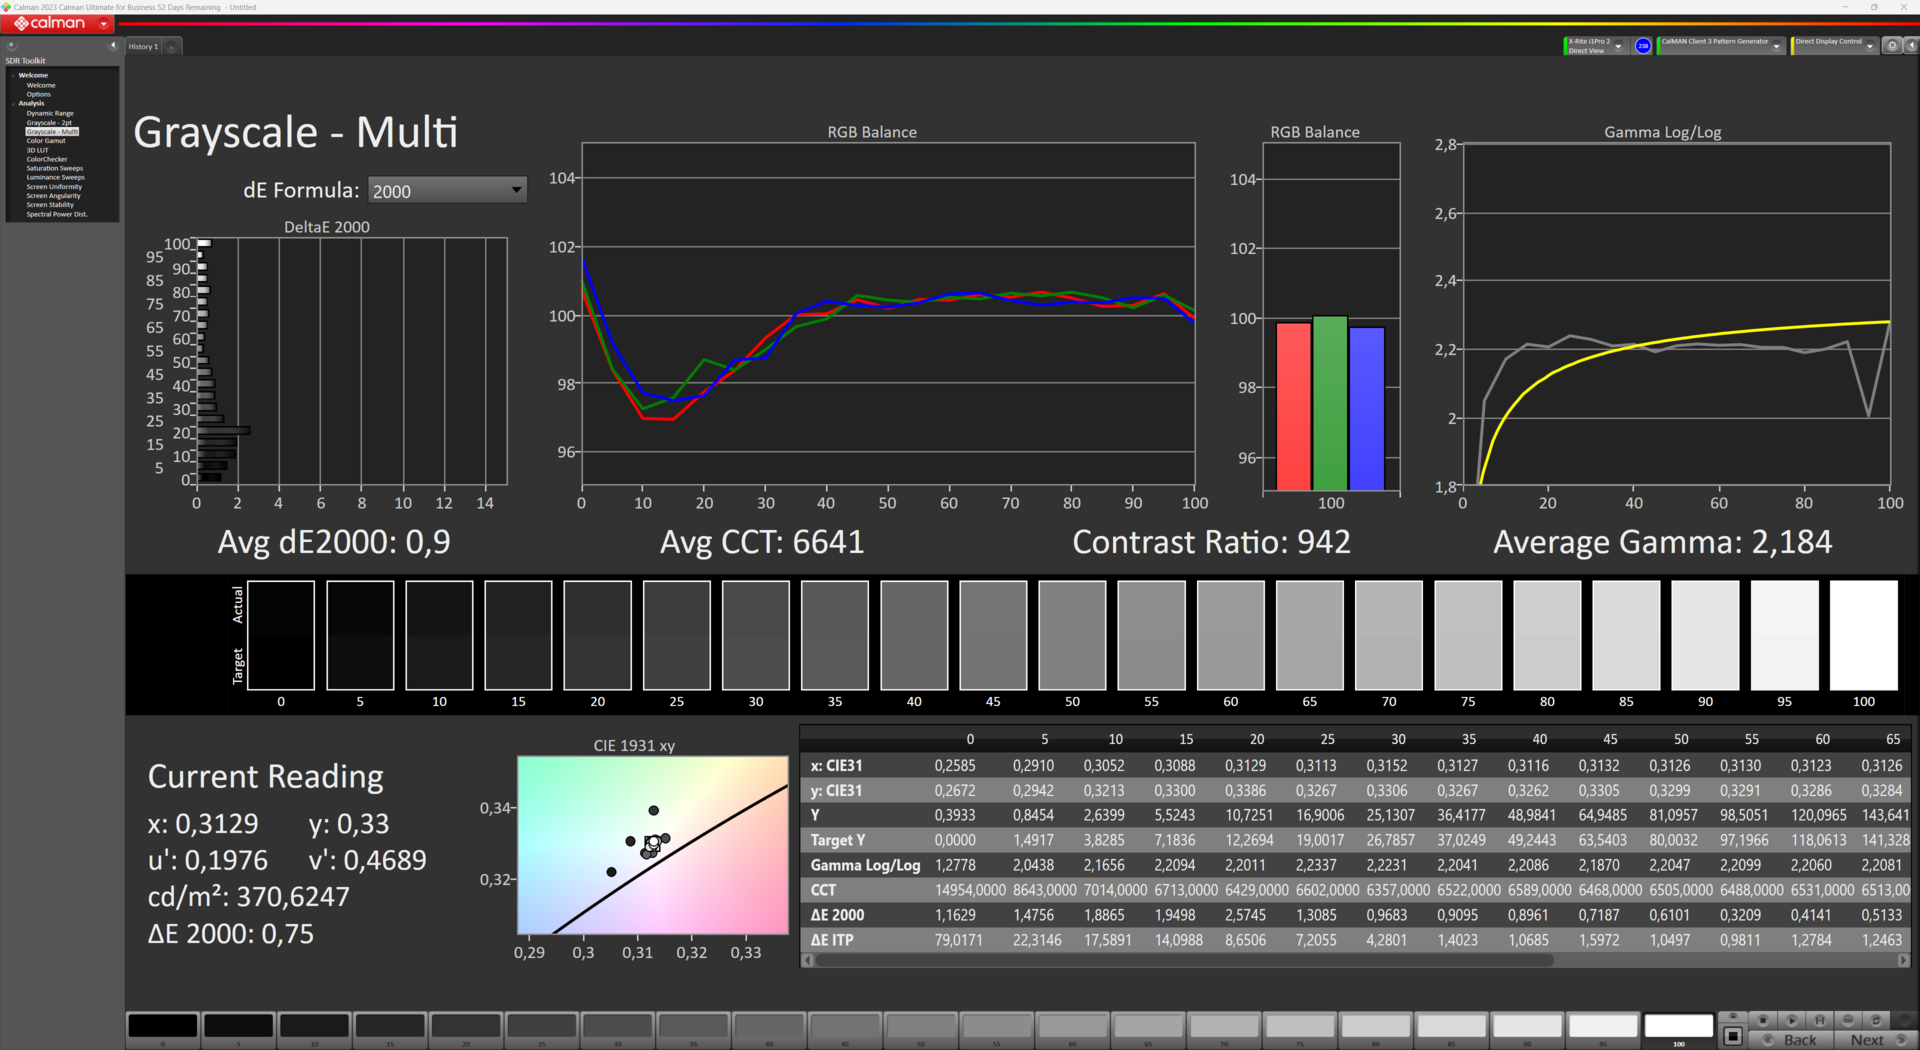
Gamma: 2.184
CCT: 6641 K
| Acer Predator Helios Neo 16 NH.QLTEG.002 B160UAN01.Q, IPS, 1920x1200, 16" | Lenovo Legion Pro 5 16ARX8 (R5 7645HX, RTX 4050) CSOT T3 MNG007DA2-2, IPS, 2560x1600, 16" | Lenovo LOQ 16IRH8 AUOC1A5 (B160QAN03.L), IPS, 2560x1600, 16" | Schenker XMG Apex 15 (Late 23) BOE CQ NE156QHM-NY2, IPS, 2560x1440, 15.6" | HP Victus 16-r0076TX Chi Mei CMN1629, IPS, 1920x1080, 16.1" | Dell G15 5530 AUO B156HAN, IPS, 1920x1080, 15.6" | |
|---|---|---|---|---|---|---|
| Display | -2% | -3% | -7% | -6% | -2% | |
| Display P3 Coverage (%) | 79.56 | 71.6 -10% | 70.5 -11% | 67.5 -15% | 67.5 -15% | 73.1 -8% |
| sRGB Coverage (%) | 99.16 | 99.8 1% | 98.9 0% | 97.6 -2% | 97.5 -2% | 98.4 -1% |
| AdobeRGB 1998 Coverage (%) | 71.36 | 72.9 2% | 72.6 2% | 68.9 -3% | 69.7 -2% | 74.4 4% |
| Response Times | -8% | 9% | -38% | 14% | 46% | |
| Response Time Grey 50% / Grey 80% * (ms) | 8 ? | 12 ? -50% | 7.2 ? 10% | 13.2 ? -65% | 6.18 ? 23% | 3.39 ? 58% |
| Response Time Black / White * (ms) | 8 ? | 5.2 ? 35% | 7.4 ? 7% | 8.8 ? -10% | 7.62 ? 5% | 5.35 ? 33% |
| PWM Frequency (Hz) | 21620 ? | |||||
| Screen | 31% | 27% | 18% | 32% | 12% | |
| Brightness middle (cd/m²) | 420.2 | 543 29% | 407 -3% | 336 -20% | 290 -31% | 320 -24% |
| Brightness (cd/m²) | 373 | 516 38% | 369 -1% | 307 -18% | 275 -26% | 316 -15% |
| Brightness Distribution (%) | 86 | 87 1% | 85 -1% | 77 -10% | 82 -5% | 94 9% |
| Black Level * (cd/m²) | 0.41 | 0.58 -41% | 0.45 -10% | 0.38 7% | 0.21 49% | 0.21 49% |
| Contrast (:1) | 1025 | 936 -9% | 904 -12% | 884 -14% | 1381 35% | 1524 49% |
| Colorchecker dE 2000 * | 4.67 | 1.35 71% | 1.43 69% | 1.96 58% | 1.7 64% | 4.55 3% |
| Colorchecker dE 2000 max. * | 8.54 | 3.22 62% | 3.58 58% | 5.07 41% | 3.57 58% | 9.83 -15% |
| Colorchecker dE 2000 calibrated * | 2.44 | 1.31 46% | 1.07 56% | 1.27 48% | 0.93 62% | 1.51 38% |
| Greyscale dE 2000 * | 7.52 | 1.03 86% | 1.13 85% | 2.3 69% | 1.5 80% | 6.2 18% |
| Gamma | 2.184 101% | 2.38 92% | 2.5 88% | 2.017 109% | 2.1 105% | 2.07 106% |
| CCT | 6641 98% | 6452 101% | 6526 100% | 6644 98% | 6538 99% | 6479 100% |
| Media totale (Programma / Settaggio) | 7% /
19% | 11% /
18% | -9% /
5% | 13% /
21% | 19% /
14% |
* ... Meglio usare valori piccoli
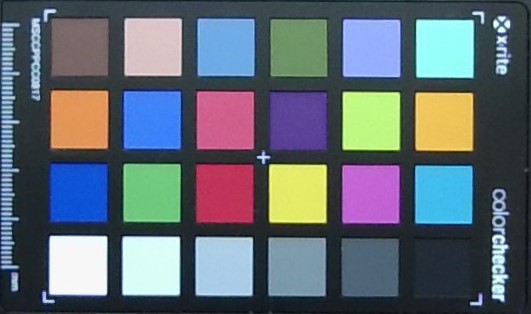
Dal momento che lo spazio cromatico sRGB è completamente coperto, l'editing professionale di immagini e video che si basa su colori accurati è certamente possibile - a condizione che la risoluzione FHD+, piuttosto bassa, non interferisca con questi usi.
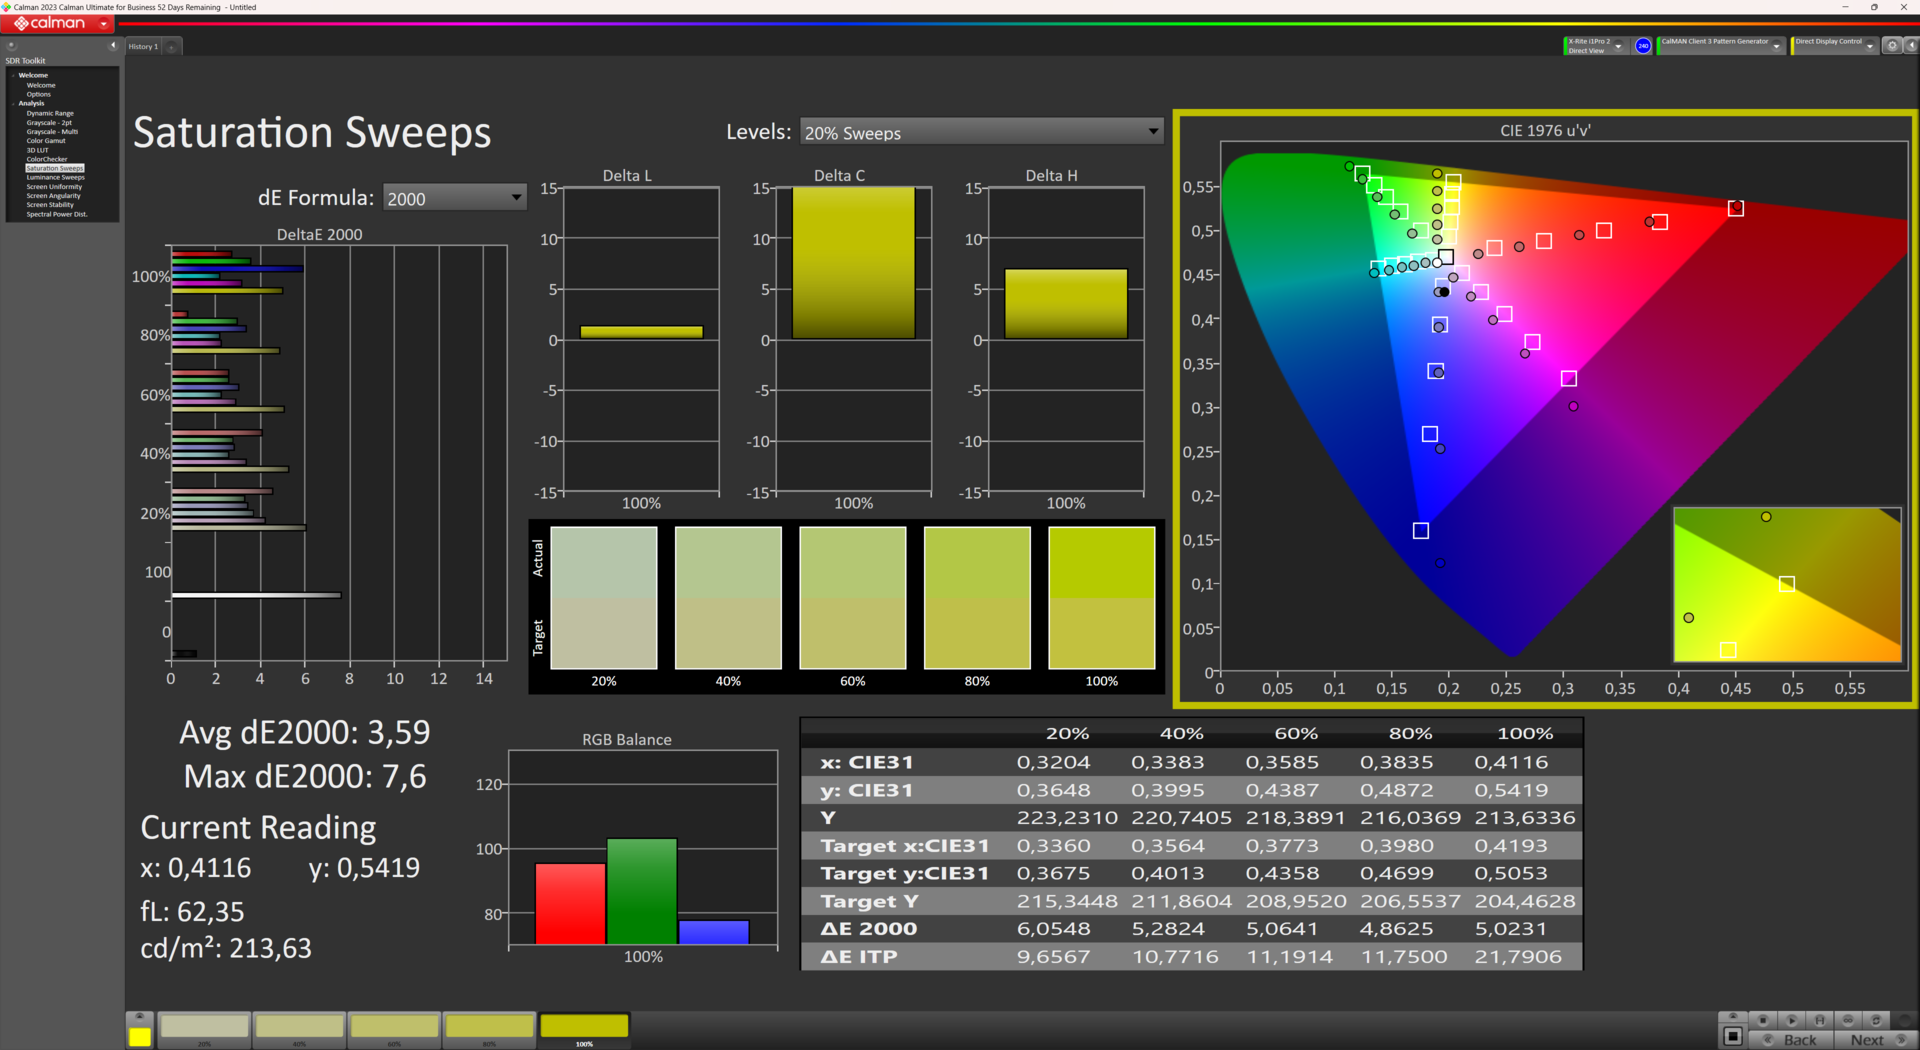
Nel nostro campo di confronto, Helios Neo 16 è l'unico computer portatile, oltre al Dell G15 5530, a superare il limite critico DeltaE 3 (fino al quale l'occhio umano può percepire le deviazioni cromatiche) con un valore di 4,67 subito dopo l'acquisto.
Fortunatamente, il suo valore DeltaE è stato ridotto a soli 2,44 dopo la nostra calibrazione, anche se i toni blu deviano ancora in modo significativo con un valore di 7. Anche la tinta ciano potrebbe essere corretta. Il nostro profilo colore calibrato può essere scaricato qui.

Tempi di risposta del Display
| ↔ Tempi di risposta dal Nero al Bianco | ||
|---|---|---|
| 8 ms ... aumenta ↗ e diminuisce ↘ combinato | ↗ 4.5 ms Incremento |  |
| ↘ 3.5 ms Calo | ||
| Lo schermo mostra veloci tempi di risposta durante i nostri tests e dovrebbe esere adatto al gaming In confronto, tutti i dispositivi di test variano da 0.1 (minimo) a 240 (massimo) ms. » 22 % di tutti i dispositivi è migliore. Questo significa che i tempi di risposta rilevati sono migliori rispettto alla media di tutti i dispositivi testati (19.8 ms). | ||
| ↔ Tempo di risposta dal 50% Grigio all'80% Grigio | ||
| 8 ms ... aumenta ↗ e diminuisce ↘ combinato | ↗ 4.5 ms Incremento |  |
| ↘ 3.5 ms Calo | ||
| Lo schermo mostra veloci tempi di risposta durante i nostri tests e dovrebbe esere adatto al gaming In confronto, tutti i dispositivi di test variano da 0.165 (minimo) a 636 (massimo) ms. » 21 % di tutti i dispositivi è migliore. Questo significa che i tempi di risposta rilevati sono migliori rispettto alla media di tutti i dispositivi testati (31 ms). | ||
Sfarfallio dello schermo / PWM (Pulse-Width Modulation)
| flickering dello schermo / PWM non rilevato |  | ||
In confronto: 52 % di tutti i dispositivi testati non utilizza PWM per ridurre la luminosita' del display. Se è rilevato PWM, una media di 7754 (minimo: 5 - massimo: 343500) Hz è stata rilevata. | |||
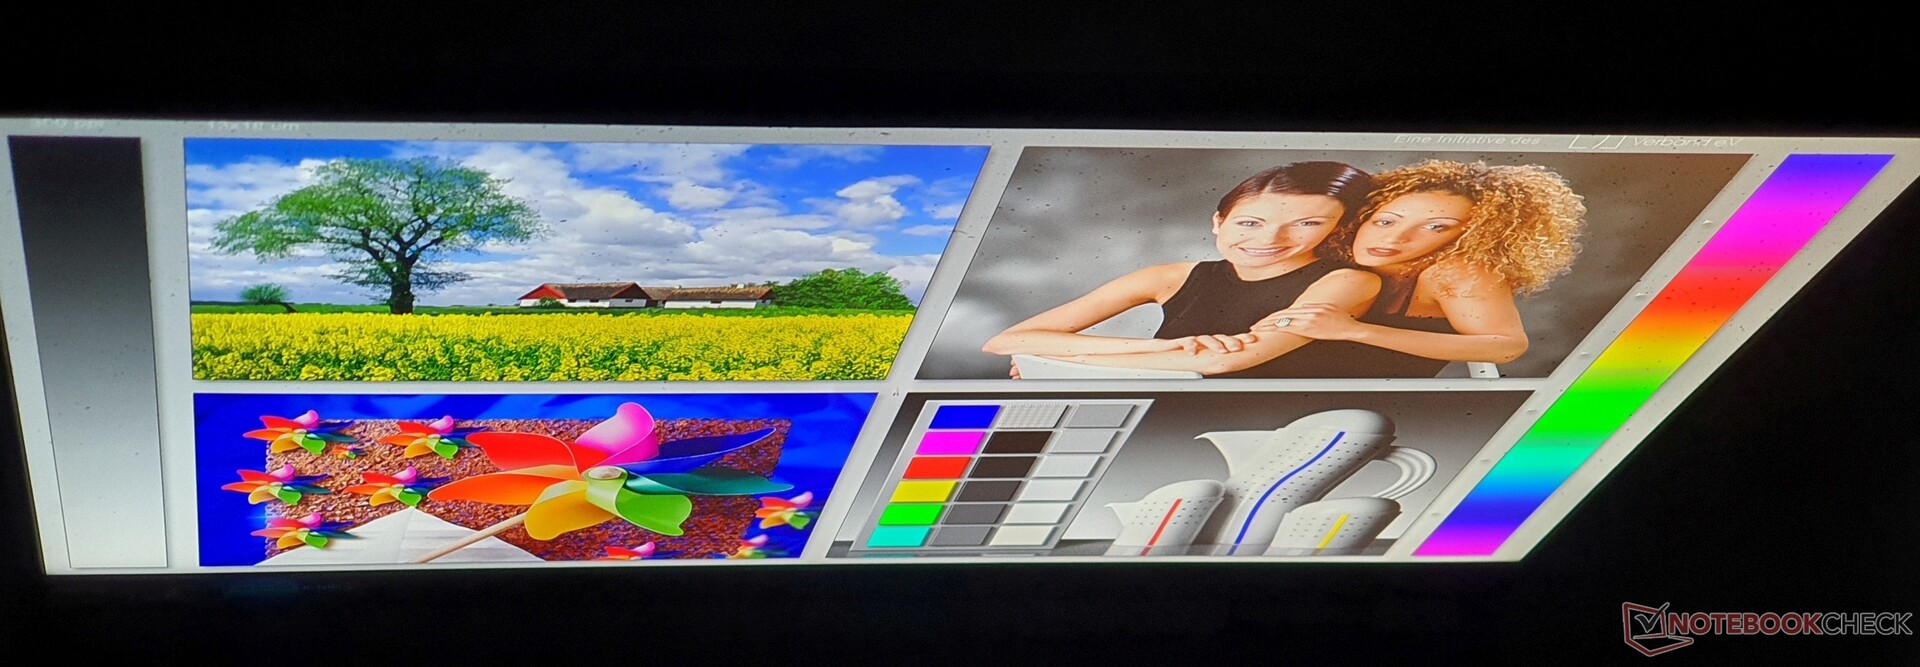
Grazie alla superficie opaca del display del dispositivo e alla sua luminosità di 373 cd/m², lo schermo rimane leggibile anche all'esterno, a patto di non sedersi alla luce diretta del sole.
Come è tipico degli schermi IPS, rimane leggibile anche da angoli di visione estremi.


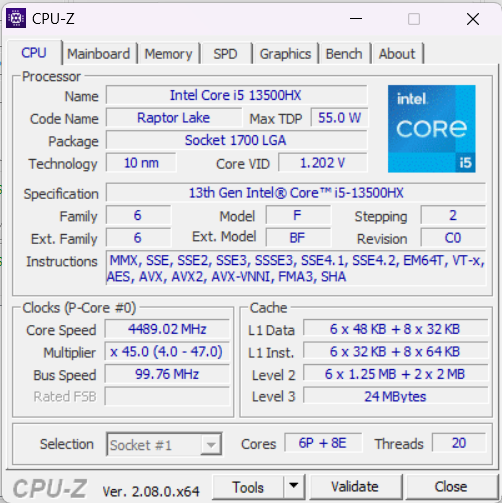
Prestazioni: CPU di classe desktop in un portatile da gioco di fascia media
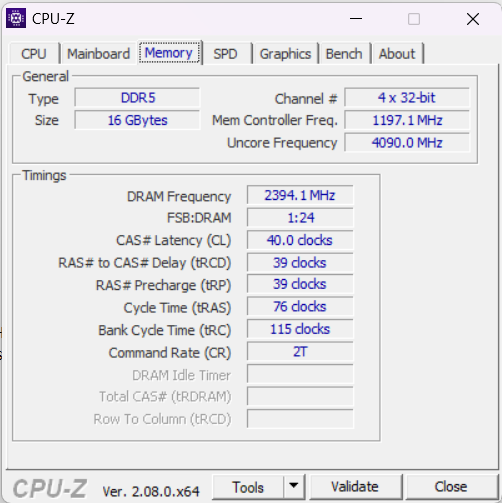
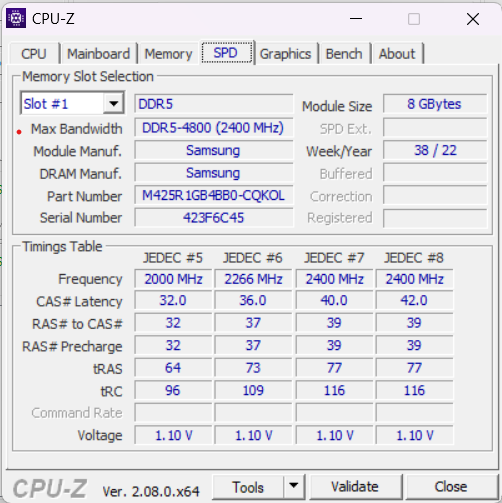
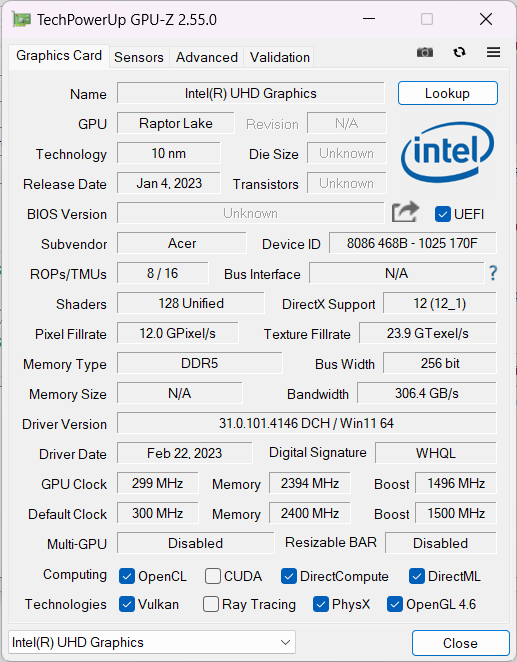
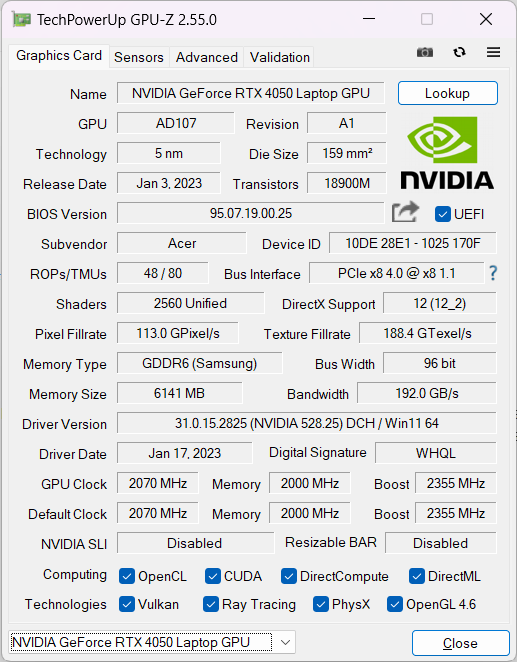
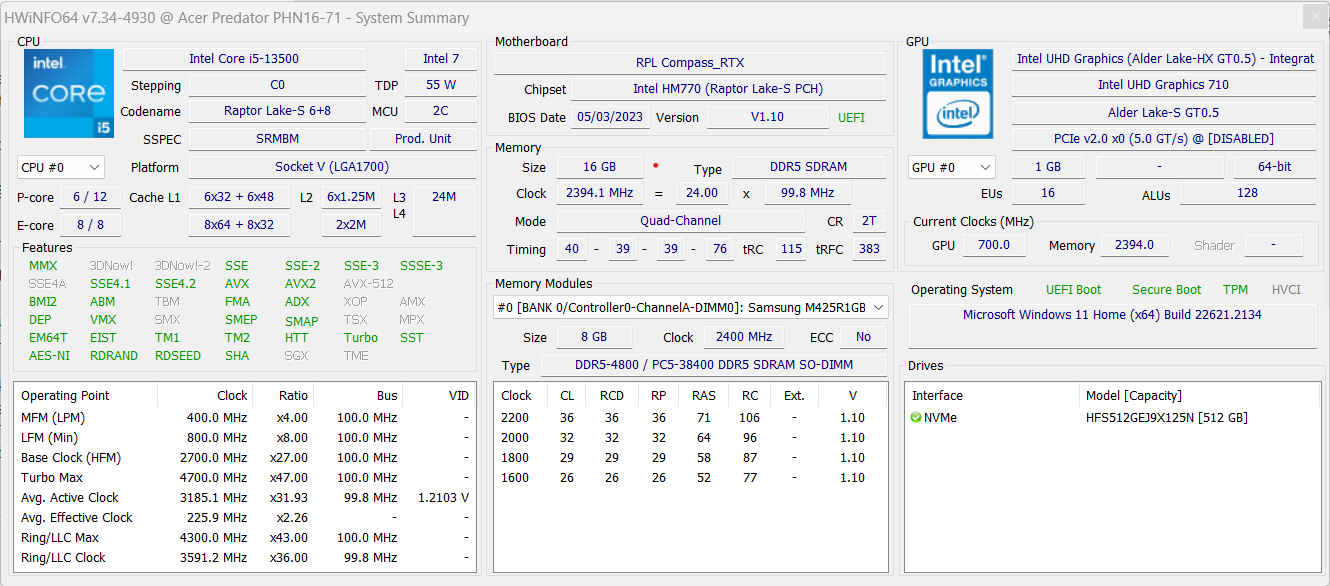
Stiamo testando l'Acer Predator Helios Neo 16 con un IntelCore i5-13500HX(6 core P + 8 core E), 16 GB di RAM DDR5-4800, un SSD da 512 GB e una Nvidia GeForce RTX 4050con un TGP da 130 watt. Si possono trovare altre varianti, che hanno fino a unCore i9-13900HX(8 core P + 16 core E) e fino a una Nvidia GeForce RTX 4070.
Il mercato di riferimento della versione che abbiamo testato comprende i giocatori che desiderano giocare a nuovi giochi con risoluzione nativa FHD+, ma che si accontentano anche di tassi FPS a due cifre. Anche altre attività grafiche sono possibili con questo modello entry-level di Helios Neo 16, anche se 8 invece di 6 GB di VRAM sarebbero ideali soprattutto per l'editing video 4K.
Condizioni di test
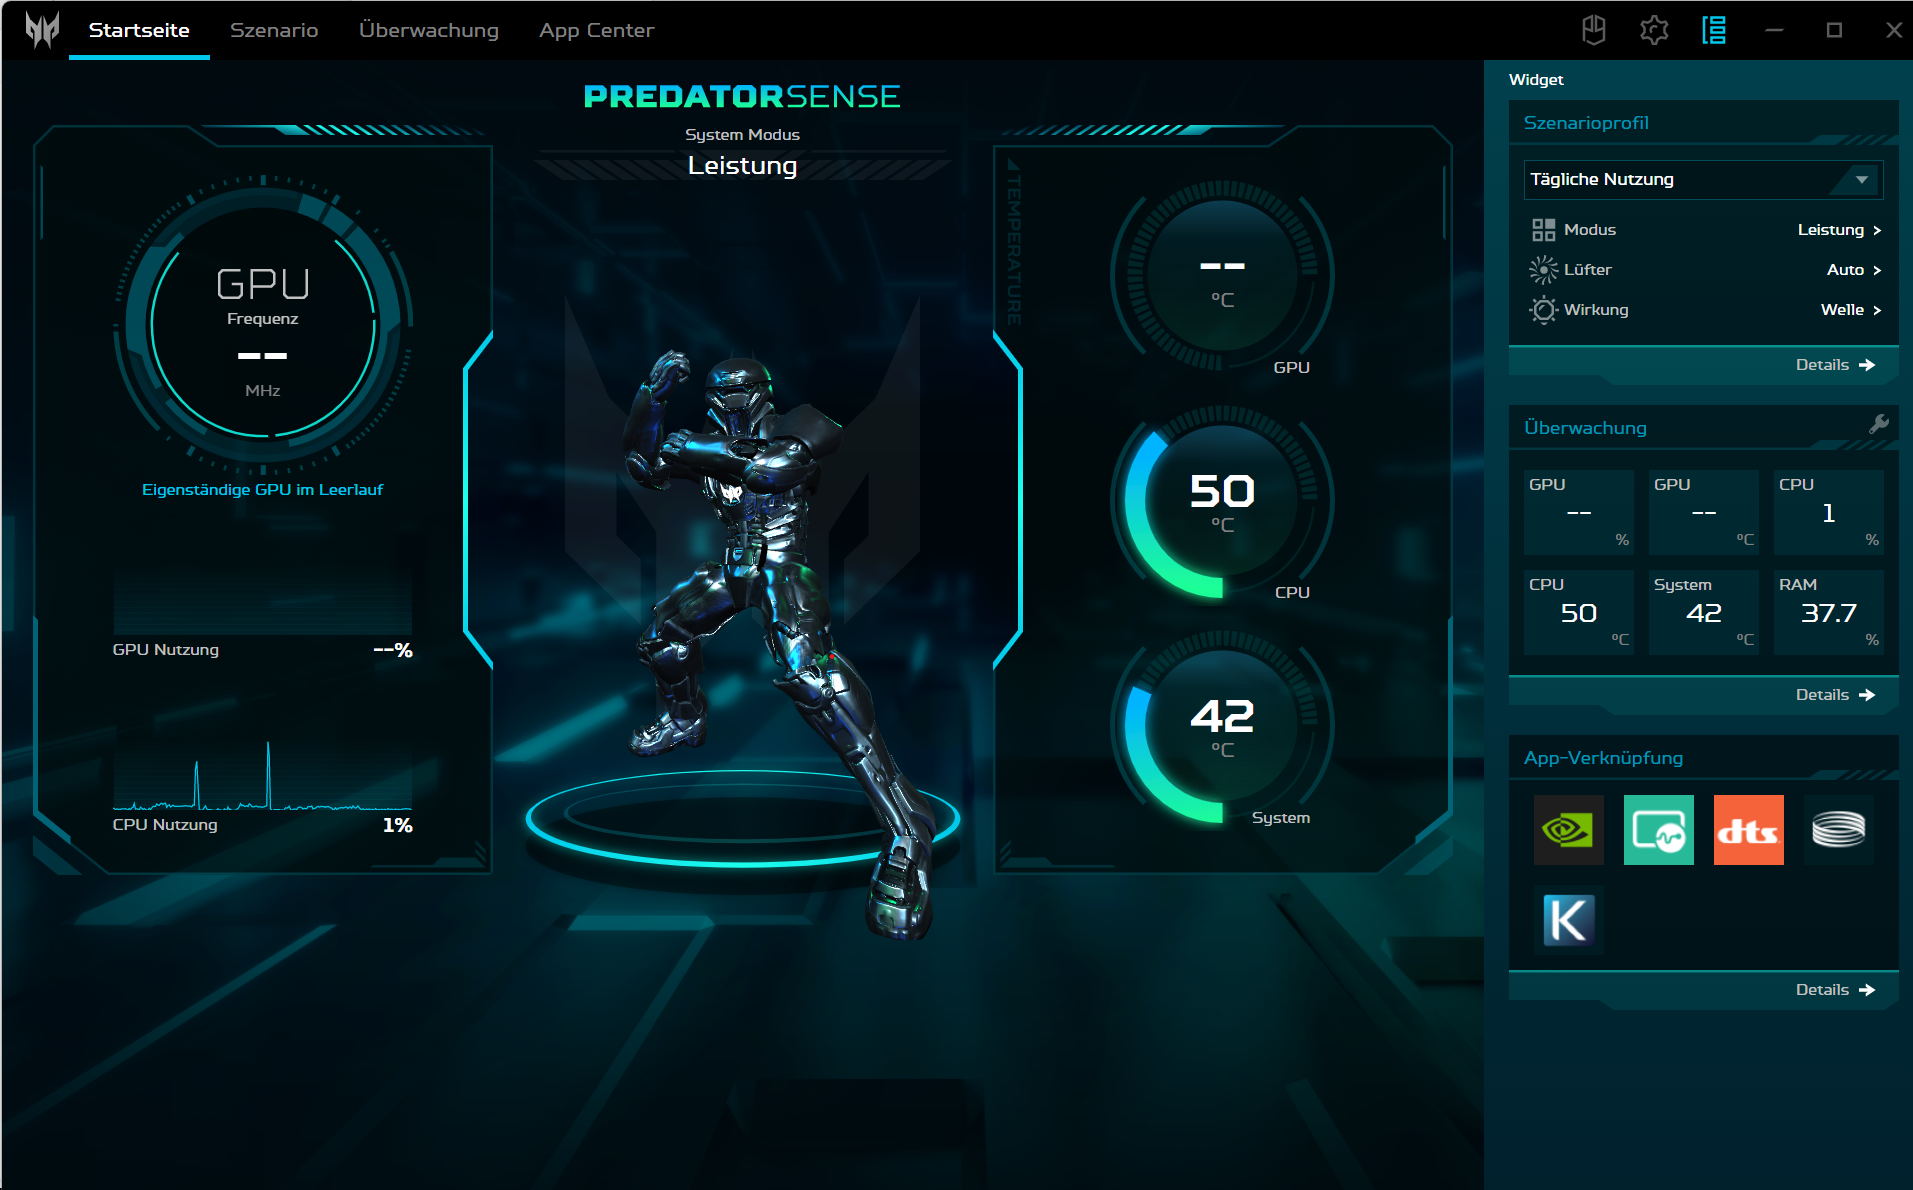
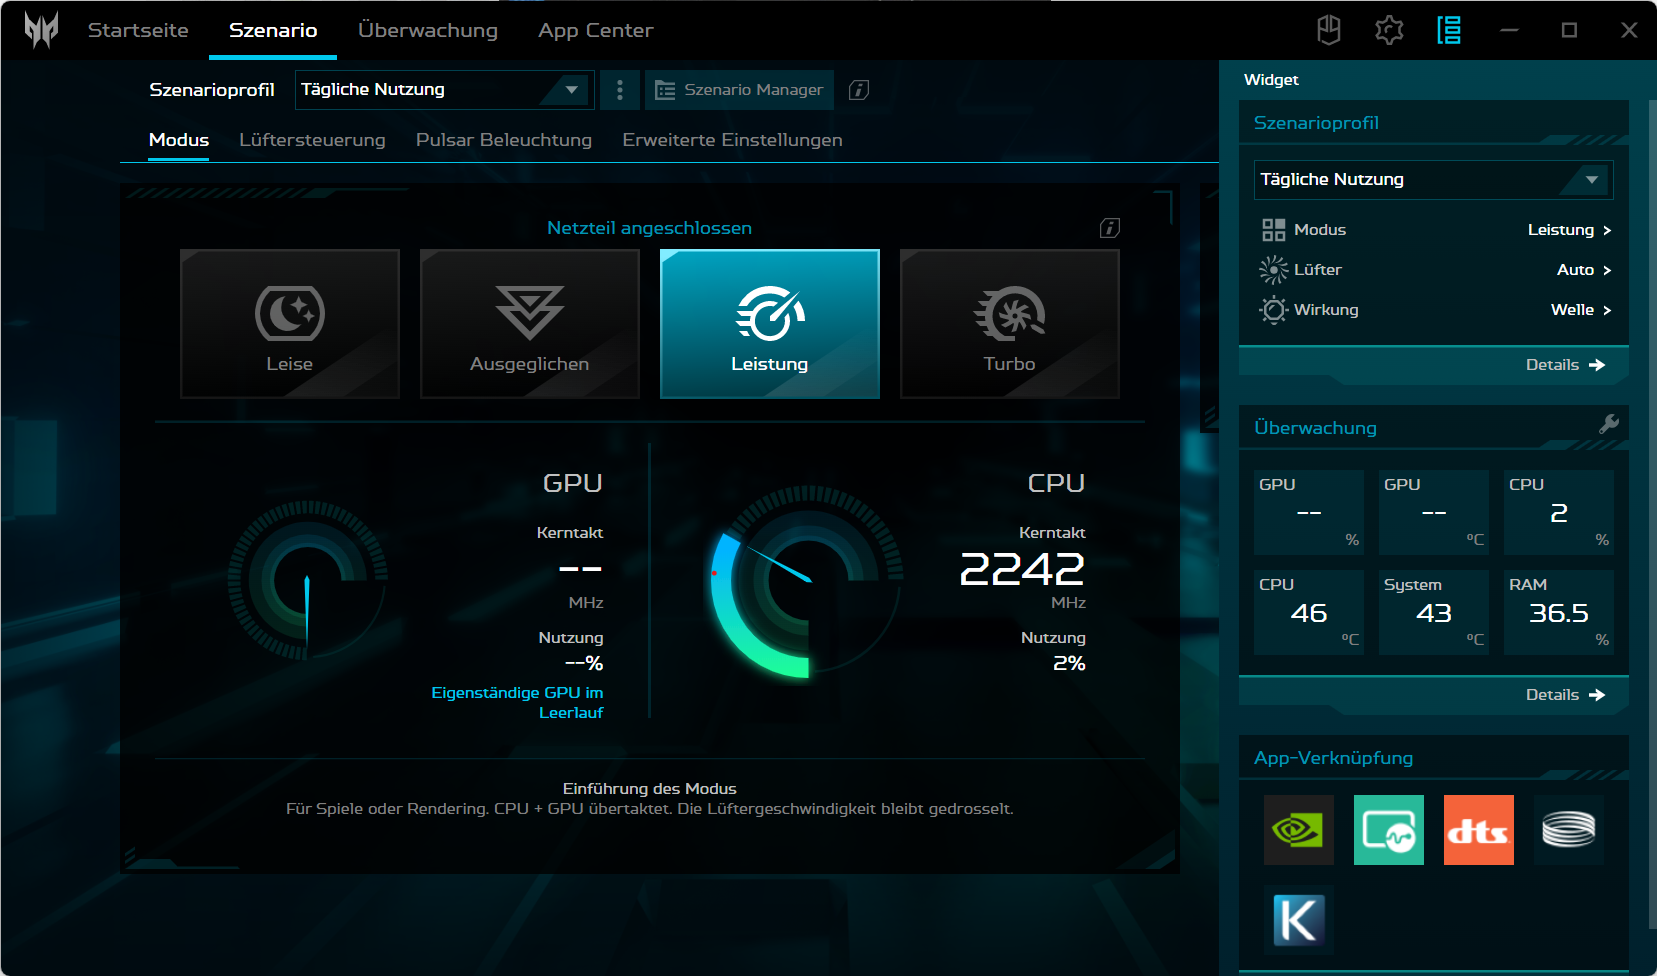
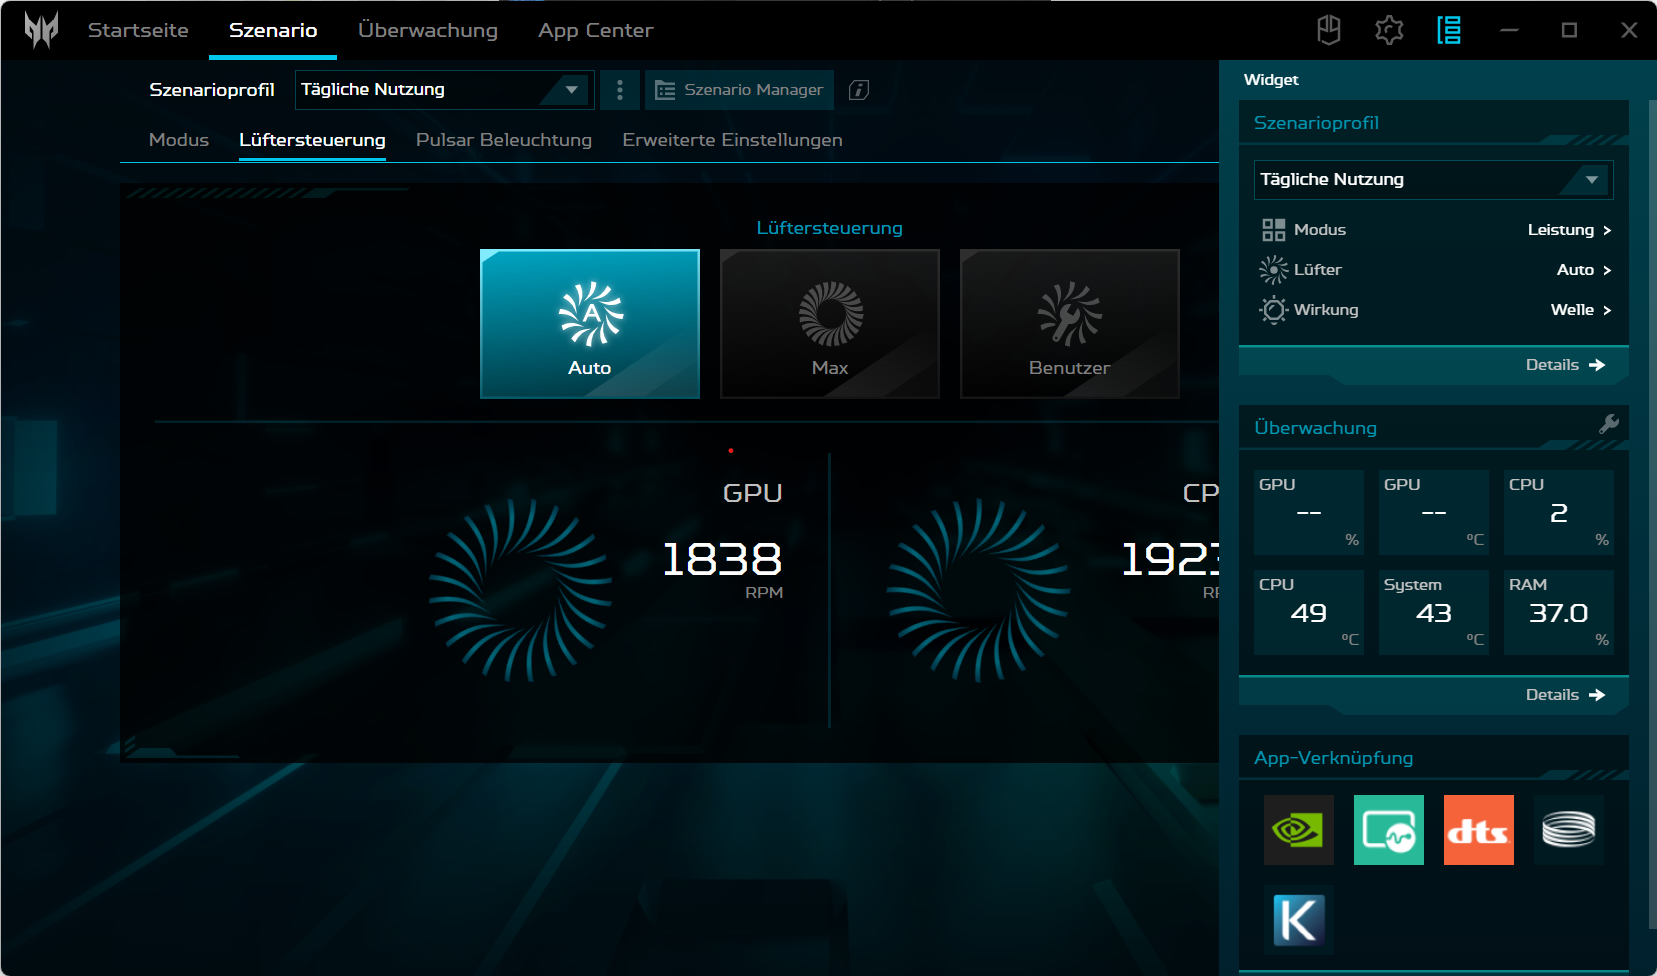
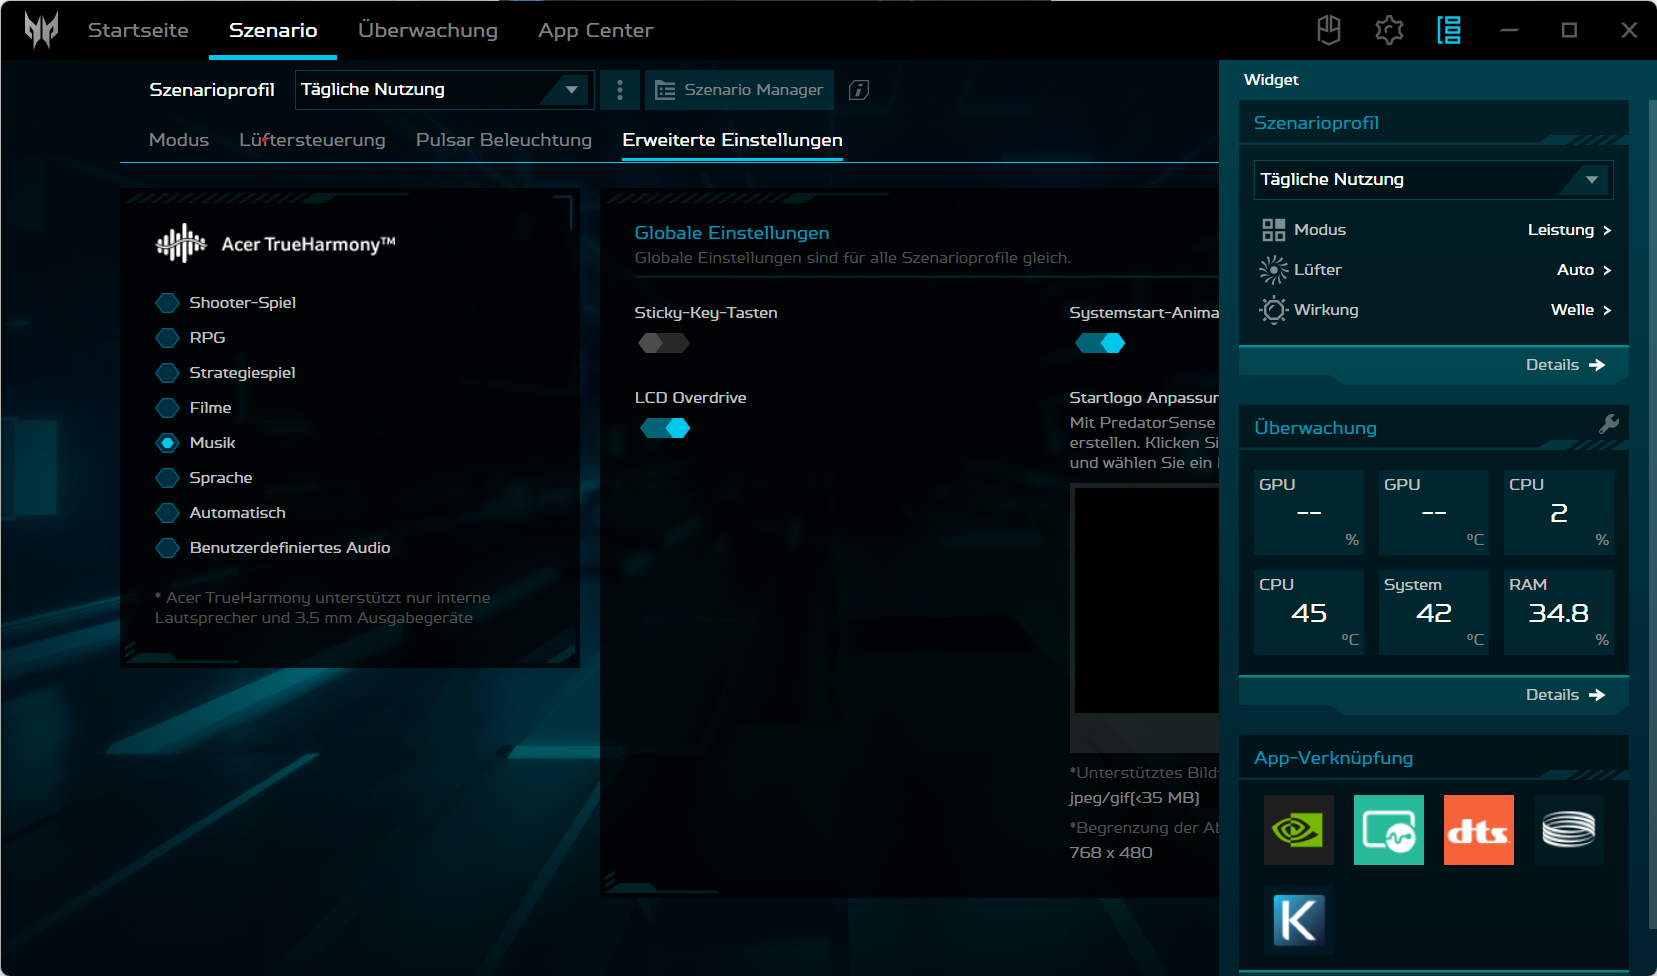
All'interno del software del centro di controllo Acer "Predator Sense" sono disponibili quattro modalità di prestazioni, che possono essere alternate tramite il pulsante a sinistra sopra la tastiera. Abbiamo eseguito i nostri benchmark relativi alle prestazioni in modalità "performance", mentre il sistema è passato automaticamente alla modalità "bilanciata" in modalità batteria. Predator Helios Neo 16 deve avere un livello di carica di almeno il 40% per poter controllare le modalità di prestazione.
La tabella seguente mostra che le prestazioni della GPU si perdono pochissimo in modalità bilanciata, mentre le ventole rimangono quasi piacevolmente silenziose. La modalità Turbo, invece, è insopportabilmente rumorosa e quindi è utile solo per lunghe sessioni di rendering video o simili.
| Scenario | Turbo | Prestazioni | Bilanciato | Silenzioso | Batteria |
|---|---|---|---|---|---|
| CPU PL2 | 147 W | 147 W | 147 W | 147 W | 27 W |
| CPU PL1 | 100 W | 80 W | 70 W | 45 W | 27 W |
| GPU @The Witcher 3 | 88 W | 86 W | 86 W | 56 W | 43 W |
| GPU @FurMark | 130 W | 130 W | 105 W | 80 W | 13 W |
| Prestazioni (Il Witcher 3 @FHD/Ultra) | 81 FPS | 79 FPS | 79 FPS | 46 FPS | 30 FPS |
Processore
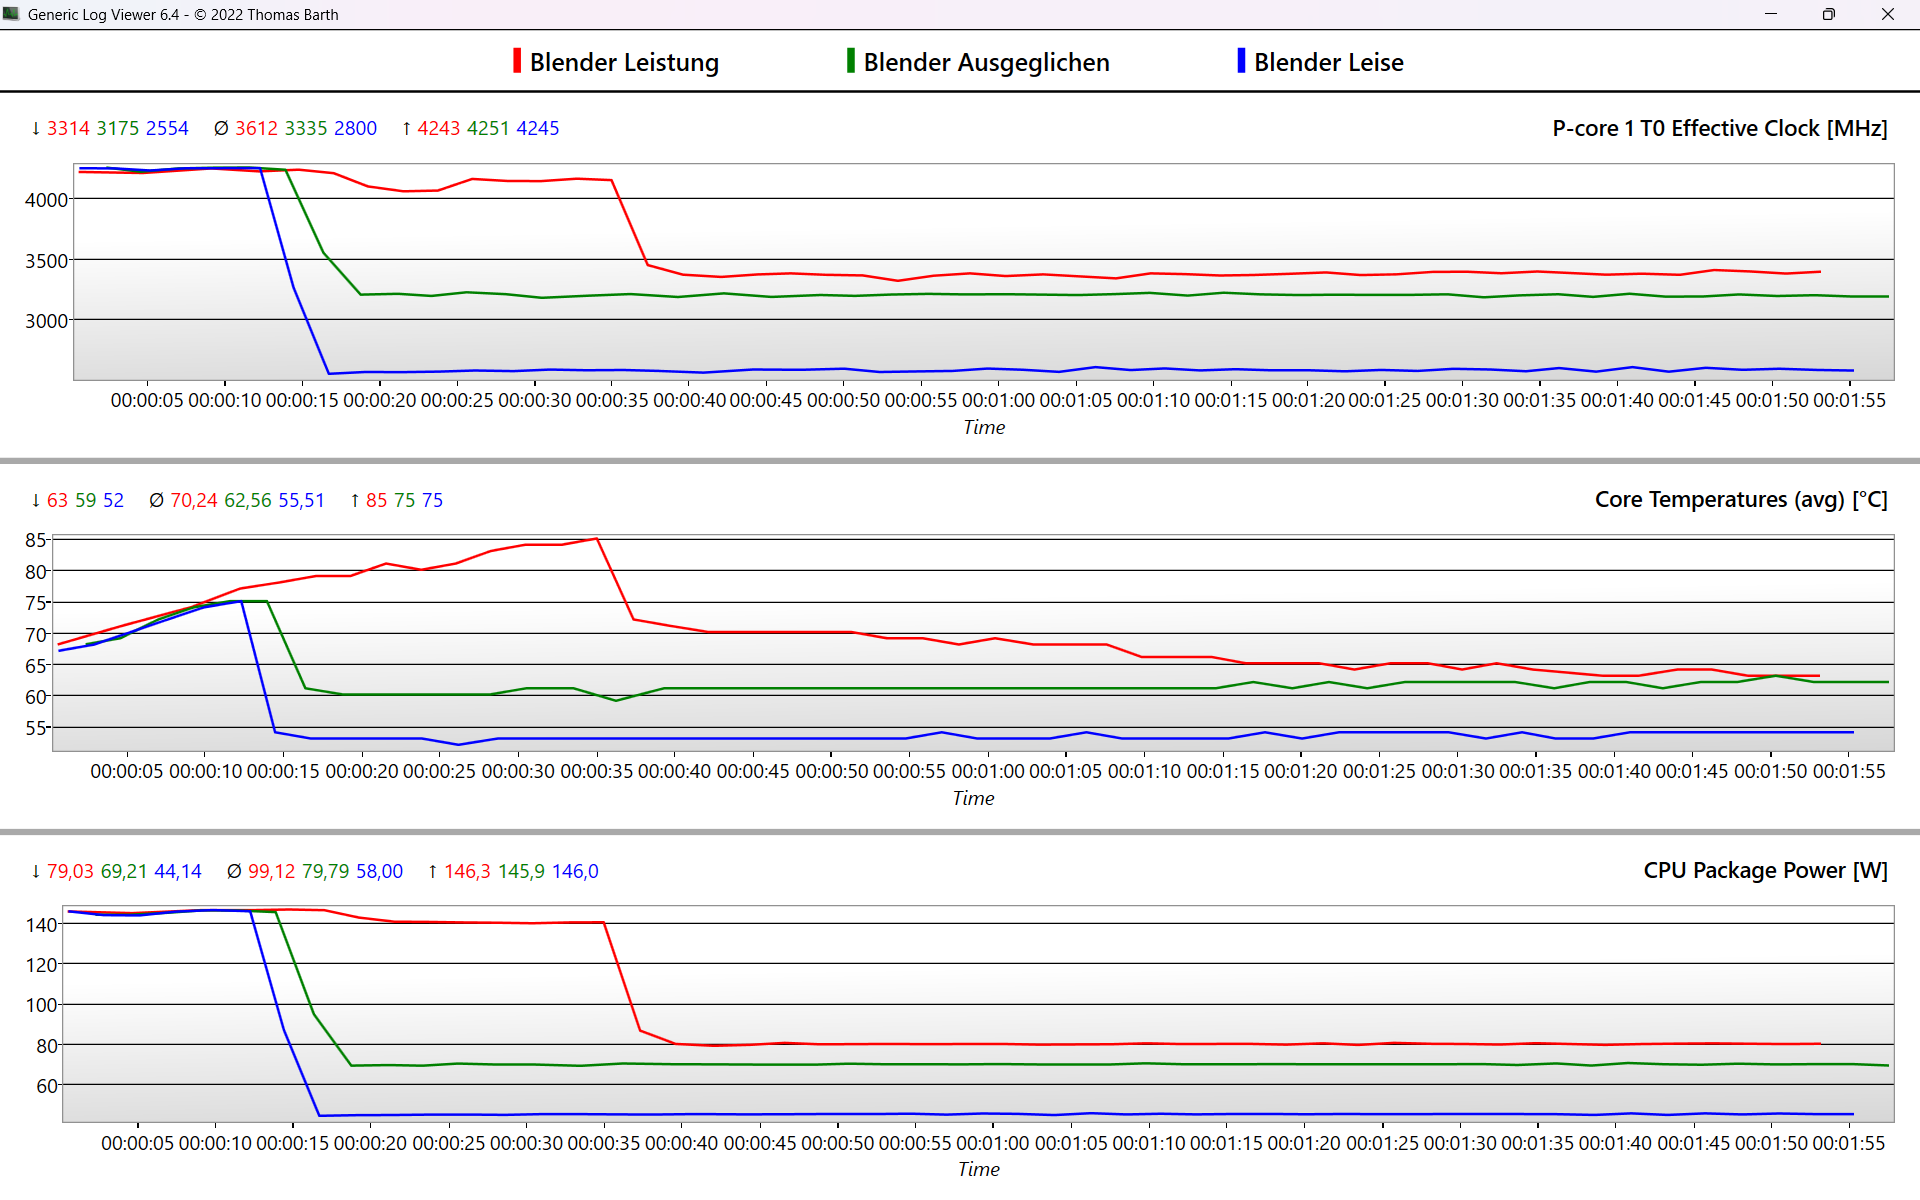
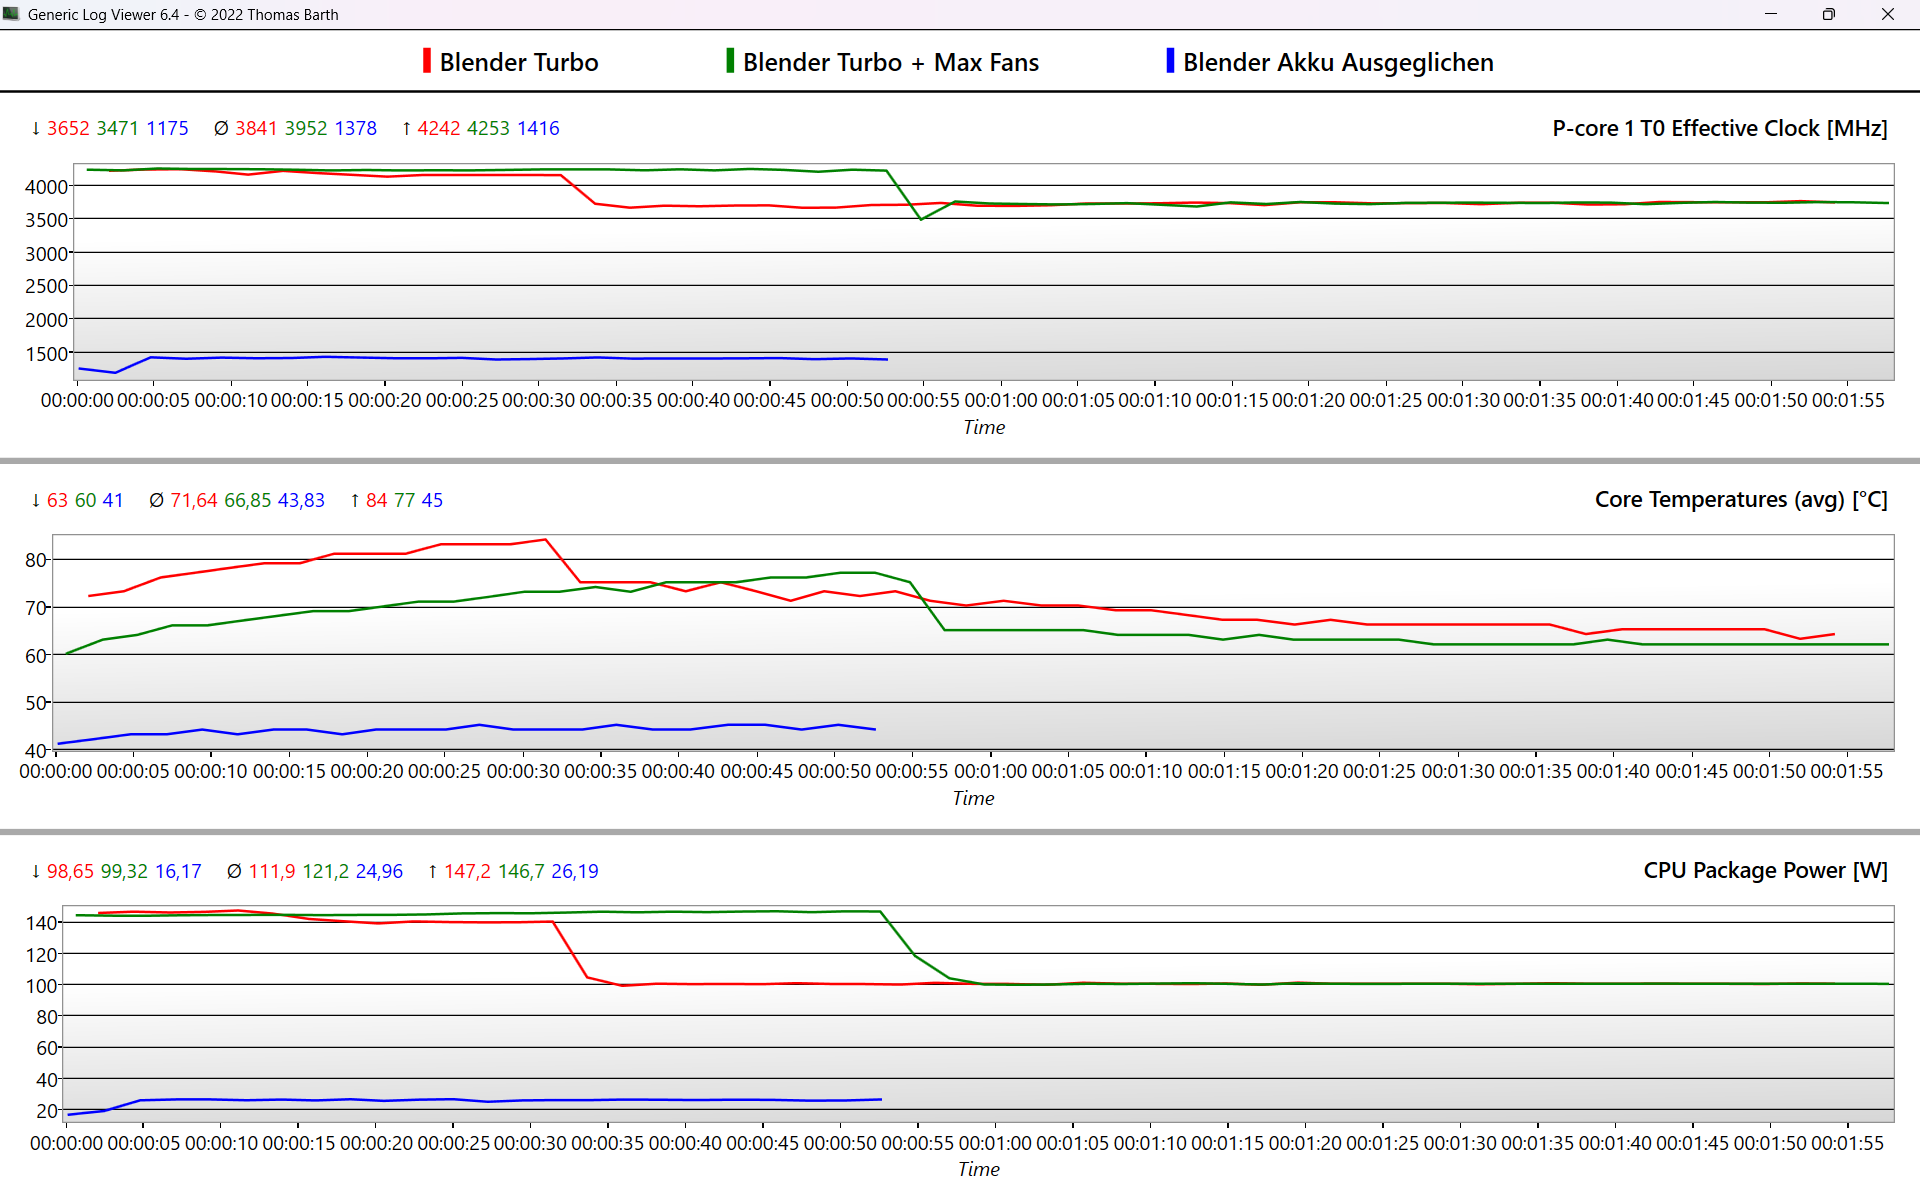
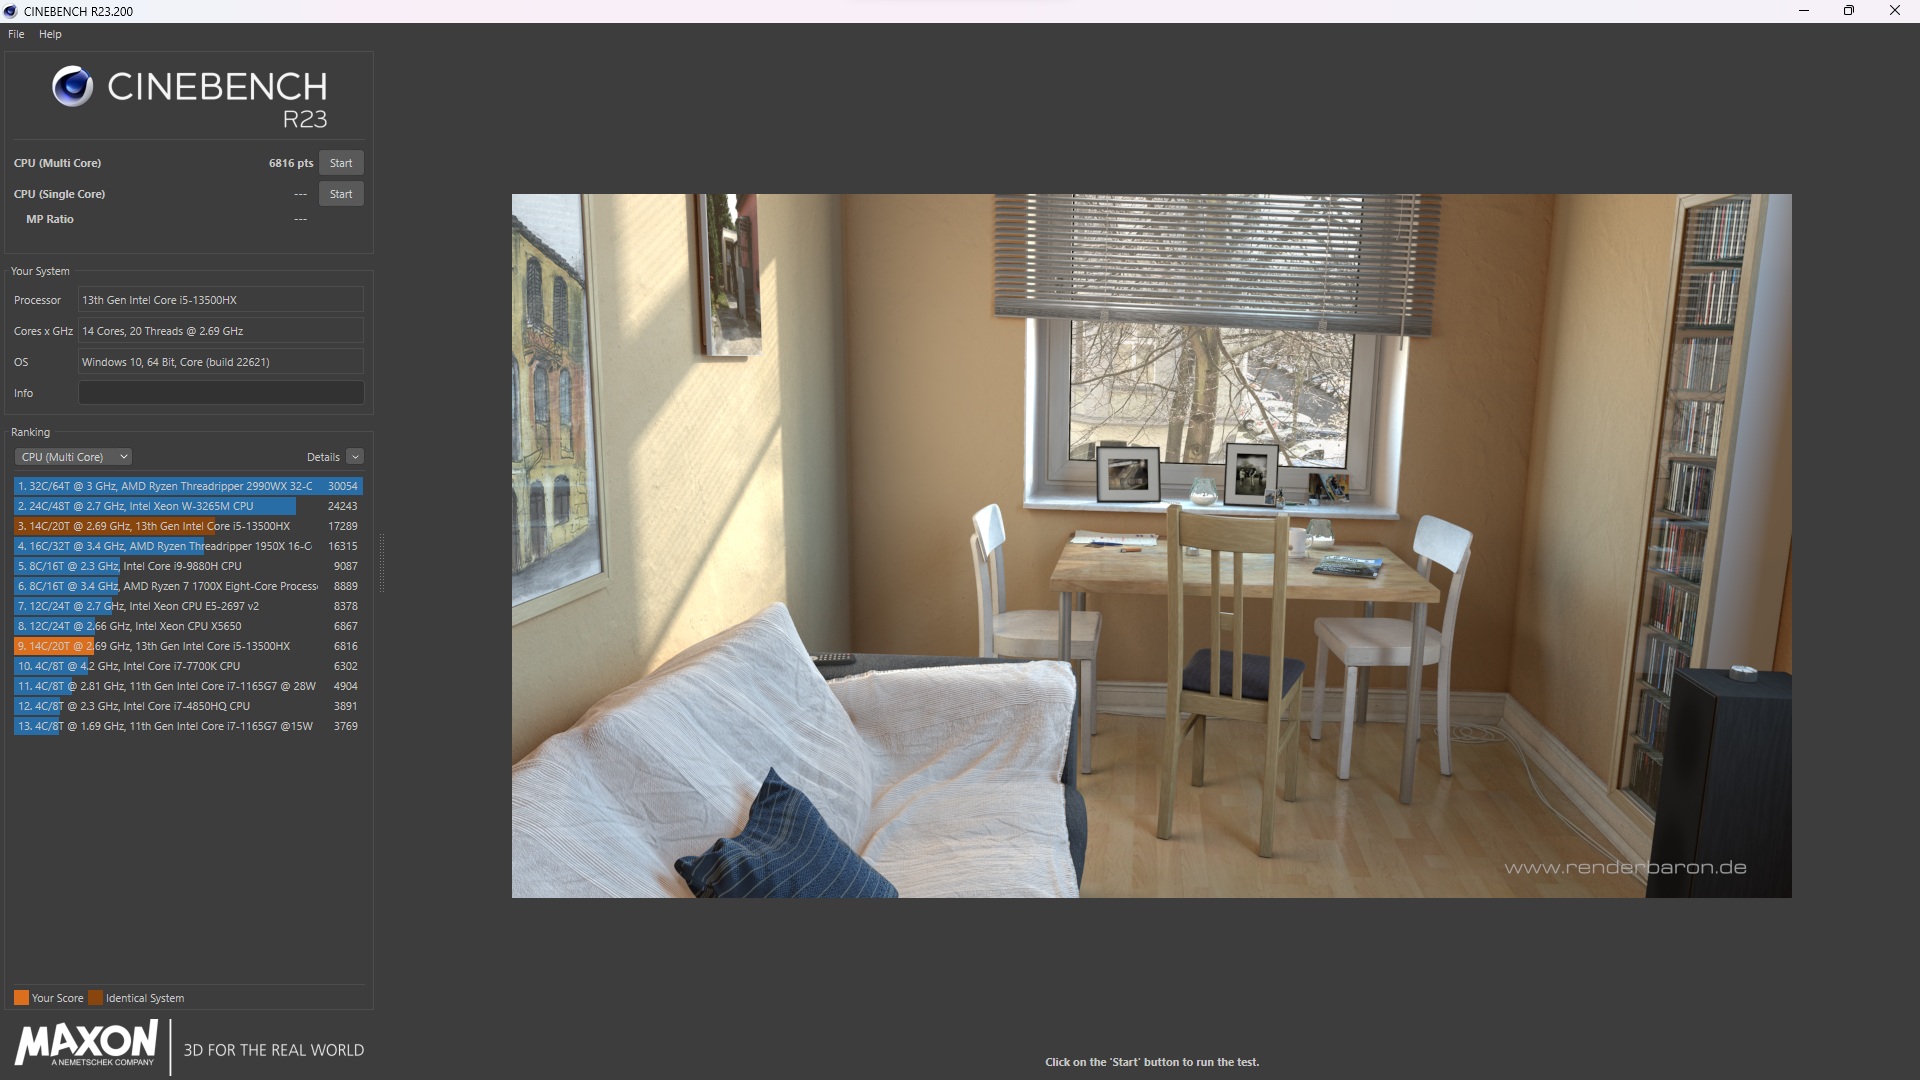
Il laptop ha installato l'IntelCore i5-13500HX è un processore di classe desktop con 14 core, 20 thread (6 core P + 8 core E) e un TDP di 55 watt. I core P hanno inizialmente un clock di circa 4,2 GHz e, di conseguenza, mancano di poco il loro Turbo massimo possibile di 4,5 GHz. Dopo circa 30 secondi, le velocità di clock scendono leggermente a 3,8 GHz (modalità Turbo) o 3,4 GHz (modalità Performance).
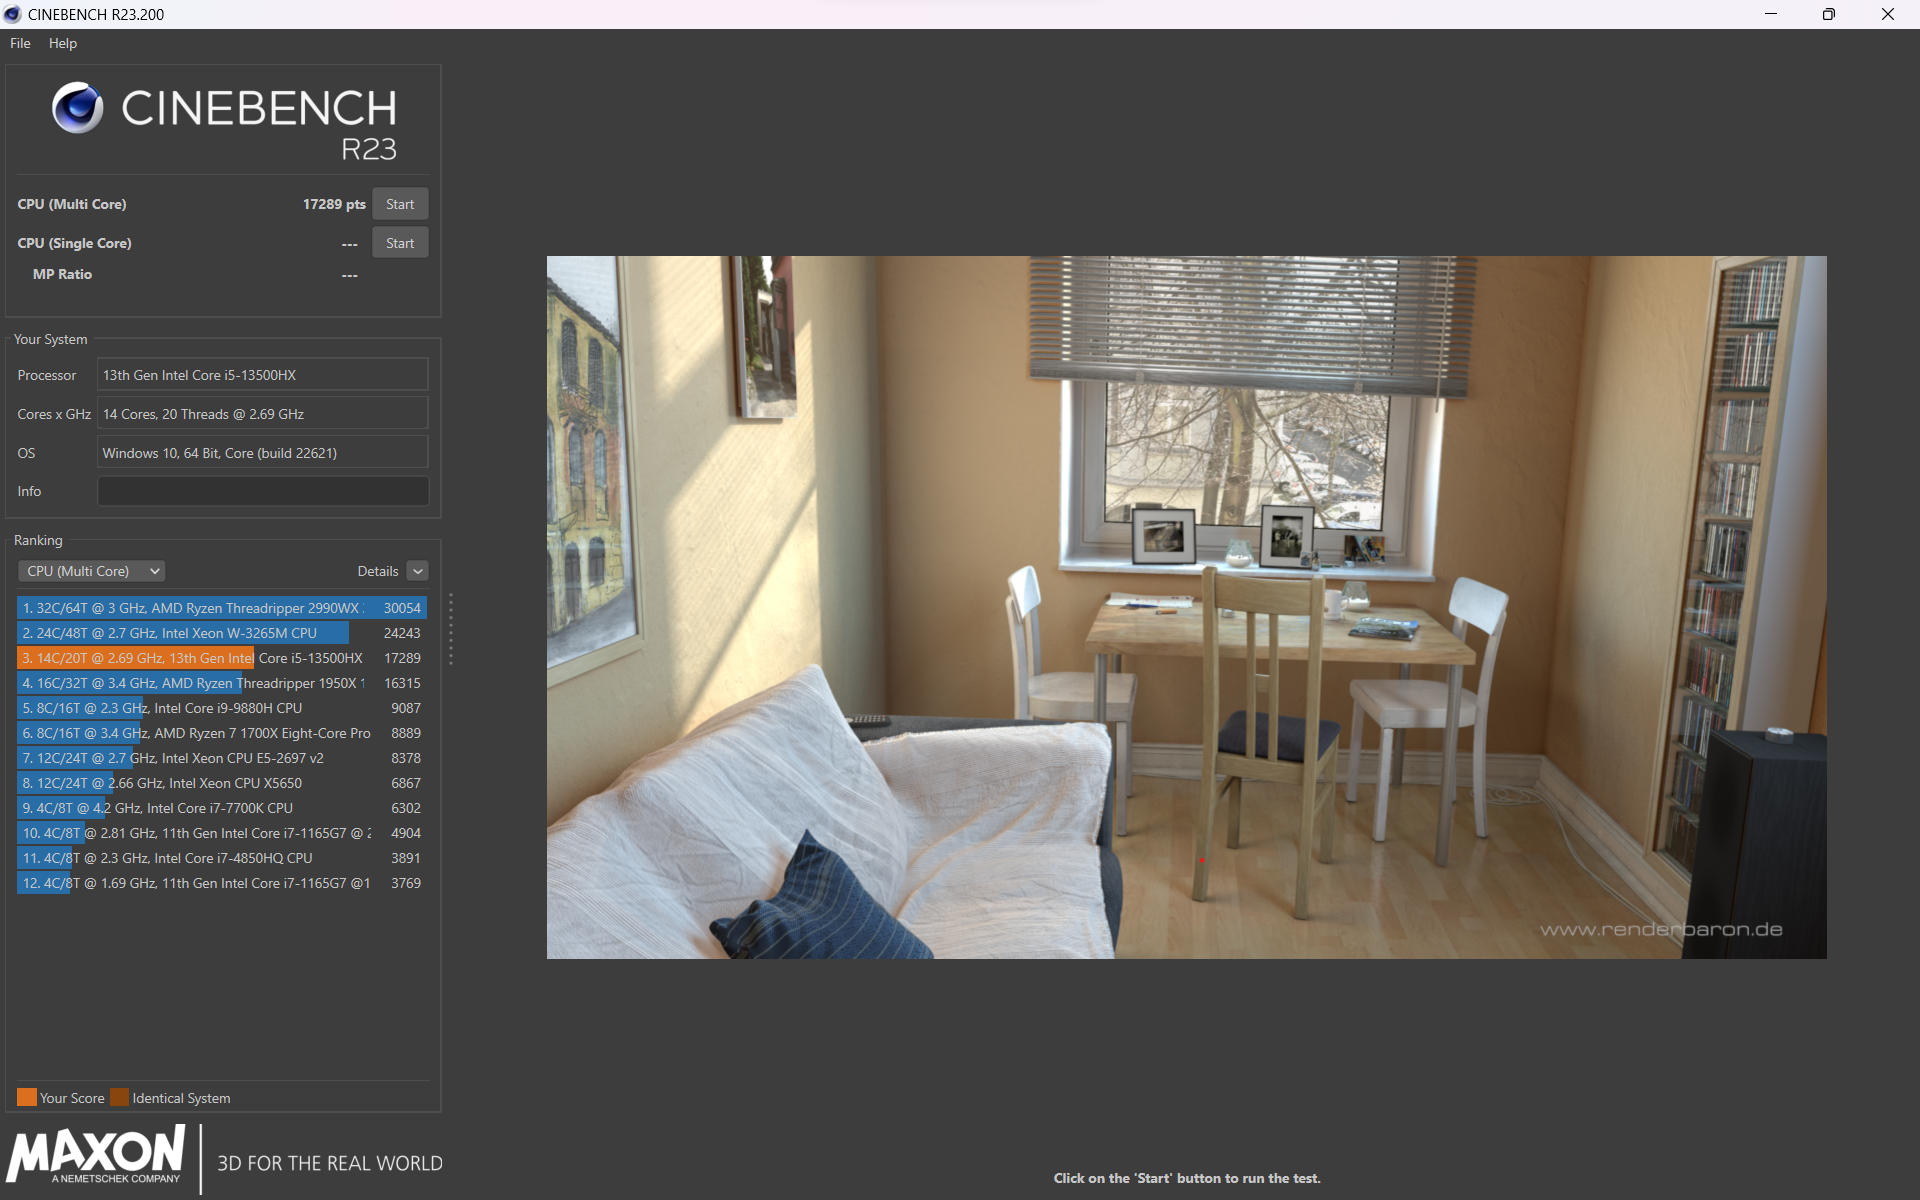
Per quanto riguarda le prestazioni multi-core, Helios Neo si è classificato al 10 % dietro aDell G15 5530 con un Corei7-13650HX e il 15 % dietro alHelios 16 con un Core i7-13700HX. Il Corei7-12700H all'interno del suo diretto predecessore, il Predator Helios 300è stato superato del 12% e l'otto core AMDRyzen 7 7840HS nel modello SchenkerXMG Apex 15 è stato superato di ben il 20 %.
Dalla quinta esecuzione di Cinebench R15 in poi, le sue prestazioni sono state strozzate di circa il 17%, ma questo può essere quasi evitato attivando la forte modalità Turbo. Il Corei9-13900HX dispone di ben 24 core e lavora il 60 % più velocemente nei compiti multi-core all'interno di Helios 18. In modalità batteria, il suo TDP è limitato a un deludente 27 watt, che si traduce in un calo delle prestazioni di quasi il 60 %.


Cinebench R15 Multi continuous test
Cinebench R23: Multi Core | Single Core
Cinebench R20: CPU (Multi Core) | CPU (Single Core)
Cinebench R15: CPU Multi 64Bit | CPU Single 64Bit
Blender: v2.79 BMW27 CPU
7-Zip 18.03: 7z b 4 | 7z b 4 -mmt1
Geekbench 5.5: Multi-Core | Single-Core
HWBOT x265 Benchmark v2.2: 4k Preset
LibreOffice : 20 Documents To PDF
R Benchmark 2.5: Overall mean
| CPU Performance rating | |
| Acer Predator Helios 18 N23Q2 | |
| Media della classe Gaming | |
| Acer Predator Helios 16 PH16-71-731Q | |
| Dell G15 5530 | |
| Acer Predator Helios Neo 16 NH.QLTEG.002 | |
| Schenker XMG Apex 15 (Late 23) | |
| Media Intel Core i5-13500HX | |
| Lenovo Legion Pro 5 16ARX8 (R5 7645HX, RTX 4050) | |
| Lenovo LOQ 16IRH8 | |
| Acer Predator Helios 300 (i7-12700H, RTX 3070 Ti) | |
| Acer Nitro 16 AN16-41-R7YE | |
| Cinebench R23 / Single Core | |
| Acer Predator Helios 18 N23Q2 | |
| Media della classe Gaming (1166 - 2415, n=107, ultimi 2 anni) | |
| Acer Predator Helios 16 PH16-71-731Q | |
| Lenovo LOQ 16IRH8 | |
| Dell G15 5530 | |
| Lenovo Legion Pro 5 16ARX8 (R5 7645HX, RTX 4050) | |
| Acer Predator Helios Neo 16 NH.QLTEG.002 | |
| Schenker XMG Apex 15 (Late 23) | |
| Acer Predator Helios 300 (i7-12700H, RTX 3070 Ti) | |
| Media Intel Core i5-13500HX (1689 - 1772, n=2) | |
| Acer Nitro 16 AN16-41-R7YE | |
| Cinebench R20 / CPU (Multi Core) | |
| Acer Predator Helios 18 N23Q2 | |
| Media della classe Gaming (4029 - 16433, n=106, ultimi 2 anni) | |
| Acer Predator Helios 16 PH16-71-731Q | |
| Dell G15 5530 | |
| Acer Predator Helios Neo 16 NH.QLTEG.002 | |
| Media Intel Core i5-13500HX (6978 - 7371, n=3) | |
| Schenker XMG Apex 15 (Late 23) | |
| Acer Predator Helios 300 (i7-12700H, RTX 3070 Ti) | |
| Lenovo LOQ 16IRH8 | |
| Lenovo Legion Pro 5 16ARX8 (R5 7645HX, RTX 4050) | |
| Acer Nitro 16 AN16-41-R7YE | |
| Cinebench R20 / CPU (Single Core) | |
| Acer Predator Helios 18 N23Q2 | |
| Media della classe Gaming (442 - 913, n=106, ultimi 2 anni) | |
| Acer Predator Helios 16 PH16-71-731Q | |
| Dell G15 5530 | |
| Lenovo LOQ 16IRH8 | |
| Lenovo Legion Pro 5 16ARX8 (R5 7645HX, RTX 4050) | |
| Acer Predator Helios 300 (i7-12700H, RTX 3070 Ti) | |
| Schenker XMG Apex 15 (Late 23) | |
| Acer Predator Helios Neo 16 NH.QLTEG.002 | |
| Media Intel Core i5-13500HX (648 - 695, n=3) | |
| Acer Nitro 16 AN16-41-R7YE | |
| Cinebench R15 / CPU Single 64Bit | |
| Media della classe Gaming (188.8 - 350, n=106, ultimi 2 anni) | |
| Acer Predator Helios 18 N23Q2 | |
| Lenovo Legion Pro 5 16ARX8 (R5 7645HX, RTX 4050) | |
| Schenker XMG Apex 15 (Late 23) | |
| Dell G15 5530 | |
| Acer Predator Helios 16 PH16-71-731Q | |
| Lenovo LOQ 16IRH8 | |
| Acer Predator Helios 300 (i7-12700H, RTX 3070 Ti) | |
| Acer Predator Helios Neo 16 NH.QLTEG.002 | |
| Media Intel Core i5-13500HX (242 - 263, n=3) | |
| Acer Nitro 16 AN16-41-R7YE | |
| Blender / v2.79 BMW27 CPU | |
| Acer Nitro 16 AN16-41-R7YE | |
| Lenovo Legion Pro 5 16ARX8 (R5 7645HX, RTX 4050) | |
| Lenovo LOQ 16IRH8 | |
| Acer Predator Helios 300 (i7-12700H, RTX 3070 Ti) | |
| Schenker XMG Apex 15 (Late 23) | |
| Acer Predator Helios Neo 16 NH.QLTEG.002 | |
| Media Intel Core i5-13500HX (178 - 193, n=3) | |
| Dell G15 5530 | |
| Acer Predator Helios 16 PH16-71-731Q | |
| Media della classe Gaming (79 - 330, n=104, ultimi 2 anni) | |
| Acer Predator Helios 18 N23Q2 | |
| 7-Zip 18.03 / 7z b 4 -mmt1 | |
| Lenovo Legion Pro 5 16ARX8 (R5 7645HX, RTX 4050) | |
| Acer Predator Helios 18 N23Q2 | |
| Schenker XMG Apex 15 (Late 23) | |
| Media della classe Gaming (4199 - 7436, n=105, ultimi 2 anni) | |
| Acer Predator Helios 16 PH16-71-731Q | |
| Lenovo LOQ 16IRH8 | |
| Dell G15 5530 | |
| Acer Predator Helios 300 (i7-12700H, RTX 3070 Ti) | |
| Acer Predator Helios Neo 16 NH.QLTEG.002 | |
| Acer Nitro 16 AN16-41-R7YE | |
| Media Intel Core i5-13500HX (5377 - 5850, n=3) | |
| Geekbench 5.5 / Multi-Core | |
| Acer Predator Helios 18 N23Q2 | |
| Media della classe Gaming (6460 - 28263, n=105, ultimi 2 anni) | |
| Acer Predator Helios 16 PH16-71-731Q | |
| Dell G15 5530 | |
| Acer Predator Helios Neo 16 NH.QLTEG.002 | |
| Acer Predator Helios 300 (i7-12700H, RTX 3070 Ti) | |
| Media Intel Core i5-13500HX (12683 - 13767, n=3) | |
| Lenovo LOQ 16IRH8 | |
| Schenker XMG Apex 15 (Late 23) | |
| Lenovo Legion Pro 5 16ARX8 (R5 7645HX, RTX 4050) | |
| Acer Nitro 16 AN16-41-R7YE | |
| Geekbench 5.5 / Single-Core | |
| Media della classe Gaming (986 - 2474, n=105, ultimi 2 anni) | |
| Acer Predator Helios 18 N23Q2 | |
| Lenovo Legion Pro 5 16ARX8 (R5 7645HX, RTX 4050) | |
| Schenker XMG Apex 15 (Late 23) | |
| Acer Predator Helios 16 PH16-71-731Q | |
| Dell G15 5530 | |
| Lenovo LOQ 16IRH8 | |
| Media Intel Core i5-13500HX (1688 - 1779, n=3) | |
| Acer Predator Helios Neo 16 NH.QLTEG.002 | |
| Acer Predator Helios 300 (i7-12700H, RTX 3070 Ti) | |
| Acer Nitro 16 AN16-41-R7YE | |
| HWBOT x265 Benchmark v2.2 / 4k Preset | |
| Acer Predator Helios 18 N23Q2 | |
| Media della classe Gaming (11.5 - 44.4, n=105, ultimi 2 anni) | |
| Acer Predator Helios 16 PH16-71-731Q | |
| Dell G15 5530 | |
| Media Intel Core i5-13500HX (20.3 - 20.9, n=3) | |
| Acer Predator Helios Neo 16 NH.QLTEG.002 | |
| Schenker XMG Apex 15 (Late 23) | |
| Lenovo Legion Pro 5 16ARX8 (R5 7645HX, RTX 4050) | |
| Lenovo LOQ 16IRH8 | |
| Acer Predator Helios 300 (i7-12700H, RTX 3070 Ti) | |
| Acer Nitro 16 AN16-41-R7YE | |
| LibreOffice / 20 Documents To PDF | |
| Acer Predator Helios 300 (i7-12700H, RTX 3070 Ti) | |
| Lenovo Legion Pro 5 16ARX8 (R5 7645HX, RTX 4050) | |
| Media della classe Gaming (33.2 - 88.8, n=105, ultimi 2 anni) | |
| Acer Predator Helios 18 N23Q2 | |
| Dell G15 5530 | |
| Acer Nitro 16 AN16-41-R7YE | |
| Lenovo LOQ 16IRH8 | |
| Acer Predator Helios Neo 16 NH.QLTEG.002 | |
| Schenker XMG Apex 15 (Late 23) | |
| Media Intel Core i5-13500HX (42.5 - 45, n=2) | |
| Acer Predator Helios 16 PH16-71-731Q | |
| R Benchmark 2.5 / Overall mean | |
| Acer Nitro 16 AN16-41-R7YE | |
| Media Intel Core i5-13500HX (0.4512 - 0.4891, n=3) | |
| Acer Predator Helios Neo 16 NH.QLTEG.002 | |
| Acer Predator Helios 300 (i7-12700H, RTX 3070 Ti) | |
| Lenovo LOQ 16IRH8 | |
| Schenker XMG Apex 15 (Late 23) | |
| Lenovo Legion Pro 5 16ARX8 (R5 7645HX, RTX 4050) | |
| Media della classe Gaming (0.3439 - 0.759, n=106, ultimi 2 anni) | |
| Acer Predator Helios 16 PH16-71-731Q | |
| Dell G15 5530 | |
| Acer Predator Helios 18 N23Q2 | |
* ... Meglio usare valori piccoli
AIDA64: FP32 Ray-Trace | FPU Julia | CPU SHA3 | CPU Queen | FPU SinJulia | FPU Mandel | CPU AES | CPU ZLib | FP64 Ray-Trace | CPU PhotoWorxx
| Performance rating | |
| Media della classe Gaming | |
| Schenker XMG Apex 15 (Late 23) | |
| Dell G15 5530 | |
| Acer Predator Helios Neo 16 NH.QLTEG.002 | |
| Media Intel Core i5-13500HX | |
| Lenovo Legion Pro 5 16ARX8 (R5 7645HX, RTX 4050) | |
| HP Victus 16-r0076TX | |
| Lenovo LOQ 16IRH8 | |
| AIDA64 / FP32 Ray-Trace | |
| Media della classe Gaming (10227 - 85542, n=105, ultimi 2 anni) | |
| Schenker XMG Apex 15 (Late 23) | |
| Lenovo Legion Pro 5 16ARX8 (R5 7645HX, RTX 4050) | |
| Dell G15 5530 | |
| Media Intel Core i5-13500HX (15888 - 16544, n=3) | |
| Acer Predator Helios Neo 16 NH.QLTEG.002 | |
| HP Victus 16-r0076TX | |
| Lenovo LOQ 16IRH8 | |
| AIDA64 / FPU Julia | |
| Media della classe Gaming (51376 - 238426, n=105, ultimi 2 anni) | |
| Schenker XMG Apex 15 (Late 23) | |
| Lenovo Legion Pro 5 16ARX8 (R5 7645HX, RTX 4050) | |
| Dell G15 5530 | |
| HP Victus 16-r0076TX | |
| Media Intel Core i5-13500HX (80761 - 85623, n=3) | |
| Acer Predator Helios Neo 16 NH.QLTEG.002 | |
| Lenovo LOQ 16IRH8 | |
| AIDA64 / CPU SHA3 | |
| Media della classe Gaming (2180 - 10115, n=105, ultimi 2 anni) | |
| Dell G15 5530 | |
| Schenker XMG Apex 15 (Late 23) | |
| Media Intel Core i5-13500HX (3868 - 4017, n=3) | |
| HP Victus 16-r0076TX | |
| Acer Predator Helios Neo 16 NH.QLTEG.002 | |
| Lenovo Legion Pro 5 16ARX8 (R5 7645HX, RTX 4050) | |
| Lenovo LOQ 16IRH8 | |
| AIDA64 / CPU Queen | |
| Media della classe Gaming (49785 - 173351, n=90, ultimi 2 anni) | |
| Dell G15 5530 | |
| Acer Predator Helios Neo 16 NH.QLTEG.002 | |
| Media Intel Core i5-13500HX (105168 - 107075, n=3) | |
| Schenker XMG Apex 15 (Late 23) | |
| HP Victus 16-r0076TX | |
| Lenovo Legion Pro 5 16ARX8 (R5 7645HX, RTX 4050) | |
| Lenovo LOQ 16IRH8 | |
| AIDA64 / FPU SinJulia | |
| Schenker XMG Apex 15 (Late 23) | |
| Media della classe Gaming (4424 - 33636, n=105, ultimi 2 anni) | |
| Lenovo Legion Pro 5 16ARX8 (R5 7645HX, RTX 4050) | |
| Dell G15 5530 | |
| Media Intel Core i5-13500HX (10334 - 10793, n=3) | |
| Acer Predator Helios Neo 16 NH.QLTEG.002 | |
| HP Victus 16-r0076TX | |
| Lenovo LOQ 16IRH8 | |
| AIDA64 / FPU Mandel | |
| Media della classe Gaming (25115 - 128721, n=105, ultimi 2 anni) | |
| Schenker XMG Apex 15 (Late 23) | |
| Lenovo Legion Pro 5 16ARX8 (R5 7645HX, RTX 4050) | |
| Dell G15 5530 | |
| Media Intel Core i5-13500HX (39805 - 41418, n=3) | |
| Acer Predator Helios Neo 16 NH.QLTEG.002 | |
| HP Victus 16-r0076TX | |
| Lenovo LOQ 16IRH8 | |
| AIDA64 / CPU AES | |
| Schenker XMG Apex 15 (Late 23) | |
| Acer Predator Helios Neo 16 NH.QLTEG.002 | |
| Media della classe Gaming (39258 - 247074, n=105, ultimi 2 anni) | |
| Media Intel Core i5-13500HX (79903 - 154368, n=3) | |
| Dell G15 5530 | |
| HP Victus 16-r0076TX | |
| Lenovo LOQ 16IRH8 | |
| Lenovo Legion Pro 5 16ARX8 (R5 7645HX, RTX 4050) | |
| AIDA64 / CPU ZLib | |
| Media della classe Gaming (574 - 2531, n=105, ultimi 2 anni) | |
| Dell G15 5530 | |
| Acer Predator Helios Neo 16 NH.QLTEG.002 | |
| Media Intel Core i5-13500HX (1104 - 1233, n=3) | |
| HP Victus 16-r0076TX | |
| Schenker XMG Apex 15 (Late 23) | |
| Lenovo Legion Pro 5 16ARX8 (R5 7645HX, RTX 4050) | |
| Lenovo LOQ 16IRH8 | |
| AIDA64 / FP64 Ray-Trace | |
| Media della classe Gaming (5509 - 45446, n=105, ultimi 2 anni) | |
| Schenker XMG Apex 15 (Late 23) | |
| Lenovo Legion Pro 5 16ARX8 (R5 7645HX, RTX 4050) | |
| Dell G15 5530 | |
| Media Intel Core i5-13500HX (8587 - 9008, n=3) | |
| Acer Predator Helios Neo 16 NH.QLTEG.002 | |
| HP Victus 16-r0076TX | |
| Lenovo LOQ 16IRH8 | |
| AIDA64 / CPU PhotoWorxx | |
| Media della classe Gaming (12271 - 89891, n=105, ultimi 2 anni) | |
| Media Intel Core i5-13500HX (36861 - 42683, n=3) | |
| Dell G15 5530 | |
| HP Victus 16-r0076TX | |
| Acer Predator Helios Neo 16 NH.QLTEG.002 | |
| Schenker XMG Apex 15 (Late 23) | |
| Lenovo LOQ 16IRH8 | |
| Lenovo Legion Pro 5 16ARX8 (R5 7645HX, RTX 4050) | |
Prestazioni del sistema
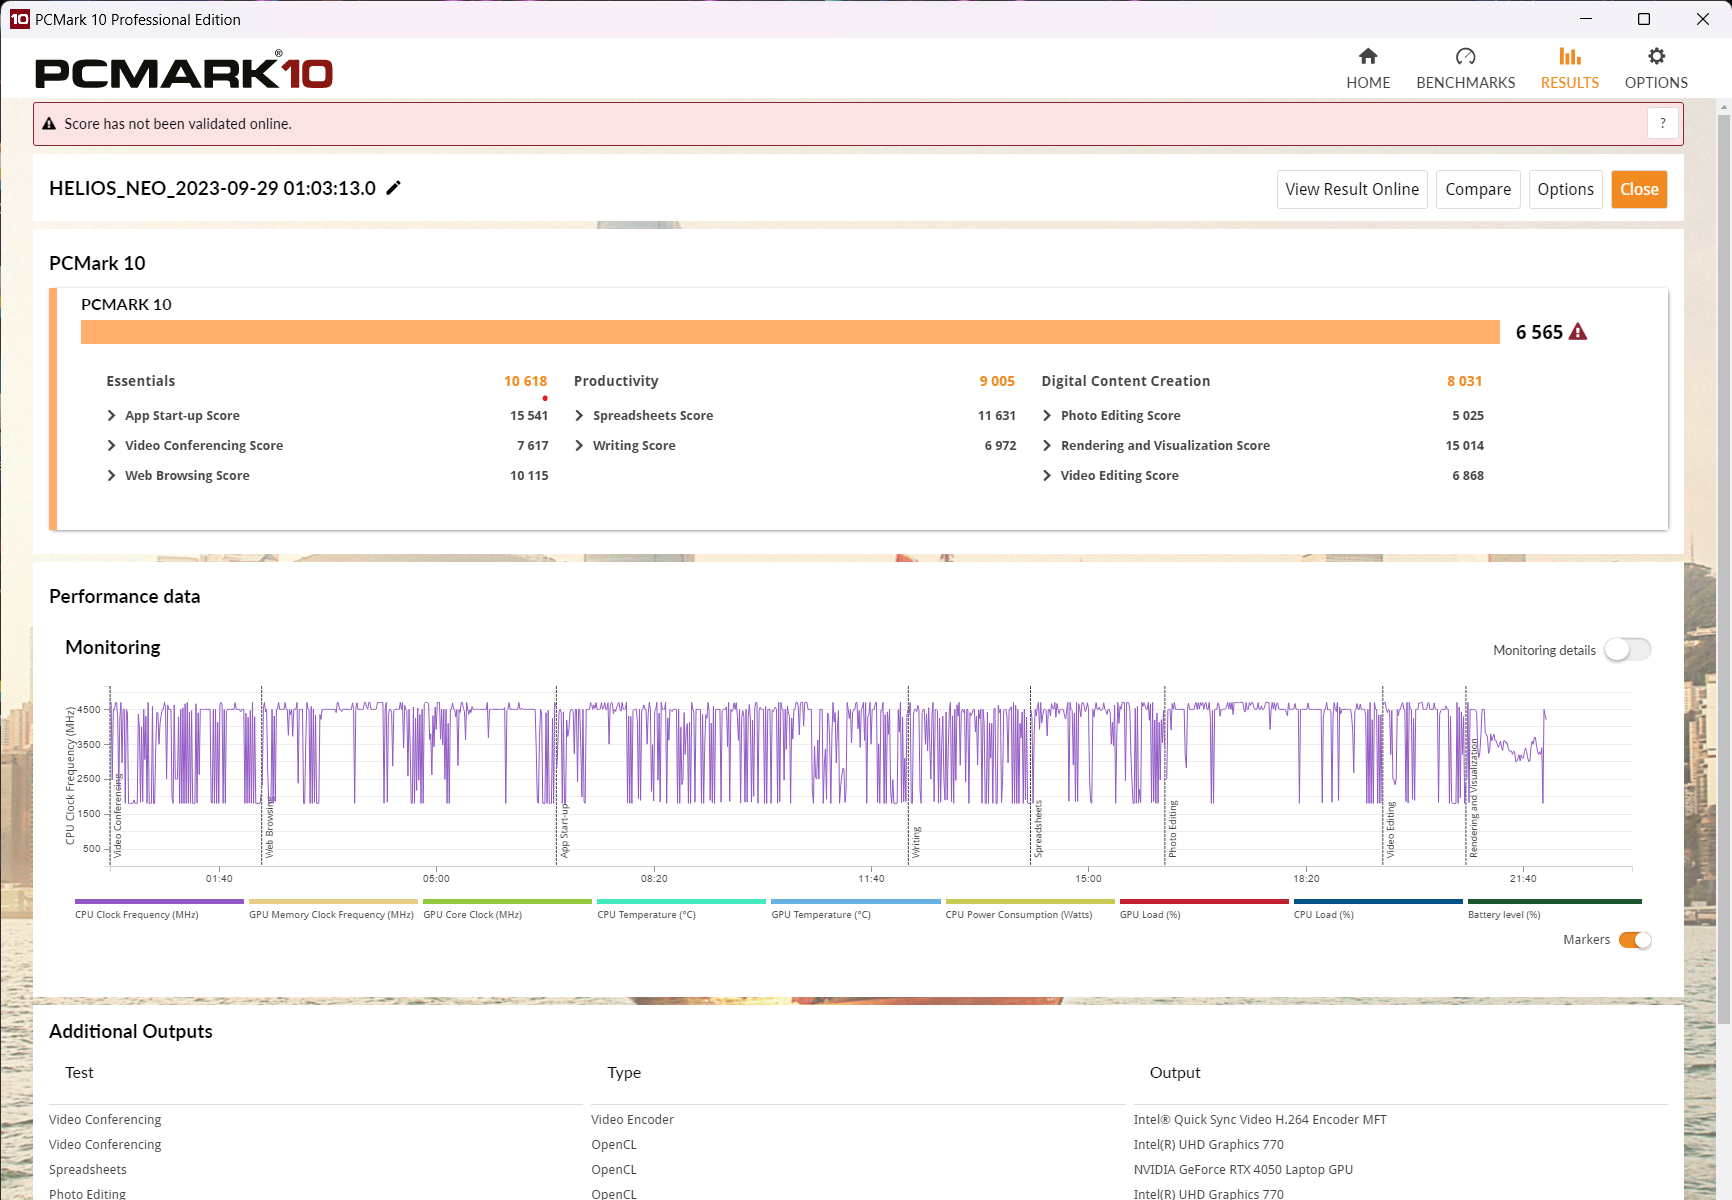
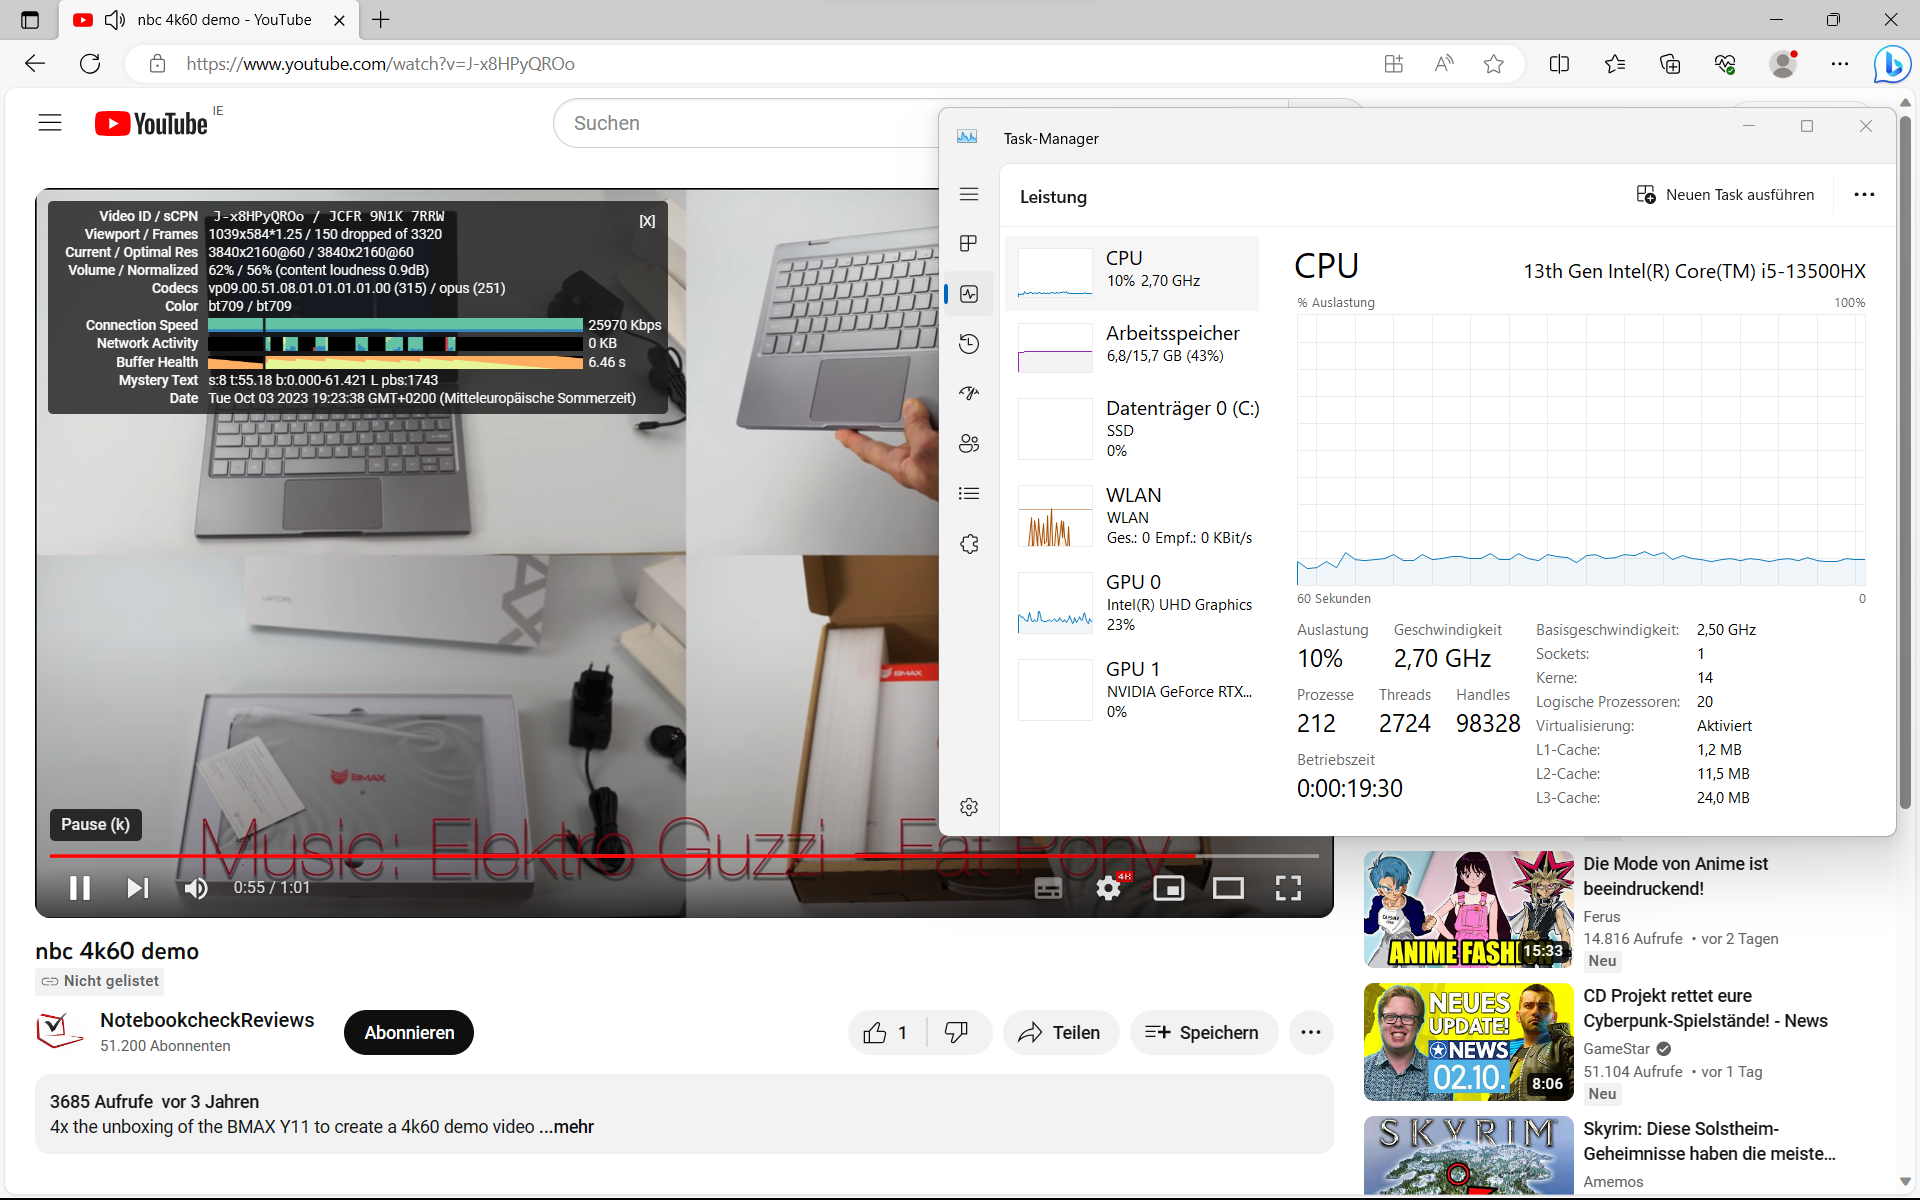
Il portatile da gioco di Acer è molto reattivo durante le attività quotidiane. Navigare sul web mentre si riproduce YouTube in 4K sembra una vacanza per il sistema Intel HX. Durante il benchmark PCMark 10, il Predator Helios Neo è rimasto indietro rispetto ai sistemi AMD LenovoLegion Pro 5 e SchenkerXMG Apex 15 di circa il 30%, soprattutto per quanto riguarda la creazione di contenuti. Tuttavia, il Neo ha quasi raggiunto la posizione più alta durante il test Crossmark.
Le sue prestazioni di navigazione web, ad esempio utilizzando Mozilla Kraken 1.1 e WebXPRT, sono molto buone grazie alle forti prestazioni single-core del portatile - ma non sono altrettanto buone di quelle di Legion Pro 5.
CrossMark: Overall | Productivity | Creativity | Responsiveness
Mozilla Kraken 1.1: Total
Octane V2: Total Score
Speedometer 2.0: Result 2.0
Jetstream 2: 2.0 Total
WebXPRT 3: Overall
WebXPRT 4: Overall
| PCMark 10 / Score | |
| Media della classe Gaming (5828 - 12414, n=93, ultimi 2 anni) | |
| Lenovo Legion Pro 5 16ARX8 (R5 7645HX, RTX 4050) | |
| Schenker XMG Apex 15 (Late 23) | |
| Dell G15 5530 | |
| Lenovo LOQ 16IRH8 | |
| Acer Predator Helios Neo 16 NH.QLTEG.002 | |
| Media Intel Core i5-13500HX, NVIDIA GeForce RTX 4050 Laptop GPU (6125 - 6565, n=2) | |
| HP Victus 16-r0076TX | |
| PCMark 10 / Essentials | |
| Lenovo Legion Pro 5 16ARX8 (R5 7645HX, RTX 4050) | |
| Dell G15 5530 | |
| Schenker XMG Apex 15 (Late 23) | |
| Media della classe Gaming (8810 - 11935, n=97, ultimi 2 anni) | |
| Acer Predator Helios Neo 16 NH.QLTEG.002 | |
| Media Intel Core i5-13500HX, NVIDIA GeForce RTX 4050 Laptop GPU (9625 - 10618, n=2) | |
| Lenovo LOQ 16IRH8 | |
| HP Victus 16-r0076TX | |
| PCMark 10 / Productivity | |
| Media della classe Gaming (6845 - 25323, n=95, ultimi 2 anni) | |
| Lenovo Legion Pro 5 16ARX8 (R5 7645HX, RTX 4050) | |
| Schenker XMG Apex 15 (Late 23) | |
| Dell G15 5530 | |
| Acer Predator Helios Neo 16 NH.QLTEG.002 | |
| Media Intel Core i5-13500HX, NVIDIA GeForce RTX 4050 Laptop GPU (8471 - 9005, n=2) | |
| Lenovo LOQ 16IRH8 | |
| HP Victus 16-r0076TX | |
| PCMark 10 / Digital Content Creation | |
| Media della classe Gaming (7602 - 19954, n=95, ultimi 2 anni) | |
| Schenker XMG Apex 15 (Late 23) | |
| Lenovo Legion Pro 5 16ARX8 (R5 7645HX, RTX 4050) | |
| Lenovo LOQ 16IRH8 | |
| Dell G15 5530 | |
| Acer Predator Helios Neo 16 NH.QLTEG.002 | |
| Media Intel Core i5-13500HX, NVIDIA GeForce RTX 4050 Laptop GPU (7649 - 8031, n=2) | |
| HP Victus 16-r0076TX | |
| CrossMark / Overall | |
| Media della classe Gaming (1366 - 2409, n=94, ultimi 2 anni) | |
| Acer Predator Helios Neo 16 NH.QLTEG.002 | |
| Lenovo LOQ 16IRH8 | |
| Lenovo Legion Pro 5 16ARX8 (R5 7645HX, RTX 4050) | |
| Dell G15 5530 | |
| Media Intel Core i5-13500HX, NVIDIA GeForce RTX 4050 Laptop GPU (1701 - 1964, n=2) | |
| Schenker XMG Apex 15 (Late 23) | |
| HP Victus 16-r0076TX | |
| CrossMark / Productivity | |
| Lenovo Legion Pro 5 16ARX8 (R5 7645HX, RTX 4050) | |
| Acer Predator Helios Neo 16 NH.QLTEG.002 | |
| Lenovo LOQ 16IRH8 | |
| Media della classe Gaming (1386 - 2254, n=94, ultimi 2 anni) | |
| Dell G15 5530 | |
| Media Intel Core i5-13500HX, NVIDIA GeForce RTX 4050 Laptop GPU (1585 - 1878, n=2) | |
| Schenker XMG Apex 15 (Late 23) | |
| HP Victus 16-r0076TX | |
| CrossMark / Creativity | |
| Media della classe Gaming (1343 - 2786, n=94, ultimi 2 anni) | |
| Dell G15 5530 | |
| Lenovo LOQ 16IRH8 | |
| Lenovo Legion Pro 5 16ARX8 (R5 7645HX, RTX 4050) | |
| Acer Predator Helios Neo 16 NH.QLTEG.002 | |
| Media Intel Core i5-13500HX, NVIDIA GeForce RTX 4050 Laptop GPU (1912 - 2022, n=2) | |
| Schenker XMG Apex 15 (Late 23) | |
| HP Victus 16-r0076TX | |
| CrossMark / Responsiveness | |
| Acer Predator Helios Neo 16 NH.QLTEG.002 | |
| Lenovo LOQ 16IRH8 | |
| Lenovo Legion Pro 5 16ARX8 (R5 7645HX, RTX 4050) | |
| Media Intel Core i5-13500HX, NVIDIA GeForce RTX 4050 Laptop GPU (1478 - 2053, n=2) | |
| Media della classe Gaming (1226 - 2334, n=94, ultimi 2 anni) | |
| Dell G15 5530 | |
| Schenker XMG Apex 15 (Late 23) | |
| HP Victus 16-r0076TX | |
| Mozilla Kraken 1.1 / Total | |
| HP Victus 16-r0076TX | |
| Media Intel Core i5-13500HX, NVIDIA GeForce RTX 4050 Laptop GPU (521 - 550, n=3) | |
| Acer Predator Helios Neo 16 NH.QLTEG.002 | |
| Schenker XMG Apex 15 (Late 23) | |
| Dell G15 5530 | |
| Lenovo LOQ 16IRH8 | |
| Lenovo LOQ 16IRH8 | |
| Lenovo Legion Pro 5 16ARX8 (R5 7645HX, RTX 4050) | |
| Media della classe Gaming (391 - 590, n=100, ultimi 2 anni) | |
| Octane V2 / Total Score | |
| Media della classe Gaming (93292 - 139447, n=27, ultimi 2 anni) | |
| Schenker XMG Apex 15 (Late 23) | |
| Acer Predator Helios Neo 16 NH.QLTEG.002 | |
| Media Intel Core i5-13500HX, NVIDIA GeForce RTX 4050 Laptop GPU (n=1) | |
| Lenovo Legion Pro 5 16ARX8 (R5 7645HX, RTX 4050) | |
| Speedometer 2.0 / Result 2.0 | |
| Media della classe Gaming (29 - 736, n=27, ultimi 2 anni) | |
| Media Intel Core i5-13500HX, NVIDIA GeForce RTX 4050 Laptop GPU (n=1) | |
| Acer Predator Helios Neo 16 NH.QLTEG.002 | |
| Schenker XMG Apex 15 (Late 23) | |
| Jetstream 2 / 2.0 Total | |
| Media della classe Gaming (334 - 516, n=27, ultimi 2 anni) | |
| Acer Predator Helios Neo 16 NH.QLTEG.002 | |
| Media Intel Core i5-13500HX, NVIDIA GeForce RTX 4050 Laptop GPU (n=1) | |
| Schenker XMG Apex 15 (Late 23) | |
| Lenovo Legion Pro 5 16ARX8 (R5 7645HX, RTX 4050) | |
| WebXPRT 3 / Overall | |
| Lenovo Legion Pro 5 16ARX8 (R5 7645HX, RTX 4050) | |
| Lenovo LOQ 16IRH8 | |
| Lenovo LOQ 16IRH8 | |
| Media della classe Gaming (220 - 532, n=98, ultimi 2 anni) | |
| Schenker XMG Apex 15 (Late 23) | |
| Acer Predator Helios Neo 16 NH.QLTEG.002 | |
| Dell G15 5530 | |
| Media Intel Core i5-13500HX, NVIDIA GeForce RTX 4050 Laptop GPU (255 - 294, n=3) | |
| HP Victus 16-r0076TX | |
| WebXPRT 4 / Overall | |
| Media della classe Gaming (165 - 354, n=98, ultimi 2 anni) | |
| Dell G15 5530 | |
| Lenovo Legion Pro 5 16ARX8 (R5 7645HX, RTX 4050) | |
| Media Intel Core i5-13500HX, NVIDIA GeForce RTX 4050 Laptop GPU (240 - 257, n=3) | |
| HP Victus 16-r0076TX | |
| Acer Predator Helios Neo 16 NH.QLTEG.002 | |
* ... Meglio usare valori piccoli
| PCMark 10 Score | 6565 punti | |
Aiuto | ||
* ... Meglio usare valori piccoli
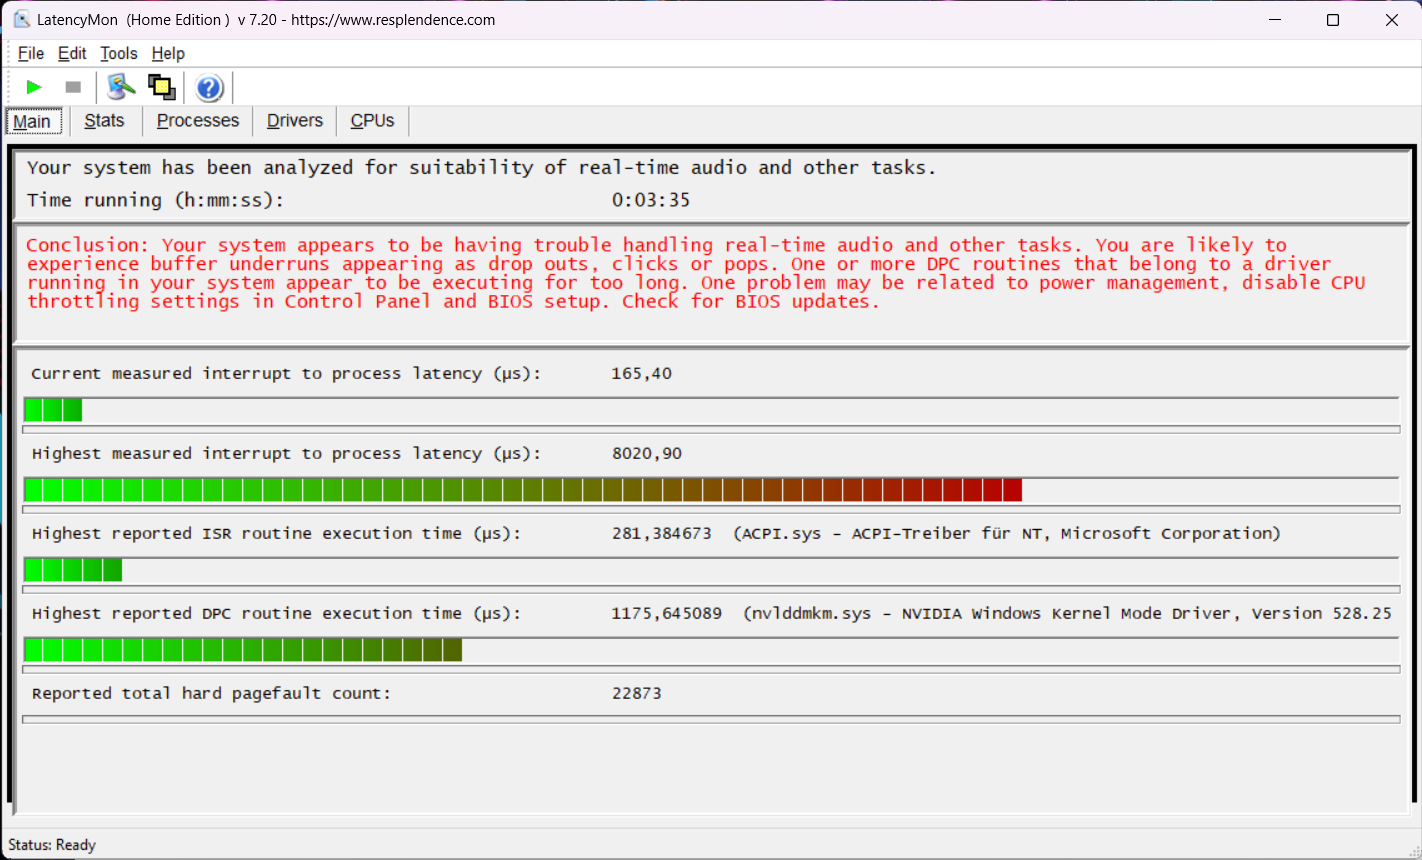
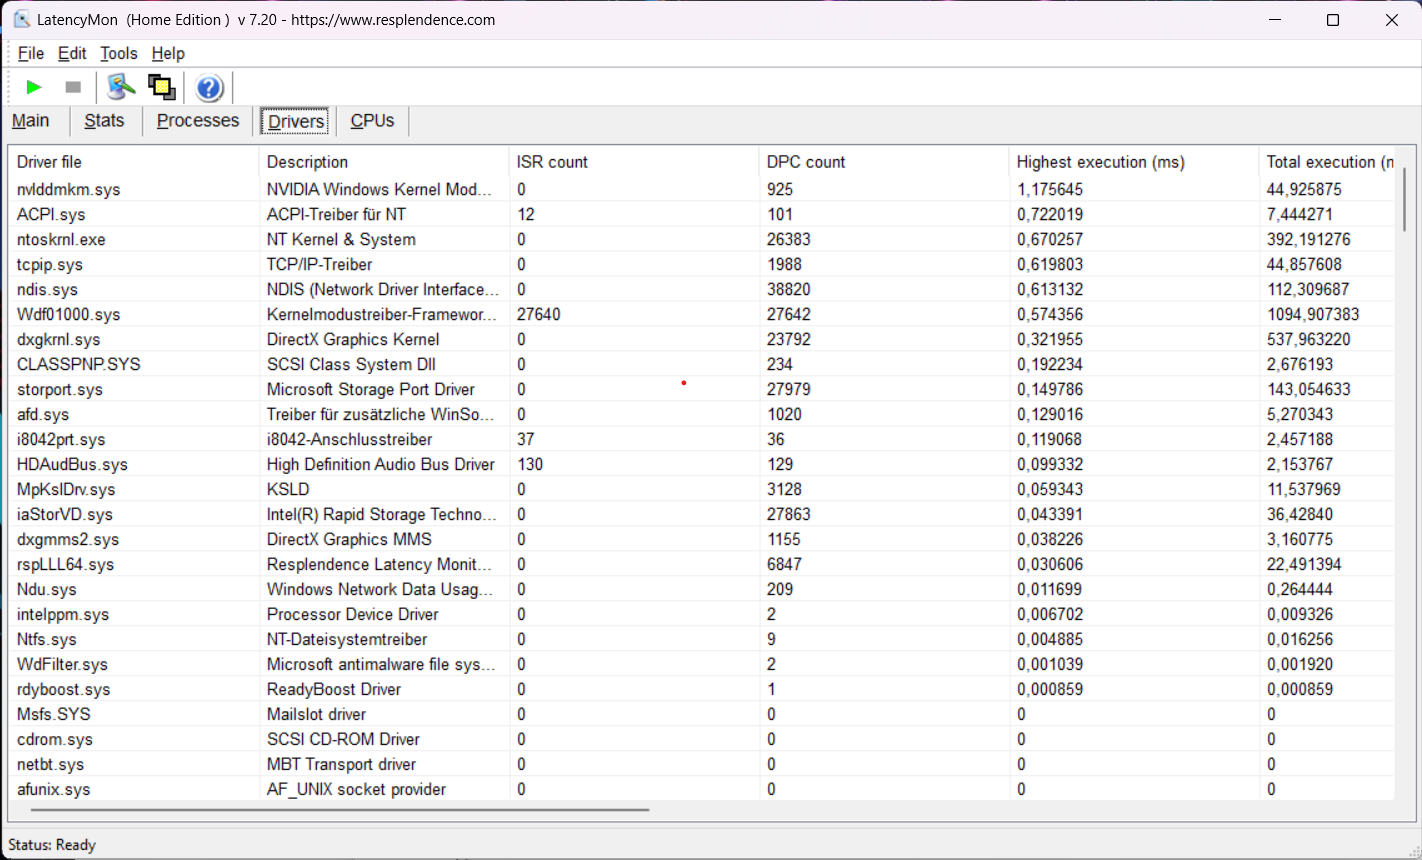
Latenza DPC
Le latenze DPC molto elevate del dispositivo Acer, pari a 8.021 µs (testate più volte), impediscono l'utilizzo di software multimediali in tempo reale. Il motivo principale è il driver grafico Nvidia. Gli aggiornamenti del driver e del BIOS possono migliorare o peggiorare il risultato.
| DPC Latencies / LatencyMon - interrupt to process latency (max), Web, Youtube, Prime95 | |
| Acer Predator Helios Neo 16 NH.QLTEG.002 | |
| Dell G15 5530 | |
| HP Victus 16-r0076TX | |
| Lenovo LOQ 16IRH8 | |
| Lenovo Legion Pro 5 16ARX8 (R5 7645HX, RTX 4050) | |
| Schenker XMG Apex 15 (Late 23) | |
* ... Meglio usare valori piccoli
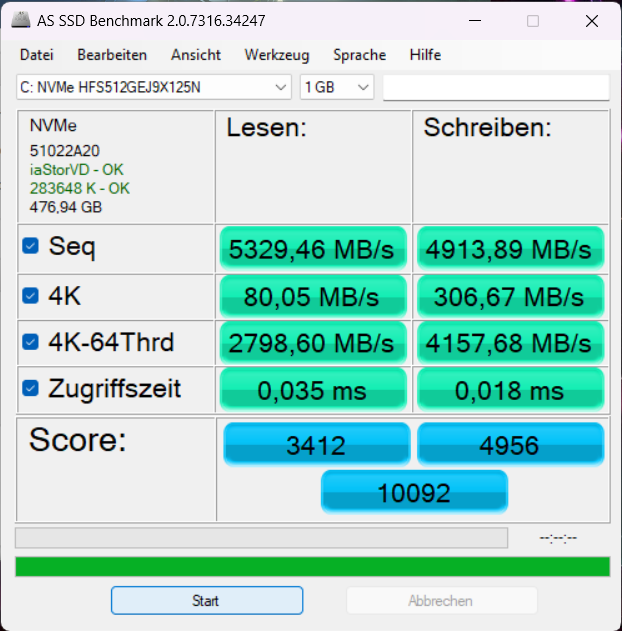
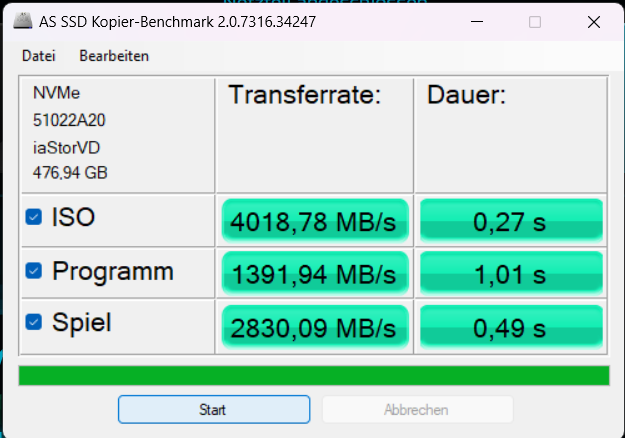
Dispositivi di archiviazione
L'SSD PCIe 4.0 di SK Hynix installato ha una capacità di 512 GB. Le sue velocità di trasferimento fino a 5.330 MB/s (letture sequenziali) sono elevate, così come le velocità di scrittura e i valori 4K. Questo pone Helios Neo 16 al primo posto tra i dispositivi di confronto nella nostra valutazione delle prestazioni.
Tuttavia, dopo un po' di tempo si verifica un throttling ciclico indotto dalla temperatura, come si può vedere nel grafico "DiskSpd Read Loop" qui sotto. Sono supportati fino a due SSD M.2 interni (anche a doppia faccia).
| Acer Predator Helios Neo 16 NH.QLTEG.002 SK hynix HFS512GEJ9X125N | Lenovo Legion Pro 5 16ARX8 (R5 7645HX, RTX 4050) SK hynix PC801 HFS512GEJ9X115N | Lenovo LOQ 16IRH8 Solidigm SSDPFINW512GZL | Schenker XMG Apex 15 (Late 23) Samsung 990 Pro 1 TB | HP Victus 16-r0076TX SK hynix PC801 HFS512GEJ9X101N BF | Dell G15 5530 SSTC CL4-3D512-Q11 | |
|---|---|---|---|---|---|---|
| AS SSD | -11% | -59% | -18% | -27% | -142% | |
| Seq Read (MB/s) | 5329.5 | 5872 10% | 2603 -51% | 5586.1 5% | 5149.98 -3% | 2603.73 -51% |
| Seq Write (MB/s) | 4913.9 | 4253 -13% | 1427 -71% | 5512.25 12% | 3064.93 -38% | 494.63 -90% |
| 4K Read (MB/s) | 80.05 | 70.52 -12% | 64.4 -20% | 65.32 -18% | 62.73 -22% | 36.37 -55% |
| 4K Write (MB/s) | 306.67 | 251.8 -18% | 237 -23% | 193.71 -37% | 219.1 -29% | 188.64 -38% |
| 4K-64 Read (MB/s) | 2798.6 | 2755 -2% | 451 -84% | 2970.82 6% | 902.17 -68% | 932.26 -67% |
| 4K-64 Write (MB/s) | 4157.7 | 2647 -36% | 1265 -70% | 3872.46 -7% | 2901.89 -30% | 276.64 -93% |
| Access Time Read * (ms) | 0.035 | 0.039 -11% | 0.055 -57% | 0.038 -9% | 0.036 -3% | 0.103 -194% |
| Access Time Write * (ms) | 0.018 | 0.017 6% | 0.036 -100% | 0.02 -11% | 0.018 -0% | 0.182 -911% |
| Score Read (Points) | 3412 | 3413 0% | 776 -77% | 3595 5% | 1480 -57% | 1229 -64% |
| Score Write (Points) | 4956 | 3324 -33% | 1645 -67% | 4617 -7% | 3427 -31% | 515 -90% |
| Score Total (Points) | 10092 | 8397 -17% | 2782 -72% | 10039 -1% | 5574 -45% | 2271 -77% |
| Copy ISO MB/s (MB/s) | 4018.8 | 2397.08 -40% | 1100.94 -73% | 3765 -6% | 488.98 -88% | |
| Copy Program MB/s (MB/s) | 1391.9 | 751.31 -46% | 579.88 -58% | 1030 -26% | 296.26 -79% | |
| Copy Game MB/s (MB/s) | 2830.1 | 1329.99 -53% | 1006.61 -64% | 2124 -25% | 452.22 -84% | |
| DiskSpd | -1% | -48% | 5% | -29% | -64% | |
| seq read (MB/s) | 3283 | 4770 45% | 2171 -34% | 3181 -3% | 4378 33% | 2726 -17% |
| seq write (MB/s) | 4923 | 4938 0% | 1640 -67% | 5612 14% | 3325 -32% | 535 -89% |
| seq q8 t1 read (MB/s) | 6309 | 7328 16% | 3507 -44% | 7148 13% | 7109 13% | 2985 -53% |
| seq q8 t1 write (MB/s) | 4968 | 4936 -1% | 1645 -67% | 6887 39% | 5027 1% | 539 -89% |
| 4k q1 t1 read (MB/s) | 78.3 | 75.5 -4% | 82.1 5% | 68 -13% | 61.5 -21% | 34 -57% |
| 4k q1 t1 write (MB/s) | 393 | 296 -25% | 288 -27% | 231 -41% | 157.3 -60% | 224 -43% |
| 4k q32 t16 read (MB/s) | 4255 | 3794 -11% | 478 -89% | 4920 16% | 954 -78% | 1054 -75% |
| 4k q32 t16 write (MB/s) | 3869 | 2679 -31% | 1631 -58% | 4336 12% | 527 -86% | 507 -87% |
| Media totale (Programma / Settaggio) | -6% /
-7% | -54% /
-55% | -7% /
-10% | -28% /
-28% | -103% /
-113% |
* ... Meglio usare valori piccoli
* ... Meglio usare valori piccoli
Reading continuous performance: DiskSpd Read Loop, Queue Depth 8
Scheda grafica
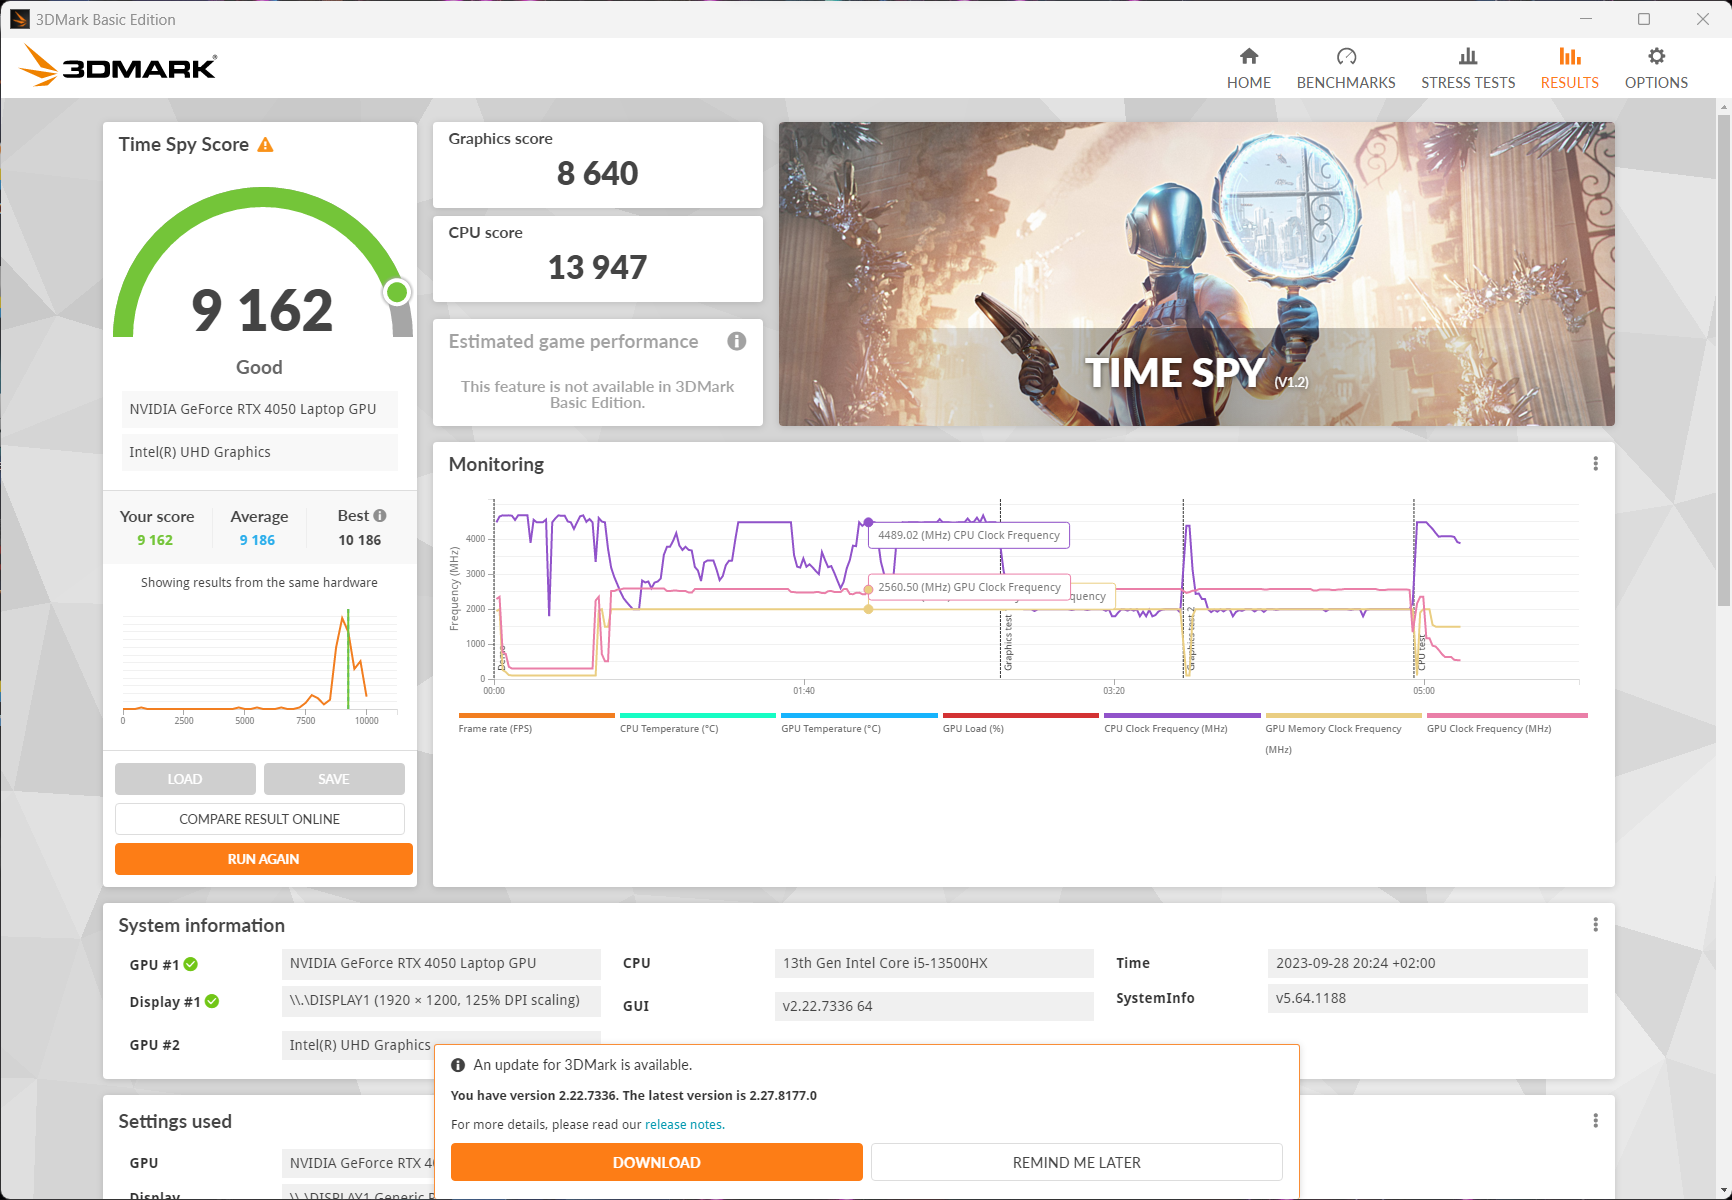
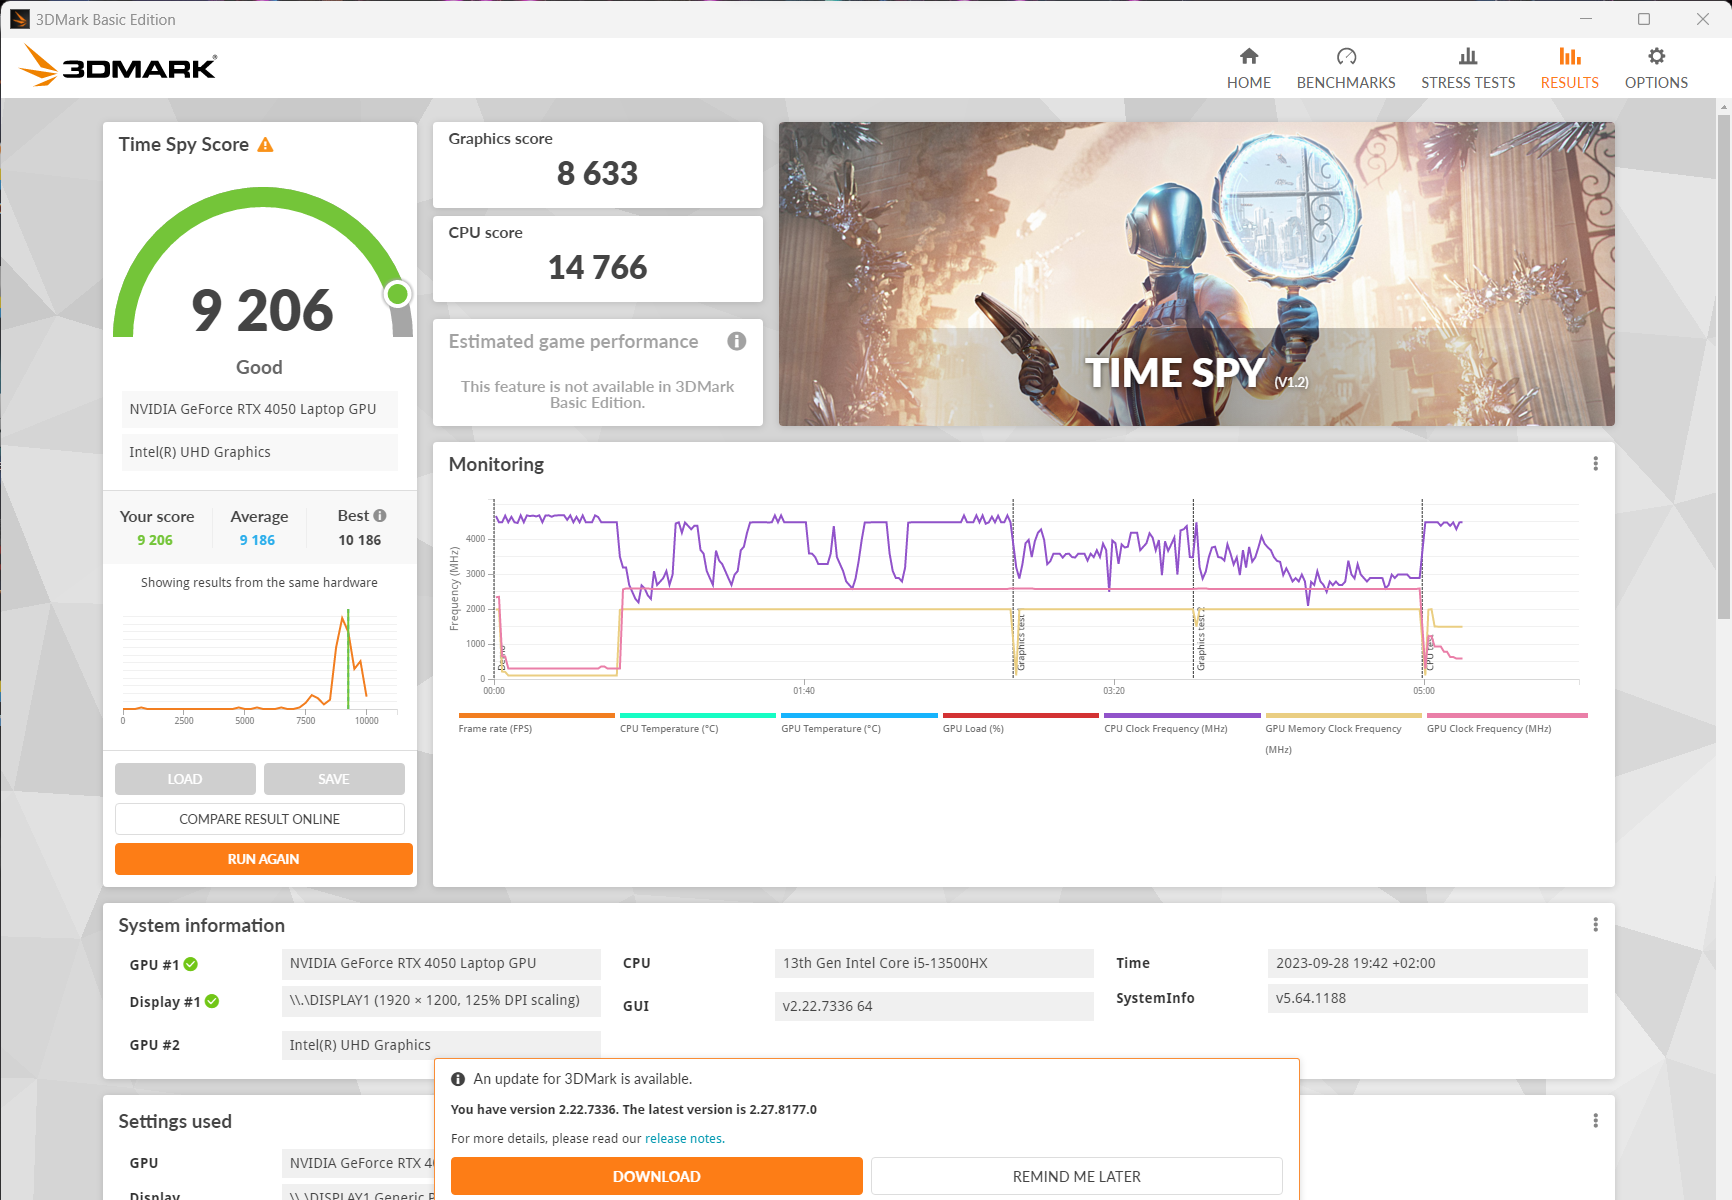
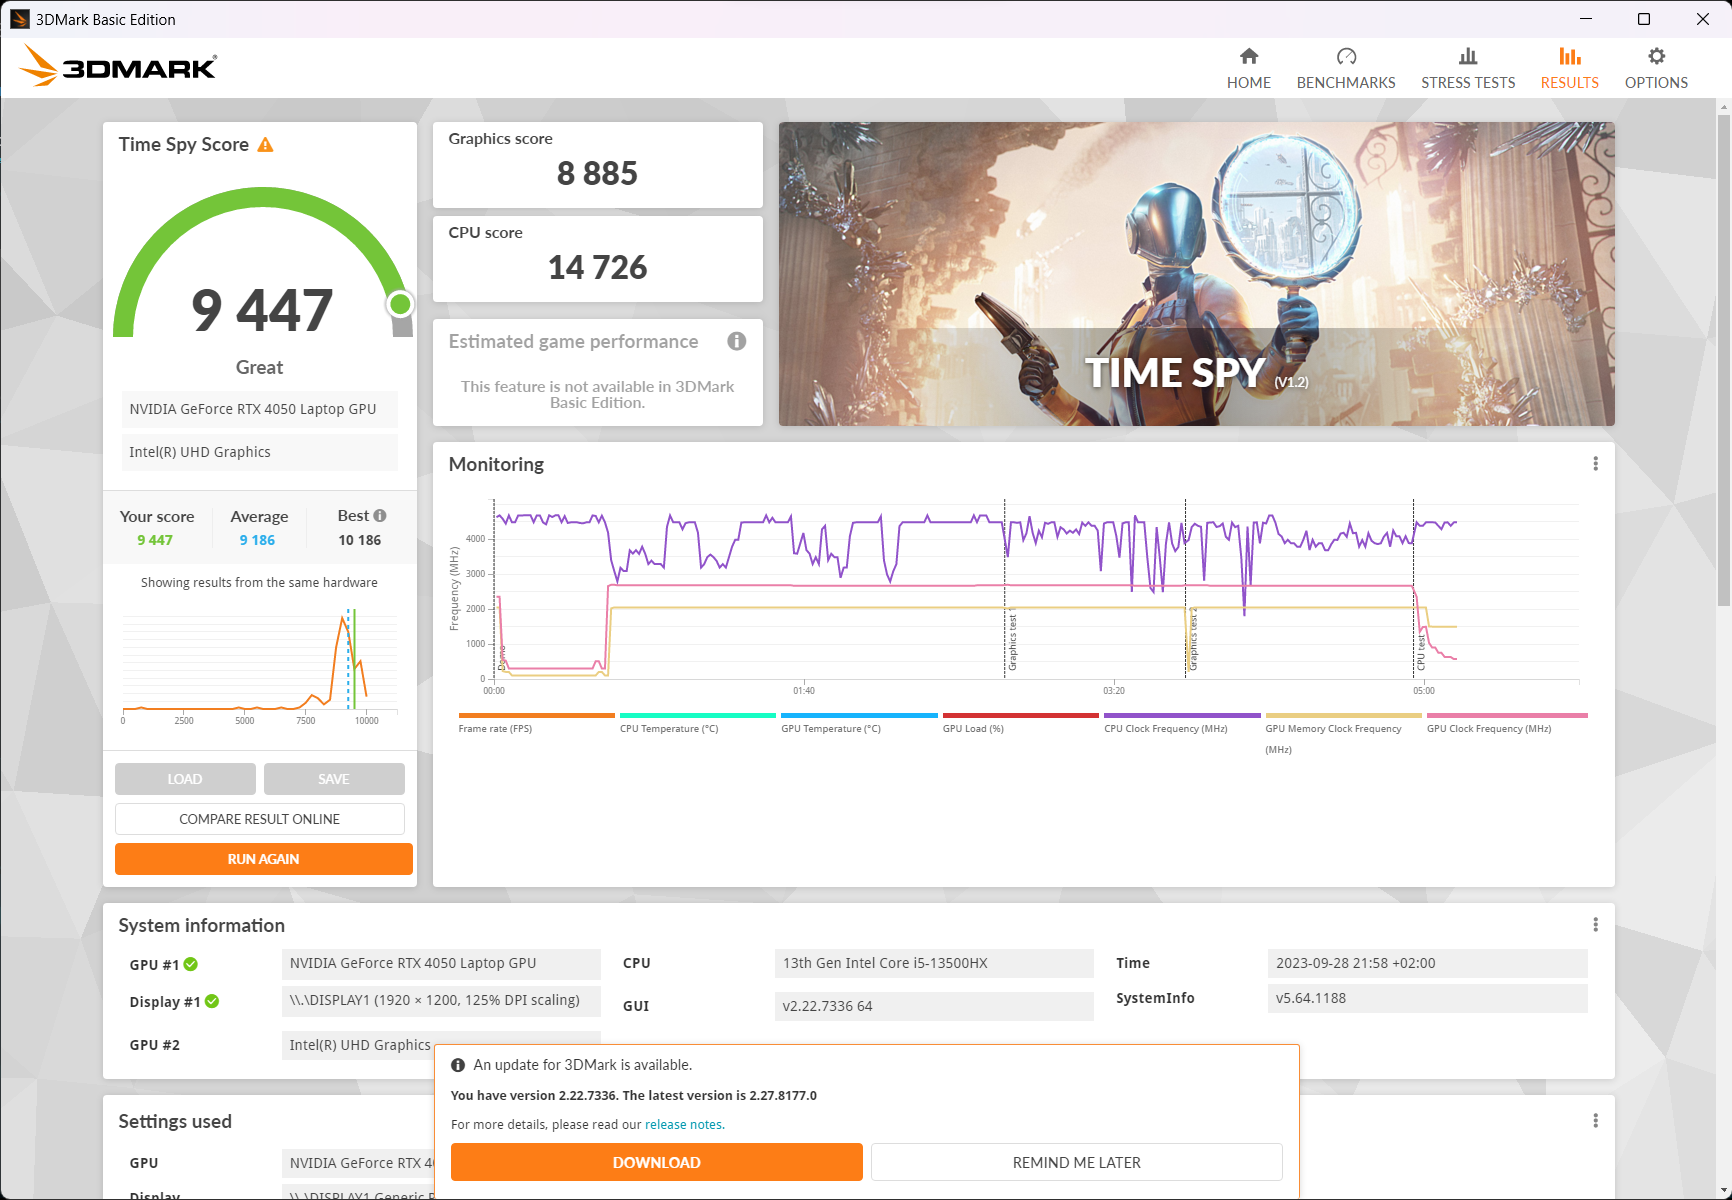
NvidiaGeForce RTX 4050 è una GPU entry-level con 6 GB di VRAM, che assorbe un massimo di 130 watt (115 watt + 15 watt Dynamic Boost) all'interno di Helios Neo 16. Tuttavia, la sua frequenza di clock massima di 2.570 MHz viene raggiunta già a 85-90 watt. Tuttavia, la sua frequenza di clock massima di 2.570 MHz viene già raggiunta con 85-90 watt. Solo il test di stress FurMark può sfruttare tutti i 130 watt, mentre la GPU del laptop non ha mai bisogno di più di ~88 watt durante l'esecuzione dei giochi.
Questo mette le prestazioni del dispositivo alla pari con altri portatili da gioco con la stessa GPU, come il modelloLegion Pro 5 16schenkerXMG Apex 15eHP Victus 16. Nei benchmark sintetici, unRTX 4060ha ottenuto risultati simili (10 % di vantaggio), come nel caso diLenovo LOQ 16 e il modelloHelios 16 (non-Neo). I suoi risultati di benchmark sintetici sono stati la metà di quelli ottenuti in modalità batteria.
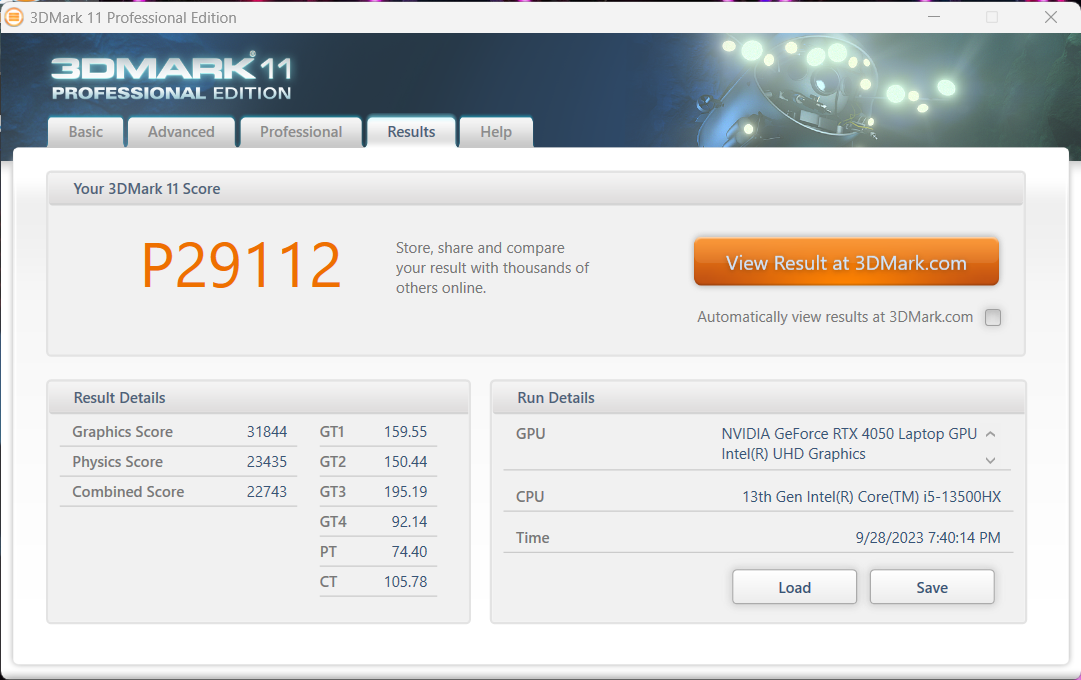
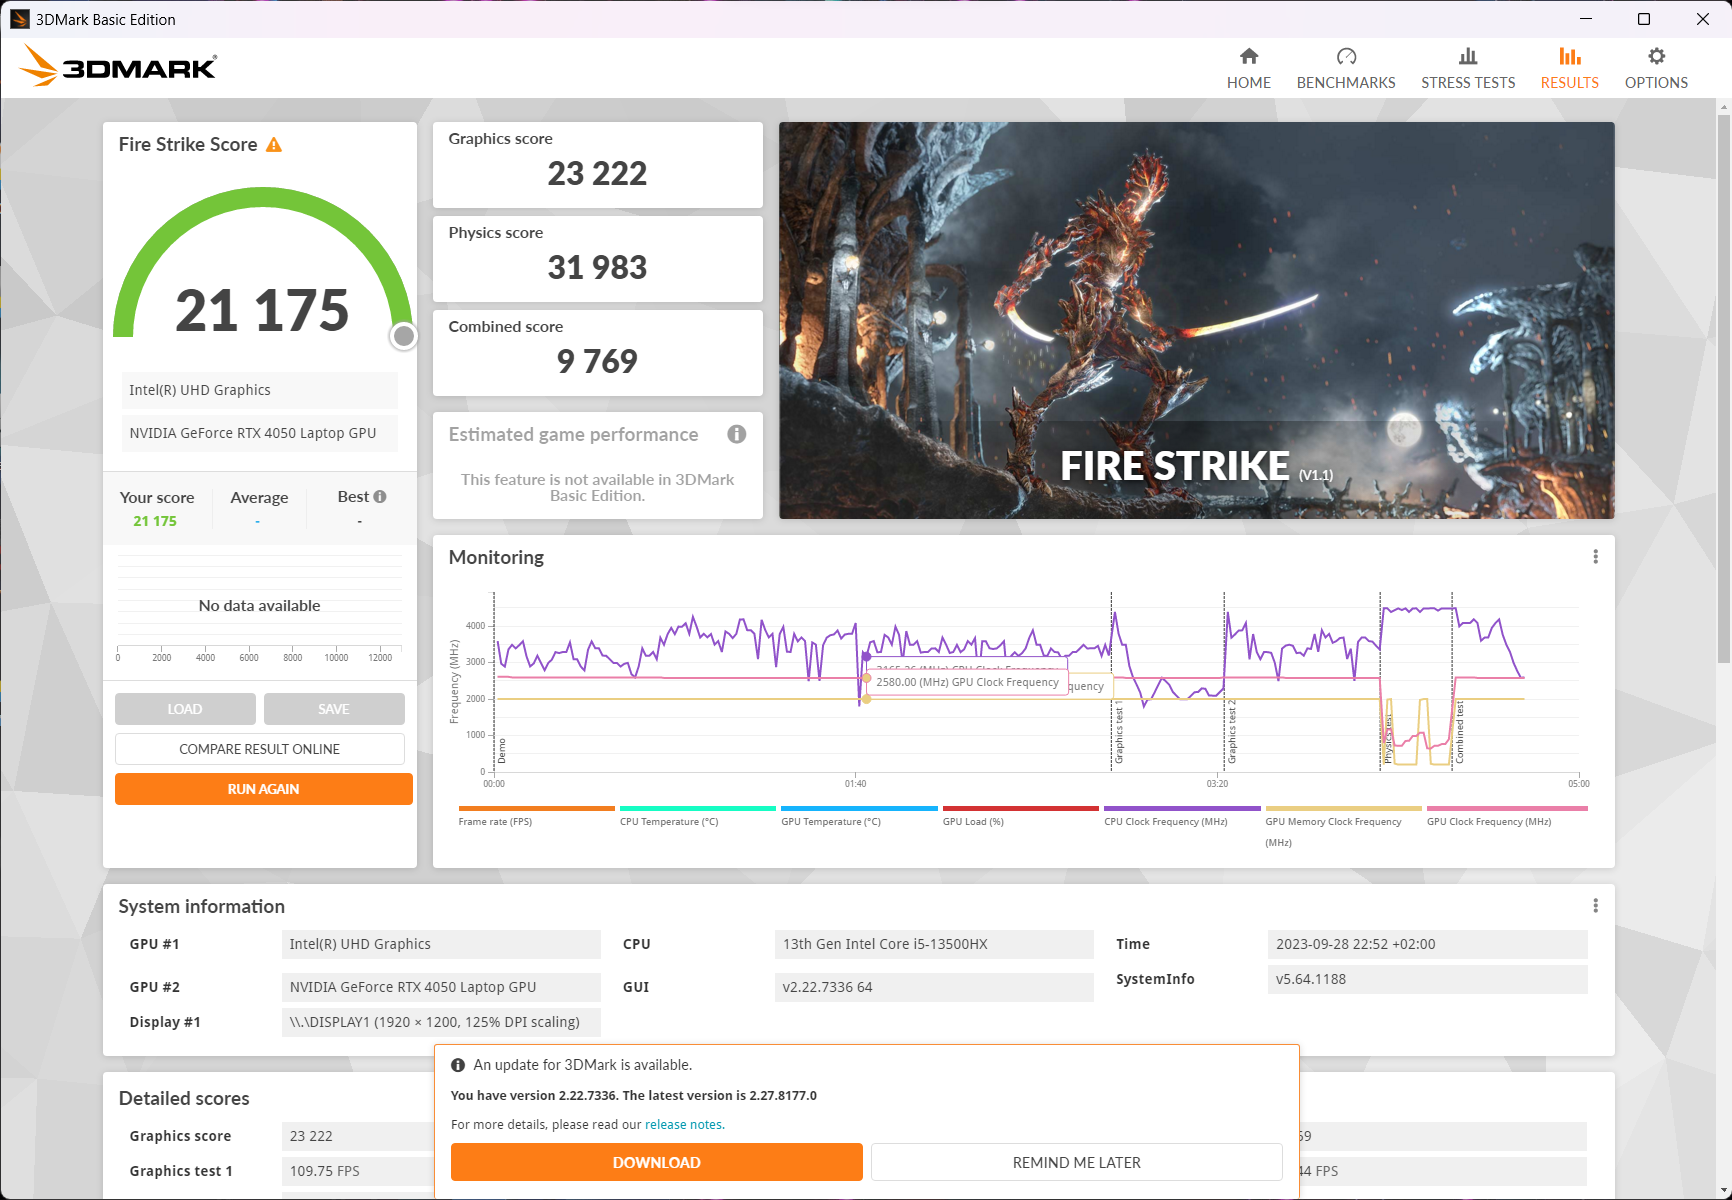
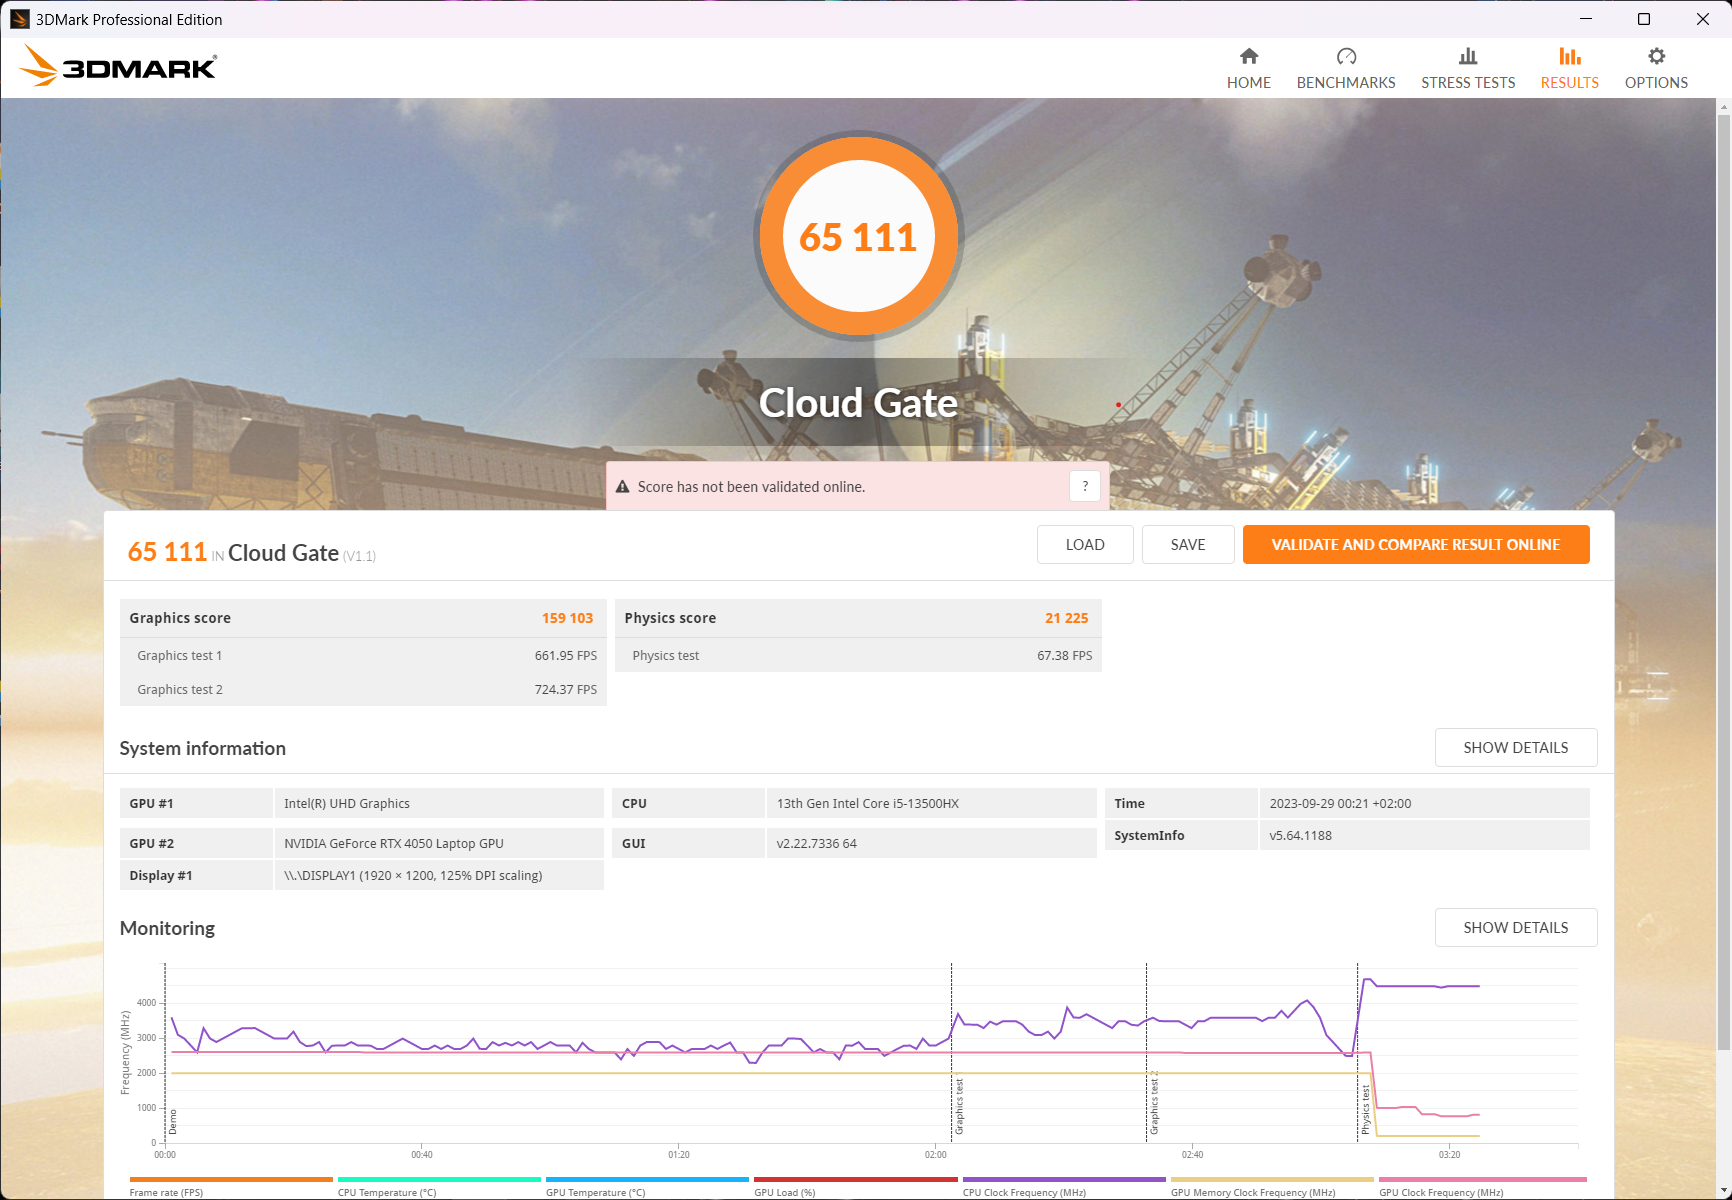
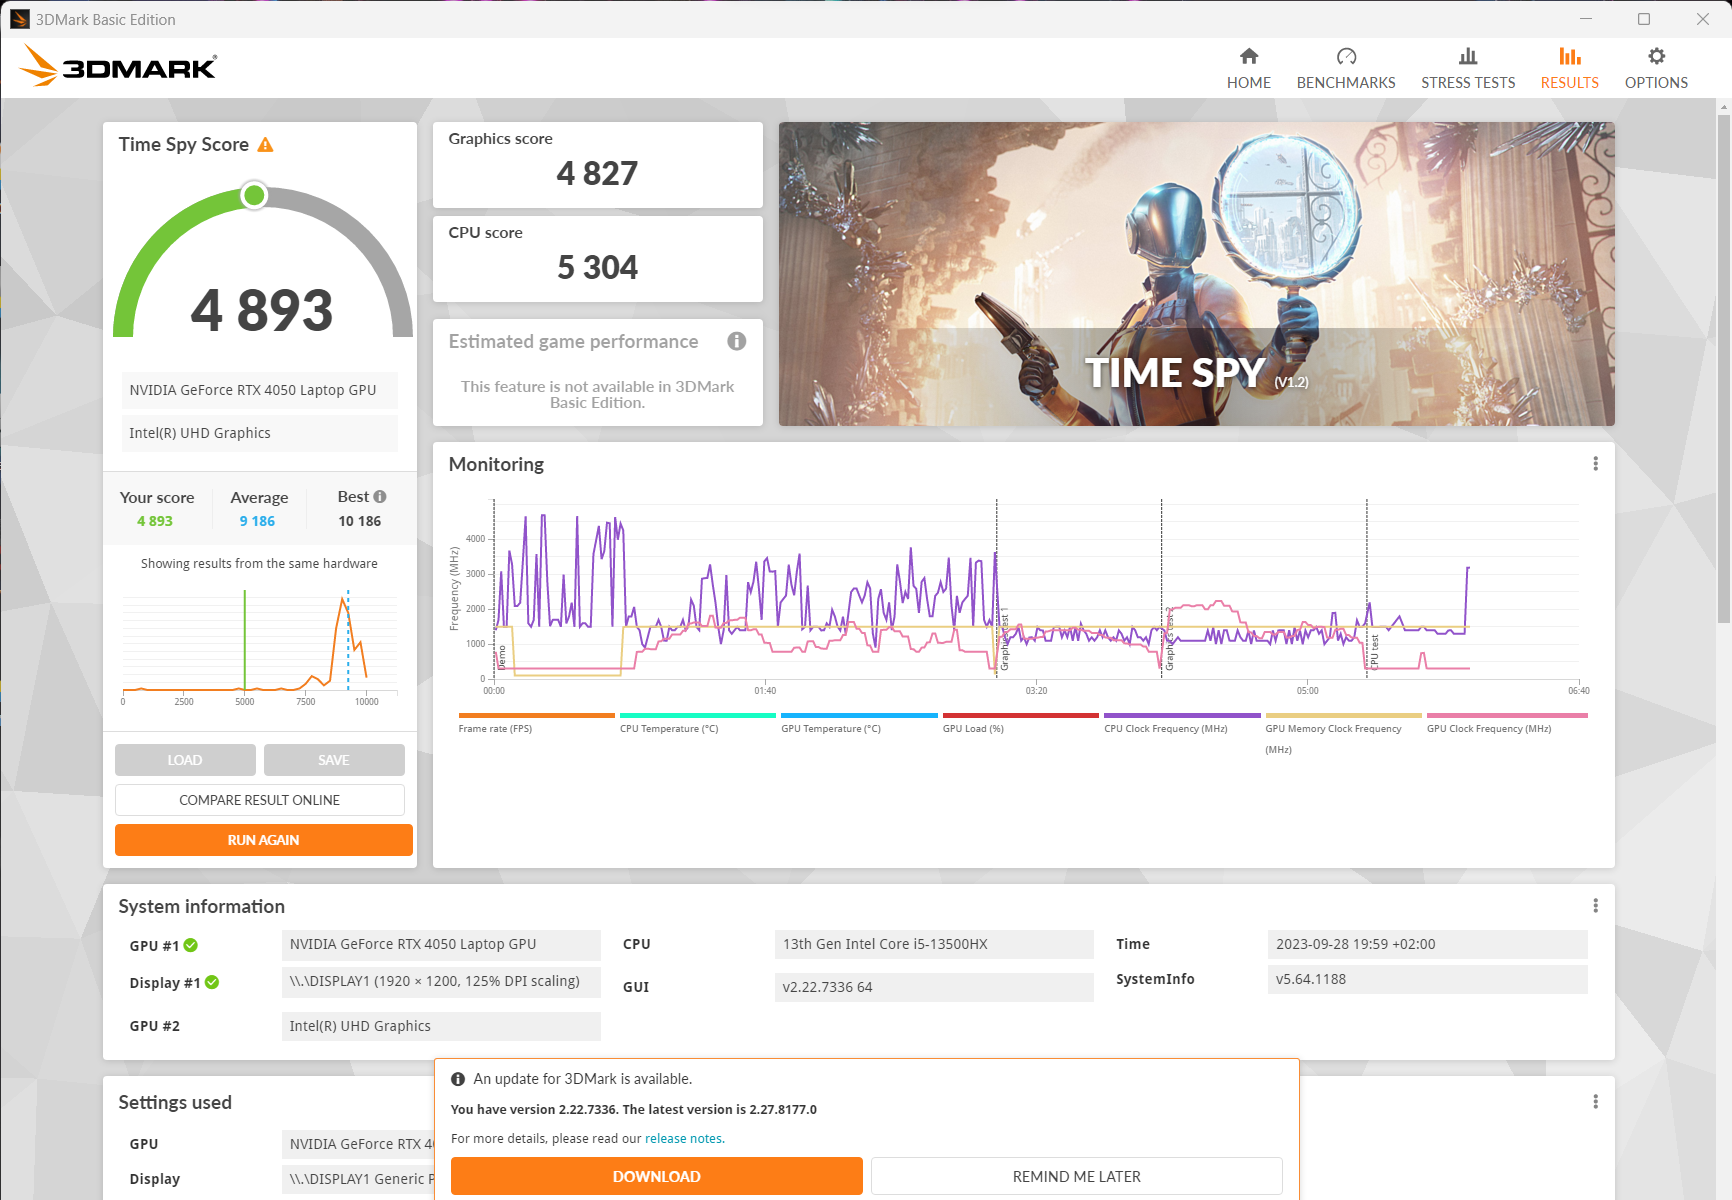
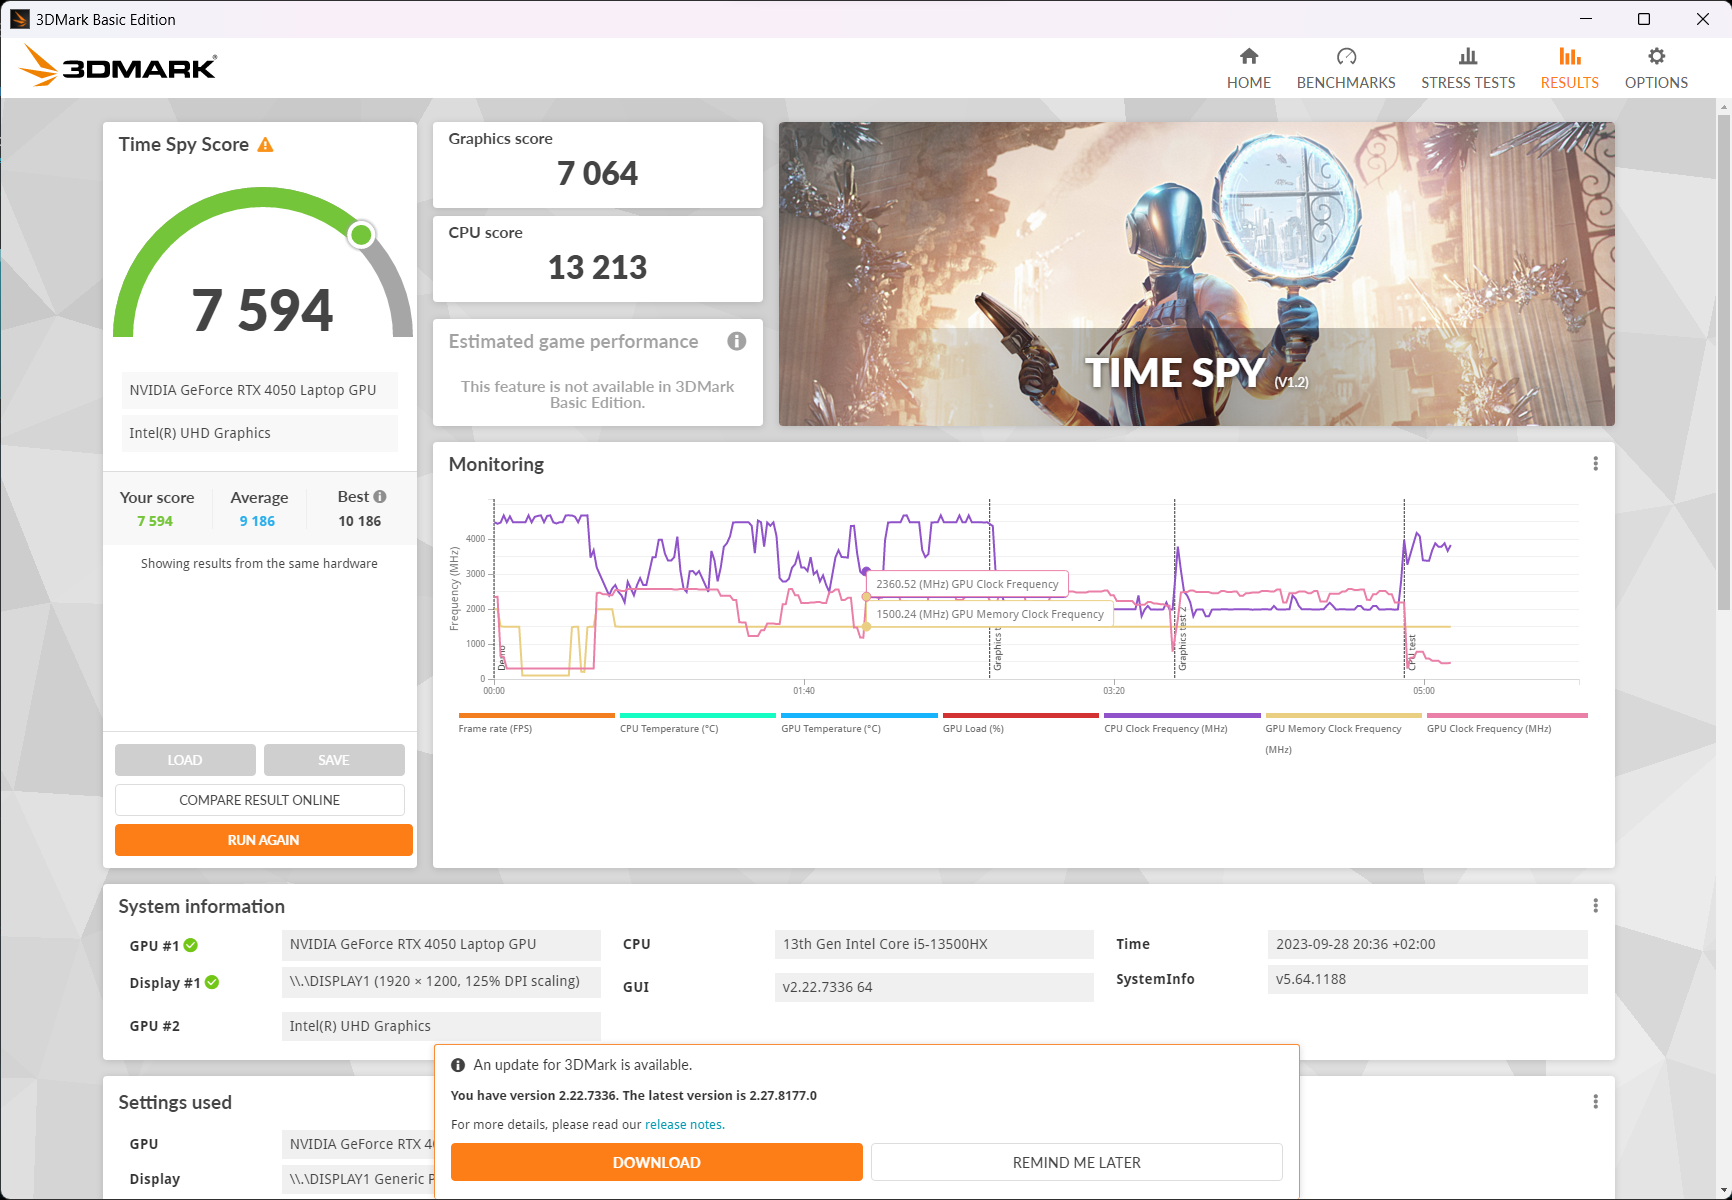
| 3DMark 11 Performance | 29112 punti | |
| 3DMark Cloud Gate Standard Score | 65111 punti | |
| 3DMark Fire Strike Score | 21175 punti | |
| 3DMark Time Spy Score | 9206 punti | |
Aiuto | ||
* ... Meglio usare valori piccoli
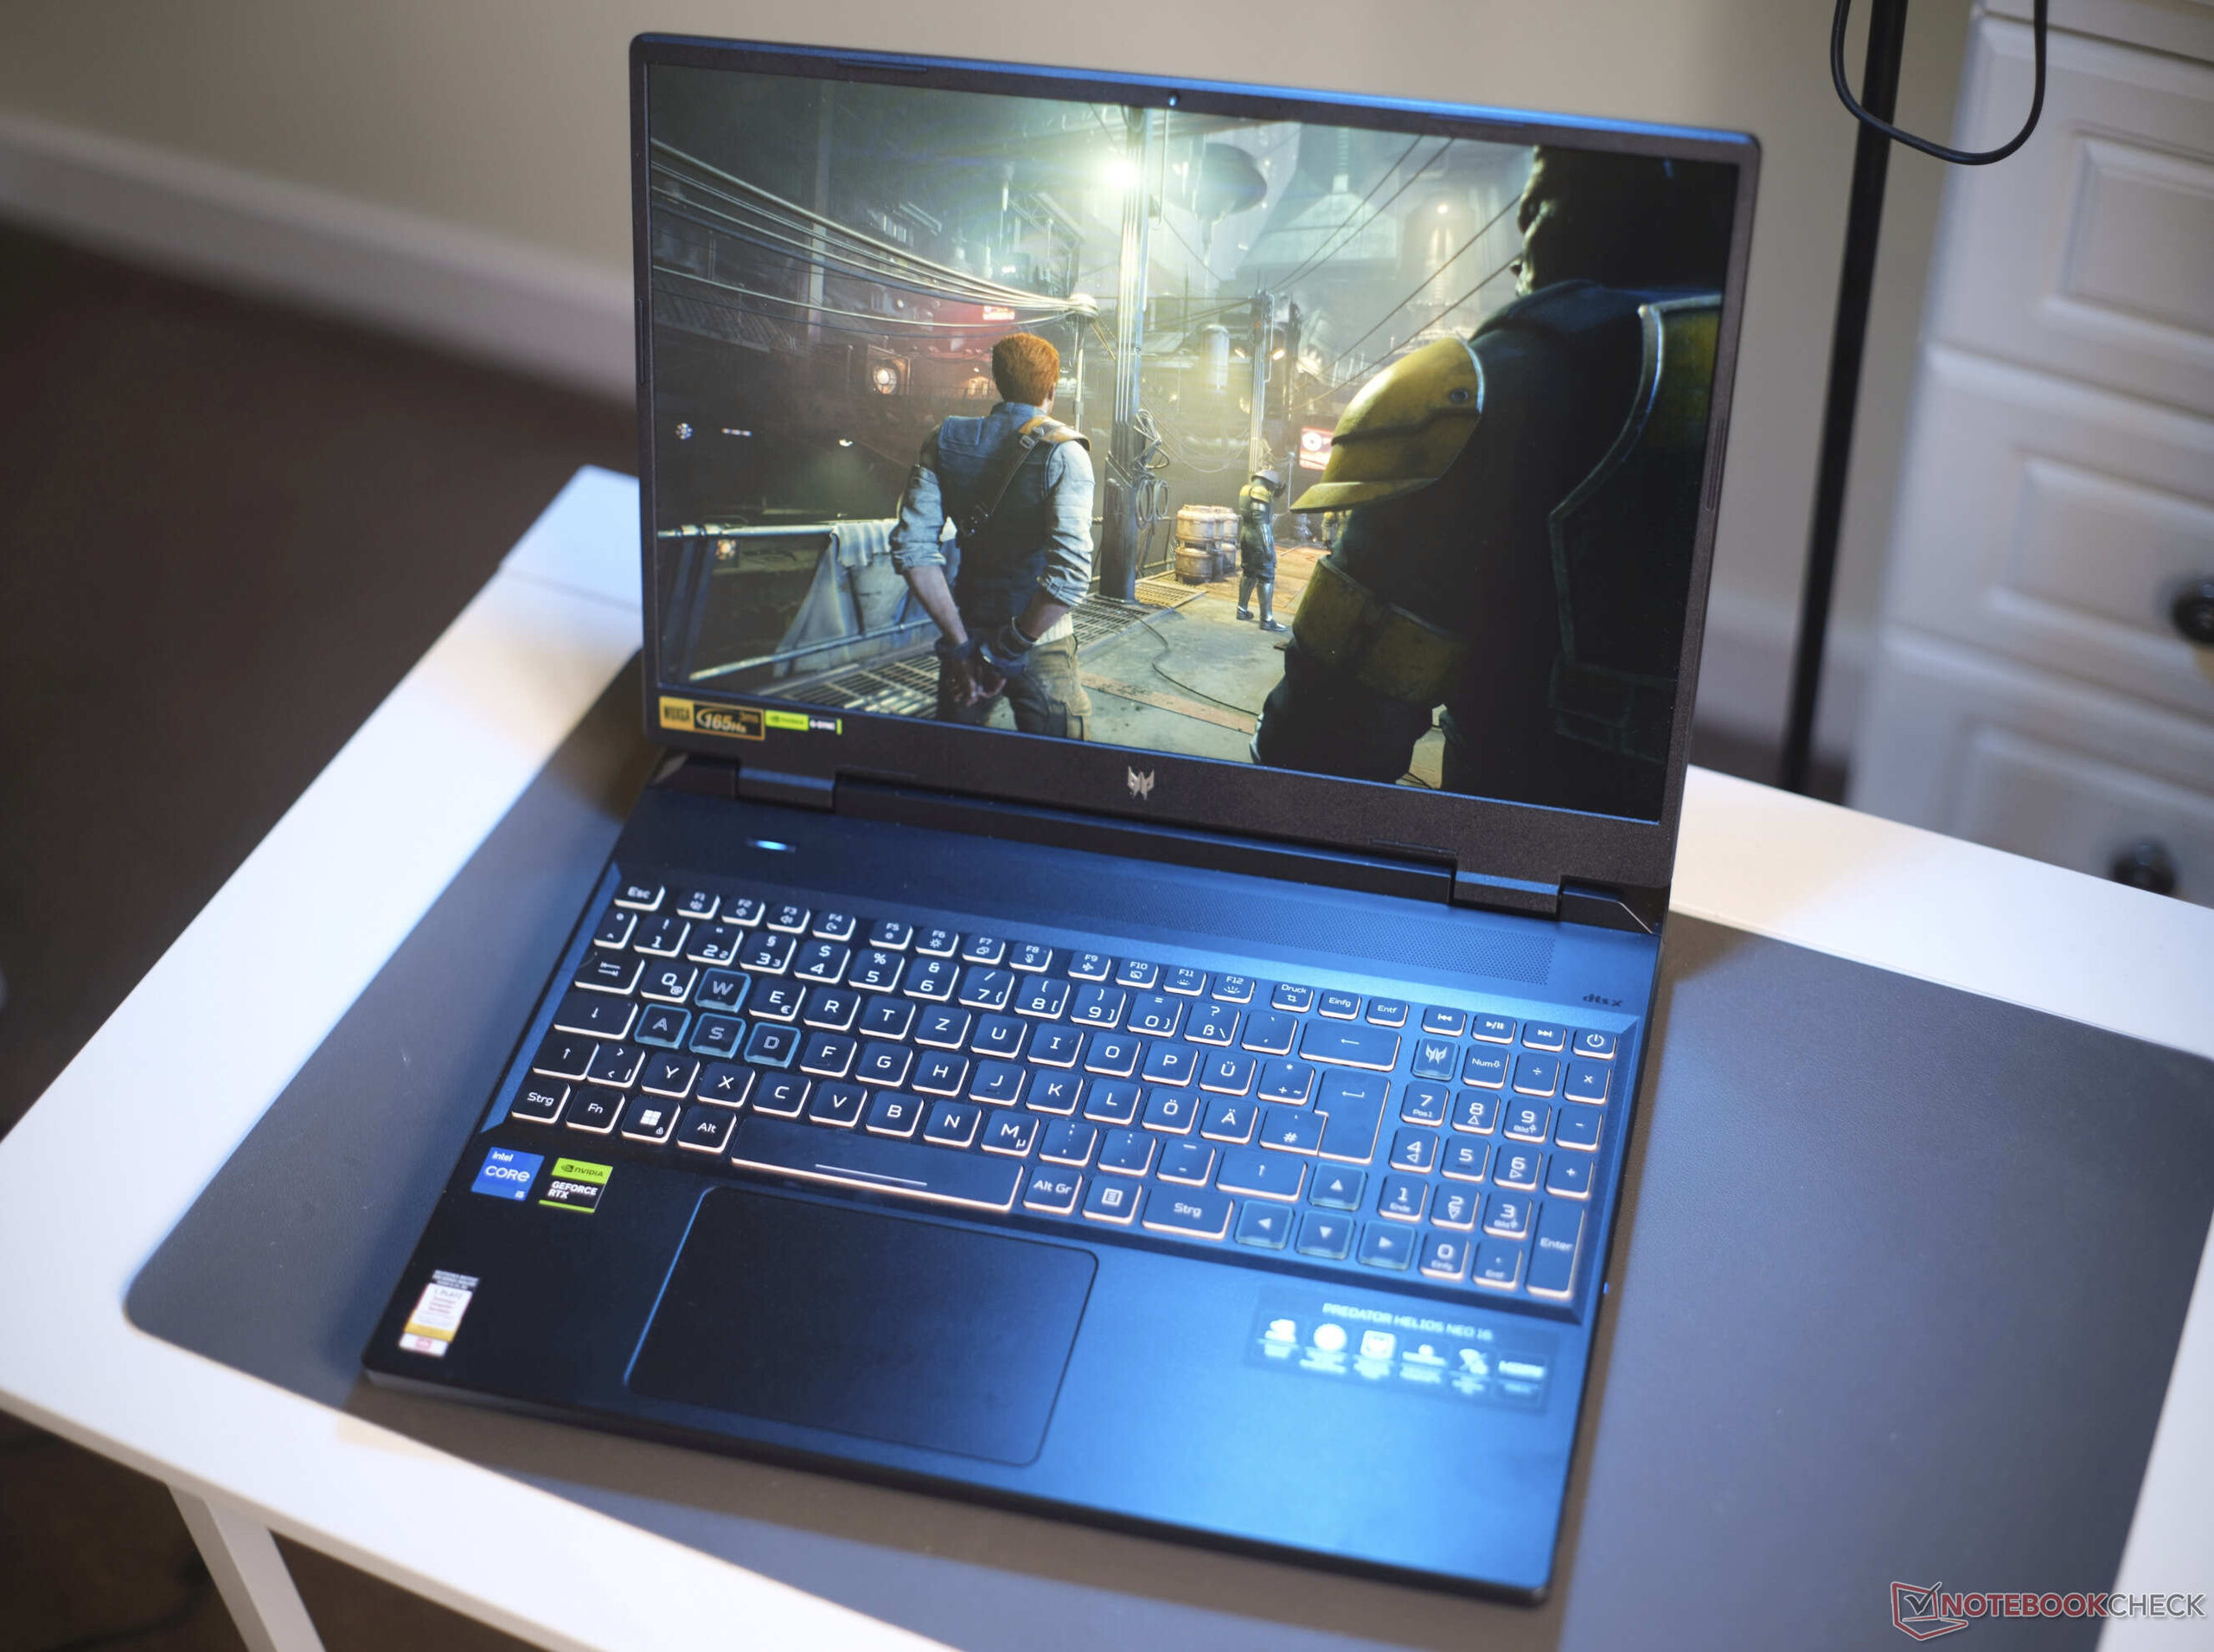
Prestazioni di gioco
Nella nostra classifica delle prestazioni, ilLegion Pro 5 16 è risultato superiore di circa il 7 % rispetto a Helios Neo 16, mentre ilDell G15 5530 e il LenovoLOQ 16 hanno fornito ciascuno circa il 15 % di prestazioni migliori con unaRTX 4060. A seconda del gioco, il divario rispetto alla RTX 4060 è aumentato - fino al 30 % per God of War e al 20 % per Hogwarts Legacy.
Consigliamo di utilizzare la modalità bilanciata, poiché si perde solo il 2-3 % delle prestazioni 3D con un rumore della ventola significativamente più silenzioso. In modalità batteria, le sue prestazioni sono state solo un terzo di quelle della RTX 4060.
| Sons of the Forest | |
| 1920x1080 Ultra Preset AA:T | |
| Lenovo Legion Pro 5 16ARX8 (R5 7645HX, RTX 4050) | |
| Media NVIDIA GeForce RTX 4050 Laptop GPU (61.9 - 76, n=4) | |
| Acer Predator Helios Neo 16 NH.QLTEG.002 | |
| 1920x1080 High Preset AA:T | |
| Lenovo Legion Pro 5 16ARX8 (R5 7645HX, RTX 4050) | |
| Acer Predator Helios Neo 16 NH.QLTEG.002 | |
| Media NVIDIA GeForce RTX 4050 Laptop GPU (63.5 - 76, n=4) | |
Witcher 3 FPS diagram
| basso | medio | alto | ultra | |
|---|---|---|---|---|
| GTA V (2015) | 186.7 | 185.1 | 176.3 | 96.5 |
| The Witcher 3 (2015) | 286 | 154.4 | 81 | |
| Dota 2 Reborn (2015) | 180.9 | 167.9 | 156.4 | 147 |
| Final Fantasy XV Benchmark (2018) | 215 | 118.6 | 84.6 | |
| X-Plane 11.11 (2018) | 152.4 | 134.7 | 106.1 | |
| Strange Brigade (2018) | 476 | 211 | 171.9 | 149.4 |
| F1 2021 (2021) | 291 | 222 | 119.5 | |
| God of War (2022) | 86.8 | 71.1 | 50.1 | |
| Hogwarts Legacy (2023) | 64 | 53.1 | 51.1 | |
| Sons of the Forest (2023) | 78.8 | 74.5 | 70 | |
| Star Wars Jedi Survivor (2023) | 58 | 53.6 | 50.7 | |
| F1 23 (2023) | 262 | 208 | 150.7 | 44.5 |
Emissioni: Metallo liquido all'interno del modello di fascia media Helios Neo 16
Emissioni di rumore
L'Acer Predator Helios Neo 16 rimane per lo più silenzioso in ogni modalità di prestazioni - non solo in modalità idle, ma anche durante la navigazione sul web e l'esecuzione di semplici attività d'ufficio, sebbene la ventola emetta sempre un silenzioso ronzio.
In caso di carico puro della CPU, i livelli di rumore salgono a 37,7 dB(A), che non è comunque eccessivamente fastidioso. La modalità bilanciata è consigliata per i giochi - quando si utilizza questa modalità, le emissioni acustiche del portatile sono quasi piacevoli. Il Legion Pro 5 16invece, raggiunge solo 43,8 dB(A) ex funziona quando si gioca. Anche il Dell G15 5530 è abbastanza silenzioso, soprattutto sotto carico medio. Non siamo riusciti a rilevare alcun rumore elettronico nel nostro modello.
Rumorosità
| Idle |
| 25.9 / 25.9 / 29.3 dB(A) |
| Sotto carico |
| 37.7 / 62.7 dB(A) |
 | ||
30 dB silenzioso 40 dB(A) udibile 50 dB(A) rumoroso |
||
min: | ||
| Acer Predator Helios Neo 16 NH.QLTEG.002 GeForce RTX 4050 Laptop GPU, i5-13500HX, SK hynix HFS512GEJ9X125N | Lenovo Legion Pro 5 16ARX8 (R5 7645HX, RTX 4050) GeForce RTX 4050 Laptop GPU, R5 7645HX, SK hynix PC801 HFS512GEJ9X115N | Lenovo LOQ 16IRH8 GeForce RTX 4060 Laptop GPU, i7-13620H, Solidigm SSDPFINW512GZL | HP Victus 16-r0076TX GeForce RTX 4050 Laptop GPU, i5-13500HX, SK hynix PC801 HFS512GEJ9X101N BF | Dell G15 5530 GeForce RTX 4060 Laptop GPU, i7-13650HX, SSTC CL4-3D512-Q11 | Schenker XMG Apex 15 (Late 23) GeForce RTX 4050 Laptop GPU, R7 7840HS, Samsung 990 Pro 1 TB | |
|---|---|---|---|---|---|---|
| Noise | 13% | 2% | 10% | 12% | 1% | |
| off /ambiente * (dB) | 25.9 | 23 11% | 23 11% | 21.57 17% | 20.41 21% | 24 7% |
| Idle Minimum * (dB) | 25.9 | 23 11% | 23 11% | 23.68 9% | 26.85 -4% | 25 3% |
| Idle Average * (dB) | 25.9 | 23 11% | 23 11% | 23.68 9% | 26.85 -4% | 29 -12% |
| Idle Maximum * (dB) | 29.3 | 24.42 17% | 27.66 6% | 23.68 19% | 26.85 8% | 33 -13% |
| Load Average * (dB) | 37.7 | 34.94 7% | 53.62 -42% | 39.44 -5% | 27.65 27% | 36 5% |
| Load Maximum * (dB) | 62.7 | 50 20% | 53.5 15% | 55.37 12% | 47.86 24% | 53 15% |
| Witcher 3 ultra * (dB) | 43.79 | 53.5 | 55.4 | 47.9 | 48 |
* ... Meglio usare valori piccoli
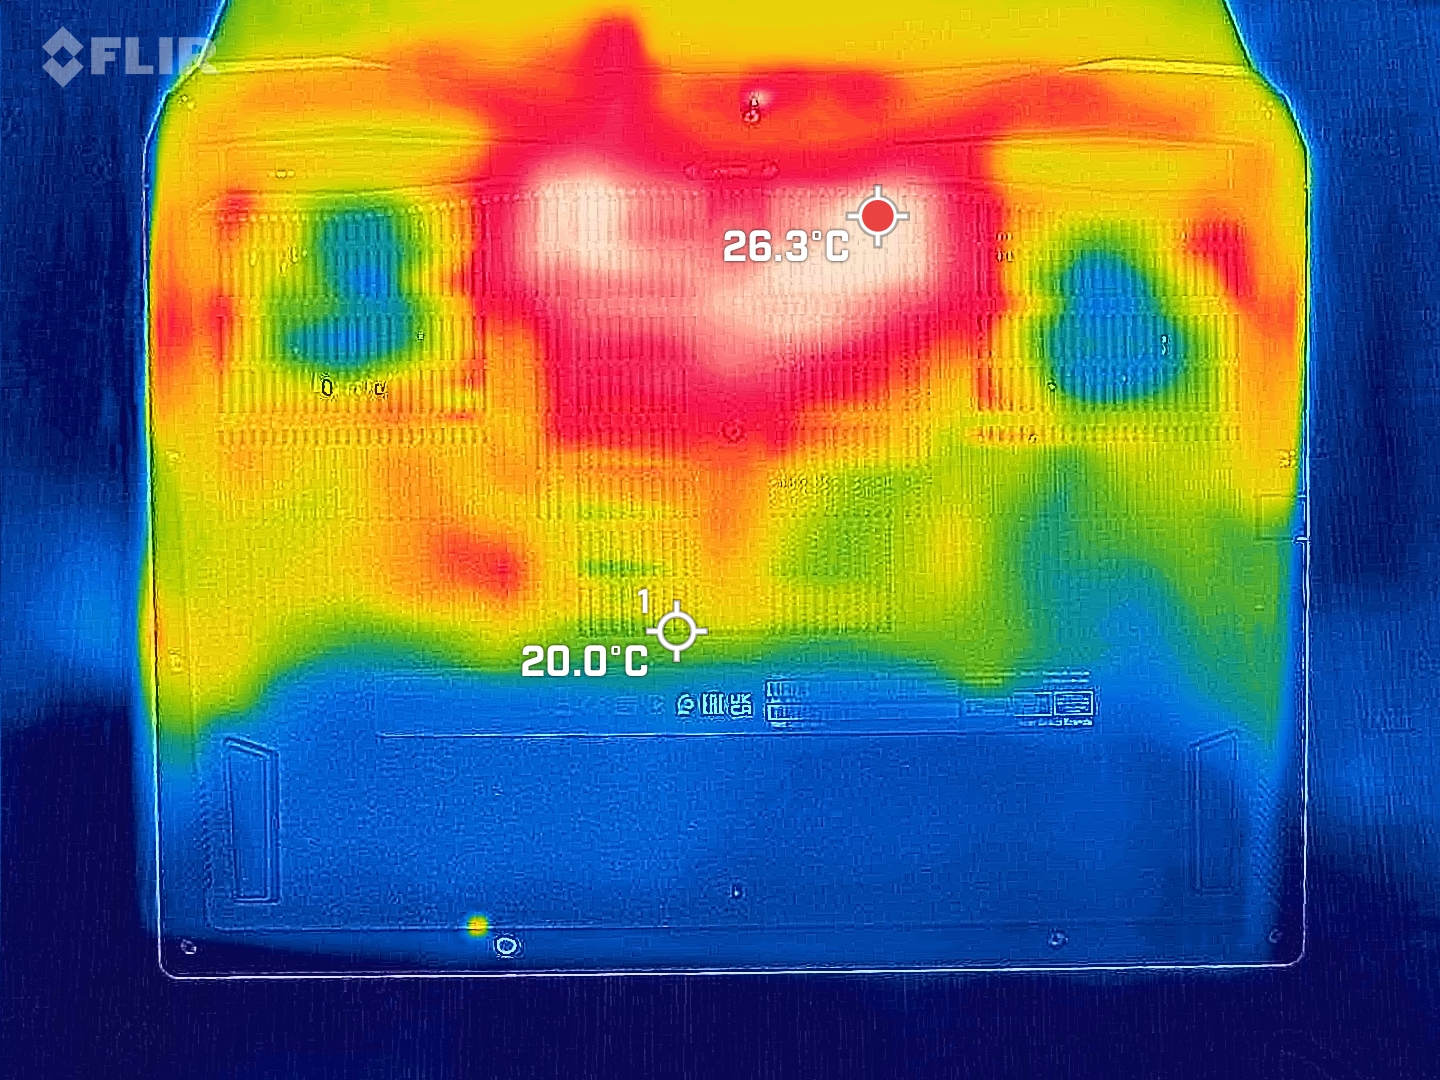
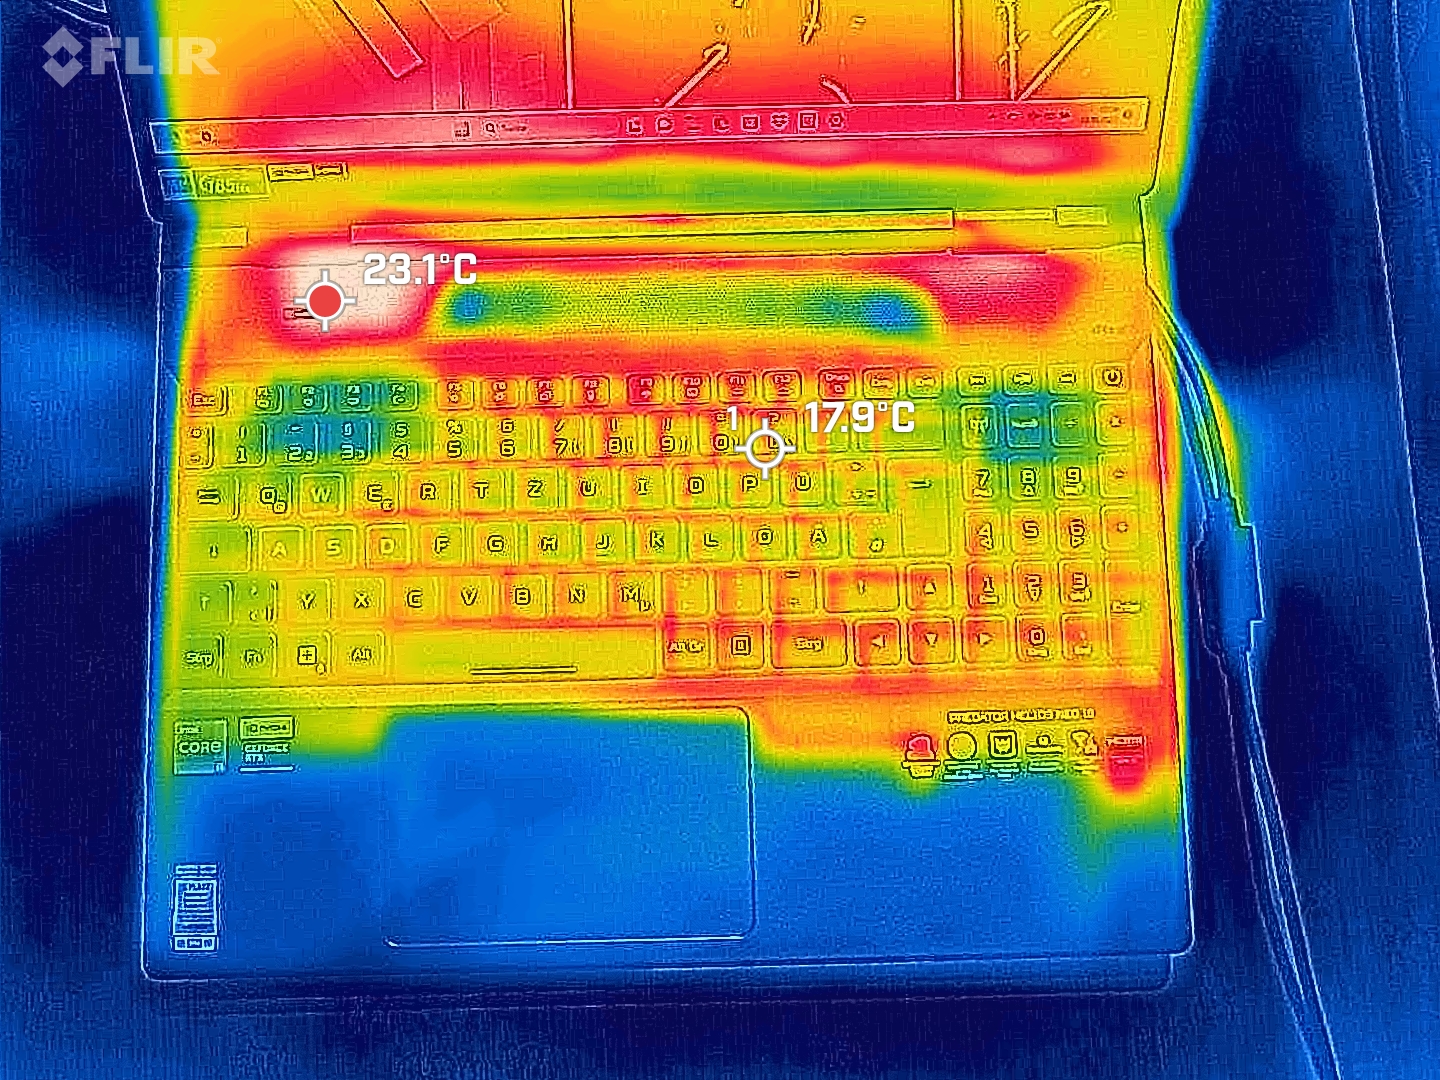
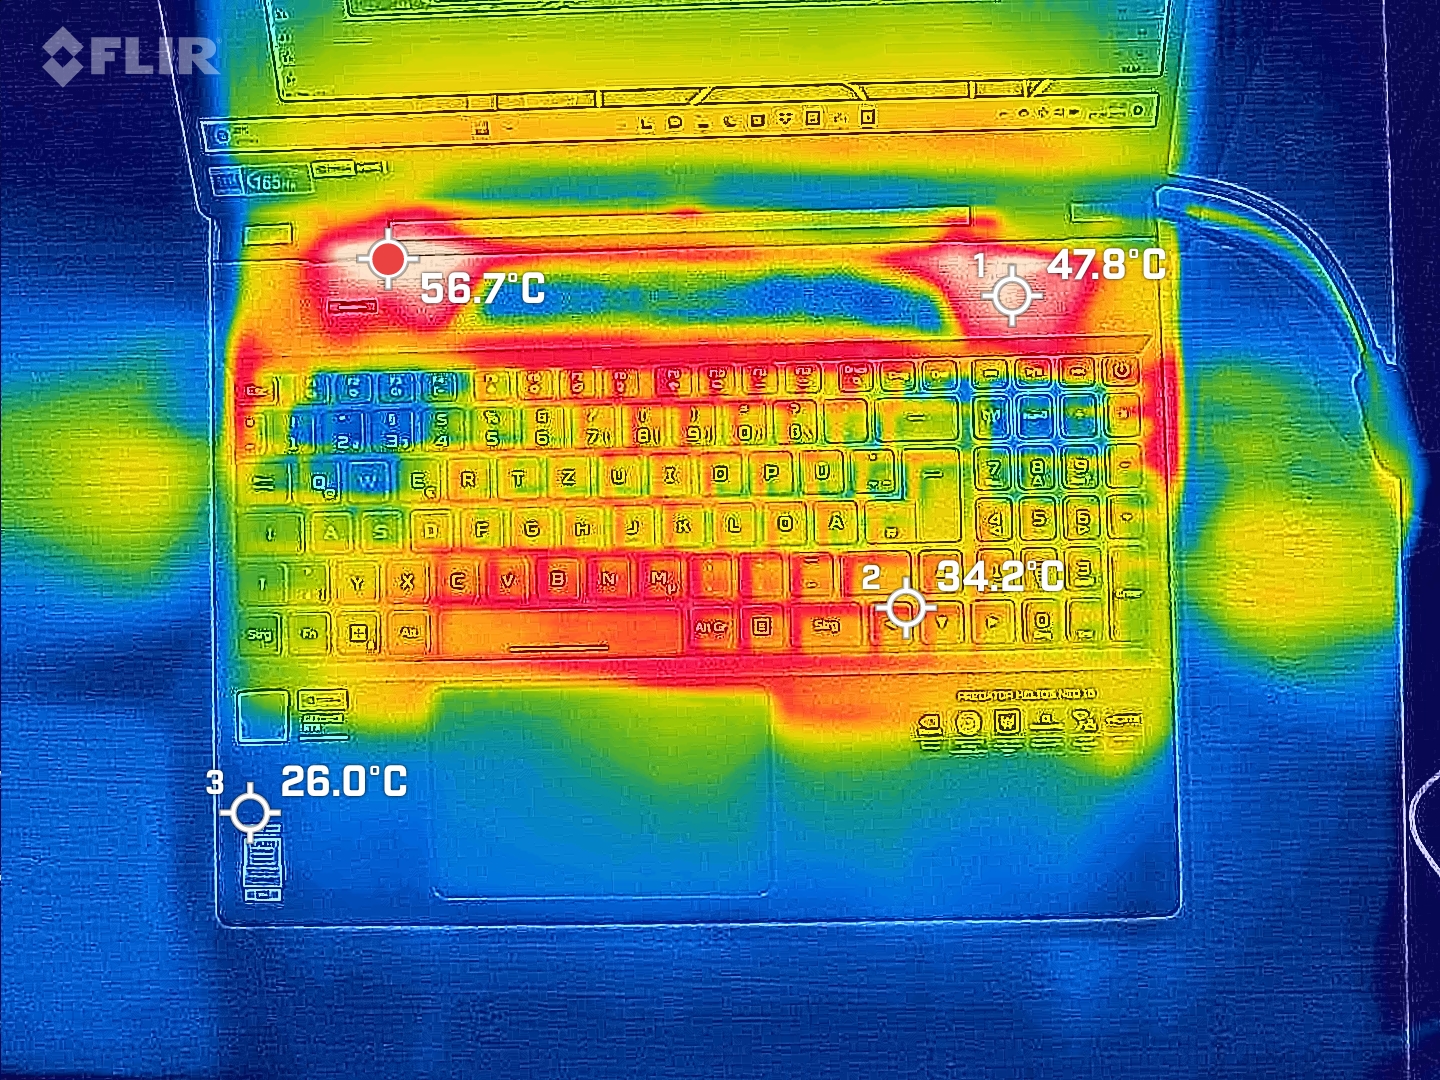
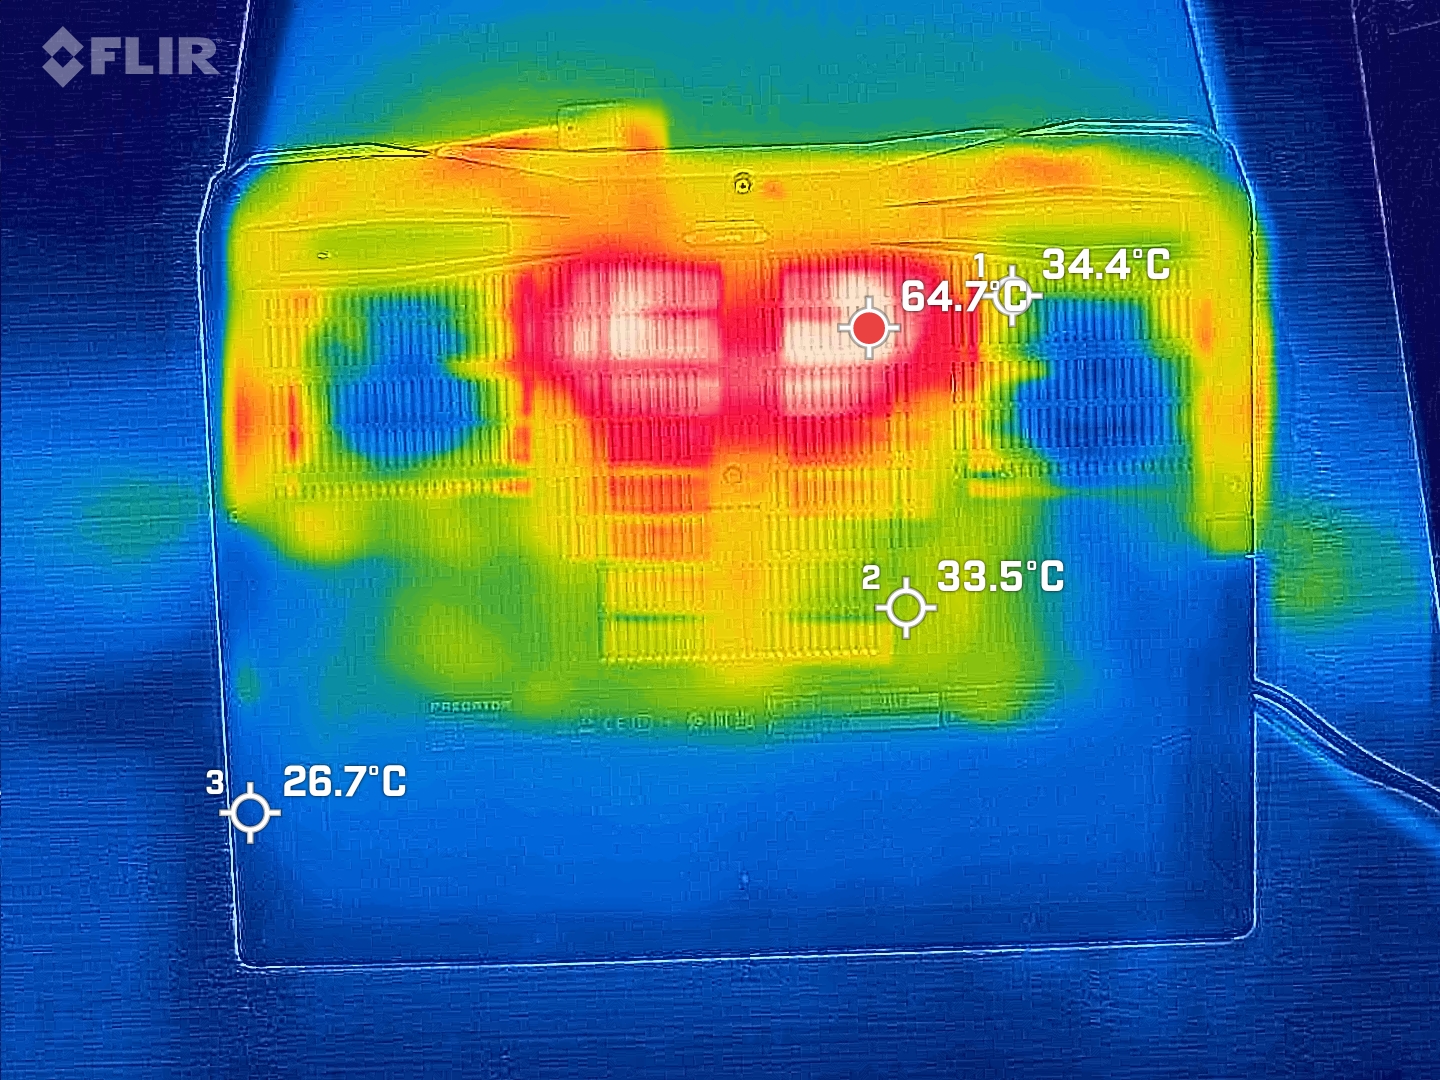
Temperatura
Nel complesso, il portatile da gioco di Acer rimane abbastanza fresco, con le sue superfici che per lo più raggiungono solo i 25-35 °C a pieno carico. Tuttavia, abbiamo notato alcuni punti caldi con temperature fino a 56 °C: a sinistra sopra la tastiera e sul retro nella parte superiore centrale. Quest'ultimo punto potrebbe risultare scomodo quando si gioca con il portatile posizionato sulle ginocchia, ad esempio.
(-) La temperatura massima sul lato superiore è di 55.7 °C / 132 F, rispetto alla media di 40.4 °C / 105 F, che varia da 21.2 a 68.8 °C per questa classe Gaming.
(-) Il lato inferiore si riscalda fino ad un massimo di 55 °C / 131 F, rispetto alla media di 43.2 °C / 110 F
(+) In idle, la temperatura media del lato superiore è di 24.1 °C / 75 F, rispetto alla media deld ispositivo di 33.9 °C / 93 F.
(+) I poggiapolsi e il touchpad sono piu' freddi della temperatura della pelle con un massimo di 26.1 °C / 79 F e sono quindi freddi al tatto.
(+) La temperatura media della zona del palmo della mano di dispositivi simili e'stata di 28.8 °C / 83.8 F (+2.7 °C / 4.8 F).
| Acer Predator Helios Neo 16 NH.QLTEG.002 Intel Core i5-13500HX, NVIDIA GeForce RTX 4050 Laptop GPU | Lenovo Legion Pro 5 16ARX8 (R5 7645HX, RTX 4050) AMD Ryzen 5 7645HX, NVIDIA GeForce RTX 4050 Laptop GPU | Lenovo LOQ 16IRH8 Intel Core i7-13620H, NVIDIA GeForce RTX 4060 Laptop GPU | Schenker XMG Apex 15 (Late 23) AMD Ryzen 7 7840HS, NVIDIA GeForce RTX 4050 Laptop GPU | HP Victus 16-r0076TX Intel Core i5-13500HX, NVIDIA GeForce RTX 4050 Laptop GPU | Dell G15 5530 Intel Core i7-13650HX, NVIDIA GeForce RTX 4060 Laptop GPU | |
|---|---|---|---|---|---|---|
| Heat | -15% | -2% | -7% | -0% | -16% | |
| Maximum Upper Side * (°C) | 55.7 | 45 19% | 48 14% | 52 7% | 48 14% | 54 3% |
| Maximum Bottom * (°C) | 55 | 54 2% | 59 -7% | 47 15% | 48 13% | 62.2 -13% |
| Idle Upper Side * (°C) | 26 | 36 -38% | 28 -8% | 33 -27% | 29.6 -14% | 33.4 -28% |
| Idle Bottom * (°C) | 26.6 | 38 -43% | 28 -5% | 33 -24% | 30.2 -14% | 33.4 -26% |
* ... Meglio usare valori piccoli
Test da sforzo
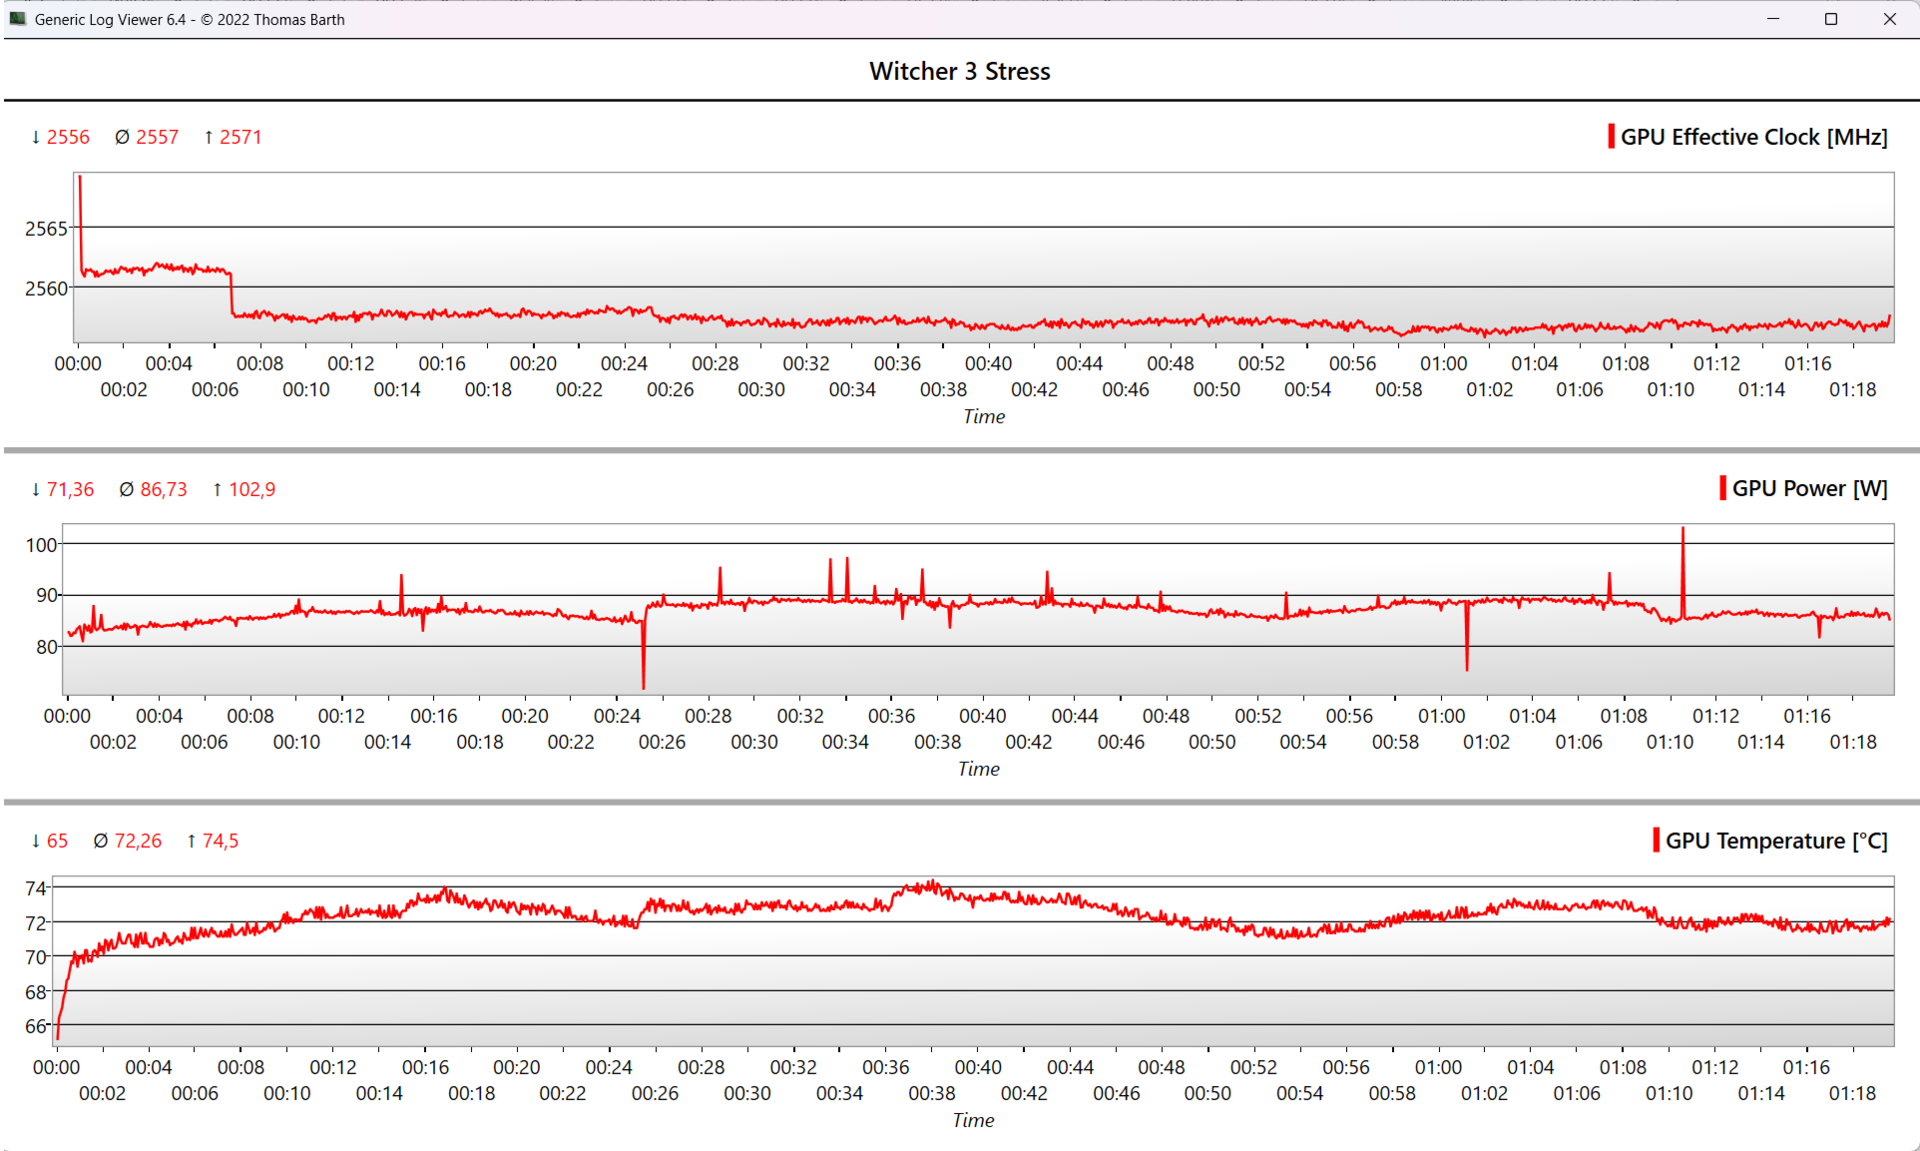
Durante il nostro test di stress combinato (FurMark + Prime95), la frequenza di clock dei core P è scesa da 4 GHz a soli 2 GHz dopo un minuto e ha iniziato a fluttuare intorno ai 2,25 GHz dal minuto 5, che è superiore al clock di base di 1,8 GHz.
La CPU ha raggiunto i 92 °C, ma ha fluttuato così tanto che anche dopo un'ora è scesa occasionalmente sotto gli 80 °C. Il consumo medio di energia è di 58 watt, mentre il modelloHelios 16 (non-Neo) con uni7-13700HX assorbe 100 watt, nonostante abbia (quasi) lo stesso sistema di raffreddamento. La frequenza di clock della GPU è passata rapidamente da 2.560 MHz (clock massimo) a circa 2.350 MHz e ha raggiunto temperature fino a 87 °C.
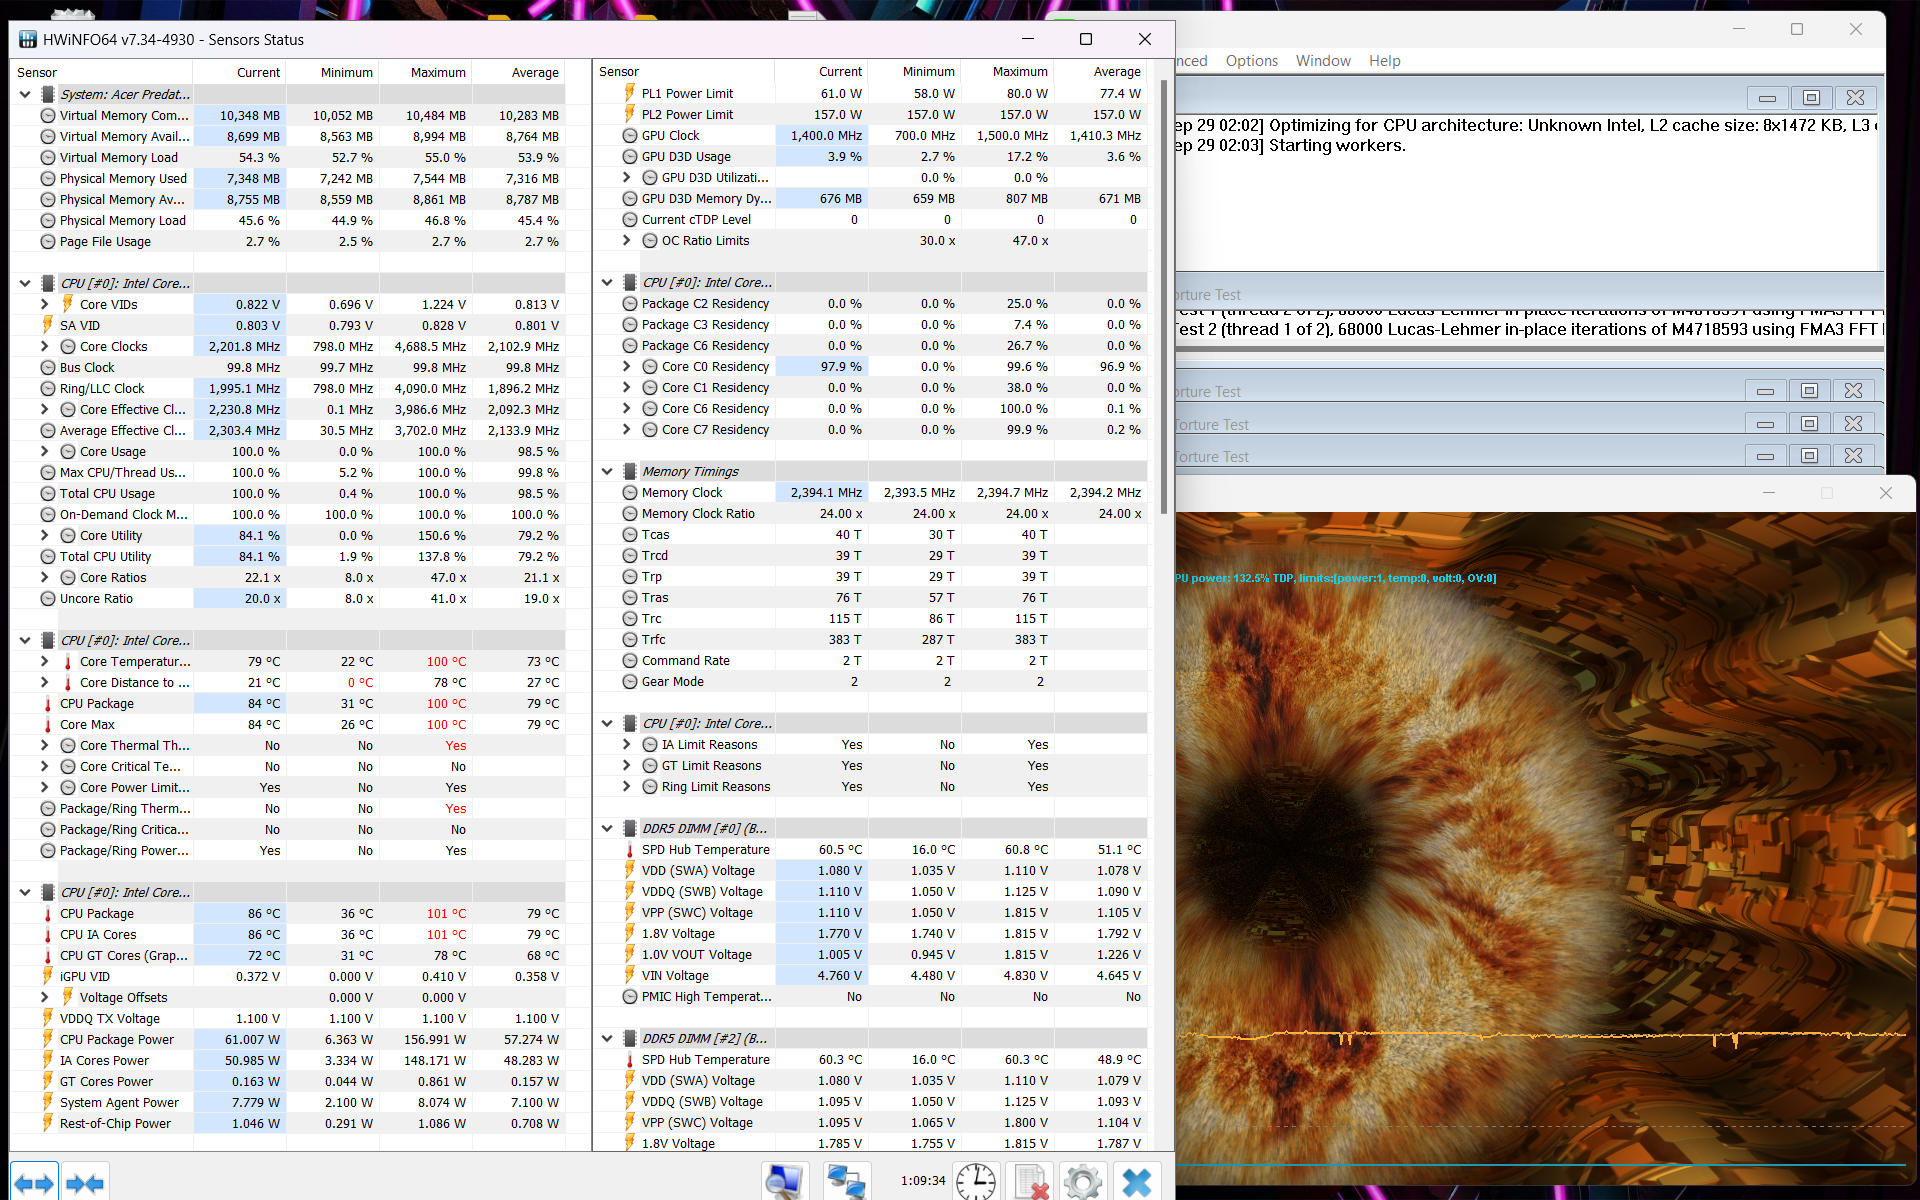
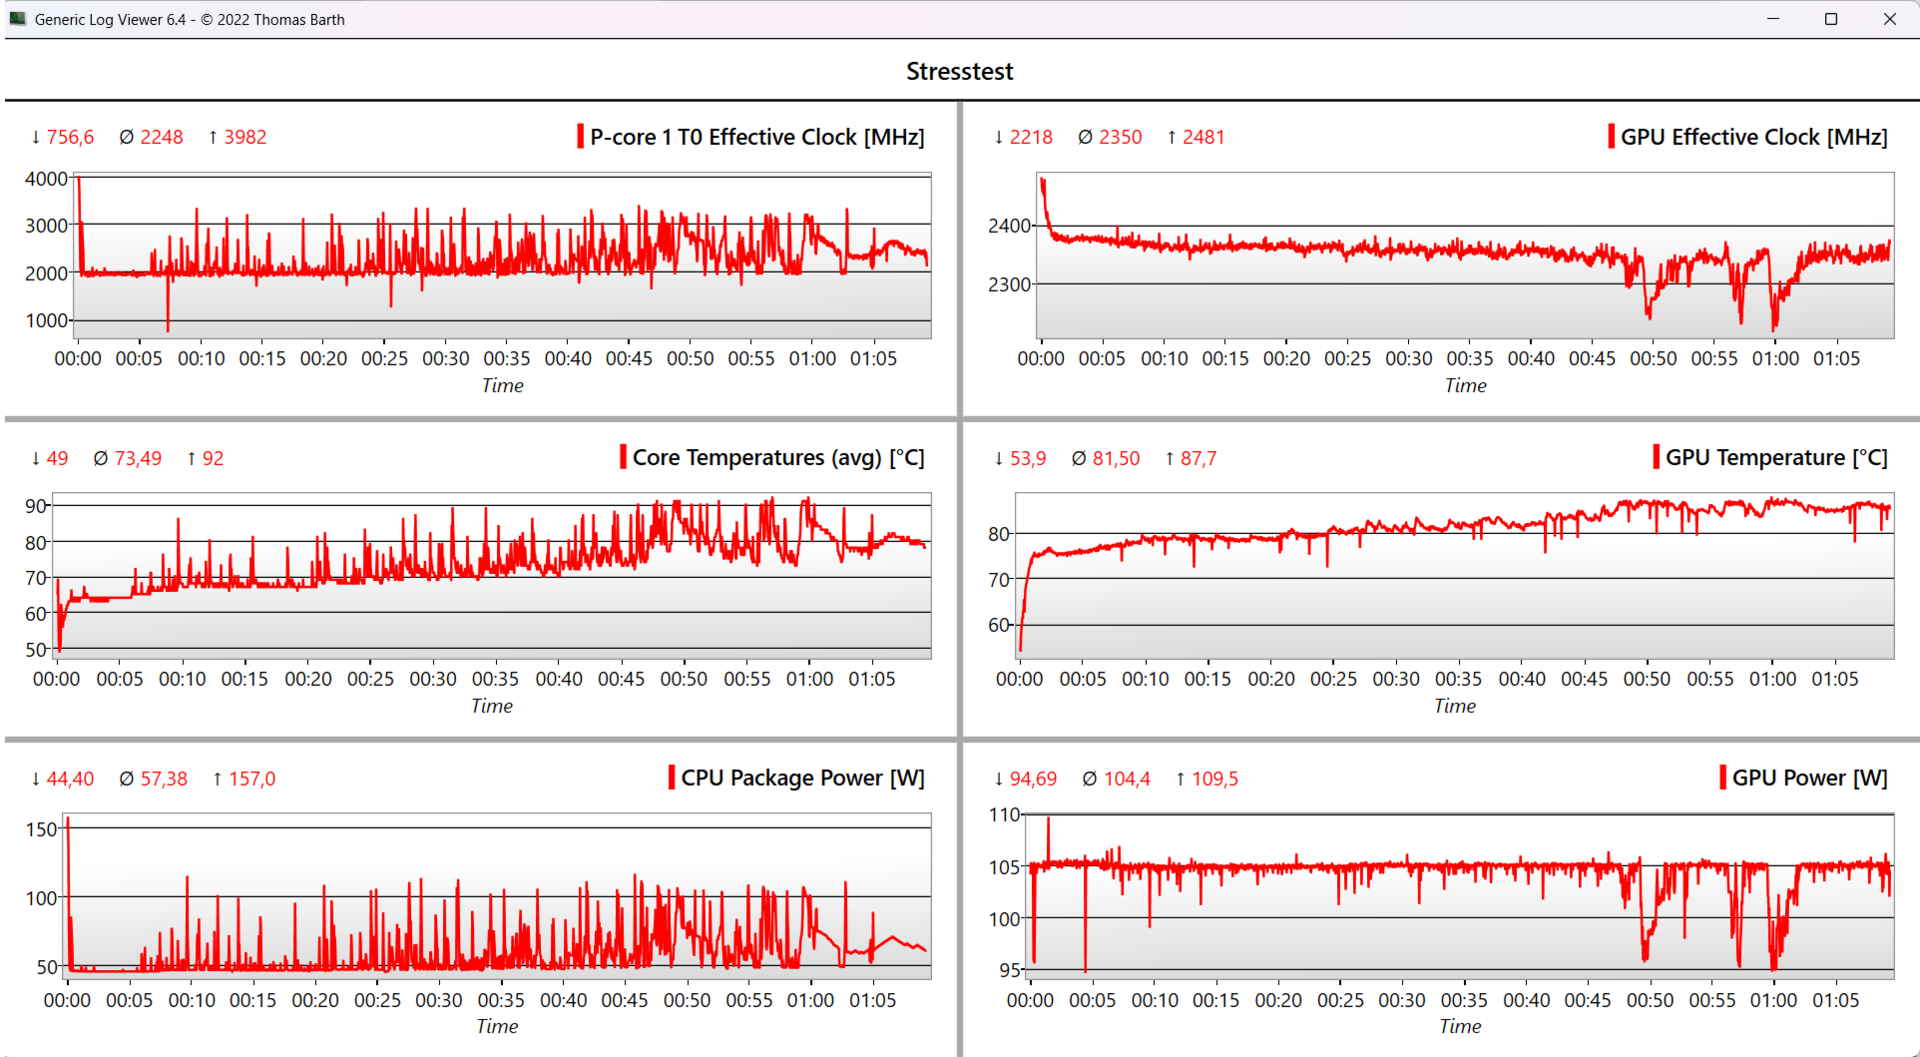
| Clock della CPU (GHz) | Clock della GPU (MHz) | Temperatura media della CPU (°C) | Temperatura media della GPU (°C) | |
| Prime95+FurMark | 2,25 | 2.350 | 74 | 82 |
Altoparlanti
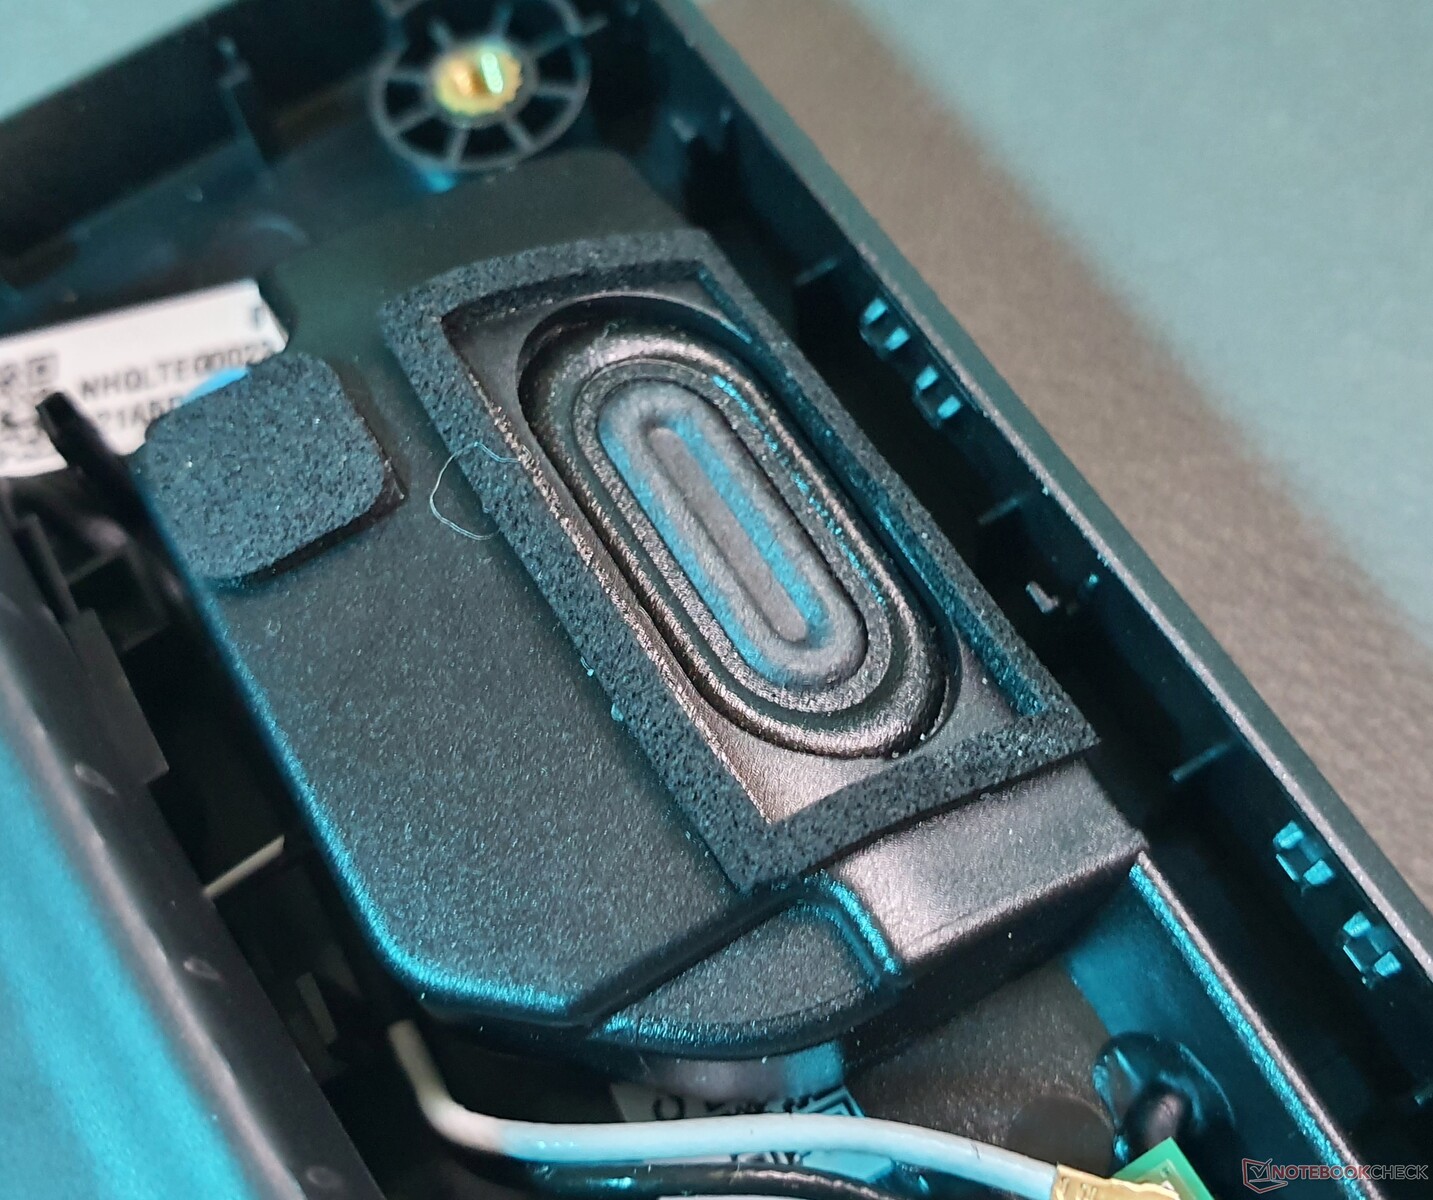
Gli altoparlanti stereo da 2 watt rivolti verso il basso del dispositivo producono medi e alti equilibrati, ma i bassi sono quasi del tutto assenti. Anche il volume massimo di 78,5 dB(A) è nella media. Anche i portatili da gioco nel nostro campo di confronto non offrono un suono migliore.
Per un'esperienza sonora coinvolgente, si consiglia di utilizzare cuffie o sistemi audio collegati tramite jack audio o Bluetooth.
Acer Predator Helios Neo 16 NH.QLTEG.002 analisi audio
(±) | potenza degli altiparlanti media ma buona (78.5 dB)
Bassi 100 - 315 Hz
(-) | quasi nessun basso - in media 24.6% inferiori alla media
(±) | la linearità dei bassi è media (12.3% delta rispetto alla precedente frequenza)
Medi 400 - 2000 Hz
(+) | medi bilanciati - solo only 2.4% rispetto alla media
(+) | medi lineari (5.7% delta rispetto alla precedente frequenza)
Alti 2 - 16 kHz
(+) | Alti bilanciati - appena 1.9% dalla media
(+) | alti lineari (3.3% delta rispetto alla precedente frequenza)
Nel complesso 100 - 16.000 Hz
(±) | la linearità complessiva del suono è media (17.4% di differenza rispetto alla media
Rispetto alla stessa classe
» 48% di tutti i dispositivi testati in questa classe è stato migliore, 12% simile, 40% peggiore
» Il migliore ha avuto un delta di 6%, medio di 18%, peggiore di 132%
Rispetto a tutti i dispositivi testati
» 33% di tutti i dispositivi testati in questa classe è stato migliore, 8% similare, 58% peggiore
» Il migliore ha avuto un delta di 4%, medio di 23%, peggiore di 134%
Lenovo Legion Pro 5 16ARX8 (R5 7645HX, RTX 4050) analisi audio
(±) | potenza degli altiparlanti media ma buona (78.06 dB)
Bassi 100 - 315 Hz
(-) | quasi nessun basso - in media 20.9% inferiori alla media
(±) | la linearità dei bassi è media (11.7% delta rispetto alla precedente frequenza)
Medi 400 - 2000 Hz
(±) | medi elevati - circa 6.8% superiore alla media
(+) | medi lineari (5.7% delta rispetto alla precedente frequenza)
Alti 2 - 16 kHz
(+) | Alti bilanciati - appena 2.8% dalla media
(±) | la linearità degli alti è media (7.5% delta rispetto alla precedente frequenza)
Nel complesso 100 - 16.000 Hz
(±) | la linearità complessiva del suono è media (21.5% di differenza rispetto alla media
Rispetto alla stessa classe
» 77% di tutti i dispositivi testati in questa classe è stato migliore, 5% simile, 18% peggiore
» Il migliore ha avuto un delta di 6%, medio di 18%, peggiore di 132%
Rispetto a tutti i dispositivi testati
» 61% di tutti i dispositivi testati in questa classe è stato migliore, 7% similare, 32% peggiore
» Il migliore ha avuto un delta di 4%, medio di 23%, peggiore di 134%
Gestione dell'energia: La CPU di classe desktop richiede il suo tributo al portatile da gioco
Consumo di energia
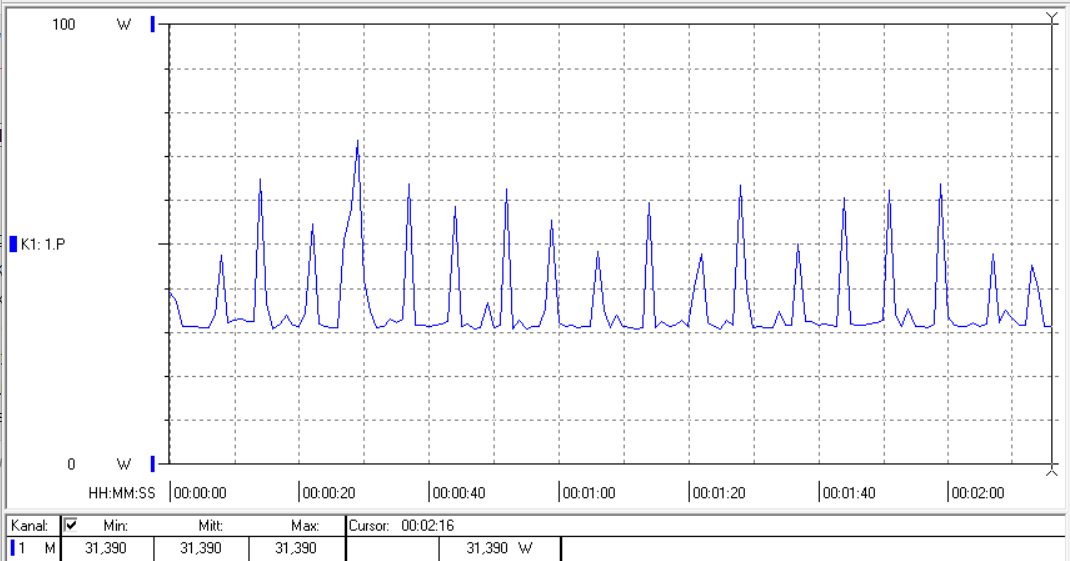
Il consumo energetico inattivo di 15,5 watt del portatile da gioco non sorprende, vista la CPU installata di classe desktop. Altri sistemi HX (TDP di 55 watt), sia Intel che AMD, spesso consumano fino a 20 watt. I sistemi AMD HS (TDP di 35 watt), come il modelloXMG Apex 15 (che consuma solo 10 watt in modalità idle) hanno spesso un vantaggio corrispondente.
Un consumo di 145 watt durante il gioco è relativamente basso, ma non se si considera che laRTX 4050 raggiunge già il suo clock massimo a ~87 watt. Solo nel test di stress non quotidiano ha raggiunto un picco di 239 watt, che l'alimentatore da 230 watt può ancora gestire.
| Off / Standby | |
| Idle | |
| Sotto carico |
|
Leggenda:
min: | |
| Acer Predator Helios Neo 16 NH.QLTEG.002 i5-13500HX, GeForce RTX 4050 Laptop GPU, SK hynix HFS512GEJ9X125N, IPS, 1920x1200, 16" | Lenovo Legion Pro 5 16ARX8 (R5 7645HX, RTX 4050) R5 7645HX, GeForce RTX 4050 Laptop GPU, SK hynix PC801 HFS512GEJ9X115N, IPS, 2560x1600, 16" | Lenovo LOQ 16IRH8 i7-13620H, GeForce RTX 4060 Laptop GPU, Solidigm SSDPFINW512GZL, IPS, 2560x1600, 16" | Schenker XMG Apex 15 (Late 23) R7 7840HS, GeForce RTX 4050 Laptop GPU, Samsung 990 Pro 1 TB, IPS, 2560x1440, 15.6" | HP Victus 16-r0076TX i5-13500HX, GeForce RTX 4050 Laptop GPU, SK hynix PC801 HFS512GEJ9X101N BF, IPS, 1920x1080, 16.1" | Dell G15 5530 i7-13650HX, GeForce RTX 4060 Laptop GPU, SSTC CL4-3D512-Q11, IPS, 1920x1080, 15.6" | Media NVIDIA GeForce RTX 4050 Laptop GPU | Media della classe Gaming | |
|---|---|---|---|---|---|---|---|---|
| Power Consumption | 4% | -6% | 31% | -9% | 7% | 15% | -10% | |
| Idle Minimum * (Watt) | 11.95 | 13 -9% | 17.2 -44% | 6 50% | 16.12 -35% | 8.4 30% | 9.95 ? 17% | 13 ? -9% |
| Idle Average * (Watt) | 32 | 17.4 46% | 19.3 40% | 11 66% | 20.47 36% | 14.98 53% | 15.8 ? 51% | 19 ? 41% |
| Idle Maximum * (Watt) | 15.5 | 21.8 -41% | 21.2 -37% | 14 10% | 22.11 -43% | 15.56 -0% | 20.1 ? -30% | 24.6 ? -59% |
| Load Average * (Watt) | 97.5 | 96.4 1% | 90 8% | 65 33% | 94.8 3% | 96.8 1% | 88 ? 10% | 110.7 ? -14% |
| Witcher 3 ultra * (Watt) | 144.9 | 125 14% | 168 -16% | 136.5 6% | 166.9 -15% | 186 -28% | ||
| Load Maximum * (Watt) | 239 | 204 15% | 211 12% | 195 18% | 237 1% | 271.42 -14% | 176.3 ? 26% | 259 ? -8% |
* ... Meglio usare valori piccoli
Power consumption Witcher 3 / stress test
Power consumption with external monitor
Tempi di esecuzione
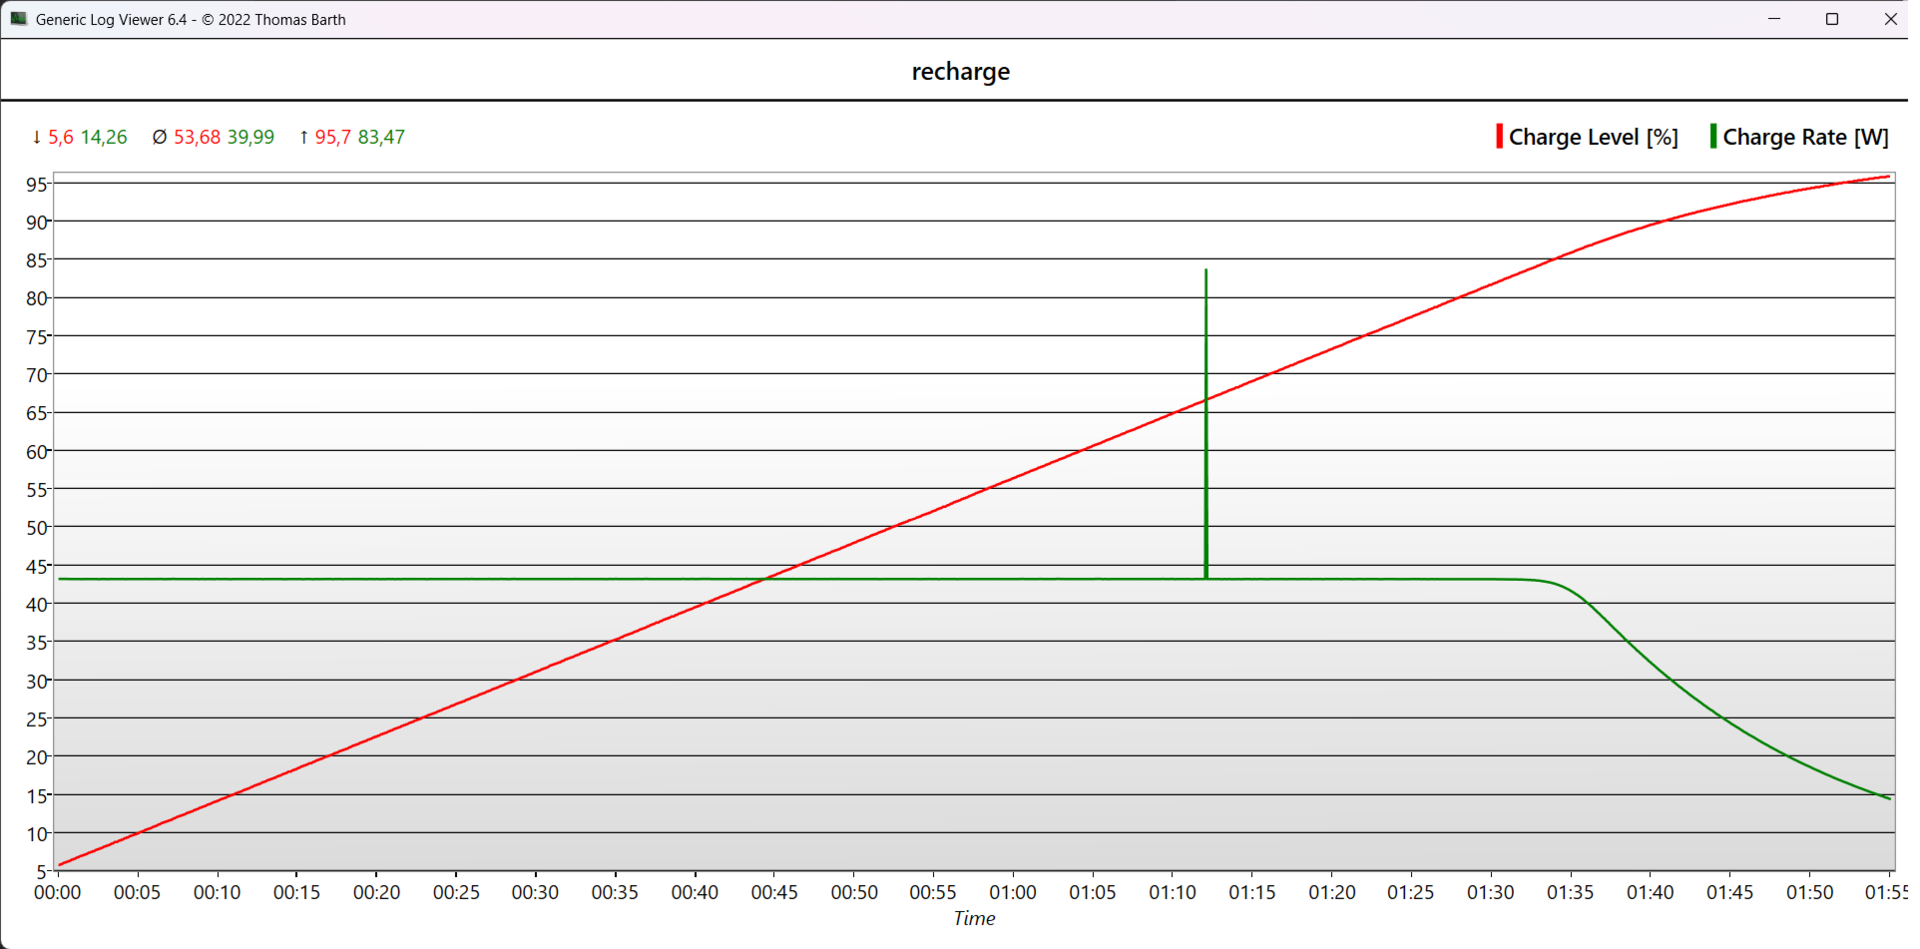
Con un'autonomia di 4 ore e 16 minuti, Helios Neo 16 non ha una resistenza eccessiva, anche nel contesto dei dispositivi di gioco. La sua frequenza di aggiornamento è impostata automaticamente in modo variabile tra 83 Hz e 120 Hz.
IlHP Victus 16 (9 ore) e l'AMDXMG Apex 15 (7 ore) offrono tempi di esecuzione della batteria significativamente più lunghi, nonostante quest'ultimo abbia una batteria più piccola da 63-Wh.
Per caricare la batteria al 50 % è necessaria un'ora intera e per una carica completa occorrono due ore. La ricarica tramite USB-C richiede ancora più tempo.
| Acer Predator Helios Neo 16 NH.QLTEG.002 i5-13500HX, GeForce RTX 4050 Laptop GPU, 90 Wh | Lenovo Legion Pro 5 16ARX8 (R5 7645HX, RTX 4050) R5 7645HX, GeForce RTX 4050 Laptop GPU, 80 Wh | Acer Predator Helios 16 PH16-71-731Q i7-13700HX, GeForce RTX 4060 Laptop GPU, 90 Wh | Lenovo LOQ 16IRH8 i7-13620H, GeForce RTX 4060 Laptop GPU, 80 Wh | Schenker XMG Apex 15 (Late 23) R7 7840HS, GeForce RTX 4050 Laptop GPU, 62.32 Wh | HP Victus 16-r0076TX i5-13500HX, GeForce RTX 4050 Laptop GPU, 83 Wh | Dell G15 5530 i7-13650HX, GeForce RTX 4060 Laptop GPU, 86 Wh | Media della classe Gaming | |
|---|---|---|---|---|---|---|---|---|
| Autonomia della batteria | 3% | -7% | 6% | 23% | 27% | -4% | 21% | |
| H.264 (h) | 7.2 | 5.4 -25% | 4.8 -33% | 6.4 -11% | 8.3 15% | 7.7 7% | 6.8 -6% | 8.32 ? 16% |
| WiFi v1.3 (h) | 4.3 | 5.6 30% | 5.6 30% | 6.3 47% | 7.1 65% | 8.9 107% | 6.5 51% | 7.11 ? 65% |
| Load (h) | 1.8 | 1.5 -17% | 1.5 -17% | 1.6 -11% | 1.2 -33% | 0.8 -56% | 1.502 ? -17% | |
| Witcher 3 ultra (h) | 0.8 | 1.5 | 1.5 | 0.8 |
Pro
Contro
Verdetto: Il gamer di fascia media con una RTX 4050 non è molto promettente
Il Predator Helios Neo 16 di Acer è una chimera composta da un solido portatile da gioco di fascia media e da alcune caratteristiche entry-level. In particolare, quest'ultimo include laRTX 4050installata nel nostro dispositivo di prova - ma il suo pannello Full HD, che può offrire valori decenti, è piuttosto standard. Lo stesso si può dire per la sua tastiera, che si trova anche in molti altri portatili da gioco economici.
Acer ha accoppiato tutto questo con un potente Intel Corei5-13500HXcon una soluzione di raffreddamento in metallo liquido, un case elegante e robusto, ben costruito, e molte opzioni di connettività, tra cui una vera HDMI 2.1 che si collega alla dGPU e due porte Thunderbolt 4. Completano la configurazione Advanced Optimus e G-Sync.
Purtroppo, non siamo del tutto sicuri che questa combinazione (in relazione al suo MRSP di 1.069 dollari) possa trovare il suo mercato di riferimento. Richiederebbe piuttosto unaRTX 4060o unaRTX 4070per valerne la pena, che spesso si possono trovare solo all'interno di Neo 16 con un sovrapprezzo. Inoltre, a differenza del normaleHelios 16questo modello non ha la possibilità di scegliere un i9-13900HX, un pannello QHD con copertura sRGB al 100% o un'opzione Mini LED. Anche la sua webcam da 720p rappresenta una grande differenza e, in considerazione del prezzo del portatile, è un vero motivo di critica. Anche la sua breve autonomia di 4 ore e mezza non è il massimo.
Acer Predator Helios Neo 16 è una versione ridotta del solido Helios 16. In teoria, questa è una buona idea. In teoria, è una buona idea, ma funzionerebbe solo se la differenza di prezzo tra i due non fosse così piccola.
Il suo potente sistema di raffreddamento è stato adottato quasi 1:1 da Helios 16, il che si traduce in basse temperature interne e basse emissioni di rumore (al più tardi quando si utilizza la modalità bilanciata) - e non a costo di alcuna prestazione. Sul versante opposto, le grandi limitazioni di potenza della GPU e della CPU in modalità batteria sono un po' eccessive.
Riteniamo del tutto bizzarro che sia possibile ottenere il normale Helios 16 con la stessa configurazione, ma con più funzioni, allo stesso prezzo. In alternativa, potrebbe valere la pena dare un'occhiata al modelloLegion Pro 5 16(Intel), che costa un po' di più ma beneficia di un pannello QHD a 240 Hz, di una RTX 4060 più potente, di una tastiera confortevole e di un raffreddamento più silenzioso durante i giochi. D'altra parte, se è alla ricerca di un vero gamer economico, potrebbe essere meglio dare un'occhiata al modelloLenovo LOQ 16che dispone di un frugale AMDRyzen 9 7940HSun pannello QHD e una RTX 4050 (1.200 dollari) o una RTX 4060 (1.400 dollari).
Prezzo e disponibilità
La versione di Acer Predator Helios 16 che abbiamo testato, con un Intel Core i5-13500HX, RTX 4050 e un display FHD+, si trova su Amazon a 1.069 dollari.
Acer Predator Helios Neo 16 NH.QLTEG.002
- 11/02/2023 v7 (old)
Marvin Gollor
Transparency
La selezione dei dispositivi da recensire viene effettuata dalla nostra redazione. Il campione di prova è stato fornito all'autore come prestito dal produttore o dal rivenditore ai fini di questa recensione. L'istituto di credito non ha avuto alcuna influenza su questa recensione, né il produttore ne ha ricevuto una copia prima della pubblicazione. Non vi era alcun obbligo di pubblicare questa recensione. In quanto società mediatica indipendente, Notebookcheck non è soggetta all'autorità di produttori, rivenditori o editori.
Ecco come Notebookcheck esegue i test
Ogni anno, Notebookcheck esamina in modo indipendente centinaia di laptop e smartphone utilizzando procedure standardizzate per garantire che tutti i risultati siano comparabili. Da circa 20 anni sviluppiamo continuamente i nostri metodi di prova e nel frattempo stabiliamo gli standard di settore. Nei nostri laboratori di prova, tecnici ed editori esperti utilizzano apparecchiature di misurazione di alta qualità. Questi test comportano un processo di validazione in più fasi. Il nostro complesso sistema di valutazione si basa su centinaia di misurazioni e parametri di riferimento ben fondati, che mantengono l'obiettività.Price comparison

