Recensione del laptop Lenovo Legion Slim 5 14APH8: punto di forza dell'OLED a 120 Hz e 2,8K

Legion Slim 5 14 è il primo e più piccolo portatile Legion da 14 pollici della famiglia. Si distingue dagli altri sul mercato per il suo display OLED da 120 Hz e per le dimensioni leggermente più grandi dello schermo da 14,5 pollici, mentre le alternative di Razer, Acer o Asus tendono ad avere pannelli IPS da 14,0 pollici.
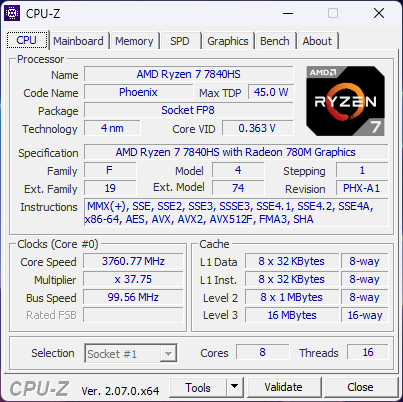
La nostra recensione configura una SKU di fascia media con lo Zen 4 Ryzen 7 7840HS E 105 W di grafica GeForce RTX 4060 per circa 1500 dollari al dettaglio. Altre SKU includono il più veloce Ryzen 9 7940HS o il più lento RTX 4050, ma il display OLED non-touch da 14,5 pollici 2,8K 120 Hz è fisso in tutte le opzioni. Al momento della pubblicazione non sono state annunciate varianti Intel.
Il modello Lenovo compete direttamente con altri portatili da gioco da 14 pollici come l'Acer Predator Triton 14, Razer Blade 14,Asus ROG Zephyrus G14, o Alienware x14.
Altre recensioni Lenovo:
Potenziali concorrenti a confronto
Punteggio | Data | Modello | Peso | Altezza | Dimensione | Risoluzione | Prezzo |
|---|---|---|---|---|---|---|---|
| 87.7 % v7 (old) | 09/2023 | Lenovo Legion Slim 5 14APH8 R7 7840HS, GeForce RTX 4060 Laptop GPU | 1.7 kg | 20.79 mm | 14.50" | 2880x1600 | |
| 87.3 % v7 (old) | 07/2023 | Acer Predator Triton 14 PT14-51 i7-13700H, GeForce RTX 4050 Laptop GPU | 1.7 kg | 19.81 mm | 14.00" | 2560x1600 | |
| 88.7 % v7 (old) | 06/2023 | Razer Blade 14 RTX 4070 R9 7940HS, GeForce RTX 4070 Laptop GPU | 1.8 kg | 17.99 mm | 14.00" | 2560x1600 | |
| 90 % v7 (old) | 05/2023 | Asus ROG Zephyrus G14 GA402XY R9 7940HS, GeForce RTX 4090 Laptop GPU | 1.7 kg | 20.5 mm | 14.00" | 2560x1600 | |
| 86.7 % v7 (old) | 03/2022 | Alienware x14 i7 RTX 3060 i7-12700H, GeForce RTX 3060 Laptop GPU | 1.8 kg | 14.5 mm | 14.00" | 1920x1080 | |
| 85.7 % v7 (old) | 07/2023 | Lenovo LOQ 15APH8 R7 7840HS, GeForce RTX 4050 Laptop GPU | 2.5 kg | 25.2 mm | 15.60" | 1920x1080 |
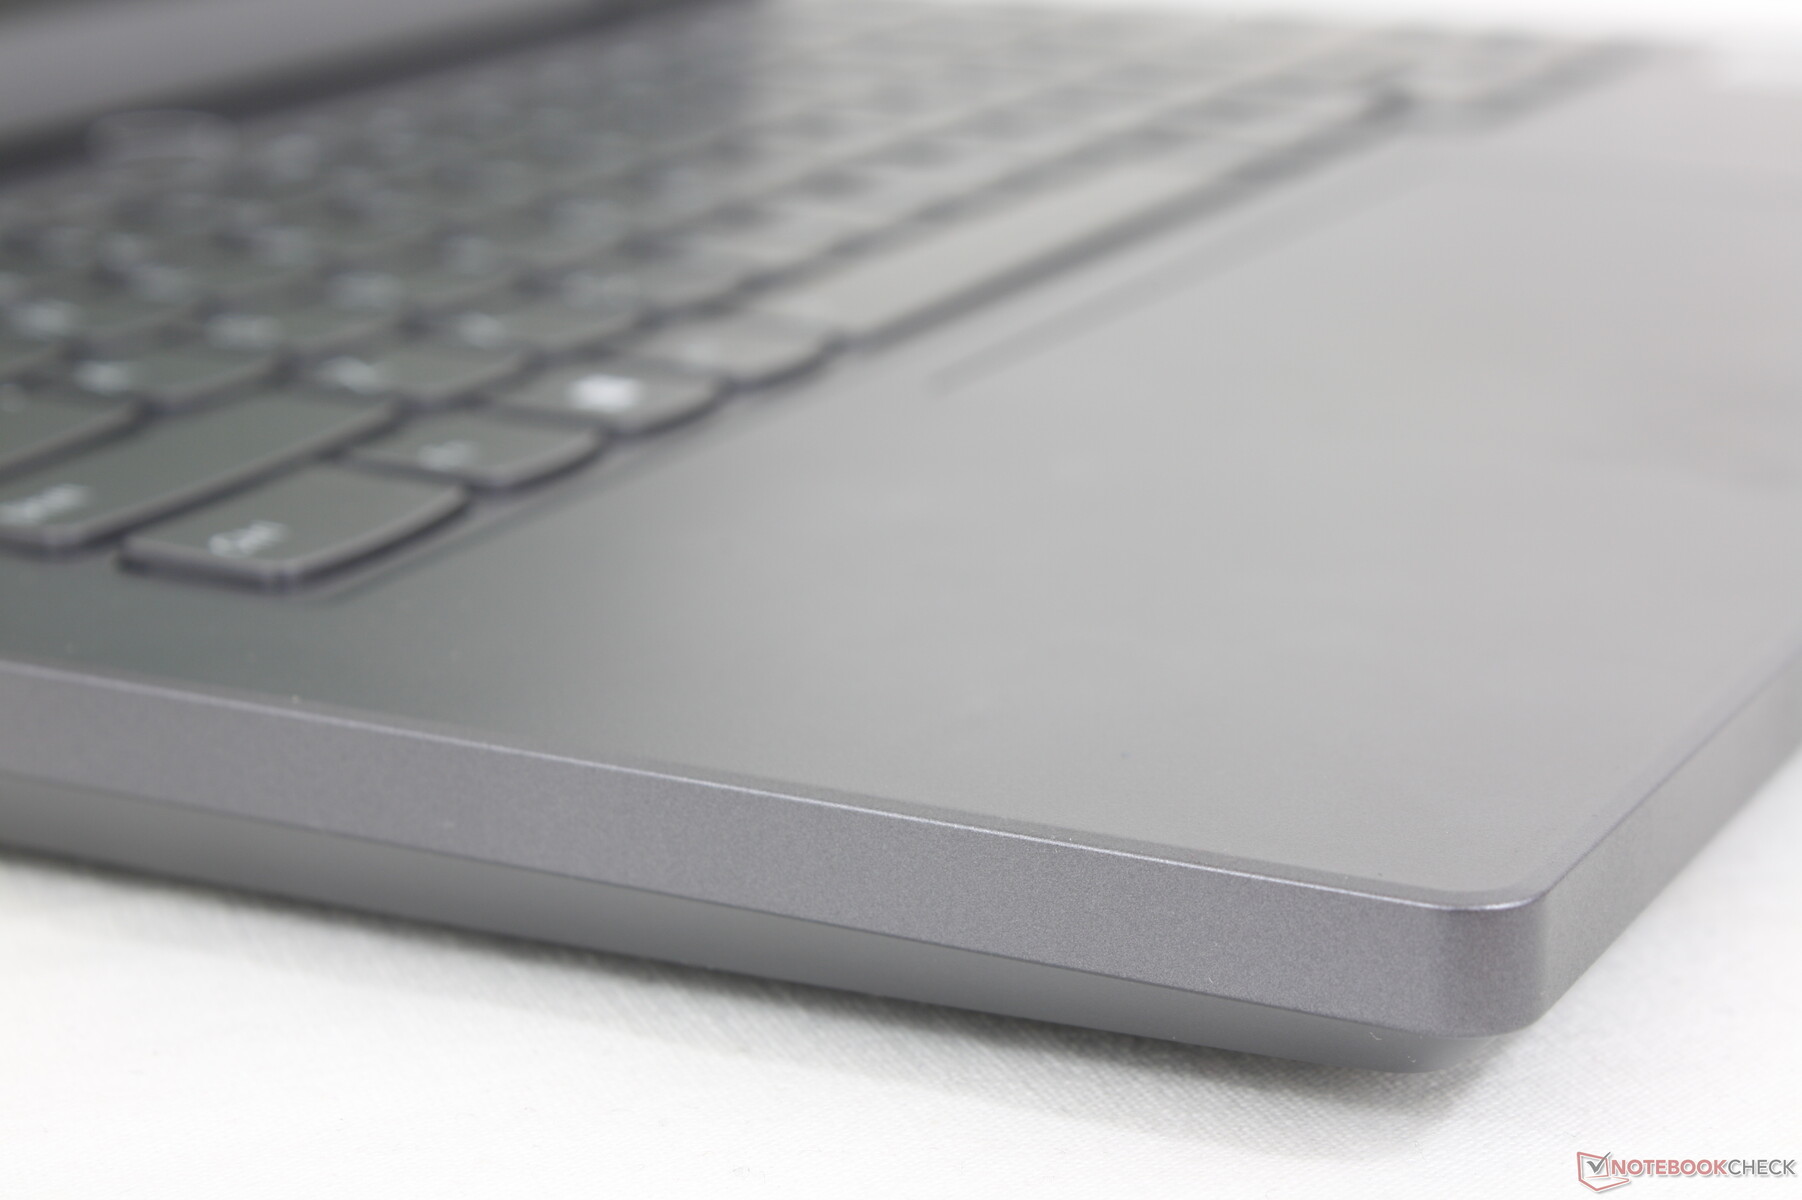
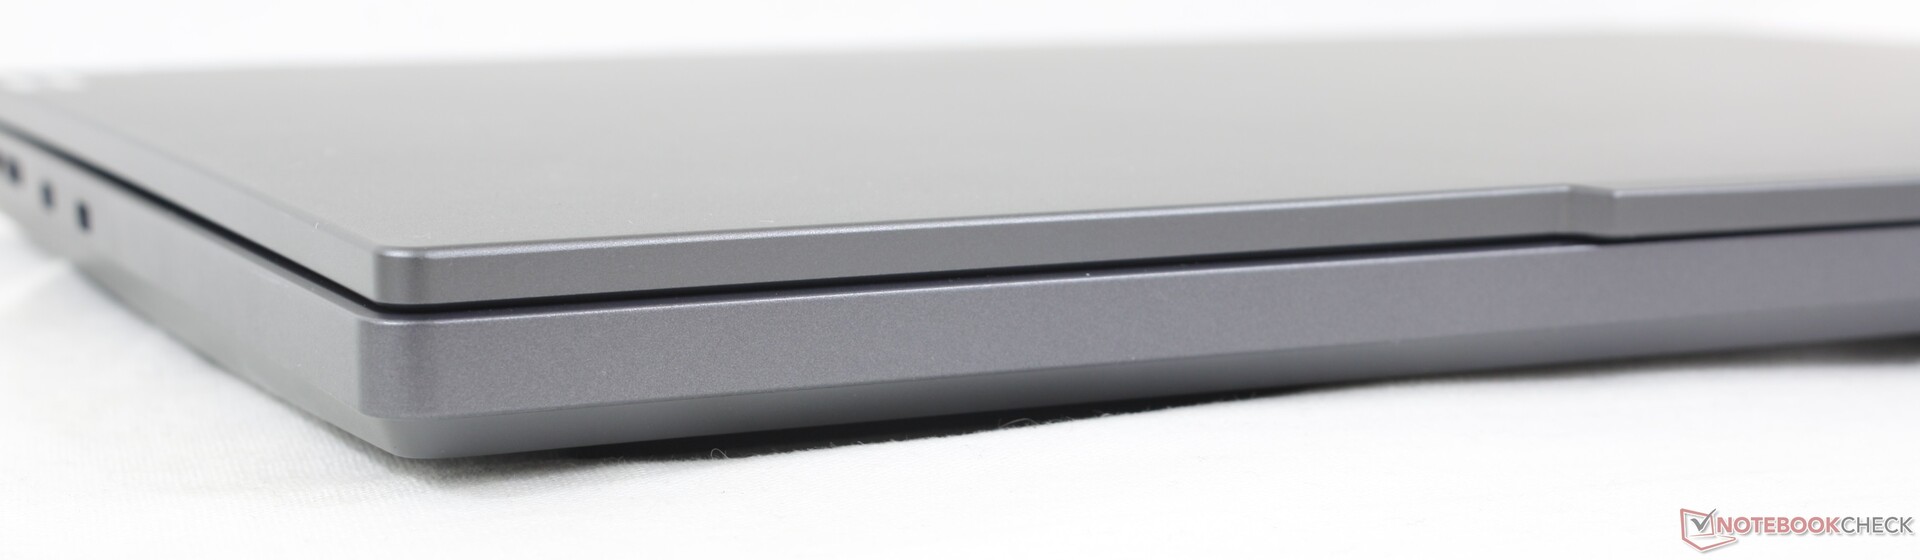
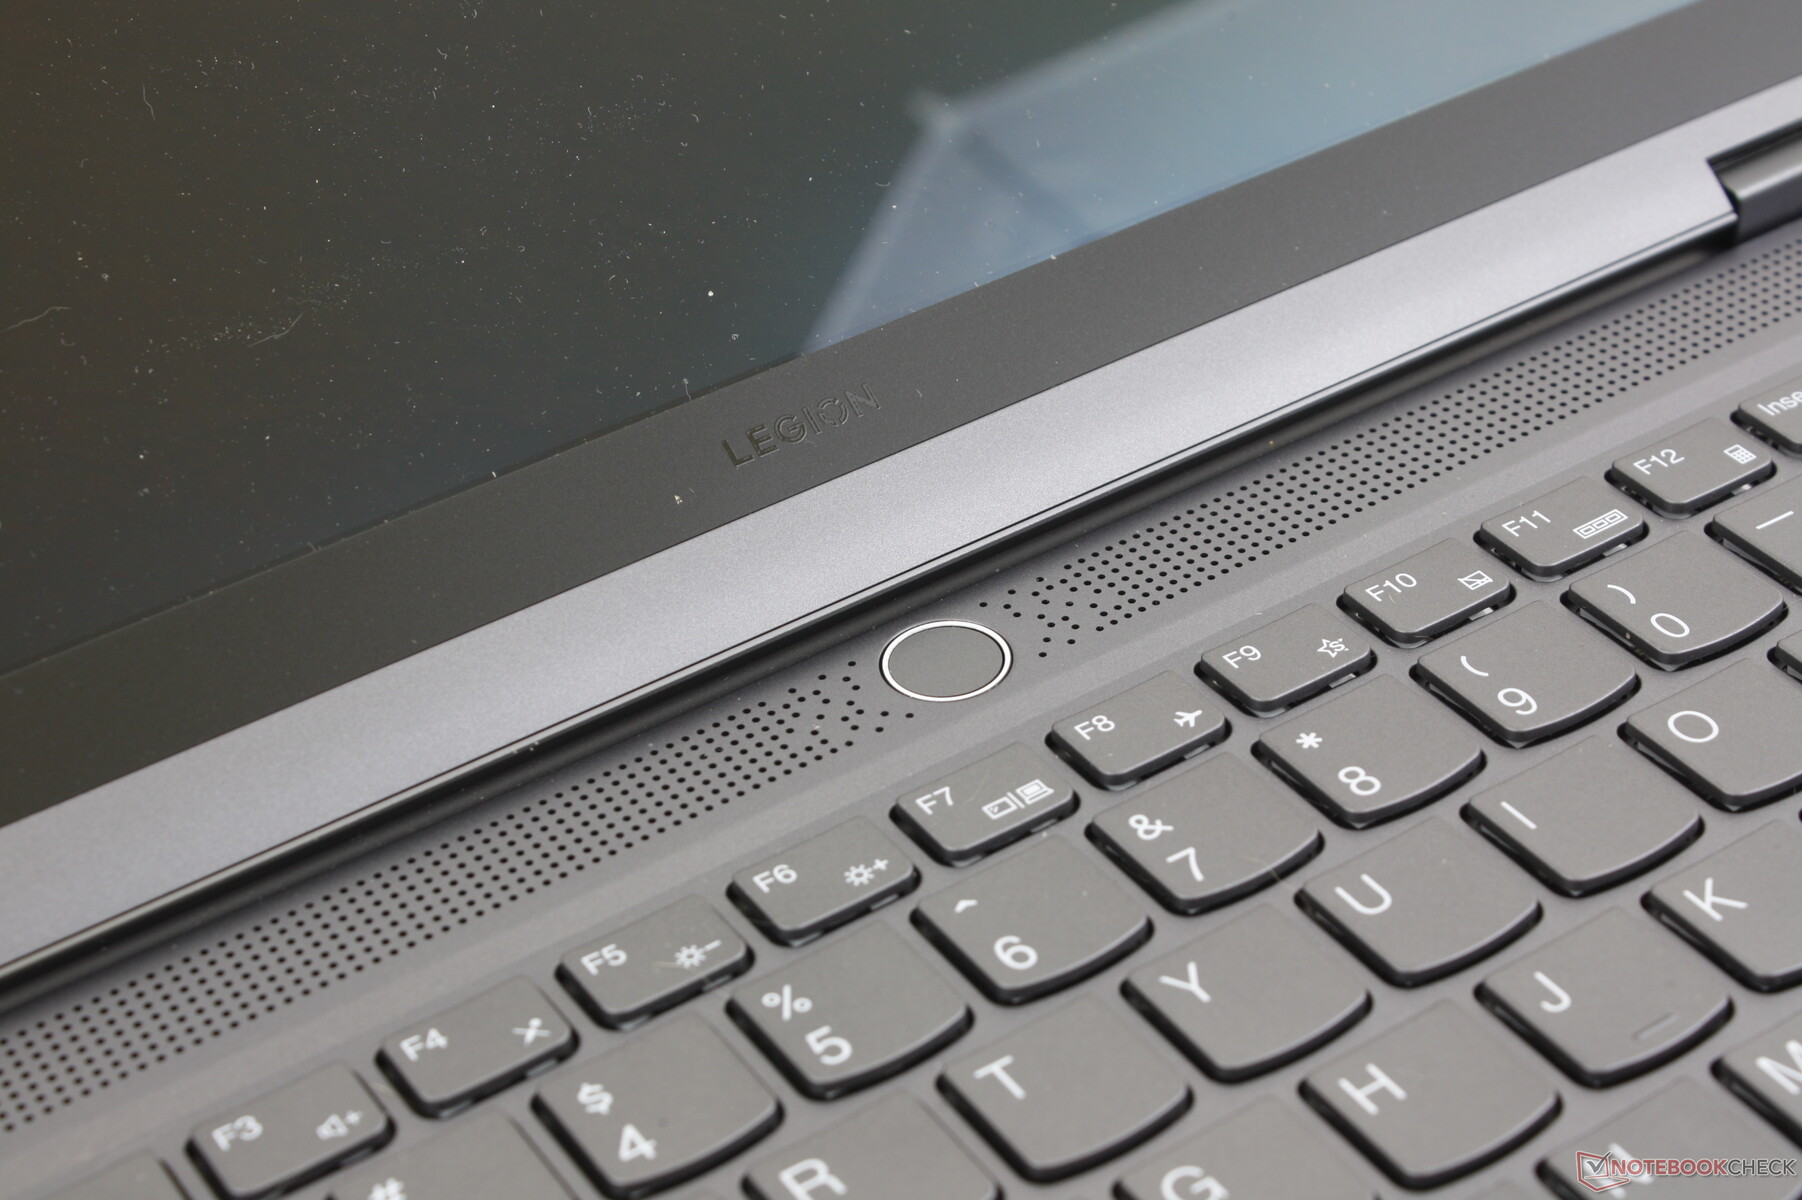
Case - Guarda come un ThinkBook, gioca come un Legion
Lenovo impiega materiali metallici lisci simili in grigio monotono in molti dei suoi modelli Legion e ThinkBook. I giocatori che non sono attratti dal design eccentrico dei portatili Alienware o Asus ROG potrebbero trovare più interessante il design più piatto e privo di RGB del Legion Slim 5 14, soprattutto per le aule e gli ambienti non di gioco.
La qualità del telaio è solida da cima a fondo per una prima impressione solida. Le superfici non sono così rigide come nel modello Blade 14 o dell'Alienware x14 e questo si nota soprattutto quando si esercita una pressione sul centro della tastiera o sui poggiapolsi o quando si ruota il coperchio, ma le flessioni sono comunque minime.
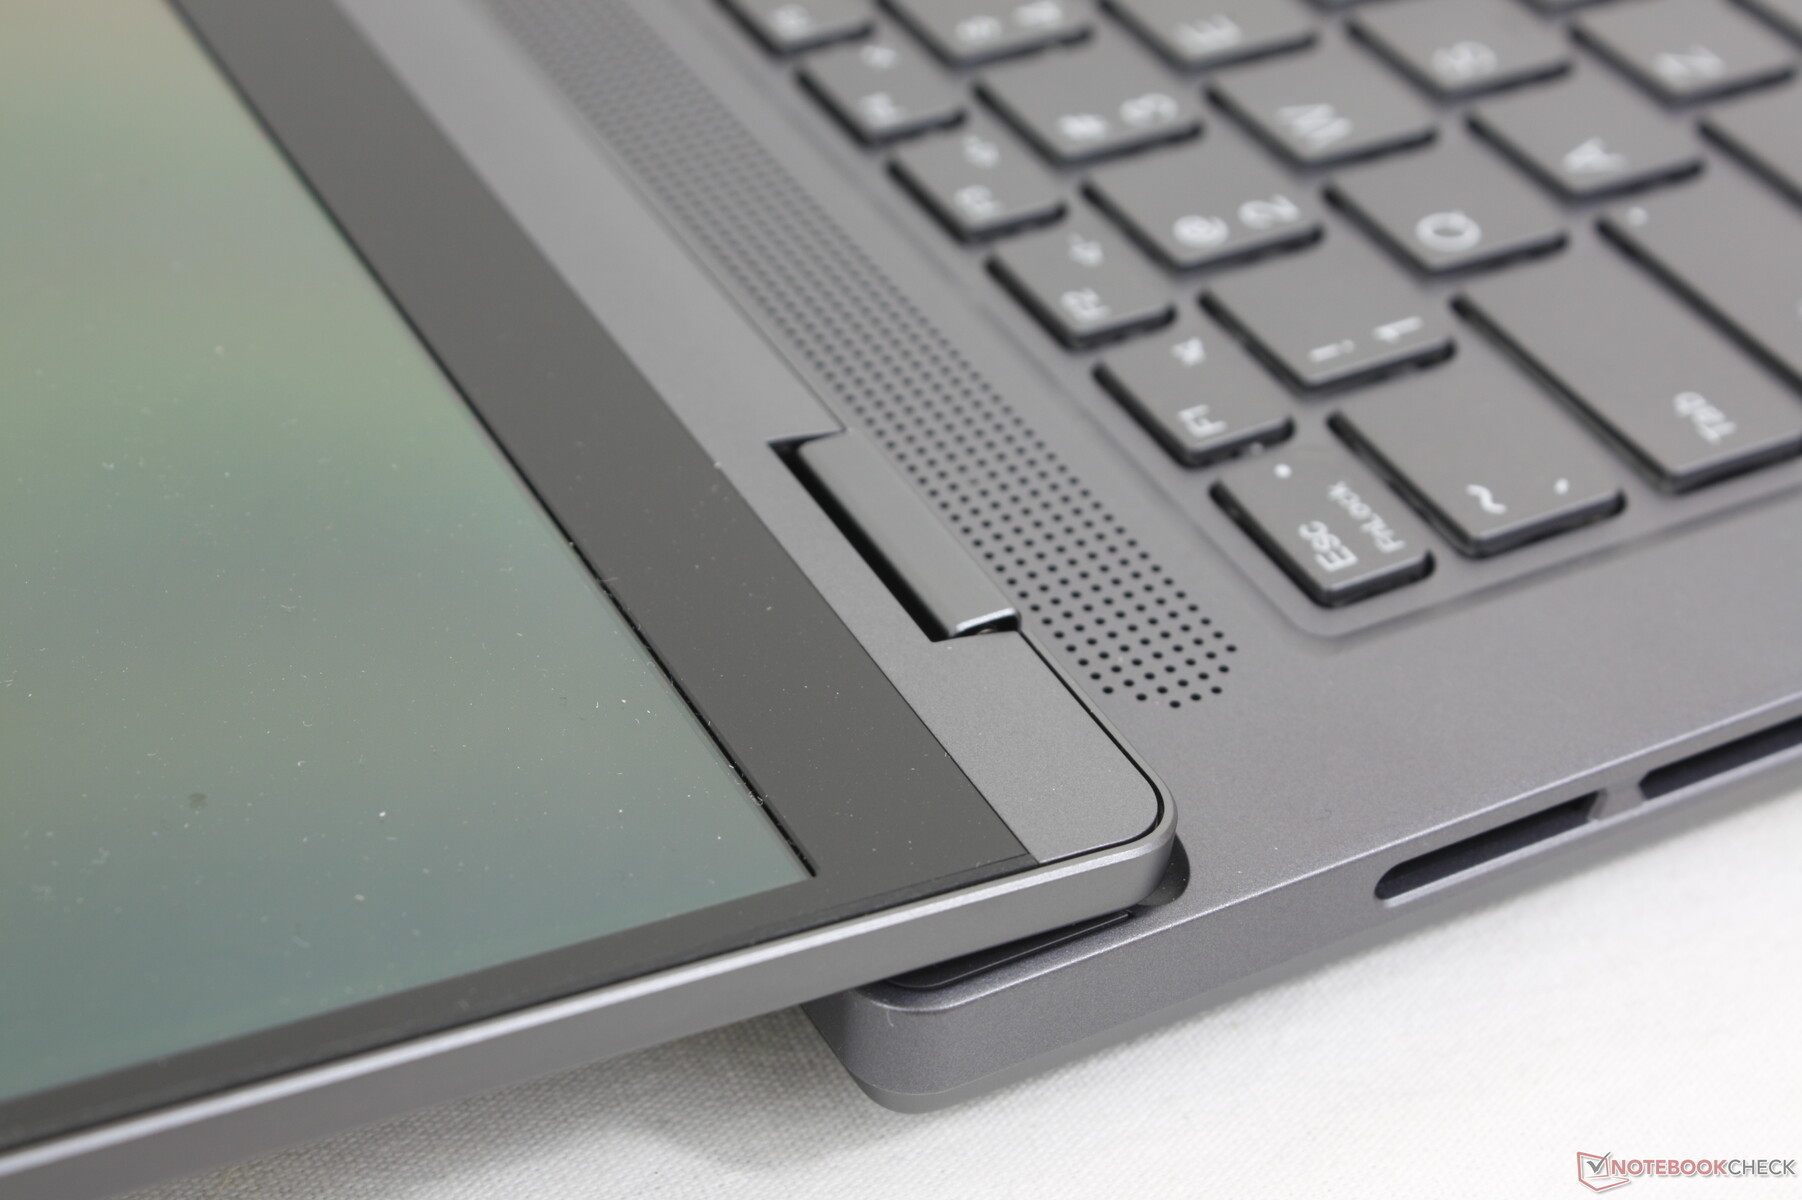
Le cerniere meritano una menzione in quanto possono aprirsi di 180 gradi, a differenza di altri portatili da gioco da 14 pollici. La rigidità delle cerniere è soddisfacente, ma avrebbe potuto essere più rigida ad angoli più ampi per una migliore sensazione di longevità.
Lo schermo più grande da 14,5 pollici e la parte posteriore estesa del design Legion conferiscono al nostro Legion Slim 5 14 un ingombro maggiore rispetto a concorrenti come il Blade 14, lo Zephyrus G14 o il Predator Triton 14. Tutti questi prodotti hanno comunque lo stesso peso. Tuttavia, il peso di tutti questi prodotti è più o meno lo stesso, e quindi il Legion Slim 5 14 non è semplicemente così denso.
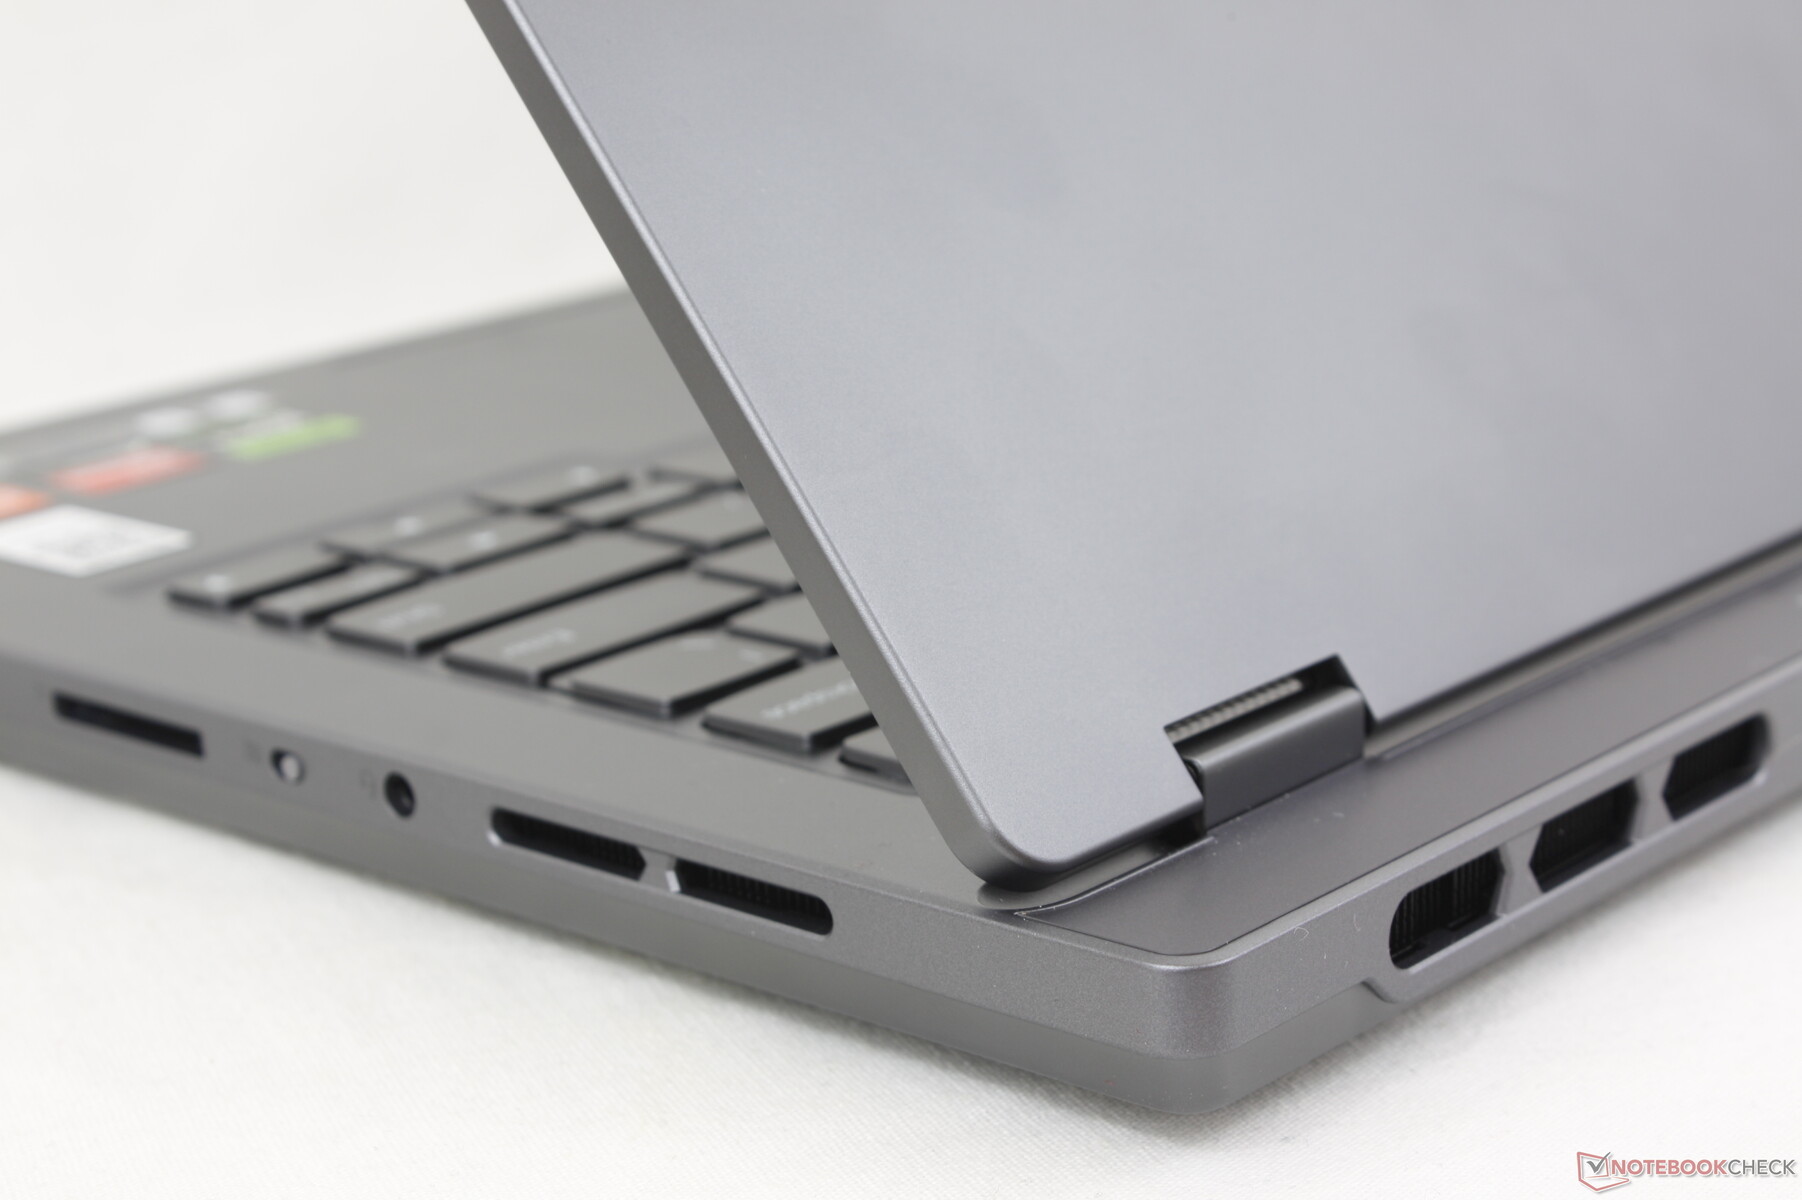
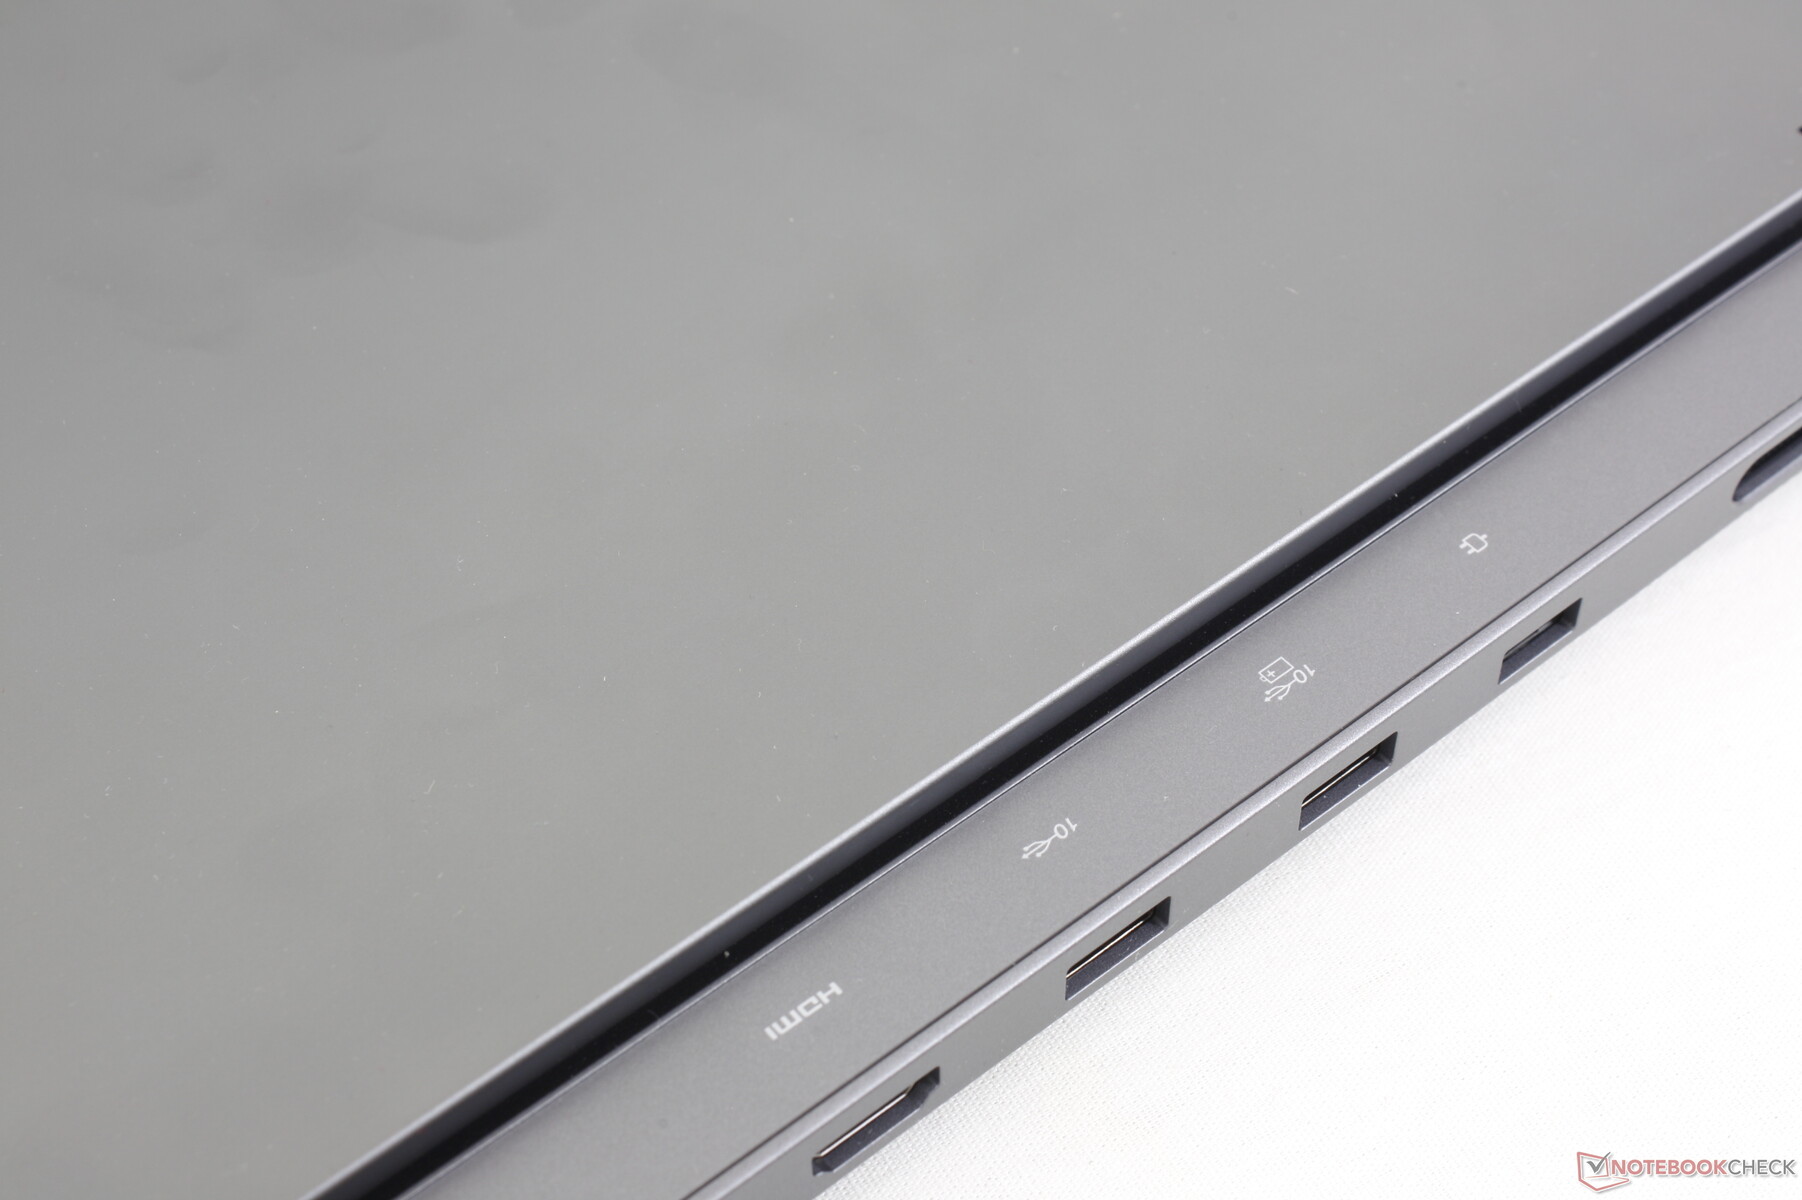
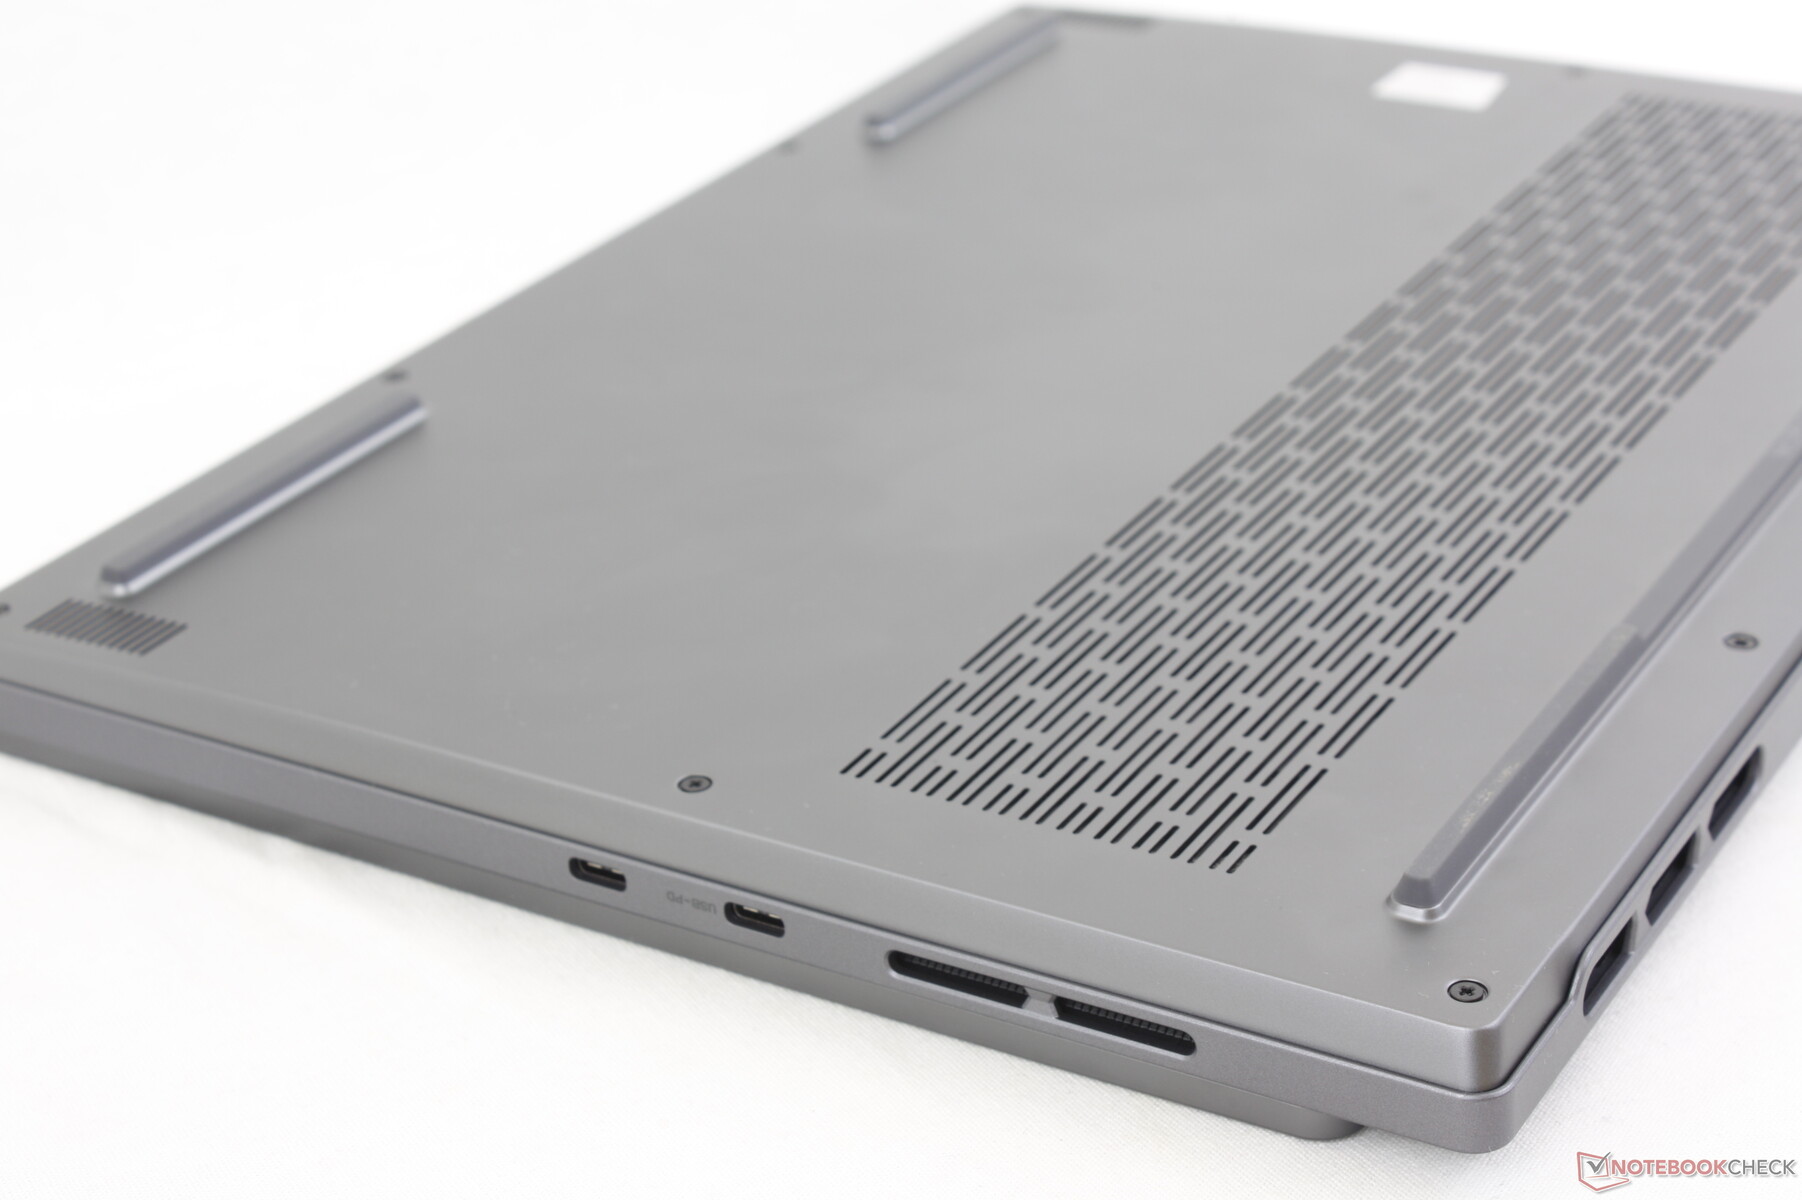
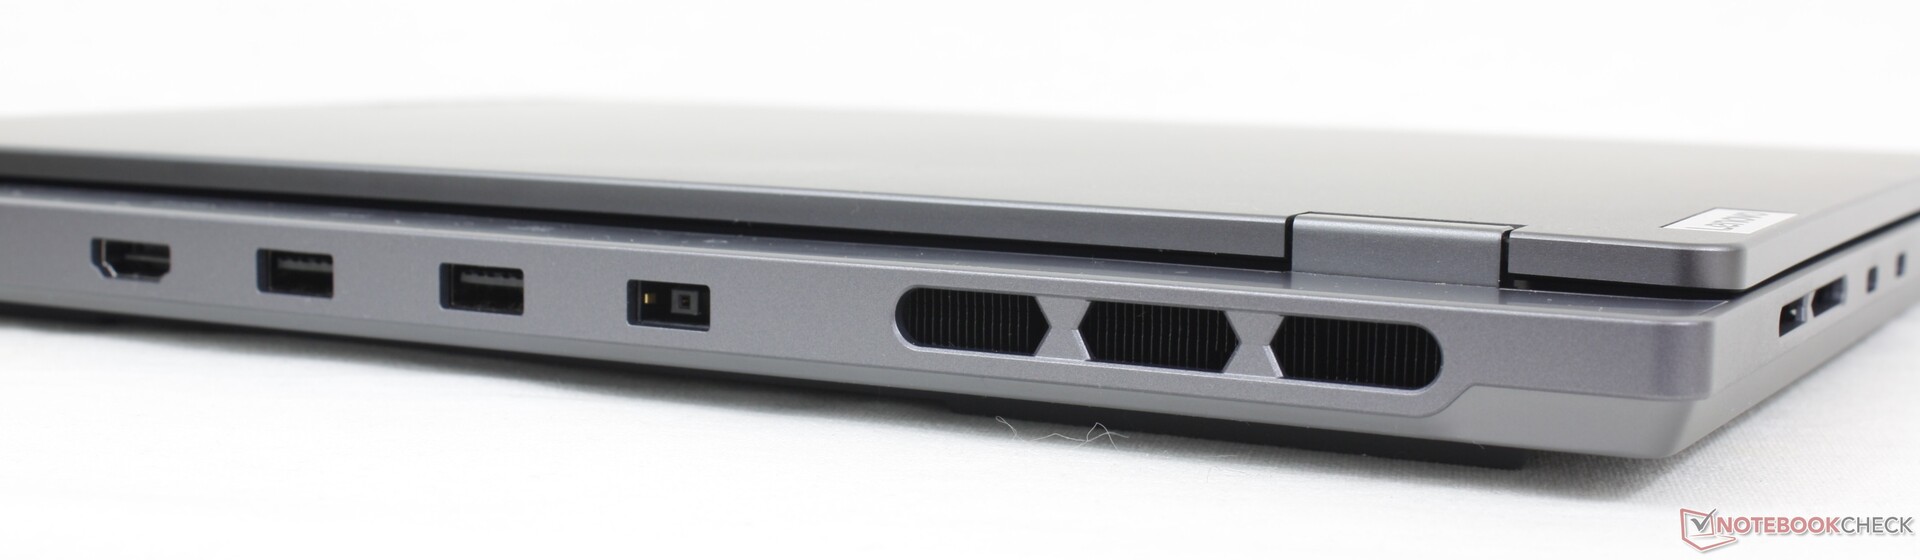
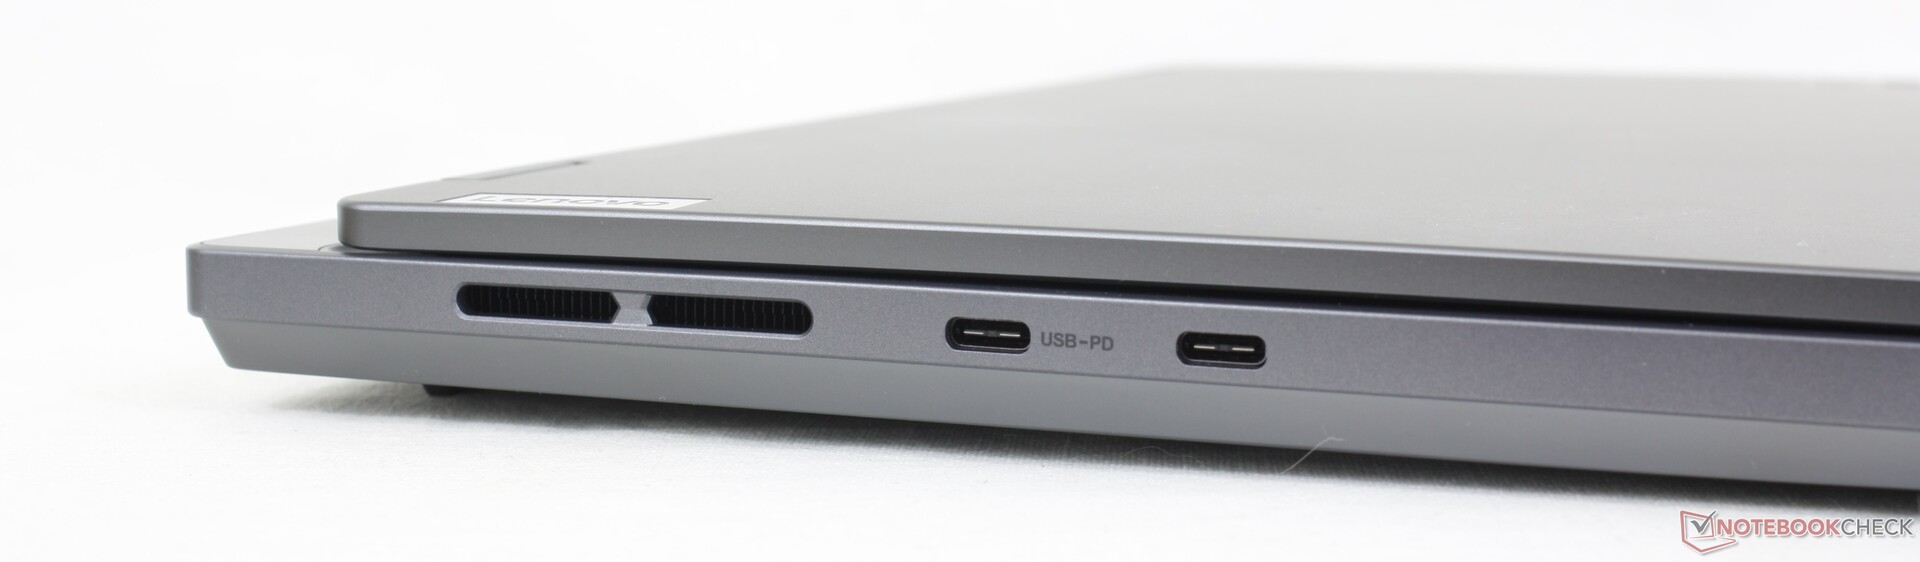
Connettività - Dov'è l'USB4?
Le porte sono molto simili a quelle del Blade 14, anche se con un posizionamento molto diverso. Riteniamo che il posizionamento sia sfavorevole su Legion Slim 5, poiché le porte non sono distribuite in modo uniforme e la maggior parte di esse si trova lungo la parte posteriore, comprese le porte USB-A.
Il modello purtroppo non dispone del supporto USB4 e Thunderbolt. Manca anche il blocco Kensington.
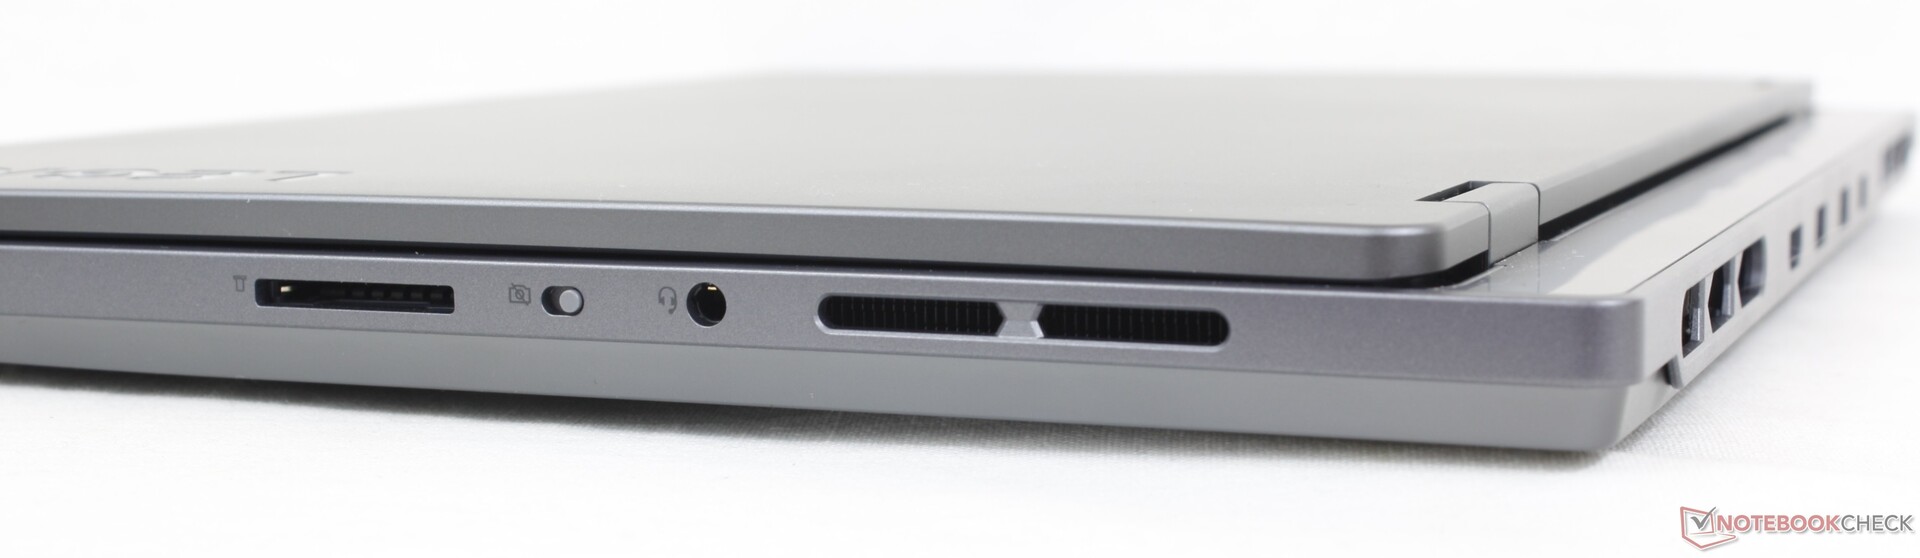
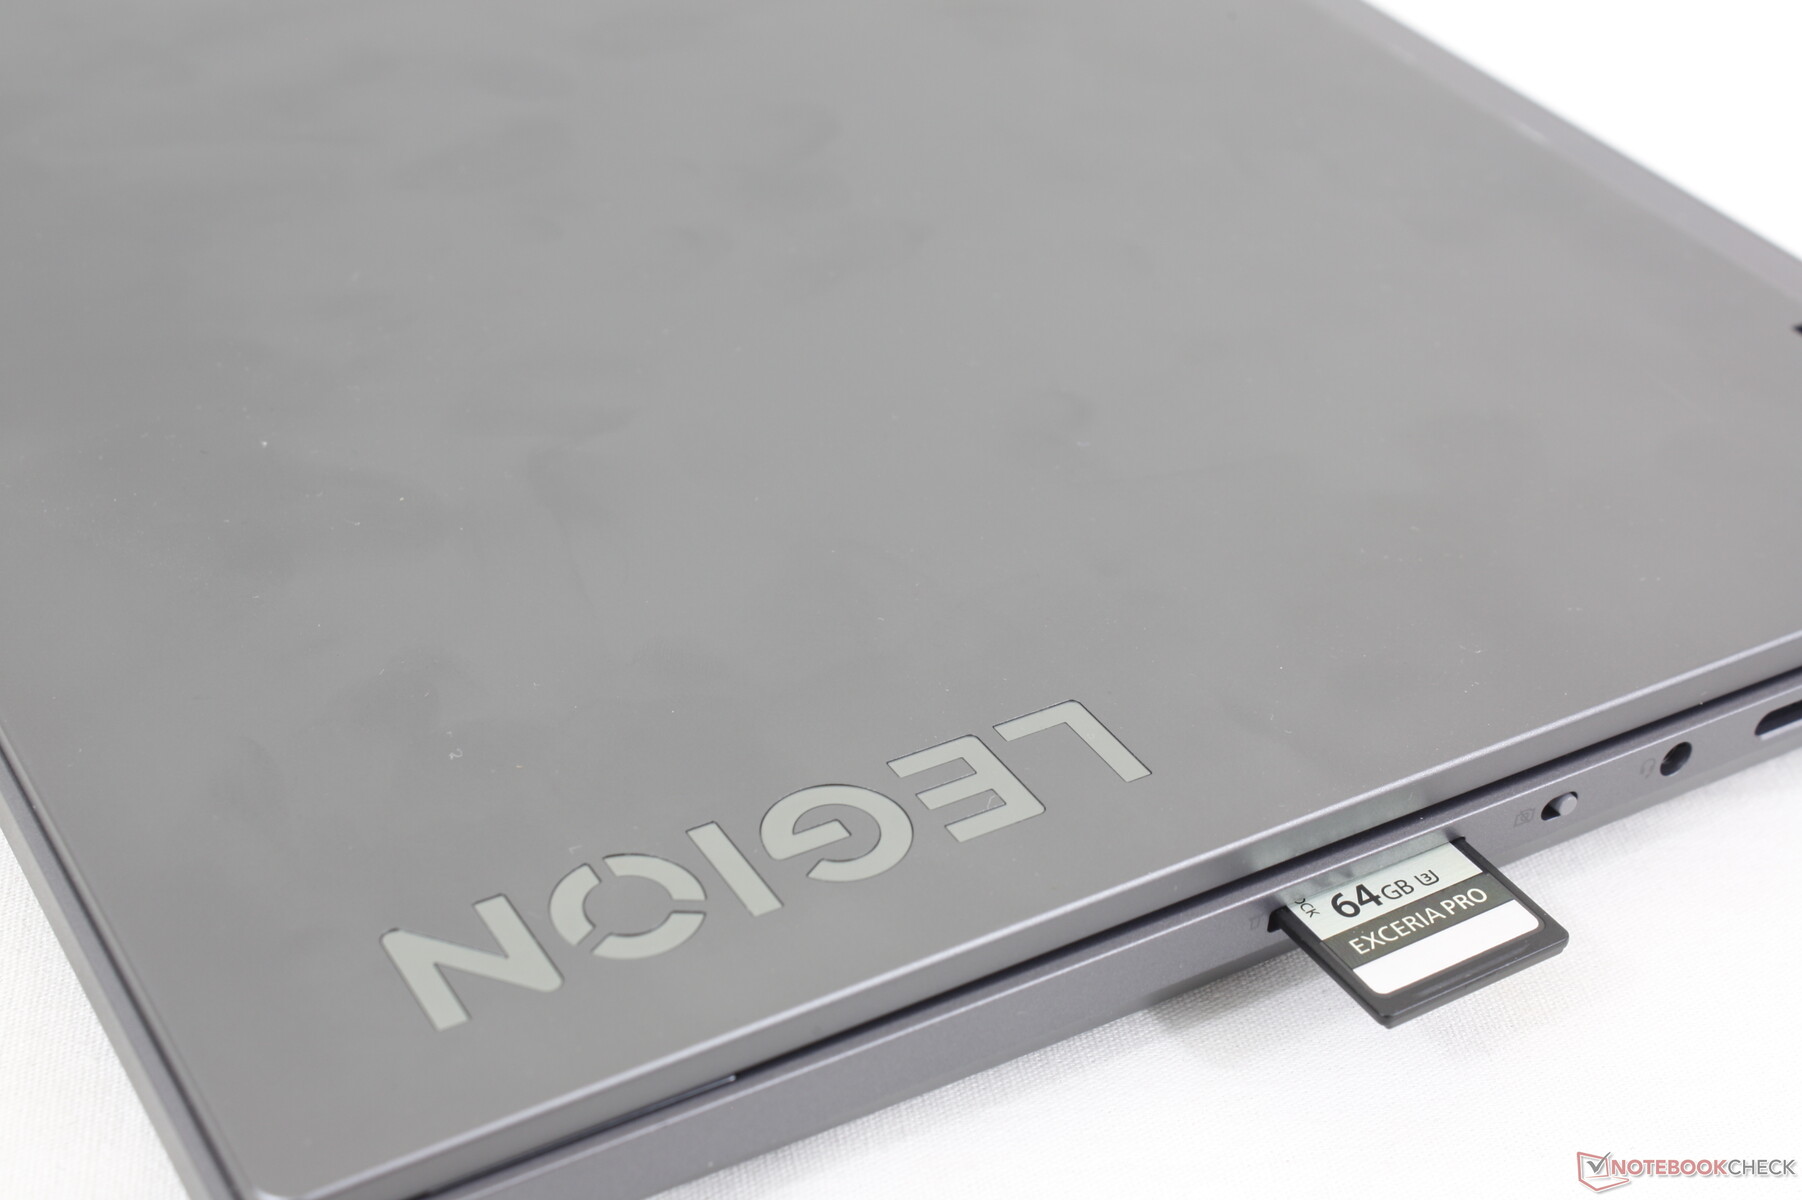
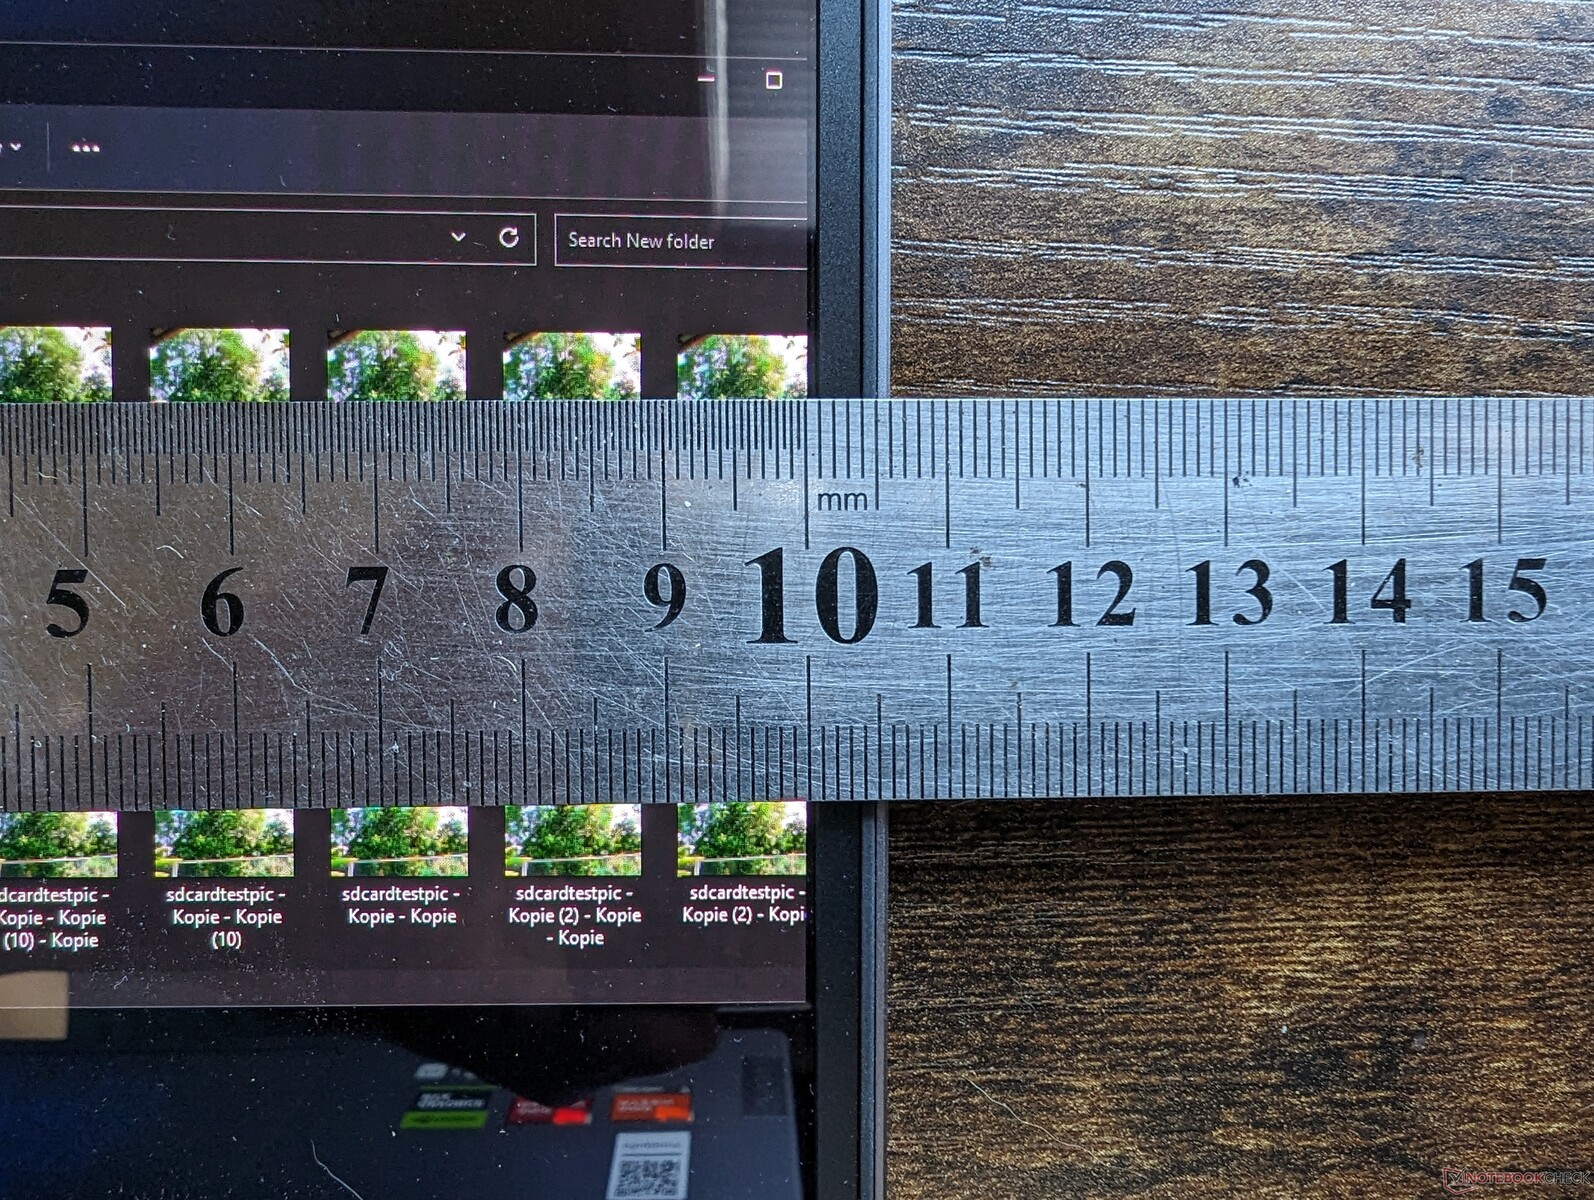
Lettore di schede SD
Il lettore SD integrato è molto più veloce di quello presente sul Predator Triton 14 ma non è altrettanto veloce di quello dello Zephyrus G14 o dell' Alienware x14. Lo spostamento di 1 GB di immagini dalla nostra scheda di prova UHS-II al desktop richiede circa 12 secondi, rispetto alla metà dell'Alienware x14.
| SD Card Reader | |
| average JPG Copy Test (av. of 3 runs) | |
| Alienware x14 i7 RTX 3060 (Angelbird AV Pro V60) | |
| Asus ROG Zephyrus G14 GA402XY (Angelibrid AV Pro V60) | |
| Lenovo Legion Slim 5 14APH8 (Toshiba Exceria Pro SDXC 64 GB UHS-II) | |
| Acer Predator Triton 14 PT14-51 (AV PRO microSD 128 GB V60) | |
| maximum AS SSD Seq Read Test (1GB) | |
| Asus ROG Zephyrus G14 GA402XY (Angelibrid AV Pro V60) | |
| Alienware x14 i7 RTX 3060 (Angelbird AV Pro V60) | |
| Lenovo Legion Slim 5 14APH8 (Toshiba Exceria Pro SDXC 64 GB UHS-II) | |
| Acer Predator Triton 14 PT14-51 (AV PRO microSD 128 GB V60) | |
Comunicazione
Per la connettività Wi-Fi 6E e Bluetooth 5.2 è presente di serie un MediaTek MT7922 invece del più comune Intel AX211. Abbiamo riscontrato prestazioni costanti e nessun problema quando siamo stati accoppiati alla nostra rete AXE11000 a 6 GHz.
| Networking | |
| iperf3 transmit AX12 | |
| Alienware x14 i7 RTX 3060 | |
| iperf3 receive AX12 | |
| Alienware x14 i7 RTX 3060 | |
| iperf3 transmit AXE11000 | |
| Asus ROG Zephyrus G14 GA402XY | |
| Acer Predator Triton 14 PT14-51 | |
| Lenovo Legion Slim 5 14APH8 | |
| Razer Blade 14 RTX 4070 | |
| Lenovo LOQ 15APH8 | |
| iperf3 receive AXE11000 | |
| Acer Predator Triton 14 PT14-51 | |
| Asus ROG Zephyrus G14 GA402XY | |
| Razer Blade 14 RTX 4070 | |
| Lenovo Legion Slim 5 14APH8 | |
| Lenovo LOQ 15APH8 | |
| iperf3 transmit AXE11000 6GHz | |
| Lenovo Legion Slim 5 14APH8 | |
| Razer Blade 14 RTX 4070 | |
| iperf3 receive AXE11000 6GHz | |
| Razer Blade 14 RTX 4070 | |
| Lenovo Legion Slim 5 14APH8 | |
Webcam
La webcam da 2 MP è uno standard per i portatili da gioco. Sono integrati sia l'IR che l'interruttore di spegnimento della telecamera.


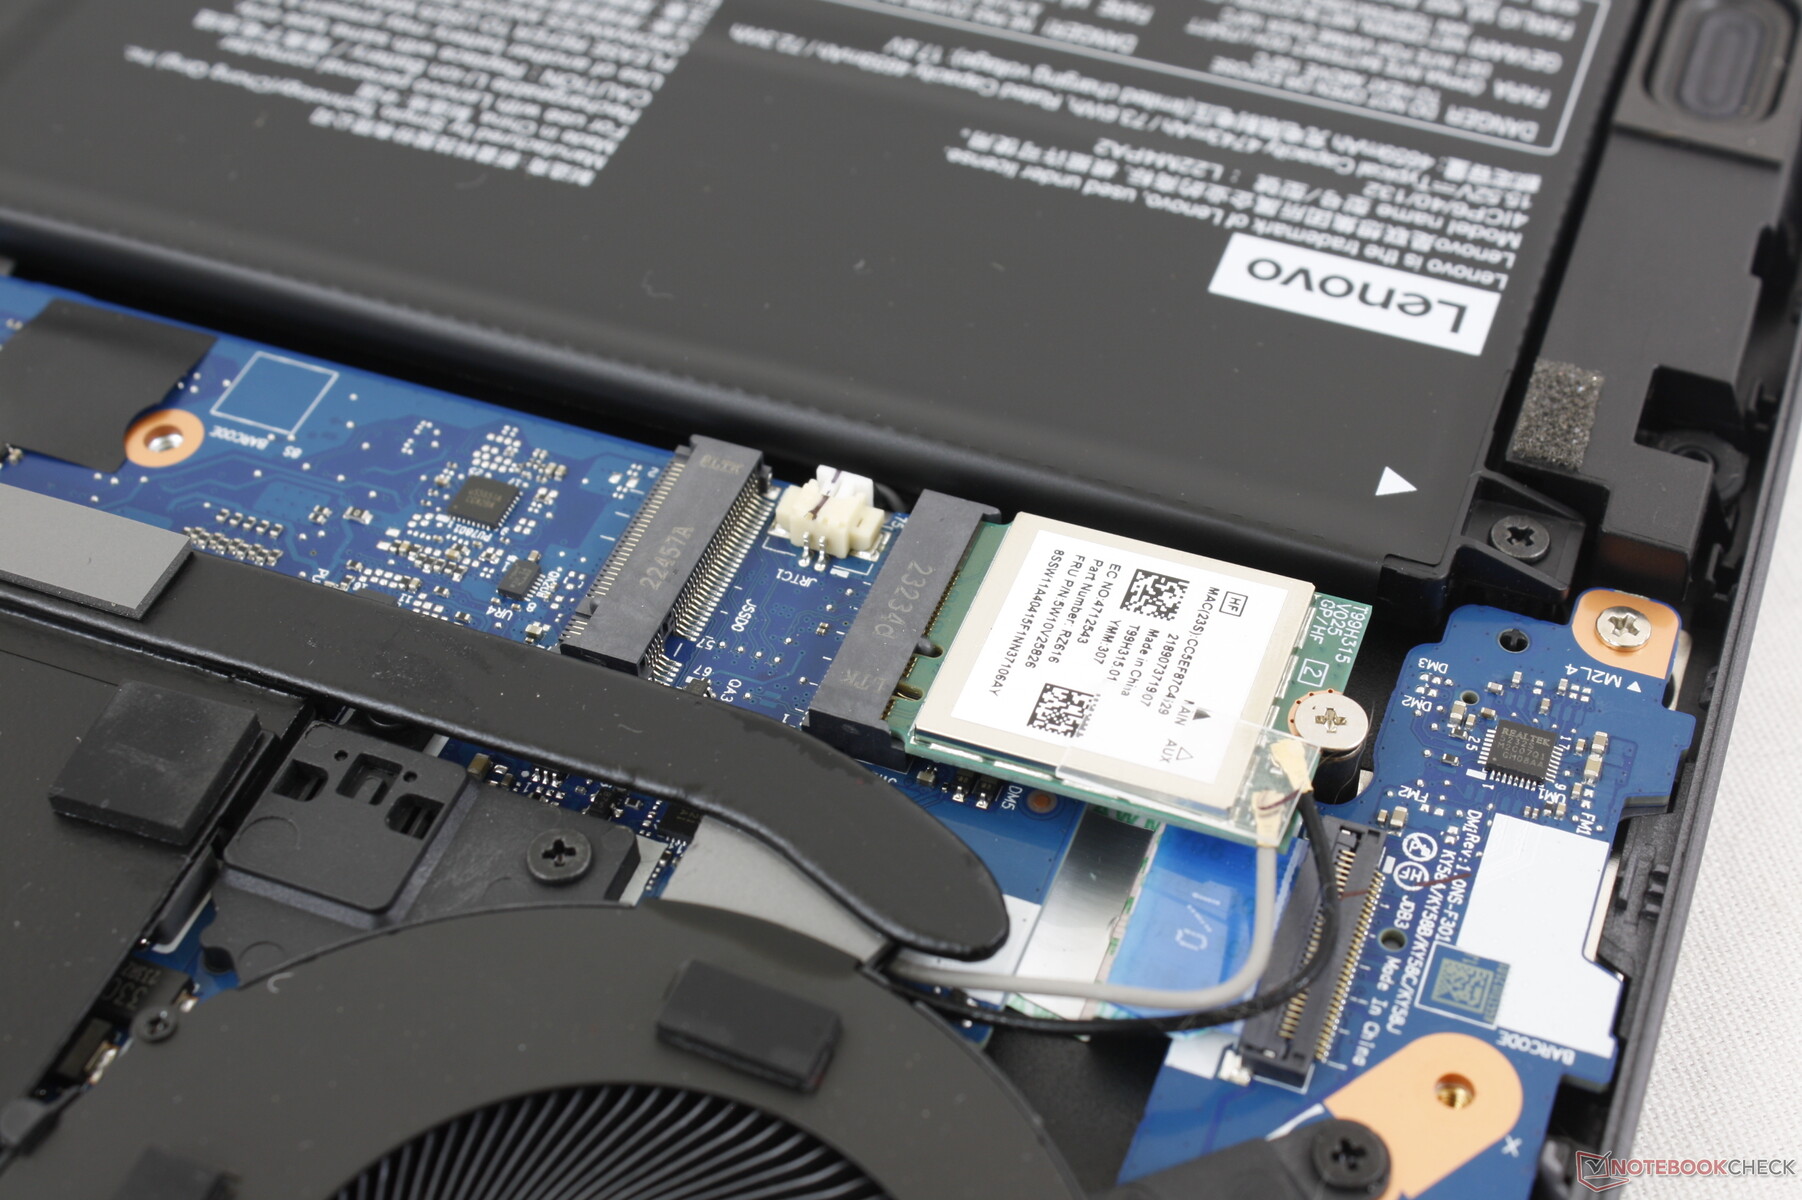
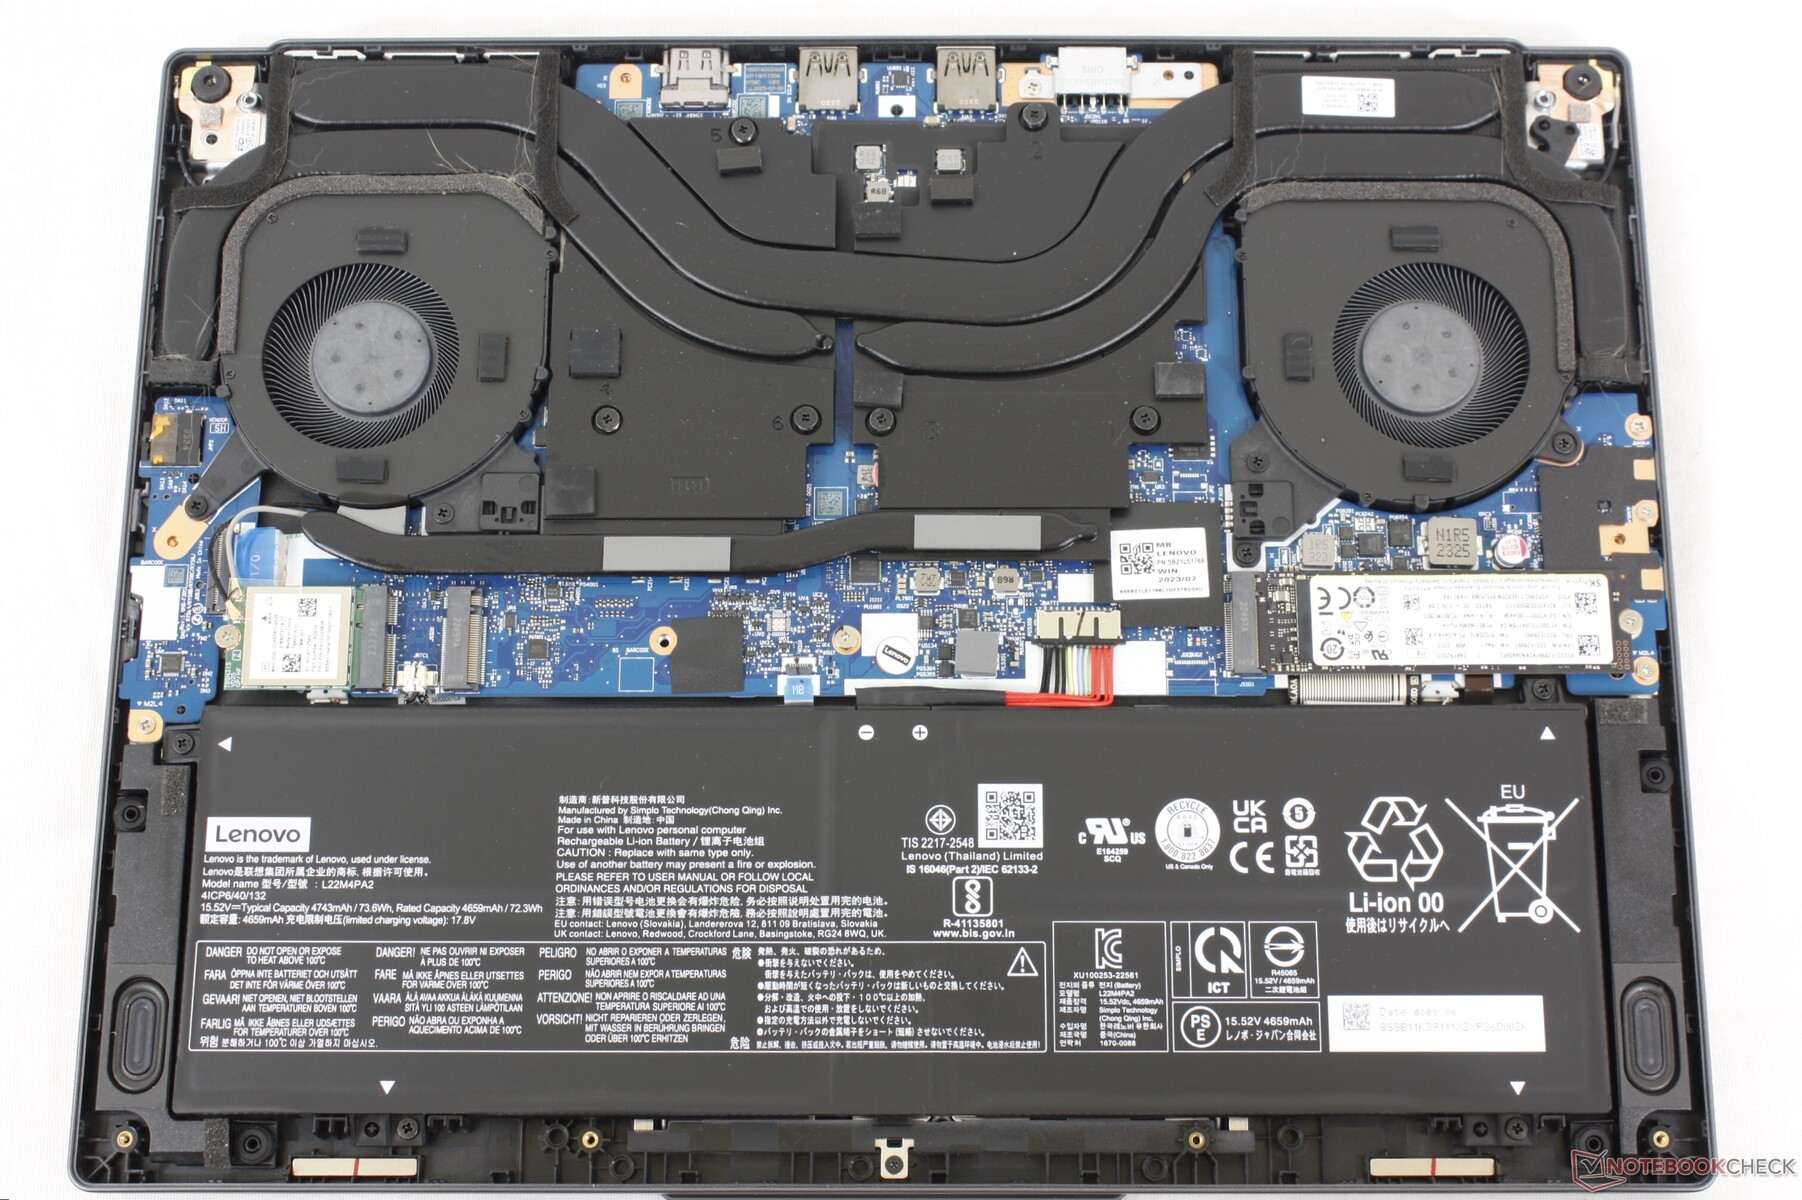
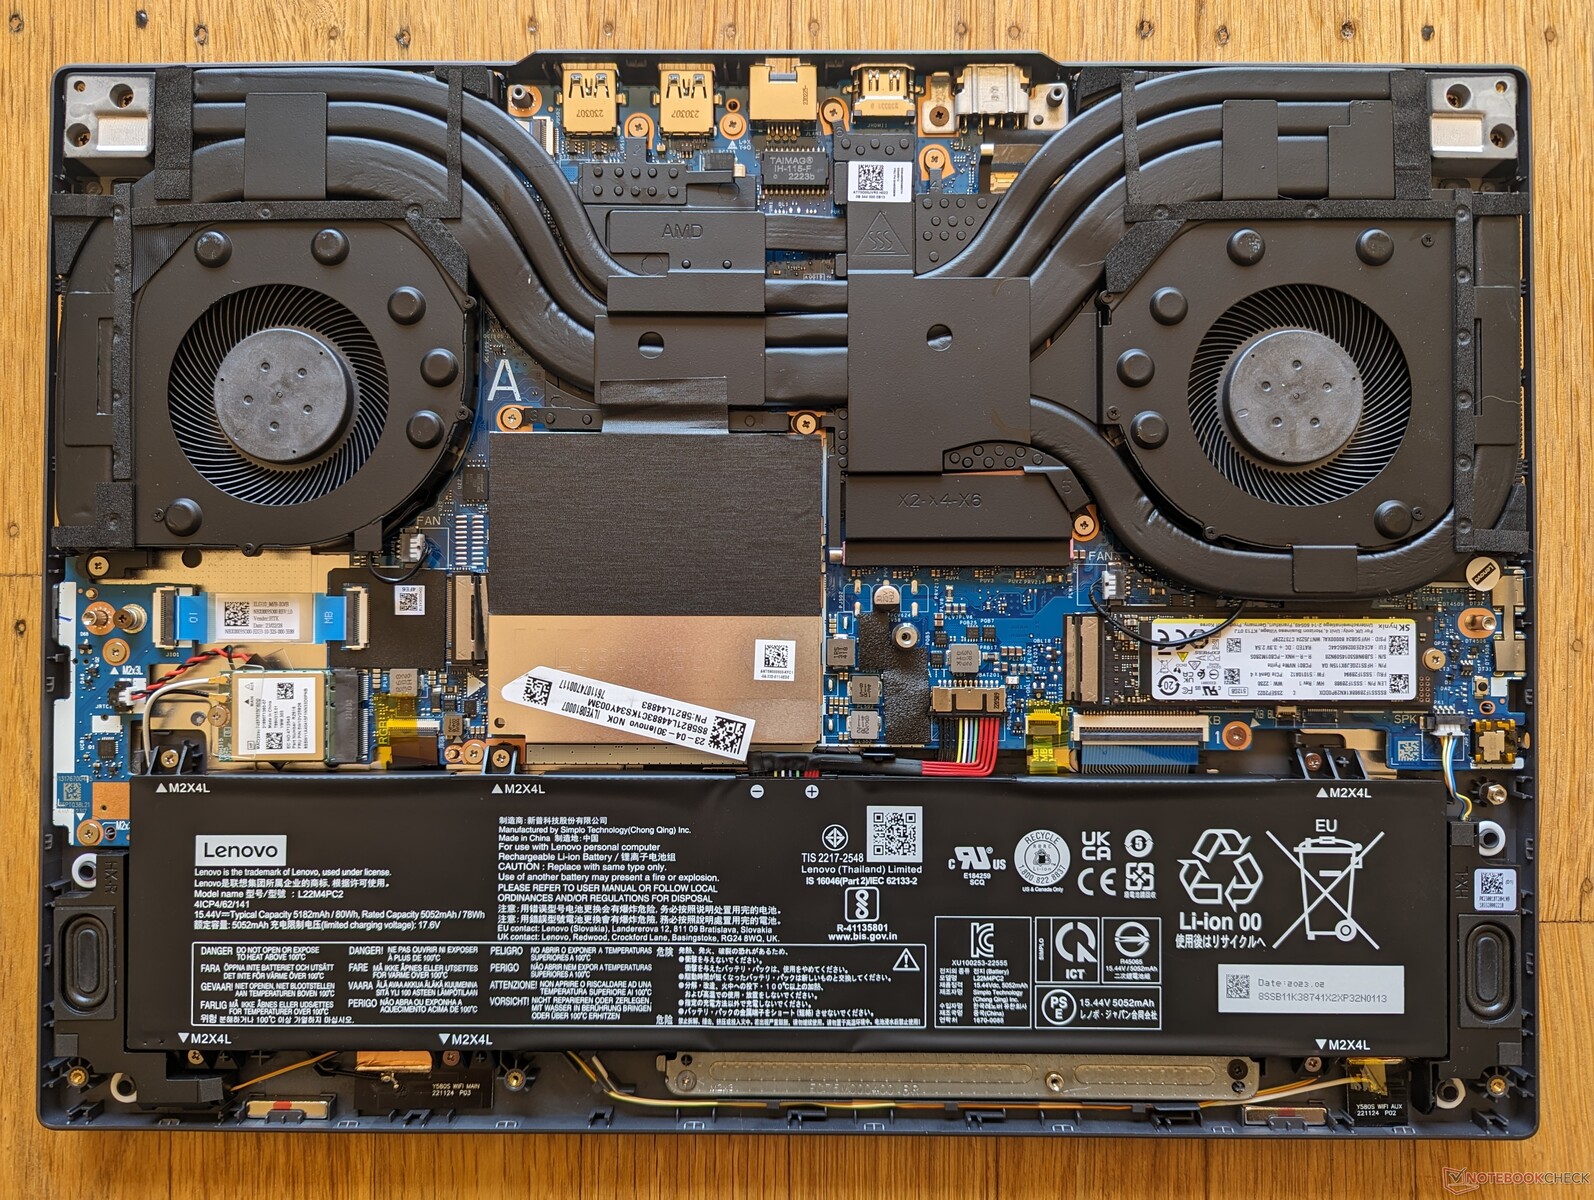
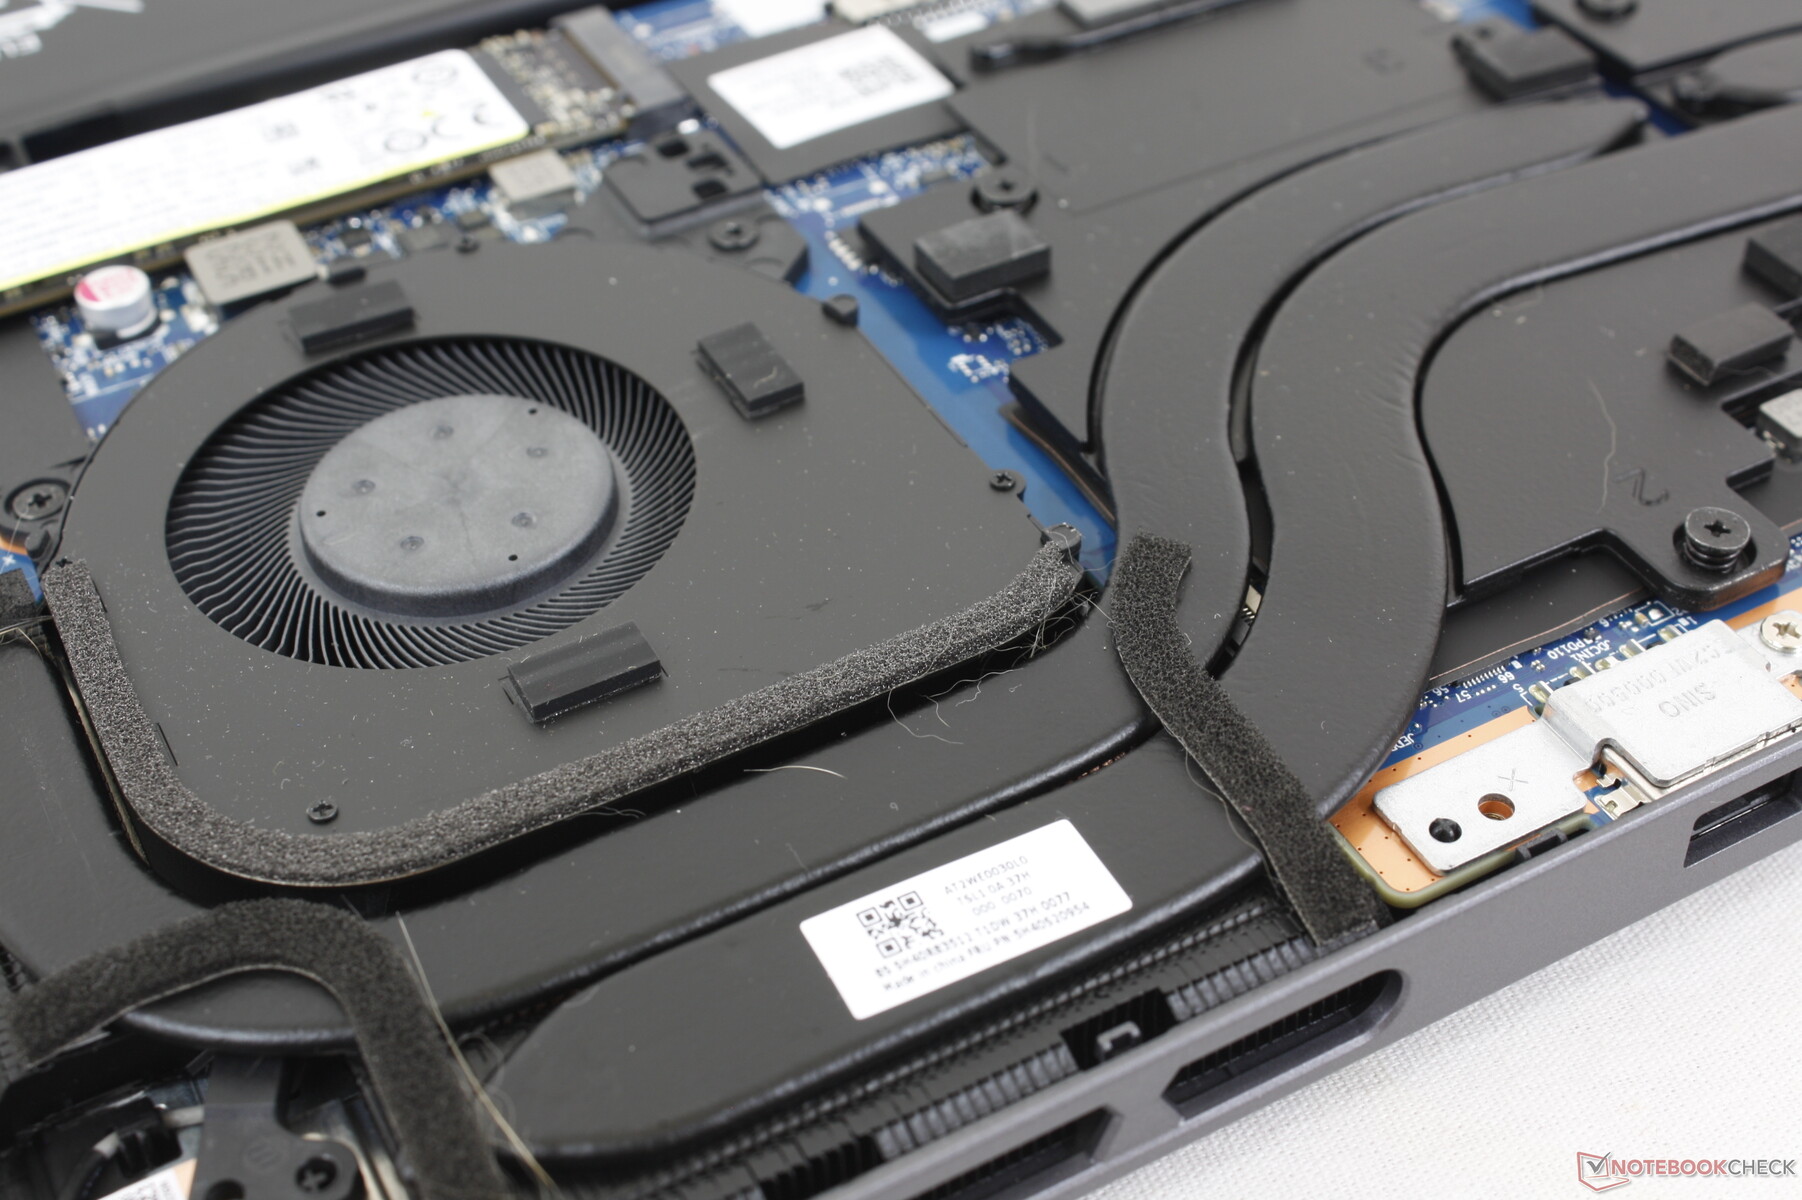
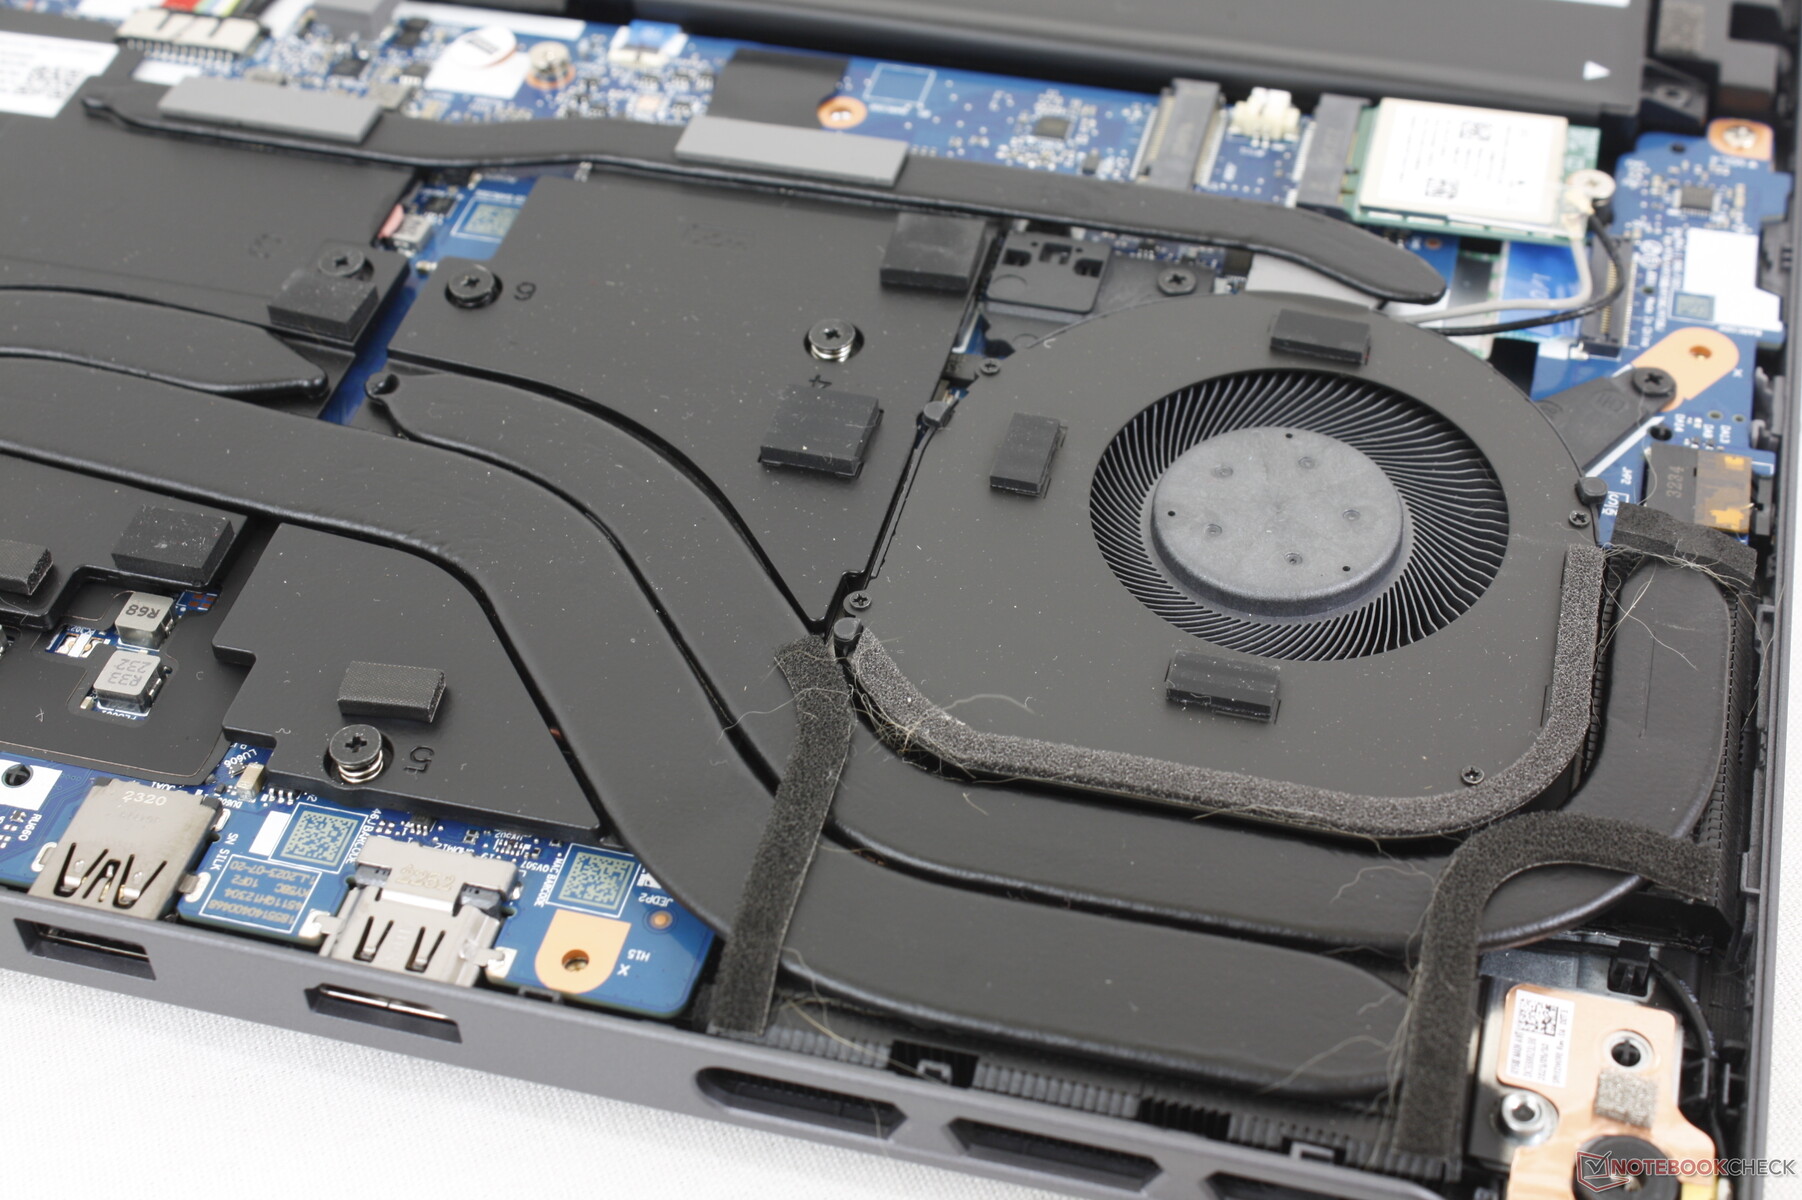
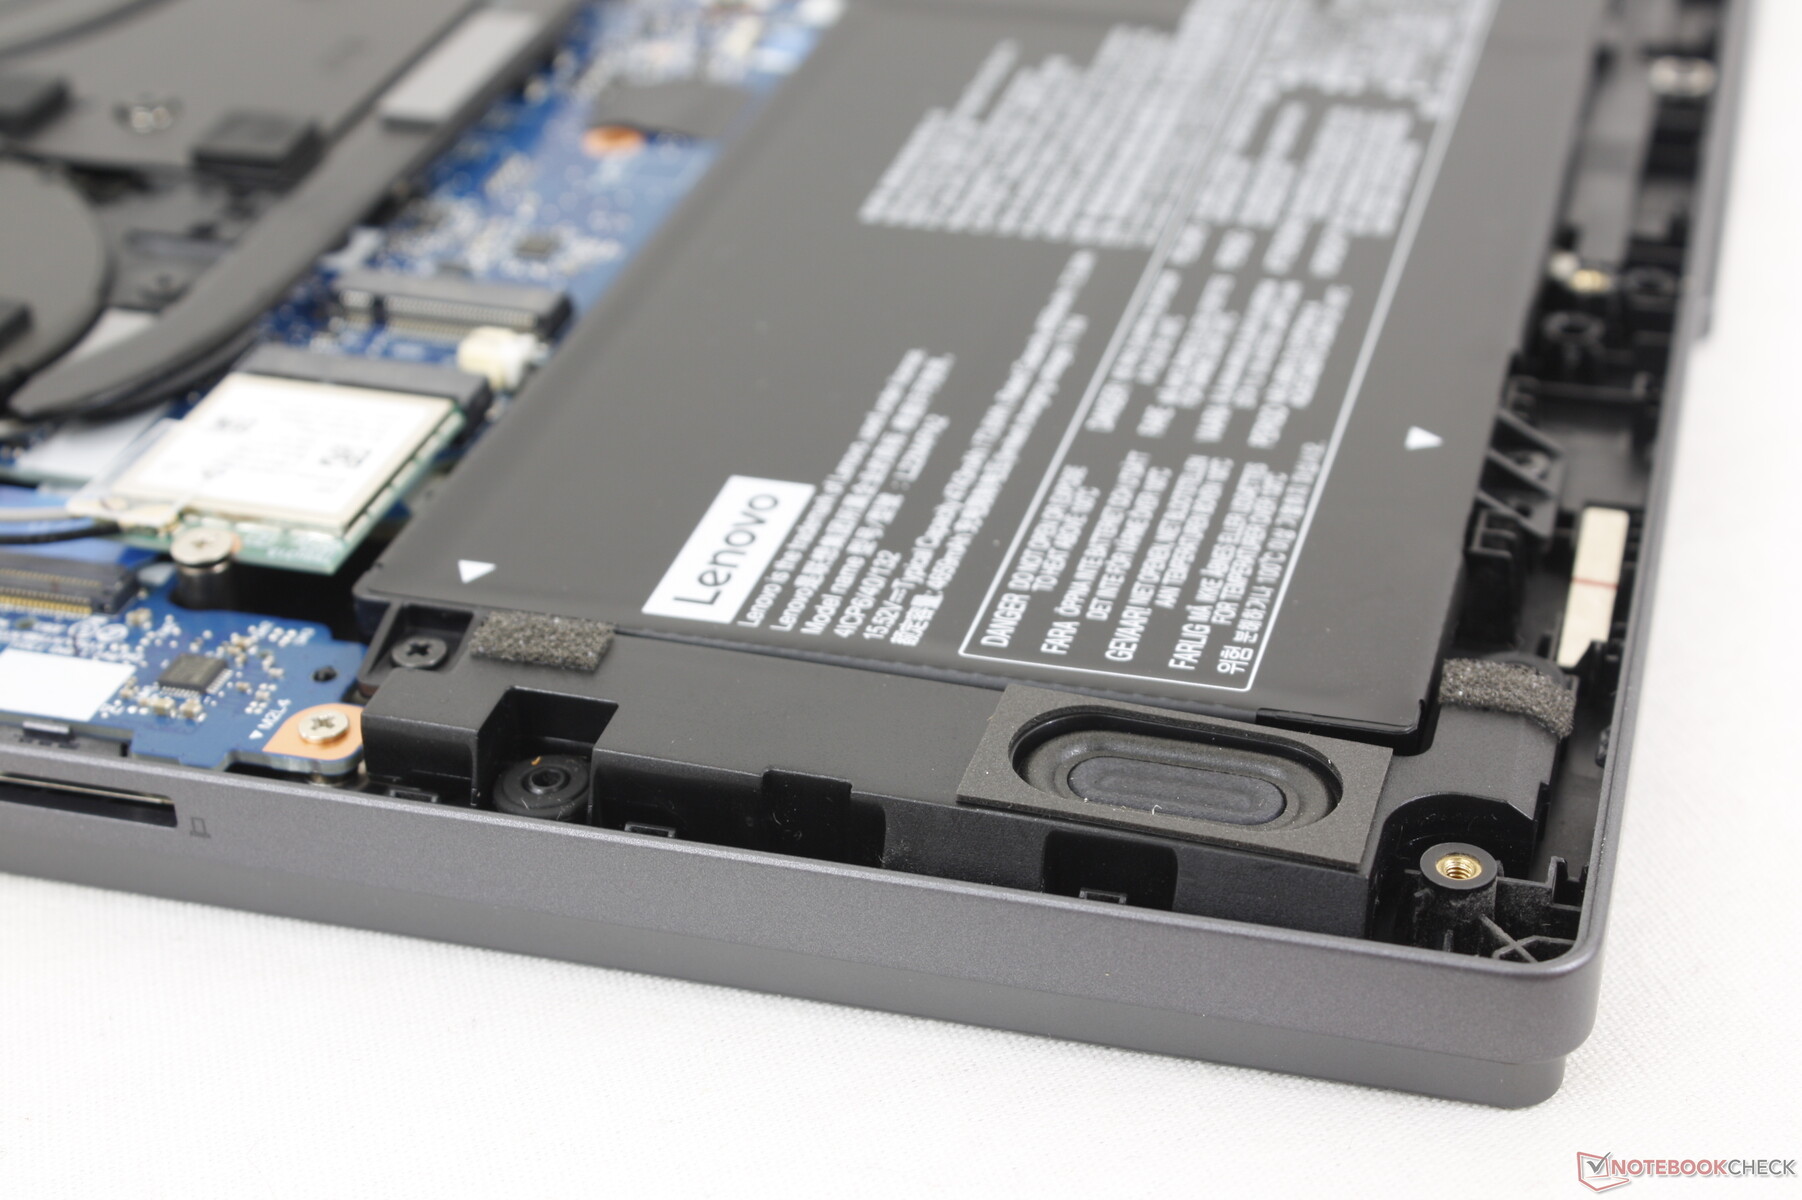
Manutenzione
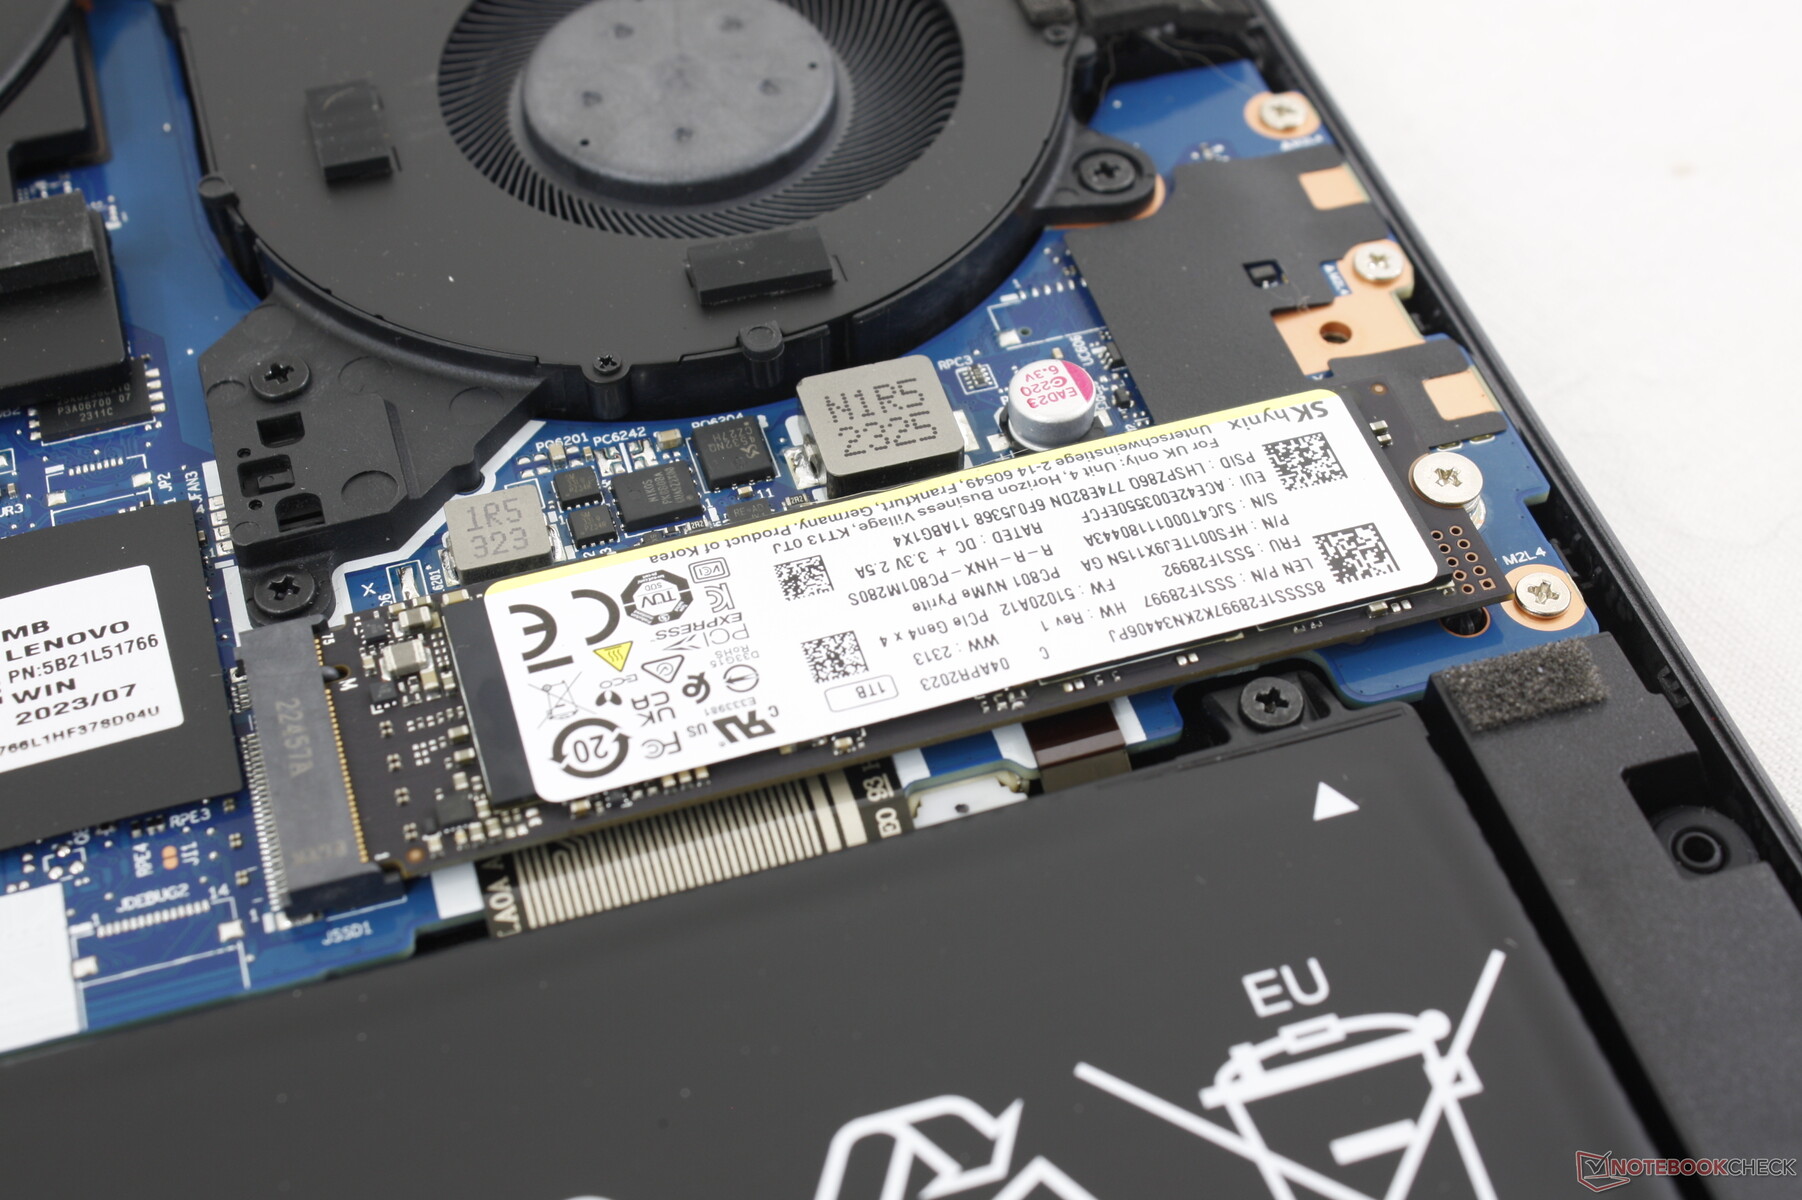
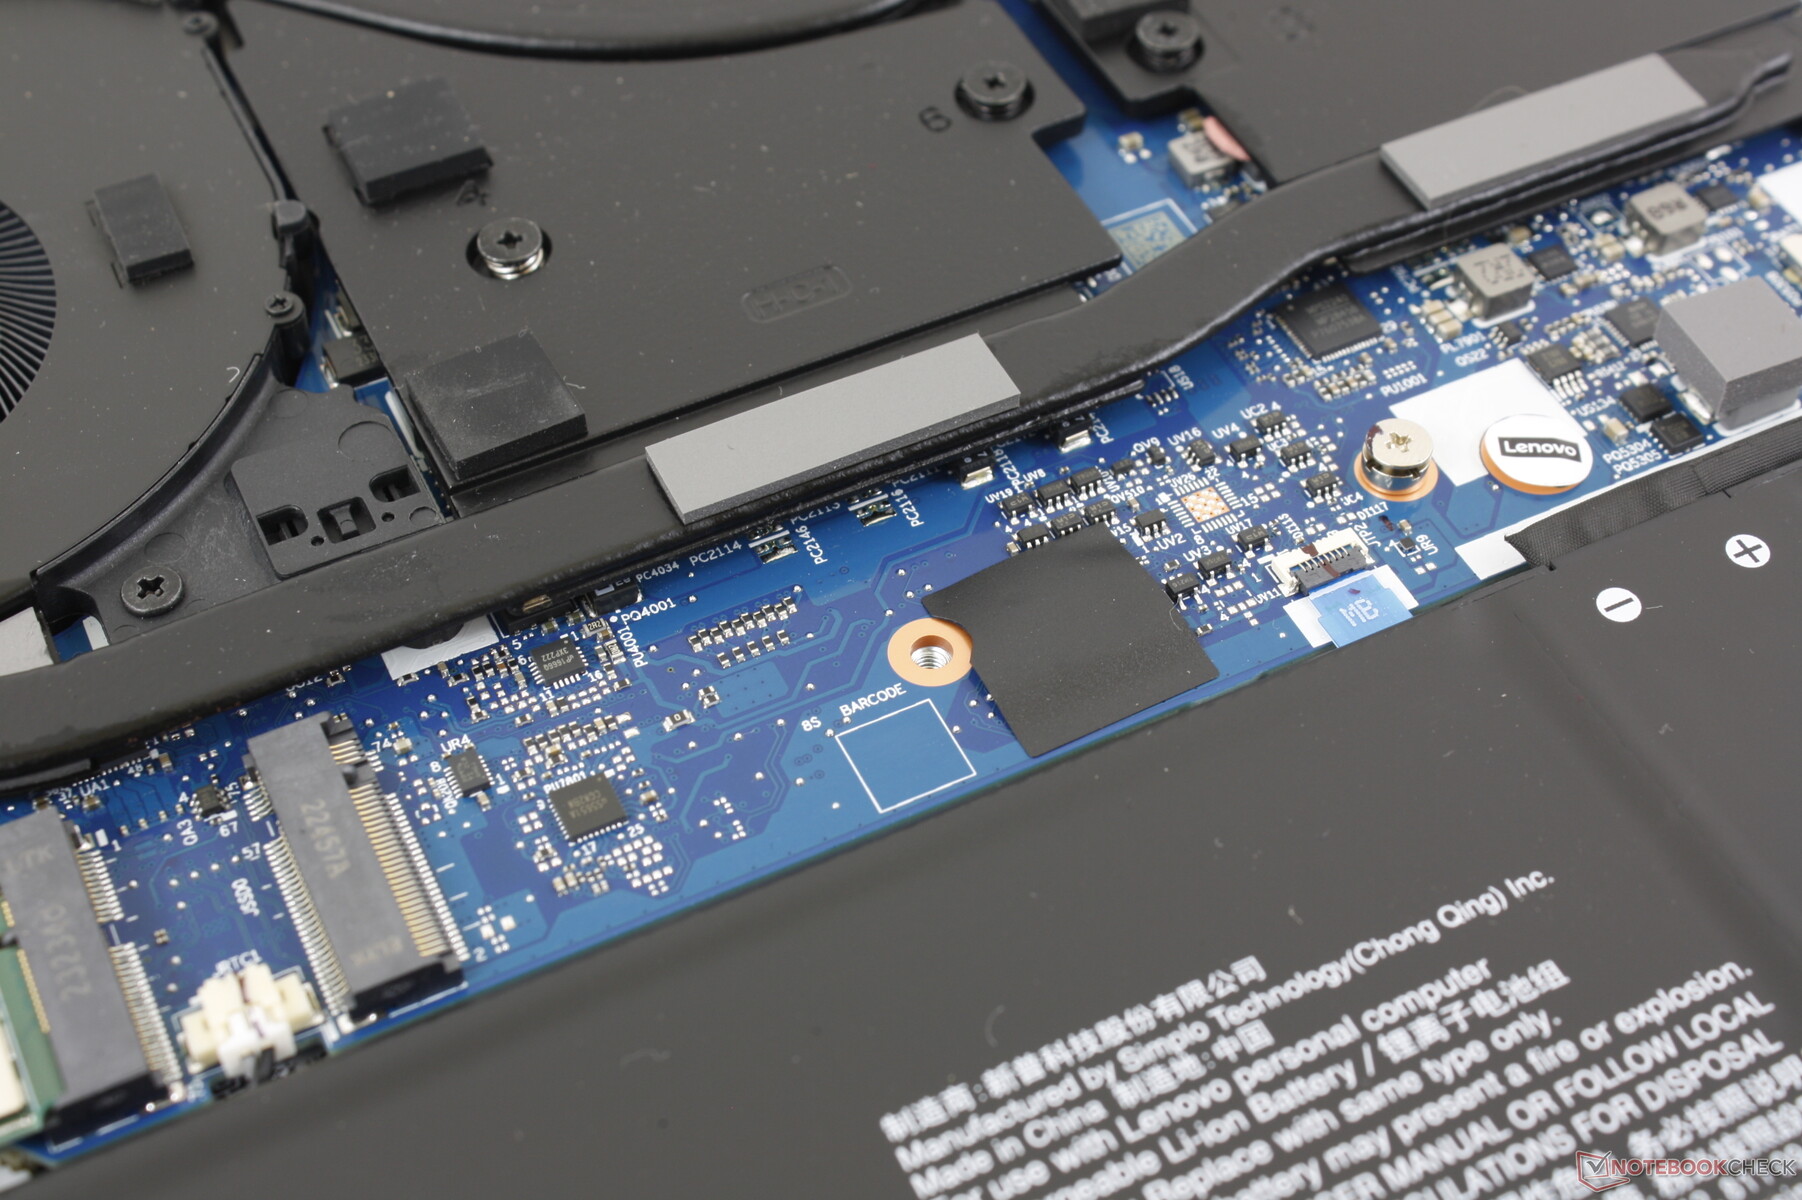
Il pannello inferiore è fissato da 10 viti Phillips per una facile rimozione. La RAM è saldata, lasciando i due slot per SSD M.2 2280 e il modulo WLAN come unici componenti aggiornabili. In confronto, la RAM è aggiornabile dall'utente sul 2023 Blade 14 e sullo Zephyrus G14.
Accessori e garanzia
La confezione di vendita comprende l'adattatore CA e la documentazione, senza alcun extra. La garanzia standard limitata di un anno del produttore è valida se acquistata negli Stati Uniti.
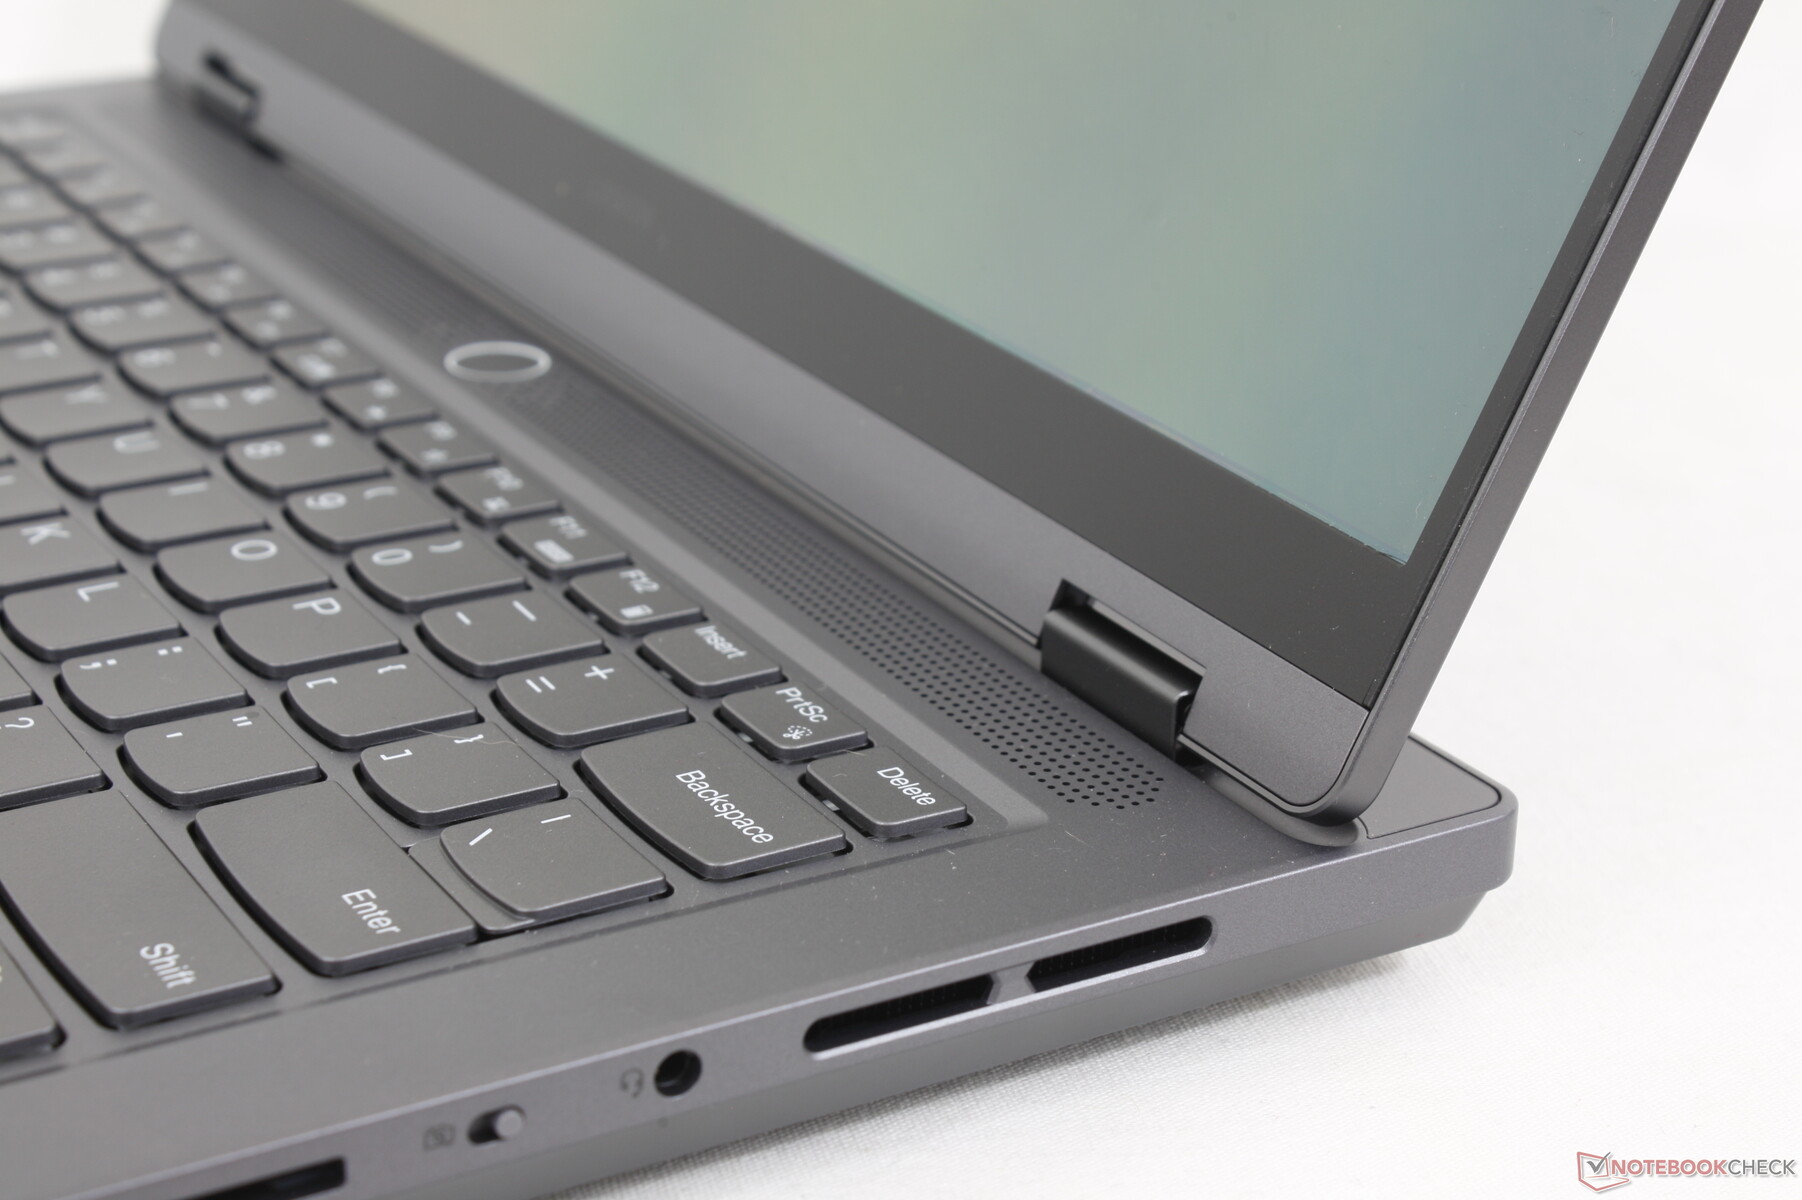
Dispositivi di input - Nessuna illuminazione RGB
Tastiera
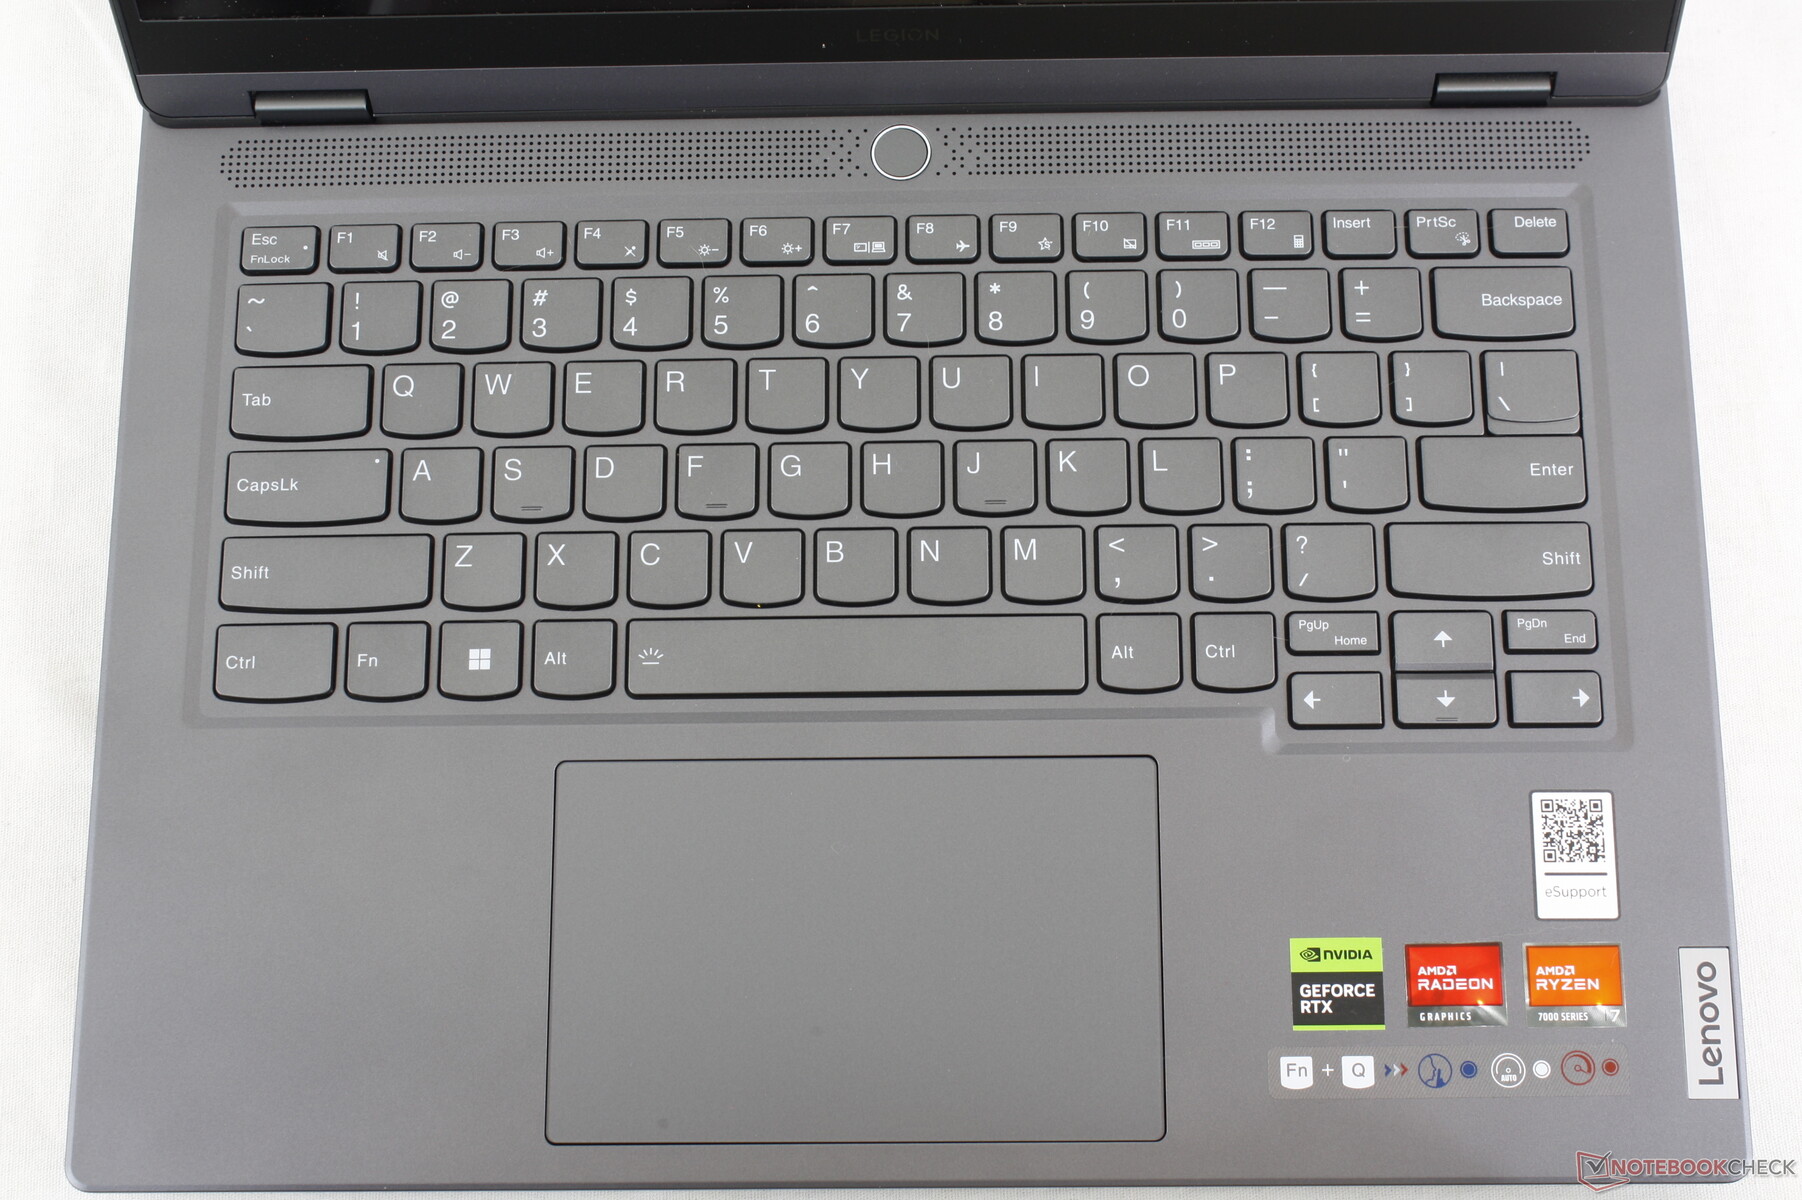
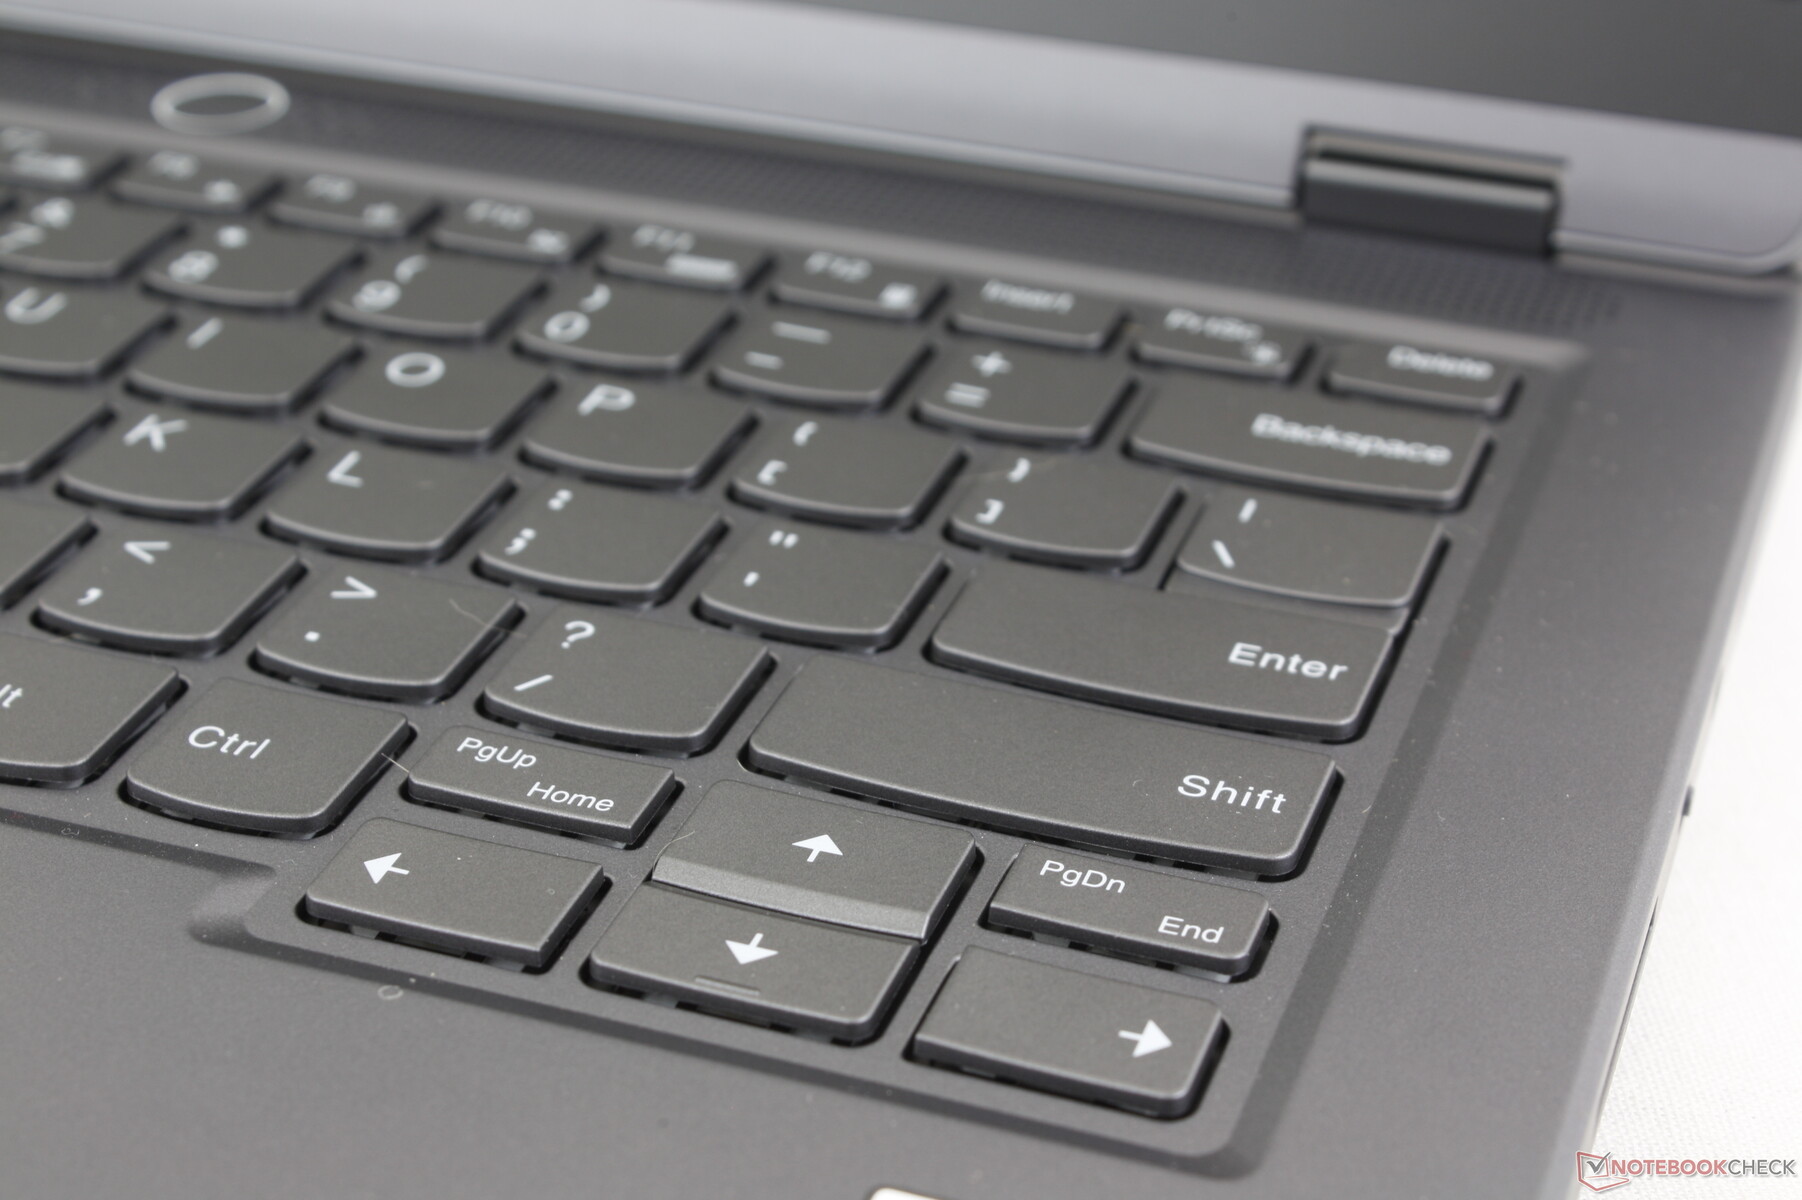
La tastiera mantiene la sensazione e le dimensioni dei tasti QWERTY principali del modello più grande Legion Slim 5 16 ma con tasti freccia più piccoli e un tastierino numerico omesso per motivi di superficie. L'esperienza di digitazione è solida e con un feedback più forte da ciascun tasto rispetto ai tasti più morbidi del Blade 14. Tuttavia, i tasti stretti PgUp e PgDn sono più grandi e più piccoli. Tuttavia, gli stretti tasti PgUp e PgDn sono schiacciati tra i tasti freccia e risultano scomodi da premere.
Lenovo offre solo una retroilluminazione bianca a zona singola, mentre i modelli di Razer, Asus e Alienware sono tutti dotati di illuminazione RGB a più zone.
Touchpad
Il clickpad (12 x 7,5 cm) è più grande rispetto a quello dell' Alienware x14 (10,8 x 5,5 cm) ma più piccolo di quello del Blade 14 (15 x 8,5 cm). È comunque fluido e affidabile, con un rumore silenzioso quando viene premuto. Il feedback durante l'inserimento di un clic potrebbe essere un po' più deciso, dato che è sul lato più morbido.

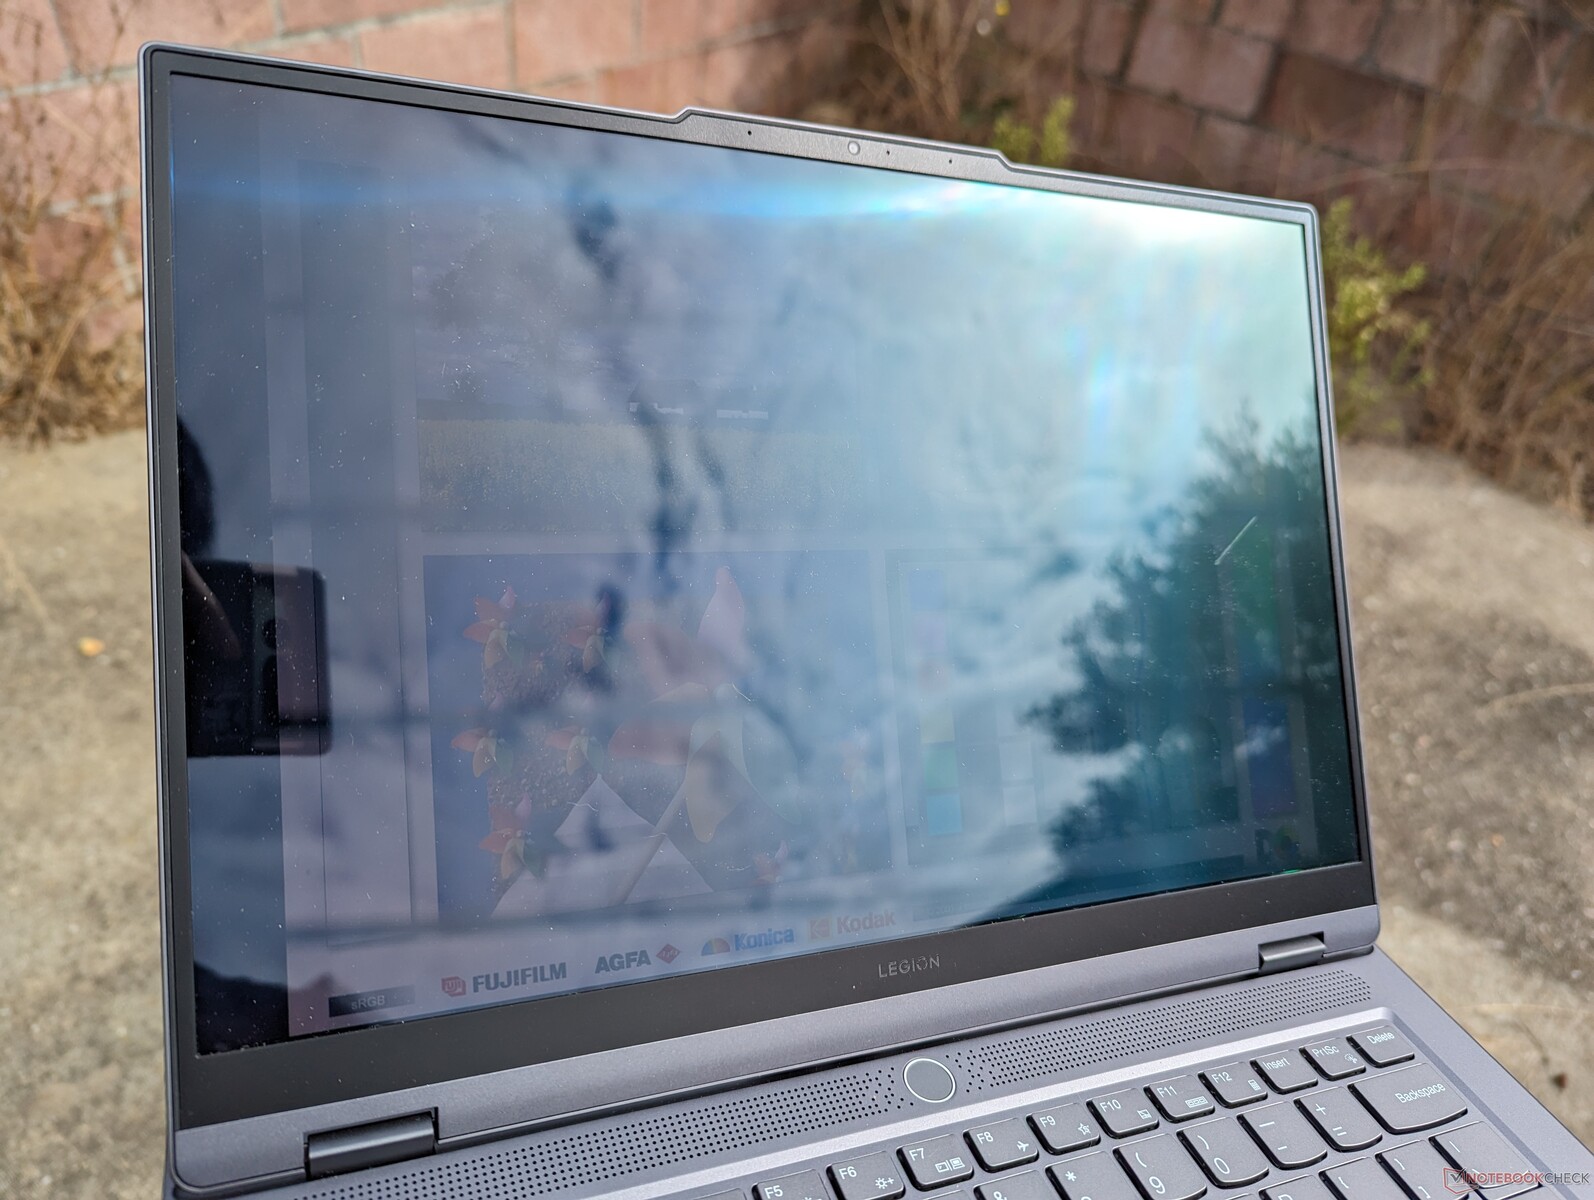
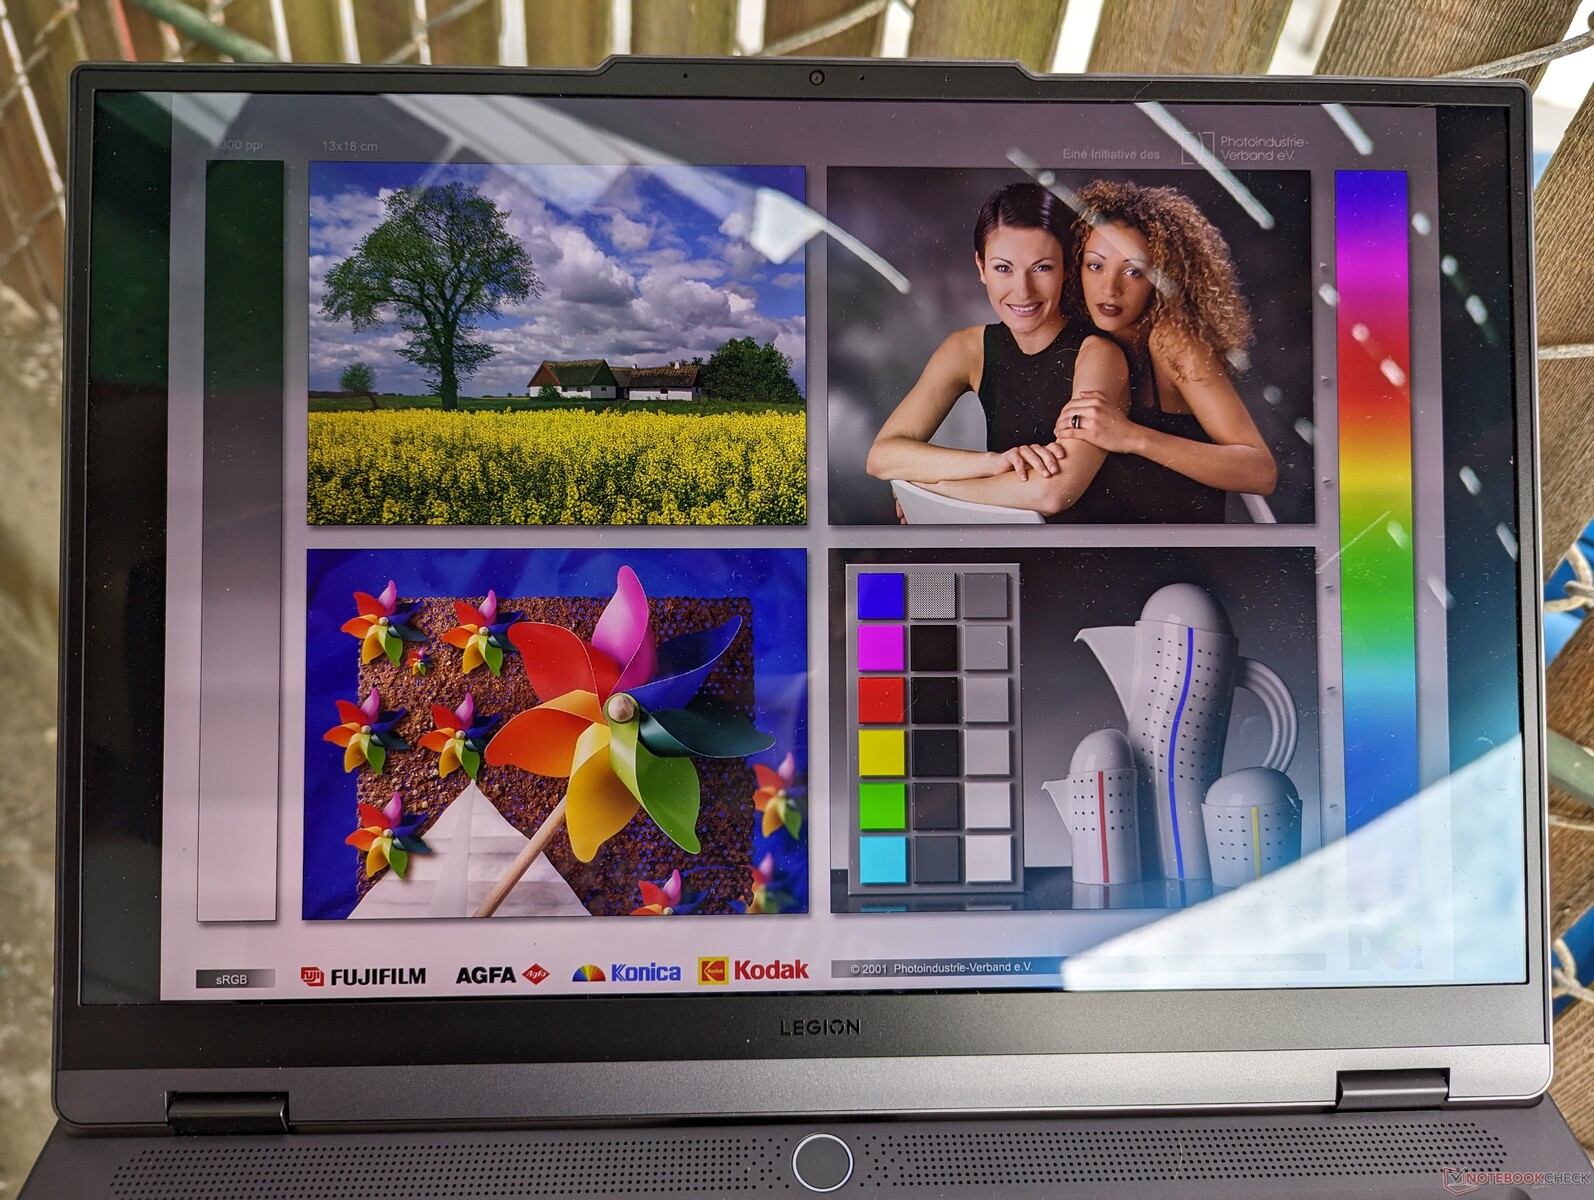
Display - Manca una caratteristica importante
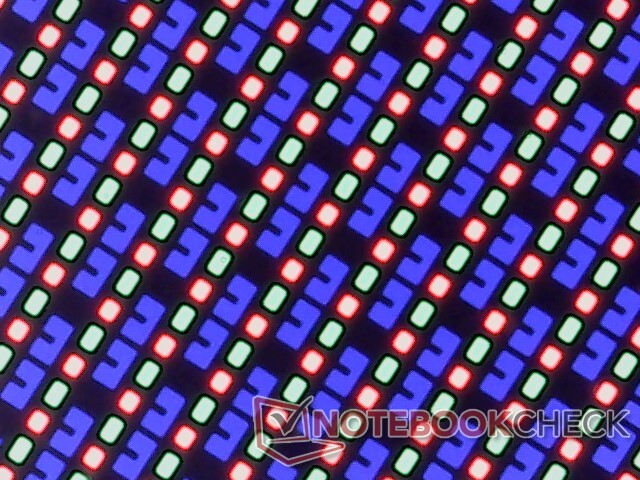
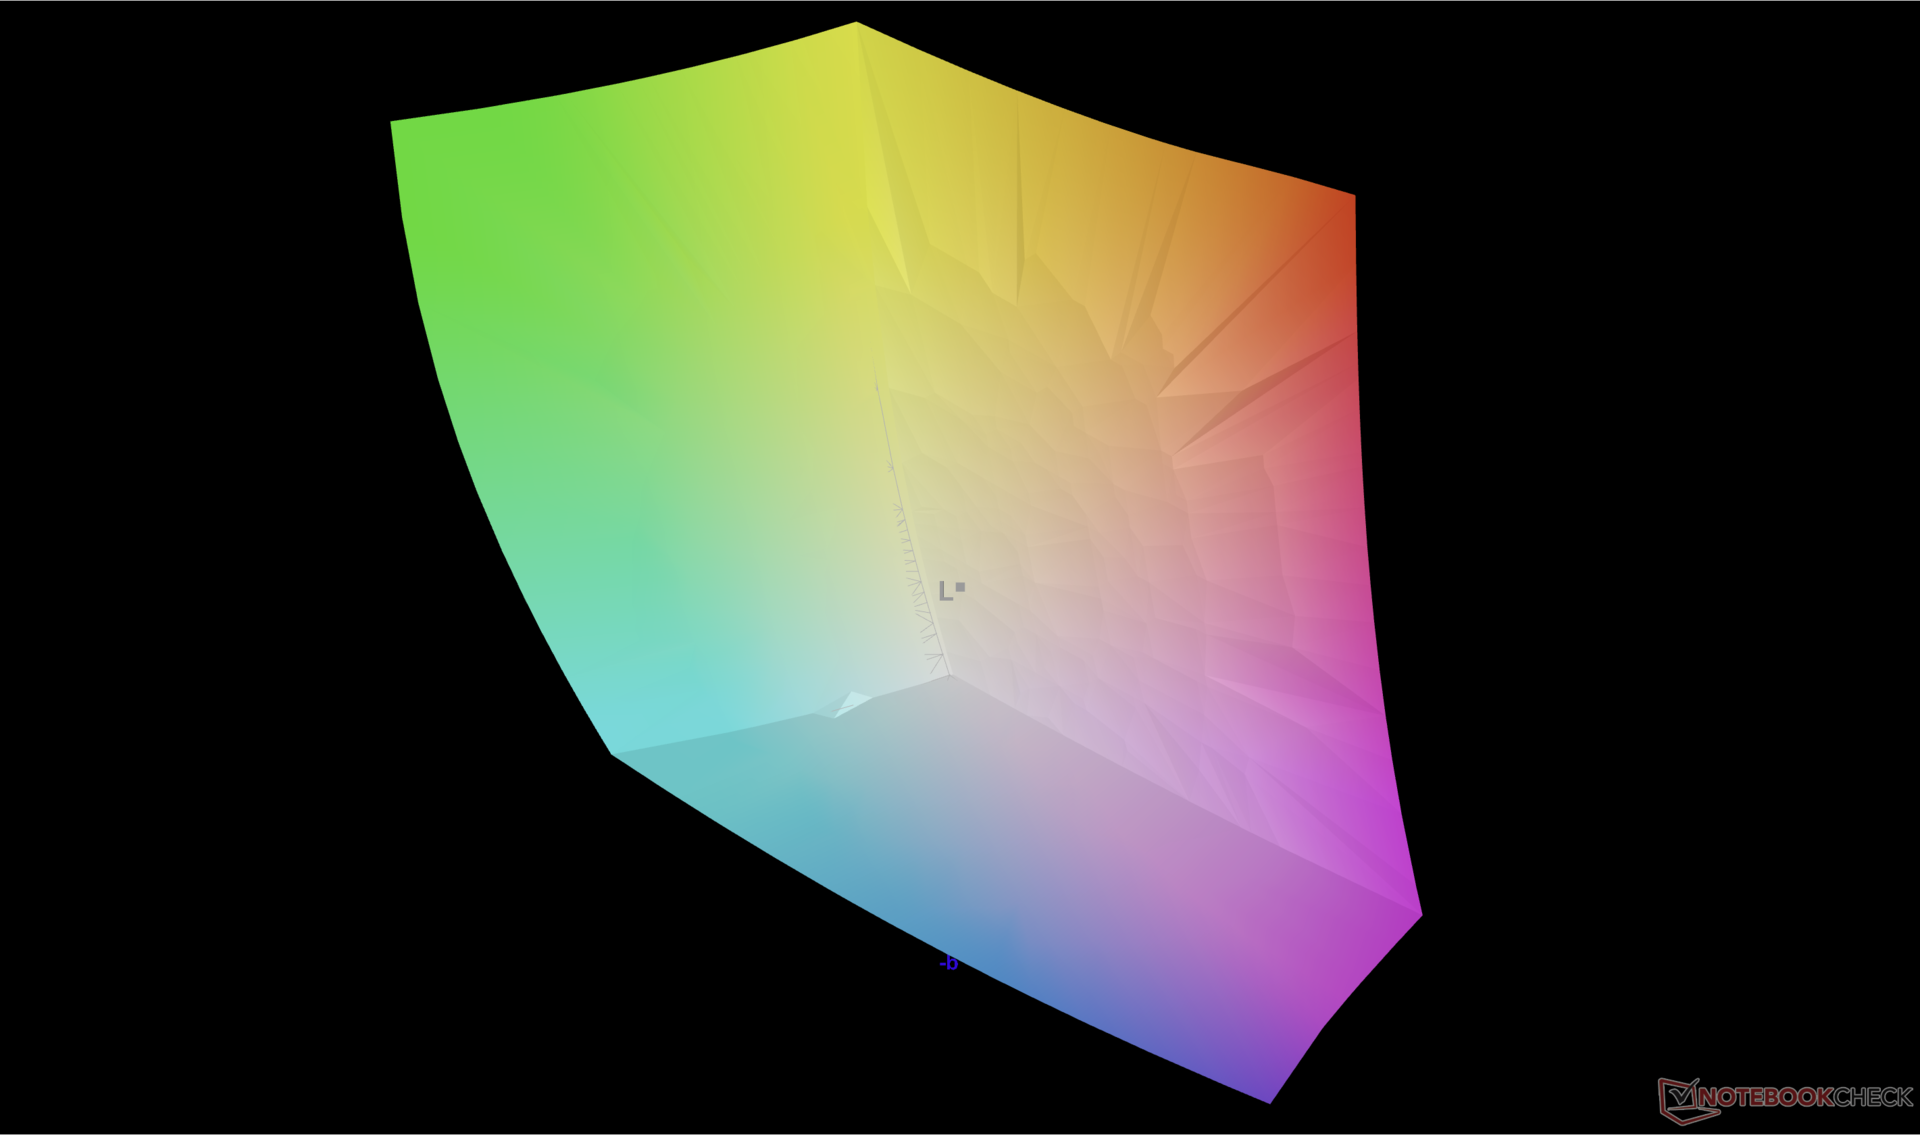
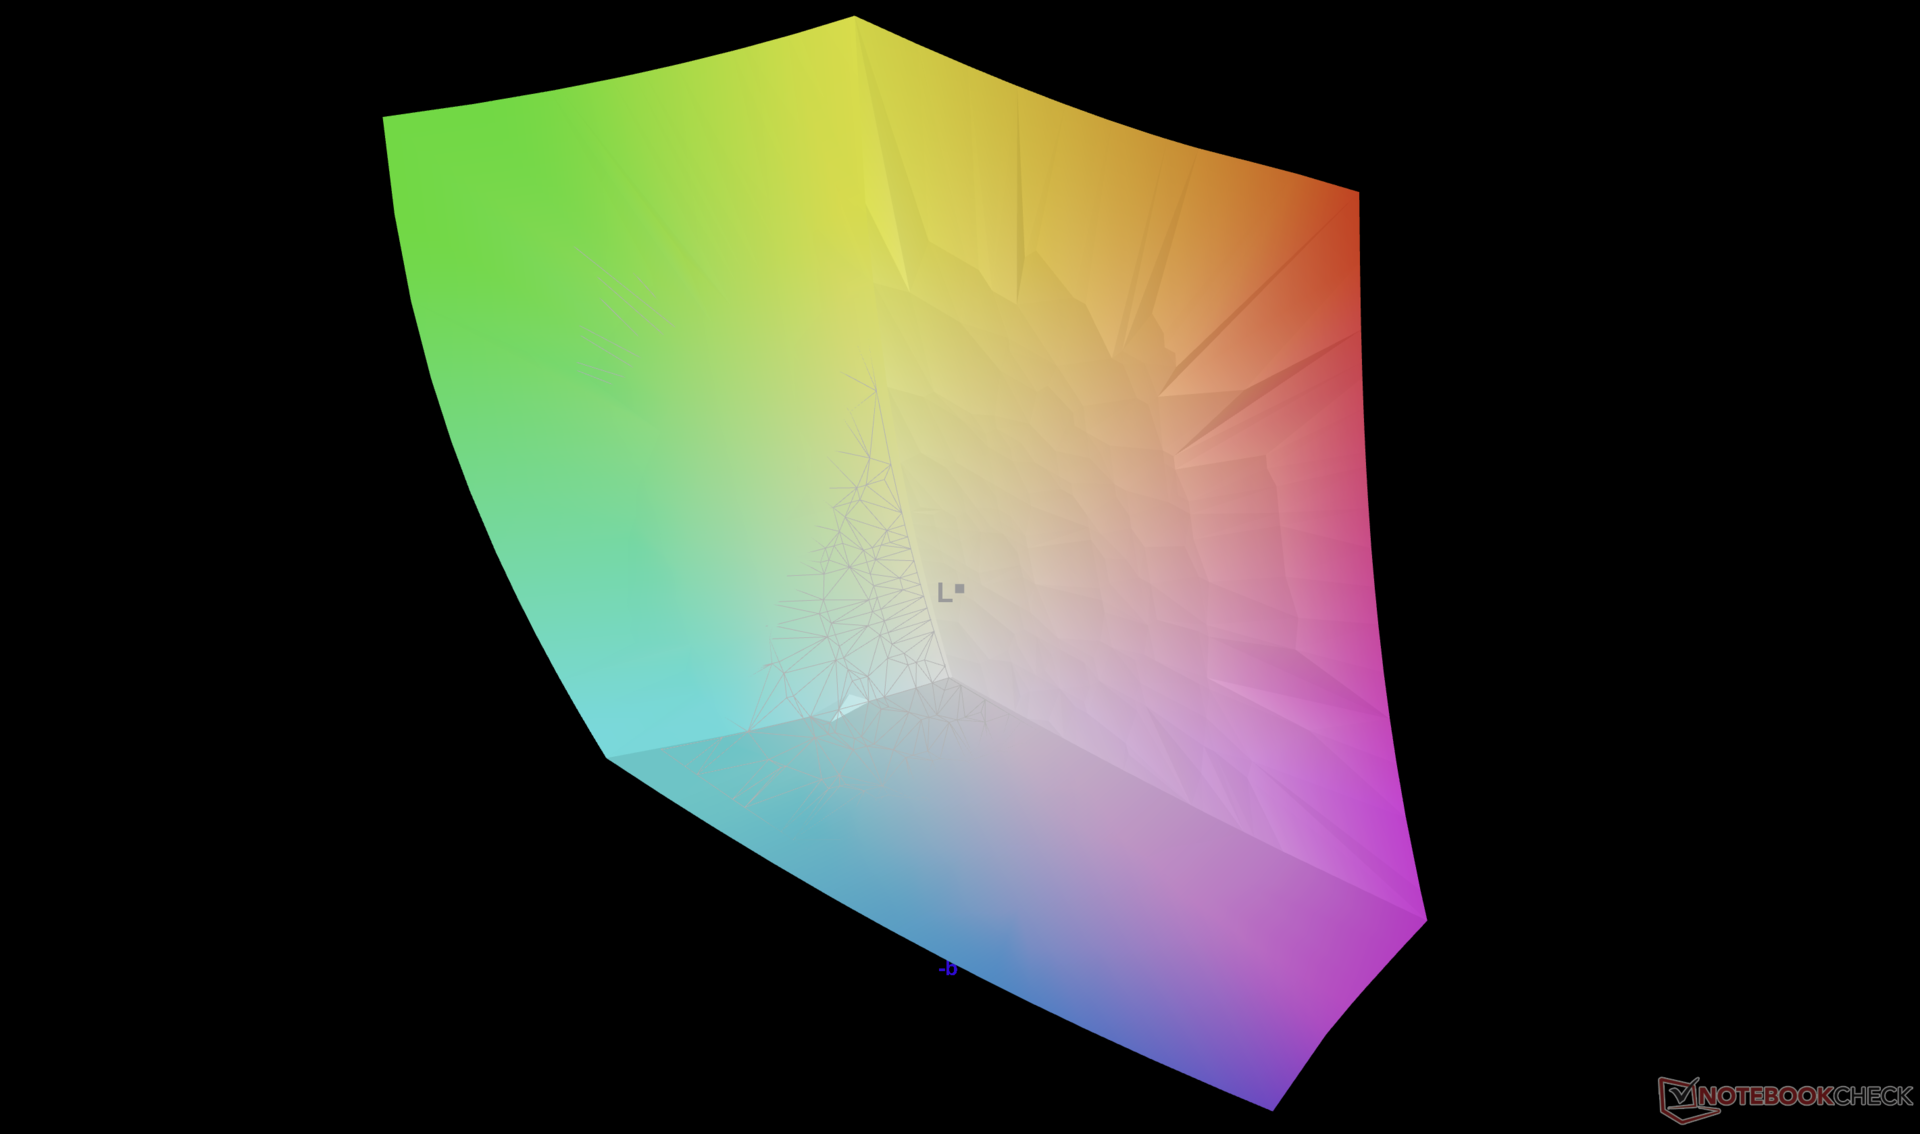
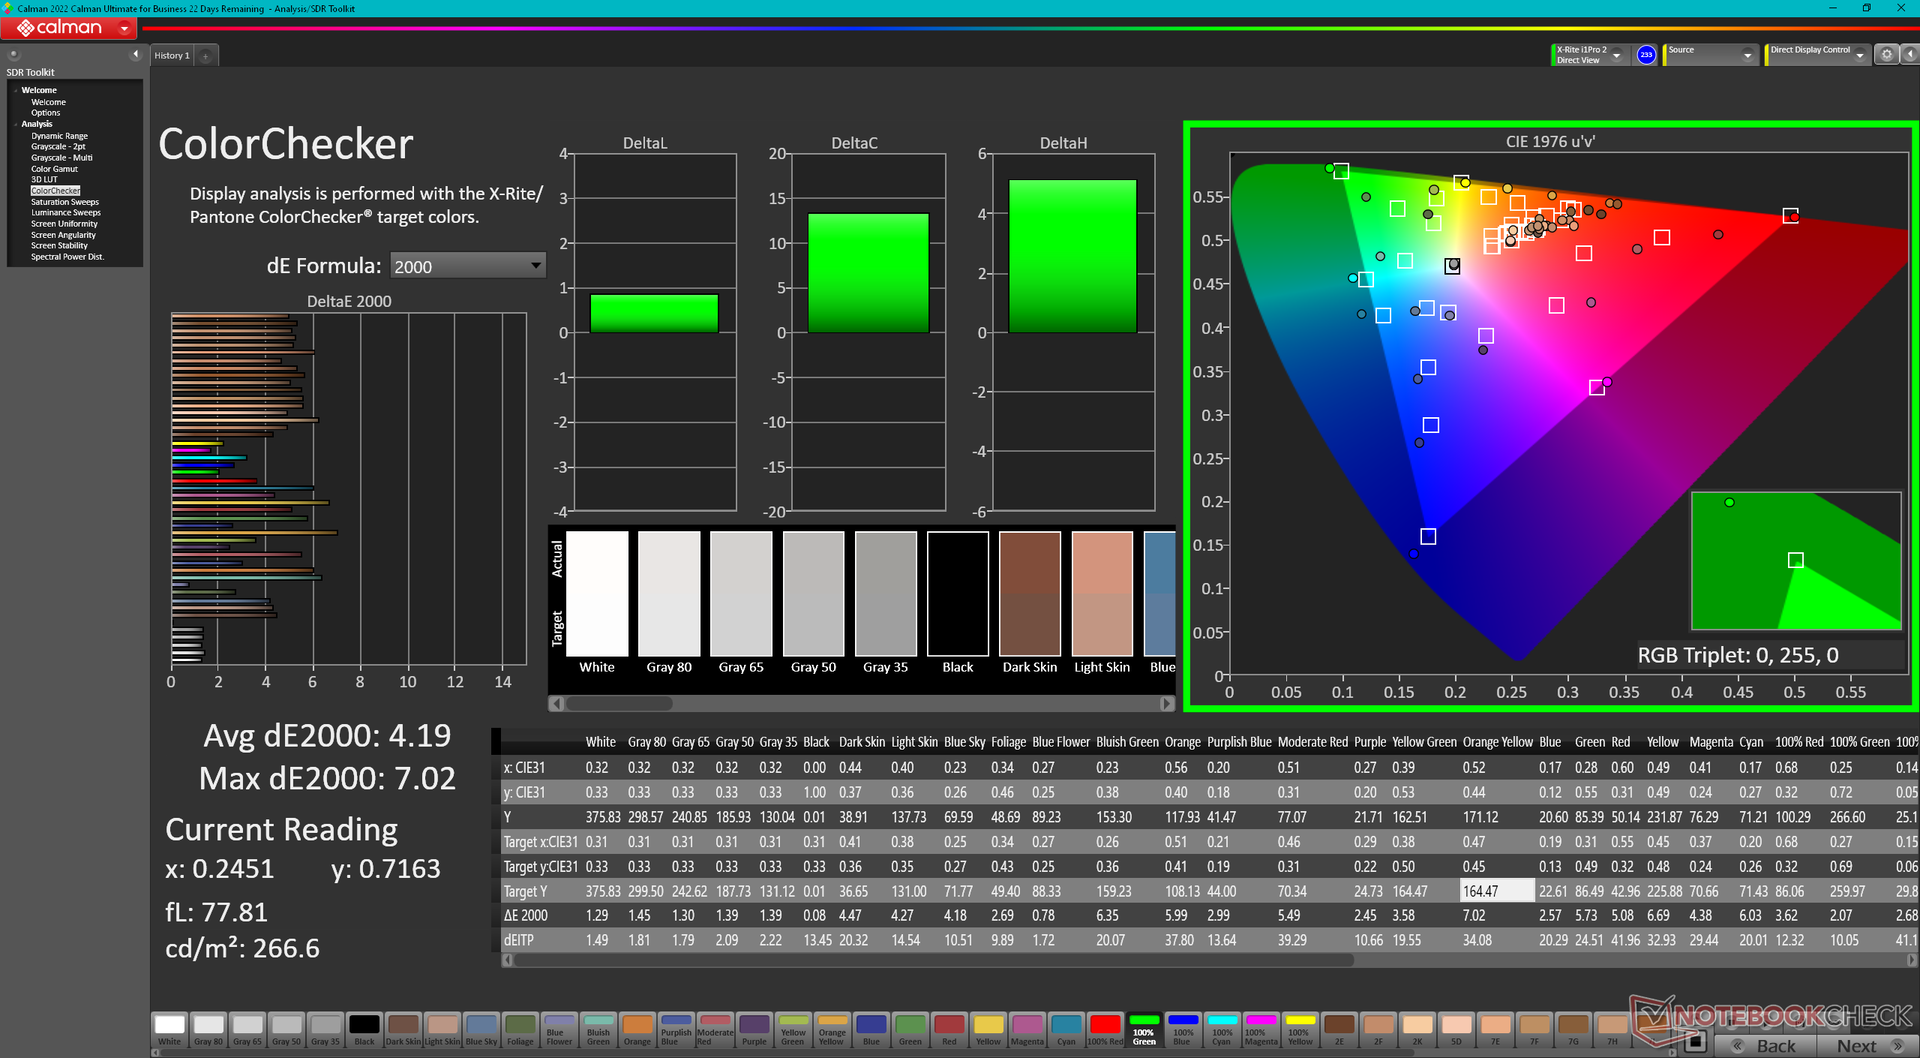
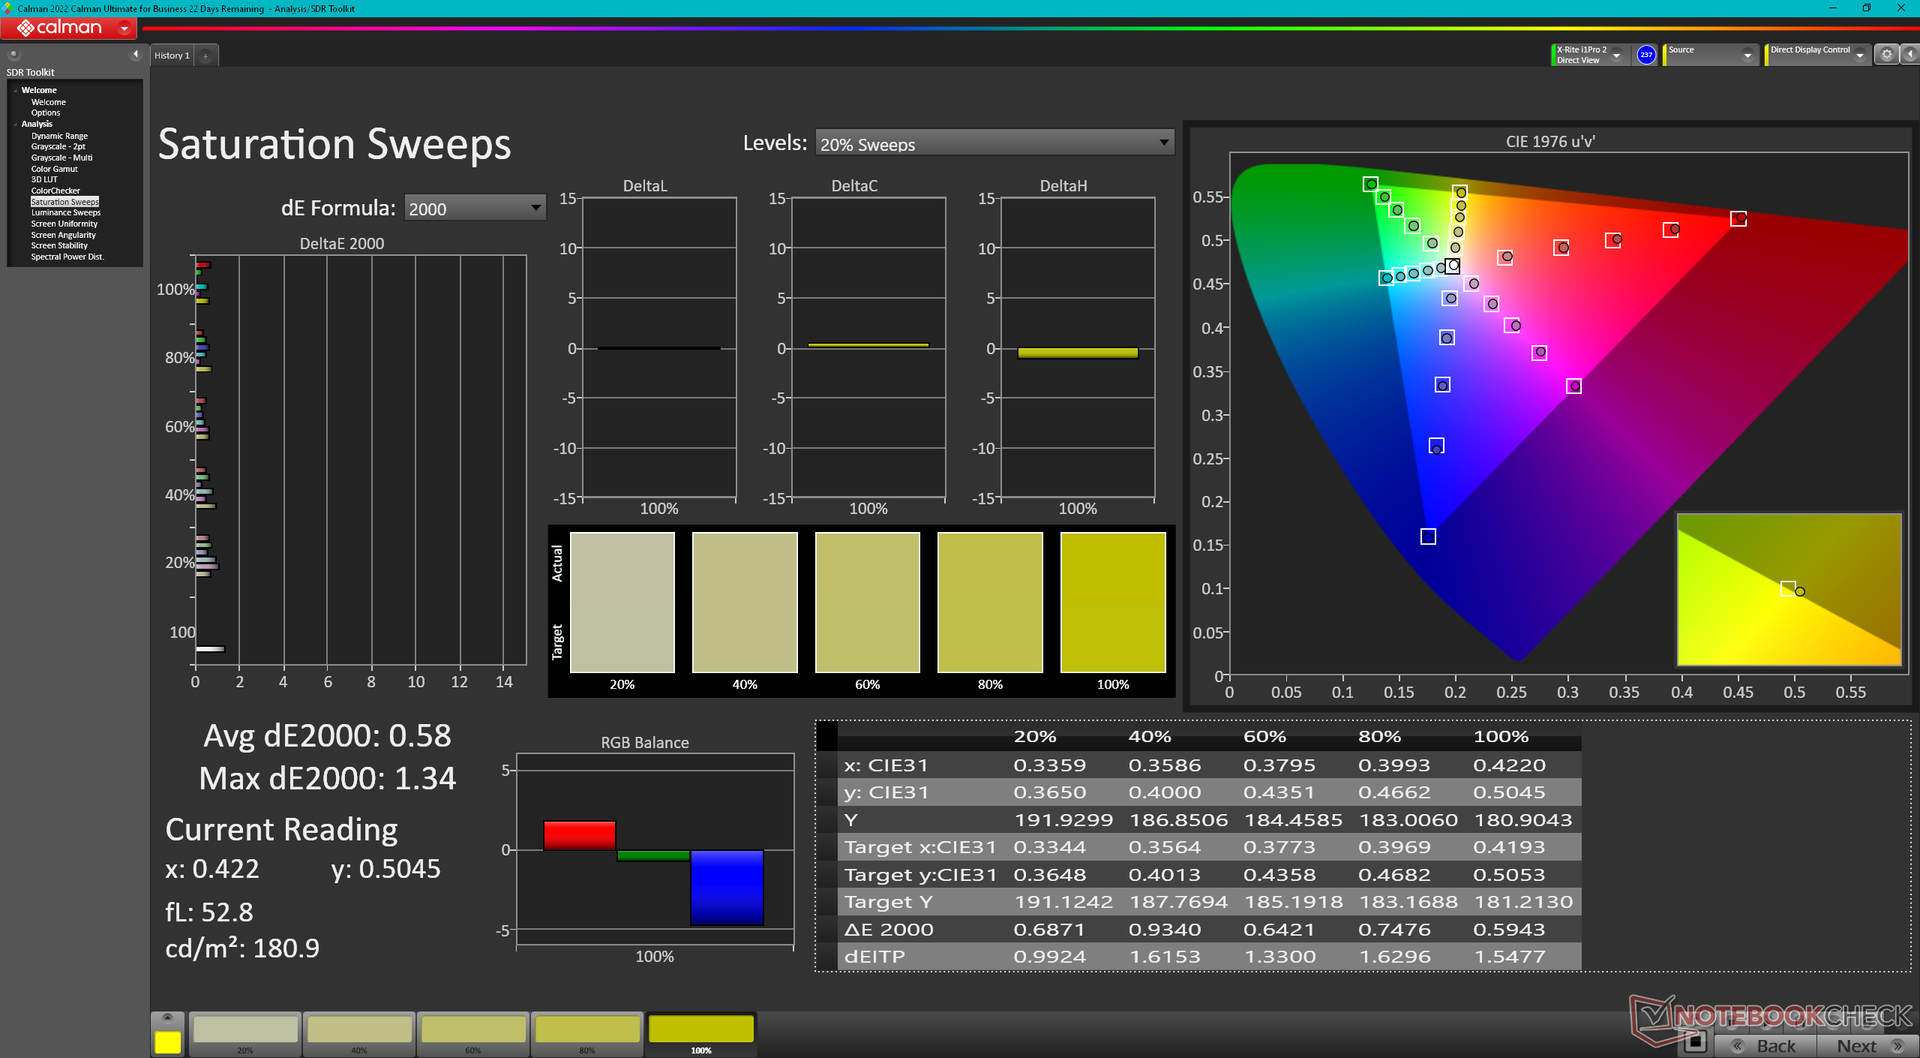
Il display OLED è il punto di forza di Legion Slim 5 14, in quanto non si trova su nessun altro portatile da gioco da 14 pollici al momento. Offre una frequenza di aggiornamento nativa di 120 Hz, una risoluzione densa di 2,8K e colori completi DCI-P3 per essere adatto sia al gioco che alla creazione di contenuti. La maggior parte degli altri pannelli OLED, come quelli dei più economici Asus VivoBook sono limitati a 60 Hz o 90 Hz. Il pannello è persino certificato Pantone, cosa che non ci saremmo aspettati da un portatile Legion progettato principalmente per il gioco.
Il più grande svantaggio del display è la mancanza del supporto G-Sync, che è un peccato per un portatile da gioco costoso.
| |||||||||||||||||||||||||
Distribuzione della luminosità: 97 %
Al centro con la batteria: 377.5 cd/m²
Contrasto: ∞:1 (Nero: 0 cd/m²)
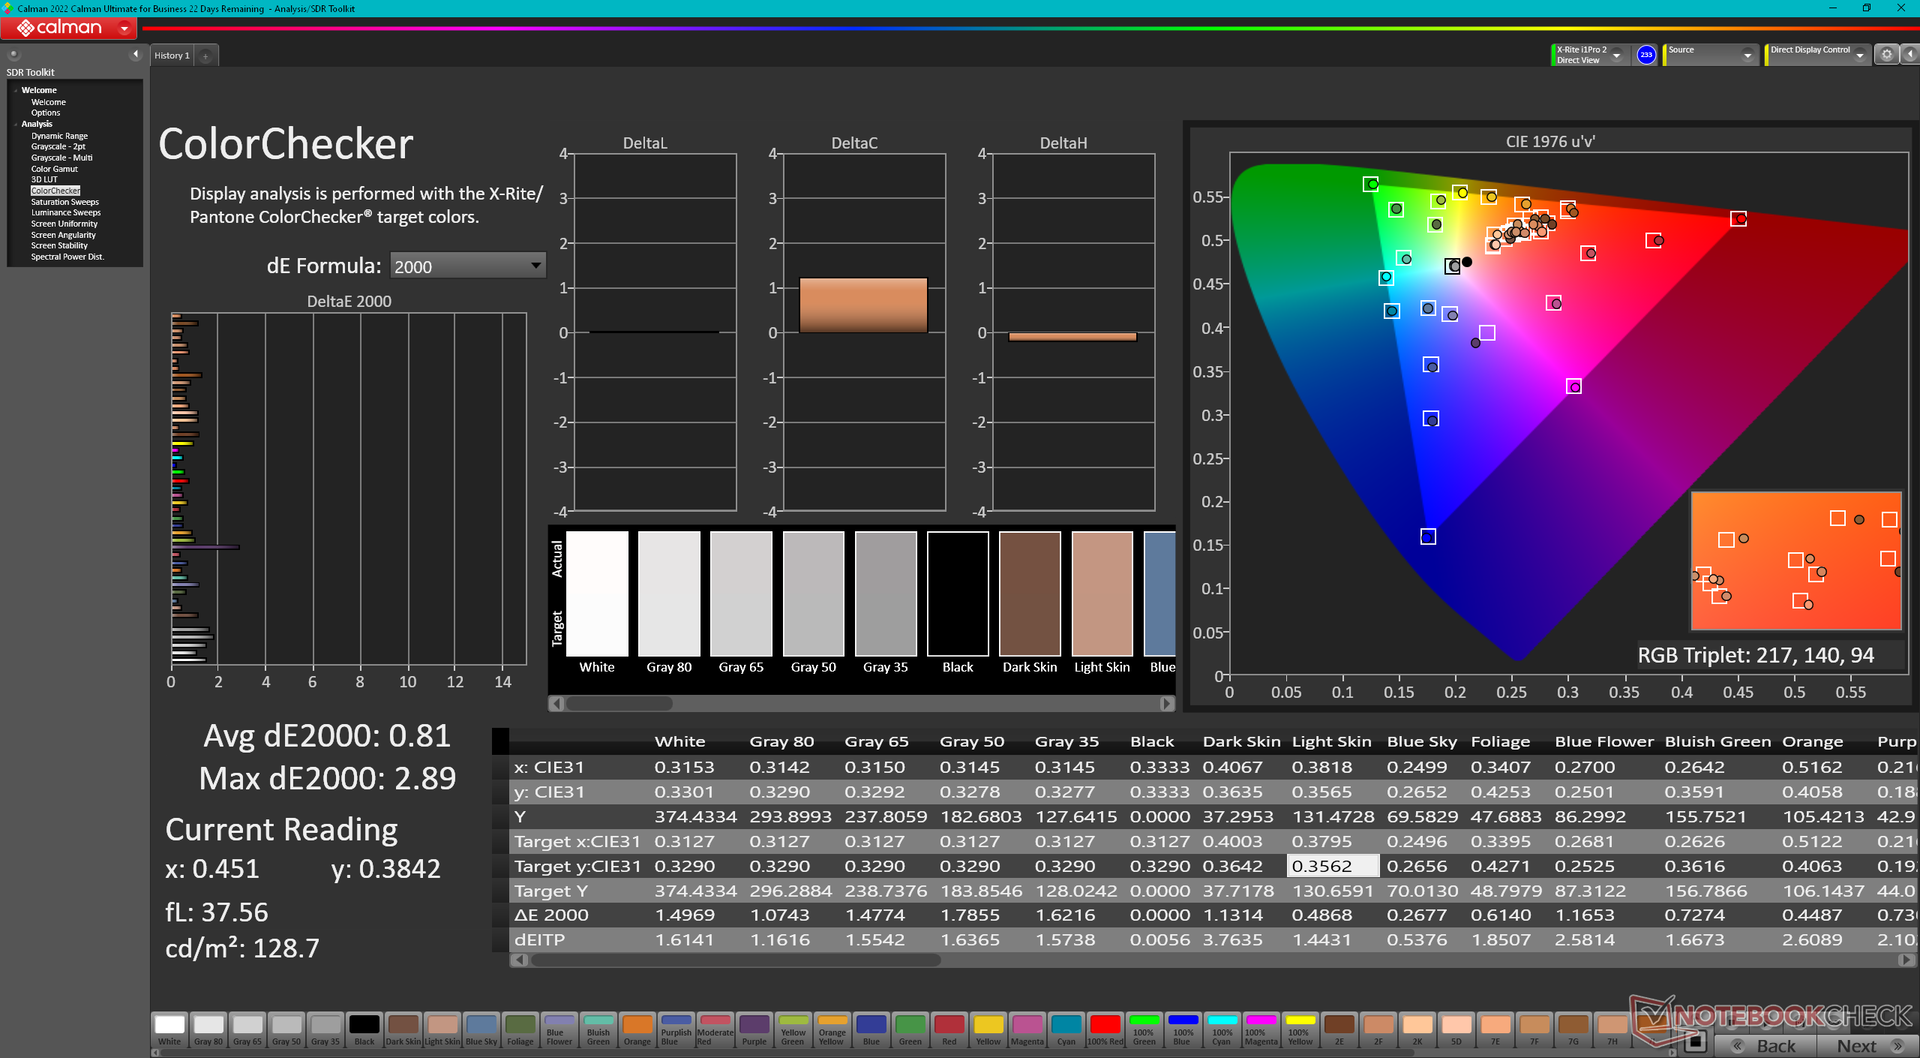
ΔE ColorChecker Calman: 4.19 | ∀{0.5-29.43 Ø4.71}
calibrated: 0.81
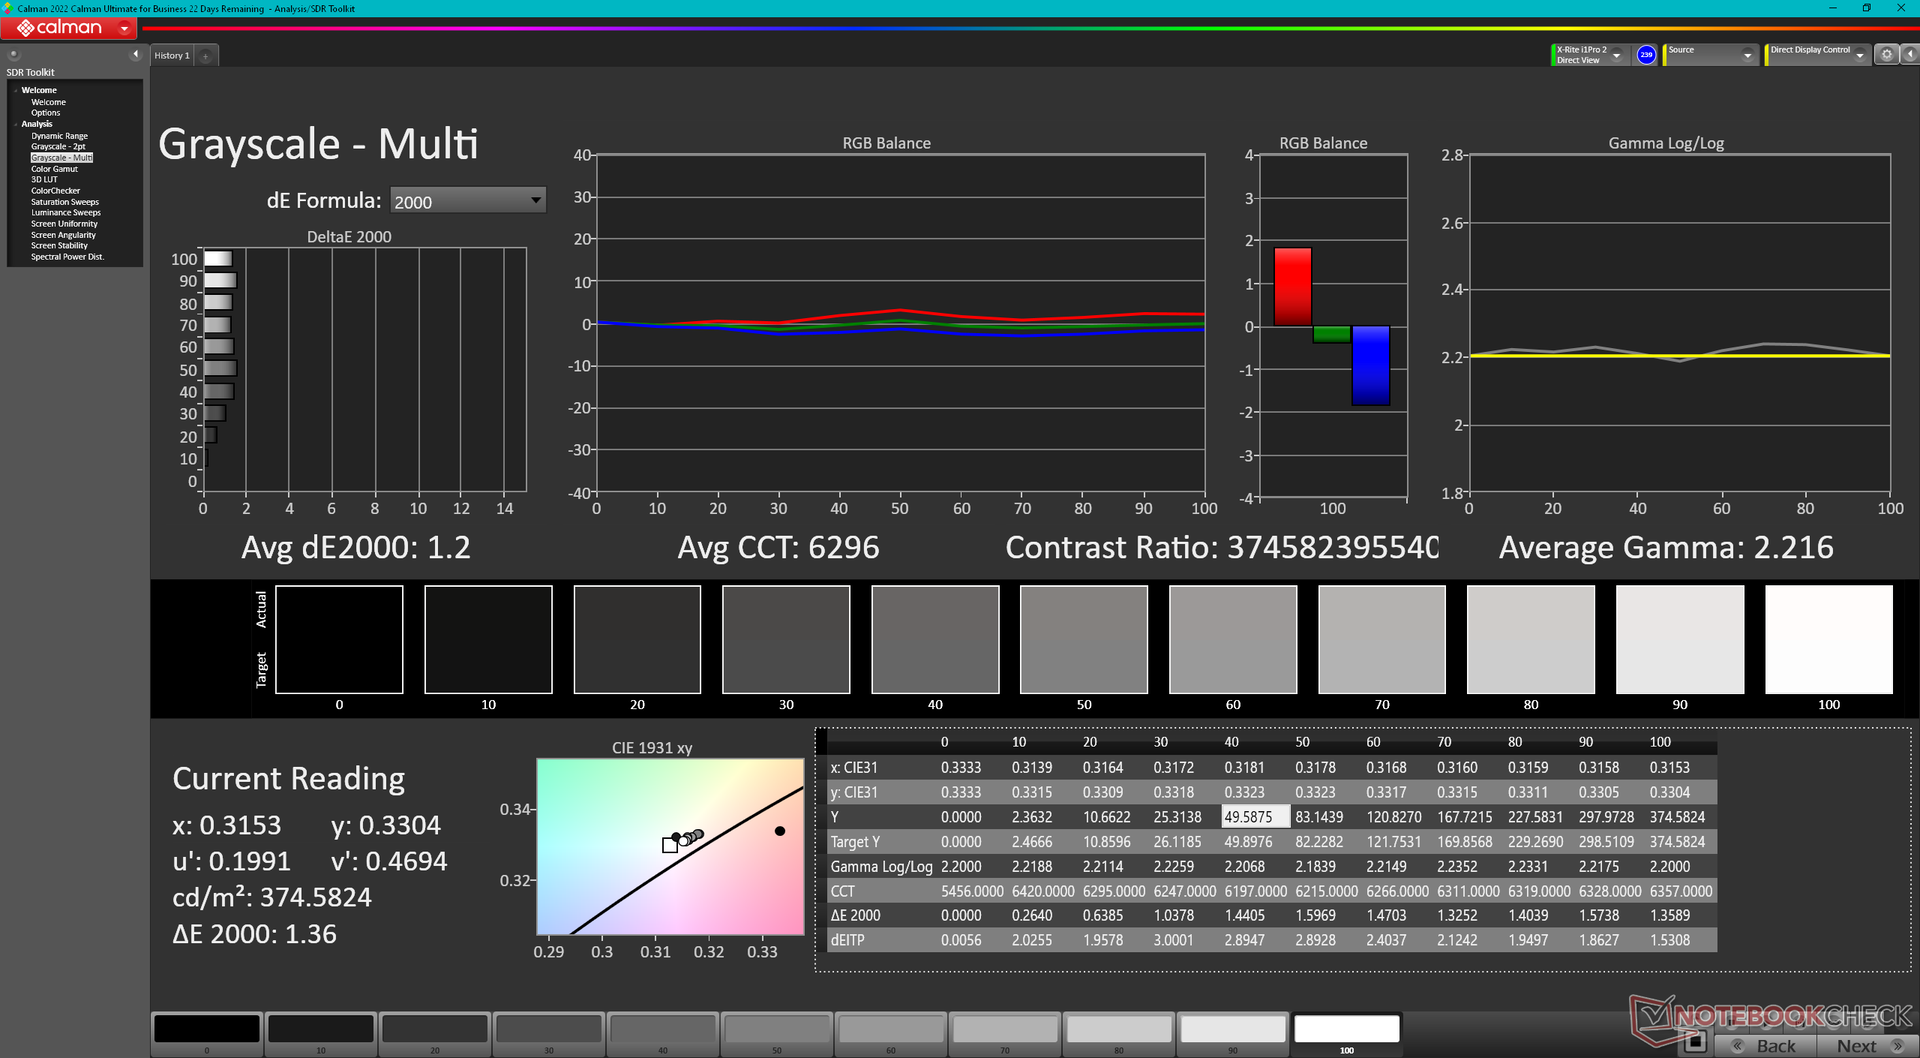
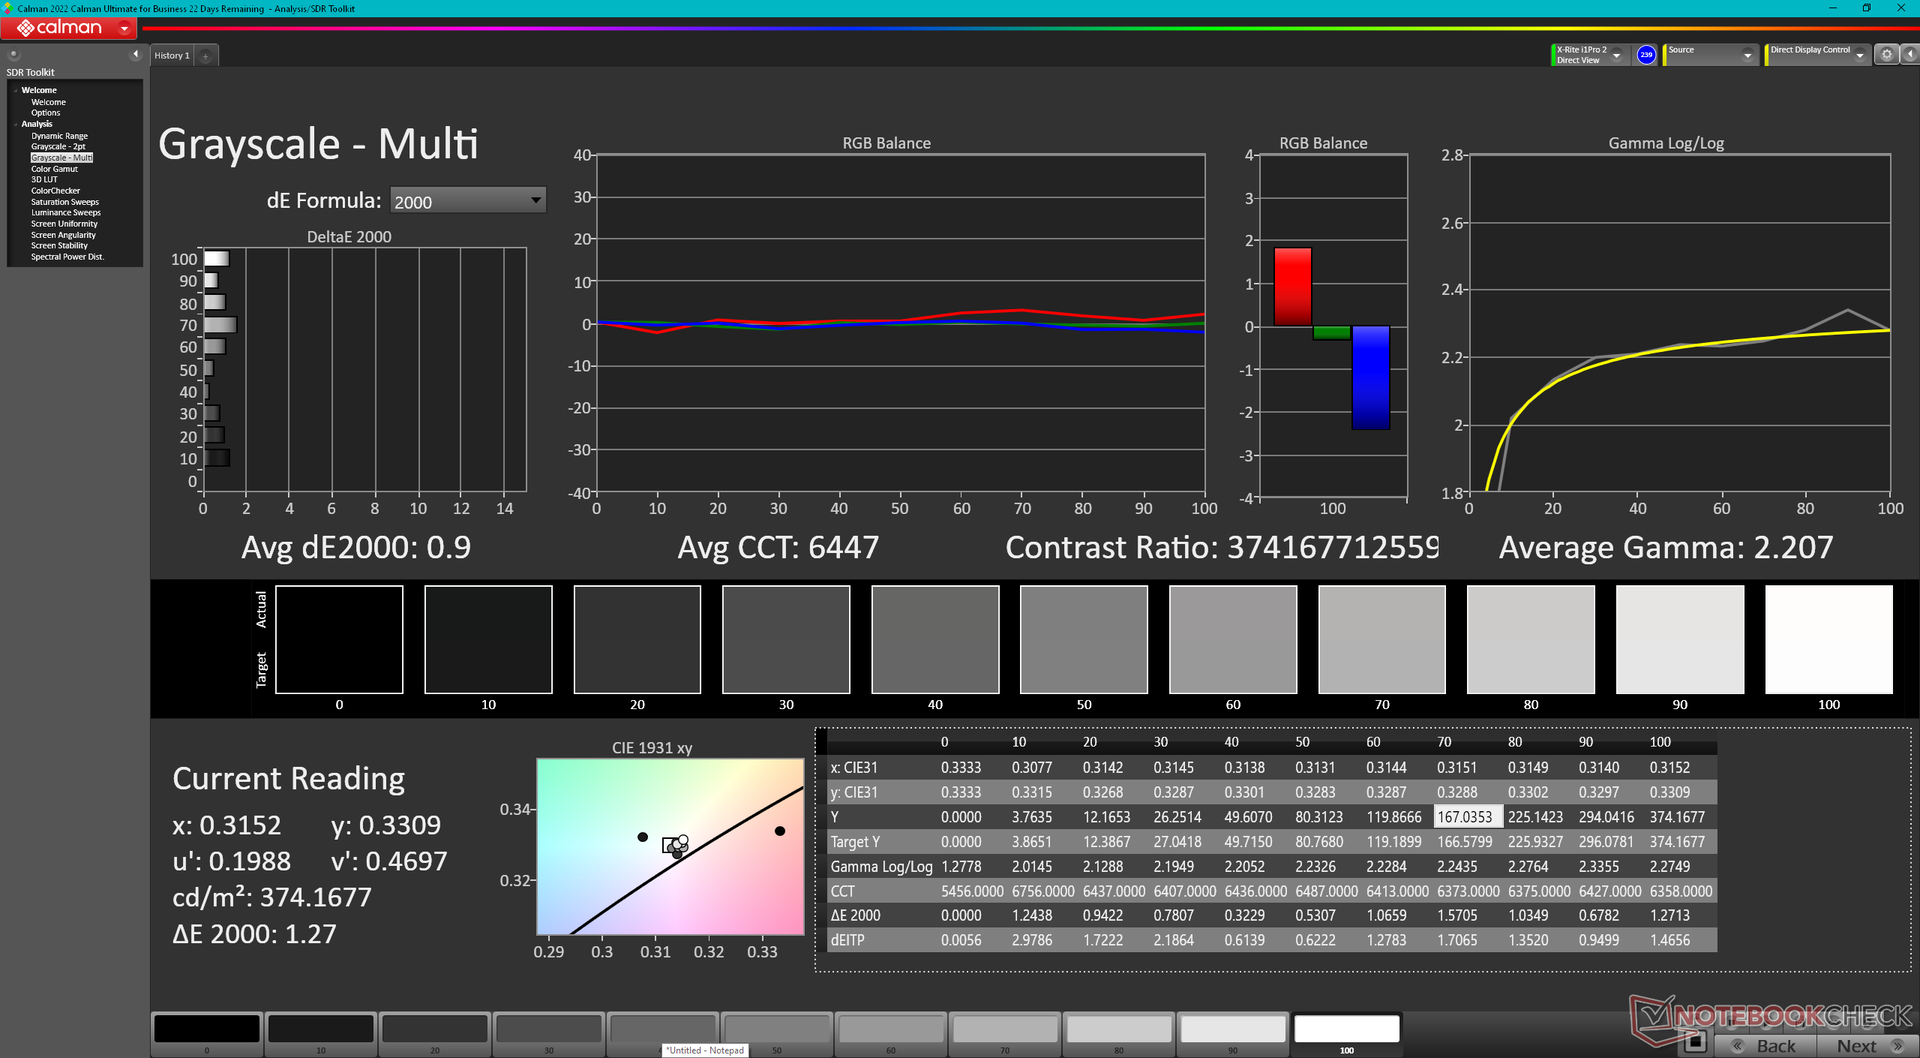
ΔE Greyscale Calman: 1.2 | ∀{0.09-98 Ø4.96}
96.5% AdobeRGB 1998 (Argyll 3D)
100% sRGB (Argyll 3D)
99.9% Display P3 (Argyll 3D)
Gamma: 2.22
CCT: 6296 K
| Lenovo Legion Slim 5 14APH8 Samsung SDC ATNA45AF02-2, OLED, 2880x1600, 14.5" | Acer Predator Triton 14 PT14-51 BOE NE140QDM-NY1, IPS, 2560x1600, 14" | Razer Blade 14 RTX 4070 AU Optronics B140QAN06.U, IPS, 2560x1600, 14" | Asus ROG Zephyrus G14 GA402XY B140QAN06.S, Mini-LED, 2560x1600, 14" | Alienware x14 i7 RTX 3060 SHP154D, IPS, 1920x1080, 14" | Lenovo LOQ 15APH8 BOE NJ NE156FHM-NX3, IPS, 1920x1080, 15.6" | |
|---|---|---|---|---|---|---|
| Display | -5% | -5% | -1% | -3% | -52% | |
| Display P3 Coverage (%) | 99.9 | 96.9 -3% | 97.3 -3% | 99.6 0% | 99.6 0% | 40.2 -60% |
| sRGB Coverage (%) | 100 | 99.9 0% | 99.8 0% | 100 0% | 100 0% | 60.2 -40% |
| AdobeRGB 1998 Coverage (%) | 96.5 | 85.5 -11% | 85.3 -12% | 93.4 -3% | 87.6 -9% | 41.5 -57% |
| Response Times | -1143% | -1049% | -1479% | -884% | -3816% | |
| Response Time Grey 50% / Grey 80% * (ms) | 0.79 ? | 15.1 ? -1811% | 11.9 ? -1406% | 17.2 ? -2077% | 9.6 ? -1115% | 42.7 ? -5305% |
| Response Time Black / White * (ms) | 1.01 ? | 5.8 ? -474% | 8 ? -692% | 9.9 ? -880% | 7.6 ? -652% | 24.5 ? -2326% |
| PWM Frequency (Hz) | 240.5 ? | 5430 | ||||
| Screen | -33% | -52% | 28% | -38% | -62% | |
| Brightness middle (cd/m²) | 377.5 | 547 45% | 559.3 48% | 535 42% | 434 15% | 346.2 -8% |
| Brightness (cd/m²) | 381 | 516 35% | 560 47% | 563 48% | 411 8% | 329 -14% |
| Brightness Distribution (%) | 97 | 88 -9% | 88 -9% | 91 -6% | 89 -8% | 81 -16% |
| Black Level * (cd/m²) | 0.56 | 0.44 | 0.25 | 0.31 | ||
| Colorchecker dE 2000 * | 4.19 | 3.28 22% | 4.44 -6% | 1 76% | 3 28% | 4.19 -0% |
| Colorchecker dE 2000 max. * | 7.02 | 8.57 -22% | 9.3 -32% | 2.8 60% | 7.1 -1% | 19.19 -173% |
| Colorchecker dE 2000 calibrated * | 0.81 | 1.09 -35% | 0.39 52% | 0.7 14% | 1.66 -105% | |
| Greyscale dE 2000 * | 1.2 | 4.4 -267% | 6.8 -467% | 1.8 -50% | 5.1 -325% | 2.6 -117% |
| Gamma | 2.22 99% | 2.168 101% | 2.3 96% | 2.24 98% | 2.19 100% | 2.19 100% |
| CCT | 6296 103% | 7767 84% | 6242 104% | 6337 103% | 6204 105% | 6749 96% |
| Contrast (:1) | 977 | 1271 | 1736 | 1117 | ||
| Media totale (Programma / Settaggio) | -394% /
-211% | -369% /
-207% | -484% /
-254% | -308% /
-170% | -1310% /
-685% |
* ... Meglio usare valori piccoli
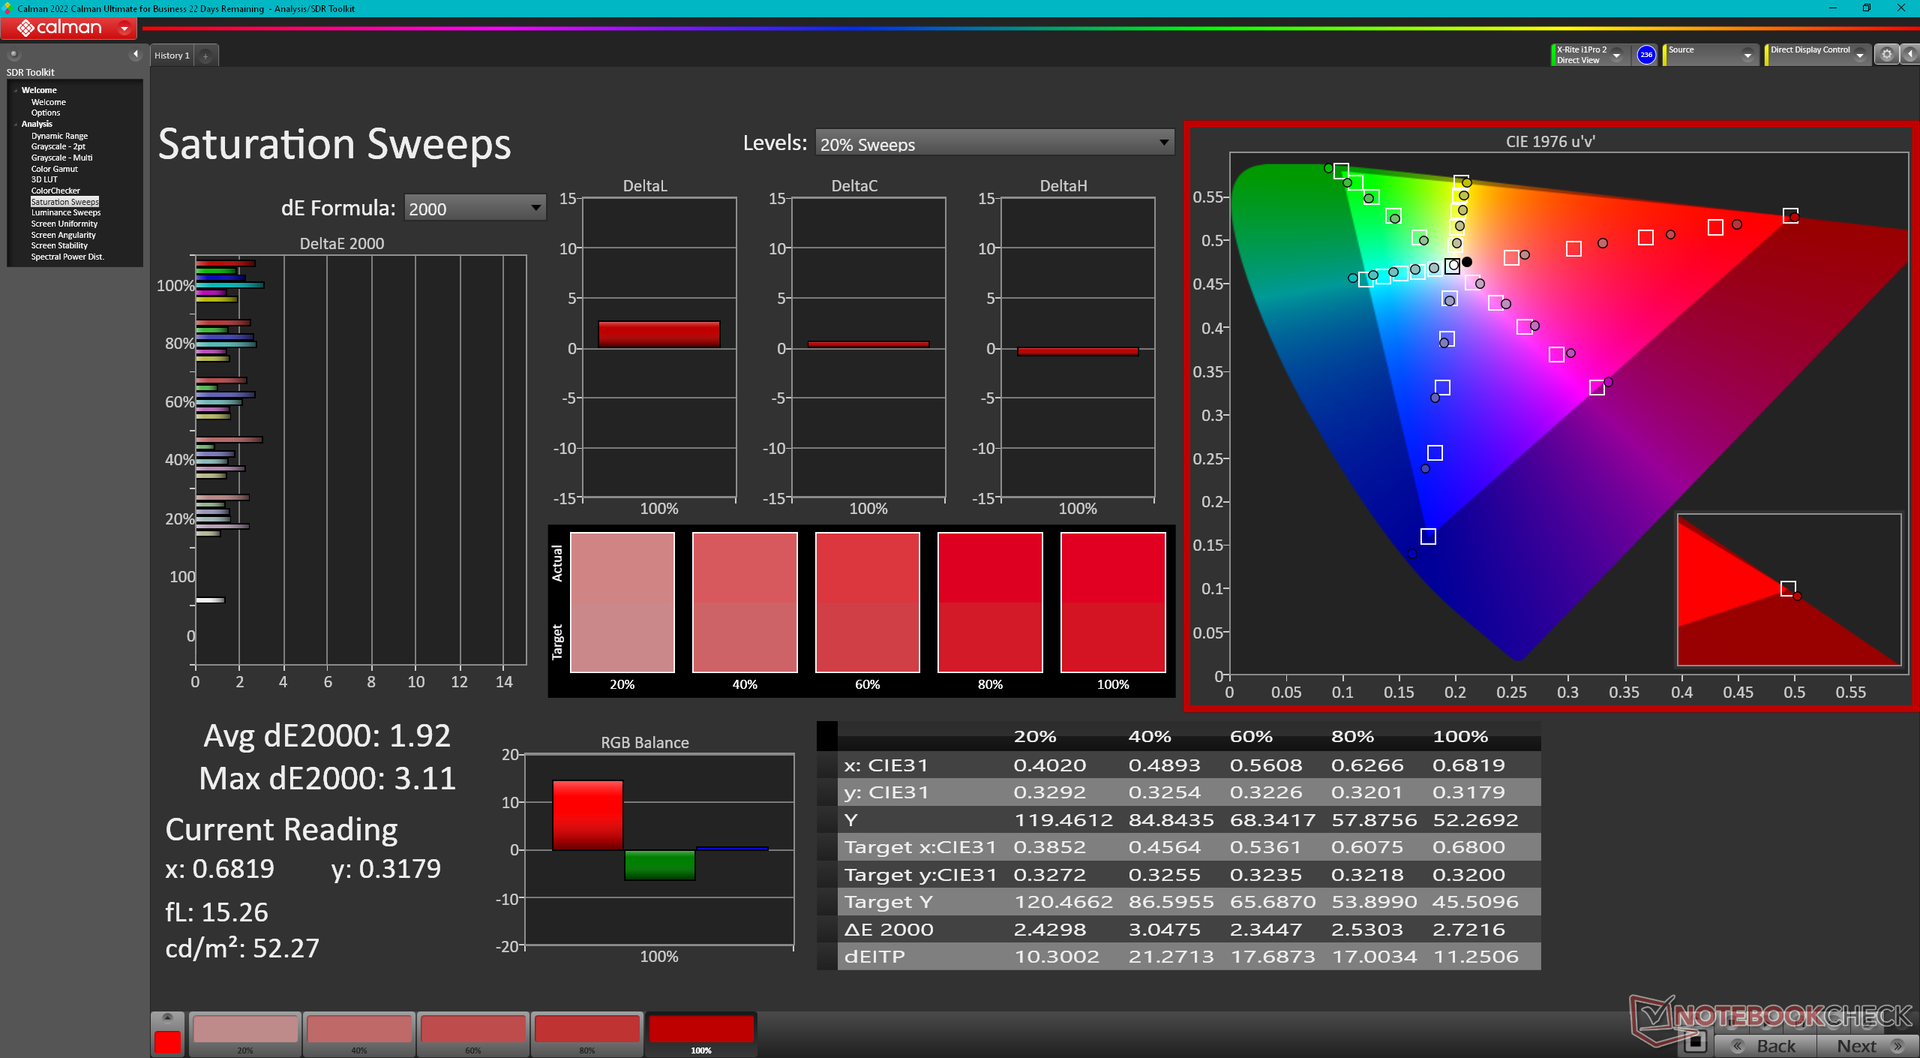
Il display è ben calibrato rispetto allo standard DCI-P3 e quindi la calibrazione finale non sarà necessaria per la maggior parte degli utenti. La temperatura del colore è leggermente troppo calda a 6300K, ma si tratta solo di un piccolo difetto. Il nostro profilo ICM è disponibile gratuitamente per il download.
Tempi di risposta del Display
| ↔ Tempi di risposta dal Nero al Bianco | ||
|---|---|---|
| 1.01 ms ... aumenta ↗ e diminuisce ↘ combinato | ↗ 0.64 ms Incremento | 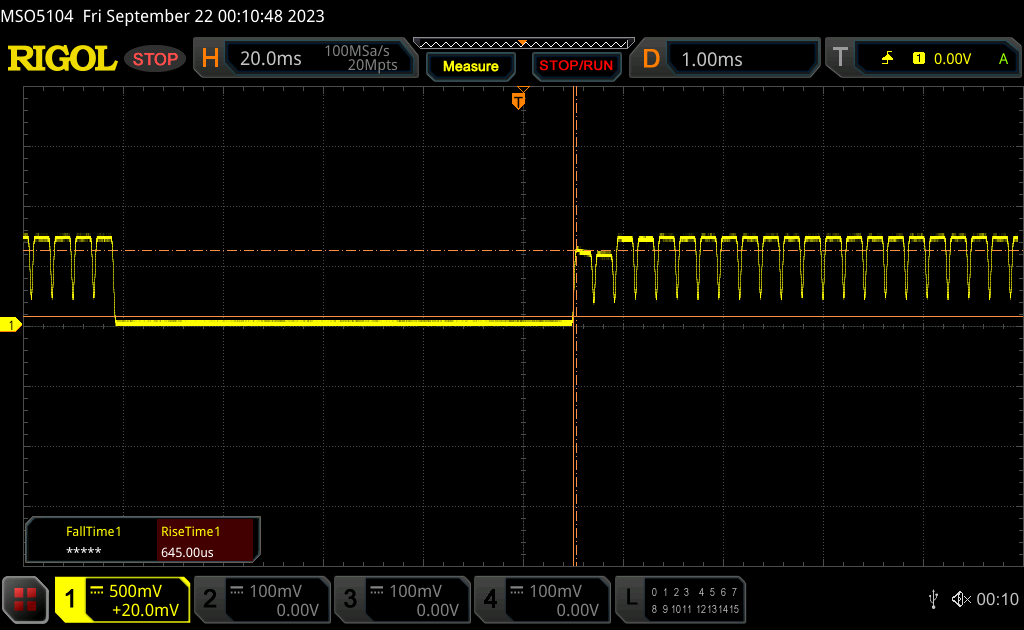 |
| ↘ 0.37 ms Calo | ||
| Lo schermo ha mostrato valori di risposta molto veloci nei nostri tests ed è molto adatto per i gaming veloce. In confronto, tutti i dispositivi di test variano da 0.1 (minimo) a 240 (massimo) ms. » 4 % di tutti i dispositivi è migliore. Questo significa che i tempi di risposta rilevati sono migliori rispettto alla media di tutti i dispositivi testati (19.8 ms). | ||
| ↔ Tempo di risposta dal 50% Grigio all'80% Grigio | ||
| 0.79 ms ... aumenta ↗ e diminuisce ↘ combinato | ↗ 0.46 ms Incremento | 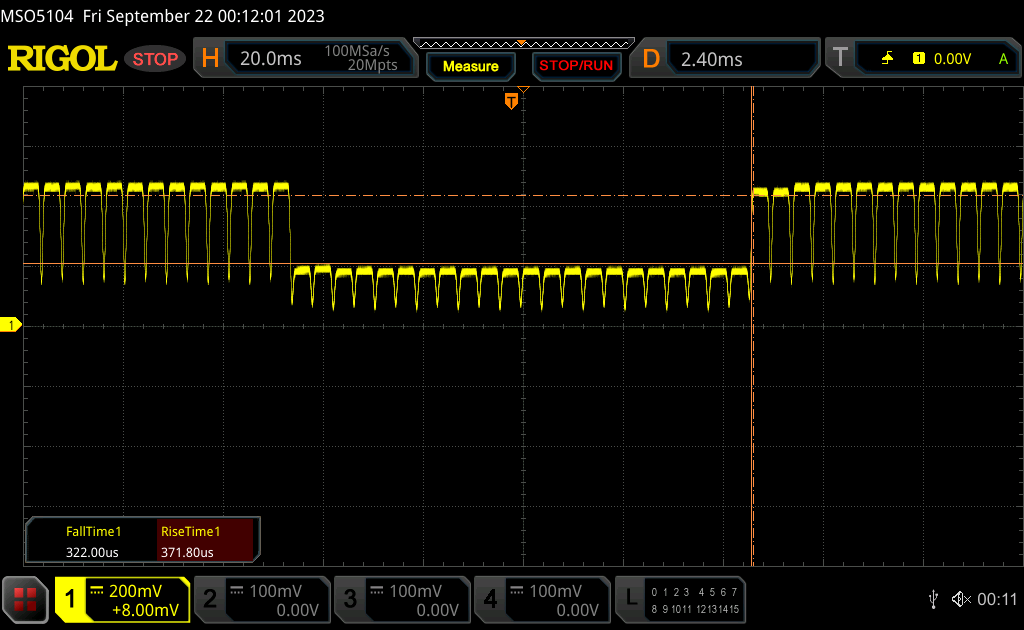 |
| ↘ 0.33 ms Calo | ||
| Lo schermo ha mostrato valori di risposta molto veloci nei nostri tests ed è molto adatto per i gaming veloce. In confronto, tutti i dispositivi di test variano da 0.165 (minimo) a 636 (massimo) ms. » 3 % di tutti i dispositivi è migliore. Questo significa che i tempi di risposta rilevati sono migliori rispettto alla media di tutti i dispositivi testati (31 ms). | ||
Sfarfallio dello schermo / PWM (Pulse-Width Modulation)
| flickering dello schermo / PWM rilevato | 240.5 Hz | ≤ 100 % settaggio luminosita' | 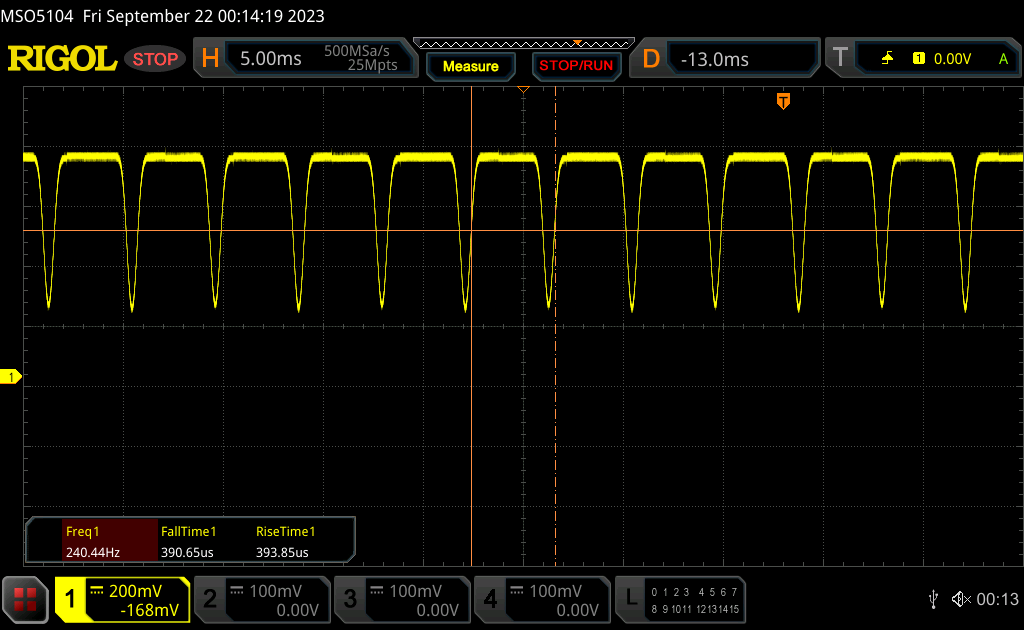 |
Il display sfarfalla a 240.5 Hz (Probabilmente a causa dell'uso di PWM) Flickering rilevato ad una luminosita' di 100 % o inferiore. Non dovrebbe verificarsi flickering o PWM sopra questo valore di luminosita'. La frequenza di 240.5 Hz è relativamente bassa, quindi gli utenti sensibili potrebbero notare il flickering ed accusare stanchezza agli occhi a questo livello di luminosità e a livelli inferiori. In confronto: 52 % di tutti i dispositivi testati non utilizza PWM per ridurre la luminosita' del display. Se è rilevato PWM, una media di 7747 (minimo: 5 - massimo: 343500) Hz è stata rilevata. | |||
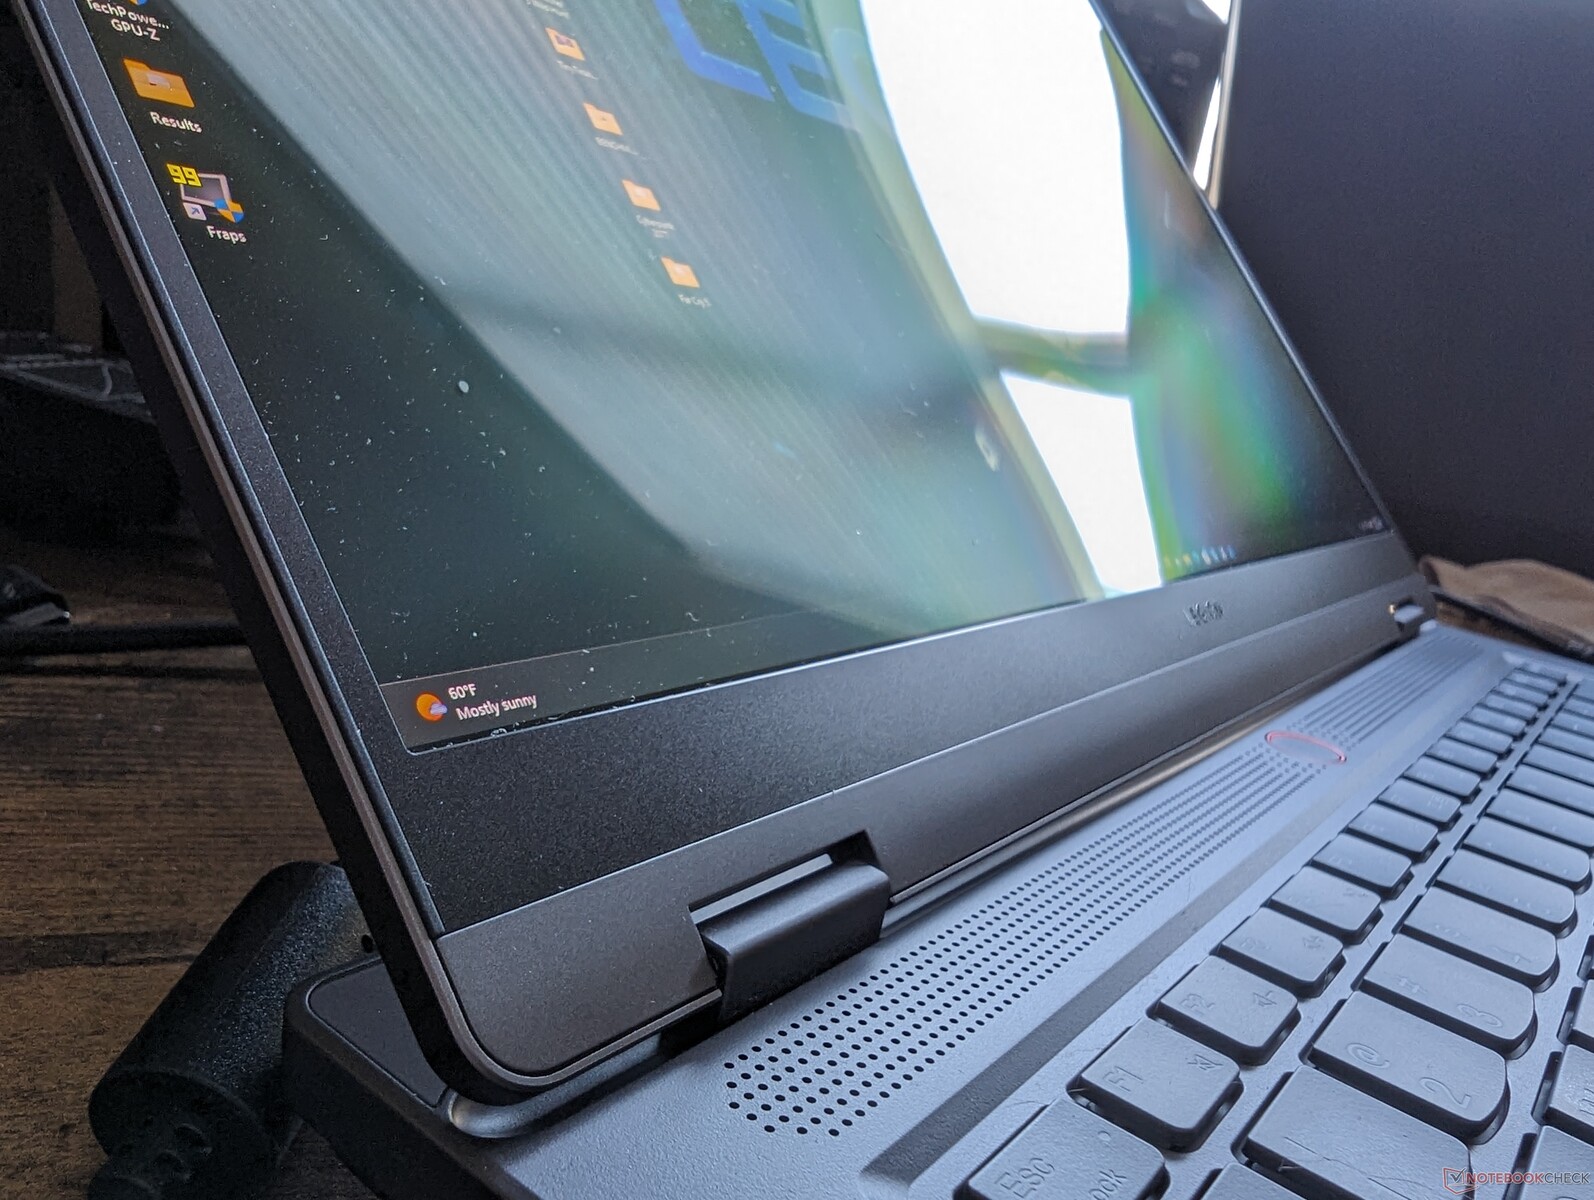
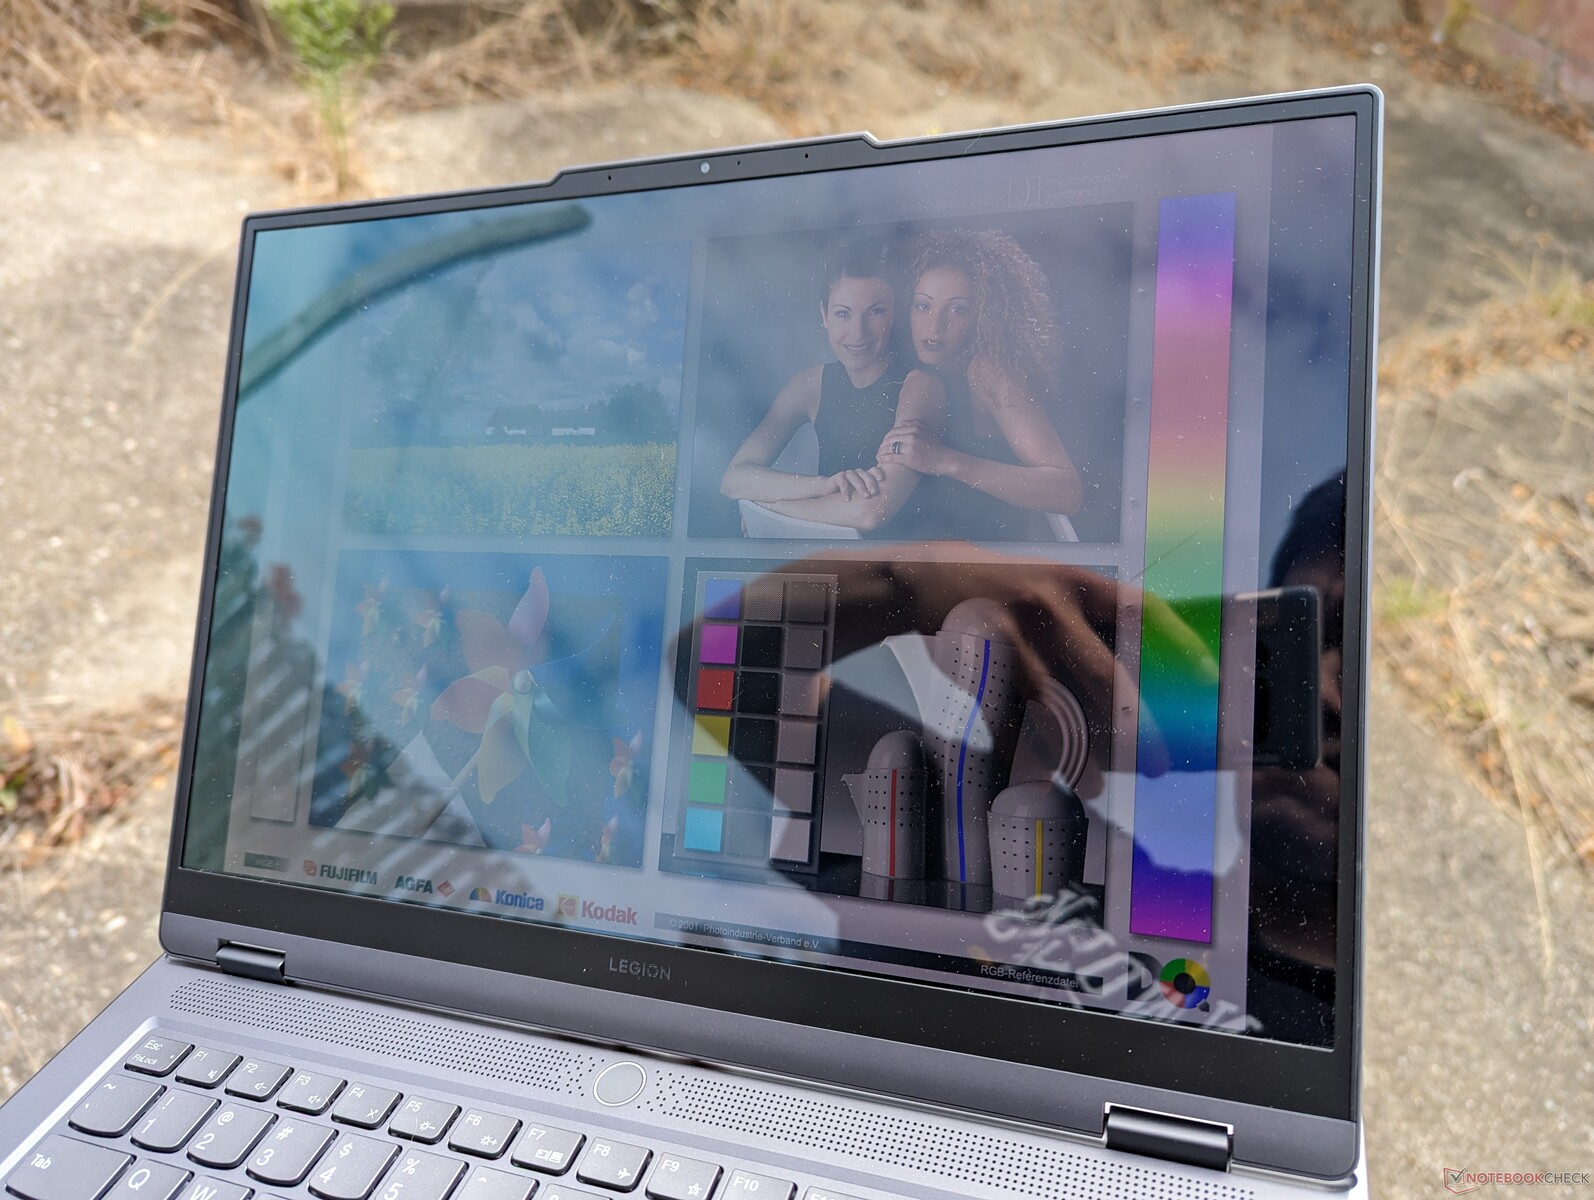
La luminosità massima nel mondo reale è di circa 386 nits rispetto ai 400 nits dichiarati da Lenovo per i contenuti SDR. Se si attiva l'HDR, la luminosità massima potrebbe raggiungere i 515 nits, il che corrisponderebbe alla dichiarazione di Lenovo di compatibilità con HDR500. I pannelli IPS opachi del Blade 14 o dello Zephyrus G14 sono notevolmente più luminosi, con circa 550 nits ciascuno per i contenuti SDR, per una migliore visibilità all'aperto rispetto al nostro modello Lenovo molto lucido.
Prestazioni - Zen 4 si abbina bene a Nvidia RTX
Condizioni di test
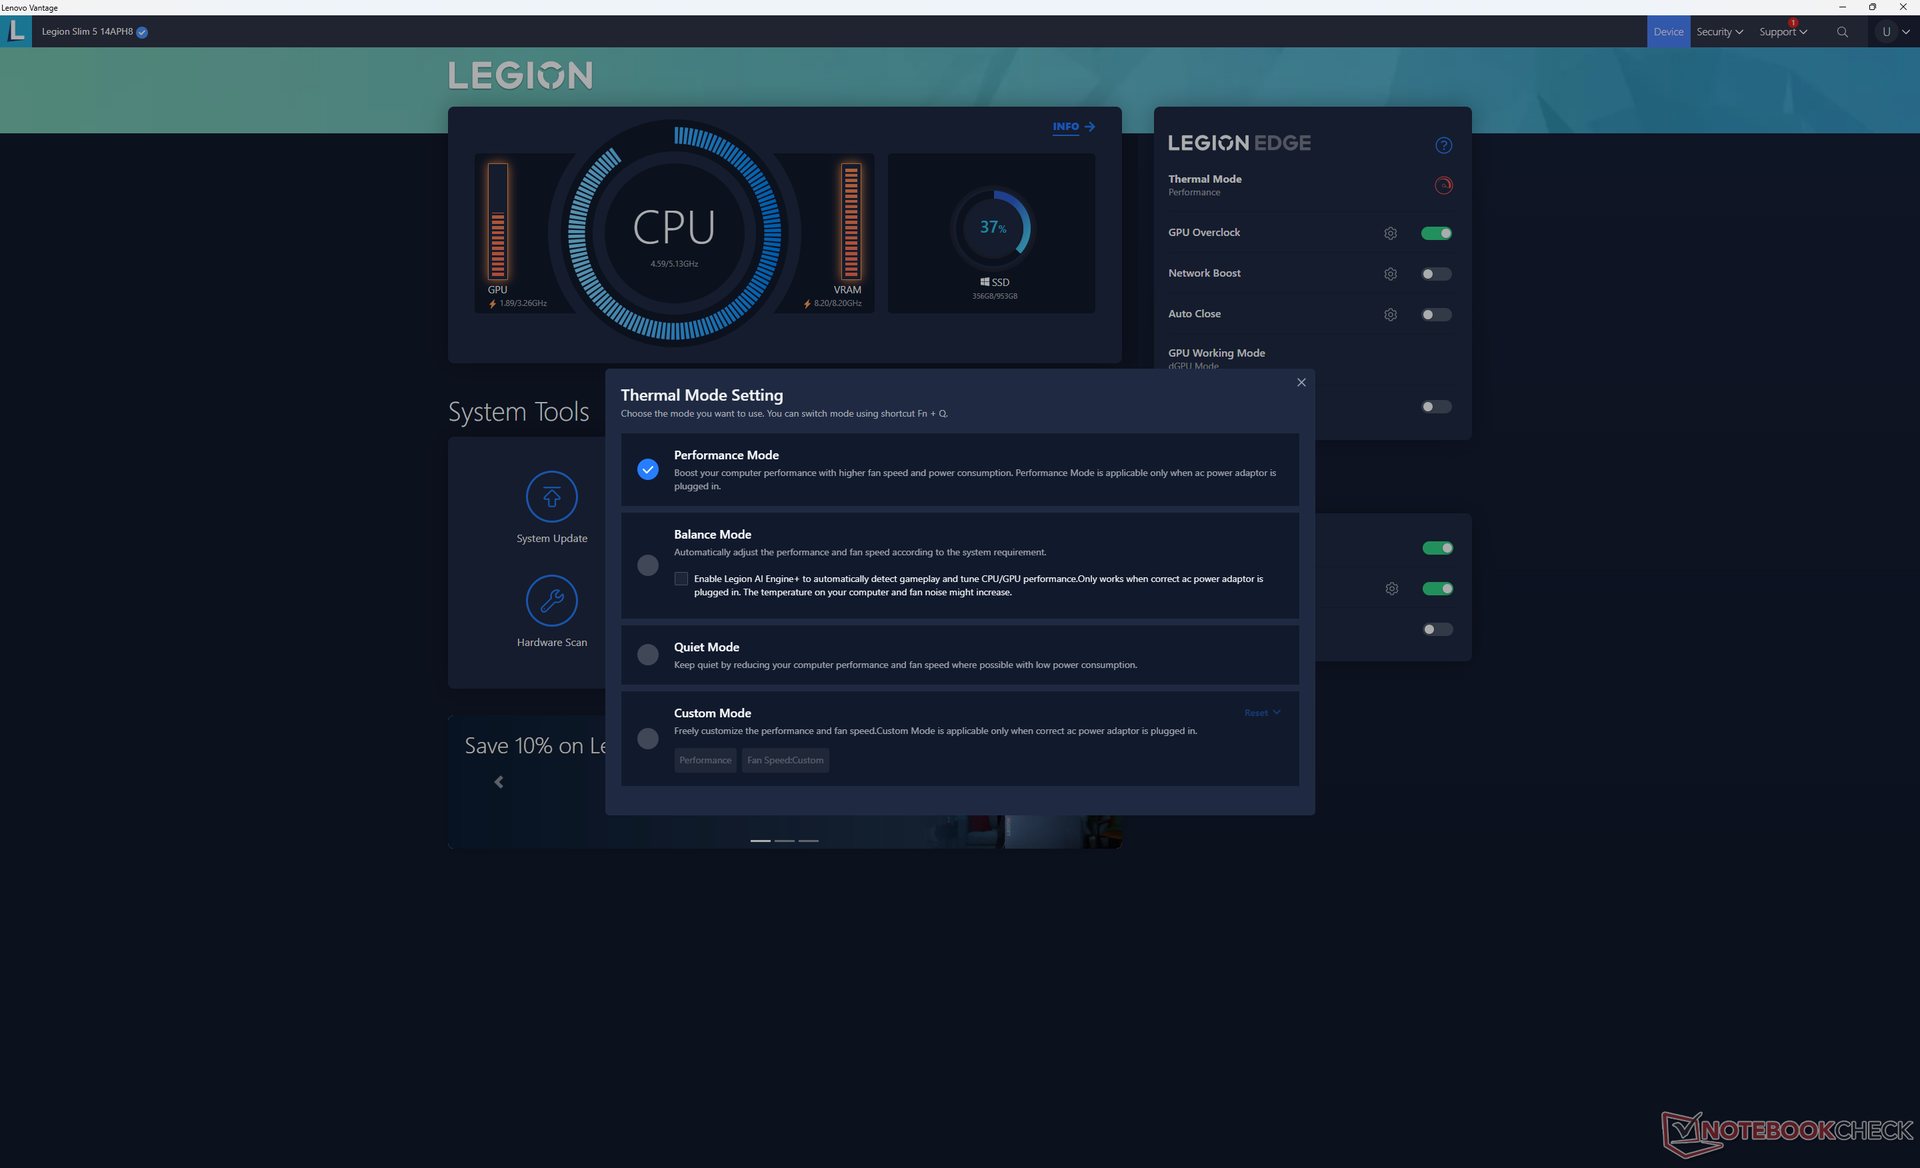
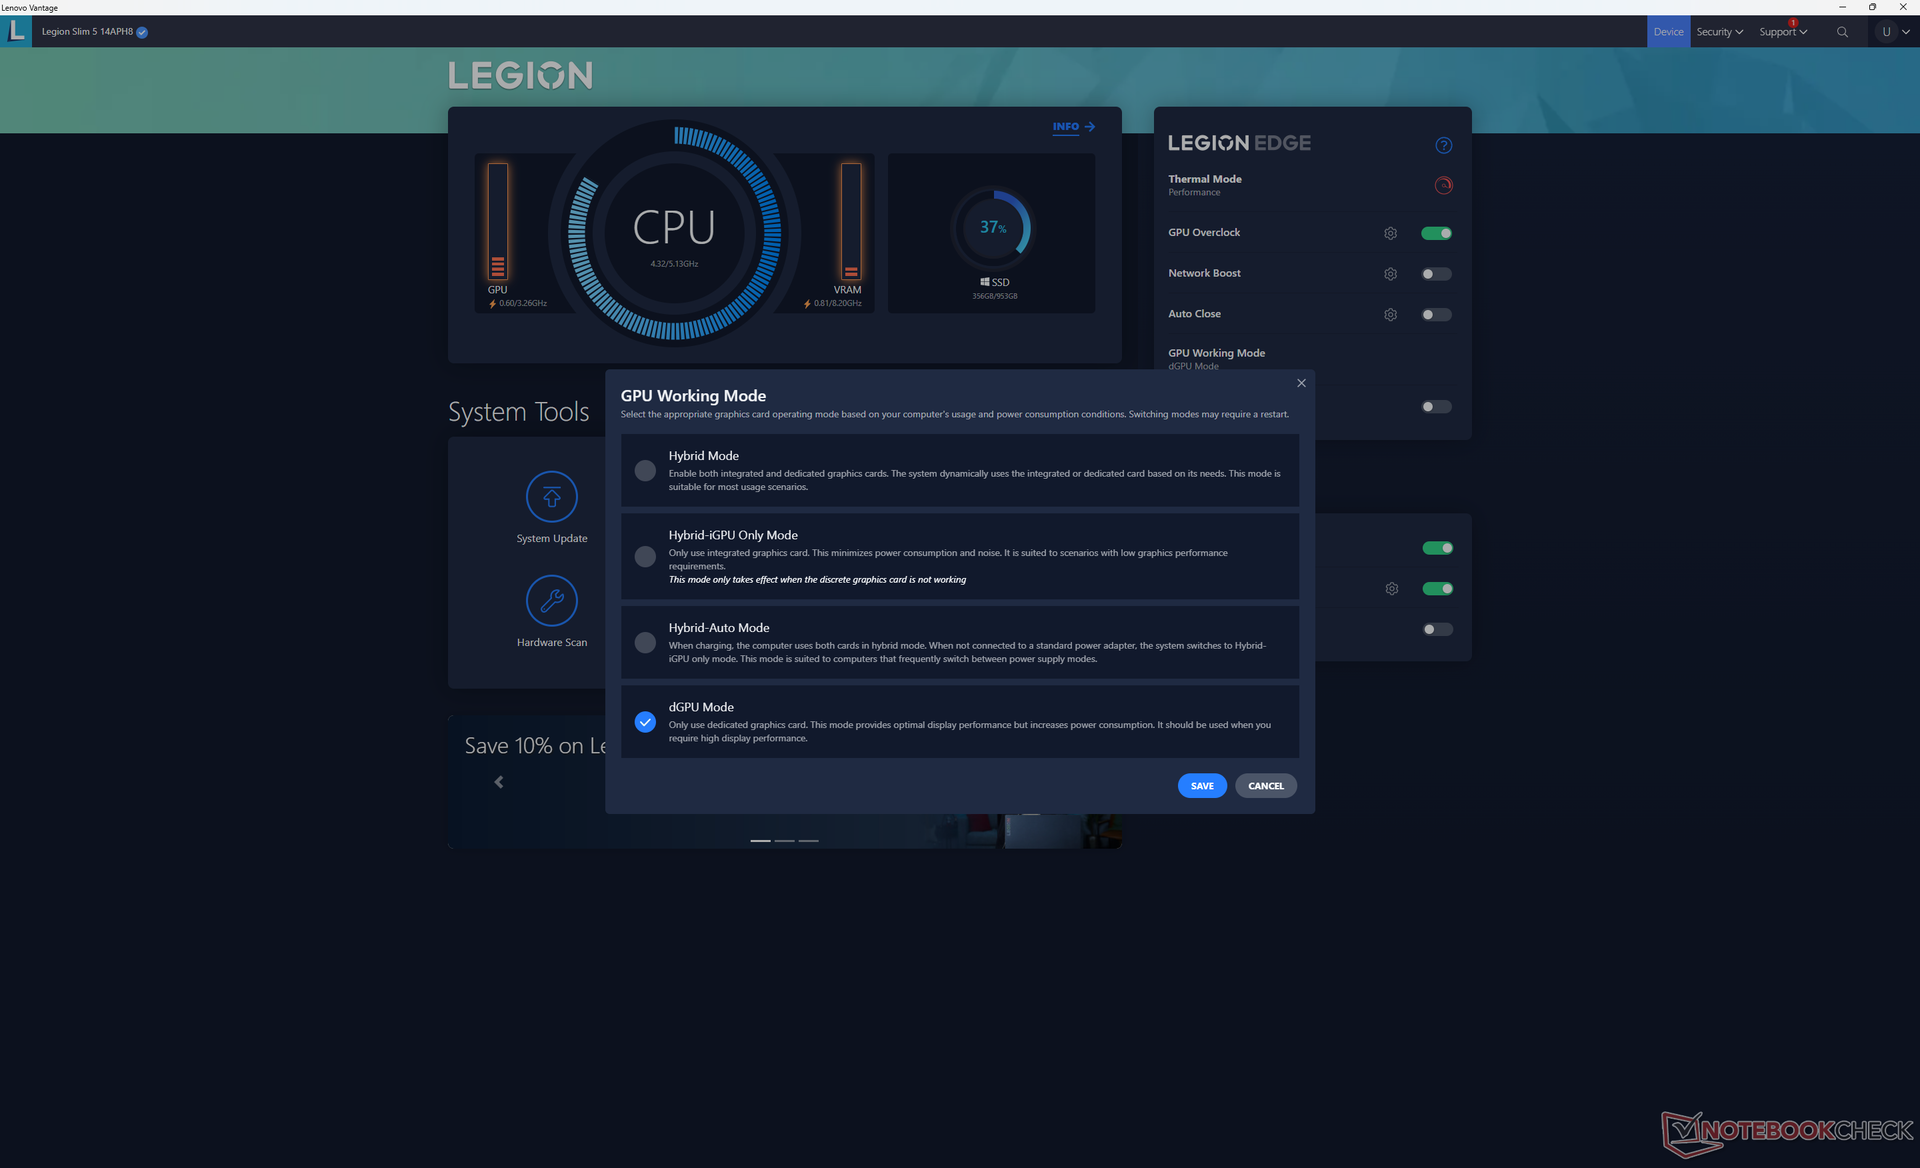
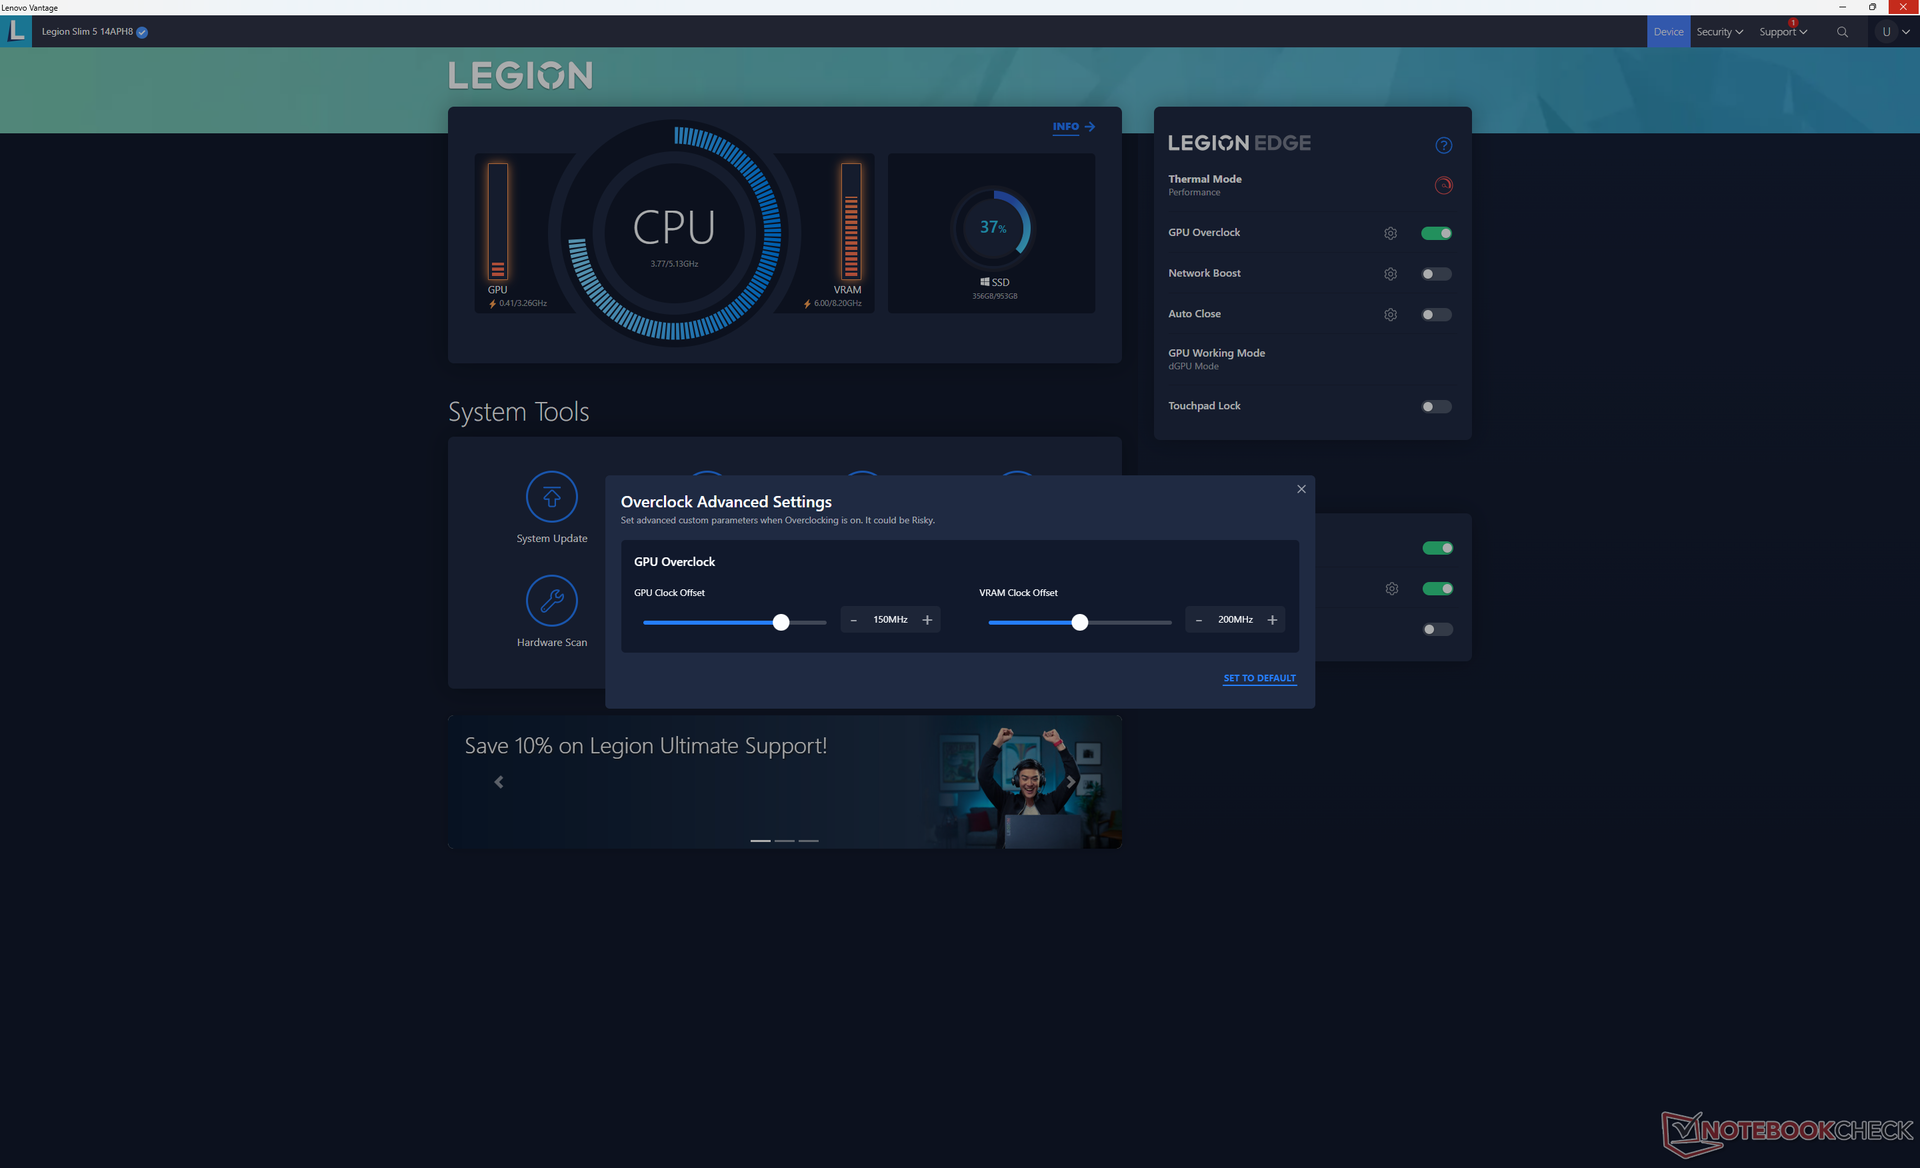
Abbiamo impostato Lenovo Vantage in modalità Performance e dGPU con Overclock GPU attivo prima di eseguire i benchmark qui sotto. Si consiglia agli utenti di familiarizzare con Vantage in quanto è l'hub di controllo per la regolazione dei profili delle prestazioni e delle impostazioni dGPU/iGPU.
Processore
Il Ryzen 7 7840HS si comporta bene, senza grossi problemi di throttling e con risultati multi-thread che sono solo del 10% inferiori al comune Core i737 di 13a generazione.Core i7-13700H. L'aggiornamento al modello Ryzen 9 7940HS dovrebbe aumentare le prestazioni del 10%, colmando di fatto questo divario. In altre parole, dovrete passare alla configurazione Ryzen 9 se volete ottenere la stessa potenza di elaborazione dell'Intel Core i7.
Le CPU Ryzen di classe HX più potenti, come il modello Ryzen 9 7945HX sono disponibili solo su schermi di dimensioni maggiori.
Cinebench R15 Multi Loop
Cinebench R23: Multi Core | Single Core
Cinebench R20: CPU (Multi Core) | CPU (Single Core)
Cinebench R15: CPU Multi 64Bit | CPU Single 64Bit
Blender: v2.79 BMW27 CPU
7-Zip 18.03: 7z b 4 | 7z b 4 -mmt1
Geekbench 5.5: Multi-Core | Single-Core
HWBOT x265 Benchmark v2.2: 4k Preset
LibreOffice : 20 Documents To PDF
R Benchmark 2.5: Overall mean
| CPU Performance rating | |
| Schenker XMG Pro 15 (E23) | |
| Dell G15 5530 | |
| Asus ROG Zephyrus G14 GA402XY | |
| Lenovo Legion Slim 5 14APH8 | |
| Acer Predator Triton 14 PT14-51 | |
| Media AMD Ryzen 7 7840HS | |
| Acer Predator Triton 300 SE | |
| Alienware x14 i7 RTX 3060 | |
| Asus TUF A15 FA507 | |
| Asus ROG Zephyrus G14 GA402RK | |
| Asus Zephyrus G14 GA401QEC | |
| Asus ROG Strix G15 G513RW | |
| Asus Zephyrus G14 GA401IV -4! | |
| Cinebench R23 / Multi Core | |
| Schenker XMG Pro 15 (E23) | |
| Dell G15 5530 | |
| Acer Predator Triton 14 PT14-51 | |
| Asus ROG Zephyrus G14 GA402XY | |
| Lenovo Legion Slim 5 14APH8 | |
| Media AMD Ryzen 7 7840HS (14784 - 17214, n=19) | |
| Acer Predator Triton 300 SE | |
| Alienware x14 i7 RTX 3060 | |
| Asus TUF A15 FA507 | |
| Asus ROG Strix G15 G513RW | |
| Asus Zephyrus G14 GA401QEC | |
| Asus ROG Zephyrus G14 GA402RK | |
| Cinebench R23 / Single Core | |
| Acer Predator Triton 300 SE | |
| Schenker XMG Pro 15 (E23) | |
| Dell G15 5530 | |
| Lenovo Legion Slim 5 14APH8 | |
| Asus ROG Zephyrus G14 GA402XY | |
| Media AMD Ryzen 7 7840HS (1718 - 1812, n=19) | |
| Alienware x14 i7 RTX 3060 | |
| Acer Predator Triton 14 PT14-51 | |
| Asus ROG Zephyrus G14 GA402RK | |
| Asus TUF A15 FA507 | |
| Asus ROG Strix G15 G513RW | |
| Asus Zephyrus G14 GA401QEC | |
| Cinebench R20 / CPU (Multi Core) | |
| Schenker XMG Pro 15 (E23) | |
| Dell G15 5530 | |
| Acer Predator Triton 14 PT14-51 | |
| Asus ROG Zephyrus G14 GA402XY | |
| Lenovo Legion Slim 5 14APH8 | |
| Media AMD Ryzen 7 7840HS (5761 - 6744, n=19) | |
| Acer Predator Triton 300 SE | |
| Alienware x14 i7 RTX 3060 | |
| Asus TUF A15 FA507 | |
| Asus Zephyrus G14 GA401QEC | |
| Asus ROG Strix G15 G513RW | |
| Asus ROG Zephyrus G14 GA402RK | |
| Asus Zephyrus G14 GA401IV | |
| Cinebench R20 / CPU (Single Core) | |
| Acer Predator Triton 300 SE | |
| Schenker XMG Pro 15 (E23) | |
| Dell G15 5530 | |
| Asus ROG Zephyrus G14 GA402XY | |
| Media AMD Ryzen 7 7840HS (661 - 705, n=19) | |
| Alienware x14 i7 RTX 3060 | |
| Lenovo Legion Slim 5 14APH8 | |
| Acer Predator Triton 14 PT14-51 | |
| Asus ROG Zephyrus G14 GA402RK | |
| Asus TUF A15 FA507 | |
| Asus ROG Strix G15 G513RW | |
| Asus Zephyrus G14 GA401QEC | |
| Asus Zephyrus G14 GA401IV | |
| Cinebench R15 / CPU Multi 64Bit | |
| Schenker XMG Pro 15 (E23) | |
| Dell G15 5530 | |
| Acer Predator Triton 14 PT14-51 | |
| Asus ROG Zephyrus G14 GA402XY | |
| Lenovo Legion Slim 5 14APH8 | |
| Media AMD Ryzen 7 7840HS (2300 - 2729, n=19) | |
| Alienware x14 i7 RTX 3060 | |
| Acer Predator Triton 300 SE | |
| Asus TUF A15 FA507 | |
| Asus Zephyrus G14 GA401QEC | |
| Asus ROG Strix G15 G513RW | |
| Asus ROG Zephyrus G14 GA402RK | |
| Asus Zephyrus G14 GA401IV | |
| Cinebench R15 / CPU Single 64Bit | |
| Asus ROG Zephyrus G14 GA402XY | |
| Media AMD Ryzen 7 7840HS (270 - 286, n=19) | |
| Lenovo Legion Slim 5 14APH8 | |
| Dell G15 5530 | |
| Acer Predator Triton 300 SE | |
| Asus ROG Zephyrus G14 GA402RK | |
| Alienware x14 i7 RTX 3060 | |
| Asus TUF A15 FA507 | |
| Schenker XMG Pro 15 (E23) | |
| Asus ROG Strix G15 G513RW | |
| Acer Predator Triton 14 PT14-51 | |
| Asus Zephyrus G14 GA401QEC | |
| Asus Zephyrus G14 GA401IV | |
| Blender / v2.79 BMW27 CPU | |
| Asus Zephyrus G14 GA401IV | |
| Asus ROG Zephyrus G14 GA402RK | |
| Asus ROG Strix G15 G513RW | |
| Asus Zephyrus G14 GA401QEC | |
| Alienware x14 i7 RTX 3060 | |
| Asus TUF A15 FA507 | |
| Acer Predator Triton 300 SE | |
| Media AMD Ryzen 7 7840HS (185 - 231, n=20) | |
| Lenovo Legion Slim 5 14APH8 | |
| Acer Predator Triton 14 PT14-51 | |
| Asus ROG Zephyrus G14 GA402XY | |
| Dell G15 5530 | |
| Schenker XMG Pro 15 (E23) | |
| 7-Zip 18.03 / 7z b 4 -mmt1 | |
| Asus ROG Zephyrus G14 GA402XY | |
| Media AMD Ryzen 7 7840HS (6049 - 6754, n=20) | |
| Schenker XMG Pro 15 (E23) | |
| Lenovo Legion Slim 5 14APH8 | |
| Asus ROG Zephyrus G14 GA402RK | |
| Asus ROG Strix G15 G513RW | |
| Dell G15 5530 | |
| Asus Zephyrus G14 GA401QEC | |
| Asus TUF A15 FA507 | |
| Alienware x14 i7 RTX 3060 | |
| Acer Predator Triton 300 SE | |
| Acer Predator Triton 14 PT14-51 | |
| Asus Zephyrus G14 GA401IV | |
| Geekbench 5.5 / Multi-Core | |
| Schenker XMG Pro 15 (E23) | |
| Acer Predator Triton 14 PT14-51 | |
| Dell G15 5530 | |
| Alienware x14 i7 RTX 3060 | |
| Acer Predator Triton 300 SE | |
| Asus ROG Zephyrus G14 GA402XY | |
| Media AMD Ryzen 7 7840HS (8446 - 12339, n=23) | |
| Lenovo Legion Slim 5 14APH8 | |
| Asus ROG Zephyrus G14 GA402RK | |
| Asus ROG Strix G15 G513RW | |
| Asus TUF A15 FA507 | |
| Asus Zephyrus G14 GA401QEC | |
| Asus Zephyrus G14 GA401IV | |
| Geekbench 5.5 / Single-Core | |
| Asus ROG Zephyrus G14 GA402XY | |
| Lenovo Legion Slim 5 14APH8 | |
| Media AMD Ryzen 7 7840HS (1837 - 2017, n=23) | |
| Acer Predator Triton 300 SE | |
| Dell G15 5530 | |
| Schenker XMG Pro 15 (E23) | |
| Alienware x14 i7 RTX 3060 | |
| Acer Predator Triton 14 PT14-51 | |
| Asus ROG Zephyrus G14 GA402RK | |
| Asus ROG Strix G15 G513RW | |
| Asus Zephyrus G14 GA401QEC | |
| Asus TUF A15 FA507 | |
| Asus Zephyrus G14 GA401IV | |
| HWBOT x265 Benchmark v2.2 / 4k Preset | |
| Schenker XMG Pro 15 (E23) | |
| Dell G15 5530 | |
| Asus ROG Zephyrus G14 GA402XY | |
| Lenovo Legion Slim 5 14APH8 | |
| Acer Predator Triton 14 PT14-51 | |
| Media AMD Ryzen 7 7840HS (11.7 - 21.8, n=20) | |
| Acer Predator Triton 300 SE | |
| Alienware x14 i7 RTX 3060 | |
| Asus TUF A15 FA507 | |
| Asus ROG Strix G15 G513RW | |
| Asus ROG Zephyrus G14 GA402RK | |
| Asus Zephyrus G14 GA401QEC | |
| Asus Zephyrus G14 GA401IV | |
| LibreOffice / 20 Documents To PDF | |
| Asus ROG Strix G15 G513RW | |
| Asus Zephyrus G14 GA401QEC | |
| Schenker XMG Pro 15 (E23) | |
| Asus TUF A15 FA507 | |
| Media AMD Ryzen 7 7840HS (38.3 - 68.3, n=20) | |
| Asus ROG Zephyrus G14 GA402RK | |
| Acer Predator Triton 14 PT14-51 | |
| Dell G15 5530 | |
| Lenovo Legion Slim 5 14APH8 | |
| Acer Predator Triton 300 SE | |
| Alienware x14 i7 RTX 3060 | |
| Asus ROG Zephyrus G14 GA402XY | |
| R Benchmark 2.5 / Overall mean | |
| Asus Zephyrus G14 GA401QEC | |
| Asus TUF A15 FA507 | |
| Asus ROG Strix G15 G513RW | |
| Acer Predator Triton 14 PT14-51 | |
| Asus ROG Zephyrus G14 GA402RK | |
| Alienware x14 i7 RTX 3060 | |
| Schenker XMG Pro 15 (E23) | |
| Lenovo Legion Slim 5 14APH8 | |
| Media AMD Ryzen 7 7840HS (0.4184 - 0.4739, n=20) | |
| Acer Predator Triton 300 SE | |
| Dell G15 5530 | |
| Asus ROG Zephyrus G14 GA402XY | |
Cinebench R23: Multi Core | Single Core
Cinebench R20: CPU (Multi Core) | CPU (Single Core)
Cinebench R15: CPU Multi 64Bit | CPU Single 64Bit
Blender: v2.79 BMW27 CPU
7-Zip 18.03: 7z b 4 | 7z b 4 -mmt1
Geekbench 5.5: Multi-Core | Single-Core
HWBOT x265 Benchmark v2.2: 4k Preset
LibreOffice : 20 Documents To PDF
R Benchmark 2.5: Overall mean
* ... Meglio usare valori piccoli
AIDA64: FP32 Ray-Trace | FPU Julia | CPU SHA3 | CPU Queen | FPU SinJulia | FPU Mandel | CPU AES | CPU ZLib | FP64 Ray-Trace | CPU PhotoWorxx
| Performance rating | |
| Razer Blade 14 RTX 4070 | |
| Lenovo Legion Slim 5 14APH8 | |
| Media AMD Ryzen 7 7840HS | |
| Lenovo LOQ 15APH8 | |
| Acer Predator Triton 14 PT14-51 | |
| Alienware x14 i7 RTX 3060 | |
| AIDA64 / FP32 Ray-Trace | |
| Razer Blade 14 RTX 4070 | |
| Lenovo Legion Slim 5 14APH8 | |
| Lenovo LOQ 15APH8 | |
| Media AMD Ryzen 7 7840HS (22845 - 28921, n=21) | |
| Acer Predator Triton 14 PT14-51 | |
| Alienware x14 i7 RTX 3060 | |
| AIDA64 / FPU Julia | |
| Lenovo LOQ 15APH8 | |
| Razer Blade 14 RTX 4070 | |
| Lenovo Legion Slim 5 14APH8 | |
| Media AMD Ryzen 7 7840HS (97164 - 123167, n=21) | |
| Acer Predator Triton 14 PT14-51 | |
| Alienware x14 i7 RTX 3060 | |
| AIDA64 / CPU SHA3 | |
| Razer Blade 14 RTX 4070 | |
| Lenovo Legion Slim 5 14APH8 | |
| Lenovo LOQ 15APH8 | |
| Media AMD Ryzen 7 7840HS (4293 - 5155, n=21) | |
| Acer Predator Triton 14 PT14-51 | |
| Alienware x14 i7 RTX 3060 | |
| AIDA64 / CPU Queen | |
| Razer Blade 14 RTX 4070 | |
| Lenovo Legion Slim 5 14APH8 | |
| Lenovo LOQ 15APH8 | |
| Media AMD Ryzen 7 7840HS (102271 - 125820, n=21) | |
| Alienware x14 i7 RTX 3060 | |
| Acer Predator Triton 14 PT14-51 | |
| AIDA64 / FPU SinJulia | |
| Razer Blade 14 RTX 4070 | |
| Lenovo Legion Slim 5 14APH8 | |
| Lenovo LOQ 15APH8 | |
| Media AMD Ryzen 7 7840HS (13767 - 15525, n=21) | |
| Acer Predator Triton 14 PT14-51 | |
| Alienware x14 i7 RTX 3060 | |
| AIDA64 / FPU Mandel | |
| Razer Blade 14 RTX 4070 | |
| Lenovo LOQ 15APH8 | |
| Lenovo Legion Slim 5 14APH8 | |
| Media AMD Ryzen 7 7840HS (52084 - 65812, n=21) | |
| Acer Predator Triton 14 PT14-51 | |
| Alienware x14 i7 RTX 3060 | |
| AIDA64 / CPU AES | |
| Acer Predator Triton 14 PT14-51 | |
| Media AMD Ryzen 7 7840HS (67389 - 177158, n=21) | |
| Alienware x14 i7 RTX 3060 | |
| Razer Blade 14 RTX 4070 | |
| Lenovo Legion Slim 5 14APH8 | |
| Lenovo LOQ 15APH8 | |
| AIDA64 / CPU ZLib | |
| Acer Predator Triton 14 PT14-51 | |
| Razer Blade 14 RTX 4070 | |
| Lenovo LOQ 15APH8 | |
| Lenovo Legion Slim 5 14APH8 | |
| Media AMD Ryzen 7 7840HS (944 - 1123, n=21) | |
| Alienware x14 i7 RTX 3060 | |
| AIDA64 / FP64 Ray-Trace | |
| Razer Blade 14 RTX 4070 | |
| Lenovo LOQ 15APH8 | |
| Lenovo Legion Slim 5 14APH8 | |
| Media AMD Ryzen 7 7840HS (12248 - 15599, n=21) | |
| Acer Predator Triton 14 PT14-51 | |
| Alienware x14 i7 RTX 3060 | |
| AIDA64 / CPU PhotoWorxx | |
| Acer Predator Triton 14 PT14-51 | |
| Alienware x14 i7 RTX 3060 | |
| Media AMD Ryzen 7 7840HS (17615 - 41516, n=21) | |
| Lenovo Legion Slim 5 14APH8 | |
| Razer Blade 14 RTX 4070 | |
| Lenovo LOQ 15APH8 | |
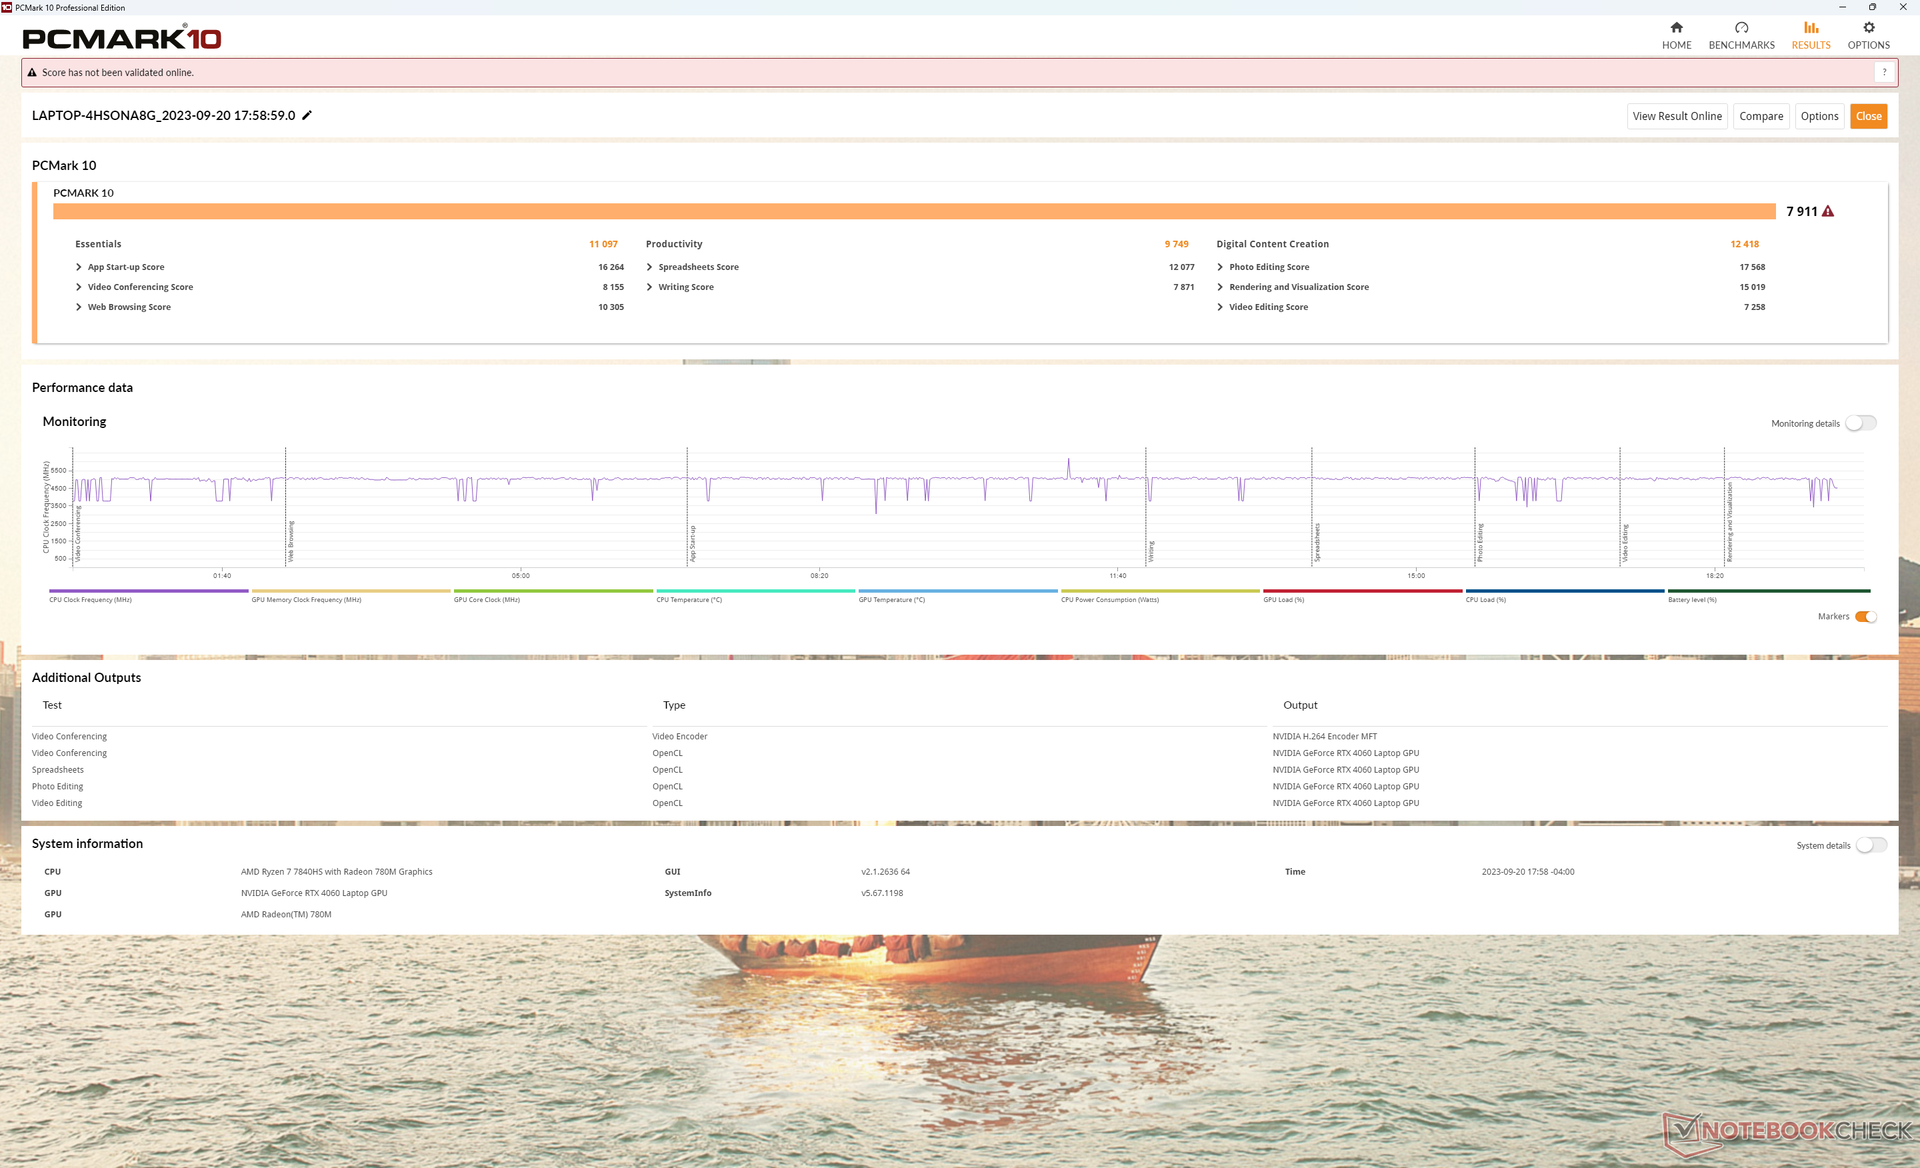
Prestazioni del sistema
I punteggi di PCMark sono paragonabili a quelli di altri portatili da gioco da 14 pollici della concorrenza, con una percentuale di appena una cifra. Non abbiamo riscontrato problemi degni di nota durante l'utilizzo dell'unità di test, a differenza dei recenti Legion Slim 5 16 o Alienware m16 R1.
CrossMark: Overall | Productivity | Creativity | Responsiveness
| PCMark 10 / Score | |
| Asus ROG Zephyrus G14 GA402XY | |
| Razer Blade 14 RTX 4070 | |
| Lenovo Legion Slim 5 14APH8 | |
| Media AMD Ryzen 7 7840HS, NVIDIA GeForce RTX 4060 Laptop GPU (7502 - 7946, n=4) | |
| Lenovo LOQ 15APH8 | |
| Acer Predator Triton 14 PT14-51 | |
| Alienware x14 i7 RTX 3060 | |
| PCMark 10 / Essentials | |
| Lenovo Legion Slim 5 14APH8 | |
| Razer Blade 14 RTX 4070 | |
| Media AMD Ryzen 7 7840HS, NVIDIA GeForce RTX 4060 Laptop GPU (10441 - 11169, n=4) | |
| Asus ROG Zephyrus G14 GA402XY | |
| Lenovo LOQ 15APH8 | |
| Acer Predator Triton 14 PT14-51 | |
| Alienware x14 i7 RTX 3060 | |
| PCMark 10 / Productivity | |
| Razer Blade 14 RTX 4070 | |
| Asus ROG Zephyrus G14 GA402XY | |
| Lenovo LOQ 15APH8 | |
| Media AMD Ryzen 7 7840HS, NVIDIA GeForce RTX 4060 Laptop GPU (9575 - 10273, n=4) | |
| Acer Predator Triton 14 PT14-51 | |
| Lenovo Legion Slim 5 14APH8 | |
| Alienware x14 i7 RTX 3060 | |
| PCMark 10 / Digital Content Creation | |
| Asus ROG Zephyrus G14 GA402XY | |
| Razer Blade 14 RTX 4070 | |
| Lenovo Legion Slim 5 14APH8 | |
| Media AMD Ryzen 7 7840HS, NVIDIA GeForce RTX 4060 Laptop GPU (11464 - 12418, n=4) | |
| Lenovo LOQ 15APH8 | |
| Acer Predator Triton 14 PT14-51 | |
| Alienware x14 i7 RTX 3060 | |
| CrossMark / Overall | |
| Alienware x14 i7 RTX 3060 | |
| Lenovo Legion Slim 5 14APH8 | |
| Acer Predator Triton 14 PT14-51 | |
| Asus ROG Zephyrus G14 GA402XY | |
| Media AMD Ryzen 7 7840HS, NVIDIA GeForce RTX 4060 Laptop GPU (1800 - 1866, n=3) | |
| Razer Blade 14 RTX 4070 | |
| Lenovo LOQ 15APH8 | |
| CrossMark / Productivity | |
| Lenovo Legion Slim 5 14APH8 | |
| Alienware x14 i7 RTX 3060 | |
| Media AMD Ryzen 7 7840HS, NVIDIA GeForce RTX 4060 Laptop GPU (1743 - 1821, n=3) | |
| Razer Blade 14 RTX 4070 | |
| Asus ROG Zephyrus G14 GA402XY | |
| Acer Predator Triton 14 PT14-51 | |
| Lenovo LOQ 15APH8 | |
| CrossMark / Creativity | |
| Asus ROG Zephyrus G14 GA402XY | |
| Alienware x14 i7 RTX 3060 | |
| Acer Predator Triton 14 PT14-51 | |
| Razer Blade 14 RTX 4070 | |
| Lenovo Legion Slim 5 14APH8 | |
| Media AMD Ryzen 7 7840HS, NVIDIA GeForce RTX 4060 Laptop GPU (1908 - 1966, n=3) | |
| Lenovo LOQ 15APH8 | |
| CrossMark / Responsiveness | |
| Alienware x14 i7 RTX 3060 | |
| Lenovo Legion Slim 5 14APH8 | |
| Acer Predator Triton 14 PT14-51 | |
| Media AMD Ryzen 7 7840HS, NVIDIA GeForce RTX 4060 Laptop GPU (1522 - 1776, n=3) | |
| Razer Blade 14 RTX 4070 | |
| Asus ROG Zephyrus G14 GA402XY | |
| Lenovo LOQ 15APH8 | |
| PCMark 10 Score | 7911 punti | |
Aiuto | ||
| AIDA64 / Memory Copy | |
| Alienware x14 i7 RTX 3060 | |
| Acer Predator Triton 14 PT14-51 | |
| Lenovo Legion Slim 5 14APH8 | |
| Media AMD Ryzen 7 7840HS (30937 - 72158, n=21) | |
| Razer Blade 14 RTX 4070 | |
| Lenovo LOQ 15APH8 | |
| AIDA64 / Memory Read | |
| Alienware x14 i7 RTX 3060 | |
| Acer Predator Triton 14 PT14-51 | |
| Razer Blade 14 RTX 4070 | |
| Media AMD Ryzen 7 7840HS (30497 - 62147, n=21) | |
| Lenovo Legion Slim 5 14APH8 | |
| Lenovo LOQ 15APH8 | |
| AIDA64 / Memory Write | |
| Lenovo Legion Slim 5 14APH8 | |
| Acer Predator Triton 14 PT14-51 | |
| Media AMD Ryzen 7 7840HS (34590 - 93323, n=21) | |
| Razer Blade 14 RTX 4070 | |
| Alienware x14 i7 RTX 3060 | |
| Lenovo LOQ 15APH8 | |
| AIDA64 / Memory Latency | |
| Lenovo Legion Slim 5 14APH8 | |
| Alienware x14 i7 RTX 3060 | |
| Acer Predator Triton 14 PT14-51 | |
| Lenovo LOQ 15APH8 | |
| Media AMD Ryzen 7 7840HS (85.1 - 112, n=21) | |
| Razer Blade 14 RTX 4070 | |
* ... Meglio usare valori piccoli
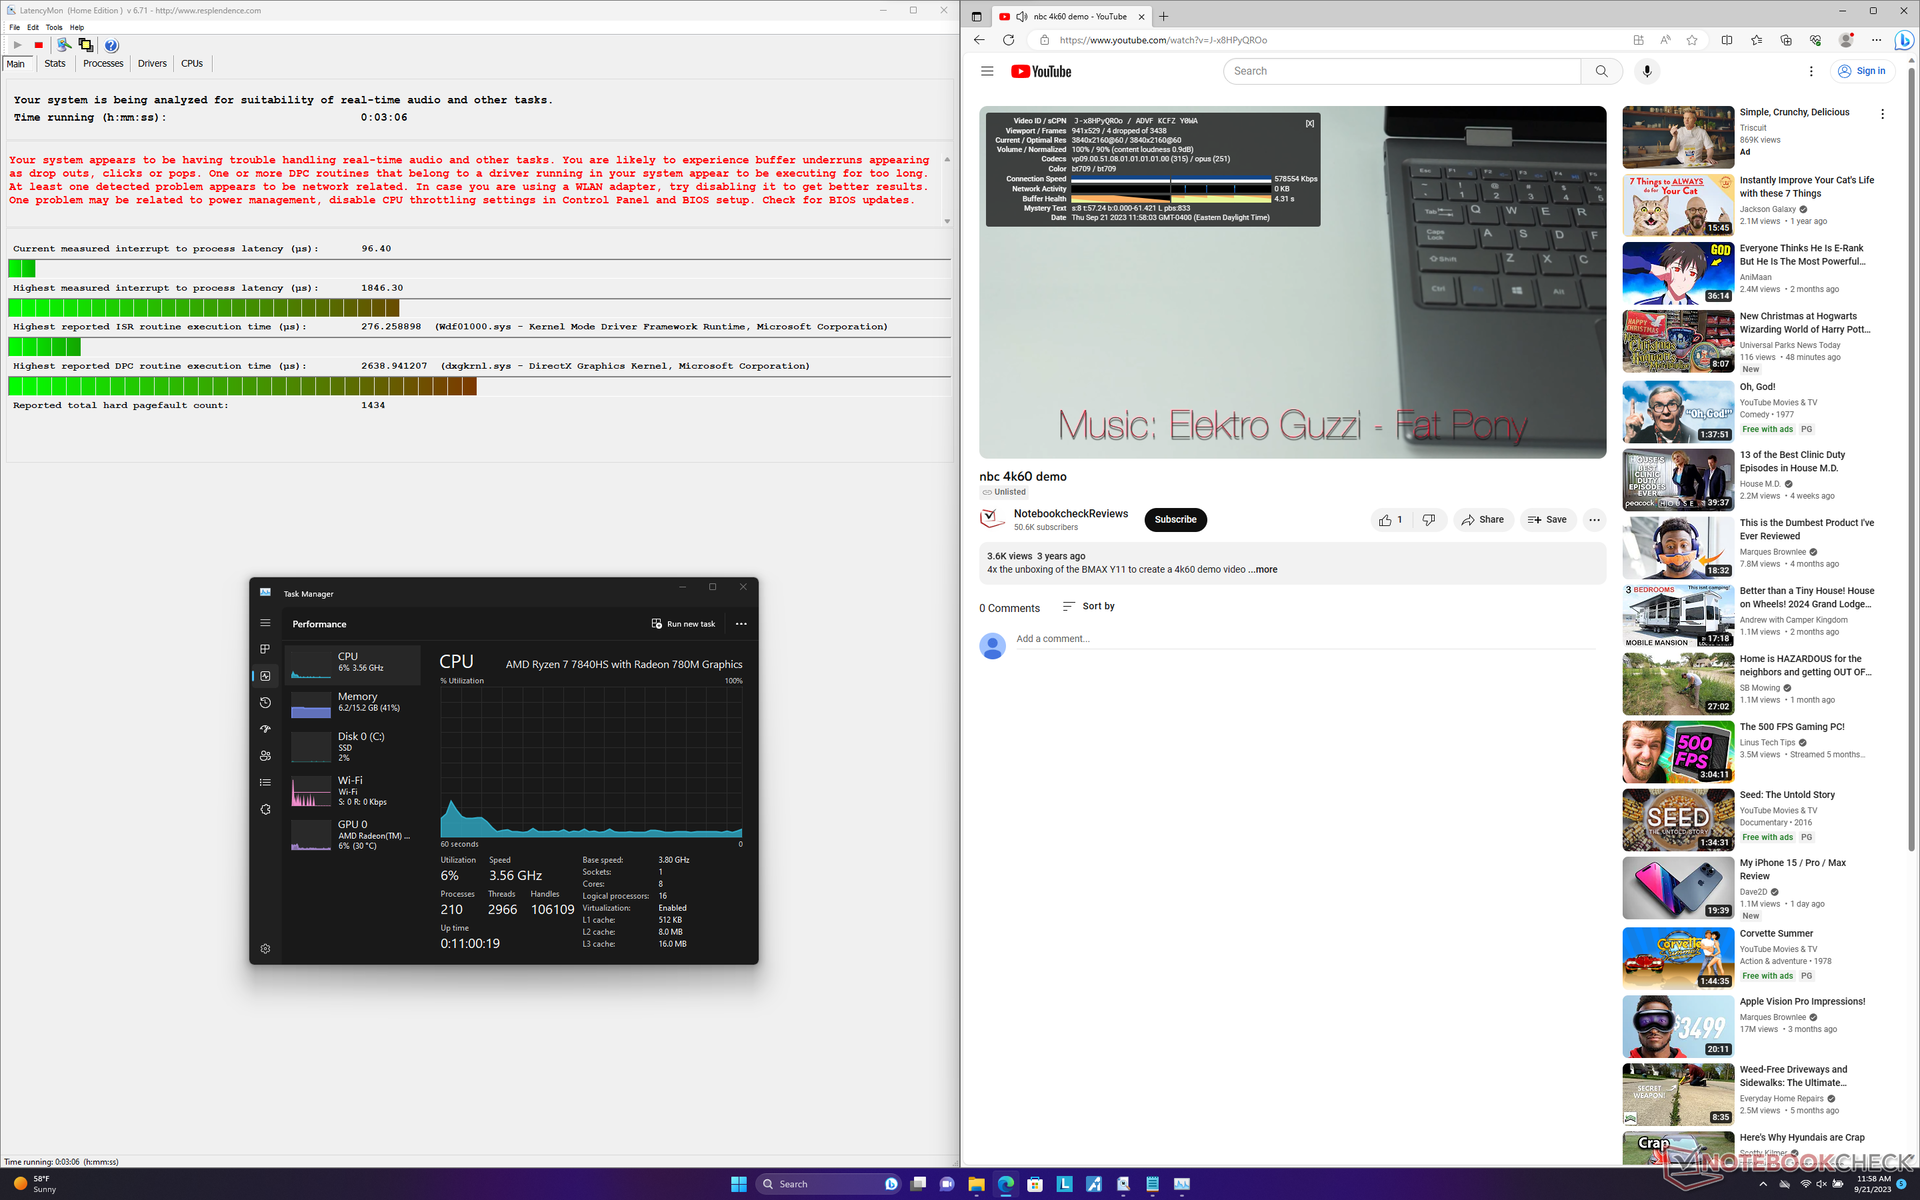
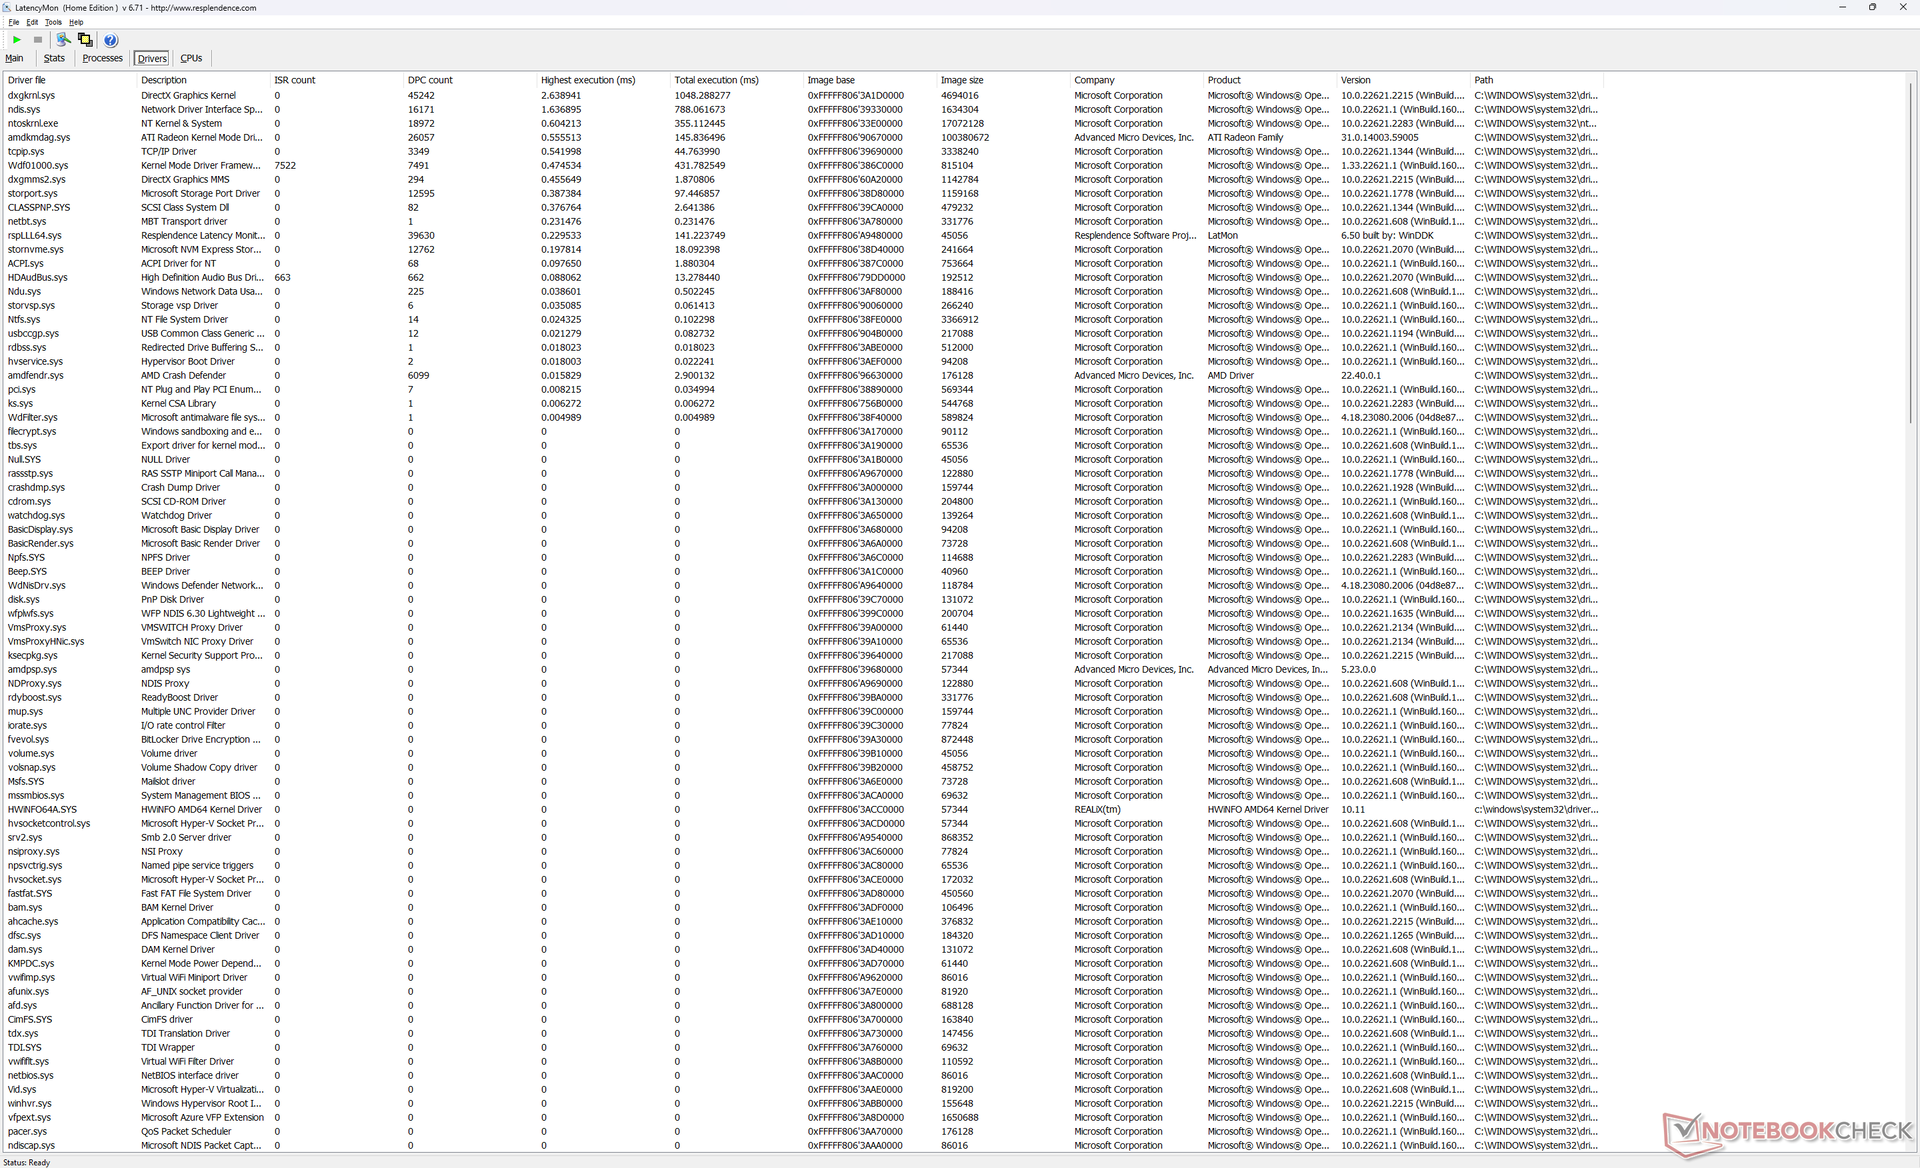
Latenza DPC
LatencyMon mostra problemi di DPC quando si aprono più schede del browser della nostra homepage. anche la riproduzione di video 4K a 60 FPS è imperfetta, con 4 fotogrammi caduti registrati nell'arco di un minuto.
| DPC Latencies / LatencyMon - interrupt to process latency (max), Web, Youtube, Prime95 | |
| Lenovo Legion Slim 5 14APH8 | |
| Acer Predator Triton 14 PT14-51 | |
| Lenovo LOQ 15APH8 | |
| Alienware x14 i7 RTX 3060 | |
| Asus ROG Zephyrus G14 GA402XY | |
| Razer Blade 14 RTX 4070 | |
* ... Meglio usare valori piccoli
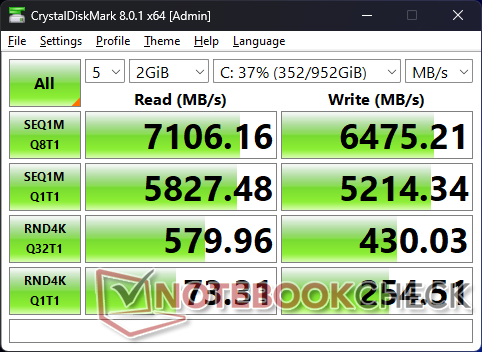
Dispositivi di archiviazione
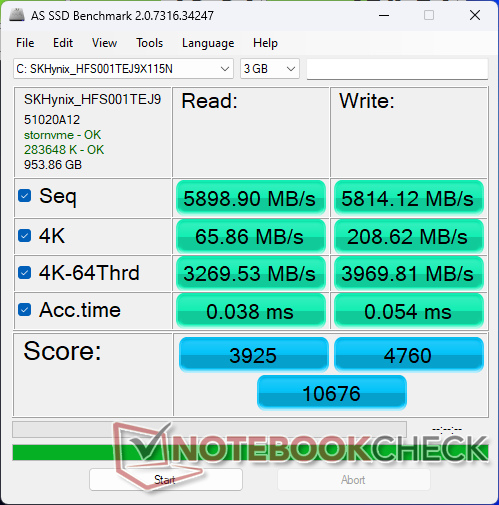
La nostra unità viene fornita con un disco da 1 TB SK hynix HFS001TEJ9X115N Che è un'unità PCIe4 x4 di fascia alta. L'unità non ha avuto problemi a mantenere velocità di trasferimento molto elevate, pari a quasi 7100 MB/s sotto sforzo, dimostrando di non avere problemi di throttling nonostante il fattore di forma più piccolo Legion Slim.

| Drive Performance rating - Percent | |
| Lenovo Legion Slim 5 14APH8 | |
| Razer Blade 14 RTX 4070 | |
| Alienware x14 i7 RTX 3060 | |
| Asus ROG Zephyrus G14 GA402XY | |
| Acer Predator Triton 14 PT14-51 | |
| Lenovo LOQ 15APH8 | |
* ... Meglio usare valori piccoli
Disk Throttling: DiskSpd Read Loop, Queue Depth 8
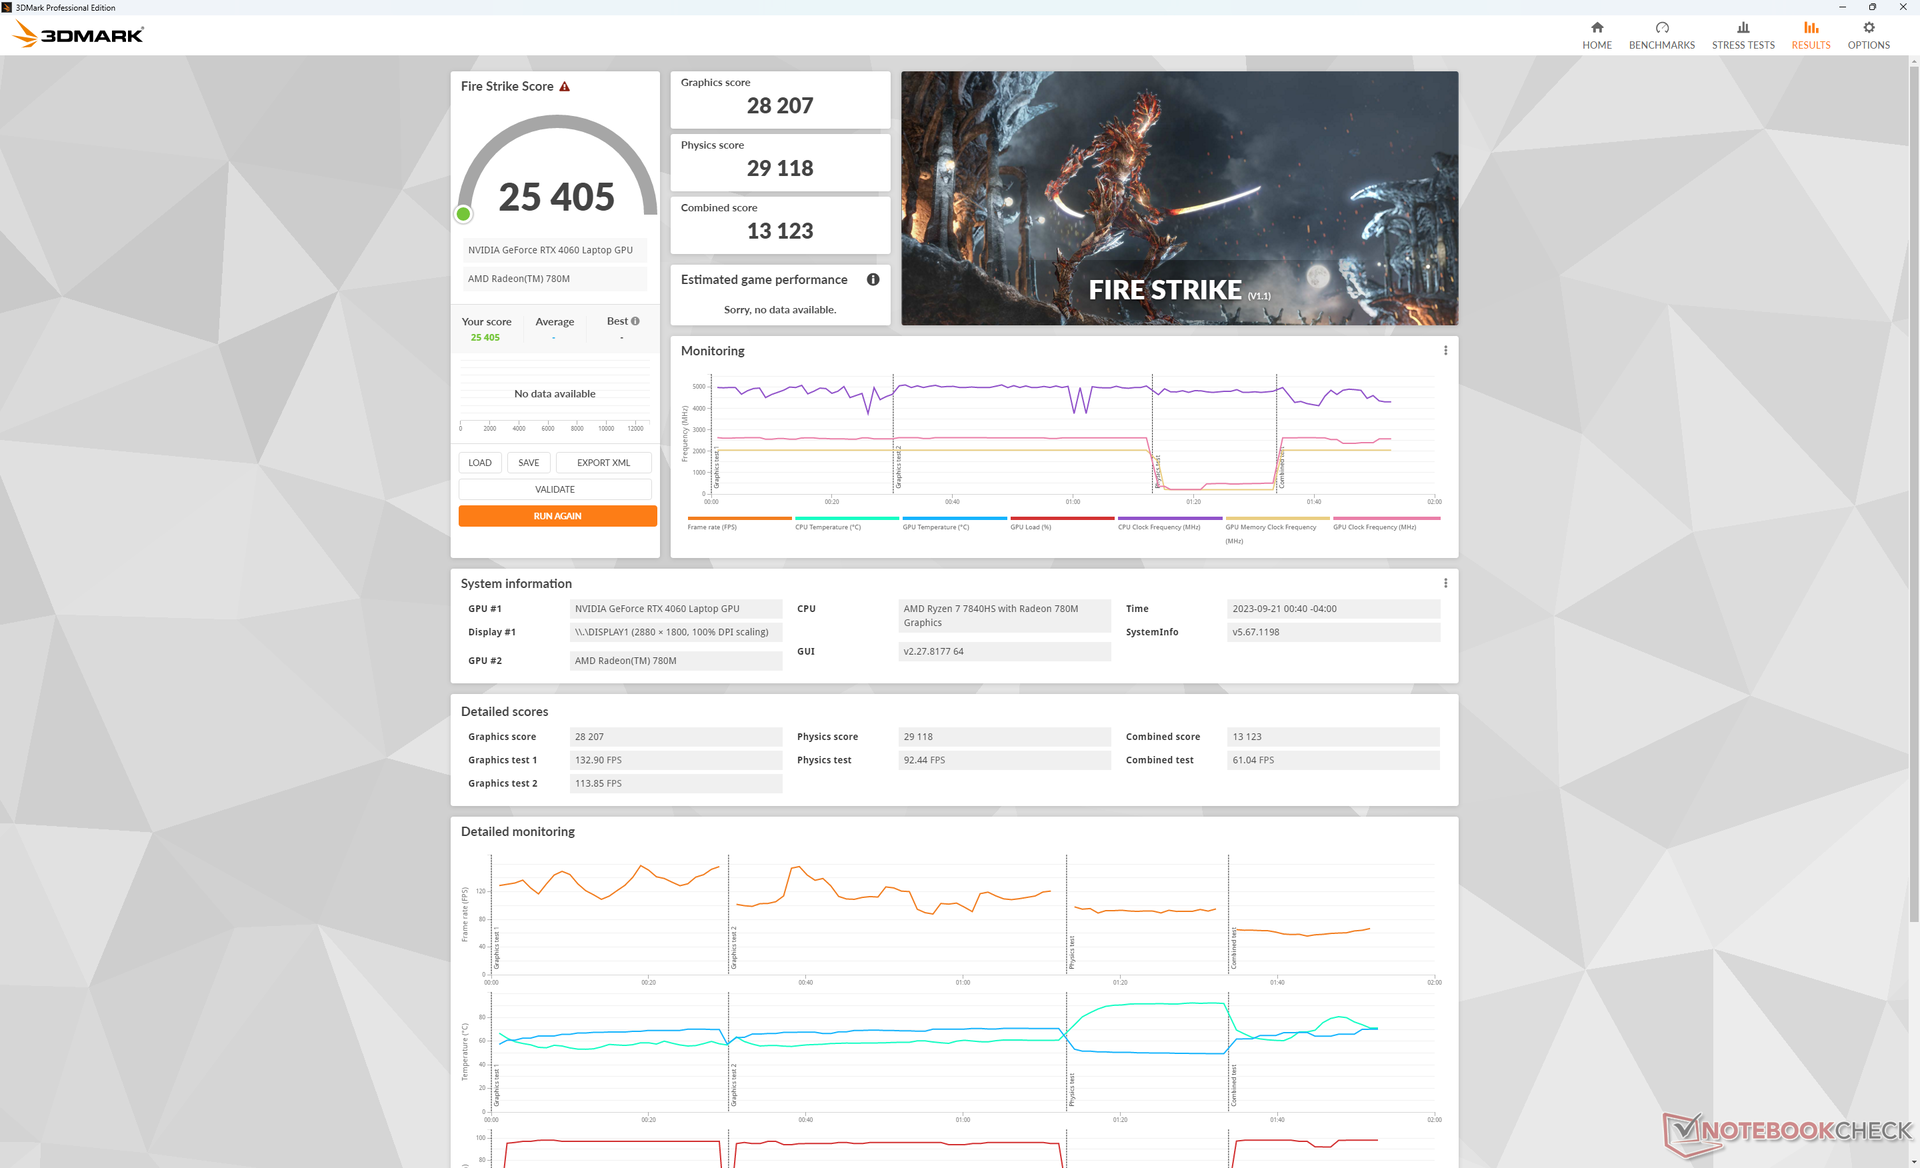
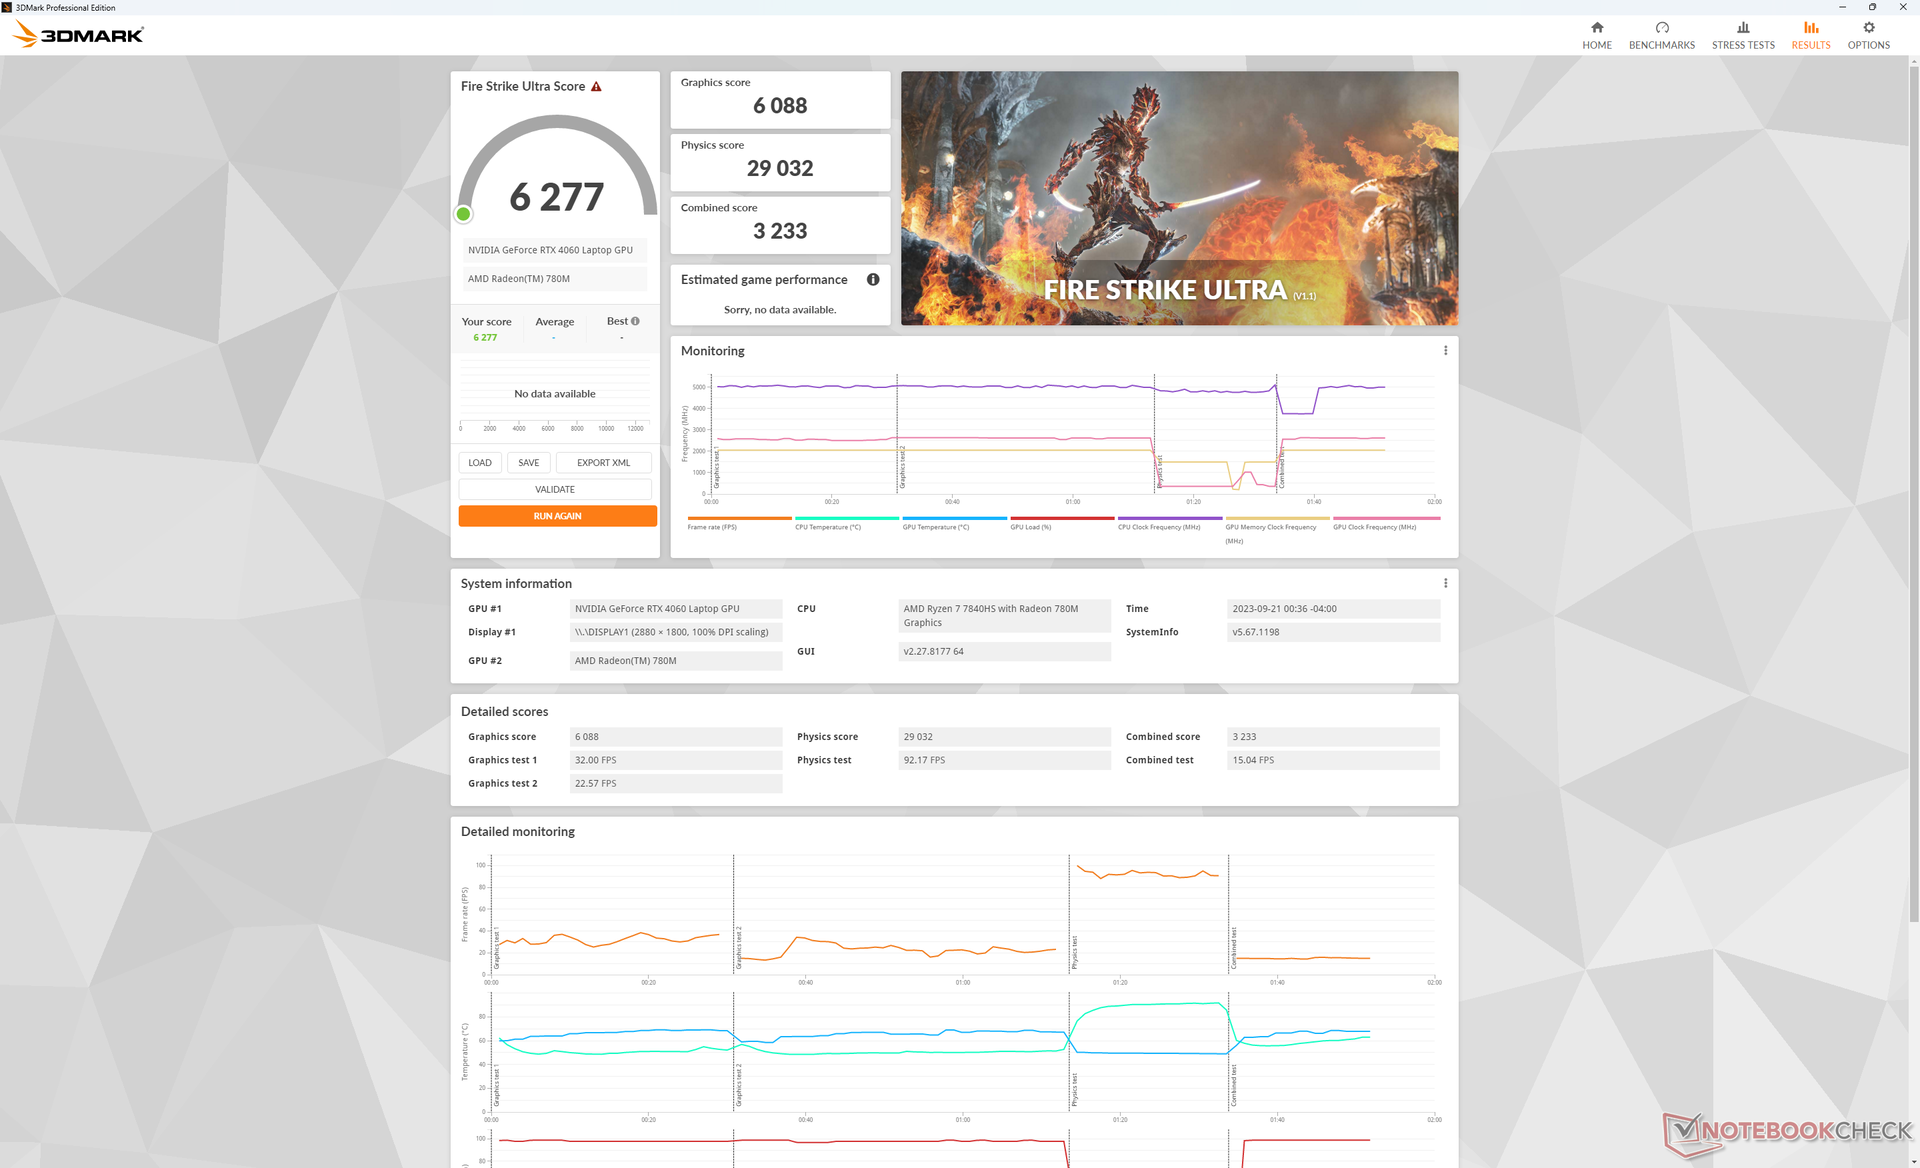
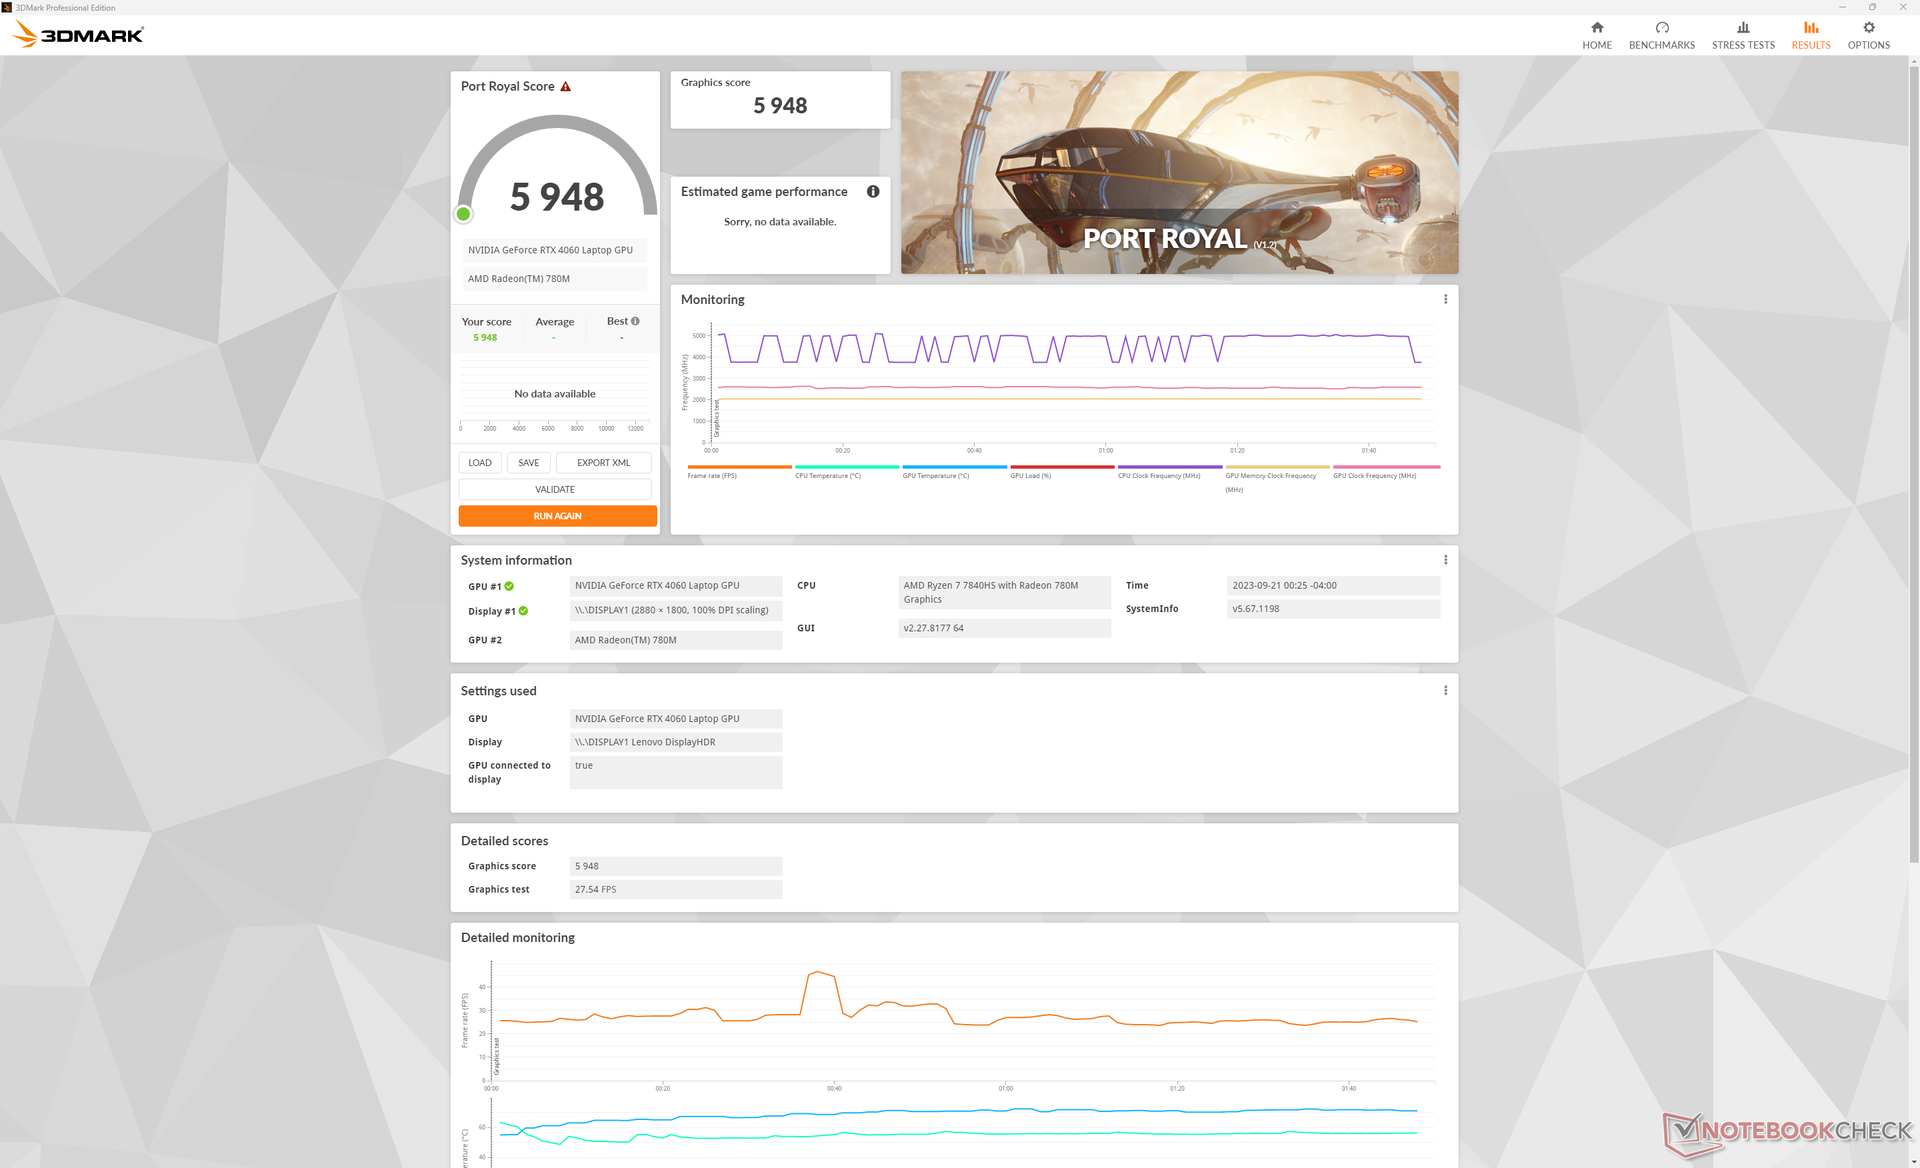
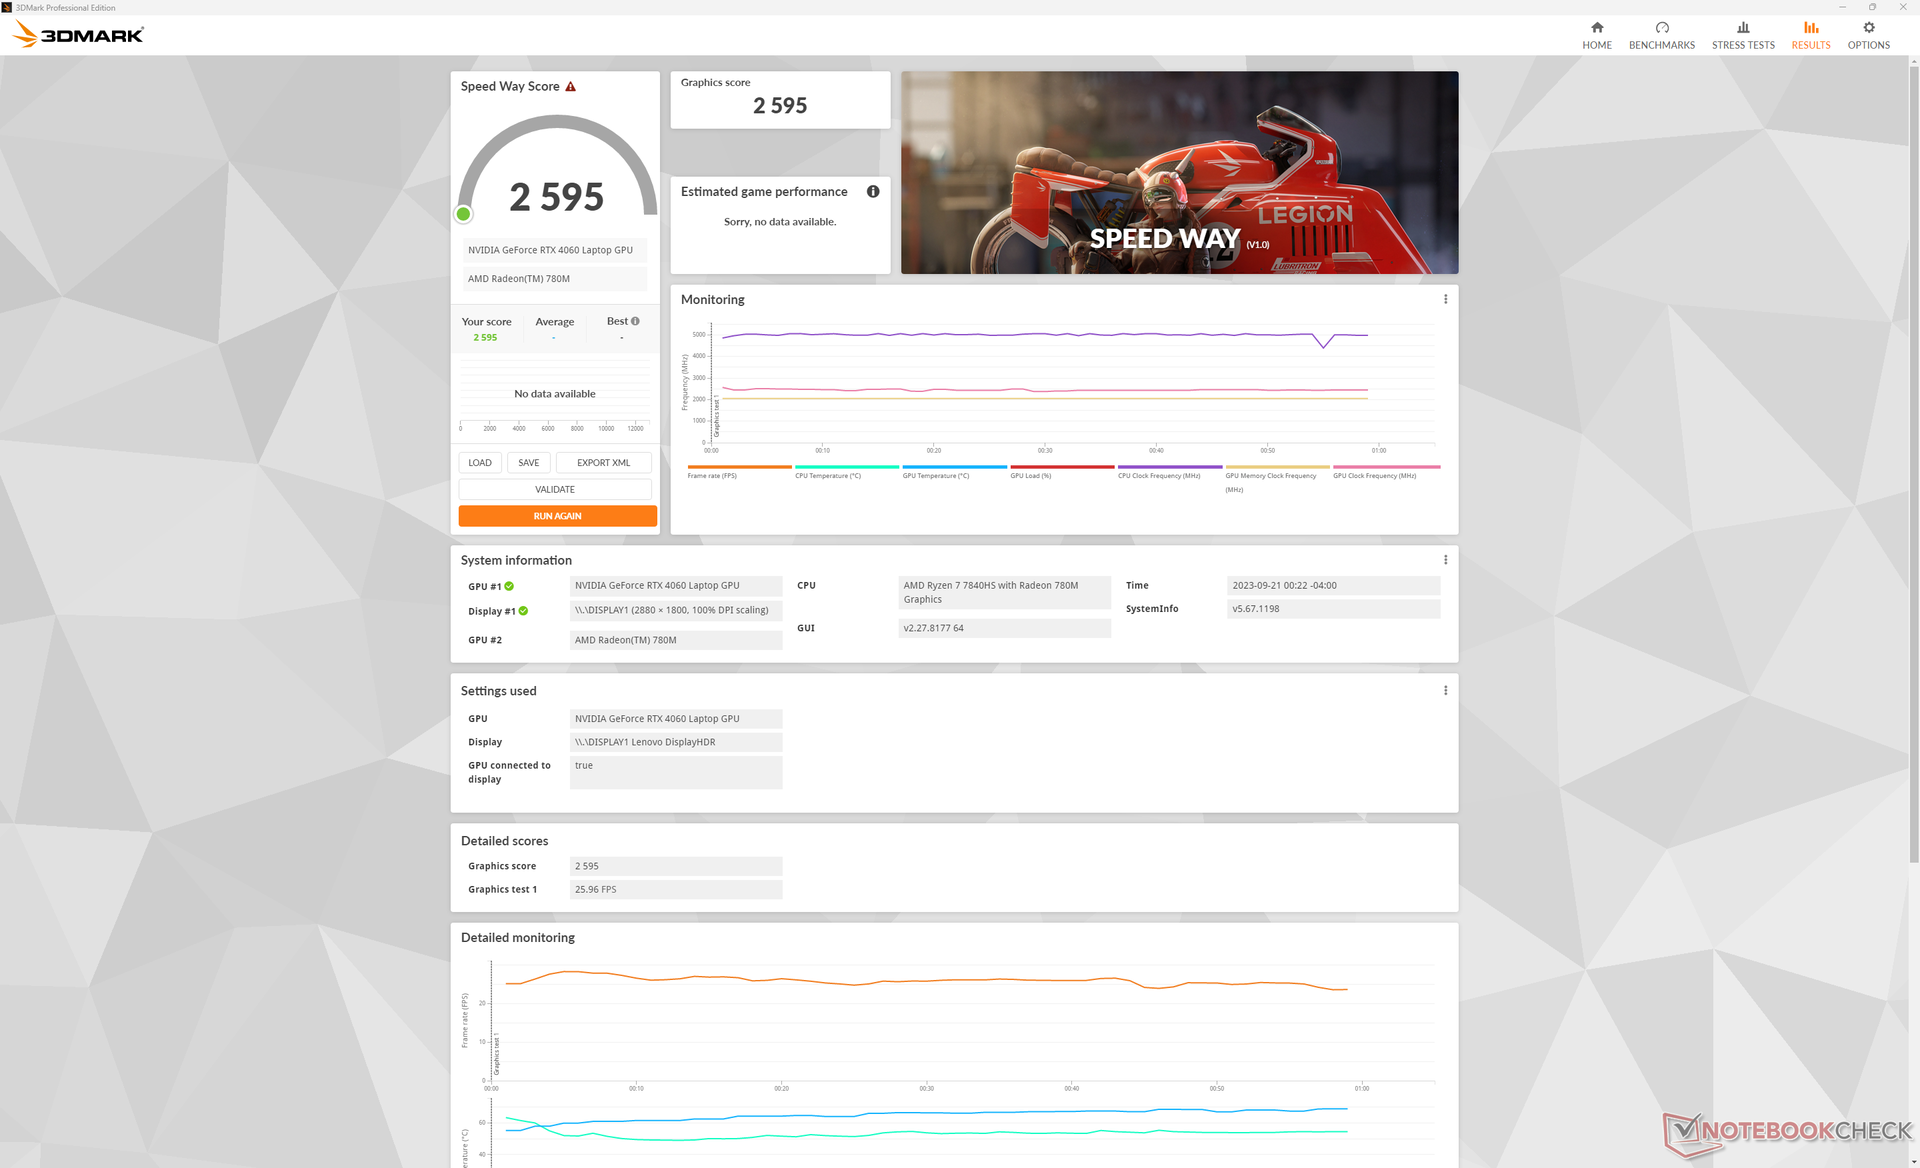
Prestazioni della GPU - 105 W GeForce RTX 4060
Le prestazioni grafiche sono eccellenti, con risultati in linea con gli altri portatili dotati della stessa RTX 4060 E che non suggeriscono alcun problema di throttling. L'RTX 4070 del Blade 14 è più veloce del 15%, ma questa opzione non è disponibile per l'attuale modello Legion Slim 5 14.
Il declassamento alla configurazione RTX 4050 avrà un impatto sulle prestazioni di circa il 20-25%, in base al tempo trascorso con il Predator Triton 14 di Acer. Anche l'utilizzo della modalità Bilanciata invece della modalità Prestazioni influisce sulle prestazioni grafiche fino al 15%, come mostra la tabella dei risultati Fire Strike qui sotto. Tuttavia, la modalità Balanced è un po' più silenziosa per compensare la riduzione delle prestazioni.
| Profilo energetico | Punteggio grafico | Punteggio fisico | Punteggio combinato |
| Modalità prestazioni | 28207 | 29118 | 13123 |
| Modalità Bilanciata (con Turbo disattivato) | 24505 (-13%) | 28015 (-4%) | 11701 (-11%) |
| Alimentazione a batteria | 22396 (-21%) | 26867 (-8%) | 10136 (-23%) |
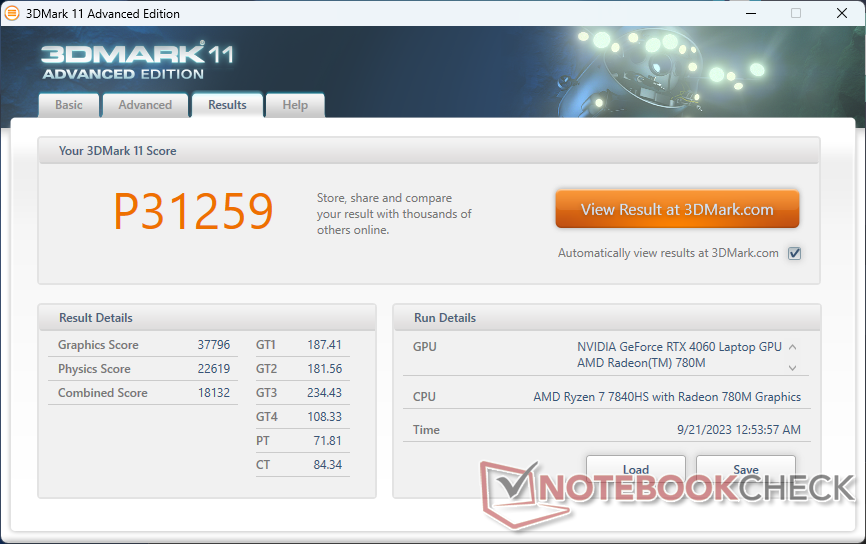
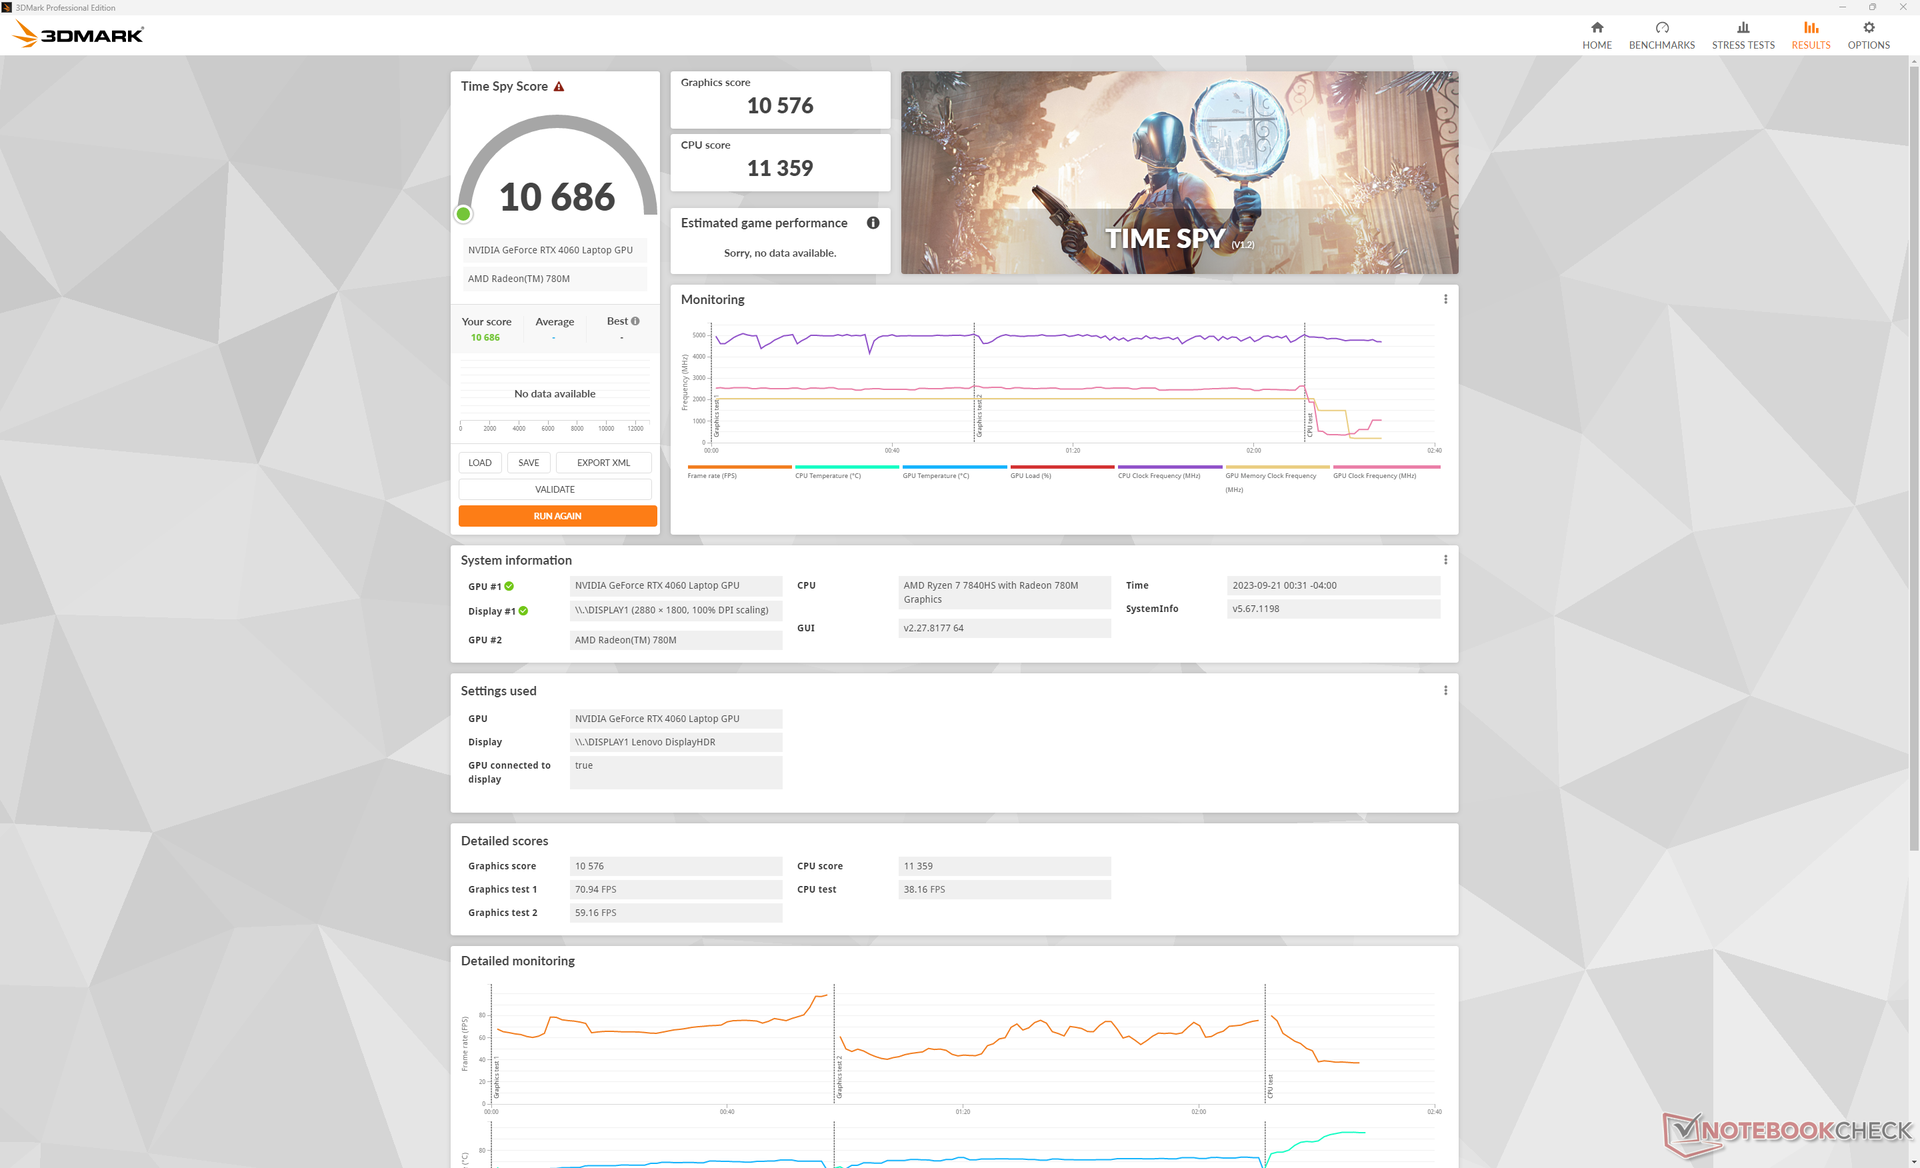
| 3DMark 11 Performance | 31259 punti | |
| 3DMark Fire Strike Score | 24304 punti | |
| 3DMark Time Spy Score | 10514 punti | |
Aiuto | ||
* ... Meglio usare valori piccoli
Prestazioni di gioco
Tutti i giochi testati funzionano bene su Legion Slim 5 14 anche quando è impostata la risoluzione nativa di 2,8K. Tuttavia, consigliamo di regolare le impostazioni su Medio se si gioca a titoli impegnativi come Star Wars Jedi Survivor o Returnal per mantenere la frequenza dei fotogrammi a 60 FPS o superiore, soprattutto perché il display principale non dispone di G-Sync.
| Far Cry 6 | |
| 1920x1080 High Graphics Quality AA:T | |
| Media NVIDIA GeForce RTX 4060 Laptop GPU (101 - 120, n=2) | |
| Asus ROG Zephyrus G14 GA402RK | |
| Asus ROG Zephyrus G14 GA402XY | |
| Inno3D GeForce RTX 3060 Twin X2 | |
| Lenovo Legion Slim 5 14APH8 | |
| 1920x1080 Ultra Graphics Quality + HD Textures AA:T | |
| Razer Blade 14 RTX 4070 | |
| Media NVIDIA GeForce RTX 4060 Laptop GPU (76 - 117, n=5) | |
| Asus ROG Zephyrus G14 GA402RK | |
| Asus ROG Zephyrus G14 GA402XY | |
| Lenovo Legion Slim 5 14APH8 | |
| Inno3D GeForce RTX 3060 Twin X2 | |
| 2560x1440 Ultra Graphics Quality + HD Textures AA:T | |
| Asus ROG Zephyrus G14 GA402XY | |
| Razer Blade 14 RTX 4070 | |
| Lenovo Legion Slim 5 14APH8 | |
| Asus ROG Zephyrus G14 GA402RK | |
| Inno3D GeForce RTX 3060 Twin X2 | |
| Media NVIDIA GeForce RTX 4060 Laptop GPU (32.6 - 83, n=5) | |
| F1 22 | |
| 1920x1080 High Preset AA:T AF:16x | |
| Asus ROG Zephyrus G14 GA402XY | |
| Lenovo Legion Slim 5 14APH8 | |
| Razer Blade 14 RTX 4070 | |
| Media NVIDIA GeForce RTX 4060 Laptop GPU (124.7 - 217, n=23) | |
| Acer Predator Triton 14 PT14-51 | |
| 1920x1080 Ultra High Preset AA:T AF:16x | |
| Asus ROG Zephyrus G14 GA402XY | |
| Razer Blade 14 RTX 4070 | |
| Lenovo Legion Slim 5 14APH8 | |
| Media NVIDIA GeForce RTX 4060 Laptop GPU (48.7 - 71.4, n=23) | |
| Acer Predator Triton 14 PT14-51 | |
| 2560x1440 Ultra High Preset AA:T AF:16x | |
| Asus ROG Zephyrus G14 GA402XY | |
| Razer Blade 14 RTX 4070 | |
| Lenovo Legion Slim 5 14APH8 | |
| Media NVIDIA GeForce RTX 4060 Laptop GPU (31 - 45.2, n=18) | |
| Acer Predator Triton 14 PT14-51 | |
| Call of Duty Modern Warfare 2 2022 | |
| 1920x1080 Ultra Quality Preset AA:T2X Filmic SM | |
| Asus ROG Zephyrus G14 GA402XY | |
| Lenovo Legion Slim 5 14APH8 | |
| Media NVIDIA GeForce RTX 4060 Laptop GPU (70 - 104, n=4) | |
| 1920x1080 Extreme Quality Preset AA:T2X Filmic SM | |
| Asus ROG Zephyrus G14 GA402XY | |
| Razer Blade 14 RTX 4070 | |
| Lenovo Legion Slim 5 14APH8 | |
| Media NVIDIA GeForce RTX 4060 Laptop GPU (68 - 94, n=9) | |
| 2560x1440 Extreme Quality Preset AA:T2X Filmic SM | |
| Asus ROG Zephyrus G14 GA402XY | |
| Razer Blade 14 RTX 4070 | |
| Lenovo Legion Slim 5 14APH8 | |
| Media NVIDIA GeForce RTX 4060 Laptop GPU (49 - 66, n=7) | |
Witcher 3 FPS Chart
| basso | medio | alto | ultra | QHD | |
|---|---|---|---|---|---|
| GTA V (2015) | 178.9 | 171.6 | 162.3 | 102.1 | 86.6 |
| The Witcher 3 (2015) | 355 | 313.5 | 209.8 | 101.4 | |
| Dota 2 Reborn (2015) | 146 | 141.9 | 137.2 | 131.8 | |
| Final Fantasy XV Benchmark (2018) | 199.9 | 145.9 | 104.3 | 76.3 | |
| X-Plane 11.11 (2018) | 124.4 | 107.8 | 84.9 | ||
| Strange Brigade (2018) | 353 | 282 | 230 | 197.9 | 131.7 |
| Shadow of the Tomb Raider (2018) | 144 | 132 | 93 | ||
| Assassin´s Creed Valhalla (2020) | 117 | 99 | 72 | ||
| Far Cry 6 (2021) | 101 | 94 | 79 | ||
| Cyberpunk 2077 1.6 (2022) | 83.68 | 78.08 | 48.54 | ||
| Tiny Tina's Wonderlands (2022) | 114.65 | 88.15 | 59.69 | ||
| F1 22 (2022) | 218 | 217 | 193.1 | 65.8 | 42.4 |
| Call of Duty Modern Warfare 2 2022 (2022) | 104 | 94 | 65 | ||
| Returnal (2023) | 73 | 67 | 45 | ||
| Star Wars Jedi Survivor (2023) | 67.6 | 65 | 39.9 |
Emissioni - Piccolo giocatore rumoroso
Rumore del sistema
Le ventole interne sono soggette a pulsazioni anche quando sono impostate in modalità Bilanciata. Il rumore della ventola oscilla tra i 23 e i 31 dB(A) se si naviga semplicemente sul web o si guarda un video in streaming. Si consiglia pertanto di far funzionare il sistema in modalità silenziosa se si desidera un rumore minore della ventola.
Giocando in modalità Bilanciata invece che in modalità Prestazioni, il rumore della ventola si ridurrebbe leggermente da 52,8 dB(A) a 49,3 dB(A). In entrambi i casi, Legion Slim 5 14 è ancora una macchina da gioco molto rumorosa, simile al Blade 14,Zephyrus G14o Alienware x14.
Rumorosità
| Idle |
| 22.8 / 27.3 / 30.7 dB(A) |
| Sotto carico |
| 41.6 / 52.6 dB(A) |
 | ||
30 dB silenzioso 40 dB(A) udibile 50 dB(A) rumoroso |
||
min: | ||
| Lenovo Legion Slim 5 14APH8 GeForce RTX 4060 Laptop GPU, R7 7840HS, SK Hynix HFS001TEJ9X115N | Acer Predator Triton 14 PT14-51 GeForce RTX 4050 Laptop GPU, i7-13700H, Micron 3400 MTFDKBA512TFH 512GB | Razer Blade 14 RTX 4070 GeForce RTX 4070 Laptop GPU, R9 7940HS, Samsung PM9A1 MZVL21T0HCLR | Asus ROG Zephyrus G14 GA402XY GeForce RTX 4090 Laptop GPU, R9 7940HS, Samsung PM9A1 MZVL21T0HCLR | Alienware x14 i7 RTX 3060 GeForce RTX 3060 Laptop GPU, i7-12700H, WDC PC SN810 1TB | Lenovo LOQ 15APH8 GeForce RTX 4050 Laptop GPU, R7 7840HS, Micron 2450 512GB MTFDKCD512TFK | |
|---|---|---|---|---|---|---|
| Noise | -0% | 7% | -2% | 0% | 6% | |
| off /ambiente * (dB) | 22.8 | 25 -10% | 22.7 -0% | 23.3 -2% | 24.7 -8% | 23.1 -1% |
| Idle Minimum * (dB) | 22.8 | 27 -18% | 23.4 -3% | 23.6 -4% | 24.7 -8% | 23.1 -1% |
| Idle Average * (dB) | 27.3 | 29 -6% | 23.4 14% | 23.6 14% | 24.7 10% | 23.1 15% |
| Idle Maximum * (dB) | 30.7 | 31 -1% | 23.4 24% | 33 -7% | 30.9 -1% | 25.2 18% |
| Load Average * (dB) | 41.6 | 42 -1% | 33 21% | 49.5 -19% | 40 4% | 44.3 -6% |
| Witcher 3 ultra * (dB) | 52.8 | 43 19% | 51.8 2% | 52.2 1% | 51.5 2% | 45.8 13% |
| Load Maximum * (dB) | 52.6 | 45 14% | 55.6 -6% | 52.2 1% | 51.5 2% | 52 1% |
* ... Meglio usare valori piccoli
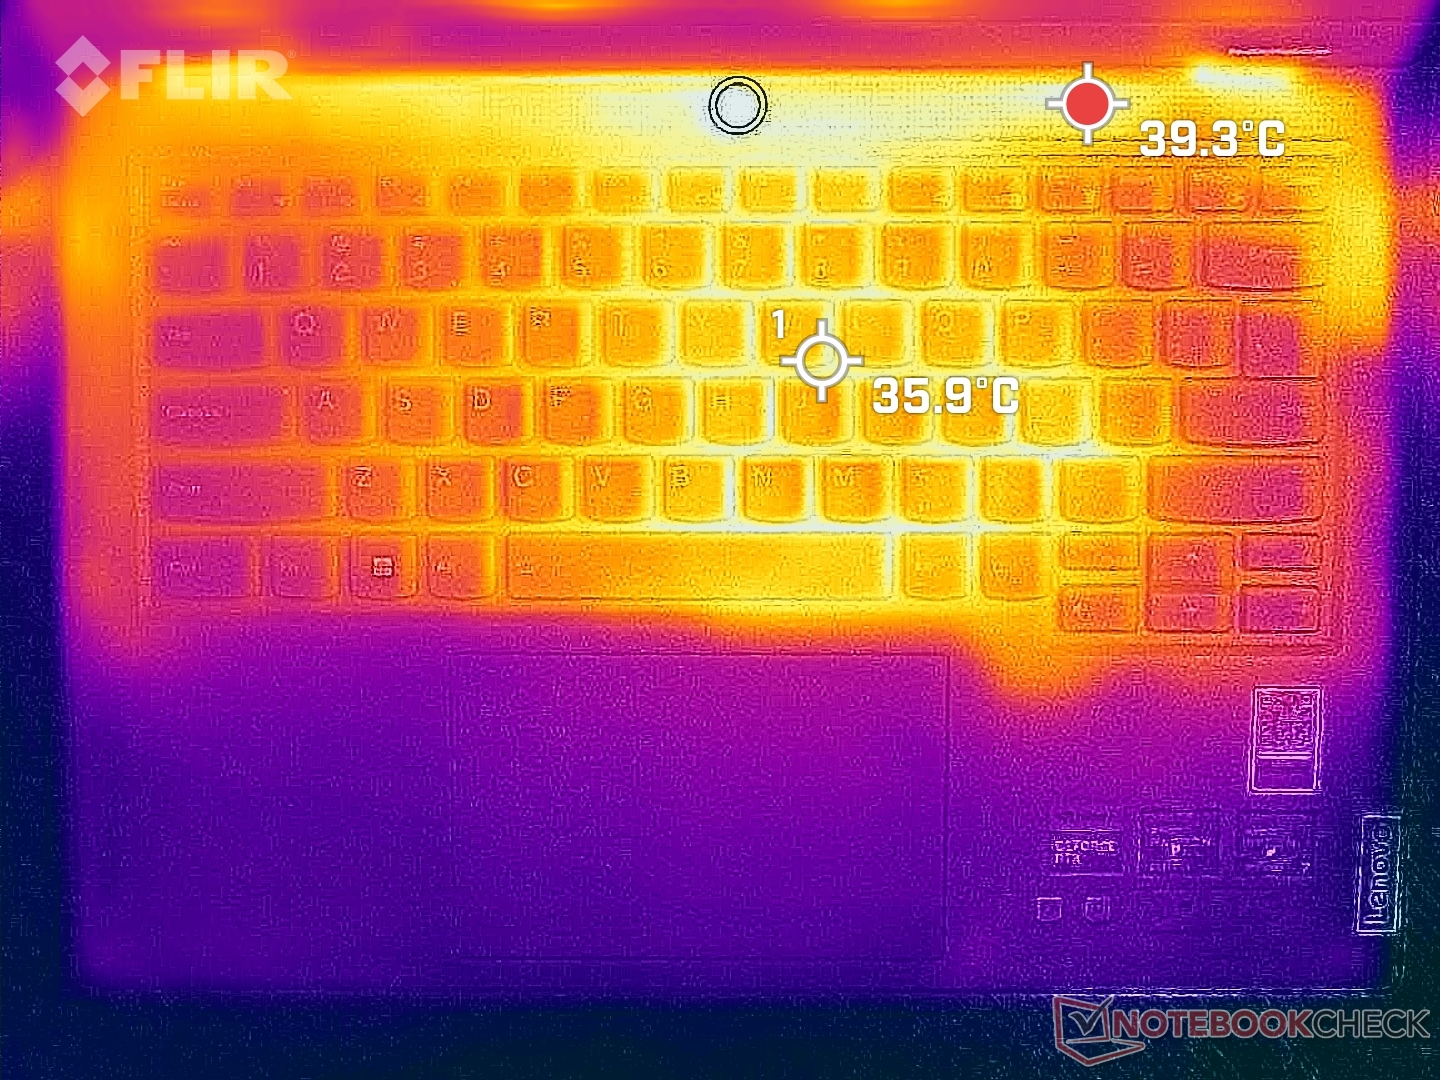
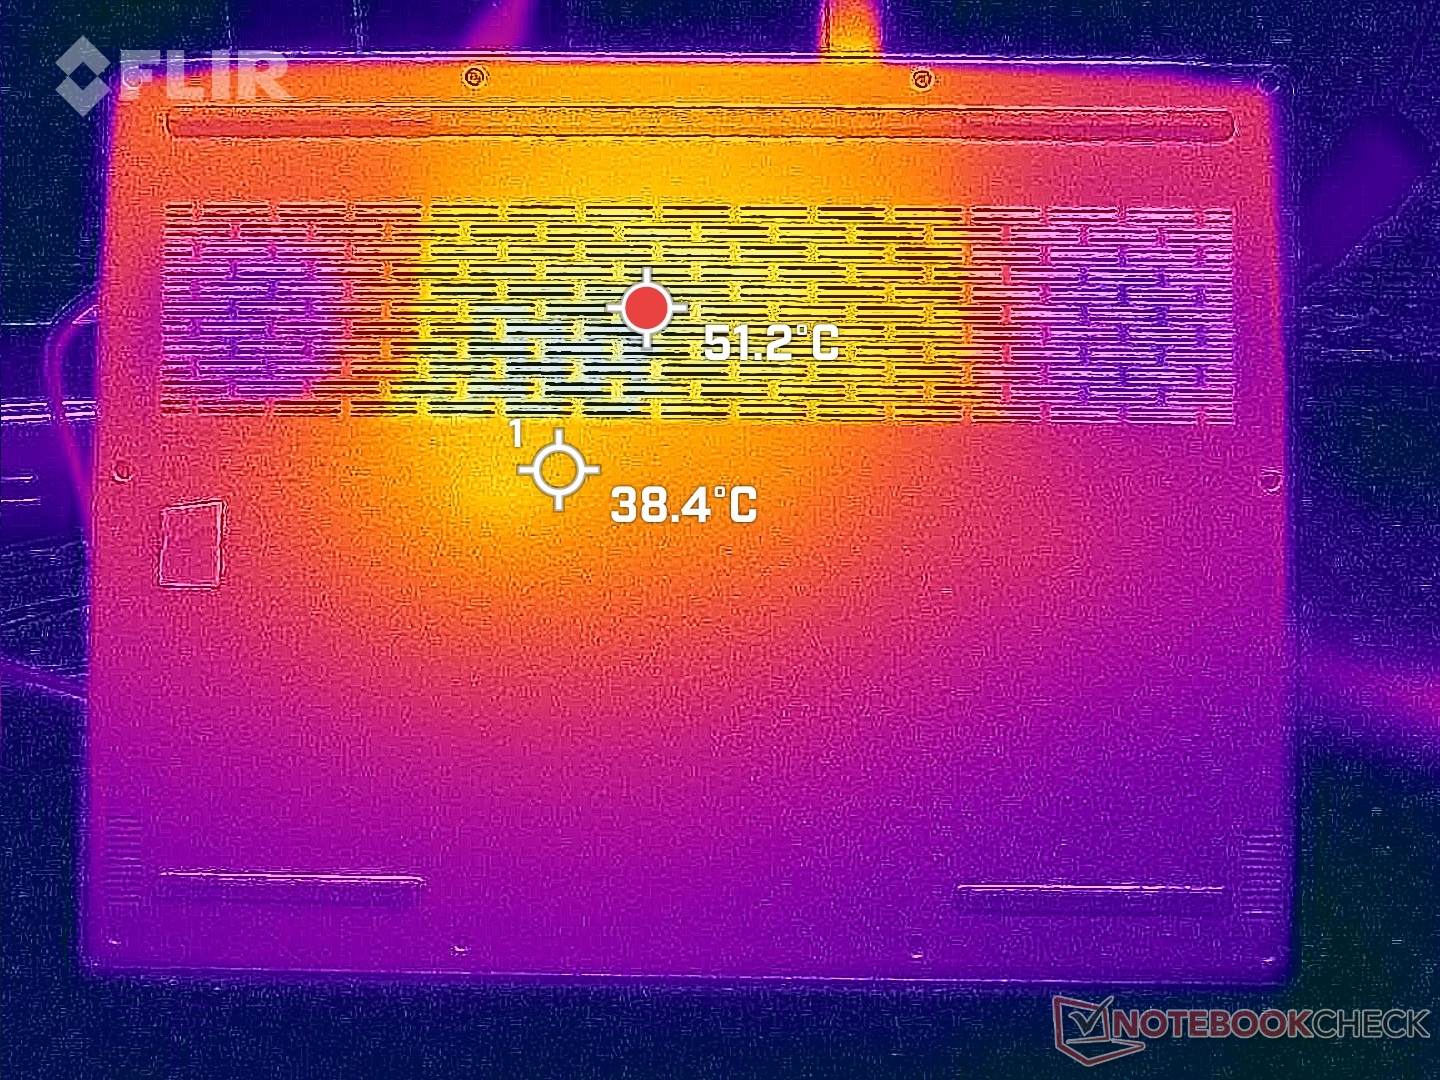
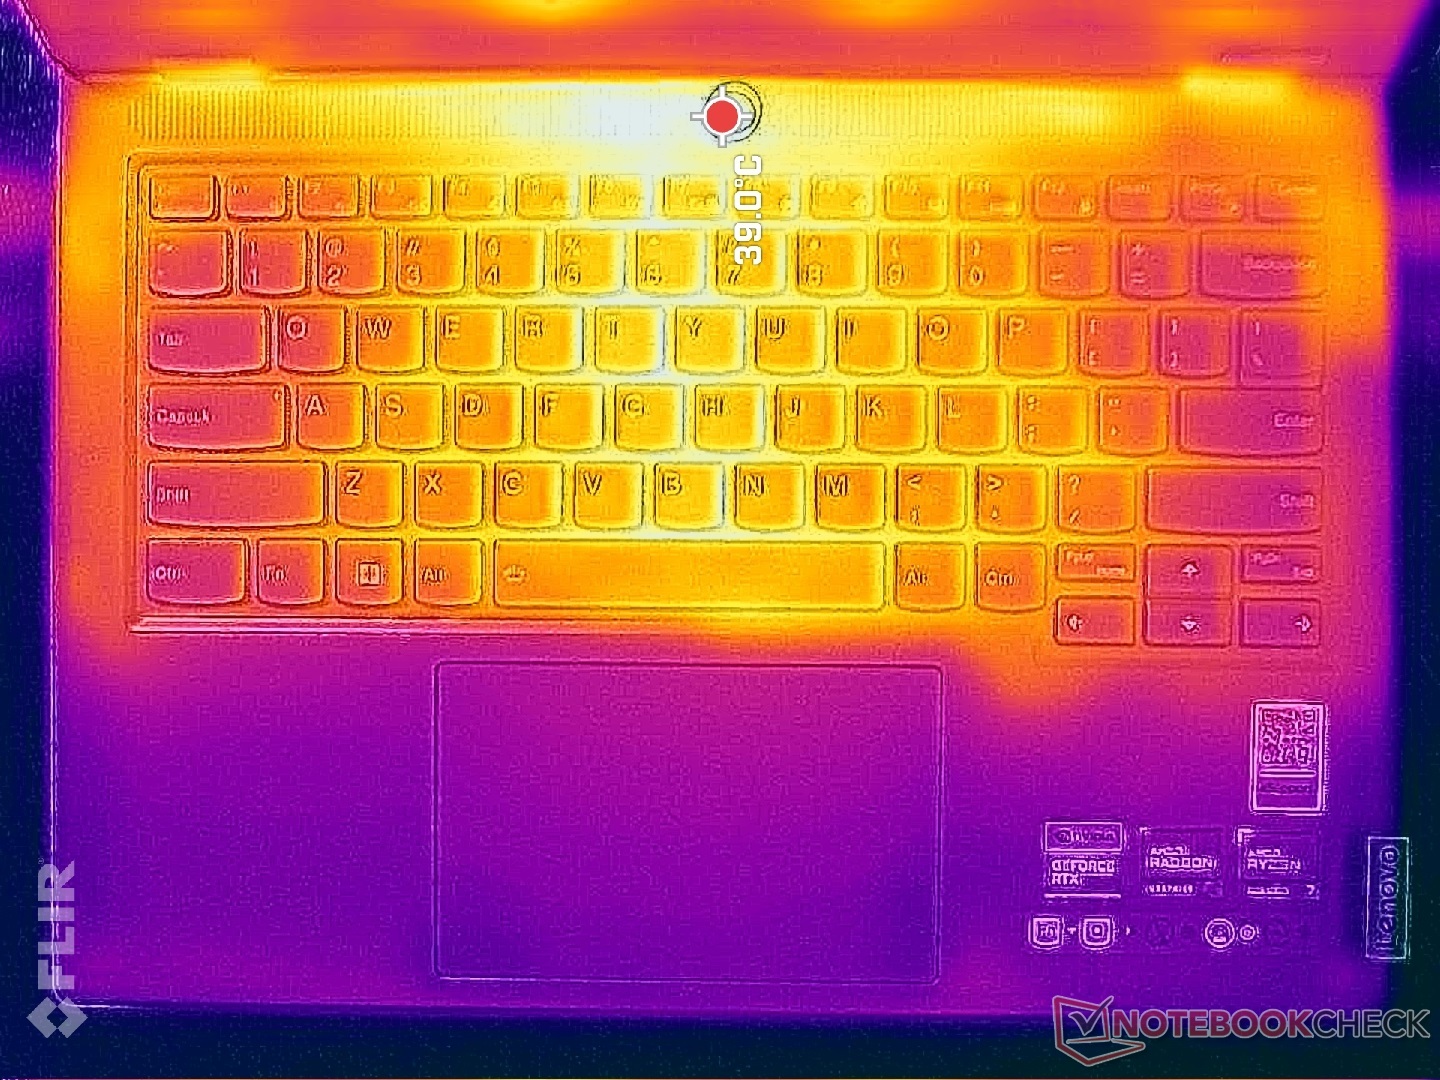
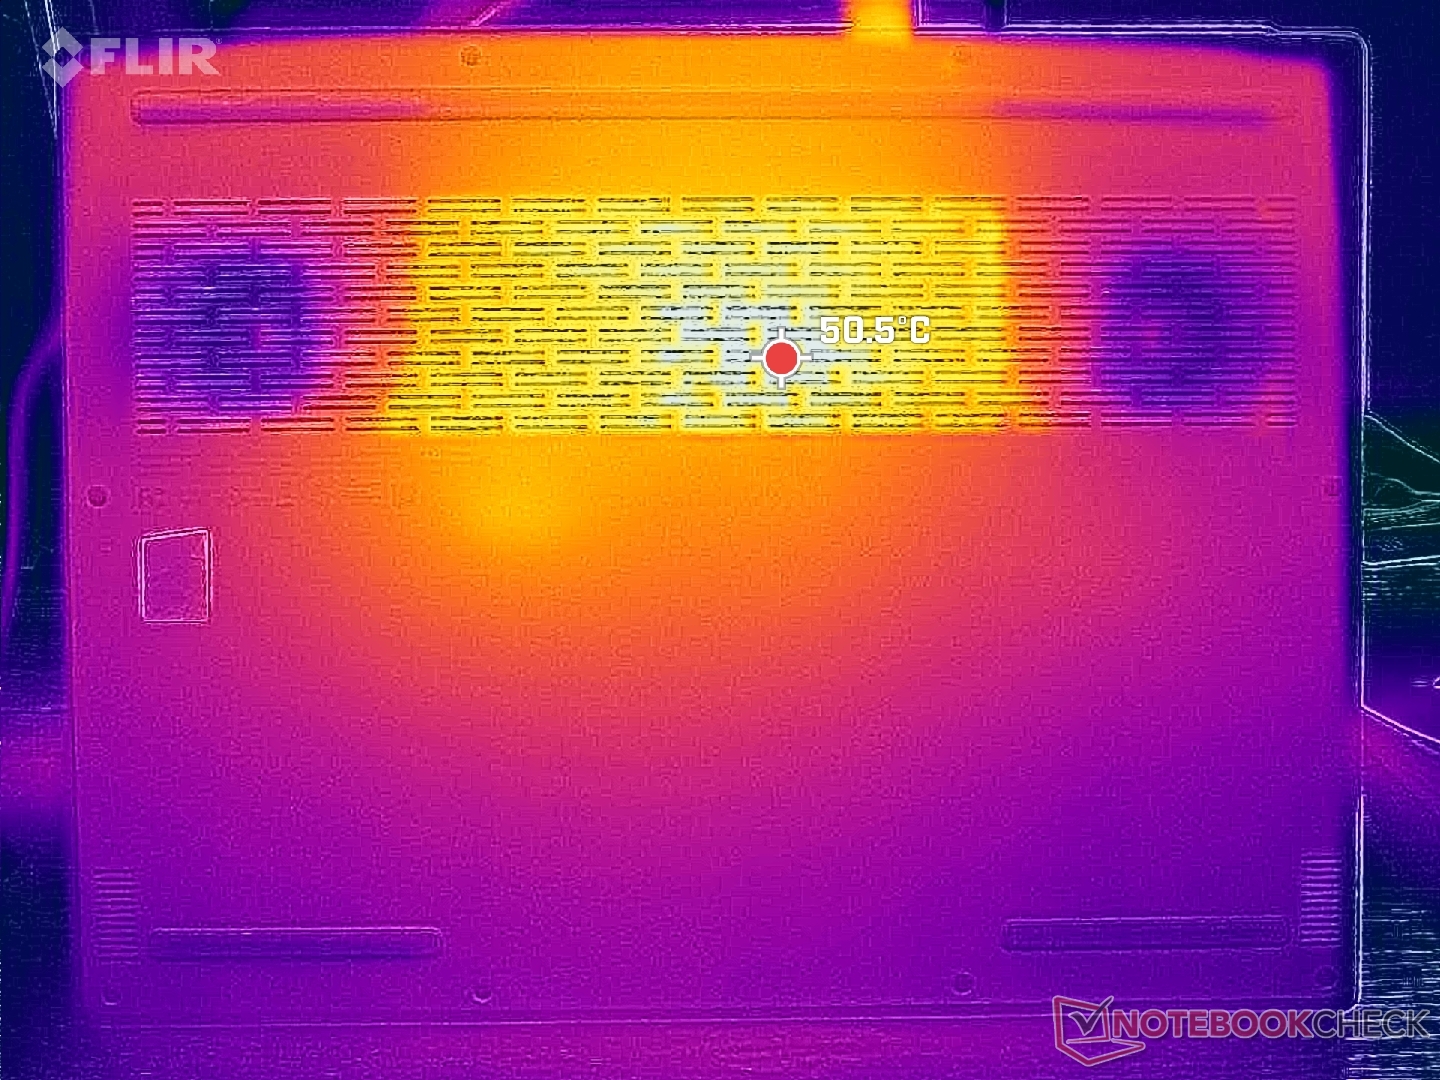
Temperatura
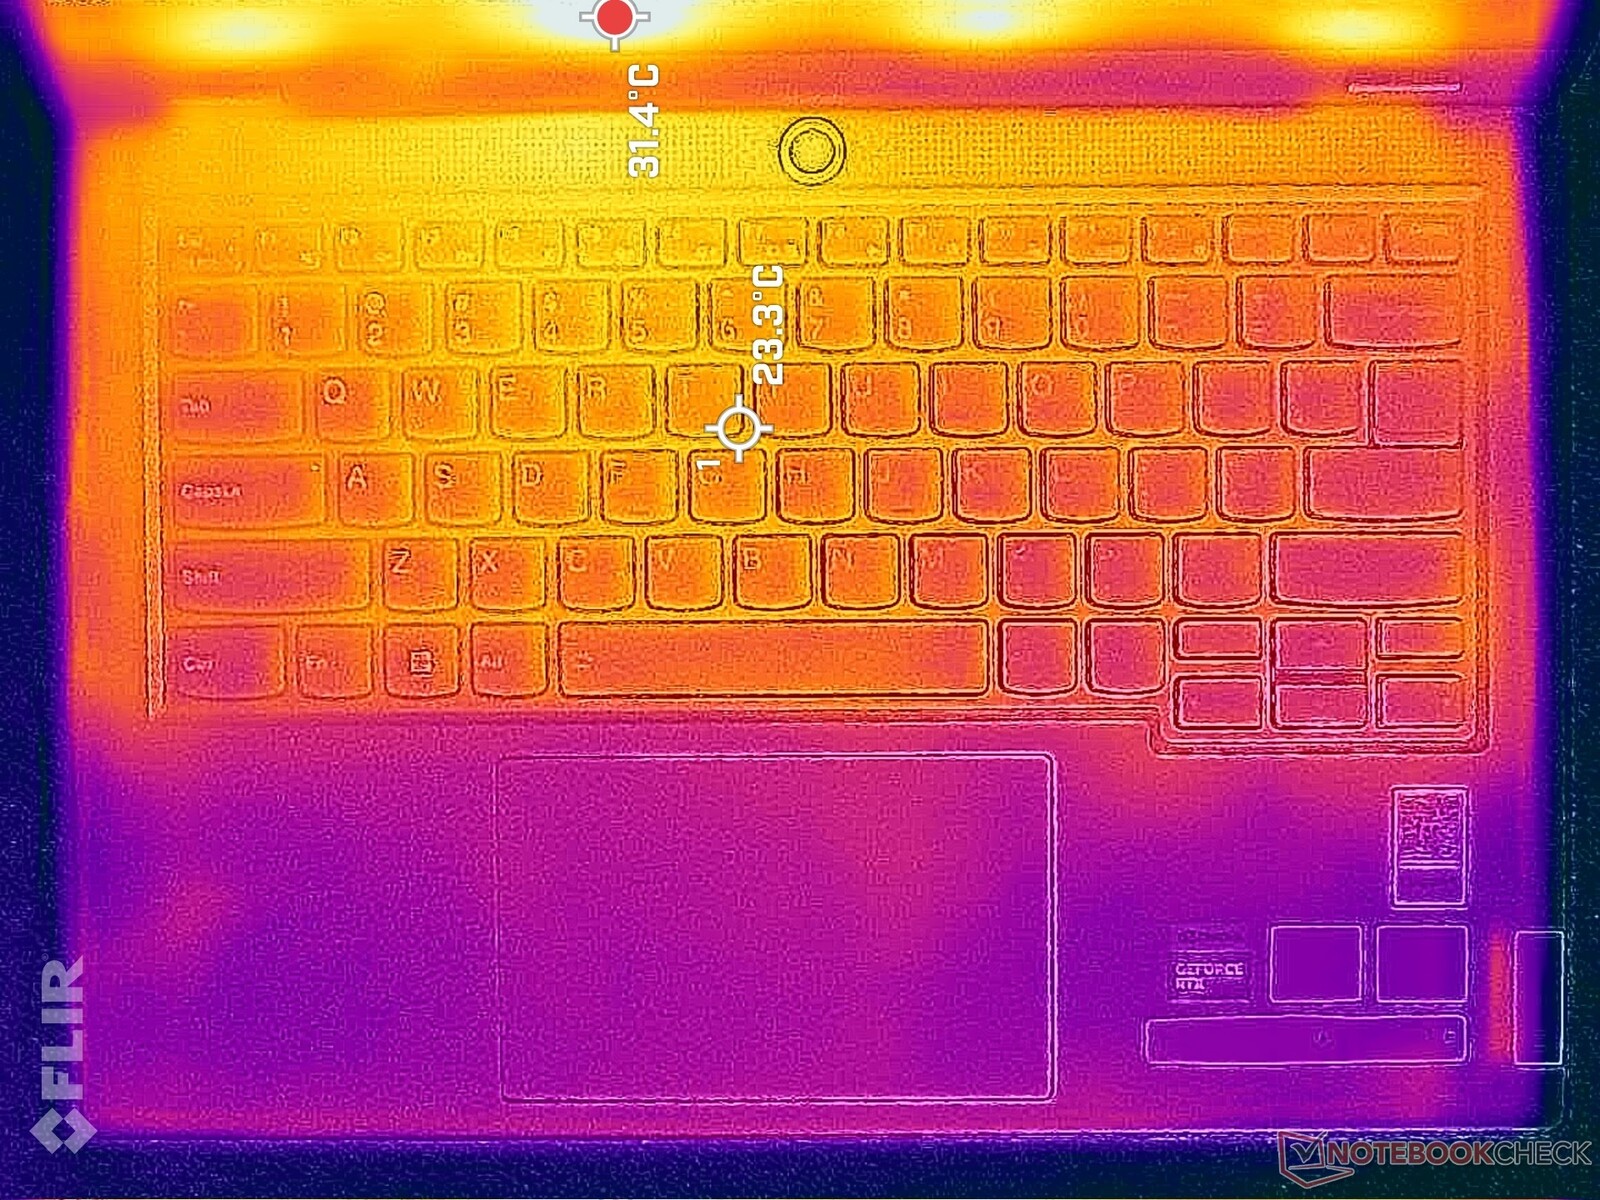
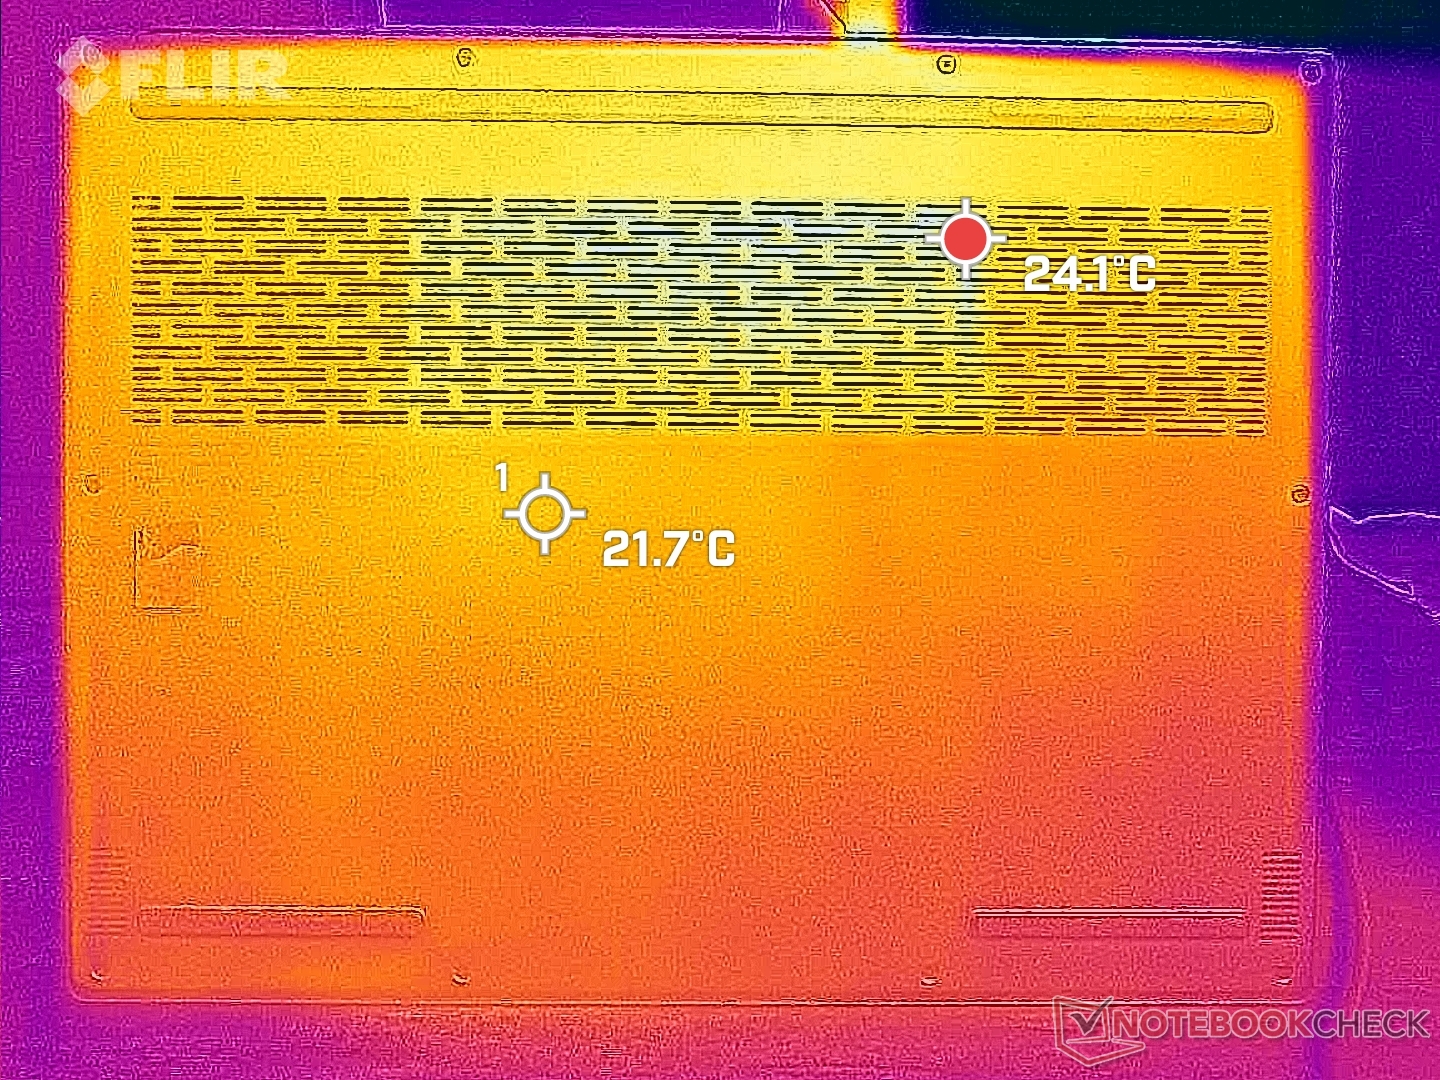
Le temperature di superficie sono più calde verso il centro e la parte posteriore della tastiera, dove possono raggiungere rispettivamente i 36 C e i 52 C, quando si eseguono carichi impegnativi come i giochi. Il sistema è leggermente più caldo del Blade 14 anche se il design Lenovo incorpora più griglie di ventilazione. I poggiapolsi e il clickpad rimangono più freschi e confortevoli al tatto.
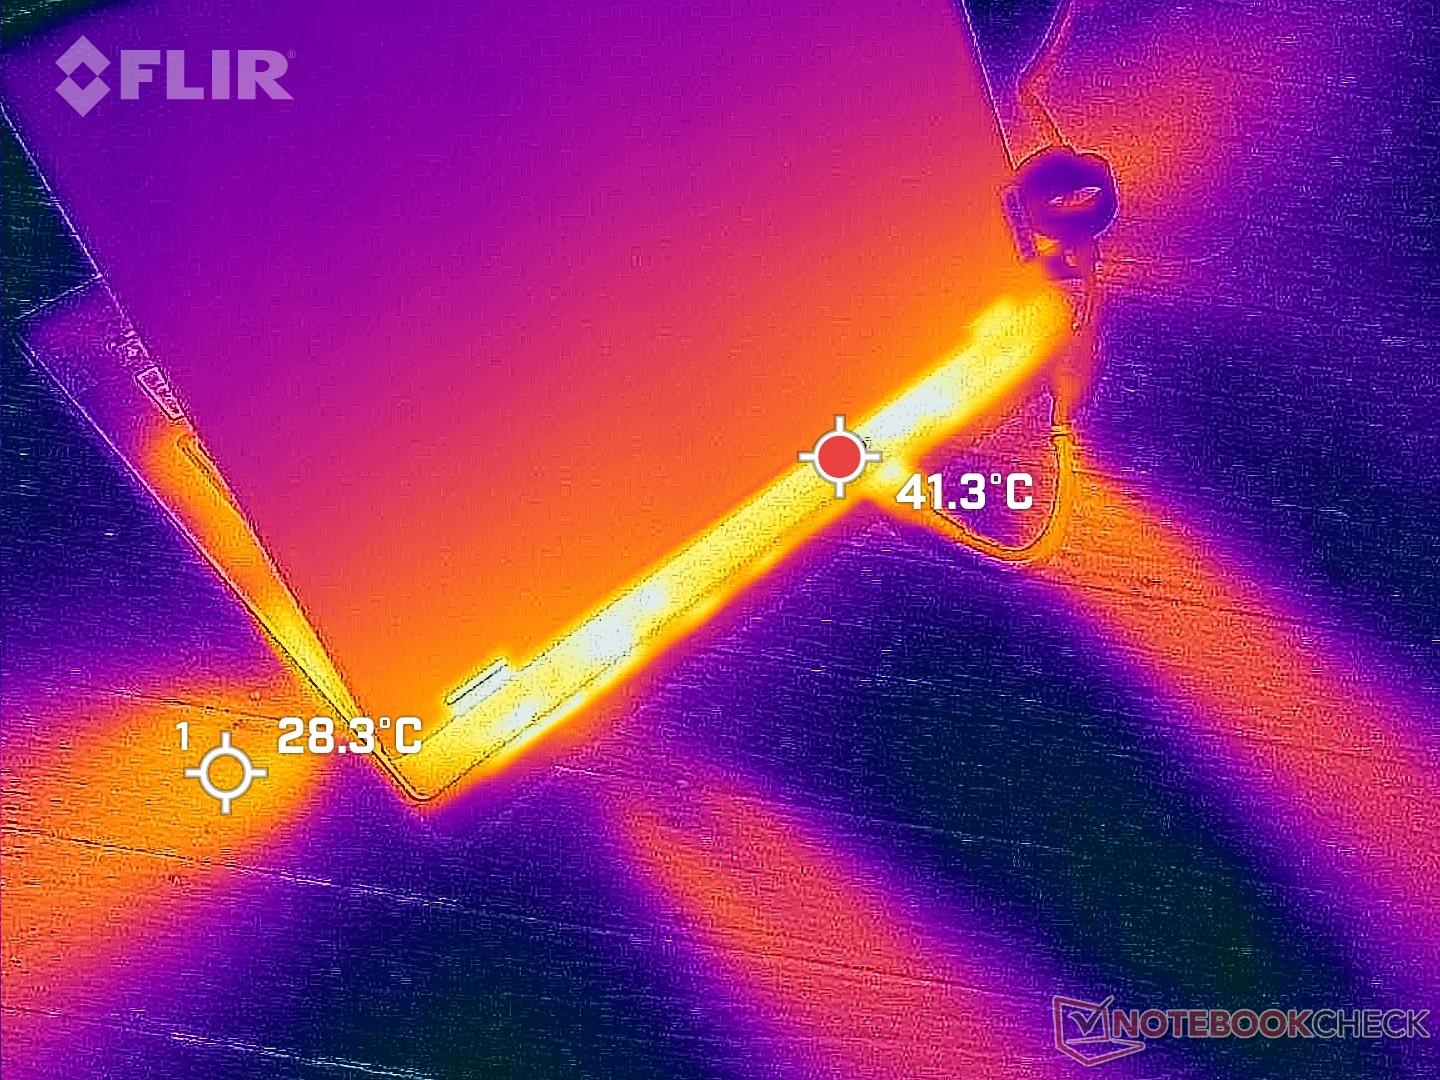
(±) La temperatura massima sul lato superiore è di 40.4 °C / 105 F, rispetto alla media di 40.4 °C / 105 F, che varia da 21.2 a 68.8 °C per questa classe Gaming.
(-) Il lato inferiore si riscalda fino ad un massimo di 49.4 °C / 121 F, rispetto alla media di 43.2 °C / 110 F
(+) In idle, la temperatura media del lato superiore è di 26.7 °C / 80 F, rispetto alla media deld ispositivo di 33.9 °C / 93 F.
(±) Riproducendo The Witcher 3, la temperatura media per il lato superiore e' di 34.8 °C / 95 F, rispetto alla media del dispositivo di 33.9 °C / 93 F.
(+) I poggiapolsi e il touchpad sono piu' freddi della temperatura della pelle con un massimo di 29.2 °C / 84.6 F e sono quindi freddi al tatto.
(±) La temperatura media della zona del palmo della mano di dispositivi simili e'stata di 28.8 °C / 83.8 F (-0.4 °C / -0.8 F).
| Lenovo Legion Slim 5 14APH8 AMD Ryzen 7 7840HS, NVIDIA GeForce RTX 4060 Laptop GPU | Acer Predator Triton 14 PT14-51 Intel Core i7-13700H, NVIDIA GeForce RTX 4050 Laptop GPU | Razer Blade 14 RTX 4070 AMD Ryzen 9 7940HS, NVIDIA GeForce RTX 4070 Laptop GPU | Asus ROG Zephyrus G14 GA402XY AMD Ryzen 9 7940HS, NVIDIA GeForce RTX 4090 Laptop GPU | Alienware x14 i7 RTX 3060 Intel Core i7-12700H, NVIDIA GeForce RTX 3060 Laptop GPU | Lenovo LOQ 15APH8 AMD Ryzen 7 7840HS, NVIDIA GeForce RTX 4050 Laptop GPU | |
|---|---|---|---|---|---|---|
| Heat | -15% | -1% | 1% | -1% | -3% | |
| Maximum Upper Side * (°C) | 40.4 | 54 -34% | 37.4 7% | 47 -16% | 51.3 -27% | 44.4 -10% |
| Maximum Bottom * (°C) | 49.4 | 56 -13% | 35.2 29% | 46.5 6% | 44.4 10% | 52 -5% |
| Idle Upper Side * (°C) | 28.2 | 31 -10% | 33.2 -18% | 25.9 8% | 27.2 4% | 28 1% |
| Idle Bottom * (°C) | 29.8 | 31 -4% | 36.2 -21% | 28 6% | 26.6 11% | 29.6 1% |
* ... Meglio usare valori piccoli
Stress test
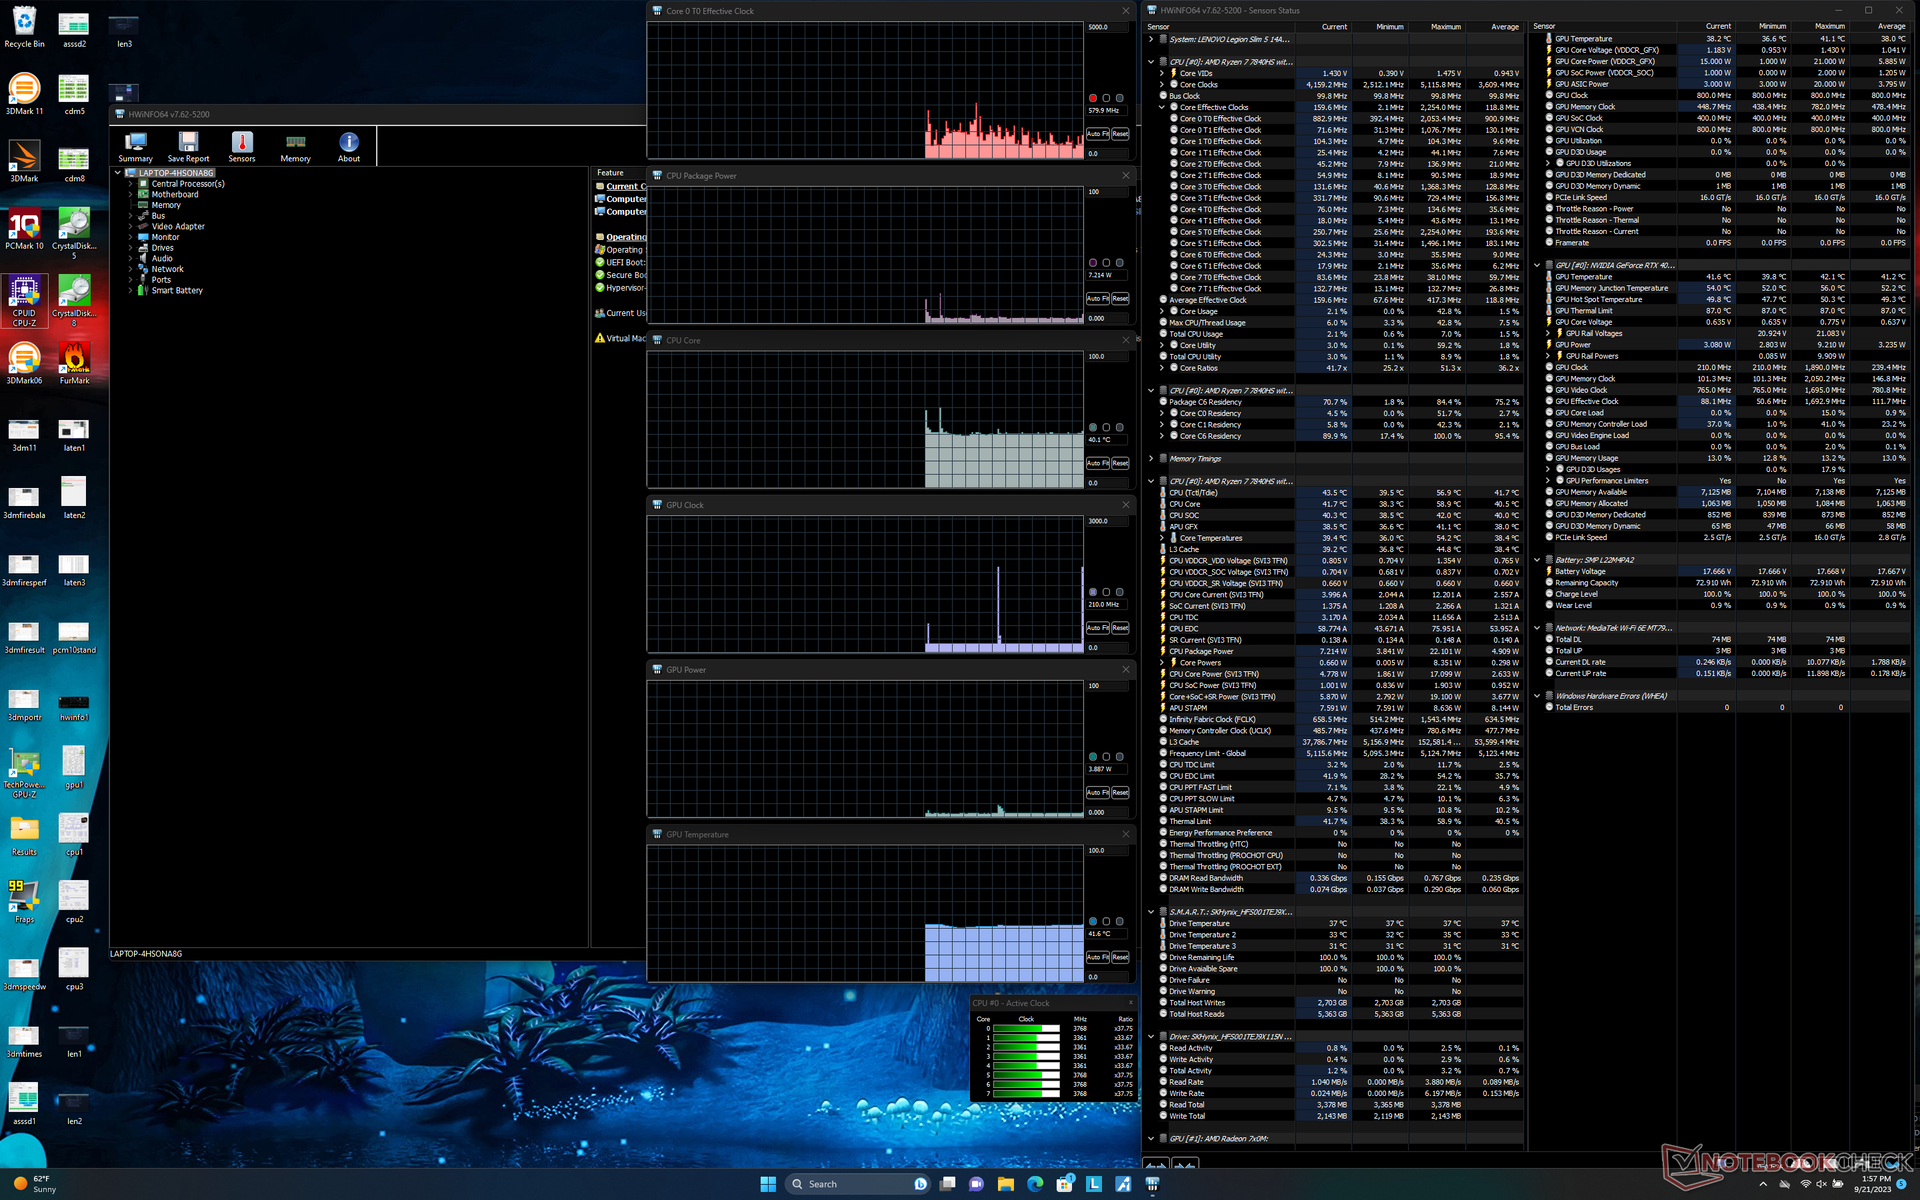
La CPU ha raggiunto un picco di 3,8 GHz e 92 W all'avvio dello stress Prime95 prima di scendere e stabilizzarsi a 4,6 GHz e 84 W pochi secondi dopo. La temperatura del core è risultata molto calda (100 C), il che suggerisce che il processore AMD sta spingendo al limite le capacità di raffreddamento del Legion Slim 5 14. Ripetendo questo test sul Blade 14 con una CPU simile di classe Zen 4 si otterrebbe una temperatura del core più bassa, pari a 90 C in confronto.
La GPU Nvidia si stabilizzerebbe a 2625 MHz, 78 C e 99 W di potenza assorbita dalla scheda quando è in esecuzione in modalità Performance Witcher 3 in modalità Performance, rispetto a soli 2160 MHz, 69 C e 69 W quando lo stesso gioco viene eseguito in modalità Balanced. La riduzione delle prestazioni è accompagnata da una riduzione del rumore della ventola, come già detto.
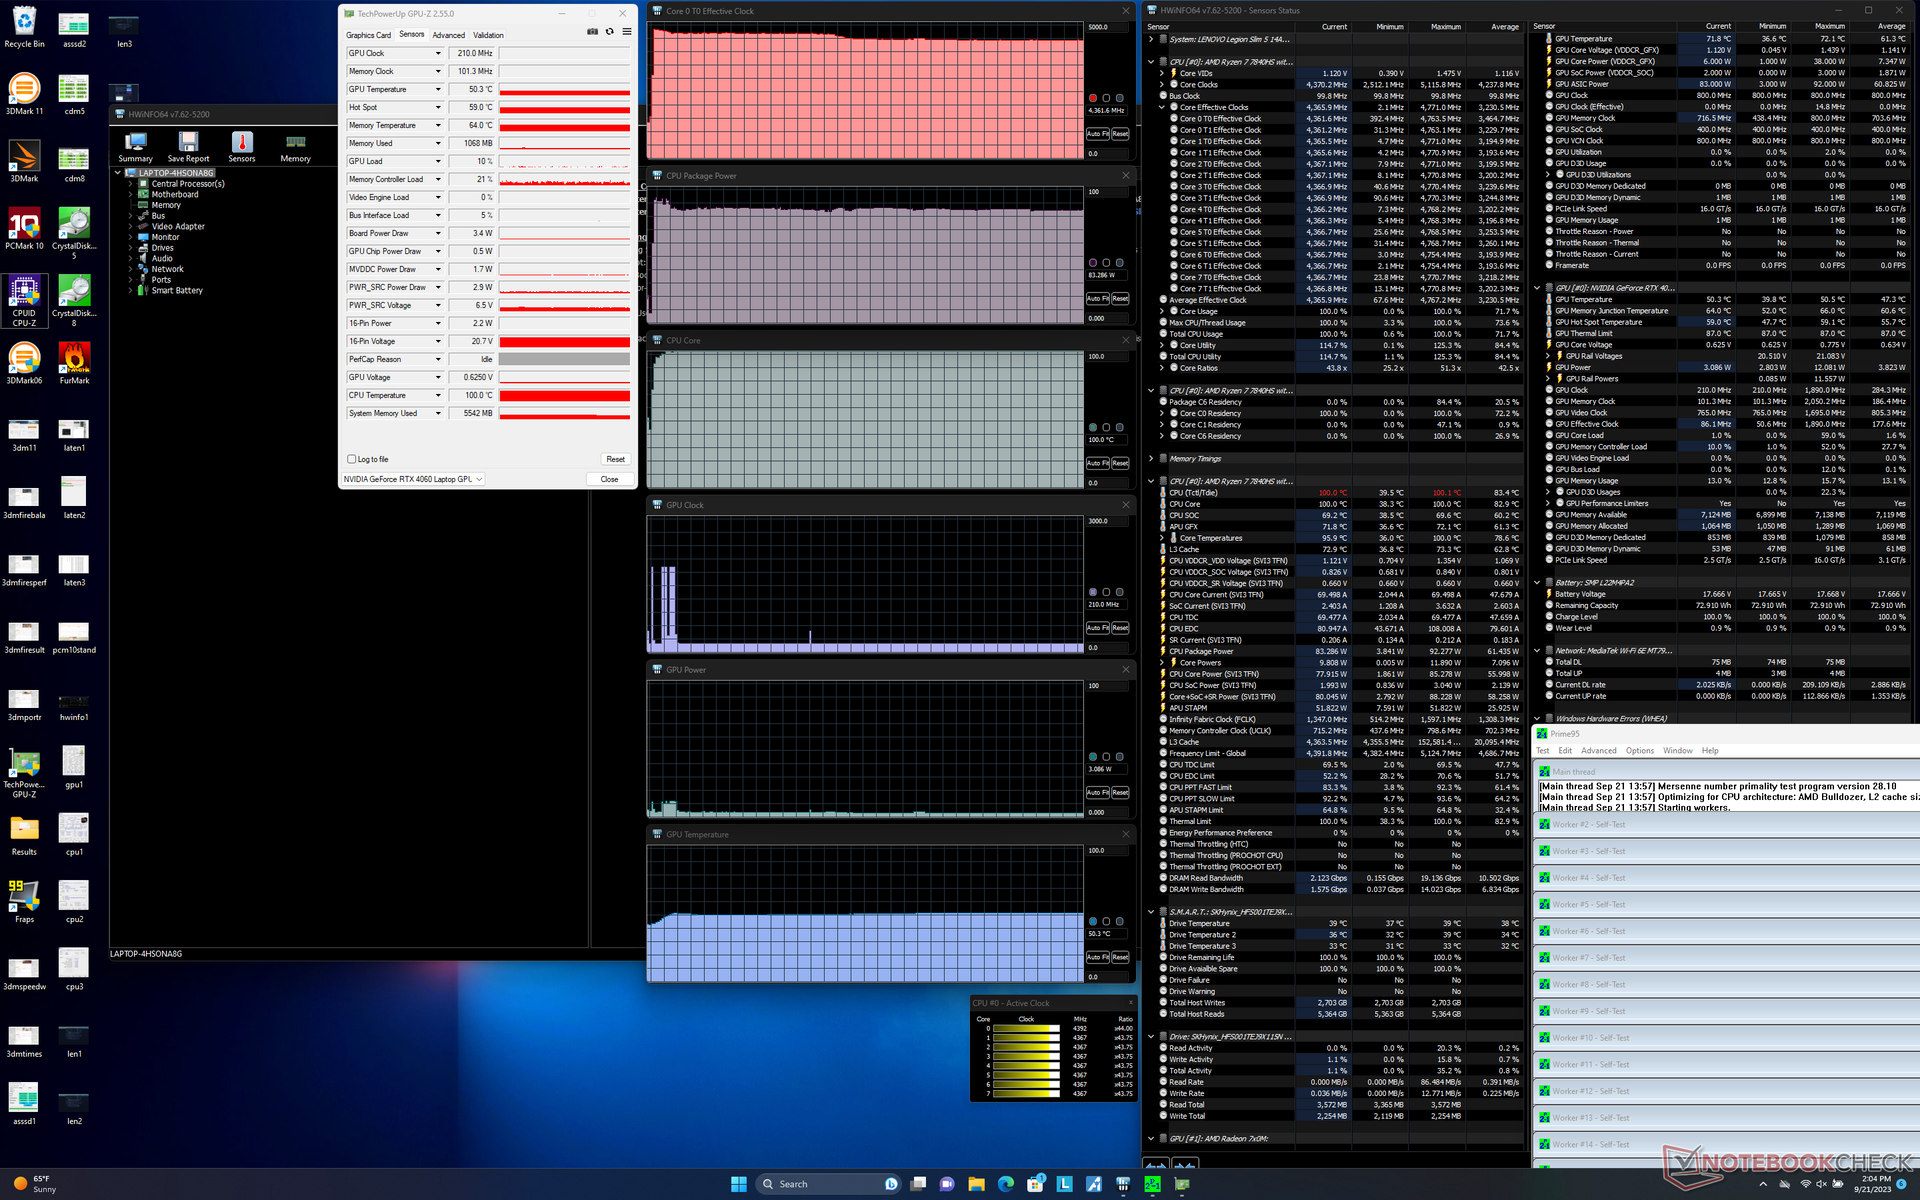
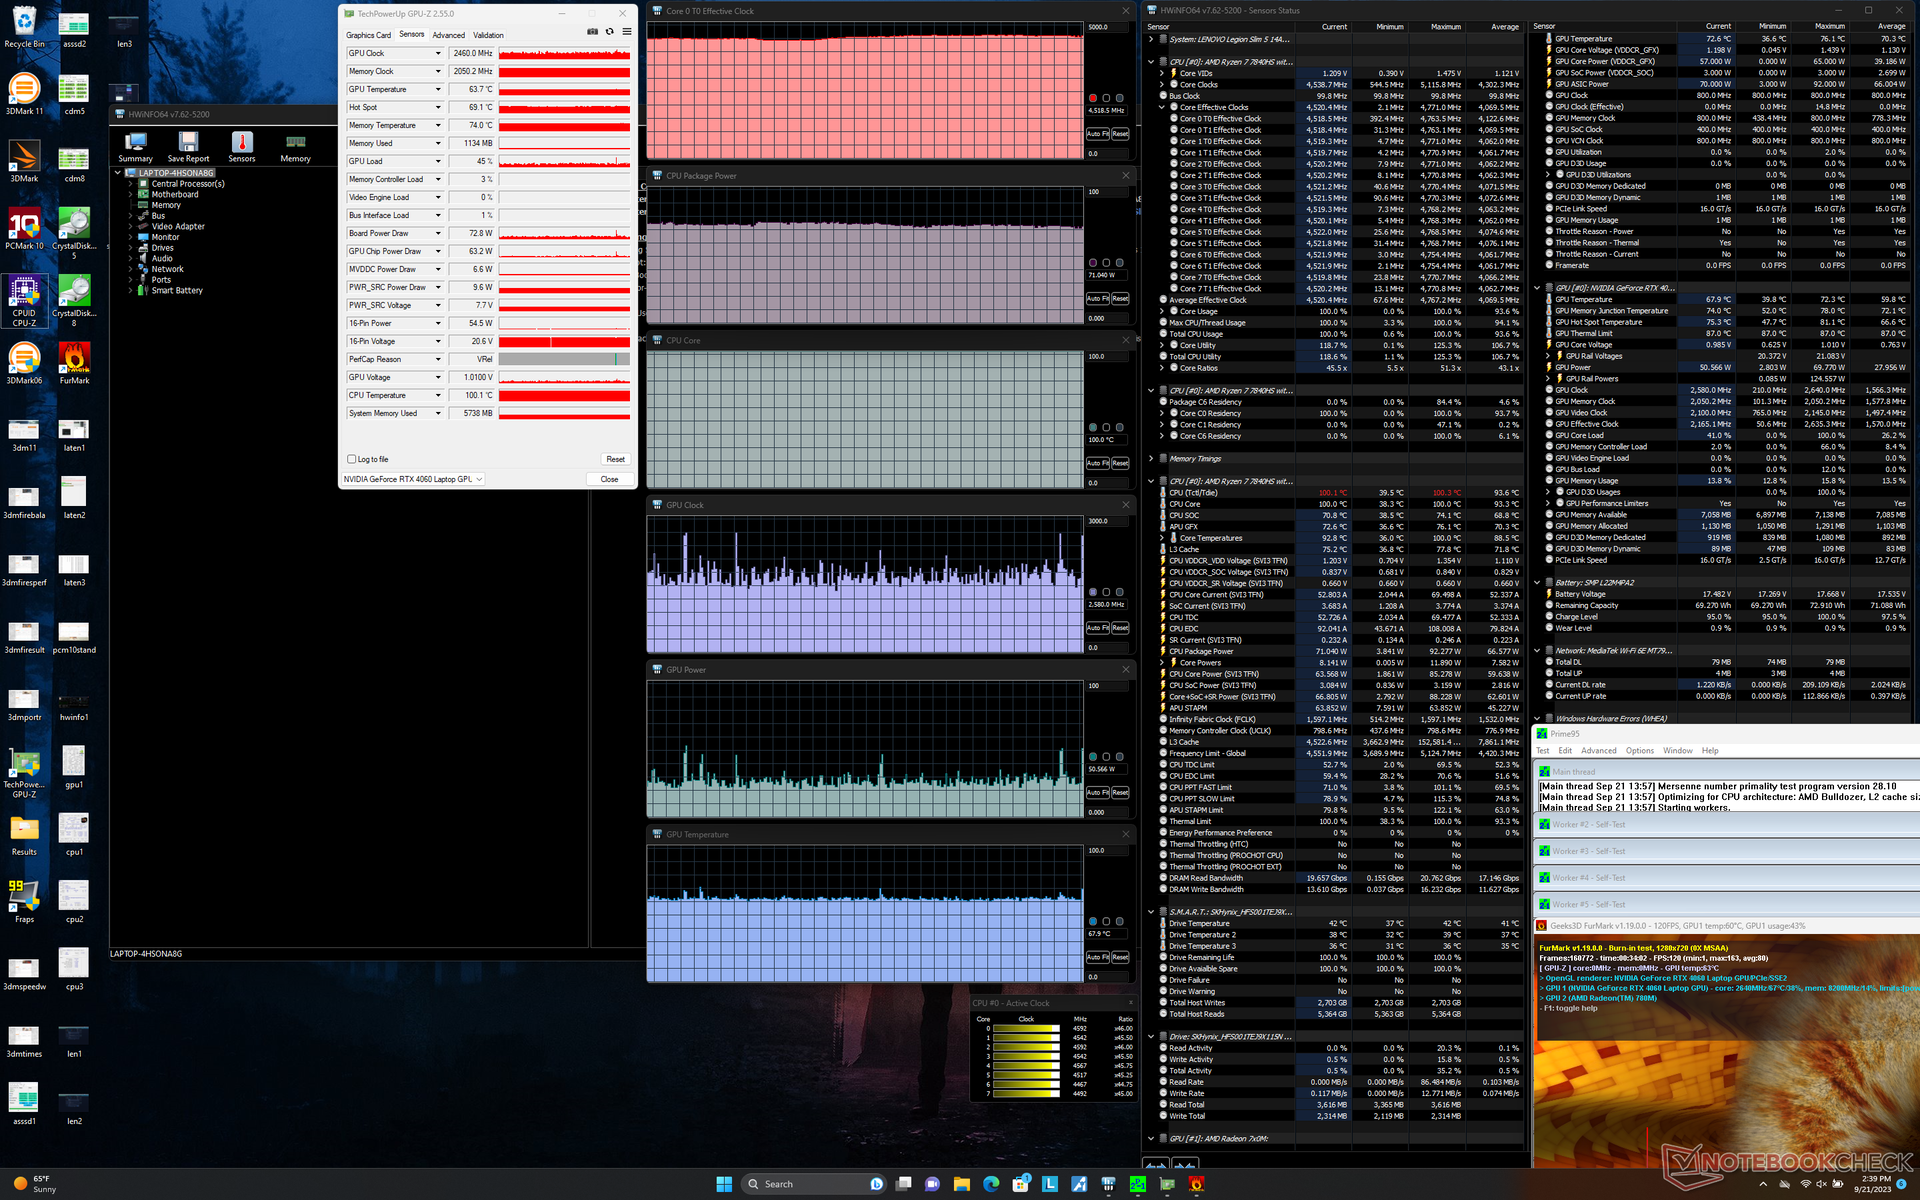
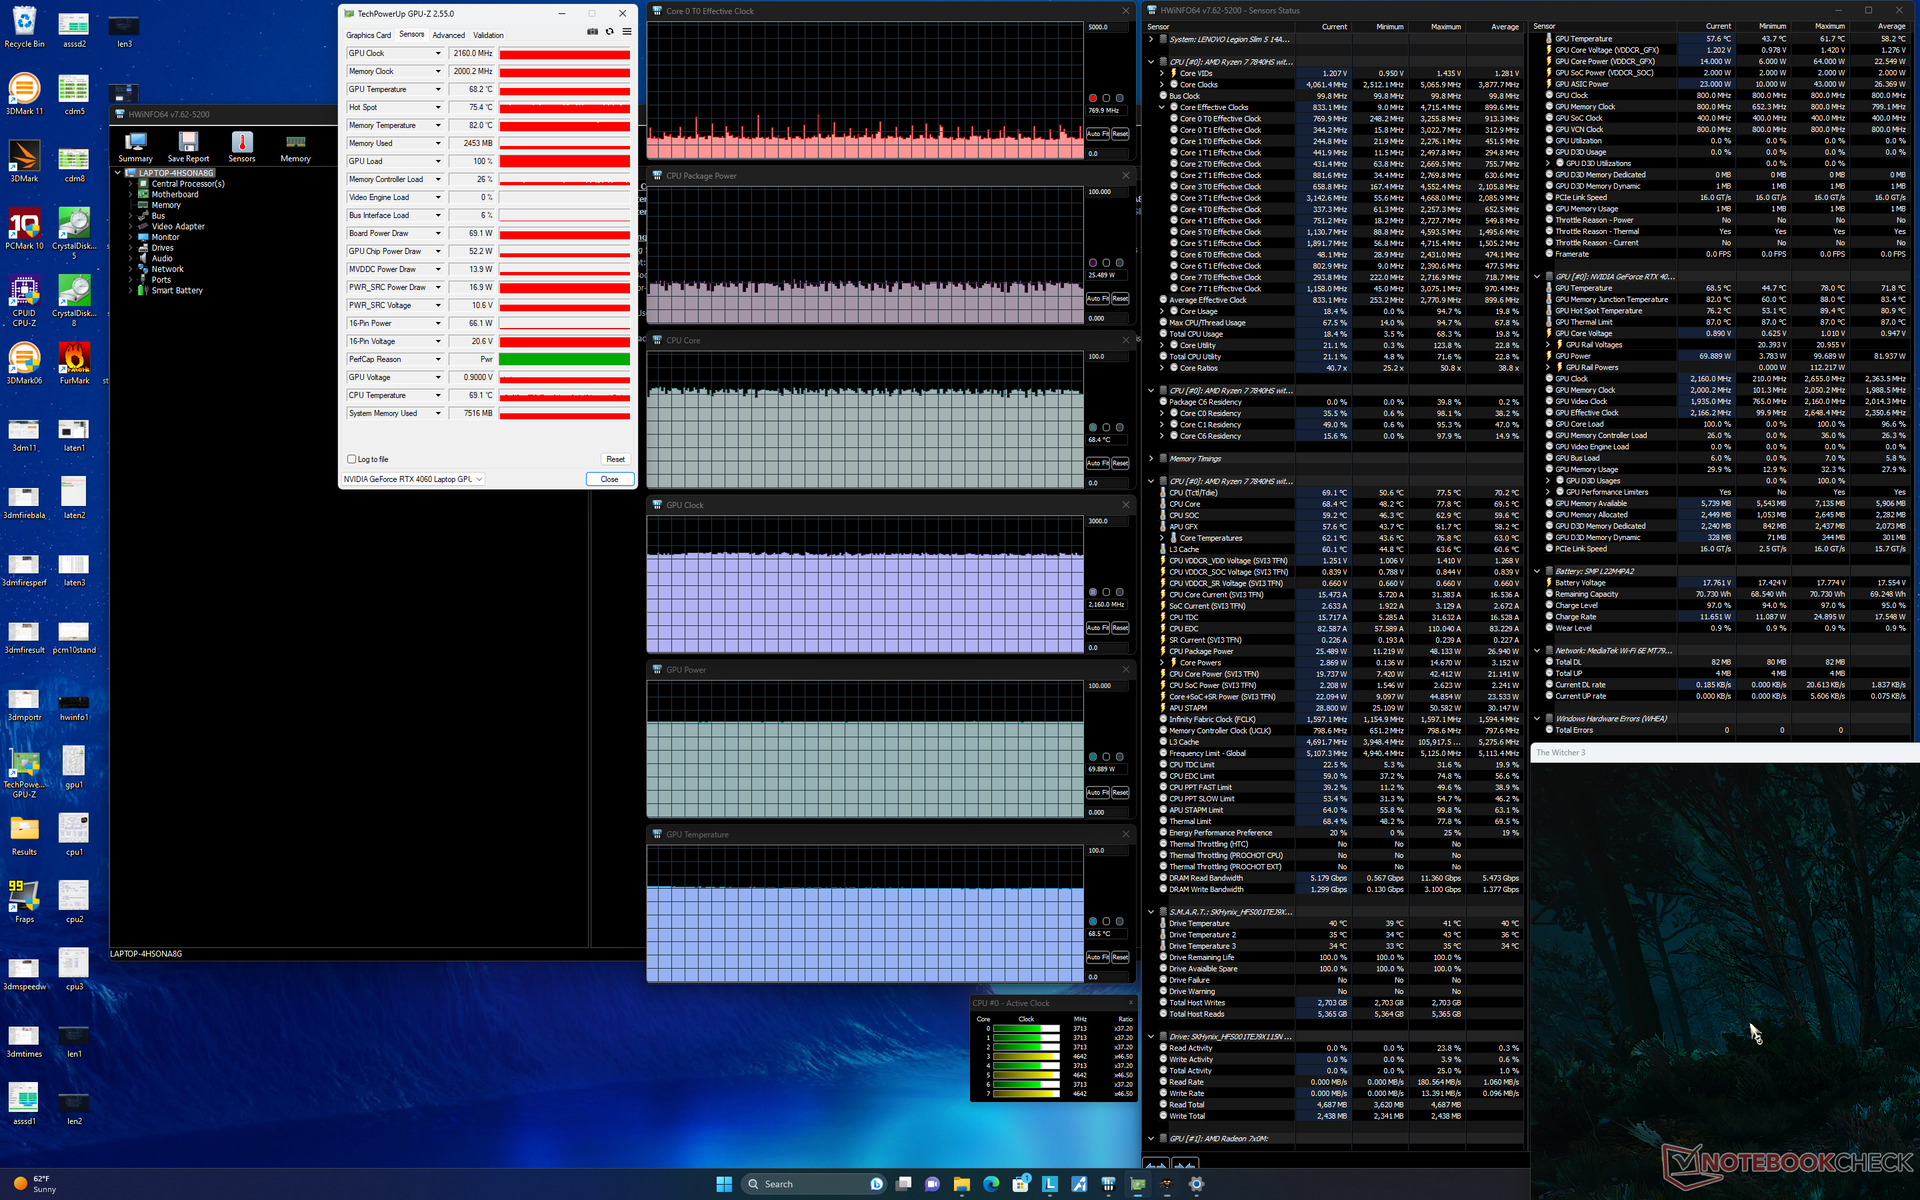
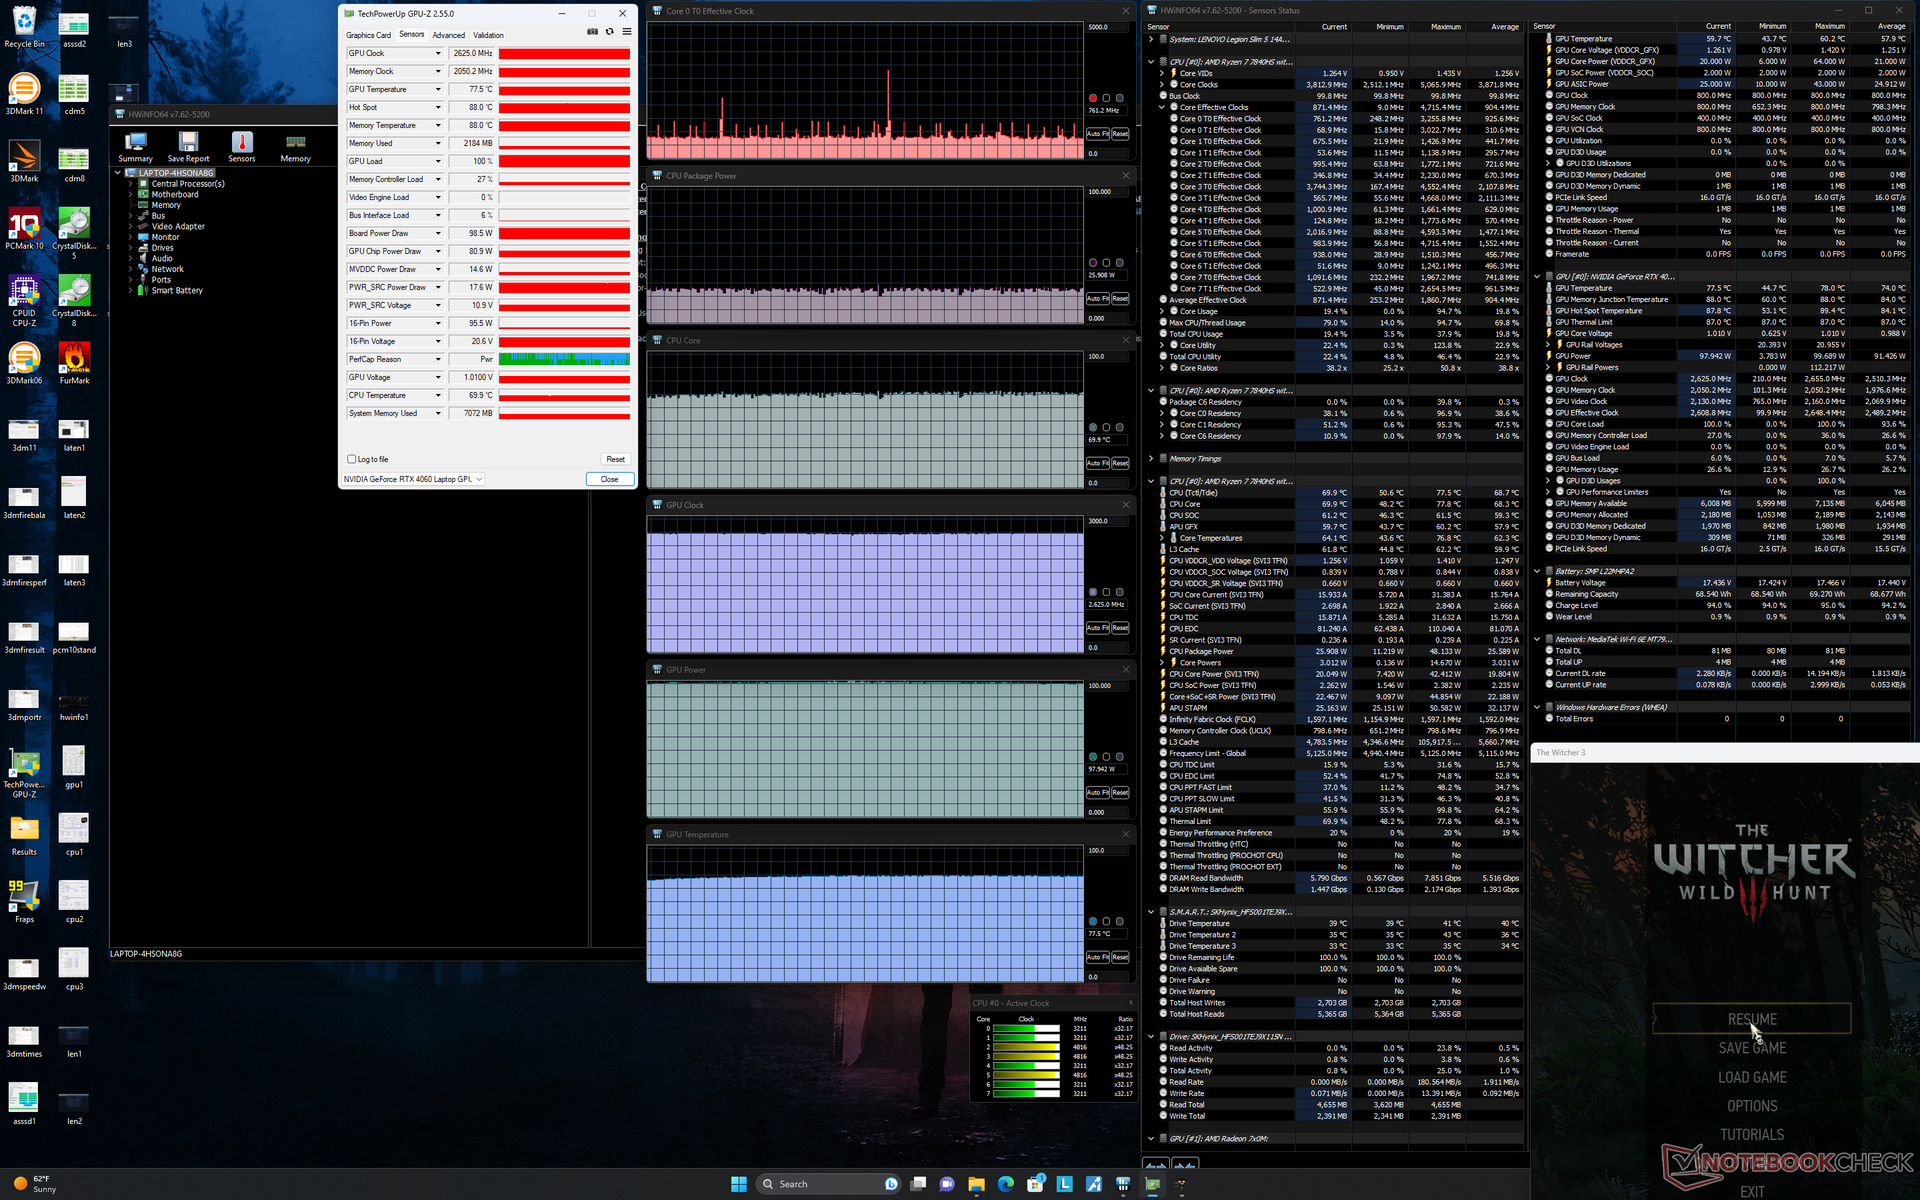
| Clock della CPU (GHz) | Clock della GPU (MHz) | Temperatura media della CPU (°C) | Temperatura media della GPU (°C) | |
| Sistema inattivo | ||||
| Stress Prime95 | 4,4 | -- | 100 | 50 |
| Prime95 + FurMark Stress | 4,5 | ~2460 | 100 | 68 |
| Witcher 3 Stress (modalità bilanciata) | ~0,8 | 2160 | 69 | 69 |
| Witcher 3 Stress (modalità Performance) | ~0,8 | 2625 | 70 | 78 |
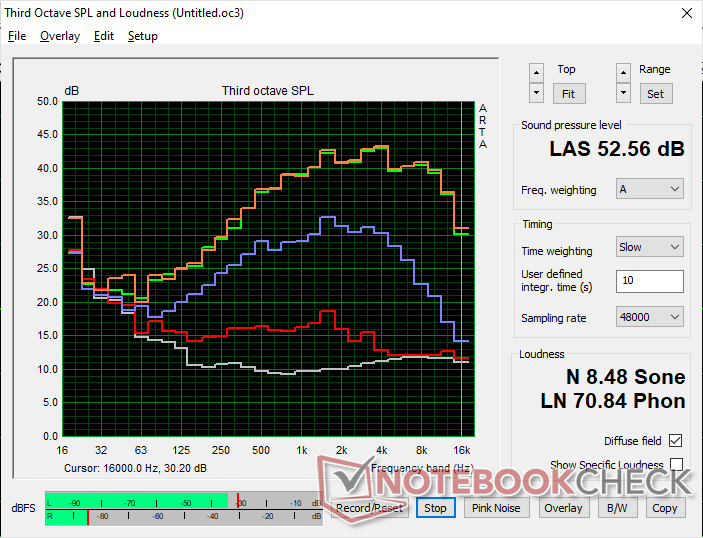
Altoparlanti
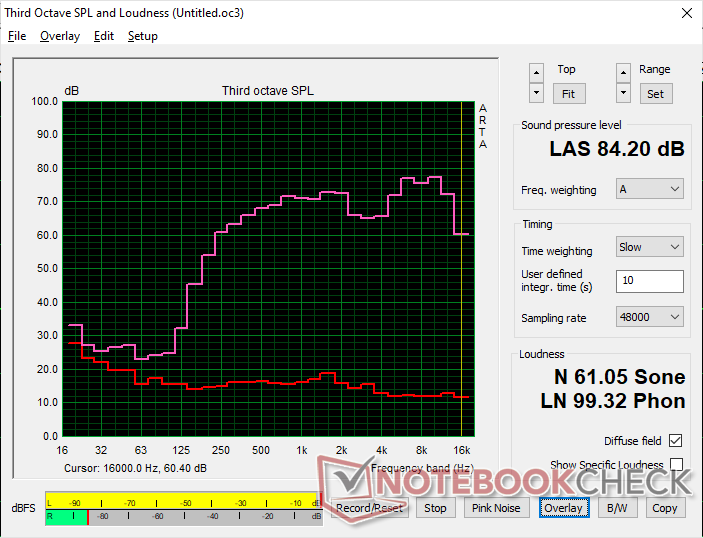
Lenovo Legion Slim 5 14APH8 analisi audio
(+) | gli altoparlanti sono relativamente potenti (84.2 dB)
Bassi 100 - 315 Hz
(-) | quasi nessun basso - in media 21.4% inferiori alla media
(±) | la linearità dei bassi è media (12.4% delta rispetto alla precedente frequenza)
Medi 400 - 2000 Hz
(+) | medi bilanciati - solo only 2.7% rispetto alla media
(+) | medi lineari (2.9% delta rispetto alla precedente frequenza)
Alti 2 - 16 kHz
(±) | alti elevati - circa 5.3% superiori alla media
(+) | alti lineari (6.1% delta rispetto alla precedente frequenza)
Nel complesso 100 - 16.000 Hz
(±) | la linearità complessiva del suono è media (16.9% di differenza rispetto alla media
Rispetto alla stessa classe
» 44% di tutti i dispositivi testati in questa classe è stato migliore, 11% simile, 45% peggiore
» Il migliore ha avuto un delta di 6%, medio di 18%, peggiore di 132%
Rispetto a tutti i dispositivi testati
» 30% di tutti i dispositivi testati in questa classe è stato migliore, 8% similare, 62% peggiore
» Il migliore ha avuto un delta di 4%, medio di 23%, peggiore di 134%
Apple MacBook Pro 16 2021 M1 Pro analisi audio
(+) | gli altoparlanti sono relativamente potenti (84.7 dB)
Bassi 100 - 315 Hz
(+) | bassi buoni - solo 3.8% dalla media
(+) | bassi in lineaa (5.2% delta rispetto alla precedente frequenza)
Medi 400 - 2000 Hz
(+) | medi bilanciati - solo only 1.3% rispetto alla media
(+) | medi lineari (2.1% delta rispetto alla precedente frequenza)
Alti 2 - 16 kHz
(+) | Alti bilanciati - appena 1.9% dalla media
(+) | alti lineari (2.7% delta rispetto alla precedente frequenza)
Nel complesso 100 - 16.000 Hz
(+) | suono nel complesso lineare (4.6% differenza dalla media)
Rispetto alla stessa classe
» 0% di tutti i dispositivi testati in questa classe è stato migliore, 0% simile, 100% peggiore
» Il migliore ha avuto un delta di 5%, medio di 17%, peggiore di 45%
Rispetto a tutti i dispositivi testati
» 0% di tutti i dispositivi testati in questa classe è stato migliore, 0% similare, 100% peggiore
» Il migliore ha avuto un delta di 4%, medio di 23%, peggiore di 134%
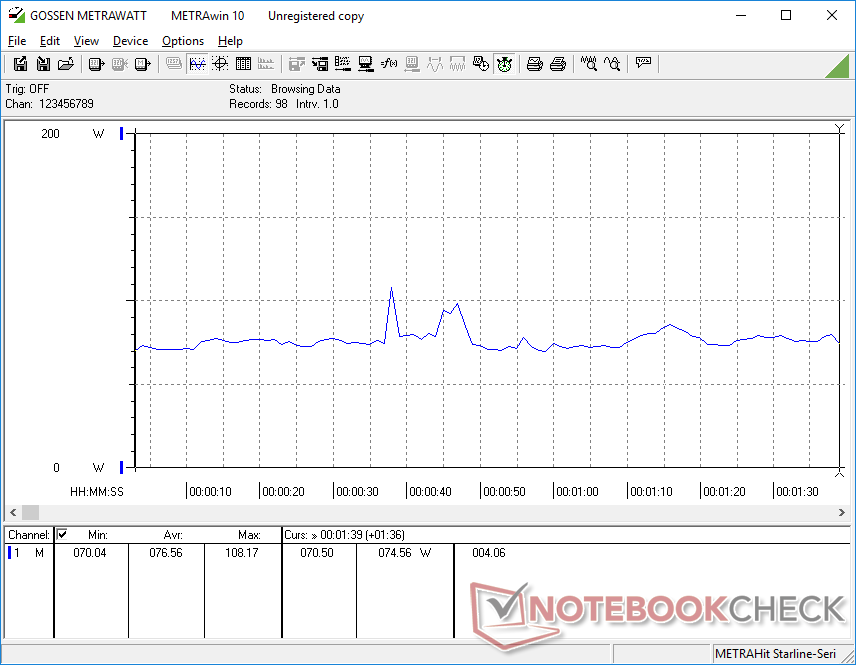
Gestione dell'energia - Elevate prestazioni per watt
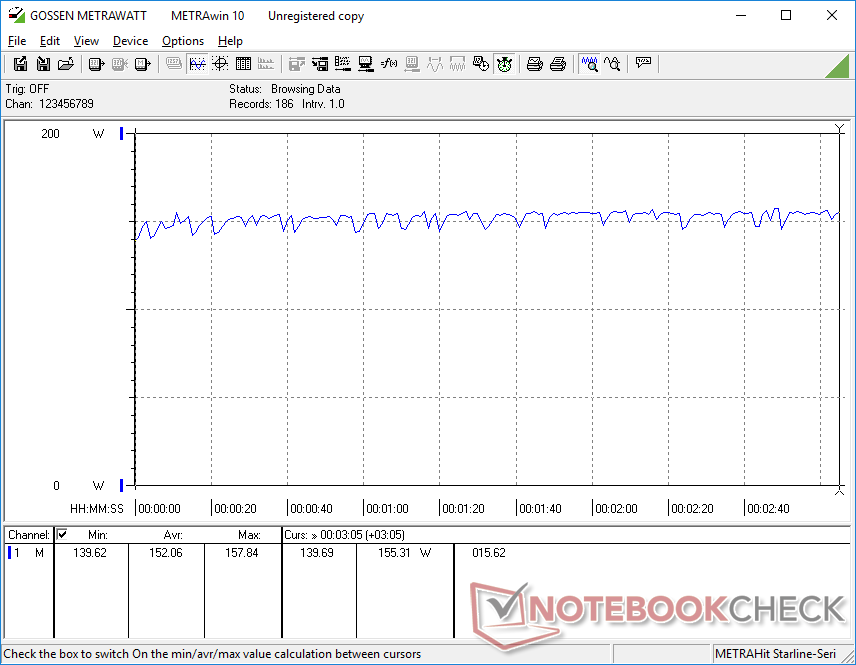
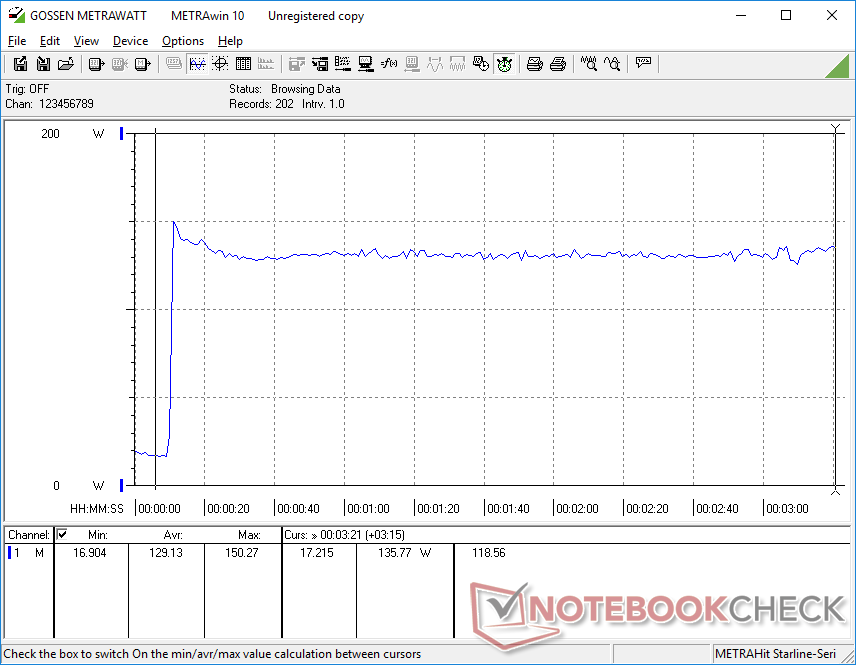
Consumo di energia
Il nostro Legion Slim 5 14 consuma leggermente meno rispetto al Blade 14, dotato di una CPU Ryzen 9 più veloce e di una GPU RTX 4070. Le prestazioni per watt rimangono eccellenti, soprattutto se confrontate con i portatili da gioco con processore Intel e la stessa GPU RTX 4060, come il modelloLegion Pro 5 16 che richiede una potenza nettamente superiore nonostante le prestazioni siano leggermente più veloci.
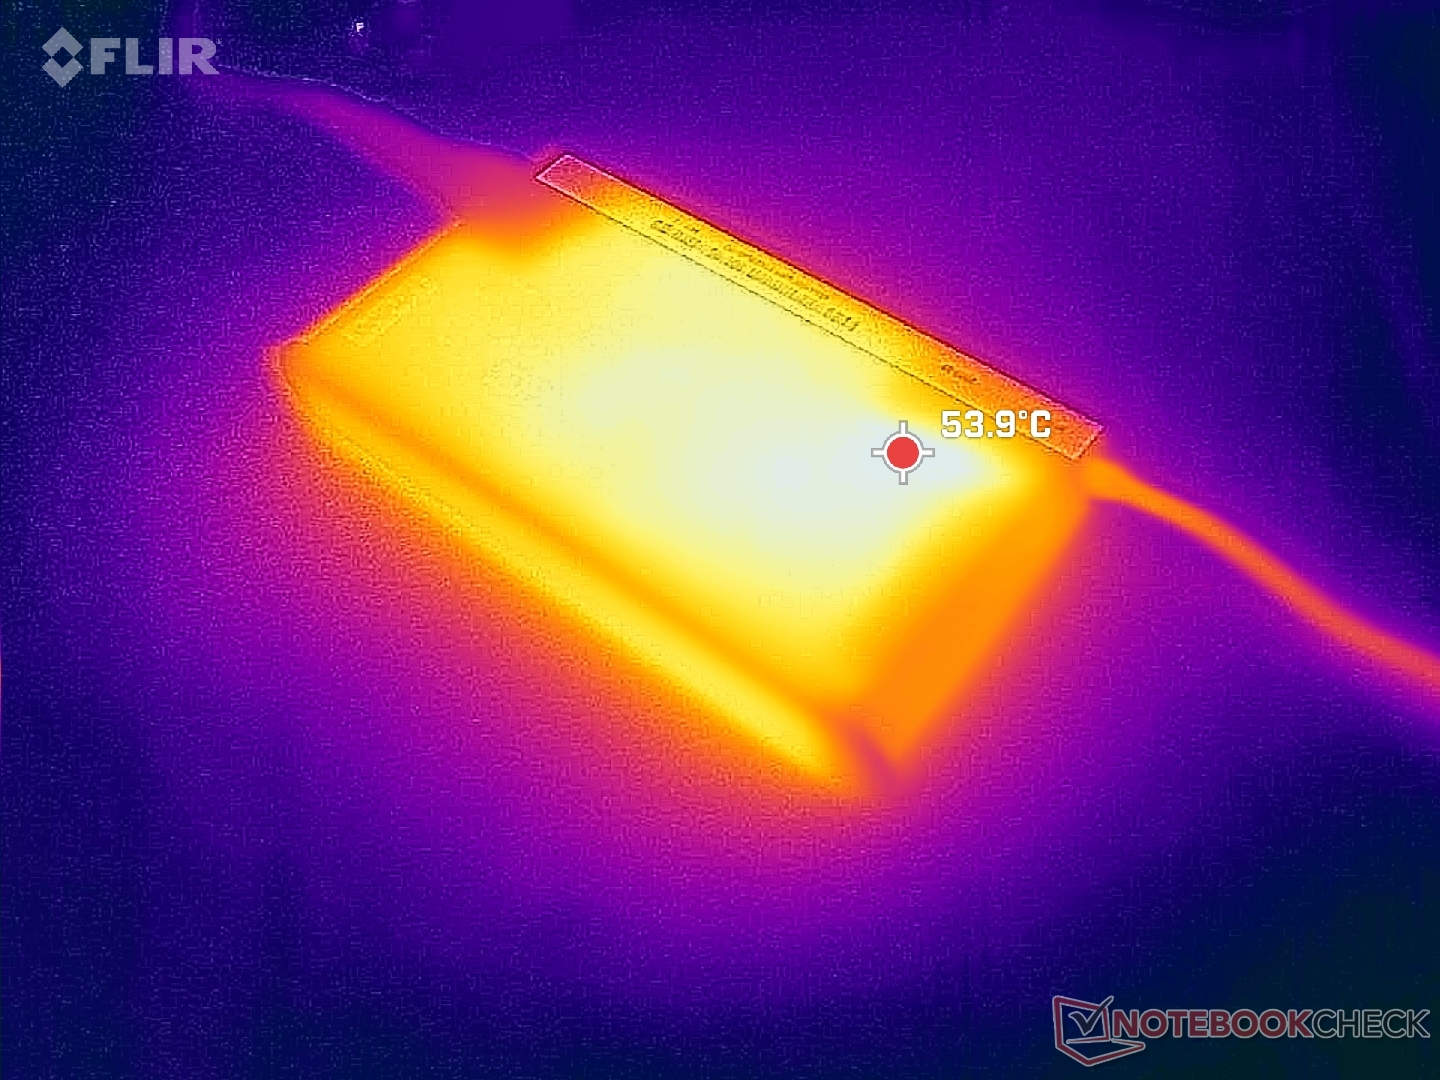
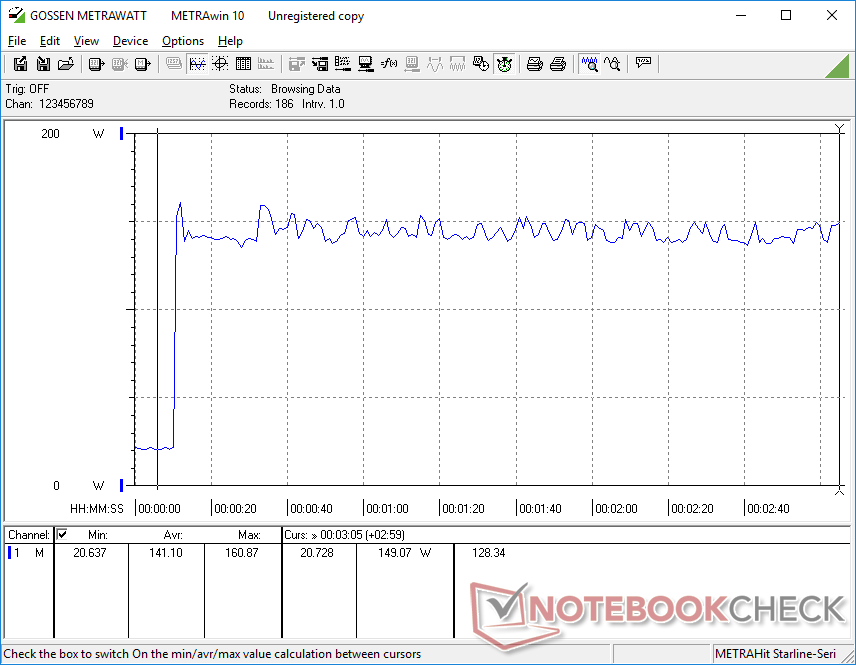
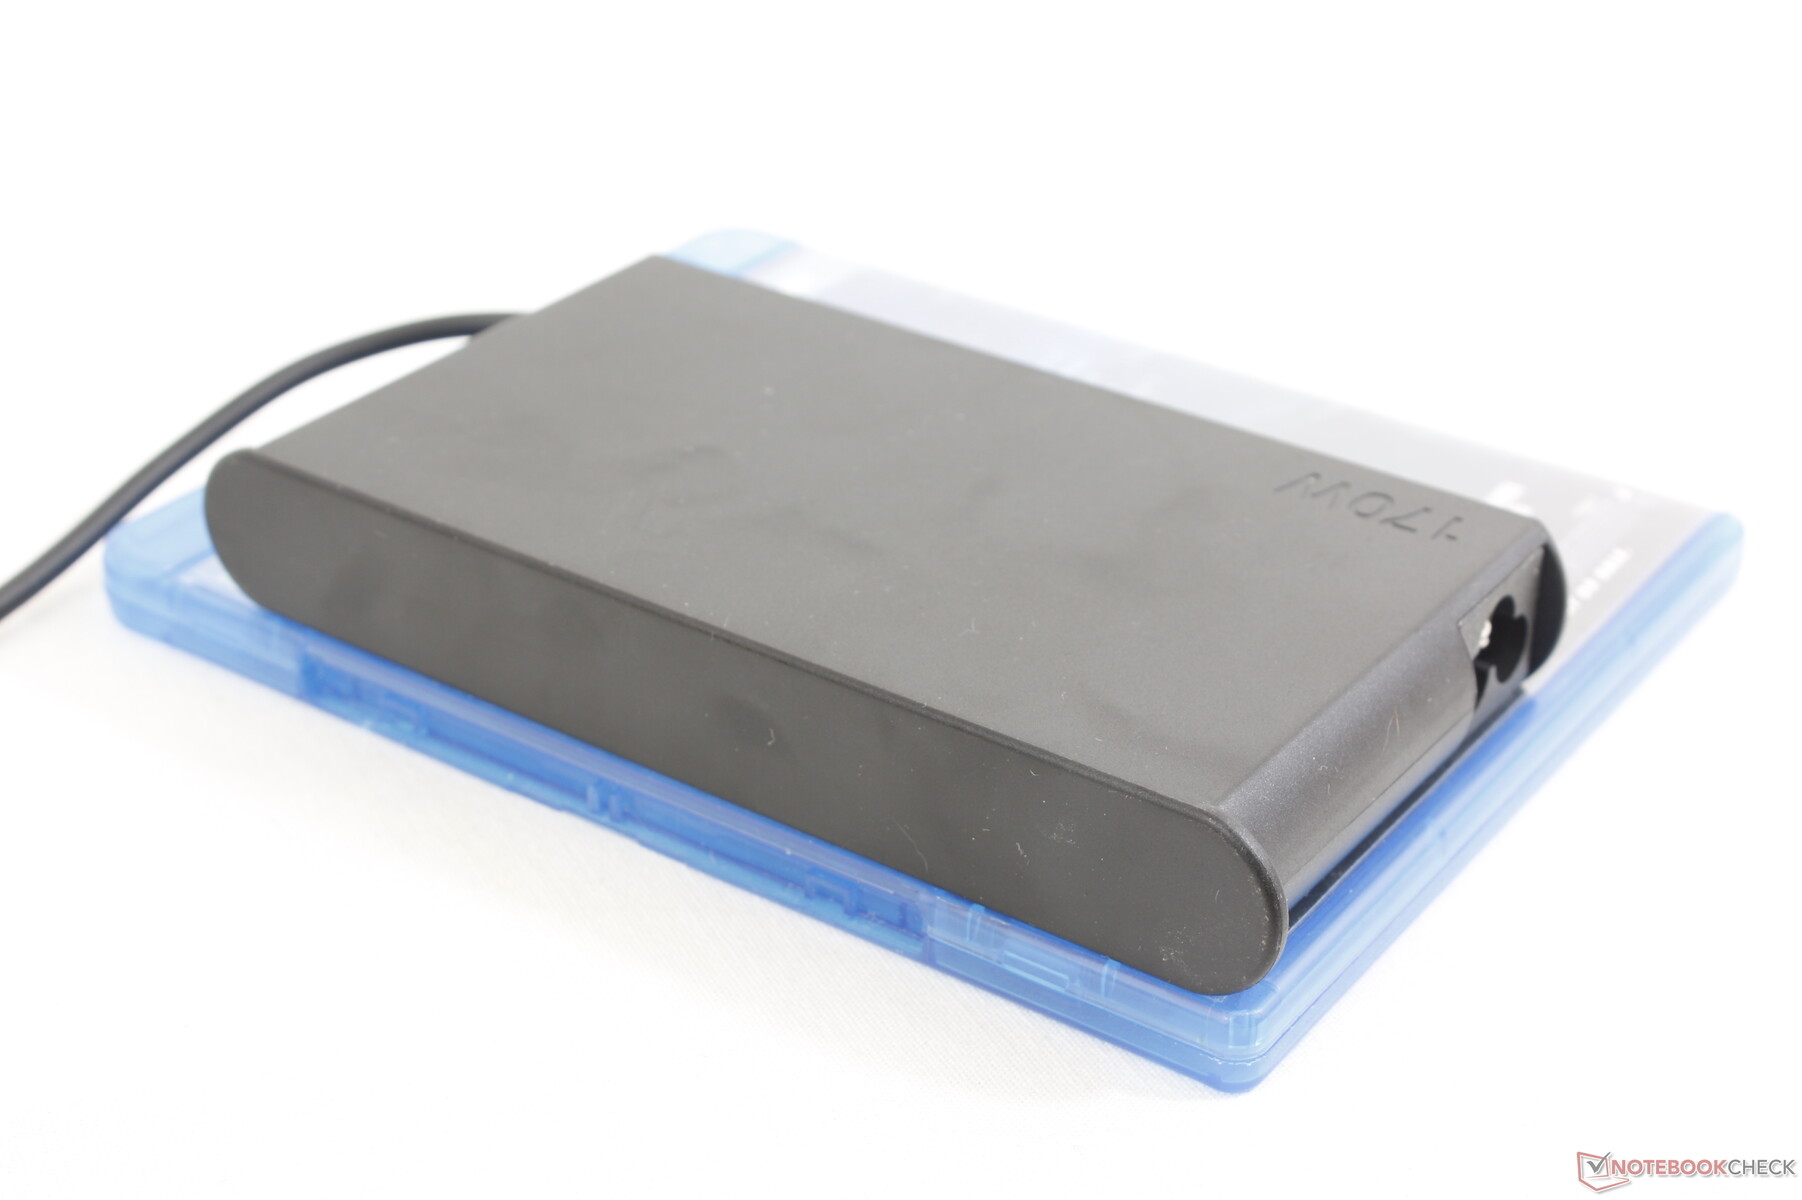
Siamo riusciti a registrare un assorbimento massimo di 161 W dall'adattatore CA di medie dimensioni (17 x 7,6 x 2,1 cm) da 170 W. I concorrenti Blade 14 e Zephyrus G14 sono dotati di adattatori CA da 230 W e 240 W, rispettivamente più grandi e più capaci. Il modello Lenovo si carica più lentamente se si eseguono contemporaneamente carichi impegnativi.
| Off / Standby | |
| Idle | |
| Sotto carico |
|
Leggenda:
min: | |
| Lenovo Legion Slim 5 14APH8 R7 7840HS, GeForce RTX 4060 Laptop GPU, SK Hynix HFS001TEJ9X115N, OLED, 2880x1600, 14.5" | Acer Predator Triton 14 PT14-51 i7-13700H, GeForce RTX 4050 Laptop GPU, Micron 3400 MTFDKBA512TFH 512GB, IPS, 2560x1600, 14" | Razer Blade 14 RTX 4070 R9 7940HS, GeForce RTX 4070 Laptop GPU, Samsung PM9A1 MZVL21T0HCLR, IPS, 2560x1600, 14" | Asus ROG Zephyrus G14 GA402XY R9 7940HS, GeForce RTX 4090 Laptop GPU, Samsung PM9A1 MZVL21T0HCLR, Mini-LED, 2560x1600, 14" | Alienware x14 i7 RTX 3060 i7-12700H, GeForce RTX 3060 Laptop GPU, WDC PC SN810 1TB, IPS, 1920x1080, 14" | Lenovo LOQ 15APH8 R7 7840HS, GeForce RTX 4050 Laptop GPU, Micron 2450 512GB MTFDKCD512TFK, IPS, 1920x1080, 15.6" | |
|---|---|---|---|---|---|---|
| Power Consumption | -31% | -71% | -19% | 1% | -35% | |
| Idle Minimum * (Watt) | 7.3 | 12 -64% | 19.5 -167% | 9.4 -29% | 7.9 -8% | 15 -105% |
| Idle Average * (Watt) | 9.6 | 14 -46% | 24.7 -157% | 14.2 -48% | 11.1 -16% | 17.7 -84% |
| Idle Maximum * (Watt) | 17.3 | 26 -50% | 27 -56% | 14.5 16% | 11.8 32% | 21.5 -24% |
| Load Average * (Watt) | 76.6 | 88 -15% | 83.2 -9% | 79 -3% | 107.4 -40% | 73.5 4% |
| Witcher 3 ultra * (Watt) | 152 | 114.9 24% | 165.8 -9% | 172 -13% | 111 27% | 138.6 9% |
| Load Maximum * (Watt) | 160.9 | 213 -32% | 204.5 -27% | 220.8 -37% | 140.4 13% | 176.5 -10% |
* ... Meglio usare valori piccoli
Power Consumption Witcher 3 / Stresstest
Power Consumption external Monitor
Durata della batteria
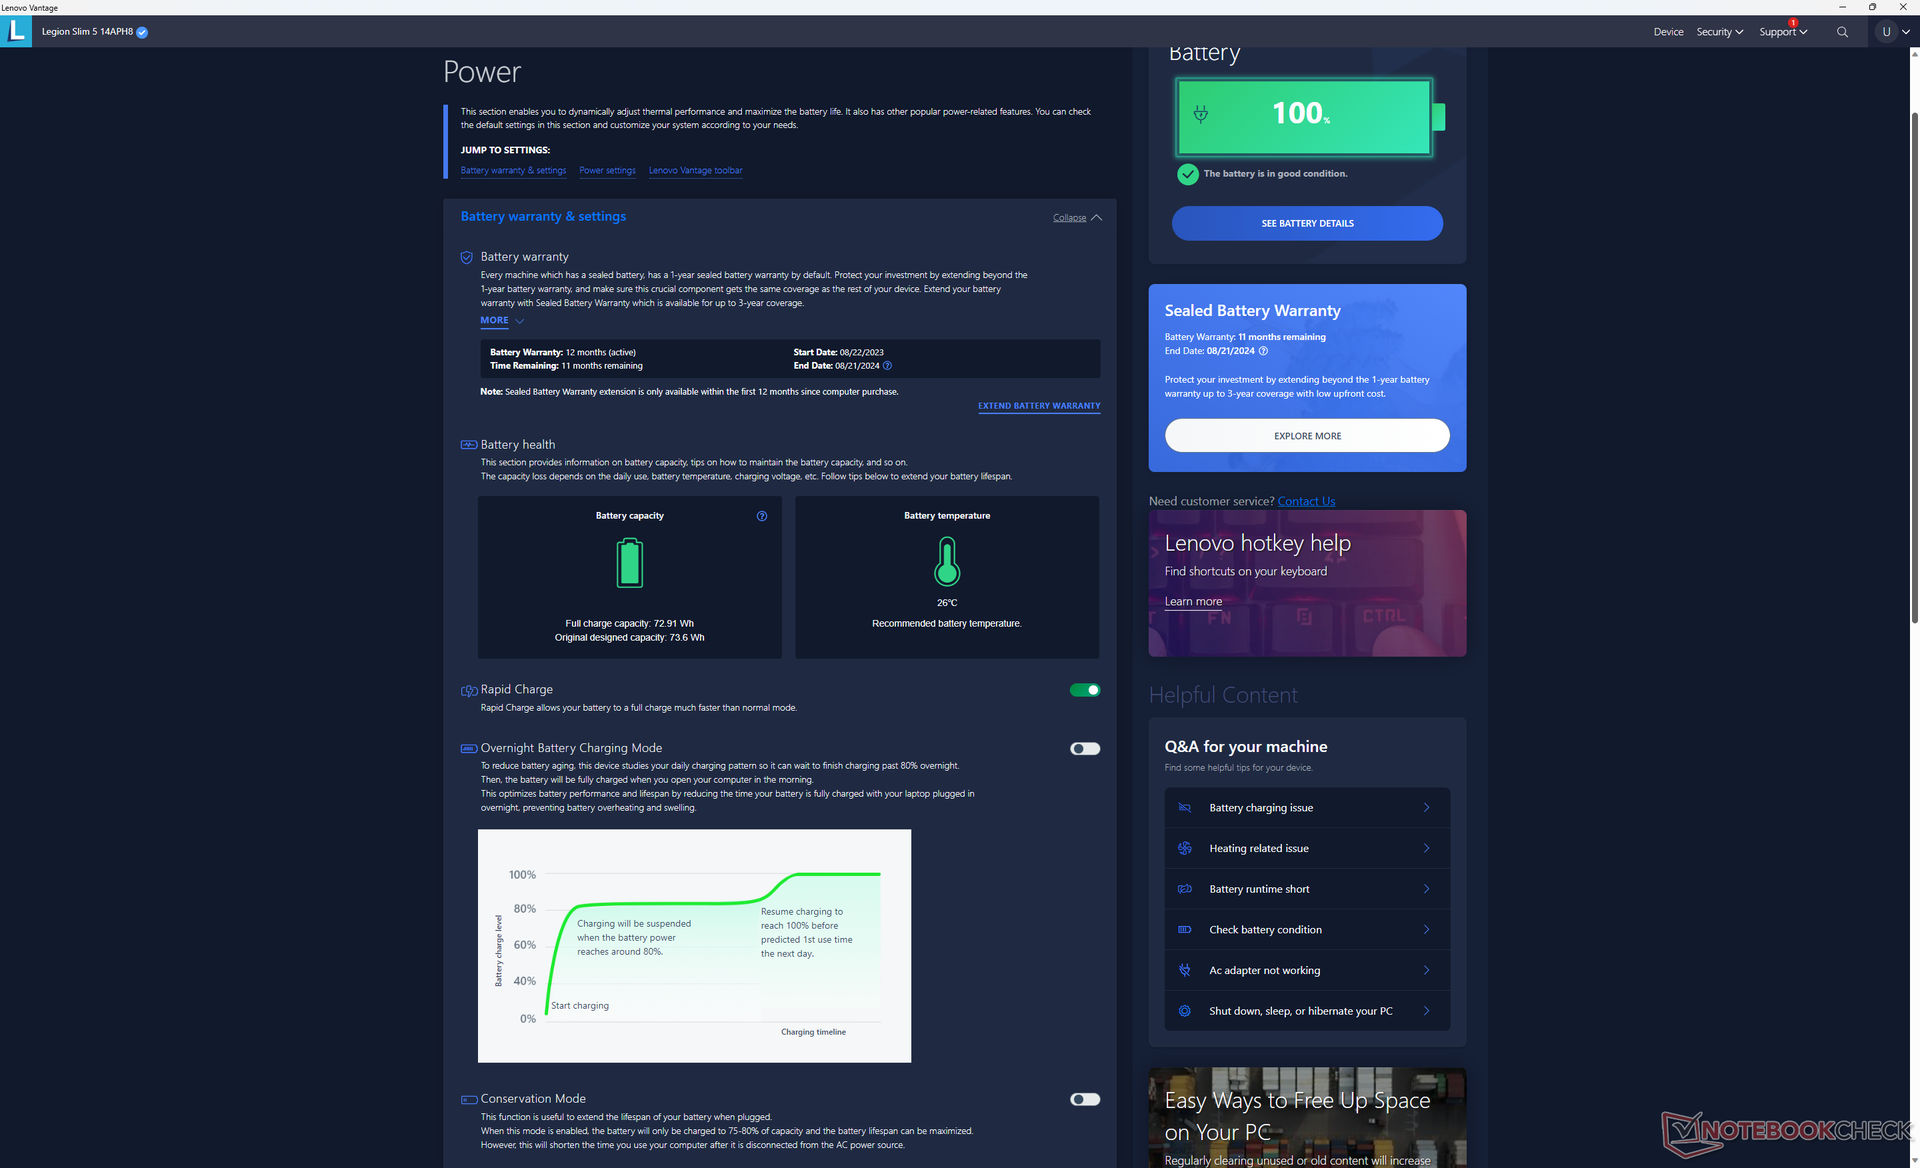
La capacità della batteria è elevata per un portatile da 14 pollici, con 74 Wh. I tempi di esecuzione sono successivamente lunghi, con quasi 7,5 ore di navigazione in modalità bilanciata, per essere più simili a quelli dello Zephyrus G14.
La ricarica da vuoto a pieno regime è molto rapida, con soli 45 minuti quando si attiva la funzione Lenovo Rapid Charge. La maggior parte degli altri computer portatili impiega il doppio del tempo o addirittura di più per ricaricarsi completamente. Il sistema può essere caricato anche tramite USB-C, ma Lenovo consiglia di caricarlo con un adattatore CA USB-C da 140 W opzionale di marca Lenovo, poiché la maggior parte degli altri adattatori non è compatibile.
| Lenovo Legion Slim 5 14APH8 R7 7840HS, GeForce RTX 4060 Laptop GPU, 73.6 Wh | Acer Predator Triton 14 PT14-51 i7-13700H, GeForce RTX 4050 Laptop GPU, 76.3 Wh | Razer Blade 14 RTX 4070 R9 7940HS, GeForce RTX 4070 Laptop GPU, 68 Wh | Asus ROG Zephyrus G14 GA402XY R9 7940HS, GeForce RTX 4090 Laptop GPU, 76 Wh | Alienware x14 i7 RTX 3060 i7-12700H, GeForce RTX 3060 Laptop GPU, 80 Wh | Lenovo LOQ 15APH8 R7 7840HS, GeForce RTX 4050 Laptop GPU, 60 Wh | |
|---|---|---|---|---|---|---|
| Autonomia della batteria | 4% | -19% | -12% | -10% | -8% | |
| Reader / Idle (h) | 10.5 | 11.2 7% | 8.6 -18% | 9.8 -7% | ||
| WiFi v1.3 (h) | 7.5 | 5 -33% | 6.2 -17% | 7.5 0% | 8.9 19% | 7.4 -1% |
| Load (h) | 1.3 | 1.8 38% | 1 -23% | 1 -23% | 0.8 -38% | 1.1 -15% |
| H.264 (h) | 9 | 7.2 | 9.4 | |||
| Witcher 3 ultra (h) | 0.8 |
Pro
Contro
Verdetto - Non solo per il gioco
Un paio di aspetti aiutano Legion Slim 5 14 a distinguersi dalla concorrenza. In primo luogo, il suo design simile a quello di un ThinkBook e l'esterno privo di RGB conferiscono un'estetica più professionale rispetto agli stili aggressivi dell'Acer Predator Triton Acer Predator Triton o Zephyrus G14. Gli utenti che desiderano avere un portatile sia per il gioco che per le riunioni di lavoro potrebbero quindi preferire il design di Legion Slim 5 14 rispetto ad altri. In secondo luogo, il suo display OLED da 120 Hz supera facilmente i display IPS di altri portatili da gioco da 14 pollici per quanto riguarda i livelli di nero, i tempi di risposta e la qualità dell'immagine.
Il primo portatile da gioco da 14 pollici Legion di Lenovo parte bene con il suo display OLED da 2,8K 120 Hz. La mancanza di G-Sync e della retroilluminazione RGB della tastiera, tuttavia, sono strane omissioni su un portatile da gioco che costa ben più di mille dollari.
Ci sono una serie di svantaggi che i potenziali acquirenti dovrebbero conoscere. Il più grave è la mancanza del supporto G-Sync per il display OLED, il che significa che è consigliabile attivare il v-sync o puntare a 120 FPS costanti con impostazioni ridotte per limitare il tearing dello schermo. Il passo successivo è l'assenza di illuminazione RGB per la tastiera e di opzioni per la GPU superiori alla RTX 4060. Sebbene la RTX 4060 sia ancora molto buona, Lenovo sta perdendo gli appassionati che potrebbero desiderare la RTX 4070 o una versione più veloce. Asus Zephyrus G14 e Razer Blade 14 sono più piccoli e sono dotati di opzioni di aggiornamento della RAM e di GPU più veloci.
Il forte rumore della ventola e le alte temperature del core sono altri svantaggi degni di nota, ma tali caratteristiche sono condivise da altri portatili da gioco da 14 pollici.
Il modello Legion Slim 5 14 è il migliore come potente compagno di viaggio per il gioco, l'elaborazione grafica e l'editing. Per il gioco puro, tuttavia, le alternative di Razer, Asus o Alienware tendono a offrire GPU di fascia più alta e funzionalità ausiliarie che i giocatori più accaniti possono apprezzare.
Prezzo e disponibilità
Lenovo sta attualmente distribuendo il modello Legion Slim 5 14 Gen 8 a partire da 1440 dollari per la configurazione base con Ryzen 7 e RTX 4050, fino a oltre 1.700 dollari se configurato con Ryzen 9 e RTX 4060.
Lenovo Legion Slim 5 14APH8
- 09/25/2023 v7 (old)
Allen Ngo
Transparency
La selezione dei dispositivi da recensire viene effettuata dalla nostra redazione. Il campione di prova è stato fornito all'autore come prestito dal produttore o dal rivenditore ai fini di questa recensione. L'istituto di credito non ha avuto alcuna influenza su questa recensione, né il produttore ne ha ricevuto una copia prima della pubblicazione. Non vi era alcun obbligo di pubblicare questa recensione. In quanto società mediatica indipendente, Notebookcheck non è soggetta all'autorità di produttori, rivenditori o editori.
Ecco come Notebookcheck esegue i test
Ogni anno, Notebookcheck esamina in modo indipendente centinaia di laptop e smartphone utilizzando procedure standardizzate per garantire che tutti i risultati siano comparabili. Da circa 20 anni sviluppiamo continuamente i nostri metodi di prova e nel frattempo stabiliamo gli standard di settore. Nei nostri laboratori di prova, tecnici ed editori esperti utilizzano apparecchiature di misurazione di alta qualità. Questi test comportano un processo di validazione in più fasi. Il nostro complesso sistema di valutazione si basa su centinaia di misurazioni e parametri di riferimento ben fondati, che mantengono l'obiettività.Price comparison

