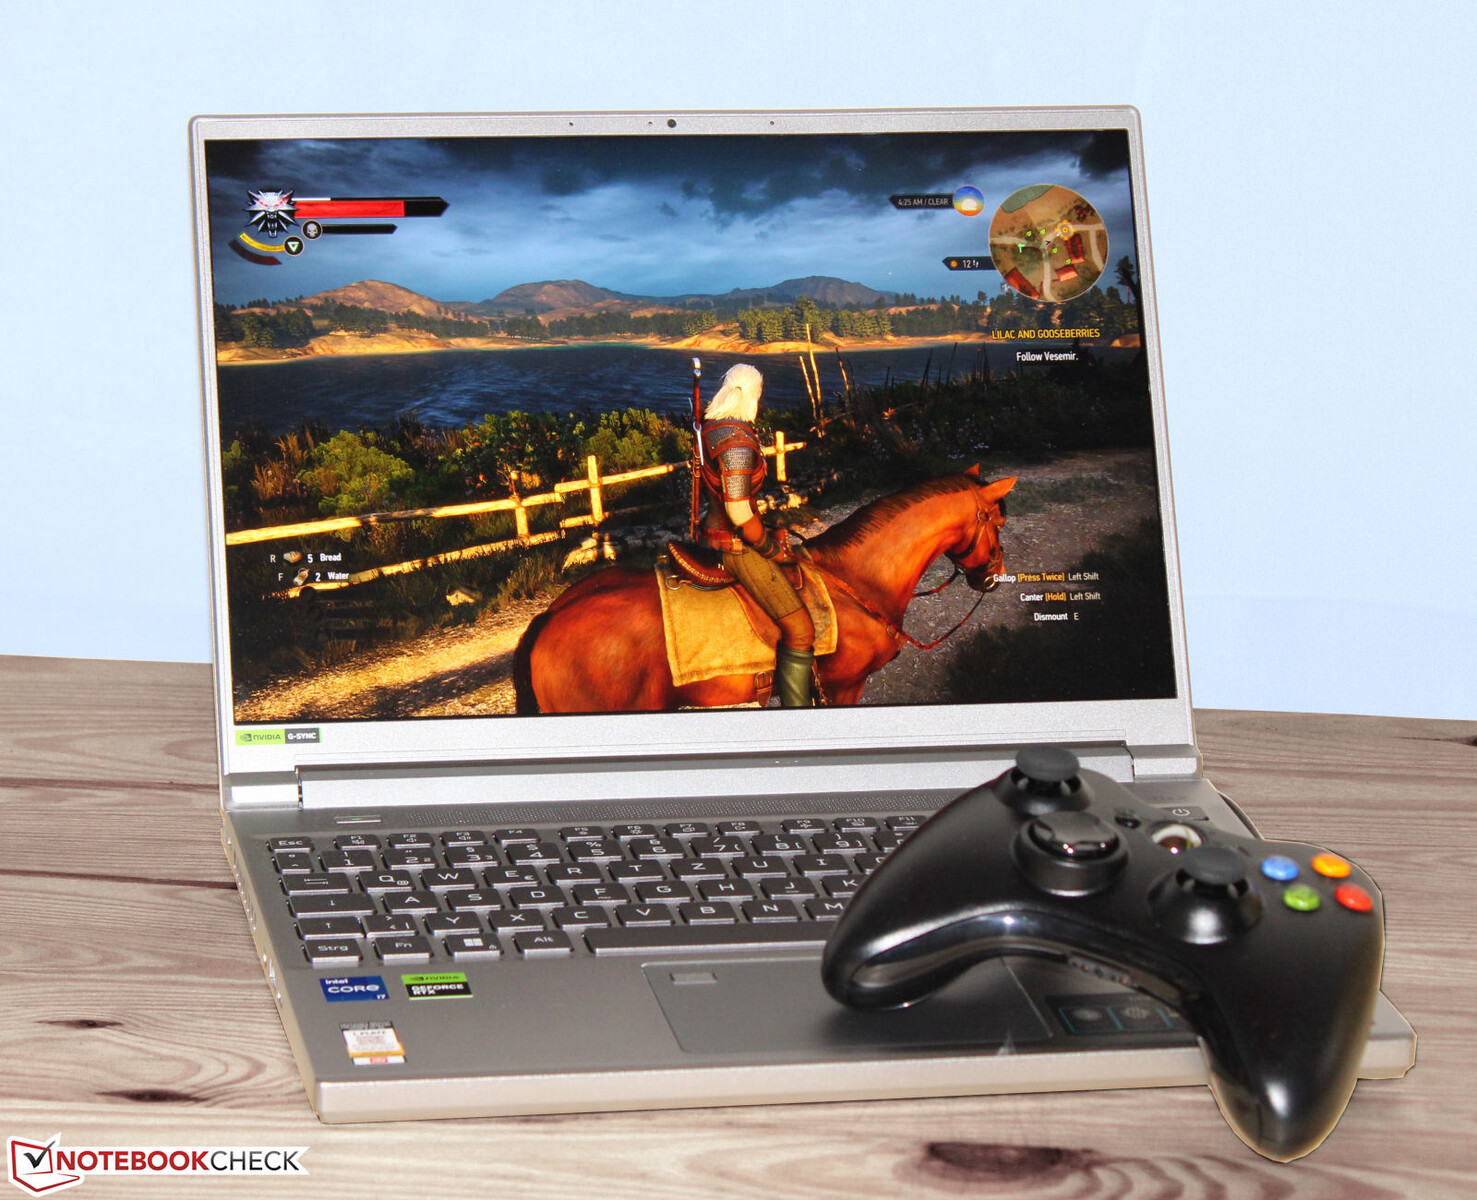
Recensione dell'Acer Predator Triton 14: Un portatile gaming da 14 pollici con un display luminoso e una RTX 4050
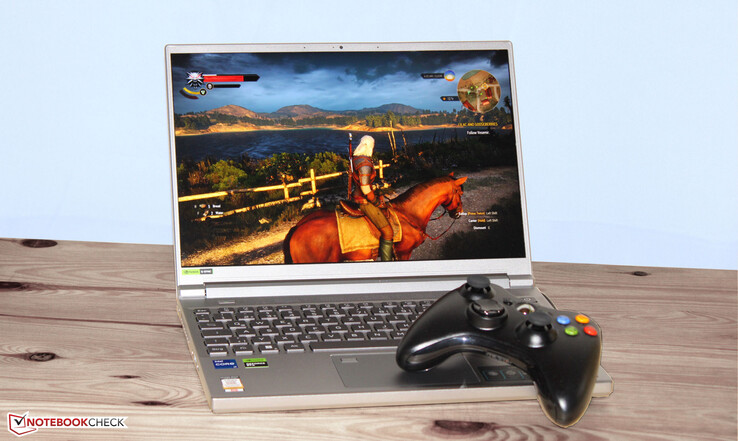
Il portatile da gioco compatto rappresenta l'attuale stato dell'arte: Raptor Lake, Ada Lovelace, LPDDR5, PCIe 4, Thunderbolt 4. Si tratta del successore quasi identico del già recensito Acer Predator Triton 300 SE. I dispositivi concorrenti sono il Razer Blade 14, ilMSI Stealth 14 Studio A13V, ilGigabyte Aero 14 OLED BMF, ilApple MacBook Pro 14 2023 M2 Pro Entrye ilAsus ROG Zephyrus G14 GA402RJ.
Potenziali concorrenti a confronto
Punteggio | Data | Modello | Peso | Altezza | Dimensione | Risoluzione | Prezzo |
|---|---|---|---|---|---|---|---|
| 87.3 % v7 (old) | 07/2023 | Acer Predator Triton 14 PT14-51 i7-13700H, GeForce RTX 4050 Laptop GPU | 1.7 kg | 19.81 mm | 14.00" | 2560x1600 | |
| 88.7 % v7 (old) | 06/2023 | Razer Blade 14 RTX 4070 R9 7940HS, GeForce RTX 4070 Laptop GPU | 1.8 kg | 17.99 mm | 14.00" | 2560x1600 | |
| 86.4 % v7 (old) | 10/2022 | Asus ROG Zephyrus G14 GA402RJ R7 6800HS, Radeon RX 6700S | 1.7 kg | 19.5 mm | 14.00" | 2560x1600 | |
| 85.4 % v7 (old) | 07/2023 | MSI Stealth 14 Studio A13V i7-13700H, GeForce RTX 4050 Laptop GPU | 1.7 kg | 19 mm | 14.00" | 2560x1600 | |
| 89.4 % v7 (old) | 05/2023 | Gigabyte Aero 14 OLED BMF i7-13700H, GeForce RTX 4050 Laptop GPU | 1.4 kg | 17 mm | 14.00" | 2880x1800 | |
| 93.4 % v7 (old) | 03/2023 | Apple MacBook Pro 14 2023 M2 Pro Entry M2 Pro 10-Core, M2 Pro 16-Core GPU | 1.6 kg | 15.5 mm | 14.20" | 3024x1964 |
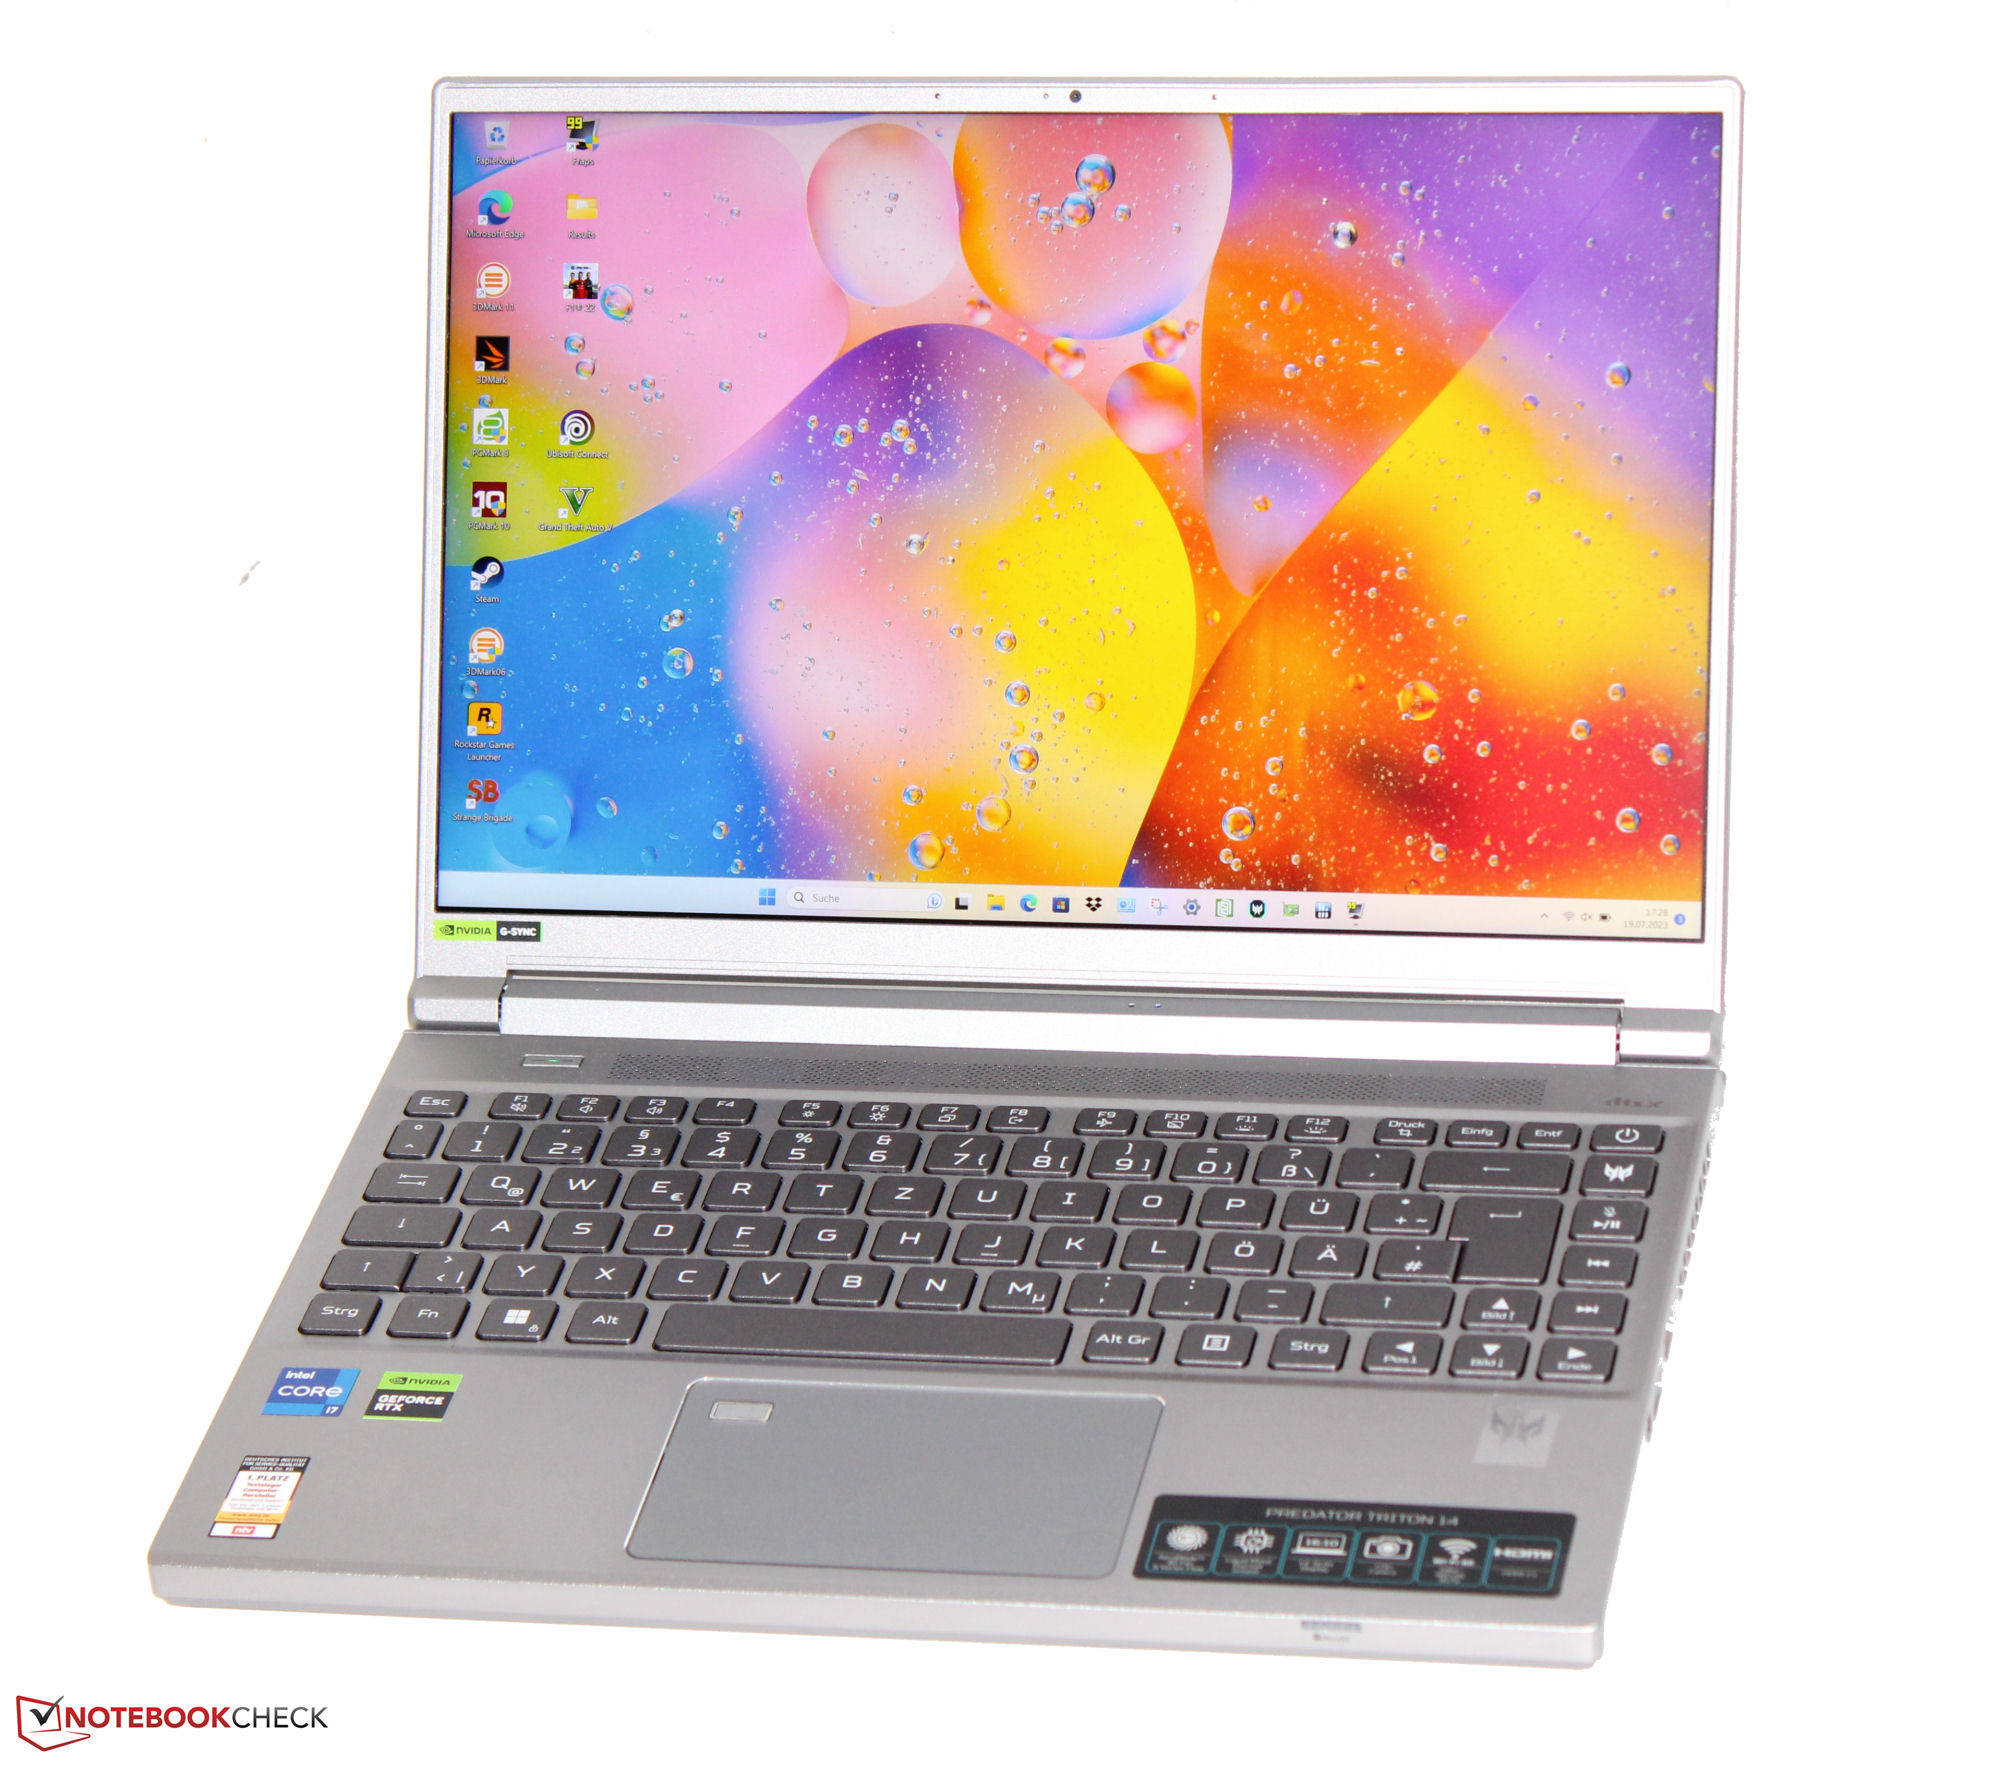
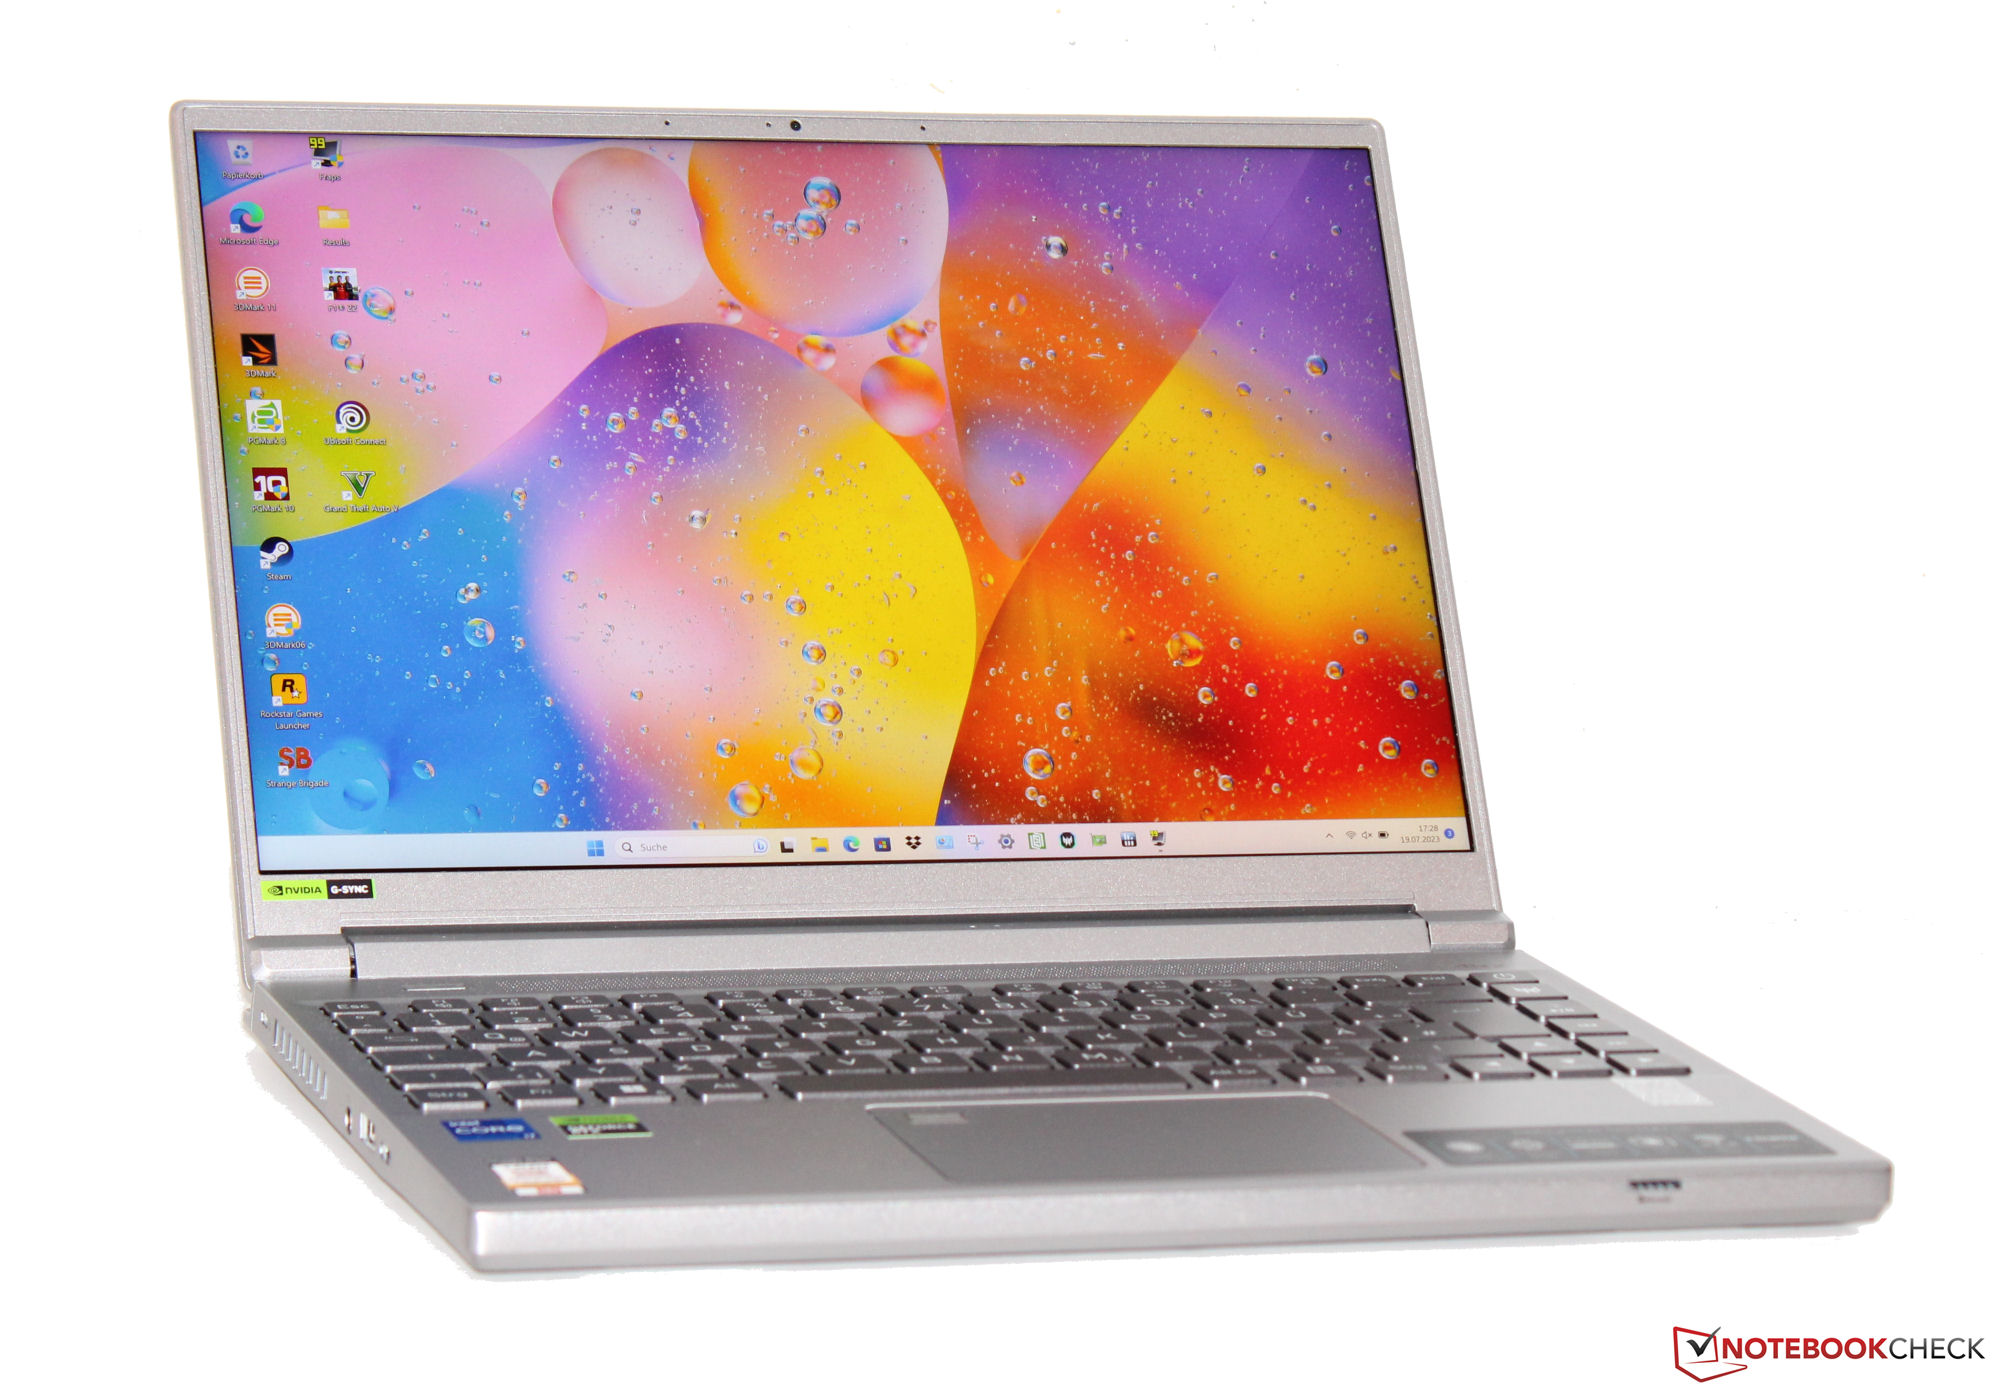
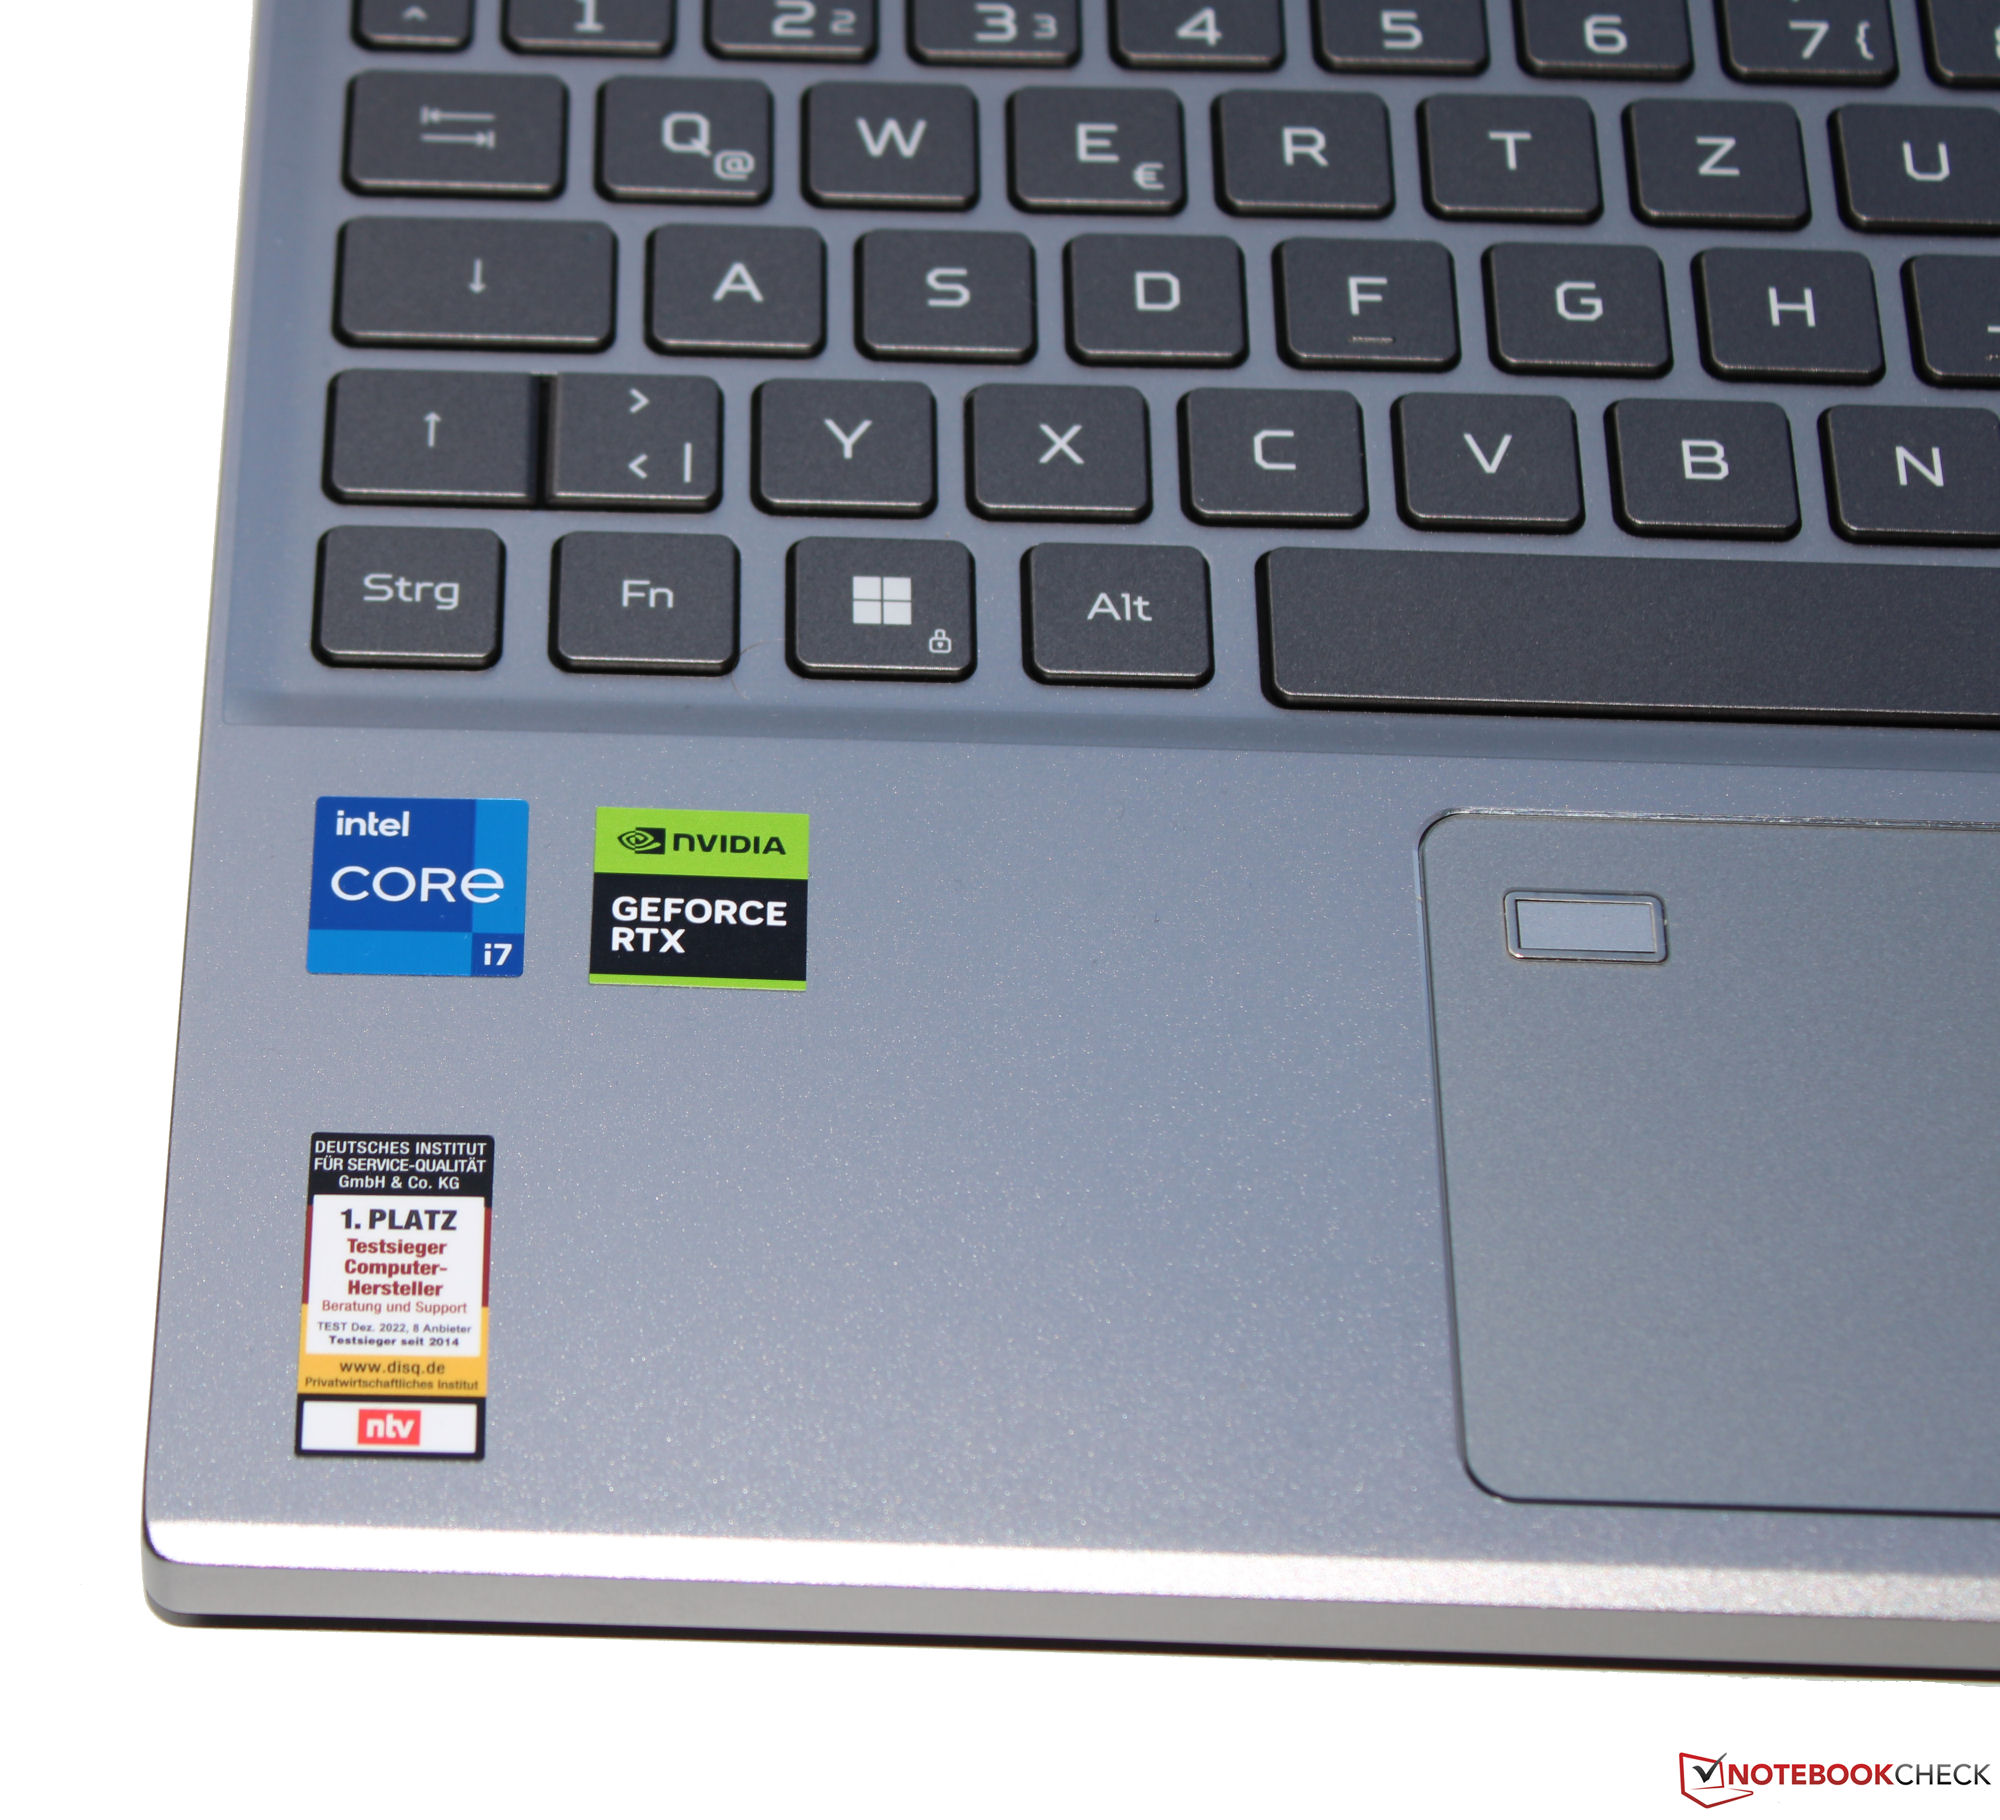
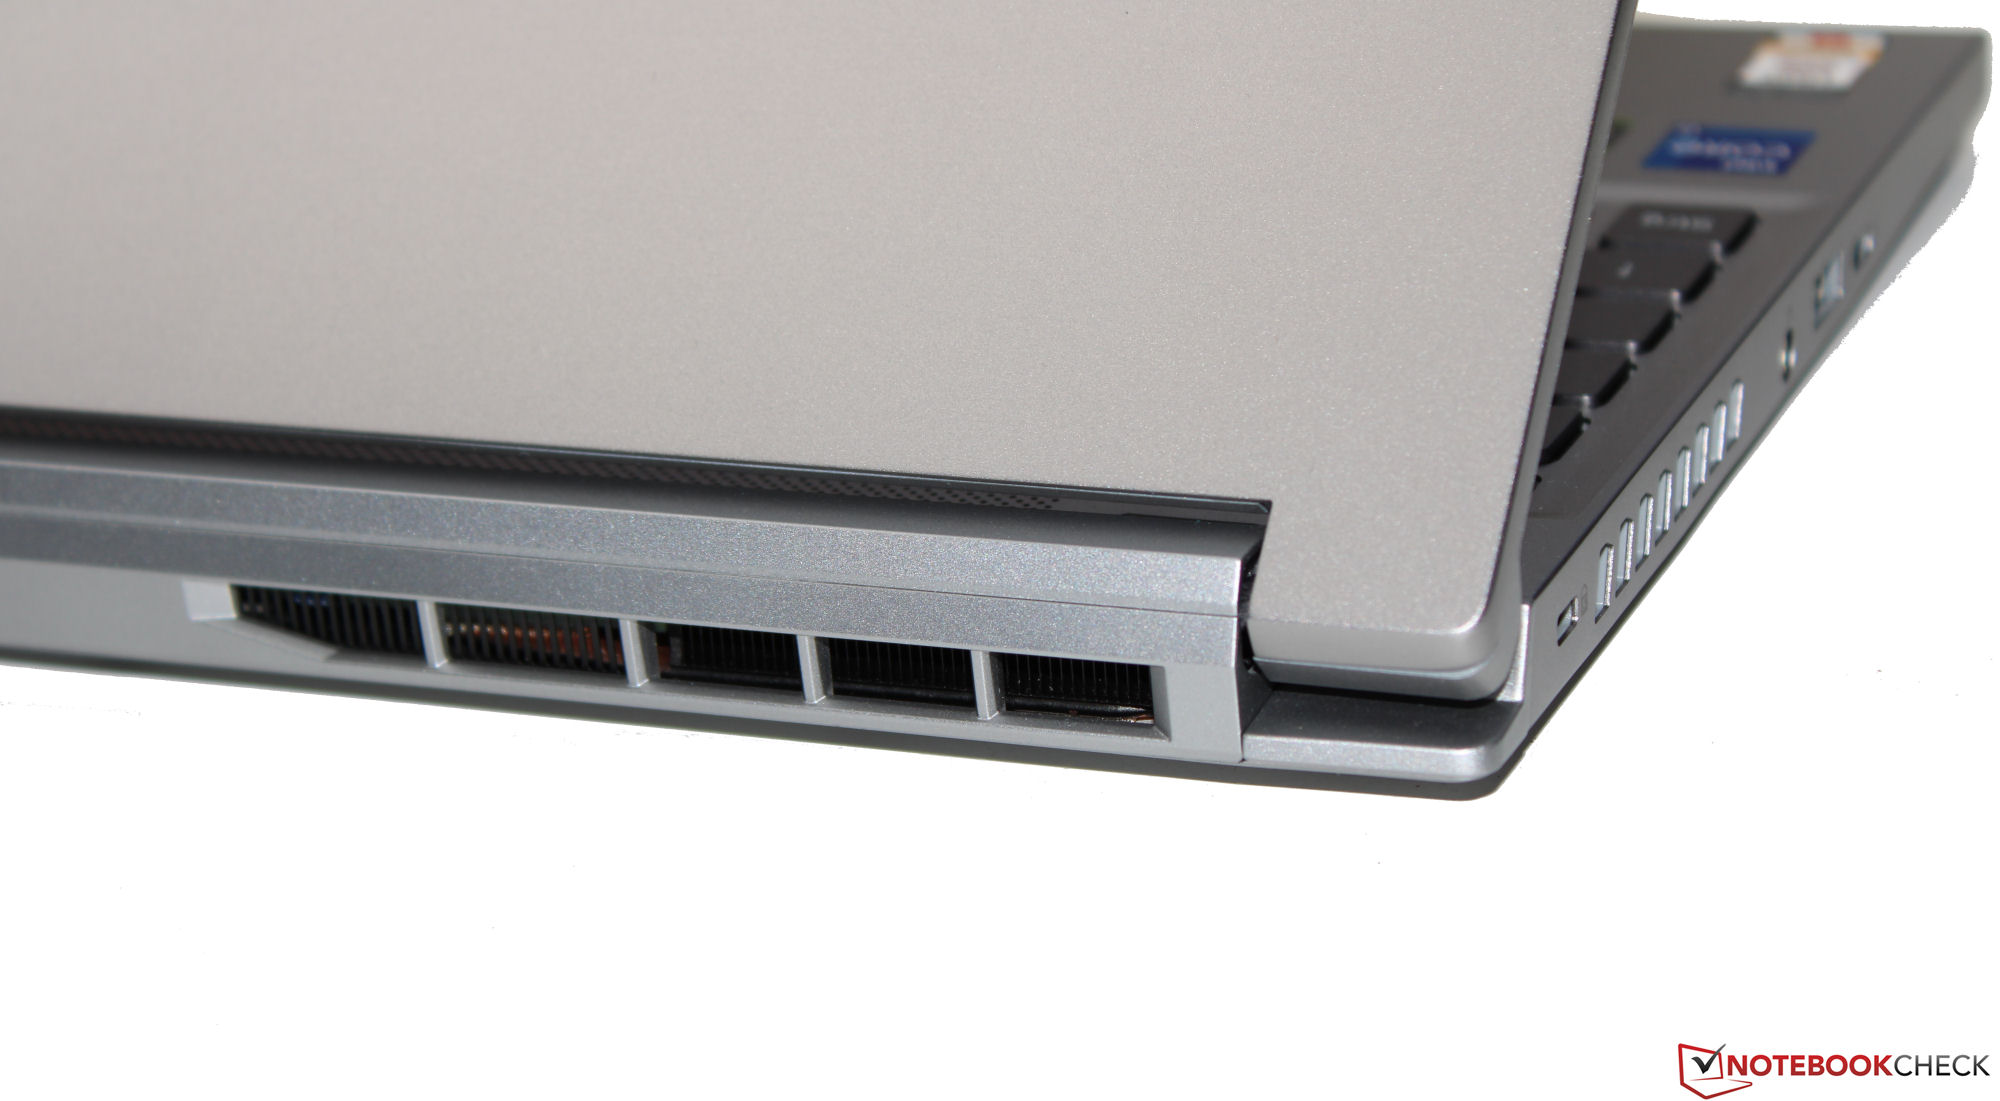
Case - Acer ha dotato il Triton di uno chassis in metallo
La tecnologia del portatile è racchiusa in un case metallico grigio-argento. Acer ha optato per superfici lisce e opache. Il computer compatto non offre elementi di design accattivanti, il che significa che può passare per un computer portatile da ufficio. Allo stesso modo, sono assenti anche le stravaganti barre LED. Oltre all'illuminazione dei tasti, un piccolo logo Predator illuminato sul poggiapolsi crea un mix di colori.
Il Triton non mostra segni di difetti di fabbricazione. Le dimensioni della fessura sono corrette e il materiale in eccesso non sporge dal dispositivo. L'unità di base e il coperchio possono essere leggermente ruotati, ma tutto rientra in un range accettabile. La pressione esercitata sulla parte posteriore del coperchio non provoca alcuna distorsione dell'immagine. Le cerniere tengono il coperchio saldamente in posizione e l'angolo di apertura massimo è di circa 175 gradi. È possibile aprire il dispositivo con una sola mano.
Per quanto riguarda le dimensioni, non c'è molto da scegliere tra la maggior parte dei dispositivi concorrenti. IlMSI Stealth 14 Studio A13Vè l'eccezione alla regola: occupa più spazio della concorrenza. Per quanto riguarda il peso, il portatile Acer si colloca a metà classifica.
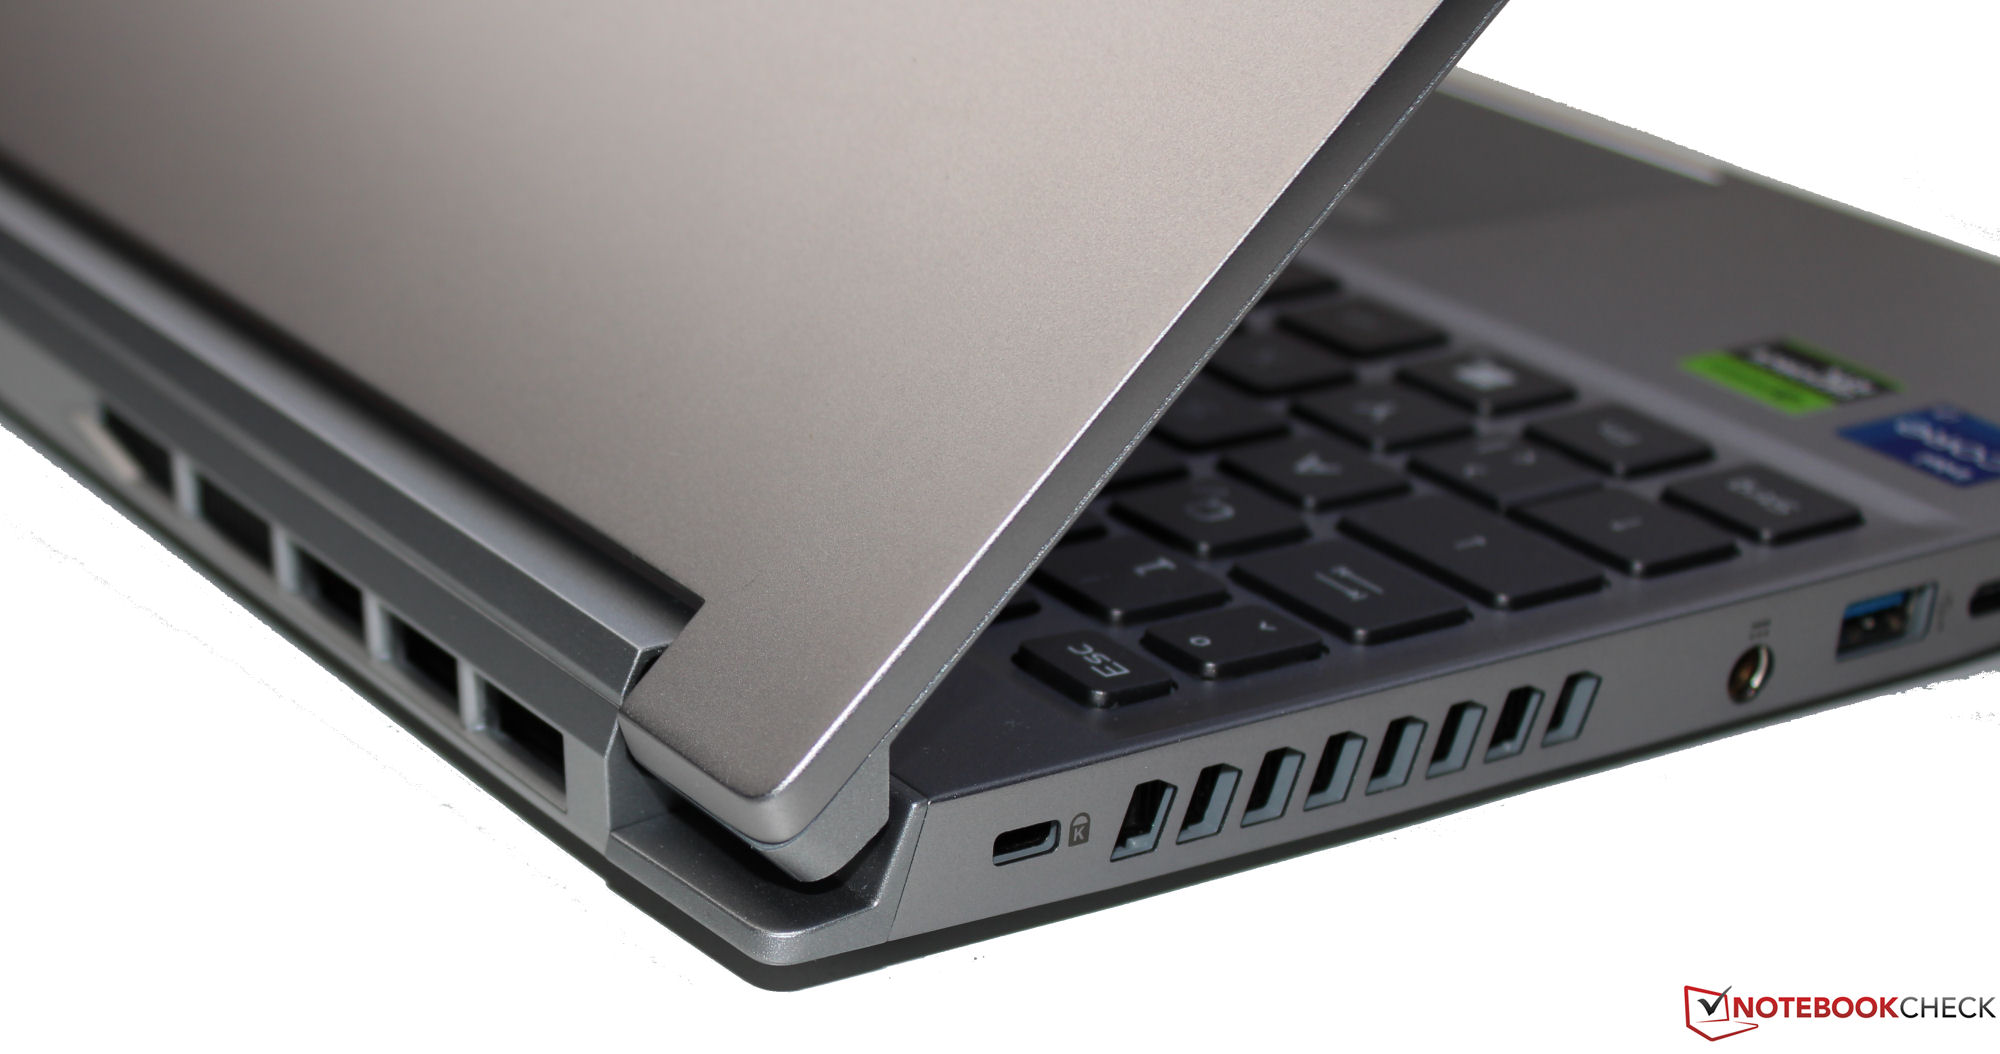
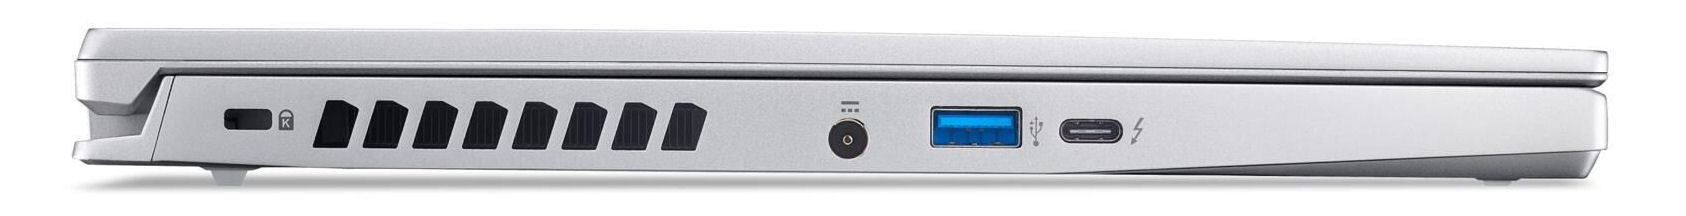
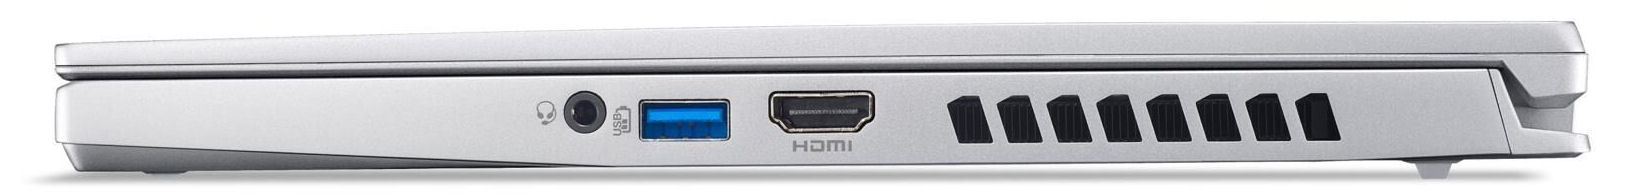
Caratteristiche - Il PT14 offre Thunderbolt 4
La selezione di porte è piuttosto limitata: Il PT14 può contare su due porte USB-A (USB 3.2 Gen 2) e una porta USB-C (Thunderbolt 4). La porta USB-C supporta Power Delivery e può emettere un segnale Displayport. In totale sono presenti due uscite video (HDMI 2.1, DP). Completa la dotazione un jack audio.
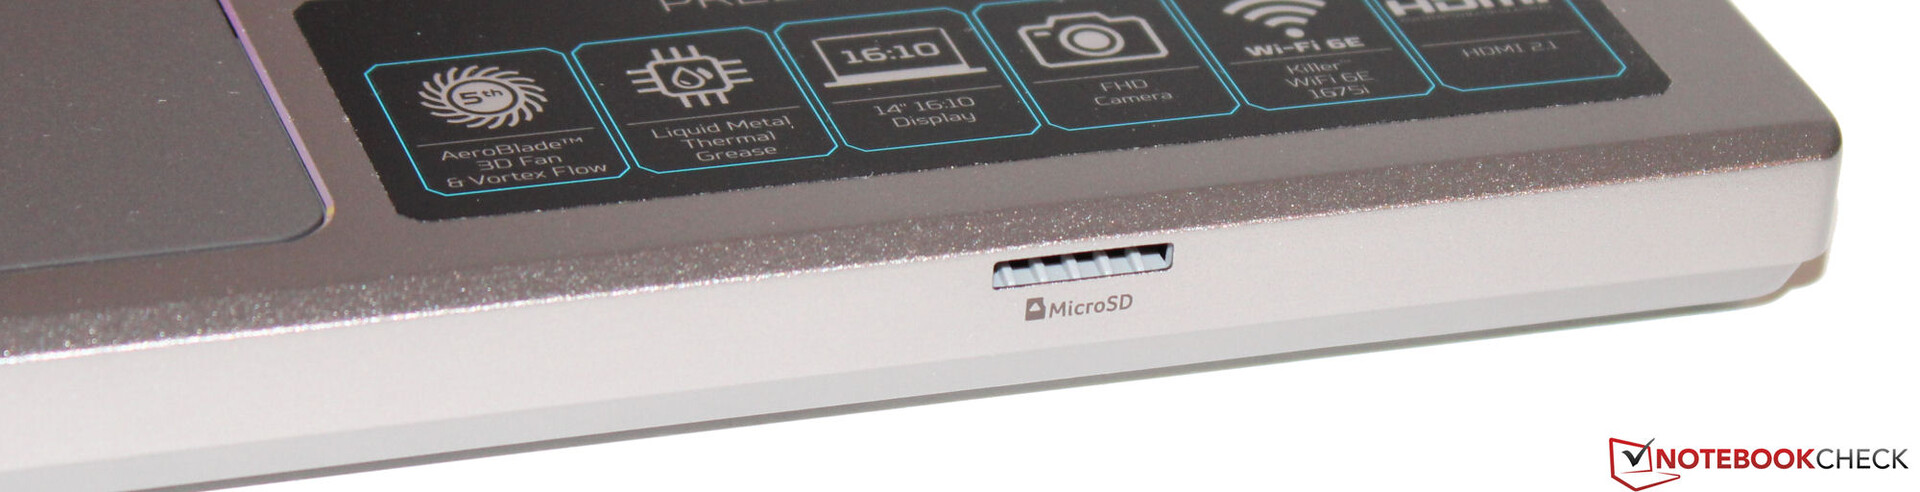
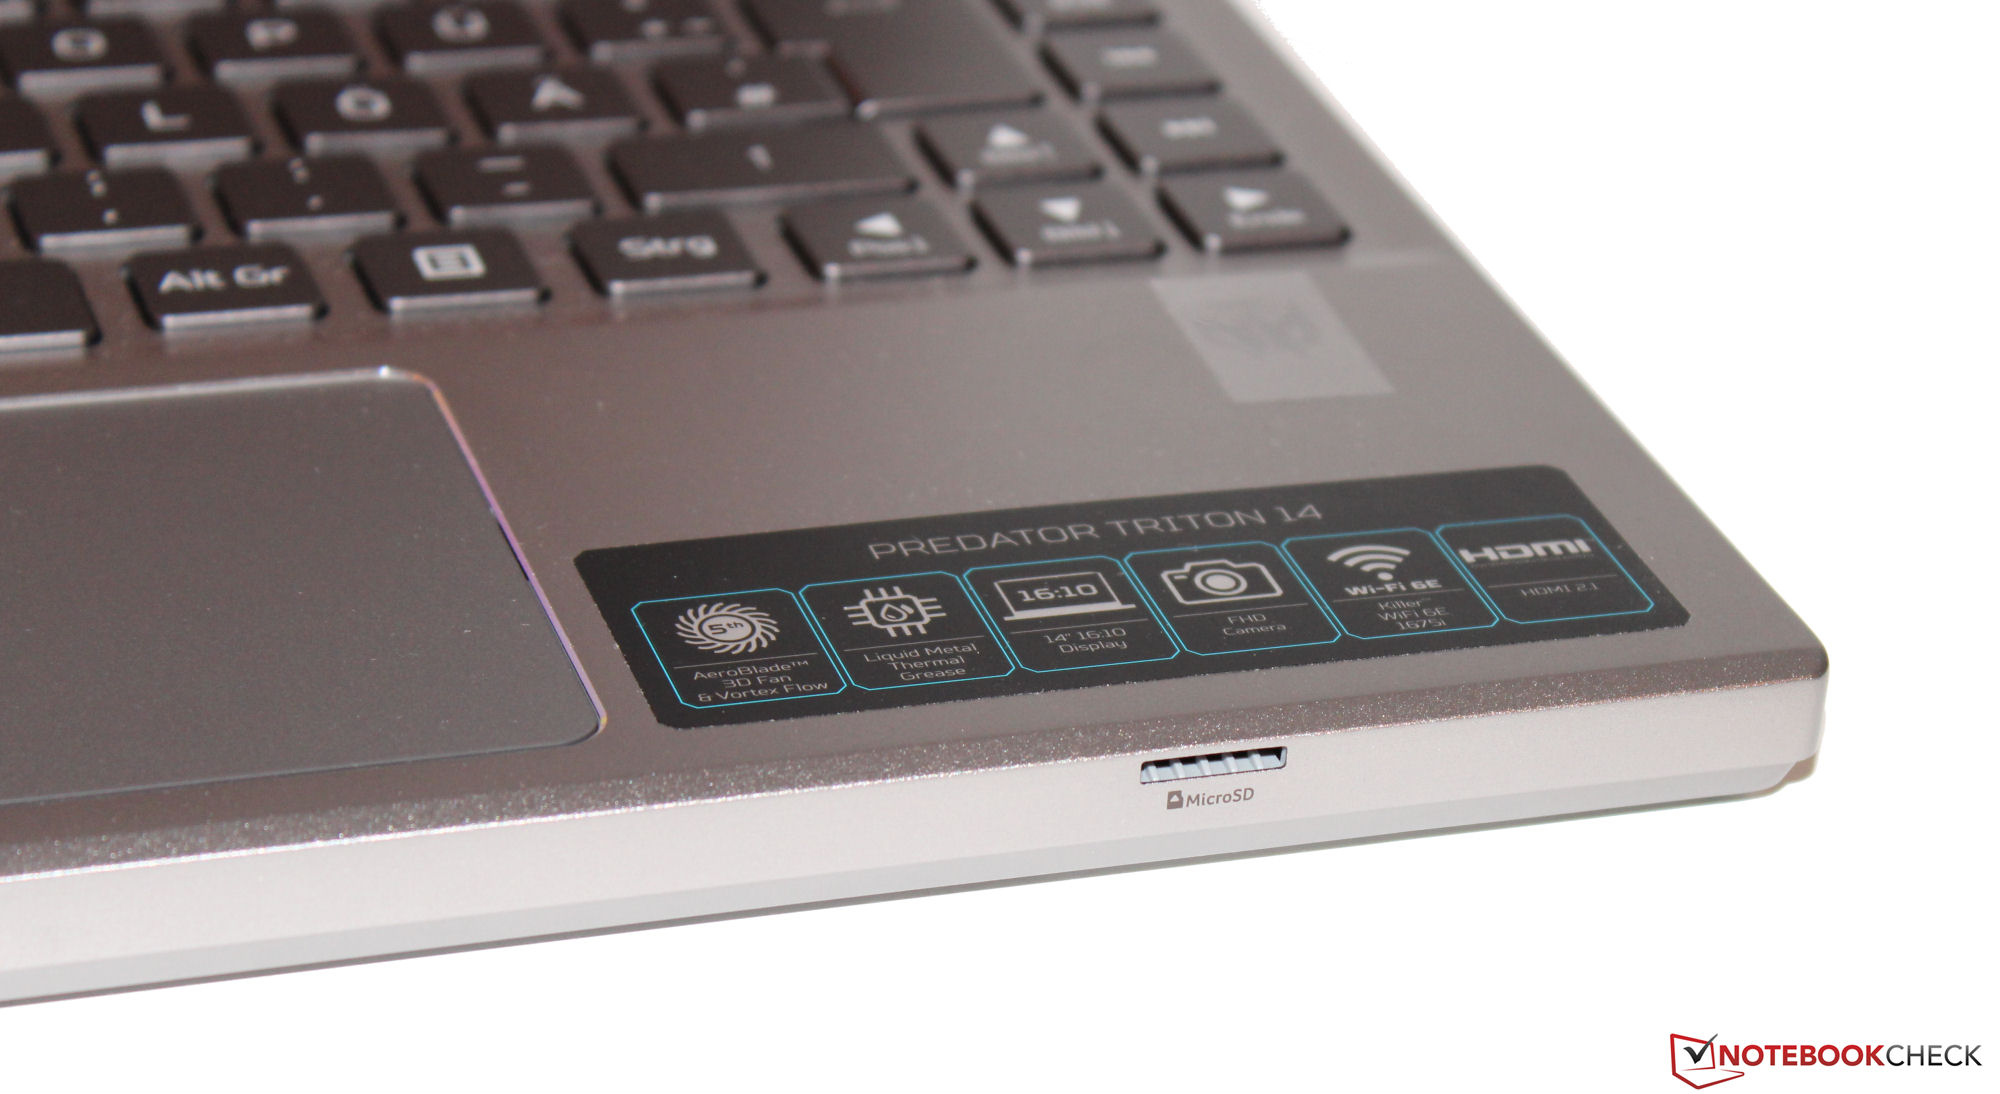
Lettore di schede SD
Il lettore di schede di memoria MicroSD (scheda di riferimento: AV PRO microSD 128 GB V60) appartiene ai modelli più lenti, con una velocità di trasferimento massima di 19 MB/s (trasferimento di 250 file immagine jpg di circa 5 MB ciascuno) e 26 MB/s (copia di grandi blocchi di dati).
| SD Card Reader | |
| average JPG Copy Test (av. of 3 runs) | |
| Gigabyte Aero 14 OLED BMF | |
| Asus ROG Zephyrus G14 GA402RJ (AV PRO microSD 128 GB V60) | |
| Media della classe Gaming (20.9 - 210, n=54, ultimi 2 anni) | |
| Acer Predator Triton 14 PT14-51 (AV PRO microSD 128 GB V60) | |
| maximum AS SSD Seq Read Test (1GB) | |
| Gigabyte Aero 14 OLED BMF | |
| Asus ROG Zephyrus G14 GA402RJ (AV PRO microSD 128 GB V60) | |
| Media della classe Gaming (25.5 - 261, n=51, ultimi 2 anni) | |
| Acer Predator Triton 14 PT14-51 (AV PRO microSD 128 GB V60) | |
Comunicazione
In condizioni ottimali (assenza di dispositivi Wi-Fi nelle vicinanze, breve distanza tra il portatile e il PC server), è possibile raggiungere velocità di trasmissione dati Wi-Fi eccezionali. Il portatile è dotato di un chip Wi-Fi 6E (Killer AX1675i). Non è disponibile una porta Ethernet.
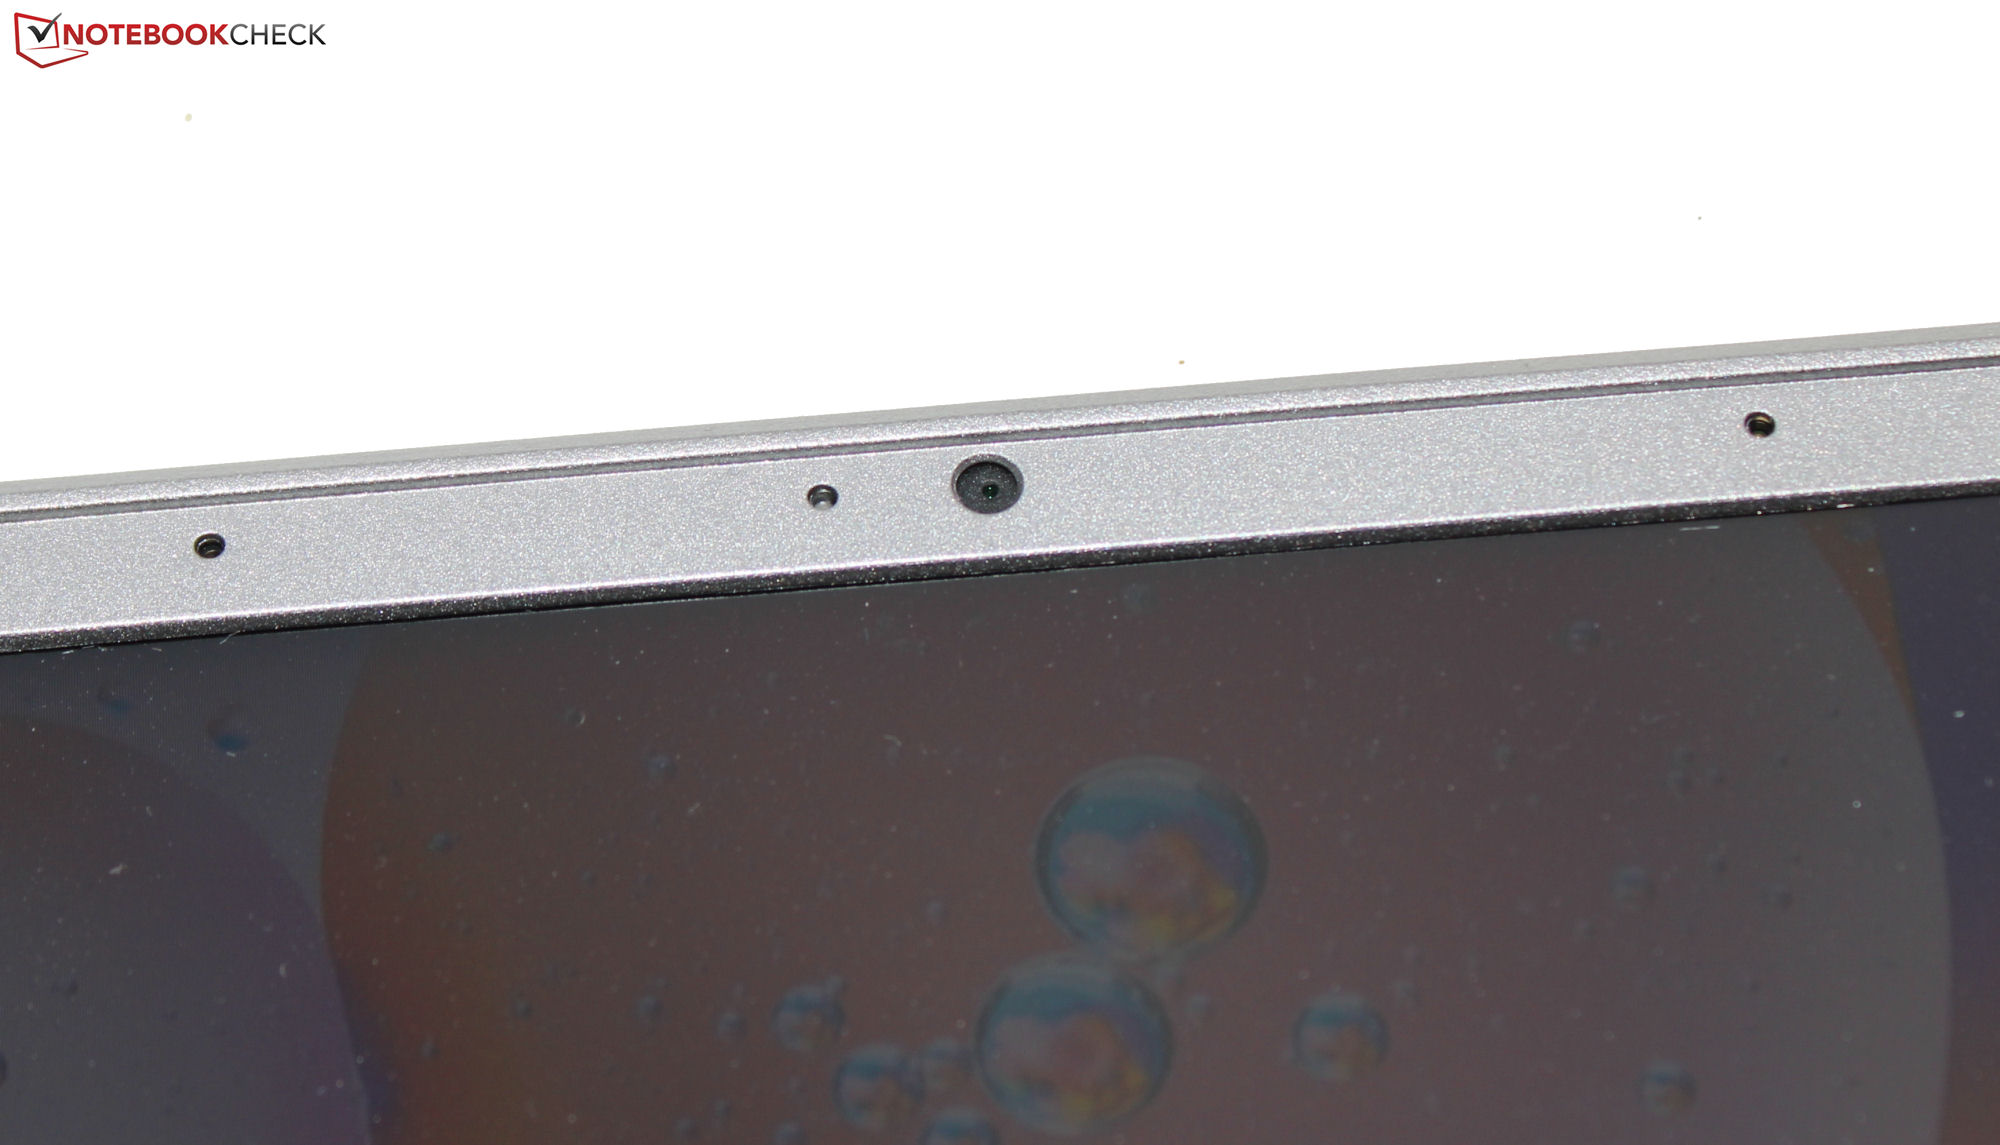
Webcam
La webcam (2,1 MP, max. 1.920 x 1.080 pixel) non è dotata di otturatore meccanico. Tuttavia, in termini di qualità, non riesce a distinguersi dalla concorrenza. La precisione dei colori si discosta dal valore target.


Accessori
Oltre ai consueti documenti (guida rapida e informazioni sulla garanzia), il portatile non è corredato da ulteriori accessori.
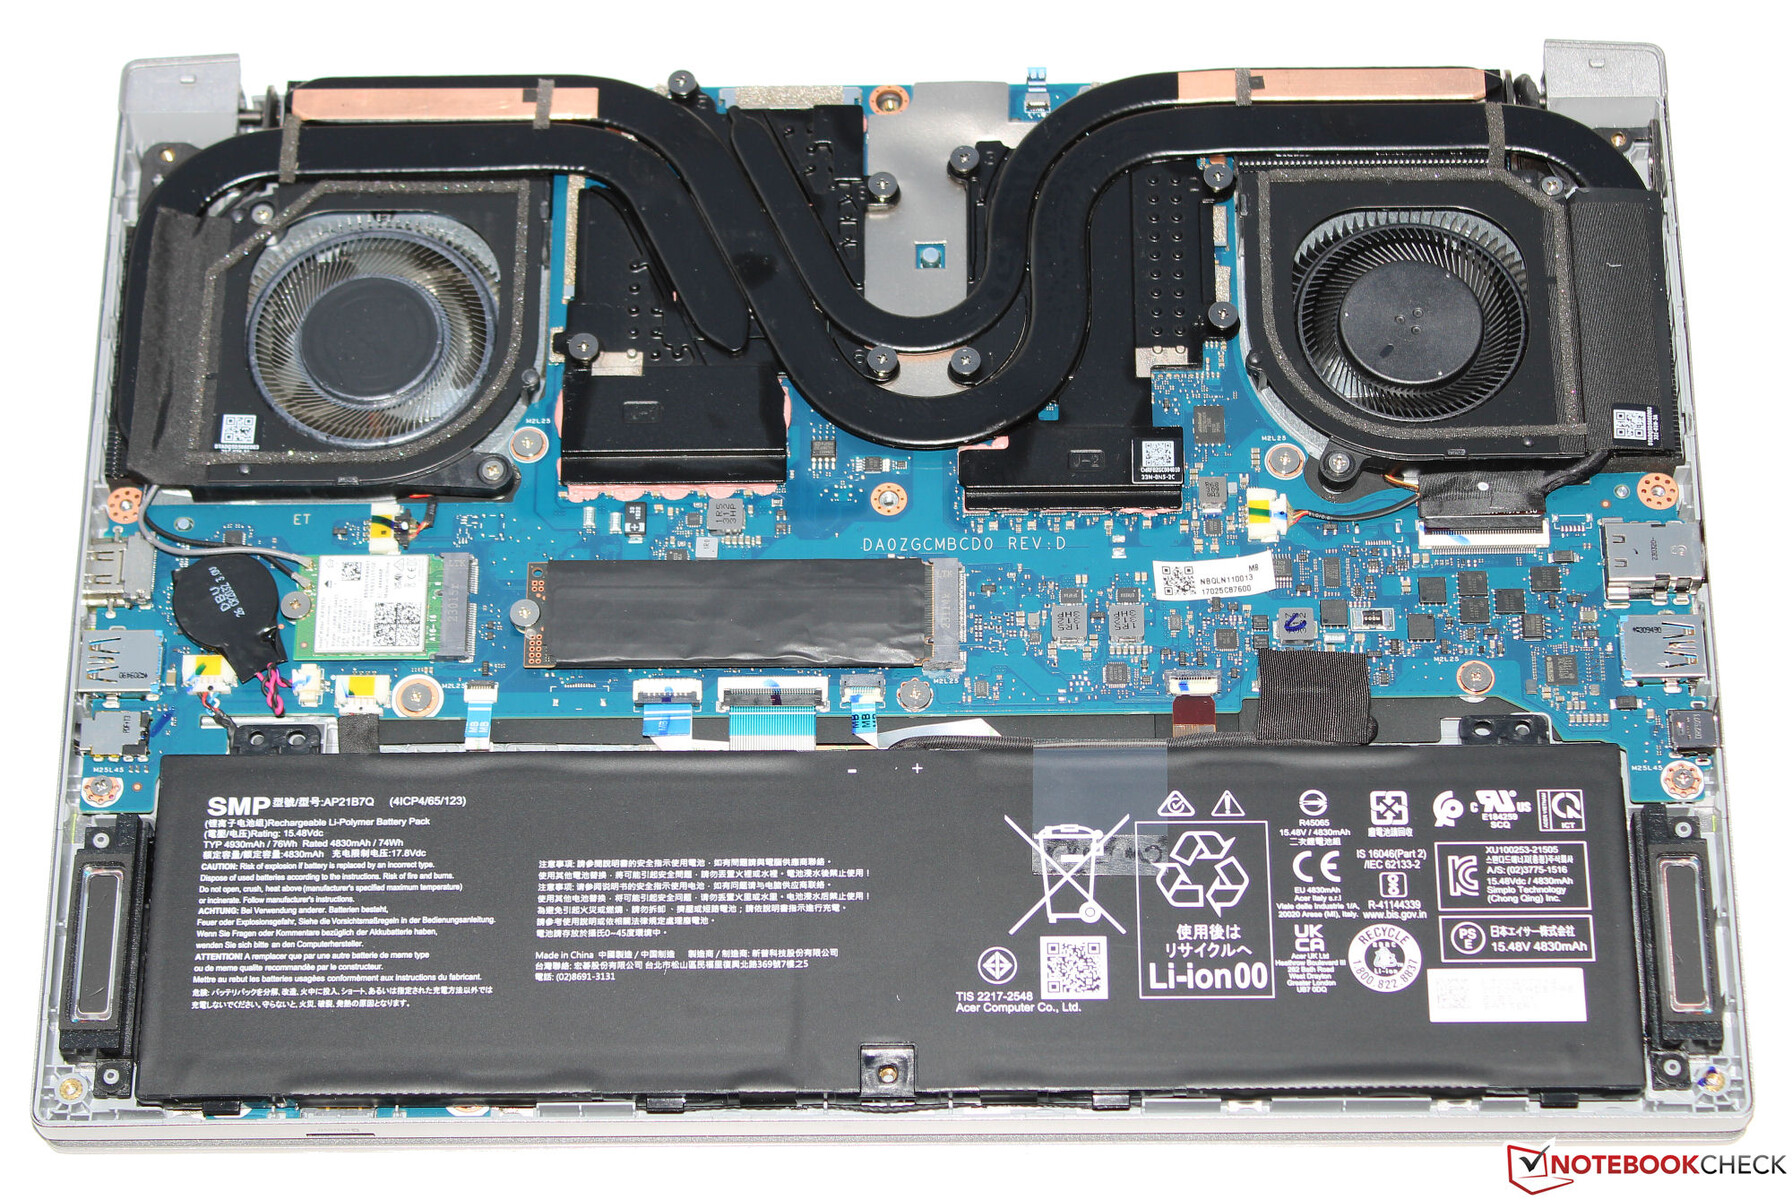
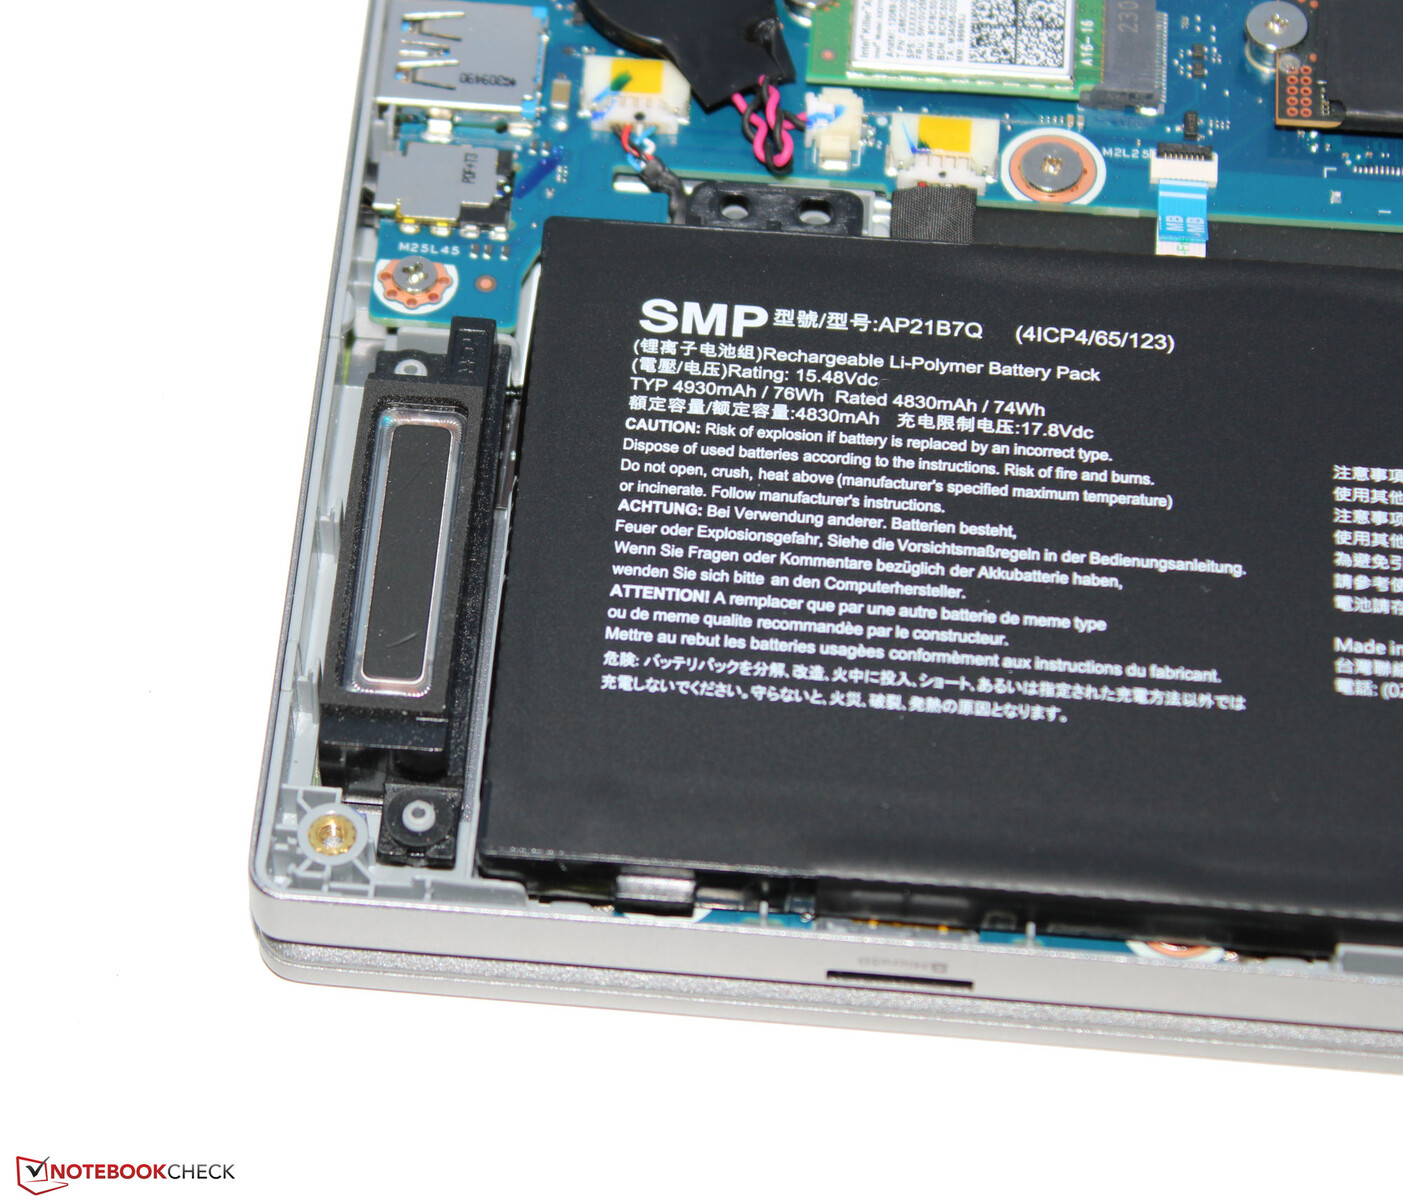
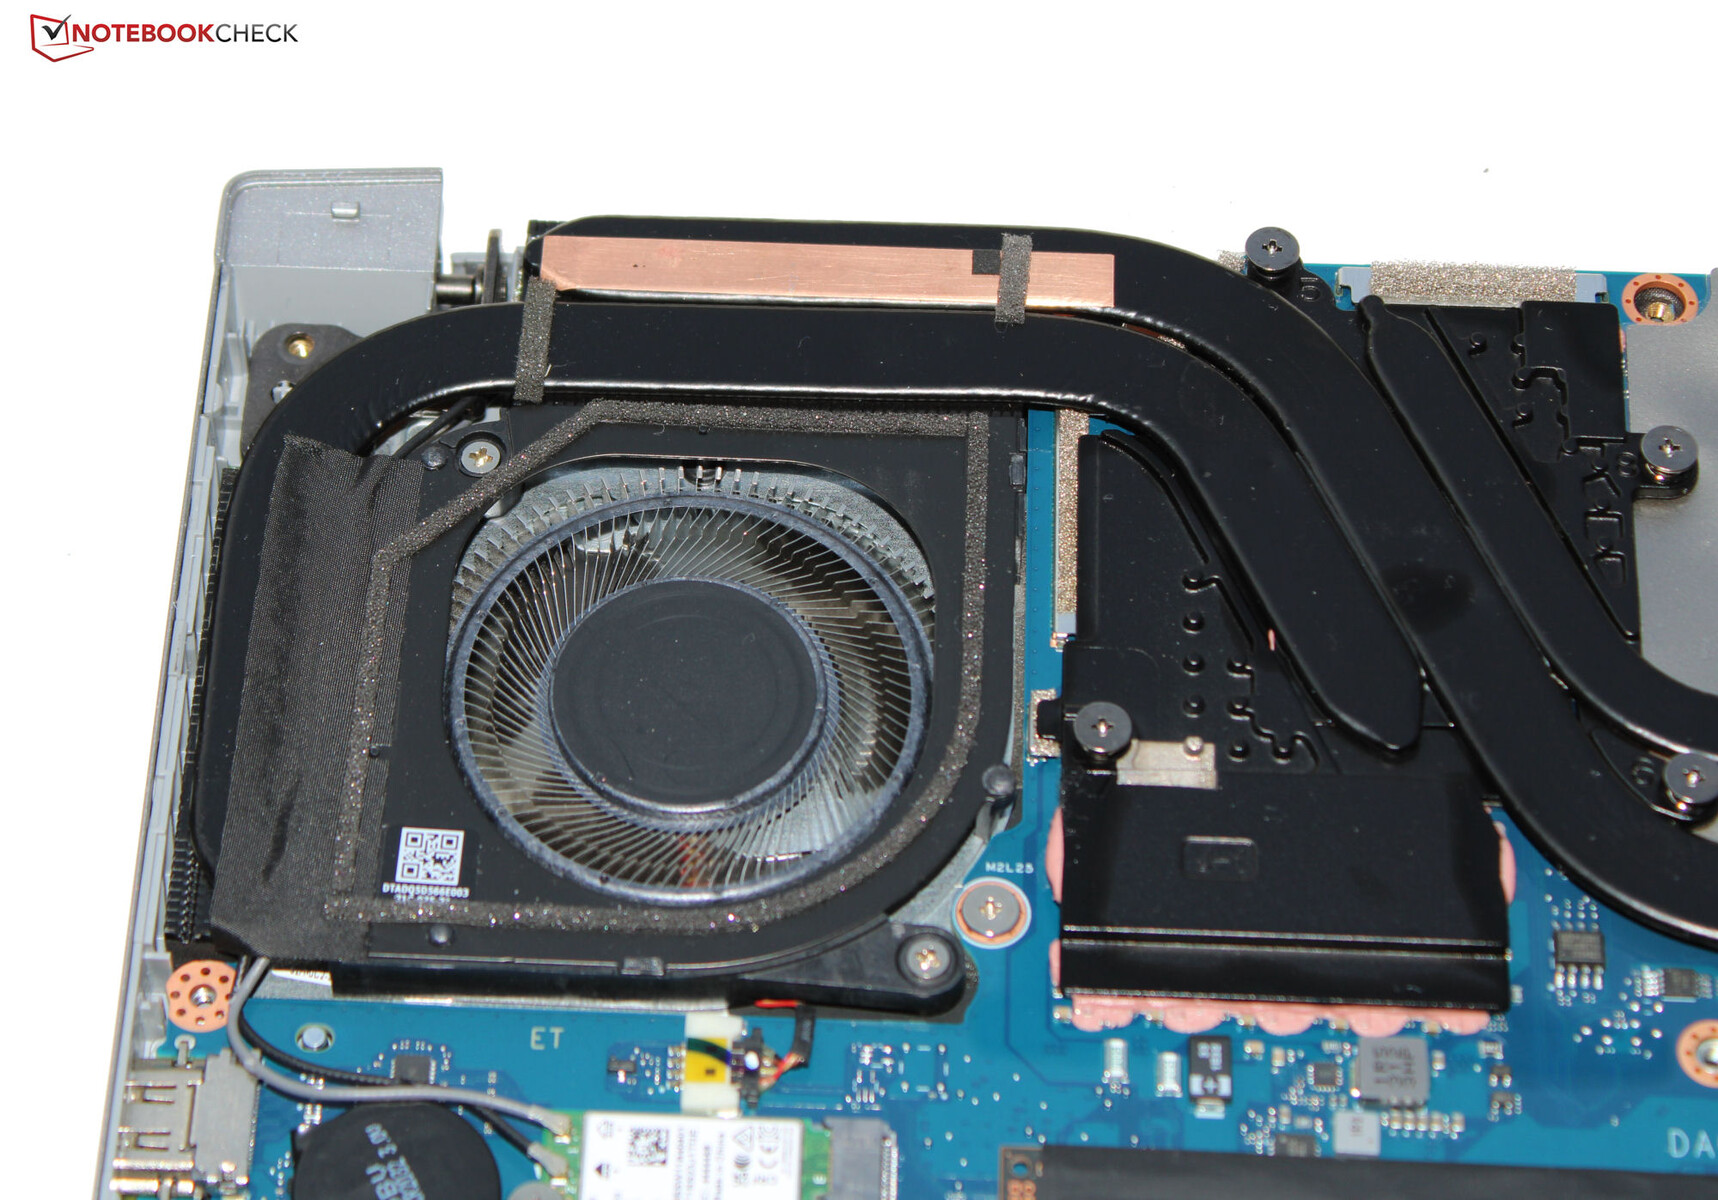
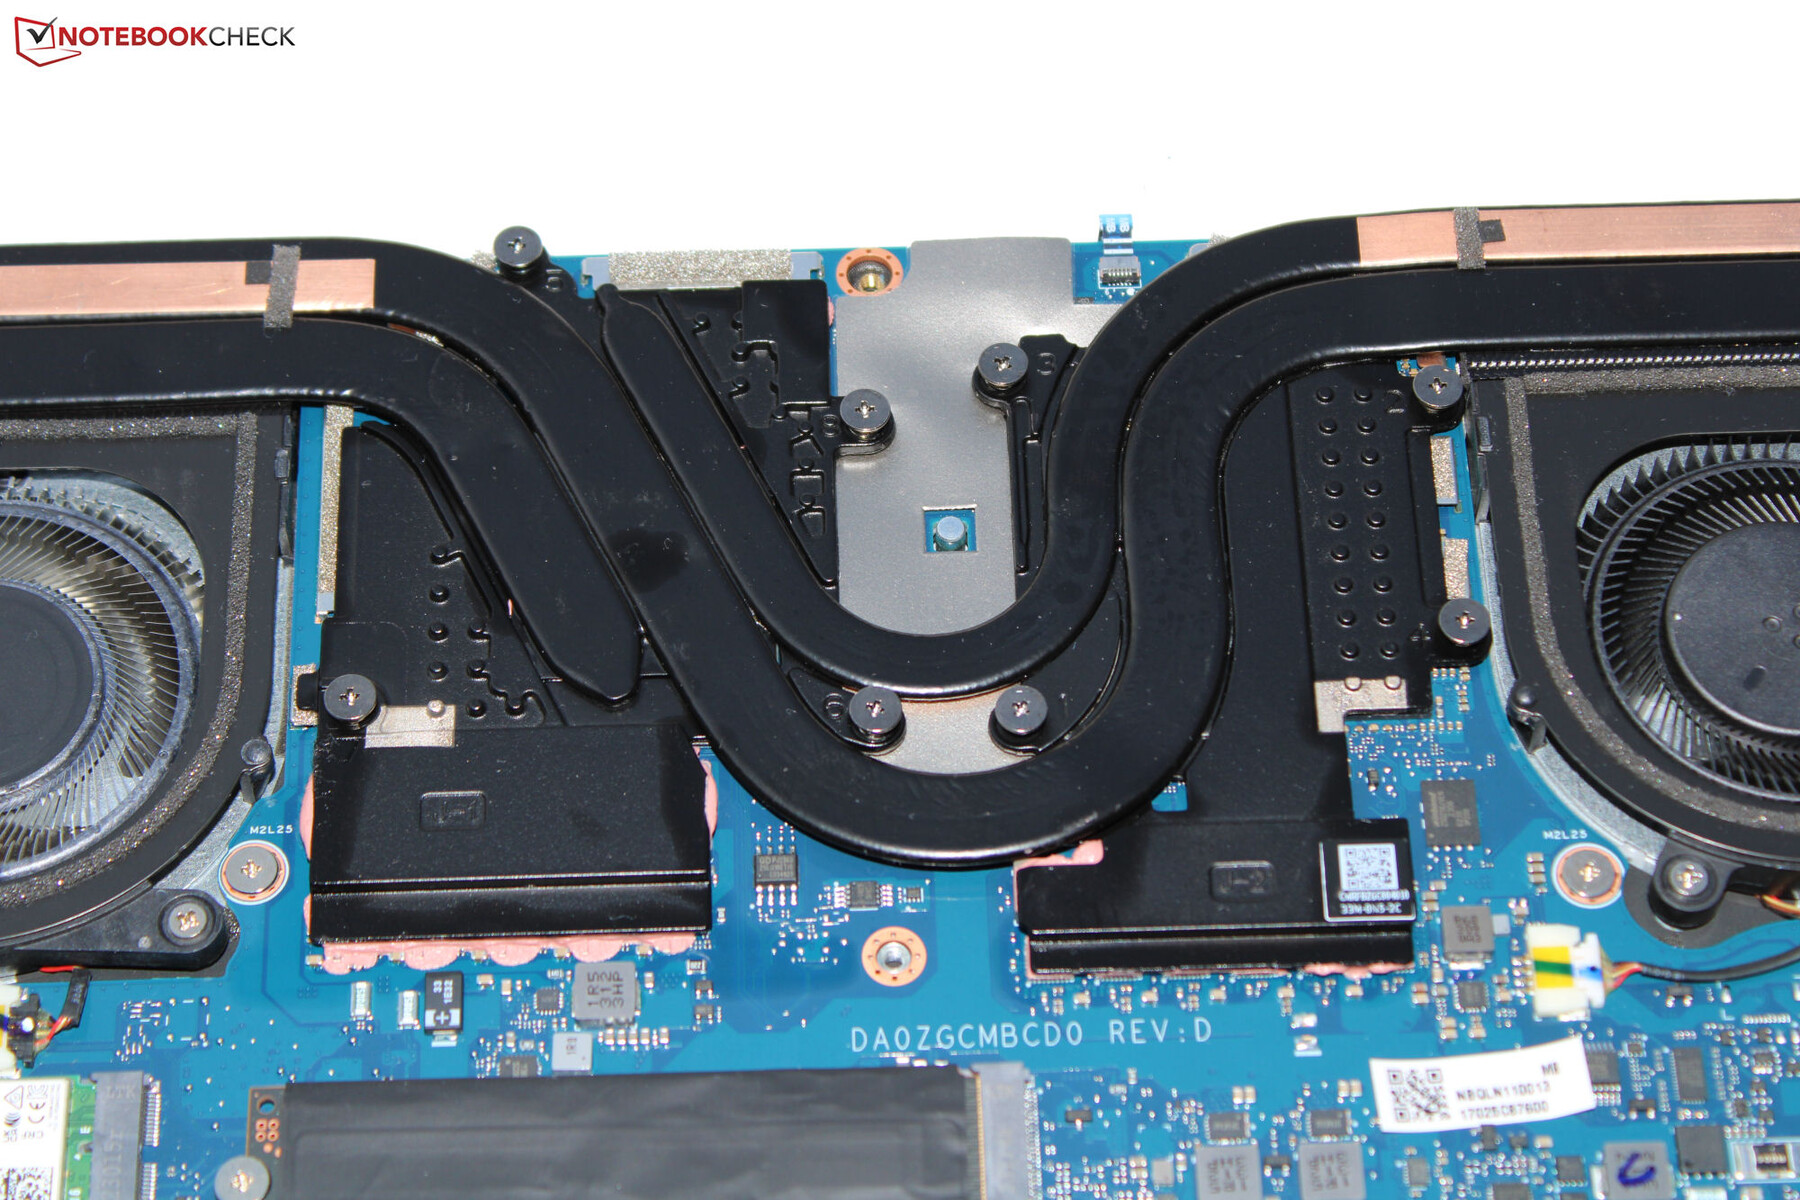
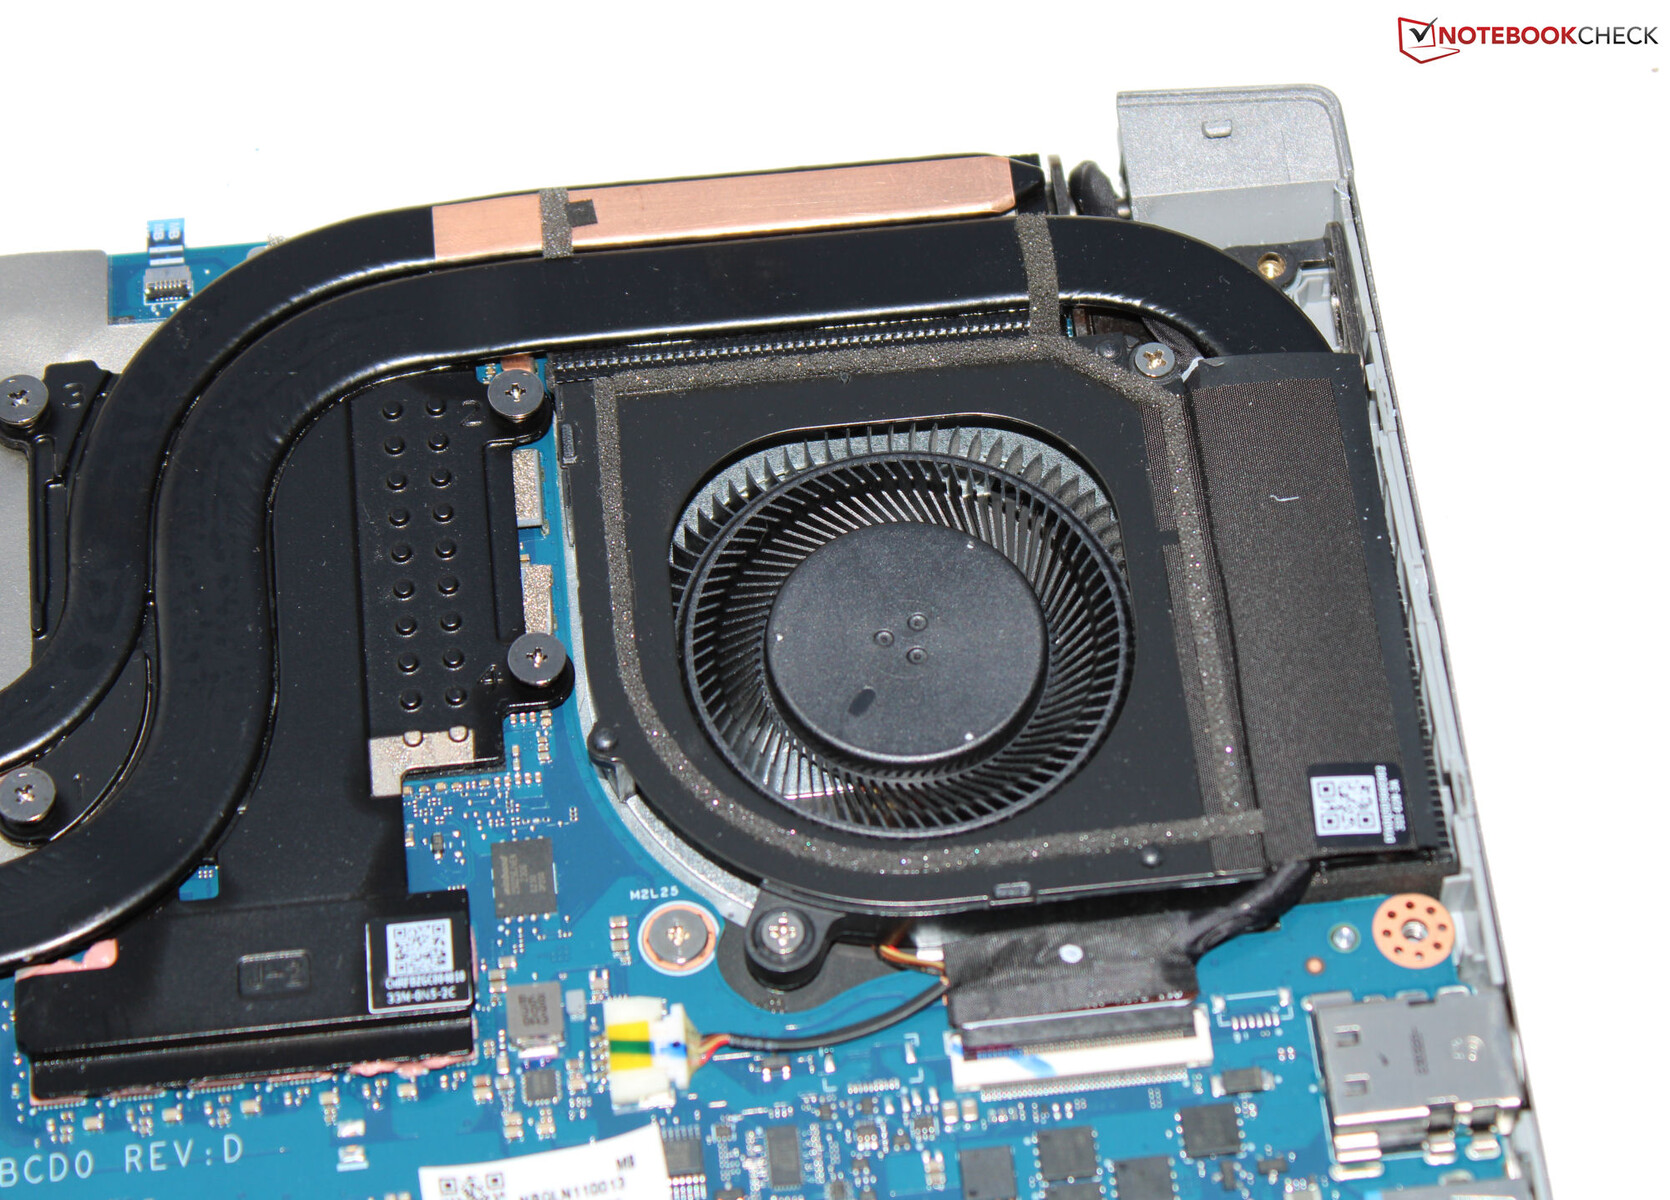
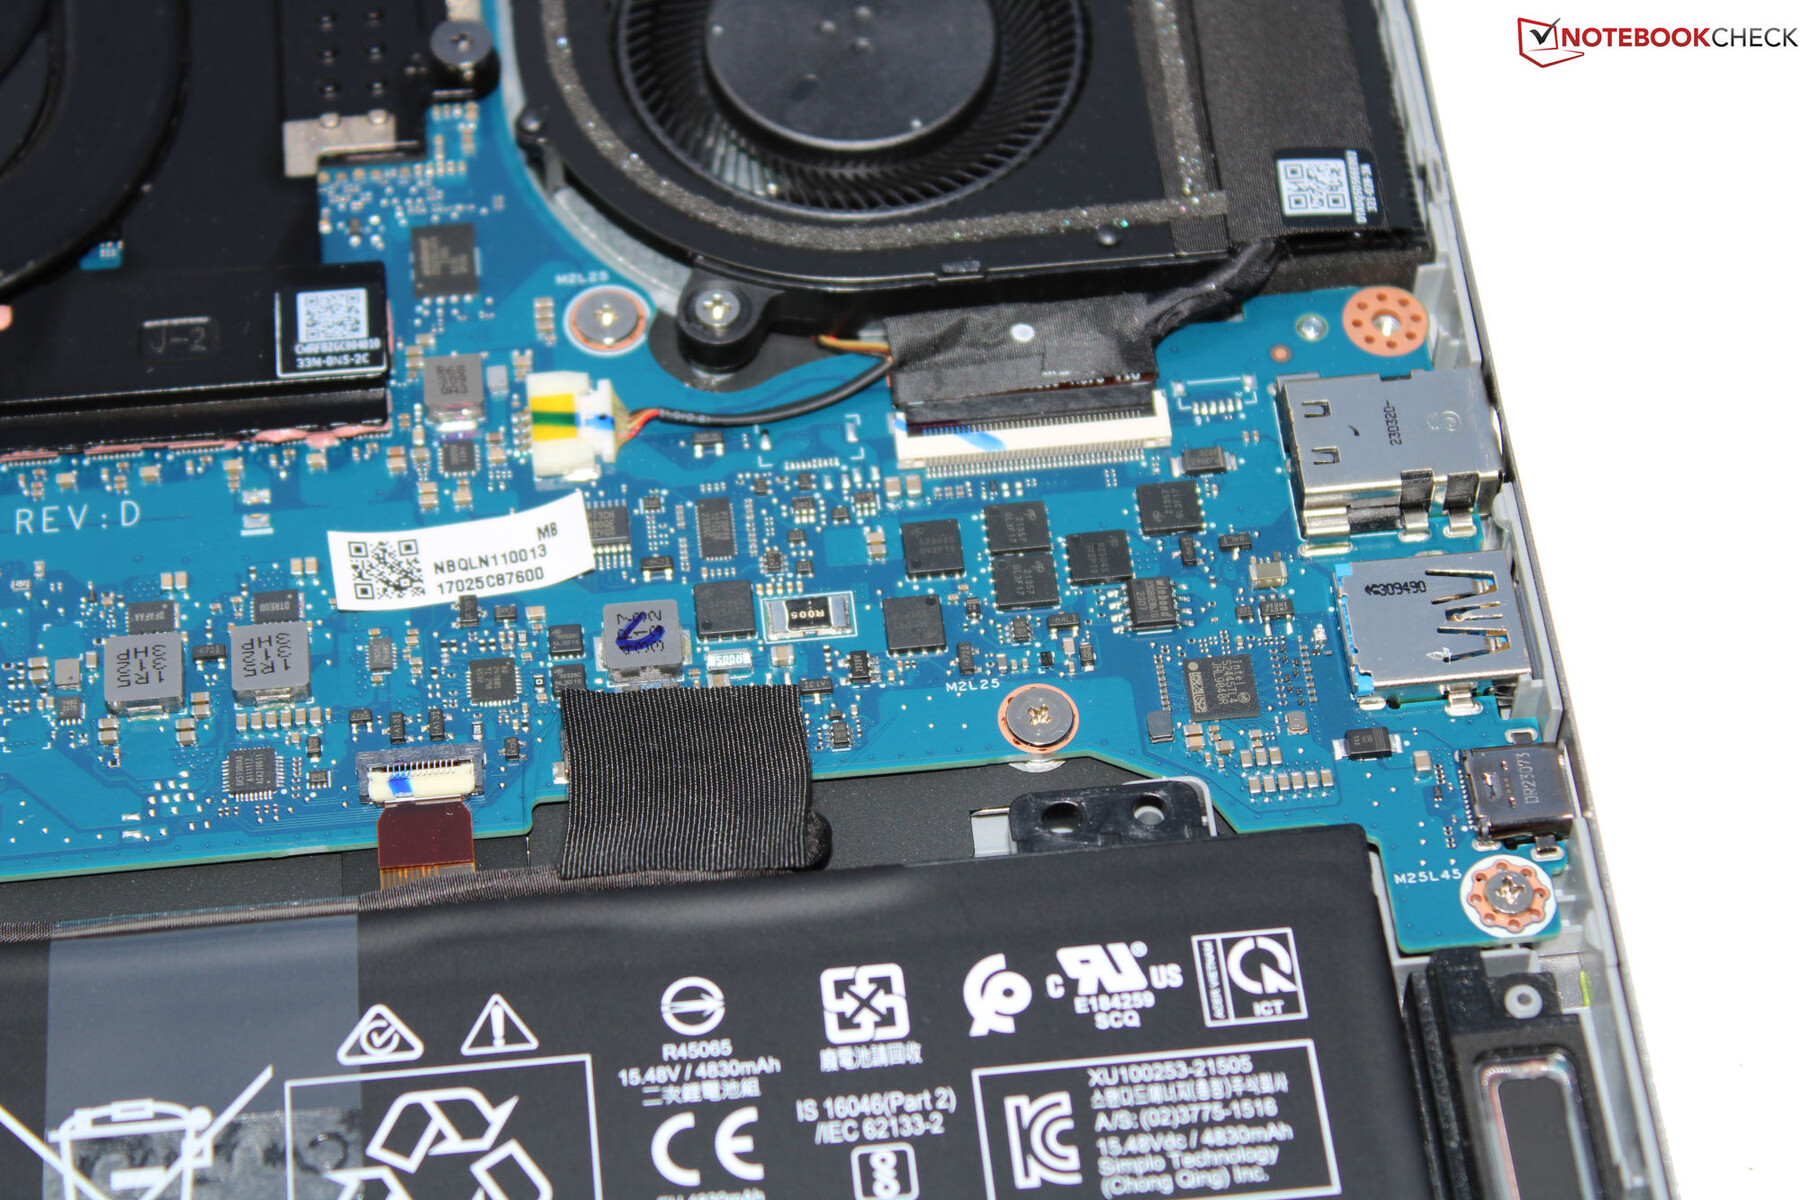
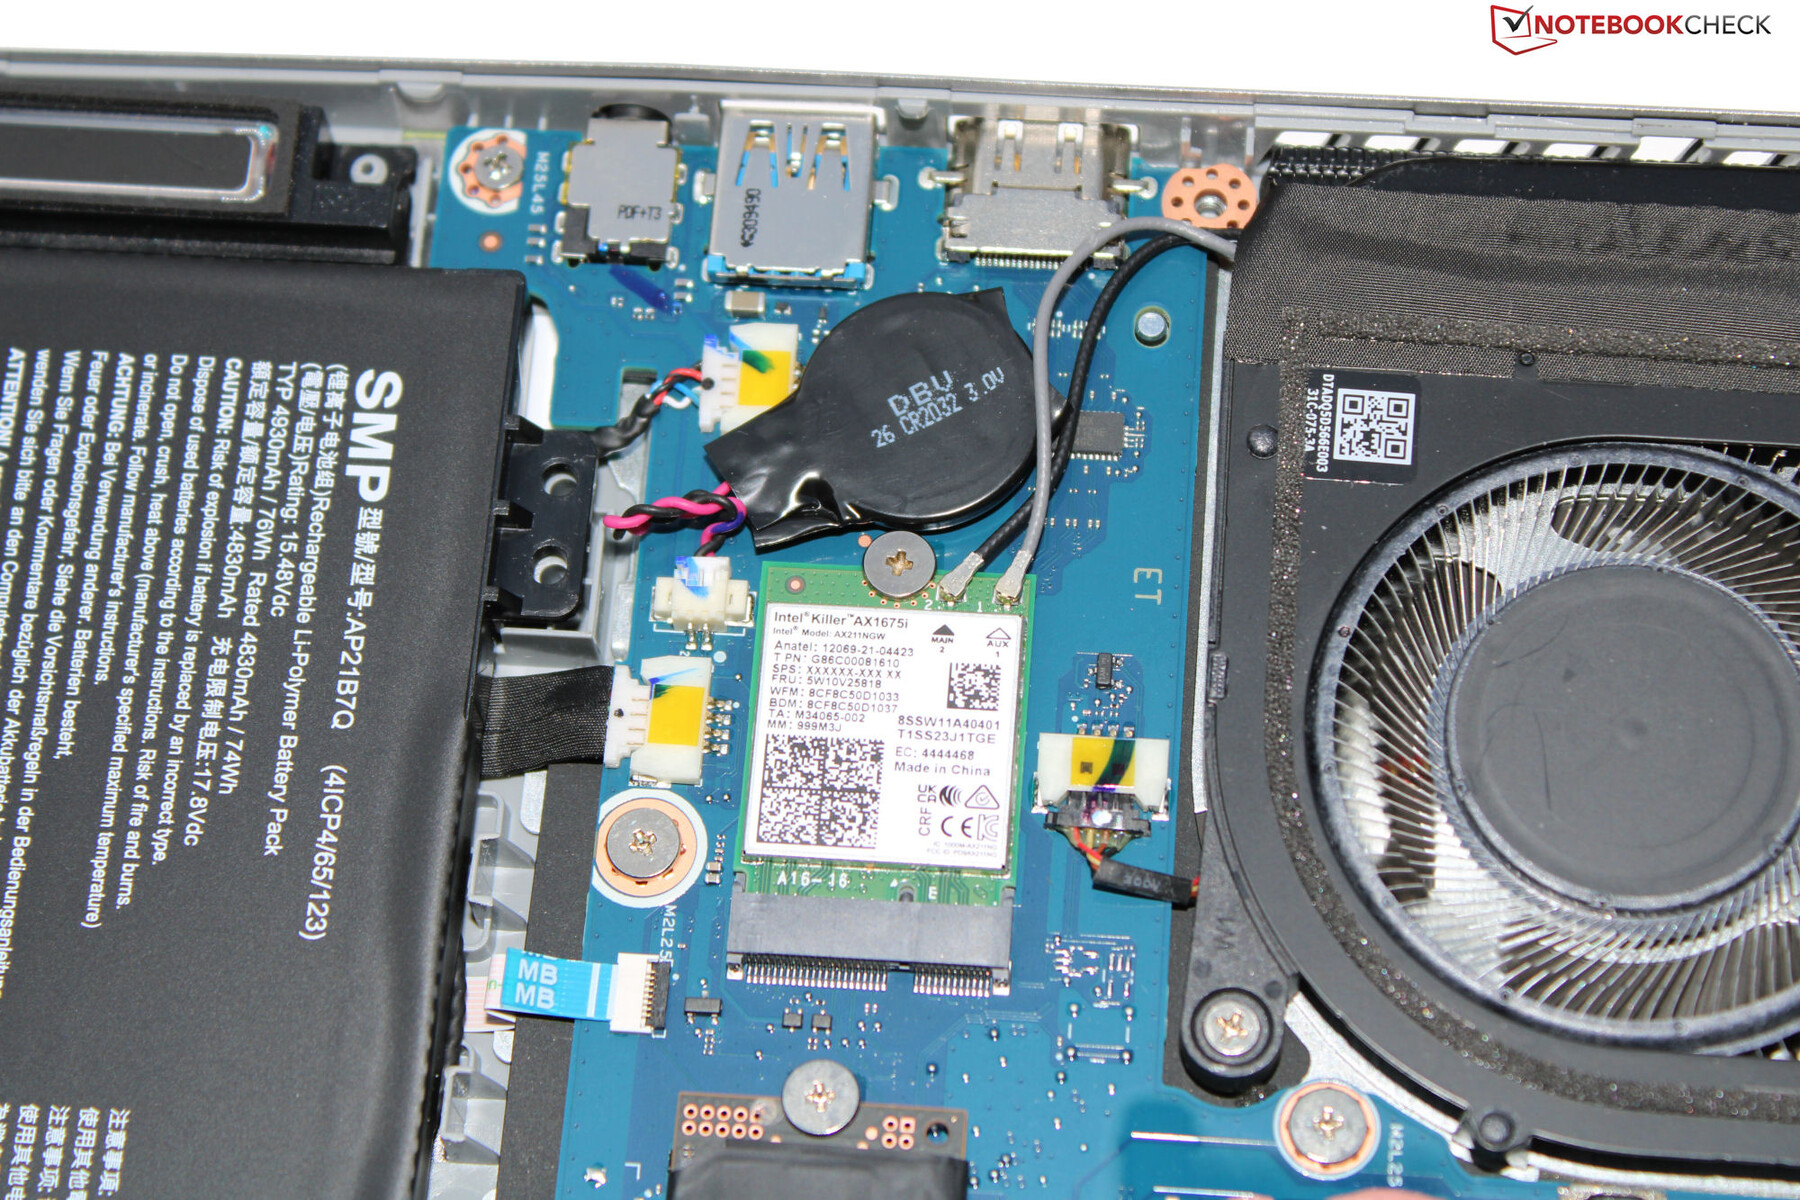
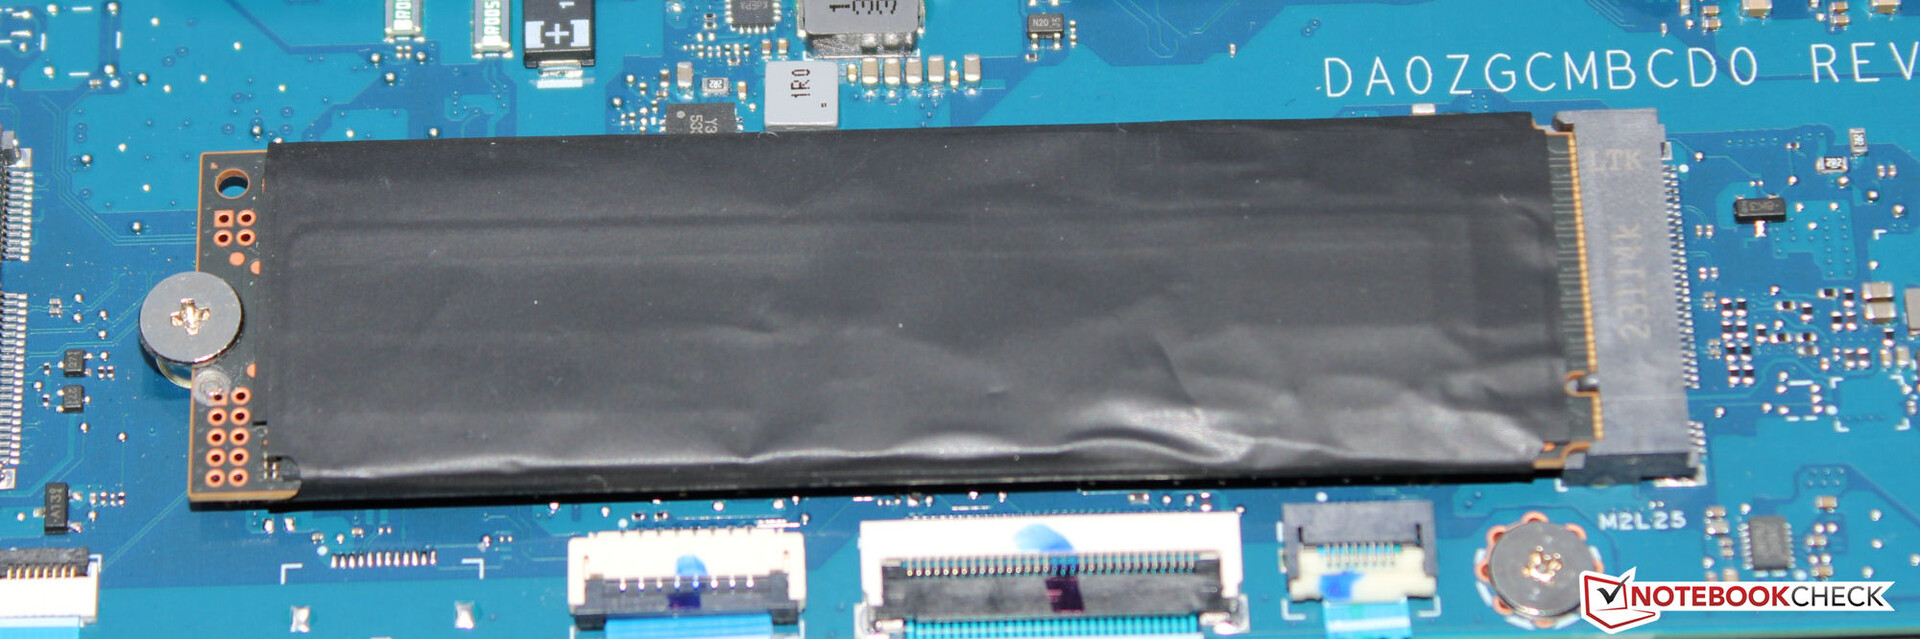
Manutenzione
Dopo aver rimosso tutte le viti sulla base del dispositivo, è possibile rimuovere il guscio inferiore con l'aiuto di un plettro. In questo modo è possibile accedere all'unità SSD (PCIe 4, M.2 2280), alla batteria del BIOS, al modulo Wi-Fi, alle ventole, agli altoparlanti e alla batteria.
Garanzia
Acer ha concesso al dispositivo da 14 pollici una garanzia di due anni. L'estensione a tre anni costa quasi 100 dollari.
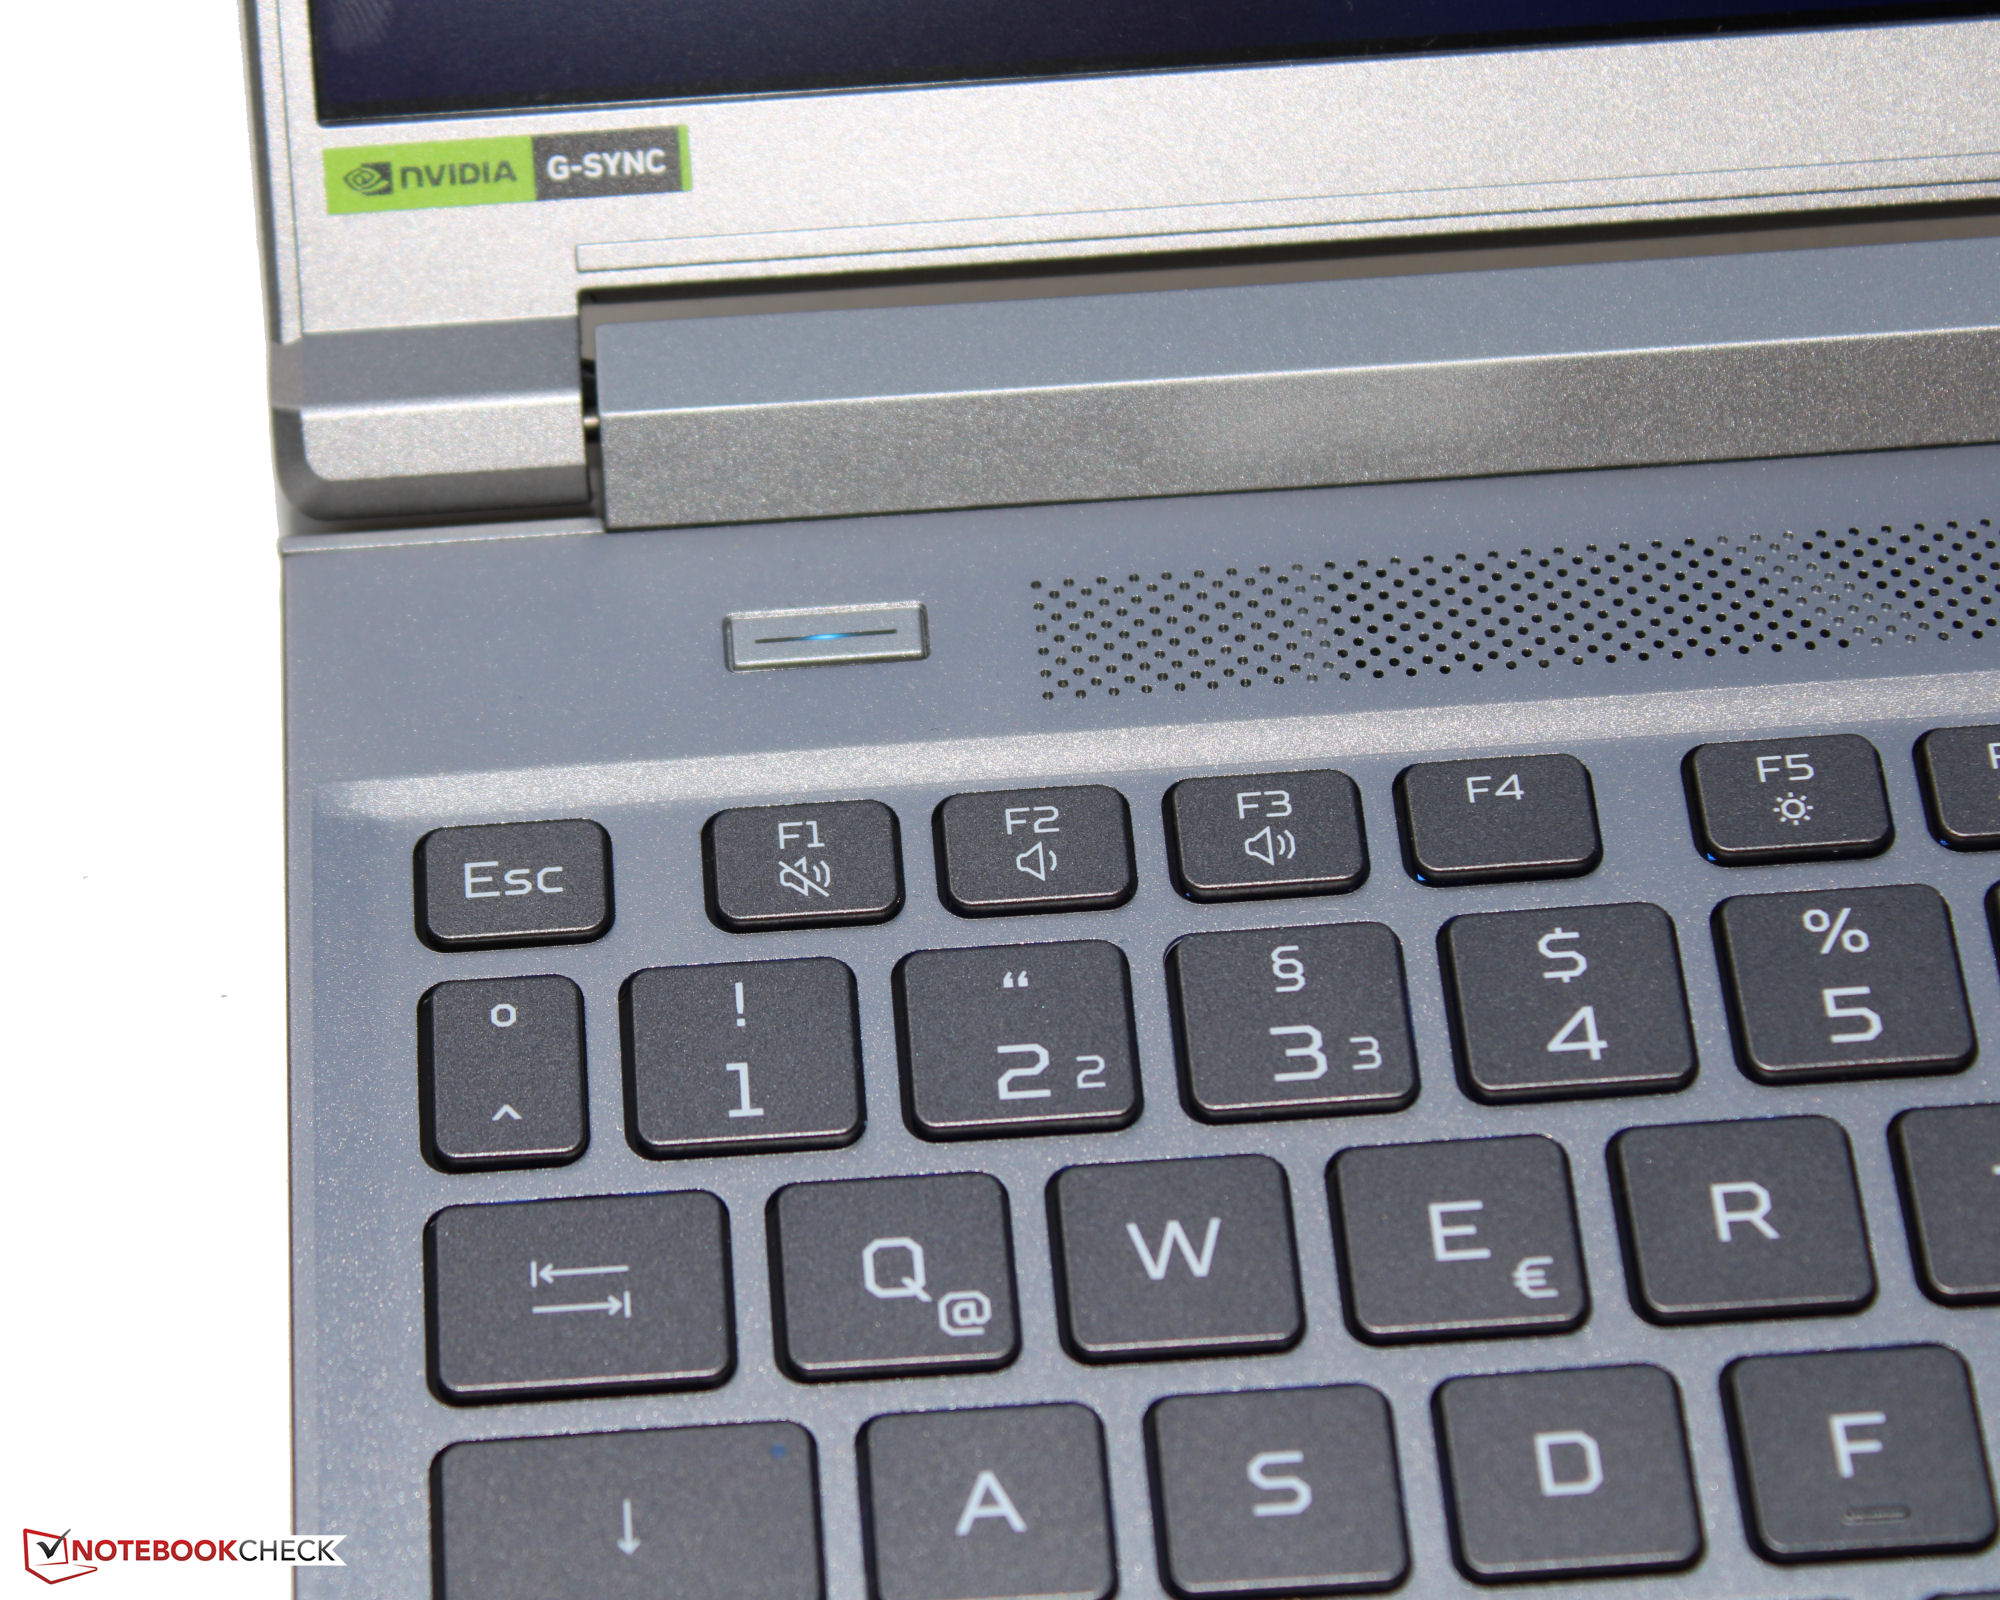
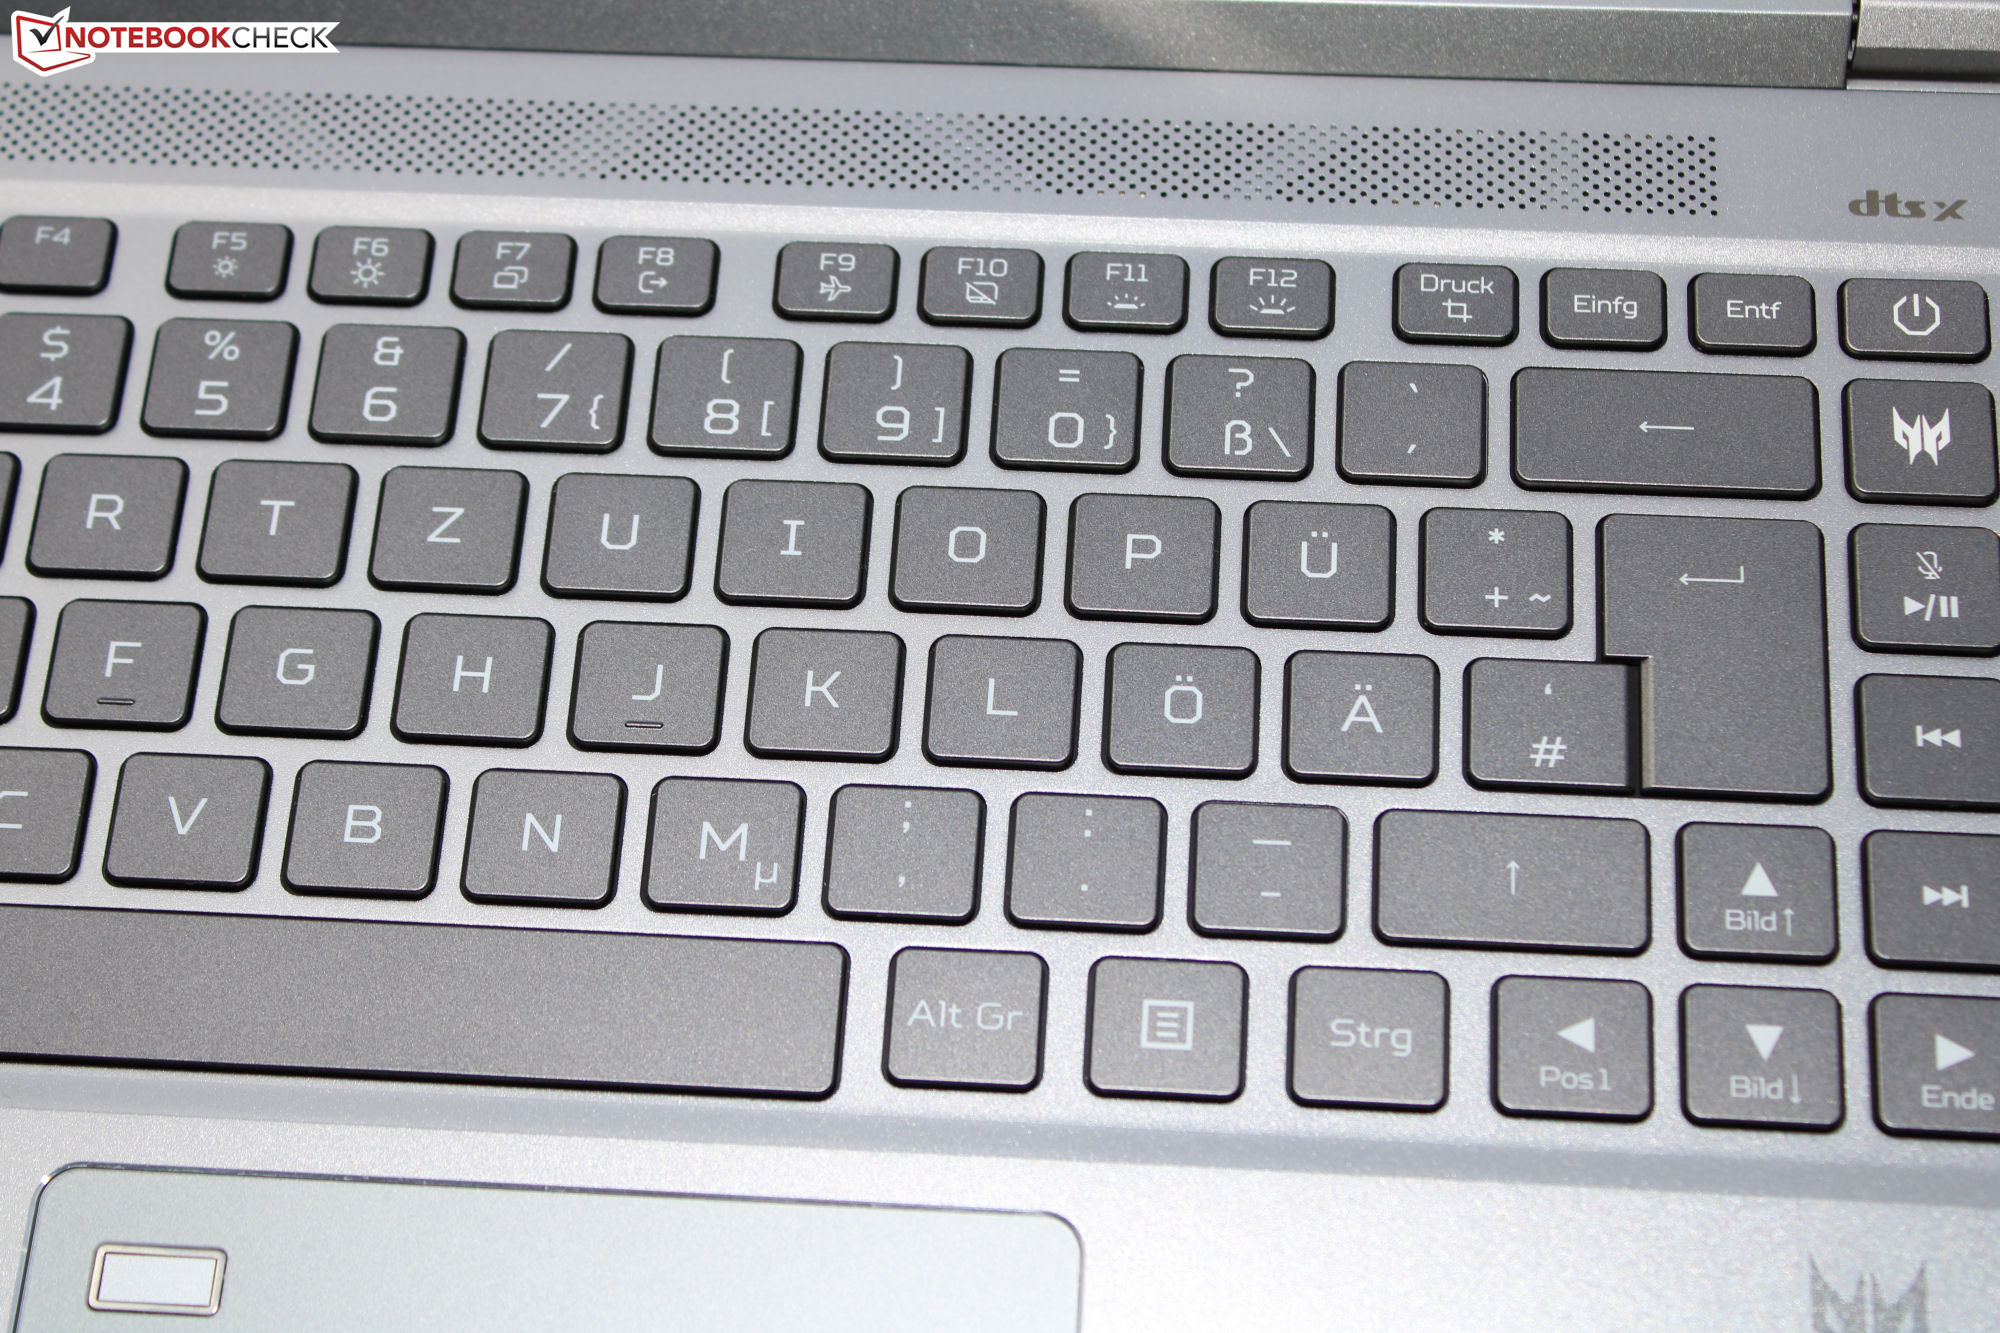
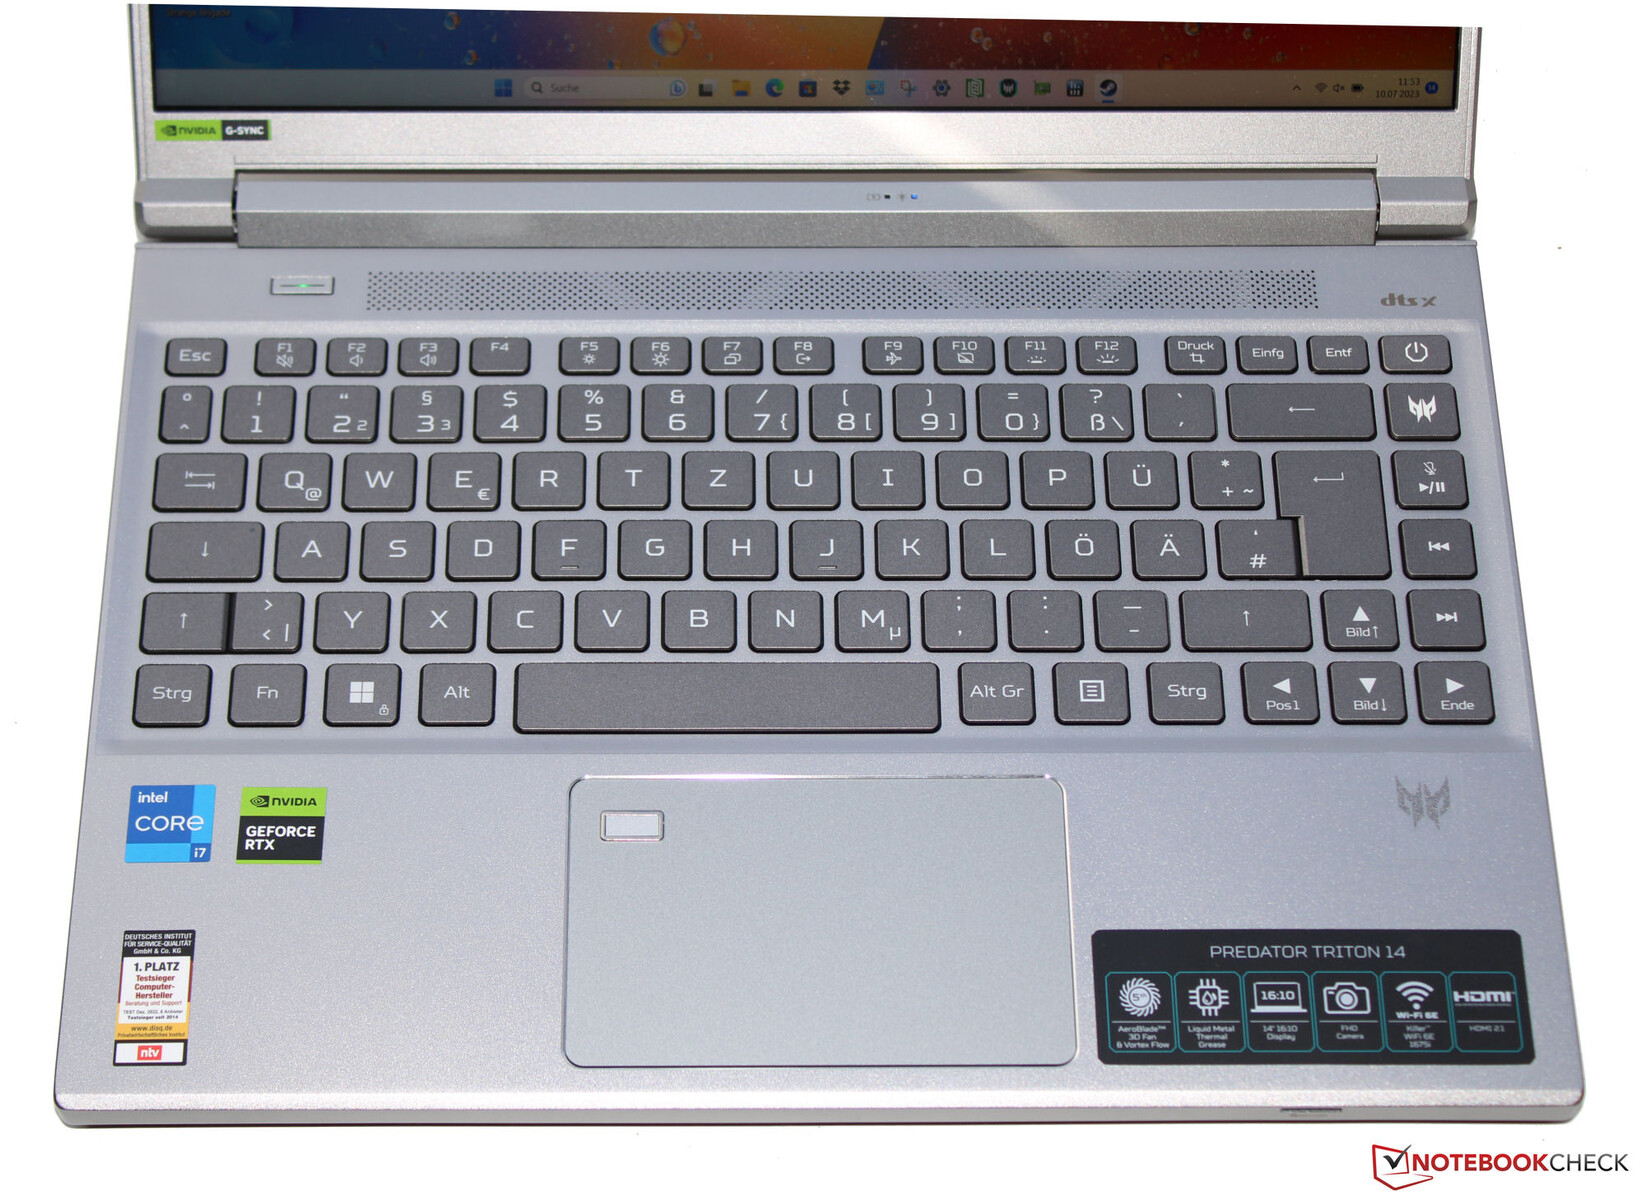
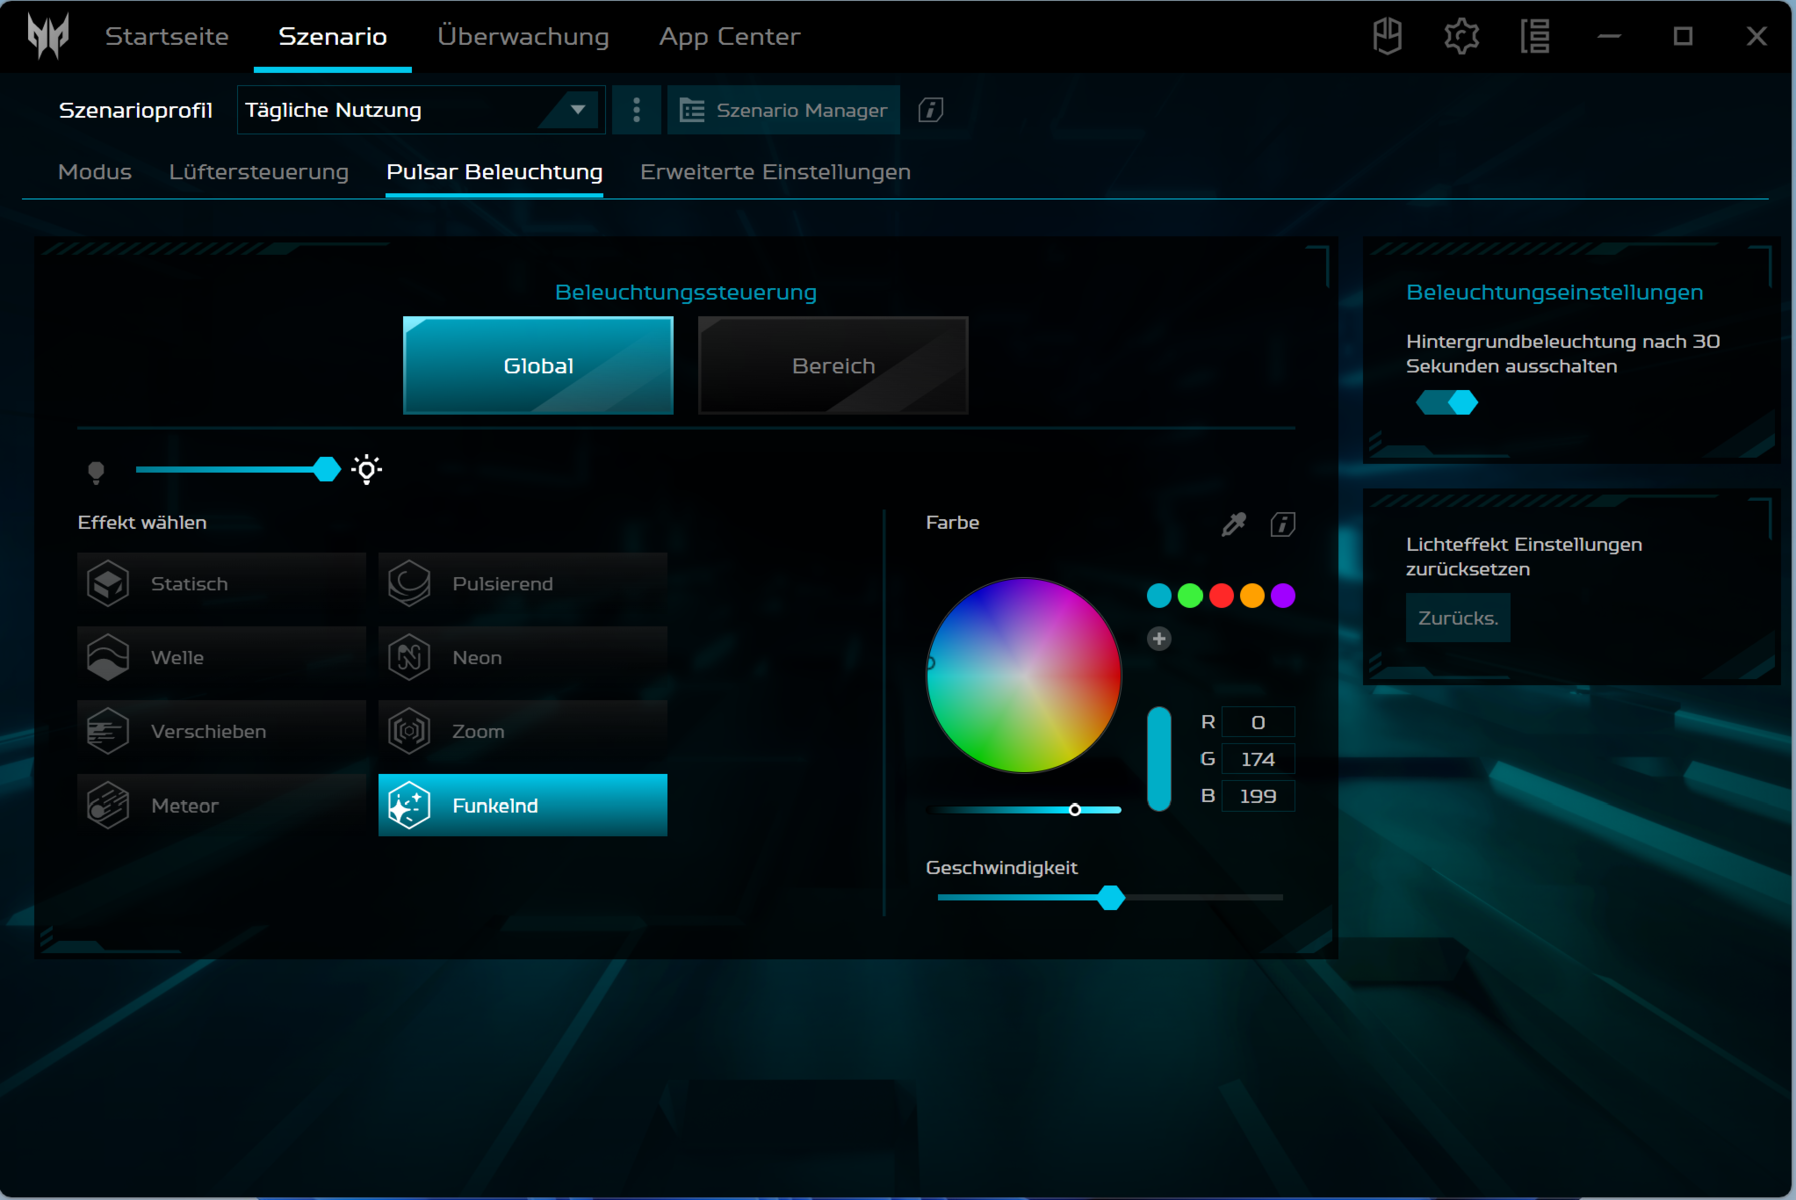
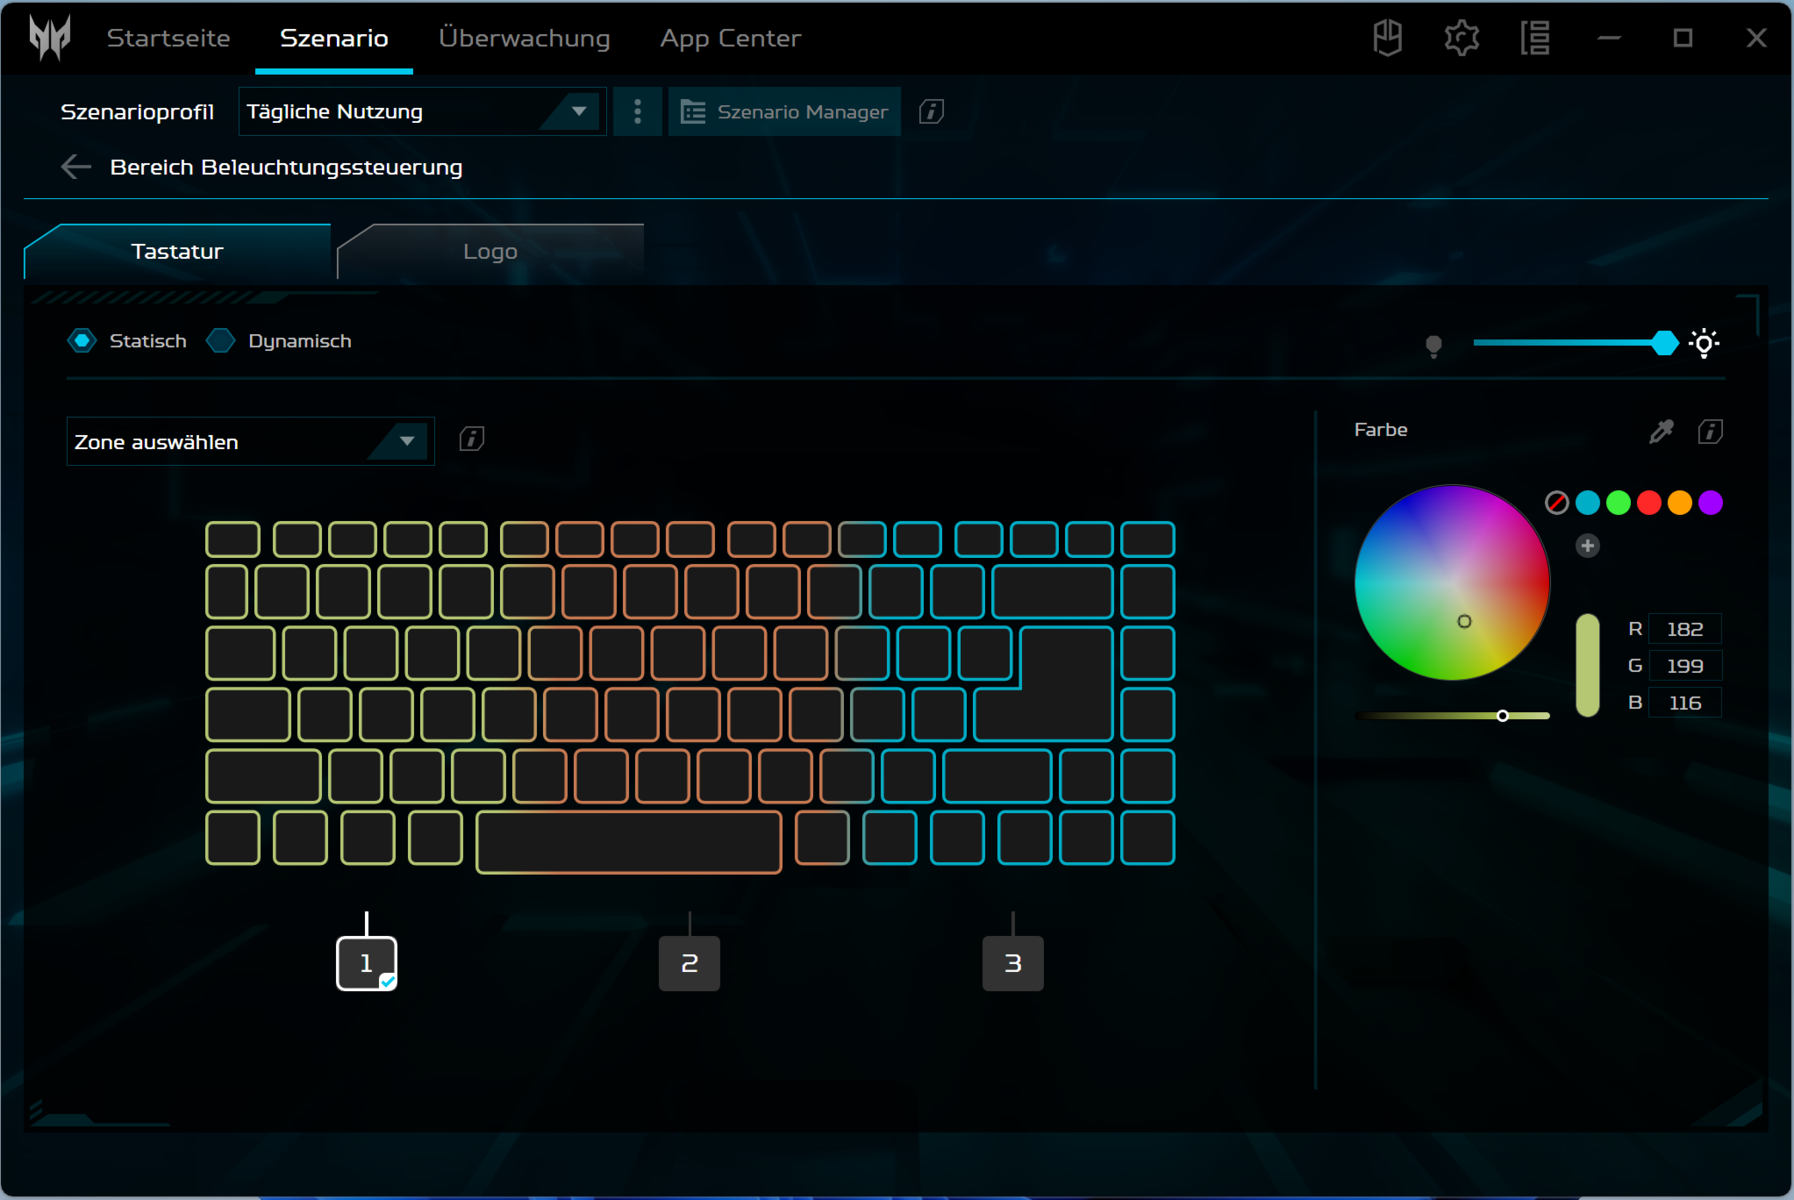
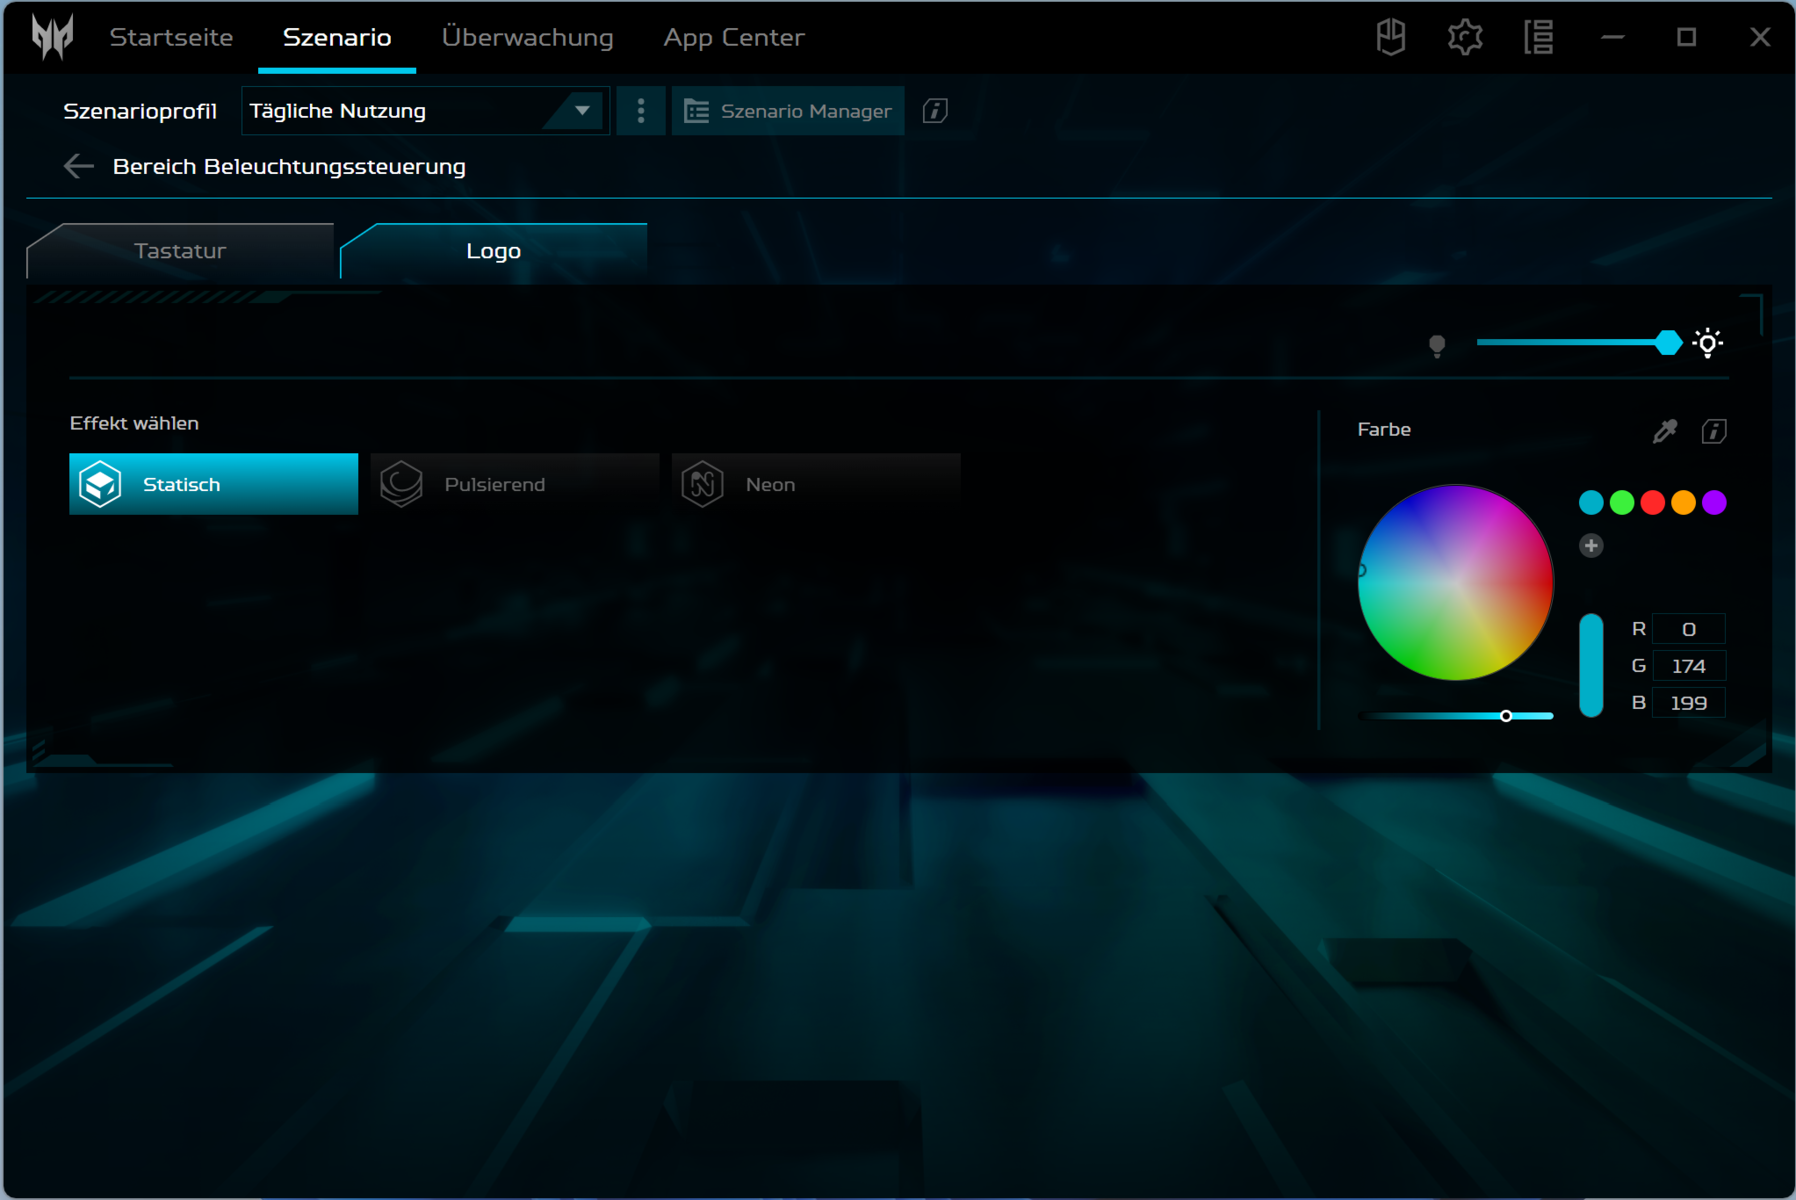
Dispositivi di input - L'Acer Predator è dotato di illuminazione dei tasti RGB
Tastiera
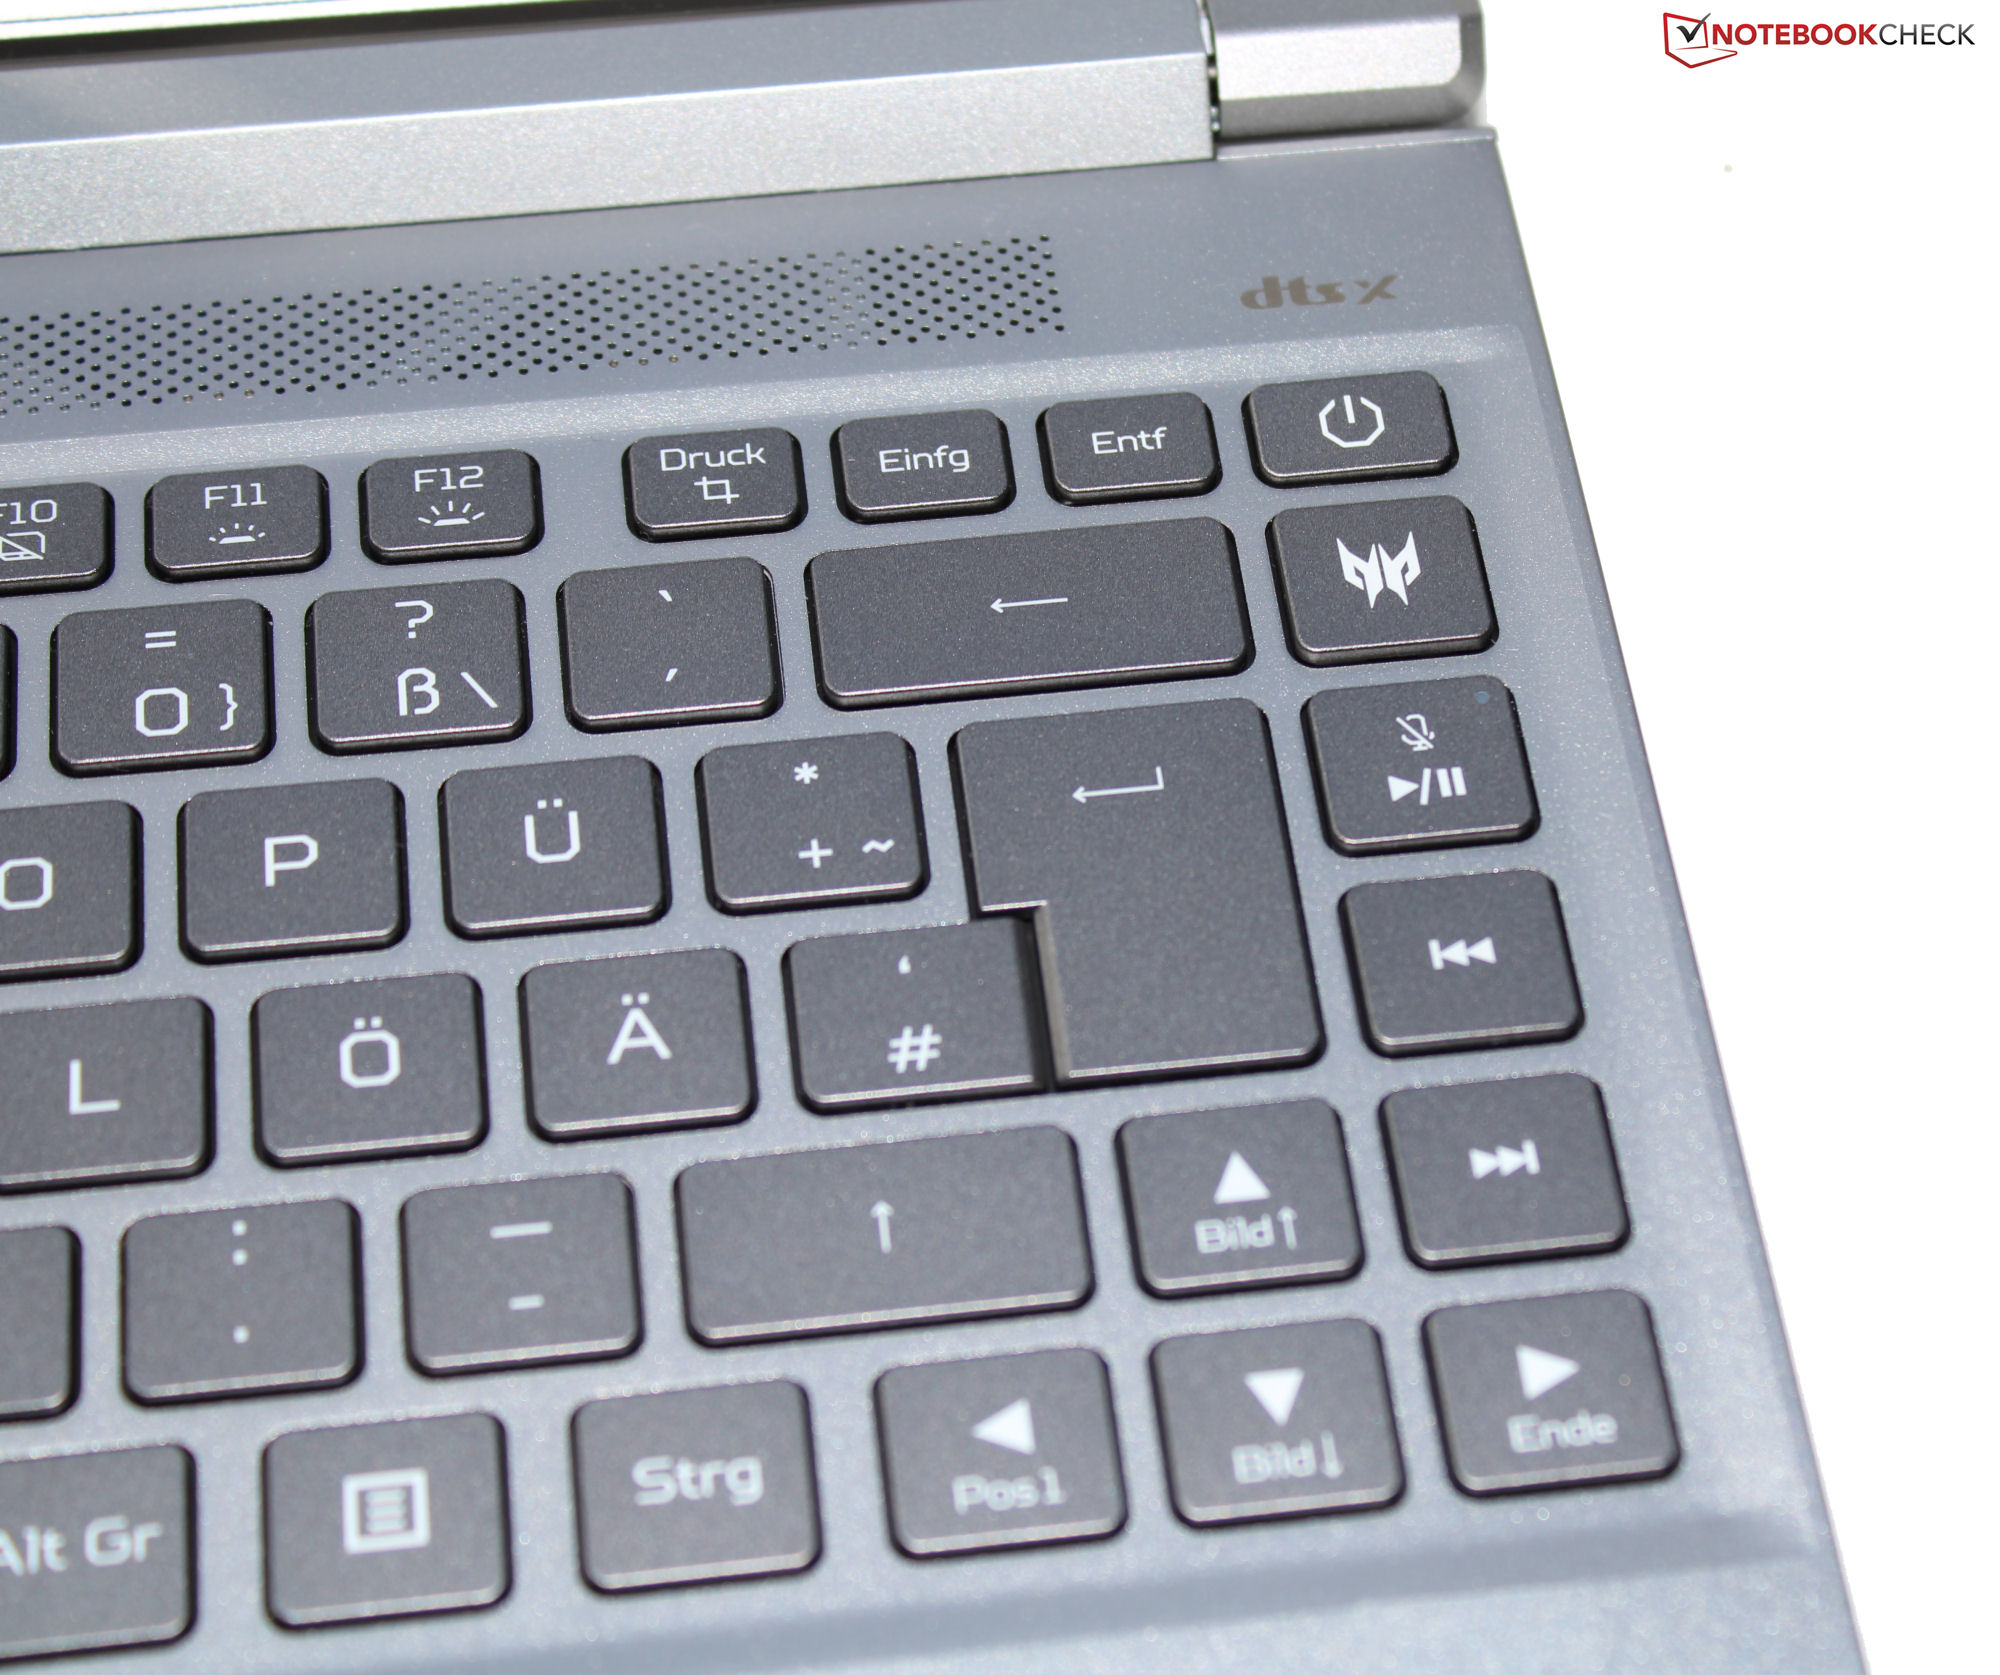
I tasti piatti e lisci della tastiera chiclet (illuminazione RGB) hanno una corsa breve, un punto di pressione ben definito e una buona resistenza dei tasti. Durante la digitazione, la tastiera non traballa. Buono: Tutti e quattro i tasti freccia sono di dimensioni normali. Nel complesso, Acer ha fornito una tastiera adatta all'uso quotidiano.
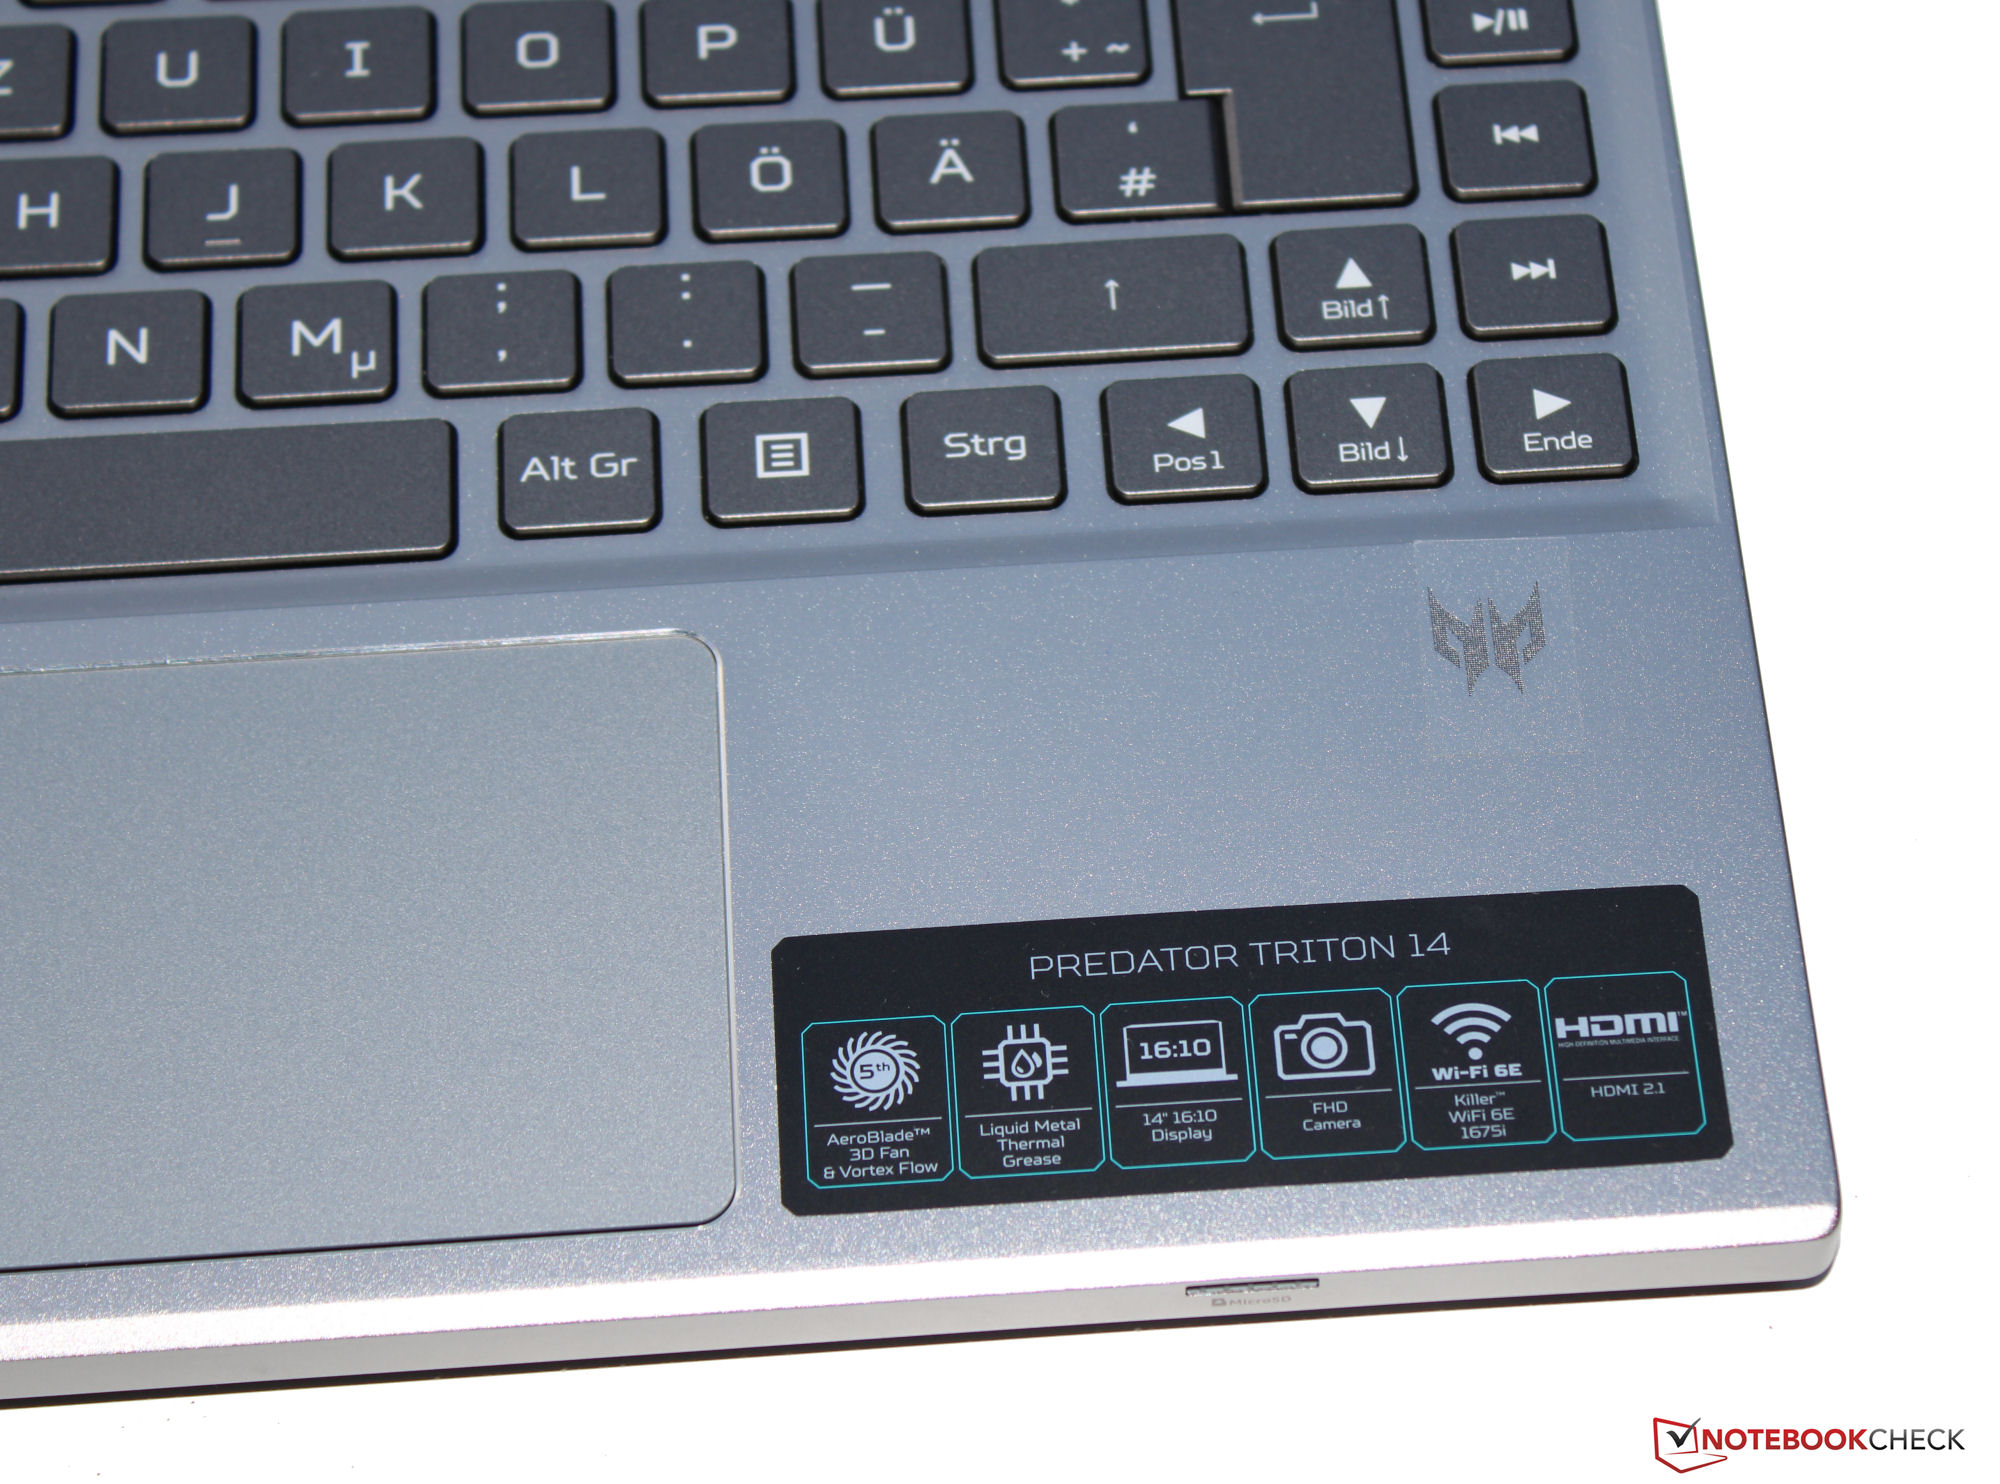
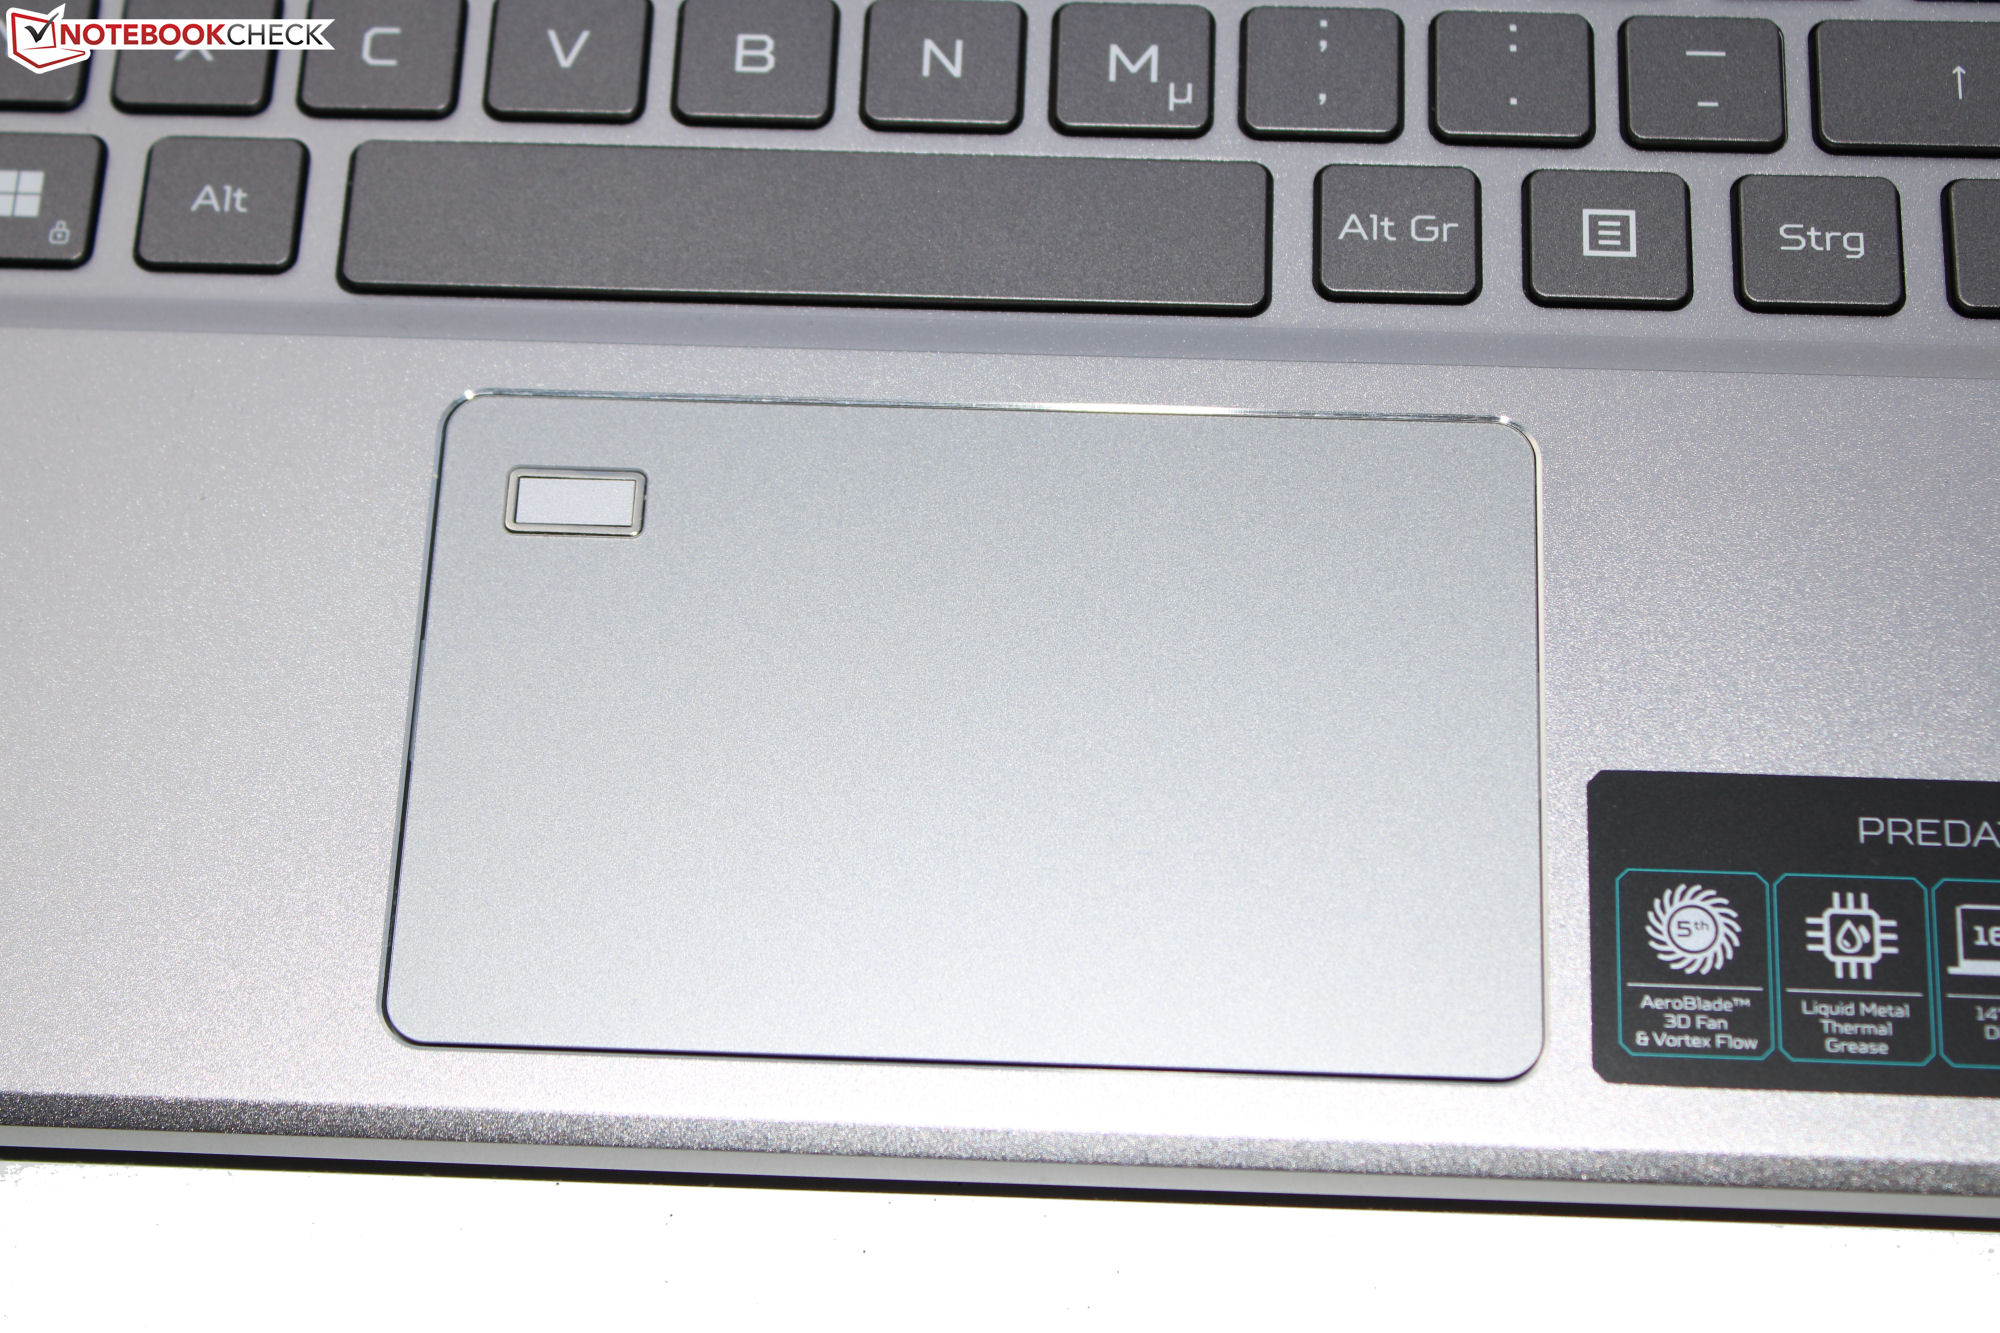
Touchpad
Un mouse alternativo è costituito da un Clickpad multi-touch (circa 10,5 x 6,5 cm) su cui le dita dell'utente si muovono senza sforzo. La corsa è breve e il punto di pressione è chiaramente definito.
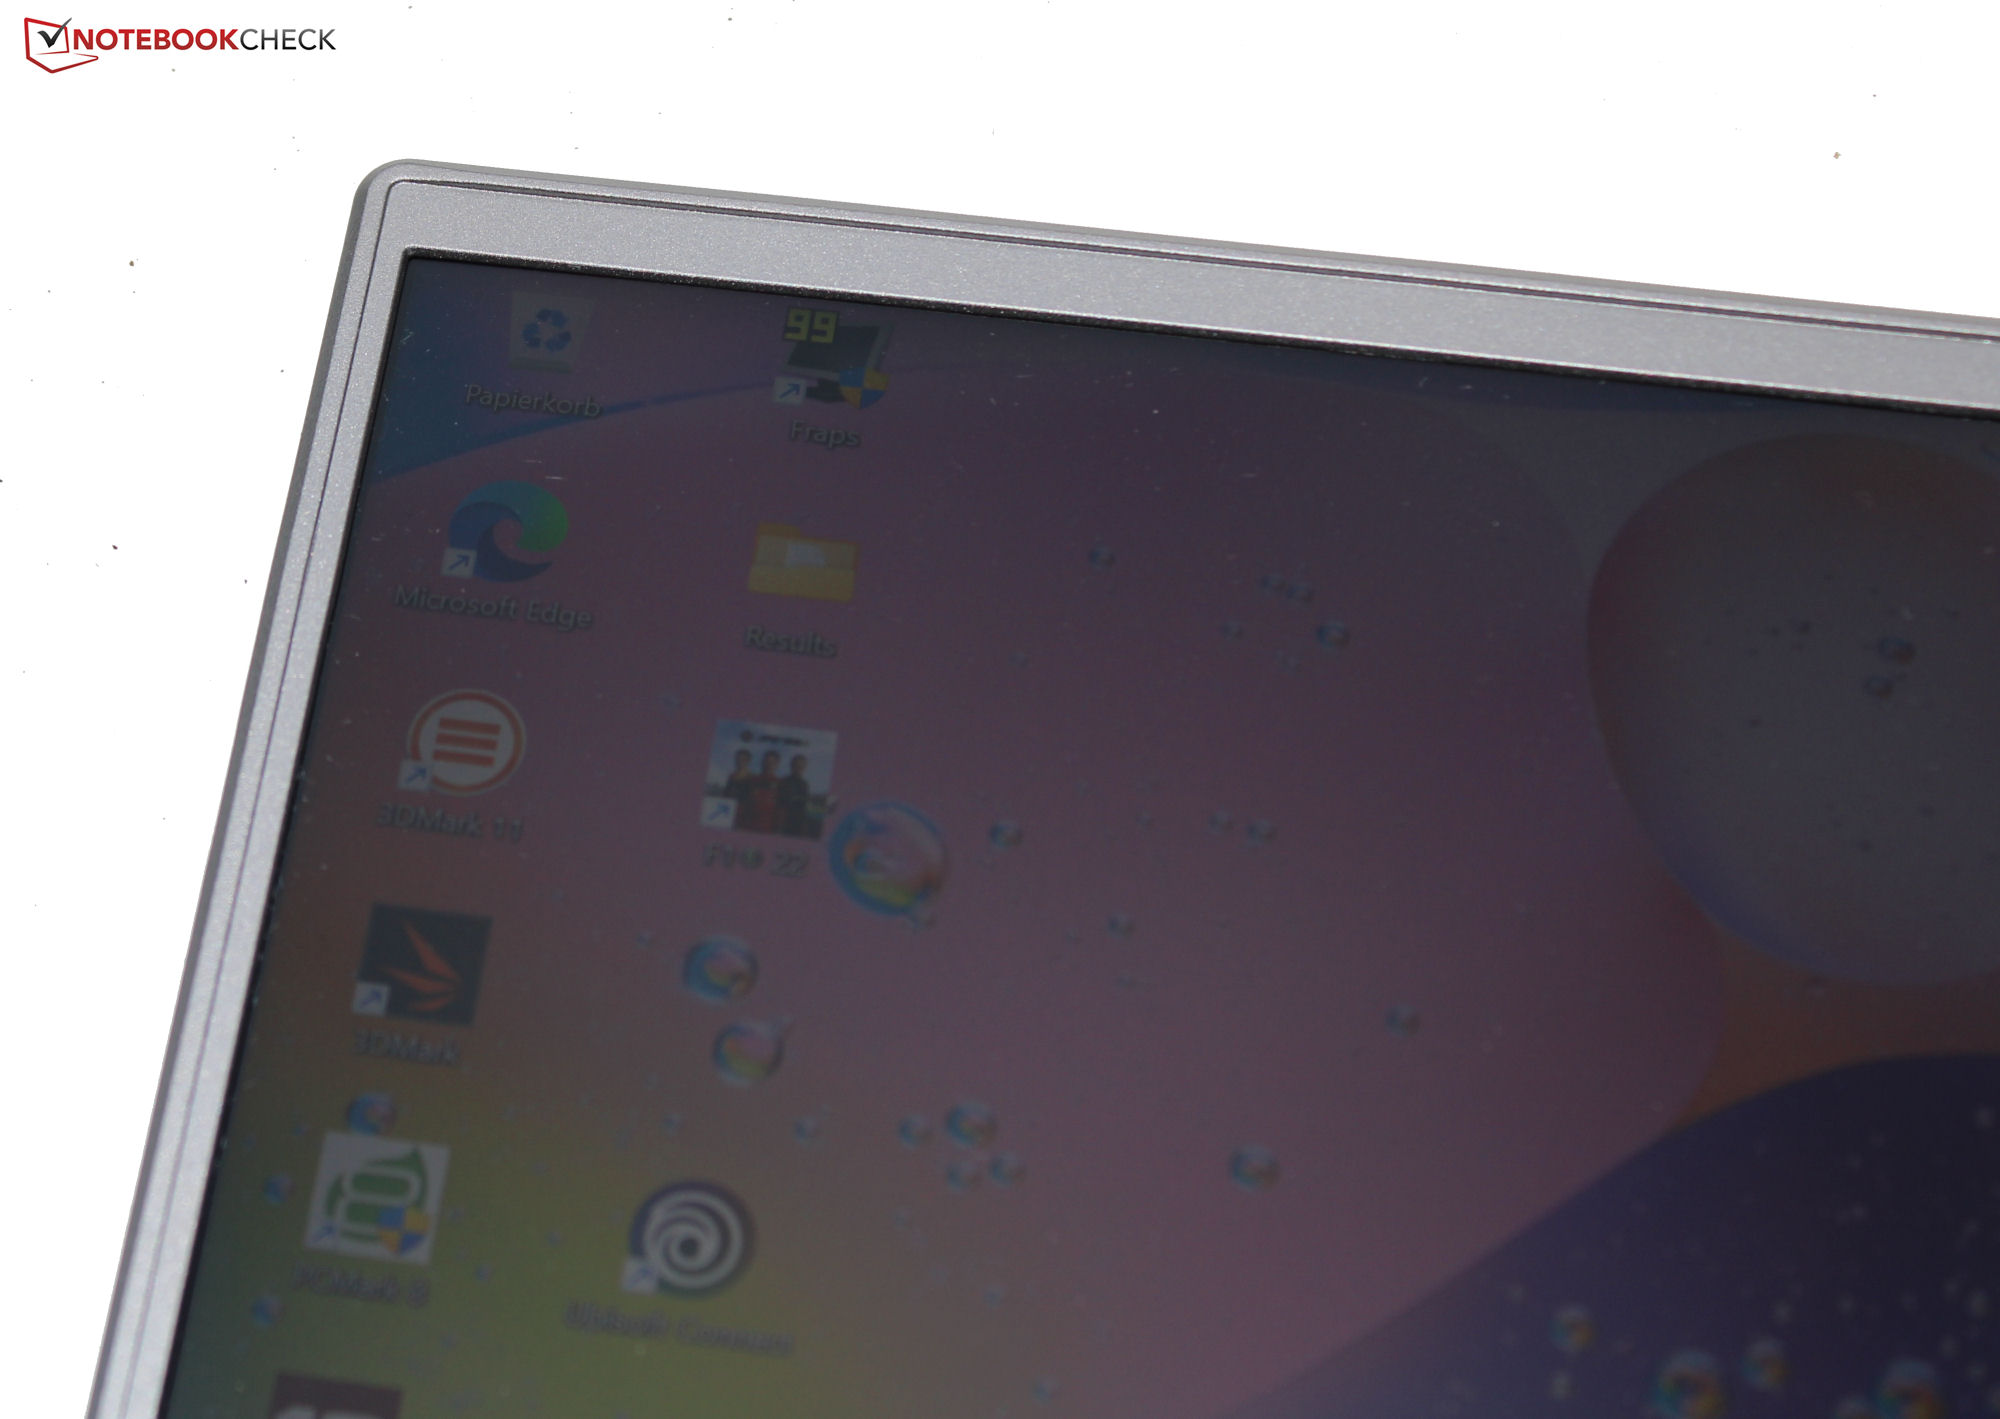
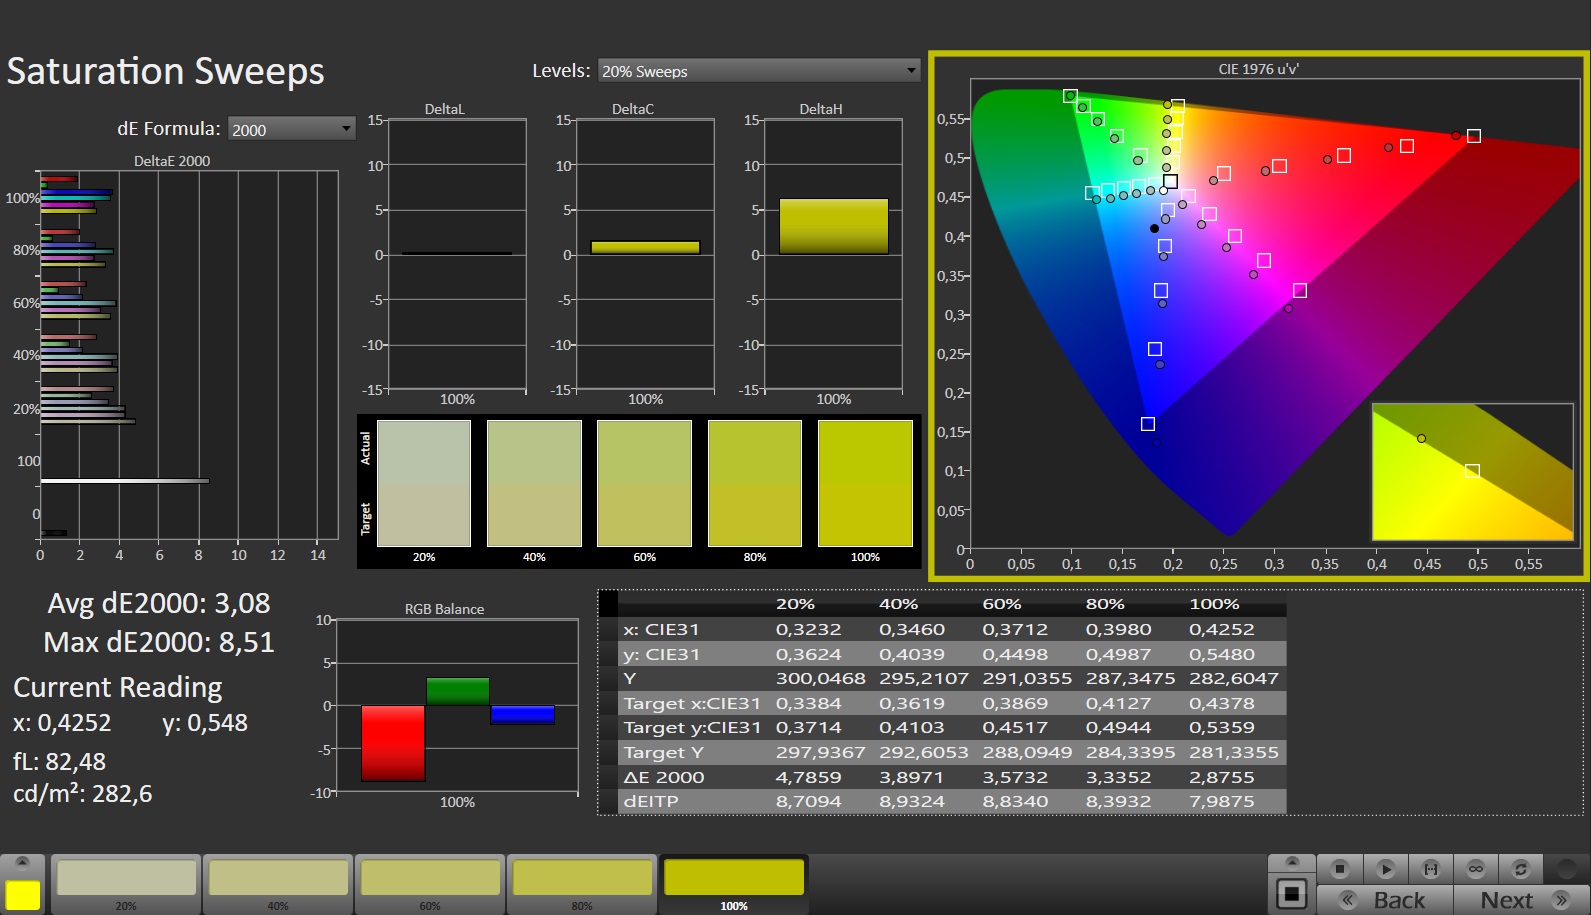
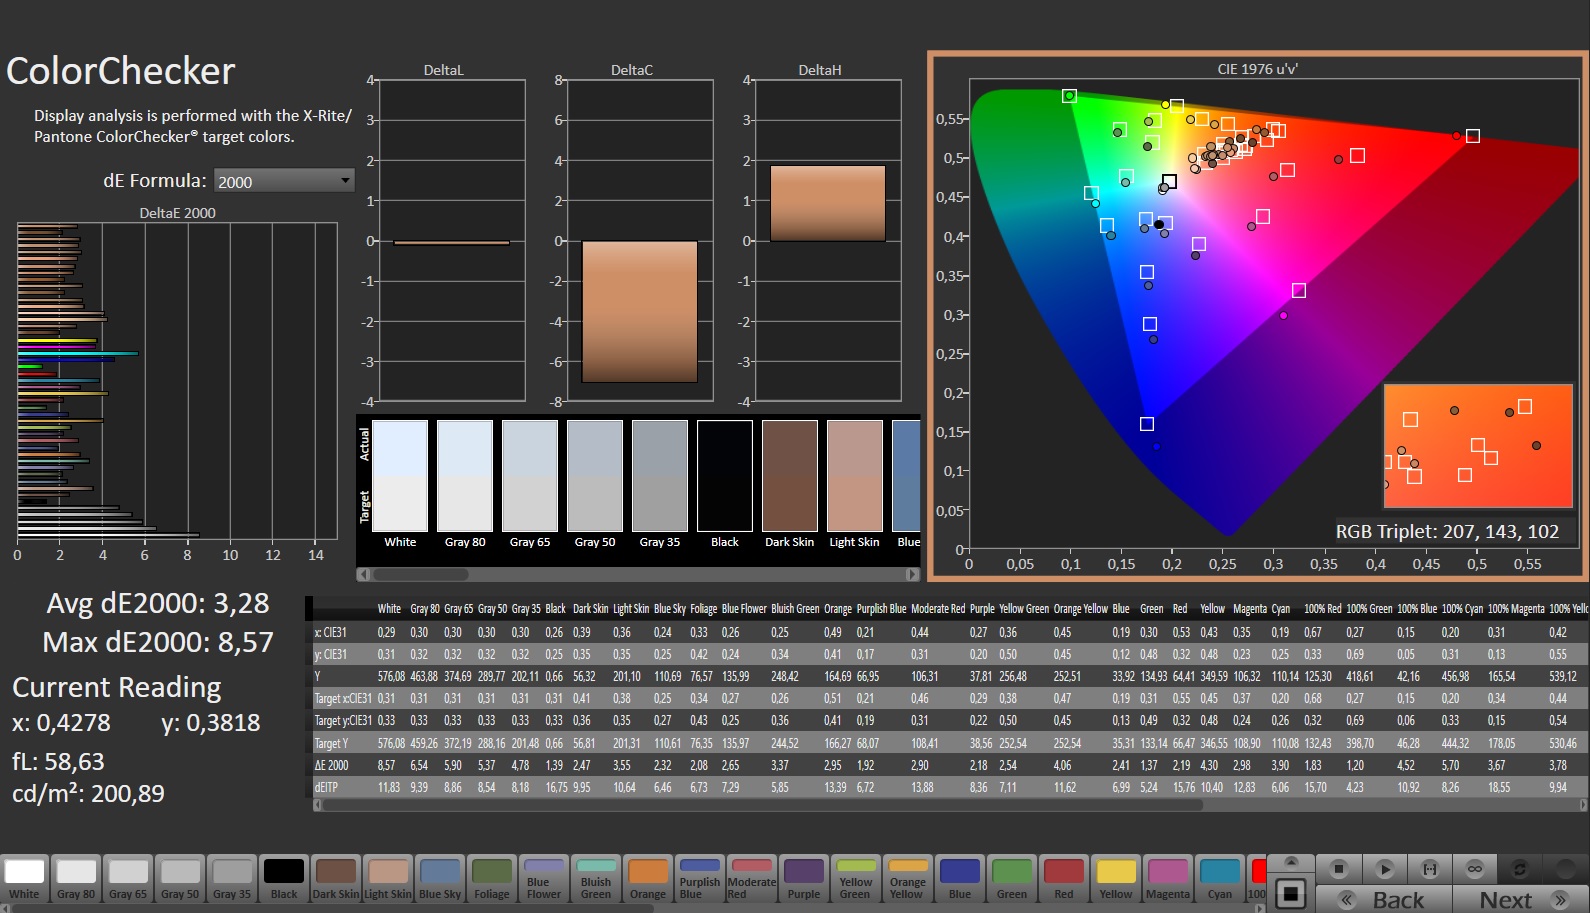
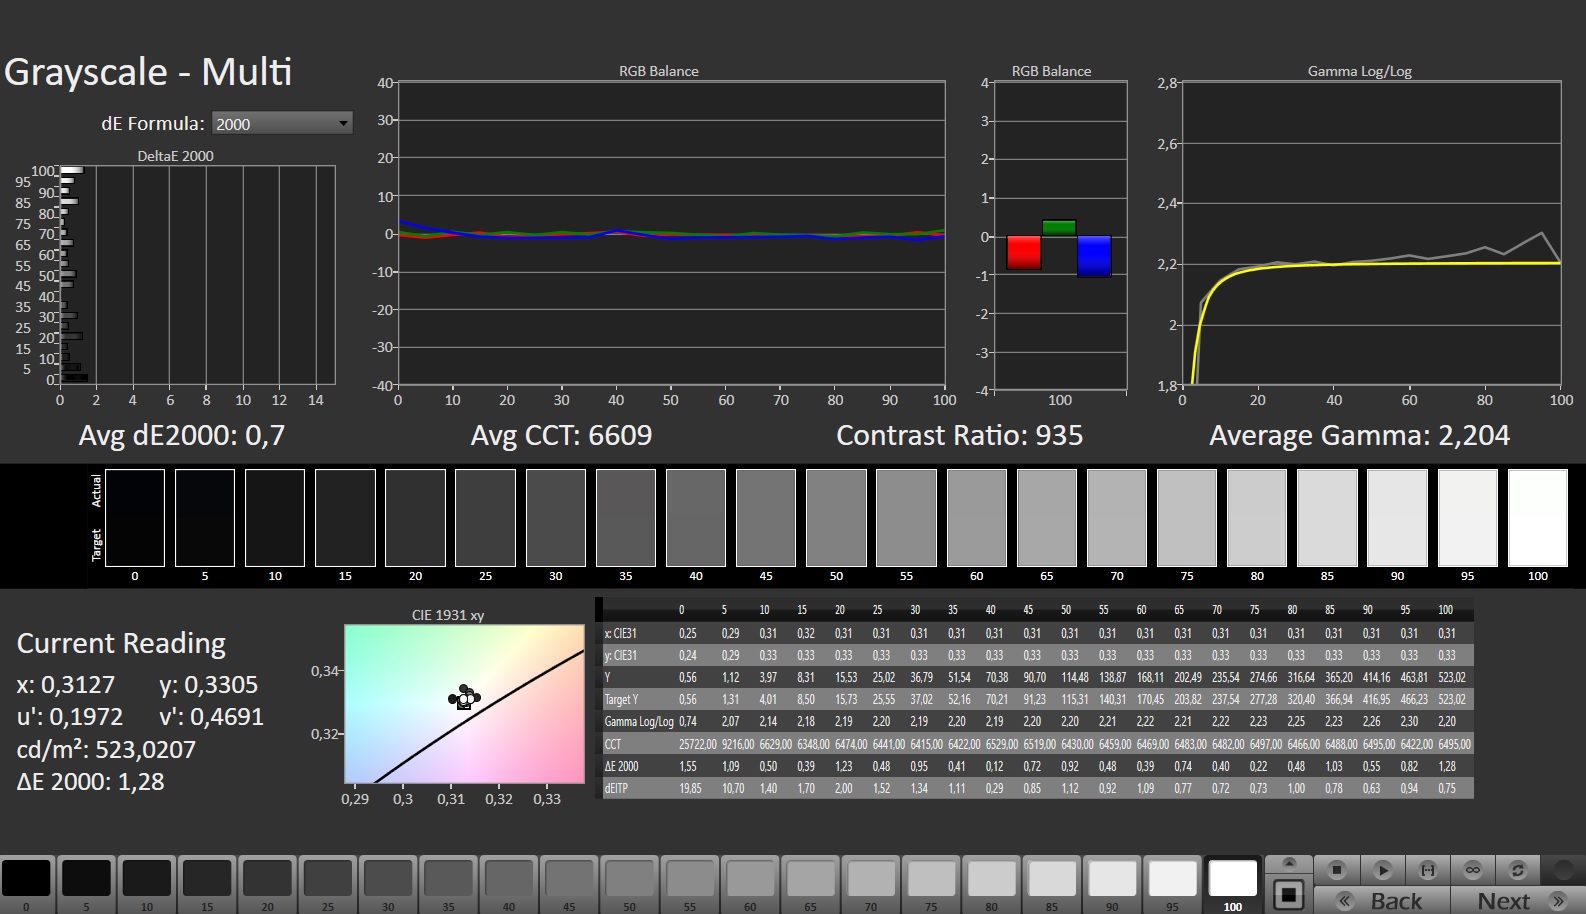
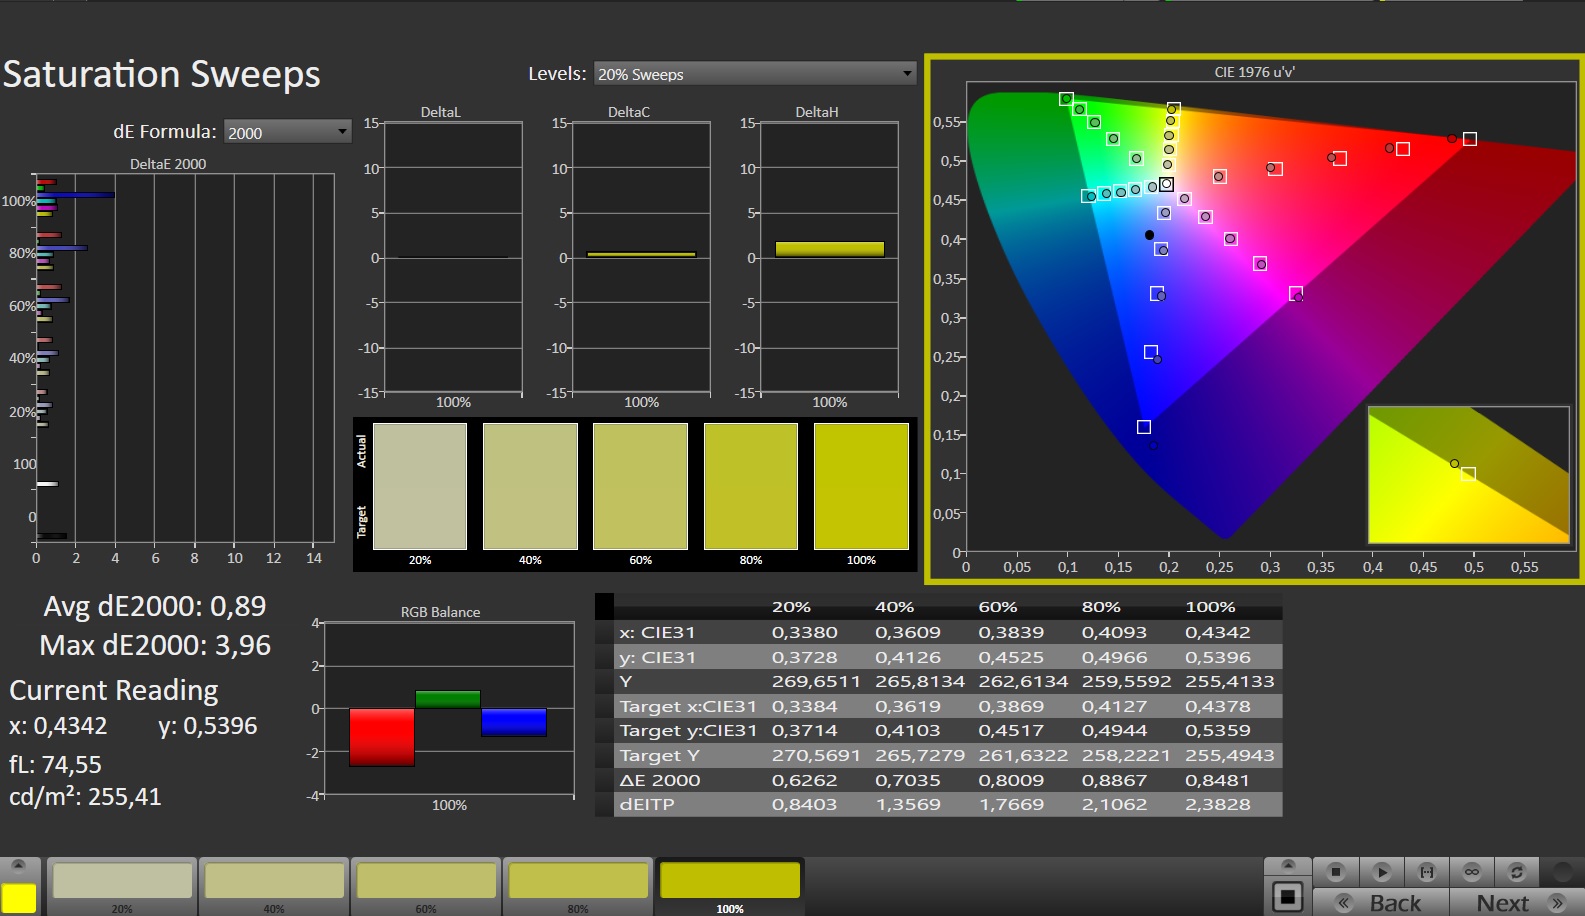
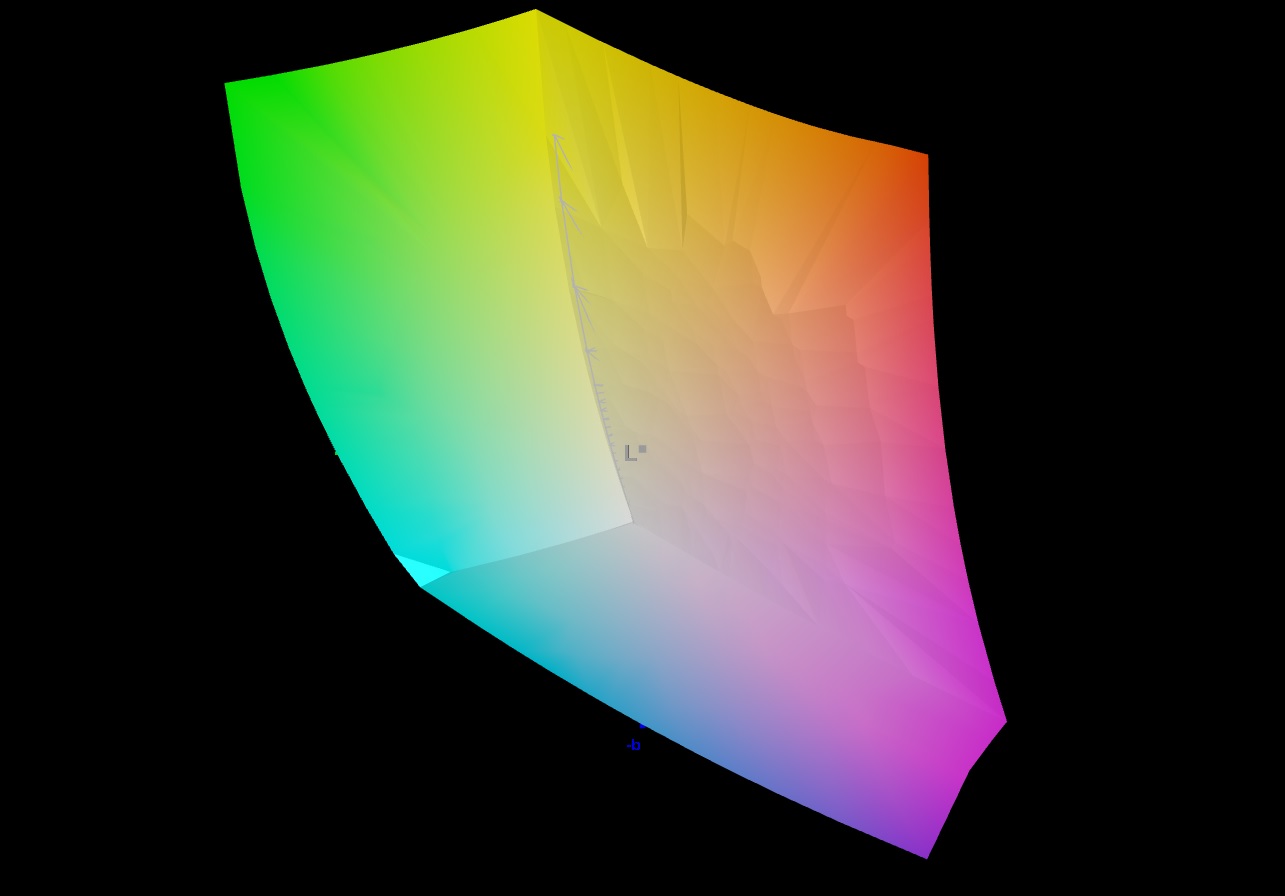
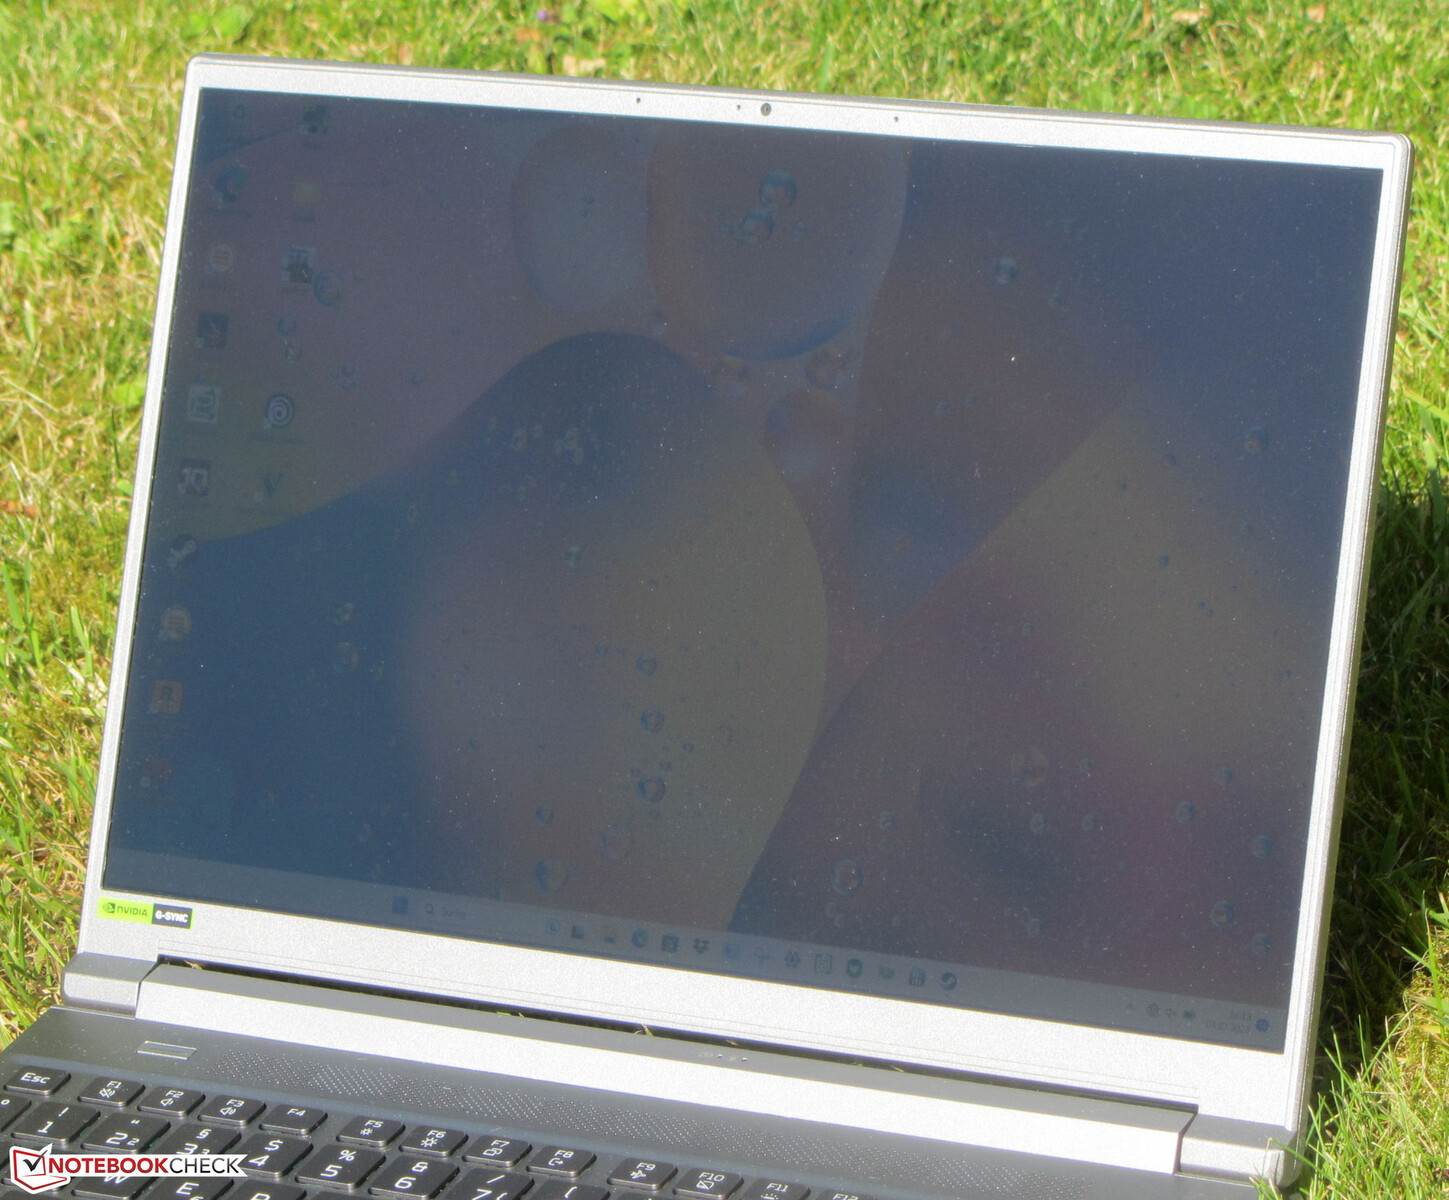
Display - Molto luminoso con copertura del colore DCI P3
Acer ha dotato il suo Predator di un display da 14 pollici (2.560 x 1.600 pixel) in formato 16:10, adatto al lavoro. Il lato positivo è il supporto G-Sync, l'assenza di sfarfallio PWM, i tempi di risposta brevi e l'elevata luminosità (516,2 cd/m²). Il rapporto di contrasto (944:1) manca di poco il valore target (> 1.000:1).
Il display mini-LED (2.560 x 1.600 pixel), disponibile in alternativa, dovrebbe avere un contrasto significativamente più elevato e viene fornito con la certificazione DisplayHDR 600.
| |||||||||||||||||||||||||
Distribuzione della luminosità: 88 %
Al centro con la batteria: 547 cd/m²
Contrasto: 977:1 (Nero: 0.56 cd/m²)
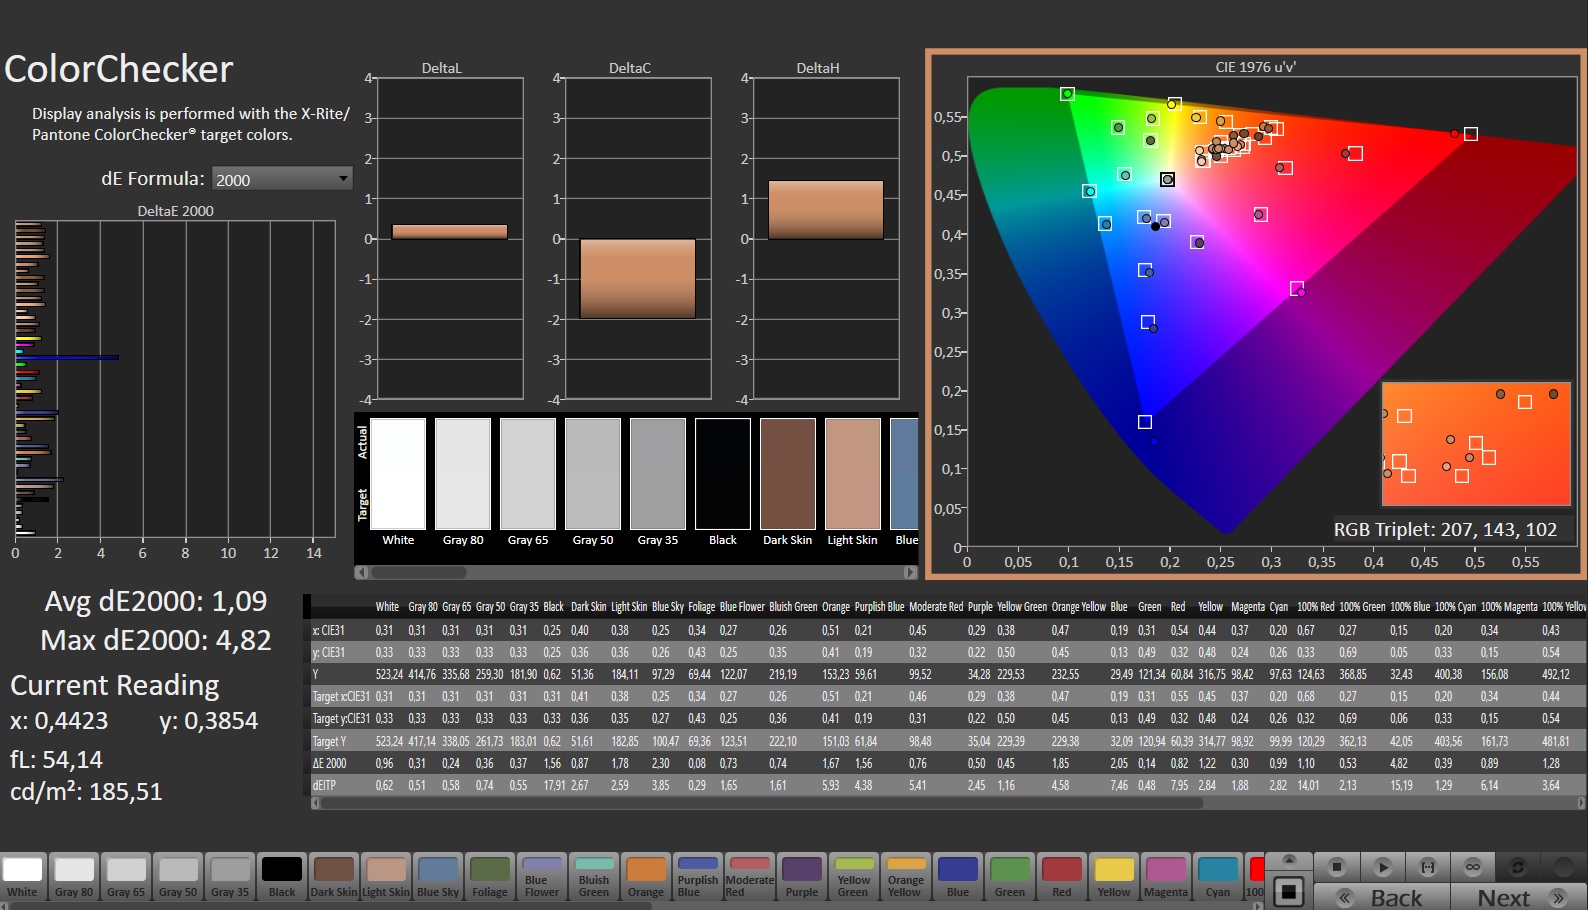
ΔE ColorChecker Calman: 3.28 | ∀{0.5-29.43 Ø4.71}
calibrated: 1.09
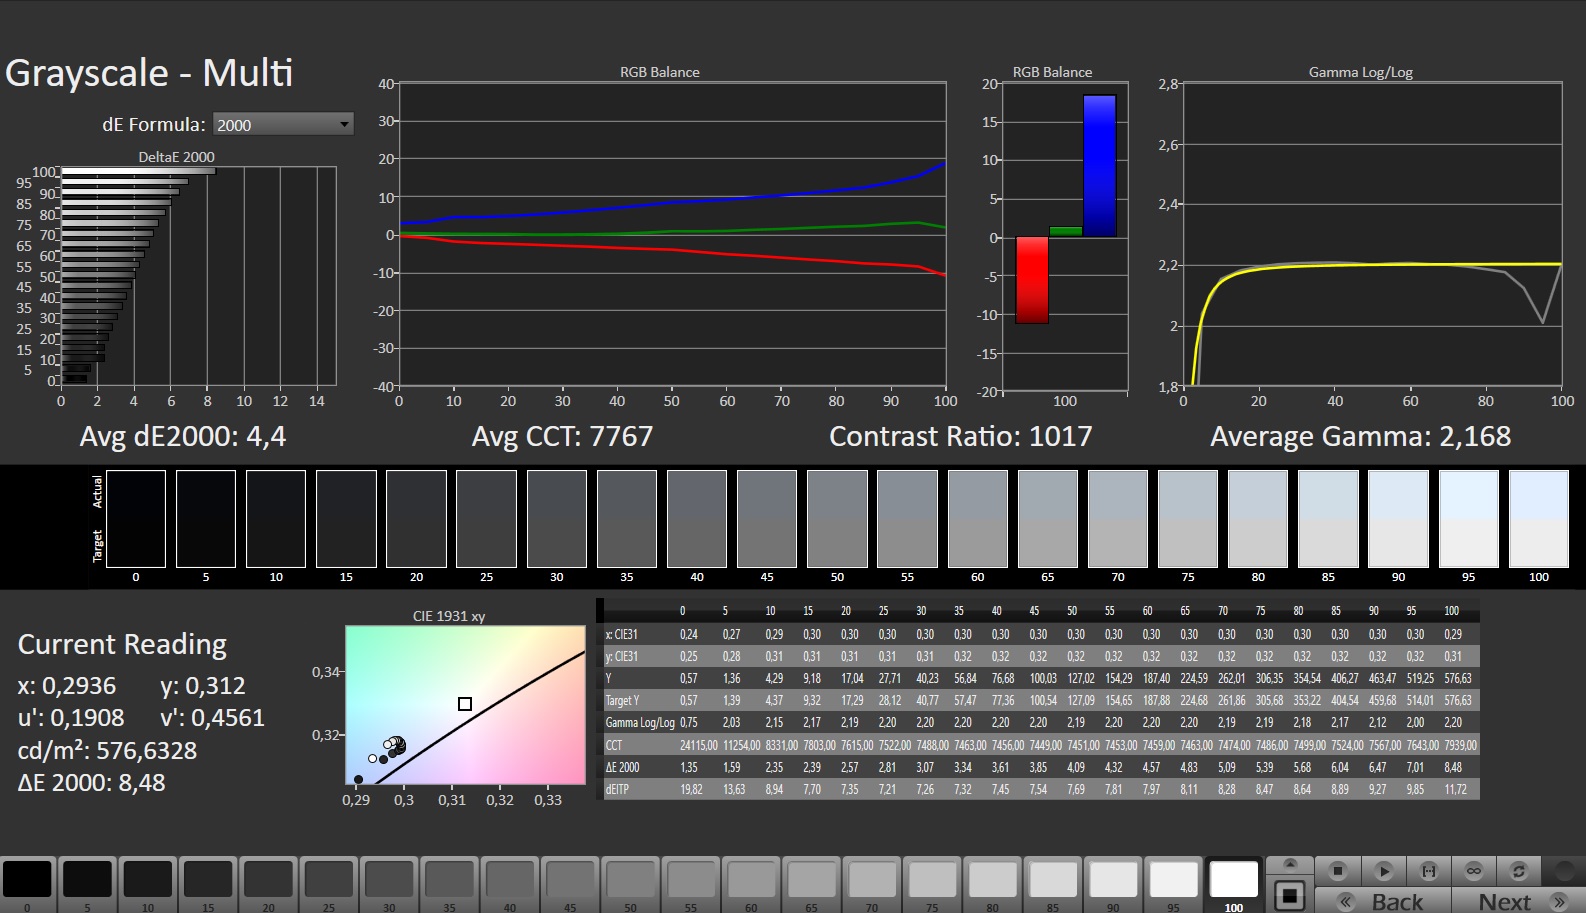
ΔE Greyscale Calman: 4.4 | ∀{0.09-98 Ø4.96}
85.5% AdobeRGB 1998 (Argyll 3D)
99.9% sRGB (Argyll 3D)
96.9% Display P3 (Argyll 3D)
Gamma: 2.168
CCT: 7767 K
| Acer Predator Triton 14 PT14-51 BOE NE140QDM-NY1, IPS, 2560x1600, 14" | Razer Blade 14 RTX 4070 AU Optronics B140QAN06.U, IPS, 2560x1600, 14" | Asus ROG Zephyrus G14 GA402RJ BOEhydis NE140QDM-NX1, IPS, 2560x1600, 14" | MSI Stealth 14 Studio A13V B140QAN06.T, IPS, 2560x1600, 14" | Gigabyte Aero 14 OLED BMF Samsung SDC4192 (ATNA40YK14-0), OLED, 2880x1800, 14" | Apple MacBook Pro 14 2023 M2 Pro Entry Mini-LED, 3024x1964, 14.2" | |
|---|---|---|---|---|---|---|
| Display | 0% | 0% | -0% | 2% | ||
| Display P3 Coverage (%) | 96.9 | 97.3 0% | 97.6 1% | 96.2 -1% | 99.8 3% | |
| sRGB Coverage (%) | 99.9 | 99.8 0% | 99.9 0% | 99.6 0% | 100 0% | |
| AdobeRGB 1998 Coverage (%) | 85.5 | 85.3 0% | 85.6 0% | 85.3 0% | 88.7 4% | |
| Response Times | -9% | 21% | 32% | 72% | ||
| Response Time Grey 50% / Grey 80% * (ms) | 15.1 ? | 11.9 ? 21% | 8.3 ? 45% | 5.5 ? 64% | 2.4 ? 84% | |
| Response Time Black / White * (ms) | 5.8 ? | 8 ? -38% | 6 ? -3% | 5.8 ? -0% | 2.4 ? 59% | |
| PWM Frequency (Hz) | 26191 ? | 300 | ||||
| Screen | 3% | 12% | 9% | 70% | ||
| Brightness middle (cd/m²) | 547 | 559.3 2% | 500 -9% | 419 -23% | 423 -23% | |
| Brightness (cd/m²) | 516 | 560 9% | 470 -9% | 402 -22% | 427 -17% | |
| Brightness Distribution (%) | 88 | 88 0% | 85 -3% | 89 1% | 98 11% | |
| Black Level * (cd/m²) | 0.56 | 0.44 21% | 0.42 25% | 0.43 23% | 0.1 82% | |
| Contrast (:1) | 977 | 1271 30% | 1190 22% | 974 0% | 4230 333% | |
| Colorchecker dE 2000 * | 3.28 | 4.44 -35% | 2.45 25% | 2.3 30% | 0.55 83% | |
| Colorchecker dE 2000 max. * | 8.57 | 9.3 -9% | 5.34 38% | 5.8 32% | 1.15 87% | |
| Colorchecker dE 2000 calibrated * | 1.09 | 0.39 64% | 1.2 -10% | 0.9 17% | 1.15 -6% | |
| Greyscale dE 2000 * | 4.4 | 6.8 -55% | 3.1 30% | 3.3 25% | 0.69 84% | |
| Gamma | 2.168 101% | 2.3 96% | 2.213 99% | 2.14 103% | 2.42 91% | |
| CCT | 7767 84% | 6242 104% | 7251 90% | 6550 99% | 6479 100% | |
| Media totale (Programma / Settaggio) | -2% /
1% | 11% /
11% | 14% /
10% | 48% /
56% |
* ... Meglio usare valori piccoli
Lo schermo ha una riproduzione dei colori decente: Con una deviazione di circa 3,3, il valore target (DeltaE < 3) viene mancato per poco. Una calibrazione riduce questo valore a 1,1 e garantisce scale di grigio equilibrate. L'accuratezza del colore è data: Il pannello riproduce completamente gli spazi colore sRGB e DCI P3 e lo spazio AdobeRGB all'86%. Gli schermi della concorrenza raccontano la stessa storia.
Abbiamo creato il nostro profilo colore personale che può essere scaricato e utilizzato. Il link è disponibile nella casella di posta "Display".


Tempi di risposta del Display
| ↔ Tempi di risposta dal Nero al Bianco | ||
|---|---|---|
| 5.8 ms ... aumenta ↗ e diminuisce ↘ combinato | ↗ 2.1 ms Incremento | 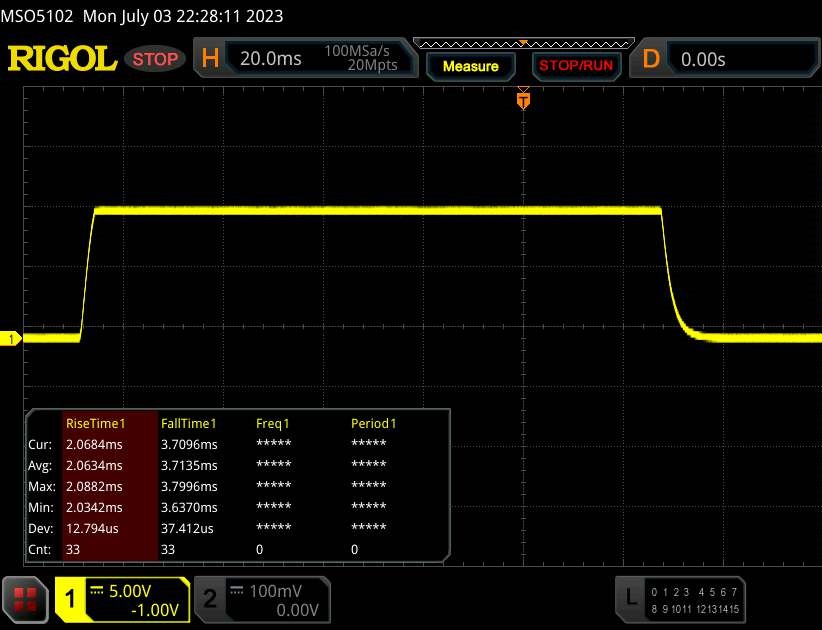 |
| ↘ 3.7 ms Calo | ||
| Lo schermo ha mostrato valori di risposta molto veloci nei nostri tests ed è molto adatto per i gaming veloce. In confronto, tutti i dispositivi di test variano da 0.1 (minimo) a 240 (massimo) ms. » 18 % di tutti i dispositivi è migliore. Questo significa che i tempi di risposta rilevati sono migliori rispettto alla media di tutti i dispositivi testati (19.8 ms). | ||
| ↔ Tempo di risposta dal 50% Grigio all'80% Grigio | ||
| 15.1 ms ... aumenta ↗ e diminuisce ↘ combinato | ↗ 6.8 ms Incremento | 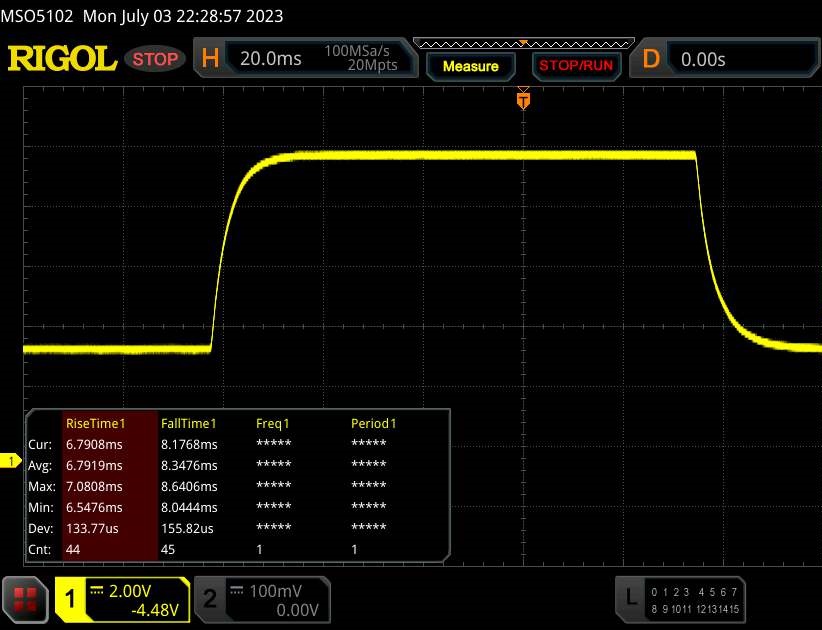 |
| ↘ 8.3 ms Calo | ||
| Lo schermo mostra buoni tempi di risposta durante i nostri tests, ma potrebbe essere troppo lento per i gamers competitivi. In confronto, tutti i dispositivi di test variano da 0.165 (minimo) a 636 (massimo) ms. » 29 % di tutti i dispositivi è migliore. Questo significa che i tempi di risposta rilevati sono migliori rispettto alla media di tutti i dispositivi testati (31 ms). | ||
Sfarfallio dello schermo / PWM (Pulse-Width Modulation)
| flickering dello schermo / PWM non rilevato | 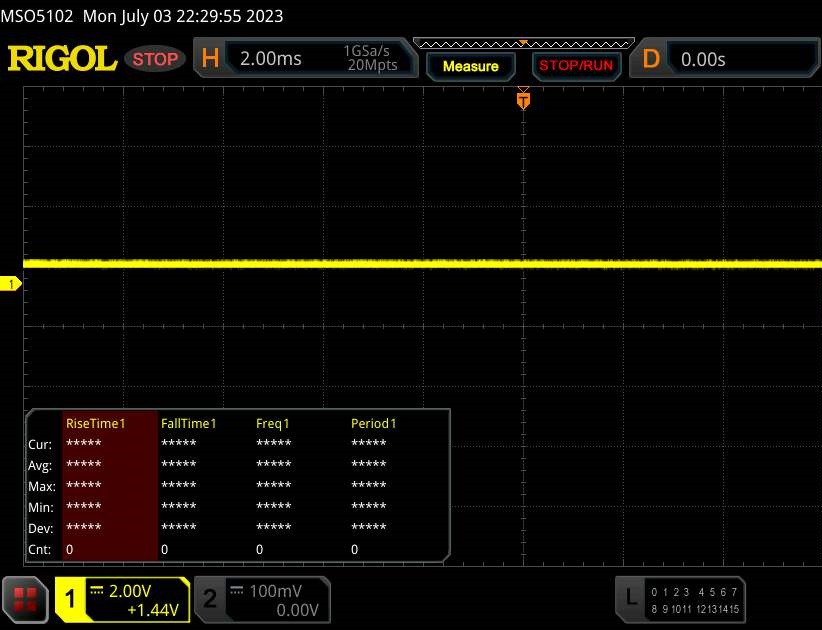 | ||
In confronto: 52 % di tutti i dispositivi testati non utilizza PWM per ridurre la luminosita' del display. Se è rilevato PWM, una media di 7757 (minimo: 5 - massimo: 343500) Hz è stata rilevata. | |||
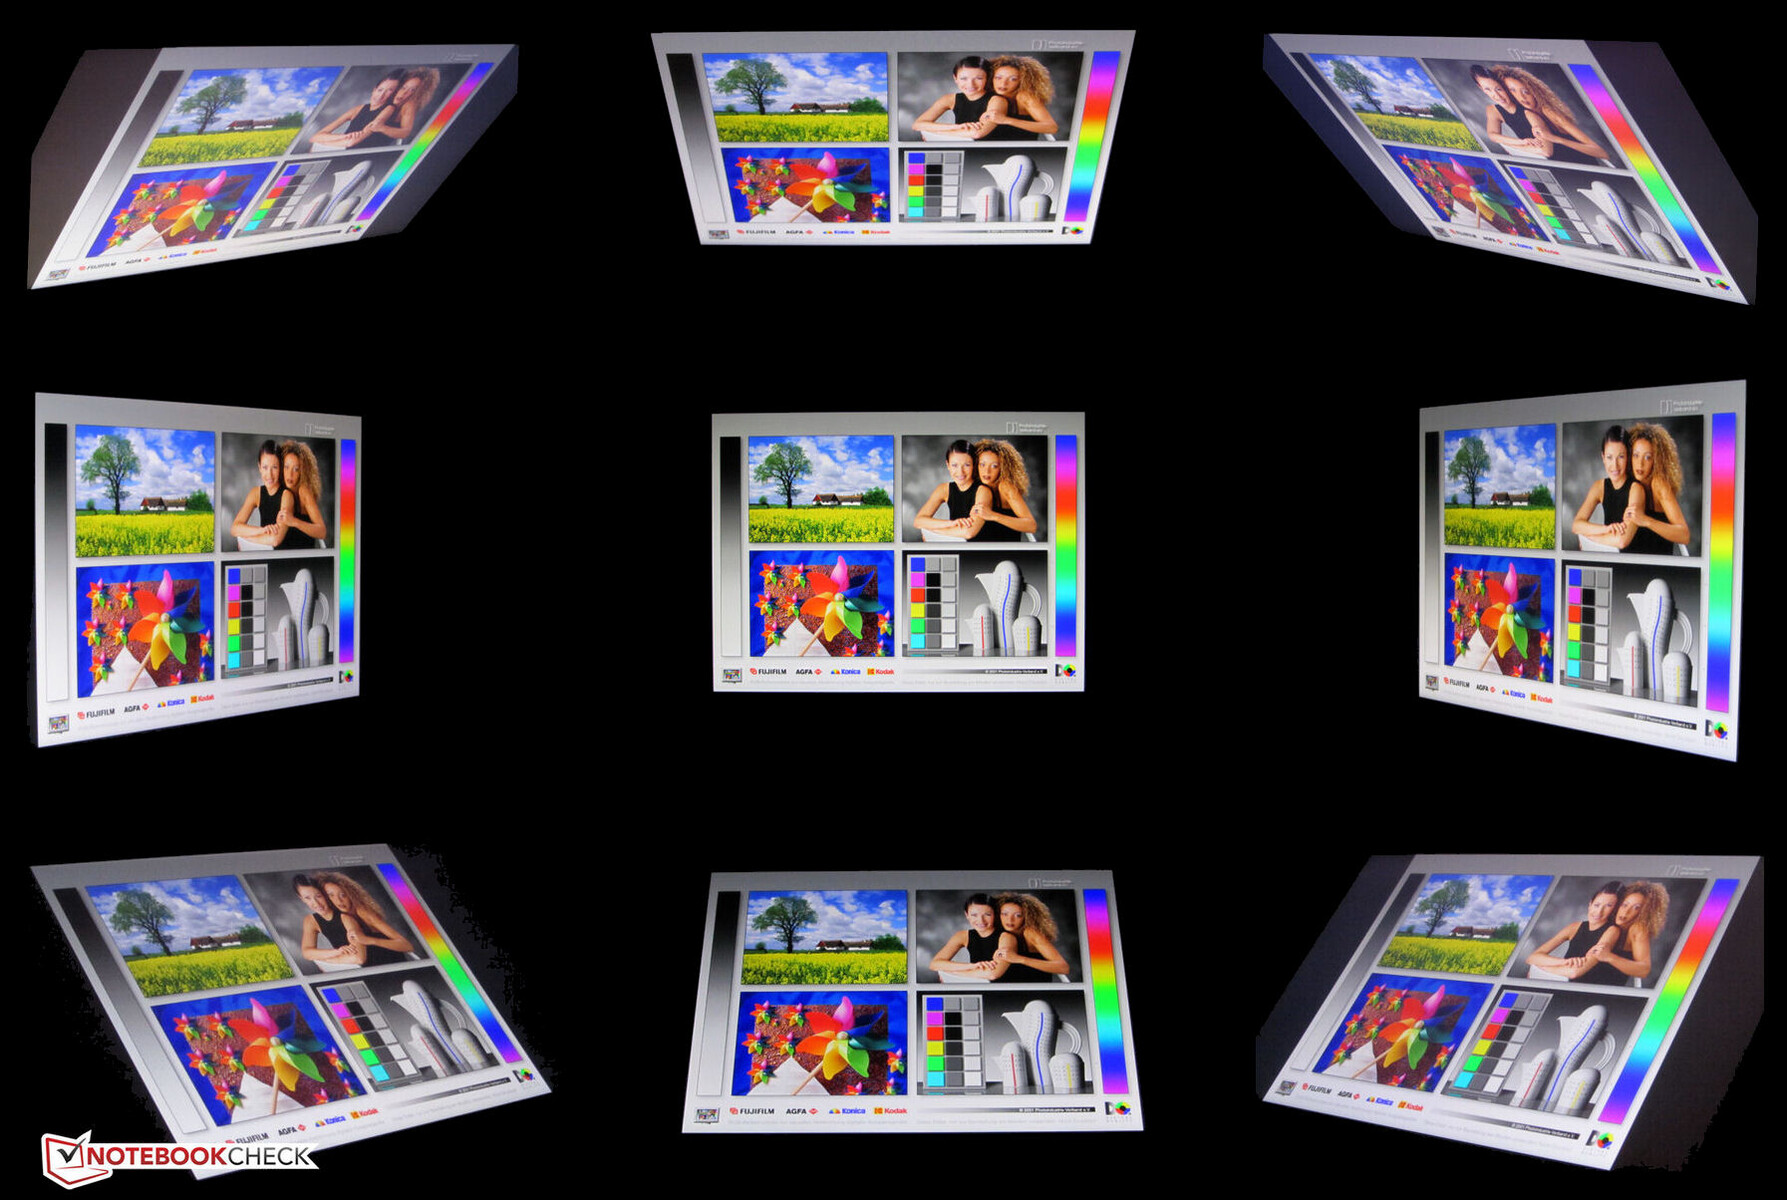
Il pannello IPS ha angoli di visione stabili ed è leggibile da ogni posizione. Grazie all'elevata luminosità del display, lo schermo può essere visualizzato anche in ambienti esterni.
Prestazioni - Raptor Lake e Ada Lovelace alimentano il computer portatile Acer
Con il Predator Triton 14, Acer propone un portatile da 14 pollici pensato per il gioco e il rendering. IlCore i7-13700He GeForce RTX 4050forniscono la potenza di calcolo necessaria. Le varianti più performanti sono dotate di GeForce RTX 4070a bordo...
Condizioni di prova
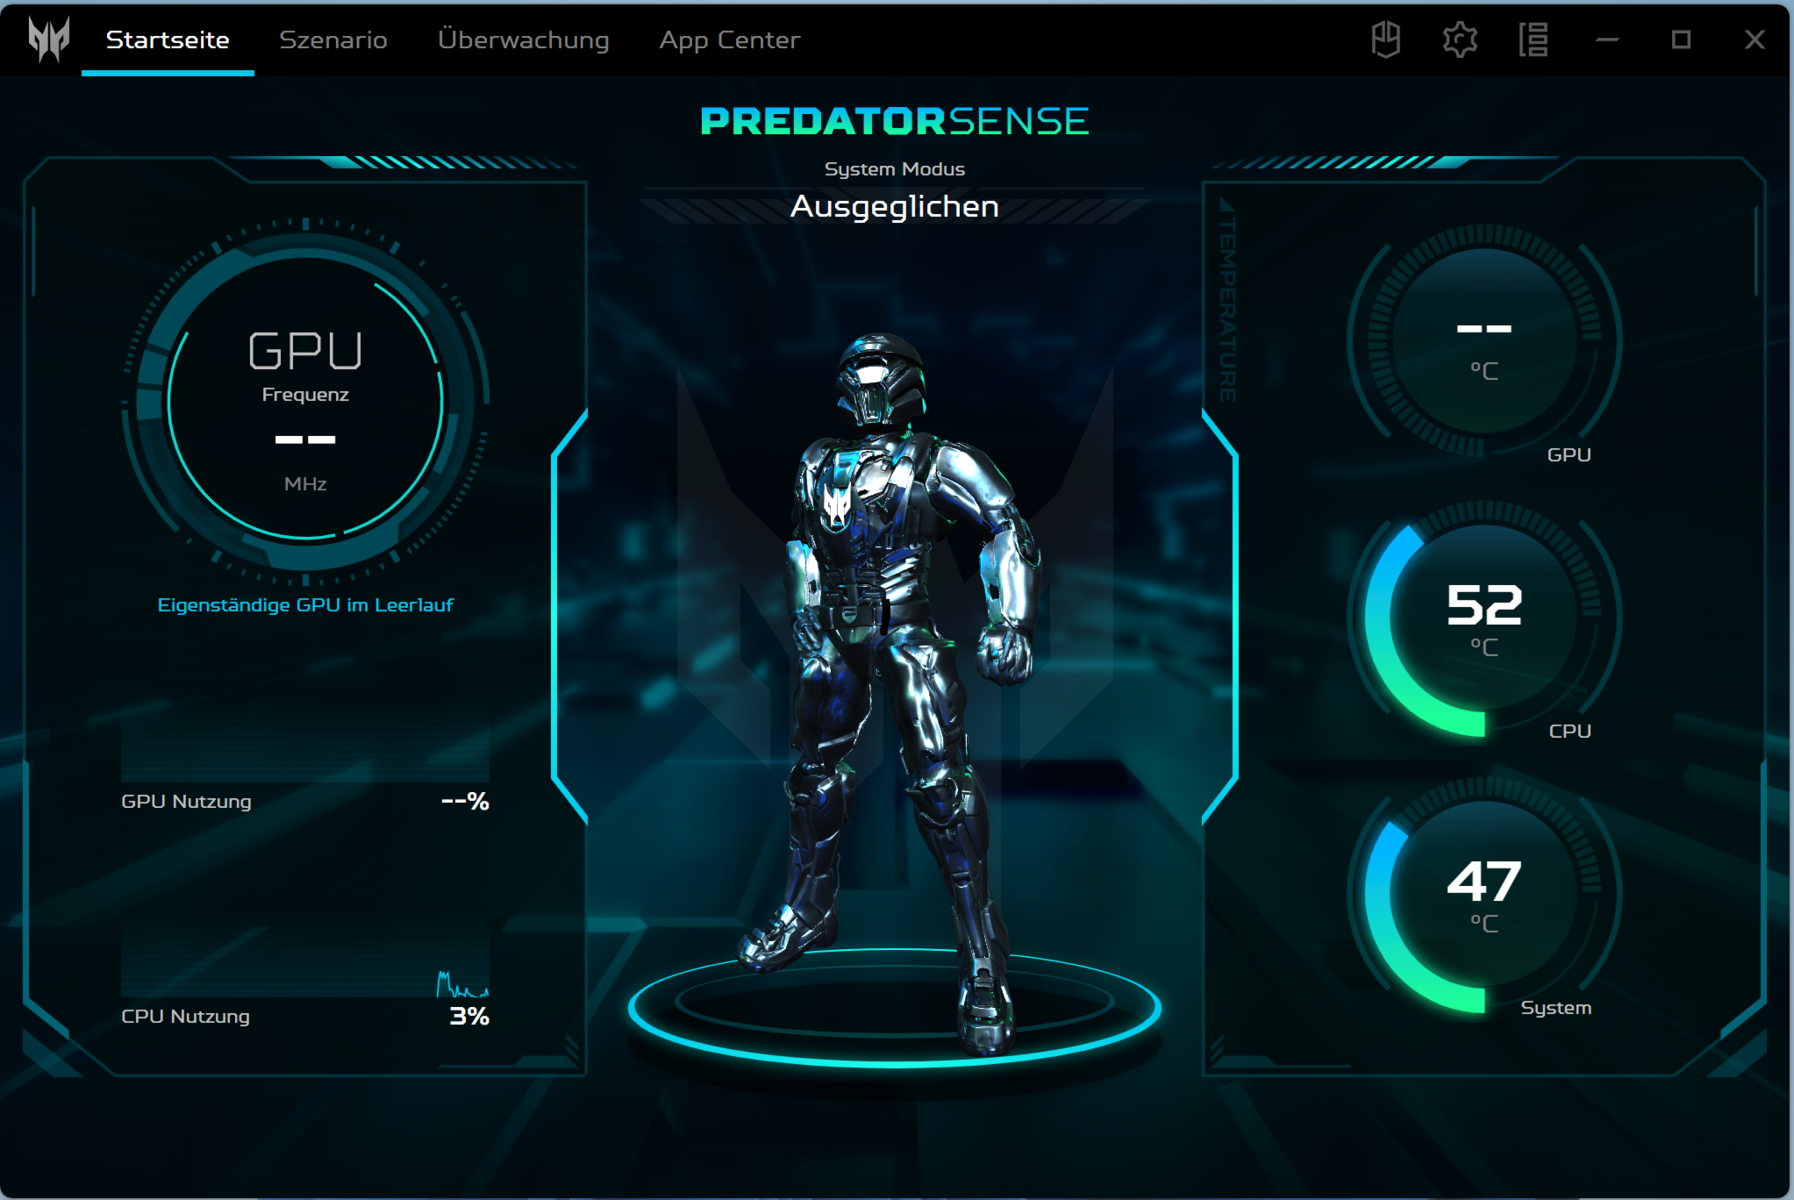
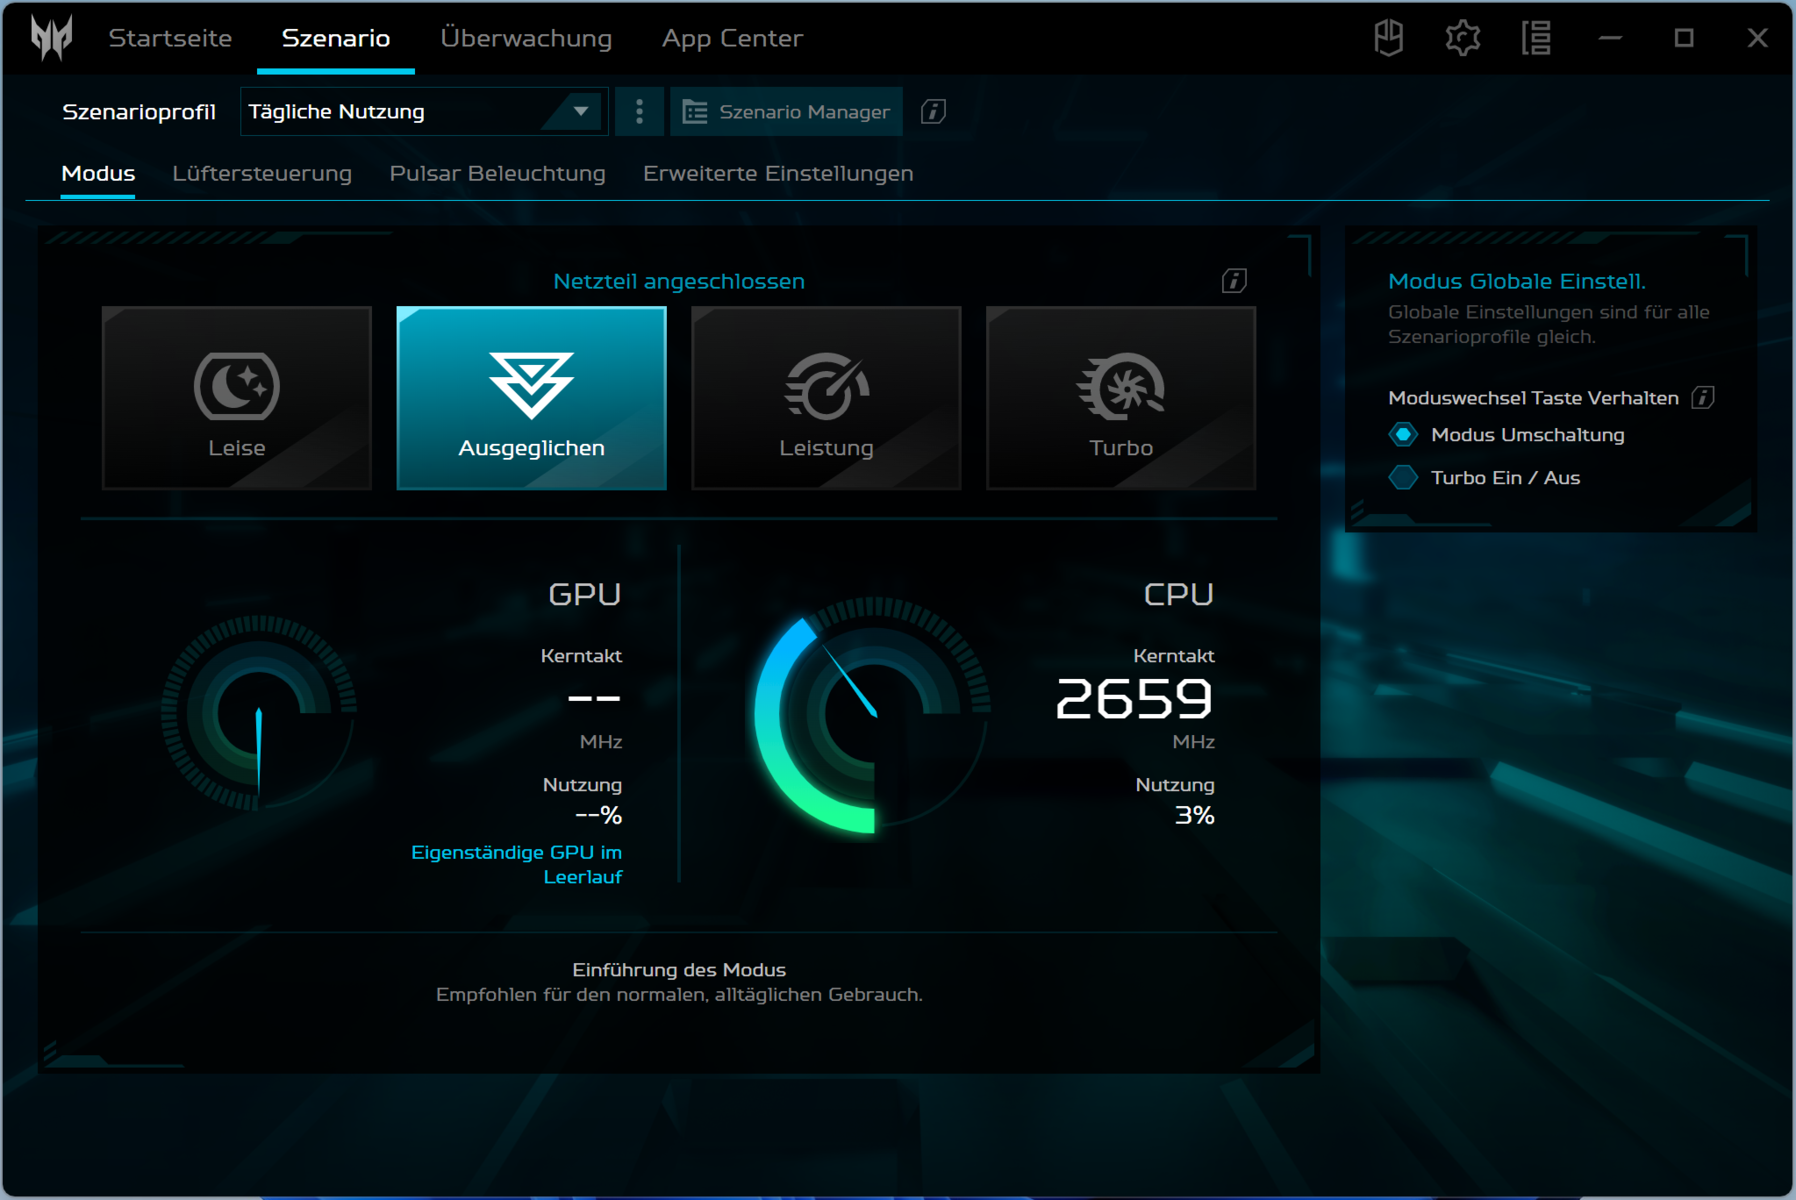
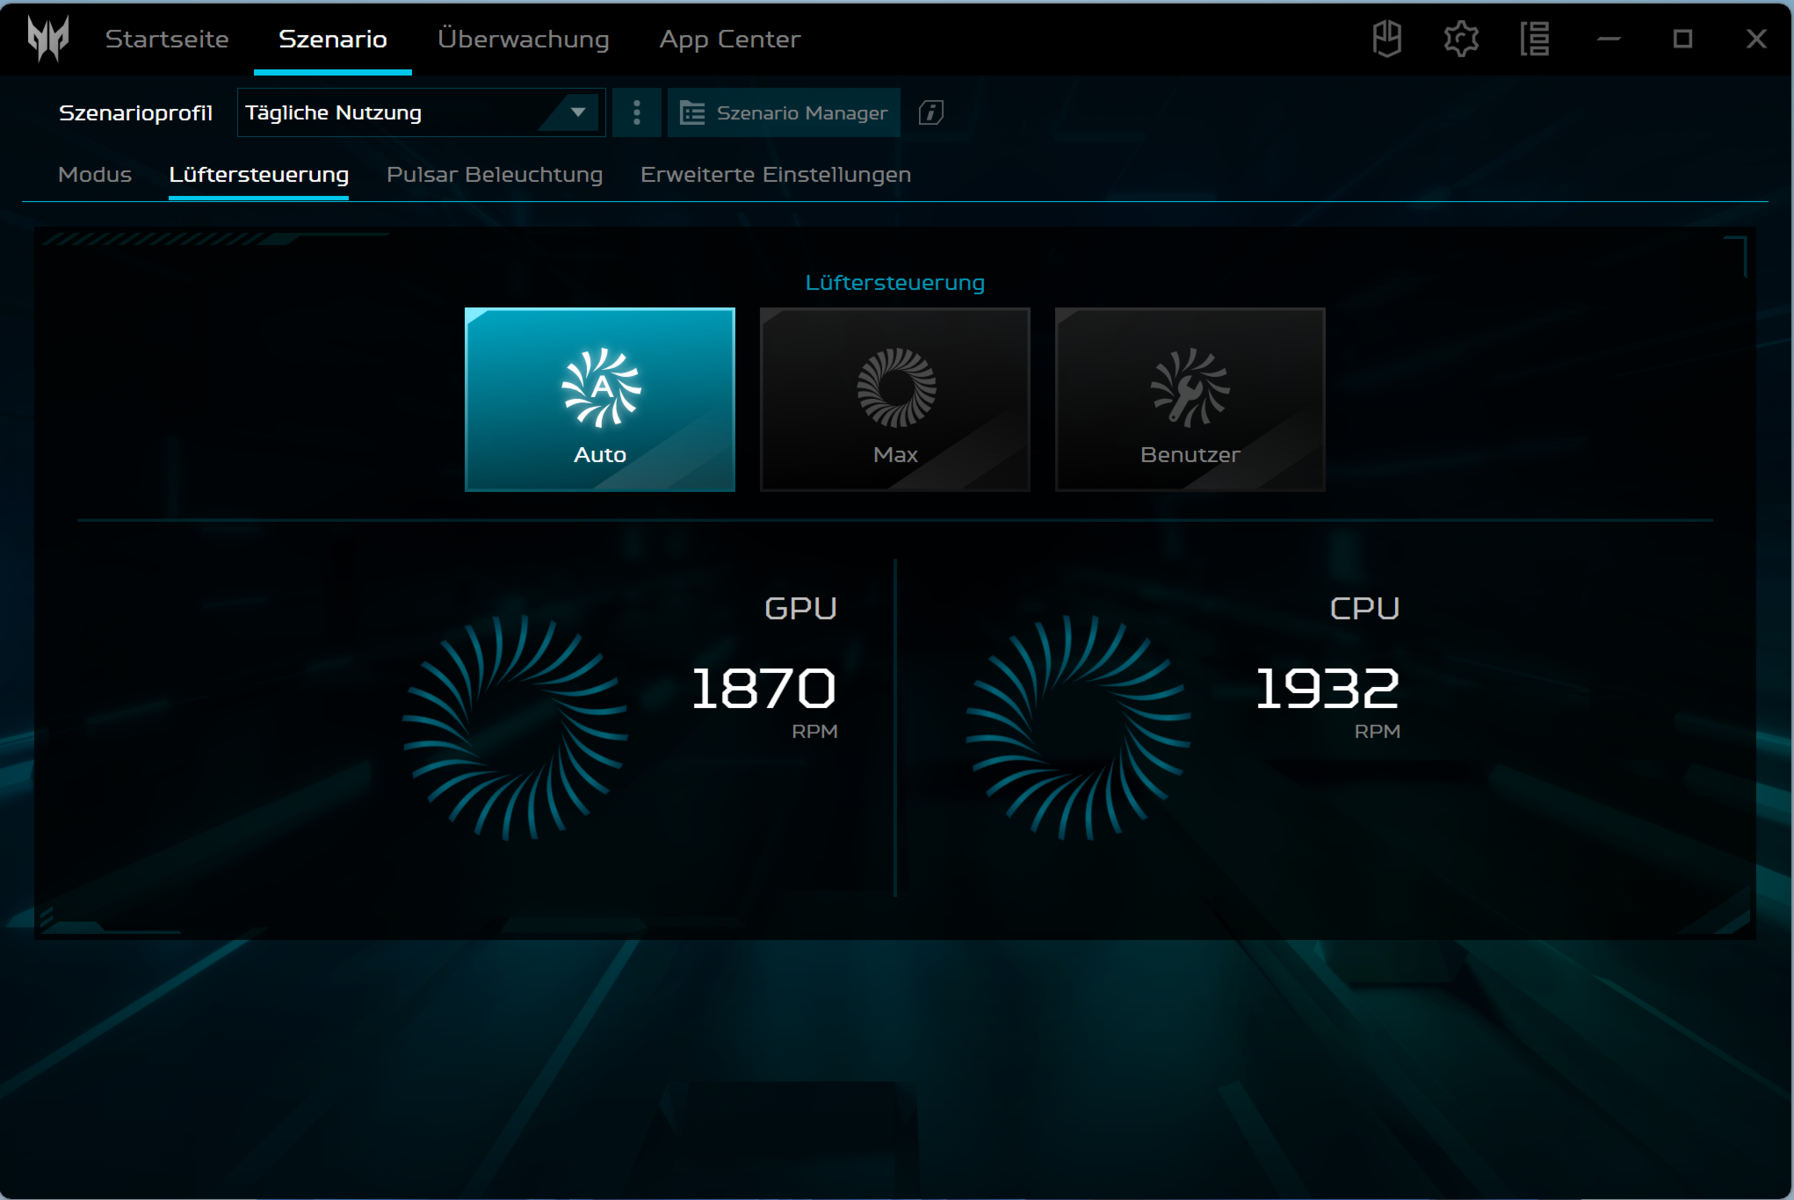
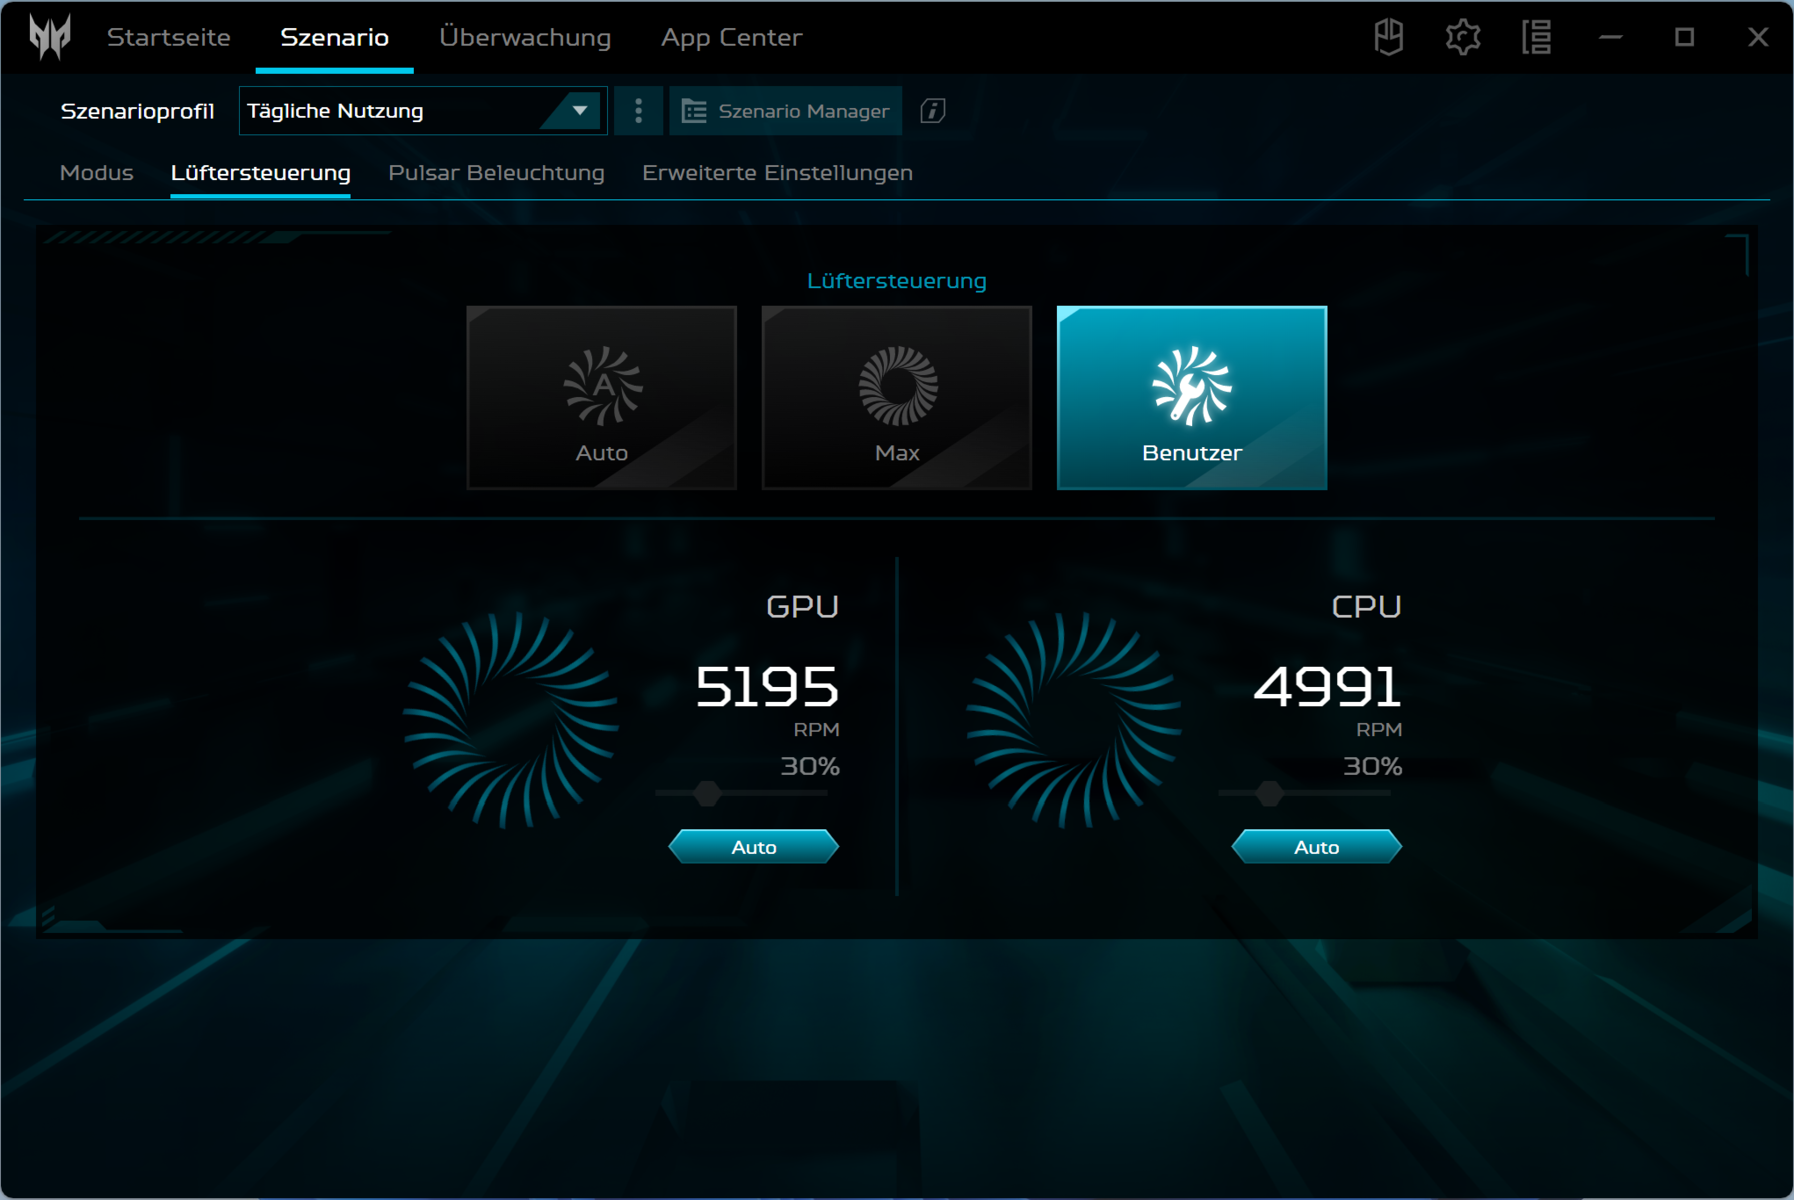
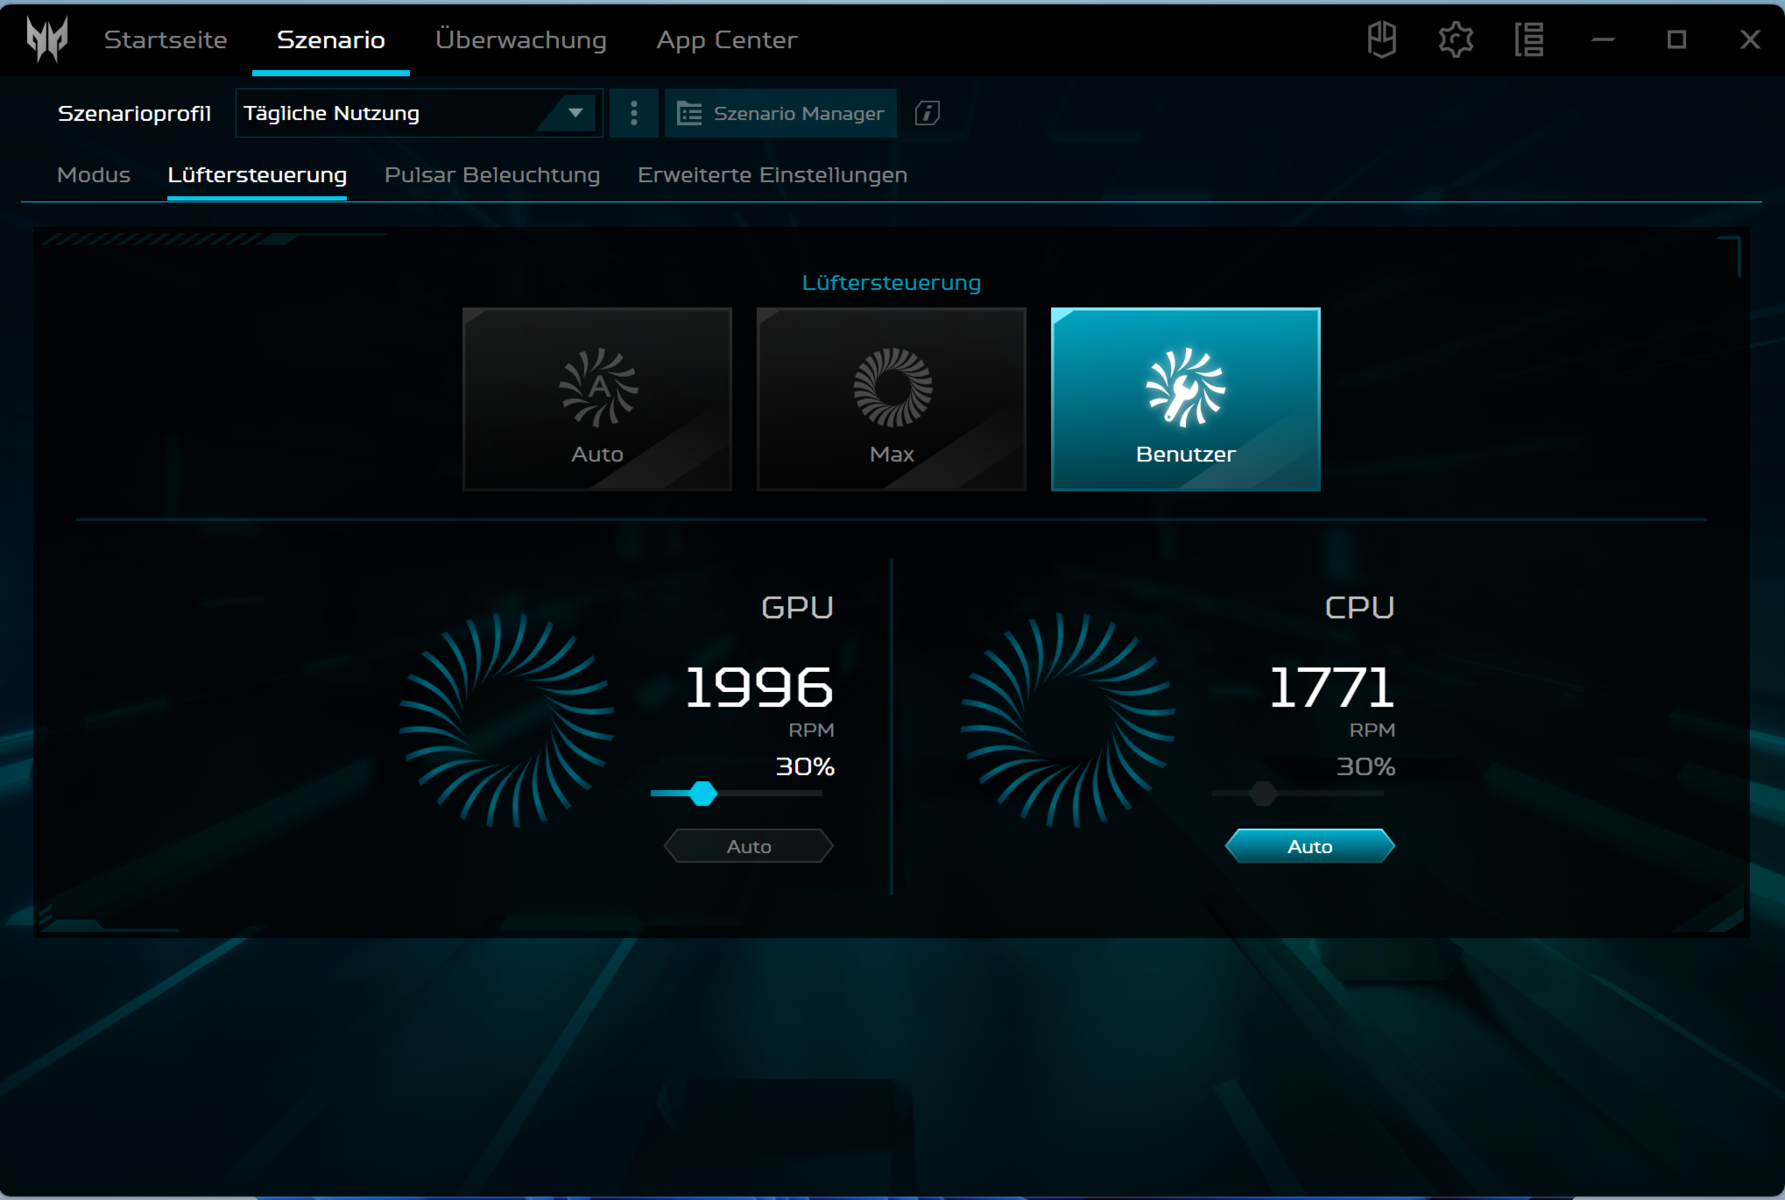
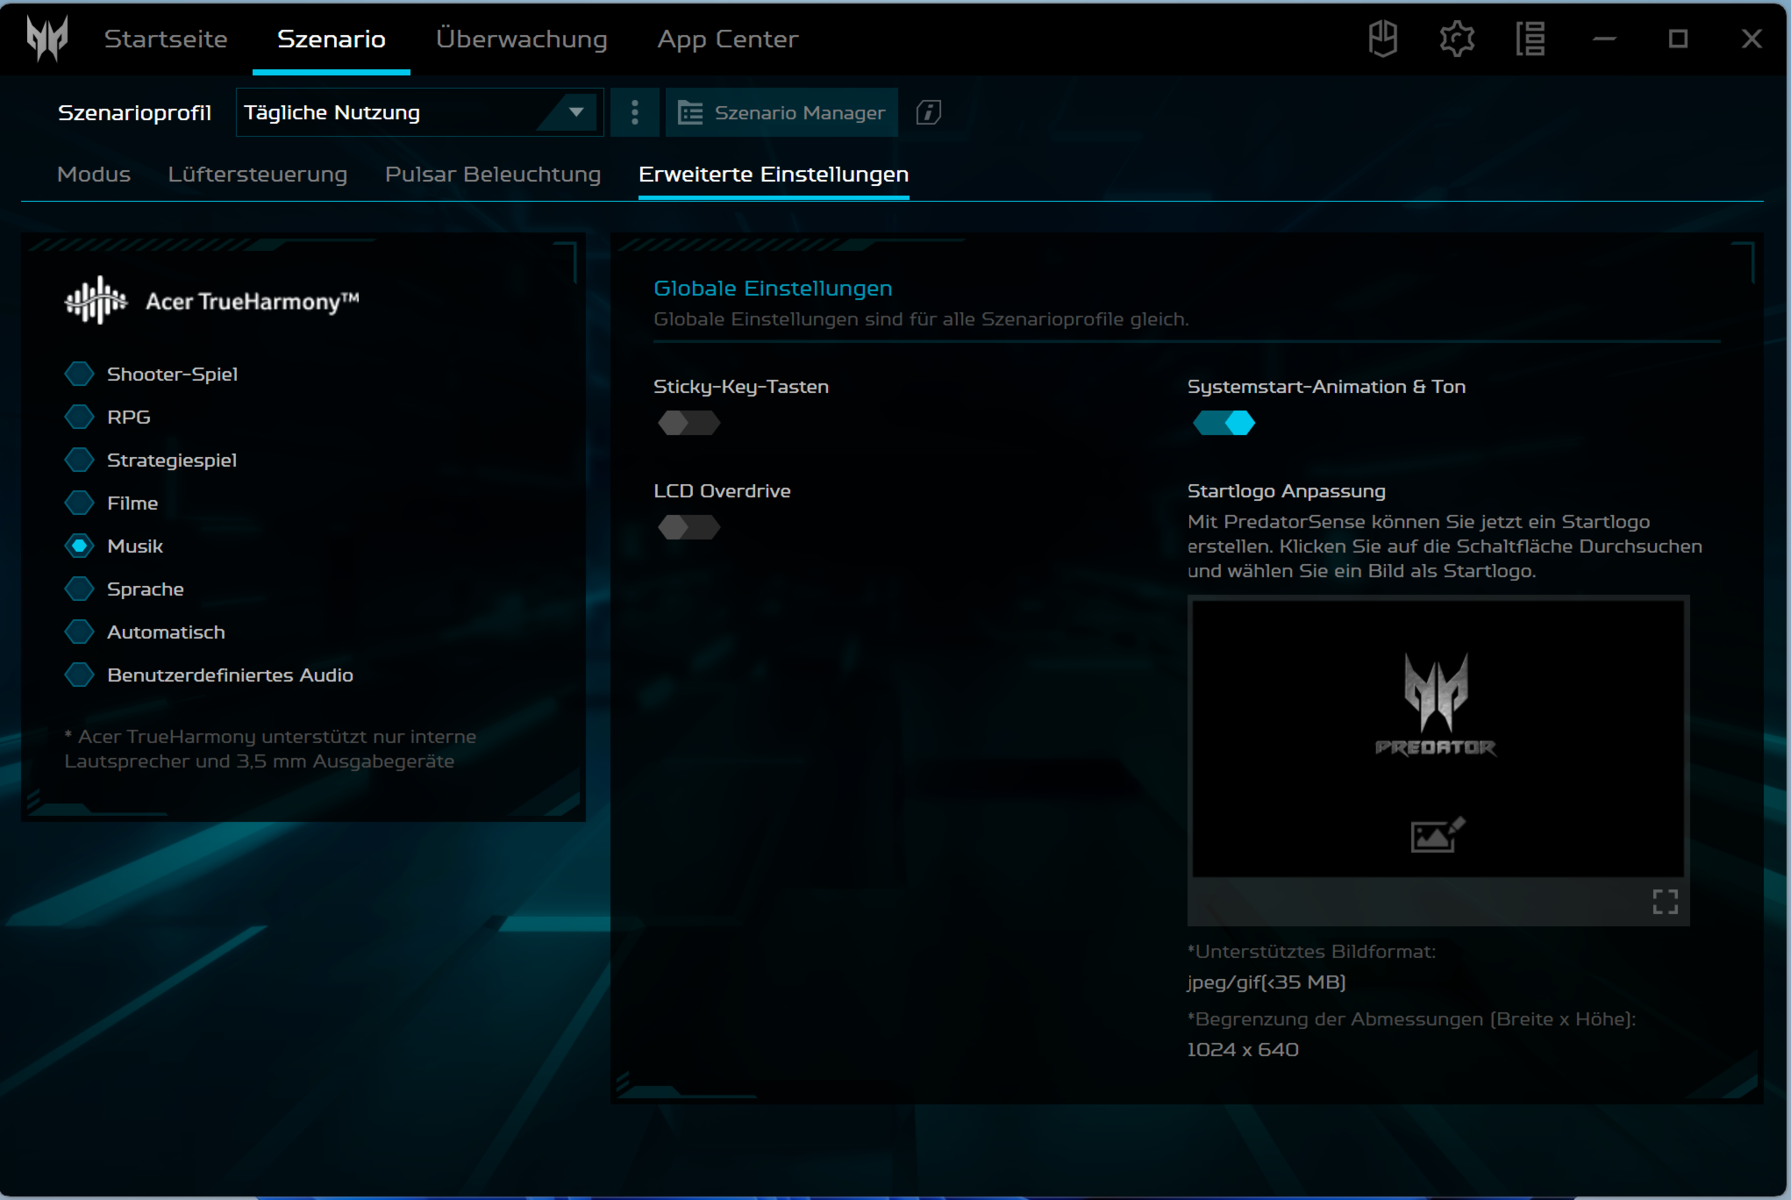
Il portatile offre sei modalità di sistema specifiche del produttore: quattro per il funzionamento a rete e due per quello a batteria (vedi tabella). Abbiamo utilizzato le modalità "Balanced" (benchmark) ed "Eco" (test della batteria). le modalità "Turbo" e "Performance" sono disponibili solo quando è collegato alla rete elettrica (livello della batteria > 30 %).
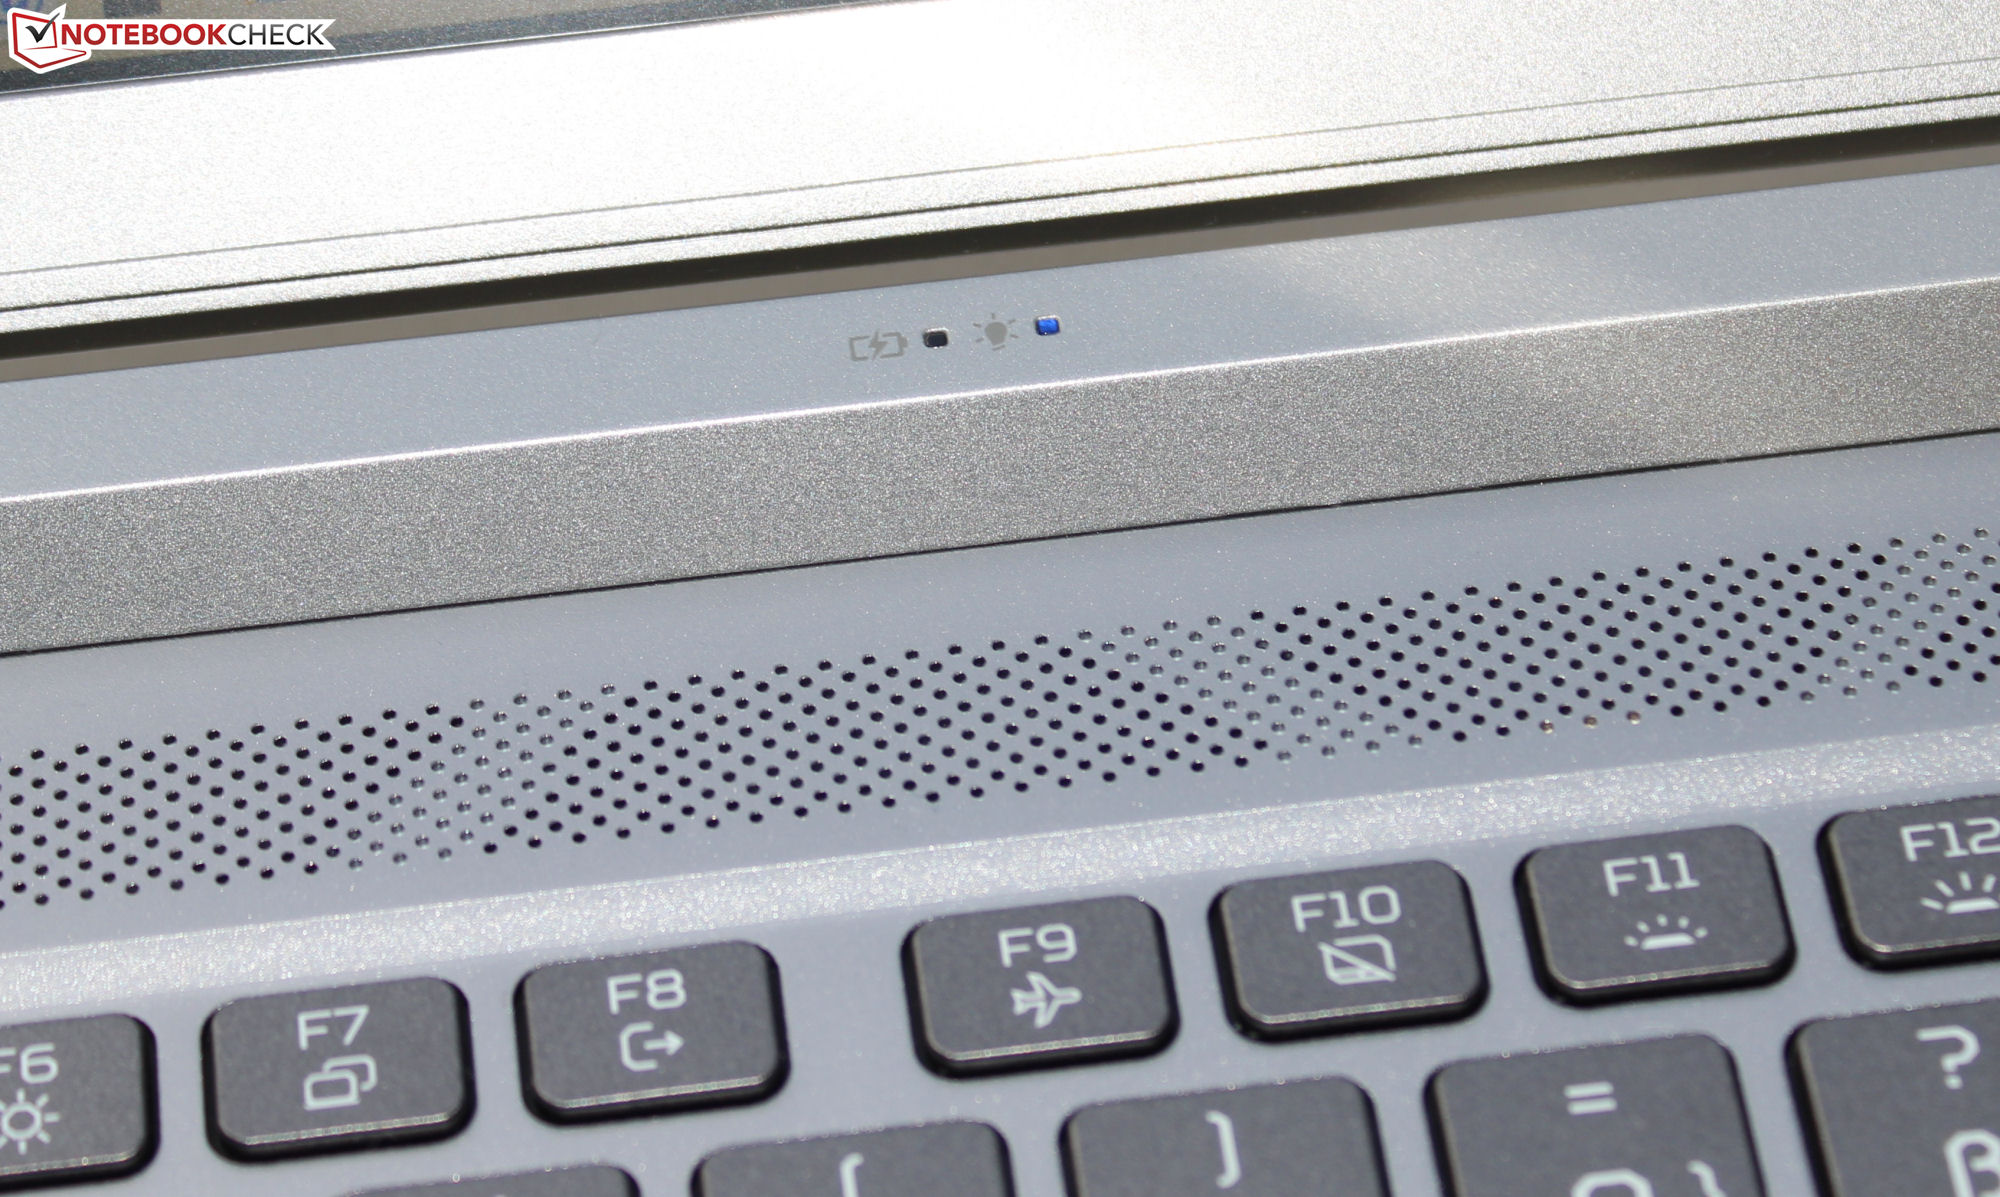
Un tasto situato sopra la tastiera è responsabile della commutazione rapida tra le modalità. In alternativa, è possibile farlo tramite il software PredatorSense (il centro di controllo del portatile). Un LED indica la modalità attiva.
| Turbo | Prestazioni | Bilanciato | Silenzioso | Bilanciato (batteria) | Eco (batteria) | |
|---|---|---|---|---|---|---|
| Limite di potenza 1 (HWInfo) | 80 watt | 75 watt | 60 watt | 50 watt | 60 watt | 25 watt |
| Limite di potenza 2 (HWInfo) | 115 watt | 115 watt | 115 watt | 115 watt | 115 watt | 30 watt |
| Rumore (Witcher 3) | 56 dB(A) | 53 dB(A) | 43 dB(A) | 36 dB(A) | - | - |
| Prestazioni (Witcher 3) | ~86 fps | ~83 fps | ~82 fps | ~58 fps | - | - |

Processore
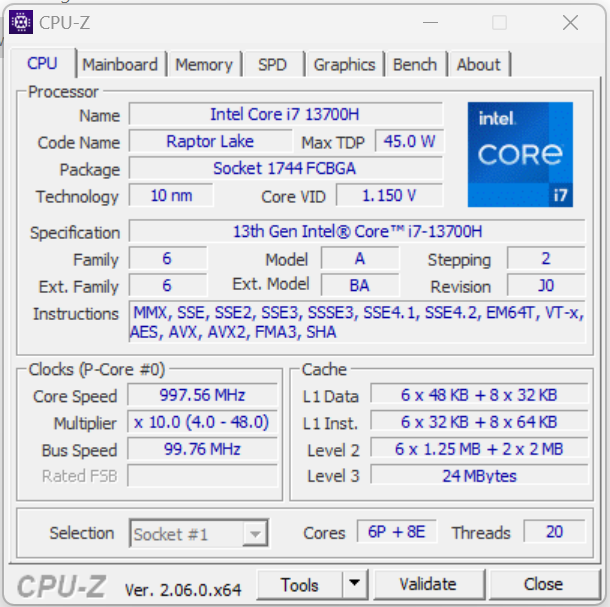
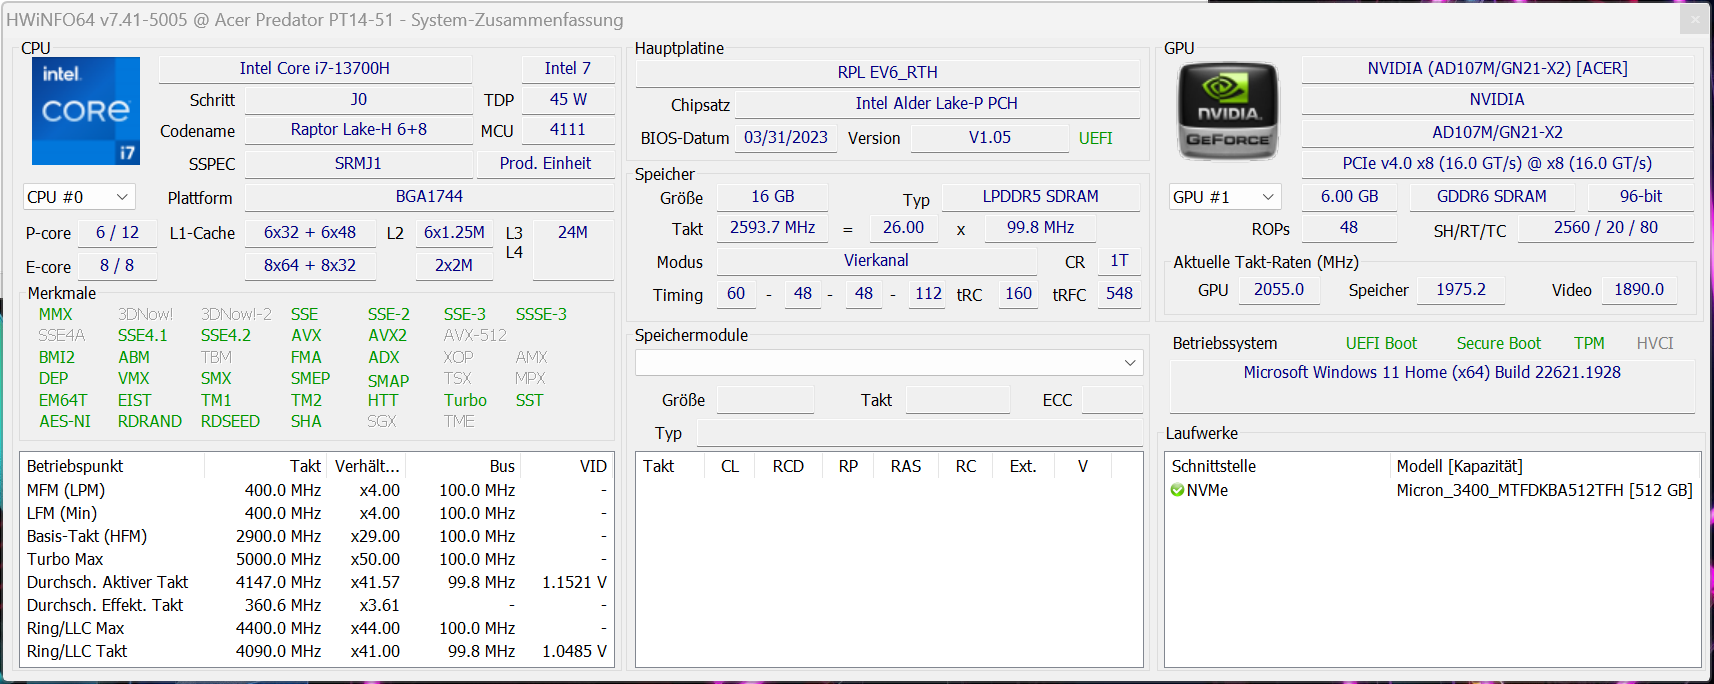
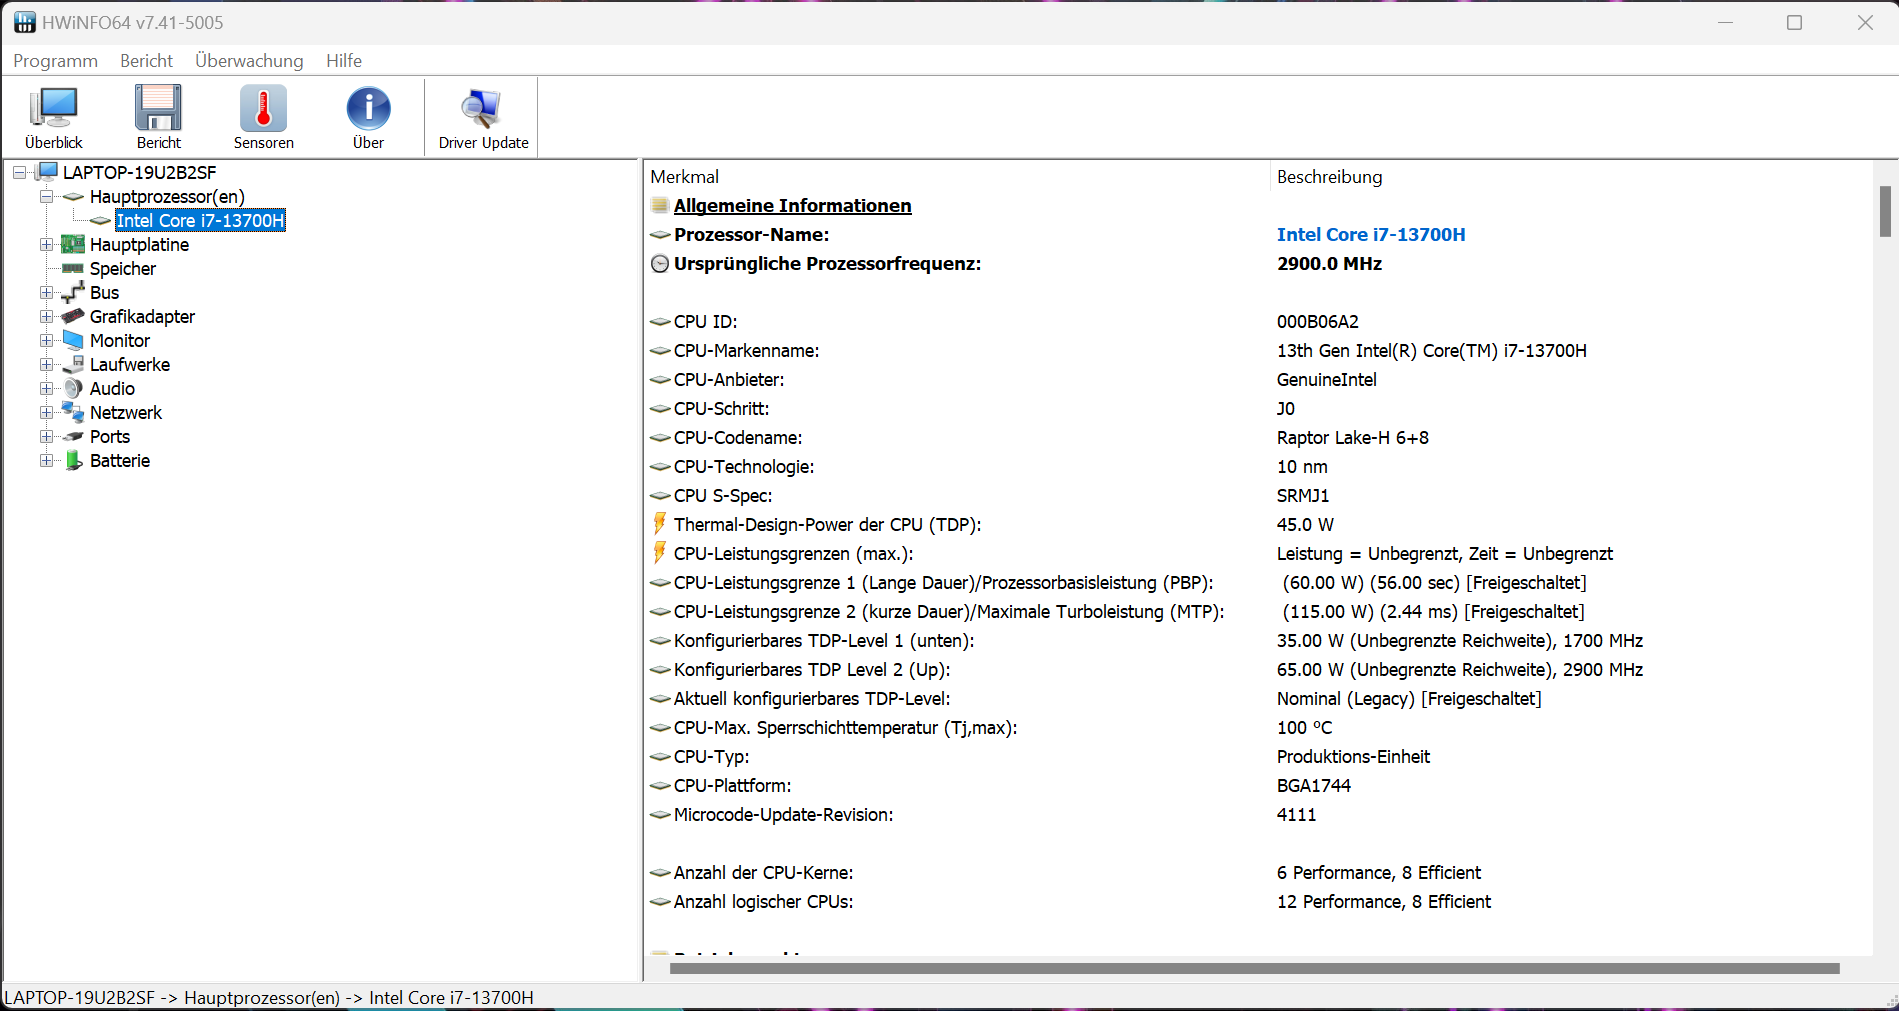
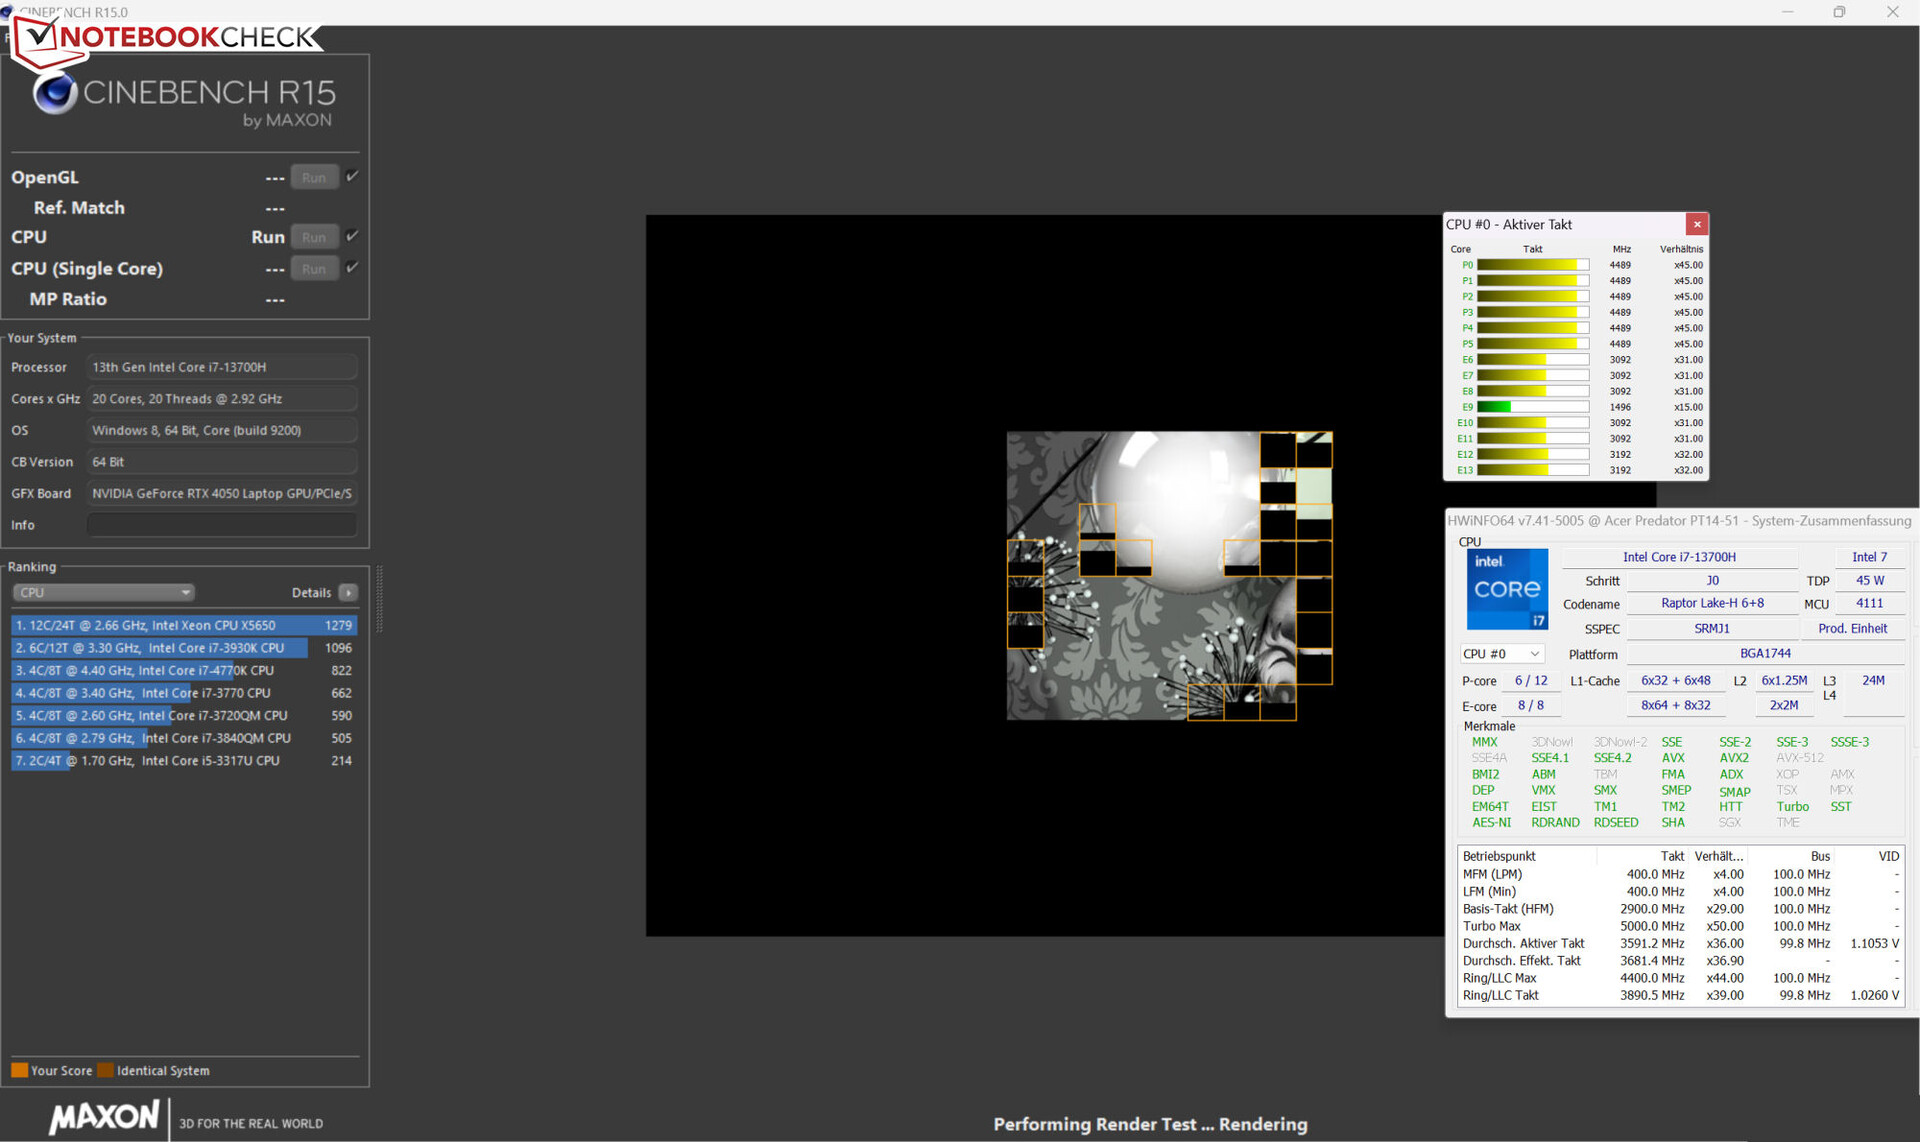
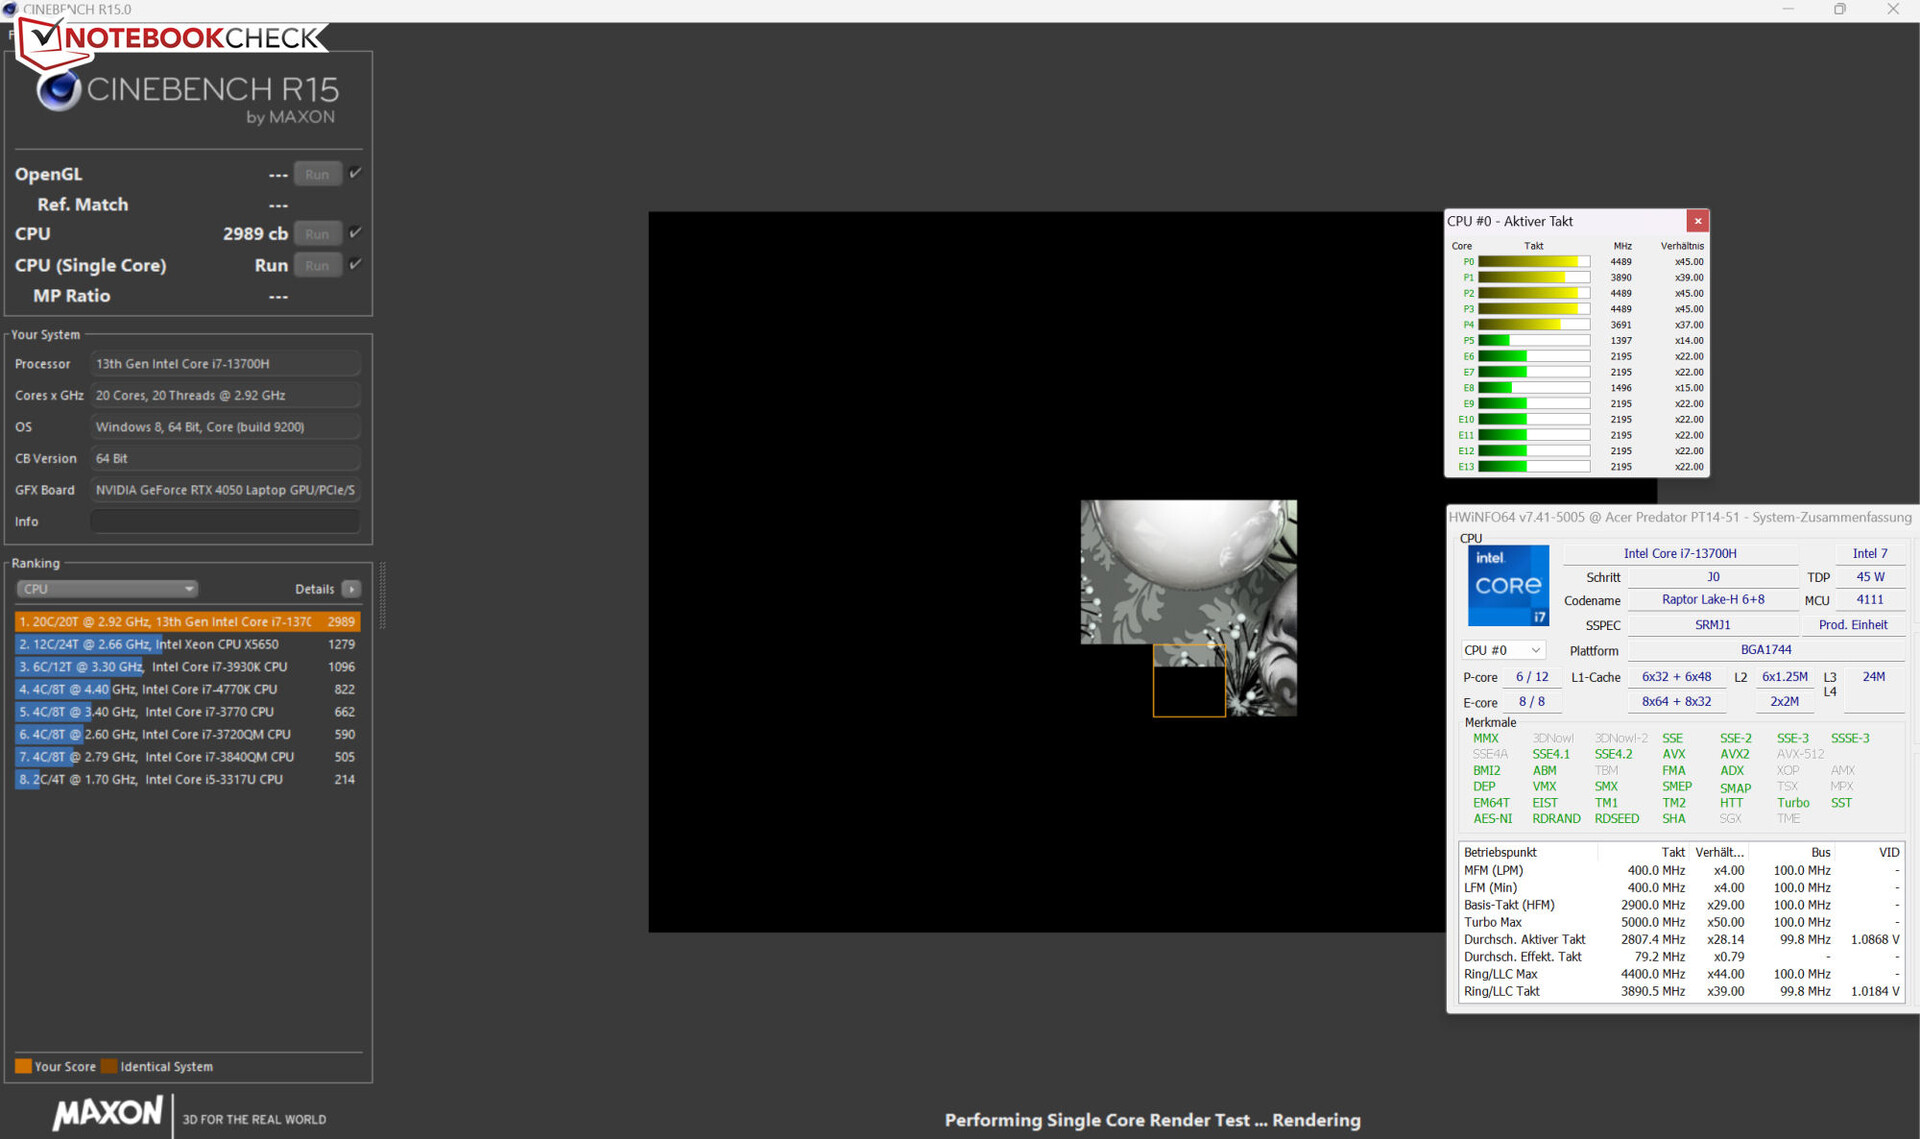
IlCore-i7-13700H(Raptor Lake) è composto da otto core di efficienza (senza hyperthreading, da 1,8 a 3,7 GHz) e sei core di prestazioni (hyperthreading, da 2,4 a 5 GHz). In totale, si tratta di 20 core logici della CPU.
I risultati del benchmark sono superiori alla media tipica delle CPU, indipendentemente dalla modalità di prestazioni selezionata. Le prestazioni single-thread (179 punti) diminuiscono meno in modalità batteria rispetto alle prestazioni multi-thread (992 punti).
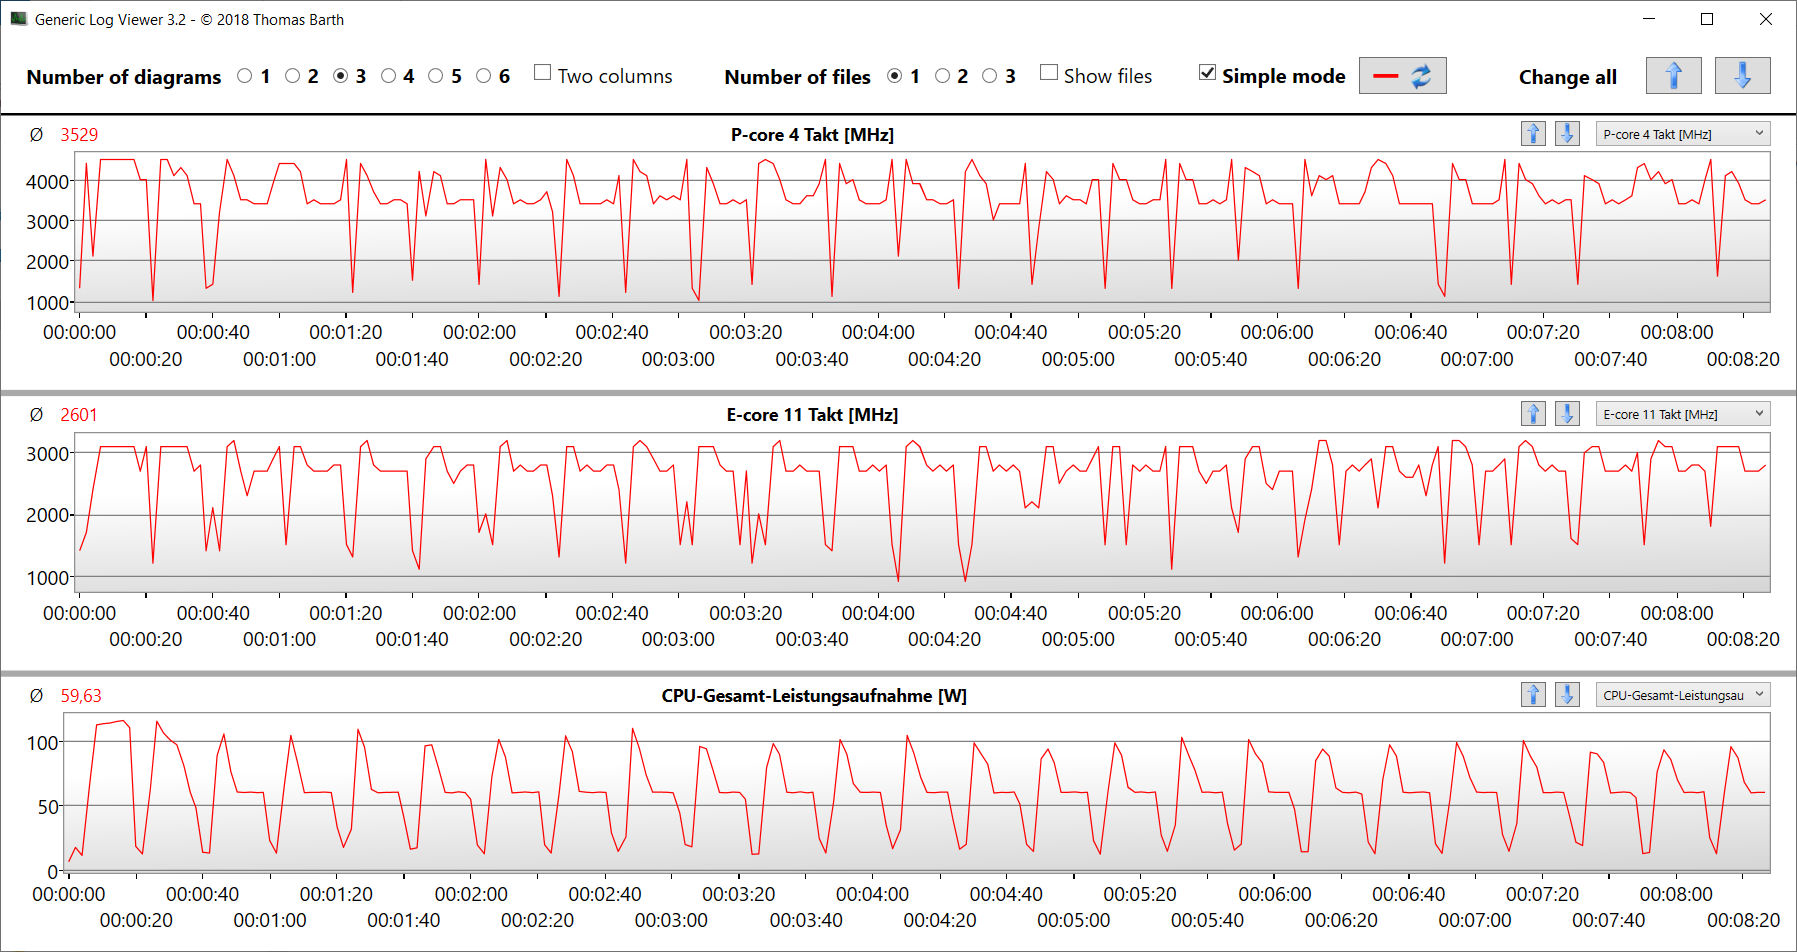
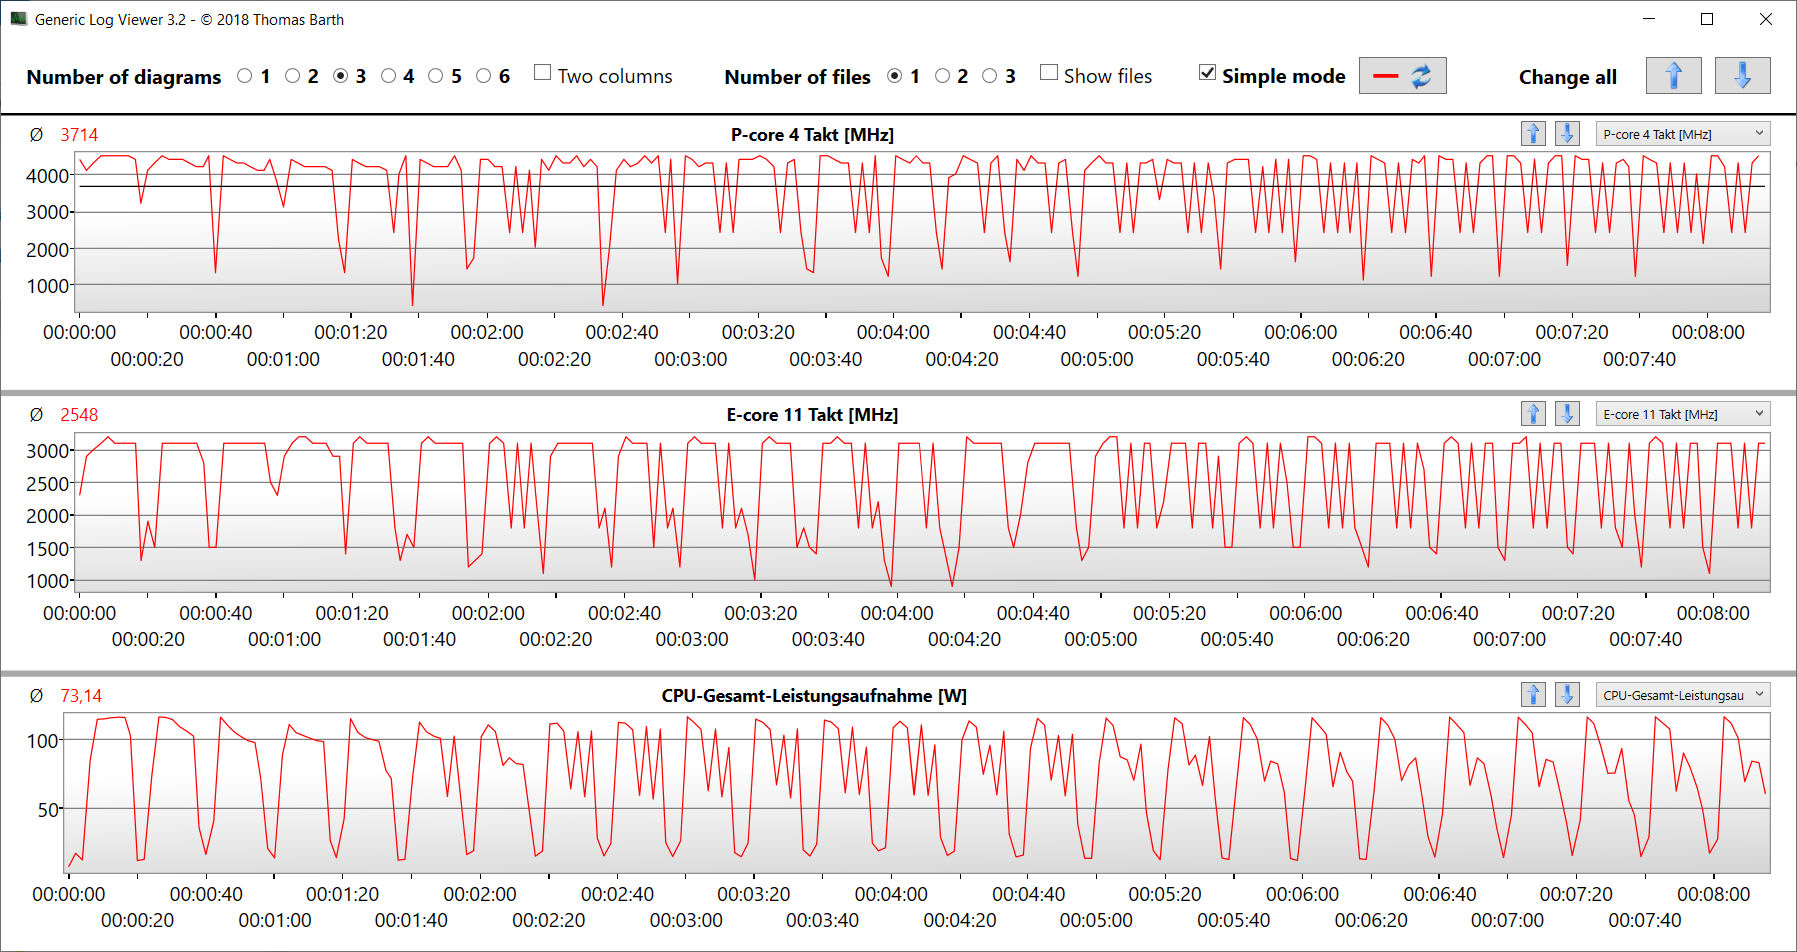
In caso di carico multi-thread continuo (ciclo CB15), la velocità di clock del turbo scende dalla prima alla terza esecuzione. Successivamente, viene mantenuto un livello costante. Il profilo "Turbo" garantisce risultati minimamente superiori. In generale, la differenza tra le modalità è molto ridotta.
Cinebench R15 Multi Continuous Test
* ... Meglio usare valori piccoli
AIDA64: FP32 Ray-Trace | FPU Julia | CPU SHA3 | CPU Queen | FPU SinJulia | FPU Mandel | CPU AES | CPU ZLib | FP64 Ray-Trace | CPU PhotoWorxx
| Performance rating | |
| Media della classe Gaming | |
| Razer Blade 14 RTX 4070 | |
| Acer Predator Triton 14 PT14-51 | |
| MSI Stealth 14 Studio A13V | |
| Asus ROG Zephyrus G14 GA402RJ | |
| Gigabyte Aero 14 OLED BMF | |
| Media Intel Core i7-13700H | |
| AIDA64 / FP32 Ray-Trace | |
| Media della classe Gaming (10227 - 85542, n=105, ultimi 2 anni) | |
| Razer Blade 14 RTX 4070 | |
| MSI Stealth 14 Studio A13V | |
| Acer Predator Triton 14 PT14-51 | |
| Media Intel Core i7-13700H (4986 - 18908, n=29) | |
| Asus ROG Zephyrus G14 GA402RJ | |
| Gigabyte Aero 14 OLED BMF | |
| AIDA64 / FPU Julia | |
| Media della classe Gaming (51376 - 238426, n=105, ultimi 2 anni) | |
| Razer Blade 14 RTX 4070 | |
| Asus ROG Zephyrus G14 GA402RJ | |
| Acer Predator Triton 14 PT14-51 | |
| MSI Stealth 14 Studio A13V | |
| Media Intel Core i7-13700H (25360 - 92359, n=29) | |
| Gigabyte Aero 14 OLED BMF | |
| AIDA64 / CPU SHA3 | |
| Media della classe Gaming (2180 - 10115, n=105, ultimi 2 anni) | |
| Razer Blade 14 RTX 4070 | |
| Acer Predator Triton 14 PT14-51 | |
| MSI Stealth 14 Studio A13V | |
| Media Intel Core i7-13700H (1339 - 4224, n=29) | |
| Gigabyte Aero 14 OLED BMF | |
| Asus ROG Zephyrus G14 GA402RJ | |
| AIDA64 / CPU Queen | |
| Razer Blade 14 RTX 4070 | |
| Media della classe Gaming (49785 - 173351, n=90, ultimi 2 anni) | |
| Gigabyte Aero 14 OLED BMF | |
| MSI Stealth 14 Studio A13V | |
| Asus ROG Zephyrus G14 GA402RJ | |
| Acer Predator Triton 14 PT14-51 | |
| Media Intel Core i7-13700H (59324 - 107159, n=29) | |
| AIDA64 / FPU SinJulia | |
| Razer Blade 14 RTX 4070 | |
| Media della classe Gaming (4424 - 33636, n=105, ultimi 2 anni) | |
| Asus ROG Zephyrus G14 GA402RJ | |
| MSI Stealth 14 Studio A13V | |
| Acer Predator Triton 14 PT14-51 | |
| Media Intel Core i7-13700H (4800 - 11050, n=29) | |
| Gigabyte Aero 14 OLED BMF | |
| AIDA64 / FPU Mandel | |
| Media della classe Gaming (25115 - 128721, n=105, ultimi 2 anni) | |
| Razer Blade 14 RTX 4070 | |
| Asus ROG Zephyrus G14 GA402RJ | |
| MSI Stealth 14 Studio A13V | |
| Acer Predator Triton 14 PT14-51 | |
| Media Intel Core i7-13700H (12321 - 45118, n=29) | |
| Gigabyte Aero 14 OLED BMF | |
| AIDA64 / CPU AES | |
| Acer Predator Triton 14 PT14-51 | |
| Asus ROG Zephyrus G14 GA402RJ | |
| Gigabyte Aero 14 OLED BMF | |
| Media della classe Gaming (39258 - 247074, n=105, ultimi 2 anni) | |
| Razer Blade 14 RTX 4070 | |
| MSI Stealth 14 Studio A13V | |
| Media Intel Core i7-13700H (28769 - 151254, n=29) | |
| AIDA64 / CPU ZLib | |
| Media della classe Gaming (574 - 2531, n=105, ultimi 2 anni) | |
| Acer Predator Triton 14 PT14-51 | |
| Razer Blade 14 RTX 4070 | |
| MSI Stealth 14 Studio A13V | |
| Media Intel Core i7-13700H (389 - 1215, n=29) | |
| Gigabyte Aero 14 OLED BMF | |
| Asus ROG Zephyrus G14 GA402RJ | |
| AIDA64 / FP64 Ray-Trace | |
| Media della classe Gaming (5509 - 45446, n=105, ultimi 2 anni) | |
| Razer Blade 14 RTX 4070 | |
| MSI Stealth 14 Studio A13V | |
| Acer Predator Triton 14 PT14-51 | |
| Media Intel Core i7-13700H (2540 - 10135, n=29) | |
| Asus ROG Zephyrus G14 GA402RJ | |
| Gigabyte Aero 14 OLED BMF | |
| AIDA64 / CPU PhotoWorxx | |
| Gigabyte Aero 14 OLED BMF | |
| Acer Predator Triton 14 PT14-51 | |
| Media della classe Gaming (12271 - 89891, n=105, ultimi 2 anni) | |
| Media Intel Core i7-13700H (12872 - 52727, n=29) | |
| MSI Stealth 14 Studio A13V | |
| Razer Blade 14 RTX 4070 | |
| Asus ROG Zephyrus G14 GA402RJ | |
Prestazioni del sistema
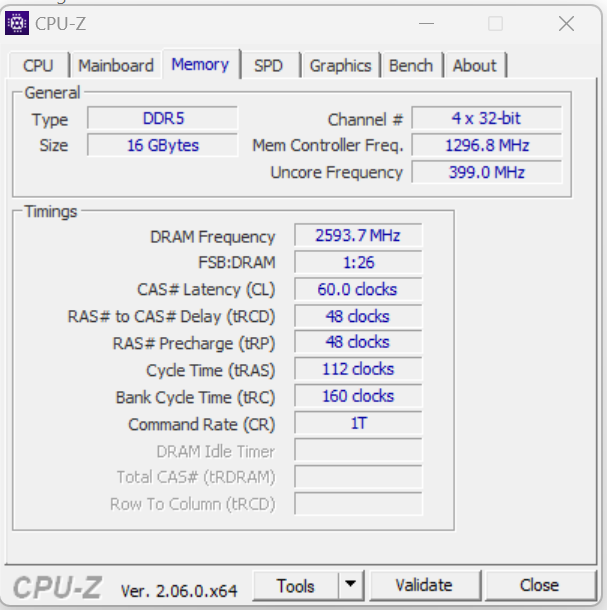
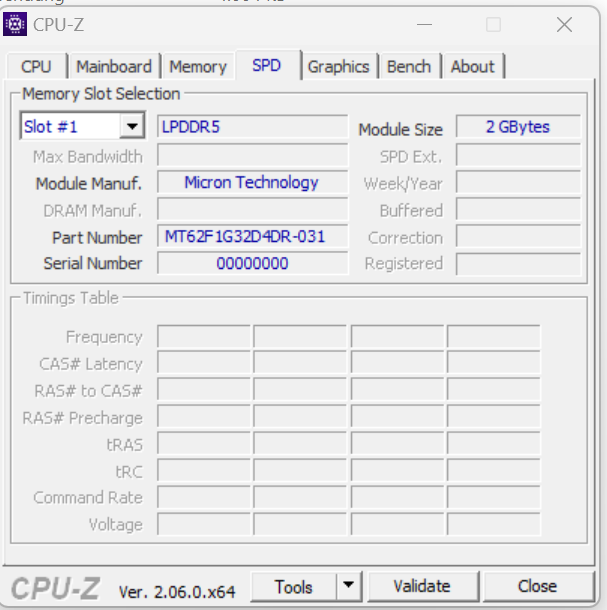
Il sistema, che funziona in modo fluido, ha a disposizione una potenza sufficiente per le applicazioni più impegnative, come il rendering e il gioco, come confermano i buoni risultati di PC Mark. Le velocità di trasferimento della RAM rientrano nella norma per una RAM LPDDR5 6000.
CrossMark: Overall | Productivity | Creativity | Responsiveness
| PCMark 10 / Score | |
| Media della classe Gaming (5828 - 12414, n=93, ultimi 2 anni) | |
| Razer Blade 14 RTX 4070 | |
| Acer Predator Triton 14 PT14-51 | |
| Asus ROG Zephyrus G14 GA402RJ | |
| Gigabyte Aero 14 OLED BMF | |
| Media Intel Core i7-13700H, NVIDIA GeForce RTX 4050 Laptop GPU (6822 - 7556, n=7) | |
| MSI Stealth 14 Studio A13V | |
| PCMark 10 / Essentials | |
| Gigabyte Aero 14 OLED BMF | |
| Razer Blade 14 RTX 4070 | |
| Media Intel Core i7-13700H, NVIDIA GeForce RTX 4050 Laptop GPU (10283 - 11549, n=7) | |
| Media della classe Gaming (8810 - 11935, n=97, ultimi 2 anni) | |
| Acer Predator Triton 14 PT14-51 | |
| MSI Stealth 14 Studio A13V | |
| Asus ROG Zephyrus G14 GA402RJ | |
| PCMark 10 / Productivity | |
| Media della classe Gaming (6845 - 25323, n=95, ultimi 2 anni) | |
| Razer Blade 14 RTX 4070 | |
| Acer Predator Triton 14 PT14-51 | |
| Asus ROG Zephyrus G14 GA402RJ | |
| Gigabyte Aero 14 OLED BMF | |
| Media Intel Core i7-13700H, NVIDIA GeForce RTX 4050 Laptop GPU (8368 - 9836, n=7) | |
| MSI Stealth 14 Studio A13V | |
| PCMark 10 / Digital Content Creation | |
| Media della classe Gaming (7602 - 19954, n=95, ultimi 2 anni) | |
| Razer Blade 14 RTX 4070 | |
| Asus ROG Zephyrus G14 GA402RJ | |
| Acer Predator Triton 14 PT14-51 | |
| MSI Stealth 14 Studio A13V | |
| Media Intel Core i7-13700H, NVIDIA GeForce RTX 4050 Laptop GPU (9527 - 10643, n=7) | |
| Gigabyte Aero 14 OLED BMF | |
| CrossMark / Overall | |
| Media della classe Gaming (1366 - 2409, n=94, ultimi 2 anni) | |
| Acer Predator Triton 14 PT14-51 | |
| Gigabyte Aero 14 OLED BMF | |
| Razer Blade 14 RTX 4070 | |
| Apple MacBook Pro 14 2023 M2 Pro Entry | |
| MSI Stealth 14 Studio A13V | |
| Media Intel Core i7-13700H, NVIDIA GeForce RTX 4050 Laptop GPU (1205 - 1937, n=9) | |
| CrossMark / Productivity | |
| Media della classe Gaming (1386 - 2254, n=94, ultimi 2 anni) | |
| Gigabyte Aero 14 OLED BMF | |
| Razer Blade 14 RTX 4070 | |
| Acer Predator Triton 14 PT14-51 | |
| Media Intel Core i7-13700H, NVIDIA GeForce RTX 4050 Laptop GPU (1158 - 1877, n=9) | |
| MSI Stealth 14 Studio A13V | |
| Apple MacBook Pro 14 2023 M2 Pro Entry | |
| CrossMark / Creativity | |
| Media della classe Gaming (1343 - 2786, n=94, ultimi 2 anni) | |
| Apple MacBook Pro 14 2023 M2 Pro Entry | |
| Acer Predator Triton 14 PT14-51 | |
| Razer Blade 14 RTX 4070 | |
| Gigabyte Aero 14 OLED BMF | |
| MSI Stealth 14 Studio A13V | |
| Media Intel Core i7-13700H, NVIDIA GeForce RTX 4050 Laptop GPU (1293 - 2044, n=9) | |
| CrossMark / Responsiveness | |
| Acer Predator Triton 14 PT14-51 | |
| Gigabyte Aero 14 OLED BMF | |
| Media della classe Gaming (1226 - 2334, n=94, ultimi 2 anni) | |
| Media Intel Core i7-13700H, NVIDIA GeForce RTX 4050 Laptop GPU (1097 - 1929, n=9) | |
| Razer Blade 14 RTX 4070 | |
| MSI Stealth 14 Studio A13V | |
| Apple MacBook Pro 14 2023 M2 Pro Entry | |
| PCMark 8 Home Score Accelerated v2 | 5120 punti | |
| PCMark 8 Work Score Accelerated v2 | 5617 punti | |
| PCMark 10 Score | 7402 punti | |
Aiuto | ||
| AIDA64 / Memory Copy | |
| Gigabyte Aero 14 OLED BMF | |
| Acer Predator Triton 14 PT14-51 | |
| Media della classe Gaming (21750 - 129946, n=105, ultimi 2 anni) | |
| Media Intel Core i7-13700H (24334 - 78081, n=29) | |
| Razer Blade 14 RTX 4070 | |
| MSI Stealth 14 Studio A13V | |
| Asus ROG Zephyrus G14 GA402RJ | |
| AIDA64 / Memory Read | |
| Gigabyte Aero 14 OLED BMF | |
| Media della classe Gaming (22956 - 118858, n=105, ultimi 2 anni) | |
| MSI Stealth 14 Studio A13V | |
| Acer Predator Triton 14 PT14-51 | |
| Media Intel Core i7-13700H (23681 - 79656, n=29) | |
| Razer Blade 14 RTX 4070 | |
| Asus ROG Zephyrus G14 GA402RJ | |
| AIDA64 / Memory Write | |
| Gigabyte Aero 14 OLED BMF | |
| Acer Predator Triton 14 PT14-51 | |
| Razer Blade 14 RTX 4070 | |
| Media della classe Gaming (22297 - 135096, n=105, ultimi 2 anni) | |
| Media Intel Core i7-13700H (22986 - 99898, n=29) | |
| Asus ROG Zephyrus G14 GA402RJ | |
| MSI Stealth 14 Studio A13V | |
| AIDA64 / Memory Latency | |
| Media della classe Gaming (75.3 - 259, n=105, ultimi 2 anni) | |
| Acer Predator Triton 14 PT14-51 | |
| Media Intel Core i7-13700H (82.4 - 136.8, n=29) | |
| Gigabyte Aero 14 OLED BMF | |
| Asus ROG Zephyrus G14 GA402RJ | |
| Razer Blade 14 RTX 4070 | |
| MSI Stealth 14 Studio A13V | |
* ... Meglio usare valori piccoli
Latenze DPC
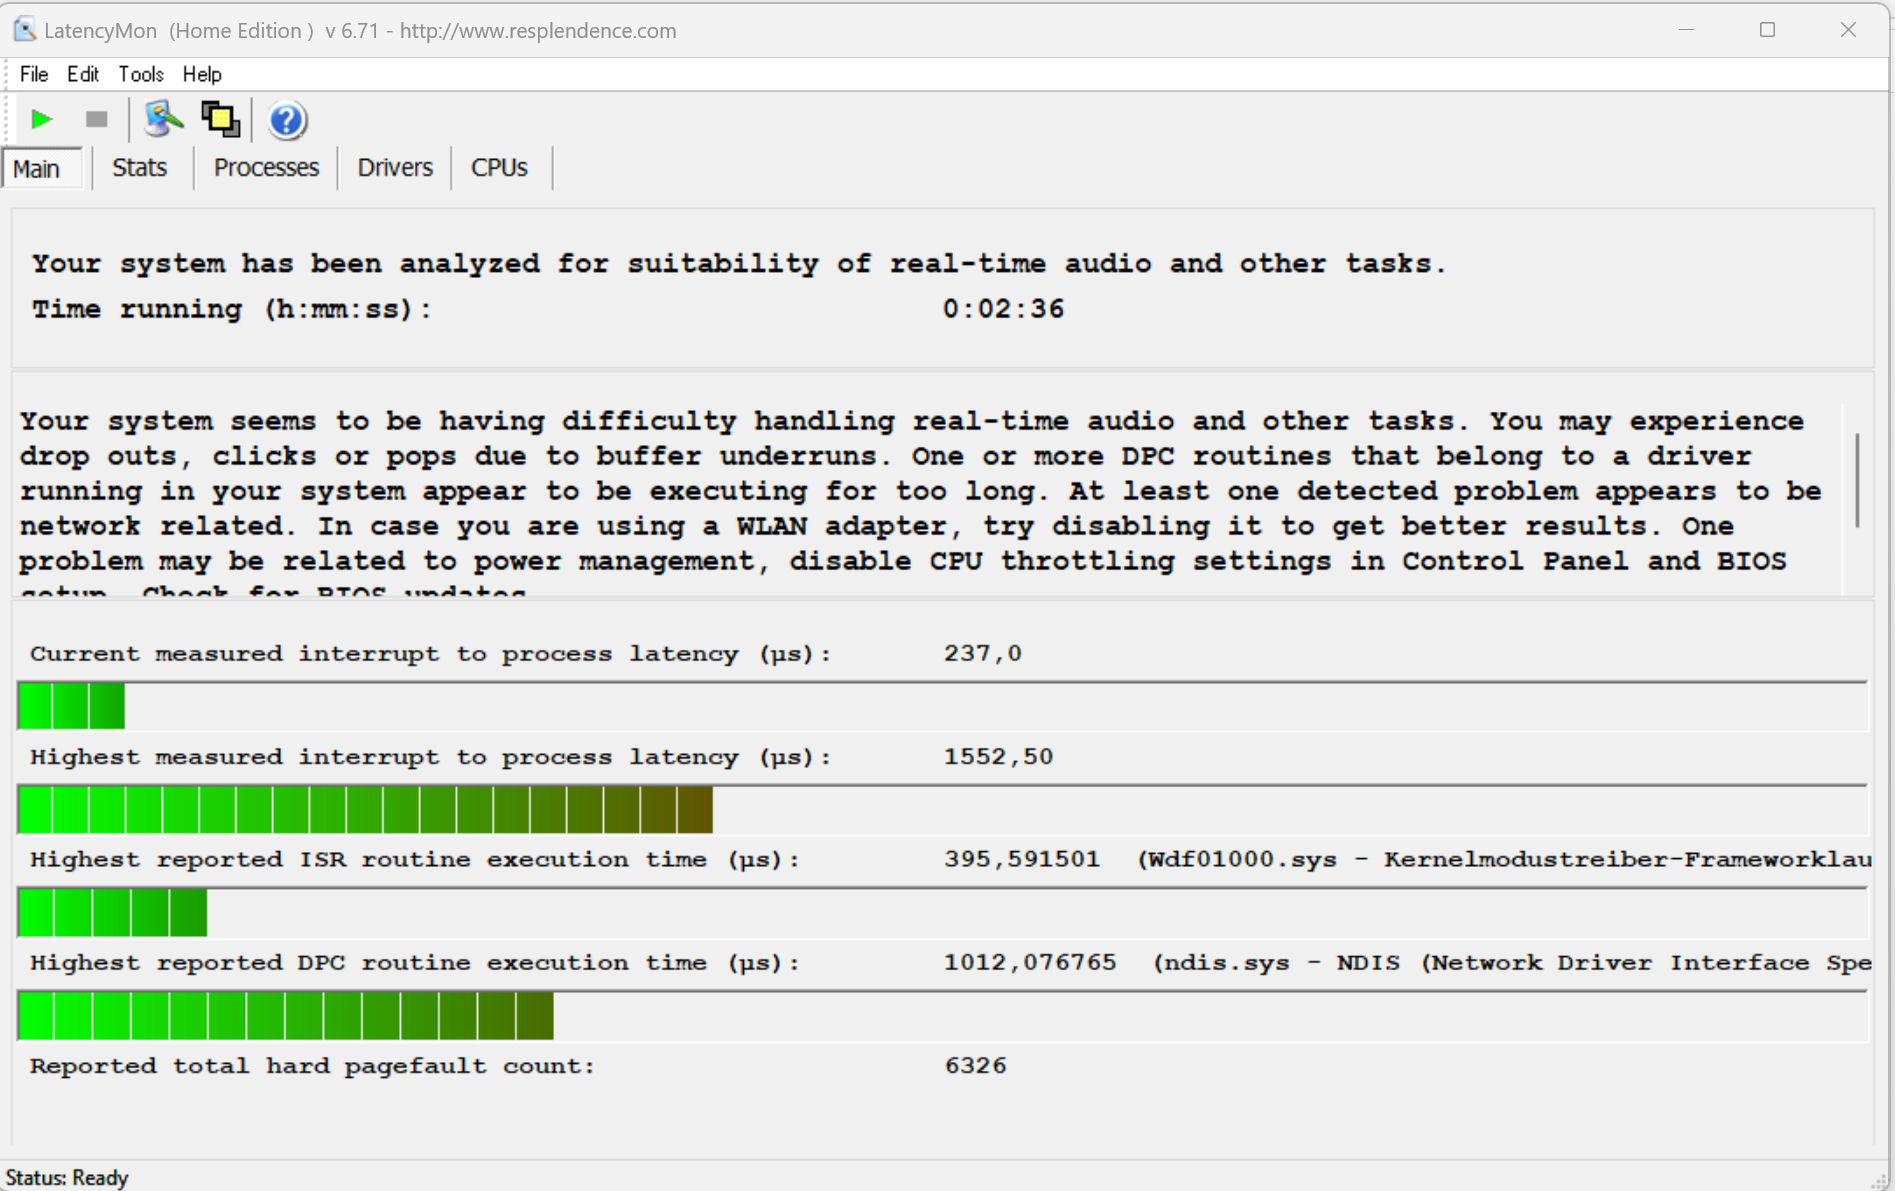
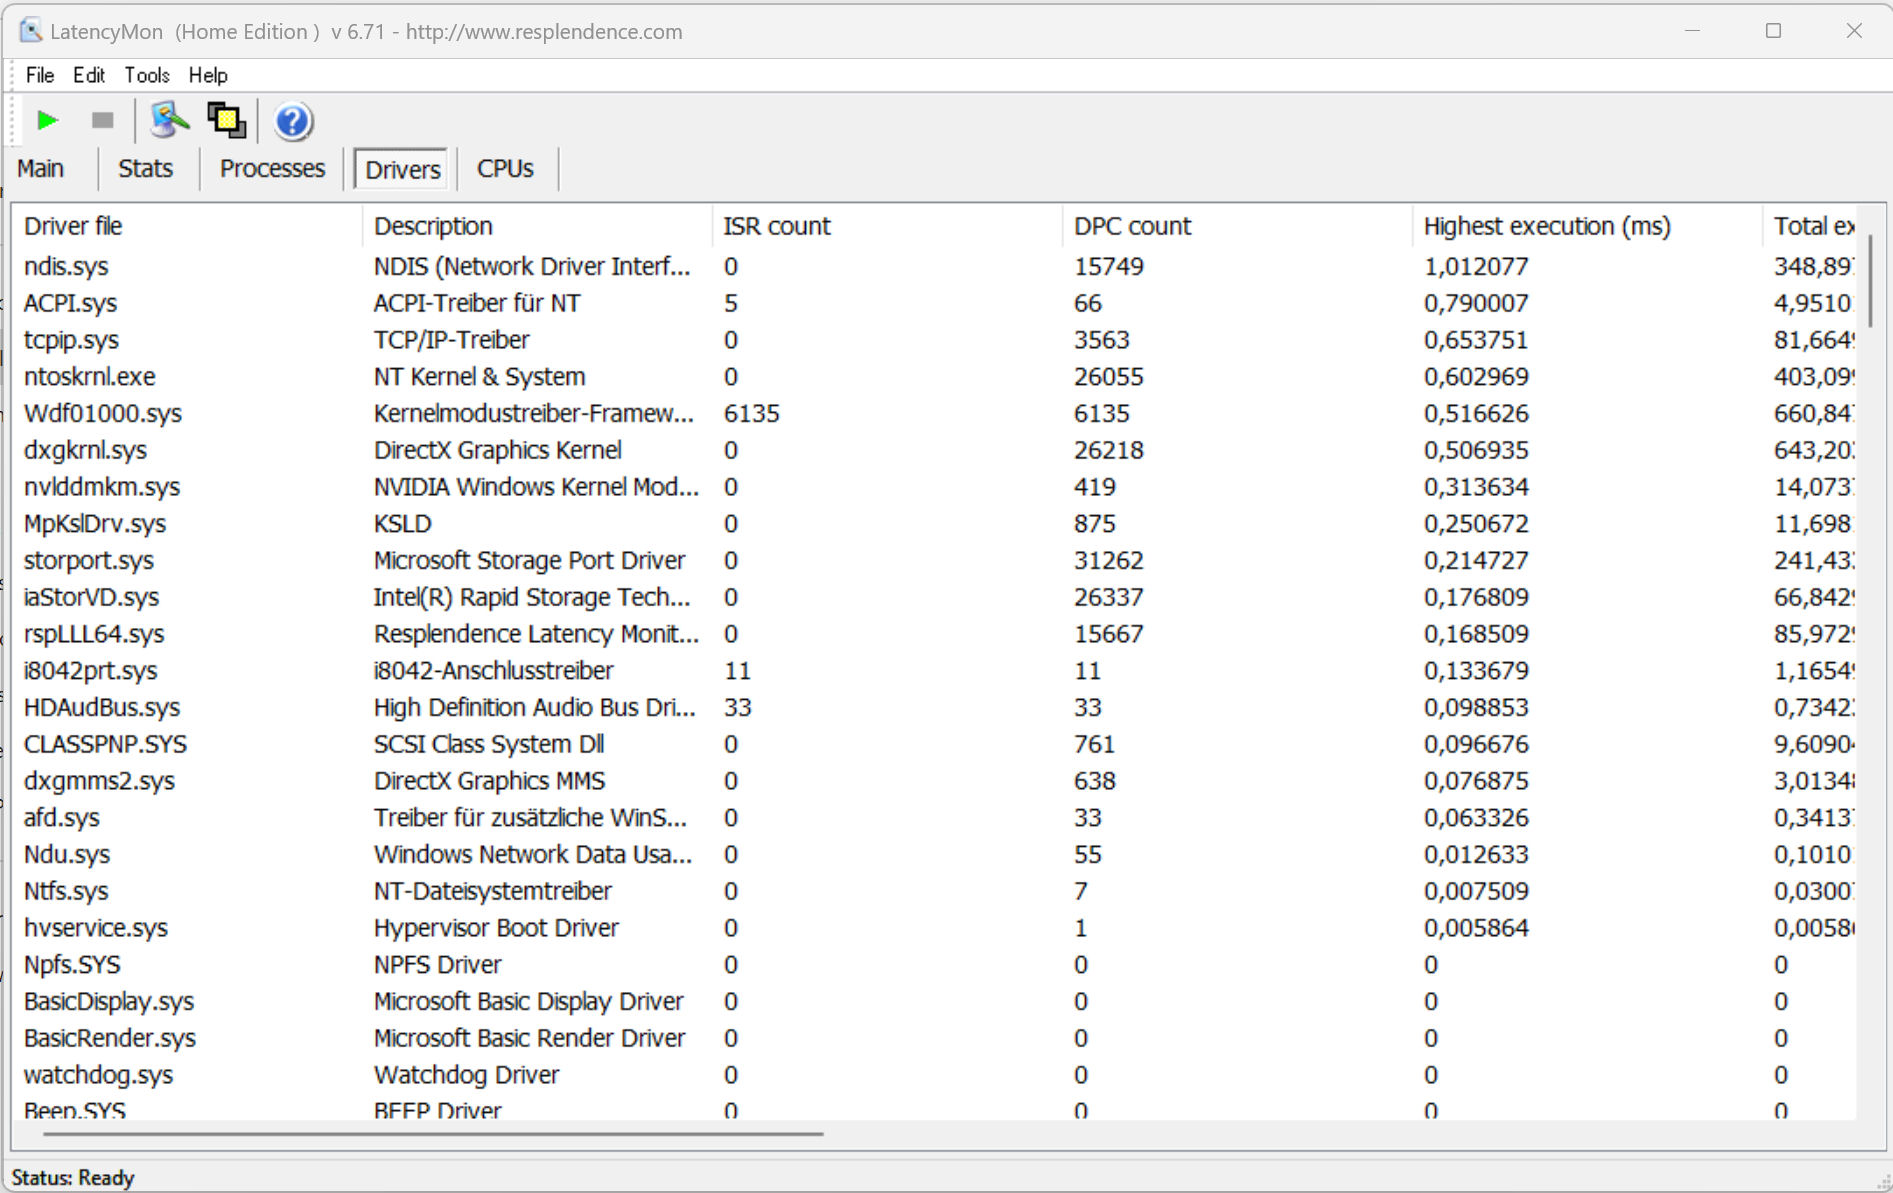
Il test standardizzato Latency Monitor (navigazione internet, riproduzione video 4k, Prime95 High Load) ha rivelato anomalie. Il sistema non sembra essere adatto all'editing video e audio in tempo reale. I futuri aggiornamenti del software potrebbero migliorare o peggiorare la situazione.
| DPC Latencies / LatencyMon - interrupt to process latency (max), Web, Youtube, Prime95 | |
| Gigabyte Aero 14 OLED BMF | |
| MSI Stealth 14 Studio A13V | |
| Acer Predator Triton 14 PT14-51 | |
| Asus ROG Zephyrus G14 GA402RJ | |
| Razer Blade 14 RTX 4070 | |
* ... Meglio usare valori piccoli
Memoria di massa
L'avarizia dello storage di Acer: L'unità SSD PCIe 4 installata (M.2 2280) ha una capacità di soli 512 GB, non sufficiente per un portatile da gioco e soprattutto per uno di questa categoria di prezzo. L'SSD Micron è molto decente ma non ha velocità di trasferimento eccezionali. Contro: Nel corso del ciclo DiskSpd, si verificano cali di prestazioni dovuti al thermal throttling. Non c'è spazio per un supporto di archiviazione aggiuntivo.

* ... Meglio usare valori piccoli
Continuous Performance Read: DiskSpd Read Loop, Queue Depth 8
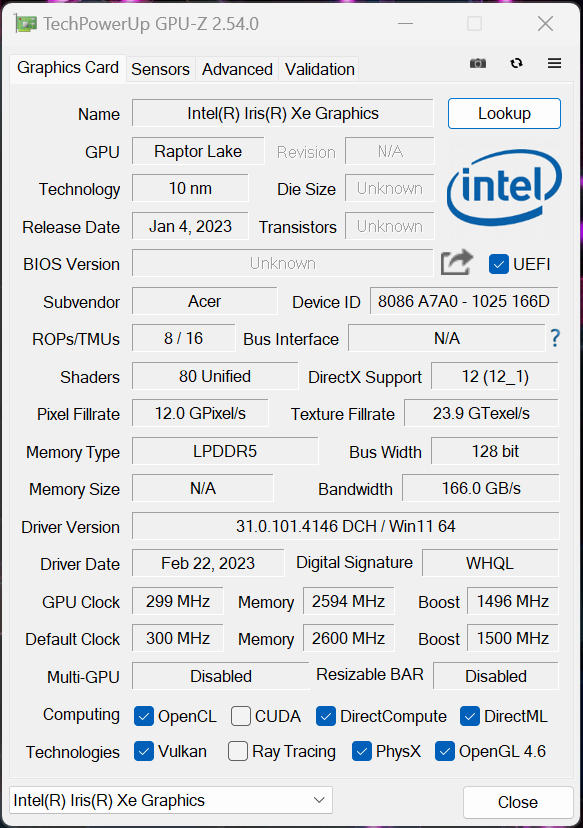
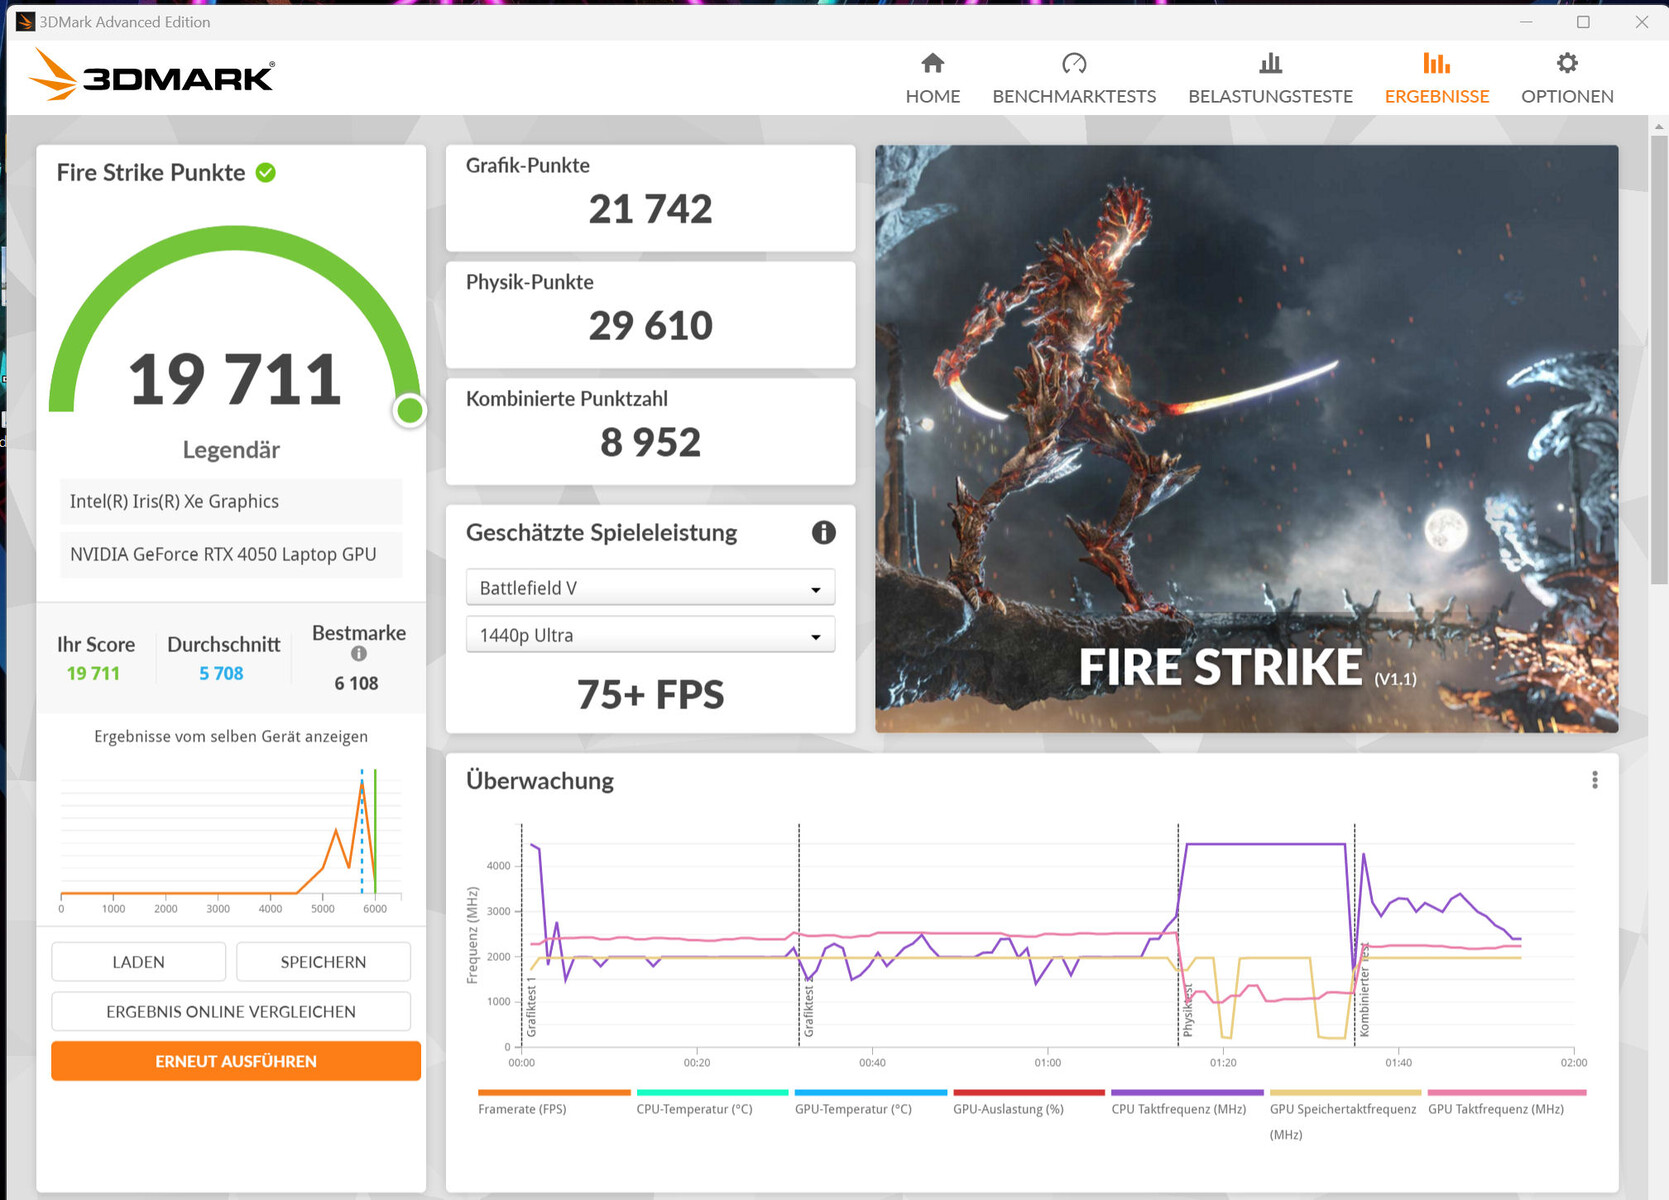
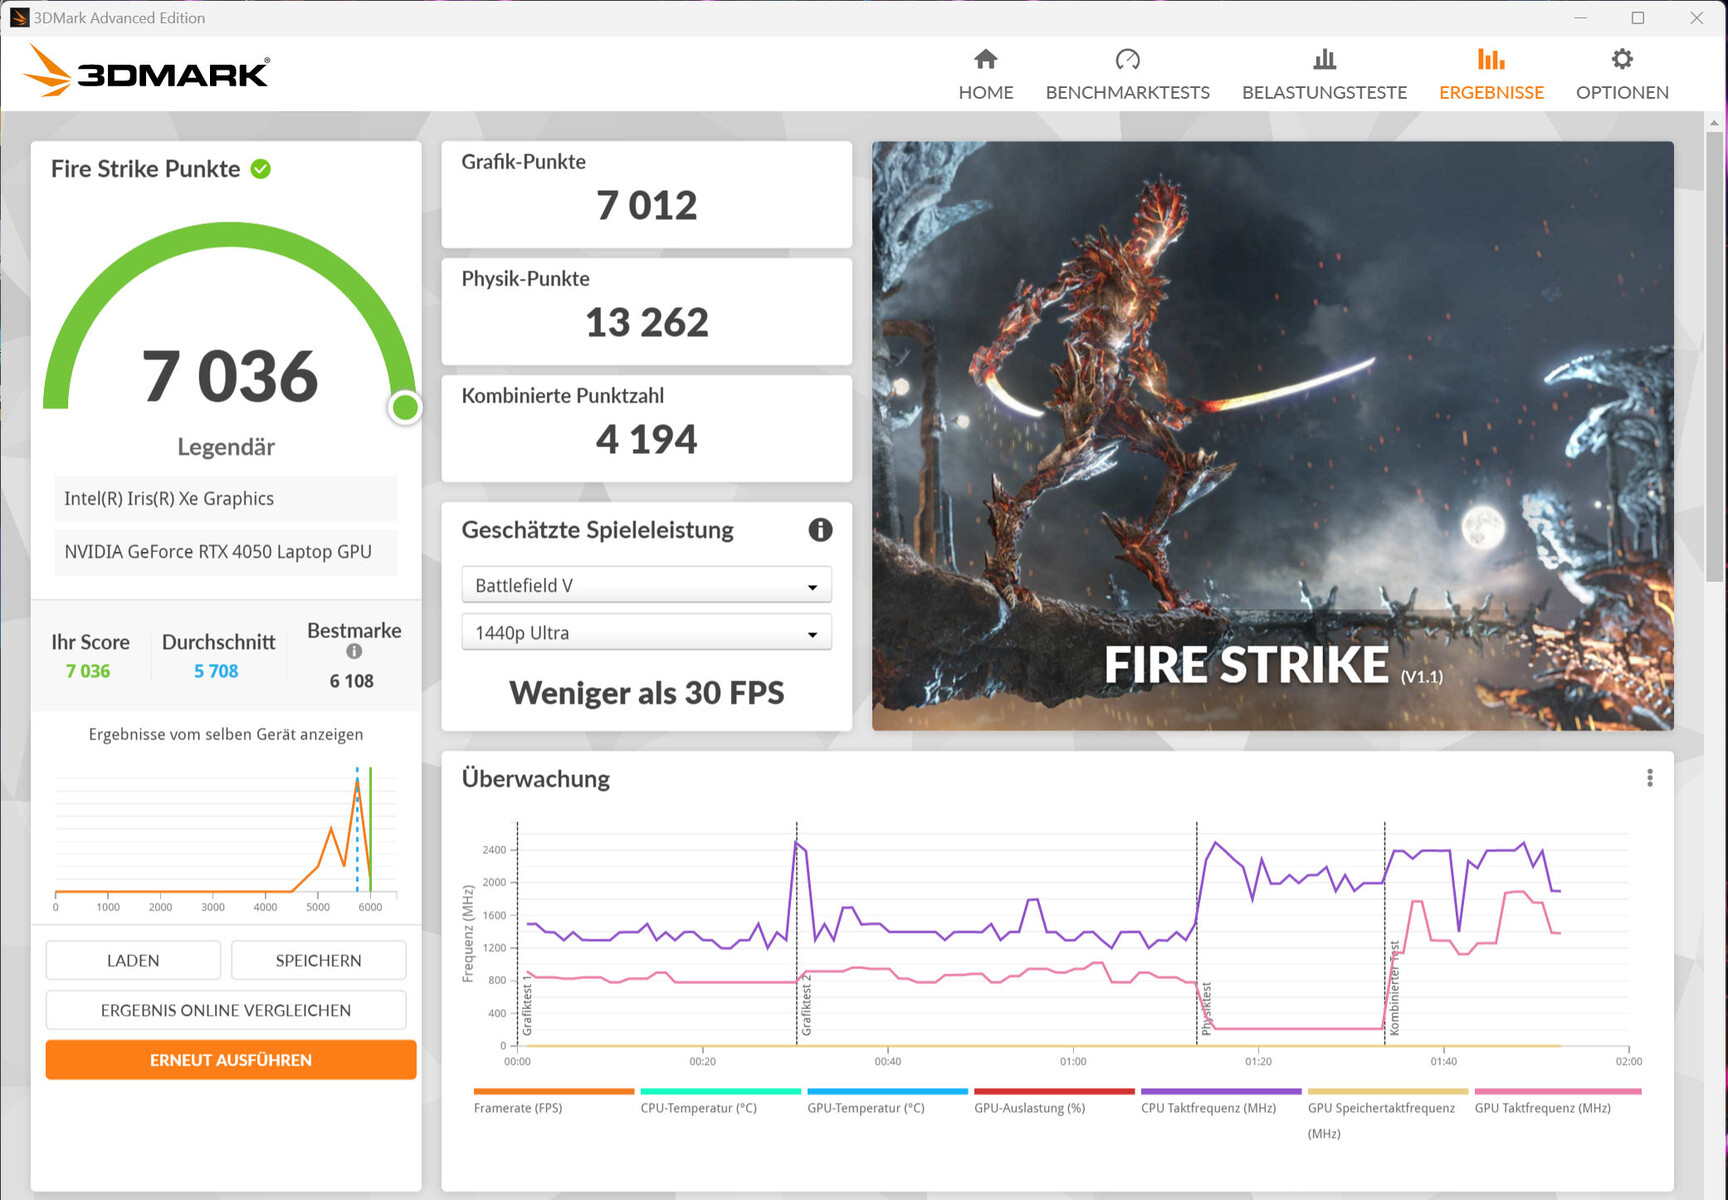
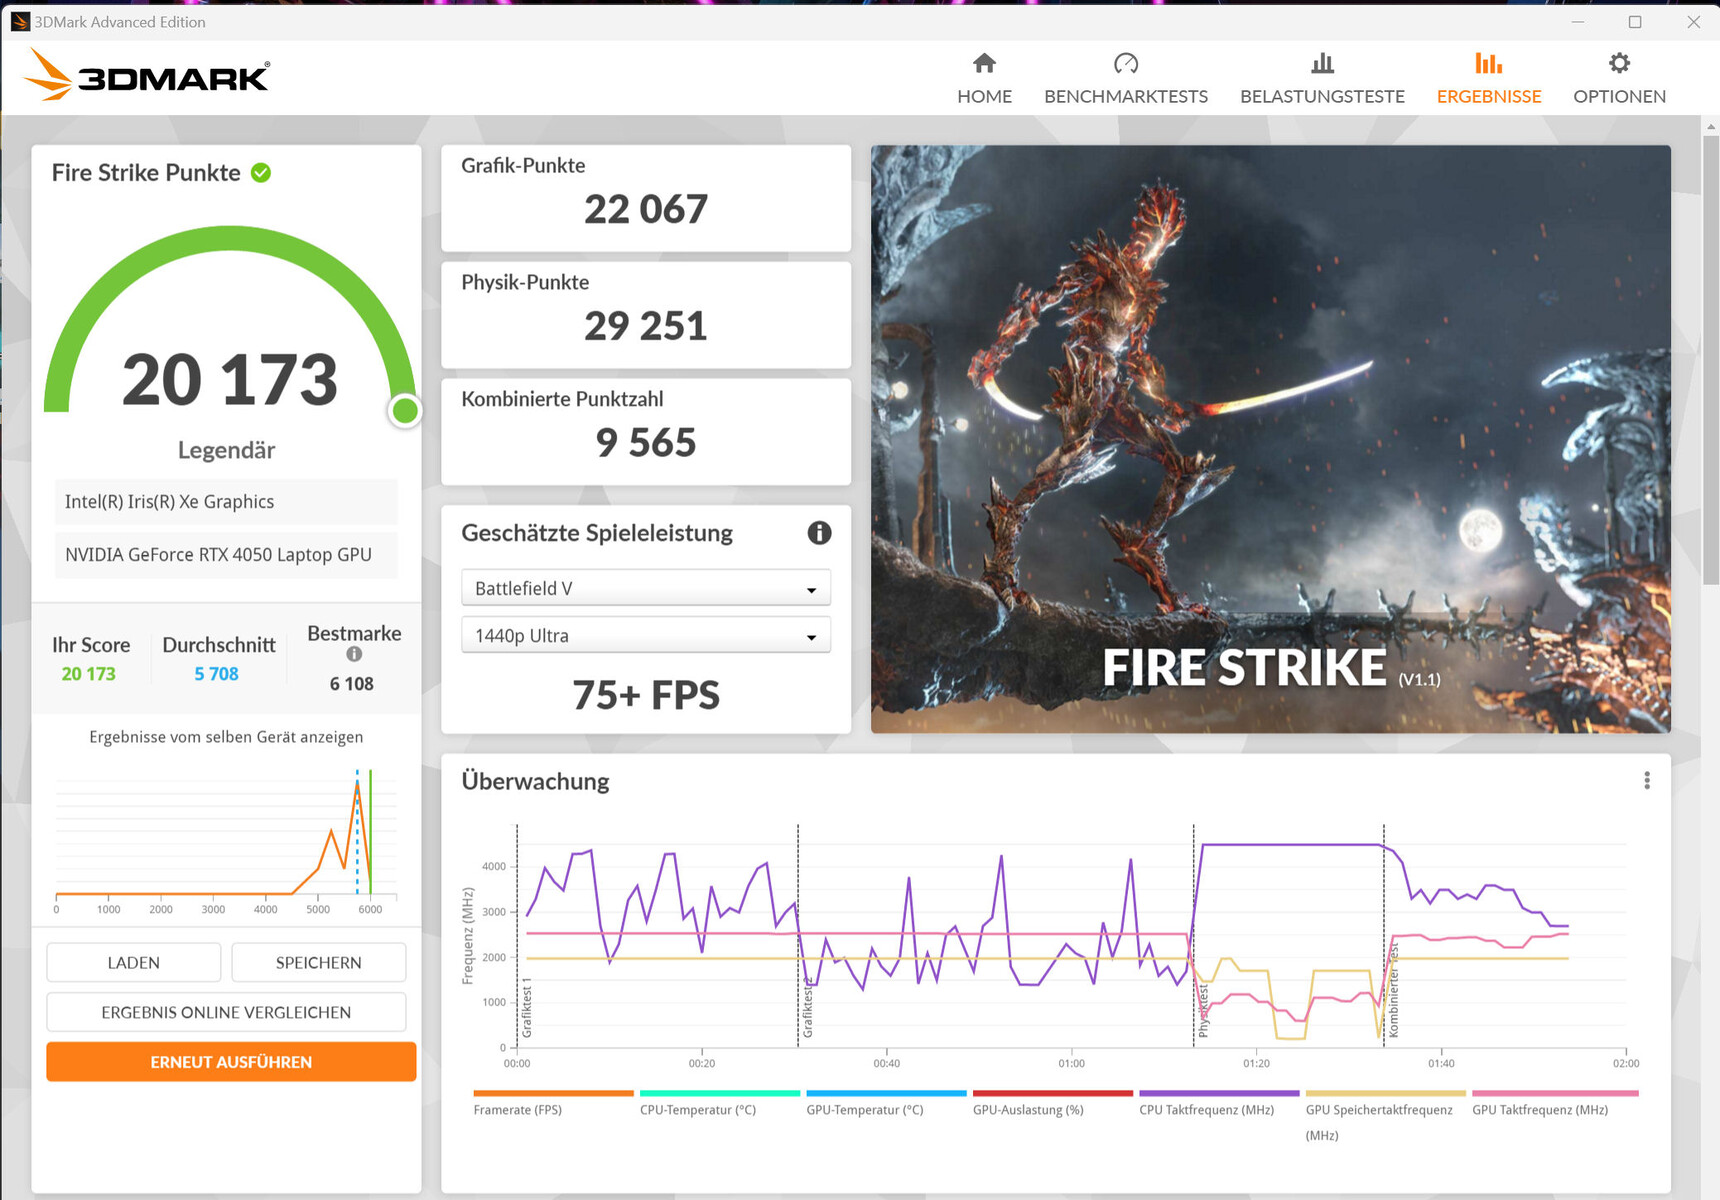
Scheda grafica
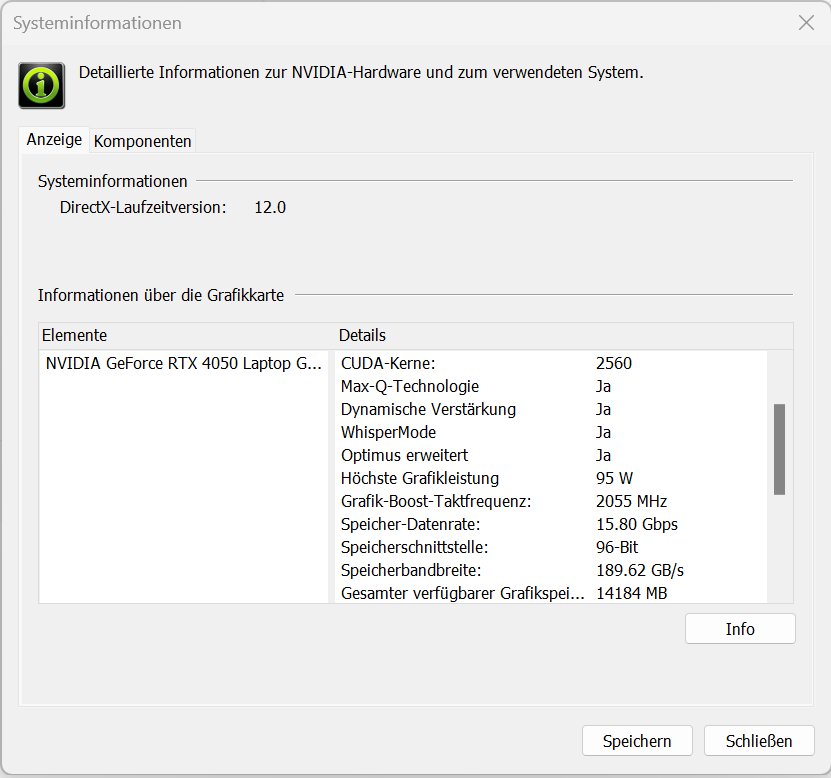
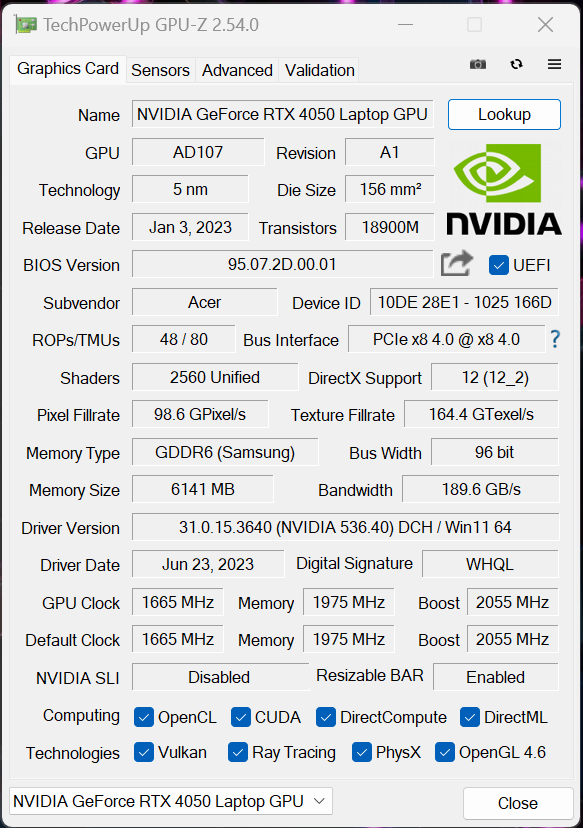
LaGeForce RTX 4050offre 2.560 shader, un bus a 96 bit e una veloce RAM GDDR6 (6.144 MB). Acer ha impostato il TGP massimo a 95 watt. Secondo il test di Witcher 3, il TGP non è al massimo.
I risultati del benchmark sono superiori alla media della RTX 4050. Tuttavia, questo non vale quando si utilizza la modalità "Quiet". L'uscita video diretta tramite la GPU GeForce non fornisce un aumento delle prestazioni e la commutazione tra dGPU e Optimus non richiede un riavvio - Optimus avanzato è supportato.

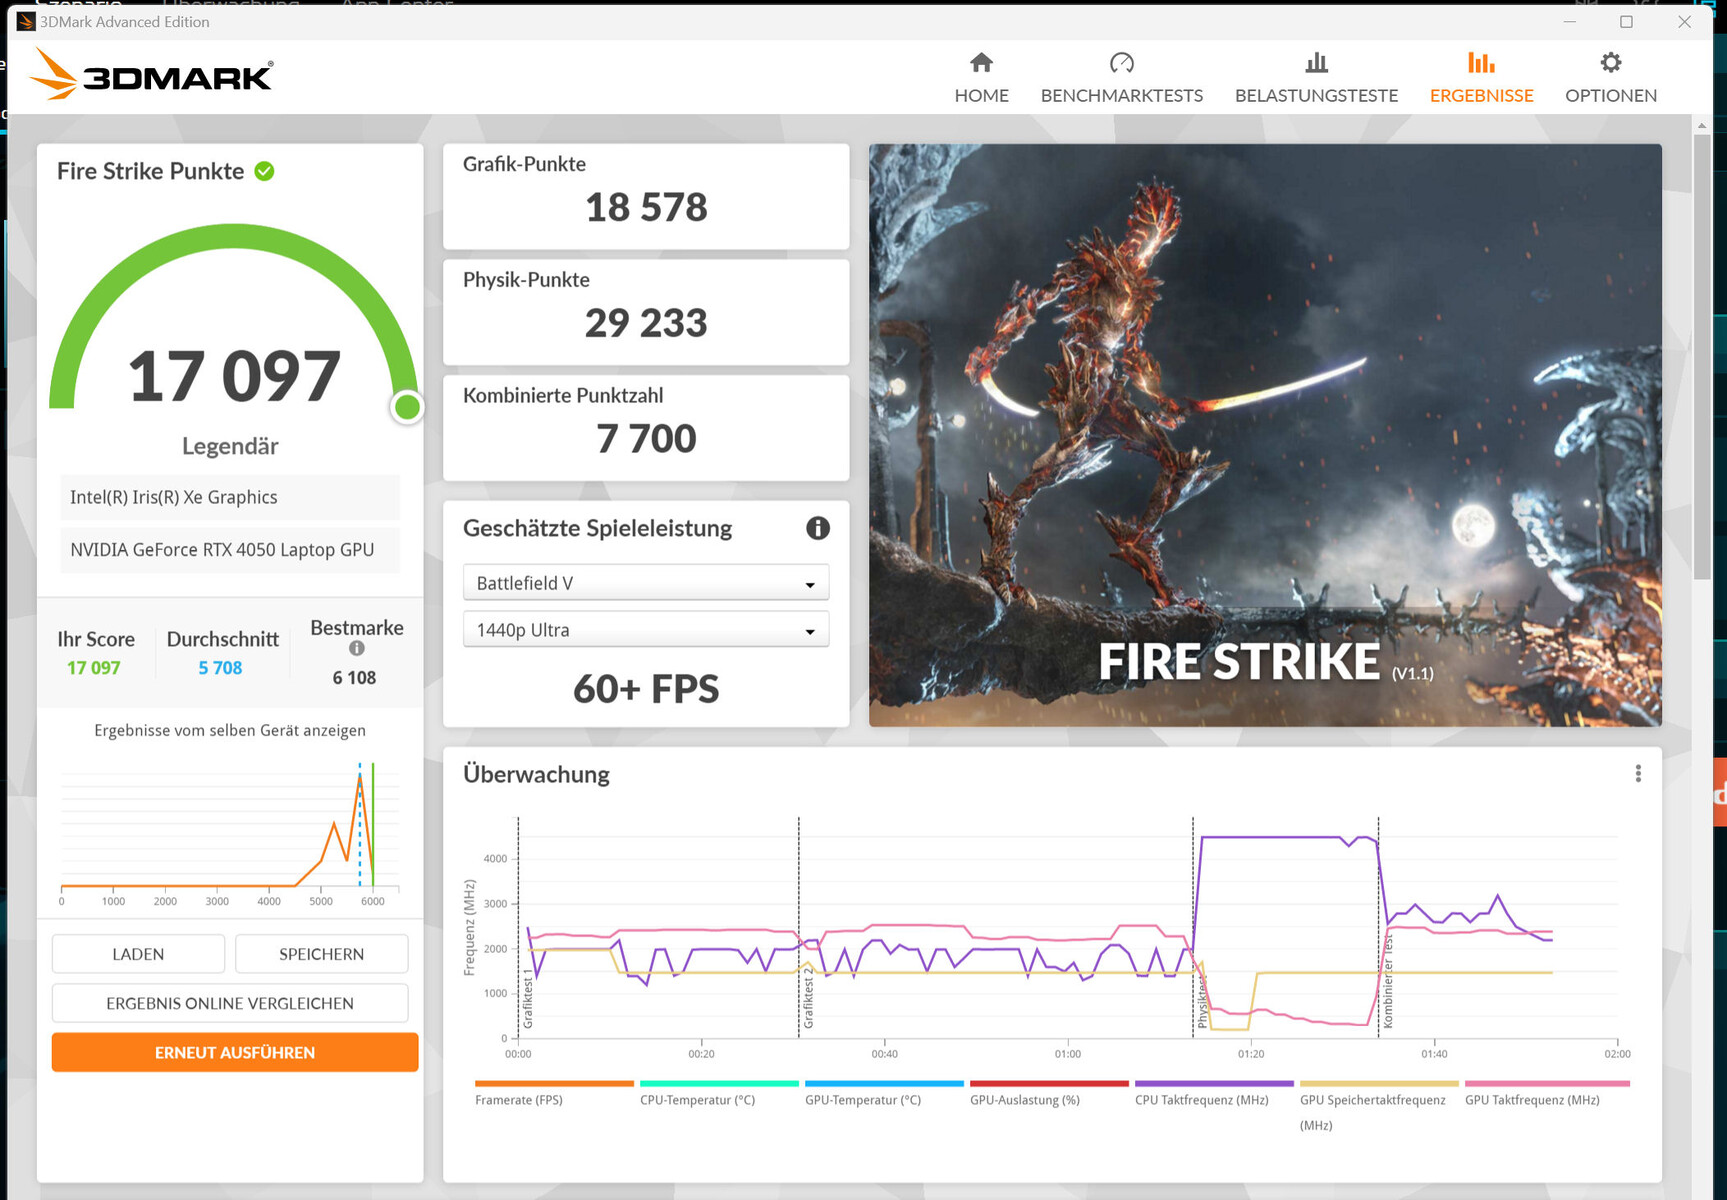
| 3DMark 06 Standard Score | 52667 punti | |
| 3DMark 11 Performance | 27364 punti | |
| 3DMark Cloud Gate Standard Score | 61034 punti | |
| 3DMark Fire Strike Score | 19711 punti | |
| 3DMark Time Spy Score | 8580 punti | |
Aiuto | ||
| Geekbench 6.7 - GPU OpenCL | |
| Media della classe Gaming (67235 - 253130, n=103, ultimi 2 anni) | |
| Acer Predator Triton 14 PT14-51 | |
| Media NVIDIA GeForce RTX 4050 Laptop GPU (60815 - 86892, n=21) | |
* ... Meglio usare valori piccoli
Prestazioni di gioco
L'hardware del Predator è destinato ai giochi in FHD con impostazioni elevate o massime. Tuttavia, la risoluzione massima dello schermo (2.560 x 1.600 pixel) può essere sfruttata - a volte con impostazioni più basse. Abbiamo misurato frame rate superiori alla media della RTX 4050.
| The Last of Us - 1920x1080 Ultra Preset | |
| Razer Blade 14 RTX 4070 | |
| Media NVIDIA GeForce RTX 4050 Laptop GPU (35.7 - 50.2, n=3) | |
| Acer Predator Triton 14 PT14-51 | |
| Gigabyte Aero 14 OLED BMF | |
| The Callisto Protocol | |
| 2560x1440 Ultra Preset (without FSR Upscaling) | |
| Acer Predator Triton 14 PT14-51 | |
| Media NVIDIA GeForce RTX 4050 Laptop GPU (29.5 - 46.7, n=3) | |
| 1920x1080 Ultra Preset (without FSR Upscaling) | |
| Acer Predator Triton 14 PT14-51 | |
| Media NVIDIA GeForce RTX 4050 Laptop GPU (41.4 - 63.1, n=3) | |
| 1920x1080 Ultra Preset (without FSR Upscaling) + Full Ray-Tracing | |
| Acer Predator Triton 14 PT14-51 | |
| Media NVIDIA GeForce RTX 4050 Laptop GPU (31 - 49.9, n=3) | |
| Star Wars Jedi Survivor | |
| 1920x1080 Epic Preset | |
| Media NVIDIA GeForce RTX 4050 Laptop GPU (48.4 - 56, n=7) | |
| Medion Erazer Scout E20 | |
| Acer Predator Triton 14 PT14-51 | |
| 2560x1440 Epic Preset | |
| Media NVIDIA GeForce RTX 4050 Laptop GPU (30.4 - 35, n=4) | |
| Acer Predator Triton 14 PT14-51 | |
| 1920x1080 Epic Preset + Ray Tracing | |
| Media NVIDIA GeForce RTX 4050 Laptop GPU (38.6 - 42, n=4) | |
| Medion Erazer Scout E20 | |
| Acer Predator Triton 14 PT14-51 | |
| F1 23 | |
| 1920x1080 Ultra High Preset AA:T AF:16x | |
| Media NVIDIA GeForce RTX 4050 Laptop GPU (25.7 - 60.8, n=14) | |
| Acer Predator Triton 14 PT14-51 | |
| 2560x1440 Ultra High Preset AA:T AF:16x | |
| Media NVIDIA GeForce RTX 4050 Laptop GPU (16.7 - 40.8, n=11) | |
| Acer Predator Triton 14 PT14-51 | |
| Dead Island 2 | |
| 2560x1440 Ultra Preset AA:High T | |
| Media NVIDIA GeForce RTX 4050 Laptop GPU (61.8 - 76.5, n=2) | |
| Acer Predator Triton 14 PT14-51 | |
| 1920x1080 Ultra Preset AA:High T | |
| Medion Erazer Scout E20 | |
| Media NVIDIA GeForce RTX 4050 Laptop GPU (90.9 - 133.5, n=3) | |
| Acer Predator Triton 14 PT14-51 | |
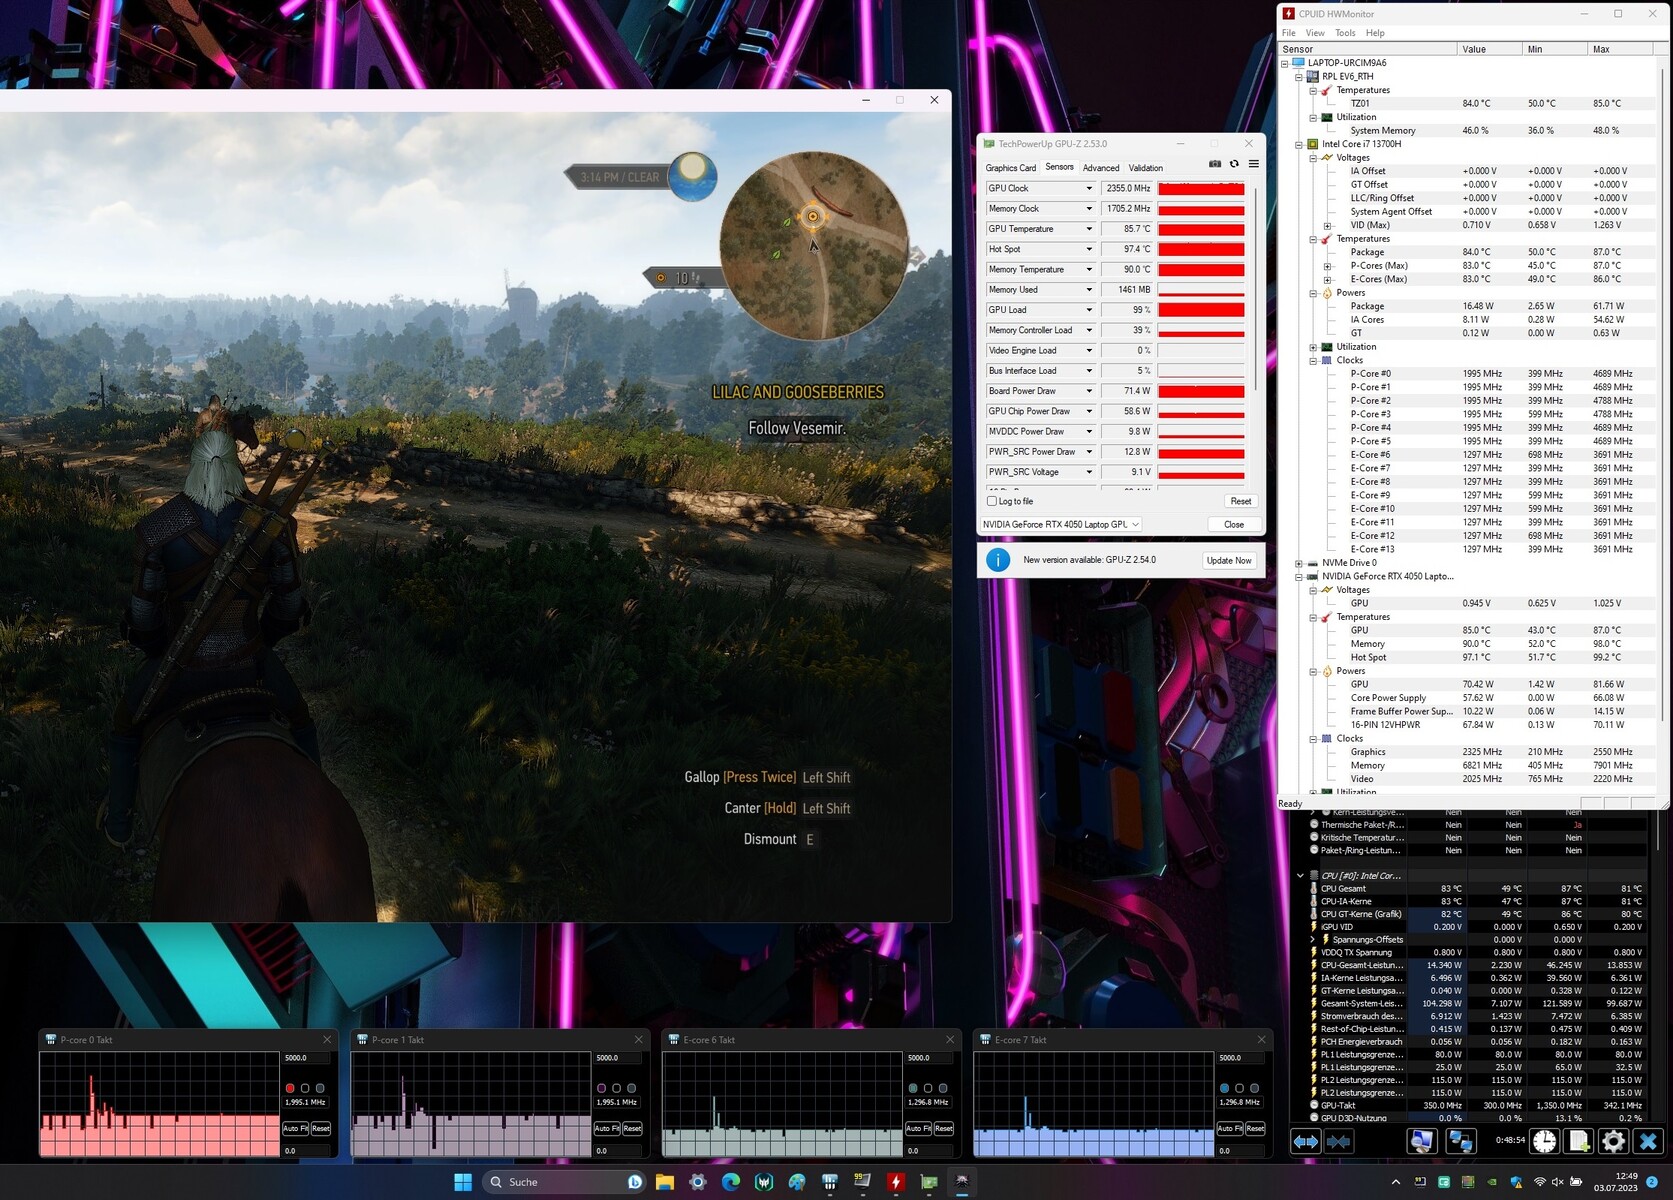
Per verificare se il frame rate rimane stabile per un periodo di tempo più lungo, abbiamo eseguito il gioco Witcher 3 per circa 60 minuti alla risoluzione FullHD e con le impostazioni di qualità massime. Il personaggio del gioco non è stato spostato e non abbiamo rilevato alcun calo del frame rate.
Witcher 3 FPS diagram
| basso | medio | alto | ultra | QHD | |
|---|---|---|---|---|---|
| The Witcher 3 (2015) | 393.7 | 253.3 | 149.7 | 80.1 | |
| Dota 2 Reborn (2015) | 159.4 | 141.8 | 132.6 | 127.2 | |
| Final Fantasy XV Benchmark (2018) | 183 | 110.5 | 79.2 | 58.2 | |
| X-Plane 11.11 (2018) | 138.1 | 128.6 | 100.2 | ||
| Far Cry 5 (2018) | 174 | 131 | 122 | 113 | 79 |
| Strange Brigade (2018) | 467 | 194.8 | 159.4 | 137 | 94.9 |
| F1 22 (2022) | 210 | 194.4 | 147.2 | 48.5 | 31 |
| The Callisto Protocol (2022) | 119 | 96 | 93.3 | 63.1 | 46.7 |
| The Last of Us (2023) | 82.2 | 67.4 | 56.2 | 42.8 | |
| Dead Island 2 (2023) | 201 | 171.8 | 125.9 | 90.9 | 61.8 |
| Star Wars Jedi Survivor (2023) | 60.6 | 54.6 | 51.6 | 48.4 | 30.4 |
| F1 23 (2023) | 197.9 | 194.8 | 139.8 | 40.5 | 31 |
Emissioni - Il portatile Acer è in grado di funzionare in modo silenzioso
Emissioni acustiche
Nell'uso quotidiano (ufficio, internet, ...) il Triton funziona generalmente in modo silenzioso, indipendentemente dalla modalità selezionata. Il livello di rumore può aumentare fino a 56 dB(A) ("Turbo") e 53 dB(A) ("Performance"), rispettivamente. Utilizzando la modalità "Balanced" abbiamo registrato un moderato 43 dB(A). Nel complesso, è possibile ottenere una minore produzione di rumore applicando la modalità "Quiet", con un calo relativamente contenuto delle prestazioni.
Rumorosità
| Idle |
| 27 / 29 / 31 dB(A) |
| Sotto carico |
| 42 / 45 dB(A) |
 | ||
30 dB silenzioso 40 dB(A) udibile 50 dB(A) rumoroso |
||
min: | ||
| Acer Predator Triton 14 PT14-51 i7-13700H, GeForce RTX 4050 Laptop GPU | Razer Blade 14 RTX 4070 R9 7940HS, GeForce RTX 4070 Laptop GPU | Asus ROG Zephyrus G14 GA402RJ R7 6800HS, Radeon RX 6700S | MSI Stealth 14 Studio A13V i7-13700H, GeForce RTX 4050 Laptop GPU | Gigabyte Aero 14 OLED BMF i7-13700H, GeForce RTX 4050 Laptop GPU | Apple MacBook Pro 14 2023 M2 Pro Entry M2 Pro 10-Core, M2 Pro 16-Core GPU | |
|---|---|---|---|---|---|---|
| Noise | 6% | 2% | -3% | 1% | 16% | |
| off /ambiente * (dB) | 25 | 22.7 9% | 25 -0% | 25.3 -1% | 24 4% | 23.6 6% |
| Idle Minimum * (dB) | 27 | 23.4 13% | 25 7% | 25.3 6% | 24 11% | 23.6 13% |
| Idle Average * (dB) | 29 | 23.4 19% | 26 10% | 25 14% | 24 17% | 23.6 19% |
| Idle Maximum * (dB) | 31 | 23.4 25% | 29 6% | 33.7 -9% | 35.71 -15% | 23.6 24% |
| Load Average * (dB) | 42 | 33 21% | 45 -7% | 42.2 -0% | 24.2 42% | |
| Witcher 3 ultra * (dB) | 43 | 51.8 -20% | 43 -0% | 51 -19% | 40.22 6% | |
| Load Maximum * (dB) | 45 | 55.6 -24% | 45 -0% | 51 -13% | 51.93 -15% | 47.5 -6% |
* ... Meglio usare valori piccoli
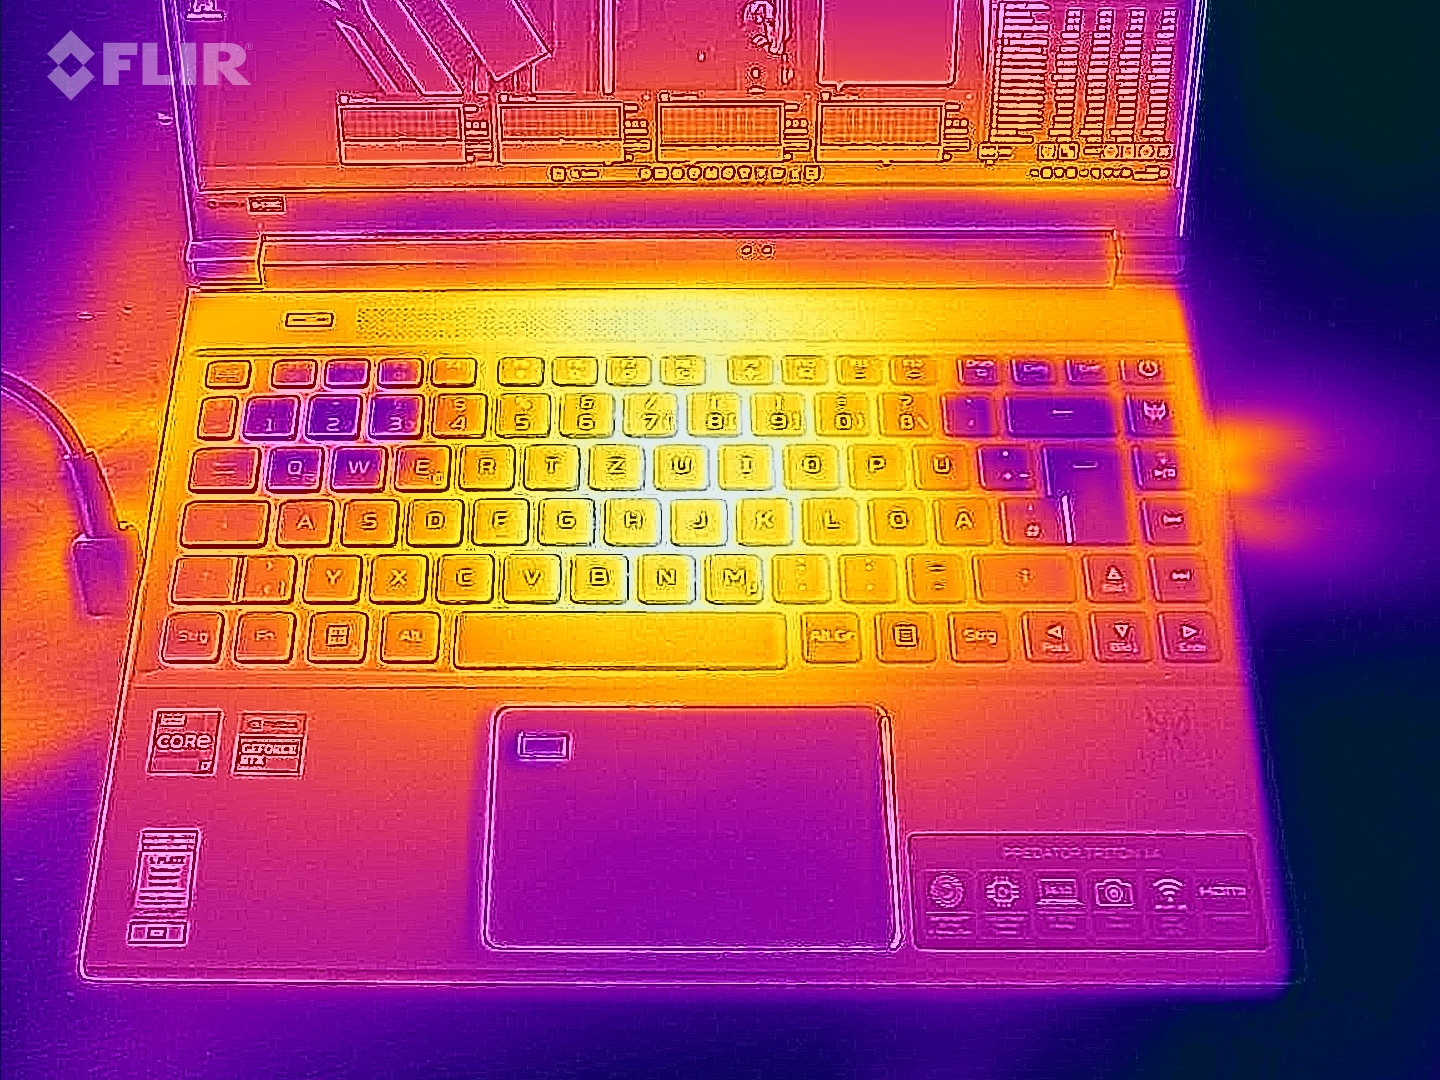
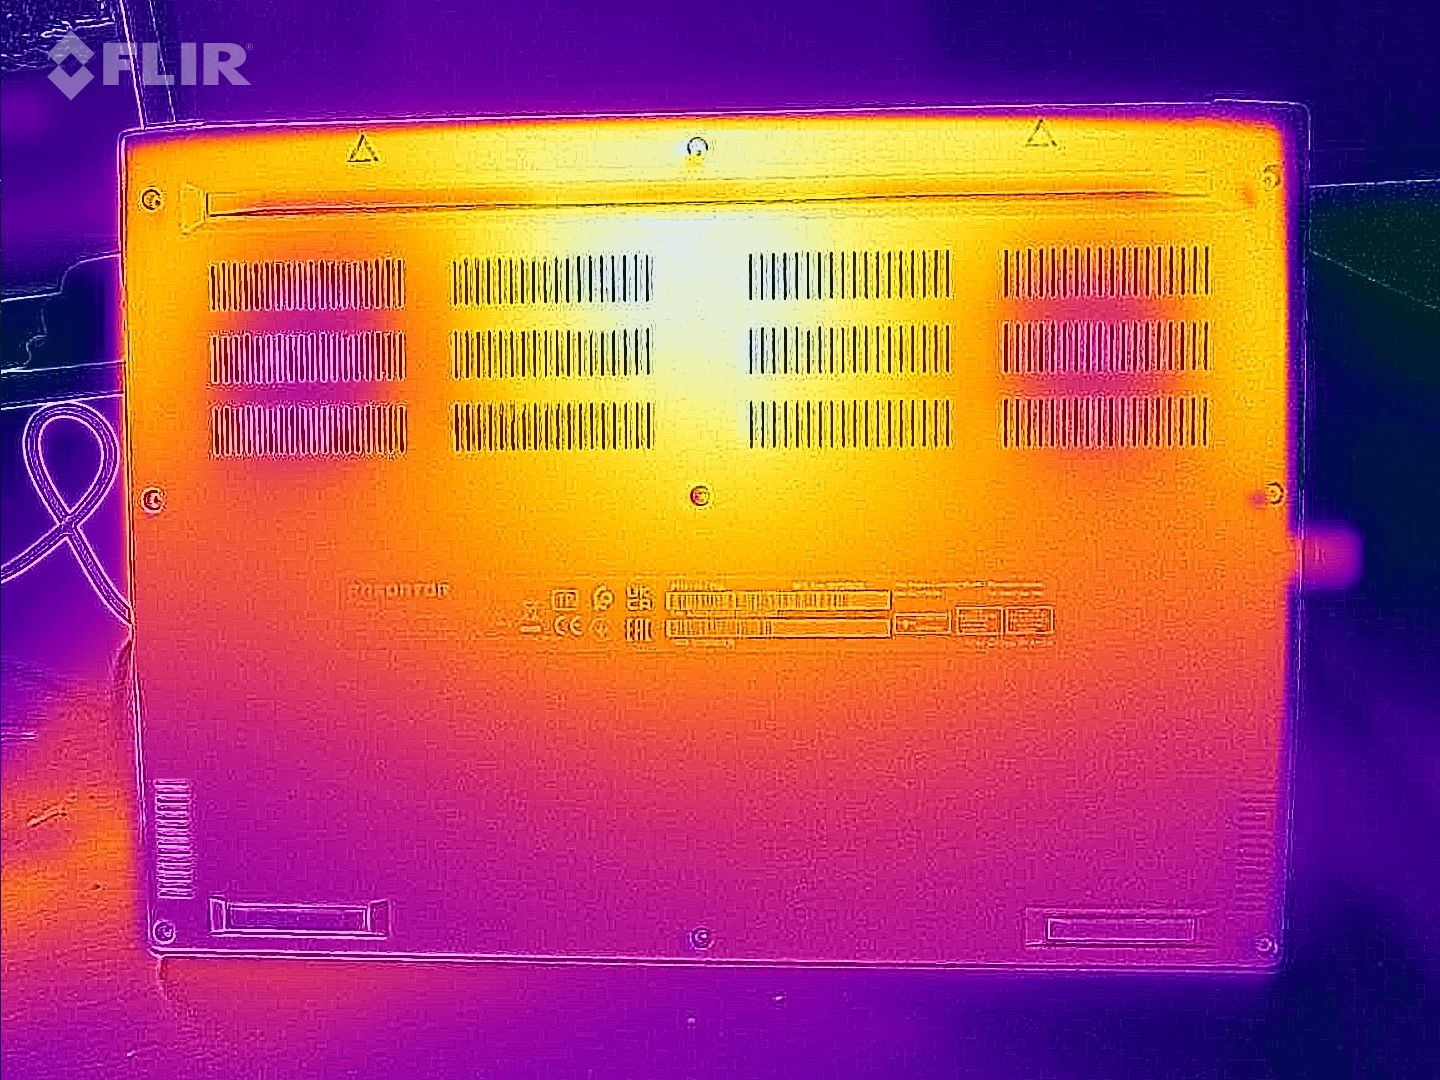
Temperatura
Sotto carico, il portatile si riscalda notevolmente. In diversi punti di misurazione, abbiamo registrato temperature tra i 50 e i 56 °C. Nell'uso quotidiano, questi valori si collocano nella zona verde.
(-) La temperatura massima sul lato superiore è di 54 °C / 129 F, rispetto alla media di 40.4 °C / 105 F, che varia da 21.2 a 68.8 °C per questa classe Gaming.
(-) Il lato inferiore si riscalda fino ad un massimo di 56 °C / 133 F, rispetto alla media di 43.2 °C / 110 F
(+) In idle, la temperatura media del lato superiore è di 29.1 °C / 84 F, rispetto alla media deld ispositivo di 33.9 °C / 93 F.
(-) Riproducendo The Witcher 3, la temperatura media per il lato superiore e' di 46.7 °C / 116 F, rispetto alla media del dispositivo di 33.9 °C / 93 F.
(-) I poggiapolsi e il touchpad possono diventare molto caldi al tatto con un massimo di 41 °C / 105.8 F.
(-) La temperatura media della zona del palmo della mano di dispositivi simili e'stata di 28.8 °C / 83.8 F (-12.2 °C / -22 F).
| Acer Predator Triton 14 PT14-51 Intel Core i7-13700H, NVIDIA GeForce RTX 4050 Laptop GPU | Razer Blade 14 RTX 4070 AMD Ryzen 9 7940HS, NVIDIA GeForce RTX 4070 Laptop GPU | Asus ROG Zephyrus G14 GA402RJ AMD Ryzen 7 6800HS, AMD Radeon RX 6700S | MSI Stealth 14 Studio A13V Intel Core i7-13700H, NVIDIA GeForce RTX 4050 Laptop GPU | Gigabyte Aero 14 OLED BMF Intel Core i7-13700H, NVIDIA GeForce RTX 4050 Laptop GPU | Apple MacBook Pro 14 2023 M2 Pro Entry Apple M2 Pro 10-Core, Apple M2 Pro 16-Core GPU | |
|---|---|---|---|---|---|---|
| Heat | 11% | -7% | -5% | 15% | 24% | |
| Maximum Upper Side * (°C) | 54 | 37.4 31% | 53 2% | 46.9 13% | 42 22% | 47 13% |
| Maximum Bottom * (°C) | 56 | 35.2 37% | 54 4% | 56.1 -0% | 52 7% | 42.8 24% |
| Idle Upper Side * (°C) | 31 | 33.2 -7% | 34 -10% | 33.8 -9% | 26 16% | 22.3 28% |
| Idle Bottom * (°C) | 31 | 36.2 -17% | 38 -23% | 37.9 -22% | 27 13% | 21.7 30% |
* ... Meglio usare valori piccoli
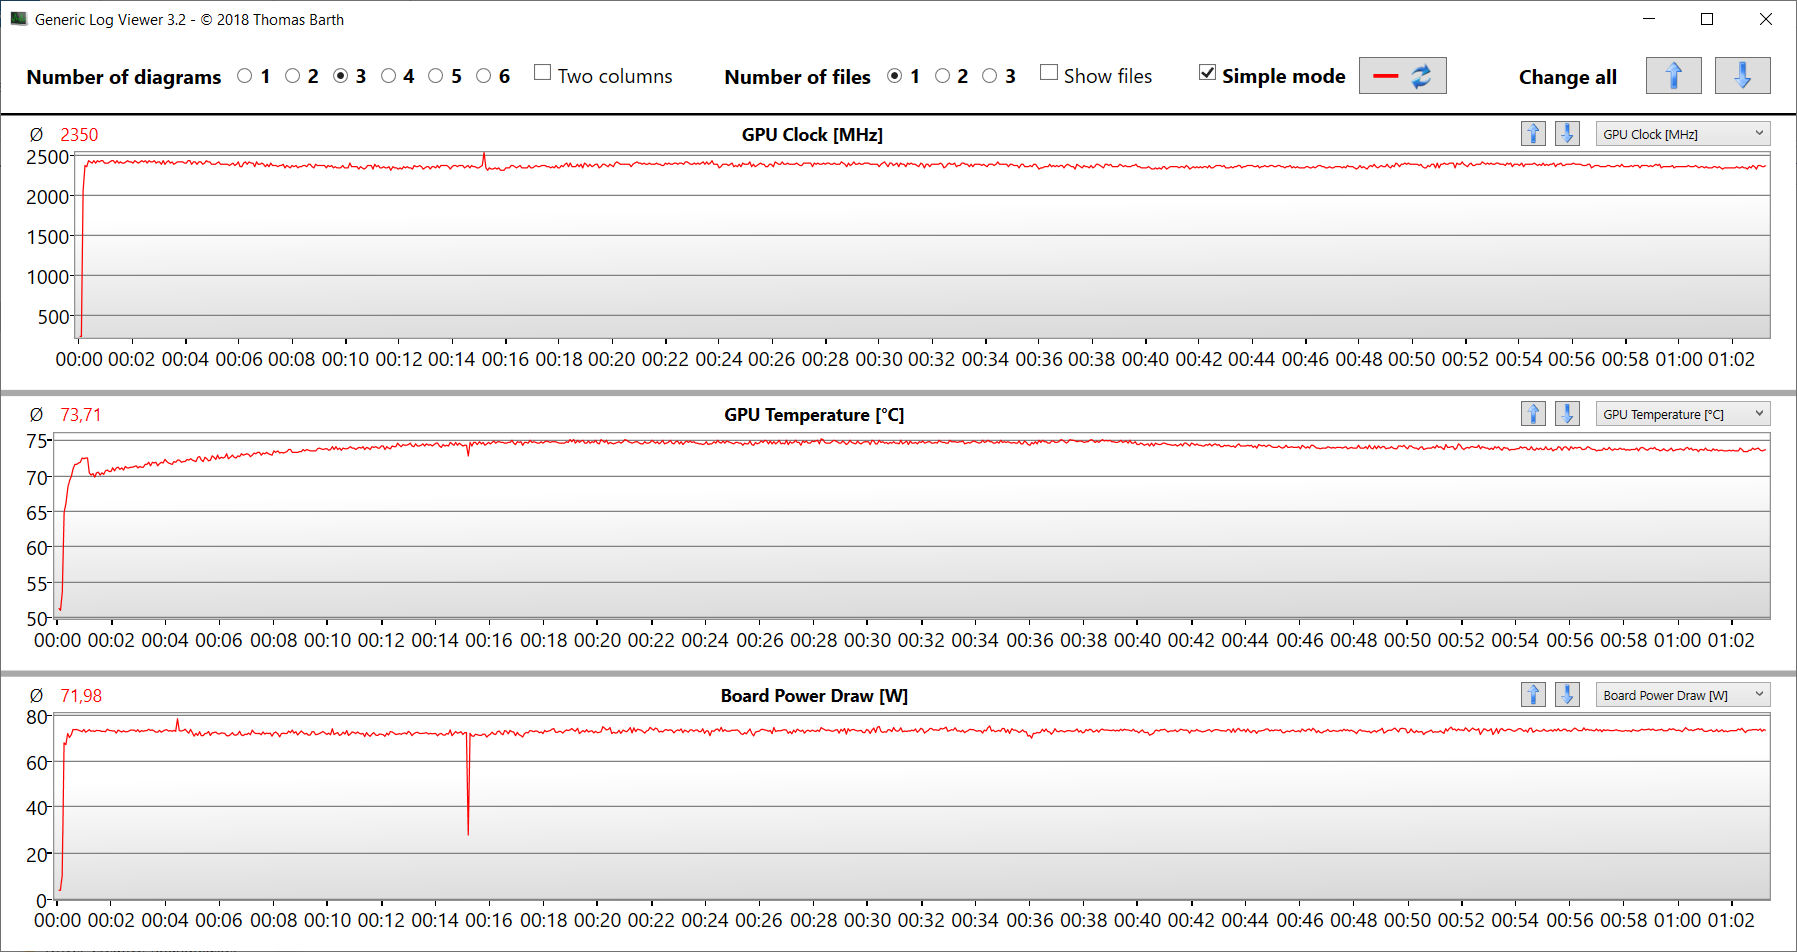
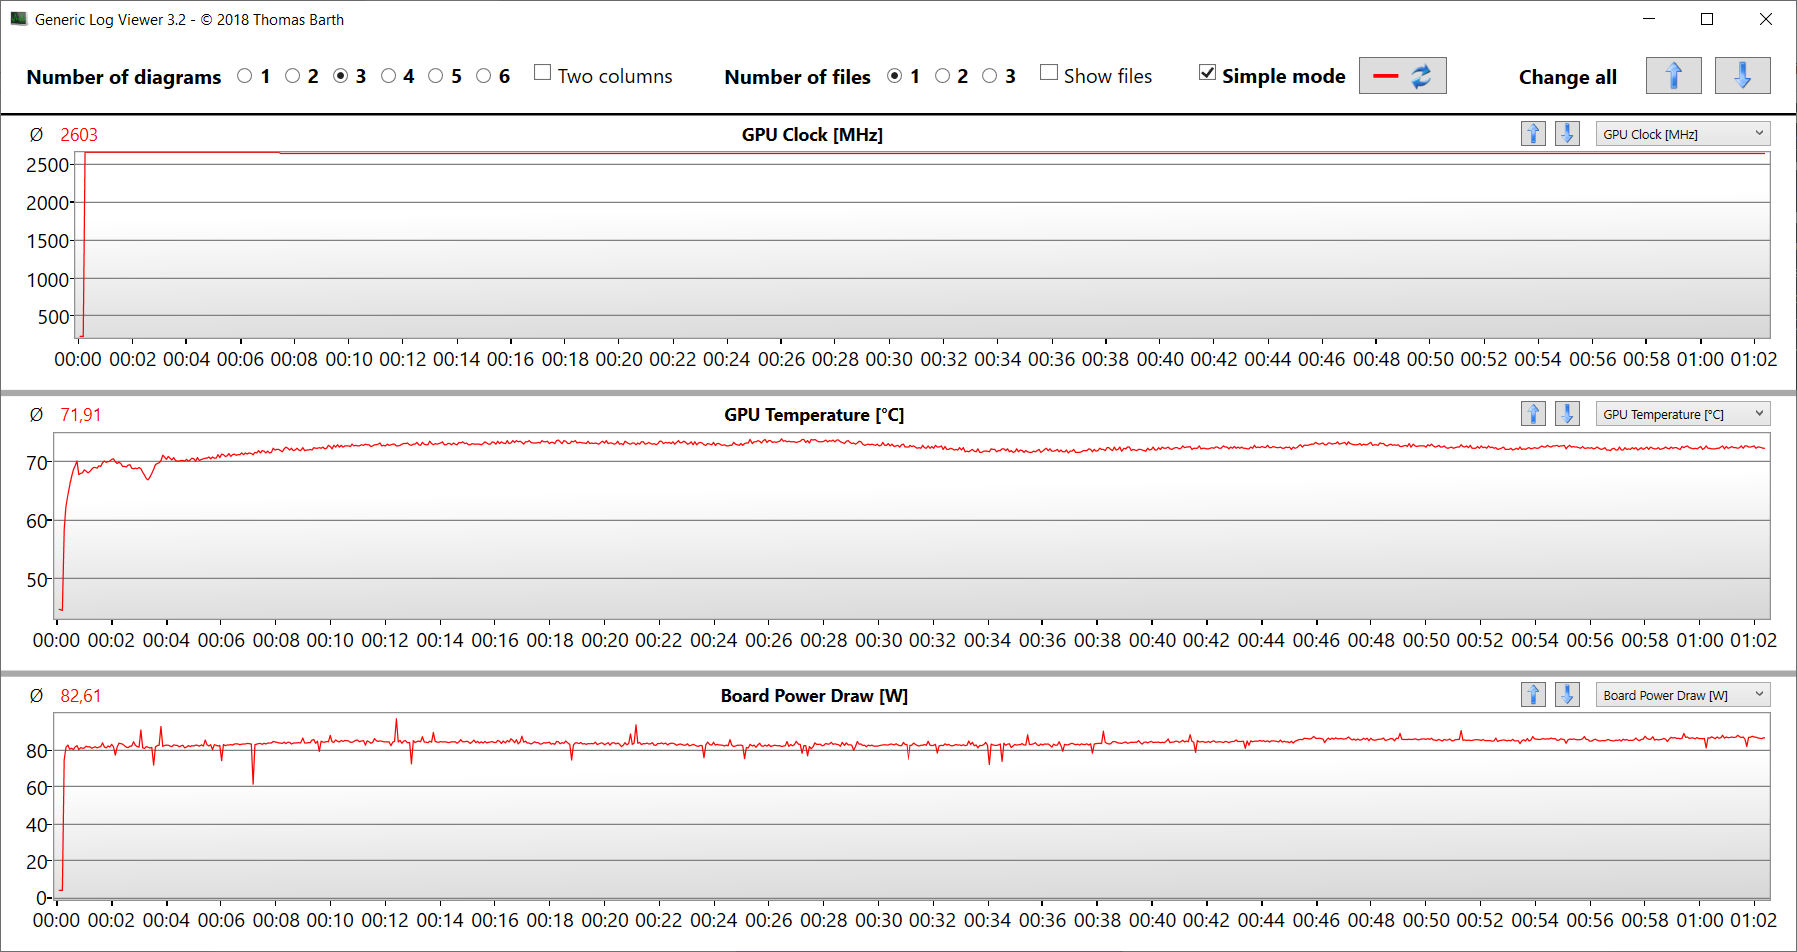
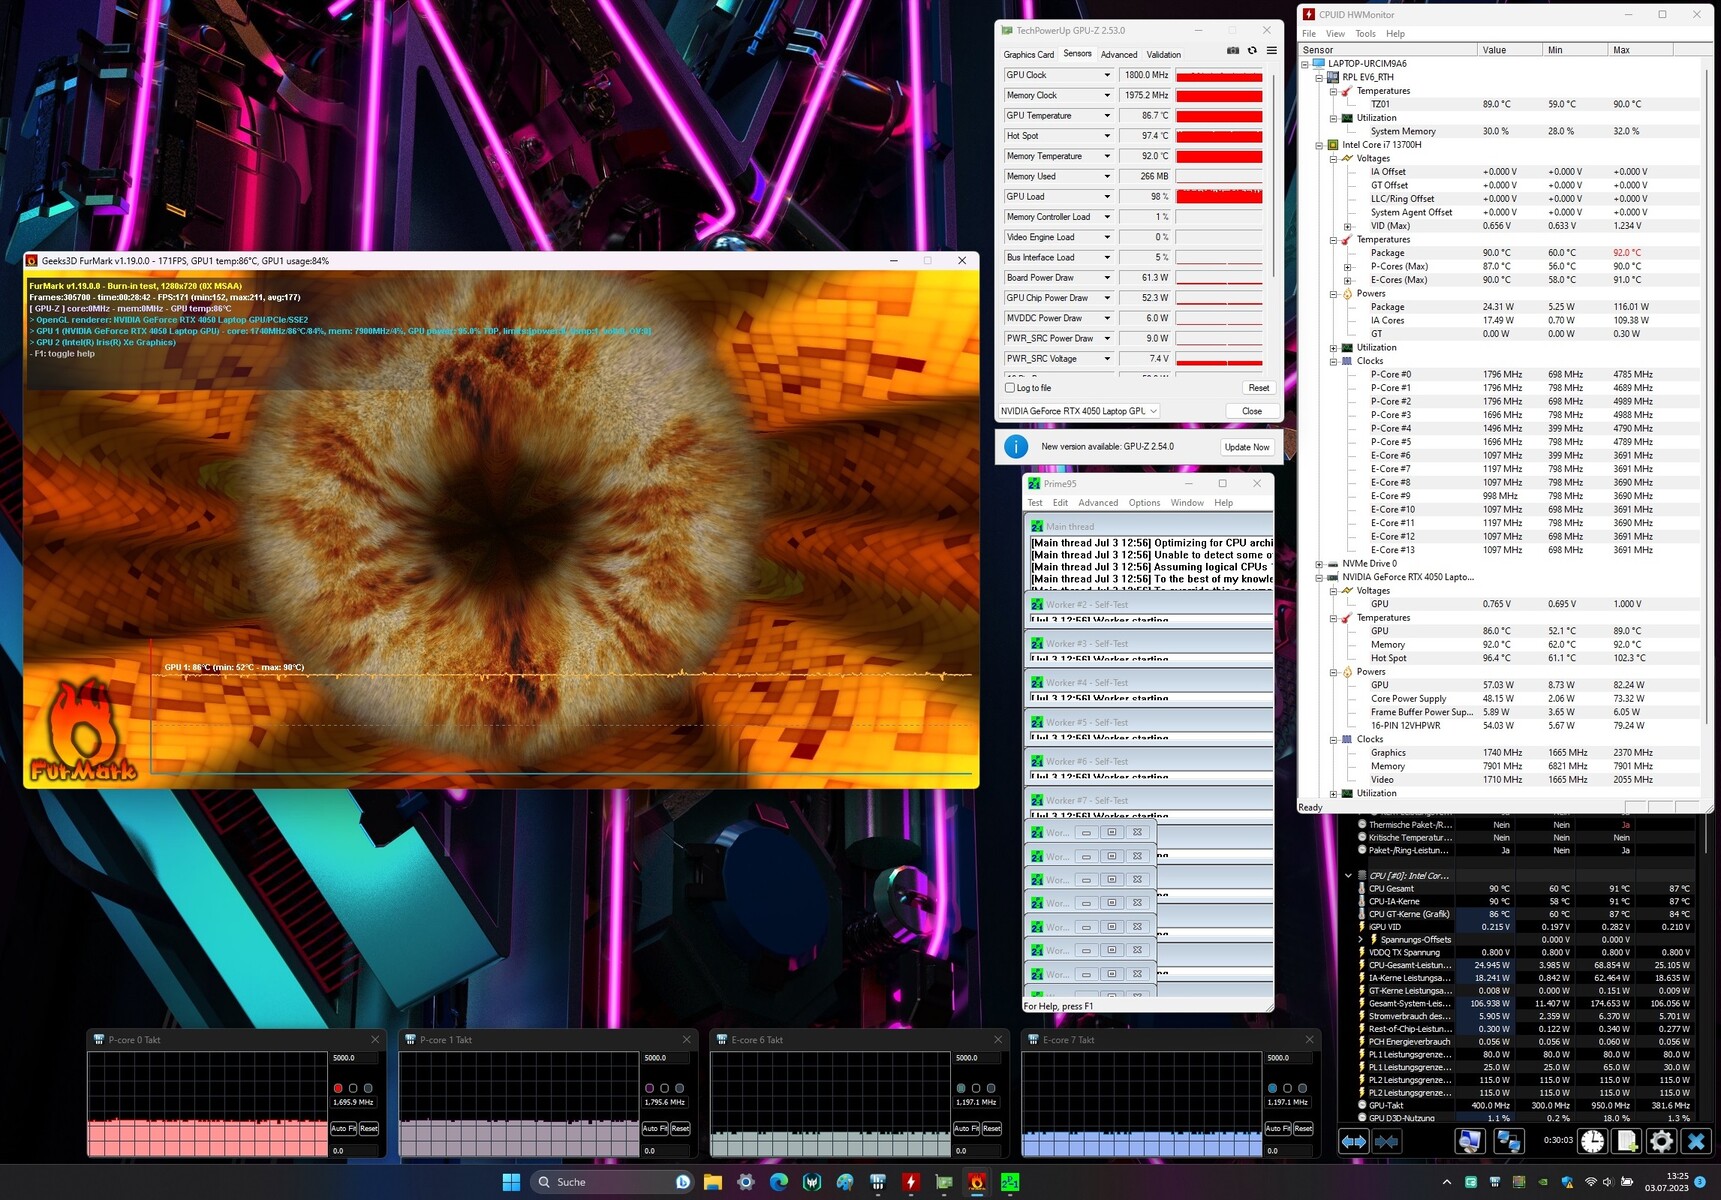
Test da sforzo
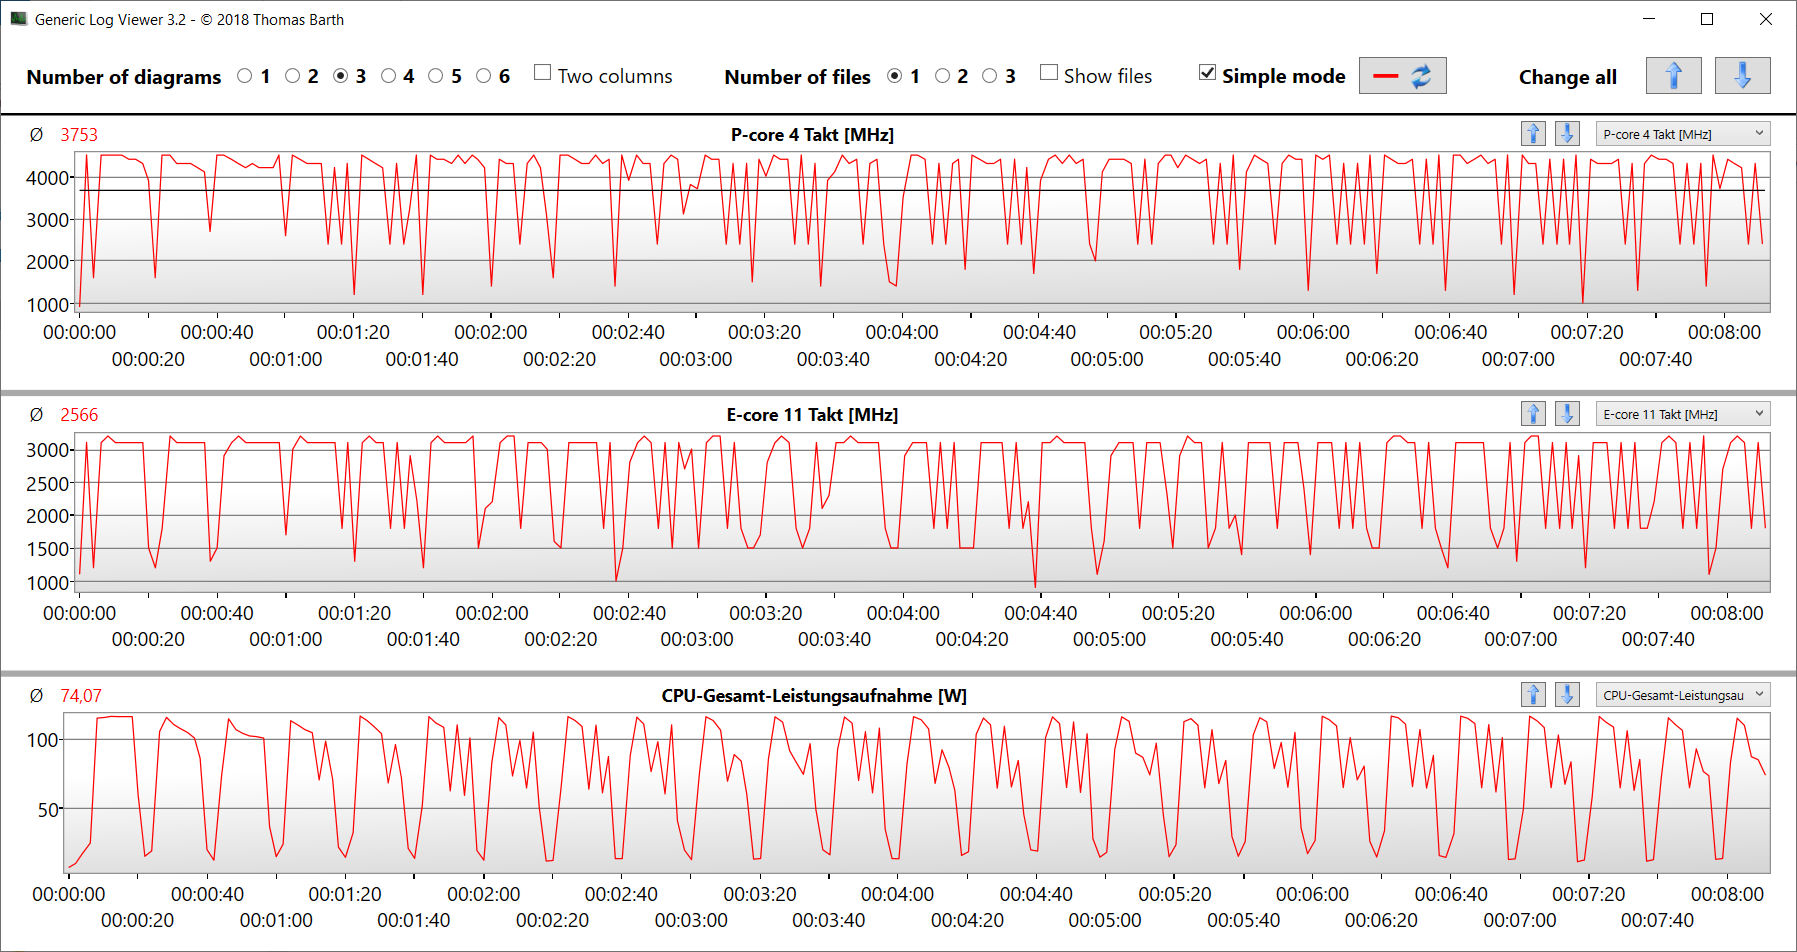
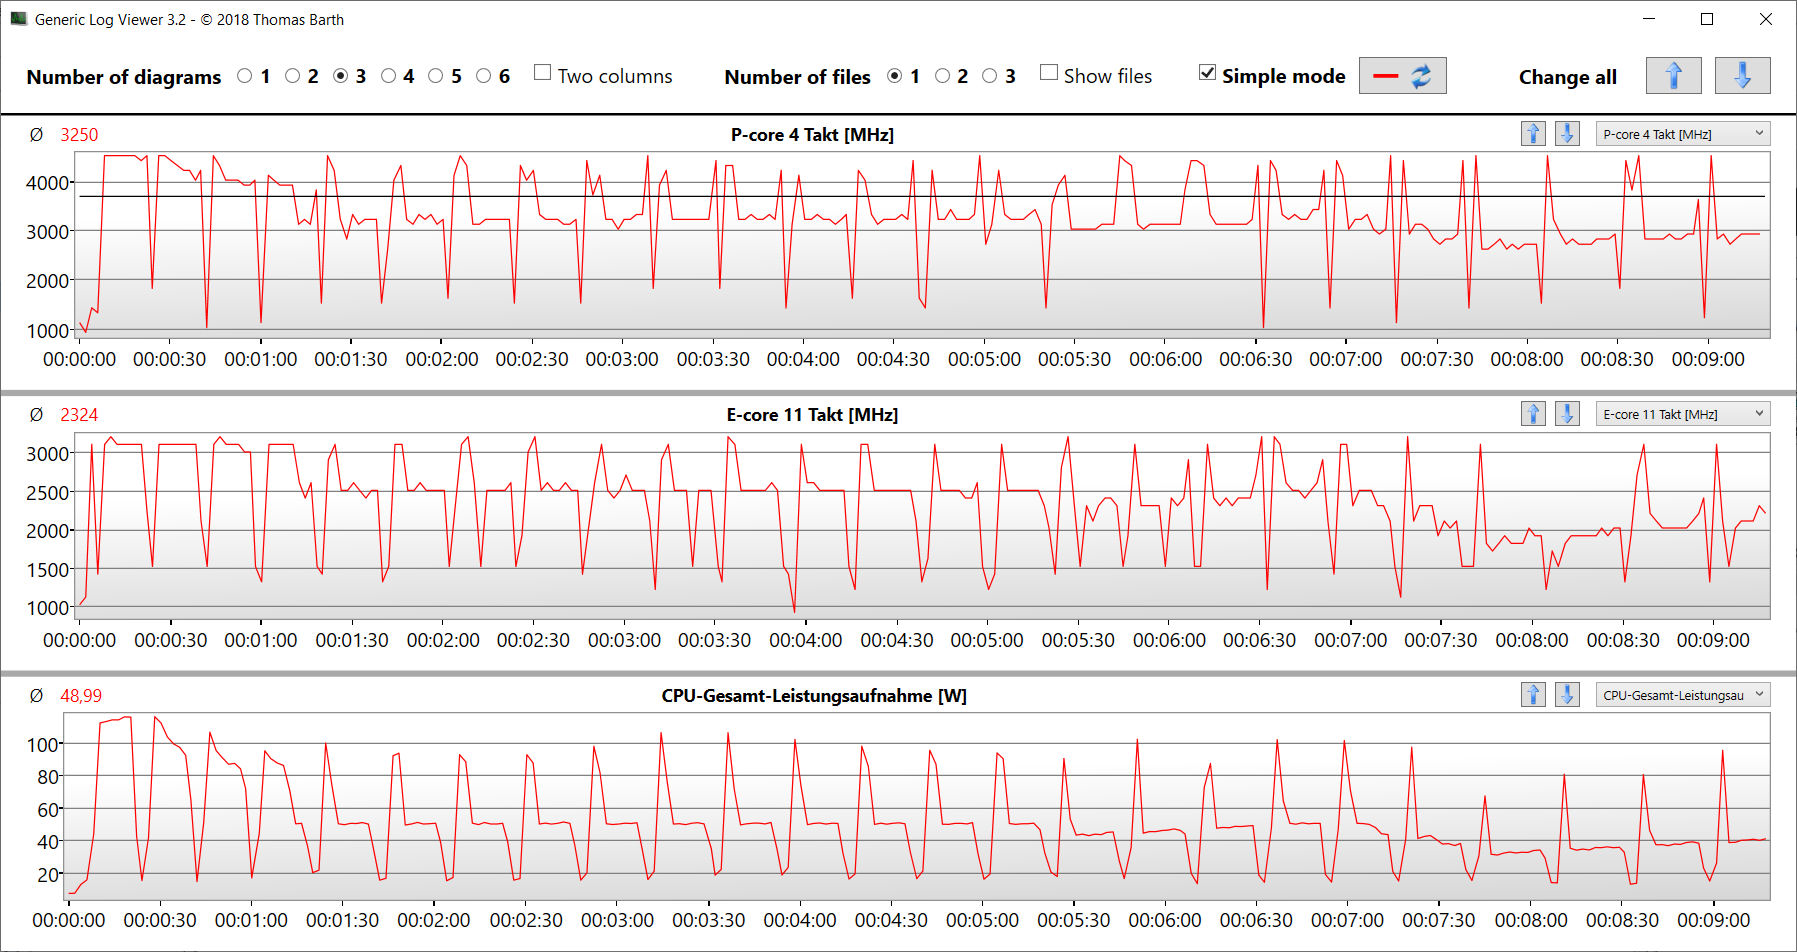
Lo stress test (Prime95 e Furmark in funzionamento continuo) è uno scenario estremo che esamina la stabilità del sistema a pieno carico. La velocità di clock della CPU scende inizialmente da 4,4 a 4,5 GHz (P) e 3,1 GHz (E) e poi gradualmente da 2,1 a 2,2 GHz (P) e 1,3 GHz (E). La velocità di clock della GPU si stabilizza a 1.750 a 1.800 MHz.
Altoparlanti
Gli altoparlanti stereo producono un suono decente, per lo più privo di bassi. Un'esperienza audio migliore può essere ottenuta utilizzando le cuffie o un altoparlante esterno.
Acer Predator Triton 14 PT14-51 analisi audio
(±) | potenza degli altiparlanti media ma buona (80 dB)
Bassi 100 - 315 Hz
(-) | quasi nessun basso - in media 18% inferiori alla media
(±) | la linearità dei bassi è media (11.8% delta rispetto alla precedente frequenza)
Medi 400 - 2000 Hz
(+) | medi bilanciati - solo only 3.7% rispetto alla media
(+) | medi lineari (4% delta rispetto alla precedente frequenza)
Alti 2 - 16 kHz
(+) | Alti bilanciati - appena 2.9% dalla media
(±) | la linearità degli alti è media (7.2% delta rispetto alla precedente frequenza)
Nel complesso 100 - 16.000 Hz
(±) | la linearità complessiva del suono è media (15.4% di differenza rispetto alla media
Rispetto alla stessa classe
» 34% di tutti i dispositivi testati in questa classe è stato migliore, 7% simile, 59% peggiore
» Il migliore ha avuto un delta di 6%, medio di 18%, peggiore di 132%
Rispetto a tutti i dispositivi testati
» 23% di tutti i dispositivi testati in questa classe è stato migliore, 4% similare, 73% peggiore
» Il migliore ha avuto un delta di 4%, medio di 23%, peggiore di 134%
Razer Blade 14 RTX 4070 analisi audio
(+) | gli altoparlanti sono relativamente potenti (82.7 dB)
Bassi 100 - 315 Hz
(-) | quasi nessun basso - in media 15.9% inferiori alla media
(±) | la linearità dei bassi è media (12.3% delta rispetto alla precedente frequenza)
Medi 400 - 2000 Hz
(+) | medi bilanciati - solo only 4.3% rispetto alla media
(+) | medi lineari (3.1% delta rispetto alla precedente frequenza)
Alti 2 - 16 kHz
(±) | alti elevati - circa 6.2% superiori alla media
(+) | alti lineari (5.5% delta rispetto alla precedente frequenza)
Nel complesso 100 - 16.000 Hz
(±) | la linearità complessiva del suono è media (16.7% di differenza rispetto alla media
Rispetto alla stessa classe
» 43% di tutti i dispositivi testati in questa classe è stato migliore, 10% simile, 47% peggiore
» Il migliore ha avuto un delta di 6%, medio di 18%, peggiore di 132%
Rispetto a tutti i dispositivi testati
» 29% di tutti i dispositivi testati in questa classe è stato migliore, 7% similare, 64% peggiore
» Il migliore ha avuto un delta di 4%, medio di 23%, peggiore di 134%
Gestione dell'energia - Il computer Acer raggiunge livelli di resistenza decenti
Consumo di energia
Non c'è nulla di anormale da dire riguardo al consumo energetico del computer. I risultati si collocano in un intervallo normale per l'hardware installato. Lo stress test e il test Witcher 3 sono stati eseguiti con un consumo energetico in calo o costante. L'alimentatore (230 watt) è di dimensioni più che adeguate.
| Off / Standby | |
| Idle | |
| Sotto carico |
|
Leggenda:
min: | |
| Acer Predator Triton 14 PT14-51 i7-13700H, GeForce RTX 4050 Laptop GPU | Razer Blade 14 RTX 4070 R9 7940HS, GeForce RTX 4070 Laptop GPU | Asus ROG Zephyrus G14 GA402RJ R7 6800HS, Radeon RX 6700S | MSI Stealth 14 Studio A13V i7-13700H, GeForce RTX 4050 Laptop GPU | Gigabyte Aero 14 OLED BMF i7-13700H, GeForce RTX 4050 Laptop GPU | Apple MacBook Pro 14 2023 M2 Pro Entry M2 Pro 10-Core, M2 Pro 16-Core GPU | Media NVIDIA GeForce RTX 4050 Laptop GPU | Media della classe Gaming | |
|---|---|---|---|---|---|---|---|---|
| Power Consumption | -30% | -10% | -4% | 40% | 52% | 9% | -17% | |
| Idle Minimum * (Watt) | 12 | 19.5 -63% | 12 -0% | 10.4 13% | 7.4 38% | 2.5 79% | 9.95 ? 17% | 13 ? -8% |
| Idle Average * (Watt) | 14 | 24.7 -76% | 18 -29% | 19.1 -36% | 8.3 41% | 12.1 14% | 15.8 ? -13% | 19 ? -36% |
| Idle Maximum * (Watt) | 26 | 27 -4% | 26 -0% | 19.4 25% | 8.7 67% | 12.3 53% | 20.1 ? 23% | 24.6 ? 5% |
| Load Average * (Watt) | 88 | 83.2 5% | 88 -0% | 95.9 -9% | 76 14% | 49.8 43% | 88 ? -0% | 110.7 ? -26% |
| Witcher 3 ultra * (Watt) | 114.9 | 165.8 -44% | 157.7 -37% | 141.6 -23% | 70 39% | 46.6 59% | ||
| Load Maximum * (Watt) | 213 | 204.5 4% | 194 9% | 203 5% | 132 38% | 71.4 66% | 176.3 ? 17% | 259 ? -22% |
* ... Meglio usare valori piccoli
Power consumption Witcher 3 / stress test
Power consumption with an external monitor
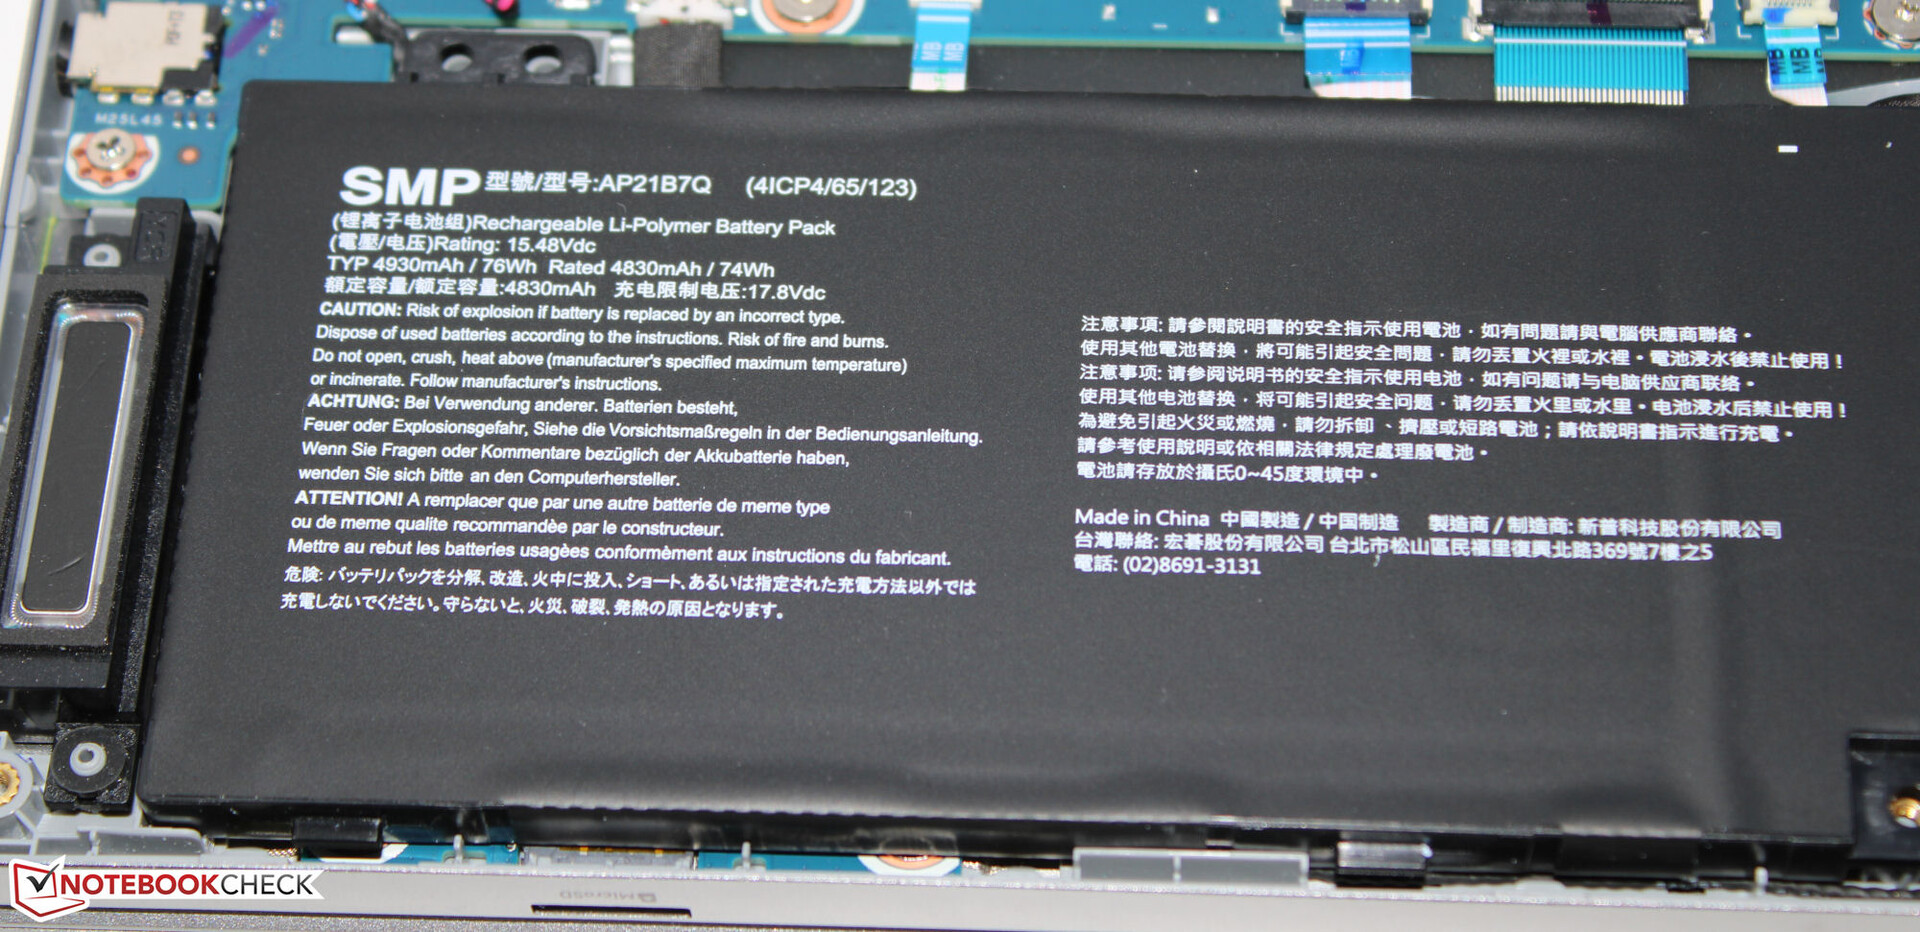
Durata della batteria
Nel test Wi-Fi (caricamento di siti web con l'aiuto di uno script) e nel test video (il cortometraggio Big Buck Bunny (codifica H.264, FHD) in loop), il dispositivo da 14 pollici ha raggiunto tempi di esecuzione rispettivamente di 5 ore e 2 minuti e 8 ore e 59 minuti. Durante entrambi i test, le funzioni di risparmio energetico del portatile sono state disattivate e la luminosità del display è stata impostata a circa 150 cd/m². Inoltre, il test video è stato eseguito con il modulo radio spento.
| Acer Predator Triton 14 PT14-51 i7-13700H, GeForce RTX 4050 Laptop GPU, 76.3 Wh | Razer Blade 14 RTX 4070 R9 7940HS, GeForce RTX 4070 Laptop GPU, 68 Wh | Asus ROG Zephyrus G14 GA402RJ R7 6800HS, Radeon RX 6700S, 76 Wh | MSI Stealth 14 Studio A13V i7-13700H, GeForce RTX 4050 Laptop GPU, 72 Wh | Gigabyte Aero 14 OLED BMF i7-13700H, GeForce RTX 4050 Laptop GPU, 63 Wh | Apple MacBook Pro 14 2023 M2 Pro Entry M2 Pro 10-Core, M2 Pro 16-Core GPU, 70 Wh | Media della classe Gaming | |
|---|---|---|---|---|---|---|---|
| Autonomia della batteria | -14% | 104% | -11% | 12% | 120% | -2% | |
| Reader / Idle (h) | 11.2 | 8.6 -23% | 11.3 1% | 8.27 ? -26% | |||
| H.264 (h) | 9 | 6.6 -27% | 16.4 82% | 8.32 ? -8% | |||
| WiFi v1.3 (h) | 5 | 6.2 24% | 10.2 104% | 6.3 26% | 7.6 52% | 12.9 158% | 7.11 ? 42% |
| Load (h) | 1.8 | 1 -44% | 1.2 -33% | 1.5 -17% | 1.502 ? -17% |
Pro
Contro
Verdetto - Un concentrato di potenza compatta
Le applicazioni principali di questo portatile da 14 pollici dovrebbero riguardare i settori del rendering e del gioco. Il Core i7-13700H e la GeForce RTX 4050 forniscono la potenza necessaria con entrambi i chip che funzionano a una velocità di clock costantemente elevata. Se è necessaria una maggiore potenza grafica, Acer offre anche le varianti GeForce RTX 4070.
Una tonnellata di potenza di calcolo in un telaio da 14 pollici: Con il Predator Triton 14, Acer ha realizzato un portatile potente.
Il portatile si scalda notevolmente e può produrre una notevole quantità di rumore. Abbiamo utilizzato principalmente la modalità di sistema "Bilanciata", che ha garantito solo un rumore di fondo moderato con una perdita di prestazioni relativamente contenuta.
Nel complesso, il display 16:10 (2.560 x 1.600 pixel, IPS, 165 Hz, G-Sync) è impressionante. I punti di forza sono l'elevata luminosità e la copertura DCI P3. A questi si aggiunge un'autonomia reale della batteria compresa tra le 5 e le 9 ore. Positivo: La batteria può essere ricaricata tramite l'adattatore di rete USB-C (min. 65 watt, 20 V). È supportato Power Delivery. Ciò significa che non è necessario essere accompagnati dall'alimentatore proprietario (230 watt) ovunque si vada.
I punti deboli del Predator risiedono principalmente nella memoria: Una scarsa capacità dell'unità SSD (512 GB), nessuno spazio per ulteriori unità SSD, RAM saldata senza possibilità di espansione e un lettore di schede di memoria molto lento. Tutto sommato, ci si dovrebbe aspettare di più da un portatile di questa categoria di prezzo.
Un'alternativa potrebbe essere rappresentata dal modelloMSI Stealth 14 Studio A13V. Dotato della stessa CPU e GPU, offre un po' più di potenza rispetto al Predator e guadagna punti extra per i due banchi di RAM. Tuttavia, con un prezzo di circa 2.000 dollari, non è uno dei dispositivi più economici.
Prezzo e disponibilità
La variante con specifiche da recensione del portatile Acer è attualmente disponibile su Amazon al prezzo di 1.440 dollari.
Acer Predator Triton 14 PT14-51
- 07/24/2023 v7 (old)
Sascha Mölck
Transparency
La selezione dei dispositivi da recensire viene effettuata dalla nostra redazione. Il campione di prova è stato fornito all'autore come prestito dal produttore o dal rivenditore ai fini di questa recensione. L'istituto di credito non ha avuto alcuna influenza su questa recensione, né il produttore ne ha ricevuto una copia prima della pubblicazione. Non vi era alcun obbligo di pubblicare questa recensione. In quanto società mediatica indipendente, Notebookcheck non è soggetta all'autorità di produttori, rivenditori o editori.
Ecco come Notebookcheck esegue i test
Ogni anno, Notebookcheck esamina in modo indipendente centinaia di laptop e smartphone utilizzando procedure standardizzate per garantire che tutti i risultati siano comparabili. Da circa 20 anni sviluppiamo continuamente i nostri metodi di prova e nel frattempo stabiliamo gli standard di settore. Nei nostri laboratori di prova, tecnici ed editori esperti utilizzano apparecchiature di misurazione di alta qualità. Questi test comportano un processo di validazione in più fasi. Il nostro complesso sistema di valutazione si basa su centinaia di misurazioni e parametri di riferimento ben fondati, che mantengono l'obiettività.Price comparison

