Recensione del portatile gaming economico Schenker XMG Focus 15 (E23): prestazioni elevate a un prezzo inferiore rispetto al Pro 15

Abbiamo testato per la prima volta ilXMG Focus 15alla fine del 2021. Il Focus 15 era un portatile che spingeva l'allora nuovissima GPUGPU RTX 3050 Tiai suoi limiti. Nonostante il raffreddamento, l'XMG Focus 15 ha mostrato solo prestazioni superiori alla media a temperature elevate.
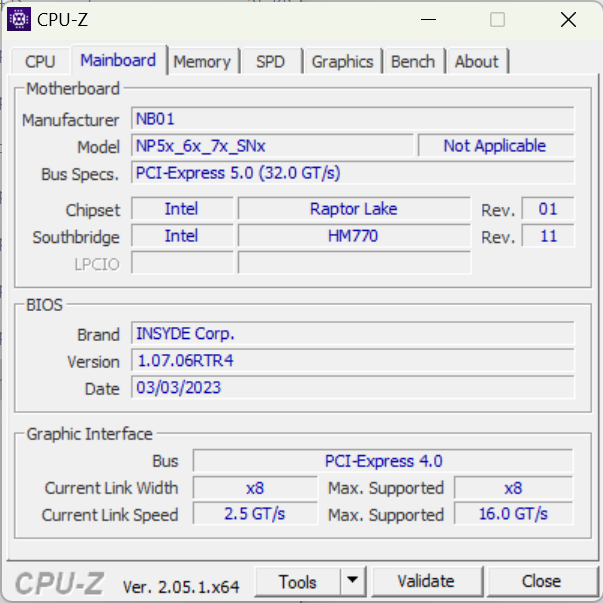
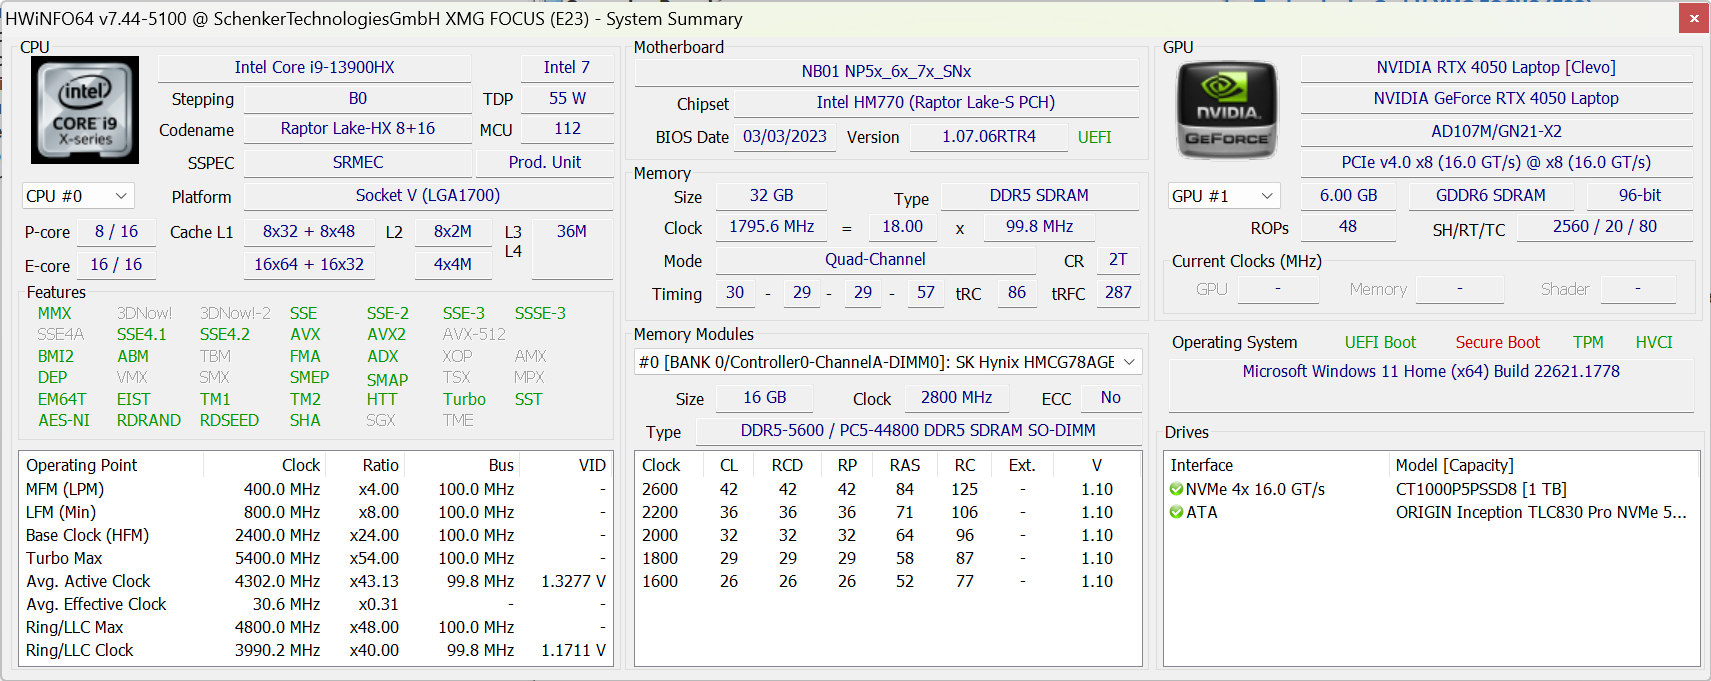
Schenker si affida ancora una volta a un barebone di Clevo per l'attuale Focus 15, e questa volta si tratta dello chassis NP50SNC. Come il recente XMG Pro 15XMG Pro 15troviamo unIntel Core i9-13900HXinstallato nel nuovo Focus 15.
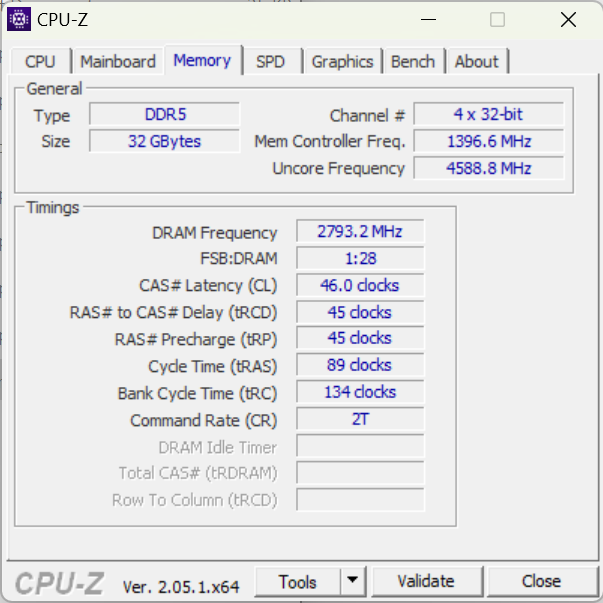
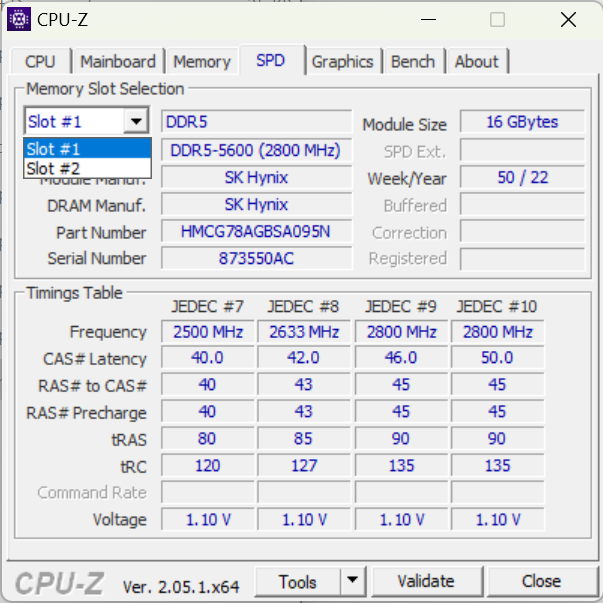
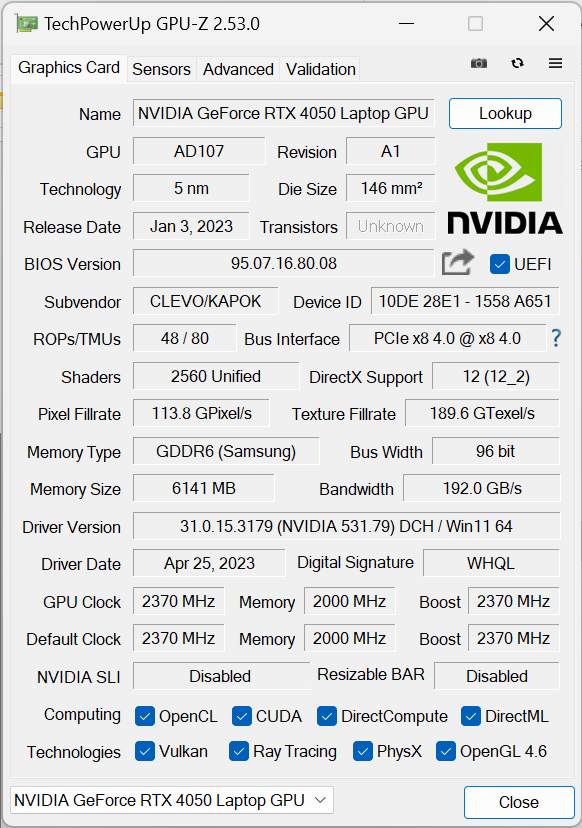
Il processore di fascia alta del Focus 15 è completato da una GPU entry-level, laNvidia GeForce RTX 4050 Laptop GPU32 GB di memoria di lavoro e un SSD Crucial NVMe da 1 TB.
Come di consueto, Schenker offre un'ampia gamma di opzioni di configurazione. Gli acquirenti possono configurare il Focus 15 anche con una GPUGPU RTX 4060 per computer portatilio unaGPU RTX 4070insieme a opzioni di RAM aggiuntive.
A causa della grafica entry-level del nostro campione in prova, classifichiamo l'XMG Pro 15 come un portatile da gioco entry-level. Tuttavia, i portatili da gioco entry-level di solito non hanno un processore così performante e non più di 16 GB di memoria di lavoro, quindi cerchiamo anche dispositivi di confronto corrispondenti tra i portatili multimediali di fascia alta.
Tra questi ci sono dispositivi comeMSI Katana 15o l'Asus TUF A15come portatili da gioco e ilSamsung Galaxy Book3 Ultra 16o ilAcer Swift X SFX14-71Gcome portatili multimediali. Il modelloXMG Pro 15il portatile più costoso di Schenker si differenzia dal suo cugino più economico solo per alcuni aspetti.
Potenziali concorrenti a confronto
Punteggio | Data | Modello | Peso | Altezza | Dimensione | Risoluzione | Prezzo |
|---|---|---|---|---|---|---|---|
| 85.1 % v7 (old) | 07/2023 | Schenker XMG Focus 15 (E23) i9-13900HX, GeForce RTX 4050 Laptop GPU | 2.4 kg | 26.9 mm | 15.60" | 2569x1440 | |
| 86.2 % v7 (old) | 07/2023 | Schenker XMG Pro 15 (E23) i9-13900HX, GeForce RTX 4060 Laptop GPU | 2.4 kg | 24.9 mm | 15.60" | 2560x1440 | |
| 86.3 % v7 (old) | 06/2023 | Asus TUF A15 FA507 R7 7735HS, GeForce RTX 4050 Laptop GPU | 2.2 kg | 24.9 mm | 15.60" | 1920x1080 | |
| 82.9 % v7 (old) | 03/2023 | MSI Katana 15 B12VEK i7-12650H, GeForce RTX 4050 Laptop GPU | 2.3 kg | 24.9 mm | 15.60" | 1920x1080 | |
| 86.3 % v7 (old) | 07/2023 | Acer Swift X SFX14-71G i7-13700H, GeForce RTX 4050 Laptop GPU | 1.5 kg | 17.9 mm | 14.50" | 2880x1800 | |
| 89.4 % v7 (old) | 04/2023 | Samsung Galaxy Book3 Ultra 16 i7-13700H, GeForce RTX 4050 Laptop GPU | 1.8 kg | 16.5 mm | 16.00" | 2880x1800 | |
| 89.4 % v7 (old) | 05/2023 | Gigabyte Aero 14 OLED BMF i7-13700H, GeForce RTX 4050 Laptop GPU | 1.4 kg | 17 mm | 14.00" | 2880x1800 |
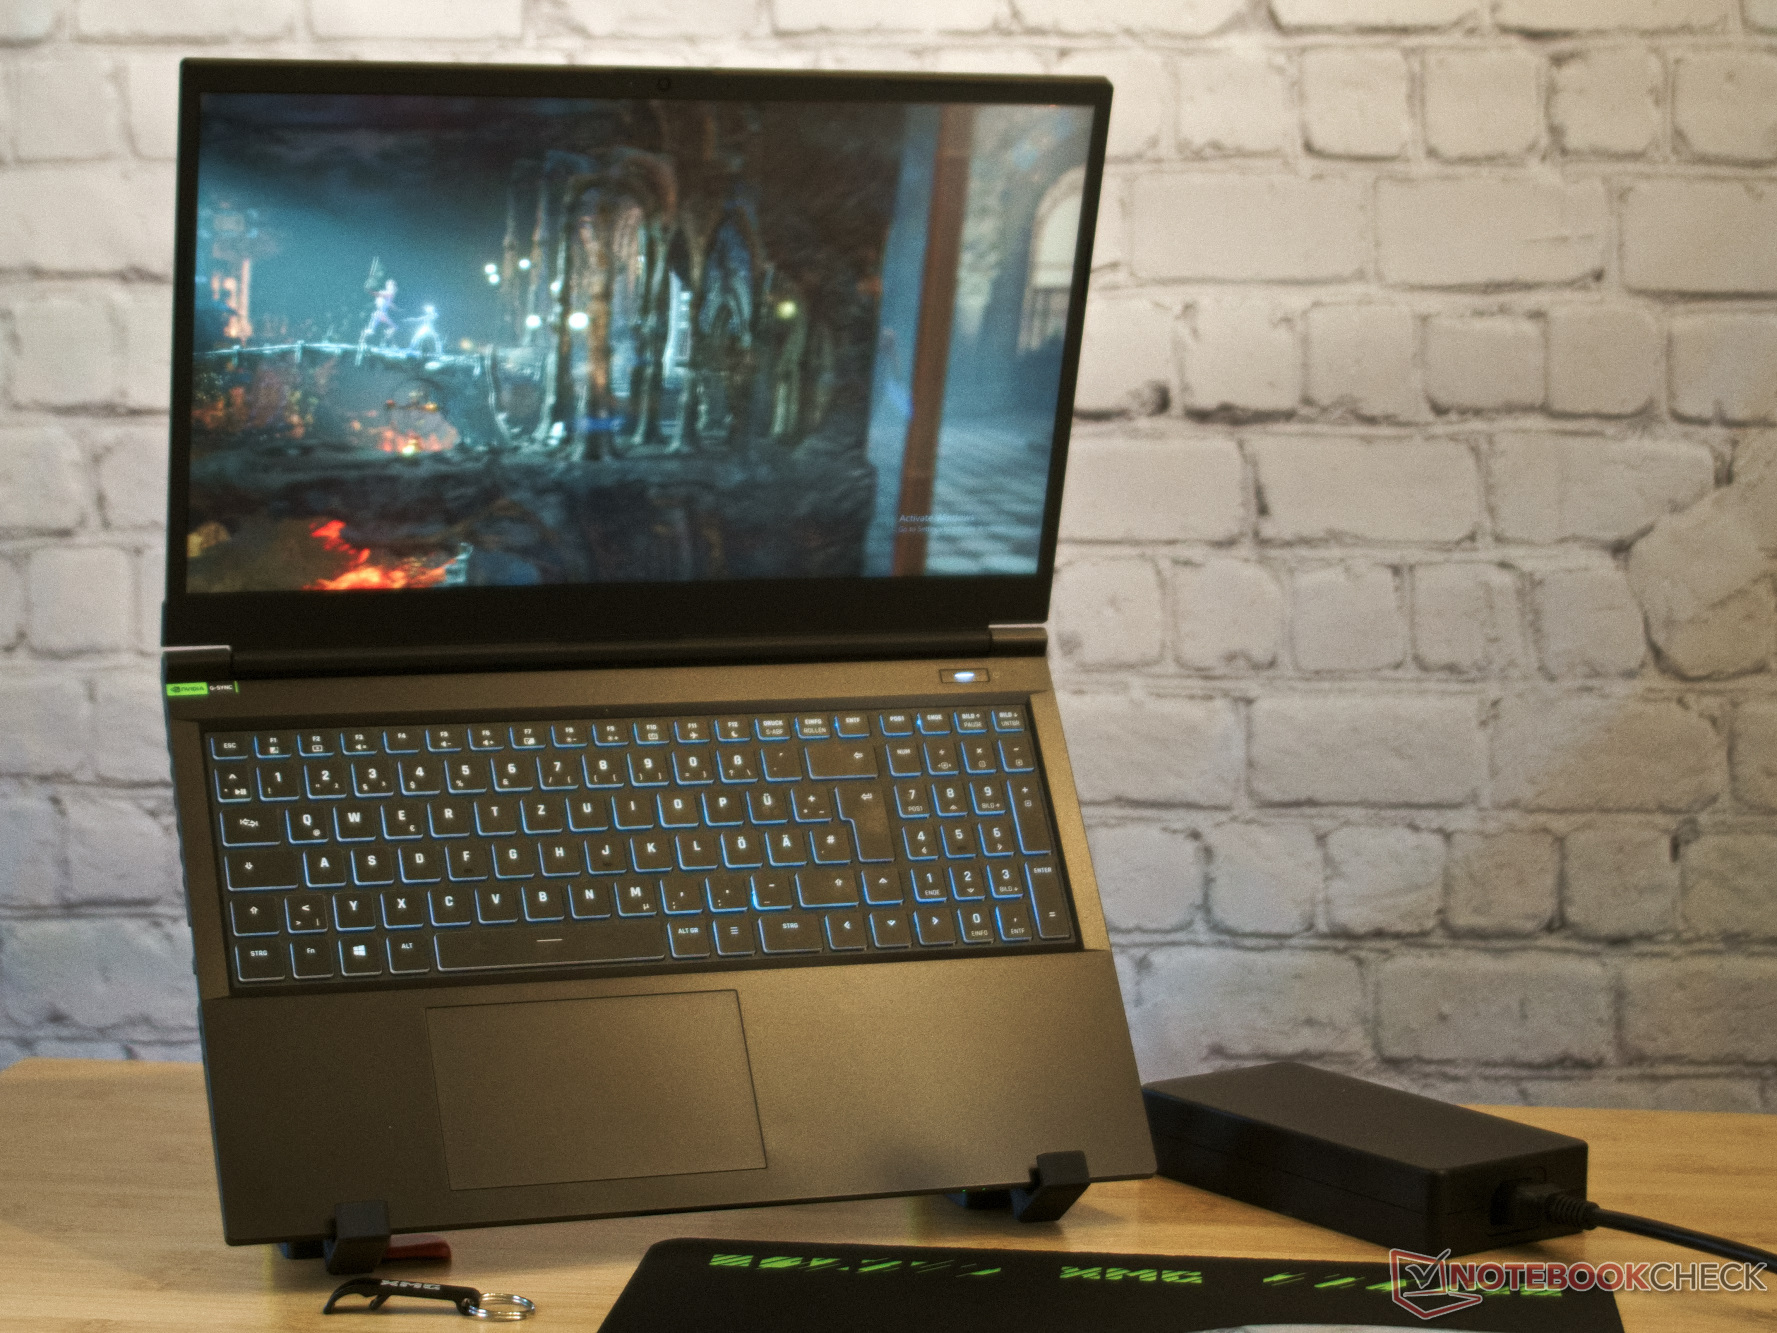
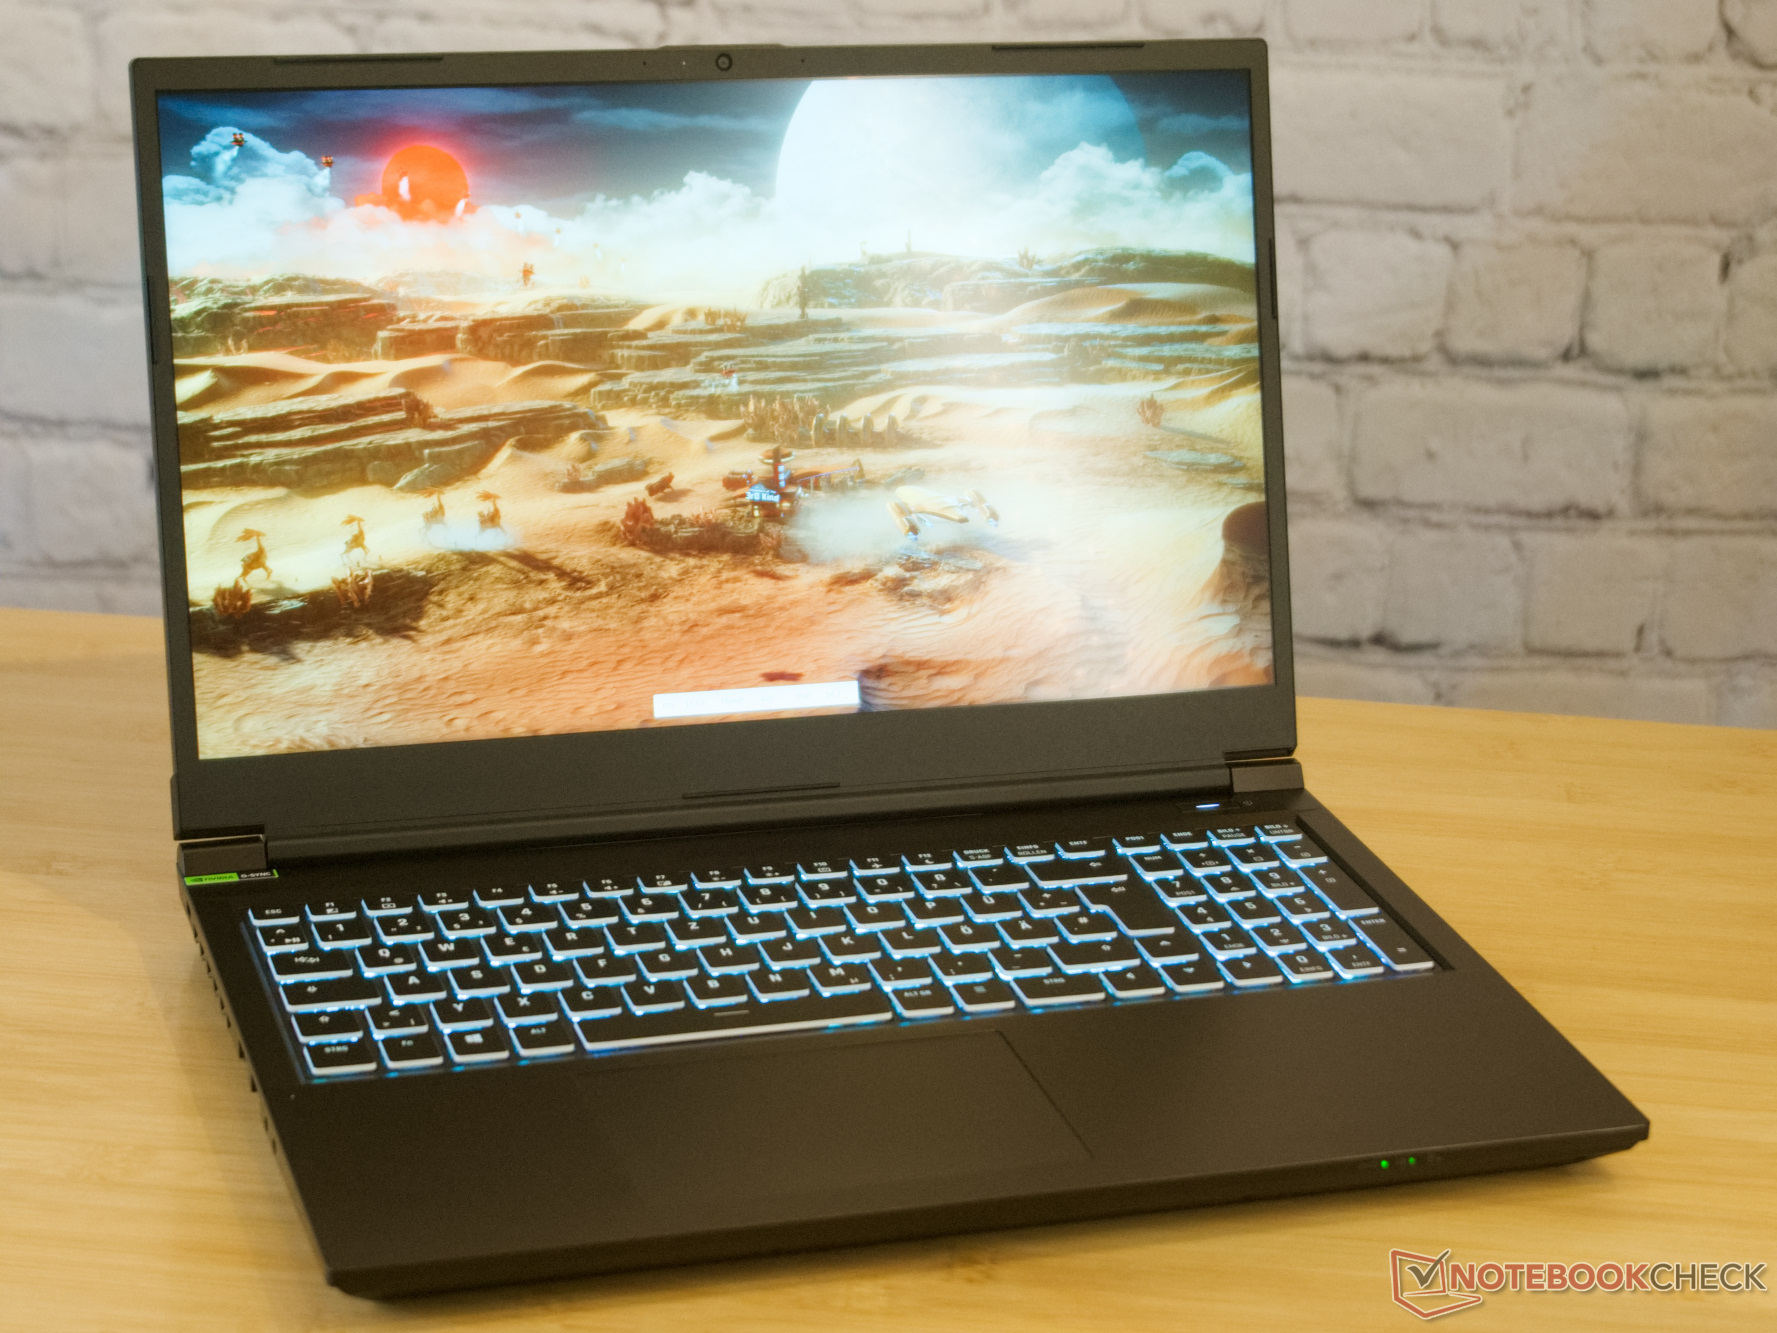
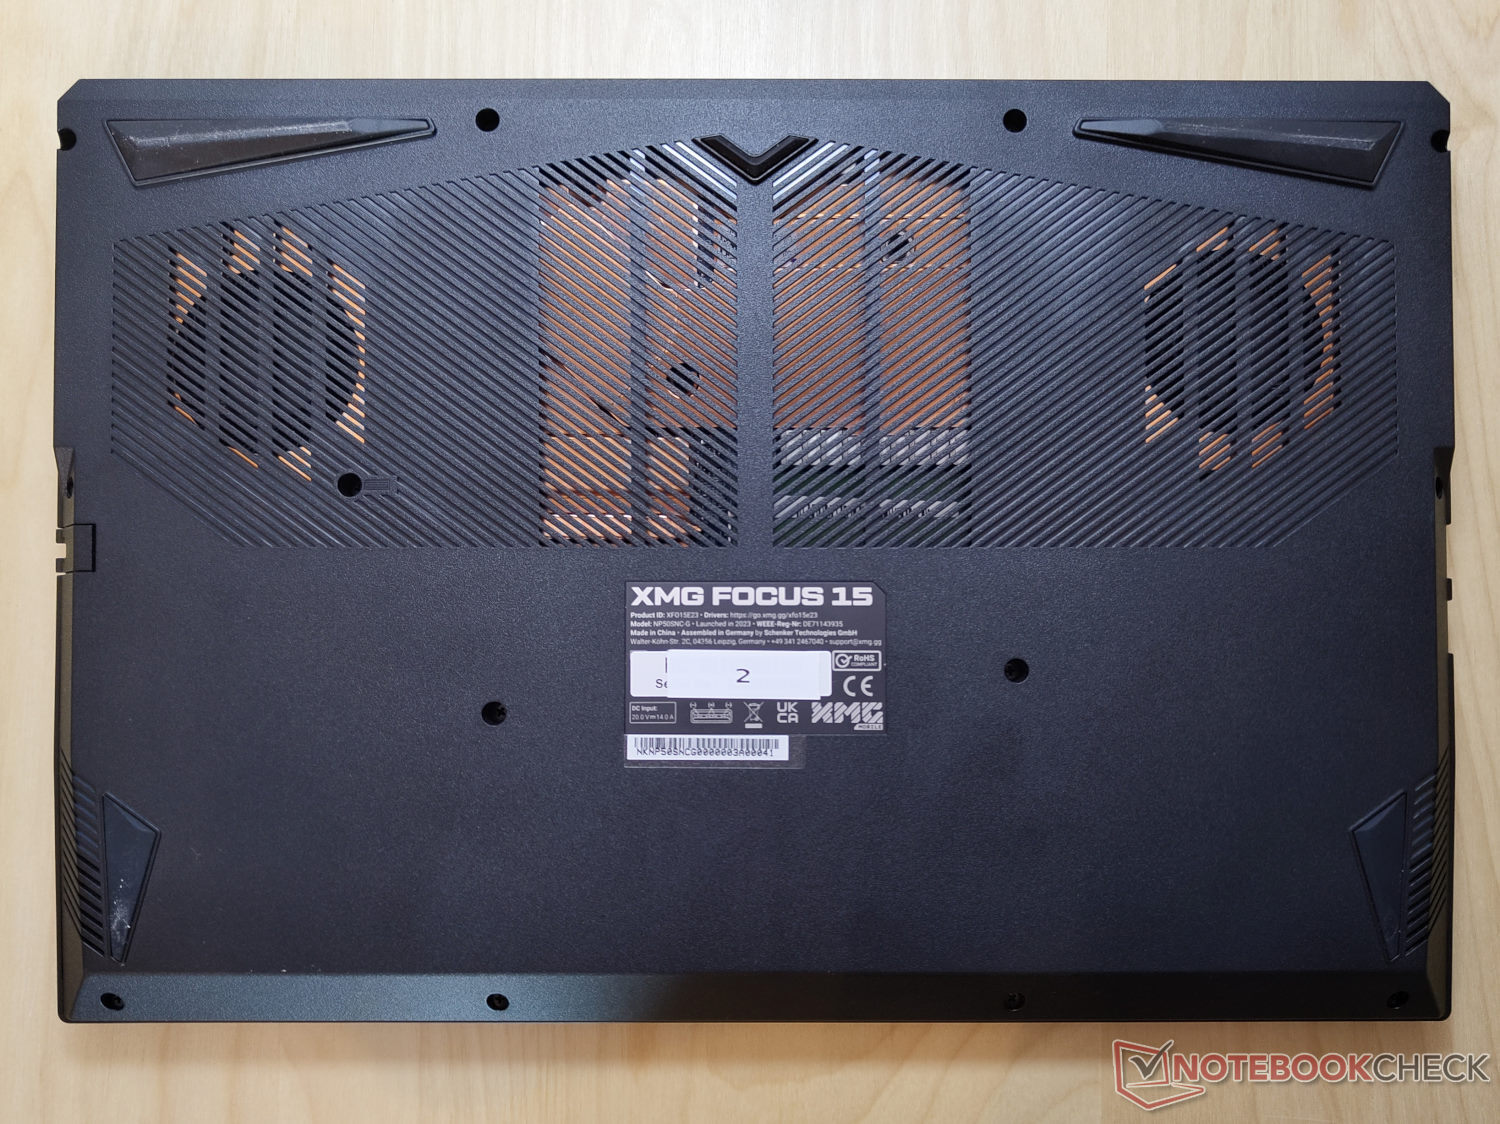
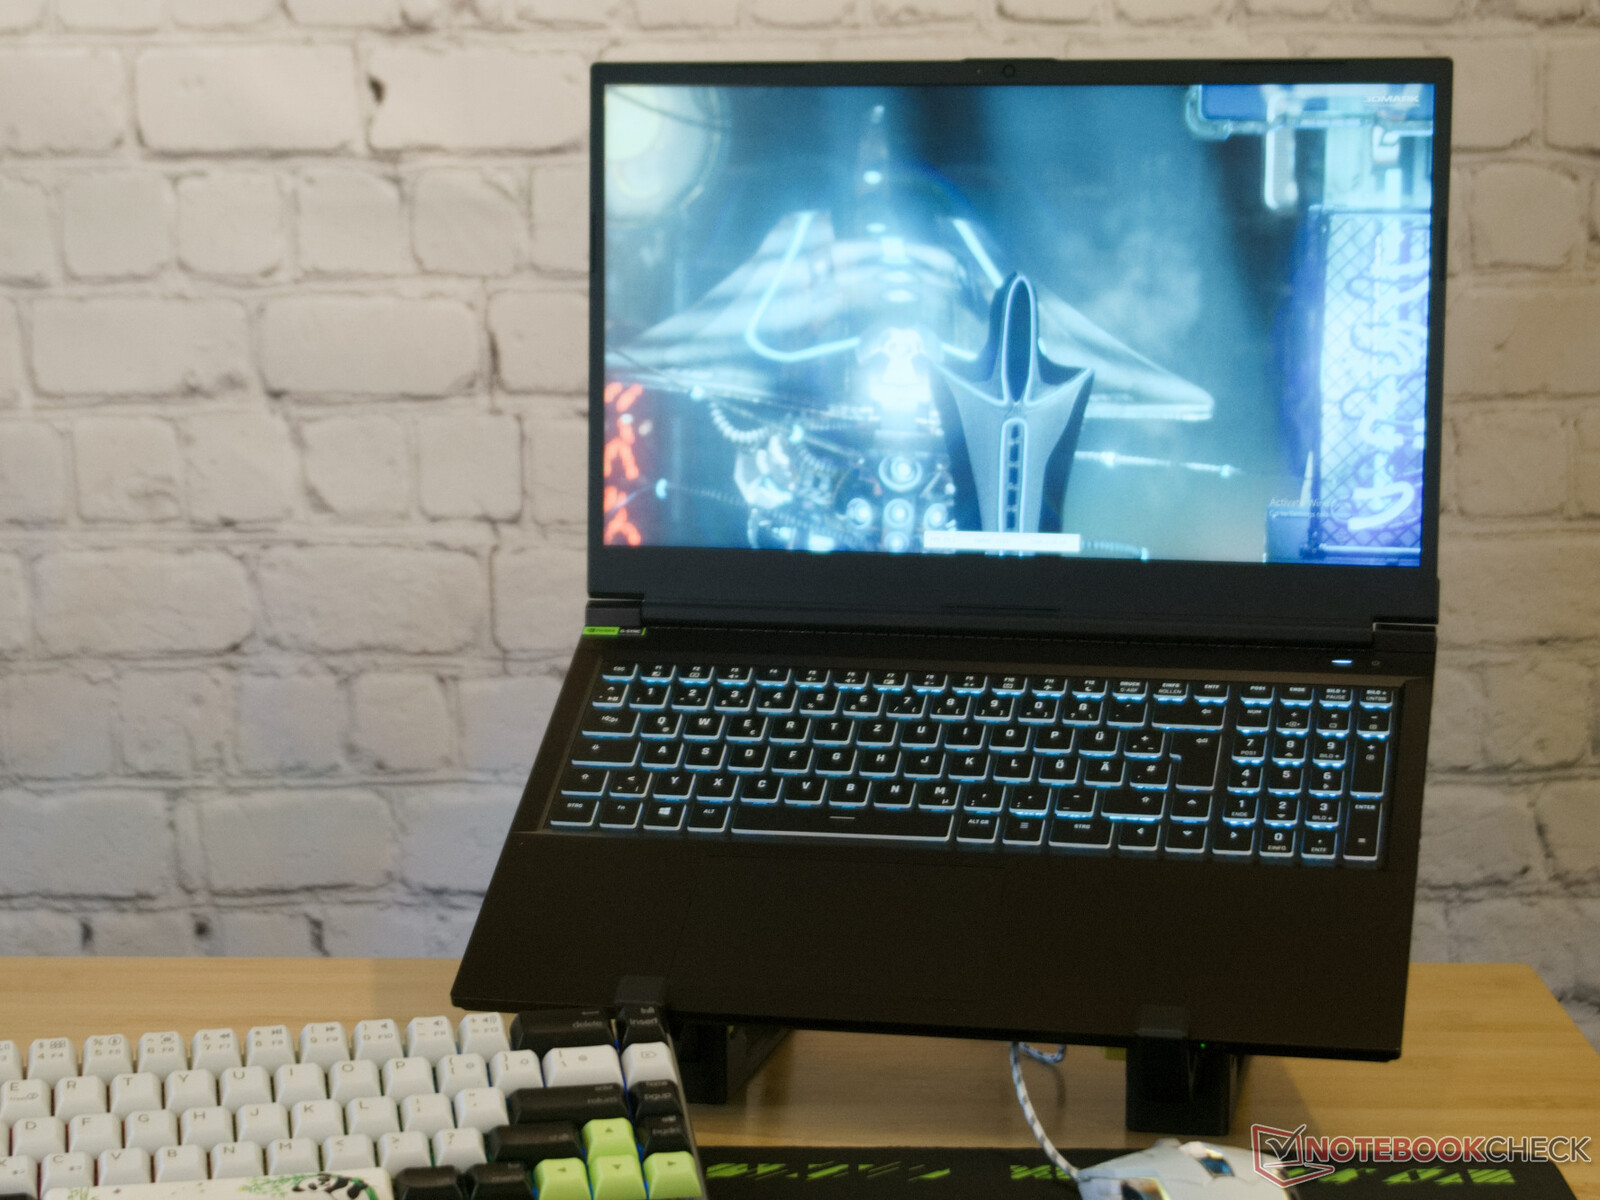
Telaio: Plastica robusta
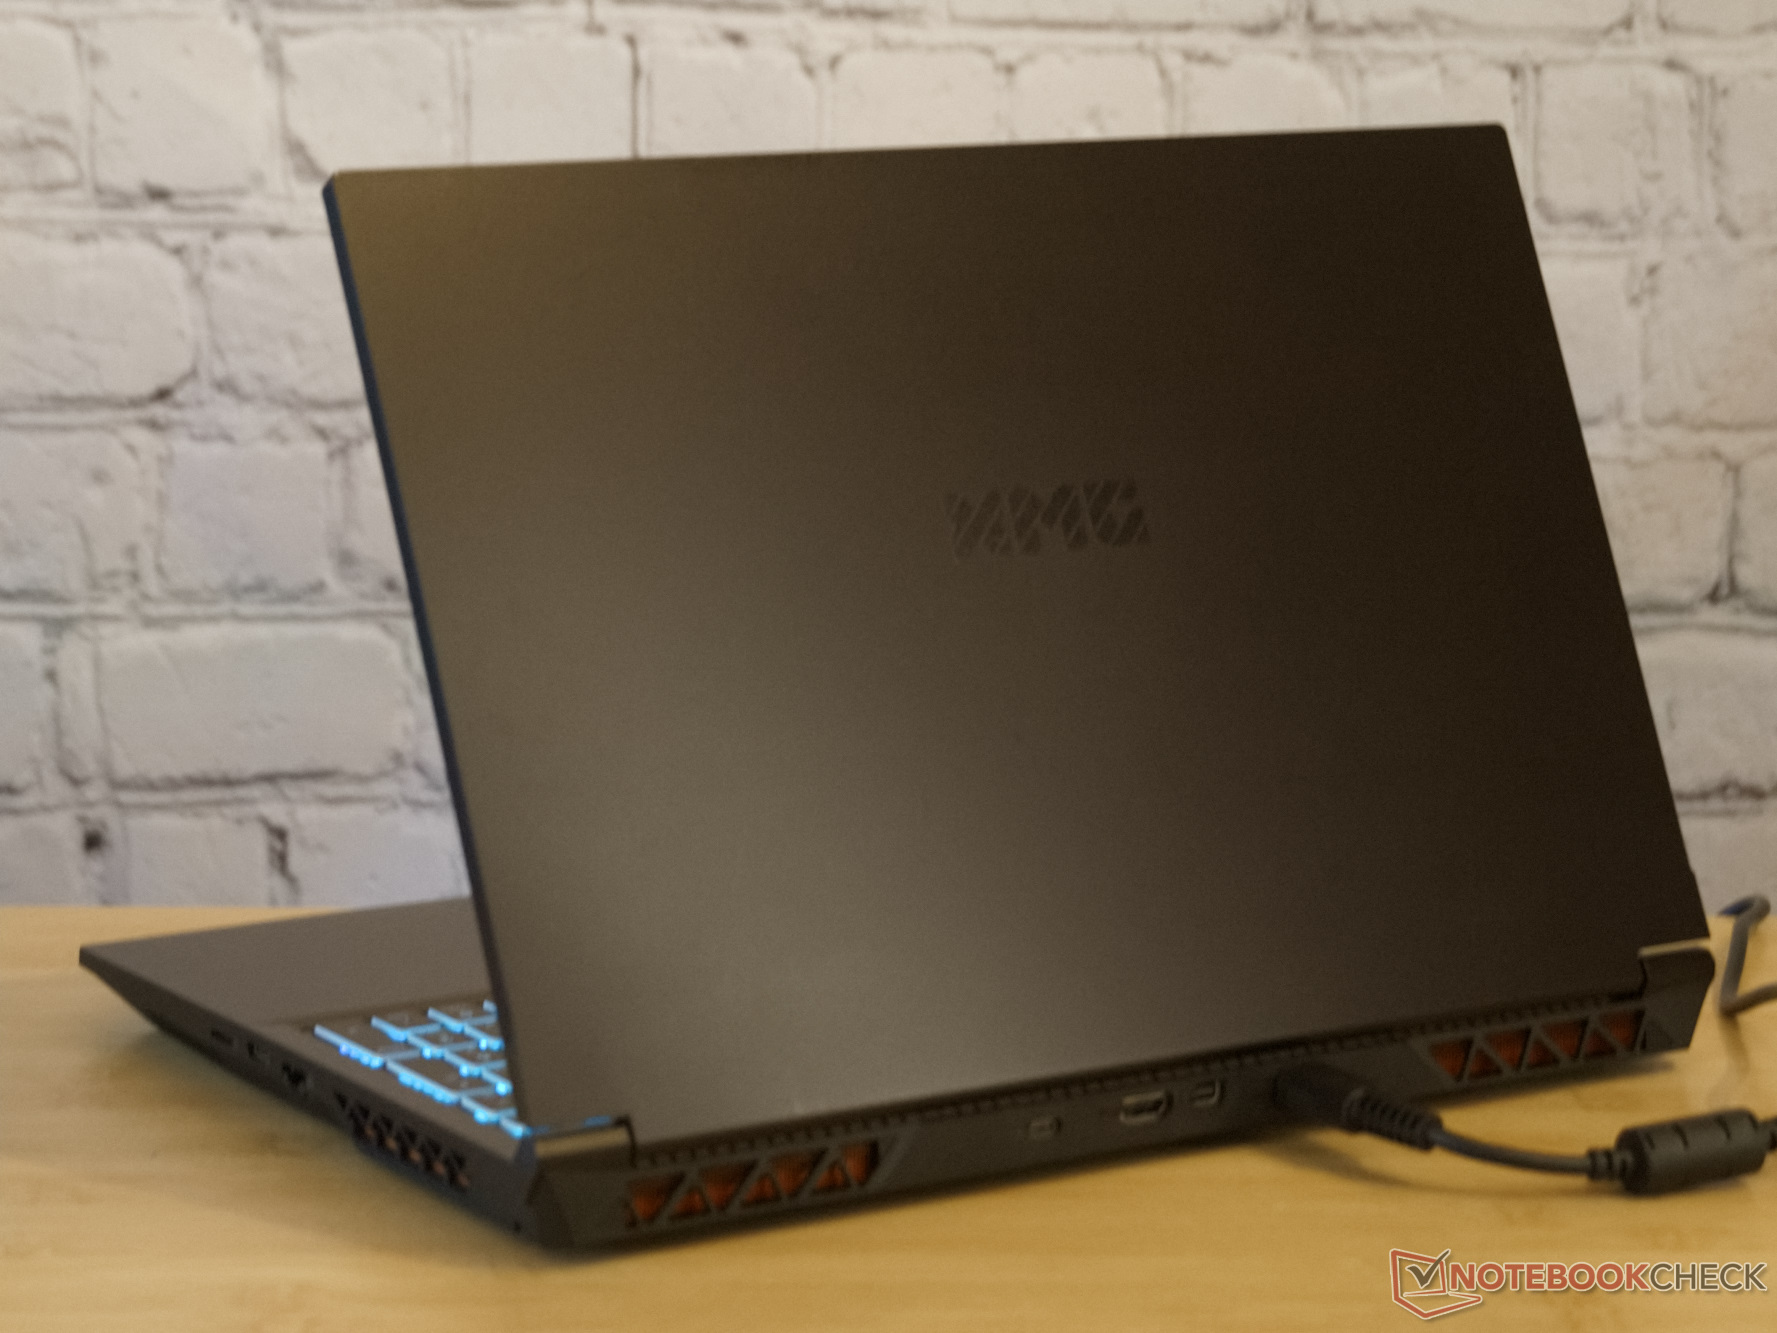
L'involucro del portatile è completamente in plastica robusta e il metallo è visibile solo dall'esterno, dietro le griglie del dissipatore di calore. Clevo e Schenker hanno mantenuto il design piuttosto semplice. Il marchio è presente solo sotto forma di logo XMG nero su sfondo nero.
Anche se il case è realizzato principalmente in plastica, non troviamo alcun punto debole in termini di qualità. Il portatile appare resistente sotto tutti i punti di vista, non scricchiola quando viene ruotato e presenta fessure molto strette e uniformi. Il coperchio del display può essere aperto a circa 140° con una sola mano e mantiene la posizione per tutto il tempo.
Né il peso né lo spessore sono atipici per un computer portatile da gioco da 15,6 pollici in formato 16:10. Tuttavia, un confronto con altri portatili multimediali mostra che quelli con hardware simile potrebbero anche essere un po' più sottili.
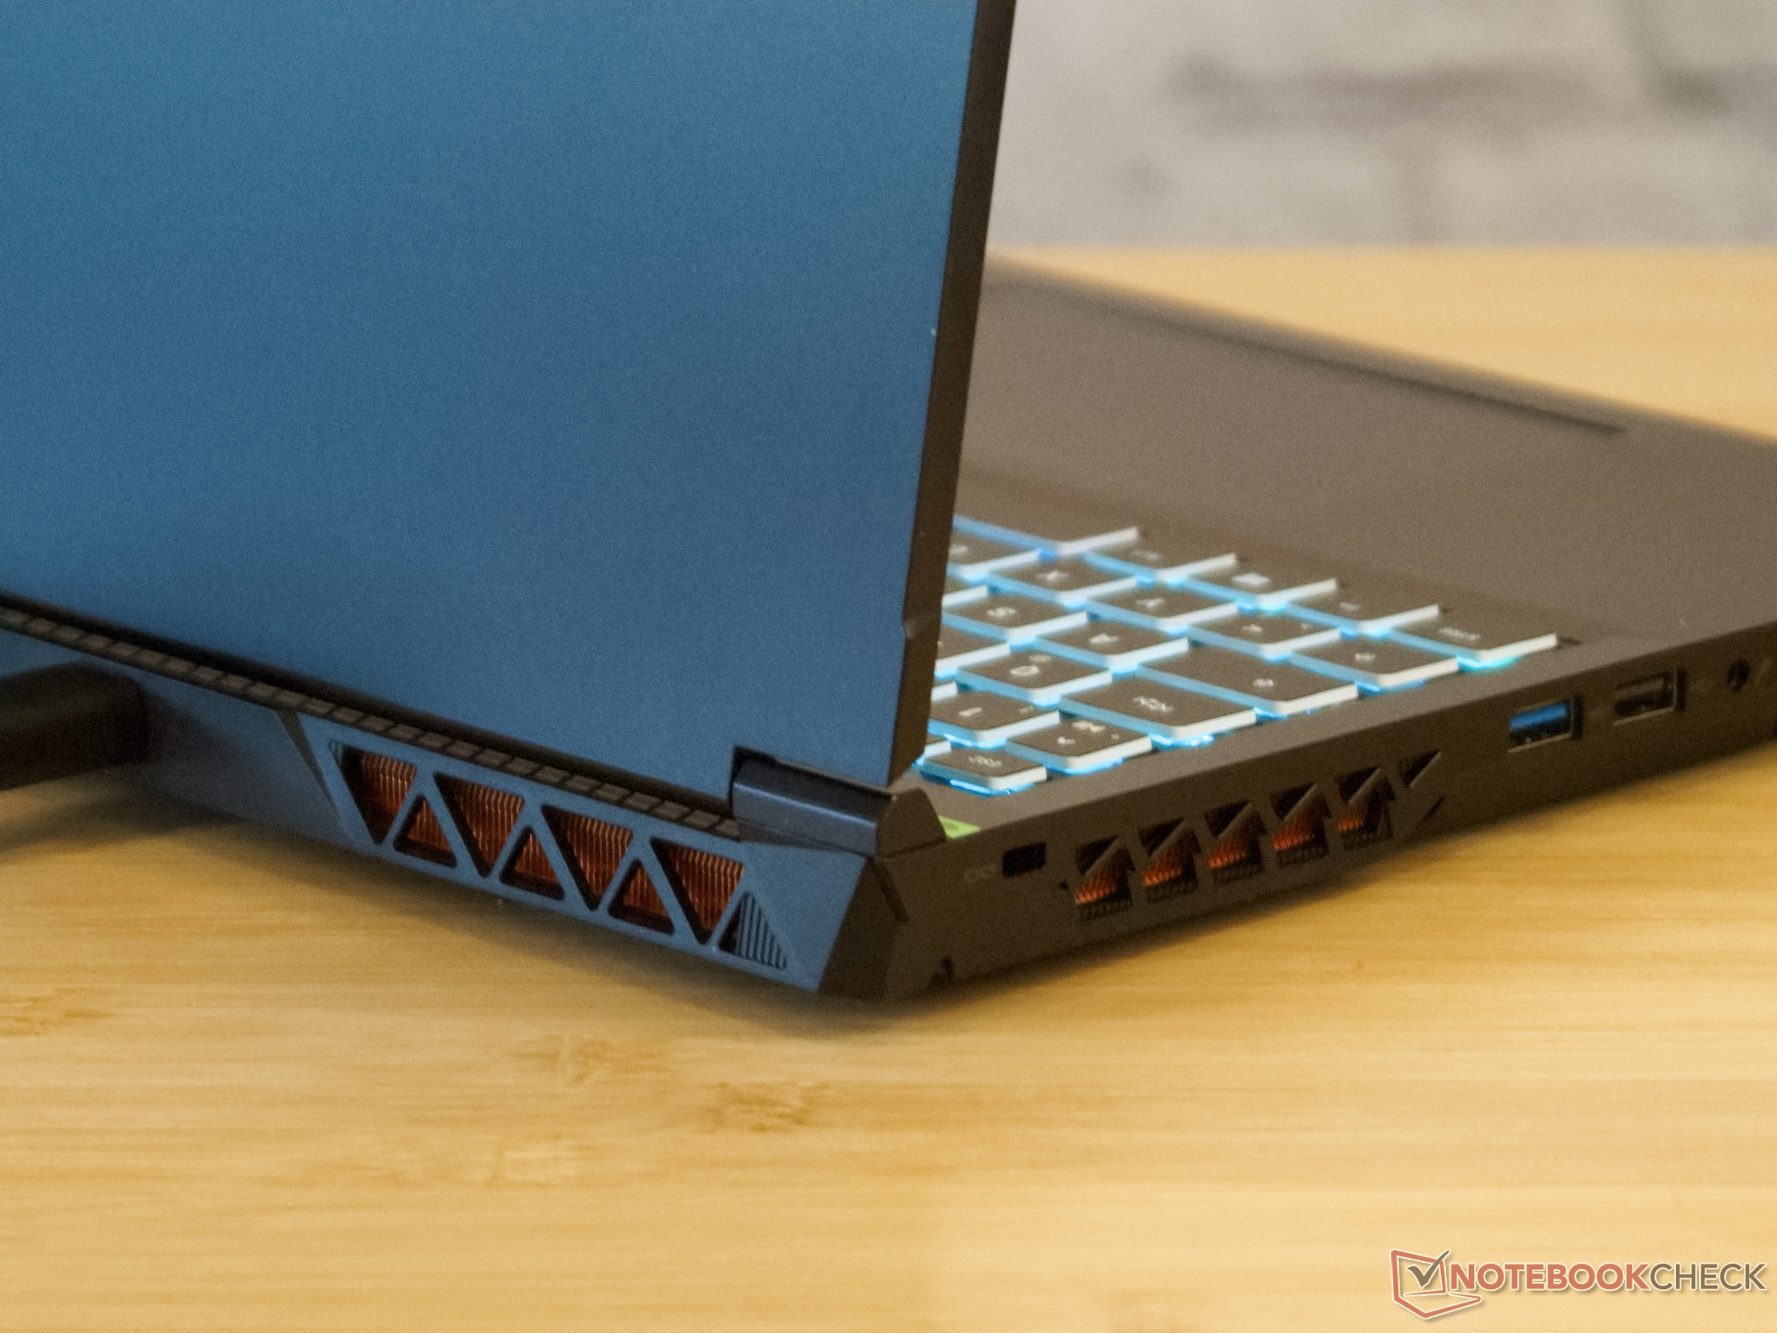
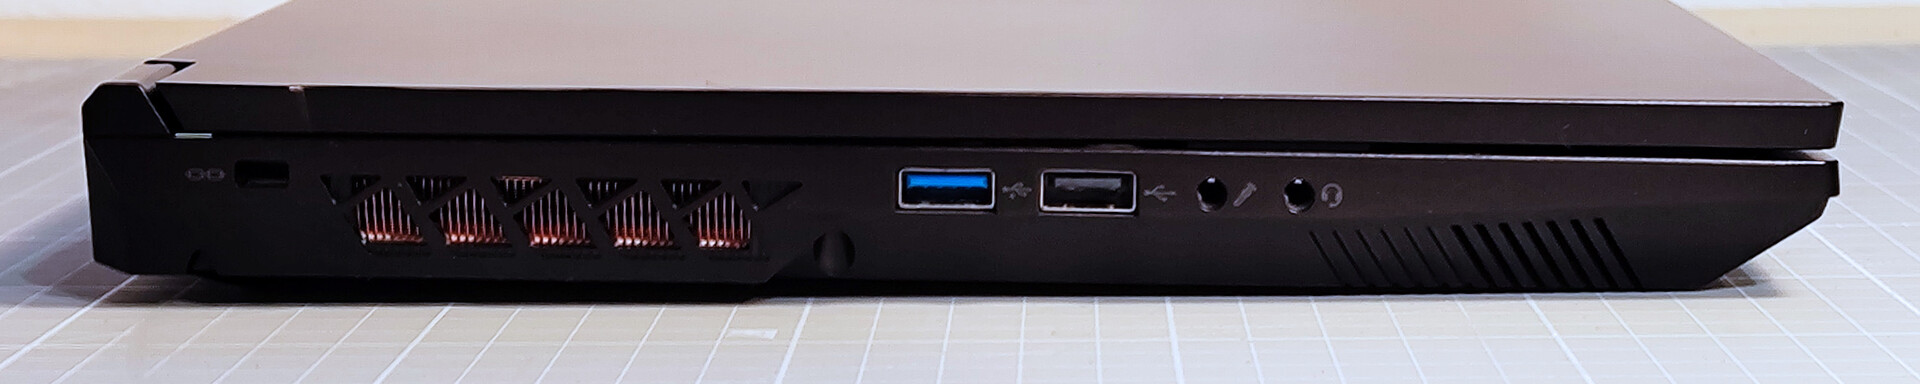
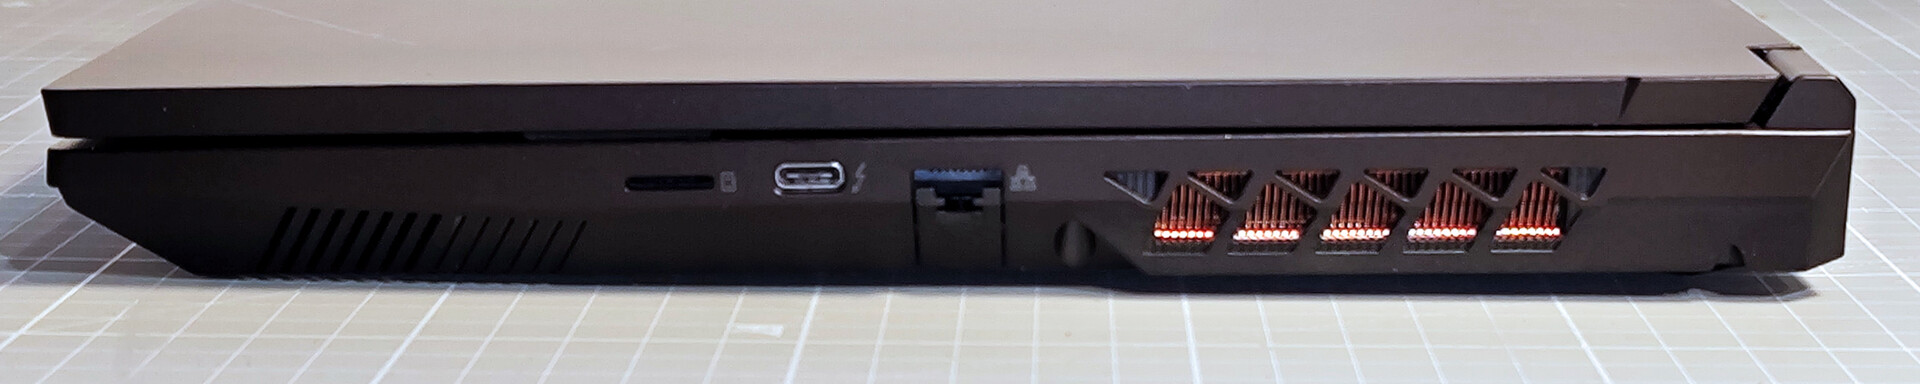
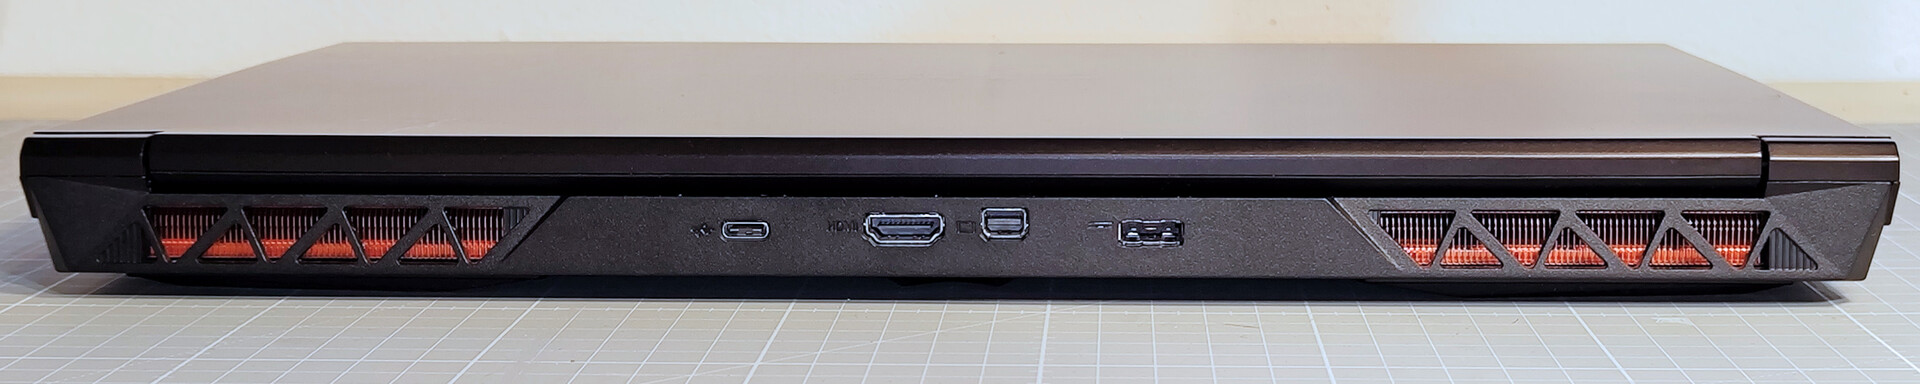
Dotazione: Porte USB su tre lati
Gli aspetti di connettività dell'XMG Focus 15 non sono praticamente cambiati rispetto alla nostra ultima recensione. L'unica novità è un'altra porta USB-C, ma il lettore di schede SD è stato ridotto al formato microSD.
Entrambe le porte USB Type-C non offrono alimentazione. Pertanto, probabilmente dovrete sempre portare con voi l'alimentatore, che pesa quasi un kg.
Lettore di schede SD
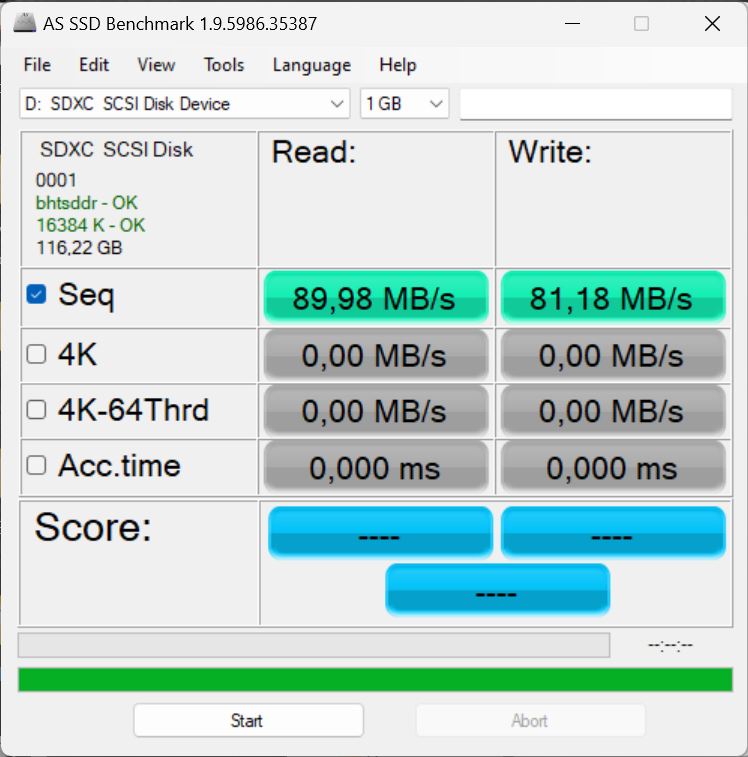
Le velocità di trasferimento della scheda SD sono buone utilizzando la AV PRO microSD 128 GB V60 con il nostro dispositivo di prova o la scheda Pro 15 GB Pro 15anche se non eccezionali.
Gli altri due portatili da gioco del nostro confronto non dispongono di un lettore di schede.
| SD Card Reader - maximum AS SSD Seq Read Test (1GB) | |
| Gigabyte Aero 14 OLED BMF | |
| Media della classe Gaming (25.5 - 261, n=51, ultimi 2 anni) | |
| Schenker XMG Focus 15 (E23) | |
| Acer Swift X SFX14-71G (Angelbird AV Pro V60) | |
| Samsung Galaxy Book3 Ultra 16 (AV PRO microSD 128 GB V60) | |
Comunicazione
Il modulo Wi-Fi Intel AX211 del Focus 15 offre velocità di trasmissione elevate nella rete Wi-Fi 6E con il nostro router di riferimento Asus ROG Rapture AXE-GT11000.
D'altra parte, le velocità di trasmissione nella rete Wi-Fi 6 a 5 GHz sembrano inferiori alla media con la stessa configurazione di test.
Webcam
La webcam Full HD del nuovo Focus 15 mette a fuoco perfettamente solo il centro dell'immagine. Pertanto, il centro è nitido e ricco di contrasto, mentre i bordi appaiono un po' sbiaditi.
Le elevate deviazioni di colore della fotocamera sono fastidiose e i toni della pelle in particolare sono mal riprodotti.

 GeForce RTX 4050 Laptop GPU, i9-13900HX, Crucial P5 Plus 1TB CT1000P5PSSD8")
 GeForce RTX 4050 Laptop GPU, i9-13900HX, Crucial P5 Plus 1TB CT1000P5PSSD8")
Sicurezza
Il Focus 15 non dispone di opzioni di autenticazione biometrica. Uno slot di sicurezza Kensington fornisce una protezione fisica contro il furto.
TPM 2.0 e SecureBoot proteggono dall'accesso non autorizzato ai dati.
Accessori
Oltre all'alimentatore e alla documentazione, la confezione contiene un ricco pacchetto di accessori. Oltre all'alimentatore e alla documentazione, la confezione contiene un grande tappetino per il mouse con il logo XMG e un apribottiglie abbinato, oltre a un CD di installazione e a una chiavetta USB contenente Windows con i relativi programmi e driver.
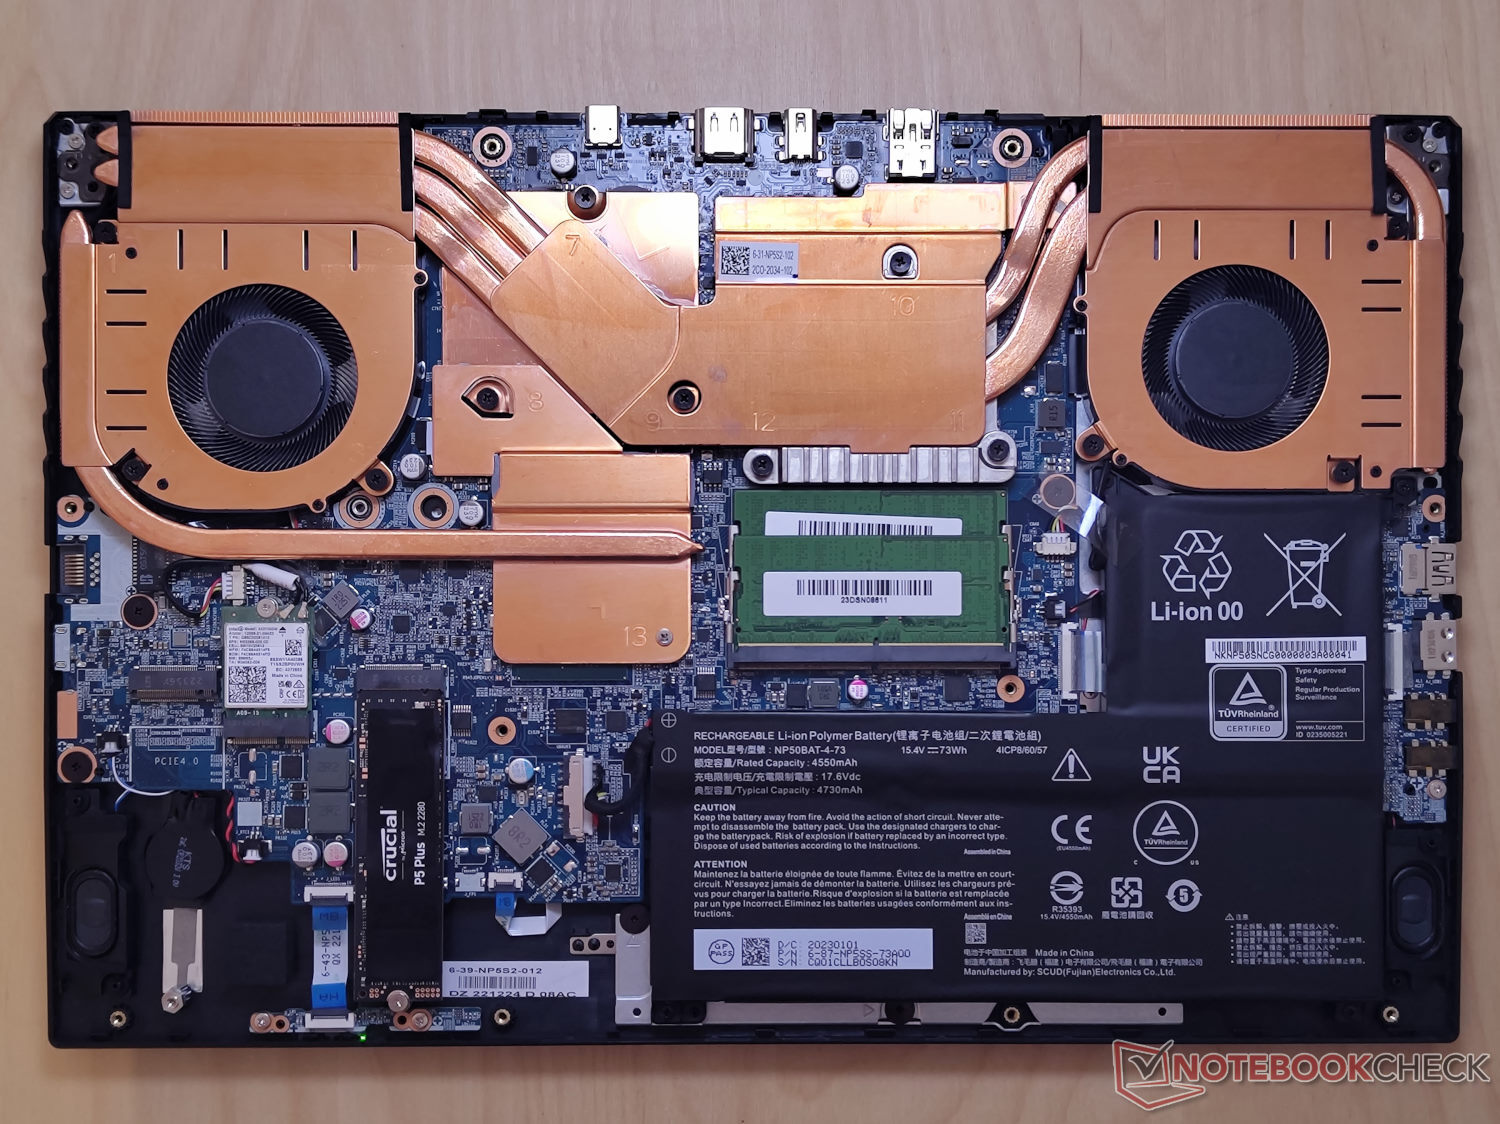
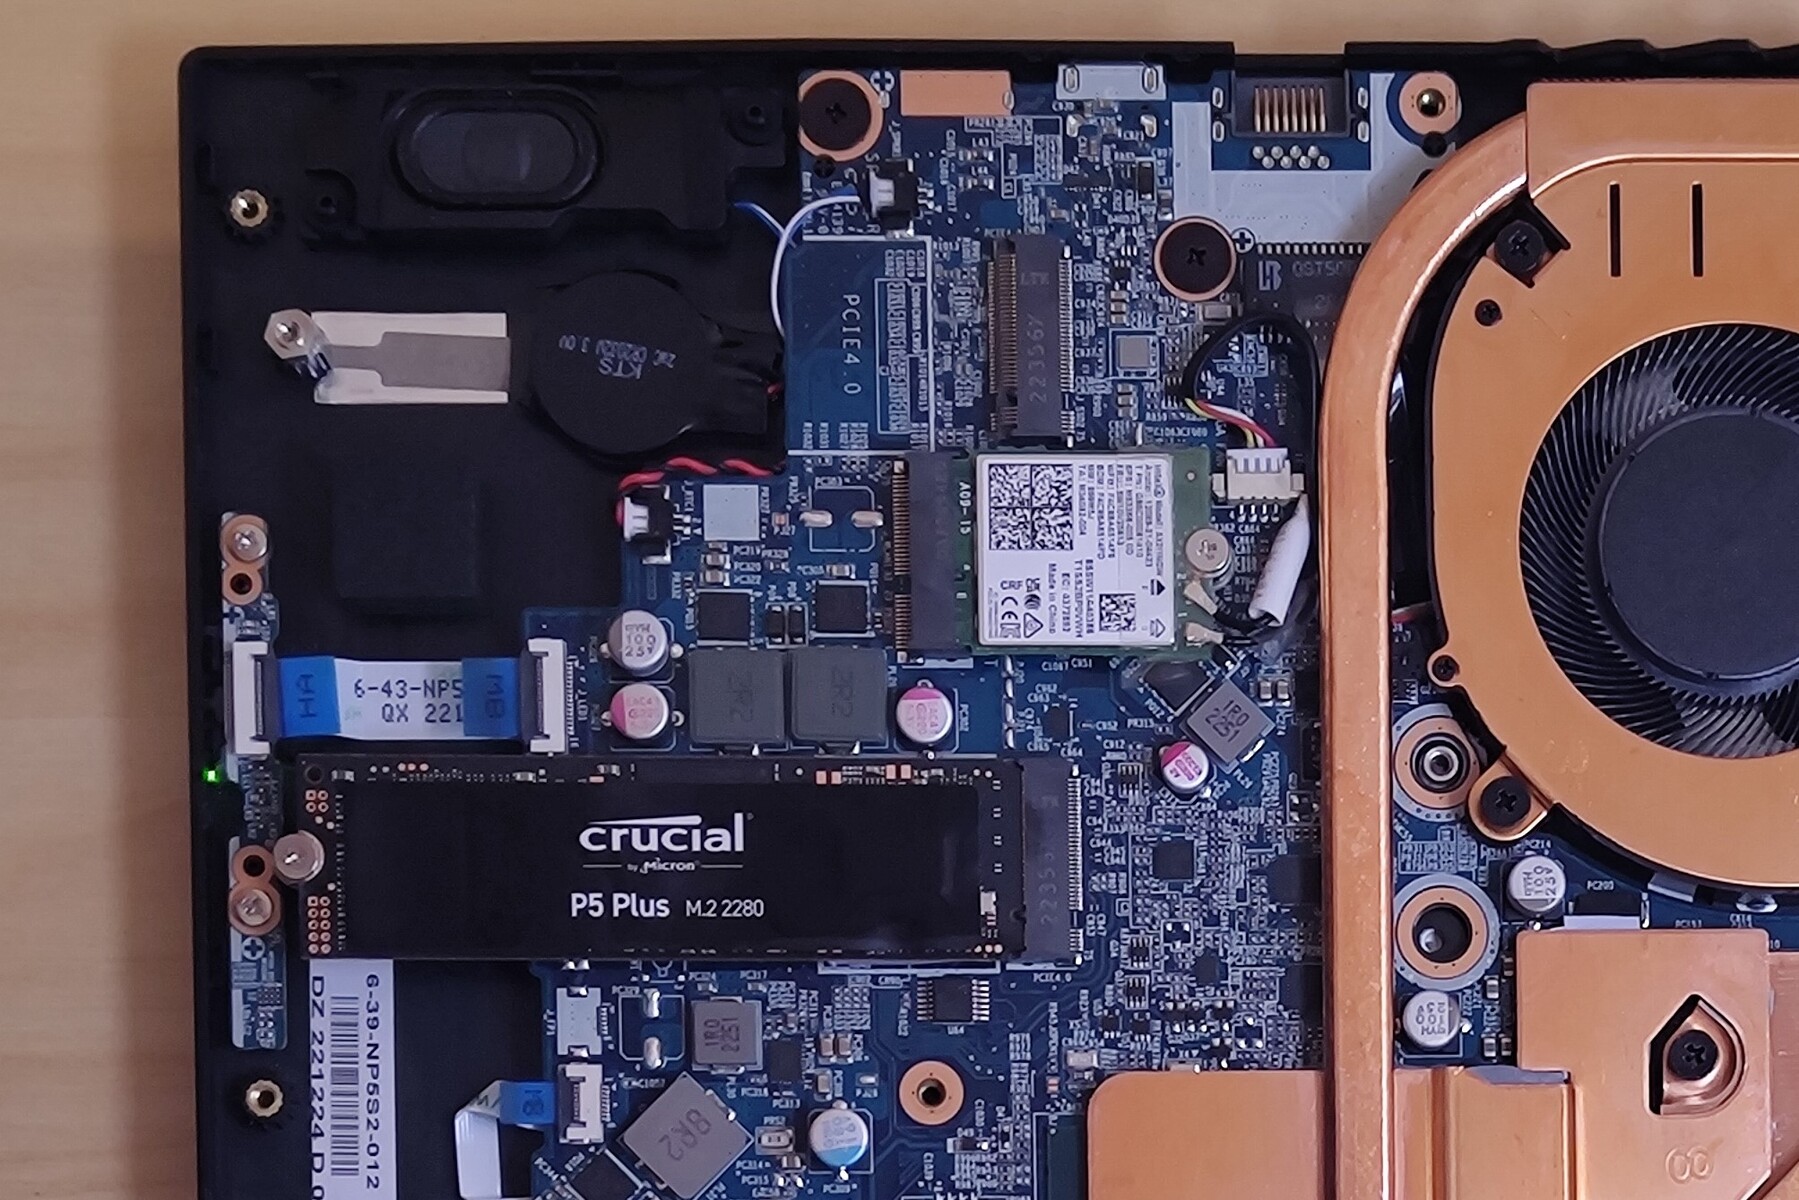
Manutenzione
L'SSD, la memoria di lavoro e il modulo WLAN dell'XMG Focus 15 sono sostituibili. Nel nostro dispositivo di prova è disponibile uno slot M.2 PCIe 4.0 libero.
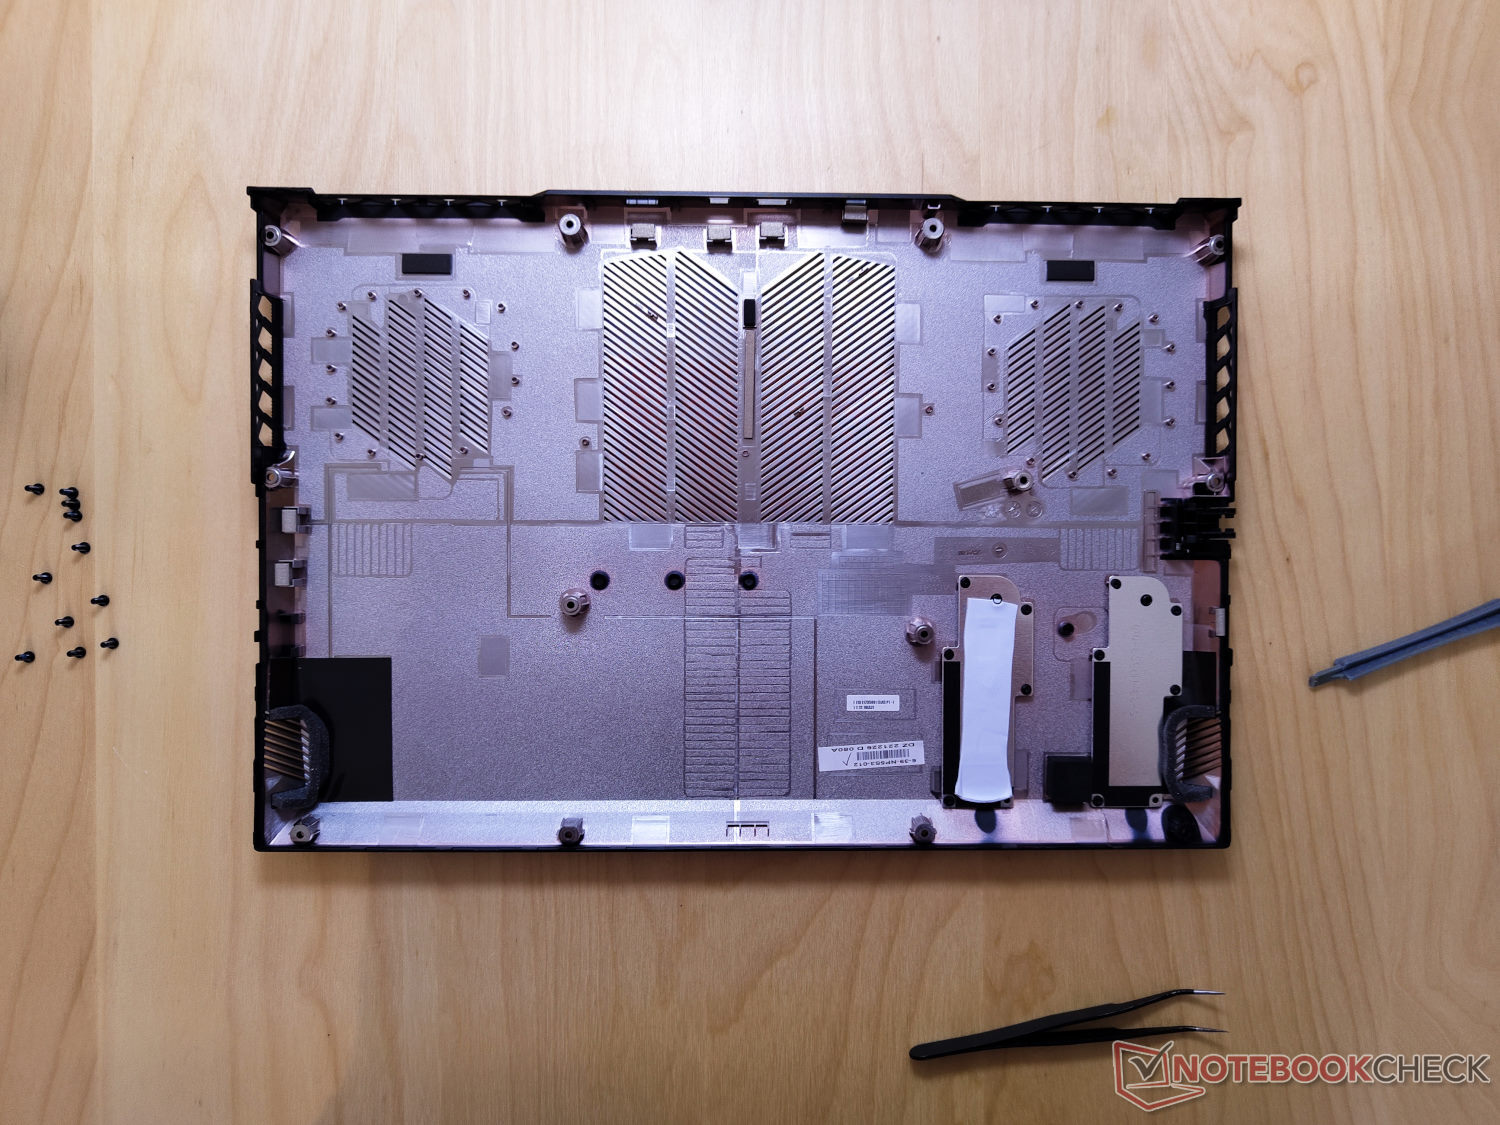
L'intera piastra di base del portatile è fissata con 11 viti PH0 e può essere rimossa abbastanza facilmente per accedere ai componenti corrispondenti. Dopo aver allentato le viti, il coperchio può essere sollevato senza problemi.
Garanzia
Schenker offre una garanzia di base gratuita di 24 mesi per il portatile. Ulteriori opzioni di garanzia possono essere aggiunte tramite Bestware durante il checkout.
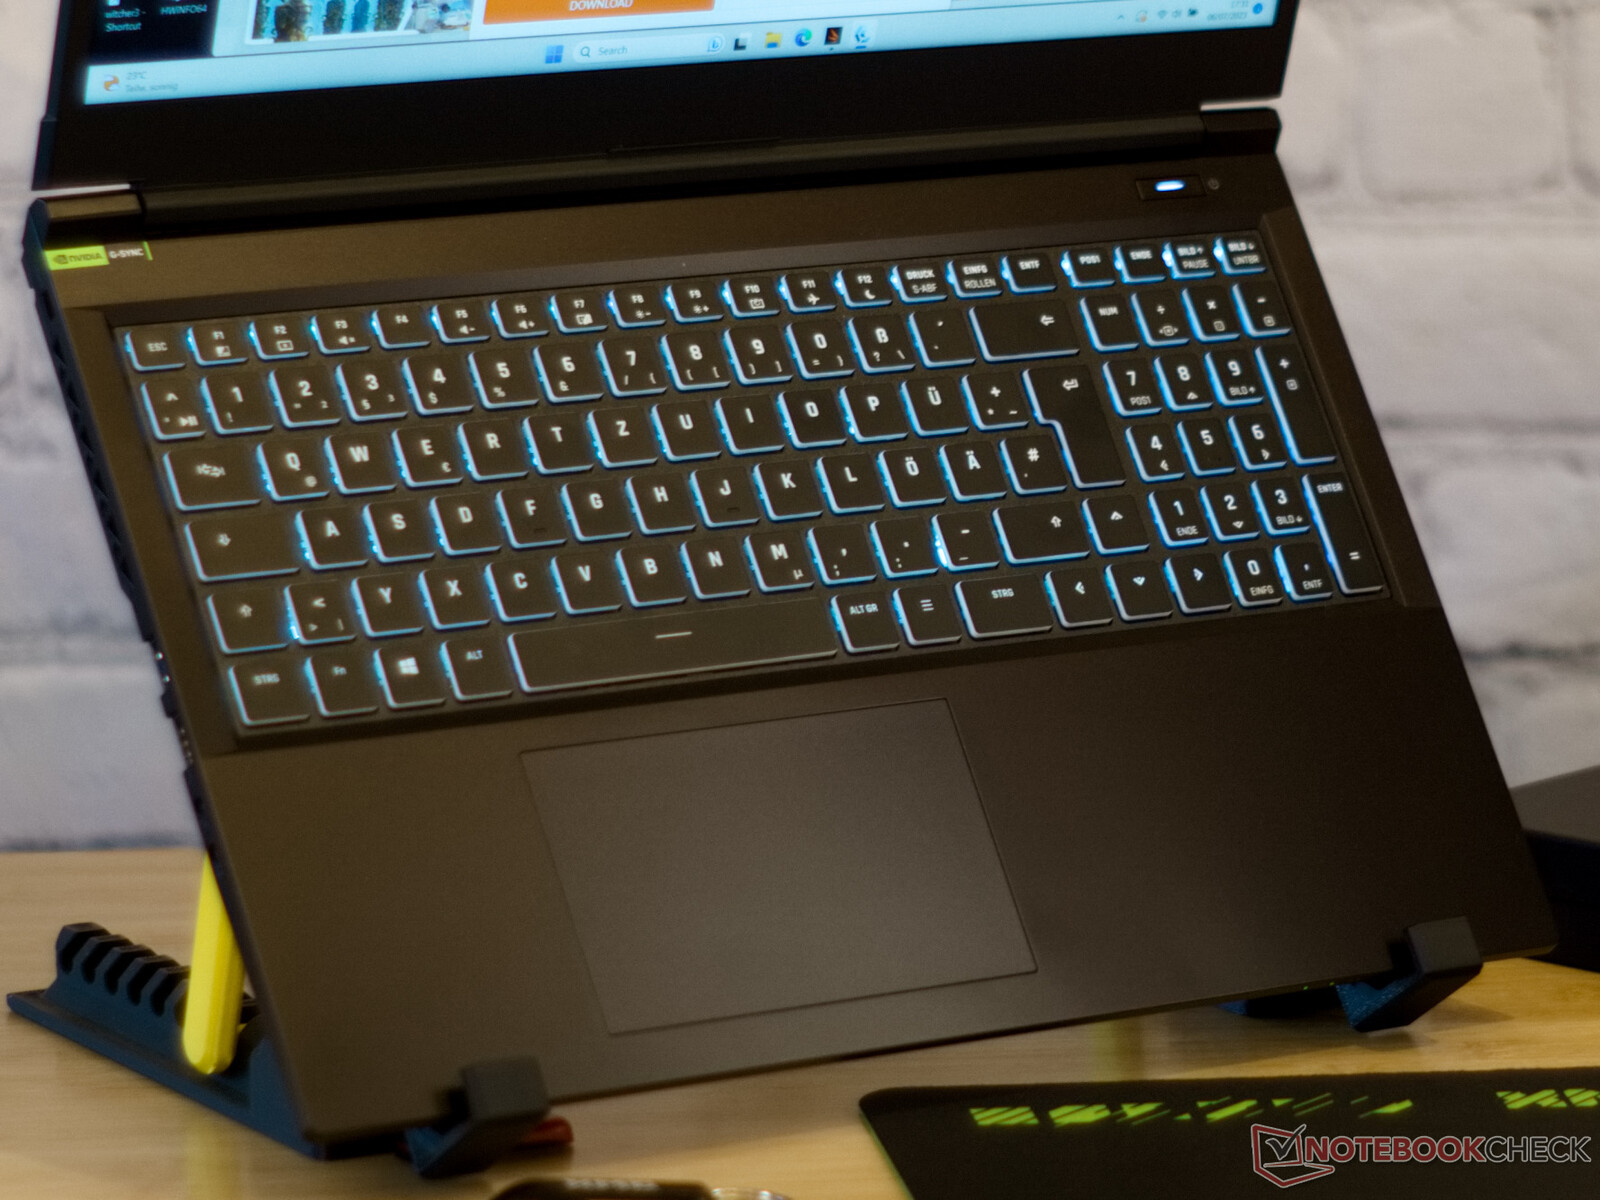
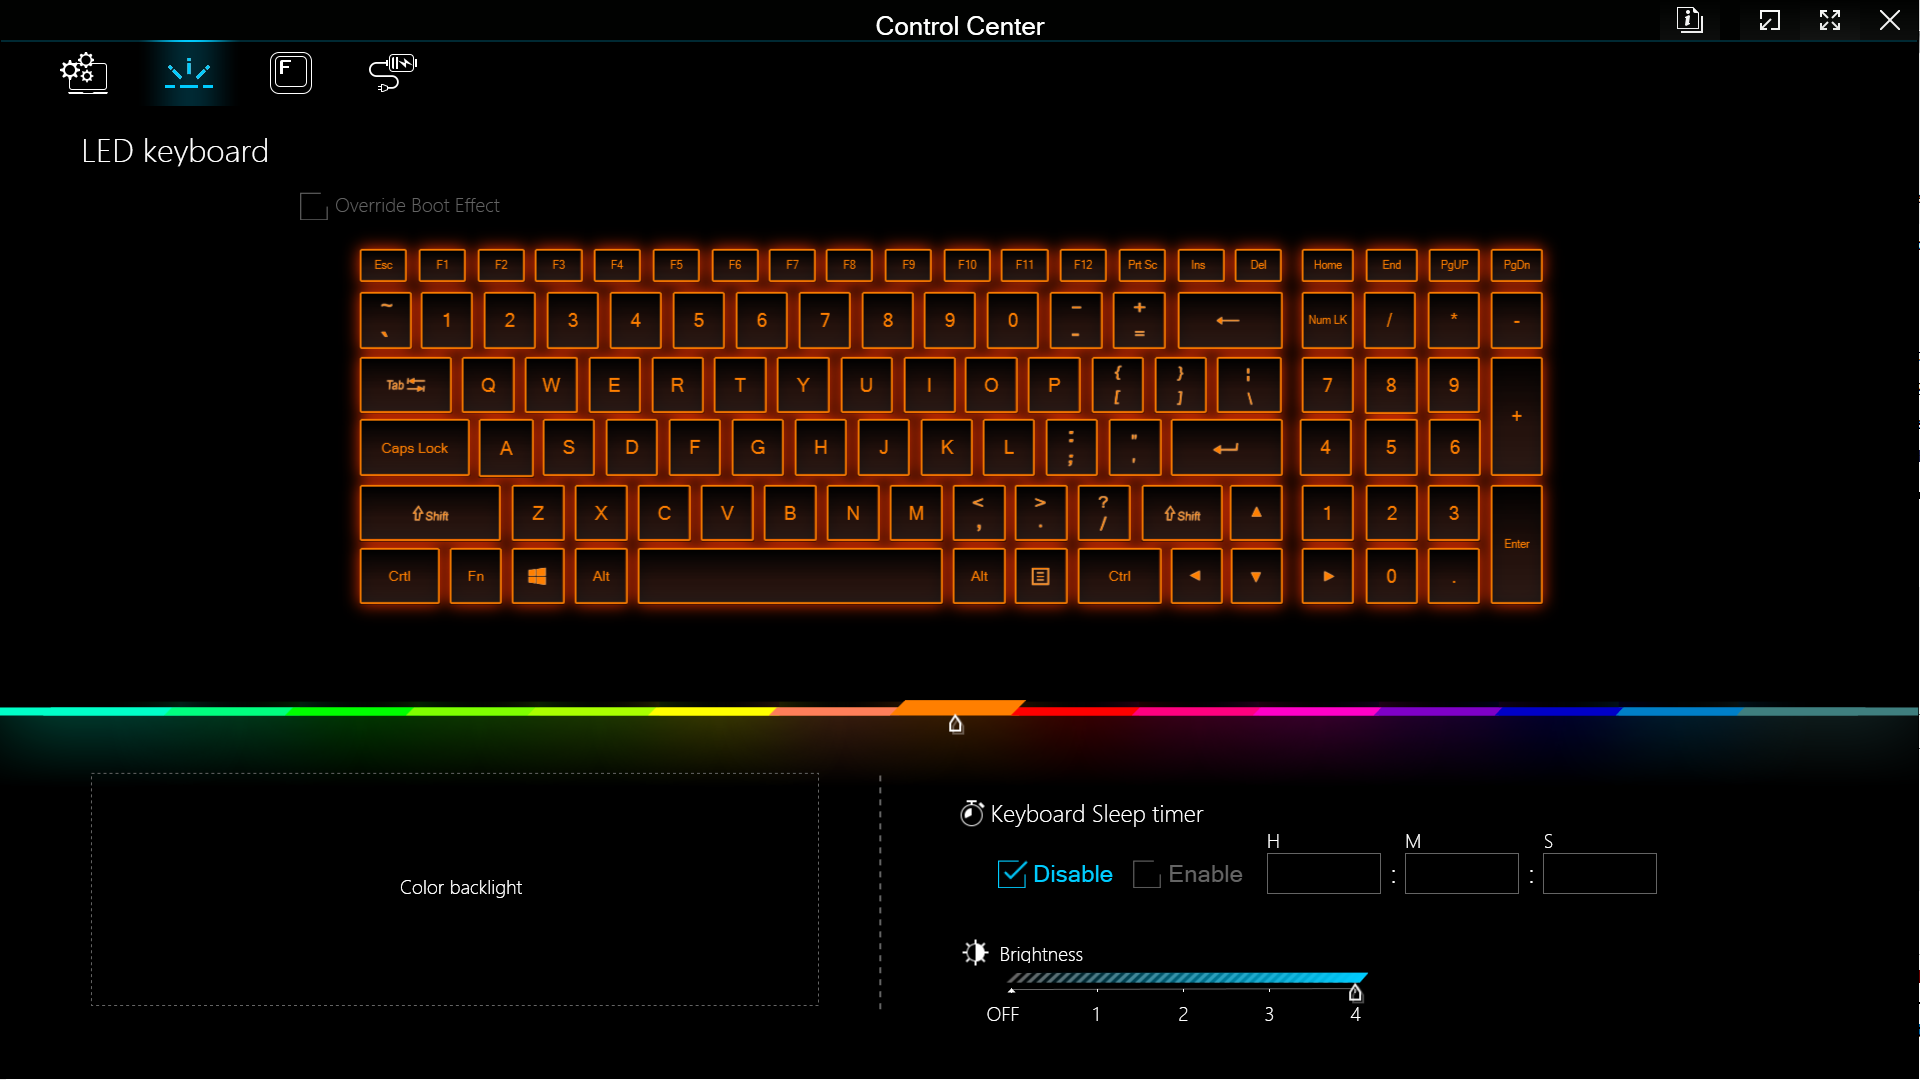
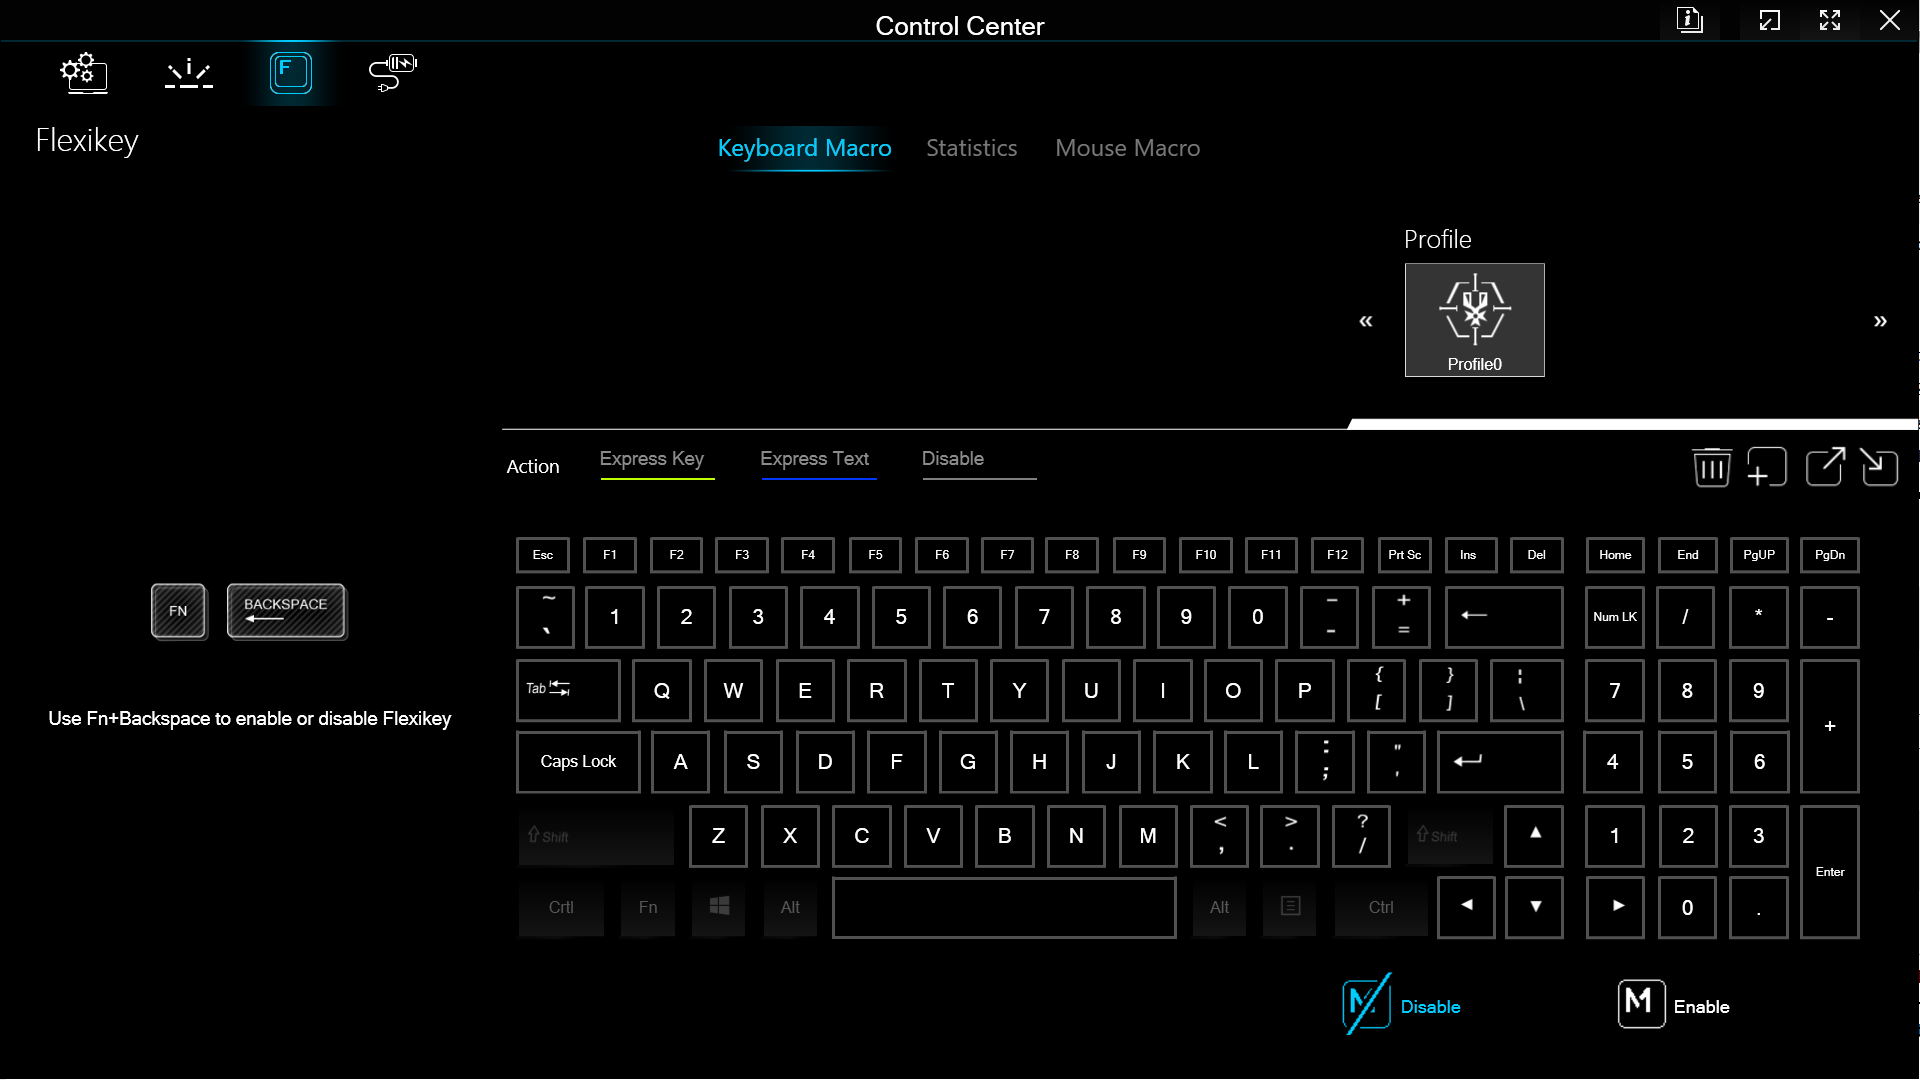
Input devices: RGB keyboard
Tastiera
La digitazione sulla tastiera nera del portatile con tasti a caratteri bianchi è buona grazie al forte feedback aptico e alla corsa dei tasti di 1,5 mm. Su richiesta, Schenker incide al laser sulla superficie nera ogni layout linguistico immaginabile. L'illuminazione RGB permette alla tastiera di brillare nel colore desiderato.
Touchpad
Con circa 7 cm × 12 cm, il touchpad del Focus 15 è più piccolo di quello della maggior parte dei portatili da gioco. Tuttavia, è sufficientemente grande per navigare comodamente sull'intero schermo con più dita ed eseguire tutti i gesti multi-touch possibili.
La posizione e le dimensioni del touchpad offrono inoltre spazio sufficiente per evitare input errati dal tallone della mano. La superficie liscia e i clic confortevoli rendono fluido l'input del mouse.
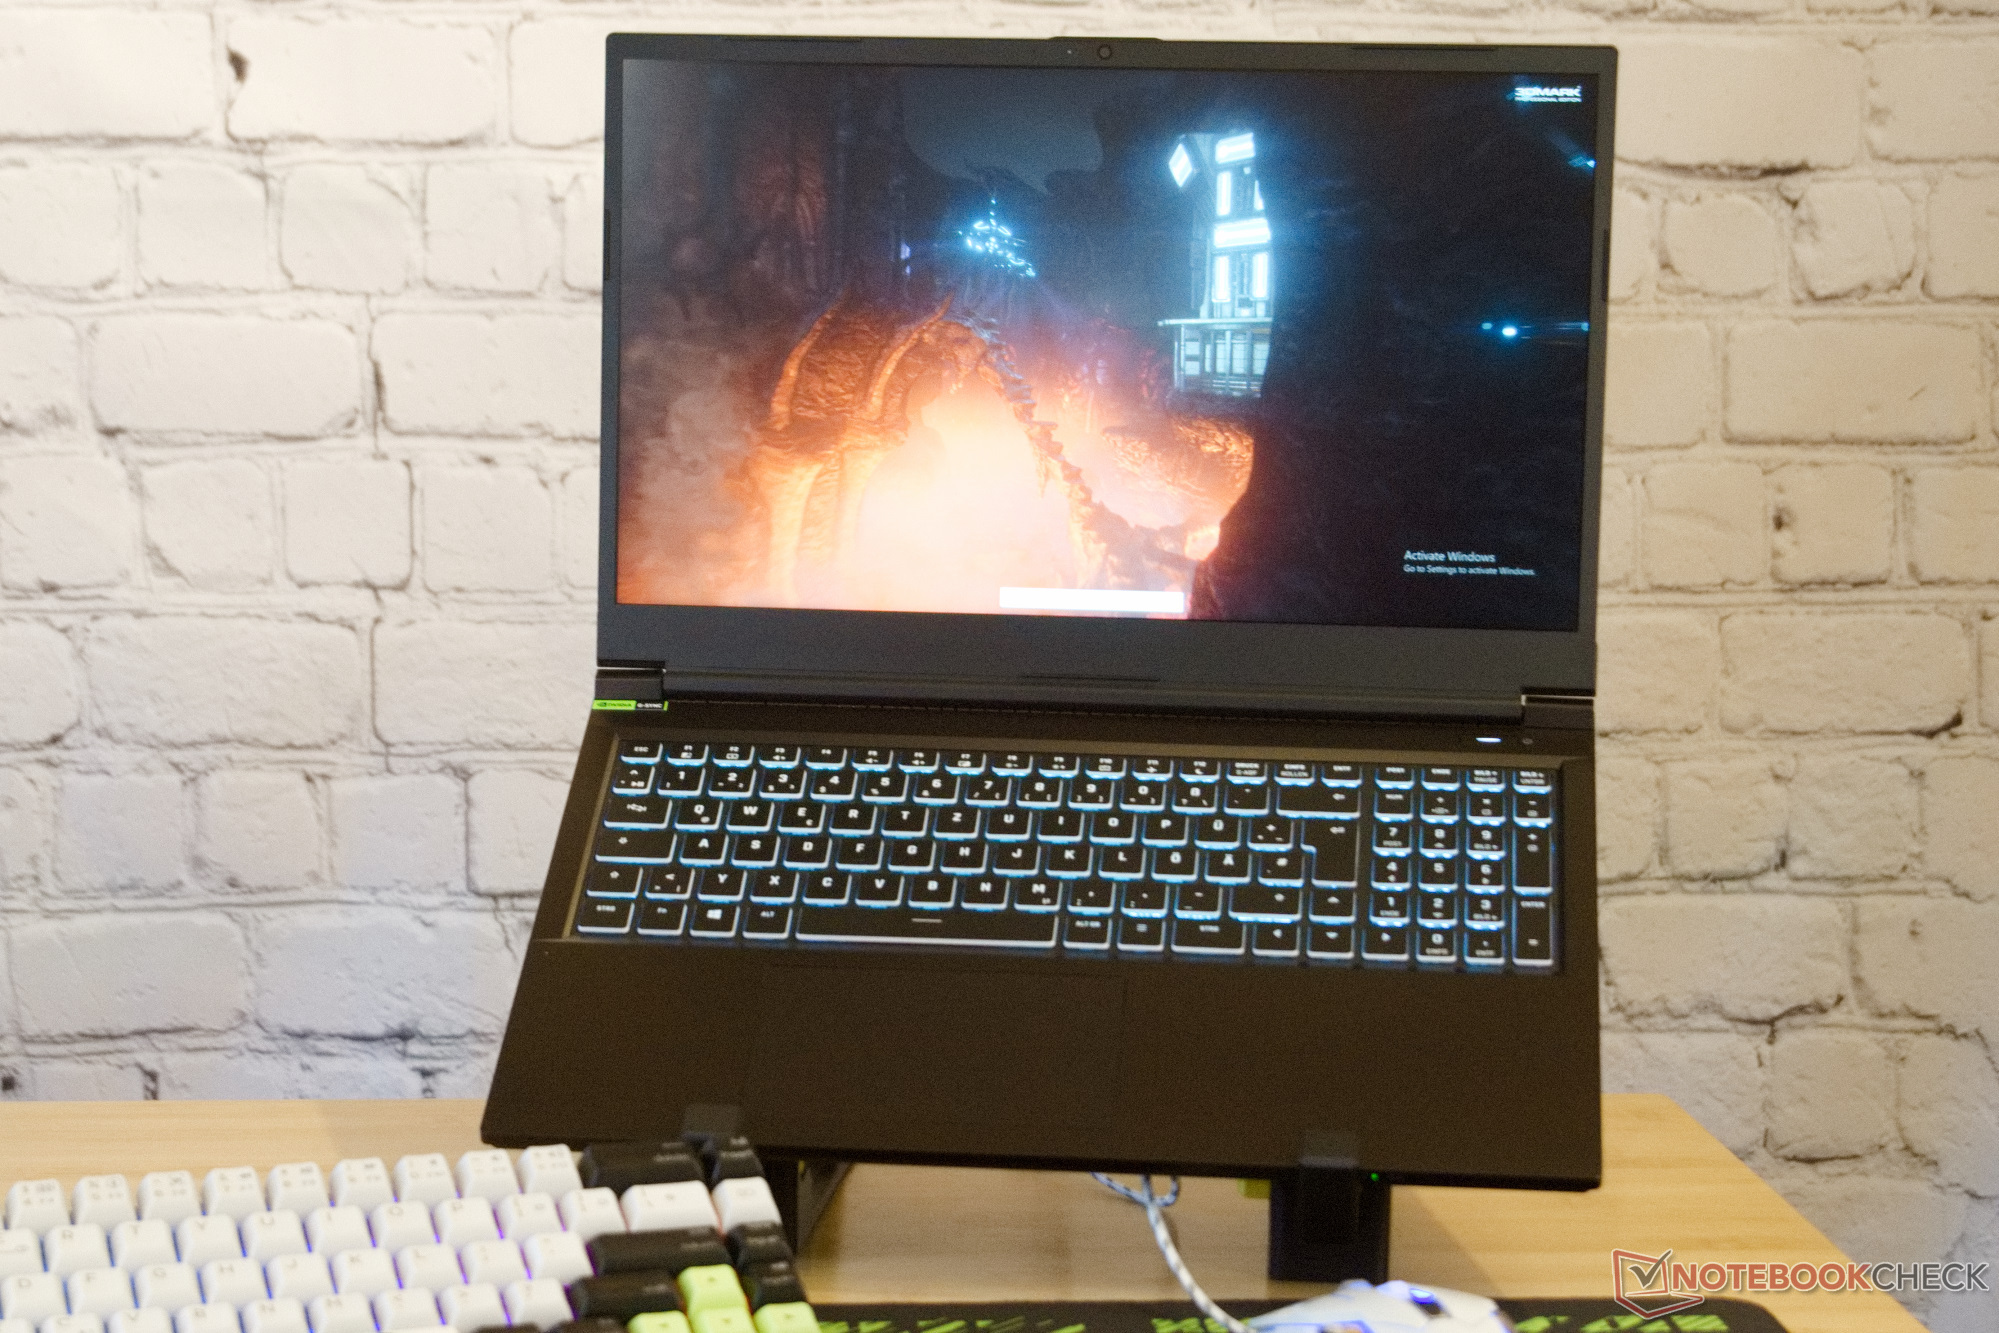
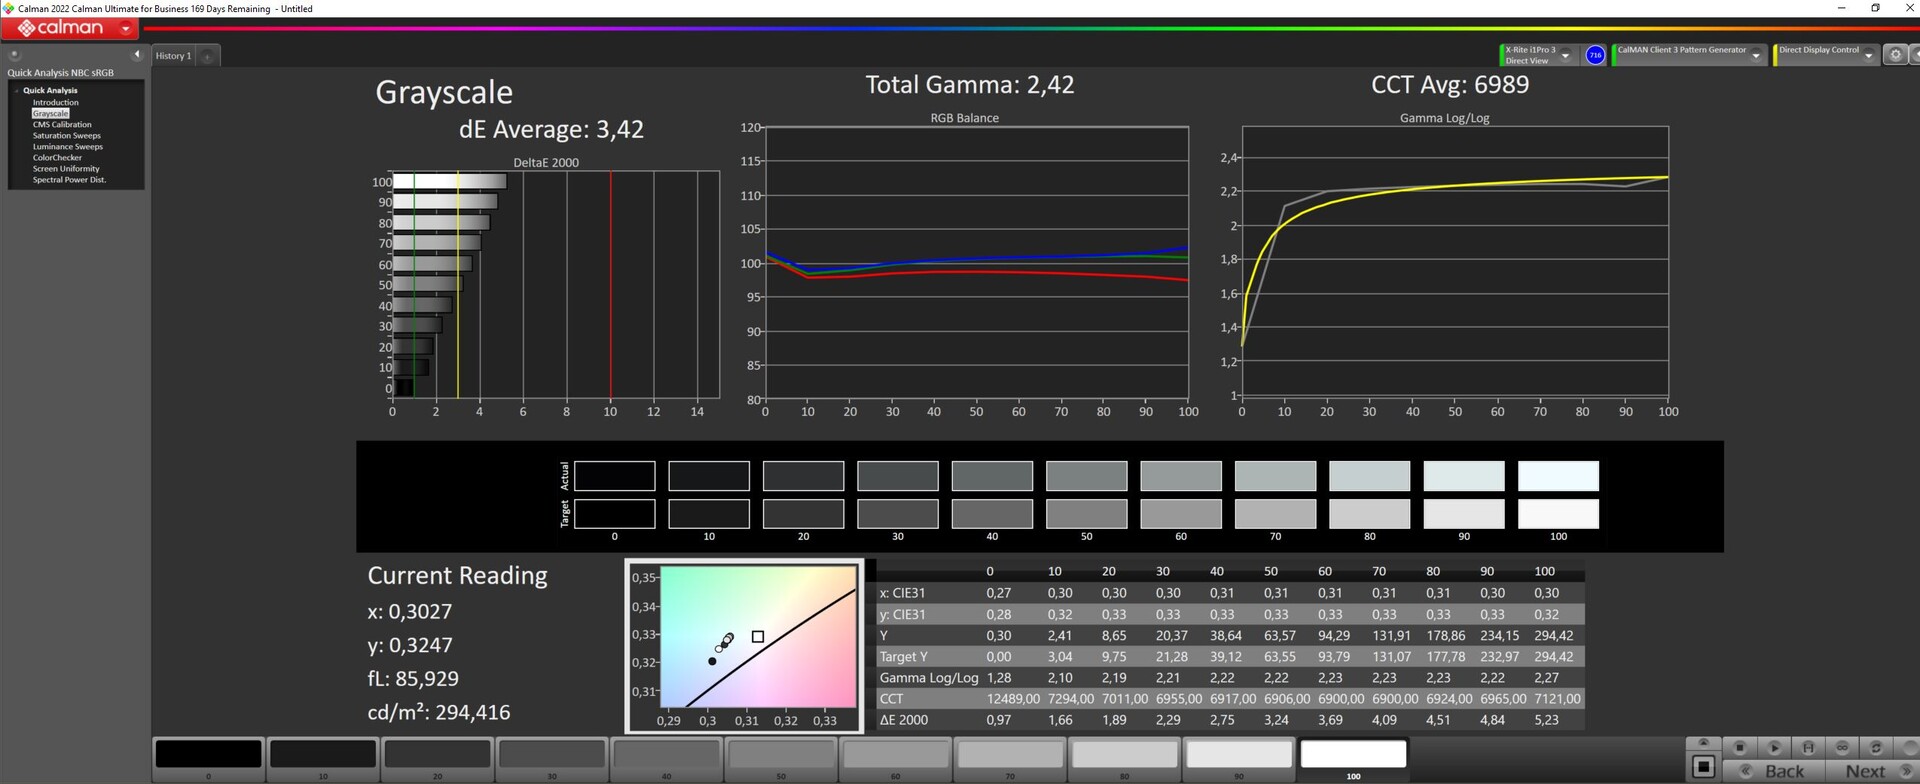
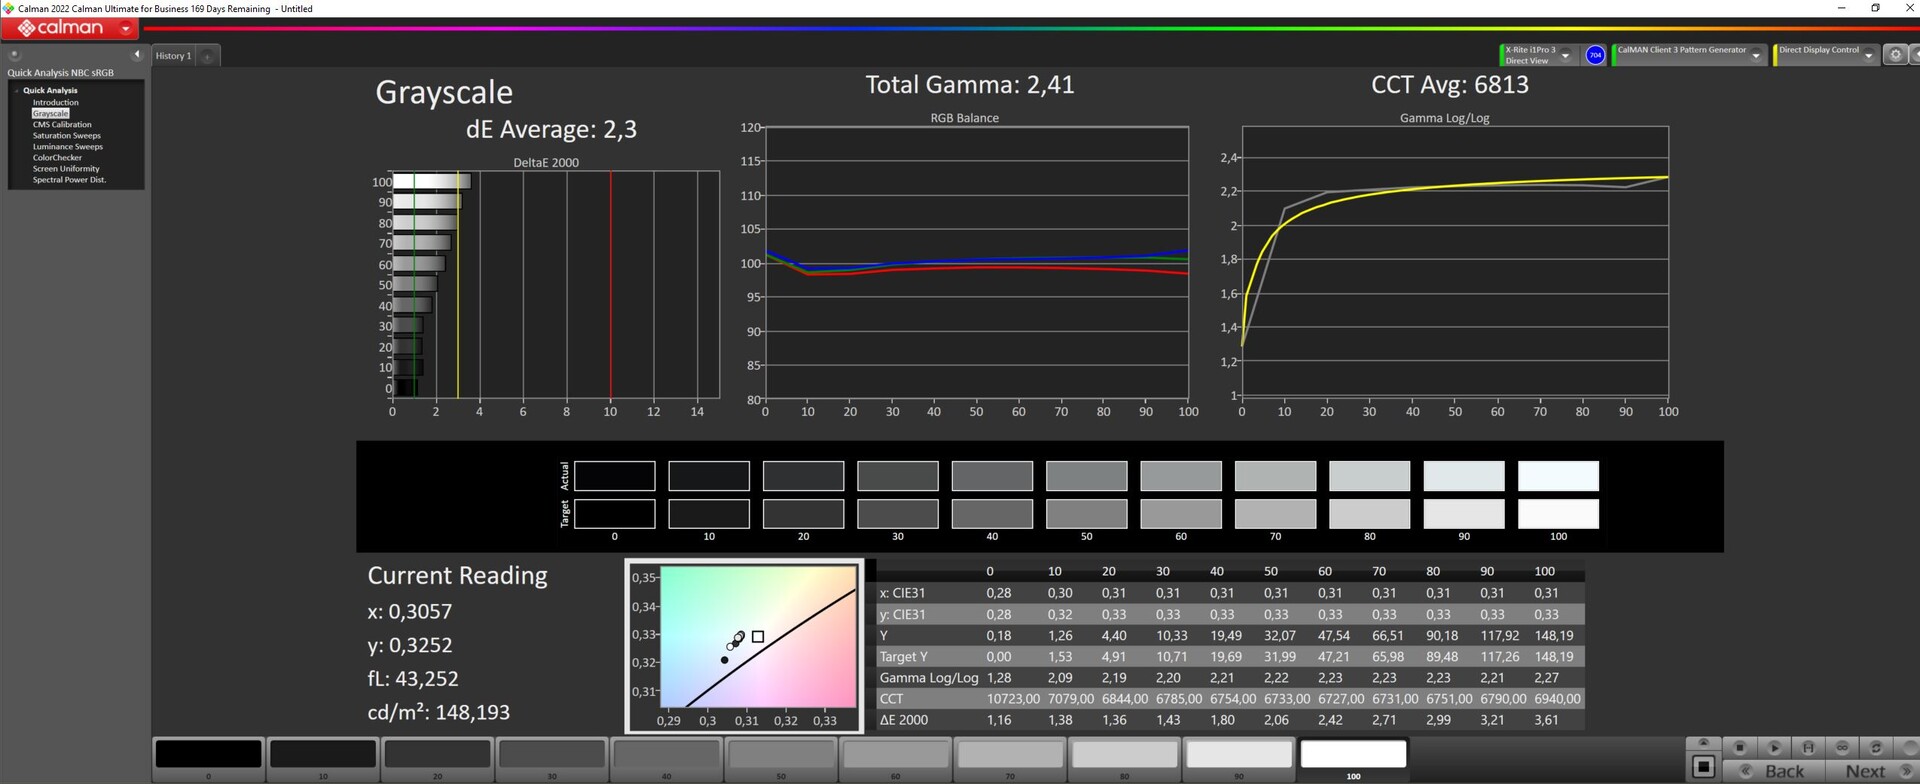
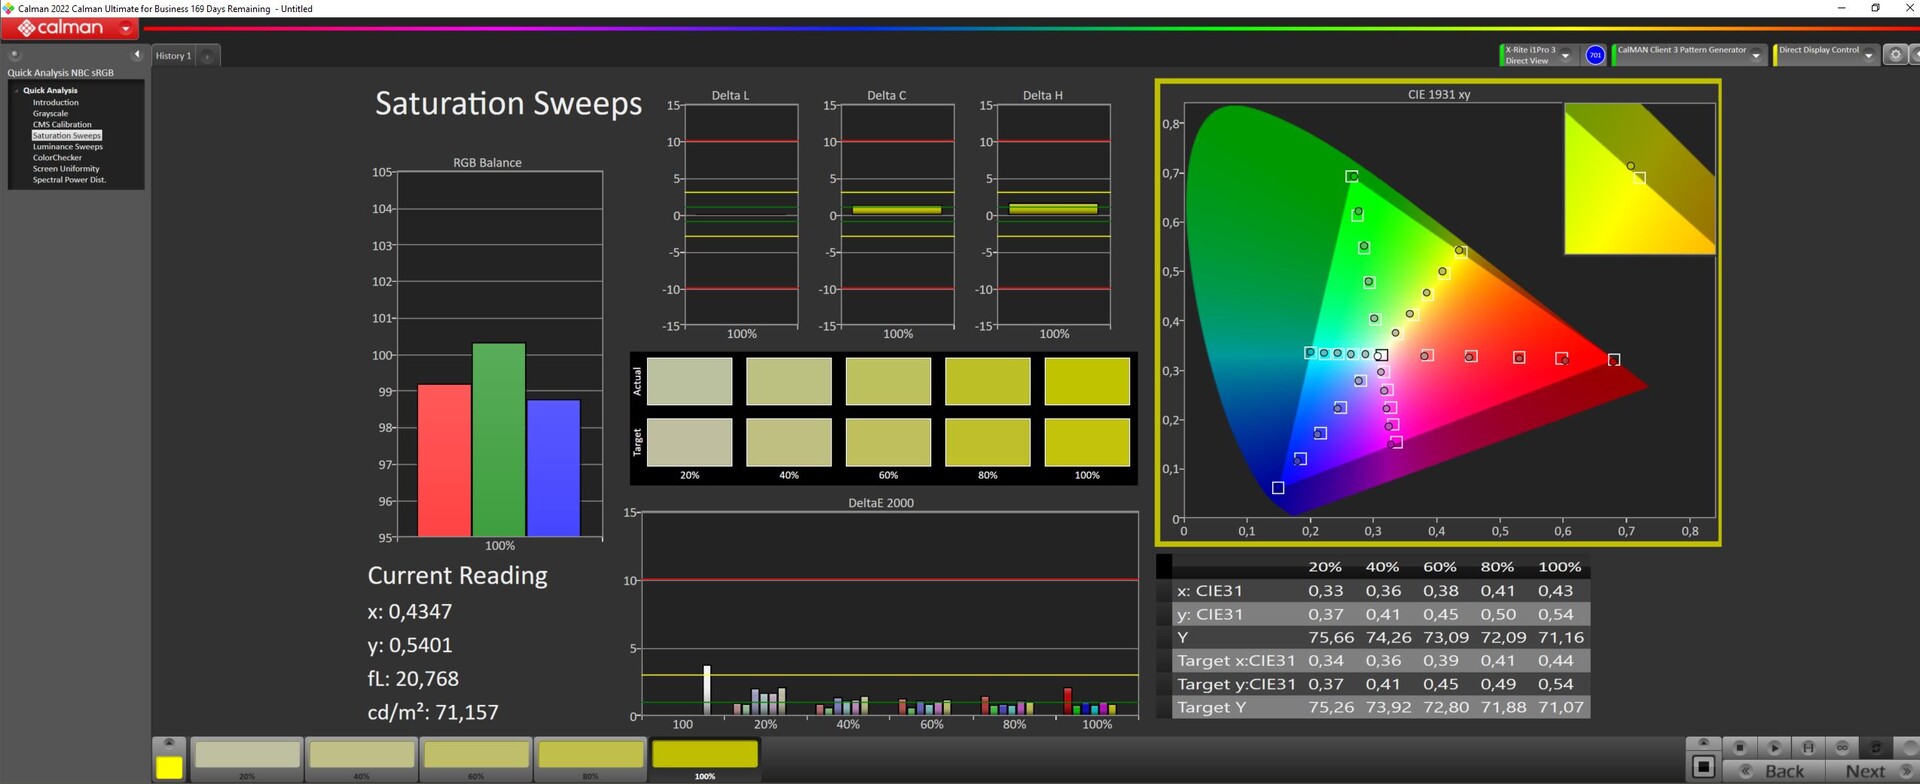
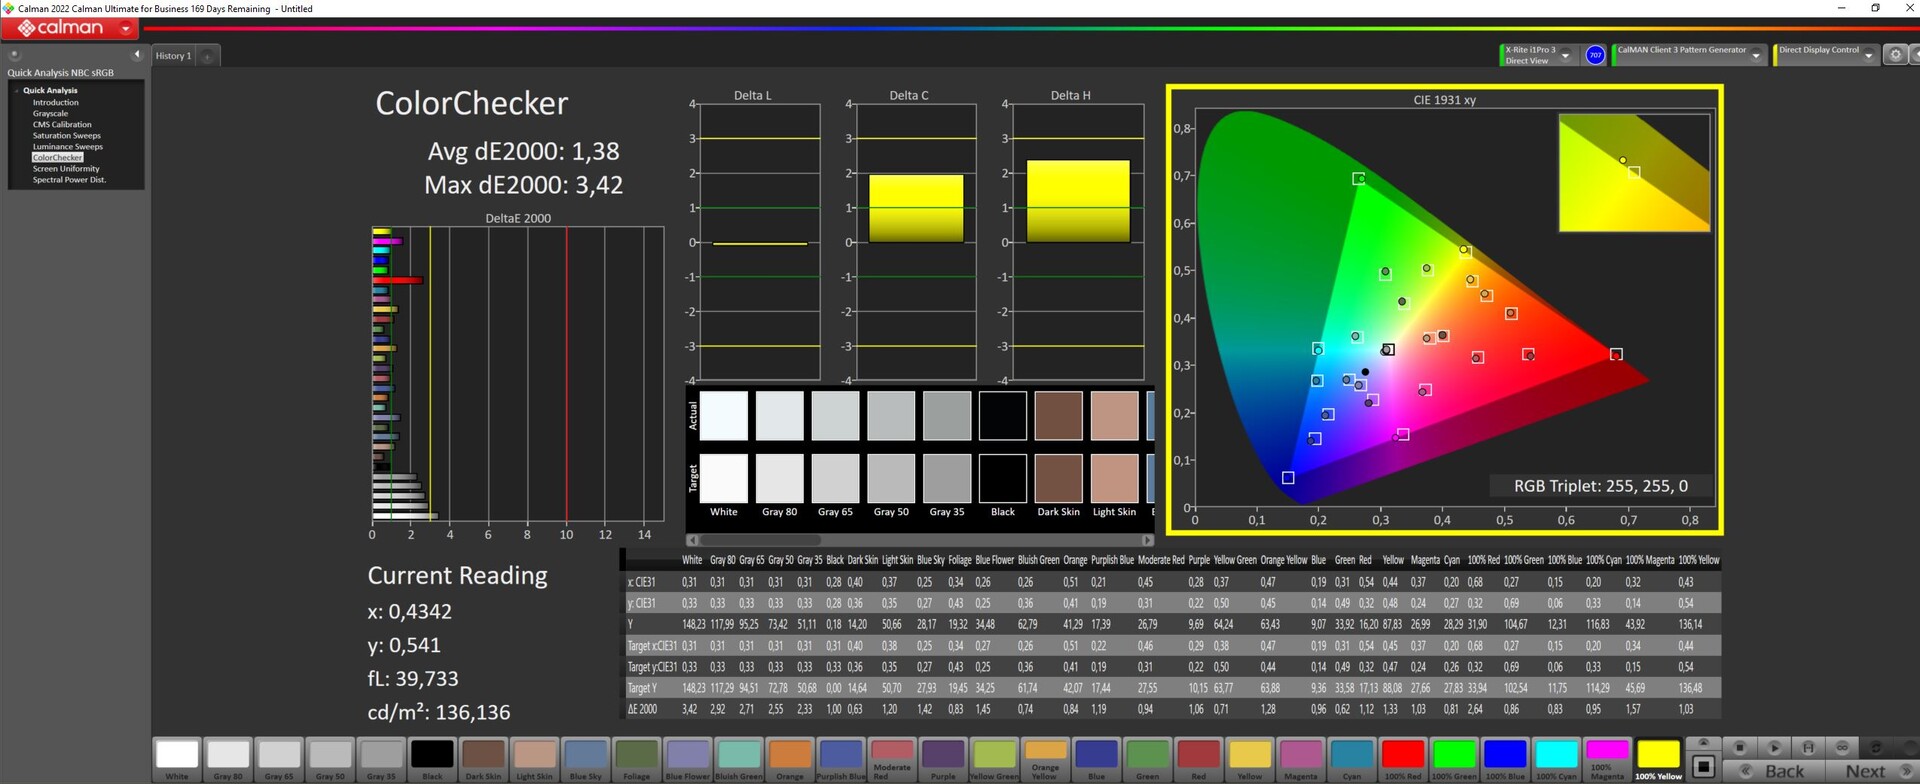
Display: QHD a 240 Hz
Il Focus 15 utilizza lo stesso pannello IPS di alta qualità dell'XMG Pro 15. Tuttavia, il pannello è leggermente più scuro di quello del Pro 15, con una luminosità media di 302 cd/m² nel nostro campione. Tuttavia, è leggermente più scuro rispetto al Pro 15, con una luminosità media di 302 cd/m² nel nostro campione in esame. Lo schermo ha una frequenza di aggiornamento di 240 Hz e una risoluzione di 2.560 × 1.440.
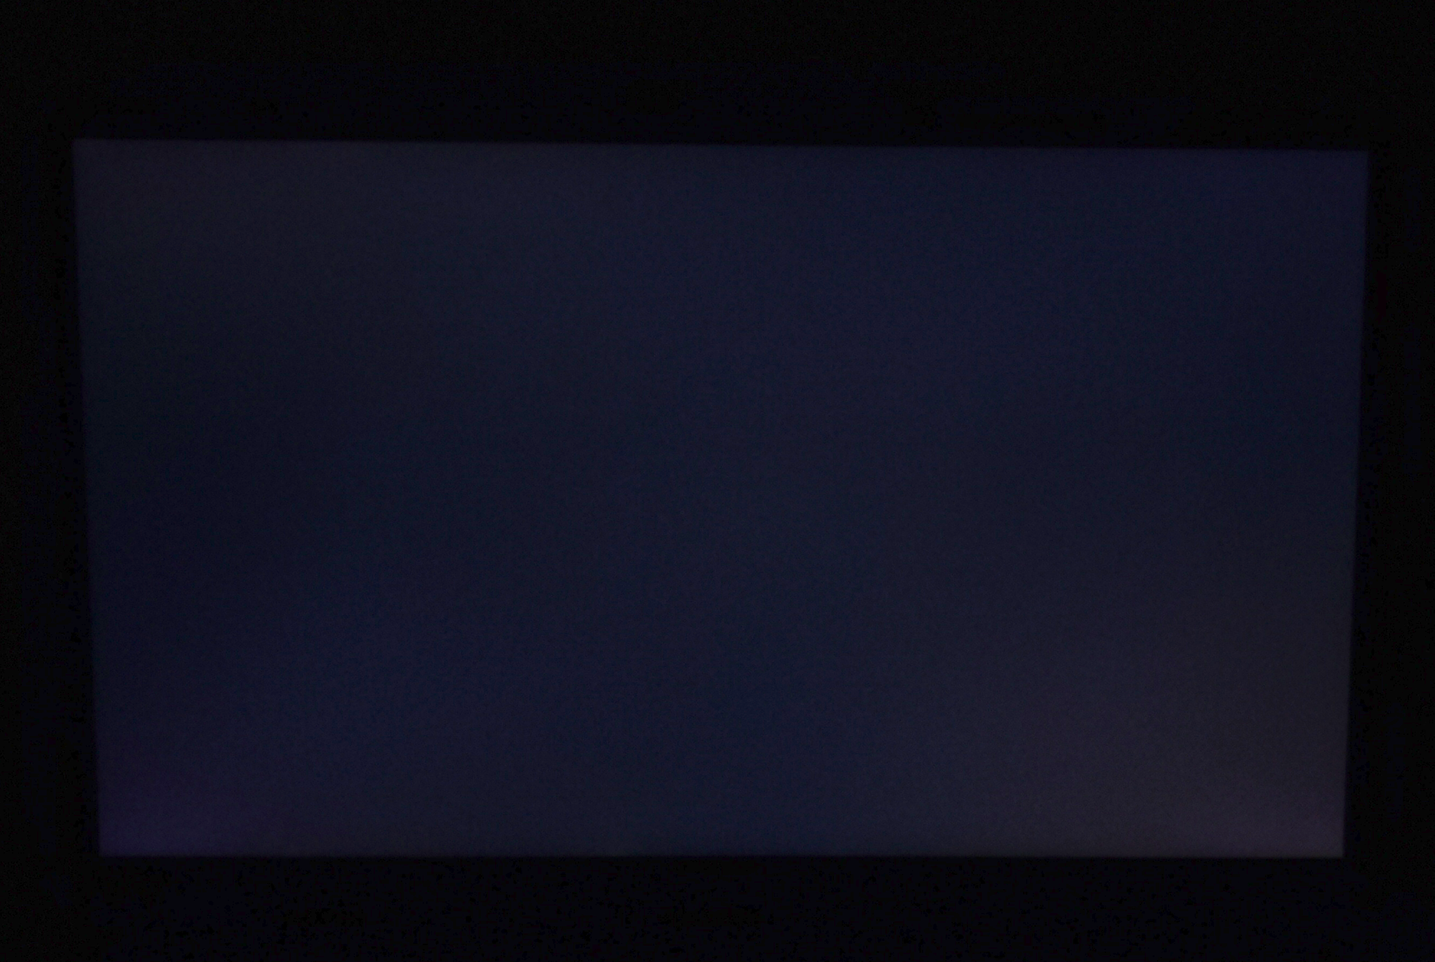
Il valore del nero e il contrasto del display opaco sono accettabili e anche l'illuminazione è buona. Il backlight bleeding è difficilmente visibile sullo schermo.
Oltre al display QHD, Schenker offre anche un'opzione di display Full HD per l'XMG Focus 15. Questo display ha una frequenza di aggiornamento di 165 volte. Questo ha una frequenza di aggiornamento di 165 Hz e, secondo Schenker, rappresenta solo il 95% dello spazio colore sRGB. Tuttavia, entrambe le opzioni di visualizzazione supportano G-Sync.
Coloro che acquistano il portatile come dispositivo di gioco puro e vogliono utilizzarlo con la RTX 4050 dovrebbe prendere in considerazione la scelta del display Full HD, che costa circa 80 euro in meno. La maggior parte dei giochi supporta comunque solo lo spazio colore sRGB e può sfruttare appieno le capacità del display in combinazione con la RTX 4050.
I giochi QHD o 4K sono possibili solo in misura limitata con la grafica Nvidia entry-level.
| |||||||||||||||||||||||||
Distribuzione della luminosità: 85 %
Al centro con la batteria: 302 cd/m²
Contrasto: 839:1 (Nero: 0.36 cd/m²)
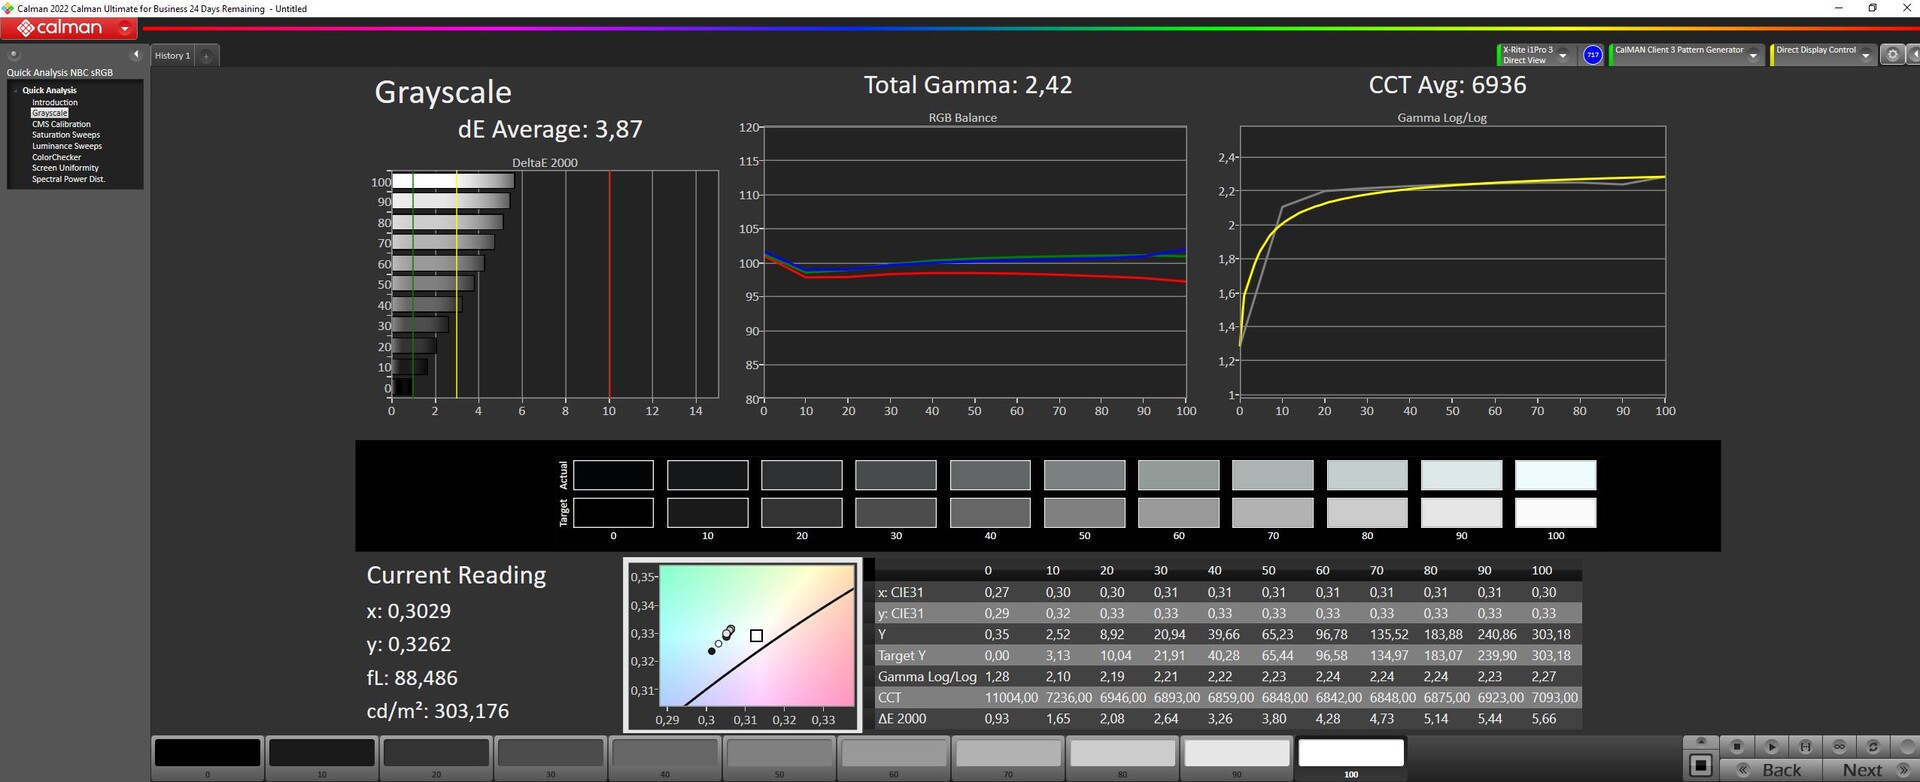
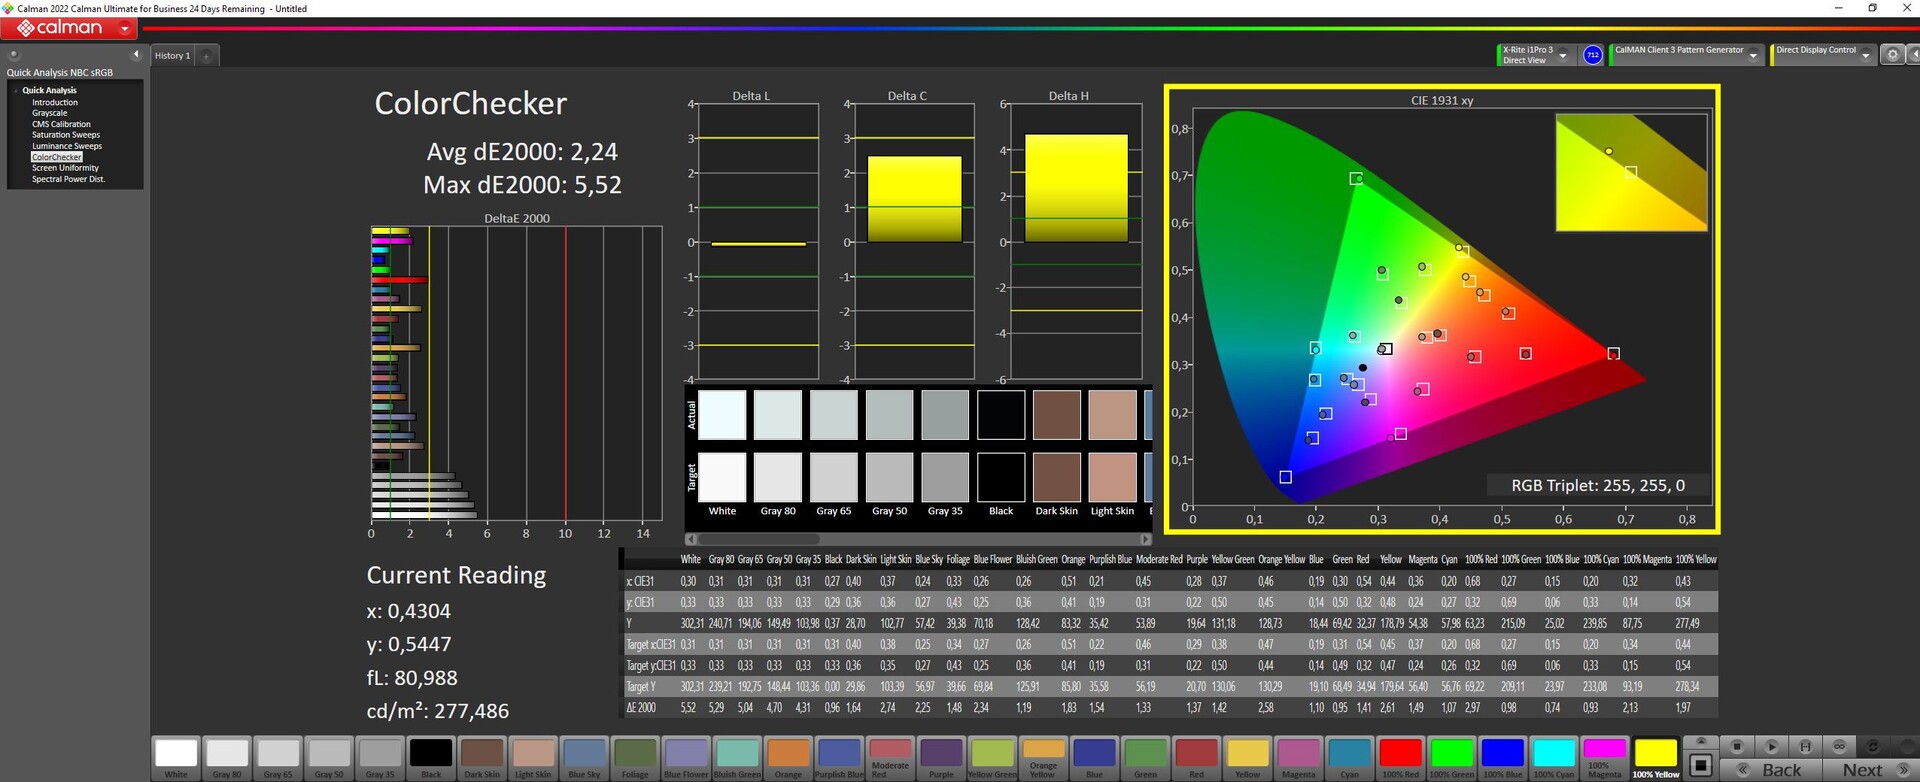
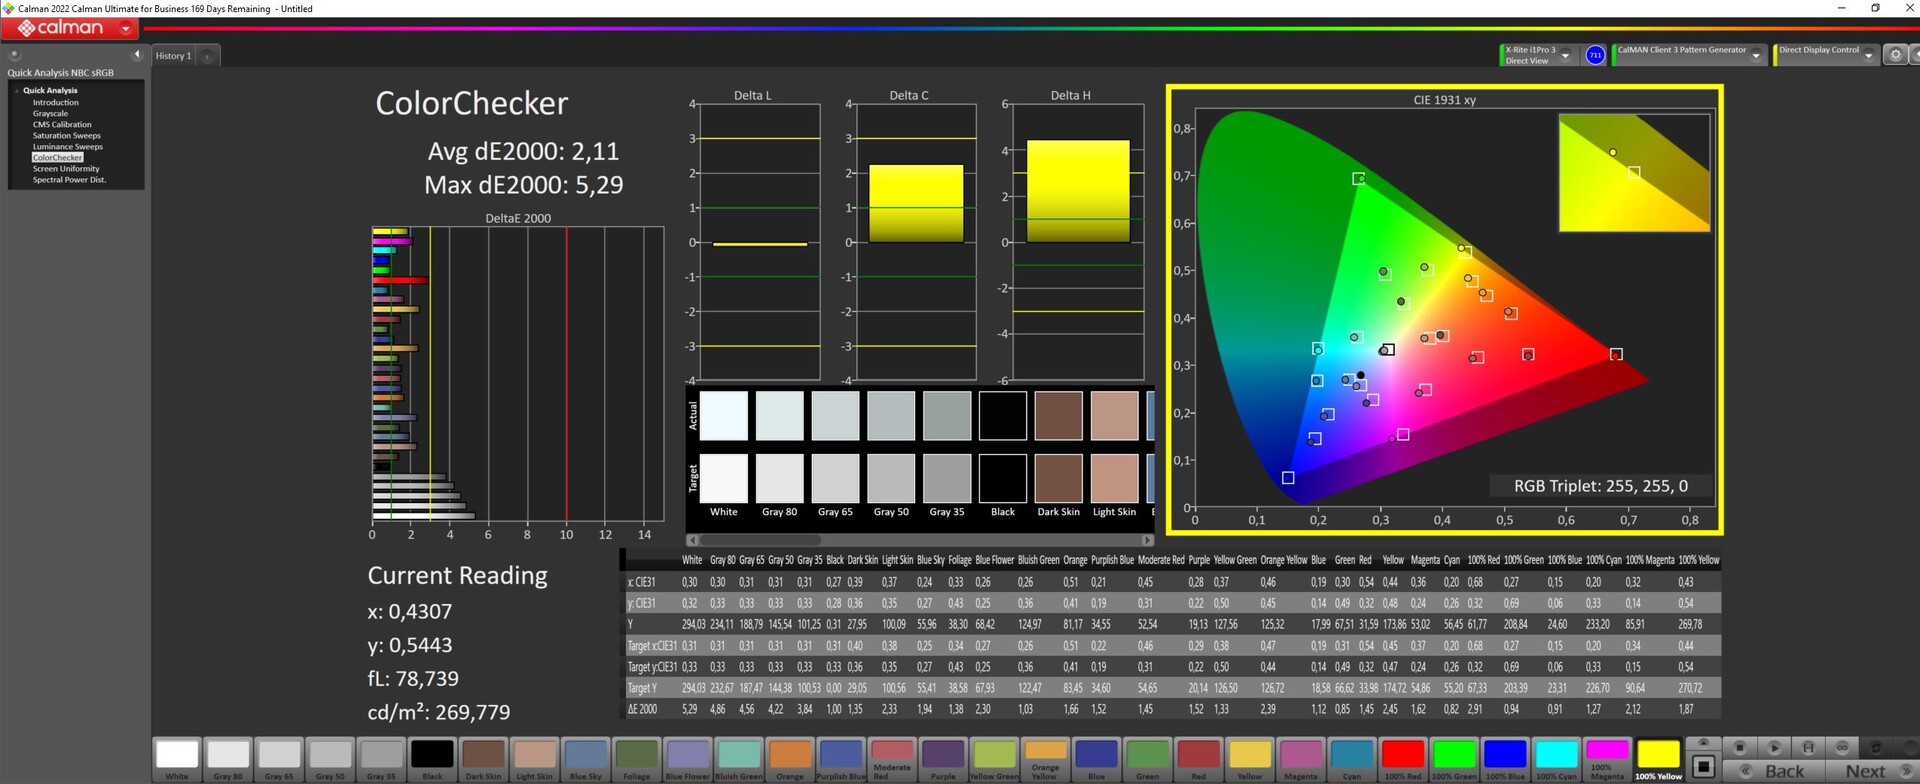
ΔE ColorChecker Calman: 2.24 | ∀{0.5-29.43 Ø4.71}
ΔE Greyscale Calman: 3.87 | ∀{0.09-98 Ø4.96}
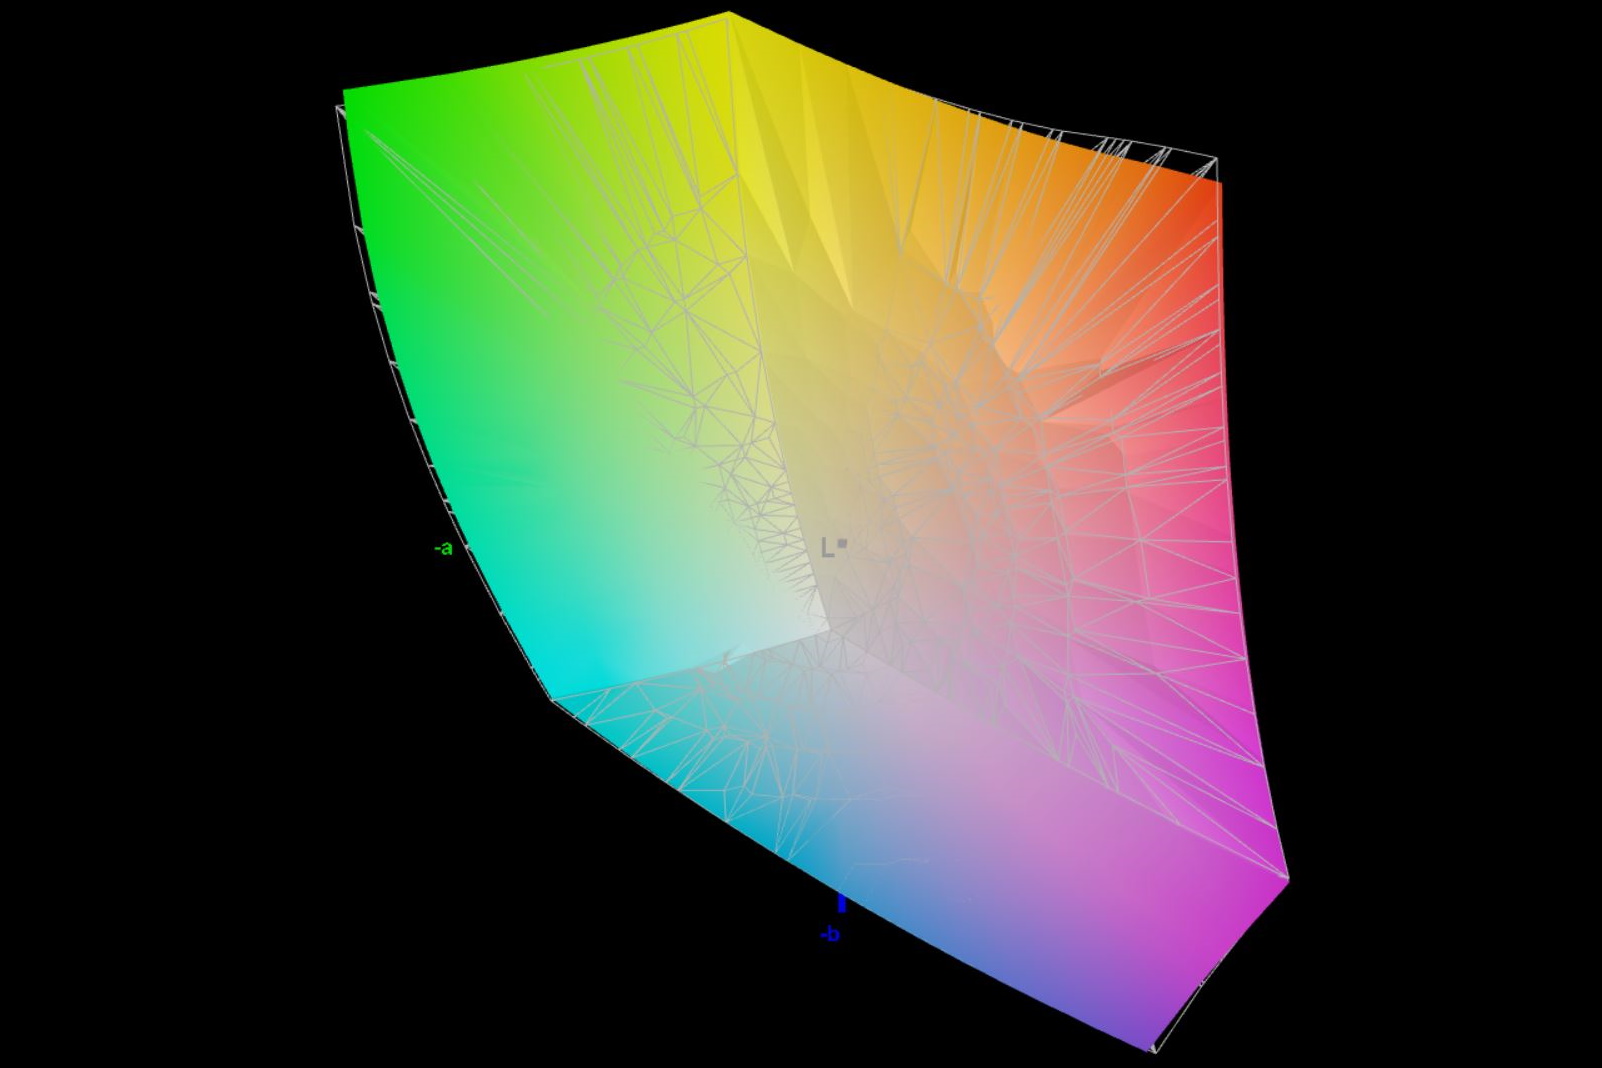
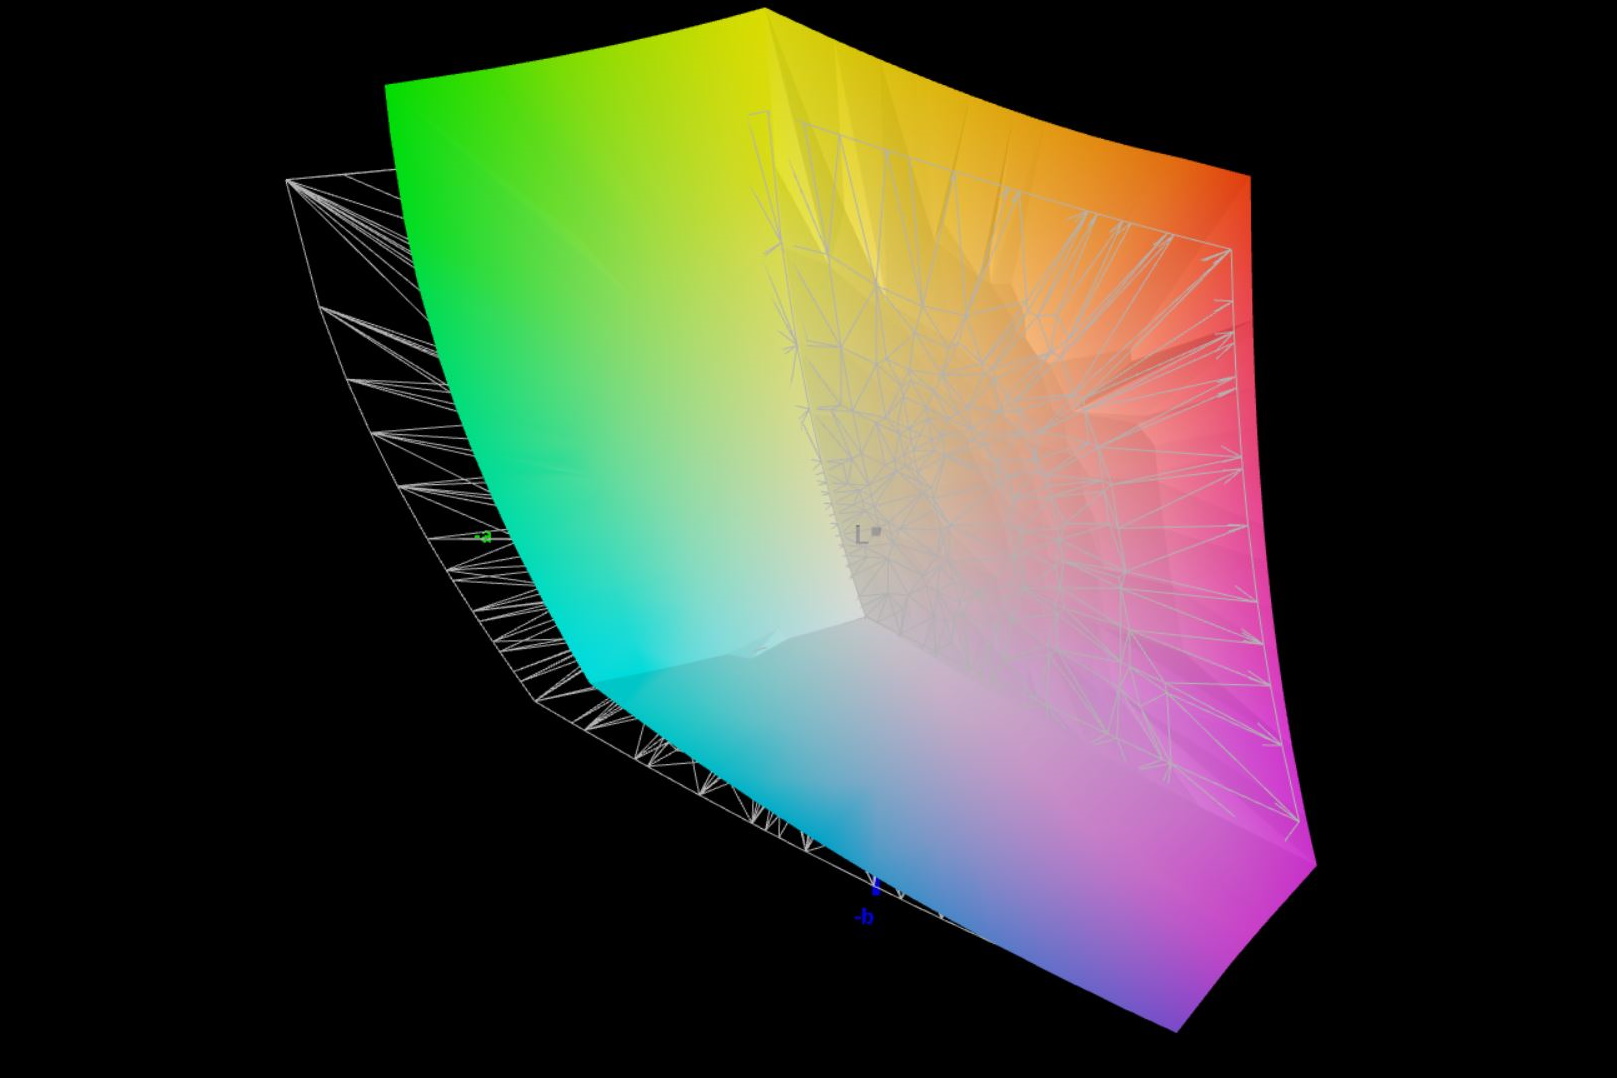
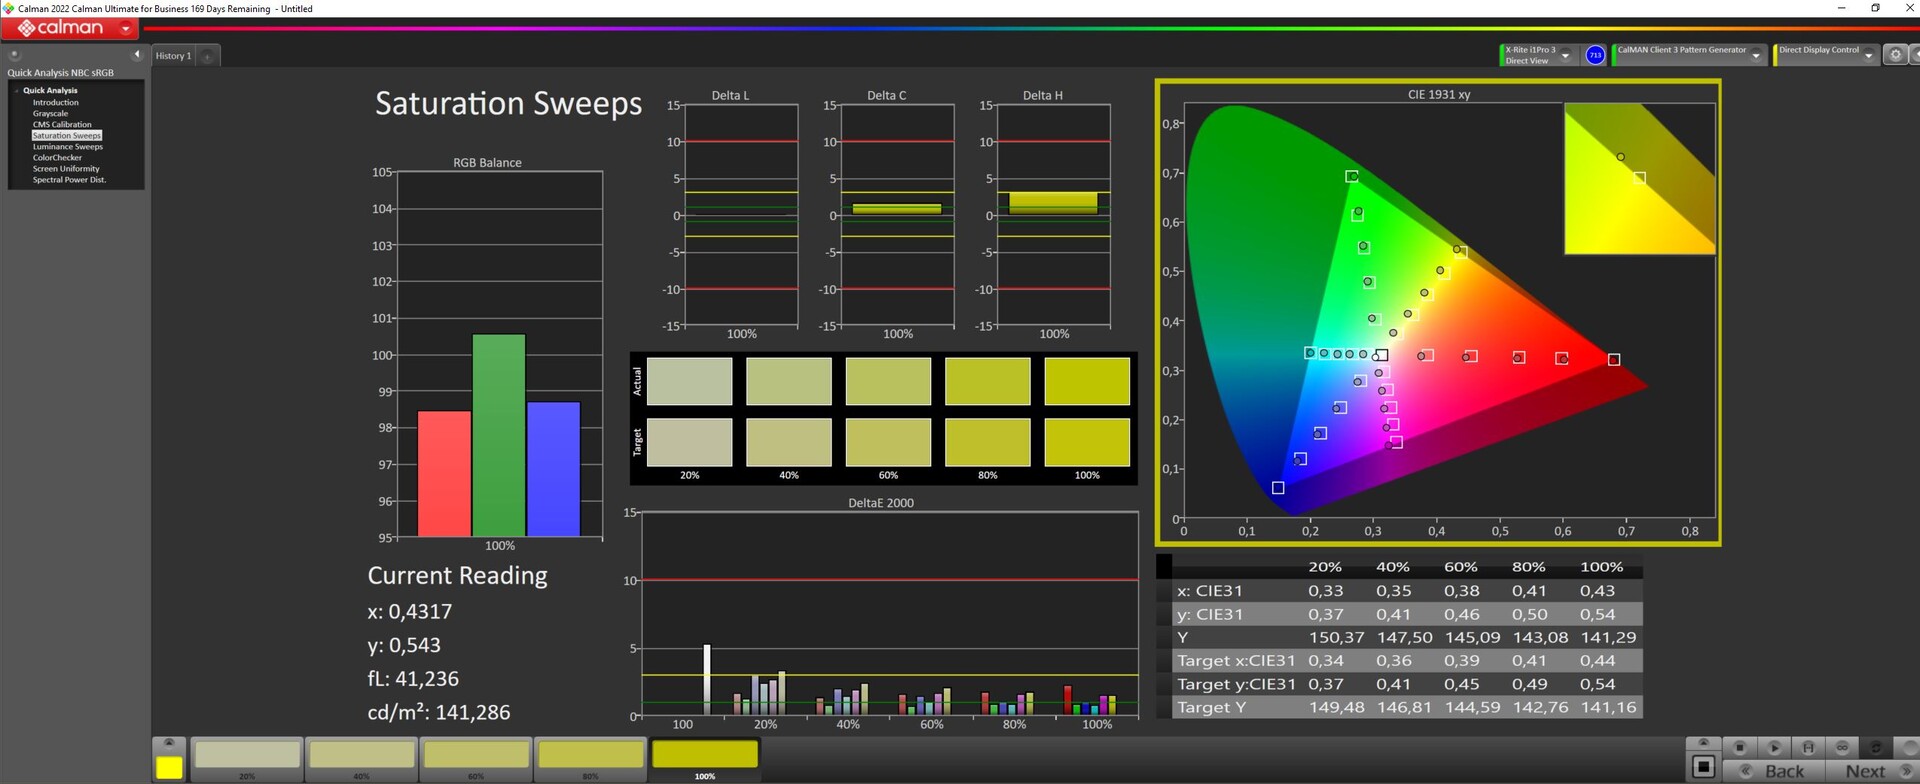
86.3% AdobeRGB 1998 (Argyll 3D)
99.9% sRGB (Argyll 3D)
98.6% Display P3 (Argyll 3D)
Gamma: 2.42
CCT: 6936 K
| Schenker XMG Focus 15 (E23) BOE0AD1, IPS, 2569x1440, 15.6" | Schenker XMG Pro 15 (E23) BOE0AD1, IPS, 2560x1440, 15.6" | Asus TUF A15 FA507 N156HMA-GA1, IPS, 1920x1080, 15.6" | MSI Katana 15 B12VEK AUOAF90 (B156HAN08.4), IPS, 1920x1080, 15.6" | Acer Swift X SFX14-71G ATNA45AF03-0, OLED, 2880x1800, 14.5" | Samsung Galaxy Book3 Ultra 16 Samsung ATNA60CL03-0, AMOLED, 2880x1800, 16" | Gigabyte Aero 14 OLED BMF Samsung SDC4192 (ATNA40YK14-0), OLED, 2880x1800, 14" | |
|---|---|---|---|---|---|---|---|
| Display | -1% | -20% | -53% | 4% | 4% | 1% | |
| Display P3 Coverage (%) | 98.6 | 97.8 -1% | 64.9 -34% | 38.1 -61% | 99.9 1% | 99.9 1% | 99.8 1% |
| sRGB Coverage (%) | 99.9 | 99.9 0% | 96.5 -3% | 56.8 -43% | 99.9 0% | 100 0% | 100 0% |
| AdobeRGB 1998 Coverage (%) | 86.3 | 85.4 -1% | 66.6 -23% | 39.3 -54% | 96.2 11% | 96.3 12% | 88.7 3% |
| Response Times | 14% | -87% | -140% | 96% | 96% | 82% | |
| Response Time Grey 50% / Grey 80% * (ms) | 15.6 ? | 14 ? 10% | 30.4 ? -95% | 38.8 ? -149% | 0.4 ? 97% | 0.49 ? 97% | 2.4 ? 85% |
| Response Time Black / White * (ms) | 11.6 ? | 9.6 ? 17% | 20.8 ? -79% | 26.8 ? -131% | 0.6 ? 95% | 0.65 ? 94% | 2.4 ? 79% |
| PWM Frequency (Hz) | 240 ? | 240 ? | 300 | ||||
| Screen | 10% | 30% | -38% | 30% | 215% | 103% | |
| Brightness middle (cd/m²) | 302 | 322 7% | 288 -5% | 261 -14% | 388 28% | 400 32% | 423 40% |
| Brightness (cd/m²) | 278 | 301 8% | 271 -3% | 258 -7% | 390 40% | 399 44% | 427 54% |
| Brightness Distribution (%) | 85 | 85 0% | 91 7% | 92 8% | 98 15% | 93 9% | 98 15% |
| Black Level * (cd/m²) | 0.36 | 0.36 -0% | 0.17 53% | 0.19 47% | 0.03 92% | 0.1 72% | |
| Contrast (:1) | 839 | 894 7% | 1694 102% | 1374 64% | 13333 1489% | 4230 404% | |
| Colorchecker dE 2000 * | 2.24 | 1.98 12% | 1.9 15% | 5.57 -149% | 2.2 2% | 2.3 -3% | 0.55 75% |
| Colorchecker dE 2000 max. * | 5.52 | 5.24 5% | 3.3 40% | 20.6 -273% | 3.9 29% | 4.15 25% | 1.15 79% |
| Greyscale dE 2000 * | 3.87 | 2.44 37% | 2.7 30% | 3.19 18% | 1.4 64% | 2.7 30% | 0.69 82% |
| Gamma | 2.42 91% | 2.42 91% | 2.32 95% | 2.45 90% | 2.22 99% | 2.266 97% | 2.42 91% |
| CCT | 6936 94% | 6984 93% | 6535 99% | 6146 106% | 6380 102% | 7047 92% | 6479 100% |
| Colorchecker dE 2000 calibrated * | 1.98 | 0.9 | 4.63 | 1.9 | 1.66 | 1.15 | |
| Media totale (Programma / Settaggio) | 8% /
8% | -26% /
0% | -77% /
-57% | 43% /
35% | 105% /
148% | 62% /
76% |
* ... Meglio usare valori piccoli
Per i videografi e i creatori di contenuti, la copertura quasi completa dello spazio colore Display P3 dell'XMG Focus 15 dovrebbe essere un vantaggio. Lo spazio colore AdobeRGB è più importante per l'editing fotografico e la stampa, e il Focus 15 riesce a riprodurre solo l'88% di questo spazio.
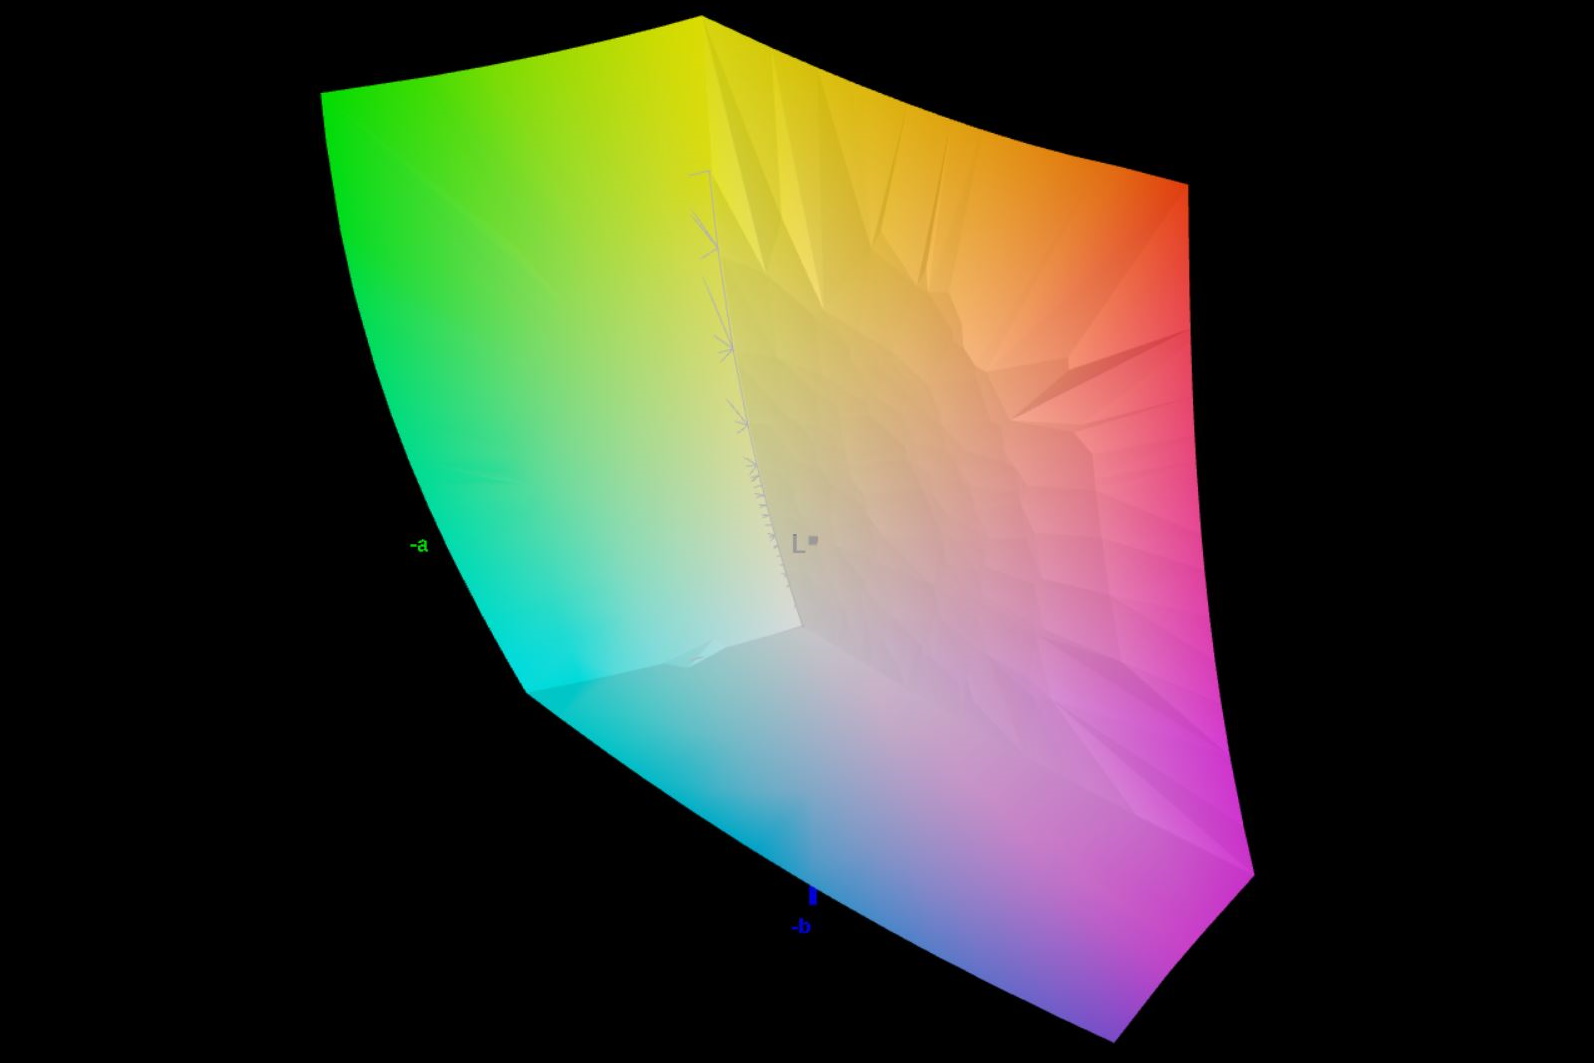
Lo schermo del nostro dispositivo di prova ha una buona riproduzione dei colori, con una deviazione media di ΔΕ 2,24 franco fabbrica. I valori migliorano ulteriormente con la calibrazione.
Abbiamo riscontrato che la riproduzione dei colori può essere migliorata anche quando l'illuminazione è impostata a 150 nits.

Tempi di risposta del Display
| ↔ Tempi di risposta dal Nero al Bianco | ||
|---|---|---|
| 11.6 ms ... aumenta ↗ e diminuisce ↘ combinato | ↗ 5.8 ms Incremento | 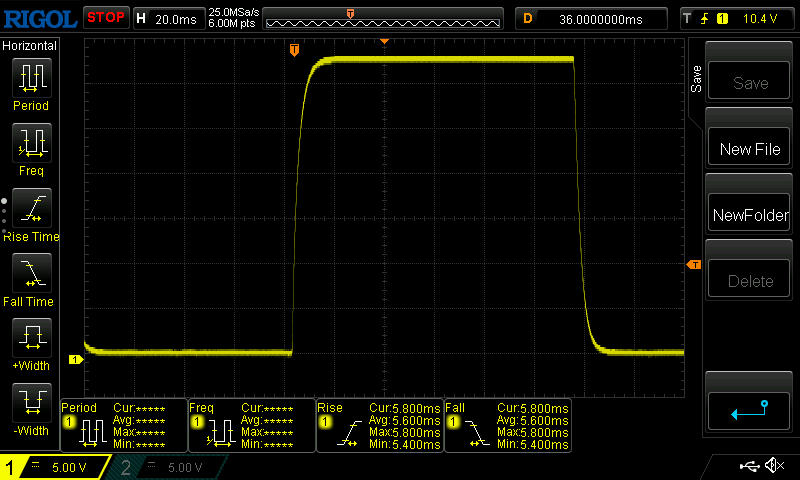 |
| ↘ 5.8 ms Calo | ||
| Lo schermo mostra buoni tempi di risposta durante i nostri tests, ma potrebbe essere troppo lento per i gamers competitivi. In confronto, tutti i dispositivi di test variano da 0.1 (minimo) a 240 (massimo) ms. » 31 % di tutti i dispositivi è migliore. Questo significa che i tempi di risposta rilevati sono migliori rispettto alla media di tutti i dispositivi testati (19.8 ms). | ||
| ↔ Tempo di risposta dal 50% Grigio all'80% Grigio | ||
| 15.6 ms ... aumenta ↗ e diminuisce ↘ combinato | ↗ 7.4 ms Incremento | 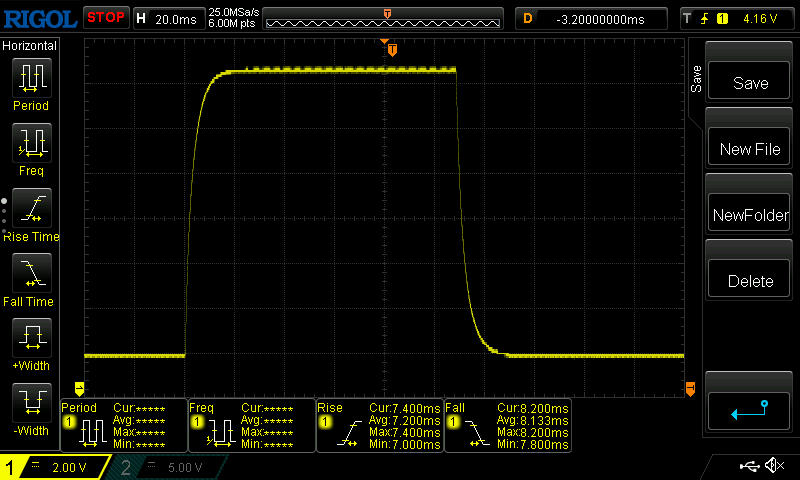 |
| ↘ 8.2 ms Calo | ||
| Lo schermo mostra buoni tempi di risposta durante i nostri tests, ma potrebbe essere troppo lento per i gamers competitivi. In confronto, tutti i dispositivi di test variano da 0.165 (minimo) a 636 (massimo) ms. » 30 % di tutti i dispositivi è migliore. Questo significa che i tempi di risposta rilevati sono migliori rispettto alla media di tutti i dispositivi testati (31 ms). | ||
Sfarfallio dello schermo / PWM (Pulse-Width Modulation)
| flickering dello schermo / PWM non rilevato |  | ||
In confronto: 52 % di tutti i dispositivi testati non utilizza PWM per ridurre la luminosita' del display. Se è rilevato PWM, una media di 7757 (minimo: 5 - massimo: 343500) Hz è stata rilevata. | |||
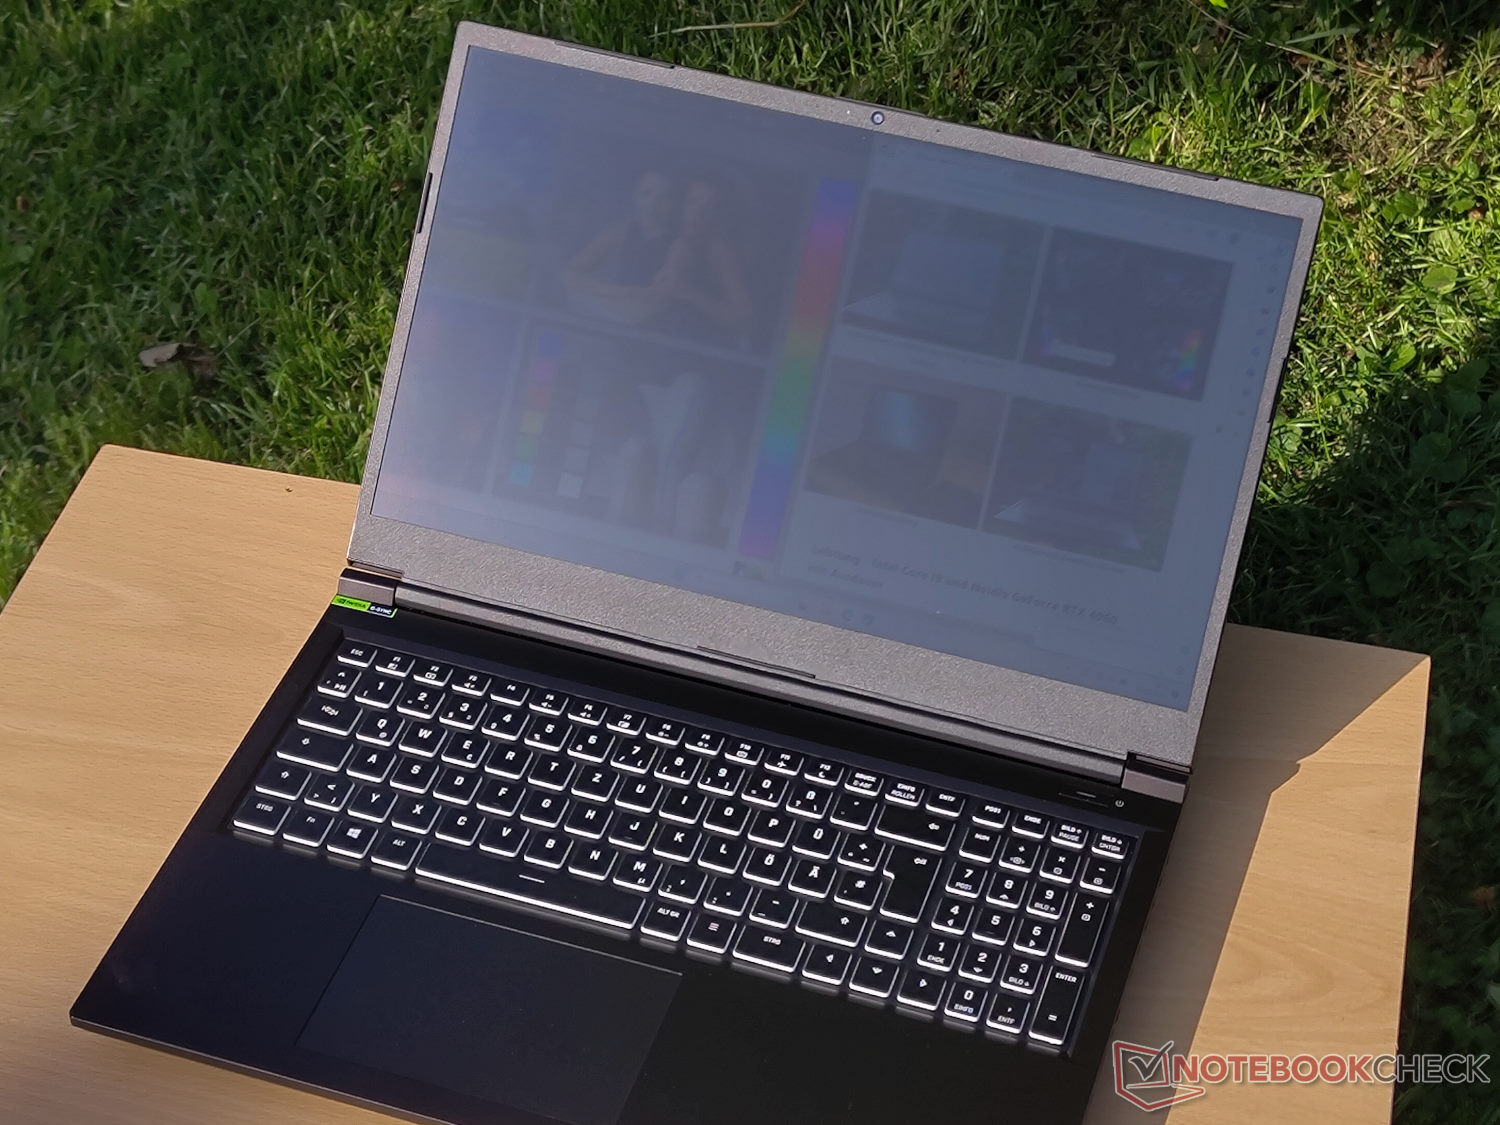
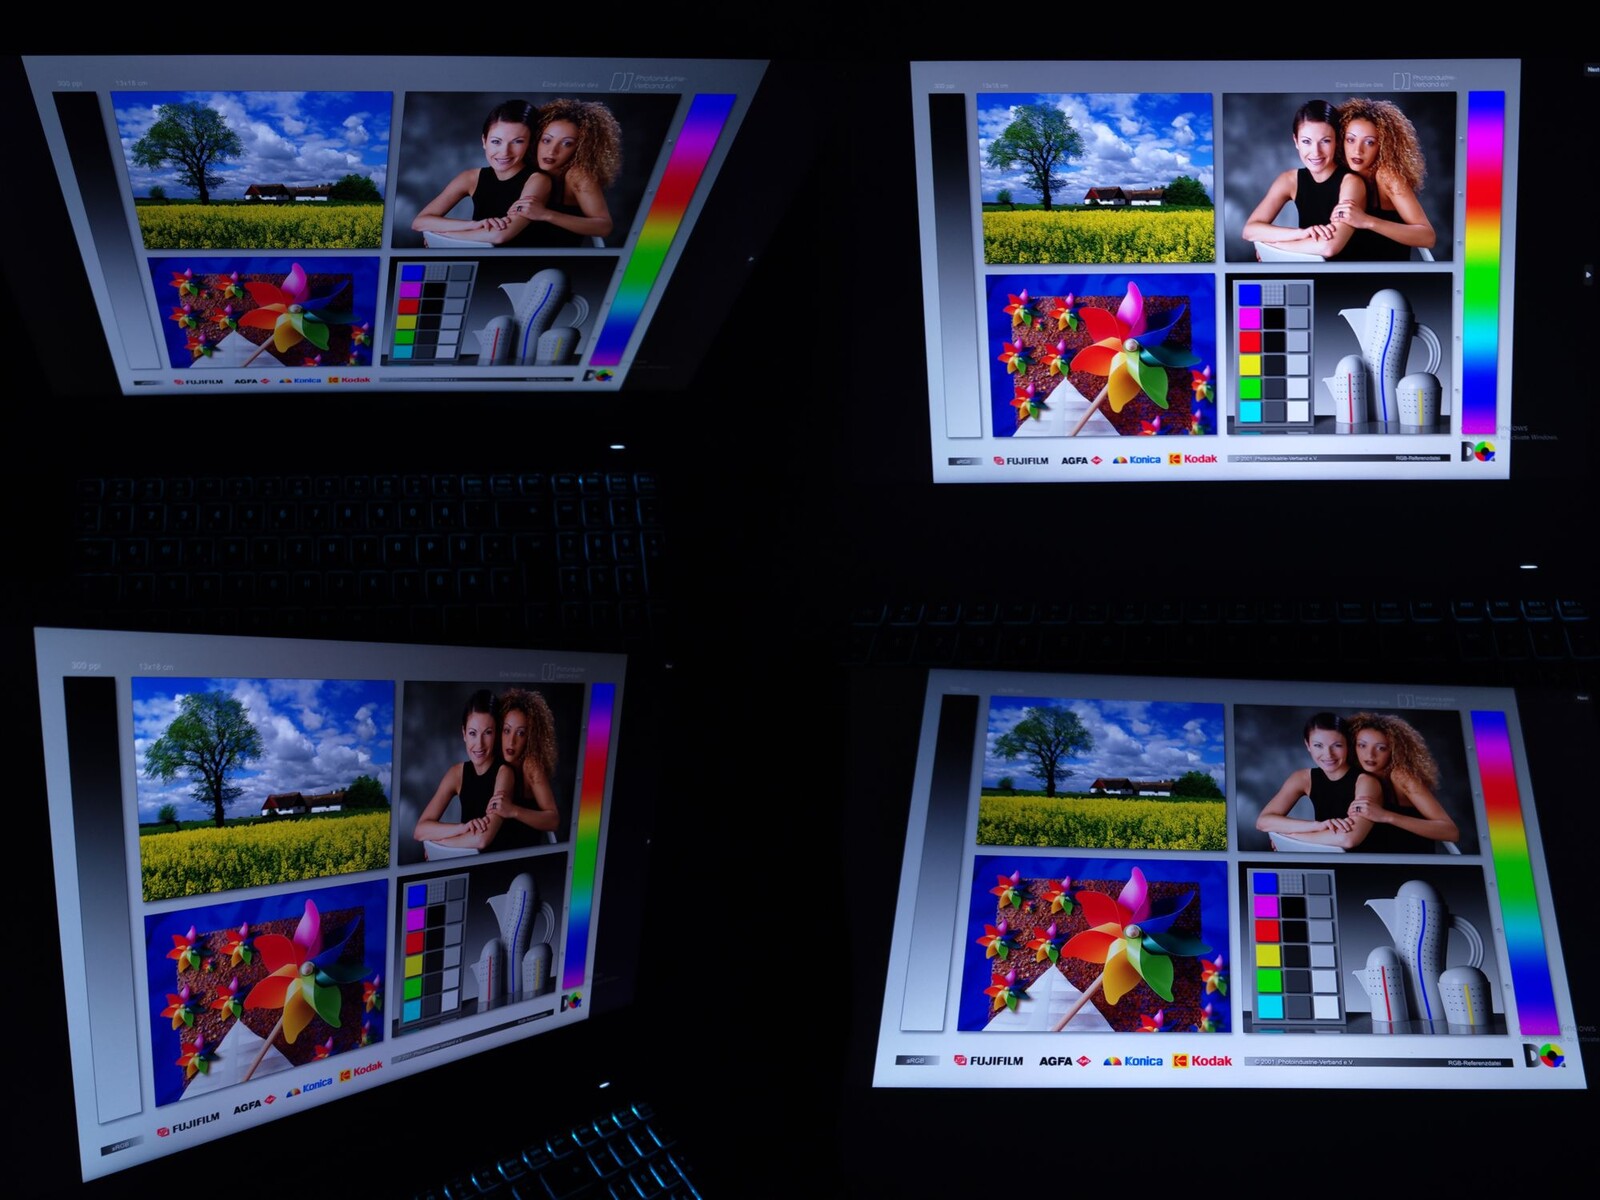
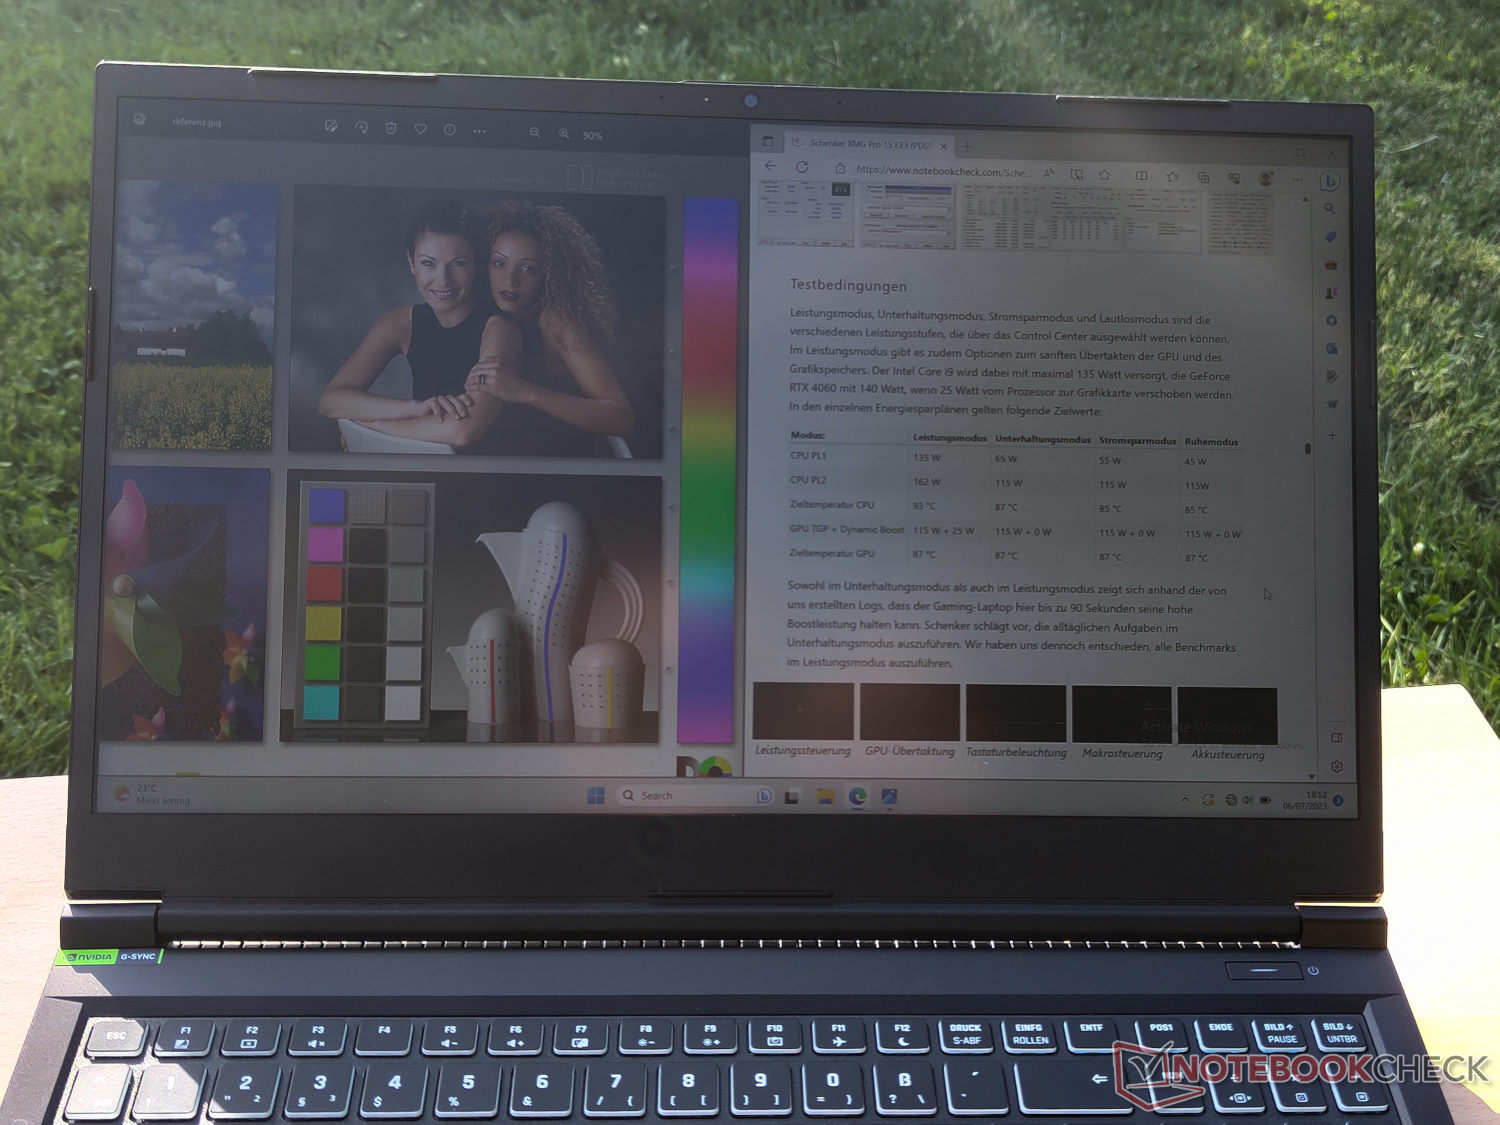
Grazie alla sua superficie opaca, il display ragionevolmente luminoso è utilizzabile anche all'aperto, a condizione che si presti attenzione alla posizione e all'angolazione rispetto al sole. Fortunatamente è possibile trovare una posizione favorevole, poiché gli angoli di visione dello schermo sono abbastanza stabili.
Prestazioni: Core i9 con prestazioni estreme
Schenker offre un'ampia gamma di opzioni di configurazione per l'XMG Focus 15. Il processore in tutte è il Intel Core i9-13900HX. Questo è supportato da un chip Nvidia con GeForce RTX 4050, RTX 4060 o RTX 4070disponibili nel processo di configurazione di Bestware insieme a diverse opzioni di memoria.
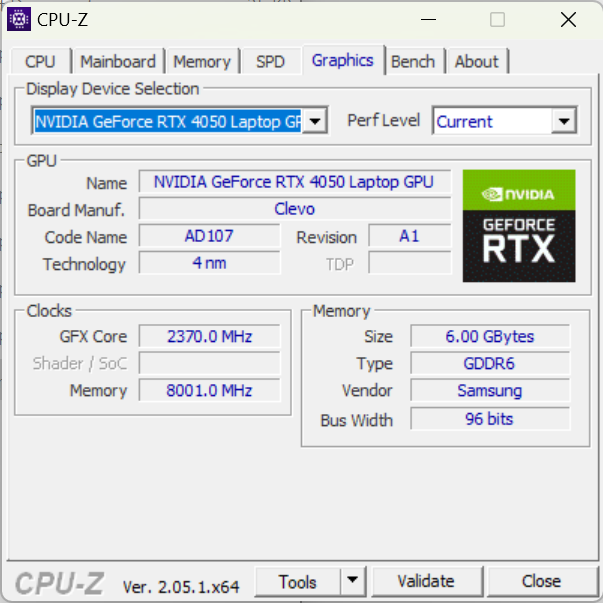
Il nostro dispositivo di prova è equipaggiato con la GPU Nvidia GeForce RTX 4050 Laptop e 32 GB di memoria di lavoro. Con il chip grafico più basso della generazione Ada Lovelace, il portatile è in grado di riprodurre senza problemi molti giochi attuali, anche se probabilmente dovrete limitare le impostazioni di qualità se volete utilizzare la piena risoluzione QHD del display.
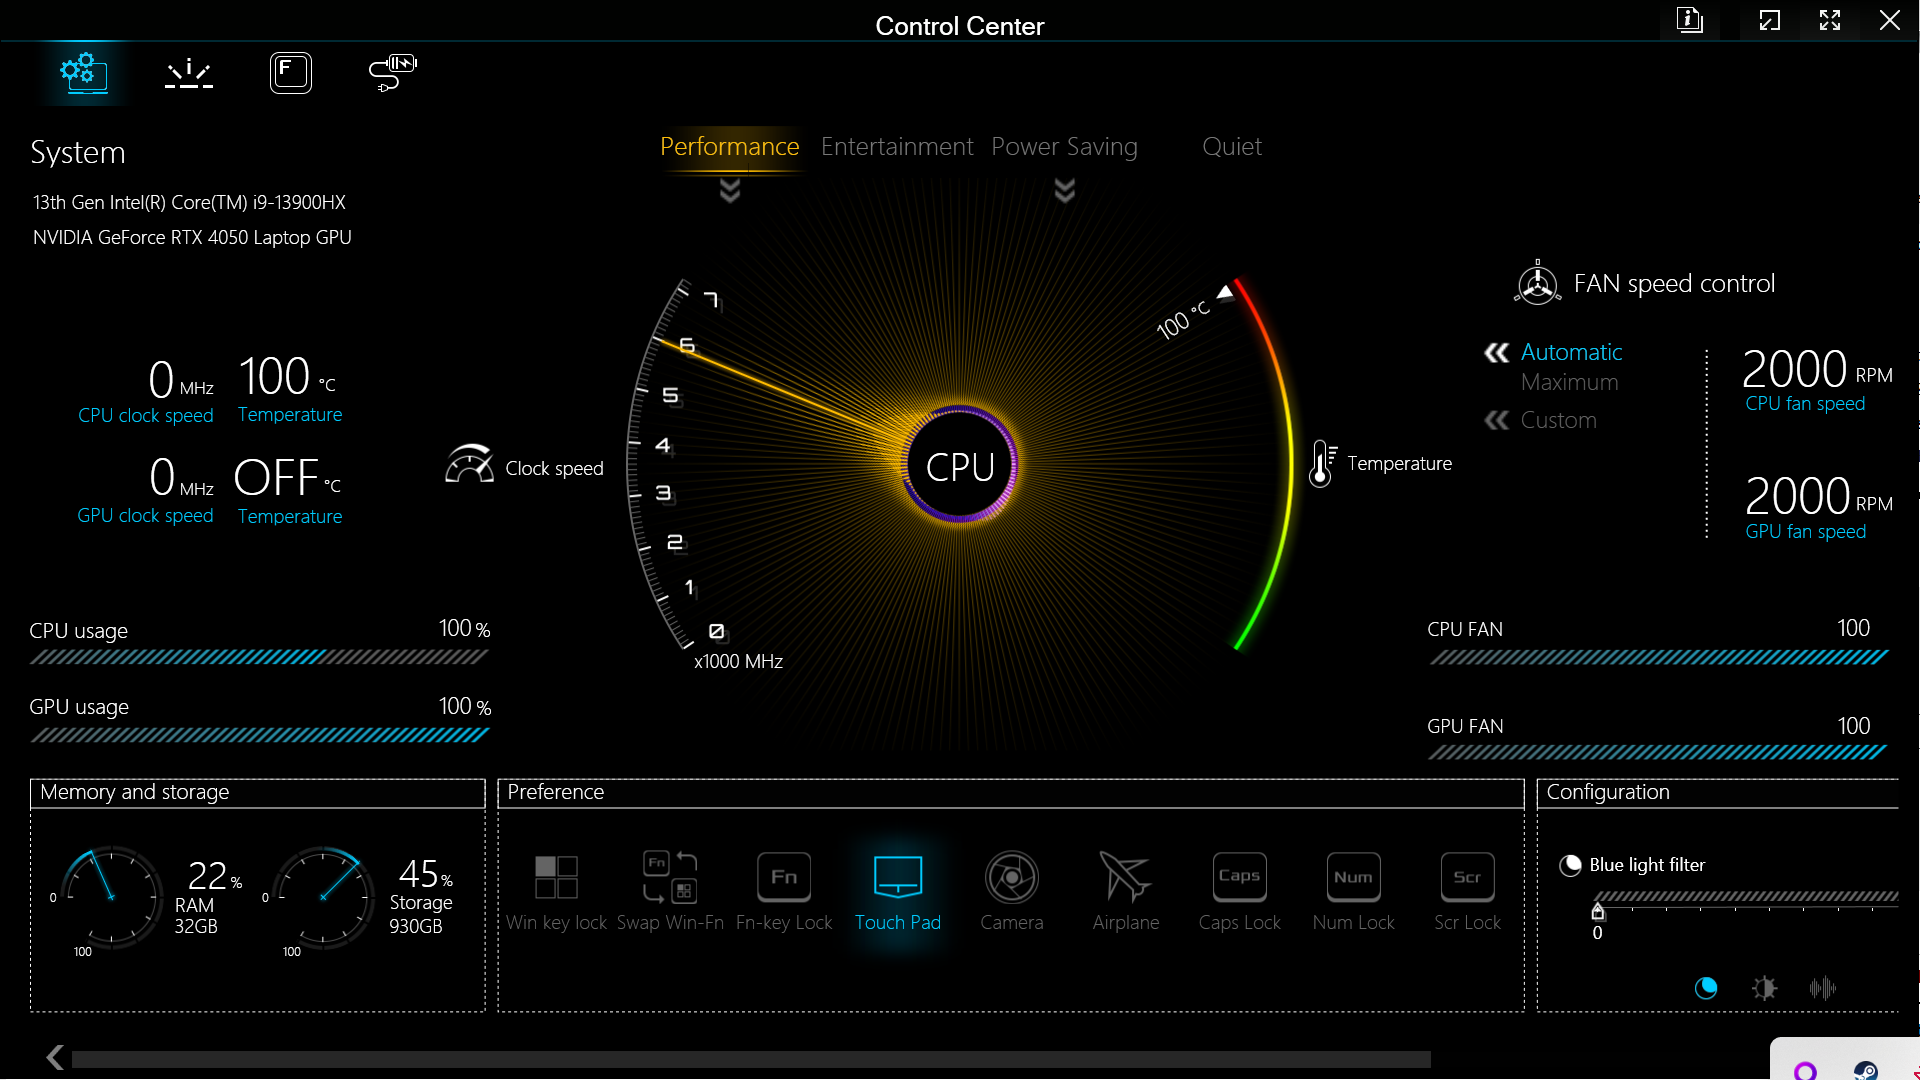
Condizioni di prova
Tramite il Control Center di Schenker è possibile accedere a quattro diversi piani di prestazioni. Mentre la modalità di risparmio energetico e la modalità Sleep limitano notevolmente le prestazioni del dispositivo di test, i benchmark delle modalità Performance e Entertainment sono spesso molto vicini tra loro quando si richiedono molte prestazioni al portatile per lunghi periodi.
Detto questo, la fase di boost del processore dura molto di più in modalità Performance. Con quasi 1,5 minuti di boost, il processore supera facilmente benchmark come Cinebench R23 o i test di Blender. I limiti di potenza nelle singole modalità sono i seguenti:
| Modalità: | Modalità di alimentazione | Modalità di intrattenimento | Modalità di risparmio energetico |
|---|---|---|---|
| CPU PL1 | 135 W | 55 W | 15 W |
| CPU PL2 | 162 W | 130 W | 30 W |
| Temperatura target CPU | 93 °C | 87 °C | 85 °C |
| GPU TGP + Dynamic Boost | 115 W + 25 W | 115 W + 0 W | 115 W + 0 W |
| Temperatura target GPU | 87 °C | 87 °C | 87 °C |
Nei nostri test il portatile è in grado di raggiungere le elevate percentuali della modalità Performance. Questi valori corrispondono esattamente a quelli che Schenker ha raggiunto anche con l' XMG Pro 15. Pertanto, le prestazioni dei due processori in Focus e Pro sono quasi identiche.
Per poter fare un confronto più preciso tra i due dispositivi, abbiamo deciso di eseguire tutti i benchmark in modalità Performance anche con l'XMG Focus 15.
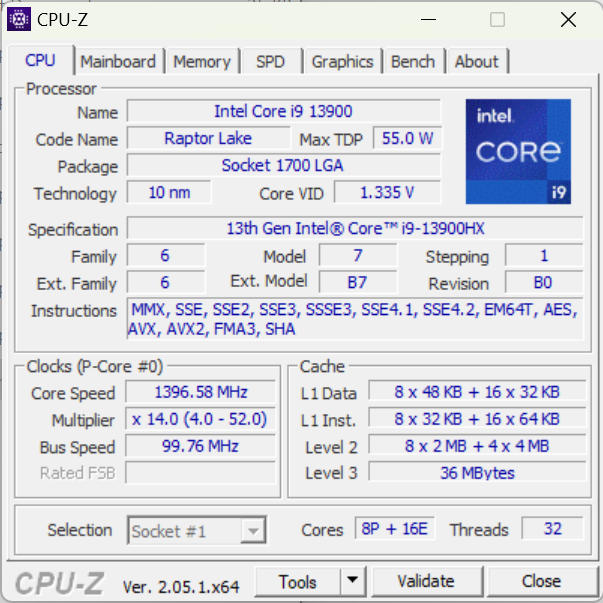
Processore
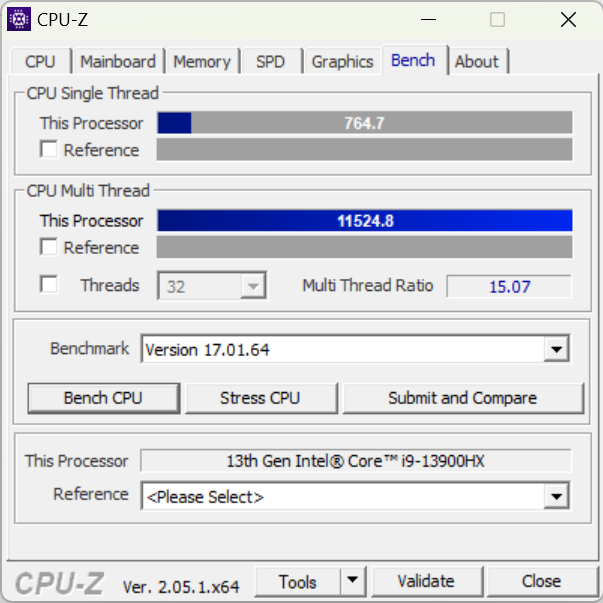
Con il Intel Core i9-13900HX, uno dei processori per laptop di fascia alta della generazione Raptor Lake-HX, è installato nell'XMG Focus 15. In questo caso il processore è persino leggermente più veloce di quello presente nel modello Pro 15.
La differenza è più percepibile nell'ambito della fluidità di funzionamento dei processori moderni. Con 8 core P e 16 core E, il processore ha 32 thread che garantiscono un multitasking estremo. Il Focus 15 e il Pro 15 sono al vertice dei dispositivi di confronto.
Cinebench R15 Multi Loop Test
Cinebench R23: Multi Core | Single Core
Cinebench R20: CPU (Multi Core) | CPU (Single Core)
Cinebench R15: CPU Multi 64Bit | CPU Single 64Bit
Blender: v2.79 BMW27 CPU
7-Zip 18.03: 7z b 4 | 7z b 4 -mmt1
Geekbench 5.5: Multi-Core | Single-Core
HWBOT x265 Benchmark v2.2: 4k Preset
LibreOffice : 20 Documents To PDF
R Benchmark 2.5: Overall mean
| CPU Performance rating | |
| Media Intel Core i9-13900HX | |
| Media della classe Gaming | |
| Schenker XMG Focus 15 (E23) | |
| Schenker XMG Pro 15 (E23) | |
| Gigabyte Aero 14 OLED BMF | |
| Acer Swift X SFX14-71G | |
| Samsung Galaxy Book3 Ultra 16 | |
| MSI Katana 15 B12VEK | |
| Asus TUF A15 FA507 | |
| Cinebench R23 / Multi Core | |
| Media Intel Core i9-13900HX (24270 - 32623, n=23) | |
| Media della classe Gaming (10488 - 42661, n=107, ultimi 2 anni) | |
| Schenker XMG Pro 15 (E23) | |
| Schenker XMG Focus 15 (E23) | |
| Acer Swift X SFX14-71G | |
| MSI Katana 15 B12VEK | |
| Samsung Galaxy Book3 Ultra 16 | |
| Gigabyte Aero 14 OLED BMF | |
| Asus TUF A15 FA507 | |
| Cinebench R23 / Single Core | |
| Media Intel Core i9-13900HX (1867 - 2105, n=20) | |
| Media della classe Gaming (1166 - 2415, n=107, ultimi 2 anni) | |
| Schenker XMG Focus 15 (E23) | |
| Acer Swift X SFX14-71G | |
| Schenker XMG Pro 15 (E23) | |
| Gigabyte Aero 14 OLED BMF | |
| Samsung Galaxy Book3 Ultra 16 | |
| MSI Katana 15 B12VEK | |
| Asus TUF A15 FA507 | |
| Cinebench R20 / CPU (Multi Core) | |
| Media Intel Core i9-13900HX (9152 - 12541, n=21) | |
| Media della classe Gaming (4029 - 16433, n=106, ultimi 2 anni) | |
| Schenker XMG Pro 15 (E23) | |
| Schenker XMG Focus 15 (E23) | |
| Acer Swift X SFX14-71G | |
| MSI Katana 15 B12VEK | |
| Samsung Galaxy Book3 Ultra 16 | |
| Gigabyte Aero 14 OLED BMF | |
| Asus TUF A15 FA507 | |
| Cinebench R20 / CPU (Single Core) | |
| Media Intel Core i9-13900HX (722 - 810, n=21) | |
| Media della classe Gaming (442 - 913, n=106, ultimi 2 anni) | |
| Schenker XMG Focus 15 (E23) | |
| Acer Swift X SFX14-71G | |
| Schenker XMG Pro 15 (E23) | |
| Gigabyte Aero 14 OLED BMF | |
| Samsung Galaxy Book3 Ultra 16 | |
| MSI Katana 15 B12VEK | |
| Asus TUF A15 FA507 | |
| Cinebench R15 / CPU Multi 64Bit | |
| Media Intel Core i9-13900HX (3913 - 4970, n=22) | |
| Schenker XMG Focus 15 (E23) | |
| Media della classe Gaming (1578 - 6330, n=105, ultimi 2 anni) | |
| Schenker XMG Pro 15 (E23) | |
| Samsung Galaxy Book3 Ultra 16 | |
| Gigabyte Aero 14 OLED BMF | |
| Acer Swift X SFX14-71G | |
| Asus TUF A15 FA507 | |
| MSI Katana 15 B12VEK | |
| Cinebench R15 / CPU Single 64Bit | |
| Media della classe Gaming (188.8 - 350, n=106, ultimi 2 anni) | |
| Media Intel Core i9-13900HX (247 - 304, n=22) | |
| Acer Swift X SFX14-71G | |
| Schenker XMG Focus 15 (E23) | |
| Gigabyte Aero 14 OLED BMF | |
| Asus TUF A15 FA507 | |
| MSI Katana 15 B12VEK | |
| Schenker XMG Pro 15 (E23) | |
| Samsung Galaxy Book3 Ultra 16 | |
| Blender / v2.79 BMW27 CPU | |
| Acer Swift X SFX14-71G | |
| MSI Katana 15 B12VEK | |
| Gigabyte Aero 14 OLED BMF | |
| Asus TUF A15 FA507 | |
| Samsung Galaxy Book3 Ultra 16 | |
| Media della classe Gaming (79 - 330, n=104, ultimi 2 anni) | |
| Schenker XMG Pro 15 (E23) | |
| Schenker XMG Focus 15 (E23) | |
| Media Intel Core i9-13900HX (101 - 153, n=22) | |
| 7-Zip 18.03 / 7z b 4 | |
| Media Intel Core i9-13900HX (90675 - 127283, n=21) | |
| Schenker XMG Focus 15 (E23) | |
| Schenker XMG Pro 15 (E23) | |
| Media della classe Gaming (33491 - 148086, n=105, ultimi 2 anni) | |
| Samsung Galaxy Book3 Ultra 16 | |
| Asus TUF A15 FA507 | |
| MSI Katana 15 B12VEK | |
| Gigabyte Aero 14 OLED BMF | |
| Acer Swift X SFX14-71G | |
| 7-Zip 18.03 / 7z b 4 -mmt1 | |
| Media Intel Core i9-13900HX (6340 - 7177, n=21) | |
| Media della classe Gaming (4199 - 7436, n=105, ultimi 2 anni) | |
| Schenker XMG Focus 15 (E23) | |
| Schenker XMG Pro 15 (E23) | |
| Acer Swift X SFX14-71G | |
| Gigabyte Aero 14 OLED BMF | |
| Asus TUF A15 FA507 | |
| MSI Katana 15 B12VEK | |
| Samsung Galaxy Book3 Ultra 16 | |
| Geekbench 5.5 / Multi-Core | |
| Media Intel Core i9-13900HX (17614 - 21075, n=22) | |
| Schenker XMG Focus 15 (E23) | |
| Schenker XMG Pro 15 (E23) | |
| Media della classe Gaming (6460 - 28263, n=105, ultimi 2 anni) | |
| Acer Swift X SFX14-71G | |
| Samsung Galaxy Book3 Ultra 16 | |
| MSI Katana 15 B12VEK | |
| Gigabyte Aero 14 OLED BMF | |
| Asus TUF A15 FA507 | |
| Geekbench 5.5 / Single-Core | |
| Media della classe Gaming (986 - 2474, n=105, ultimi 2 anni) | |
| Media Intel Core i9-13900HX (1345 - 2093, n=22) | |
| Gigabyte Aero 14 OLED BMF | |
| Acer Swift X SFX14-71G | |
| Schenker XMG Pro 15 (E23) | |
| Samsung Galaxy Book3 Ultra 16 | |
| MSI Katana 15 B12VEK | |
| Asus TUF A15 FA507 | |
| Schenker XMG Focus 15 (E23) | |
| HWBOT x265 Benchmark v2.2 / 4k Preset | |
| Media Intel Core i9-13900HX (23.5 - 34.4, n=22) | |
| Media della classe Gaming (11.5 - 44.4, n=105, ultimi 2 anni) | |
| Schenker XMG Focus 15 (E23) | |
| Schenker XMG Pro 15 (E23) | |
| MSI Katana 15 B12VEK | |
| Asus TUF A15 FA507 | |
| Samsung Galaxy Book3 Ultra 16 | |
| Gigabyte Aero 14 OLED BMF | |
| Acer Swift X SFX14-71G | |
| LibreOffice / 20 Documents To PDF | |
| Schenker XMG Pro 15 (E23) | |
| Asus TUF A15 FA507 | |
| Media della classe Gaming (33.2 - 88.8, n=105, ultimi 2 anni) | |
| Samsung Galaxy Book3 Ultra 16 | |
| MSI Katana 15 B12VEK | |
| Media Intel Core i9-13900HX (32.8 - 51.1, n=21) | |
| Gigabyte Aero 14 OLED BMF | |
| Acer Swift X SFX14-71G | |
| Schenker XMG Focus 15 (E23) | |
| R Benchmark 2.5 / Overall mean | |
| Asus TUF A15 FA507 | |
| MSI Katana 15 B12VEK | |
| Samsung Galaxy Book3 Ultra 16 | |
| Schenker XMG Pro 15 (E23) | |
| Gigabyte Aero 14 OLED BMF | |
| Acer Swift X SFX14-71G | |
| Schenker XMG Focus 15 (E23) | |
| Media della classe Gaming (0.3439 - 0.759, n=106, ultimi 2 anni) | |
| Media Intel Core i9-13900HX (0.375 - 0.4564, n=22) | |
* ... Meglio usare valori piccoli
AIDA64: FP32 Ray-Trace | FPU Julia | CPU SHA3 | CPU Queen | FPU SinJulia | FPU Mandel | CPU AES | CPU ZLib | FP64 Ray-Trace | CPU PhotoWorxx
| Performance rating | |
| Media della classe Gaming | |
| Media Intel Core i9-13900HX | |
| Schenker XMG Focus 15 (E23) | |
| Schenker XMG Pro 15 (E23) | |
| Asus TUF A15 FA507 | |
| Gigabyte Aero 14 OLED BMF | |
| Samsung Galaxy Book3 Ultra 16 | |
| MSI Katana 15 B12VEK | |
| Acer Swift X SFX14-71G | |
| AIDA64 / FP32 Ray-Trace | |
| Media della classe Gaming (10227 - 85542, n=105, ultimi 2 anni) | |
| Media Intel Core i9-13900HX (17589 - 27615, n=22) | |
| Schenker XMG Focus 15 (E23) | |
| Schenker XMG Pro 15 (E23) | |
| Asus TUF A15 FA507 | |
| MSI Katana 15 B12VEK | |
| Samsung Galaxy Book3 Ultra 16 | |
| Gigabyte Aero 14 OLED BMF | |
| Acer Swift X SFX14-71G | |
| AIDA64 / FPU Julia | |
| Media della classe Gaming (51376 - 238426, n=105, ultimi 2 anni) | |
| Media Intel Core i9-13900HX (88686 - 137015, n=22) | |
| Schenker XMG Focus 15 (E23) | |
| Asus TUF A15 FA507 | |
| Schenker XMG Pro 15 (E23) | |
| MSI Katana 15 B12VEK | |
| Samsung Galaxy Book3 Ultra 16 | |
| Gigabyte Aero 14 OLED BMF | |
| Acer Swift X SFX14-71G | |
| AIDA64 / CPU SHA3 | |
| Media della classe Gaming (2180 - 10115, n=105, ultimi 2 anni) | |
| Media Intel Core i9-13900HX (4362 - 7029, n=22) | |
| Schenker XMG Focus 15 (E23) | |
| Schenker XMG Pro 15 (E23) | |
| Asus TUF A15 FA507 | |
| Samsung Galaxy Book3 Ultra 16 | |
| MSI Katana 15 B12VEK | |
| Gigabyte Aero 14 OLED BMF | |
| Acer Swift X SFX14-71G | |
| AIDA64 / CPU Queen | |
| Schenker XMG Focus 15 (E23) | |
| Media Intel Core i9-13900HX (125644 - 141385, n=22) | |
| Schenker XMG Pro 15 (E23) | |
| Media della classe Gaming (49785 - 173351, n=90, ultimi 2 anni) | |
| Gigabyte Aero 14 OLED BMF | |
| Acer Swift X SFX14-71G | |
| Asus TUF A15 FA507 | |
| Samsung Galaxy Book3 Ultra 16 | |
| MSI Katana 15 B12VEK | |
| AIDA64 / FPU SinJulia | |
| Media Intel Core i9-13900HX (12334 - 17179, n=22) | |
| Media della classe Gaming (4424 - 33636, n=105, ultimi 2 anni) | |
| Schenker XMG Focus 15 (E23) | |
| Asus TUF A15 FA507 | |
| Schenker XMG Pro 15 (E23) | |
| Samsung Galaxy Book3 Ultra 16 | |
| Gigabyte Aero 14 OLED BMF | |
| MSI Katana 15 B12VEK | |
| Acer Swift X SFX14-71G | |
| AIDA64 / FPU Mandel | |
| Media della classe Gaming (25115 - 128721, n=105, ultimi 2 anni) | |
| Media Intel Core i9-13900HX (43850 - 69202, n=22) | |
| Asus TUF A15 FA507 | |
| Schenker XMG Focus 15 (E23) | |
| Schenker XMG Pro 15 (E23) | |
| MSI Katana 15 B12VEK | |
| Samsung Galaxy Book3 Ultra 16 | |
| Gigabyte Aero 14 OLED BMF | |
| Acer Swift X SFX14-71G | |
| AIDA64 / CPU AES | |
| Media Intel Core i9-13900HX (89413 - 237881, n=22) | |
| Gigabyte Aero 14 OLED BMF | |
| Media della classe Gaming (39258 - 247074, n=105, ultimi 2 anni) | |
| Schenker XMG Focus 15 (E23) | |
| Schenker XMG Pro 15 (E23) | |
| Acer Swift X SFX14-71G | |
| Samsung Galaxy Book3 Ultra 16 | |
| MSI Katana 15 B12VEK | |
| Asus TUF A15 FA507 | |
| AIDA64 / CPU ZLib | |
| Media Intel Core i9-13900HX (1284 - 1958, n=22) | |
| Schenker XMG Focus 15 (E23) | |
| Media della classe Gaming (574 - 2531, n=105, ultimi 2 anni) | |
| Schenker XMG Pro 15 (E23) | |
| Samsung Galaxy Book3 Ultra 16 | |
| MSI Katana 15 B12VEK | |
| Gigabyte Aero 14 OLED BMF | |
| Acer Swift X SFX14-71G | |
| Asus TUF A15 FA507 | |
| AIDA64 / FP64 Ray-Trace | |
| Media della classe Gaming (5509 - 45446, n=105, ultimi 2 anni) | |
| Media Intel Core i9-13900HX (9481 - 15279, n=22) | |
| Schenker XMG Focus 15 (E23) | |
| Schenker XMG Pro 15 (E23) | |
| Asus TUF A15 FA507 | |
| MSI Katana 15 B12VEK | |
| Samsung Galaxy Book3 Ultra 16 | |
| Gigabyte Aero 14 OLED BMF | |
| Acer Swift X SFX14-71G | |
| AIDA64 / CPU PhotoWorxx | |
| Gigabyte Aero 14 OLED BMF | |
| Schenker XMG Focus 15 (E23) | |
| Schenker XMG Pro 15 (E23) | |
| Media Intel Core i9-13900HX (42994 - 51994, n=22) | |
| Samsung Galaxy Book3 Ultra 16 | |
| Media della classe Gaming (12271 - 89891, n=105, ultimi 2 anni) | |
| Acer Swift X SFX14-71G | |
| MSI Katana 15 B12VEK | |
| Asus TUF A15 FA507 | |
Prestazioni del sistema
Con la GPU entry-level di Nvidia, la GeForce RTX 4050il Focus non riesce a ottenere lo stesso punteggio nel benchmark PCMark 10 del Pro 15 Pro 15. Tuttavia, il Focus 15 riesce a tenere il passo con gli altri dispositivi di confronto.
Il processore leggermente più veloce del Focus 15 si fa notare anche nel benchmark CrossMark. L'esemplare recensito ottiene un punteggio leggermente superiore a quello del Pro 15. CrossMark considera le prestazioni della scheda grafica molto meno di PCMark.
CrossMark: Overall | Productivity | Creativity | Responsiveness
| PCMark 10 / Score | |
| Media della classe Gaming (5828 - 12414, n=93, ultimi 2 anni) | |
| Schenker XMG Pro 15 (E23) | |
| Gigabyte Aero 14 OLED BMF | |
| Acer Swift X SFX14-71G | |
| Asus TUF A15 FA507 | |
| Schenker XMG Focus 15 (E23) | |
| Media Intel Core i9-13900HX, NVIDIA GeForce RTX 4050 Laptop GPU (n=1) | |
| MSI Katana 15 B12VEK | |
| Samsung Galaxy Book3 Ultra 16 | |
| PCMark 10 / Essentials | |
| Gigabyte Aero 14 OLED BMF | |
| Schenker XMG Pro 15 (E23) | |
| Acer Swift X SFX14-71G | |
| Media della classe Gaming (8810 - 11935, n=97, ultimi 2 anni) | |
| Asus TUF A15 FA507 | |
| Samsung Galaxy Book3 Ultra 16 | |
| MSI Katana 15 B12VEK | |
| Schenker XMG Focus 15 (E23) | |
| Media Intel Core i9-13900HX, NVIDIA GeForce RTX 4050 Laptop GPU (n=1) | |
| PCMark 10 / Productivity | |
| Media della classe Gaming (6845 - 25323, n=95, ultimi 2 anni) | |
| Schenker XMG Pro 15 (E23) | |
| MSI Katana 15 B12VEK | |
| Schenker XMG Focus 15 (E23) | |
| Media Intel Core i9-13900HX, NVIDIA GeForce RTX 4050 Laptop GPU (n=1) | |
| Acer Swift X SFX14-71G | |
| Gigabyte Aero 14 OLED BMF | |
| Asus TUF A15 FA507 | |
| Samsung Galaxy Book3 Ultra 16 | |
| PCMark 10 / Digital Content Creation | |
| Media della classe Gaming (7602 - 19954, n=95, ultimi 2 anni) | |
| Asus TUF A15 FA507 | |
| Acer Swift X SFX14-71G | |
| Gigabyte Aero 14 OLED BMF | |
| Schenker XMG Pro 15 (E23) | |
| Schenker XMG Focus 15 (E23) | |
| Media Intel Core i9-13900HX, NVIDIA GeForce RTX 4050 Laptop GPU (n=1) | |
| Samsung Galaxy Book3 Ultra 16 | |
| MSI Katana 15 B12VEK | |
| CrossMark / Overall | |
| Schenker XMG Focus 15 (E23) | |
| Media Intel Core i9-13900HX, NVIDIA GeForce RTX 4050 Laptop GPU (n=1) | |
| Media della classe Gaming (1366 - 2409, n=94, ultimi 2 anni) | |
| Schenker XMG Pro 15 (E23) | |
| Acer Swift X SFX14-71G | |
| Gigabyte Aero 14 OLED BMF | |
| MSI Katana 15 B12VEK | |
| Samsung Galaxy Book3 Ultra 16 | |
| Asus TUF A15 FA507 | |
| CrossMark / Productivity | |
| Schenker XMG Focus 15 (E23) | |
| Media Intel Core i9-13900HX, NVIDIA GeForce RTX 4050 Laptop GPU (n=1) | |
| Acer Swift X SFX14-71G | |
| Media della classe Gaming (1386 - 2254, n=94, ultimi 2 anni) | |
| Schenker XMG Pro 15 (E23) | |
| Gigabyte Aero 14 OLED BMF | |
| MSI Katana 15 B12VEK | |
| Asus TUF A15 FA507 | |
| Samsung Galaxy Book3 Ultra 16 | |
| CrossMark / Creativity | |
| Schenker XMG Focus 15 (E23) | |
| Media Intel Core i9-13900HX, NVIDIA GeForce RTX 4050 Laptop GPU (n=1) | |
| Media della classe Gaming (1343 - 2786, n=94, ultimi 2 anni) | |
| Schenker XMG Pro 15 (E23) | |
| Acer Swift X SFX14-71G | |
| Gigabyte Aero 14 OLED BMF | |
| MSI Katana 15 B12VEK | |
| Asus TUF A15 FA507 | |
| Samsung Galaxy Book3 Ultra 16 | |
| CrossMark / Responsiveness | |
| Acer Swift X SFX14-71G | |
| Schenker XMG Focus 15 (E23) | |
| Media Intel Core i9-13900HX, NVIDIA GeForce RTX 4050 Laptop GPU (n=1) | |
| Schenker XMG Pro 15 (E23) | |
| Gigabyte Aero 14 OLED BMF | |
| Media della classe Gaming (1226 - 2334, n=94, ultimi 2 anni) | |
| MSI Katana 15 B12VEK | |
| Samsung Galaxy Book3 Ultra 16 | |
| Asus TUF A15 FA507 | |
| PCMark 10 Score | 6926 punti | |
Aiuto | ||
| AIDA64 / Memory Copy | |
| Gigabyte Aero 14 OLED BMF | |
| Schenker XMG Focus 15 (E23) | |
| Schenker XMG Pro 15 (E23) | |
| Media Intel Core i9-13900HX (67716 - 79193, n=22) | |
| Media della classe Gaming (21750 - 129946, n=105, ultimi 2 anni) | |
| Samsung Galaxy Book3 Ultra 16 | |
| Acer Swift X SFX14-71G | |
| MSI Katana 15 B12VEK | |
| Asus TUF A15 FA507 | |
| AIDA64 / Memory Read | |
| Schenker XMG Focus 15 (E23) | |
| Schenker XMG Pro 15 (E23) | |
| Media Intel Core i9-13900HX (73998 - 88462, n=22) | |
| Gigabyte Aero 14 OLED BMF | |
| Media della classe Gaming (22956 - 118858, n=105, ultimi 2 anni) | |
| Samsung Galaxy Book3 Ultra 16 | |
| MSI Katana 15 B12VEK | |
| Acer Swift X SFX14-71G | |
| Asus TUF A15 FA507 | |
| AIDA64 / Memory Write | |
| Gigabyte Aero 14 OLED BMF | |
| Samsung Galaxy Book3 Ultra 16 | |
| Schenker XMG Focus 15 (E23) | |
| Media della classe Gaming (22297 - 135096, n=105, ultimi 2 anni) | |
| Schenker XMG Pro 15 (E23) | |
| Media Intel Core i9-13900HX (65472 - 77045, n=22) | |
| Acer Swift X SFX14-71G | |
| MSI Katana 15 B12VEK | |
| Asus TUF A15 FA507 | |
| AIDA64 / Memory Latency | |
| Media della classe Gaming (75.3 - 259, n=105, ultimi 2 anni) | |
| Acer Swift X SFX14-71G | |
| Samsung Galaxy Book3 Ultra 16 | |
| MSI Katana 15 B12VEK | |
| Gigabyte Aero 14 OLED BMF | |
| Media Intel Core i9-13900HX (75.3 - 91.1, n=22) | |
| Schenker XMG Focus 15 (E23) | |
| Schenker XMG Pro 15 (E23) | |
| Asus TUF A15 FA507 | |
* ... Meglio usare valori piccoli
Latenza DPC
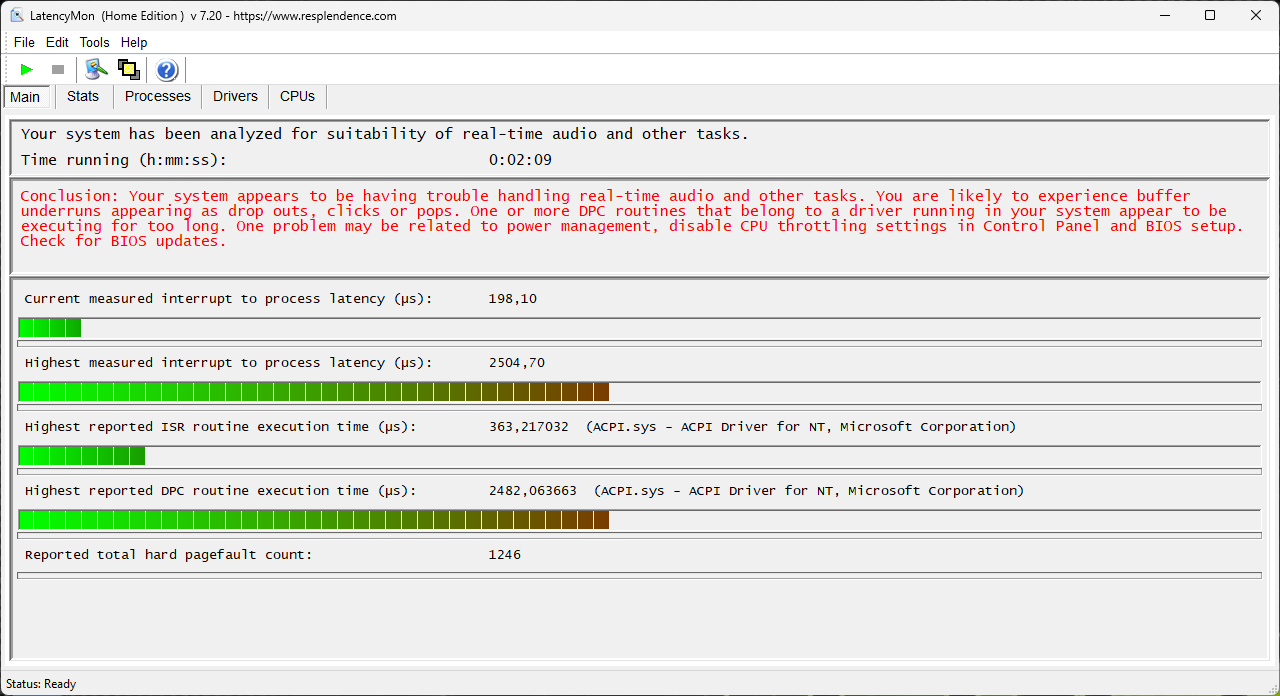
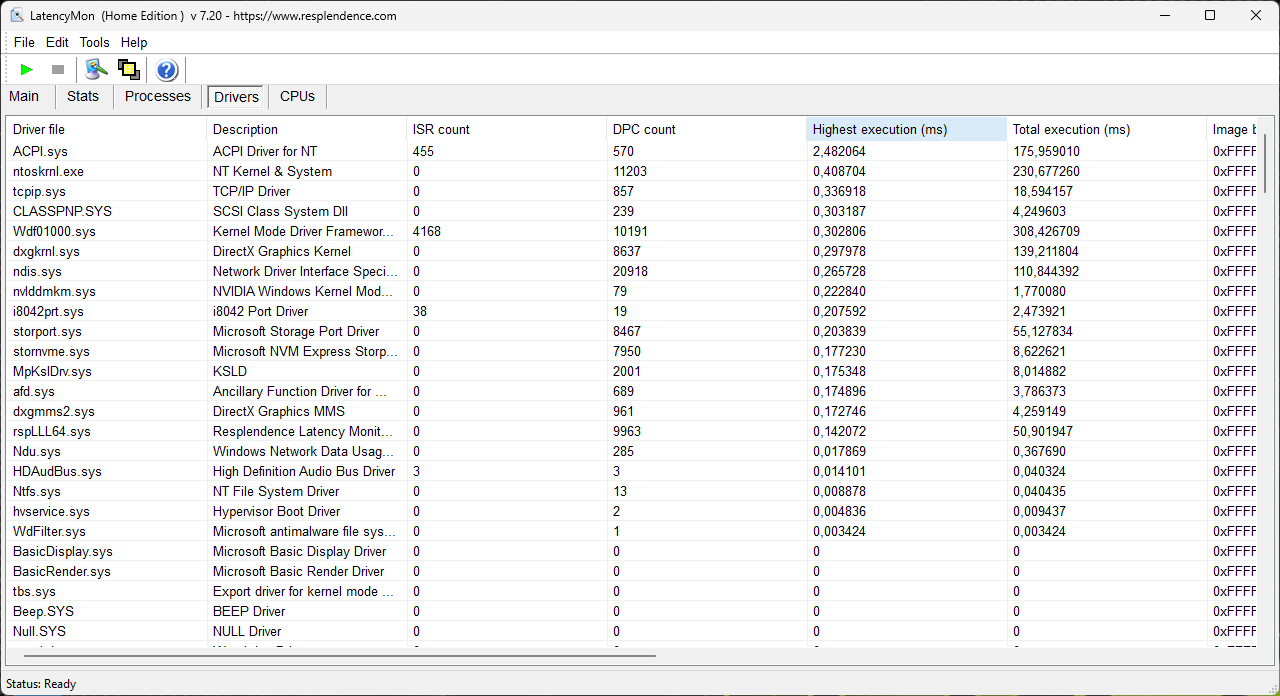
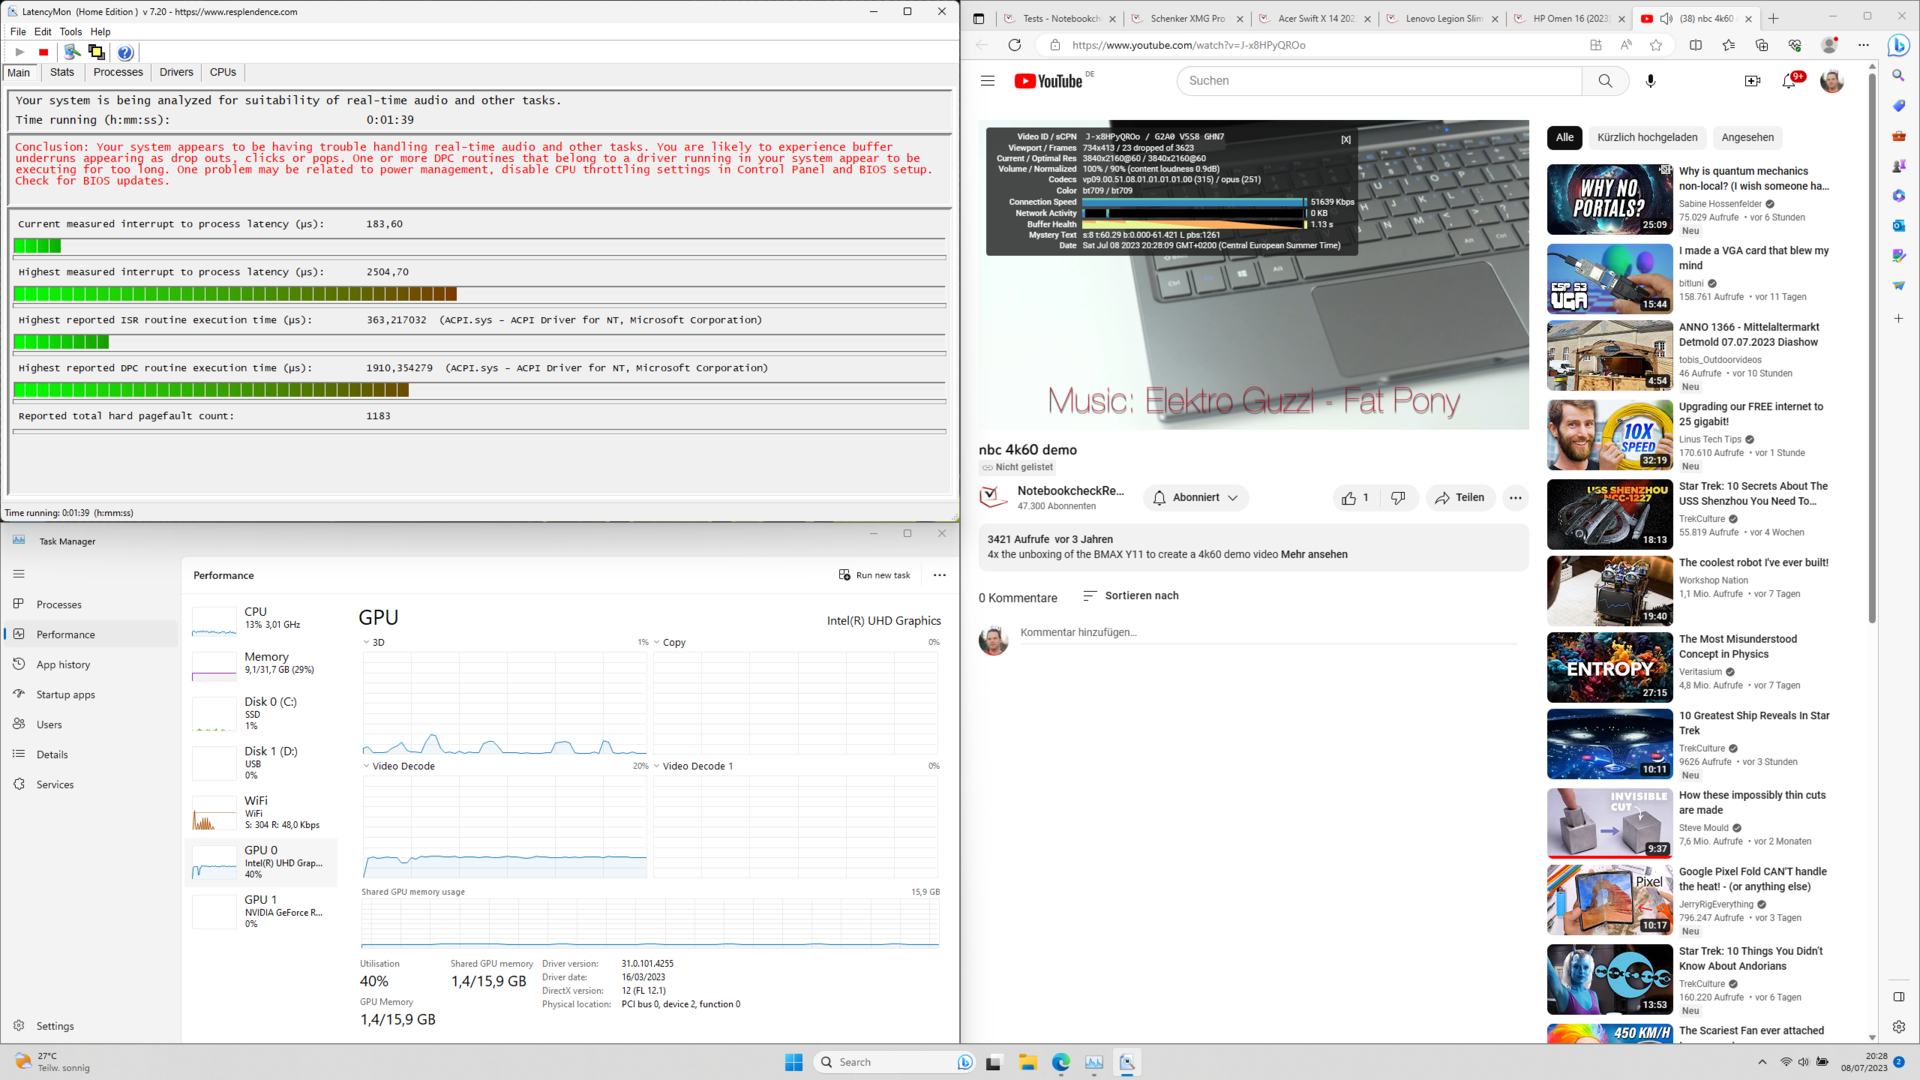
Il nostro test di latenza con varie schede del browser, la riproduzione di YouTube e Prime95 mostra che il portatile da gioco ha purtroppo latenze DPC piuttosto elevate.
Il driver ACPI, che stabilisce la connessione tra il BIOS/UEFI e Windows, è evidente in questo caso. Un aggiornamento dell'UEFI non ha migliorato la situazione.
| DPC Latencies / LatencyMon - interrupt to process latency (max), Web, Youtube, Prime95 | |
| MSI Katana 15 B12VEK | |
| Acer Swift X SFX14-71G | |
| Samsung Galaxy Book3 Ultra 16 | |
| Schenker XMG Focus 15 (E23) | |
| Gigabyte Aero 14 OLED BMF | |
| Schenker XMG Pro 15 (E23) | |
* ... Meglio usare valori piccoli
Memoria di massa
IlCrucial P5 Plus nel dispositivo di test offre buone velocità di trasferimento. Tuttavia, sembra che si surriscaldi durante i carichi più lunghi.
Nel nostro test a lungo termine della velocità di scrittura, l'unità SSD NVMe perde chiaramente prestazioni dopo qualche tempo.

* ... Meglio usare valori piccoli
Disk throttling: DiskSpd Read Loop, Queue Depth 8
Scheda grafica
Nel nostro campione Focus 15, le prestazioni del chip grafico sono inferiori di circa il 15-20% rispetto a quelle dellaRTX 4060 nel modello Pro 15. Uno sguardo al modello Aorus 15X ASF mostra anche come le prestazioni del Focus 15 in combinazione con una RTX 4070 rTX 4070. Poiché tutti e tre i portatili hanno valori TGP equivalenti, le prestazioni dovrebbero essere comparabili quando i portatili sono dotati dello stesso chip grafico.
La GPU Nvidia RTX 4050 è valutata fino a 140 W TGP. Questo valore è al top delle configurazioni TGP raccomandate da Nvidia. Tuttavia, questo non dà alla scheda grafica nessun vantaggio rispetto agli altri portatili da gioco in tutti i benchmark.
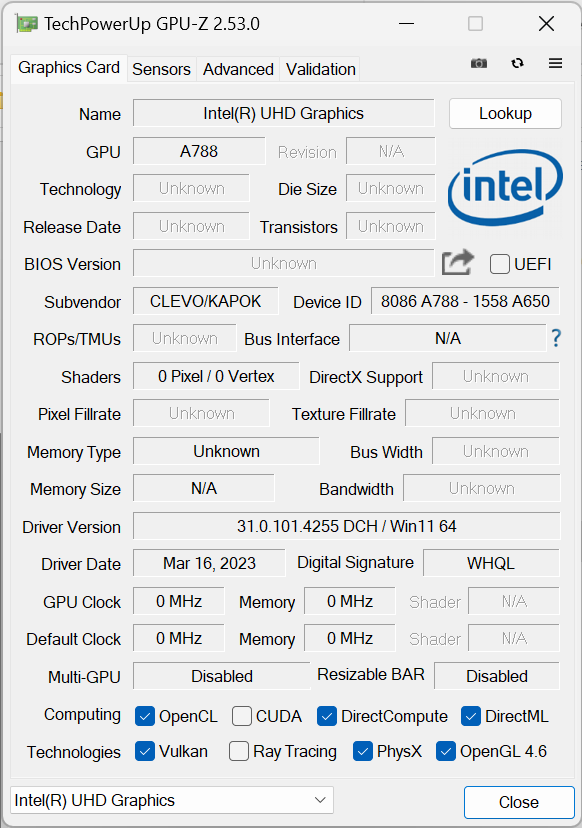
Il chip grafico può essere selezionato direttamente nel Focus 15 tramite gli interruttori Optimus e MUX - è disponibile anche l'iGPU del Core i9. Detto questo, la scheda grafica Intel UHD Graphics 770 con 32 EU nel modello 13900HX è una delle opzioni grafiche più deboli che Intel offre negli attuali processori. Pertanto, è in grado di eseguire solo compiti di base.
| 3DMark 11 Performance | 27613 punti | |
| 3DMark Ice Storm Standard Score | 134251 punti | |
| 3DMark Cloud Gate Standard Score | 52615 punti | |
| 3DMark Fire Strike Score | 20964 punti | |
| 3DMark Time Spy Score | 9236 punti | |
Aiuto | ||
| Geekbench 6.7 - GPU OpenCL | |
| Media della classe Gaming (67235 - 253130, n=103, ultimi 2 anni) | |
| Schenker XMG Focus 15 (E23) | |
| Media NVIDIA GeForce RTX 4050 Laptop GPU (60815 - 86892, n=21) | |
* ... Meglio usare valori piccoli
Prestazioni di gioco
Come indicato in precedenza, la grafica può essere gestita sia dal chip Intel che dal chip Nvidia GeForce RTX 4050. In realtà volevamo utilizzare la modalità dual-GPU con commutazione automatica per tutti i benchmark. Tuttavia, la selezione automatica non ha funzionato bene in tutti i casi. Pertanto, i nostri benchmark di gioco sono stati eseguiti in modalità solo dGPU.
Tra i dispositivi di confronto con RTX 4050, il Focus 15 mostra le migliori prestazioni di gioco. Ad eccezione di The Witcher 3 , la RTX 4050 produce fps leggermente più alti del solito. I risultati diDota 2 Reborn e X-Plane 11potrebbero sembrare evidenti. Il Focus 15 raggiunge più fps in entrambi i giochi rispetto alPro 15 con la più potente RTX 4060.
Tuttavia, entrambi i giochi sono ora limitati più dalle prestazioni della CPU che da quelle della GPU. Ciò diventa particolarmente chiaro quando si confrontano le prestazioni del Galaxy Book3 Ultra 16 con il Acer Swift Go. Entrambi i dispositivi utilizzano ilIntel Core i7-13700H con valori TDP simili e possono mostrare fps simili in Dota 2 Reborn.
| The Witcher 3 - 1920x1080 Ultra Graphics & Postprocessing (HBAO+) | |
| Media della classe Gaming (104.7 - 240, n=7, ultimi 2 anni) | |
| Schenker XMG Pro 15 (E23) | |
| MSI Katana 15 B12VEK | |
| Asus TUF A15 FA507 | |
| Gigabyte Aero 14 OLED BMF | |
| Gigabyte Aero 14 OLED BMF | |
| Schenker XMG Focus 15 (E23) | |
| Samsung Galaxy Book3 Ultra 16 | |
| Acer Swift X SFX14-71G | |
| Acer Swift Go SFG16-71 | |
| Final Fantasy XV Benchmark - 1920x1080 High Quality | |
| Media della classe Gaming (41 - 215, n=95, ultimi 2 anni) | |
| Schenker XMG Focus 15 (E23) | |
| MSI Katana 15 B12VEK | |
| Asus TUF A15 FA507 | |
| Acer Swift X SFX14-71G | |
| Gigabyte Aero 14 OLED BMF | |
| Samsung Galaxy Book3 Ultra 16 | |
| Acer Swift Go SFG16-71 | |
| basso | medio | alto | ultra | QHD | 4K | |
|---|---|---|---|---|---|---|
| GTA V (2015) | 185.6 | 175.8 | 93.7 | |||
| The Witcher 3 (2015) | 64 | |||||
| Dota 2 Reborn (2015) | 193.2 | 181.6 | 175.8 | 160.7 | 106.6 | |
| Final Fantasy XV Benchmark (2018) | 114.1 | 85 | 58.5 | |||
| X-Plane 11.11 (2018) | 165.2 | 144.9 | 117 | 108.6 | ||
| Far Cry 5 (2018) | 141 | 131 | 123 | 86 | ||
| Strange Brigade (2018) | 417 | 218 | 175.4 | 151.2 | ||
| F1 22 (2022) | 244 | 234 | 174.7 | 55.7 | ||
| F1 23 (2023) | 259 | 235 | 164.5 | 45.3 | 36.9 |
Emissioni: Appoggio del palmo della mano destra caldo
Emissioni acustiche
Il Focus 15 presenta livelli di rumorosità della ventola tipici dei portatili da gioco. Con un massimo di 55 dB(A) misurati a una distanza di 15 cm, il dispositivo di prova diventa talvolta spiacevolmente rumoroso in modalità Performance.
La modalità Entertainment mostra emissioni di rumore intorno ai 50 dB(A). È inoltre possibile far funzionare il notebook in modo quasi silenzioso con la modalità Sleep, a costo di perdere una notevole potenza di calcolo.
Rumorosità
| Idle |
| 24 / 25.14 / 35.14 dB(A) |
| Sotto carico |
| 55.93 / 56.34 dB(A) |
 | ||
30 dB silenzioso 40 dB(A) udibile 50 dB(A) rumoroso |
||
min: | ||
| Schenker XMG Focus 15 (E23) GeForce RTX 4050 Laptop GPU, i9-13900HX, Crucial P5 Plus 1TB CT1000P5PSSD8 | Schenker XMG Pro 15 (E23) GeForce RTX 4060 Laptop GPU, i9-13900HX, Crucial P5 Plus 1TB CT1000P5PSSD8 | Asus TUF A15 FA507 GeForce RTX 4050 Laptop GPU, R7 7735HS, Micron 2400 MTFDKBA512QFM | MSI Katana 15 B12VEK GeForce RTX 4050 Laptop GPU, i7-12650H, Micron 2400 MTFDKBA1T0QFM | Acer Swift X SFX14-71G GeForce RTX 4050 Laptop GPU, i7-13700H, Samsung PM9A1 MZVL21T0HCLR | Samsung Galaxy Book3 Ultra 16 GeForce RTX 4050 Laptop GPU, i7-13700H, Samsung PM9A1 MZVL2512HCJQ | Gigabyte Aero 14 OLED BMF GeForce RTX 4050 Laptop GPU, i7-13700H, Gigabyte AG470S1TB-SI B10 | |
|---|---|---|---|---|---|---|---|
| Noise | 7% | 20% | 13% | 1% | 12% | 6% | |
| off /ambiente * (dB) | 24 | 24 -0% | 23.3 3% | 24 -0% | 24.8 -3% | 25 -4% | 24 -0% |
| Idle Minimum * (dB) | 24 | 24 -0% | 23.3 3% | 24 -0% | 28.2 -18% | 26 -8% | 24 -0% |
| Idle Average * (dB) | 25.14 | 24 5% | 23.3 7% | 24 5% | 31.8 -26% | 27 -7% | 24 5% |
| Idle Maximum * (dB) | 35.14 | 24 32% | 23.3 34% | 24 32% | 31.8 10% | 28 20% | 35.71 -2% |
| Load Average * (dB) | 55.93 | 53.65 4% | 29.6 47% | 37.71 33% | 38.2 32% | 40 28% | |
| Witcher 3 ultra * (dB) | 54.62 | 53.53 2% | 43 21% | 45.75 16% | 50 8% | 39 29% | 40.22 26% |
| Load Maximum * (dB) | 56.34 | 53.65 5% | 43 24% | 54.55 3% | 52.2 7% | 41 27% | 51.93 8% |
* ... Meglio usare valori piccoli
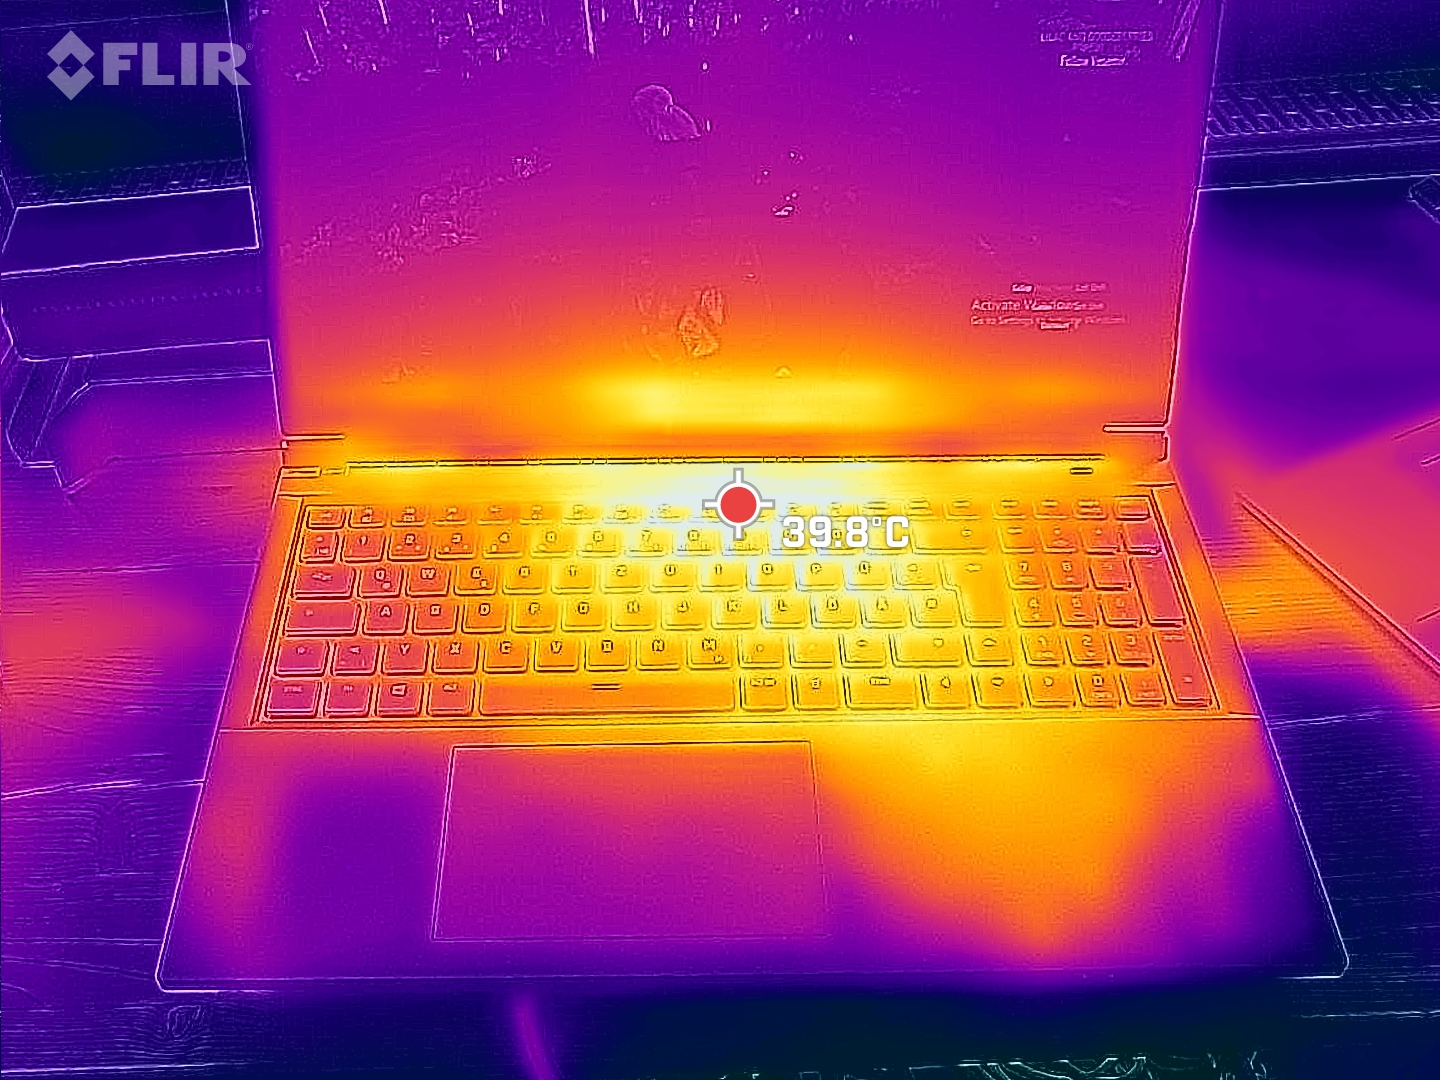
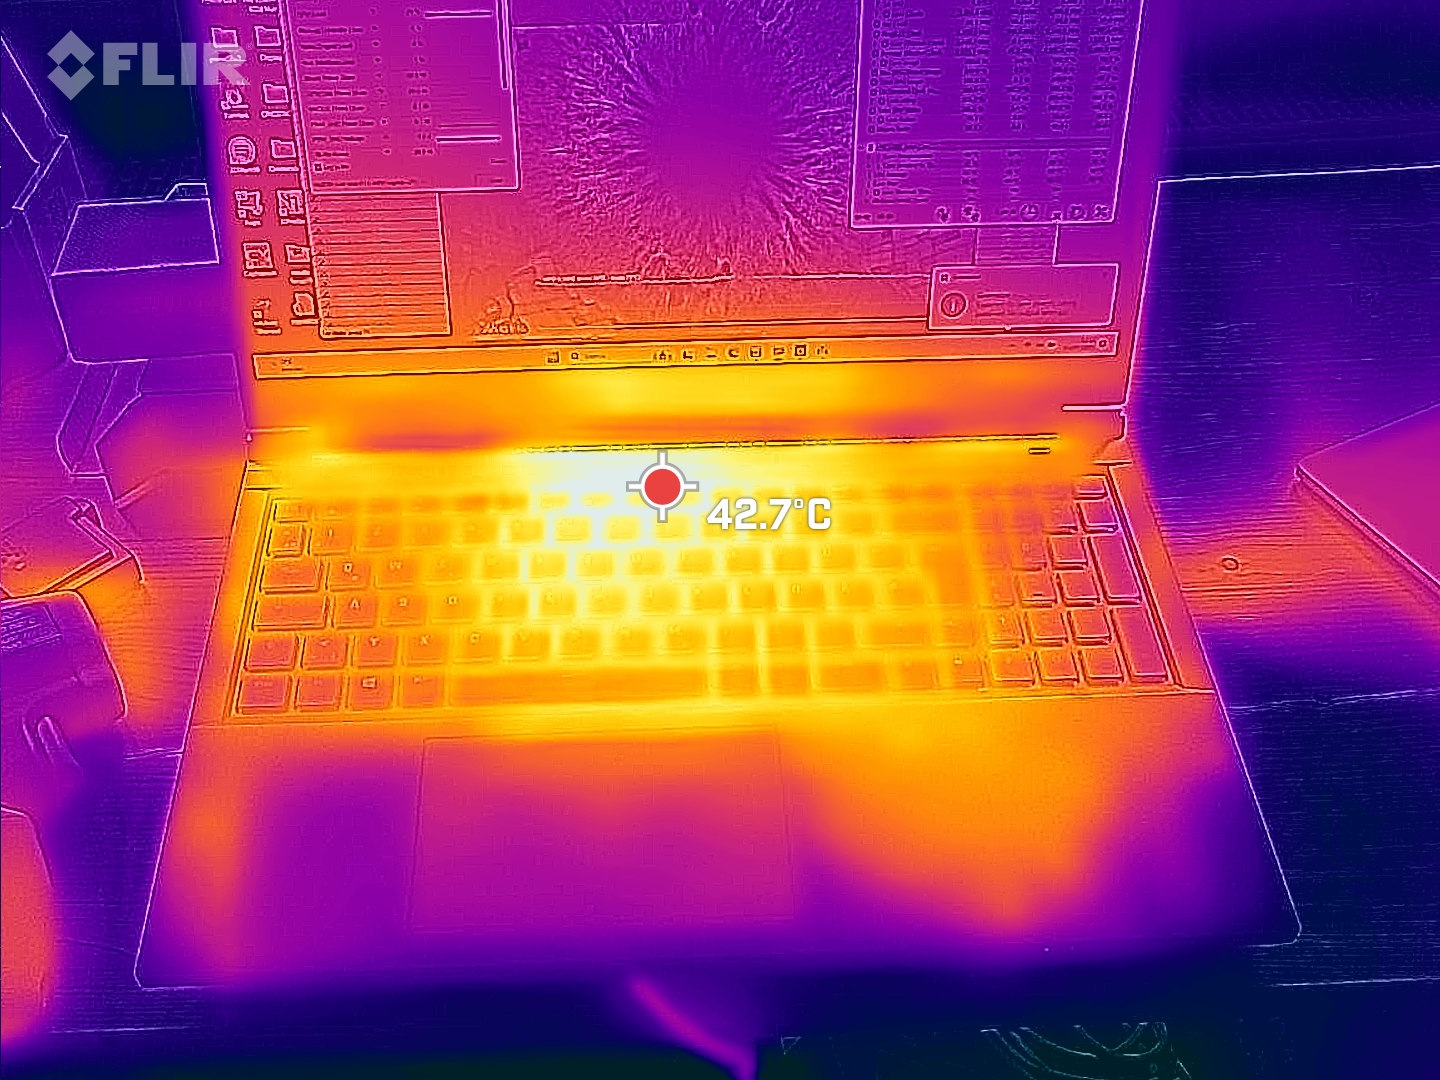
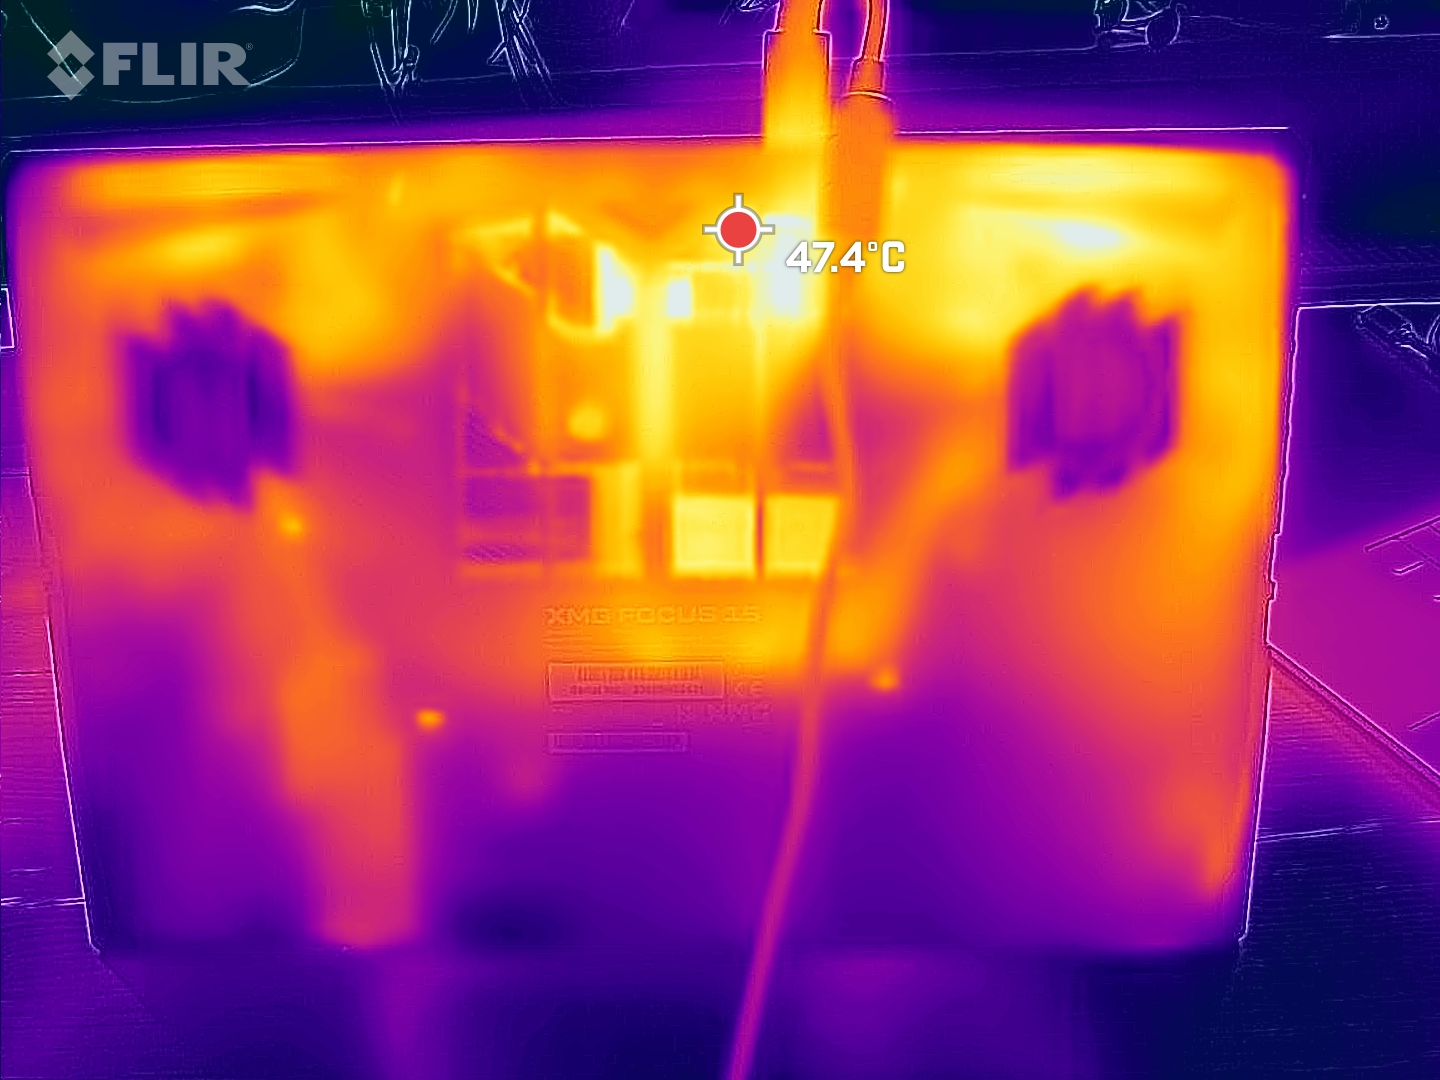
Temperatura
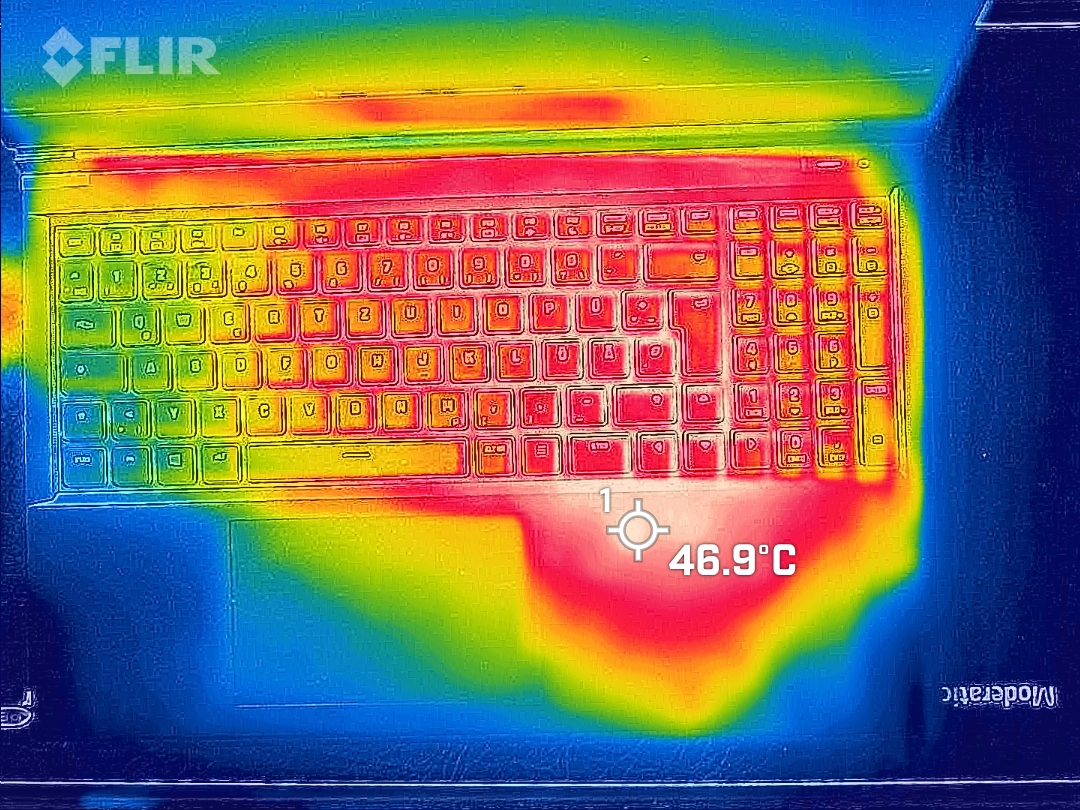
Le temperature superficiali di questo portatile da gioco non sono affatto fresche. Abbiamo misurato punti caldi di 51 °C, ma fortunatamente sono lontani dai punti di contatto abituali.
Tuttavia, il portatile si scalda molto anche sul poggiapolsi destro durante l'uso. Dato che di solito si usa un mouse esterno per i giochi, questo probabilmente non è un grosso problema per i destrimani. Il poggiapolsi sinistro e i tasti W, A, S, D rimangono freschi.
Anche il carico prolungato dell'unità SSD NVMe installata sembra essere sufficiente ad aumentare significativamente la temperatura del palm rest. Ha raggiunto quasi 46 °C quando abbiamo installato i nostri giochi di prova.
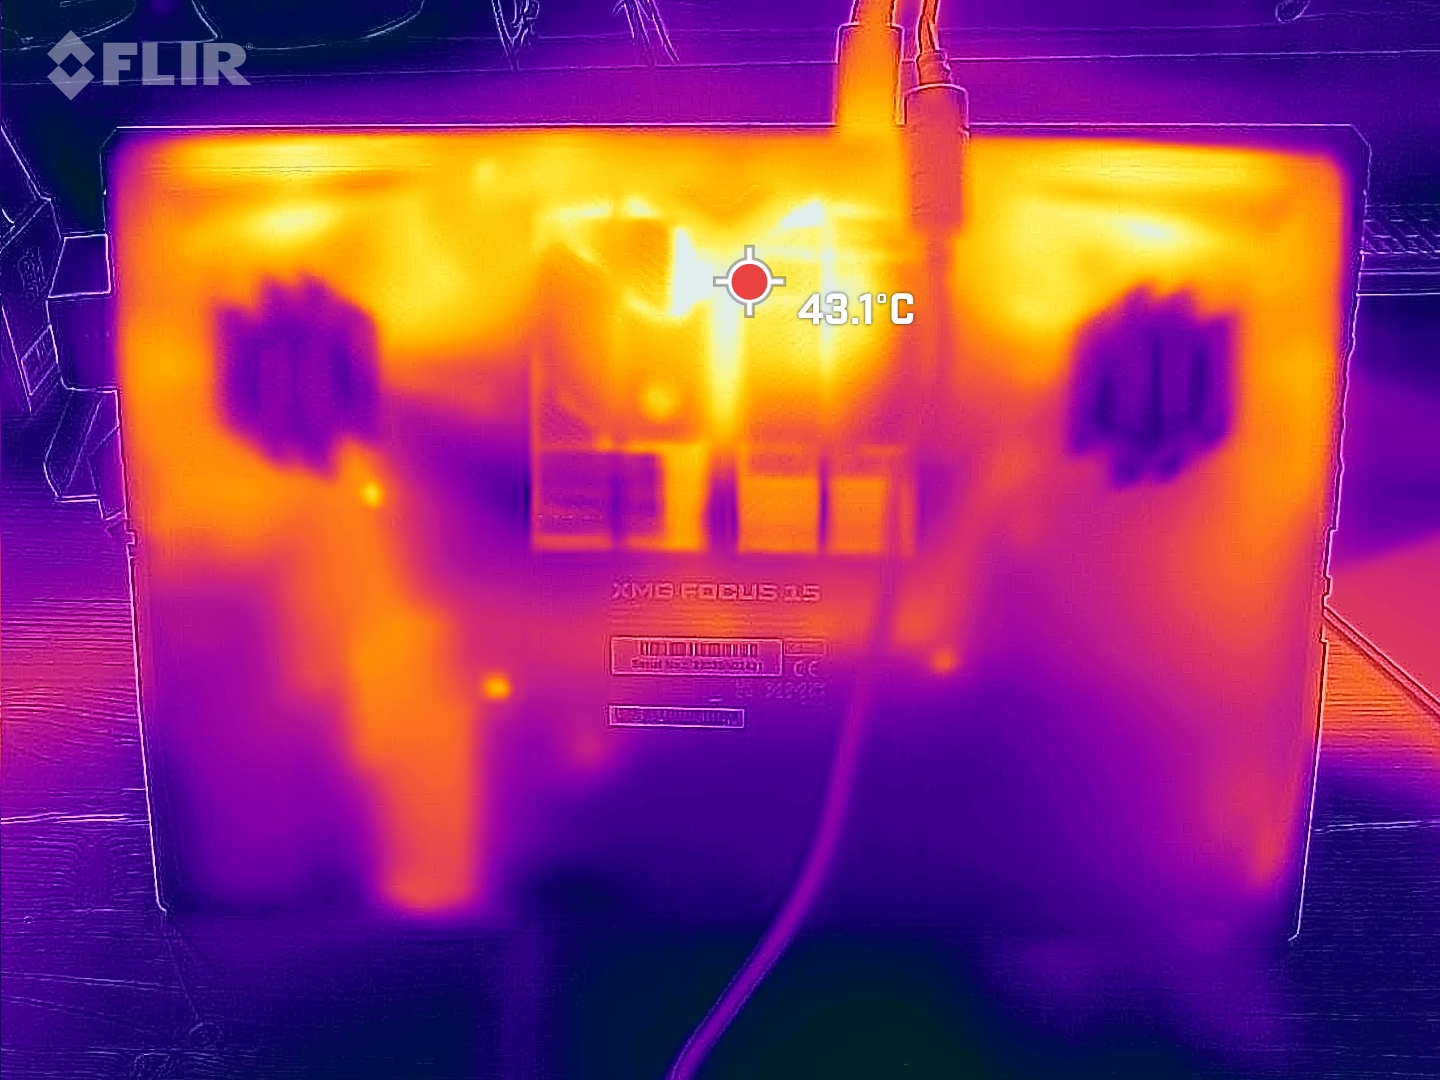
(-) La temperatura massima sul lato superiore è di 51 °C / 124 F, rispetto alla media di 40.4 °C / 105 F, che varia da 21.2 a 68.8 °C per questa classe Gaming.
(-) Il lato inferiore si riscalda fino ad un massimo di 53 °C / 127 F, rispetto alla media di 43.2 °C / 110 F
(+) In idle, la temperatura media del lato superiore è di 25.8 °C / 78 F, rispetto alla media deld ispositivo di 33.9 °C / 93 F.
(±) Riproducendo The Witcher 3, la temperatura media per il lato superiore e' di 36.2 °C / 97 F, rispetto alla media del dispositivo di 33.9 °C / 93 F.
(±) I poggiapolsi e il touchpad possono diventare molto caldi al tatto con un massimo di 36 °C / 96.8 F.
(-) La temperatura media della zona del palmo della mano di dispositivi simili e'stata di 28.8 °C / 83.8 F (-7.2 °C / -13 F).
| Schenker XMG Focus 15 (E23) Intel Core i9-13900HX, NVIDIA GeForce RTX 4050 Laptop GPU | Schenker XMG Pro 15 (E23) Intel Core i9-13900HX, NVIDIA GeForce RTX 4060 Laptop GPU | Asus TUF A15 FA507 AMD Ryzen 7 7735HS, NVIDIA GeForce RTX 4050 Laptop GPU | MSI Katana 15 B12VEK Intel Core i7-12650H, NVIDIA GeForce RTX 4050 Laptop GPU | Acer Swift X SFX14-71G Intel Core i7-13700H, NVIDIA GeForce RTX 4050 Laptop GPU | Samsung Galaxy Book3 Ultra 16 Intel Core i7-13700H, NVIDIA GeForce RTX 4050 Laptop GPU | Gigabyte Aero 14 OLED BMF Intel Core i7-13700H, NVIDIA GeForce RTX 4050 Laptop GPU | |
|---|---|---|---|---|---|---|---|
| Heat | -3% | 9% | -8% | 9% | 18% | 10% | |
| Maximum Upper Side * (°C) | 51 | 50 2% | 48.9 4% | 47 8% | 46.4 9% | 41 20% | 42 18% |
| Maximum Bottom * (°C) | 53 | 50 6% | 44.6 16% | 48 9% | 49 8% | 44 17% | 52 2% |
| Idle Upper Side * (°C) | 29 | 33 -14% | 27.1 7% | 35 -21% | 26.5 9% | 23 21% | 26 10% |
| Idle Bottom * (°C) | 30 | 32 -7% | 27.5 8% | 38 -27% | 26.6 11% | 26 13% | 27 10% |
* ... Meglio usare valori piccoli
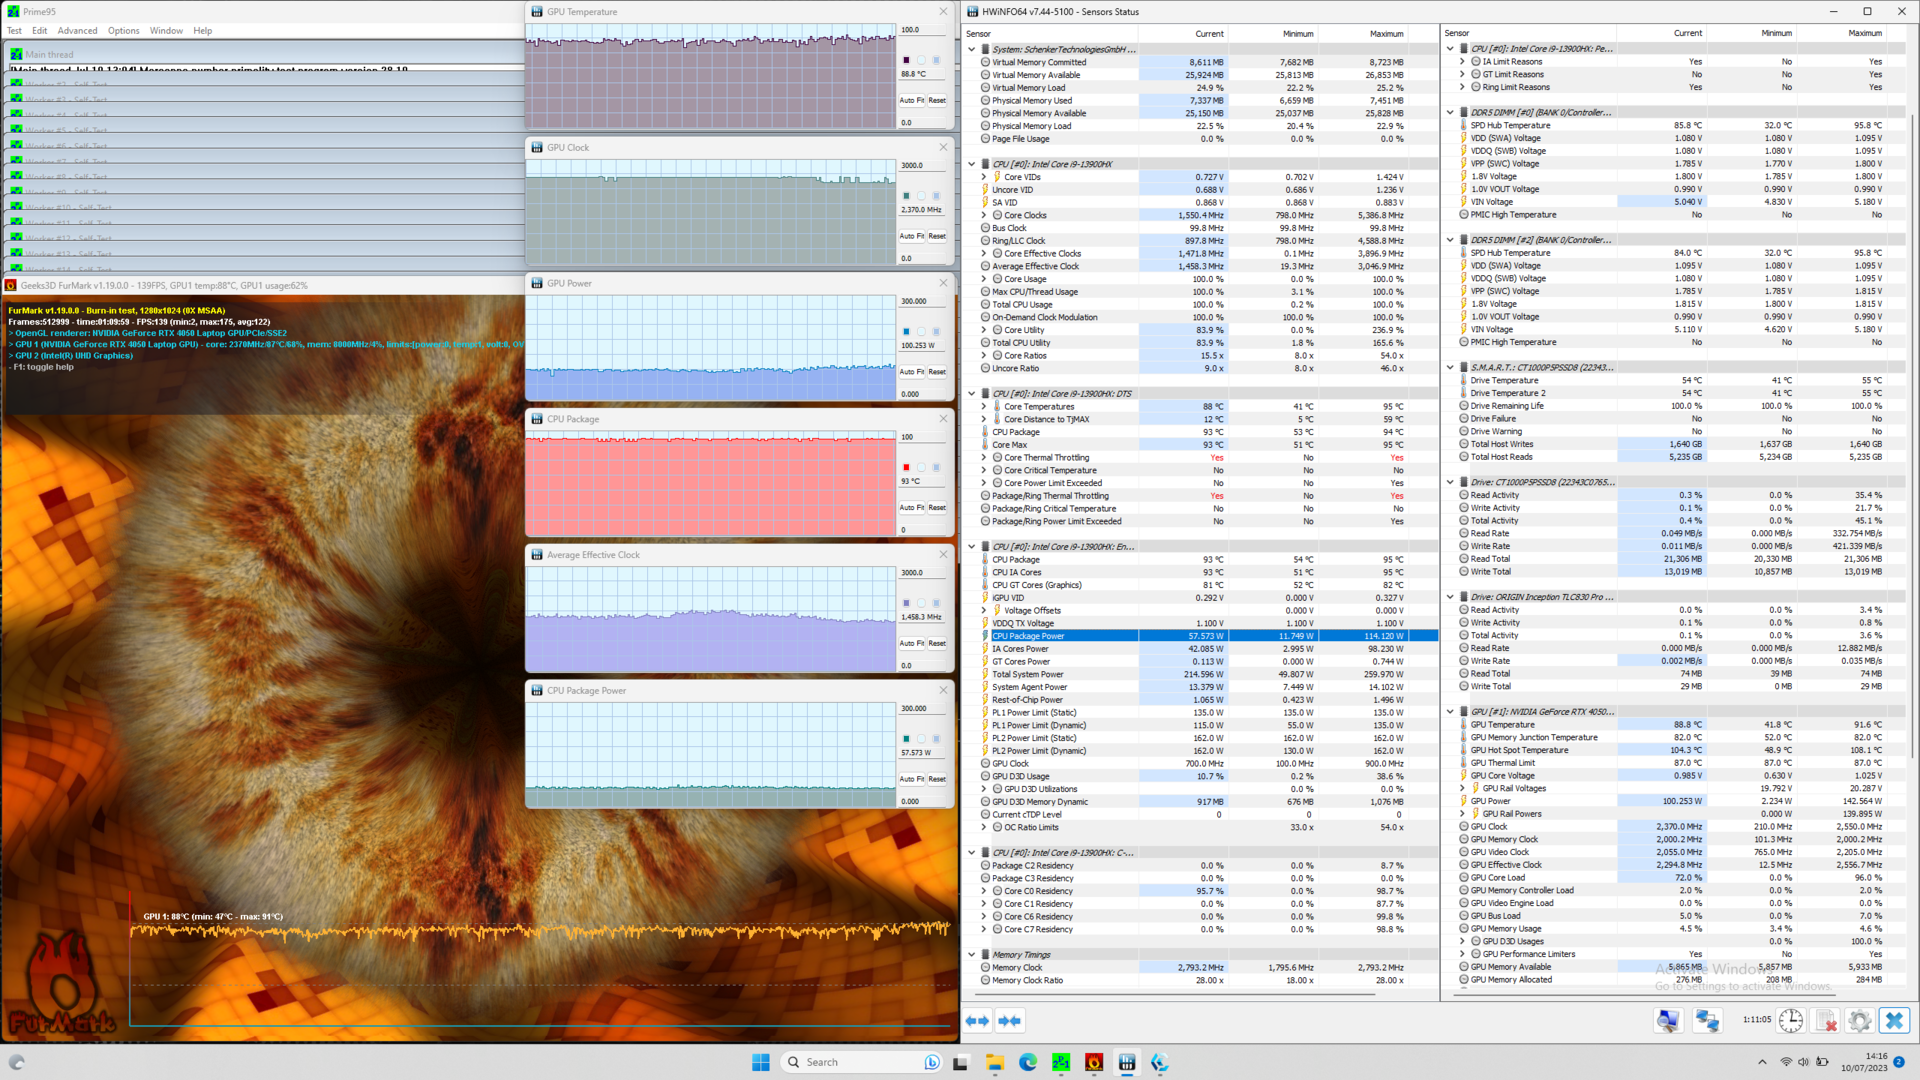
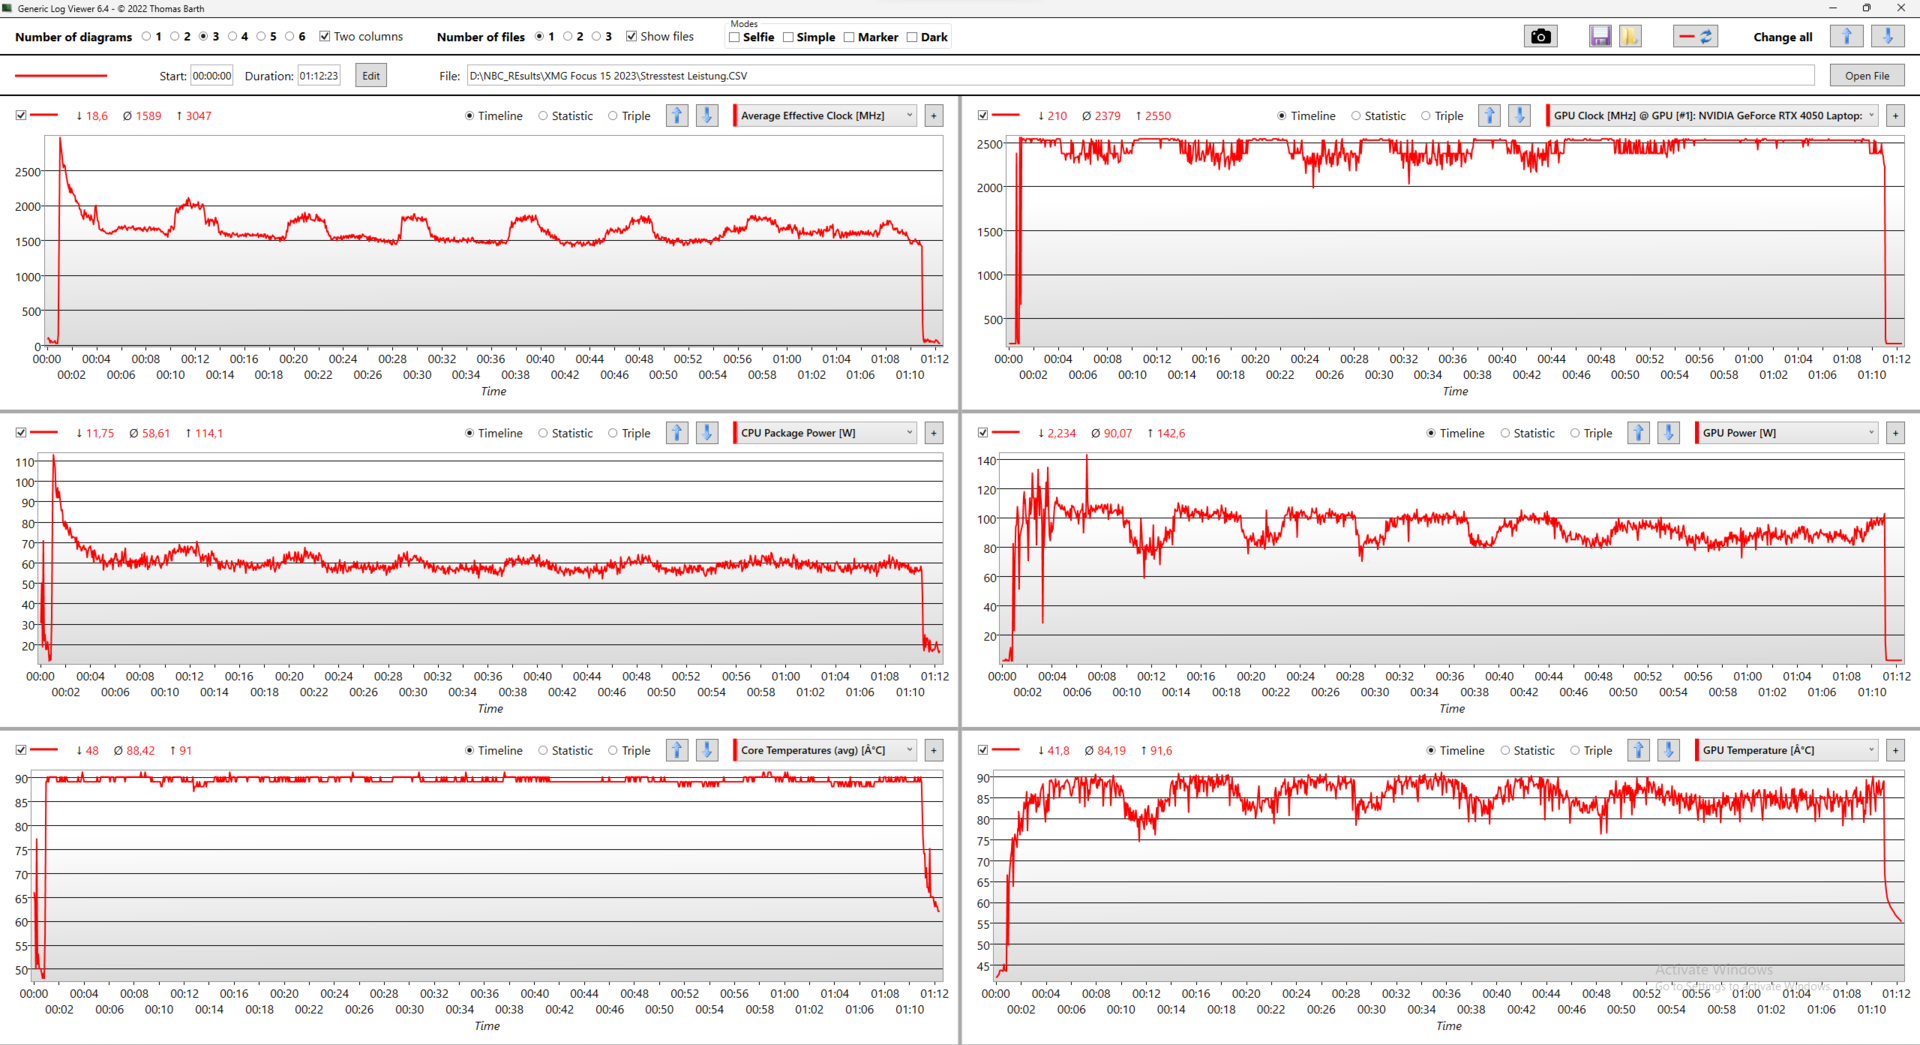
Test da sforzo
L'XMG Focus 15 sopravvive allo stress test con Prime95 e Furmark ad alte temperature con prestazioni costanti. Non siamo riusciti a determinare un calo del clock della CPU o della GPU dopo la fase di boost.
In compenso, le temperature del Core i9 sono relativamente elevate, intorno ai 90 °C. Tuttavia, osservando i log dello stress test, dobbiamo notare che i valori dichiarati da Schenker non vengono mantenuti a lungo termine.
Dopo circa 10 minuti di stress test, le prestazioni della CPU si assestano intorno ai 60 W e il consumo energetico della GPU a 100 W. Nel frattempo, il Dynamic Boost da 15 W viene scambiato di tanto in tanto tra il processore e il chip grafico.
Altoparlante
I diffusori del Focus 15 presentano relativamente bene i medi e gli alti, ma non sono in grado di riprodurre i bassi. Per questo motivo, il Focus 15 suona un po' meglio del Pro 15.
Se gli altoparlanti interni sembrano inadeguati, è sempre possibile utilizzare dispositivi esterni collegati tramite Bluetooth o jack da 3,5 mm.
Schenker XMG Focus 15 (E23) analisi audio
(±) | potenza degli altiparlanti media ma buona (77.39 dB)
Bassi 100 - 315 Hz
(-) | quasi nessun basso - in media 29% inferiori alla media
(±) | la linearità dei bassi è media (9.5% delta rispetto alla precedente frequenza)
Medi 400 - 2000 Hz
(±) | medi elevati - circa 5.2% superiore alla media
(±) | linearità dei medi adeguata (7.2% delta rispetto alla precedente frequenza)
Alti 2 - 16 kHz
(±) | alti elevati - circa 5.4% superiori alla media
(+) | alti lineari (3.4% delta rispetto alla precedente frequenza)
Nel complesso 100 - 16.000 Hz
(±) | la linearità complessiva del suono è media (24.9% di differenza rispetto alla media
Rispetto alla stessa classe
» 89% di tutti i dispositivi testati in questa classe è stato migliore, 3% simile, 7% peggiore
» Il migliore ha avuto un delta di 6%, medio di 18%, peggiore di 132%
Rispetto a tutti i dispositivi testati
» 76% di tutti i dispositivi testati in questa classe è stato migliore, 5% similare, 19% peggiore
» Il migliore ha avuto un delta di 4%, medio di 23%, peggiore di 134%
Schenker XMG Pro 15 (E23) analisi audio
(±) | potenza degli altiparlanti media ma buona (72.52 dB)
Bassi 100 - 315 Hz
(±) | bassi ridotti - in media 12.9% inferiori alla media
(±) | la linearità dei bassi è media (7.2% delta rispetto alla precedente frequenza)
Medi 400 - 2000 Hz
(±) | medi elevati - circa 6.2% superiore alla media
(±) | linearità dei medi adeguata (7.8% delta rispetto alla precedente frequenza)
Alti 2 - 16 kHz
(+) | Alti bilanciati - appena 2.5% dalla media
(+) | alti lineari (4.6% delta rispetto alla precedente frequenza)
Nel complesso 100 - 16.000 Hz
(±) | la linearità complessiva del suono è media (18% di differenza rispetto alla media
Rispetto alla stessa classe
» 56% di tutti i dispositivi testati in questa classe è stato migliore, 9% simile, 36% peggiore
» Il migliore ha avuto un delta di 6%, medio di 18%, peggiore di 132%
Rispetto a tutti i dispositivi testati
» 38% di tutti i dispositivi testati in questa classe è stato migliore, 8% similare, 54% peggiore
» Il migliore ha avuto un delta di 4%, medio di 23%, peggiore di 134%
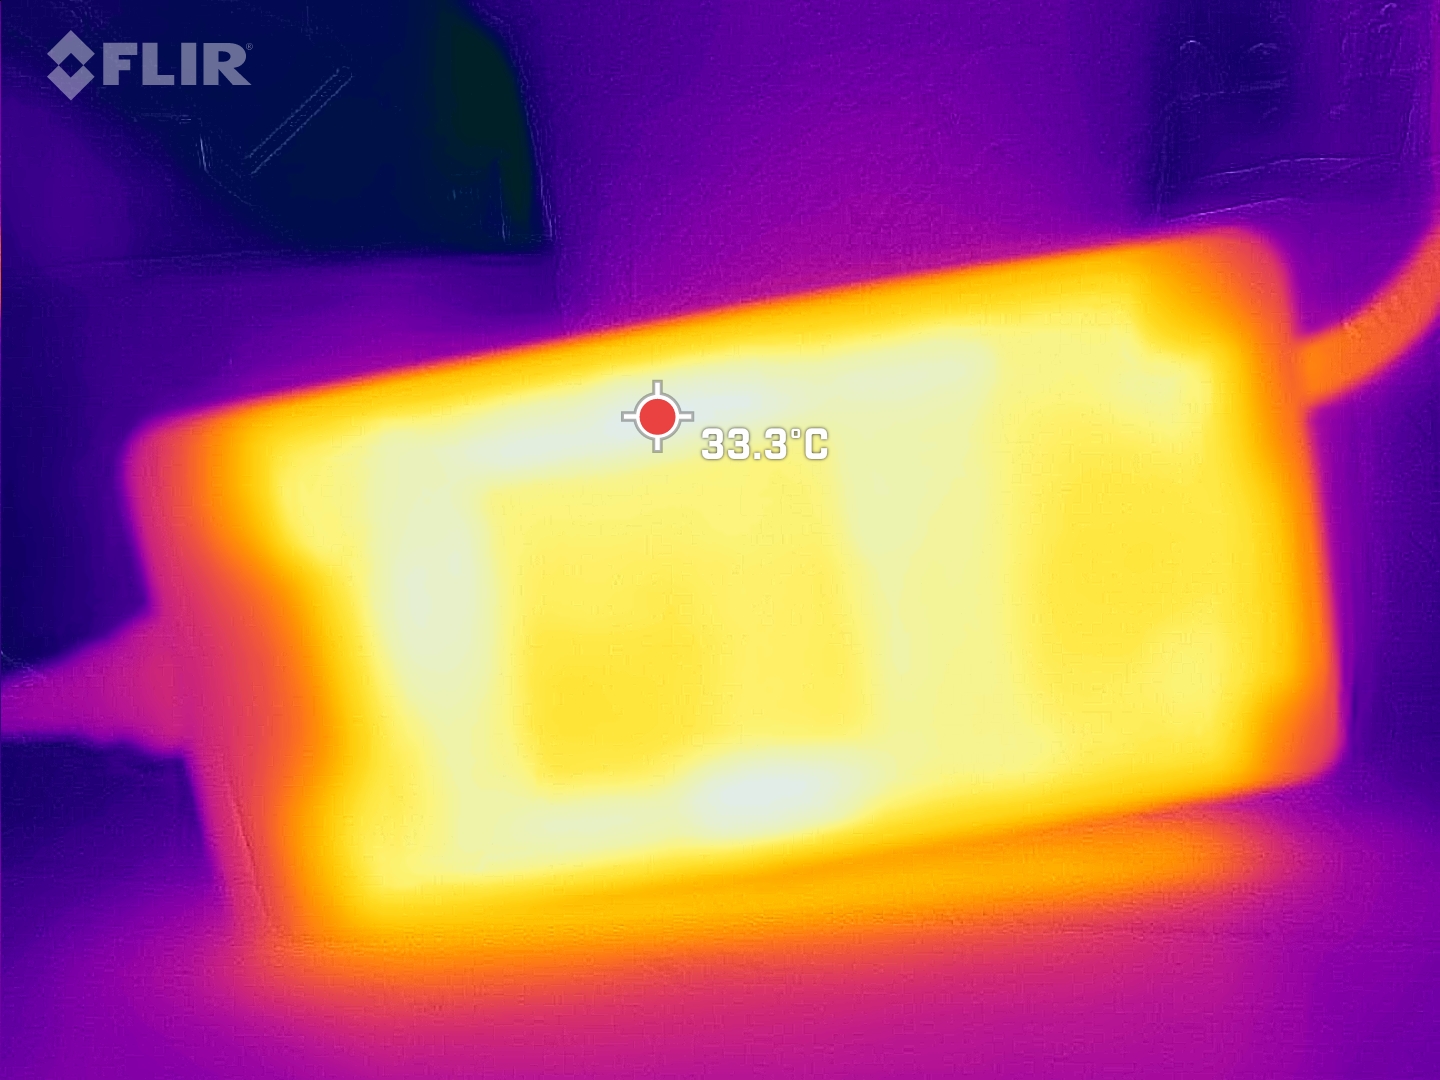
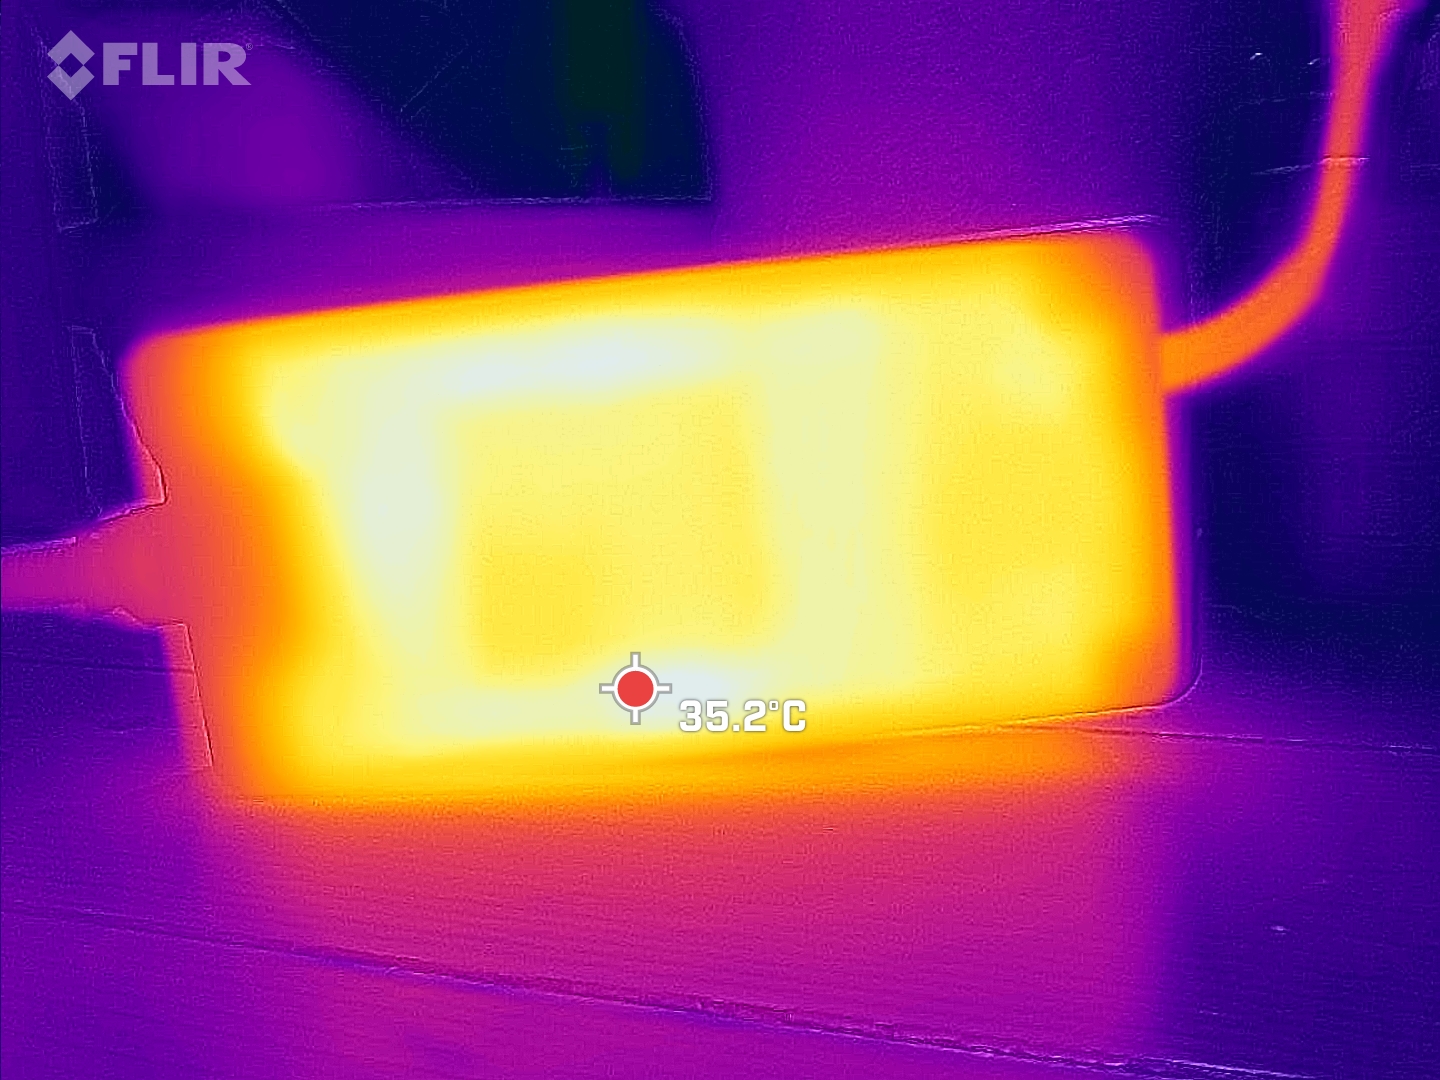
Gestione dell'alimentazione: Laptop da gioco affamato di energia
Consumo di energia
Lo Schenker XMG Focus 15 è dotato di una fame di energia di classe. È incluso un alimentatore di grandi dimensioni che può erogare fino a 280 W.
È interessante notare che il consumo di picco del Focus 15 è superiore a quello del Pro 15, quindi anche la potenza dell'alimentatore viene sfruttata appieno.
Quando si utilizza un monitor esterno, il portatile è stabile anche oltre i 280 W nello stress test. Con il monitor interno, il consumo energetico è sceso un po' in breve tempo.
| Off / Standby | |
| Idle | |
| Sotto carico |
|
Leggenda:
min: | |
| Schenker XMG Focus 15 (E23) i9-13900HX, GeForce RTX 4050 Laptop GPU, Crucial P5 Plus 1TB CT1000P5PSSD8, IPS, 2569x1440, 15.6" | Schenker XMG Pro 15 (E23) i9-13900HX, GeForce RTX 4060 Laptop GPU, Crucial P5 Plus 1TB CT1000P5PSSD8, IPS, 2560x1440, 15.6" | Asus TUF A15 FA507 R7 7735HS, GeForce RTX 4050 Laptop GPU, Micron 2400 MTFDKBA512QFM, IPS, 1920x1080, 15.6" | MSI Katana 15 B12VEK i7-12650H, GeForce RTX 4050 Laptop GPU, Micron 2400 MTFDKBA1T0QFM, IPS, 1920x1080, 15.6" | Acer Swift X SFX14-71G i7-13700H, GeForce RTX 4050 Laptop GPU, Samsung PM9A1 MZVL21T0HCLR, OLED, 2880x1800, 14.5" | Samsung Galaxy Book3 Ultra 16 i7-13700H, GeForce RTX 4050 Laptop GPU, Samsung PM9A1 MZVL2512HCJQ, AMOLED, 2880x1800, 16" | Gigabyte Aero 14 OLED BMF i7-13700H, GeForce RTX 4050 Laptop GPU, Gigabyte AG470S1TB-SI B10, OLED, 2880x1800, 14" | Media NVIDIA GeForce RTX 4050 Laptop GPU | Media della classe Gaming | |
|---|---|---|---|---|---|---|---|---|---|
| Power Consumption | -39% | 40% | 41% | 47% | 64% | 54% | 23% | 2% | |
| Idle Minimum * (Watt) | 11.4 | 21.6 -89% | 8 30% | 8.5 25% | 8.4 26% | 3 74% | 7.4 35% | 9.95 ? 13% | 13 ? -14% |
| Idle Average * (Watt) | 16.7 | 29 -74% | 12.1 28% | 10.2 39% | 11.5 31% | 5 70% | 8.3 50% | 15.8 ? 5% | 18.7 ? -12% |
| Idle Maximum * (Watt) | 25.8 | 42.7 -66% | 12.5 52% | 11.3 56% | 11.9 54% | 11 57% | 8.7 66% | 20.1 ? 22% | 24.3 ? 6% |
| Load Average * (Watt) | 139 | 190 -37% | 74.9 46% | 84 40% | 84.9 39% | 72 48% | 76 45% | 88 ? 37% | 110.2 ? 21% |
| Witcher 3 ultra * (Watt) | 265 | 189 29% | 136.6 48% | 128 52% | 83.6 68% | 69.7 74% | 70 74% | ||
| Load Maximum * (Watt) | 280 | 269 4% | 185 34% | 189 32% | 104.2 63% | 108 61% | 132 53% | 176.3 ? 37% | 258 ? 8% |
* ... Meglio usare valori piccoli
Power consumption: The Witcher 3 / Stress test
Power consumption: External Monitor
Durata della batteria
Abbiamo determinato quasi sei ore di autonomia nel test pratico di navigazione web Wi-Fi. Pertanto, il dispositivo di prova è inferiore di soli due minuti alla media dei portatili da gioco.
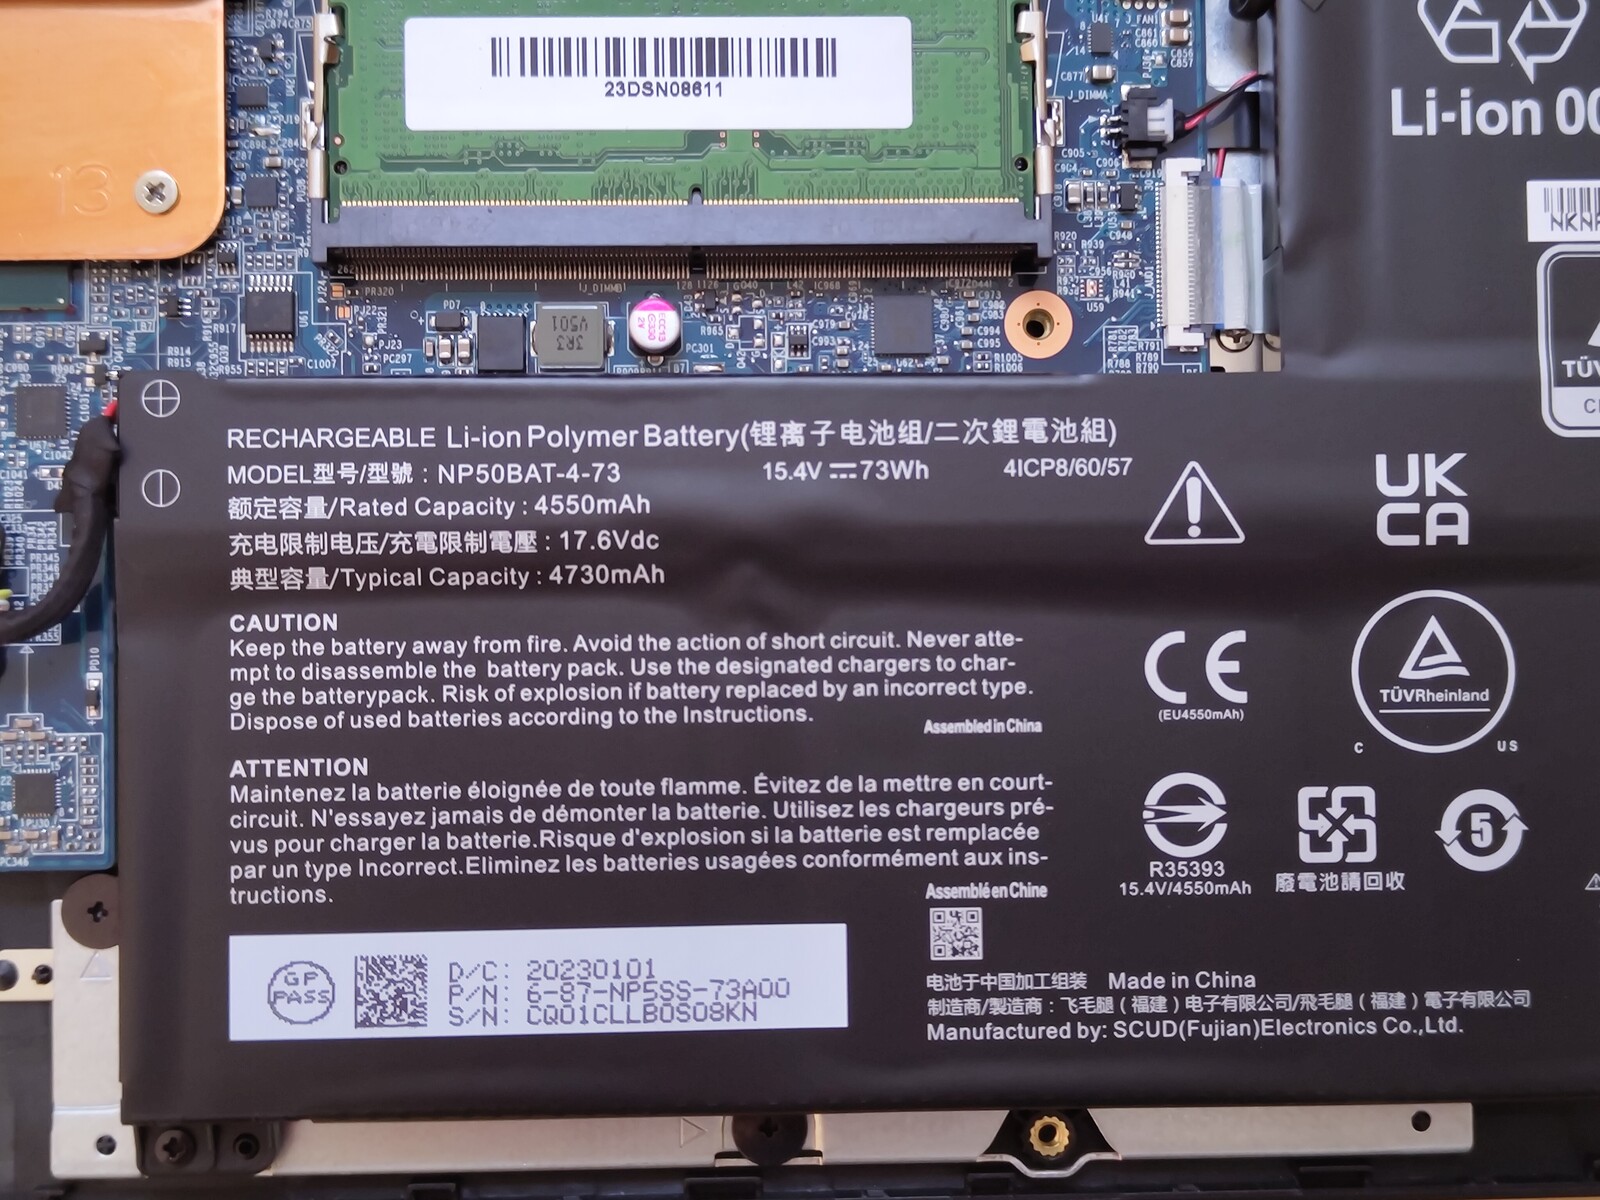
Nel frattempo, i giocatori possono ottenere tempi di esecuzione significativamente più lunghi in modalità batteria. Tuttavia, la capacità di 73 Wh della batteria si scarica piuttosto rapidamente.
| Schenker XMG Focus 15 (E23) i9-13900HX, GeForce RTX 4050 Laptop GPU, 73 Wh | Schenker XMG Pro 15 (E23) i9-13900HX, GeForce RTX 4060 Laptop GPU, 80 Wh | Asus TUF A15 FA507 R7 7735HS, GeForce RTX 4050 Laptop GPU, 90 Wh | MSI Katana 15 B12VEK i7-12650H, GeForce RTX 4050 Laptop GPU, 53.5 Wh | Acer Swift X SFX14-71G i7-13700H, GeForce RTX 4050 Laptop GPU, 76 Wh | Samsung Galaxy Book3 Ultra 16 i7-13700H, GeForce RTX 4050 Laptop GPU, 76 Wh | Gigabyte Aero 14 OLED BMF i7-13700H, GeForce RTX 4050 Laptop GPU, 63 Wh | Media della classe Gaming | |
|---|---|---|---|---|---|---|---|---|
| Autonomia della batteria | 22% | 38% | -6% | -8% | 51% | 22% | 19% | |
| WiFi v1.3 (h) | 5.9 | 5.7 -3% | 11.7 98% | 4.3 -27% | 7.7 31% | 9.6 63% | 7.6 29% | 7.11 ? 21% |
| Load (h) | 1.3 | 1.9 46% | 1 -23% | 1.5 15% | 0.7 -46% | 1.8 38% | 1.5 15% | 1.502 ? 16% |
| H.264 (h) | 12.5 | 4.4 | 9.5 | 13.4 | 8.32 ? | |||
| Reader / Idle (h) | 18.2 | 11.3 | 8.16 ? |
Pro
Contro
Verdetto: XMG cattura l'essenza del gioco
Se volete un portatile da 15,6 pollici con una GPU Nvidia attuale di Schenker o XMG, potete scegliere tra il modelloXMG Apex 15 Max e Focus, oltre ai modelli Schenker Key e Media. Il modello XMG Pro 15 e l'XMG Focus 15 sono molto vicini nel test.
Il Focus 15 si concentra sugli aspetti fondamentali. Il portatile da gioco convince soprattutto per l'hardware ad alte prestazioni. IlIntel Core i9-13900HX e Nvidia GeForce RTX 4050 lavorano a un livello di prestazioni molto elevato. Se da un lato questo si traduce in punteggi elevati nei benchmark, dall'altro contribuisce a creare temperature superficiali elevate, ventole più rumorose e tempi di esecuzione della batteria più brevi rispetto a molti dei suoi contemporanei, come l'Asus TUF A15 Asus TUF A15.
Se lo chassis debba essere in metallo come quello del Pro 15 o se possa essere realizzato in plastica è una questione di gusti. Dall'esterno, il Pro 15 e il Focus 15 sembrano molto simili. Tuttavia, l'esemplare in prova offre meno connettività e manca di una porta USB Type-C con Power Delivery.
L'XMG Focus 15 soddisfa i requisiti di base di un portatile da gioco. Grazie alle numerose opzioni di configurazione, può essere adattato alle esigenze dell'utente.
Come nel caso del Pro 15, anche nel Focus 15 si possono trovare solo pochi punti negativi. Infatti, tutti gli svantaggi che il portatile presenta sono tipici della sua classe di prezzo e di prestazioni.
Rispetto ad altri portatili da gioco più economici come Asus TUF A15 o MSI Katana 15, l'estremamente potente Core i9-13900HX e il buon schermo QHD dell'XMG Focus spiccano positivamente.
Prezzo e disponibilità
L'XMG Focus 15 può essere configurato liberamente da Bestware. Sono disponibili due opzioni di display, tre scelte di GPU e diverse combinazioni di memoria. Nella configurazione di base assoluta, con soli 8 GB di memoria di lavoro e senza SSD o Windows, il prezzo di base è di circa 1.440 euro (~US$1.618).
Per una configurazione con un display Full HD, 16 GB di memoria di lavoro e un'unità SSD Samsung da 1 TB, Bestware chiede circa 1.560 euro. La nostra configurazione di prova costa circa 300 euro in più. Se avete intenzione di fare il passo più lungo della gamba e di scegliere i componenti più costosi, prevedete di spendere più di 3.500 euro per questo portatile.
Schenker XMG Focus 15 (E23)
- 07/10/2023 v7 (old)
Marc Herter
Transparency
La selezione dei dispositivi da recensire viene effettuata dalla nostra redazione. Il campione di prova è stato fornito all'autore come prestito dal produttore o dal rivenditore ai fini di questa recensione. L'istituto di credito non ha avuto alcuna influenza su questa recensione, né il produttore ne ha ricevuto una copia prima della pubblicazione. Non vi era alcun obbligo di pubblicare questa recensione. In quanto società mediatica indipendente, Notebookcheck non è soggetta all'autorità di produttori, rivenditori o editori.
Ecco come Notebookcheck esegue i test
Ogni anno, Notebookcheck esamina in modo indipendente centinaia di laptop e smartphone utilizzando procedure standardizzate per garantire che tutti i risultati siano comparabili. Da circa 20 anni sviluppiamo continuamente i nostri metodi di prova e nel frattempo stabiliamo gli standard di settore. Nei nostri laboratori di prova, tecnici ed editori esperti utilizzano apparecchiature di misurazione di alta qualità. Questi test comportano un processo di validazione in più fasi. Il nostro complesso sistema di valutazione si basa su centinaia di misurazioni e parametri di riferimento ben fondati, che mantengono l'obiettività.Price comparison
