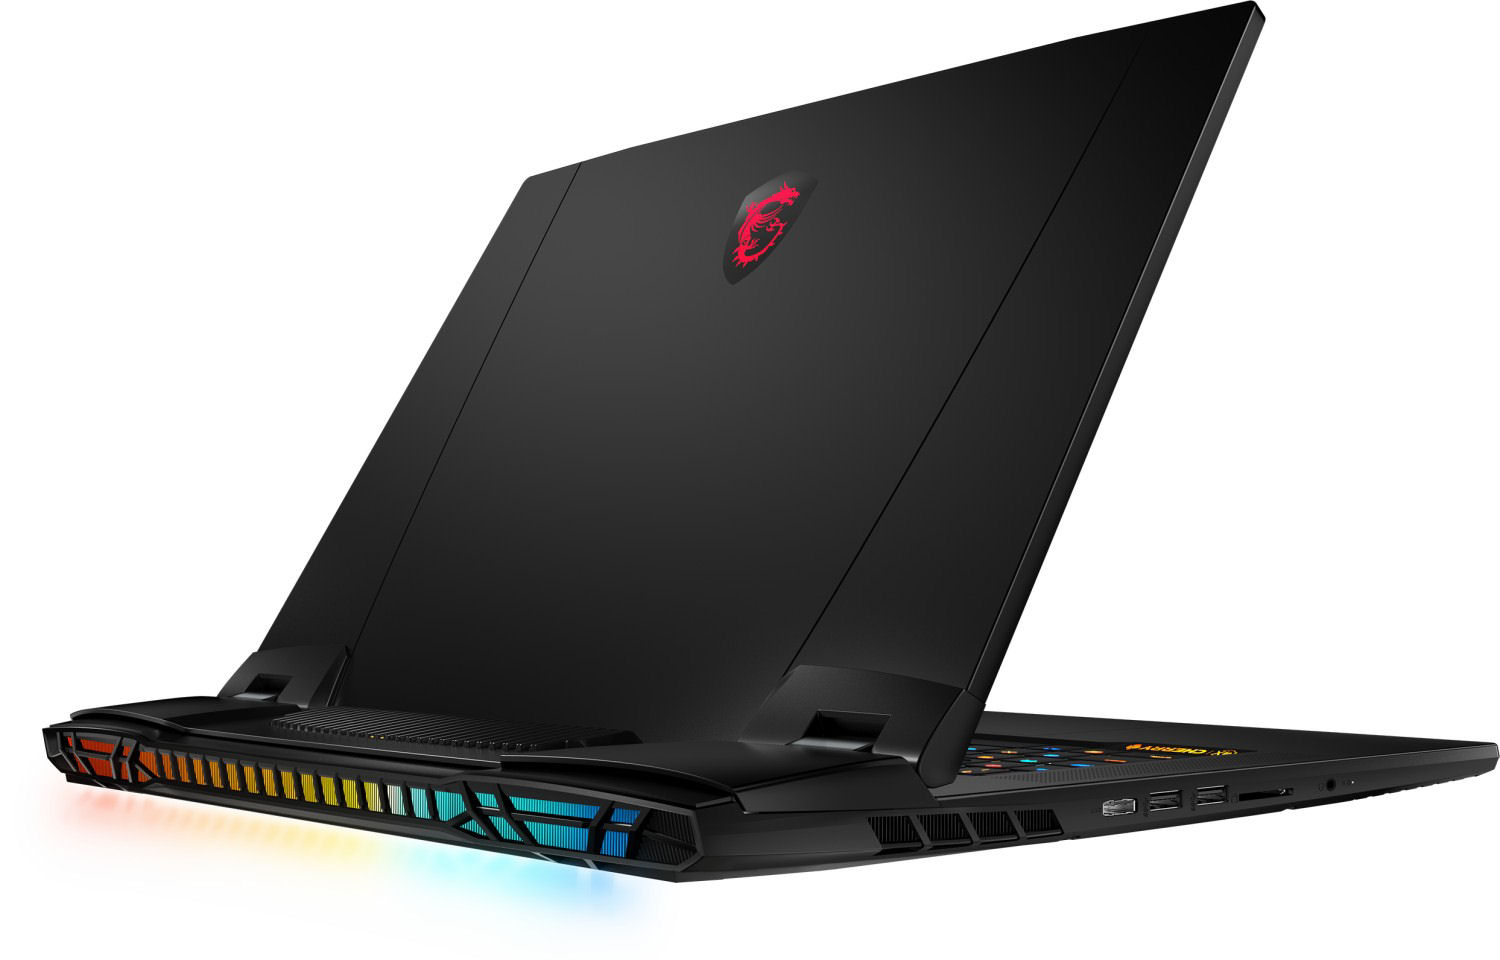
Recensione dell'MSI Titan GT77 12UHS 4K: Elite tra i portatili UHD DTR
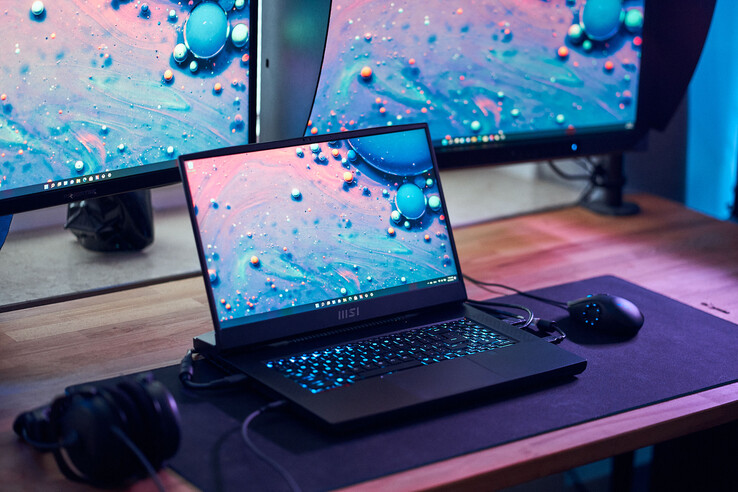
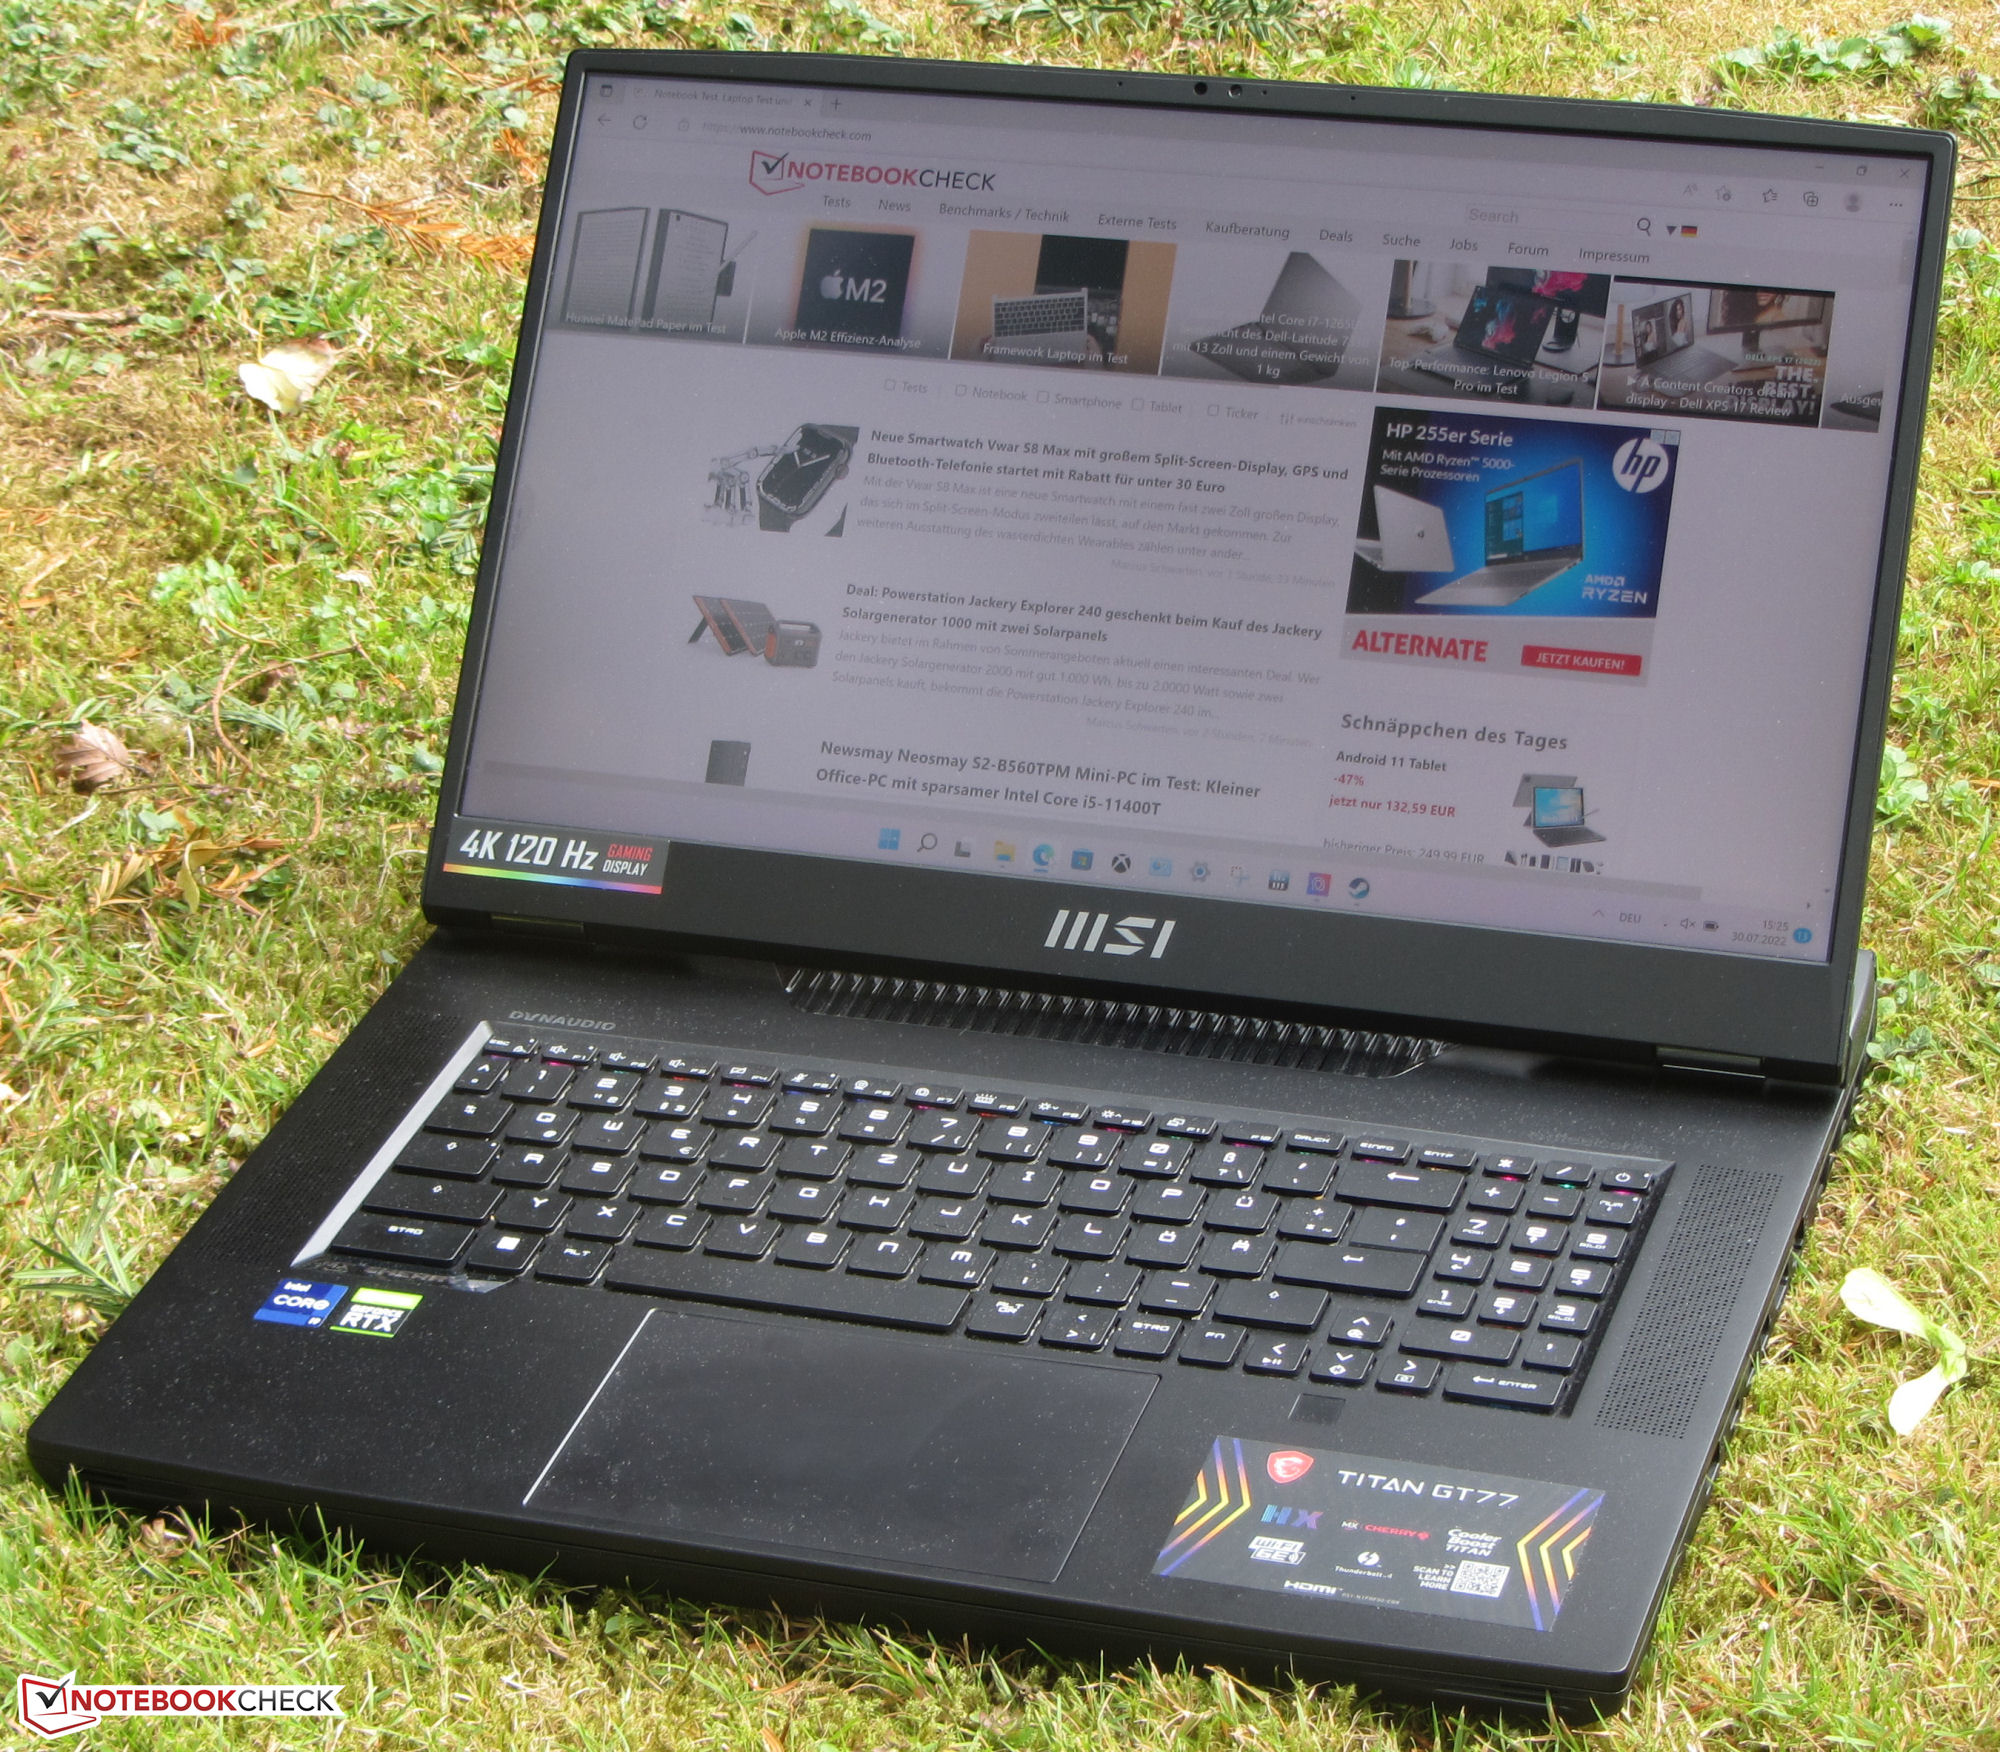
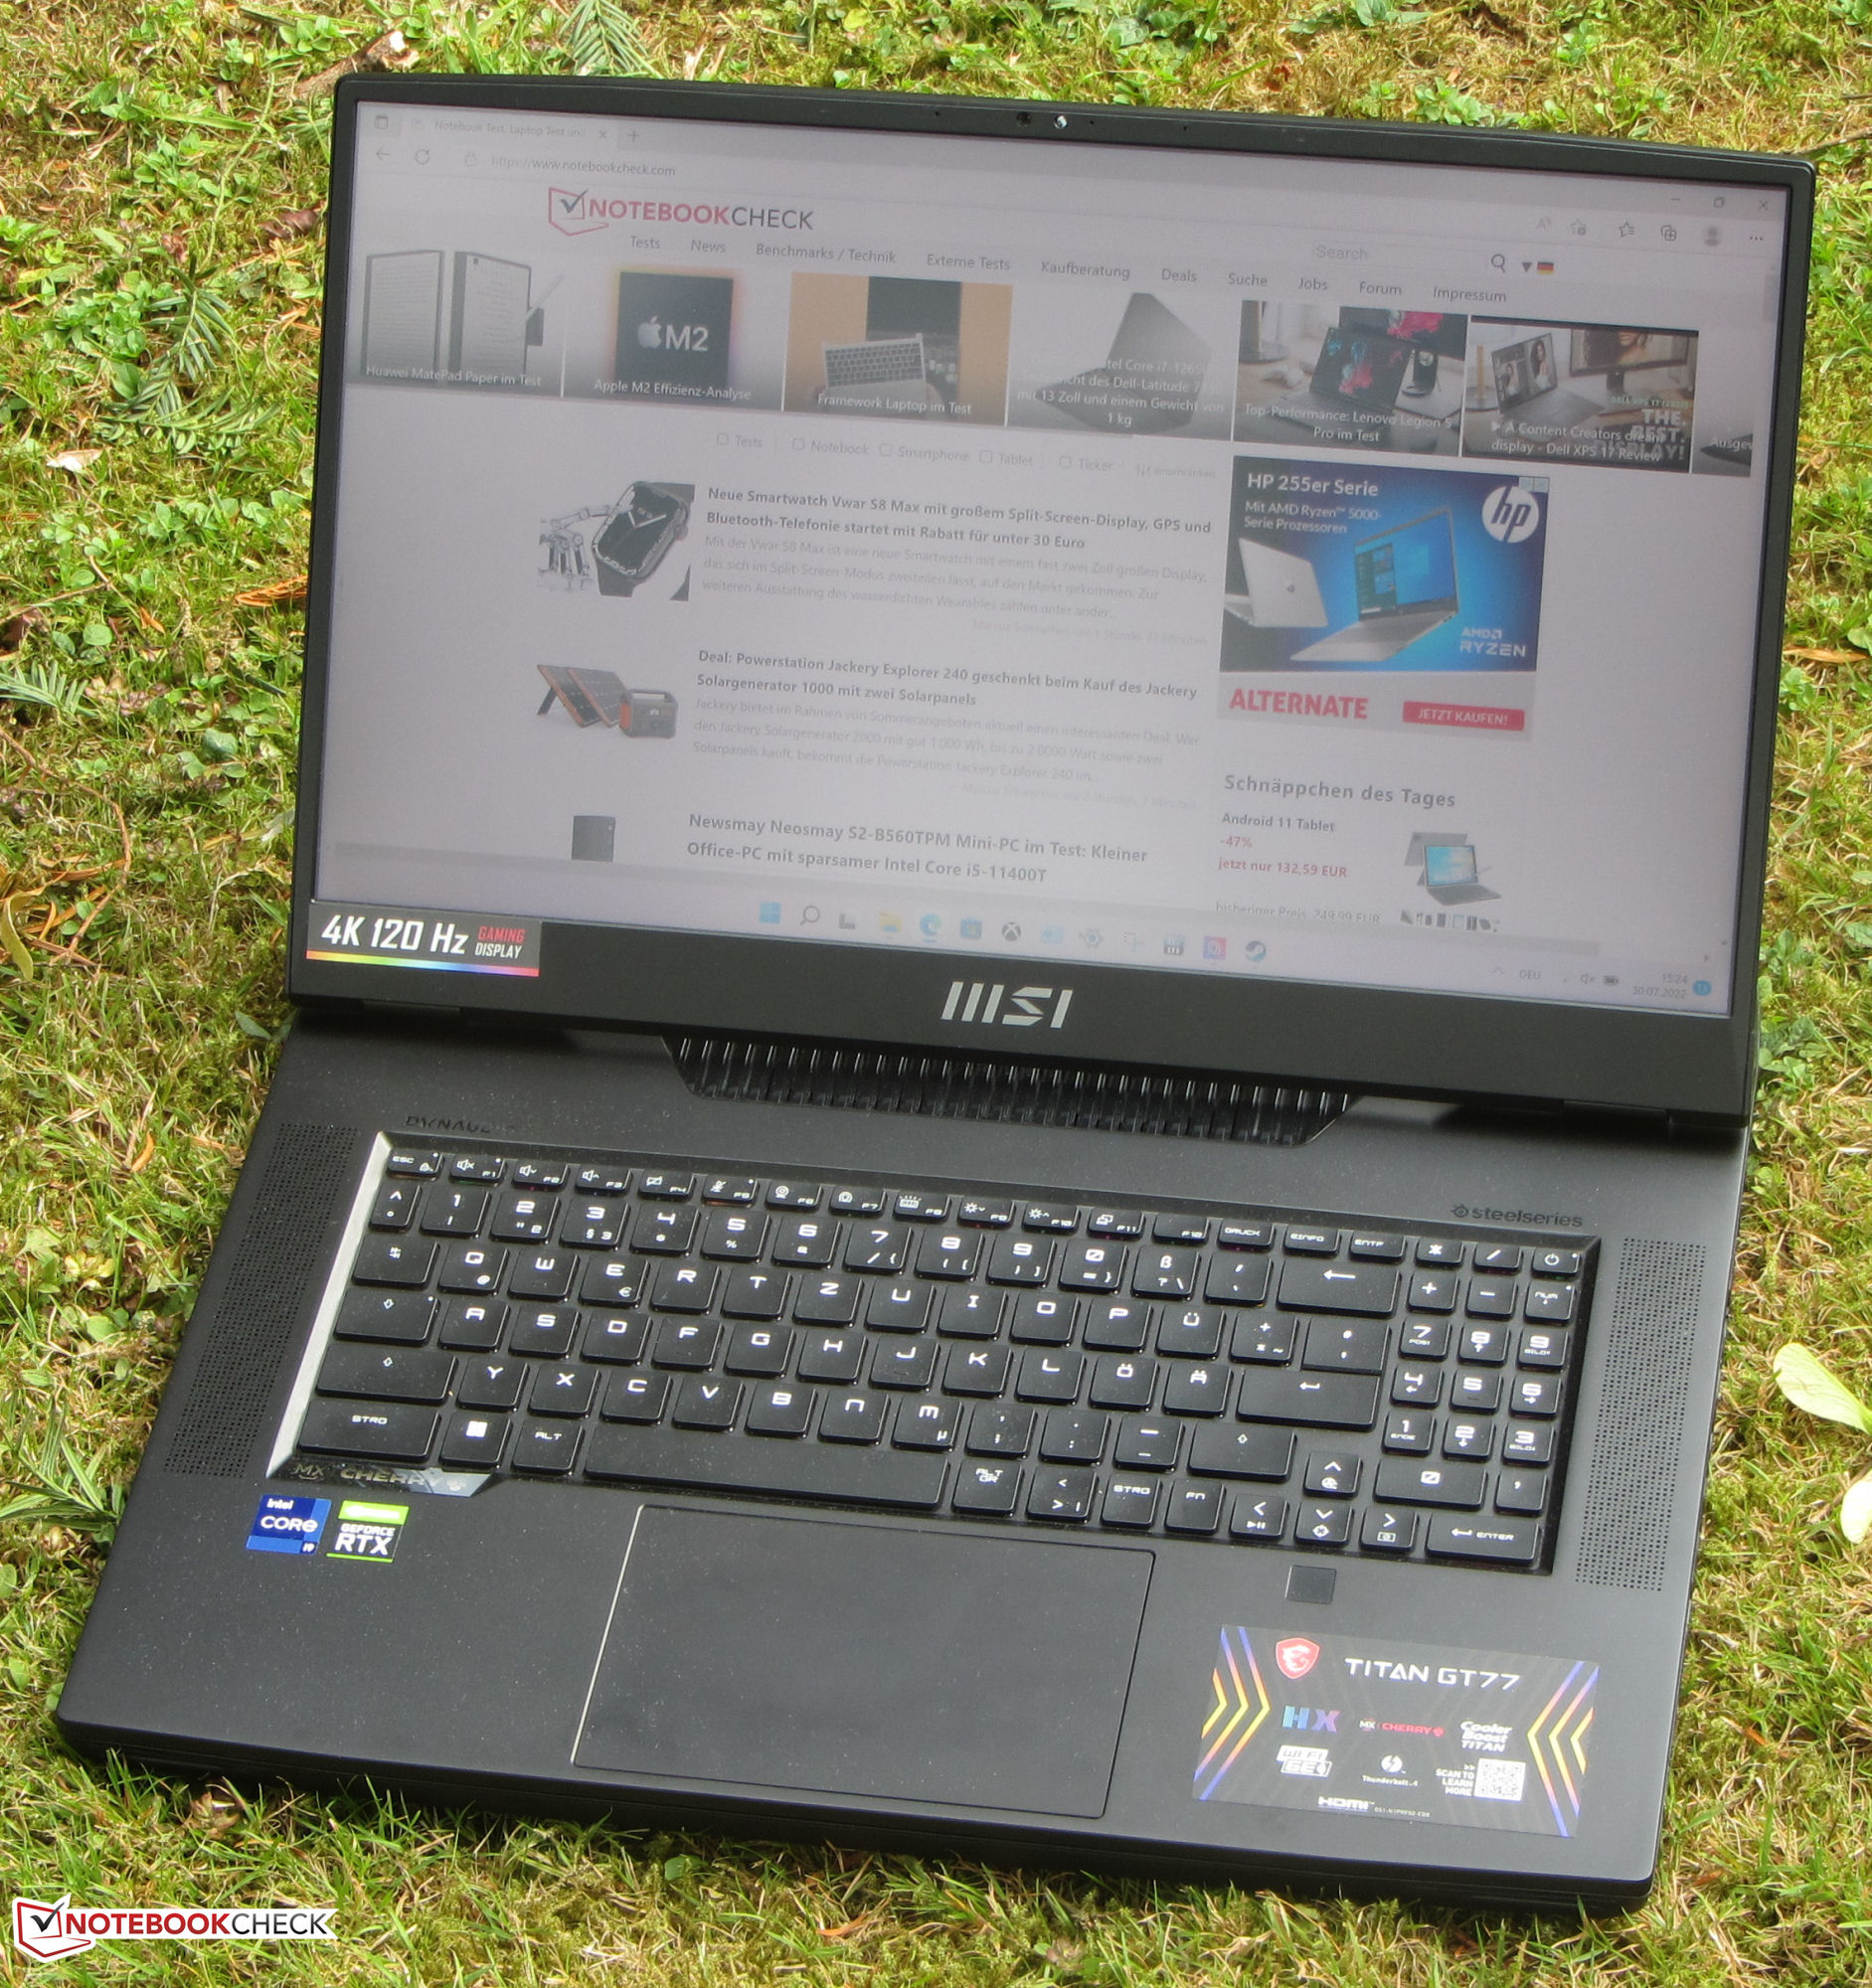
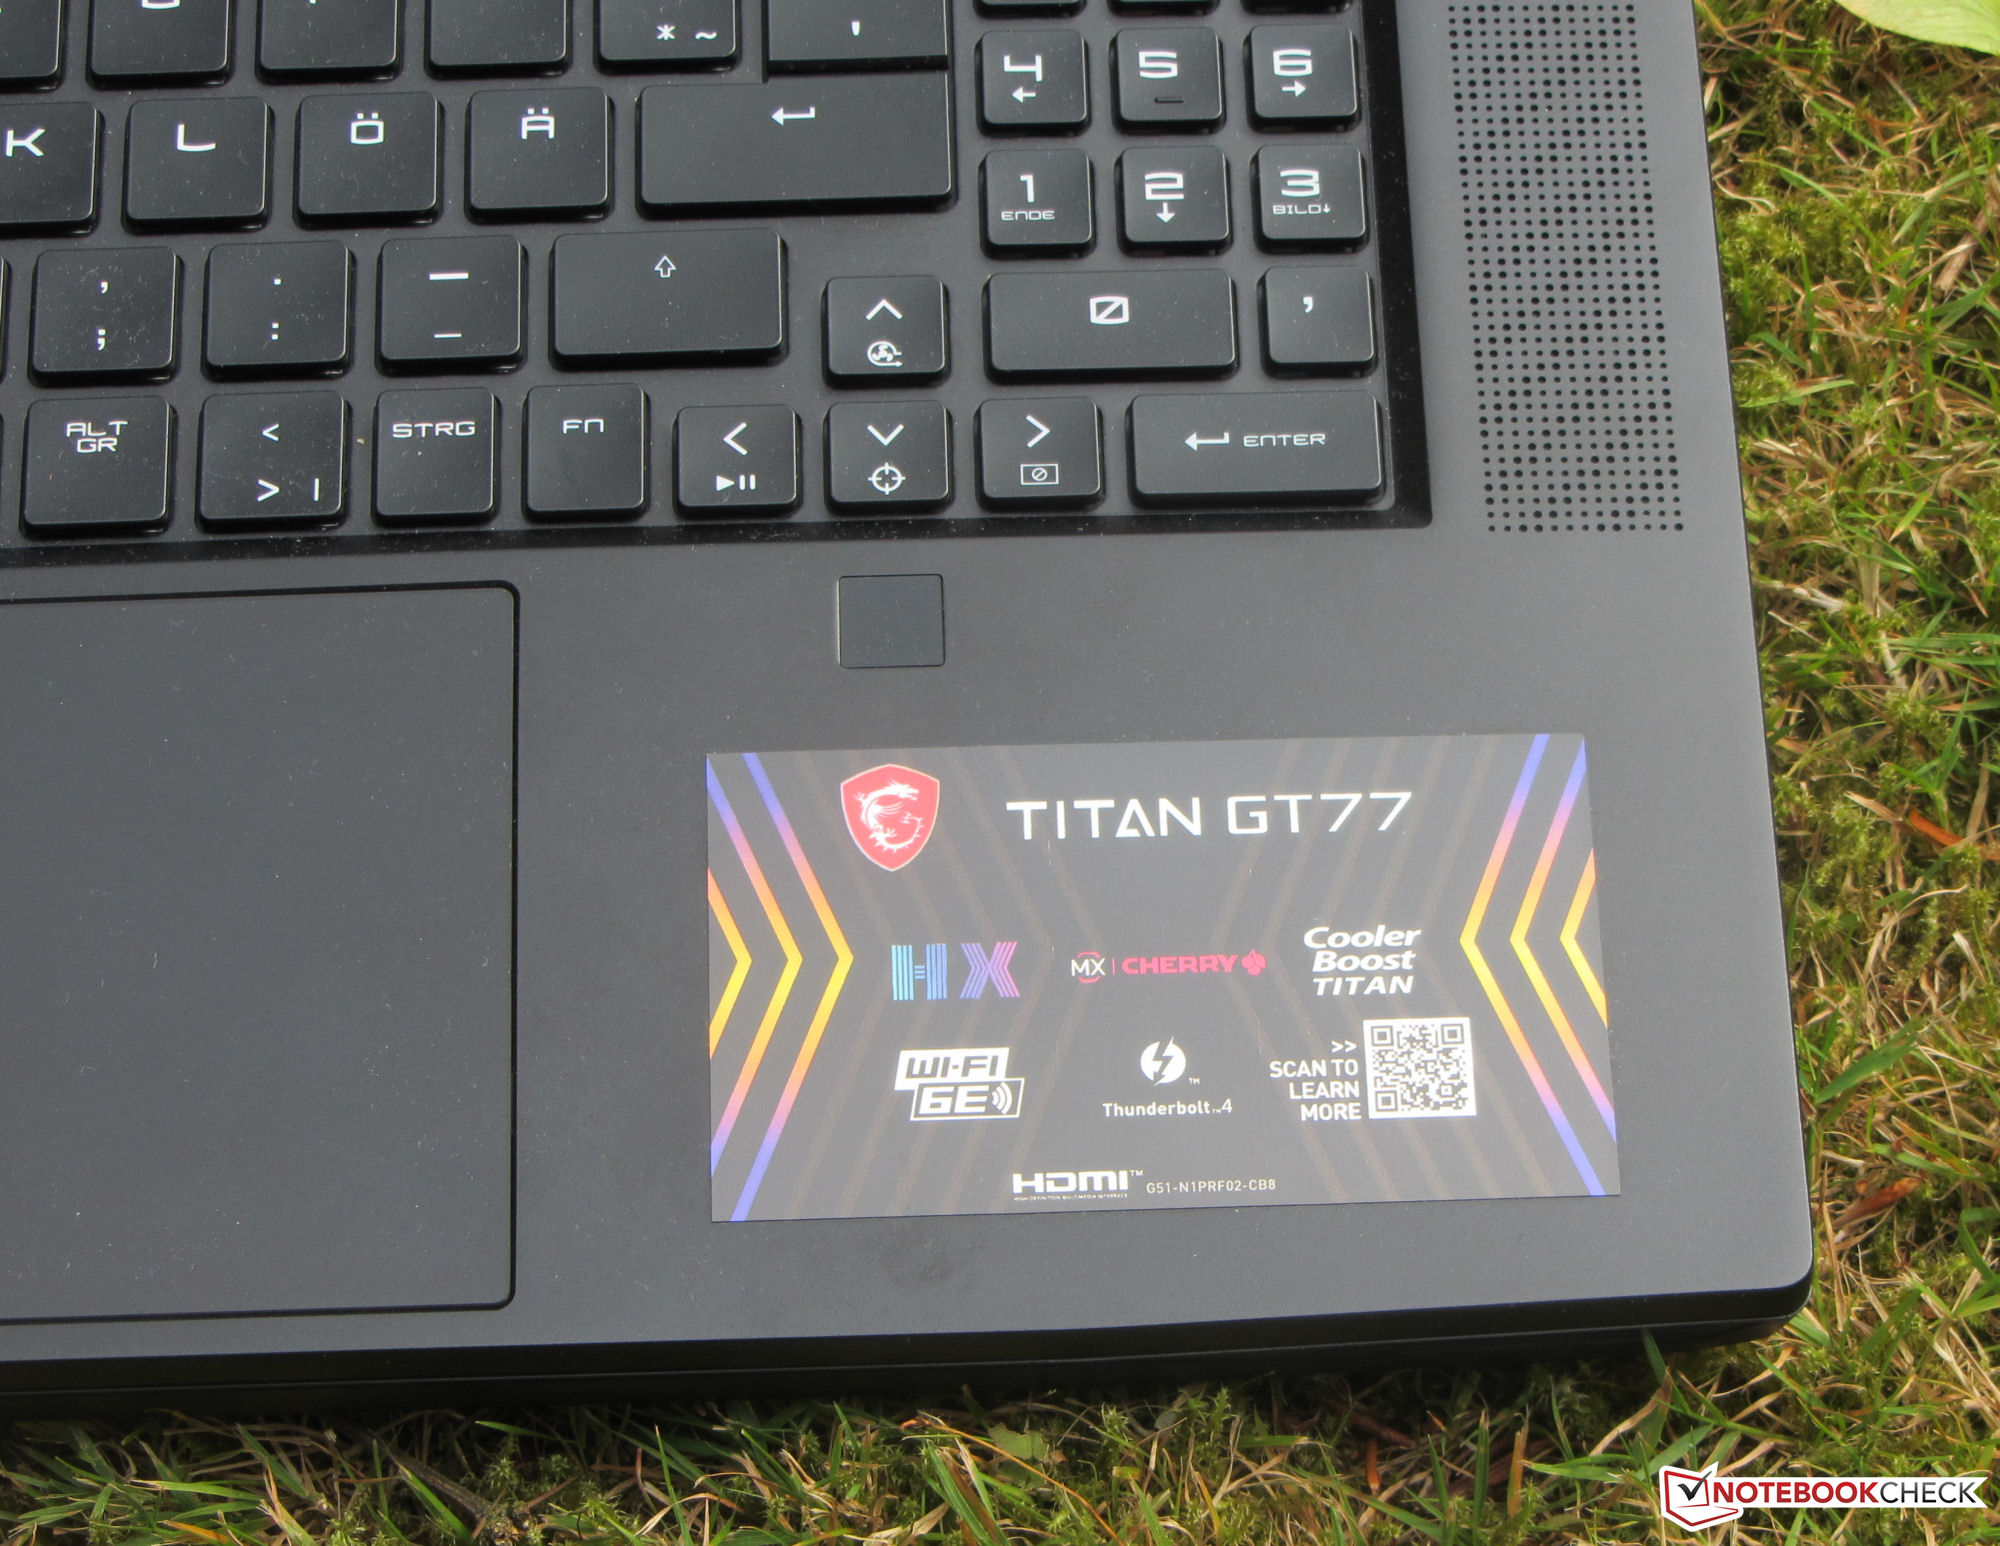
I videogiocatori e i creativi sono entrambi parte del pubblico di riferimento dell'MSI Titan GT77 12UHS - un laptop desktop replacement (DTR). Le specifiche di fascia alta (Core i9-12900HX, GeForce RTX 3080 Ti Laptop e 64 GB di RAM) spingono il prezzo del portatile a circa 5.600 euro (5.980 dollari). Il display è la principale differenza tra questo dispositivo e il suo Modello fratello FHDche abbiamo recensito di recente: l'attuale unità in prova ha a bordo un pannello 4K. Tra i suoi concorrenti troviamo il modello Schenker XMG Ultra 17, il Razer Blade 17 e l' Alienware x17 R2.
Poiché questo dispositivo e la sua controparte FHD sono costruiti in modo identico, potete leggere la nostra recensione dell' MSI Titan GT77 12UHS (Core i9, FHD)per ulteriori informazioni su chassis, dispositivi di input e altoparlanti.
Potenziali concorrenti a confronto
Punteggio | Data | Modello | Peso | Altezza | Dimensione | Risoluzione | Prezzo |
|---|---|---|---|---|---|---|---|
| 87.8 % v7 (old) | 09/2022 | MSI Titan GT77 12UHS i9-12900HX, GeForce RTX 3080 Ti Laptop GPU | 3.4 kg | 23 mm | 17.30" | 3840x2160 | |
| 89.9 % v7 (old) | 07/2022 | Razer Blade 17 Early 2022 i9-12900H, GeForce RTX 3080 Ti Laptop GPU | 2.8 kg | 19.9 mm | 17.30" | 3840x2160 | |
| 89.2 % v7 (old) | 05/2022 | Alienware x17 R2 P48E i9-12900HK, GeForce RTX 3080 Ti Laptop GPU | 3.1 kg | 20.9 mm | 17.30" | 1920x1080 | |
| 84.9 % v7 (old) | 04/2021 | Schenker XMG Ultra 17 Rocket Lake i9-11900K, GeForce RTX 3080 Laptop GPU | 4.7 kg | 43.5 mm | 17.30" | 1920x1080 |

| SD Card Reader - average JPG Copy Test (av. of 3 runs) | |
| Schenker XMG Ultra 17 Rocket Lake | |
| Alienware x17 R2 P48E (AV Pro V60) | |
| Razer Blade 17 Early 2022 (AV PRO microSD 128 GB V60) | |
| Media della classe Gaming (20.9 - 210, n=54, ultimi 2 anni) | |
| MSI Titan GT77 12UHS (AV PRO microSD 128 GB V60) | |
| MSI Titan GT77 12UHS 4k (AV PRO microSD 128 GB V60) | |


Display - Pannello luminoso con elevata copertura DCI-P3
Il pannello opaco 4K (3.840 x 2.160 pixel) dell'attuale unità in prova offre una luminosità di picco significativamente superiore rispetto al display FHD del modello fratello del modello fratello (401 cd/m² contro 275,1 cd/m²).
Ciononostante, c'è ancora margine di miglioramento in termini di contrasto (871:1 contro 700:1): entrambi i display non raggiungono i valori che consideriamo buoni (> 1.000:1). Sebbene i due pannelli siano molto reattivi, il modello FHD offre una frequenza di aggiornamento notevolmente superiore (120 Hz contro 360 Hz). Durante le nostre misurazioni non abbiamo osservato alcuno sfarfallio PWM.
| |||||||||||||||||||||||||
Distribuzione della luminosità: 91 %
Al centro con la batteria: 418 cd/m²
Contrasto: 871:1 (Nero: 0.48 cd/m²)
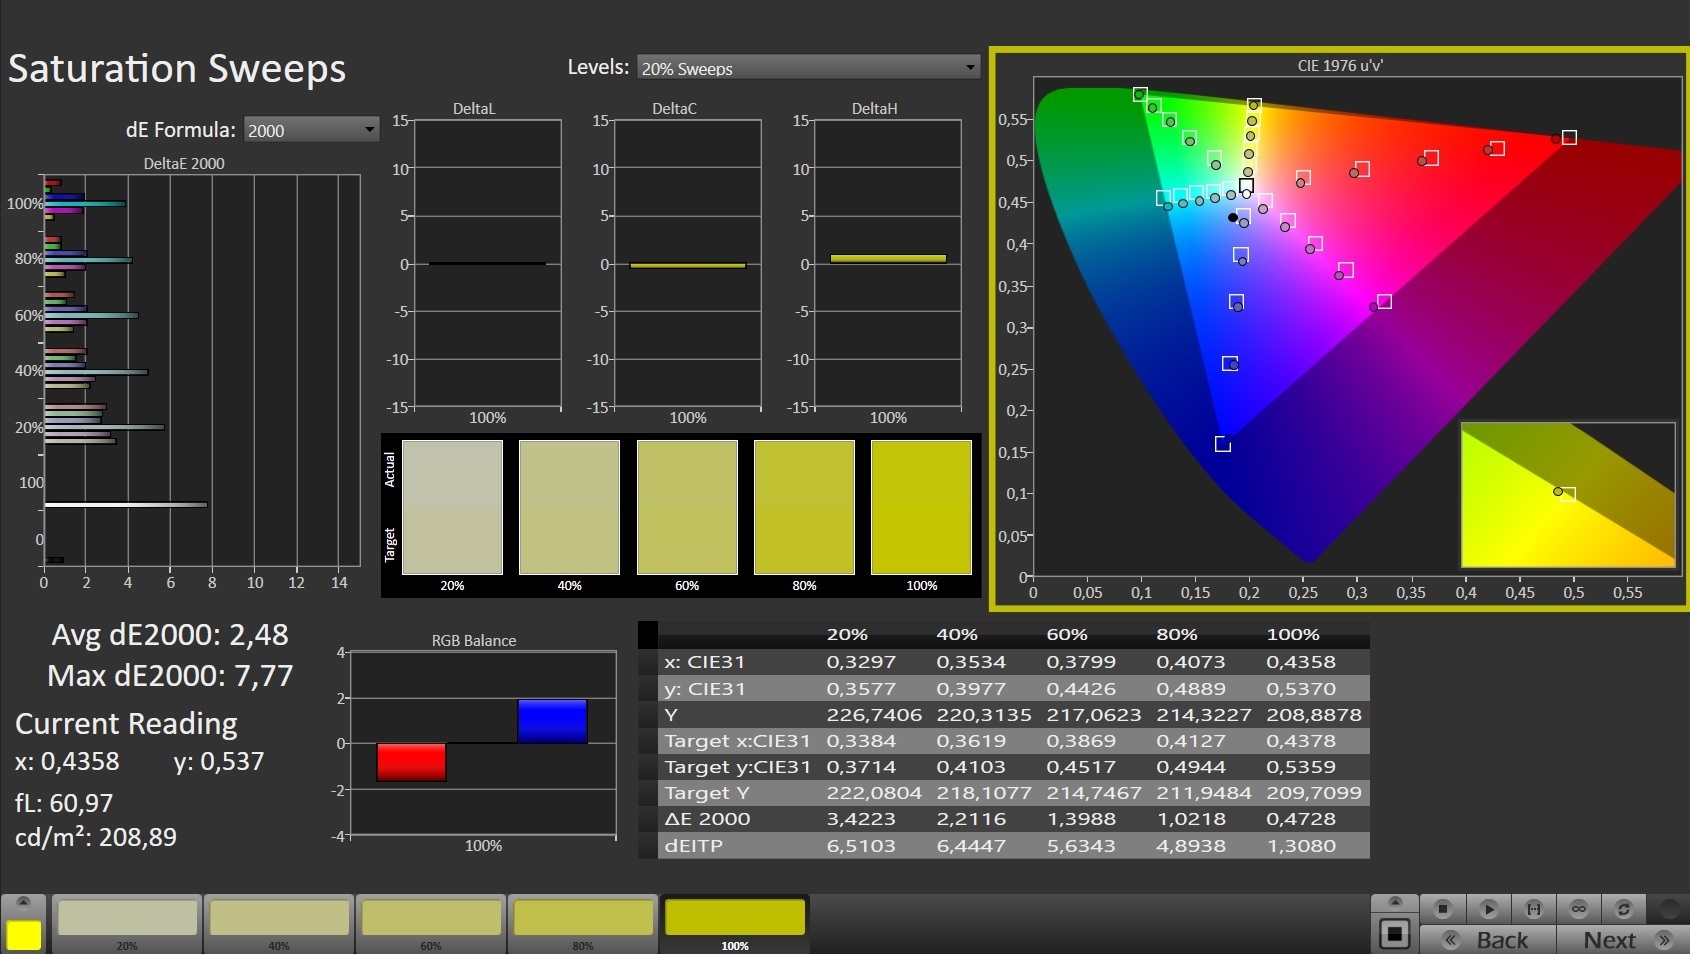
ΔE ColorChecker Calman: 2.47 | ∀{0.5-29.43 Ø4.71}
calibrated: 0.66
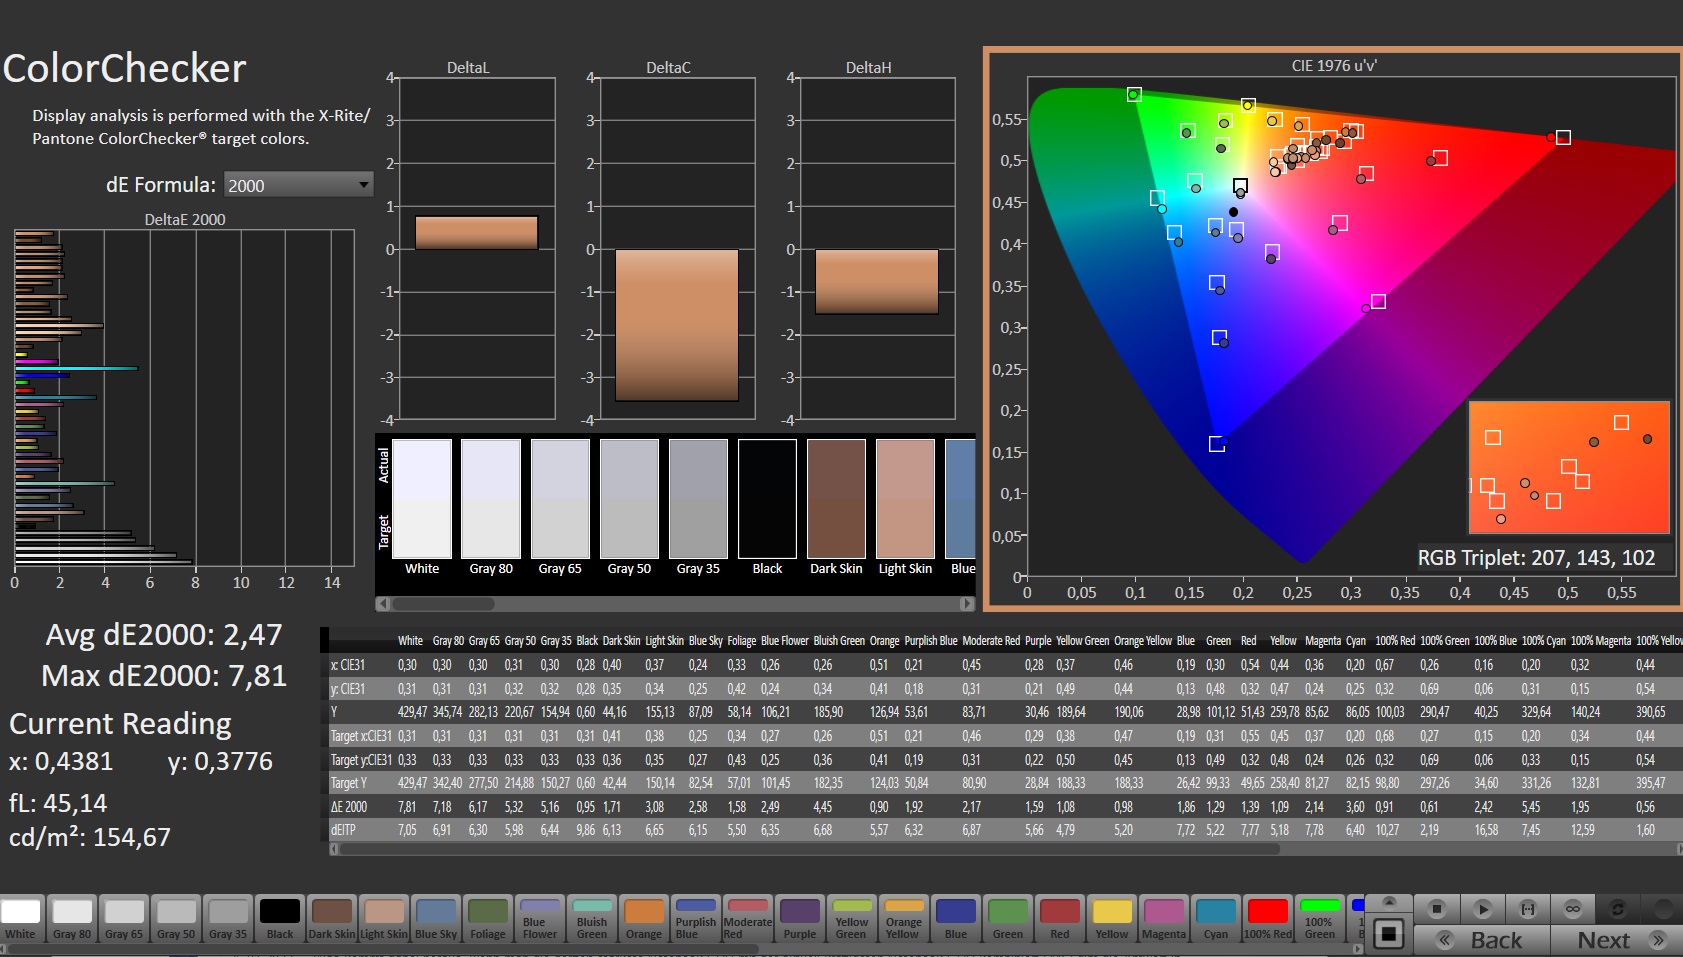
ΔE Greyscale Calman: 4.4 | ∀{0.09-98 Ø4.96}
86.2% AdobeRGB 1998 (Argyll 3D)
99.8% sRGB (Argyll 3D)
97% Display P3 (Argyll 3D)
Gamma: 2.129
CCT: 7197 K
| MSI Titan GT77 12UHS 4k AU Optronics B173ZAN06.1, IPS, 3840x2160, 17.3" | Razer Blade 17 Early 2022 AU Optronics B173ZAN06.9, IPS, 3840x2160, 17.3" | Alienware x17 R2 P48E AU Optronics B173HAN, IPS, 1920x1080, 17.3" | Schenker XMG Ultra 17 Rocket Lake AU Optronics B173HAN05.1, IPS, 1920x1080, 17.3" | MSI Titan GT77 12UHS Sharp SHP1544 LQ173M1JW08, IPS-Level, 1920x1080, 17.3" | |
|---|---|---|---|---|---|
| Display | 1% | -9% | -16% | -14% | |
| Display P3 Coverage (%) | 97 | 99.4 2% | 79.2 -18% | 69.8 -28% | 70.8 -27% |
| sRGB Coverage (%) | 99.8 | 100 0% | 99.8 0% | 97.2 -3% | 98.9 -1% |
| AdobeRGB 1998 Coverage (%) | 86.2 | 87.3 1% | 79.6 -8% | 72 -16% | 73 -15% |
| Response Times | -27% | -109% | -44% | 19% | |
| Response Time Grey 50% / Grey 80% * (ms) | 5.2 ? | 7.5 ? -44% | 12.4 ? -138% | 5.6 ? -8% | 3.03 ? 42% |
| Response Time Black / White * (ms) | 5.1 ? | 5.6 ? -10% | 9.2 ? -80% | 9.2 ? -80% | 5.28 ? -4% |
| PWM Frequency (Hz) | |||||
| Screen | 28% | 3% | 9% | -17% | |
| Brightness middle (cd/m²) | 418 | 503 20% | 365.4 -13% | 306 -27% | 280 -33% |
| Brightness (cd/m²) | 401 | 486 21% | 344 -14% | 299 -25% | 275 -31% |
| Brightness Distribution (%) | 91 | 84 -8% | 85 -7% | 93 2% | 79 -13% |
| Black Level * (cd/m²) | 0.48 | 0.44 8% | 0.29 40% | 0.22 54% | 0.4 17% |
| Contrast (:1) | 871 | 1143 31% | 1260 45% | 1391 60% | 700 -20% |
| Colorchecker dE 2000 * | 2.47 | 1.08 56% | 3.17 -28% | 1.92 22% | 2.1 15% |
| Colorchecker dE 2000 max. * | 7.81 | 4.54 42% | 7.69 2% | 4.78 39% | 5.83 25% |
| Colorchecker dE 2000 calibrated * | 0.66 | 0.6 9% | 0.51 23% | 1.34 -103% | 1.58 -139% |
| Greyscale dE 2000 * | 4.4 | 1.3 70% | 5.3 -20% | 2 55% | 3.3 25% |
| Gamma | 2.129 103% | 2.151 102% | 2.18 101% | 2.153 102% | 2.13 103% |
| CCT | 7197 90% | 6541 99% | 5879 111% | 6738 96% | 7060 92% |
| Color Space (Percent of AdobeRGB 1998) (%) | 72 | ||||
| Color Space (Percent of sRGB) (%) | 93 | ||||
| Media totale (Programma / Settaggio) | 1% /
14% | -38% /
-15% | -17% /
-4% | -4% /
-11% |
* ... Meglio usare valori piccoli
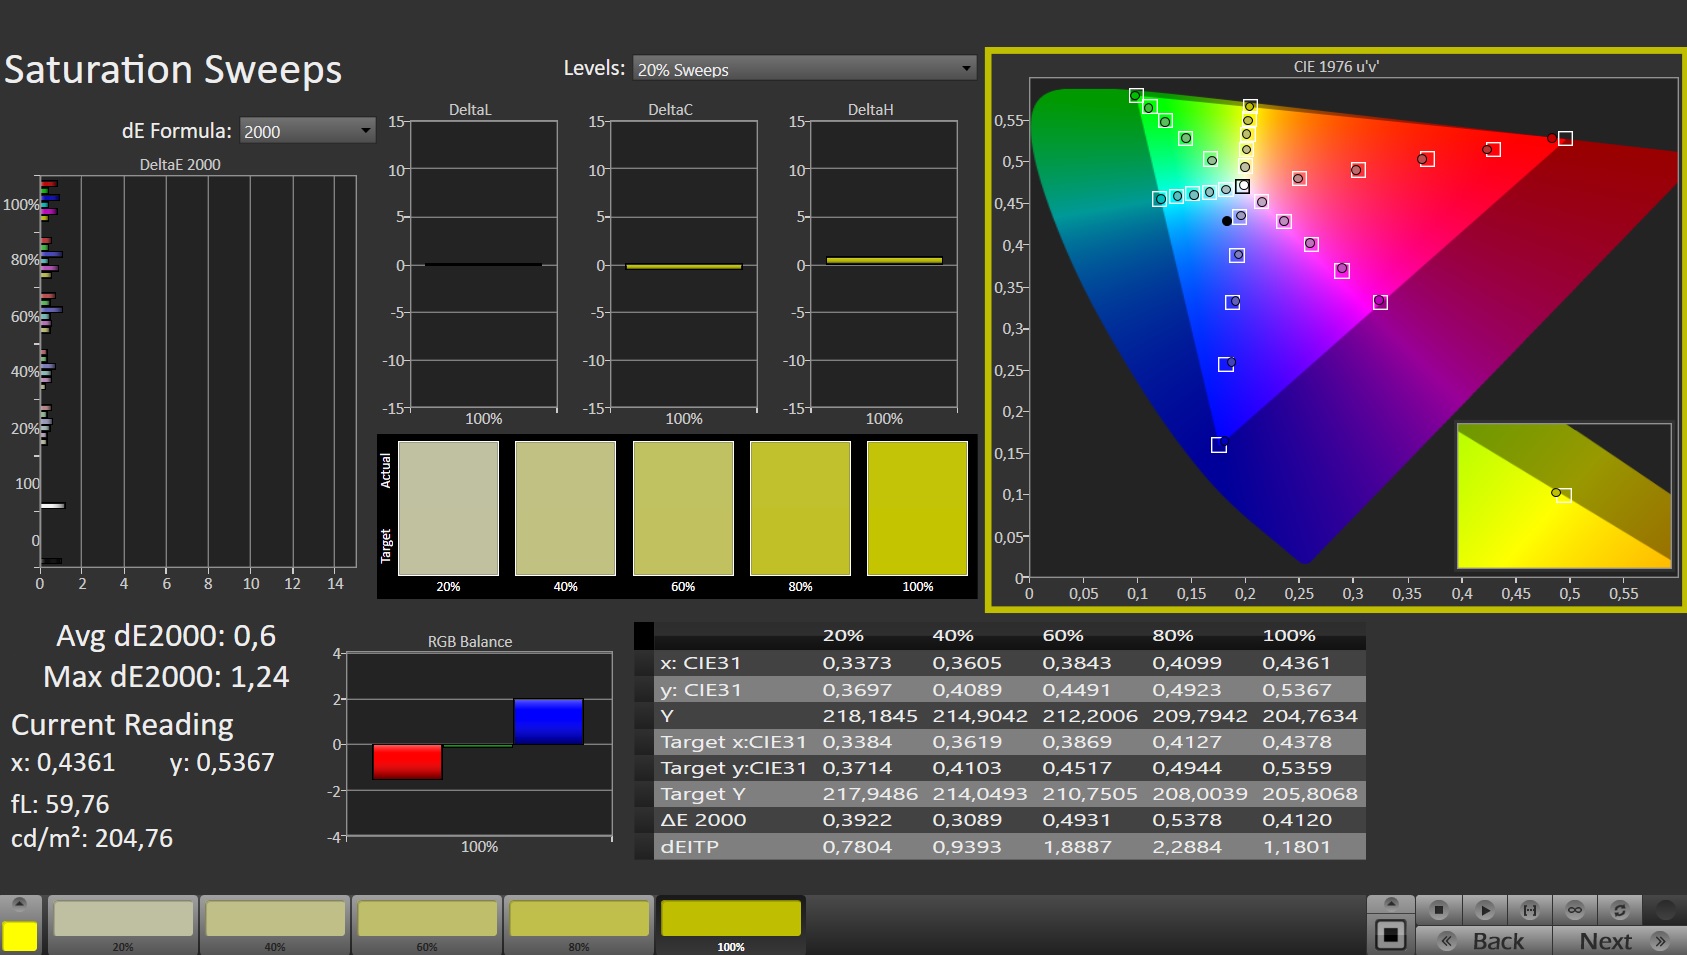
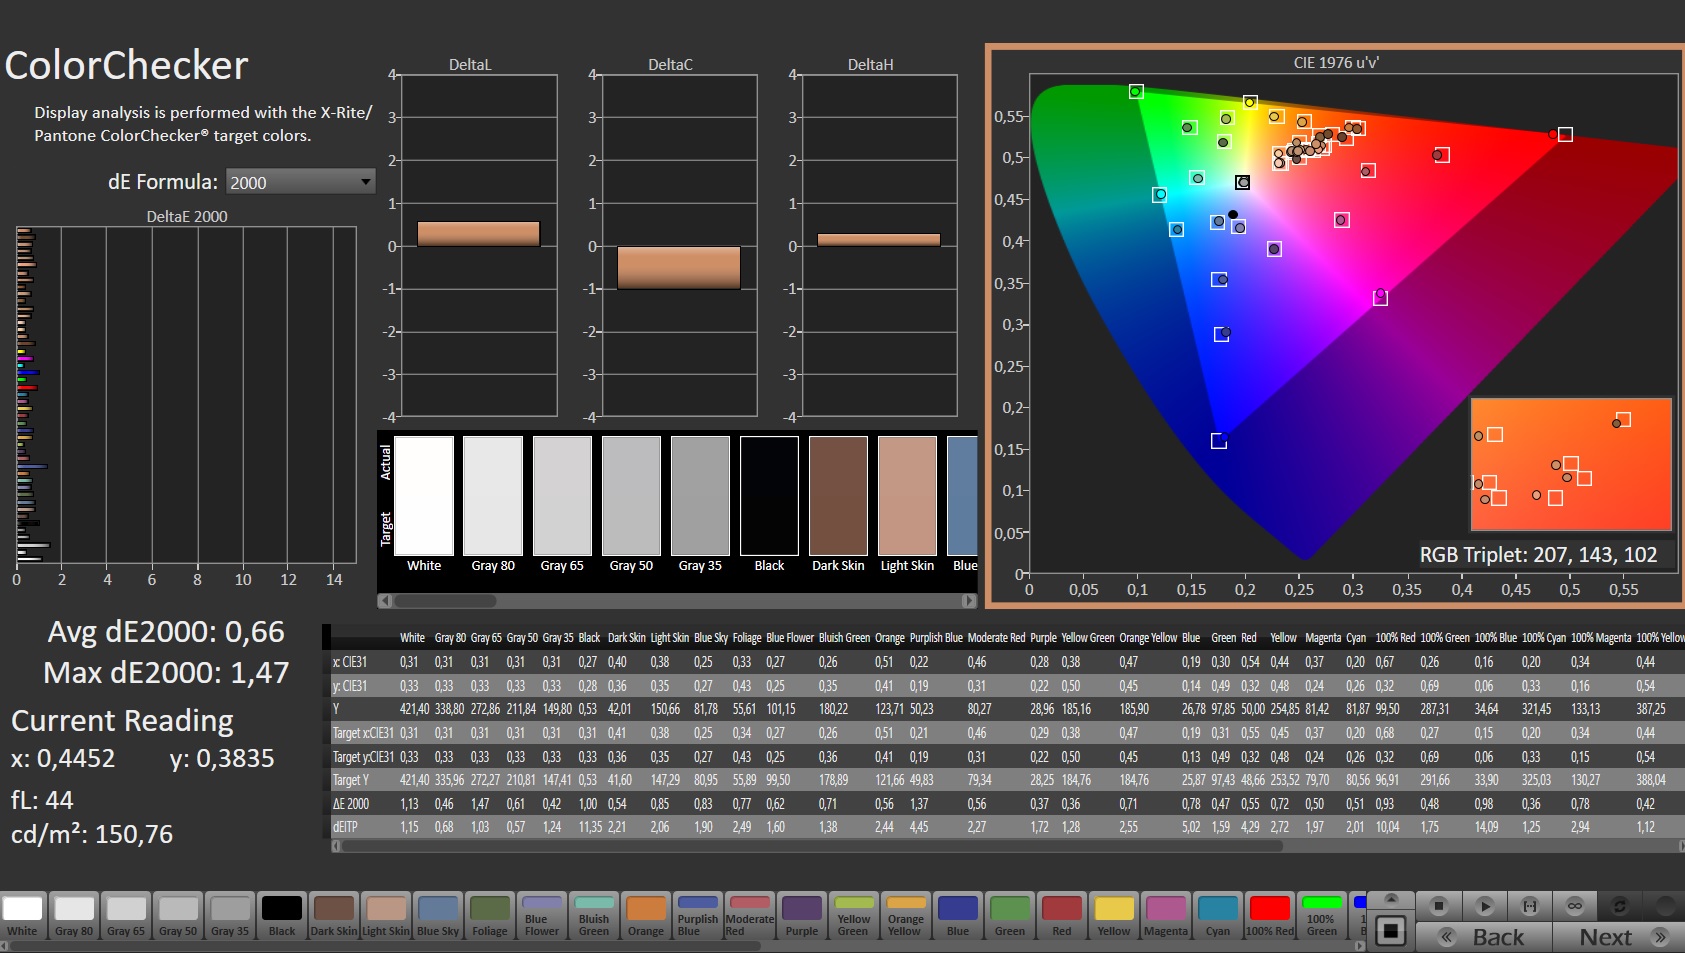
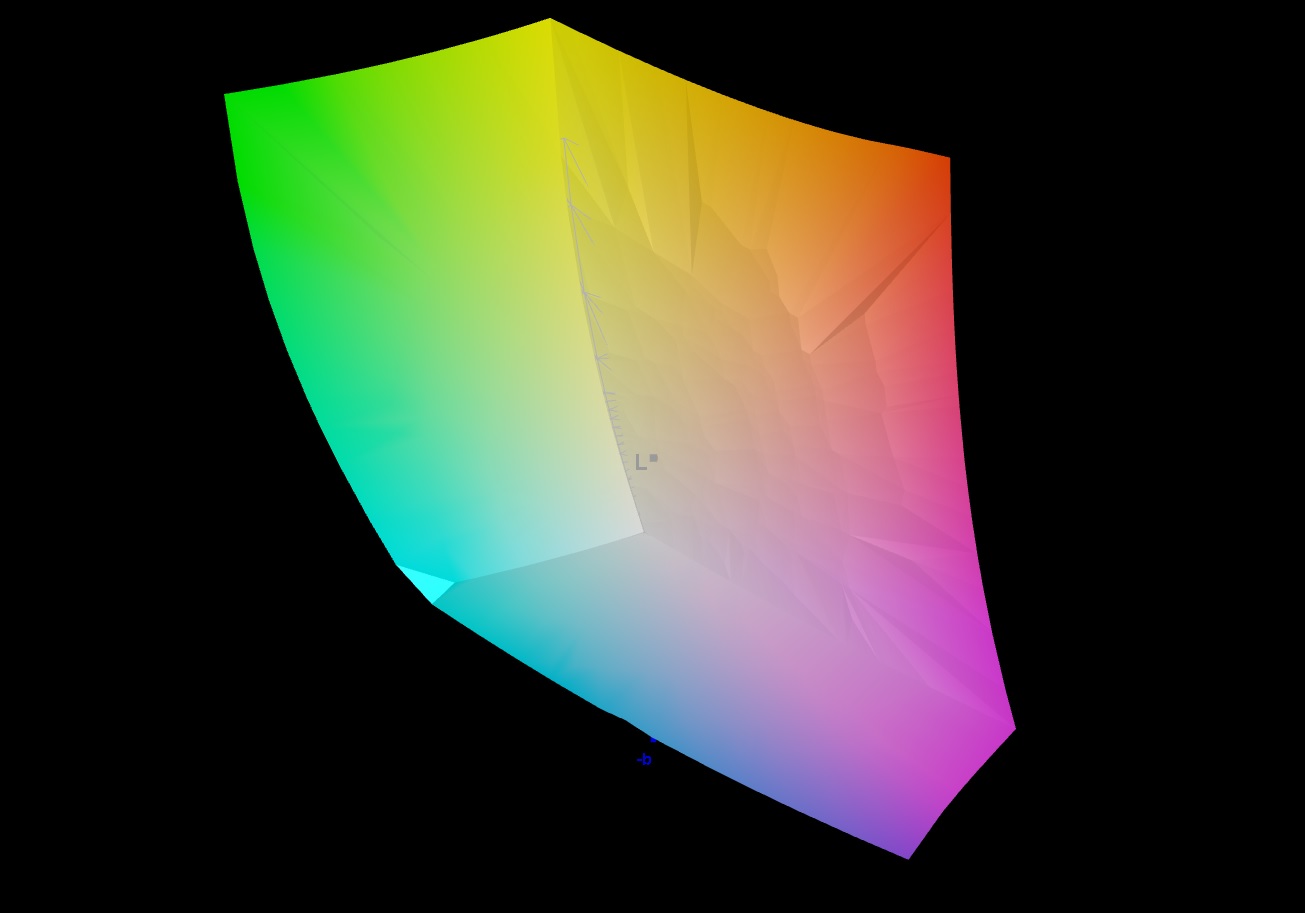
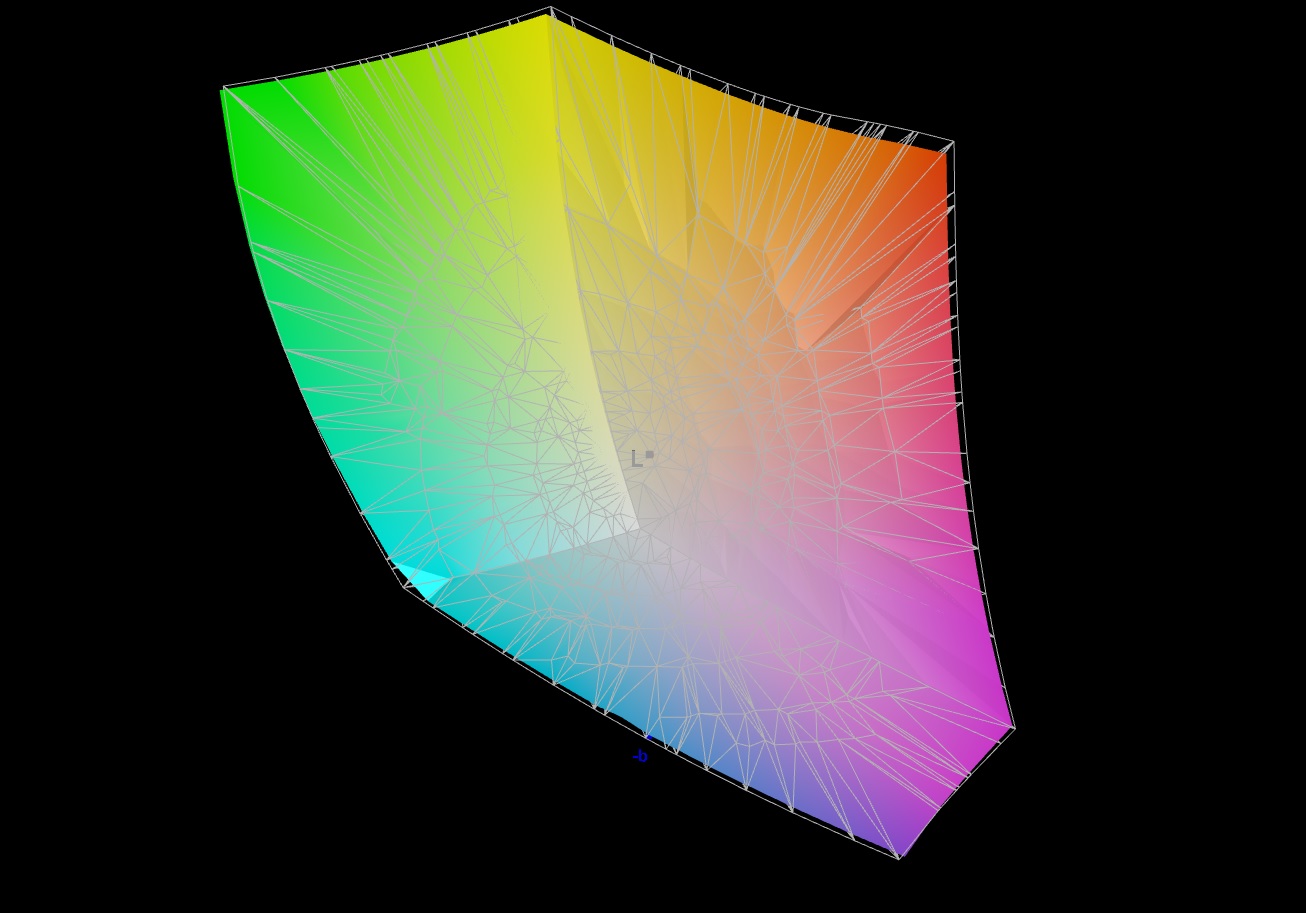
Il display 4K copre quasi interamente lo spazio colore sRGB (99,8%) e DCI-P3 (97%) e fino all'86% di AdobeRGB. Il pannello FHD del fratello Recensione del portatile MSI Titan GT77 12UHS: Il figlio di Alder Lake-HX con prestazioni senza ostacoli di classe desktop non è in grado di tenere il passo (sRGB: 97%, AdobeRGB: 73%, DCI-P3: 71%). Ciò significa che il pannello 4K è l'opzione migliore se la precisione del colore è importante per voi
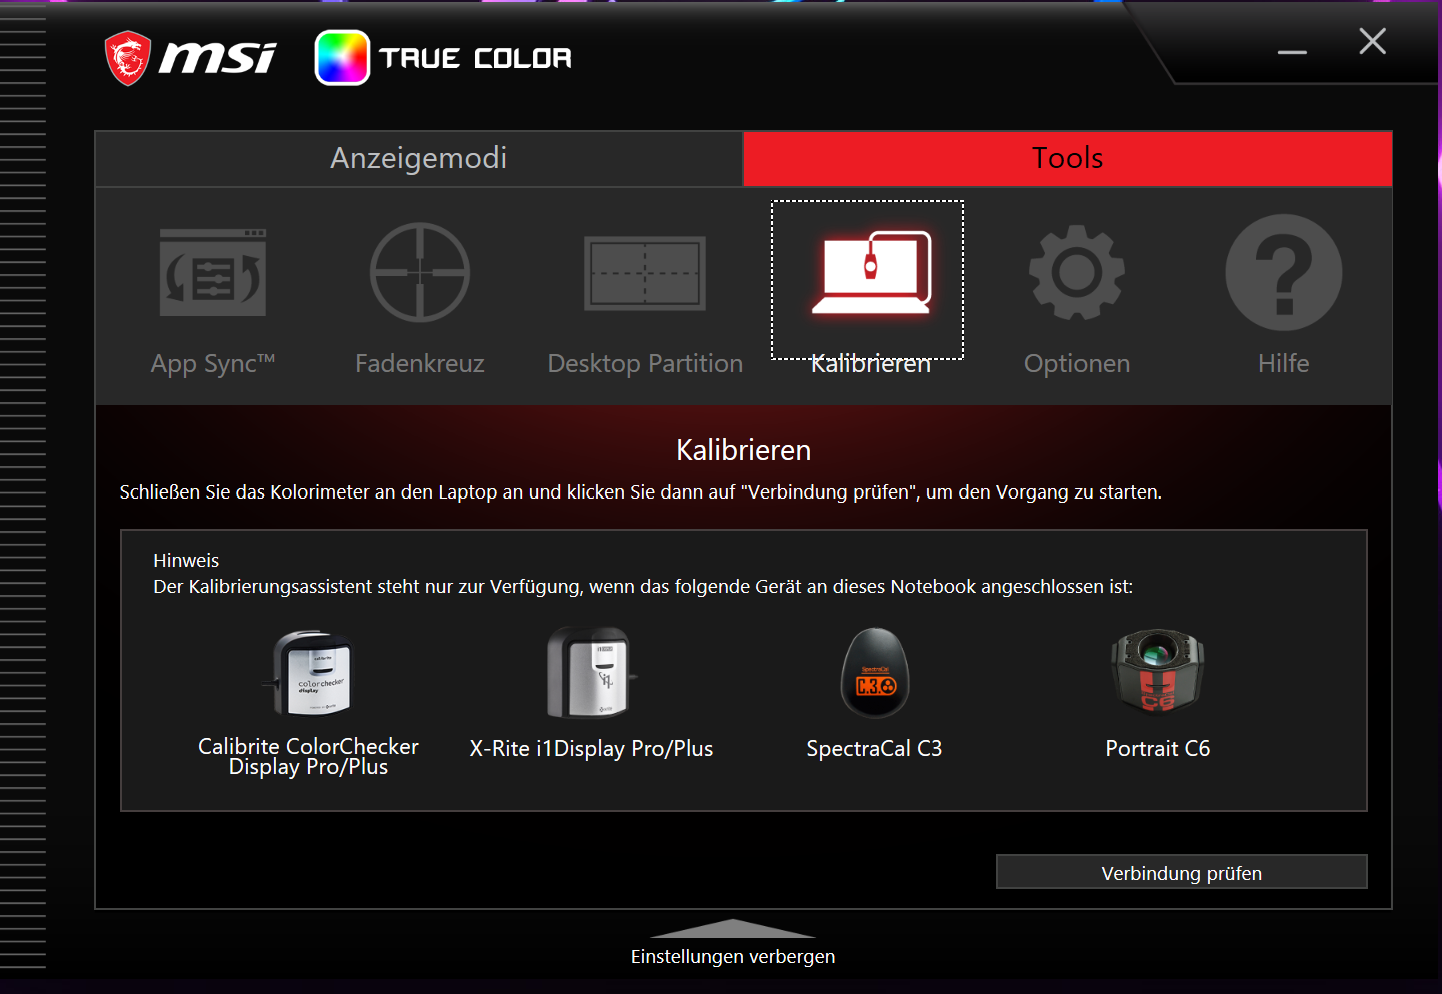
Gli schermi hanno già una buona riproduzione dei colori fin dall'inizio: i display UHD e FHD soddisfano il valore desiderato (Delta E < 3) con differenze cromatiche non percepibili rispettivamente di 2,47 e 2,1. La calibrazione degli schermi ha reso la riproduzione della scala di grigi più equilibrata e ha ridotto le differenze di colore rispettivamente a 0,66 e 1,58. Nell'infobox di ogni schermo è possibile trovare un link per scaricare gratuitamente i profili colore da noi creati.
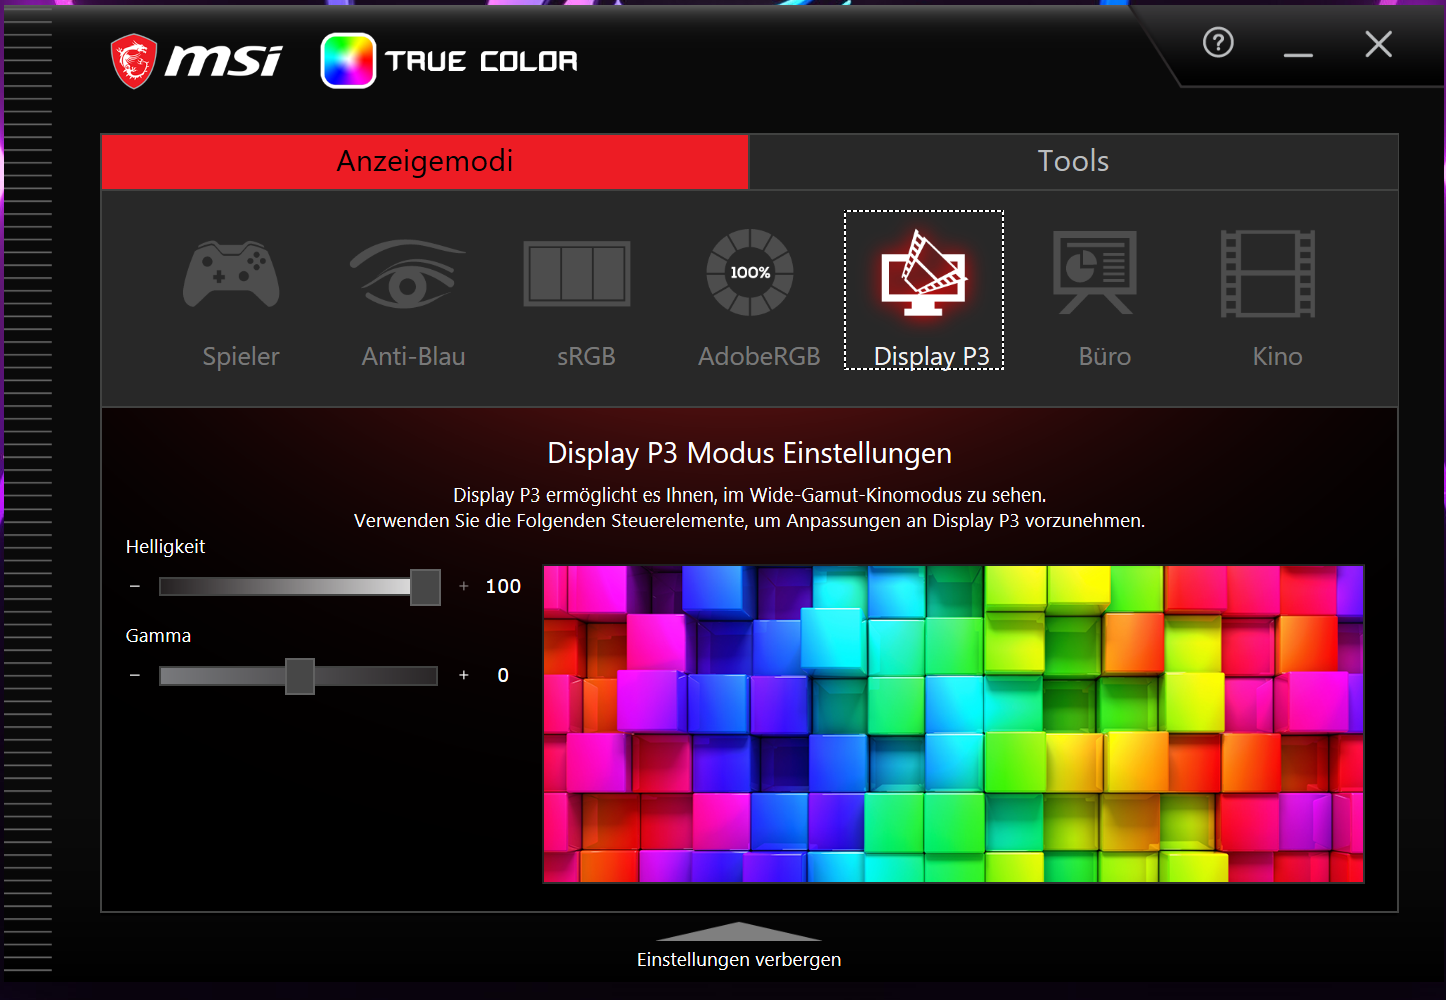
Nota: il software MSI True Color consente di regolare i colori per adattarli meglio a una gamma cromatica o a uno scenario di utilizzo definito. Noi abbiamo scelto l'impostazione "Display P3".


Tempi di risposta del Display
| ↔ Tempi di risposta dal Nero al Bianco | ||
|---|---|---|
| 5.1 ms ... aumenta ↗ e diminuisce ↘ combinato | ↗ 1.5 ms Incremento | 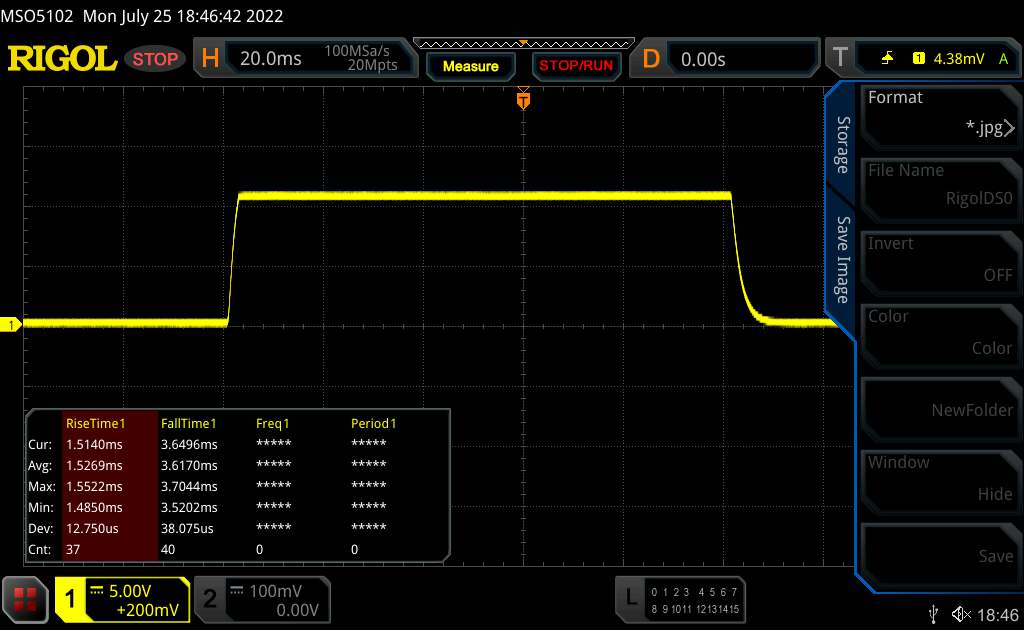 |
| ↘ 3.6 ms Calo | ||
| Lo schermo ha mostrato valori di risposta molto veloci nei nostri tests ed è molto adatto per i gaming veloce. In confronto, tutti i dispositivi di test variano da 0.1 (minimo) a 240 (massimo) ms. » 18 % di tutti i dispositivi è migliore. Questo significa che i tempi di risposta rilevati sono migliori rispettto alla media di tutti i dispositivi testati (19.8 ms). | ||
| ↔ Tempo di risposta dal 50% Grigio all'80% Grigio | ||
| 5.2 ms ... aumenta ↗ e diminuisce ↘ combinato | ↗ 1.2 ms Incremento | 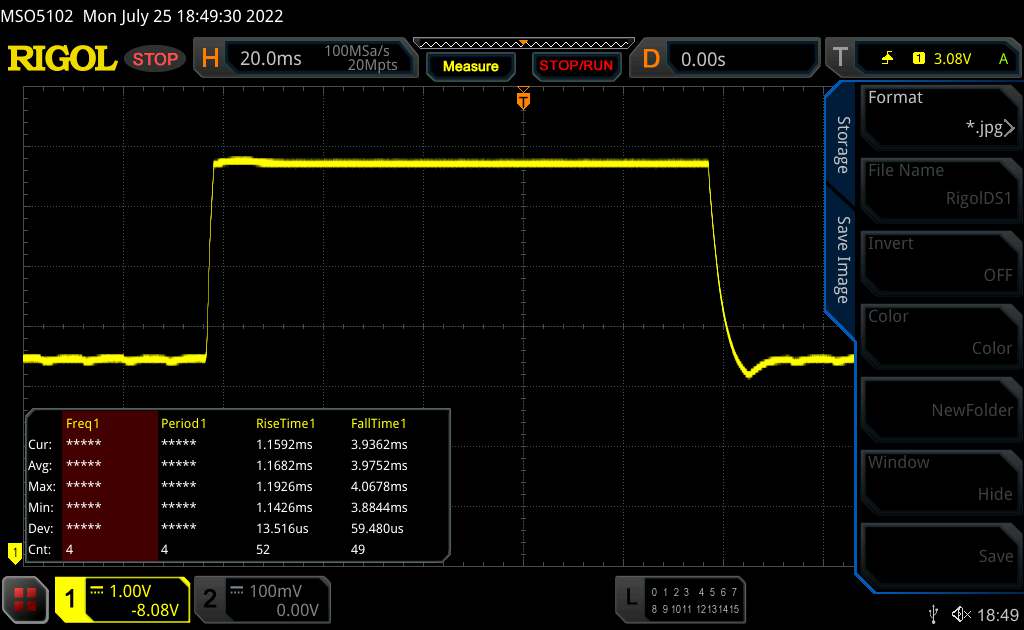 |
| ↘ 4 ms Calo | ||
| Lo schermo ha mostrato valori di risposta molto veloci nei nostri tests ed è molto adatto per i gaming veloce. In confronto, tutti i dispositivi di test variano da 0.165 (minimo) a 636 (massimo) ms. » 18 % di tutti i dispositivi è migliore. Questo significa che i tempi di risposta rilevati sono migliori rispettto alla media di tutti i dispositivi testati (31 ms). | ||
Sfarfallio dello schermo / PWM (Pulse-Width Modulation)
| flickering dello schermo / PWM non rilevato |  | ||
In confronto: 52 % di tutti i dispositivi testati non utilizza PWM per ridurre la luminosita' del display. Se è rilevato PWM, una media di 7754 (minimo: 5 - massimo: 343500) Hz è stata rilevata. | |||
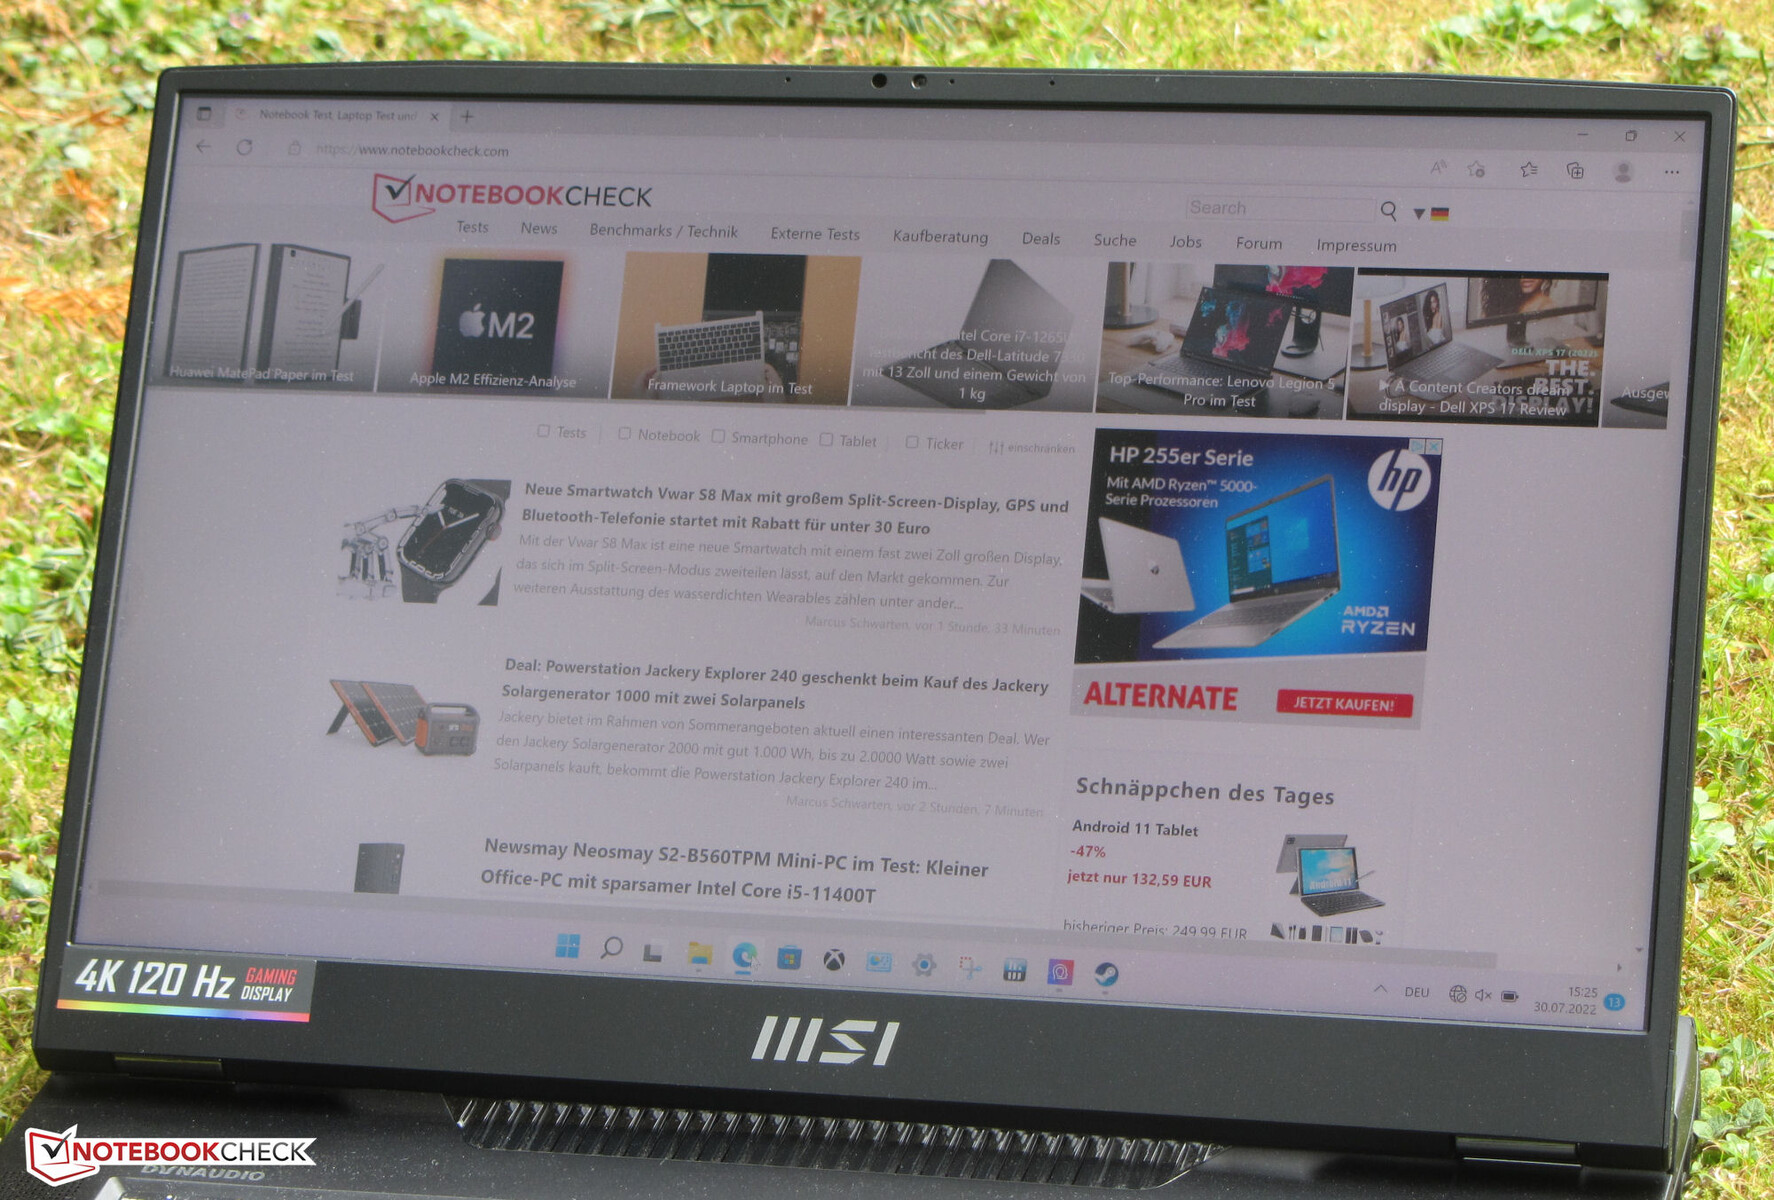
Il pannello IPS offre un angolo di visione stabile e può quindi essere facilmente visualizzato da qualsiasi posizione. Il display è molto leggibile anche all'aperto.

Riproduzione dei colori imprecisa a causa di problemi di software
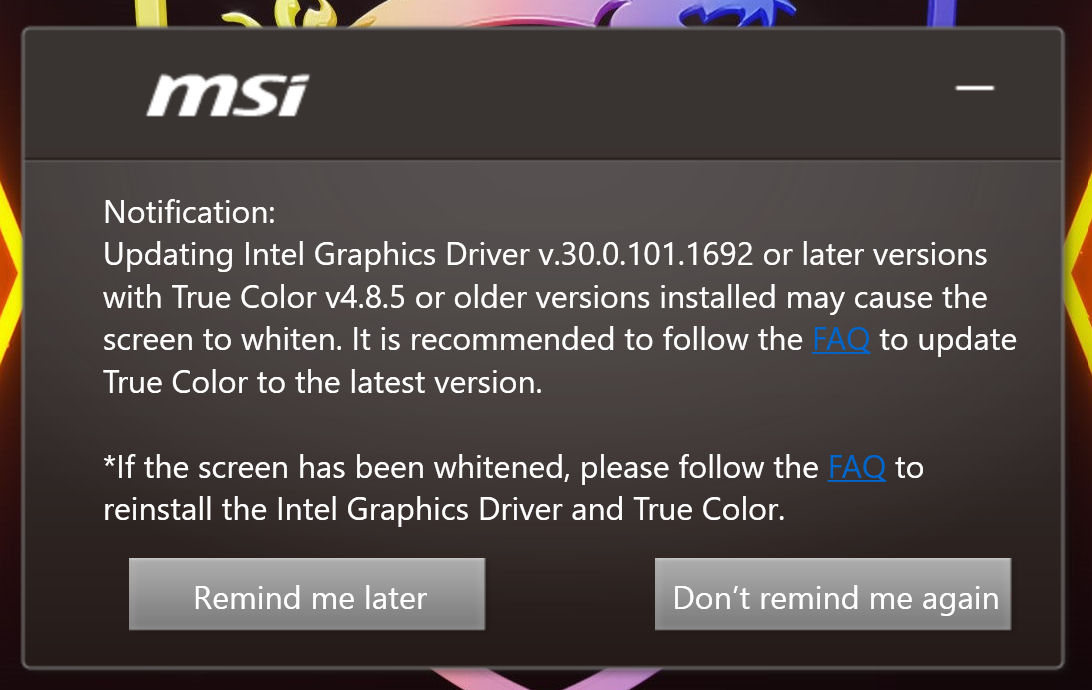
Alcune combinazioni del software True Color e del driver iGPU possono causare una riproduzione imprecisa delle immagini. In questo caso, tutti i colori visualizzati appaiono distorti e sbiancati. MSI consiglia di disinstallare completamente e poi reinstallare entrambi i componenti. Dopo aver provato, abbiamo scoperto che questo metodo risolve il problema.
Prestazioni - Ampere e Alder Lake offrono molta energia.
Con il Titan GT77 12UHS, MSI ha inserito nella sua gamma di prodotti un portatile da 17,3 pollici molto potente che si comporta bene in tutti gli scenari di utilizzo più impegnativi.
Condizioni di prova
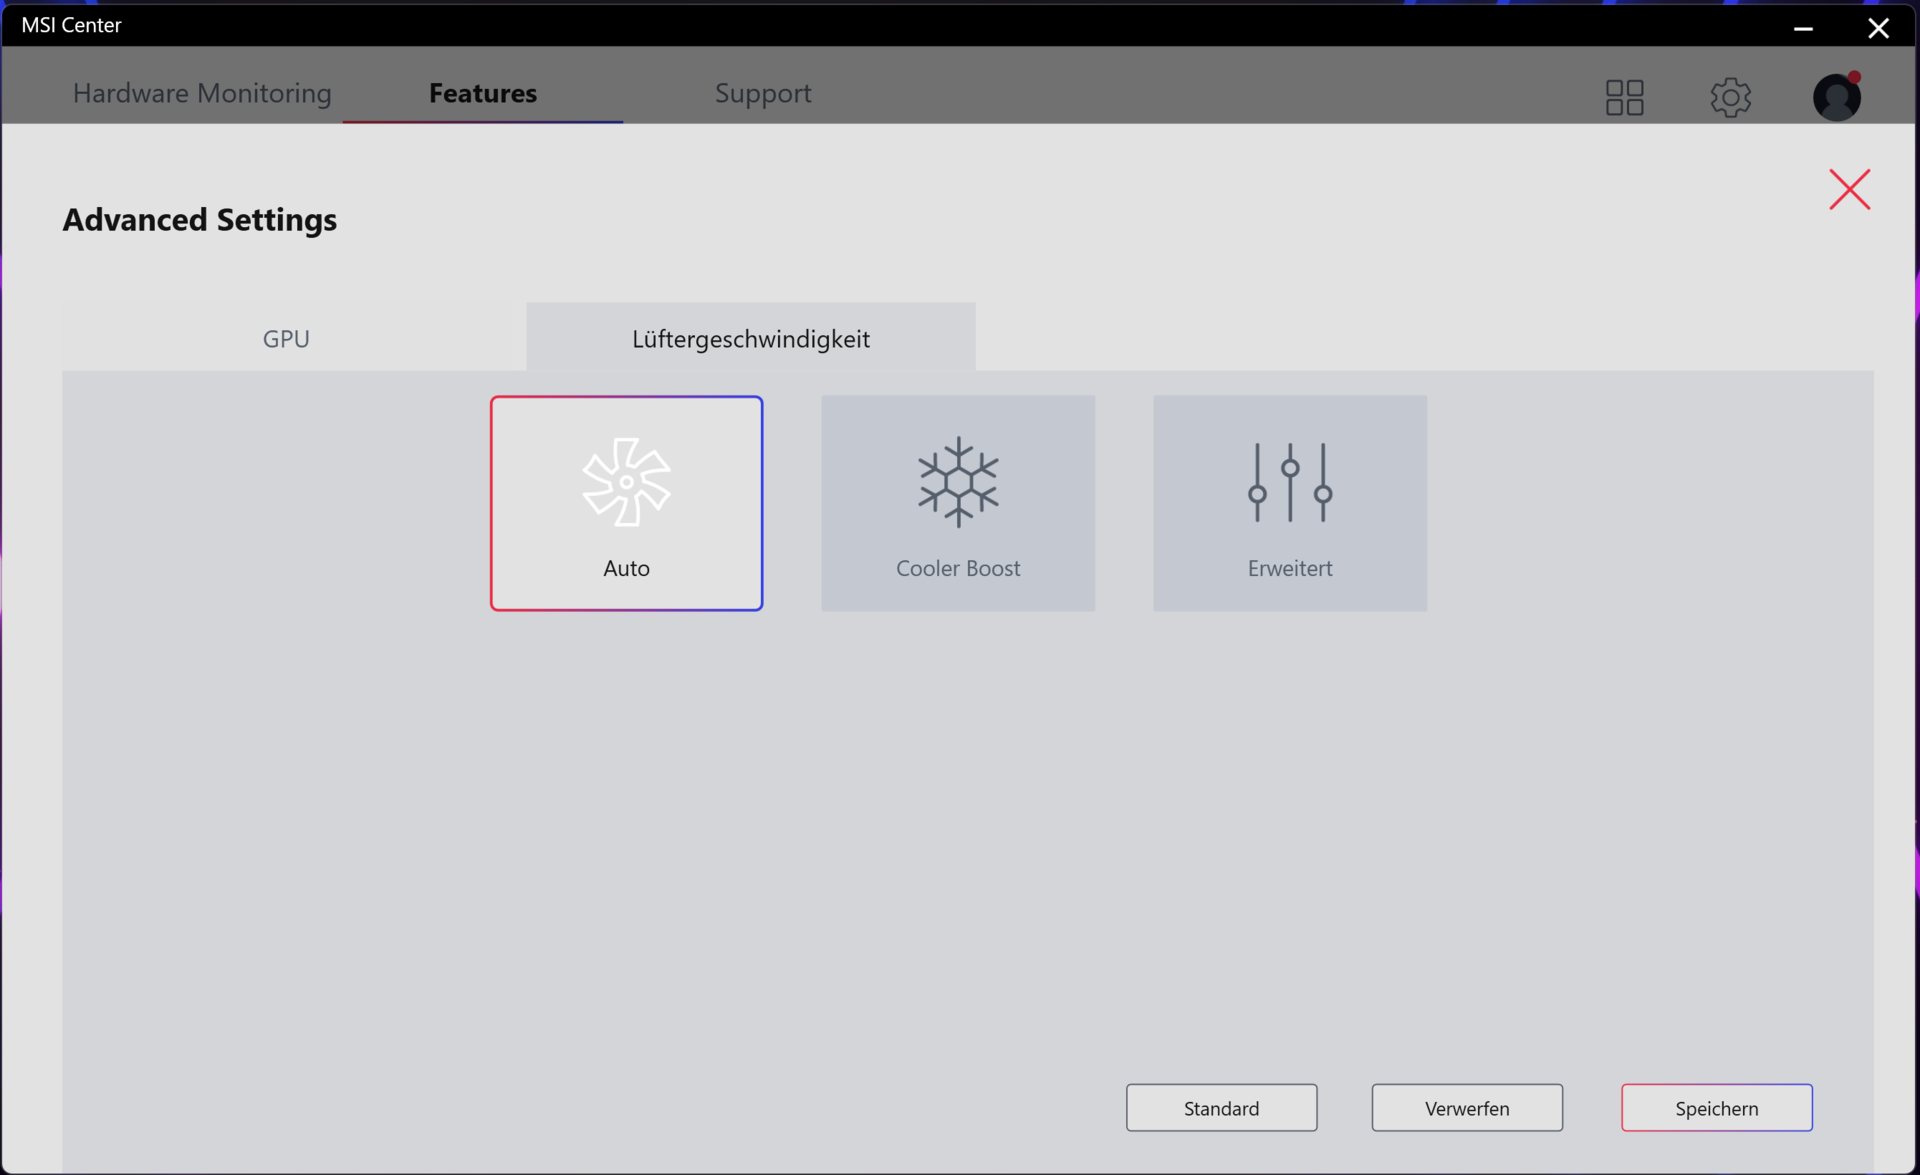
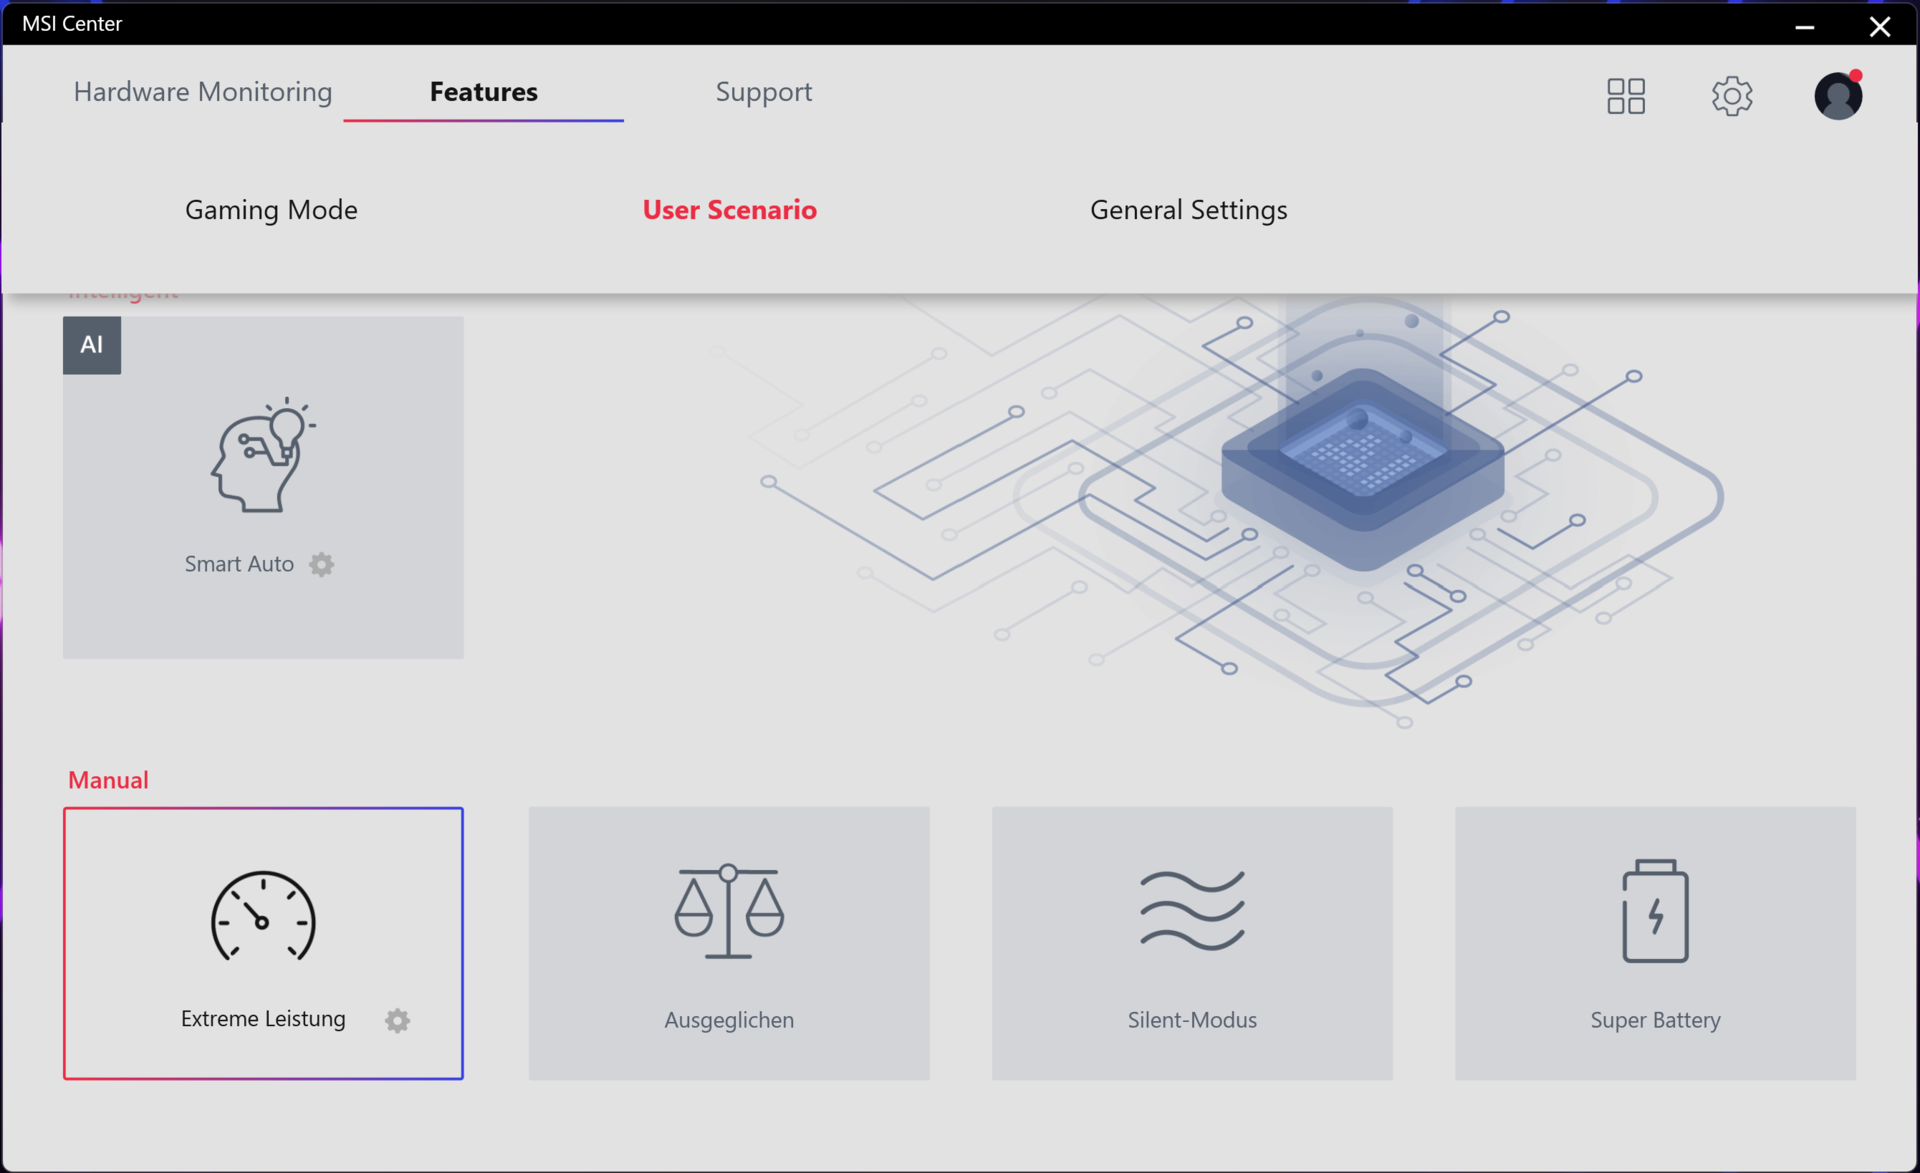
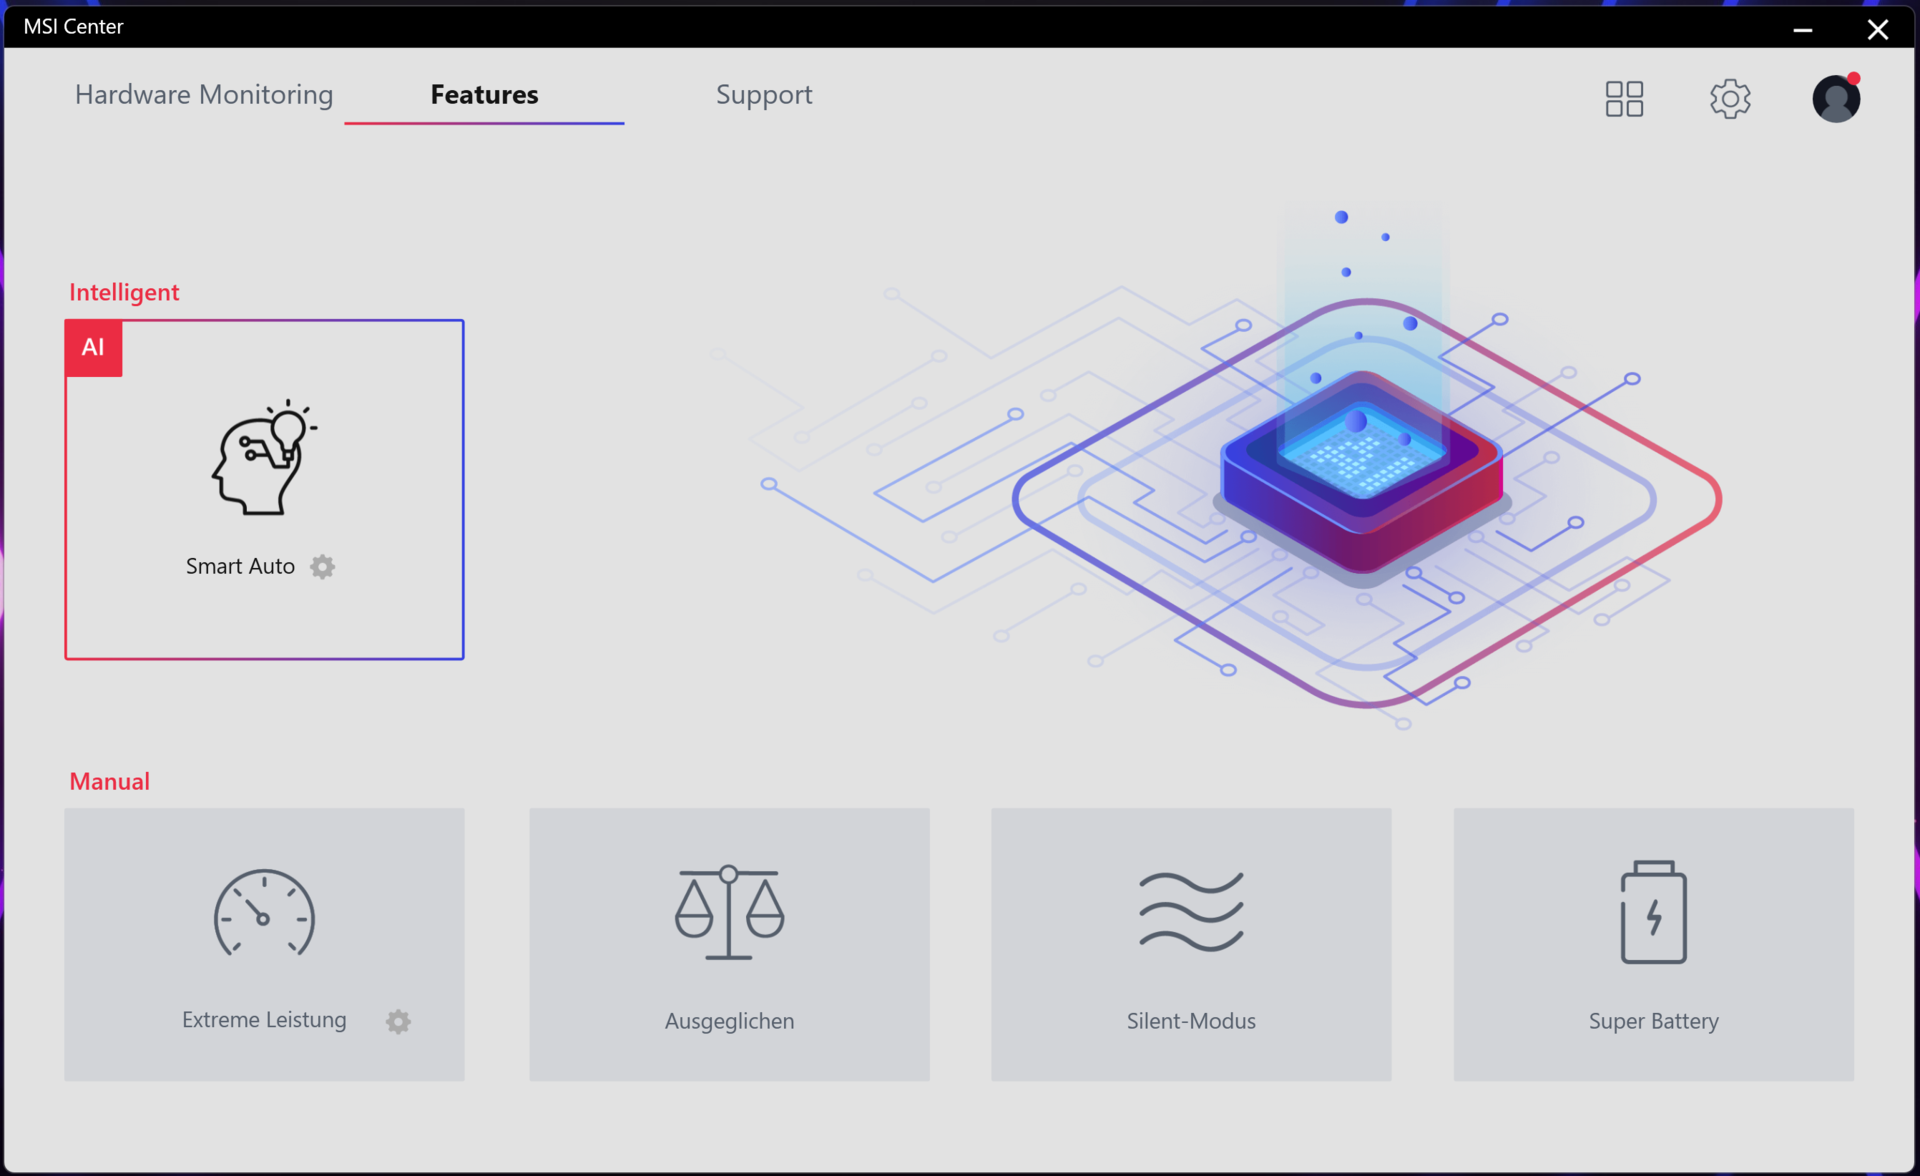
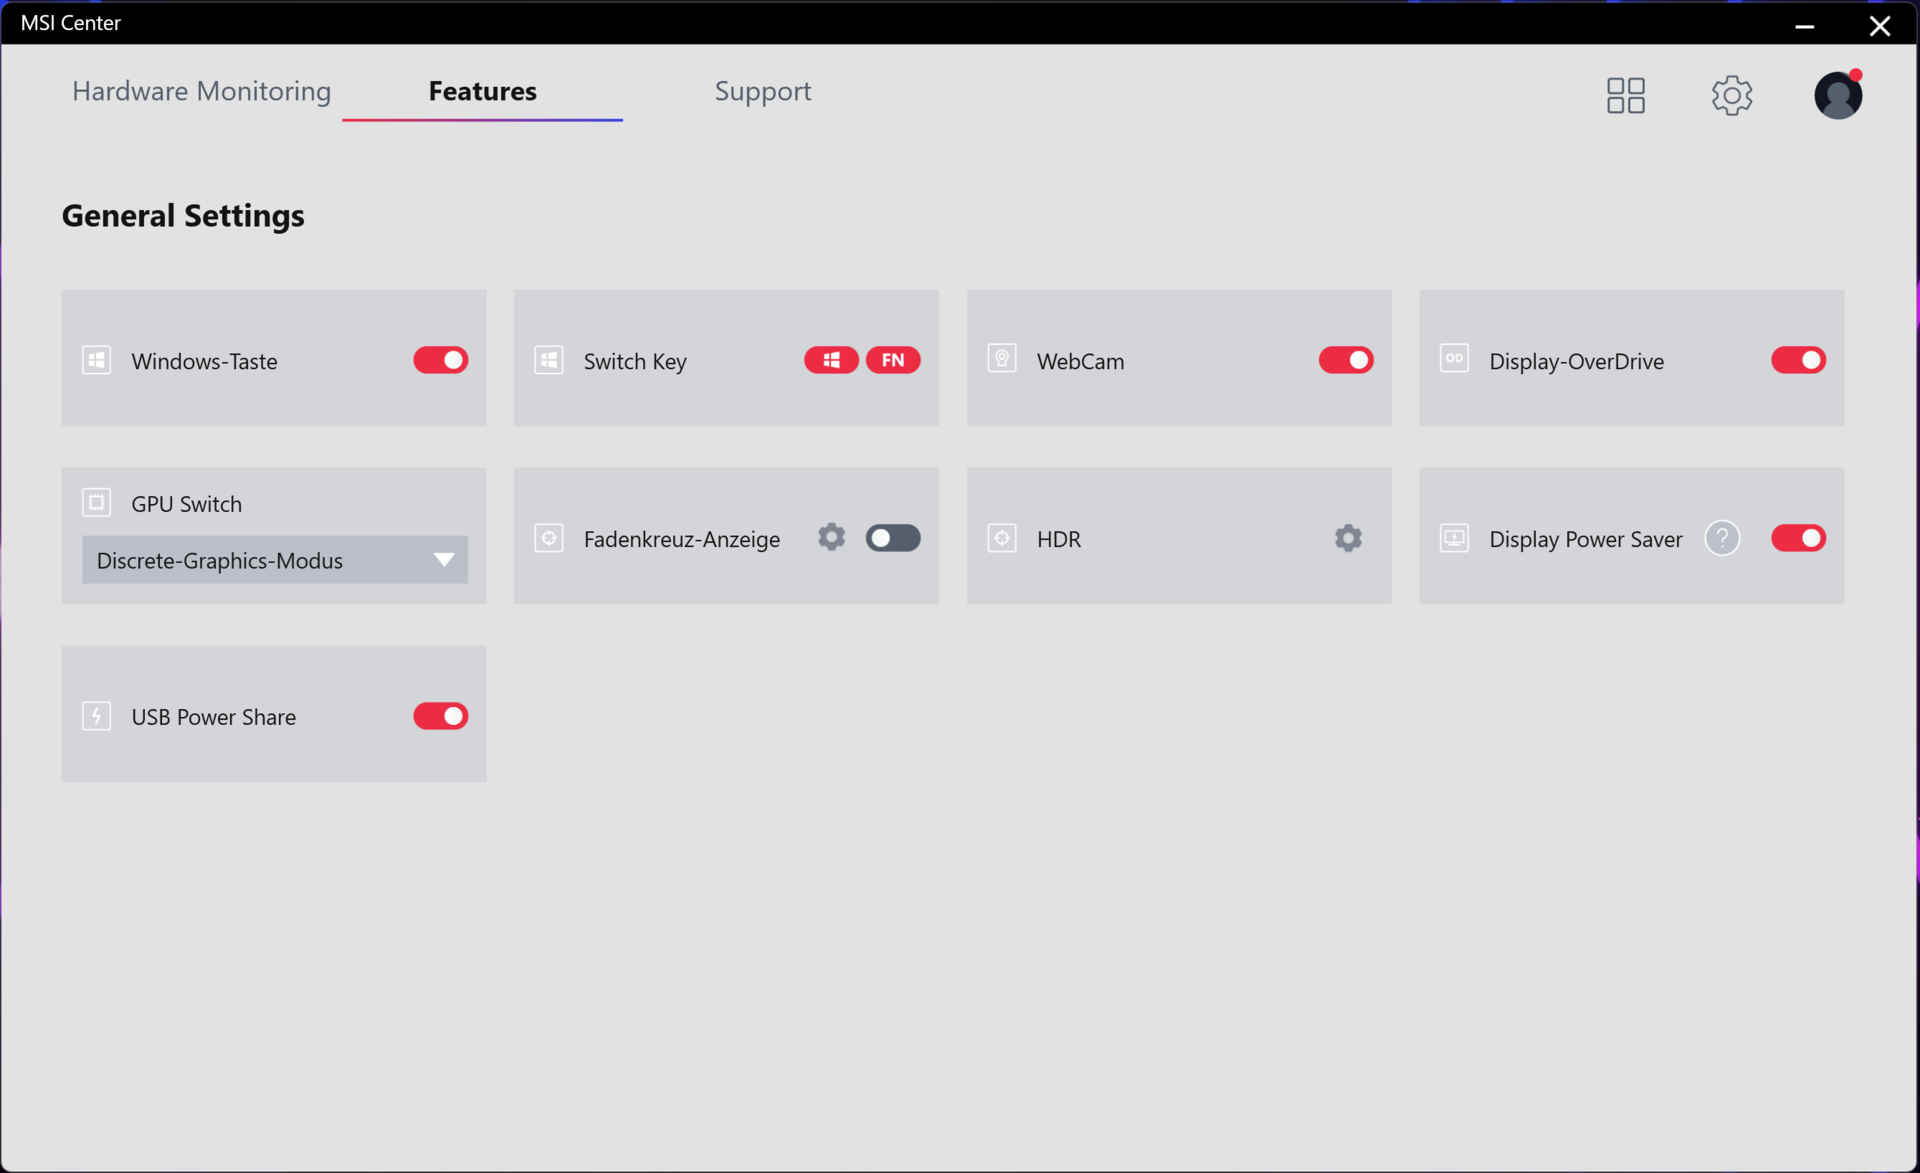
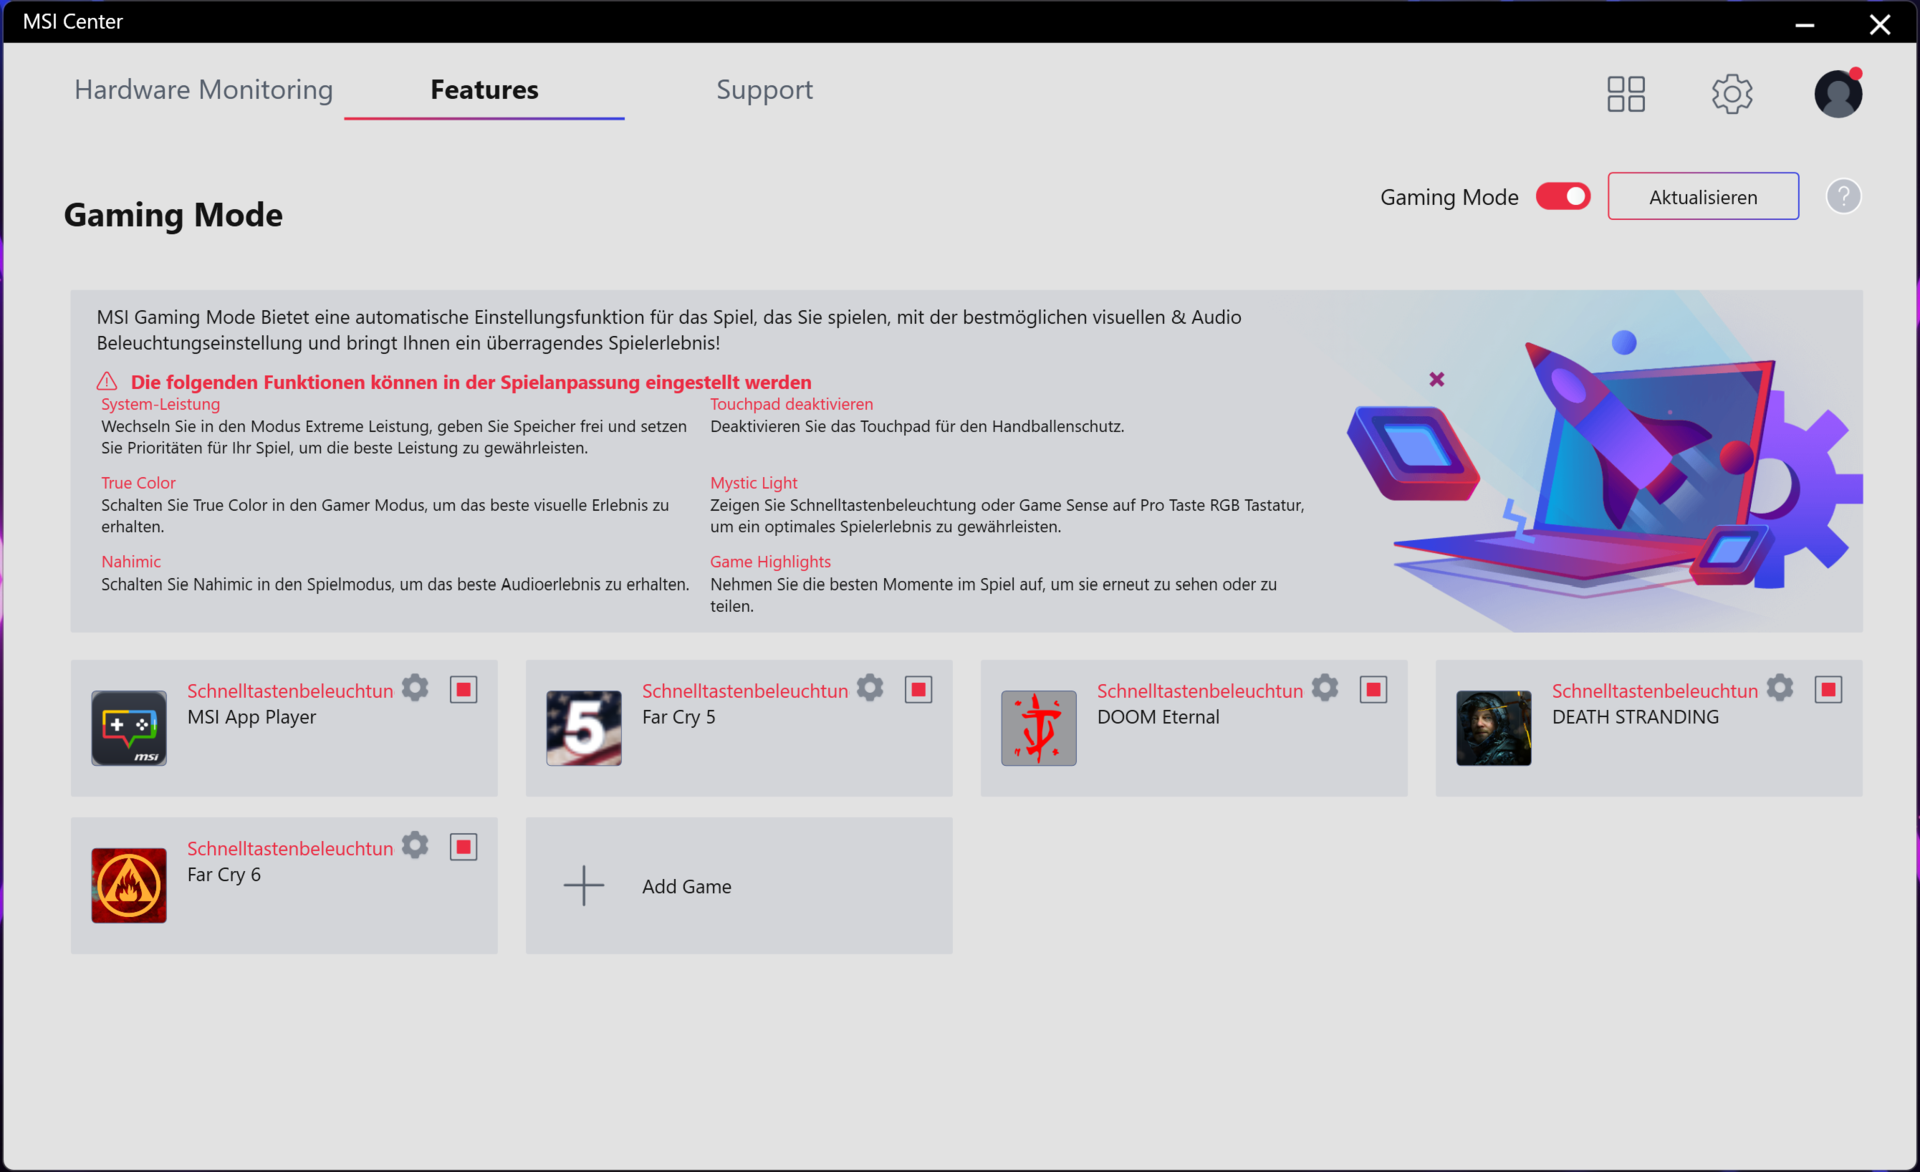
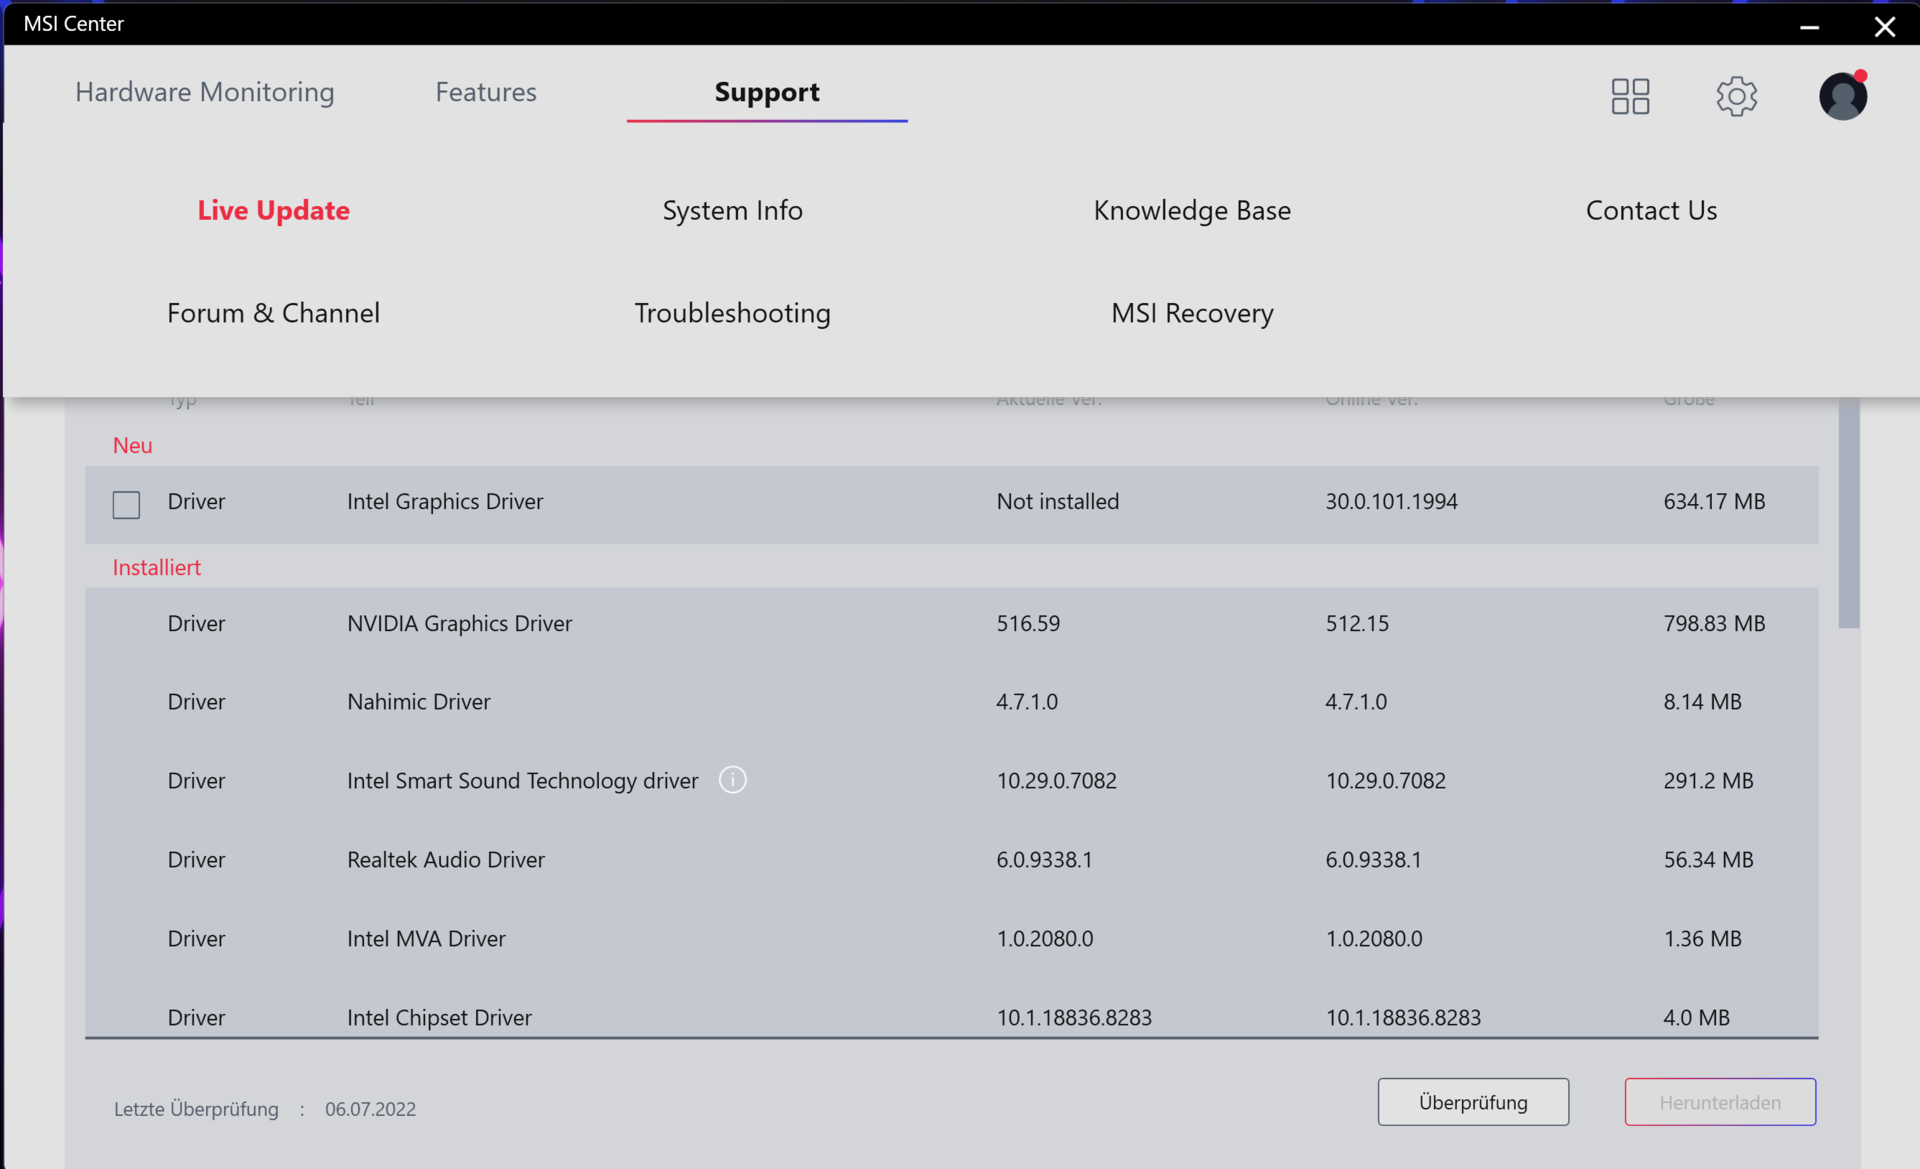
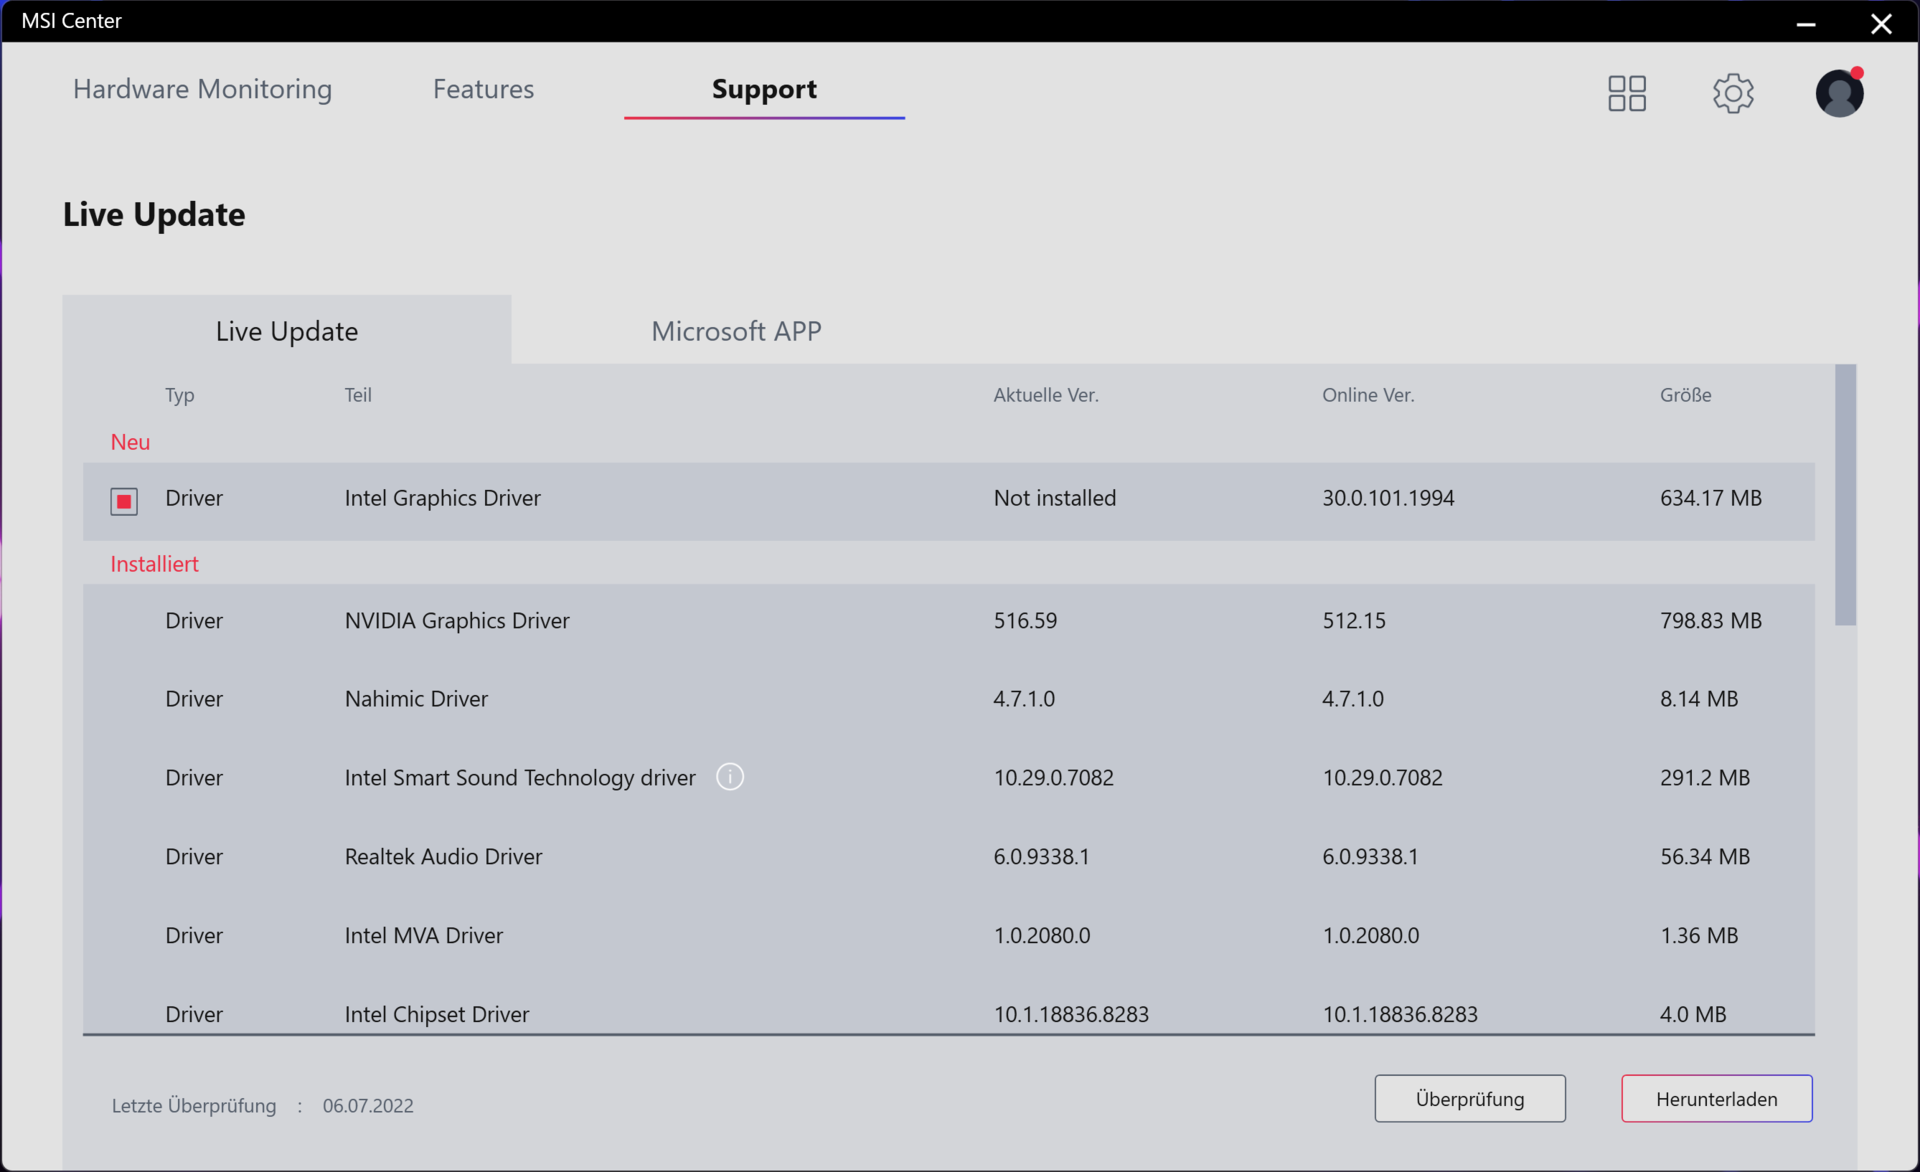
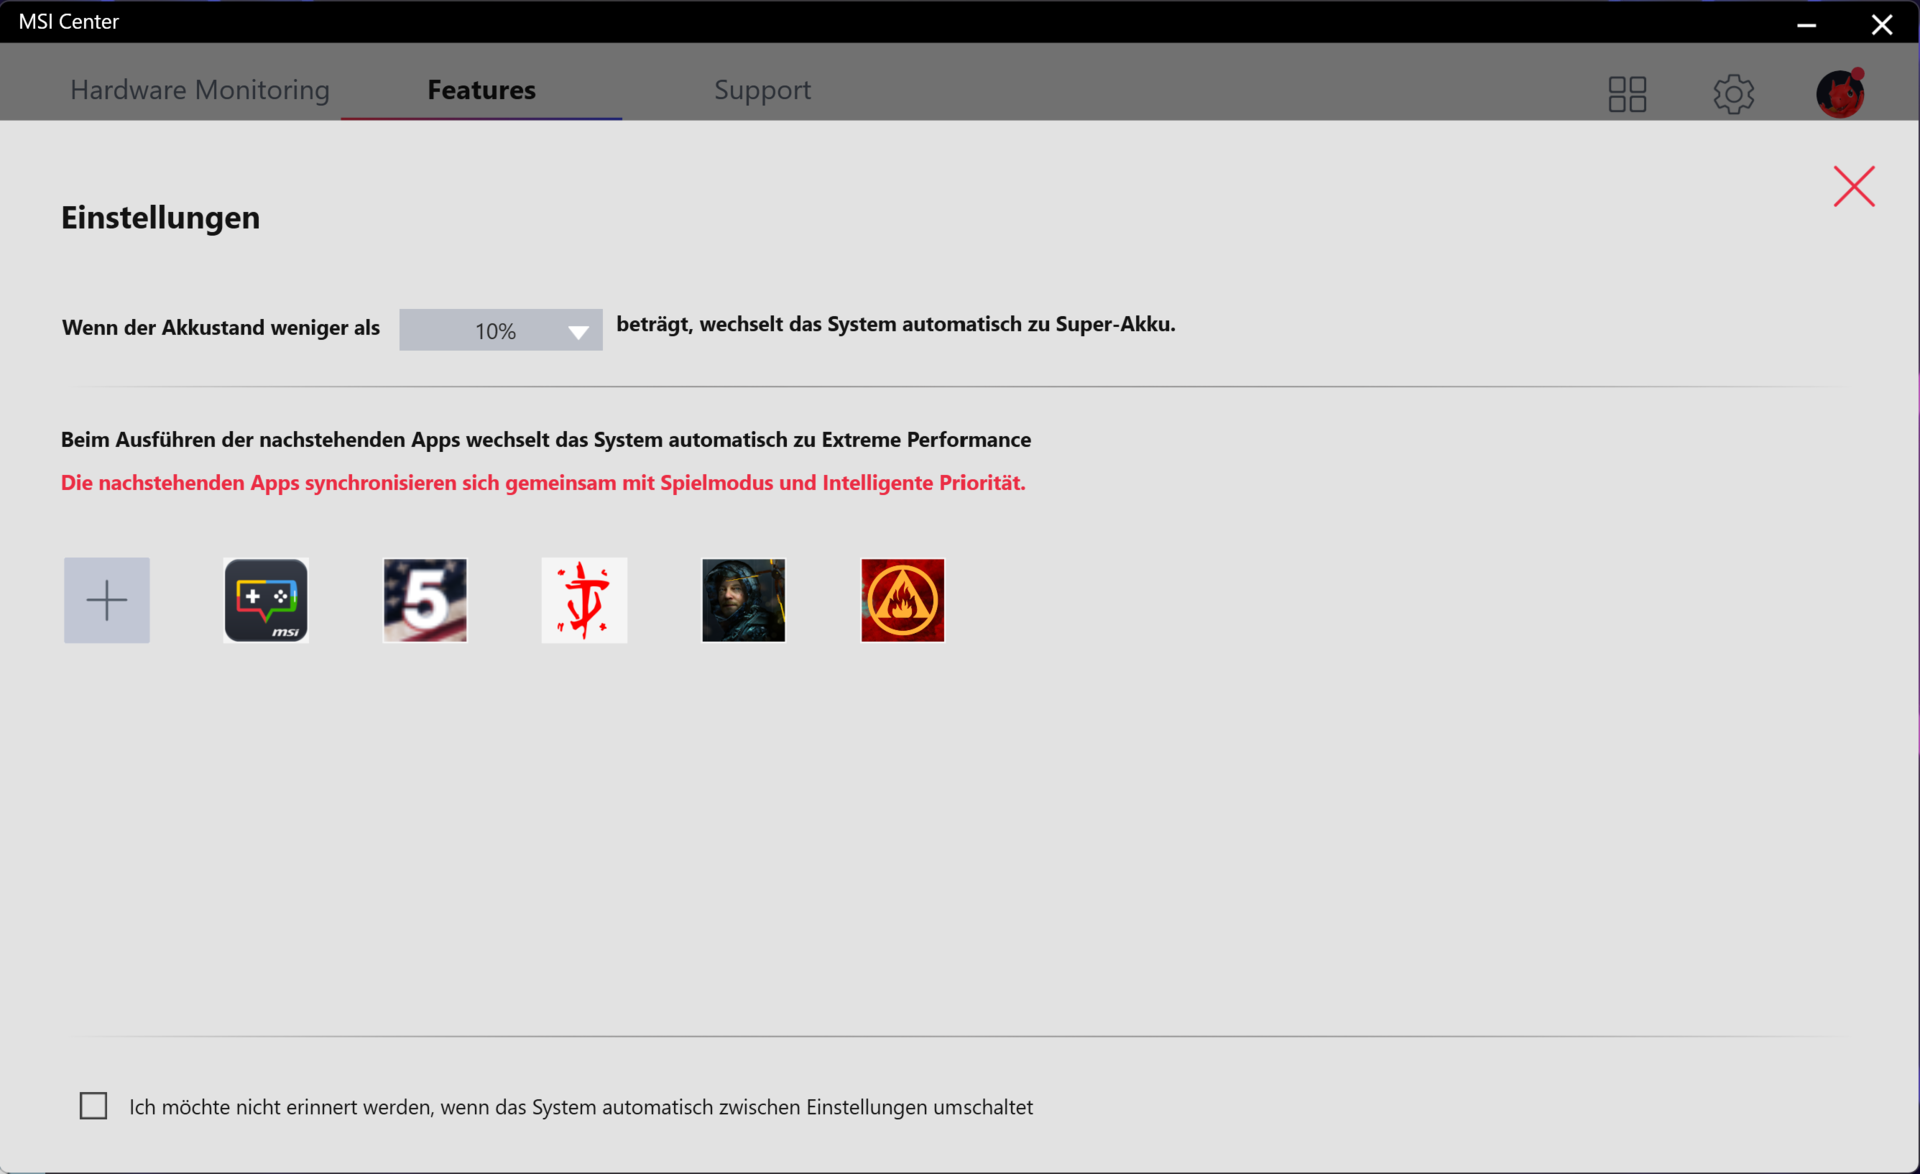
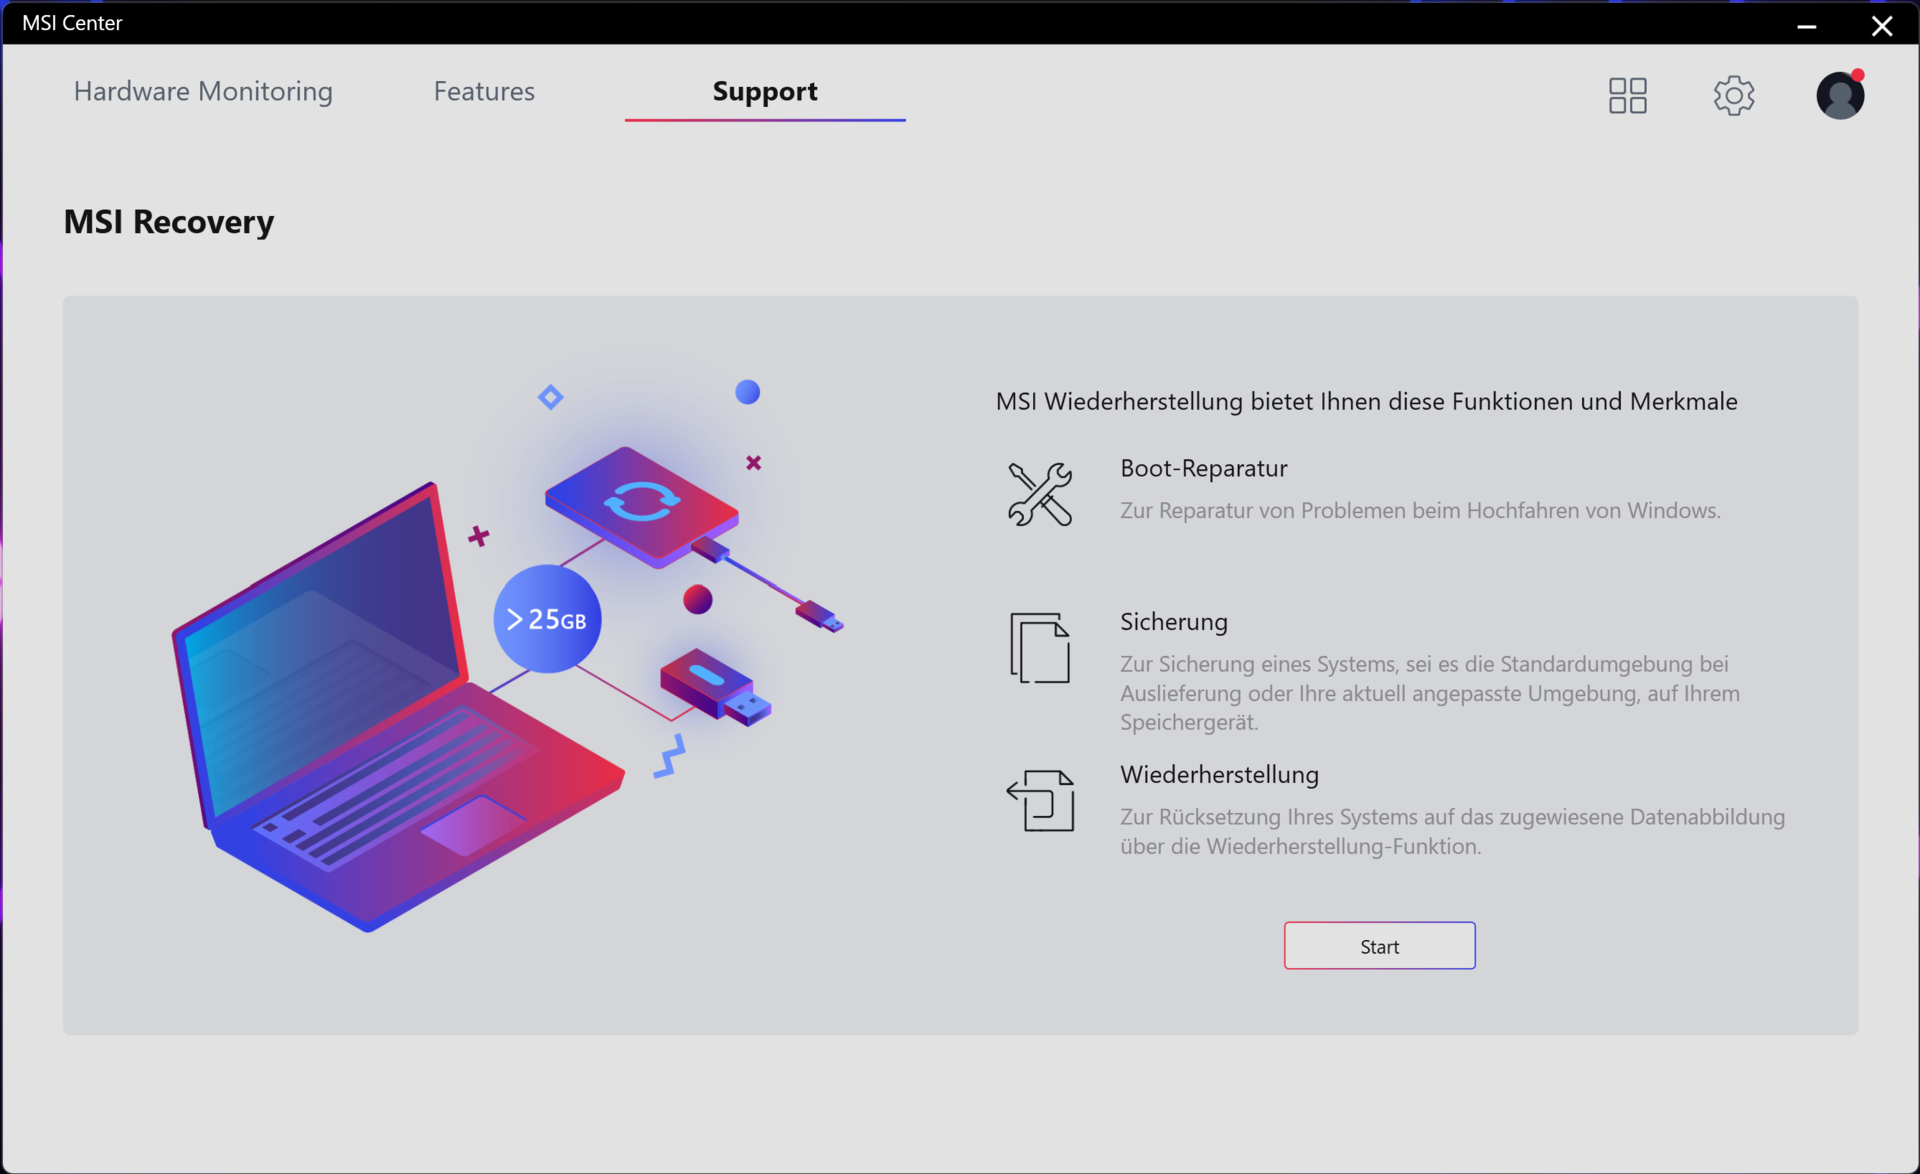
È possibile passare tra quattro profili di prestazioni utilizzando l'MSI Center preinstallato (vedi immagini) o premendo la combinazione di tasti Fn+F7. Se è attivata la funzione di livello superiore "Smart Auto" basata sull'intelligenza artificiale (come nel nostro caso), l'MSI Center sceglierà automaticamente il profilo appropriato per la situazione attuale.
Abbiamo testato il modello FHD con la modalità dGPU attiva. Al contrario, Nvidia Optimus era abilitato durante la nostra recensione del dispositivo attuale. Pertanto, i risultati delle misurazioni potrebbero non essere sempre direttamente comparabili.
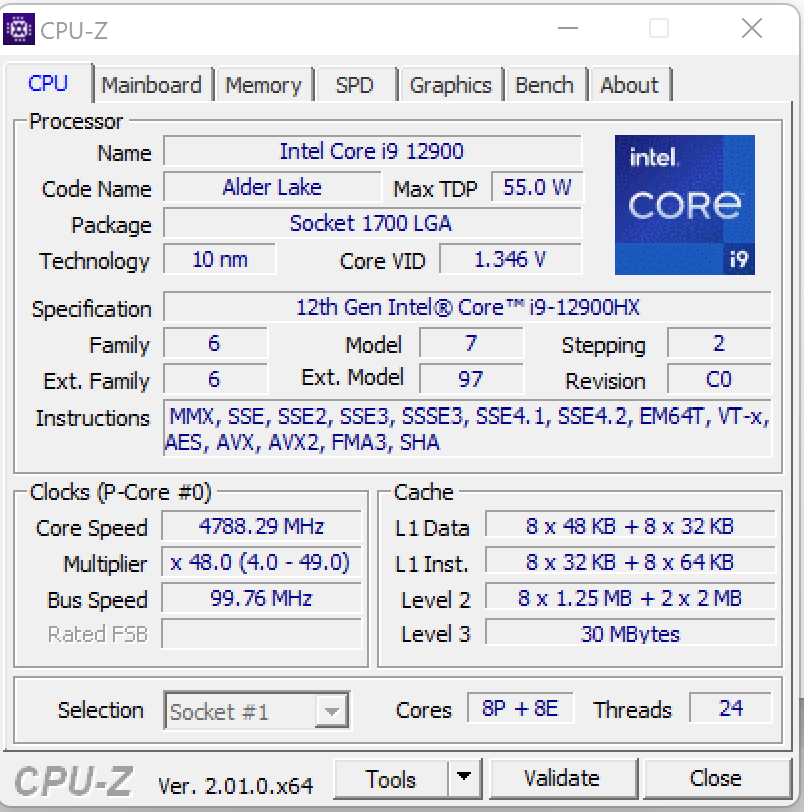
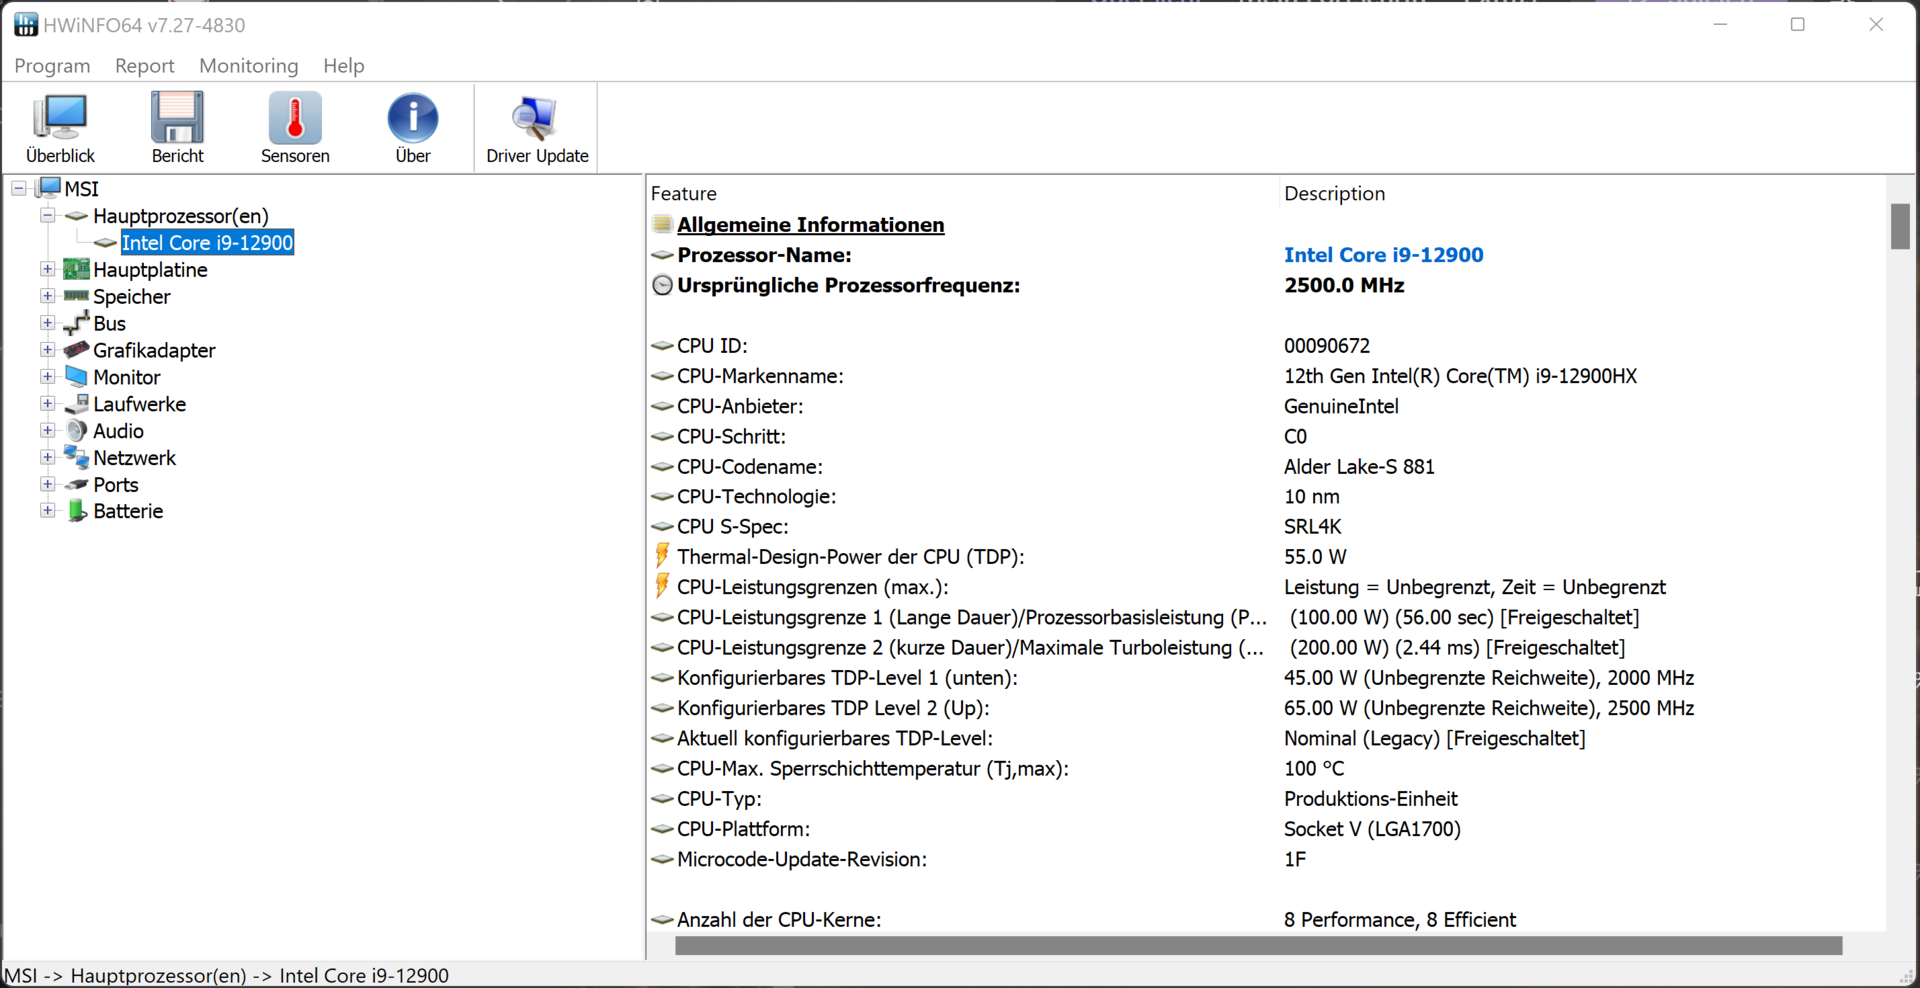
Processore
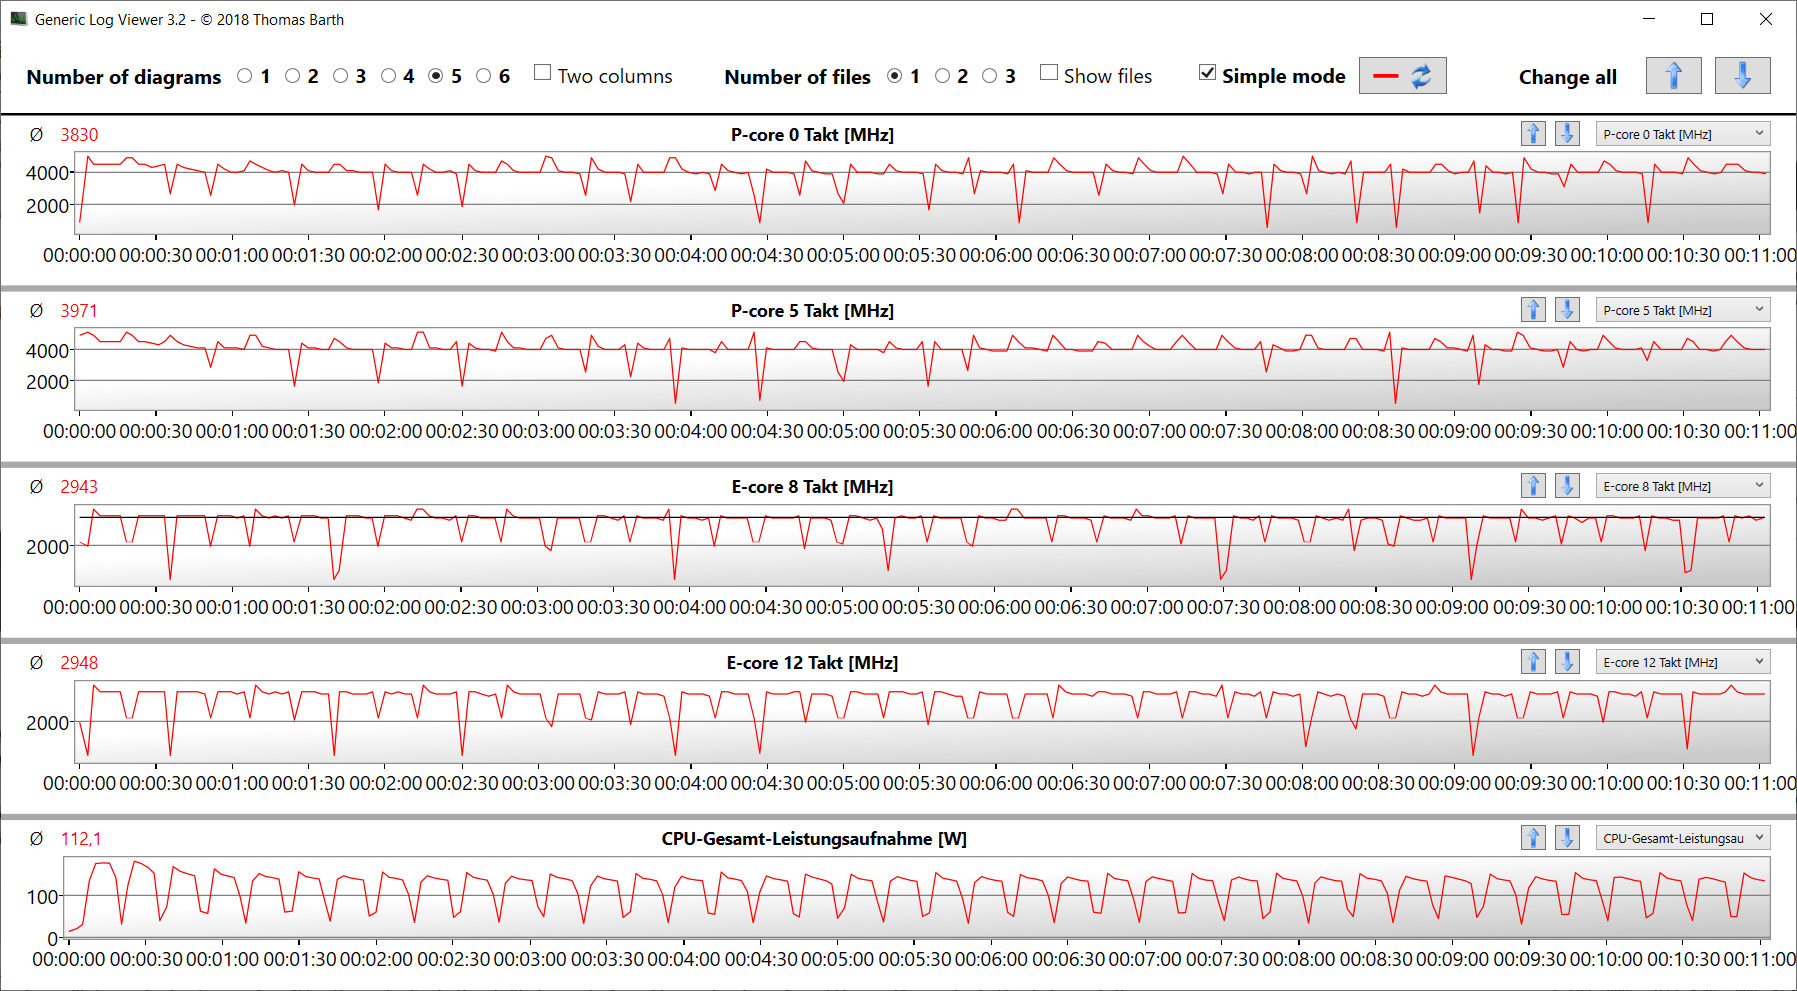
Il processore Core i9-12900HX (Alder Lake) è composto da otto core per le prestazioni (Hyper-Threading, da 2,3 a 5 GHz) e otto core per l'efficienza (senza Hyper-Threading, da 1,7 a 3,6 GHz), per un totale di 24 thread.
In Cinebench R15, la CPU ha completato sia il test multi-thread (P-cores: 4,4 GHz, E-cores: 3,3 GHz) che il test single-thread (P-cores: da 500 MHz a 5 GHz, E-cores: da 400 MHz a 3,6 GHz) a velocità di clock elevate. Le prestazioni sono state leggermente inferiori con l'alimentazione a batteria.
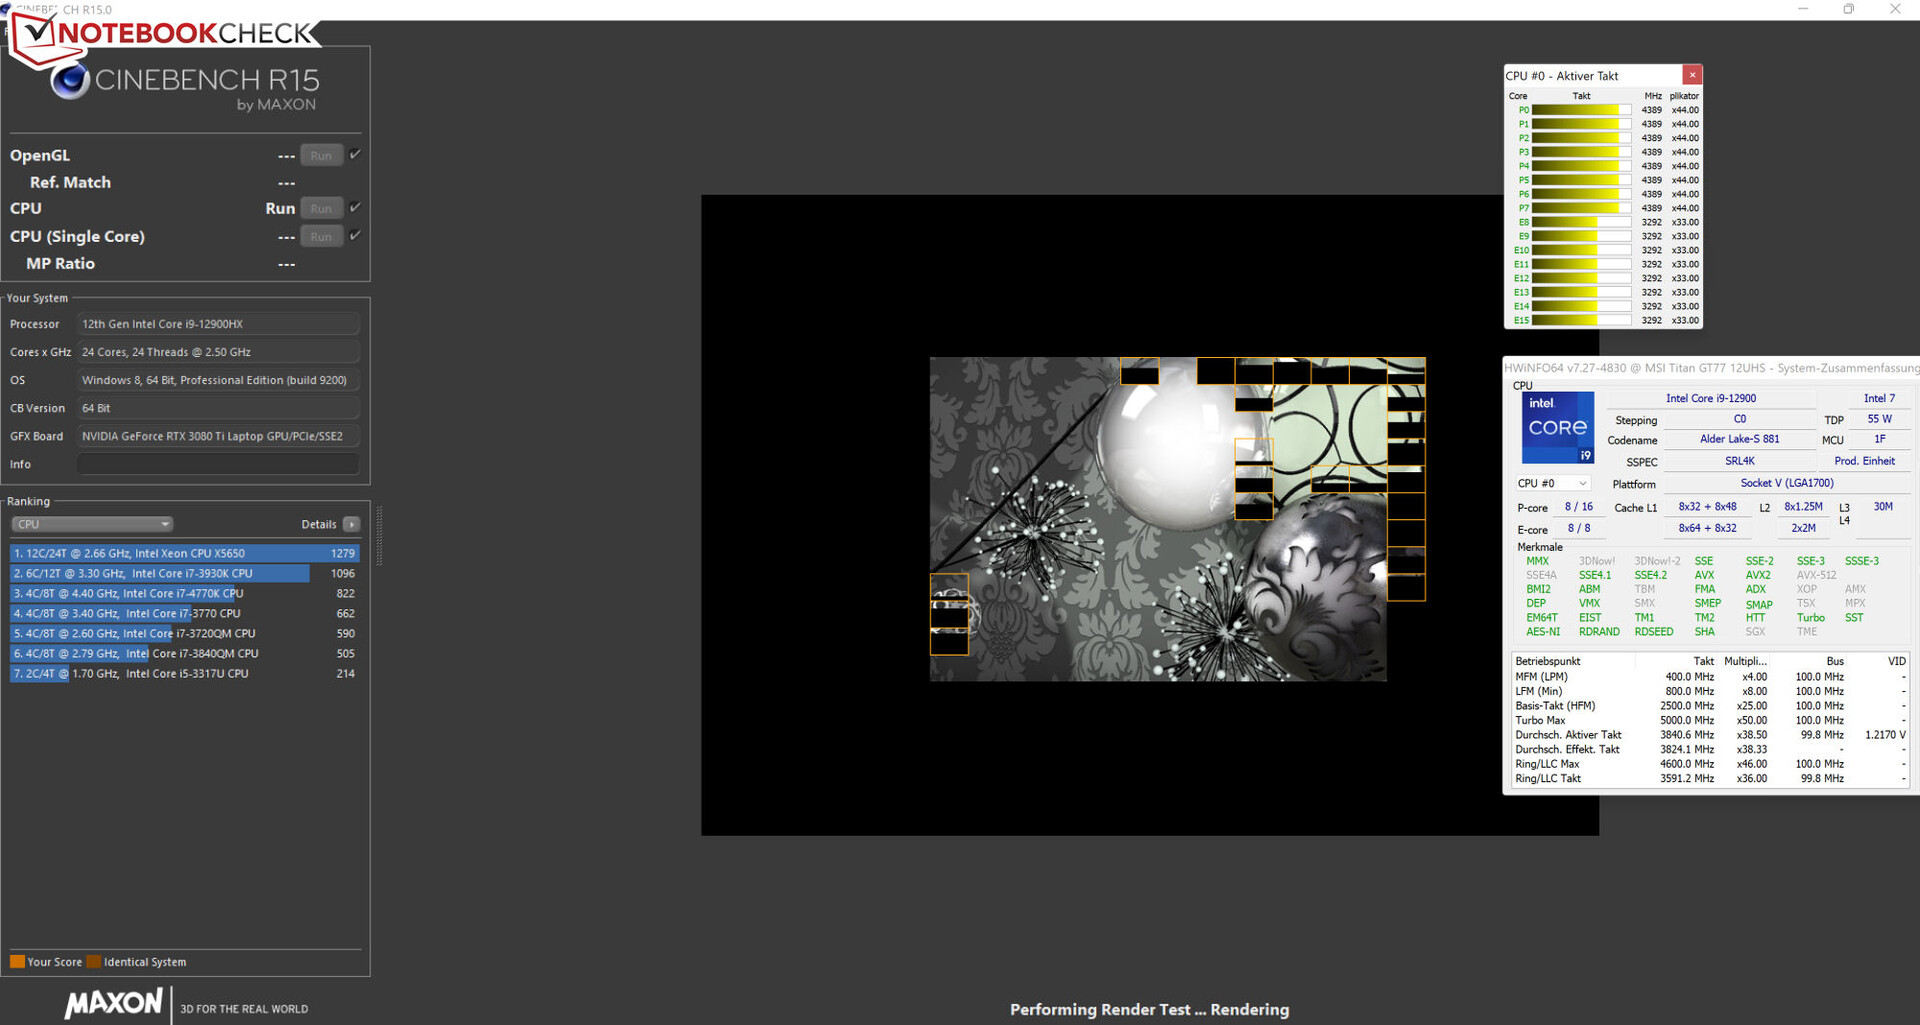
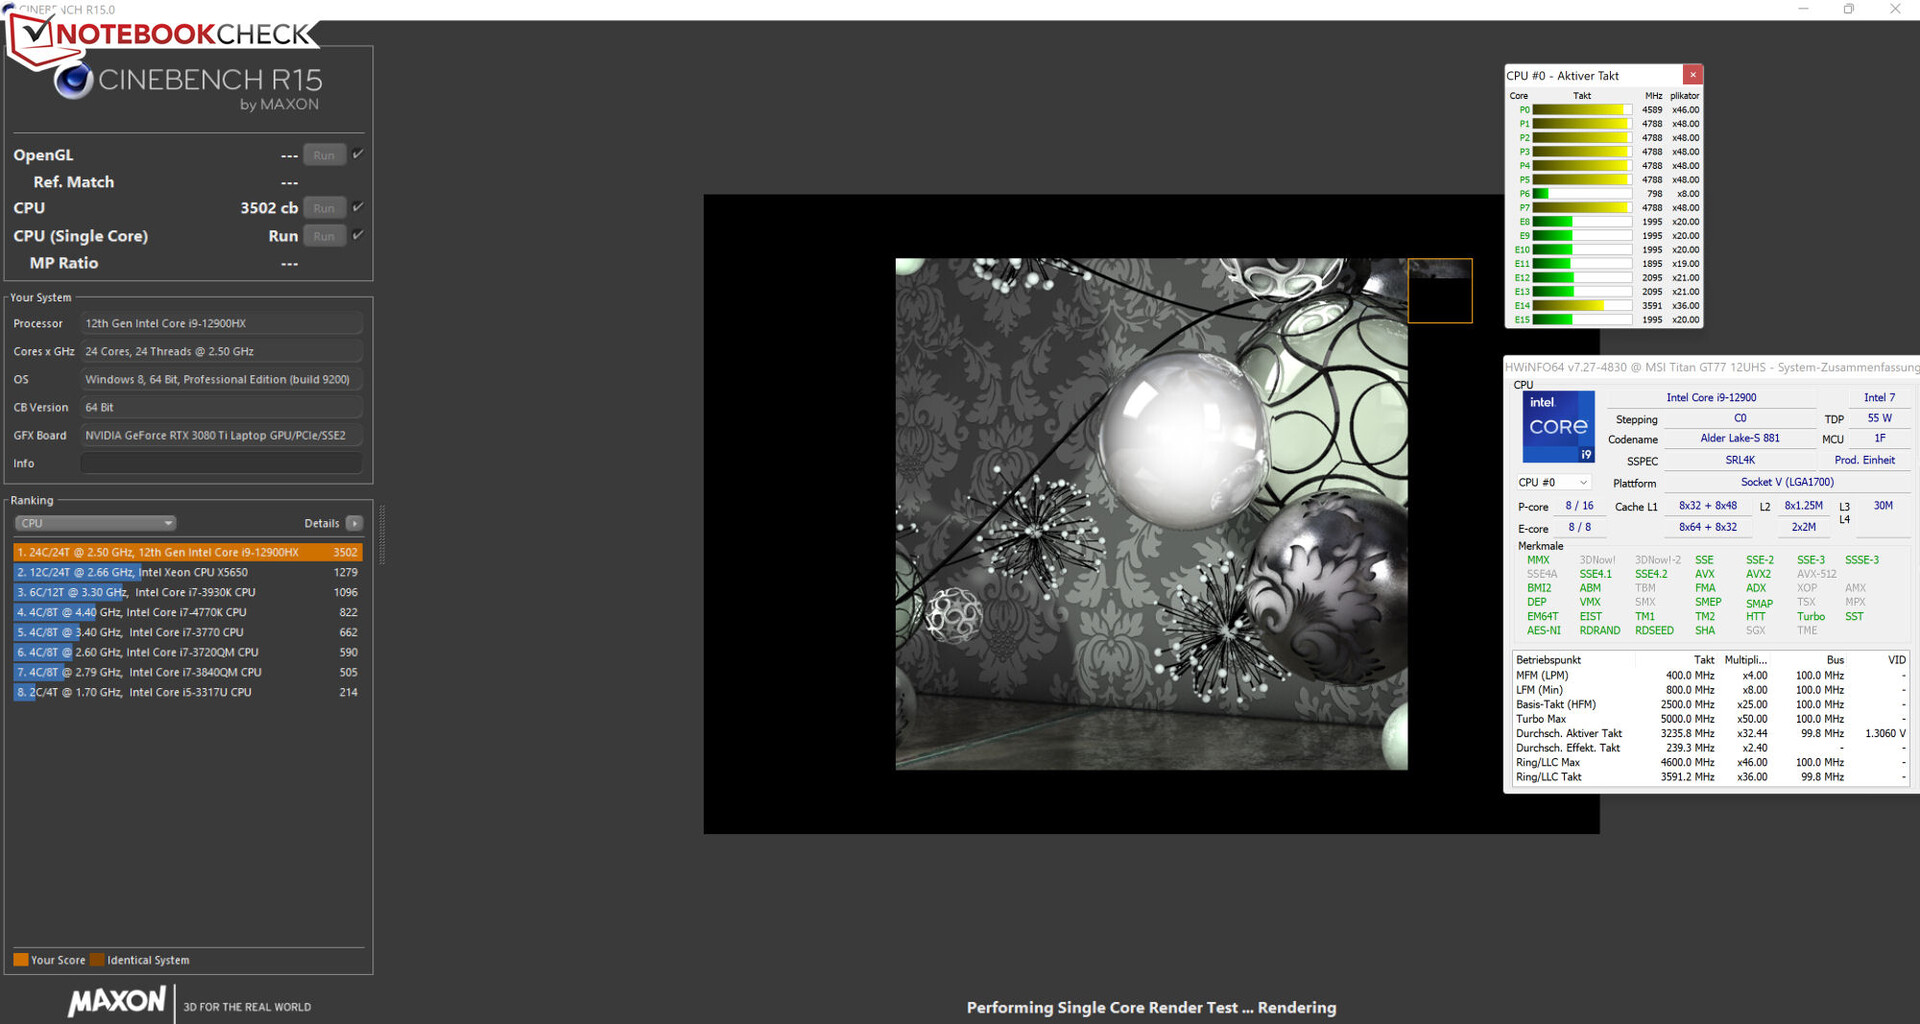
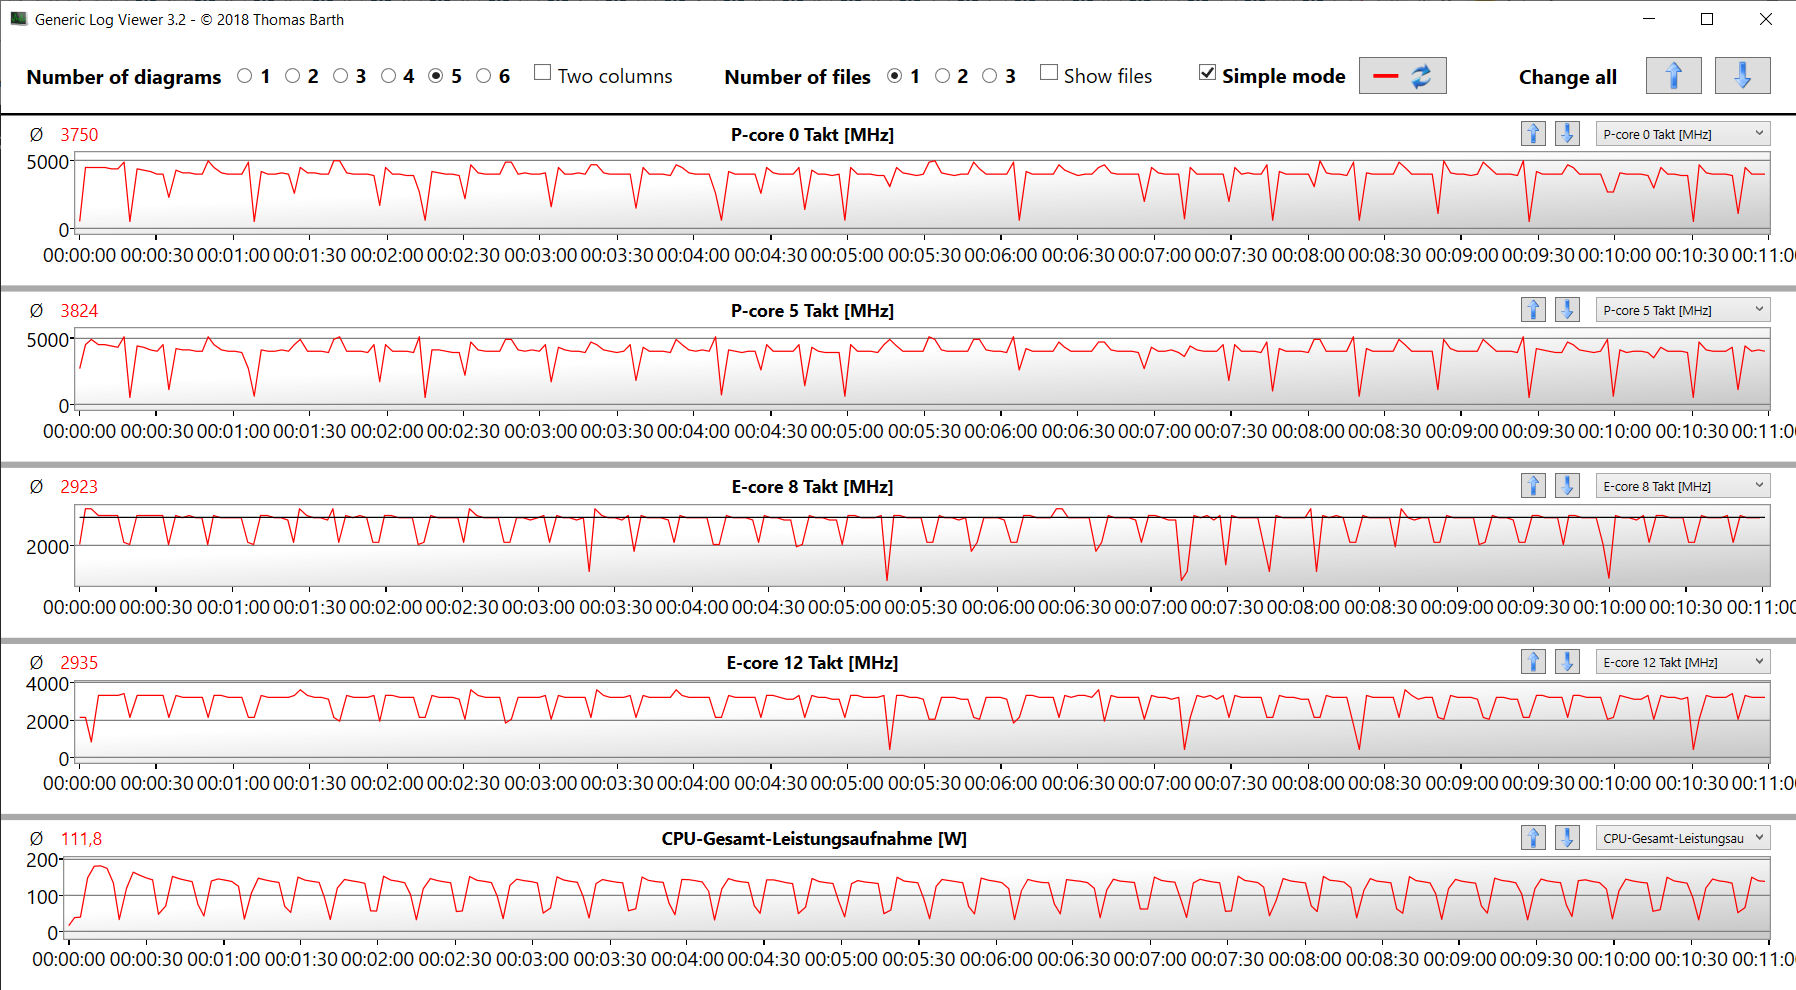
Il test Cinebench 15 ha rivelato che la CPU è in grado di funzionare continuamente a velocità di clock elevate. Utilizzando il profilo "Extreme Performance" le prestazioni sono risultate marginalmente più stabili.
Cinebench R15 Multi continuous test
| CPU Performance rating - Percent | |
| Media della classe Gaming | |
| MSI Titan GT77 12UHS 4k | |
| MSI Titan GT77 12UHS | |
| MSI Titan GT77 12UHS | |
| Media Intel Core i9-12900HX | |
| Alienware x17 R2 P48E | |
| Schenker XMG Ultra 17 Rocket Lake | |
| Razer Blade 17 Early 2022 | |
| Cinebench R23 | |
| Multi Core | |
| Media della classe Gaming (10488 - 42661, n=107, ultimi 2 anni) | |
| MSI Titan GT77 12UHS 4k | |
| MSI Titan GT77 12UHS (4k, Extreme Leistung, Cooler Boost) | |
| MSI Titan GT77 12UHS | |
| Media Intel Core i9-12900HX (18337 - 23482, n=8) | |
| Alienware x17 R2 P48E | |
| Schenker XMG Ultra 17 Rocket Lake | |
| Razer Blade 17 Early 2022 | |
| Single Core | |
| Media della classe Gaming (1166 - 2415, n=107, ultimi 2 anni) | |
| MSI Titan GT77 12UHS 4k | |
| Media Intel Core i9-12900HX (1897 - 1936, n=8) | |
| MSI Titan GT77 12UHS | |
| MSI Titan GT77 12UHS (4k, Extreme Leistung, Cooler Boost) | |
| Razer Blade 17 Early 2022 | |
| Alienware x17 R2 P48E | |
| Schenker XMG Ultra 17 Rocket Lake | |
| Cinebench R20 | |
| CPU (Multi Core) | |
| Media della classe Gaming (4029 - 16433, n=106, ultimi 2 anni) | |
| MSI Titan GT77 12UHS 4k | |
| MSI Titan GT77 12UHS (4k, Extreme Leistung, Cooler Boost) | |
| MSI Titan GT77 12UHS | |
| Media Intel Core i9-12900HX (7037 - 9042, n=8) | |
| Alienware x17 R2 P48E | |
| Schenker XMG Ultra 17 Rocket Lake | |
| Razer Blade 17 Early 2022 | |
| CPU (Single Core) | |
| Media della classe Gaming (442 - 913, n=106, ultimi 2 anni) | |
| MSI Titan GT77 12UHS 4k | |
| MSI Titan GT77 12UHS | |
| Media Intel Core i9-12900HX (728 - 745, n=8) | |
| MSI Titan GT77 12UHS (4k, Extreme Leistung, Cooler Boost) | |
| Alienware x17 R2 P48E | |
| Razer Blade 17 Early 2022 | |
| Schenker XMG Ultra 17 Rocket Lake | |
| Cinebench R15 | |
| CPU Multi 64Bit | |
| Media della classe Gaming (1578 - 6330, n=105, ultimi 2 anni) | |
| MSI Titan GT77 12UHS 4k | |
| MSI Titan GT77 12UHS (4k, Extreme Leistung, Cooler Boost) | |
| MSI Titan GT77 12UHS | |
| Media Intel Core i9-12900HX (2830 - 3652, n=8) | |
| Alienware x17 R2 P48E | |
| Schenker XMG Ultra 17 Rocket Lake | |
| Razer Blade 17 Early 2022 | |
| CPU Single 64Bit | |
| Media della classe Gaming (188.8 - 350, n=106, ultimi 2 anni) | |
| MSI Titan GT77 12UHS 4k | |
| MSI Titan GT77 12UHS | |
| MSI Titan GT77 12UHS (4k, Extreme Leistung, Cooler Boost) | |
| Media Intel Core i9-12900HX (274 - 282, n=8) | |
| Alienware x17 R2 P48E | |
| Razer Blade 17 Early 2022 | |
| Schenker XMG Ultra 17 Rocket Lake | |
| Blender - v2.79 BMW27 CPU | |
| Razer Blade 17 Early 2022 | |
| Schenker XMG Ultra 17 Rocket Lake | |
| Alienware x17 R2 P48E | |
| Media Intel Core i9-12900HX (144 - 201, n=8) | |
| Media della classe Gaming (79 - 330, n=104, ultimi 2 anni) | |
| MSI Titan GT77 12UHS 4k | |
| MSI Titan GT77 12UHS | |
| MSI Titan GT77 12UHS (4k, Extreme Leistung, Cooler Boost) | |
| 7-Zip 18.03 | |
| 7z b 4 | |
| Media della classe Gaming (33491 - 148086, n=105, ultimi 2 anni) | |
| MSI Titan GT77 12UHS 4k | |
| MSI Titan GT77 12UHS (4k, Extreme Leistung, Cooler Boost) | |
| MSI Titan GT77 12UHS | |
| Media Intel Core i9-12900HX (69778 - 88128, n=7) | |
| Alienware x17 R2 P48E | |
| Schenker XMG Ultra 17 Rocket Lake | |
| Razer Blade 17 Early 2022 | |
| 7z b 4 -mmt1 | |
| Media della classe Gaming (4199 - 7436, n=105, ultimi 2 anni) | |
| MSI Titan GT77 12UHS 4k | |
| Media Intel Core i9-12900HX (6165 - 6358, n=7) | |
| MSI Titan GT77 12UHS | |
| MSI Titan GT77 12UHS | |
| Schenker XMG Ultra 17 Rocket Lake | |
| Razer Blade 17 Early 2022 | |
| Alienware x17 R2 P48E | |
| Geekbench 5.5 | |
| Multi-Core | |
| Media della classe Gaming (6460 - 28263, n=105, ultimi 2 anni) | |
| MSI Titan GT77 12UHS 4k | |
| MSI Titan GT77 12UHS (4k, Extreme Leistung, Cooler Boost) | |
| MSI Titan GT77 12UHS | |
| Media Intel Core i9-12900HX (15116 - 16925, n=8) | |
| Alienware x17 R2 P48E | |
| Schenker XMG Ultra 17 Rocket Lake | |
| Razer Blade 17 Early 2022 | |
| Single-Core | |
| Media della classe Gaming (986 - 2474, n=105, ultimi 2 anni) | |
| MSI Titan GT77 12UHS | |
| MSI Titan GT77 12UHS 4k | |
| MSI Titan GT77 12UHS (4k, Extreme Leistung, Cooler Boost) | |
| Media Intel Core i9-12900HX (1874 - 1949, n=8) | |
| Alienware x17 R2 P48E | |
| Razer Blade 17 Early 2022 | |
| Schenker XMG Ultra 17 Rocket Lake | |
| HWBOT x265 Benchmark v2.2 - 4k Preset | |
| Media della classe Gaming (11.5 - 44.4, n=105, ultimi 2 anni) | |
| MSI Titan GT77 12UHS 4k | |
| MSI Titan GT77 12UHS (4k, Extreme Leistung, Cooler Boost) | |
| MSI Titan GT77 12UHS | |
| Media Intel Core i9-12900HX (19.6 - 26.6, n=7) | |
| Alienware x17 R2 P48E | |
| Schenker XMG Ultra 17 Rocket Lake | |
| Razer Blade 17 Early 2022 | |
| LibreOffice - 20 Documents To PDF | |
| Media della classe Gaming (33.2 - 88.8, n=105, ultimi 2 anni) | |
| Alienware x17 R2 P48E | |
| Schenker XMG Ultra 17 Rocket Lake | |
| Razer Blade 17 Early 2022 | |
| MSI Titan GT77 12UHS | |
| MSI Titan GT77 12UHS 4k | |
| Media Intel Core i9-12900HX (33.6 - 42.4, n=7) | |
| MSI Titan GT77 12UHS (4k, Extreme Leistung, Cooler Boost) | |
| R Benchmark 2.5 - Overall mean | |
| Schenker XMG Ultra 17 Rocket Lake | |
| Razer Blade 17 Early 2022 | |
| Alienware x17 R2 P48E | |
| Media della classe Gaming (0.3439 - 0.759, n=106, ultimi 2 anni) | |
| MSI Titan GT77 12UHS 4k | |
| MSI Titan GT77 12UHS (4k, Extreme Leistung, Cooler Boost) | |
| Media Intel Core i9-12900HX (0.4159 - 0.4242, n=7) | |
| MSI Titan GT77 12UHS | |
* ... Meglio usare valori piccoli
AIDA64: FP32 Ray-Trace | FPU Julia | CPU SHA3 | CPU Queen | FPU SinJulia | FPU Mandel | CPU AES | CPU ZLib | FP64 Ray-Trace | CPU PhotoWorxx
| Performance rating | |
| Media della classe Gaming | |
| MSI Titan GT77 12UHS 4k | |
| MSI Titan GT77 12UHS | |
| MSI Titan GT77 12UHS | |
| Media Intel Core i9-12900HX | |
| Schenker XMG Ultra 17 Rocket Lake | |
| Alienware x17 R2 P48E | |
| Razer Blade 17 Early 2022 | |
| AIDA64 / FP32 Ray-Trace | |
| Media della classe Gaming (10227 - 85542, n=105, ultimi 2 anni) | |
| MSI Titan GT77 12UHS 4k (v6.70.6000) | |
| MSI Titan GT77 12UHS (v6.70.6000, 4k, Extreme Leistung, Cooler Boost) | |
| MSI Titan GT77 12UHS (v6.70.6000) | |
| Media Intel Core i9-12900HX (11535 - 22183, n=7) | |
| Schenker XMG Ultra 17 Rocket Lake (v6.32.5600) | |
| Alienware x17 R2 P48E (v6.50.5800) | |
| Razer Blade 17 Early 2022 (v6.50.5800) | |
| AIDA64 / FPU Julia | |
| Media della classe Gaming (51376 - 238426, n=105, ultimi 2 anni) | |
| MSI Titan GT77 12UHS 4k (v6.70.6000) | |
| MSI Titan GT77 12UHS (v6.70.6000) | |
| MSI Titan GT77 12UHS (v6.70.6000, 4k, Extreme Leistung, Cooler Boost) | |
| Media Intel Core i9-12900HX (52916 - 110093, n=7) | |
| Schenker XMG Ultra 17 Rocket Lake (v6.32.5600) | |
| Alienware x17 R2 P48E (v6.50.5800) | |
| Razer Blade 17 Early 2022 (v6.50.5800) | |
| AIDA64 / CPU SHA3 | |
| Media della classe Gaming (2180 - 10115, n=105, ultimi 2 anni) | |
| MSI Titan GT77 12UHS 4k (v6.70.6000) | |
| MSI Titan GT77 12UHS (v6.70.6000, 4k, Extreme Leistung, Cooler Boost) | |
| MSI Titan GT77 12UHS (v6.70.6000) | |
| Schenker XMG Ultra 17 Rocket Lake (v6.32.5600) | |
| Media Intel Core i9-12900HX (3559 - 5123, n=7) | |
| Alienware x17 R2 P48E (v6.50.5800) | |
| Razer Blade 17 Early 2022 (v6.50.5800) | |
| AIDA64 / CPU Queen | |
| Media della classe Gaming (49785 - 173351, n=90, ultimi 2 anni) | |
| Alienware x17 R2 P48E (v6.50.5800) | |
| Schenker XMG Ultra 17 Rocket Lake (v6.32.5600) | |
| MSI Titan GT77 12UHS (v6.70.6000) | |
| MSI Titan GT77 12UHS 4k (v6.70.6000) | |
| MSI Titan GT77 12UHS (v6.70.6000, 4k, Extreme Leistung, Cooler Boost) | |
| Media Intel Core i9-12900HX (101029 - 104457, n=7) | |
| Razer Blade 17 Early 2022 (v6.50.5800) | |
| AIDA64 / FPU SinJulia | |
| Media della classe Gaming (4424 - 33636, n=105, ultimi 2 anni) | |
| MSI Titan GT77 12UHS 4k (v6.70.6000) | |
| MSI Titan GT77 12UHS (v6.70.6000, 4k, Extreme Leistung, Cooler Boost) | |
| MSI Titan GT77 12UHS (v6.70.6000) | |
| Media Intel Core i9-12900HX (10475 - 13062, n=7) | |
| Schenker XMG Ultra 17 Rocket Lake (v6.32.5600) | |
| Alienware x17 R2 P48E (v6.50.5800) | |
| Razer Blade 17 Early 2022 (v6.50.5800) | |
| AIDA64 / FPU Mandel | |
| Media della classe Gaming (25115 - 128721, n=105, ultimi 2 anni) | |
| MSI Titan GT77 12UHS 4k (v6.70.6000) | |
| MSI Titan GT77 12UHS (v6.70.6000, 4k, Extreme Leistung, Cooler Boost) | |
| MSI Titan GT77 12UHS (v6.70.6000) | |
| Media Intel Core i9-12900HX (31779 - 53628, n=7) | |
| Schenker XMG Ultra 17 Rocket Lake (v6.32.5600) | |
| Alienware x17 R2 P48E (v6.50.5800) | |
| Razer Blade 17 Early 2022 (v6.50.5800) | |
| AIDA64 / CPU AES | |
| MSI Titan GT77 12UHS (v6.70.6000, 4k, Extreme Leistung, Cooler Boost) | |
| MSI Titan GT77 12UHS | |
| MSI Titan GT77 12UHS 4k (v6.70.6000) | |
| Media Intel Core i9-12900HX (125268 - 183146, n=7) | |
| Schenker XMG Ultra 17 Rocket Lake (v6.32.5600) | |
| Media della classe Gaming (39258 - 247074, n=105, ultimi 2 anni) | |
| Alienware x17 R2 P48E (v6.50.5800) | |
| Razer Blade 17 Early 2022 (v6.50.5800) | |
| AIDA64 / CPU ZLib | |
| Media della classe Gaming (574 - 2531, n=105, ultimi 2 anni) | |
| MSI Titan GT77 12UHS 4k (v6.70.6000) | |
| MSI Titan GT77 12UHS (v6.70.6000, 4k, Extreme Leistung, Cooler Boost) | |
| MSI Titan GT77 12UHS (v6.70.6000) | |
| Media Intel Core i9-12900HX (990 - 1408, n=7) | |
| Alienware x17 R2 P48E (v6.50.5800) | |
| Schenker XMG Ultra 17 Rocket Lake (v6.32.5600) | |
| Razer Blade 17 Early 2022 (v6.50.5800) | |
| AIDA64 / FP64 Ray-Trace | |
| Media della classe Gaming (5509 - 45446, n=105, ultimi 2 anni) | |
| MSI Titan GT77 12UHS 4k (v6.70.6000) | |
| MSI Titan GT77 12UHS (v6.70.6000, 4k, Extreme Leistung, Cooler Boost) | |
| MSI Titan GT77 12UHS (v6.70.6000) | |
| Media Intel Core i9-12900HX (6663 - 11913, n=7) | |
| Schenker XMG Ultra 17 Rocket Lake (v6.32.5600) | |
| Alienware x17 R2 P48E (v6.50.5800) | |
| Razer Blade 17 Early 2022 (v6.50.5800) | |
| AIDA64 / CPU PhotoWorxx | |
| Media della classe Gaming (12271 - 89891, n=105, ultimi 2 anni) | |
| Media Intel Core i9-12900HX (40239 - 47710, n=7) | |
| MSI Titan GT77 12UHS (v6.70.6000) | |
| MSI Titan GT77 12UHS 4k (v6.70.6000) | |
| MSI Titan GT77 12UHS (v6.70.6000, 4k, Extreme Leistung, Cooler Boost) | |
| Razer Blade 17 Early 2022 (v6.50.5800) | |
| Alienware x17 R2 P48E (v6.50.5800) | |
| Schenker XMG Ultra 17 Rocket Lake (v6.32.5600) | |
Prestazioni del sistema
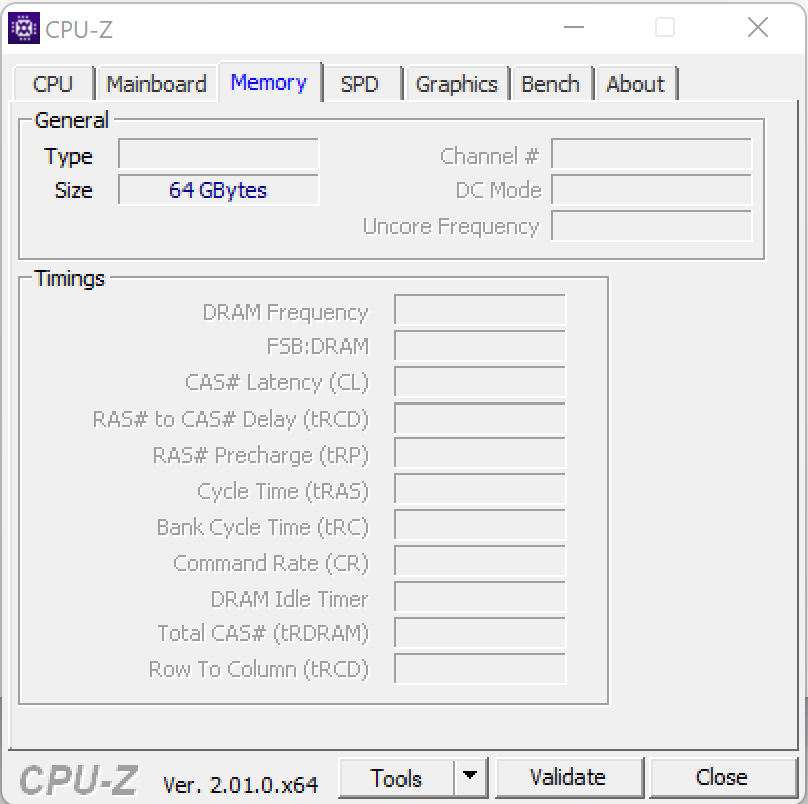
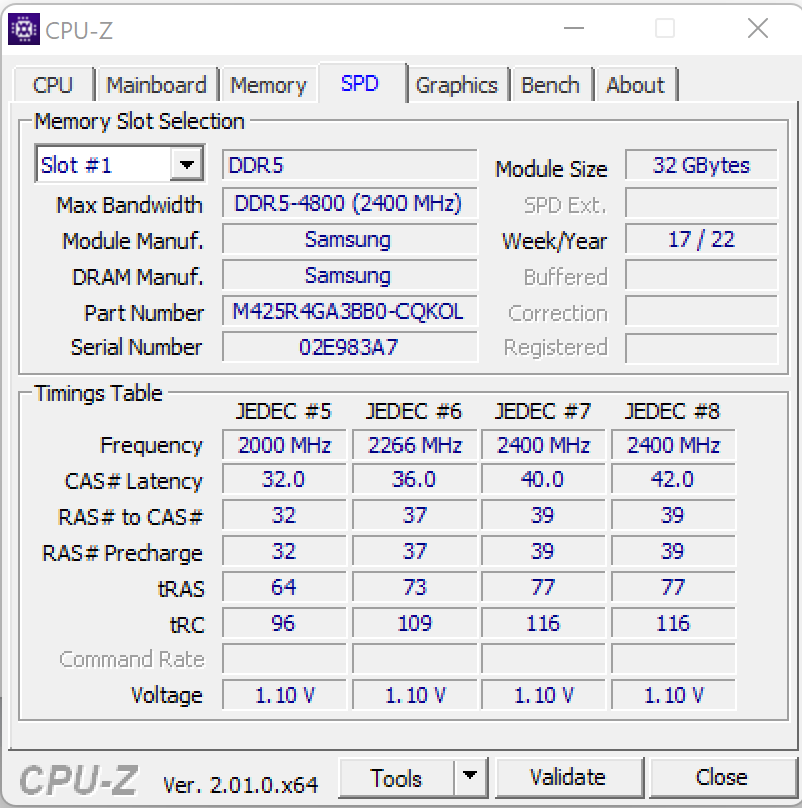
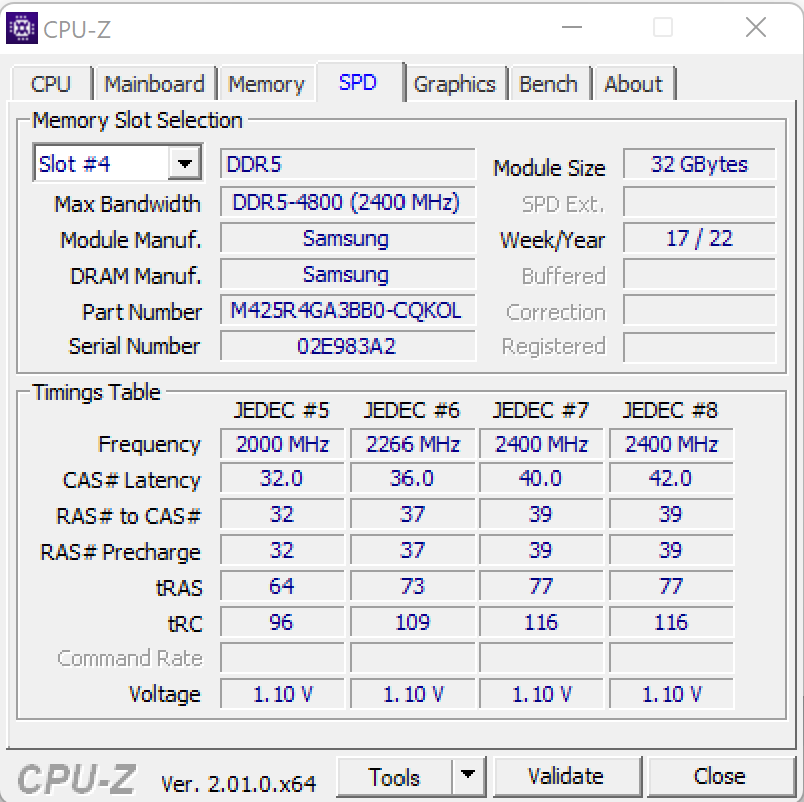
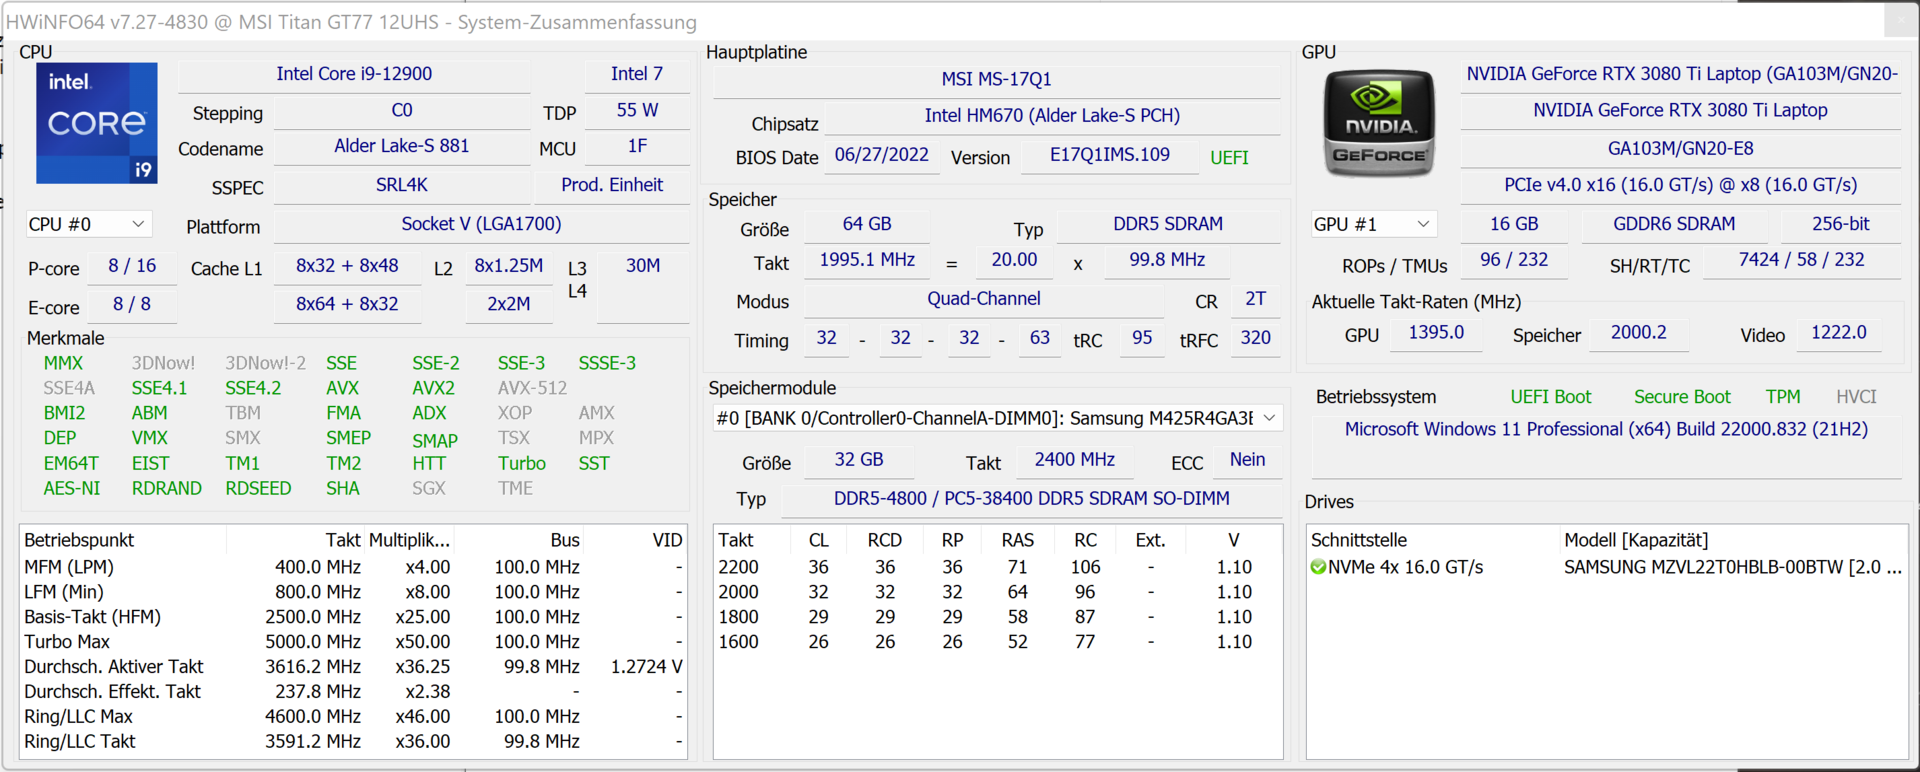
Al GT77 non manca certo la potenza di calcolo, come è evidente già solo guardando le sue specifiche. Il portatile da 17 pollici è in grado di gestire con facilità giochi, rendering e molto altro. Le velocità di trasferimento della RAM sono in linea con il livello di prestazioni abituale della memoria DDR4-4800. Il sistema ha ottenuto buoni risultati anche in PCMark.
CrossMark: Overall | Productivity | Creativity | Responsiveness
| PCMark 10 / Score | |
| Media della classe Gaming (5828 - 12414, n=93, ultimi 2 anni) | |
| MSI Titan GT77 12UHS (dGPU, Extreme Leistung) | |
| MSI Titan GT77 12UHS | |
| Alienware x17 R2 P48E | |
| Media Intel Core i9-12900HX, NVIDIA GeForce RTX 3080 Ti Laptop GPU (6812 - 8636, n=6) | |
| Schenker XMG Ultra 17 Rocket Lake | |
| Razer Blade 17 Early 2022 | |
| MSI Titan GT77 12UHS 4k | |
| PCMark 10 / Essentials | |
| Alienware x17 R2 P48E | |
| MSI Titan GT77 12UHS (dGPU, Extreme Leistung) | |
| MSI Titan GT77 12UHS | |
| Schenker XMG Ultra 17 Rocket Lake | |
| Media della classe Gaming (8810 - 11935, n=97, ultimi 2 anni) | |
| Media Intel Core i9-12900HX, NVIDIA GeForce RTX 3080 Ti Laptop GPU (9598 - 11192, n=6) | |
| Razer Blade 17 Early 2022 | |
| MSI Titan GT77 12UHS 4k | |
| PCMark 10 / Productivity | |
| Media della classe Gaming (6845 - 25323, n=95, ultimi 2 anni) | |
| MSI Titan GT77 12UHS (dGPU, Extreme Leistung) | |
| Media Intel Core i9-12900HX, NVIDIA GeForce RTX 3080 Ti Laptop GPU (9365 - 10932, n=6) | |
| MSI Titan GT77 12UHS | |
| Alienware x17 R2 P48E | |
| Schenker XMG Ultra 17 Rocket Lake | |
| MSI Titan GT77 12UHS 4k | |
| Razer Blade 17 Early 2022 | |
| PCMark 10 / Digital Content Creation | |
| Media della classe Gaming (7602 - 19954, n=95, ultimi 2 anni) | |
| MSI Titan GT77 12UHS (dGPU, Extreme Leistung) | |
| MSI Titan GT77 12UHS | |
| Alienware x17 R2 P48E | |
| Media Intel Core i9-12900HX, NVIDIA GeForce RTX 3080 Ti Laptop GPU (9543 - 14291, n=6) | |
| Schenker XMG Ultra 17 Rocket Lake | |
| Razer Blade 17 Early 2022 | |
| MSI Titan GT77 12UHS 4k | |
| CrossMark / Overall | |
| MSI Titan GT77 12UHS 4k | |
| Media Intel Core i9-12900HX, NVIDIA GeForce RTX 3080 Ti Laptop GPU (2108 - 2170, n=5) | |
| MSI Titan GT77 12UHS | |
| Media della classe Gaming (1366 - 2409, n=94, ultimi 2 anni) | |
| Alienware x17 R2 P48E | |
| Razer Blade 17 Early 2022 | |
| CrossMark / Productivity | |
| MSI Titan GT77 12UHS 4k | |
| Media Intel Core i9-12900HX, NVIDIA GeForce RTX 3080 Ti Laptop GPU (1978 - 2047, n=5) | |
| MSI Titan GT77 12UHS | |
| Media della classe Gaming (1386 - 2254, n=94, ultimi 2 anni) | |
| Alienware x17 R2 P48E | |
| Razer Blade 17 Early 2022 | |
| CrossMark / Creativity | |
| MSI Titan GT77 12UHS 4k | |
| Media Intel Core i9-12900HX, NVIDIA GeForce RTX 3080 Ti Laptop GPU (2288 - 2366, n=5) | |
| MSI Titan GT77 12UHS | |
| Media della classe Gaming (1343 - 2786, n=94, ultimi 2 anni) | |
| Alienware x17 R2 P48E | |
| Razer Blade 17 Early 2022 | |
| CrossMark / Responsiveness | |
| MSI Titan GT77 12UHS 4k | |
| Media Intel Core i9-12900HX, NVIDIA GeForce RTX 3080 Ti Laptop GPU (1991 - 2090, n=5) | |
| MSI Titan GT77 12UHS | |
| Media della classe Gaming (1226 - 2334, n=94, ultimi 2 anni) | |
| Alienware x17 R2 P48E | |
| Razer Blade 17 Early 2022 | |
| PCMark 8 Home Score Accelerated v2 | 4166 punti | |
| PCMark 8 Creative Score Accelerated v2 | 6677 punti | |
| PCMark 8 Work Score Accelerated v2 | 5165 punti | |
| PCMark 10 Score | 6812 punti | |
Aiuto | ||
| AIDA64 / Memory Copy | |
| Media della classe Gaming (21750 - 129946, n=105, ultimi 2 anni) | |
| Media Intel Core i9-12900HX (62852 - 70863, n=7) | |
| MSI Titan GT77 12UHS | |
| MSI Titan GT77 12UHS 4k | |
| Razer Blade 17 Early 2022 | |
| Alienware x17 R2 P48E | |
| Schenker XMG Ultra 17 Rocket Lake | |
| AIDA64 / Memory Read | |
| Media della classe Gaming (22956 - 118858, n=105, ultimi 2 anni) | |
| Media Intel Core i9-12900HX (62140 - 72930, n=7) | |
| MSI Titan GT77 12UHS 4k | |
| Razer Blade 17 Early 2022 | |
| MSI Titan GT77 12UHS | |
| Alienware x17 R2 P48E | |
| Schenker XMG Ultra 17 Rocket Lake | |
| AIDA64 / Memory Write | |
| Media della classe Gaming (22297 - 135096, n=105, ultimi 2 anni) | |
| Media Intel Core i9-12900HX (60001 - 68782, n=7) | |
| MSI Titan GT77 12UHS 4k | |
| MSI Titan GT77 12UHS | |
| Razer Blade 17 Early 2022 | |
| Alienware x17 R2 P48E | |
| Schenker XMG Ultra 17 Rocket Lake | |
| AIDA64 / Memory Latency | |
| Media della classe Gaming (75.3 - 259, n=105, ultimi 2 anni) | |
| Alienware x17 R2 P48E | |
| MSI Titan GT77 12UHS 4k | |
| MSI Titan GT77 12UHS | |
| Media Intel Core i9-12900HX (83.9 - 93.4, n=7) | |
| Schenker XMG Ultra 17 Rocket Lake | |
* ... Meglio usare valori piccoli
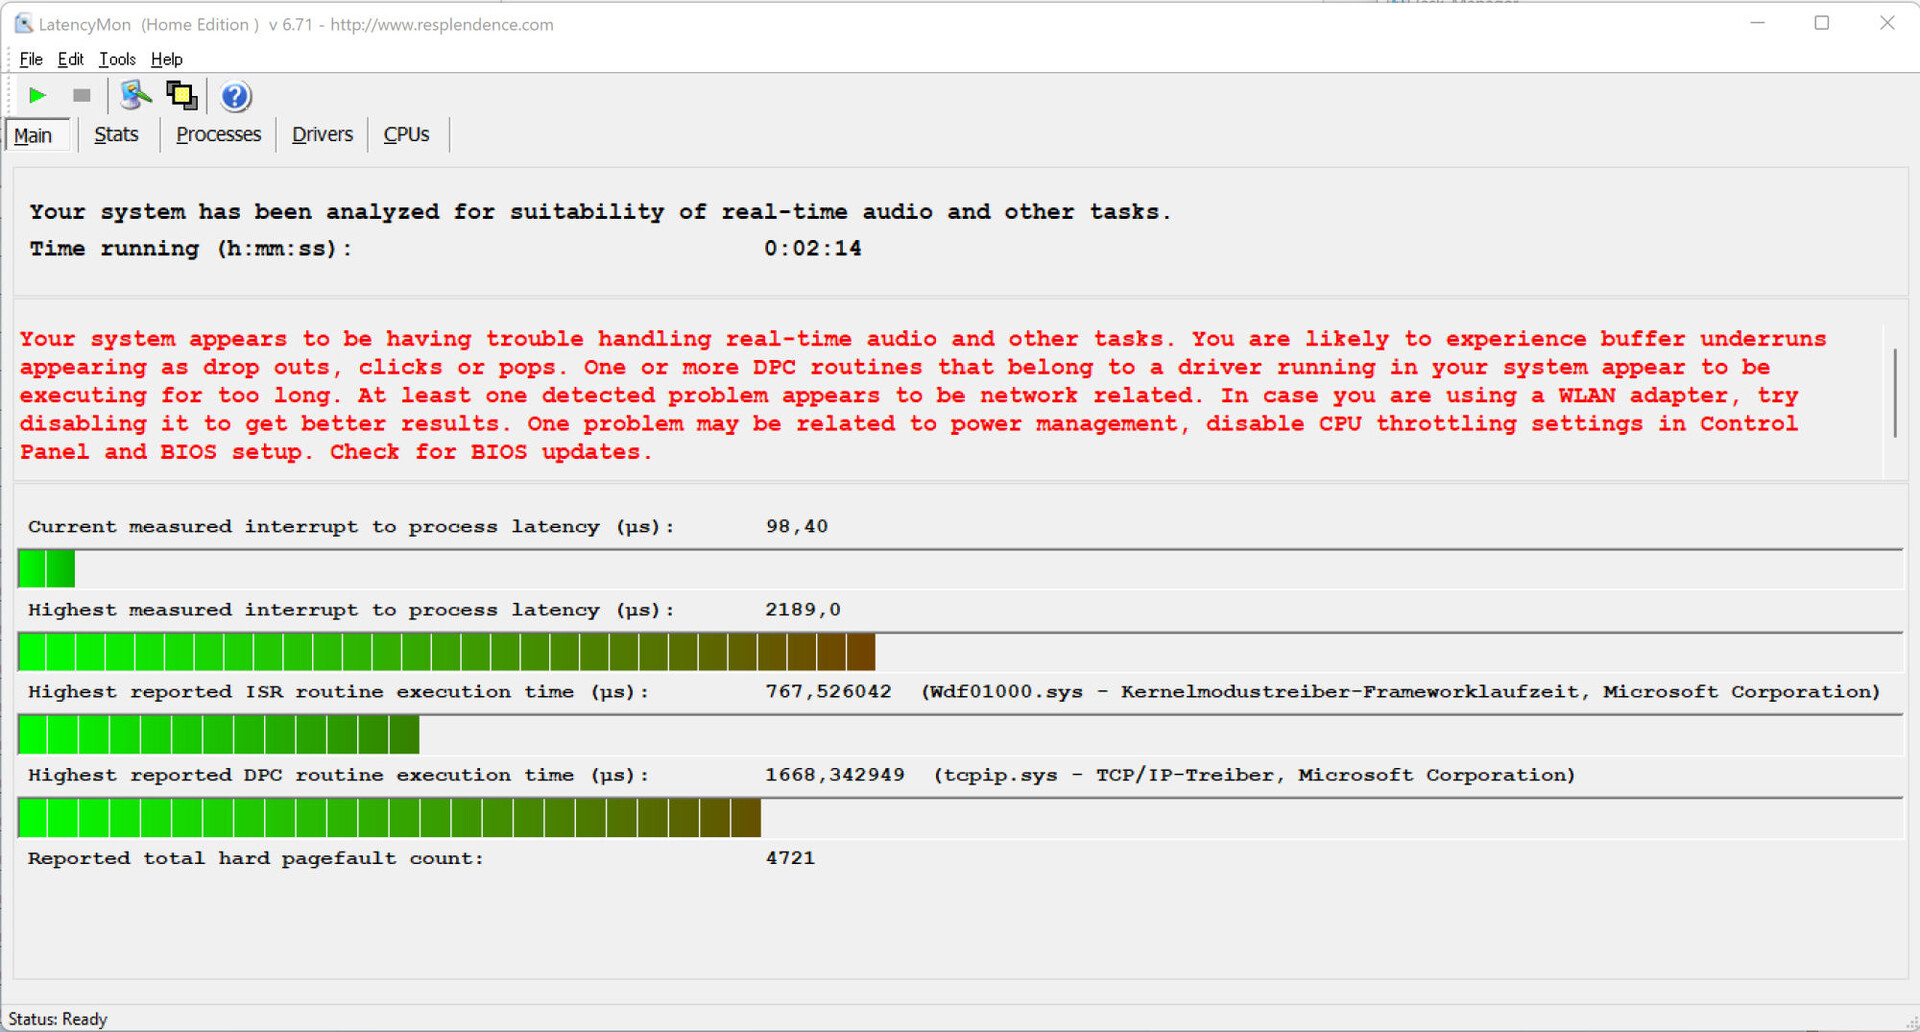
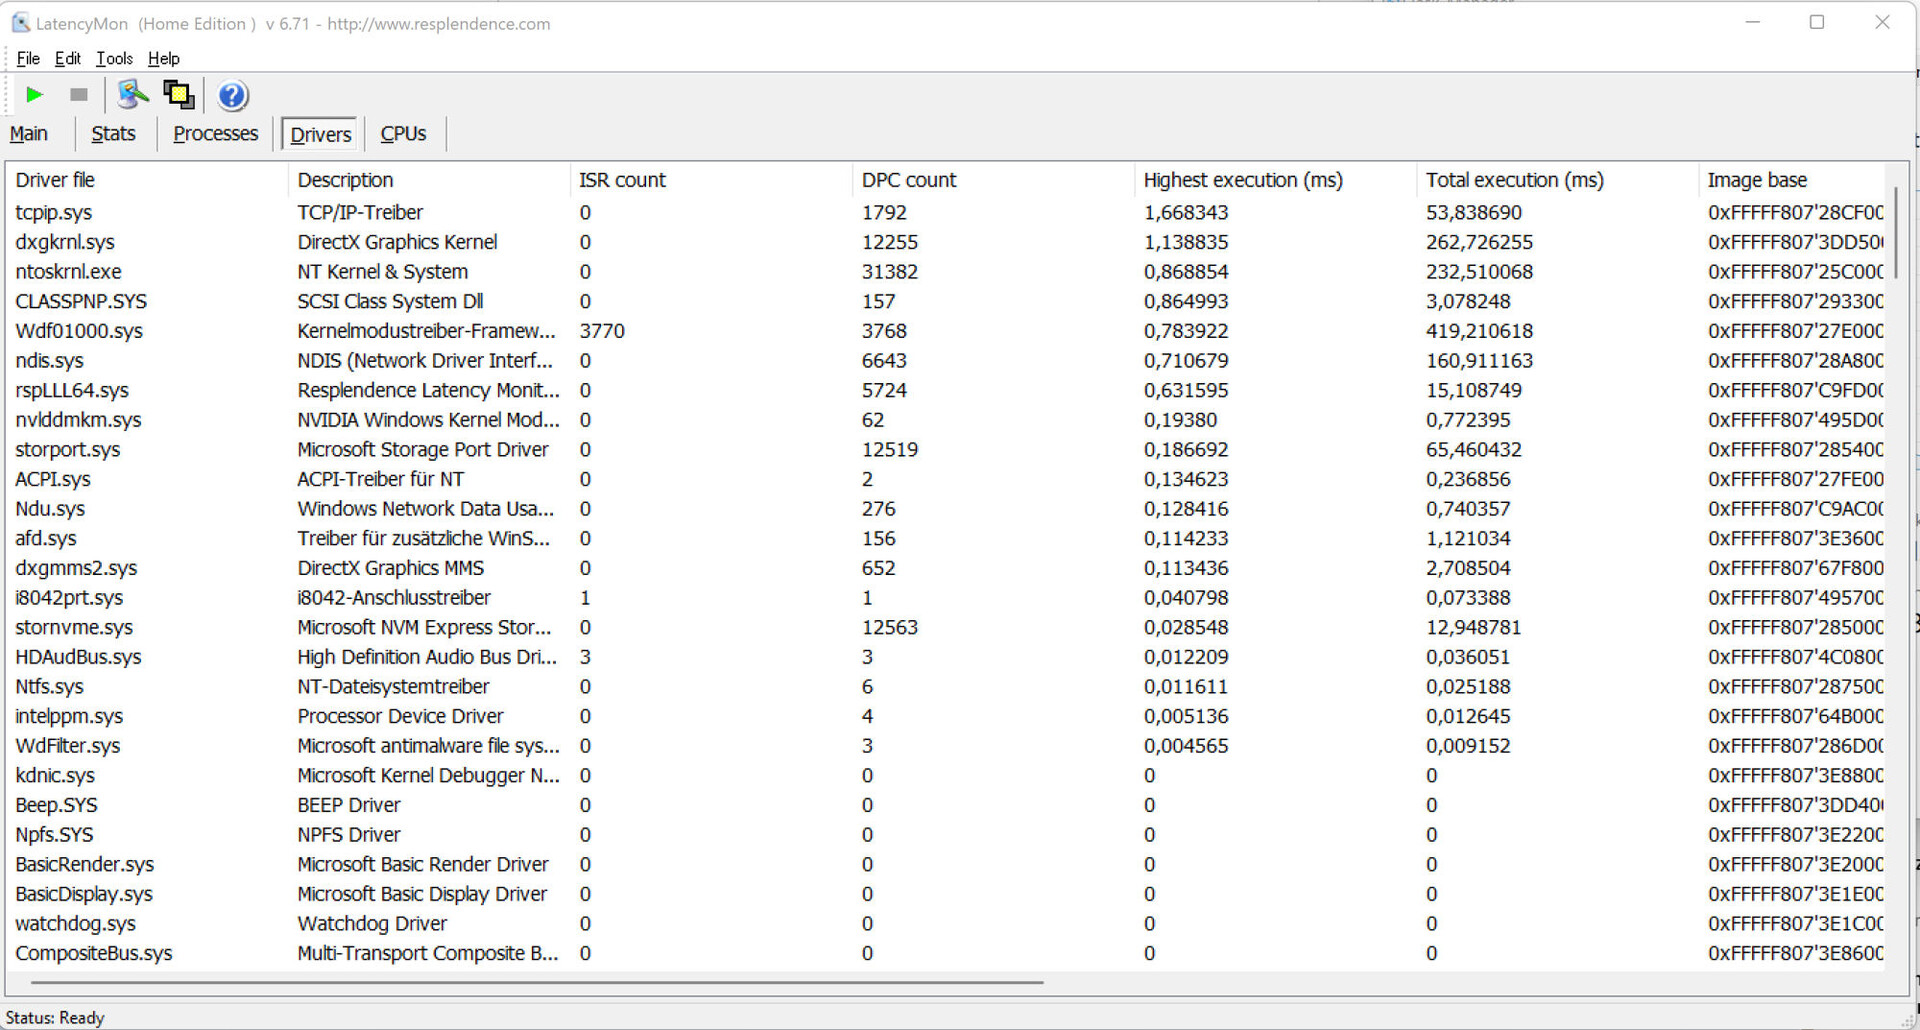
Latenza DPC
Il nostro test standardizzato di monitoraggio della latenza (navigazione in Internet, riproduzione di video 4K, Prime95 ad alto carico) ha rivelato alcuni problemi con la latenza del DPC. Il sistema non sembra essere adatto all'elaborazione di video e audio in tempo reale. I futuri aggiornamenti del software potrebbero migliorare o addirittura peggiorare questo problema.
| DPC Latencies / LatencyMon - interrupt to process latency (max), Web, Youtube, Prime95 | |
| MSI Titan GT77 12UHS | |
| MSI Titan GT77 12UHS | |
| MSI Titan GT77 12UHS 4k | |
| Alienware x17 R2 P48E | |
| Schenker XMG Ultra 17 Rocket Lake | |
| Razer Blade 17 Early 2022 | |
* ... Meglio usare valori piccoli
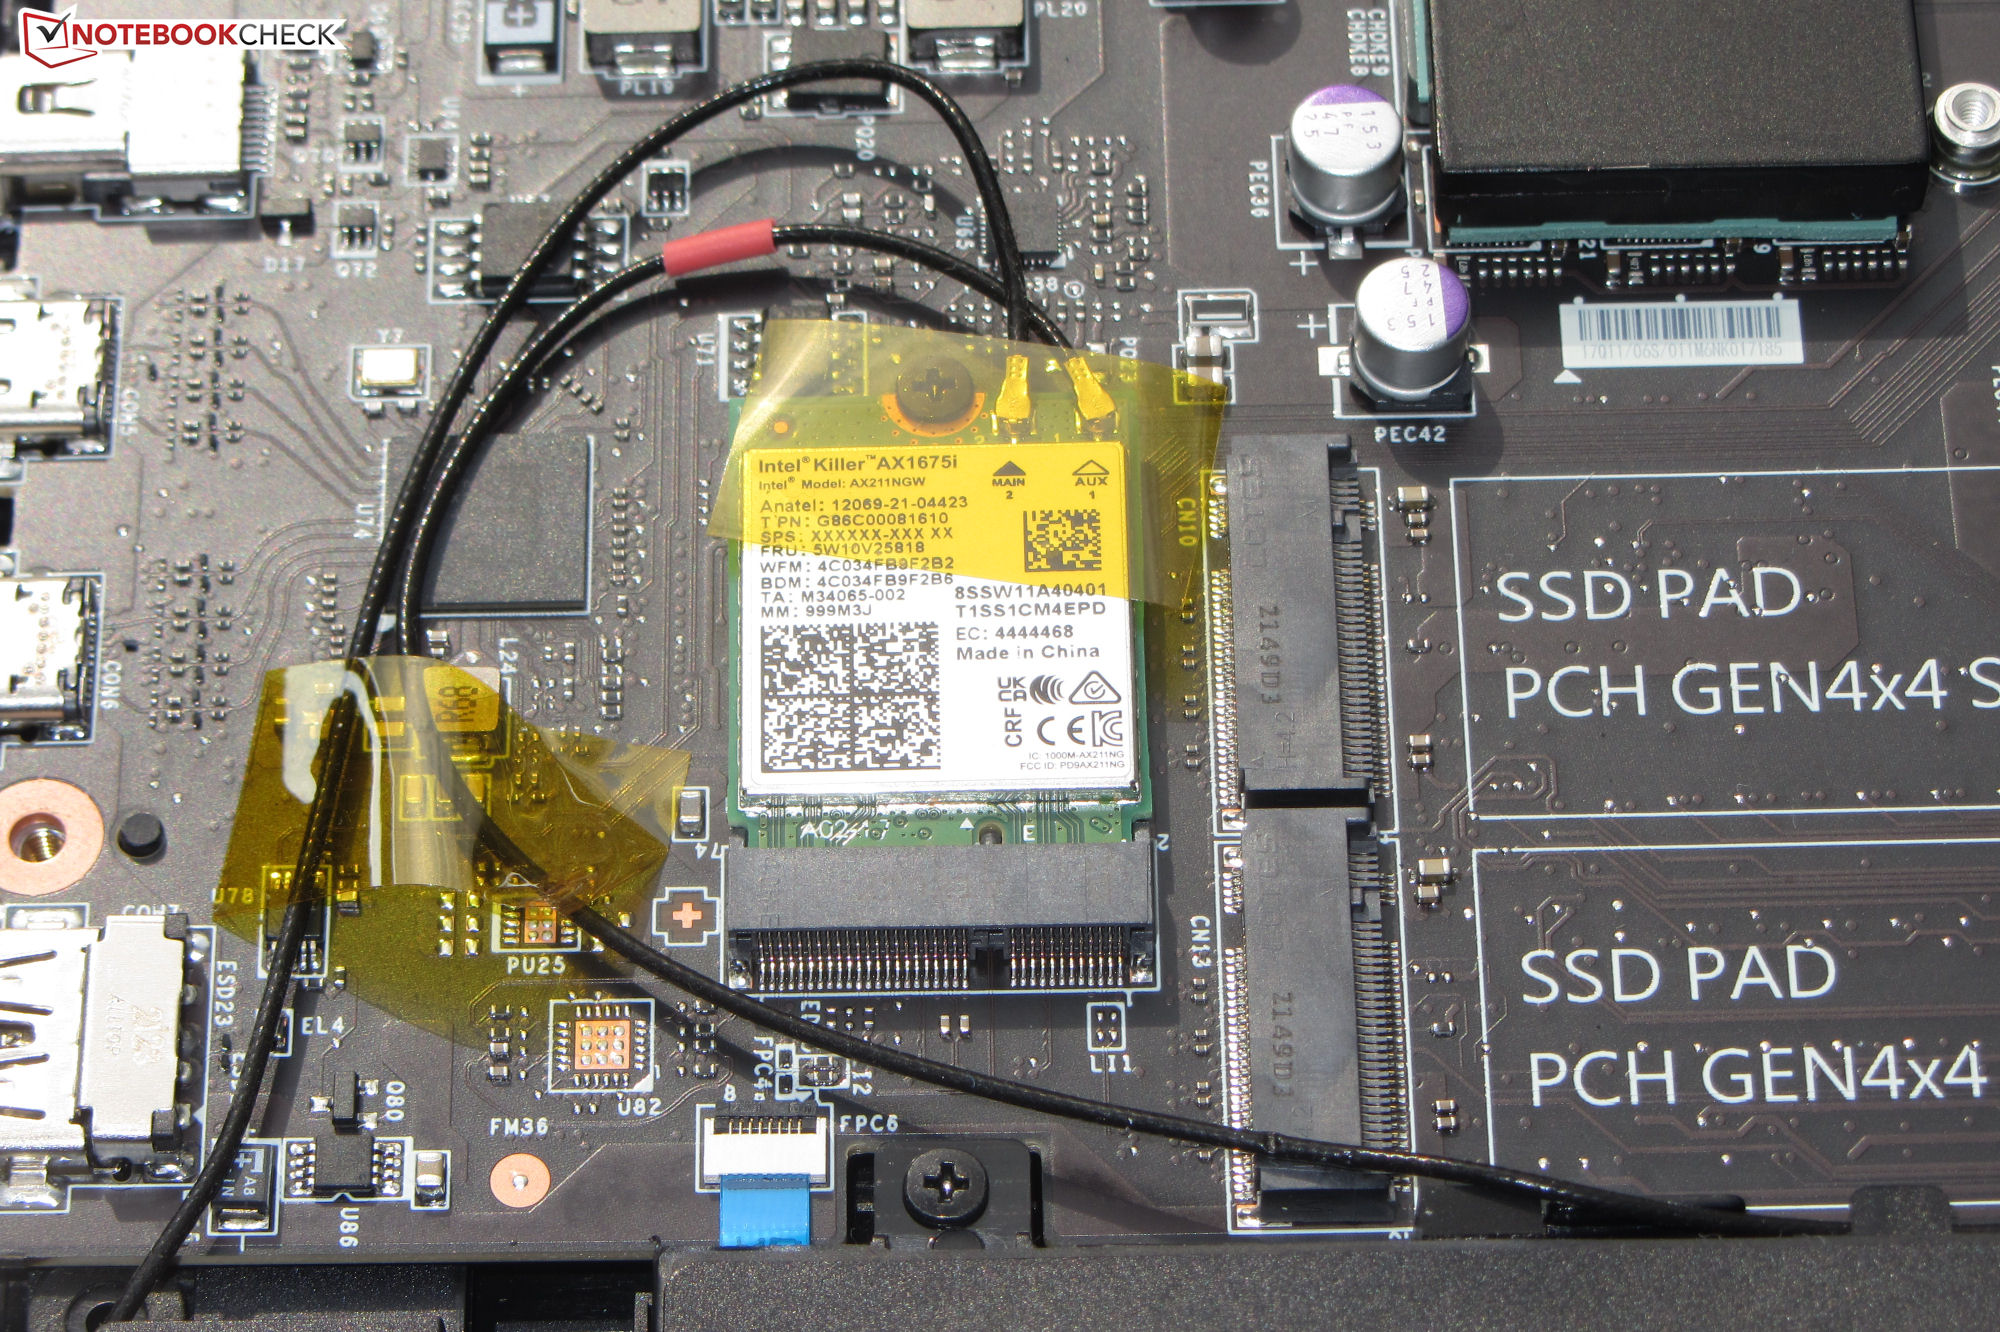
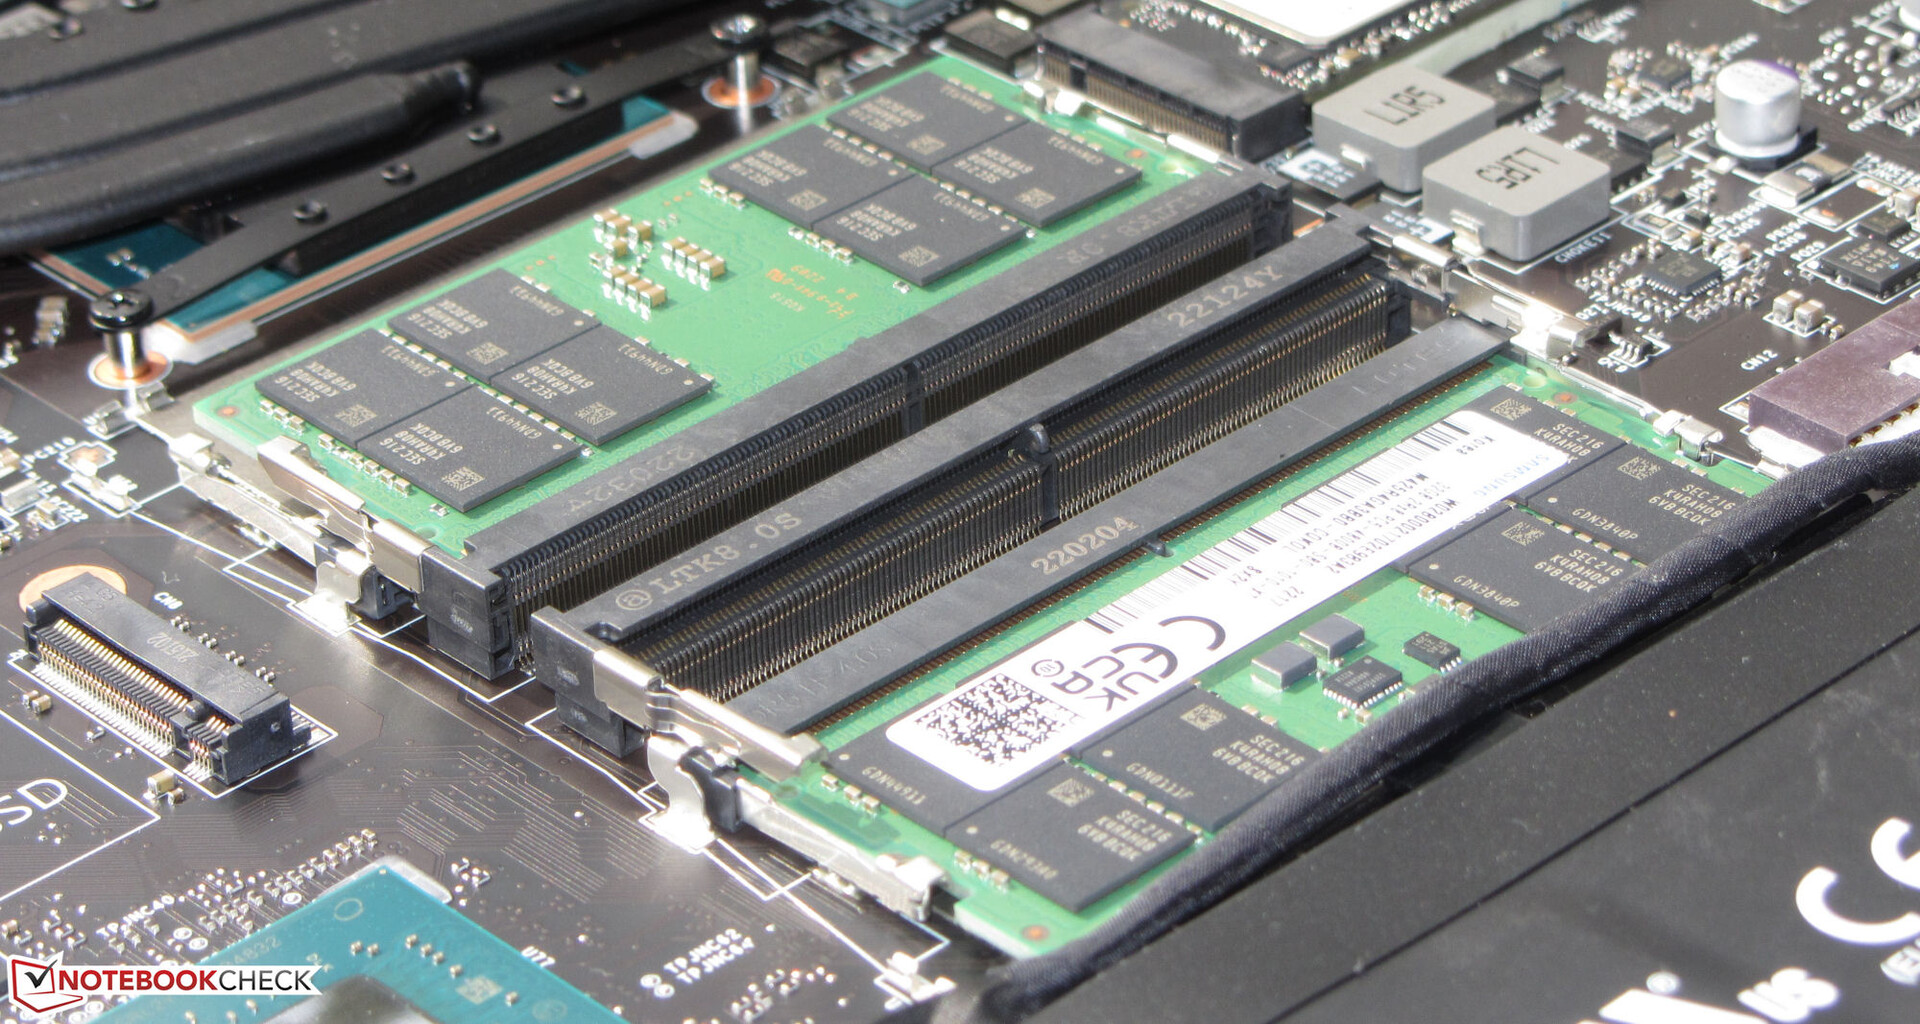
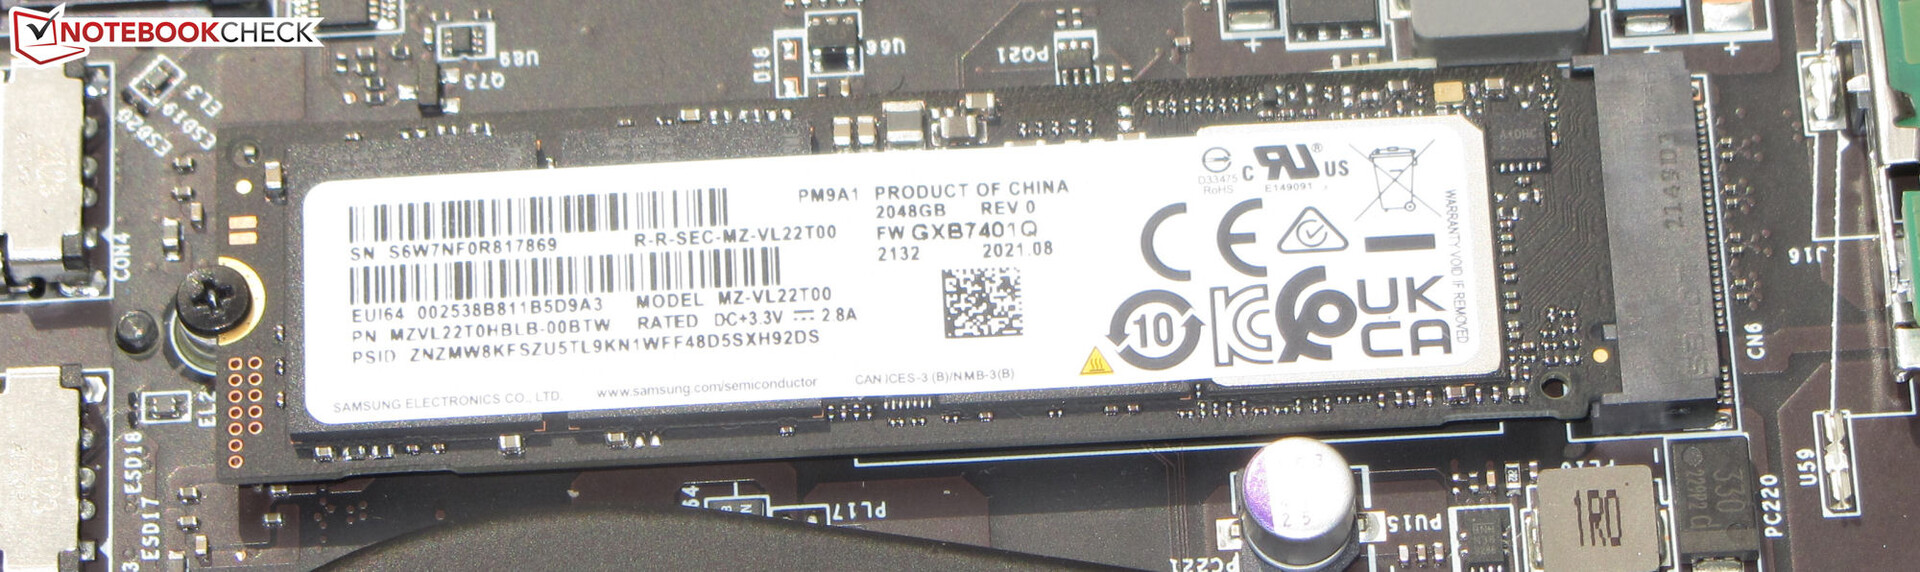
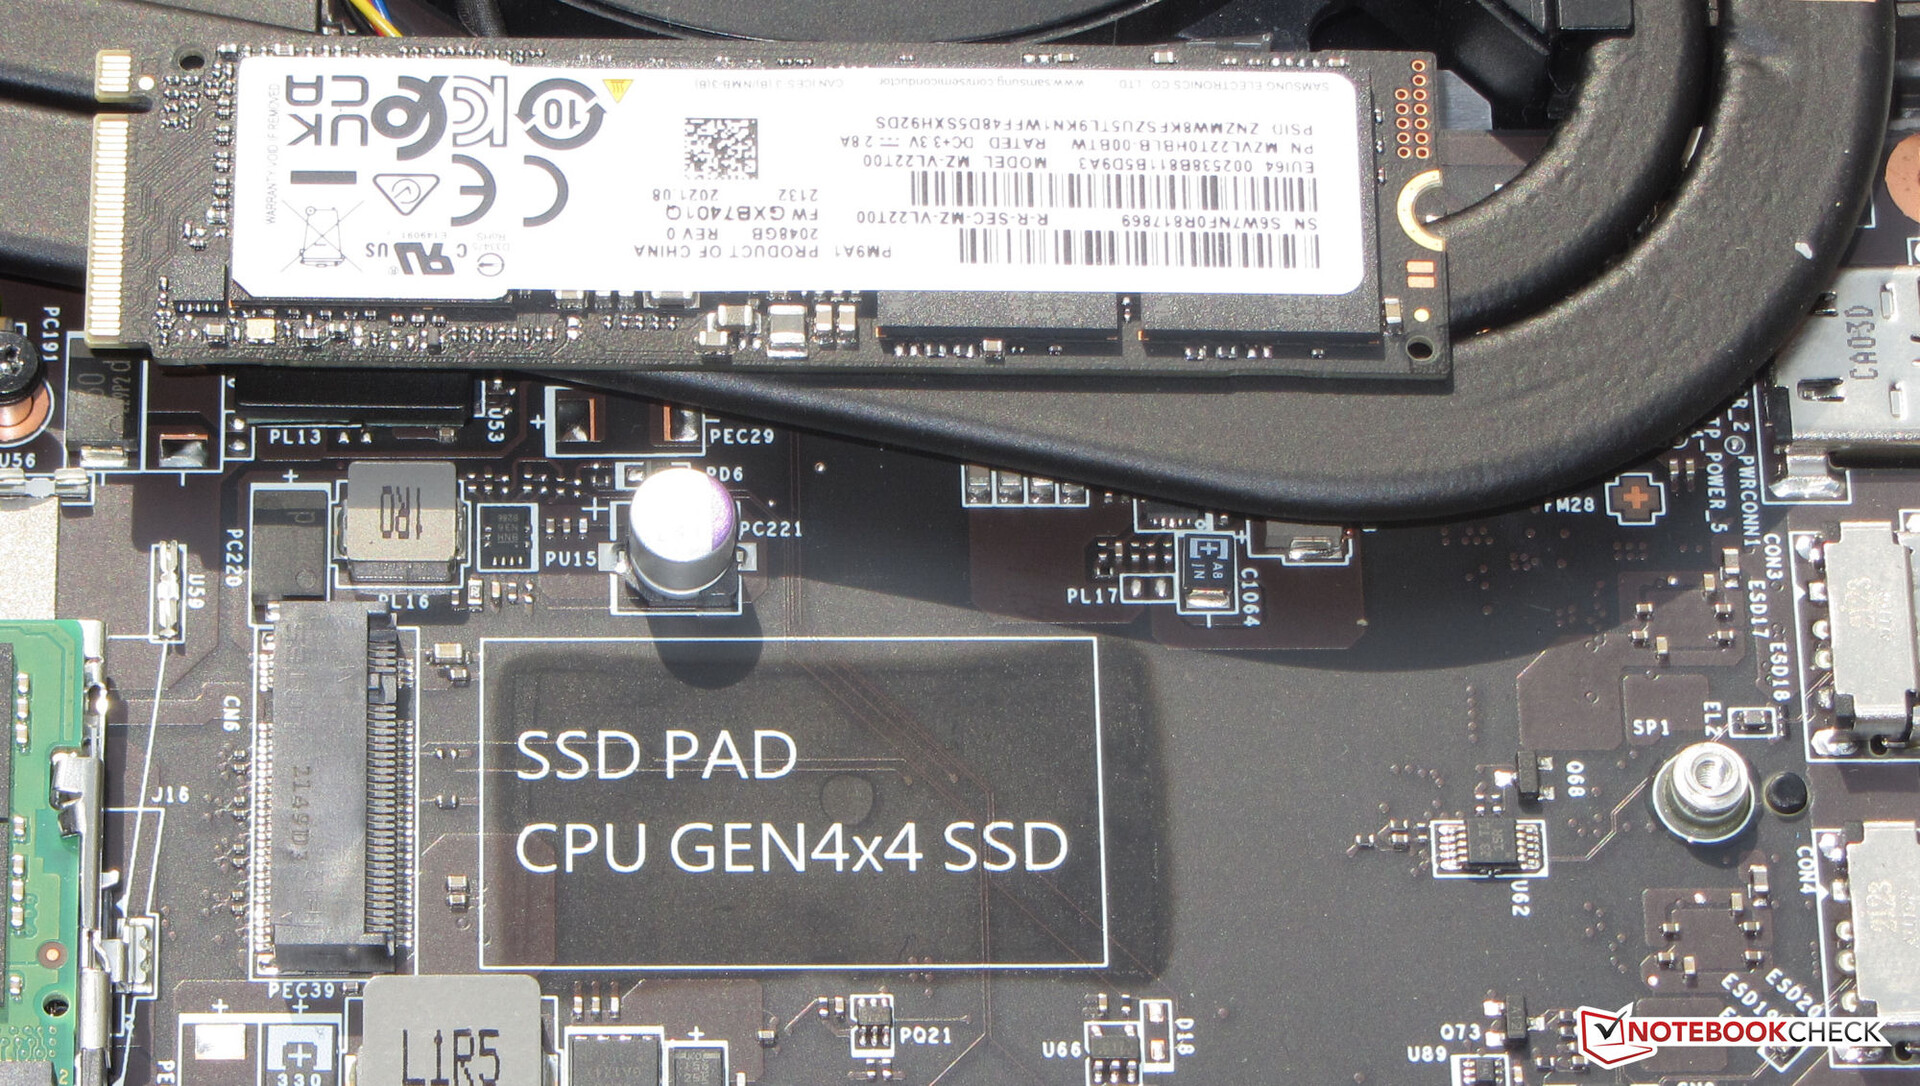
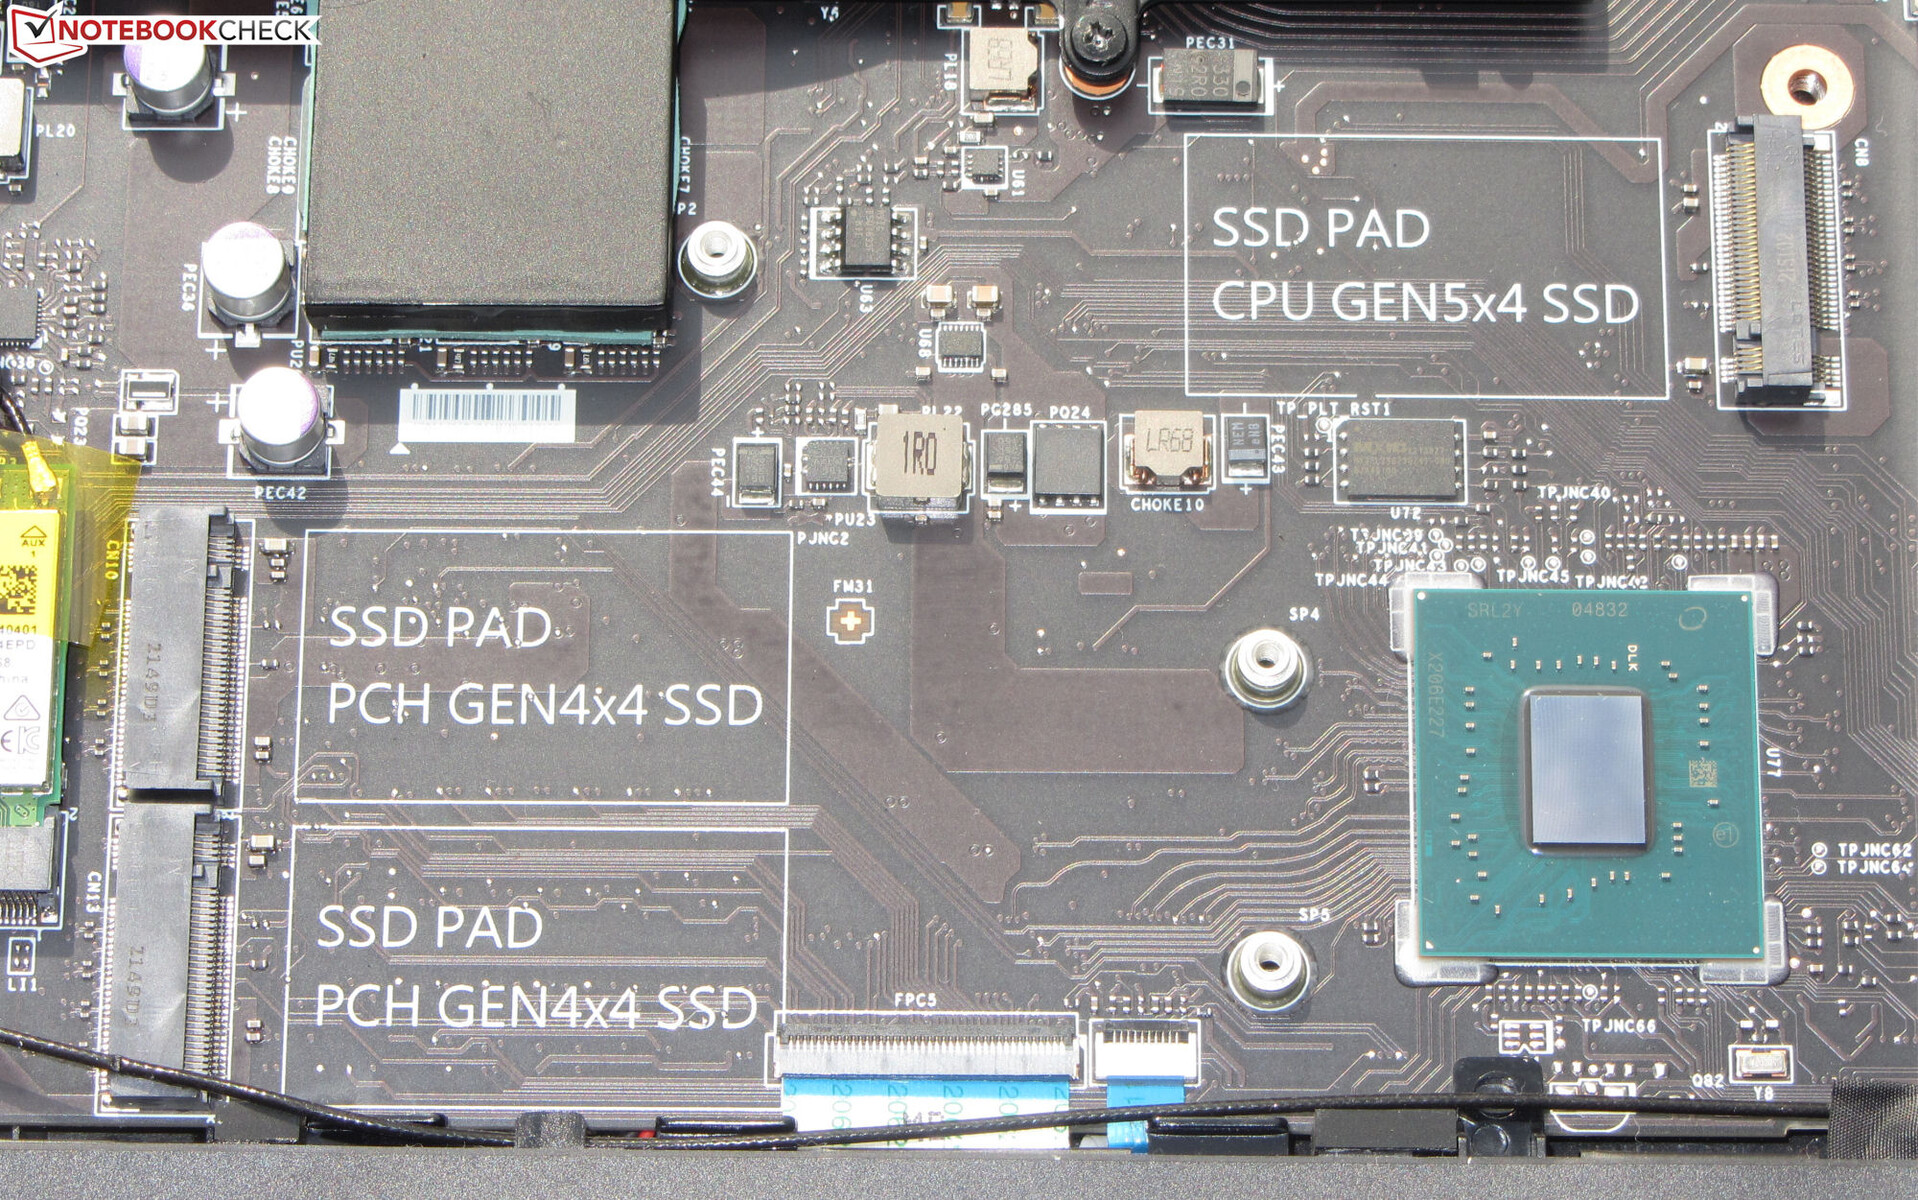
Memoria di massa
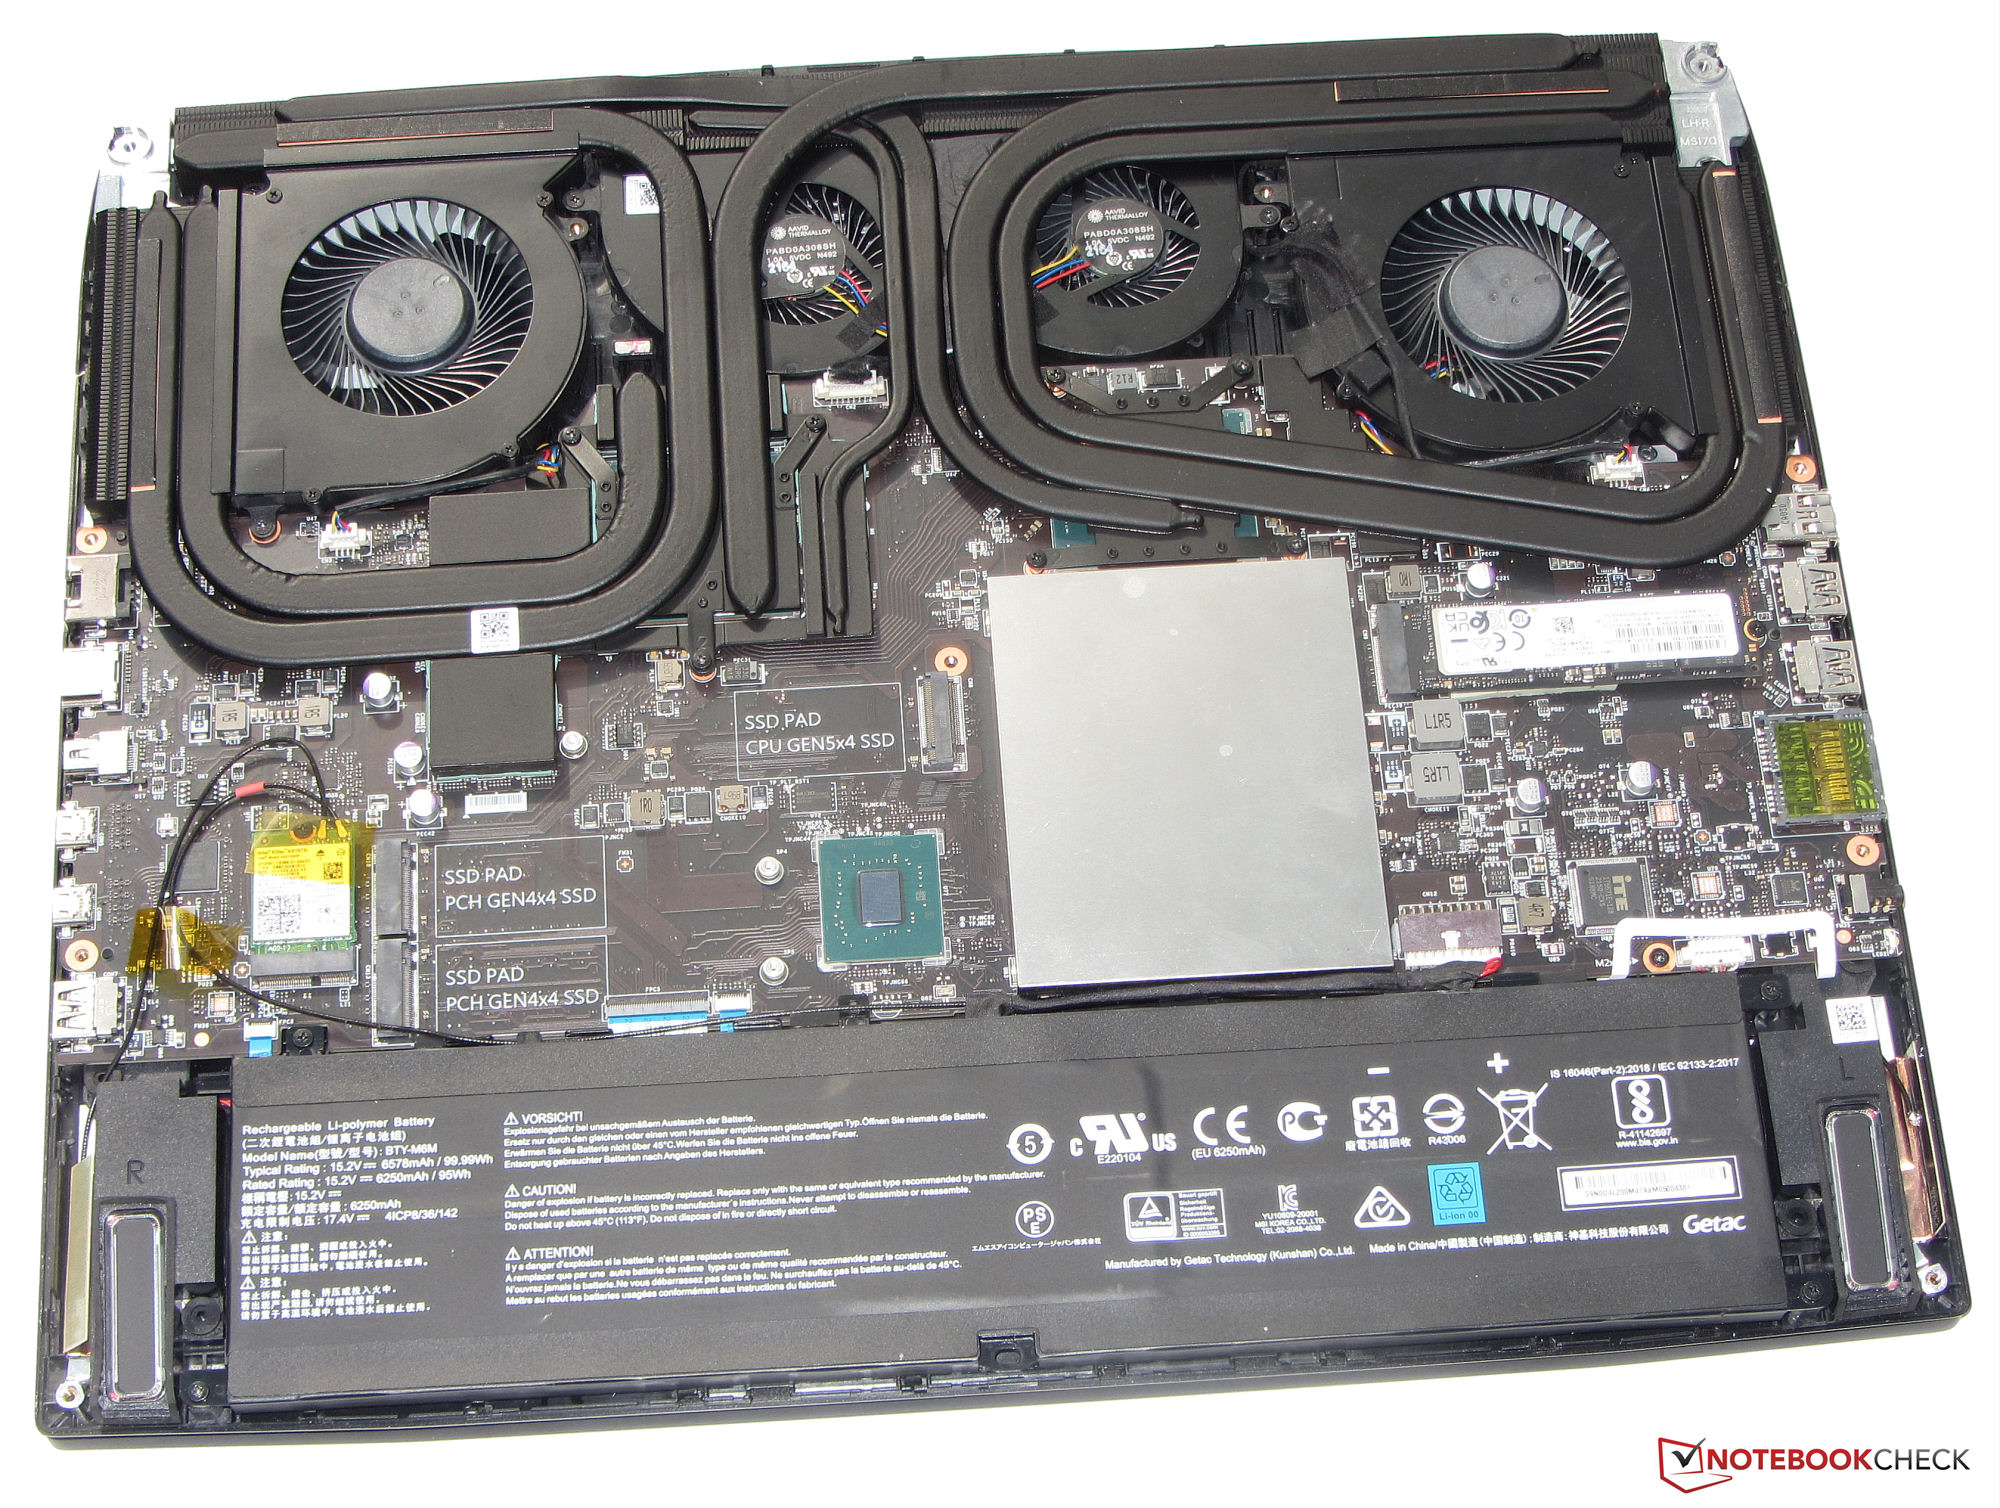
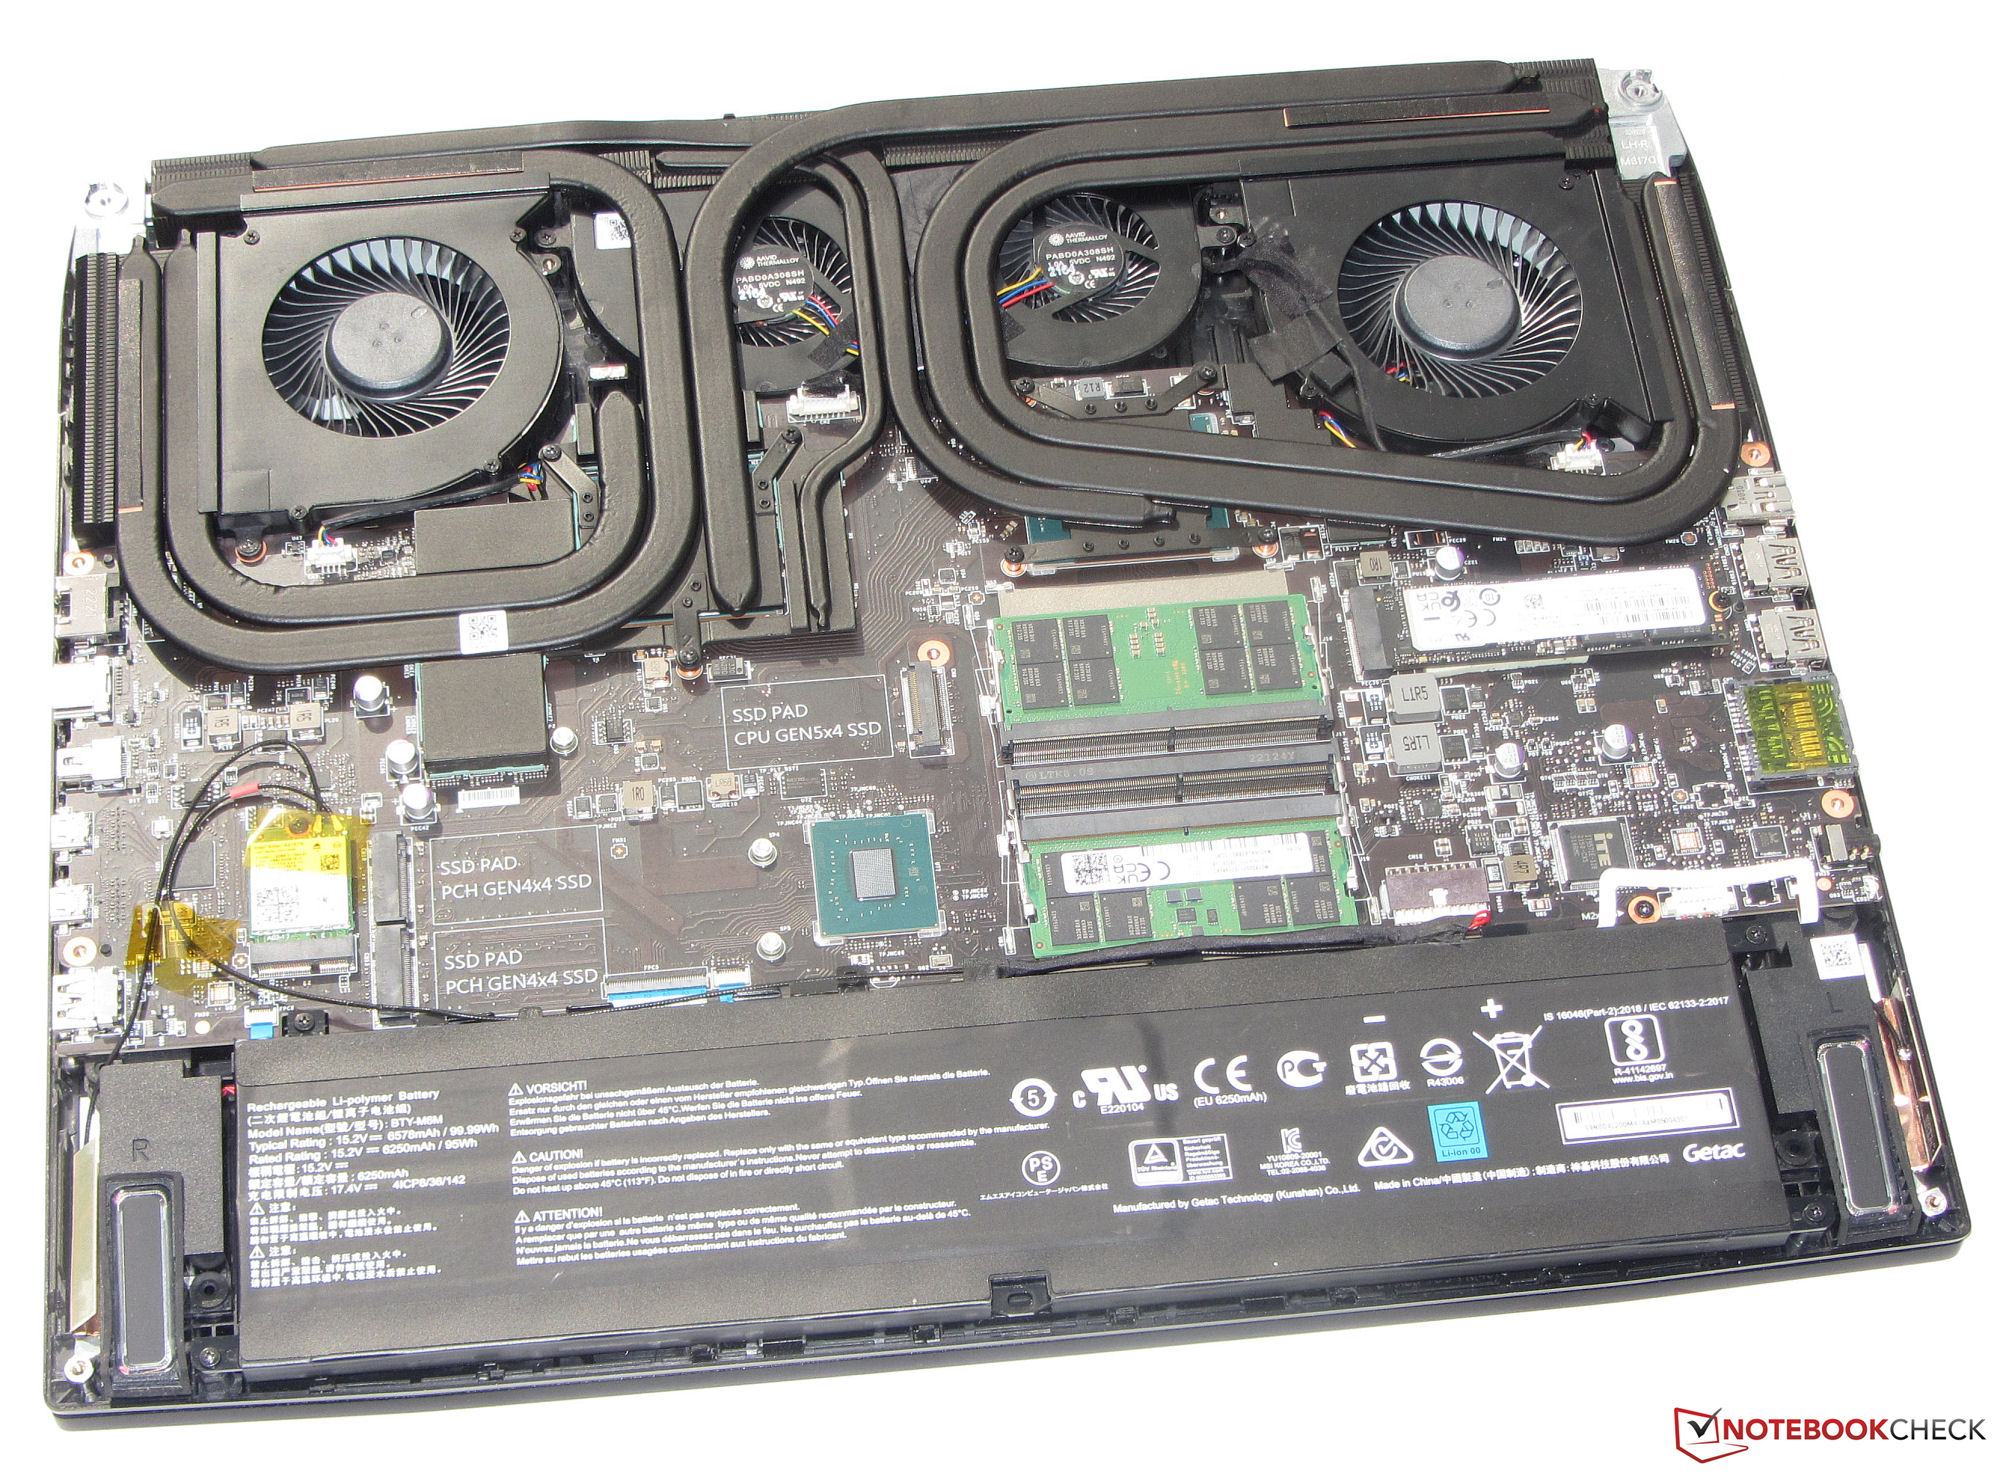
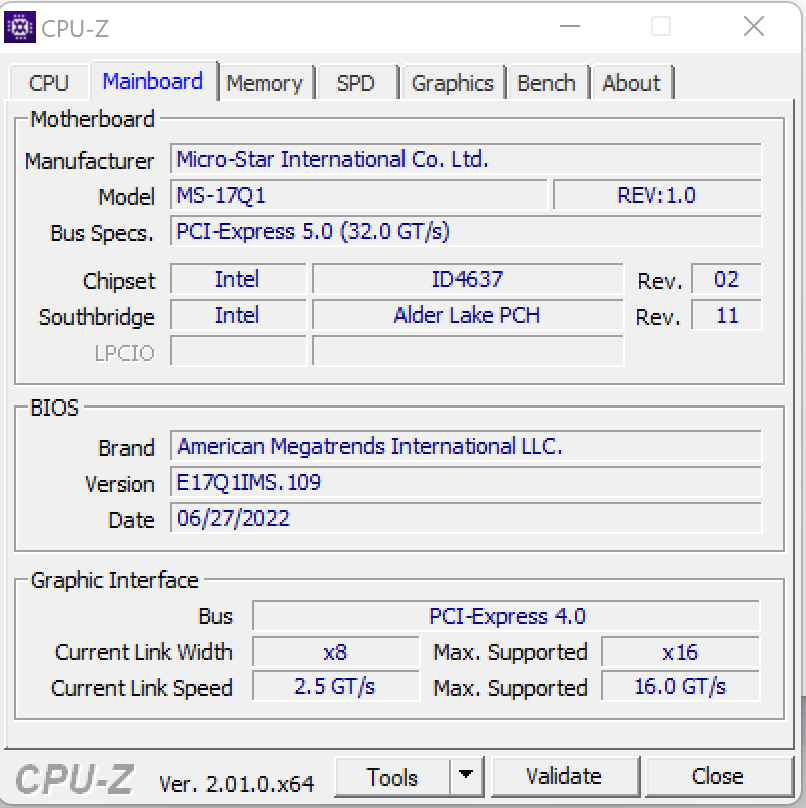
Il Titan può contenere fino a quattro unità SSD M.2 2280 (3x PCIe 4, 1x PCIe 5). L'unità SSD Samsung da 2 TB (PCIe 4) inclusa è in grado di fornire eccellenti velocità di trasferimento
NelModello FHDl'SSD con il sistema operativo (anch'esso prodotto da Samsung) soffre di cali di prestazioni dovuti al thermal throttling. Forse le altre tre unità SSD installate nel portatile impediscono un flusso d'aria ottimale. L'SSD nella nostra attuale unità di recensione non presenta alcun calo di prestazioni.

* ... Meglio usare valori piccoli
Continuous read: DiskSpd Read Loop, Queue Depth 8
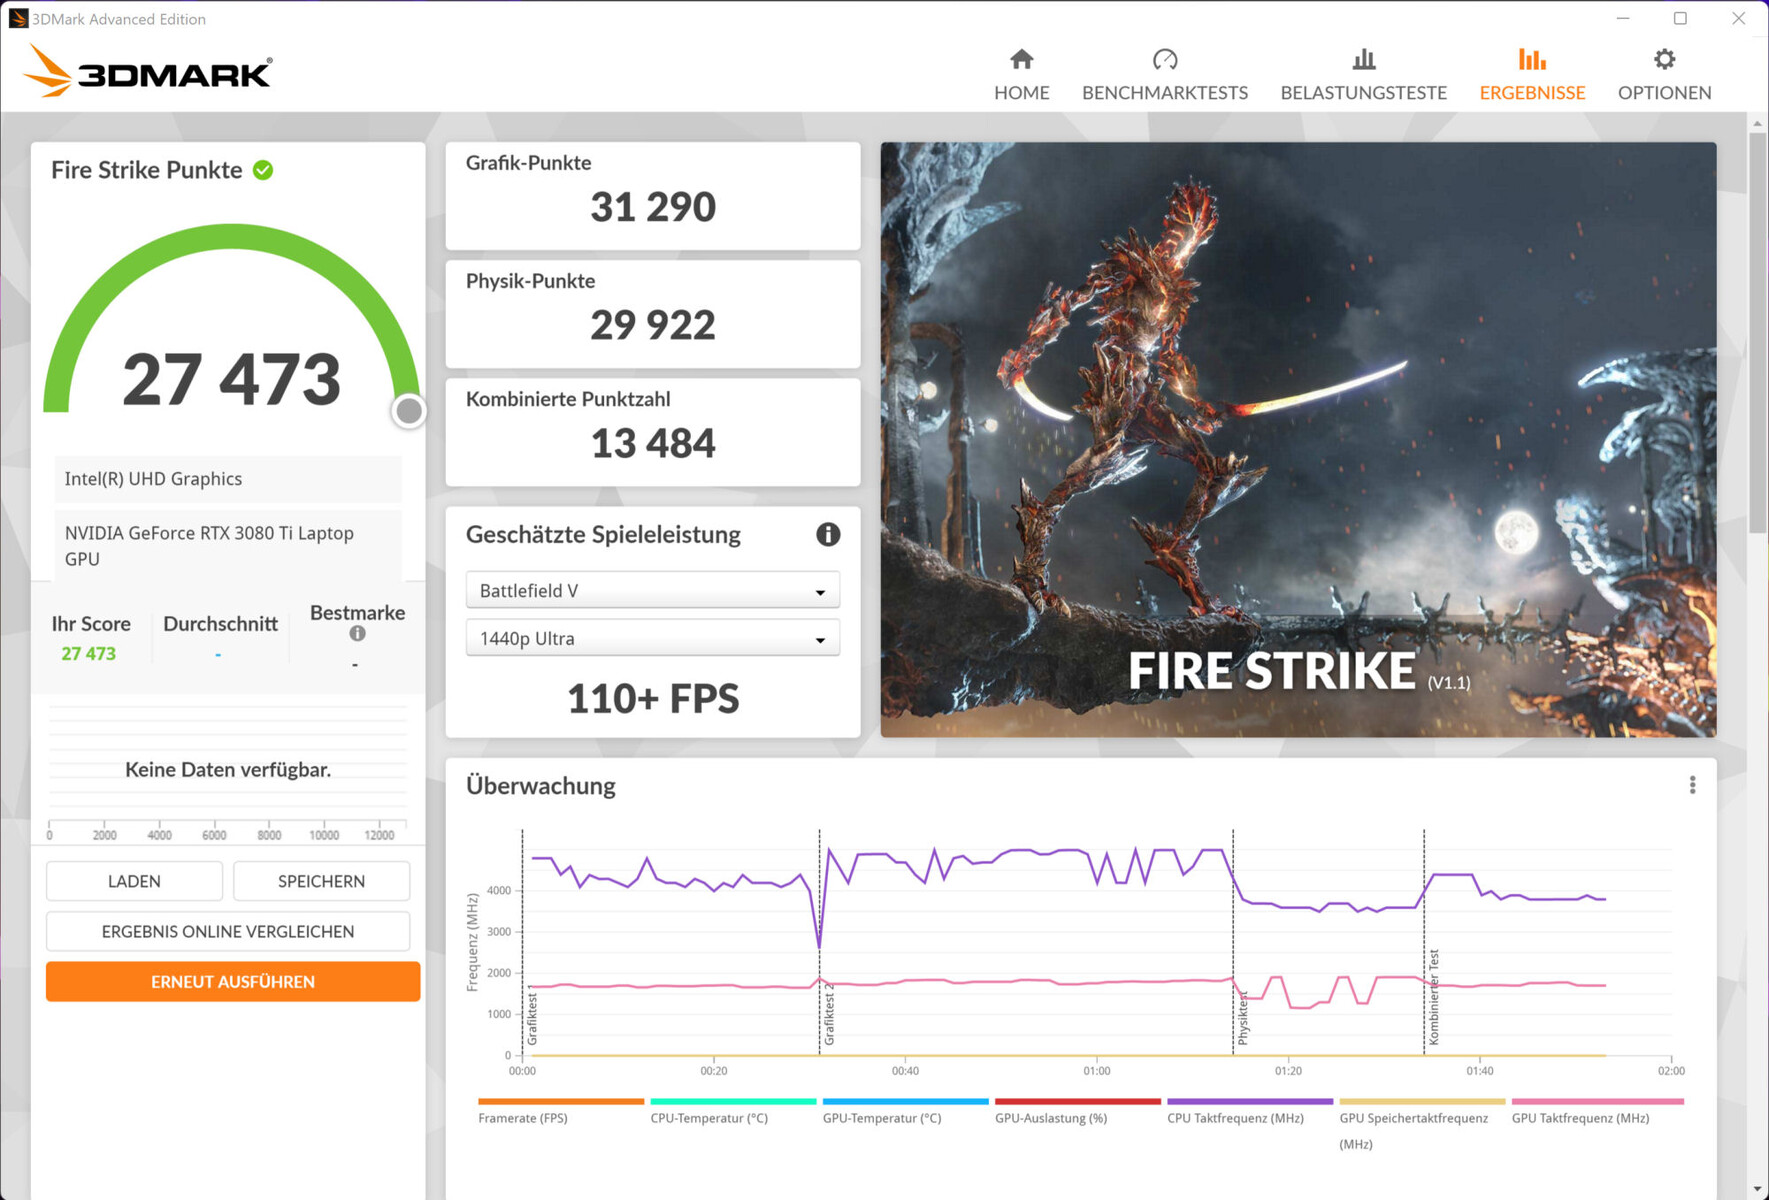
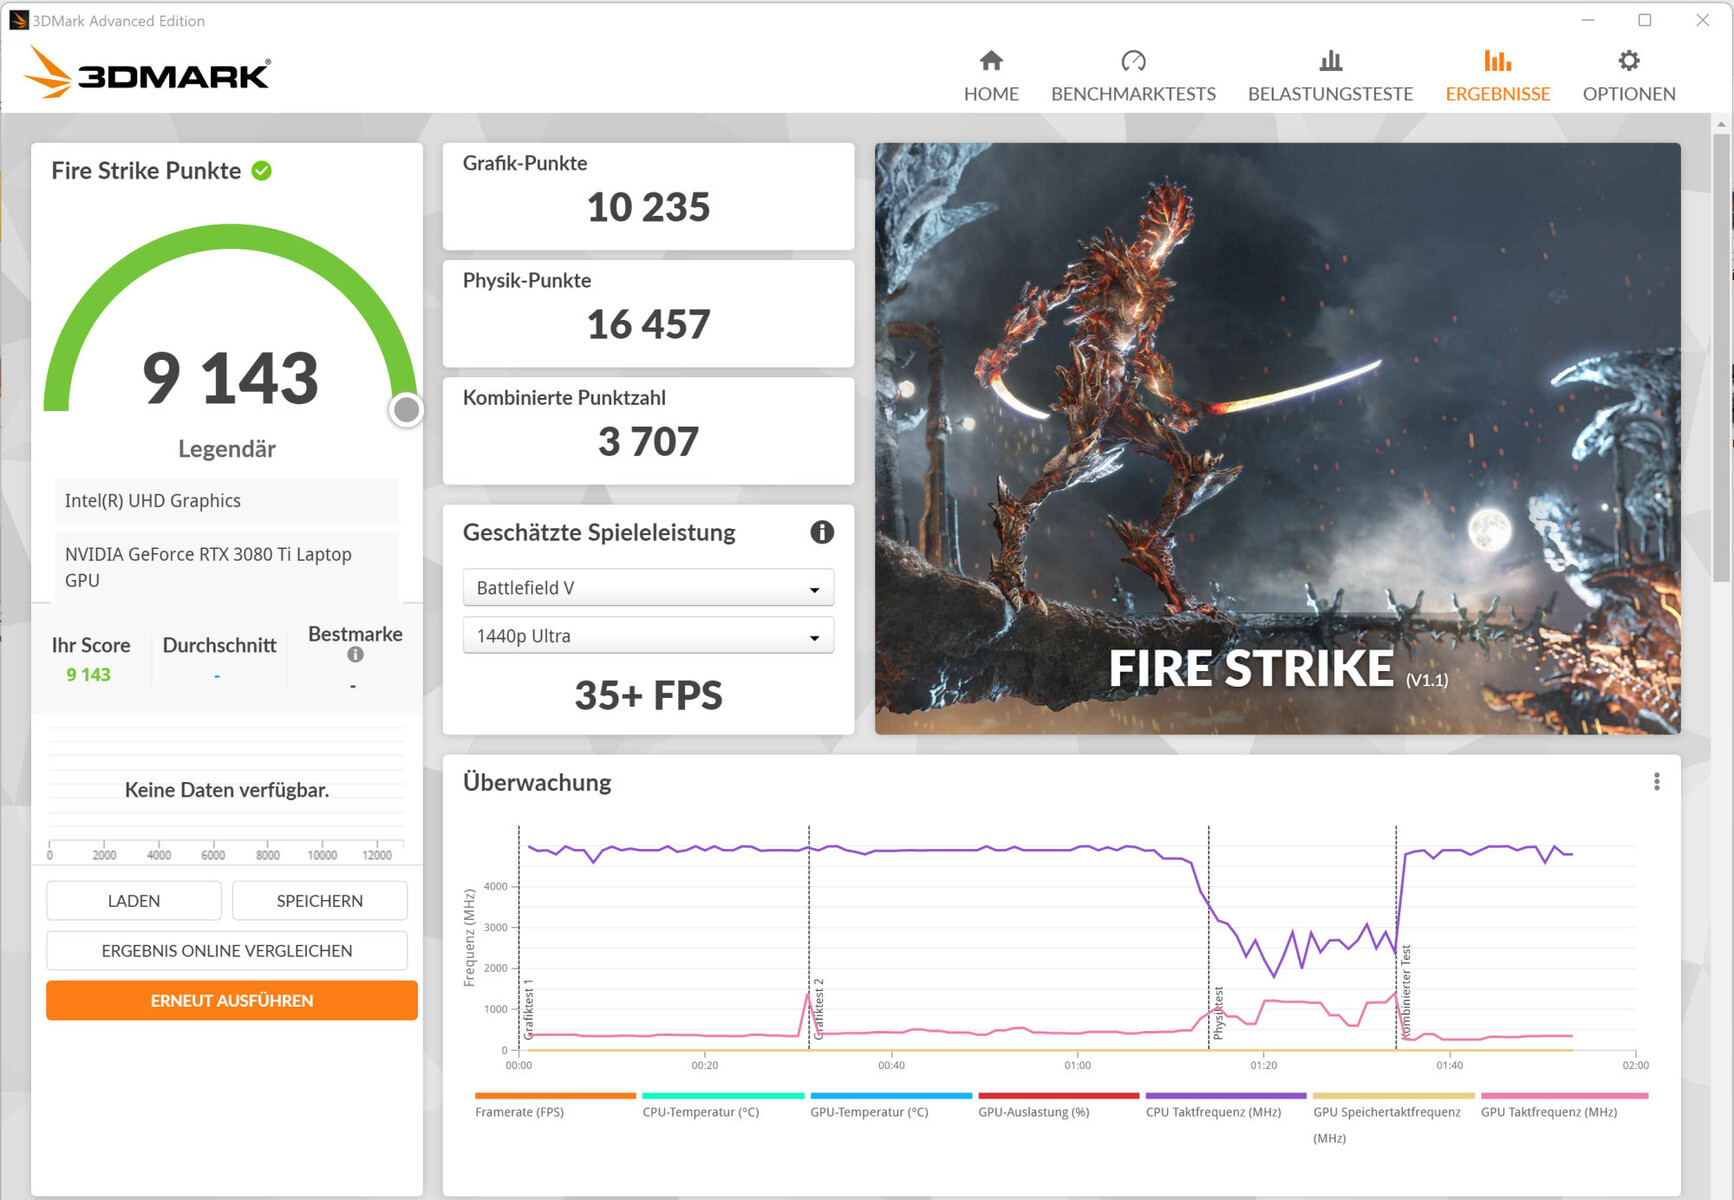
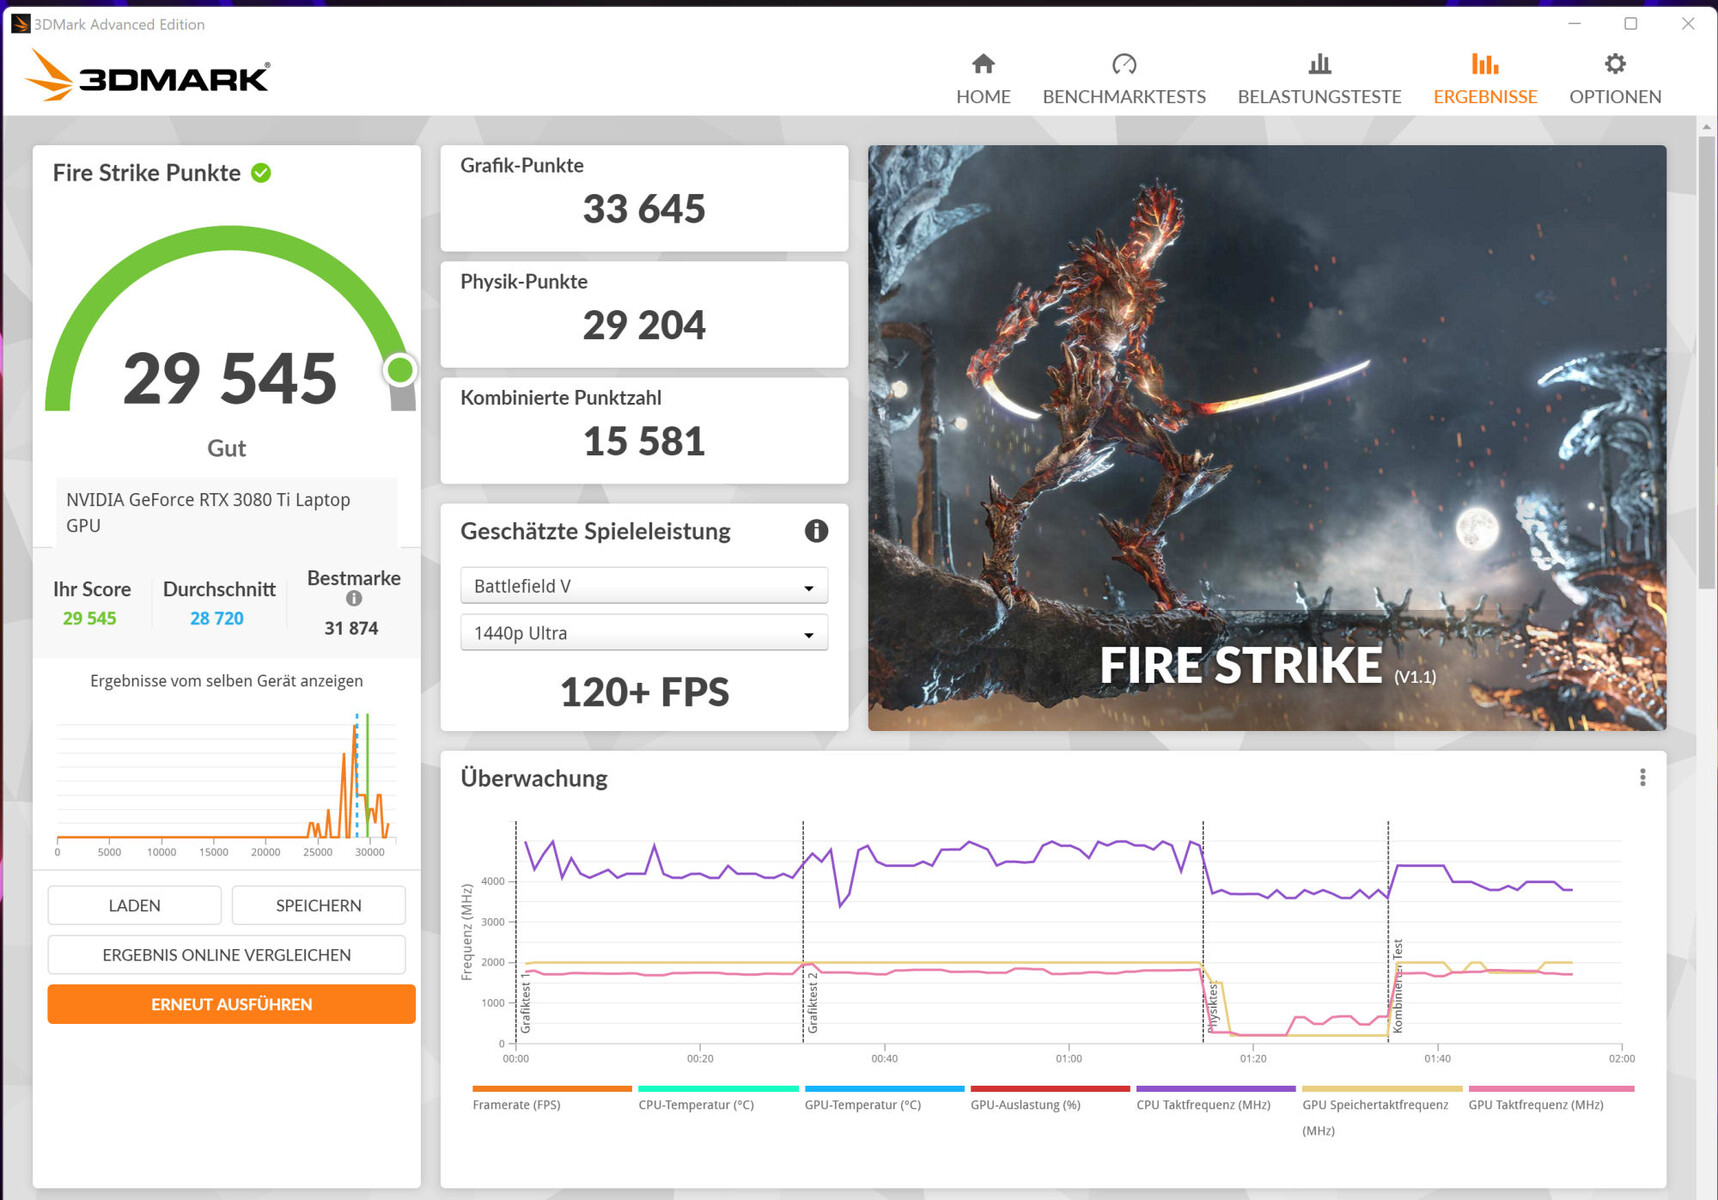
Scheda grafica
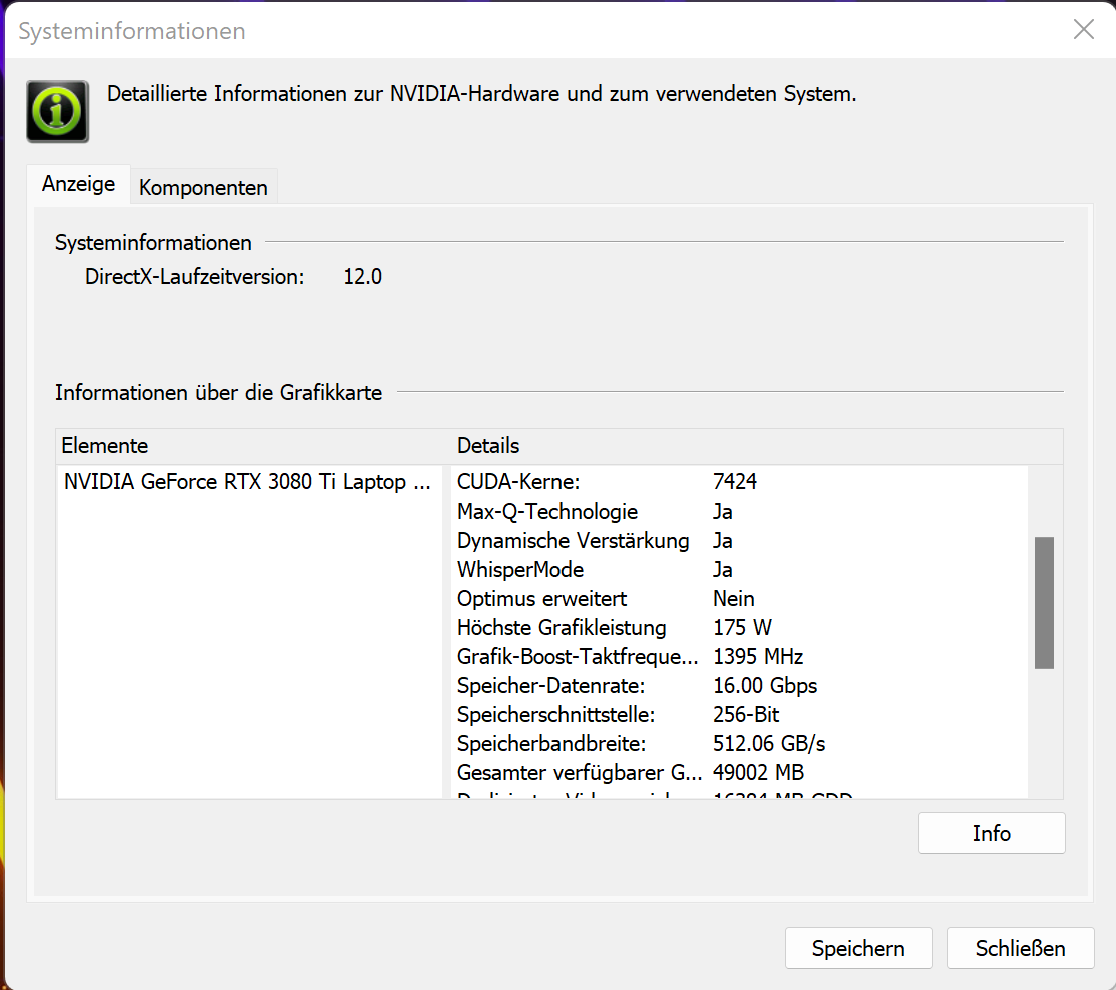
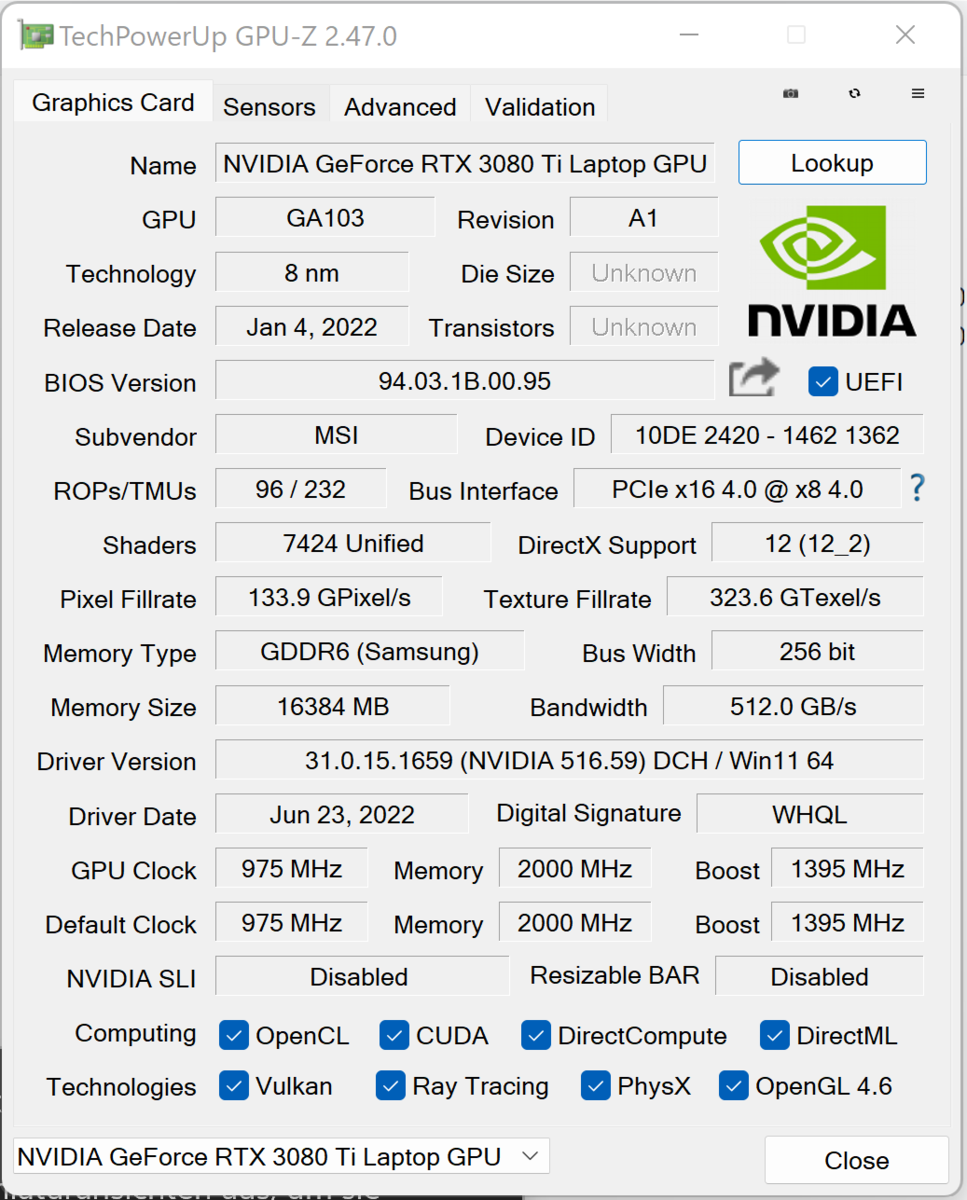
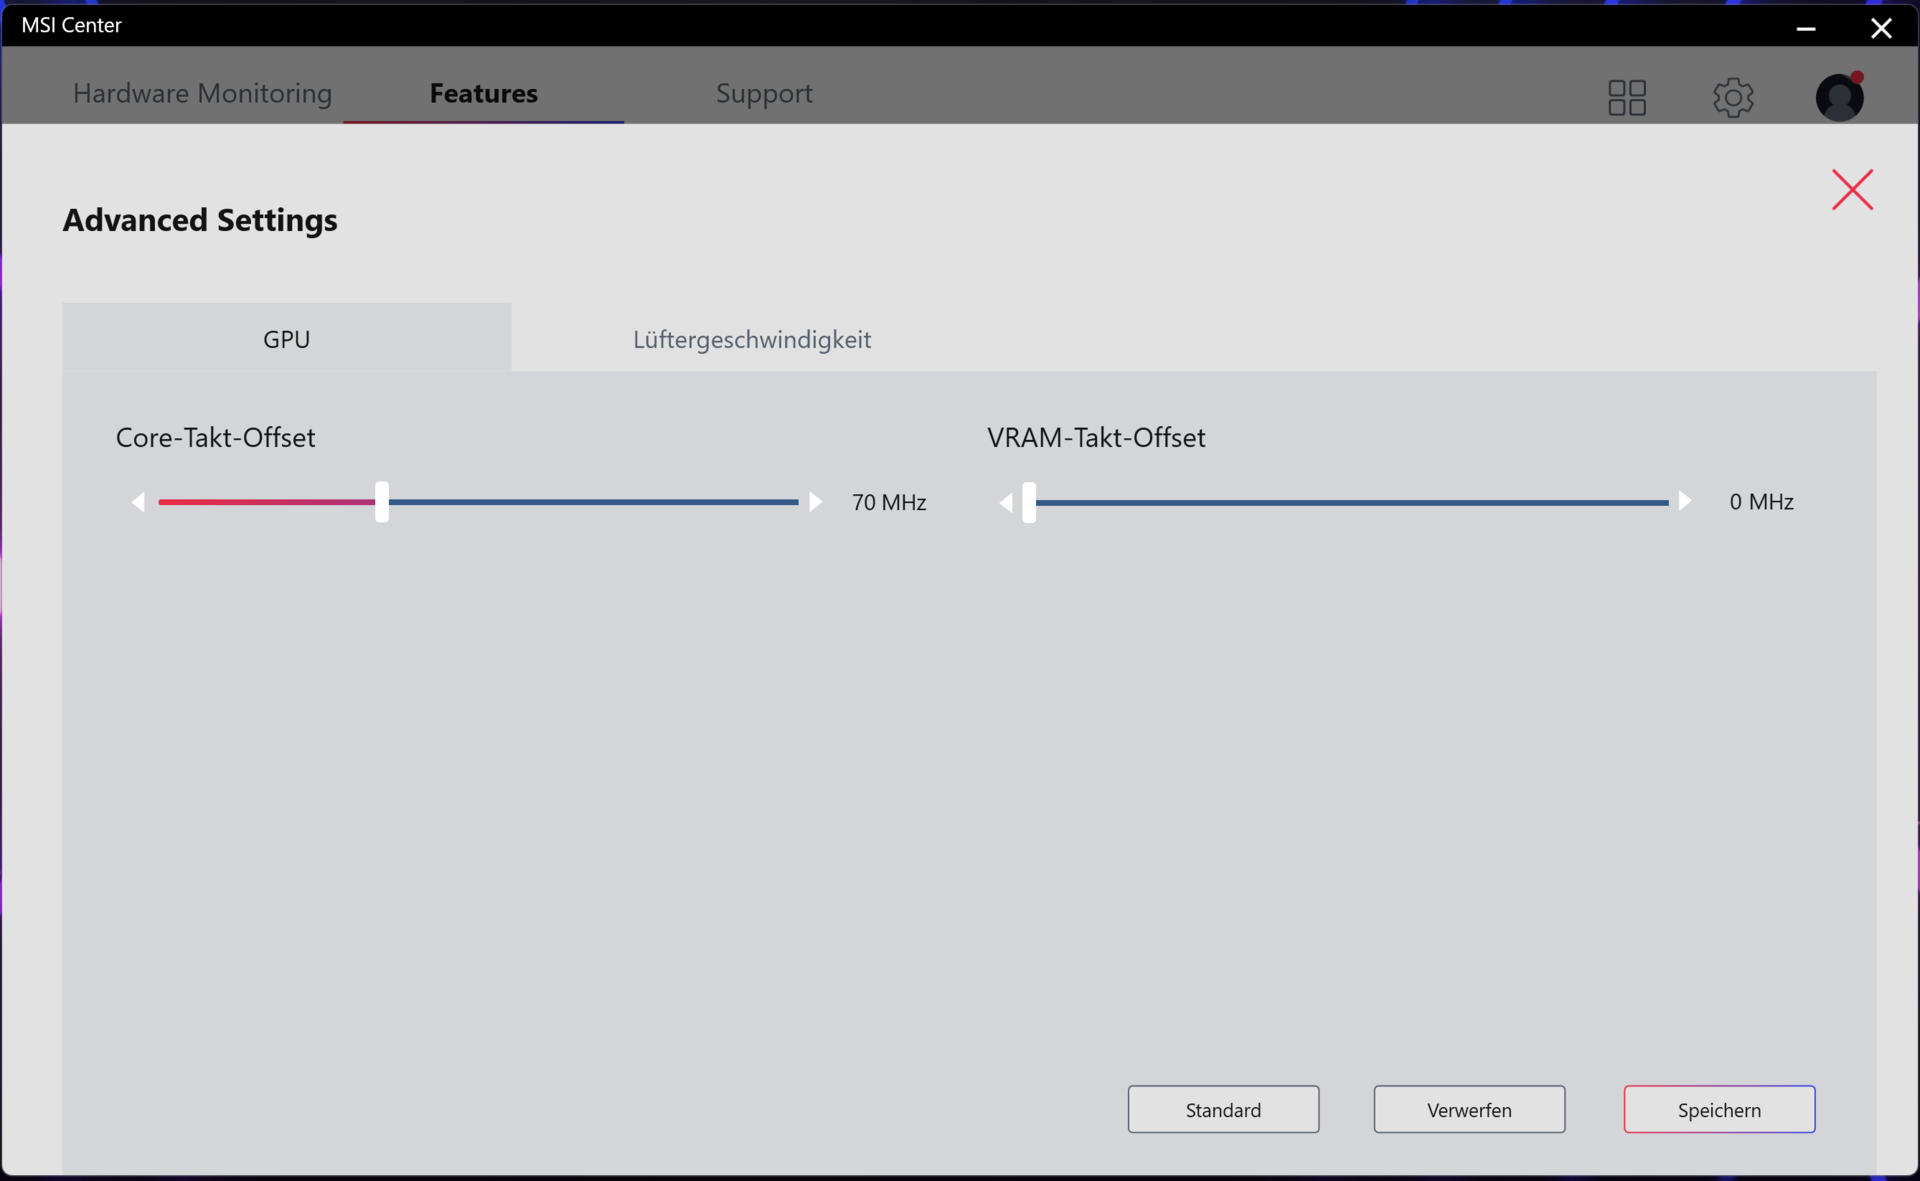
La GeForce RTX 3080 Ti Laptop (TGP: 175 watt, 16 GB di VRAM GDDR6) nella MSI Titan GT77 ha prodotto alcuni dei migliori punteggi che abbiamo visto finora da questa GPU. Tuttavia, il TGP non viene utilizzato appieno, come dimostra il test Witcher 3. Il profilo "Extreme Performance" offre opzioni per l'overclocking della GPU e della memoria grafica. L'Advanced Optimus non è supportato. Il passaggio da dGPU a Optimus richiede sempre il riavvio del computer
| 3DMark Performance rating - Percent | |
| Media della classe Gaming | |
| MSI Titan GT77 12UHS | |
| Alienware x17 R2 P48E | |
| MSI Titan GT77 12UHS | |
| MSI Titan GT77 12UHS 4k -1! | |
| Razer Blade 17 Early 2022 | |
| Schenker XMG Ultra 17 Rocket Lake | |
| Media NVIDIA GeForce RTX 3080 Ti Laptop GPU | |
| 3DMark 11 - 1280x720 Performance GPU | |
| Media della classe Gaming (21841 - 80022, n=104, ultimi 2 anni) | |
| MSI Titan GT77 12UHS | |
| Alienware x17 R2 P48E | |
| MSI Titan GT77 12UHS 4k | |
| Razer Blade 17 Early 2022 | |
| MSI Titan GT77 12UHS (dGPU, Extreme Leistung) | |
| Schenker XMG Ultra 17 Rocket Lake | |
| Media NVIDIA GeForce RTX 3080 Ti Laptop GPU (13920 - 45841, n=45) | |
| 3DMark | |
| 1920x1080 Fire Strike Graphics | |
| Media della classe Gaming (12242 - 62849, n=115, ultimi 2 anni) | |
| MSI Titan GT77 12UHS | |
| MSI Titan GT77 12UHS (dGPU, Extreme Leistung) | |
| Alienware x17 R2 P48E | |
| MSI Titan GT77 12UHS 4k | |
| Razer Blade 17 Early 2022 | |
| Schenker XMG Ultra 17 Rocket Lake | |
| Media NVIDIA GeForce RTX 3080 Ti Laptop GPU (6928 - 34439, n=43) | |
| 2560x1440 Time Spy Graphics | |
| Media della classe Gaming (5012 - 26212, n=115, ultimi 2 anni) | |
| MSI Titan GT77 12UHS | |
| Alienware x17 R2 P48E | |
| MSI Titan GT77 12UHS (dGPU, Extreme Leistung) | |
| Schenker XMG Ultra 17 Rocket Lake | |
| MSI Titan GT77 12UHS 4k | |
| Razer Blade 17 Early 2022 | |
| Media NVIDIA GeForce RTX 3080 Ti Laptop GPU (4921 - 13835, n=43) | |
| 2560x1440 Port Royal Graphics | |
| Media della classe Gaming (4395 - 17286, n=71, ultimi 2 anni) | |
| Alienware x17 R2 P48E | |
| MSI Titan GT77 12UHS | |
| MSI Titan GT77 12UHS (dGPU, Extreme Leistung) | |
| Razer Blade 17 Early 2022 | |
| Schenker XMG Ultra 17 Rocket Lake | |
| Media NVIDIA GeForce RTX 3080 Ti Laptop GPU (6423 - 8462, n=28) | |
| Geekbench 5.5 - OpenCL Score | |
| Media della classe Gaming (80702 - 277970, n=101, ultimi 2 anni) | |
| Alienware x17 R2 P48E | |
| MSI Titan GT77 12UHS (dGPU, Extreme Leistung) | |
| MSI Titan GT77 12UHS 4k | |
| Asus ROG Zephyrus Duo 16 GX650RX | |
| Schenker XMG Ultra 17 Rocket Lake | |
| Media NVIDIA GeForce RTX 3080 Ti Laptop GPU (88580 - 151633, n=41) | |
| MSI Titan GT77 12UHS | |
| Razer Blade 17 Early 2022 | |
| Gigabyte Aero 16 YE5 | |
| V-Ray Benchmark Next 4.10 | |
| GPU | |
| Media della classe Gaming (427 - 1627, n=99, ultimi 2 anni) | |
| MSI Titan GT77 12UHS (v4.10.07, dGPU, Extreme Leistung) | |
| MSI Titan GT77 12UHS (v4.10.07 ) | |
| Asus ROG Zephyrus Duo 16 GX650RX (v4.10.07 ) | |
| MSI Titan GT77 12UHS 4k (v4.10.07 ) | |
| Media NVIDIA GeForce RTX 3080 Ti Laptop GPU (311 - 552, n=35) | |
| Razer Blade 17 Early 2022 (v4.10.07 ) | |
| Gigabyte Aero 16 YE5 (v4.10.07 ) | |
| Schenker XMG Ultra 17 Rocket Lake (v4.10.07 ) | |
| CPU | |
| Media della classe Gaming (10048 - 45327, n=97, ultimi 2 anni) | |
| MSI Titan GT77 12UHS 4k (v4.10.07 ) | |
| MSI Titan GT77 12UHS (v4.10.07, dGPU, Extreme Leistung) | |
| MSI Titan GT77 12UHS (v4.10.07 ) | |
| Media NVIDIA GeForce RTX 3080 Ti Laptop GPU (5564 - 23947, n=35) | |
| Gigabyte Aero 16 YE5 (v4.10.07 ) | |
| Schenker XMG Ultra 17 Rocket Lake (v4.10.07 ) | |
| Asus ROG Zephyrus Duo 16 GX650RX (v4.10.07 ) | |
| Razer Blade 17 Early 2022 (v4.10.07 ) | |
| Blender | |
| v3.3 Classroom CUDA | |
| MSI Titan GT77 12UHS 4k | |
| MSI Titan GT77 12UHS (dGPU, Extreme Leistung) | |
| Media NVIDIA GeForce RTX 3080 Ti Laptop GPU (32 - 41, n=13) | |
| Media della classe Gaming (15 - 228, n=106, ultimi 2 anni) | |
| MSI Titan GT77 12UHS | |
| v3.3 Classroom OPTIX/RTX | |
| MSI Titan GT77 12UHS 4k | |
| Media NVIDIA GeForce RTX 3080 Ti Laptop GPU (20 - 28, n=13) | |
| MSI Titan GT77 12UHS | |
| MSI Titan GT77 12UHS (dGPU, Extreme Leistung) | |
| Media della classe Gaming (9 - 32, n=106, ultimi 2 anni) | |
* ... Meglio usare valori piccoli
| 3DMark 11 Performance | 35867 punti | |
| 3DMark Cloud Gate Standard Score | 53629 punti | |
| 3DMark Fire Strike Score | 27273 punti | |
| 3DMark Fire Strike Extreme Score | 15613 punti | |
| 3DMark Time Spy Score | 12865 punti | |
Aiuto | ||
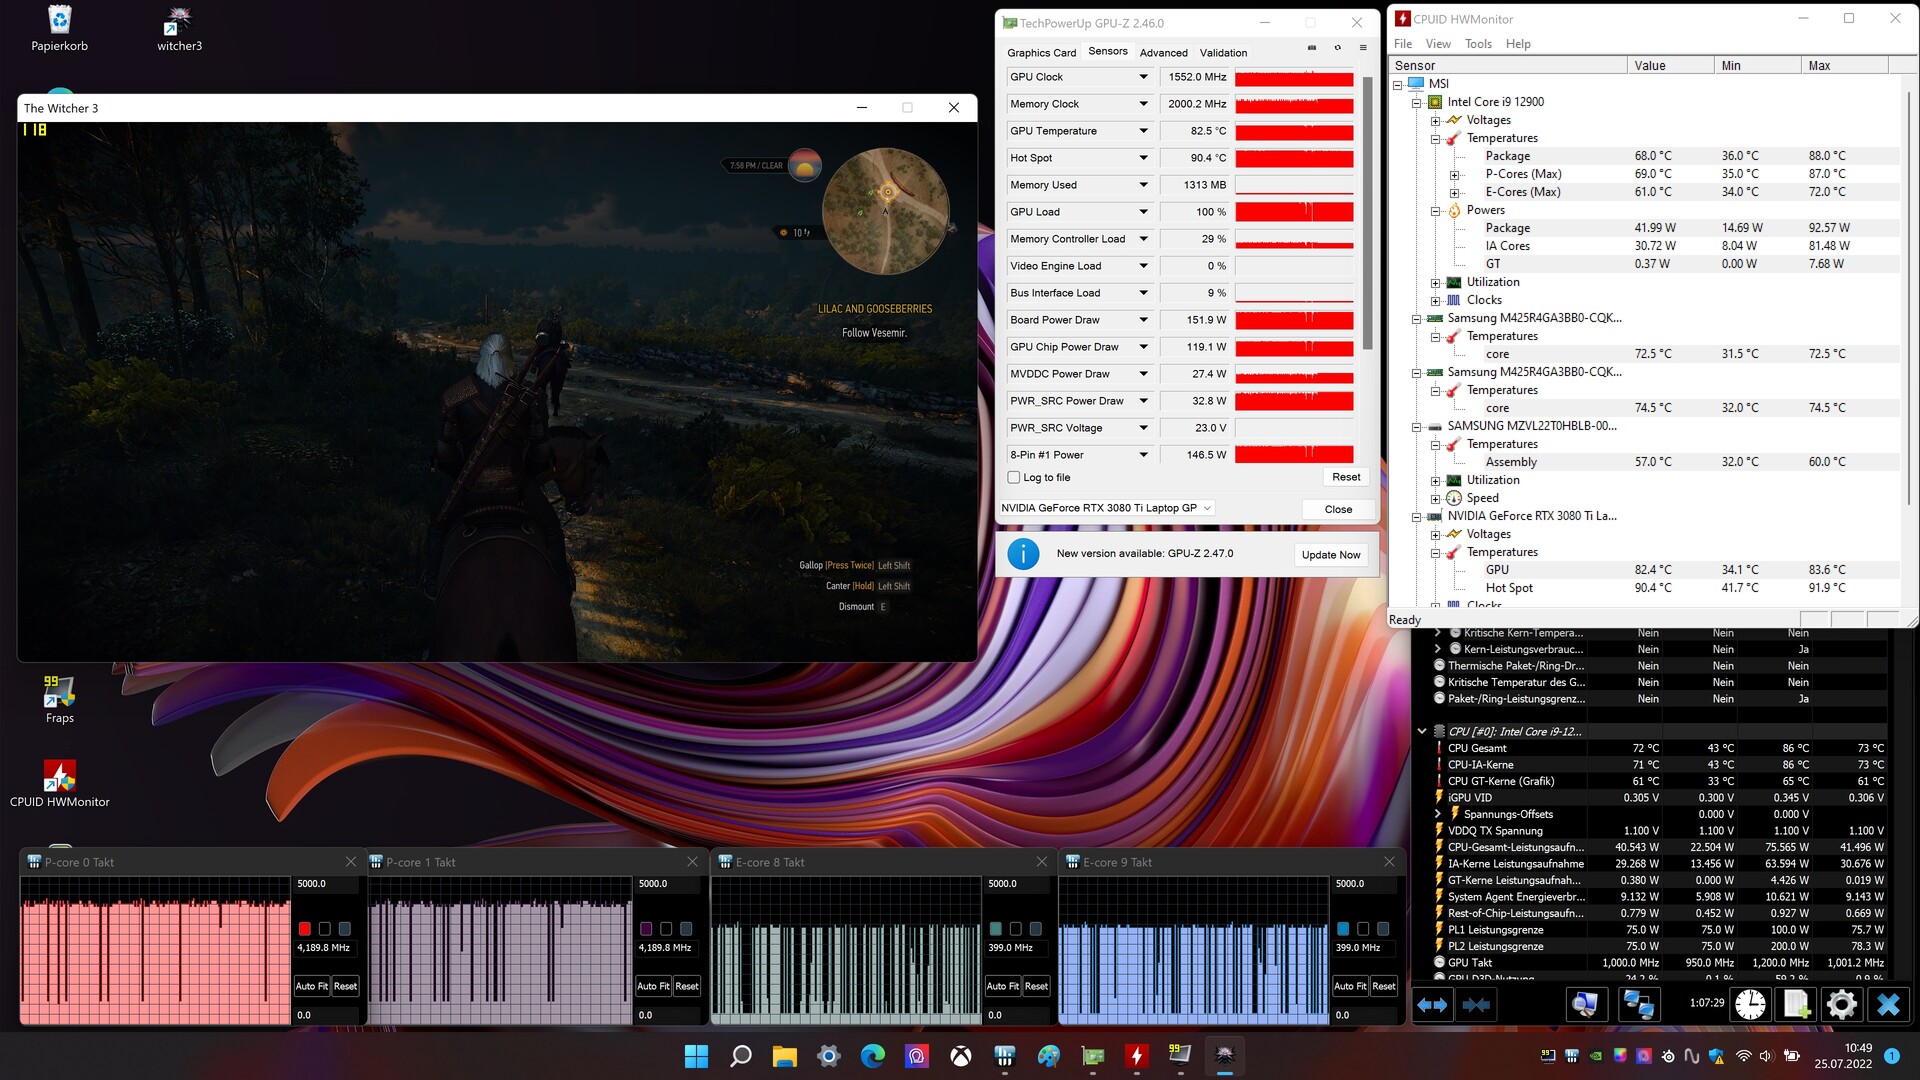
Prestazioni di gioco
L'hardware è progettato per il gioco in 4K con impostazioni elevate o massime. I frame rate sono superiori a quelli che una RTX 3080 Ti è in grado di raggiungere in media. Quando la GPU GeForce ha pilotato direttamente il display, ha spesso prodotto i migliori frame rate che abbiamo visto finora da una RTX 3080 Ti. In ogni caso, come dimostrato dal test di Witcher 3, il portatile offre risultati buoni e stabili.
| The Witcher 3 | |
| 1920x1080 Ultra Graphics & Postprocessing (HBAO+) | |
| Media della classe Gaming (104.7 - 240, n=7, ultimi 2 anni) | |
| MSI Titan GT77 12UHS (dGPU, Extreme Leistung) | |
| MSI Titan GT77 12UHS | |
| Alienware x17 R2 P48E | |
| MSI Titan GT77 12UHS 4k | |
| Schenker XMG Ultra 17 Rocket Lake | |
| Razer Blade 17 Early 2022 | |
| Media NVIDIA GeForce RTX 3080 Ti Laptop GPU (30 - 130.6, n=43) | |
| 3840x2160 Ultra Graphics & Postprocessing (HBAO+) | |
| Media della classe Gaming (112.4 - 114.8, n=2, ultimi 2 anni) | |
| MSI Titan GT77 12UHS (dGPU, Extreme Leistung) | |
| MSI Titan GT77 12UHS 4k | |
| Razer Blade 17 Early 2022 | |
| Media NVIDIA GeForce RTX 3080 Ti Laptop GPU (44.8 - 62.7, n=5) | |
| Dota 2 Reborn | |
| 1920x1080 ultra (3/3) best looking | |
| MSI Titan GT77 12UHS | |
| MSI Titan GT77 12UHS (dGPU, Extreme Leistung) | |
| MSI Titan GT77 12UHS 4k | |
| Alienware x17 R2 P48E | |
| Schenker XMG Ultra 17 Rocket Lake | |
| Media della classe Gaming (84.8 - 248, n=107, ultimi 2 anni) | |
| Media NVIDIA GeForce RTX 3080 Ti Laptop GPU (29.9 - 170.5, n=45) | |
| Razer Blade 17 Early 2022 | |
| 3840x2160 ultra (3/3) best looking | |
| Media della classe Gaming (114.9 - 199.2, n=32, ultimi 2 anni) | |
| MSI Titan GT77 12UHS (dGPU, Extreme Leistung) | |
| MSI Titan GT77 12UHS 4k | |
| Media NVIDIA GeForce RTX 3080 Ti Laptop GPU (70.8 - 155.6, n=19) | |
| Razer Blade 17 Early 2022 | |
| X-Plane 11.11 | |
| 3840x2160 high (fps_test=3) | |
| MSI Titan GT77 12UHS (dGPU, Extreme Leistung) | |
| MSI Titan GT77 12UHS 4k | |
| Media della classe Gaming (60 - 124.1, n=32, ultimi 2 anni) | |
| Media NVIDIA GeForce RTX 3080 Ti Laptop GPU (32.9 - 109.5, n=20) | |
| Razer Blade 17 Early 2022 | |
| 1920x1080 high (fps_test=3) | |
| MSI Titan GT77 12UHS | |
| MSI Titan GT77 12UHS (dGPU, Extreme Leistung) | |
| MSI Titan GT77 12UHS 4k | |
| Schenker XMG Ultra 17 Rocket Lake | |
| Alienware x17 R2 P48E | |
| Media NVIDIA GeForce RTX 3080 Ti Laptop GPU (32.6 - 127, n=45) | |
| Media della classe Gaming (55.5 - 143.5, n=109, ultimi 2 anni) | |
| Razer Blade 17 Early 2022 | |
| Final Fantasy XV Benchmark | |
| 3840x2160 High Quality | |
| Media della classe Gaming (49.1 - 111.8, n=33, ultimi 2 anni) | |
| MSI Titan GT77 12UHS (1.3, dGPU, Extreme Leistung) | |
| MSI Titan GT77 12UHS 4k (1.3) | |
| Razer Blade 17 Early 2022 (1.3) | |
| Media NVIDIA GeForce RTX 3080 Ti Laptop GPU (35.1 - 61.2, n=18) | |
| 1920x1080 High Quality | |
| Media della classe Gaming (41 - 215, n=95, ultimi 2 anni) | |
| MSI Titan GT77 12UHS (1.3, dGPU, Extreme Leistung) | |
| MSI Titan GT77 12UHS (1.3) | |
| MSI Titan GT77 12UHS 4k (1.3) | |
| Alienware x17 R2 P48E (1.3) | |
| Media NVIDIA GeForce RTX 3080 Ti Laptop GPU (30.7 - 140.6, n=42) | |
| Razer Blade 17 Early 2022 (1.3) | |
| GTA V | |
| 3840x2160 Highest AA:4xMSAA + FX AF:16x | |
| Media della classe Gaming (53.9 - 123.2, n=25, ultimi 2 anni) | |
| MSI Titan GT77 12UHS (dGPU, Extreme Leistung) | |
| MSI Titan GT77 12UHS 4k | |
| Razer Blade 17 Early 2022 | |
| Media NVIDIA GeForce RTX 3080 Ti Laptop GPU (37.7 - 67.2, n=14) | |
| 1920x1080 Highest AA:4xMSAA + FX AF:16x | |
| MSI Titan GT77 12UHS 4k | |
| MSI Titan GT77 12UHS (dGPU, Extreme Leistung) | |
| Media della classe Gaming (48.3 - 186.9, n=94, ultimi 2 anni) | |
| MSI Titan GT77 12UHS | |
| Alienware x17 R2 P48E | |
| Media NVIDIA GeForce RTX 3080 Ti Laptop GPU (30 - 139.2, n=42) | |
| Razer Blade 17 Early 2022 | |
| Strange Brigade | |
| 3840x2160 ultra AA:ultra AF:16 | |
| Media della classe Gaming (83 - 187.2, n=34, ultimi 2 anni) | |
| MSI Titan GT77 12UHS (1.47.22.14 D3D12, dGPU, Extreme Leistung) | |
| MSI Titan GT77 12UHS 4k (1.47.22.14 D3D12) | |
| Razer Blade 17 Early 2022 (1.47.22.14 D3D12) | |
| Media NVIDIA GeForce RTX 3080 Ti Laptop GPU (61.7 - 100.7, n=15) | |
| 1920x1080 ultra AA:ultra AF:16 | |
| Media della classe Gaming (76.3 - 458, n=87, ultimi 2 anni) | |
| MSI Titan GT77 12UHS (1.47.22.14 D3D12) | |
| MSI Titan GT77 12UHS (1.47.22.14 D3D12, dGPU, Extreme Leistung) | |
| Alienware x17 R2 P48E (1.47.22.14 D3D12) | |
| MSI Titan GT77 12UHS 4k (1.47.22.14 D3D12) | |
| Razer Blade 17 Early 2022 (1.47.22.14 D3D12) | |
| Media NVIDIA GeForce RTX 3080 Ti Laptop GPU (42.3 - 224, n=41) | |
| F1 2021 | |
| 3840x2160 Ultra High Preset + Raytracing AA:T AF:16x | |
| MSI Titan GT77 12UHS (874931, dGPU, Extreme Leistung) | |
| MSI Titan GT77 12UHS 4k (874931) | |
| Razer Blade 17 Early 2022 (874931) | |
| Media NVIDIA GeForce RTX 3080 Ti Laptop GPU (41.1 - 70.2, n=18) | |
| 1920x1080 Ultra High Preset + Raytracing AA:T AF:16x | |
| MSI Titan GT77 12UHS (874931) | |
| MSI Titan GT77 12UHS (874931, dGPU, Extreme Leistung) | |
| Razer Blade 17 Early 2022 (874931) | |
| MSI Titan GT77 12UHS 4k (874931) | |
| Media NVIDIA GeForce RTX 3080 Ti Laptop GPU (30.2 - 160.6, n=30) | |
| Far Cry 5 | |
| 3840x2160 Ultra Preset AA:T | |
| Media della classe Gaming (n=1ultimi 2 anni) | |
| MSI Titan GT77 12UHS 4k | |
| MSI Titan GT77 12UHS (dGPU, Extreme Leistung) | |
| Razer Blade 17 Early 2022 | |
| Media NVIDIA GeForce RTX 3080 Ti Laptop GPU (45 - 76, n=9) | |
| 1920x1080 Ultra Preset AA:T | |
| MSI Titan GT77 12UHS (dGPU, Extreme Leistung) | |
| MSI Titan GT77 12UHS | |
| MSI Titan GT77 12UHS 4k | |
| Schenker XMG Ultra 17 Rocket Lake | |
| Media NVIDIA GeForce RTX 3080 Ti Laptop GPU (111 - 162, n=24) | |
| Razer Blade 17 Early 2022 | |
| Media della classe Gaming (70 - 151, n=6, ultimi 2 anni) | |
Witcher 3 FPS graph
| basso | medio | alto | ultra | QHD | 4K | |
|---|---|---|---|---|---|---|
| GTA V (2015) | 187.3 | 186.6 | 182.3 | 134.4 | 117.8 | 121.7 |
| The Witcher 3 (2015) | 480 | 379 | 240 | 123.7 | 91.9 | |
| Dota 2 Reborn (2015) | 199.9 | 180.7 | 169.7 | 162.7 | 139.9 | |
| Final Fantasy XV Benchmark (2018) | 220 | 174.1 | 131 | 100.3 | 58.3 | |
| X-Plane 11.11 (2018) | 170.8 | 150.8 | 118.3 | 100.9 | ||
| Far Cry 5 (2018) | 199 | 169 | 161 | 151 | 134 | 76 |
| Strange Brigade (2018) | 519 | 286 | 233 | 206 | 156.2 | 93.7 |
| F1 2021 (2021) | 348 | 237 | 205 | 130.4 | 103.4 | 62.8 |
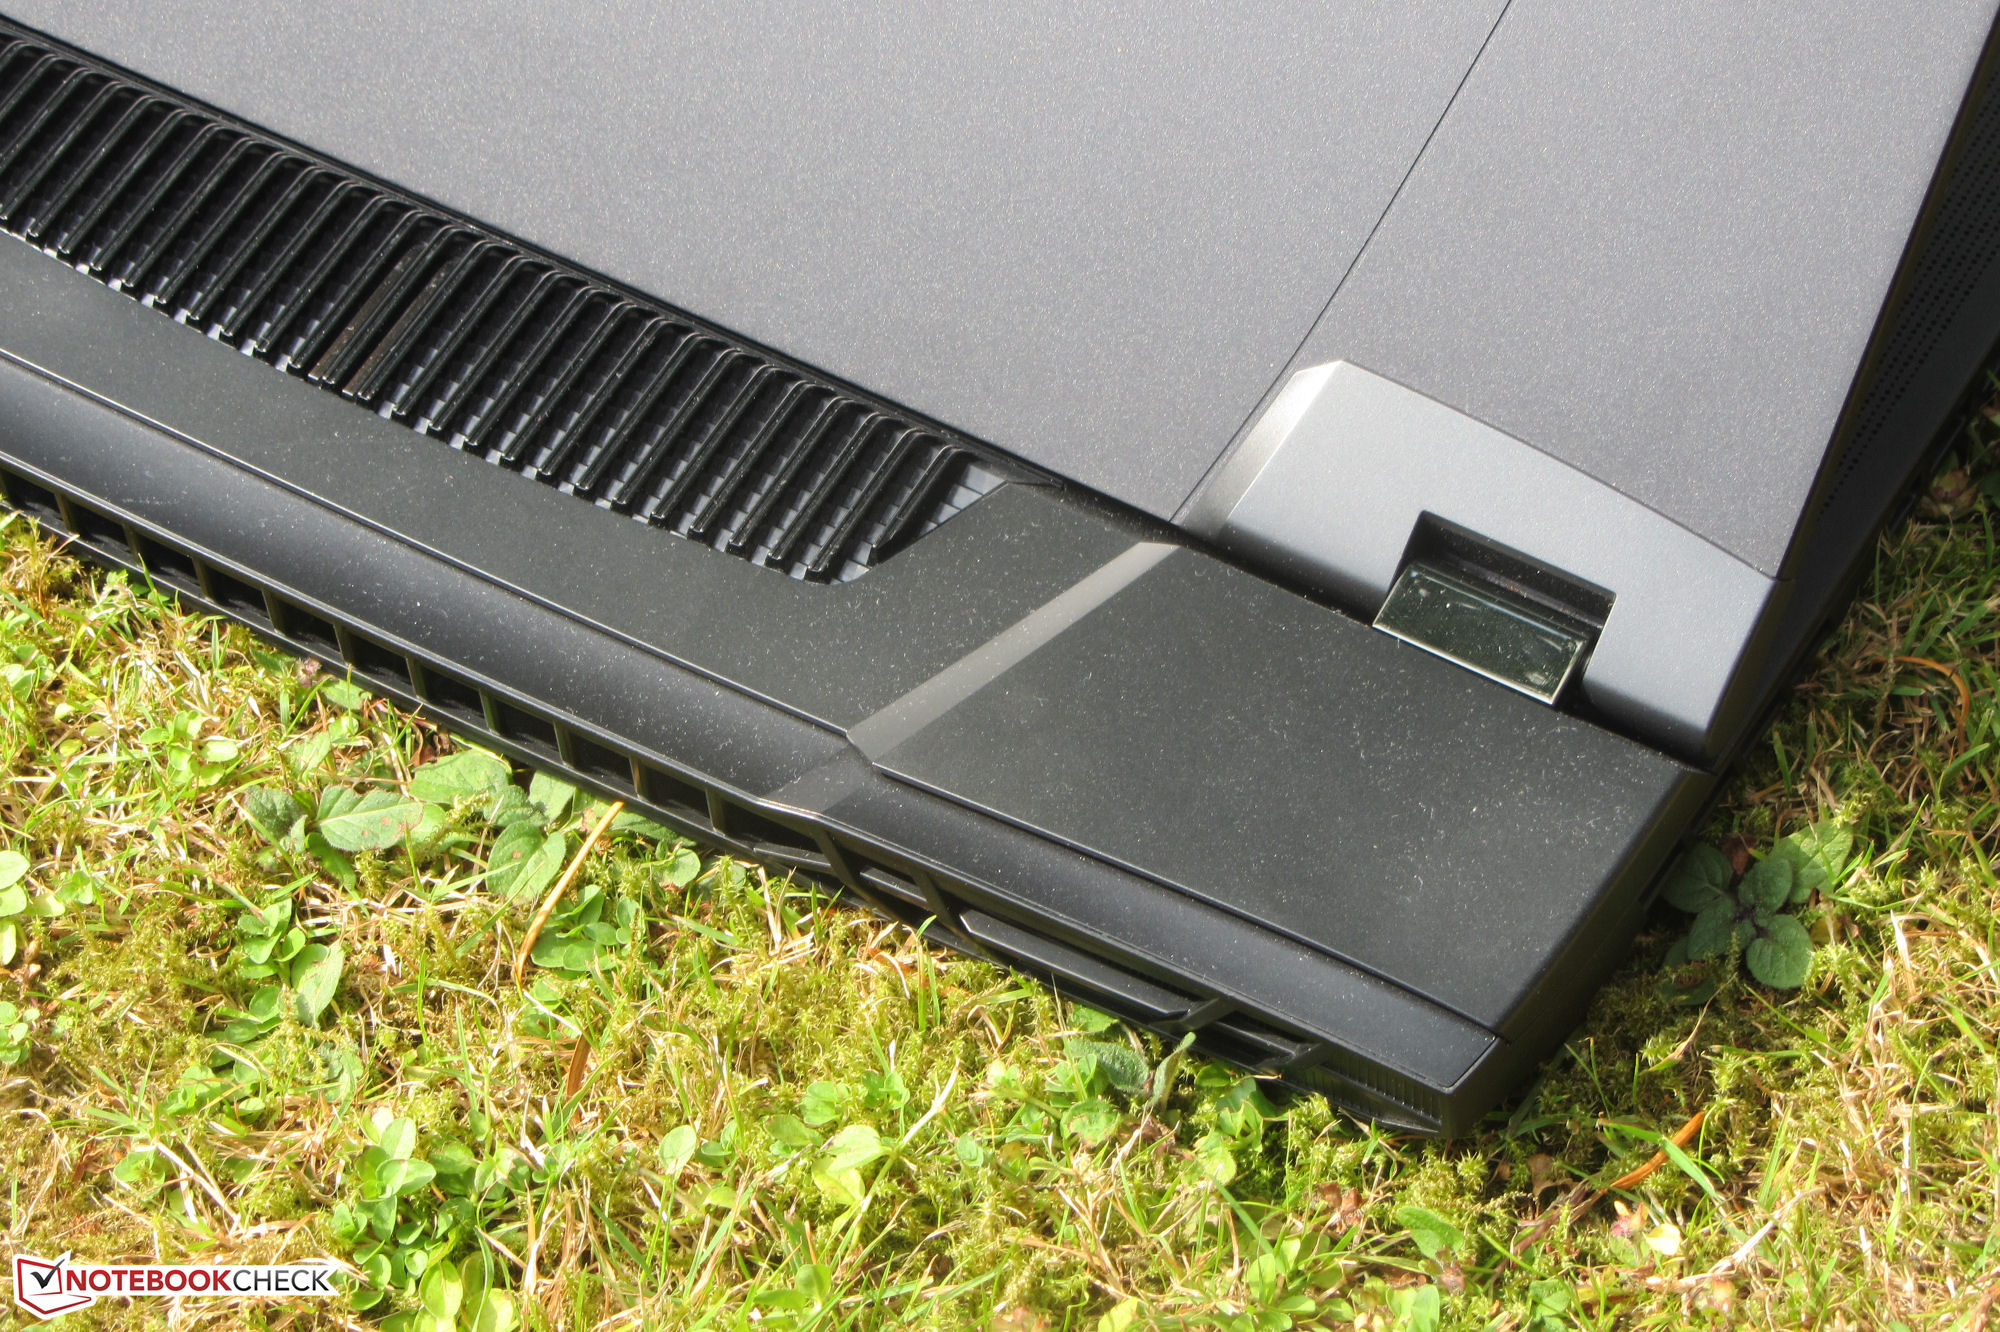
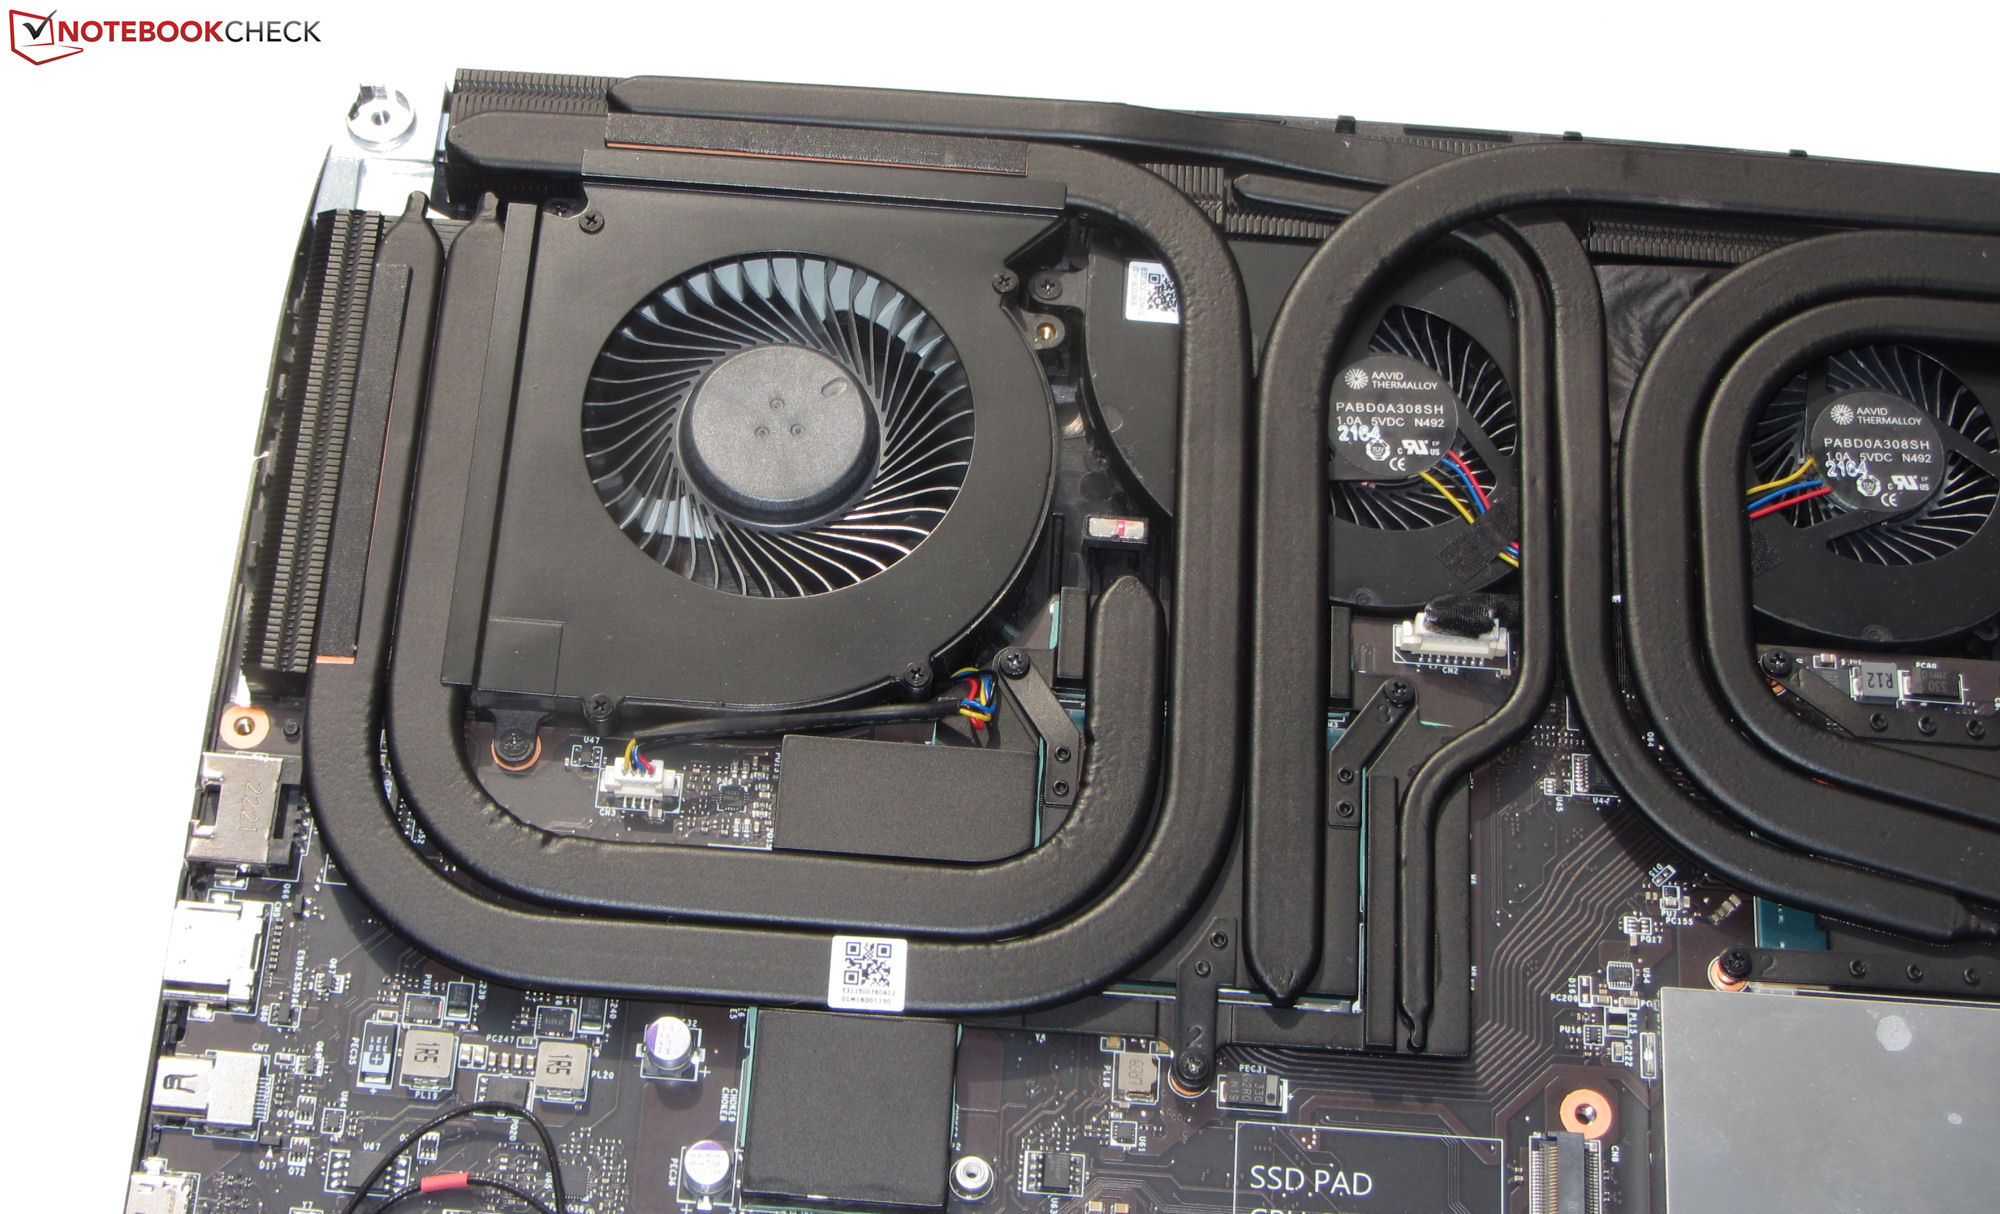
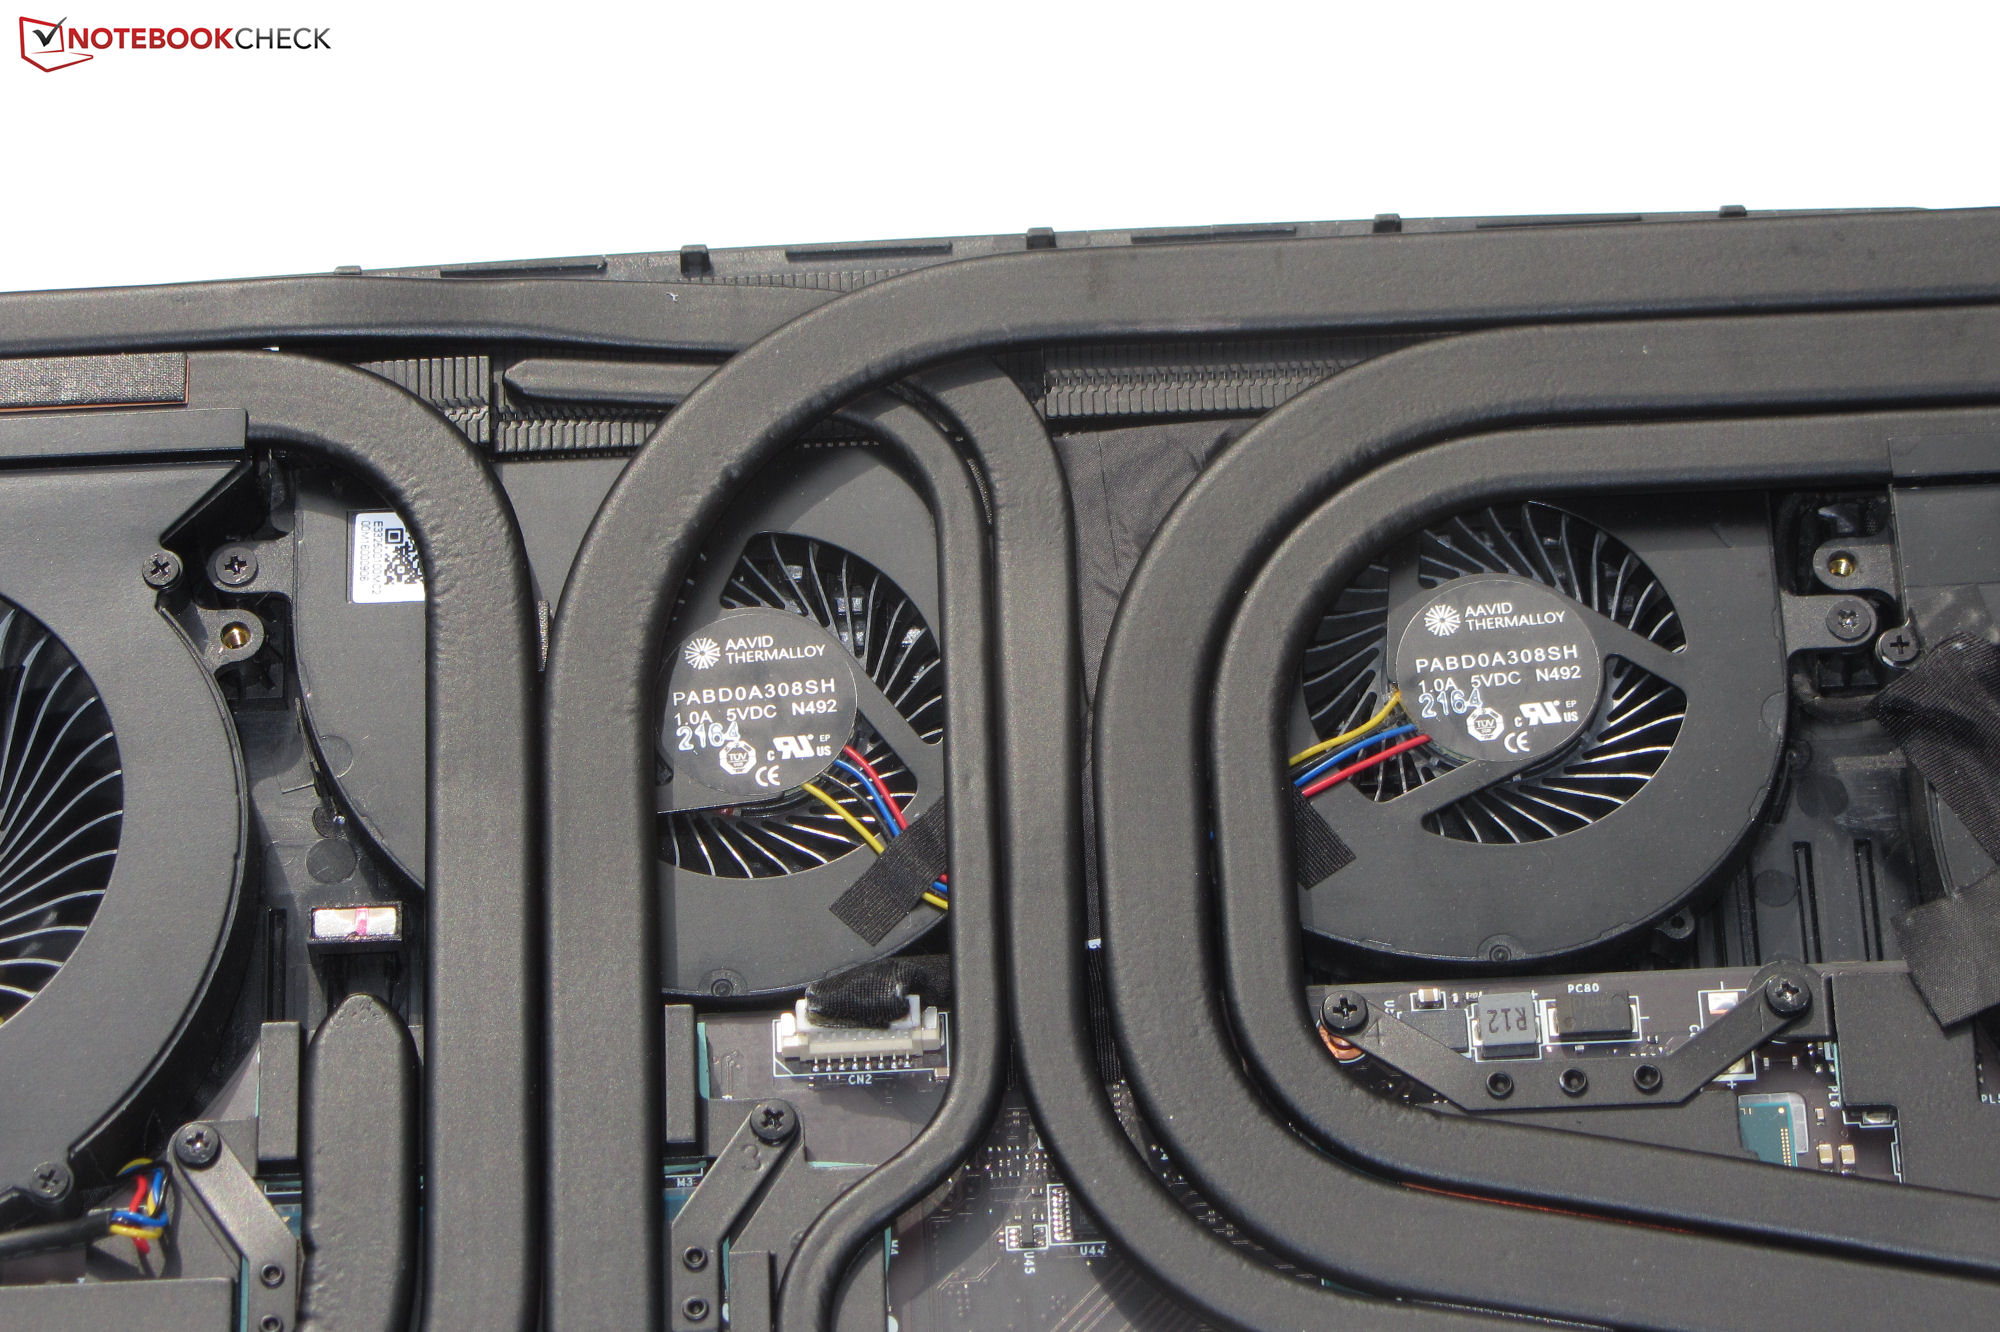
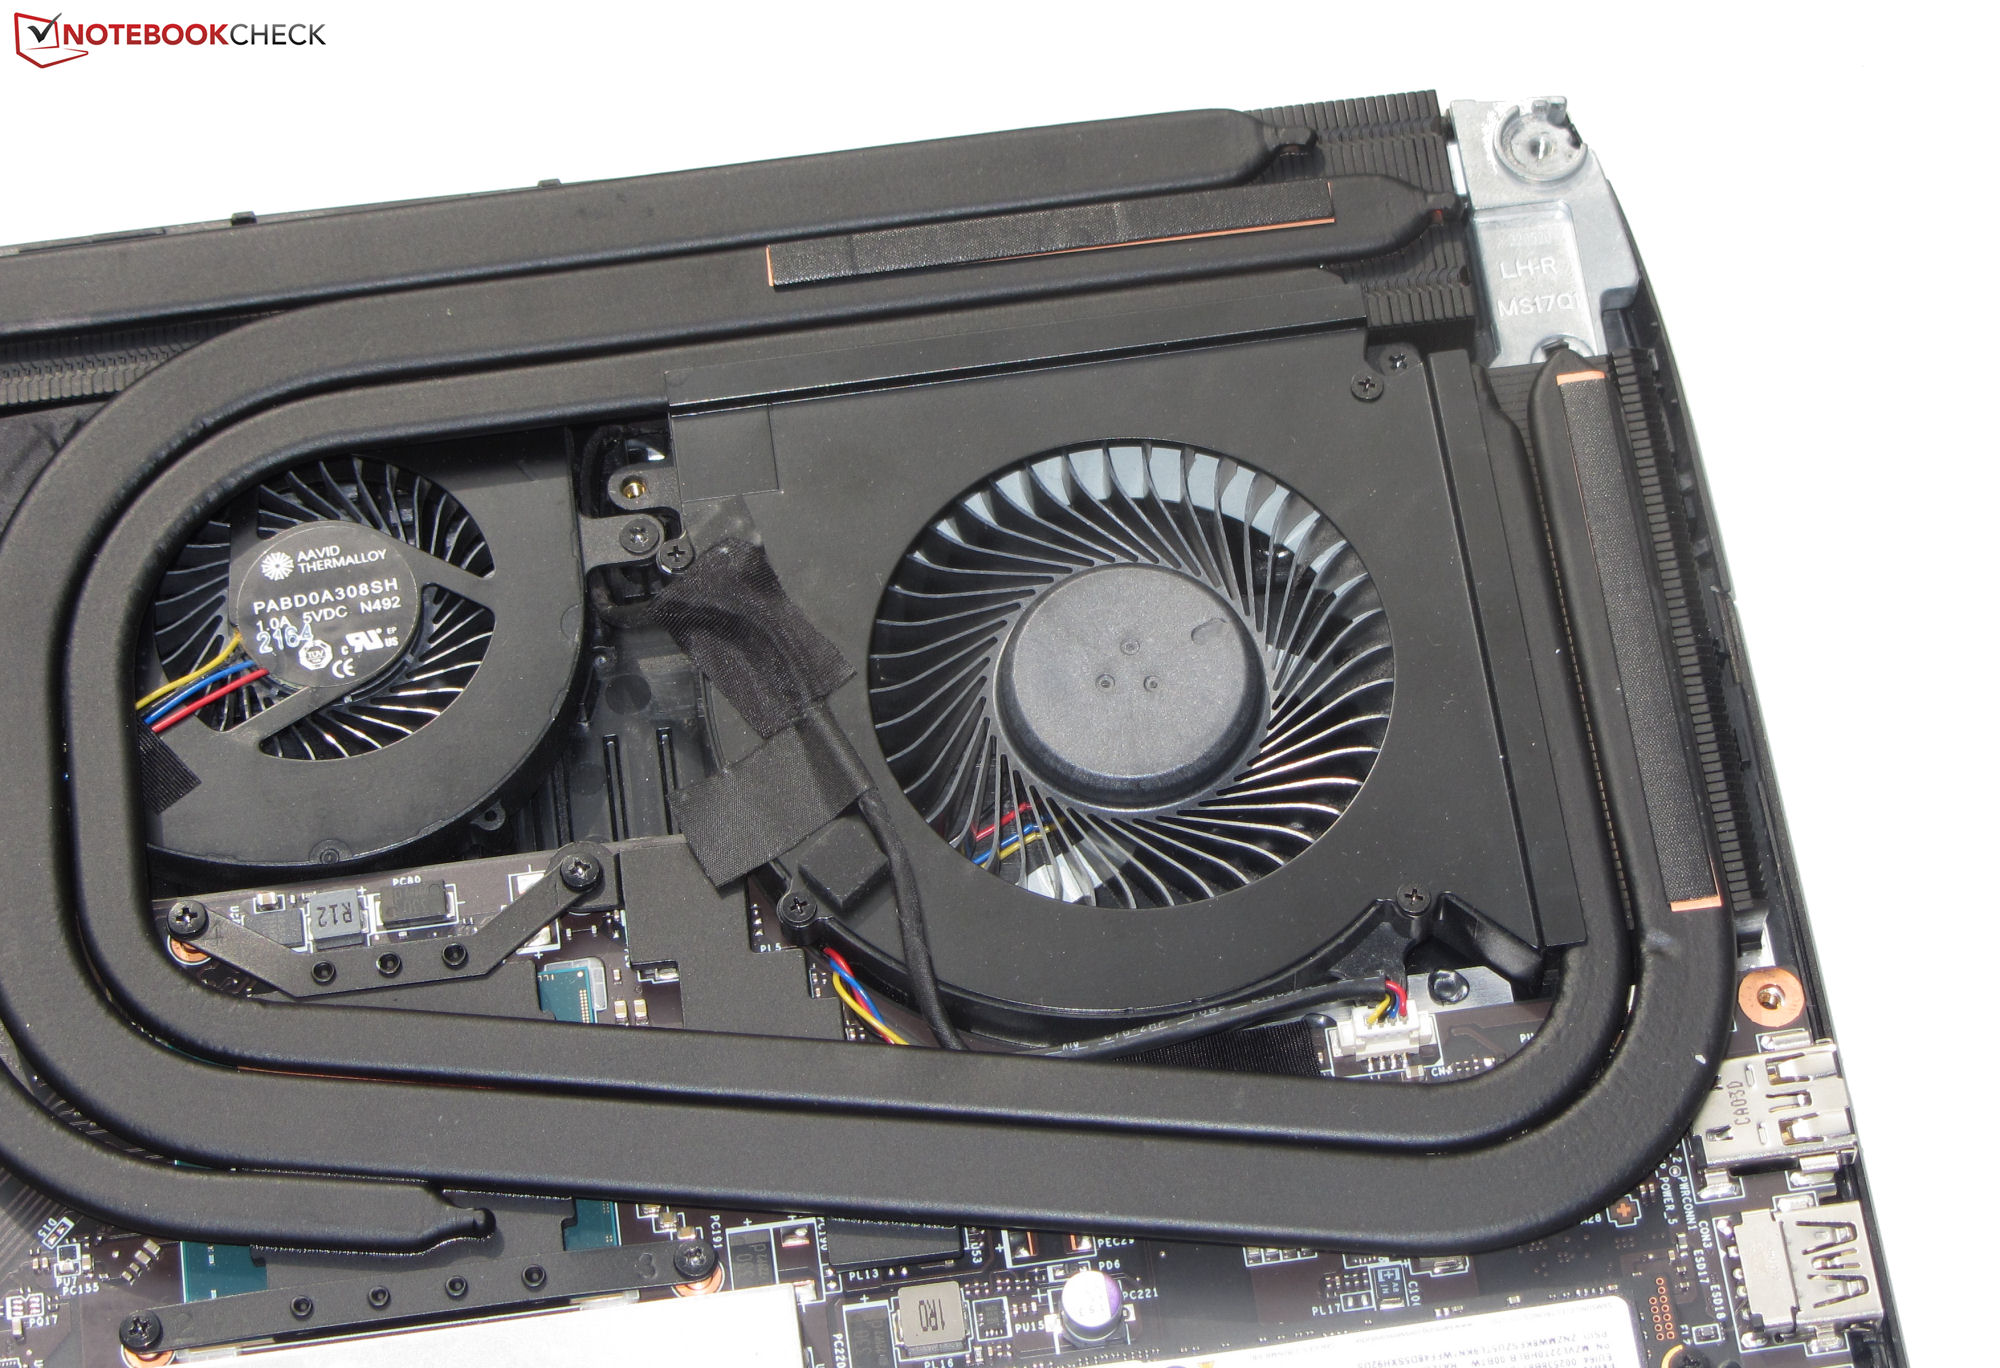
Emissioni - MSI GT77 è dotato di quattro ventole
Emissioni acustiche
Le quattro ventole possono generare un discreto rumore: sotto carico, i livelli di rumore hanno raggiunto i 53 dB(A) durante il test Witcher 3 e i 56 dB(A) durante lo stress test. In condizioni di inattività o di basso carico, almeno una delle ventole sta solitamente girando e il rumore delle ventole può raggiungere i 42 dB(A). Tuttavia, il FHD Titan non ne risente. Una possibile spiegazione è che il controllo della ventola sul modello 4K potrebbe essere un po' più difficile da gestire grazie alla funzione "Smart Auto" attiva. Il profilo "Modalità silenziosa" aiuta a ridurre la quantità di rumore quando il sistema è in funzione, a scapito della potenza di calcolo
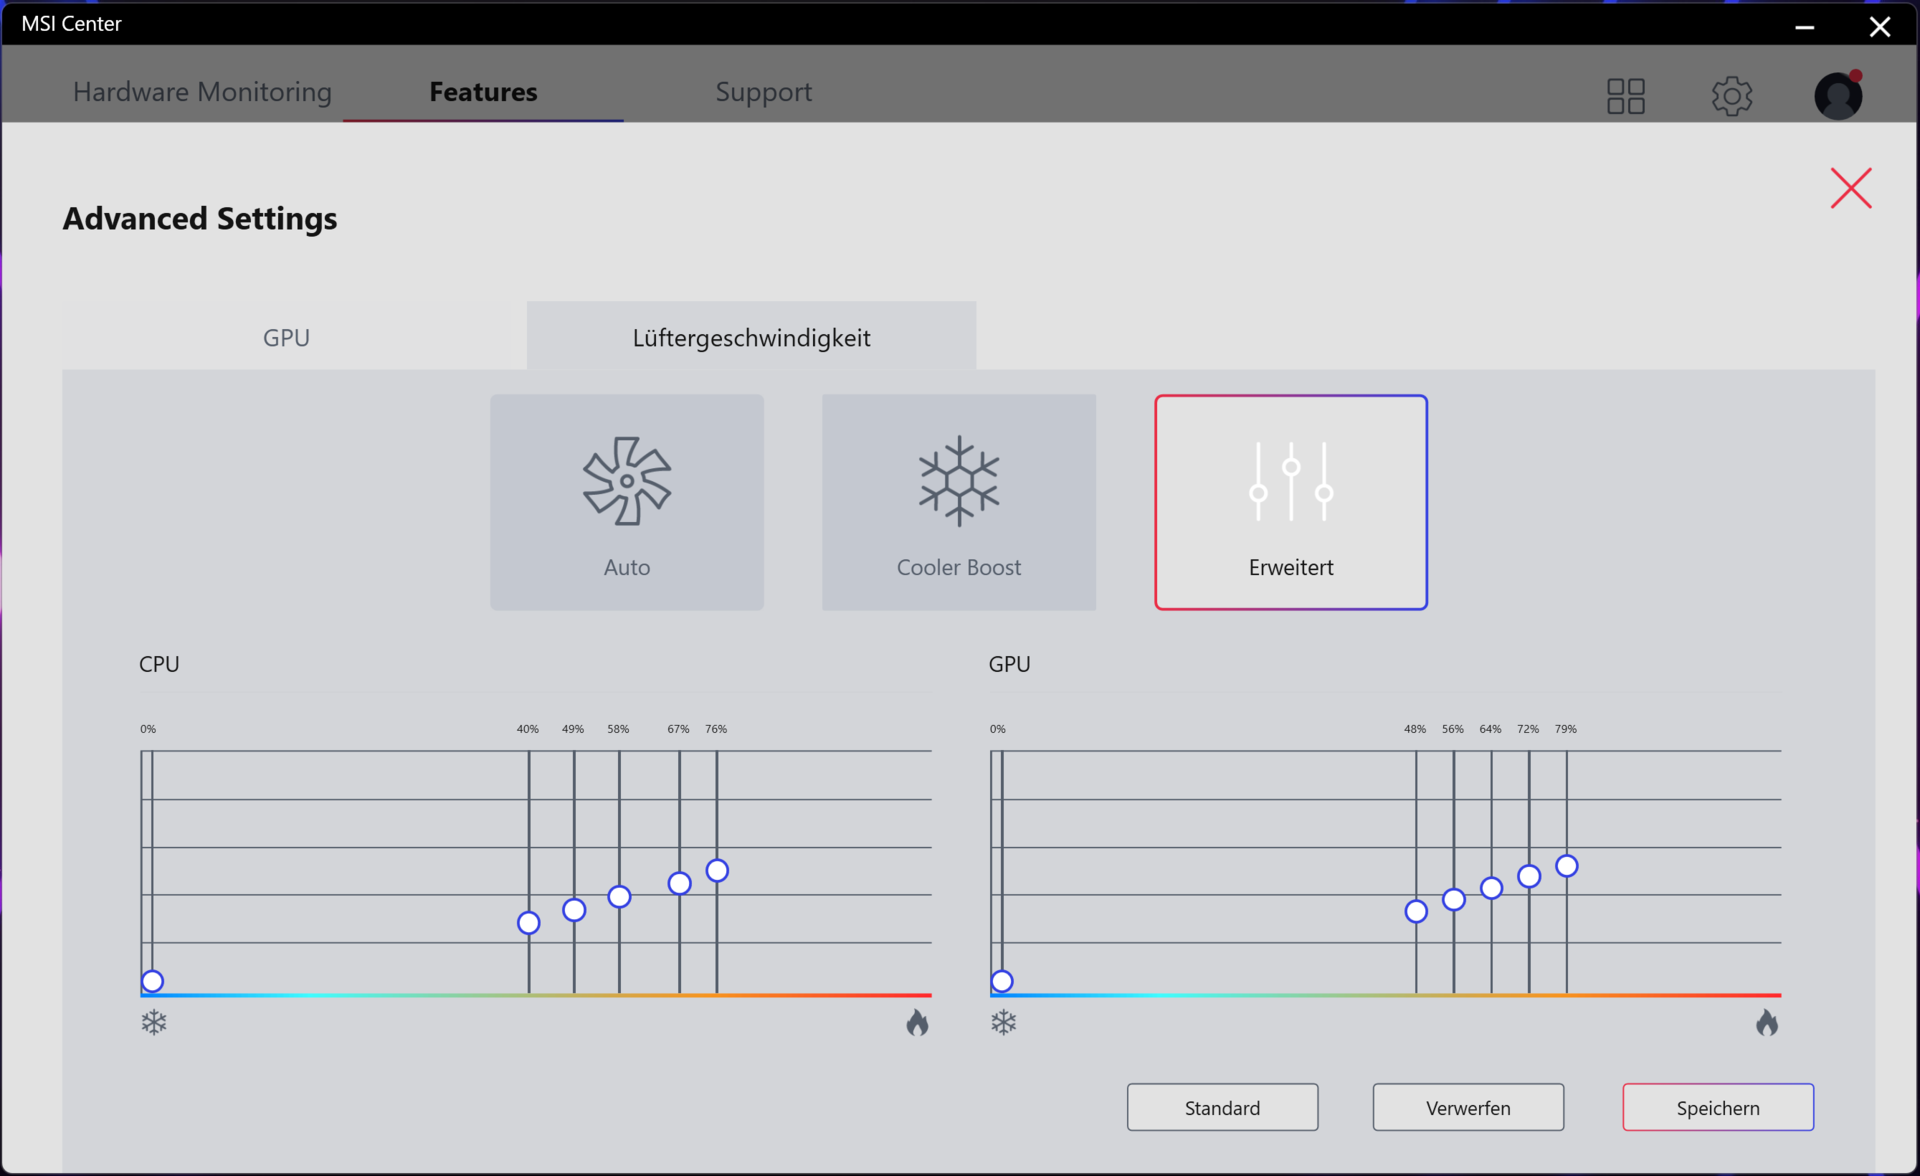
Il profilo "Extreme Performance" consente di modificare il controllo della ventola. Le opzioni disponibili sono "Auto", "Cooler Boost" (le ventole funzionano alla massima velocità) e "Advanced" (personalizzazione delle curve delle ventole).
Rumorosità
| Idle |
| 29 / 30 / 42 dB(A) |
| Sotto carico |
| 54 / 56 dB(A) |
 | ||
30 dB silenzioso 40 dB(A) udibile 50 dB(A) rumoroso |
||
min: | ||
| MSI Titan GT77 12UHS 4k i9-12900HX, GeForce RTX 3080 Ti Laptop GPU | Razer Blade 17 Early 2022 i9-12900H, GeForce RTX 3080 Ti Laptop GPU | Alienware x17 R2 P48E i9-12900HK, GeForce RTX 3080 Ti Laptop GPU | Schenker XMG Ultra 17 Rocket Lake i9-11900K, GeForce RTX 3080 Laptop GPU | MSI Titan GT77 12UHS i9-12900HX, GeForce RTX 3080 Ti Laptop GPU | |
|---|---|---|---|---|---|
| Noise | 9% | 21% | -12% | 14% | |
| off /ambiente * (dB) | 26 | 26 -0% | 22.7 13% | 24 8% | 21.9 16% |
| Idle Minimum * (dB) | 29 | 26 10% | 23.1 20% | 30 -3% | 24.53 15% |
| Idle Average * (dB) | 30 | 27 10% | 23.1 23% | 31 -3% | 24.53 18% |
| Idle Maximum * (dB) | 42 | 32 24% | 23.1 45% | 57 -36% | 24.53 42% |
| Load Average * (dB) | 54 | 50 7% | 31.9 41% | 63 -17% | 46.25 14% |
| Witcher 3 ultra * (dB) | 52 | 51 2% | 52.5 -1% | 61 -17% | 56.86 -9% |
| Load Maximum * (dB) | 56 | 51 9% | 52.5 6% | 63 -13% | 54.25 3% |
* ... Meglio usare valori piccoli
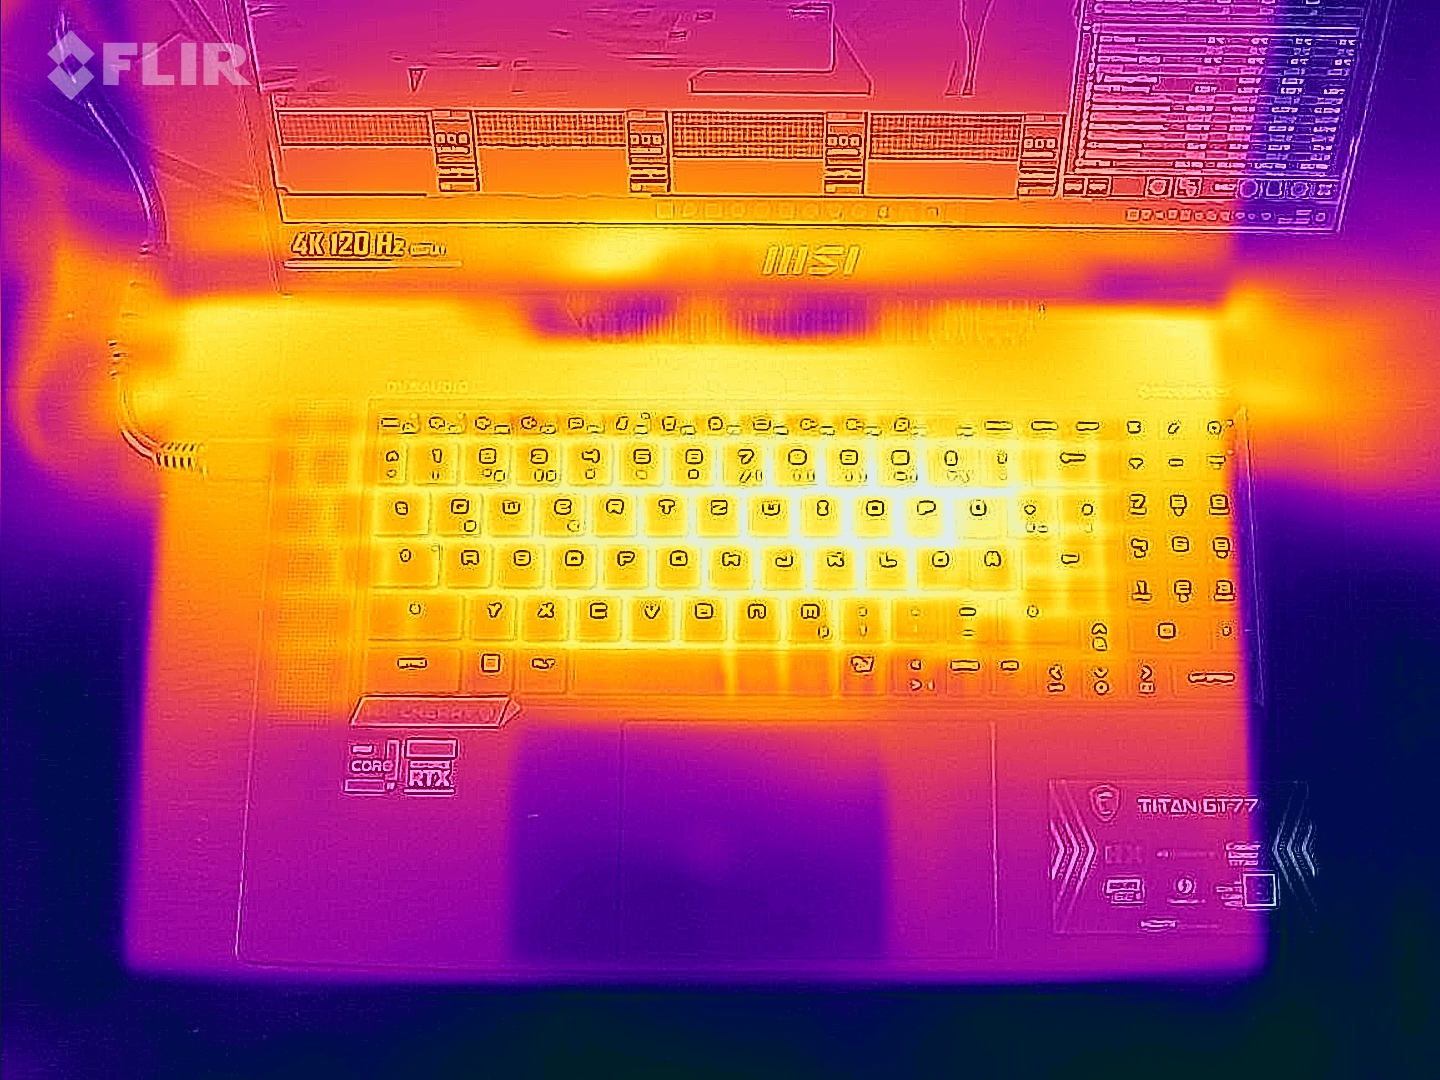
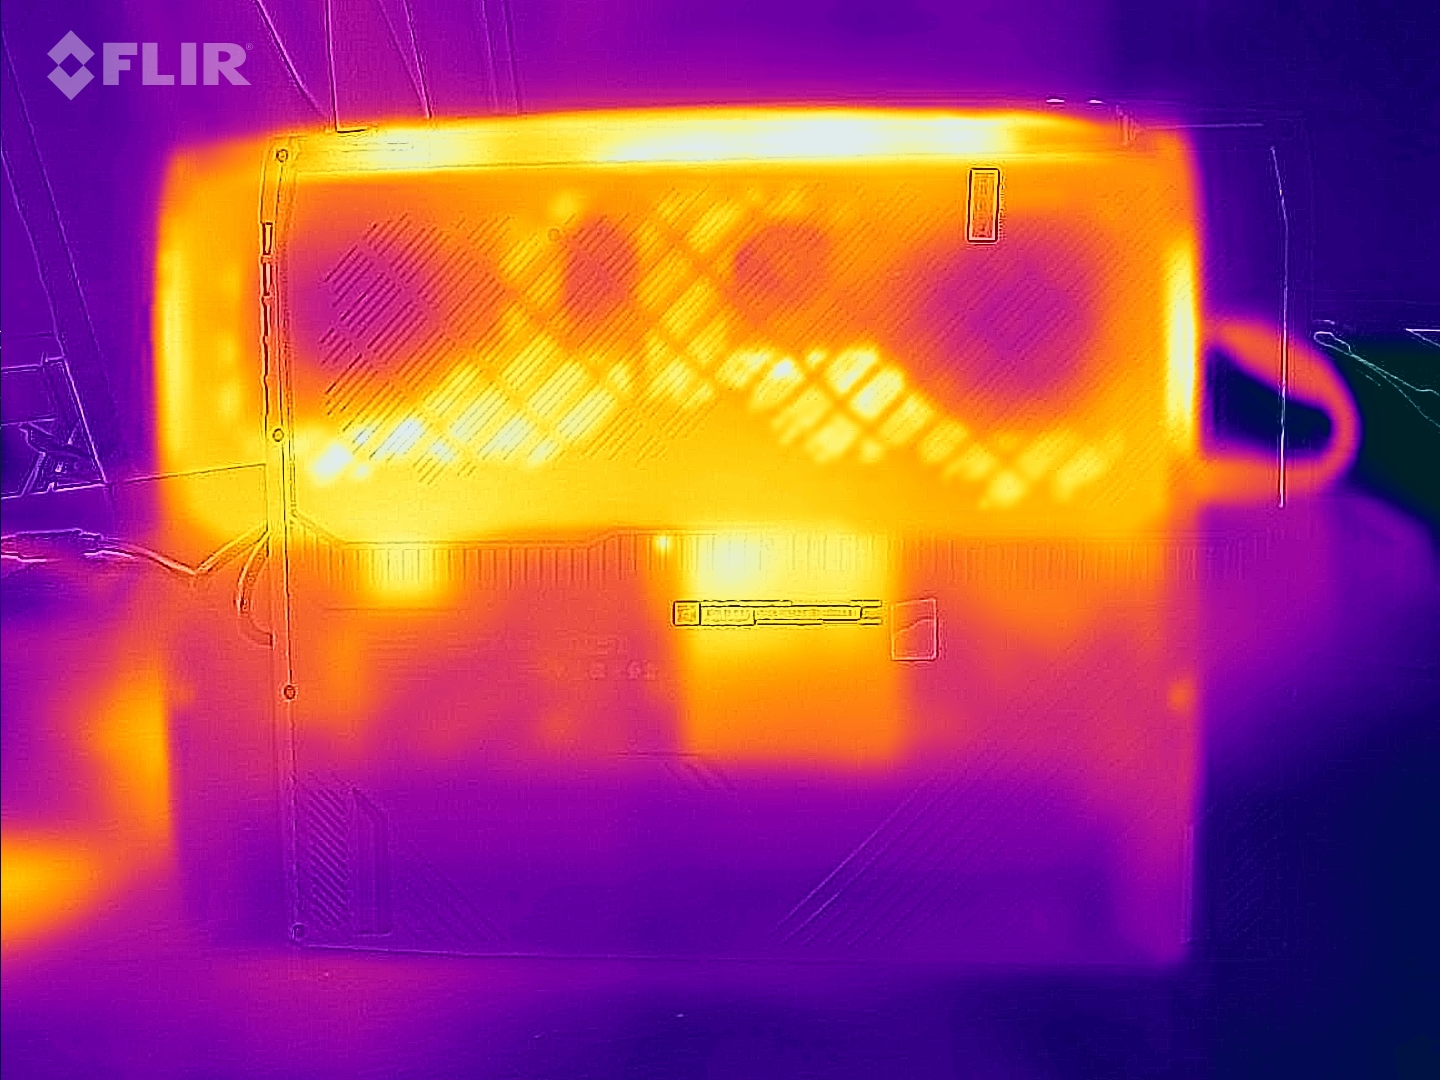
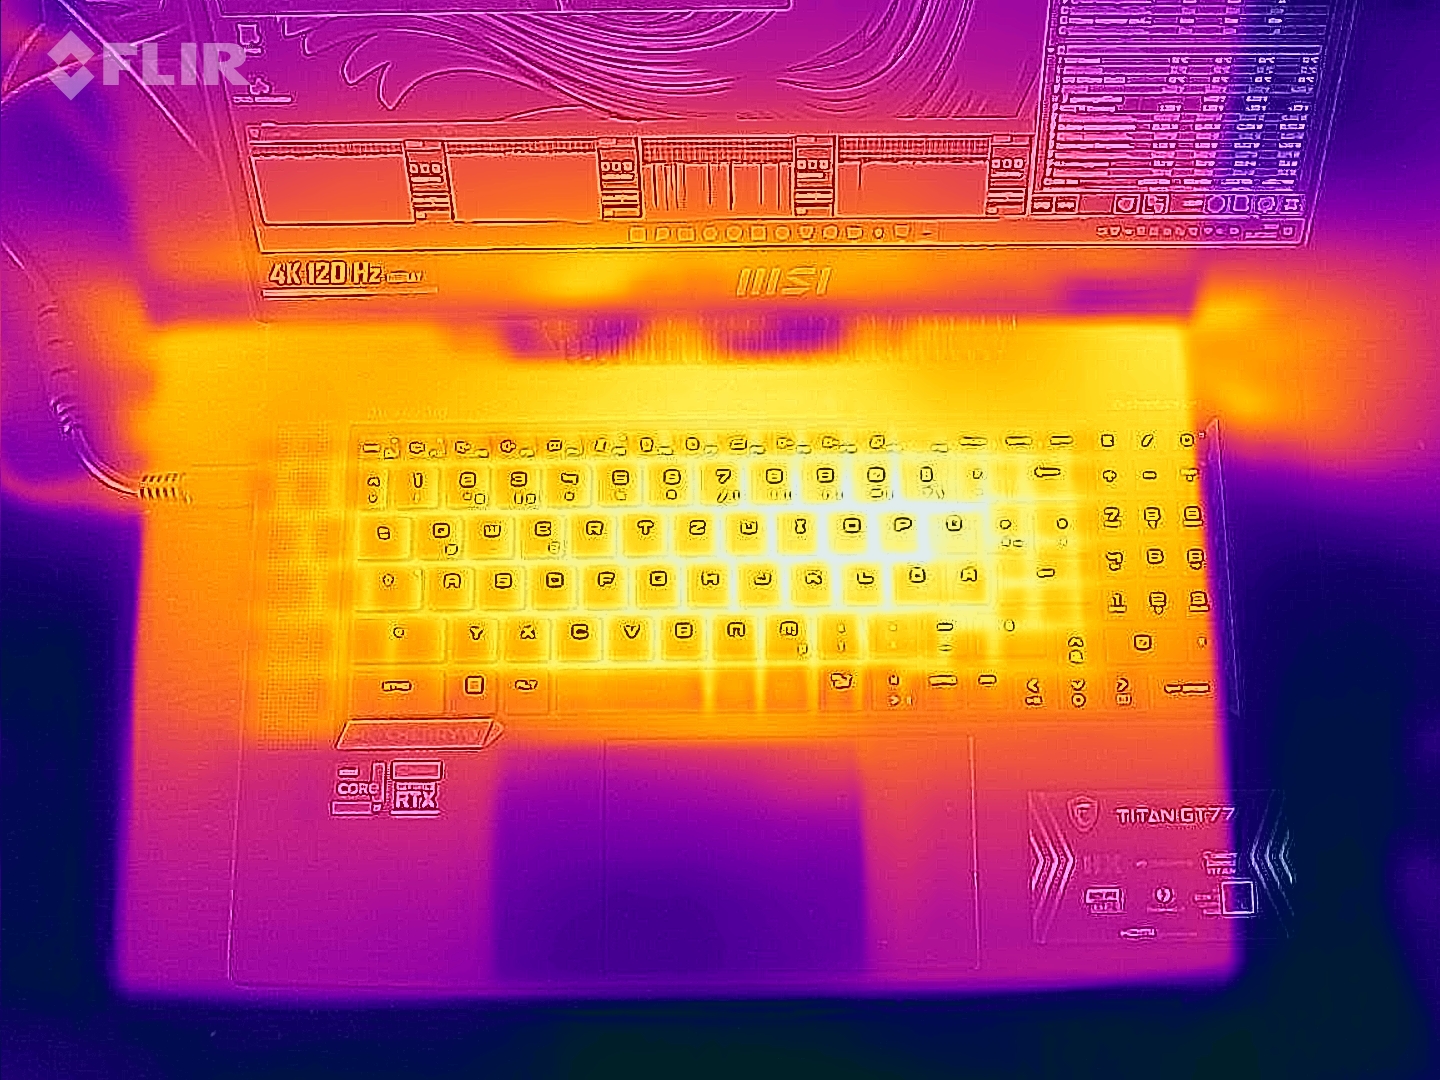
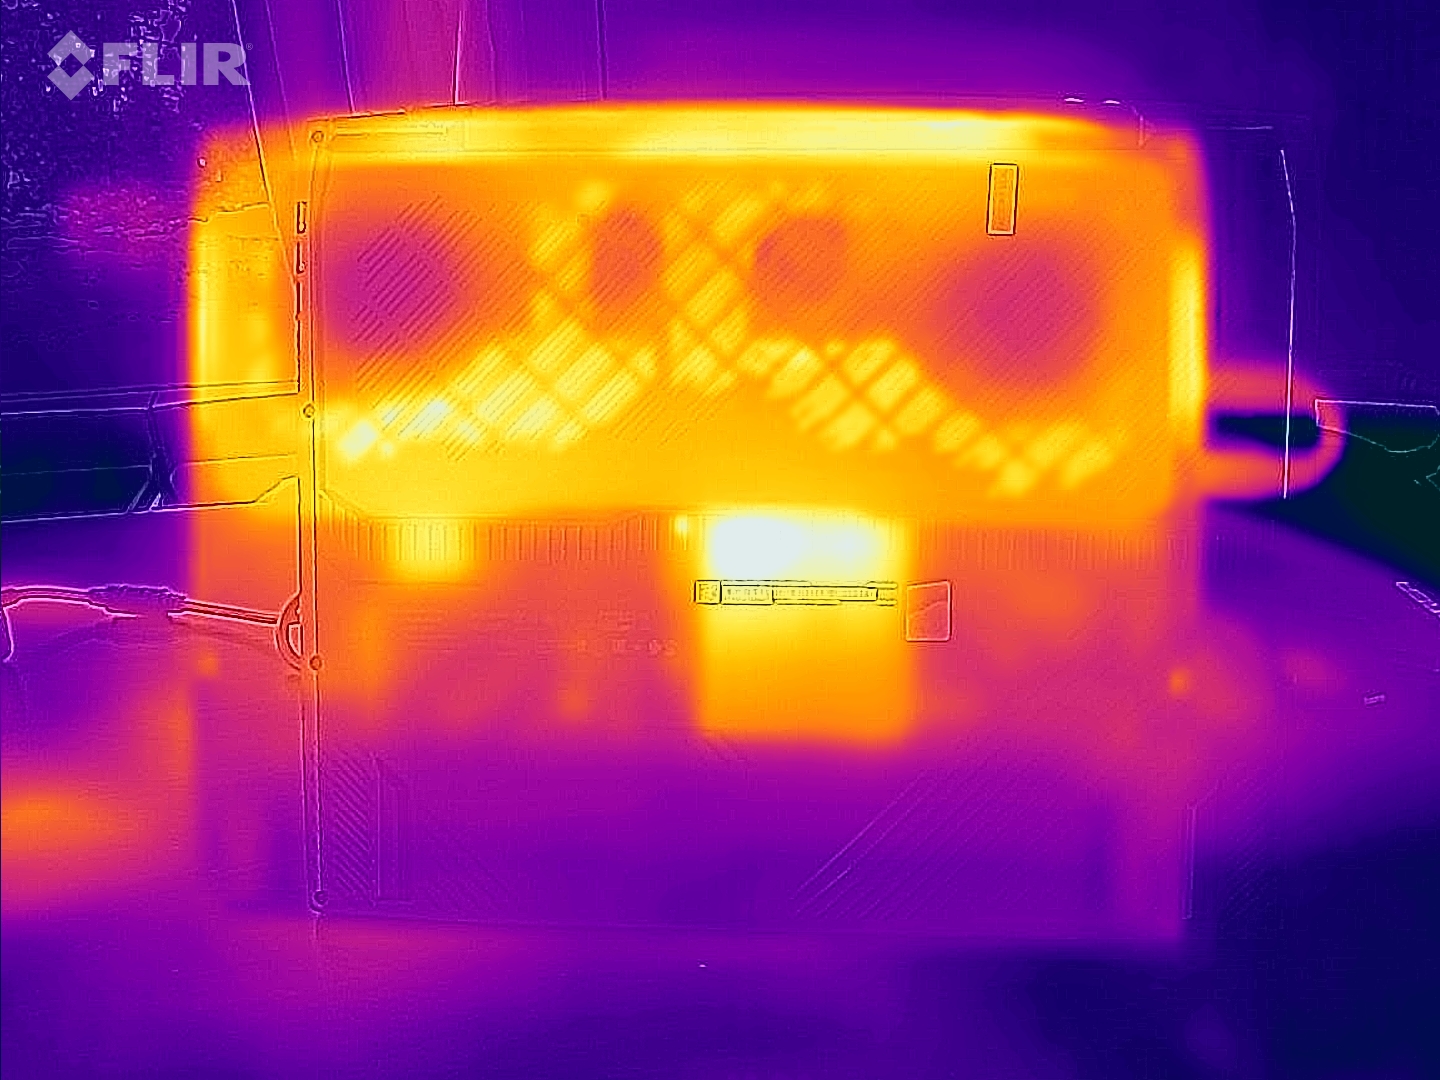
Temperatura
Nell'uso quotidiano (lavoro d'ufficio, navigazione in Internet), le temperature dello chassis sono rimaste entro un intervallo accettabile. Sotto carico (stress test, test Witcher 3 ), il portatile è diventato significativamente più caldo, ma non troppo. Non c'è motivo di preoccuparsi per quanto riguarda le temperature della CPU.
(-) La temperatura massima sul lato superiore è di 49 °C / 120 F, rispetto alla media di 40.4 °C / 105 F, che varia da 21.2 a 68.8 °C per questa classe Gaming.
(-) Il lato inferiore si riscalda fino ad un massimo di 50 °C / 122 F, rispetto alla media di 43.2 °C / 110 F
(±) In idle, la temperatura media del lato superiore è di 33.2 °C / 92 F, rispetto alla media deld ispositivo di 33.9 °C / 93 F.
(-) Riproducendo The Witcher 3, la temperatura media per il lato superiore e' di 48.1 °C / 119 F, rispetto alla media del dispositivo di 33.9 °C / 93 F.
(-) I poggiapolsi e il touchpad possono diventare molto caldi al tatto con un massimo di 43 °C / 109.4 F.
(-) La temperatura media della zona del palmo della mano di dispositivi simili e'stata di 28.8 °C / 83.8 F (-14.2 °C / -25.6 F).
| MSI Titan GT77 12UHS 4k Intel Core i9-12900HX, NVIDIA GeForce RTX 3080 Ti Laptop GPU | Razer Blade 17 Early 2022 Intel Core i9-12900H, NVIDIA GeForce RTX 3080 Ti Laptop GPU | Alienware x17 R2 P48E Intel Core i9-12900HK, NVIDIA GeForce RTX 3080 Ti Laptop GPU | Schenker XMG Ultra 17 Rocket Lake Intel Core i9-11900K, NVIDIA GeForce RTX 3080 Laptop GPU | MSI Titan GT77 12UHS Intel Core i9-12900HX, NVIDIA GeForce RTX 3080 Ti Laptop GPU | |
|---|---|---|---|---|---|
| Heat | -5% | 11% | 8% | 2% | |
| Maximum Upper Side * (°C) | 49 | 50 -2% | 49.6 -1% | 34 31% | 40.8 17% |
| Maximum Bottom * (°C) | 50 | 56 -12% | 42.4 15% | 43 14% | 52.4 -5% |
| Idle Upper Side * (°C) | 34 | 36 -6% | 29.2 14% | 38 -12% | 34.6 -2% |
| Idle Bottom * (°C) | 38 | 38 -0% | 32 16% | 39 -3% | 38.4 -1% |
* ... Meglio usare valori piccoli
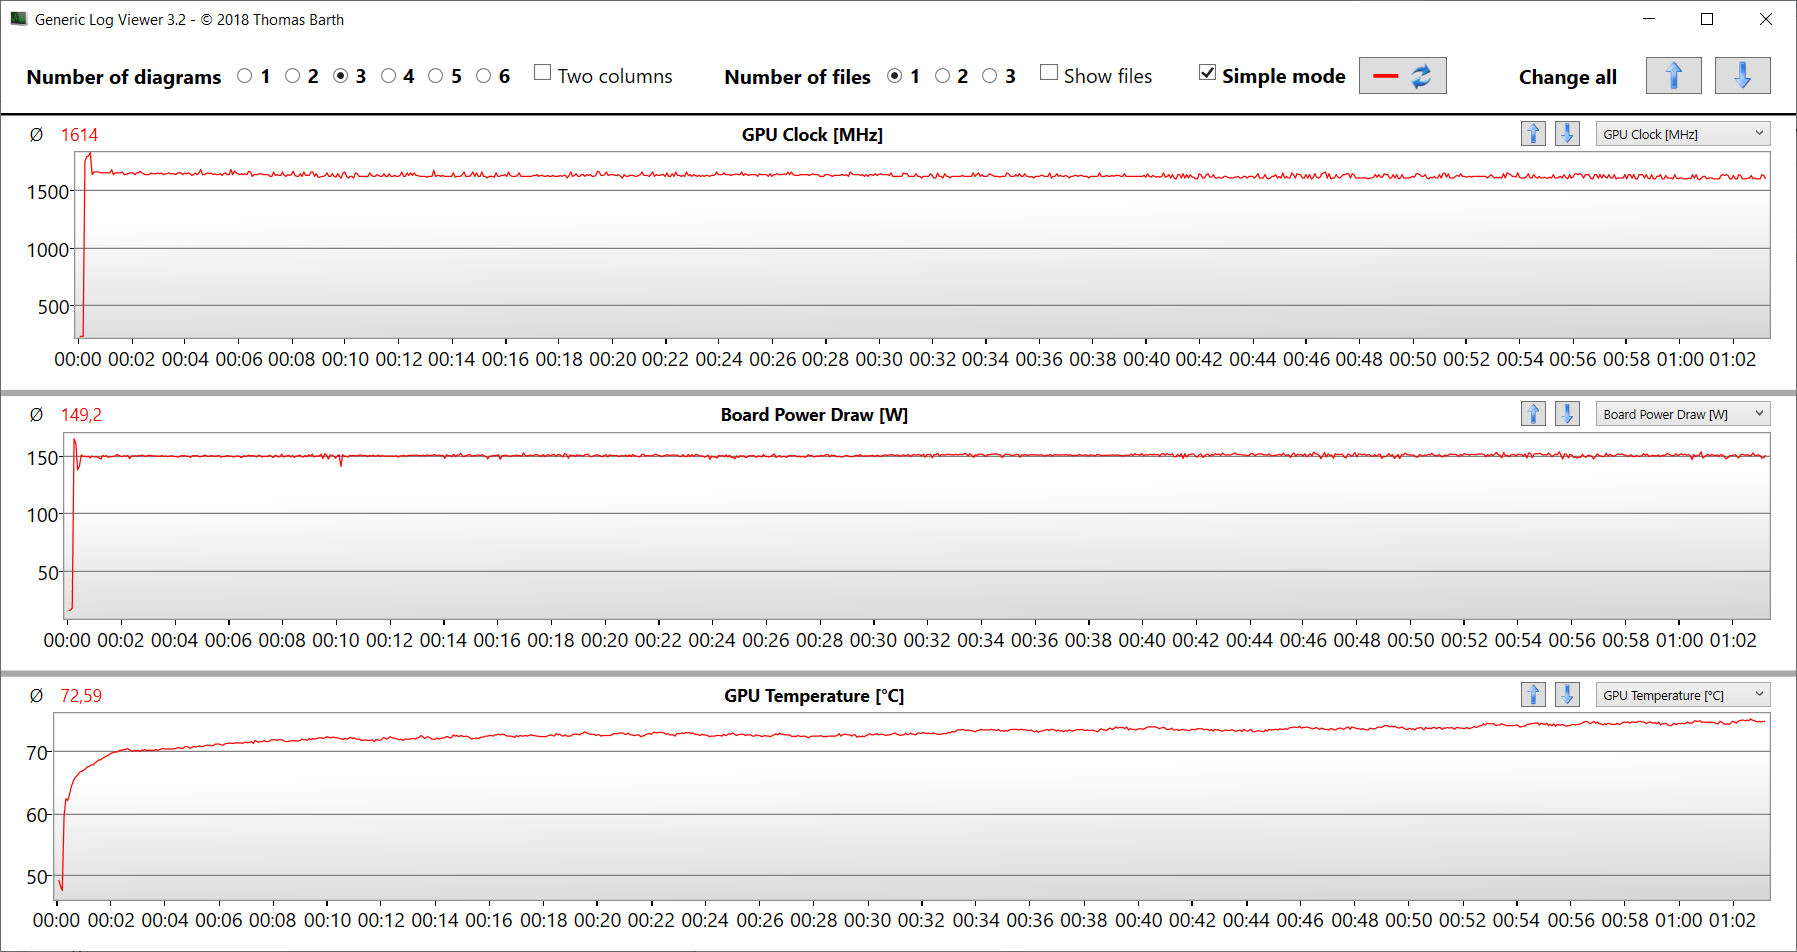
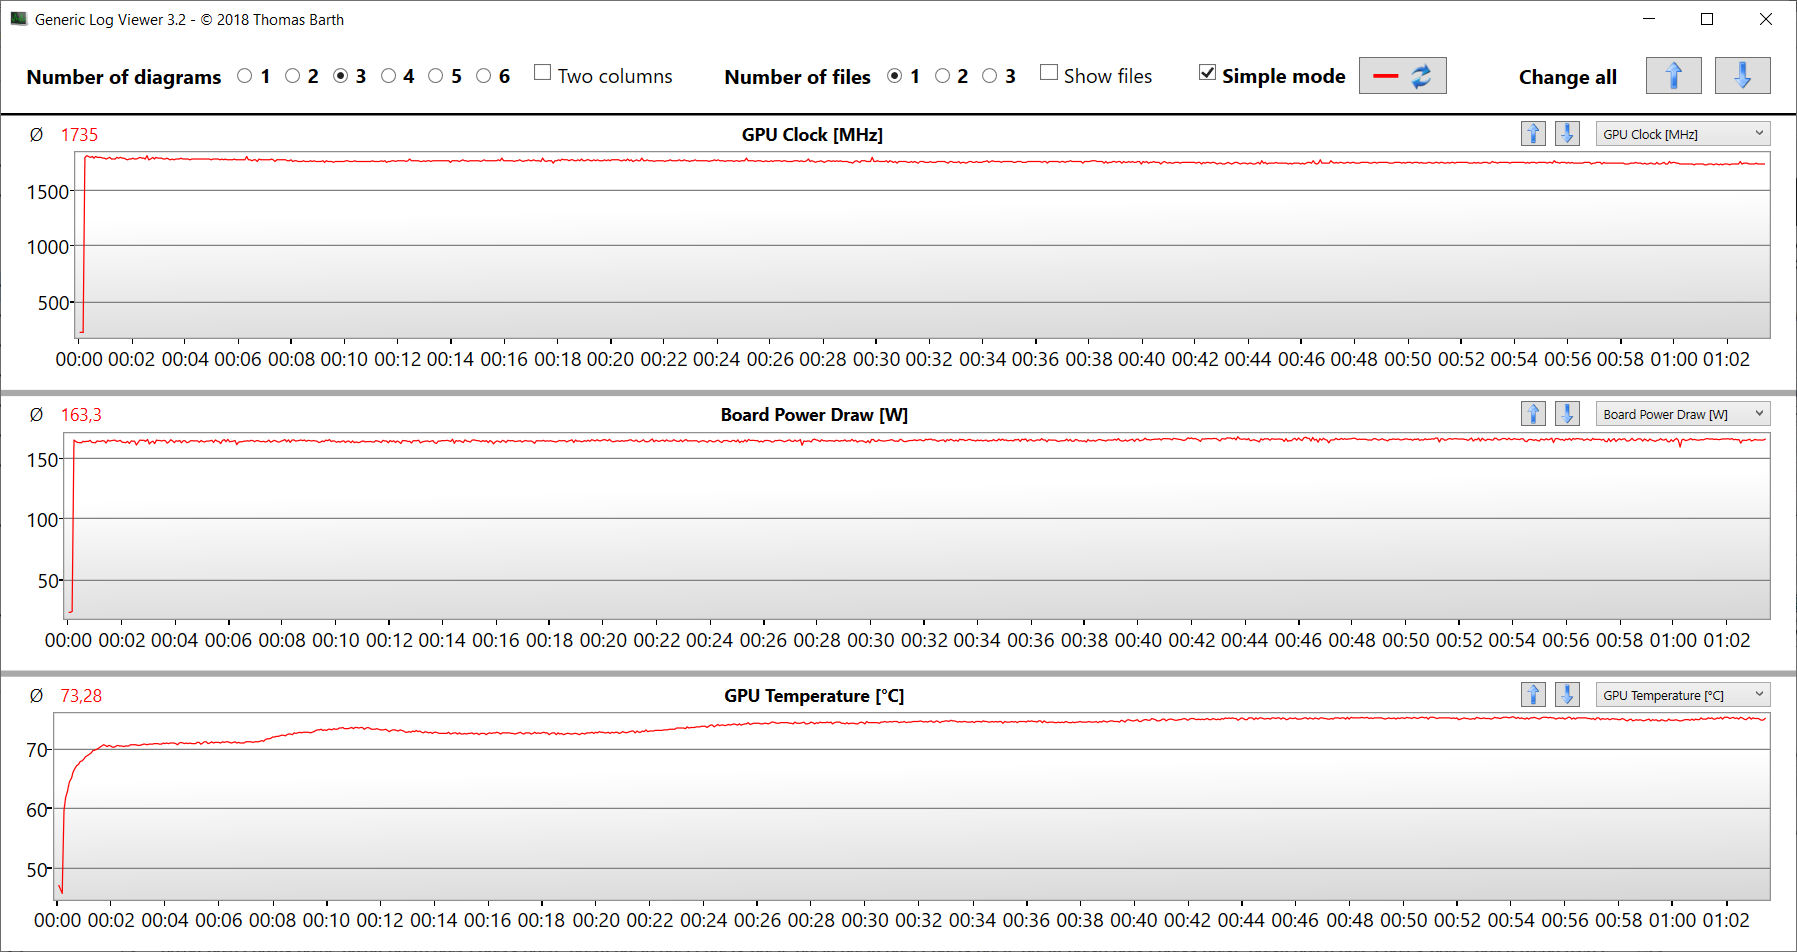
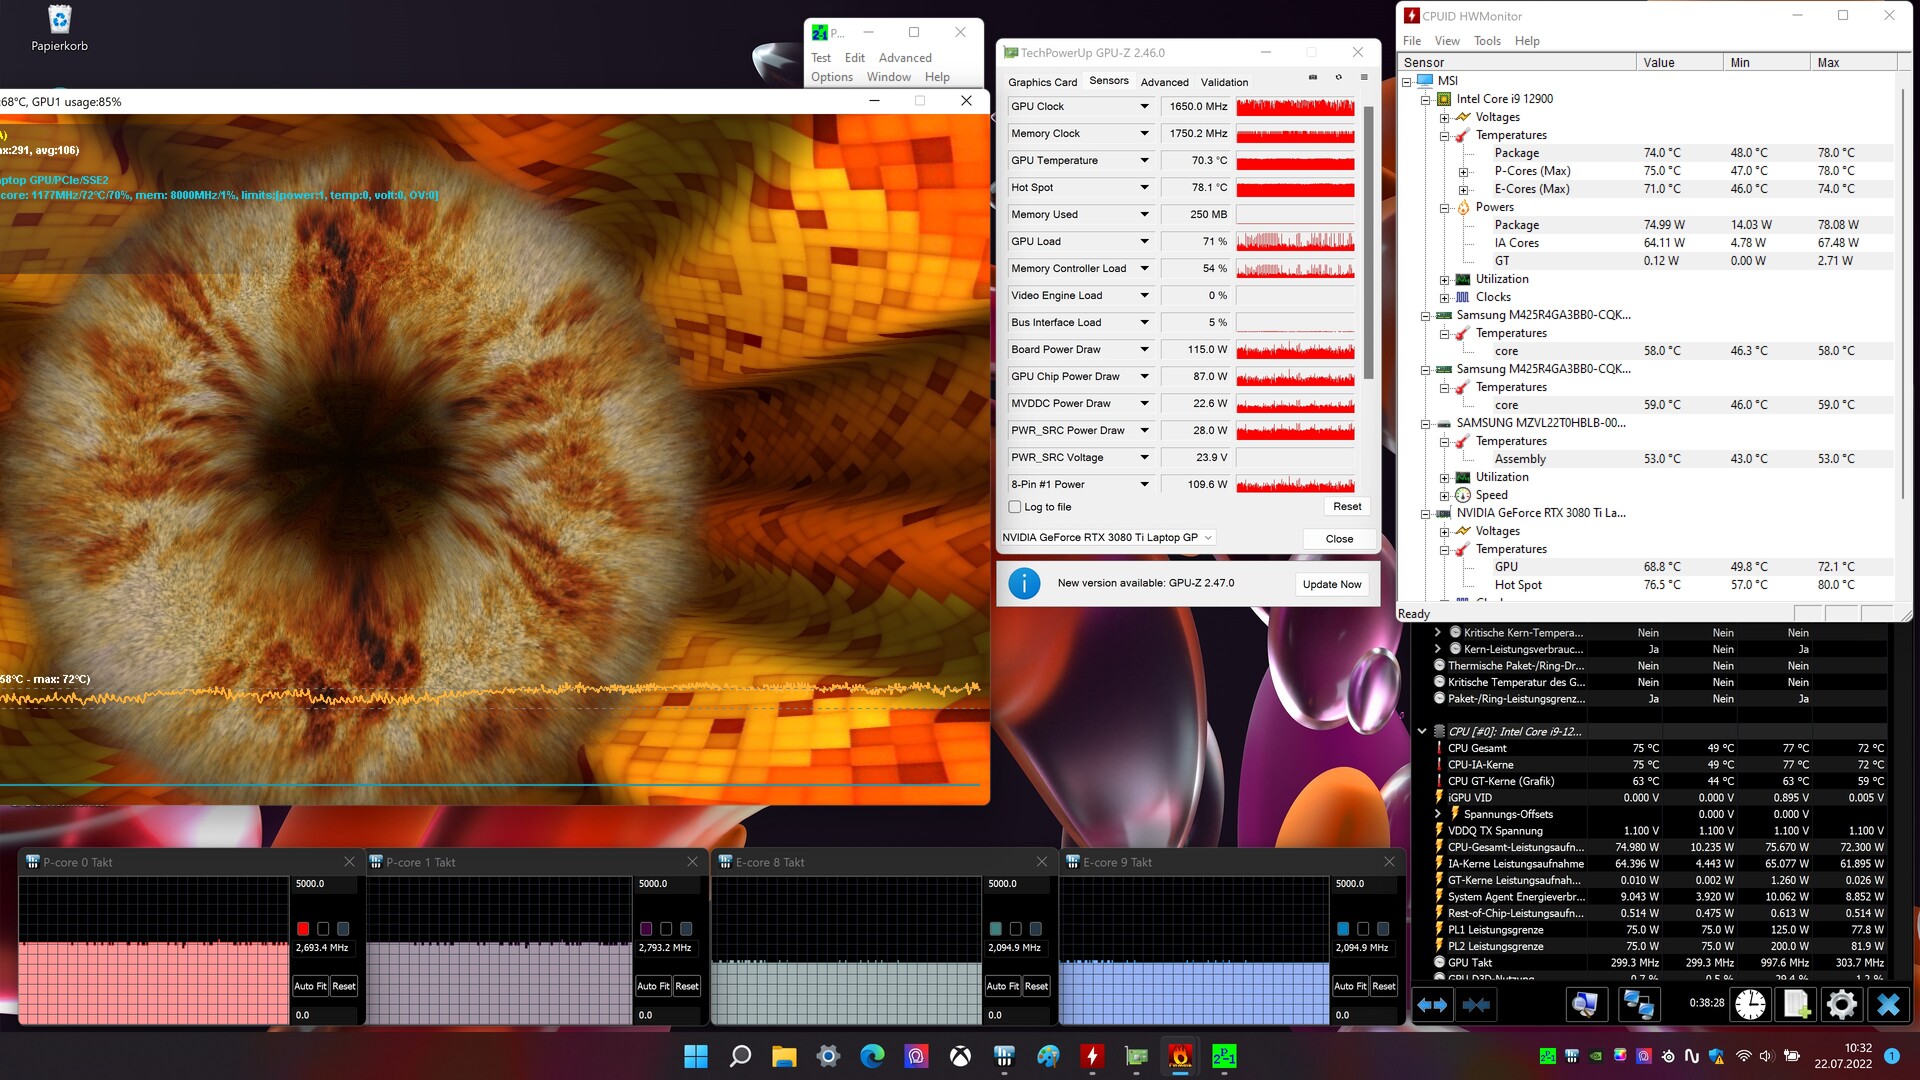
Test da sforzo
La CPU ha completato lo stress test (eseguendo Prime95 e FurMark per almeno un'ora) a velocità di elaborazione medie, mentre la GPU è stata in grado di raggiungere la sua massima velocità di clock. Lo stress test rappresenta una situazione estrema. Questo test viene condotto per verificare se il sistema è stabile quando funziona a pieno carico.
Altoparlanti
MSI Titan GT77 12UHS analisi audio
(+) | gli altoparlanti sono relativamente potenti (91 dB)
Bassi 100 - 315 Hz
(±) | bassi ridotti - in media 13.9% inferiori alla media
(±) | la linearità dei bassi è media (9.7% delta rispetto alla precedente frequenza)
Medi 400 - 2000 Hz
(+) | medi bilanciati - solo only 4% rispetto alla media
(+) | medi lineari (3.6% delta rispetto alla precedente frequenza)
Alti 2 - 16 kHz
(+) | Alti bilanciati - appena 1.8% dalla media
(+) | alti lineari (3.9% delta rispetto alla precedente frequenza)
Nel complesso 100 - 16.000 Hz
(+) | suono nel complesso lineare (11.4% differenza dalla media)
Rispetto alla stessa classe
» 9% di tutti i dispositivi testati in questa classe è stato migliore, 3% simile, 88% peggiore
» Il migliore ha avuto un delta di 6%, medio di 18%, peggiore di 132%
Rispetto a tutti i dispositivi testati
» 7% di tutti i dispositivi testati in questa classe è stato migliore, 2% similare, 90% peggiore
» Il migliore ha avuto un delta di 4%, medio di 23%, peggiore di 134%
Alienware x17 R2 P48E analisi audio
(+) | gli altoparlanti sono relativamente potenti (84.3 dB)
Bassi 100 - 315 Hz
(±) | bassi ridotti - in media 9.7% inferiori alla media
(+) | bassi in lineaa (5.5% delta rispetto alla precedente frequenza)
Medi 400 - 2000 Hz
(+) | medi bilanciati - solo only 1.6% rispetto alla media
(+) | medi lineari (3% delta rispetto alla precedente frequenza)
Alti 2 - 16 kHz
(±) | alti elevati - circa 5% superiori alla media
(±) | la linearità degli alti è media (7.6% delta rispetto alla precedente frequenza)
Nel complesso 100 - 16.000 Hz
(+) | suono nel complesso lineare (9.3% differenza dalla media)
Rispetto alla stessa classe
» 3% di tutti i dispositivi testati in questa classe è stato migliore, 2% simile, 95% peggiore
» Il migliore ha avuto un delta di 6%, medio di 18%, peggiore di 132%
Rispetto a tutti i dispositivi testati
» 3% di tutti i dispositivi testati in questa classe è stato migliore, 1% similare, 96% peggiore
» Il migliore ha avuto un delta di 4%, medio di 23%, peggiore di 134%
Gestione dell'alimentazione - Il portatile MSI offre una durata della batteria decente
Consumo di energia
Il consumo di energia del portatile rientra nella norma per l'hardware presente al suo interno. Durante il test Witcher 3 e lo stress test, il consumo energetico è aumentato fino a una media di 236 watt e un picco di 309 watt. Il dispositivo ha utilizzato una quantità costante di energia durante entrambi i test
Nota: il Modello FHDè stato testato con la modalità dGPU attiva. Questo spiega perché ha consumato più energia al minimo.
| Off / Standby | |
| Idle | |
| Sotto carico |
|
Leggenda:
min: | |
| MSI Titan GT77 12UHS i9-12900HX, GeForce RTX 3080 Ti Laptop GPU | Razer Blade 17 Early 2022 i9-12900H, GeForce RTX 3080 Ti Laptop GPU | Alienware x17 R2 P48E i9-12900HK, GeForce RTX 3080 Ti Laptop GPU | Schenker XMG Ultra 17 Rocket Lake i9-11900K, GeForce RTX 3080 Laptop GPU | MSI Titan GT77 12UHS i9-12900HX, GeForce RTX 3080 Ti Laptop GPU | Media NVIDIA GeForce RTX 3080 Ti Laptop GPU | Media della classe Gaming | |
|---|---|---|---|---|---|---|---|
| Power Consumption | -7% | -44% | -146% | -41% | -10% | 8% | |
| Idle Minimum * (Watt) | 12 | 17 -42% | 24.1 -101% | 62 -417% | 30.21 -152% | 17.2 ? -43% | 13 ? -8% |
| Idle Average * (Watt) | 18 | 23 -28% | 28.5 -58% | 64 -256% | 32.42 -80% | 23.3 ? -29% | 19 ? -6% |
| Idle Maximum * (Watt) | 30 | 34 -13% | 60 -100% | 69 -130% | 33.7 -12% | 30.8 ? -3% | 24.6 ? 18% |
| Load Average * (Watt) | 141 | 120 15% | 128.7 9% | 183 -30% | 125.09 11% | 121.2 ? 14% | 110.7 ? 21% |
| Witcher 3 ultra * (Watt) | 236 | 229 3% | 254 -8% | 297 -26% | 256 -8% | ||
| Load Maximum * (Watt) | 309 | 243 21% | 323 -5% | 368 -19% | 321.88 -4% | 276 ? 11% | 259 ? 16% |
* ... Meglio usare valori piccoli
Power consumption Witcher 3 / stress test
Power consumption with external monitor
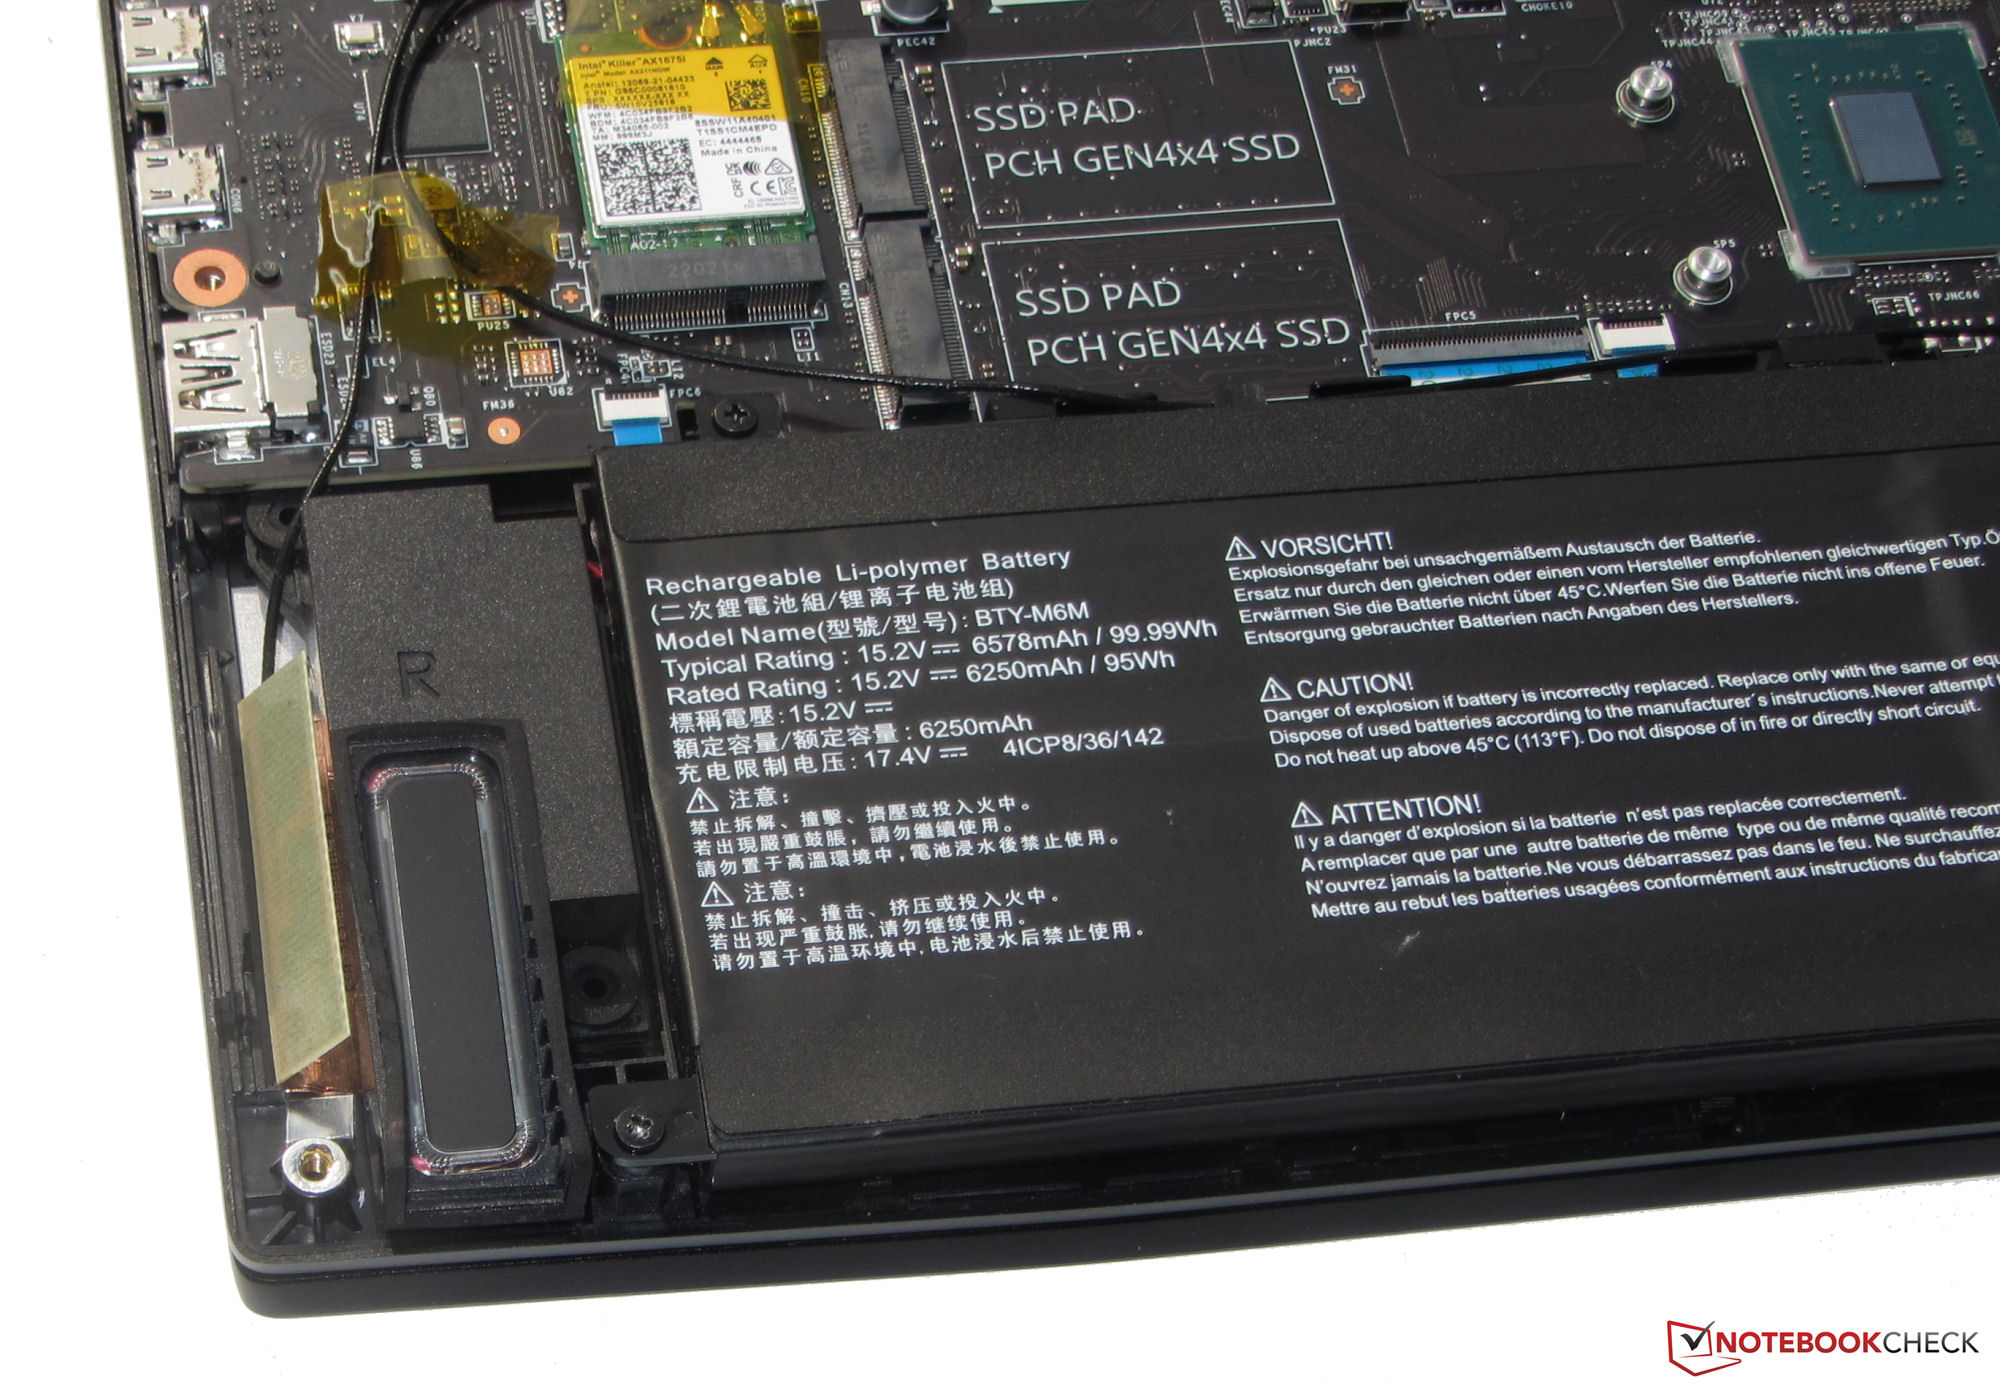
Durata della batteria
Per il nostro test Wi-Fi (visita automatica di siti web tramite uno script) e il test video (riproduzione in loop del cortometraggio Big Buck Bunny (codifica H.264, FHD)), il portatile da 17,3 pollici è riuscito a funzionare rispettivamente per 5:52 ore e 6:50 ore. Il Modello fratello FHDè durato leggermente di più a causa della risoluzione dello schermo inferiore.
| MSI Titan GT77 12UHS 4k i9-12900HX, GeForce RTX 3080 Ti Laptop GPU, 99.99 Wh | Razer Blade 17 Early 2022 i9-12900H, GeForce RTX 3080 Ti Laptop GPU, 82 Wh | Alienware x17 R2 P48E i9-12900HK, GeForce RTX 3080 Ti Laptop GPU, 87 Wh | Schenker XMG Ultra 17 Rocket Lake i9-11900K, GeForce RTX 3080 Laptop GPU, 97 Wh | MSI Titan GT77 12UHS i9-12900HX, GeForce RTX 3080 Ti Laptop GPU, 99.9 Wh | Media della classe Gaming | |
|---|---|---|---|---|---|---|
| Autonomia della batteria | -16% | -55% | -58% | 5% | 11% | |
| Reader / Idle (h) | 8.2 | 7.1 -13% | 3.9 -52% | 3 -63% | 8.27 ? 1% | |
| H.264 (h) | 6.8 | 4.8 -29% | 1.9 -72% | 7.2 6% | 8.32 ? 22% | |
| WiFi v1.3 (h) | 5.9 | 3.8 -36% | 2 -66% | 1.8 -69% | 6.9 17% | 7.11 ? 21% |
| Load (h) | 1.5 | 1.7 13% | 0.8 -47% | 1.1 -27% | 1.4 -7% | 1.502 ? 0% |
| Witcher 3 ultra (h) | 1.5 |
Pro
Contro
Verdetto - Ancora meglio con un display 4K
Con la Titan GT77, MSI offre uno dei portatili DTR più performanti del momento. È stato progettato per scenari di utilizzo che richiedono una potenza di calcolo intensa e una grande quantità di RAM, come il rendering e il gioco.
MSI Titan GT77 - uno dei portatili più performanti del momento.
Il Core i9-12900HX e GeForce RTX 3080 Ti (175 watt TGP, 16 GB di VRAM) sono in grado di funzionare costantemente a velocità di clock elevate. Il portatile genera un discreto calore e rumore, tipico di questa classe di hardware. Le due porte Thunderbolt 4 offrono opzioni di espansione (ad esempio, GPU esterne, soluzioni docking). Inoltre, il portatile è dotato di una tastiera meccanica ben progettata e di una durata della batteria molto decente. Questi sono tutti elementi che questa variante attuale condivide con il suo modello fratello che abbiamo recensito in precedenza.
Il display è la principale differenza tra i due modelli Titan: il pannello 4K (120 Hz) dell'attuale unità recensita è superiore al pannello FHD (360 Hz) dell'altro modello in termini di risoluzione, luminosità di picco e copertura del colore (quasi il 100% DCI-P3). È quindi l'opzione migliore se la precisione del colore è importante per voi. Il display FHD, invece, offre una frequenza di aggiornamento molto elevata e dovrebbe essere in grado di rendere felici molti giocatori. Purtroppo, entrambi i display mancano di contrasto.
Alienware x17 R2 è una valida alternativa al Titan in termini di prestazioni. Tuttavia, offre meno opzioni di espansione e una durata della batteria inferiore
Prezzo e disponibilità
MSI Titan GT77 12UHS è disponibile presso rivenditori come Amazon.com. La configurazione che abbiamo recensito ha un prezzo di circa 5.600 euro (5.980 dollari).
MSI Titan GT77 12UHS
- 08/28/2022 v7 (old)
Sascha Mölck
Price comparison

