Recensione del portatile MSI Pulse GL76: grafica GeForce RTX 3070 105 W TGP
Il Pulse GL76 è un portatile da gioco MSI di fascia media che si colloca tra le serie Katana o Sword, più economiche, e le serie GE Raider o GT Titan, più costose. Si tratta essenzialmente della versione da 17,3 pollici del più piccolo Pulse GL66 da 15,6 pollici Pulse GL66. I modelli GL76 del 2021 e del 2022 hanno un design dello chassis identico.
La nostra unità in prova è una configurazione di fascia alta con CPU Core i7-12700H di 12a generazione, GPU GeForce RTX 3070 da 105 W e display IPS 1080p a 360 Hz per un prezzo al dettaglio di circa 1300 dollari. Sono disponibili altre SKU con frequenze di aggiornamento del display più basse, GPU GeForce RTX 3050/3050 Ti/3060 o CPU Core i5-12500H.
Tra i concorrenti del Pulse GL76 ci sono altri portatili da gioco da 17,3 pollici di fascia media come l' Acer Nitro 5, Asus TUF, HP Victuso la Dell serie G.
Altre recensioni di MSI:
Potenziali concorrenti a confronto
Punteggio | Data | Modello | Peso | Altezza | Dimensione | Risoluzione | Prezzo |
|---|---|---|---|---|---|---|---|
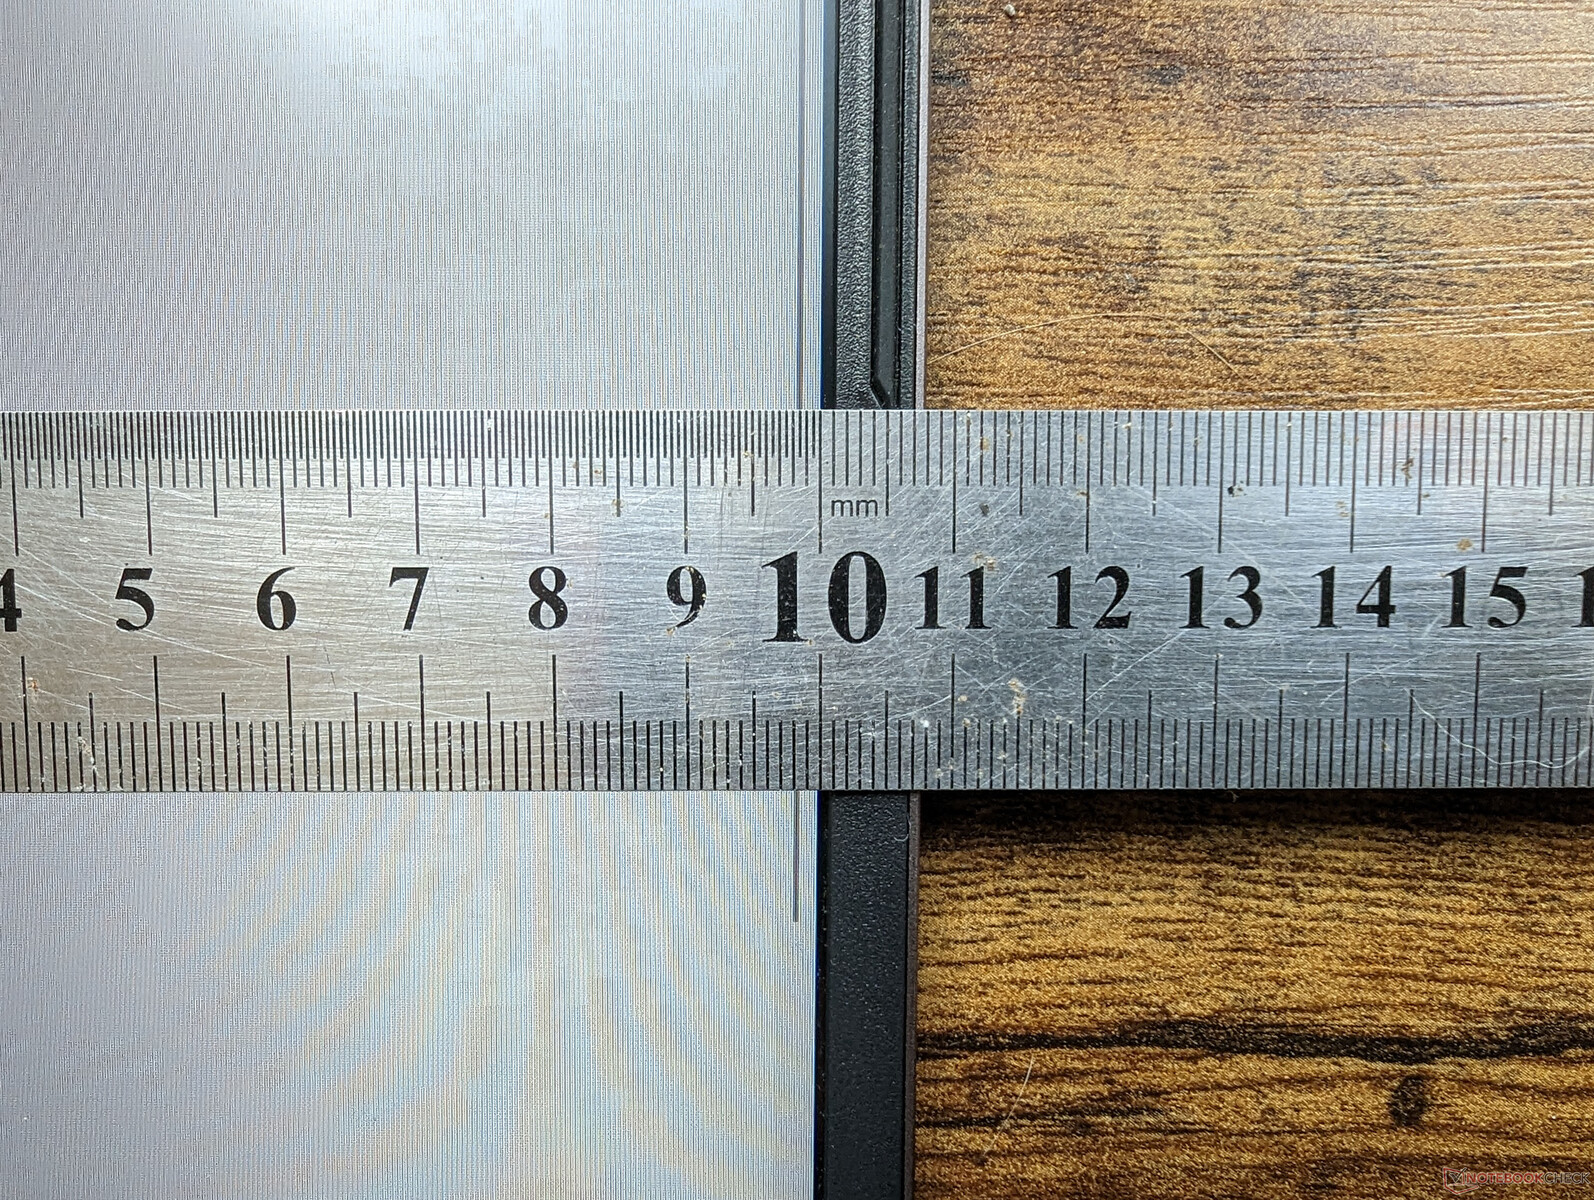
| 83.2 % v7 (old) | 01/2023 | MSI Pulse GL76 12UGK i7-12700H, GeForce RTX 3070 Laptop GPU | 2.6 kg | 24.2 mm | 17.30" | 1920x1080 | |
| 86.1 % v7 (old) | 01/2023 | Alienware m17 R5 (R9 6900HX, RX 6850M XT) R9 6900HX, Radeon RX 6850M XT | 3.4 kg | 26.7 mm | 17.00" | 3840x2160 | |
| 86.9 % v7 (old) | 11/2022 | Asus ROG Strix Scar 17 SE G733CX-LL014W i9-12950HX, GeForce RTX 3080 Ti Laptop GPU | 2.9 kg | 28.3 mm | 17.30" | 2560x1440 | |
| 86.5 % v7 (old) | 11/2022 | Acer Predator Helios 300 (i7-12700H, RTX 3070 Ti) i7-12700H, GeForce RTX 3070 Ti Laptop GPU | 3 kg | 27.65 mm | 17.30" | 2560x1440 | |
| 89.9 % v7 (old) | 07/2022 | Razer Blade 17 Early 2022 i9-12900H, GeForce RTX 3080 Ti Laptop GPU | 2.8 kg | 19.9 mm | 17.30" | 3840x2160 | |
| 86.7 % v7 (old) | 05/2022 | MSI Vector GP76 12UGS-434 i7-12700H, GeForce RTX 3070 Ti Laptop GPU | 2.9 kg | 25.9 mm | 17.30" | 1920x1080 |
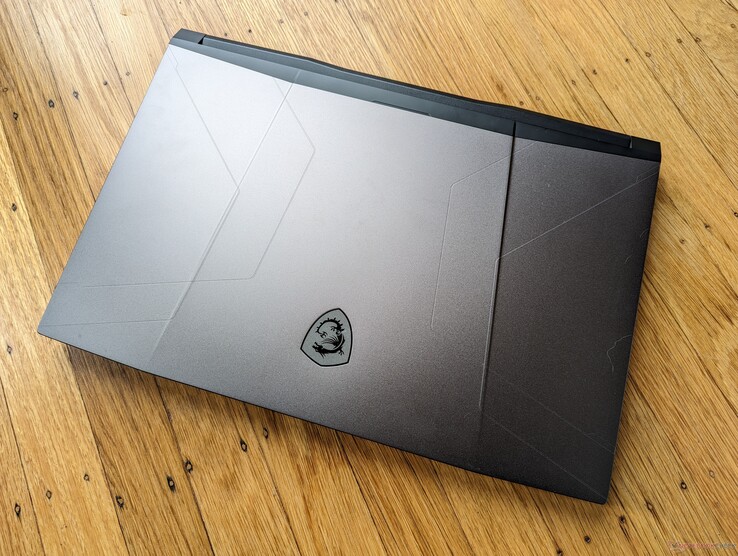
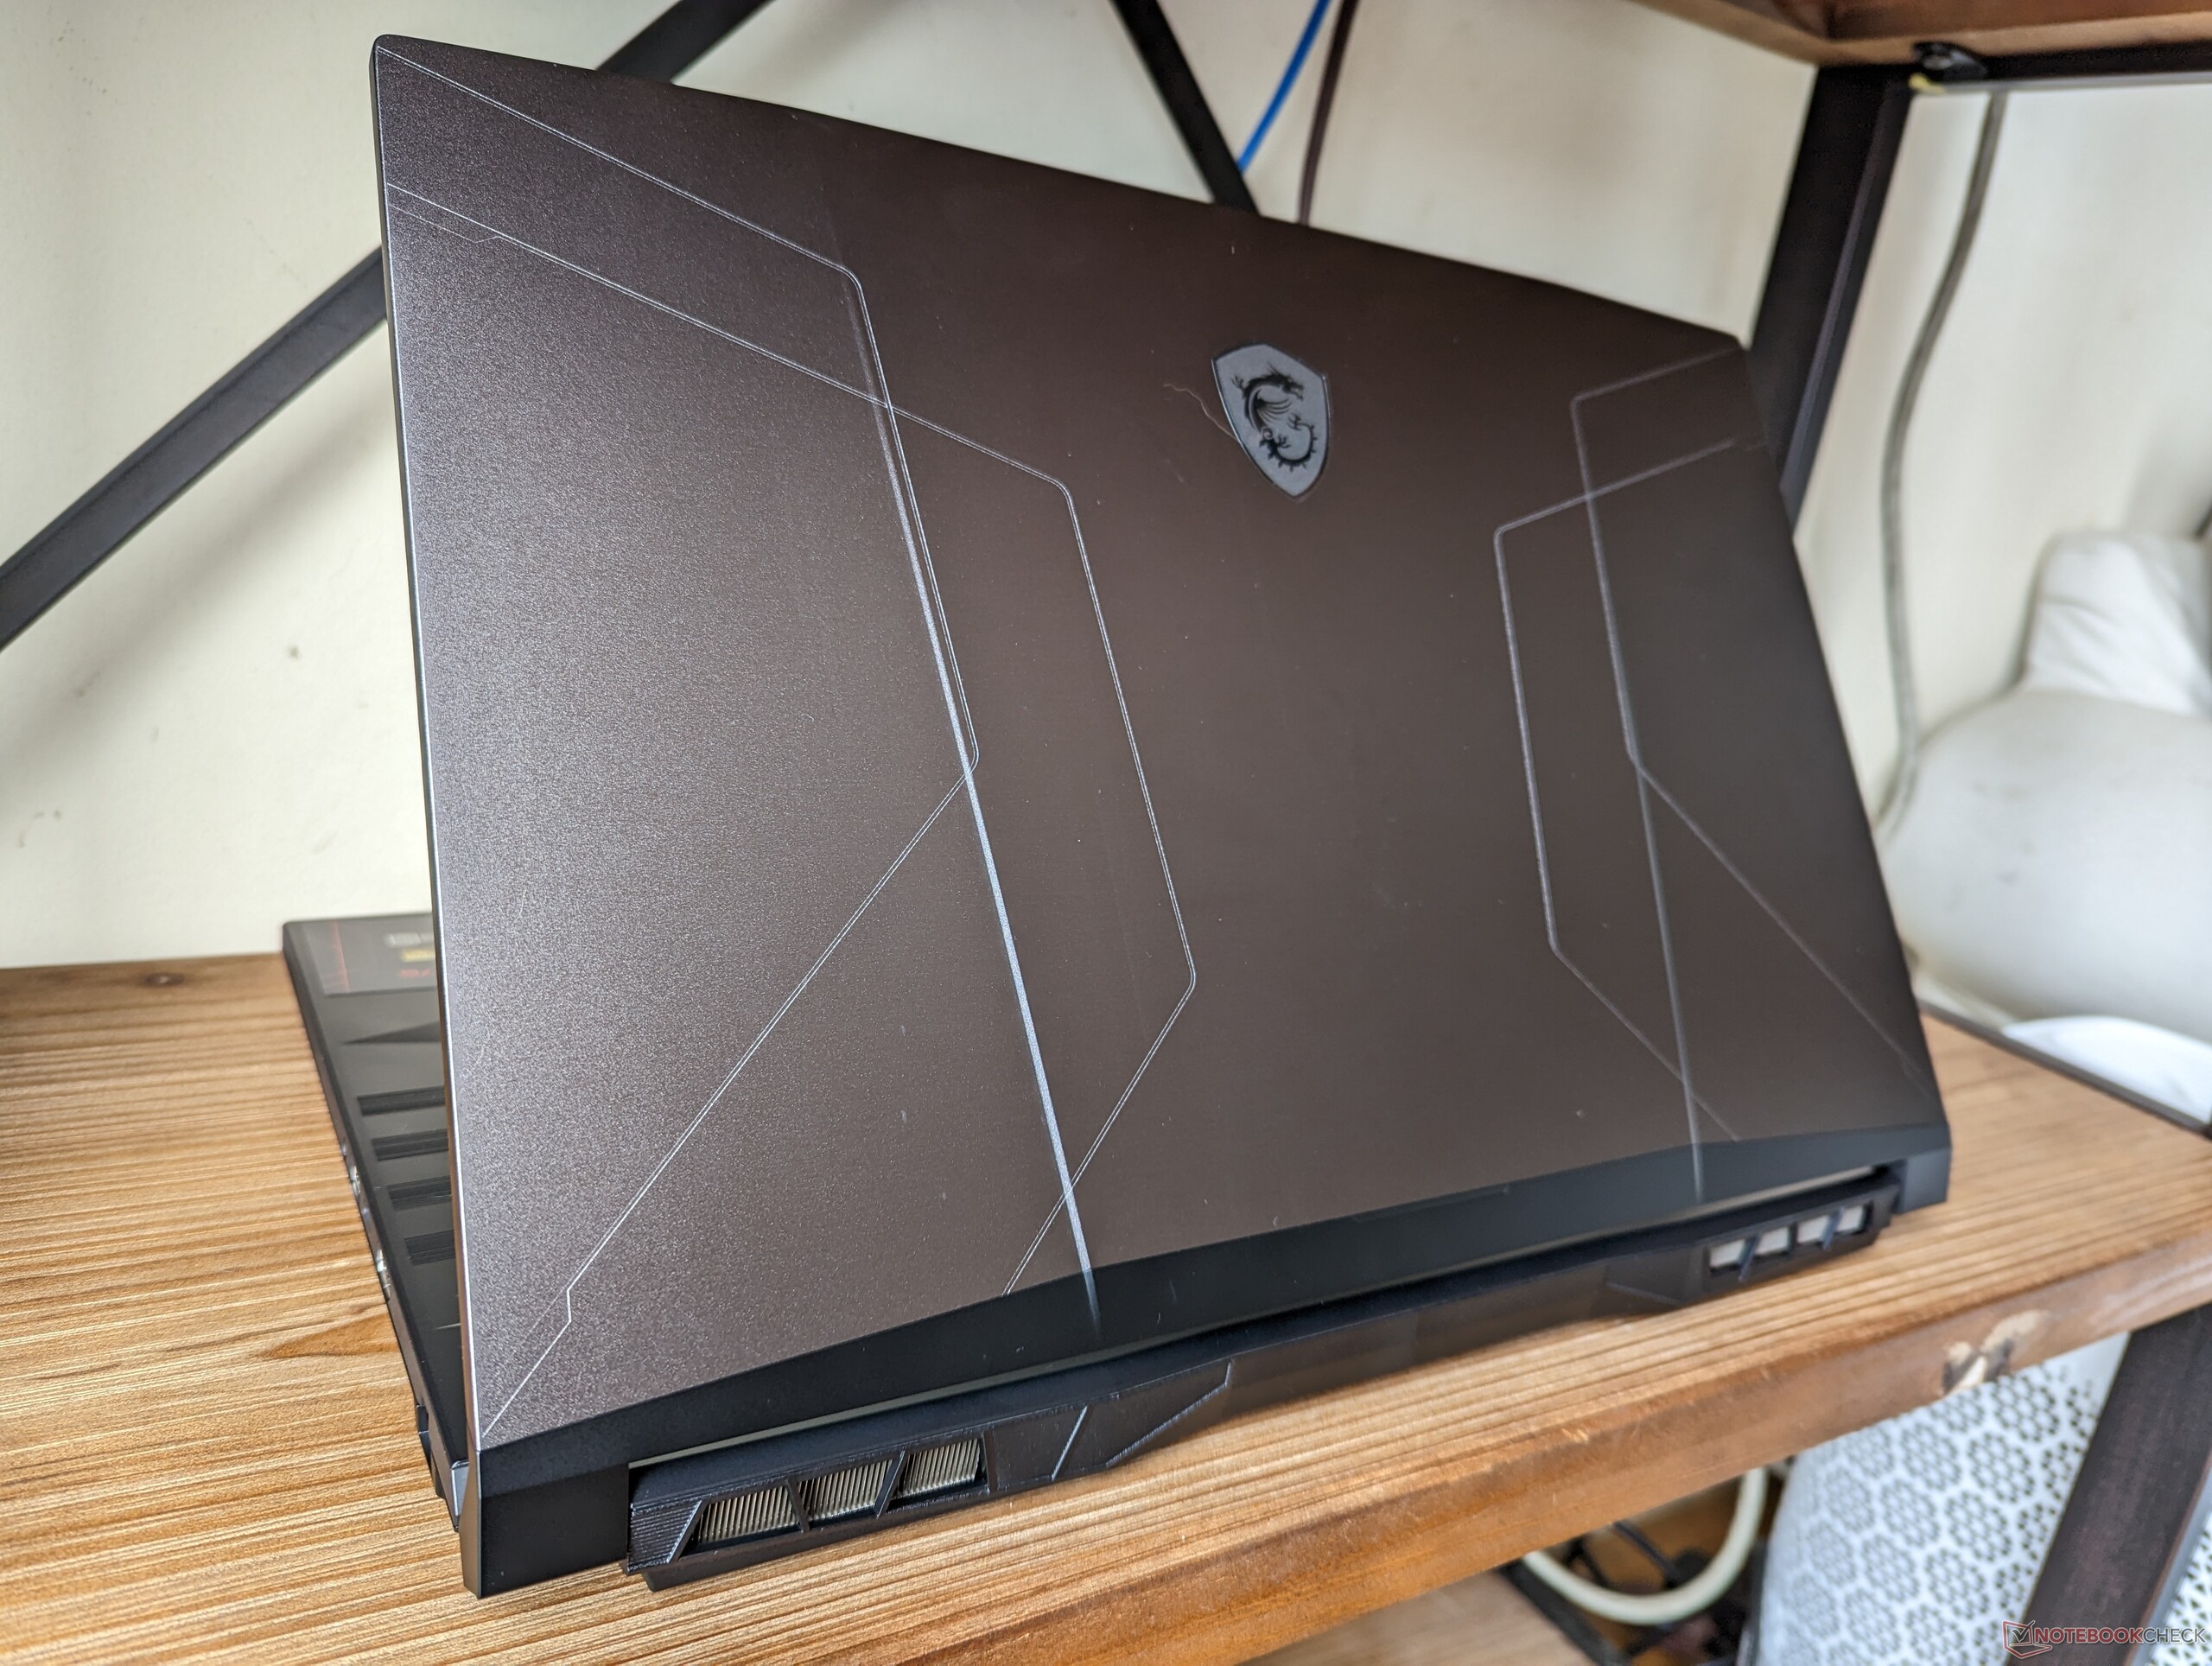
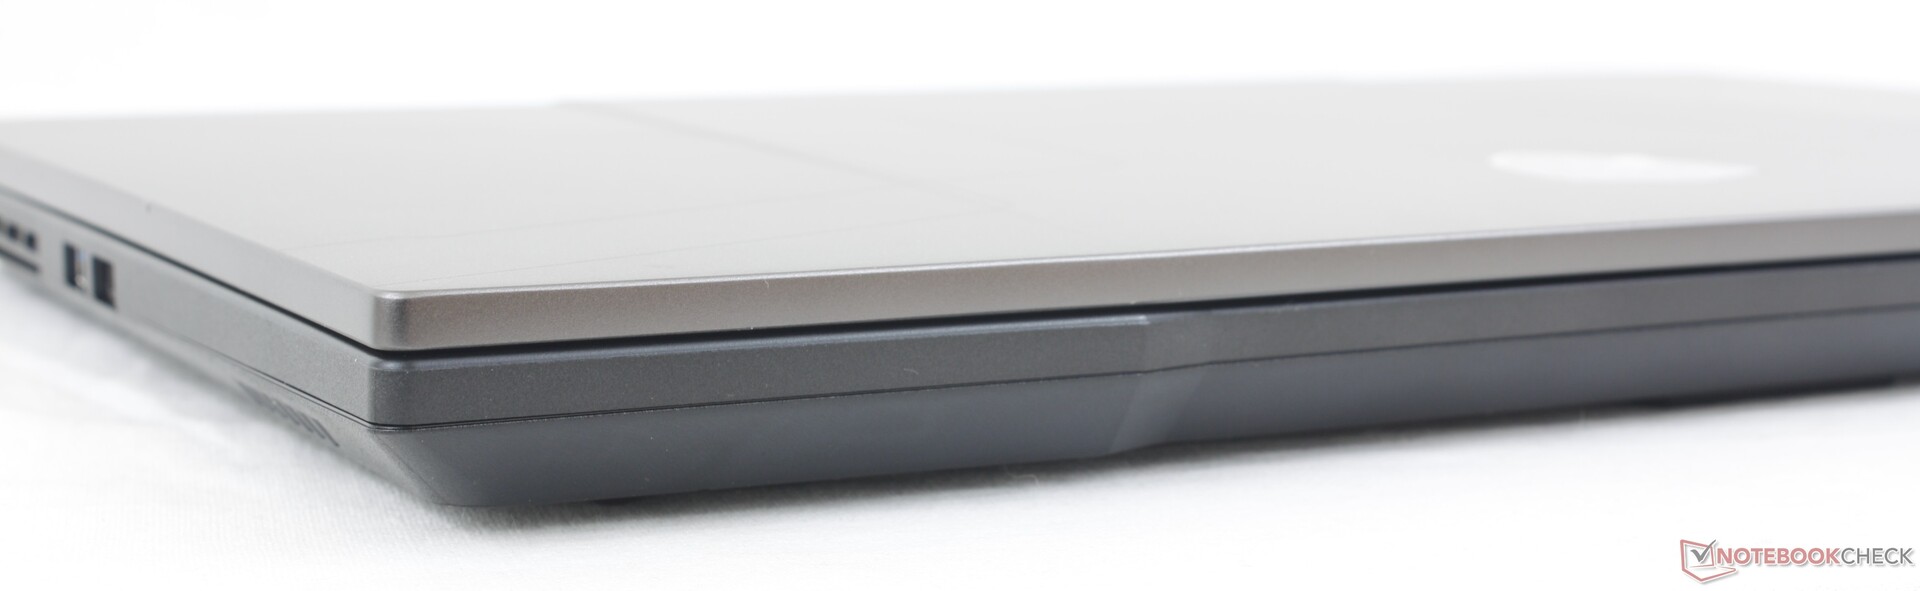
Custodia - Nessun colore o LED di fantasia
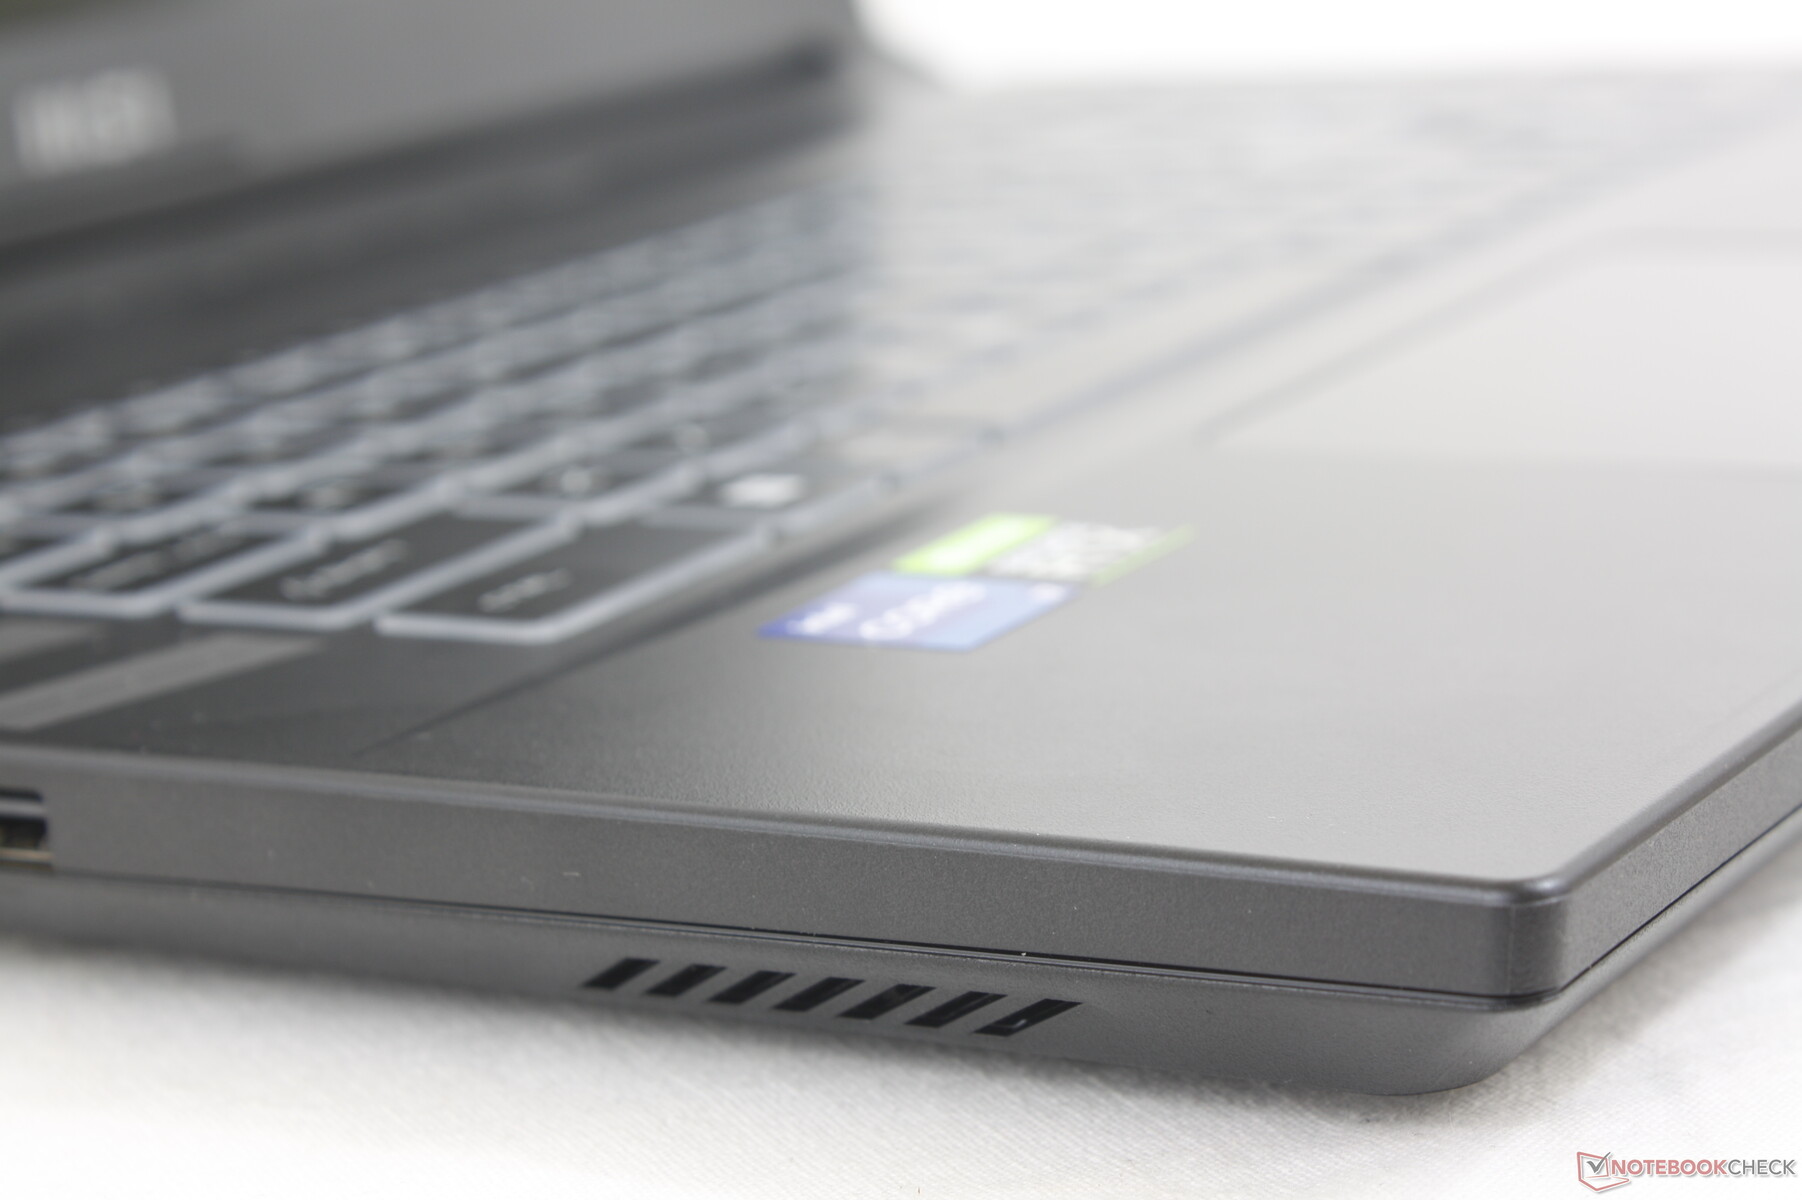
Lo chassis è per lo più in plastica, come in tutti i portatili da gioco economici e di fascia media di MSI. Mancano i tocchi lussuosi, i LED appariscenti e la sensazione di morbidezza dei modelli di fascia più alta, come l'MSI GE77 MSI GE77 o Razer Blade 17 per un'impressione più blanda. Questo non dovrebbe sorprendere, dato che l'aspetto è uno dei primi elementi che vengono eliminati quando si tagliano i costi dei modelli da gioco economici e di fascia media.
La rigidità del telaio non è fortunatamente compromessa. Sebbene le superfici in plastica risultino più economiche al tatto rispetto a quelle di un modello GE, GS o GT, sono comunque abbastanza robuste e resistenti alle torsioni o agli avvallamenti anche al centro della tastiera o al coperchio esterno. Non ci sono nemmeno grossi scricchiolii. Tuttavia, le cerniere avrebbero potuto essere più rigide ad angoli più ampi per una maggiore longevità.
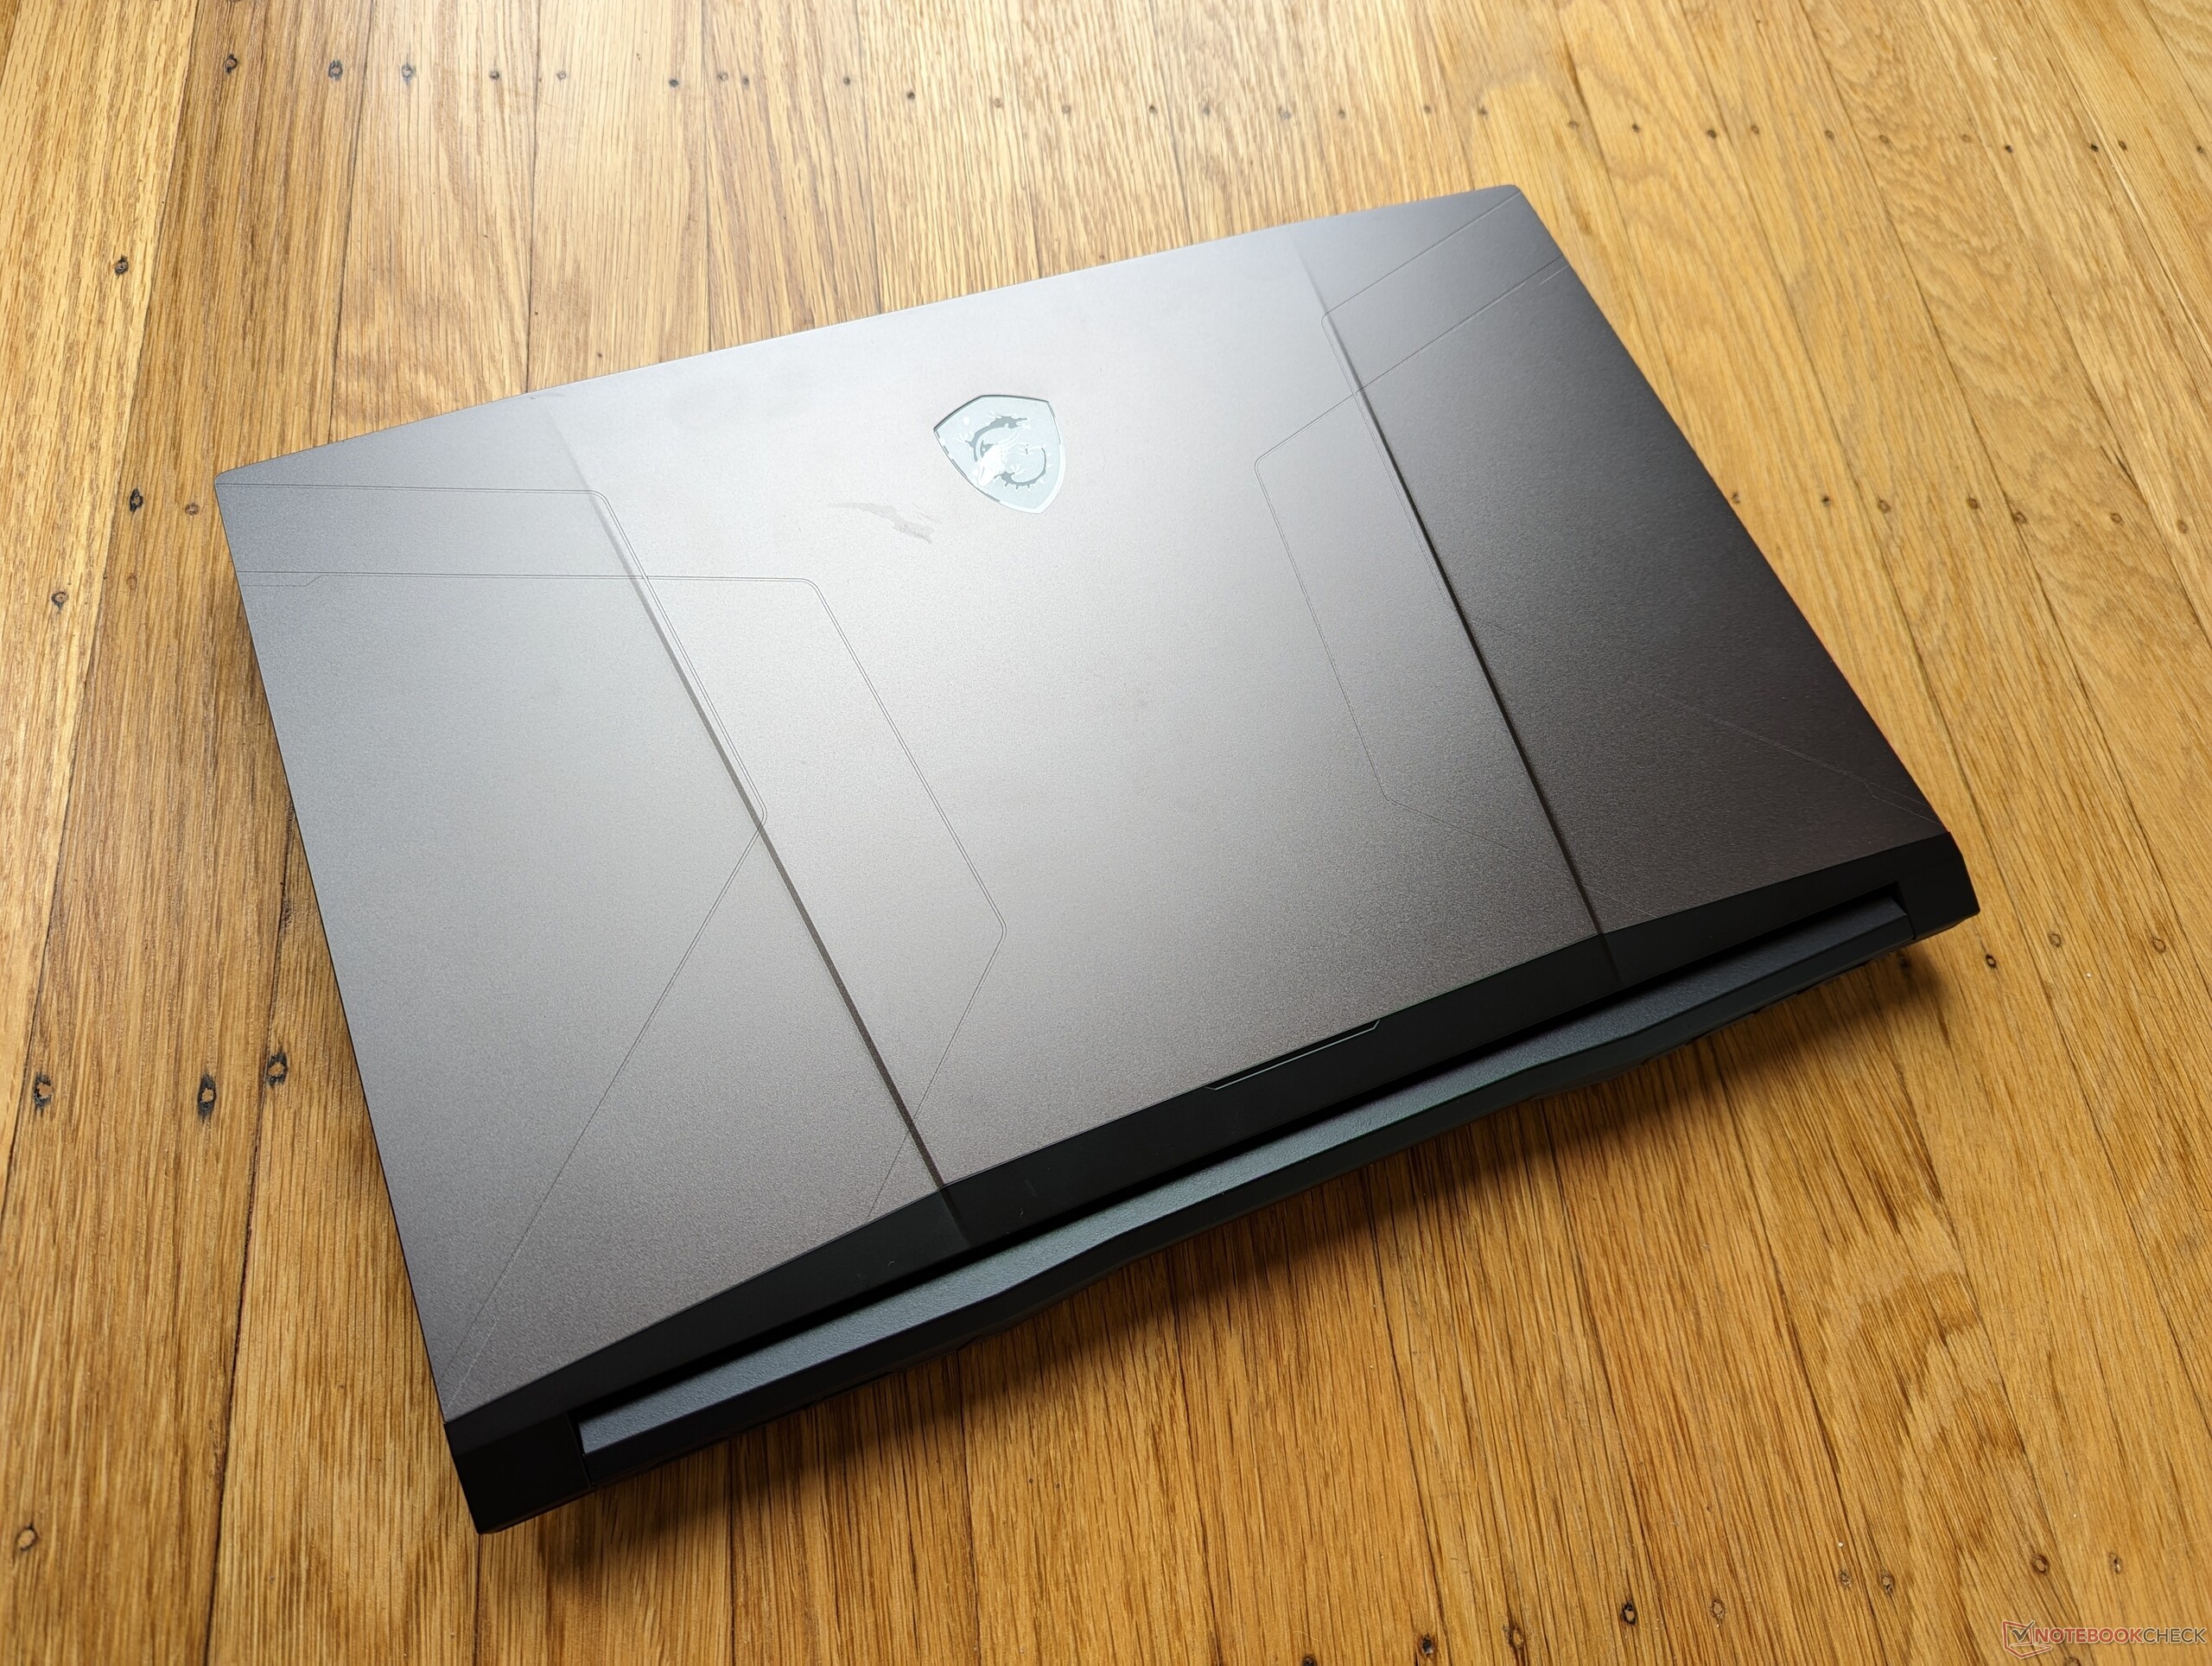
Il sistema è più leggero del previsto, soprattutto per un portatile da gioco da 17,3 pollici. Con un peso di 2,6 kg, è più leggero del Razer Blade 17, dell'Asus ROG Strix Scar 17 e dell'Acer Predator Helios 300 di qualche centinaio di grammi ciascuno. Il vantaggio in termini di peso è probabilmente dovuto alla lunghezza notevolmente ridotta del design dello chassis GL76. Tuttavia, è un po' più largo, ma il risparmio di peso compensa l'ingombro leggermente maggiore.
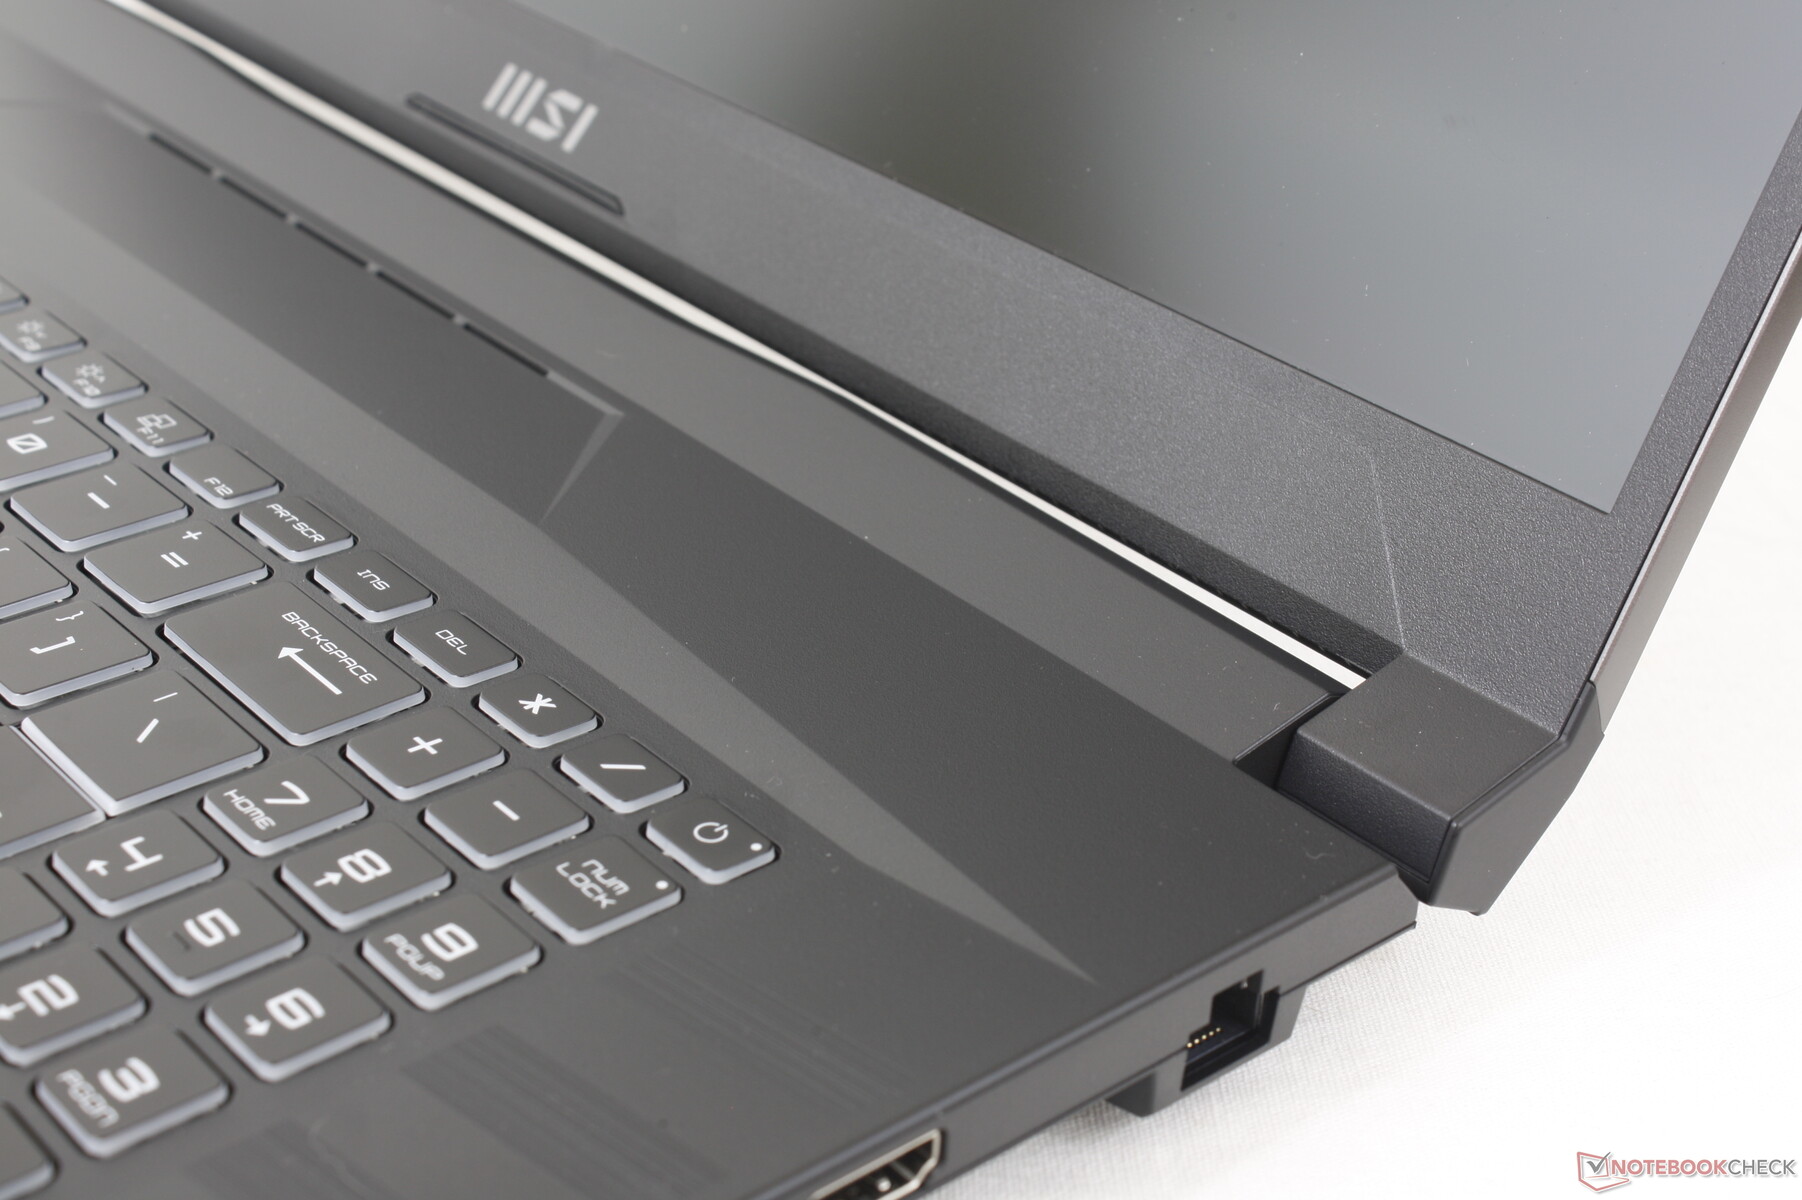
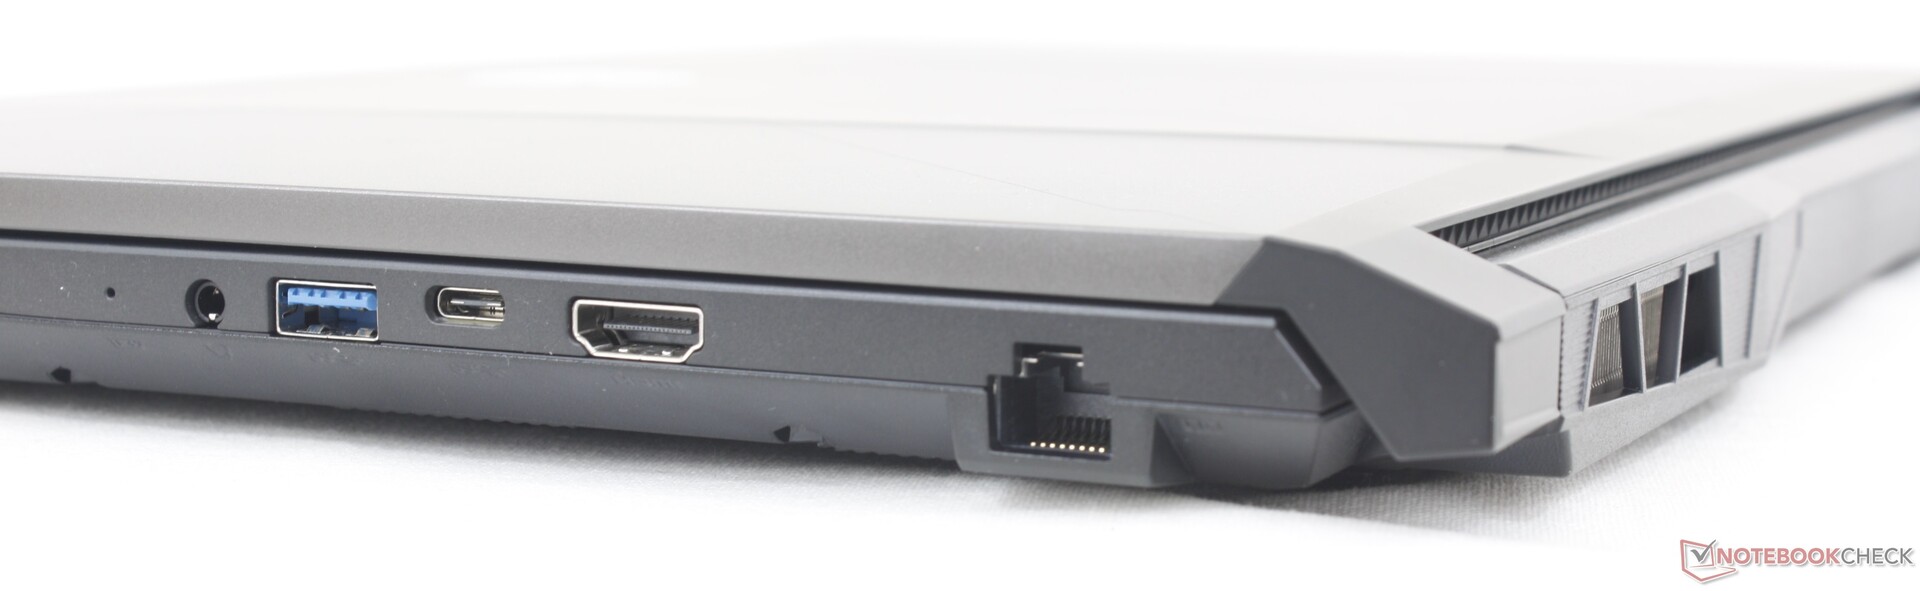
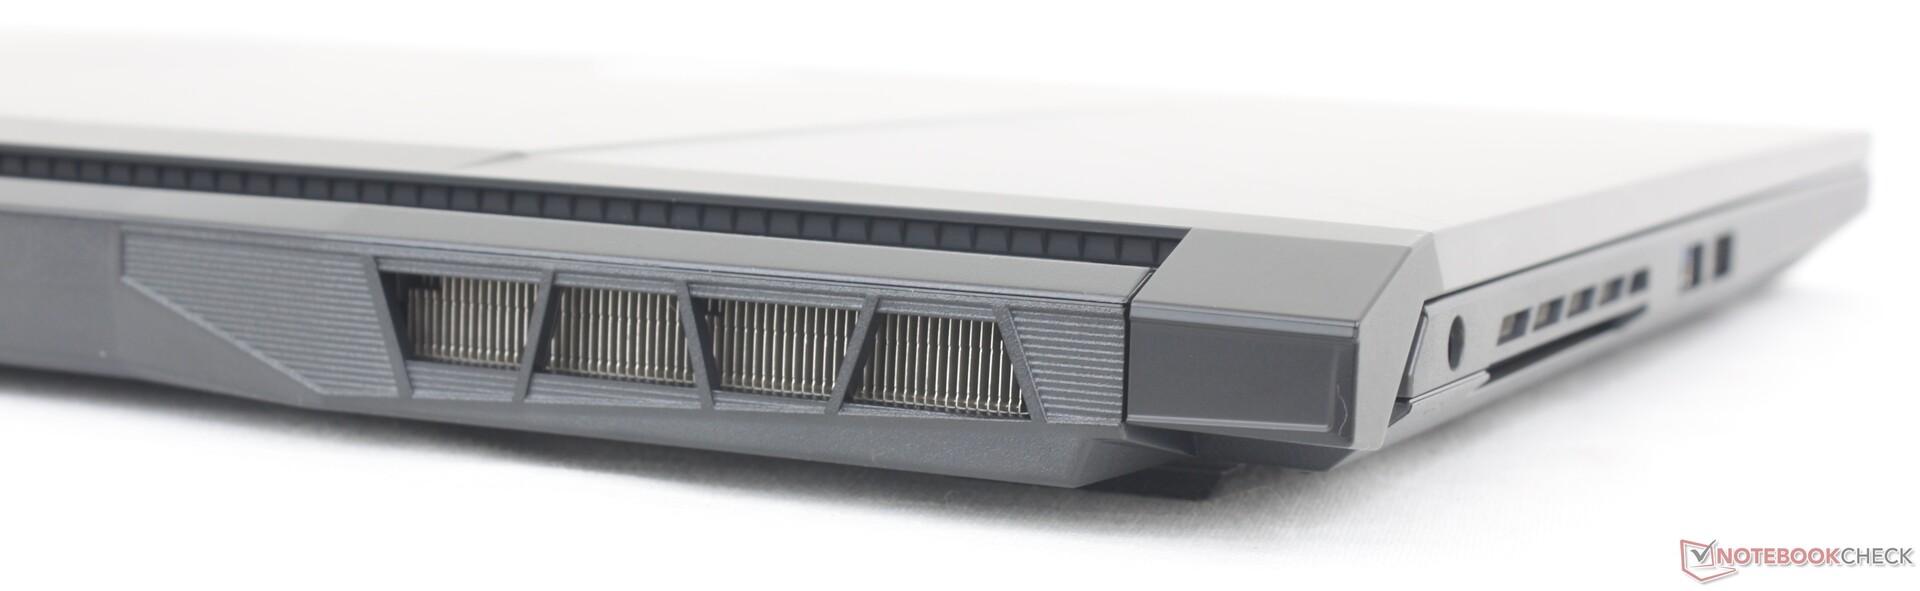
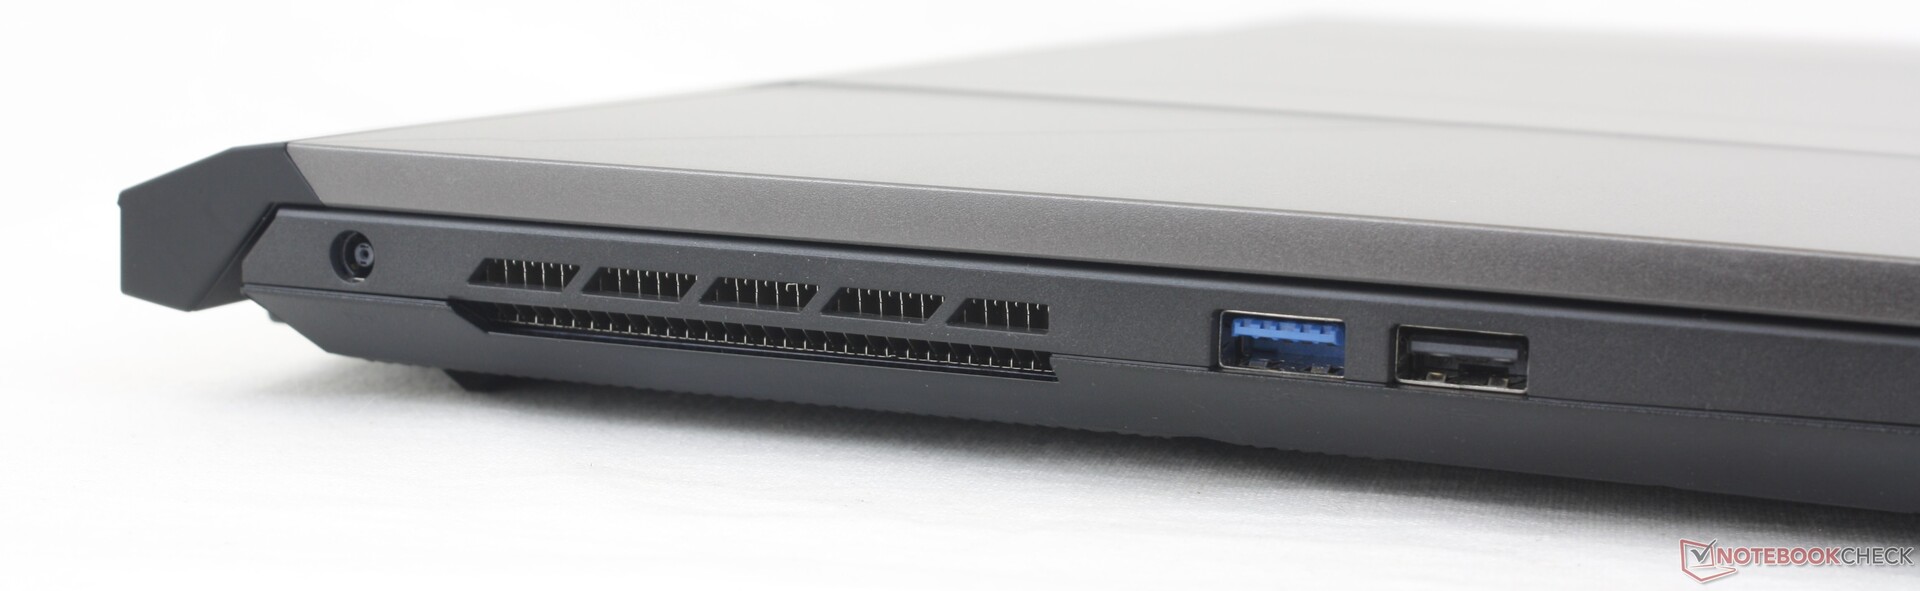
Connettività: limitata per le dimensioni
Le opzioni per le porte sono più limitate rispetto ad altri portatili da gioco di fascia media come il Dell G16, Acer Nitro 5 o Asus TUF G17. L'omissione più importante è la mancanza del supporto Thunderbolt, mentre tutte e tre le alternative citate ne sono dotate. Si tratta probabilmente di uno sforzo consapevole di MSI per incoraggiare gli utenti a prendere in considerazione le serie GE, GS o GT di fascia più alta.
DisplayPort-over-USB non è supportato. La nostra unità di test non ha riconosciuto nessuno dei nostri monitor esterni tramite USB-C.
Comunicazione
La connettività Wi-Fi 6 e Bluetooth 5.2 è garantita da un Intel AX201 di serie. Il Wi-Fi 6E non è incluso, probabilmente per risparmiare sui costi, ma l'aggiornamento per l'utente finale è comunque semplice. Le prestazioni sono comunque costanti e non presentano problemi di rilievo quando viene accoppiato al nostro router Asus AXE11000.
| Networking | |
| iperf3 transmit AX12 | |
| MSI Vector GP76 12UGS-434 | |
| iperf3 receive AX12 | |
| MSI Vector GP76 12UGS-434 | |
| iperf3 receive AXE11000 6GHz | |
| Asus ROG Strix Scar 17 SE G733CX-LL014W | |
| Acer Predator Helios 300 (i7-12700H, RTX 3070 Ti) | |
| iperf3 receive AXE11000 | |
| Razer Blade 17 Early 2022 | |
| MSI Pulse GL76 12UGK | |
| Alienware m17 R5 (R9 6900HX, RX 6850M XT) | |
| iperf3 transmit AXE11000 | |
| MSI Pulse GL76 12UGK | |
| Alienware m17 R5 (R9 6900HX, RX 6850M XT) | |
| iperf3 transmit AXE11000 6GHz | |
| Asus ROG Strix Scar 17 SE G733CX-LL014W | |
| Acer Predator Helios 300 (i7-12700H, RTX 3070 Ti) | |
Webcam
La webcam integrata da 720p produce immagini confuse con colori scadenti. Un'alternativa non di gioco come lo HP Spectre se la qualità della fotocamera è importante.
L'interruttore di spegnimento della fotocamera digitale è legato al tasto F7, mentre Windows Hello non è supportato.


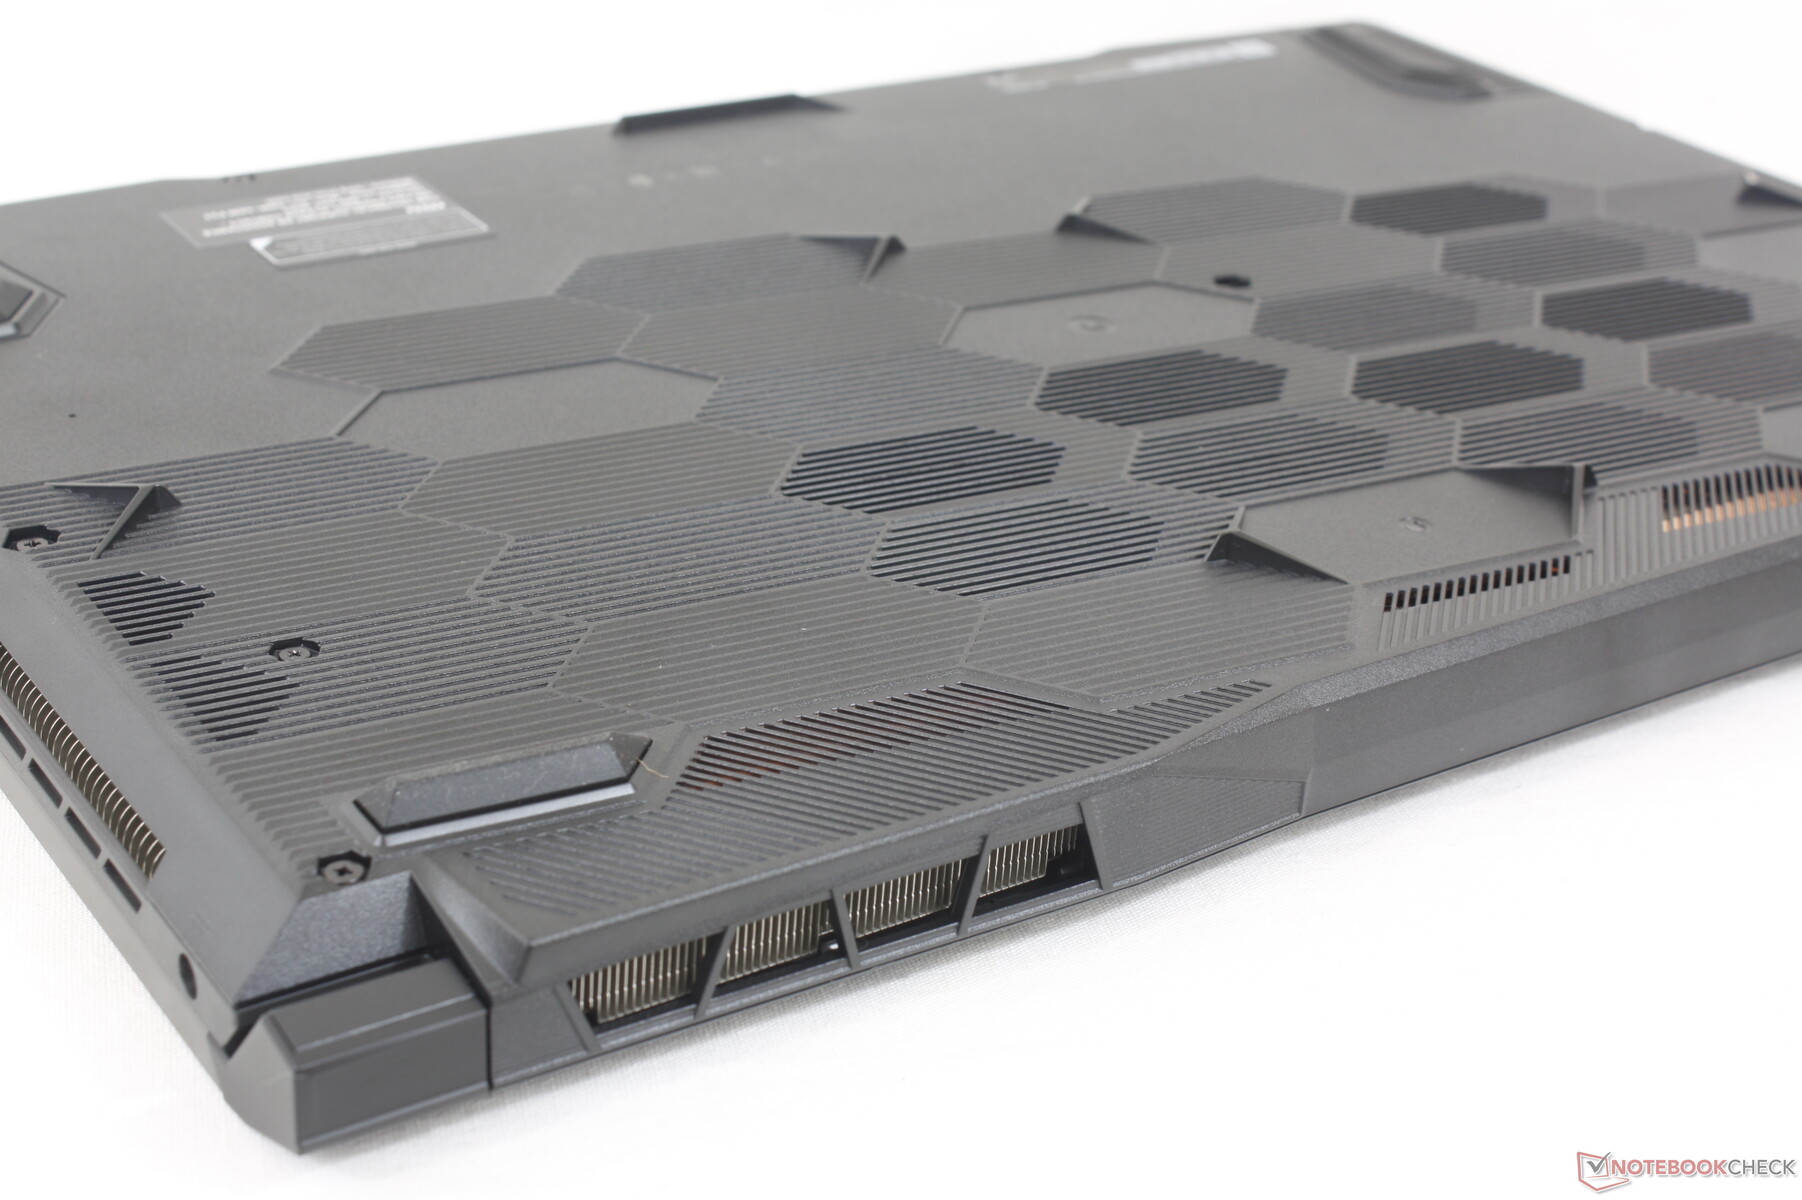
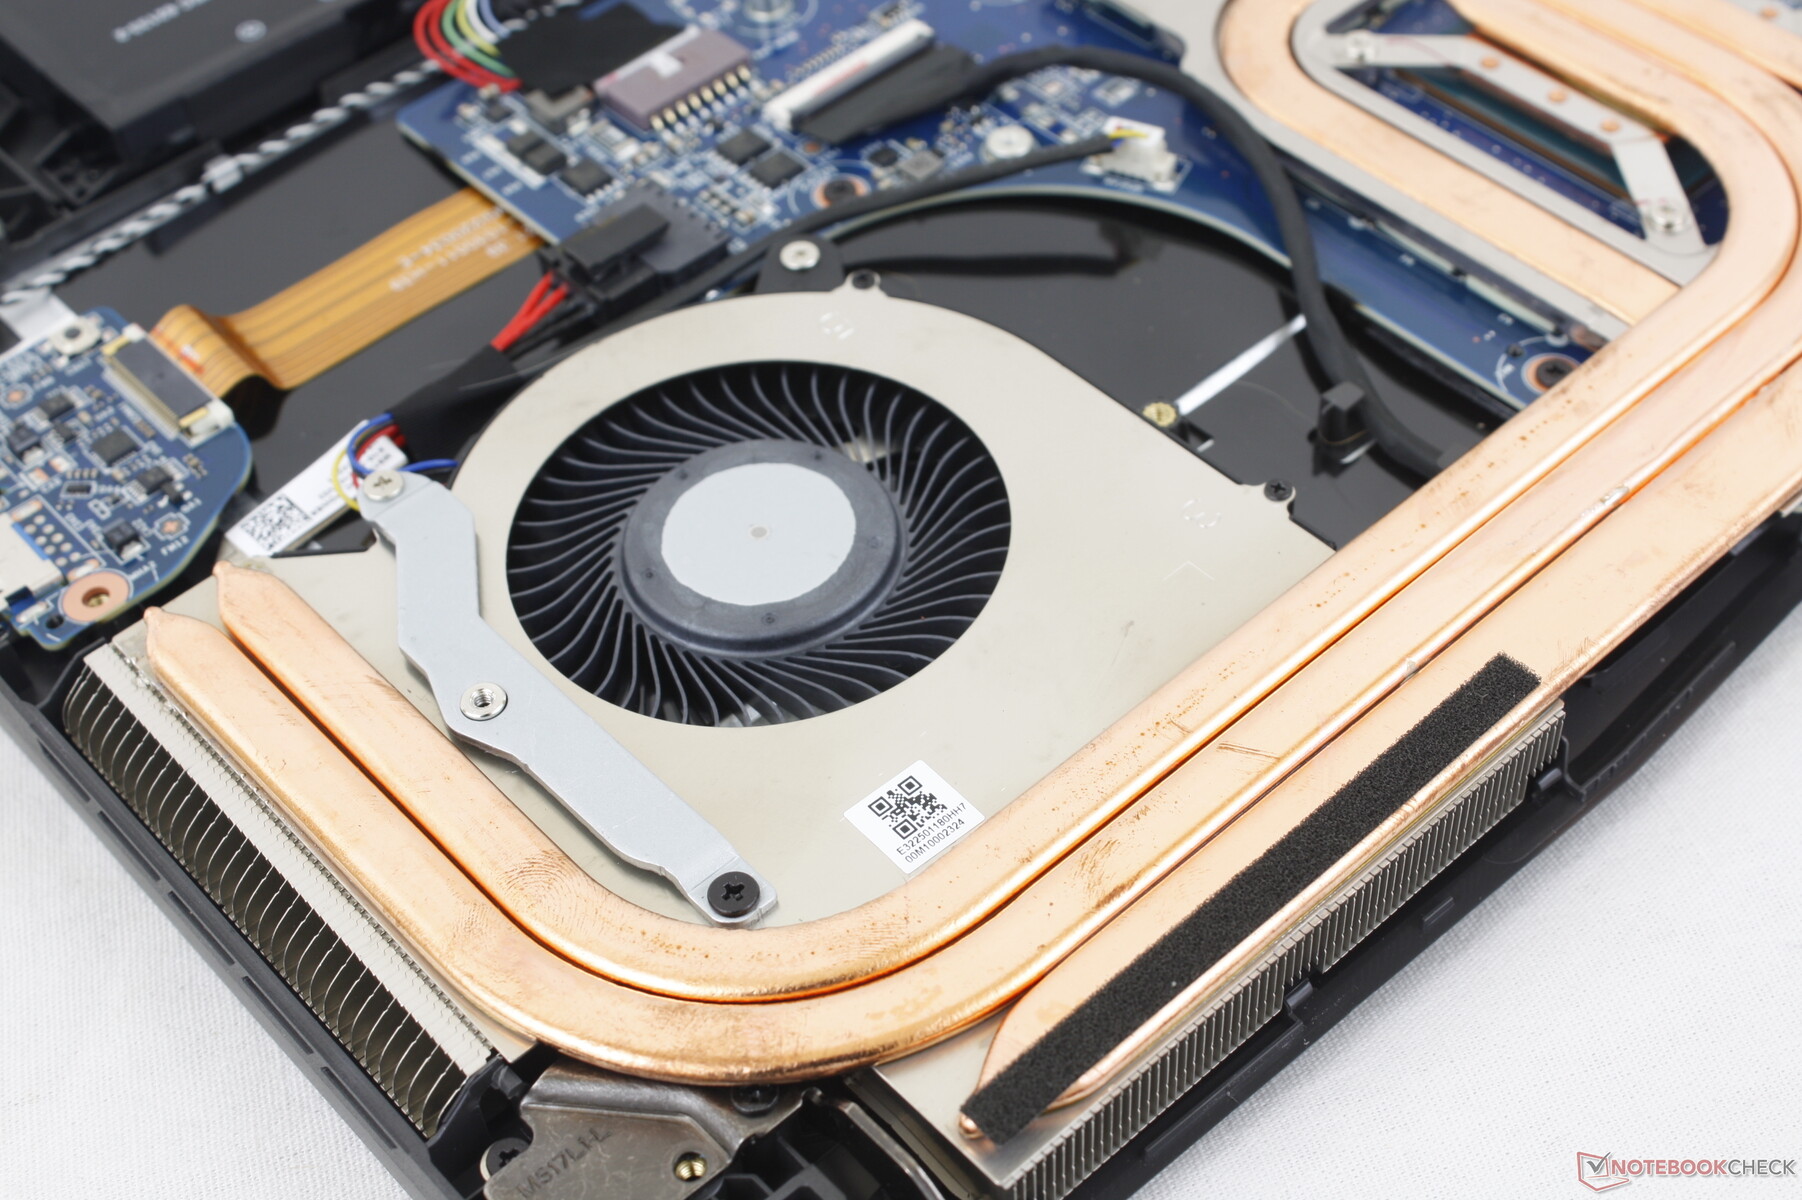
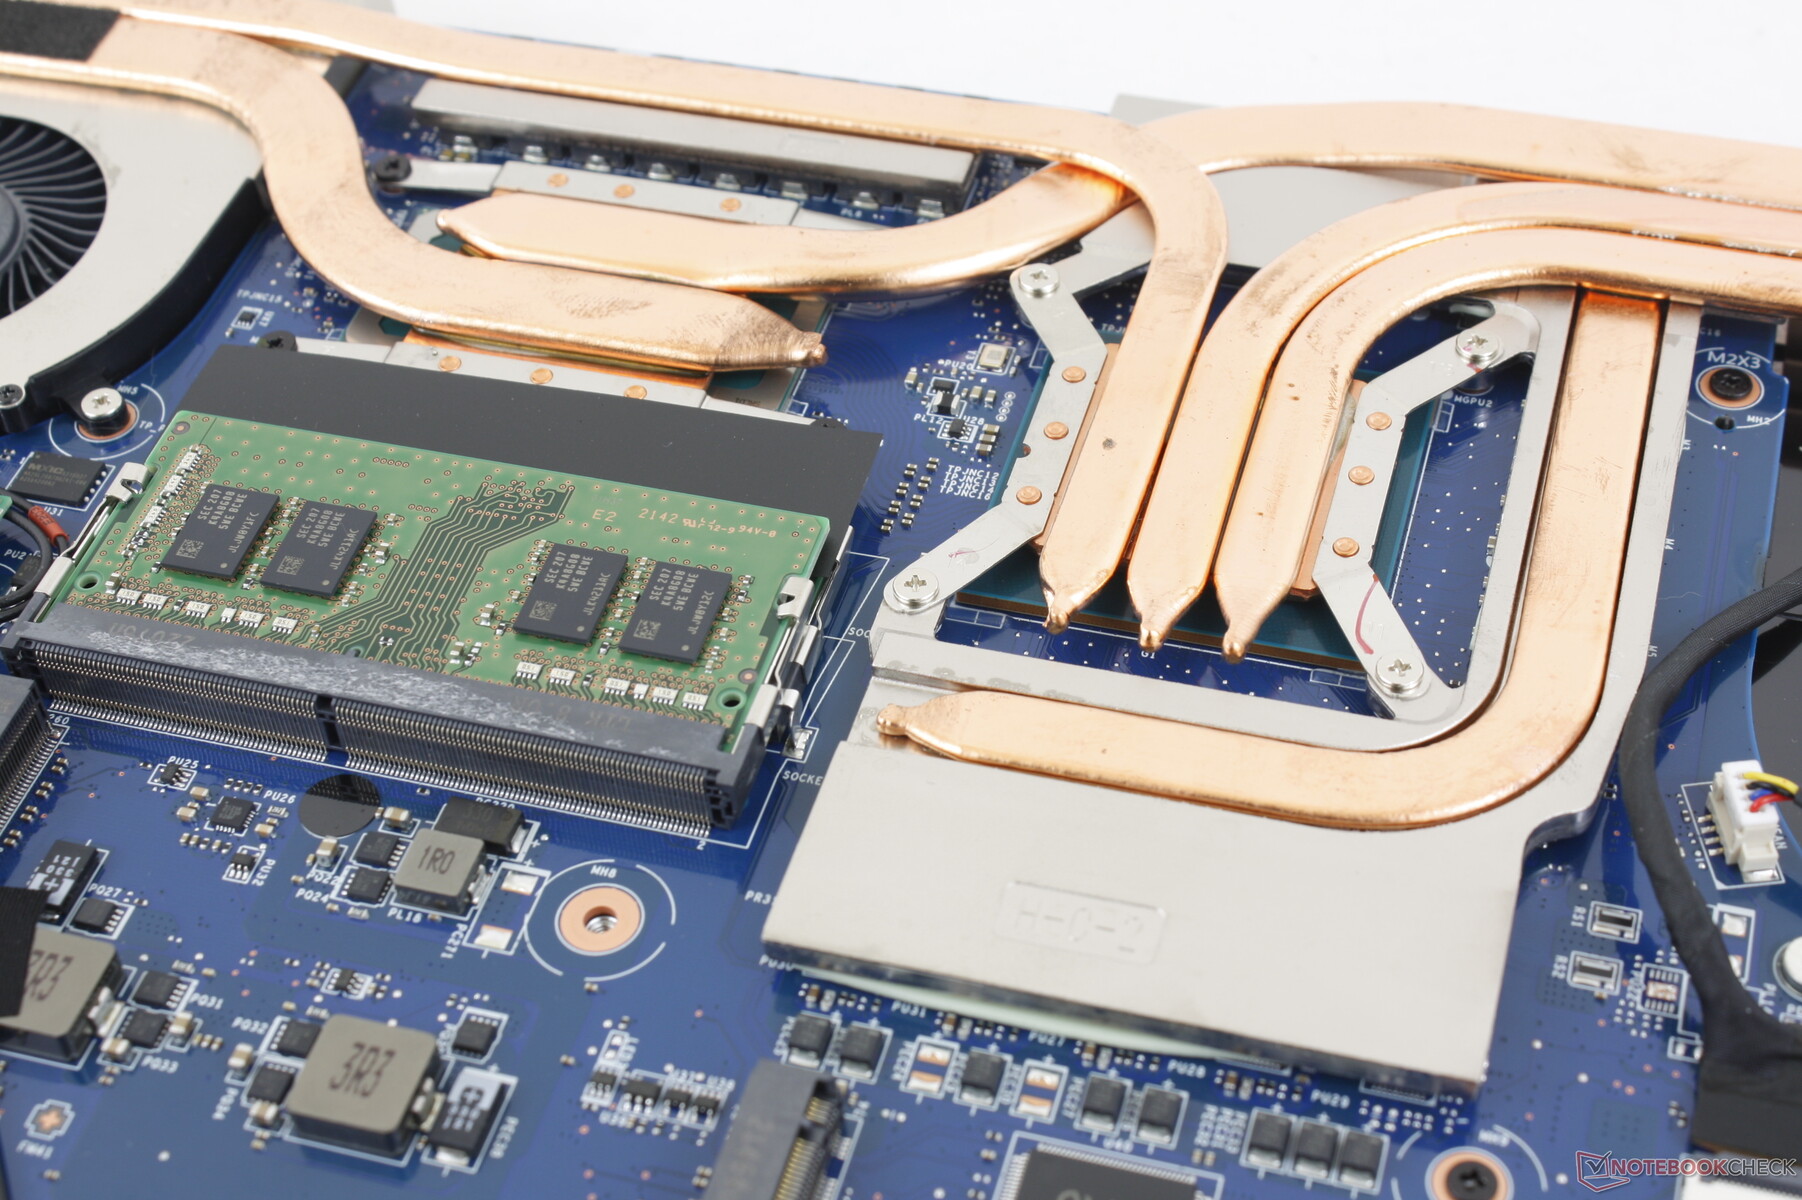
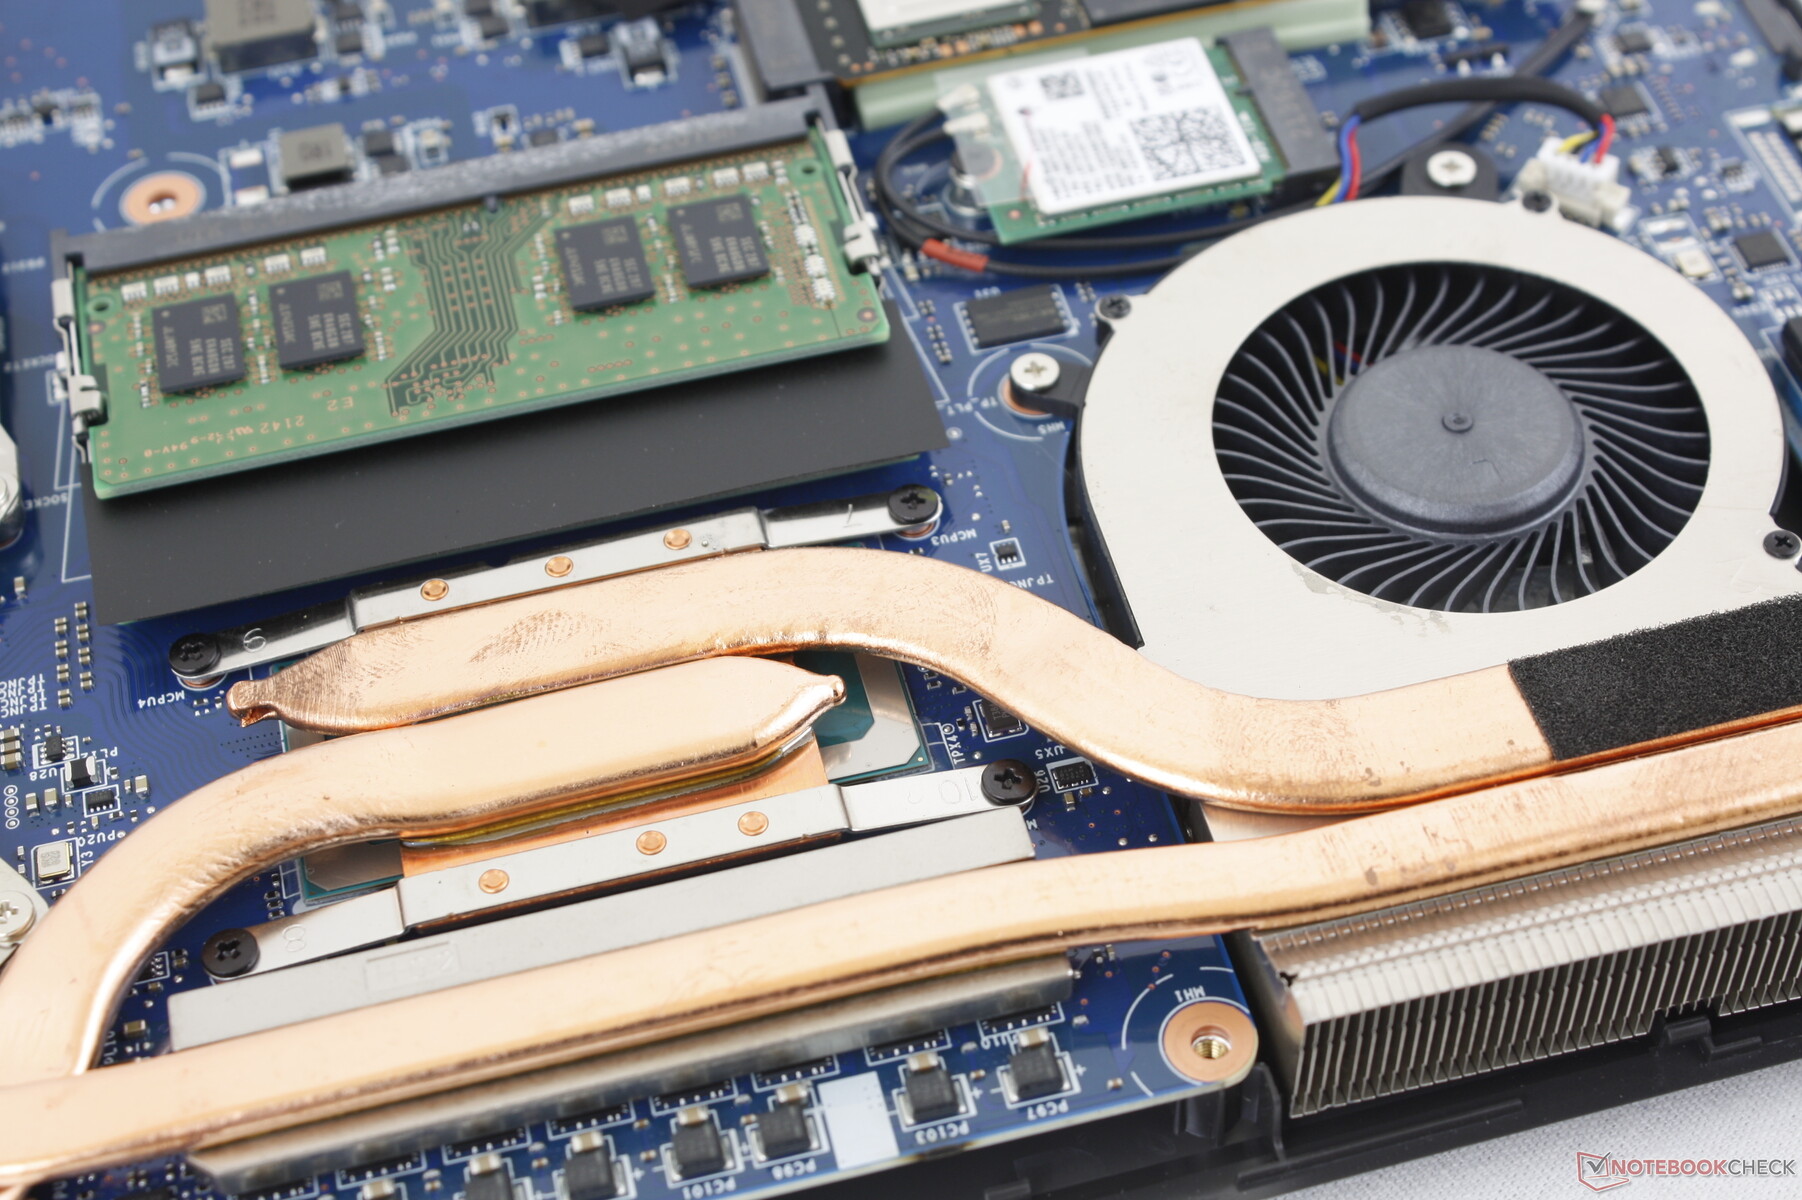
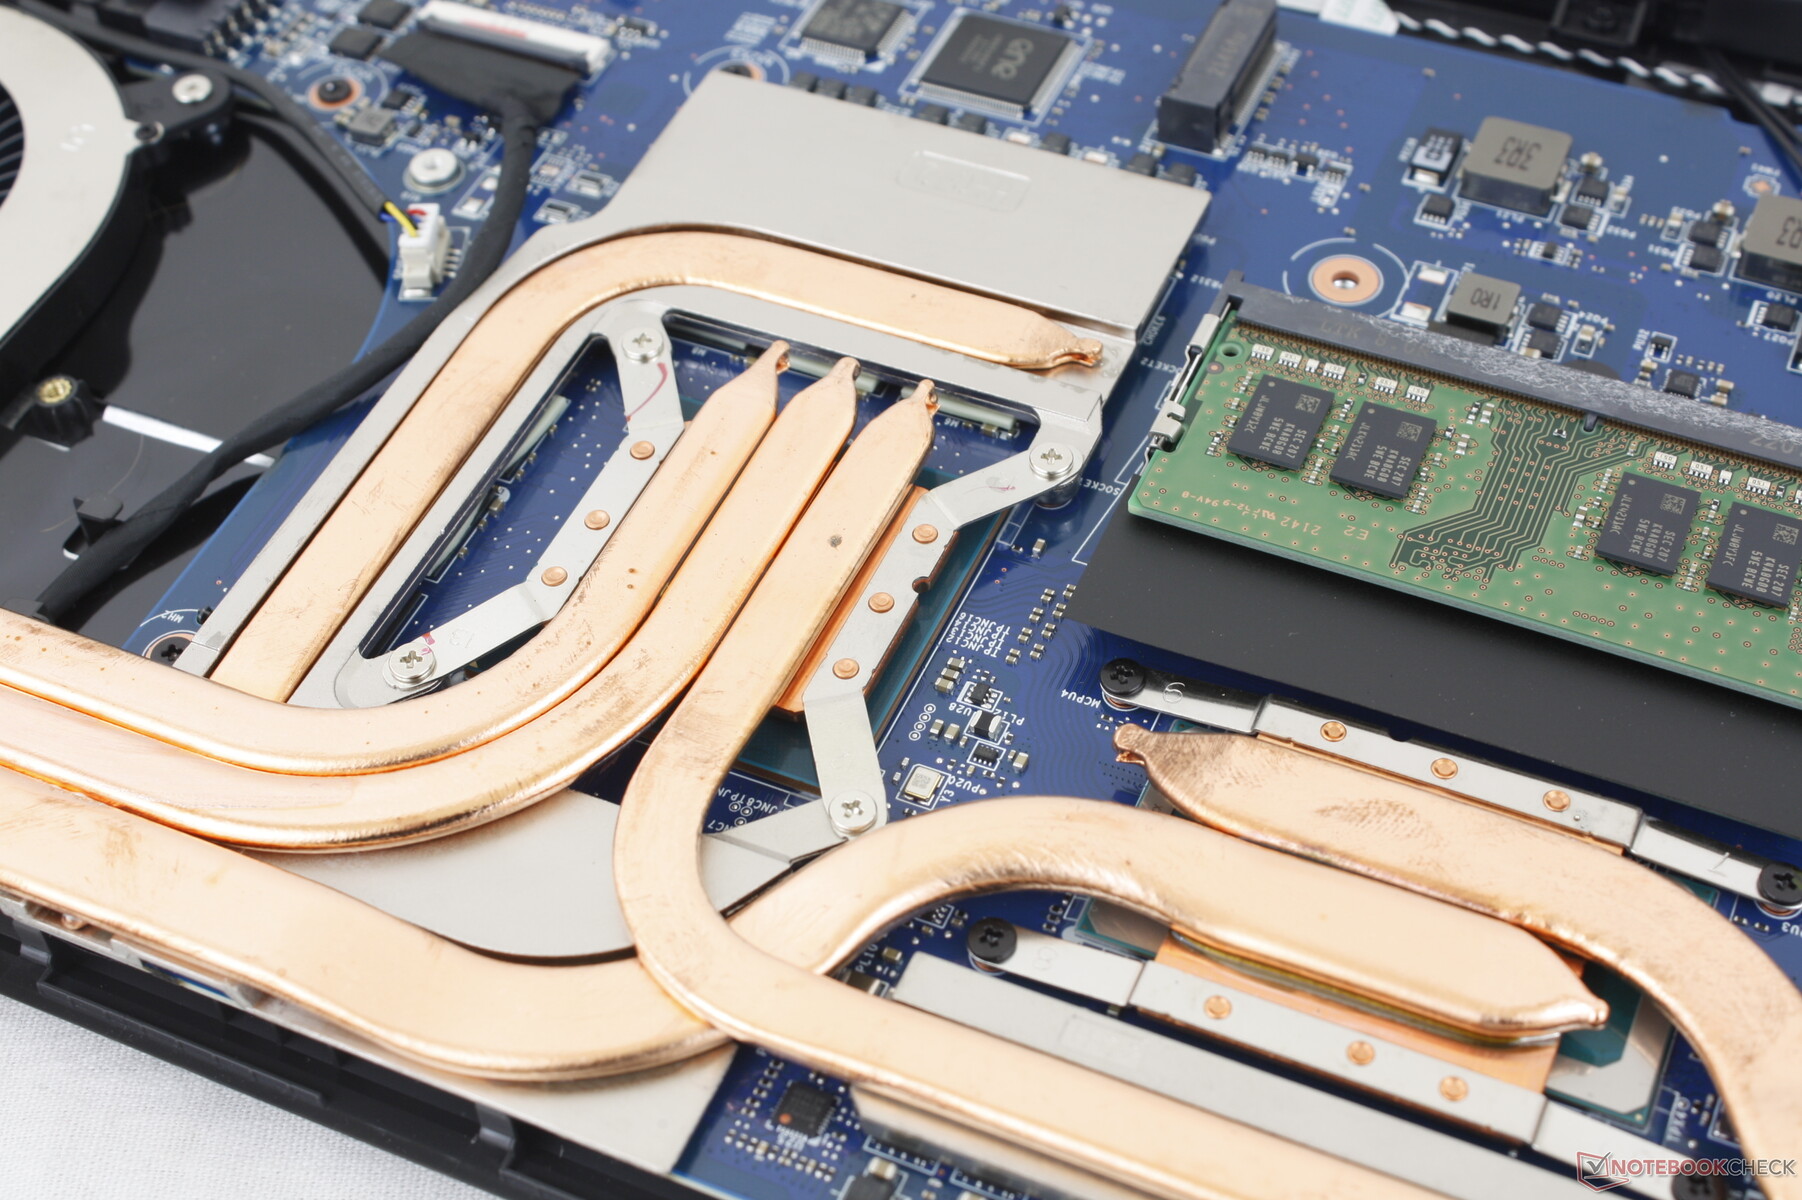
Manutenzione
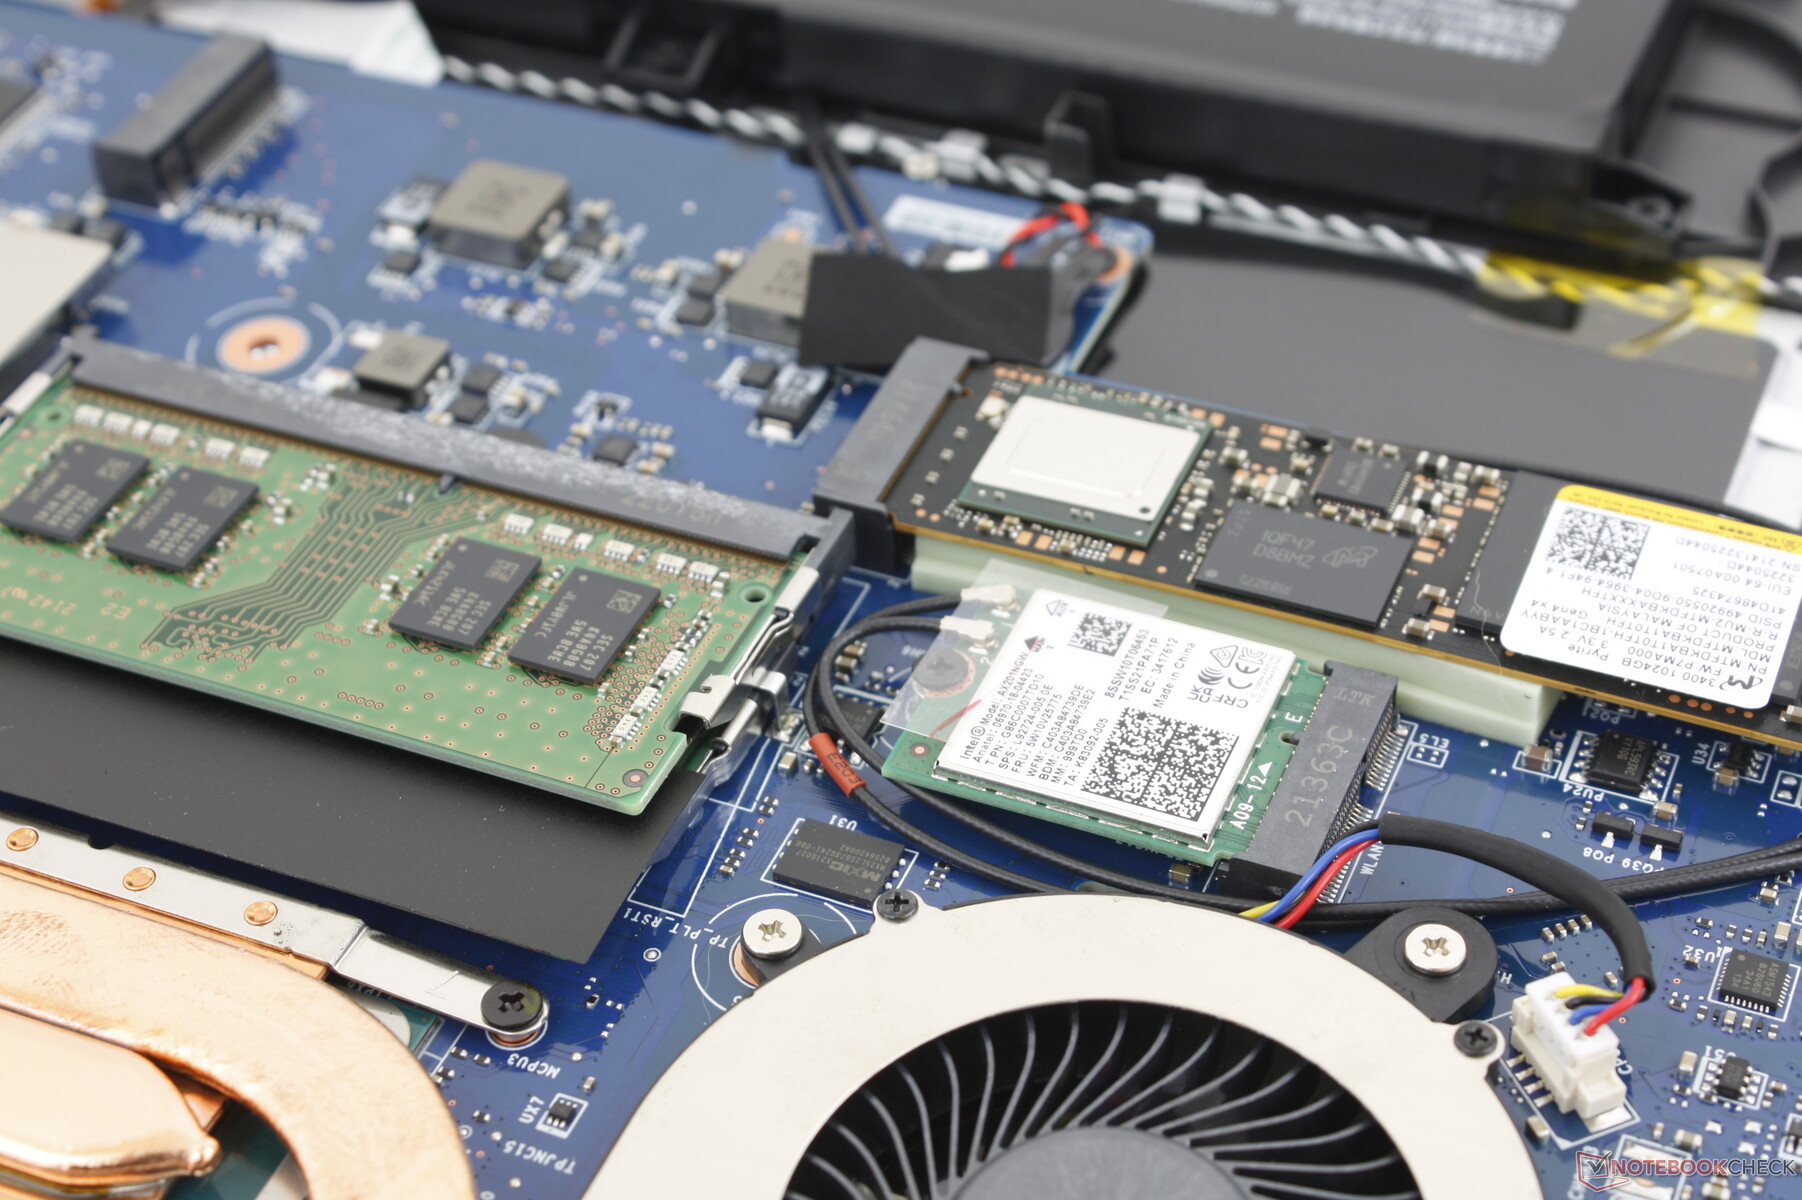
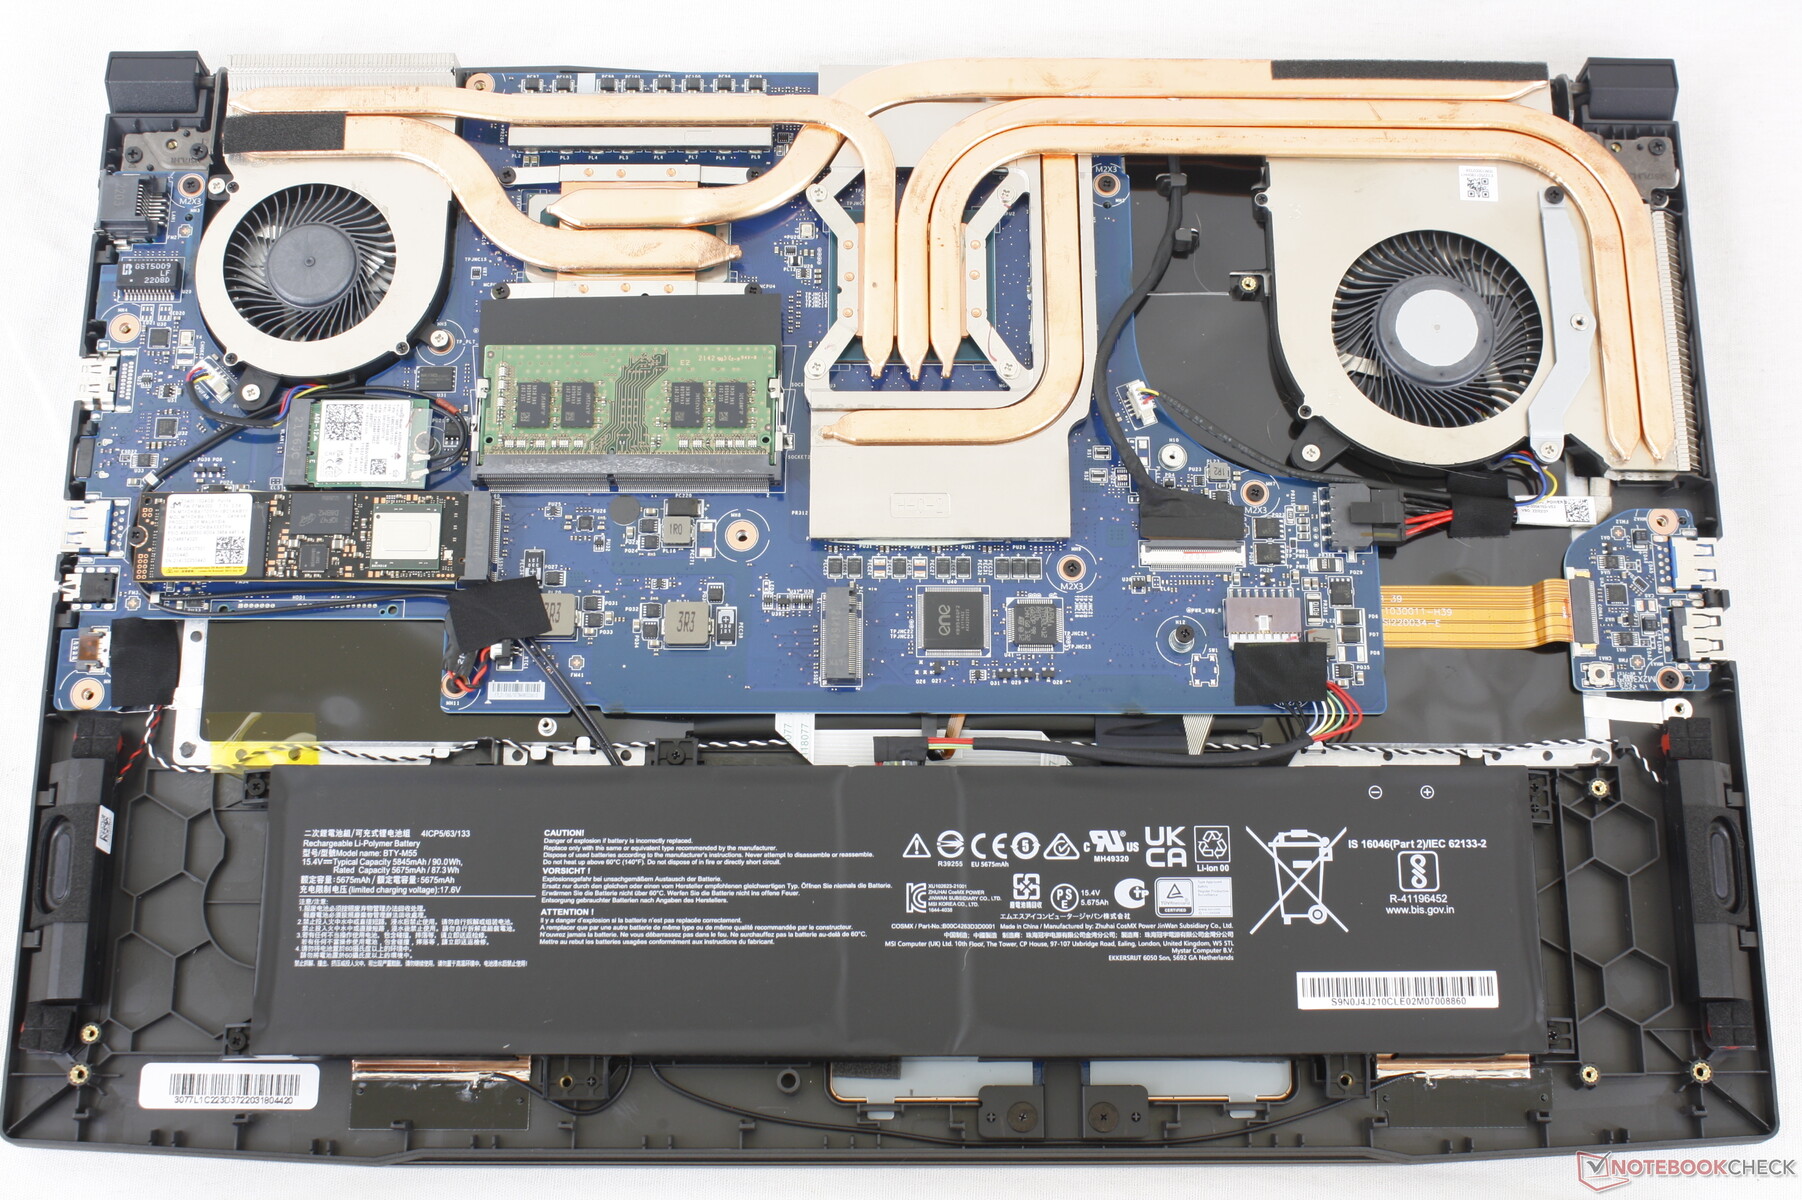
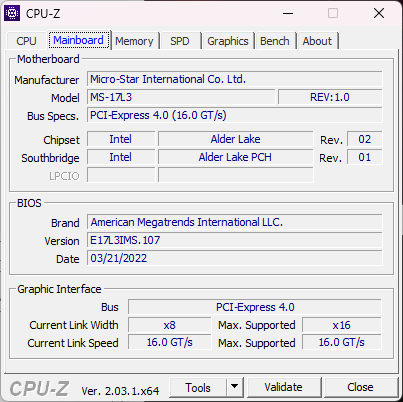
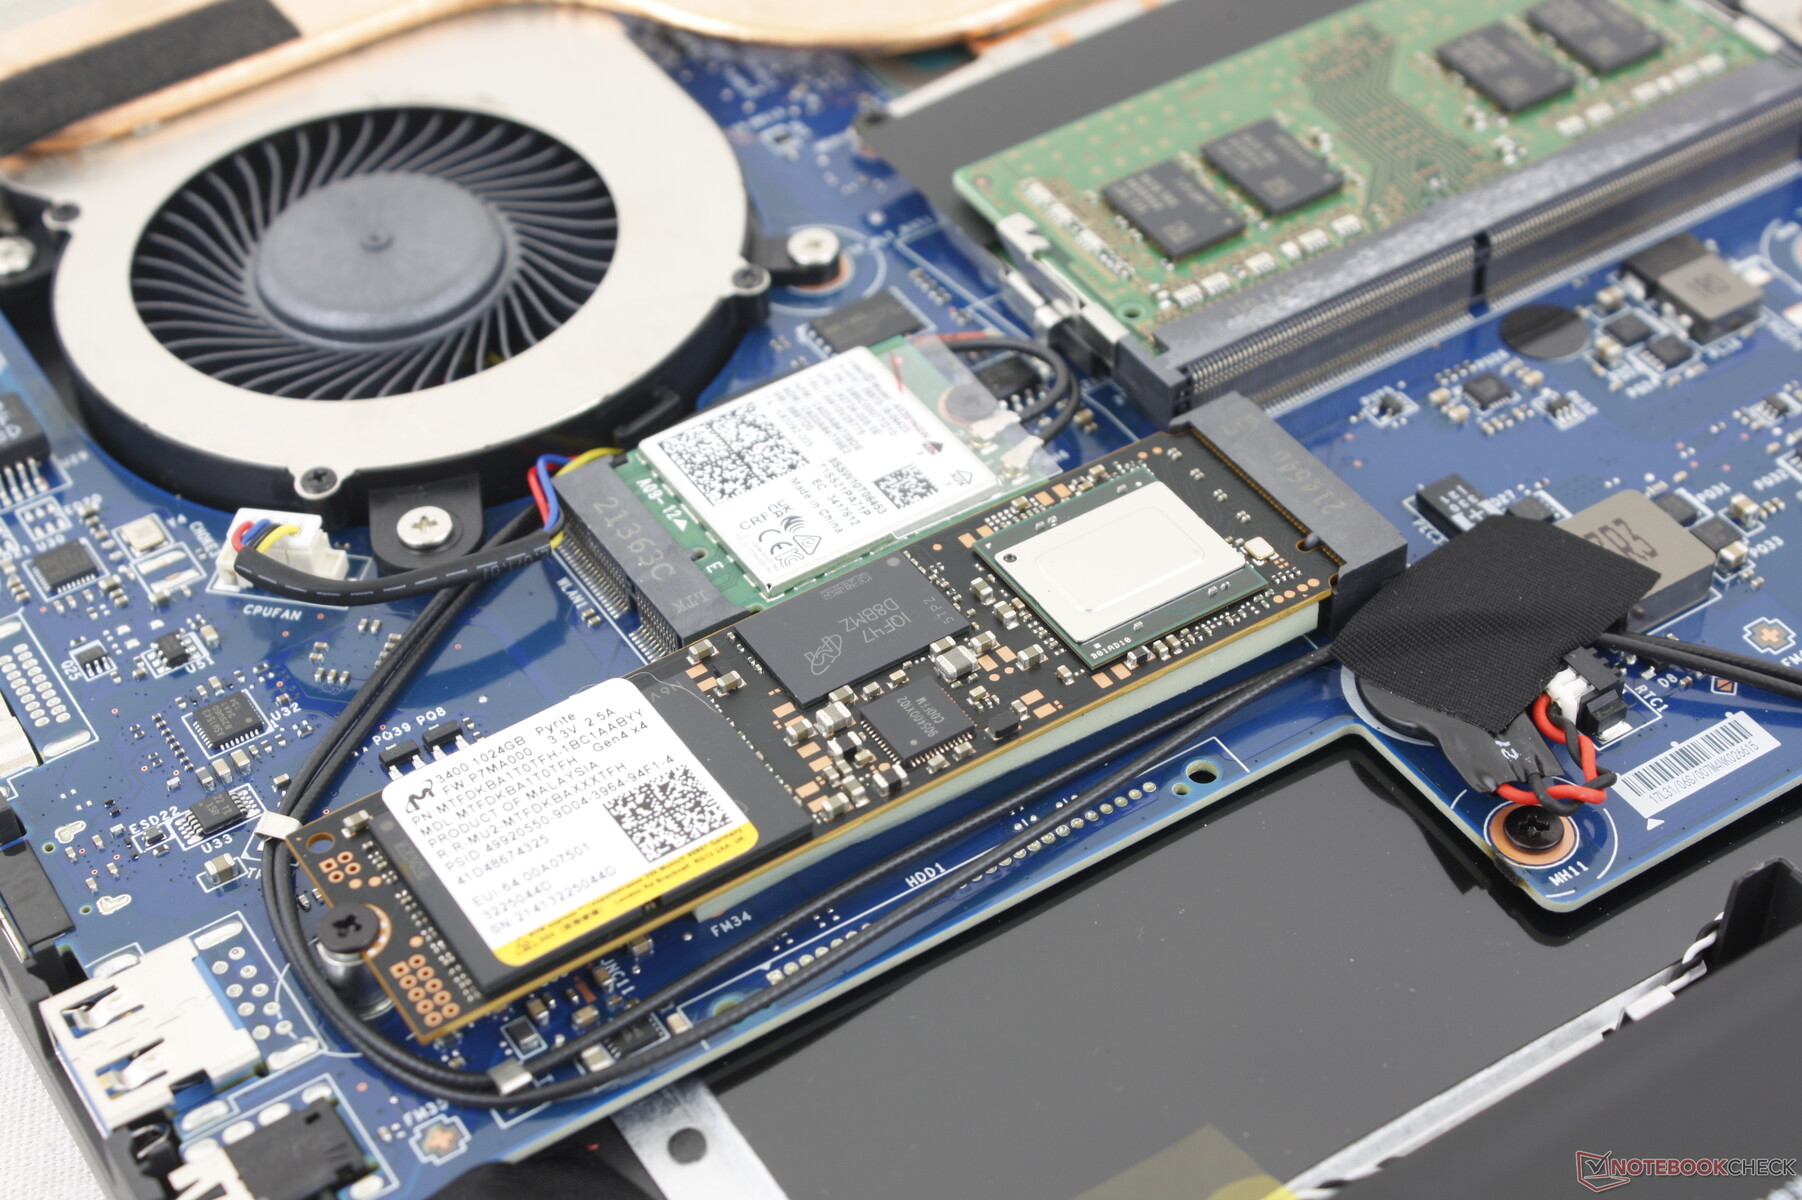
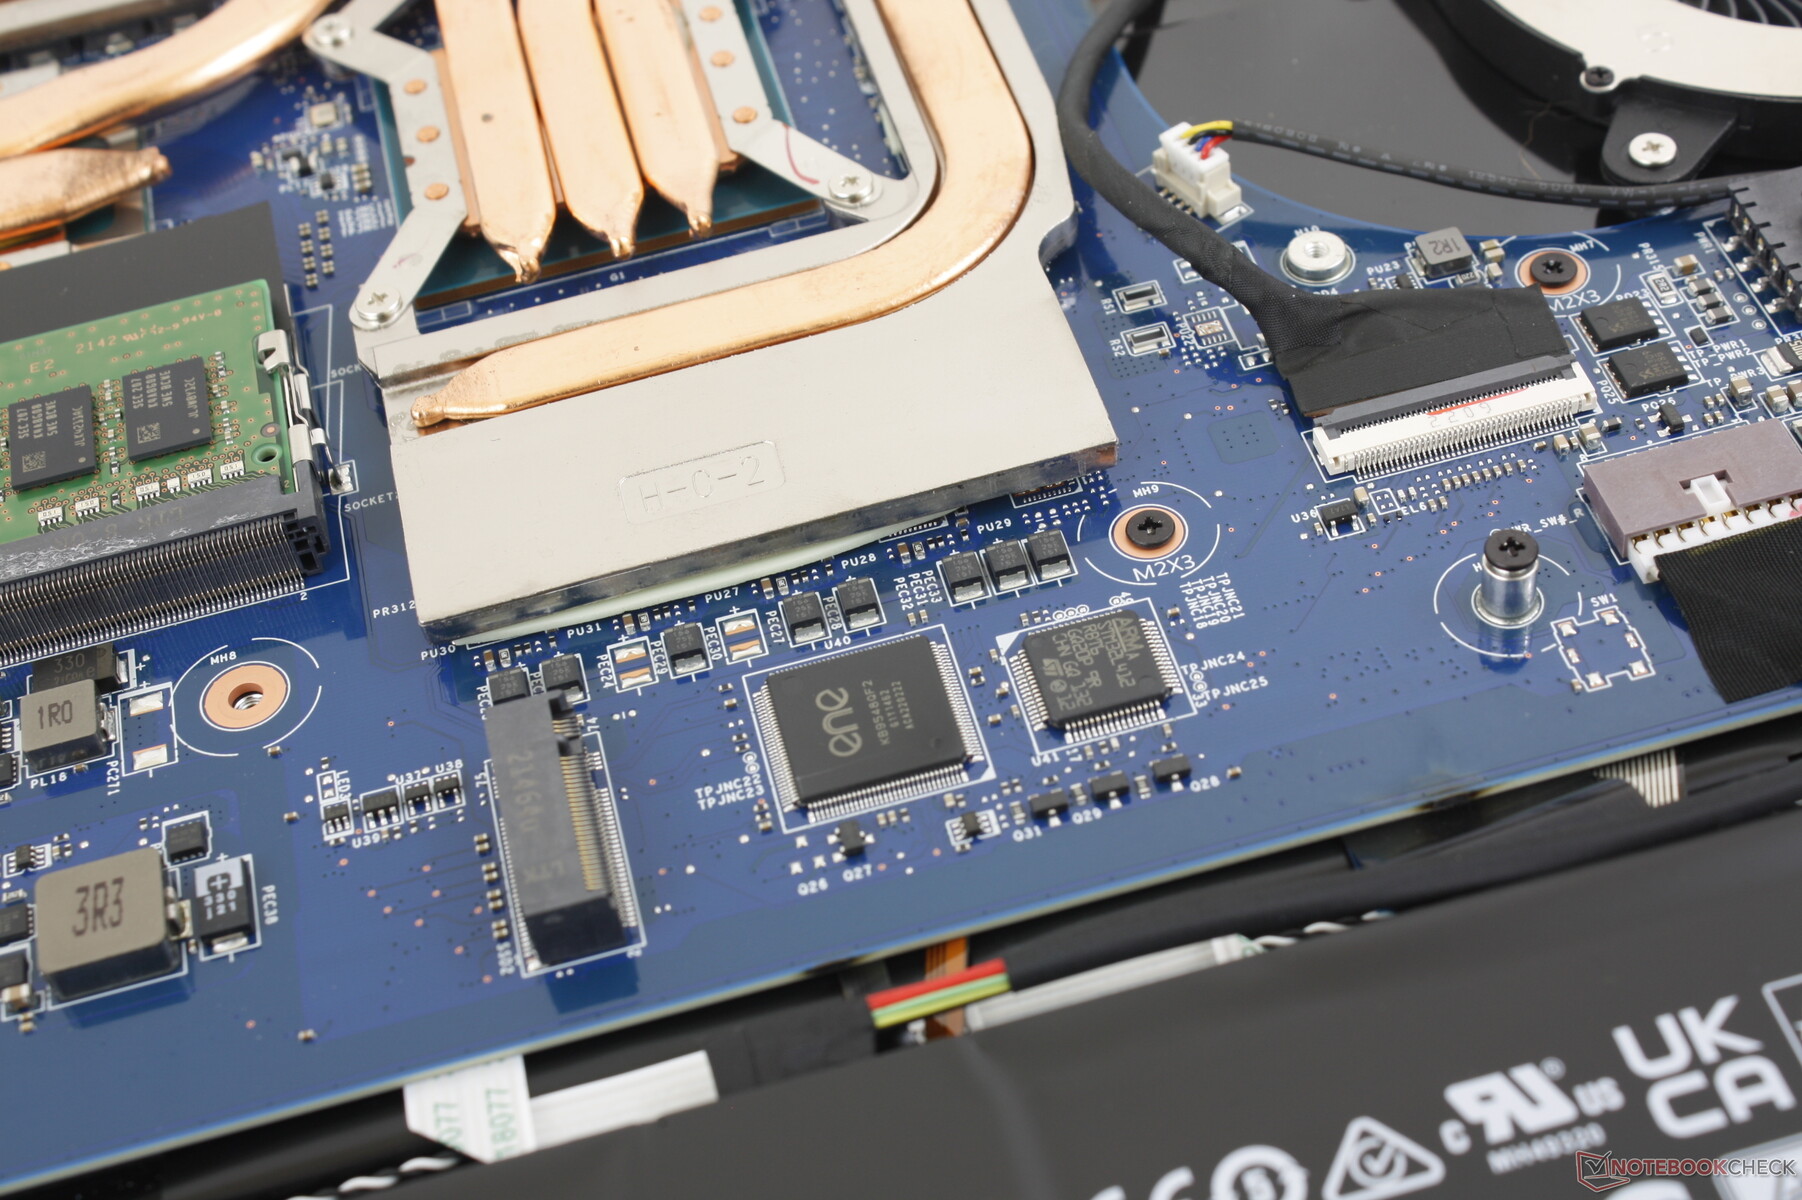
Il pannello inferiore è fissato da 13 viti Philips facili da rimuovere. Tuttavia, è necessario tenere presente che per farlo è necessario rompere l'adesivo del sigillo di fabbrica. MSI continua a essere uno dei pochissimi produttori importanti ad avere un adesivo con il sigillo di fabbrica anche per semplici aggiornamenti come la RAM o lo storage.
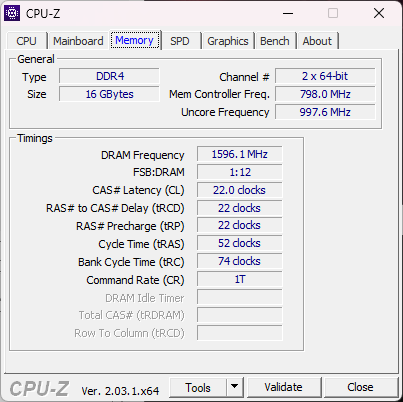
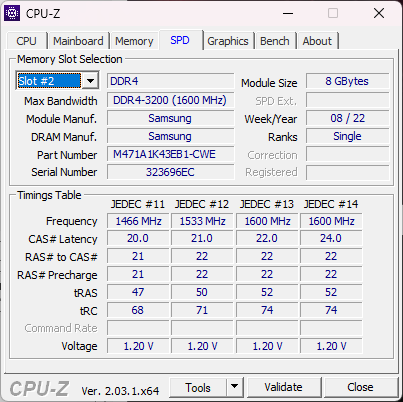
Una volta all'interno, gli utenti avranno accesso diretto a 2 slot SSD PCIe4, 2 slot SODIMM, modulo WLAN, batteria e soluzione di raffreddamento.
Accessori e garanzia
La confezione non contiene altri extra oltre all'adattatore CA e alla documentazione. Se acquistato negli Stati Uniti, si applica la garanzia limitata di un anno.
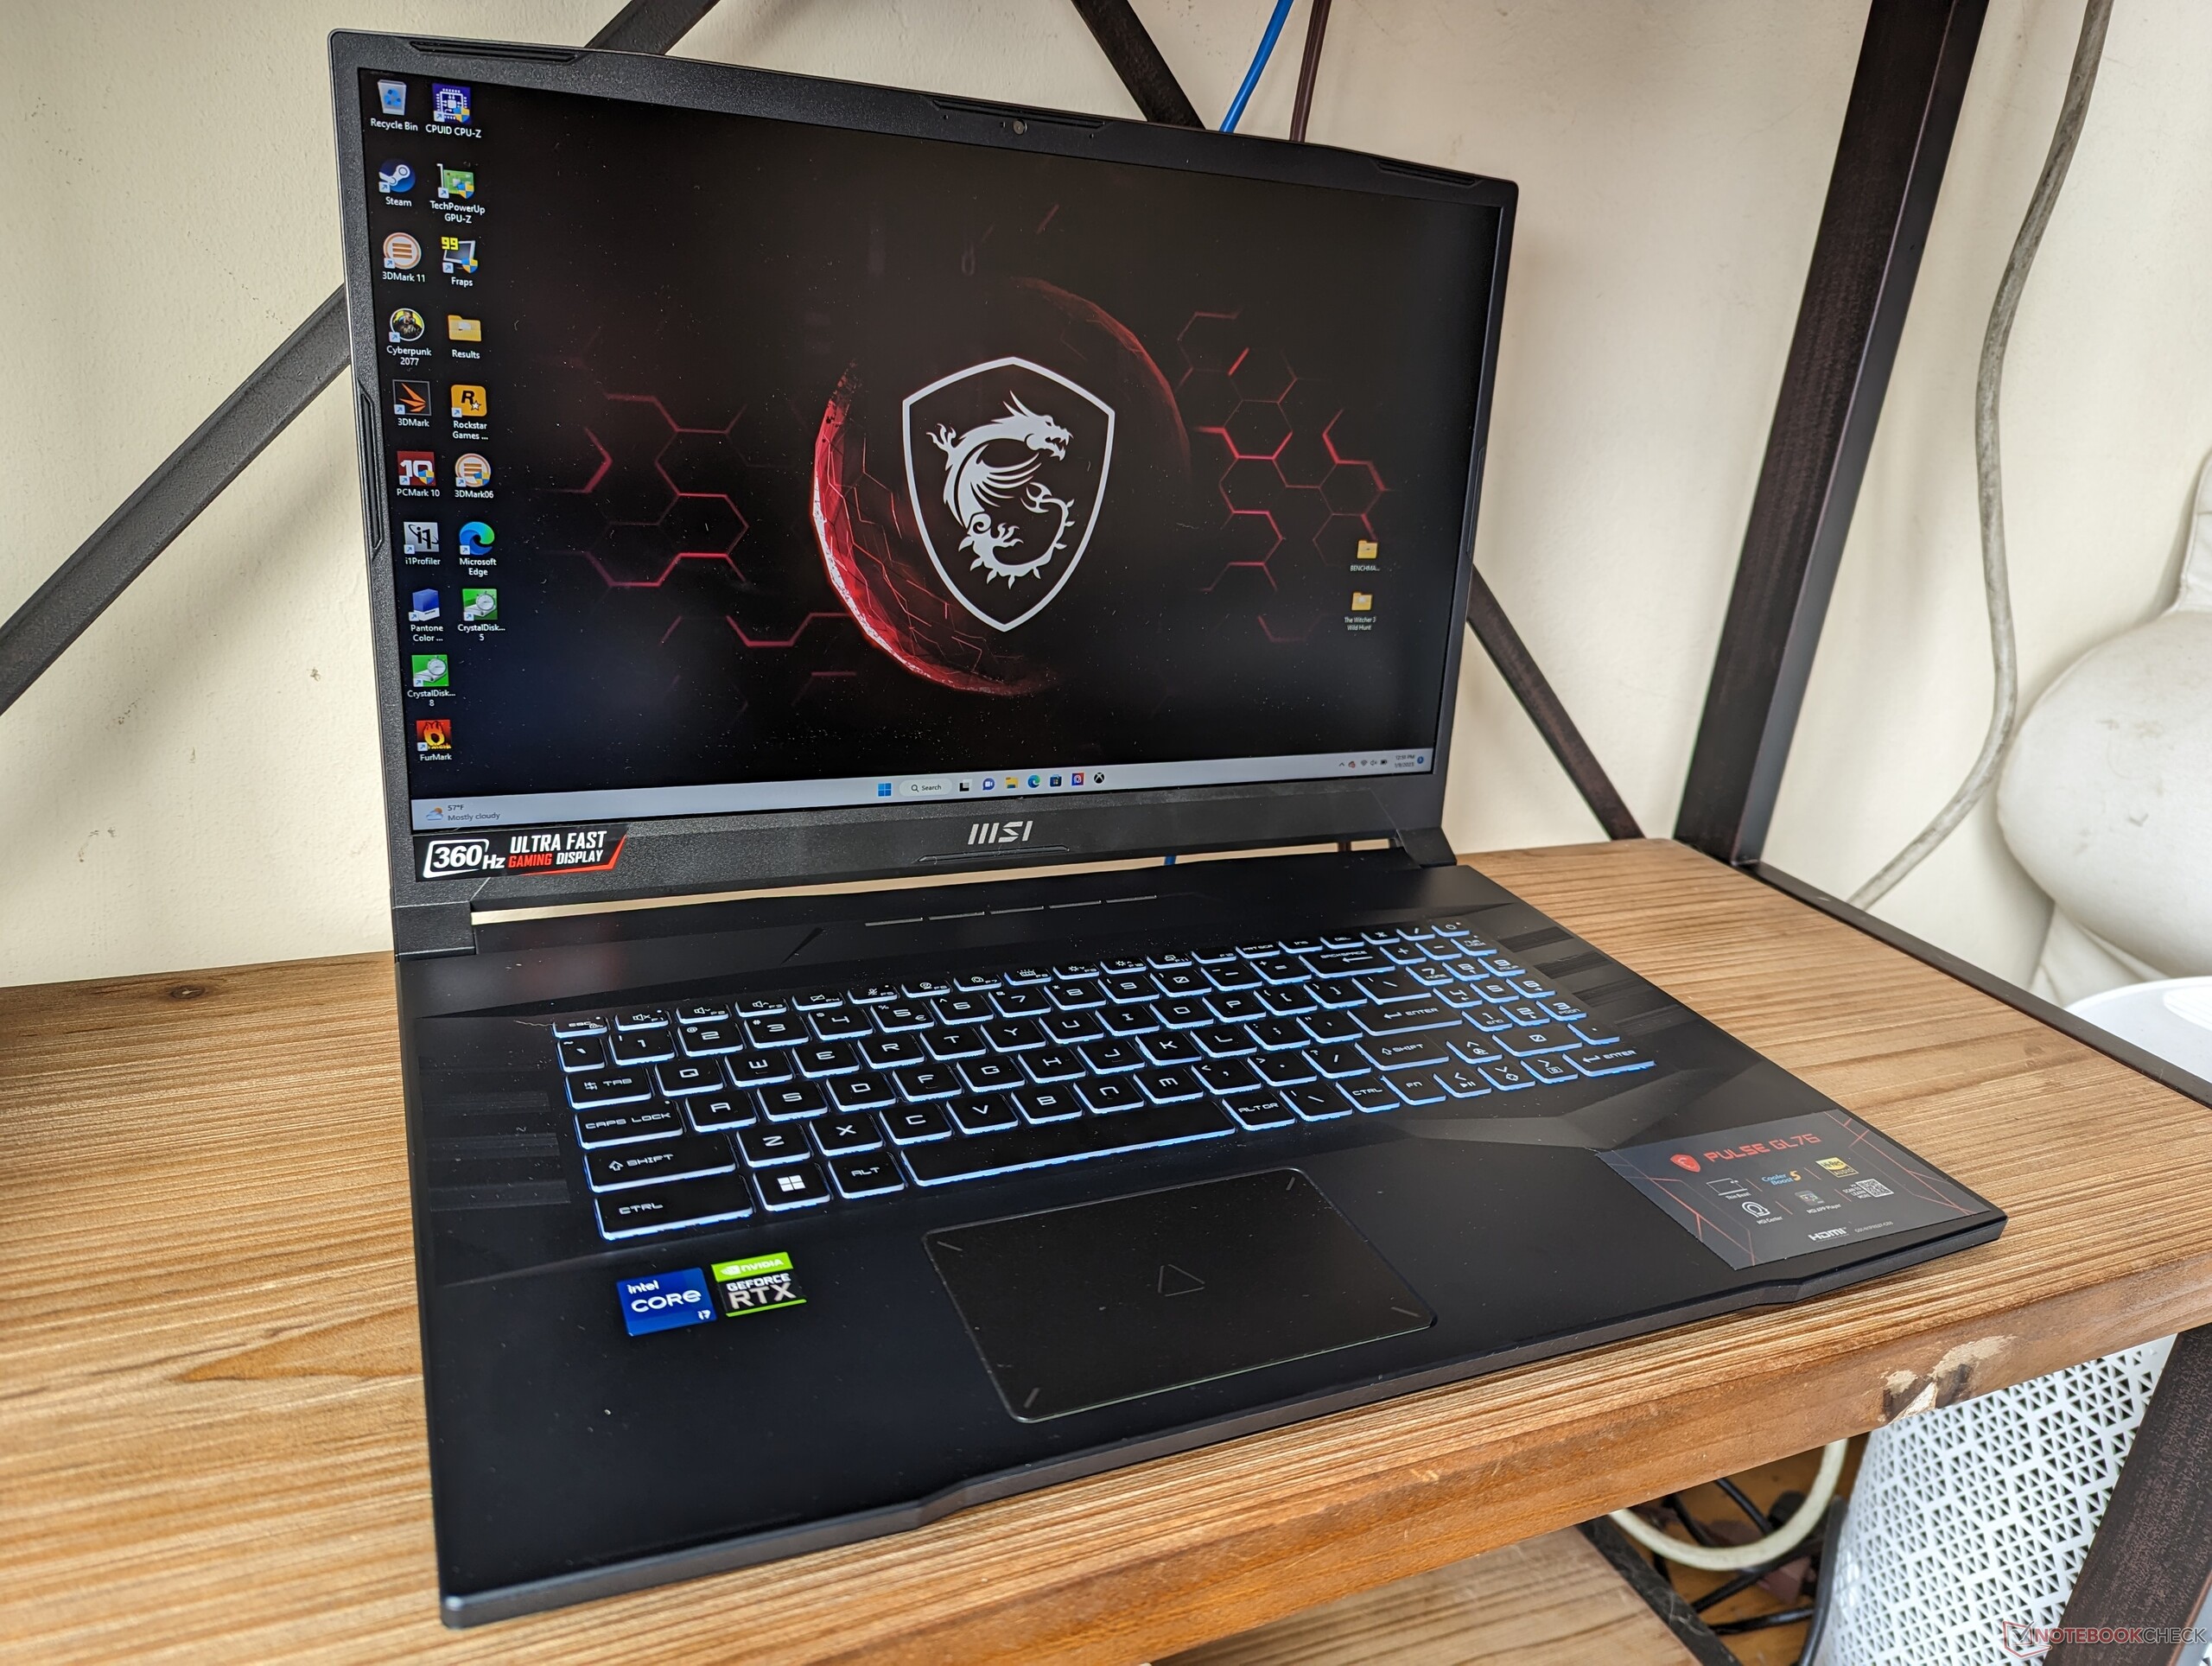
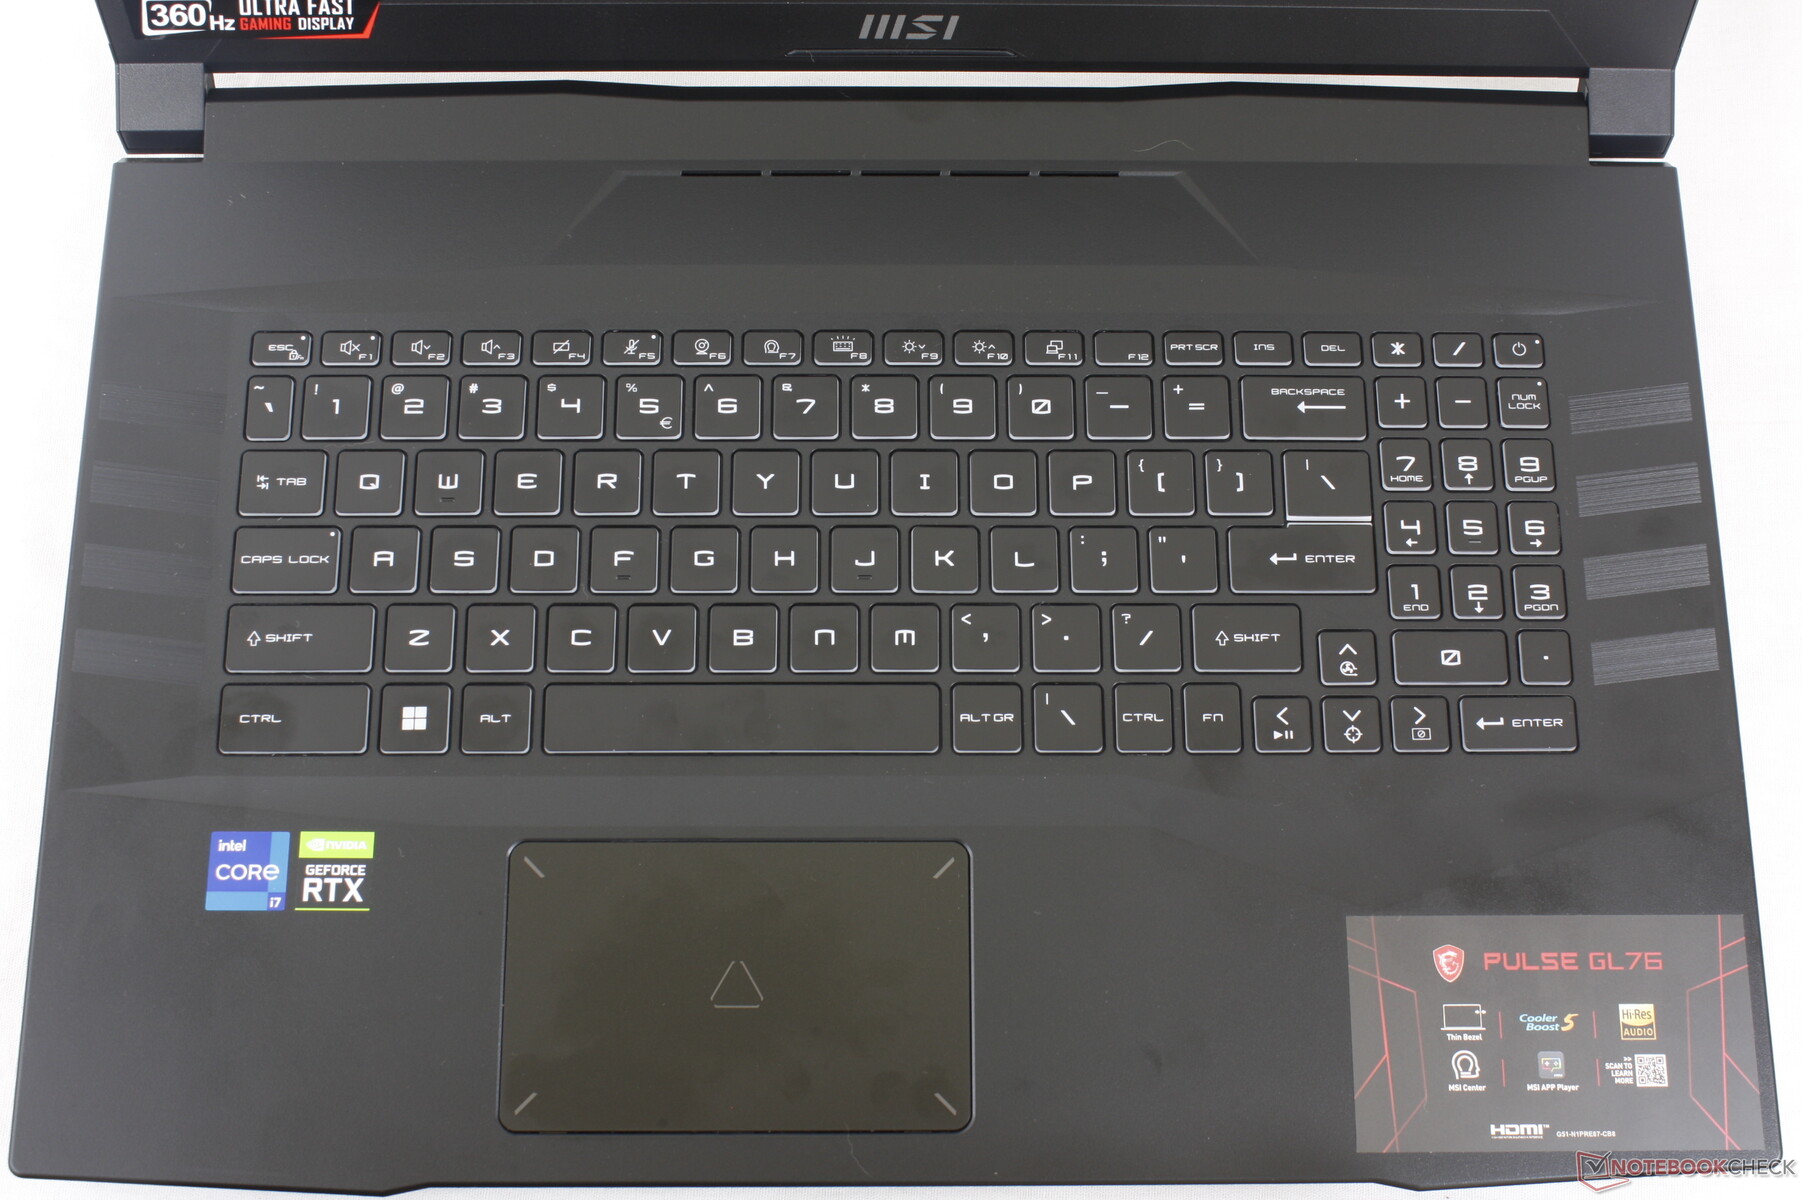
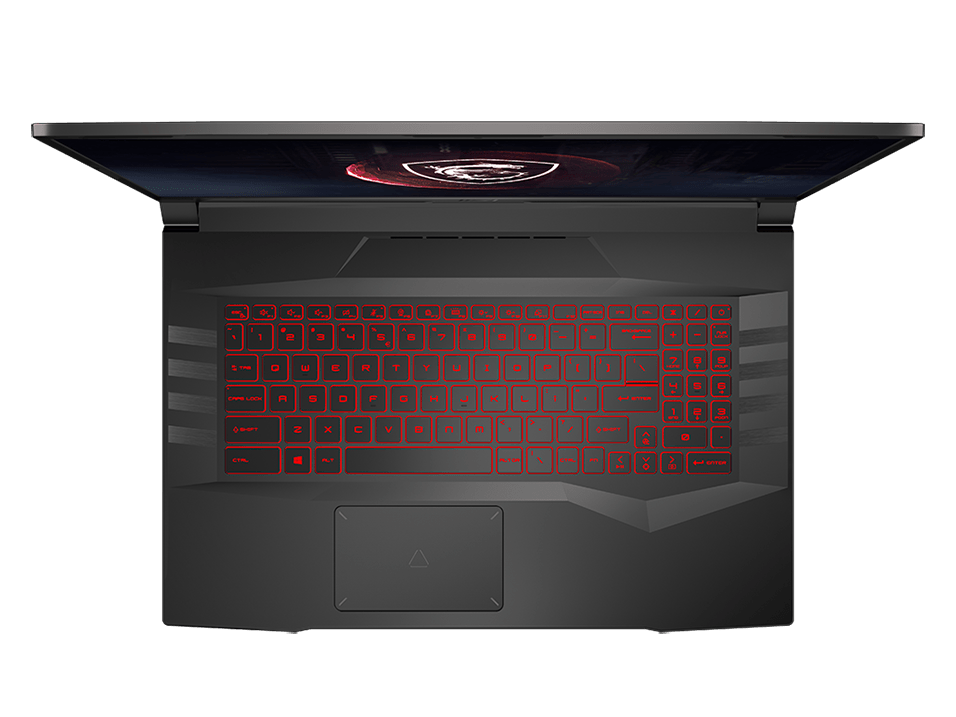
Dispositivi di input - Tastiera OK, Clickpad spugnoso
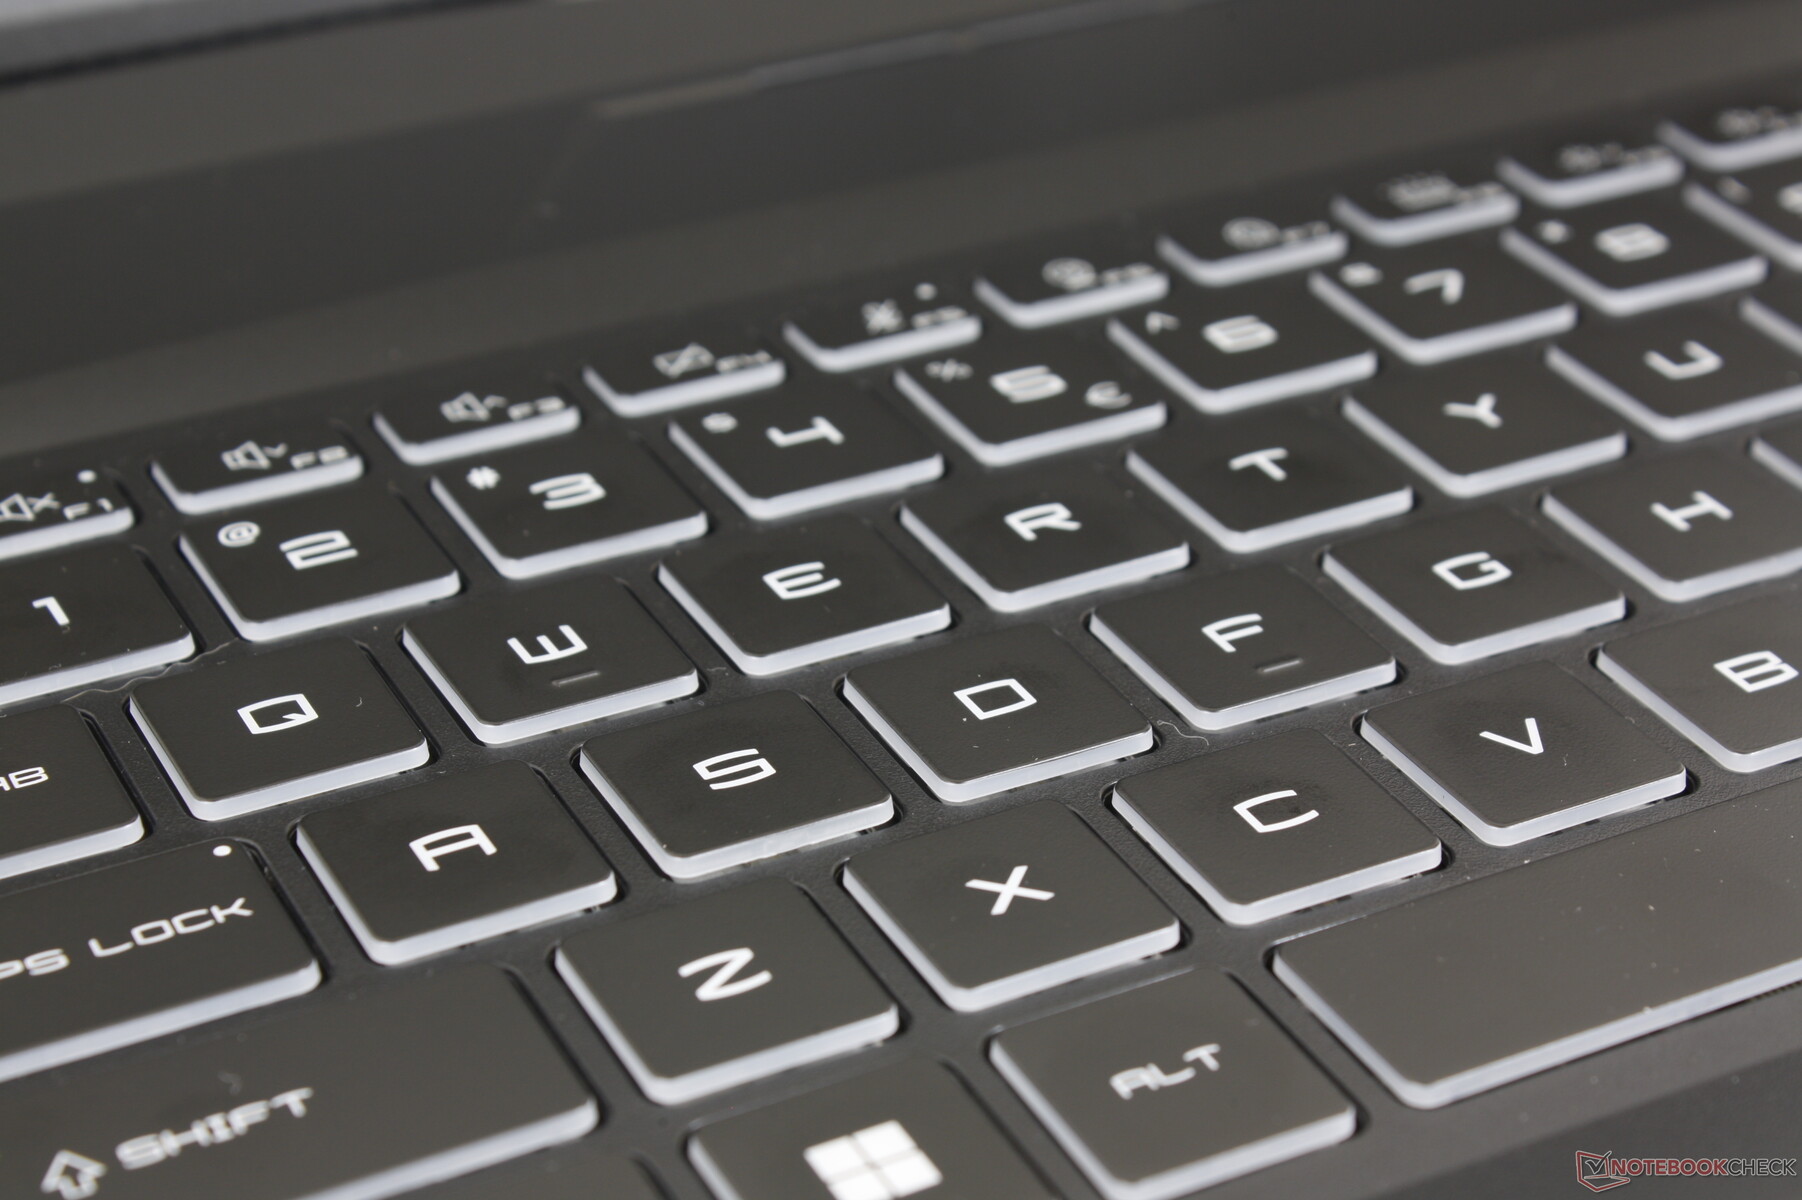
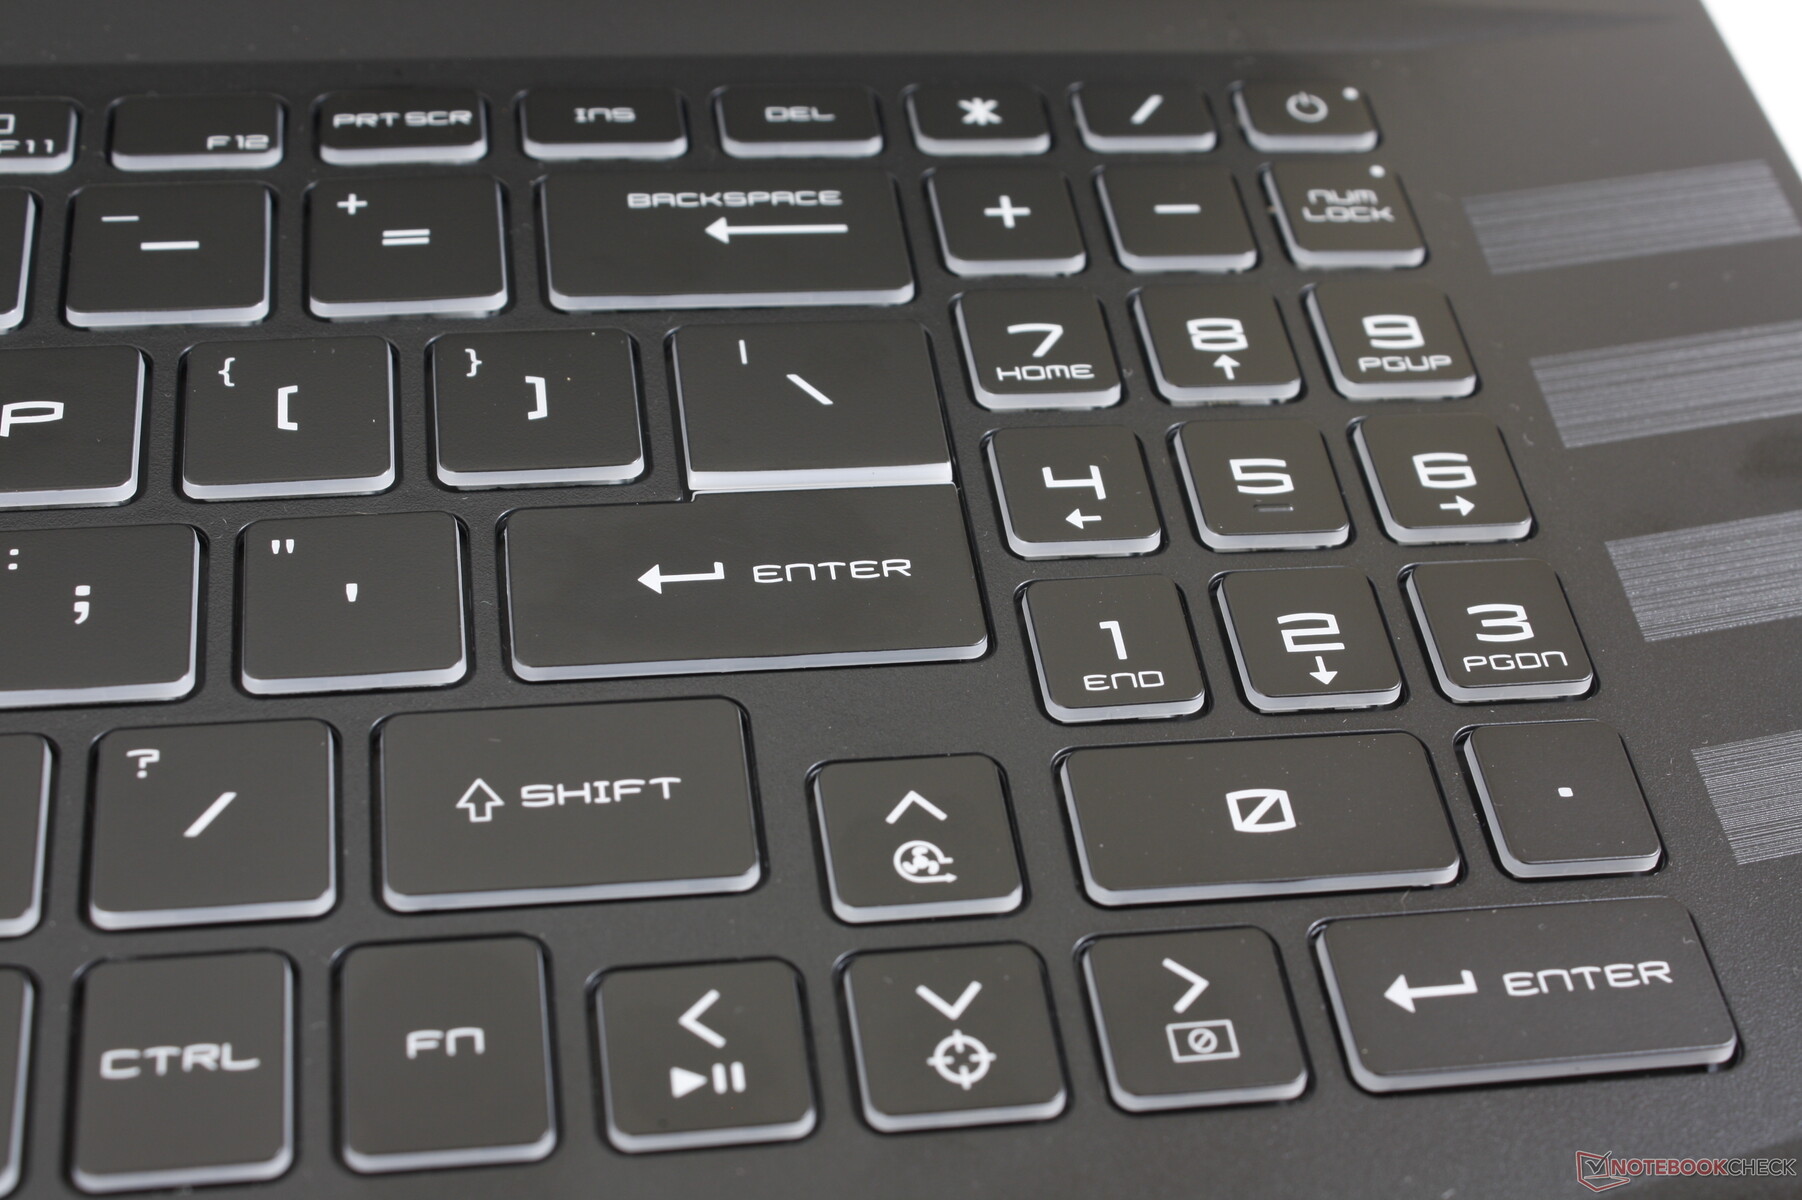
Tastiera
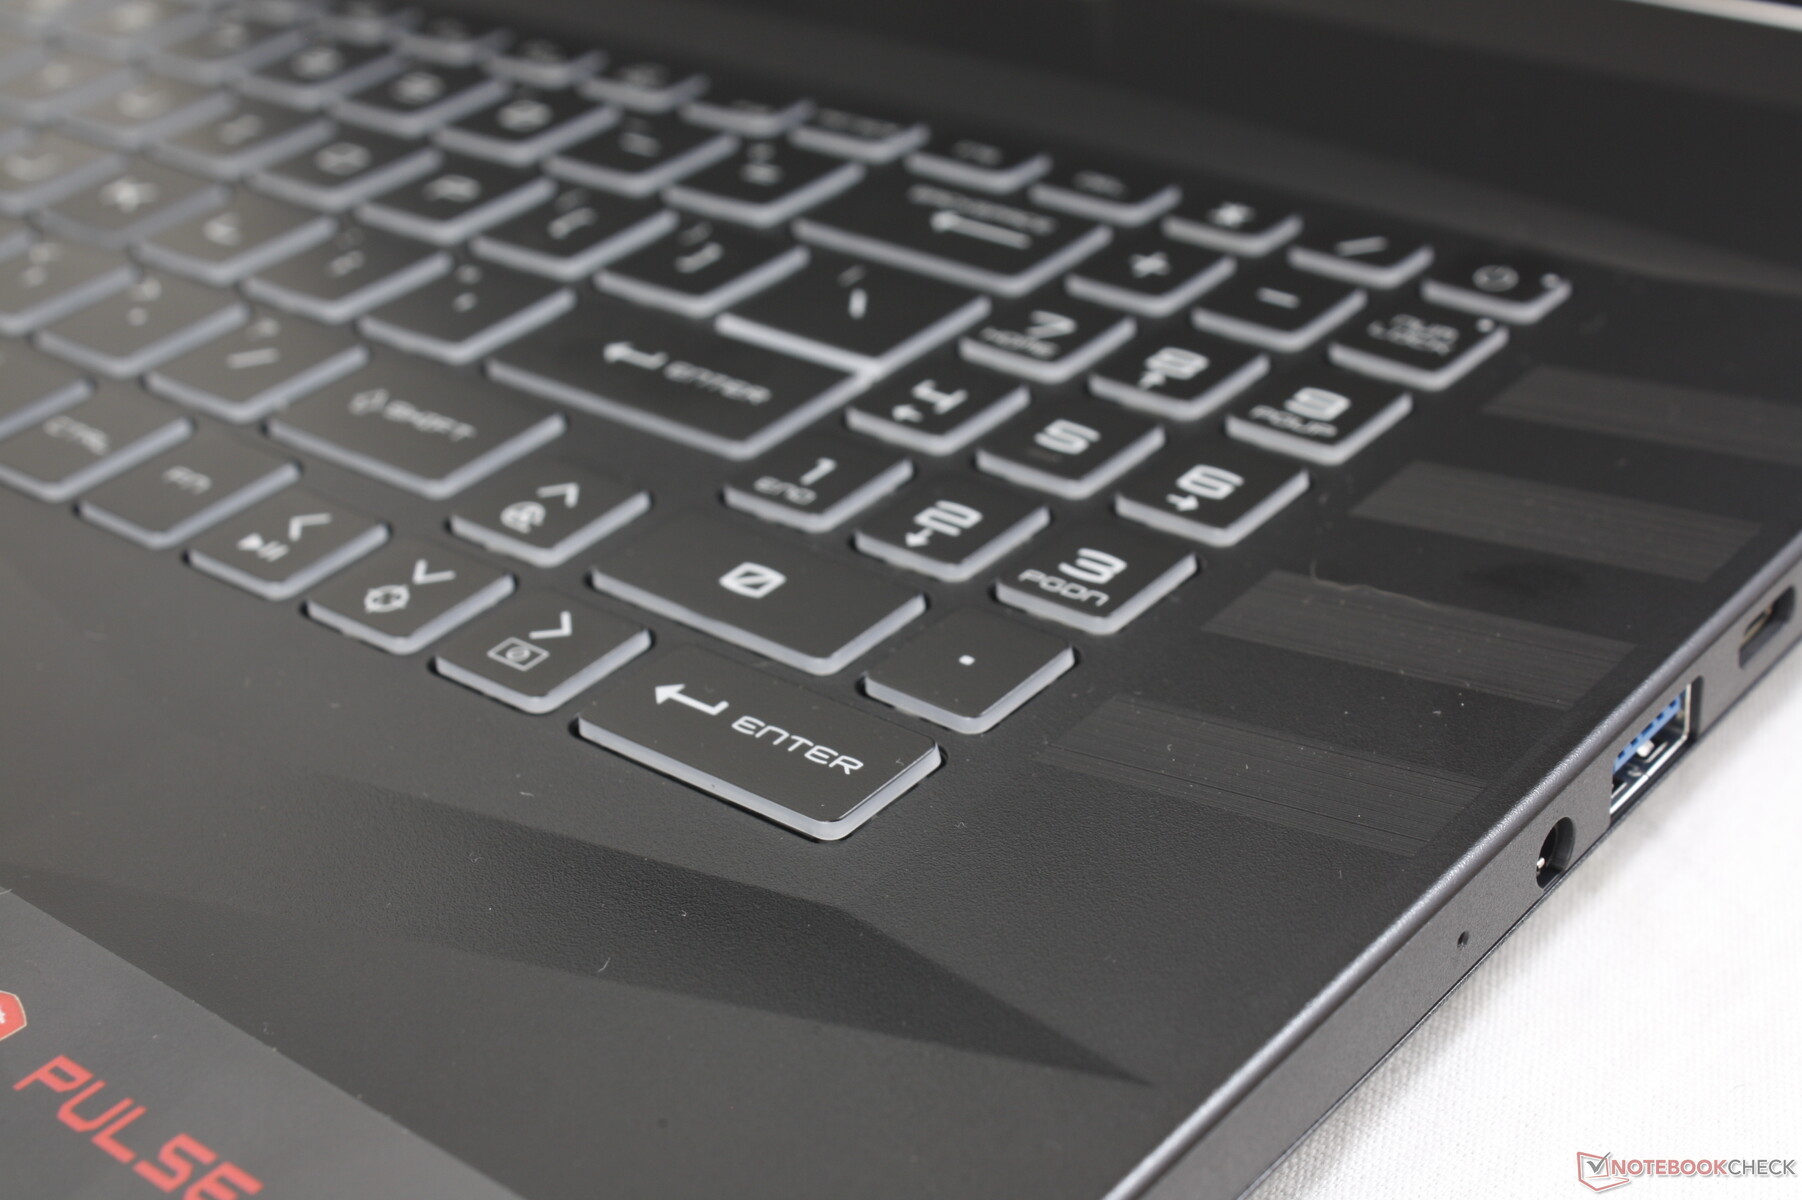
Il GL76 condivide la stessa tastiera e la stessa esperienza di digitazione del modello GL66 nonostante le differenze di forma. Pertanto, la breve corsa dei tasti e il feedback passabile del GL66 si applicano anche al GL76. È un peccato che MSI non abbia sfruttato meglio il fattore di forma più grande da 17,3 pollici aumentando le dimensioni del tastierino numerico e dei tasti freccia, che sono più piccoli, più spugnosi e più angusti rispetto ai tasti QWERTY più grandi. Questa caratteristica è condivisa con il Asus TUF Gaming F17.
La retroilluminazione RGB a zona singola è di serie, senza opzioni RGB per ogni tasto. Tutti i tasti e i simboli sono illuminati.
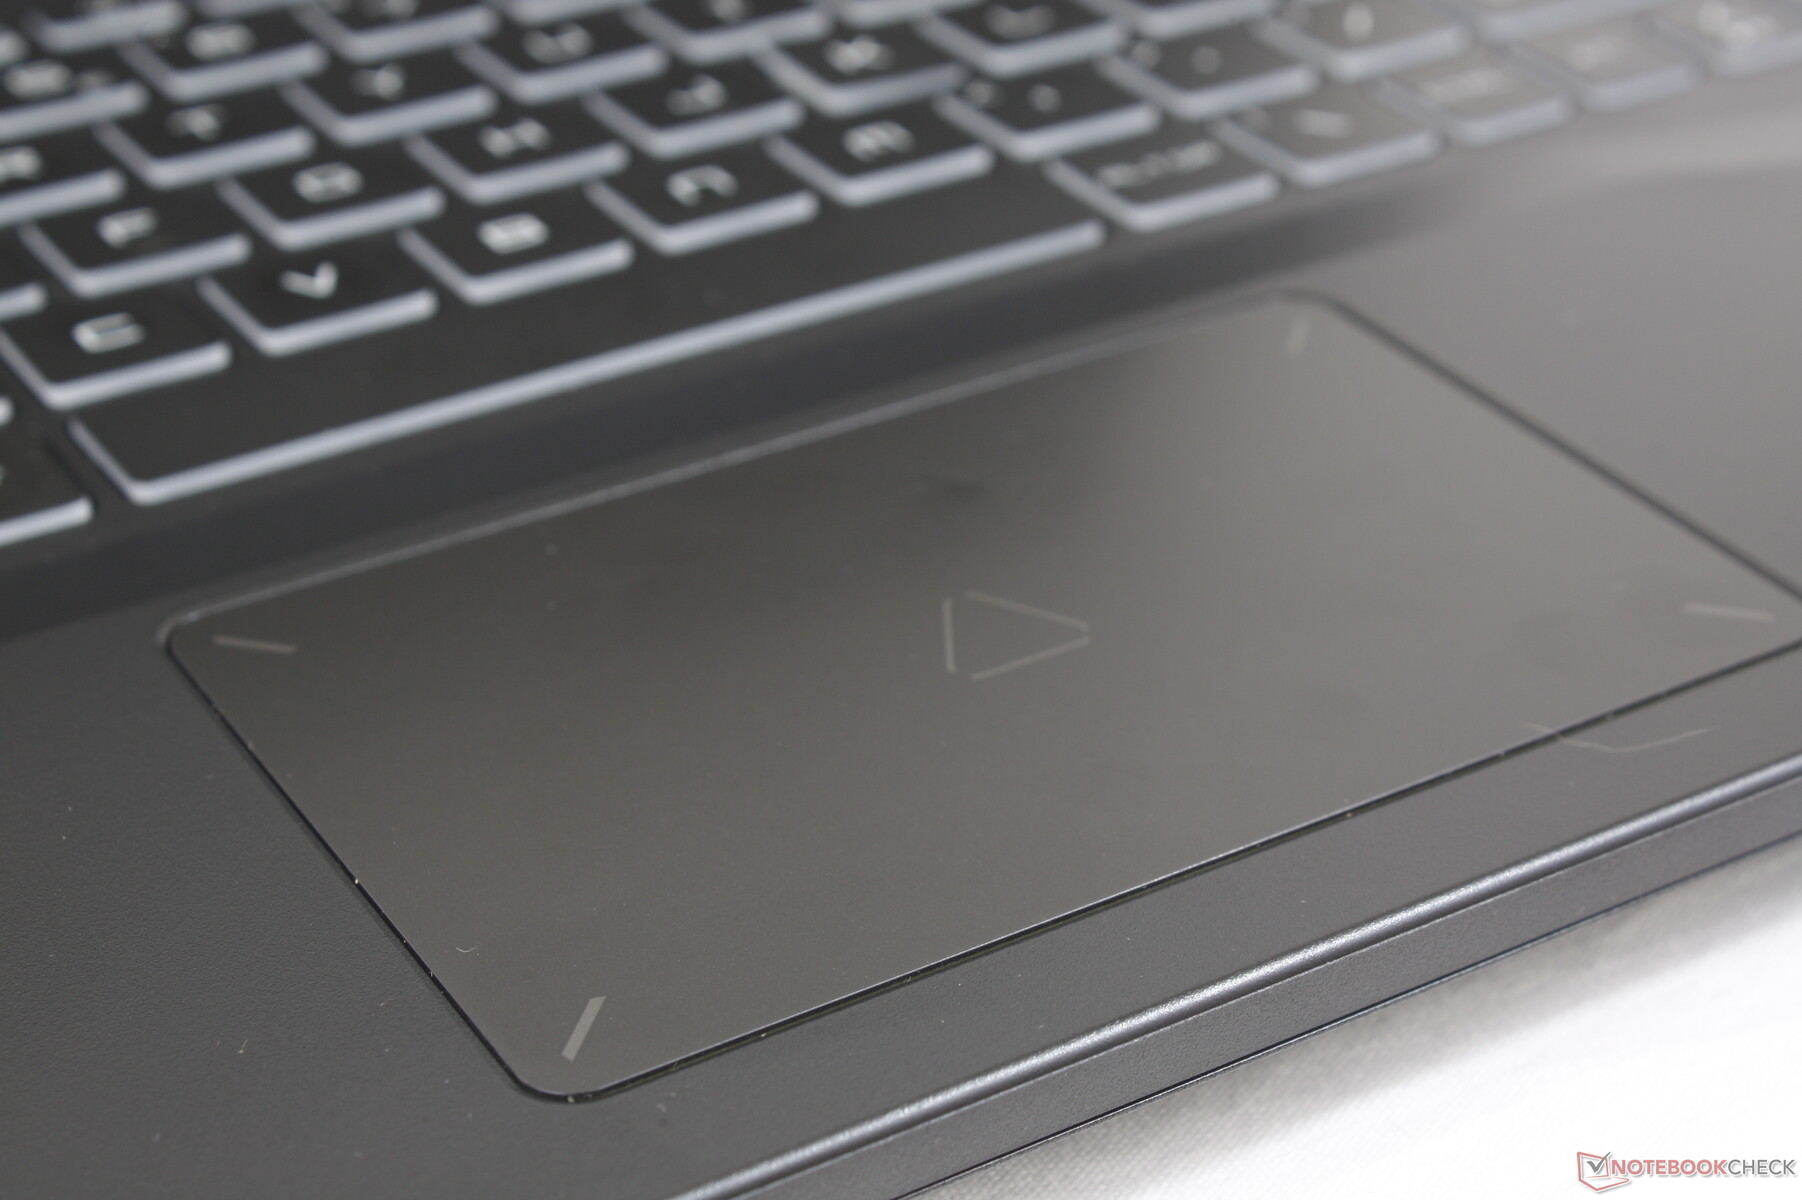
Touchpad
Il clickpad è relativamente piccolo, 10,5 x 6,7 cm, ma è almeno leggermente più grande del clickpad da 10,5 x 6 cm del Dell G16 Dell G16. La sua superficie in plastica tende ad aderire quando si scivola a velocità medie o basse, il che può rendere il controllo del cursore a volte un po' irregolare. Inoltre, il feedback quando si fa clic sulla superficie è spugnoso e la sensazione è davvero insoddisfacente. È assolutamente necessario avere a portata di mano un mouse esterno adeguato, quando possibile.
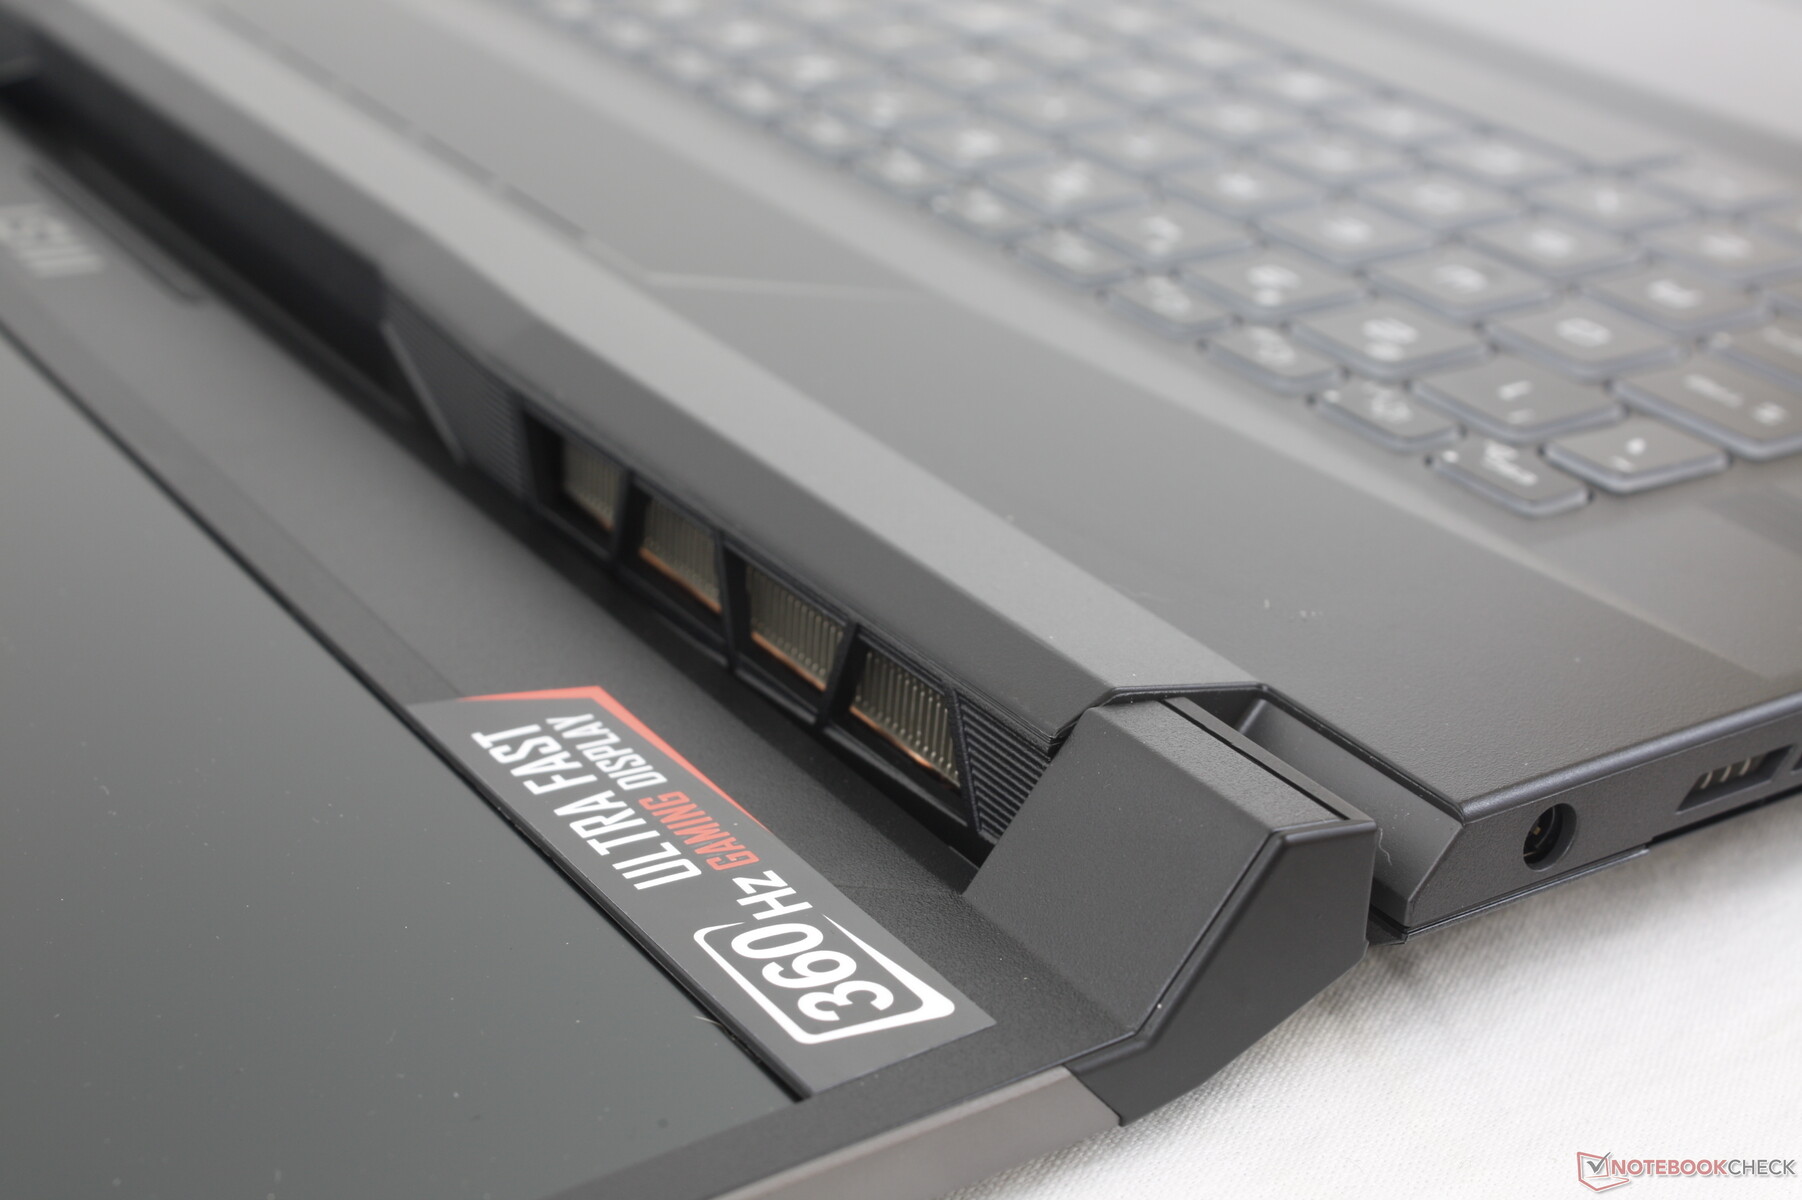
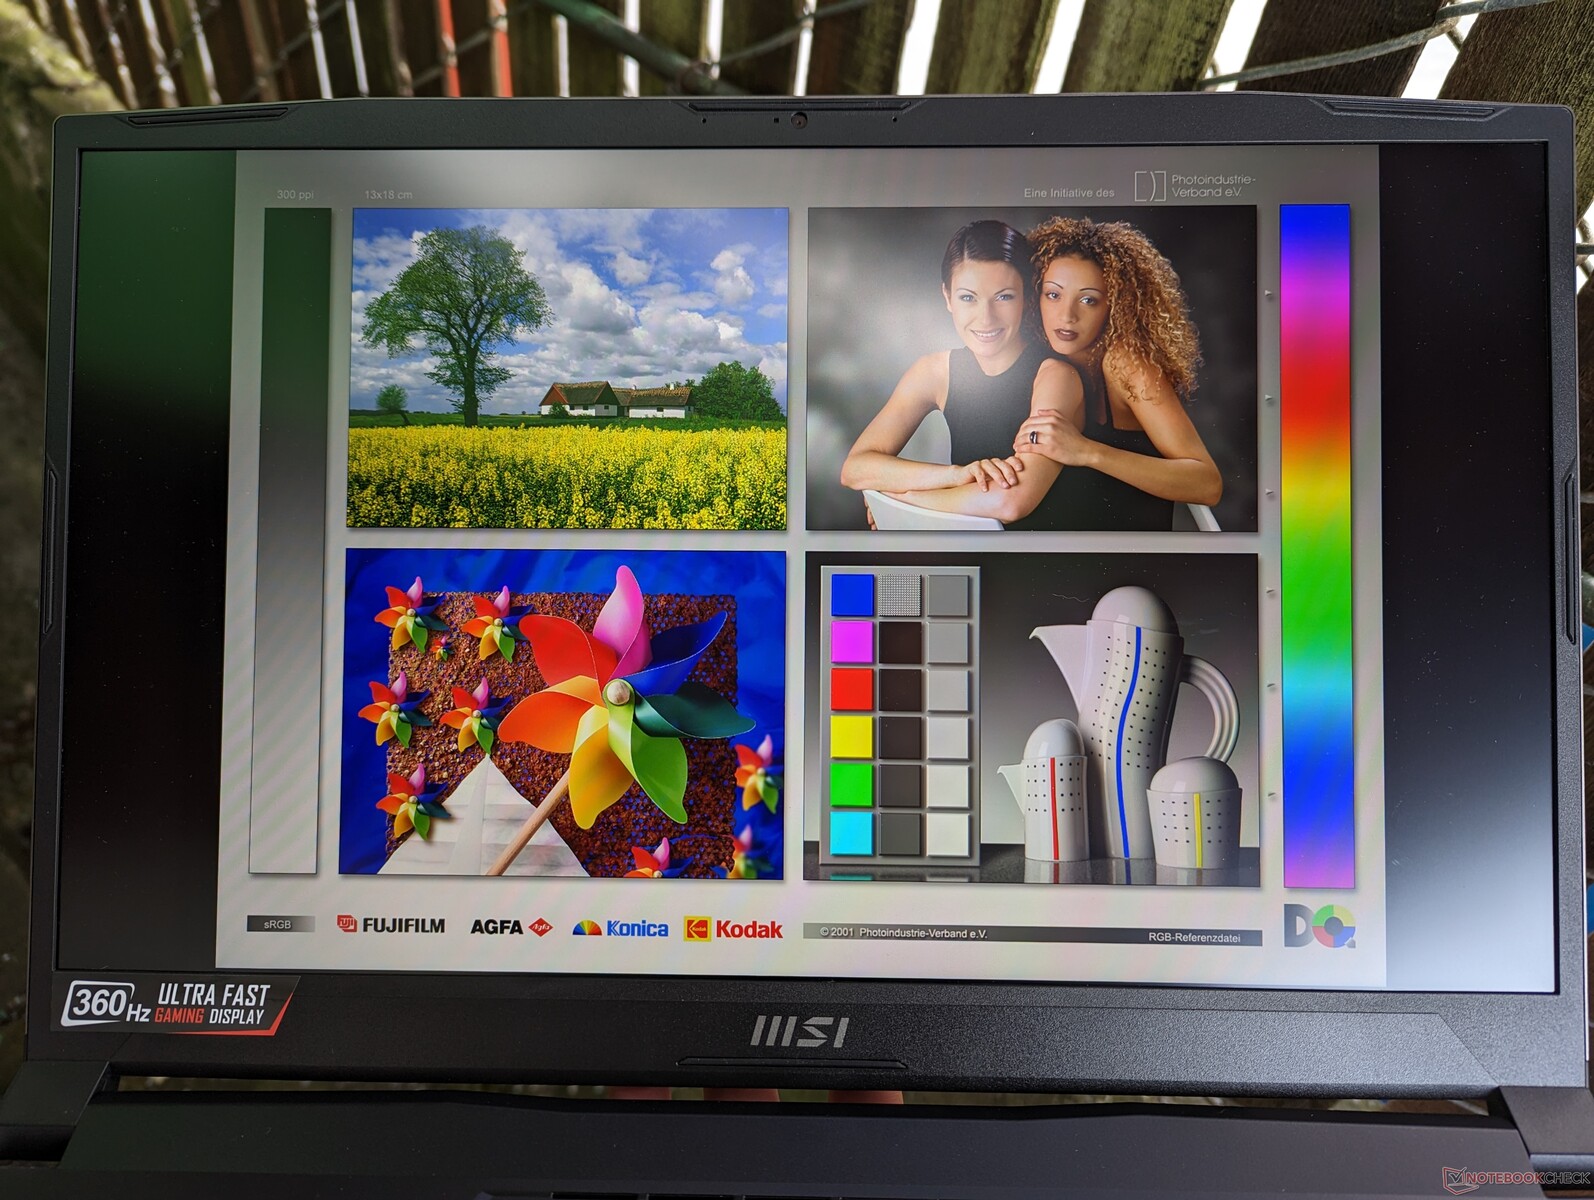
Display - Solo 1080p
Per il modello 2022 GL76 sono disponibili solo due opzioni di pannello, come elencato di seguito. la risoluzione di 1080p è l'unica opzione per ora, mentre il modello 2021 aveva una SKU QHD.
- 144 Hz, 1080p, 60% sRGB, IPS
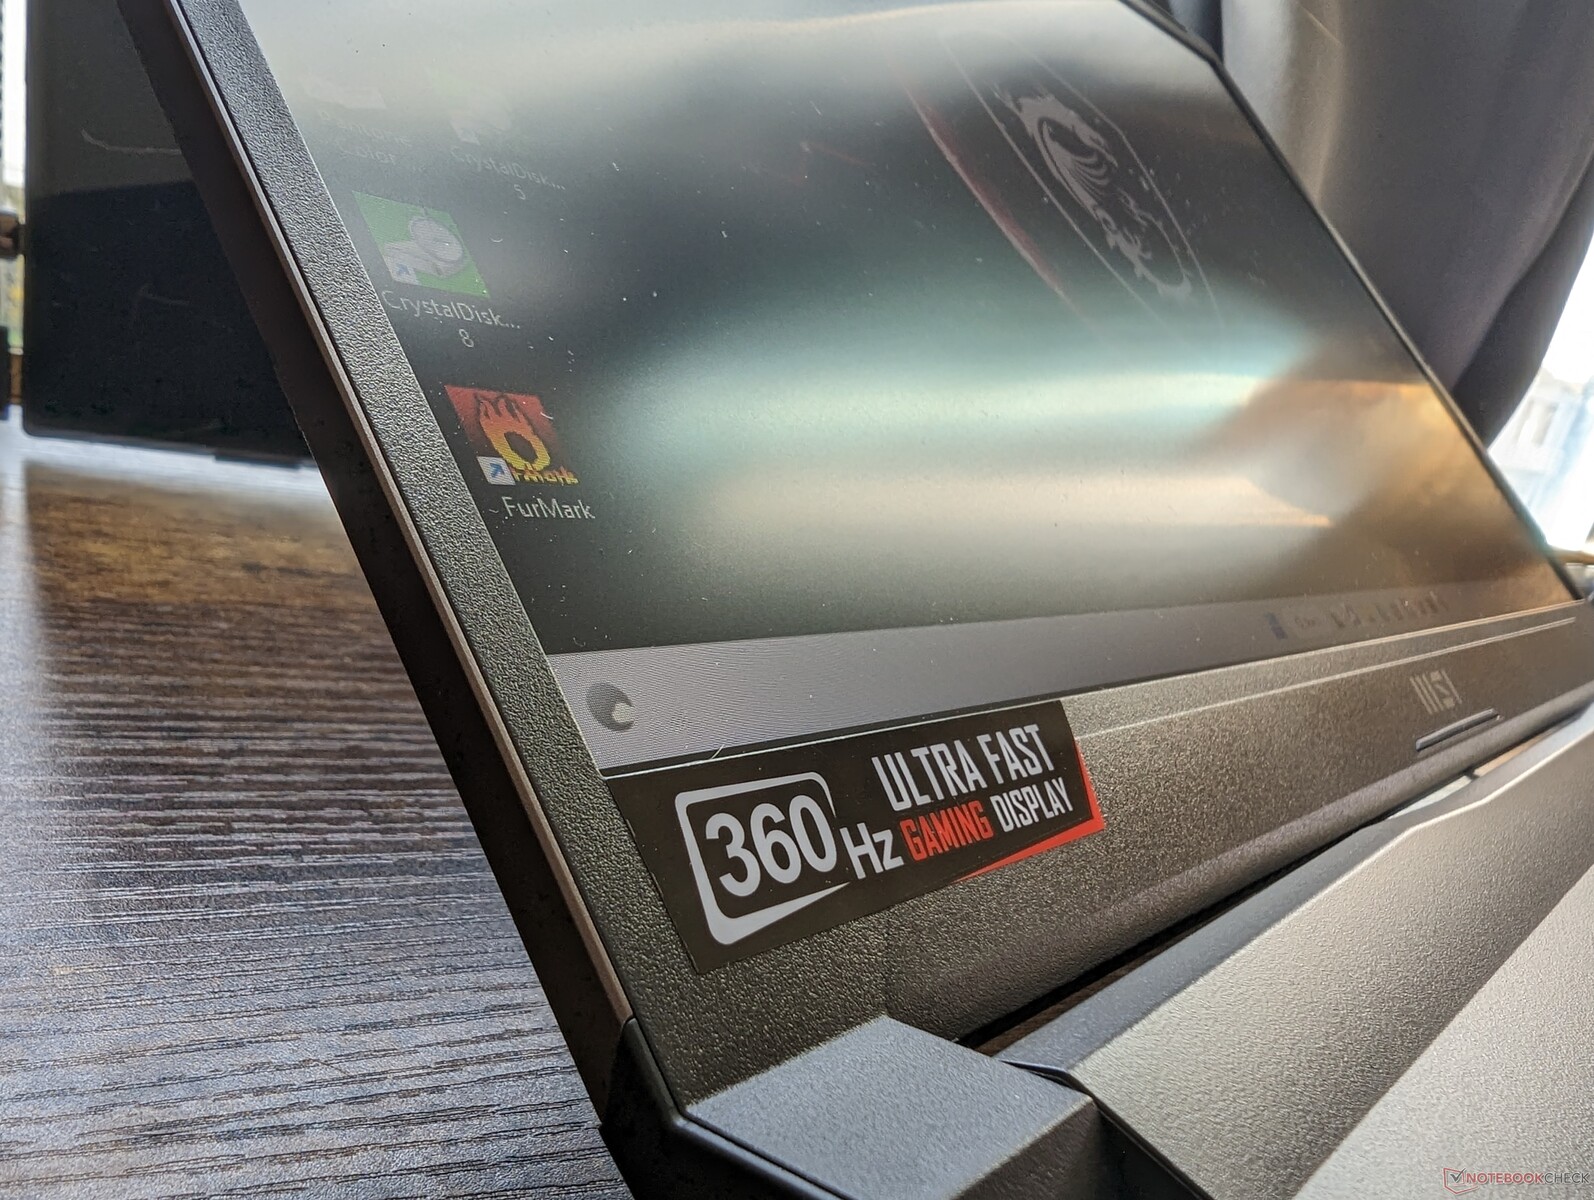
- 360 Hz, 1080p, 100% sRGB, IPS
Il pannello a 360 Hz ha tempi di risposta in bianco e nero molto più rapidi rispetto al pannello a 144 Hz. Si tratta inoltre dello stesso pannello IPS Sharp LQ173M1JW08 che MSI utilizza anche sulla sua ammiraglia Titan GT77. Consigliamo di evitare l'opzione a 144 Hz, in quanto lo spazio colore limitato è un buon indicatore di un pannello molto economico.
La qualità dell'immagine è eccellente e fluida grazie alla velocissima frequenza di aggiornamento. Tenete presente che non è così nitida come quella della maggior parte degli Ultrabook o dei portatili da gioco da 15,6 pollici più piccoli, a causa dei PPI relativamente bassi. Questo particolare pannello privilegia la reattività e la velocità dei fotogrammi rispetto alla risoluzione.
| |||||||||||||||||||||||||
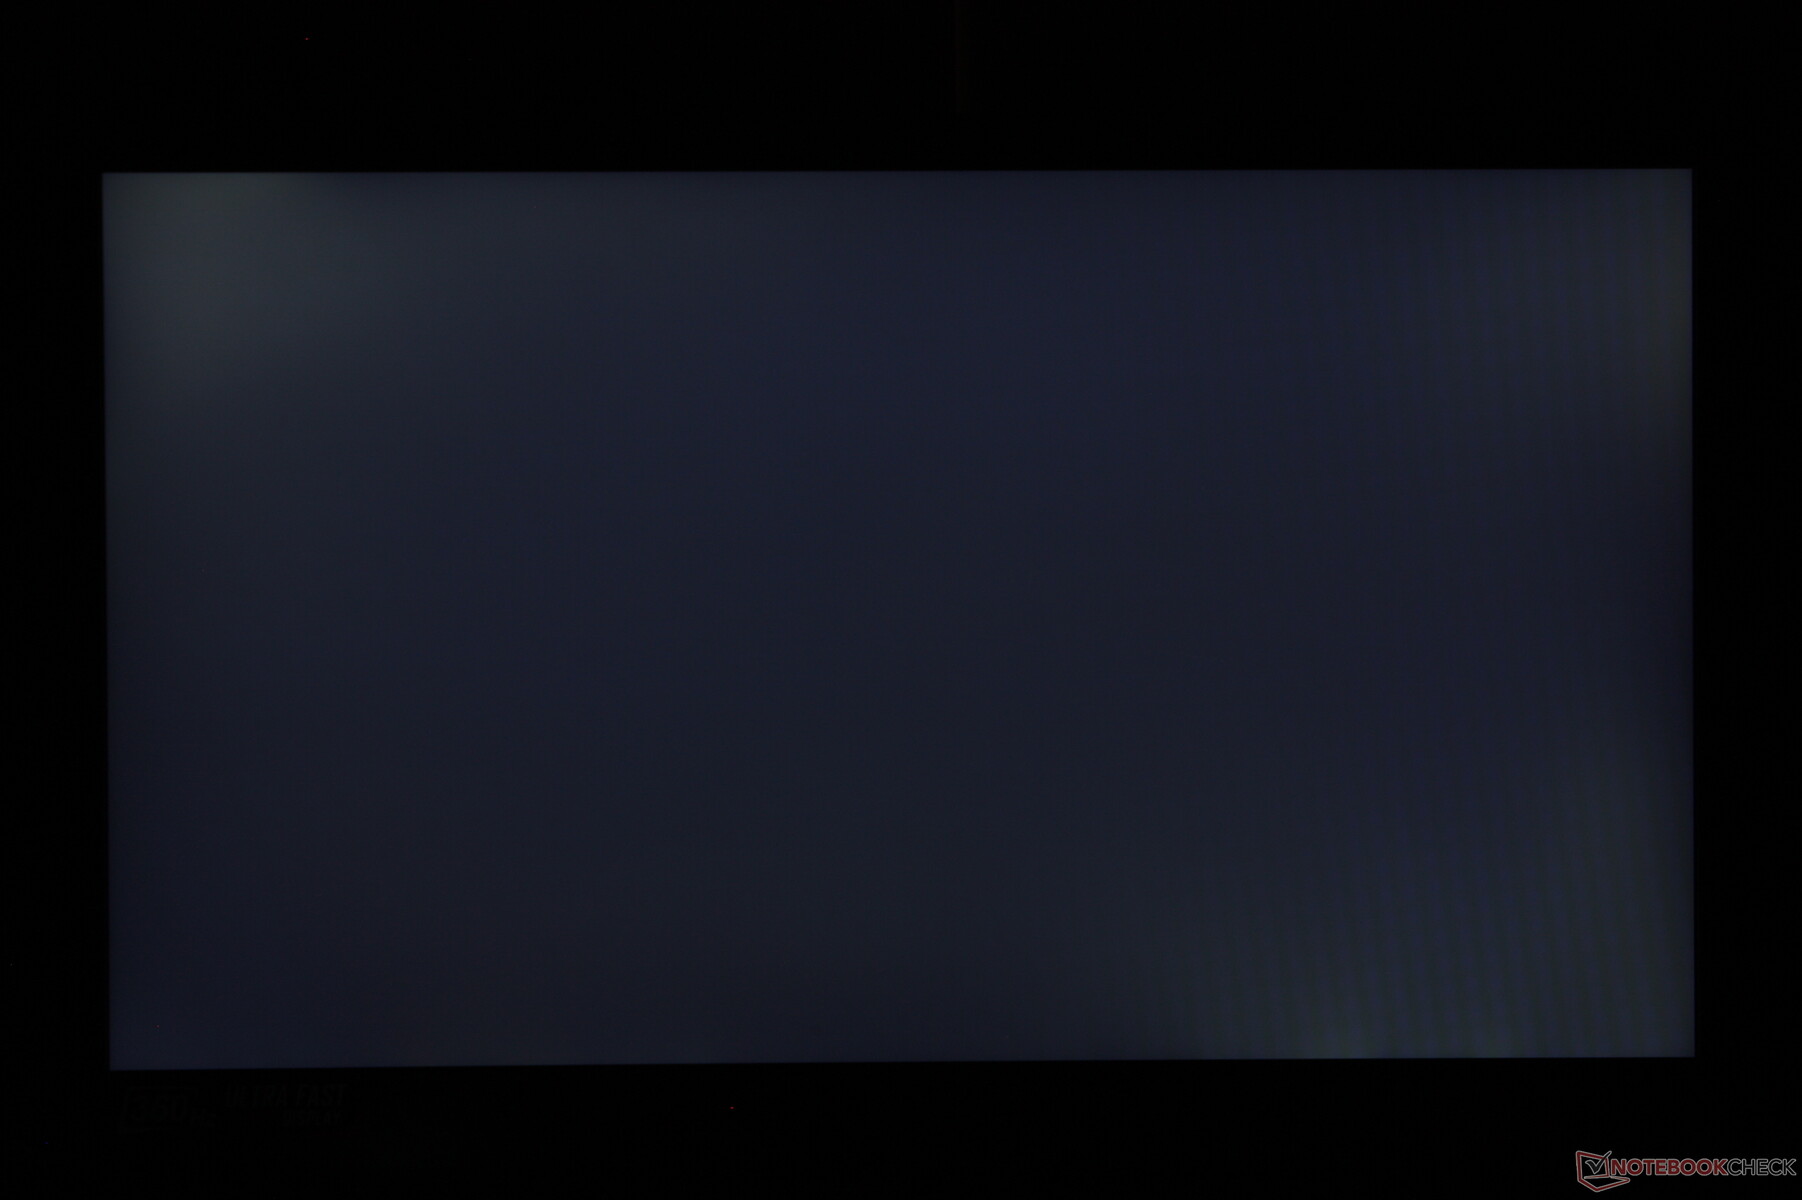
Distribuzione della luminosità: 82 %
Al centro con la batteria: 337.7 cd/m²
Contrasto: 1089:1 (Nero: 0.31 cd/m²)
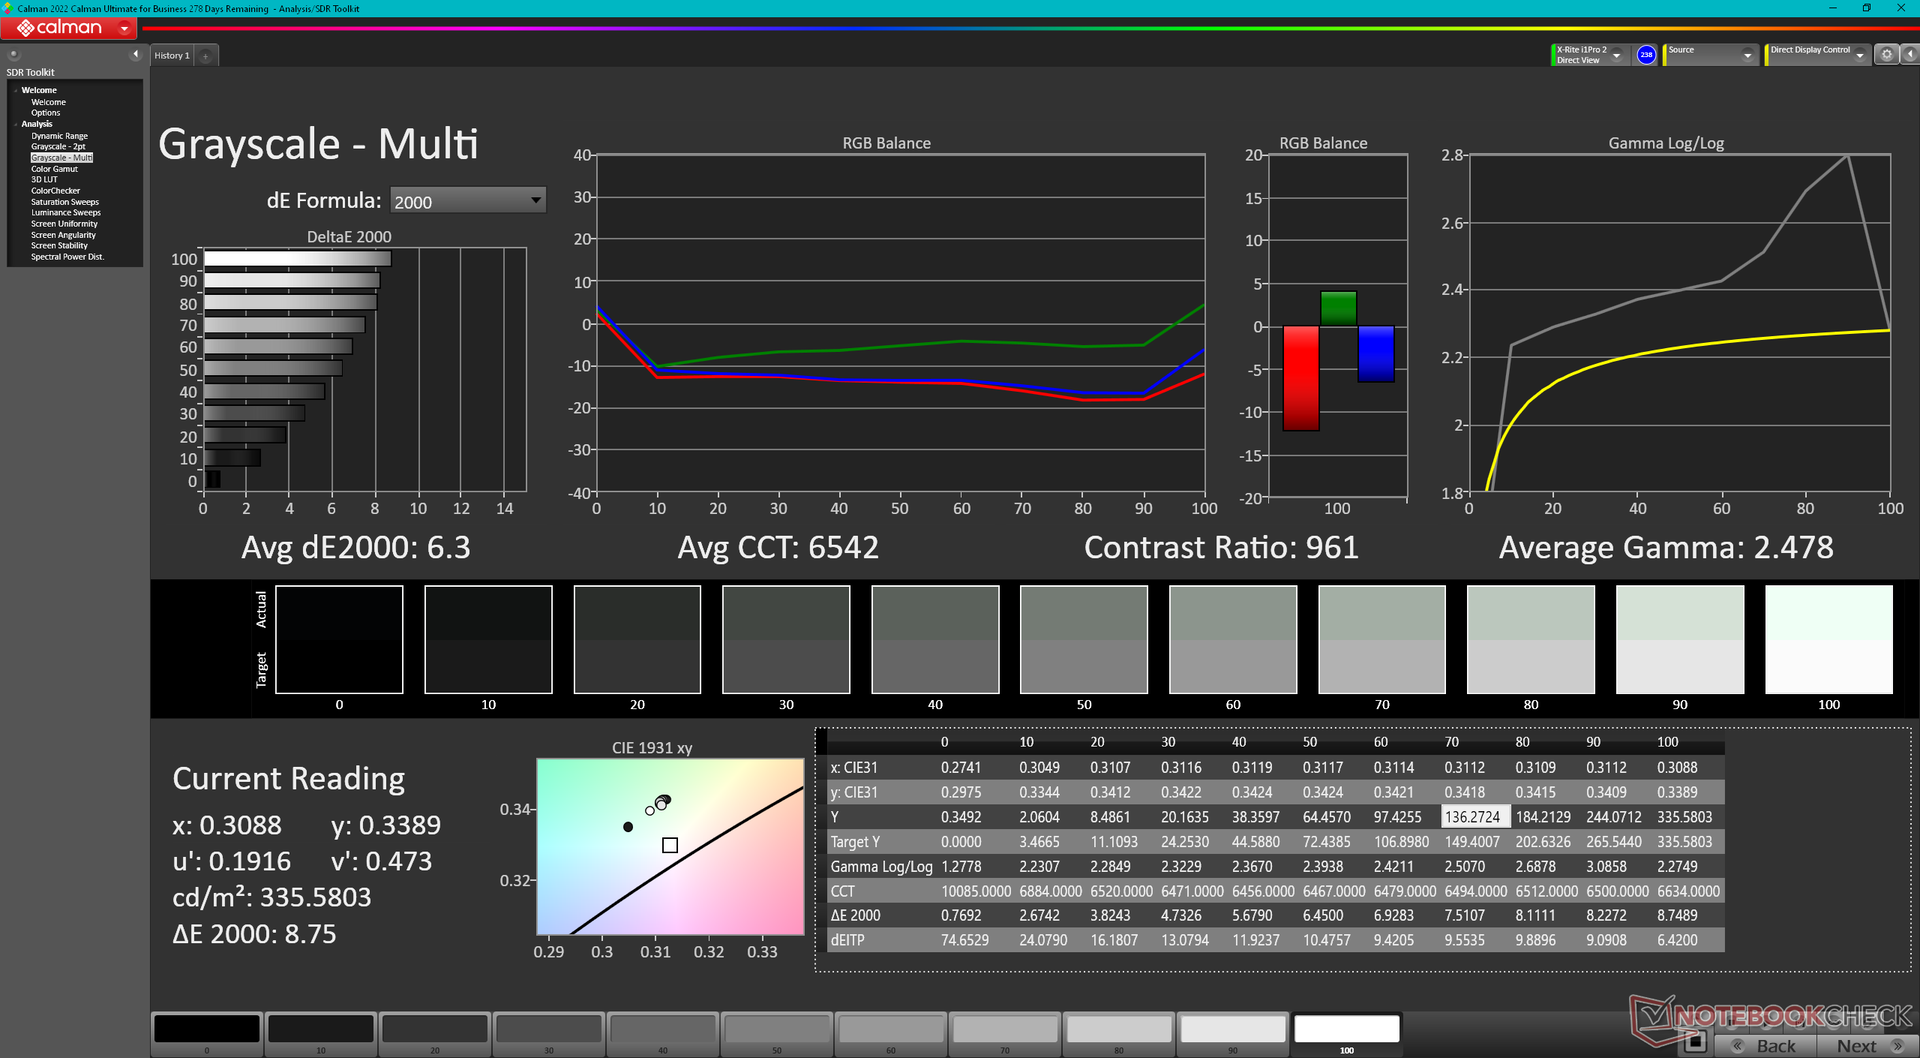
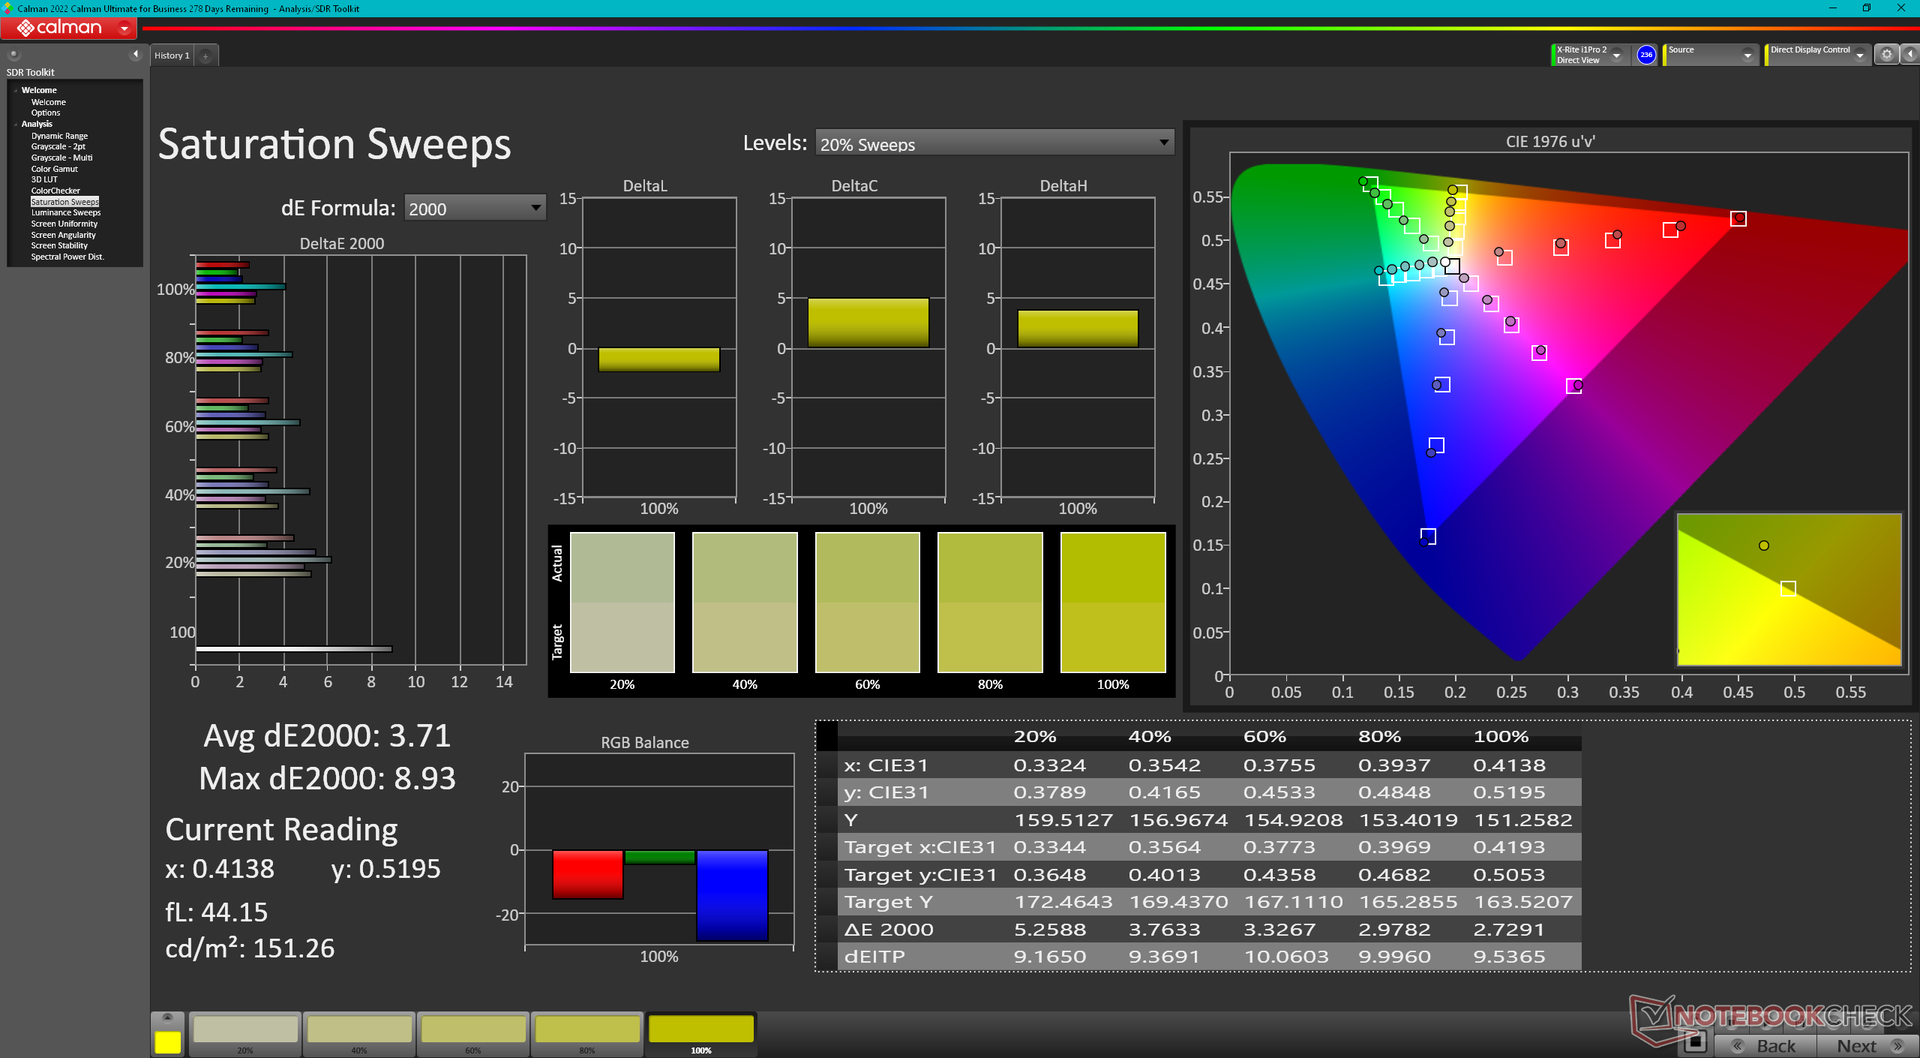
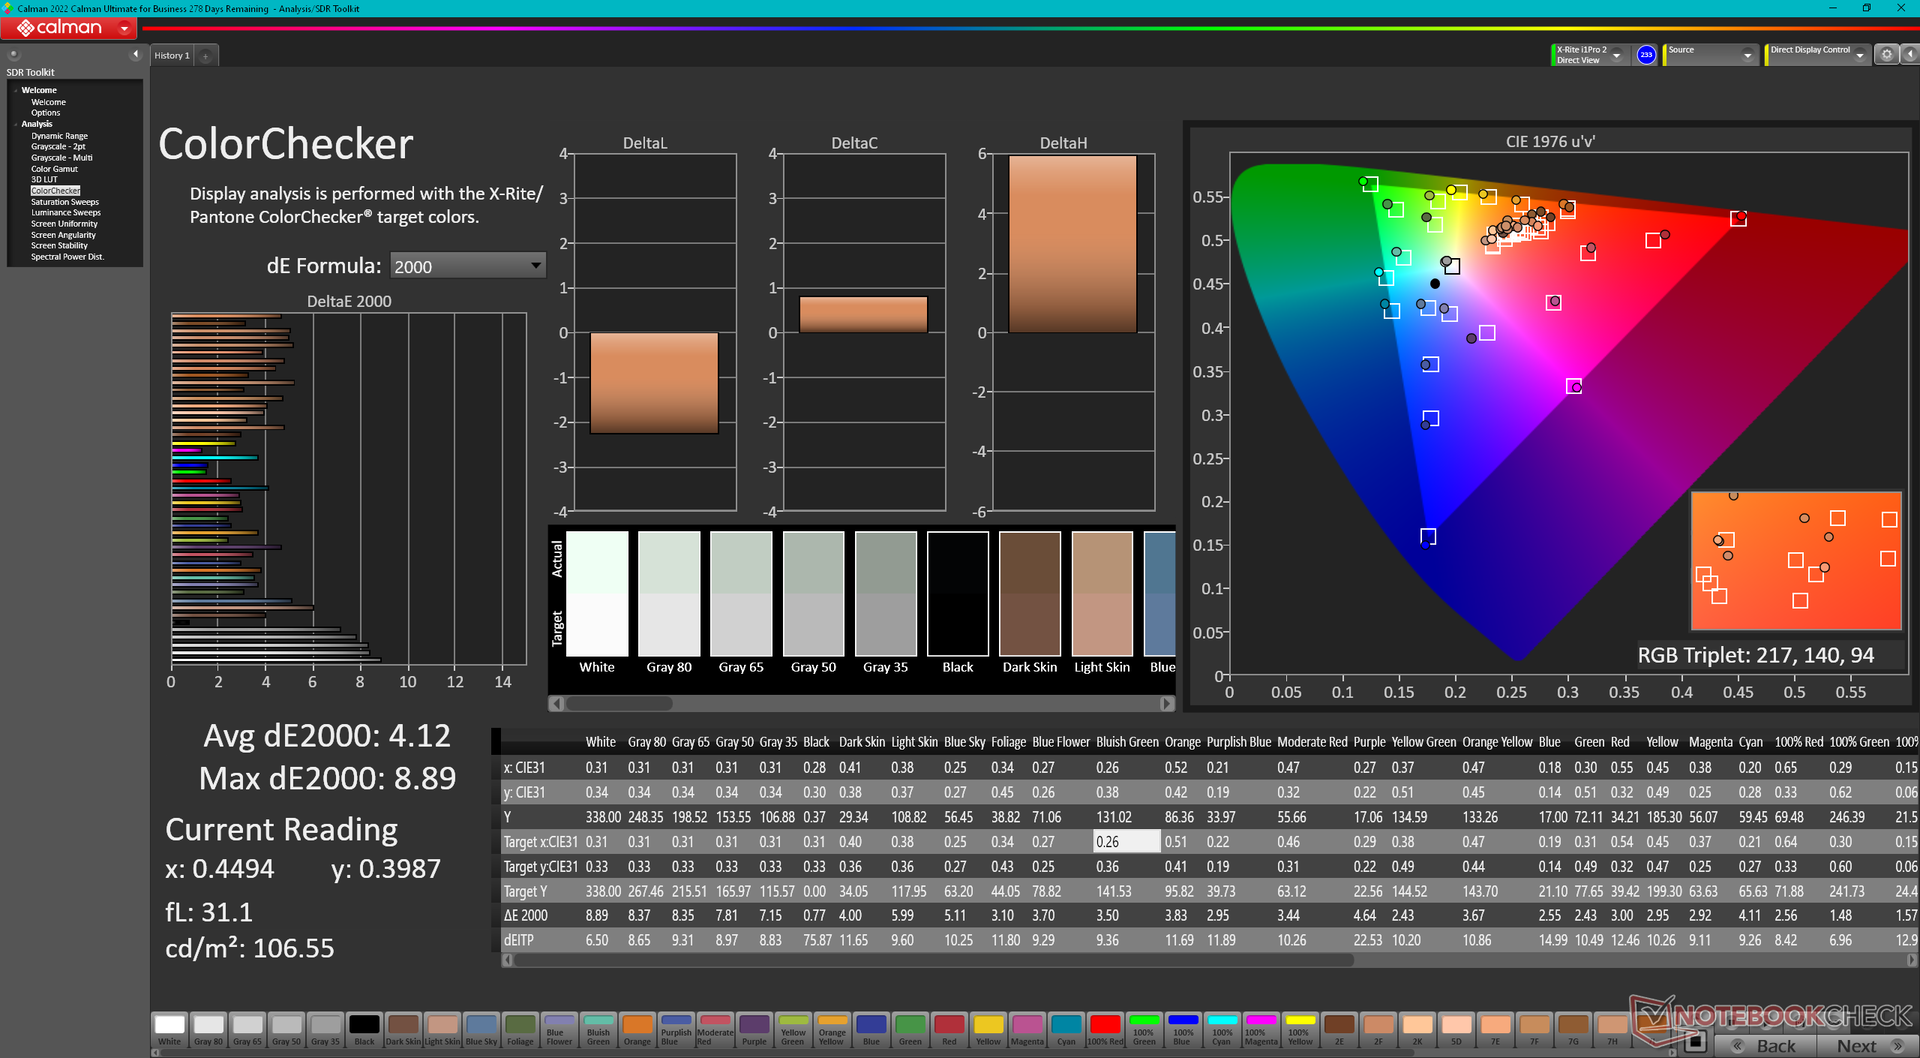
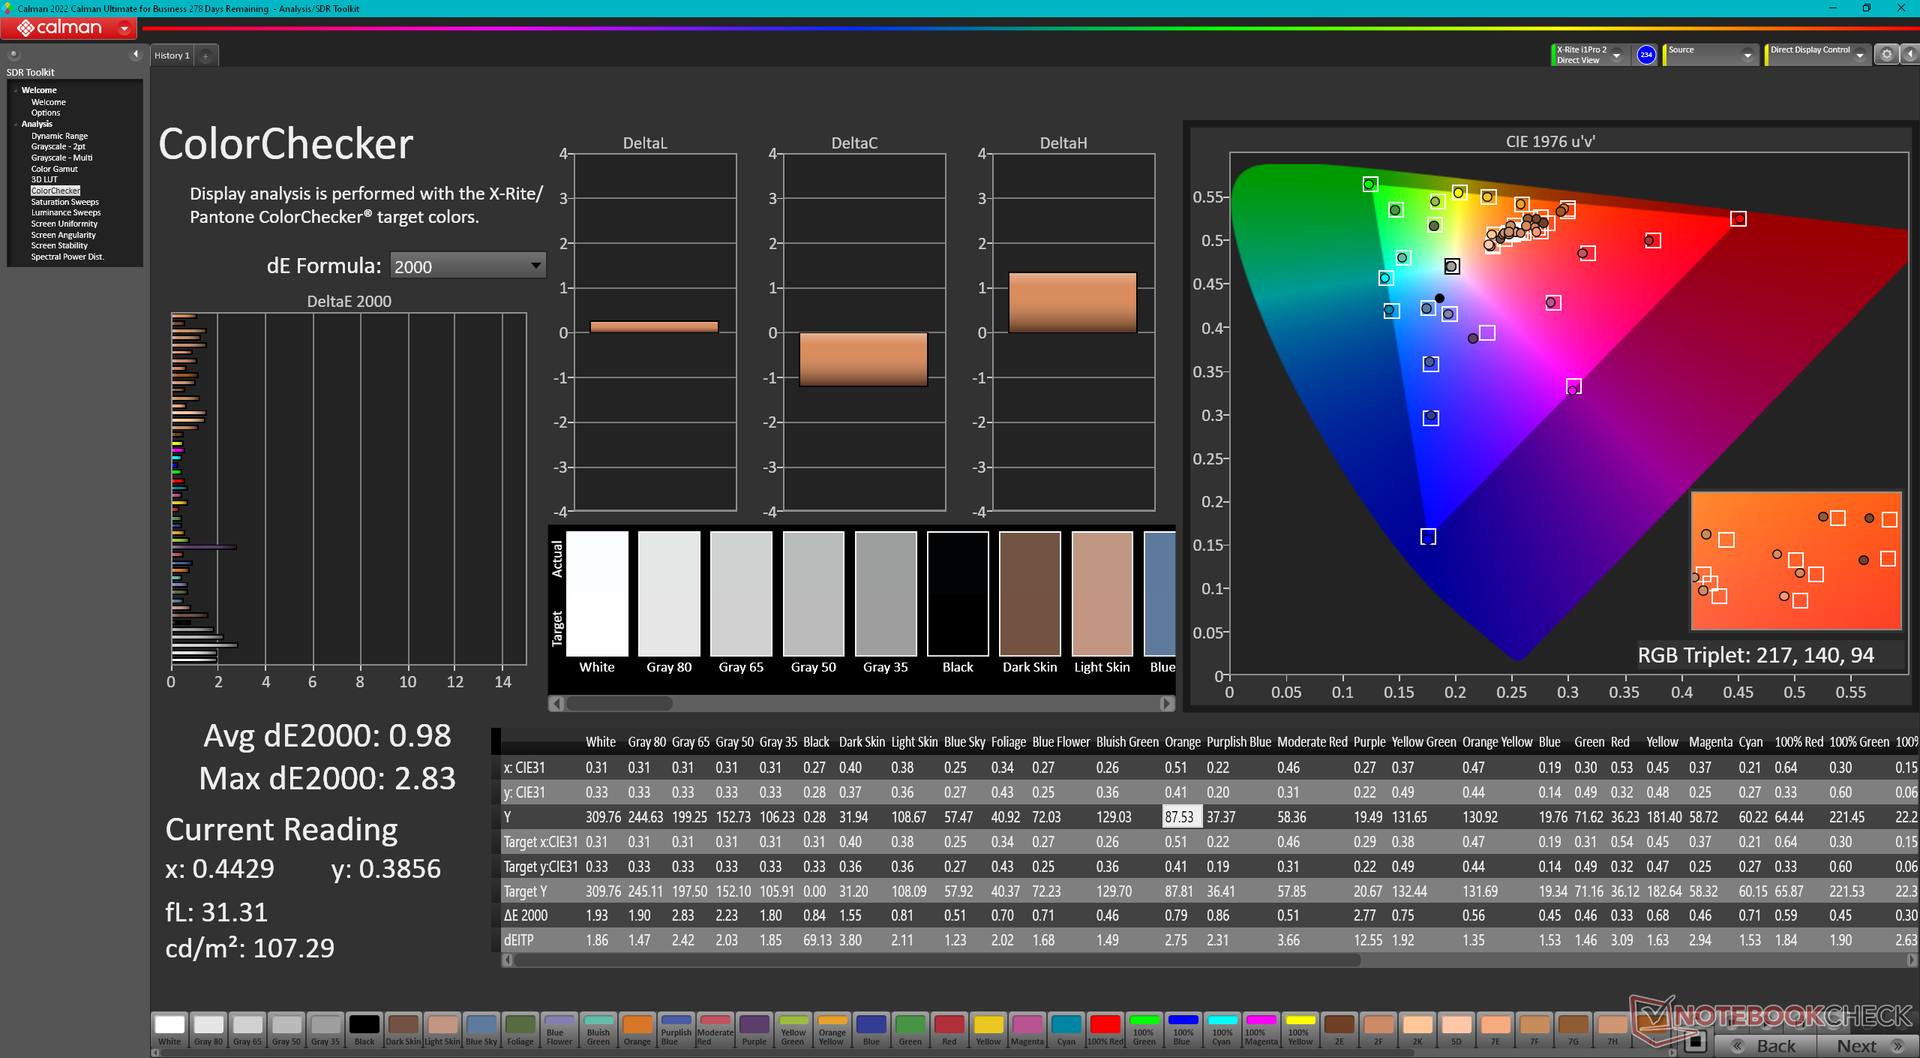
ΔE ColorChecker Calman: 4.12 | ∀{0.5-29.43 Ø4.72}
calibrated: 0.98
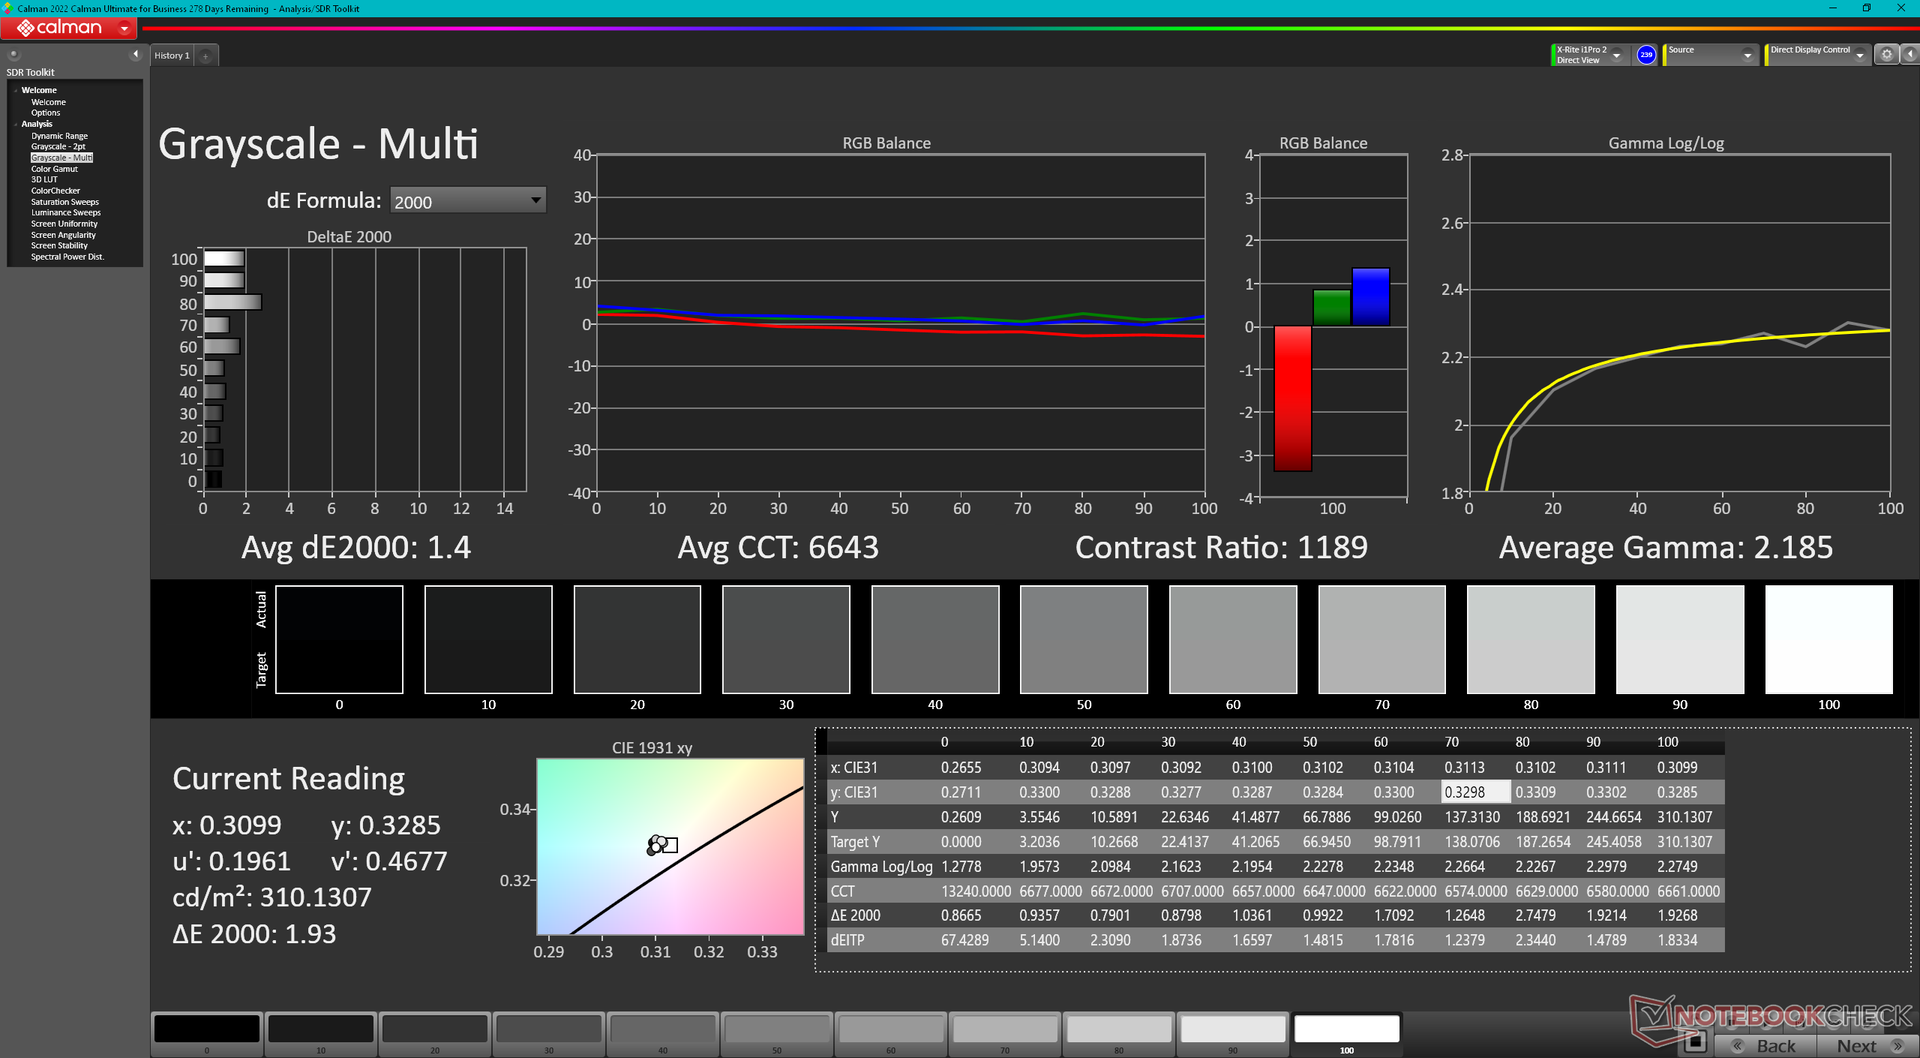
ΔE Greyscale Calman: 6.3 | ∀{0.09-98 Ø4.97}
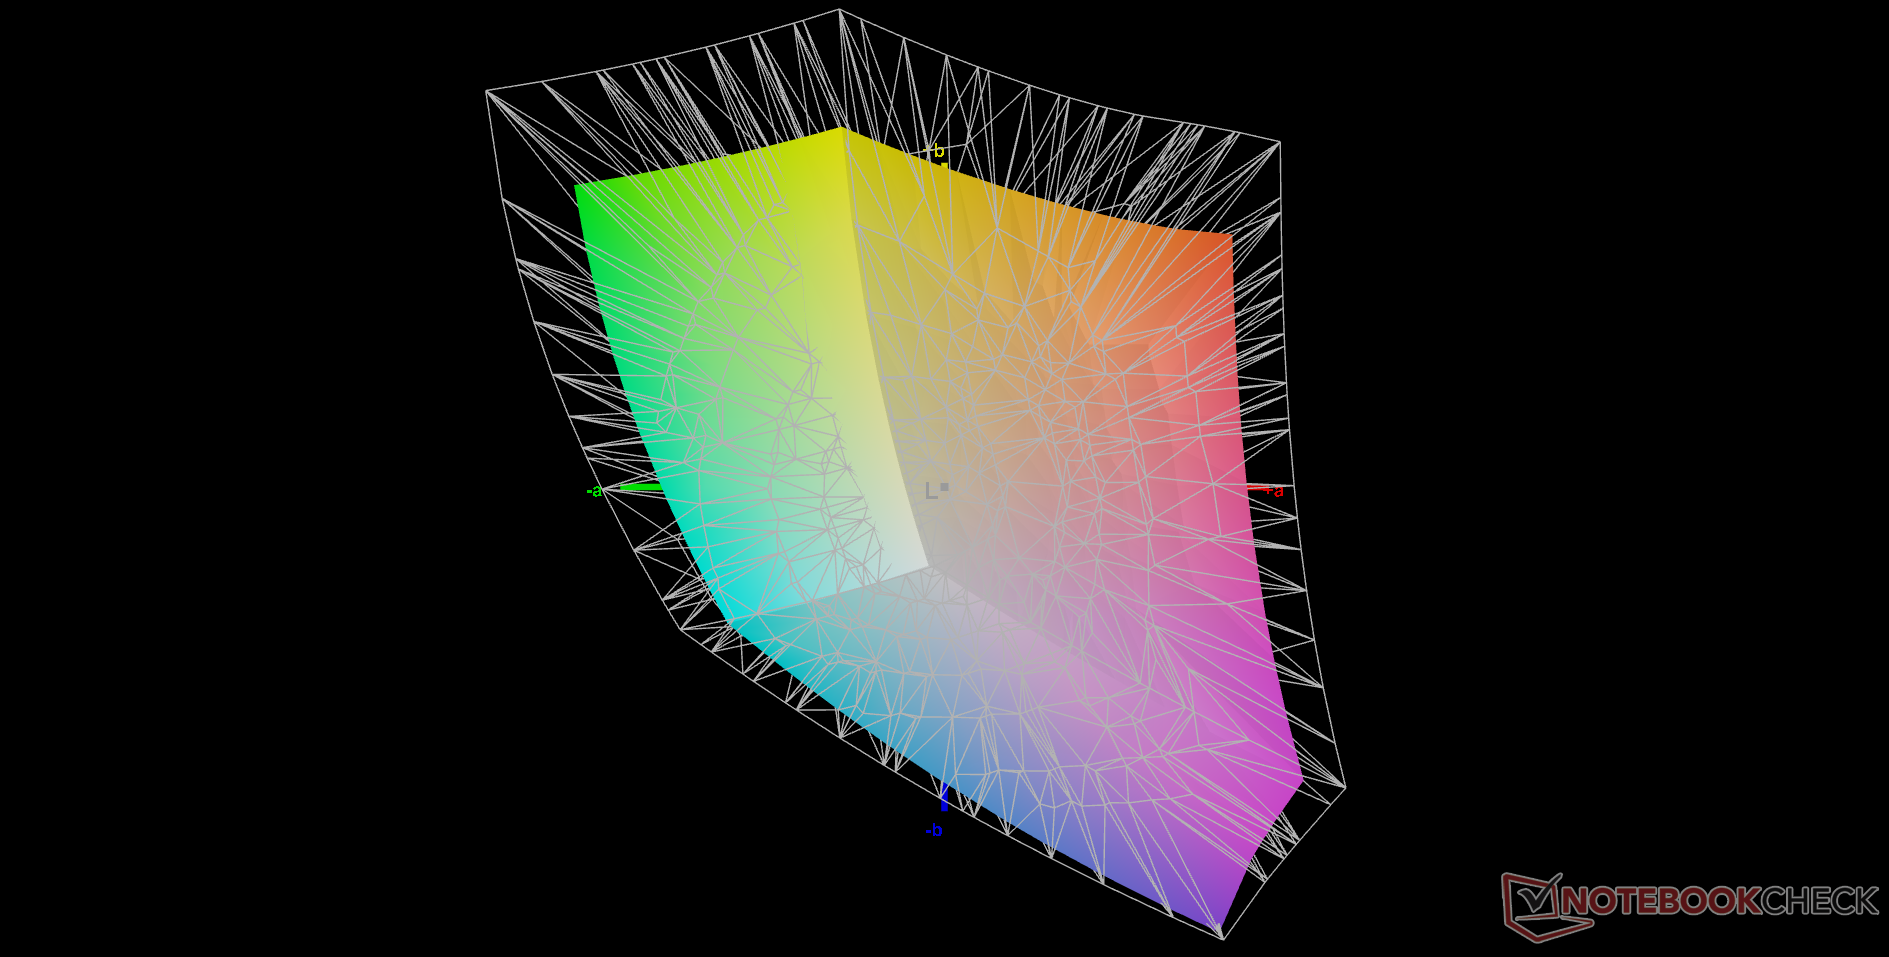
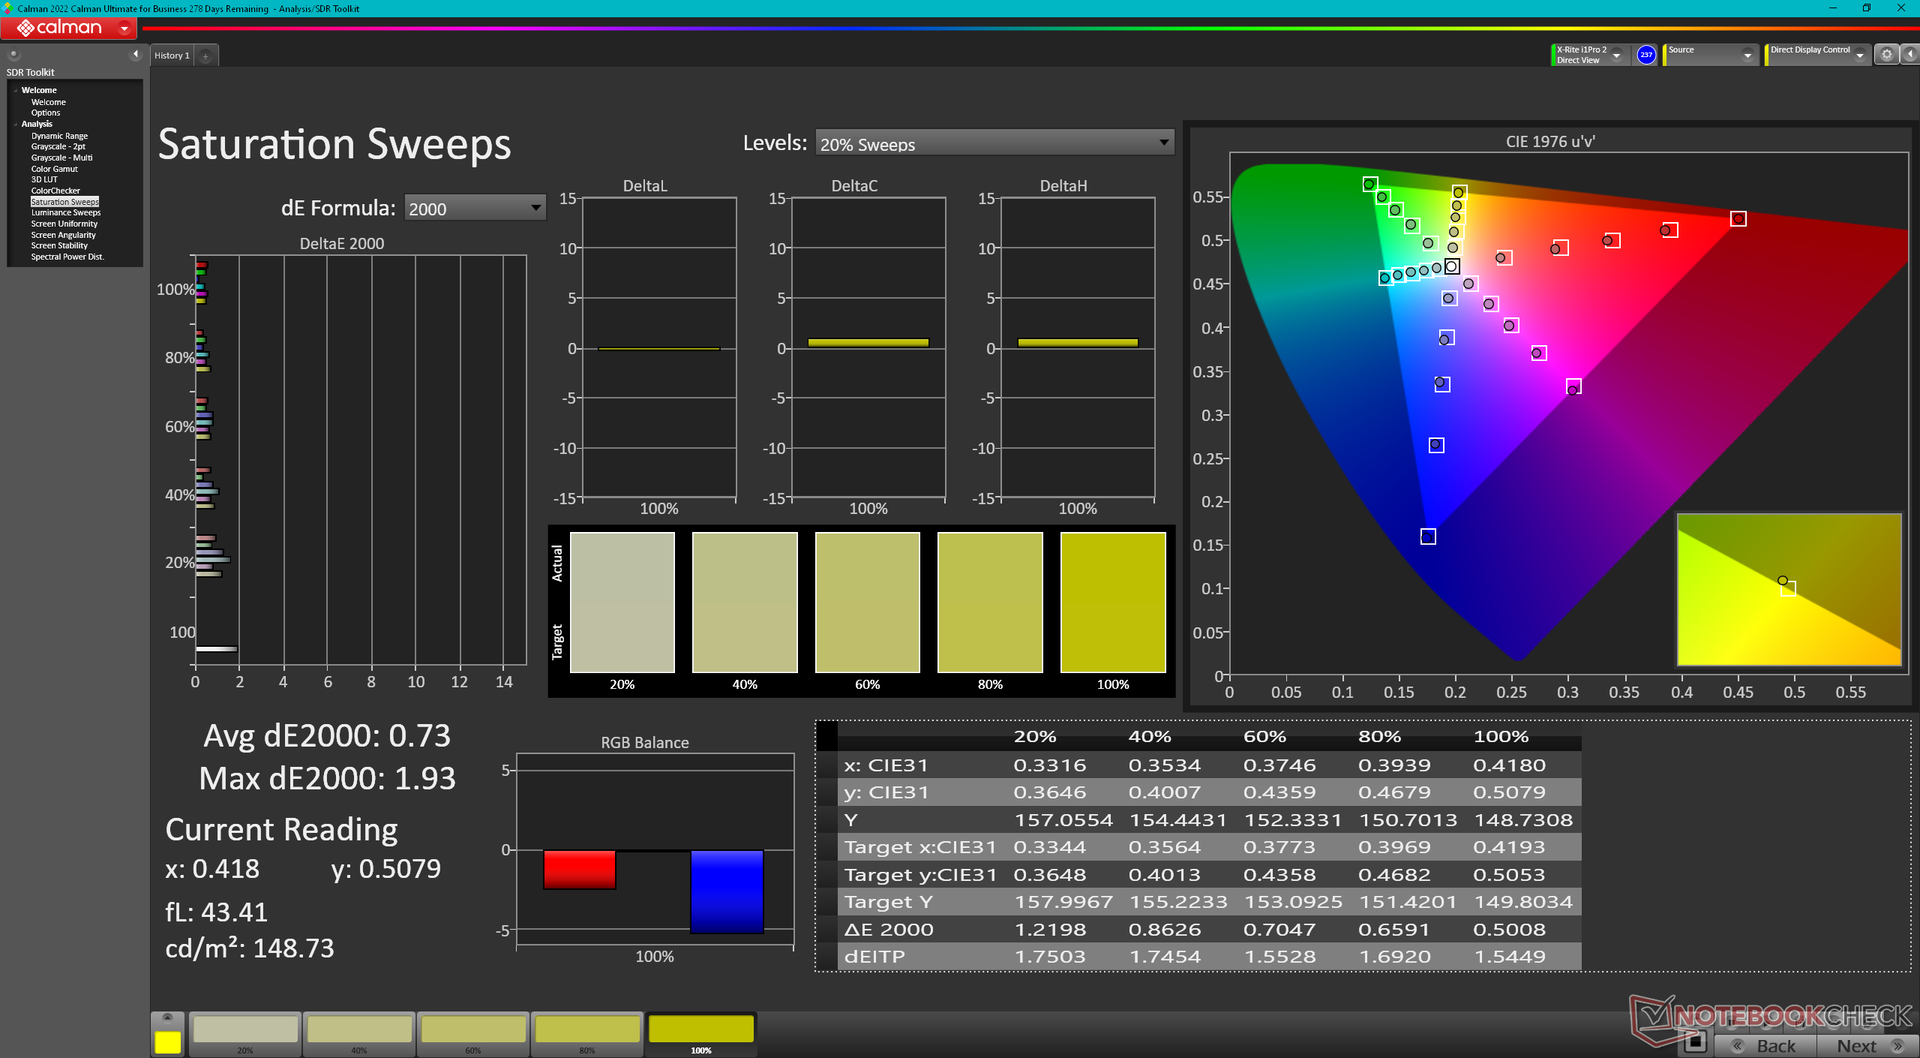
73.7% AdobeRGB 1998 (Argyll 3D)
99.9% sRGB (Argyll 3D)
71.9% Display P3 (Argyll 3D)
Gamma: 2.48
CCT: 6542 K
| MSI Pulse GL76 12UGK Sharp LQ173M1JW08, IPS, 1920x1080, 17.3" | Alienware m17 R5 (R9 6900HX, RX 6850M XT) AU Optronics AUODBA3, IPS, 3840x2160, 17" | Asus ROG Strix Scar 17 SE G733CX-LL014W NE173QHM-NZ2, IPS, 2560x1440, 17.3" | Acer Predator Helios 300 (i7-12700H, RTX 3070 Ti) BOE0A1A, IPS, 2560x1440, 17.3" | Razer Blade 17 Early 2022 AU Optronics B173ZAN06.9, IPS, 3840x2160, 17.3" | MSI Vector GP76 12UGS-434 AUO B173HAN05.4, IPS, 1920x1080, 17.3" | |
|---|---|---|---|---|---|---|
| Display | 18% | 17% | 17% | 19% | -3% | |
| Display P3 Coverage (%) | 71.9 | 97.2 35% | 97.1 35% | 96.8 35% | 99.4 38% | 70.09 -3% |
| sRGB Coverage (%) | 99.9 | 99.6 0% | 99.9 0% | 99.9 0% | 100 0% | 98.98 -1% |
| AdobeRGB 1998 Coverage (%) | 73.7 | 88.4 20% | 84.8 15% | 84.8 15% | 87.3 18% | 70.91 -4% |
| Response Times | -131% | -7% | -129% | -7% | 21% | |
| Response Time Grey 50% / Grey 80% * (ms) | 4.6 ? | 16.4 ? -257% | 5.7 ? -24% | 16.4 ? -257% | 7.5 ? -63% | 4 ? 13% |
| Response Time Black / White * (ms) | 11.2 ? | 11.6 ? -4% | 10.1 ? 10% | 11.2 ? -0% | 5.6 ? 50% | 8 ? 29% |
| PWM Frequency (Hz) | ||||||
| Screen | -43% | 28% | -12% | 34% | 11% | |
| Brightness middle (cd/m²) | 337.7 | 484 43% | 320 -5% | 366 8% | 503 49% | 274 -19% |
| Brightness (cd/m²) | 331 | 449 36% | 303 -8% | 340 3% | 486 47% | 264 -20% |
| Brightness Distribution (%) | 82 | 87 6% | 87 6% | 85 4% | 84 2% | 87 6% |
| Black Level * (cd/m²) | 0.31 | 0.55 -77% | 0.3 3% | 0.31 -0% | 0.44 -42% | 0.25 19% |
| Contrast (:1) | 1089 | 880 -19% | 1067 -2% | 1181 8% | 1143 5% | 1096 1% |
| Colorchecker dE 2000 * | 4.12 | 4.8 -17% | 1.1 73% | 3.56 14% | 1.08 74% | 2.53 39% |
| Colorchecker dE 2000 max. * | 8.89 | 7.48 16% | 2.7 70% | 5.66 36% | 4.54 49% | 6.76 24% |
| Colorchecker dE 2000 calibrated * | 0.98 | 4.74 -384% | 3.31 -238% | 0.6 39% | 0.98 -0% | |
| Greyscale dE 2000 * | 6.3 | 5.5 13% | 1.1 83% | 2.84 55% | 1.3 79% | 3.49 45% |
| Gamma | 2.48 89% | 2.42 91% | 2.13 103% | 2.29 96% | 2.151 102% | 2.31 95% |
| CCT | 6542 99% | 6148 106% | 6599 98% | 6835 95% | 6541 99% | 6714 97% |
| Media totale (Programma / Settaggio) | -52% /
-42% | 13% /
20% | -41% /
-23% | 15% /
25% | 10% /
9% |
* ... Meglio usare valori piccoli
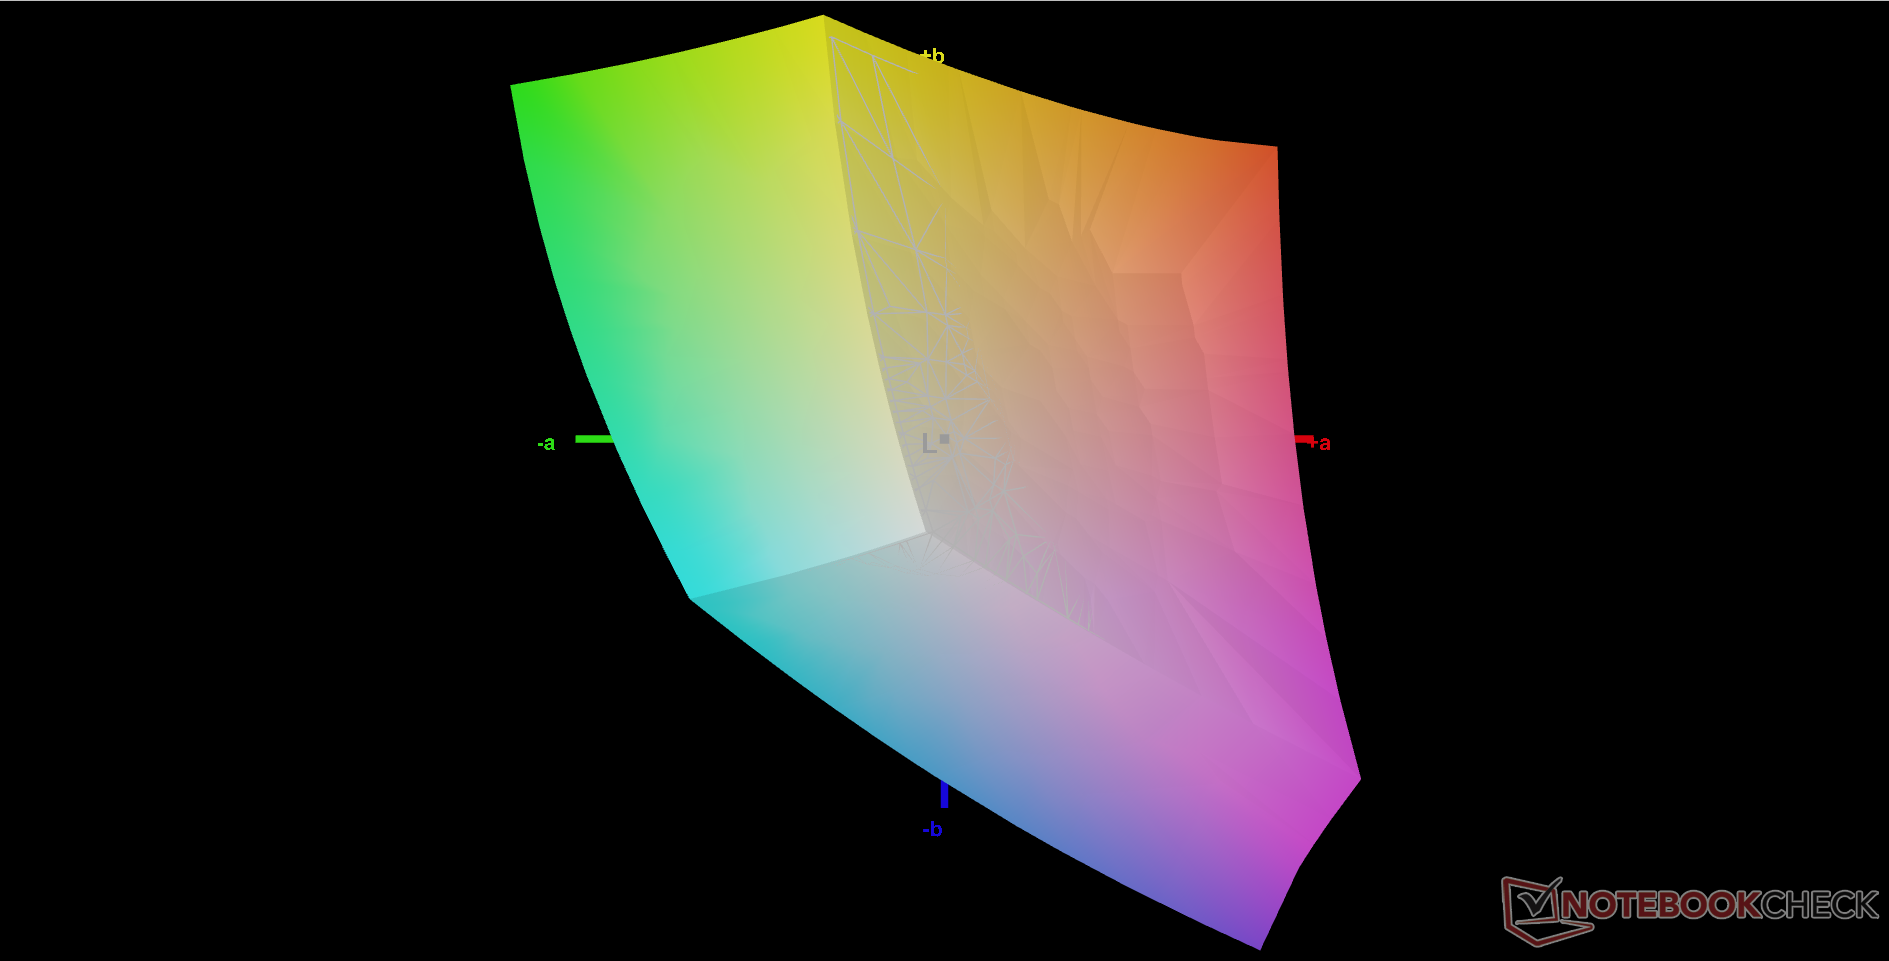
Il display non è stato calibrato in partenza. I valori medi del DeltaE della scala di grigi e del colore migliorerebbero significativamente da 6,3 e 4,12 a soli 1,4 e 0,98, rispettivamente, dopo una corretta calibrazione con un colorimetro X-Rite. Consigliamo di applicare il nostro profilo ICM per sfruttare al meglio l'intera copertura sRGB del pannello.
Tempi di risposta del Display
| ↔ Tempi di risposta dal Nero al Bianco | ||
|---|---|---|
| 11.2 ms ... aumenta ↗ e diminuisce ↘ combinato | ↗ 6.8 ms Incremento | 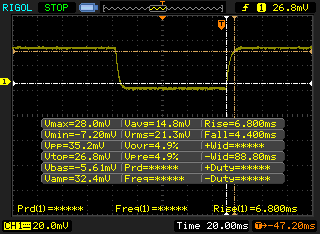 |
| ↘ 4.4 ms Calo | ||
| Lo schermo mostra buoni tempi di risposta durante i nostri tests, ma potrebbe essere troppo lento per i gamers competitivi. In confronto, tutti i dispositivi di test variano da 0.1 (minimo) a 240 (massimo) ms. » 30 % di tutti i dispositivi è migliore. Questo significa che i tempi di risposta rilevati sono migliori rispettto alla media di tutti i dispositivi testati (19.8 ms). | ||
| ↔ Tempo di risposta dal 50% Grigio all'80% Grigio | ||
| 4.6 ms ... aumenta ↗ e diminuisce ↘ combinato | ↗ 2.2 ms Incremento | 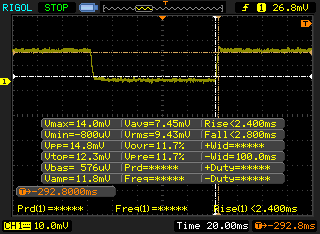 |
| ↘ 2.4 ms Calo | ||
| Lo schermo ha mostrato valori di risposta molto veloci nei nostri tests ed è molto adatto per i gaming veloce. In confronto, tutti i dispositivi di test variano da 0.165 (minimo) a 636 (massimo) ms. » 16 % di tutti i dispositivi è migliore. Questo significa che i tempi di risposta rilevati sono migliori rispettto alla media di tutti i dispositivi testati (31 ms). | ||
Sfarfallio dello schermo / PWM (Pulse-Width Modulation)
| flickering dello schermo / PWM non rilevato | 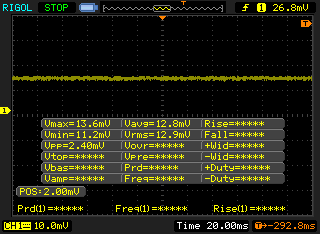 | ||
In confronto: 52 % di tutti i dispositivi testati non utilizza PWM per ridurre la luminosita' del display. Se è rilevato PWM, una media di 7772 (minimo: 5 - massimo: 343500) Hz è stata rilevata. | |||
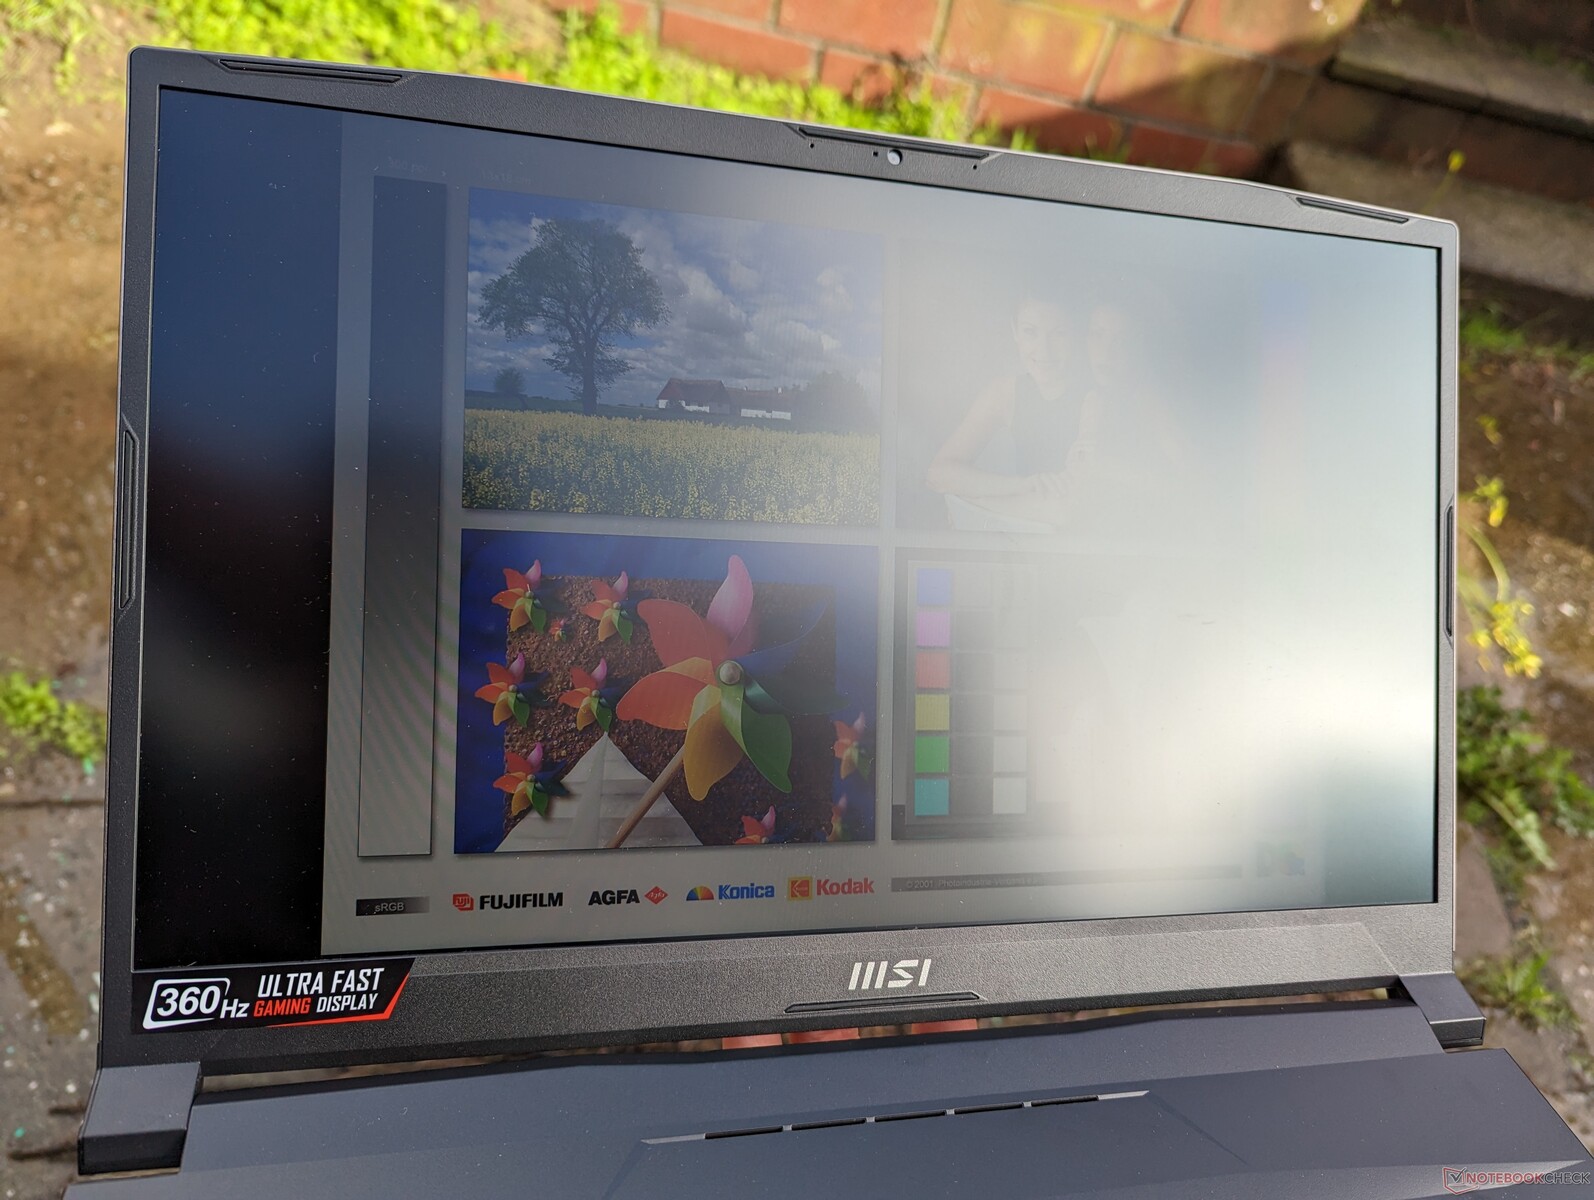
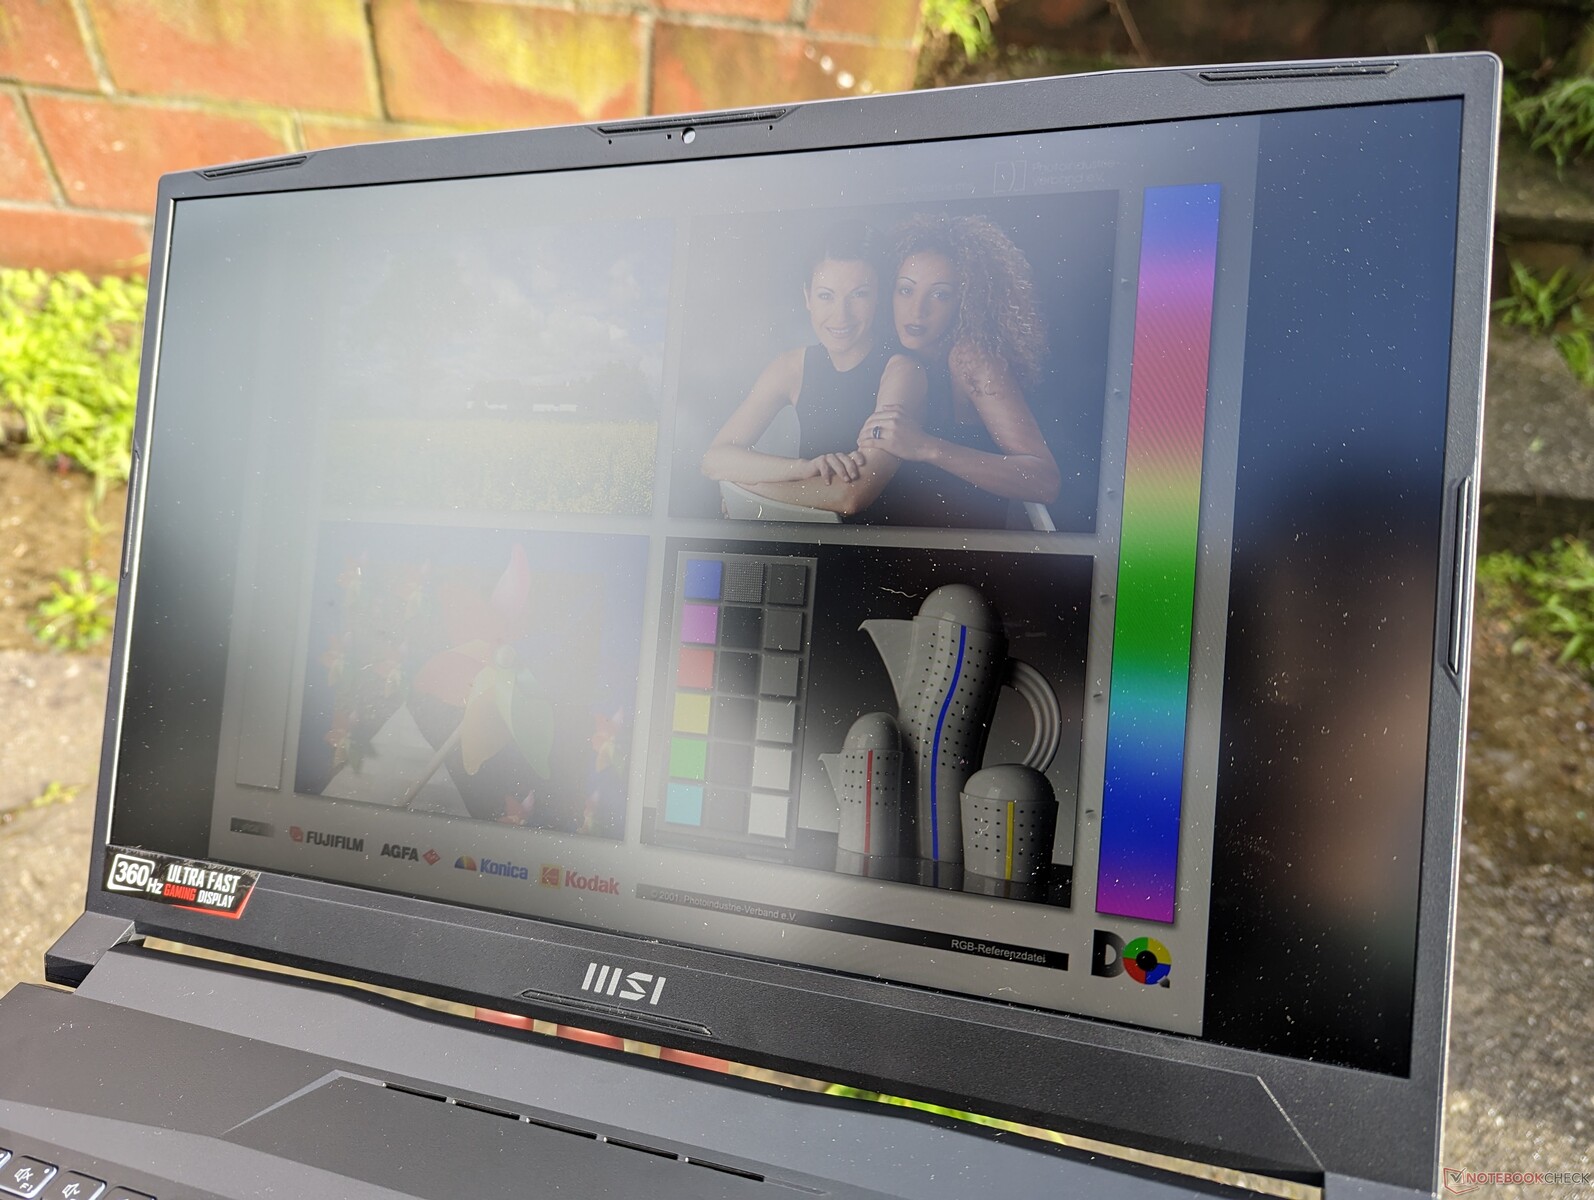
Il display opaco è sufficientemente luminoso per l'uso all'ombra, ma non è progettato per condizioni esterne più luminose. Alcuni portatili da gioco, come il Razer Blade 17 OLEDhanno display più luminosi da 500 nit per una maggiore leggibilità all'aperto.
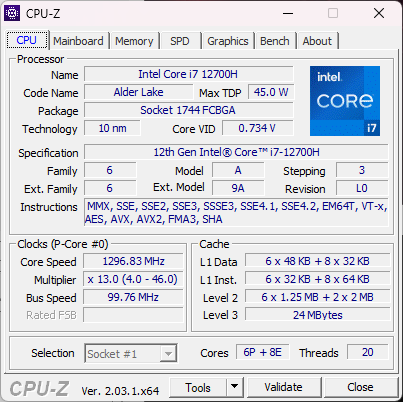
Prestazioni - Intel 12th Gen Alder Lake-H
Condizioni di test
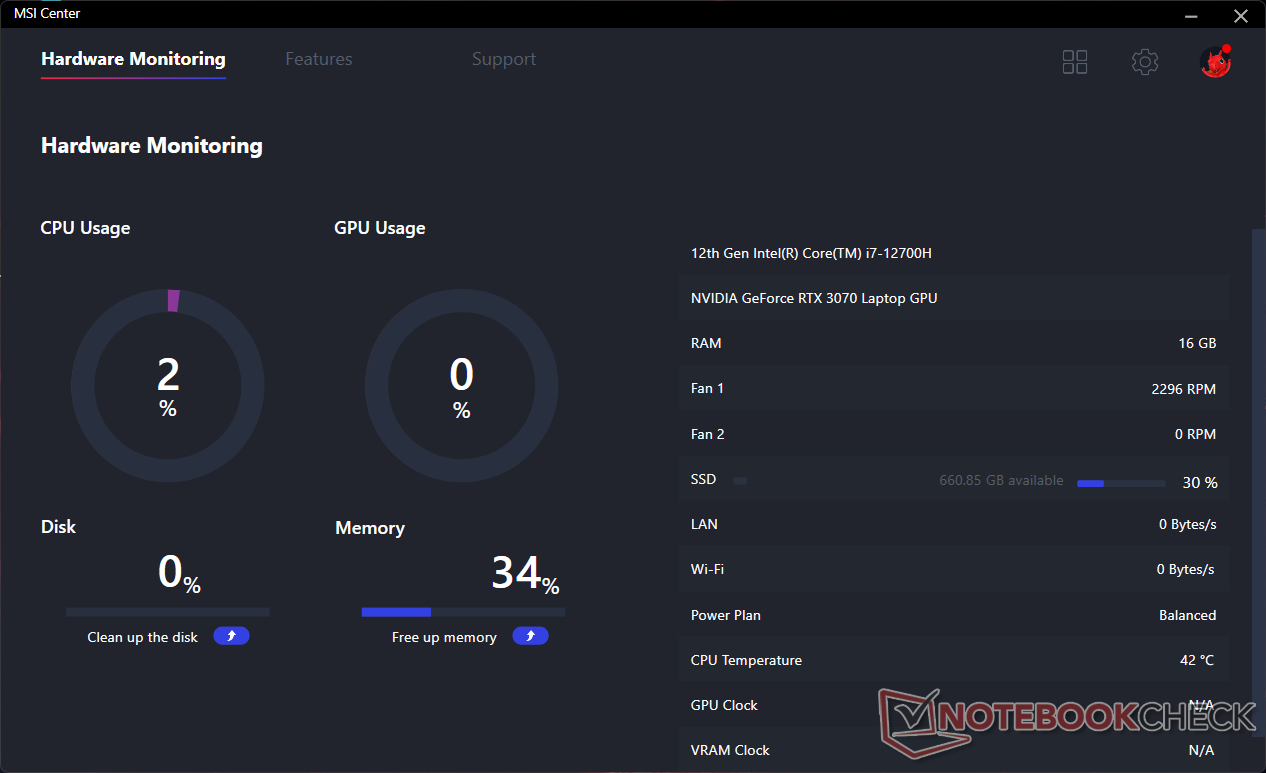
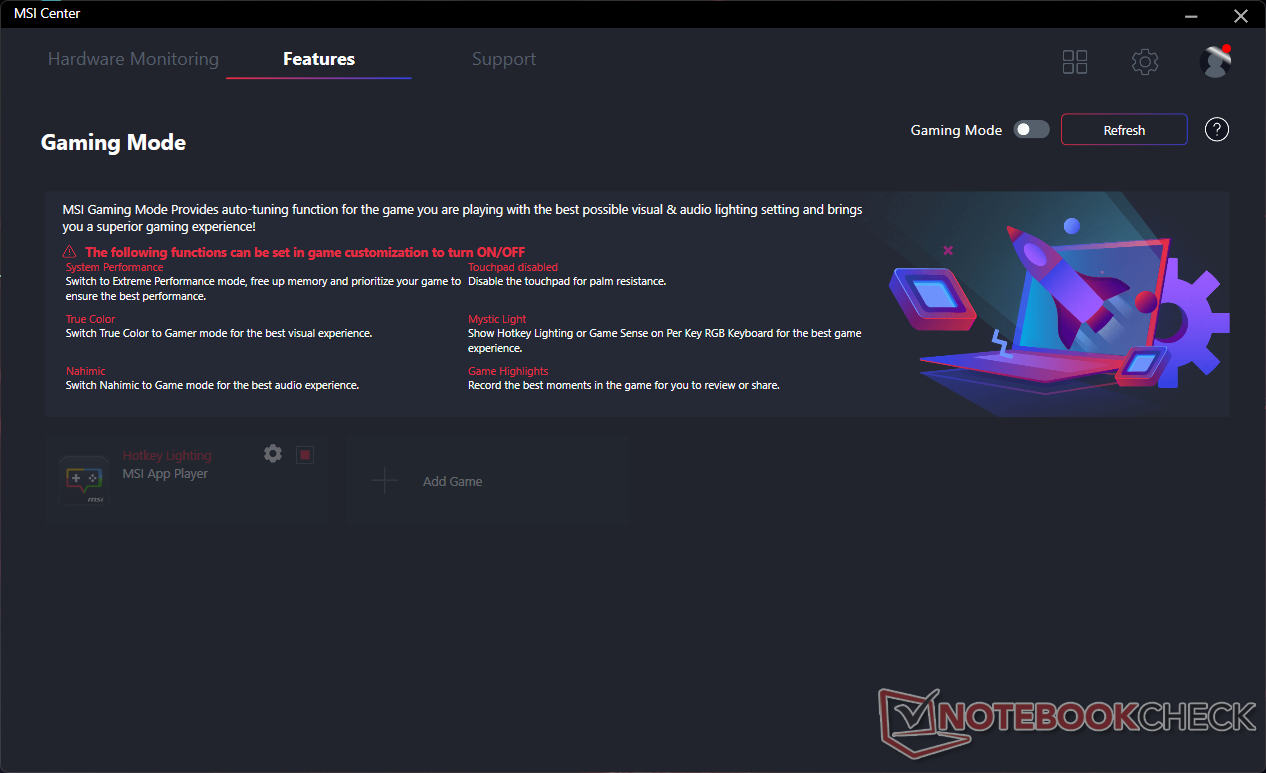
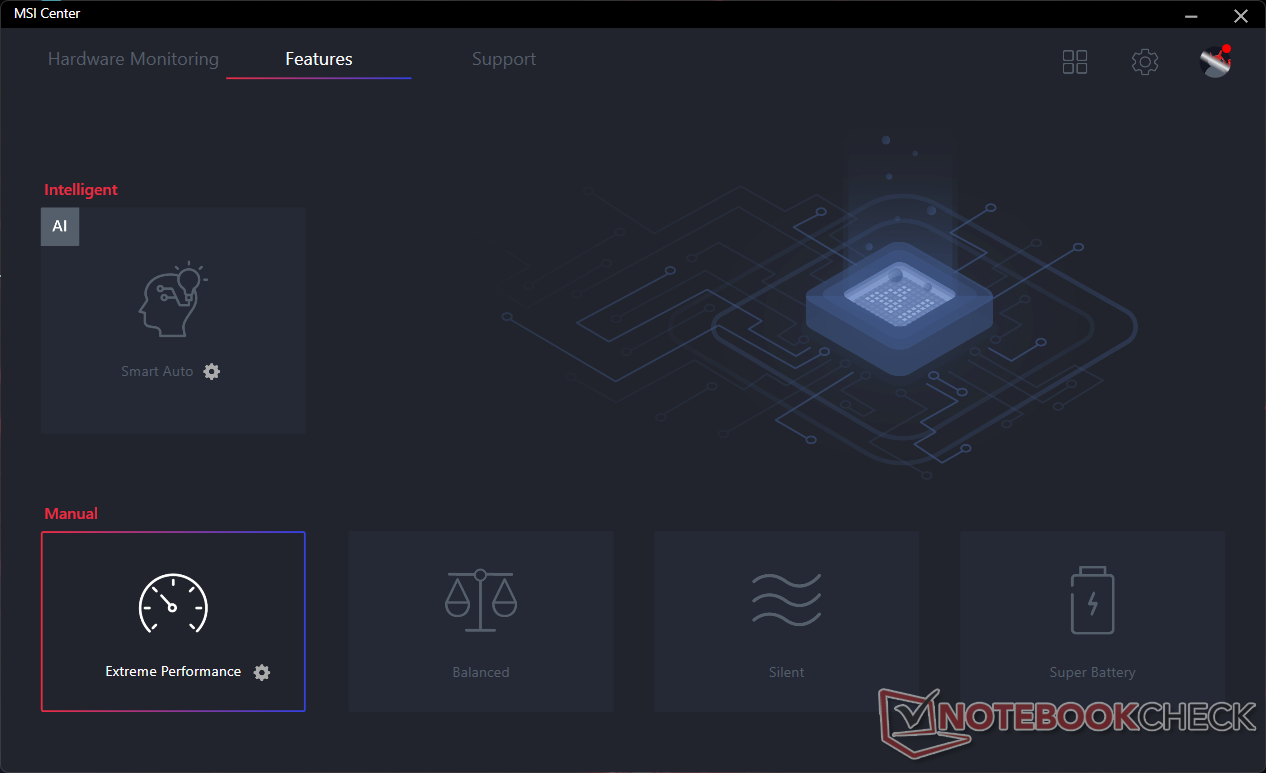
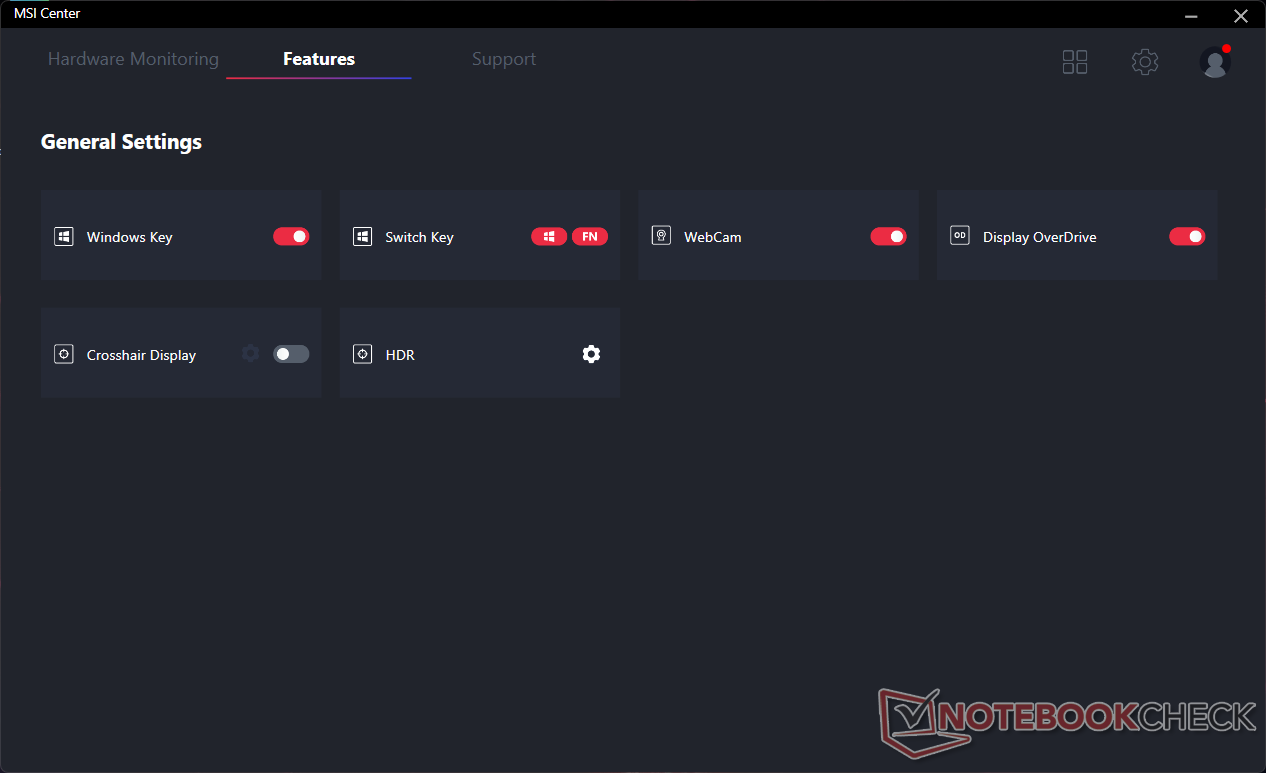
Abbiamo impostato la nostra unità in modalità Performance tramite Windows e in modalità Extreme Performance tramite MSI Center, con la dGPU attiva, prima di eseguire i benchmark delle prestazioni riportati di seguito. Anche la modalità della ventola è stata impostata su Auto. Gli utenti dovrebbero familiarizzare con MSI Center, in quanto è l'hub di controllo per gli aggiornamenti specifici di MSI, i profili delle prestazioni, il monitoraggio dell'hardware e altro ancora, come mostrano gli screenshot qui sotto.
La serie GL76 non supporta Advanced Optimus o MUX.
Processore
Le prestazioni della CPU sono eccellenti, con risultati multi-thread più veloci di circa il 10% rispetto alla media dei laptop del nostro database equipaggiati con lo stesso Core i7-12700H CORE I7-12700H. Complessivamente, si trova a pochi punti percentuali dalla CPU Core i9-12900H del molto più costoso Alienware x15 R2.
Optando per il Core i5-12500H di fascia bassa Core i5-12500H di fascia bassa invece del nostro Core i7, si otterrebbe un deficit di prestazioni multi-thread di circa il 15%.
Cinebench R15 Multi Loop
Cinebench R20: CPU (Multi Core) | CPU (Single Core)
Cinebench R23: Multi Core | Single Core
Cinebench R15: CPU Multi 64Bit | CPU Single 64Bit
Blender: v2.79 BMW27 CPU
7-Zip 18.03: 7z b 4 | 7z b 4 -mmt1
Geekbench 5.5: Multi-Core | Single-Core
HWBOT x265 Benchmark v2.2: 4k Preset
LibreOffice : 20 Documents To PDF
R Benchmark 2.5: Overall mean
| HWBOT x265 Benchmark v2.2 / 4k Preset | |
| MSI GE67 HX 12UGS | |
| Asus ROG Strix Scar 17 SE G733CX-LL014W | |
| Alienware x15 R2 P111F | |
| MSI Pulse GL76 12UGK | |
| Razer Blade 15 2022 | |
| Alienware m17 R5 (R9 6900HX, RX 6850M XT) | |
| Media Intel Core i7-12700H (4.67 - 21.8, n=64) | |
| HP Omen 16-n0033dx | |
| Lenovo IdeaPad Gaming 3 15IAH7 | |
| MSI GE76 Raider 10UH | |
| Schenker XMG Apex 15 Max | |
* ... Meglio usare valori piccoli
AIDA64: FP32 Ray-Trace | FPU Julia | CPU SHA3 | CPU Queen | FPU SinJulia | FPU Mandel | CPU AES | CPU ZLib | FP64 Ray-Trace | CPU PhotoWorxx
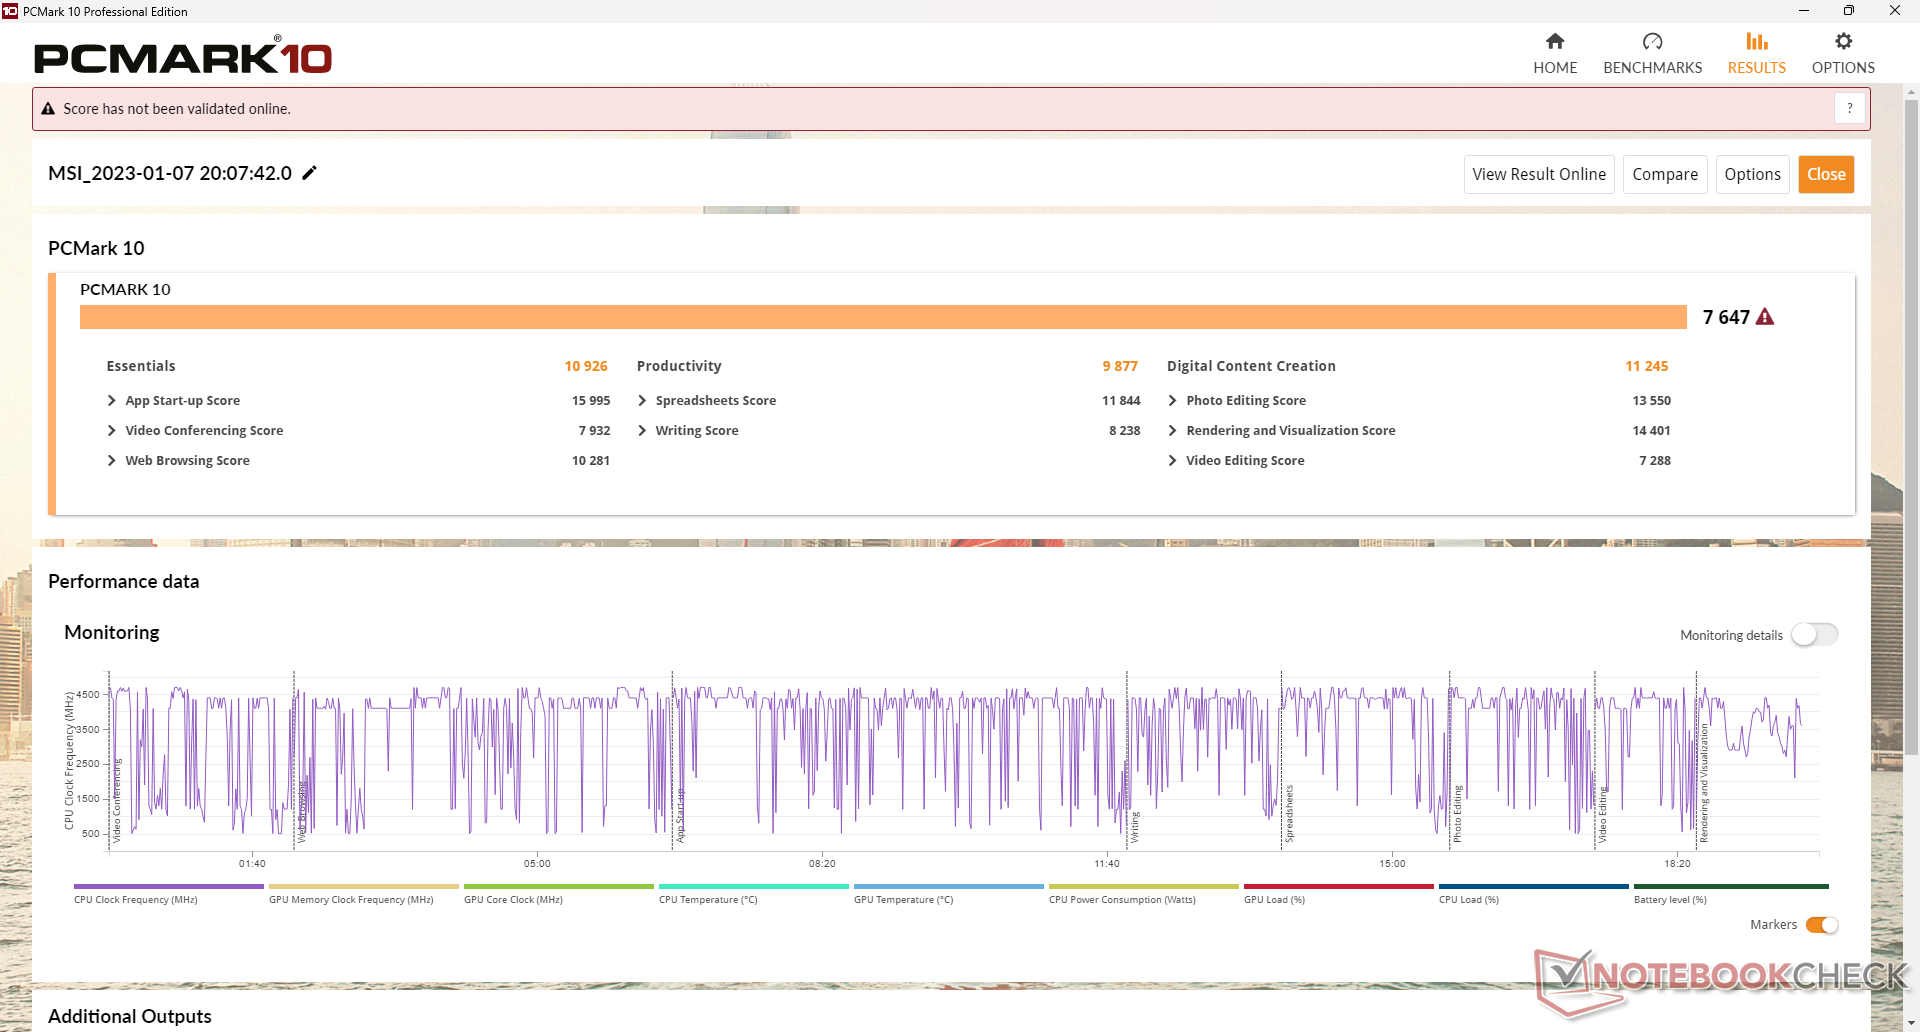
Prestazioni del sistema
I risultati di PCMark sono eccellenti e paragonabili a quelli di portatili da gioco di fascia alta come l'Asus ROG Strix Scar 17. In altre parole, il GL76 è in grado di offrire quasi le stesse prestazioni di un'alternativa di punta, ma a un prezzo molto inferiore.
CrossMark: Overall | Productivity | Creativity | Responsiveness
| PCMark 10 / Score | |
| MSI Vector GP76 12UGS-434 | |
| Acer Predator Helios 300 (i7-12700H, RTX 3070 Ti) | |
| MSI Pulse GL76 12UGK | |
| Media Intel Core i7-12700H, NVIDIA GeForce RTX 3070 Laptop GPU (7082 - 7647, n=2) | |
| Alienware m17 R5 (R9 6900HX, RX 6850M XT) | |
| Asus ROG Strix Scar 17 SE G733CX-LL014W | |
| Razer Blade 17 Early 2022 | |
| PCMark 10 / Essentials | |
| MSI Pulse GL76 12UGK | |
| Acer Predator Helios 300 (i7-12700H, RTX 3070 Ti) | |
| MSI Vector GP76 12UGS-434 | |
| Media Intel Core i7-12700H, NVIDIA GeForce RTX 3070 Laptop GPU (10076 - 10926, n=2) | |
| Asus ROG Strix Scar 17 SE G733CX-LL014W | |
| Razer Blade 17 Early 2022 | |
| Alienware m17 R5 (R9 6900HX, RX 6850M XT) | |
| PCMark 10 / Productivity | |
| MSI Vector GP76 12UGS-434 | |
| Acer Predator Helios 300 (i7-12700H, RTX 3070 Ti) | |
| MSI Pulse GL76 12UGK | |
| Asus ROG Strix Scar 17 SE G733CX-LL014W | |
| Media Intel Core i7-12700H, NVIDIA GeForce RTX 3070 Laptop GPU (9460 - 9877, n=2) | |
| Razer Blade 17 Early 2022 | |
| Alienware m17 R5 (R9 6900HX, RX 6850M XT) | |
| PCMark 10 / Digital Content Creation | |
| Acer Predator Helios 300 (i7-12700H, RTX 3070 Ti) | |
| MSI Vector GP76 12UGS-434 | |
| Alienware m17 R5 (R9 6900HX, RX 6850M XT) | |
| MSI Pulse GL76 12UGK | |
| Media Intel Core i7-12700H, NVIDIA GeForce RTX 3070 Laptop GPU (10113 - 11245, n=2) | |
| Razer Blade 17 Early 2022 | |
| Asus ROG Strix Scar 17 SE G733CX-LL014W | |
| CrossMark / Overall | |
| Asus ROG Strix Scar 17 SE G733CX-LL014W | |
| MSI Vector GP76 12UGS-434 | |
| Media Intel Core i7-12700H, NVIDIA GeForce RTX 3070 Laptop GPU (1844 - 2003, n=2) | |
| Acer Predator Helios 300 (i7-12700H, RTX 3070 Ti) | |
| MSI Pulse GL76 12UGK | |
| Razer Blade 17 Early 2022 | |
| Alienware m17 R5 (R9 6900HX, RX 6850M XT) | |
| CrossMark / Productivity | |
| Asus ROG Strix Scar 17 SE G733CX-LL014W | |
| MSI Vector GP76 12UGS-434 | |
| Media Intel Core i7-12700H, NVIDIA GeForce RTX 3070 Laptop GPU (1785 - 1971, n=2) | |
| MSI Pulse GL76 12UGK | |
| Acer Predator Helios 300 (i7-12700H, RTX 3070 Ti) | |
| Razer Blade 17 Early 2022 | |
| Alienware m17 R5 (R9 6900HX, RX 6850M XT) | |
| CrossMark / Creativity | |
| Asus ROG Strix Scar 17 SE G733CX-LL014W | |
| Acer Predator Helios 300 (i7-12700H, RTX 3070 Ti) | |
| Media Intel Core i7-12700H, NVIDIA GeForce RTX 3070 Laptop GPU (1912 - 1979, n=2) | |
| MSI Vector GP76 12UGS-434 | |
| MSI Pulse GL76 12UGK | |
| Razer Blade 17 Early 2022 | |
| Alienware m17 R5 (R9 6900HX, RX 6850M XT) | |
| CrossMark / Responsiveness | |
| MSI Vector GP76 12UGS-434 | |
| Media Intel Core i7-12700H, NVIDIA GeForce RTX 3070 Laptop GPU (1824 - 2182, n=2) | |
| Asus ROG Strix Scar 17 SE G733CX-LL014W | |
| MSI Pulse GL76 12UGK | |
| Acer Predator Helios 300 (i7-12700H, RTX 3070 Ti) | |
| Razer Blade 17 Early 2022 | |
| Alienware m17 R5 (R9 6900HX, RX 6850M XT) | |
| PCMark 10 Score | 7647 punti | |
Aiuto | ||
| AIDA64 / Memory Latency | |
| Alienware m17 R5 (R9 6900HX, RX 6850M XT) | |
| MSI Pulse GL76 12UGK | |
| MSI Vector GP76 12UGS-434 | |
| Acer Predator Helios 300 (i7-12700H, RTX 3070 Ti) | |
| Asus ROG Strix Scar 17 SE G733CX-LL014W | |
| Media Intel Core i7-12700H (76.2 - 133.9, n=62) | |
* ... Meglio usare valori piccoli
Latenza DPC
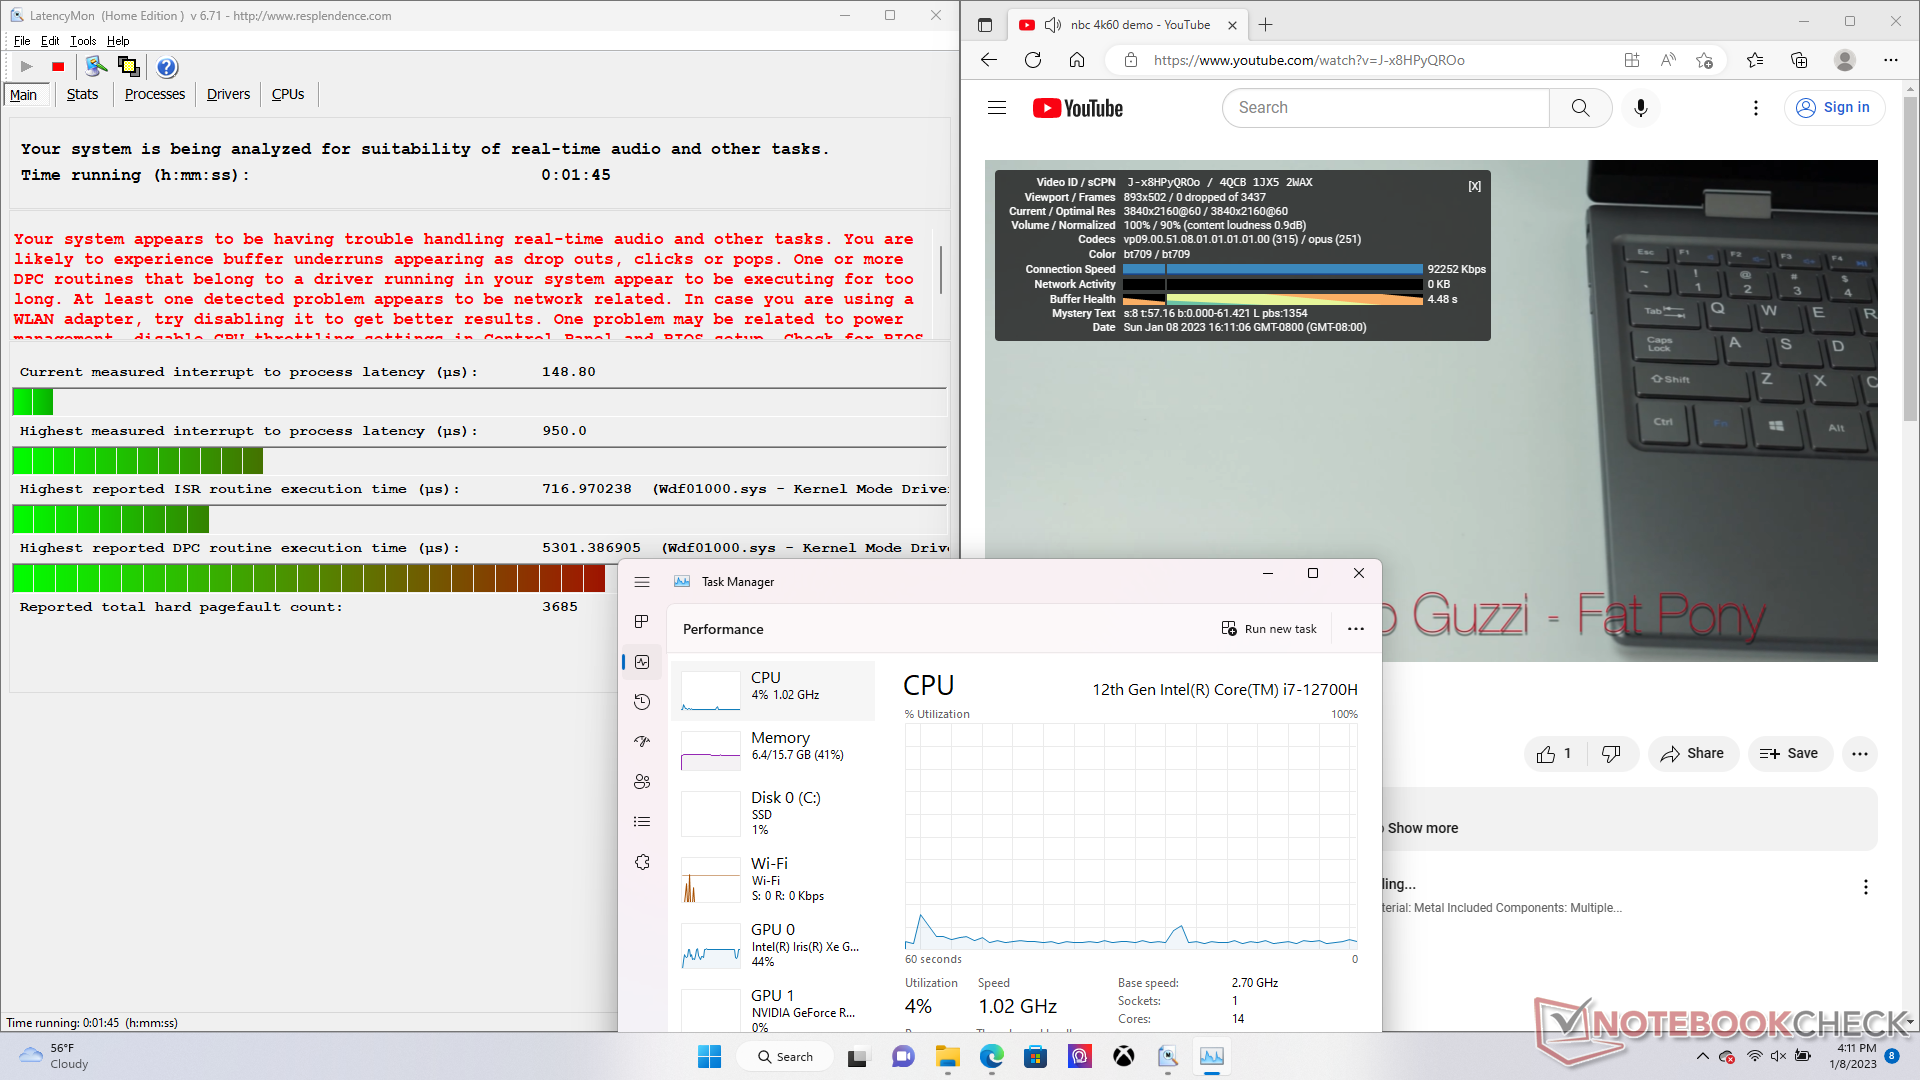
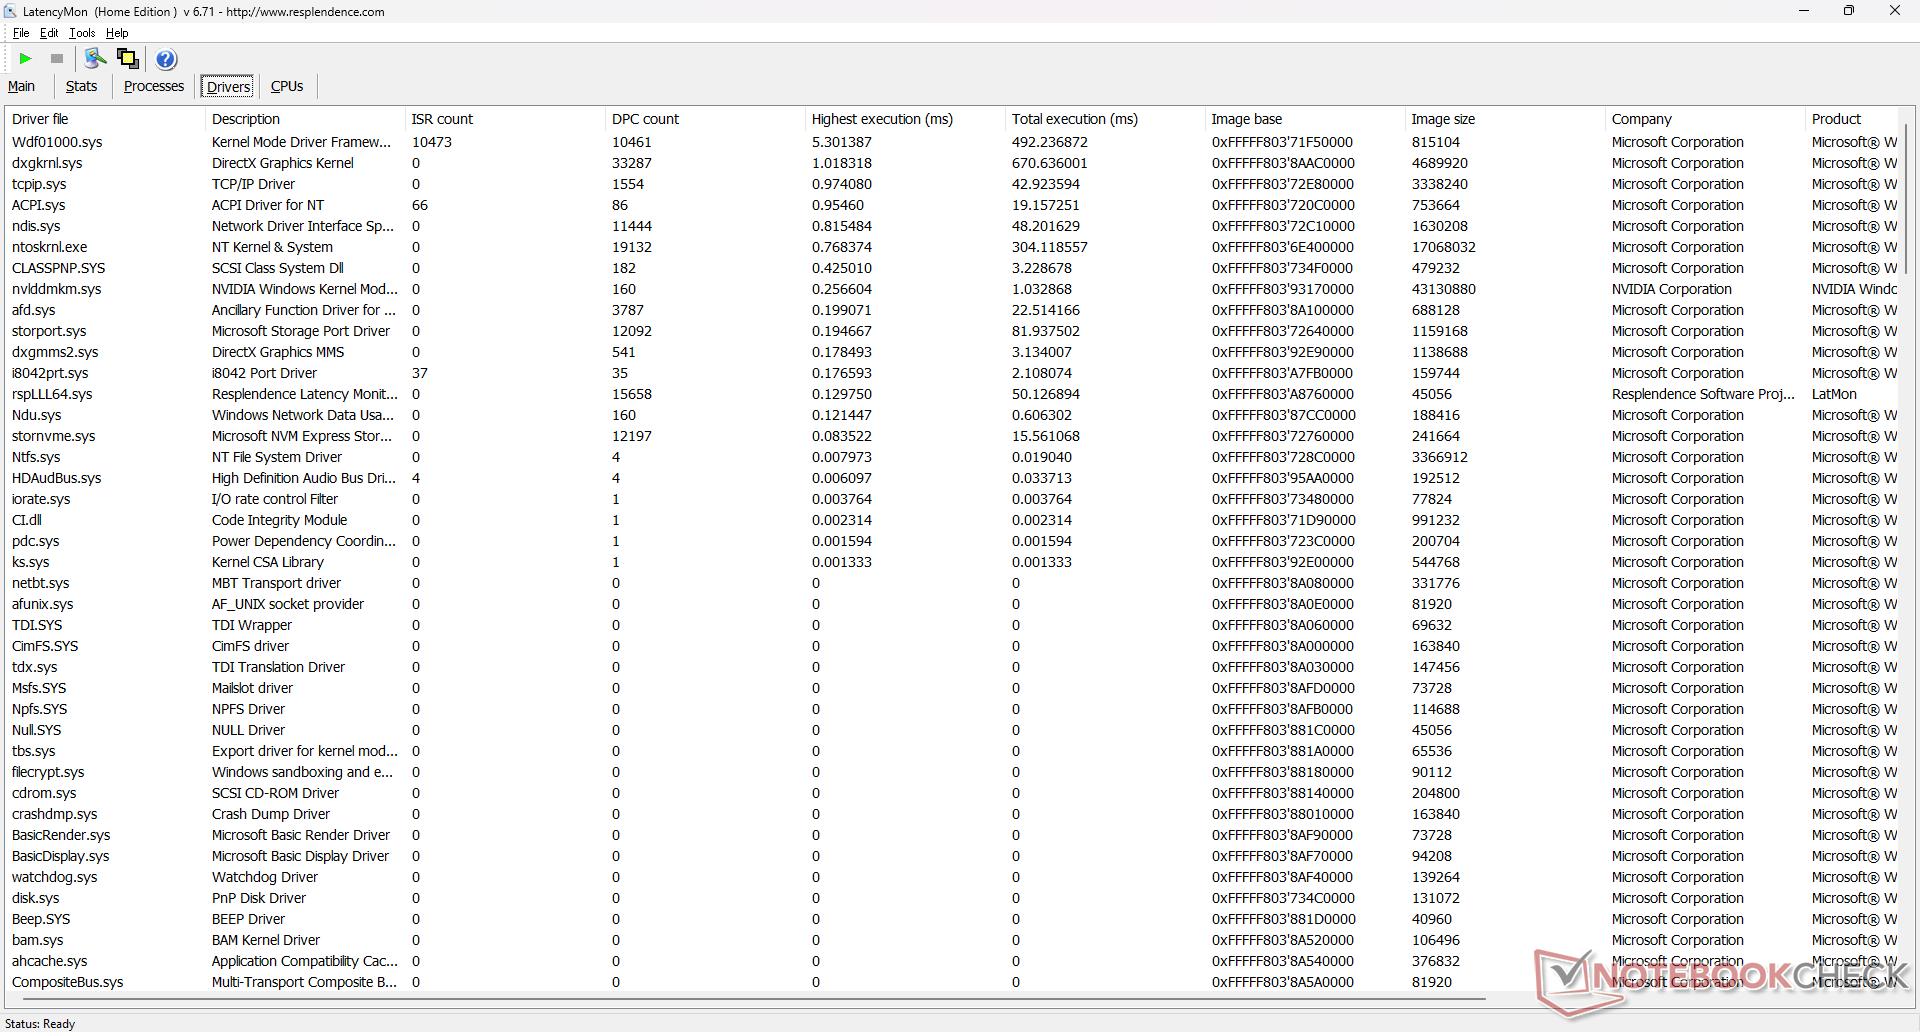
LatencyMon non rivela alcun problema di DPC quando si aprono più schede del browser della nostra homepage. anche la riproduzione di video 4K a 60 FPS è impeccabile, senza alcuna caduta di fotogrammi.
| DPC Latencies / LatencyMon - interrupt to process latency (max), Web, Youtube, Prime95 | |
| Asus ROG Strix Scar 17 SE G733CX-LL014W | |
| MSI Vector GP76 12UGS-434 | |
| Acer Predator Helios 300 (i7-12700H, RTX 3070 Ti) | |
| Alienware m17 R5 (R9 6900HX, RX 6850M XT) | |
| MSI Pulse GL76 12UGK | |
| Razer Blade 17 Early 2022 | |
* ... Meglio usare valori piccoli
Dispositivi di archiviazione - Fino a due unità SSD NVMe
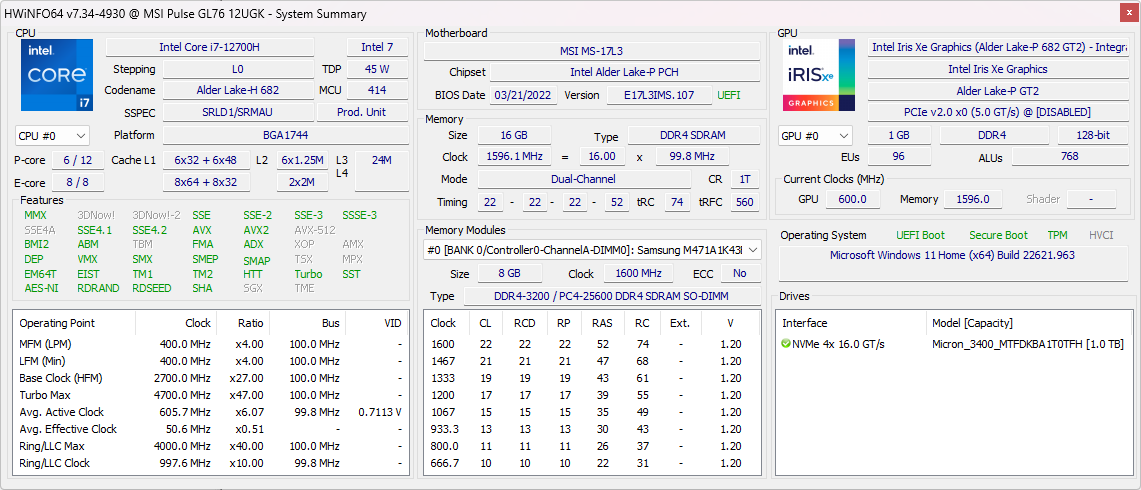
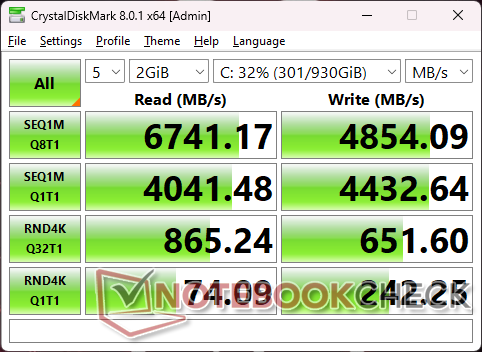
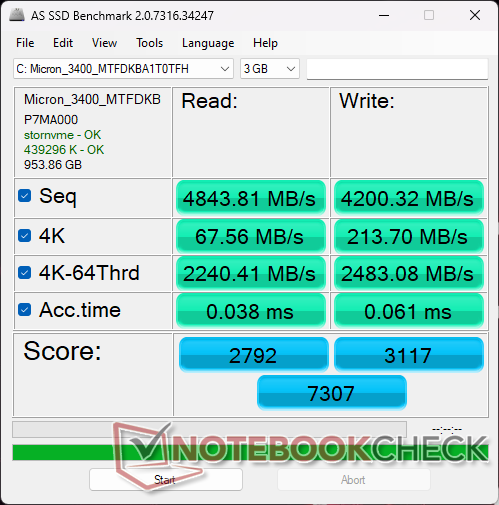
La nostra unità viene fornita con un 1 TB Micron 3400 PCIe4 x4 NVMe da 1 TB invece del più comune Samsung PM9A1 da 1 TB, probabilmente per risparmiare sui costi. Le velocità di trasferimento sono solo leggermente più lente, in media del 10%. Siamo più colpiti dalla capacità dell'unità di mantenere velocità di trasferimento molto elevate, superiori a 6400 MB/s, per periodi prolungati, senza l'ausilio di un dissipatore di calore.

* ... Meglio usare valori piccoli
Disk Throttling: DiskSpd Read Loop, Queue Depth 8
Prestazioni della GPU - Grafica TGP da 105 W
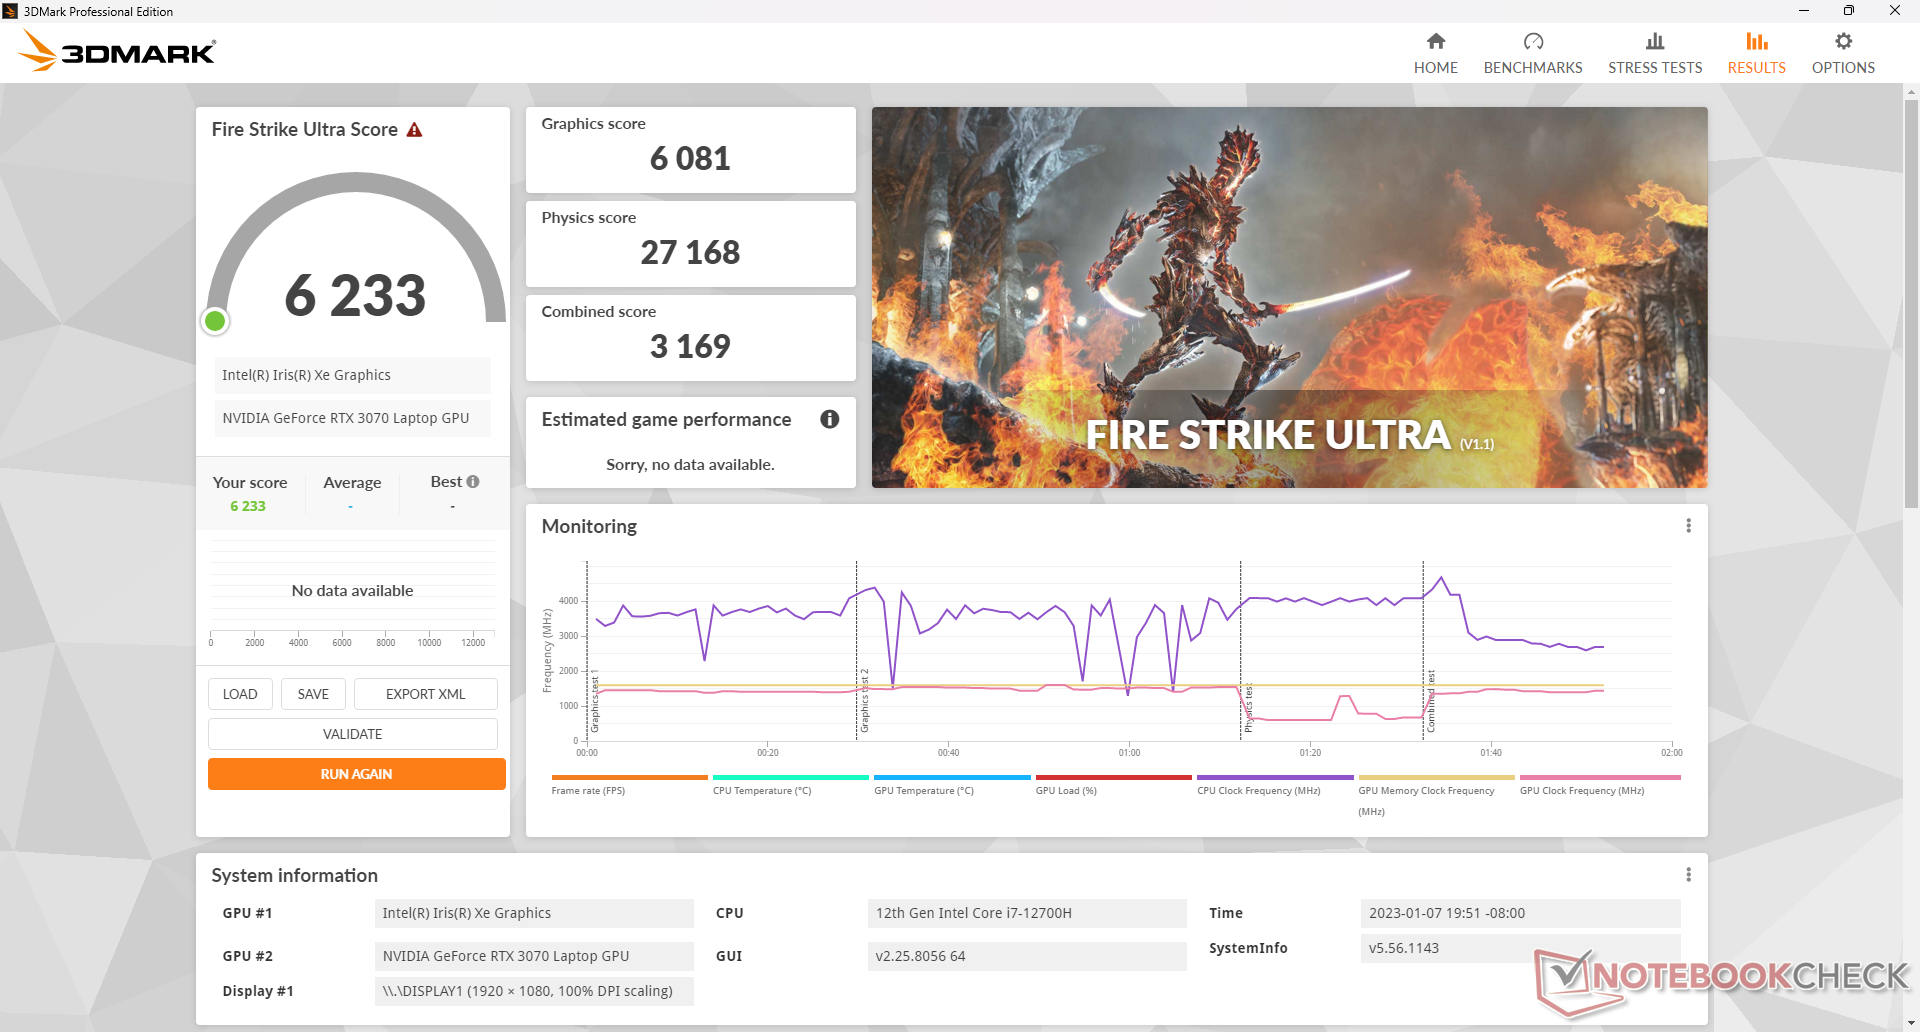
Le prestazioni grafiche grezze sono circa il 25% più lente della nostra GeForce RTX 3070 desktop di riferimento. Se confrontato con il modello 115 WGeForce RTX 3070 nel modello Schenker XMG Apex 15la nostra versione da 105 W è inferiore solo del 5%. Passando al modello RTX 3060 o RTX 3050 avrà un impatto sulle prestazioni grafiche rispettivamente del 10-15% e del 40-45%.
Tutti i titoli attuali sono giocabili alla risoluzione nativa di 1080p con le impostazioni al massimo. Per sfruttare al meglio la veloce frequenza di aggiornamento nativa di 360 Hz, tuttavia, si può prendere in considerazione la possibilità di ridurre le impostazioni a medie o inferiori, soprattutto per i giochi competitivi come CS:GO o Overwatch.
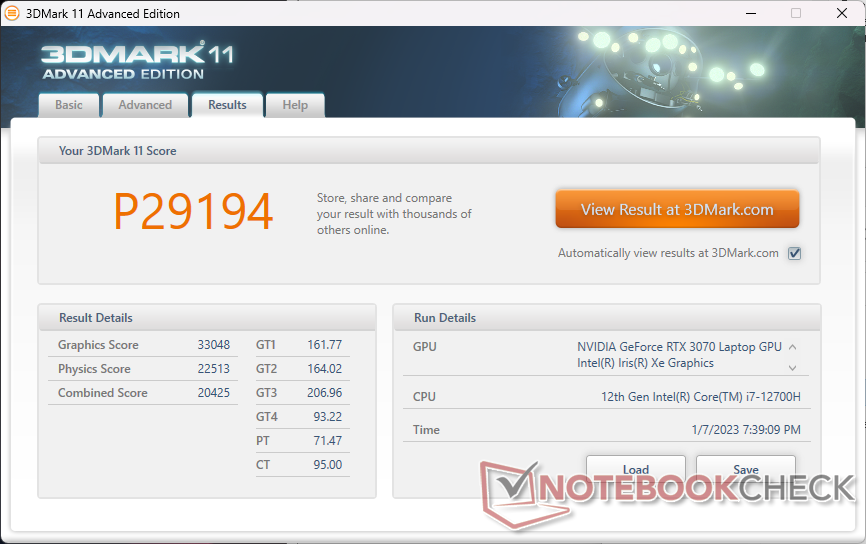
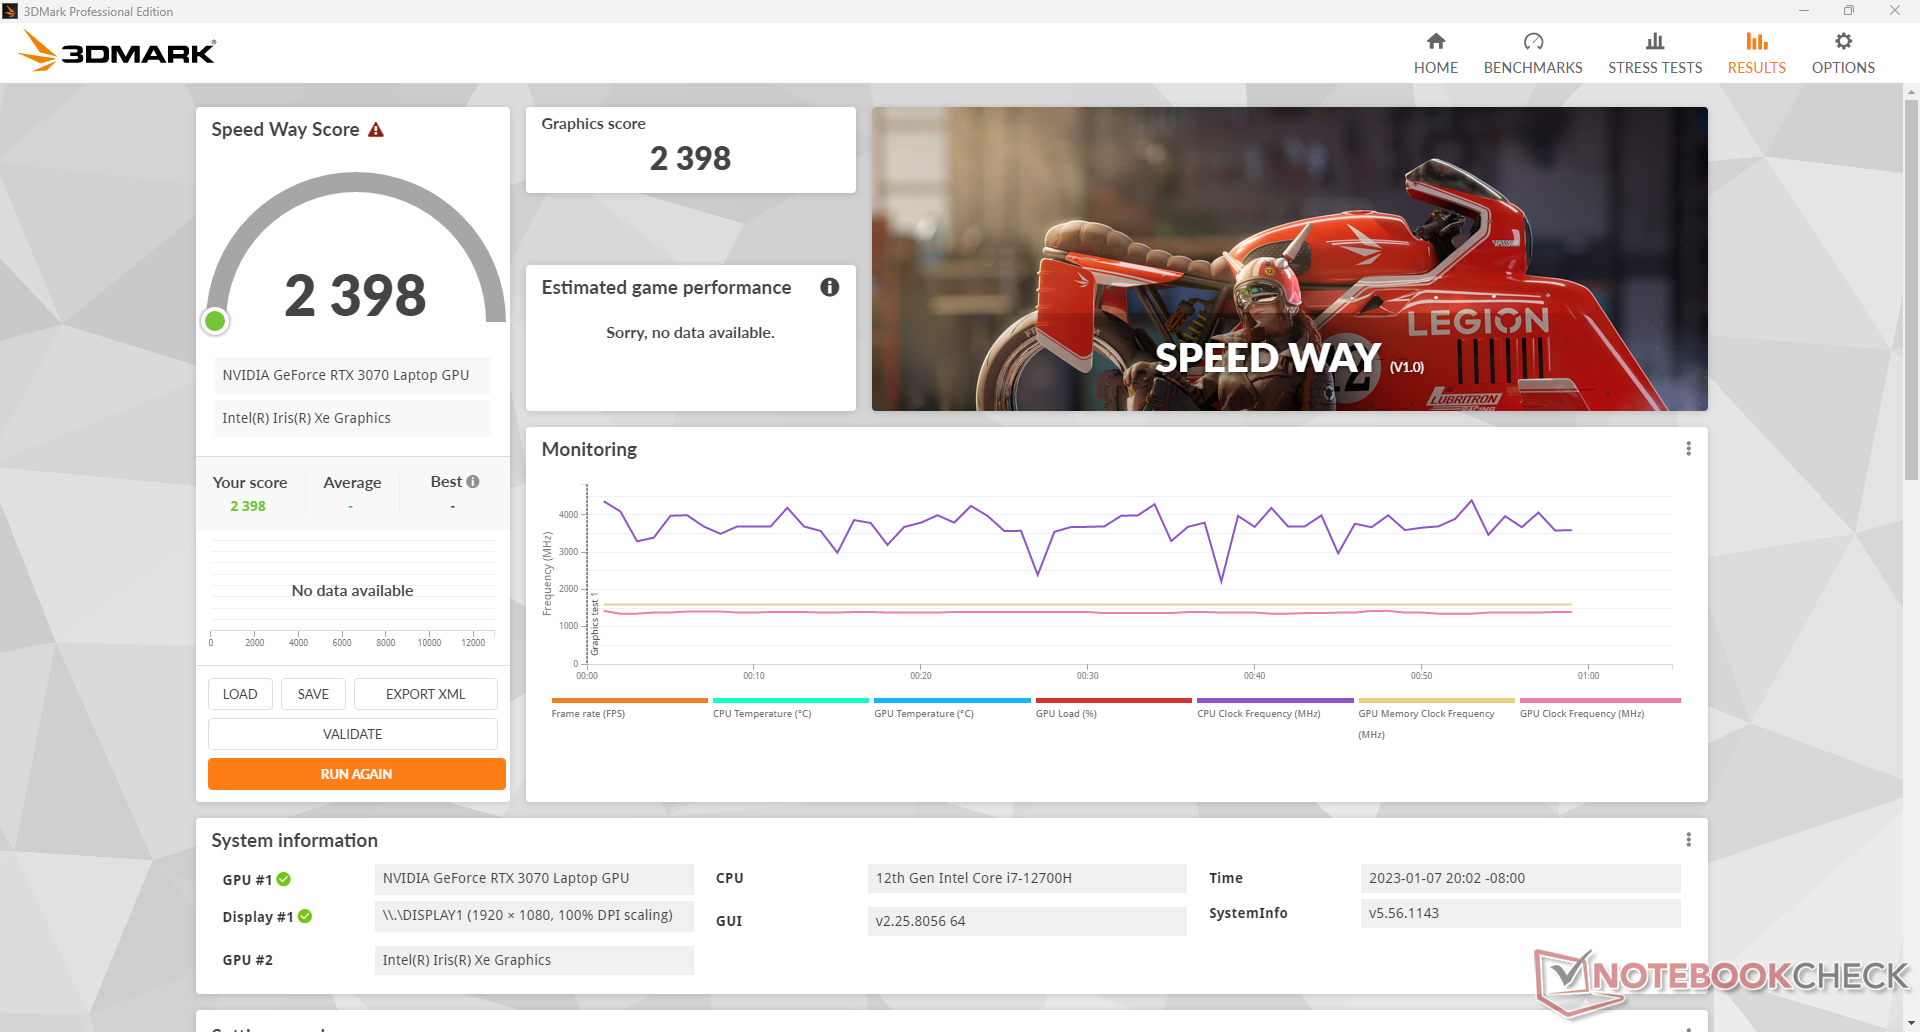
| 3DMark 11 Performance | 29194 punti | |
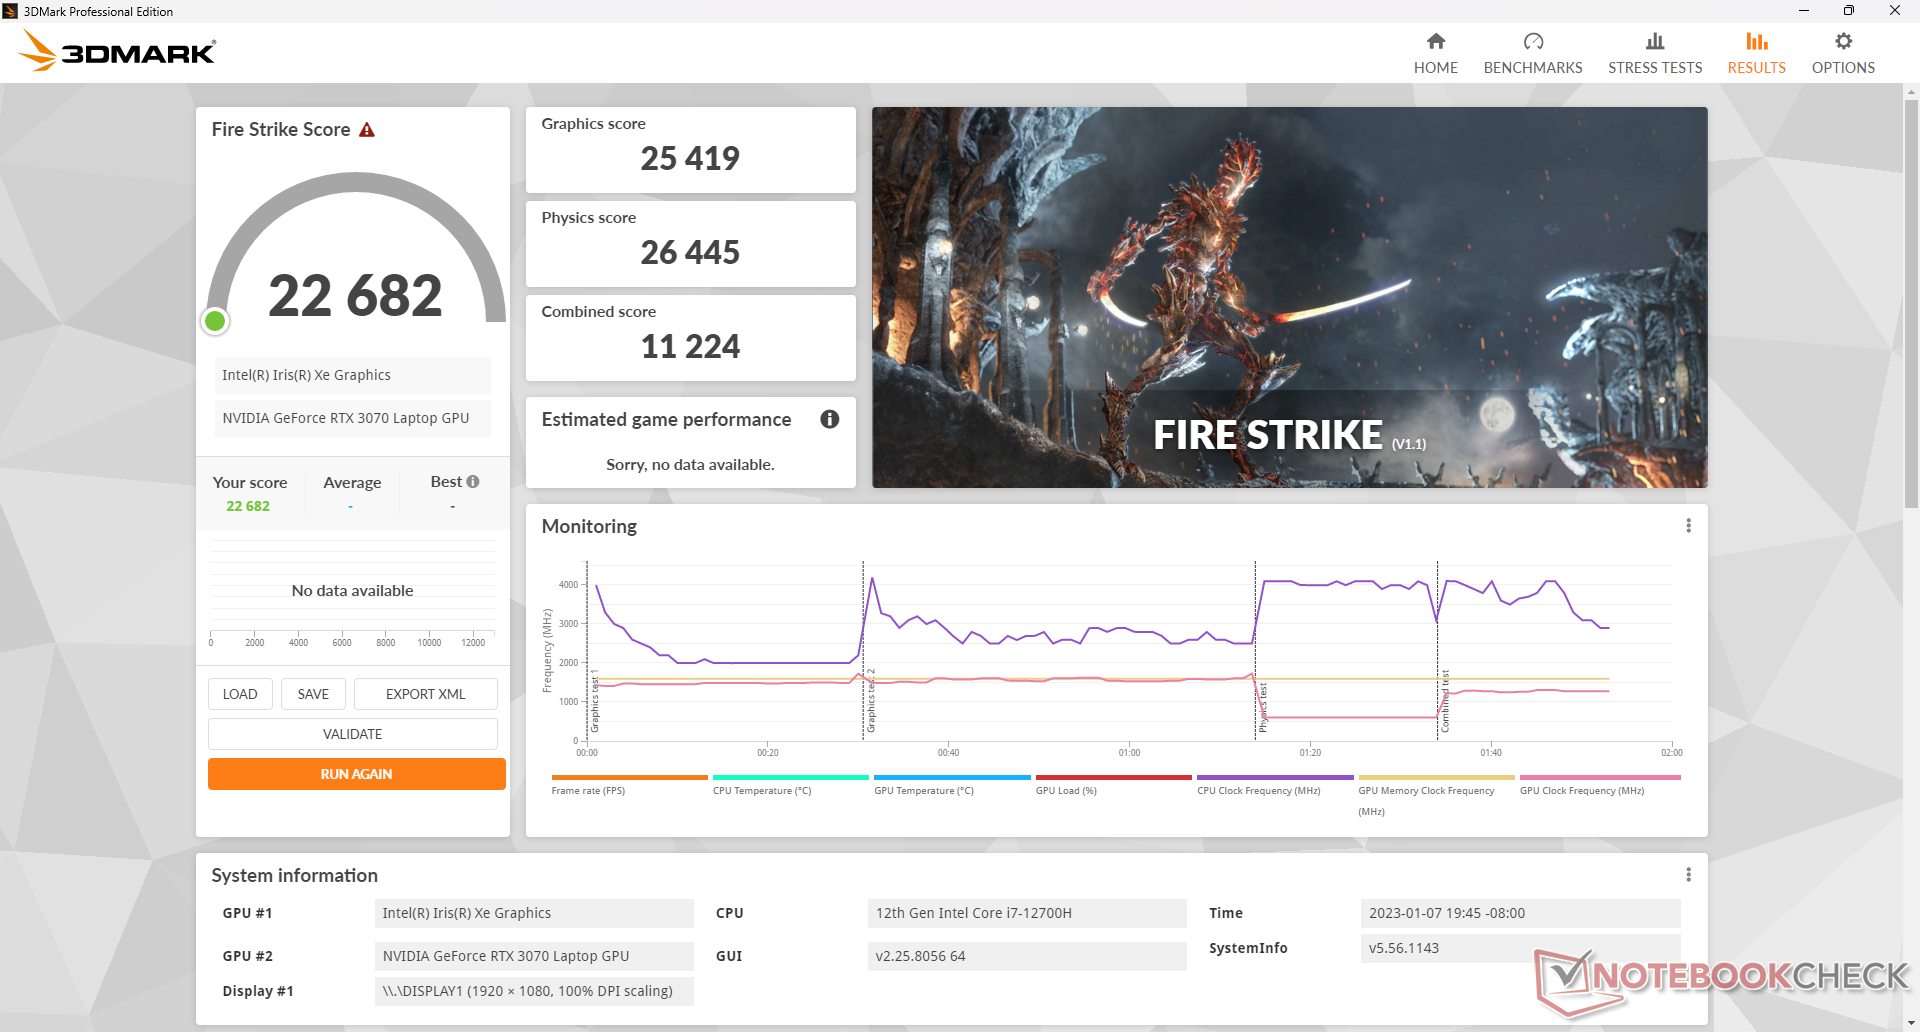
| 3DMark Fire Strike Score | 22682 punti | |
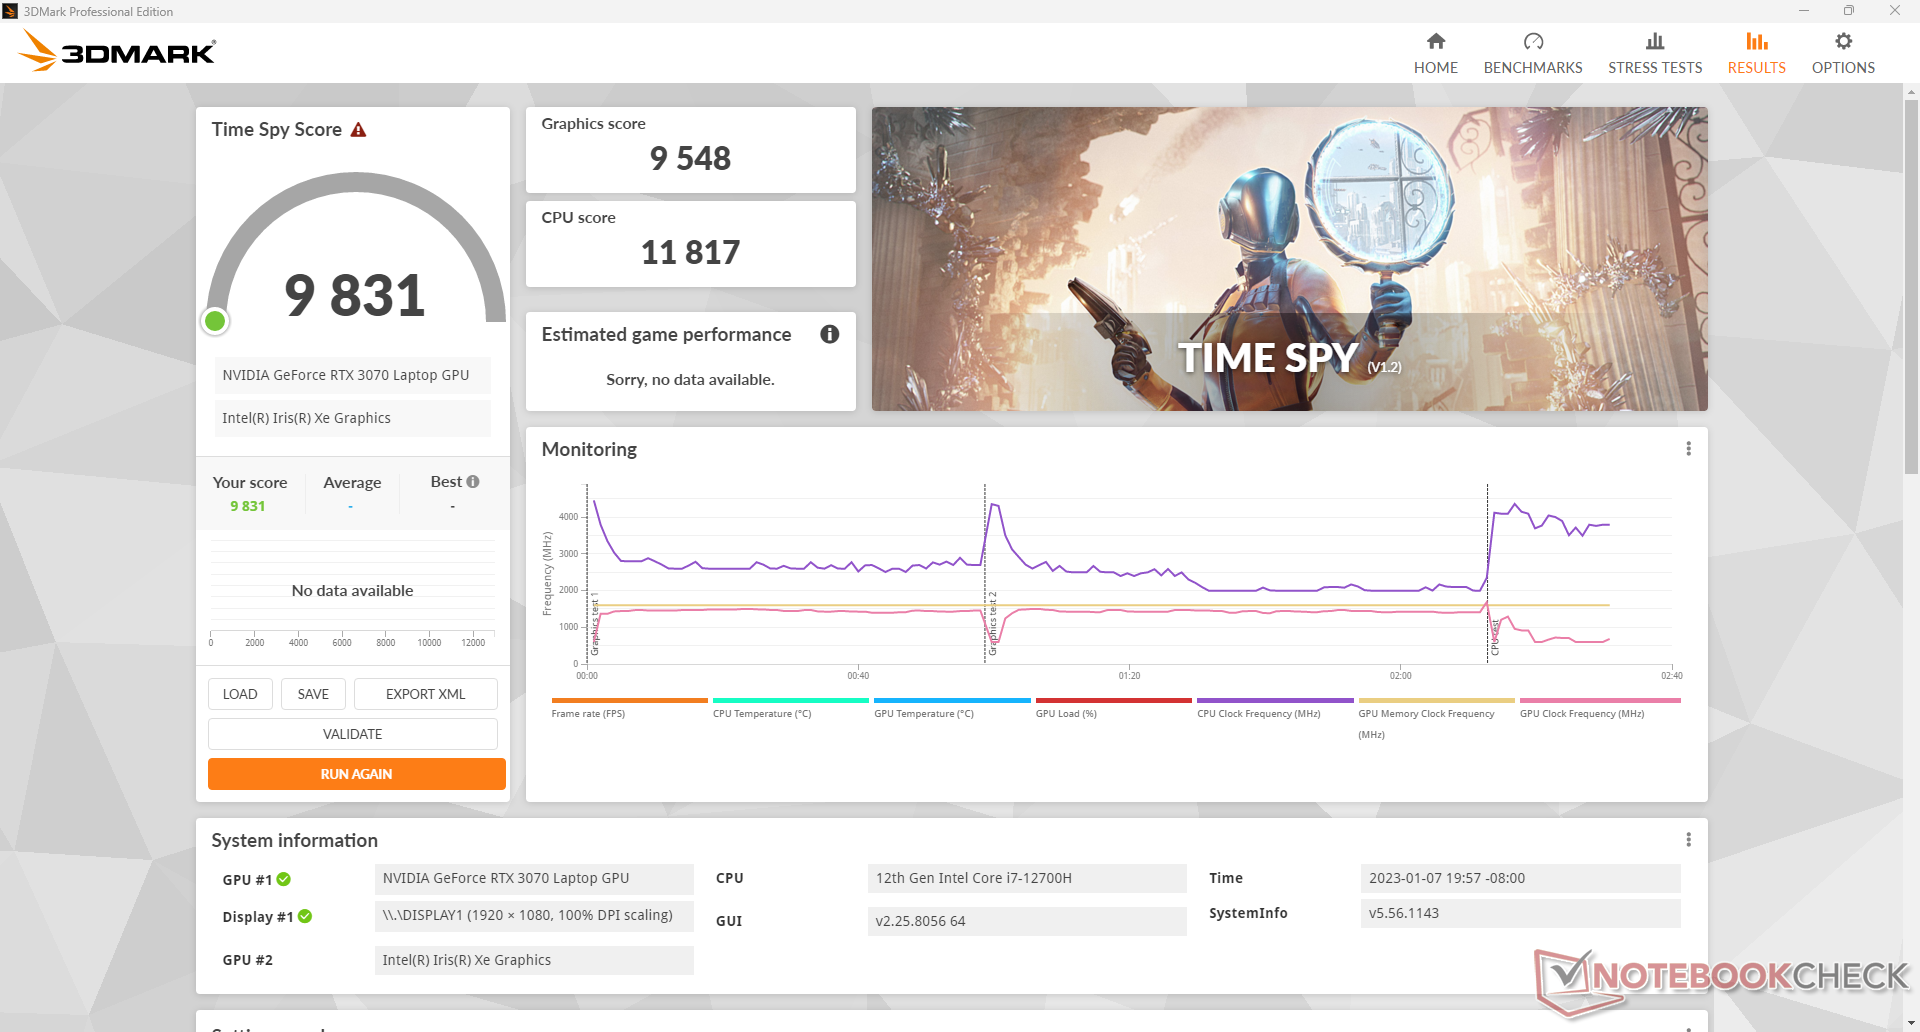
| 3DMark Time Spy Score | 9831 punti | |
Aiuto | ||
* ... Meglio usare valori piccoli
Witcher 3 FPS Chart
| basso | medio | alto | ultra | |
|---|---|---|---|---|
| GTA V (2015) | 185.7 | 182.3 | 175.5 | 108.1 |
| The Witcher 3 (2015) | 377.1 | 252.8 | 170.5 | 92.8 |
| Dota 2 Reborn (2015) | 168.1 | 152.1 | 141.2 | 132.8 |
| Final Fantasy XV Benchmark (2018) | 186.3 | 118.5 | 89.7 | |
| X-Plane 11.11 (2018) | 139.9 | 122.9 | 97.7 | |
| Strange Brigade (2018) | 414 | 224 | 186.6 | 164.5 |
| Cyberpunk 2077 1.6 (2022) | 118.8 | 102.4 | 83.2 | 69.8 |
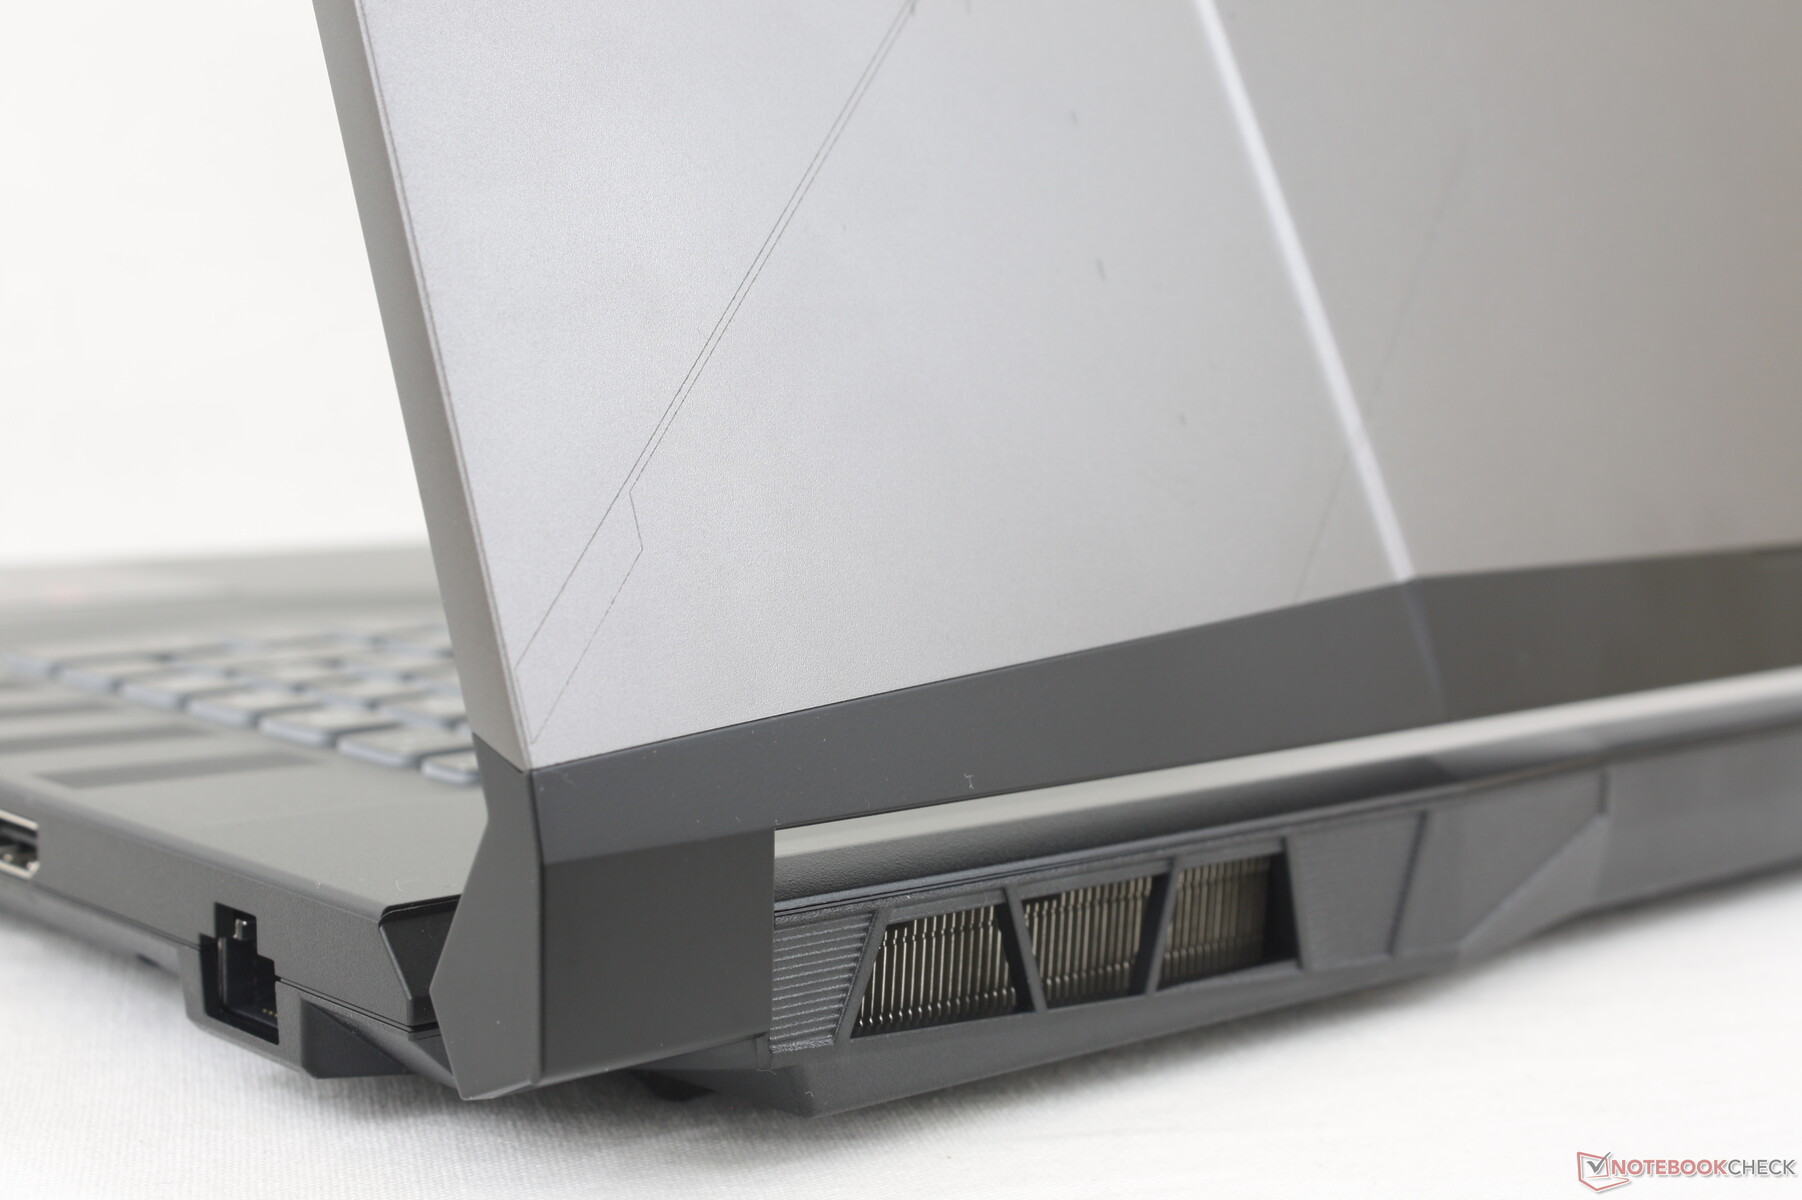
Emissioni - Non troppo rumorose
Rumore del sistema
Le ventole non si muovono mai al minimo anche quando sono impostate in modalità "Silent". Siamo riusciti a registrare un minimo di 26,9 dB(A) a fronte di uno sfondo silenzioso di 24,1 dB(A), appena udibile nella maggior parte degli scenari. La modalità "Silenziosa" è invece eccellente per evitare che le ventole interne pulsino in risposta ai cambiamenti di carico sullo schermo. Durante lo streaming di video o la navigazione sul Web, ad esempio, la modalità Silent è consigliata rispetto alla modalità Balanced, in cui le ventole pulsano frequentemente tra 27 e 43,8 dB(A).
Il rumore della ventola quando è in funzione Witcher 3 si stabilizza a poco meno di 45 dB(A), risultando più silenzioso di molti altri prodotti concorrenti, come mostra la tabella seguente. Se si attiva la modalità Cooler Boost (cioè la modalità con ventola massima), il rumore della ventola raggiunge i 58 dB(A). Questa modalità serve più a ridurre le temperature che ad aumentare le prestazioni e quindi non è necessaria per la maggior parte degli scenari di gioco.
Rumorosità
| Idle |
| 26.9 / 26.9 / 27 dB(A) |
| Sotto carico |
| 43.8 / 58.3 dB(A) |
 | ||
30 dB silenzioso 40 dB(A) udibile 50 dB(A) rumoroso |
||
min: | ||
| MSI Pulse GL76 12UGK GeForce RTX 3070 Laptop GPU, i7-12700H, Micron 3400 1TB MTFDKBA1T0TFH | Alienware m17 R5 (R9 6900HX, RX 6850M XT) Radeon RX 6850M XT, R9 6900HX, SSSTC CA6-8D1024 | Asus ROG Strix Scar 17 SE G733CX-LL014W GeForce RTX 3080 Ti Laptop GPU, i9-12950HX, Samsung PM9A1 MZVL22T0HBLB | Acer Predator Helios 300 (i7-12700H, RTX 3070 Ti) GeForce RTX 3070 Ti Laptop GPU, i7-12700H, Samsung PM9A1 MZVL21T0HCLR | Razer Blade 17 Early 2022 GeForce RTX 3080 Ti Laptop GPU, i9-12900H, Samsung PM9A1 MZVL21T0HCLR | MSI Vector GP76 12UGS-434 GeForce RTX 3070 Ti Laptop GPU, i7-12700H, Micron 2450 1TB MTFDKBA1T0TFK | |
|---|---|---|---|---|---|---|
| Noise | 6% | 13% | -10% | -6% | -6% | |
| off /ambiente * (dB) | 24.1 | 23 5% | 23.9 1% | 23 5% | 26 -8% | 25.6 -6% |
| Idle Minimum * (dB) | 26.9 | 23 14% | 23.9 11% | 23 14% | 26 3% | 27 -0% |
| Idle Average * (dB) | 26.9 | 28.11 -4% | 23.9 11% | 25.92 4% | 27 -0% | 27 -0% |
| Idle Maximum * (dB) | 27 | 28.11 -4% | 23.9 11% | 40.67 -51% | 32 -19% | 30.1 -11% |
| Load Average * (dB) | 43.8 | 30.62 30% | 34.3 22% | 42.7 3% | 50 -14% | 54.4 -24% |
| Witcher 3 ultra * (dB) | 44.7 | 49.75 -11% | 62.48 -40% | 51 -14% | ||
| Load Maximum * (dB) | 58.3 | 50.17 14% | 45.9 21% | 62.67 -7% | 51 13% | 56.2 4% |
* ... Meglio usare valori piccoli
Temperatura
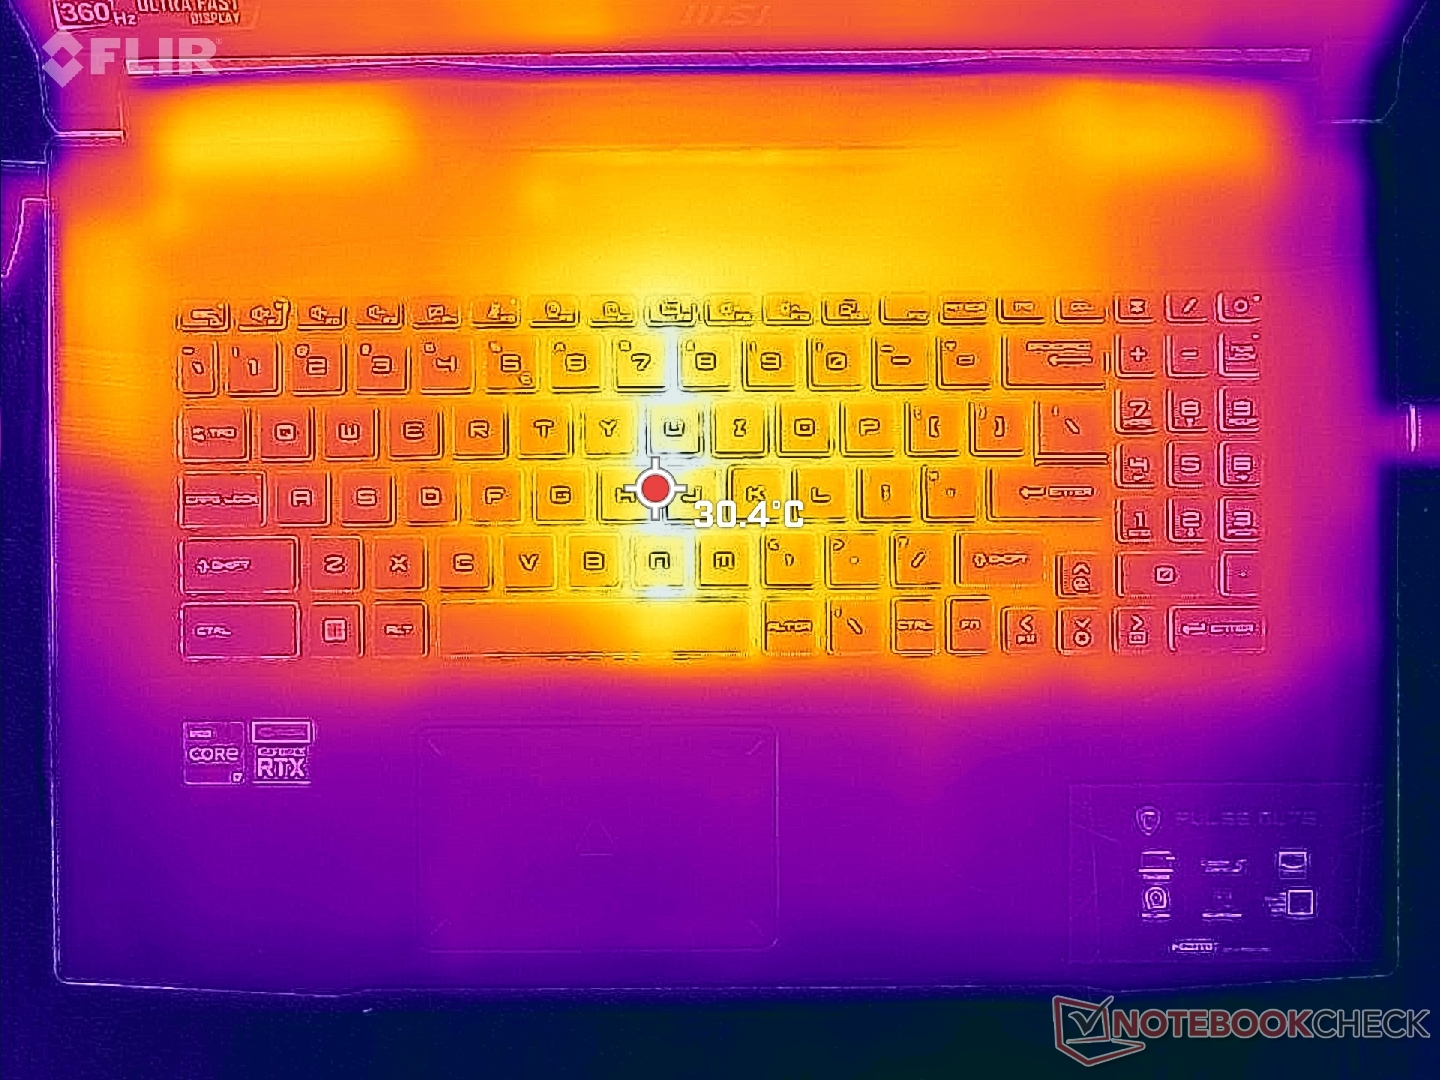
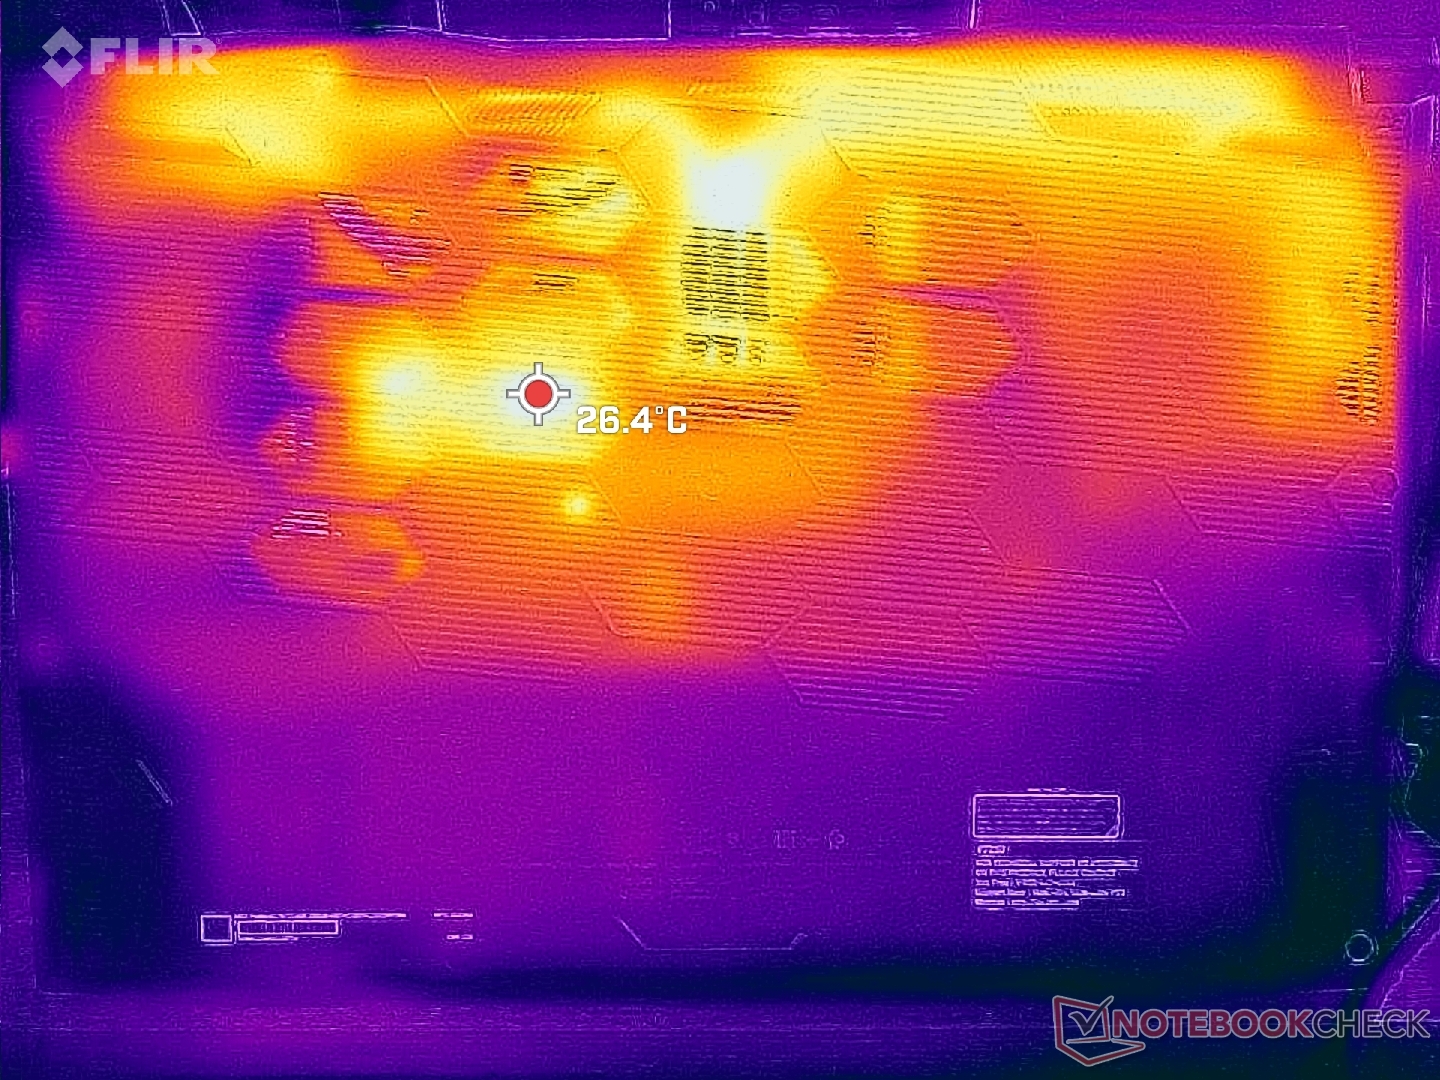
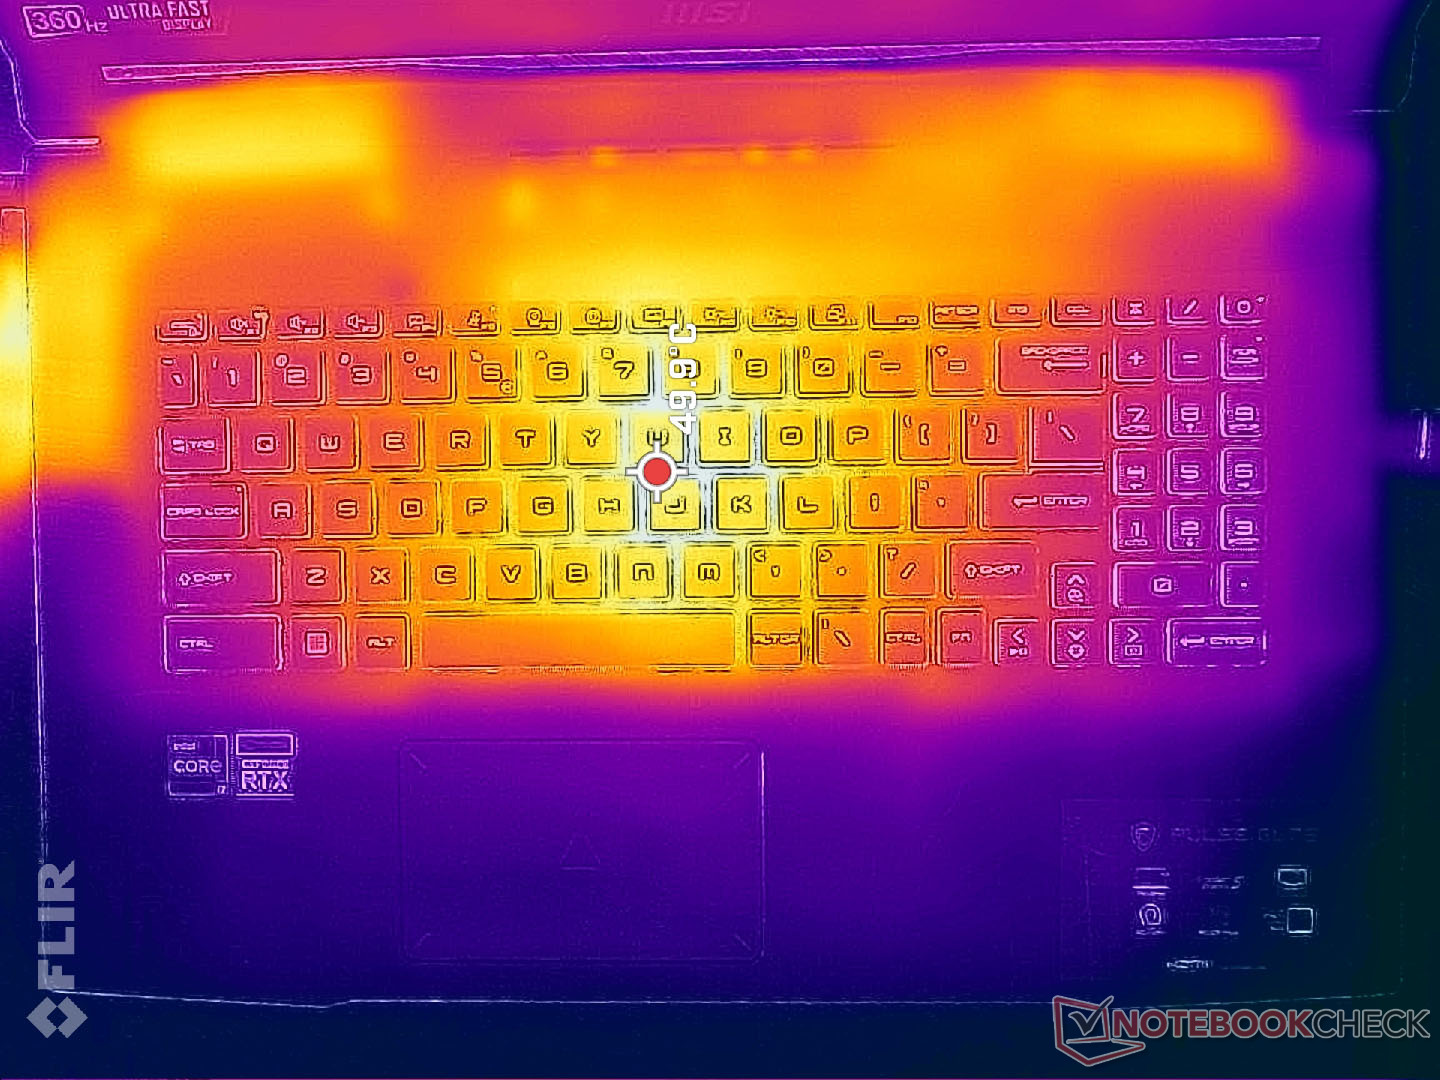
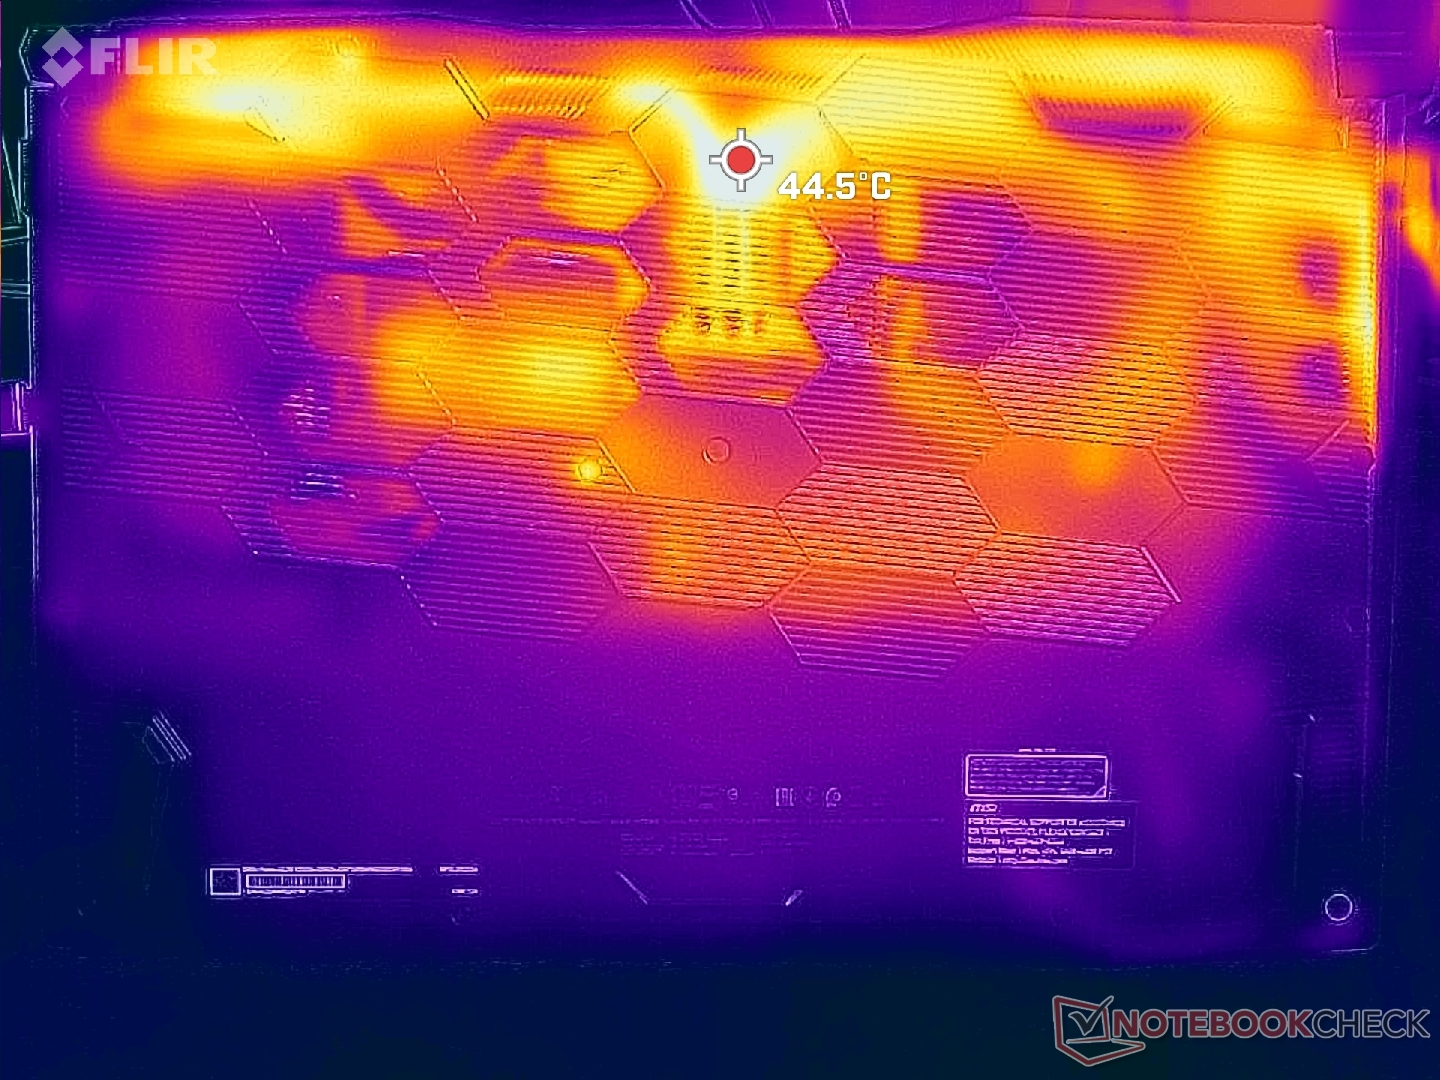
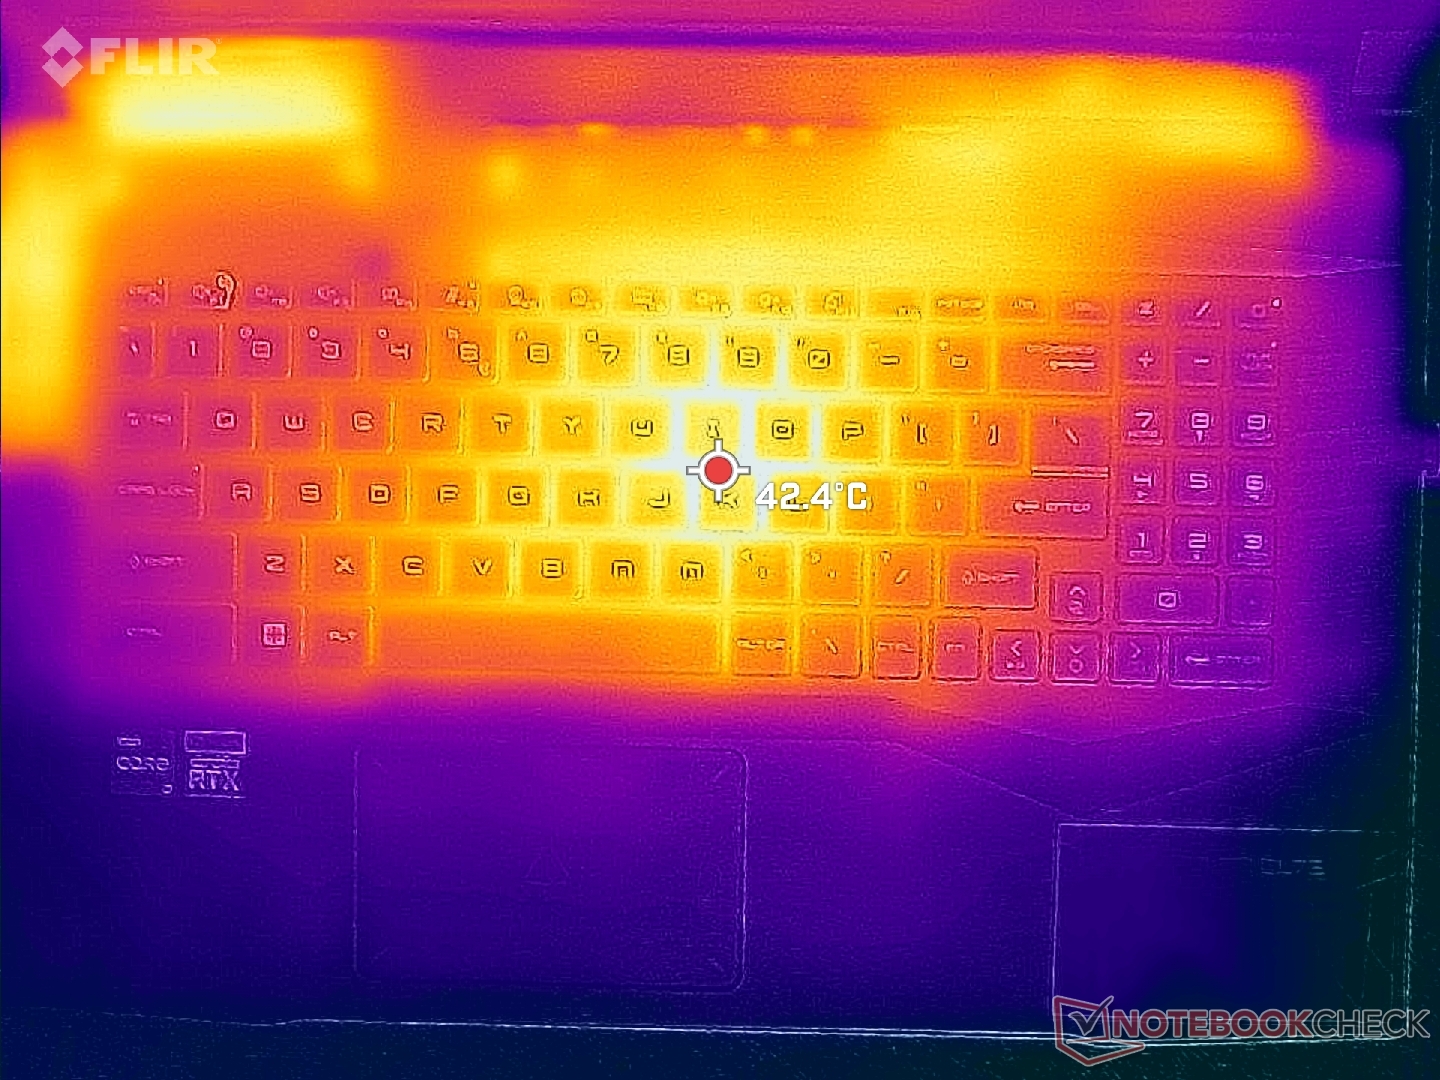
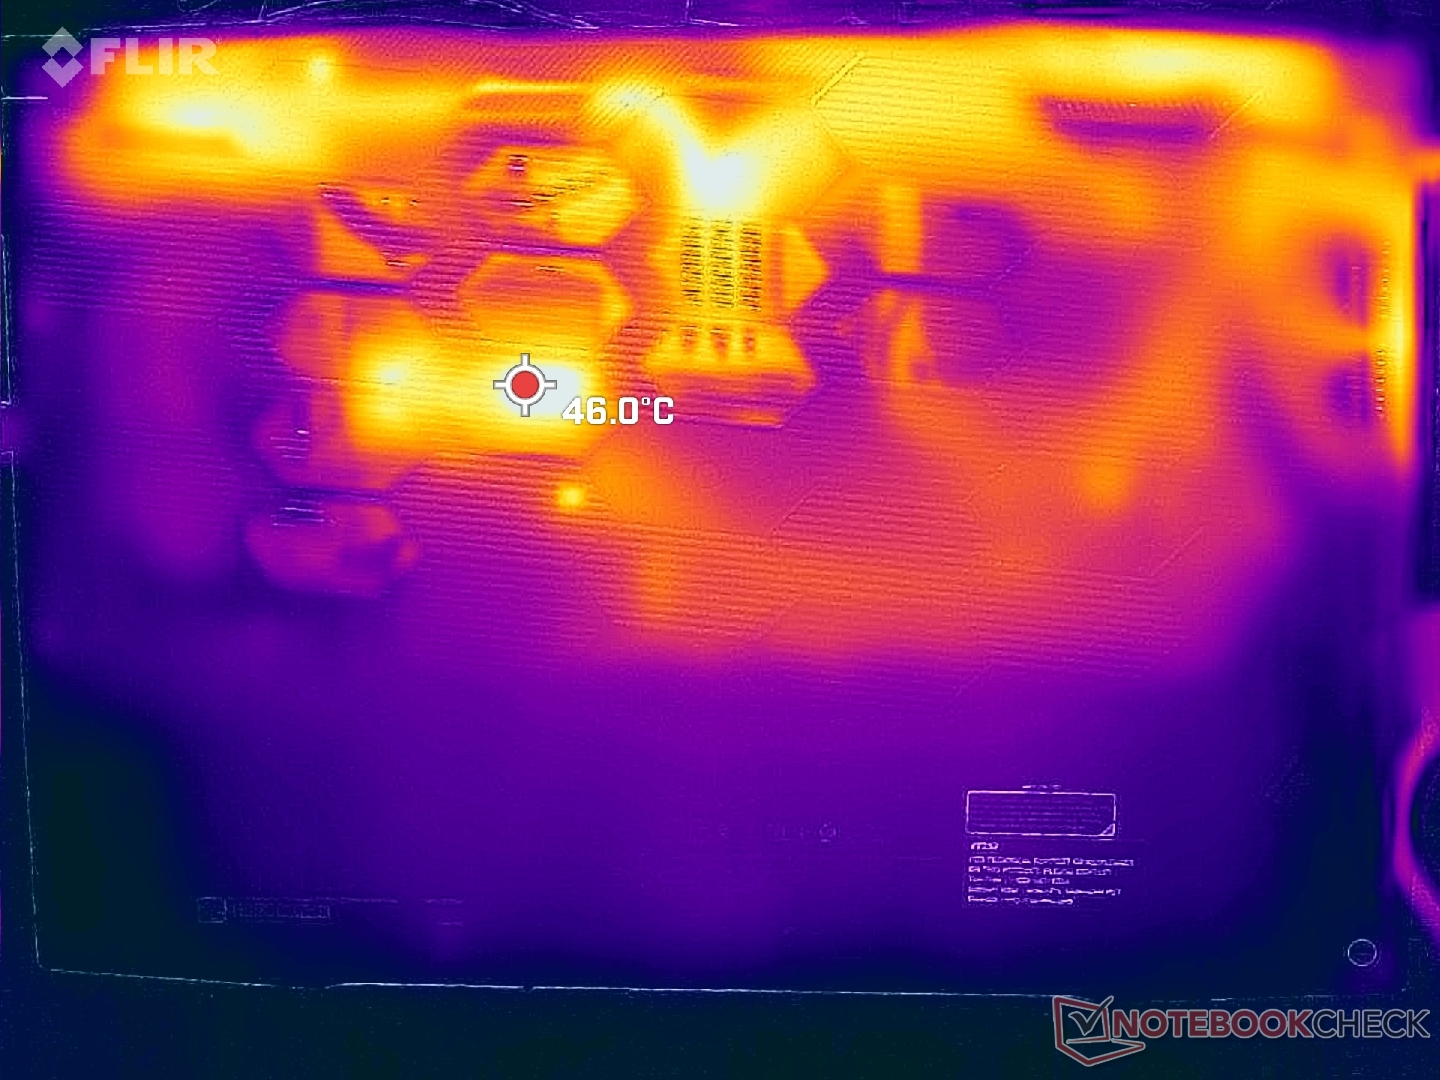
Le temperature medie delle superfici non sono fastidiosamente calde e gli eventuali punti caldi sono molto isolati grazie all'ampio fattore di forma da 17,3 pollici e allo chassis prevalentemente in plastica. La parte centrale della tastiera, ad esempio, può raggiungere quasi i 50 C durante il gioco, mentre i poggiapolsi e i lati della tastiera sono molto più freschi, rispettivamente intorno ai 20 C e ai 30 C. I punti caldi sulla parte superiore e inferiore si notano raramente durante il gioco, poiché il contatto con la pelle su queste aree è raro.
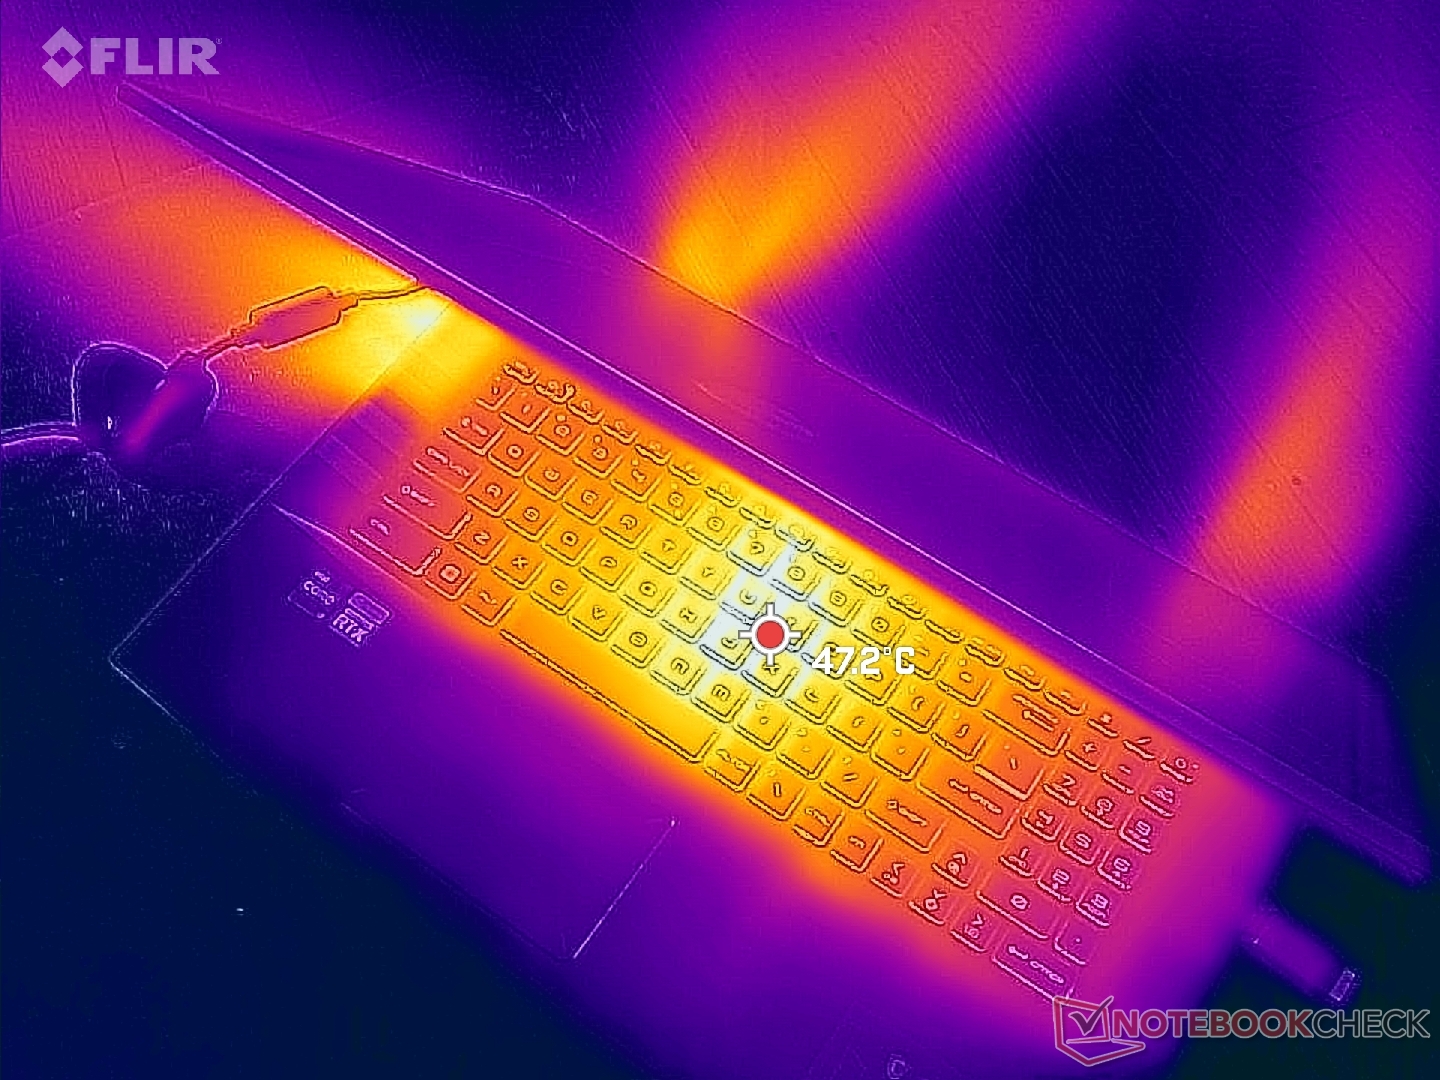
(±) La temperatura massima sul lato superiore è di 44.2 °C / 112 F, rispetto alla media di 40.4 °C / 105 F, che varia da 21.2 a 68.8 °C per questa classe Gaming.
(-) Il lato inferiore si riscalda fino ad un massimo di 45.2 °C / 113 F, rispetto alla media di 43.2 °C / 110 F
(+) In idle, la temperatura media del lato superiore è di 27.7 °C / 82 F, rispetto alla media deld ispositivo di 33.9 °C / 93 F.
(±) Riproducendo The Witcher 3, la temperatura media per il lato superiore e' di 35.1 °C / 95 F, rispetto alla media del dispositivo di 33.9 °C / 93 F.
(+) I poggiapolsi e il touchpad sono piu' freddi della temperatura della pelle con un massimo di 25.4 °C / 77.7 F e sono quindi freddi al tatto.
(+) La temperatura media della zona del palmo della mano di dispositivi simili e'stata di 28.8 °C / 83.8 F (+3.4 °C / 6.1 F).
| MSI Pulse GL76 12UGK Intel Core i7-12700H, NVIDIA GeForce RTX 3070 Laptop GPU | Alienware m17 R5 (R9 6900HX, RX 6850M XT) AMD Ryzen 9 6900HX, AMD Radeon RX 6850M XT | Asus ROG Strix Scar 17 SE G733CX-LL014W Intel Core i9-12950HX, NVIDIA GeForce RTX 3080 Ti Laptop GPU | Acer Predator Helios 300 (i7-12700H, RTX 3070 Ti) Intel Core i7-12700H, NVIDIA GeForce RTX 3070 Ti Laptop GPU | Razer Blade 17 Early 2022 Intel Core i9-12900H, NVIDIA GeForce RTX 3080 Ti Laptop GPU | MSI Vector GP76 12UGS-434 Intel Core i7-12700H, NVIDIA GeForce RTX 3070 Ti Laptop GPU | |
|---|---|---|---|---|---|---|
| Heat | -3% | -2% | 6% | -12% | -3% | |
| Maximum Upper Side * (°C) | 44.2 | 53 -20% | 48.8 -10% | 35 21% | 50 -13% | 46.3 -5% |
| Maximum Bottom * (°C) | 45.2 | 56 -24% | 52.4 -16% | 53 -17% | 56 -24% | 45 -0% |
| Idle Upper Side * (°C) | 35.4 | 30 15% | 30.4 14% | 29 18% | 36 -2% | 34.2 3% |
| Idle Bottom * (°C) | 35 | 29 17% | 34.1 3% | 34 3% | 38 -9% | 38.3 -9% |
* ... Meglio usare valori piccoli
Stress test
Durante l'esecuzione di Prime95, la frequenza di clock della CPU e l'assorbimento di potenza della scheda aumentano rispettivamente a 4,1 GHz e 110 W, per pochi secondi o fino a quando la temperatura del nucleo raggiunge i 95 C. Successivamente, la frequenza di clock e l'assorbimento di potenza della scheda scendono a 3,6 GHz e 92 W prima di stabilizzarsi a 3,1 - 3,6 GHz e 85 W, rispettivamente. Anche la temperatura del core si stabilizza a 90 C, indicando che la soluzione di raffreddamento è praticamente al limite.
La GPU Nvidia si stabilizzerebbe a 1575 MHz e 76 C con l'esecuzione di Witcher 3 rispetto ai 1725 MHz e 72 C del Razer Blade 17 equipaggiato con una TGP GeForce RTX 3070 da 130 W. GPU-Z sulla nostra unità di test MSI indicherebbe anche un assorbimento di potenza della scheda GPU di 102 W, molto vicino all'obiettivo pubblicizzato di 105 W.
Il funzionamento a batteria limita le prestazioni. Un test 3DMark 11 a batteria restituirebbe punteggi di Fisica e Grafica rispettivamente di 9089 e 11291 punti, rispetto a 22513 e 33048 punti con l'alimentazione di rete.
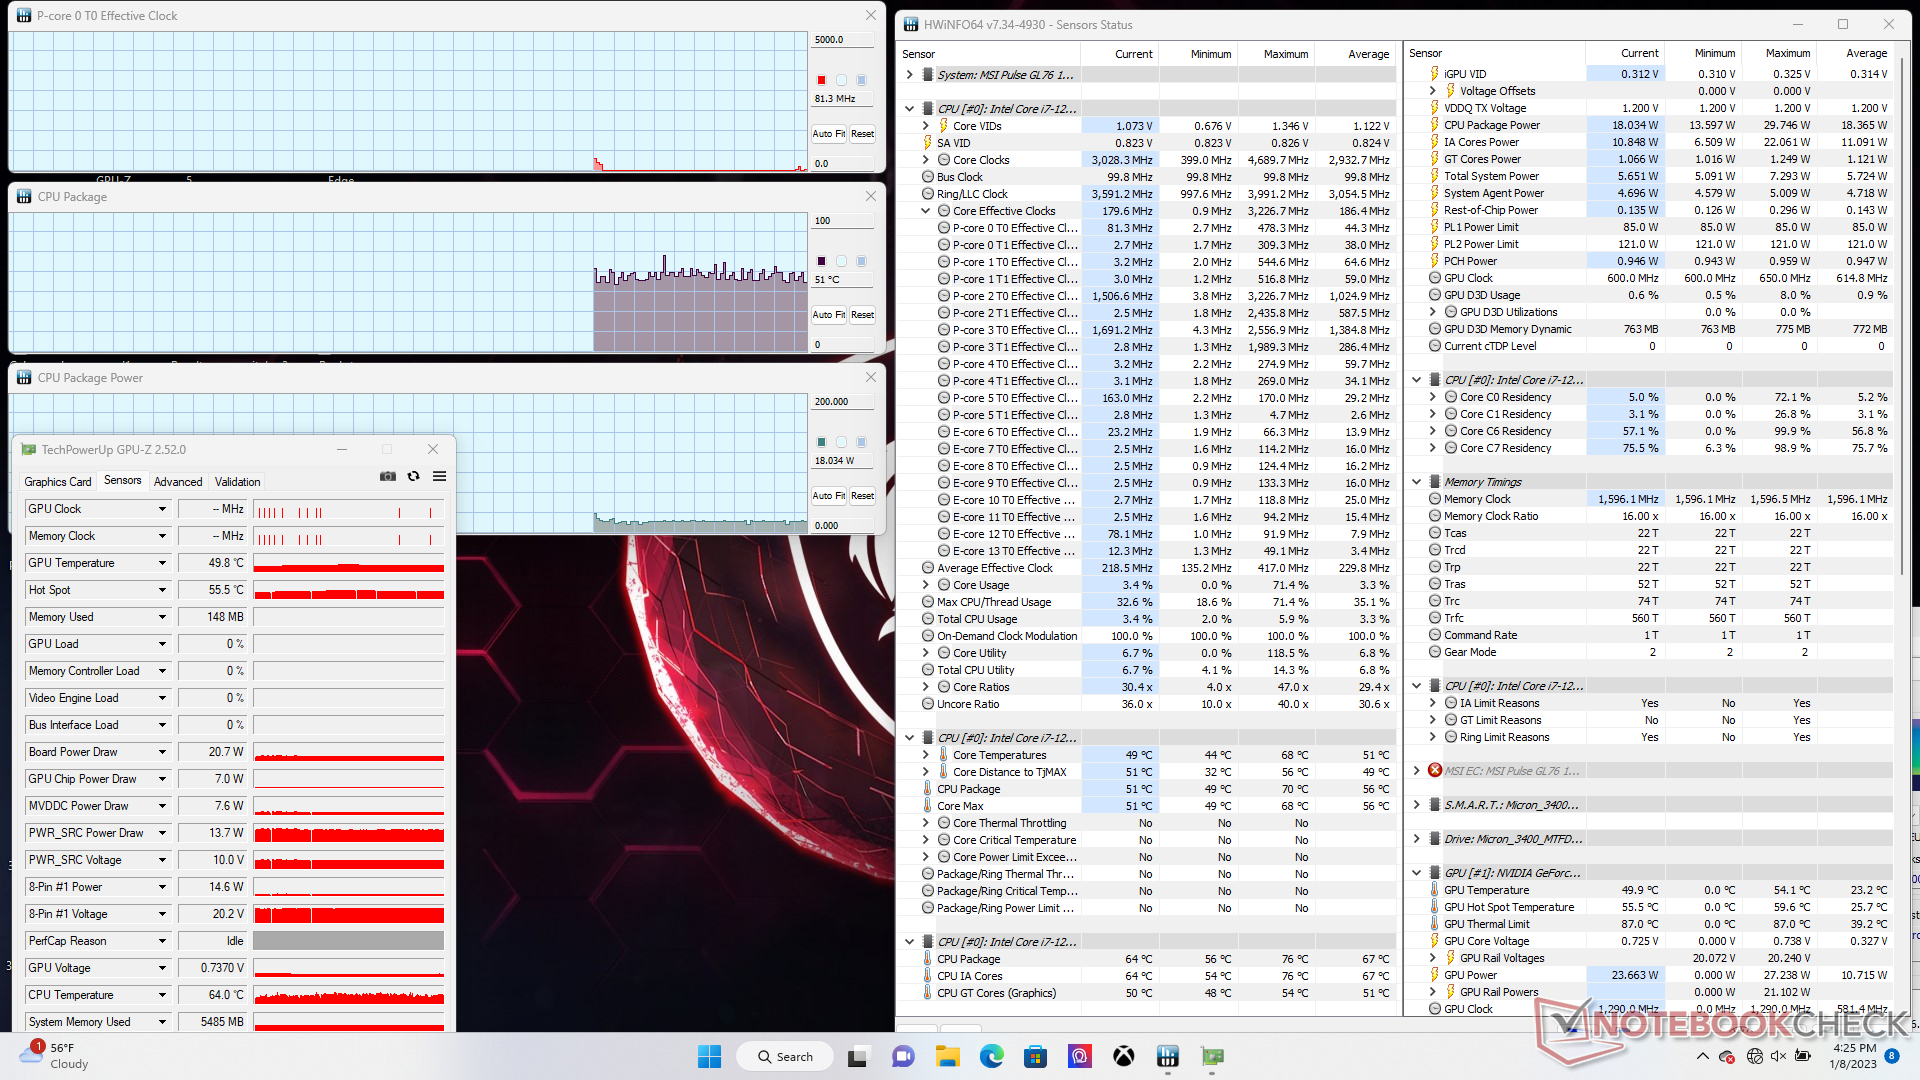
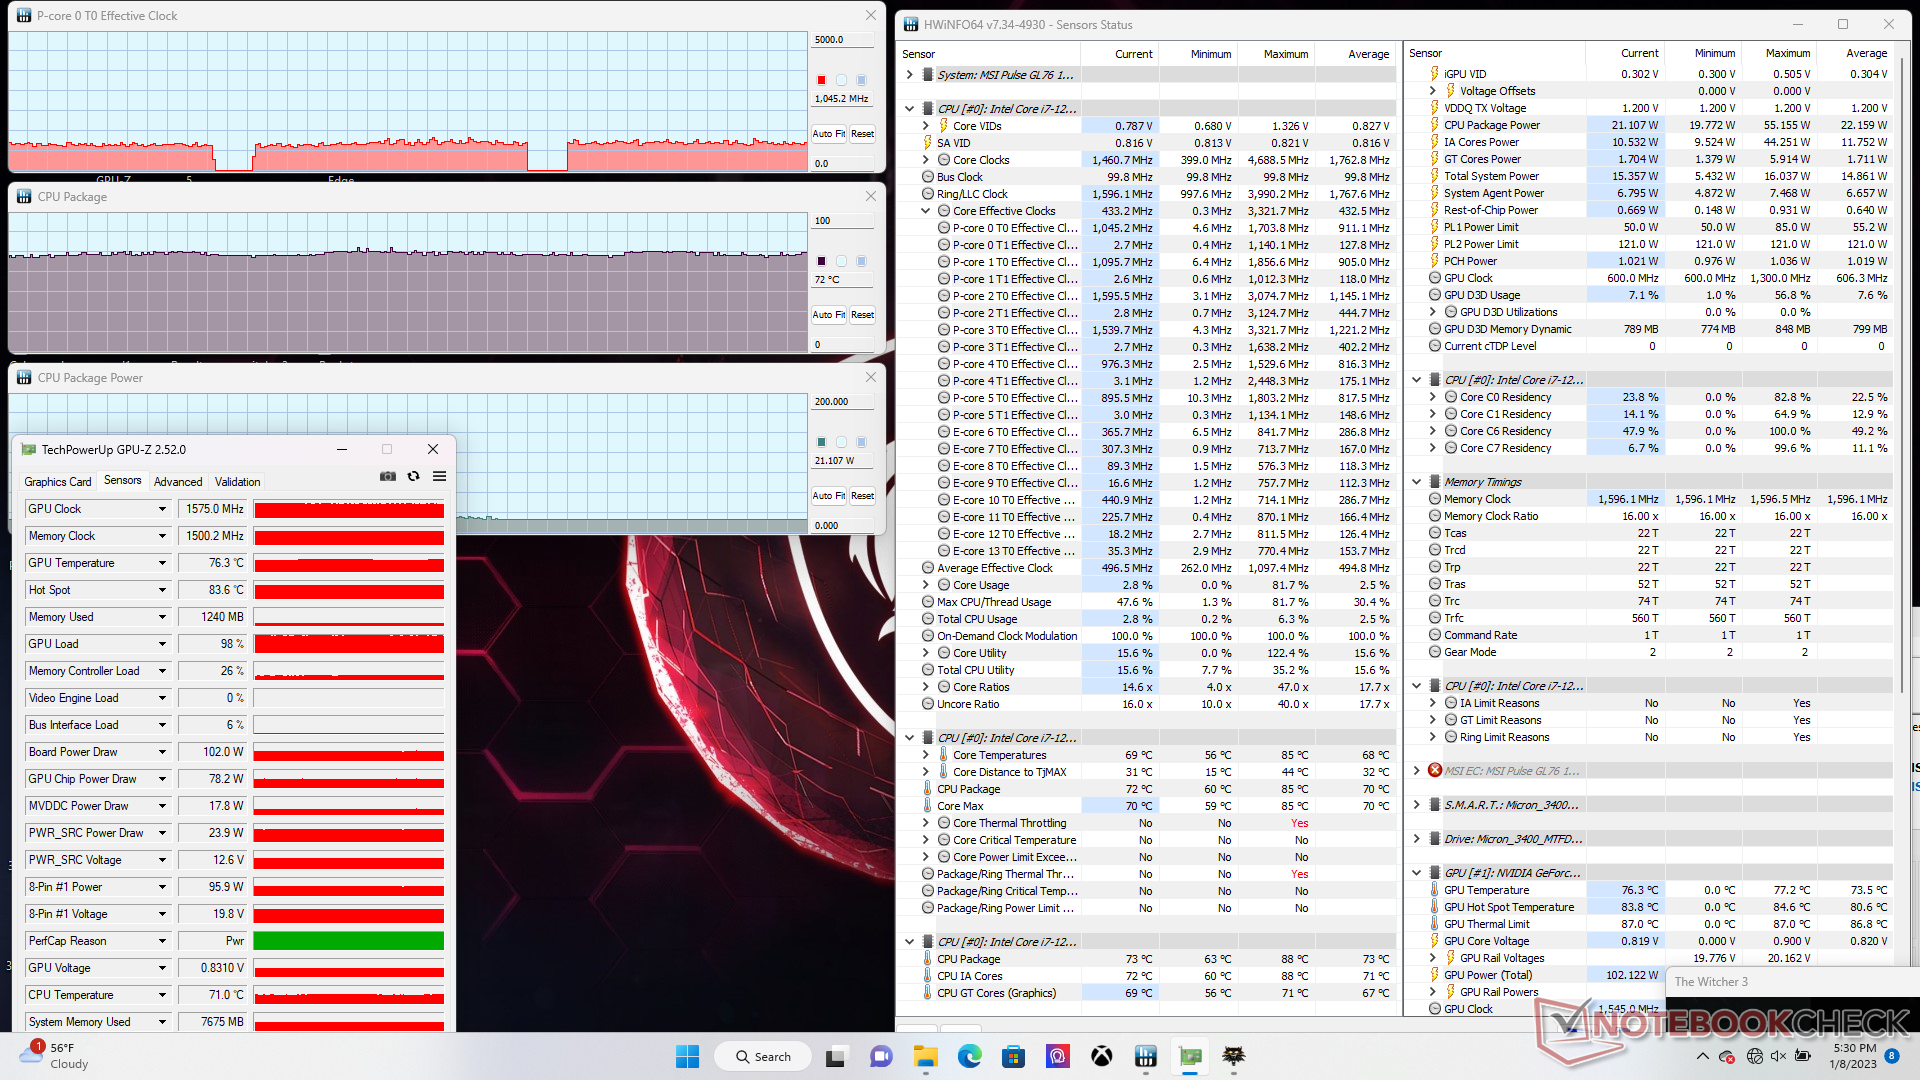
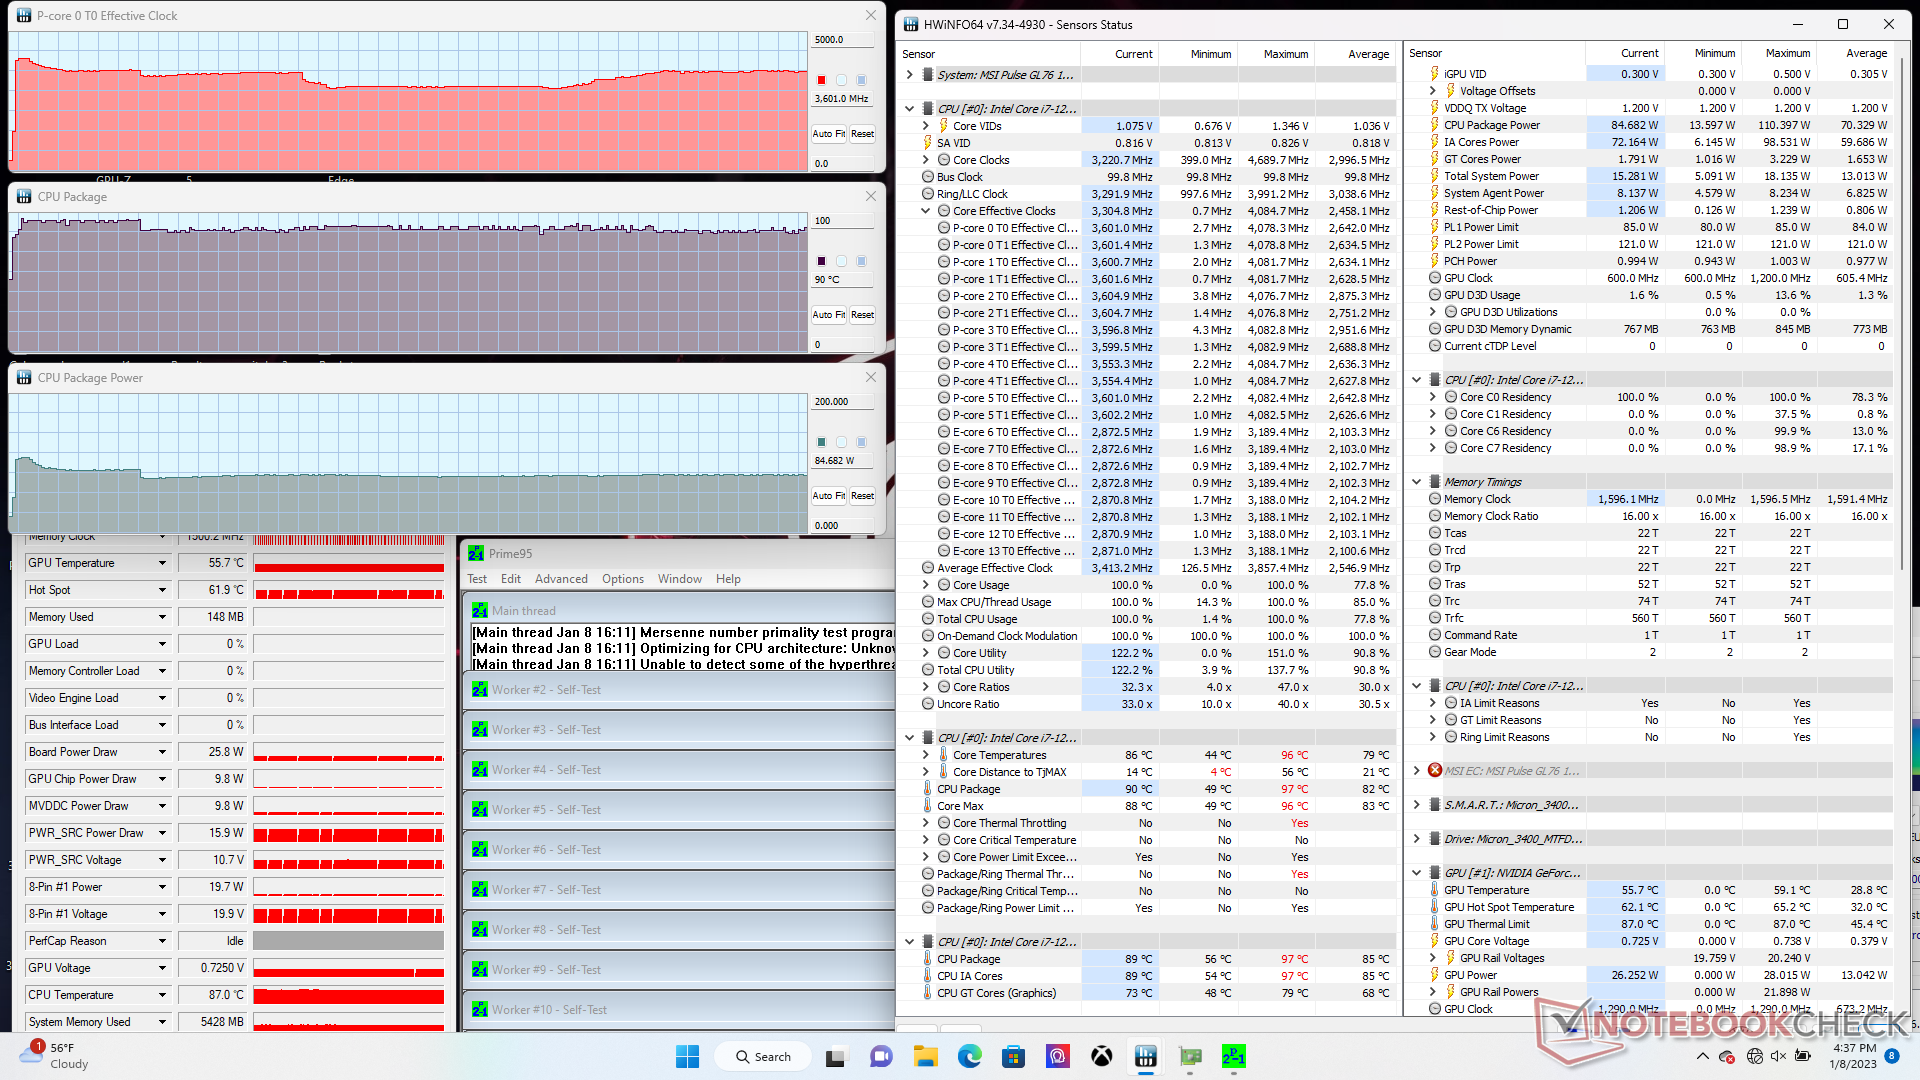
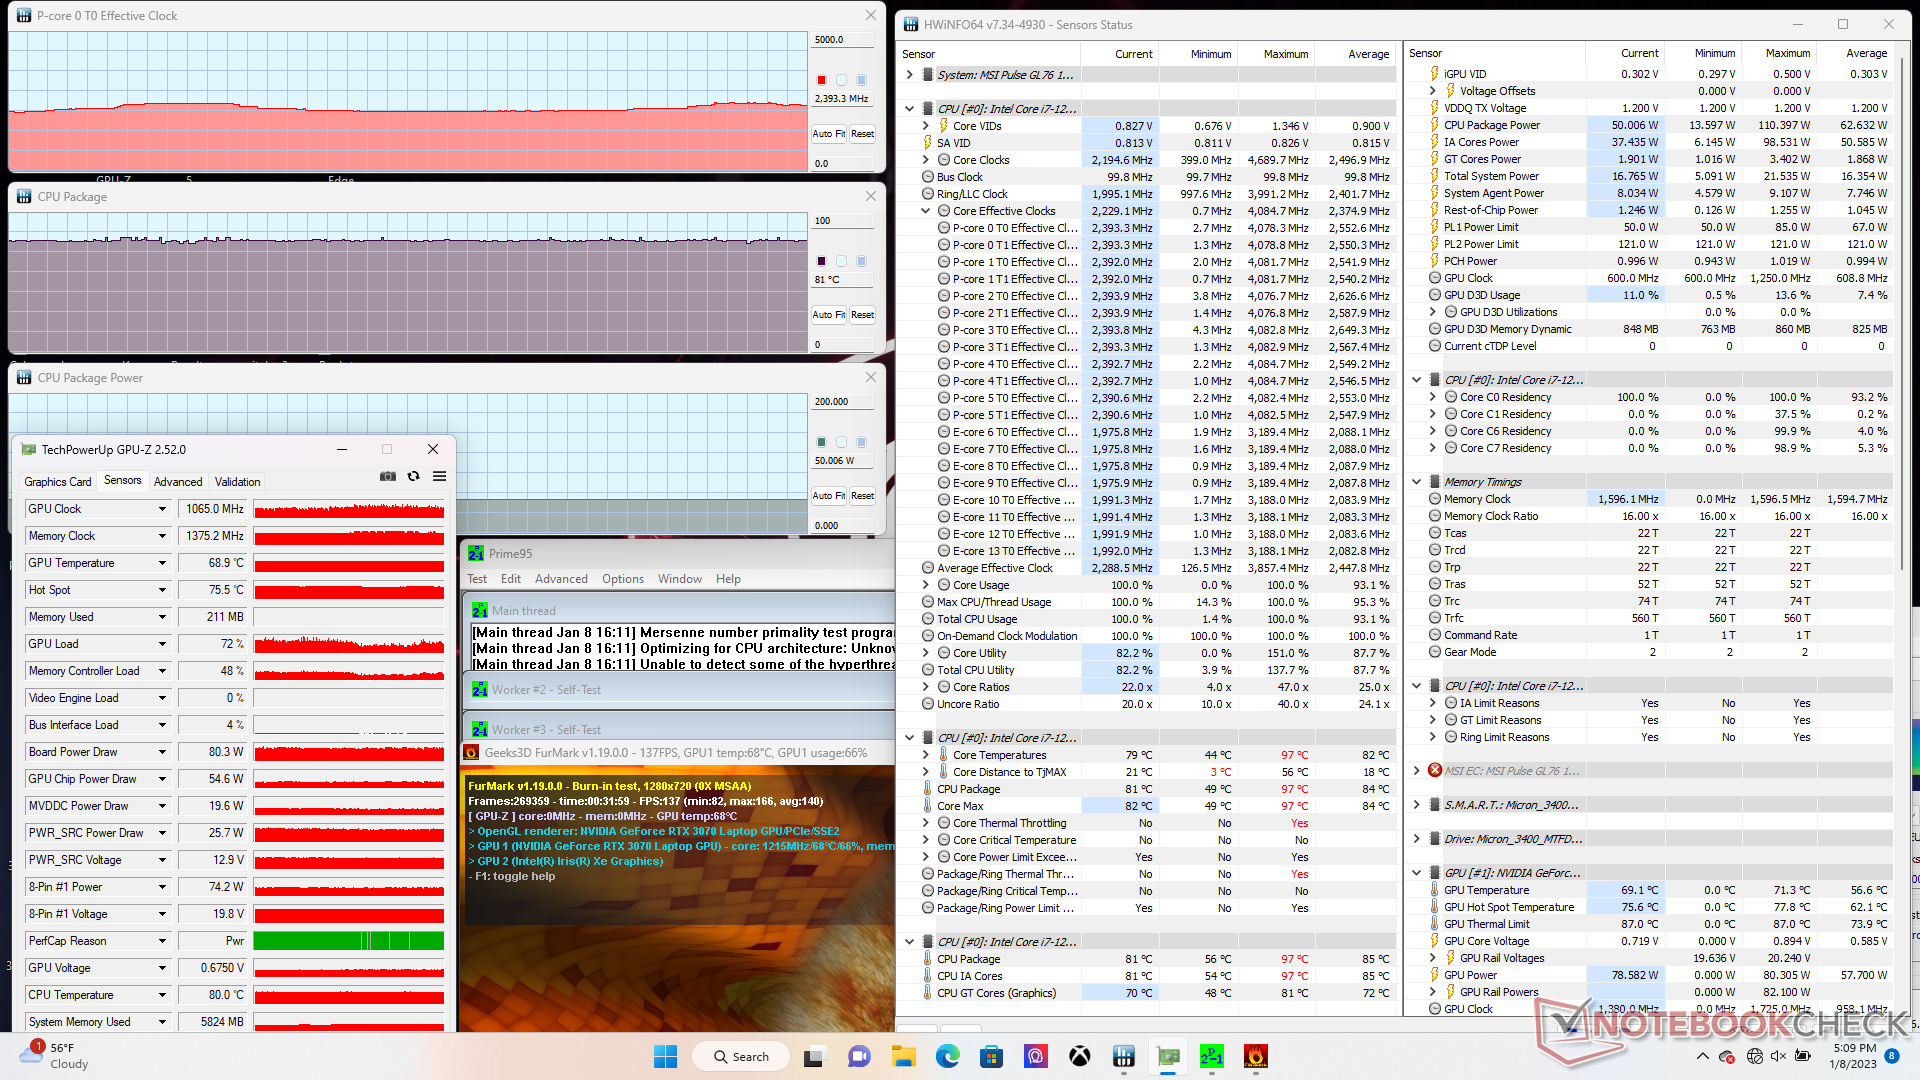
| Clock della CPU (GHz) | Clock della GPU (MHz) | Temperatura media della CPU (°C) | Temperatura media della GPU (°C) | |
| Sistema inattivo | -- | -- | 51 | 50 |
| Stress Prime95 | 3,4 - 3,6 | -- | 90 | 56 |
| Prime95 + FurMark Stress | 2,3 - 2,4 | 1065 | 81 | 69 |
| Witcher 3 Stress | ~1.1 | 1575 | 72 | 76 |
Altoparlanti
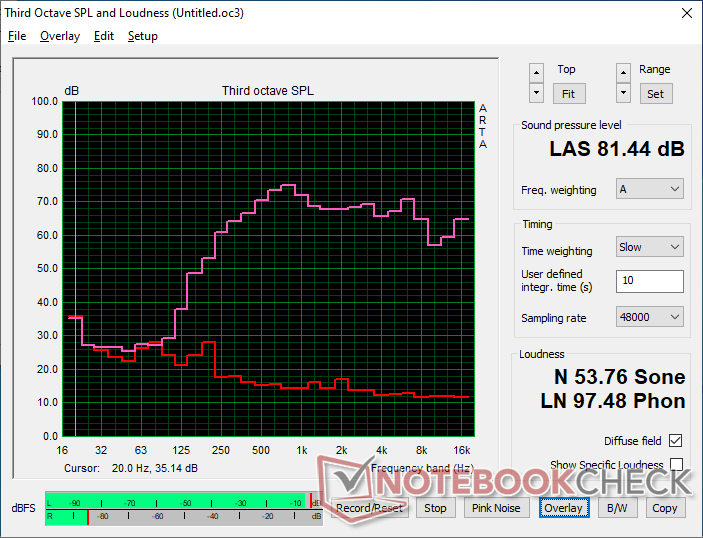
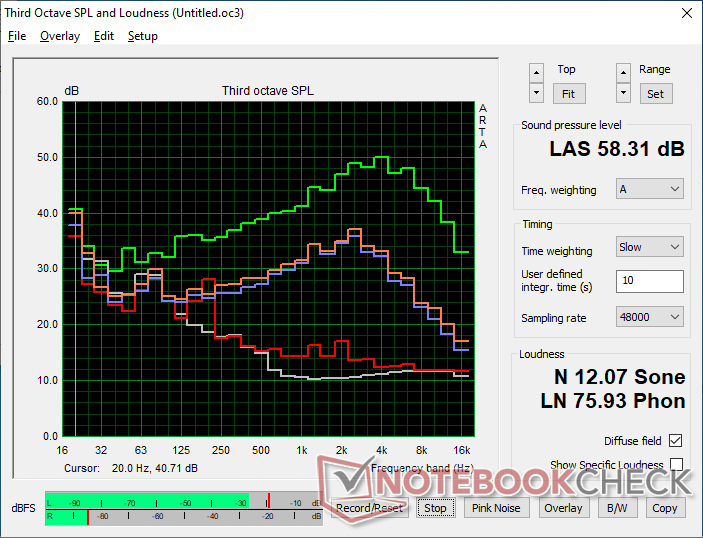
MSI Pulse GL76 12UGK analisi audio
(±) | potenza degli altiparlanti media ma buona (81.4 dB)
Bassi 100 - 315 Hz
(-) | quasi nessun basso - in media 17.5% inferiori alla media
(±) | la linearità dei bassi è media (11.8% delta rispetto alla precedente frequenza)
Medi 400 - 2000 Hz
(+) | medi bilanciati - solo only 3.7% rispetto alla media
(+) | medi lineari (4.3% delta rispetto alla precedente frequenza)
Alti 2 - 16 kHz
(+) | Alti bilanciati - appena 3.1% dalla media
(+) | alti lineari (6.6% delta rispetto alla precedente frequenza)
Nel complesso 100 - 16.000 Hz
(+) | suono nel complesso lineare (14.8% differenza dalla media)
Rispetto alla stessa classe
» 29% di tutti i dispositivi testati in questa classe è stato migliore, 7% simile, 64% peggiore
» Il migliore ha avuto un delta di 6%, medio di 18%, peggiore di 132%
Rispetto a tutti i dispositivi testati
» 20% di tutti i dispositivi testati in questa classe è stato migliore, 4% similare, 76% peggiore
» Il migliore ha avuto un delta di 4%, medio di 24%, peggiore di 134%
Apple MacBook Pro 16 2021 M1 Pro analisi audio
(+) | gli altoparlanti sono relativamente potenti (84.7 dB)
Bassi 100 - 315 Hz
(+) | bassi buoni - solo 3.8% dalla media
(+) | bassi in lineaa (5.2% delta rispetto alla precedente frequenza)
Medi 400 - 2000 Hz
(+) | medi bilanciati - solo only 1.3% rispetto alla media
(+) | medi lineari (2.1% delta rispetto alla precedente frequenza)
Alti 2 - 16 kHz
(+) | Alti bilanciati - appena 1.9% dalla media
(+) | alti lineari (2.7% delta rispetto alla precedente frequenza)
Nel complesso 100 - 16.000 Hz
(+) | suono nel complesso lineare (4.6% differenza dalla media)
Rispetto alla stessa classe
» 0% di tutti i dispositivi testati in questa classe è stato migliore, 0% simile, 100% peggiore
» Il migliore ha avuto un delta di 5%, medio di 17%, peggiore di 45%
Rispetto a tutti i dispositivi testati
» 0% di tutti i dispositivi testati in questa classe è stato migliore, 0% similare, 100% peggiore
» Il migliore ha avuto un delta di 4%, medio di 24%, peggiore di 134%
Gestione dell'energia: più efficiente del previsto
Consumo di energia
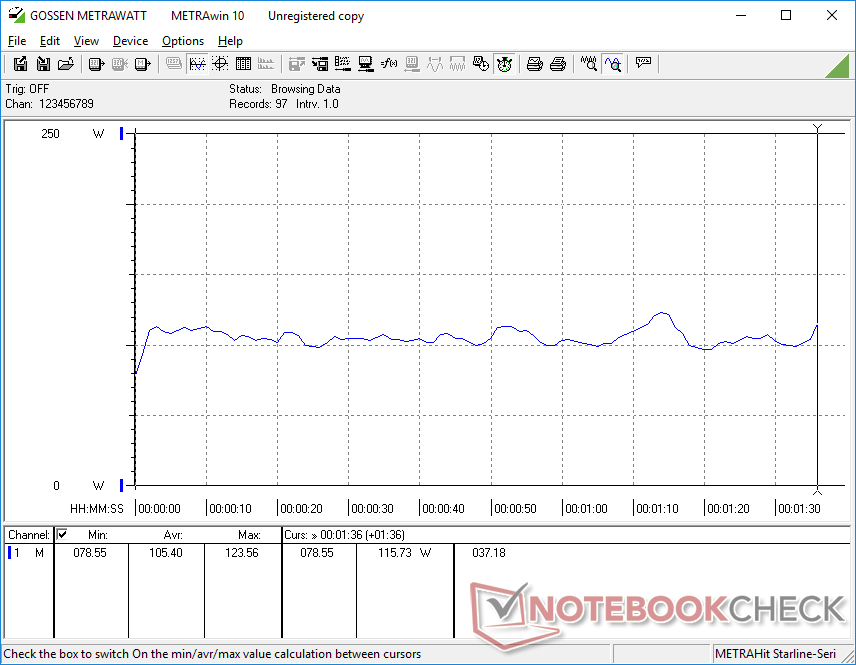
Il funzionamento al minimo sul desktop consuma solo 12 W quando è attivo il profilo Power Saver con l'iGPU attiva e la luminosità impostata al minimo. Al contrario, il funzionamento al minimo sul desktop può consumare poco più di 25 W quando si attiva la modalità Extreme Performance con la luminosità impostata al massimo. Pertanto, il passaggio da una modalità energetica all'altra è un fattore importante per prolungare la durata della batteria.
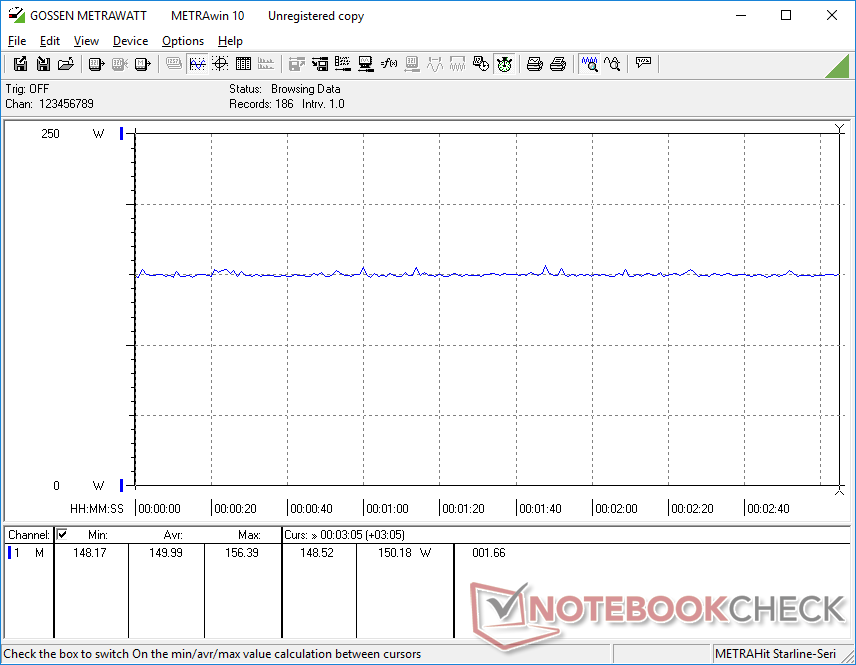
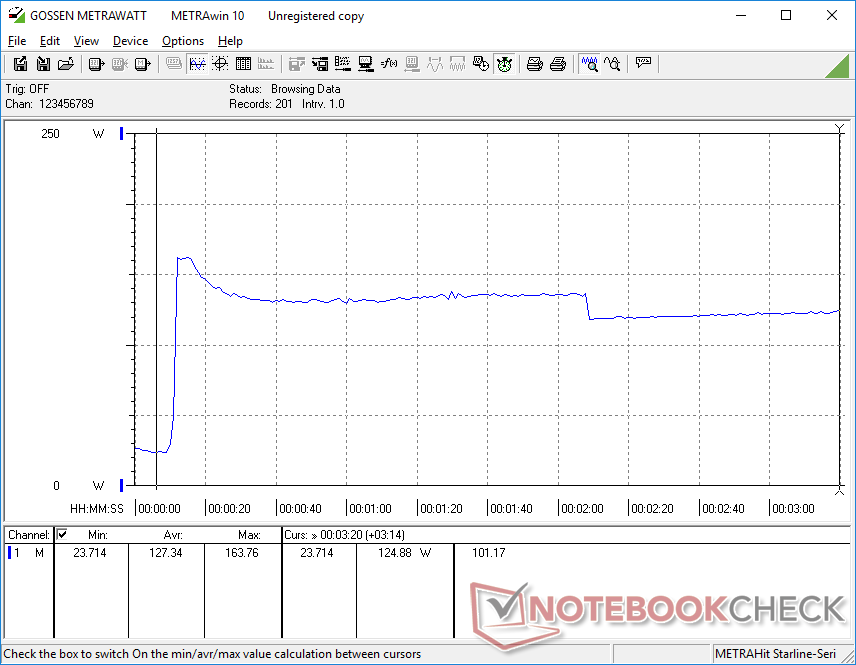
Il consumo energetico complessivo è inferiore a quello della maggior parte dei portatili da gioco da 17,3 pollici. L'esecuzione di Witcher 3, ad esempio, consuma solo 150 W rispetto ai 199 W e 231 W di MSI Vector GP76 e Acer Predator Helios 300, rispettivamente con GPU RTX 3070 Ti. Il consumo è anche significativamente inferiore a quello dell'Alienware m17 R5 con Radeon RX 6850M XT, pur offrendo quasi le stesse prestazioni grafiche grezze.
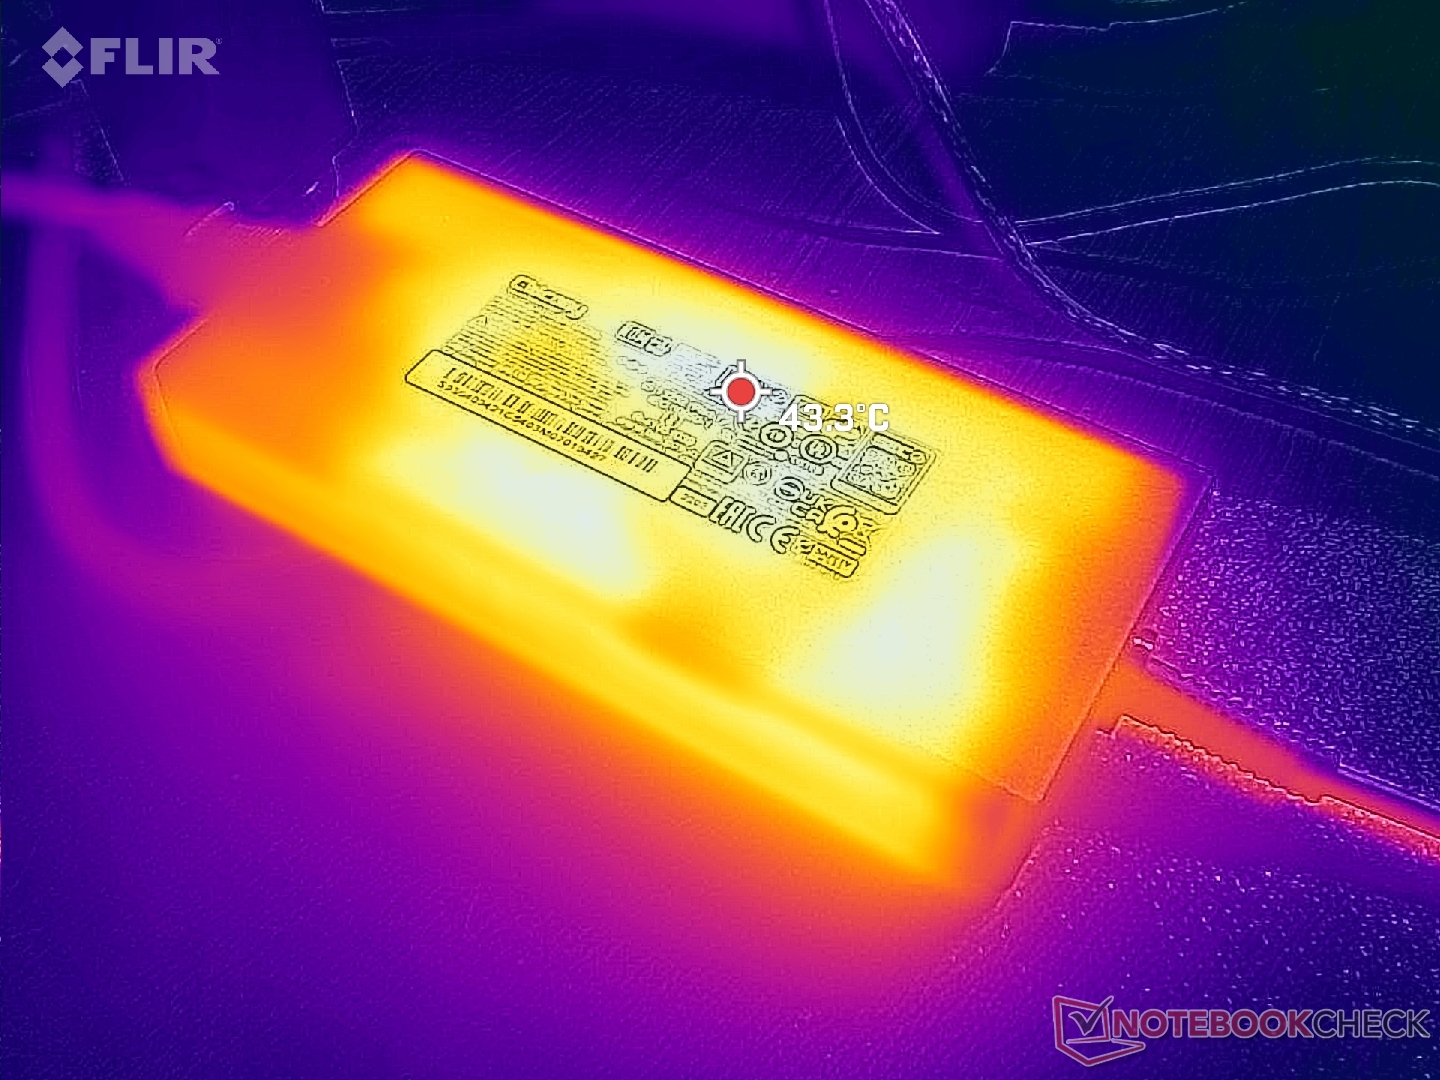
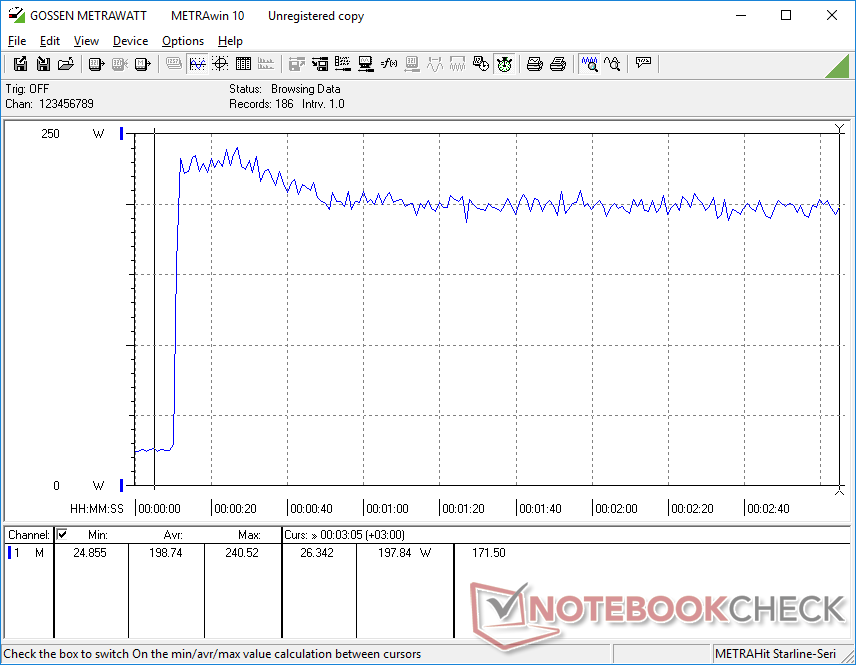
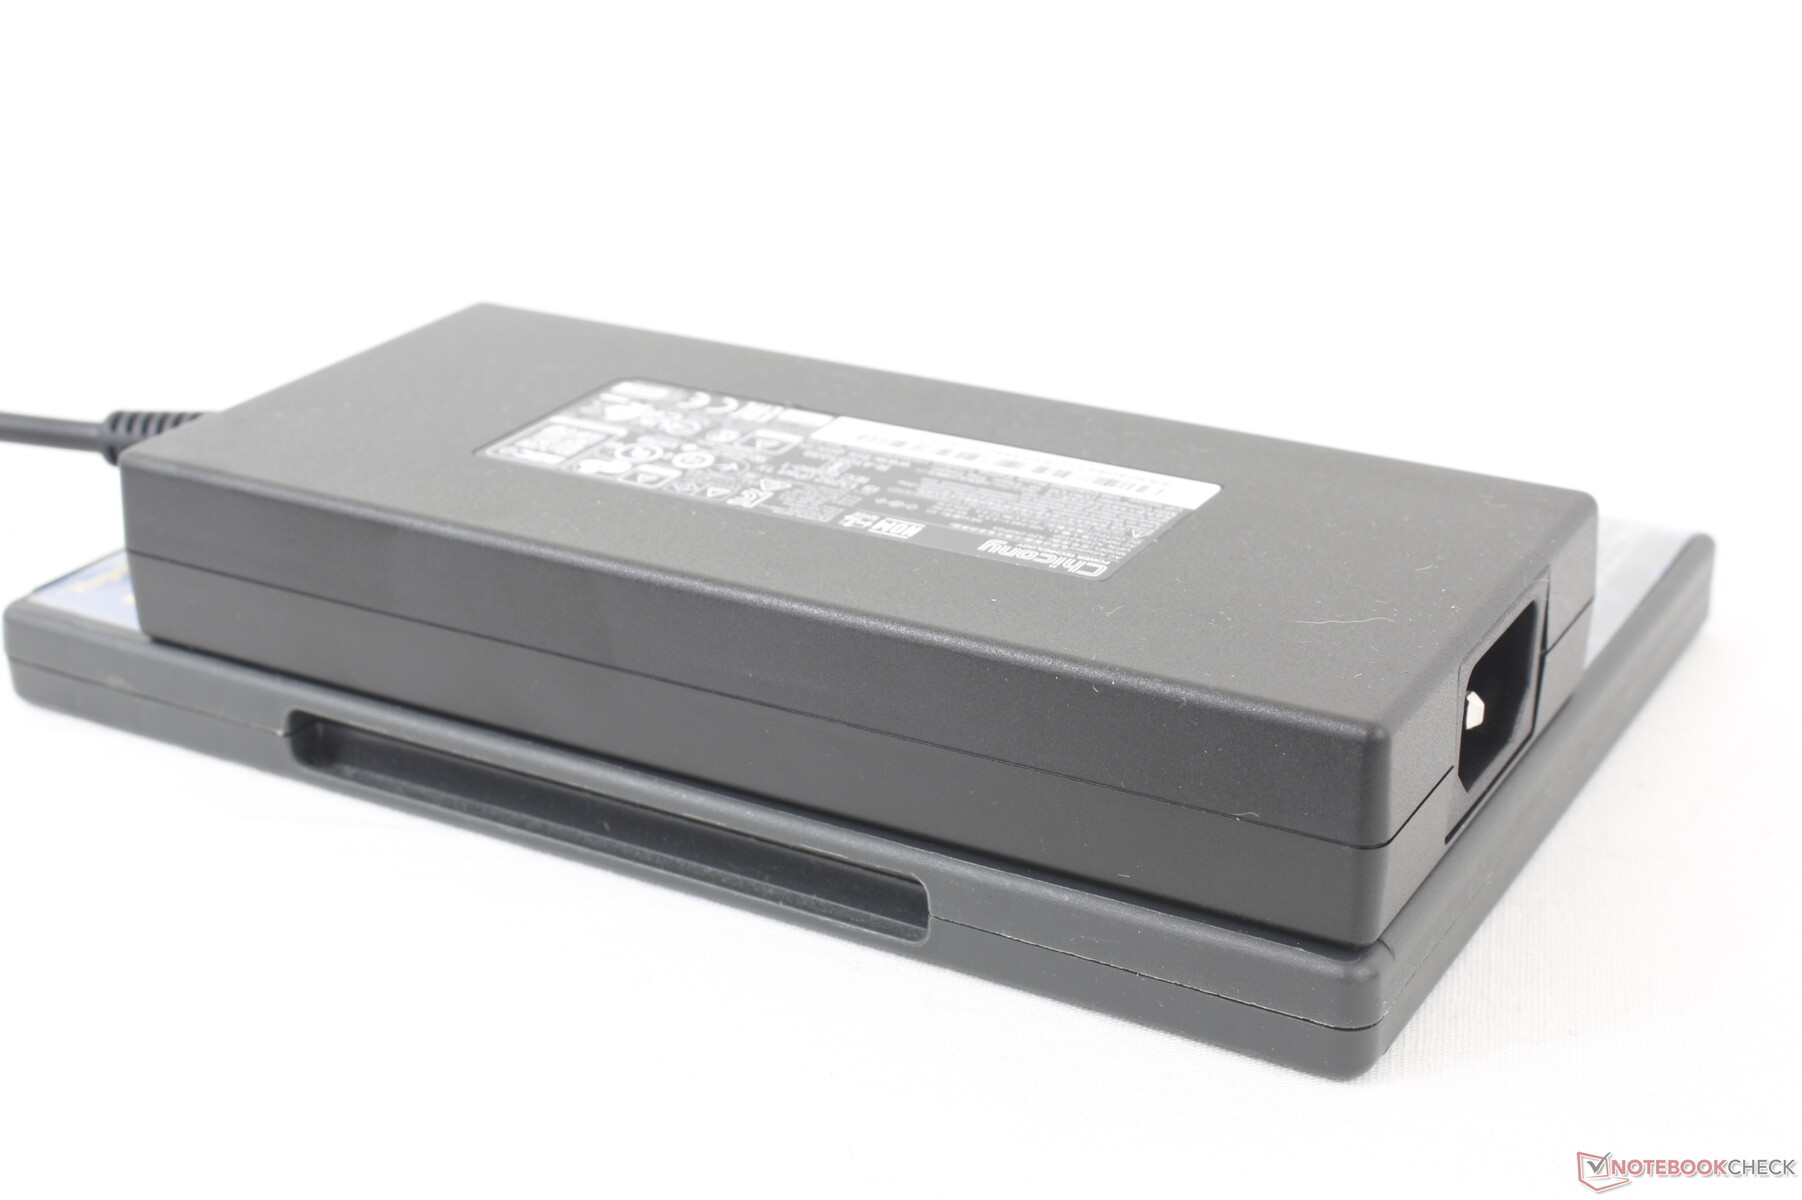
Siamo riusciti a misurare un consumo massimo di 241 W dall'adattatore CA di medie dimensioni (~16,4 x 7,4 x 2,5 cm) da 240 W quando la CPU e la GPU sono utilizzate al 100%. Questa percentuale è solo temporanea, come mostrano gli screenshot qui sotto, a causa del limitato potenziale Turbo Boost della CPU. La batteria può ancora caricarsi a un ritmo decente durante l'esecuzione di carichi elevati come i giochi.
| Off / Standby | |
| Idle | |
| Sotto carico |
|
Leggenda:
min: | |
| MSI Pulse GL76 12UGK i7-12700H, GeForce RTX 3070 Laptop GPU, Micron 3400 1TB MTFDKBA1T0TFH, IPS, 1920x1080, 17.3" | Alienware m17 R5 (R9 6900HX, RX 6850M XT) R9 6900HX, Radeon RX 6850M XT, SSSTC CA6-8D1024, IPS, 3840x2160, 17" | Asus ROG Strix Scar 17 SE G733CX-LL014W i9-12950HX, GeForce RTX 3080 Ti Laptop GPU, Samsung PM9A1 MZVL22T0HBLB, IPS, 2560x1440, 17.3" | Acer Predator Helios 300 (i7-12700H, RTX 3070 Ti) i7-12700H, GeForce RTX 3070 Ti Laptop GPU, Samsung PM9A1 MZVL21T0HCLR, IPS, 2560x1440, 17.3" | Razer Blade 17 Early 2022 i9-12900H, GeForce RTX 3080 Ti Laptop GPU, Samsung PM9A1 MZVL21T0HCLR, IPS, 3840x2160, 17.3" | MSI Vector GP76 12UGS-434 i7-12700H, GeForce RTX 3070 Ti Laptop GPU, Micron 2450 1TB MTFDKBA1T0TFK, IPS, 1920x1080, 17.3" | |
|---|---|---|---|---|---|---|
| Power Consumption | -8% | -46% | -27% | -36% | -27% | |
| Idle Minimum * (Watt) | 12.4 | 13 -5% | 19.3 -56% | 15 -21% | 17 -37% | 13.5 -9% |
| Idle Average * (Watt) | 13.1 | 16.5 -26% | 26.5 -102% | 20 -53% | 23 -76% | 15.6 -19% |
| Idle Maximum * (Watt) | 25.3 | 17 33% | 27.1 -7% | 22.3 12% | 34 -34% | 20.6 19% |
| Load Average * (Watt) | 105.4 | 93 12% | 141 -34% | 133 -26% | 120 -14% | 198 -88% |
| Witcher 3 ultra * (Watt) | 150 | 239 -59% | 225 -50% | 231 -54% | 229 -53% | 199 -33% |
| Load Maximum * (Watt) | 240.5 | 251 -4% | 307.9 -28% | 290 -21% | 243 -1% | 319 -33% |
* ... Meglio usare valori piccoli
Power Consumption Witcher 3 / Stresstest
Power Consumption external Monitor
Durata della batteria - Batteria agli ioni di litio da 99 Wh
È interessante notare che le specifiche ufficiali MSI di https://us.msi.com/Laptop/Pulse-GL76-12UX/Specification dichiarano una batteria da 53 Wh per il GL76, mentre uno sguardo più attento a HWiNFO e alla batteria fisica della nostra unità di test mostra una capacità di 90 Wh. La discrepanza è probabilmente un errore del produttore. Tuttavia, la durata della batteria è buona per un portatile da gioco. Siamo riusciti a registrare un'autonomia in WLAN di poco meno di 6 ore, circa 2 ore in più rispetto al Razer Blade 17 o all'Asus ROG Strix Scar 17.
La ricarica da vuoto a pieno regime richiede poco più di 2 ore. L'USB-PD non è supportato e quindi il sistema può essere ricaricato solo con l'adattatore CA in dotazione.
| MSI Pulse GL76 12UGK i7-12700H, GeForce RTX 3070 Laptop GPU, 90 Wh | Alienware m17 R5 (R9 6900HX, RX 6850M XT) R9 6900HX, Radeon RX 6850M XT, 97 Wh | Asus ROG Strix Scar 17 SE G733CX-LL014W i9-12950HX, GeForce RTX 3080 Ti Laptop GPU, 90 Wh | Acer Predator Helios 300 (i7-12700H, RTX 3070 Ti) i7-12700H, GeForce RTX 3070 Ti Laptop GPU, 90 Wh | Razer Blade 17 Early 2022 i9-12900H, GeForce RTX 3080 Ti Laptop GPU, 82 Wh | MSI Vector GP76 12UGS-434 i7-12700H, GeForce RTX 3070 Ti Laptop GPU, 65 Wh | |
|---|---|---|---|---|---|---|
| Autonomia della batteria | -17% | -29% | -6% | -19% | -11% | |
| Reader / Idle (h) | 7.3 | 7.1 -3% | 7.3 0% | |||
| WiFi v1.3 (h) | 5.9 | 4.8 -19% | 4.2 -29% | 6 2% | 3.8 -36% | 5.1 -14% |
| Load (h) | 2.1 | 1.8 -14% | 1.8 -14% | 1.7 -19% | 1.7 -19% | |
| H.264 (h) | 4.9 | 5.9 | 4.8 |
Pro
Contro
Verdetto - Tanta potenza grezza, ma con alcune caratteristiche chiave mancanti
Il Pulse GL76 è un ottimo prodotto in termini di prezzo, prestazioni e display. Il Core i7-12700H si abbina bene alla RTX 3070 di GeForce, mentre il pannello da 360 Hz a 1080p è lo stesso che MSI utilizza per la sua ben più costosa GT77 Titan. Per 1400 dollari o addirittura 1200 dollari se in offerta, sarebbe difficile trovare un altro portatile da gioco da 17,3 pollici con CPU, GPU e display migliori del nostro GL76.
Tuttavia, se si guarda al di là dei processori e del display, i tagli iniziano a farsi sentire. In particolare, la mancanza di G-Sync, MUX, Advanced Optimus e supporto Thunderbolt mette a dura prova un sistema altrimenti potente. Alternative come Asus TUF Gaming F17 o Acer Predator Helios 300 offrono molte di queste caratteristiche mancanti che gli utenti avanzati o i giocatori potrebbero apprezzare. Non ci aspettiamo che i portatili da gioco economici abbiano caratteristiche così moderne, ma il GL76 ha un prezzo ben superiore ai 1000 dollari per meritarsi almeno alcune di esse.
L'MSI Pulse GL76 privilegia le prestazioni Intel e Nvidia grezze insieme a un display IPS di alta qualità a 360 Hz. Mancano alcune funzioni avanzate, probabilmente per tenere sotto controllo i costi.
Altri aspetti negativi, come il clickpad spugnoso, la webcam fangosa, le cerniere mediocri, il design prevalentemente in plastica e la mancanza dell'illuminazione RGB per tasto, sono per lo più tipici dei portatili da gioco di fascia media e non costituiscono un problema. I giocatori che vogliono massimizzare le prestazioni e la qualità dello schermo senza spendere troppo dovrebbero comunque prendere in considerazione il GL76.
Prezzo e disponibilità
Il Pulse GL76, così come configurato, è attualmente disponibile sul sito Costco per un prezzo compreso tra $1200 e $1400 USD. Il modello è disponibile anche su Amazon per 1650 dollari, Newegg a 1750 dollari o Best Buy a 1700 dollari.
MSI Pulse GL76 12UGK
- 01/11/2023 v7 (old)
Allen Ngo
Price comparison

