Recensione del portatile MSI CreatorPro Z16P - Workstation mobile con problemi di temperatura
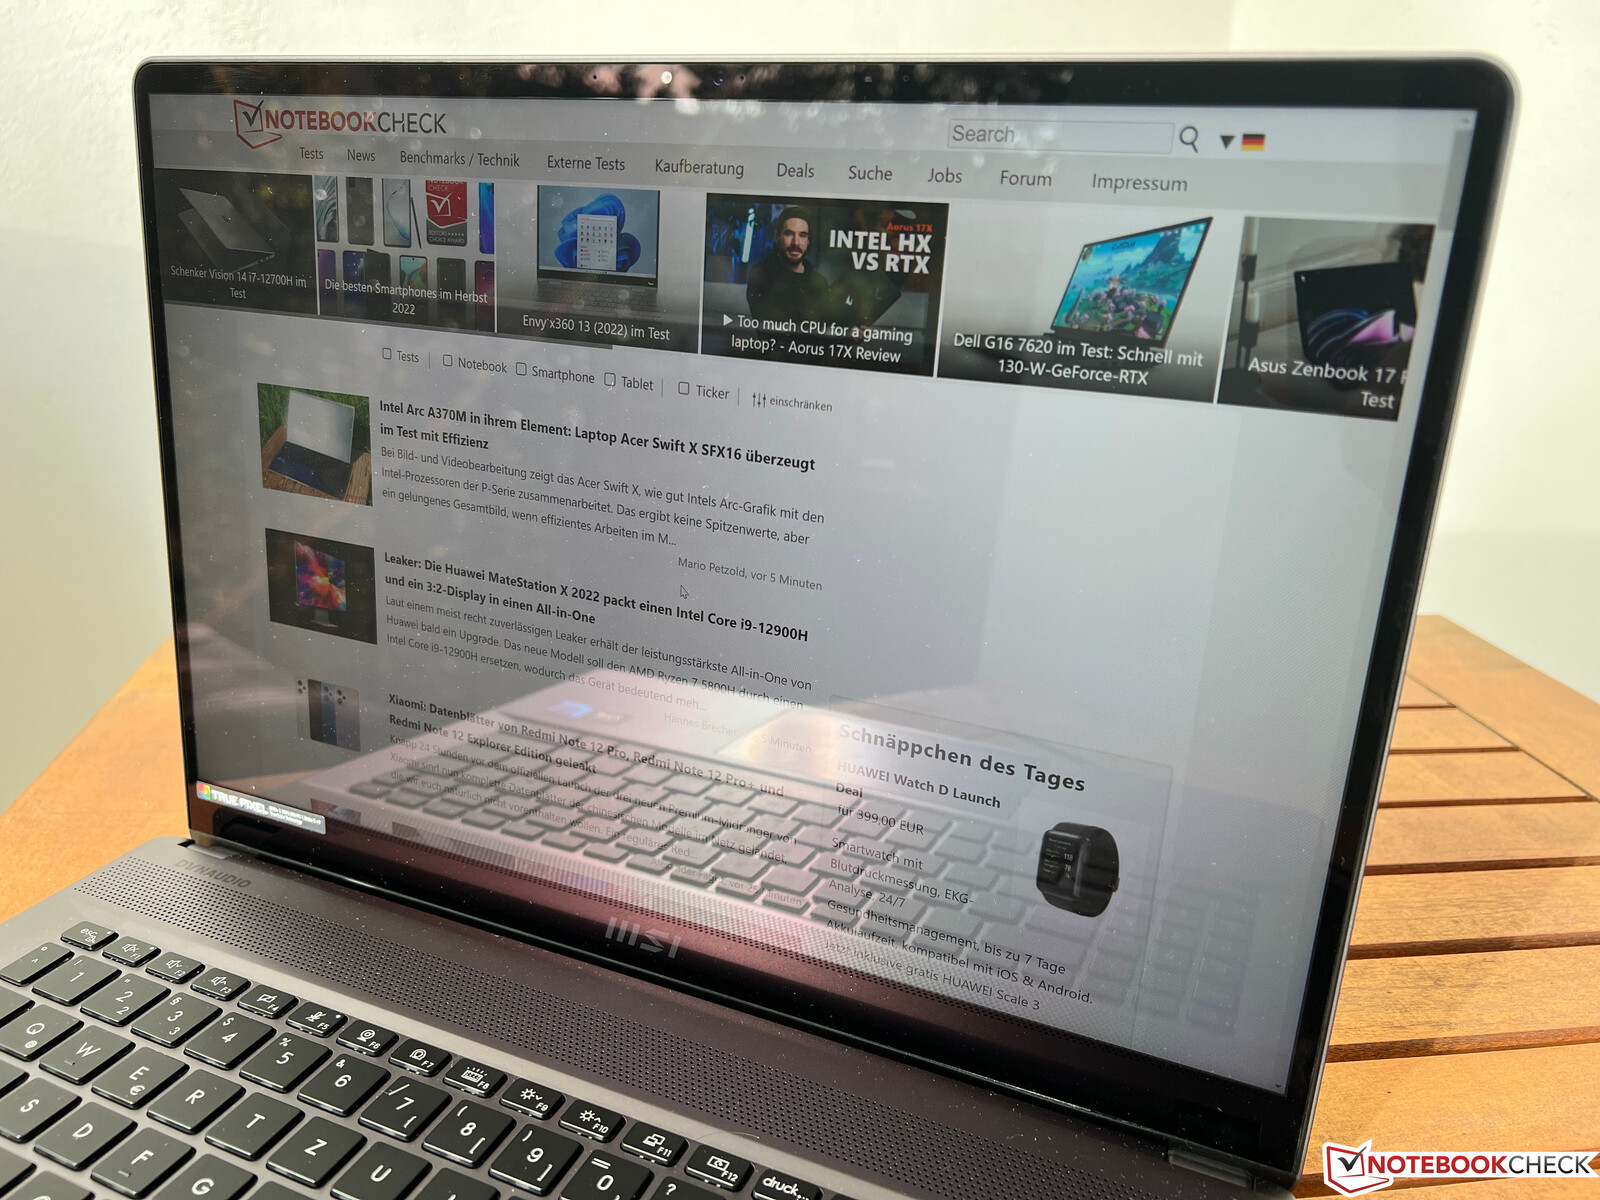
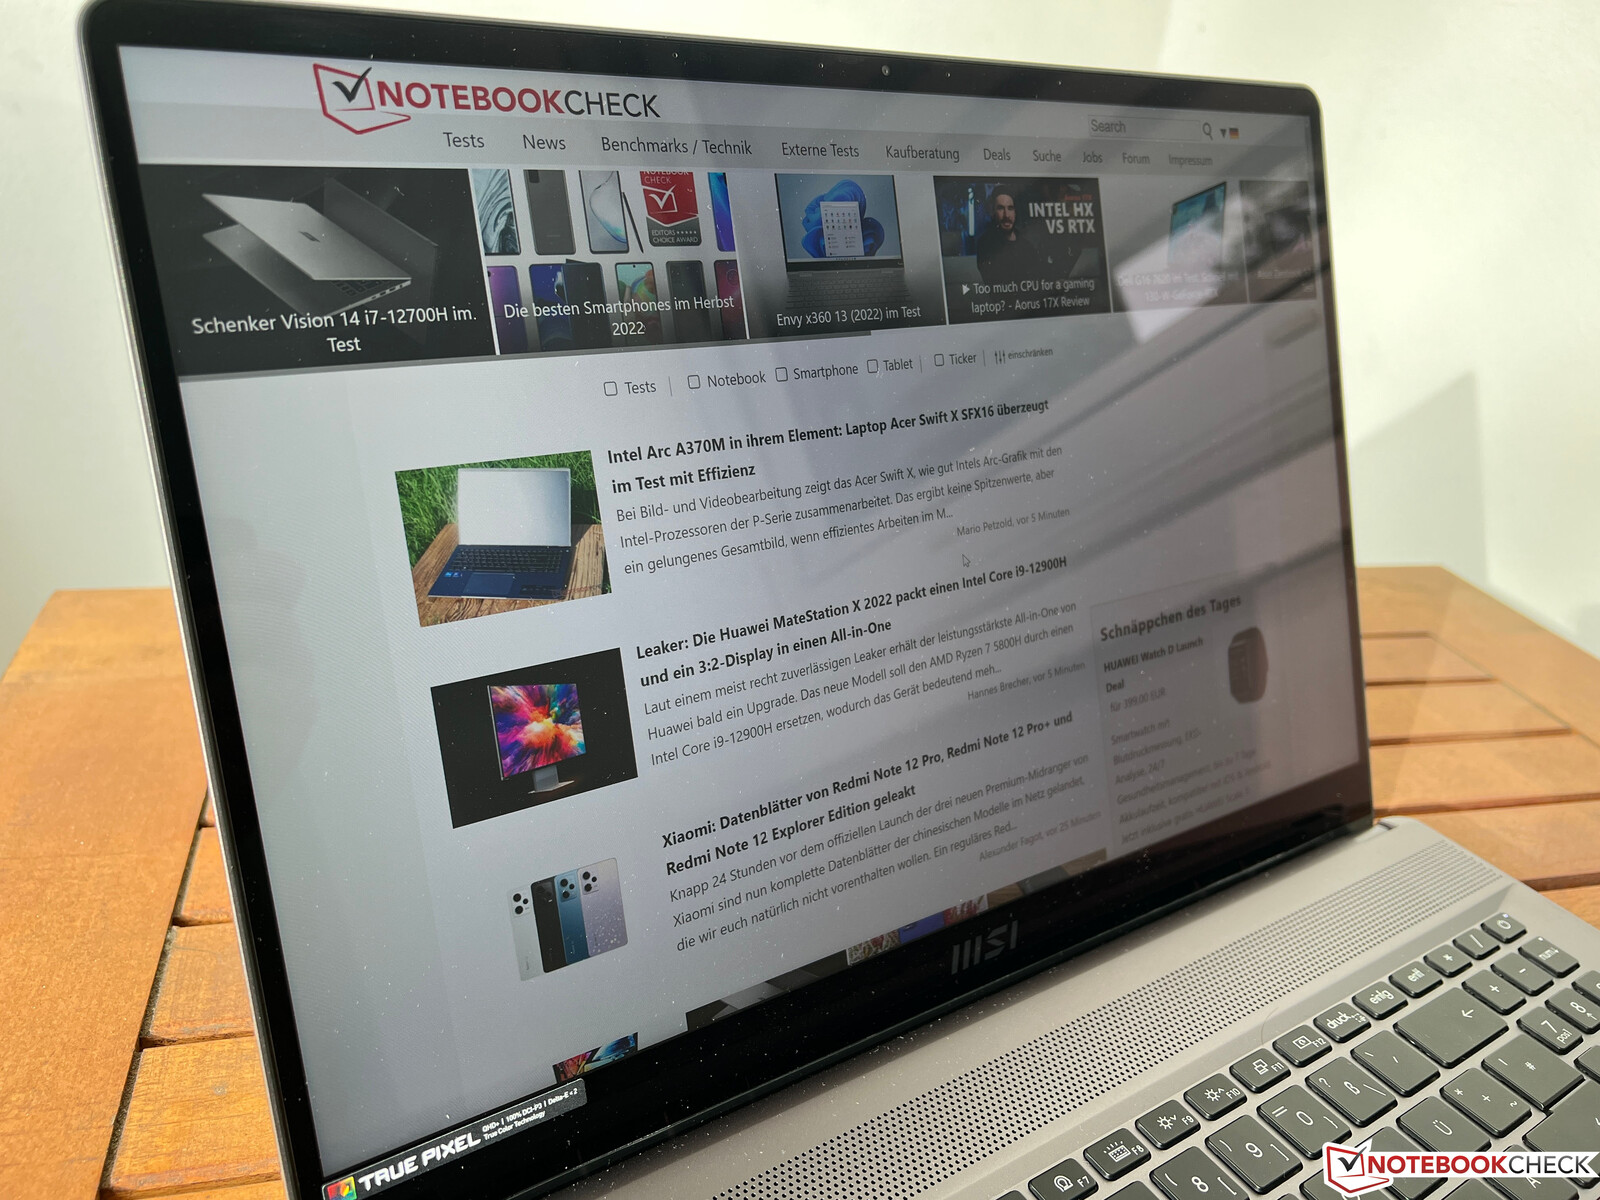
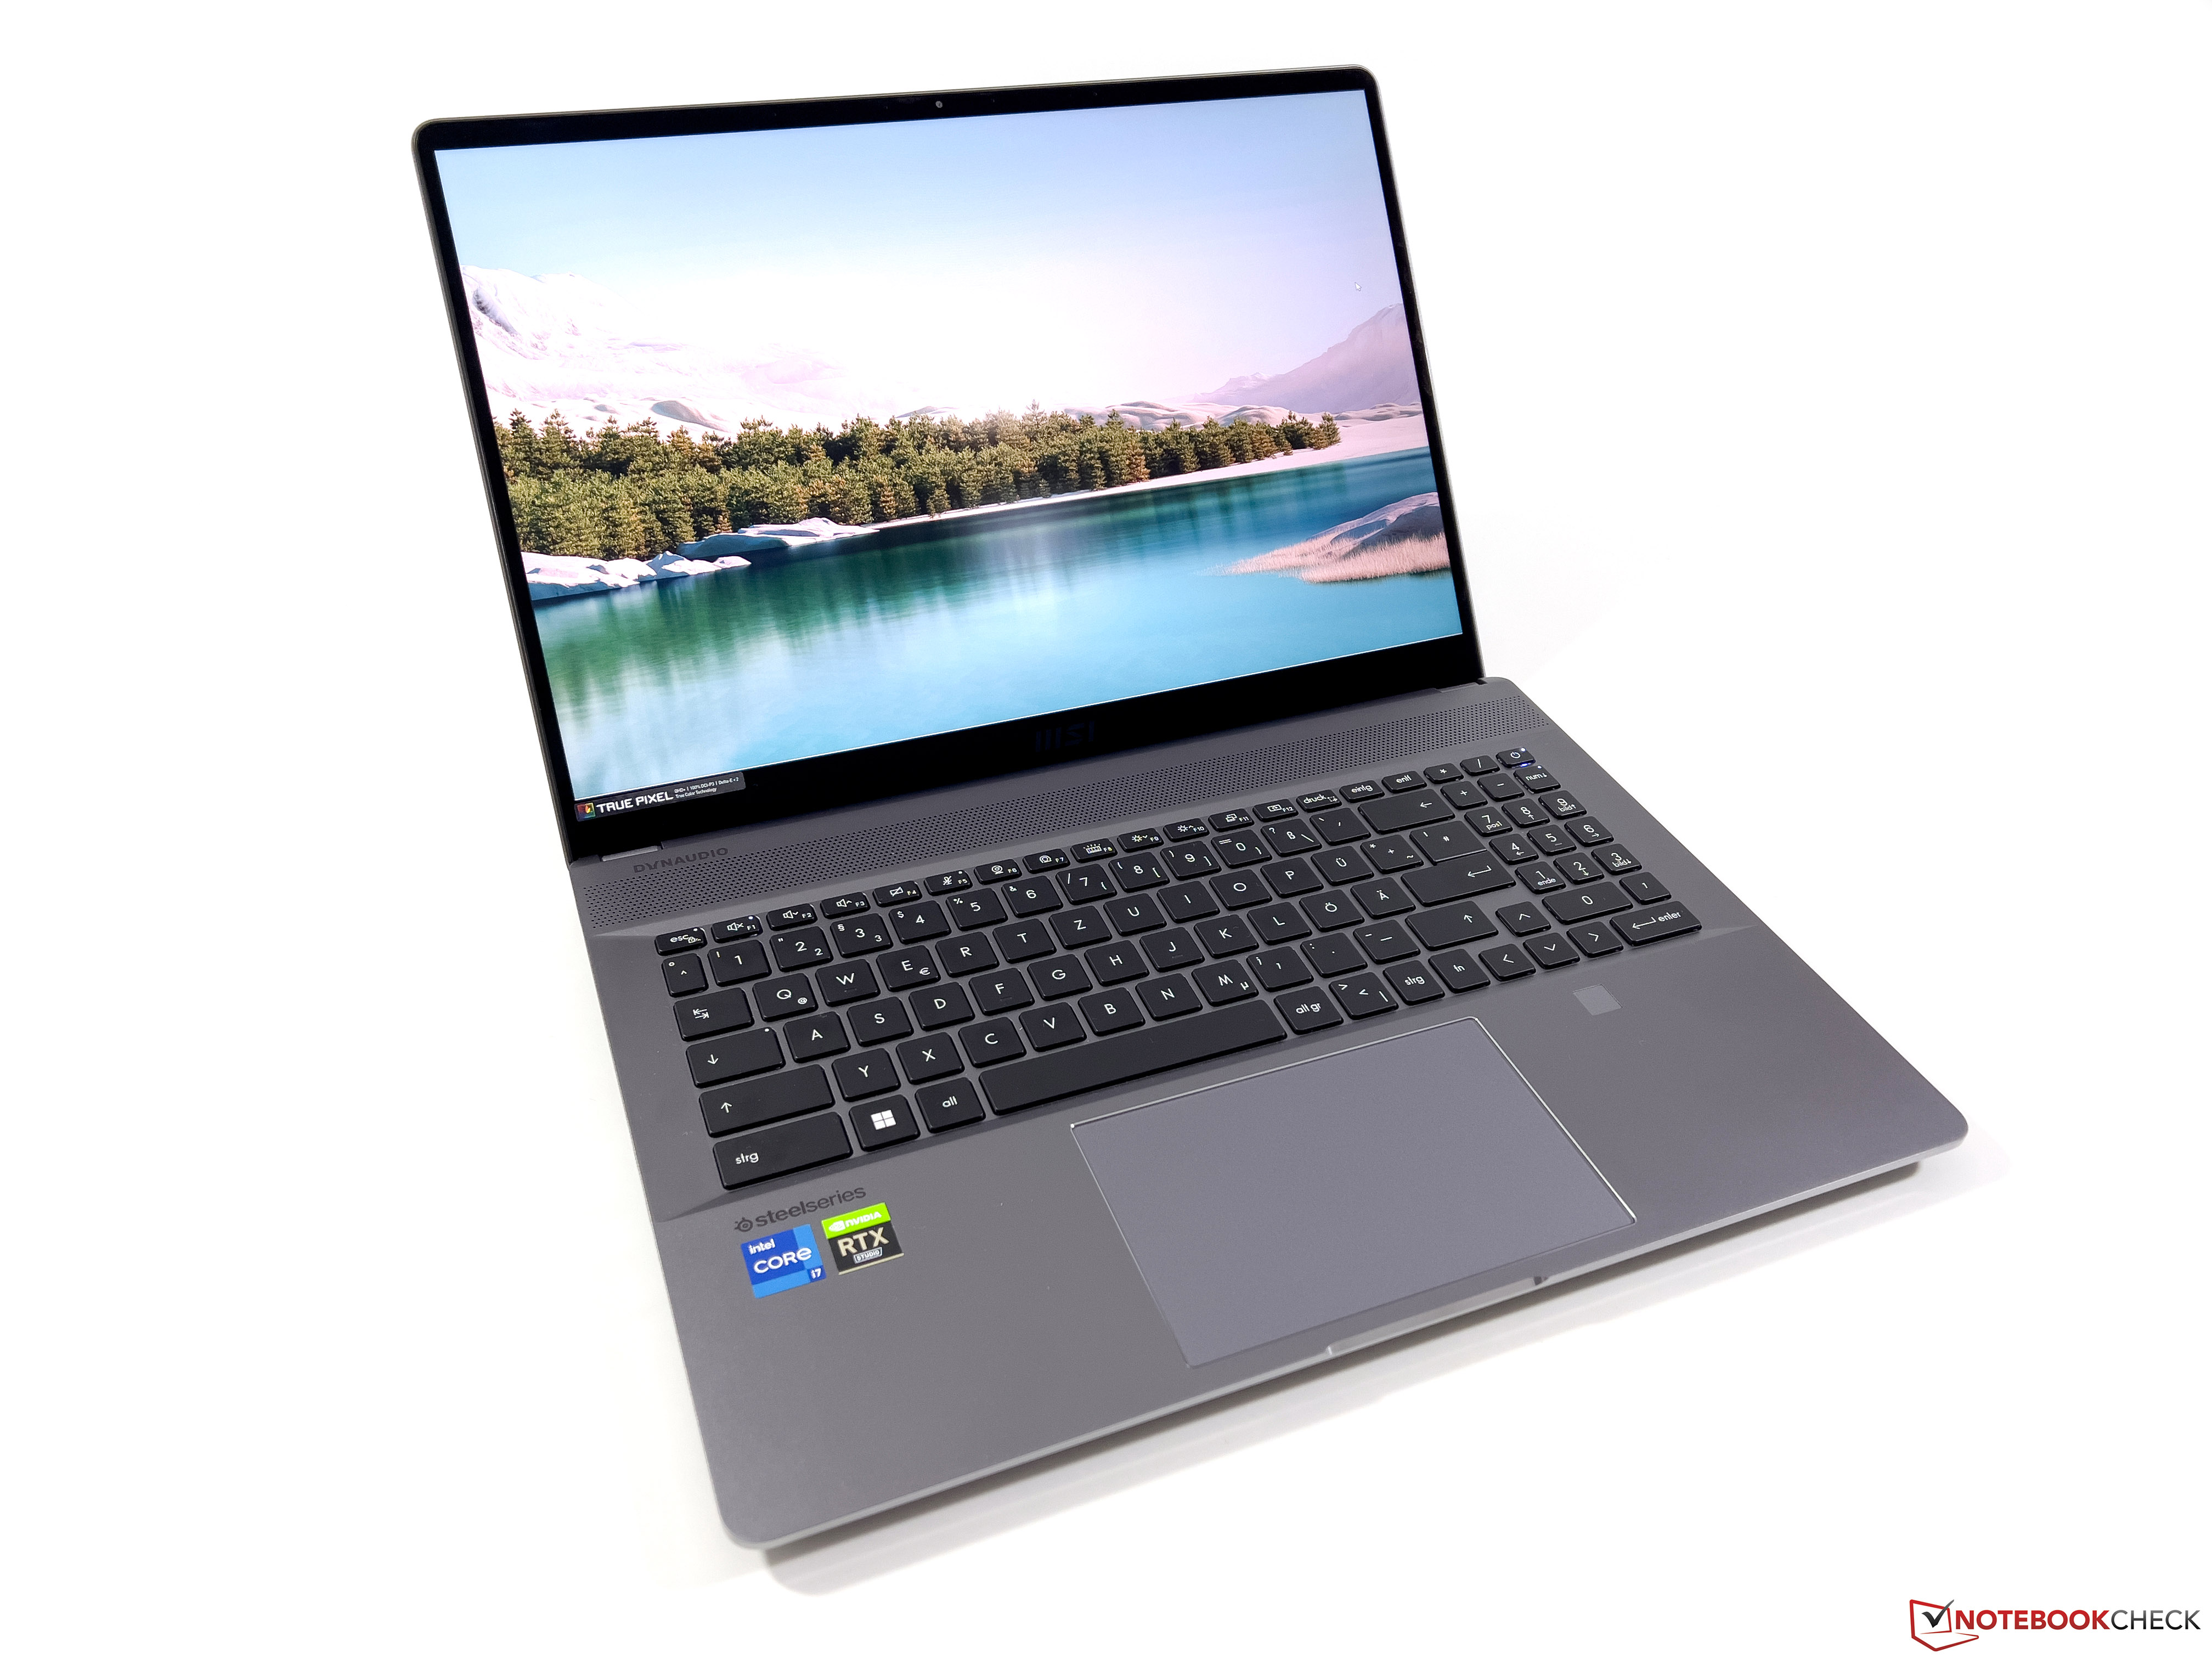
Abbiamo già testato ilCreator Z16P di MSIche è un portatile sottile da 16 pollici per i creatori di contenuti. Tuttavia, il produttore offre anche il dispositivo con GPU professionali di Nvidia con il nome di "CreatorPro Z16P", che esaminiamo oggi. Stiamo testando la configurazione denominata "B12UKST-078" al prezzo di 3.499 euro (~$3.620), che combina un processore Intel Core i7-12700Hcon laNvidia RTX A3000. Inoltre, sono presenti 32 GB di RAM e un'ampia unità SSD da 1 TB, oltre a un display IPS da 16 pollici con risoluzione WQHD e frequenza di aggiornamento di 165 Hz. In questo test ci concentriamo principalmente sulle prestazioni. Potete trovare informazioni dettagliate su case, equipaggiamento, dispositivi di input e altoparlanti nel nostro test del Creator Z16P:
Potenziali concorrenti a confronto
Punteggio | Data | Modello | Peso | Altezza | Dimensione | Risoluzione | Prezzo |
|---|---|---|---|---|---|---|---|
| 84.3 % v7 (old) | 11/2022 | MSI CreatorPro Z16P B12UKST i7-12700H, RTX A3000 Laptop GPU | 2.4 kg | 19 mm | 16.00" | 2560x1600 | |
| 90.1 % v7 (old) | 11/2022 | HP ZBook Studio 16 G9 62U04EA i7-12800H, RTX A2000 Laptop GPU | 1.8 kg | 19 mm | 16.00" | 3840x2400 | |
| 89.8 % v7 (old) | 11/2021 | Lenovo ThinkPad P1 G4-20Y4S0KS00 i7-11850H, GeForce RTX 3070 Laptop GPU | 2 kg | 17.7 mm | 16.00" | 3840x2400 | |
| 88.3 % v7 (old) | 10/2021 | Dell Precision 5000 5560 i7-11850H, RTX A2000 Laptop GPU | 2 kg | 18 mm | 15.60" | 3840x2400 | |
| 83.7 % v7 (old) | 06/2022 | MSI Creator Z16P B12UHST i9-12900H, GeForce RTX 3080 Ti Laptop GPU | 2.4 kg | 20.4 mm | 16.00" | 2560x1600 |
Valigetta, apparecchiatura e dispositivi di input
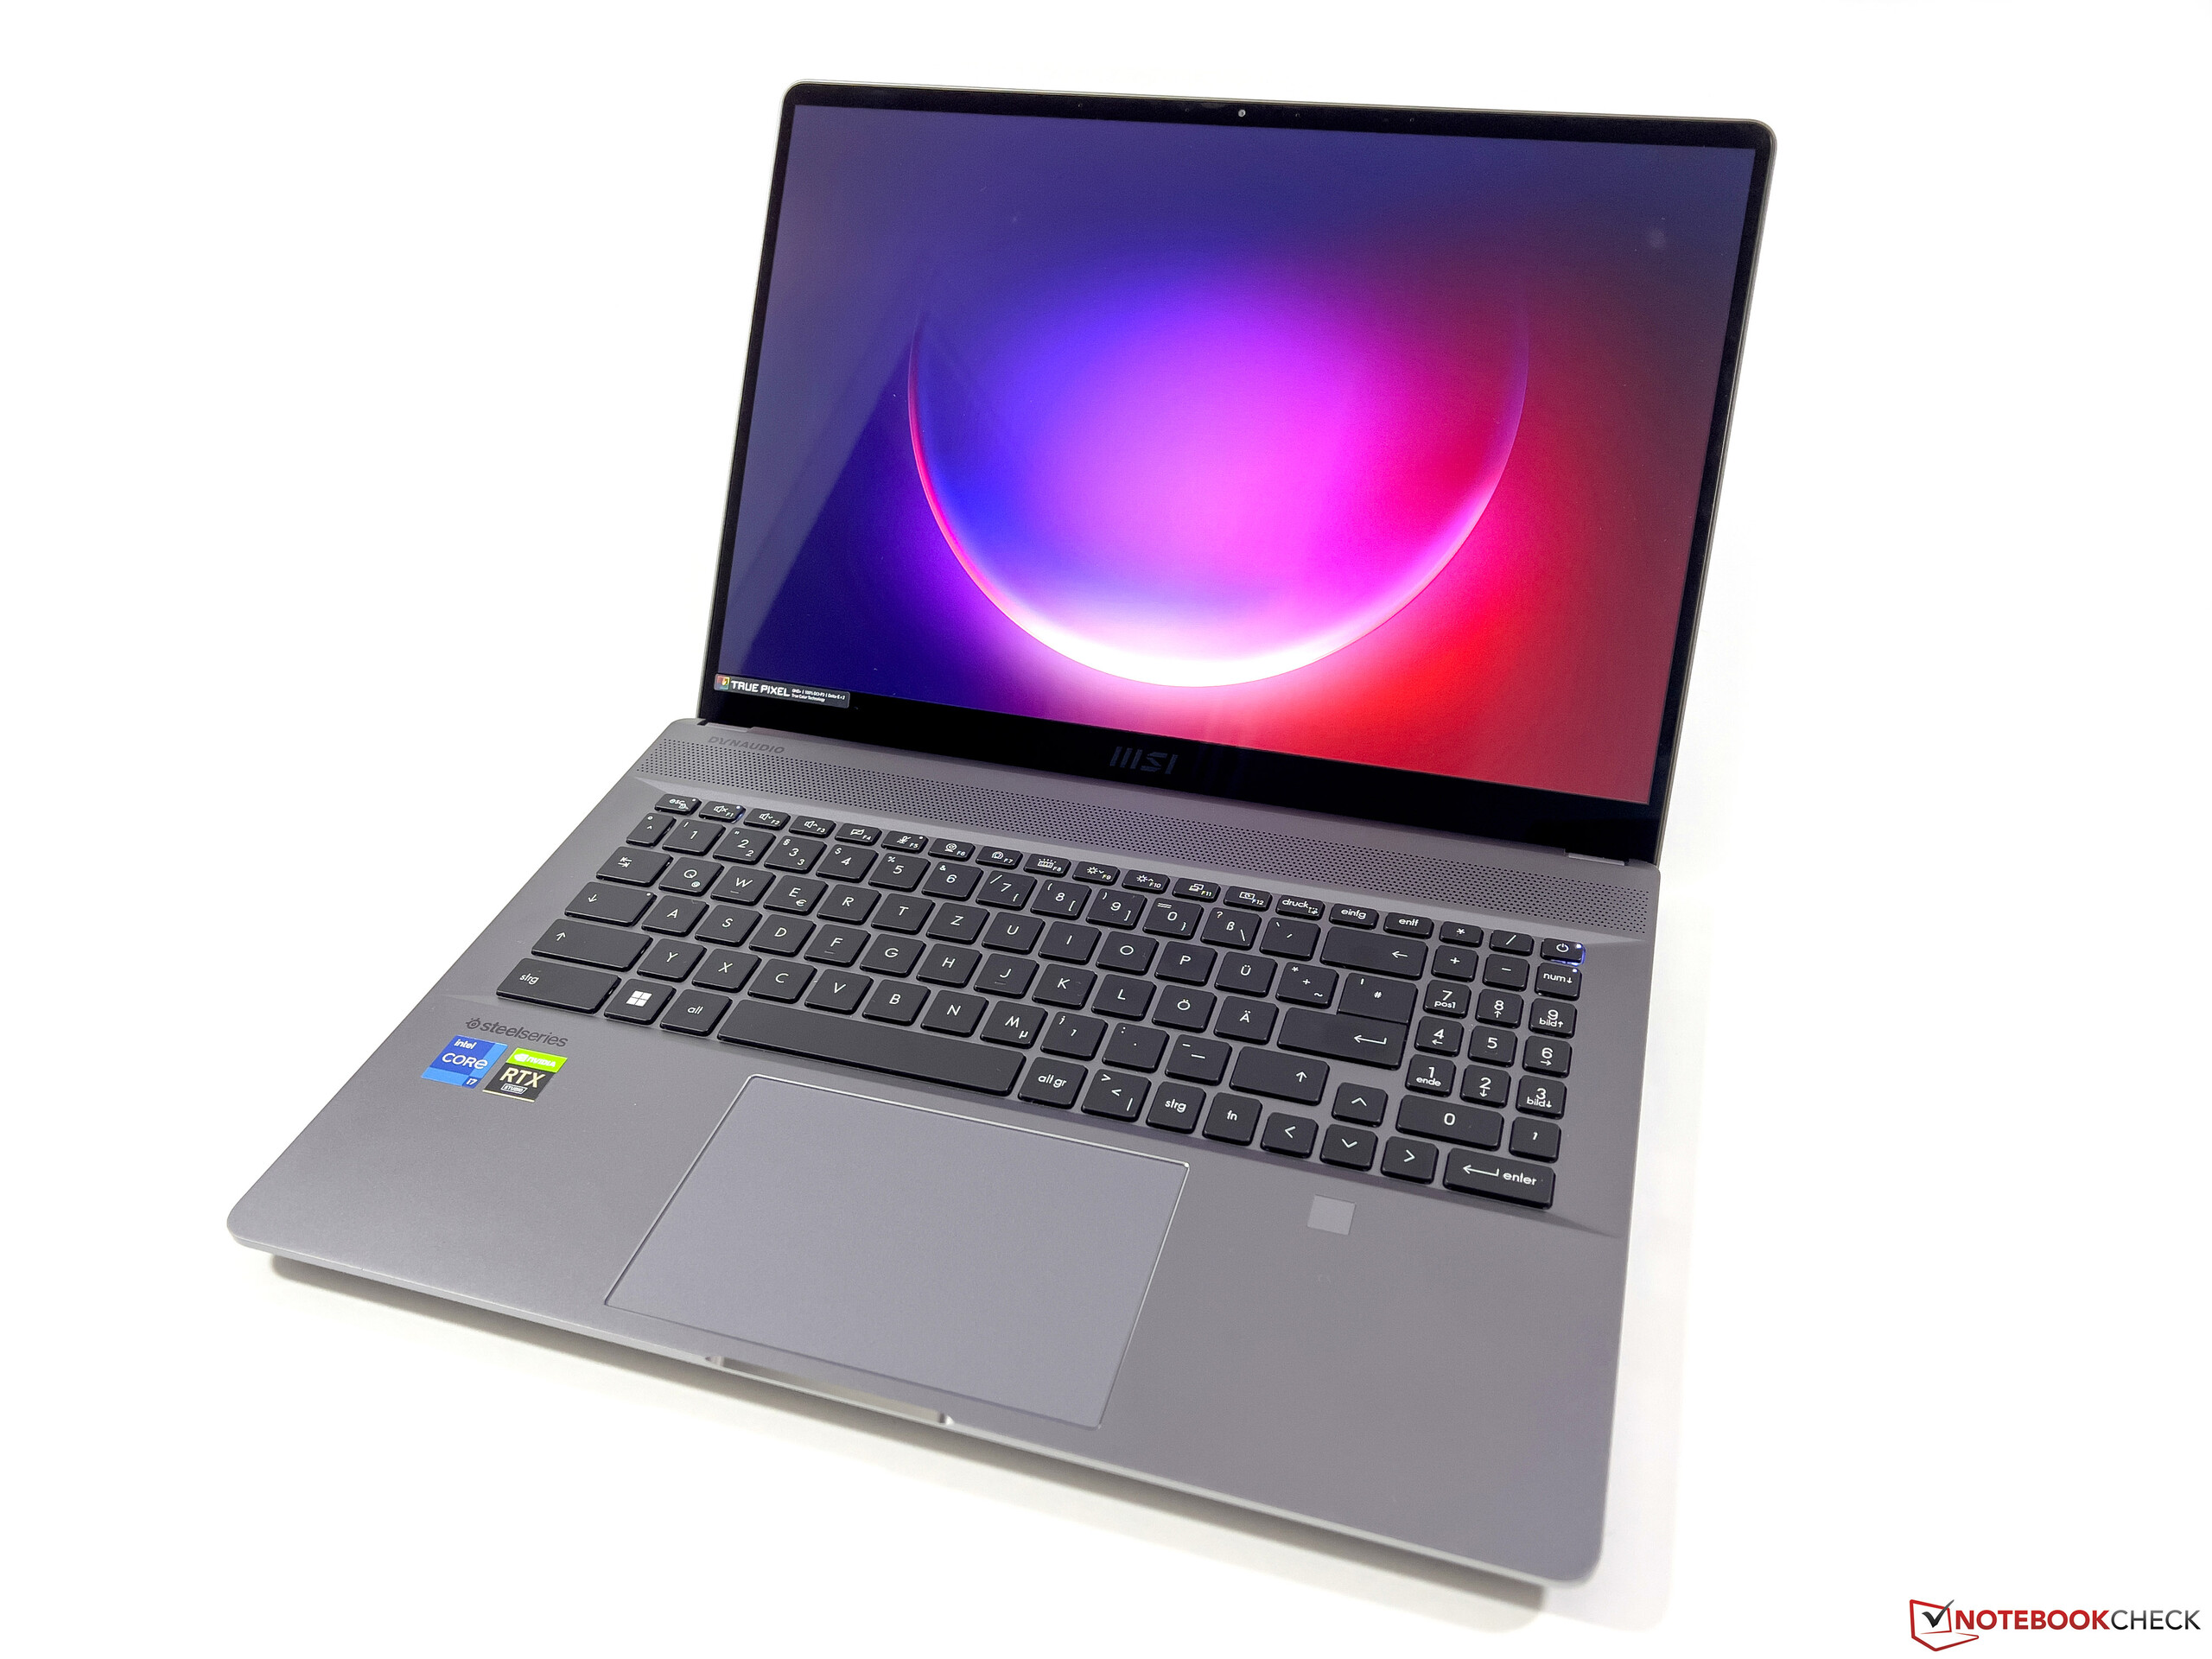
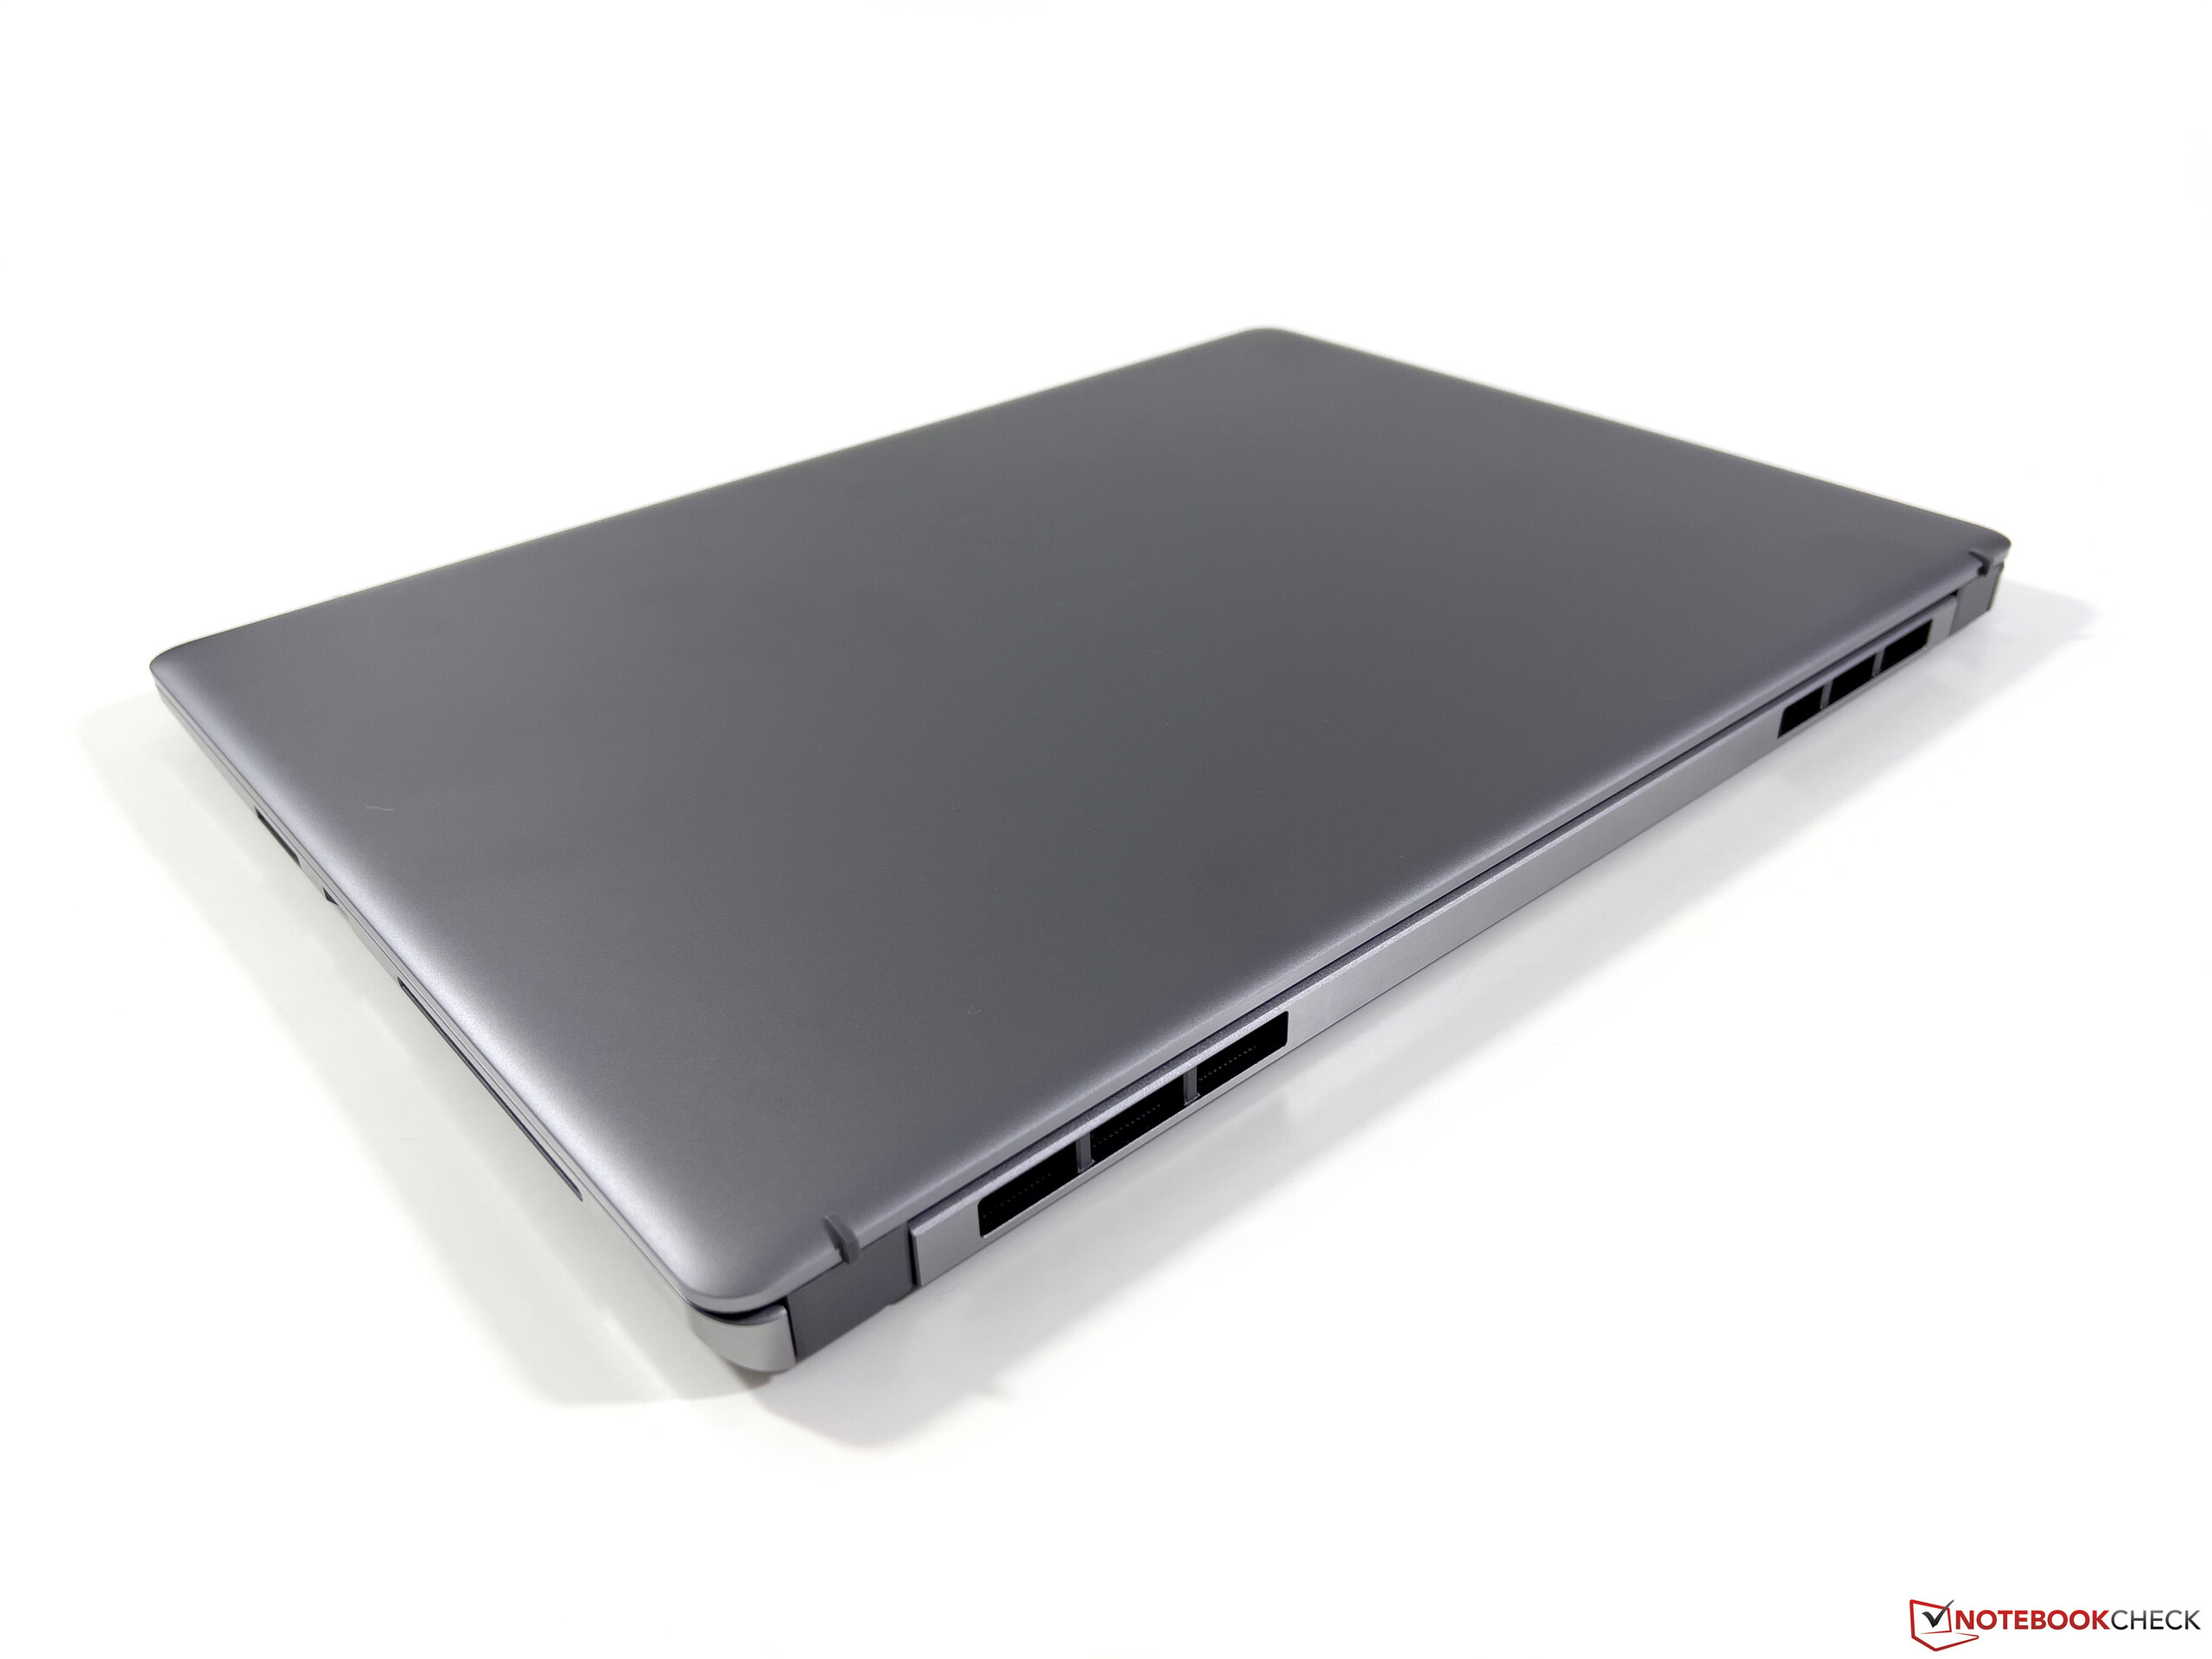
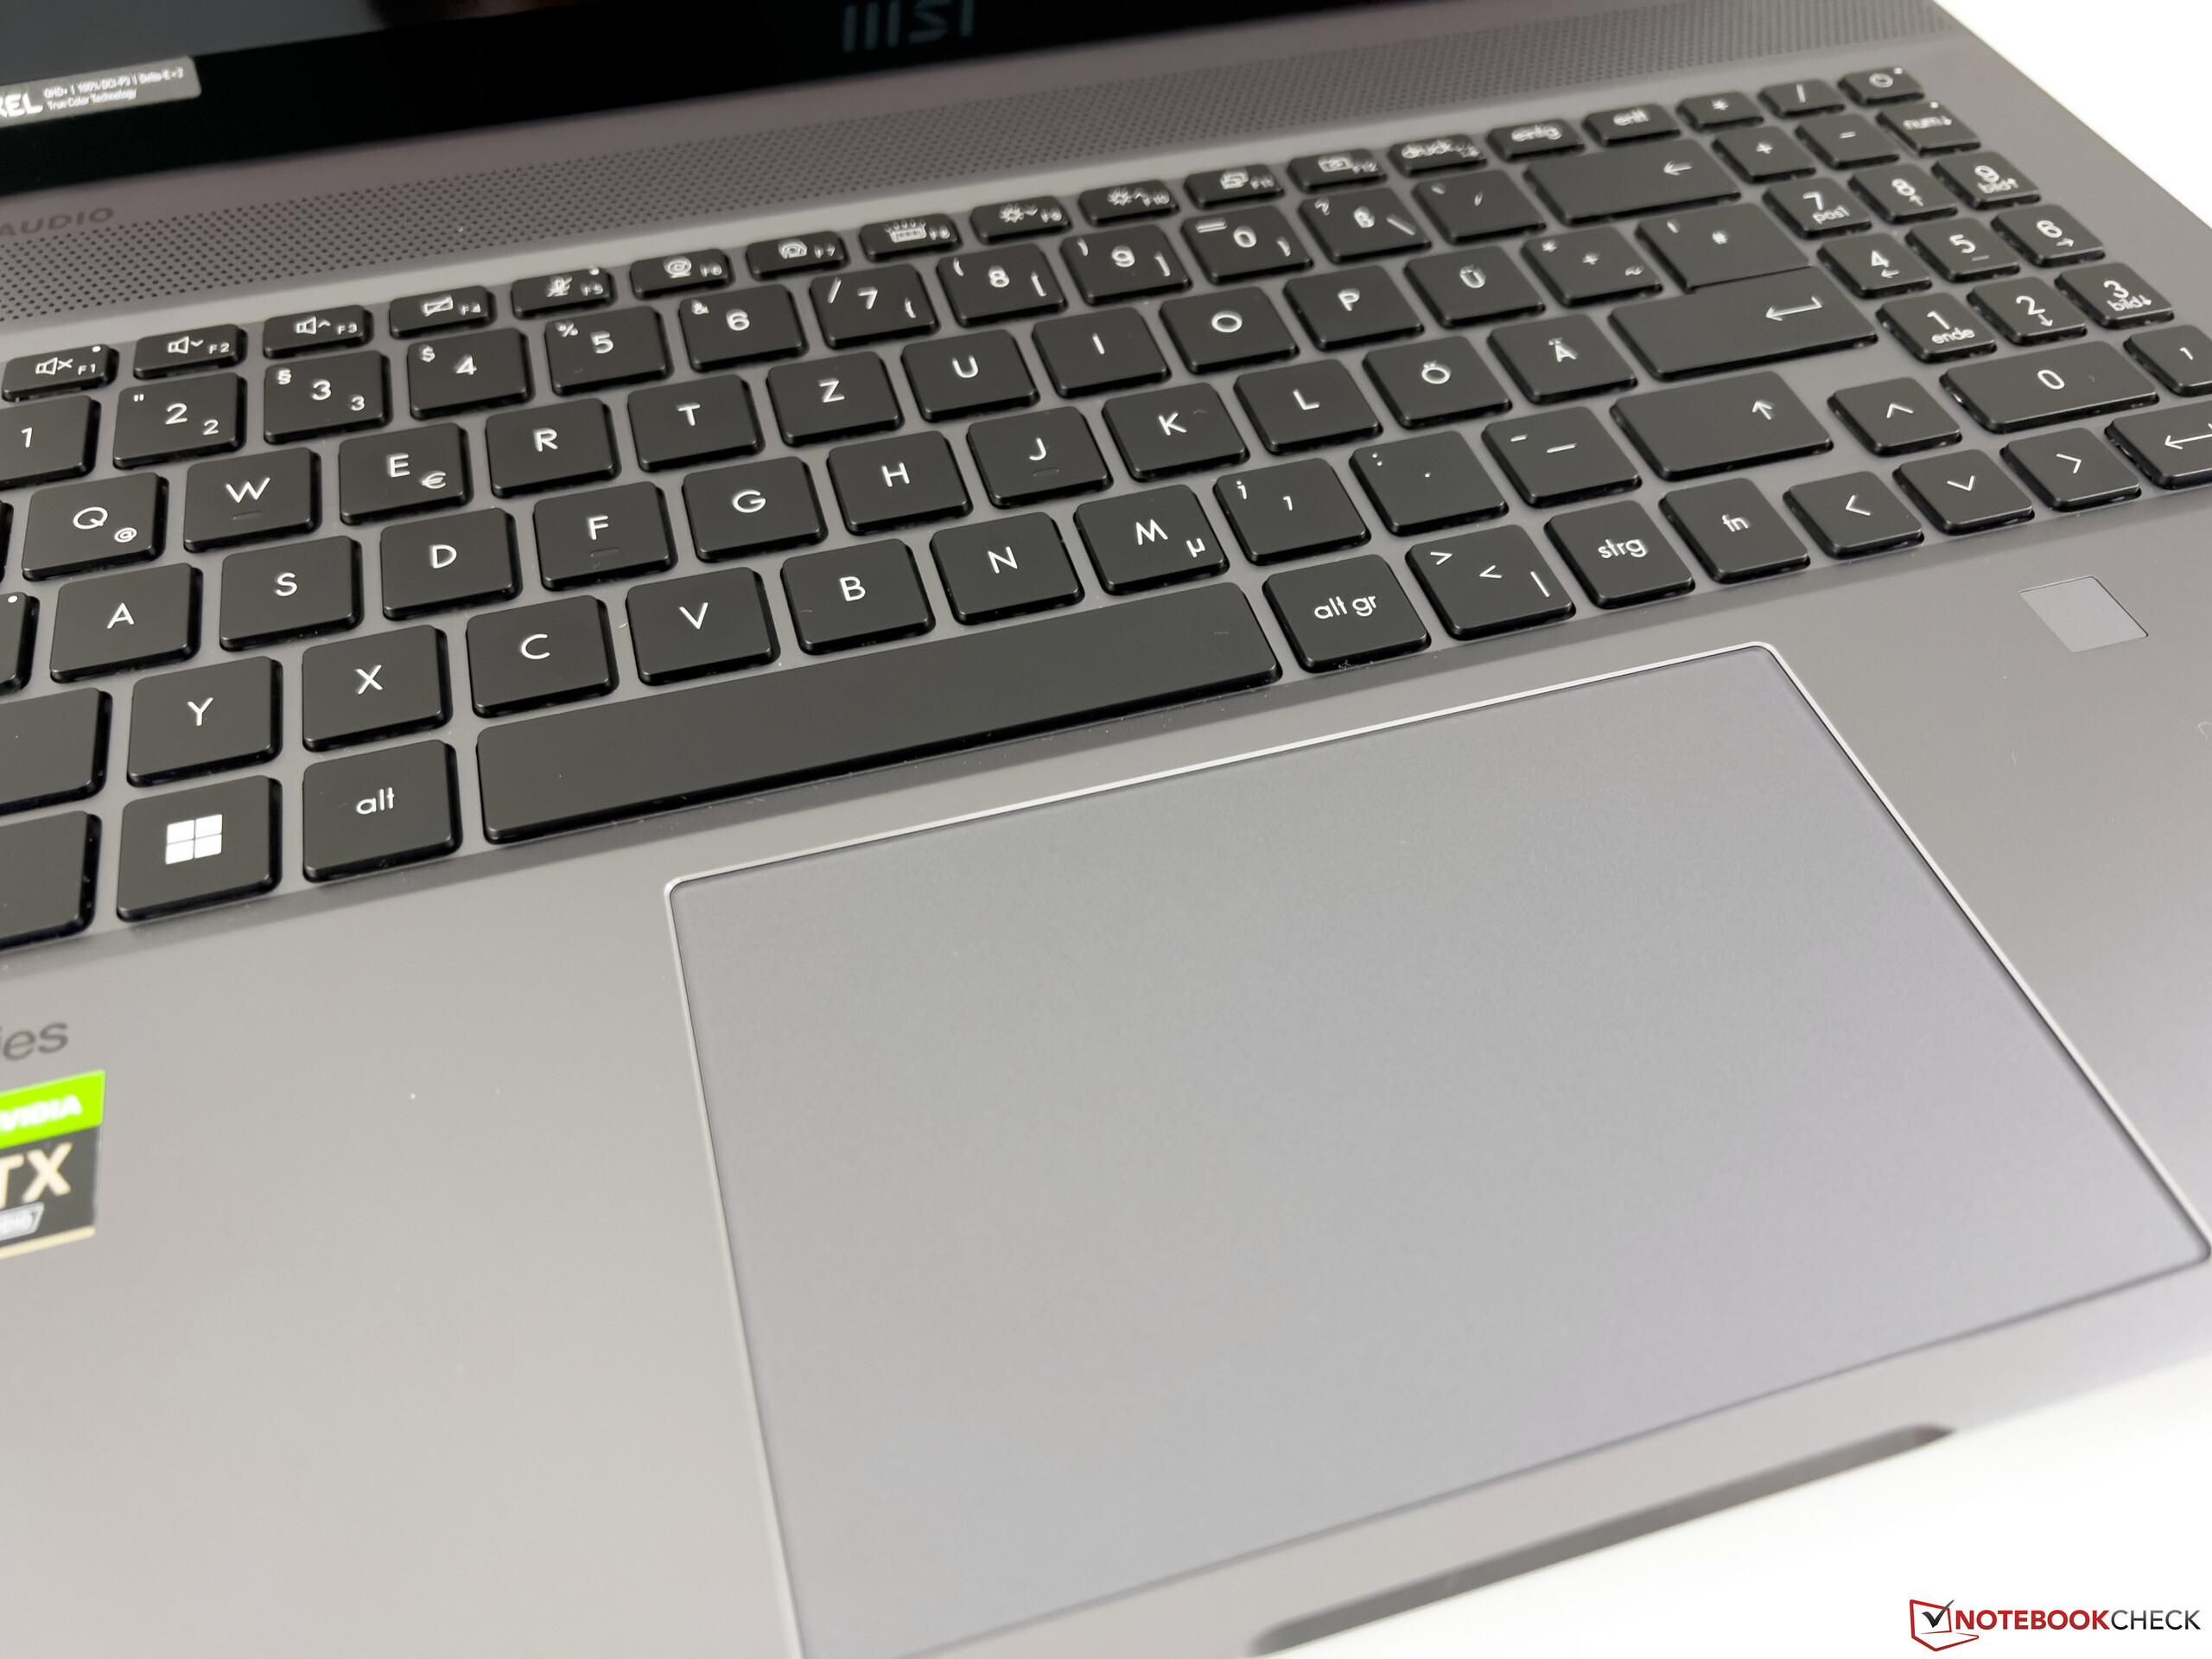
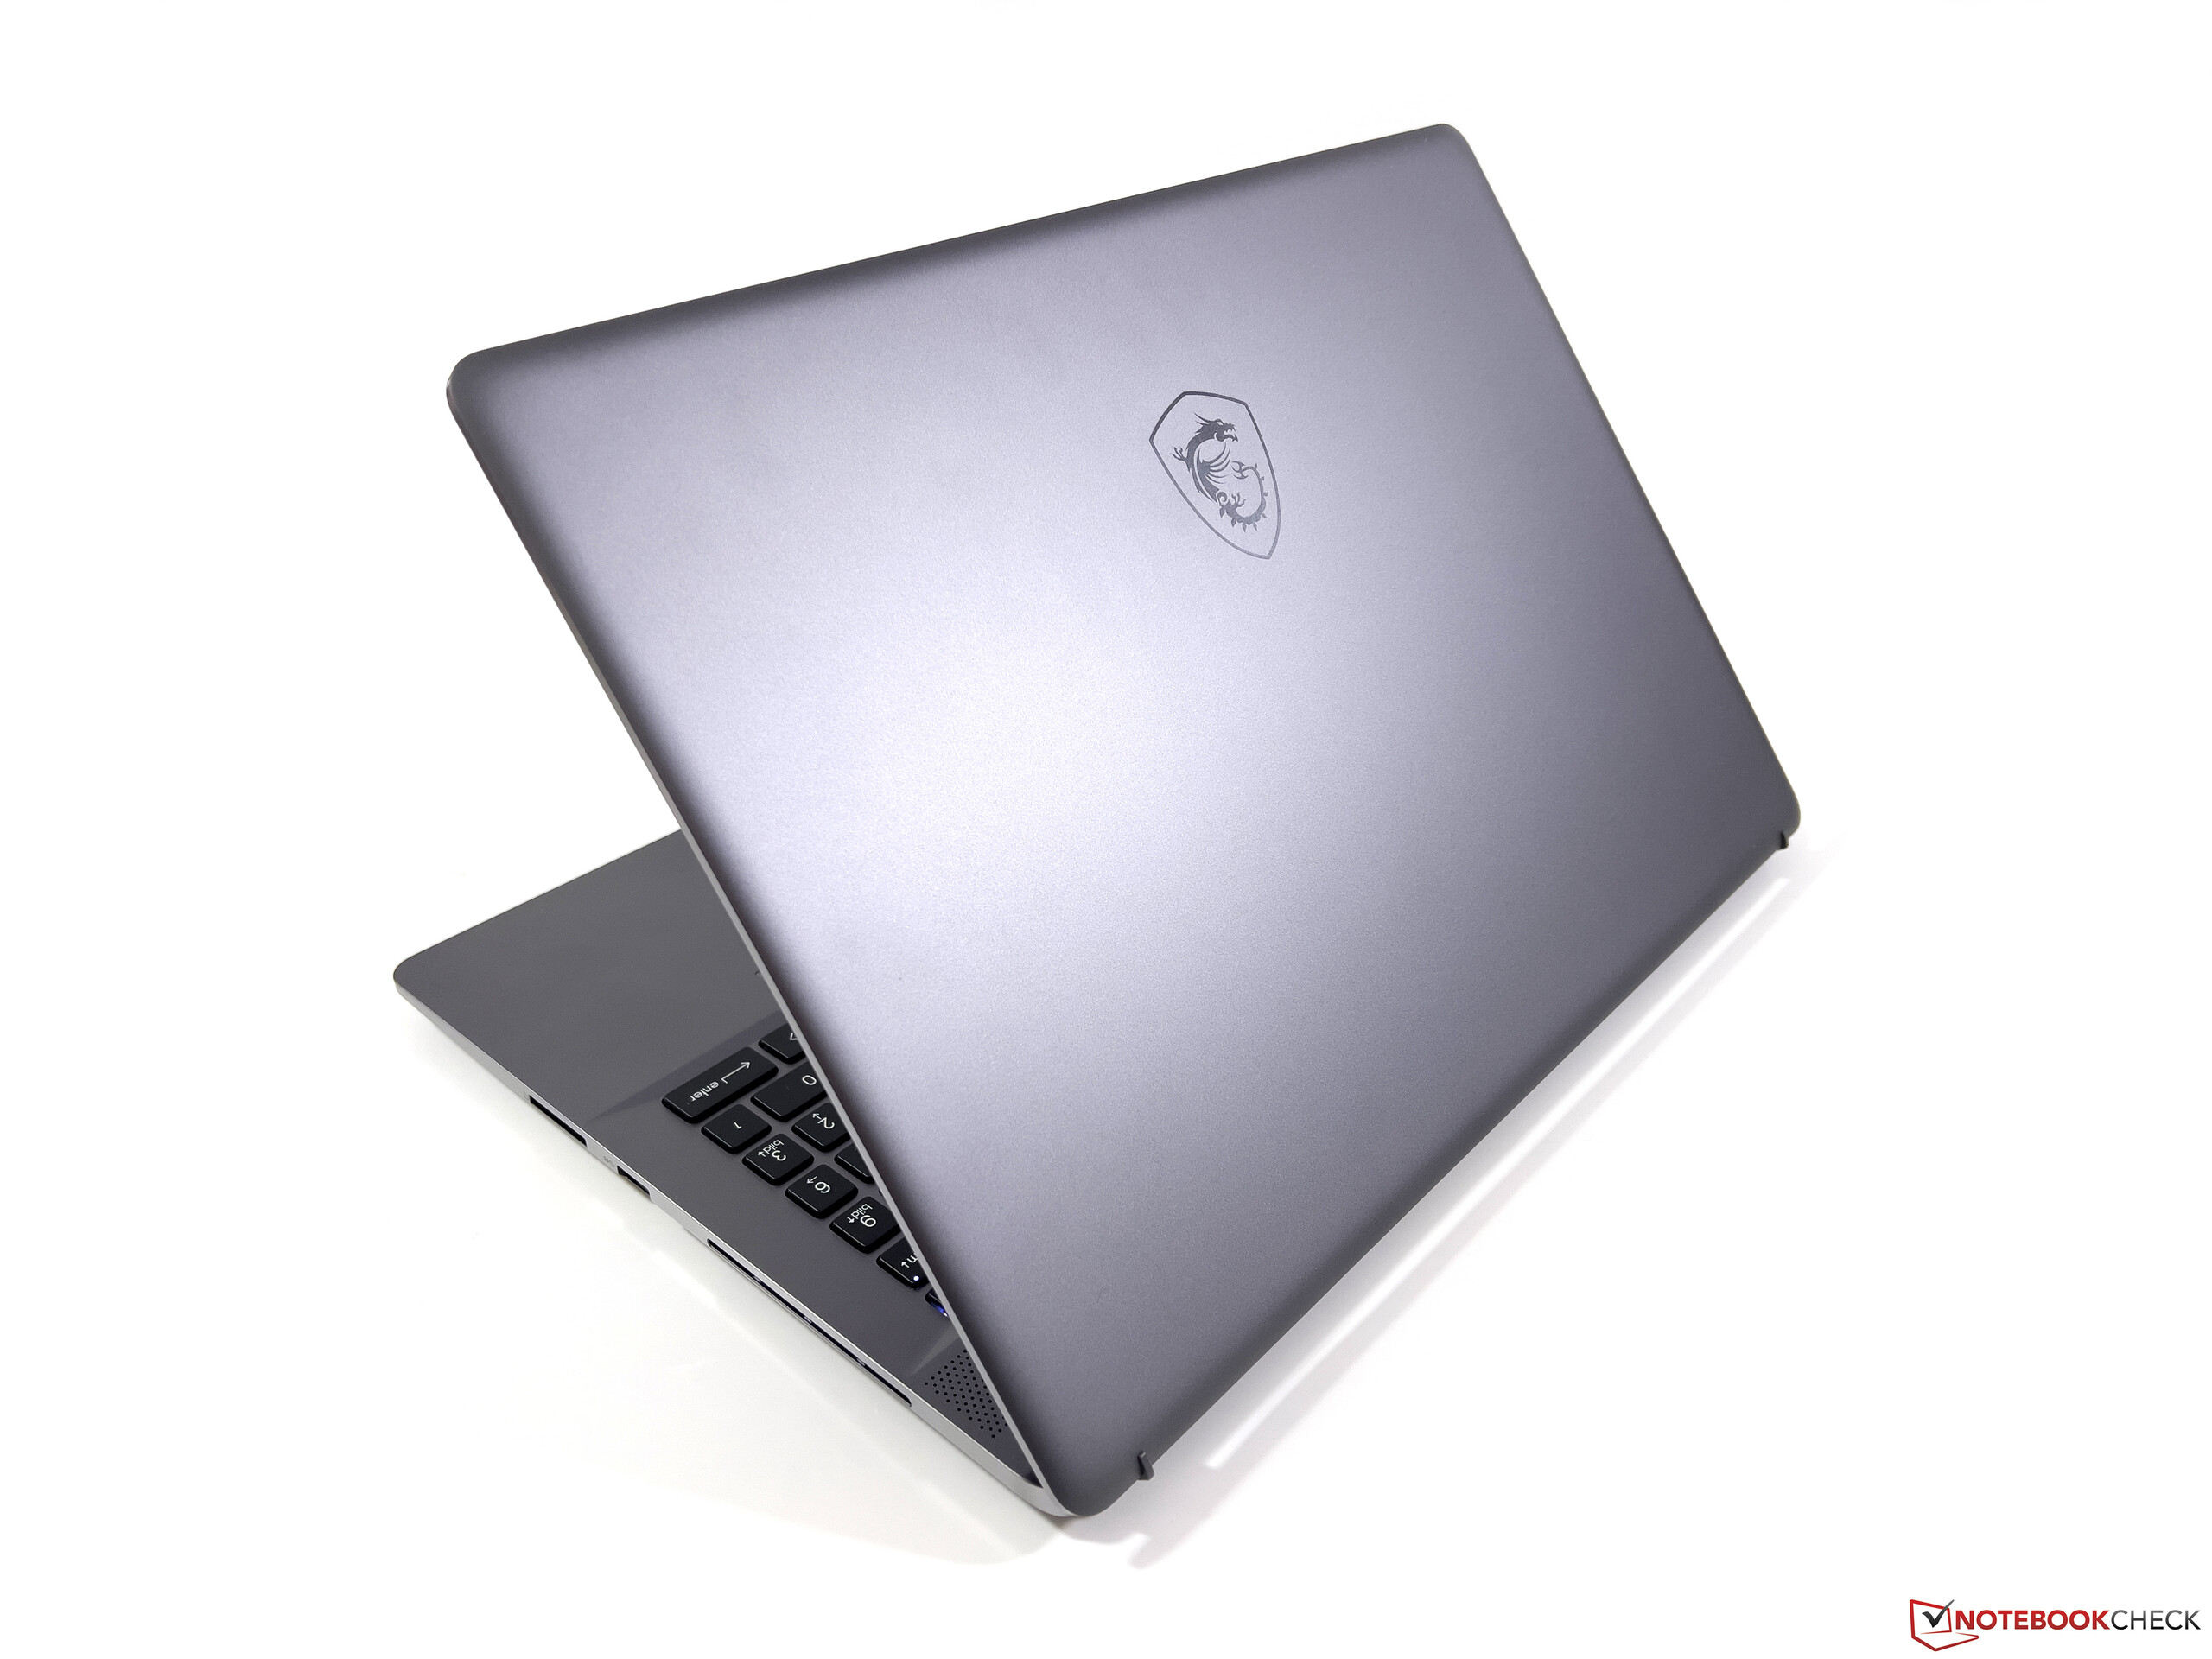
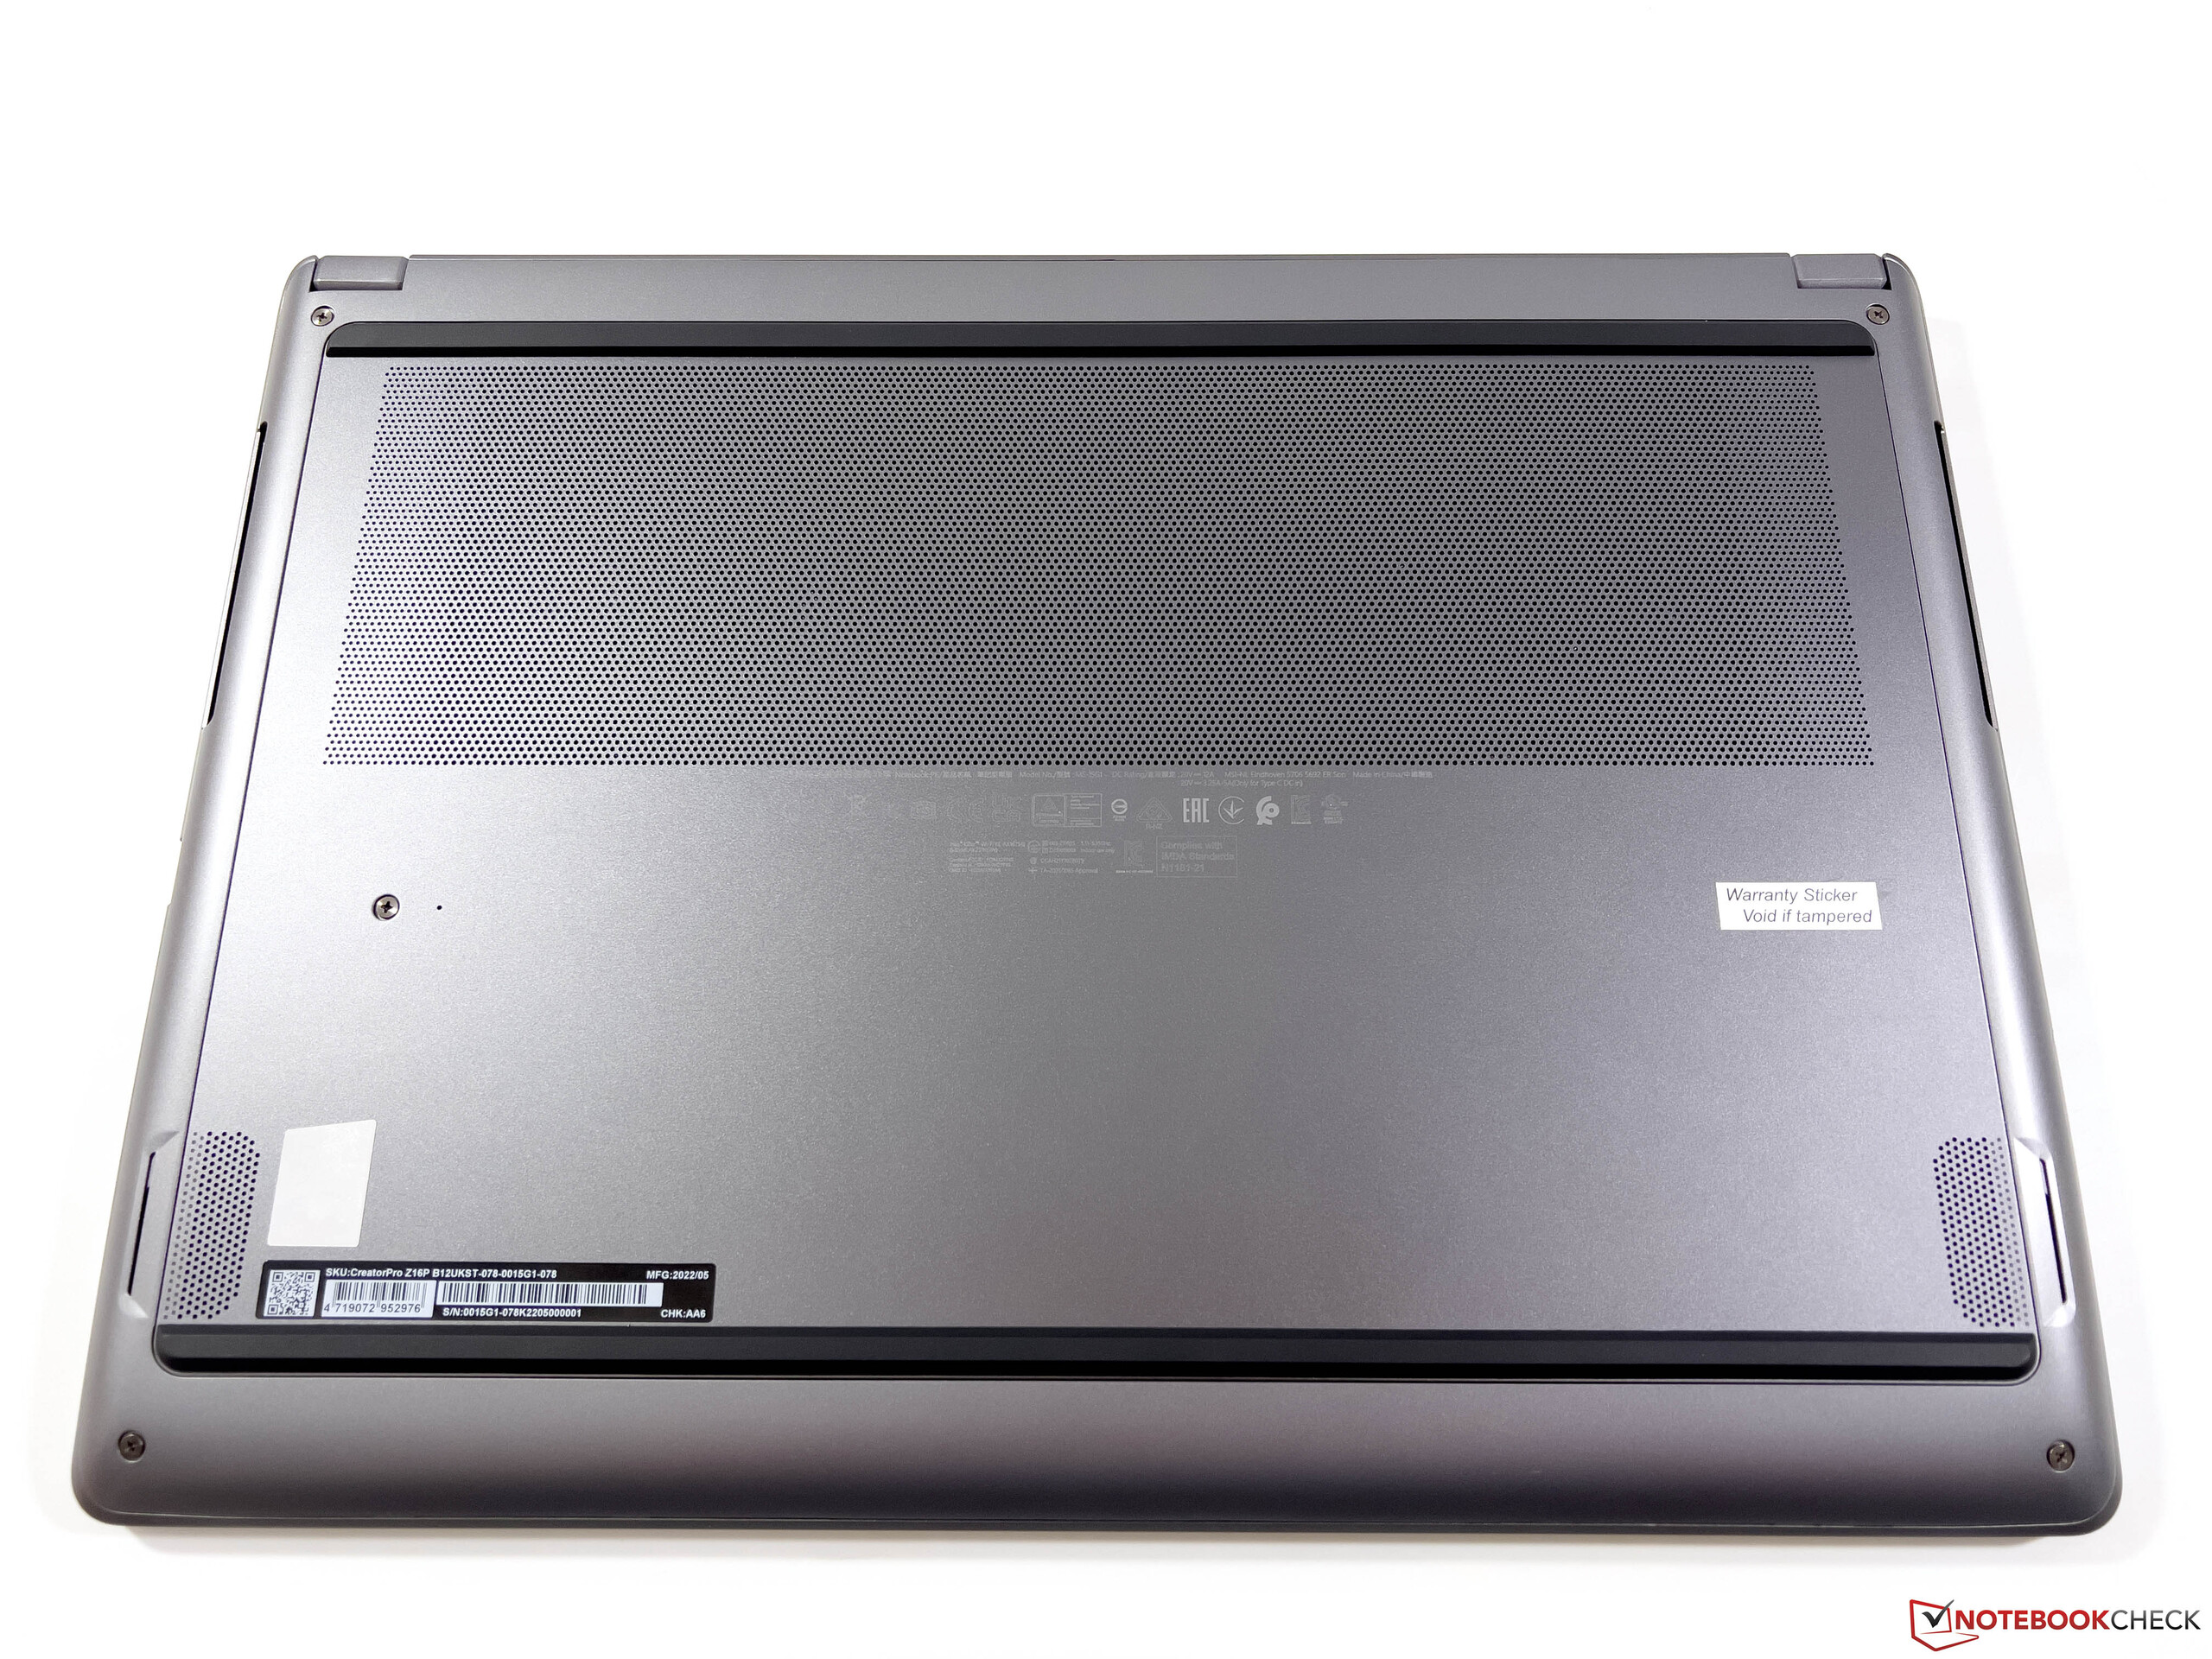
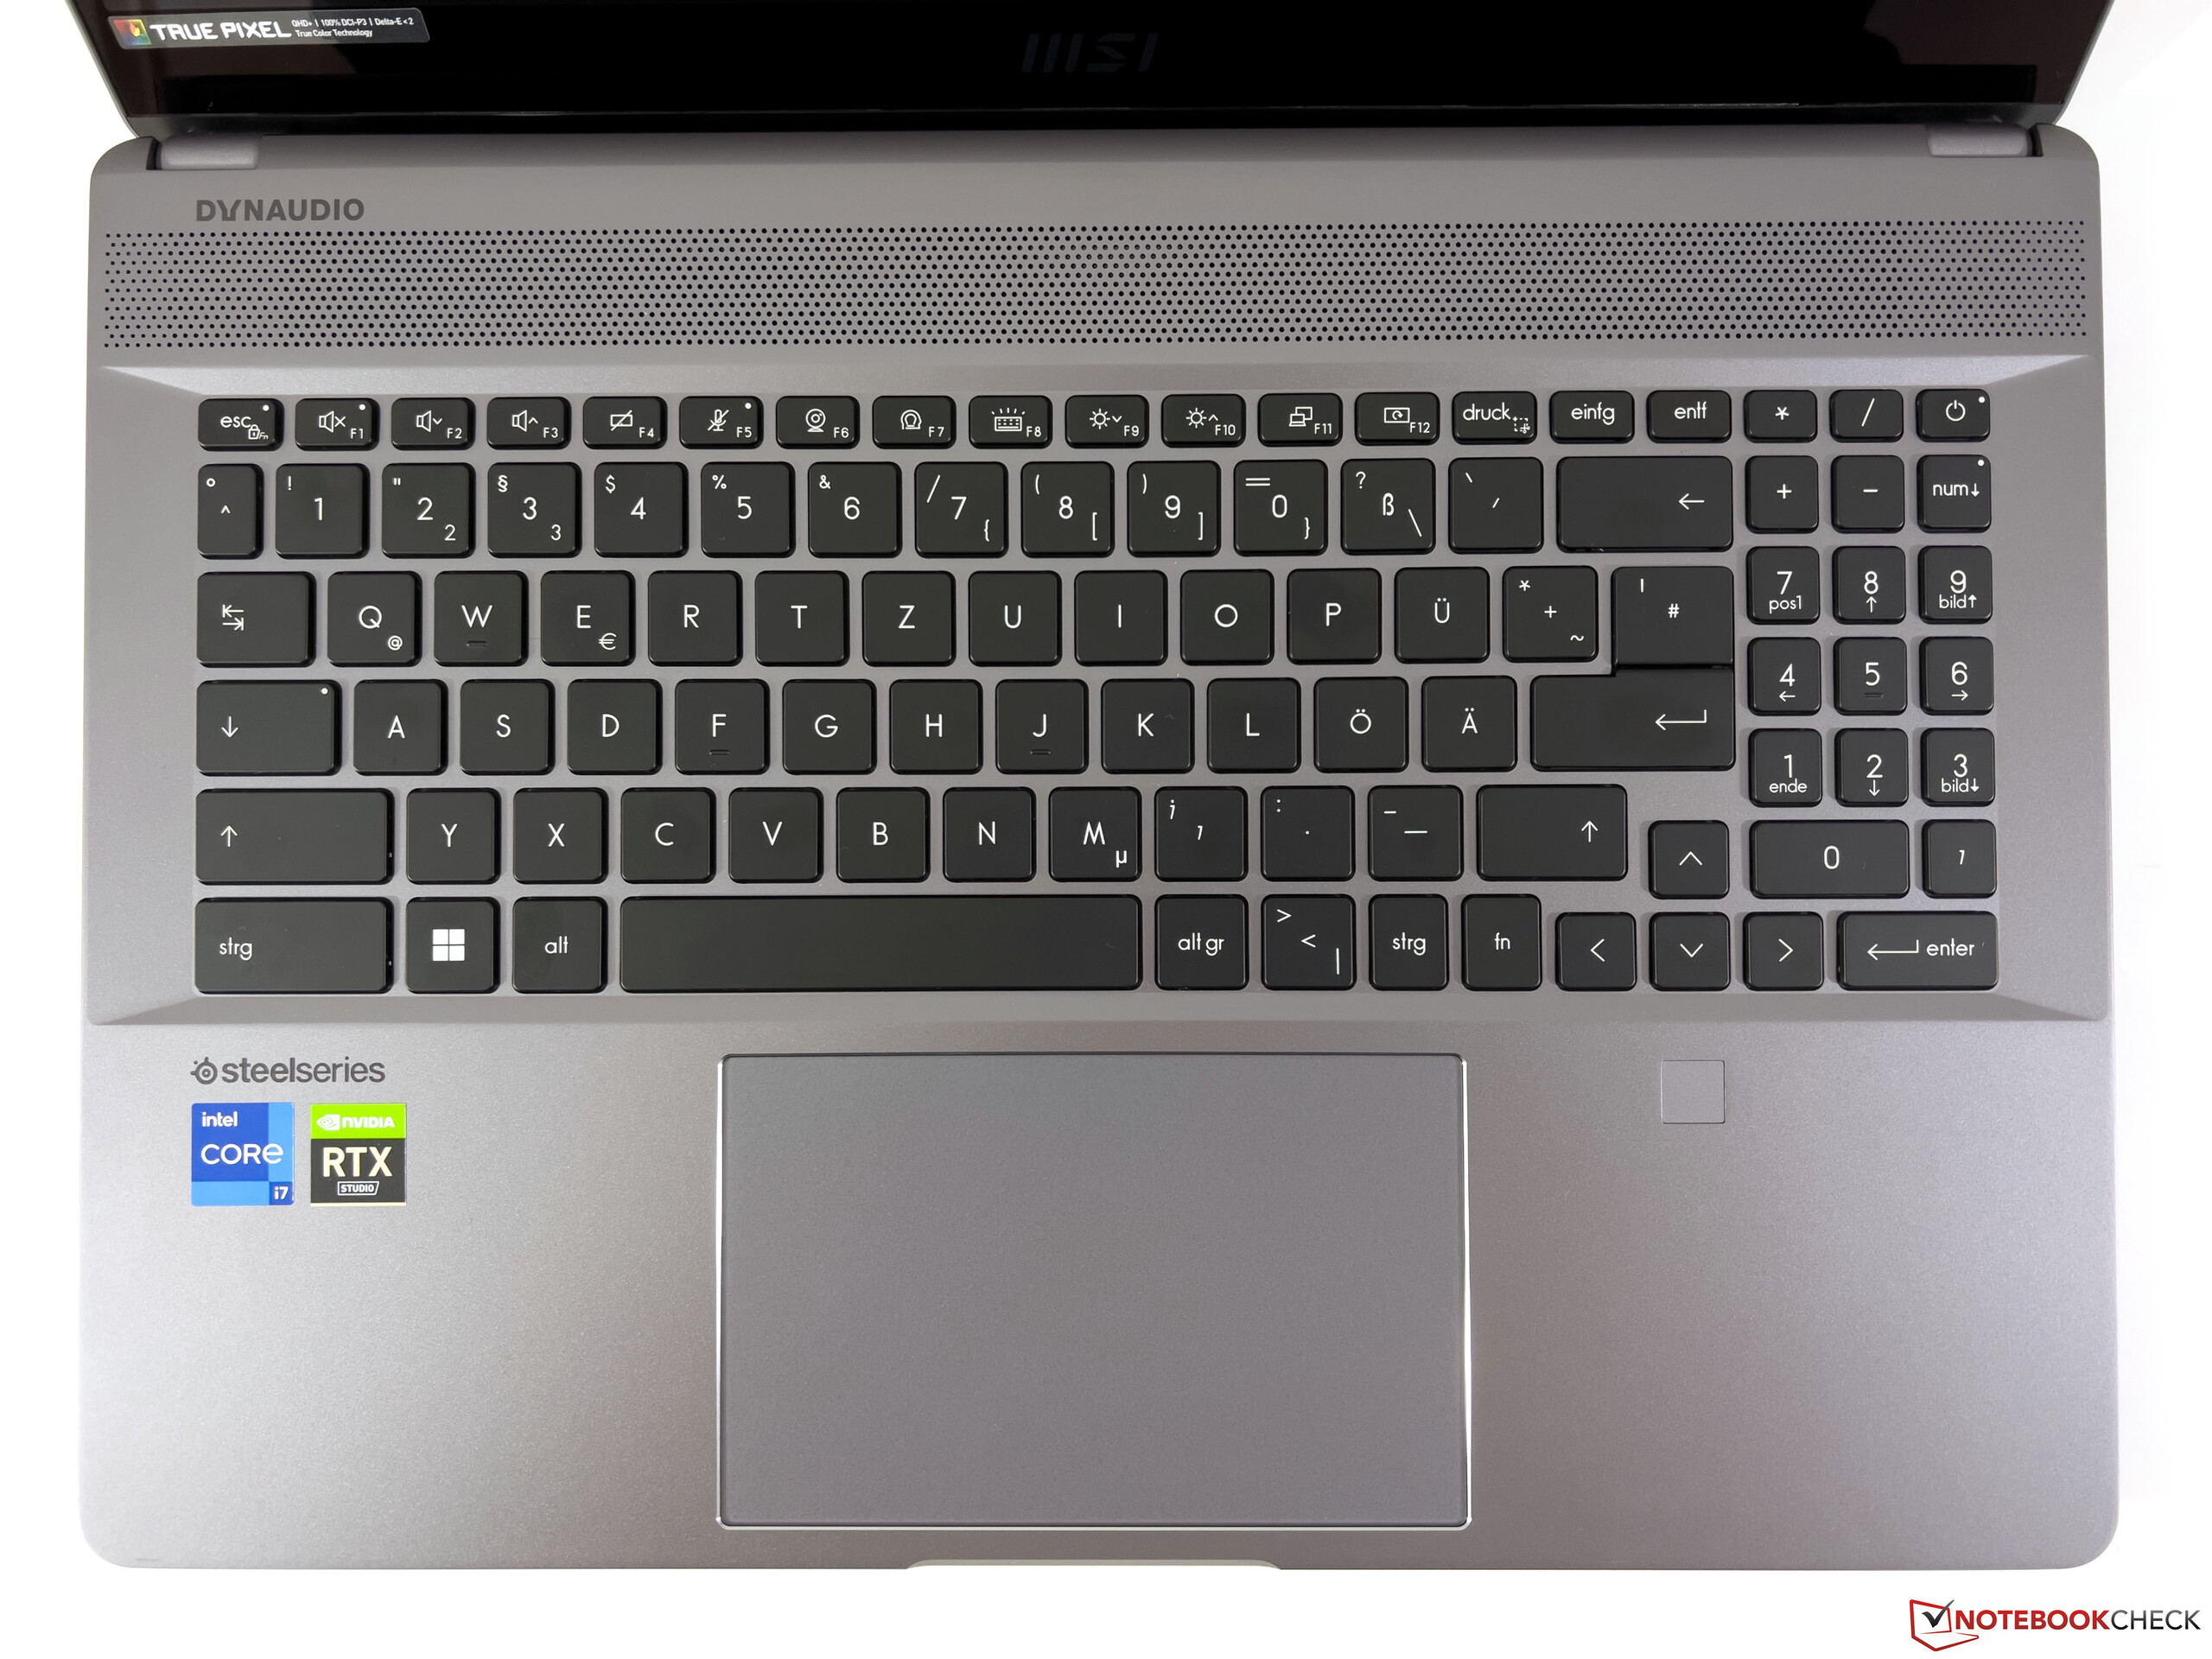
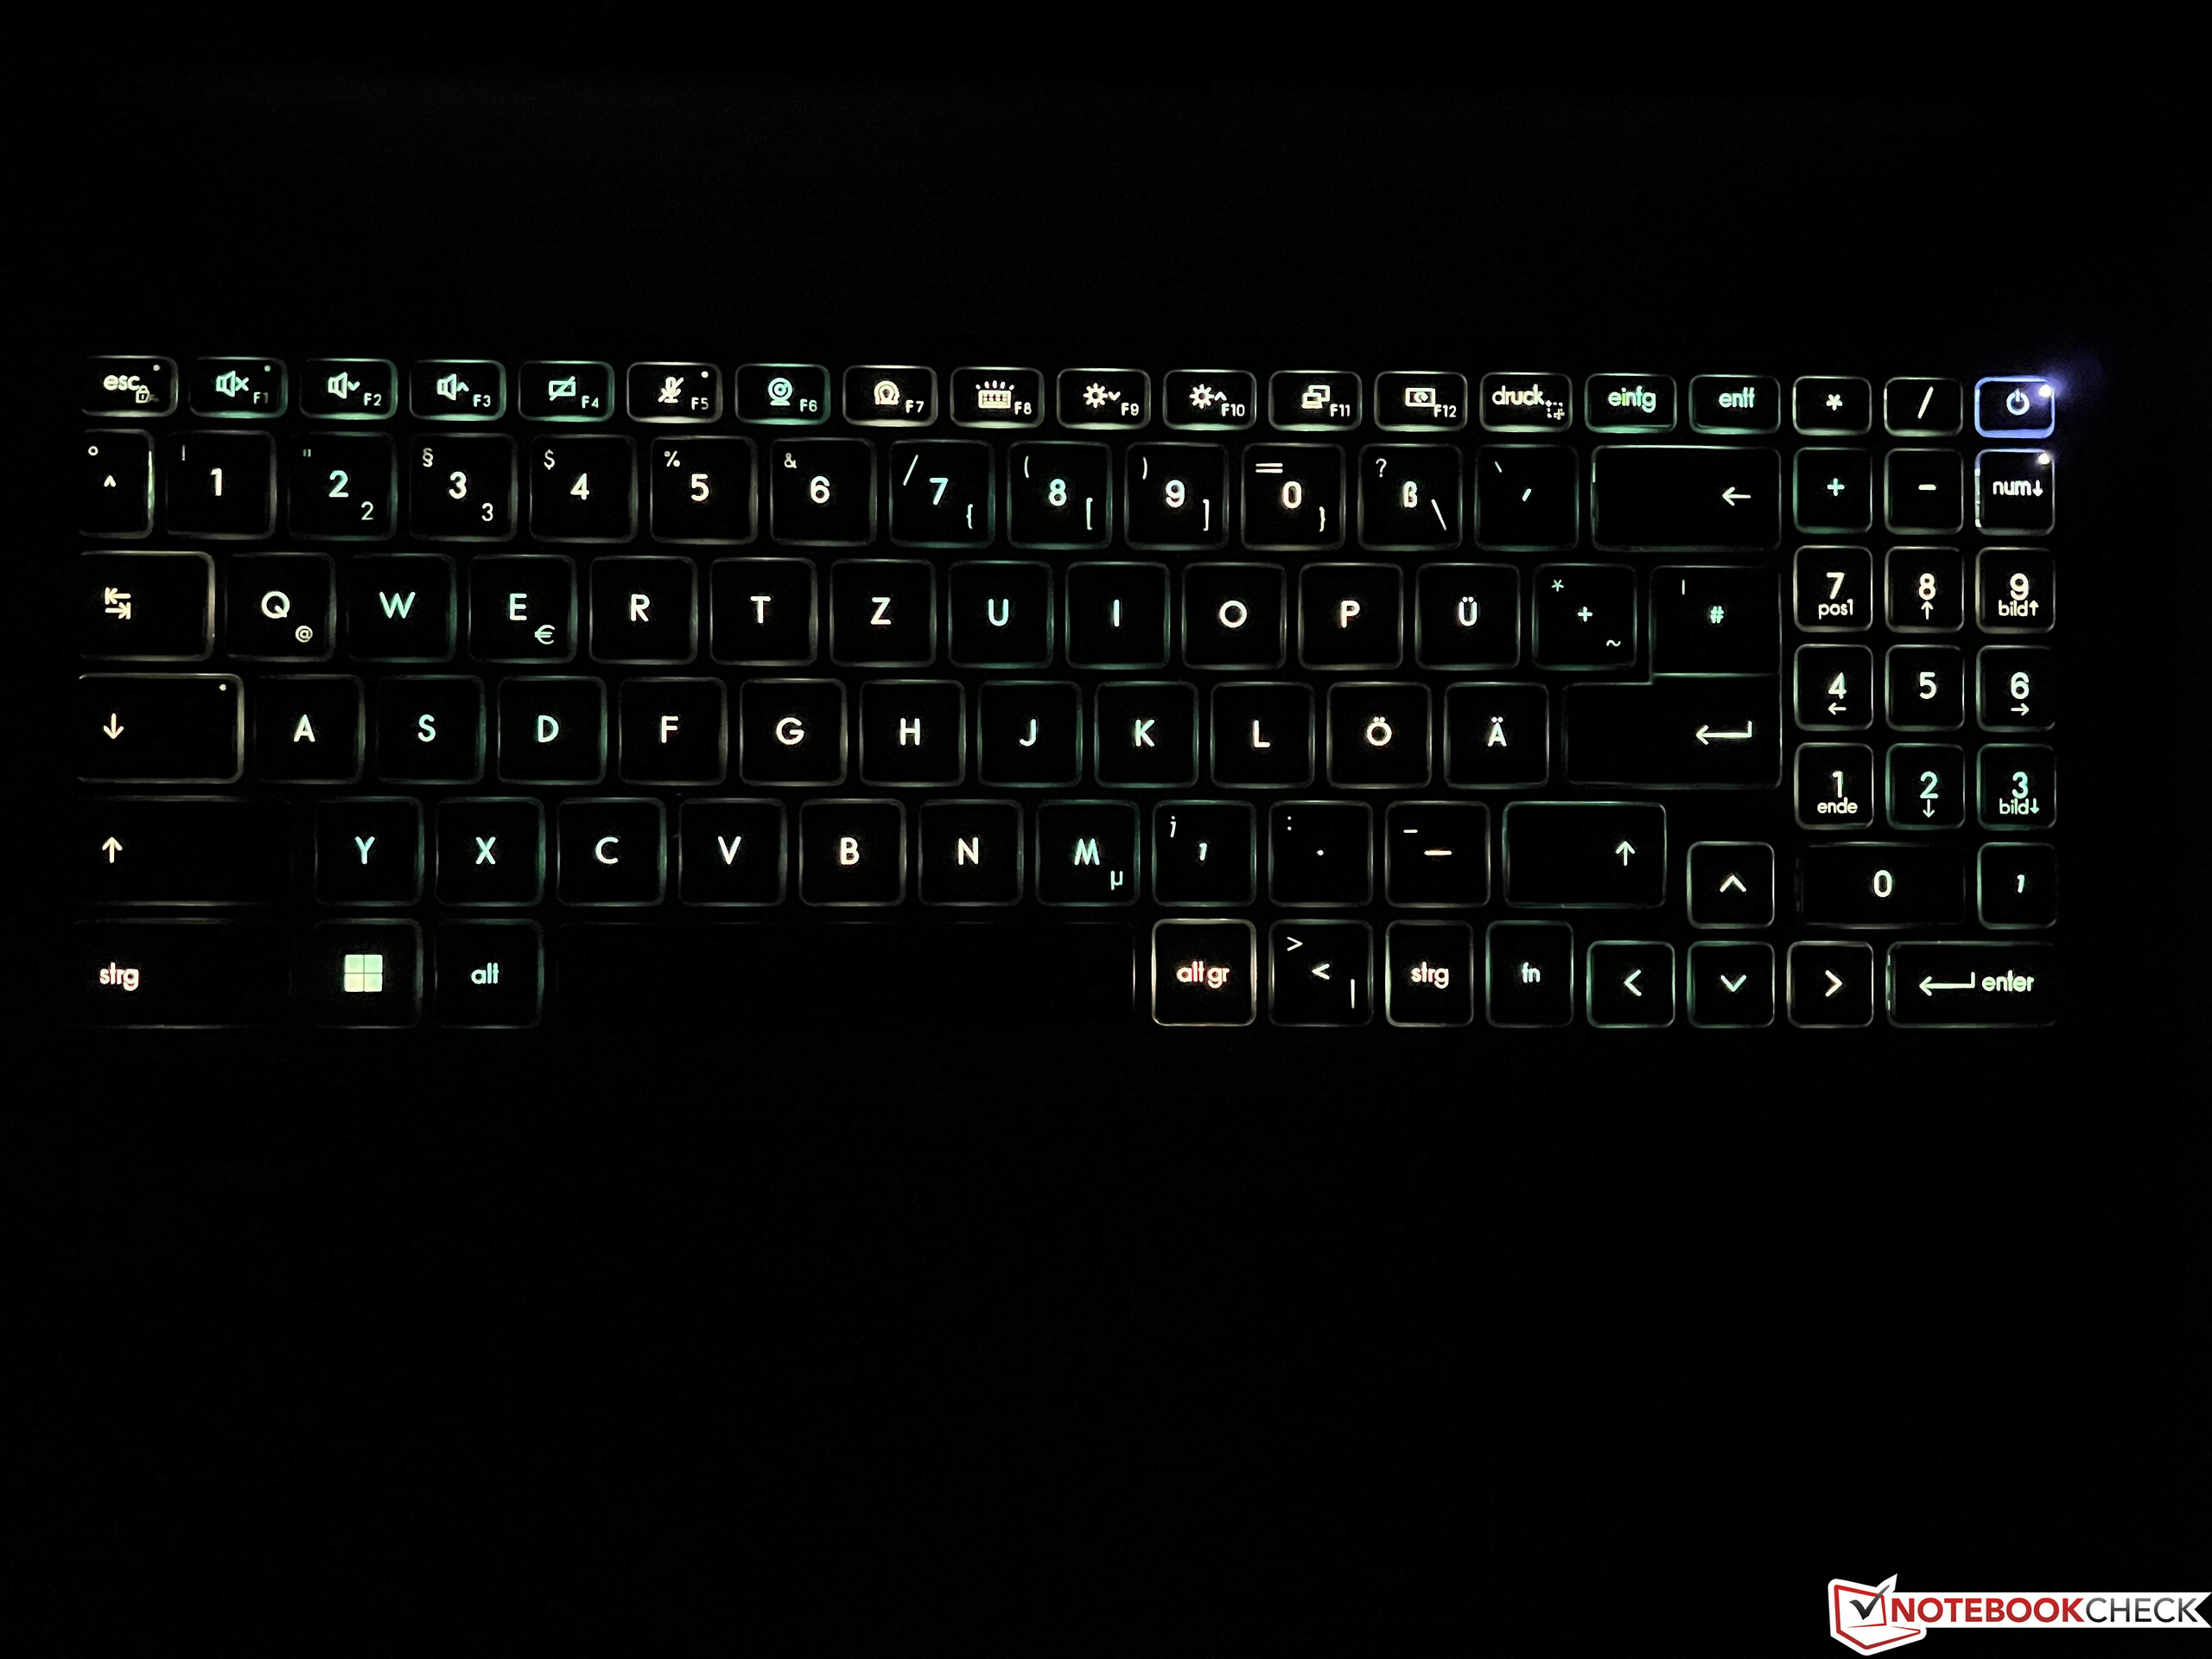
Il case del CreatorPro Z16P non differisce da quello del Creator Z16P normale normale Creator Z16Pche ovviamente comprende anche le connessioni e i dispositivi di input. Il case grigio scuro (Lunar Gray) non dovrebbe creare problemi nemmeno in ufficio, a patto che ci si limiti all'illuminazione della tastiera, il cui colore può essere configurato individualmente per ogni tasto. La tastiera stessa offre un'esperienza di digitazione molto confortevole e beneficia di una lunga corsa dei tasti. Da questo punto di vista, il CreatorPro è in grado di tenere il passo con i migliori computer portatili aziendali. Anche il ClickPad funziona senza problemi.
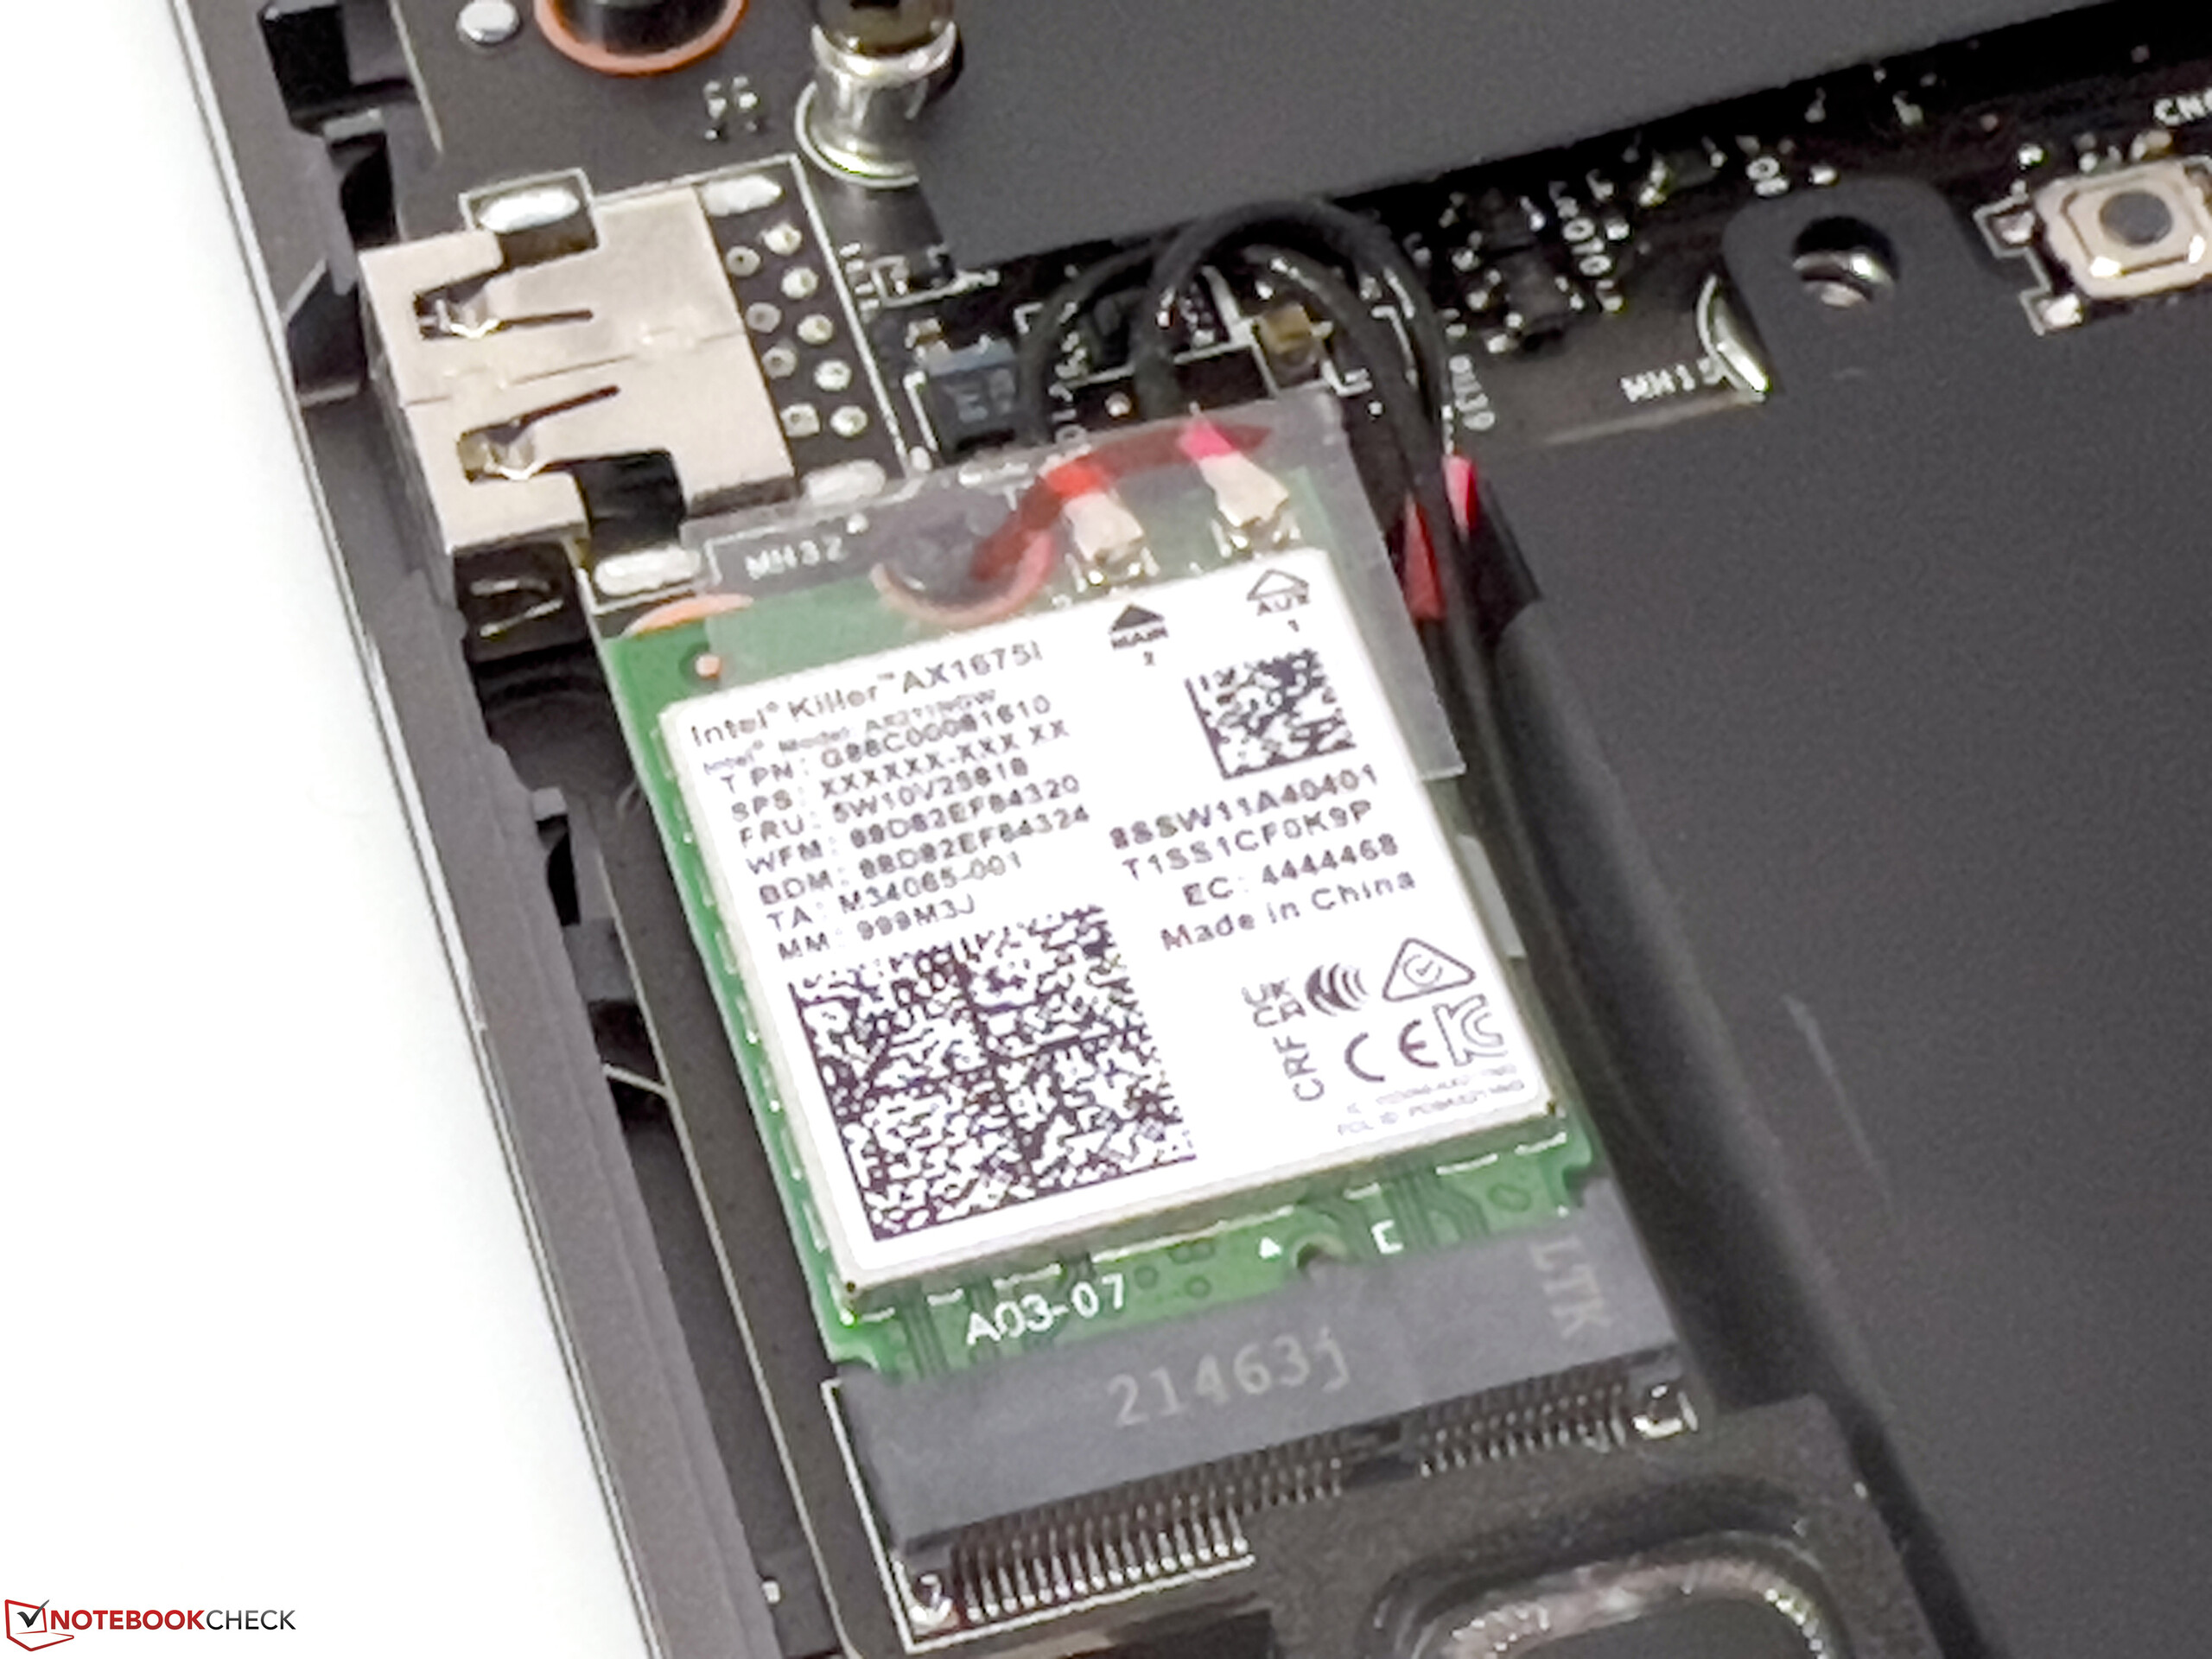
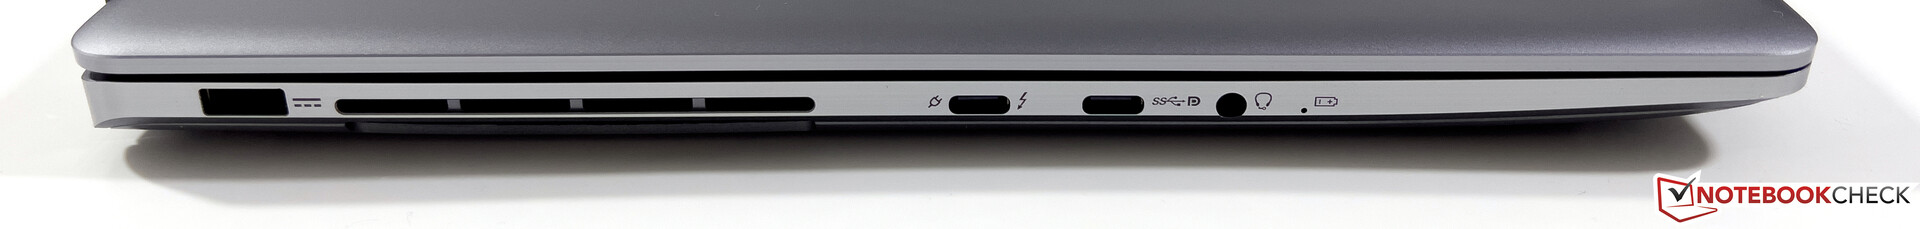
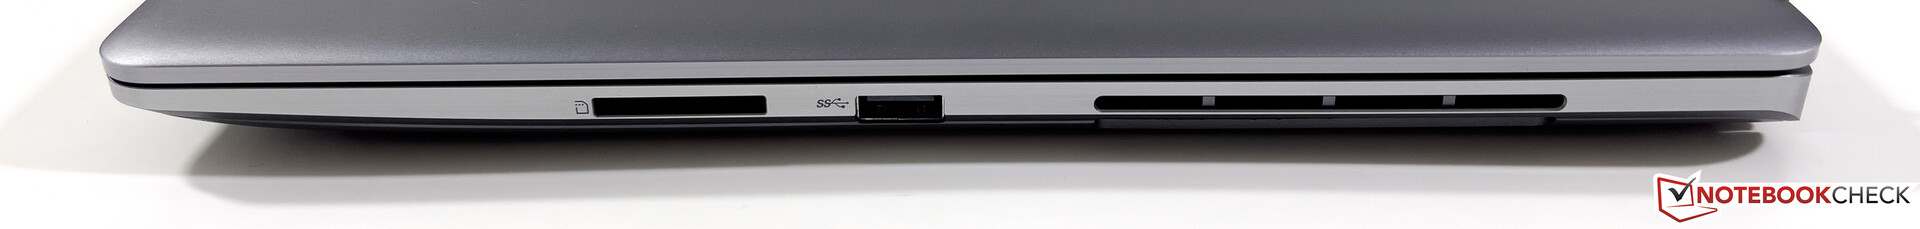
Per quanto riguarda le connessioni, sono presenti in totale tre porte USB, di cui una Thunderbolt 4, e un lettore di schede SD full-size. D'altra parte, si deve fare a meno di un'uscita grafica dedicata. A causa del raffreddamento, tutte le connessioni, ad eccezione della porta di alimentazione, si trovano nelle aree frontali di entrambi i lati, il che non è ottimale nell'uso quotidiano.
| SD Card Reader | |
| average JPG Copy Test (av. of 3 runs) | |
| Dell Precision 5000 5560 (AV Pro V60) | |
| Media della classe Workstation (49.6 - 681, n=14, ultimi 2 anni) | |
| MSI CreatorPro Z16P B12UKST (AV Pro V60) | |
| MSI Creator Z16P B12UHST (AV PRO microSD 128 GB V60) | |
| HP ZBook Studio 16 G9 62U04EA (Angelbird AV PRO V60) | |
| maximum AS SSD Seq Read Test (1GB) | |
| Media della classe Workstation (87.6 - 1455, n=14, ultimi 2 anni) | |
| Dell Precision 5000 5560 (AV Pro V60) | |
| MSI CreatorPro Z16P B12UKST (AV Pro V60) | |
| HP ZBook Studio 16 G9 62U04EA (Angelbird AV PRO V60) | |
| Networking | |
| MSI CreatorPro Z16P B12UKST | |
| iperf3 receive AXE11000 6GHz | |
| iperf3 transmit AXE11000 6GHz | |
| HP ZBook Studio 16 G9 62U04EA | |
| iperf3 receive AXE11000 6GHz | |
| iperf3 transmit AXE11000 6GHz | |
| Dell Precision 5000 5560 | |
| iperf3 transmit AX12 | |
| iperf3 receive AX12 | |
| MSI Creator Z16P B12UHST | |
| iperf3 receive AXE11000 | |
| Lenovo ThinkPad P1 G4-20Y4Z9DVUS | |
| iperf3 transmit AX12 | |
| iperf3 receive AX12 | |


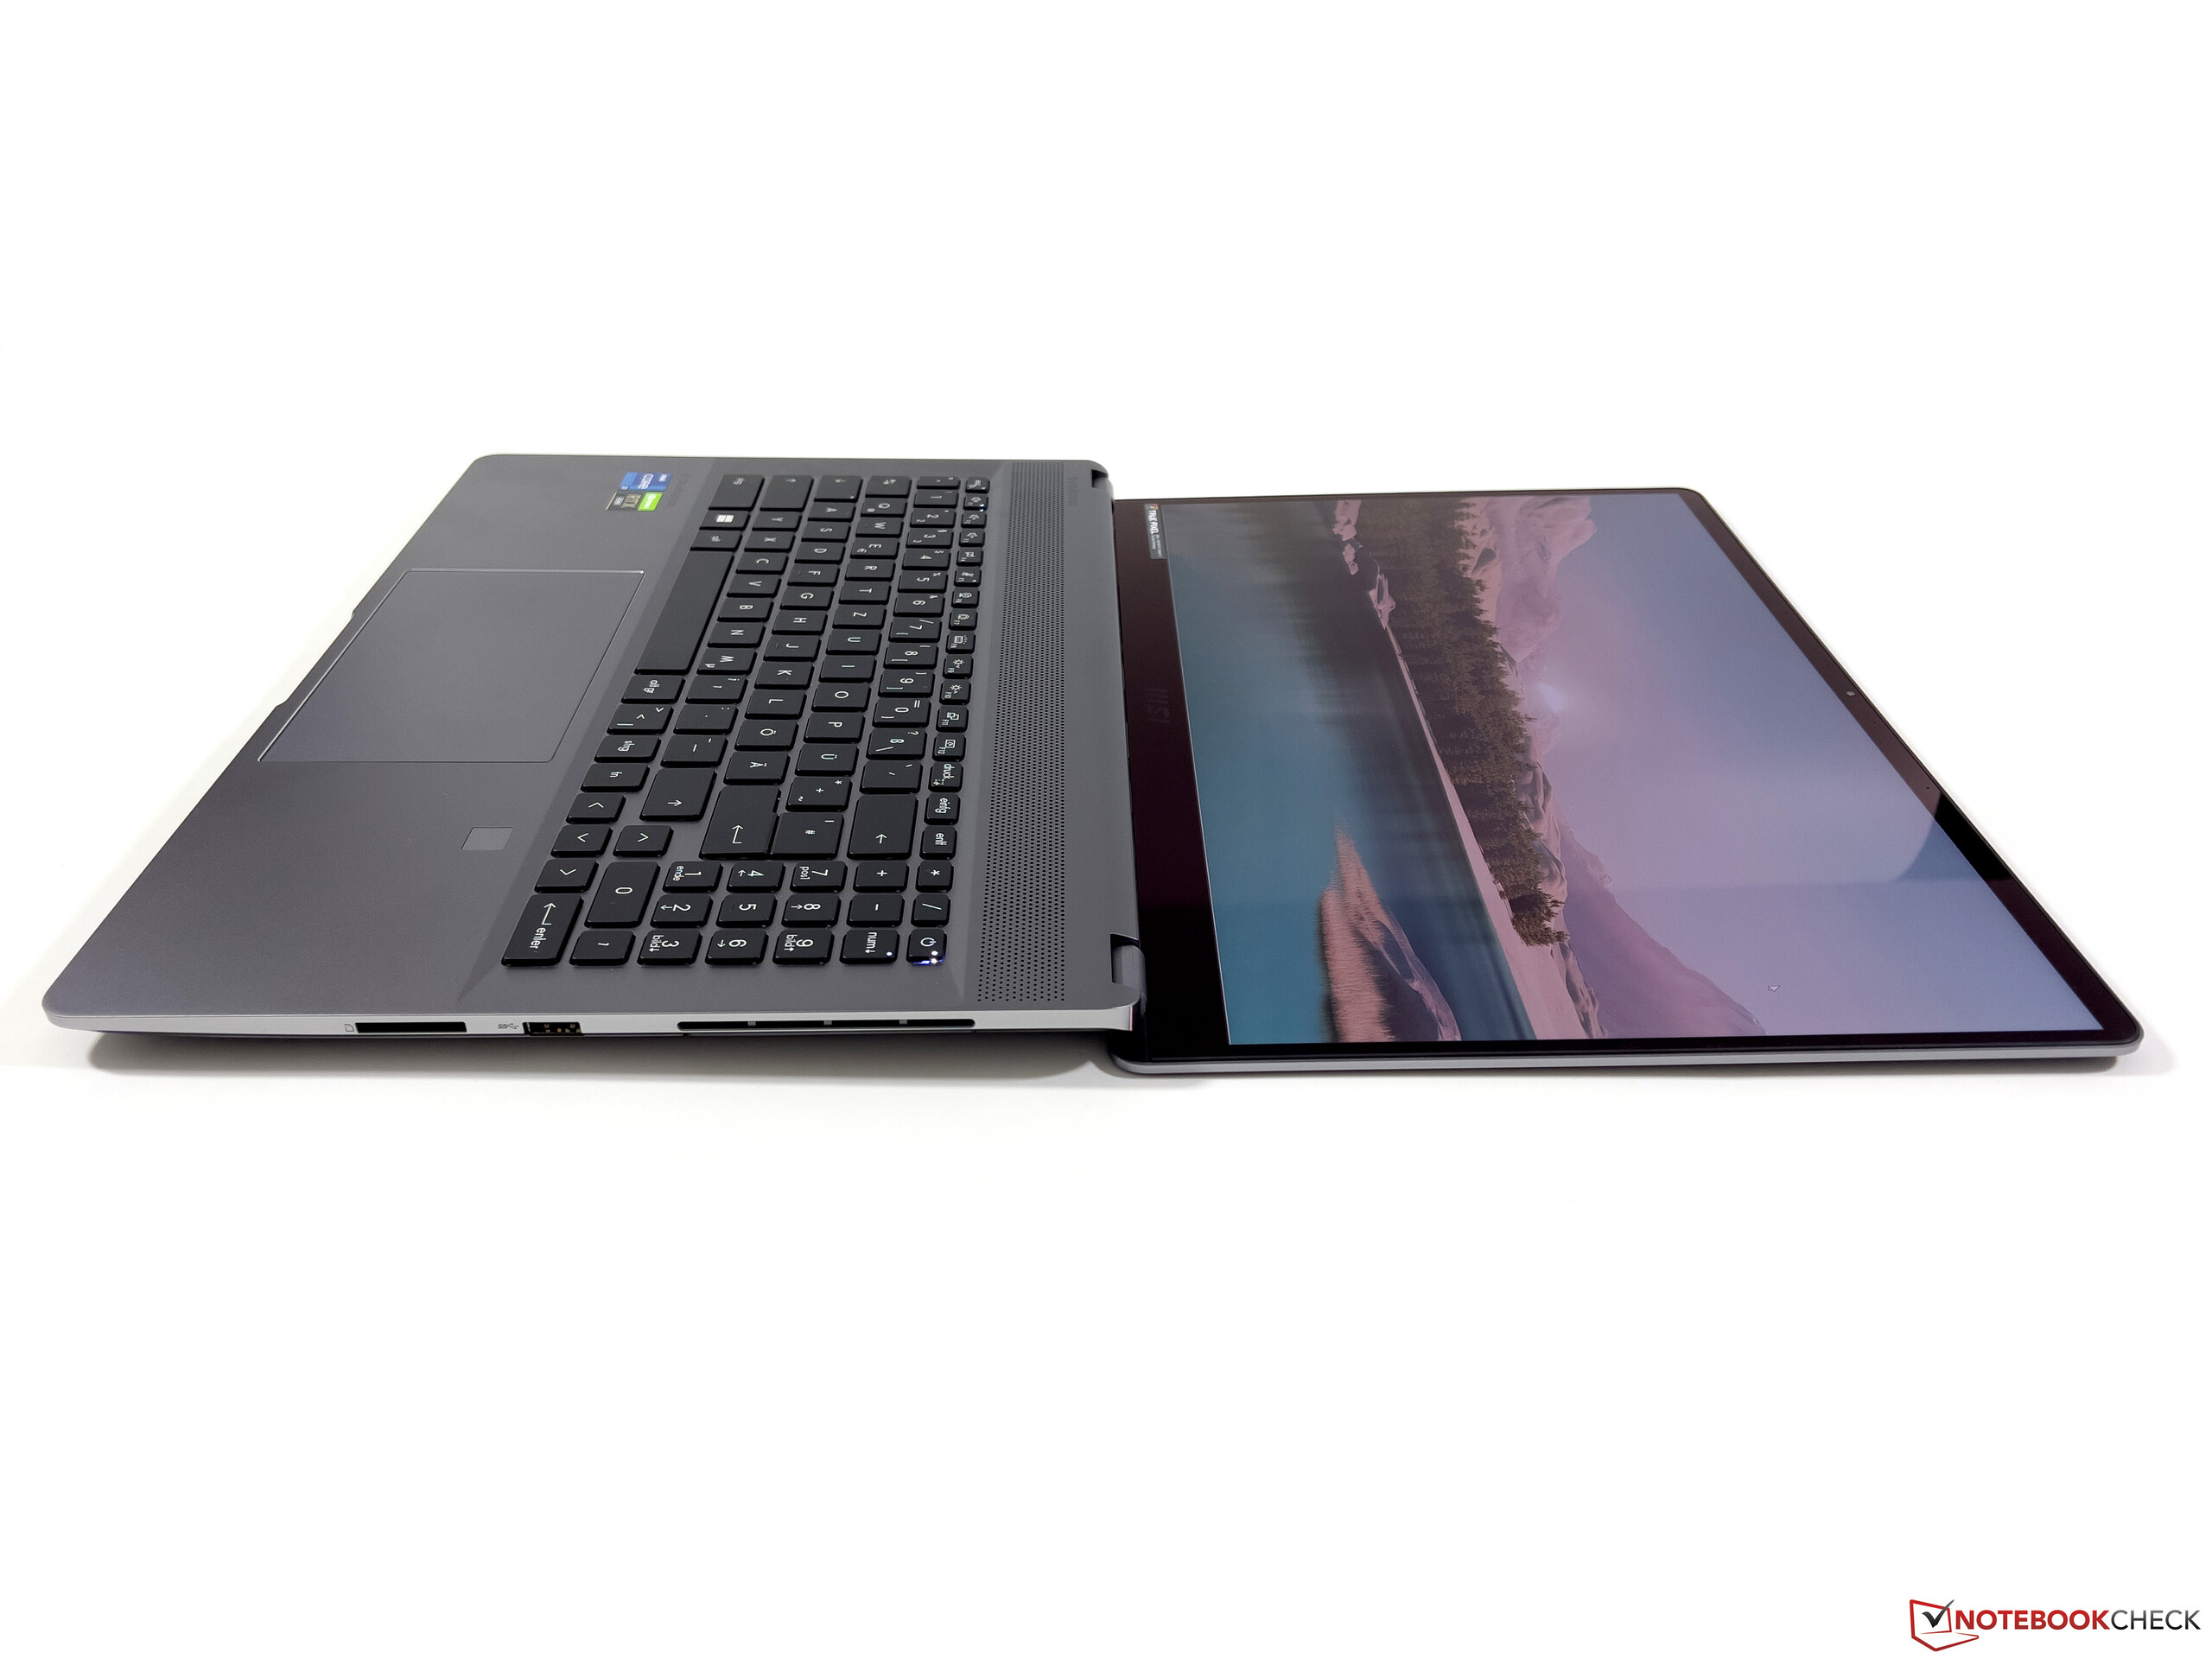
Display - TrueColor con 165 Hz
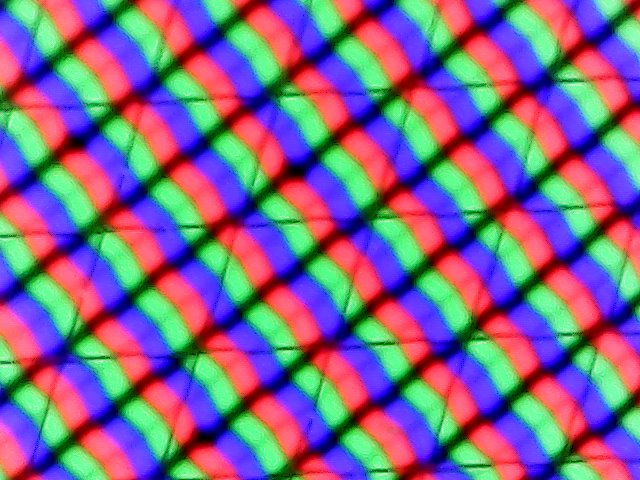
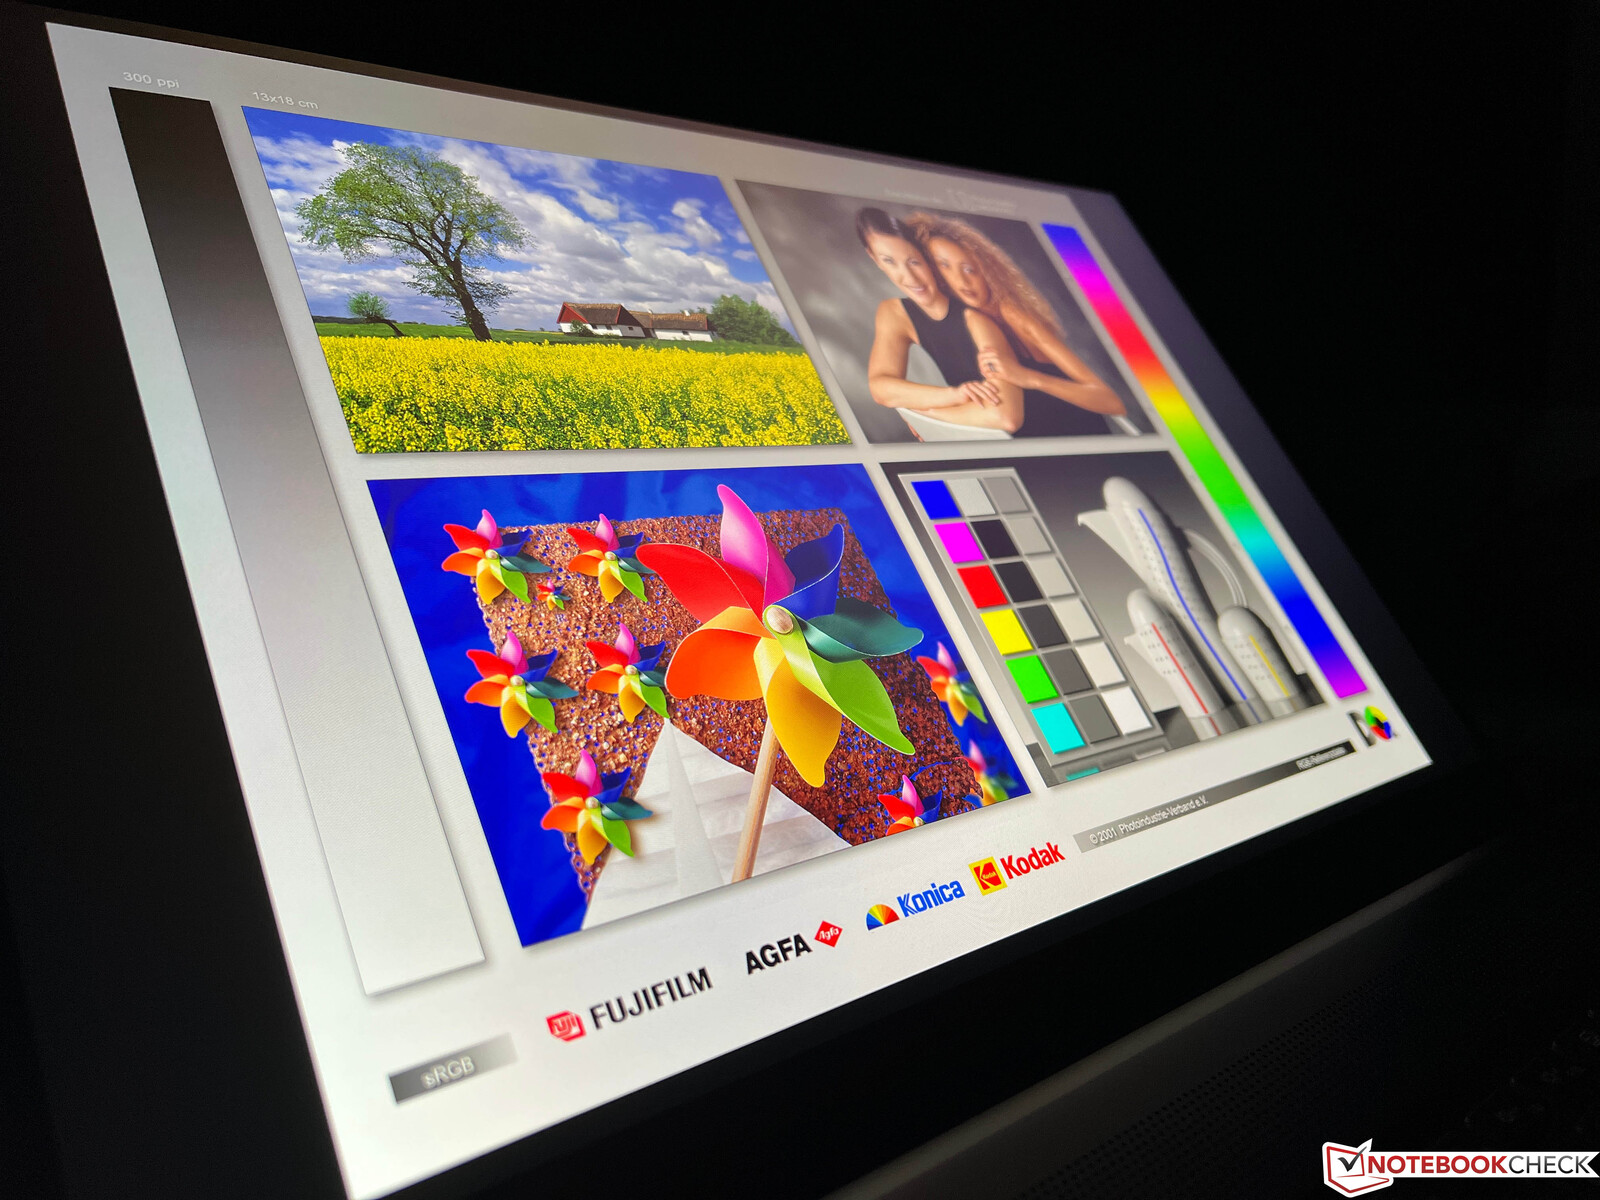
Possiamo essere brevi anche nella sezione Display, dato che non ci sono differenze rispetto al normale Creator Z16Pqui. Sebbene il design del pannello TrueColor WQHD riflettente (2560 x 1600 pixel, IPS) nel formato 16:10 sia rivolto più a un pubblico di creatori di contenuti, la qualità dell'immagine soggettiva è semplicemente molto buona e anche altri utenti apprezzeranno molto il pannello.
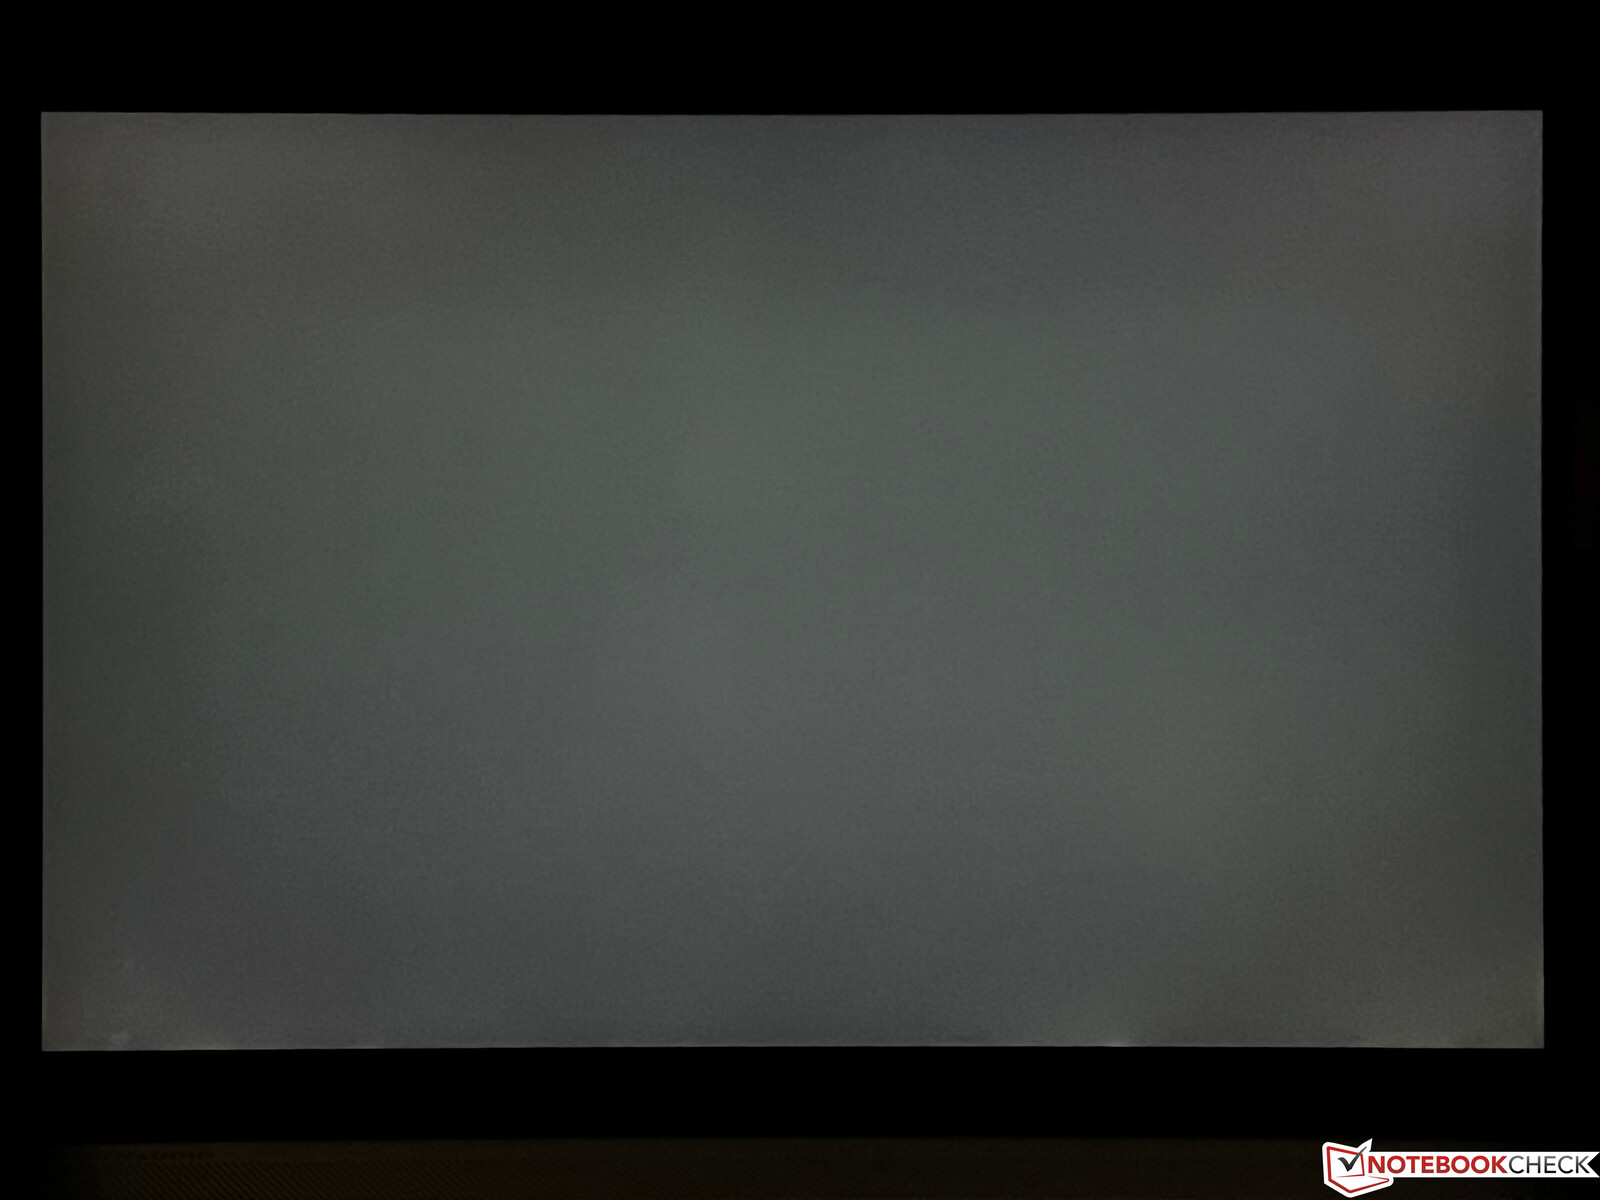
Nelle nostre misurazioni, il pannello offre valori decenti (luminosità media ~390 cd/m²), anche se il rapporto di contrasto di ~1.100:1 avrebbe potuto essere leggermente migliore e il valore del nero inferiore. I tempi di risposta del pannello a 165 Hz sono eccellenti e lo stesso vale per la stabilità degli angoli di visione. Gli aloni di luce non saranno un problema e non viene utilizzato il PWM.
| |||||||||||||||||||||||||
Distribuzione della luminosità: 88 %
Al centro con la batteria: 408 cd/m²
Contrasto: 1131:1 (Nero: 0.36 cd/m²)
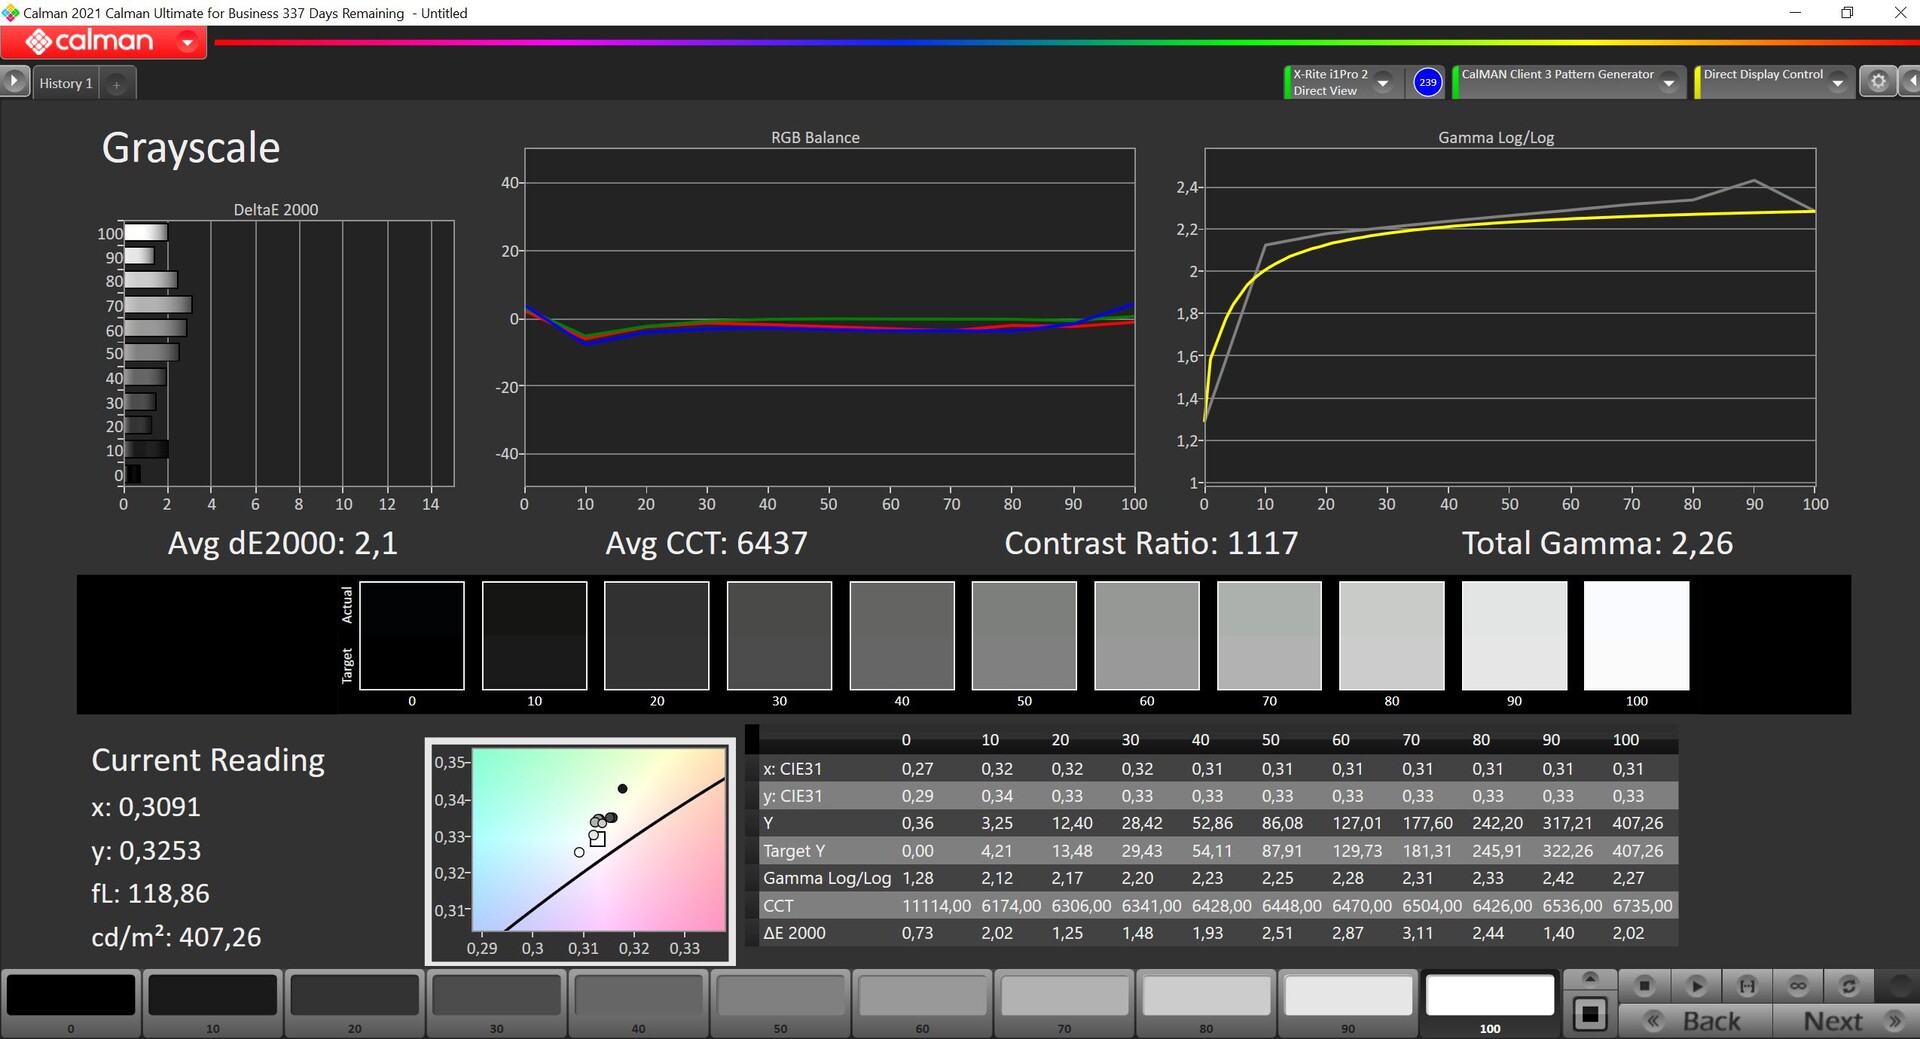
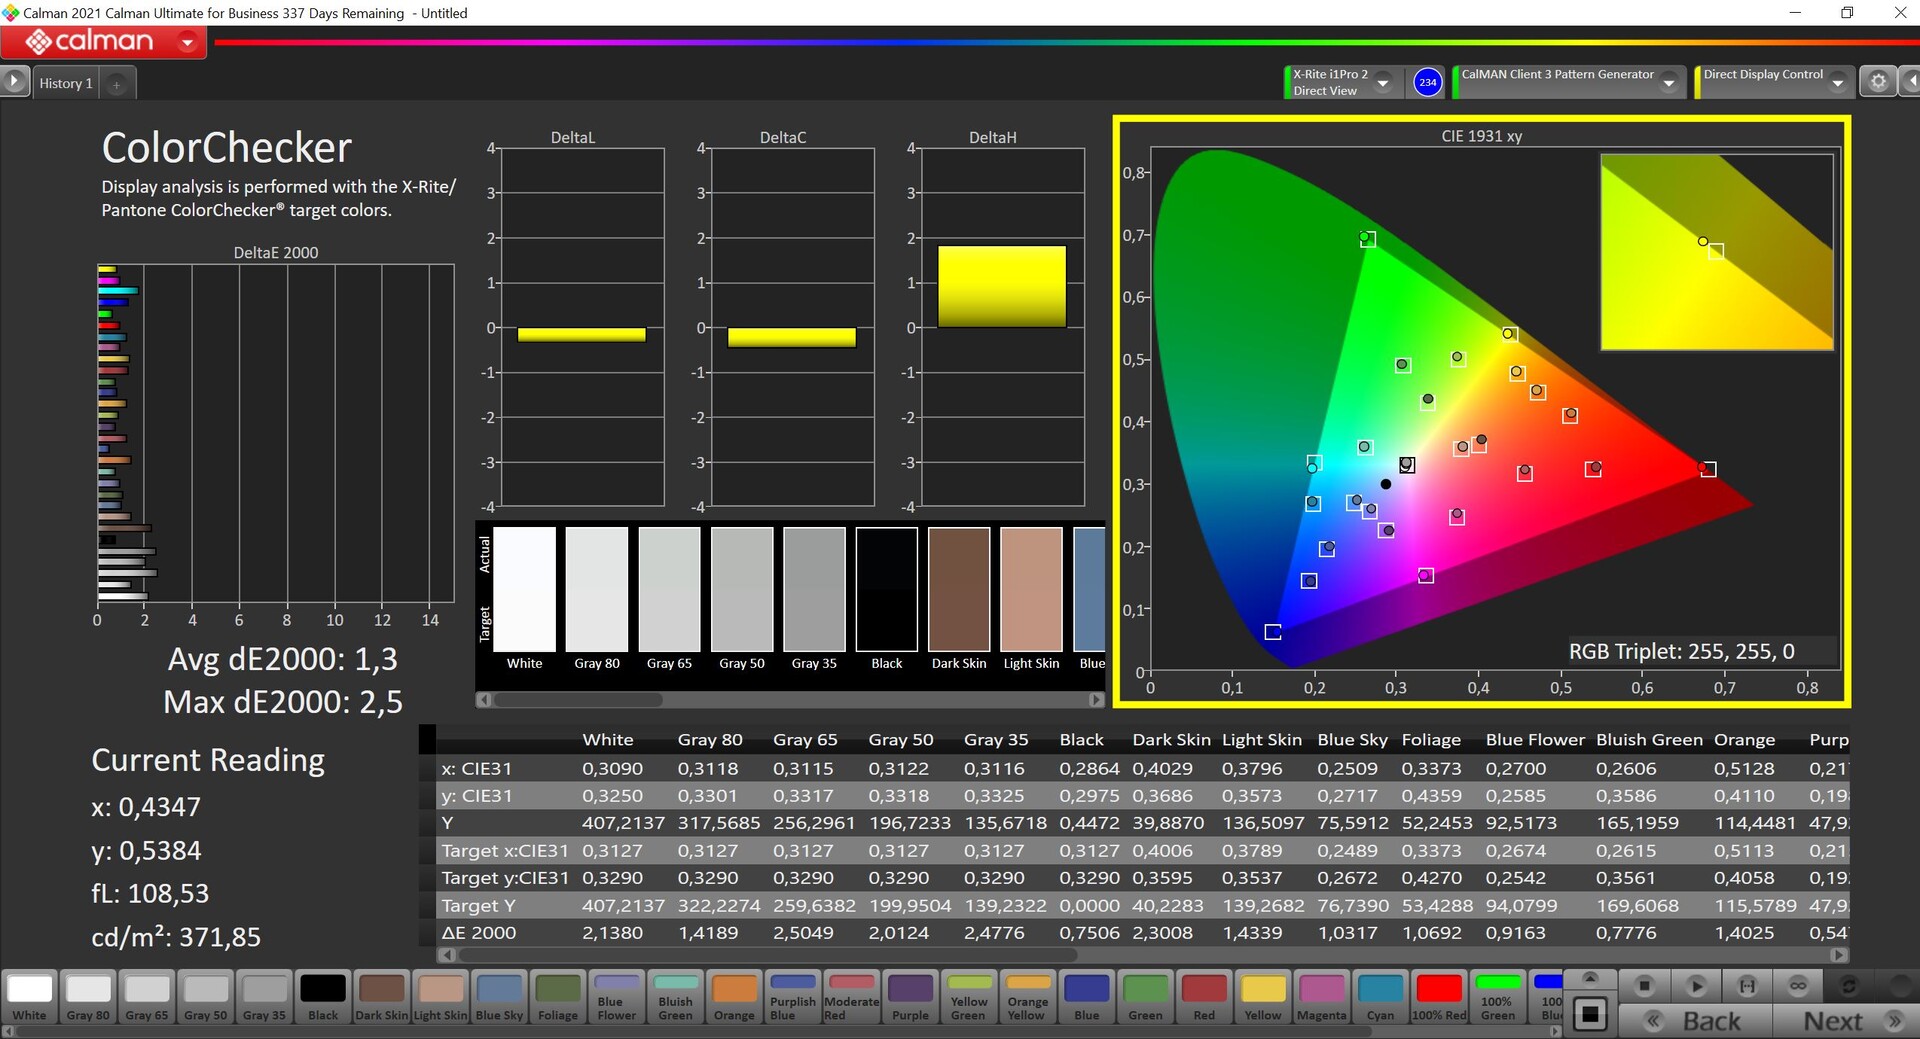
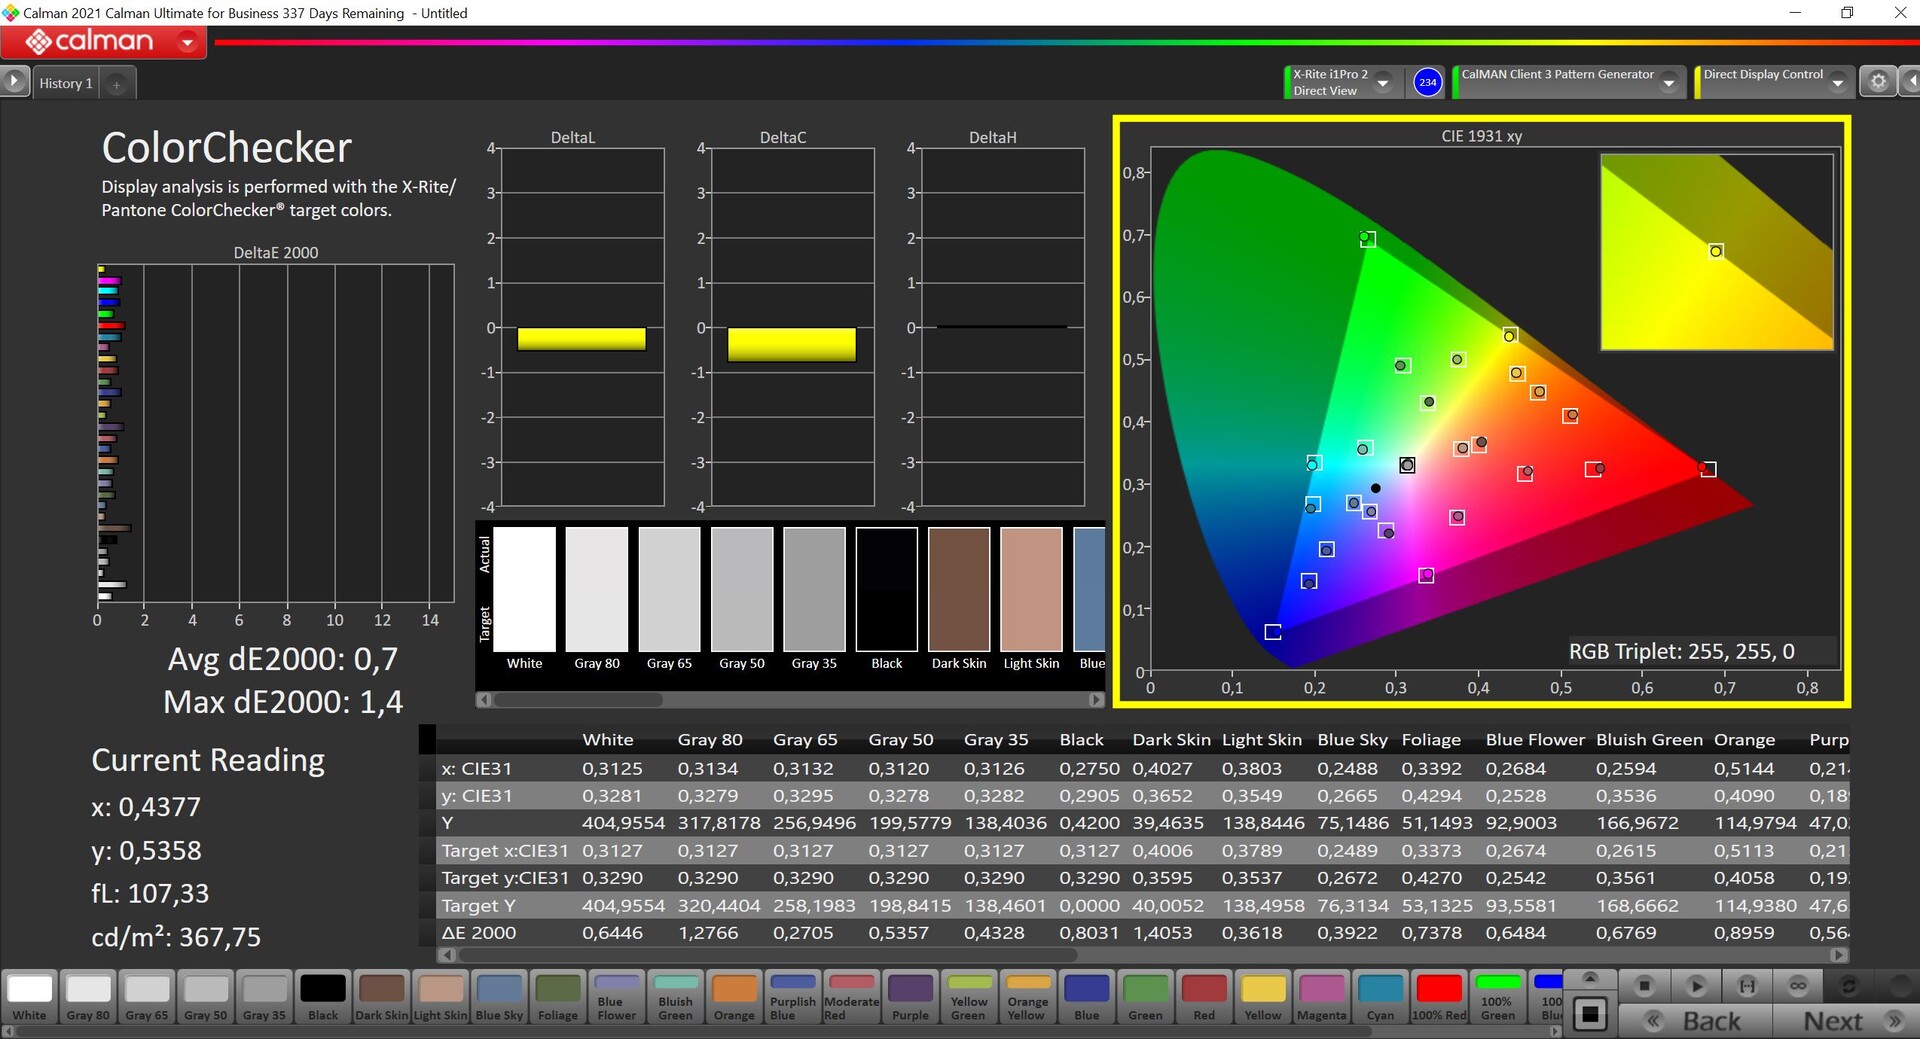
ΔE ColorChecker Calman: 1.3 | ∀{0.5-29.43 Ø4.73}
calibrated: 0.7
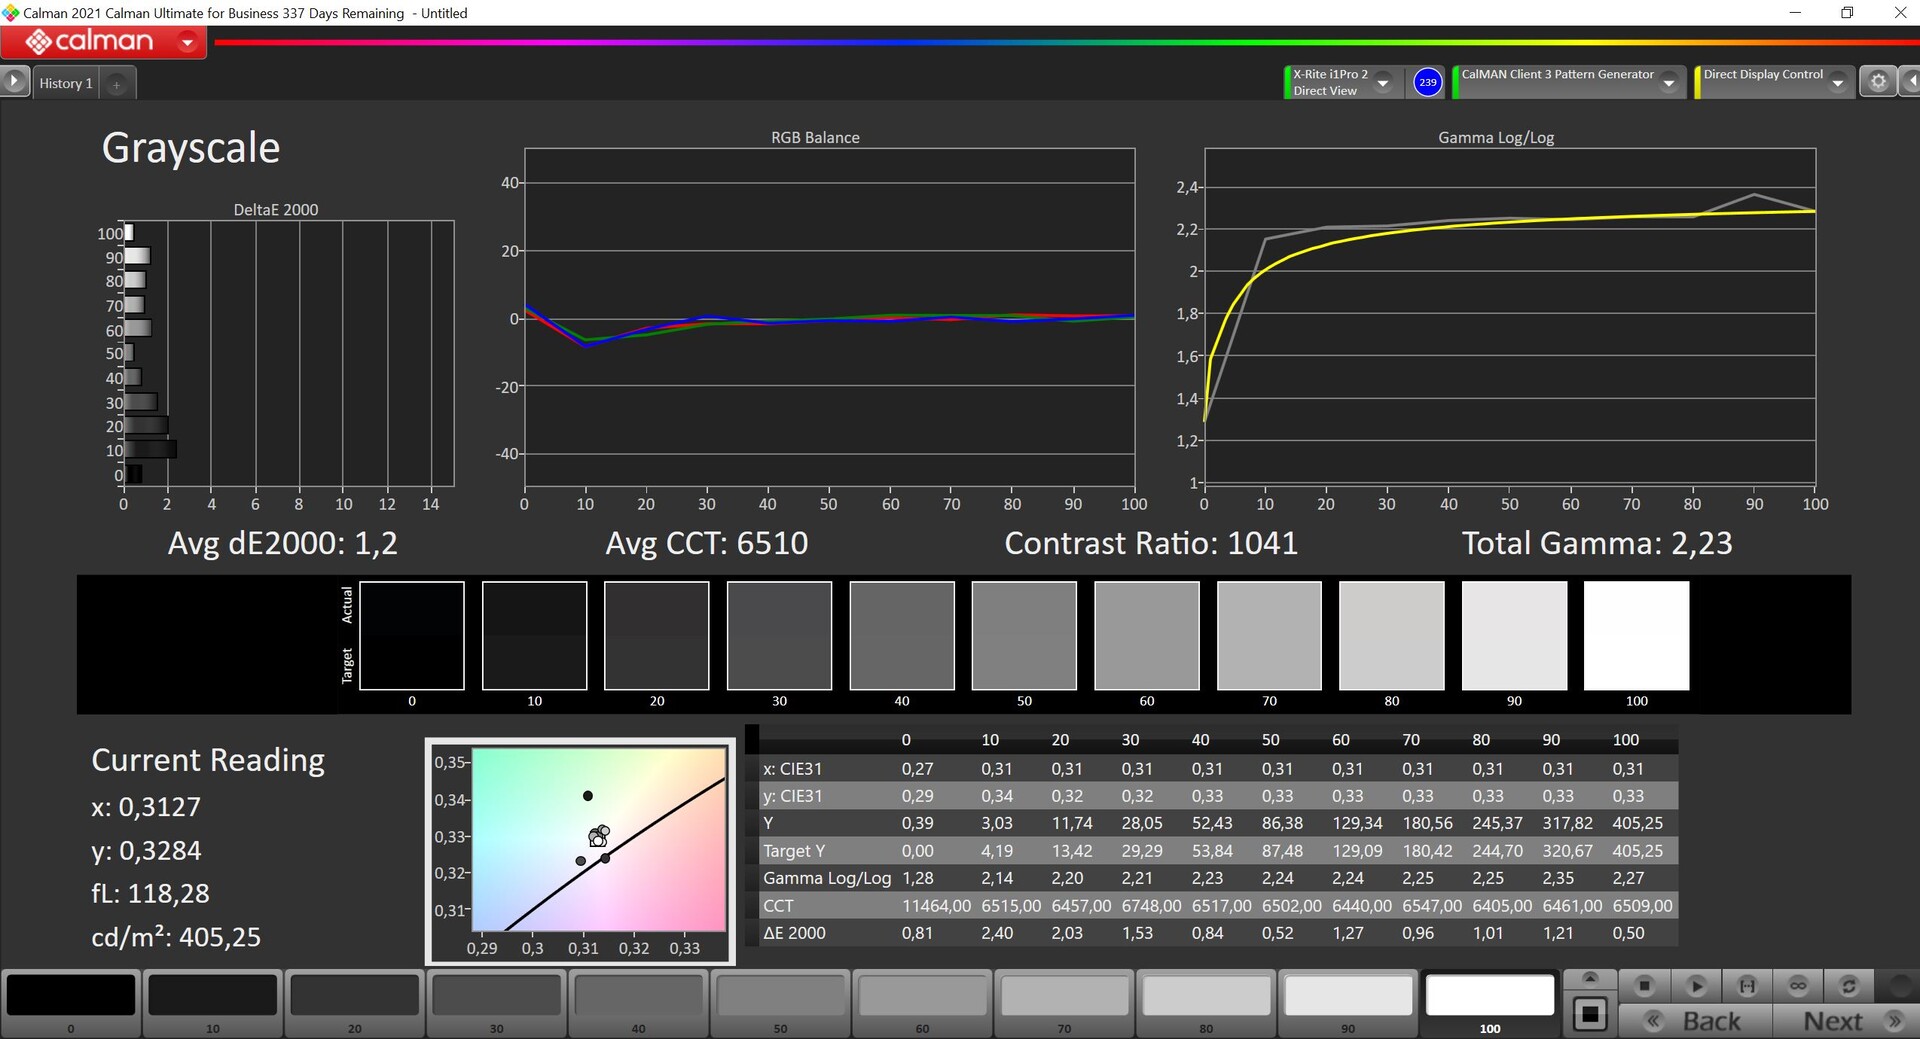
ΔE Greyscale Calman: 2.1 | ∀{0.09-98 Ø4.97}
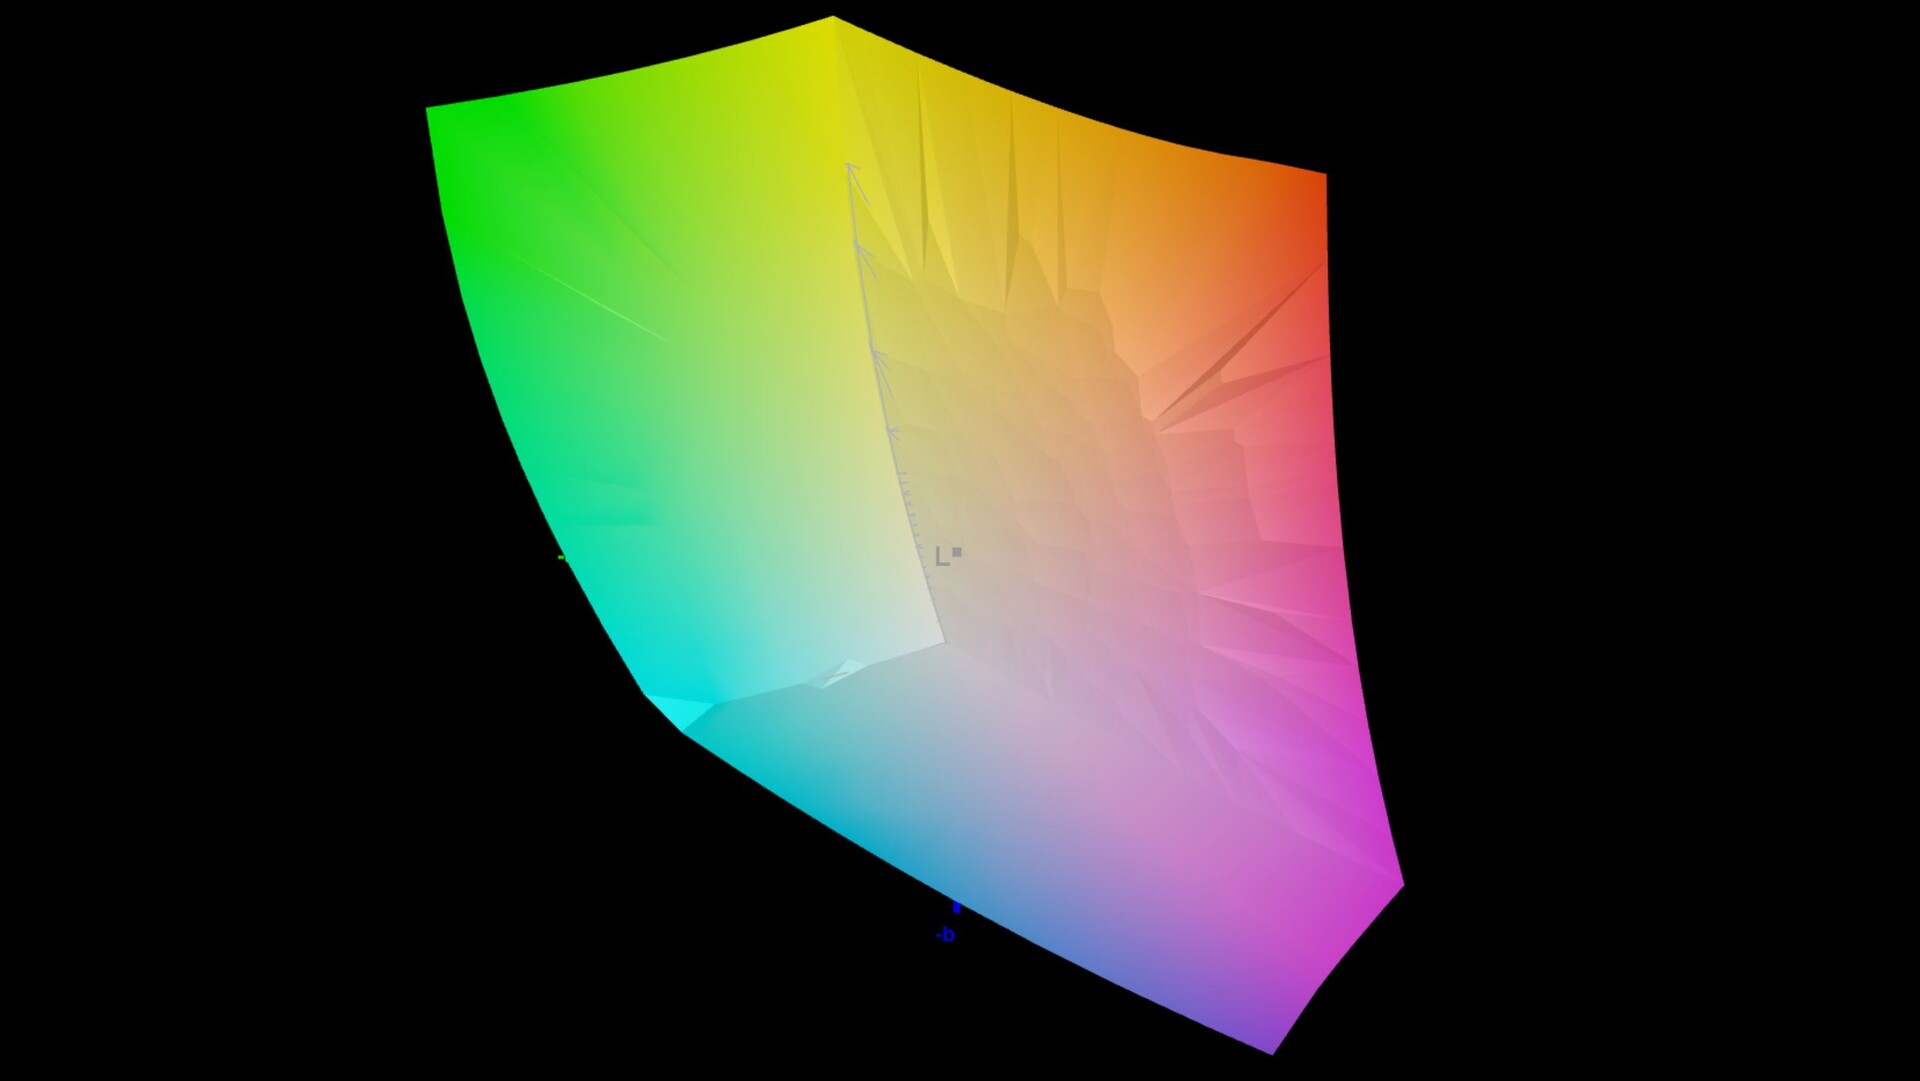
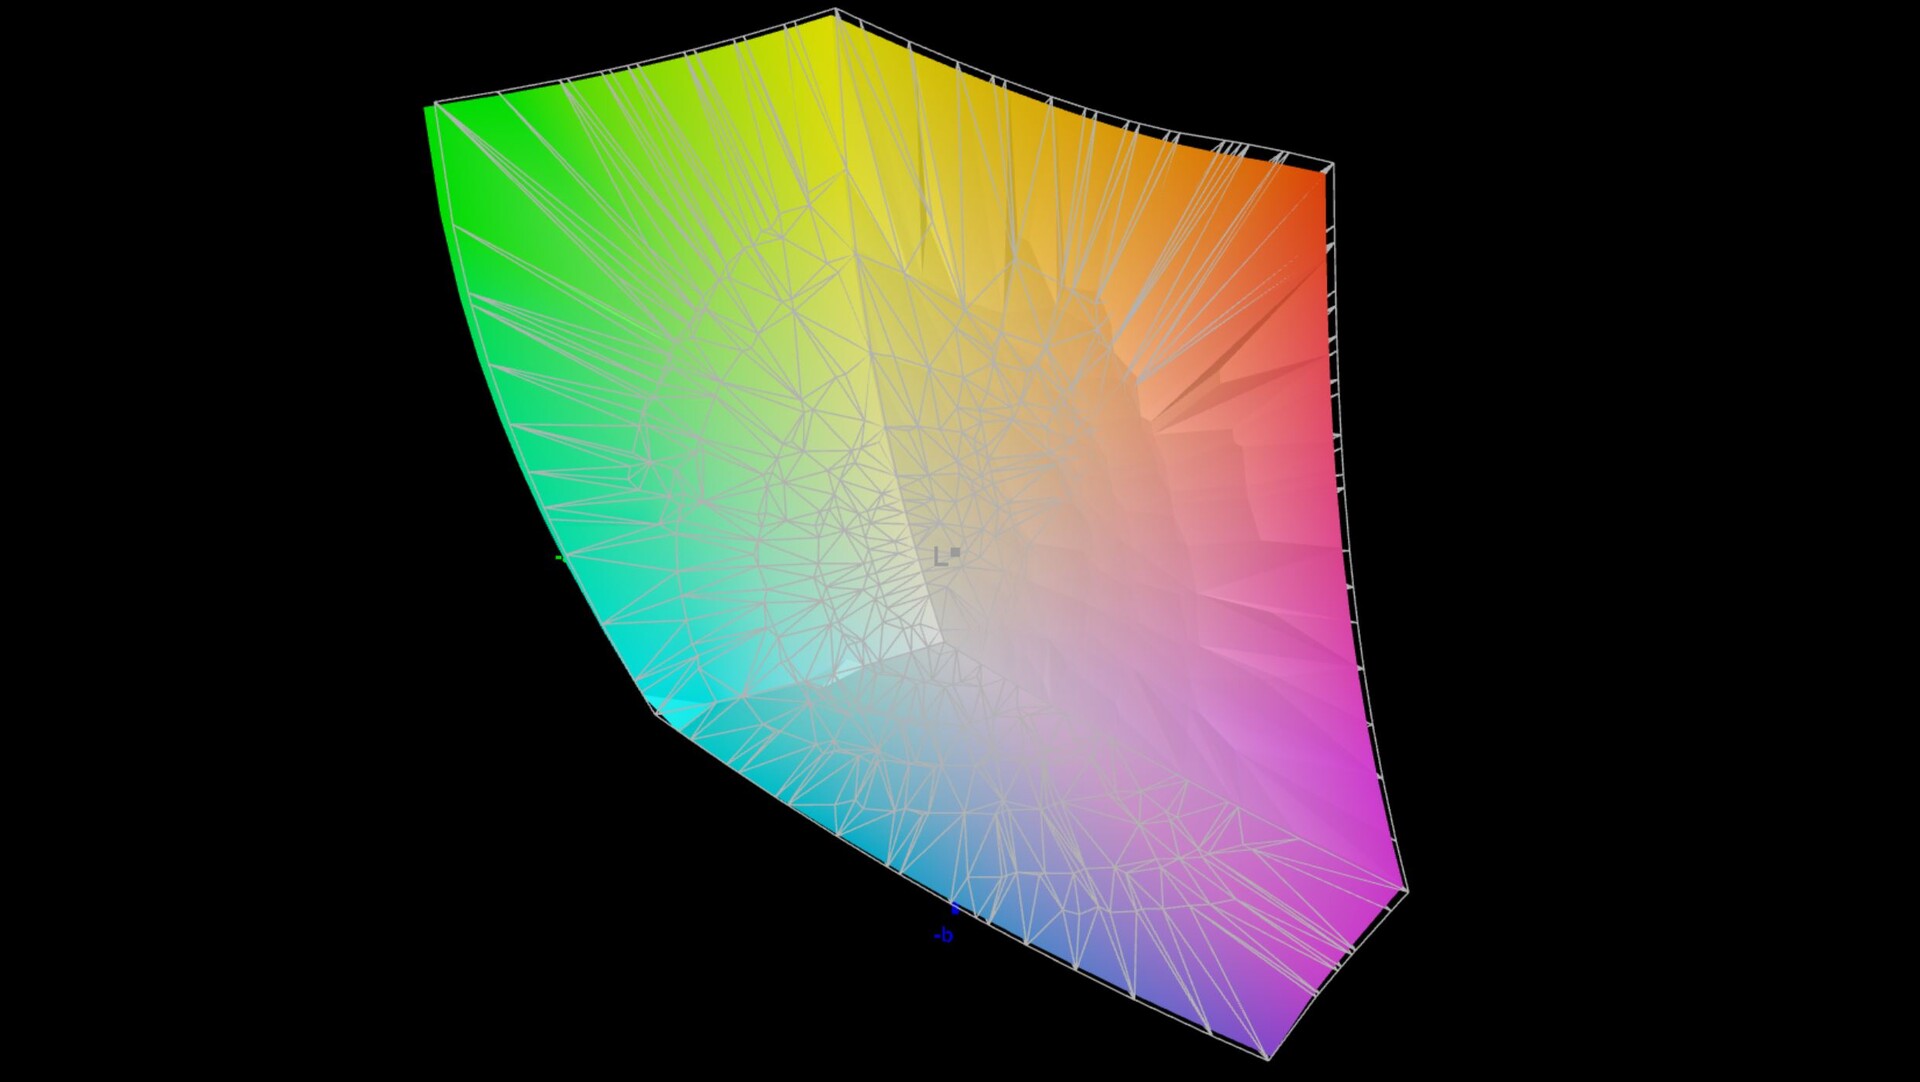
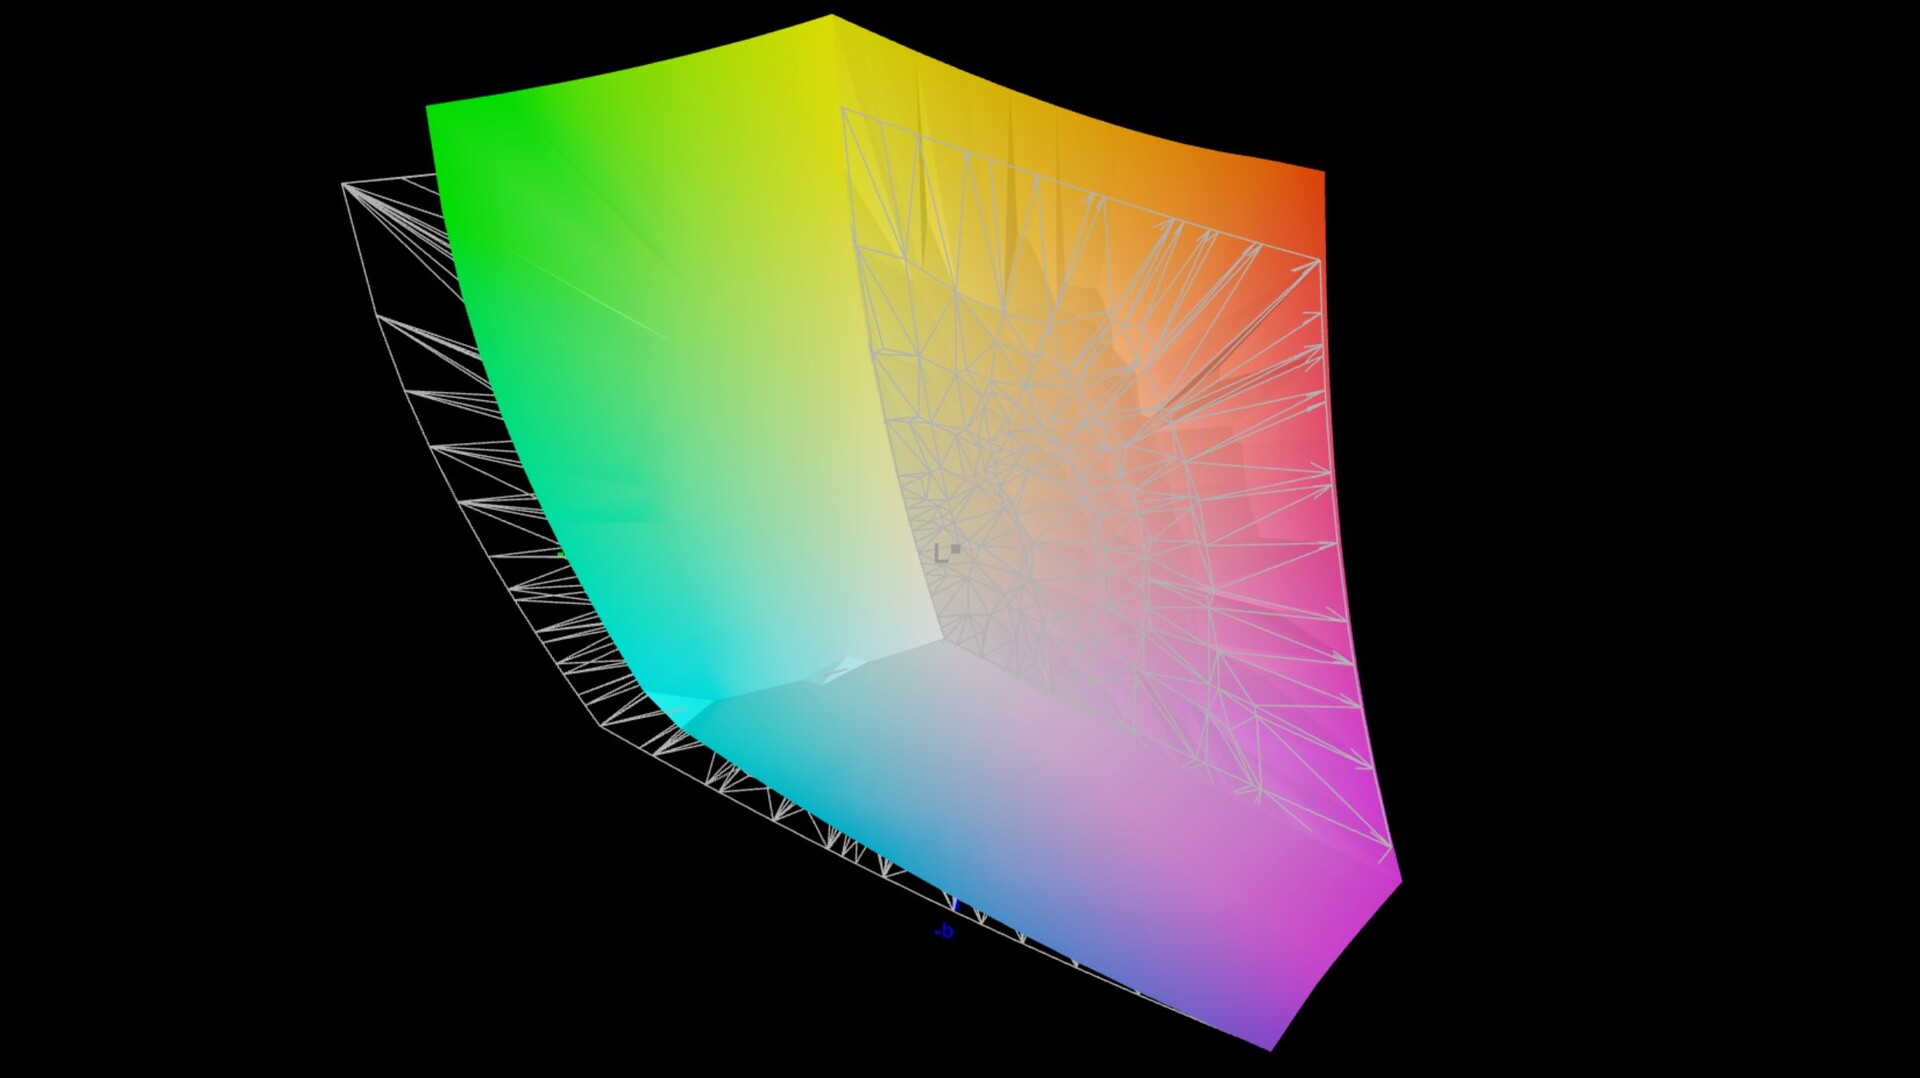
87.4% AdobeRGB 1998 (Argyll 3D)
99.9% sRGB (Argyll 3D)
97.6% Display P3 (Argyll 3D)
Gamma: 2.26
CCT: 6437 K
| MSI CreatorPro Z16P B12UKST B160QAN02.N, IPS, 2560x1600, 16" | HP ZBook Studio 16 G9 62U04EA BOE0A52, IPS, 3840x2400, 16" | Lenovo ThinkPad P1 G4-20Y4S0KS00 LP160UQ1-SPB1, IPS LED, 3840x2400, 16" | Dell Precision 5000 5560 Sharp LQ156R1, IPS, 3840x2400, 15.6" | MSI Creator Z16P B12UHST AUOD298, IPS True Pixel (~100% DCI-P3), 2560x1600, 16" | |
|---|---|---|---|---|---|
| Display | -0% | 0% | 4% | -0% | |
| Display P3 Coverage (%) | 97.6 | 97.5 0% | 85.7 -12% | 94.9 -3% | 97.6 0% |
| sRGB Coverage (%) | 99.9 | 99.9 0% | 99.4 -1% | 100 0% | 99.9 0% |
| AdobeRGB 1998 Coverage (%) | 87.4 | 86.3 -1% | 98.9 13% | 100 14% | 86.8 -1% |
| Response Times | -1% | -327% | -290% | 7% | |
| Response Time Grey 50% / Grey 80% * (ms) | 12.8 ? | 15.3 ? -20% | 55.2 ? -331% | 47.2 ? -269% | 12.9 ? -1% |
| Response Time Black / White * (ms) | 7.4 ? | 6.1 ? 18% | 31.2 ? -322% | 30.4 ? -311% | 6.4 ? 14% |
| PWM Frequency (Hz) | |||||
| Screen | 11% | -11% | -59% | -25% | |
| Brightness middle (cd/m²) | 407 | 554 36% | 630 55% | 501.5 23% | 428 5% |
| Brightness (cd/m²) | 388 | 516 33% | 622 60% | 467 20% | 394 2% |
| Brightness Distribution (%) | 88 | 84 -5% | 90 2% | 83 -6% | 86 -2% |
| Black Level * (cd/m²) | 0.36 | 0.47 -31% | 0.41 -14% | 0.44 -22% | 0.42 -17% |
| Contrast (:1) | 1131 | 1179 4% | 1537 36% | 1140 1% | 1019 -10% |
| Colorchecker dE 2000 * | 1.3 | 1 23% | 2.2 -69% | 4.73 -264% | 1.67 -28% |
| Colorchecker dE 2000 max. * | 2.5 | 2.4 4% | 5 -100% | 8.45 -238% | 5.71 -128% |
| Colorchecker dE 2000 calibrated * | 0.7 | 0.6 14% | 1 -43% | 0.51 27% | 0.71 -1% |
| Greyscale dE 2000 * | 2.1 | 1.6 24% | 2.7 -29% | 3.6 -71% | 3.1 -48% |
| Gamma | 2.26 97% | 2.29 96% | 2.26 97% | 2.08 106% | 2.195 100% |
| CCT | 6437 101% | 6458 101% | 6886 94% | 6447 101% | 6498 100% |
| Media totale (Programma / Settaggio) | 3% /
7% | -113% /
-54% | -115% /
-79% | -6% /
-15% |
* ... Meglio usare valori piccoli
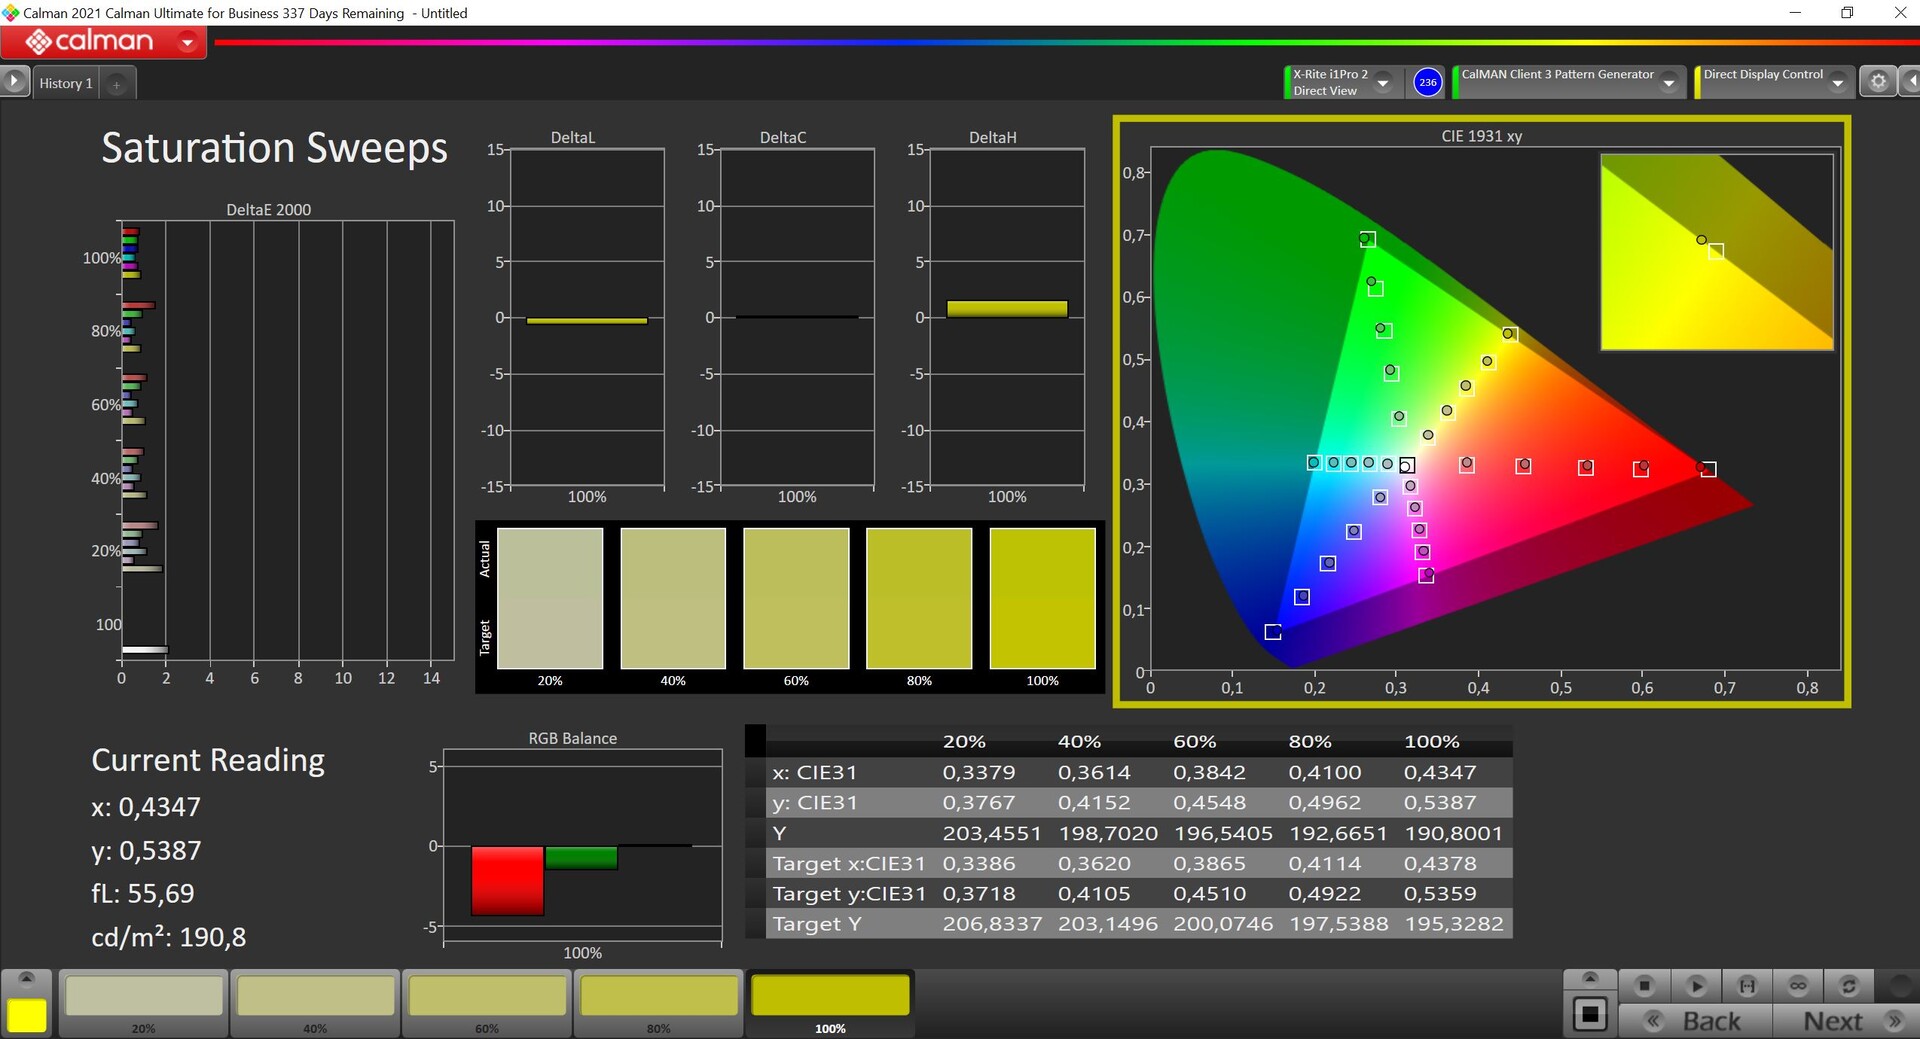
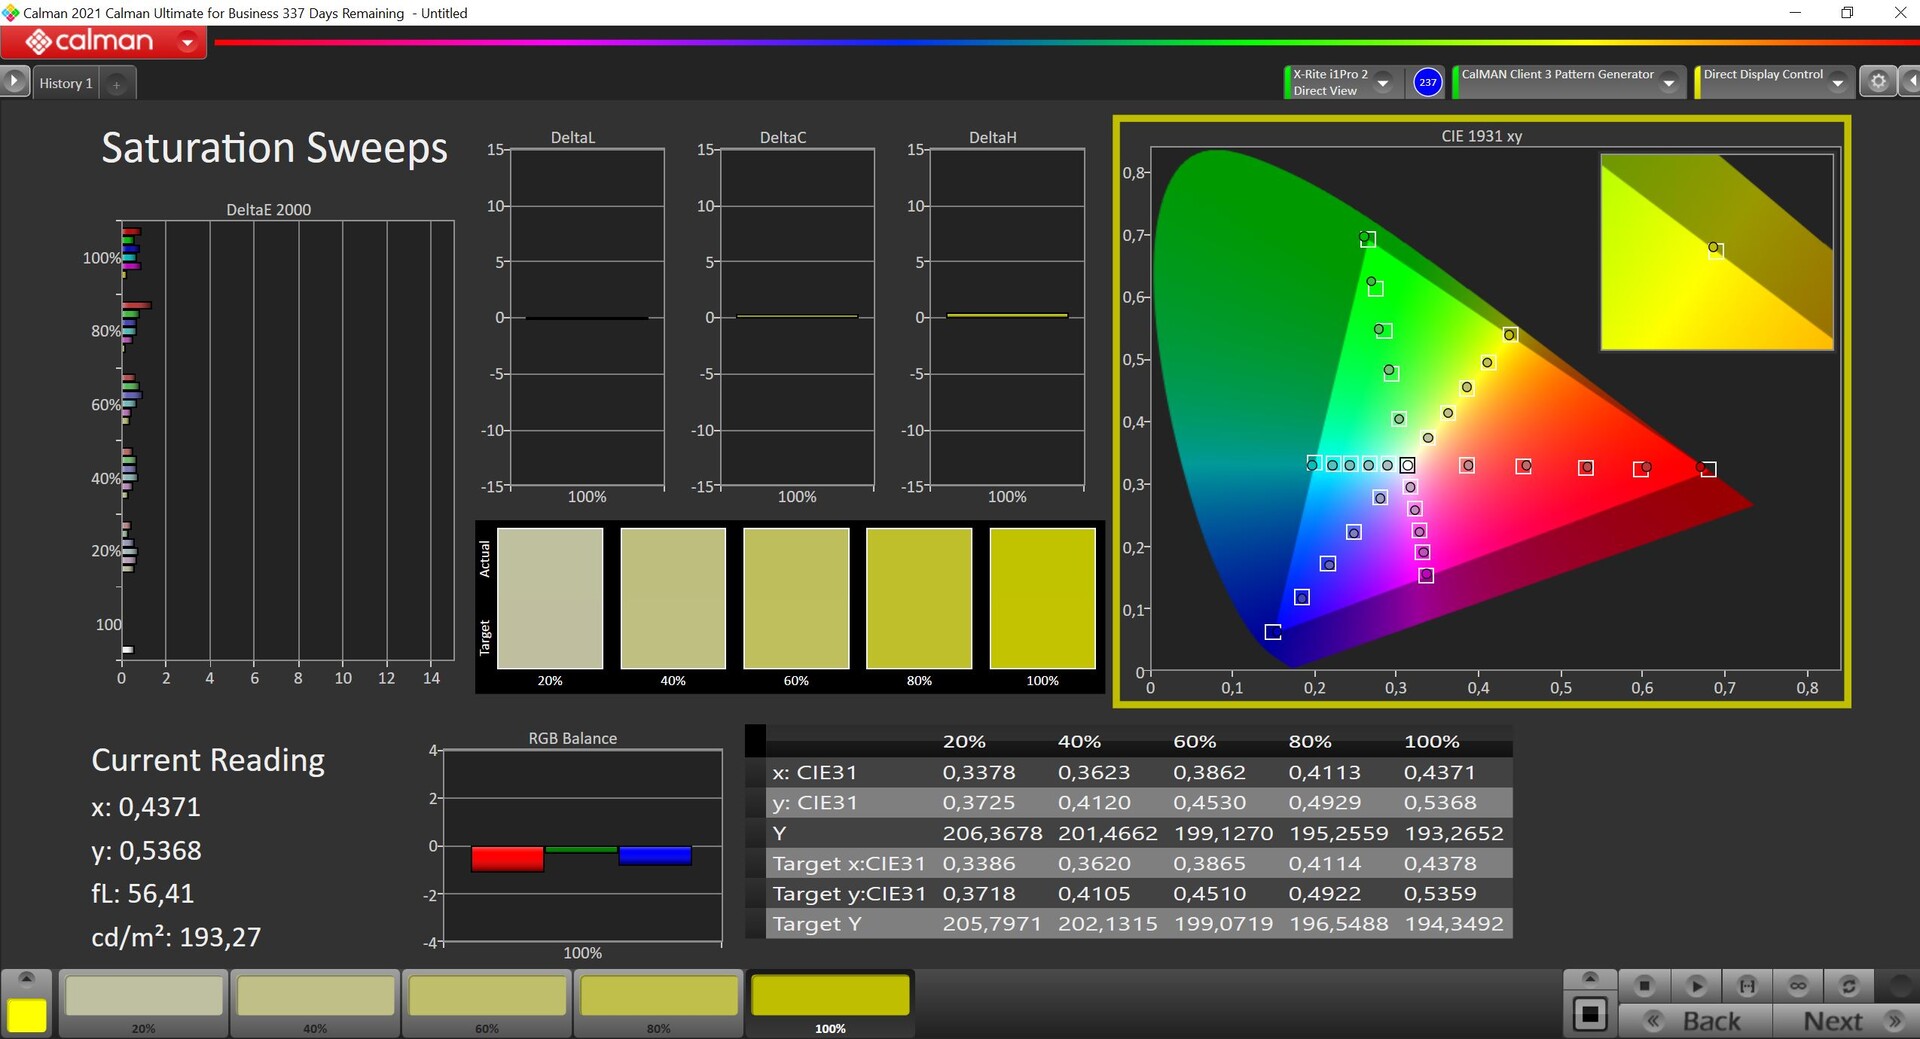
La nostra analisi con il software professionale CalMAN (X-Rite i1 Pro 2) mostra che il pannello è già ben calibrato al momento della consegna, e la deviazione DeltaE inferiore a 2 pubblicizzata da MSI rispetto allo spazio colore di riferimento DCI-P3 è corretta. La deviazione è molto ridotta anche nella scala di grigi e non c'è alcuna sfumatura di colore. Siamo in grado di migliorare ulteriormente le deviazioni con la nostra calibrazione (scaricabile gratuitamente dal link più sopra), ma non è necessario.
Il software TrueColor consente anche di cambiare lo spazio colore, se ad esempio si desidera lavorare nello spazio colore sRGB. Inoltre, il software consente anche di calibrare il display e, a questo proposito, il CreatorPro Z16P offre persino alcuni vantaggi rispetto ad alcune workstation (come ad esempio i modelli ZBook di HP con Dream Dream) I modelli ZBook di HP con pannelli DreamColorche a questo punto non offrono più alcun software di visualizzazione).
Tempi di risposta del Display
| ↔ Tempi di risposta dal Nero al Bianco | ||
|---|---|---|
| 7.4 ms ... aumenta ↗ e diminuisce ↘ combinato | ↗ 3.4 ms Incremento | 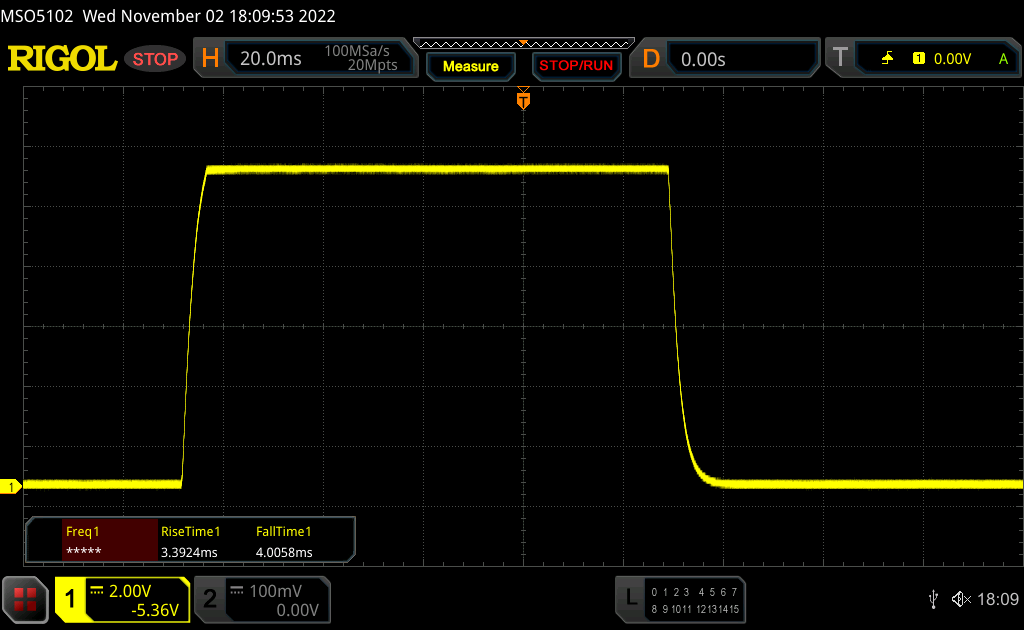 |
| ↘ 4 ms Calo | ||
| Lo schermo ha mostrato valori di risposta molto veloci nei nostri tests ed è molto adatto per i gaming veloce. In confronto, tutti i dispositivi di test variano da 0.1 (minimo) a 240 (massimo) ms. » 22 % di tutti i dispositivi è migliore. Questo significa che i tempi di risposta rilevati sono migliori rispettto alla media di tutti i dispositivi testati (19.9 ms). | ||
| ↔ Tempo di risposta dal 50% Grigio all'80% Grigio | ||
| 12.8 ms ... aumenta ↗ e diminuisce ↘ combinato | ↗ 6.2 ms Incremento | 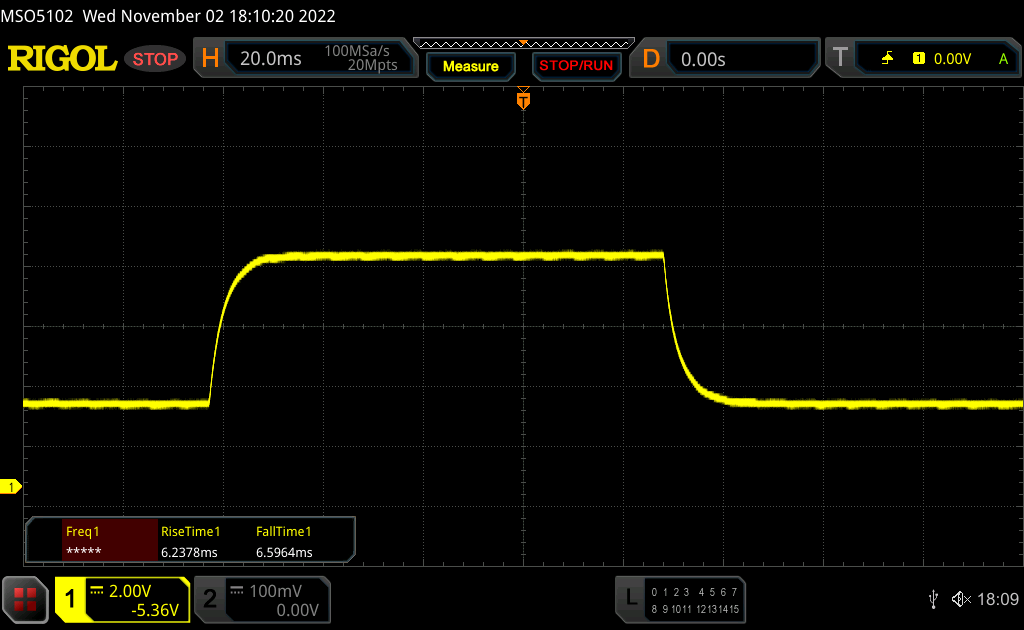 |
| ↘ 6.6 ms Calo | ||
| Lo schermo mostra buoni tempi di risposta durante i nostri tests, ma potrebbe essere troppo lento per i gamers competitivi. In confronto, tutti i dispositivi di test variano da 0.165 (minimo) a 636 (massimo) ms. » 26 % di tutti i dispositivi è migliore. Questo significa che i tempi di risposta rilevati sono migliori rispettto alla media di tutti i dispositivi testati (31.1 ms). | ||
Sfarfallio dello schermo / PWM (Pulse-Width Modulation)
| flickering dello schermo / PWM non rilevato | 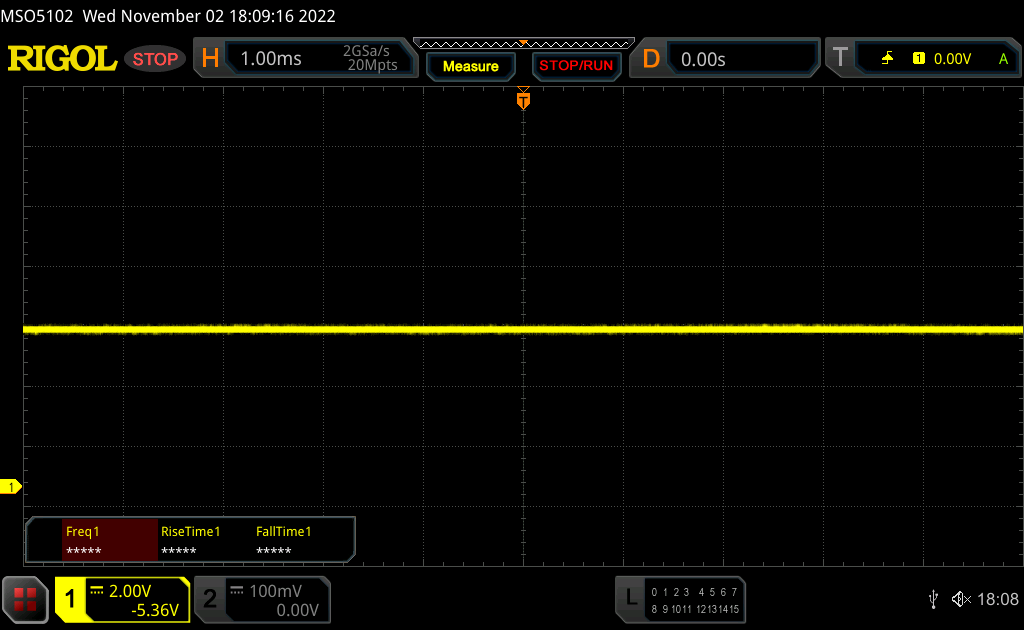 | ||
In confronto: 52 % di tutti i dispositivi testati non utilizza PWM per ridurre la luminosita' del display. Se è rilevato PWM, una media di 7801 (minimo: 5 - massimo: 343500) Hz è stata rilevata. | |||
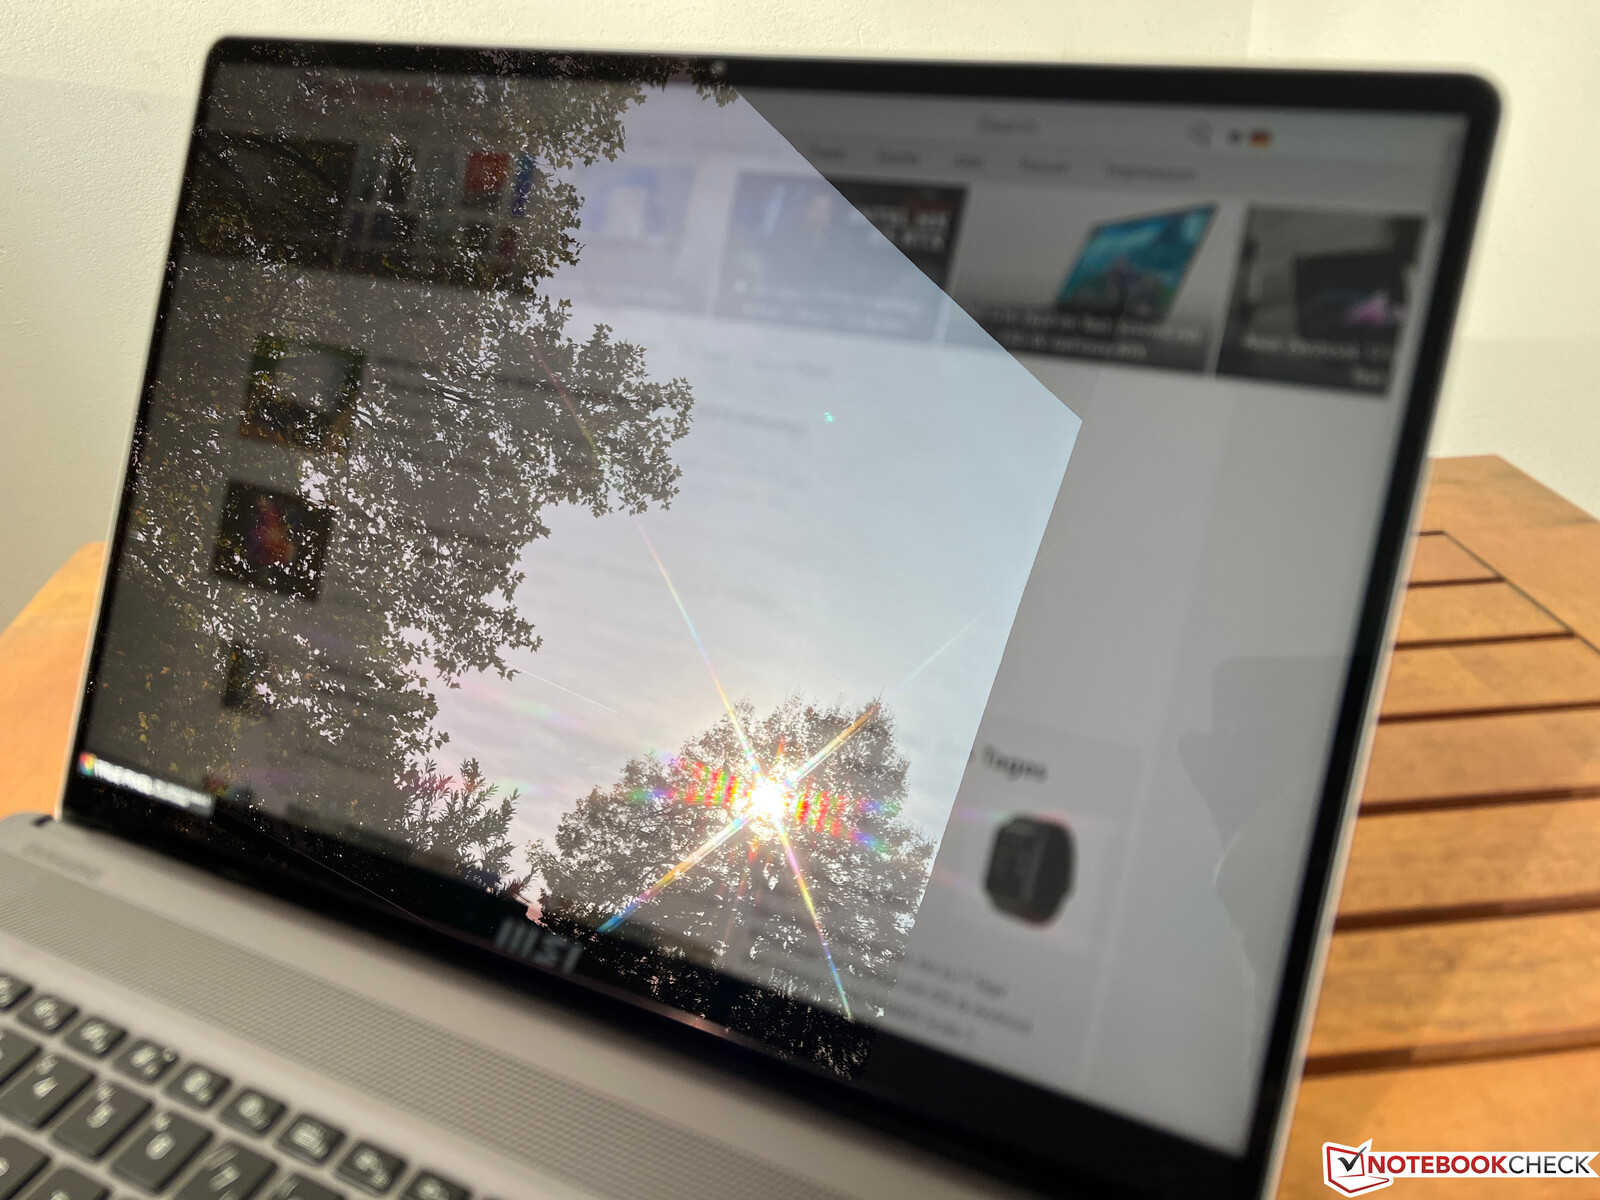
Anche se la superficie riflettente del display aiuta la qualità dell'immagine, ovviamente rende le cose più difficili all'aperto. Finché si riesce a evitare i riflessi delle fonti di luce o delle aree luminose, i contenuti possono essere riconosciuti abbastanza facilmente, ma chi ama lavorare occasionalmente in mobilità o in condizioni di luce mutevole farebbe meglio a scegliere un display opaco.
Prestazioni - MSI utilizza Intel Alder Lake e Nvidia Studio
Condizioni di prova
Oltre alle impostazioni di Windows, MSI offre anche i propri profili di alimentazione nel software CenterPro preinstallato e anche una modalità Smart Auto AI, che controlla le prestazioni indipendentemente dal carico. Durante i nostri test, abbiamo ottenuto risultati che variavano in parte con i profili di alimentazione. I risultati migliori li abbiamo ottenuti con la modalità Performance, anche se anche in questo caso ci sono state delle variazioni.
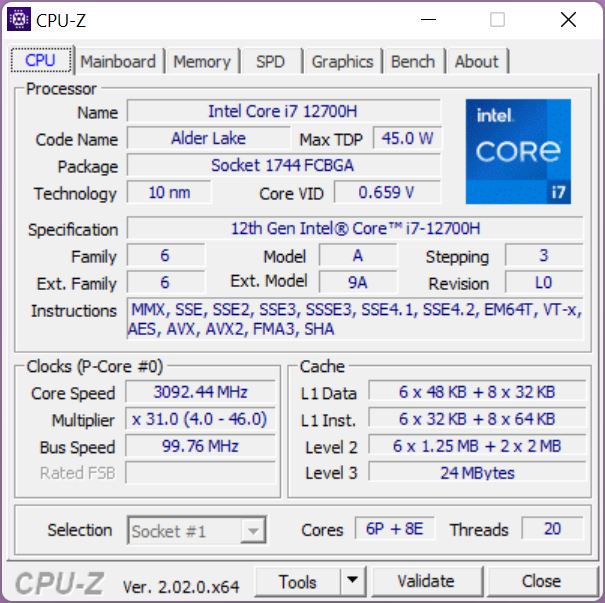
Processore - Core i7-12700H
IlIntel Core i7-12700Hè attualmente utilizzato in molti portatili e offre ottime prestazioni grazie ai suoi 6 core Performance e 8 core Efficiency, ma possono esserci notevoli differenze a seconda della configurazione del TDP. Nel CreatorPro Z16P, i valori sono scelti in modo piuttosto conservativo e non sono sempre stabili. A volte, il processore è autorizzato a consumare fino a 76 watt, ma nel ciclo di Cinebench, il consumo è di soli 55-60 watt. MSI dovrebbe fare un altro tentativo e consentire risultati riproducibili.
Tuttavia, in tutti i benchmark della CPU, le prestazioni sono complessivamente molto buone, posizionandosi solo in minima parte dietro l' HP ZBook Studio 16 G9con il Core i7-12800H. Il normale Creatore Z16P nella configurazione con il Core i9-12900H è mediamente più veloce di circa il 9%. Nel funzionamento a batteria, il consumo energetico del processore è limitato a 45 watt, con una conseguente riduzione delle prestazioni di circa il 25% nei test multicore. Ulteriori benchmark della CPU sono disponibili nella la nostra sezione dedicata ai processori mobili.
Cinebench R15 Multi Constant Load Test
Cinebench R23: Multi Core | Single Core
Cinebench R20: CPU (Multi Core) | CPU (Single Core)
Cinebench R15: CPU Multi 64Bit | CPU Single 64Bit
Blender: v2.79 BMW27 CPU
7-Zip 18.03: 7z b 4 | 7z b 4 -mmt1
Geekbench 5.5: Multi-Core | Single-Core
HWBOT x265 Benchmark v2.2: 4k Preset
LibreOffice : 20 Documents To PDF
R Benchmark 2.5: Overall mean
| CPU Performance rating | |
| Media della classe Workstation | |
| MSI Creator Z16P B12UHST | |
| HP ZBook Studio 16 G9 62U04EA | |
| MSI CreatorPro Z16P B12UKST | |
| Media Intel Core i7-12700H | |
| Lenovo ThinkPad P1 G4-20Y4S0KS00 | |
| Dell Precision 5000 5560 -2! | |
| Cinebench R23 / Multi Core | |
| Media della classe Workstation (14055 - 38520, n=25, ultimi 2 anni) | |
| MSI Creator Z16P B12UHST | |
| MSI CreatorPro Z16P B12UKST | |
| HP ZBook Studio 16 G9 62U04EA | |
| Media Intel Core i7-12700H (4032 - 19330, n=64) | |
| Lenovo ThinkPad P1 G4-20Y4S0KS00 | |
| Dell Precision 5000 5560 | |
| Cinebench R23 / Single Core | |
| Media della classe Workstation (1712 - 2228, n=25, ultimi 2 anni) | |
| MSI Creator Z16P B12UHST | |
| HP ZBook Studio 16 G9 62U04EA | |
| Media Intel Core i7-12700H (778 - 1826, n=63) | |
| MSI CreatorPro Z16P B12UKST | |
| Lenovo ThinkPad P1 G4-20Y4S0KS00 | |
| Dell Precision 5000 5560 | |
| Cinebench R20 / CPU (Multi Core) | |
| Media della classe Workstation (5471 - 15043, n=25, ultimi 2 anni) | |
| MSI Creator Z16P B12UHST | |
| MSI CreatorPro Z16P B12UKST | |
| HP ZBook Studio 16 G9 62U04EA | |
| Media Intel Core i7-12700H (1576 - 7407, n=64) | |
| Lenovo ThinkPad P1 G4-20Y4S0KS00 | |
| Dell Precision 5000 5560 | |
| Cinebench R20 / CPU (Single Core) | |
| Media della classe Workstation (671 - 857, n=25, ultimi 2 anni) | |
| MSI Creator Z16P B12UHST | |
| HP ZBook Studio 16 G9 62U04EA | |
| Media Intel Core i7-12700H (300 - 704, n=64) | |
| MSI CreatorPro Z16P B12UKST | |
| Lenovo ThinkPad P1 G4-20Y4S0KS00 | |
| Dell Precision 5000 5560 | |
| Cinebench R15 / CPU Multi 64Bit | |
| Media della classe Workstation (2489 - 5810, n=25, ultimi 2 anni) | |
| MSI Creator Z16P B12UHST | |
| HP ZBook Studio 16 G9 62U04EA | |
| Media Intel Core i7-12700H (1379 - 2916, n=70) | |
| MSI CreatorPro Z16P B12UKST | |
| Lenovo ThinkPad P1 G4-20Y4S0KS00 | |
| Dell Precision 5000 5560 | |
| Cinebench R15 / CPU Single 64Bit | |
| Media della classe Workstation (191.4 - 328, n=25, ultimi 2 anni) | |
| MSI Creator Z16P B12UHST | |
| HP ZBook Studio 16 G9 62U04EA | |
| Media Intel Core i7-12700H (113 - 263, n=65) | |
| MSI CreatorPro Z16P B12UKST | |
| Lenovo ThinkPad P1 G4-20Y4S0KS00 | |
| Dell Precision 5000 5560 | |
| Blender / v2.79 BMW27 CPU | |
| Dell Precision 5000 5560 | |
| Lenovo ThinkPad P1 G4-20Y4S0KS00 | |
| Media Intel Core i7-12700H (168 - 732, n=63) | |
| MSI CreatorPro Z16P B12UKST | |
| HP ZBook Studio 16 G9 62U04EA | |
| MSI Creator Z16P B12UHST | |
| Media della classe Workstation (91 - 261, n=25, ultimi 2 anni) | |
| 7-Zip 18.03 / 7z b 4 | |
| Media della classe Workstation (54741 - 116969, n=25, ultimi 2 anni) | |
| MSI Creator Z16P B12UHST | |
| HP ZBook Studio 16 G9 62U04EA | |
| MSI CreatorPro Z16P B12UKST | |
| Media Intel Core i7-12700H (22844 - 73067, n=63) | |
| Lenovo ThinkPad P1 G4-20Y4S0KS00 | |
| Dell Precision 5000 5560 | |
| 7-Zip 18.03 / 7z b 4 -mmt1 | |
| Media della classe Workstation (5126 - 6960, n=25, ultimi 2 anni) | |
| MSI Creator Z16P B12UHST | |
| HP ZBook Studio 16 G9 62U04EA | |
| MSI CreatorPro Z16P B12UKST | |
| Lenovo ThinkPad P1 G4-20Y4S0KS00 | |
| Dell Precision 5000 5560 | |
| Media Intel Core i7-12700H (2743 - 5972, n=63) | |
| Geekbench 5.5 / Multi-Core | |
| Media della classe Workstation (11542 - 25554, n=25, ultimi 2 anni) | |
| MSI Creator Z16P B12UHST | |
| HP ZBook Studio 16 G9 62U04EA | |
| MSI CreatorPro Z16P B12UKST | |
| Media Intel Core i7-12700H (5144 - 13745, n=64) | |
| Lenovo ThinkPad P1 G4-20Y4S0KS00 | |
| Geekbench 5.5 / Single-Core | |
| Media della classe Workstation (1781 - 2183, n=25, ultimi 2 anni) | |
| MSI Creator Z16P B12UHST | |
| HP ZBook Studio 16 G9 62U04EA | |
| MSI CreatorPro Z16P B12UKST | |
| Media Intel Core i7-12700H (803 - 1851, n=64) | |
| Lenovo ThinkPad P1 G4-20Y4S0KS00 | |
| HWBOT x265 Benchmark v2.2 / 4k Preset | |
| Media della classe Workstation (14.4 - 40.5, n=25, ultimi 2 anni) | |
| HP ZBook Studio 16 G9 62U04EA | |
| MSI CreatorPro Z16P B12UKST | |
| MSI Creator Z16P B12UHST | |
| Media Intel Core i7-12700H (4.67 - 21.8, n=64) | |
| Lenovo ThinkPad P1 G4-20Y4S0KS00 | |
| Dell Precision 5000 5560 | |
| LibreOffice / 20 Documents To PDF | |
| Dell Precision 5000 5560 | |
| Media della classe Workstation (37.1 - 74.7, n=25, ultimi 2 anni) | |
| Media Intel Core i7-12700H (34.2 - 95.3, n=63) | |
| Lenovo ThinkPad P1 G4-20Y4S0KS00 | |
| HP ZBook Studio 16 G9 62U04EA | |
| MSI Creator Z16P B12UHST | |
| MSI CreatorPro Z16P B12UKST | |
| R Benchmark 2.5 / Overall mean | |
| Dell Precision 5000 5560 | |
| Lenovo ThinkPad P1 G4-20Y4S0KS00 | |
| Media Intel Core i7-12700H (0.4441 - 1.052, n=63) | |
| MSI CreatorPro Z16P B12UKST | |
| HP ZBook Studio 16 G9 62U04EA | |
| Media della classe Workstation (0.3825 - 0.603, n=25, ultimi 2 anni) | |
| MSI Creator Z16P B12UHST | |
* ... Meglio usare valori piccoli
AIDA64: FP32 Ray-Trace | FPU Julia | CPU SHA3 | CPU Queen | FPU SinJulia | FPU Mandel | CPU AES | CPU ZLib | FP64 Ray-Trace | CPU PhotoWorxx
| Performance rating | |
| Media della classe Workstation | |
| MSI CreatorPro Z16P B12UKST | |
| HP ZBook Studio 16 G9 62U04EA | |
| Lenovo ThinkPad P1 G4-20Y4Z9DVUS | |
| MSI Creator Z16P B12UHST | |
| Media Intel Core i7-12700H | |
| AIDA64 / FP32 Ray-Trace | |
| Media della classe Workstation (10658 - 61611, n=25, ultimi 2 anni) | |
| Lenovo ThinkPad P1 G4-20Y4Z9DVUS | |
| HP ZBook Studio 16 G9 62U04EA | |
| MSI CreatorPro Z16P B12UKST | |
| Media Intel Core i7-12700H (2585 - 17957, n=64) | |
| MSI Creator Z16P B12UHST | |
| AIDA64 / FPU Julia | |
| Media della classe Workstation (56664 - 186971, n=25, ultimi 2 anni) | |
| HP ZBook Studio 16 G9 62U04EA | |
| MSI CreatorPro Z16P B12UKST | |
| Lenovo ThinkPad P1 G4-20Y4Z9DVUS | |
| Media Intel Core i7-12700H (12439 - 90760, n=64) | |
| MSI Creator Z16P B12UHST | |
| AIDA64 / CPU SHA3 | |
| Media della classe Workstation (2608 - 8975, n=25, ultimi 2 anni) | |
| Lenovo ThinkPad P1 G4-20Y4Z9DVUS | |
| HP ZBook Studio 16 G9 62U04EA | |
| MSI CreatorPro Z16P B12UKST | |
| Media Intel Core i7-12700H (833 - 4242, n=64) | |
| MSI Creator Z16P B12UHST | |
| AIDA64 / CPU Queen | |
| HP ZBook Studio 16 G9 62U04EA | |
| Media della classe Workstation (60778 - 144411, n=25, ultimi 2 anni) | |
| MSI Creator Z16P B12UHST | |
| MSI CreatorPro Z16P B12UKST | |
| Media Intel Core i7-12700H (57923 - 103202, n=63) | |
| Lenovo ThinkPad P1 G4-20Y4Z9DVUS | |
| AIDA64 / FPU SinJulia | |
| Media della classe Workstation (8165 - 29343, n=25, ultimi 2 anni) | |
| MSI Creator Z16P B12UHST | |
| Lenovo ThinkPad P1 G4-20Y4Z9DVUS | |
| HP ZBook Studio 16 G9 62U04EA | |
| MSI CreatorPro Z16P B12UKST | |
| Media Intel Core i7-12700H (3249 - 9939, n=64) | |
| AIDA64 / FPU Mandel | |
| Media della classe Workstation (27301 - 98153, n=25, ultimi 2 anni) | |
| HP ZBook Studio 16 G9 62U04EA | |
| Lenovo ThinkPad P1 G4-20Y4Z9DVUS | |
| MSI CreatorPro Z16P B12UKST | |
| Media Intel Core i7-12700H (7135 - 44760, n=64) | |
| MSI Creator Z16P B12UHST | |
| AIDA64 / CPU AES | |
| MSI CreatorPro Z16P B12UKST | |
| Media della classe Workstation (56077 - 187841, n=25, ultimi 2 anni) | |
| MSI Creator Z16P B12UHST | |
| Lenovo ThinkPad P1 G4-20Y4Z9DVUS | |
| Media Intel Core i7-12700H (31839 - 144360, n=64) | |
| HP ZBook Studio 16 G9 62U04EA | |
| AIDA64 / CPU ZLib | |
| Media della classe Workstation (742 - 2148, n=25, ultimi 2 anni) | |
| MSI Creator Z16P B12UHST | |
| HP ZBook Studio 16 G9 62U04EA | |
| MSI CreatorPro Z16P B12UKST | |
| Media Intel Core i7-12700H (305 - 1171, n=64) | |
| Lenovo ThinkPad P1 G4-20Y4Z9DVUS | |
| AIDA64 / FP64 Ray-Trace | |
| Media della classe Workstation (5580 - 32891, n=25, ultimi 2 anni) | |
| HP ZBook Studio 16 G9 62U04EA | |
| Lenovo ThinkPad P1 G4-20Y4Z9DVUS | |
| MSI CreatorPro Z16P B12UKST | |
| Media Intel Core i7-12700H (1437 - 9692, n=64) | |
| MSI Creator Z16P B12UHST | |
| AIDA64 / CPU PhotoWorxx | |
| Media della classe Workstation (37151 - 93684, n=25, ultimi 2 anni) | |
| MSI CreatorPro Z16P B12UKST | |
| MSI Creator Z16P B12UHST | |
| HP ZBook Studio 16 G9 62U04EA | |
| Media Intel Core i7-12700H (12863 - 52207, n=64) | |
| Lenovo ThinkPad P1 G4-20Y4Z9DVUS | |
Prestazioni del sistema
Non è sorprendente che non ci siano problemi nelle prestazioni di base del sistema. Nei nostri test, il portatile è sempre molto reattivo e anche i risultati dei benchmark sono molto buoni.
CrossMark: Overall | Productivity | Creativity | Responsiveness
| PCMark 10 / Score | |
| MSI Creator Z16P B12UHST | |
| Media della classe Workstation (6436 - 10409, n=21, ultimi 2 anni) | |
| Lenovo ThinkPad P1 G4-20Y4S0KS00 | |
| MSI CreatorPro Z16P B12UKST | |
| Media Intel Core i7-12700H, NVIDIA RTX A3000 Laptop GPU (n=1) | |
| Dell Precision 5000 5560 | |
| HP ZBook Studio 16 G9 62U04EA | |
| PCMark 10 / Essentials | |
| MSI Creator Z16P B12UHST | |
| Lenovo ThinkPad P1 G4-20Y4S0KS00 | |
| Dell Precision 5000 5560 | |
| MSI CreatorPro Z16P B12UKST | |
| Media Intel Core i7-12700H, NVIDIA RTX A3000 Laptop GPU (n=1) | |
| Media della classe Workstation (9622 - 11157, n=21, ultimi 2 anni) | |
| HP ZBook Studio 16 G9 62U04EA | |
| PCMark 10 / Productivity | |
| Media della classe Workstation (8789 - 20616, n=21, ultimi 2 anni) | |
| MSI Creator Z16P B12UHST | |
| MSI CreatorPro Z16P B12UKST | |
| Media Intel Core i7-12700H, NVIDIA RTX A3000 Laptop GPU (n=1) | |
| Dell Precision 5000 5560 | |
| Lenovo ThinkPad P1 G4-20Y4S0KS00 | |
| HP ZBook Studio 16 G9 62U04EA | |
| PCMark 10 / Digital Content Creation | |
| Media della classe Workstation (7744 - 15631, n=21, ultimi 2 anni) | |
| MSI Creator Z16P B12UHST | |
| Lenovo ThinkPad P1 G4-20Y4S0KS00 | |
| MSI CreatorPro Z16P B12UKST | |
| Media Intel Core i7-12700H, NVIDIA RTX A3000 Laptop GPU (n=1) | |
| HP ZBook Studio 16 G9 62U04EA | |
| Dell Precision 5000 5560 | |
| CrossMark / Overall | |
| MSI CreatorPro Z16P B12UKST | |
| Media Intel Core i7-12700H, NVIDIA RTX A3000 Laptop GPU (n=1) | |
| Media della classe Workstation (1307 - 2267, n=24, ultimi 2 anni) | |
| HP ZBook Studio 16 G9 62U04EA | |
| Lenovo ThinkPad P1 G4-20Y4S0KS00 | |
| CrossMark / Productivity | |
| MSI CreatorPro Z16P B12UKST | |
| Media Intel Core i7-12700H, NVIDIA RTX A3000 Laptop GPU (n=1) | |
| Media della classe Workstation (1130 - 2122, n=24, ultimi 2 anni) | |
| HP ZBook Studio 16 G9 62U04EA | |
| Lenovo ThinkPad P1 G4-20Y4S0KS00 | |
| CrossMark / Creativity | |
| Media della classe Workstation (1657 - 2725, n=24, ultimi 2 anni) | |
| HP ZBook Studio 16 G9 62U04EA | |
| MSI CreatorPro Z16P B12UKST | |
| Media Intel Core i7-12700H, NVIDIA RTX A3000 Laptop GPU (n=1) | |
| Lenovo ThinkPad P1 G4-20Y4S0KS00 | |
| CrossMark / Responsiveness | |
| MSI CreatorPro Z16P B12UKST | |
| Media Intel Core i7-12700H, NVIDIA RTX A3000 Laptop GPU (n=1) | |
| Media della classe Workstation (993 - 2096, n=24, ultimi 2 anni) | |
| HP ZBook Studio 16 G9 62U04EA | |
| Lenovo ThinkPad P1 G4-20Y4S0KS00 | |
| PCMark 10 Score | 7086 punti | |
Aiuto | ||
| AIDA64 / Memory Copy | |
| Media della classe Workstation (56003 - 164795, n=25, ultimi 2 anni) | |
| MSI Creator Z16P B12UHST | |
| MSI CreatorPro Z16P B12UKST | |
| HP ZBook Studio 16 G9 62U04EA | |
| Media Intel Core i7-12700H (25615 - 80511, n=64) | |
| Lenovo ThinkPad P1 G4-20Y4Z9DVUS | |
| AIDA64 / Memory Read | |
| Media della classe Workstation (55795 - 121563, n=25, ultimi 2 anni) | |
| MSI Creator Z16P B12UHST | |
| MSI CreatorPro Z16P B12UKST | |
| HP ZBook Studio 16 G9 62U04EA | |
| Media Intel Core i7-12700H (25586 - 79442, n=64) | |
| Lenovo ThinkPad P1 G4-20Y4Z9DVUS | |
| AIDA64 / Memory Write | |
| Media della classe Workstation (55663 - 214520, n=25, ultimi 2 anni) | |
| MSI CreatorPro Z16P B12UKST | |
| MSI Creator Z16P B12UHST | |
| HP ZBook Studio 16 G9 62U04EA | |
| Media Intel Core i7-12700H (23679 - 88660, n=64) | |
| Lenovo ThinkPad P1 G4-20Y4Z9DVUS | |
| AIDA64 / Memory Latency | |
| Media della classe Workstation (84.5 - 165.2, n=25, ultimi 2 anni) | |
| MSI CreatorPro Z16P B12UKST | |
| MSI Creator Z16P B12UHST | |
| HP ZBook Studio 16 G9 62U04EA | |
| Lenovo ThinkPad P1 G4-20Y4Z9DVUS | |
| Media Intel Core i7-12700H (76.2 - 133.9, n=62) | |
* ... Meglio usare valori piccoli
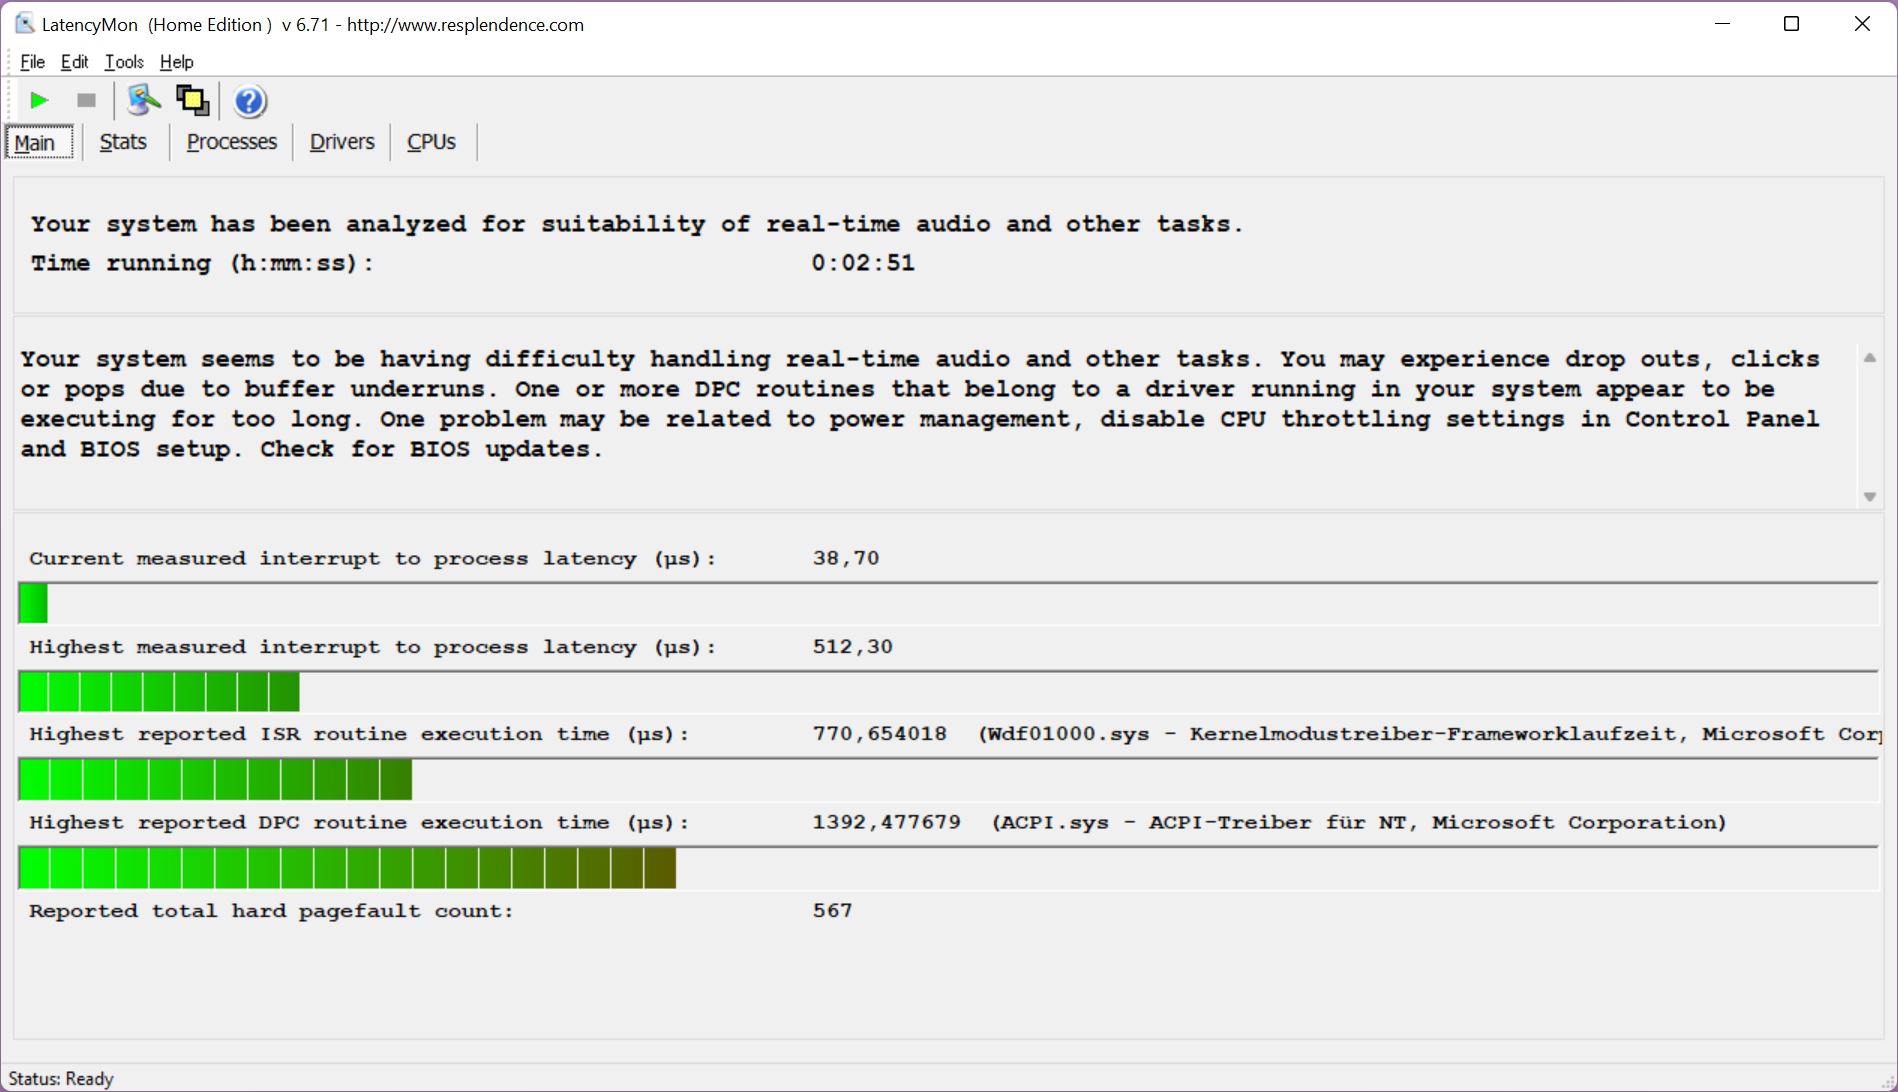
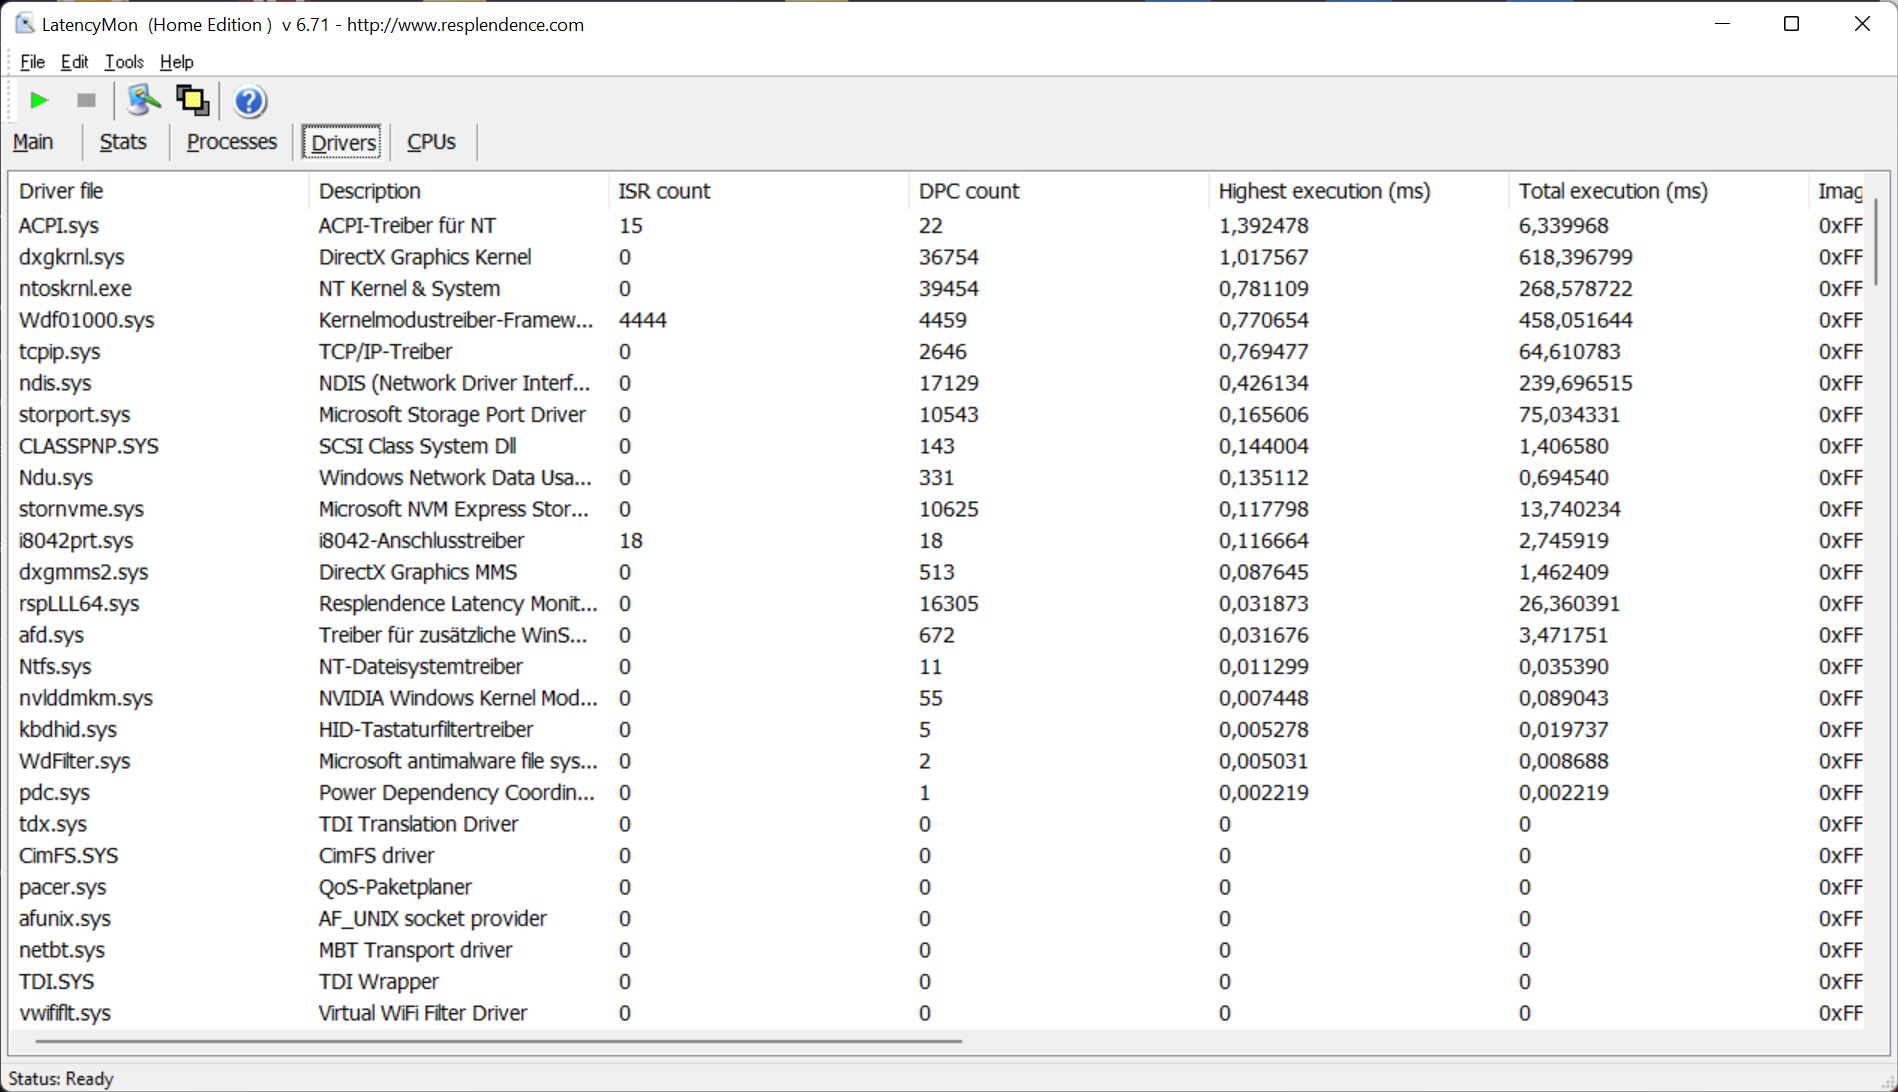
Latenze DPC
Con il BIOS al momento del test, l'unità di prova non mostra limitazioni nel nostro test di latenza (navigazione in Internet, riproduzione di YouTube in 4K, carico della CPU). Anche se uno dei driver causa un leggero outlier, non dovrebbero esserci problemi nell'utilizzo di applicazioni audio in tempo reale.
| DPC Latencies / LatencyMon - interrupt to process latency (max), Web, Youtube, Prime95 | |
| HP ZBook Studio 16 G9 62U04EA | |
| MSI Creator Z16P B12UHST | |
| Dell Precision 5000 5560 | |
| Lenovo ThinkPad P1 G4-20Y4S0KS00 | |
| MSI CreatorPro Z16P B12UKST | |
* ... Meglio usare valori piccoli
Soluzione di stoccaggio
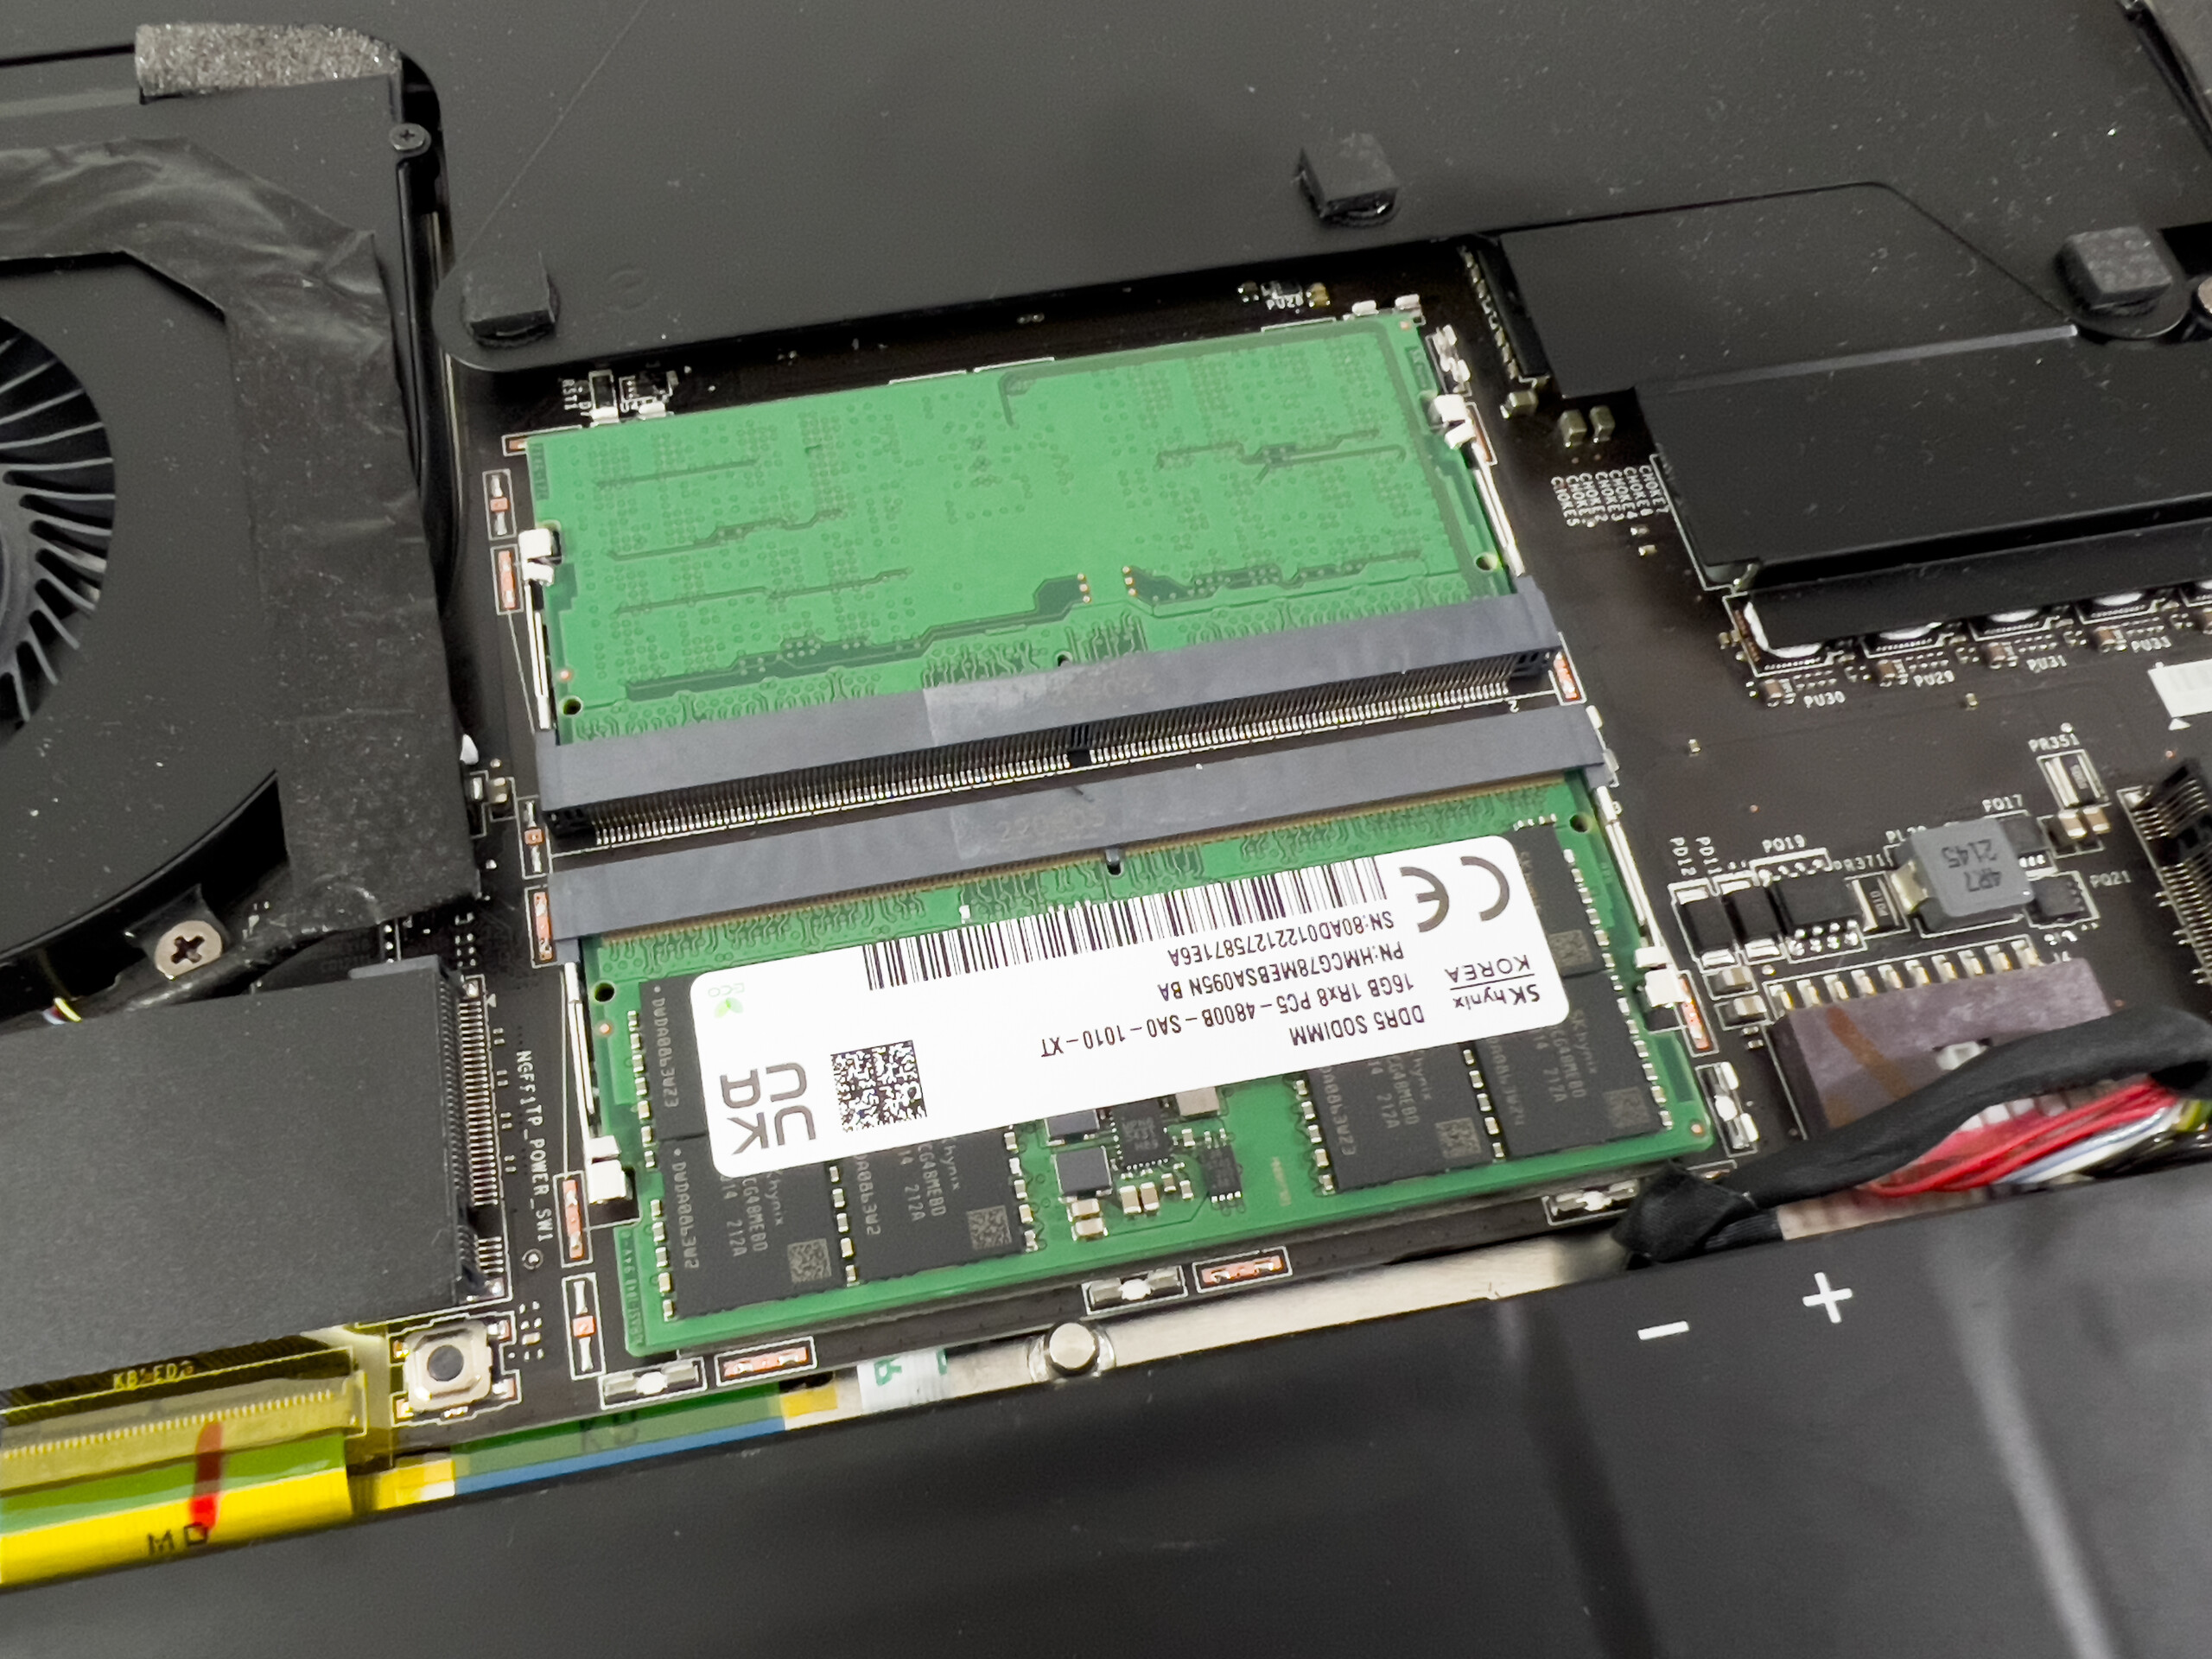
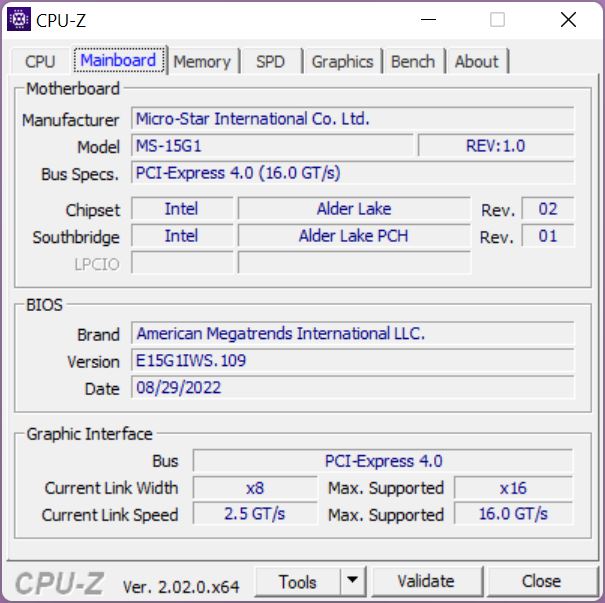
MSI CreatorPro Z16P include due slot per SSD M.2-2280 con interfaccia veloce PCIe 4.0. La nostra unità di prova è dotata del veloce PM9A1 di Samsung (versione OEM del 980 Pro). La sua capacità di archiviazione è di 1 TB, di cui 870 GB disponibili per l'utente dopo il primo avvio. Le velocità di trasferimento sono molto elevate, ma a causa di problemi di temperatura le prestazioni non rimangono stabili, scendendo da oltre 6 a circa 4 GB/s dopo pochi minuti. Tuttavia, si tratta comunque di una velocità elevata e non dovrebbero esserci limitazioni nella pratica. Potete trovare altri benchmark sulle unità SSD qui.

* ... Meglio usare valori piccoli
Disk Throttling: DiskSpd Read Loop, Queue Depth 8
Scheda grafica - Nvidia RTX A3000
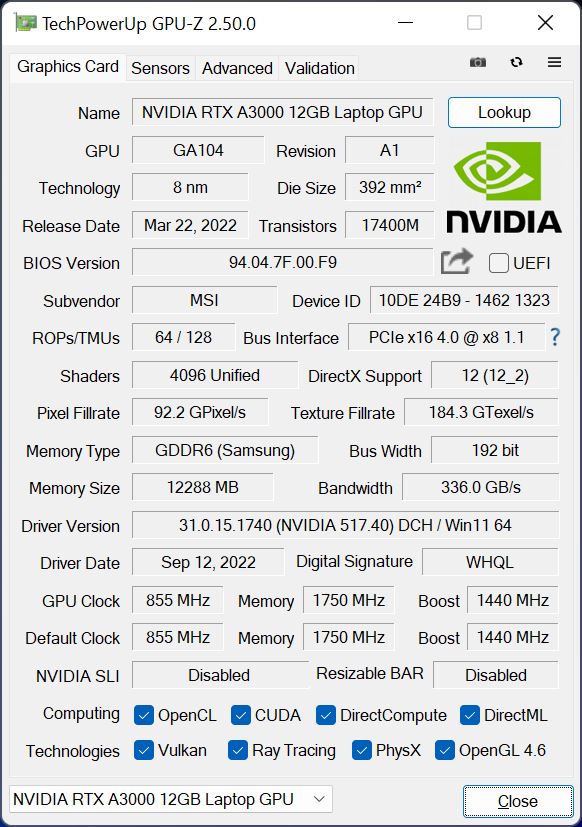
La nostra unità di prova è equipaggiata con la scheda professionale Nvidia RTX A3000che ha ricevuto un aggiornamento da 6 a 12 GB di GDDR6-VRAM nel 2022. Ci sono molte somiglianze tecniche con la consumer GeForce RTX 3060ma la RTX A3000 offre 256 CUDA core aggiuntivi. Questa è la versione con un TGP di 80 watt, con ulteriori 10 watt di boost dinamico che possono essere utilizzati dalla CPU
Le prestazioni grafiche rientrano pienamente nell'obiettivo della RTX A3000, e notiamo anche un vantaggio significativo rispetto alla più piccola RTX A2000 nel modello ZBook Studio 16 G9. In termini di prestazioni pure, la RTX 3070 o 3080 Tisono ovviamente più veloci, ma anche i test professionali mostrano il vantaggio delle certificazioni dei driver. MSI supera lo stress test 3DMark Time Spy con il 97,9%.
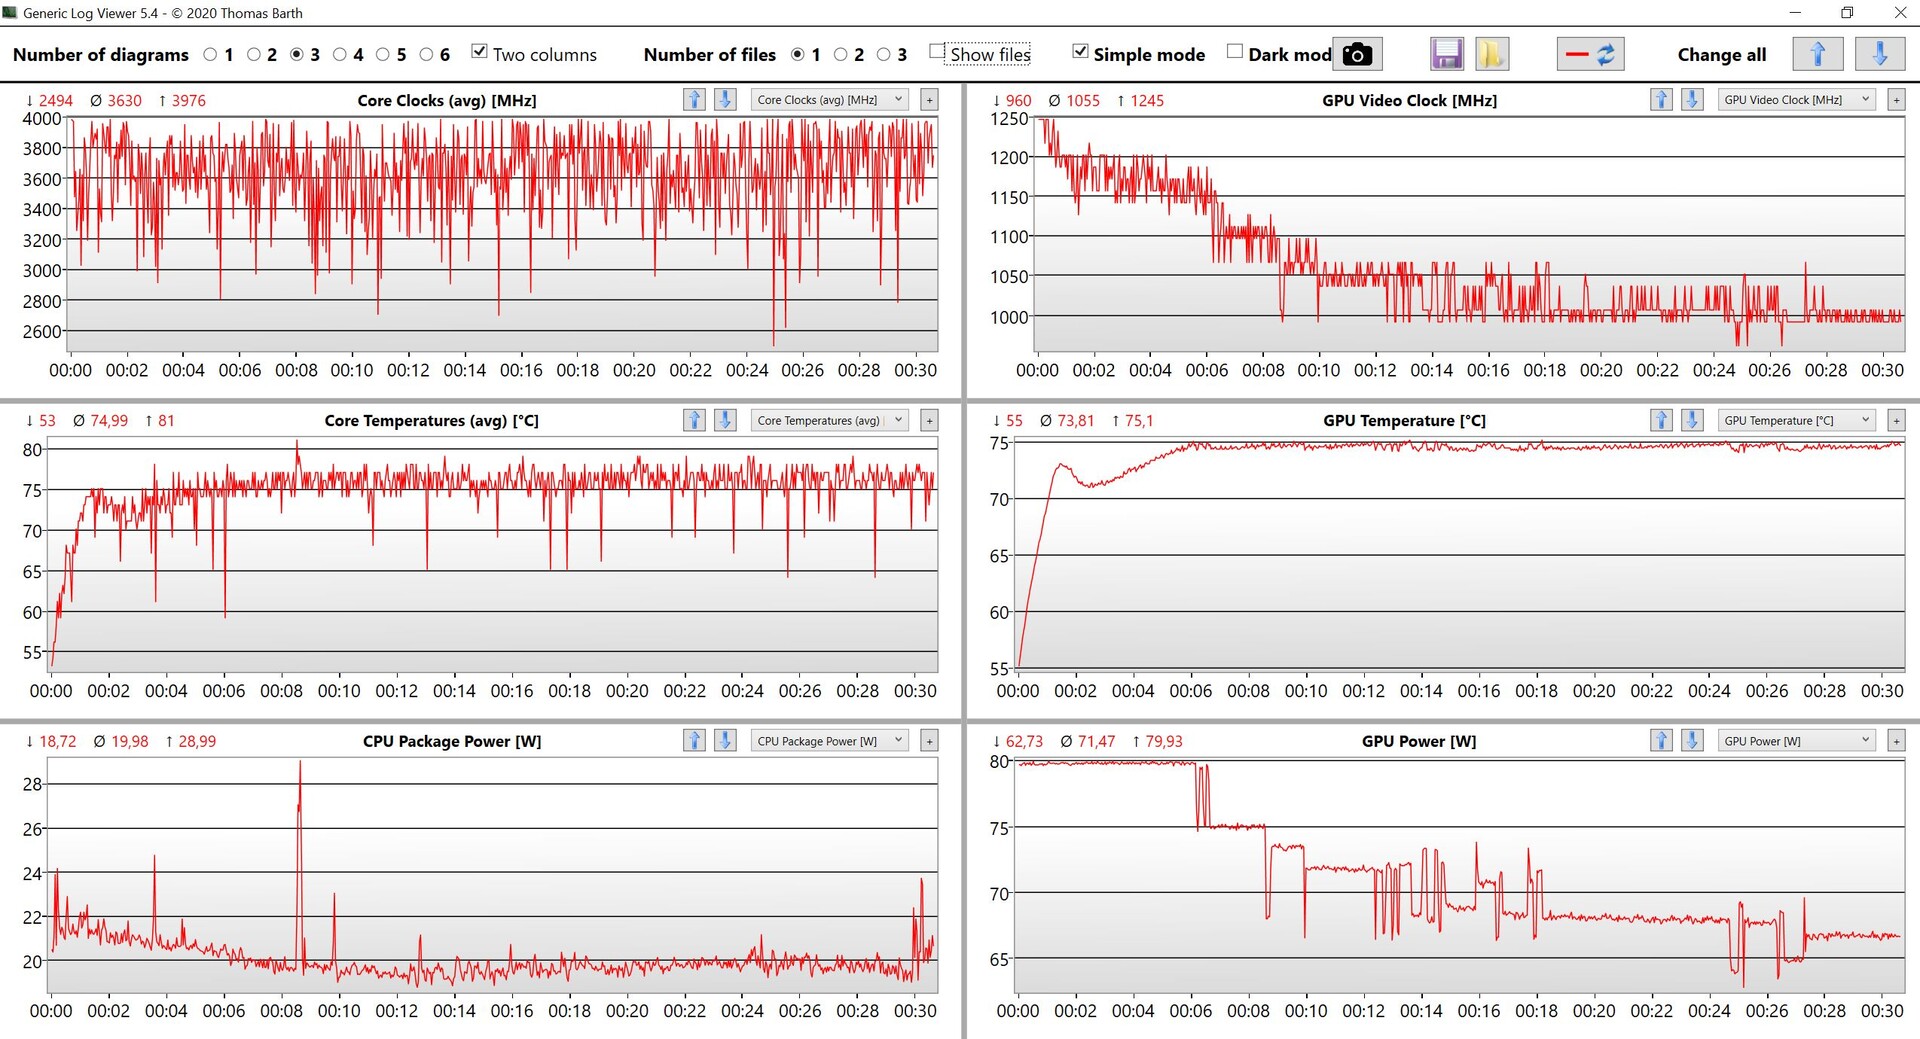
D'altra parte, i benchmark di gioco mostrano un quadro leggermente diverso, poiché le prestazioni calano dopo pochi minuti, come si può vedere chiaramente anche nel nostro test The Witcher 3. Abbiamo potuto osservare un comportamento simile nel test di Creator Z16Pcon la RTX 3080 Ti, anche se non c'è una vera ragione tecnica per questo, e sospettiamo ancora una volta che i colpevoli siano alcuni problemi con i profili delle prestazioni
Nel funzionamento a batteria, la RTX A3000 può consumare un massimo di 40 watt, con una riduzione significativa delle prestazioni del 75%. Potete trovare altri benchmark della GPU qui.
| 3DMark 11 Performance | 24865 punti | |
| 3DMark Fire Strike Score | 18097 punti | |
| 3DMark Time Spy Score | 7703 punti | |
Aiuto | ||
| Blender / v3.3 Classroom OPTIX/RTX | |
| HP ZBook Firefly 14 G9-6B8A2EA | |
| Dell Precision 5000 5470 | |
| HP Envy 16 h0112nr | |
| HP ZBook Studio 16 G9 62U04EA | |
| Dell Precision 7670 | |
| MSI CreatorPro Z16P B12UKST | |
| Media NVIDIA RTX A3000 Laptop GPU (n=1) | |
| Media della classe Workstation (10 - 95, n=19, ultimi 2 anni) | |
| Blender / v3.3 Classroom CUDA | |
| HP ZBook Firefly 14 G9-6B8A2EA | |
| Dell Precision 5000 5470 | |
| HP ZBook Studio 16 G9 62U04EA | |
| HP Envy 16 h0112nr | |
| Dell Precision 7670 | |
| MSI CreatorPro Z16P B12UKST | |
| Media NVIDIA RTX A3000 Laptop GPU (n=1) | |
| Media della classe Workstation (16 - 142, n=19, ultimi 2 anni) | |
| Blender / v3.3 Classroom CPU | |
| HP ZBook Firefly 14 G9-6B8A2EA | |
| HP Envy 16 h0112nr | |
| Dell Precision 5000 5470 | |
| Dell Precision 7670 | |
| MSI CreatorPro Z16P B12UKST | |
| Media NVIDIA RTX A3000 Laptop GPU (n=1) | |
| HP ZBook Studio 16 G9 62U04EA | |
| Media della classe Workstation (148 - 464, n=25, ultimi 2 anni) | |
* ... Meglio usare valori piccoli
The Witcher 3 FPS Chart
| basso | medio | alto | ultra | QHD | |
|---|---|---|---|---|---|
| GTA V (2015) | 185.8 | 182.5 | 168.5 | 95.3 | 71.3 |
| The Witcher 3 (2015) | 381 | 262 | 151 | 59.6 | |
| Dota 2 Reborn (2015) | 182 | 166.8 | 155.8 | 147.1 | |
| Final Fantasy XV Benchmark (2018) | 176 | 83.8 | 64.3 | 45.6 | |
| X-Plane 11.11 (2018) | 142.1 | 120.7 | 97.5 | ||
| Far Cry 5 (2018) | 170 | 128 | 117 | 108 | 76 |
| Strange Brigade (2018) | 344 | 152 | 121 | 108 | 85 |
| F1 2021 (2021) | 334 | 187 | 151.1 | 77.5 | 56.3 |
| Cyberpunk 2077 1.6 (2022) | 77 | 66 | 53 | 43 | 27 |
| F1 22 (2022) | 181 | 167.5 | 120.9 | 39 | 26.2 |
Emissioni e gestione dell'energia
Livelli di rumore
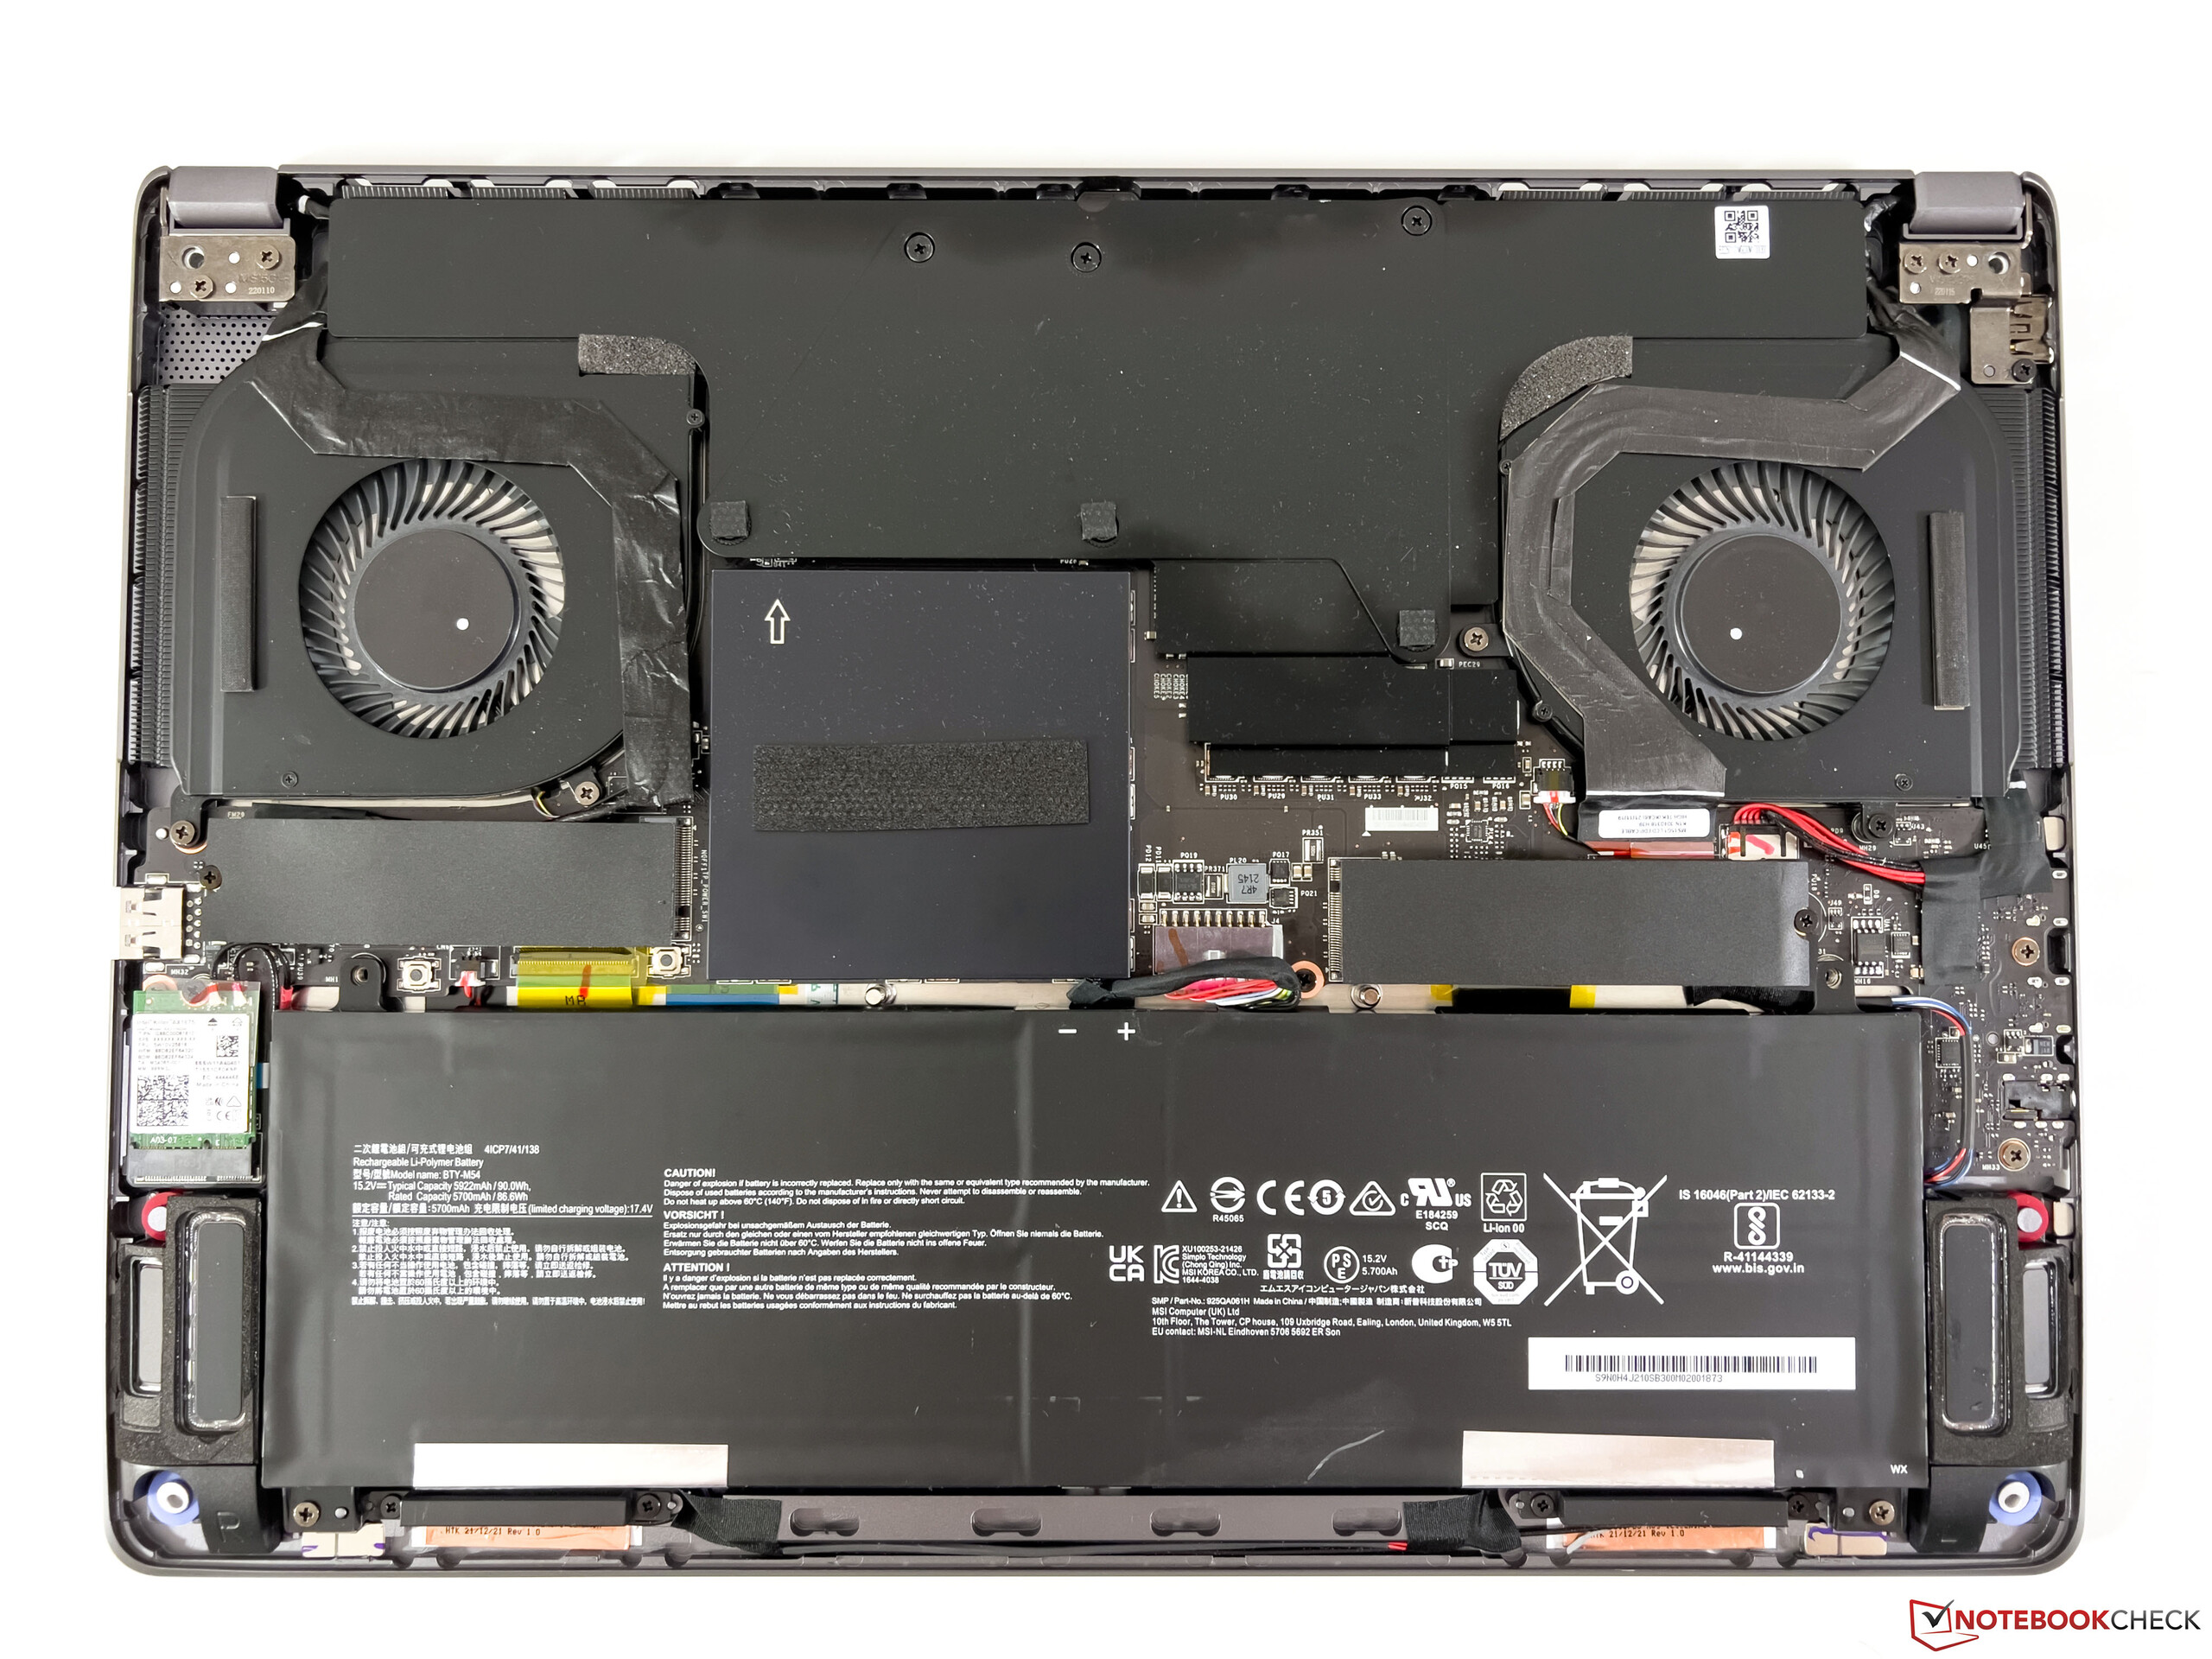
Le due ventole del CreatorPro Z16P sono sempre in funzione, ma il loro fruscio si sente solo se si appoggia l'orecchio direttamente al case in una stanza silenziosa. Nel funzionamento quotidiano, si beneficia anche della curva difensiva delle ventole, poiché ci vogliono circa 30 secondi, anche a pieno carico, prima che diventino più rumorose. Durante il gioco, misuriamo circa 44 e 47 dB(A) a pieno carico, con un fruscio chiaramente udibile senza essere offensivo. Non si sentono altri rumori elettronici, come il fruscio della bobina.
Rumorosità
| Idle |
| 27.1 / 27.1 / 27.1 dB(A) |
| Sotto carico |
| 42.9 / 47 dB(A) |
 | ||
30 dB silenzioso 40 dB(A) udibile 50 dB(A) rumoroso |
||
min: | ||
| MSI CreatorPro Z16P B12UKST RTX A3000 Laptop GPU, i7-12700H, Samsung PM9A1 MZVL21T0HCLR | HP ZBook Studio 16 G9 62U04EA RTX A2000 Laptop GPU, i7-12800H, Micron 3400 1TB MTFDKBA1T0TFH | Lenovo ThinkPad P1 G4-20Y4S0KS00 GeForce RTX 3070 Laptop GPU, i7-11850H, Samsung PM9A1 MZVL21T0HCLR | Dell Precision 5000 5560 RTX A2000 Laptop GPU, i7-11850H, Samsung PM9A1 MZVL22T0HBLB | MSI Creator Z16P B12UHST GeForce RTX 3080 Ti Laptop GPU, i9-12900H, Samsung PM9A1 MZVL22T0HBLB | |
|---|---|---|---|---|---|
| Noise | 2% | 3% | 15% | -4% | |
| off /ambiente * (dB) | 24.1 | 24 -0% | 23.8 1% | 23.4 3% | 26 -8% |
| Idle Minimum * (dB) | 27.1 | 24 11% | 23.8 12% | 23.6 13% | 27 -0% |
| Idle Average * (dB) | 27.1 | 27.7 -2% | 23.8 12% | 23.6 13% | 29 -7% |
| Idle Maximum * (dB) | 27.1 | 27.7 -2% | 28.3 -4% | 23.6 13% | 31 -14% |
| Load Average * (dB) | 42.9 | 39.8 7% | 38.6 10% | 25.8 40% | 43 -0% |
| Witcher 3 ultra * (dB) | 44 | 44.3 -1% | 47.4 -8% | 40.1 9% | 43 2% |
| Load Maximum * (dB) | 47 | 47.7 -1% | 47.4 -1% | 41.4 12% | 46 2% |
* ... Meglio usare valori piccoli
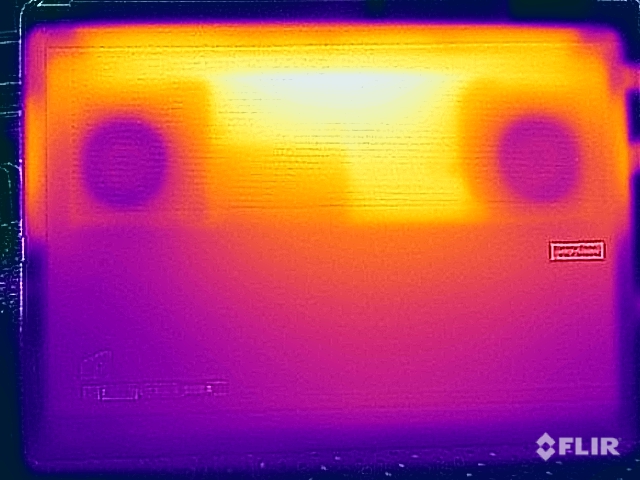
Temperature
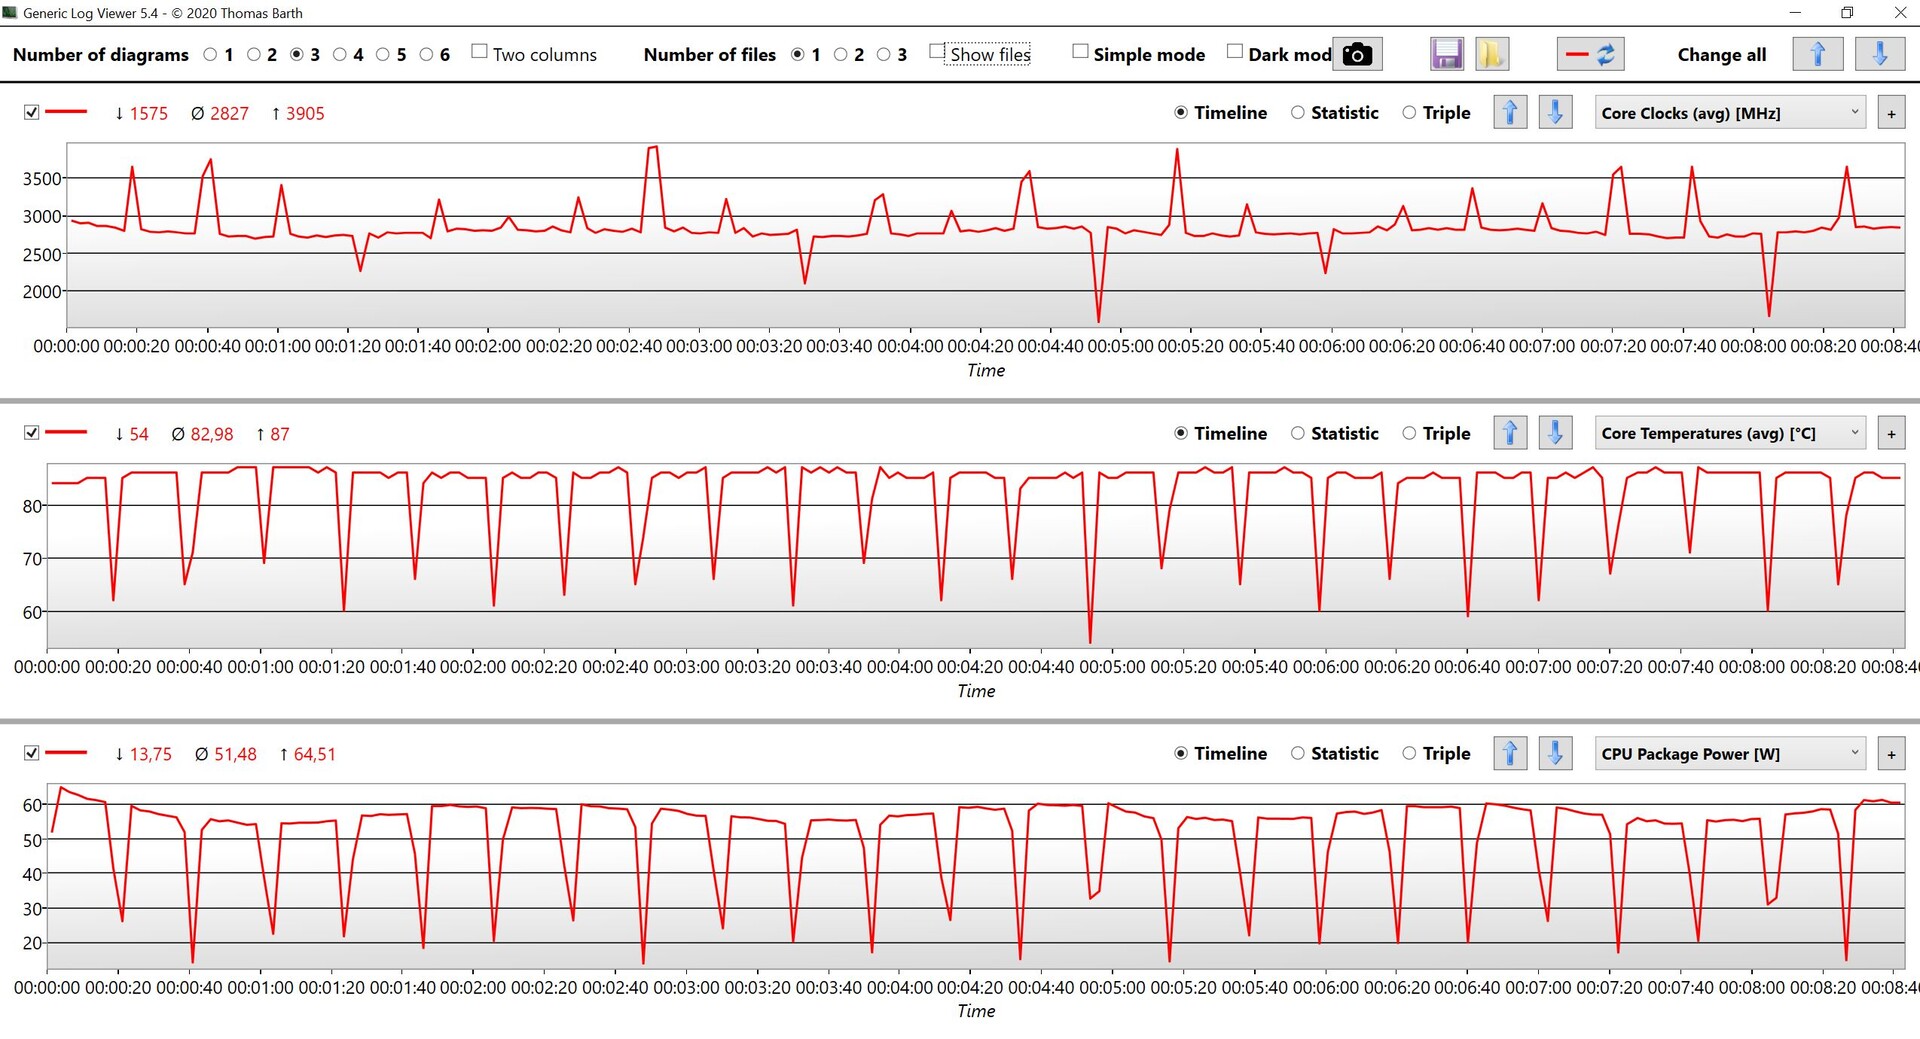
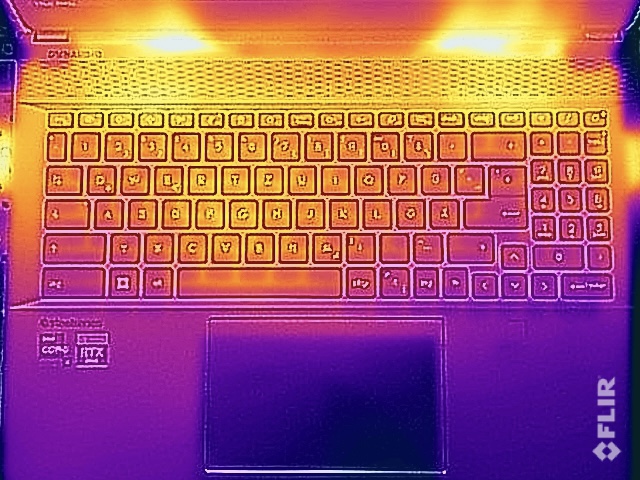
L'andamento della temperatura era già un grosso problema nella nostra unità di test del Creator Z16Pcon Core i9 e RTX 3080 Ti. Il CreatorPro con il più debole Core i7 e la RTX A3000 se la cava leggermente meglio, ma rimane comunque problematico, nonostante utilizzi un sistema di raffreddamento a camera di vapore. Soggettivamente, il problema è aumentato anche dal case in metallo. Con attività meno impegnative non ci sono limitazioni, ma già dopo alcune brevi fasi di carico di pochi minuti, la parte superiore dell'unità di base si riscalda molto e l'uso della tastiera diventa effettivamente scomodo. Inoltre, in nessun caso si dovrebbe far funzionare il dispositivo in grembo sotto carico, dato che abbiamo misurato quasi 70 °C (158 °F) sul fondo del case. Il sistema di raffreddamento è semplicemente troppo debole, anche per i componenti più lenti.
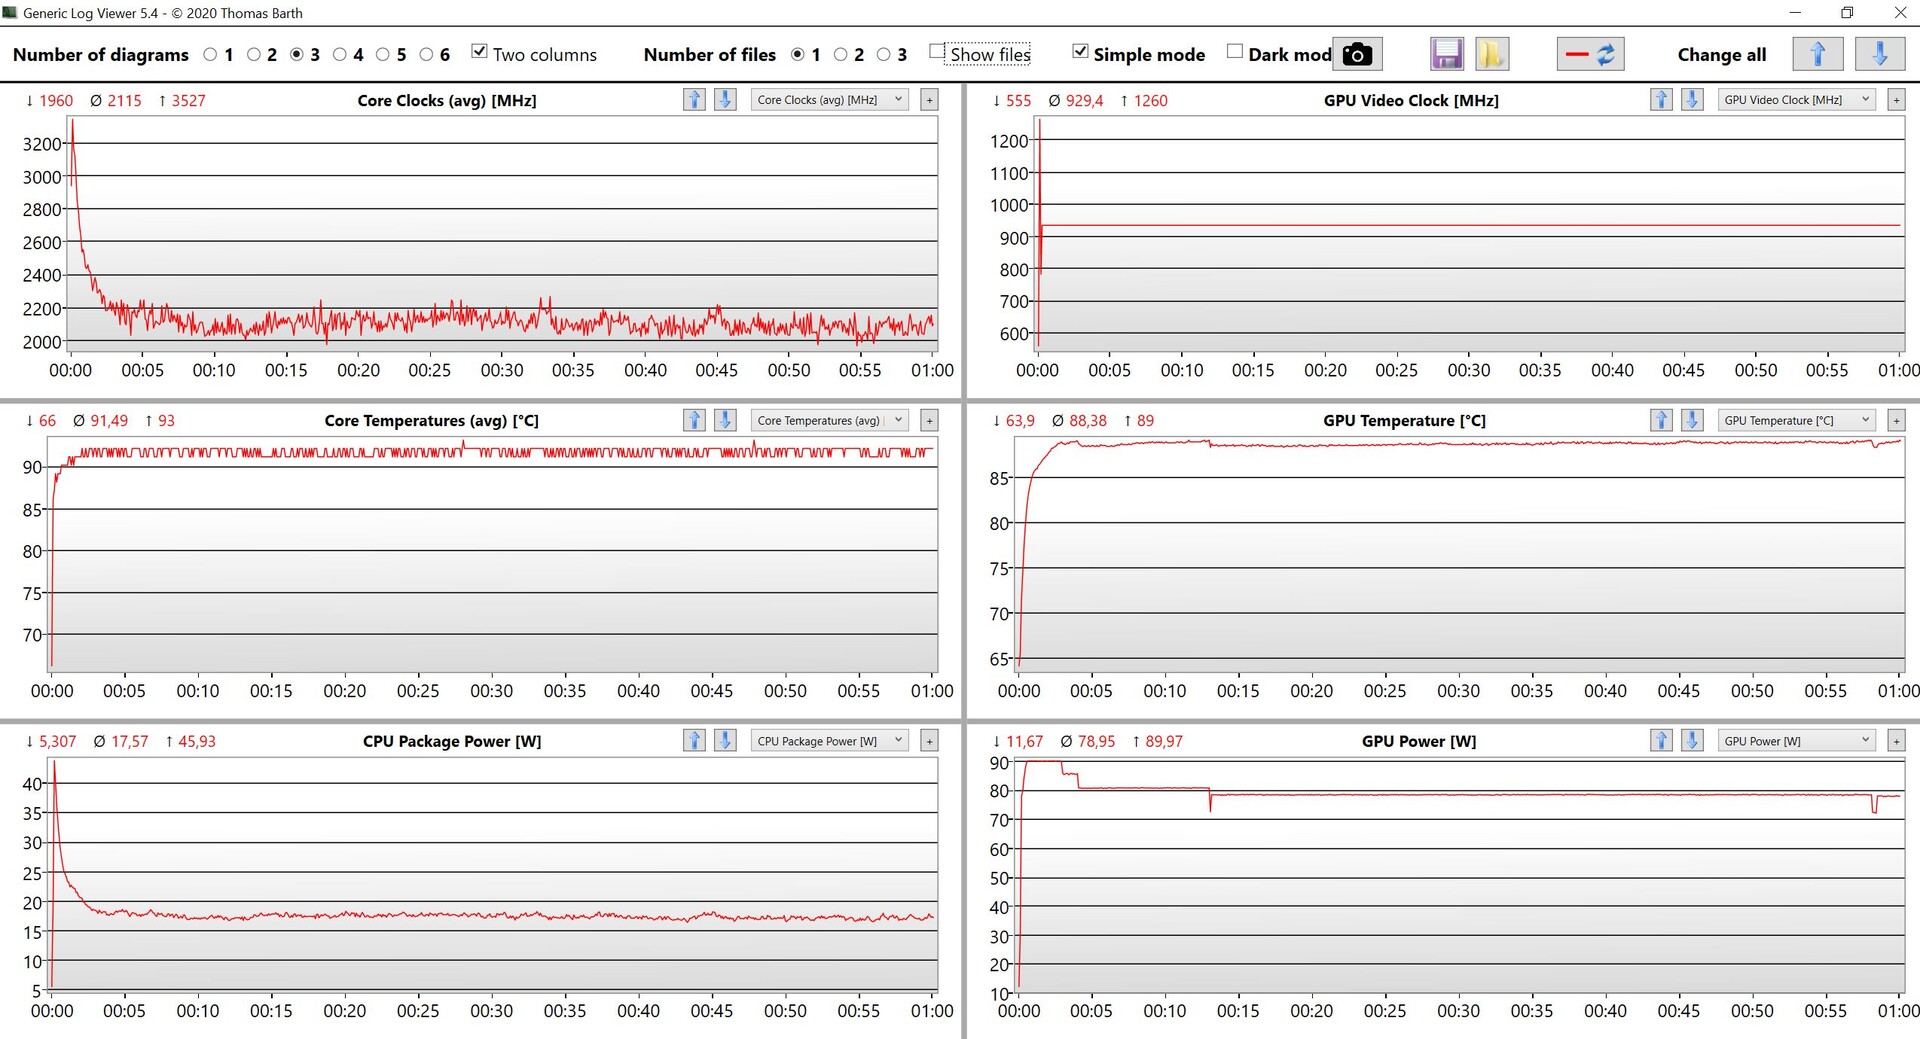
Lo stress test mostra che il sistema privilegia la GPU, che rimane abbastanza stabile a circa 80 watt, mentre la CPU scende sotto i 20 watt. Non c'è alcuna riproduzione delle prestazioni dopo lo stress test.
(-) La temperatura massima sul lato superiore è di 56.3 °C / 133 F, rispetto alla media di 38.2 °C / 101 F, che varia da 22.2 a 69.8 °C per questa classe Workstation.
(-) Il lato inferiore si riscalda fino ad un massimo di 68.3 °C / 155 F, rispetto alla media di 41.1 °C / 106 F
(+) In idle, la temperatura media del lato superiore è di 24.1 °C / 75 F, rispetto alla media deld ispositivo di 32 °C / 90 F.
(-) Riproducendo The Witcher 3, la temperatura media per il lato superiore e' di 44 °C / 111 F, rispetto alla media del dispositivo di 32 °C / 90 F.
(±) I poggiapolsi e il touchpad possono diventare molto caldi al tatto con un massimo di 38.2 °C / 100.8 F.
(-) La temperatura media della zona del palmo della mano di dispositivi simili e'stata di 27.8 °C / 82 F (-10.4 °C / -18.8 F).
| MSI CreatorPro Z16P B12UKST Intel Core i7-12700H, NVIDIA RTX A3000 Laptop GPU | HP ZBook Studio 16 G9 62U04EA Intel Core i7-12800H, NVIDIA RTX A2000 Laptop GPU | Lenovo ThinkPad P1 G4-20Y4S0KS00 Intel Core i7-11850H, NVIDIA GeForce RTX 3070 Laptop GPU | Dell Precision 5000 5560 Intel Core i7-11850H, NVIDIA RTX A2000 Laptop GPU | MSI Creator Z16P B12UHST Intel Core i9-12900H, NVIDIA GeForce RTX 3080 Ti Laptop GPU | |
|---|---|---|---|---|---|
| Heat | 6% | 1% | -6% | -12% | |
| Maximum Upper Side * (°C) | 56.3 | 38.7 31% | 51 9% | 48.2 14% | 67 -19% |
| Maximum Bottom * (°C) | 68.3 | 53.4 22% | 53.5 22% | 42.6 38% | 69 -1% |
| Idle Upper Side * (°C) | 25.2 | 27.3 -8% | 28.8 -14% | 34.8 -38% | 29 -15% |
| Idle Bottom * (°C) | 25.9 | 31.6 -22% | 29.3 -13% | 35.2 -36% | 29 -12% |
* ... Meglio usare valori piccoli
Altoparlanti
MSI CreatorPro Z16P B12UKST analisi audio
(+) | gli altoparlanti sono relativamente potenti (83.3 dB)
Bassi 100 - 315 Hz
(-) | quasi nessun basso - in media 18.7% inferiori alla media
(±) | la linearità dei bassi è media (7% delta rispetto alla precedente frequenza)
Medi 400 - 2000 Hz
(+) | medi bilanciati - solo only 3% rispetto alla media
(+) | medi lineari (6.8% delta rispetto alla precedente frequenza)
Alti 2 - 16 kHz
(+) | Alti bilanciati - appena 4.6% dalla media
(+) | alti lineari (6.4% delta rispetto alla precedente frequenza)
Nel complesso 100 - 16.000 Hz
(±) | la linearità complessiva del suono è media (15.2% di differenza rispetto alla media
Rispetto alla stessa classe
» 33% di tutti i dispositivi testati in questa classe è stato migliore, 10% simile, 57% peggiore
» Il migliore ha avuto un delta di 7%, medio di 17%, peggiore di 35%
Rispetto a tutti i dispositivi testati
» 21% di tutti i dispositivi testati in questa classe è stato migliore, 4% similare, 74% peggiore
» Il migliore ha avuto un delta di 4%, medio di 24%, peggiore di 134%
HP ZBook Studio 16 G9 62U04EA analisi audio
(±) | potenza degli altiparlanti media ma buona (81.6 dB)
Bassi 100 - 315 Hz
(±) | bassi ridotti - in media 8.7% inferiori alla media
(±) | la linearità dei bassi è media (10.4% delta rispetto alla precedente frequenza)
Medi 400 - 2000 Hz
(+) | medi bilanciati - solo only 3.7% rispetto alla media
(+) | medi lineari (4.6% delta rispetto alla precedente frequenza)
Alti 2 - 16 kHz
(+) | Alti bilanciati - appena 2.7% dalla media
(+) | alti lineari (3.5% delta rispetto alla precedente frequenza)
Nel complesso 100 - 16.000 Hz
(+) | suono nel complesso lineare (10.6% differenza dalla media)
Rispetto alla stessa classe
» 9% di tutti i dispositivi testati in questa classe è stato migliore, 5% simile, 87% peggiore
» Il migliore ha avuto un delta di 7%, medio di 17%, peggiore di 35%
Rispetto a tutti i dispositivi testati
» 6% di tutti i dispositivi testati in questa classe è stato migliore, 1% similare, 93% peggiore
» Il migliore ha avuto un delta di 4%, medio di 24%, peggiore di 134%
Consumo di energia
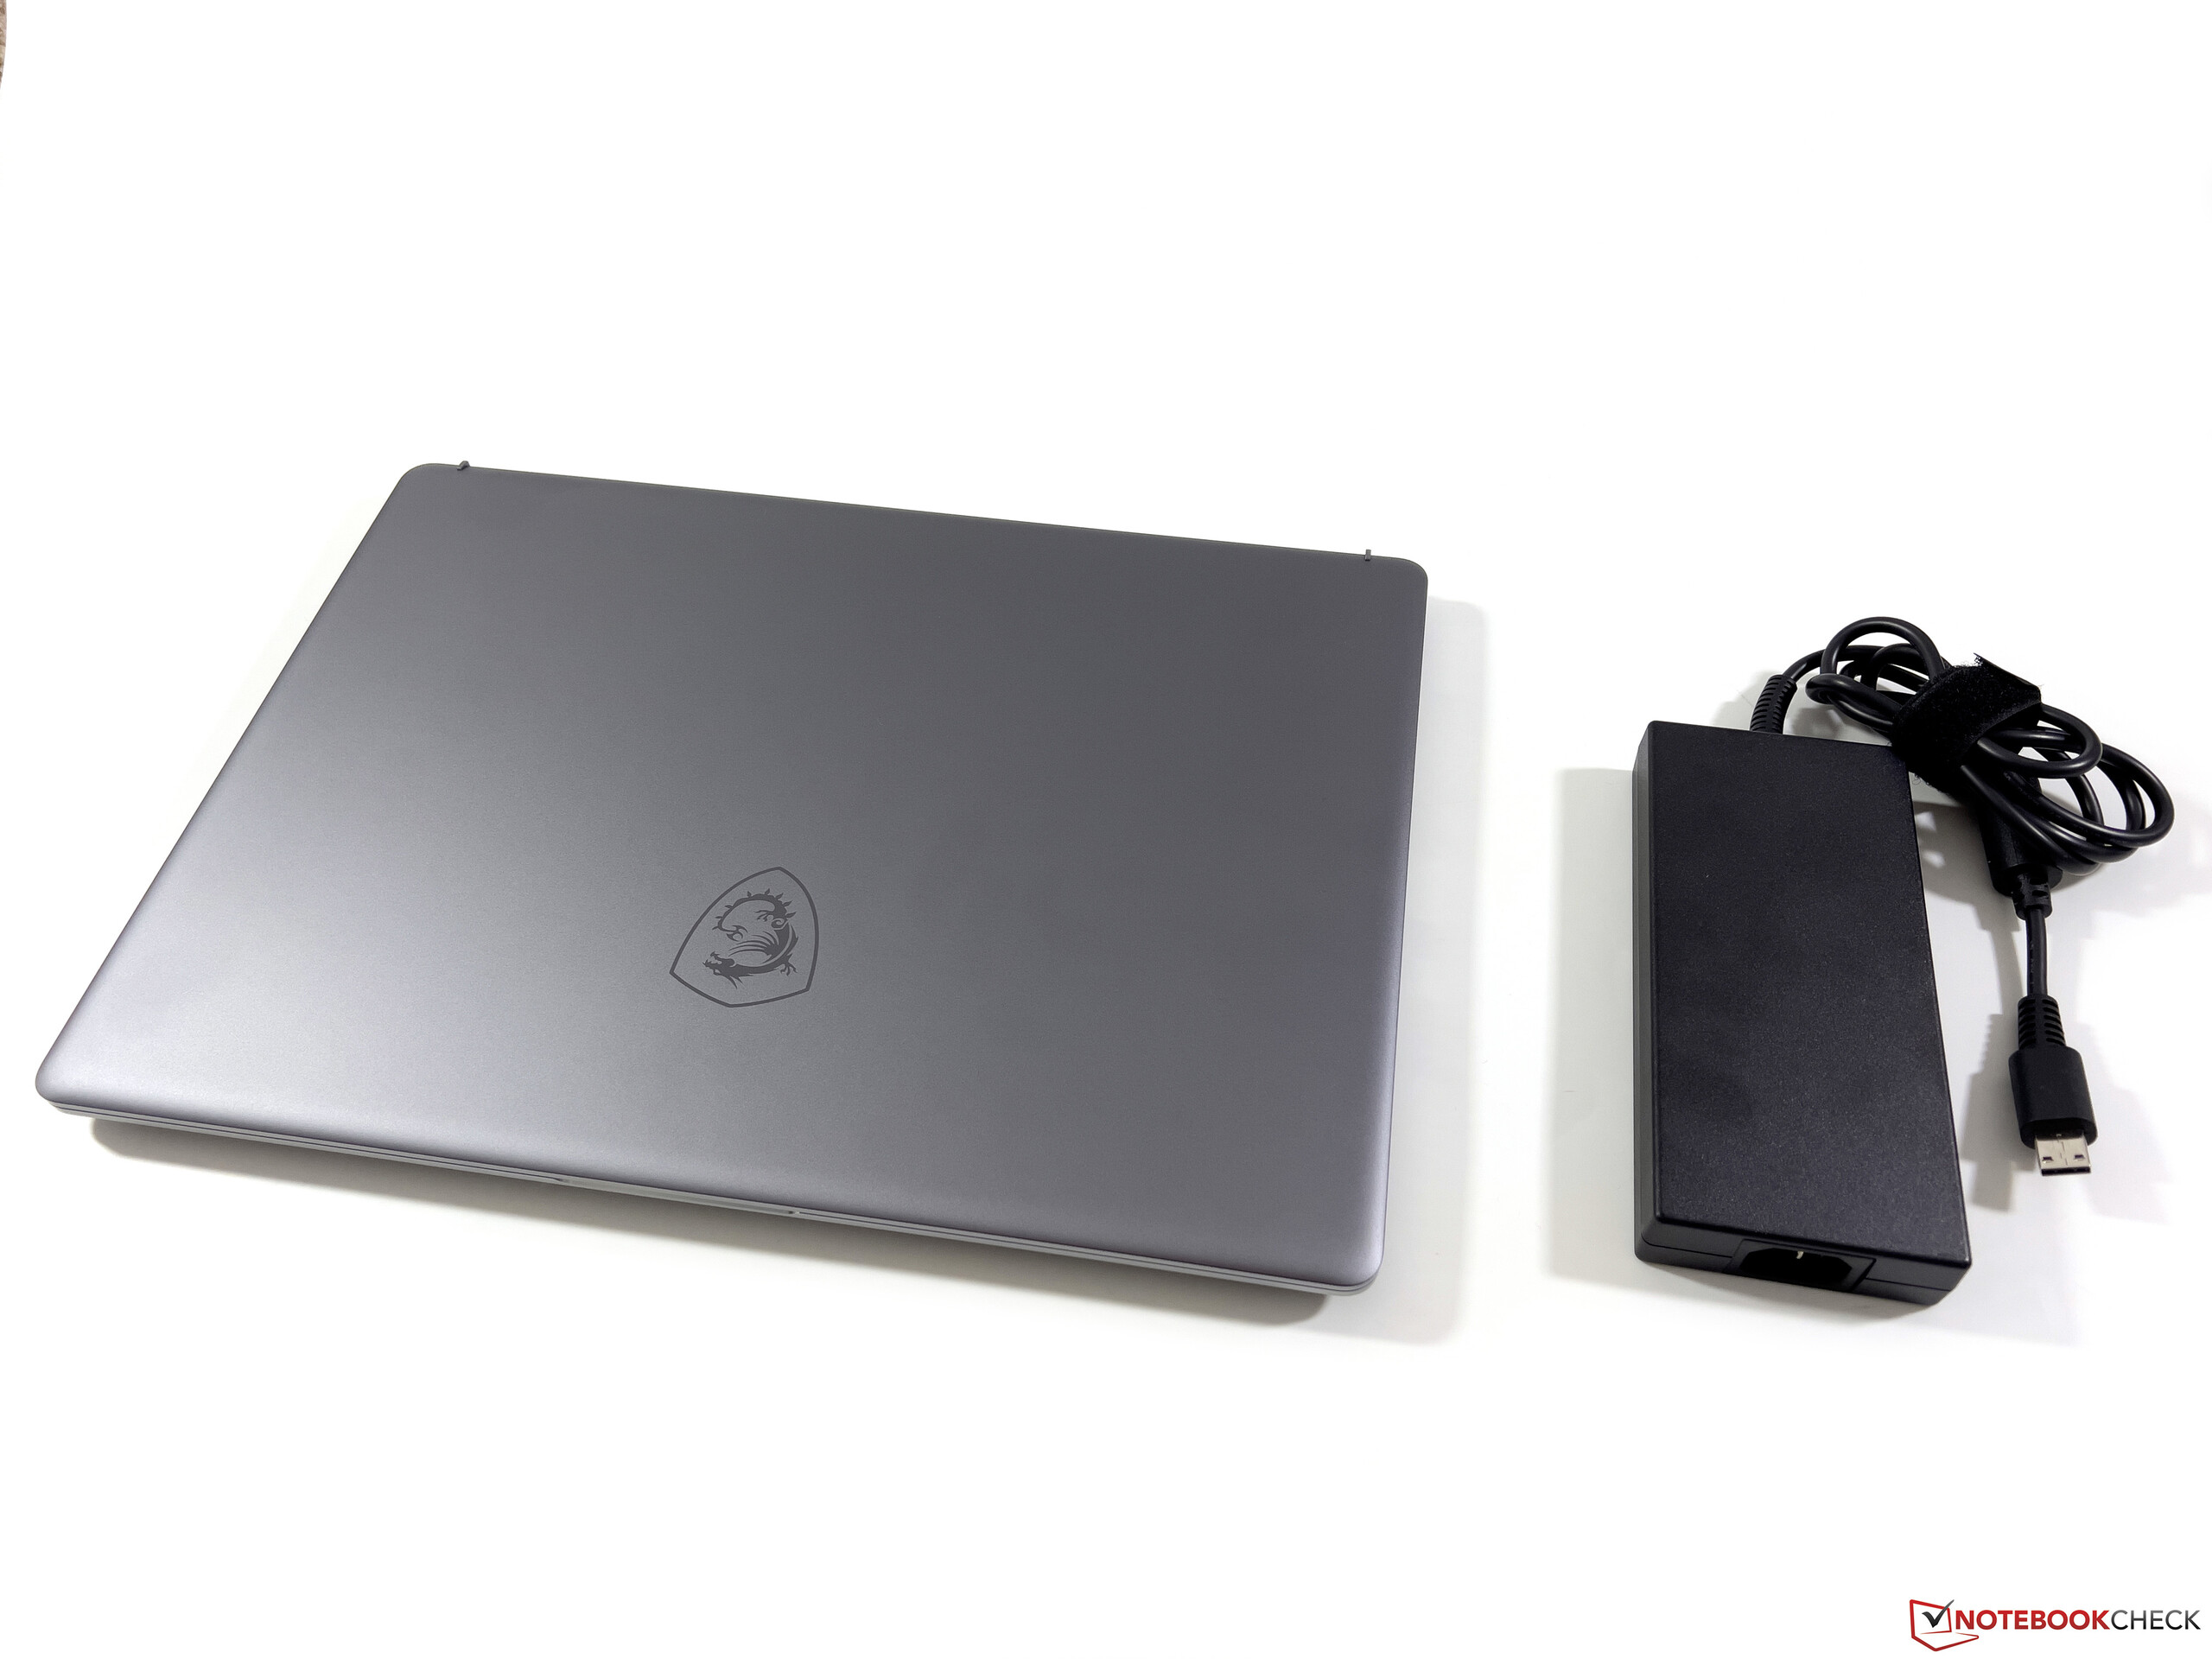
Le nostre misurazioni del consumo mostrano ora delle sorprese. I potenti componenti, compreso il pannello WQHD, hanno semplicemente bisogno di energia e misuriamo già quasi 17 watt alla massima luminosità del display durante il funzionamento inattivo. Sotto carico, i valori aumentano notevolmente e misuriamo circa 150 watt durante il gioco. Durante lo stress test, c'è un breve picco di carico a quasi 180 watt, ma il valore si stabilizza rapidamente a circa 157 watt. Come già con il Creator Z16PmSI include un alimentatore da 240 Watt con il CreatorPro, anche se nella nostra configurazione un alimentatore più compatto da 200 Watt (o anche solo 180 Watt) sarebbe stato del tutto sufficiente.
| Off / Standby | |
| Idle | |
| Sotto carico |
|
Leggenda:
min: | |
Power Consumption The Witcher 3 / Stress Test
Power Consumption With External Monitor
Durata della batteria
Le workstation mobili sono solo raramente in grado di ottenere una lunga durata della batteria, in particolare le configurazioni con display ad alta risoluzione. Nonostante la batteria da 90 W del CreatorPro Z16P sia molto capiente, nel nostro test WLAN abbiamo misurato appena 6 ore a 150 cd/m², corrispondenti al 39% della luminosità massima. Alla massima luminosità, la batteria dura solo 4,5 ore
Con il portatile acceso, il processo di ricarica completa richiede 142 minuti, ma il 65% della capacità viene raggiunto già dopo quasi 37 minuti e circa l'80% dopo 54 minuti. La curva di carica si appiattisce significativamente solo dopo.
Pro
Contro
Verdetto - Il raffreddamento del CreatorPro Z16P è sovrastimato
Mentre la scheda grafica professionale trasforma l'MSI Creator Z16P nel CreatorPro Z16P, non ci sono altre differenze. Non sorprende quindi che i dispositivi condividano anche vantaggi e svantaggi. I vantaggi includono sicuramente il buon case, l'ottimo display e anche la buona tastiera. Ma ci sono anche alcuni problemi, dato che le prestazioni dei componenti non sono sempre affidabili (anche se abbiamo utilizzato il profilo Highest Performance). Anche l'andamento della temperatura rimane un grosso problema. L'uso della tastiera diventa scomodo già dopo brevi fasi di carico e, con carichi più lunghi, siamo riusciti a misurare temperature superficiali superiori a 65 °C (149 °F)
Le prestazioni di MSI CreatorPro Z16P non rimangono sempre stabili e le temperature superficiali diventano troppo elevate sotto carico. L'uso della tastiera diventa scomodo già dopo pochi minuti.
Nel complesso, abbiamo qualche difficoltà a raccomandare l'MSI CreatorPro Z16P come workstation. Anche se ci sono alcuni aspetti positivi, i problemi di prestazioni e le temperature di superficie estreme non sono una buona qualifica per una workstation. Il recente test HP ZBook Studio 16 G9è riuscito a lasciare un'impressione decisamente migliore ed è anche disponibile con GPU più potenti. Nelle prossime settimane testeremo anche gli altri modelli di workstation della concorrenza.
Prezzo e disponibilità
La configurazione top di MSI CreatorPro Z16P con Intel Core i9-12900H, RTX A5500, 64GB di RAM, 1 TB SSD e display QHD+ è disponibile su Amazon per 4862 dollari.
MSI CreatorPro Z16P B12UKST
- 11/14/2022 v7 (old)
Andreas Osthoff
Price comparison

