Recensione del portatile Asus TUF Gaming F17: Buone prestazioni 3D e durata della batteria incontrano un display poco luminoso
Dopo l'aggiornamento minore dell'anno scorso, Asus ha optato per una grande revisione per il suo conveniente portatile da gioco da 17 pollici quest'anno. Il risultato è un nuovo design e un case aggiornato, una CPU Intel Alder Lake con supporto DDR5 RAM, e un totale di quattro opzioni di GPU tra cui la GTX 3060 della nostra unità di recensione.
Oltre al suo immediato predecessore di 11a generazione, abbiamo incluso un certo numero di notebook da gioco da 17 pollici nel nostro gruppo di confronto, tra cui il Lenovo Legion 5 17, il MSI GE76 Raider (stessa CPU), l MSI Katana GF76 (stessa GPU con CPU di 11a generazione), e il Schenker XMG Core 17 (CPU di decima generazione).
Potenziali concorrenti a confronto
Punteggio | Data | Modello | Peso | Altezza | Dimensione | Risoluzione | Prezzo |
|---|---|---|---|---|---|---|---|
| 84.1 % v7 (old) | 04/2022 | Asus TUF Gaming F17 FX707Z-HX011W i7-12700H, GeForce RTX 3060 Laptop GPU | 2.5 kg | 25 mm | 17.30" | 1920x1080 | |
| 82.8 % v7 (old) | 06/2021 | Asus TUF Gaming F17 FX706HM i9-11900H, GeForce RTX 3060 Laptop GPU | 2.7 kg | 26 mm | 17.30" | 1920x1080 | |
| 85.2 % v7 (old) | 02/2022 | Lenovo Legion 5 17ACH6H-82JY0003GE R5 5600H, GeForce RTX 3060 Laptop GPU | 3.1 kg | 24.3 mm | 17.30" | 1920x1080 | |
| 87.5 % v7 (old) | 01/2022 | MSI GE76 Raider i9-12900HK, GeForce RTX 3080 Ti Laptop GPU | 3 kg | 26 mm | 17.30" | 1920x1080 | |
| 80.4 % v7 (old) | 06/2021 | MSI Katana GF76 11UE i7-11800H, GeForce RTX 3060 Laptop GPU | 2.7 kg | 25.2 mm | 17.30" | 1920x1080 | |
| 83.9 % v7 (old) | 06/2021 | Schenker XMG Core 17 (Early 2021) i7-10870H, GeForce RTX 3060 Laptop GPU | 2.5 kg | 30.05 mm | 17.30" | 2560x1440 |
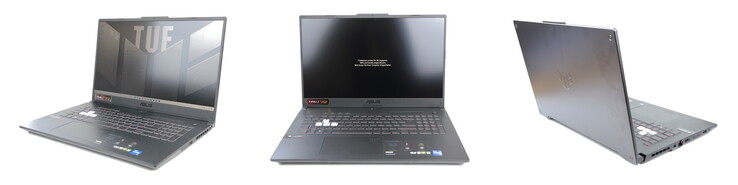
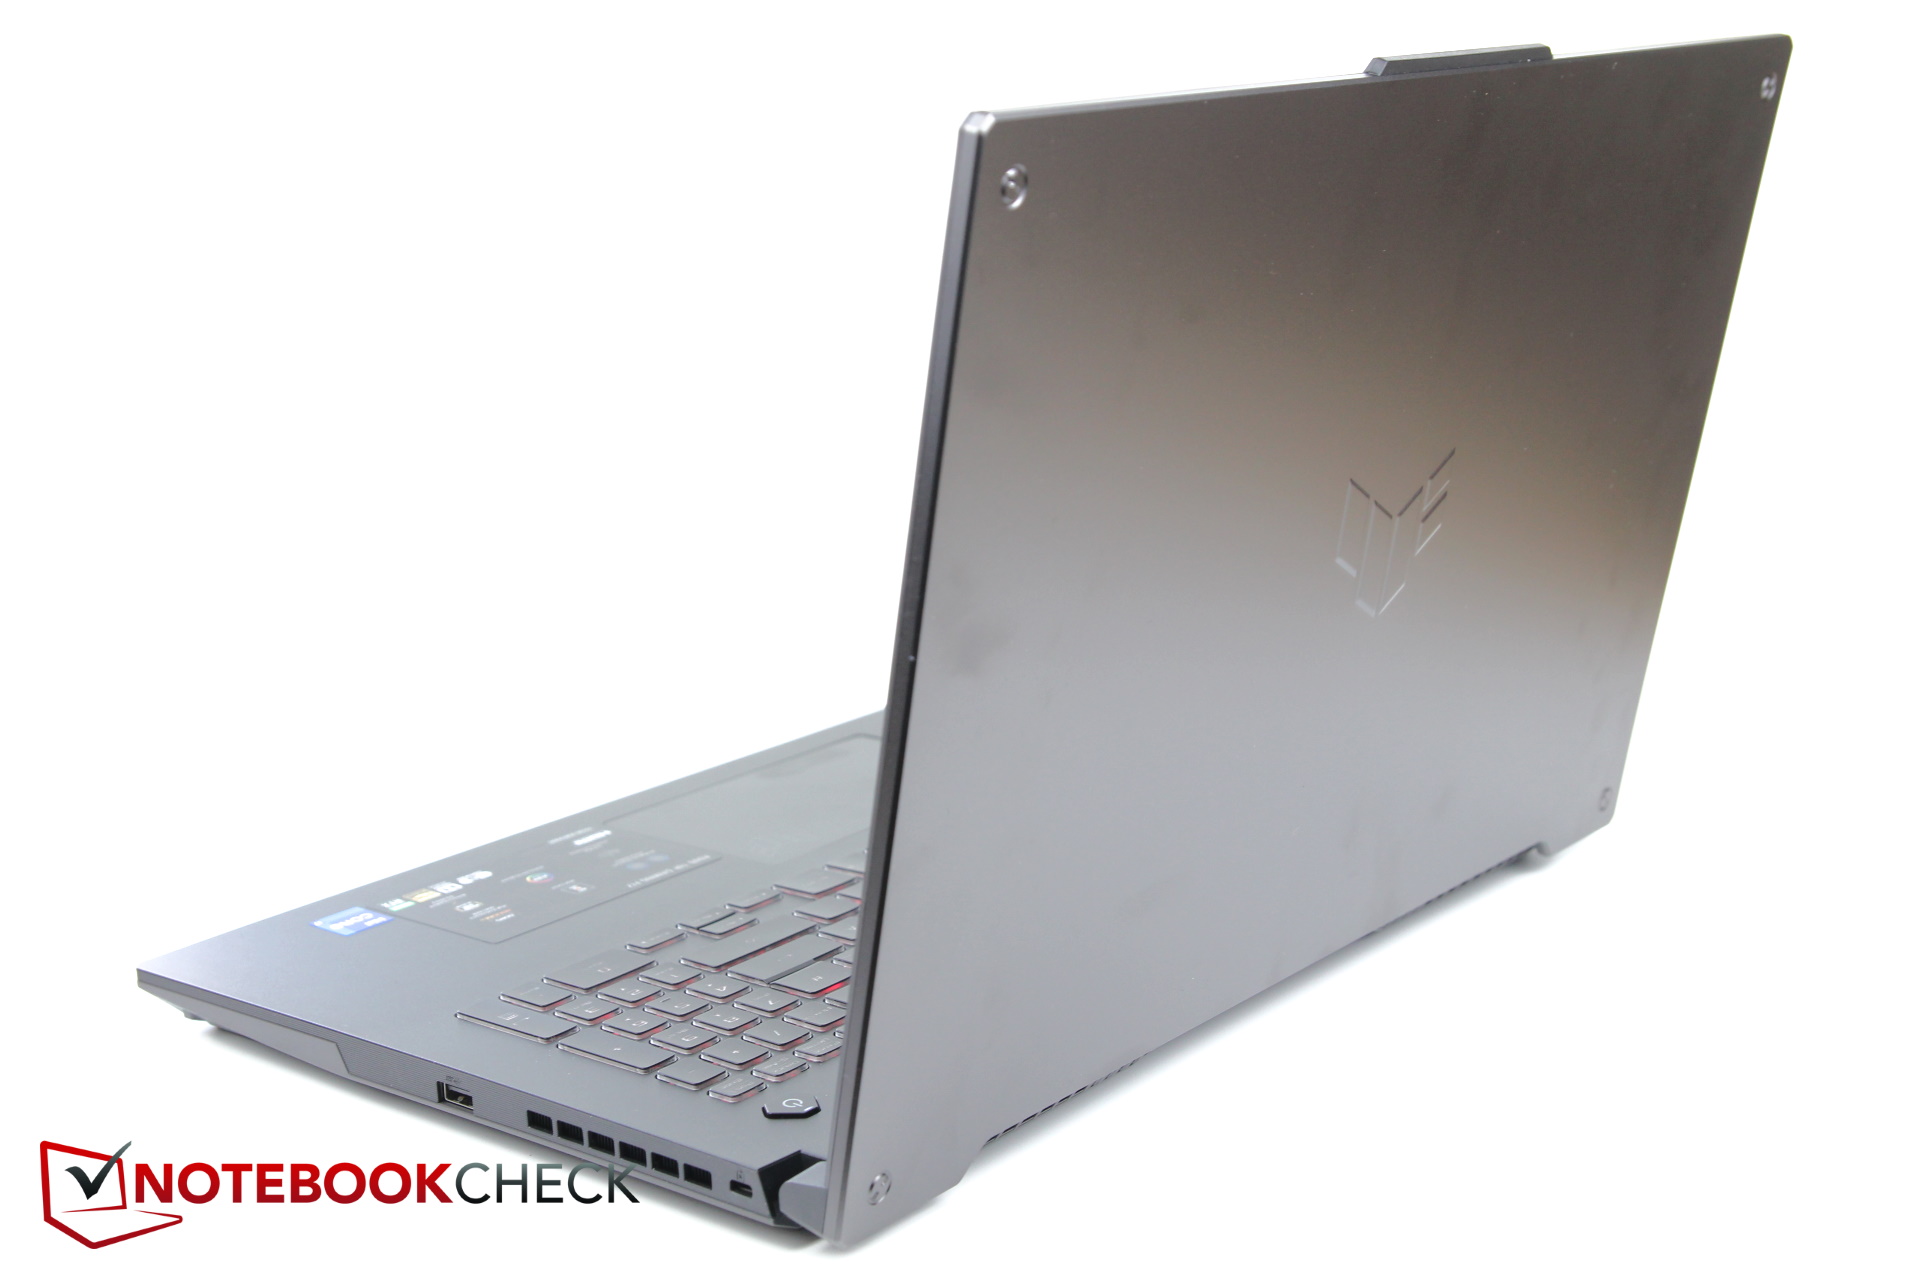
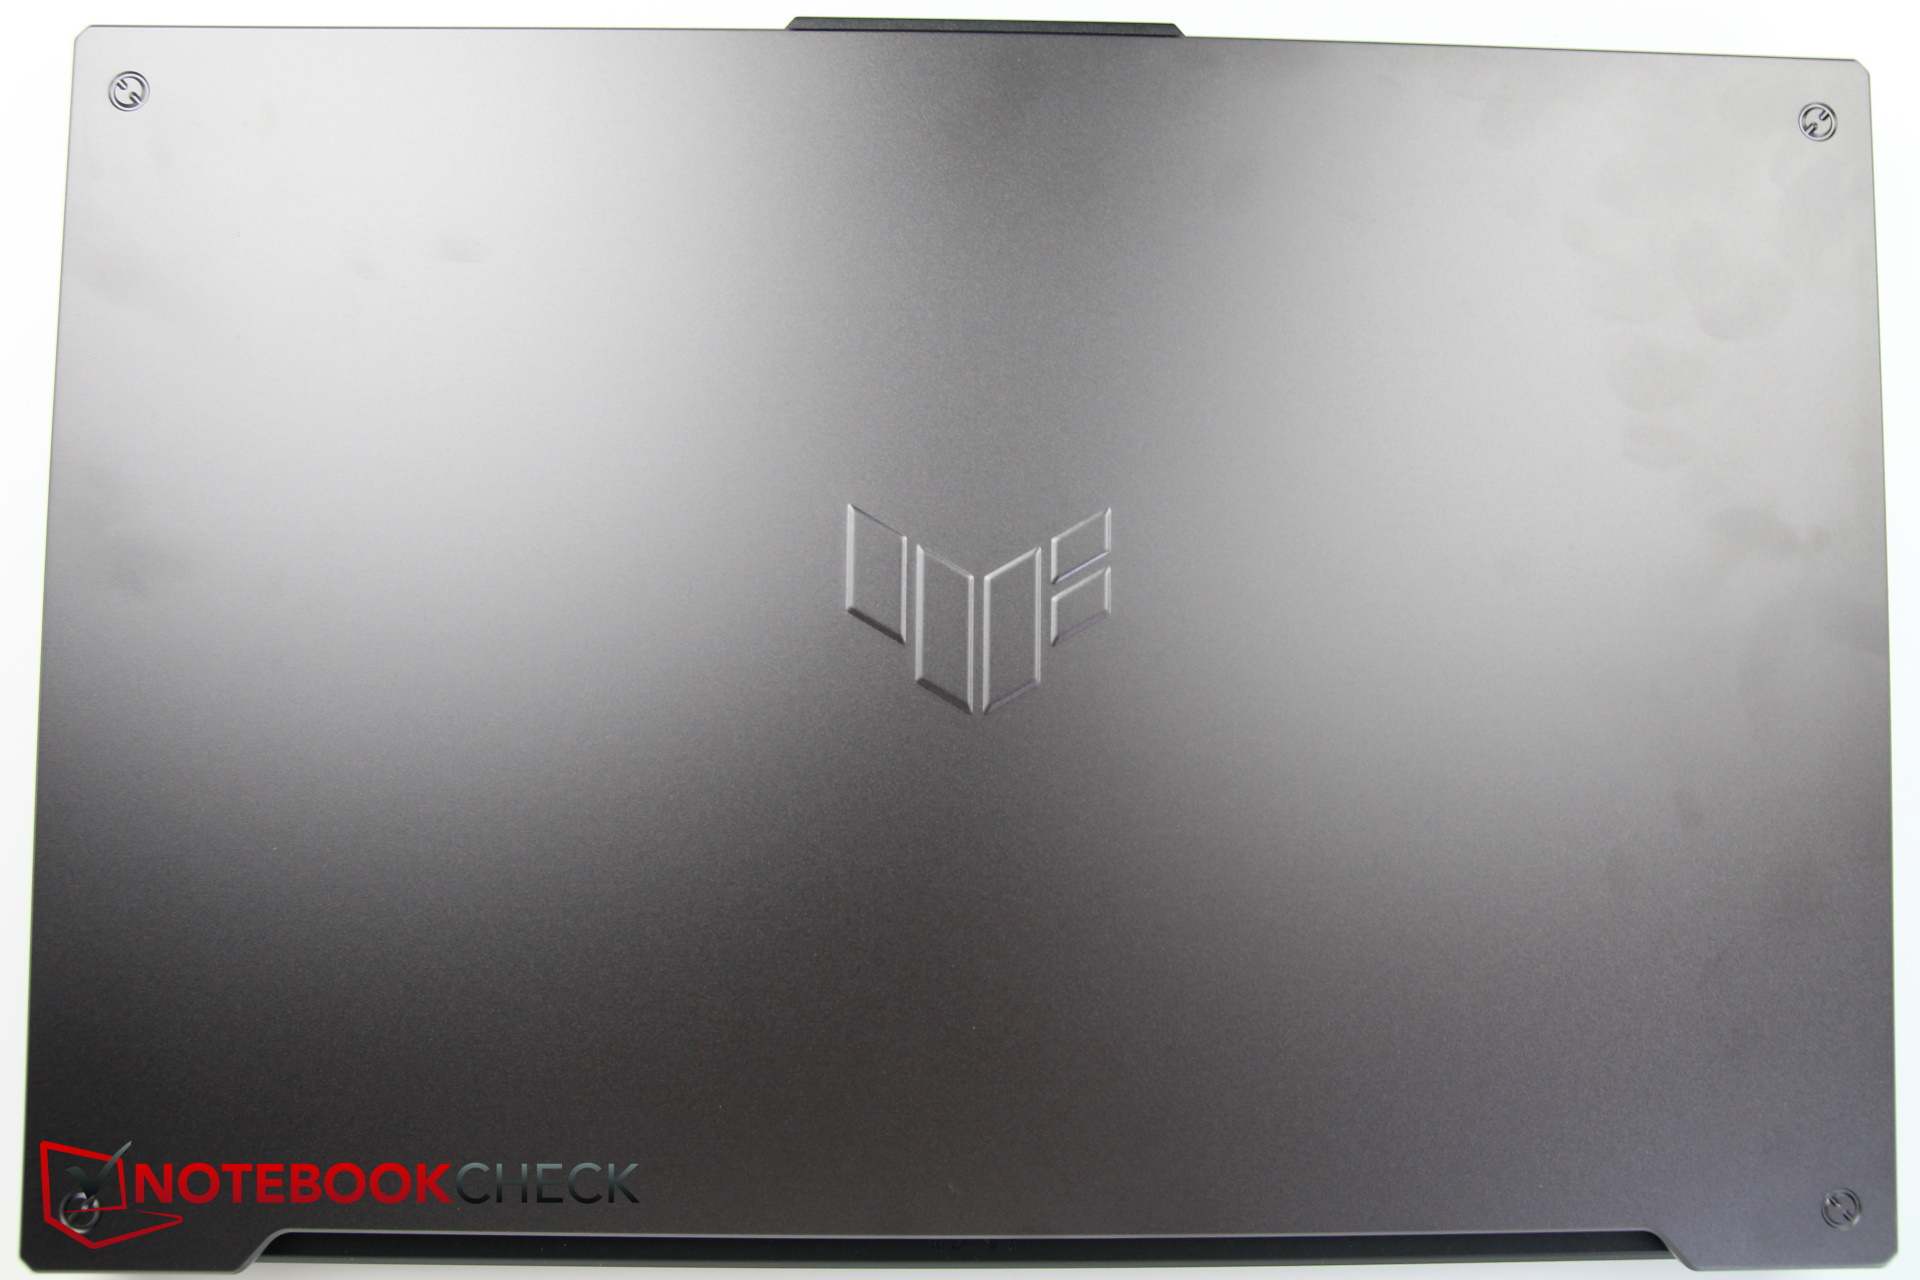
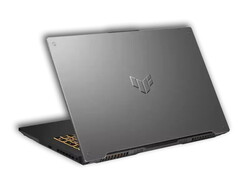
Custodia - Coperchio in metallo, base in plastica
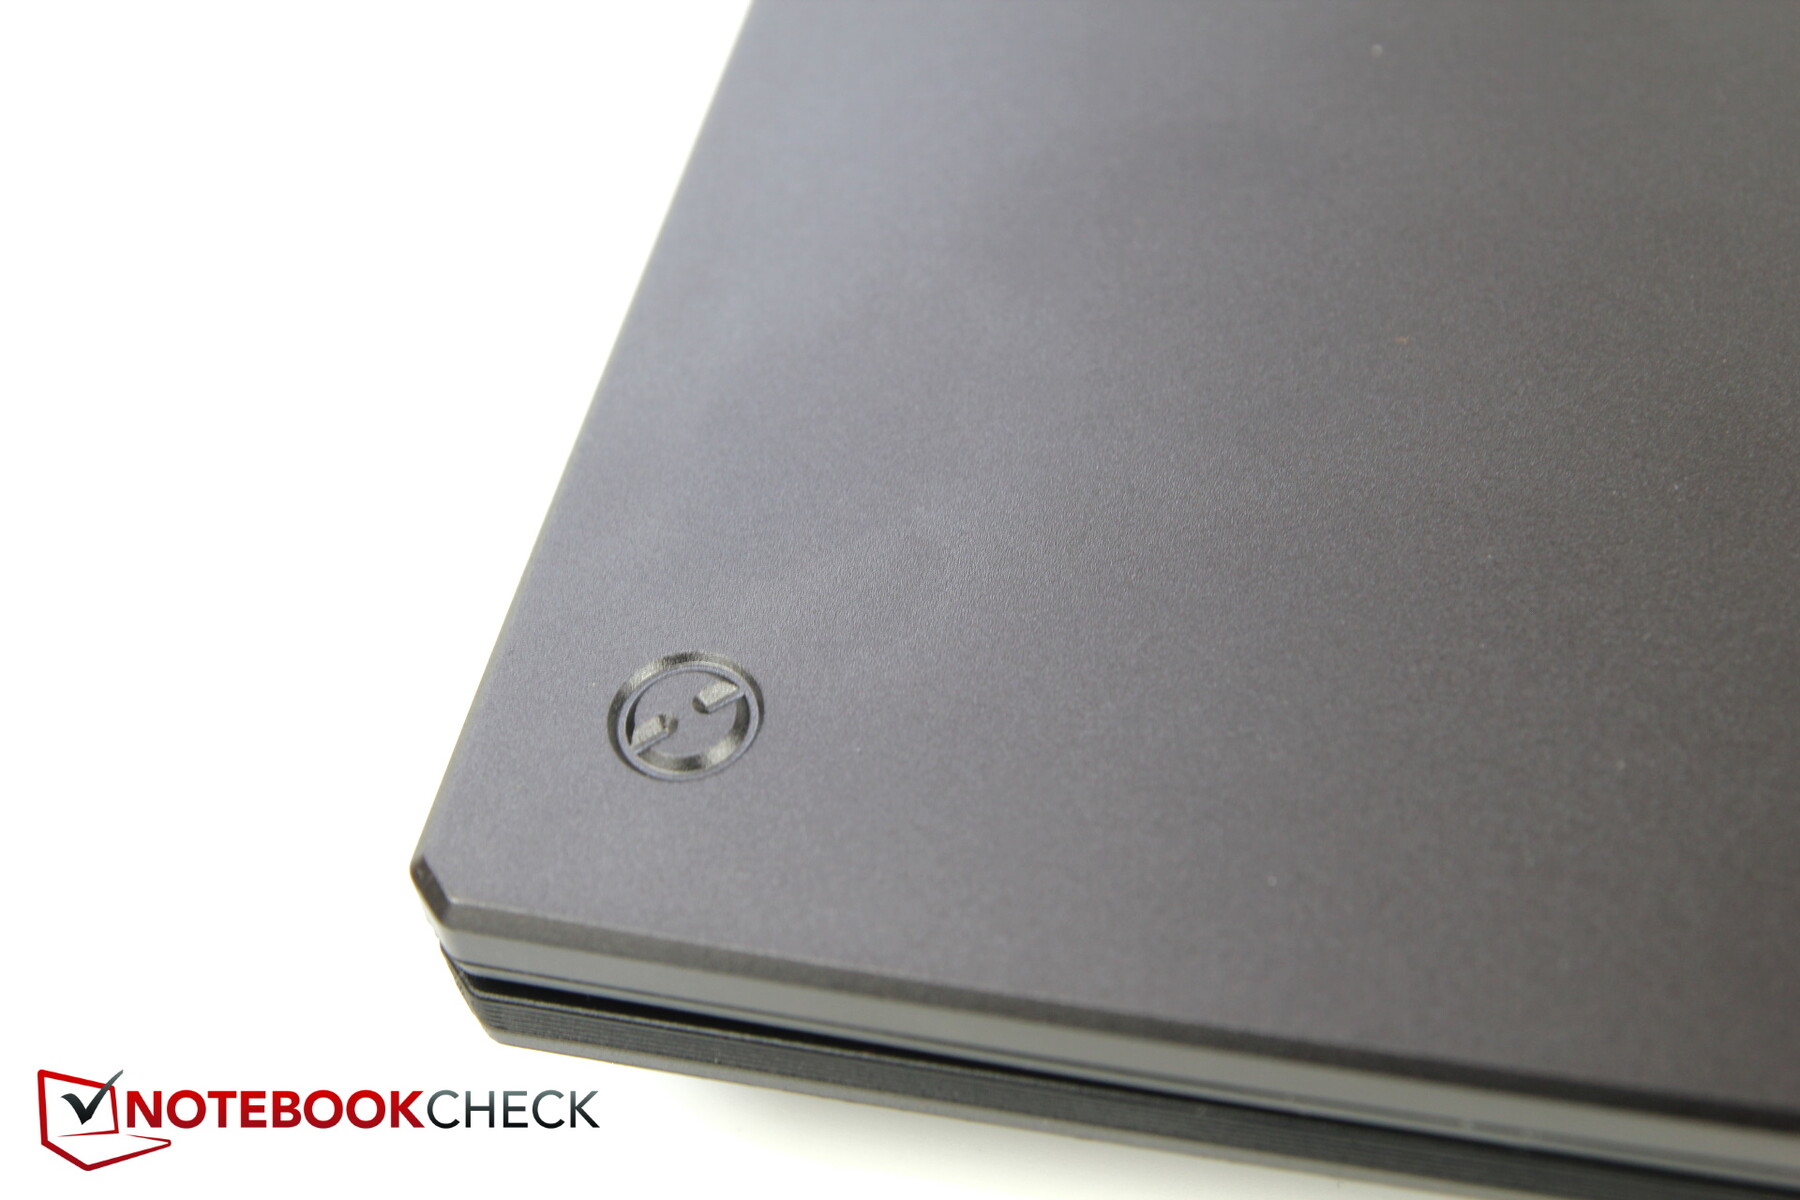
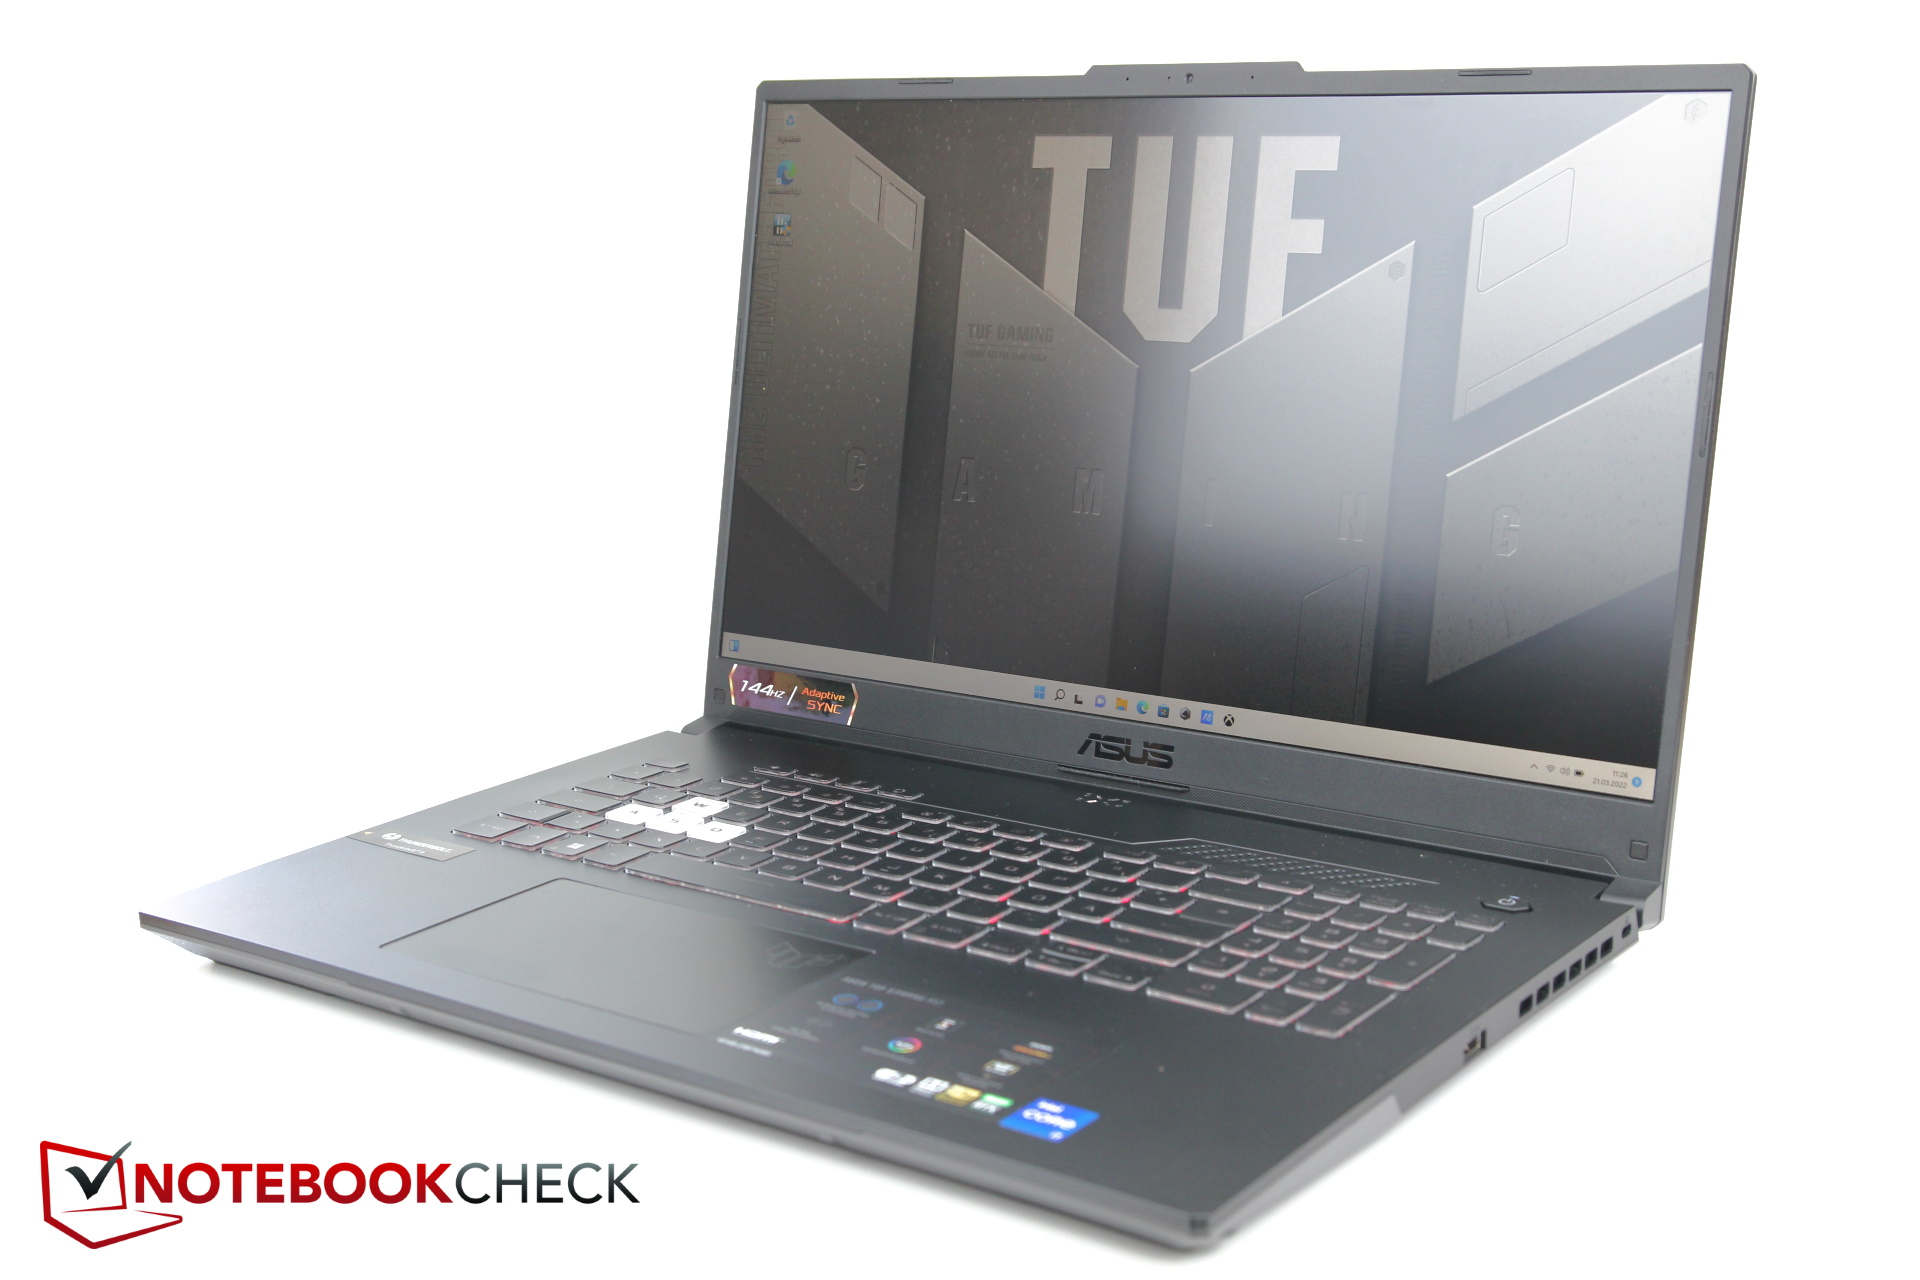
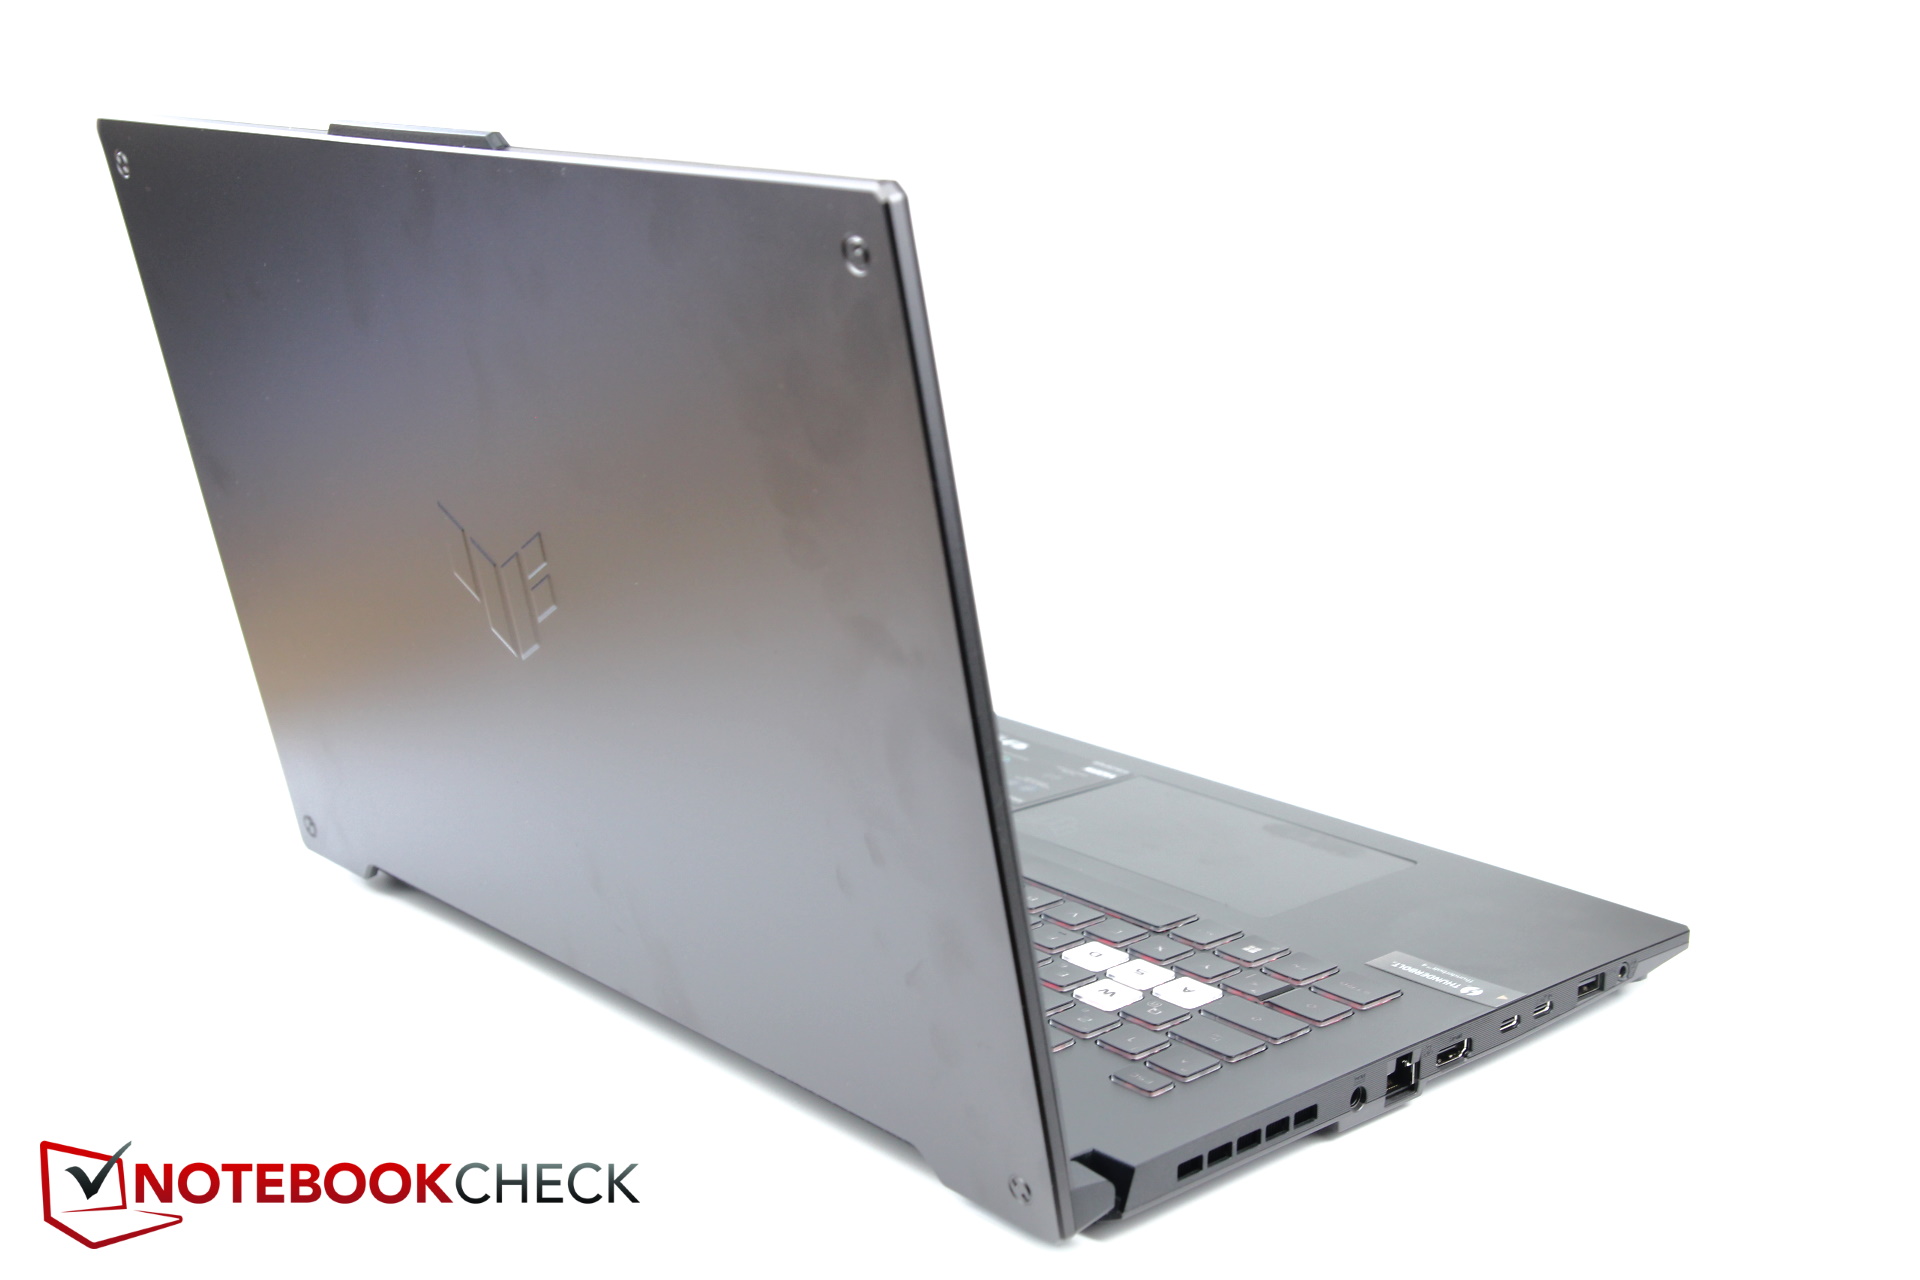
Il design aggiornato è disponibile in colori simili al suo predecessore. Il logo TUF, precedentemente molto prominente, è stato rimosso e sostituito con un'impronta sporgente molto più piccola al centro del coperchio del display in metallo. Gli angoli ornati da "finte viti" sono rimasti invariati.
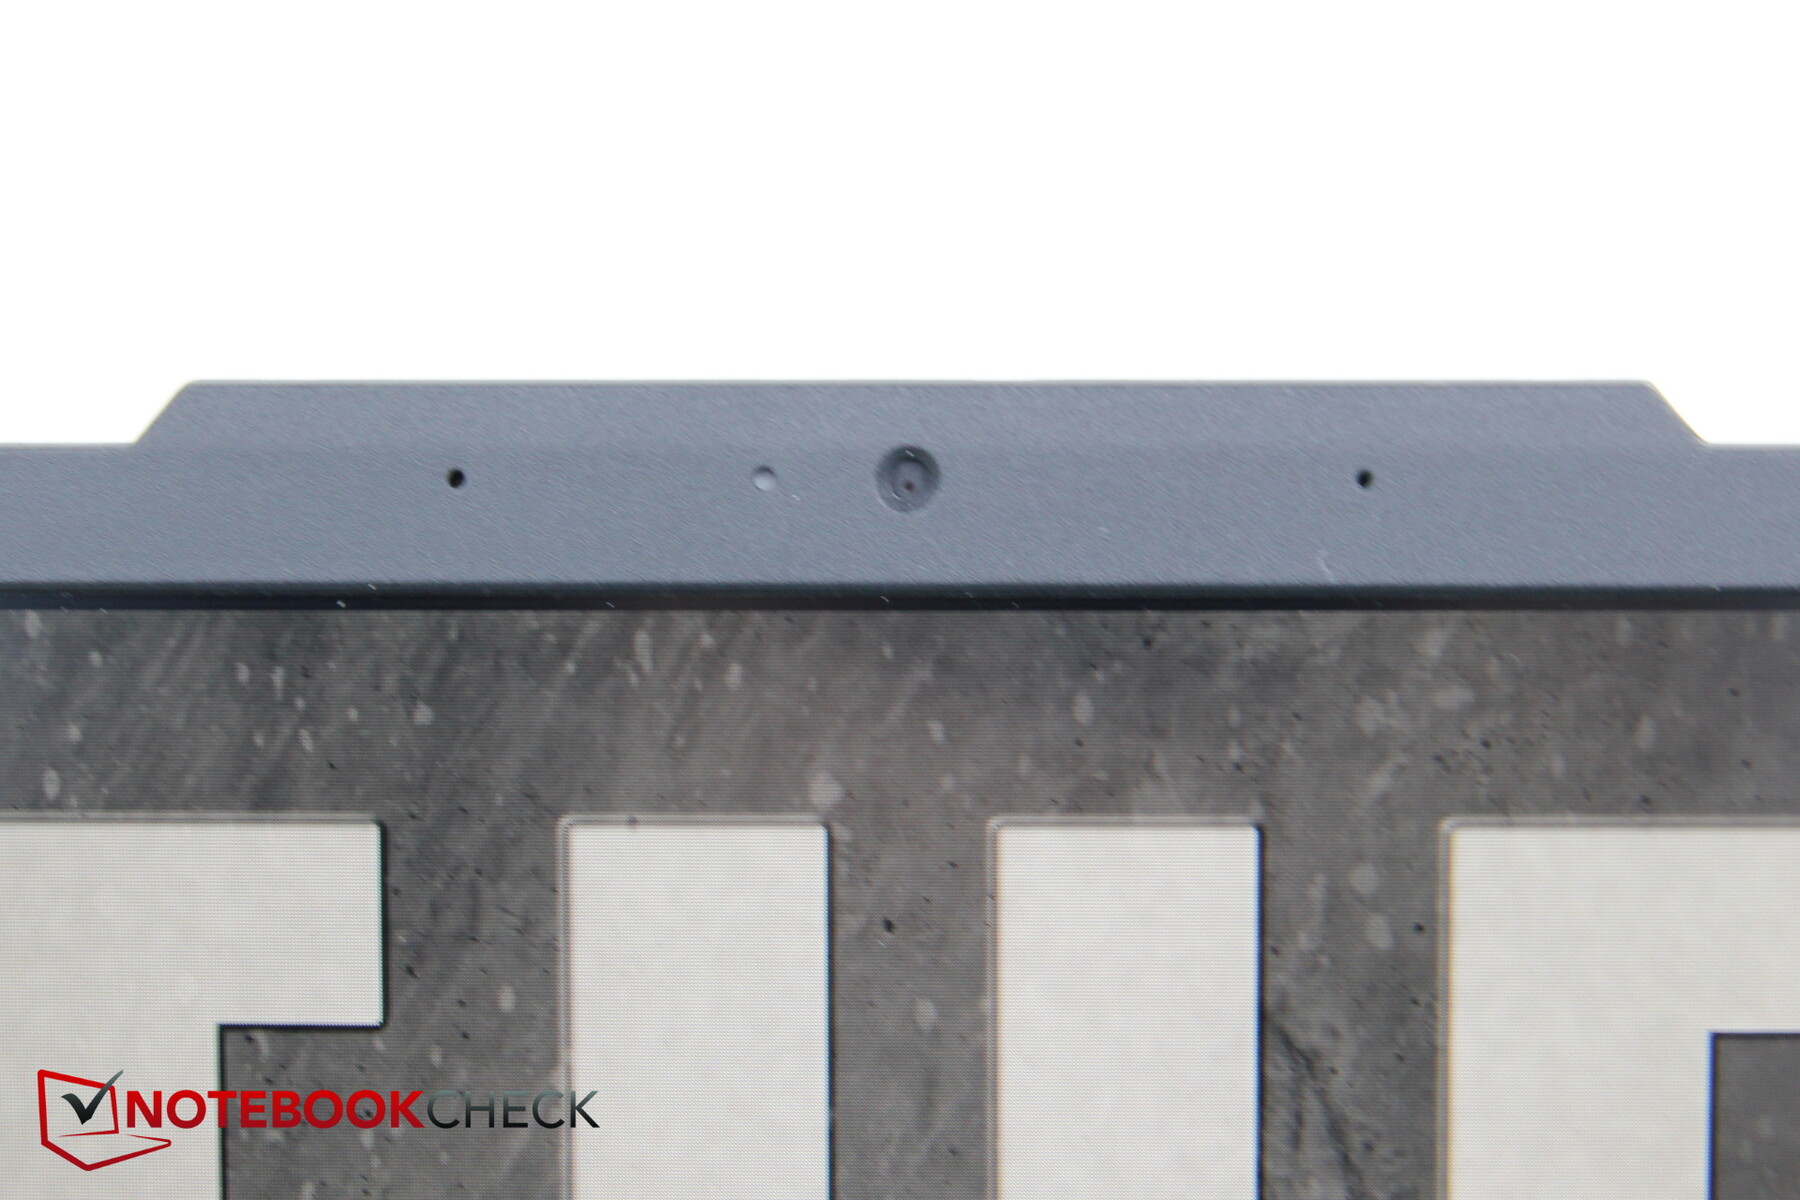
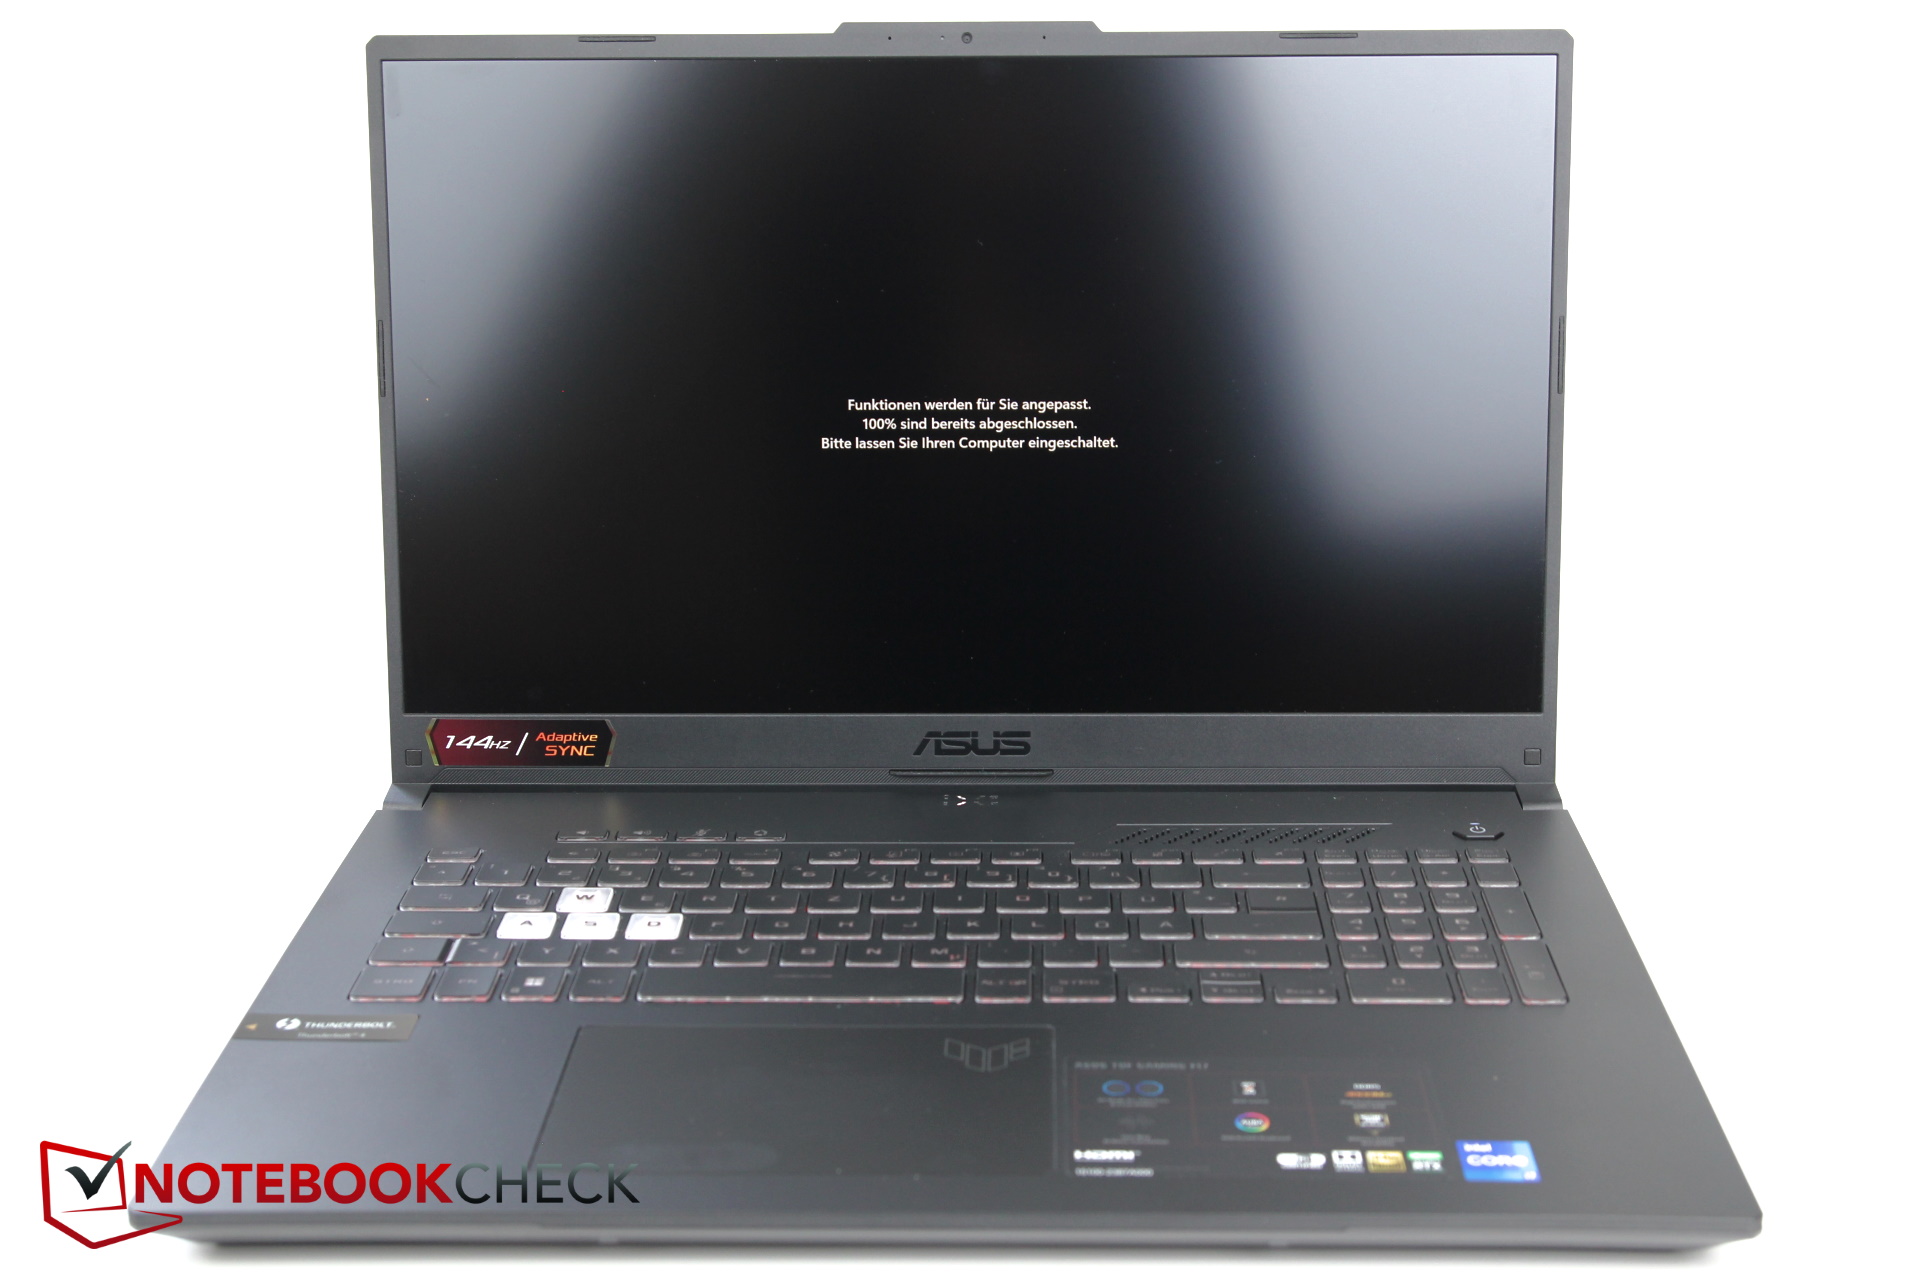
Nella parte superiore troviamo una sorta di tacca fisica sporgente che ospita la fotocamera e i microfoni e che serve come fermo per aprire il coperchio del display. Non c'è modo di aprire il portatile con una sola mano; sono necessarie entrambe le mani.
Con il coperchio del display chiuso, un piccolo pannello LED a forma di stella mostra lo stato attuale del portatile, per esempio se è in carica o se è stato messo in modalità aereo.
Un'altra differenza si trova con il coperchio del display aperto. La base, fatta di plastica robusta, non è più adornata con sfumature "eleganti", ma completamente piana e quindi piatta. Di conseguenza, la tastiera non è più incassata nel top case.
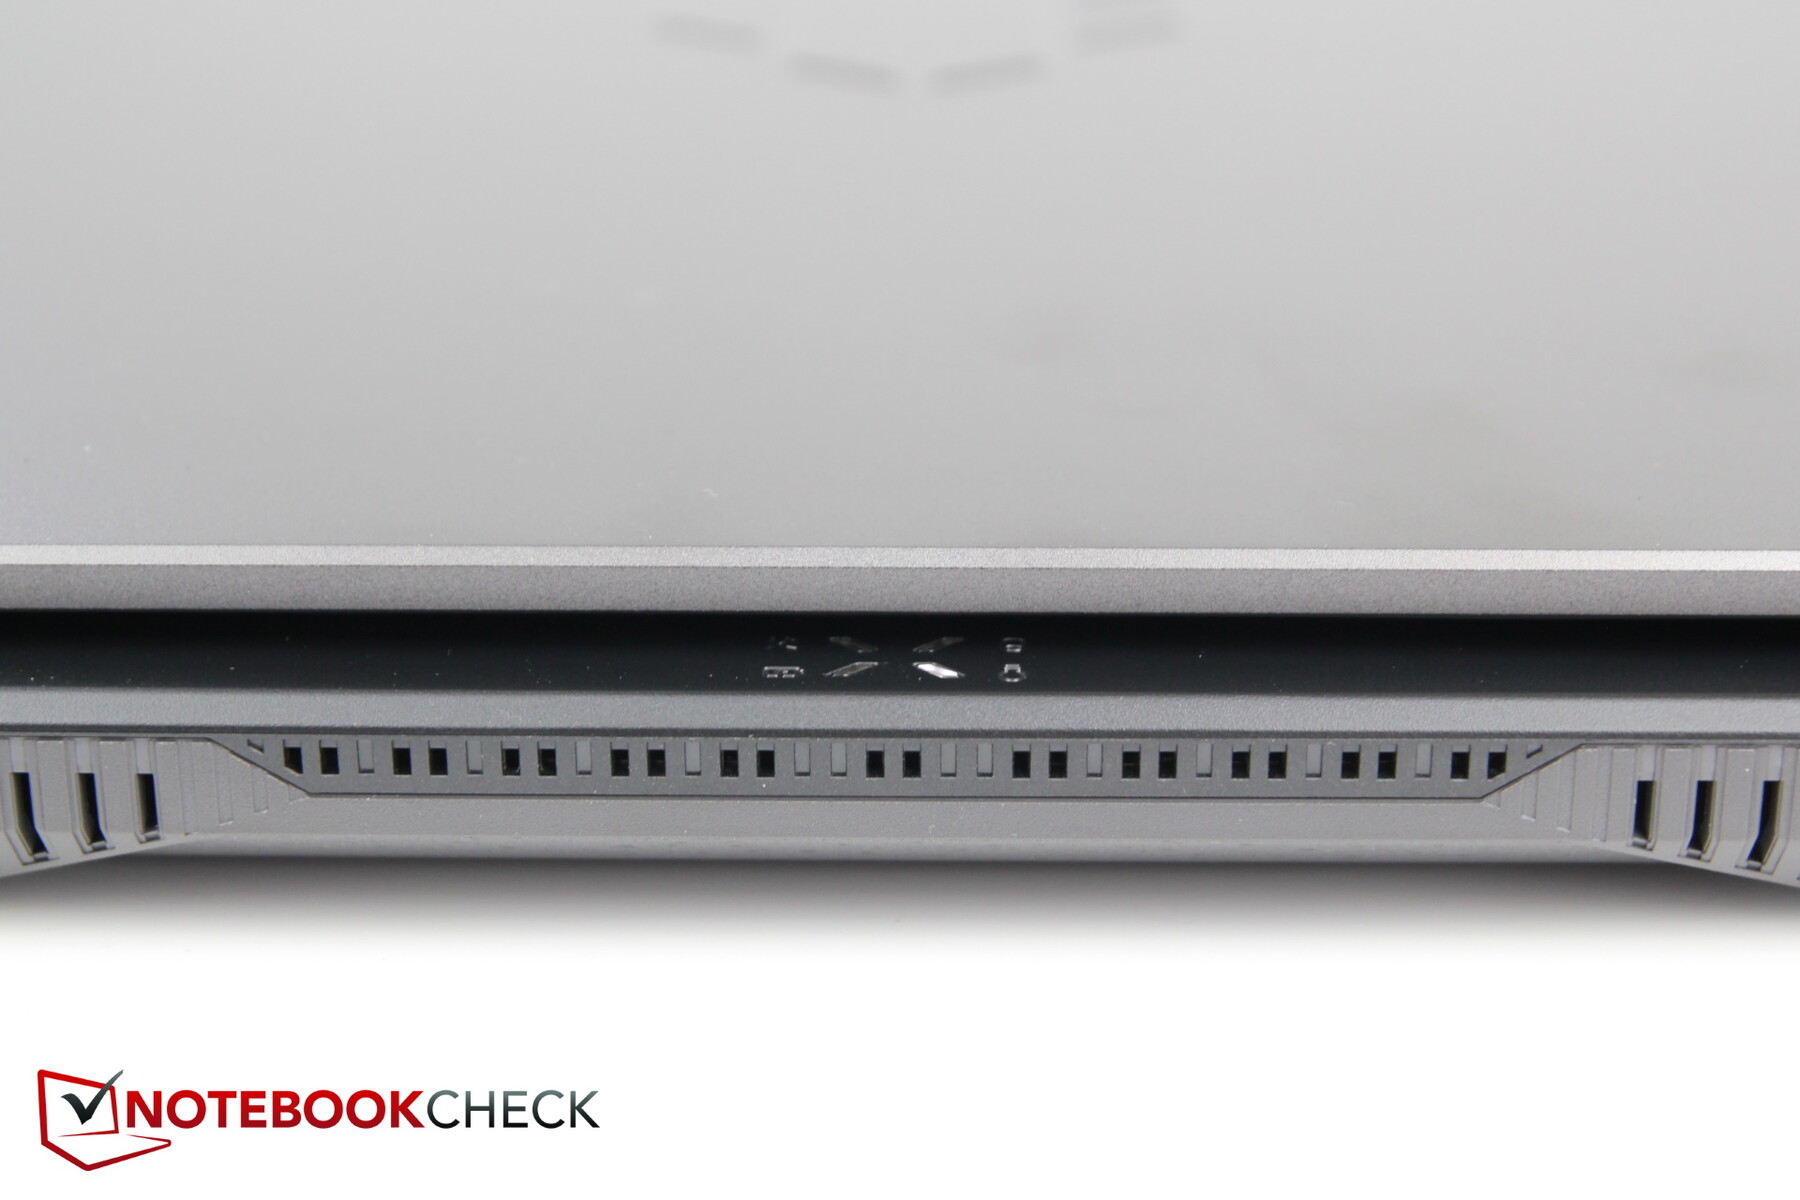
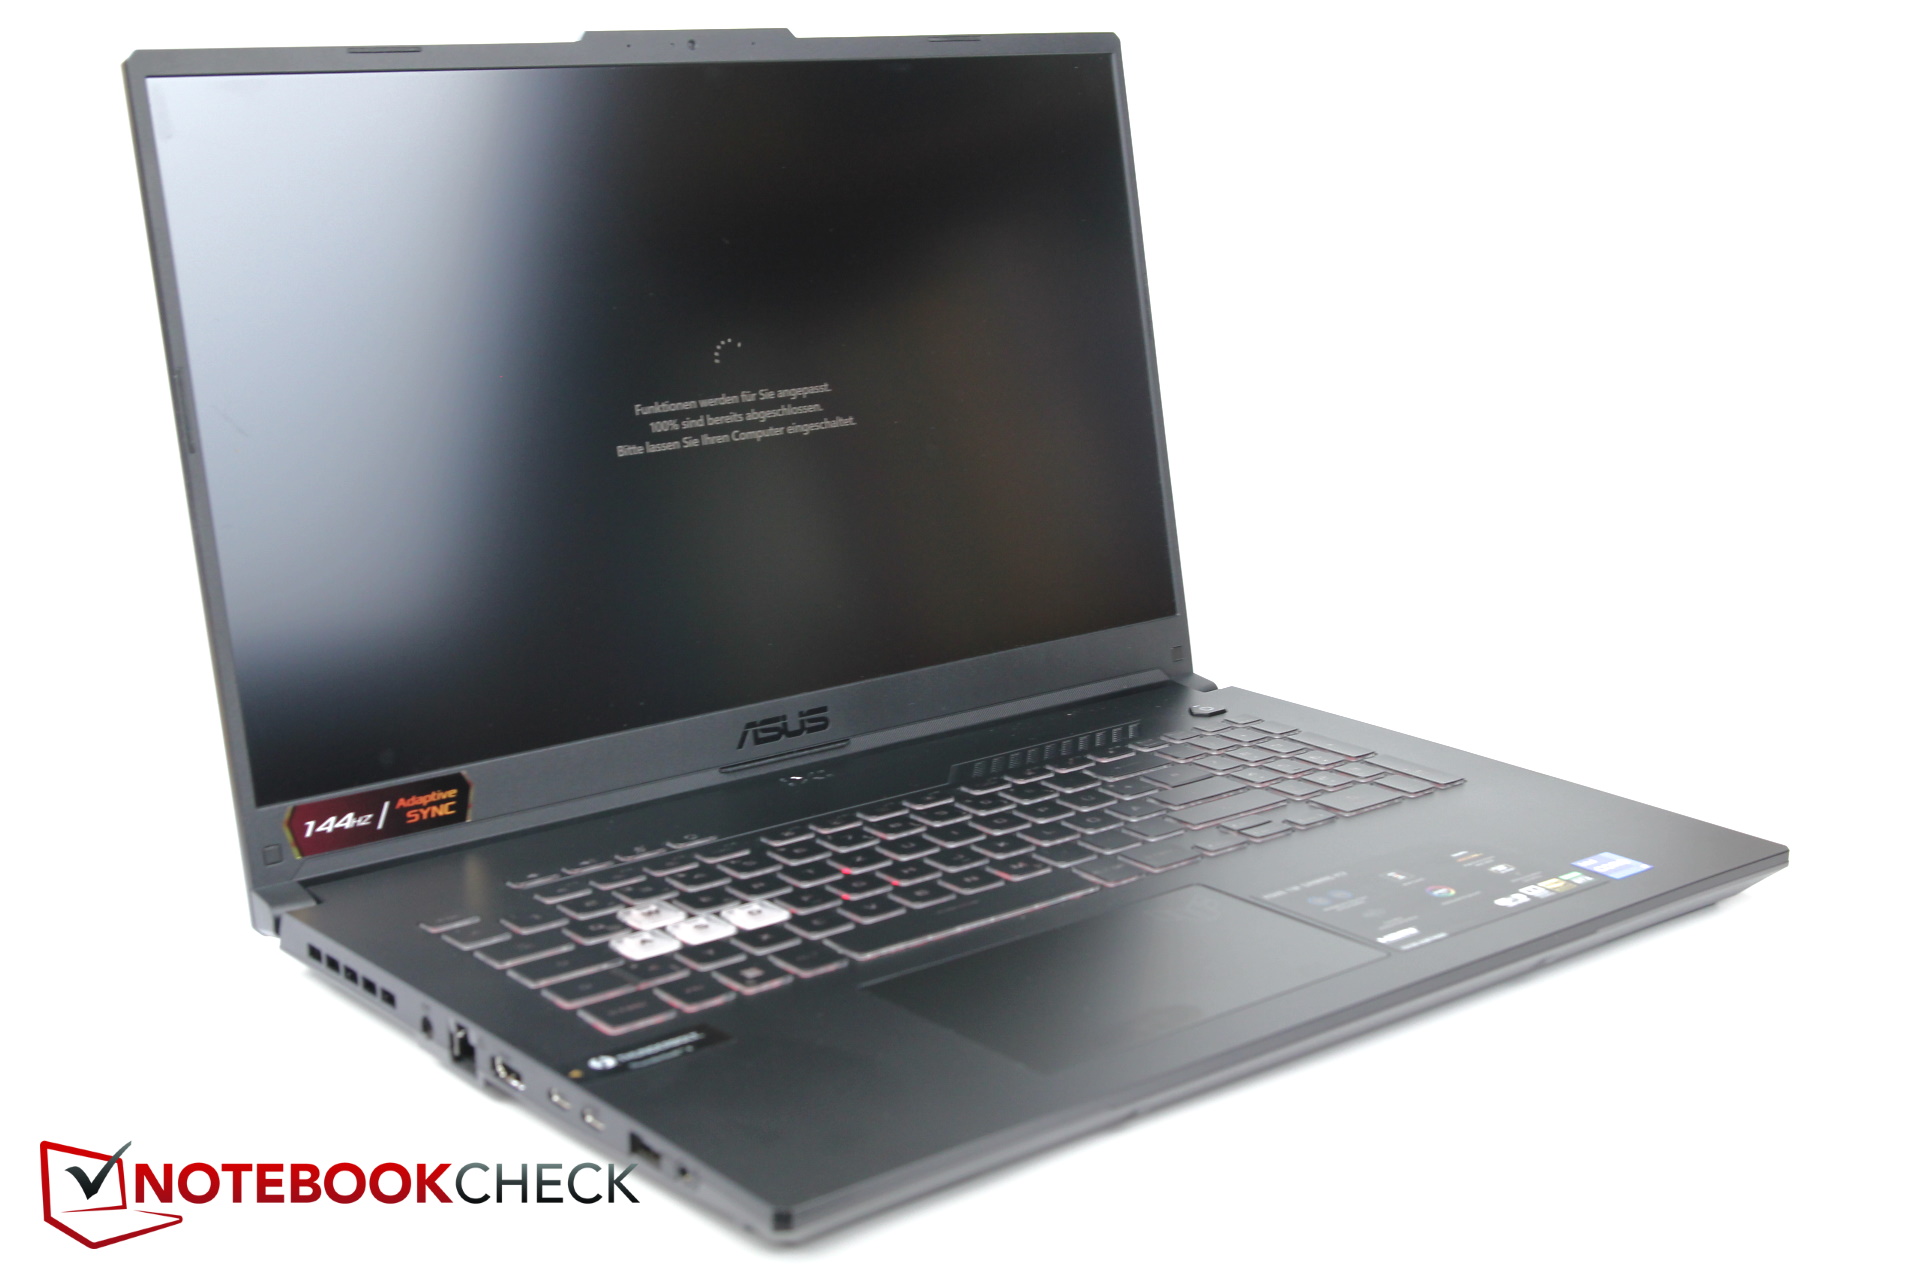
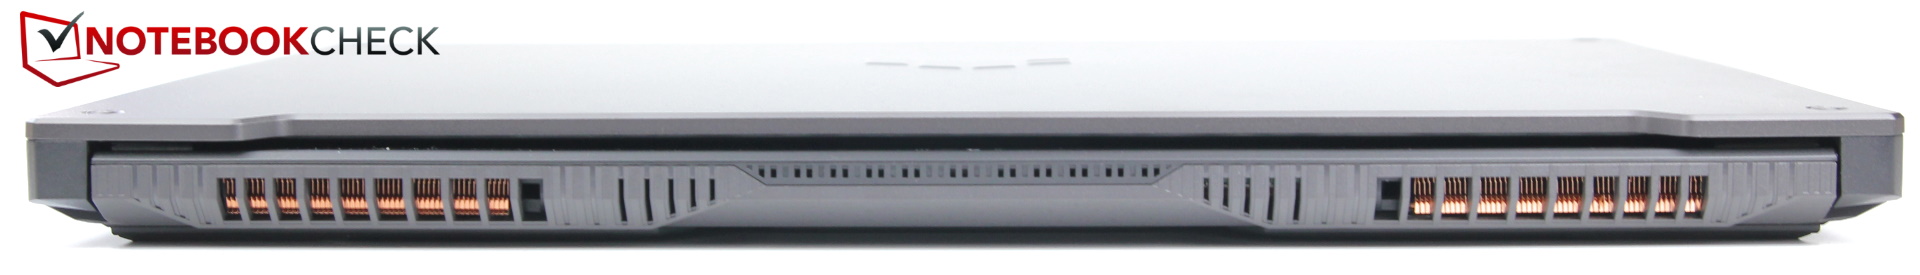
Le prese d'aria della ventola non sono più posizionate lungo tutta la larghezza del dispositivo, ma sono diventate molto più piccole e si trovano ora sul lato destro.

Quando si tratta di spessore, le specifiche ufficiali di Asus di 22.9 mm sono ingannevoli. Può essere solo così spesso nel suo punto più sottile, tuttavia più del 50% della sua superficie è sollevata di altri 2-3 mm con il risultato di uno spessore reale più vicino ai 25 mm.
In termini di ingombro il nuovo design è leggermente più stretto del suo predecessore di pochi millimetri, ed è stato in grado di tagliare circa 200 g di peso.
La maggior parte dei suoi concorrenti (dichiaratamente più vecchi) sono più grandi, ad eccezione del leggermente più sottile ma significativamente più pesante Lenovo Legion.
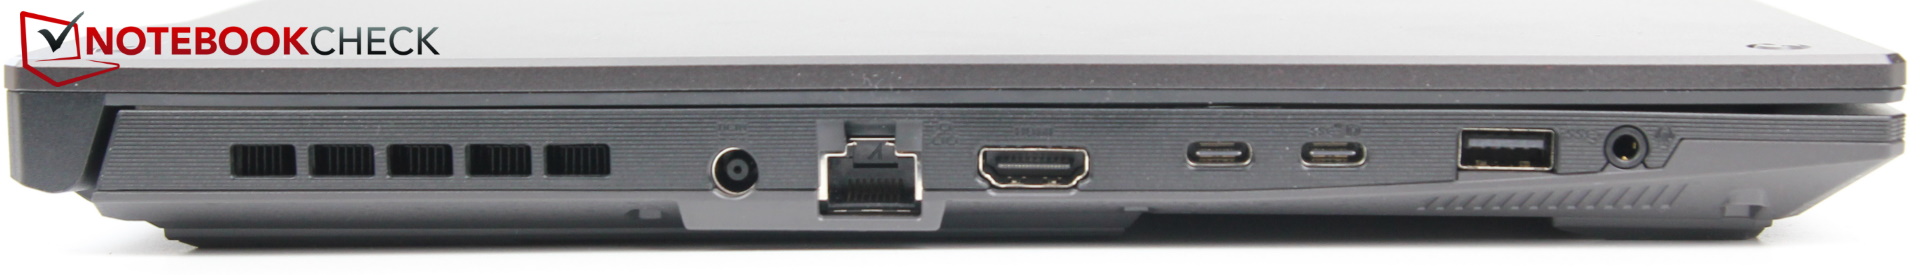
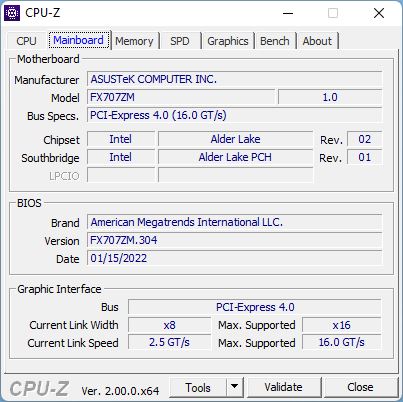
Connettività - Thunderbolt 4; Wi-Fi scadente
Le porte sono rimaste in gran parte identiche al suo predecessore con la notevole eccezione di una porta USB-A che è stata trasformata in una porta USB-C per un totale di due porte USB-C, una delle quali è collegata a un controller Thunderbolt 4.
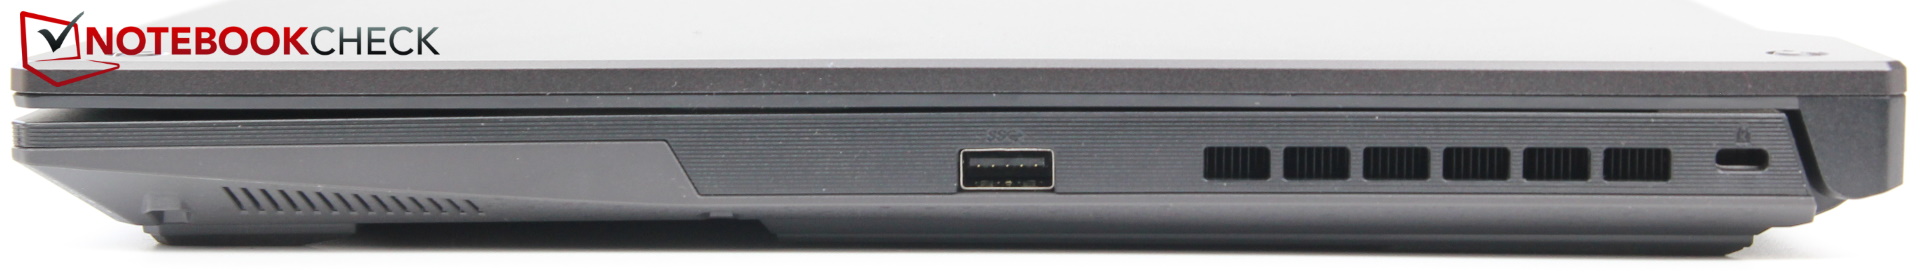
Inoltre, tutte le porte sono state spostate leggermente in avanti dato che i lati posteriori sono dotati di prese d'aria aggiuntive per le ventole. I destrorsi saranno lieti di sapere che il lato destro del dispositivo è dotato di una sola porta USB, mentre i mancini probabilmente avranno da ridire su questo posizionamento. Abbiamo anche trovato il jack per le cuffie del dispositivo troppo vicino alla porta USB-A. Altrimenti, la spaziatura delle porte era ok nel complesso.
Comunicazione
Le comunicazioni via cavo sono gestite dal controller integrato della CPU che è stato introdotto per la prima volta nel 2015. Di conseguenza, supporta solo velocità fino a 1 Gbps. In confronto, molti controller di rete moderni supportano velocità di 2,5 Gbps e più.
Le comunicazioni wireless sono gestite dal comunissimo adattatore Intel AX201. Sfortunatamente, l'implementazione dell'F17 si è rivelata particolarmente lenta con velocità di trasferimento solo circa la metà di quelle dei suoi concorrenti. Questo era già il caso sul suo predecessore, e siamo delusi di vedere che non è stato affrontato e migliorato.
Webcam
L'F17 è dotato di una comune webcam 720p con colori poveri e una qualità d'immagine generale molto scarsa.


Sicurezza
L'F17 dispone di un blocco Kensington e di un TPM 2.0. Altre caratteristiche di sicurezza, come per esempio un lettore di impronte digitali, non sono disponibili.
Accessori e garanzia
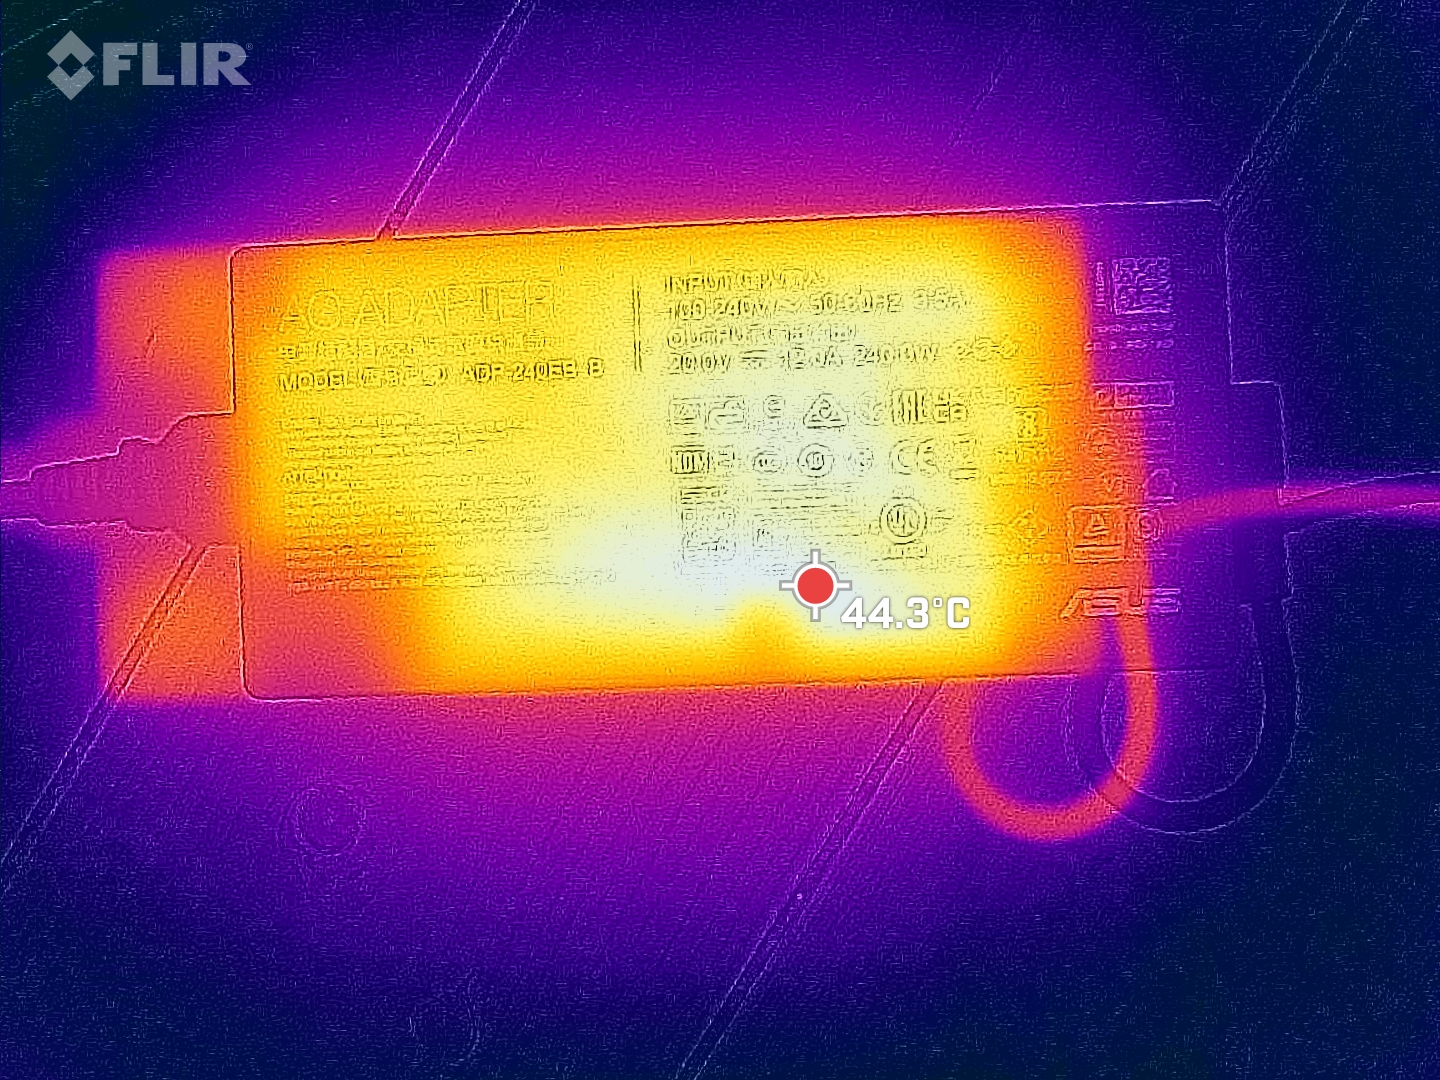
Come è comune per la fascia di prezzo dell'F17, non ci sono accessori aggiuntivi da trovare nella scatola, a parte un alimentatore da 240 W.
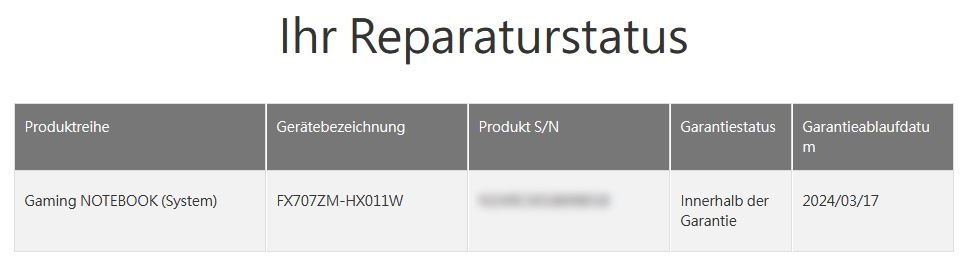
I clienti europei ottengono una garanzia limitata di 24 mesi, mentre i clienti statunitensi devono ancora una volta accontentarsi di soli 12 mesi.
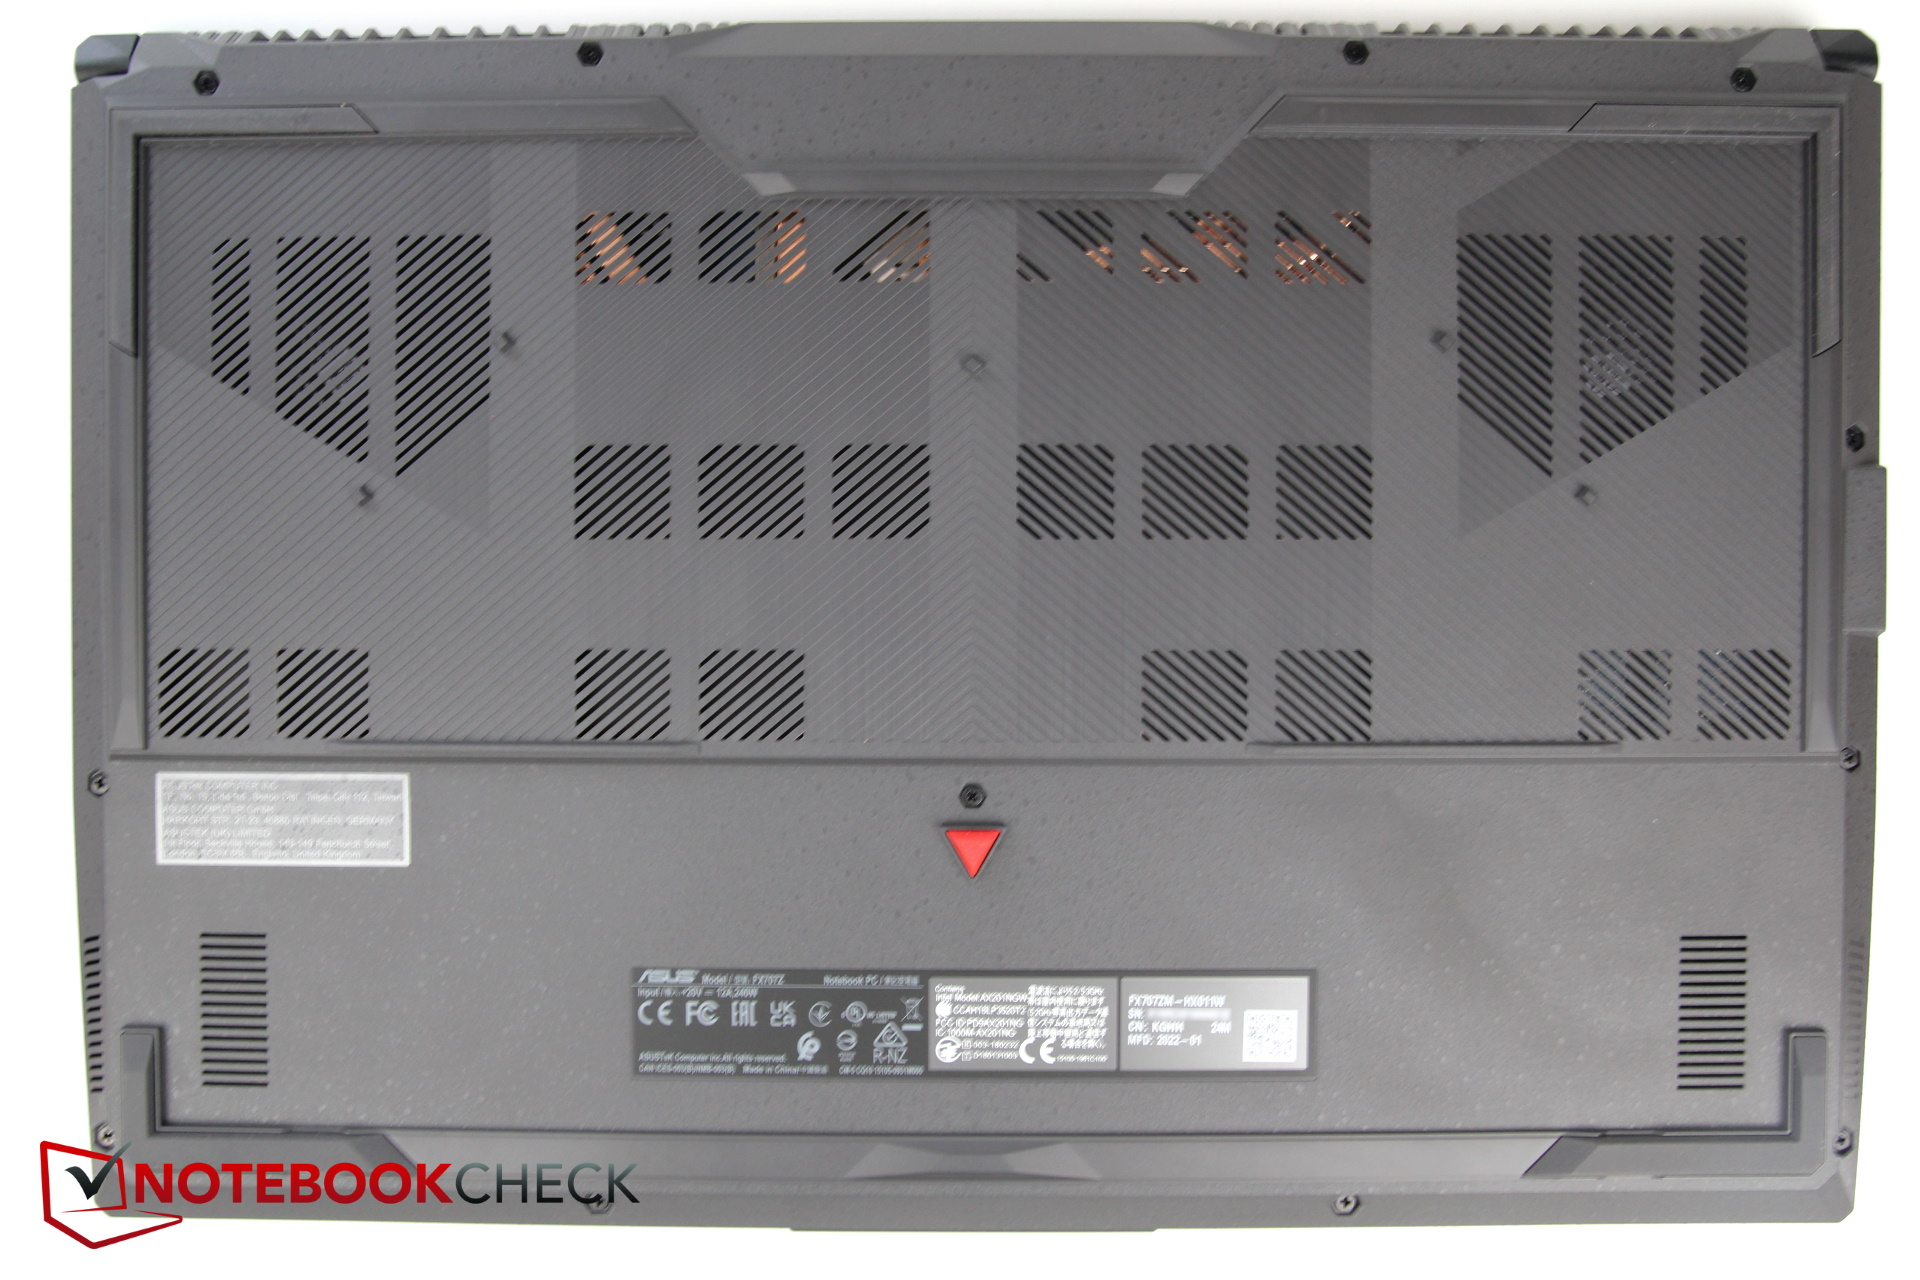
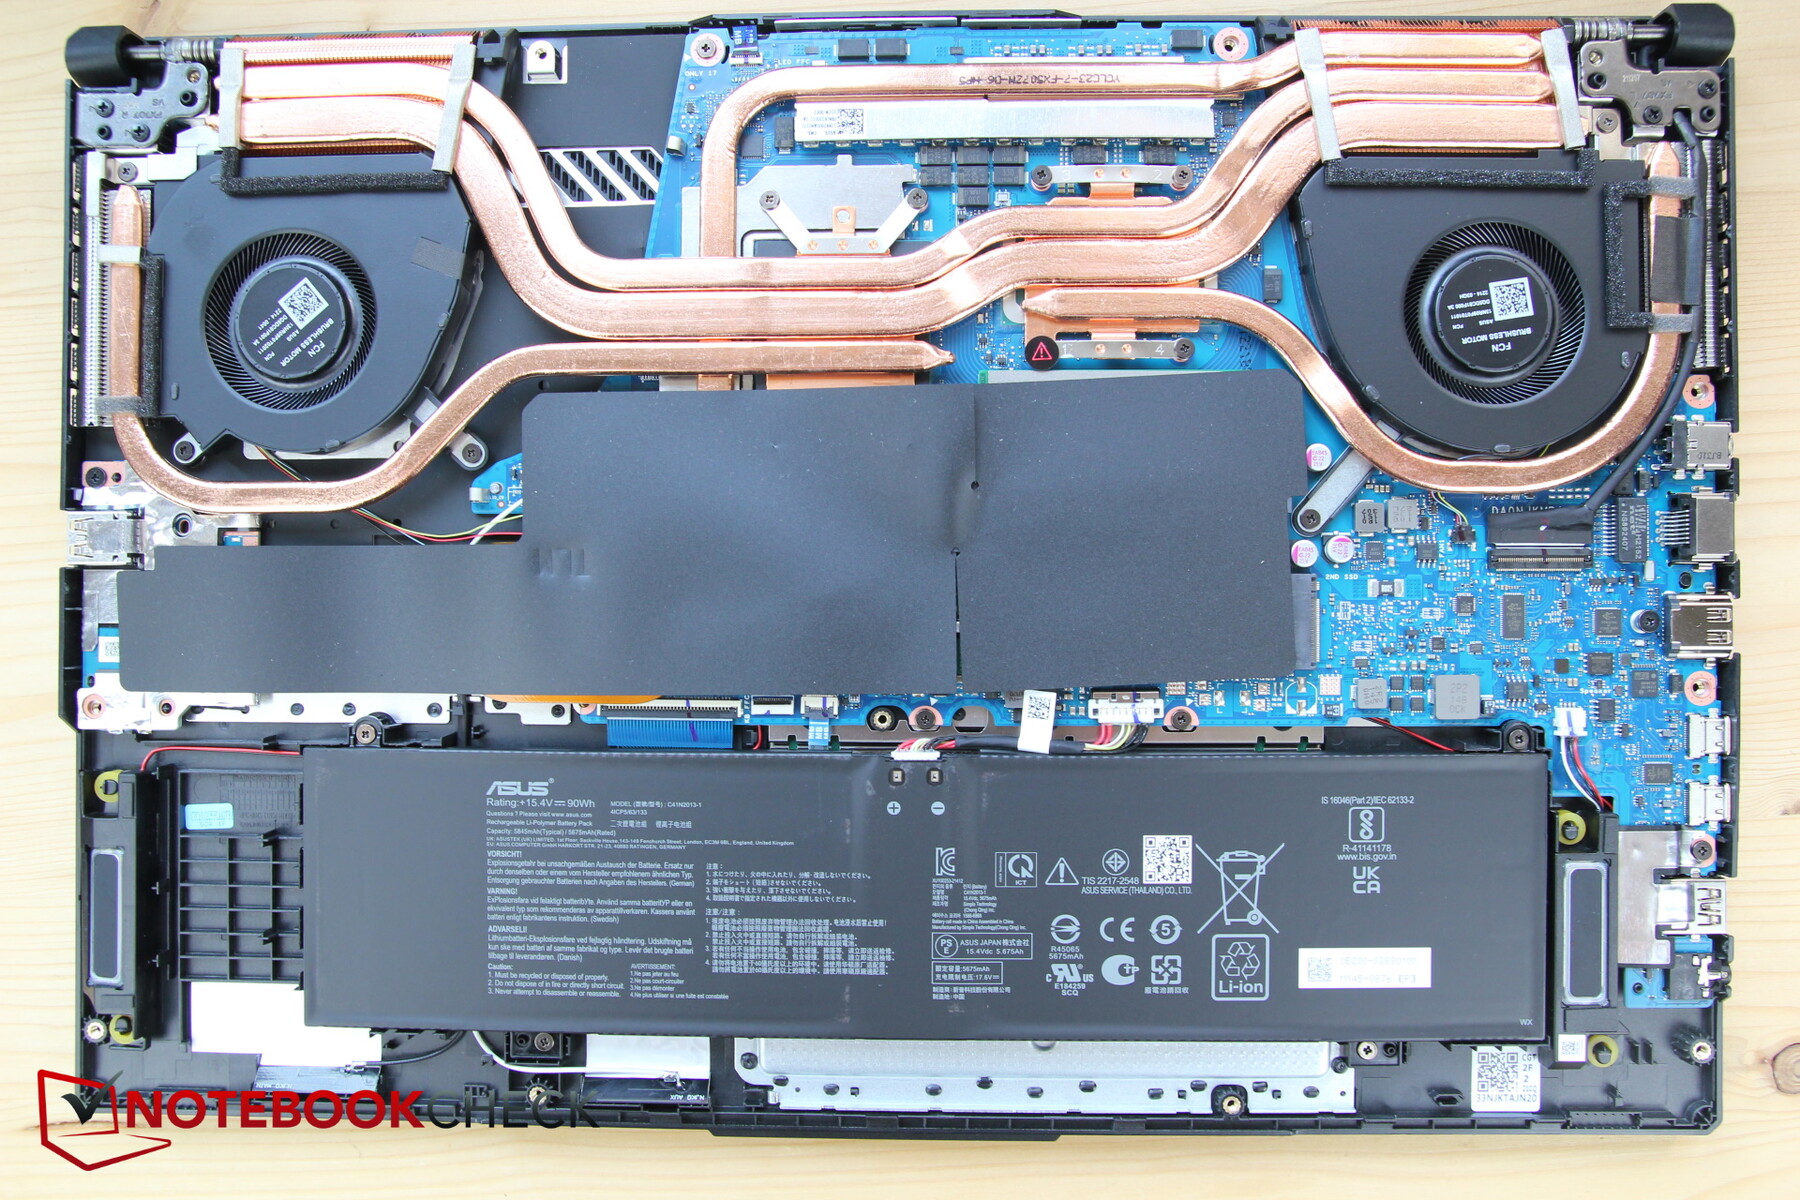
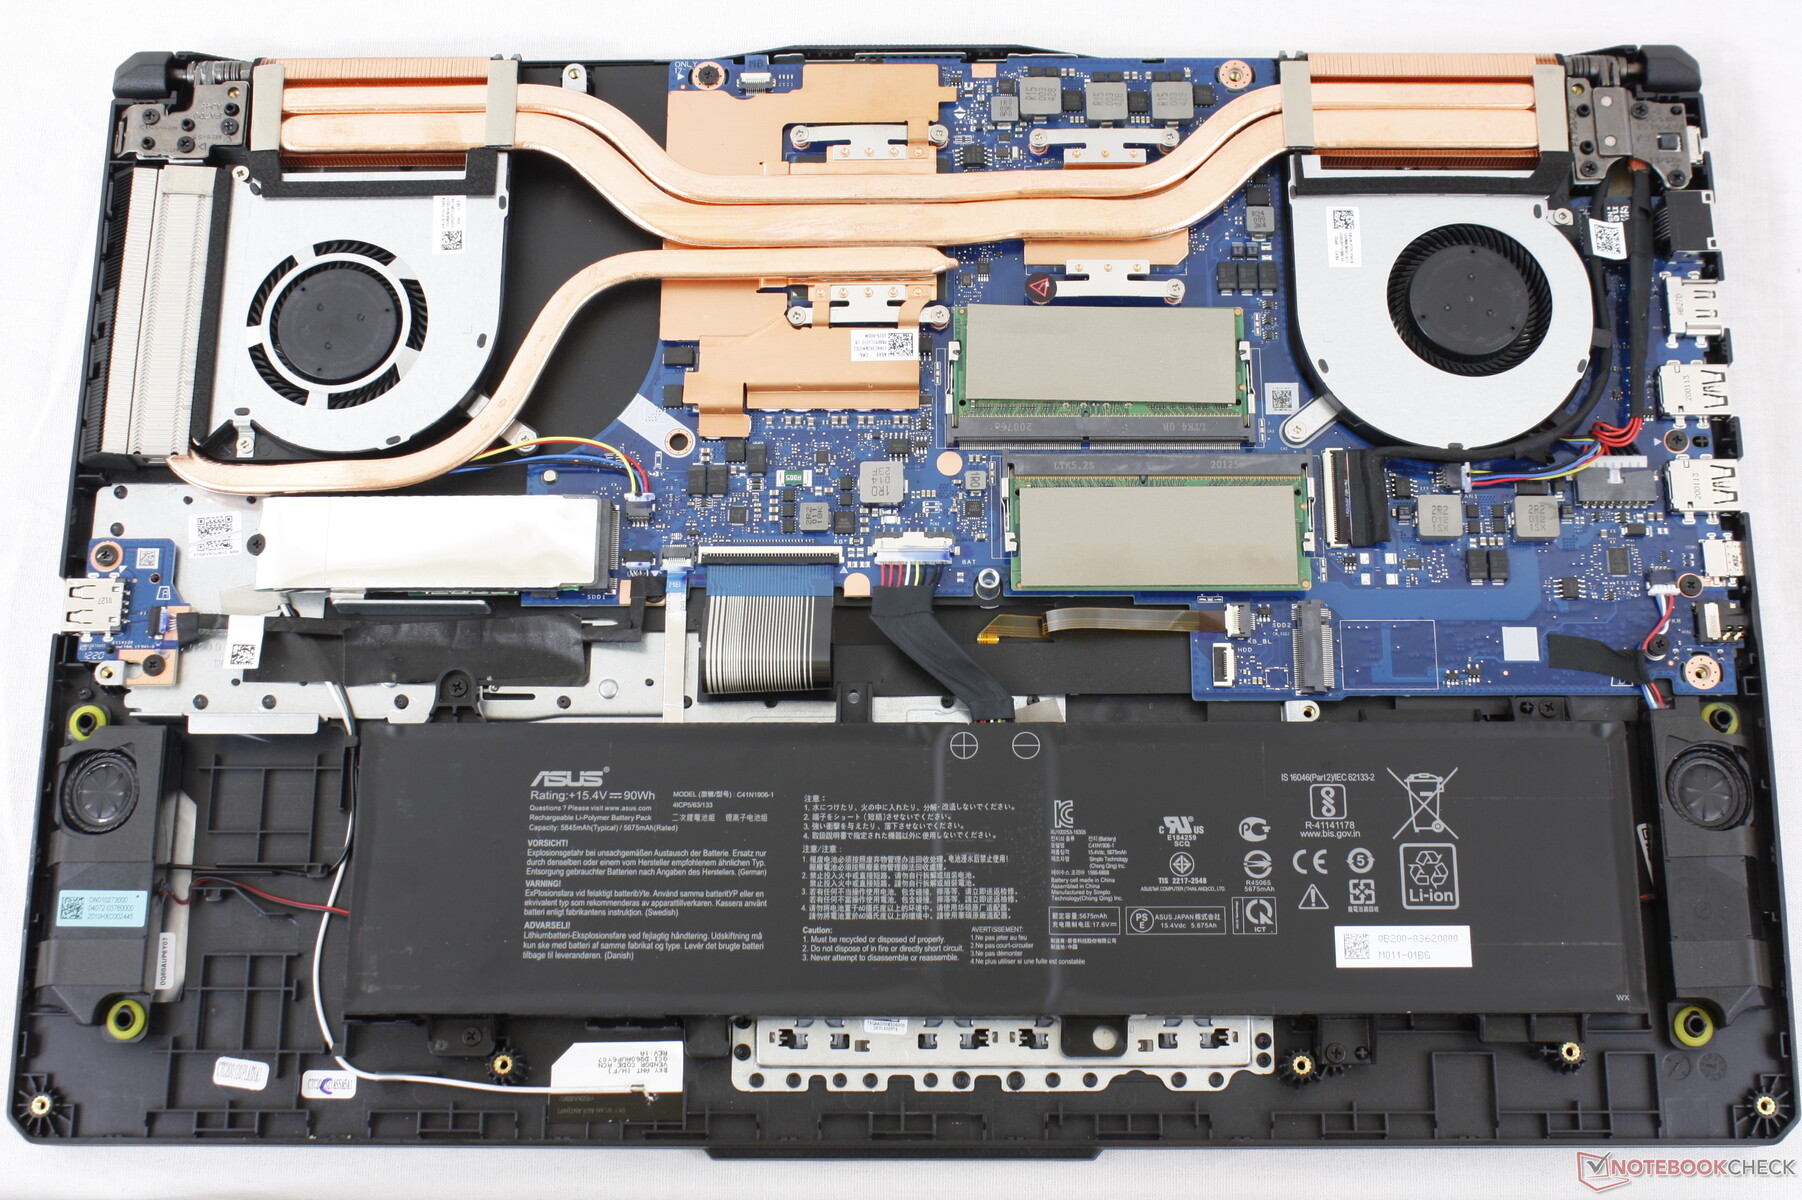
Manutenzione
Il coperchio inferiore è tenuto in posizione da 12 viti Phillips facilmente visibili. Sfortunatamente, sono disponibili in tre diverse lunghezze, quindi è necessario tenere traccia di quale vite va dove.
Togliere il coperchio inferiore si è rivelata un'esperienza relativamente semplice. Con il coperchio rimosso, si ha accesso alle ventole, alla batteria, all'SSD e alla RAM. Questi ultimi due sono protetti da una copertura di plastica nera fissata con del nastro adesivo, oltre alla quale l'SSD è anche coperto da una sorta di foglio di metallo per migliorare la dissipazione del calore. È disponibile uno slot M.2 secondario per un ulteriore SSD.

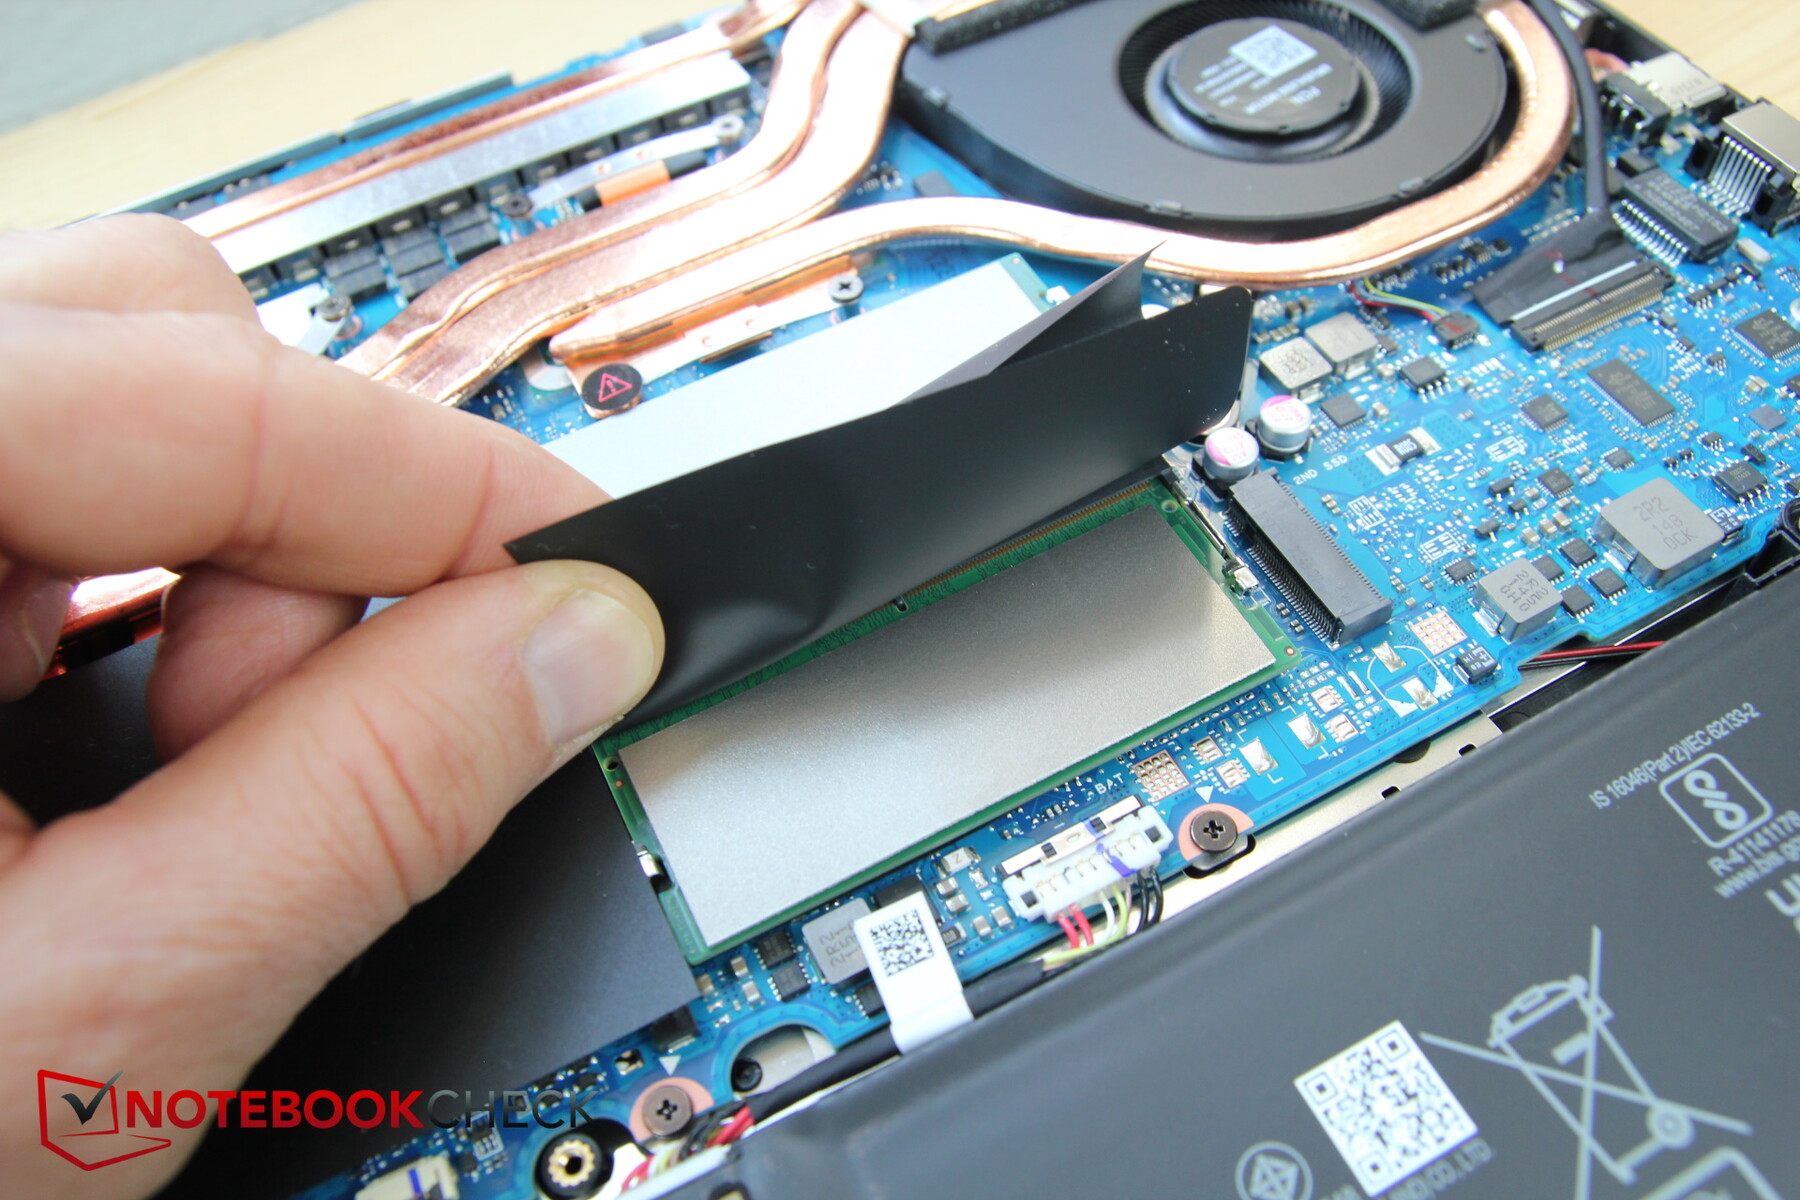
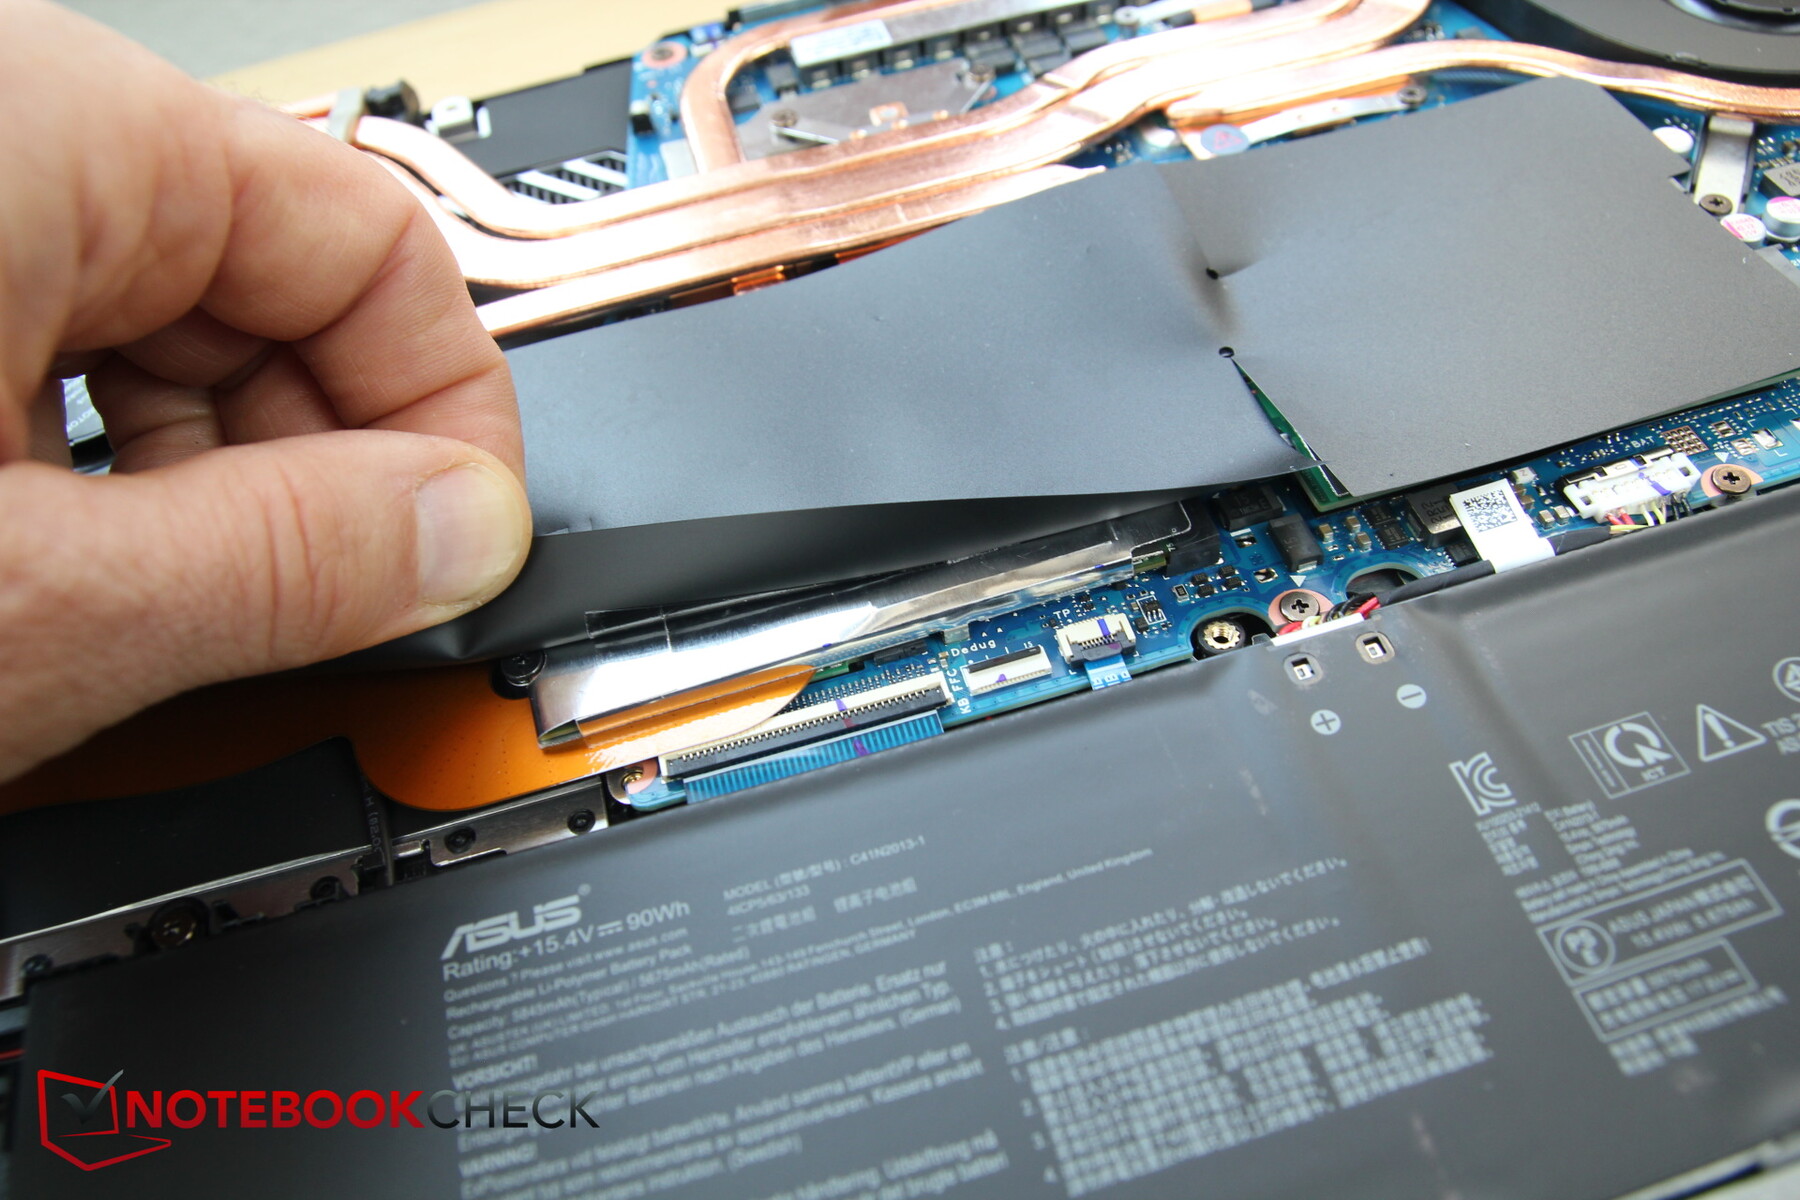
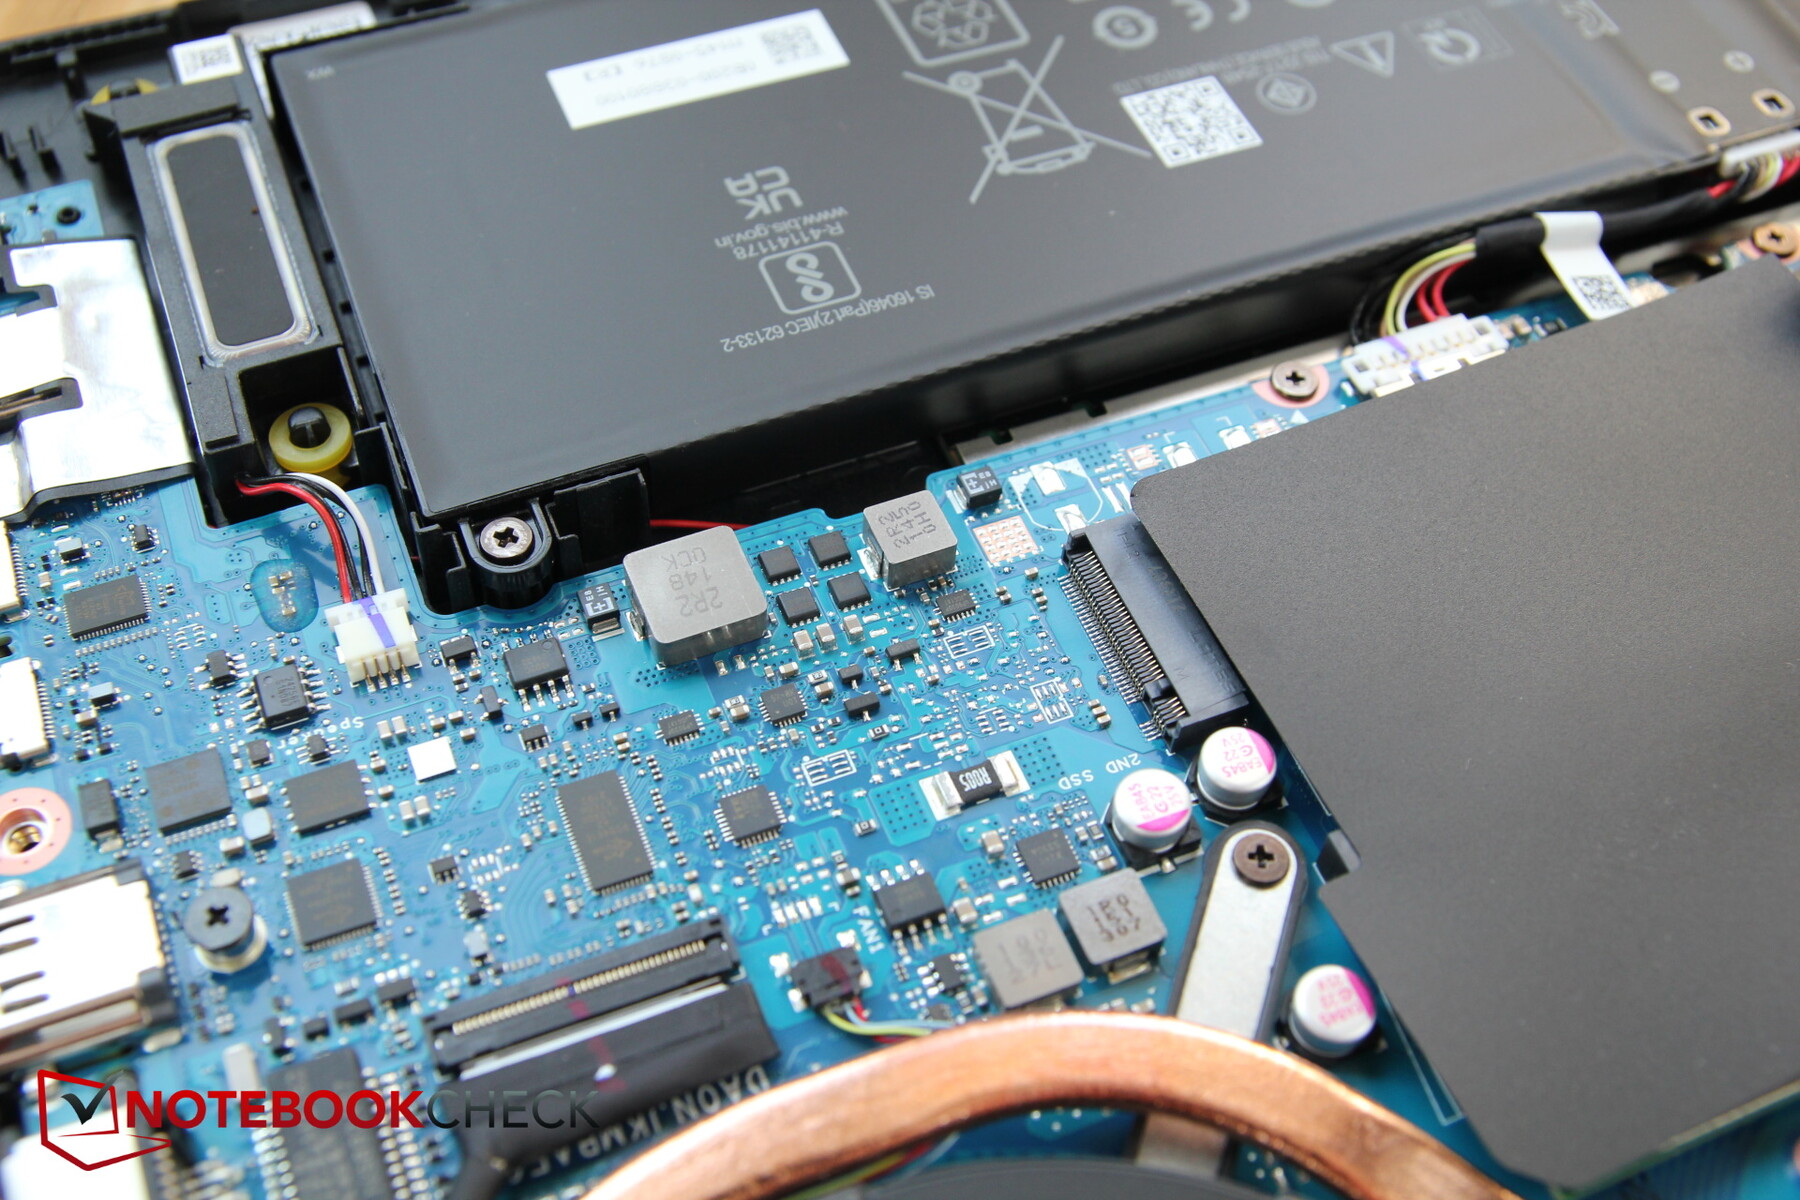
Il nuovo modello sembra abbastanza diverso all'interno rispetto all'FX706. Si nota per i tubi di calore aggiuntivi, altoparlanti più grandi, SSD riposizionati e altro.
Dispositivi di input - Tasti piccoli
Tastiera
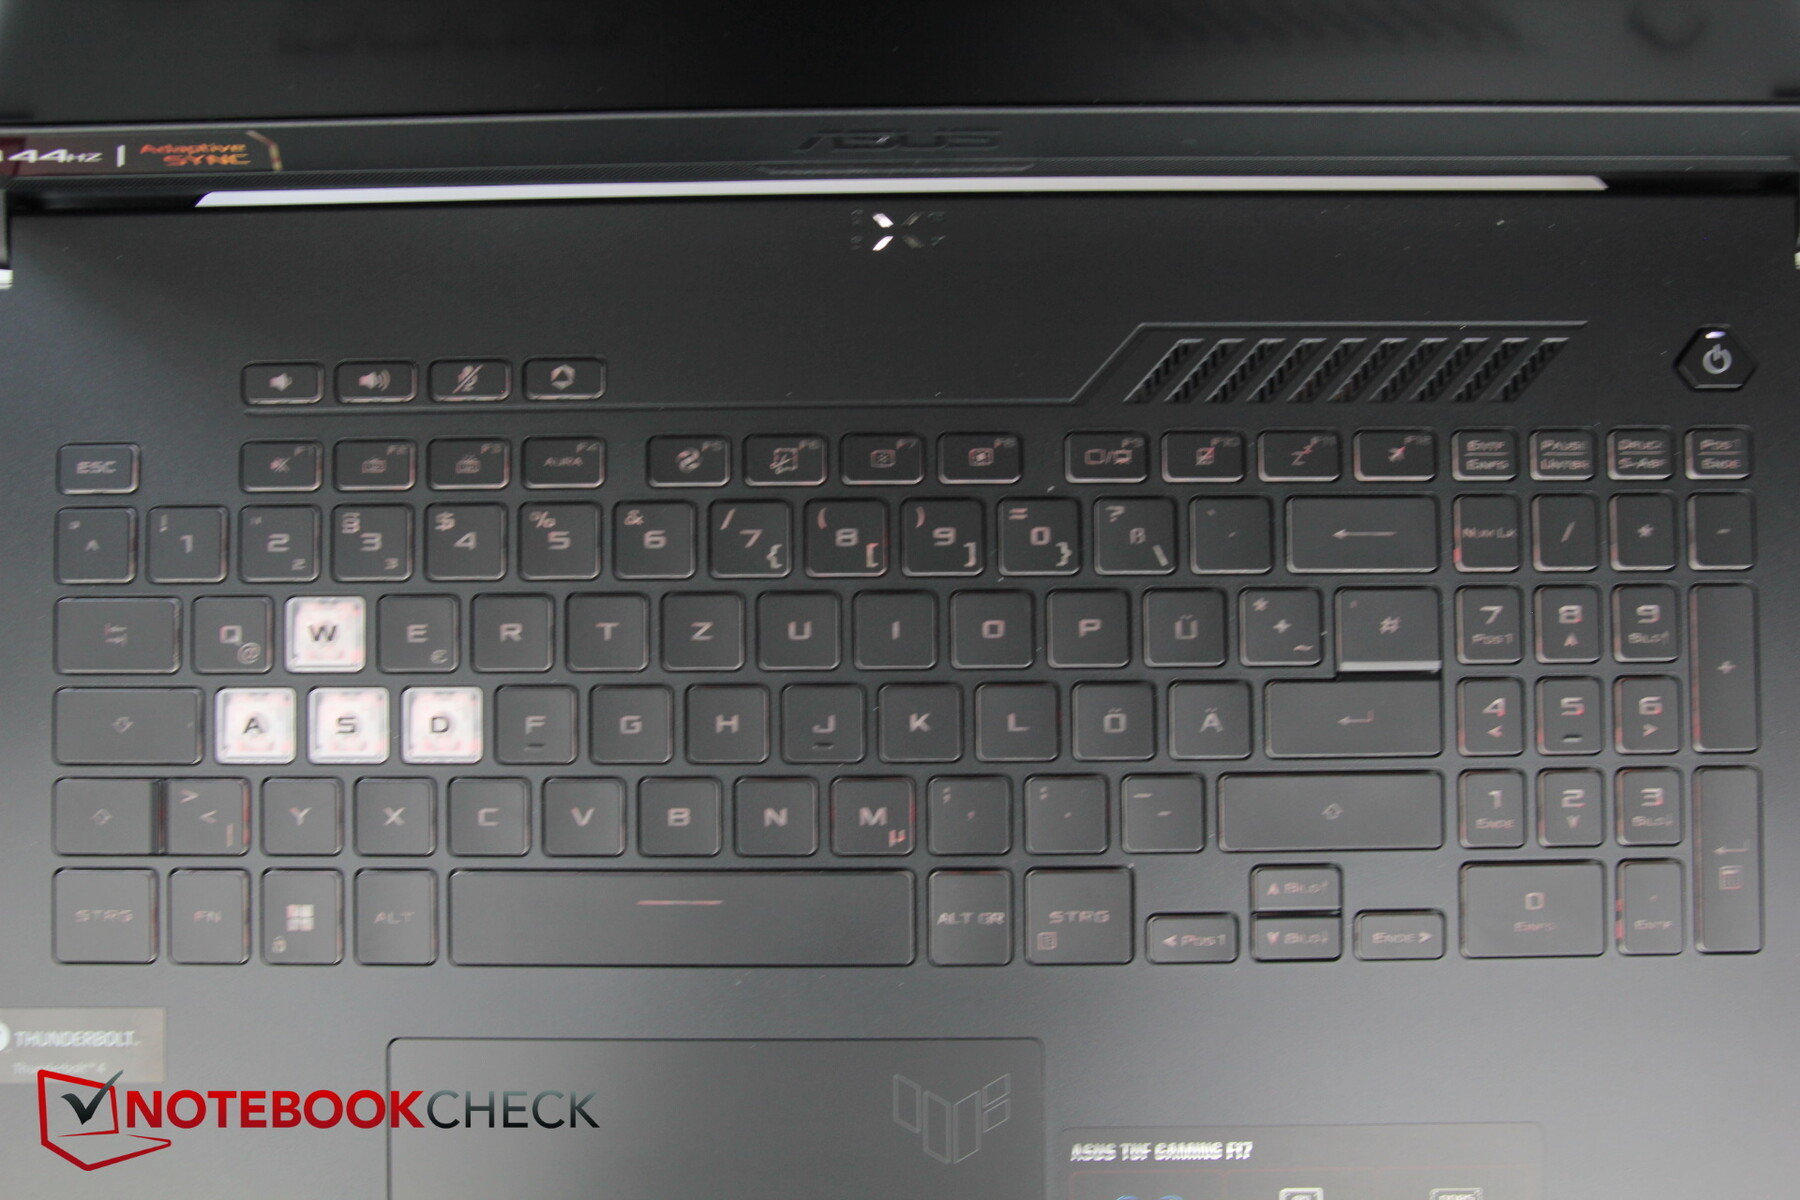
Il layout della tastiera rimane in gran parte identico, con un numpad che è molto stretto per un notebook da 17 pollici. I tasti cursore sono ancora solo la metà delle dimensioni dei tasti normali; i tasti su/giù prendono lo spazio di un tasto di dimensioni normali.
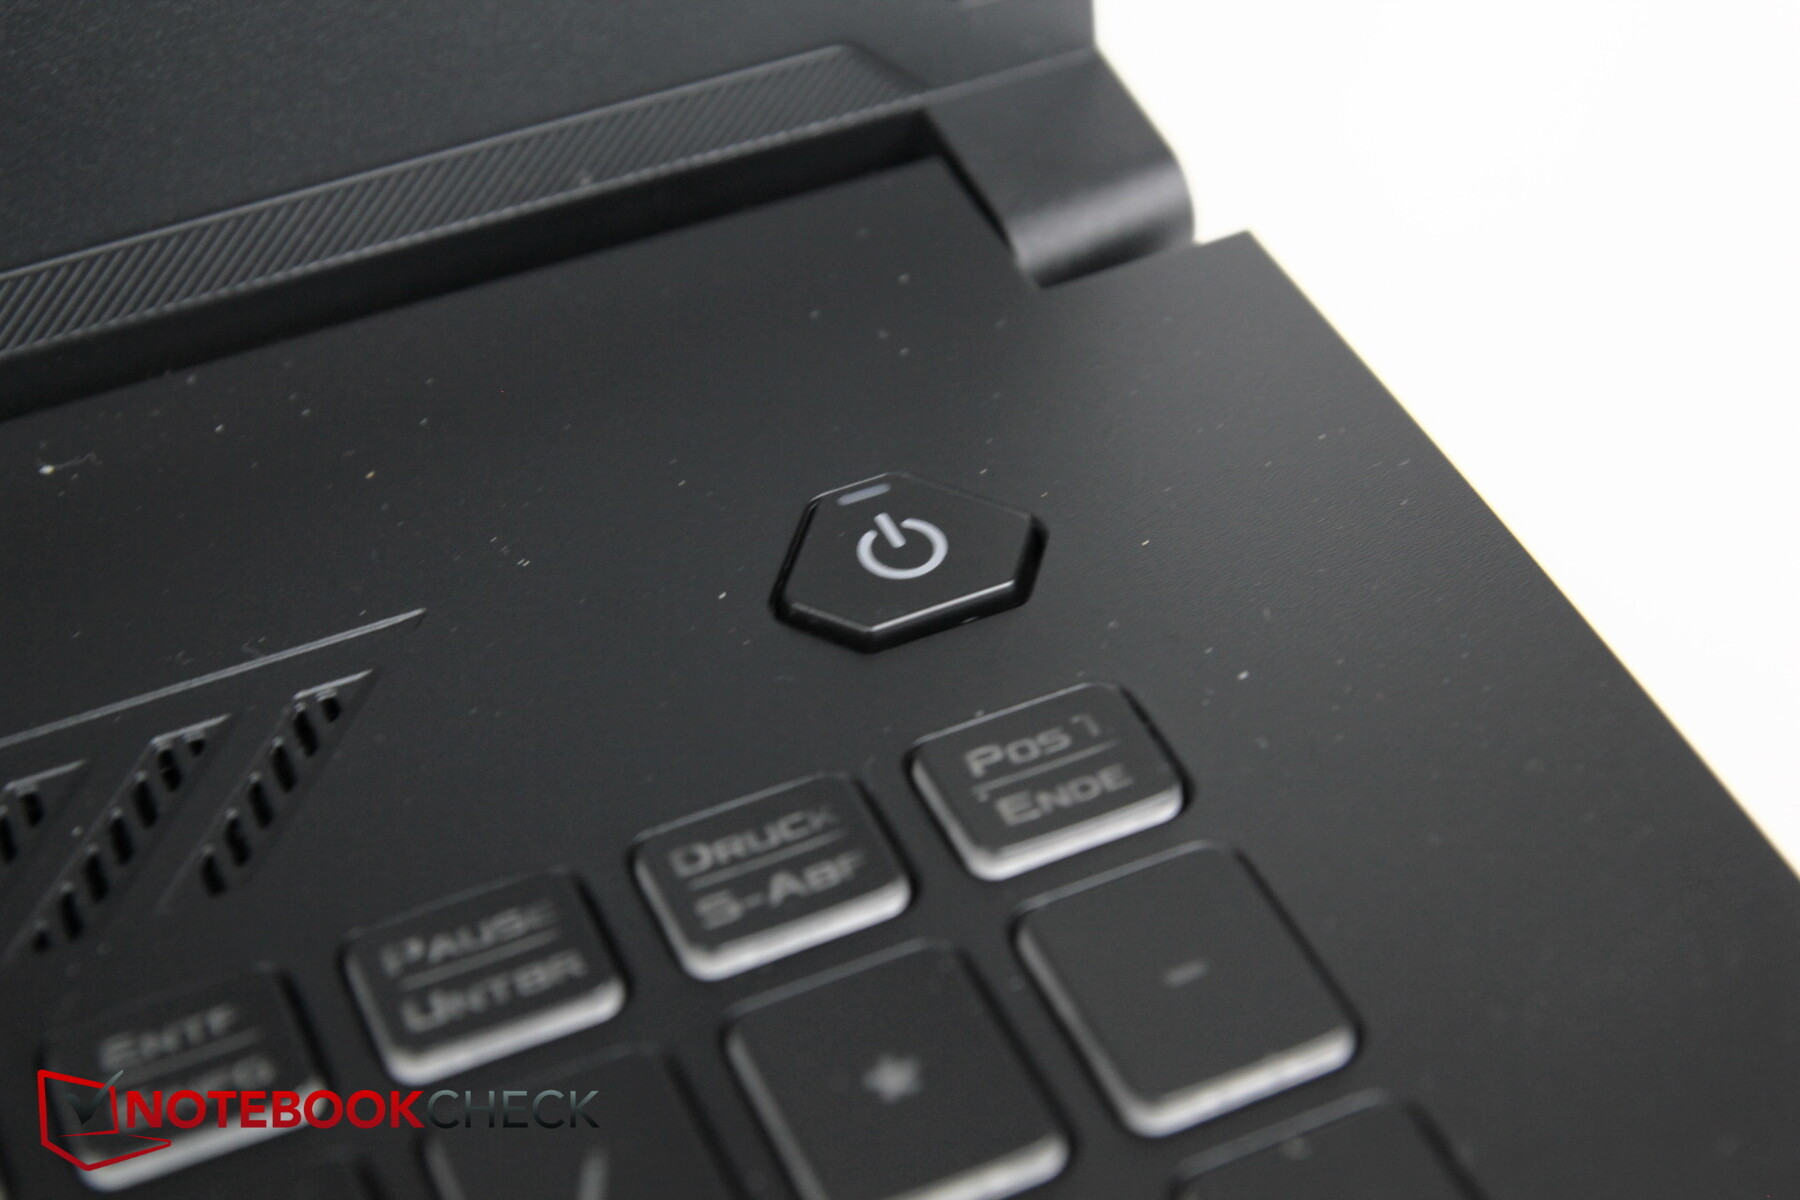
Nuovi sono i quattro tasti funzione extra in alto a sinistra, sopra la tastiera, usati per alzare e abbassare il volume, silenziare e lanciare il software Armory Crate. Come prima il pulsante di accensione è un'entità dedicata e separata nell'angolo in alto a destra, e come è comune sui notebook da gioco i tasti WASD hanno un colore bianco traslucido separato che contrasta molto nettamente con il resto della tastiera.
La tastiera è retroilluminata con una retroilluminazione RGB a tre stadi che non può essere personalizzata per tasto ma solo per zona.
La corsa dei tasti rimane relativamente breve, con un feedback significativo ma un po' più morbido rispetto al suo predecessore. Nel complesso, la tastiera è molto piacevole da digitare con emissioni di rumore moderate.
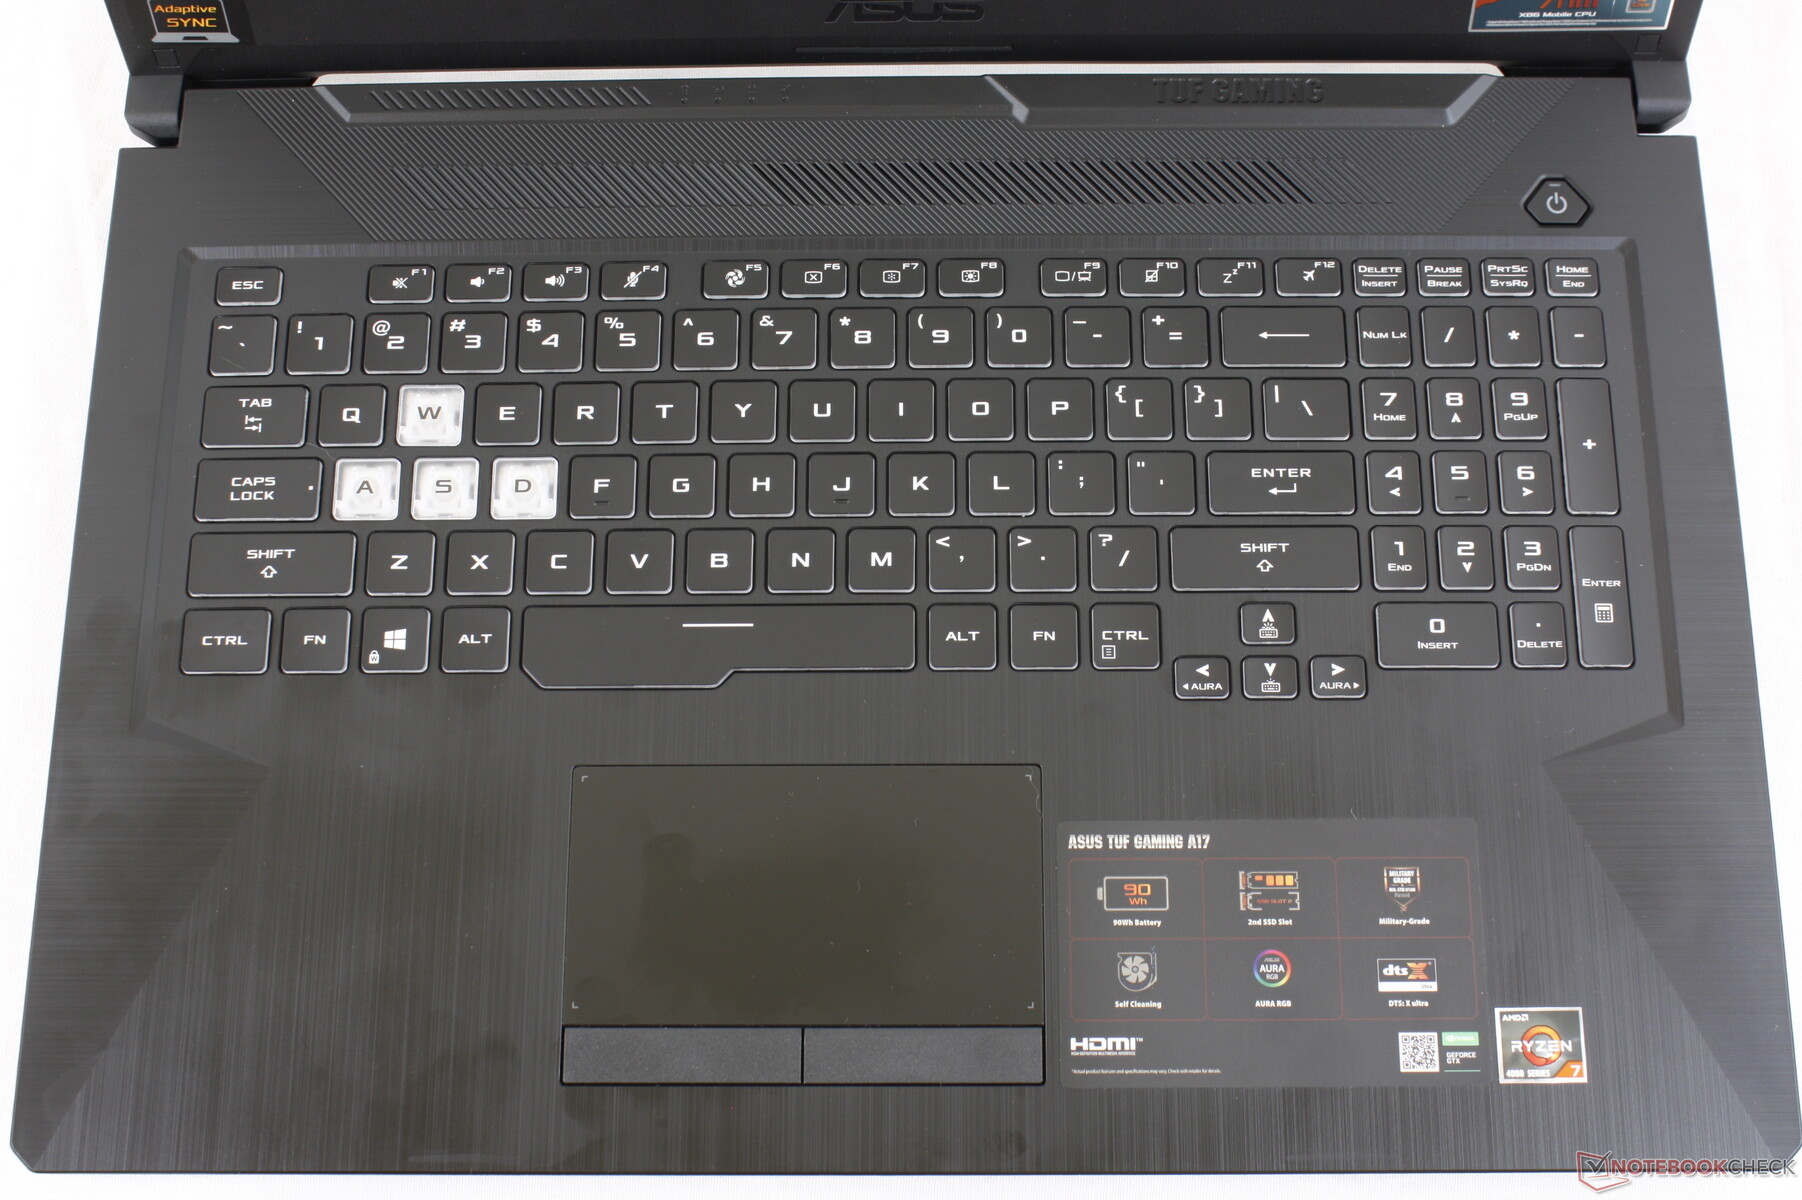

Touchpad
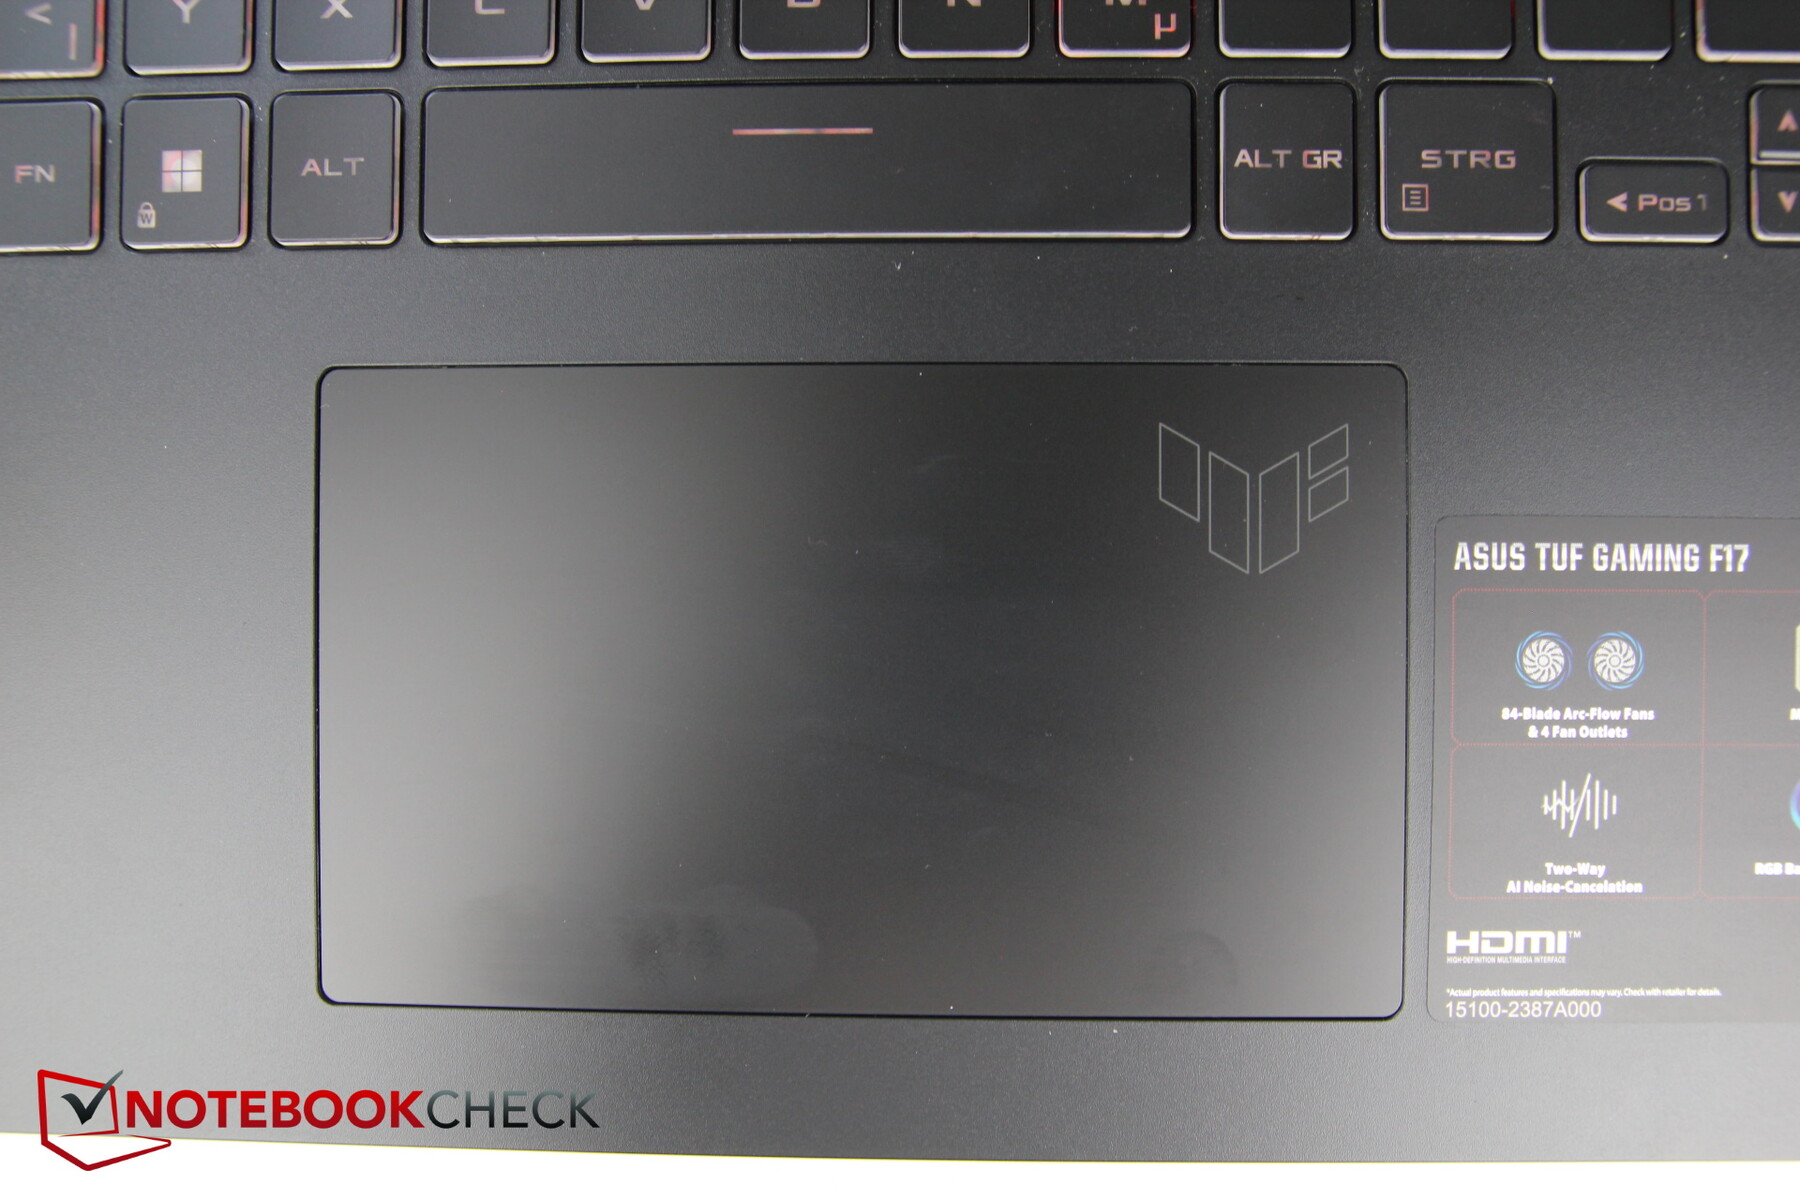
Il touchpad non presenta più pulsanti dedicati ma è ora un po' più grande di prima (circa 13 x 7,7 cm / 5,1 x 3 pollici). La sua superficie è piacevolmente liscia e solo leggermente appiccicosa con movimenti molto lenti. Abbiamo anche scoperto la presenza di un piccolo punto morto nell'angolo in basso a destra.
I pulsanti integrati funzionano bene senza problemi e con emissioni di rumore moderate.
Schermo - poco luminoso e non veramente fatto per il gioco
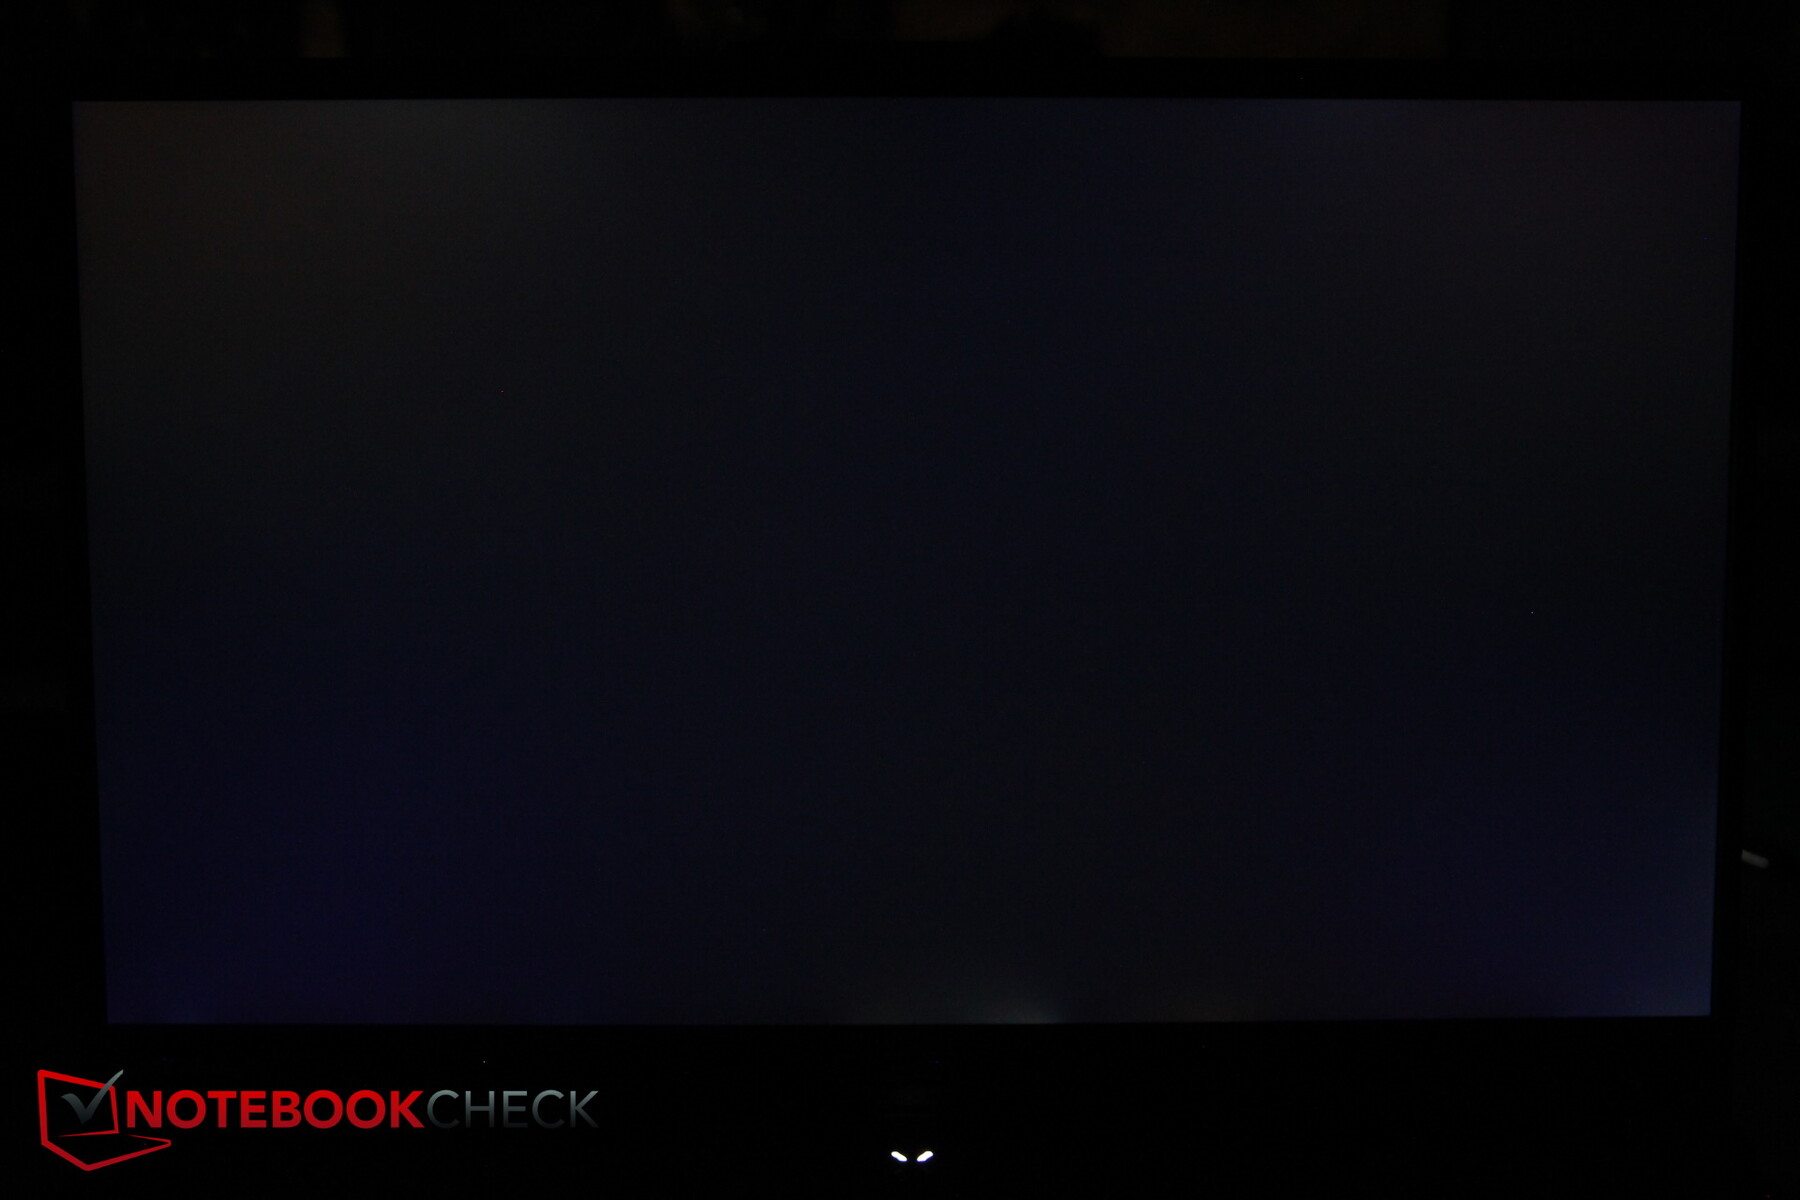
L'unico display con cui questo Asus viene spedito è un pannello FHD IPS 144 Hz prodotto da AU Optronics.
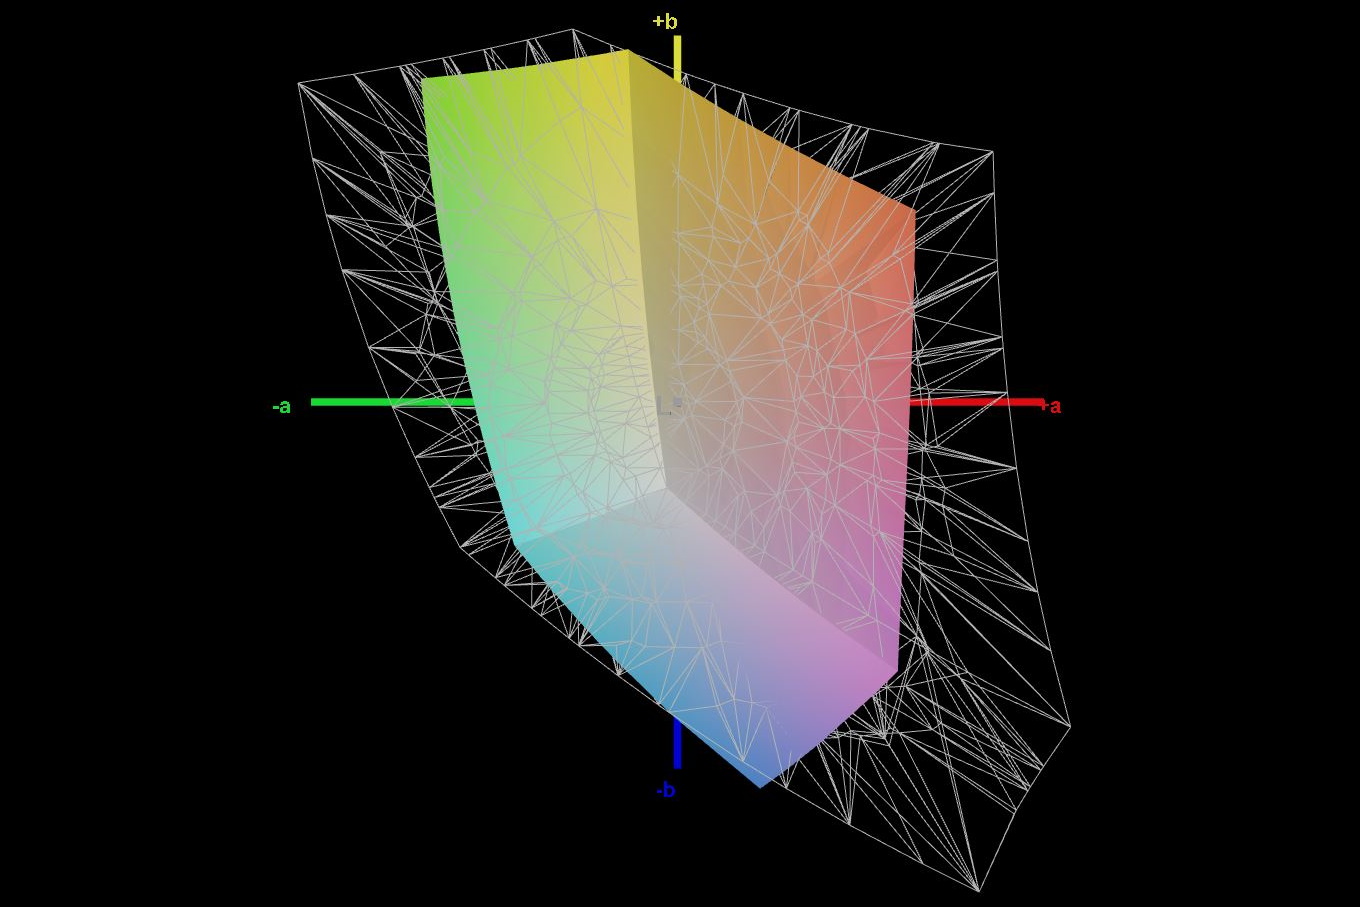
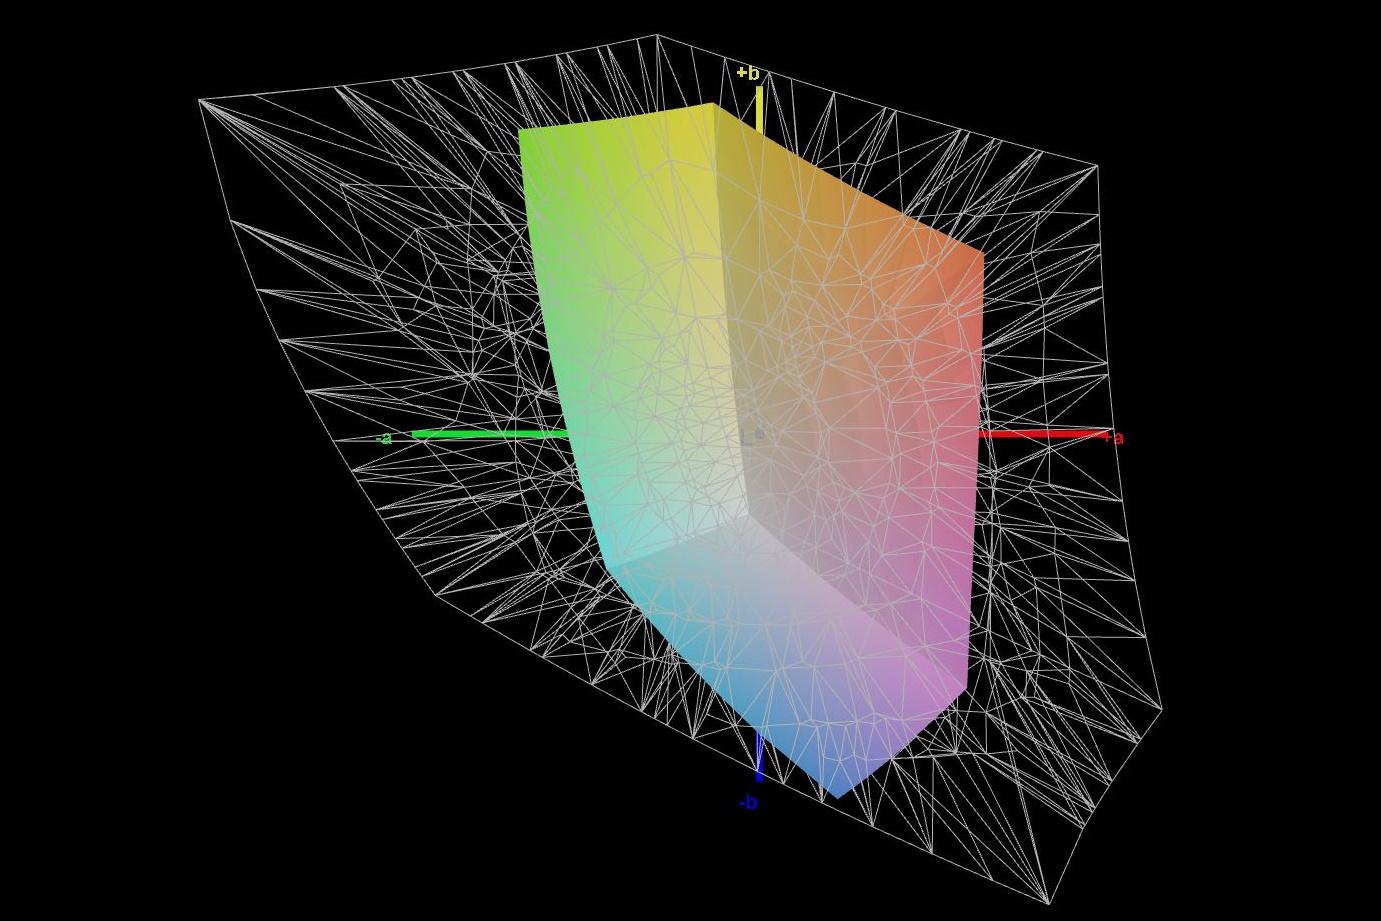
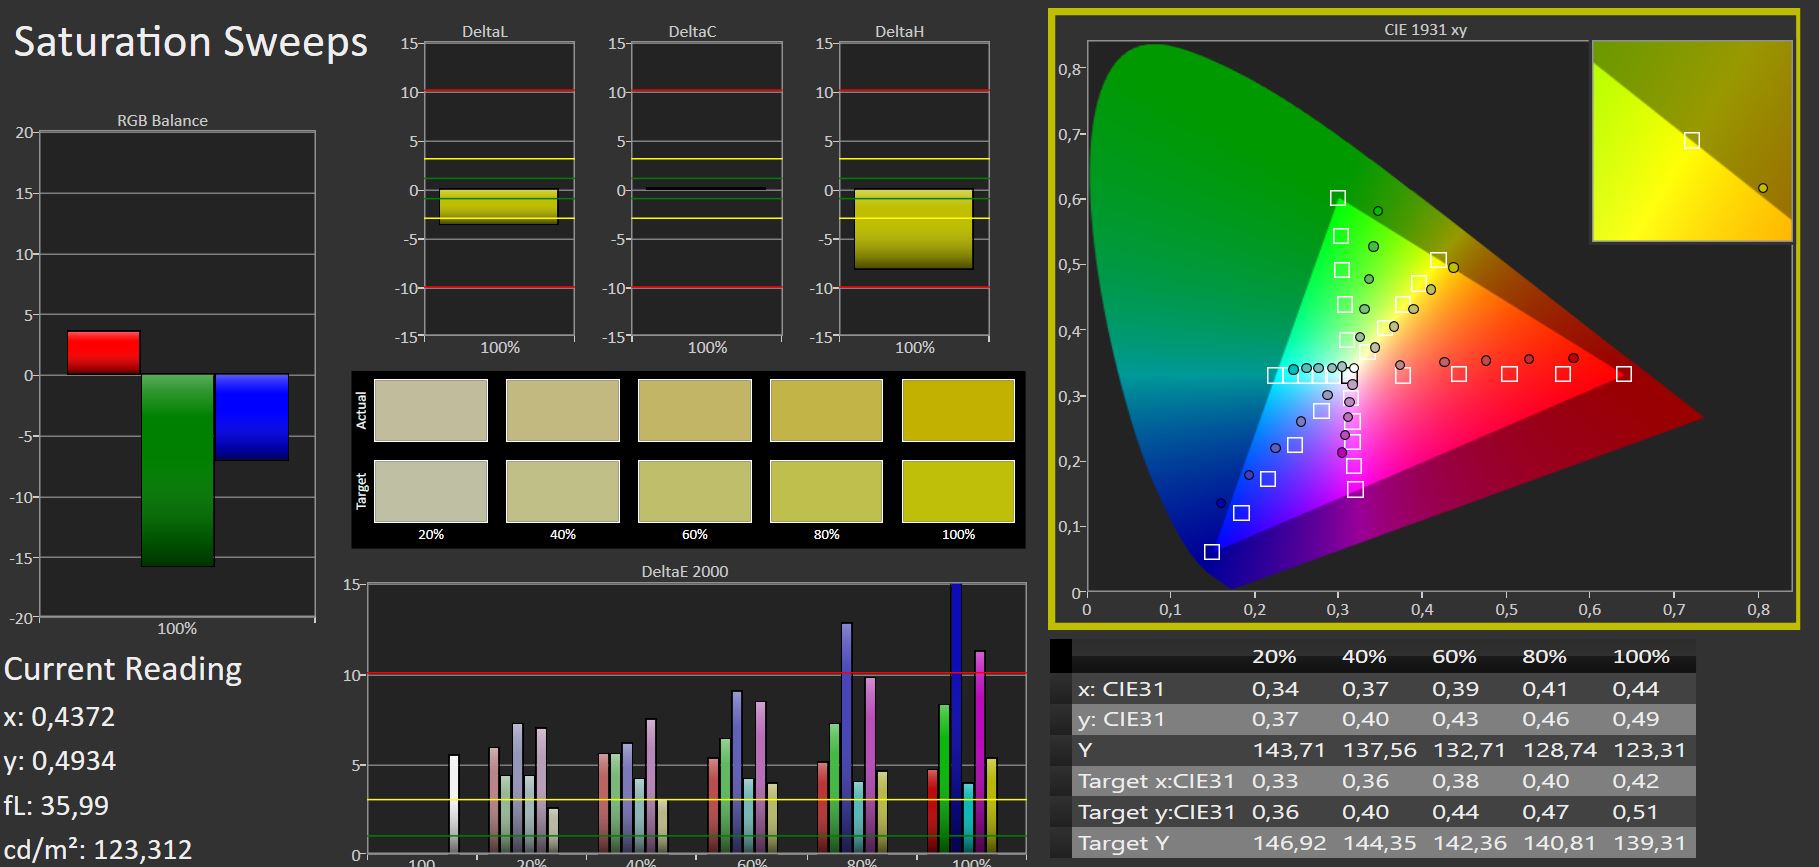
Il pannello è ben noto ed è stato in circolazione per un bel po', e data la sua bassa luminosità di soli 268 nits, i tempi di risposta lenti di 30-40 ms, e la copertura dello spazio colore del 60% sRGB e circa il 41% AdobeRGB, siamo abituati a vederlo utilizzato nei portatili più economici come l'MSI GF75 Thin.
Sul lato positivo, il suo livello di nero è abbastanza basso a causa della bassa luminosità complessiva, rendendo il suo rapporto di contrasto relativamente alto. Lo sviluppo dell'illuminazione è decente all'89%.
E mentre il pannello non soffre di sfarfallio PWM, soffre di un minore ma ancora evidente sanguinamento della retroilluminazione lungo i bordi.
| |||||||||||||||||||||||||
Distribuzione della luminosità: 89 %
Contrasto: 1688:1 (Nero: 0.17 cd/m²)
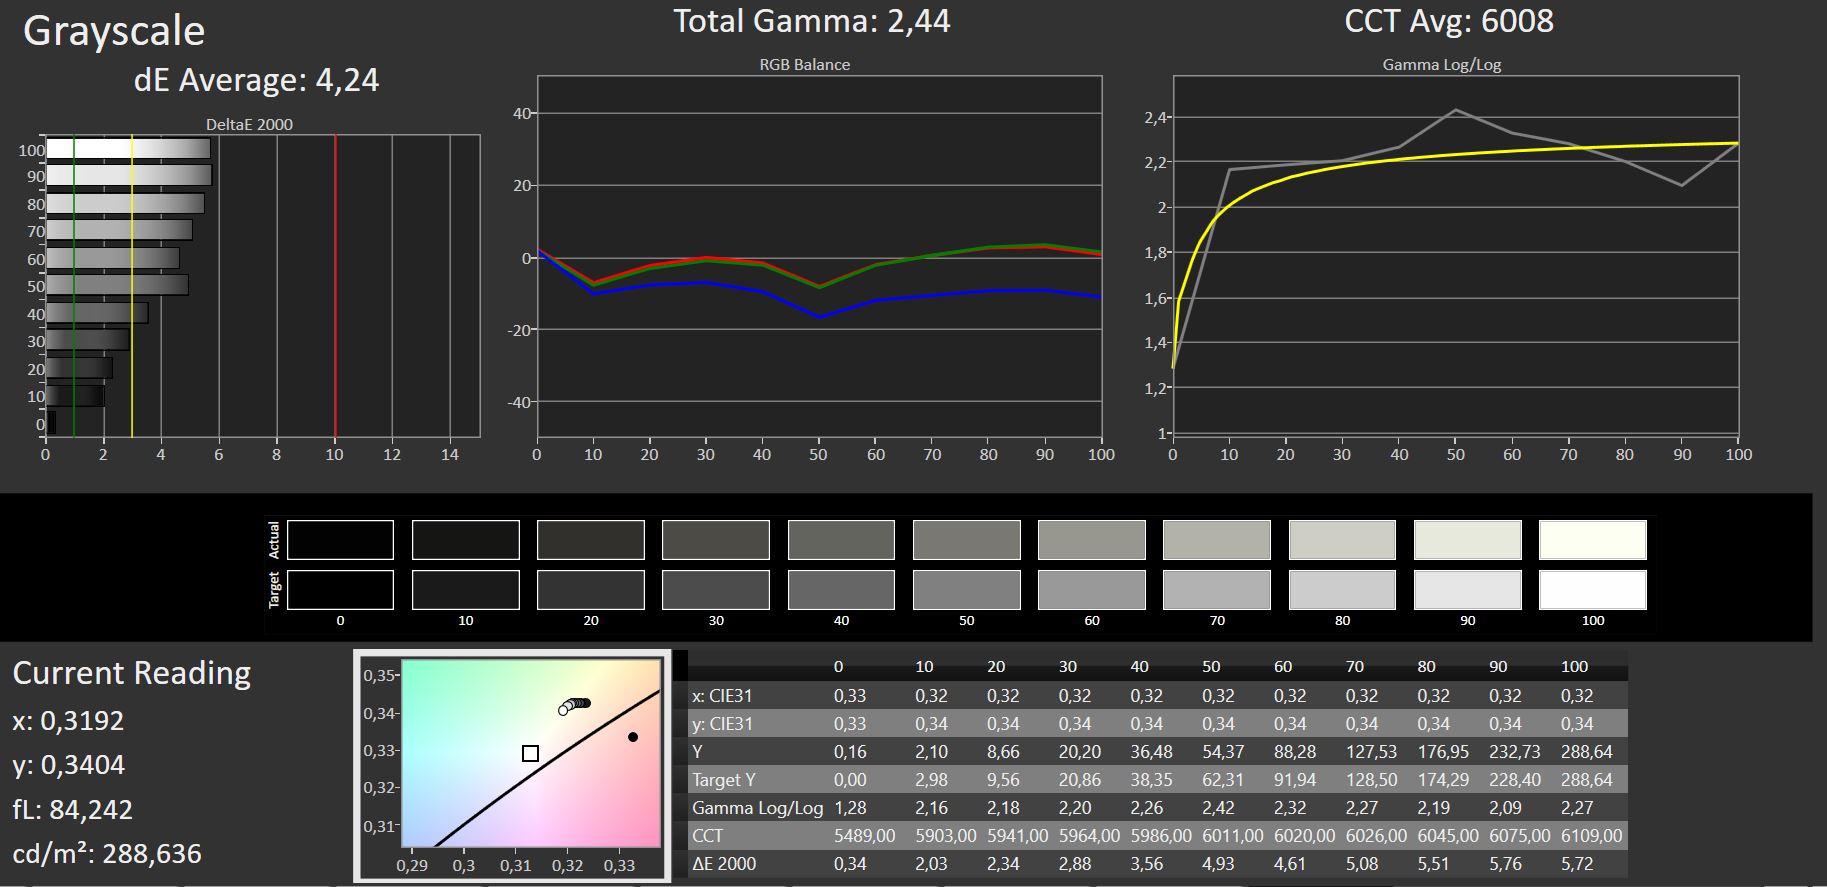
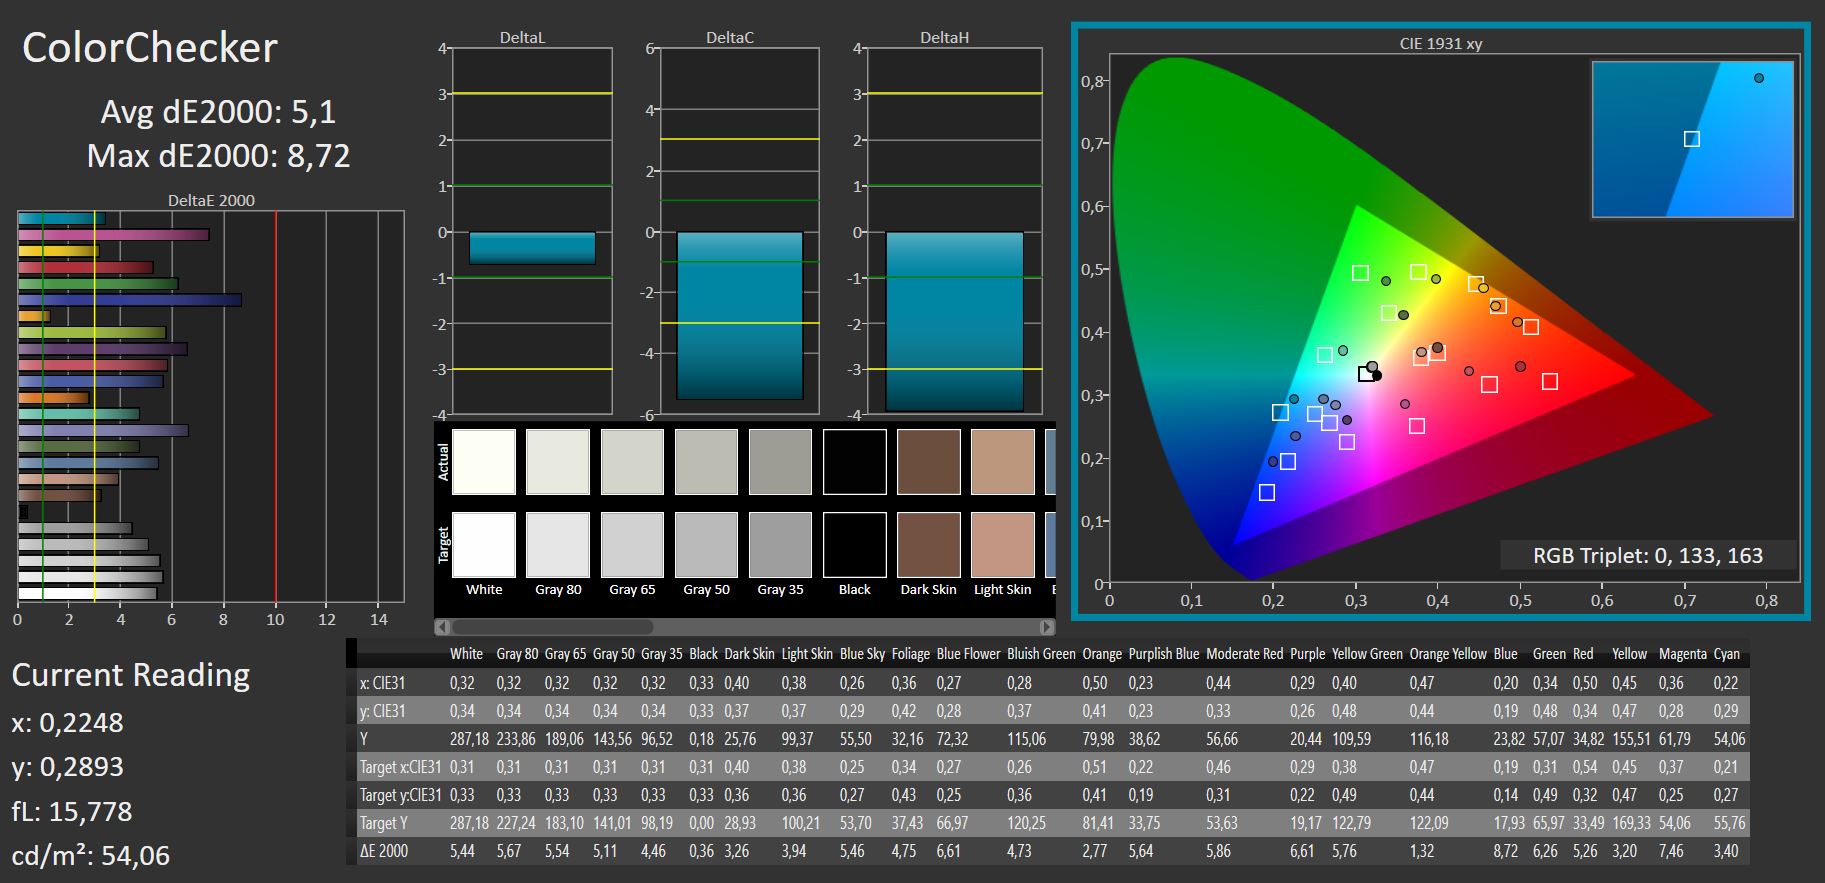
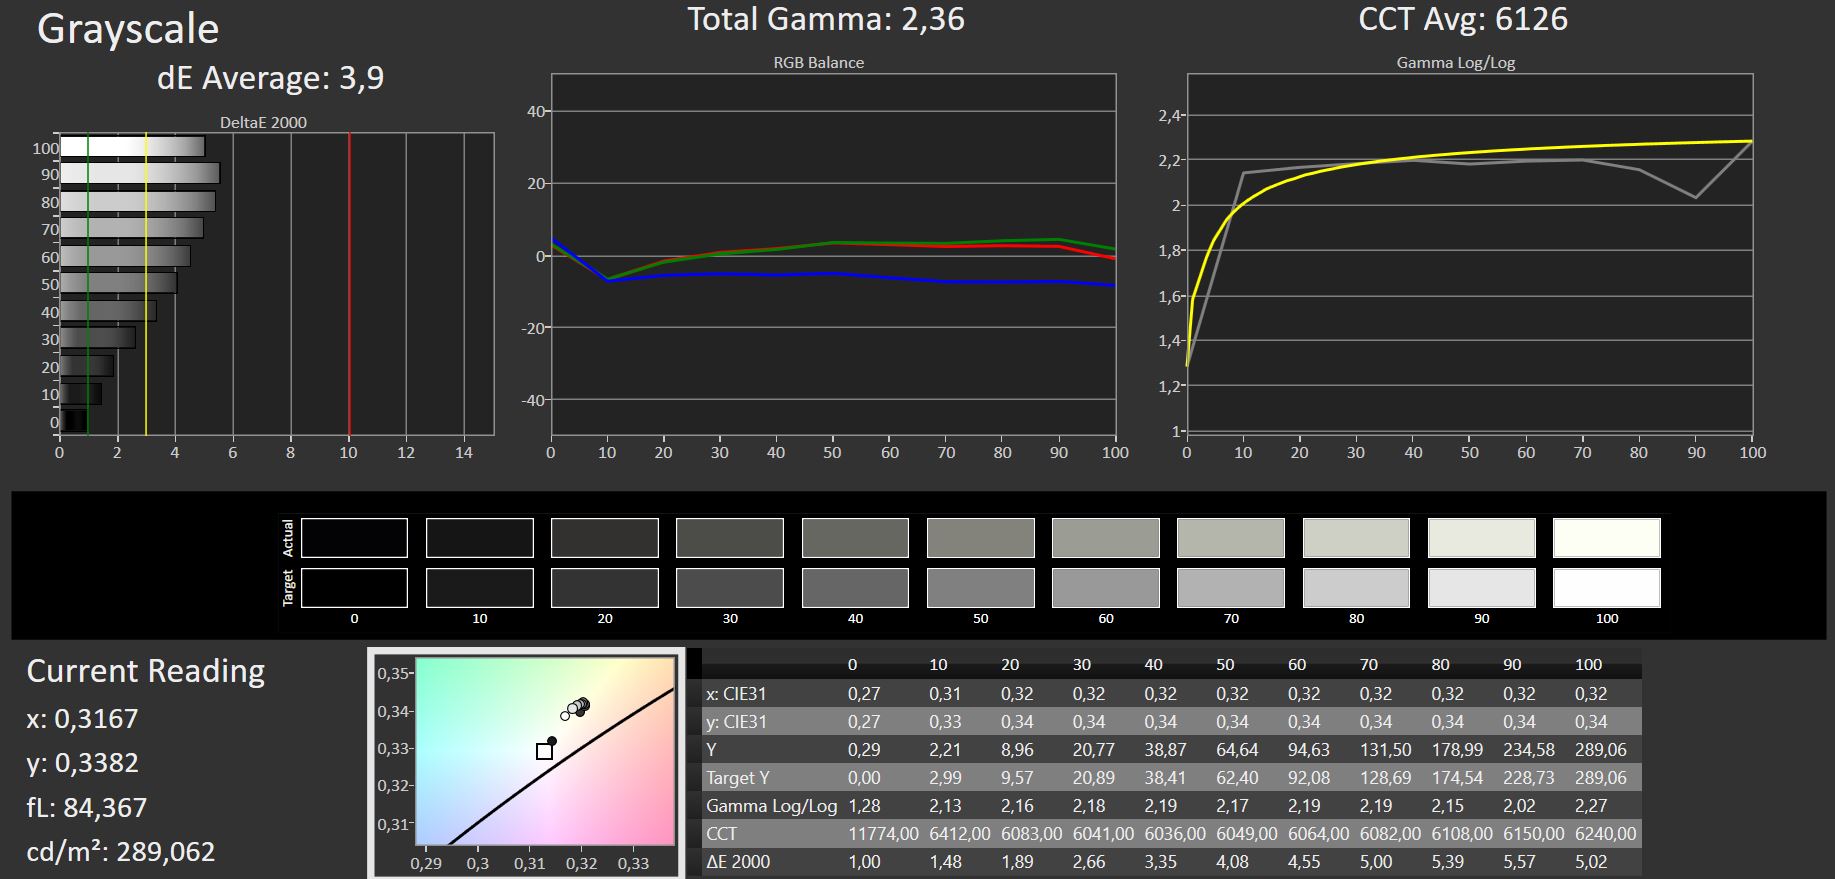
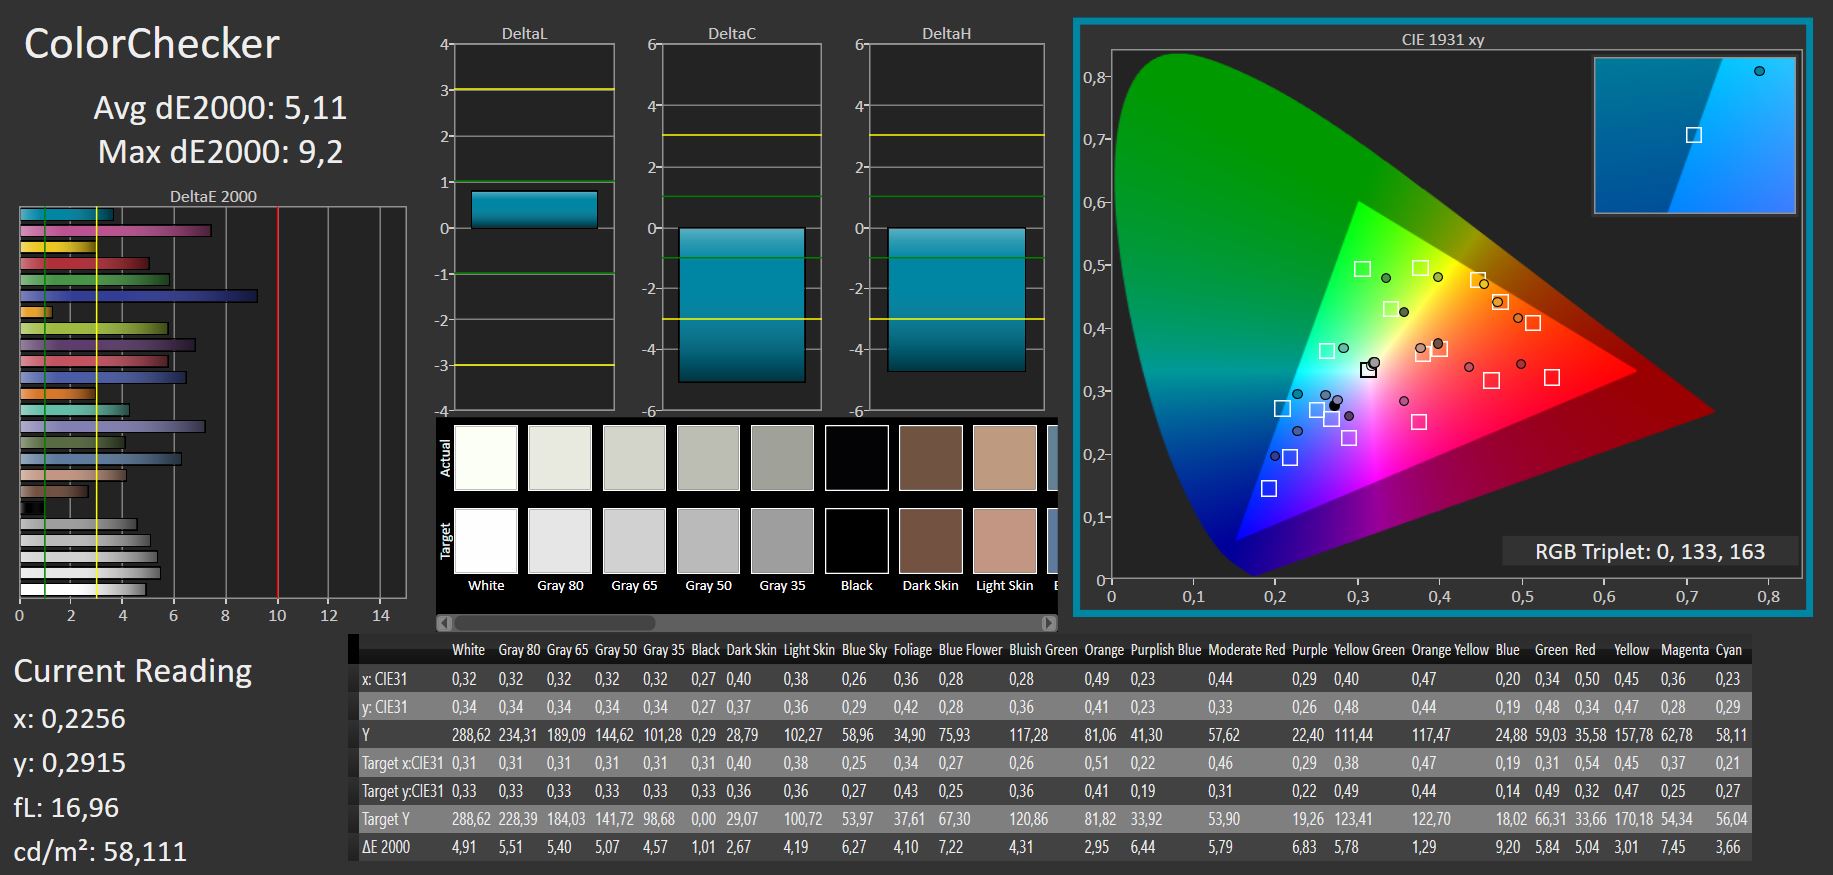
ΔE ColorChecker Calman: 5.1 | ∀{0.5-29.43 Ø4.73}
calibrated: 5.1
ΔE Greyscale Calman: 4.24 | ∀{0.09-98 Ø4.97}
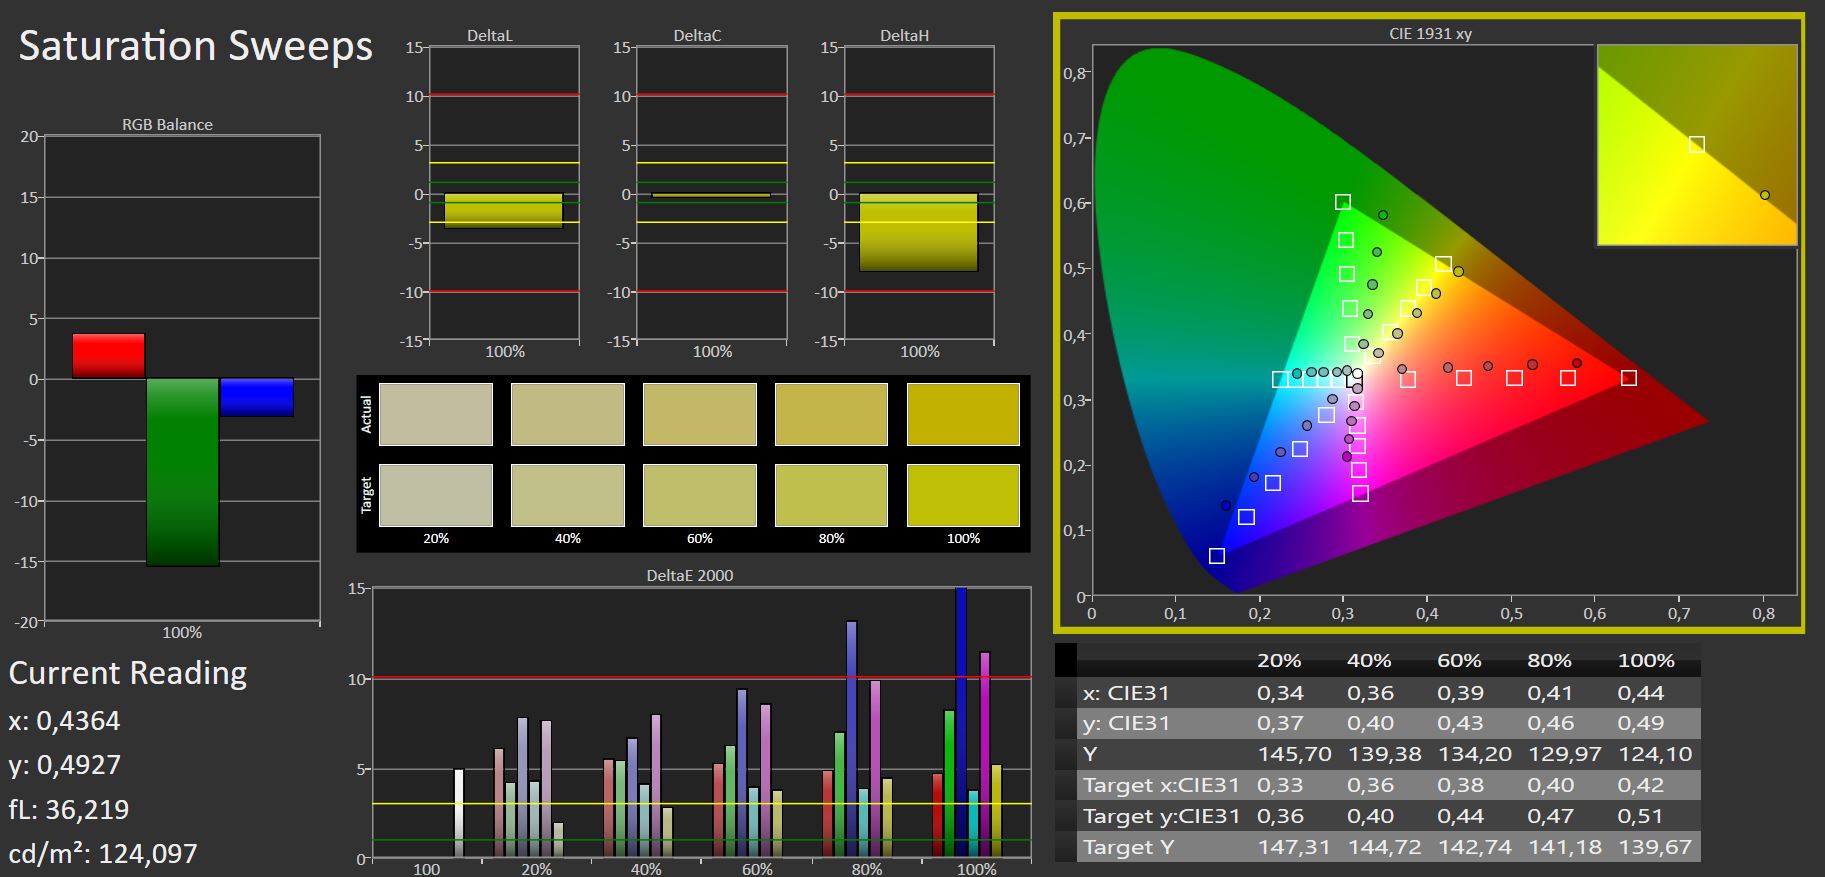
41.5% AdobeRGB 1998 (Argyll 3D)
59.7% sRGB (Argyll 3D)
40.2% Display P3 (Argyll 3D)
Gamma: 2.44
CCT: 6008 K
| Asus TUF Gaming F17 FX707Z-HX011W AU Optronics B173HAN04.9 (AUO4B9D), IPS, 1920x1080, 17.3" | Asus TUF Gaming F17 FX706HM AU Optronics AUI8294 (B173HAN04.9), IPS, 1920x1080, 17.3" | Lenovo Legion 5 17ACH6H-82JY0003GE LEN173FHD, IPS, 1920x1080, 17.3" | MSI GE76 Raider AU Optronics B173HAN05.4 (AUOE295), IPS-Level, 1920x1080, 17.3" | MSI Katana GF76 11UE AU Optronics B173HAN04.9, IPS, 1920x1080, 17.3" | Schenker XMG Core 17 (Early 2021) BOE CQ NE173QHM-NY2, IPS, 2560x1440, 17.3" | |
|---|---|---|---|---|---|---|
| Display | 0% | 62% | 57% | -1% | 67% | |
| Display P3 Coverage (%) | 40.2 | 40.1 0% | 64.8 61% | 63.1 57% | 39.8 -1% | 68.1 69% |
| sRGB Coverage (%) | 59.7 | 60 1% | 97.2 63% | 94 57% | 59.5 0% | 98.5 65% |
| AdobeRGB 1998 Coverage (%) | 41.5 | 41.4 0% | 66.7 61% | 65.2 57% | 41.12 -1% | 69.3 67% |
| Response Times | 21% | 66% | 77% | 9% | 62% | |
| Response Time Grey 50% / Grey 80% * (ms) | 39.2 ? | 32.4 17% | 15 ? 62% | 5.6 ? 86% | 36.8 ? 6% | 16.8 ? 57% |
| Response Time Black / White * (ms) | 29.6 ? | 22.4 24% | 9 ? 70% | 9.6 ? 68% | 26 ? 12% | 10 ? 66% |
| PWM Frequency (Hz) | ||||||
| Screen | -5% | 21% | 24% | -15% | 4% | |
| Brightness middle (cd/m²) | 287 | 266 -7% | 323 13% | 290 1% | 260 -9% | 370 29% |
| Brightness (cd/m²) | 268 | 264 -1% | 305 14% | 290 8% | 251 -6% | 333 24% |
| Brightness Distribution (%) | 89 | 79 -11% | 89 0% | 96 8% | 85 -4% | 84 -6% |
| Black Level * (cd/m²) | 0.17 | 0.32 -88% | 0.25 -47% | 0.23 -35% | 0.26 -53% | 0.38 -124% |
| Contrast (:1) | 1688 | 831 -51% | 1292 -23% | 1261 -25% | 1000 -41% | 974 -42% |
| Colorchecker dE 2000 * | 5.1 | 3.97 22% | 1.87 63% | 1.59 69% | 3.9 24% | 2.41 53% |
| Colorchecker dE 2000 max. * | 8.72 | 8.93 -2% | 4.84 44% | 3.17 64% | 20.64 -137% | 7.32 16% |
| Colorchecker dE 2000 calibrated * | 5.1 | 3.5 31% | 0.92 82% | 0.87 83% | 3.71 27% | 1.19 77% |
| Greyscale dE 2000 * | 4.24 | 1.8 58% | 2.57 39% | 2.5 41% | 1.6 62% | 3.9 8% |
| Gamma | 2.44 90% | 2.31 95% | 2.42 91% | 2.253 98% | 2.068 106% | 2.287 96% |
| CCT | 6008 108% | 6754 96% | 7012 93% | 6640 98% | 6511 100% | 7302 89% |
| Color Space (Percent of AdobeRGB 1998) (%) | 41.4 | 69 | ||||
| Color Space (Percent of sRGB) (%) | 60 | 93 | ||||
| Media totale (Programma / Settaggio) | 5% /
-1% | 50% /
36% | 53% /
39% | -2% /
-9% | 44% /
26% |
* ... Meglio usare valori piccoli
La calibrazione manuale del pannello del display ha migliorato a malapena la qualità dell'immagine. Mentre l'accuratezza della scala di grigi è stata migliorata leggermente, non abbiamo trovato alcun miglioramento nell'accuratezza del colore.
Tempi di risposta del Display
| ↔ Tempi di risposta dal Nero al Bianco | ||
|---|---|---|
| 29.6 ms ... aumenta ↗ e diminuisce ↘ combinato | ↗ 15.4 ms Incremento | 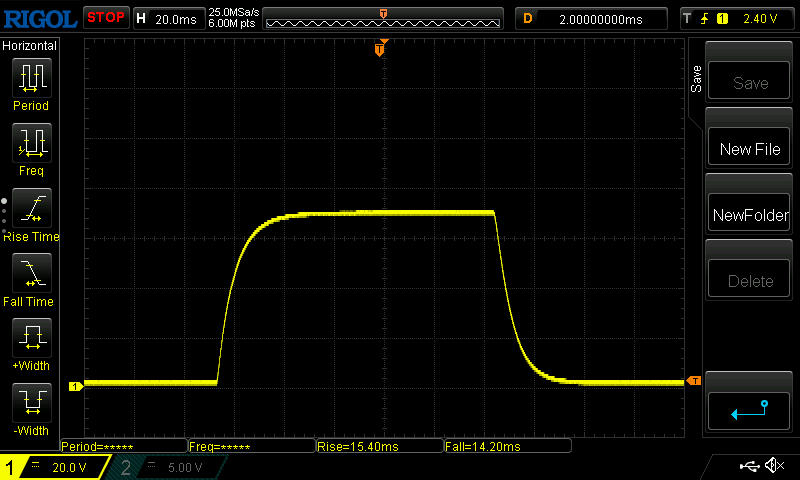 |
| ↘ 14.2 ms Calo | ||
| Lo schermo mostra tempi di risposta relativamente lenti nei nostri tests e potrebbe essere troppo lento per i gamers. In confronto, tutti i dispositivi di test variano da 0.1 (minimo) a 240 (massimo) ms. » 79 % di tutti i dispositivi è migliore. Questo significa che i tempi di risposta rilevati sono peggiori rispetto alla media di tutti i dispositivi testati (19.9 ms). | ||
| ↔ Tempo di risposta dal 50% Grigio all'80% Grigio | ||
| 39.2 ms ... aumenta ↗ e diminuisce ↘ combinato | ↗ 18.2 ms Incremento | 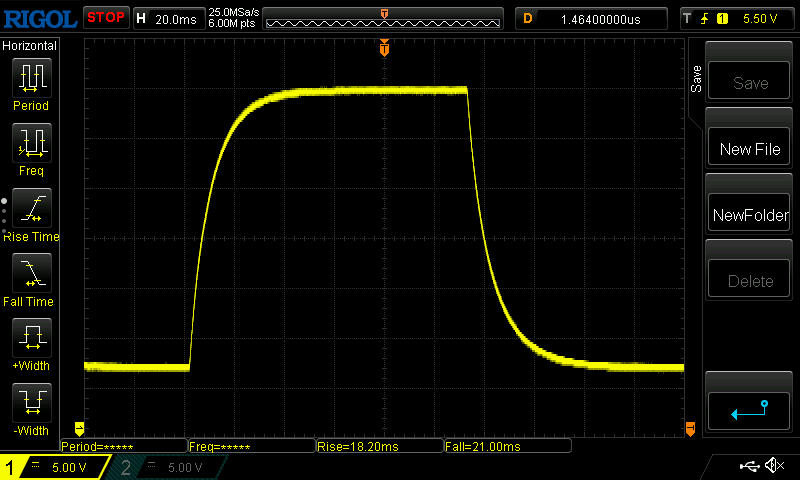 |
| ↘ 21 ms Calo | ||
| Lo schermo mostra tempi di risposta lenti nei nostri tests e sarà insoddisfacente per i gamers. In confronto, tutti i dispositivi di test variano da 0.165 (minimo) a 636 (massimo) ms. » 60 % di tutti i dispositivi è migliore. Questo significa che i tempi di risposta rilevati sono peggiori rispetto alla media di tutti i dispositivi testati (31.1 ms). | ||
Sfarfallio dello schermo / PWM (Pulse-Width Modulation)
| flickering dello schermo / PWM non rilevato | 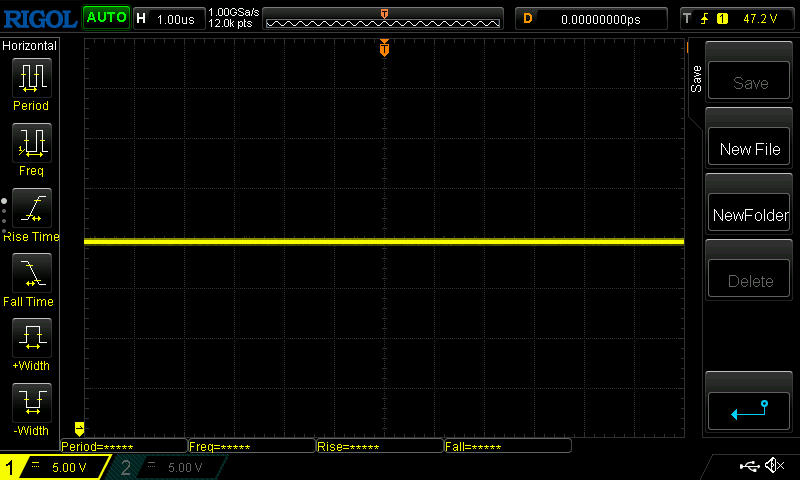 | ||
In confronto: 52 % di tutti i dispositivi testati non utilizza PWM per ridurre la luminosita' del display. Se è rilevato PWM, una media di 7798 (minimo: 5 - massimo: 343500) Hz è stata rilevata. | |||
L'usabilità all'aperto era molto limitata a causa della bassa luminosità. L'immagine è semplicemente troppo scura per essere leggibile e utilizzabile in ambienti luminosi.
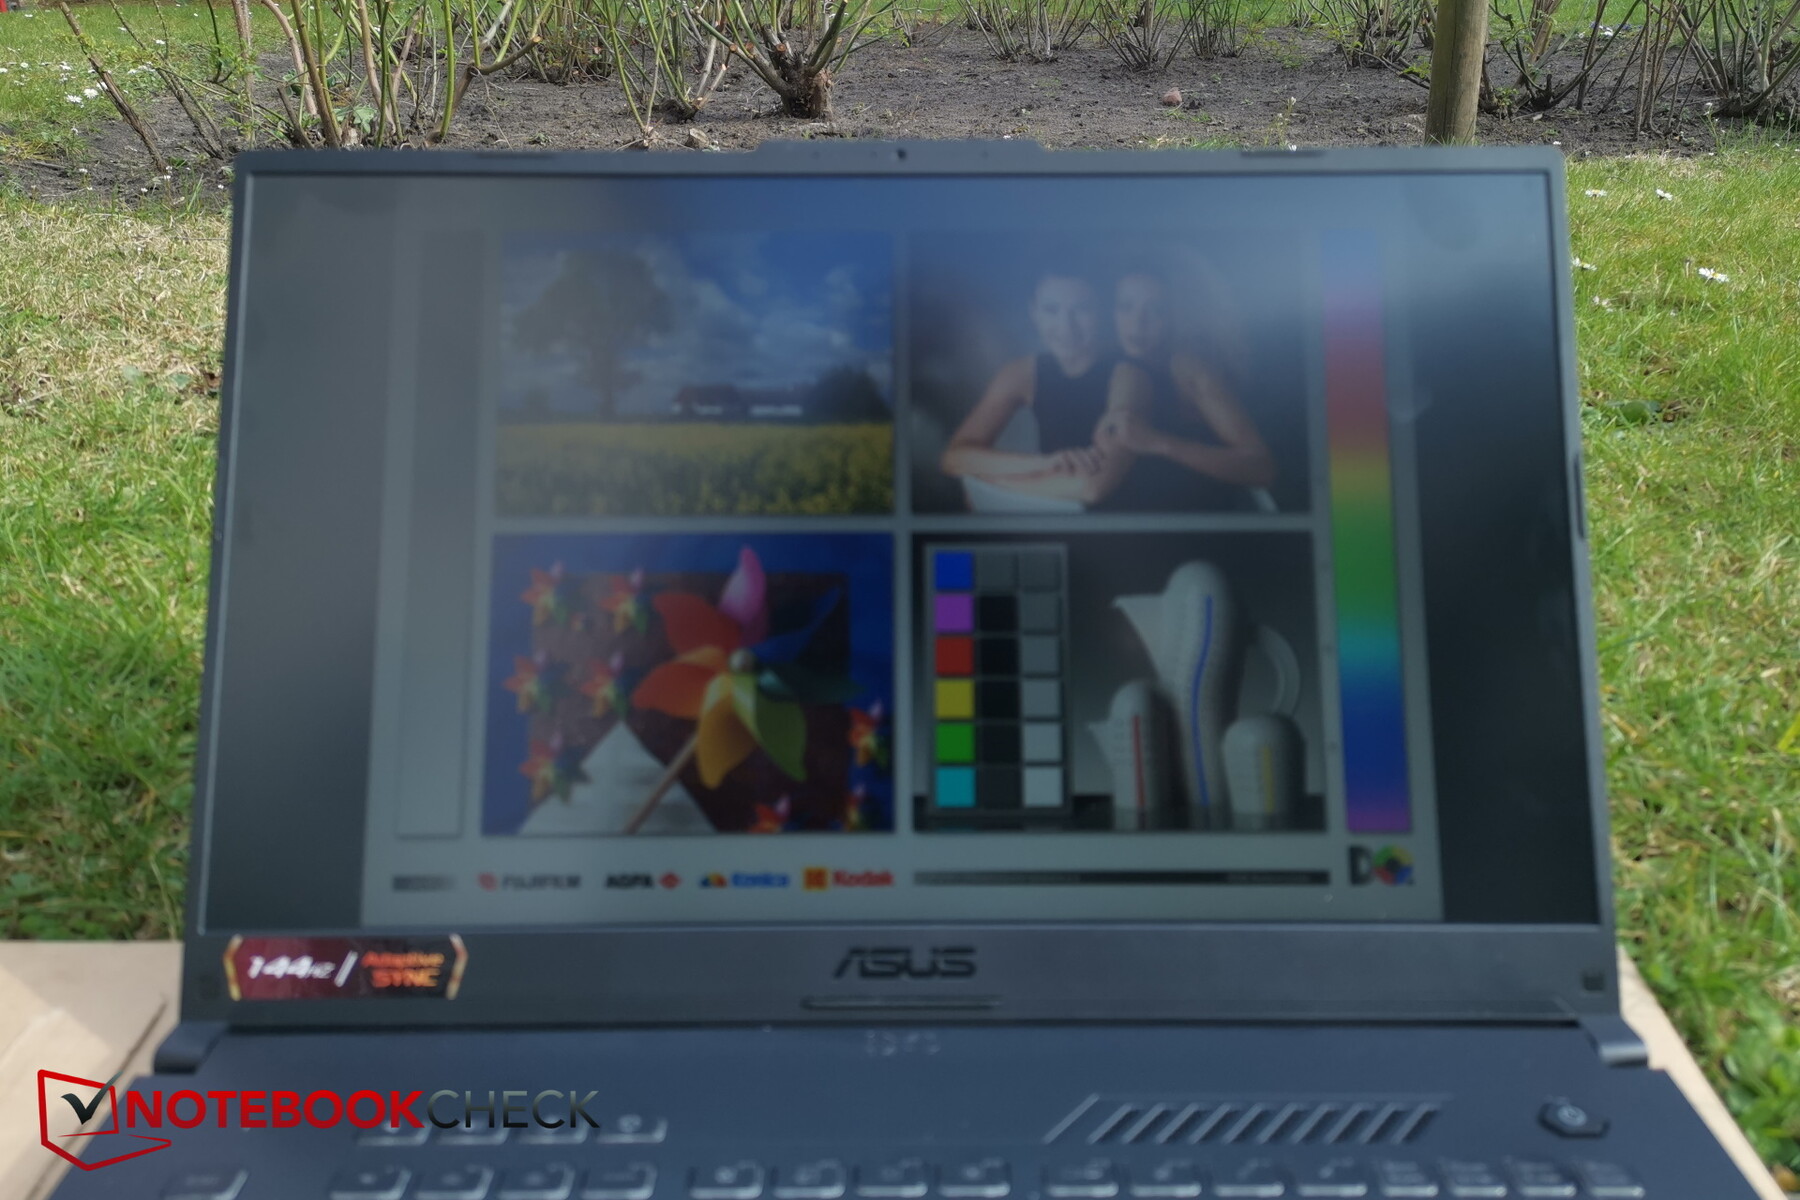
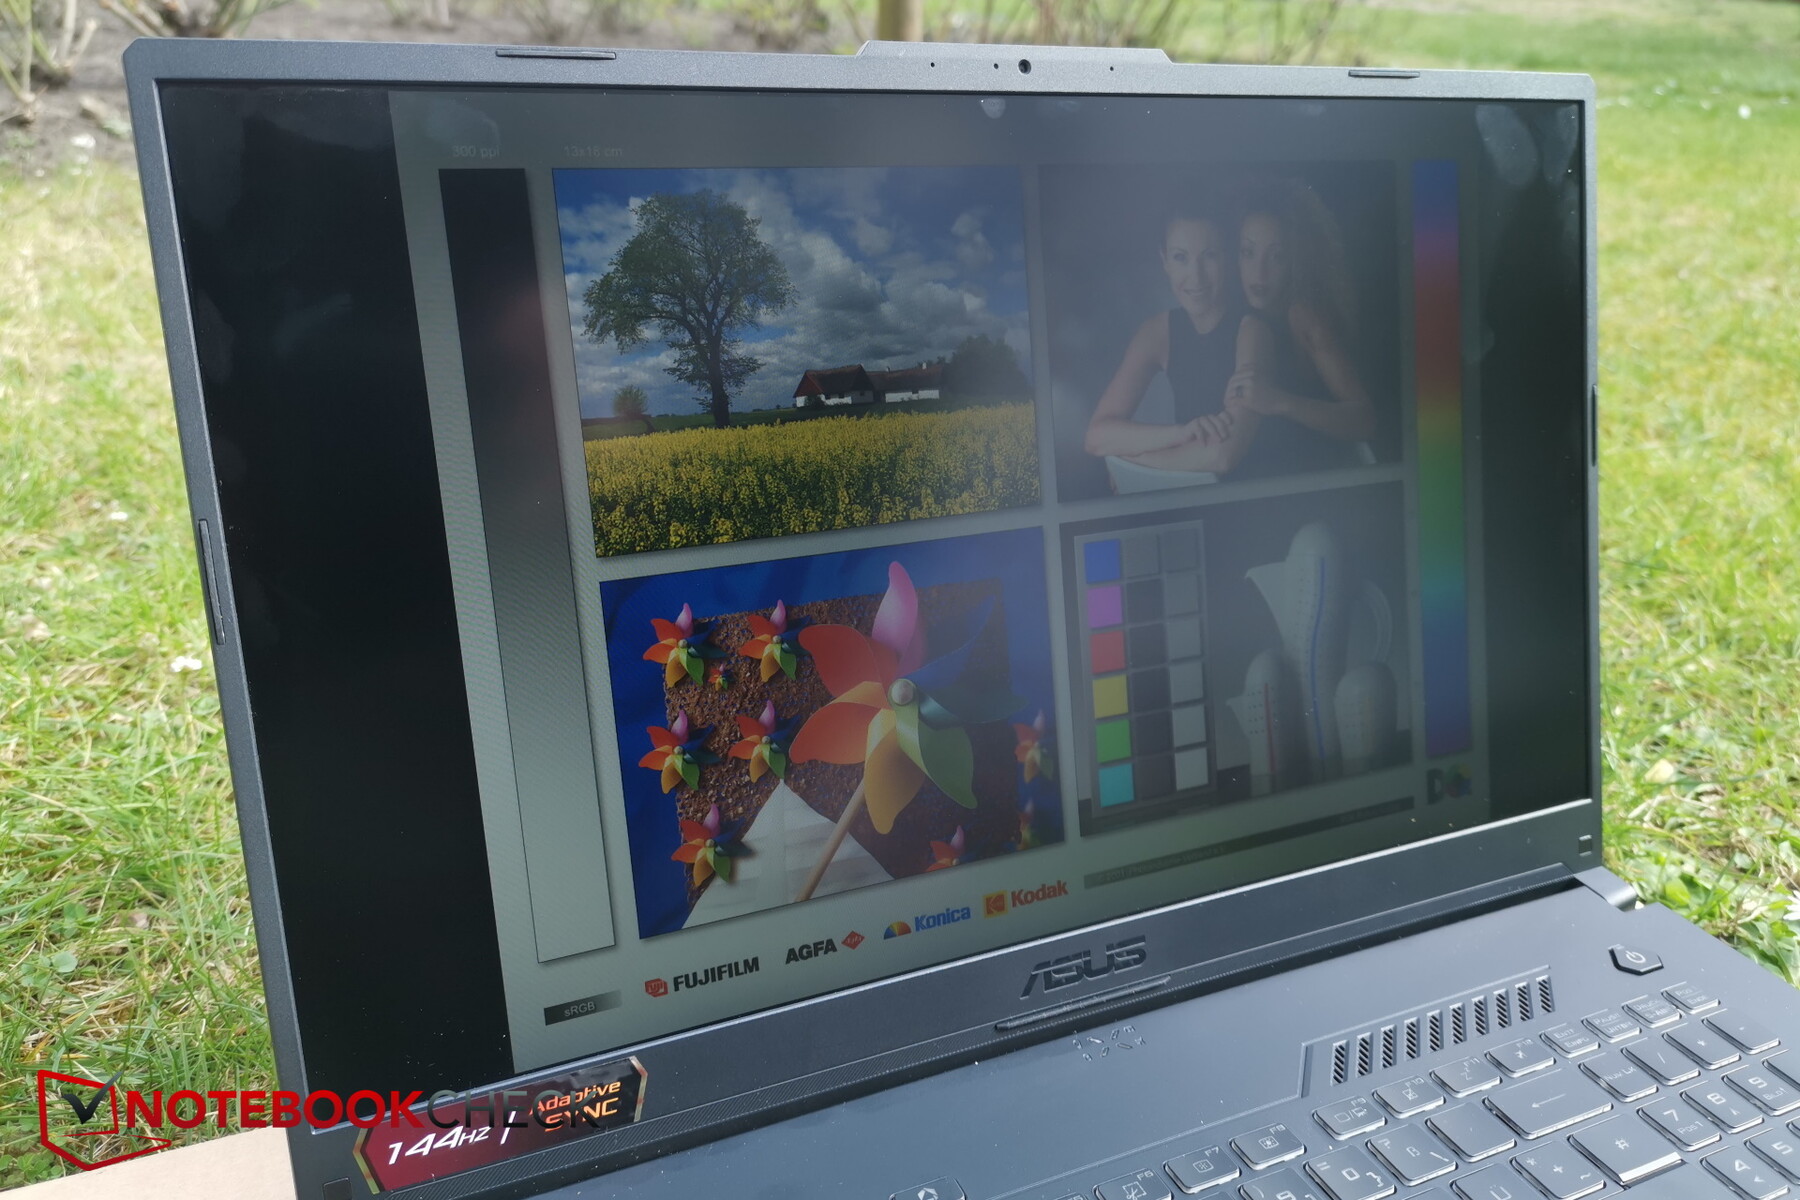
Per un pannello IPS abbiamo trovato questo pannello AU Optronics per offrire angoli di visualizzazione relativamente poveri, con notevoli cali di luminosità ad angoli estremi che rendono questo display già fioco ancora più fioco e meno utilizzabile.

Prestazioni - Massime prestazioni 3D
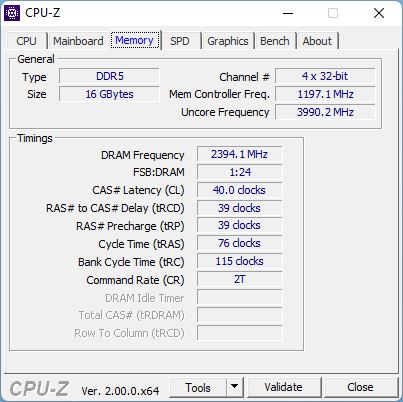
La combinazione di Intel Core i7-12700H e Nvidia Geforce RTX 3060 accoppiata con 16 GB di RAM DDR5 dovrebbe essere abbastanza potente per tutti i compiti e le sfide, compresi i giochi moderni che, a parte forse qualche eccezione, dovrebbero girare perfettamente lisci nei massimi dettagli in risoluzione FHD nativa.
Mentre il processore è identico per tutte le SKU la GPU non lo è, e Asus offre una scelta tra quattro diverse GPU: RTX 3050, RTX 3050 Ti, RTX 3060 e RTX 3070.
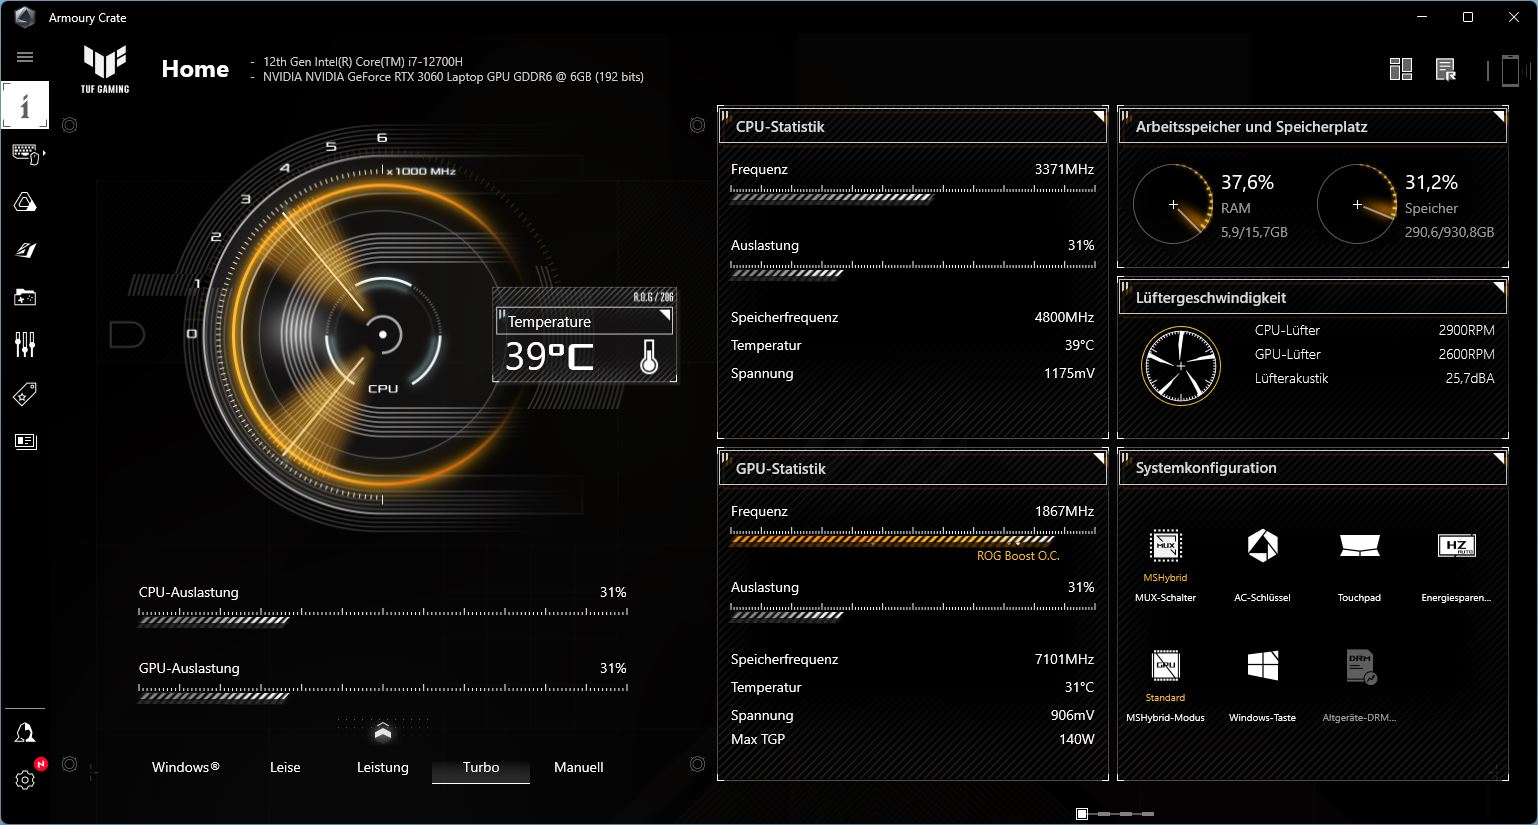
Condizioni di prova
Per ottenere i migliori risultati possibili, abbiamo impostato il profilo delle prestazioni su "Turbo" tramite il software Armory Crate incluso.
Dato che molte opzioni possono essere configurate solo usando il software di Asus, gli utenti non avranno essenzialmente altra scelta che usarlo. Tenete a mente che alcuni produttori usano il loro software per raccogliere i dati dell'attività dell'utente.
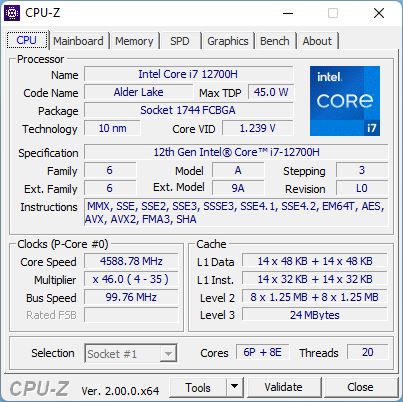
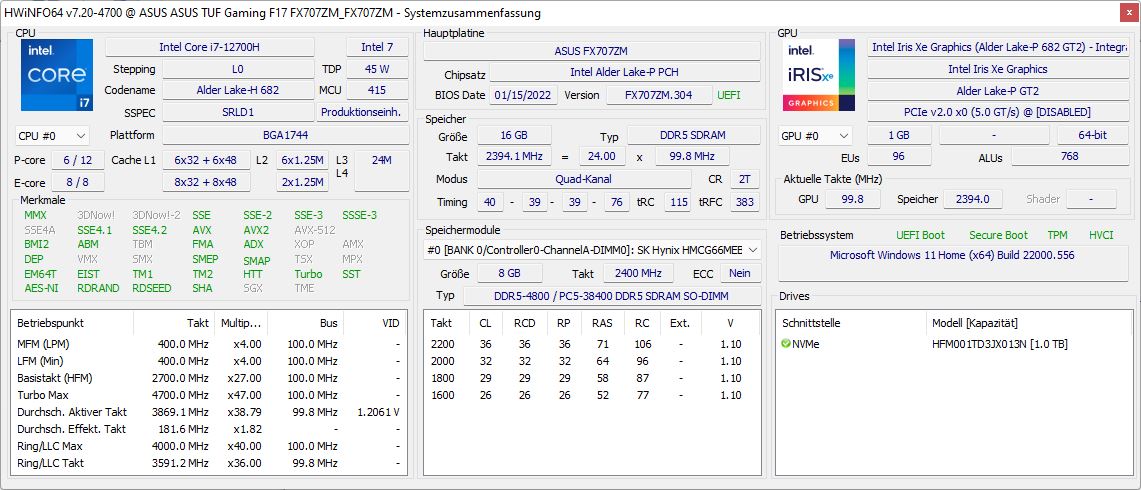
Processore
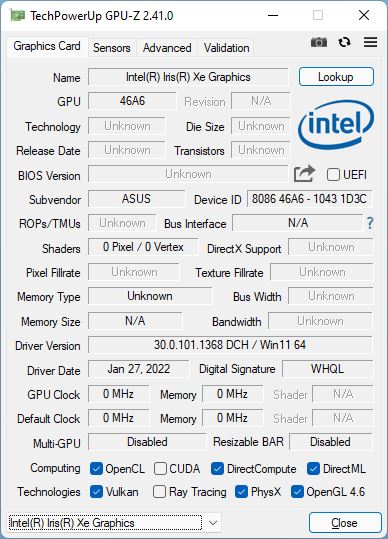
Il Intel Core i7-12700H è un membro dell'attuale famiglia Alder Lake di Intel e dispone di un totale di 14 core (6 x P-cores, 8 x E-cores) per un totale di 20 threads. La sua GPU Intel Xe Graphics integrata ha 96 EU e funziona fino a 1,4 GHz.
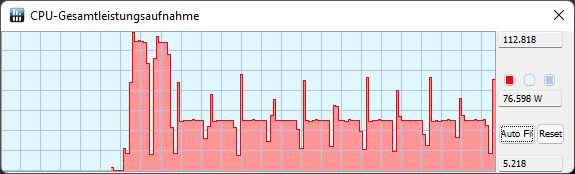
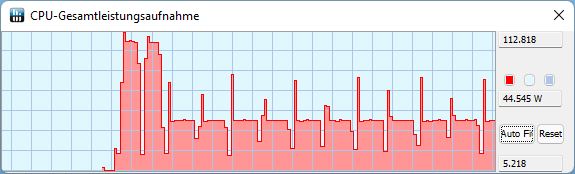
Durante il nostro ciclo CineBench di 30 minuti il nostro i7-12700H ha iniziato a un livello paragonabile al Core i9-12900HK dell'MSI GE76 Raider, ma poi è rapidamente sceso a un livello più adatto all'i9-11900H della scorsa generazione. Questo diventa molto evidente quando si guarda il TDP della CPU. Durante le prime due esecuzioni il consumo di energia della CPU ha un picco di 111 W per alcuni secondi prima di essere ridotto a 45 W. A partire dalla terza iterazione il picco è registrato ad un molto più basso 75-80 W che sono poi ridotti molto rapidamente a soli 45 W.
In altre parole: le prestazioni a breve termine a raffica sono circa il 30% più veloci rispetto al suo predecessore, mentre le prestazioni sostenute a lungo termine non lo sono.
Sulla batteria, le prestazioni sono scese da 2.820 (prima corsa) e 1.925 (seconda corsa e oltre) a soli 1.768 punti. Questo calo di prestazioni è notevole ma ancora relativamente minore.
Cinebench R15 Multi Sustained Load
Cinebench R23: Multi Core | Single Core
Cinebench R20: CPU (Multi Core) | CPU (Single Core)
Cinebench R15: CPU Multi 64Bit | CPU Single 64Bit
Blender: v2.79 BMW27 CPU
7-Zip 18.03: 7z b 4 | 7z b 4 -mmt1
Geekbench 5.5: Multi-Core | Single-Core
HWBOT x265 Benchmark v2.2: 4k Preset
LibreOffice : 20 Documents To PDF
R Benchmark 2.5: Overall mean
| CPU Performance rating | |
| Media della classe Gaming | |
| MSI GE76 Raider | |
| Media Intel Core i7-12700H | |
| Asus TUF Gaming F17 FX707Z-HX011W | |
| Asus TUF Gaming F17 FX706HM | |
| MSI Katana GF76 11UE | |
| Lenovo Legion 5 17ACH6H-82JY0003GE | |
| Schenker XMG Core 17 (Early 2021) | |
| Cinebench R23 / Multi Core | |
| Media della classe Gaming (10488 - 40970, n=112, ultimi 2 anni) | |
| MSI GE76 Raider | |
| Media Intel Core i7-12700H (4032 - 19330, n=64) | |
| Asus TUF Gaming F17 FX707Z-HX011W | |
| Asus TUF Gaming F17 FX706HM | |
| MSI Katana GF76 11UE | |
| Lenovo Legion 5 17ACH6H-82JY0003GE | |
| Schenker XMG Core 17 (Early 2021) | |
| Cinebench R23 / Single Core | |
| Media della classe Gaming (1166 - 2356, n=112, ultimi 2 anni) | |
| MSI GE76 Raider | |
| Asus TUF Gaming F17 FX707Z-HX011W | |
| Media Intel Core i7-12700H (778 - 1826, n=63) | |
| Asus TUF Gaming F17 FX706HM | |
| MSI Katana GF76 11UE | |
| Lenovo Legion 5 17ACH6H-82JY0003GE | |
| Schenker XMG Core 17 (Early 2021) | |
| Cinebench R20 / CPU (Multi Core) | |
| Media della classe Gaming (4029 - 16108, n=111, ultimi 2 anni) | |
| MSI GE76 Raider | |
| Media Intel Core i7-12700H (1576 - 7407, n=64) | |
| Asus TUF Gaming F17 FX707Z-HX011W | |
| Asus TUF Gaming F17 FX706HM | |
| MSI Katana GF76 11UE | |
| Lenovo Legion 5 17ACH6H-82JY0003GE | |
| Schenker XMG Core 17 (Early 2021) | |
| Cinebench R20 / CPU (Single Core) | |
| Media della classe Gaming (442 - 895, n=111, ultimi 2 anni) | |
| MSI GE76 Raider | |
| Asus TUF Gaming F17 FX707Z-HX011W | |
| Media Intel Core i7-12700H (300 - 704, n=64) | |
| Asus TUF Gaming F17 FX706HM | |
| MSI Katana GF76 11UE | |
| Lenovo Legion 5 17ACH6H-82JY0003GE | |
| Schenker XMG Core 17 (Early 2021) | |
| Cinebench R15 / CPU Multi 64Bit | |
| Media della classe Gaming (1578 - 6271, n=111, ultimi 2 anni) | |
| MSI GE76 Raider | |
| Asus TUF Gaming F17 FX707Z-HX011W | |
| Media Intel Core i7-12700H (1379 - 2916, n=70) | |
| Asus TUF Gaming F17 FX706HM | |
| MSI Katana GF76 11UE | |
| Lenovo Legion 5 17ACH6H-82JY0003GE | |
| Schenker XMG Core 17 (Early 2021) | |
| Cinebench R15 / CPU Single 64Bit | |
| Media della classe Gaming (188.8 - 343, n=111, ultimi 2 anni) | |
| MSI GE76 Raider | |
| Asus TUF Gaming F17 FX707Z-HX011W | |
| Media Intel Core i7-12700H (113 - 263, n=65) | |
| Asus TUF Gaming F17 FX706HM | |
| MSI Katana GF76 11UE | |
| Lenovo Legion 5 17ACH6H-82JY0003GE | |
| Schenker XMG Core 17 (Early 2021) | |
| Blender / v2.79 BMW27 CPU | |
| Schenker XMG Core 17 (Early 2021) | |
| Lenovo Legion 5 17ACH6H-82JY0003GE | |
| MSI Katana GF76 11UE | |
| Asus TUF Gaming F17 FX707Z-HX011W | |
| Asus TUF Gaming F17 FX706HM | |
| Media Intel Core i7-12700H (168 - 732, n=63) | |
| MSI GE76 Raider | |
| Media della classe Gaming (80 - 330, n=109, ultimi 2 anni) | |
| 7-Zip 18.03 / 7z b 4 | |
| Media della classe Gaming (33491 - 148086, n=110, ultimi 2 anni) | |
| MSI GE76 Raider | |
| Media Intel Core i7-12700H (22844 - 73067, n=63) | |
| Asus TUF Gaming F17 FX707Z-HX011W | |
| Asus TUF Gaming F17 FX706HM | |
| Lenovo Legion 5 17ACH6H-82JY0003GE | |
| MSI Katana GF76 11UE | |
| Schenker XMG Core 17 (Early 2021) | |
| 7-Zip 18.03 / 7z b 4 -mmt1 | |
| Media della classe Gaming (4199 - 7436, n=110, ultimi 2 anni) | |
| MSI GE76 Raider | |
| Asus TUF Gaming F17 FX706HM | |
| Media Intel Core i7-12700H (2743 - 5972, n=63) | |
| Asus TUF Gaming F17 FX707Z-HX011W | |
| MSI Katana GF76 11UE | |
| Schenker XMG Core 17 (Early 2021) | |
| Lenovo Legion 5 17ACH6H-82JY0003GE | |
| Geekbench 5.5 / Multi-Core | |
| Media della classe Gaming (6460 - 27010, n=110, ultimi 2 anni) | |
| MSI GE76 Raider | |
| Asus TUF Gaming F17 FX707Z-HX011W | |
| Media Intel Core i7-12700H (5144 - 13745, n=64) | |
| MSI Katana GF76 11UE | |
| Asus TUF Gaming F17 FX706HM | |
| Schenker XMG Core 17 (Early 2021) | |
| Lenovo Legion 5 17ACH6H-82JY0003GE | |
| Geekbench 5.5 / Single-Core | |
| Media della classe Gaming (986 - 2474, n=110, ultimi 2 anni) | |
| MSI GE76 Raider | |
| Asus TUF Gaming F17 FX707Z-HX011W | |
| Media Intel Core i7-12700H (803 - 1851, n=64) | |
| Asus TUF Gaming F17 FX706HM | |
| MSI Katana GF76 11UE | |
| Lenovo Legion 5 17ACH6H-82JY0003GE | |
| Schenker XMG Core 17 (Early 2021) | |
| HWBOT x265 Benchmark v2.2 / 4k Preset | |
| Media della classe Gaming (11.5 - 44.3, n=110, ultimi 2 anni) | |
| MSI GE76 Raider | |
| Media Intel Core i7-12700H (4.67 - 21.8, n=64) | |
| Asus TUF Gaming F17 FX706HM | |
| Asus TUF Gaming F17 FX707Z-HX011W | |
| MSI Katana GF76 11UE | |
| Lenovo Legion 5 17ACH6H-82JY0003GE | |
| Schenker XMG Core 17 (Early 2021) | |
| LibreOffice / 20 Documents To PDF | |
| Asus TUF Gaming F17 FX707Z-HX011W | |
| Schenker XMG Core 17 (Early 2021) | |
| Lenovo Legion 5 17ACH6H-82JY0003GE | |
| Media della classe Gaming (19 - 88.8, n=110, ultimi 2 anni) | |
| MSI Katana GF76 11UE | |
| Media Intel Core i7-12700H (34.2 - 95.3, n=63) | |
| Asus TUF Gaming F17 FX706HM | |
| MSI GE76 Raider | |
| R Benchmark 2.5 / Overall mean | |
| Schenker XMG Core 17 (Early 2021) | |
| MSI Katana GF76 11UE | |
| Lenovo Legion 5 17ACH6H-82JY0003GE | |
| Asus TUF Gaming F17 FX706HM | |
| Media Intel Core i7-12700H (0.4441 - 1.052, n=63) | |
| Asus TUF Gaming F17 FX707Z-HX011W | |
| Media della classe Gaming (0.3439 - 0.759, n=111, ultimi 2 anni) | |
| MSI GE76 Raider | |
* ... Meglio usare valori piccoli
AIDA64: FP32 Ray-Trace | FPU Julia | CPU SHA3 | CPU Queen | FPU SinJulia | FPU Mandel | CPU AES | CPU ZLib | FP64 Ray-Trace | CPU PhotoWorxx
| Performance rating | |
| Media della classe Gaming | |
| MSI GE76 Raider | |
| Media Intel Core i7-12700H | |
| Lenovo Legion 5 17ACH6H-82JY0003GE | |
| Asus TUF Gaming F17 FX707Z-HX011W | |
| Schenker XMG Core 17 (Early 2021) | |
| Asus TUF Gaming F17 FX706HM -9! | |
| MSI Katana GF76 11UE -9! | |
| AIDA64 / FP32 Ray-Trace | |
| Media della classe Gaming (10227 - 85542, n=109, ultimi 2 anni) | |
| Lenovo Legion 5 17ACH6H-82JY0003GE | |
| Media Intel Core i7-12700H (2585 - 17957, n=64) | |
| Schenker XMG Core 17 (Early 2021) | |
| MSI GE76 Raider | |
| Asus TUF Gaming F17 FX707Z-HX011W | |
| AIDA64 / FPU Julia | |
| Media della classe Gaming (51376 - 238426, n=109, ultimi 2 anni) | |
| Lenovo Legion 5 17ACH6H-82JY0003GE | |
| Media Intel Core i7-12700H (12439 - 90760, n=64) | |
| Schenker XMG Core 17 (Early 2021) | |
| MSI GE76 Raider | |
| Asus TUF Gaming F17 FX707Z-HX011W | |
| AIDA64 / CPU SHA3 | |
| Media della classe Gaming (2180 - 9817, n=109, ultimi 2 anni) | |
| MSI GE76 Raider | |
| Media Intel Core i7-12700H (833 - 4242, n=64) | |
| Lenovo Legion 5 17ACH6H-82JY0003GE | |
| Schenker XMG Core 17 (Early 2021) | |
| Asus TUF Gaming F17 FX707Z-HX011W | |
| AIDA64 / CPU Queen | |
| Media della classe Gaming (49785 - 173351, n=100, ultimi 2 anni) | |
| MSI GE76 Raider | |
| Asus TUF Gaming F17 FX707Z-HX011W | |
| Media Intel Core i7-12700H (57923 - 103202, n=63) | |
| Lenovo Legion 5 17ACH6H-82JY0003GE | |
| Schenker XMG Core 17 (Early 2021) | |
| AIDA64 / FPU SinJulia | |
| Media della classe Gaming (4424 - 33636, n=109, ultimi 2 anni) | |
| MSI GE76 Raider | |
| Lenovo Legion 5 17ACH6H-82JY0003GE | |
| Media Intel Core i7-12700H (3249 - 9939, n=64) | |
| Schenker XMG Core 17 (Early 2021) | |
| Asus TUF Gaming F17 FX707Z-HX011W | |
| AIDA64 / FPU Mandel | |
| Media della classe Gaming (25115 - 128721, n=109, ultimi 2 anni) | |
| Lenovo Legion 5 17ACH6H-82JY0003GE | |
| Media Intel Core i7-12700H (7135 - 44760, n=64) | |
| Schenker XMG Core 17 (Early 2021) | |
| MSI GE76 Raider | |
| Asus TUF Gaming F17 FX707Z-HX011W | |
| AIDA64 / CPU AES | |
| Media della classe Gaming (39258 - 247074, n=109, ultimi 2 anni) | |
| MSI GE76 Raider | |
| Lenovo Legion 5 17ACH6H-82JY0003GE | |
| Media Intel Core i7-12700H (31839 - 144360, n=64) | |
| Asus TUF Gaming F17 FX707Z-HX011W | |
| Schenker XMG Core 17 (Early 2021) | |
| AIDA64 / CPU ZLib | |
| Media della classe Gaming (574 - 2531, n=109, ultimi 2 anni) | |
| MSI GE76 Raider | |
| Media Intel Core i7-12700H (305 - 1171, n=64) | |
| Asus TUF Gaming F17 FX707Z-HX011W | |
| Lenovo Legion 5 17ACH6H-82JY0003GE | |
| Schenker XMG Core 17 (Early 2021) | |
| MSI Katana GF76 11UE | |
| Asus TUF Gaming F17 FX706HM | |
| AIDA64 / FP64 Ray-Trace | |
| Media della classe Gaming (5509 - 45446, n=109, ultimi 2 anni) | |
| Lenovo Legion 5 17ACH6H-82JY0003GE | |
| Media Intel Core i7-12700H (1437 - 9692, n=64) | |
| Schenker XMG Core 17 (Early 2021) | |
| MSI GE76 Raider | |
| Asus TUF Gaming F17 FX707Z-HX011W | |
| AIDA64 / CPU PhotoWorxx | |
| Media della classe Gaming (12271 - 89891, n=109, ultimi 2 anni) | |
| MSI GE76 Raider | |
| Media Intel Core i7-12700H (12863 - 52207, n=64) | |
| Asus TUF Gaming F17 FX707Z-HX011W | |
| Schenker XMG Core 17 (Early 2021) | |
| Lenovo Legion 5 17ACH6H-82JY0003GE | |
Prestazioni del sistema
In PCMark 10 l'F17 si è comportato molto peggio di quanto ci saremmo aspettati con un 6-15 % sotto la media dei sistemi comparabili. È in grado di superare il suo predecessore solo nella Creazione di contenuti digitali ma si comporta molto più lentamente nel complesso. Siamo stati in grado di riprodurre questi risultati eseguendo il test una seconda volta.
Soggettivamente parlando il sistema ha funzionato molto bene e senza alcun singhiozzo evidente.
CrossMark: Overall | Productivity | Creativity | Responsiveness
| PCMark 10 / Score | |
| Media della classe Gaming (5828 - 11574, n=95, ultimi 2 anni) | |
| MSI GE76 Raider | |
| Media Intel Core i7-12700H, NVIDIA GeForce RTX 3060 Laptop GPU (5986 - 8156, n=12) | |
| Asus TUF Gaming F17 FX706HM | |
| Lenovo Legion 5 17ACH6H-82JY0003GE | |
| MSI Katana GF76 11UE | |
| Asus TUF Gaming F17 FX707Z-HX011W | |
| Schenker XMG Core 17 (Early 2021) | |
| PCMark 10 / Essentials | |
| MSI GE76 Raider | |
| Media della classe Gaming (8810 - 12600, n=99, ultimi 2 anni) | |
| Asus TUF Gaming F17 FX706HM | |
| Media Intel Core i7-12700H, NVIDIA GeForce RTX 3060 Laptop GPU (9289 - 12144, n=12) | |
| MSI Katana GF76 11UE | |
| Lenovo Legion 5 17ACH6H-82JY0003GE | |
| Asus TUF Gaming F17 FX707Z-HX011W | |
| Schenker XMG Core 17 (Early 2021) | |
| PCMark 10 / Productivity | |
| Media della classe Gaming (6845 - 18766, n=97, ultimi 2 anni) | |
| MSI GE76 Raider | |
| Media Intel Core i7-12700H, NVIDIA GeForce RTX 3060 Laptop GPU (6161 - 10362, n=12) | |
| Asus TUF Gaming F17 FX706HM | |
| Lenovo Legion 5 17ACH6H-82JY0003GE | |
| MSI Katana GF76 11UE | |
| Schenker XMG Core 17 (Early 2021) | |
| Asus TUF Gaming F17 FX707Z-HX011W | |
| PCMark 10 / Digital Content Creation | |
| Media della classe Gaming (7602 - 19657, n=97, ultimi 2 anni) | |
| MSI GE76 Raider | |
| Media Intel Core i7-12700H, NVIDIA GeForce RTX 3060 Laptop GPU (8950 - 12554, n=12) | |
| Asus TUF Gaming F17 FX707Z-HX011W | |
| Asus TUF Gaming F17 FX706HM | |
| Lenovo Legion 5 17ACH6H-82JY0003GE | |
| MSI Katana GF76 11UE | |
| Schenker XMG Core 17 (Early 2021) | |
| CrossMark / Overall | |
| Media della classe Gaming (1366 - 2409, n=97, ultimi 2 anni) | |
| Media Intel Core i7-12700H, NVIDIA GeForce RTX 3060 Laptop GPU (1649 - 2017, n=11) | |
| Asus TUF Gaming F17 FX707Z-HX011W | |
| Lenovo Legion 5 17ACH6H-82JY0003GE | |
| CrossMark / Productivity | |
| Media della classe Gaming (1386 - 2254, n=97, ultimi 2 anni) | |
| Media Intel Core i7-12700H, NVIDIA GeForce RTX 3060 Laptop GPU (1536 - 1958, n=11) | |
| Asus TUF Gaming F17 FX707Z-HX011W | |
| Lenovo Legion 5 17ACH6H-82JY0003GE | |
| CrossMark / Creativity | |
| Media della classe Gaming (1343 - 2729, n=97, ultimi 2 anni) | |
| Asus TUF Gaming F17 FX707Z-HX011W | |
| Media Intel Core i7-12700H, NVIDIA GeForce RTX 3060 Laptop GPU (1816 - 2084, n=11) | |
| Lenovo Legion 5 17ACH6H-82JY0003GE | |
| CrossMark / Responsiveness | |
| Media della classe Gaming (1226 - 2334, n=97, ultimi 2 anni) | |
| Media Intel Core i7-12700H, NVIDIA GeForce RTX 3060 Laptop GPU (1210 - 2207, n=11) | |
| Asus TUF Gaming F17 FX707Z-HX011W | |
| Lenovo Legion 5 17ACH6H-82JY0003GE | |
| PCMark 10 Score | 5986 punti | |
Aiuto | ||
| AIDA64 / Memory Copy | |
| Media della classe Gaming (21750 - 129946, n=109, ultimi 2 anni) | |
| MSI GE76 Raider | |
| Media Intel Core i7-12700H (25615 - 80511, n=64) | |
| Asus TUF Gaming F17 FX707Z-HX011W | |
| Lenovo Legion 5 17ACH6H-82JY0003GE | |
| Schenker XMG Core 17 (Early 2021) | |
| AIDA64 / Memory Read | |
| Media della classe Gaming (22956 - 118858, n=109, ultimi 2 anni) | |
| MSI GE76 Raider | |
| Asus TUF Gaming F17 FX707Z-HX011W | |
| Media Intel Core i7-12700H (25586 - 79442, n=64) | |
| Lenovo Legion 5 17ACH6H-82JY0003GE | |
| Schenker XMG Core 17 (Early 2021) | |
| AIDA64 / Memory Write | |
| Media della classe Gaming (22297 - 135096, n=109, ultimi 2 anni) | |
| MSI GE76 Raider | |
| Asus TUF Gaming F17 FX707Z-HX011W | |
| Media Intel Core i7-12700H (23679 - 88660, n=64) | |
| Schenker XMG Core 17 (Early 2021) | |
| Lenovo Legion 5 17ACH6H-82JY0003GE | |
| AIDA64 / Memory Latency | |
| Media della classe Gaming (75.3 - 259, n=109, ultimi 2 anni) | |
| MSI GE76 Raider | |
| Lenovo Legion 5 17ACH6H-82JY0003GE | |
| Media Intel Core i7-12700H (76.2 - 133.9, n=62) | |
| Schenker XMG Core 17 (Early 2021) | |
| MSI Katana GF76 11UE | |
| Asus TUF Gaming F17 FX706HM | |
| Asus TUF Gaming F17 FX707Z-HX011W | |
* ... Meglio usare valori piccoli
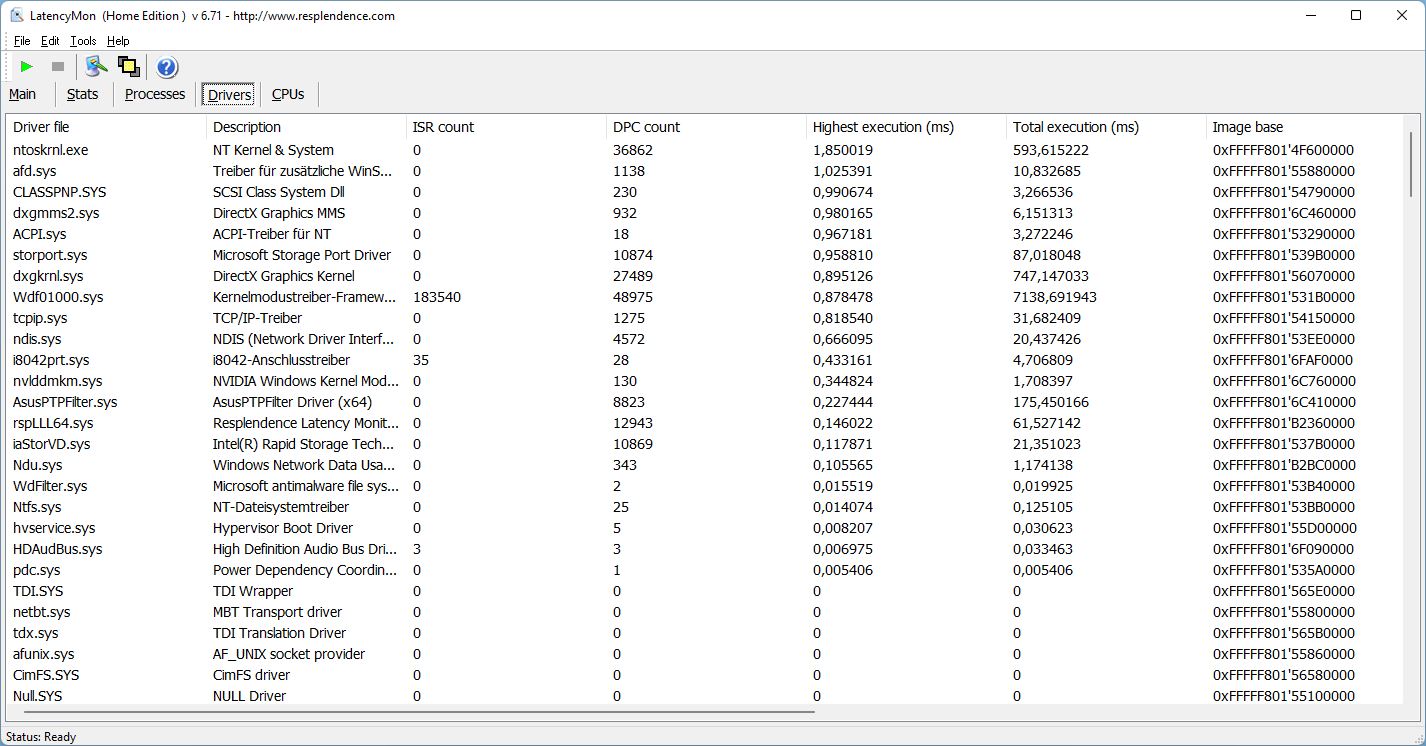
Latenze DPC
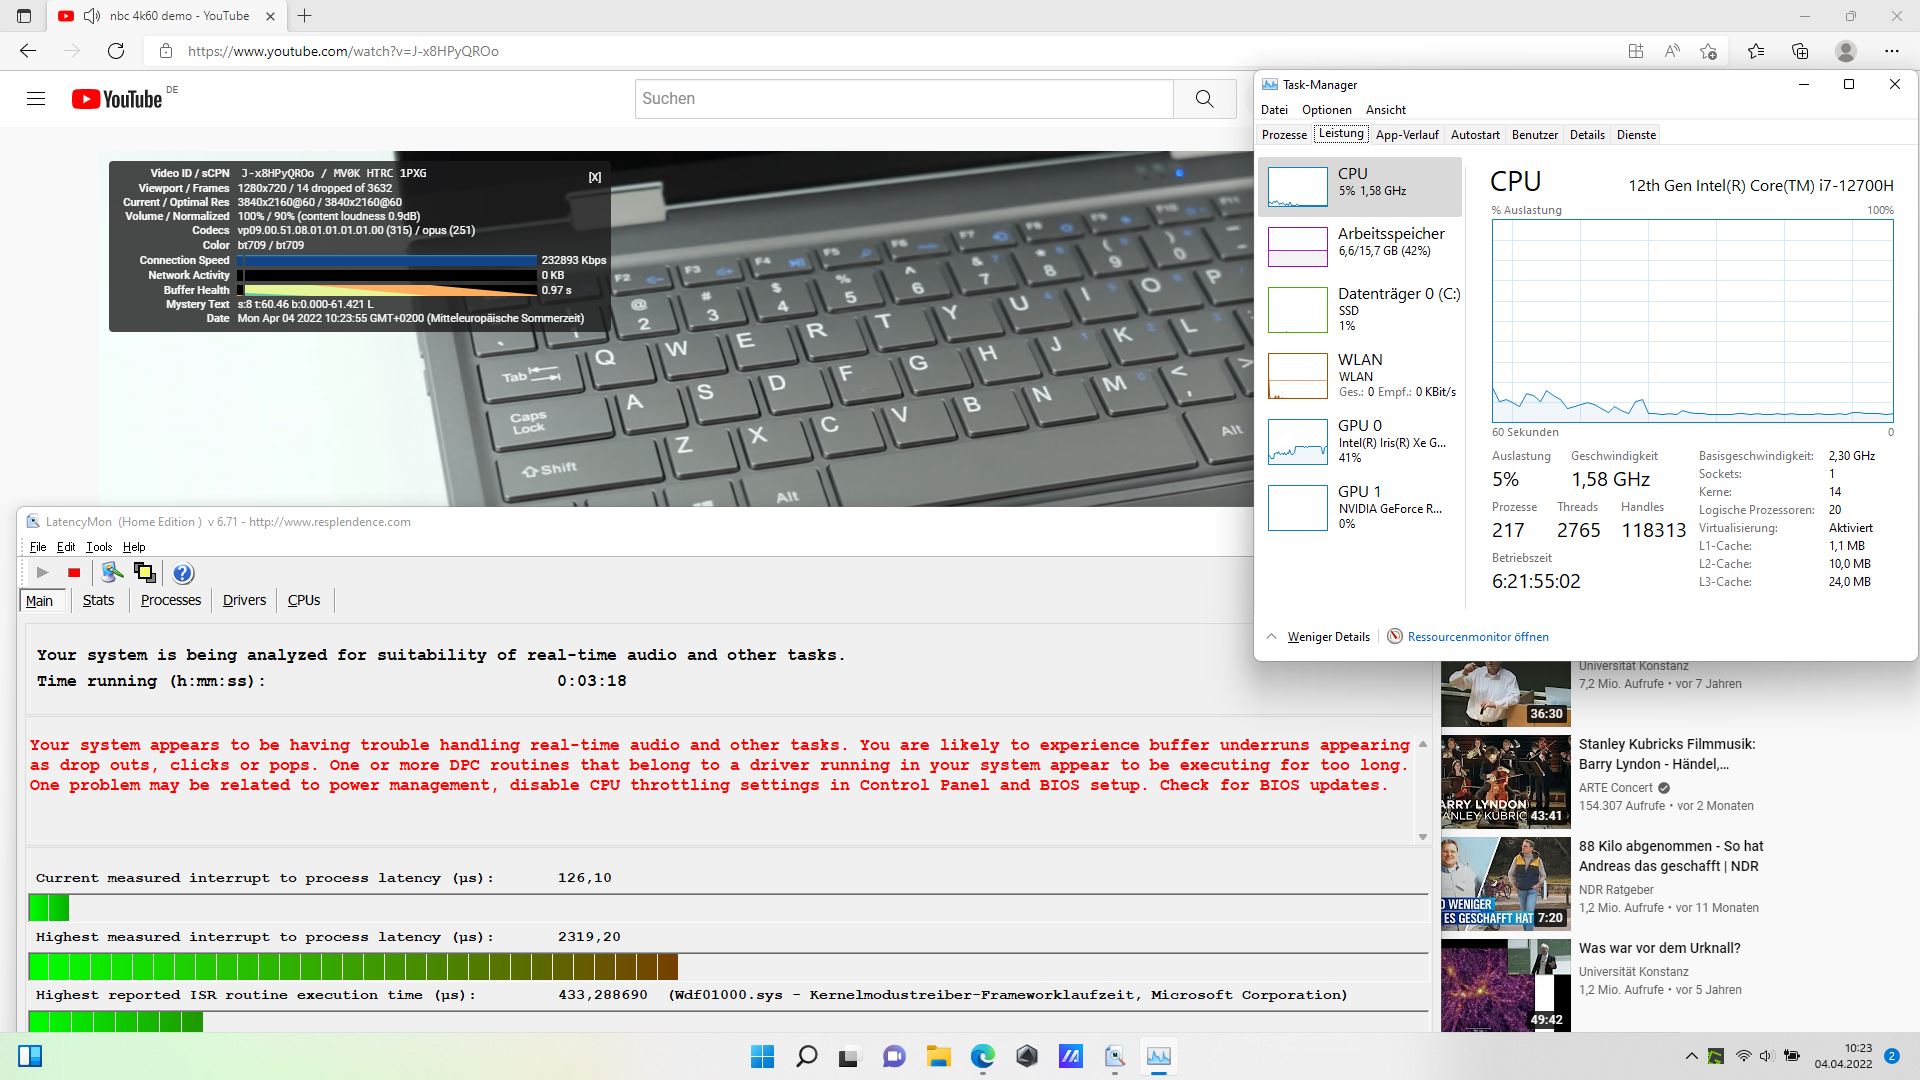
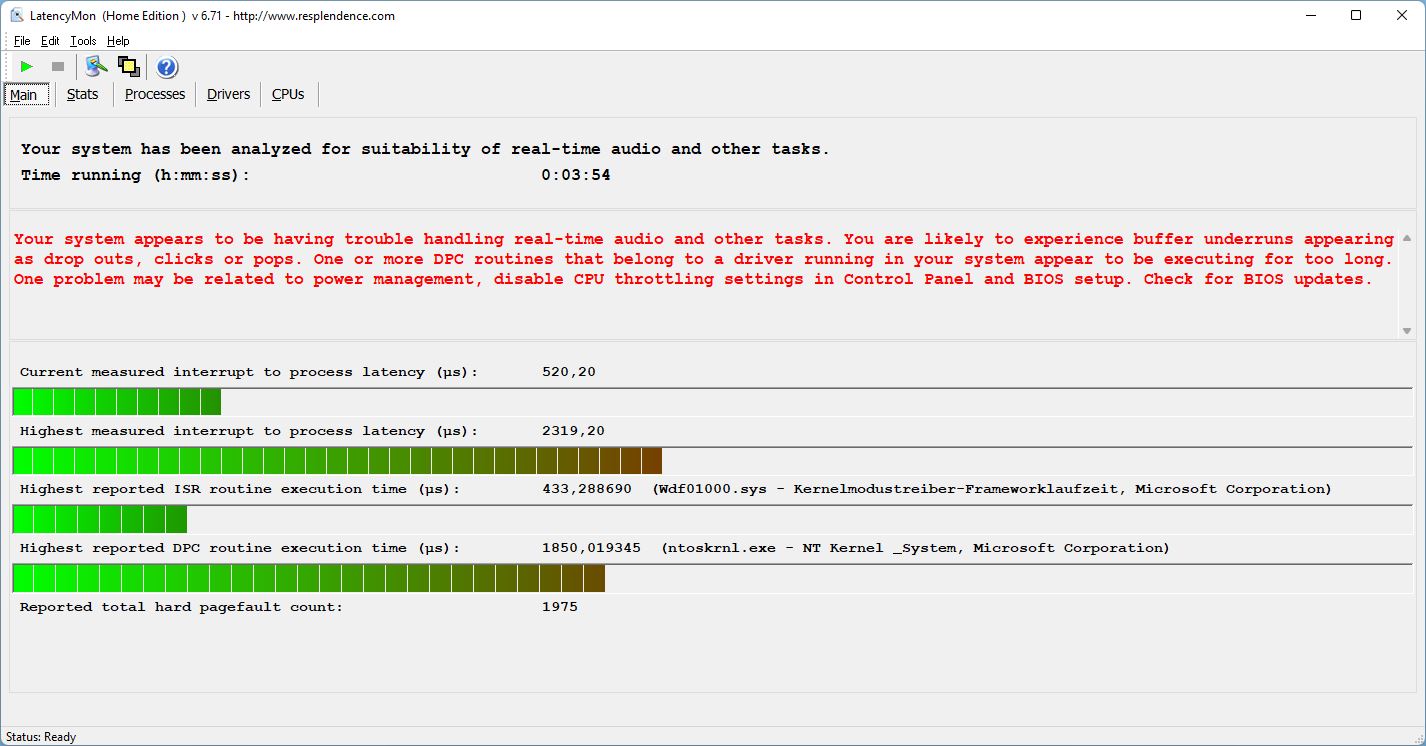
Sfortunatamente, abbiamo trovato significative latenze DPC già all'avvio del browser Edge. Come nota positiva, queste non sono peggiorate da quel punto in poi, indipendentemente dal test che abbiamo eseguito. Questo significa che il nostro test dei video di YouTube 4K/60 FPS non ha funzionato molto bene, con un totale di 14 fotogrammi persi. Il nostro principale sospetto per questo comportamento è il driver del kernel NT.
| DPC Latencies / LatencyMon - interrupt to process latency (max), Web, Youtube, Prime95 | |
| MSI Katana GF76 11UE | |
| Asus TUF Gaming F17 FX707Z-HX011W | |
| MSI GE76 Raider | |
| Lenovo Legion 5 17ACH6H-82JY0003GE | |
| Asus TUF Gaming F17 FX706HM | |
| Schenker XMG Core 17 (Early 2021) | |
* ... Meglio usare valori piccoli
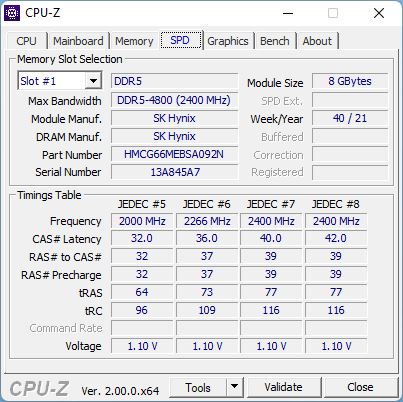
Dispositivi di archiviazione
La nostra unità in prova era equipaggiata con un SSD SK Hynix PCIe 3 da 1 TB, che può essere trovato al 44° posto nella nostra Elenco SSD/HDD top. Lo stesso SSD era già installato nel predecessore dell'F17. Si comporta bene nel complesso, ma è incapace di tenere il passo con gli SSD Samsung che si trovano nell'XMG Core o nell'MSI Raider.
Le prestazioni di lettura sostenuta si sono rivelate piuttosto incoerenti e hanno fluttuato dopo poco tempo. Questa potrebbe essere una delle ragioni per le sue prestazioni PCMark complessivamente sotto la media.

* ... Meglio usare valori piccoli
Sustained Read: DiskSpd Read Loop, Queue Depth 8
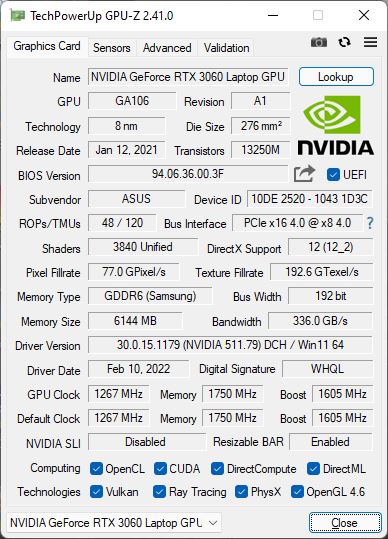
Prestazioni della GPU
Per la gioia nostra (e di tutti i giocatori) la RTX 3060 GPU è configurata per utilizzare il suo massimo di 140 W TGP (inclusi 25 W Dynamic Boost). Di conseguenza, l'F17 si è comportato meglio della media dei laptop dotati di RTX 3060 in 3DMark con solo il Lenovo Legion capace di tenere a malapena il passo.
Sulla batteria, il frame rate durante l'esecuzione di Witcher 3 in FHD con dettagli massimi è sceso da 80 FPS a soli 35 FPS. Questo può sembrare eccessivamente drammatico, ma abbiamo visto computer portatili con GPU più potenti girare anche più lentamente con la batteria.
| 3DMark 11 Performance | 28010 punti | |
| 3DMark Cloud Gate Standard Score | 55142 punti | |
| 3DMark Fire Strike Score | 21179 punti | |
| 3DMark Time Spy Score | 9490 punti | |
Aiuto | ||
Prestazioni di gioco
Quando è stato messo a confronto con i suoi concorrenti nel nostro test Witcher 3, l'F17 è riuscito ad assicurarsi il primo posto. Anche l'MSI Raider con RTX 3080 è stato solo il 50% più veloce. In media, l'F17 si è rivelato tra il 6 e il 10 % più veloce del laptop medio dotato di RTX 3060 e circa il 15 % più veloce del Lenovo Legion 5 con la sua GPU RTX 3060 da 130 W.
Far Cry 5 ha girato con oltre 100 FPS in FHD e dettagli massimi, il che significa il primo posto anche per l'F17.
Cyberpunk 2077 1.5 ha gestito un buon 78 FPS in dettagli massimi con Raytracing disabilitato.
Nel complesso, ogni gioco attuale dovrebbe girare molto bene in FHD con dettagli massimi sull'Asus TUF Gaming, che ha fatto meglio della maggior parte dei suoi concorrenti nei nostri benchmark di gioco.
| Cyberpunk 2077 1.6 | |
| 1920x1080 Medium Preset | |
| Media NVIDIA GeForce RTX 3060 Laptop GPU (68 - 118, n=14) | |
| Asus TUF Gaming F17 FX707Z-HX011W | |
| 1920x1080 High Preset | |
| Asus TUF Gaming F17 FX707Z-HX011W | |
| Media NVIDIA GeForce RTX 3060 Laptop GPU (42.2 - 87.7, n=14) | |
| 1920x1080 Ultra Preset | |
| Asus TUF Gaming F17 FX707Z-HX011W | |
| Media NVIDIA GeForce RTX 3060 Laptop GPU (40 - 78.8, n=16) | |
| 1920x1080 Ray Tracing Ultra Preset (DLSS off) | |
| Asus TUF Gaming F17 FX707Z-HX011W | |
| Media NVIDIA GeForce RTX 3060 Laptop GPU (12.6 - 28.9, n=7) | |
In Witcher 3, i framerate sono rimasti coerenti per tutta l'ora in cui abbiamo eseguito il test senza alcun calo delle prestazioni.
Witcher 3 FPS Graph
| basso | medio | alto | ultra | |
|---|---|---|---|---|
| GTA V (2015) | 177 | 171 | 161 | 97.5 |
| The Witcher 3 (2015) | 360 | 261.7 | 159 | 86.1 |
| Dota 2 Reborn (2015) | 168 | 154 | 144 | 135 |
| Final Fantasy XV Benchmark (2018) | 173 | 105 | 78 | |
| X-Plane 11.11 (2018) | 128 | 115 | 94.3 | |
| Far Cry 5 (2018) | 163 | 130 | 124 | 118 |
| Strange Brigade (2018) | 289 | 202 | 163 | 142 |
| Cyberpunk 2077 1.6 (2022) | 92 | 82 | 79.1 | 78.8 |
Emissioni - Relativamente silenzioso e fresco
Emissioni di rumore
Al minimo le ventole erano spente per la maggior parte del tempo, anche in modalità Turbo. Sotto carico, l'F17 è rimasto più silenzioso di quasi tutti i suoi concorrenti. Siamo anche in grado di sentire un po' di fruscio della bobina in alcune situazioni, ad esempio durante l'esecuzione di 3DMark 06, che si notava solo con le nostre orecchie posizionate molto vicino al dispositivo.
Rumorosità
| Idle |
| 24 / 24 / 24 dB(A) |
| Sotto carico |
| 42.6 / 46.84 dB(A) |
 | ||
30 dB silenzioso 40 dB(A) udibile 50 dB(A) rumoroso |
||
min: | ||
| Asus TUF Gaming F17 FX707Z-HX011W GeForce RTX 3060 Laptop GPU, i7-12700H, SK Hynix HFM001TD3JX013N | Asus TUF Gaming F17 FX706HM GeForce RTX 3060 Laptop GPU, i9-11900H, SK Hynix HFM001TD3JX013N | Lenovo Legion 5 17ACH6H-82JY0003GE GeForce RTX 3060 Laptop GPU, R5 5600H, Samsung PM991a MZALQ512HBLU | MSI GE76 Raider GeForce RTX 3080 Ti Laptop GPU, i9-12900HK, Samsung PM9A1 MZVL22T0HBLB | MSI Katana GF76 11UE GeForce RTX 3060 Laptop GPU, i7-11800H, Kingston OM8PCP3512F-AB | Schenker XMG Core 17 (Early 2021) GeForce RTX 3060 Laptop GPU, i7-10870H, Samsung SSD 970 EVO Plus 1TB | |
|---|---|---|---|---|---|---|
| Noise | -14% | -6% | -20% | -26% | -23% | |
| off /ambiente * (dB) | 24 | 25 -4% | 25 -4% | 26 -8% | 25 -4% | 25 -4% |
| Idle Minimum * (dB) | 24 | 26 -8% | 25 -4% | 26 -8% | 33 -38% | 30 -25% |
| Idle Average * (dB) | 24 | 31 -29% | 25 -4% | 27 -13% | 34 -42% | 32 -33% |
| Idle Maximum * (dB) | 24 | 33 -38% | 30.5 -27% | 40 -67% | 35 -46% | 36 -50% |
| Load Average * (dB) | 42.6 | 48 -13% | 37.5 12% | 50 -17% | 53 -24% | 53 -24% |
| Witcher 3 ultra * (dB) | 46.84 | 47 -0% | 53 -13% | 49 -5% | 51 -9% | |
| Load Maximum * (dB) | 46.84 | 49 -5% | 51 -9% | 53 -13% | 57 -22% | 54 -15% |
* ... Meglio usare valori piccoli
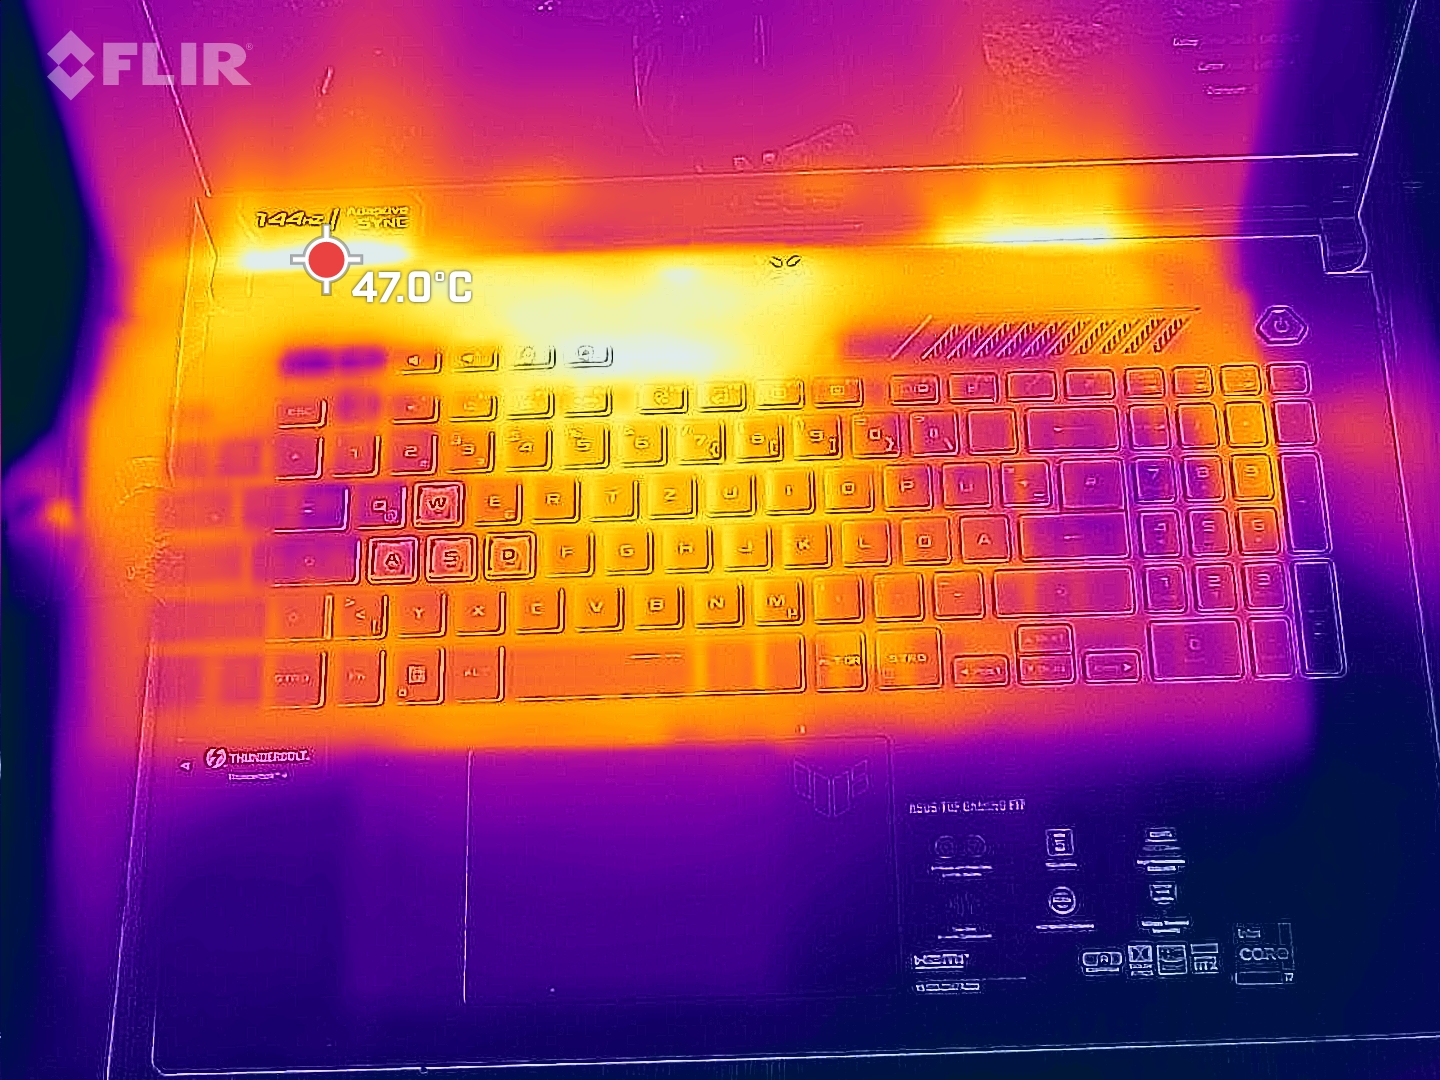
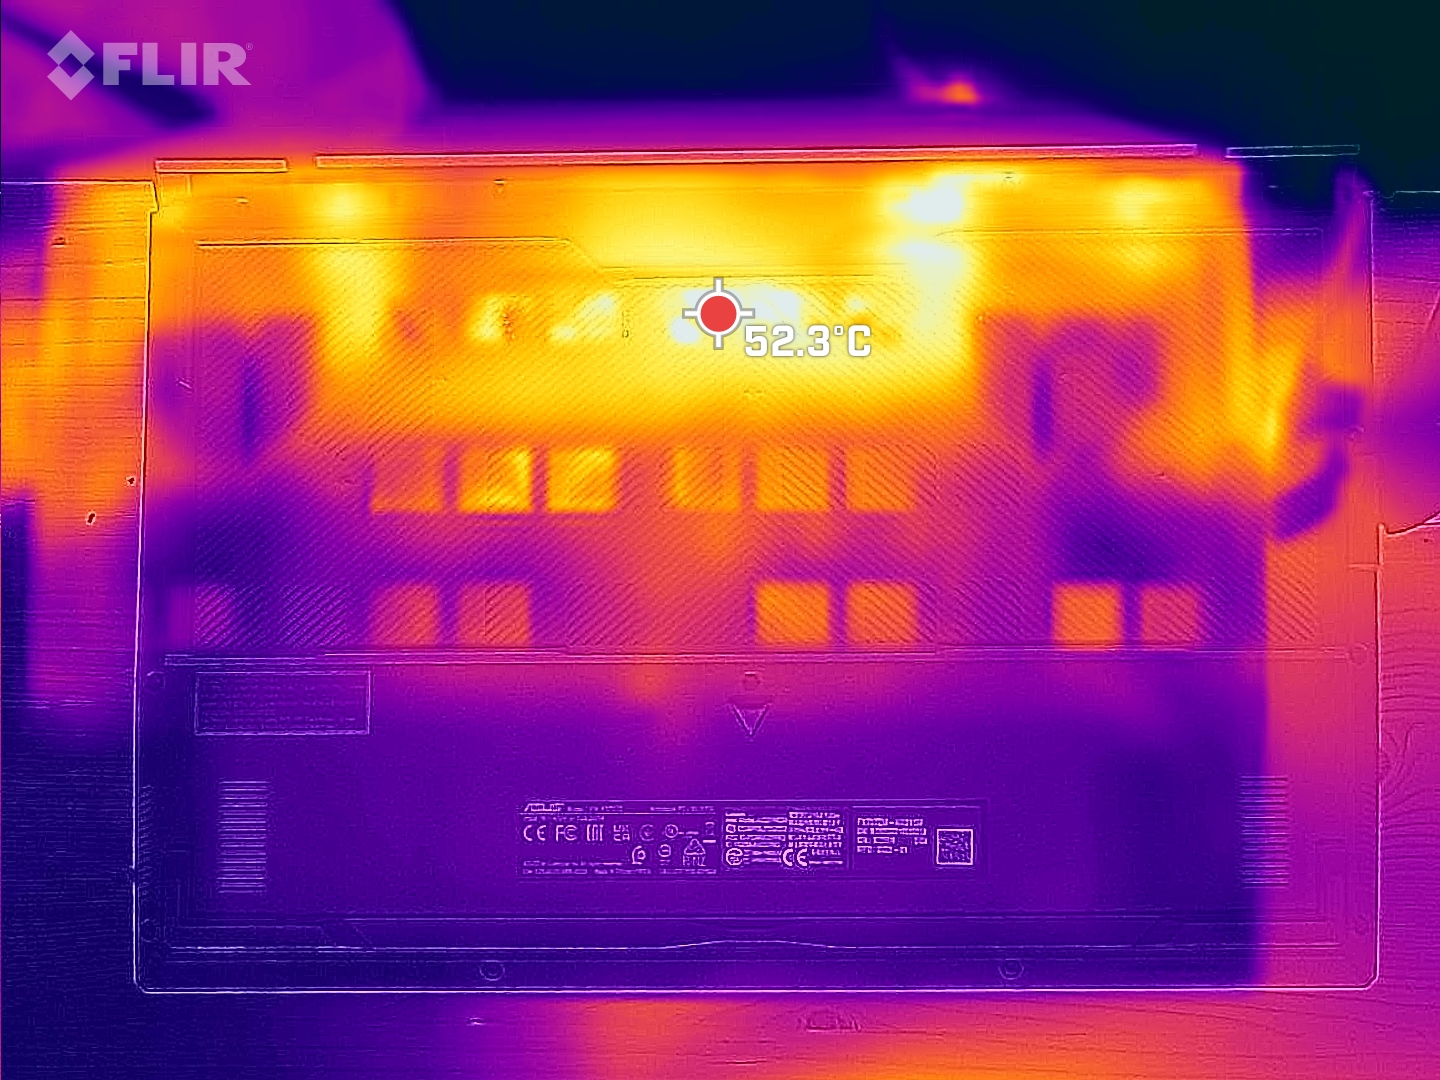
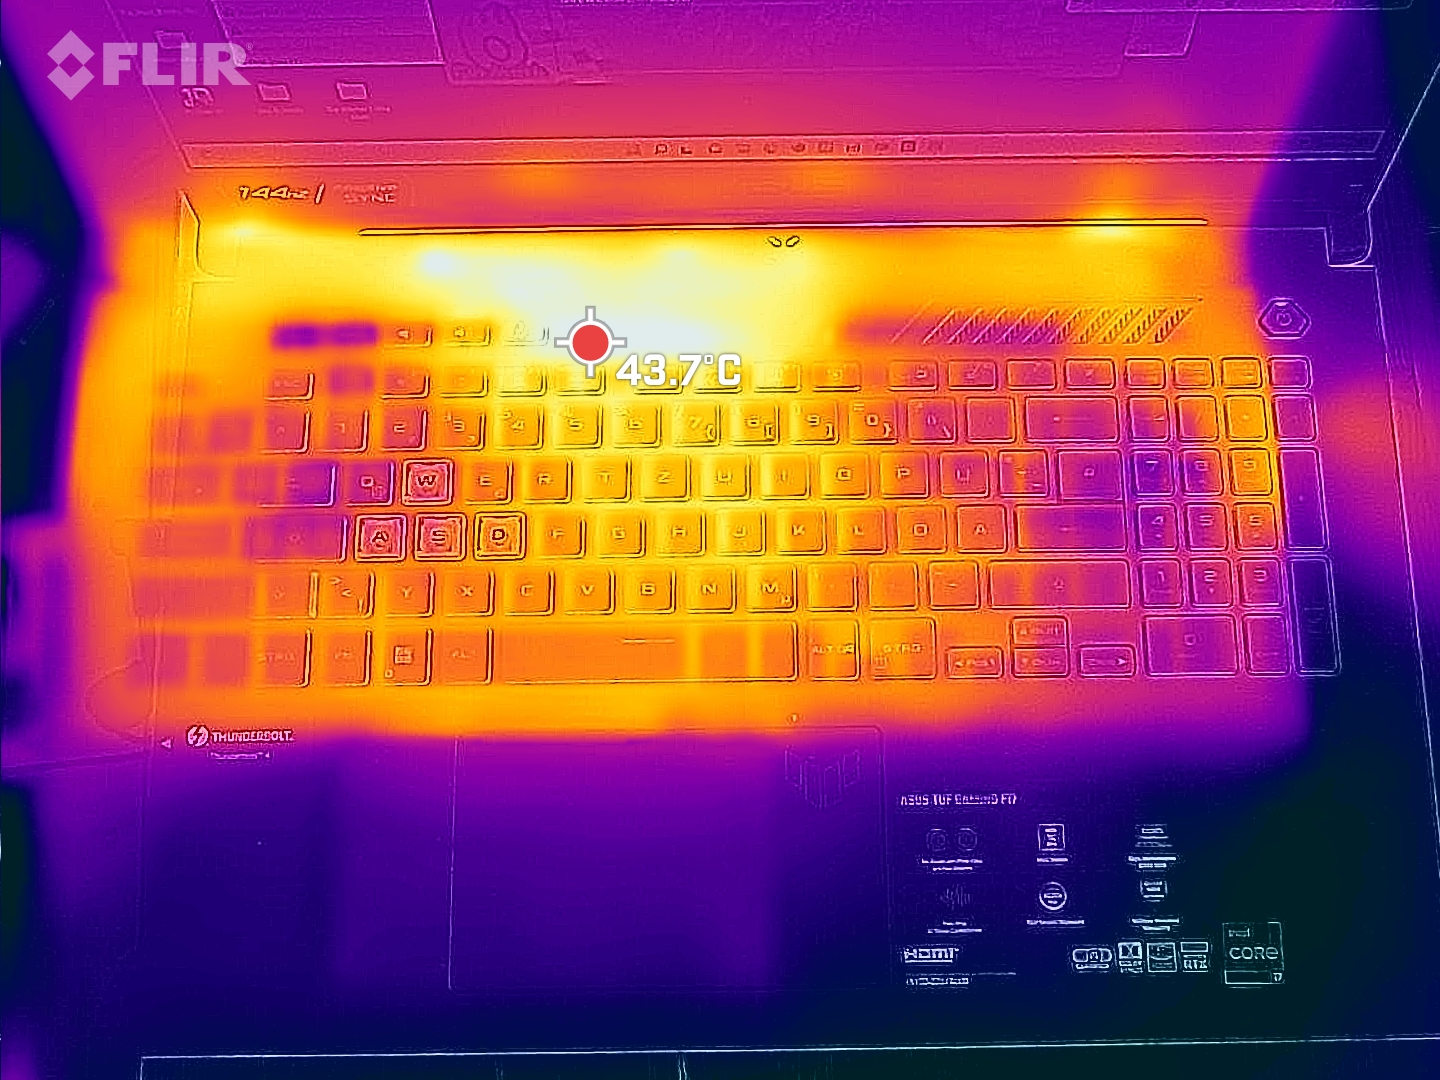
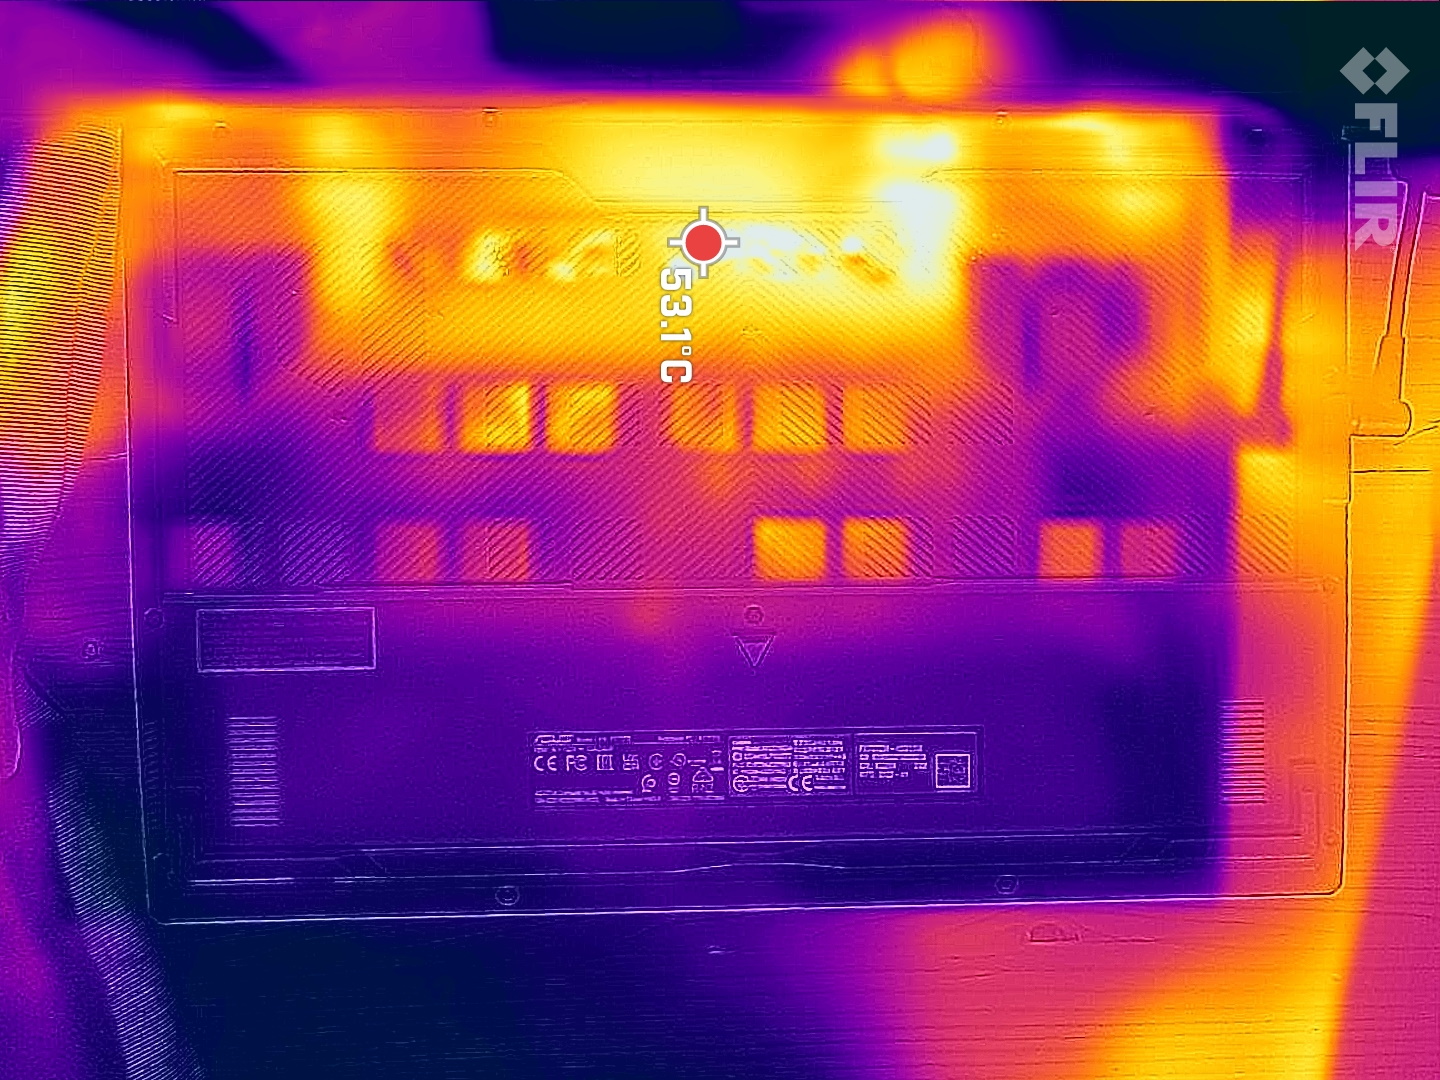
Temperatura
Le temperature erano simili a quelle di altri notebook da gioco da 17 pollici e significativamente inferiori a quelle del predecessore dell'F17. I punti caldi sono situati nella parte superiore verso la parte posteriore e possono raggiungere fino a 50 °C.
I poggiapolsi rimangono piacevolmente freschi in ogni momento. L'area intorno ai tasti WASD può raggiungere una temperatura calda ma ancora accettabile di 43 °C durante il gioco.
(-) La temperatura massima sul lato superiore è di 52 °C / 126 F, rispetto alla media di 40.4 °C / 105 F, che varia da 21.2 a 68.8 °C per questa classe Gaming.
(-) Il lato inferiore si riscalda fino ad un massimo di 47 °C / 117 F, rispetto alla media di 43.2 °C / 110 F
(+) In idle, la temperatura media del lato superiore è di 28.8 °C / 84 F, rispetto alla media deld ispositivo di 33.9 °C / 93 F.
(-) Riproducendo The Witcher 3, la temperatura media per il lato superiore e' di 39.9 °C / 104 F, rispetto alla media del dispositivo di 33.9 °C / 93 F.
(+) I poggiapolsi e il touchpad sono piu' freddi della temperatura della pelle con un massimo di 30 °C / 86 F e sono quindi freddi al tatto.
(±) La temperatura media della zona del palmo della mano di dispositivi simili e'stata di 28.8 °C / 83.8 F (-1.2 °C / -2.2 F).
| Asus TUF Gaming F17 FX707Z-HX011W Intel Core i7-12700H, NVIDIA GeForce RTX 3060 Laptop GPU | Asus TUF Gaming F17 FX706HM Intel Core i9-11900H, NVIDIA GeForce RTX 3060 Laptop GPU | Lenovo Legion 5 17ACH6H-82JY0003GE AMD Ryzen 5 5600H, NVIDIA GeForce RTX 3060 Laptop GPU | MSI GE76 Raider Intel Core i9-12900HK, NVIDIA GeForce RTX 3080 Ti Laptop GPU | MSI Katana GF76 11UE Intel Core i7-11800H, NVIDIA GeForce RTX 3060 Laptop GPU | Schenker XMG Core 17 (Early 2021) Intel Core i7-10870H, NVIDIA GeForce RTX 3060 Laptop GPU | |
|---|---|---|---|---|---|---|
| Heat | -22% | -1% | -2% | -2% | -1% | |
| Maximum Upper Side * (°C) | 52 | 58.5 -13% | 42.2 19% | 43 17% | 51 2% | 44 15% |
| Maximum Bottom * (°C) | 47 | 58.5 -24% | 50.9 -8% | 47 -0% | 52 -11% | 50 -6% |
| Idle Upper Side * (°C) | 31 | 38 -23% | 34.3 -11% | 33 -6% | 32 -3% | 30 3% |
| Idle Bottom * (°C) | 31 | 39 -26% | 32 -3% | 37 -19% | 29 6% | 36 -16% |
* ... Meglio usare valori piccoli
Test di stress
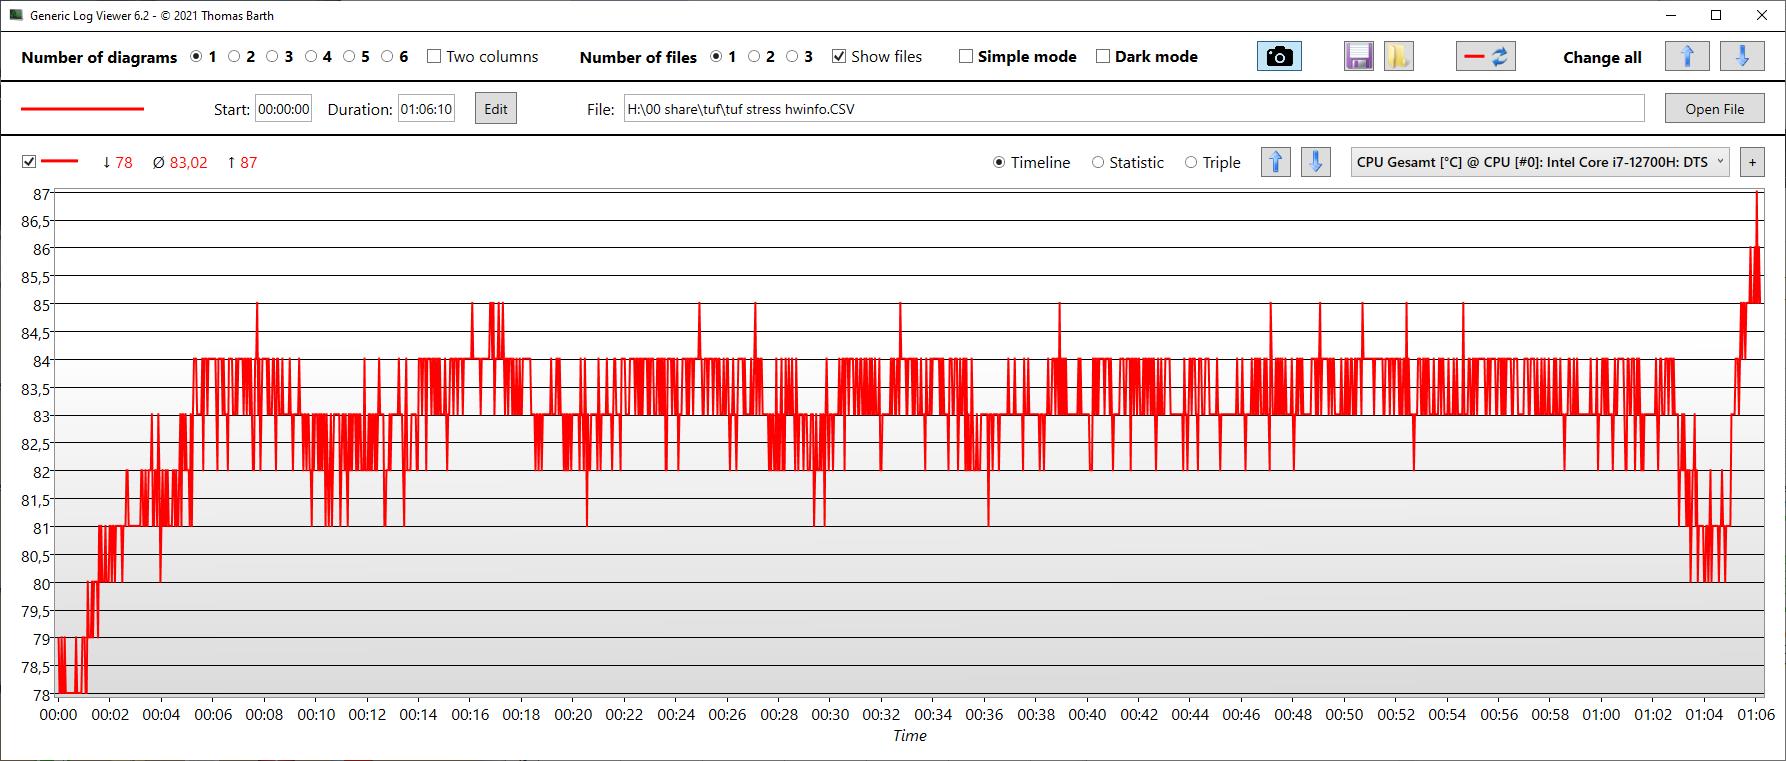
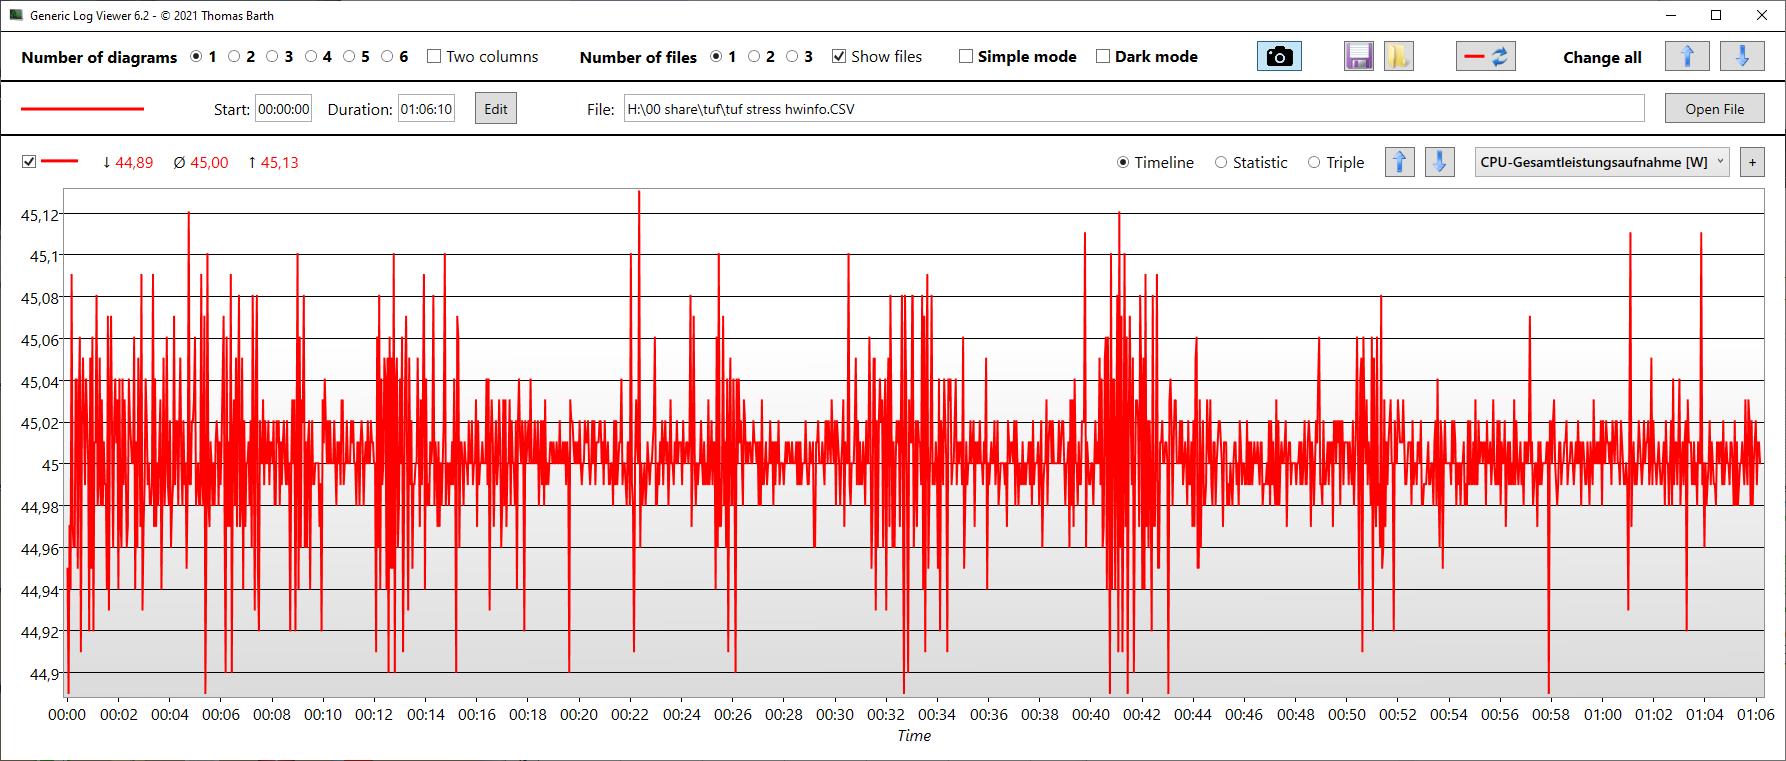
Durante il nostro stress test di un'ora, la CPU ha iniziato a 3,6 GHz su tutti i core, per poi scendere a 2,5 GHz dopo meno di un minuto e a 2,3 GHz alla fine del test dopo un'ora intera. Le temperature registrate hanno una media di 83 °C con un picco di 87 °C.
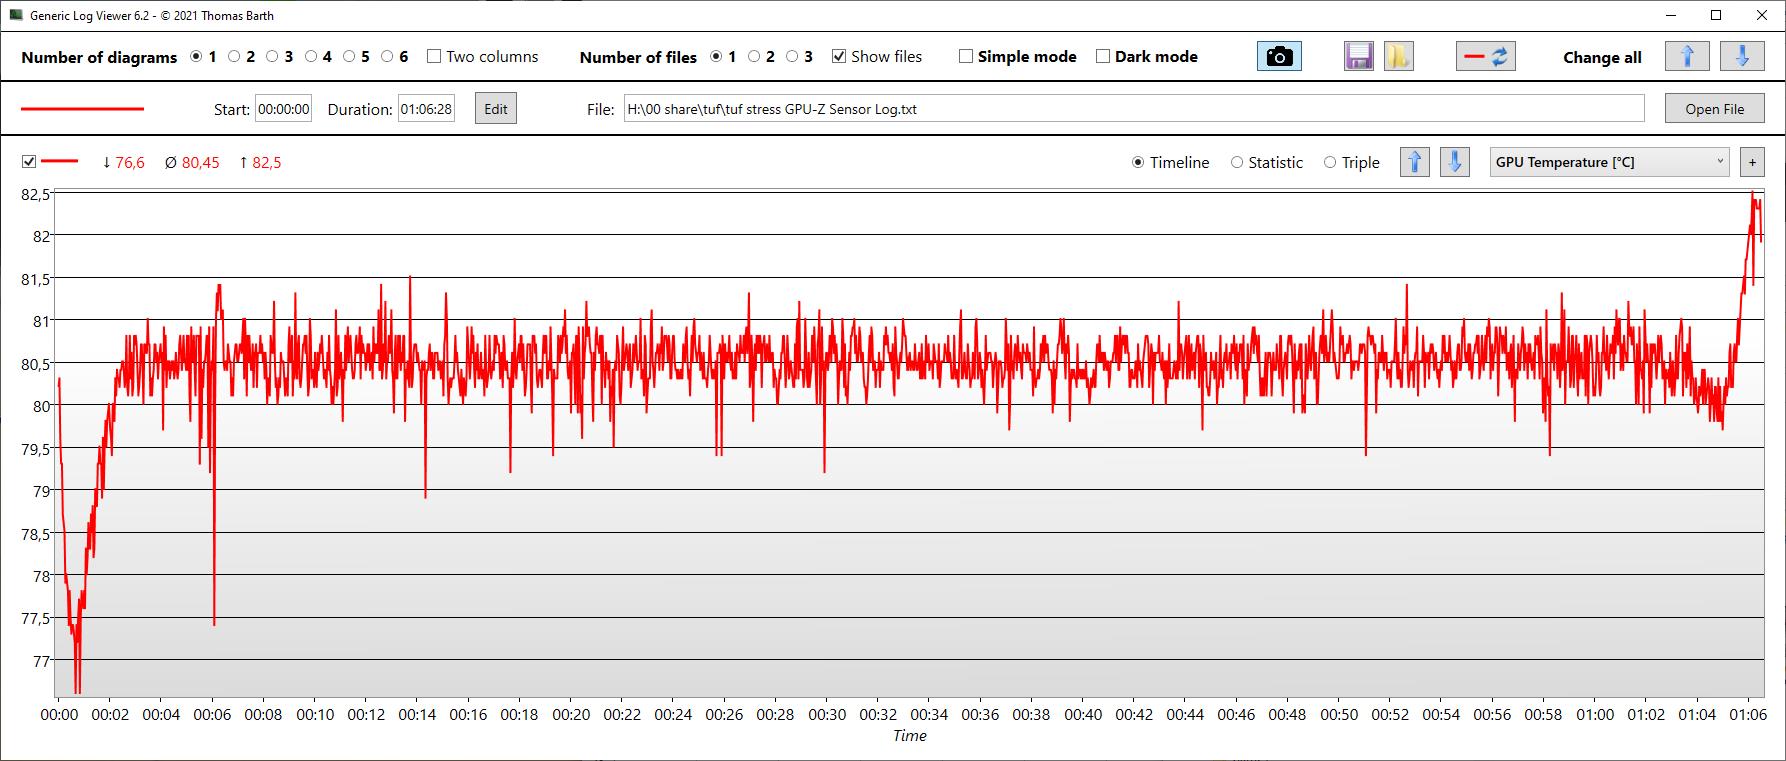
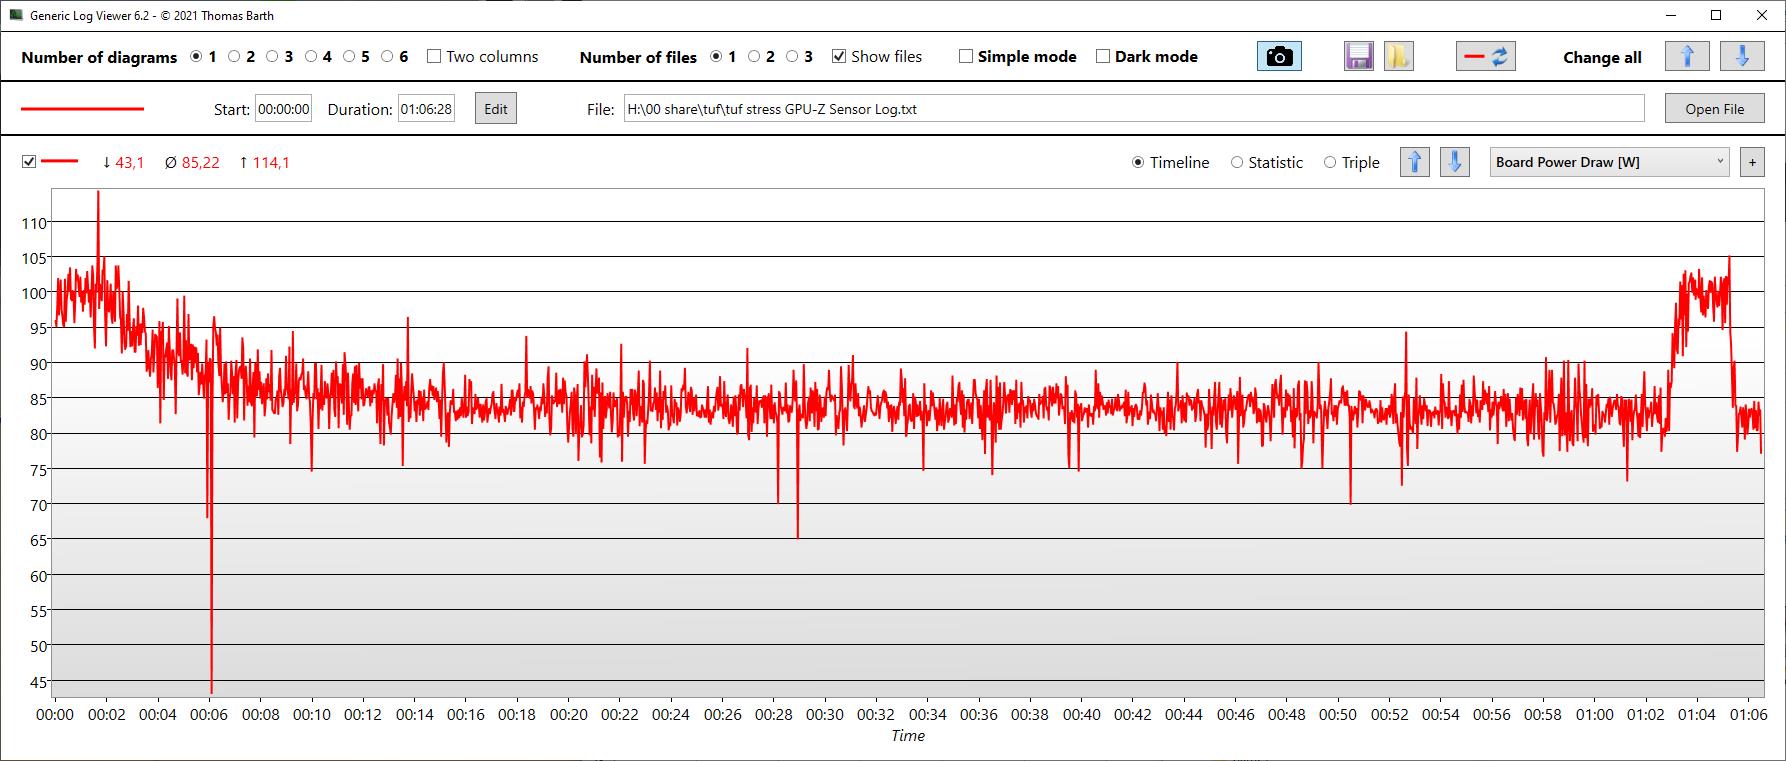
La GPU inizia a 1,6 GHz ma poi scende a 1,3 GHz con una temperatura media registrata di 81 °C.
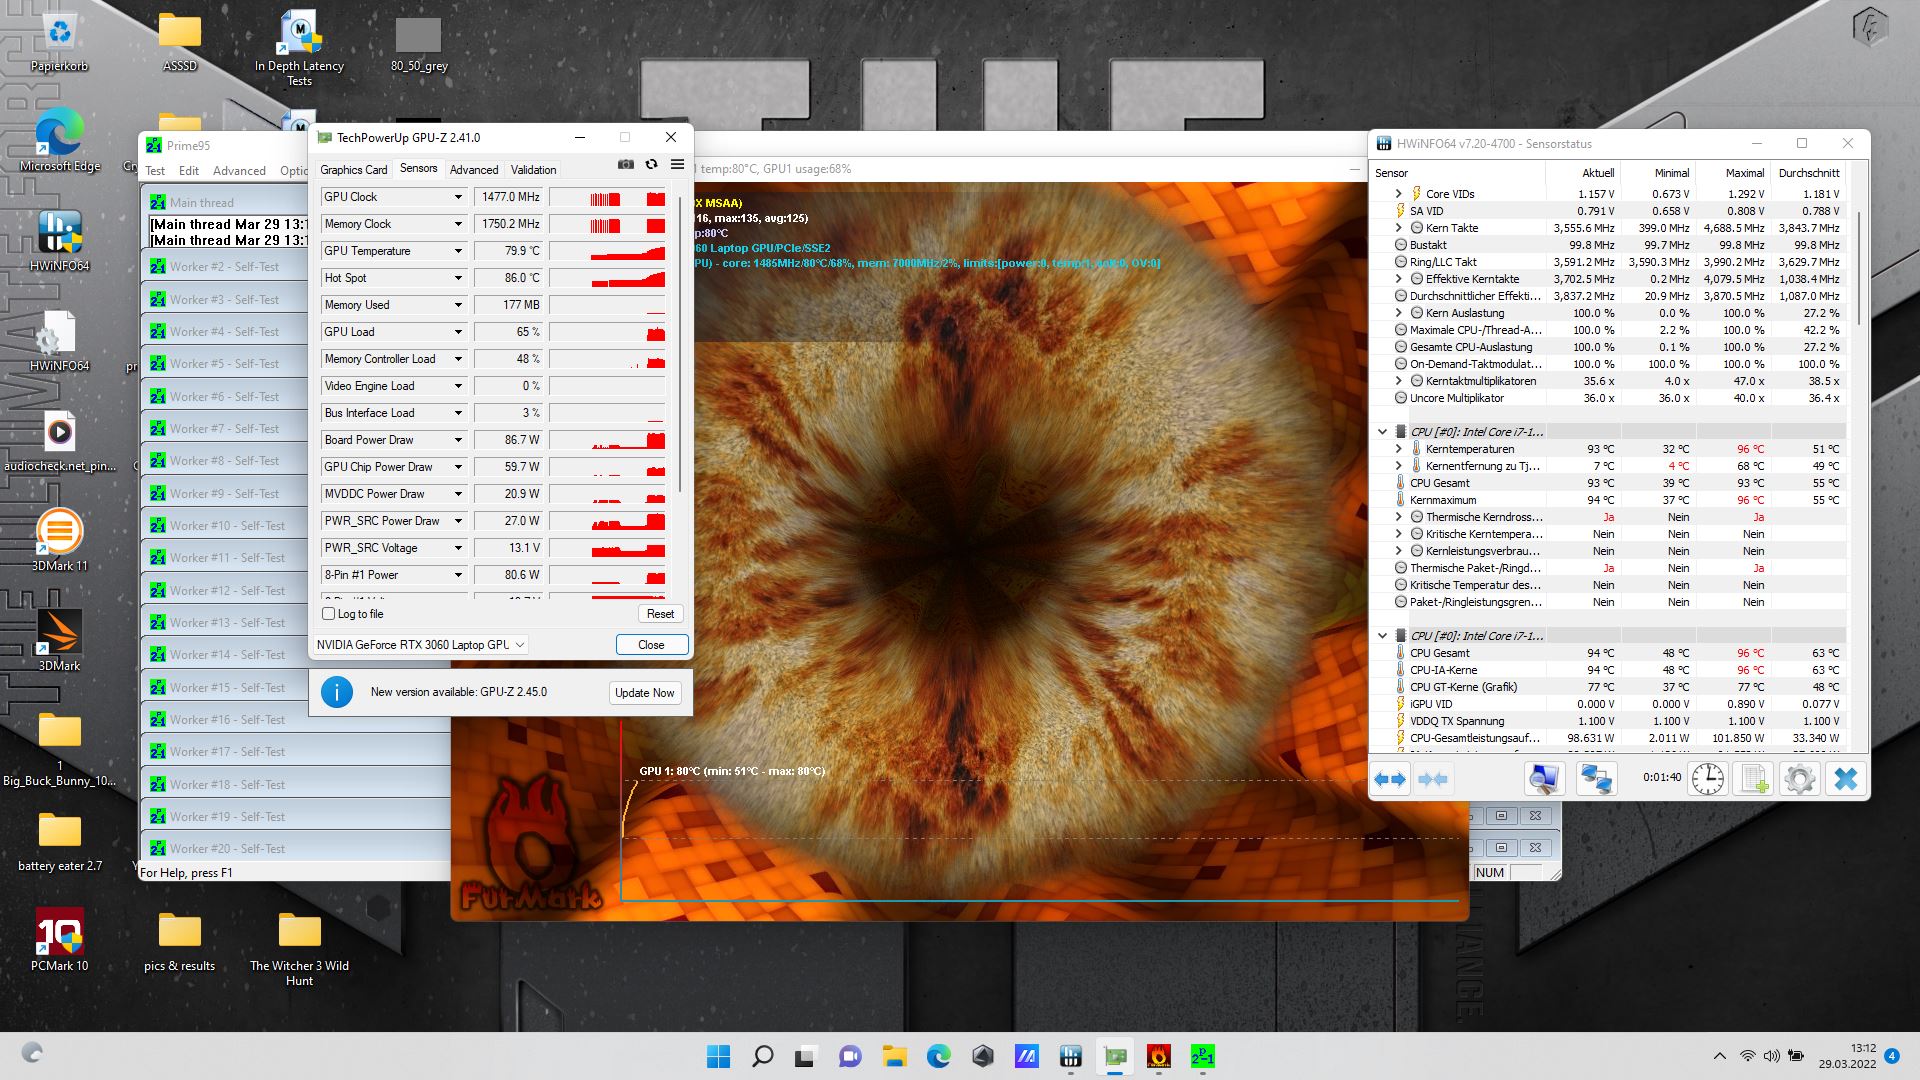
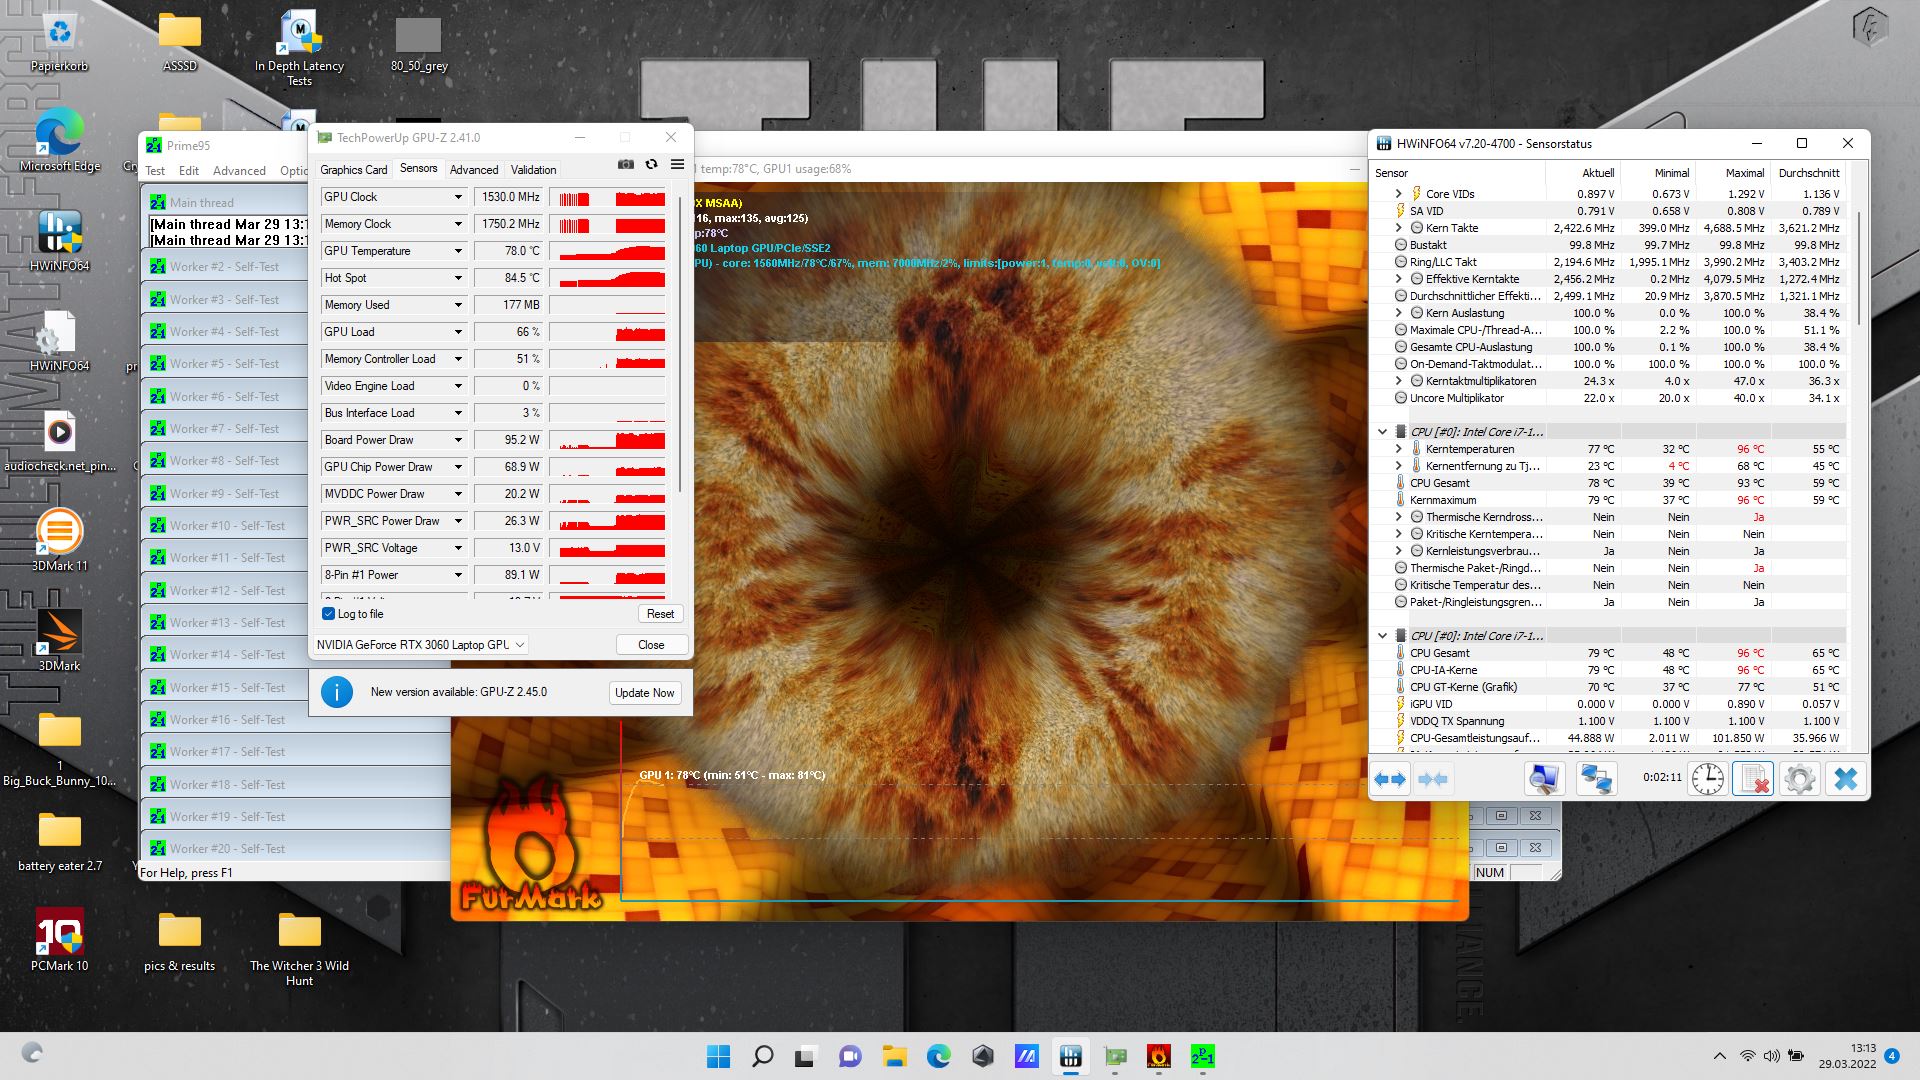
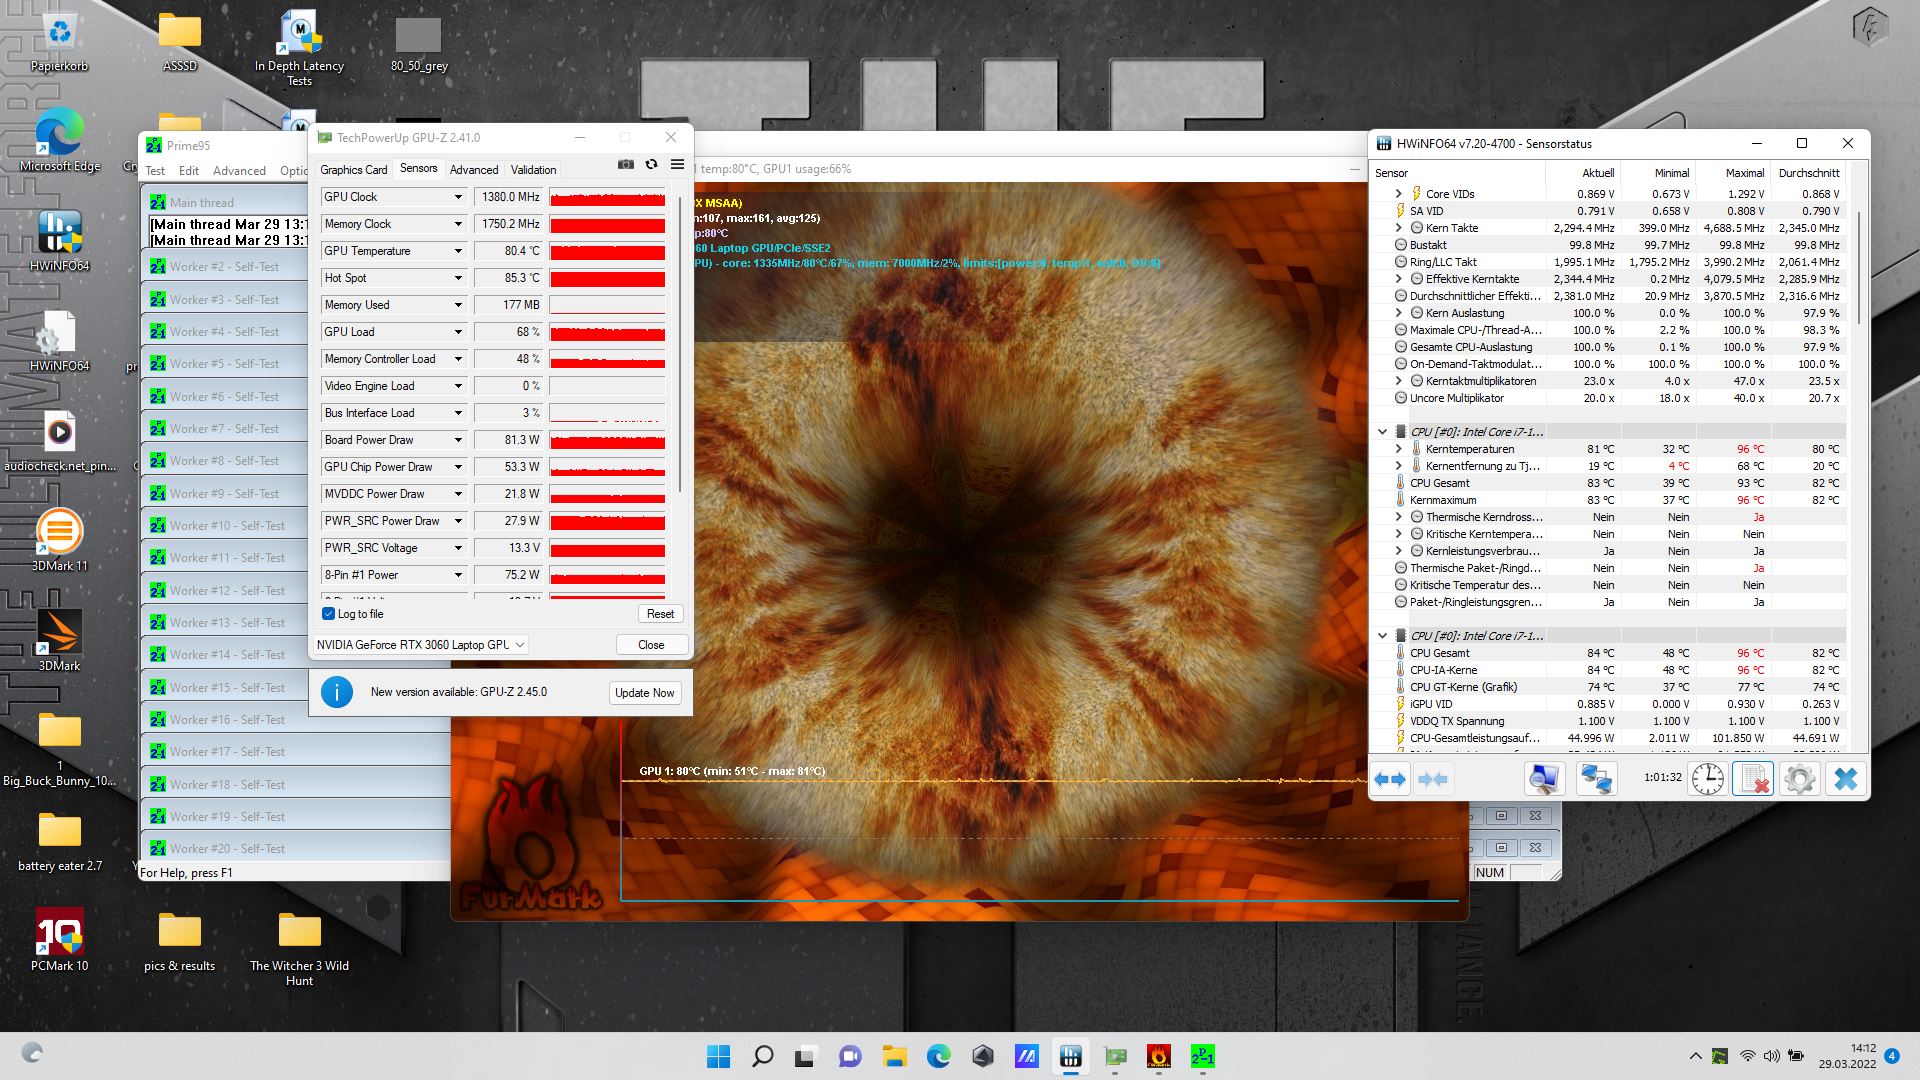
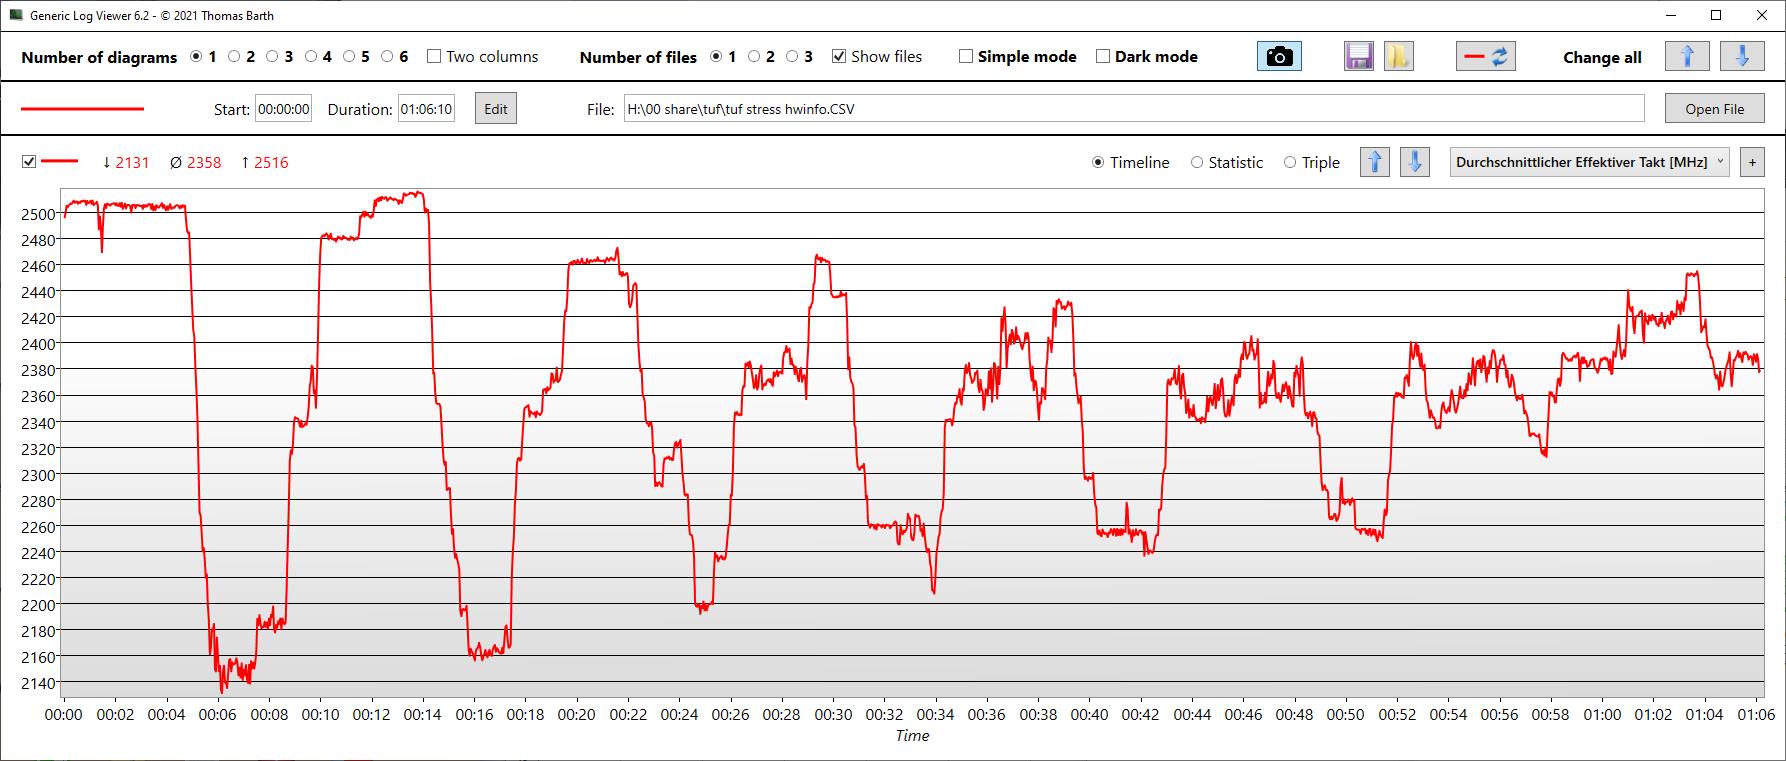
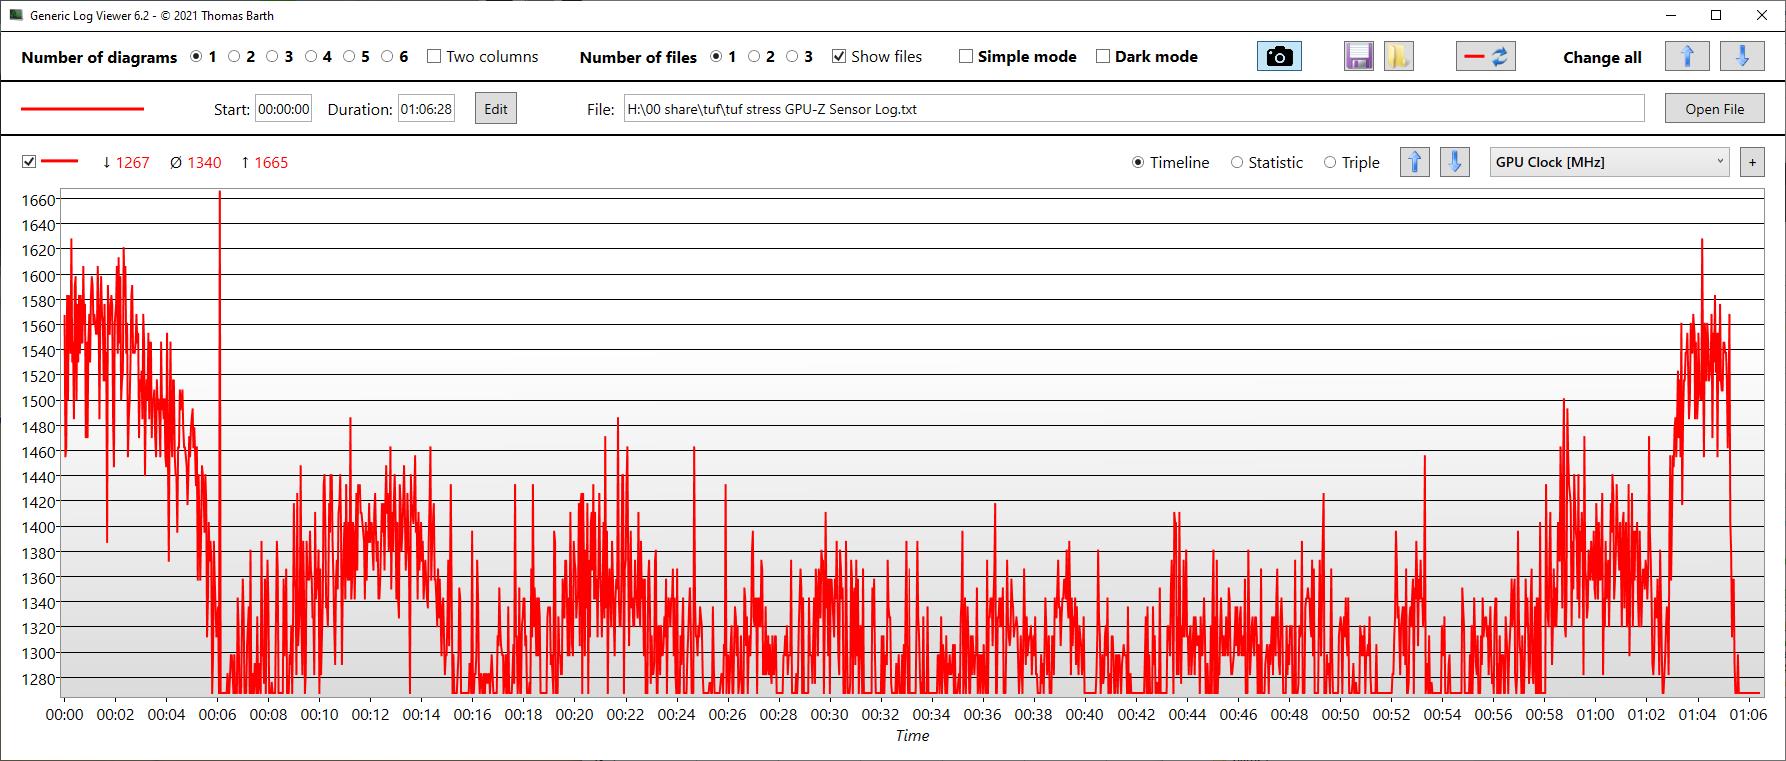
| CPU Clock (GHz) | GPU Clock (MHz) | Temperatura media della CPU (°C) | Temperatura media della GPU (°C) | |
| Prime95 + FurMark Stress | 2,4 | 1.340 | 83 | 81 |
Altoparlanti
Gli altoparlanti sono stati aumentati nelle dimensioni rispetto al predecessore. In ogni caso, le loro prestazioni sono mediocri nel migliore dei casi, con solo minimi miglioramenti in termini di bassi. Gli altoparlanti analogici e le cuffie possono essere collegati al jack audio da 3,5 mm dell'F17.
Asus TUF Gaming F17 FX707Z-HX011W analisi audio
(±) | potenza degli altiparlanti media ma buona (79.5 dB)
Bassi 100 - 315 Hz
(±) | bassi ridotti - in media 13.1% inferiori alla media
(±) | la linearità dei bassi è media (9% delta rispetto alla precedente frequenza)
Medi 400 - 2000 Hz
(±) | medi elevati - circa 9.1% superiore alla media
(±) | linearità dei medi adeguata (7.8% delta rispetto alla precedente frequenza)
Alti 2 - 16 kHz
(+) | Alti bilanciati - appena 3.9% dalla media
(±) | la linearità degli alti è media (9.1% delta rispetto alla precedente frequenza)
Nel complesso 100 - 16.000 Hz
(±) | la linearità complessiva del suono è media (20.4% di differenza rispetto alla media
Rispetto alla stessa classe
» 72% di tutti i dispositivi testati in questa classe è stato migliore, 6% simile, 22% peggiore
» Il migliore ha avuto un delta di 6%, medio di 18%, peggiore di 132%
Rispetto a tutti i dispositivi testati
» 53% di tutti i dispositivi testati in questa classe è stato migliore, 8% similare, 39% peggiore
» Il migliore ha avuto un delta di 4%, medio di 24%, peggiore di 134%
Lenovo Legion 5 17ACH6H-82JY0003GE analisi audio
(±) | potenza degli altiparlanti media ma buona (78.3 dB)
Bassi 100 - 315 Hz
(-) | quasi nessun basso - in media 19.1% inferiori alla media
(±) | la linearità dei bassi è media (13.8% delta rispetto alla precedente frequenza)
Medi 400 - 2000 Hz
(+) | medi bilanciati - solo only 3% rispetto alla media
(+) | medi lineari (5% delta rispetto alla precedente frequenza)
Alti 2 - 16 kHz
(+) | Alti bilanciati - appena 4.8% dalla media
(+) | alti lineari (6.7% delta rispetto alla precedente frequenza)
Nel complesso 100 - 16.000 Hz
(±) | la linearità complessiva del suono è media (15.8% di differenza rispetto alla media
Rispetto alla stessa classe
» 37% di tutti i dispositivi testati in questa classe è stato migliore, 7% simile, 56% peggiore
» Il migliore ha avuto un delta di 6%, medio di 18%, peggiore di 132%
Rispetto a tutti i dispositivi testati
» 24% di tutti i dispositivi testati in questa classe è stato migliore, 5% similare, 71% peggiore
» Il migliore ha avuto un delta di 4%, medio di 24%, peggiore di 134%
Gestione dell'energia - Lunga durata della batteria
Consumo di energia
Il consumo energetico a riposo è stato superbamente basso, per gentile concessione del display poco luminoso dell'F17.
A causa dell'alto TGP della GPU, il consumo energetico sotto carico era abbastanza alto. Durante il gioco, l'F17 può aver superato i suoi concorrenti, ma ha anche mostrato un consumo energetico più elevato di tutti loro, ad eccezione dello Schenker Core, che ha consumato più energia ma si è comportato peggio dell'F17.
| Idle | |
| Sotto carico |
|
Leggenda:
min: | |
| Asus TUF Gaming F17 FX707Z-HX011W i7-12700H, GeForce RTX 3060 Laptop GPU, SK Hynix HFM001TD3JX013N, IPS, 1920x1080, 17.3" | Asus TUF Gaming F17 FX706HM i9-11900H, GeForce RTX 3060 Laptop GPU, SK Hynix HFM001TD3JX013N, IPS, 1920x1080, 17.3" | Lenovo Legion 5 17ACH6H-82JY0003GE R5 5600H, GeForce RTX 3060 Laptop GPU, Samsung PM991a MZALQ512HBLU, IPS, 1920x1080, 17.3" | MSI GE76 Raider i9-12900HK, GeForce RTX 3080 Ti Laptop GPU, Samsung PM9A1 MZVL22T0HBLB, IPS-Level, 1920x1080, 17.3" | MSI Katana GF76 11UE i7-11800H, GeForce RTX 3060 Laptop GPU, Kingston OM8PCP3512F-AB, IPS, 1920x1080, 17.3" | Schenker XMG Core 17 (Early 2021) i7-10870H, GeForce RTX 3060 Laptop GPU, Samsung SSD 970 EVO Plus 1TB, IPS, 2560x1440, 17.3" | Media NVIDIA GeForce RTX 3060 Laptop GPU | Media della classe Gaming | |
|---|---|---|---|---|---|---|---|---|
| Power Consumption | -16% | -58% | -66% | -20% | -53% | -40% | -68% | |
| Idle Minimum * (Watt) | 6.6 | 10.3 -56% | 15.6 -136% | 12 -82% | 9 -36% | 13 -97% | 10.4 ? -58% | 13.2 ? -100% |
| Idle Average * (Watt) | 8.3 | 13.1 -58% | 20.7 -149% | 17 -105% | 13 -57% | 16 -93% | 14.5 ? -75% | 18.9 ? -128% |
| Idle Maximum * (Watt) | 11.8 | 14.1 -19% | 22.9 -94% | 28 -137% | 20 -69% | 29 -146% | 21.4 ? -81% | 24.3 ? -106% |
| Load Average * (Watt) | 119 | 110 8% | 134 -13% | 118 1% | 102 14% | 100 16% | 109.3 ? 8% | 108 ? 9% |
| Witcher 3 ultra * (Watt) | 169 | 138 18% | 135 20% | 252 -49% | 149 12% | 173 -2% | ||
| Load Maximum * (Watt) | 222 | 190 14% | 170 23% | 272 -23% | 187 16% | 213 4% | 206 ? 7% | 254 ? -14% |
* ... Meglio usare valori piccoli
Power Consumption Witcher 3 / Stresstest
Power Consumption with External Display
Durata della batteria
Il TUF Gaming F17 è dotato di una batteria relativamente grande da 90 Wh, e il modello attuale offre una durata complessiva della batteria impressionante proprio come il predecessore.
Il dispositivo è durato più di 7,5 ore nel nostro test di riproduzione video a luminosità ridotta, e tra 7 e 8,5 ore nel nostro test Wi-Fi a seconda della luminosità del display.
| Asus TUF Gaming F17 FX707Z-HX011W i7-12700H, GeForce RTX 3060 Laptop GPU, 90 Wh | Asus TUF Gaming F17 FX706HM i9-11900H, GeForce RTX 3060 Laptop GPU, 90 Wh | Lenovo Legion 5 17ACH6H-82JY0003GE R5 5600H, GeForce RTX 3060 Laptop GPU, 80 Wh | MSI GE76 Raider i9-12900HK, GeForce RTX 3080 Ti Laptop GPU, 99.99 Wh | MSI Katana GF76 11UE i7-11800H, GeForce RTX 3060 Laptop GPU, 53 Wh | Schenker XMG Core 17 (Early 2021) i7-10870H, GeForce RTX 3060 Laptop GPU, 62 Wh | Media della classe Gaming | |
|---|---|---|---|---|---|---|---|
| Autonomia della batteria | 2% | -40% | -41% | -50% | -42% | -16% | |
| H.264 (h) | 7.7 | 8.5 10% | 3.5 -55% | 3.9 -49% | 4.7 -39% | 8.26 ? 7% | |
| WiFi v1.3 (h) | 8.7 | 7.6 -13% | 4.4 -49% | 5.1 -41% | 3.7 -57% | 4.9 -44% | 7.02 ? -19% |
| Load (h) | 2.3 | 2.5 9% | 1.9 -17% | 1.3 -43% | 1.3 -43% | 1.47 ? -36% | |
| Reader / Idle (h) | 5.5 | 4.8 | 7.7 | 8.71 ? | |||
| Witcher 3 ultra (h) | 0.8 |
Pro
Contro
Verdetto - Prestazioni 3D eccellenti ma nessun display da gioco
Uno dei punti forti dell'Asus TUF Gaming F17 è senza dubbio le sue eccellenti prestazioni di gioco. Il fatto che Asus abbia configurato la GPU RTX 3060 per il suo massimo specificato di 140 W è diventato immediatamente evidente nei nostri benchmark. Per essere un notebook da 17 pollici, l'F17 offre anche una durata della batteria molto lunga, che lo rende piuttosto portatile.
Il rovescio della medaglia è il display. Può essere salvato dal suo buon rapporto di contrasto generale, ma la sua luminosità complessiva è semplicemente troppo bassa, e i suoi tempi di risposta sono troppo lenti per un dispositivo di gioco. Il successore dell'F17 deve migliorare questo aspetto.
L'Asus TUF (Gaming F)17 offre prestazioni di gioco relativamente elevate, ma in cambio soffre di un display povero e di scarse prestazioni Wi-Fi.
Prezzo e disponibilità
Al momento della scrittura, l'aggiornato 2022 Asus TUF Gaming F17 non era ancora disponibile in Nord America. Con le attuali carenze della catena di approvvigionamento, non è nemmeno chiaro quando questo cambierà.
Asus TUF Gaming F17 FX707Z-HX011W
- 04/14/2022 v7 (old)
Christian Hintze
Price comparison

