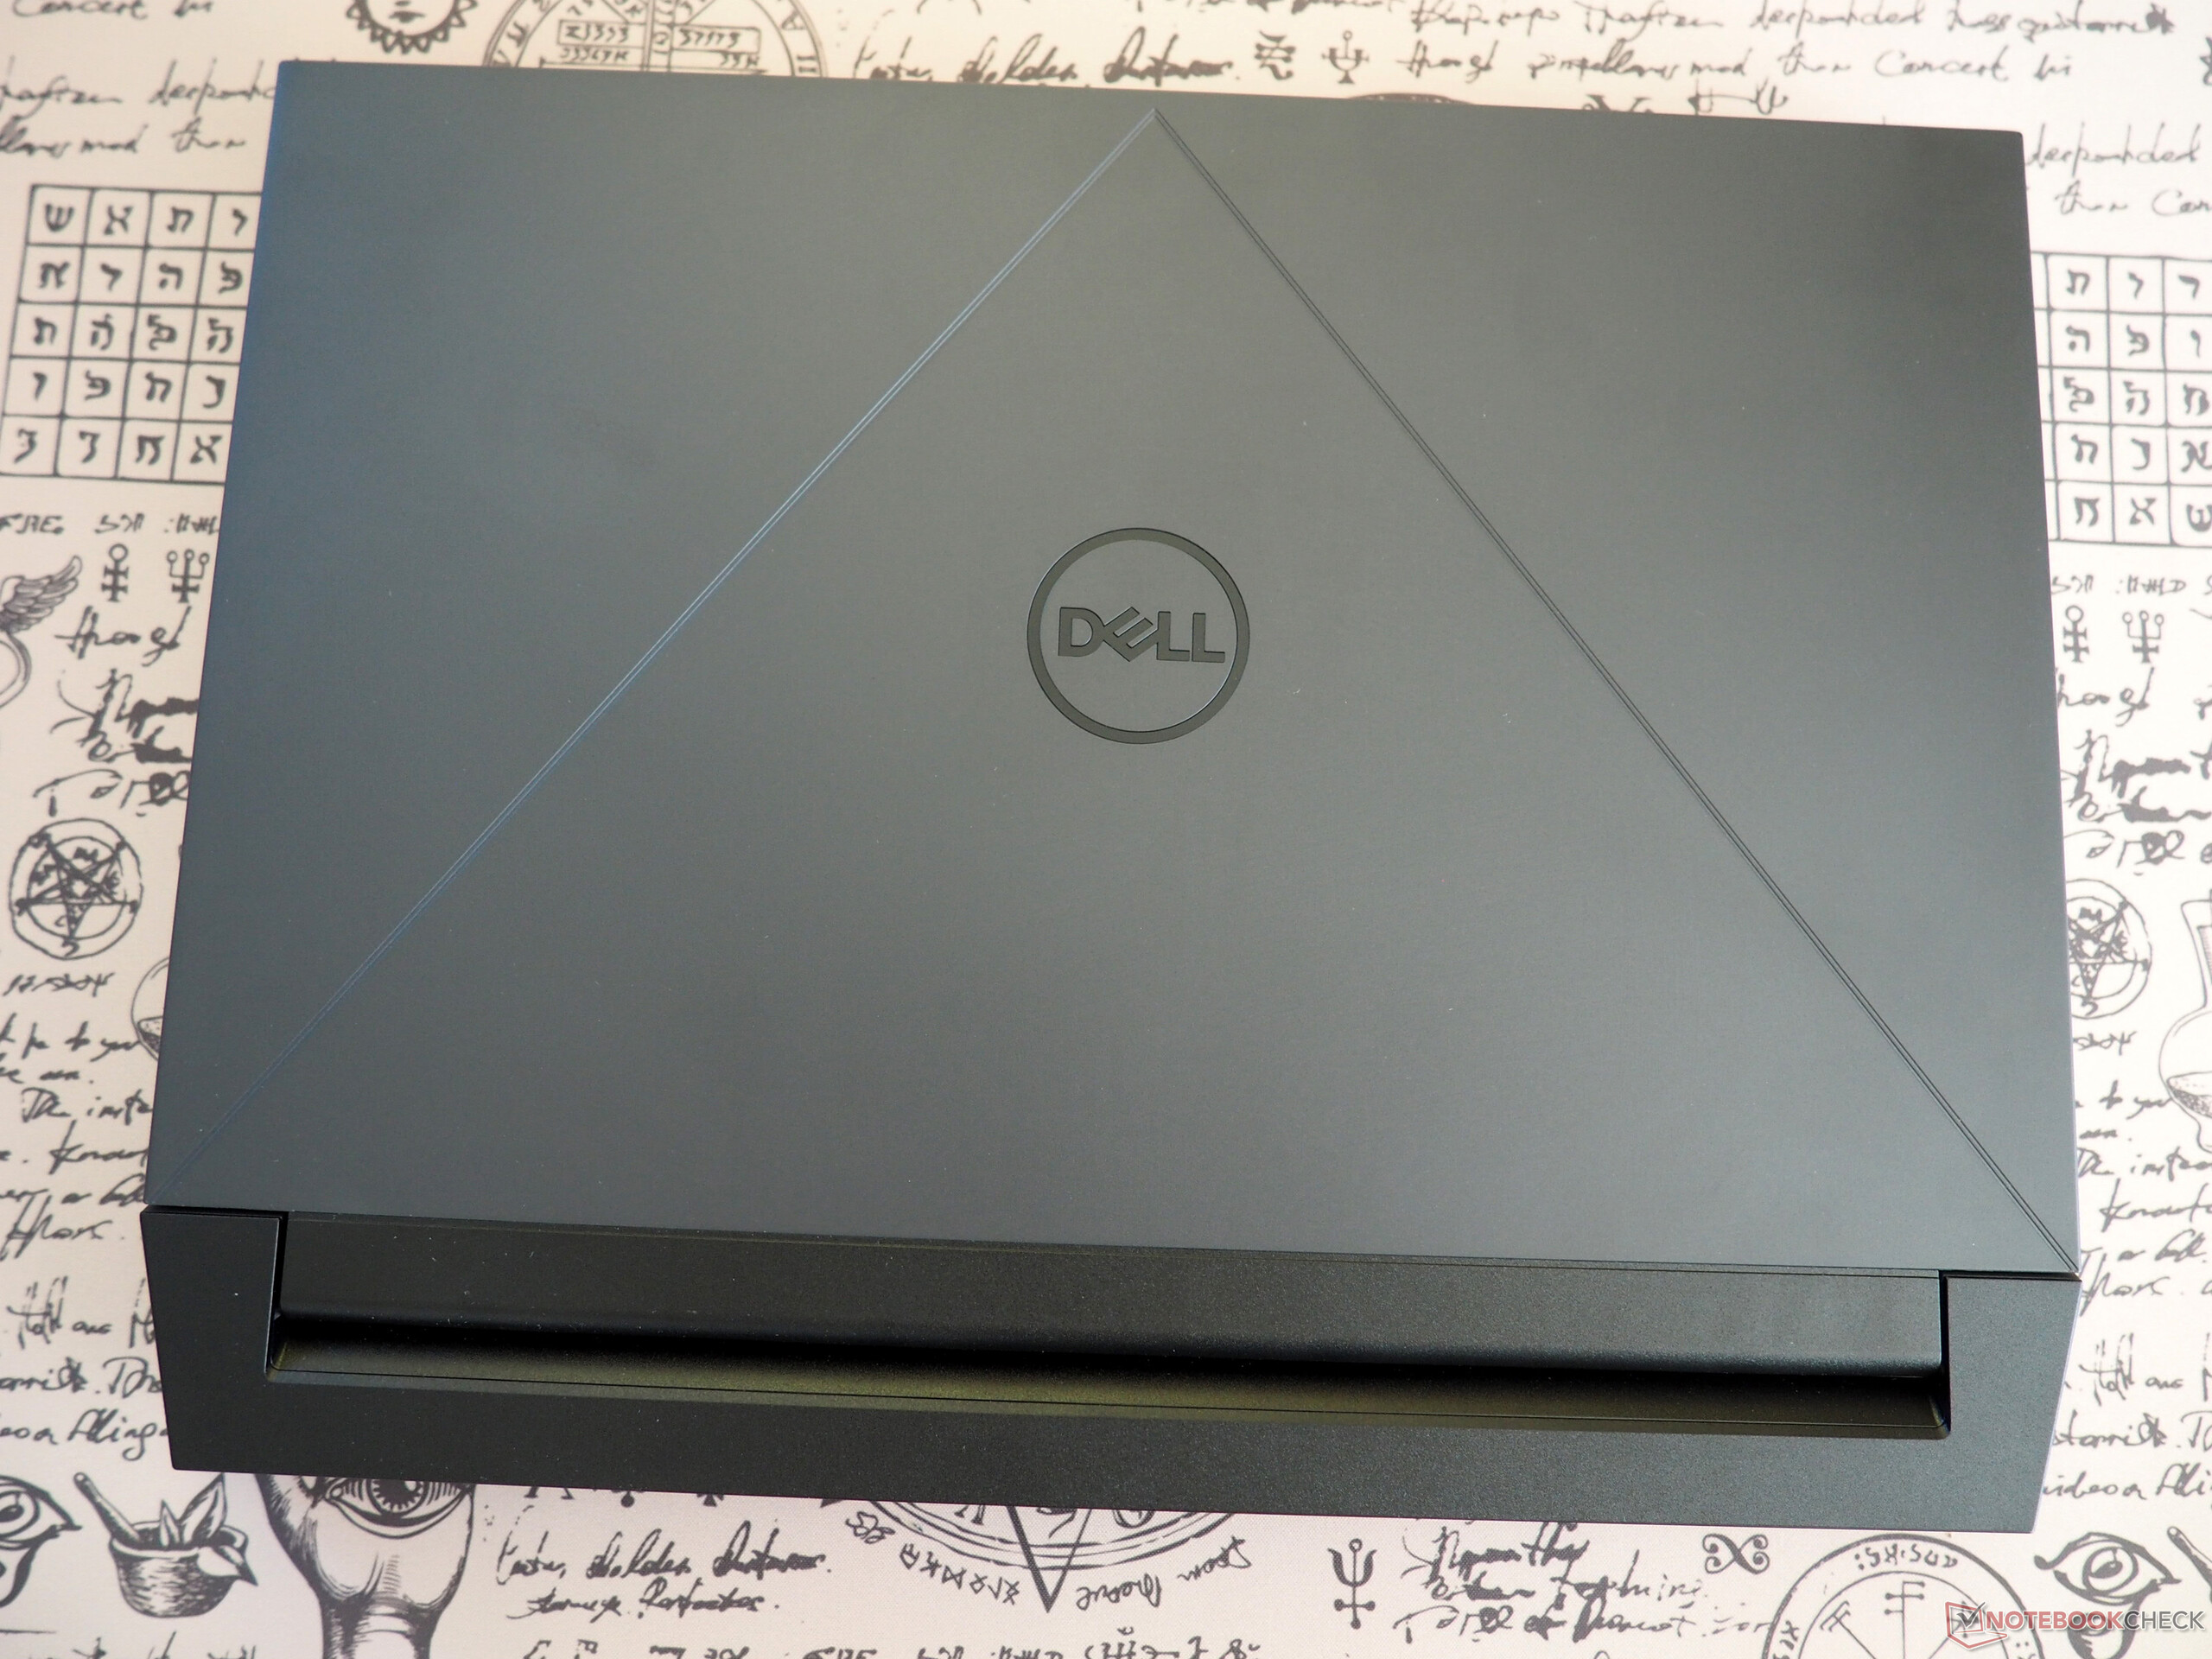
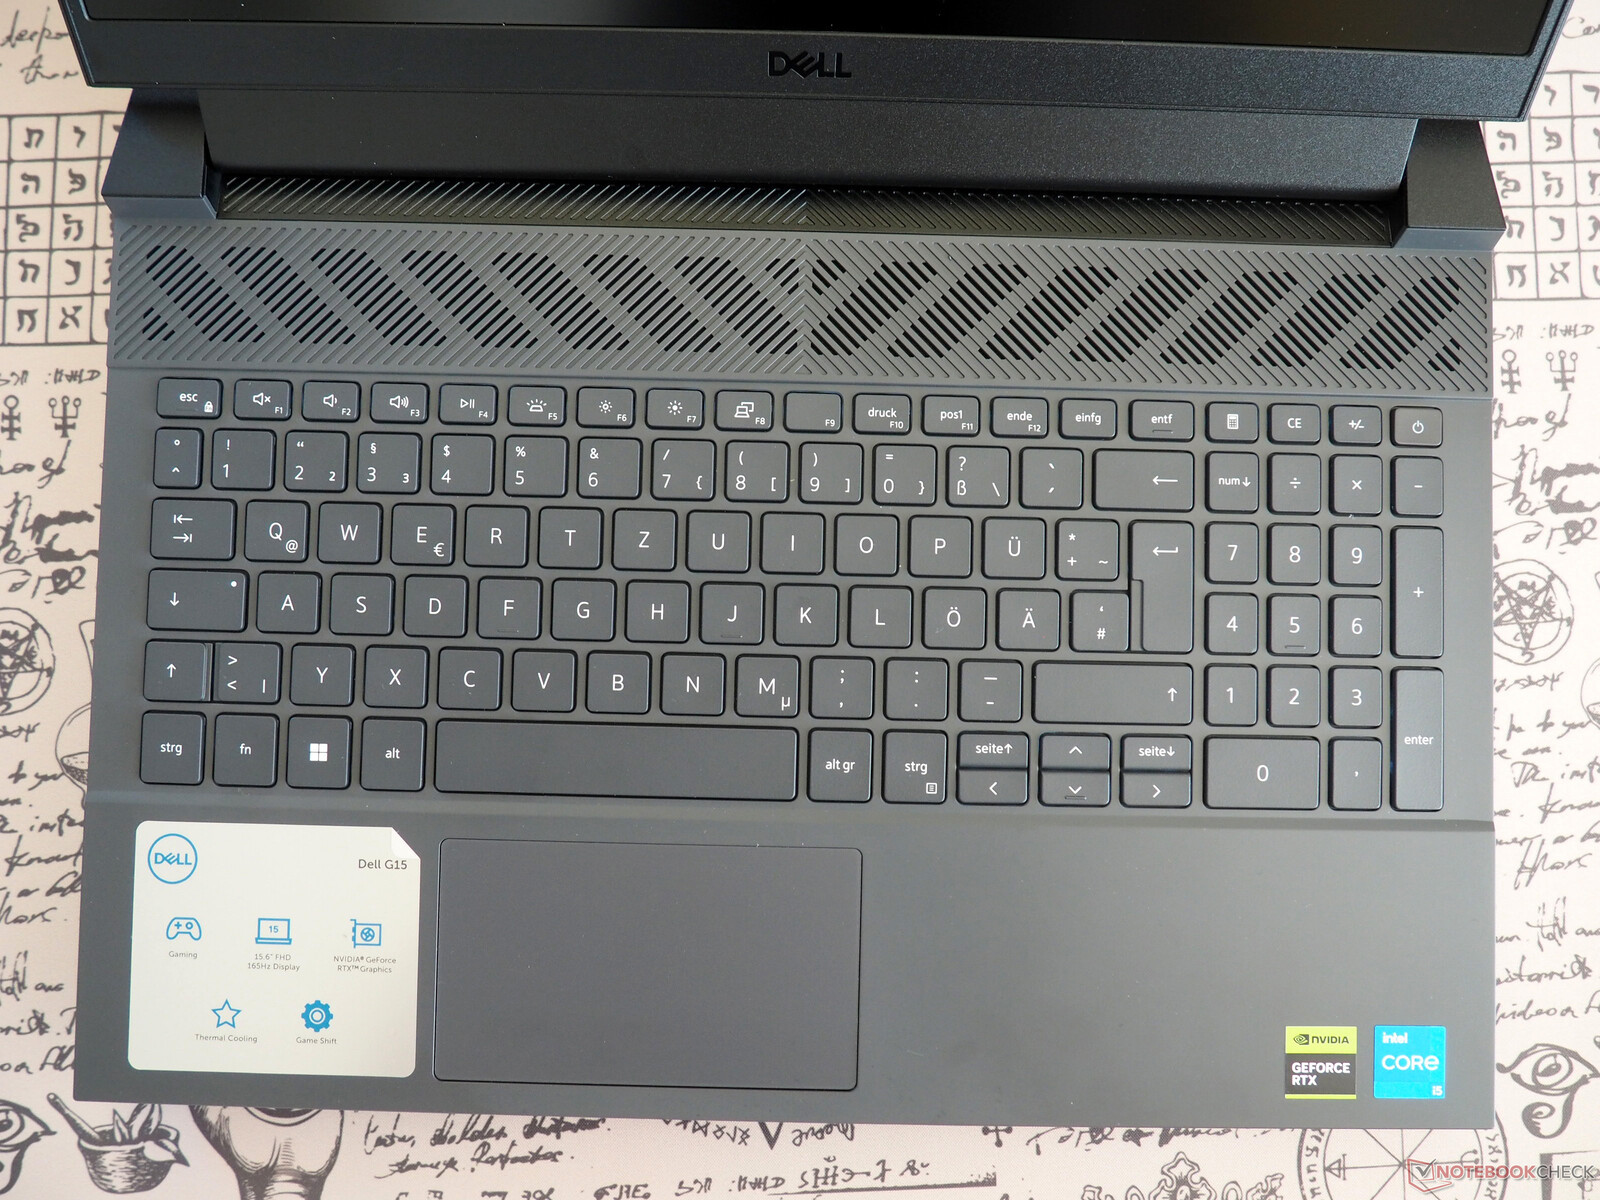
Recensione del Dell G15 5530: Computer portatile gaming con RTX 4050 in grigio scuro (Dark Shadow Gray)

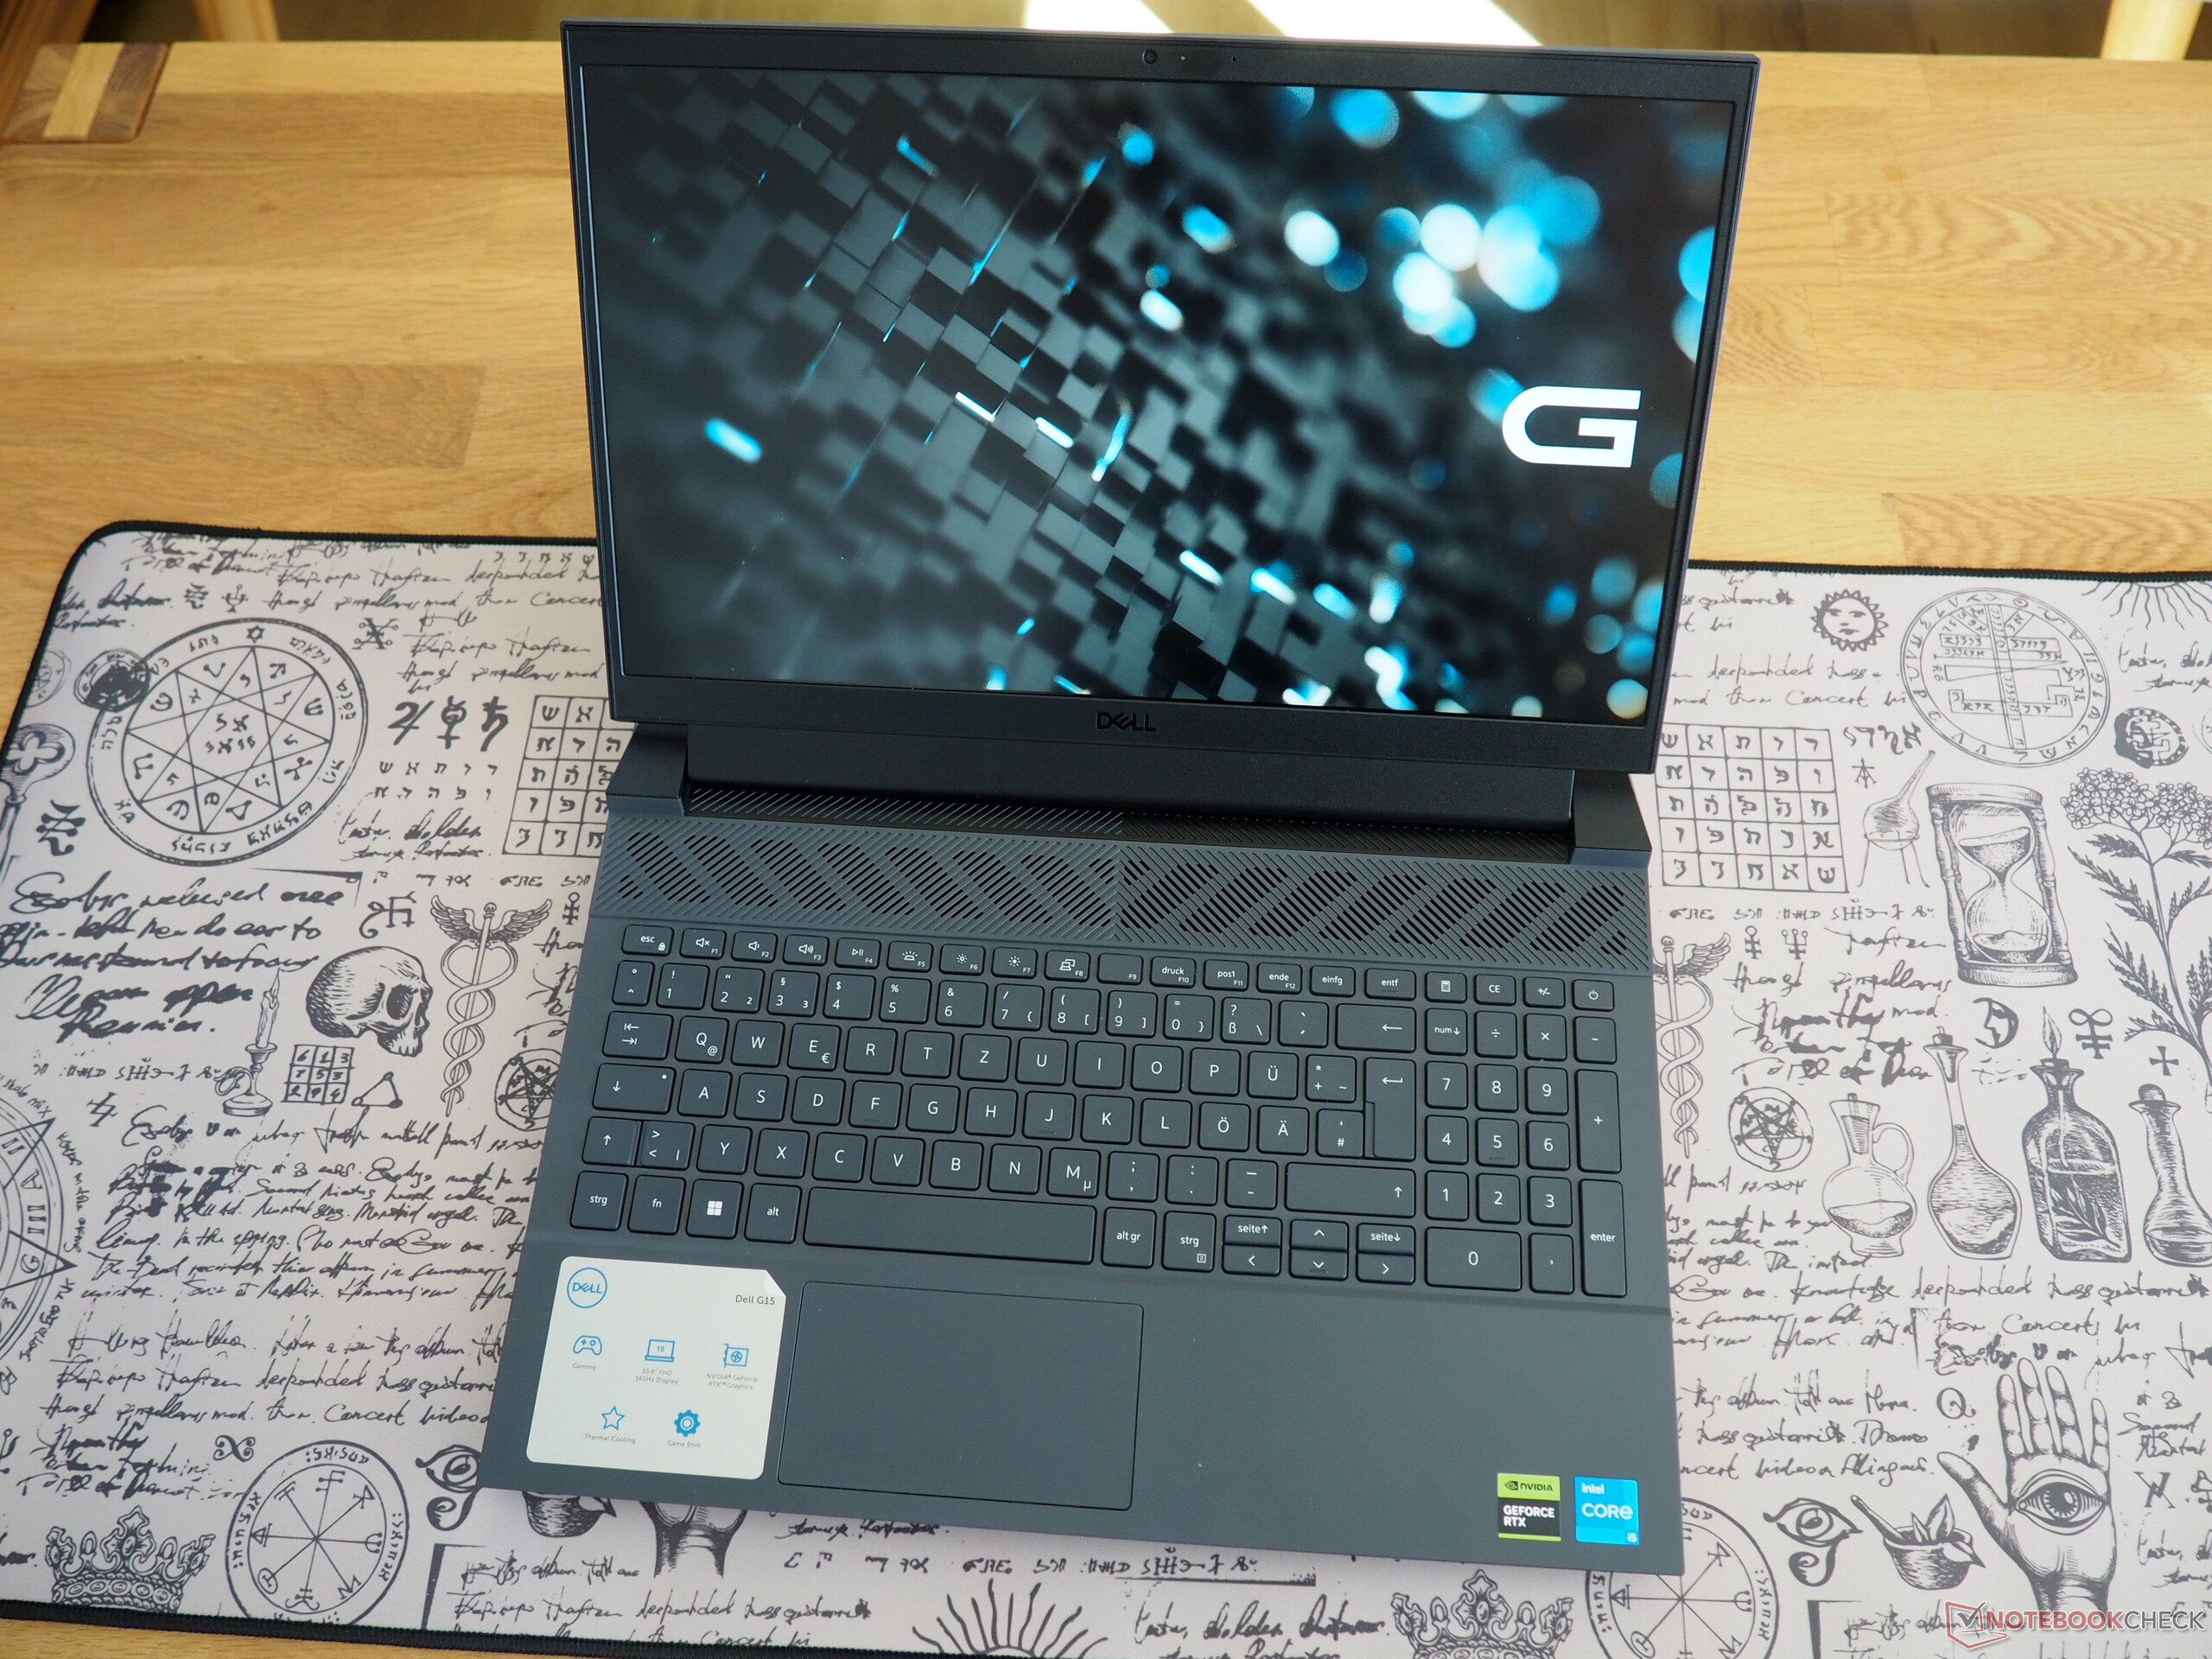
Dopo aver esaminato il G15 con un Core i7-13650HX e GeForce RTX 4060 qualche mese fa (vedere articolo), ora stiamo verificando la versione più economica (di qualche centinaio di euro) con un Core i5-13450HX e GeForce RTX 4050. Questa variante è equipaggiata allo stesso modo con 16 GB di RAM DDR-4800, un disco da 512 GB e un display IPS da 165 Hz, anche se occasionalmente vengono utilizzati modelli diversi per questi componenti. Completa il pacchetto il sistema operativo Windows 11 Home 64 Bit.
Il G15 si confronta con altri computer portatili da gioco da 15 pollici basati su RTX 4050, come i modelli Medion Erazer Crawler E40il Lenovo LOQ 15IRH8 e l' Asus TUF A15 FA507che appaiono tutti nelle tabelle sottostanti a scopo di confronto.
Poiché il telaio è identico a quello del G15 che abbiamo recensito in precedenza, a parte la combinazione di colori (grigio anziché bianco) e la lingua della tastiera, in questo articolo tratteremo solo brevemente il telaio, le specifiche e i dispositivi di input.
Potenziali concorrenti a confrontos
Punteggio | Data | Modello | Peso | Altezza | Dimensione | Risoluzione | Prezzo |
|---|---|---|---|---|---|---|---|
| 84.7 % v7 (old) | 01/2024 | Dell G15 5530, i5-13450HX RTX 4050 i5-13450HX, GeForce RTX 4050 Laptop GPU | 2.7 kg | 27 mm | 15.60" | 1920x1080 | |
| 85.4 % v7 (old) | 12/2023 | Medion Erazer Crawler E40 - MD 62518 i5-13500H, GeForce RTX 4050 Laptop GPU | 2.3 kg | 28 mm | 15.60" | 1920x1080 | |
| 85.9 % v7 (old) | 10/2023 | Lenovo LOQ 15IRH8 Core i7 i7-13620H, GeForce RTX 4050 Laptop GPU | 2.4 kg | 25.2 mm | 15.60" | 2560x1440 | |
| 86.3 % v7 (old) | 06/2023 | Asus TUF A15 FA507 R7 7735HS, GeForce RTX 4050 Laptop GPU | 2.2 kg | 24.9 mm | 15.60" | 1920x1080 | |
| 84.2 % v7 (old) | 06/2023 | Dell G15 5530 i7-13650HX, GeForce RTX 4060 Laptop GPU | 3 kg | 26.95 mm | 15.60" | 1920x1080 |
Caso
Il G15 risulta essere un notebook con una struttura classica, il che significa che non è né molto sottile (2,7 cm, o 1,06 pollici) né particolarmente leggero (2,7 kg, o 5,95 libbre). I concorrenti offrono design più moderni, anche se questo non è sempre un bene (parola chiave: emissioni). In termini di estetica, il design del portatile è particolarmente accattivante, ma, come fanno molti altri produttori in questa fascia di prezzo, Dell ha optato per un esterno interamente in plastica che ha la tendenza a tintinnare in alcuni punti. La qualità delle rifiniture è invece buona. Il meccanismo della cerniera fa un lavoro decente; il portatile può essere aperto facilmente con una sola mano.
Specifiche
Interfacce
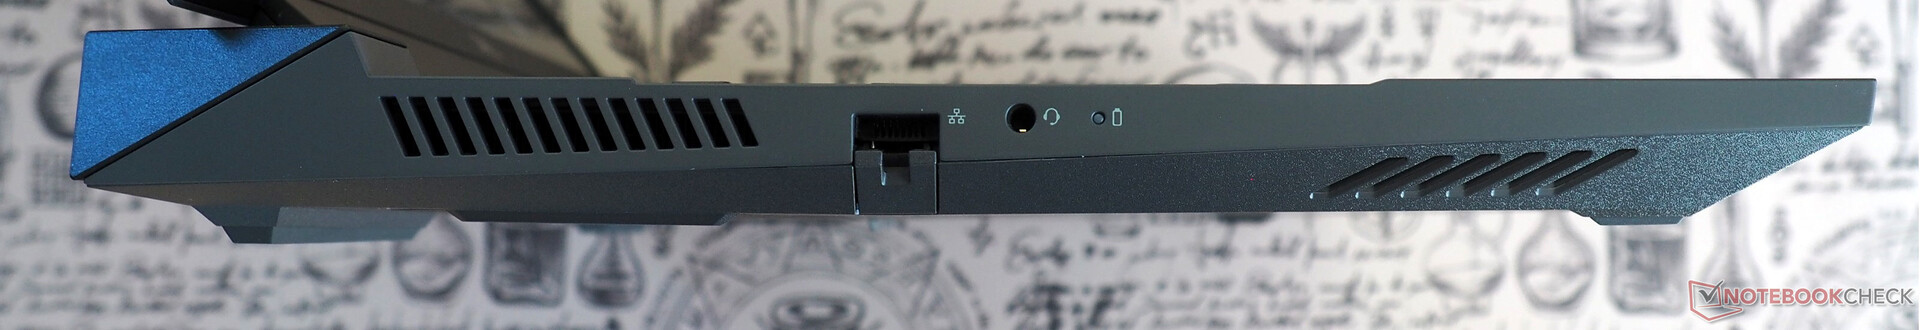
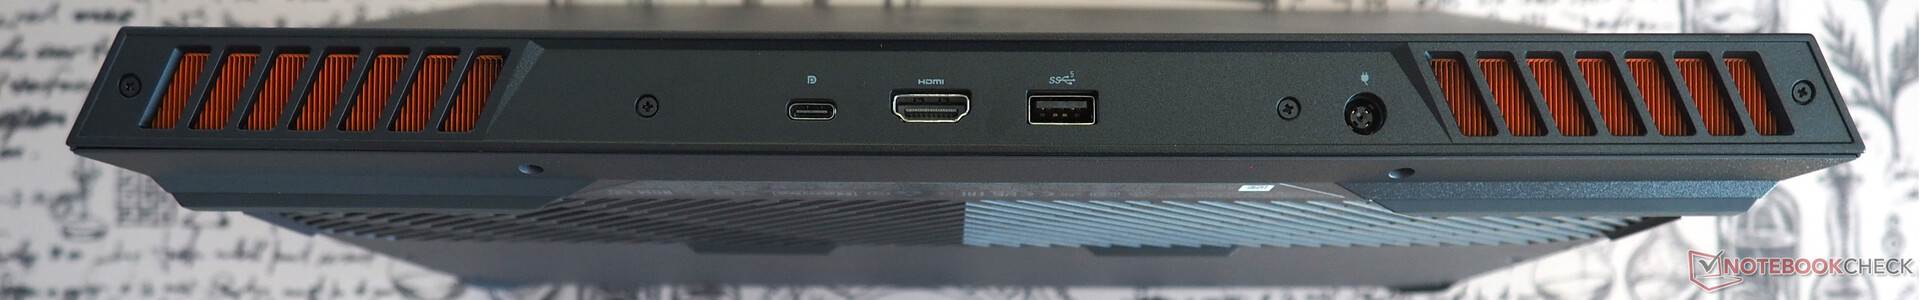
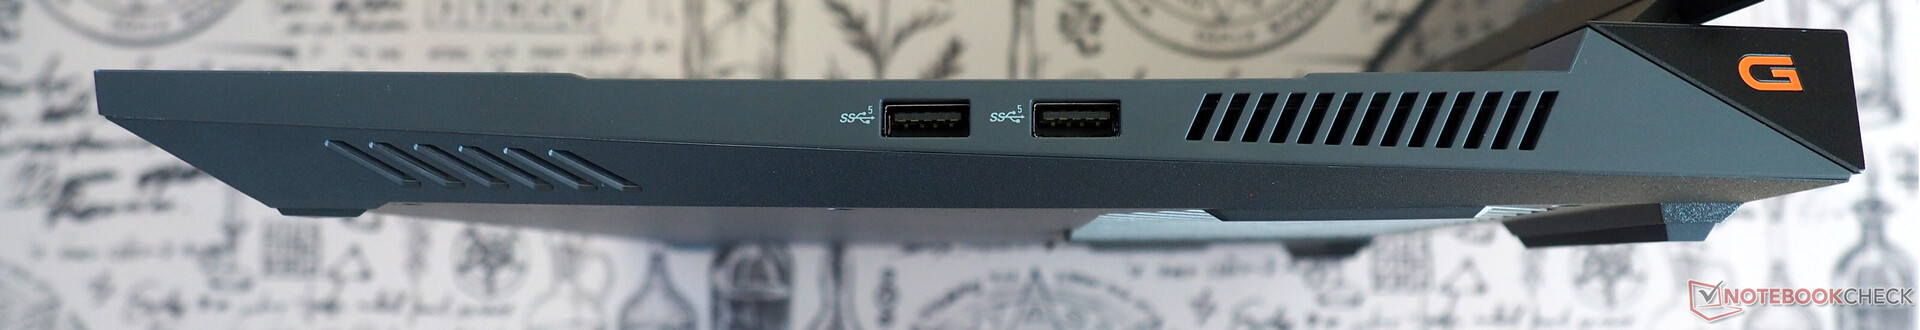
La selezione di porte è piuttosto obsoleta e scarsa. Per esempio, non troverà una singola porta USB4 sul dispositivo. Invece, è dotato solo di una porta USB. 3.2 Gen 2 (Tipo C) e tre porte USB 3.2 Gen 1 (Tipo A). Gli utenti dovranno anche fare a meno di un lettore di schede e di uno slot Kensington. Ma almeno il dispositivo ha un'uscita HDMI 2.1, una porta Ethernet e un jack audio.
Connettività
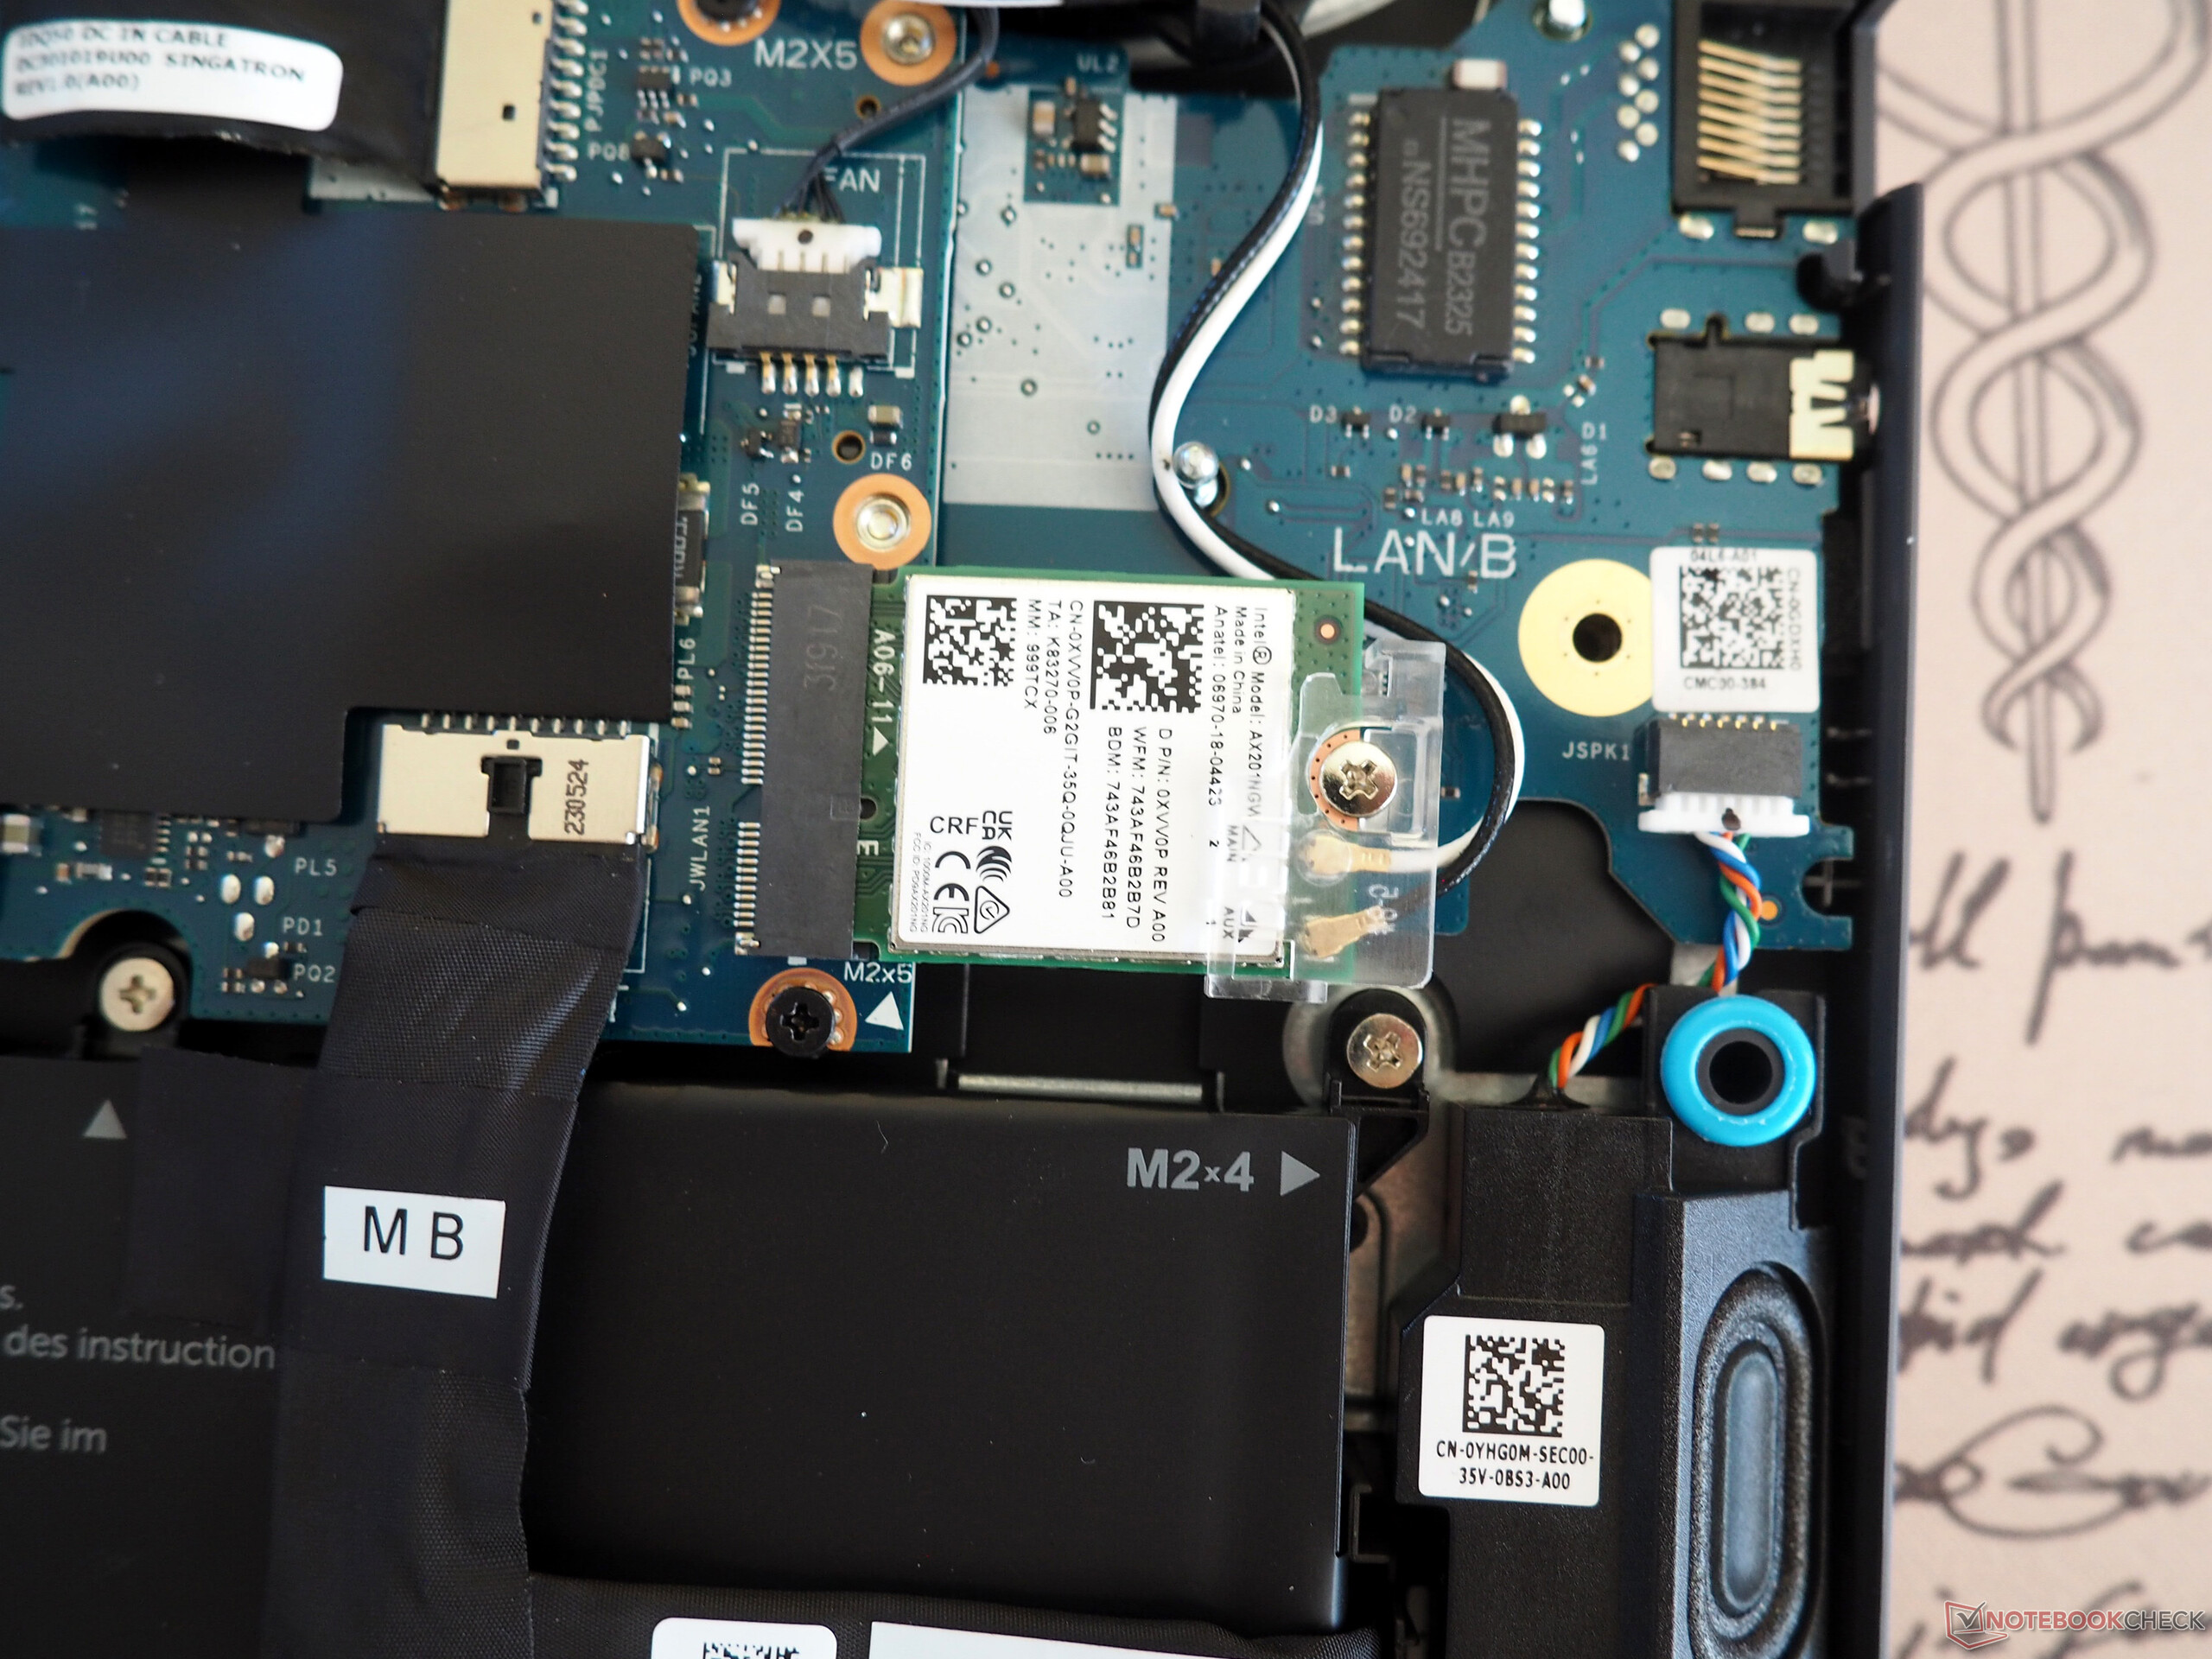
Le prestazioni wireless del G15 sono pari (invio) o superiori (ricezione) alla media che abbiamo visto finora in questa classe di portatili. La scheda wireless integrata è realizzata da Intel (Wi-Fi 6 AX201).
Webcam
La webcam ha una qualità piuttosto mediocre. C'è ancora margine di miglioramento per quanto riguarda la precisione del colore e la nitidezza dell'immagine.


Accessori
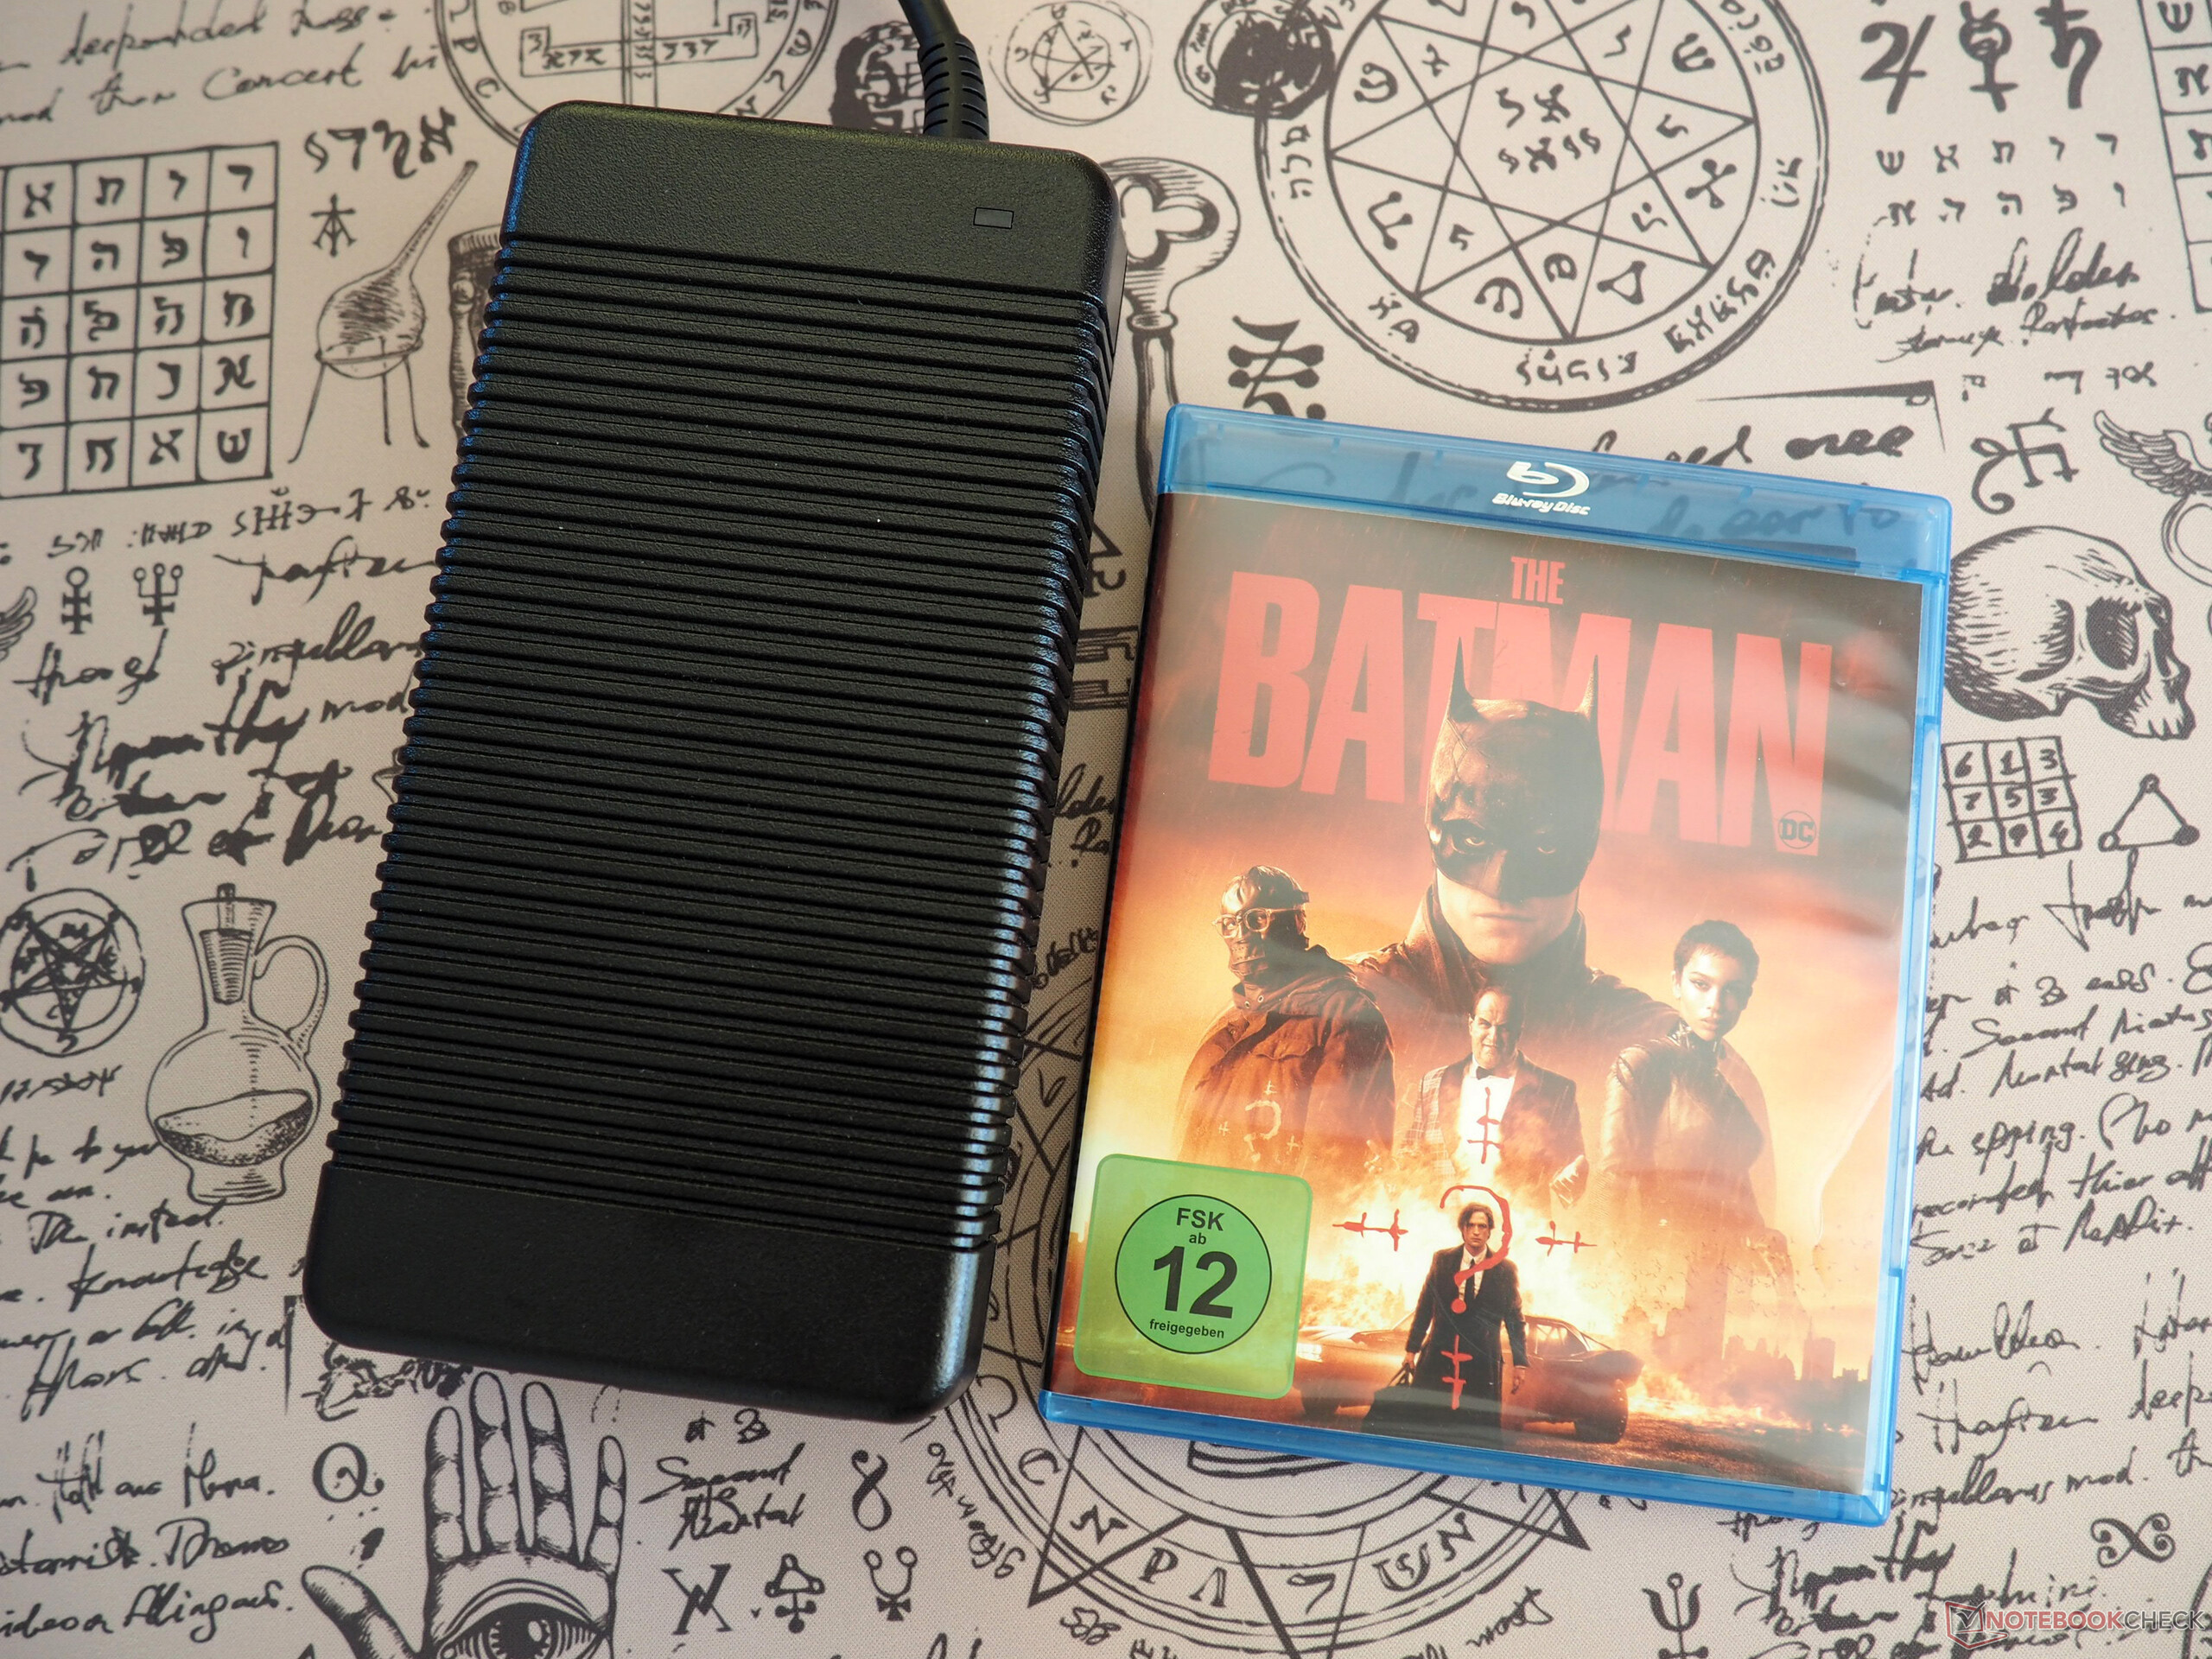
Dato il livello di prestazioni offerto, il G15 viene fornito con un adattatore di alimentazione assurdamente grande e pesante (cavo incluso, 1,5 kg).
Manutenzione
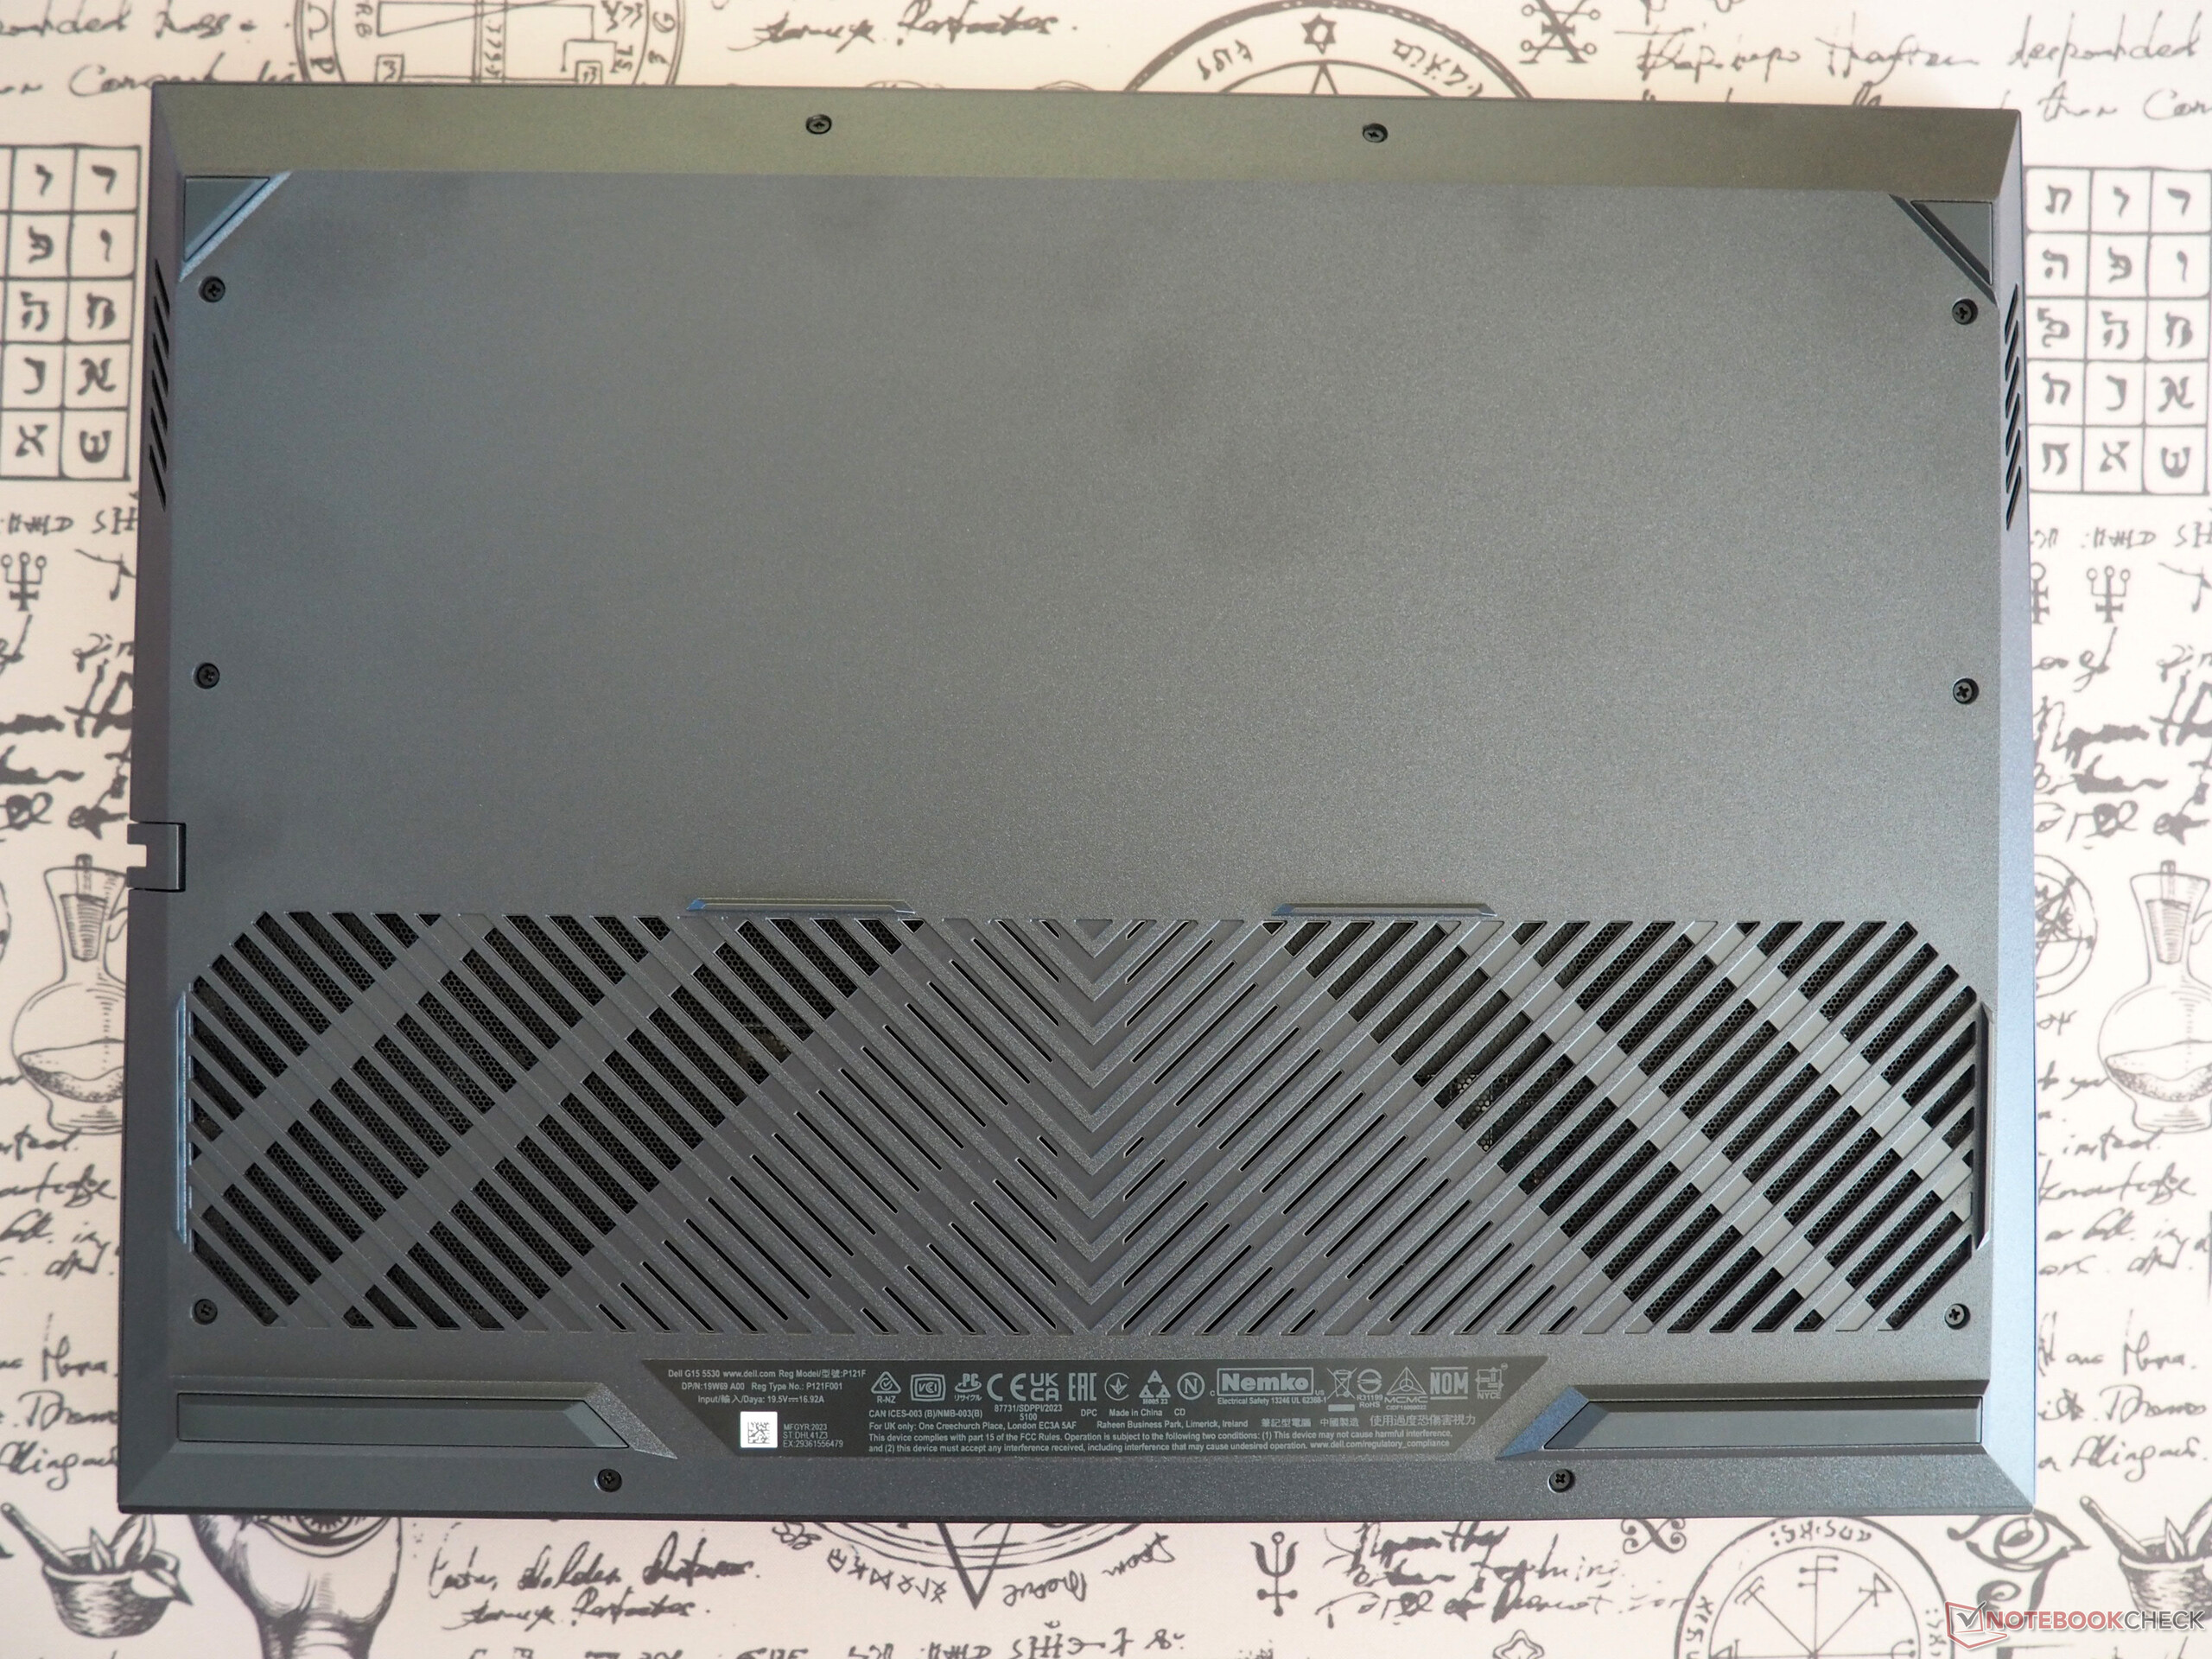
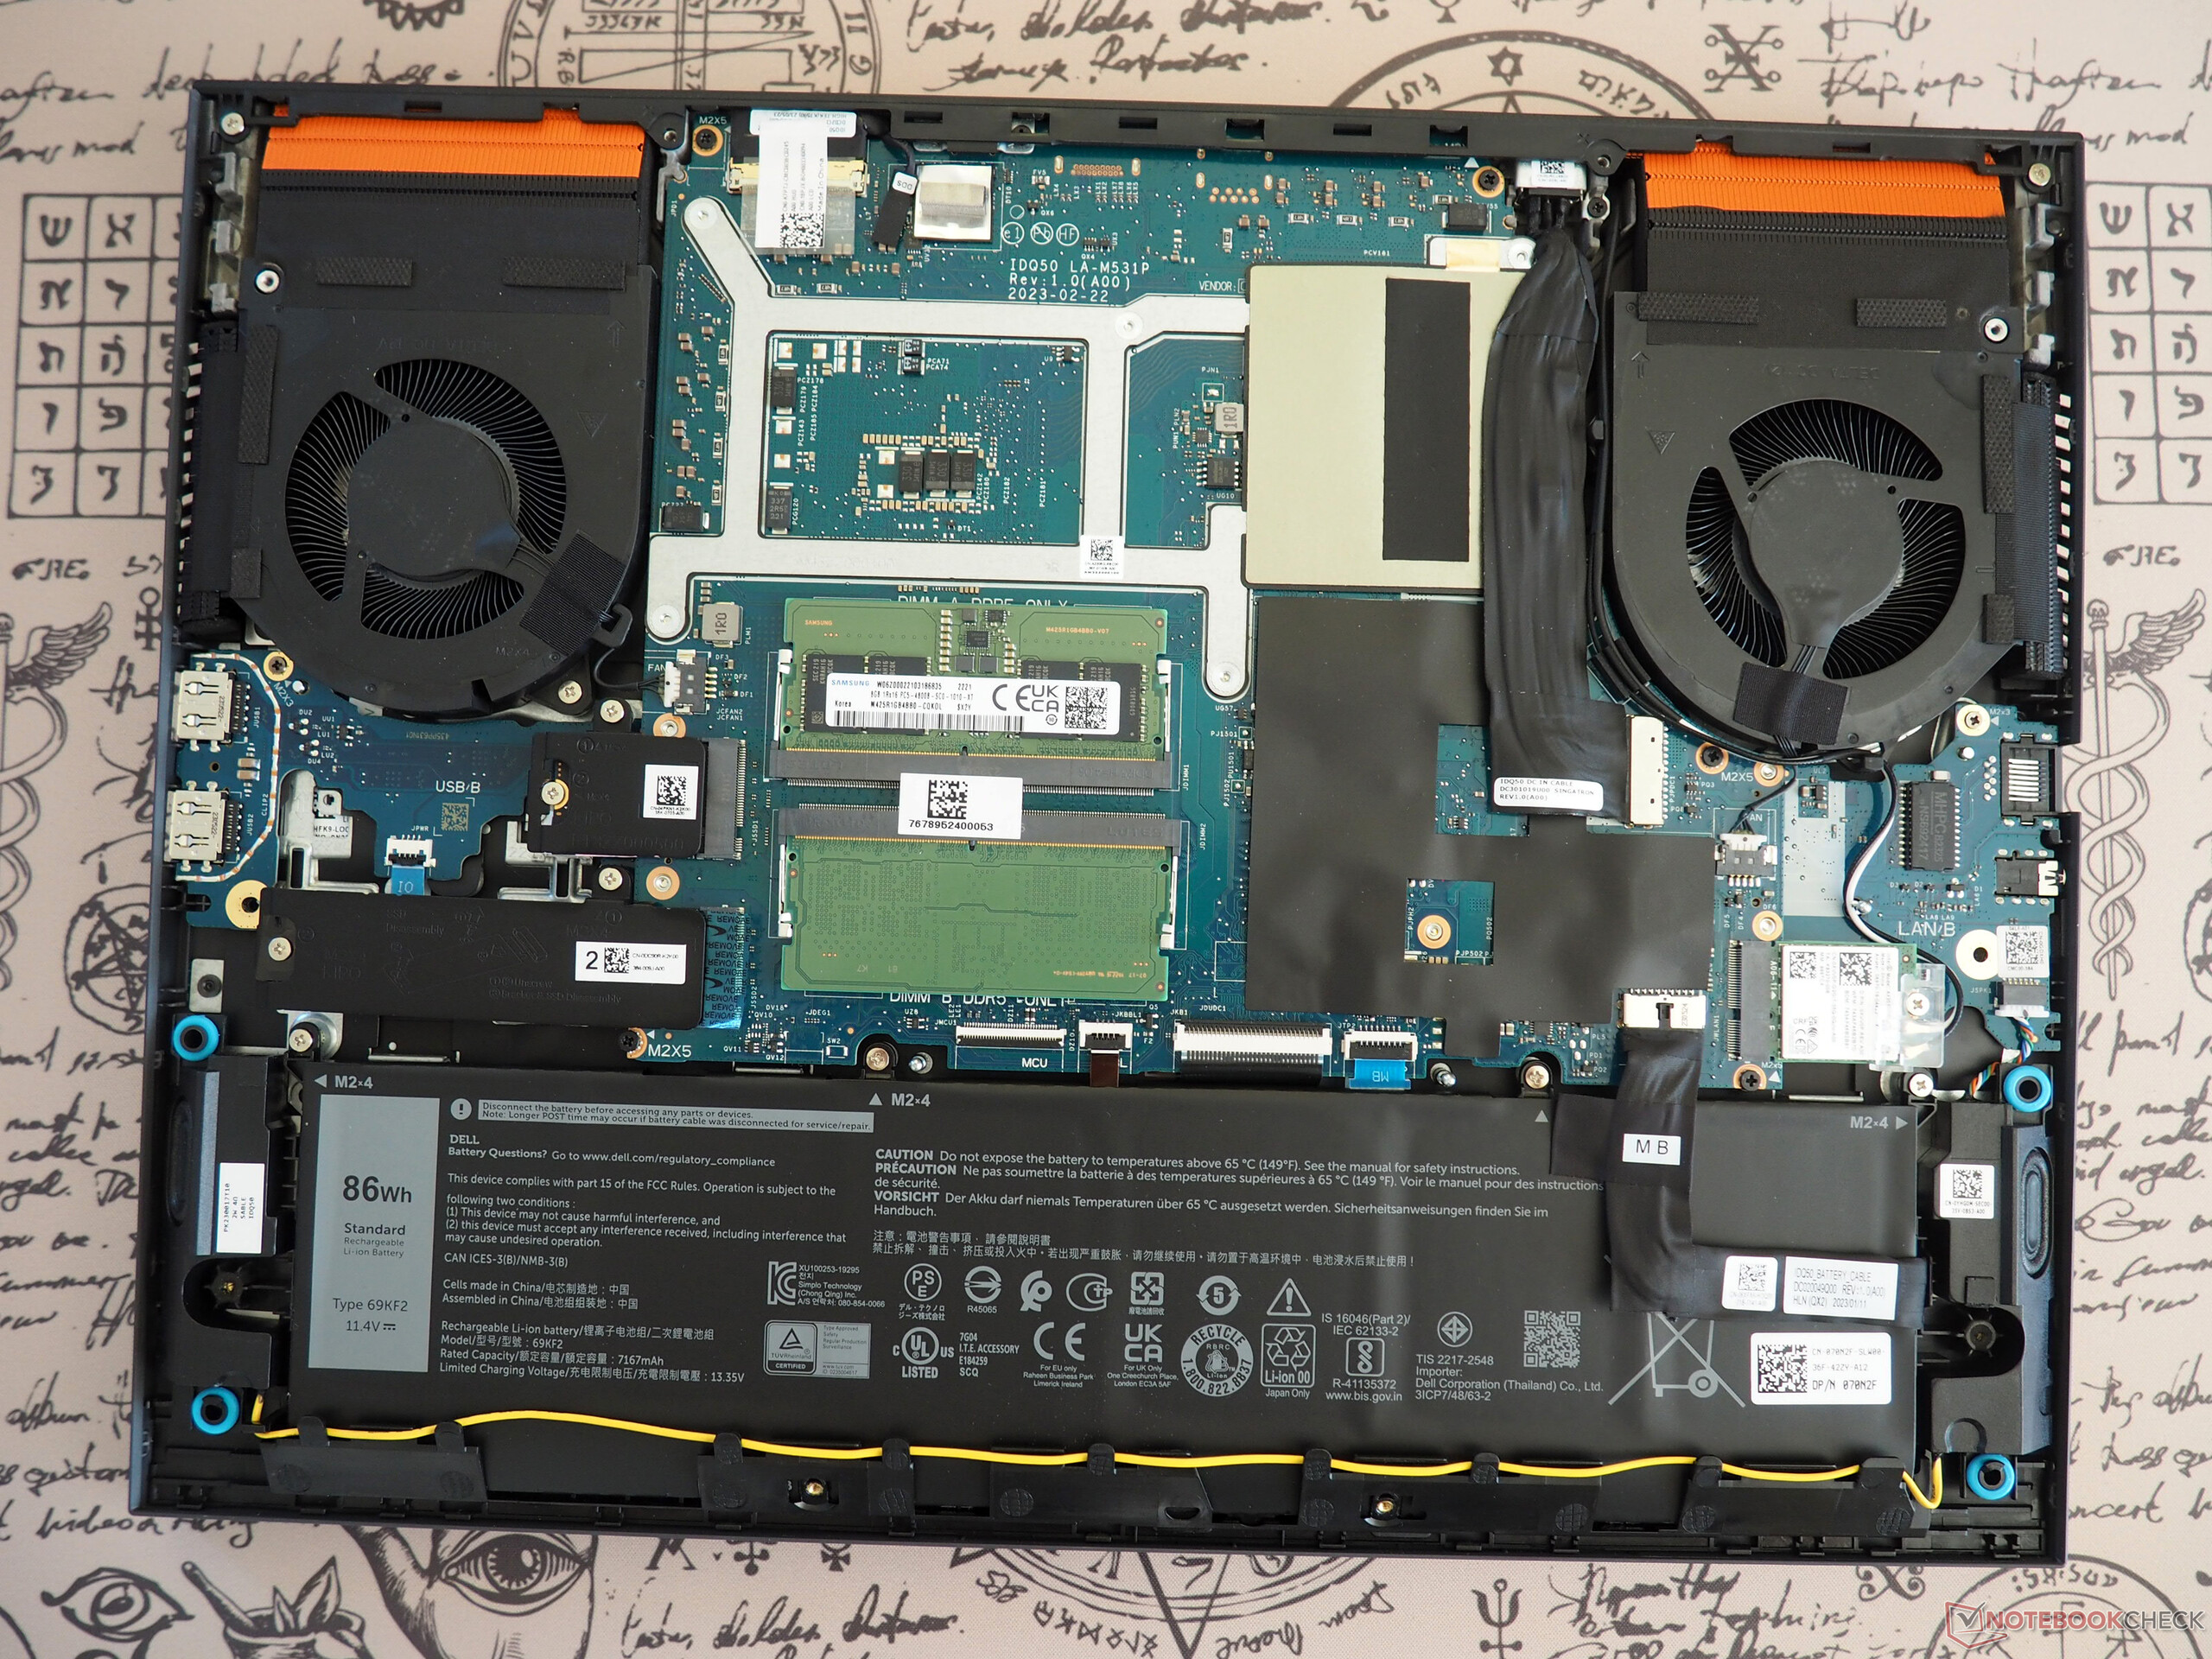
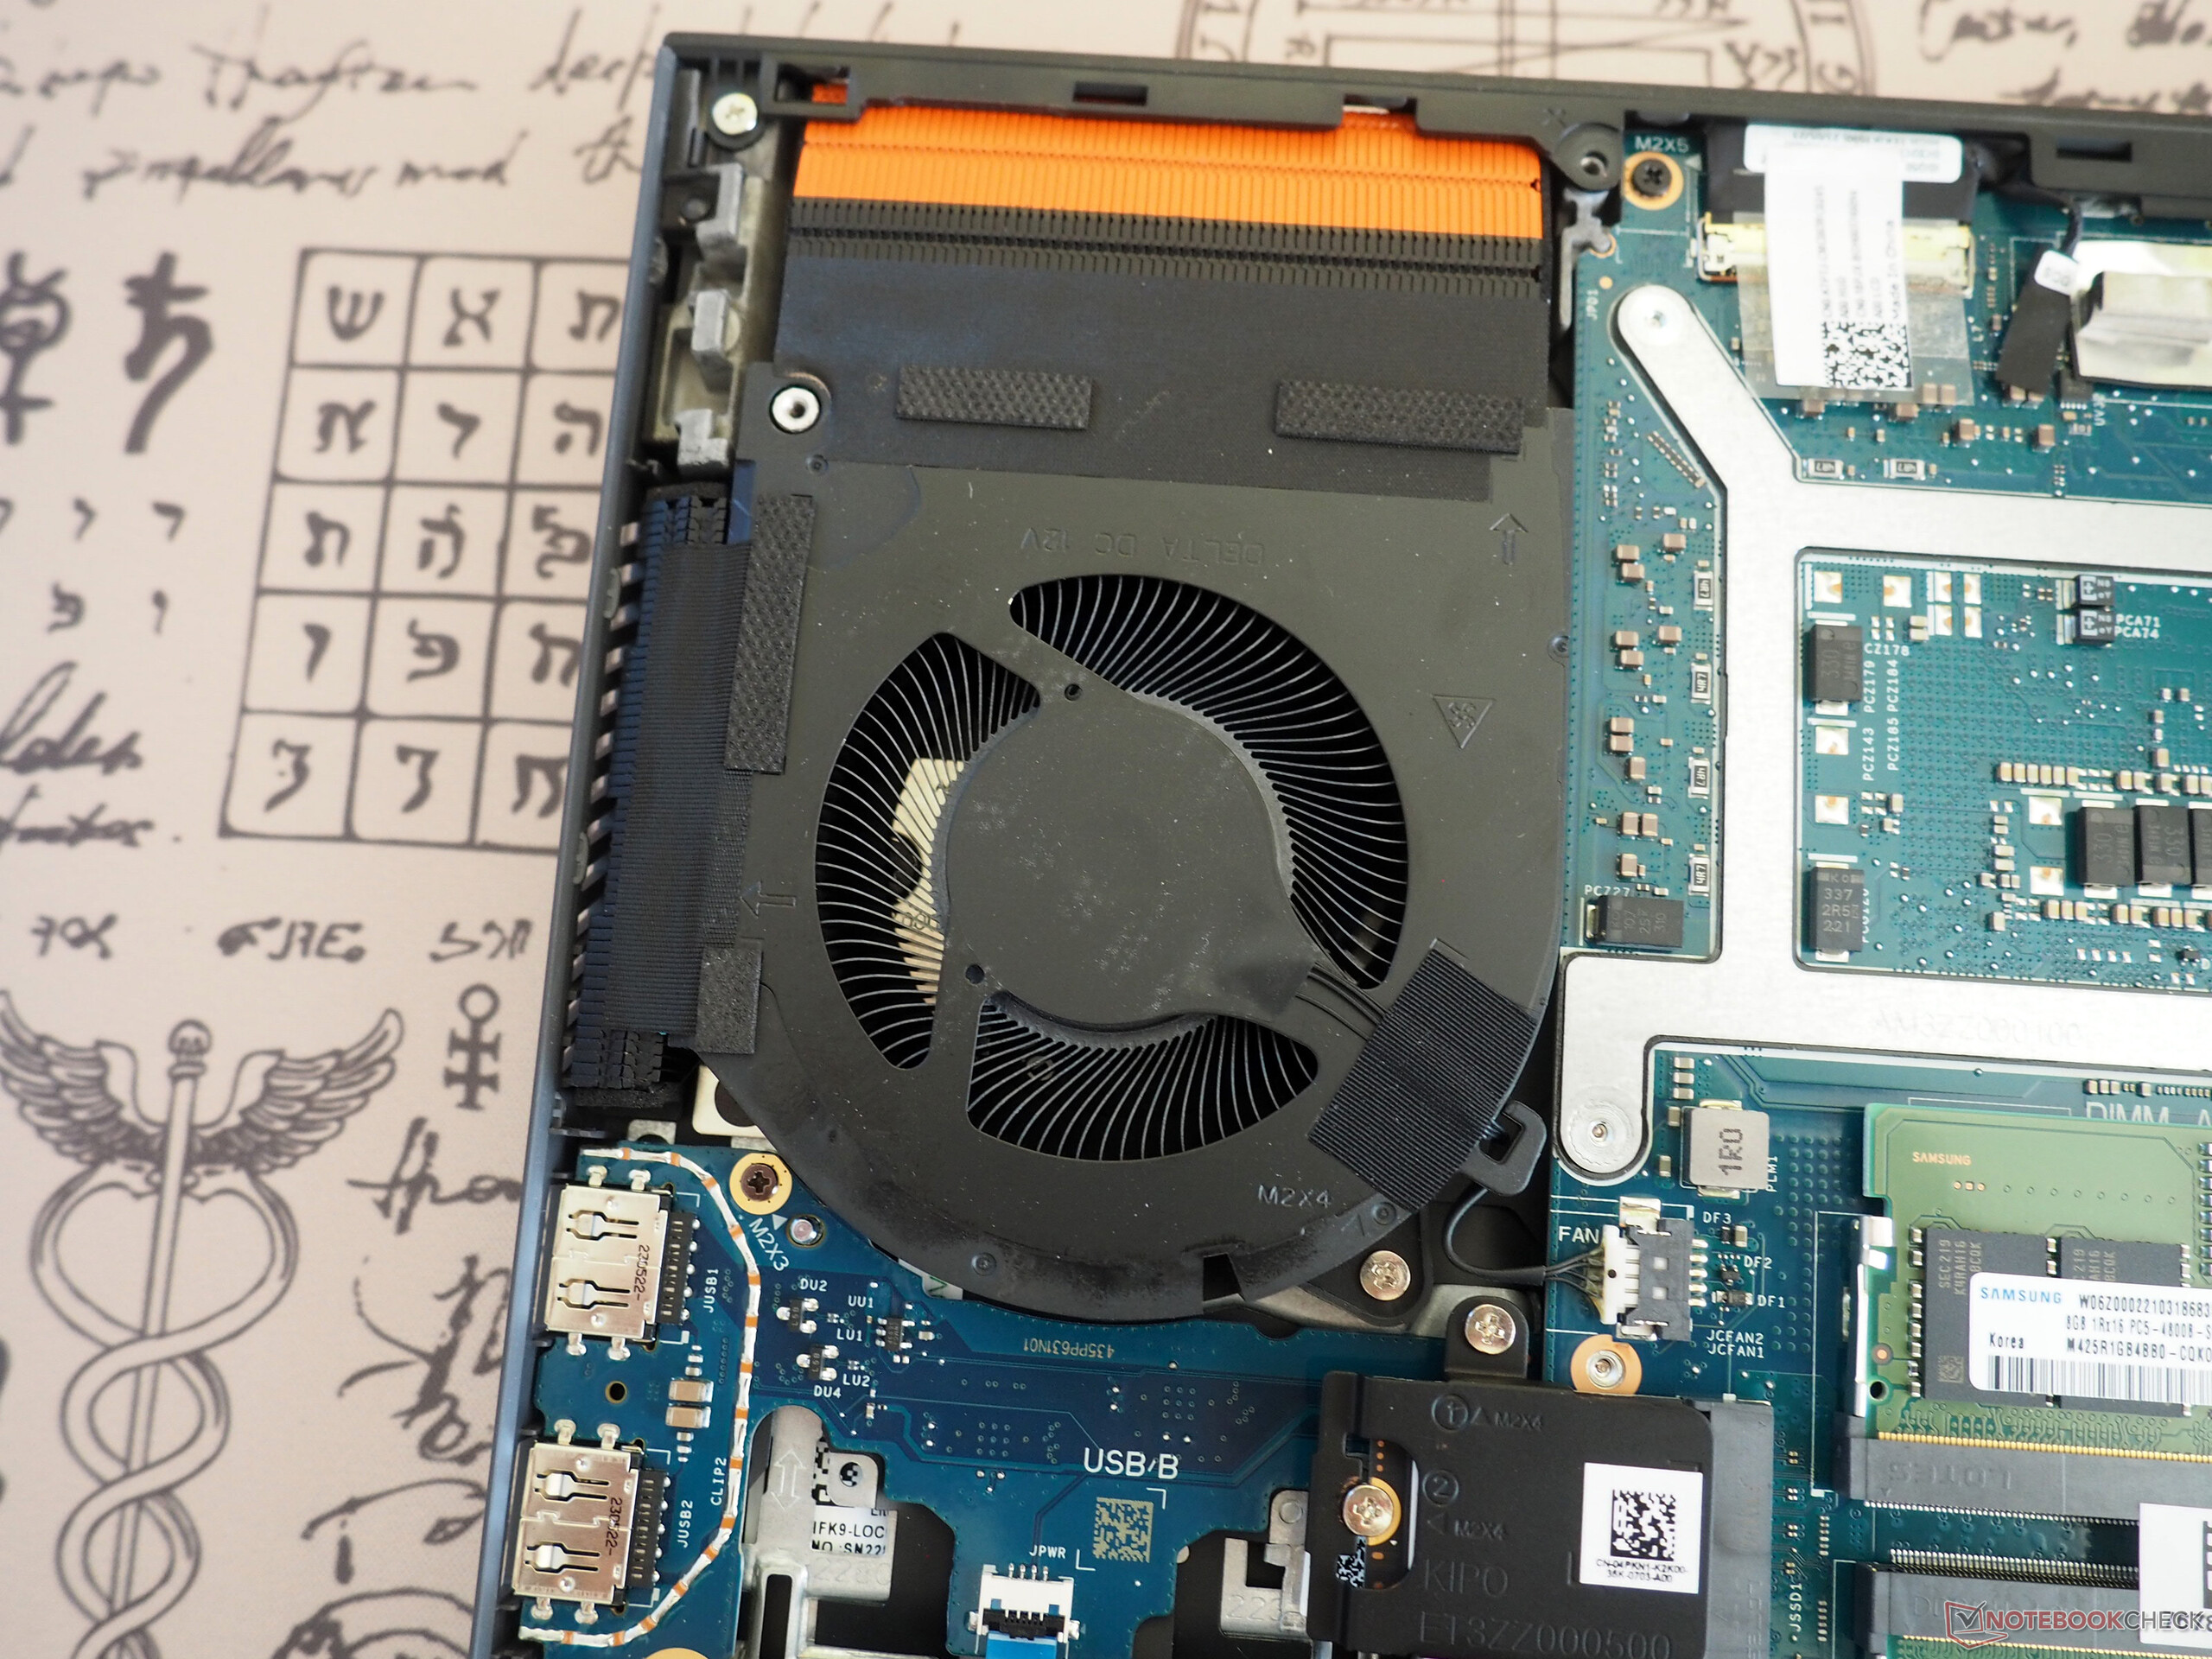
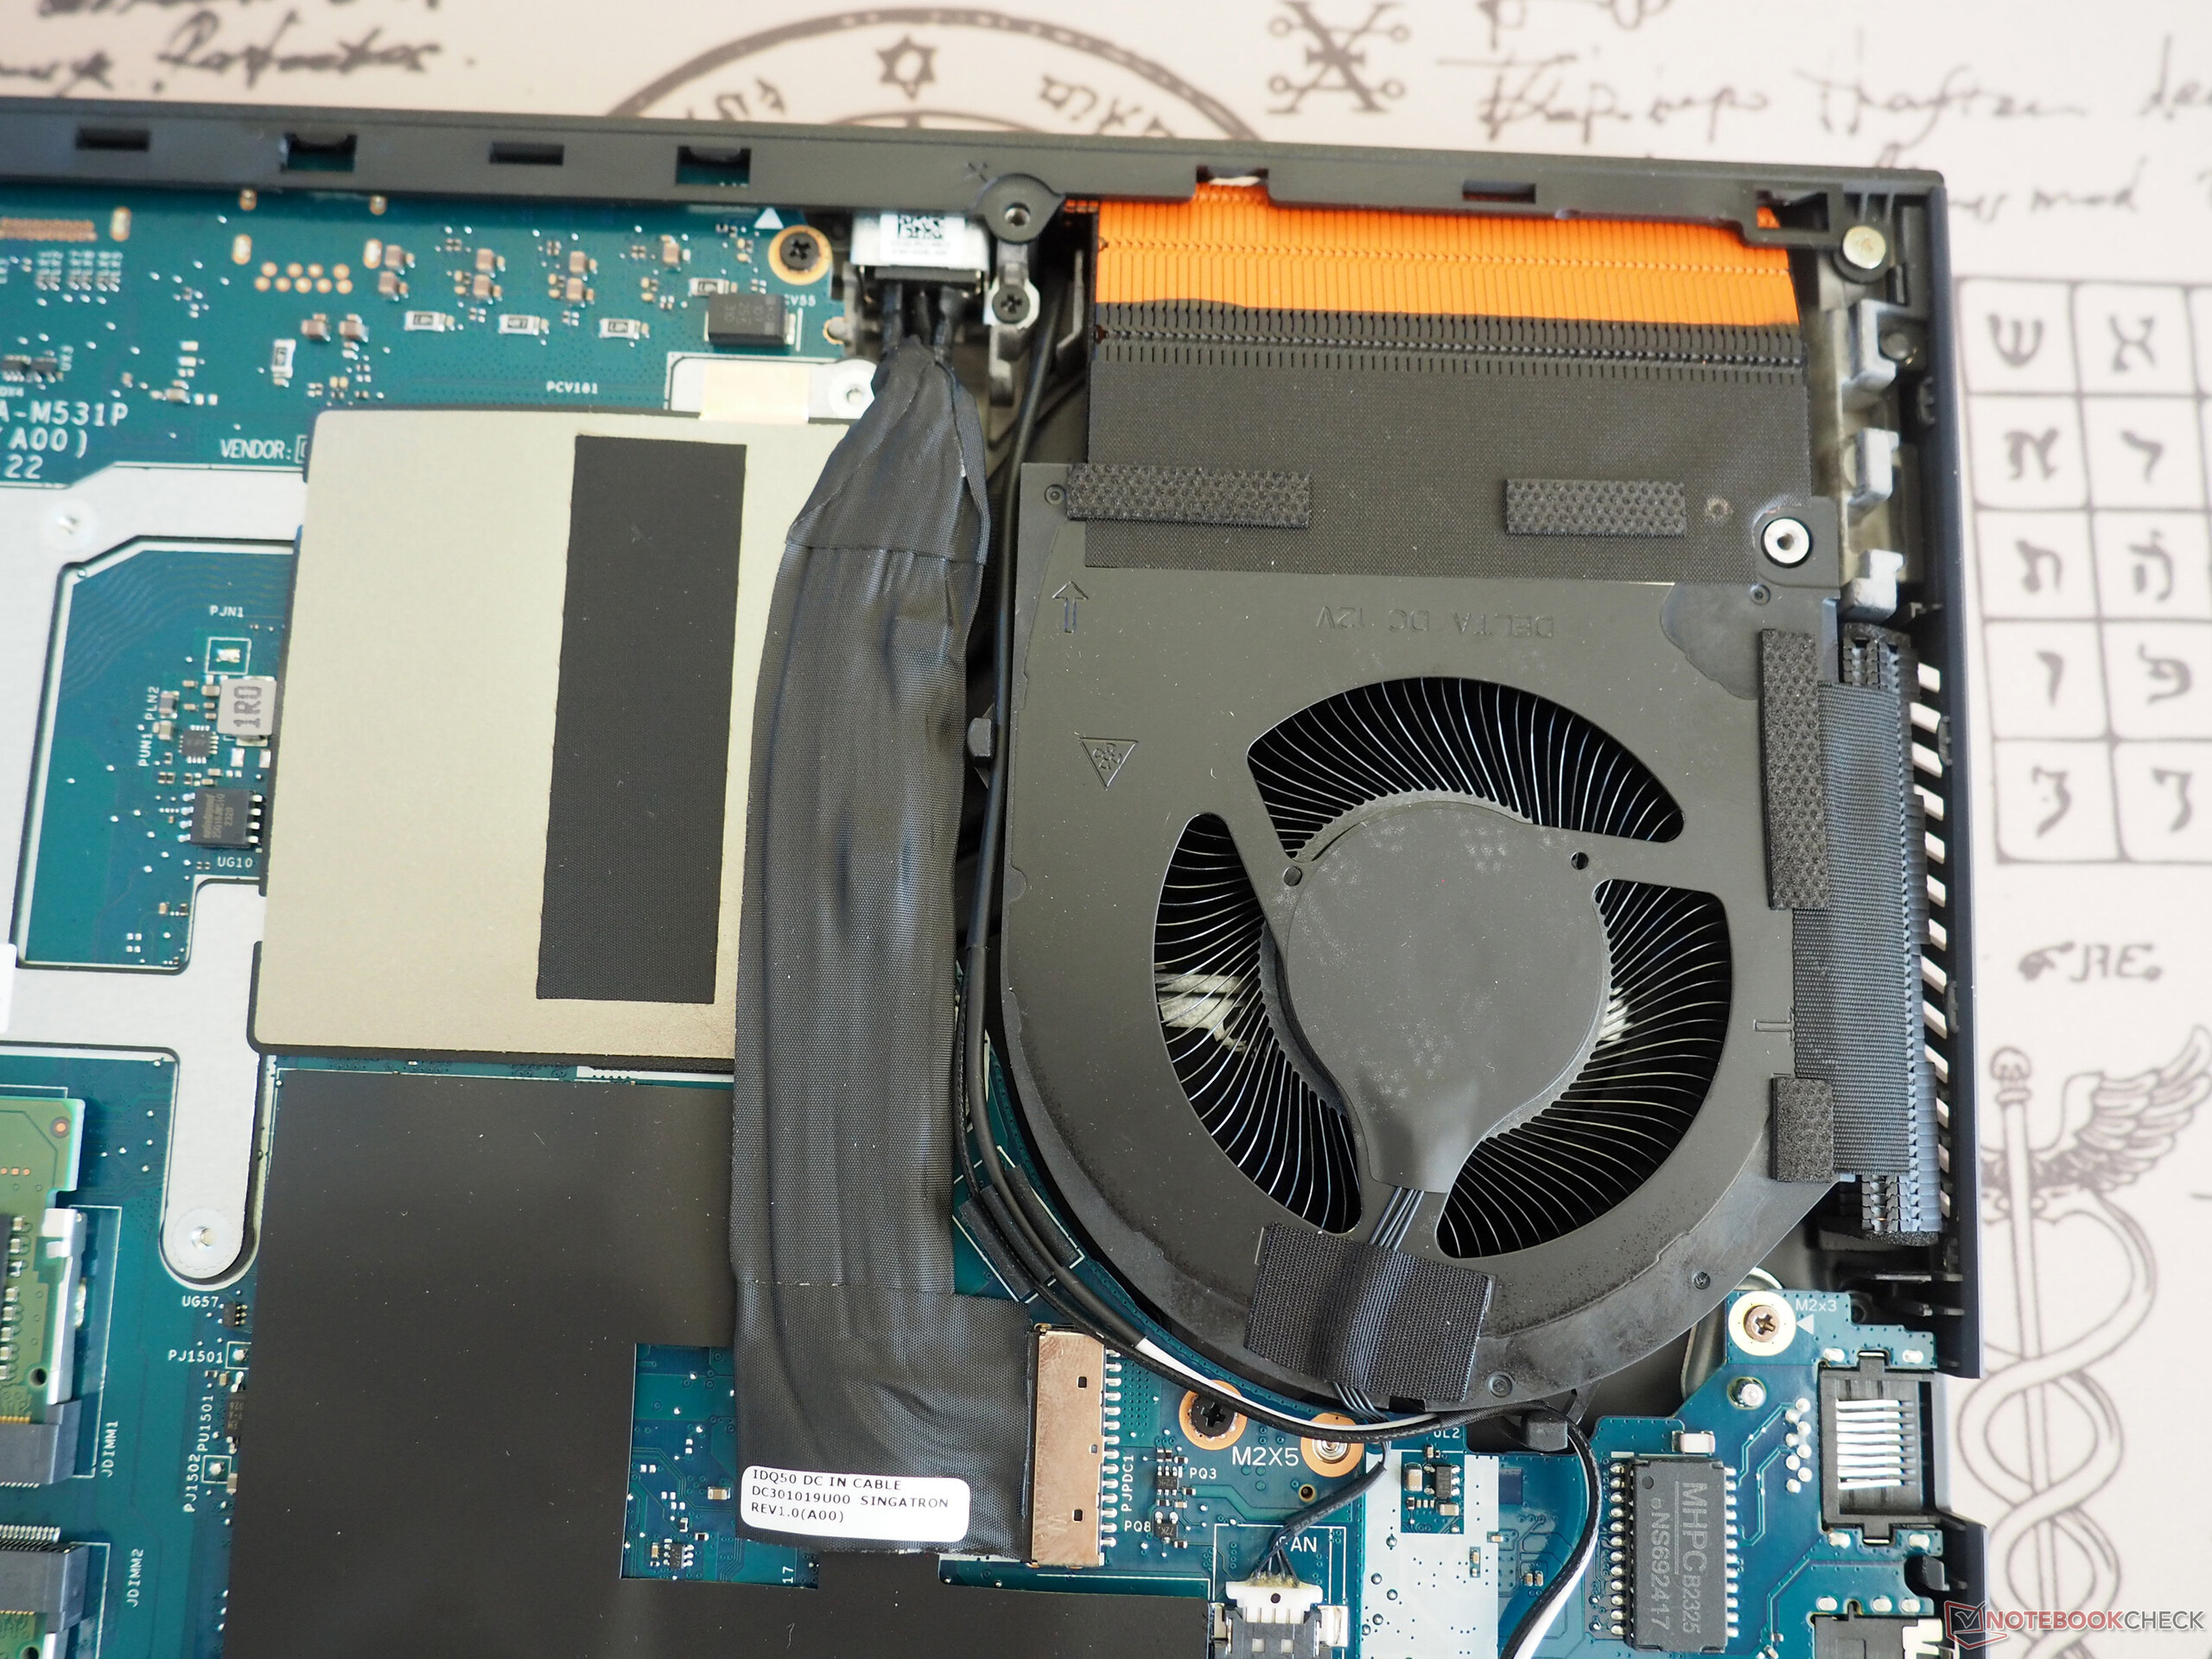
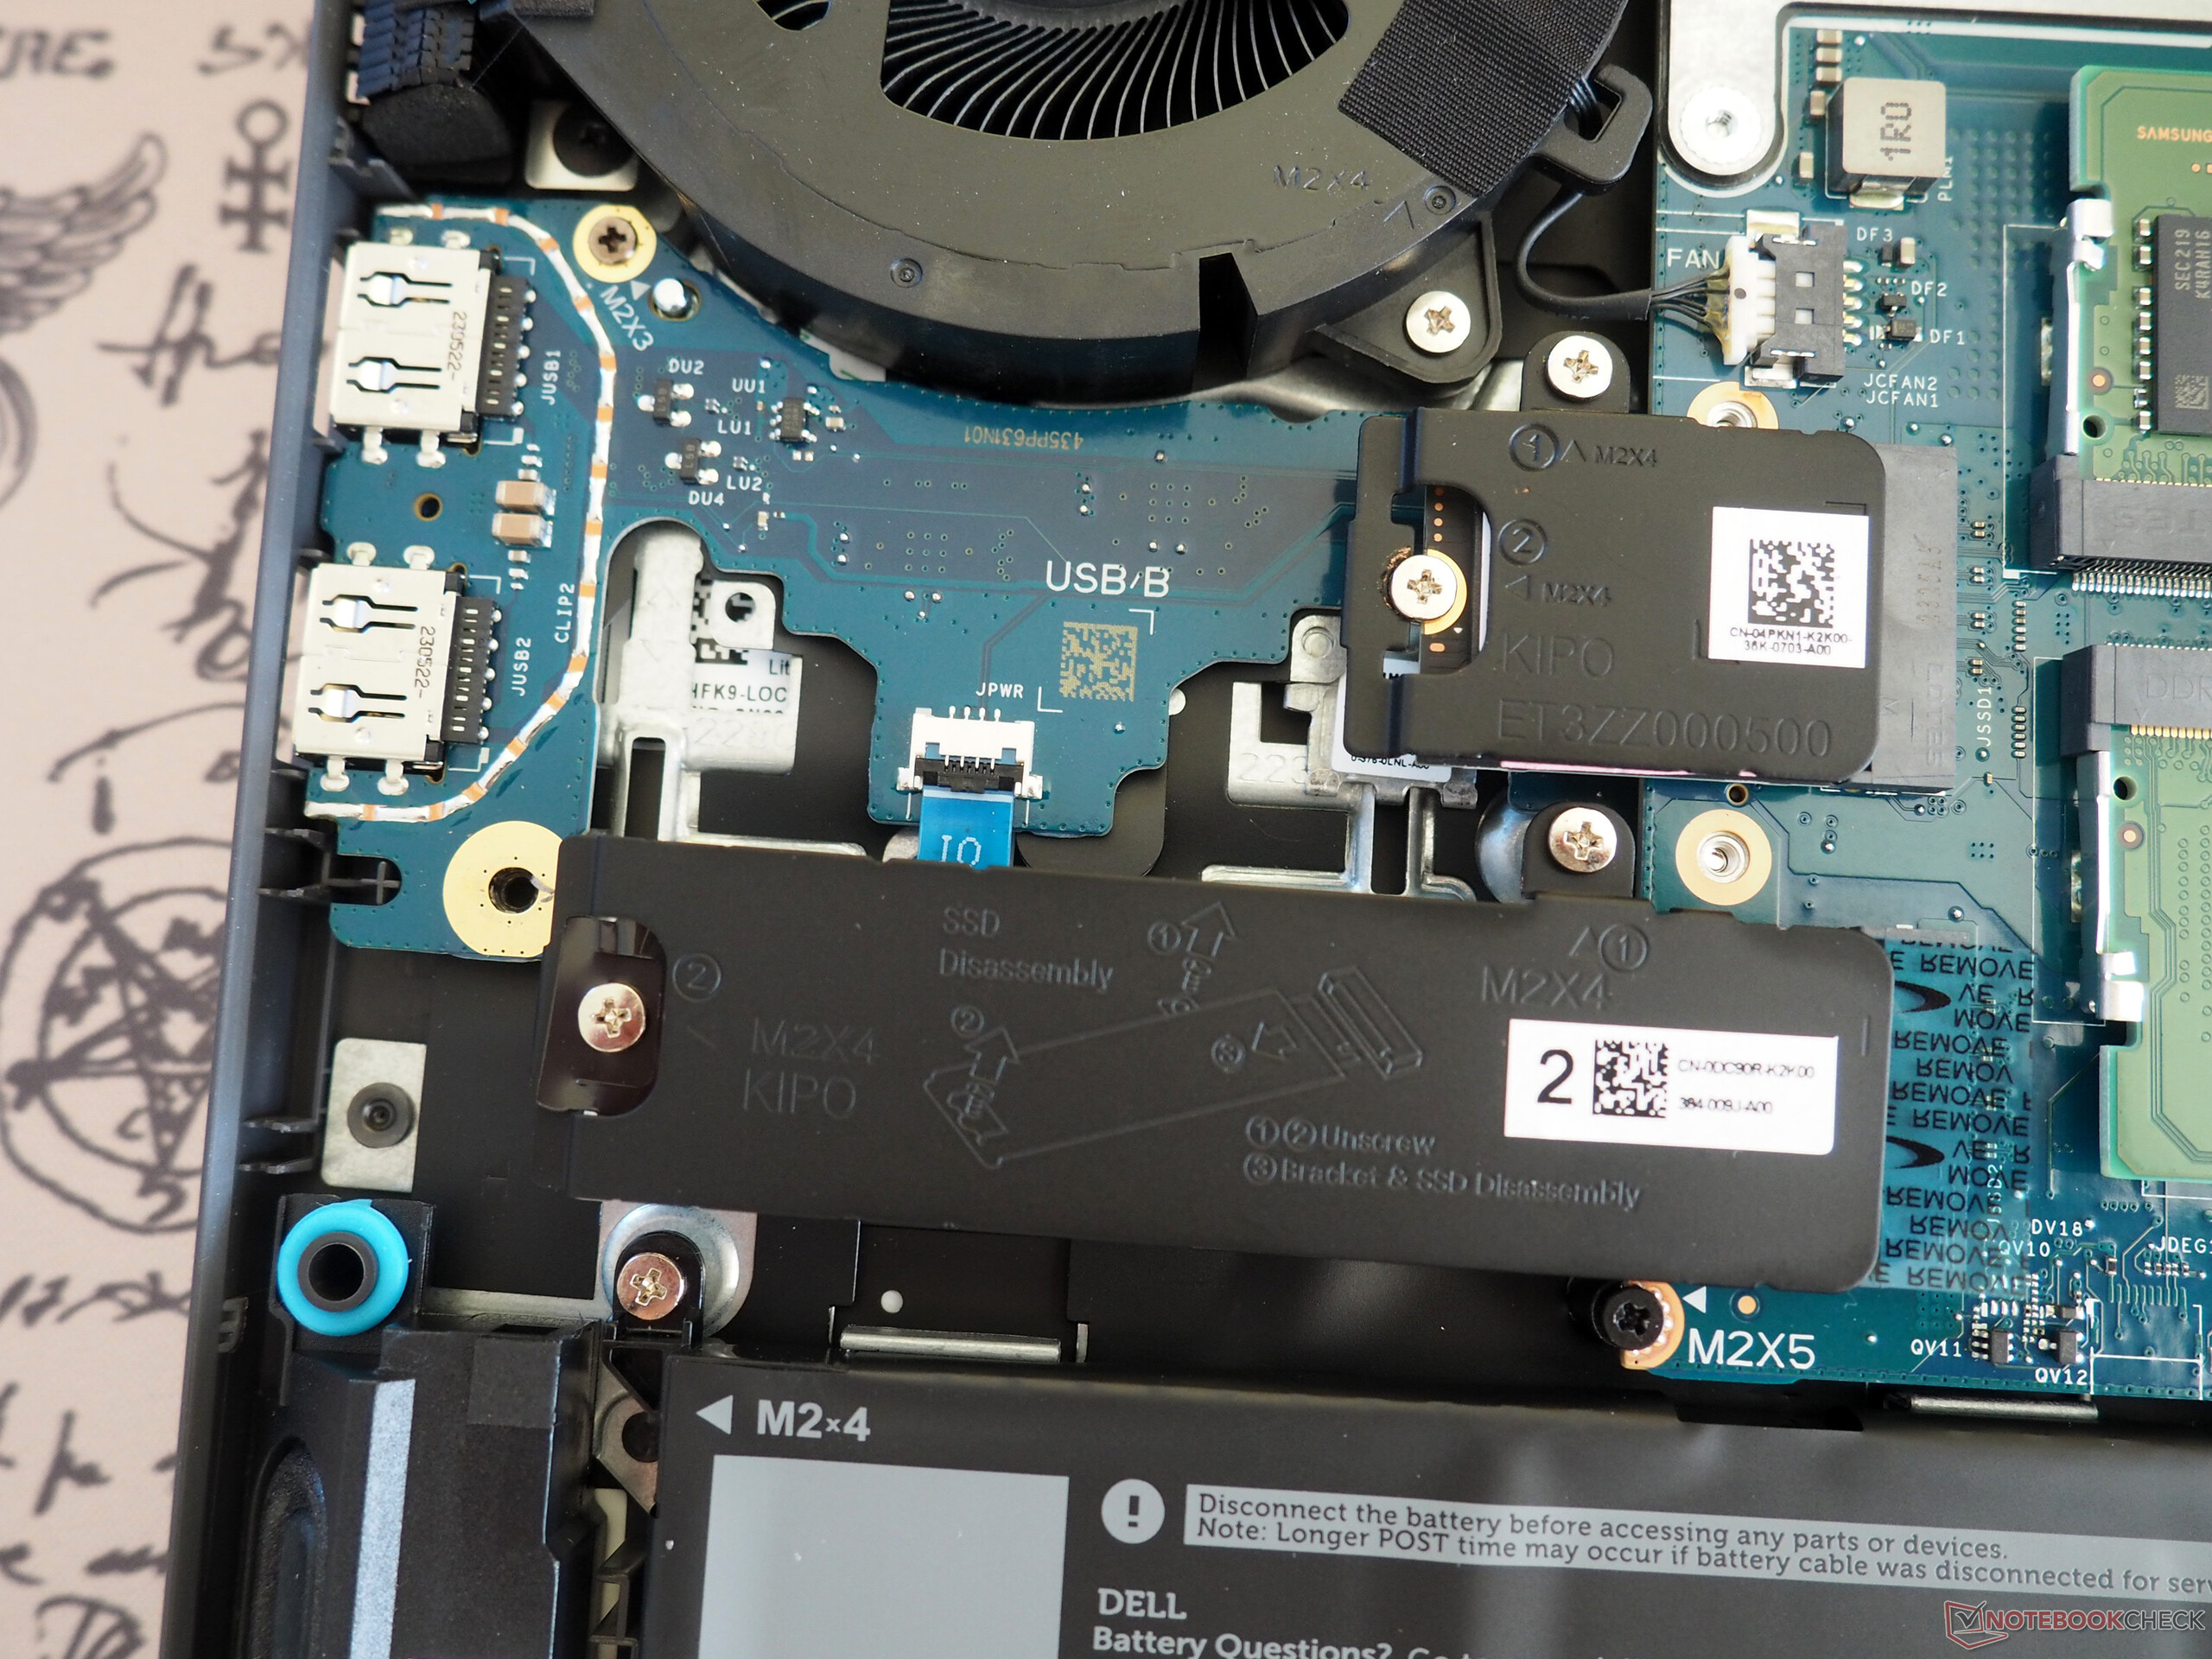
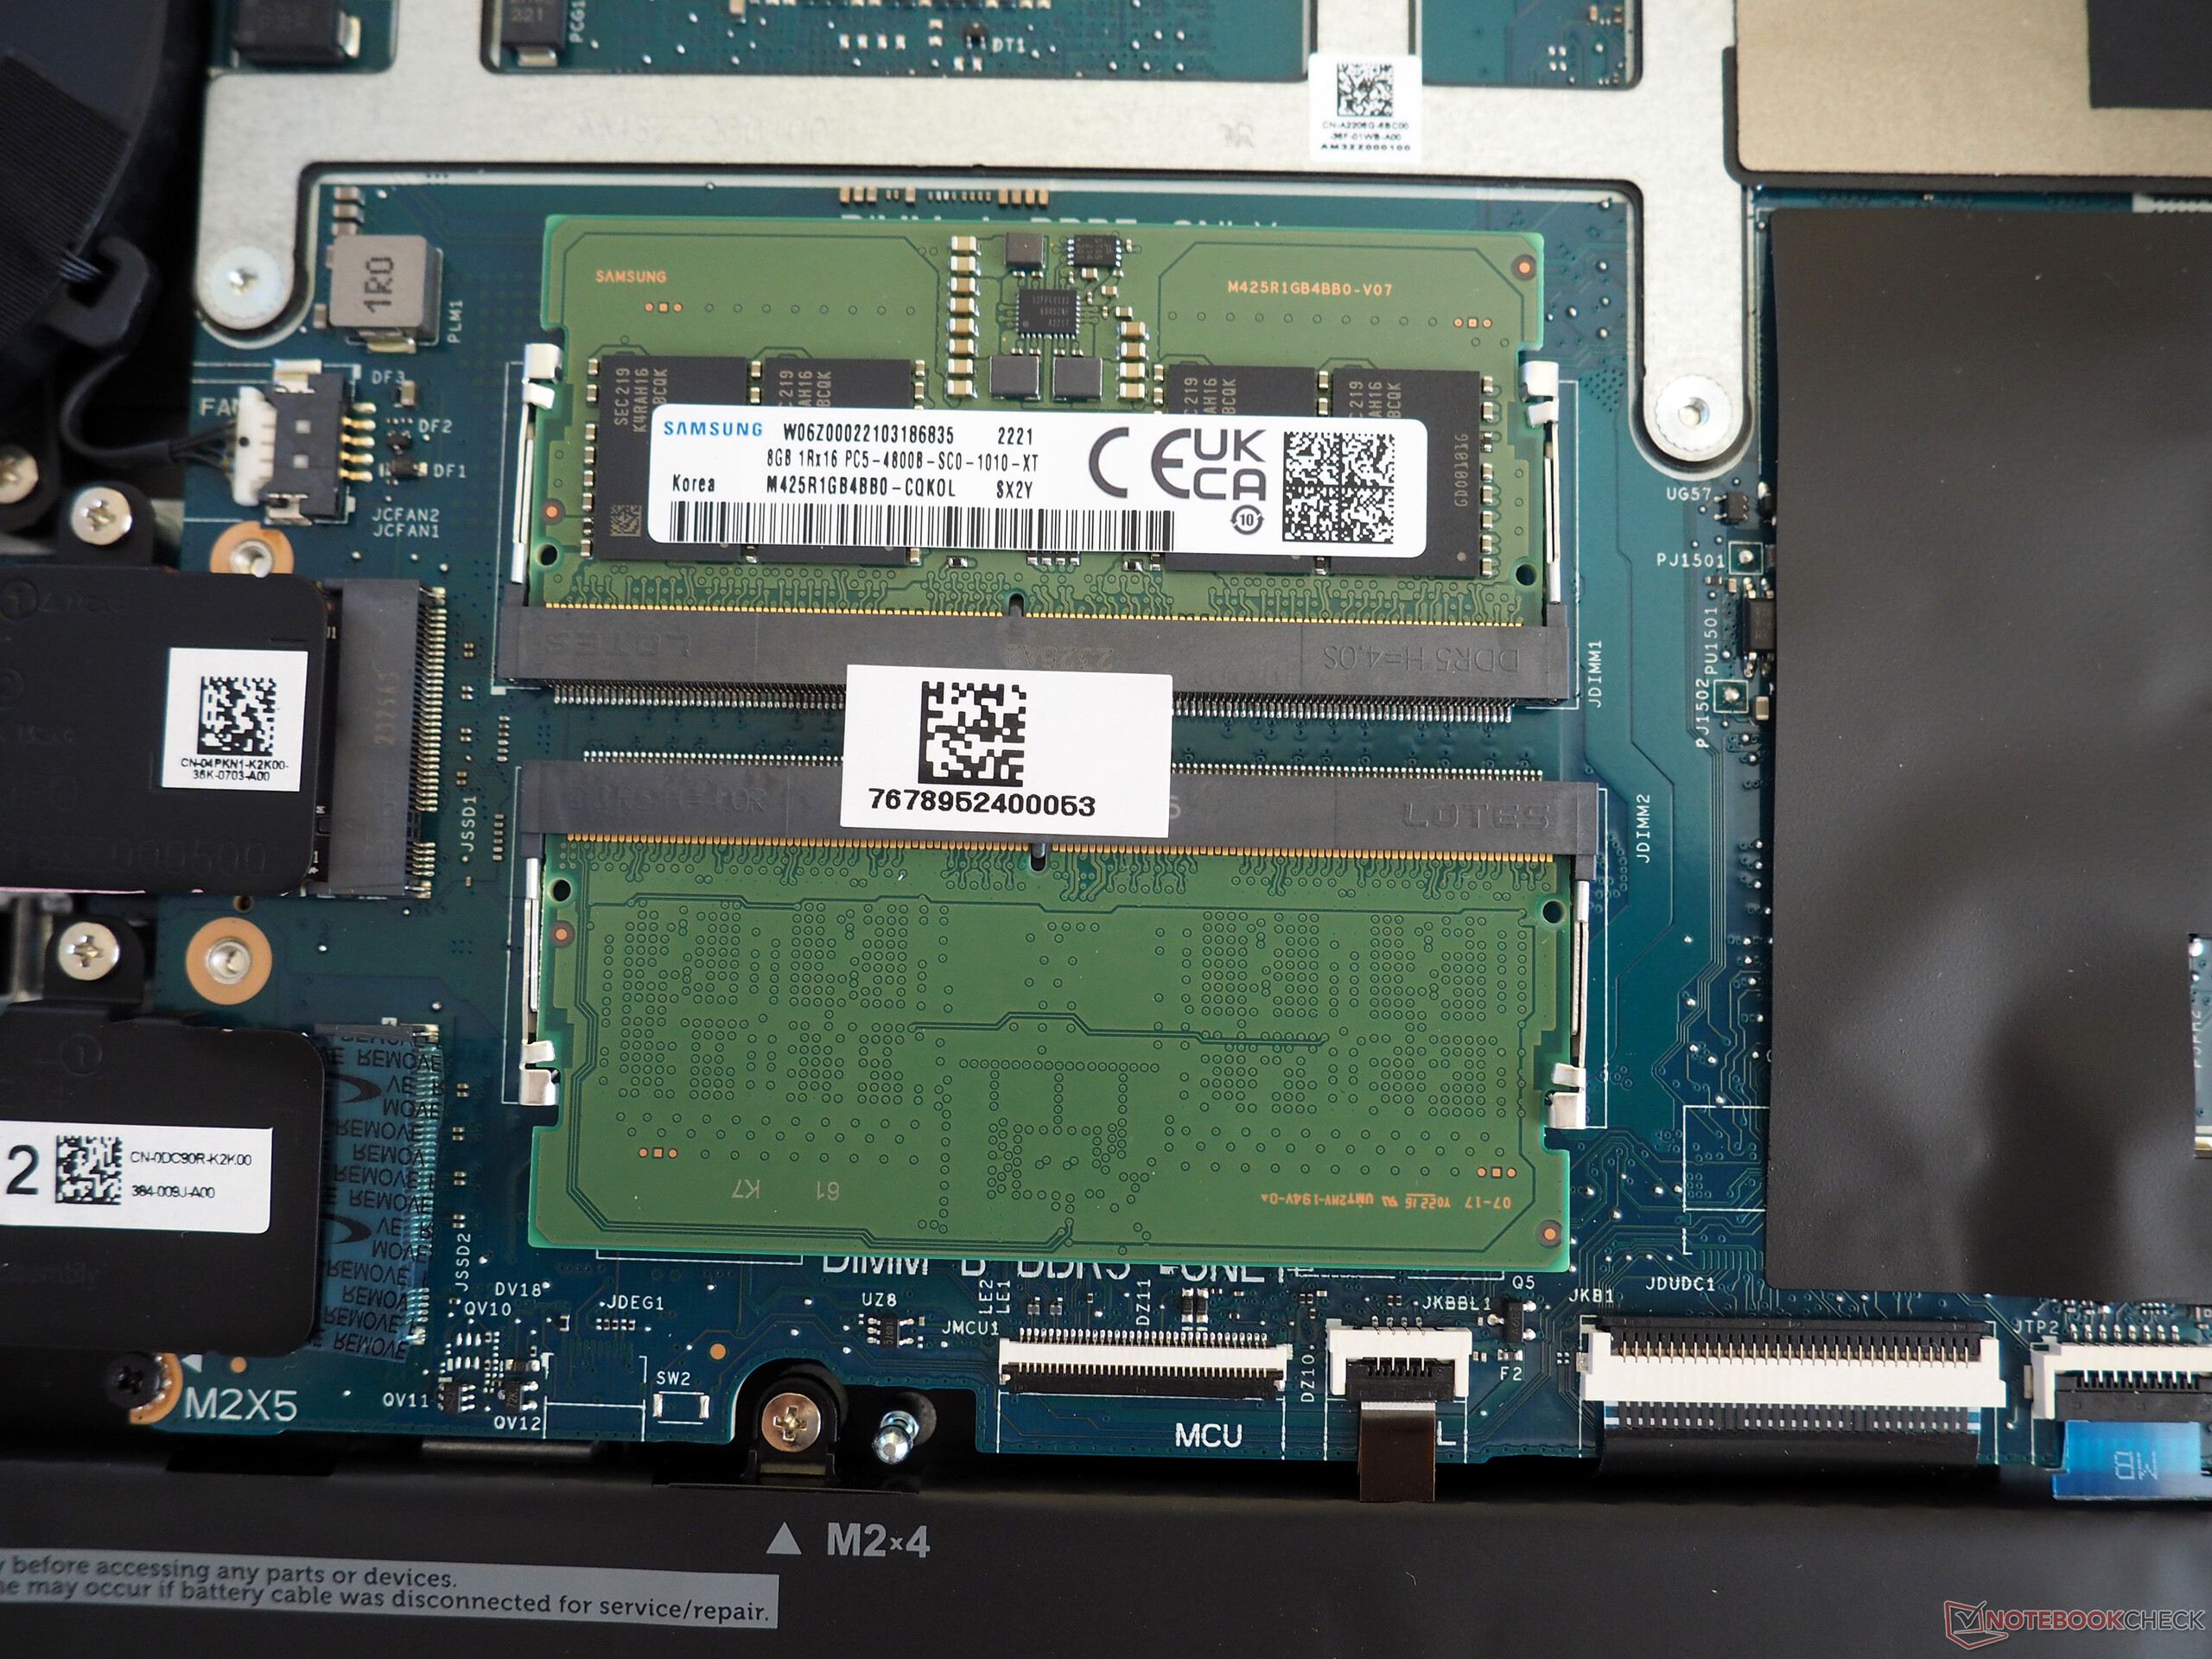
L'apertura dello chassis può essere effettuata anche da un utente medio. Dopo aver rimosso dieci viti a croce, sarà in grado di sollevare il pannello inferiore dal fermo. Sotto il cofano si trovano l'unità di raffreddamento, la batteria, il modulo Wi-Fi, due slot di memoria occupati, uno slot M.2 2230 in uso e uno slot M.2 2280 libero per l'aggiornamento dello storage.
Garanzia
Dell fornisce solo una garanzia di 12 mesi per impostazione predefinita in Germania. Ma il periodo di garanzia può variare a seconda della regione.
Dispositivi di ingresso
Tastiera
I dispositivi di input sono solidi senza essere davvero sorprendenti. Nonostante i minuscoli tasti freccia, ci piace soprattutto il layout della tastiera tedesca, che si attiene in gran parte alla disposizione standard e offre un tastierino numerico a grandezza naturale. La sensazione di digitazione è piuttosto mediocre e, a nostro avviso, potrebbe essere ancora più solida. La retroilluminazione bianca con due livelli di luminosità facilita la digitazione in un ambiente buio.
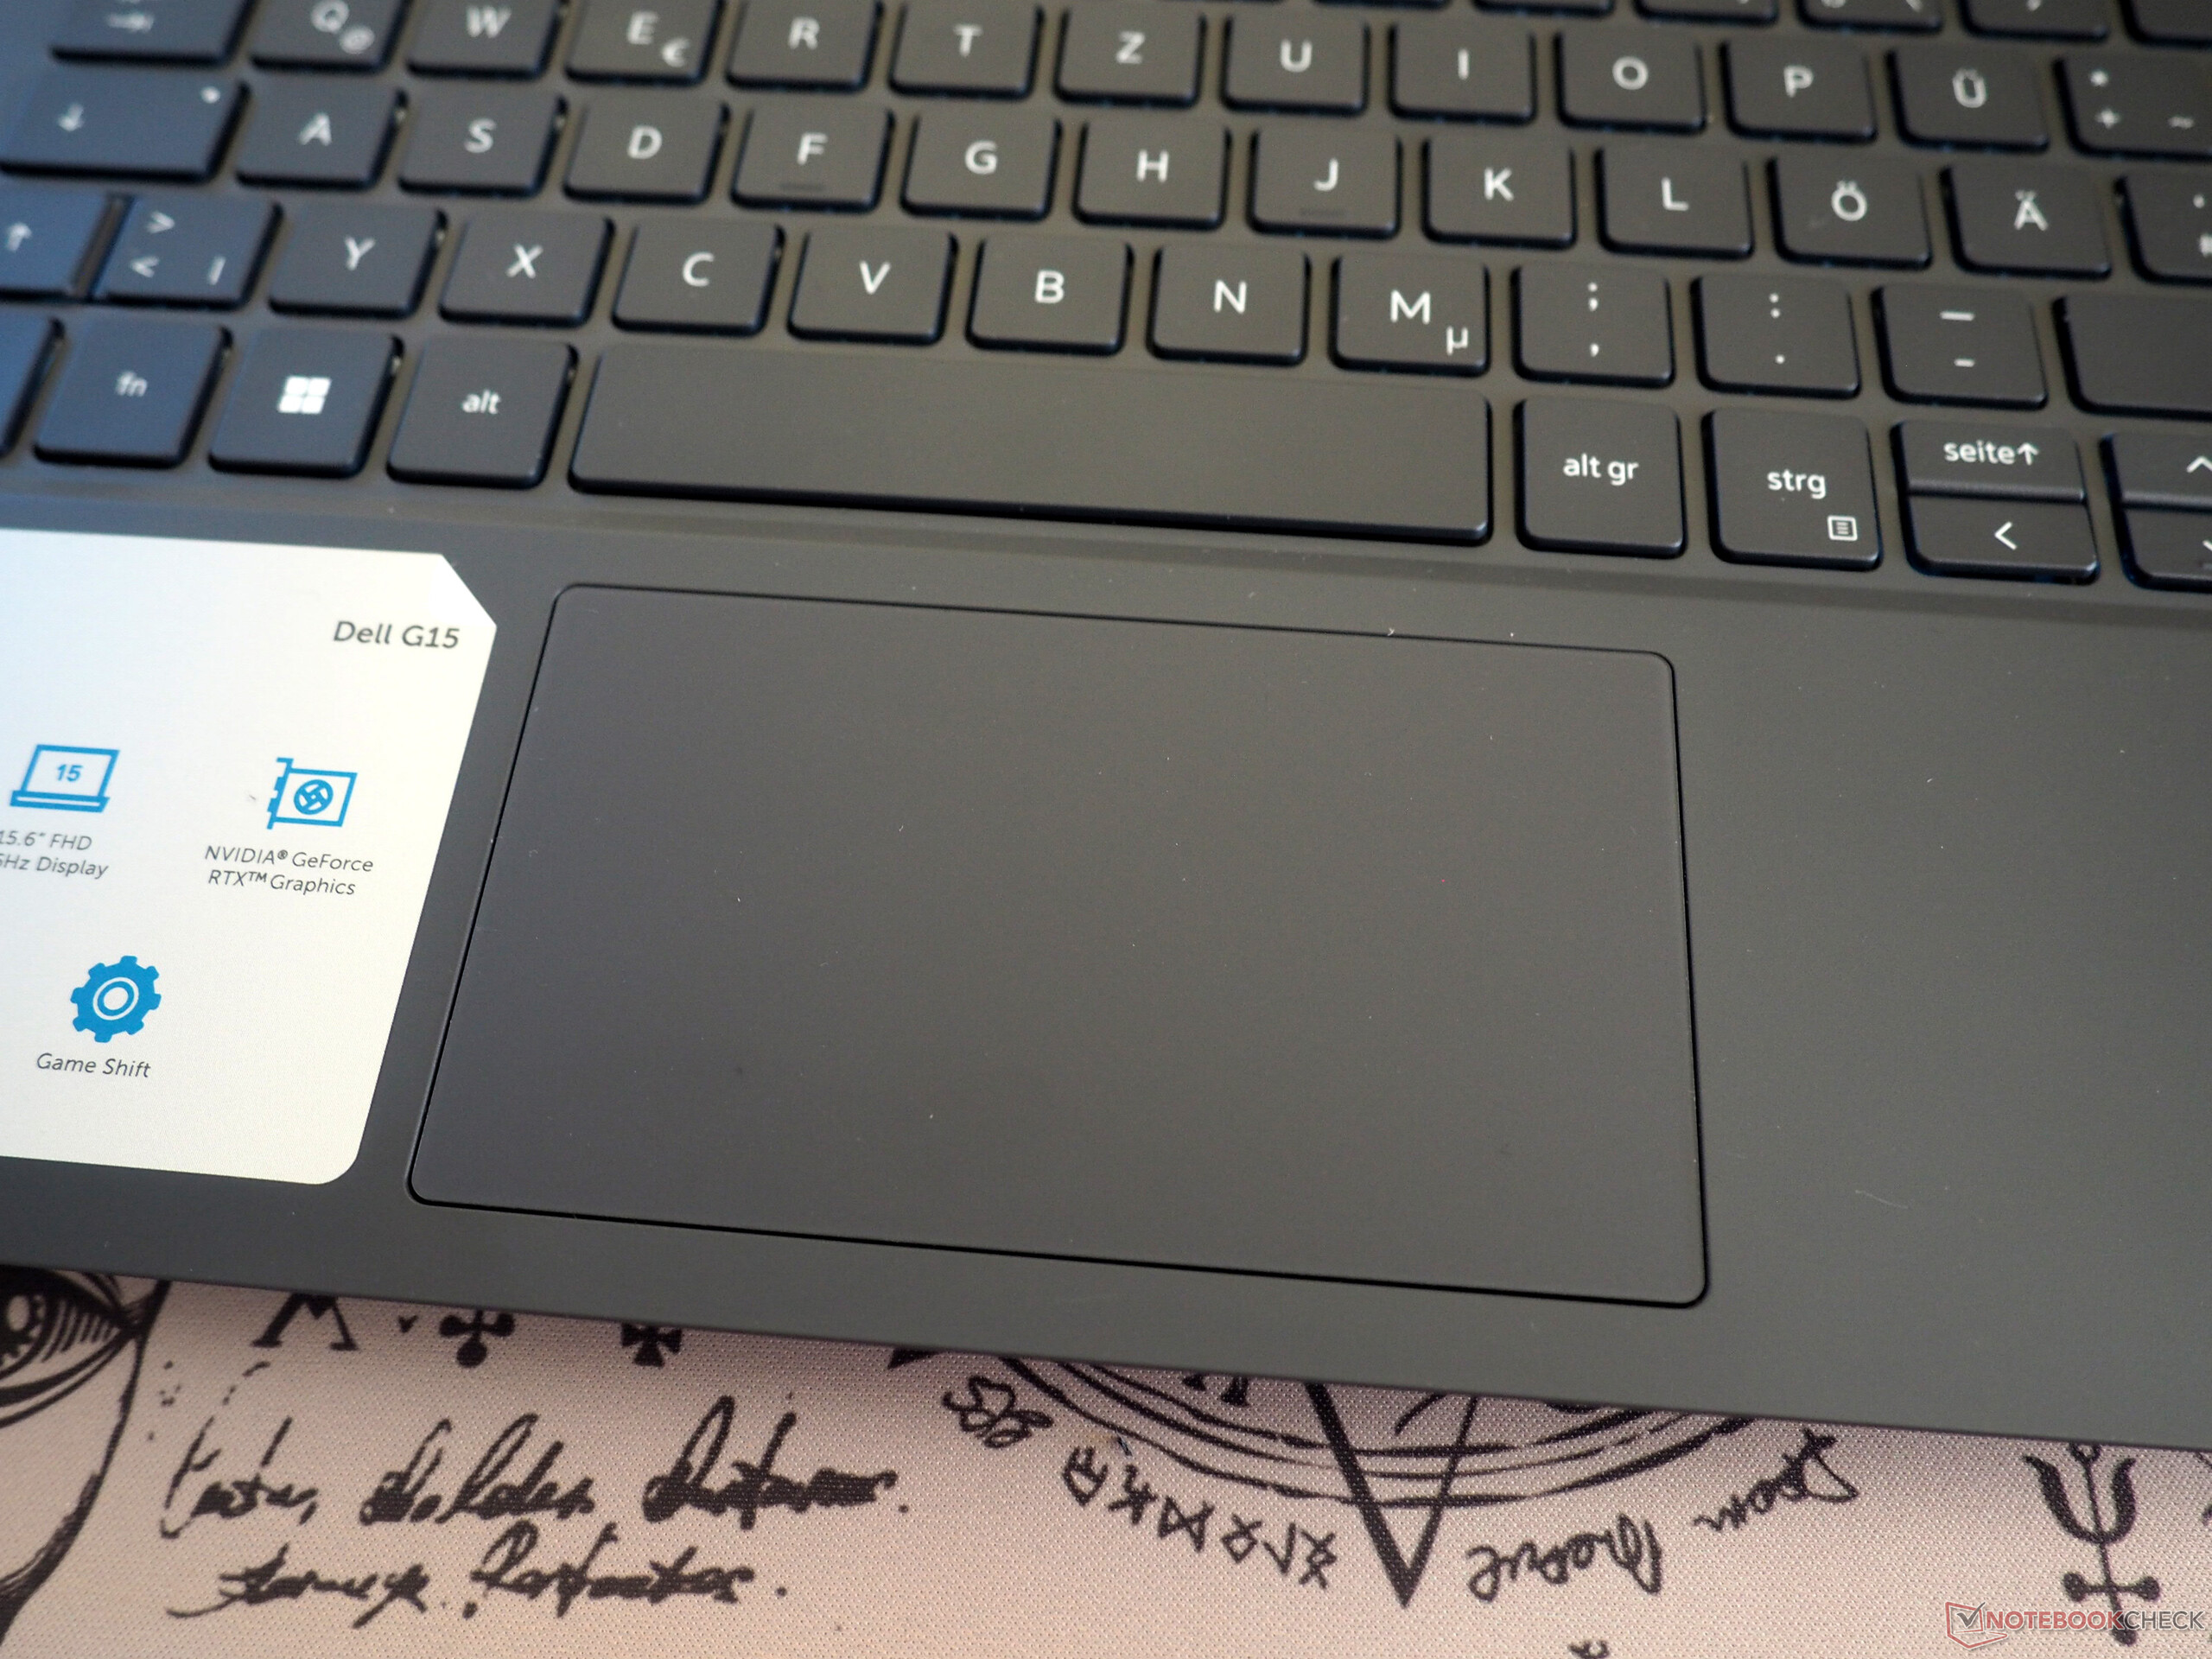
Touchpad
Anche il touchpad potrebbe richiedere un po' di lavoro da parte di Dell. Ad esempio, oltre alle dimensioni un po' modeste (circa 10,5 x 6 cm, 4,1 x 2,4 pollici), abbiamo anche delle lamentele sulla superficie molto allentata. Detto questo, il touchpad offre un livello accettabile di scorrevolezza e precisione.
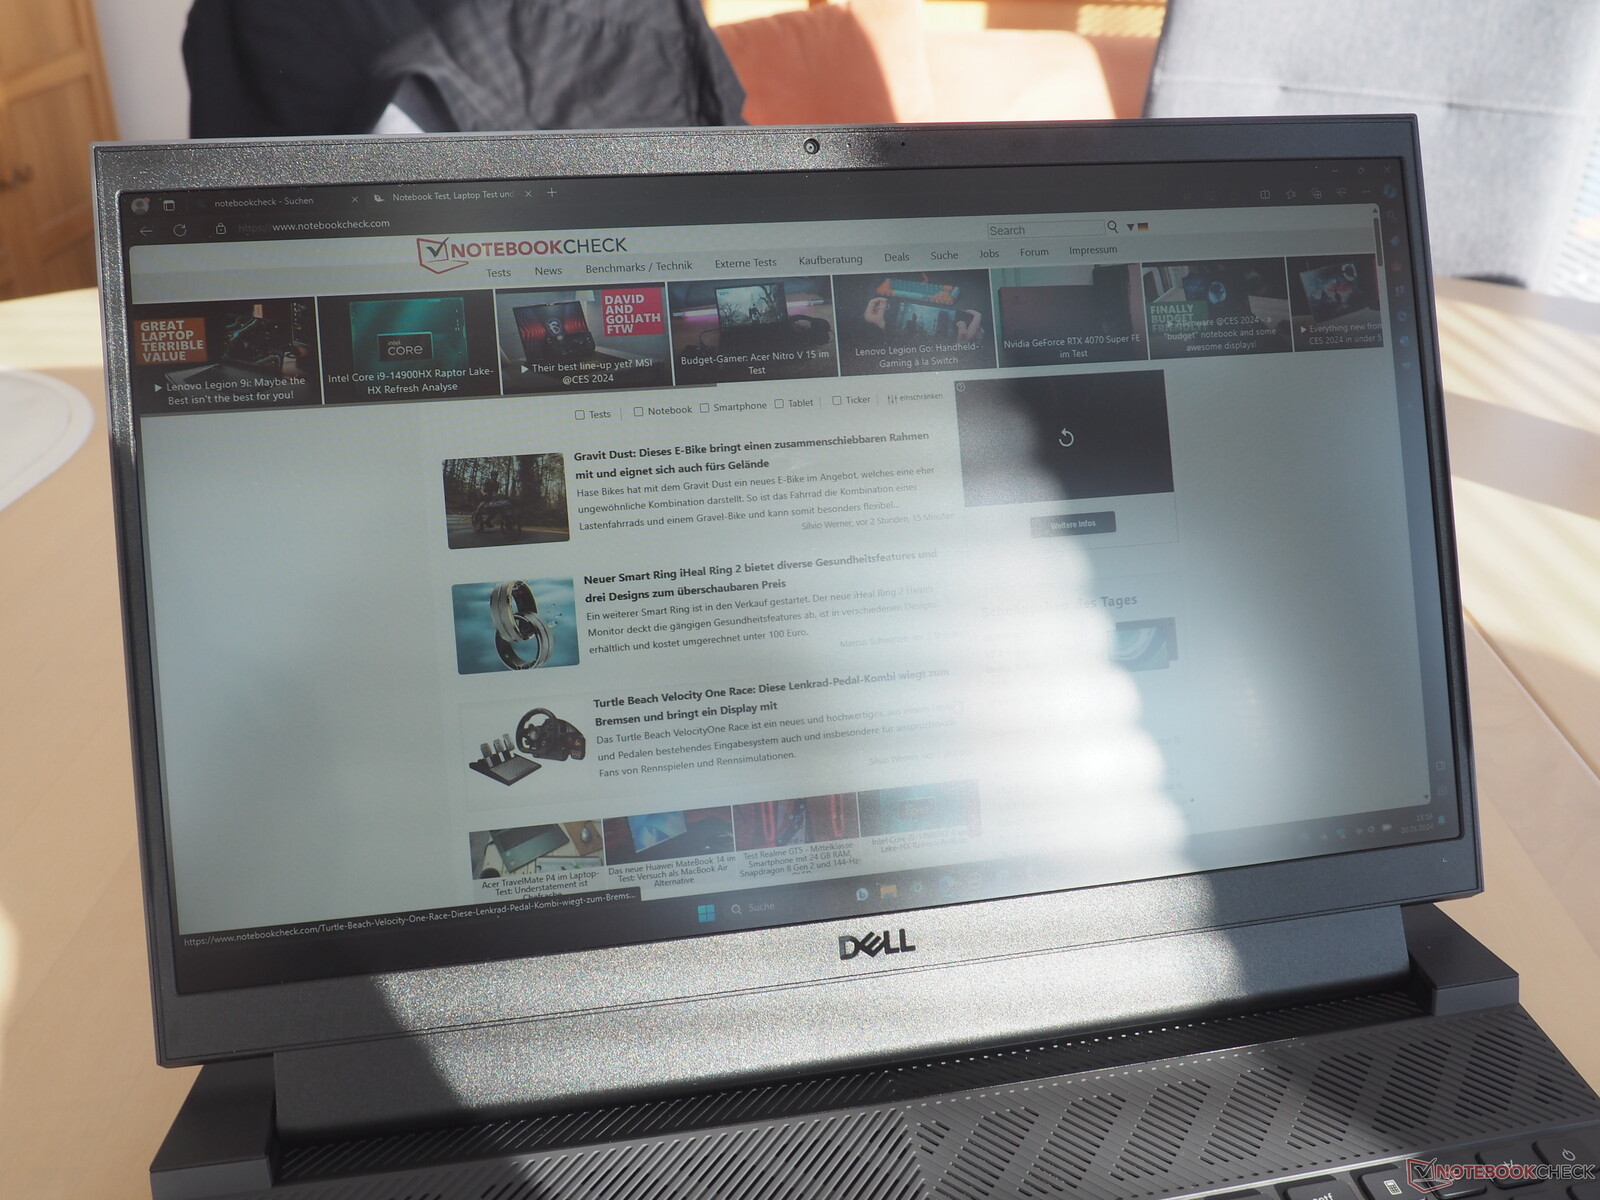
Display
Il portatile è dotato anche di un display a 165 Hz. Tuttavia, il pannello è diverso da quello utilizzato sul modello G15 che abbiamo recensito in precedenza (vedere tabella). Questo spiega anche perché alcuni dei risultati ottenuti per i due display differiscono tra loro.
| |||||||||||||||||||||||||
Distribuzione della luminosità: 89 %
Al centro con la batteria: 389 cd/m²
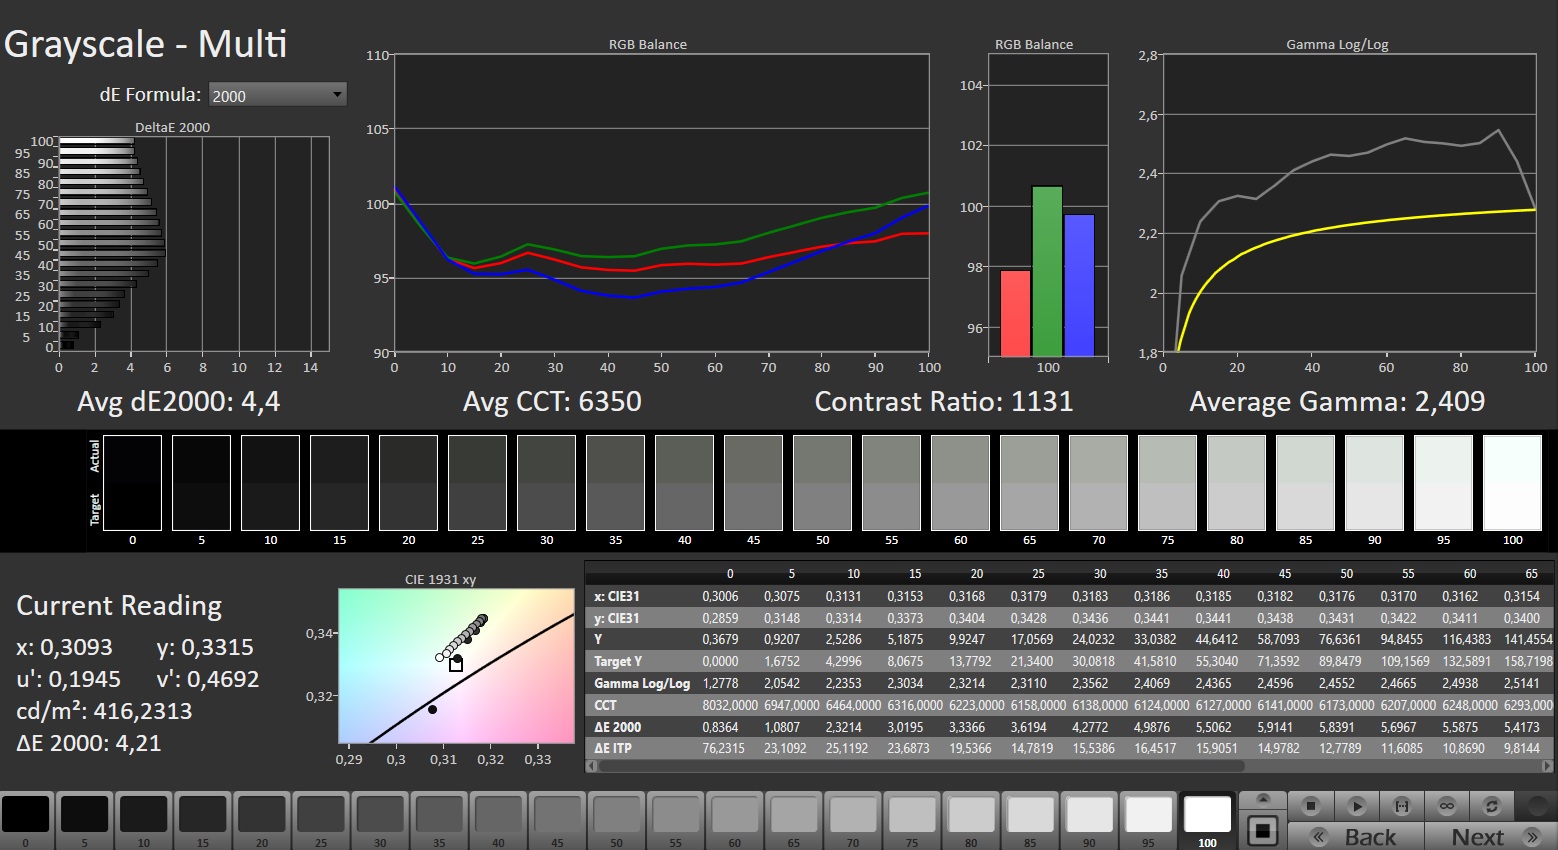
Contrasto: 1111:1 (Nero: 0.35 cd/m²)
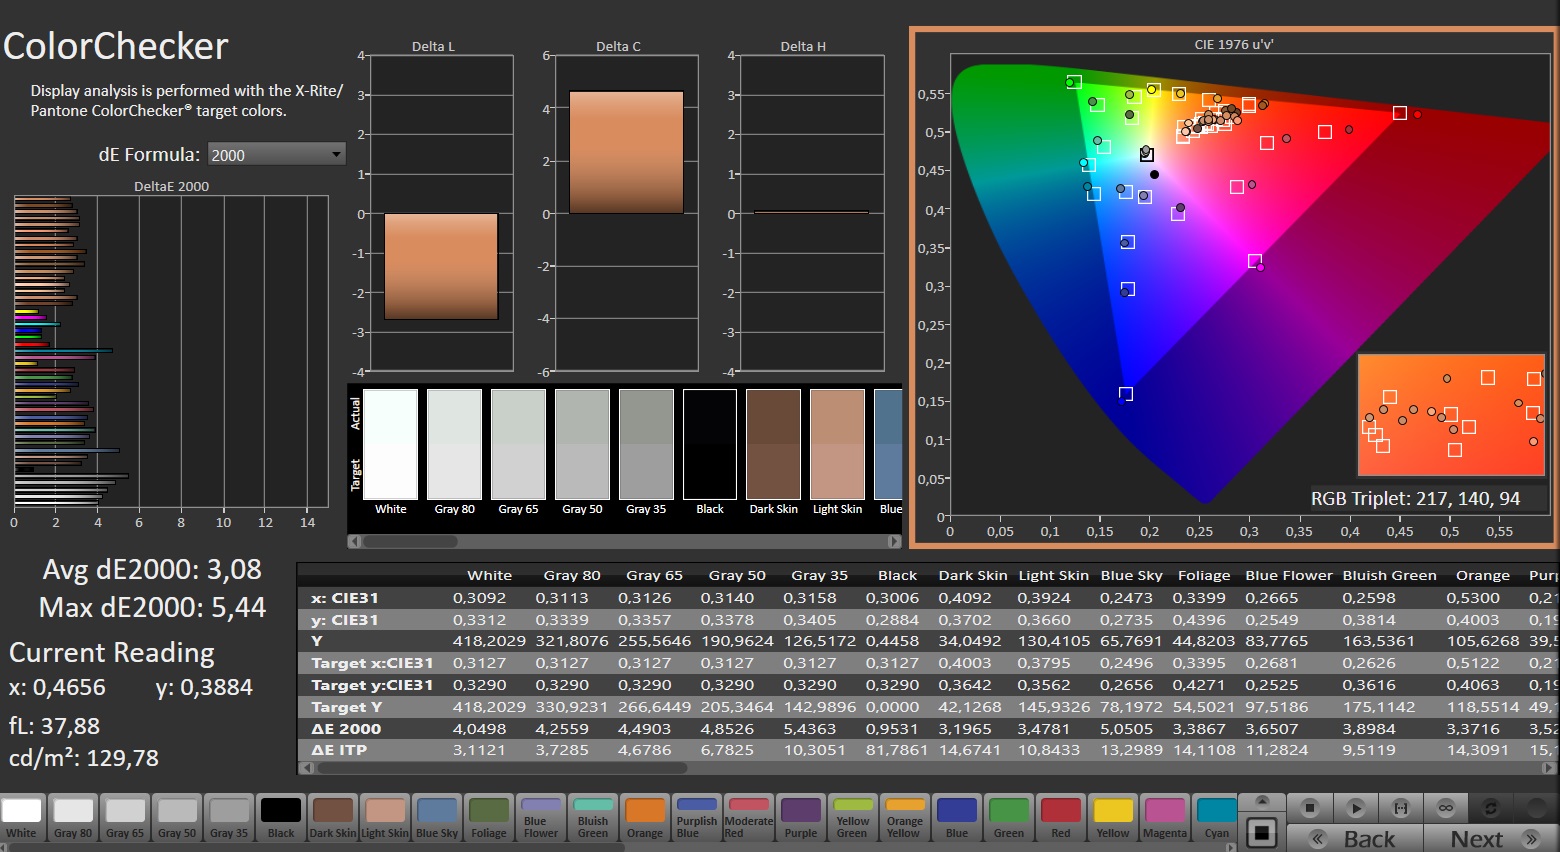
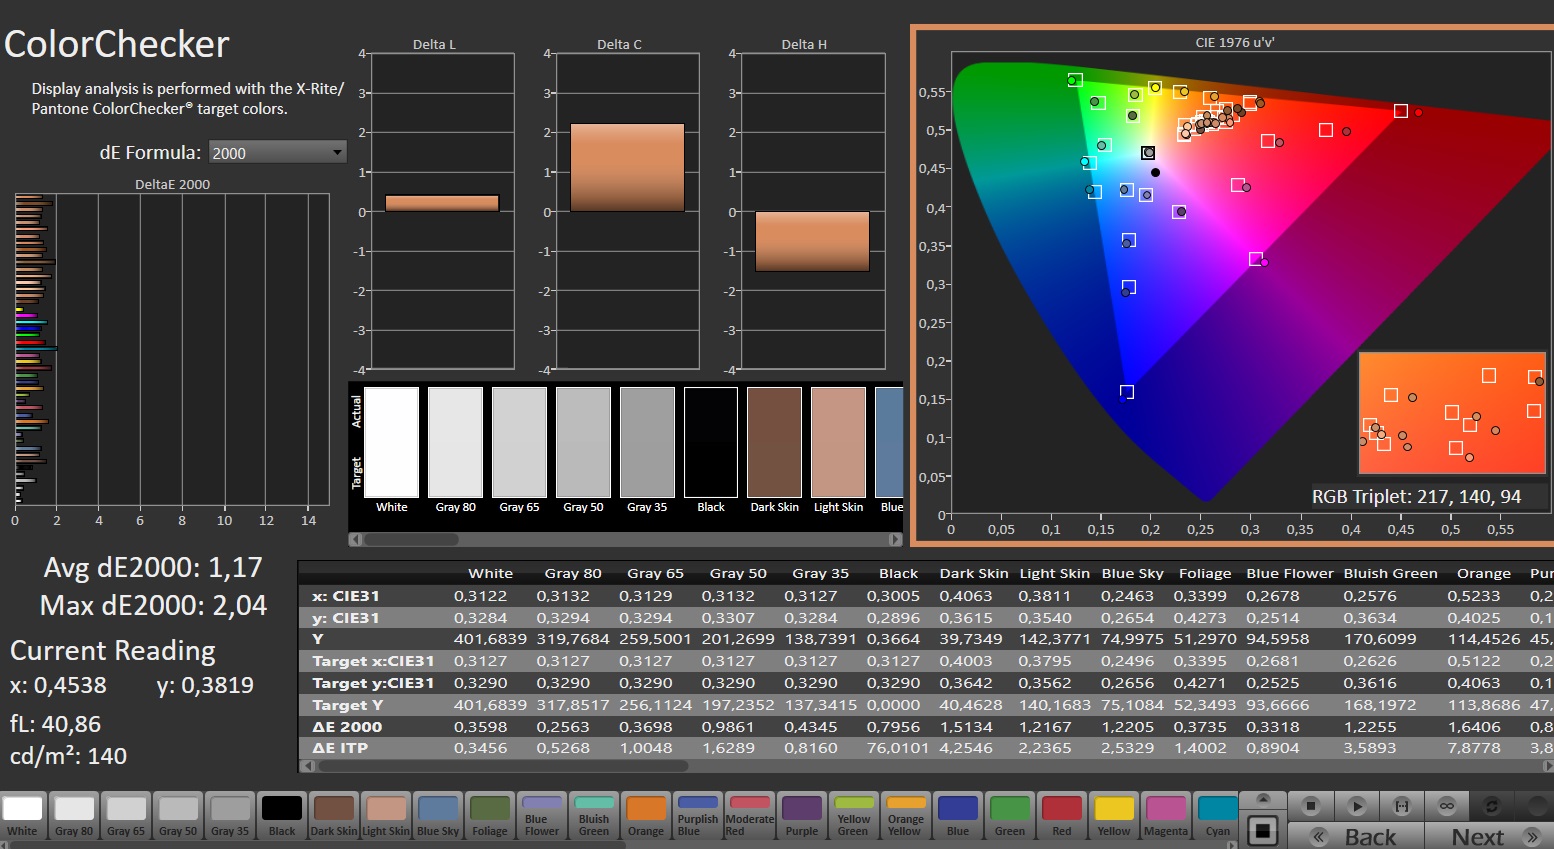
ΔE ColorChecker Calman: 3.08 | ∀{0.5-29.43 Ø4.71}
calibrated: 1.17
ΔE Greyscale Calman: 4.4 | ∀{0.09-98 Ø4.96}
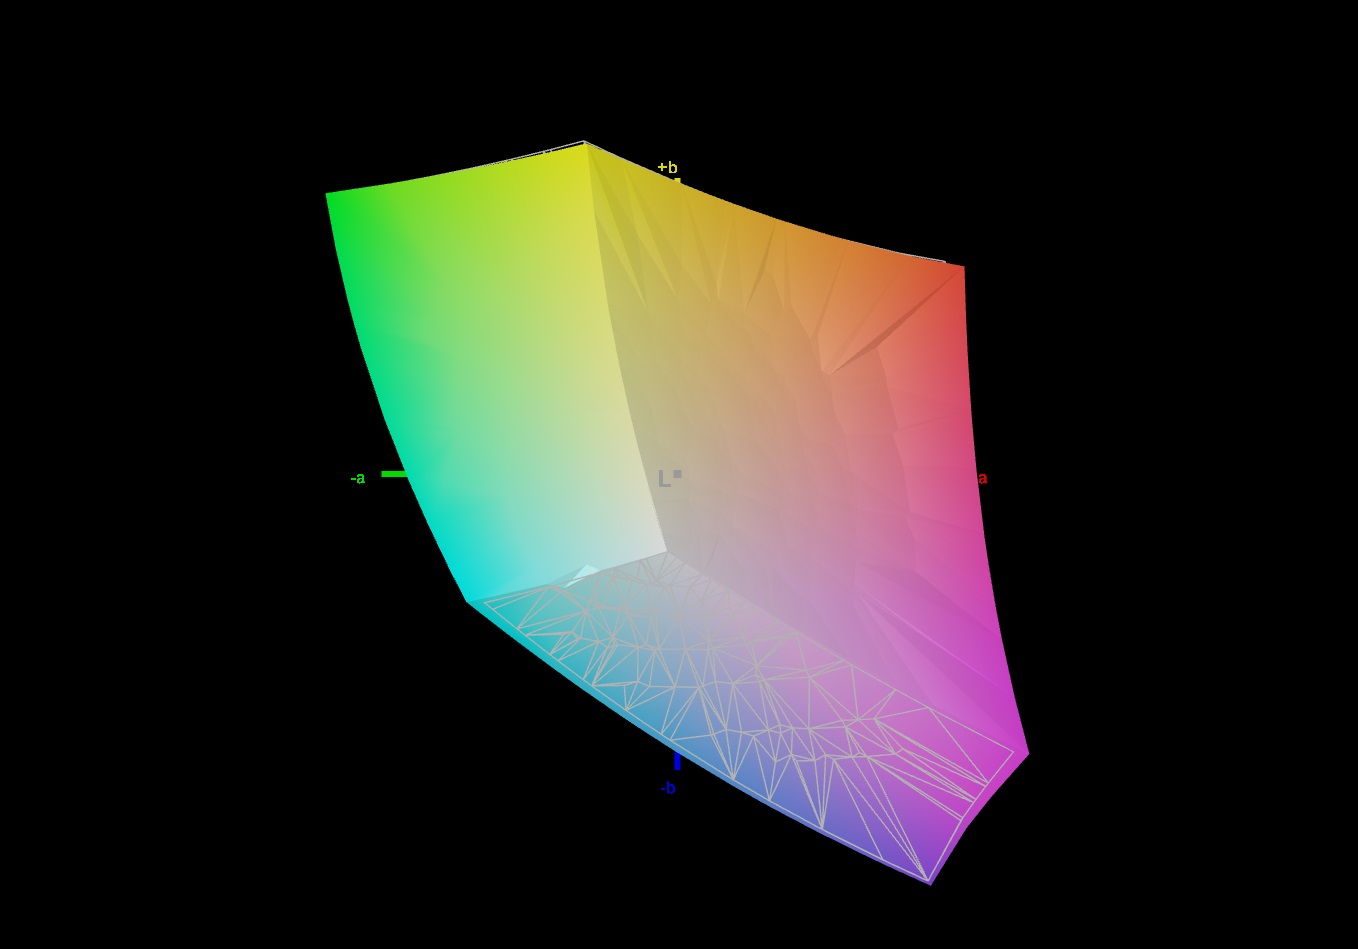
71.4% AdobeRGB 1998 (Argyll 3D)
99.3% sRGB (Argyll 3D)
71.1% Display P3 (Argyll 3D)
Gamma: 2.409
CCT: 6350 K
| Dell G15 5530, i5-13450HX RTX 4050 BOEhydis NV15NY9 (Dell 18PJX), IPS, 1920x1080, 15.6" | Medion Erazer Crawler E40 - MD 62518 BOE HF NV156FHM-N4G, IPS, 1920x1080, 15.6" | Lenovo LOQ 15IRH8 Core i7 BOE CQ NE156QHM-NY4, IPS, 2560x1440, 15.6" | Asus TUF A15 FA507 N156HMA-GA1, IPS, 1920x1080, 15.6" | Dell G15 5530 AUO B156HAN, IPS, 1920x1080, 15.6" | |
|---|---|---|---|---|---|
| Display | -12% | -5% | -6% | 2% | |
| Display P3 Coverage (%) | 71.1 | 61.4 -14% | 66.3 -7% | 64.9 -9% | 73.1 3% |
| sRGB Coverage (%) | 99.3 | 89.7 -10% | 96.6 -3% | 96.5 -3% | 98.4 -1% |
| AdobeRGB 1998 Coverage (%) | 71.4 | 63.2 -11% | 67.7 -5% | 66.6 -7% | 74.4 4% |
| Response Times | -19% | 8% | -234% | 40% | |
| Response Time Grey 50% / Grey 80% * (ms) | 8.5 ? | 8 ? 6% | 5 ? 41% | 30.4 ? -258% | 3.39 ? 60% |
| Response Time Black / White * (ms) | 6.7 ? | 9.6 ? -43% | 8.41 ? -26% | 20.8 ? -210% | 5.35 ? 20% |
| PWM Frequency (Hz) | 21620 ? | ||||
| Screen | -13% | -10% | 21% | -17% | |
| Brightness middle (cd/m²) | 389 | 364 -6% | 373 -4% | 288 -26% | 320 -18% |
| Brightness (cd/m²) | 374 | 351 -6% | 365 -2% | 271 -28% | 316 -16% |
| Brightness Distribution (%) | 89 | 91 2% | 90 1% | 91 2% | 94 6% |
| Black Level * (cd/m²) | 0.35 | 0.43 -23% | 0.33 6% | 0.17 51% | 0.21 40% |
| Contrast (:1) | 1111 | 847 -24% | 1130 2% | 1694 52% | 1524 37% |
| Colorchecker dE 2000 * | 3.08 | 3.98 -29% | 4.19 -36% | 1.9 38% | 4.55 -48% |
| Colorchecker dE 2000 max. * | 5.44 | 6.38 -17% | 8.47 -56% | 3.3 39% | 9.83 -81% |
| Colorchecker dE 2000 calibrated * | 1.17 | 1.36 -16% | 1.07 9% | 0.9 23% | 1.51 -29% |
| Greyscale dE 2000 * | 4.4 | 4.39 -0% | 5 -14% | 2.7 39% | 6.2 -41% |
| Gamma | 2.409 91% | 2.58 85% | 1.93 114% | 2.32 95% | 2.07 106% |
| CCT | 6350 102% | 7316 89% | 7520 86% | 6535 99% | 6479 100% |
| Media totale (Programma / Settaggio) | -15% /
-14% | -2% /
-7% | -73% /
-21% | 8% /
-5% |
* ... Meglio usare valori piccoli
Mentre il pannello attuale ha un livello di nero leggermente peggiore (0,35 contro 0,21 cd/m²), la sua luminosità massima media è leggermente superiore (374 contro 316 cd/m²). L'altro modello G15 ha un contrasto e un tempo di risposta migliori rispetto all'unità oggetto della recensione. Tuttavia, un contrasto di 1.111:1 e un tempo di risposta da grigio a grigio di 8,5 ms sono rispettabili per un pannello IPS.
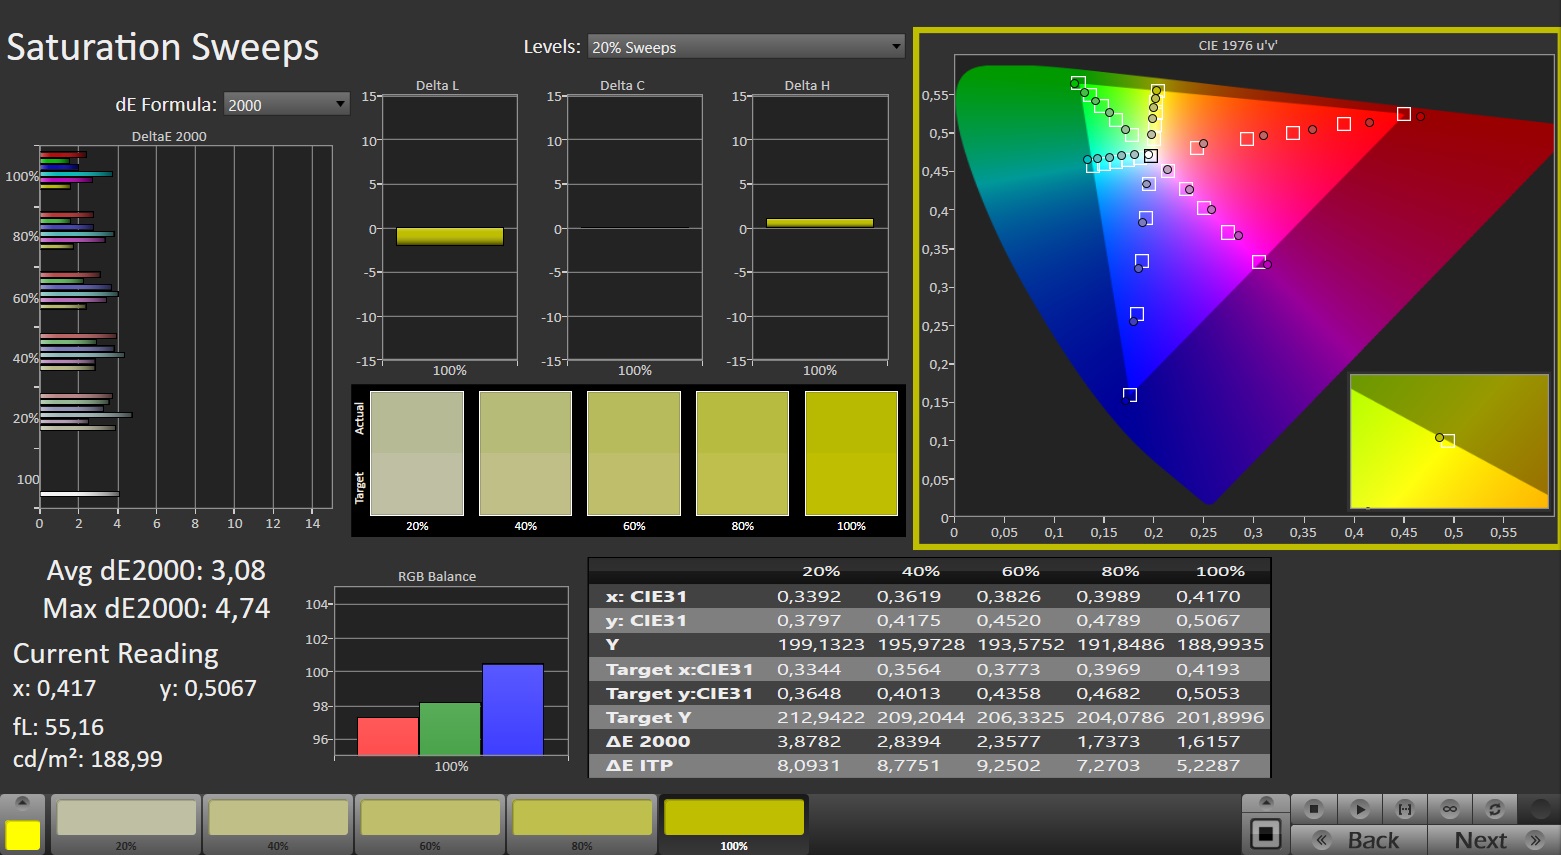
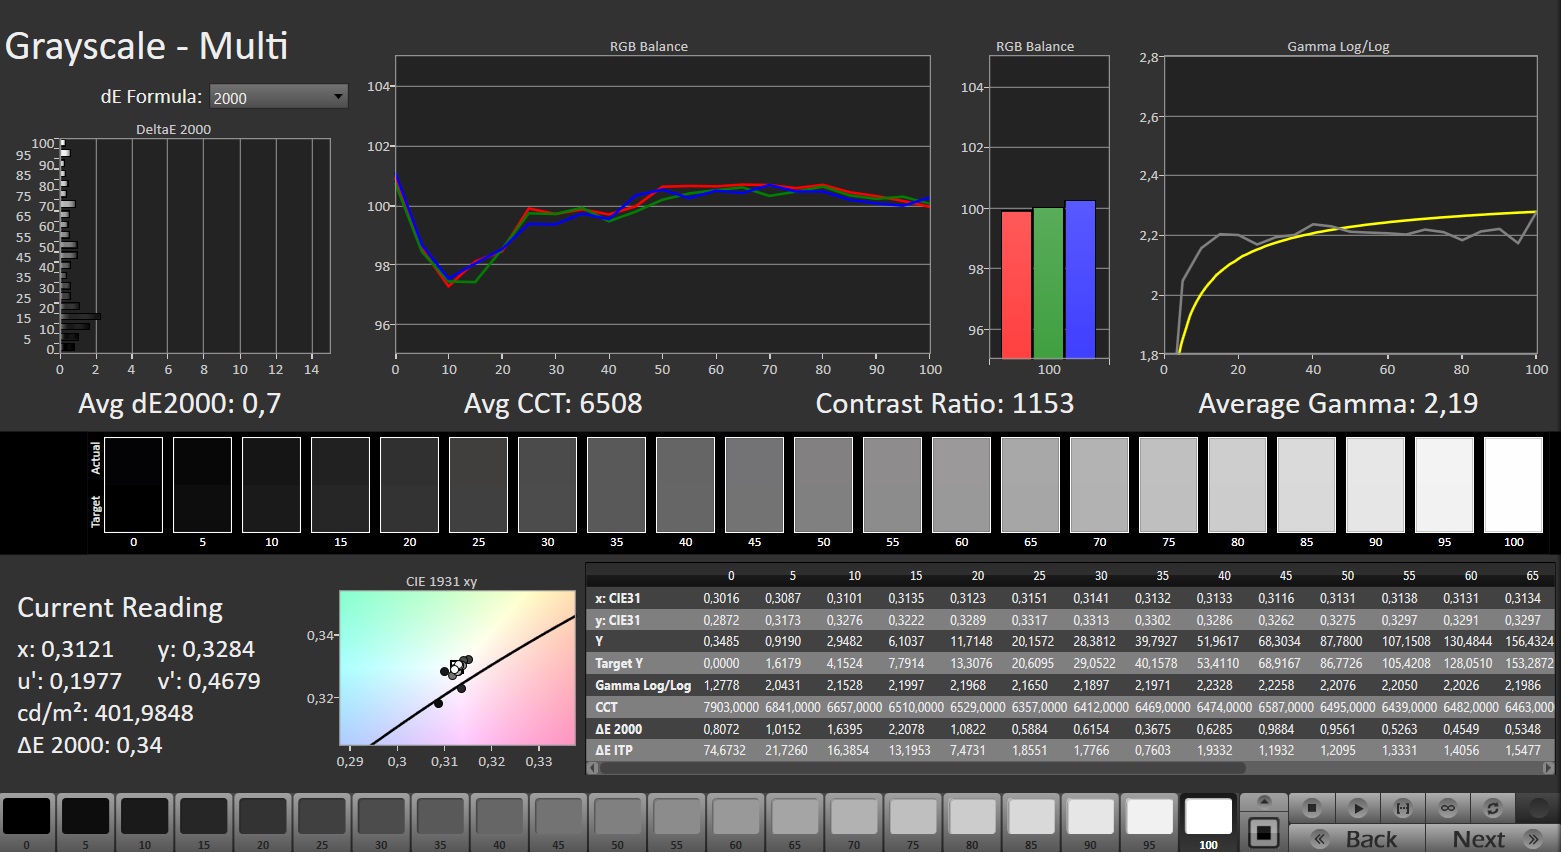
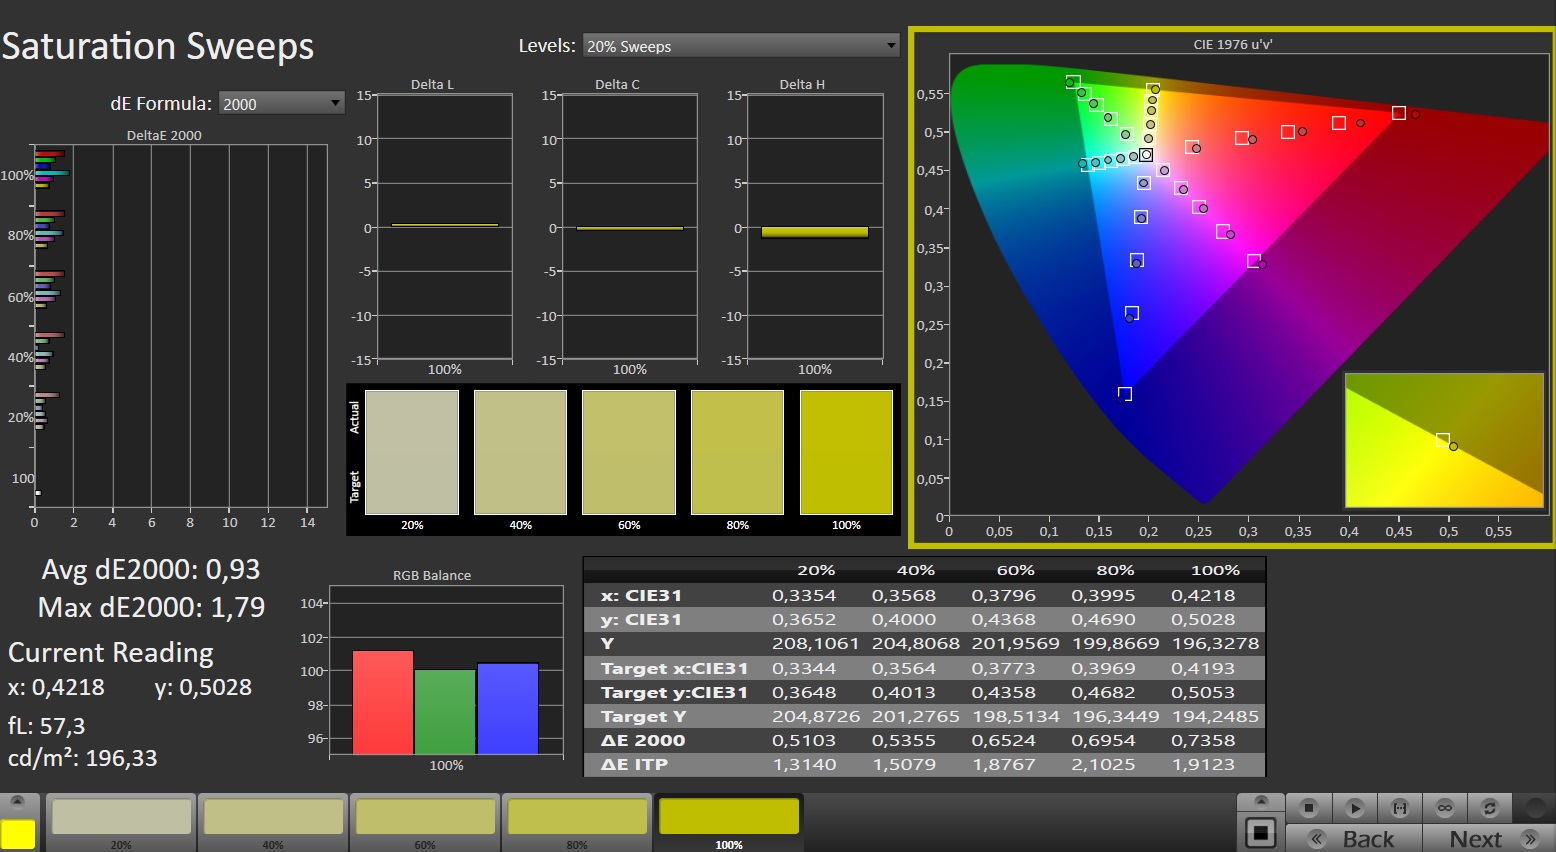
"Rispettabile" è anche una descrizione appropriata per la copertura del colore: anche se il portatile da 15 pollici non è in grado di riprodurre completamente gli spazi colore DCI-P3 e AdobeRGB, avere una copertura sRGB quasi al 100% non è una cosa scontata nella fascia di prezzo di 1.000 euro (1.090 dollari), come dimostra l'Acer Nitro V 15 pollici Acer Nitro V 15 che abbiamo recensito di recente, ad esempio.
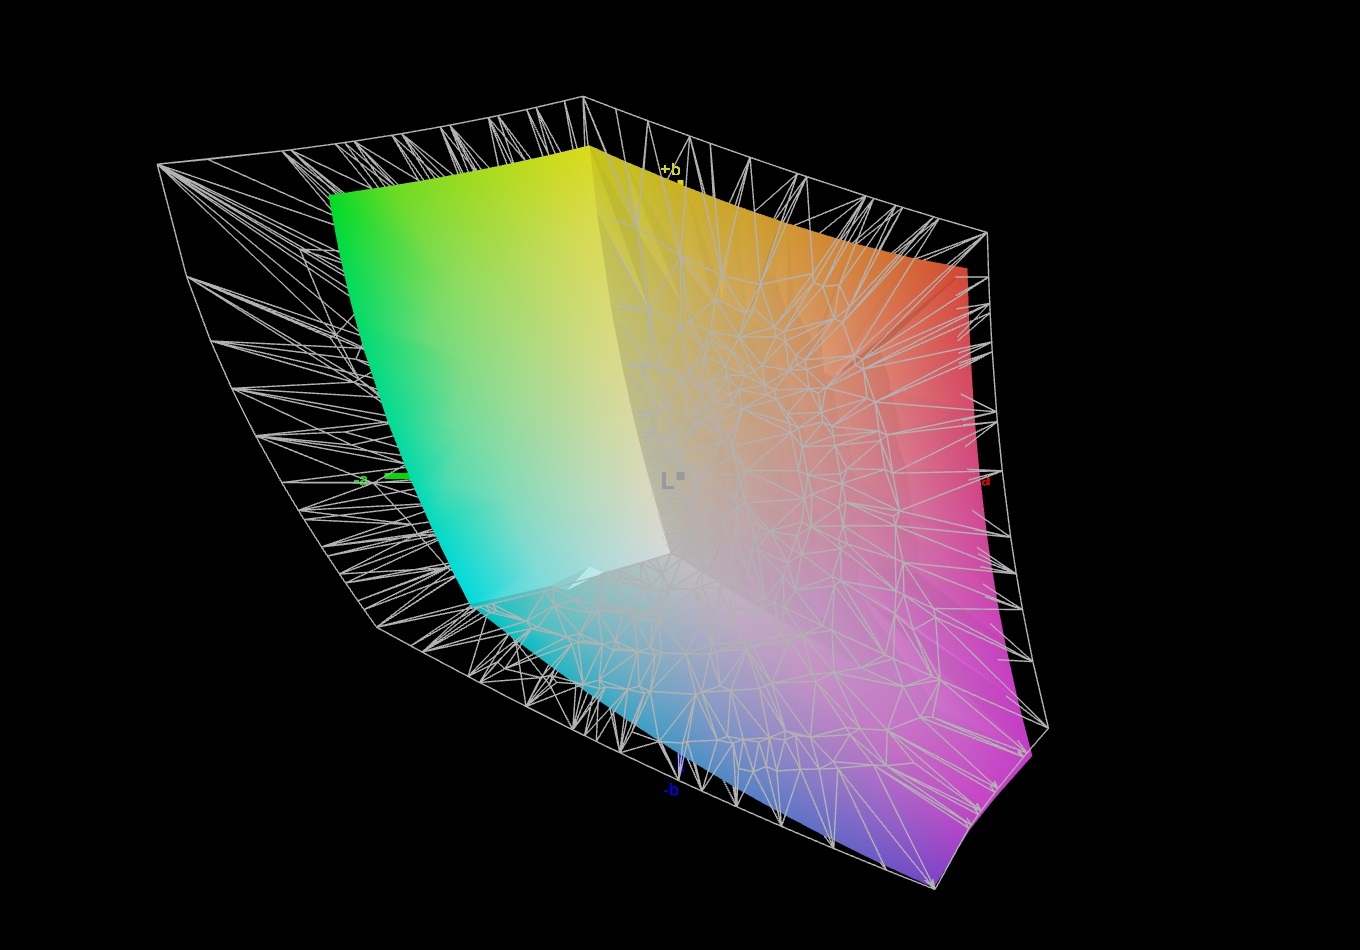
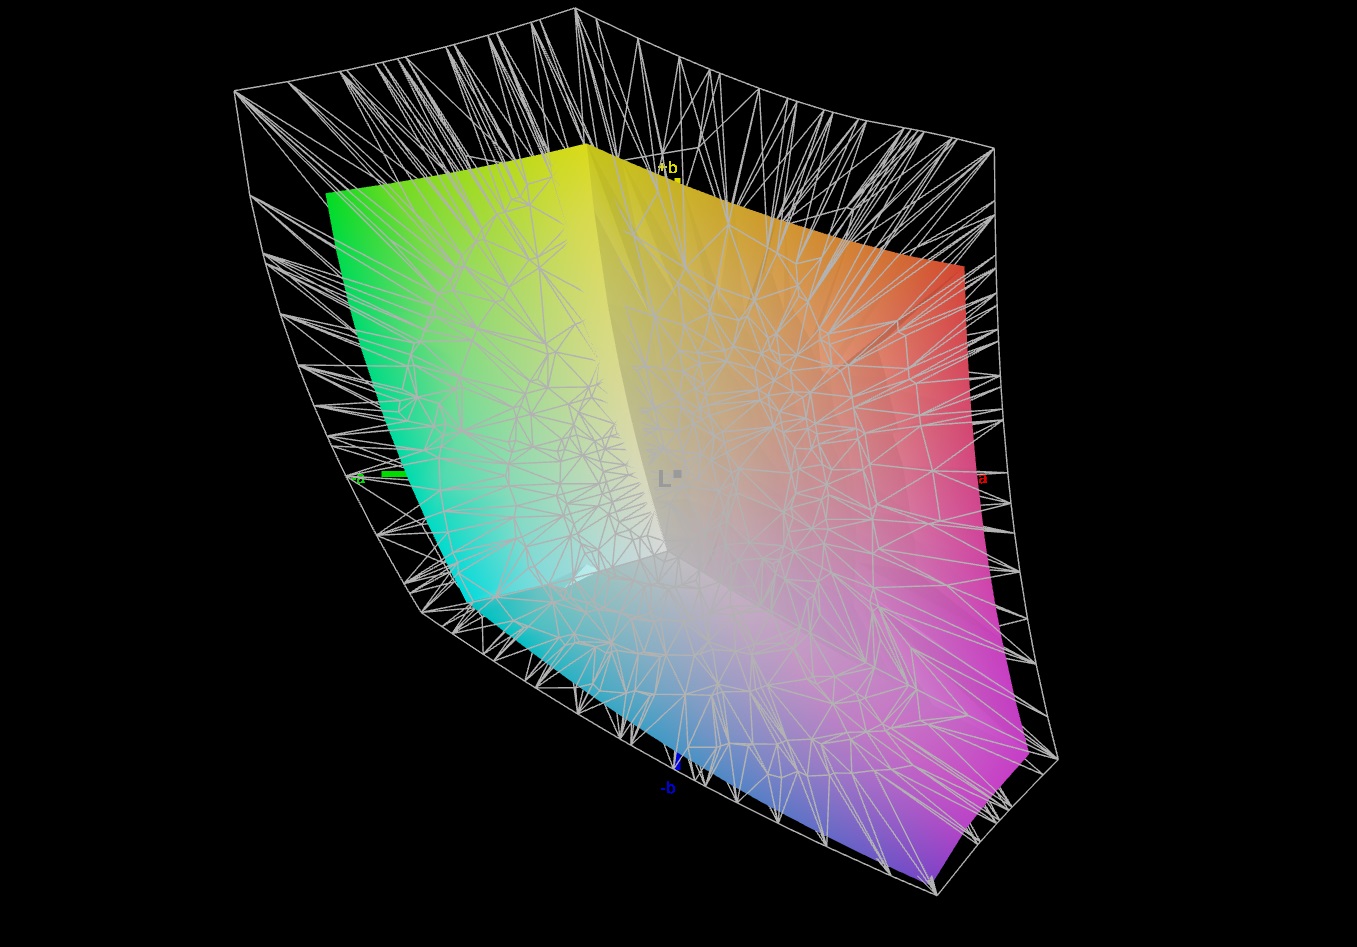
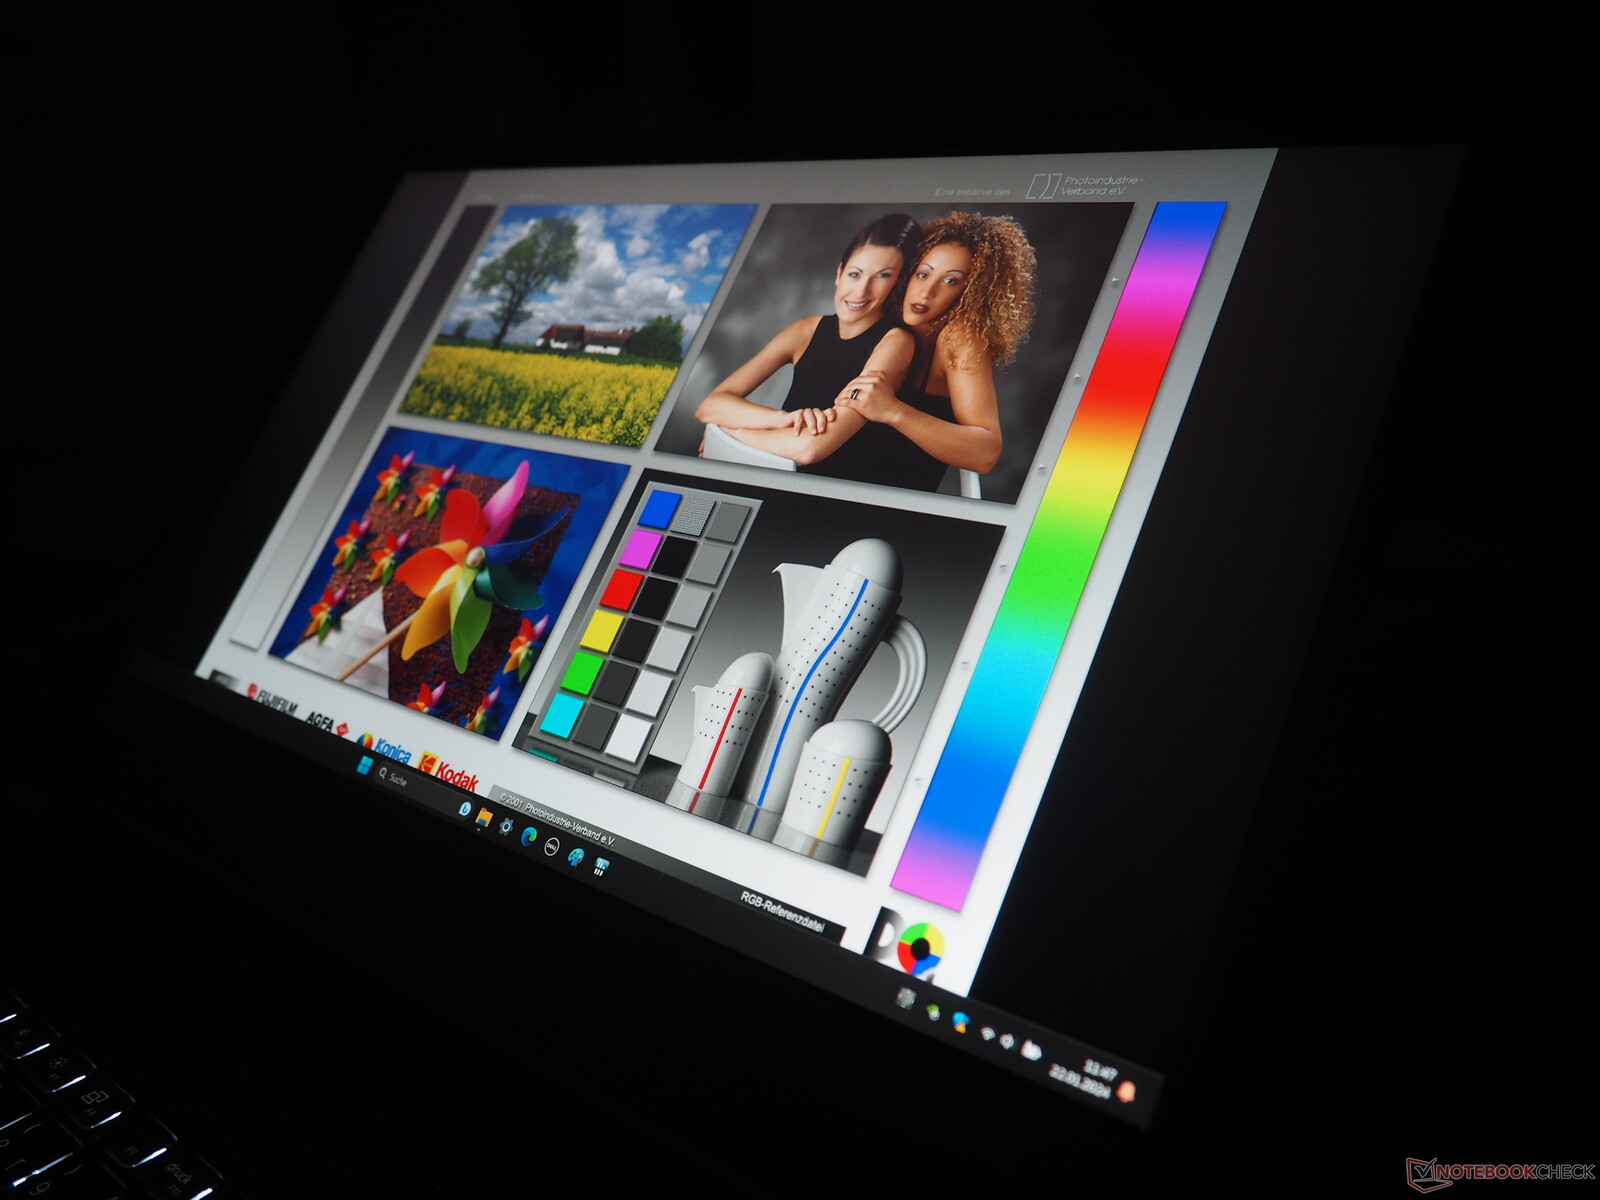
L'angolo di visione è abbastanza tipico per un display IPS, cioè abbastanza buono. La maggior parte degli acquirenti dovrebbe essere soddisfatta anche della precisione del colore.
Tempi di risposta del Display
| ↔ Tempi di risposta dal Nero al Bianco | ||
|---|---|---|
| 6.7 ms ... aumenta ↗ e diminuisce ↘ combinato | ↗ 3.1 ms Incremento | 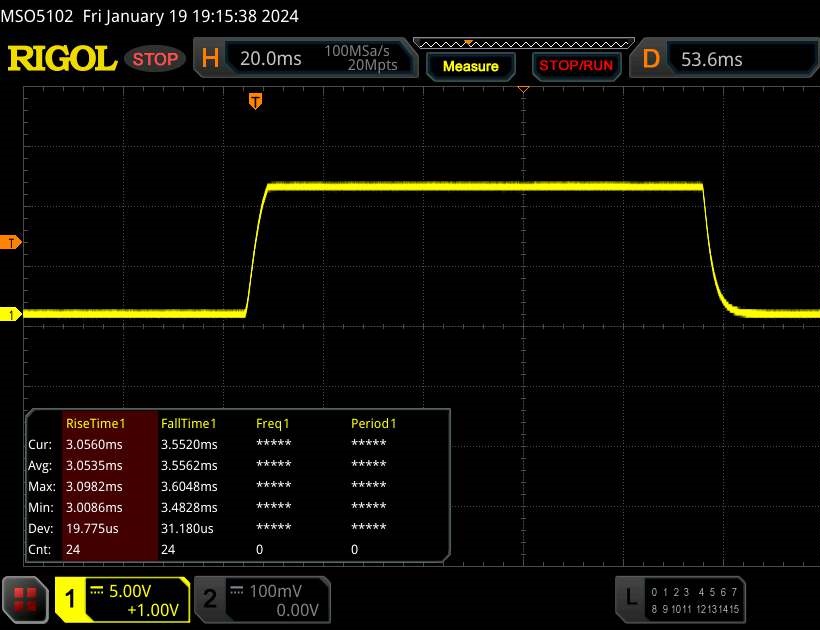 |
| ↘ 3.6 ms Calo | ||
| Lo schermo ha mostrato valori di risposta molto veloci nei nostri tests ed è molto adatto per i gaming veloce. In confronto, tutti i dispositivi di test variano da 0.1 (minimo) a 240 (massimo) ms. » 21 % di tutti i dispositivi è migliore. Questo significa che i tempi di risposta rilevati sono migliori rispettto alla media di tutti i dispositivi testati (19.8 ms). | ||
| ↔ Tempo di risposta dal 50% Grigio all'80% Grigio | ||
| 8.5 ms ... aumenta ↗ e diminuisce ↘ combinato | ↗ 4.2 ms Incremento | 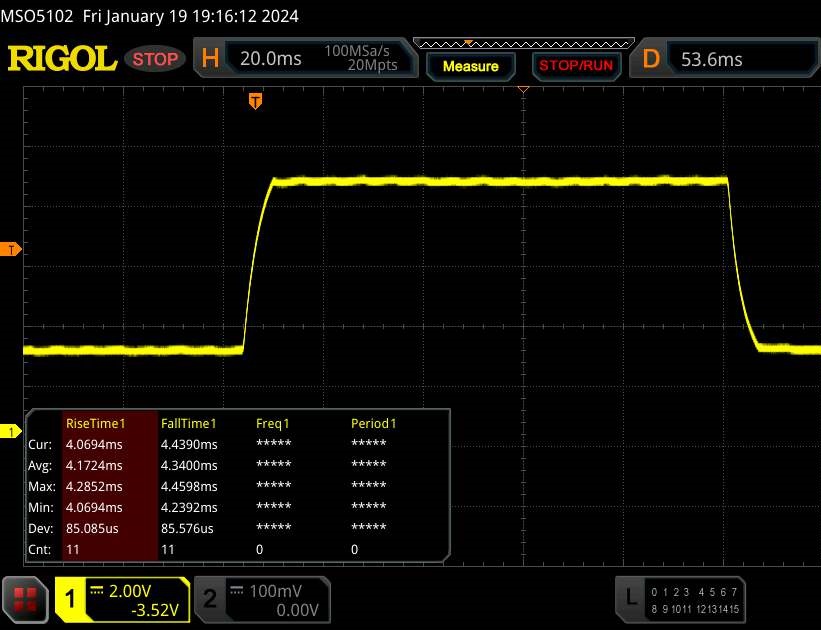 |
| ↘ 4.3 ms Calo | ||
| Lo schermo mostra veloci tempi di risposta durante i nostri tests e dovrebbe esere adatto al gaming In confronto, tutti i dispositivi di test variano da 0.165 (minimo) a 636 (massimo) ms. » 22 % di tutti i dispositivi è migliore. Questo significa che i tempi di risposta rilevati sono migliori rispettto alla media di tutti i dispositivi testati (31 ms). | ||
Sfarfallio dello schermo / PWM (Pulse-Width Modulation)
| flickering dello schermo / PWM non rilevato | 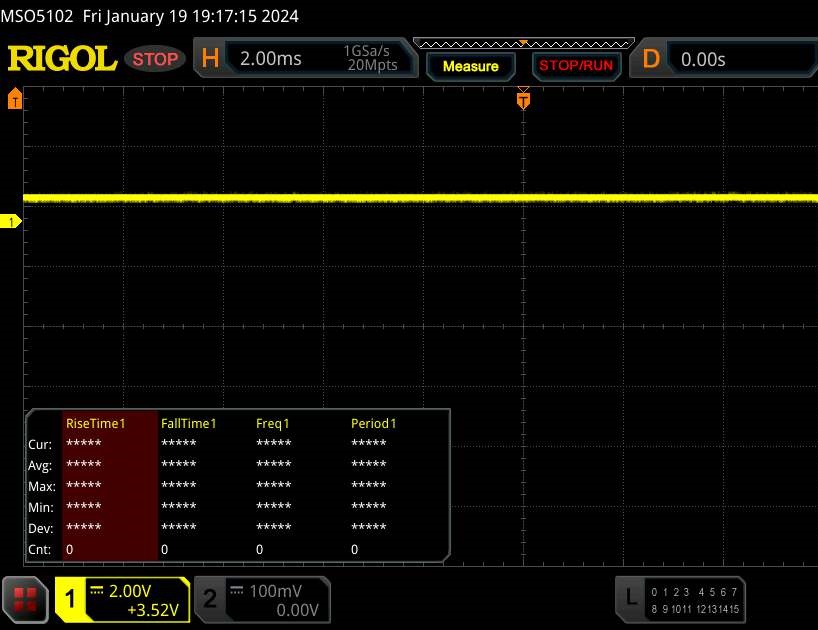 | ||
In confronto: 52 % di tutti i dispositivi testati non utilizza PWM per ridurre la luminosita' del display. Se è rilevato PWM, una media di 7757 (minimo: 5 - massimo: 343500) Hz è stata rilevata. | |||
Prestazioni
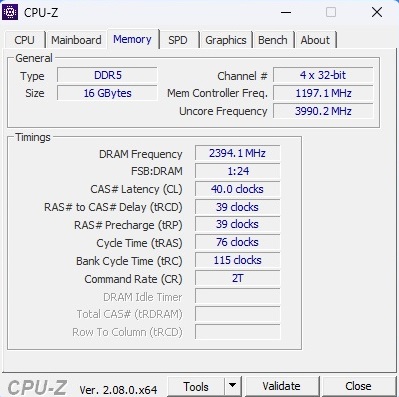
Che abbia una RTX 4050 o una RTX 4060 al suo interno, Dell G15 5530 è comunque un portatile da gioco di fascia media. I 16 GB di memoria DDR5 sono assolutamente sufficienti per il gioco al momento; come già detto, i 512 GB di memoria SSD, leggermente scarsi, possono essere ampliati aggiungendo un'unità M.2 più grande.
Condizione del test
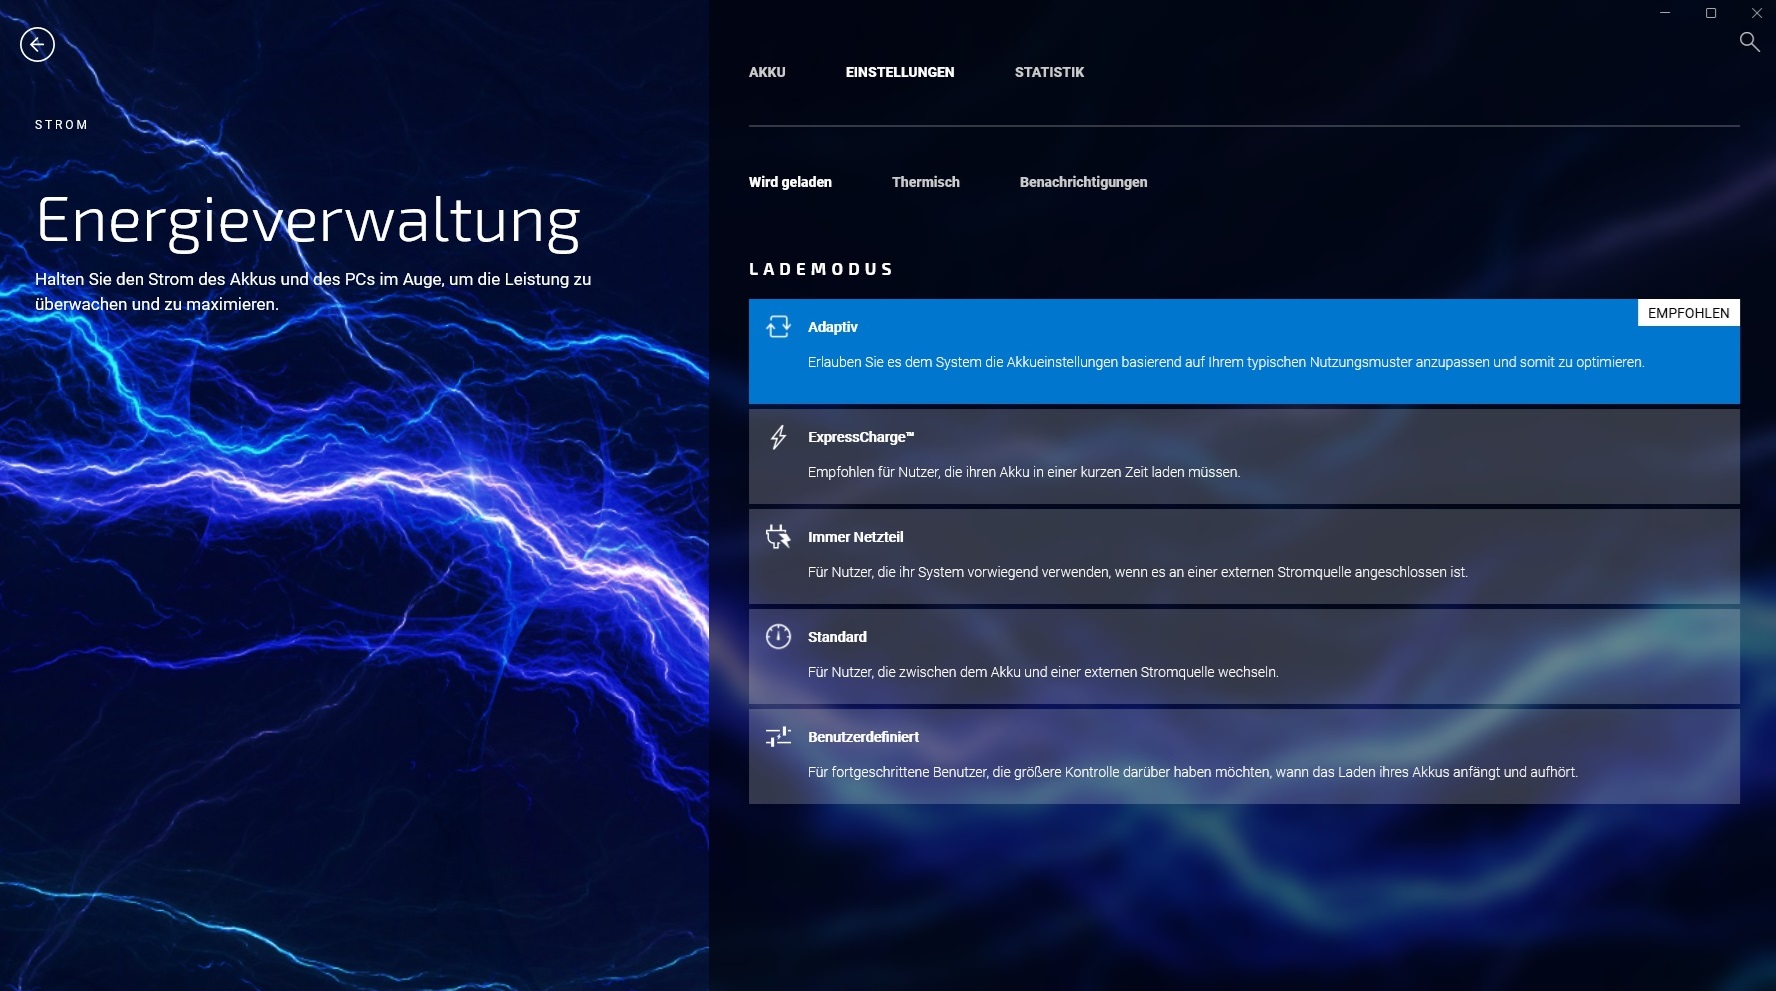
Ci sono diverse modalità di alimentazione nascoste dietro vari menu nel software Dell preinstallato. Secondo le nostre misurazioni, queste modalità non hanno alcun impatto sulle prestazioni 3D, ma influenzano principalmente il volume di funzionamento del portatile (vedere tabella). Tutti i nostri test sono stati eseguiti in modalità "Ottimizzata", che è abilitata per impostazione predefinita fin dall'inizio. In alternativa, il Centro di comando Alienware offre un'ampia gamma di opzioni di personalizzazione.
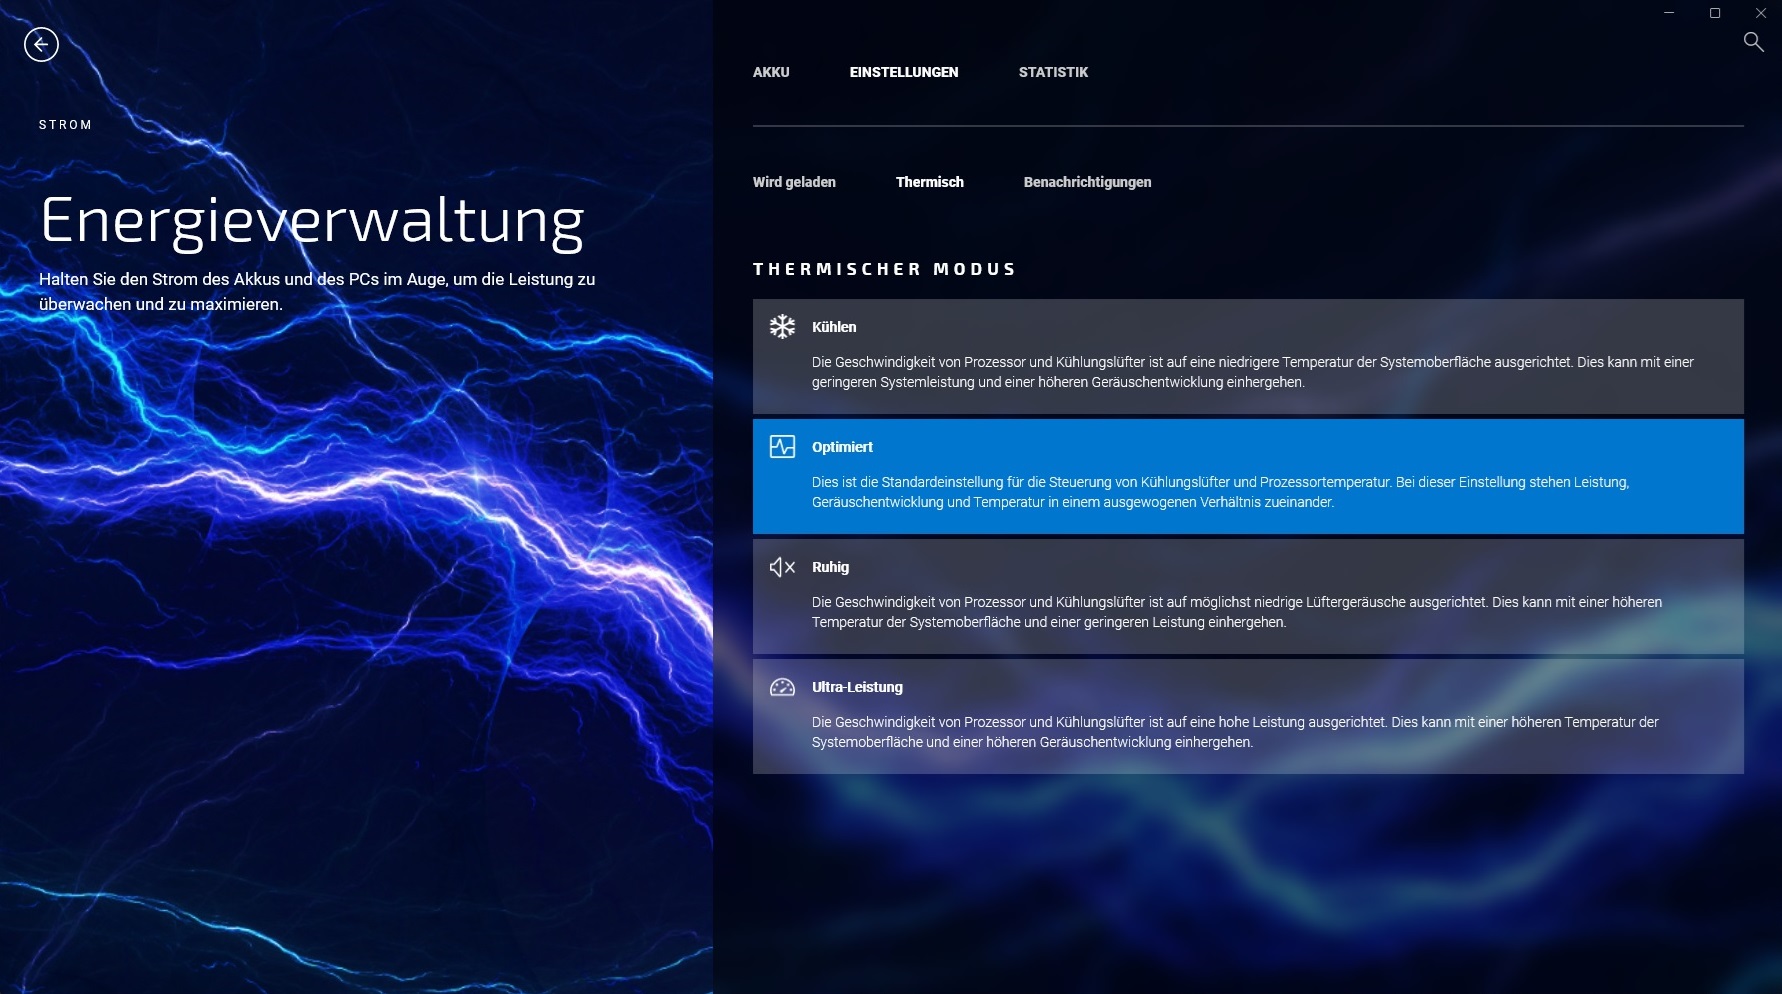
| Witcher 3 (FHD/Ultra) | Silenzioso | Ottimizzato | Raffreddamento | Ultra Performance |
| Rumore | 40 - 41 dB(A) | 43 - 44 dB(A) | 46 - 47 dB(A) | 49 - 50 dB(A) |
| Prestazioni | 84 fps | 84 fps | 84 fps | 84 fps |
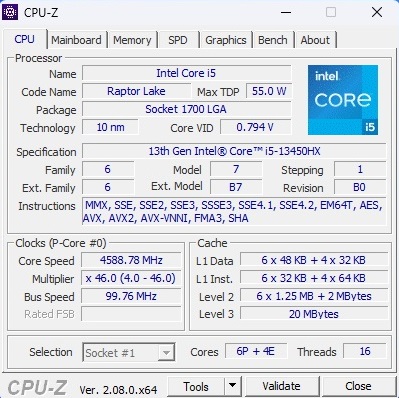
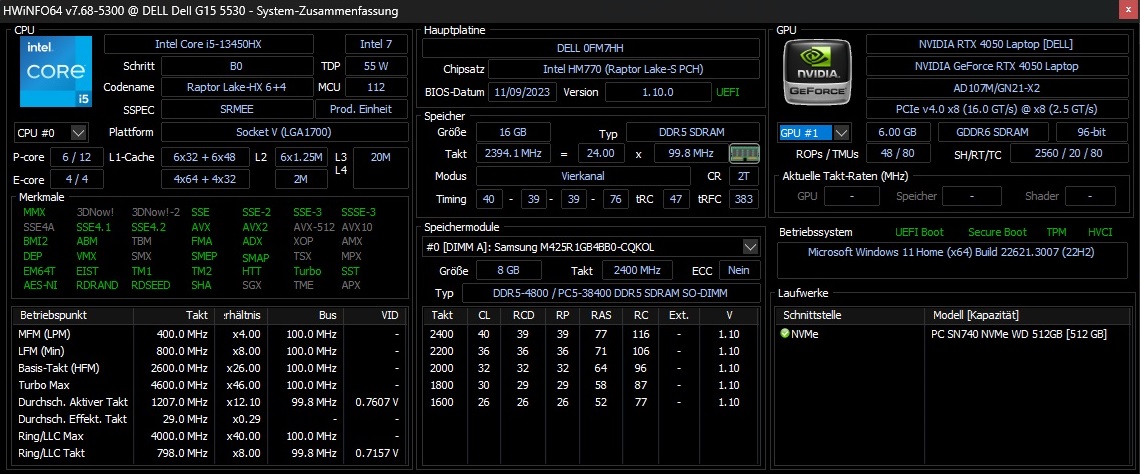
Processore
Rispetto al Core i7-13650HX, il Core i5-13450HX ha solo quattro core di efficienza invece di otto, ma il numero di core di prestazioni rimane invariato a sei. Entrambe le CPU appartengono alla generazione Raptor Lake e sono state prodotte utilizzando il processo migliorato a 10 nm. Prendendo in considerazione tutti i benchmark della CPU, il Core i5-13450HX è più lento del 15% circa rispetto al fratello più costoso e si colloca tra il Core i5-13500HX e il Core i5-13500HX Core i5-13500H (Medion Erazer Crawler E40) e il Core i7-13620H (Lenovo LOQ 15IRH8). Il punteggio è diminuito leggermente nel tempo durante il nostro test Cinebench loop, ma non ci sono stati cali drastici delle prestazioni.
Cinebench R15 Multi Sustained Load
* ... Meglio usare valori piccoli
AIDA64: FP32 Ray-Trace | FPU Julia | CPU SHA3 | CPU Queen | FPU SinJulia | FPU Mandel | CPU AES | CPU ZLib | FP64 Ray-Trace | CPU PhotoWorxx
| Performance rating | |
| Media della classe Gaming | |
| Dell G15 5530 | |
| Asus TUF A15 FA507 | |
| Dell G15 5530, i5-13450HX RTX 4050 | |
| Media Intel Core i5-13450HX | |
| Medion Erazer Crawler E40 - MD 62518 | |
| Lenovo LOQ 15IRH8 Core i7 | |
| AIDA64 / FP32 Ray-Trace | |
| Media della classe Gaming (10227 - 85542, n=105, ultimi 2 anni) | |
| Dell G15 5530 | |
| Dell G15 5530, i5-13450HX RTX 4050 | |
| Asus TUF A15 FA507 | |
| Media Intel Core i5-13450HX (13747 - 17767, n=3) | |
| Medion Erazer Crawler E40 - MD 62518 | |
| Lenovo LOQ 15IRH8 Core i7 | |
| AIDA64 / FPU Julia | |
| Media della classe Gaming (51376 - 238426, n=105, ultimi 2 anni) | |
| Asus TUF A15 FA507 | |
| Dell G15 5530 | |
| Dell G15 5530, i5-13450HX RTX 4050 | |
| Media Intel Core i5-13450HX (71834 - 83862, n=3) | |
| Medion Erazer Crawler E40 - MD 62518 | |
| Lenovo LOQ 15IRH8 Core i7 | |
| AIDA64 / CPU SHA3 | |
| Media della classe Gaming (2180 - 10115, n=105, ultimi 2 anni) | |
| Dell G15 5530 | |
| Media Intel Core i5-13450HX (3519 - 3530, n=3) | |
| Dell G15 5530, i5-13450HX RTX 4050 | |
| Medion Erazer Crawler E40 - MD 62518 | |
| Asus TUF A15 FA507 | |
| Lenovo LOQ 15IRH8 Core i7 | |
| AIDA64 / CPU Queen | |
| Media della classe Gaming (49785 - 173351, n=90, ultimi 2 anni) | |
| Dell G15 5530 | |
| Asus TUF A15 FA507 | |
| Media Intel Core i5-13450HX (85888 - 86148, n=3) | |
| Dell G15 5530, i5-13450HX RTX 4050 | |
| Medion Erazer Crawler E40 - MD 62518 | |
| Lenovo LOQ 15IRH8 Core i7 | |
| AIDA64 / FPU SinJulia | |
| Media della classe Gaming (4424 - 33636, n=105, ultimi 2 anni) | |
| Asus TUF A15 FA507 | |
| Dell G15 5530 | |
| Media Intel Core i5-13450HX (9325 - 9354, n=3) | |
| Dell G15 5530, i5-13450HX RTX 4050 | |
| Medion Erazer Crawler E40 - MD 62518 | |
| Lenovo LOQ 15IRH8 Core i7 | |
| AIDA64 / FPU Mandel | |
| Media della classe Gaming (25115 - 128721, n=105, ultimi 2 anni) | |
| Asus TUF A15 FA507 | |
| Dell G15 5530 | |
| Dell G15 5530, i5-13450HX RTX 4050 | |
| Media Intel Core i5-13450HX (34956 - 42825, n=3) | |
| Medion Erazer Crawler E40 - MD 62518 | |
| Lenovo LOQ 15IRH8 Core i7 | |
| AIDA64 / CPU AES | |
| Media della classe Gaming (39258 - 247074, n=105, ultimi 2 anni) | |
| Dell G15 5530 | |
| Dell G15 5530, i5-13450HX RTX 4050 | |
| Media Intel Core i5-13450HX (70296 - 70680, n=3) | |
| Asus TUF A15 FA507 | |
| Medion Erazer Crawler E40 - MD 62518 | |
| Lenovo LOQ 15IRH8 Core i7 | |
| AIDA64 / CPU ZLib | |
| Media della classe Gaming (574 - 2531, n=105, ultimi 2 anni) | |
| Dell G15 5530 | |
| Dell G15 5530, i5-13450HX RTX 4050 | |
| Medion Erazer Crawler E40 - MD 62518 | |
| Media Intel Core i5-13450HX (977 - 1002, n=3) | |
| Lenovo LOQ 15IRH8 Core i7 | |
| Asus TUF A15 FA507 | |
| AIDA64 / FP64 Ray-Trace | |
| Media della classe Gaming (5509 - 45446, n=105, ultimi 2 anni) | |
| Dell G15 5530 | |
| Dell G15 5530, i5-13450HX RTX 4050 | |
| Media Intel Core i5-13450HX (7428 - 9561, n=3) | |
| Asus TUF A15 FA507 | |
| Medion Erazer Crawler E40 - MD 62518 | |
| Lenovo LOQ 15IRH8 Core i7 | |
| AIDA64 / CPU PhotoWorxx | |
| Media della classe Gaming (12271 - 89891, n=105, ultimi 2 anni) | |
| Dell G15 5530 | |
| Medion Erazer Crawler E40 - MD 62518 | |
| Media Intel Core i5-13450HX (36014 - 36764, n=3) | |
| Dell G15 5530, i5-13450HX RTX 4050 | |
| Lenovo LOQ 15IRH8 Core i7 | |
| Asus TUF A15 FA507 | |
Prestazioni del sistema
Tutti i dispositivi del nostro confronto sono abbastanza vicini in termini di prestazioni di sistema. In PCMark 10, l'unità di recensione ha ottenuto quasi lo stesso punteggio complessivo del più costoso modello G15.
CrossMark: Overall | Productivity | Creativity | Responsiveness
WebXPRT 3: Overall
WebXPRT 4: Overall
Mozilla Kraken 1.1: Total
| PCMark 10 / Score | |
| Media della classe Gaming (5828 - 12414, n=93, ultimi 2 anni) | |
| Lenovo LOQ 15IRH8 Core i7 | |
| Medion Erazer Crawler E40 - MD 62518 | |
| Asus TUF A15 FA507 | |
| Dell G15 5530 | |
| Dell G15 5530, i5-13450HX RTX 4050 | |
| Media Intel Core i5-13450HX, NVIDIA GeForce RTX 4050 Laptop GPU (n=1) | |
| PCMark 10 / Essentials | |
| Dell G15 5530 | |
| Lenovo LOQ 15IRH8 Core i7 | |
| Media della classe Gaming (8810 - 11935, n=97, ultimi 2 anni) | |
| Asus TUF A15 FA507 | |
| Medion Erazer Crawler E40 - MD 62518 | |
| Dell G15 5530, i5-13450HX RTX 4050 | |
| Media Intel Core i5-13450HX, NVIDIA GeForce RTX 4050 Laptop GPU (n=1) | |
| PCMark 10 / Productivity | |
| Media della classe Gaming (6845 - 25323, n=95, ultimi 2 anni) | |
| Dell G15 5530 | |
| Lenovo LOQ 15IRH8 Core i7 | |
| Asus TUF A15 FA507 | |
| Medion Erazer Crawler E40 - MD 62518 | |
| Dell G15 5530, i5-13450HX RTX 4050 | |
| Media Intel Core i5-13450HX, NVIDIA GeForce RTX 4050 Laptop GPU (n=1) | |
| PCMark 10 / Digital Content Creation | |
| Media della classe Gaming (7602 - 19954, n=95, ultimi 2 anni) | |
| Lenovo LOQ 15IRH8 Core i7 | |
| Medion Erazer Crawler E40 - MD 62518 | |
| Dell G15 5530, i5-13450HX RTX 4050 | |
| Media Intel Core i5-13450HX, NVIDIA GeForce RTX 4050 Laptop GPU (n=1) | |
| Asus TUF A15 FA507 | |
| Dell G15 5530 | |
| CrossMark / Overall | |
| Media della classe Gaming (1366 - 2409, n=94, ultimi 2 anni) | |
| Lenovo LOQ 15IRH8 Core i7 | |
| Dell G15 5530 | |
| Medion Erazer Crawler E40 - MD 62518 | |
| Asus TUF A15 FA507 | |
| CrossMark / Productivity | |
| Media della classe Gaming (1386 - 2254, n=94, ultimi 2 anni) | |
| Lenovo LOQ 15IRH8 Core i7 | |
| Dell G15 5530 | |
| Medion Erazer Crawler E40 - MD 62518 | |
| Asus TUF A15 FA507 | |
| CrossMark / Creativity | |
| Media della classe Gaming (1343 - 2786, n=94, ultimi 2 anni) | |
| Dell G15 5530 | |
| Lenovo LOQ 15IRH8 Core i7 | |
| Medion Erazer Crawler E40 - MD 62518 | |
| Asus TUF A15 FA507 | |
| CrossMark / Responsiveness | |
| Lenovo LOQ 15IRH8 Core i7 | |
| Medion Erazer Crawler E40 - MD 62518 | |
| Media della classe Gaming (1226 - 2334, n=94, ultimi 2 anni) | |
| Dell G15 5530 | |
| Asus TUF A15 FA507 | |
| WebXPRT 3 / Overall | |
| Media della classe Gaming (220 - 532, n=98, ultimi 2 anni) | |
| Dell G15 5530 | |
| Asus TUF A15 FA507 | |
| Lenovo LOQ 15IRH8 Core i7 | |
| Dell G15 5530, i5-13450HX RTX 4050 | |
| Dell G15 5530, i5-13450HX RTX 4050 | |
| Media Intel Core i5-13450HX, NVIDIA GeForce RTX 4050 Laptop GPU (281 - 281, n=2) | |
| Medion Erazer Crawler E40 - MD 62518 | |
| WebXPRT 4 / Overall | |
| Media della classe Gaming (165 - 354, n=98, ultimi 2 anni) | |
| Dell G15 5530 | |
| Lenovo LOQ 15IRH8 Core i7 | |
| Medion Erazer Crawler E40 - MD 62518 | |
| Asus TUF A15 FA507 | |
| Mozilla Kraken 1.1 / Total | |
| Asus TUF A15 FA507 | |
| Dell G15 5530, i5-13450HX RTX 4050 | |
| Dell G15 5530, i5-13450HX RTX 4050 | |
| Media Intel Core i5-13450HX, NVIDIA GeForce RTX 4050 Laptop GPU (531 - 531, n=2) | |
| Medion Erazer Crawler E40 - MD 62518 | |
| Dell G15 5530 | |
| Lenovo LOQ 15IRH8 Core i7 | |
| Media della classe Gaming (391 - 590, n=100, ultimi 2 anni) | |
* ... Meglio usare valori piccoli
| PCMark 10 Score | 6969 punti | |
Aiuto | ||
| AIDA64 / Memory Copy | |
| Media della classe Gaming (21750 - 129946, n=105, ultimi 2 anni) | |
| Dell G15 5530 | |
| Dell G15 5530, i5-13450HX RTX 4050 | |
| Media Intel Core i5-13450HX (58673 - 58861, n=3) | |
| Medion Erazer Crawler E40 - MD 62518 | |
| Lenovo LOQ 15IRH8 Core i7 | |
| Asus TUF A15 FA507 | |
| AIDA64 / Memory Read | |
| Media della classe Gaming (22956 - 118858, n=105, ultimi 2 anni) | |
| Media Intel Core i5-13450HX (66626 - 69024, n=3) | |
| Dell G15 5530 | |
| Dell G15 5530, i5-13450HX RTX 4050 | |
| Medion Erazer Crawler E40 - MD 62518 | |
| Lenovo LOQ 15IRH8 Core i7 | |
| Asus TUF A15 FA507 | |
| AIDA64 / Memory Write | |
| Media della classe Gaming (22297 - 135096, n=105, ultimi 2 anni) | |
| Medion Erazer Crawler E40 - MD 62518 | |
| Dell G15 5530, i5-13450HX RTX 4050 | |
| Dell G15 5530 | |
| Media Intel Core i5-13450HX (58540 - 60196, n=3) | |
| Asus TUF A15 FA507 | |
| Lenovo LOQ 15IRH8 Core i7 | |
| AIDA64 / Memory Latency | |
| Lenovo LOQ 15IRH8 Core i7 | |
| Media della classe Gaming (75.3 - 259, n=105, ultimi 2 anni) | |
| Medion Erazer Crawler E40 - MD 62518 | |
| Dell G15 5530, i5-13450HX RTX 4050 | |
| Media Intel Core i5-13450HX (90 - 94.2, n=3) | |
| Dell G15 5530 | |
| Asus TUF A15 FA507 | |
* ... Meglio usare valori piccoli
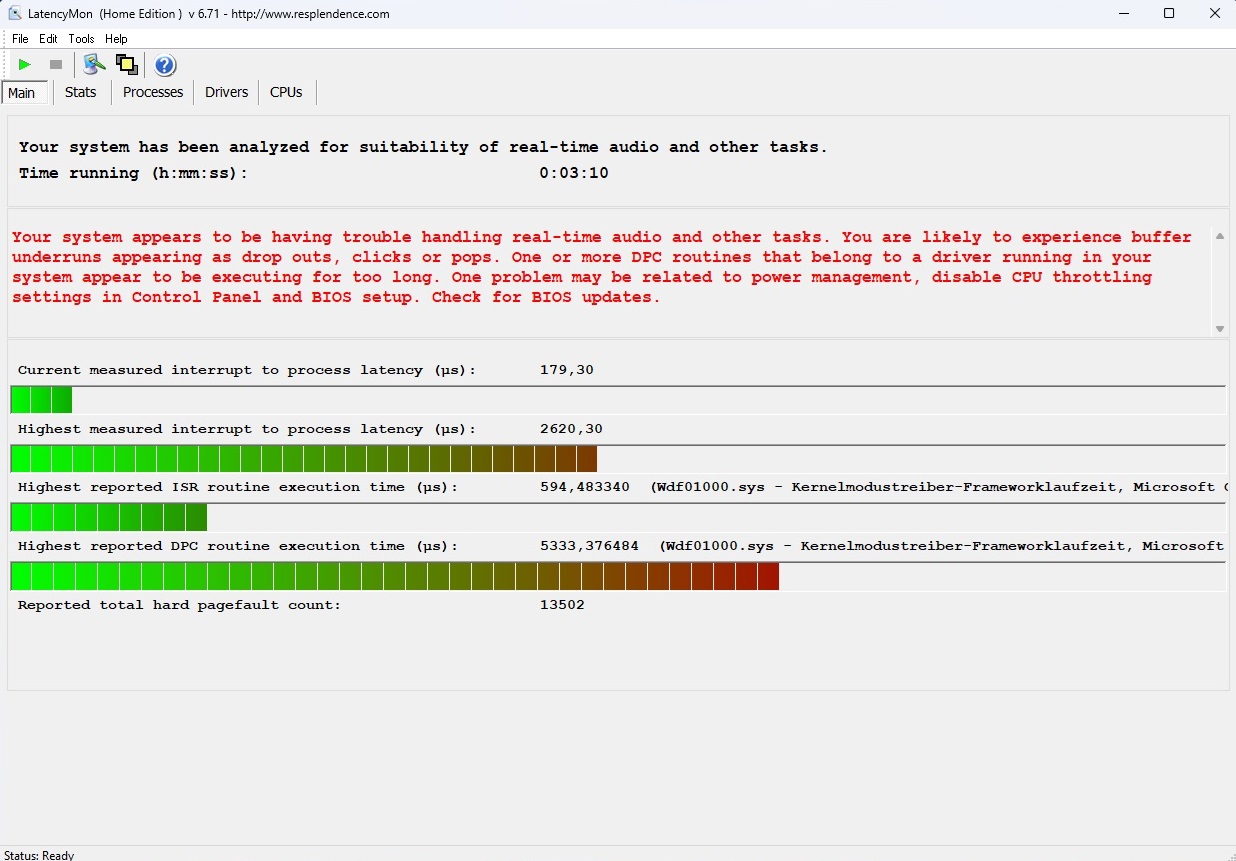
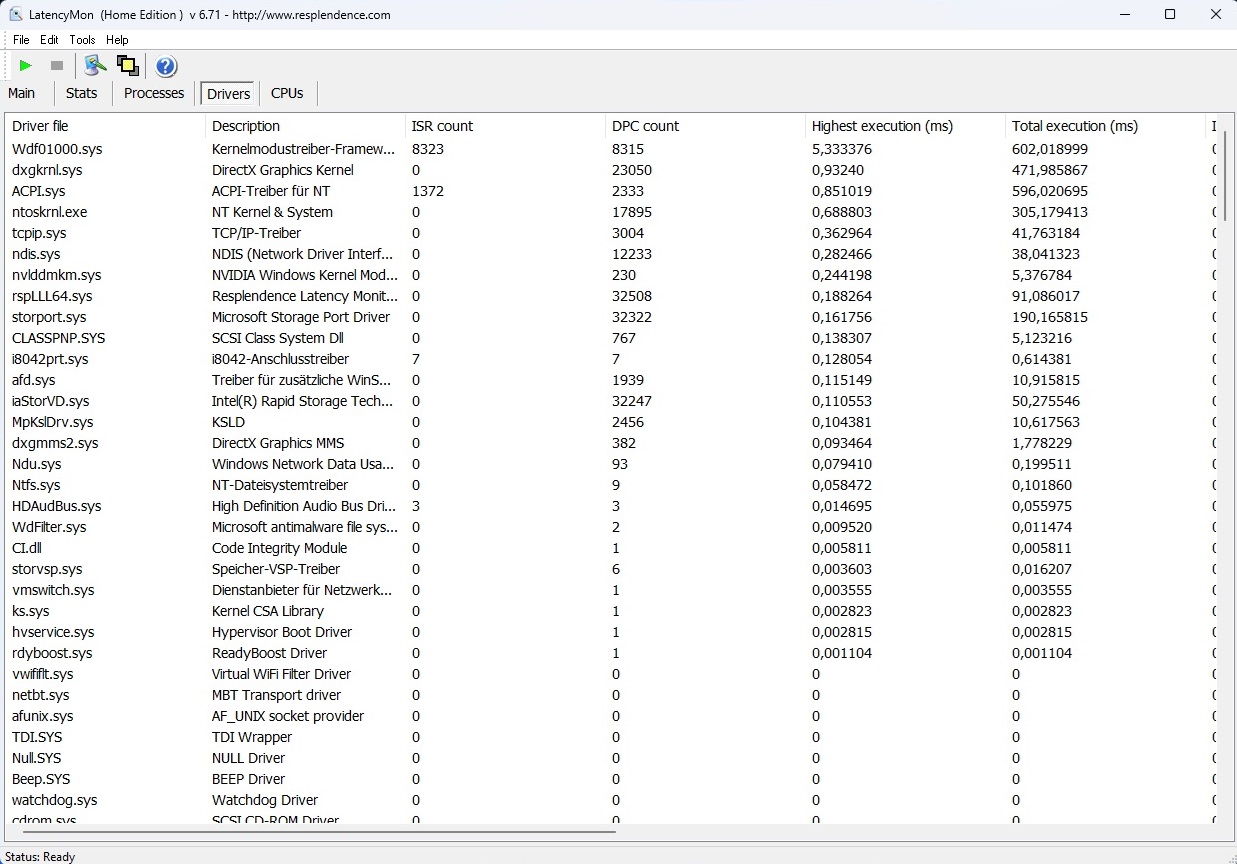
Latenza DPC
Il laptop da 15 pollici presenta dei punti deboli nell'area della latenza. LatencyMon ha riferito che il portatile - almeno appena uscito dalla scatola - sembra avere problemi nella gestione dell'elaborazione audio e video in tempo reale. Detto questo, ciò dovrebbe interessare solo coloro che intendono utilizzare il portatile per tali scopi.
| DPC Latencies / LatencyMon - interrupt to process latency (max), Web, Youtube, Prime95 | |
| Dell G15 5530 | |
| Dell G15 5530, i5-13450HX RTX 4050 | |
| Medion Erazer Crawler E40 - MD 62518 | |
| Lenovo LOQ 15IRH8 Core i7 | |
* ... Meglio usare valori piccoli
Memoria di massa
A prima vista, l'archiviazione di massa del portatile fa una figura eccellente. Nonostante le dimensioni compatte, l'unità M.2 2230 da 512 GB prodotta da WDC ha ottenuto un ottimo risultato nella nostra serie di benchmark. Ciononostante, il nostro loop test ha rivelato che, in caso di carico prolungato o di stress, l'unità ha talvolta sperimentato un grave livello di throttling non riscontrato in nessuno dei concorrenti.

* ... Meglio usare valori piccoli
Sustained Load Read: DiskSpd Read Loop, Queue Depth 8
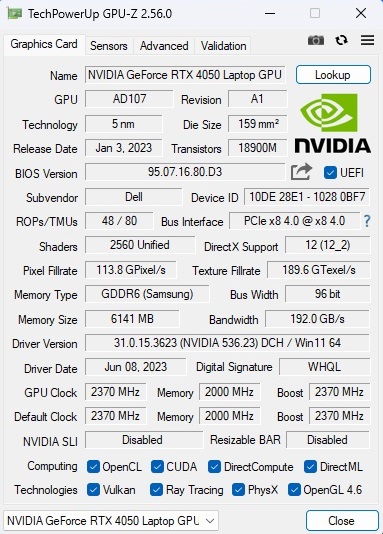
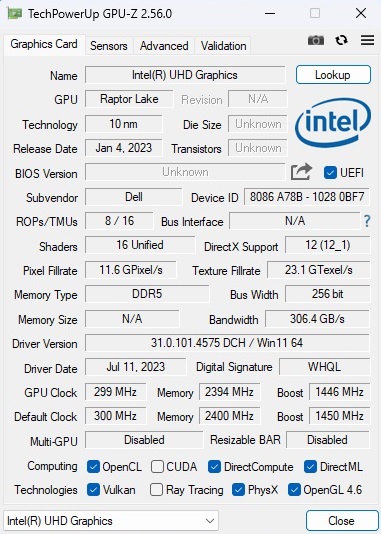
Scheda grafica
La RTX 4050 di GeForce è una popolare GPU di fascia media della linea Ada Lovelace di Nvidia, ma i 6 GB di memoria video GDDR6 e il bus a 96 bit sono piuttosto stretti per gli standard odierni. Le prestazioni effettive dipendono in gran parte dal sistema di raffreddamento e dal TGP specificato. Dell ha scelto un TGP da 140 watt per il G15, che corrisponde al massimo consentito per la RTX 4050. Non sorprende quindi che il laptop Dell da 15 pollici abbia fornito prestazioni superiori alla media nel benchmark 3D, anche se dobbiamo ricordare che alcuni concorrenti hanno spesso ottenuto risultati simili con un TGP inferiore e di conseguenza sono più efficienti.
| 3DMark 11 Performance | 28326 punti | |
| 3DMark Ice Storm Standard Score | 222203 punti | |
| 3DMark Cloud Gate Standard Score | 58346 punti | |
| 3DMark Fire Strike Score | 19919 punti | |
| 3DMark Time Spy Score | 9091 punti | |
Aiuto | ||
* ... Meglio usare valori piccoli
Prestazioni di gioco
Le prestazioni di gioco sono simili a quelle che abbiamo visto nei benchmark sintetici. La RTX 4050 è generalmente abbastanza veloce da far girare senza problemi la maggior parte dei giochi moderni a 1080p e con impostazioni alte o massime. Le cose si fanno difficili solo quando si gioca con titoli molto impegnativi, come ad esempio Starfield. Consigliamo di avere almeno una GeForce RTX 4070 se desidera utilizzare risoluzioni più elevate (QHD o superiori).
| The Witcher 3 - 1920x1080 Ultra Graphics & Postprocessing (HBAO+) | |
| Media della classe Gaming (104.7 - 240, n=7, ultimi 2 anni) | |
| Dell G15 5530 | |
| Lenovo LOQ 15IRH8 Core i7 | |
| Dell G15 5530, i5-13450HX RTX 4050 | |
| Asus TUF A15 FA507 | |
| Medion Erazer Crawler E40 - MD 62518 | |
| Media NVIDIA GeForce RTX 4050 Laptop GPU (18.5 - 94.7, n=40) | |
| Lies of P - 1920x1080 Best Preset | |
| XMG Focus 15 E23 | |
| Media NVIDIA GeForce RTX 4050 Laptop GPU (101.4 - 105.7, n=3) | |
| Dell G15 5530, i5-13450HX RTX 4050 | |
| The Crew Motorfest - 1920x1080 Ultra Preset | |
| XMG Focus 15 E23 | |
| Dell G15 5530, i5-13450HX RTX 4050 | |
| Media NVIDIA GeForce RTX 4050 Laptop GPU (59 - 59, n=3) | |
| Starfield - 1920x1080 Ultra Preset | |
| Media della classe Gaming (n=1ultimi 2 anni) | |
| Dell G15 5530, i5-13450HX RTX 4050 | |
| Media NVIDIA GeForce RTX 4050 Laptop GPU (35.7 - 37.3, n=3) | |
| XMG Focus 15 E23 | |
| Armored Core 6 - 1920x1080 Maximum Preset | |
| XMG Focus 15 E23 | |
| Media NVIDIA GeForce RTX 4050 Laptop GPU (79 - 87.8, n=3) | |
| Dell G15 5530, i5-13450HX RTX 4050 | |
| Media della classe Gaming (n=1ultimi 2 anni) | |
| Atlas Fallen - 1920x1080 Very High Preset | |
| Media NVIDIA GeForce RTX 4050 Laptop GPU (81.1 - 94.2, n=3) | |
| Dell G15 5530, i5-13450HX RTX 4050 | |
| XMG Focus 15 E23 | |
| Baldur's Gate 3 - 1920x1080 Ultra Preset AA:T | |
| Media della classe Gaming (59.4 - 246, n=104, ultimi 2 anni) | |
| XMG Focus 15 E23 | |
| Dell G15 5530, i5-13450HX RTX 4050 | |
| Media NVIDIA GeForce RTX 4050 Laptop GPU (48.3 - 81.3, n=11) | |
| Ratchet & Clank Rift Apart - 1920x1080 Very High Preset AA:T | |
| XMG Focus 15 E23 | |
| Media NVIDIA GeForce RTX 4050 Laptop GPU (32.9 - 45.8, n=3) | |
| Dell G15 5530, i5-13450HX RTX 4050 | |
| Resident Evil 4 Remake - 1920x1080 Max Preset | |
| Dell G15 5530, i5-13450HX RTX 4050 | |
| Media NVIDIA GeForce RTX 4050 Laptop GPU (36.8 - 53.9, n=2) | |
| XMG Focus 15 E23 | |
Abbiamo usato Il Witcher 3 (in esecuzione a FHD/Ultra per circa 60 minuti) per scoprire le prestazioni di ciascun portatile nelle applicazioni 3D per un periodo prolungato. Il risultato: i frame rate sono rimasti abbastanza costanti sul G15 5530.
Witcher 3 FPS chart
| basso | medio | alto | ultra | |
|---|---|---|---|---|
| GTA V (2015) | 178 | 168.6 | 96.6 | |
| The Witcher 3 (2015) | 84 | |||
| Dota 2 Reborn (2015) | 170 | 156.1 | 154.1 | 146.8 |
| Final Fantasy XV Benchmark (2018) | 120.3 | 84.1 | ||
| X-Plane 11.11 (2018) | 153.1 | 139.6 | 108.5 | |
| Strange Brigade (2018) | 203 | 171.4 | 145.1 | |
| Company of Heroes 3 (2023) | 127 | 70.2 | 68.7 | |
| Resident Evil 4 Remake (2023) | 88.6 | 80.9 | 53.9 | |
| Ratchet & Clank Rift Apart (2023) | 67.7 | 40.2 | 32.9 | |
| Atlas Fallen (2023) | 114.3 | 104.1 | 83.3 | |
| Armored Core 6 (2023) | 103.8 | 96.7 | 79 | |
| Starfield (2023) | 55.9 | 43.7 | 37.3 | |
| The Crew Motorfest (2023) | 60 | 60 | 59 | |
| Lies of P (2023) | 132.8 | 113.3 | 101.4 | |
| Baldur's Gate 3 (2023) | 84.4 | 71.3 | 69.3 |
Emissioni
Emissioni di rumore
Il Dell G15 5530 rimane per lo più silenzioso al minimo. Le ventole sono completamente ferme o funzionano a un livello di rumore decente. Si alzano abbastanza raramente, ma ciò può verificarsi più frequentemente durante le attività quotidiane, come la riproduzione di video e la navigazione web. Tuttavia, con circa 44 dB(A), la quantità di rumore prodotta durante il gioco in modalità "ottimizzata" è inferiore alla media per un notebook RTX 4050.
Rumorosità
| Idle |
| 25 / 26 / 30 dB(A) |
| Sotto carico |
| 38 / 50 dB(A) |
 | ||
30 dB silenzioso 40 dB(A) udibile 50 dB(A) rumoroso |
||
min: | ||
| Dell G15 5530, i5-13450HX RTX 4050 GeForce RTX 4050 Laptop GPU, i5-13450HX | Medion Erazer Crawler E40 - MD 62518 GeForce RTX 4050 Laptop GPU, i5-13500H | Lenovo LOQ 15IRH8 Core i7 GeForce RTX 4050 Laptop GPU, i7-13620H | Asus TUF A15 FA507 GeForce RTX 4050 Laptop GPU, R7 7735HS | Dell G15 5530 GeForce RTX 4060 Laptop GPU, i7-13650HX | |
|---|---|---|---|---|---|
| Noise | -4% | -8% | 12% | 6% | |
| off /ambiente * (dB) | 25 | 23 8% | 23.69 5% | 23.3 7% | 20.41 18% |
| Idle Minimum * (dB) | 25 | 23 8% | 29.03 -16% | 23.3 7% | 26.85 -7% |
| Idle Average * (dB) | 26 | 23 12% | 29.03 -12% | 23.3 10% | 26.85 -3% |
| Idle Maximum * (dB) | 30 | 28.02 7% | 29.03 3% | 23.3 22% | 26.85 10% |
| Load Average * (dB) | 38 | 50.21 -32% | 48.7 -28% | 29.6 22% | 27.65 27% |
| Witcher 3 ultra * (dB) | 44 | 51.46 -17% | 48.5 -10% | 43 2% | 47.9 -9% |
| Load Maximum * (dB) | 50 | 56.79 -14% | 48.7 3% | 43 14% | 47.86 4% |
* ... Meglio usare valori piccoli
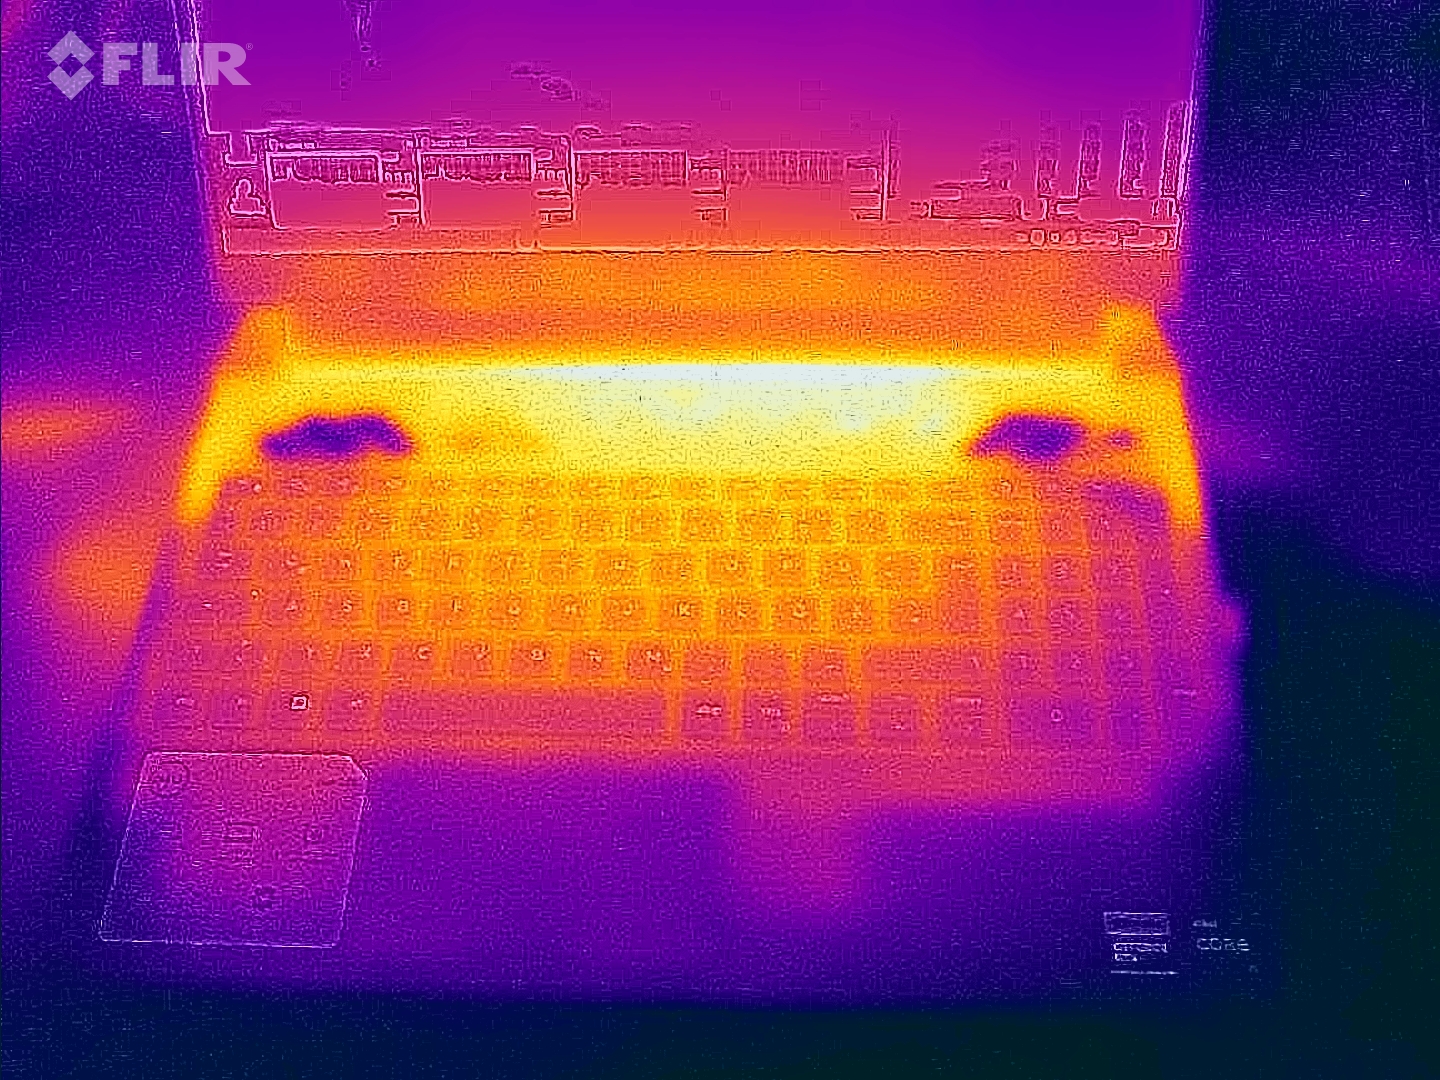
Temperatura
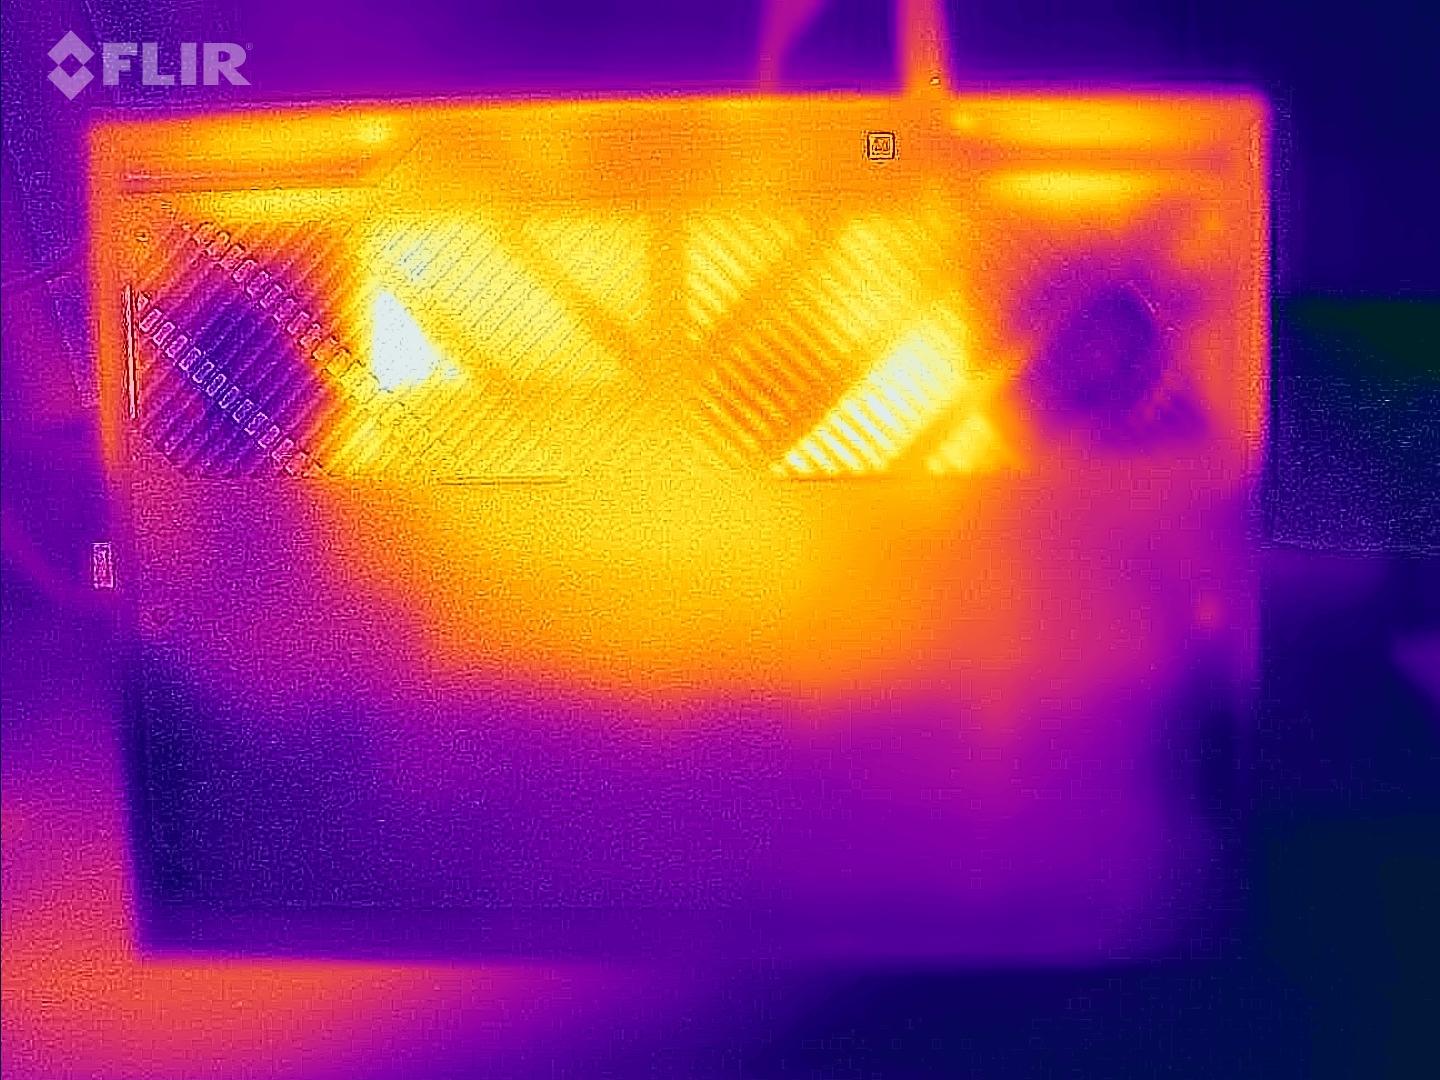
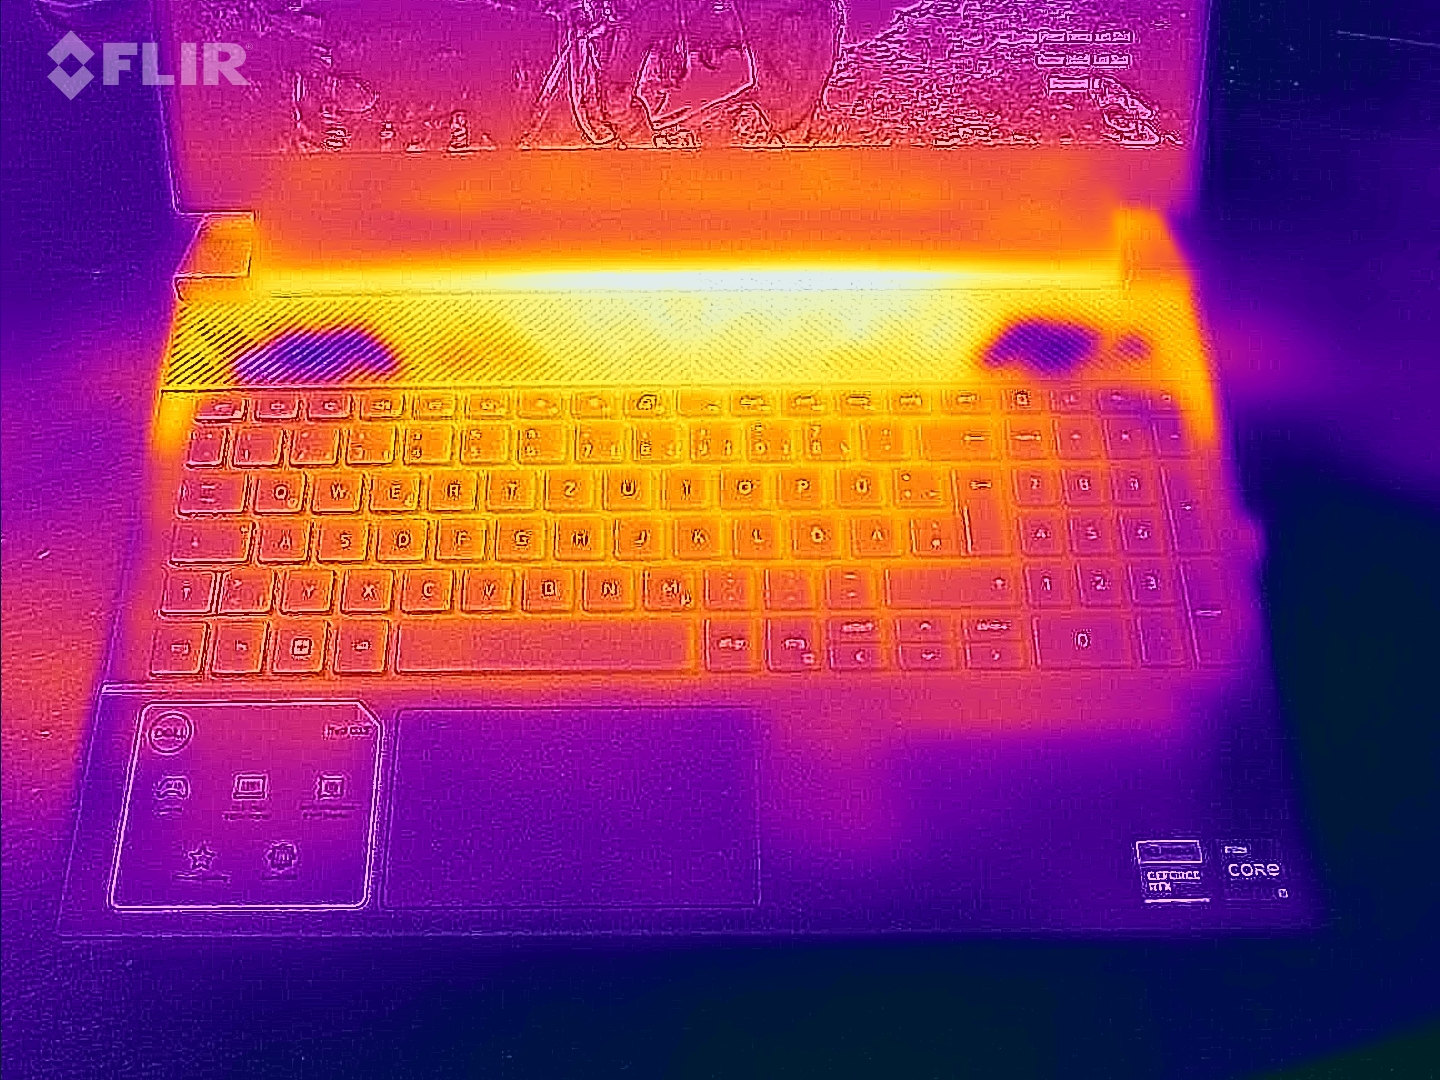
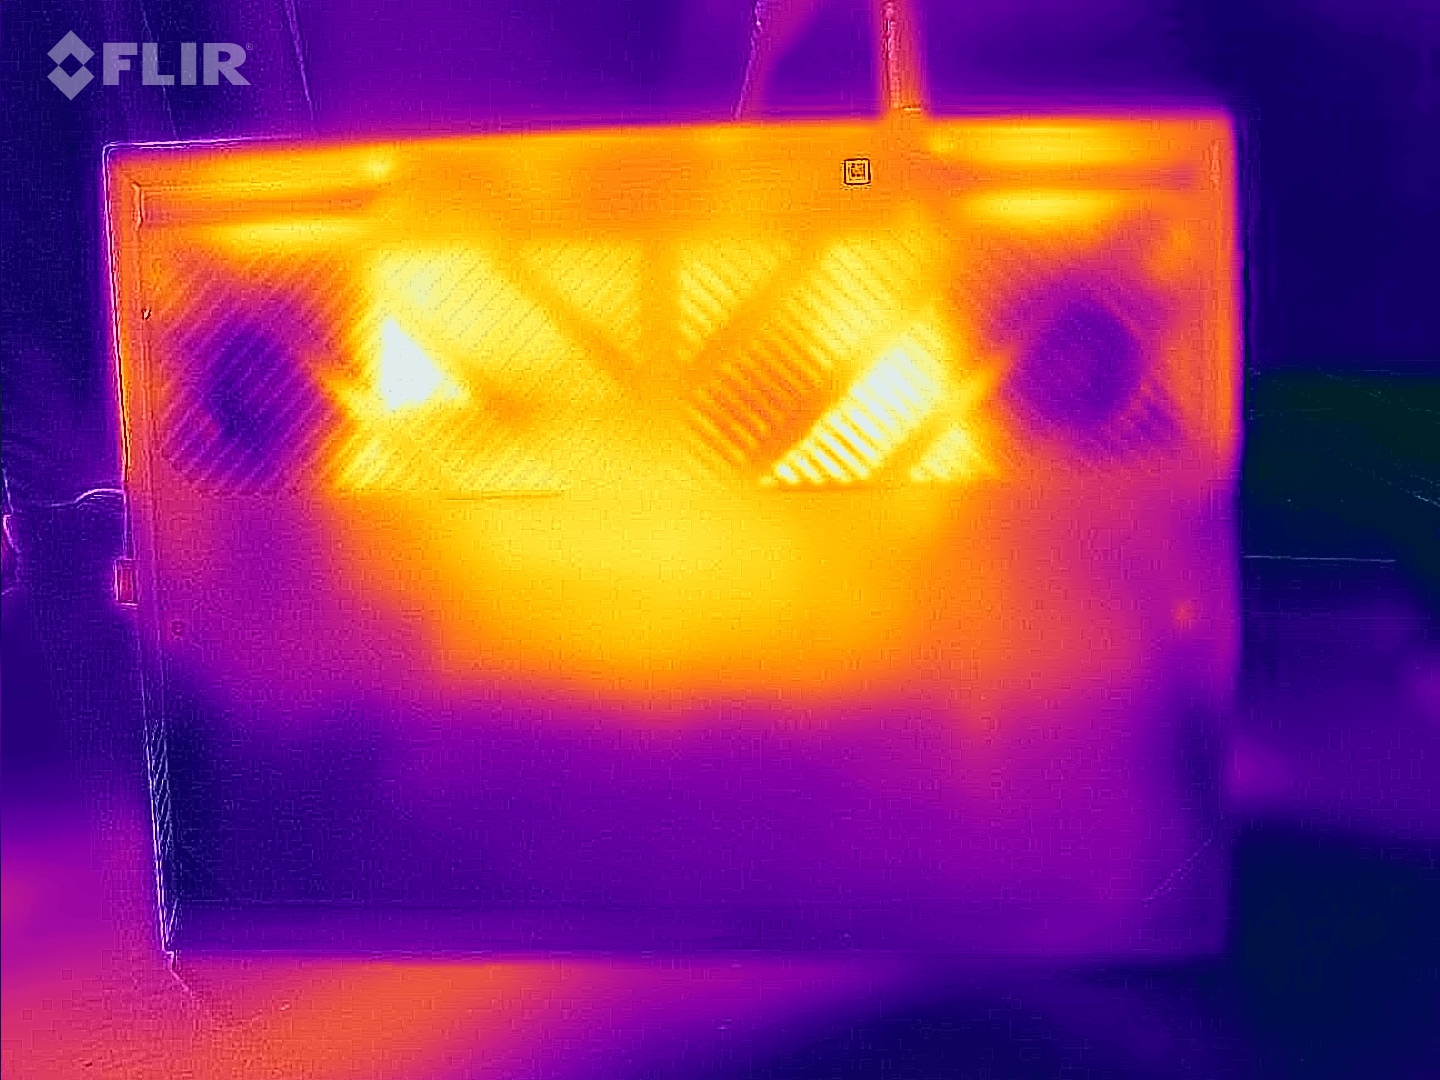
In media, le temperature dello chassis sono leggermente inferiori rispetto al modello G15, più costoso. Dopo 60 minuti di funzionamento di The Witcher 3, le temperature massime misurate sul piano tastiera e sul pannello inferiore erano rispettivamente di 54°C (129,4°F) e 52°C (125,6°F), che in teoria sono piuttosto elevate. Tuttavia, poiché il poggiapolsi non ha mai superato i 32°C (89,6°F), le sessioni di gioco più lunghe non dovrebbero essere un problema, a condizione di non appoggiare il dispositivo sulle ginocchia.
(-) La temperatura massima sul lato superiore è di 58 °C / 136 F, rispetto alla media di 40.4 °C / 105 F, che varia da 21.2 a 68.8 °C per questa classe Gaming.
(-) Il lato inferiore si riscalda fino ad un massimo di 57 °C / 135 F, rispetto alla media di 43.2 °C / 110 F
(+) In idle, la temperatura media del lato superiore è di 26 °C / 79 F, rispetto alla media deld ispositivo di 33.9 °C / 93 F.
(-) Riproducendo The Witcher 3, la temperatura media per il lato superiore e' di 41.7 °C / 107 F, rispetto alla media del dispositivo di 33.9 °C / 93 F.
(+) I poggiapolsi e il touchpad raggiungono la temperatura massima della pelle (32 °C / 89.6 F) e quindi non sono caldi.
(-) La temperatura media della zona del palmo della mano di dispositivi simili e'stata di 28.8 °C / 83.8 F (-3.2 °C / -5.8 F).
| Dell G15 5530, i5-13450HX RTX 4050 GeForce RTX 4050 Laptop GPU, i5-13450HX | Medion Erazer Crawler E40 - MD 62518 GeForce RTX 4050 Laptop GPU, i5-13500H | Lenovo LOQ 15IRH8 Core i7 GeForce RTX 4050 Laptop GPU, i7-13620H | Asus TUF A15 FA507 GeForce RTX 4050 Laptop GPU, R7 7735HS | Dell G15 5530 GeForce RTX 4060 Laptop GPU, i7-13650HX | |
|---|---|---|---|---|---|
| Heat | 24% | -6% | 13% | -7% | |
| Maximum Upper Side * (°C) | 58 | 36 38% | 46.4 20% | 48.9 16% | 54 7% |
| Maximum Bottom * (°C) | 57 | 36 37% | 59.2 -4% | 44.6 22% | 62.2 -9% |
| Idle Upper Side * (°C) | 30 | 26 13% | 34.4 -15% | 27.1 10% | 33.4 -11% |
| Idle Bottom * (°C) | 29 | 27 7% | 36.2 -25% | 27.5 5% | 33.4 -15% |
* ... Meglio usare valori piccoli
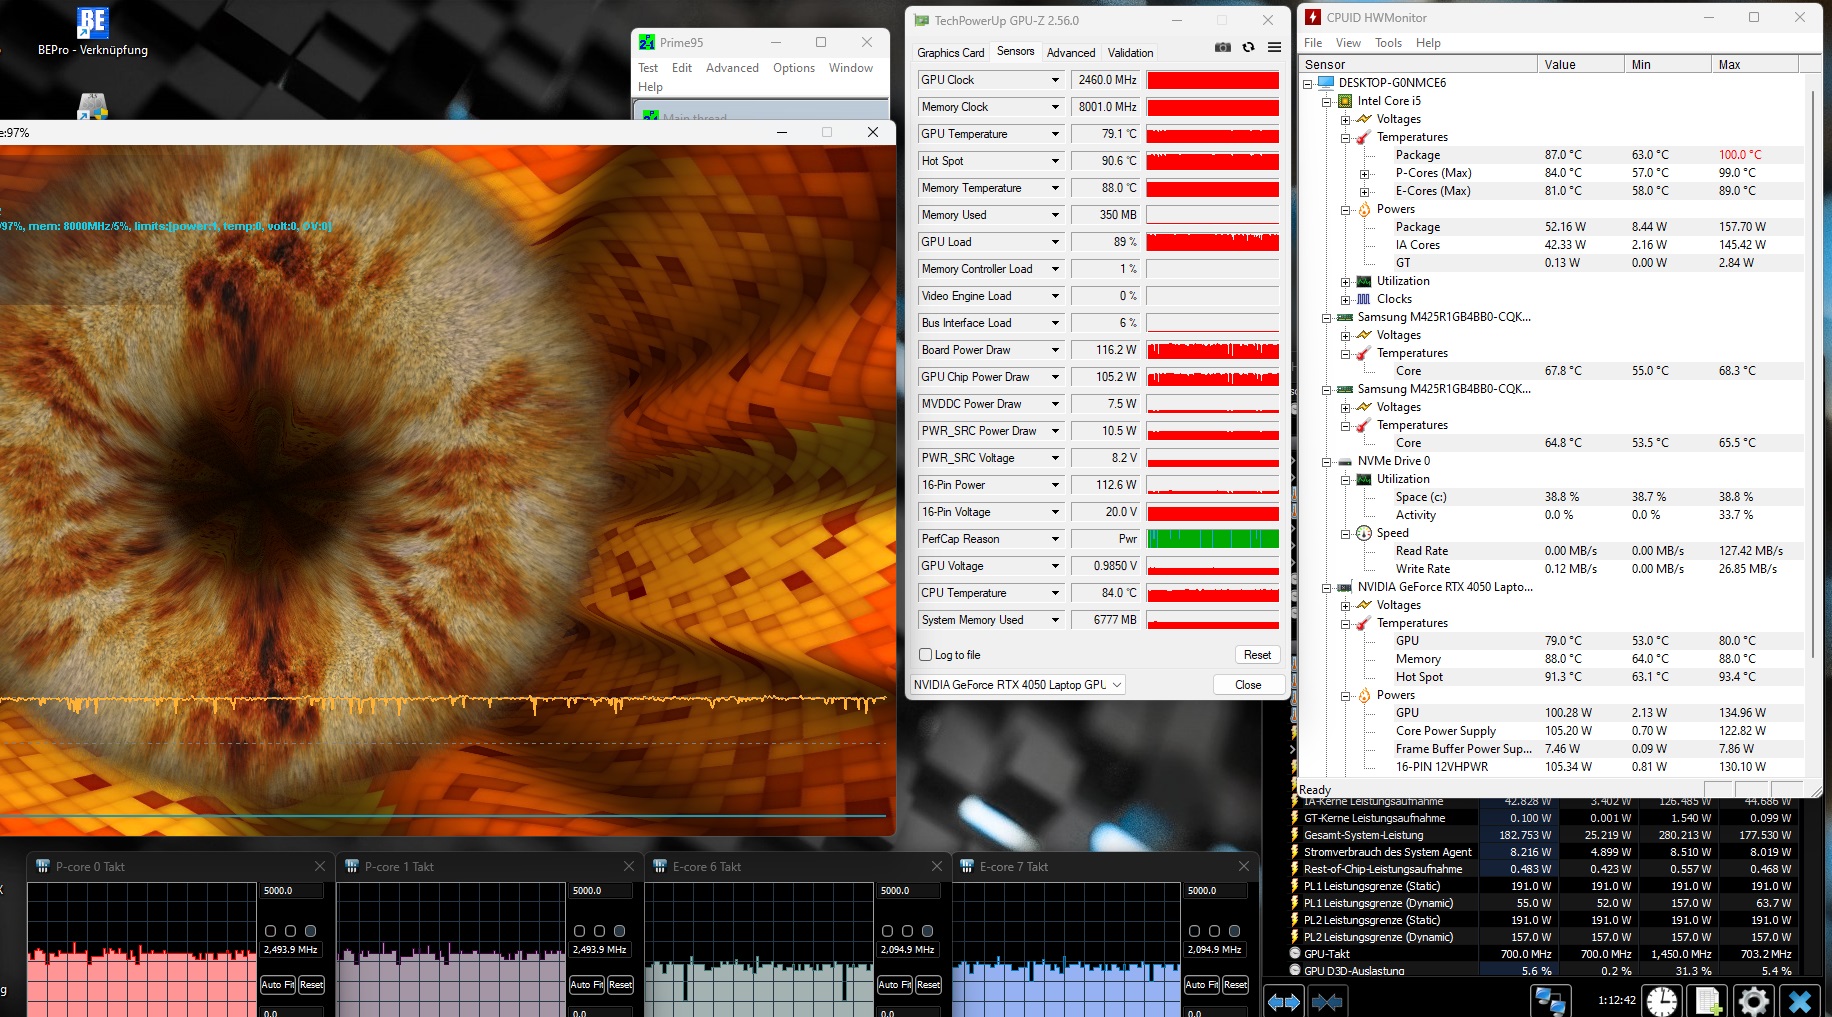
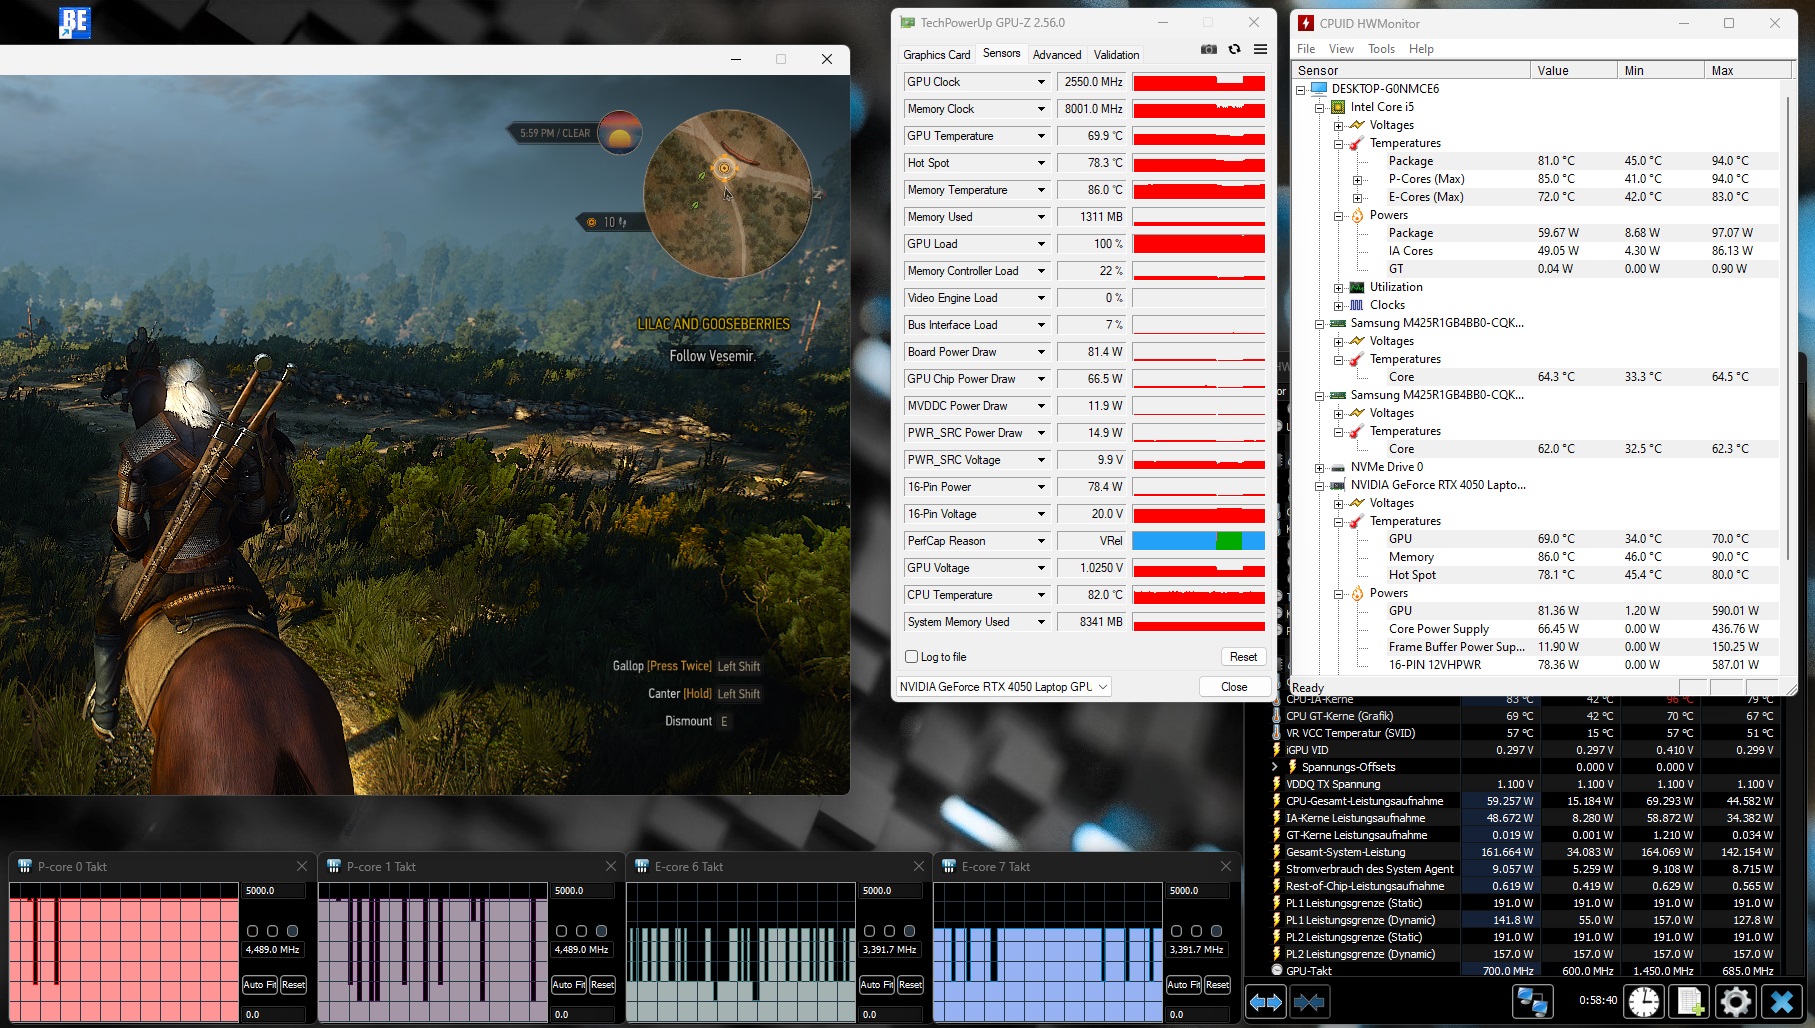
Test da sforzo
La CPU, in particolare, ha faticato durante il test di stress eseguito con FurMark & Prime95. Dopo aver raggiunto brevemente i 100°C (212°F), il Core i5-13450HX ha ridotto la velocità di clock, facendo sì che le temperature si stabilizzassero a 80-90°C (176-94°F). La RTX 4050 di GeForce è arrivata a "soli" 79°C (174,2°F) dopo un'ora, ma ha una temperatura hotspot di circa 91°C (195,8°F).
Altoparlanti
Il portatile ha una qualità audio media. Gli altoparlanti hanno un buon volume massimo, ma sono frenati dalla debolezza dei bassi.
Dell G15 5530, i5-13450HX RTX 4050 analisi audio
(+) | gli altoparlanti sono relativamente potenti (86 dB)
Bassi 100 - 315 Hz
(-) | quasi nessun basso - in media 32% inferiori alla media
(±) | la linearità dei bassi è media (14% delta rispetto alla precedente frequenza)
Medi 400 - 2000 Hz
(+) | medi bilanciati - solo only 3.5% rispetto alla media
(+) | medi lineari (4.3% delta rispetto alla precedente frequenza)
Alti 2 - 16 kHz
(+) | Alti bilanciati - appena 2.4% dalla media
(+) | alti lineari (4.2% delta rispetto alla precedente frequenza)
Nel complesso 100 - 16.000 Hz
(±) | la linearità complessiva del suono è media (18% di differenza rispetto alla media
Rispetto alla stessa classe
» 56% di tutti i dispositivi testati in questa classe è stato migliore, 9% simile, 36% peggiore
» Il migliore ha avuto un delta di 6%, medio di 18%, peggiore di 132%
Rispetto a tutti i dispositivi testati
» 38% di tutti i dispositivi testati in questa classe è stato migliore, 8% similare, 54% peggiore
» Il migliore ha avuto un delta di 4%, medio di 23%, peggiore di 134%
Medion Erazer Crawler E40 - MD 62518 analisi audio
(±) | potenza degli altiparlanti media ma buona (81.47 dB)
Bassi 100 - 315 Hz
(-) | quasi nessun basso - in media 32.7% inferiori alla media
(±) | la linearità dei bassi è media (11% delta rispetto alla precedente frequenza)
Medi 400 - 2000 Hz
(+) | medi bilanciati - solo only 4.6% rispetto alla media
(±) | linearità dei medi adeguata (7.1% delta rispetto alla precedente frequenza)
Alti 2 - 16 kHz
(+) | Alti bilanciati - appena 3.1% dalla media
(+) | alti lineari (5.7% delta rispetto alla precedente frequenza)
Nel complesso 100 - 16.000 Hz
(±) | la linearità complessiva del suono è media (21.8% di differenza rispetto alla media
Rispetto alla stessa classe
» 78% di tutti i dispositivi testati in questa classe è stato migliore, 6% simile, 16% peggiore
» Il migliore ha avuto un delta di 6%, medio di 18%, peggiore di 132%
Rispetto a tutti i dispositivi testati
» 62% di tutti i dispositivi testati in questa classe è stato migliore, 7% similare, 31% peggiore
» Il migliore ha avuto un delta di 4%, medio di 23%, peggiore di 134%
Gestione dell'energia
Consumo di energia
I nostri risultati sono molto discordanti per quanto riguarda il consumo energetico del portatile. Sebbene il G15 consumasse in media solo 12 watt al minimo, che è una quantità molto ridotta per un notebook da gioco, i 100-262 watt richiesti sotto carico sono immensamente alti rispetto alle prestazioni offerte.
| Off / Standby | |
| Idle | |
| Sotto carico |
|
Leggenda:
min: | |
| Dell G15 5530, i5-13450HX RTX 4050 i5-13450HX, GeForce RTX 4050 Laptop GPU | Medion Erazer Crawler E40 - MD 62518 i5-13500H, GeForce RTX 4050 Laptop GPU | Lenovo LOQ 15IRH8 Core i7 i7-13620H, GeForce RTX 4050 Laptop GPU | Asus TUF A15 FA507 R7 7735HS, GeForce RTX 4050 Laptop GPU | Dell G15 5530 i7-13650HX, GeForce RTX 4060 Laptop GPU | Media della classe Gaming | |
|---|---|---|---|---|---|---|
| Power Consumption | -58% | -148% | -30% | -53% | -122% | |
| Idle Minimum * (Watt) | 2 | 10 -400% | 18.52 -826% | 8 -300% | 8.4 -320% | 13 ? -550% |
| Idle Average * (Watt) | 12 | 15.3 -28% | 22.54 -88% | 12.1 -1% | 14.98 -25% | 19 ? -58% |
| Idle Maximum * (Watt) | 27 | 15.5 43% | 29.79 -10% | 12.5 54% | 15.56 42% | 24.6 ? 9% |
| Load Average * (Watt) | 100 | 88 12% | 94.5 5% | 74.9 25% | 96.8 3% | 110.7 ? -11% |
| Witcher 3 ultra * (Watt) | 161.9 | 155 4% | 154.4 5% | 136.6 16% | 186 -15% | |
| Load Maximum * (Watt) | 262 | 202.47 23% | 190.4 27% | 185 29% | 271.42 -4% | 259 ? 1% |
* ... Meglio usare valori piccoli
Power consumption Witcher 3 / Stresstest
Power consumption with external monitor
Durata della batteria
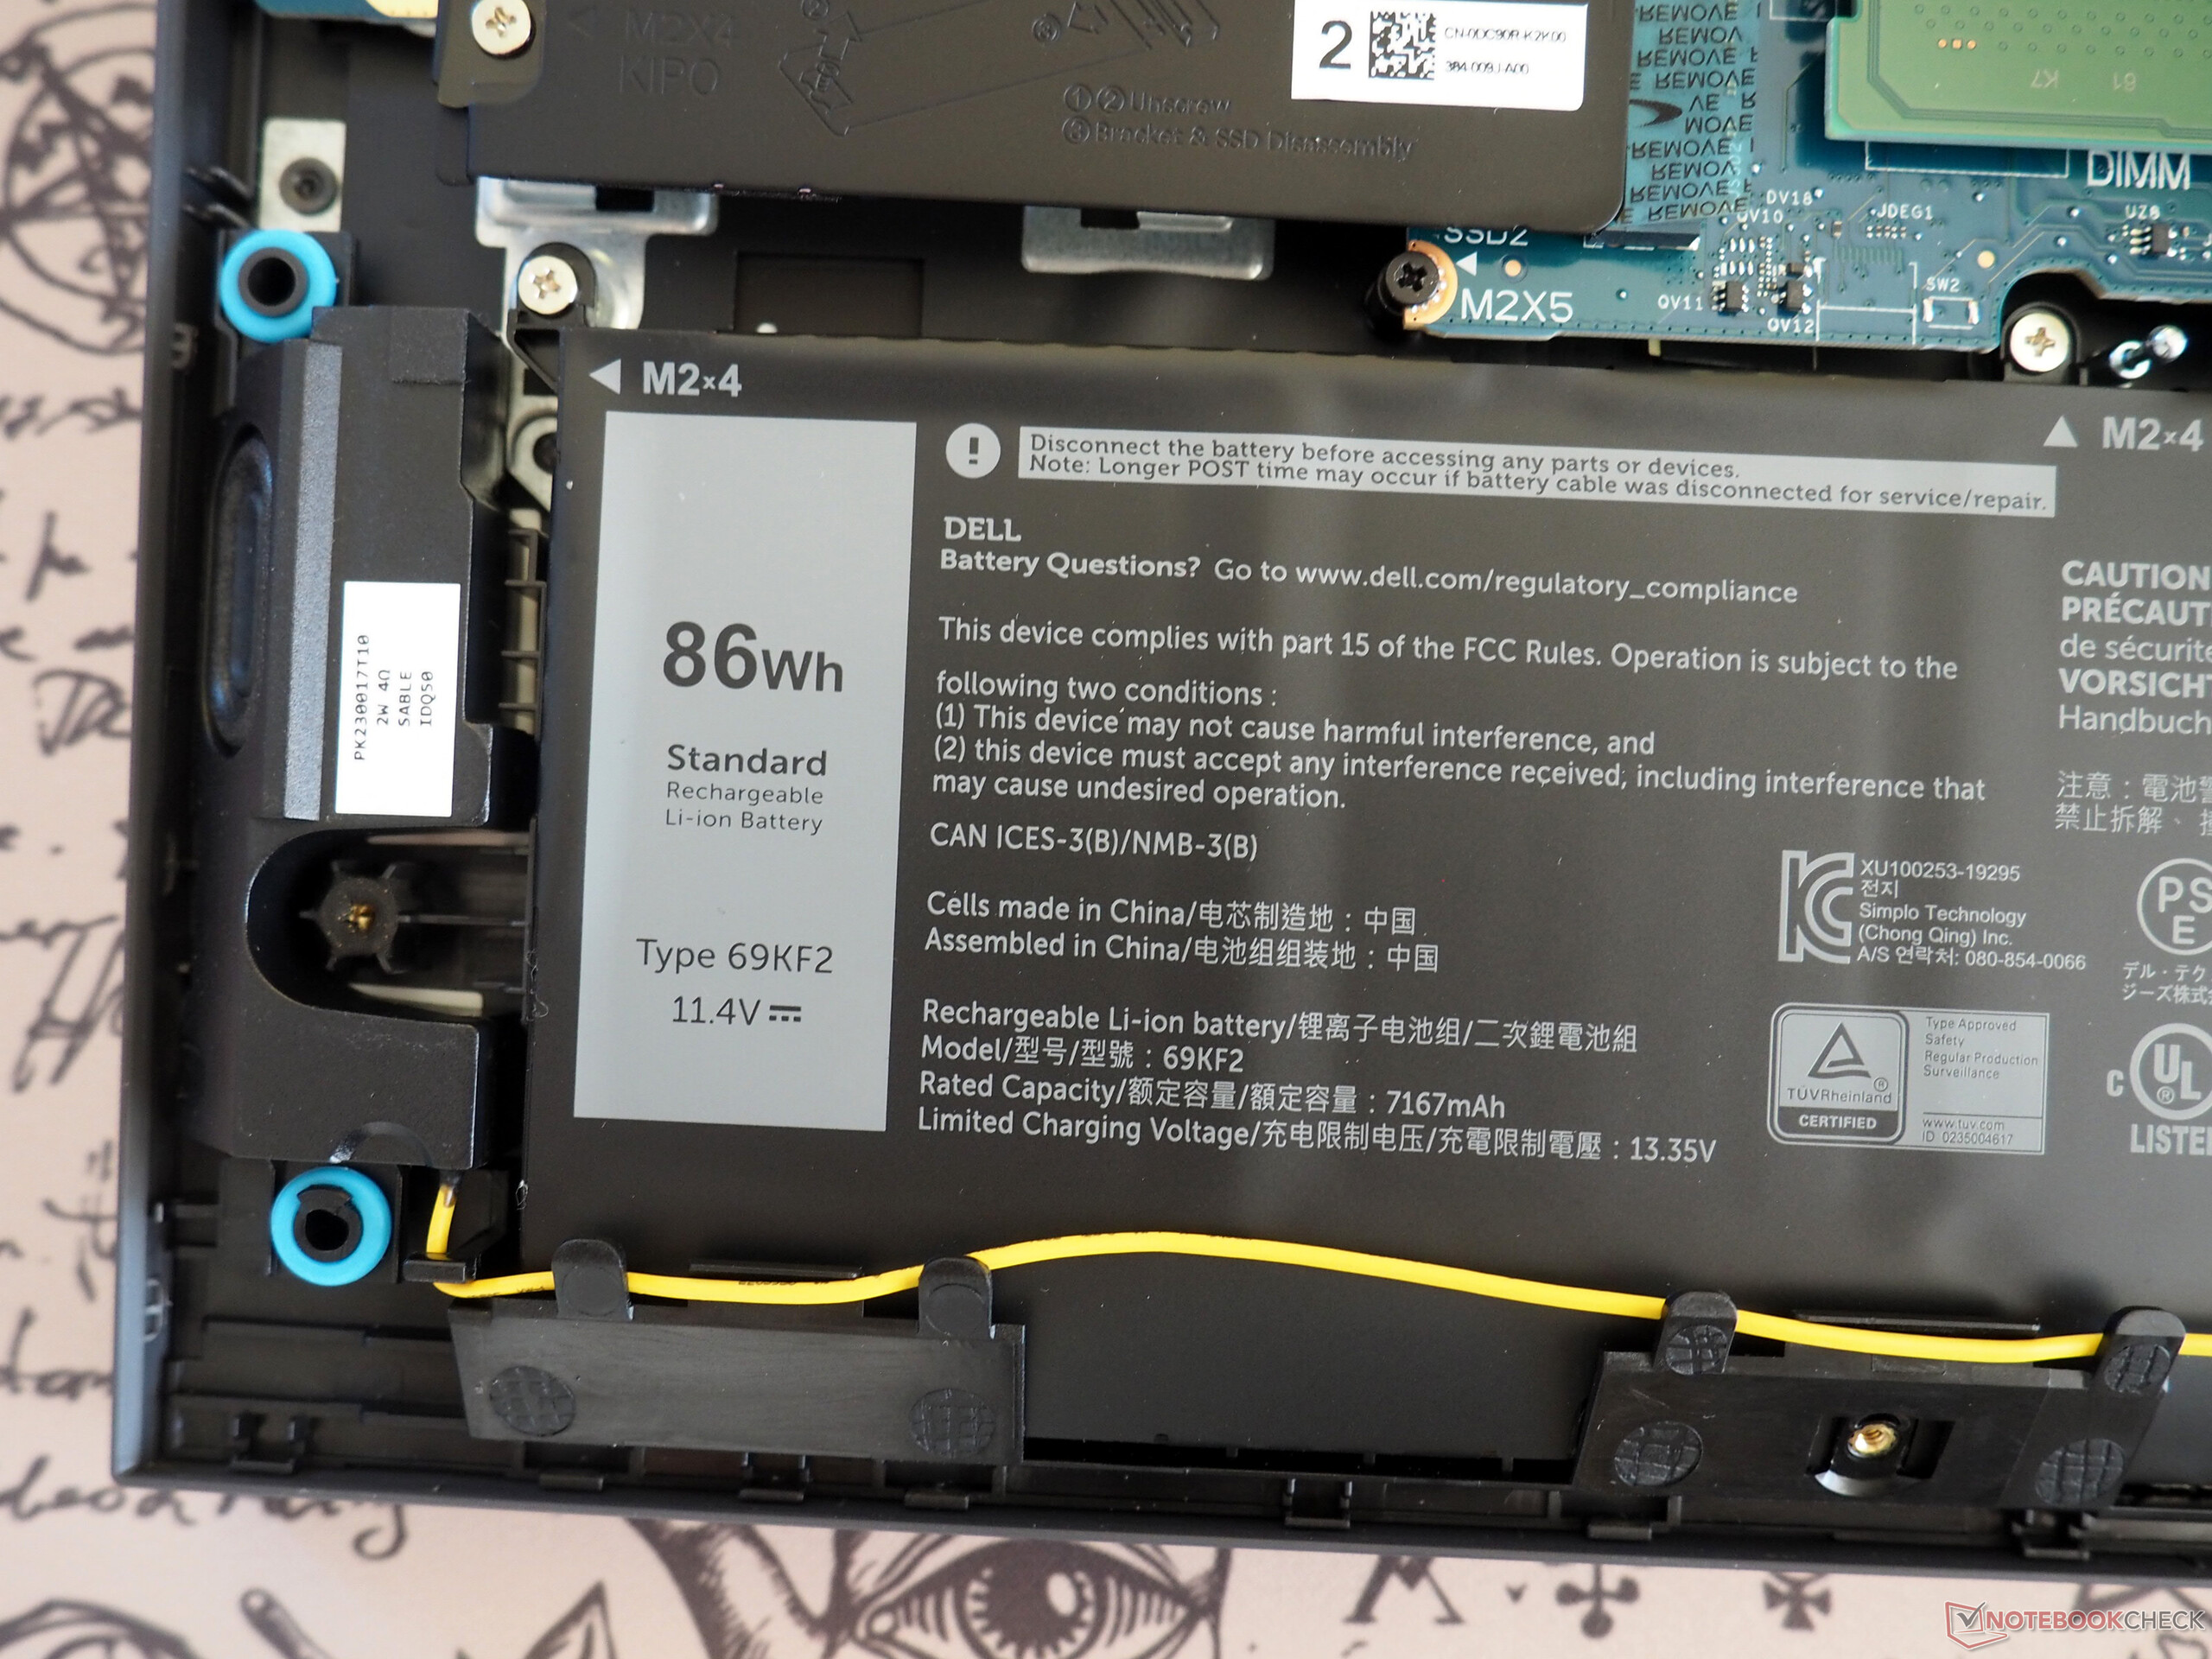
La durata della batteria è più che decente sul G15, anche grazie alla commutazione grafica. Nel nostro test Wi-Fi (con luminosità dello schermo ridotta a 150 cd/m²), siamo riusciti a ottenere circa 7 ore di utilizzo dall'enorme batteria da 86 Wh.
| Dell G15 5530, i5-13450HX RTX 4050 i5-13450HX, GeForce RTX 4050 Laptop GPU, 86 Wh | Medion Erazer Crawler E40 - MD 62518 i5-13500H, GeForce RTX 4050 Laptop GPU, 54 Wh | Lenovo LOQ 15IRH8 Core i7 i7-13620H, GeForce RTX 4050 Laptop GPU, 60 Wh | Asus TUF A15 FA507 R7 7735HS, GeForce RTX 4050 Laptop GPU, 90 Wh | Dell G15 5530 i7-13650HX, GeForce RTX 4060 Laptop GPU, 86 Wh | Media della classe Gaming | |
|---|---|---|---|---|---|---|
| Autonomia della batteria | -42% | -17% | 65% | -8% | 0% | |
| WiFi v1.3 (h) | 7.1 | 4.1 -42% | 5.9 -17% | 11.7 65% | 6.5 -8% | 7.11 ? 0% |
| H.264 (h) | 3.9 | 6.1 | 12.5 | 6.8 | 8.32 ? | |
| Load (h) | 1.2 | 1 | 0.8 | 1.502 ? | ||
| Witcher 3 ultra (h) | 0.8 |
Pro
Contro
Il verdetto
Il Dell G15 5530 con un Core i5-13450HX e GeForce RTX 4050 eredita la maggior parte dei punti di forza e di debolezza del suo fratello più fratello più costoso con un i7-13650HX e RTX 4060. Tra gli aspetti positivi, il dispositivo ha un display relativamente buono, una solida durata della batteria e un ragionevole rapporto qualità-prezzo.
Tra i lati negativi, invece, abbiamo uno chassis piuttosto pesante e ingombrante, un caricabatterie inutilmente ingombrante e una selezione di porte poco soddisfacente (niente USB4 e lettore di schede). Dell dovrebbe anche lavorare per risolvere il problema dell'enorme strozzamento dell'SSD sotto stress prolungato, nonché il consumo di energia sotto carico.
In ogni caso, il G15 5530 è nel complesso un'ottima opzione per i giocatori attenti al budget che cercano una macchina da gioco adatta nella fascia di prezzo di 1.000 euro (1.090 dollari).
I concorrenti citati nella recensione (Medion Crawler E40, Asus TUF A15 e Lenovo LOQ 15) offrono in gran parte prestazioni simili, ma a volte presentano altri vantaggi e svantaggi.
Prezzo e disponibilità
Il Dell G15 5530 con un Core i5-13450HX e GeForce RTX 4050 è attualmente disponibile su Amazon Germania per 950 euro. Negli Stati Uniti, è possibile ottenere una versione con specifiche simili direttamente da Dell per 900 dollari o il modello con Core i7-13650HX e RTX 4060 da Amazon US per 1.200 dollari.
Dell G15 5530, i5-13450HX RTX 4050
- 01/23/2024 v7 (old)
Florian Glaser
Transparency
La selezione dei dispositivi da recensire viene effettuata dalla nostra redazione. Il campione di prova è stato fornito all'autore come prestito dal produttore o dal rivenditore ai fini di questa recensione. L'istituto di credito non ha avuto alcuna influenza su questa recensione, né il produttore ne ha ricevuto una copia prima della pubblicazione. Non vi era alcun obbligo di pubblicare questa recensione. In quanto società mediatica indipendente, Notebookcheck non è soggetta all'autorità di produttori, rivenditori o editori.
Ecco come Notebookcheck esegue i test
Ogni anno, Notebookcheck esamina in modo indipendente centinaia di laptop e smartphone utilizzando procedure standardizzate per garantire che tutti i risultati siano comparabili. Da circa 20 anni sviluppiamo continuamente i nostri metodi di prova e nel frattempo stabiliamo gli standard di settore. Nei nostri laboratori di prova, tecnici ed editori esperti utilizzano apparecchiature di misurazione di alta qualità. Questi test comportano un processo di validazione in più fasi. Il nostro complesso sistema di valutazione si basa su centinaia di misurazioni e parametri di riferimento ben fondati, che mantengono l'obiettività.Price comparison

