Recensione del computer portatile Medion Erazer Crawler E40: Un gamer economico con buone prestazioni RTX 4050
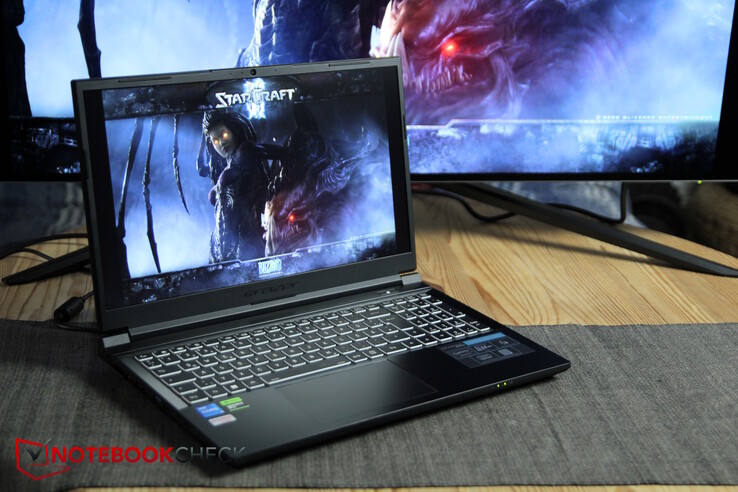
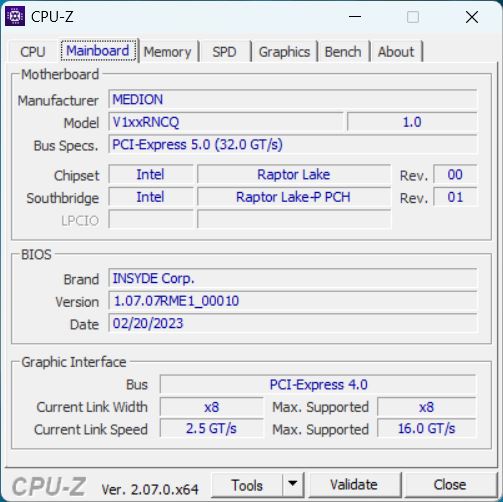
Medion Erazer Crawler E40 sostituisce il modello E30 (con Intel Gen12 e RTX 30xx) e porta la serie all'attuale stato dell'arte con Intel Gen 13 e RTX 4050. Questo portatile da gioco entry-level ha attualmente un prezzo di poco inferiore a ~US$1100.
In competizione con altri portatili da gioco economici, Medion Erazer Crawler E40 si confronta con rivali quali Lenovo LOQ 15, l' Asus TUF Gaming A15, l' XMG Apex 15o il MSI Katana 15
Medion racchiude numerosi modelli sotto il marchio "Erazer", rendendo difficile tenere traccia di tutti. Mentre altri produttori organizzano serie in cui combinano diverse configurazioni nello stesso case, Medion sembra credere che ogni configurazione giustifichi un nuovo nome di serie. Erazer Crawler E40 è disponibile solo in questa configurazione specifica e quindi viene venduto solo come questo modello. Non ci sono opzioni per quanto riguarda CPU, GPU o display.
Altri modelli Medion Erazer che abbiamo testato in precedenza sono:
Potenziali concorrenti a confronto
Punteggio | Data | Modello | Peso | Altezza | Dimensione | Risoluzione | Prezzo |
|---|---|---|---|---|---|---|---|
| 85.4 % v7 (old) | 12/2023 | Medion Erazer Crawler E40 - MD 62518 i5-13500H, GeForce RTX 4050 Laptop GPU | 2.3 kg | 28 mm | 15.60" | 1920x1080 | |
| 85.9 % v7 (old) | 10/2023 | Lenovo LOQ 15IRH8 Core i7 i7-13620H, GeForce RTX 4050 Laptop GPU | 2.4 kg | 25.2 mm | 15.60" | 2560x1440 | |
| 86.3 % v7 (old) | 06/2023 | Asus TUF A15 FA507 R7 7735HS, GeForce RTX 4050 Laptop GPU | 2.2 kg | 24.9 mm | 15.60" | 1920x1080 | |
| 86.2 % v7 (old) | 10/2023 | Schenker XMG Apex 15 (Late 23) R7 7840HS, GeForce RTX 4050 Laptop GPU | 2.2 kg | 26.7 mm | 15.60" | 2560x1440 | |
| 82.9 % v7 (old) | 03/2023 | MSI Katana 15 B12VEK i7-12650H, GeForce RTX 4050 Laptop GPU | 2.3 kg | 24.9 mm | 15.60" | 1920x1080 |
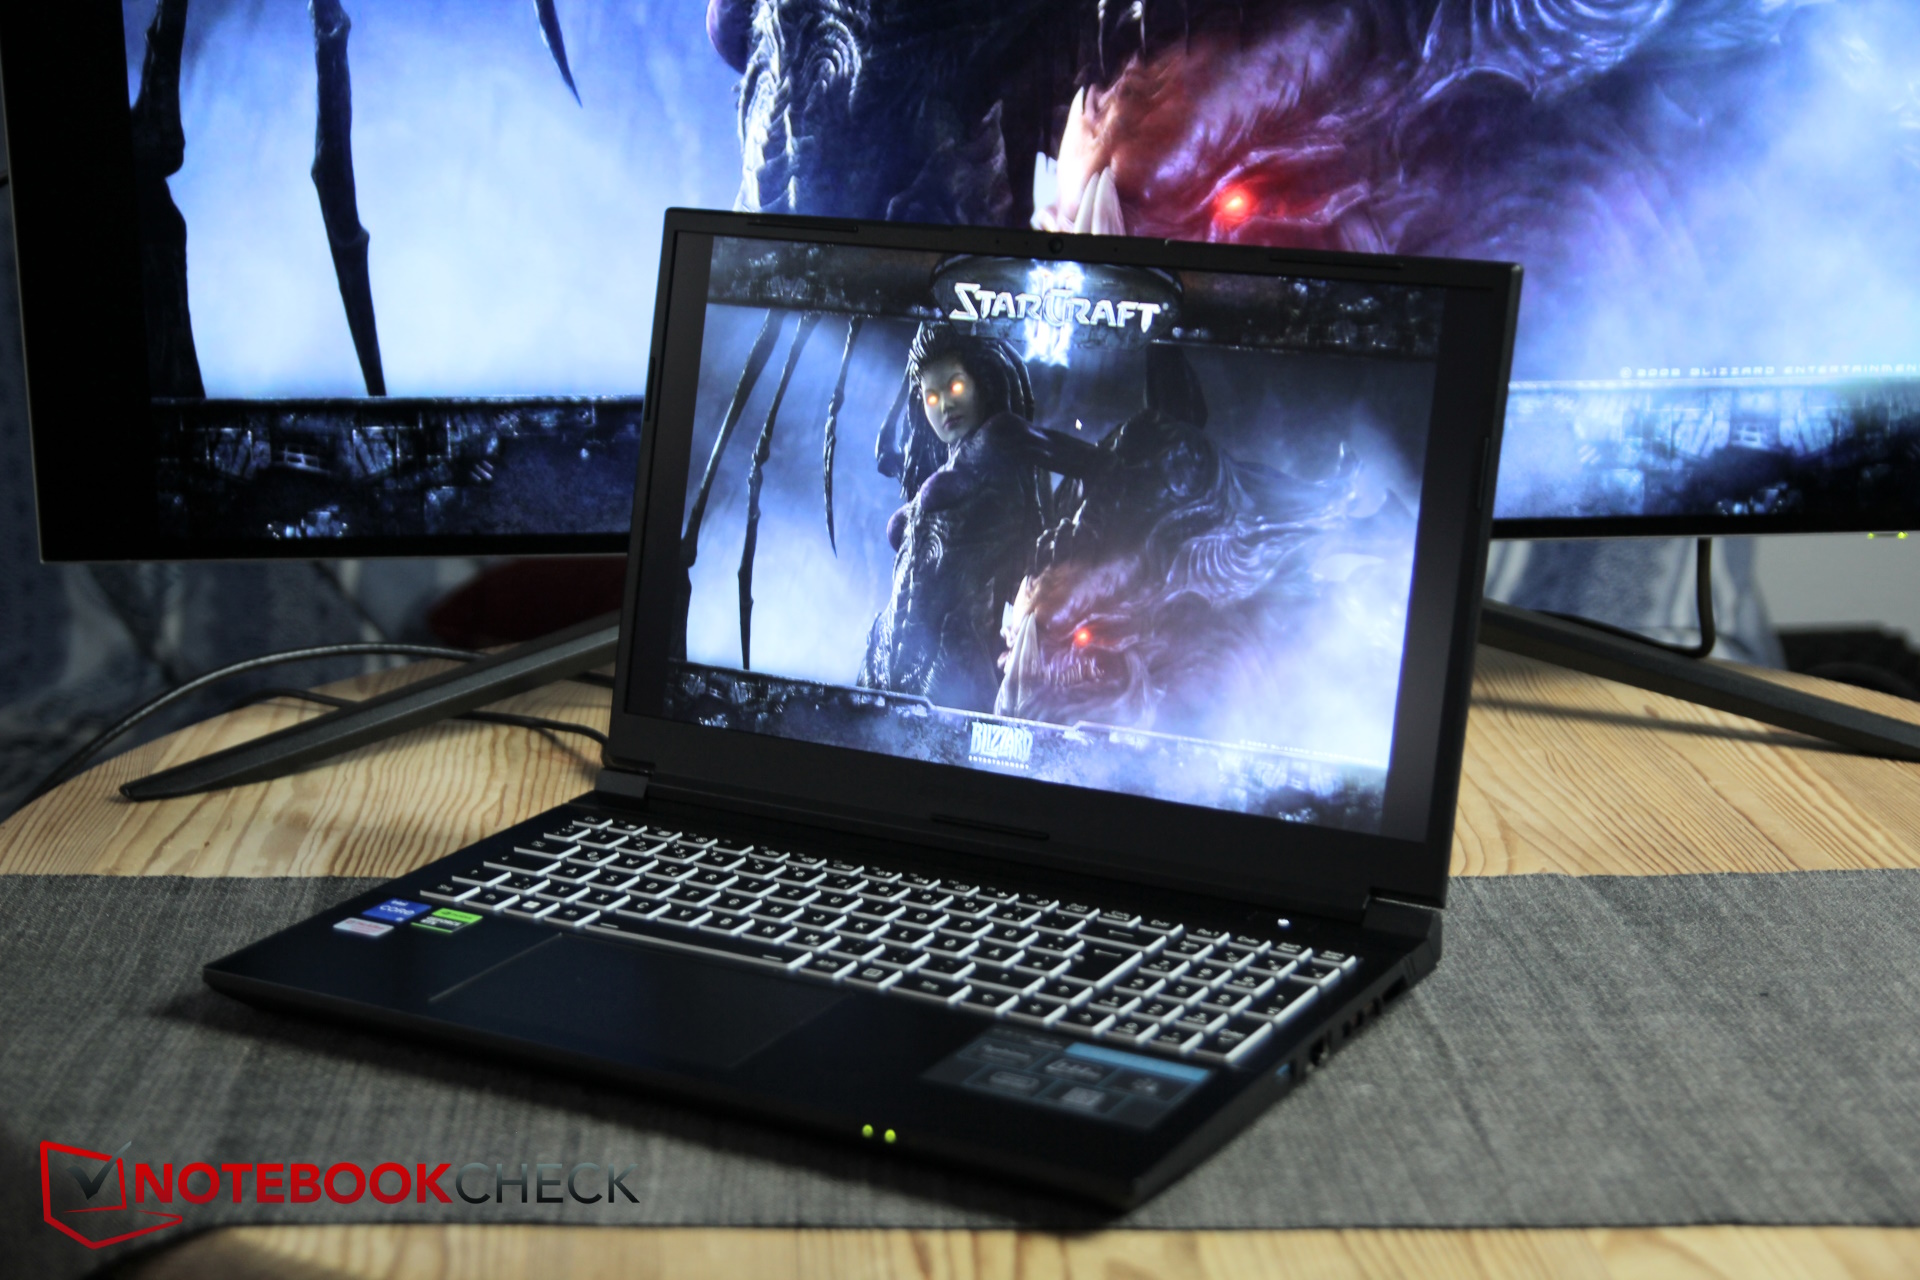
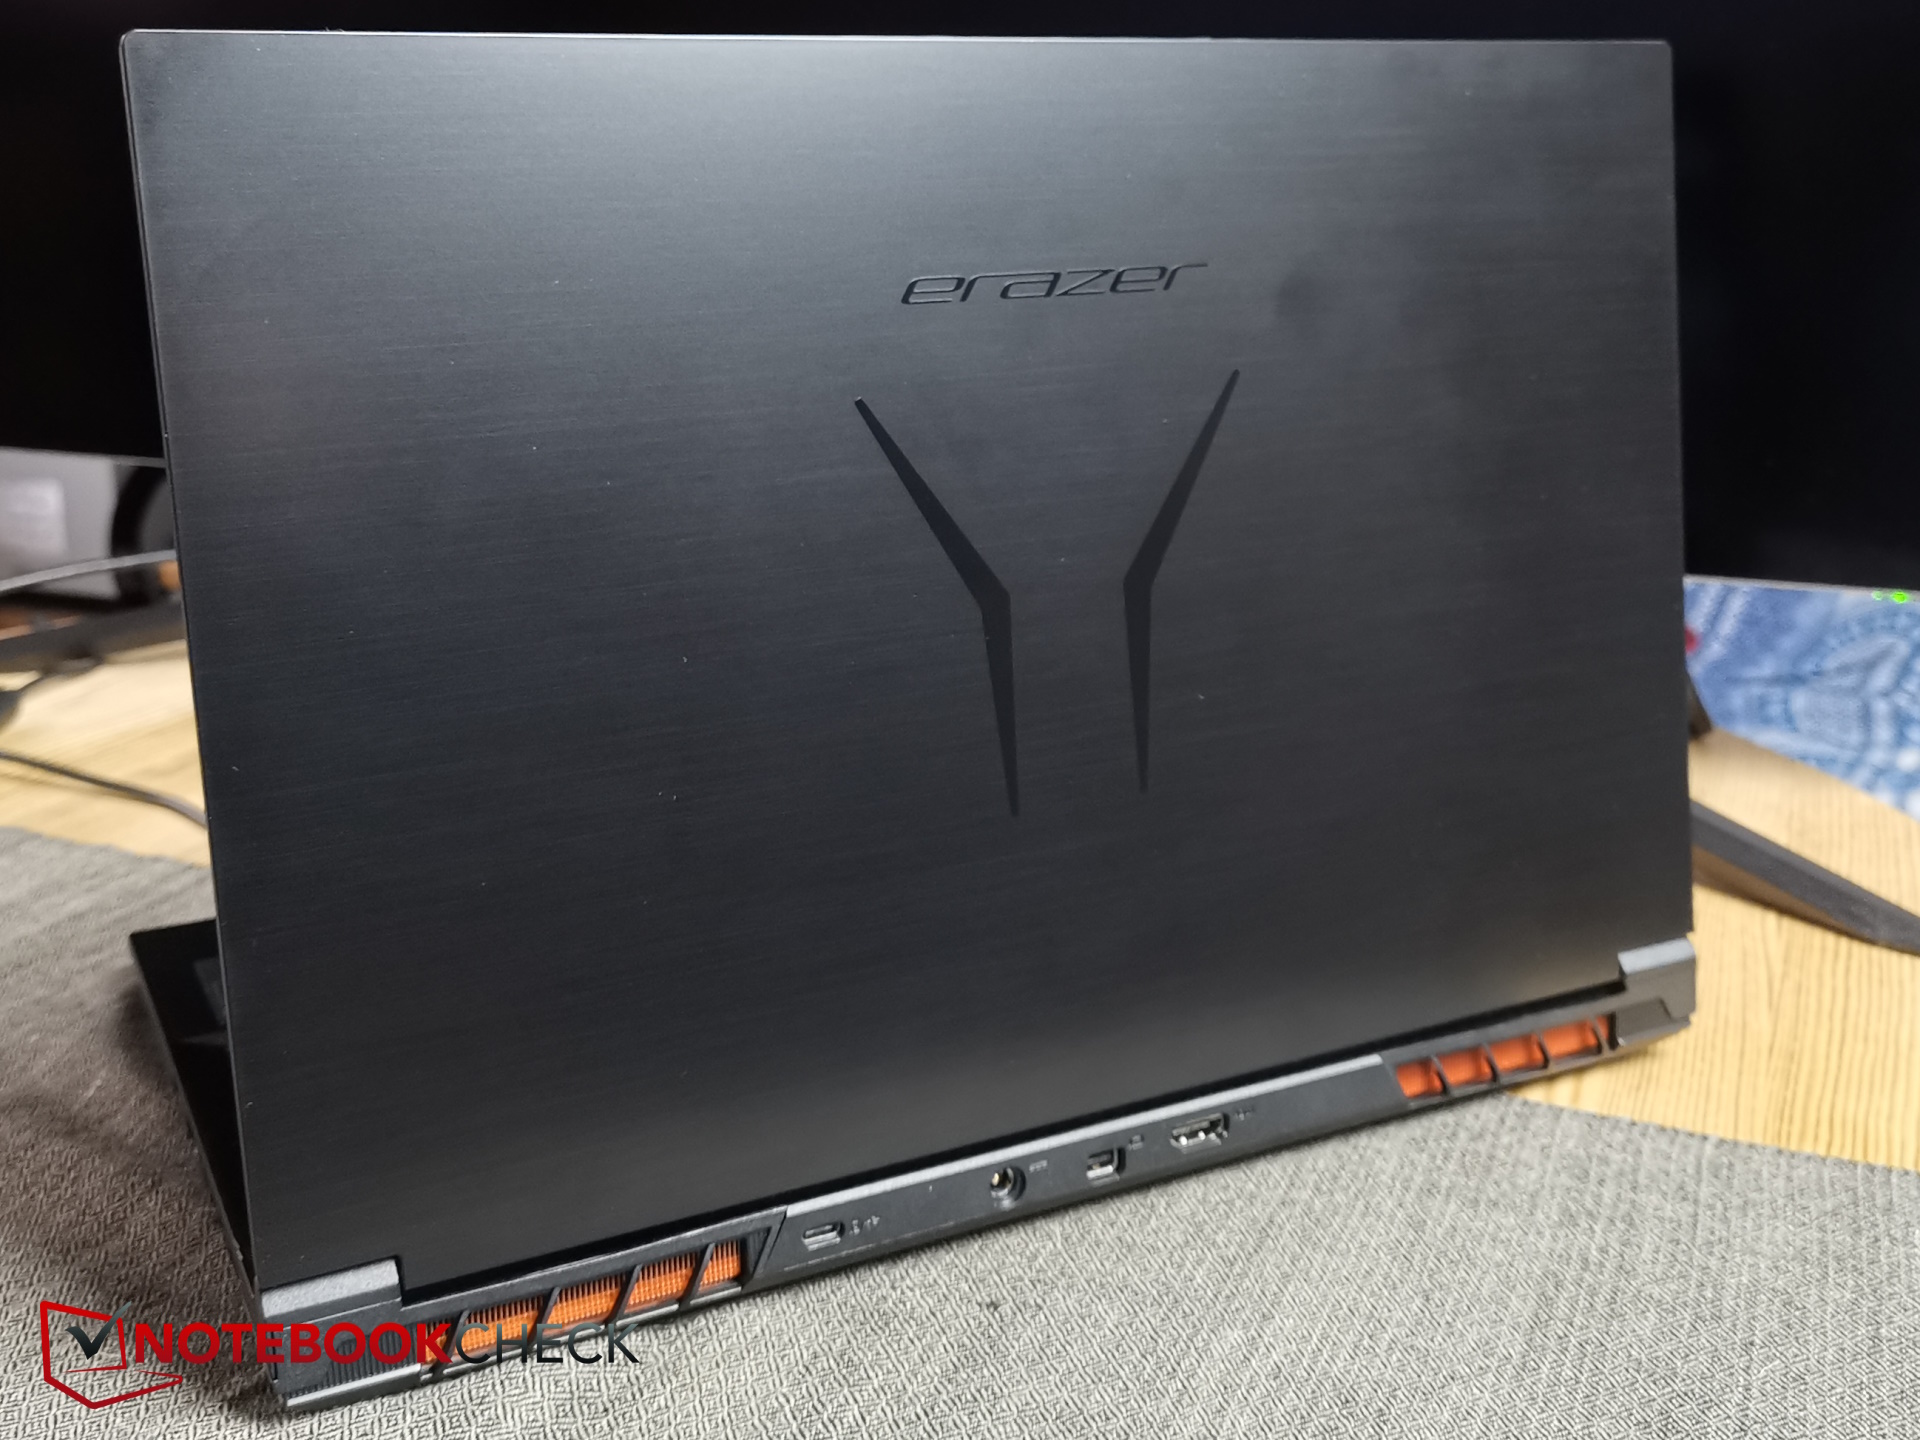
Custodia e connettività - Crawler E40 con finitura in plastica spazzolata
Il coperchio del display e la base sono realizzati in plastica robusta che ricorda da vicino l'alluminio, conferendogli un aspetto intenzionale. I bordi del display e la parte inferiore del portatile sono realizzati in plastica morbida. Sia il coperchio liscio che la base sono inclini ad attirare le impronte digitali.
Caratterizzato da un design interamente nero, compreso il logo Erazer sul coperchio, il portatile ha un'estetica relativamente semplice. La base presenta un alto livello di resistenza alla torsione, mentre il coperchio, anche se meno, appare notevolmente 'morbido' e si flette notevolmente quando viene ruotato, mentre il display lo gestisce stoicamente. La lavorazione complessiva è di buon livello e non sono presenti lacune visibili.
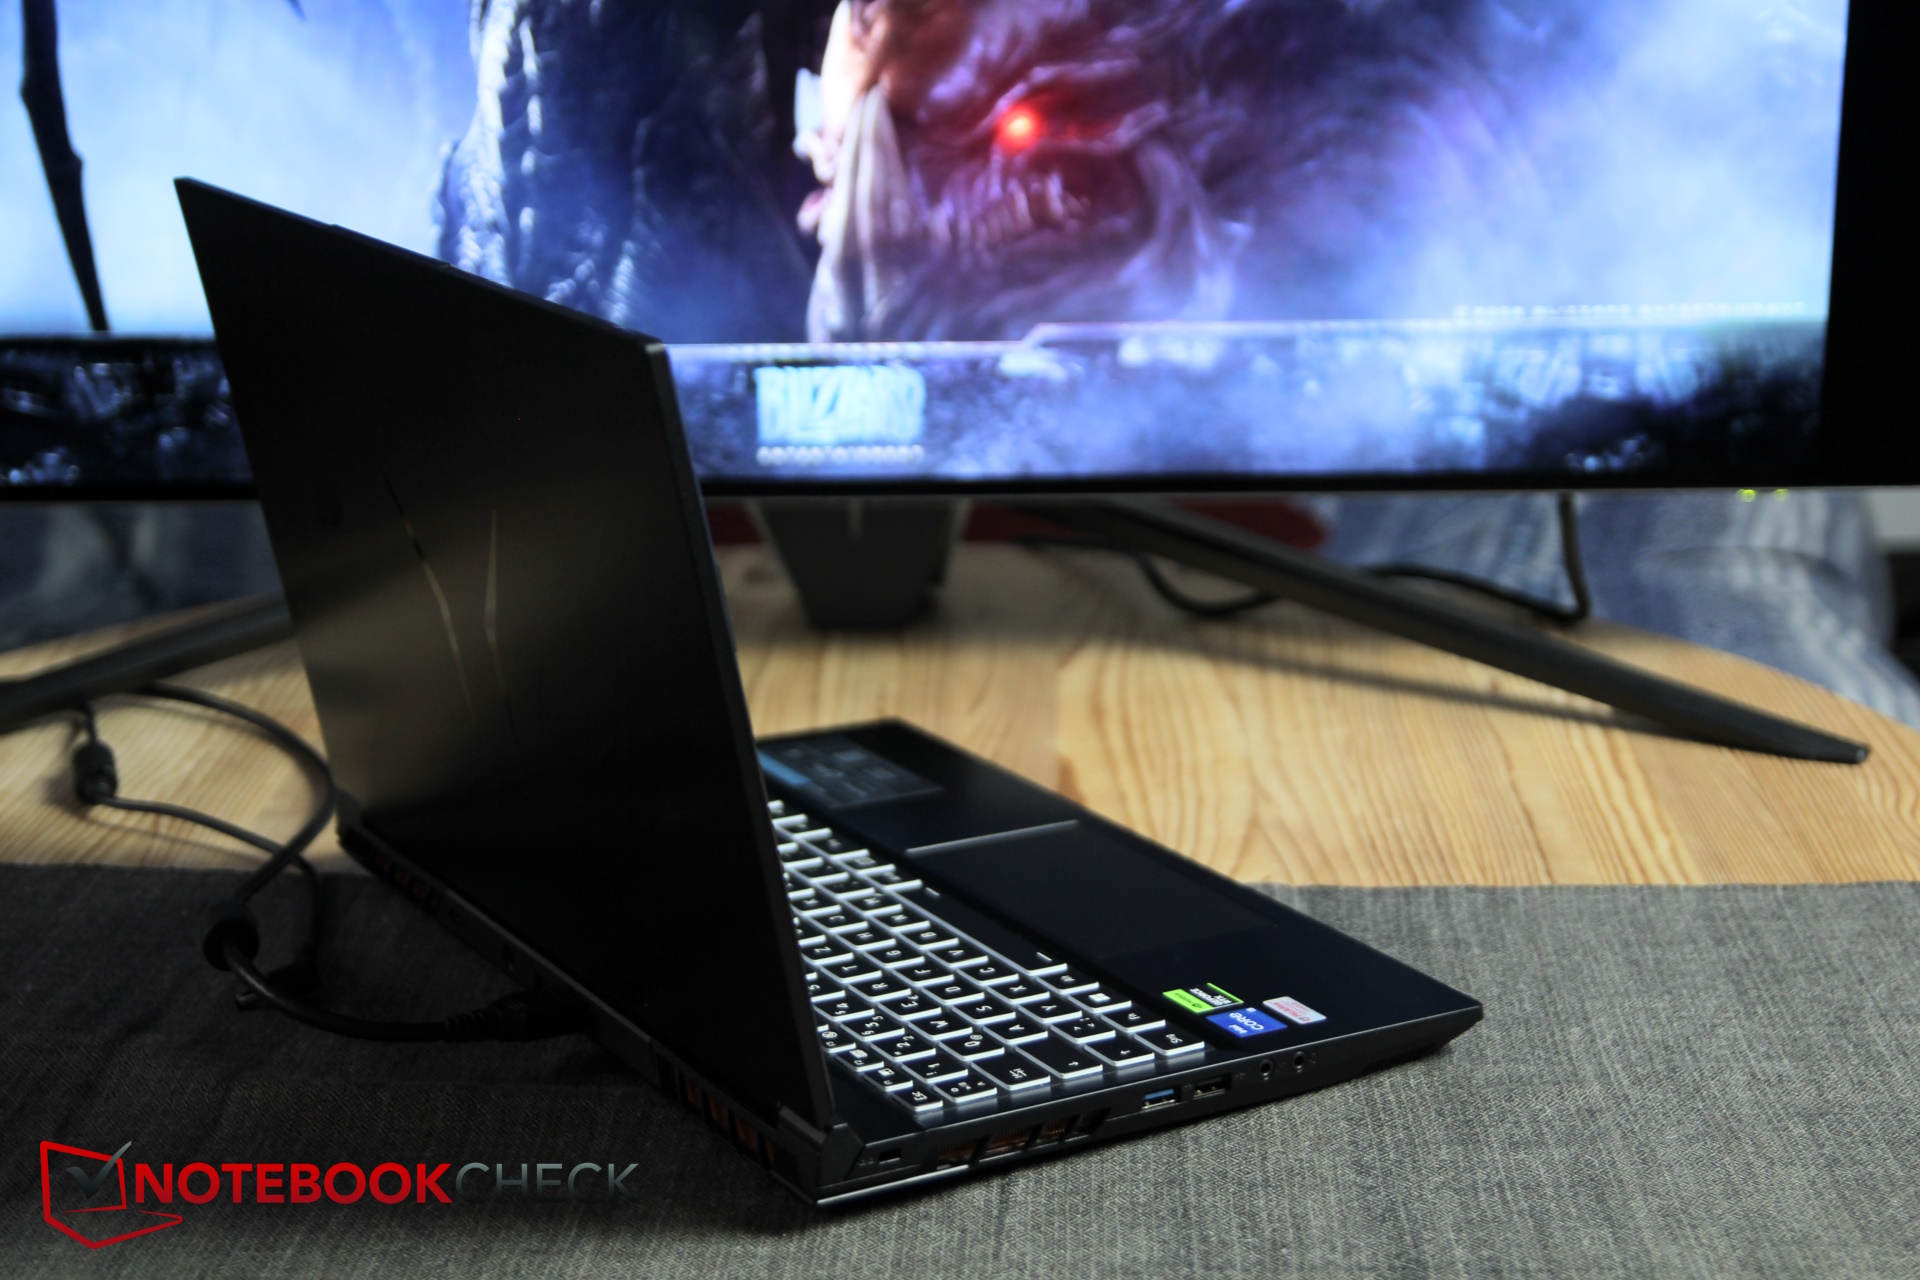
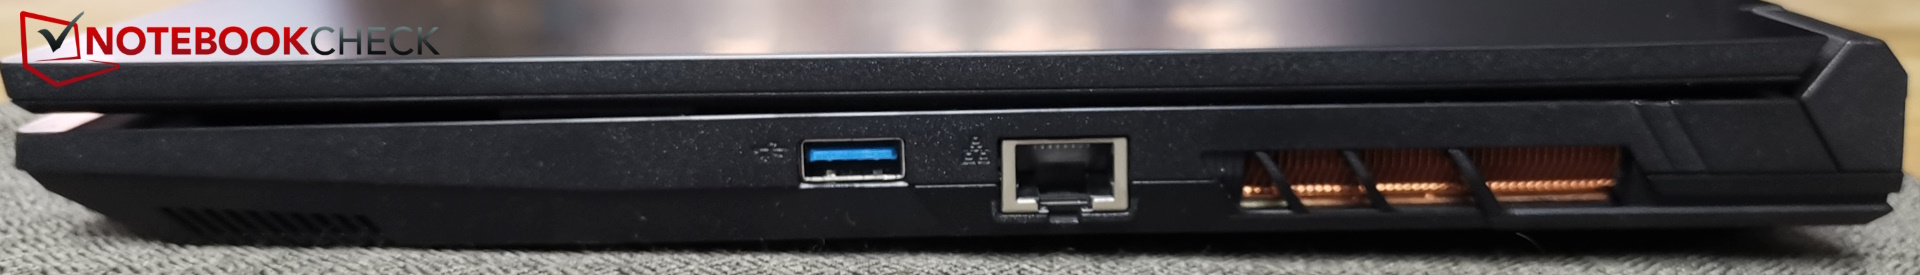
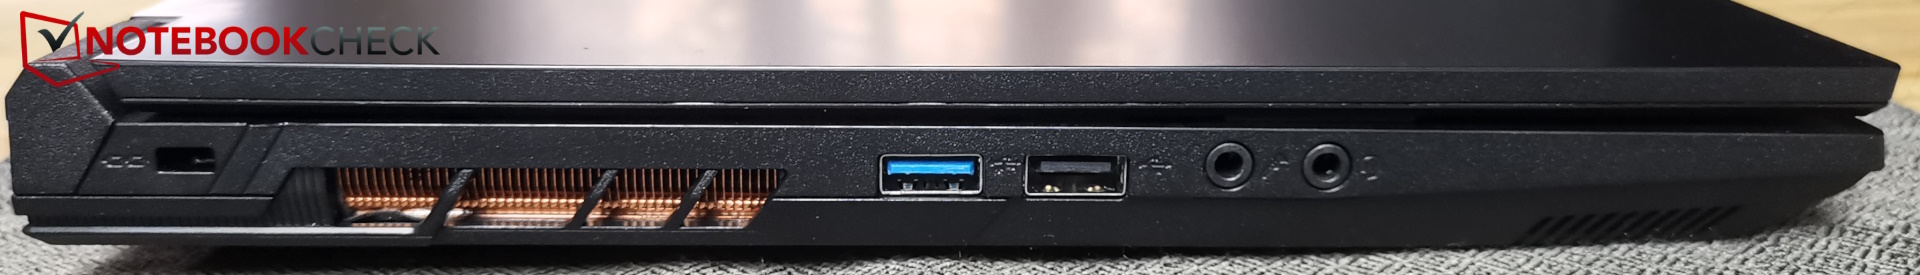
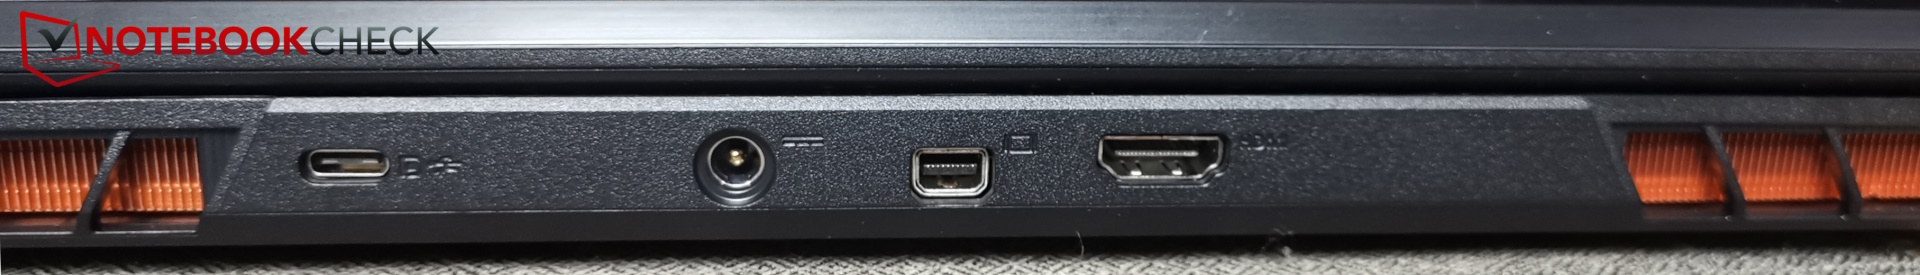
Connessioni - Niente Thunderbolt, ma invece USB 2.0
Nonostante la CPU Intel, l'E40 non supporta Thunderbolt. Include la porta USB-C con una velocità di 10 Gb/s. Tuttavia, incorpora anche una porta USB-A 2.0 obsoleta, che potrebbe essere potenzialmente aggiornata con un'alternativa più veloce. In particolare, non è presente un lettore di schede.


Manutenzione
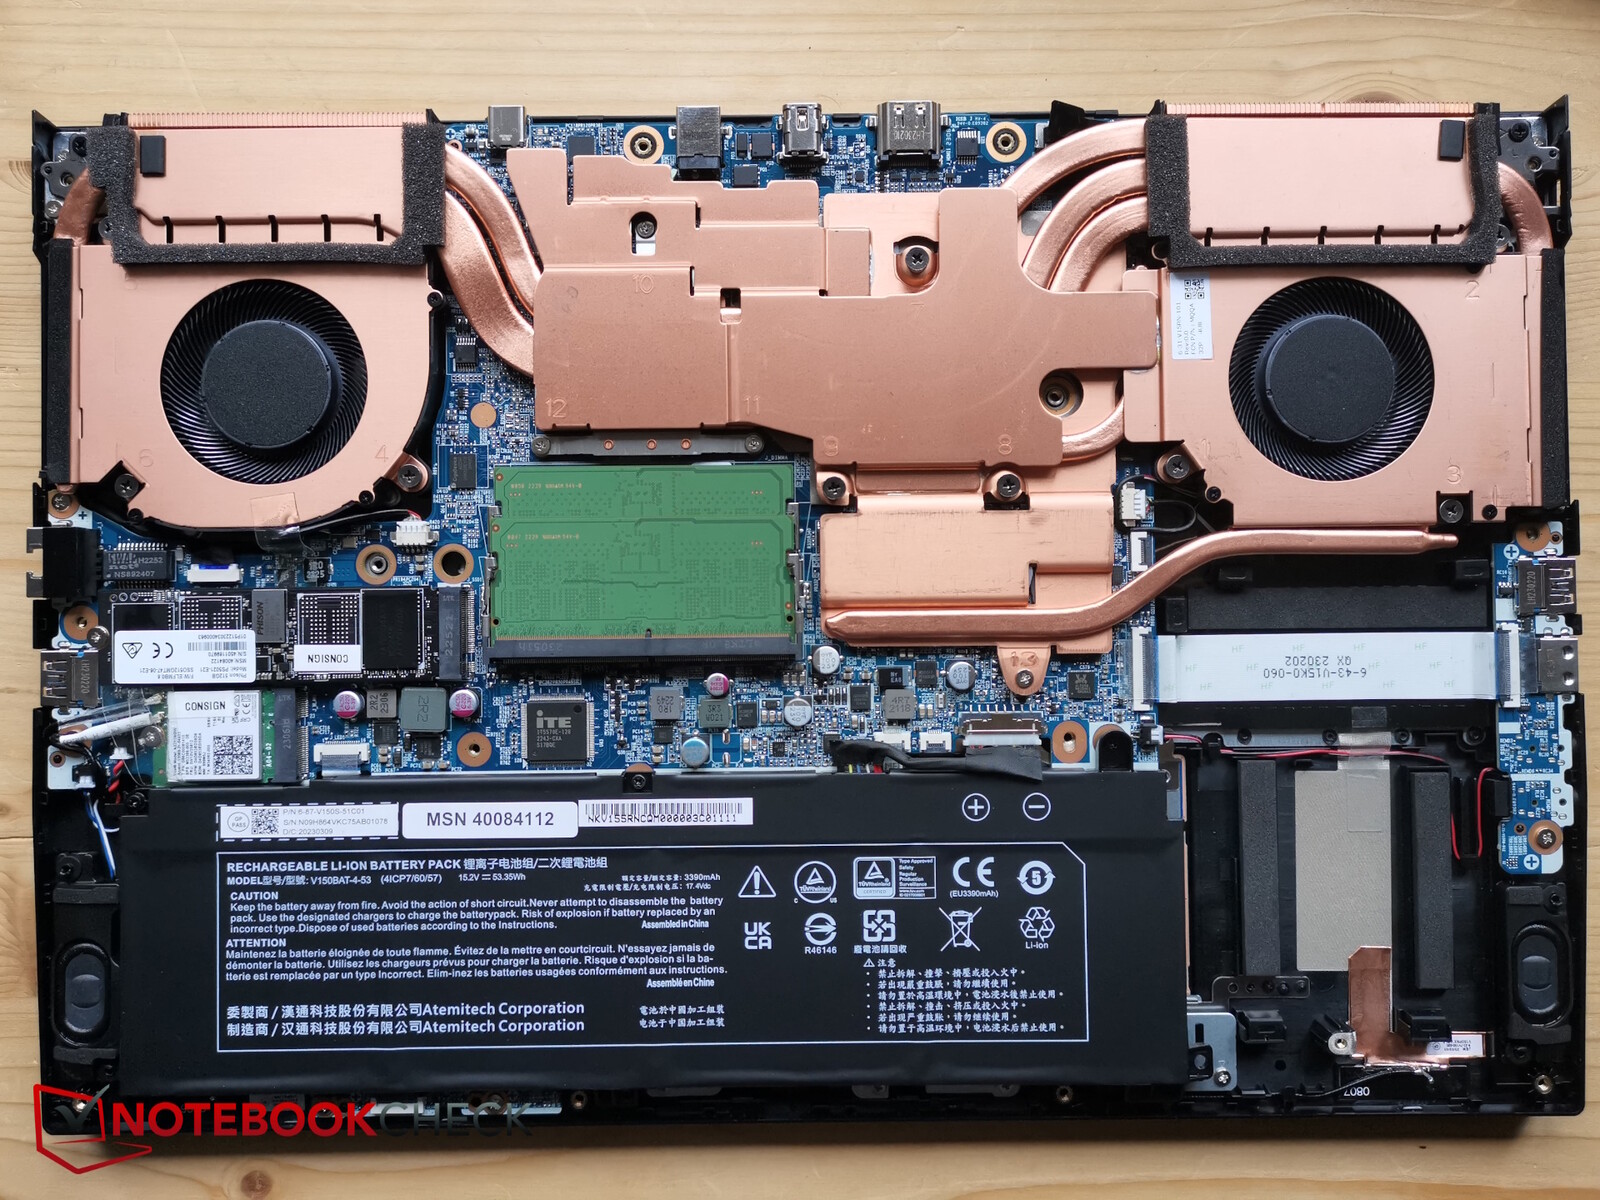
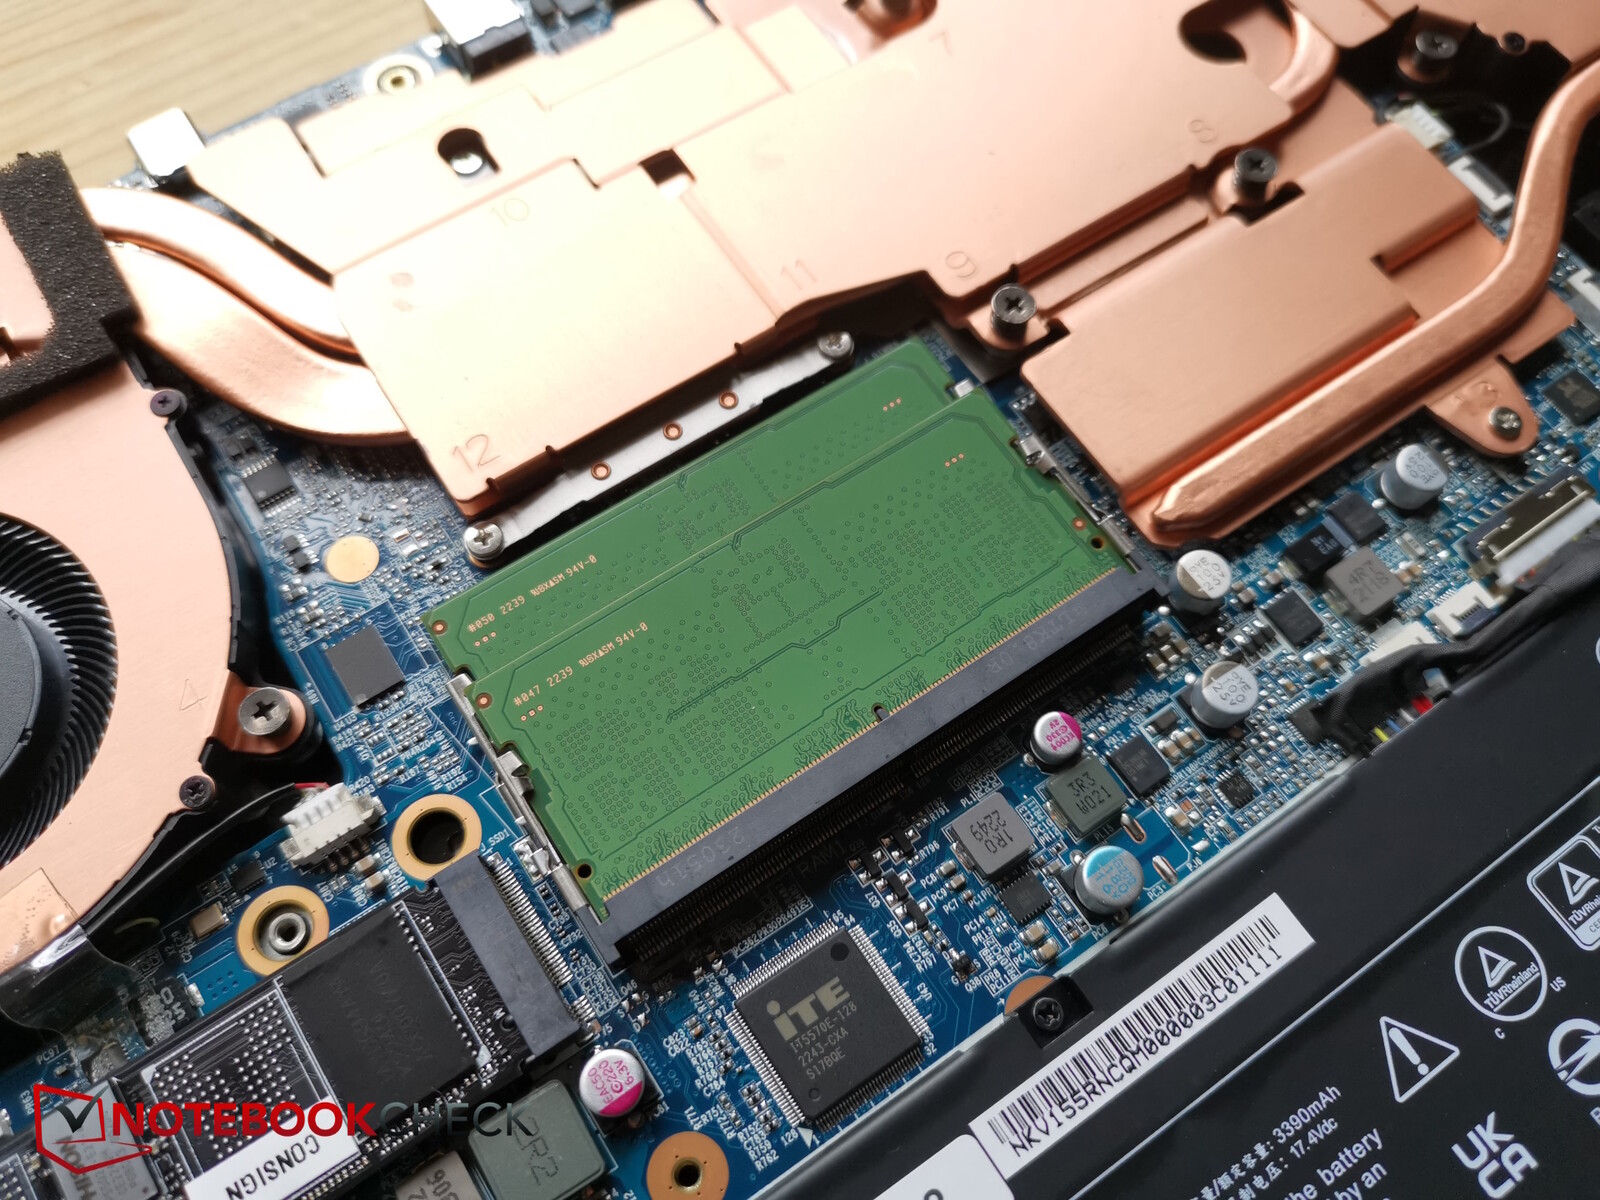
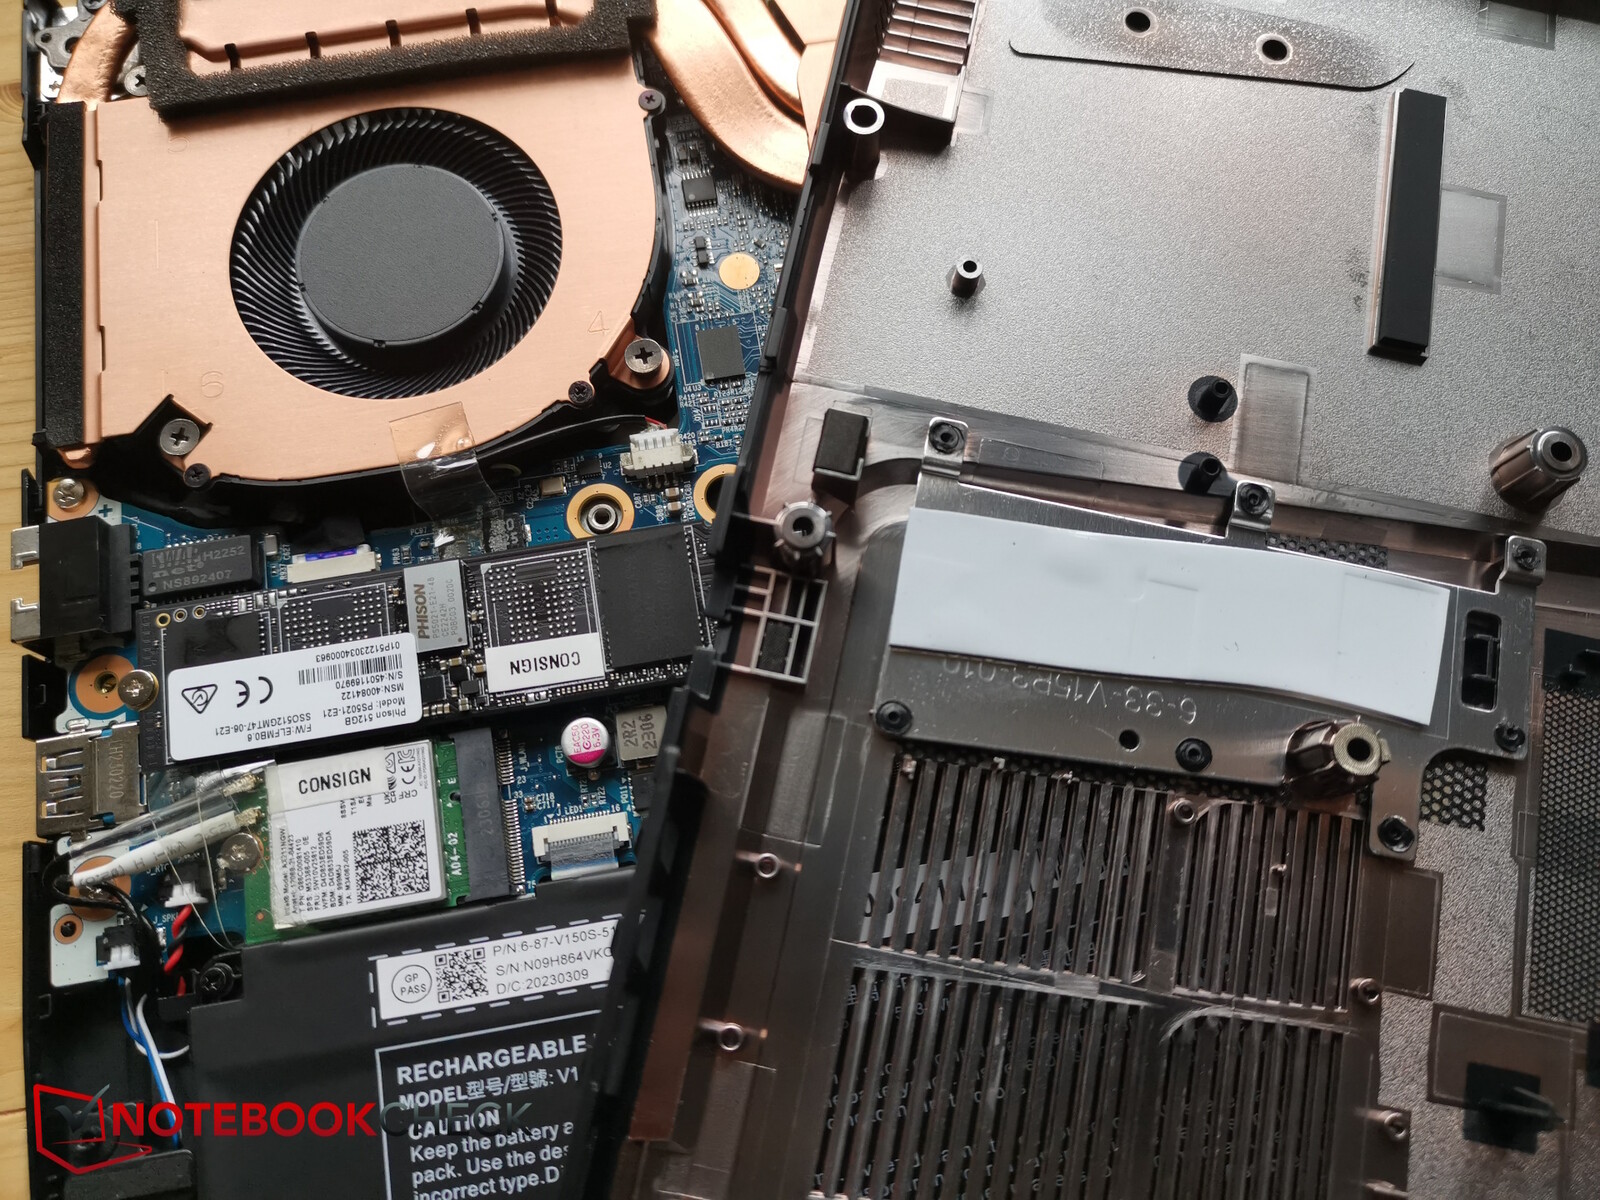
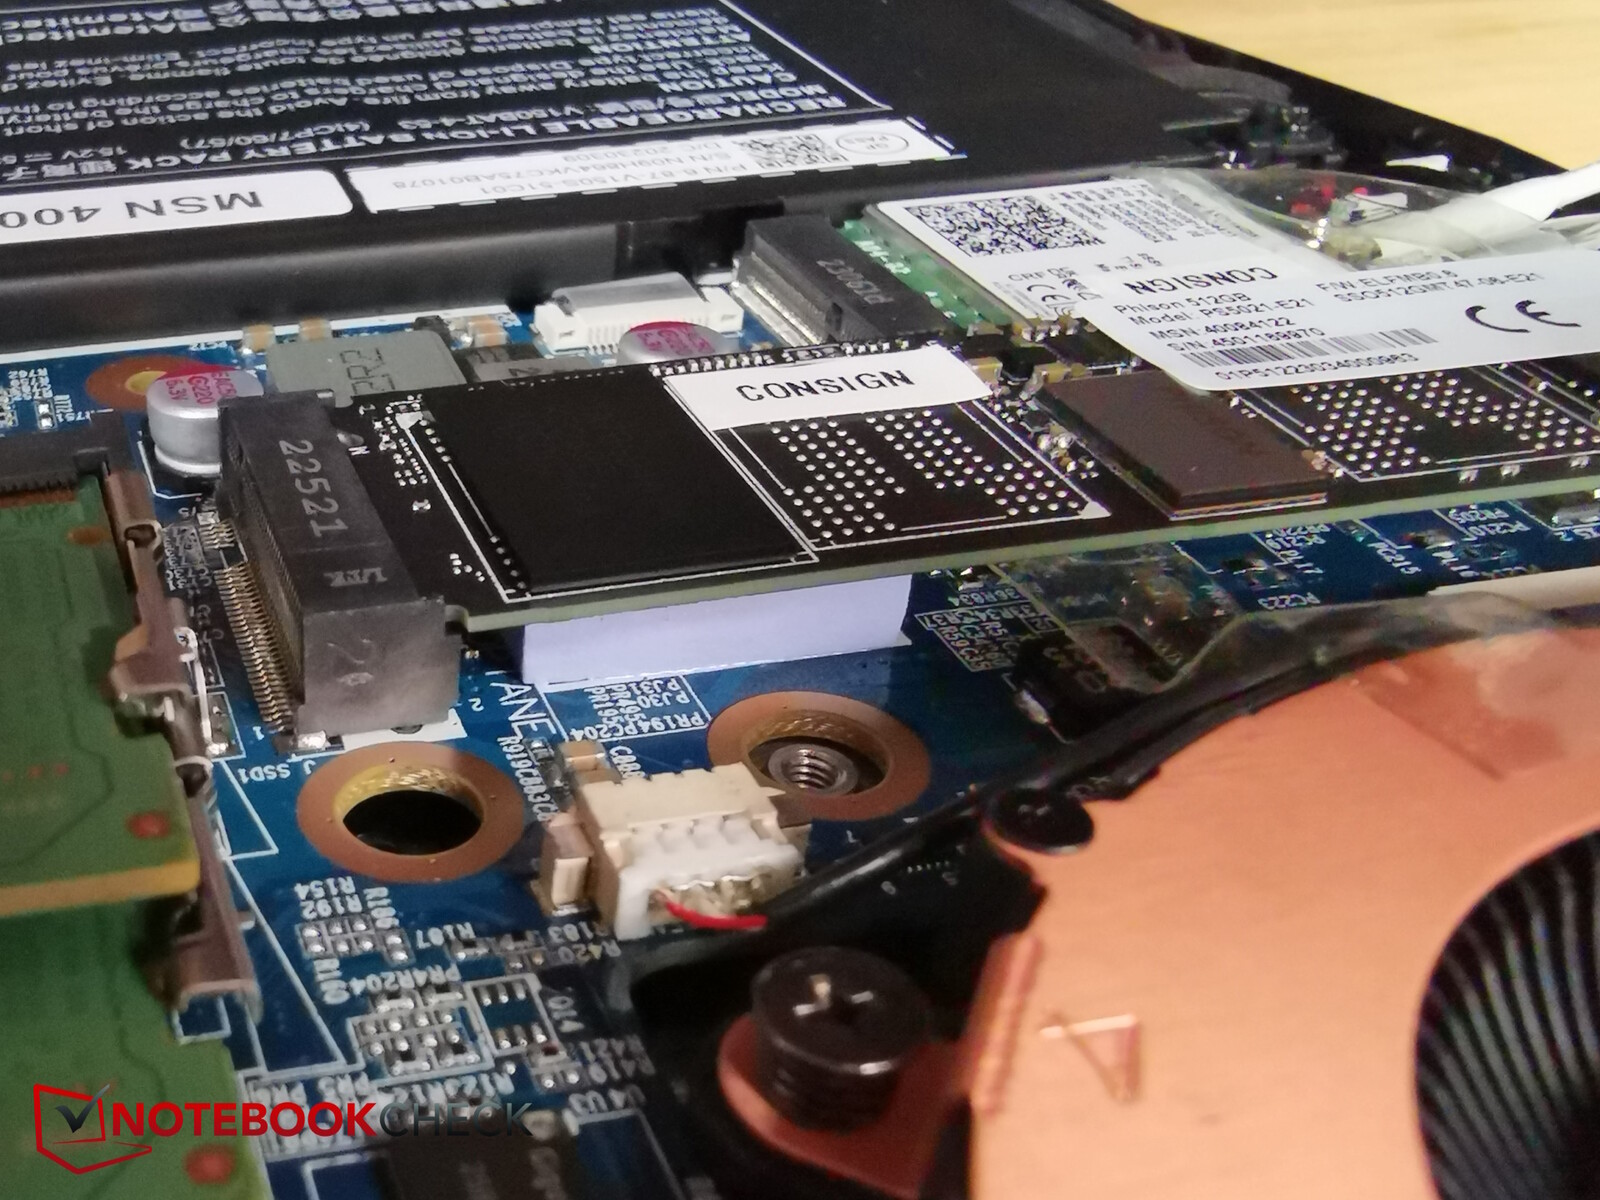
Per accedere ai componenti interni, è necessario rimuovere 14 viti Phillips della stessa dimensione. La piastra di base in plastica può quindi essere facilmente rimossa. Sotto, troverà un sistema di raffreddamento con molto rame, una batteria avvitata, due slot per la RAM, l'SSD raffreddato da due pad e il modulo WiFi sostituibile.
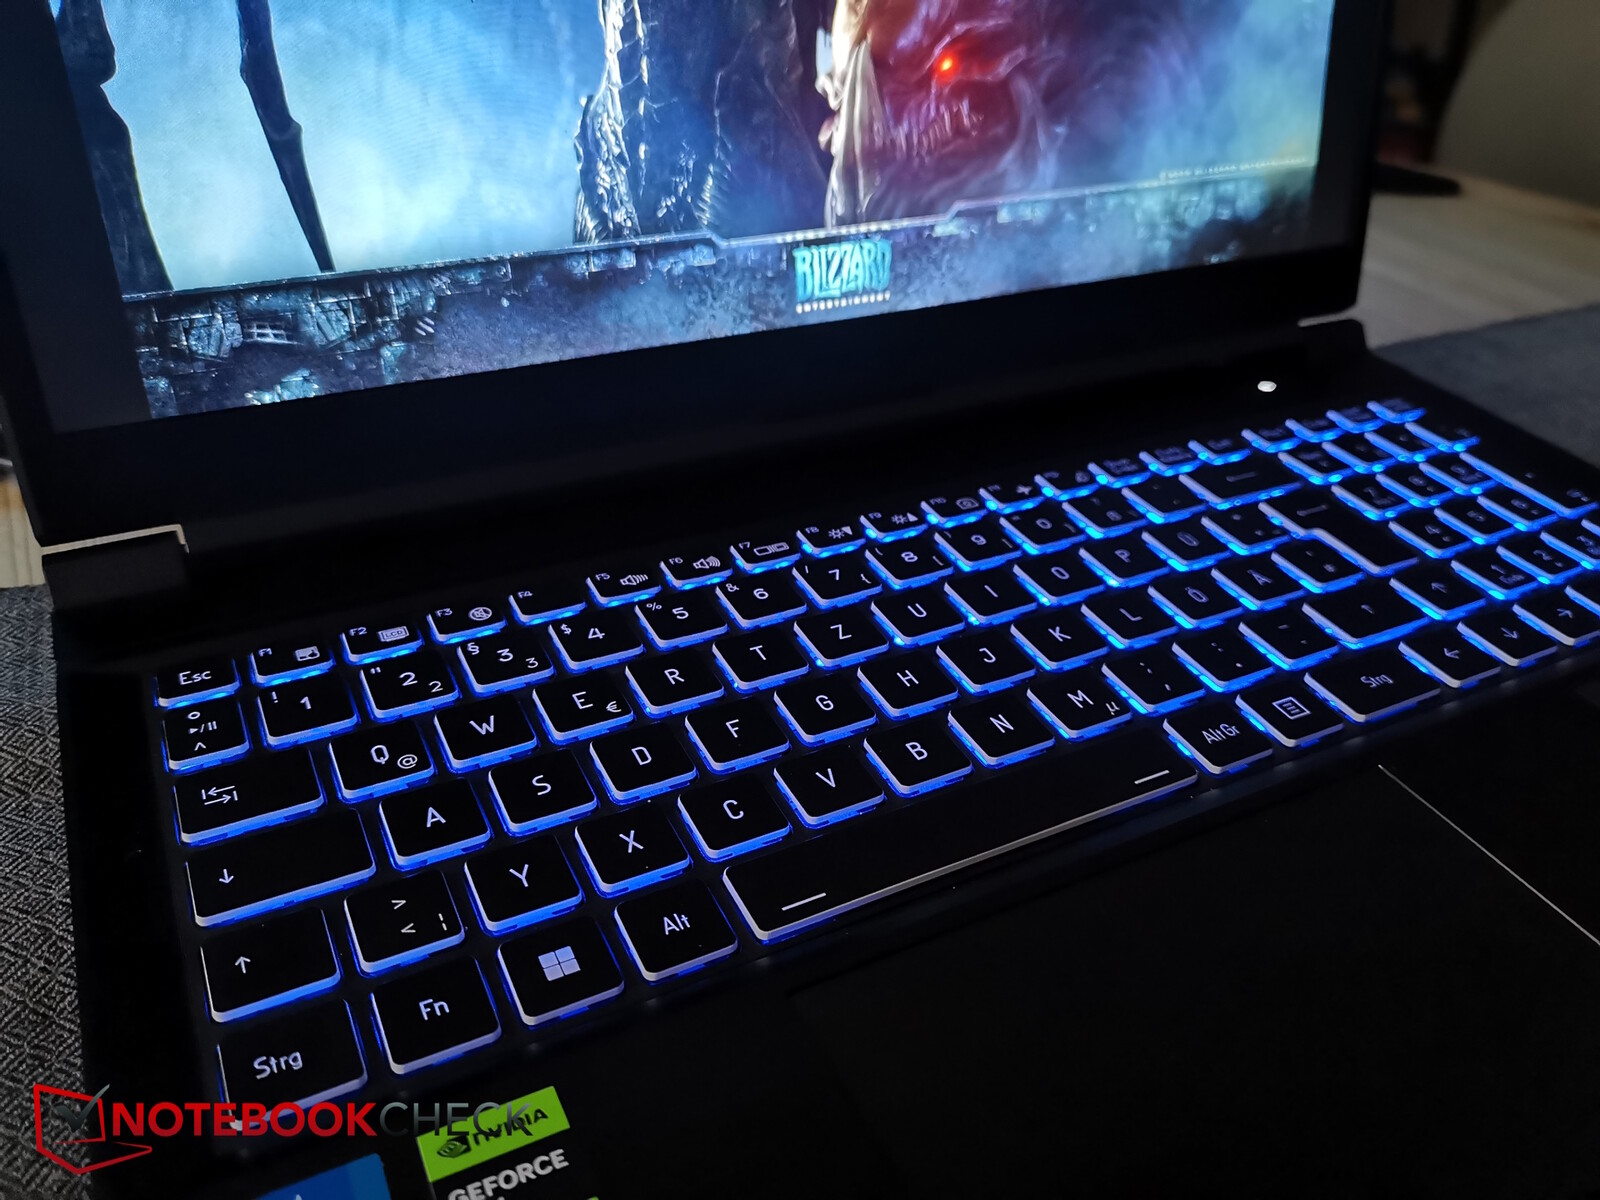
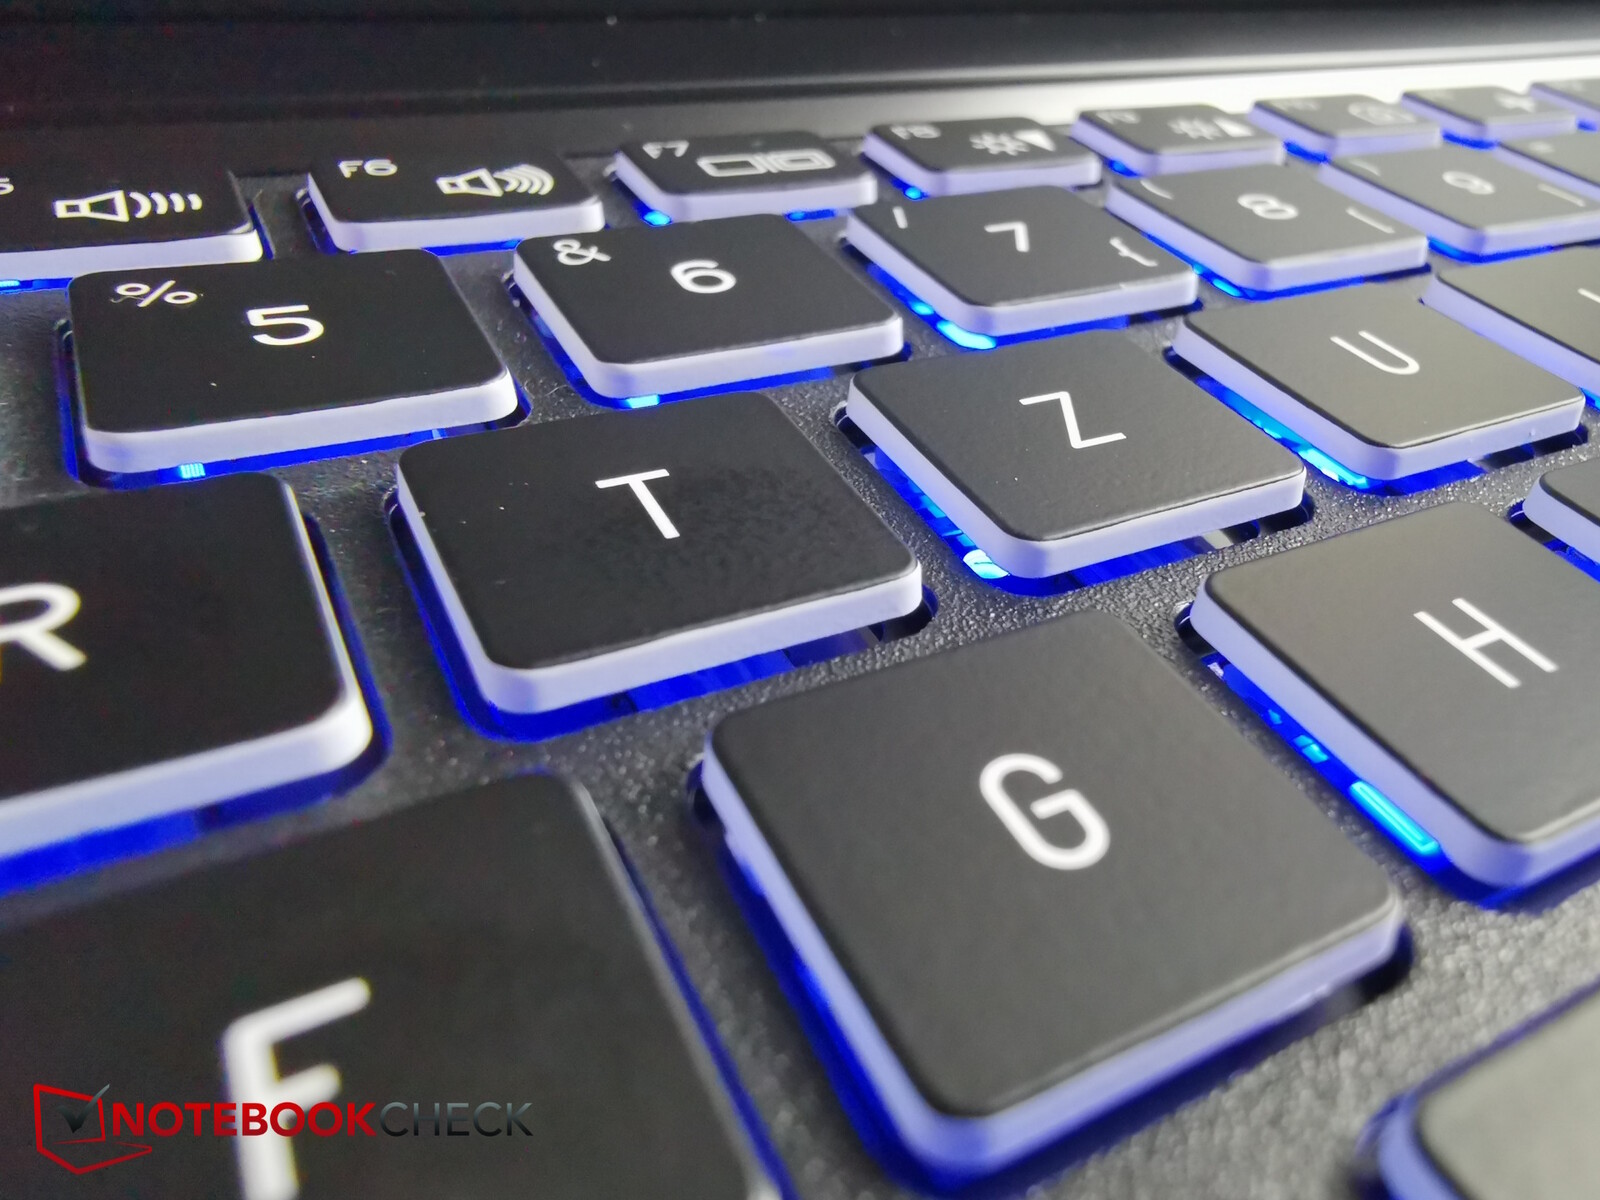
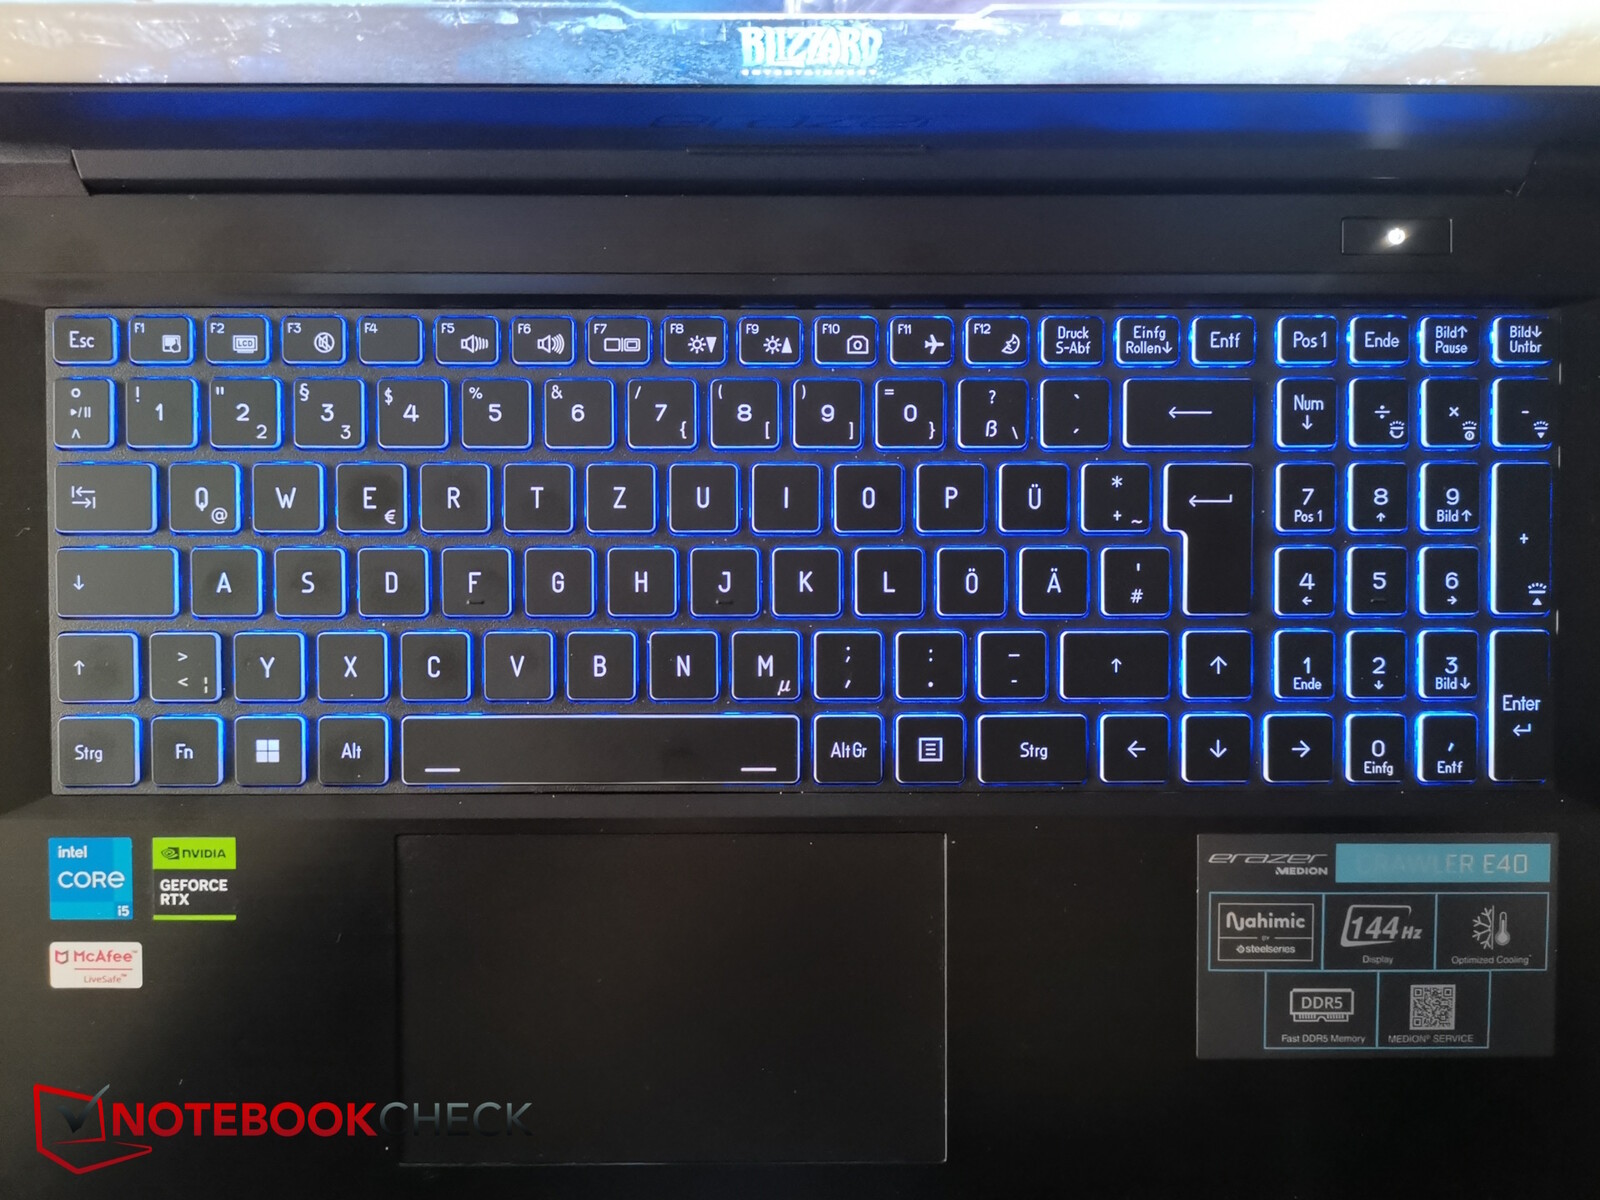
Dispositivi di input - Complessivamente solido
Il layout della tastiera, come quello di altri dispositivi Medion recensiti quest'anno, è abbastanza pulito. I tasti, tuttavia, sono piuttosto piccoli (1,4 cm), ma sono adeguatamente spaziati. A destra, c'è un tastierino numerico con tasti ancora più piccoli.
La corsa dei tasti è media e il feedback è un po' morbido. Tuttavia, è facile e veloce da digitare.
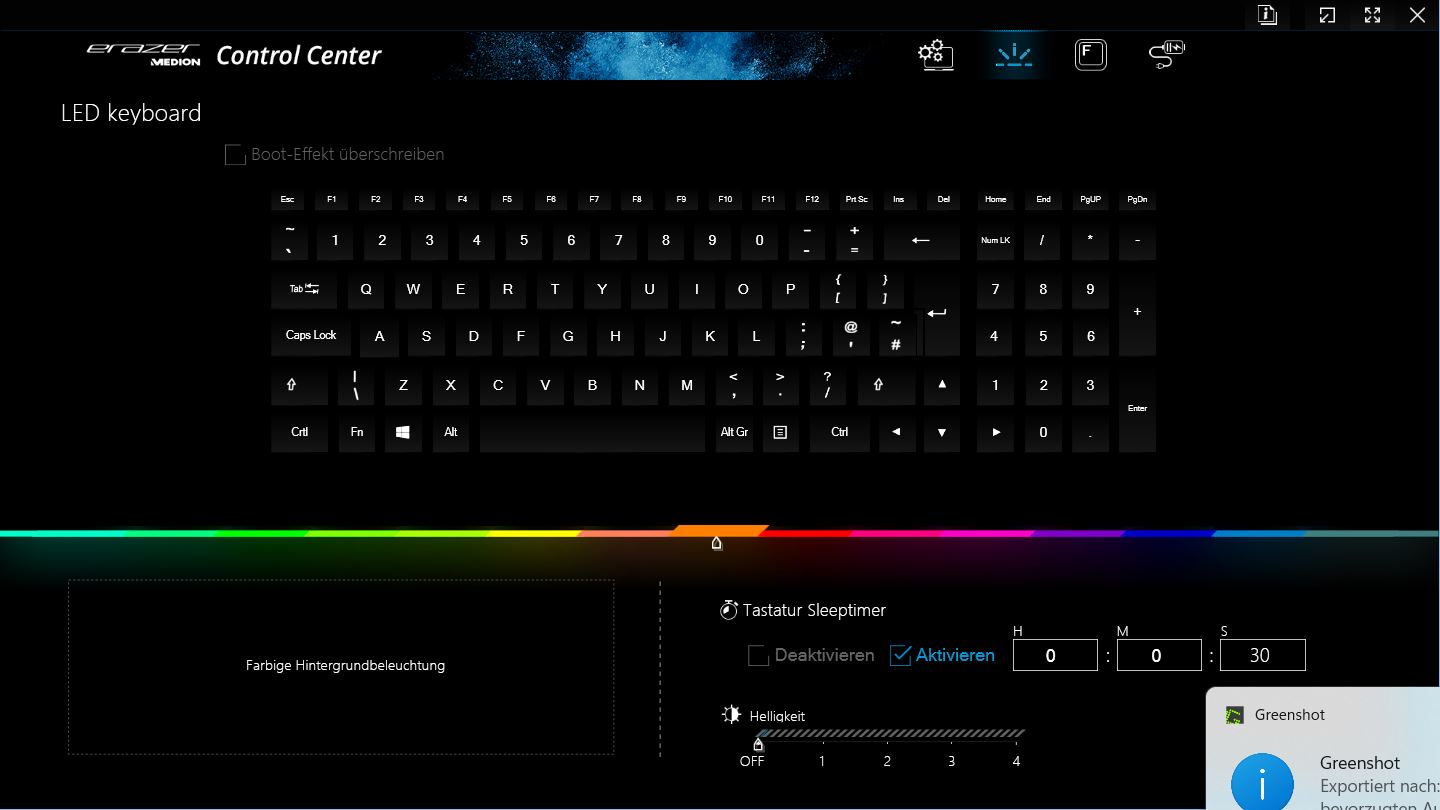
La retroilluminazione RGB a due livelli, che può essere configurata tramite il Control Center (vari colori) e controllata tramite tasti speciali, aiuta negli ambienti bui. Ma si tratta solo di una zona singola.
Il touchpad (circa 12,1 x 7,3 cm) è leggermente sfalsato a sinistra per essere il più centrale possibile sotto gli altri tasti del tastierino numerico. La superficie è scivolosa, ma i rumori di clic non proprio silenziosi sembrano un po' economici.
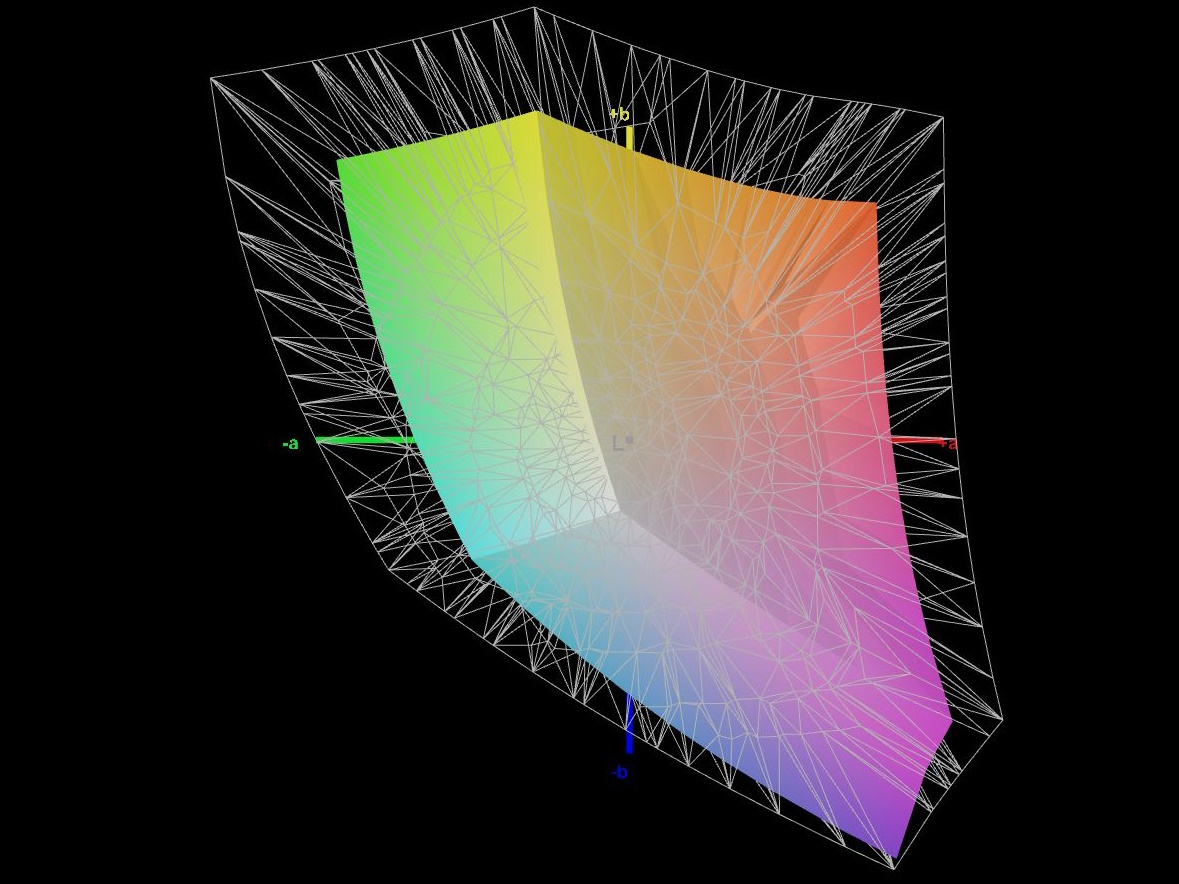
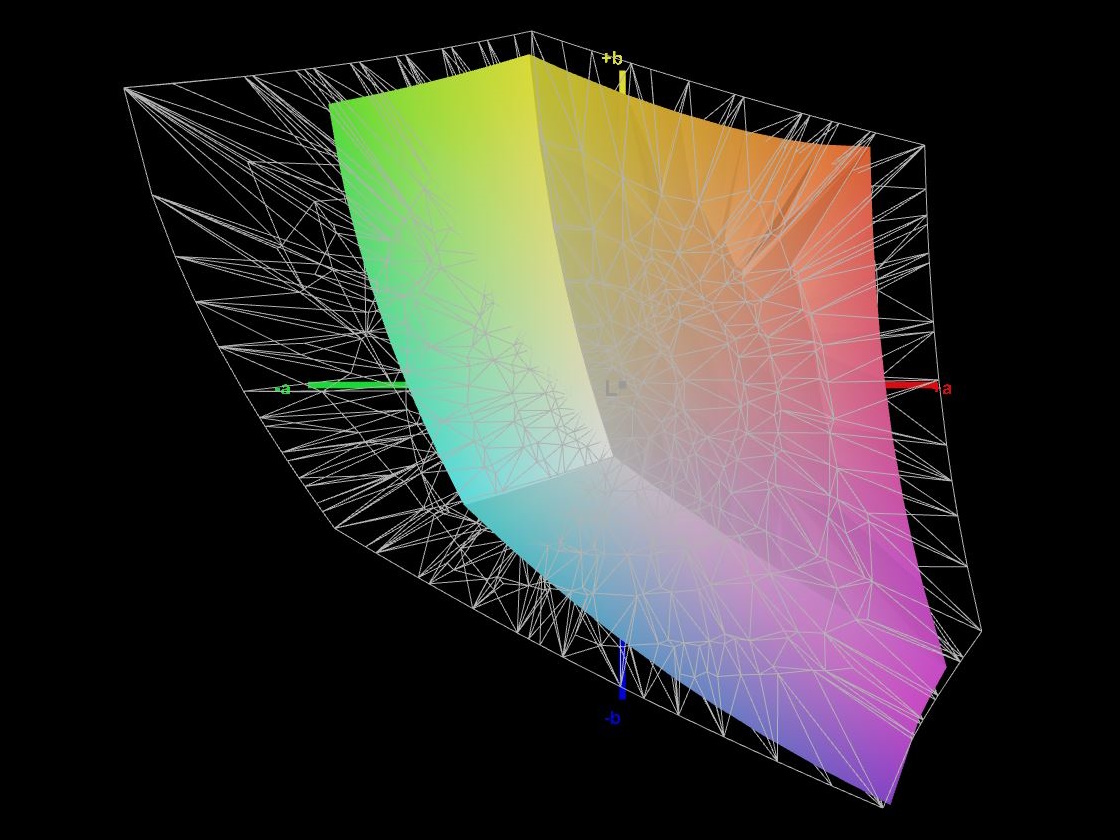
Display - Una vecchia conoscenza del 2019
Medion Erazer Crawler E40 presenta un display familiare, che è stato utilizzato in diversi computer portatili in precedenza. Il display IPS Full HD opaco con una frequenza di aggiornamento di 144 Hz non è l'ultimo arrivato, essendo stato utilizzato nel modello XMG Fusion 15 nel 2019.
La luminosità media del display di 350 nit è accettabile, anche se il contrasto è un po' compromesso dal debole valore del nero.
I tempi di risposta sono decenti per un computer portatile da gioco, e c'è una leggera presenza di backlight bleeding.
| |||||||||||||||||||||||||
Distribuzione della luminosità: 91 %
Al centro con la batteria: 356 cd/m²
Contrasto: 847:1 (Nero: 0.43 cd/m²)
ΔE ColorChecker Calman: 3.98 | ∀{0.5-29.43 Ø4.71}
calibrated: 1.36
ΔE Greyscale Calman: 4.39 | ∀{0.09-98 Ø4.96}
63.2% AdobeRGB 1998 (Argyll 3D)
89.7% sRGB (Argyll 3D)
61.4% Display P3 (Argyll 3D)
Gamma: 2.58
CCT: 7316 K
| Medion Erazer Crawler E40 - MD 62518 BOE HF NV156FHM-N4G, IPS, 1920x1080, 15.6" | Lenovo LOQ 15IRH8 Core i7 BOE CQ NE156QHM-NY4, IPS, 2560x1440, 15.6" | Asus TUF A15 FA507 N156HMA-GA1, IPS, 1920x1080, 15.6" | Schenker XMG Apex 15 (Late 23) BOE CQ NE156QHM-NY2, IPS, 2560x1440, 15.6" | MSI Katana 15 B12VEK AUOAF90 (B156HAN08.4), IPS, 1920x1080, 15.6" | |
|---|---|---|---|---|---|
| Display | 8% | 6% | 9% | -38% | |
| Display P3 Coverage (%) | 61.4 | 66.3 8% | 64.9 6% | 67.5 10% | 38.1 -38% |
| sRGB Coverage (%) | 89.7 | 96.6 8% | 96.5 8% | 97.6 9% | 56.8 -37% |
| AdobeRGB 1998 Coverage (%) | 63.2 | 67.7 7% | 66.6 5% | 68.9 9% | 39.3 -38% |
| Response Times | 25% | -199% | -29% | -282% | |
| Response Time Grey 50% / Grey 80% * (ms) | 8 ? | 5 ? 37% | 30.4 ? -280% | 13.2 ? -65% | 38.8 ? -385% |
| Response Time Black / White * (ms) | 9.6 ? | 8.41 ? 12% | 20.8 ? -117% | 8.8 ? 8% | 26.8 ? -179% |
| PWM Frequency (Hz) | |||||
| Screen | 3% | 32% | 12% | -46% | |
| Brightness middle (cd/m²) | 364 | 373 2% | 288 -21% | 336 -8% | 261 -28% |
| Brightness (cd/m²) | 351 | 365 4% | 271 -23% | 307 -13% | 258 -26% |
| Brightness Distribution (%) | 91 | 90 -1% | 91 0% | 77 -15% | 92 1% |
| Black Level * (cd/m²) | 0.43 | 0.33 23% | 0.17 60% | 0.38 12% | 0.19 56% |
| Contrast (:1) | 847 | 1130 33% | 1694 100% | 884 4% | 1374 62% |
| Colorchecker dE 2000 * | 3.98 | 4.19 -5% | 1.9 52% | 1.96 51% | 5.57 -40% |
| Colorchecker dE 2000 max. * | 6.38 | 8.47 -33% | 3.3 48% | 5.07 21% | 20.6 -223% |
| Colorchecker dE 2000 calibrated * | 1.36 | 1.07 21% | 0.9 34% | 1.27 7% | 4.63 -240% |
| Greyscale dE 2000 * | 4.39 | 5 -14% | 2.7 38% | 2.3 48% | 3.19 27% |
| Gamma | 2.58 85% | 1.93 114% | 2.32 95% | 2.017 109% | 2.45 90% |
| CCT | 7316 89% | 7520 86% | 6535 99% | 6644 98% | 6146 106% |
| Media totale (Programma / Settaggio) | 12% /
7% | -54% /
-6% | -3% /
6% | -122% /
-78% |
* ... Meglio usare valori piccoli
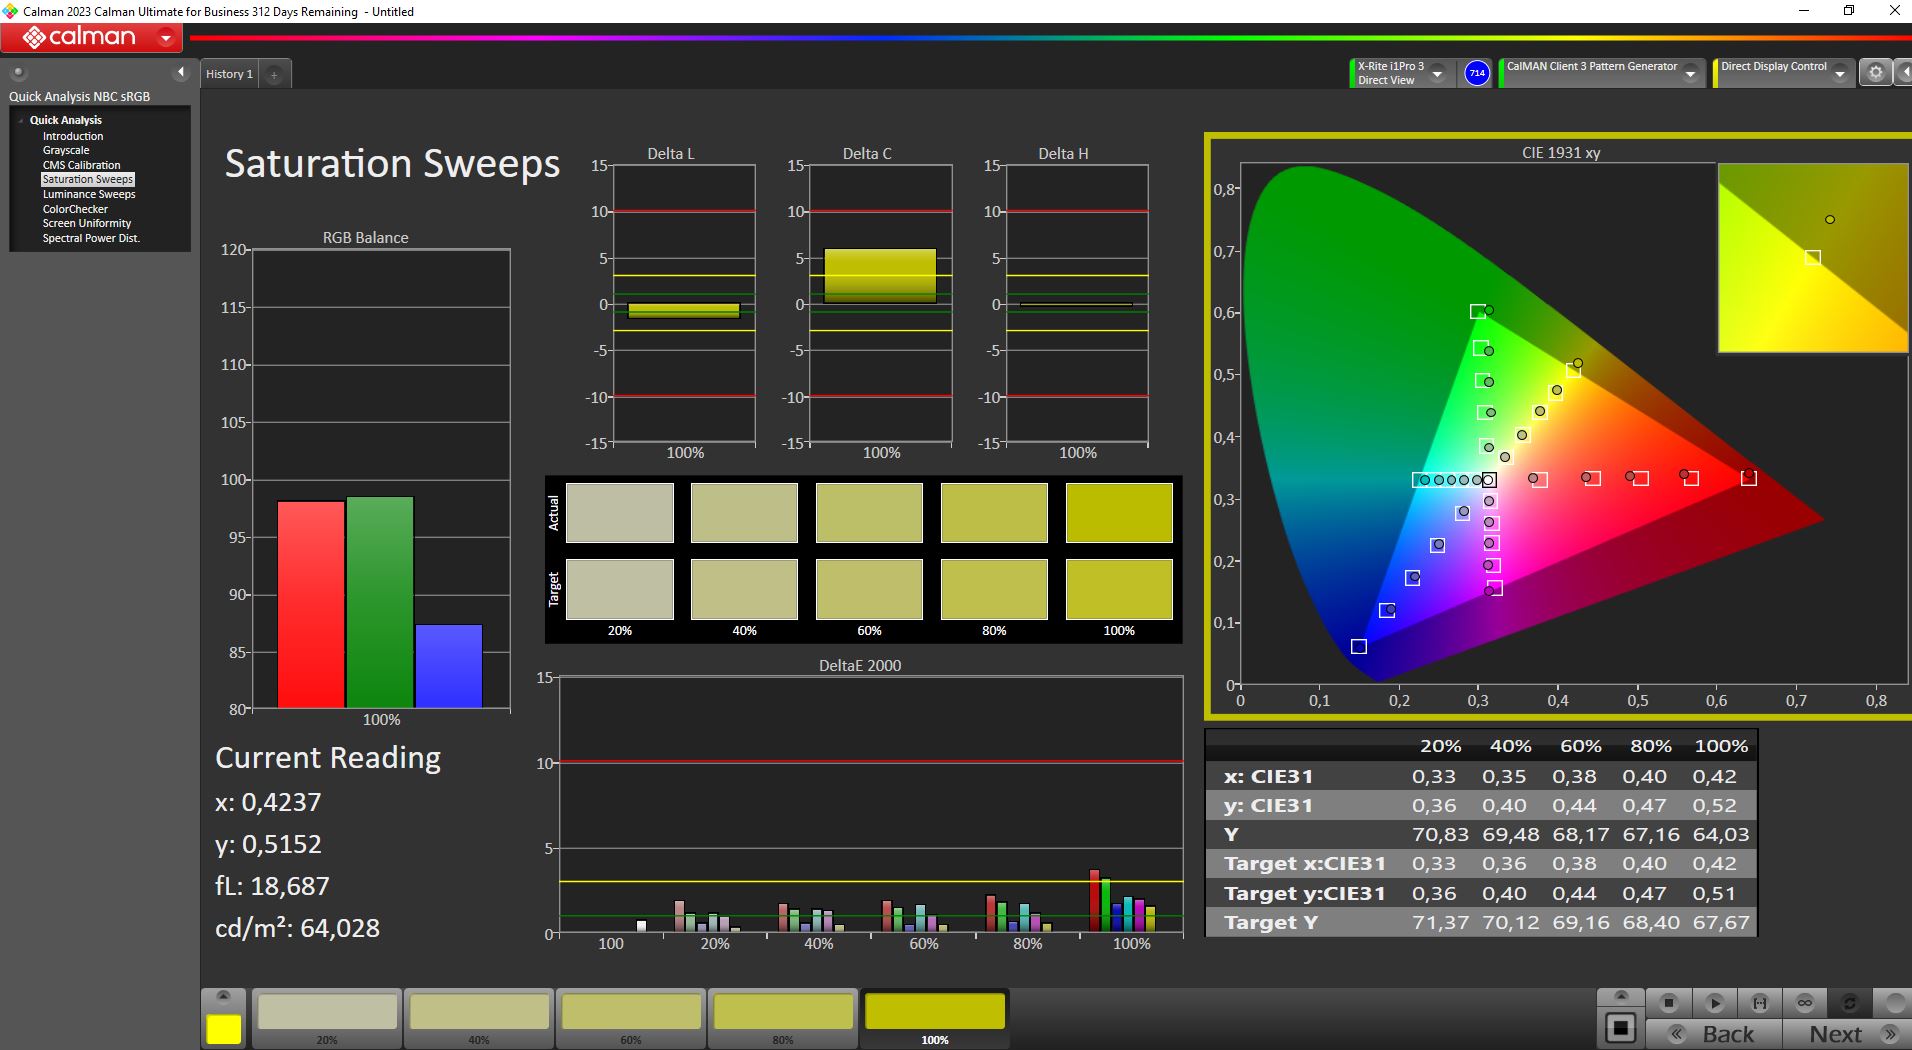
Le prestazioni del display sono subottimali, con valori DeltaE per i colori e la scala di grigi molto superiori all'obiettivo e un livello di nero eccessivamente alto. Tuttavia, la calibrazione del pannello e la riduzione della luminosità migliorano notevolmente la qualità della visualizzazione. Dopo la calibrazione, i valori DeltaE si riducono a un lodevole 0,55 per la scala di grigi e 1,36 per ColorChecker.
Può scaricare gratuitamente il nostro profilo colore calibrato qui sopra.
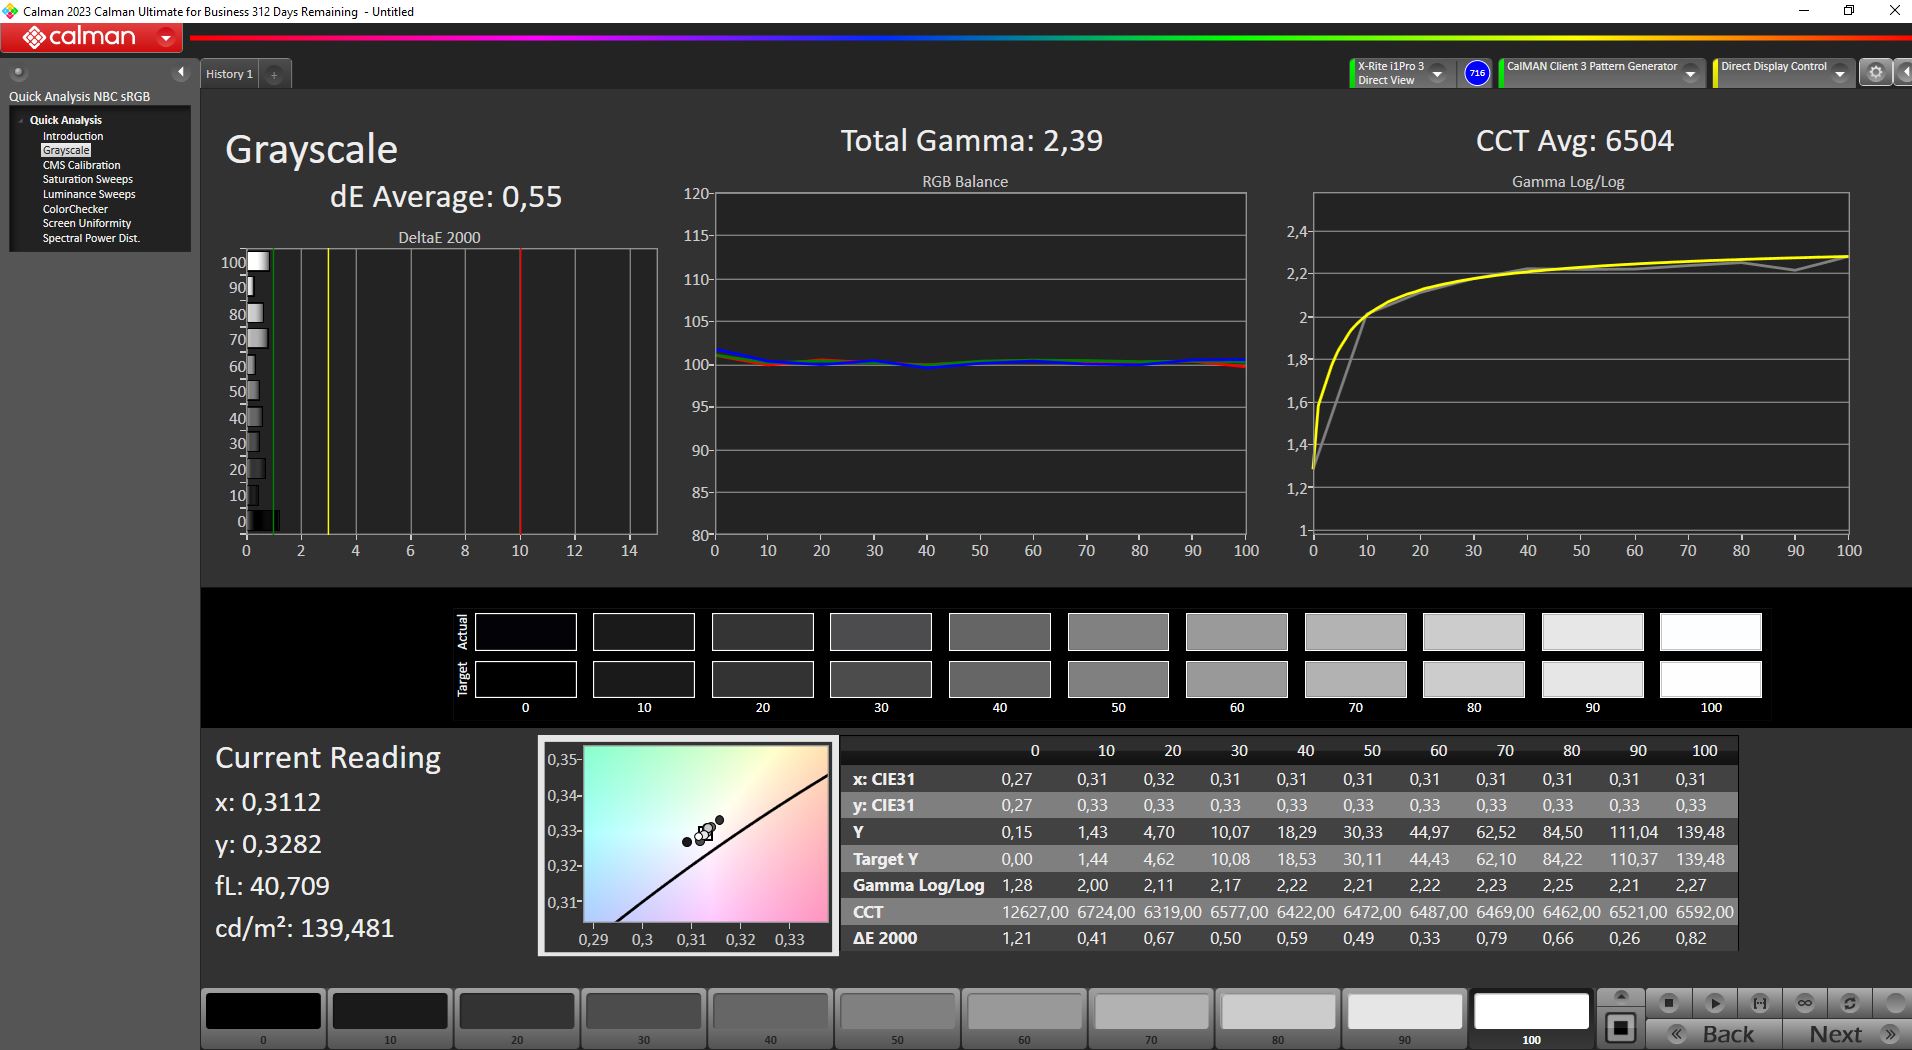
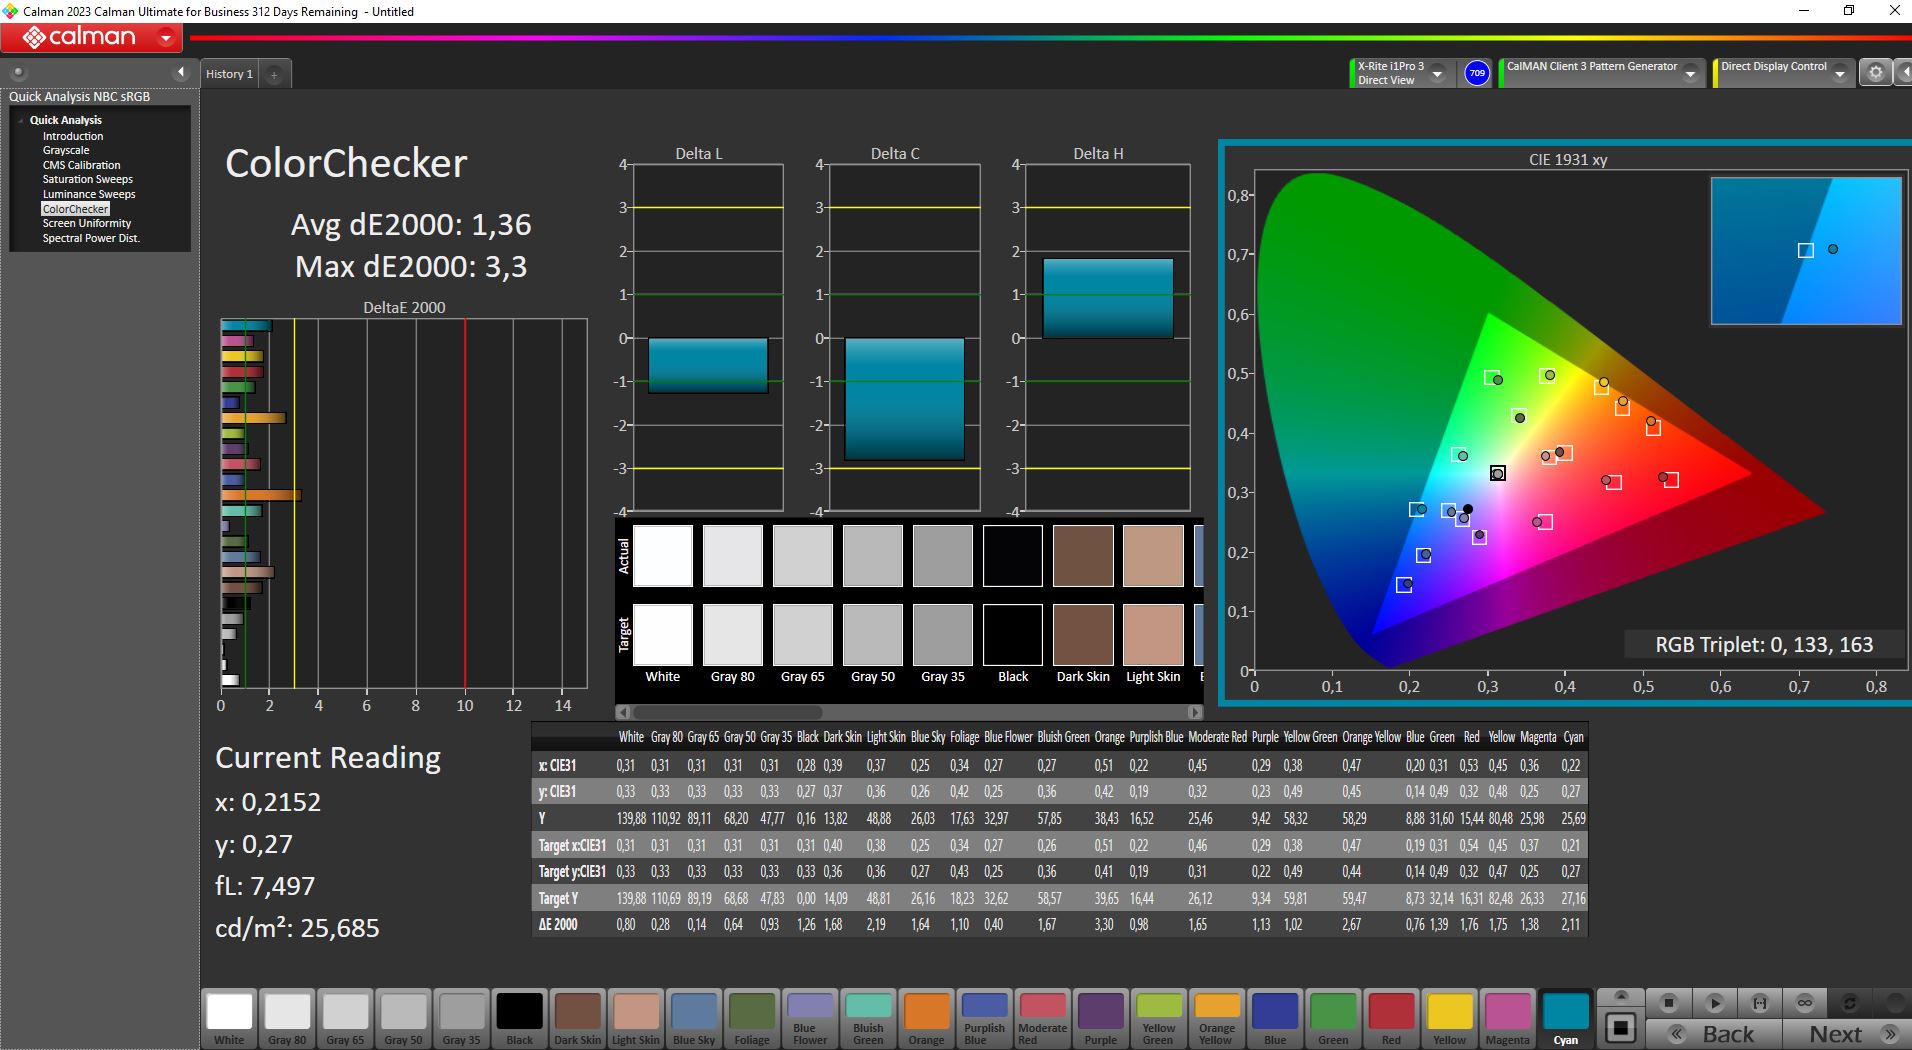
Il pannello più vecchio presenta evidenti debolezze in termini di copertura dello spazio colore, con una copertura di sRGB pari solo al 90 percento nel migliore dei casi. Nonostante i buoni valori DeltaE, il pannello potrebbe essere meno adatto ai creatori di contenuti.
Tempi di risposta del Display
| ↔ Tempi di risposta dal Nero al Bianco | ||
|---|---|---|
| 9.6 ms ... aumenta ↗ e diminuisce ↘ combinato | ↗ 5.4 ms Incremento | 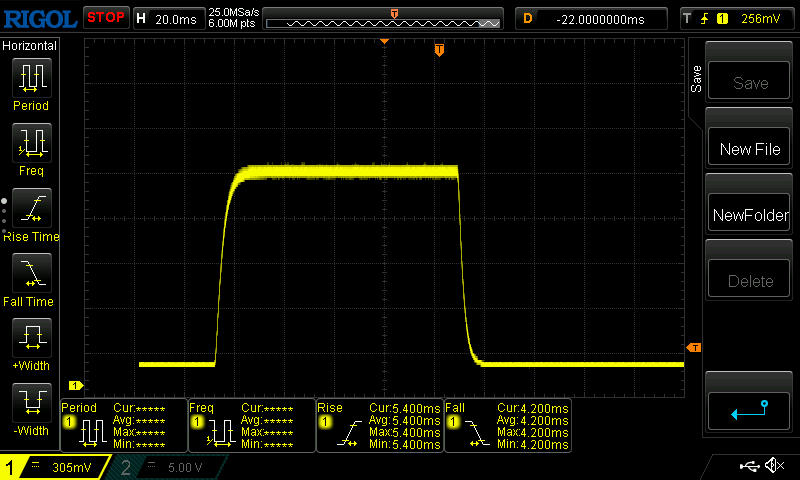 |
| ↘ 4.2 ms Calo | ||
| Lo schermo mostra veloci tempi di risposta durante i nostri tests e dovrebbe esere adatto al gaming In confronto, tutti i dispositivi di test variano da 0.1 (minimo) a 240 (massimo) ms. » 26 % di tutti i dispositivi è migliore. Questo significa che i tempi di risposta rilevati sono migliori rispettto alla media di tutti i dispositivi testati (19.8 ms). | ||
| ↔ Tempo di risposta dal 50% Grigio all'80% Grigio | ||
| 8 ms ... aumenta ↗ e diminuisce ↘ combinato | ↗ 3.8 ms Incremento | 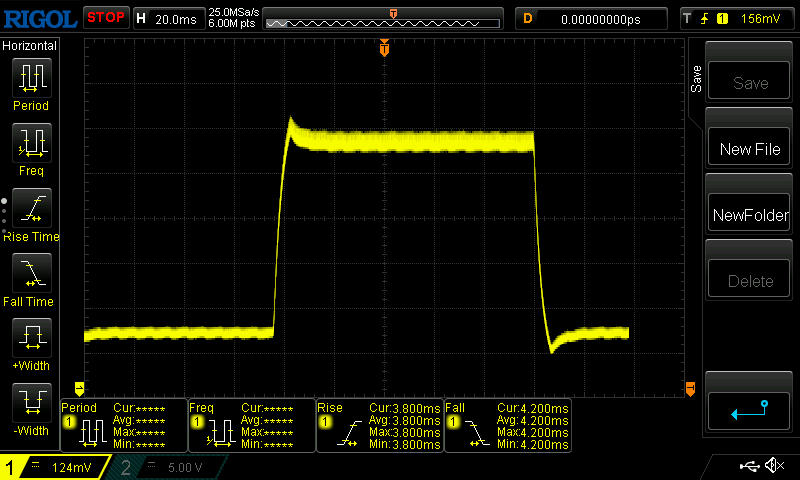 |
| ↘ 4.2 ms Calo | ||
| Lo schermo mostra veloci tempi di risposta durante i nostri tests e dovrebbe esere adatto al gaming In confronto, tutti i dispositivi di test variano da 0.165 (minimo) a 636 (massimo) ms. » 21 % di tutti i dispositivi è migliore. Questo significa che i tempi di risposta rilevati sono migliori rispettto alla media di tutti i dispositivi testati (31 ms). | ||
Sfarfallio dello schermo / PWM (Pulse-Width Modulation)
| flickering dello schermo / PWM non rilevato |  | ||
In confronto: 52 % di tutti i dispositivi testati non utilizza PWM per ridurre la luminosita' del display. Se è rilevato PWM, una media di 7754 (minimo: 5 - massimo: 343500) Hz è stata rilevata. | |||
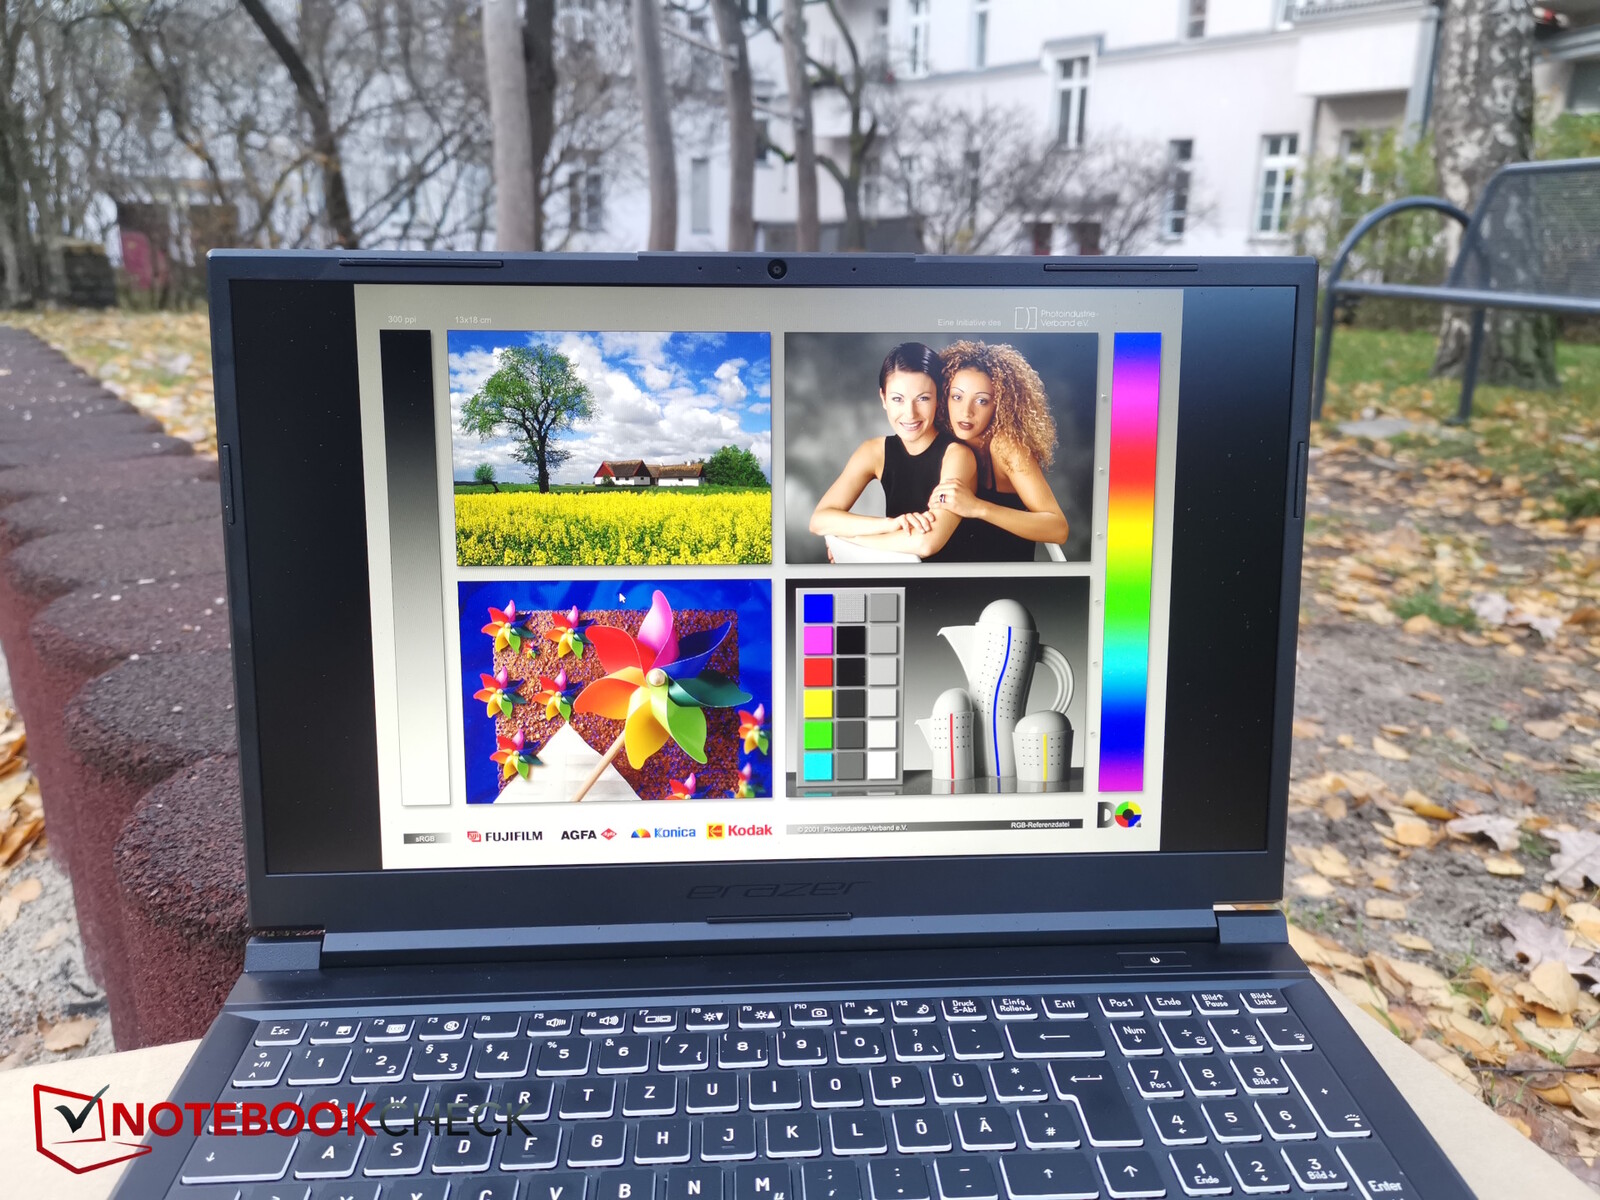
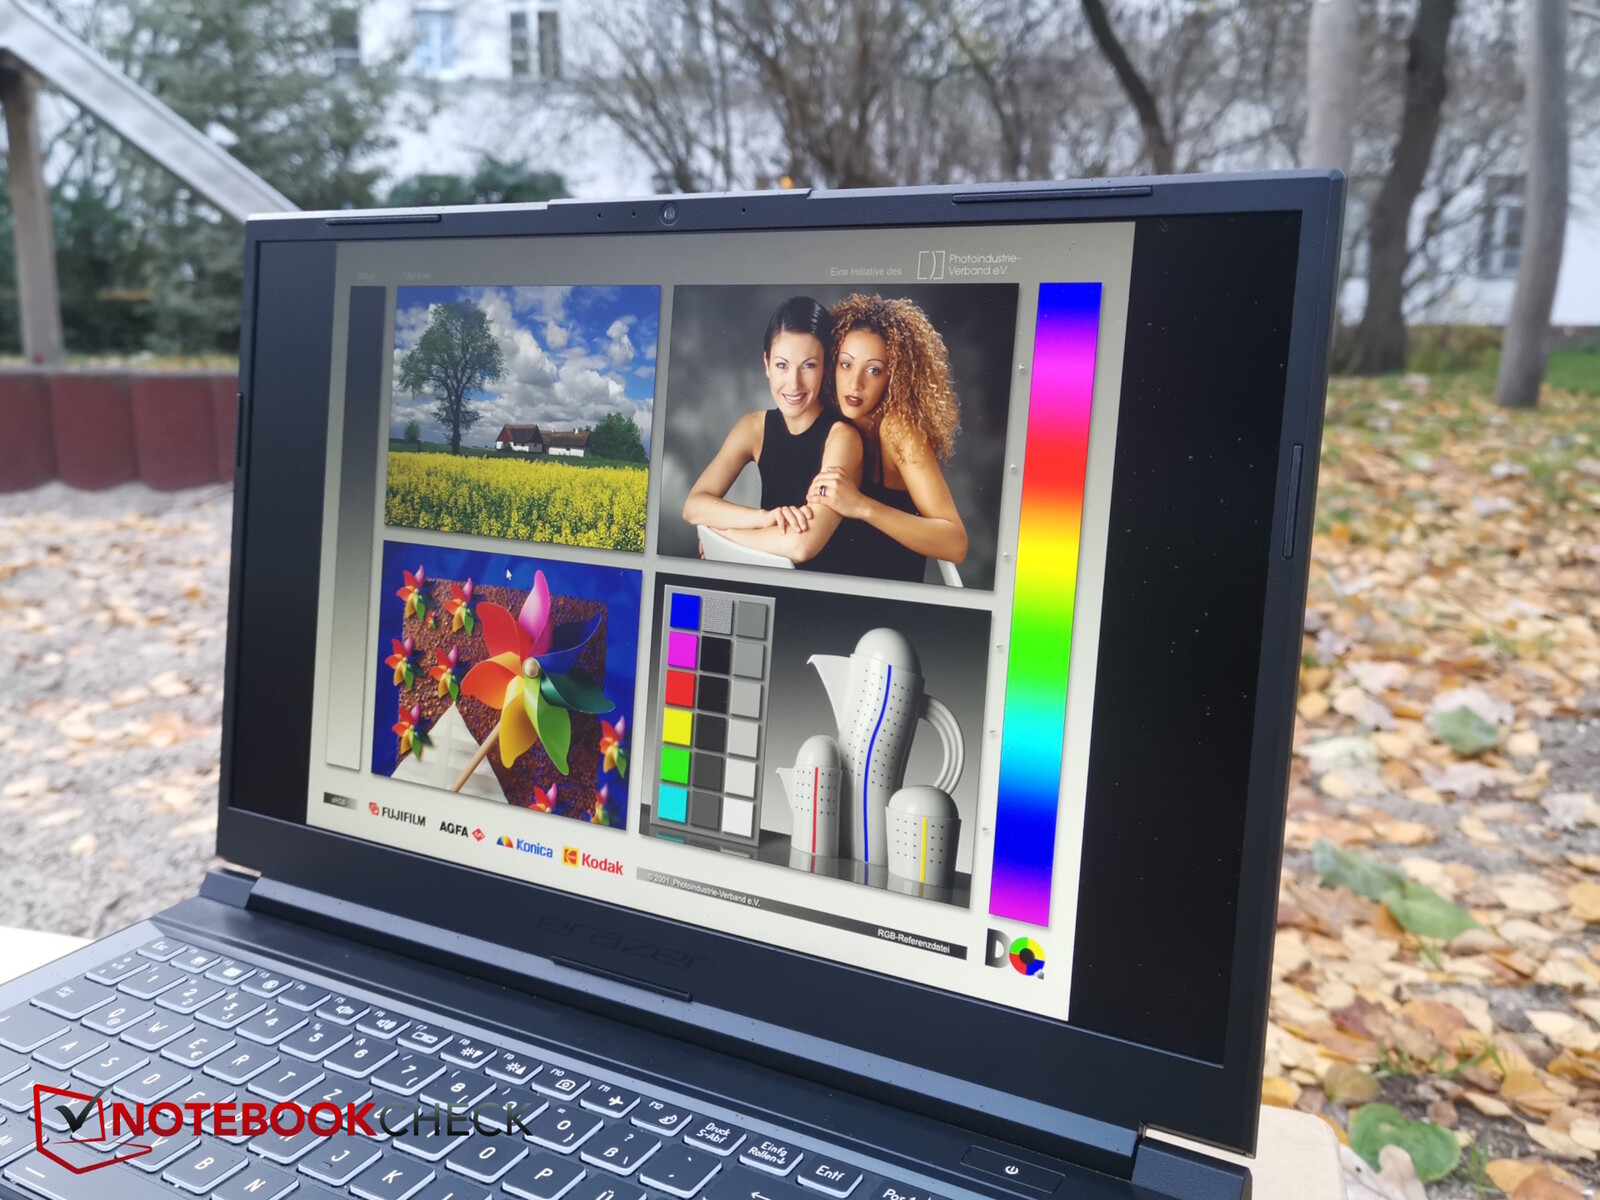
La superficie opaca, insieme alla luminosità di 350 nit, fa sì che lavorare all'aperto, almeno in un luogo ombreggiato, non sia una sfida.

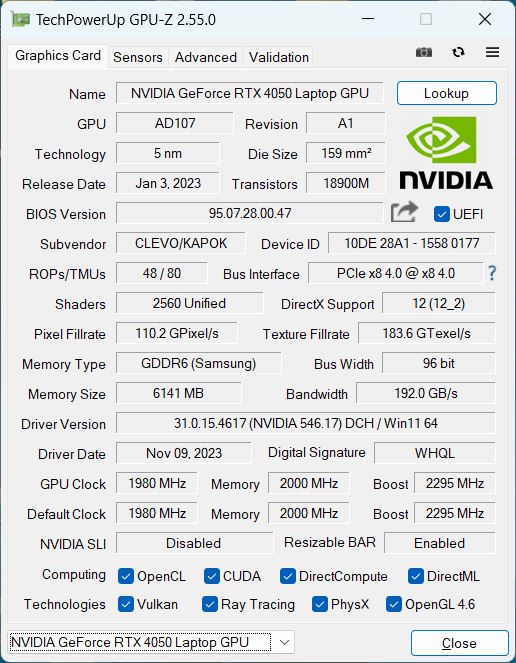
Prestazioni - Una buona combinazione di i5-13500H e RTX 4050
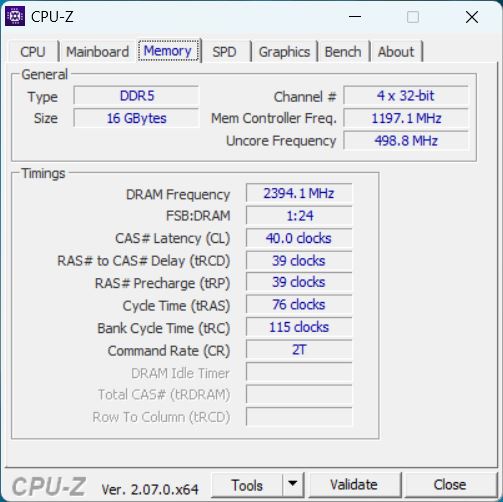
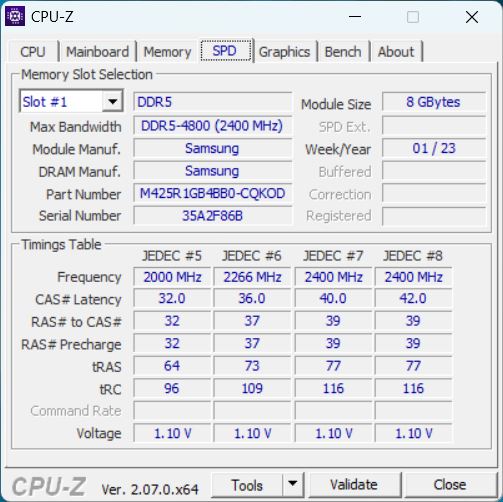
Con il Crawler, abbiamo un computer portatile da gioco entry-level, come indicato dal modello Nvidia GeForce RTX 4050 e dal Intel Core i5-13500Hentrambi sono solide varianti economiche tra i componenti da gioco. Ci sono anche 16 GB di moderna RAM DDR5-4800 e un SSD NVMe da 512 GB, e anche lo spazio di archiviazione è un'opzione più economica.
Questo rende il portatile adatto a chi non deve necessariamente giocare a tutti i giochi attuali con il massimo dei dettagli. Per molti giochi, tuttavia, le prestazioni nella risoluzione nativa di 1080p dovrebbero essere sufficienti per ottenere dettagli elevati. Anche i creatori di contenuti potrebbero essere interessati alle prestazioni e al design semplice, ma è probabile che il display sia un criterio di successo per il lavoro creativo vero e proprio (immagini, video).
Condizioni del test
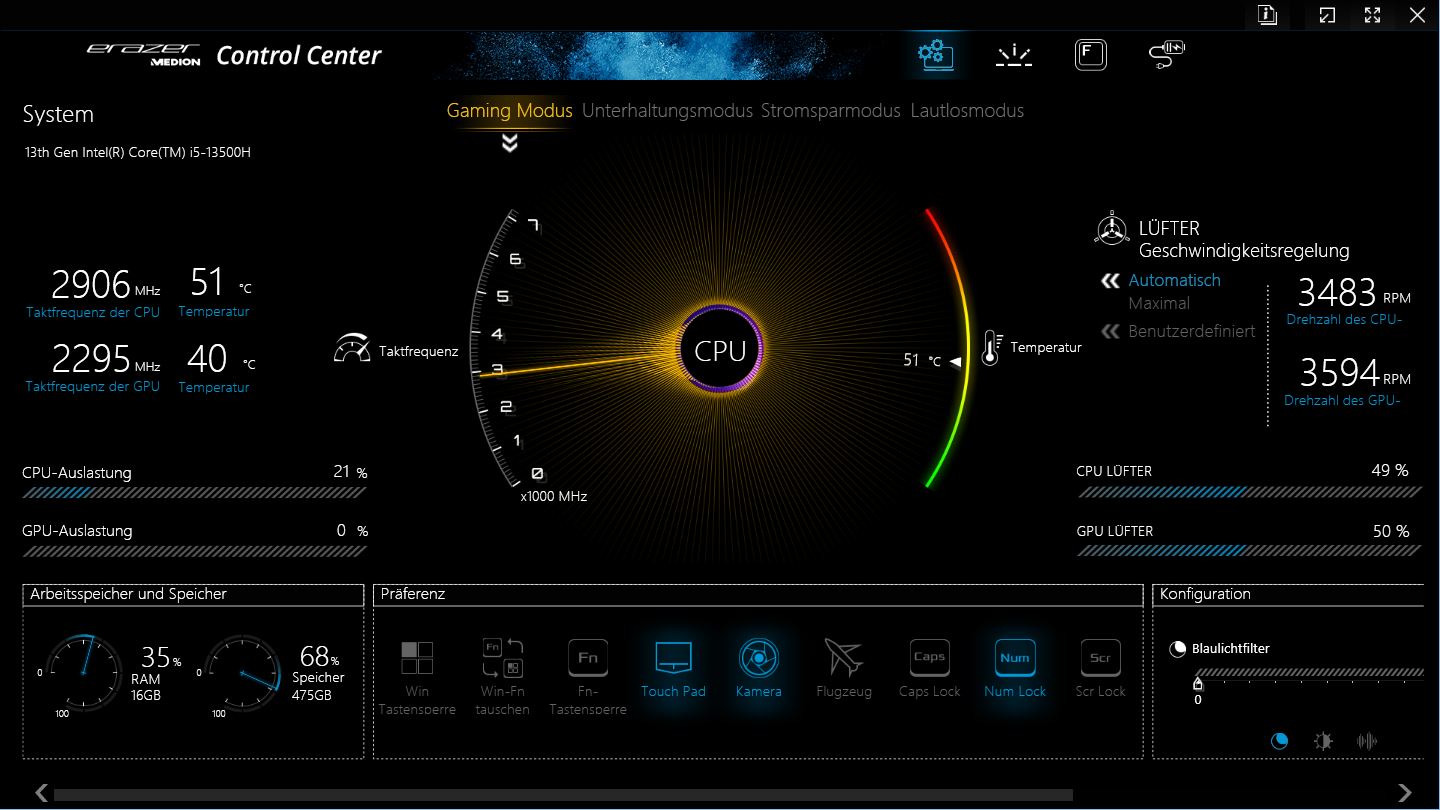
Medion ha preinstallato un Control Center generico su Crawler E40, che ospita i profili delle prestazioni, l'illuminazione della tastiera e altre impostazioni. L'applicazione non è particolarmente veloce e spesso elabora gli input con un leggero ritardo.
Nella schermata principale, è anche un po' fastidioso che si debba scorrere in basso a destra per accedere all'interruttore della GPU (MSHybrid vs. dGPU, è necessario il riavvio), ad esempio, che potrebbe essere disegnato in modo più chiaro con un piccolo sforzo.
Abbiamo utilizzato la modalità di gioco per i benchmark delle prestazioni e la modalità di risparmio energetico per i test della batteria, in quanto la dGPU viene disattivata e la GPU integrata prende il sopravvento.
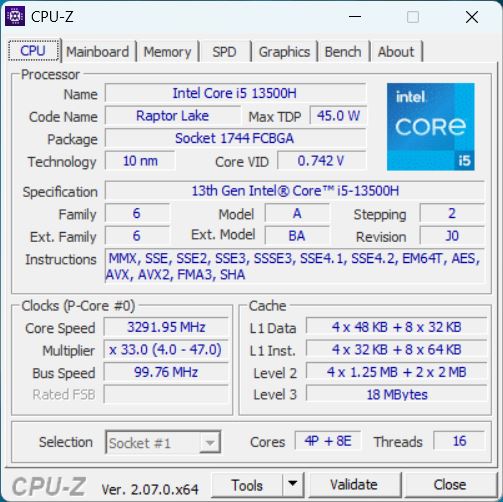
Processore
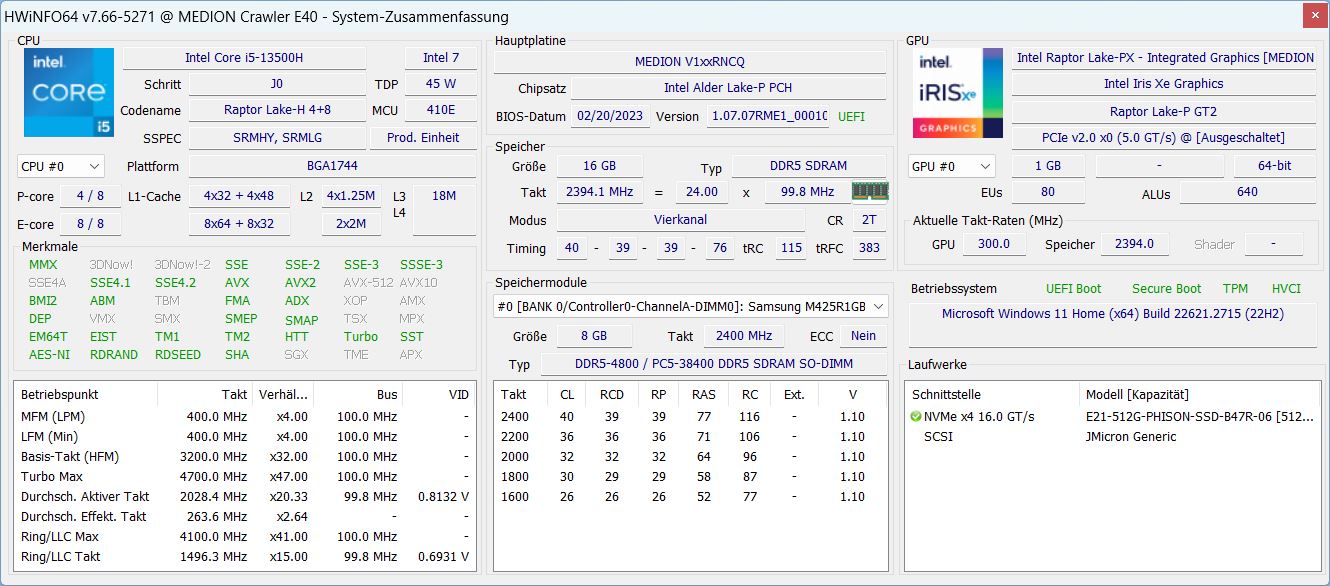
Il Intel Core i5-13500H è una CPU di fascia media dell'attuale serie Raptor Lake-H (Intel Gen13). Dispone di 4 dei possibili 6 core P e 8 core E. Insieme, ha 12 core e 16 thread (solo i core P supportano l'hyperthreading). Il clock di base E è di 1,9 GHz, i core P possono raggiungere individualmente un clock di 4,7 GHz e insieme un clock di 4,6 GHz.
Per inciso, esiste un Medion Erazer Crawler E50 con Intel Gen 12 i5-12450H. Lo schema di denominazione di Medion è davvero molto opaco e può trarre in inganno gli acquirenti, quindi faccia attenzione al momento dell'acquisto!
Nei nostri benchmark, la CPU ha fornito buone prestazioni ed è praticamente alla pari con un i5-13500 medio del nostro database.
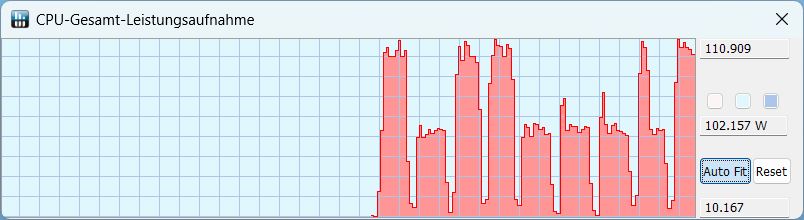
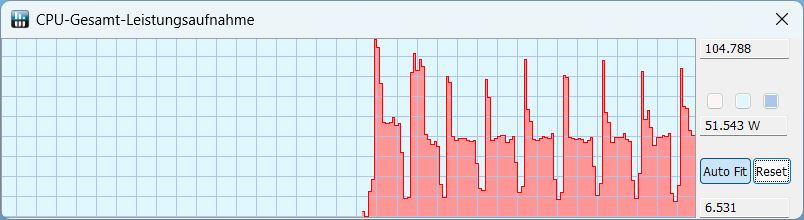
Durante il ciclo Cinebench R15, il processore mostra prestazioni molto costanti fin dall'inizio, senza cali dopo i primi cicli. La tabella seguente mostra il comportamento nelle varie modalità di prestazioni, compresa la modalità batteria.
| Modalità/Valore | Punteggio Cinebench R15 | Consumo della CPU Gamma | Consumo della CPU tipico |
|---|---|---|---|
| Gaming | 2.331 | 60 - 110 W | 105 |
| Intrattenimento | 2.135 | 50-105 | 51 |
| Silenzioso | 835 | 15-23 | 15 |
| Batteria | 1.065 | 19-21 | 21 |
Cinebench R15 Multi Loop
Cinebench R23: Multi Core | Single Core
Cinebench R20: CPU (Multi Core) | CPU (Single Core)
Cinebench R15: CPU Multi 64Bit | CPU Single 64Bit
Blender: v2.79 BMW27 CPU
7-Zip 18.03: 7z b 4 | 7z b 4 -mmt1
Geekbench 5.5: Multi-Core | Single-Core
HWBOT x265 Benchmark v2.2: 4k Preset
LibreOffice : 20 Documents To PDF
R Benchmark 2.5: Overall mean
| CPU Performance rating | |
| Media della classe Gaming | |
| Schenker XMG Apex 15 (Late 23) | |
| Lenovo LOQ 15IRH8 Core i7 | |
| MSI Katana 15 B12VEK | |
| Medion Erazer Crawler E40 - MD 62518 | |
| Media Intel Core i5-13500H | |
| Asus TUF A15 FA507 | |
| Cinebench R23 / Multi Core | |
| Media della classe Gaming (10488 - 42661, n=107, ultimi 2 anni) | |
| Schenker XMG Apex 15 (Late 23) | |
| MSI Katana 15 B12VEK | |
| Lenovo LOQ 15IRH8 Core i7 | |
| Media Intel Core i5-13500H (13542 - 16335, n=5) | |
| Medion Erazer Crawler E40 - MD 62518 | |
| Asus TUF A15 FA507 | |
| Cinebench R23 / Single Core | |
| Media della classe Gaming (1166 - 2415, n=107, ultimi 2 anni) | |
| Lenovo LOQ 15IRH8 Core i7 | |
| Medion Erazer Crawler E40 - MD 62518 | |
| Schenker XMG Apex 15 (Late 23) | |
| Media Intel Core i5-13500H (1704 - 1799, n=5) | |
| MSI Katana 15 B12VEK | |
| Asus TUF A15 FA507 | |
| Cinebench R20 / CPU (Multi Core) | |
| Media della classe Gaming (4029 - 16433, n=106, ultimi 2 anni) | |
| Schenker XMG Apex 15 (Late 23) | |
| MSI Katana 15 B12VEK | |
| Lenovo LOQ 15IRH8 Core i7 | |
| Media Intel Core i5-13500H (5108 - 6212, n=5) | |
| Asus TUF A15 FA507 | |
| Medion Erazer Crawler E40 - MD 62518 | |
| Cinebench R20 / CPU (Single Core) | |
| Media della classe Gaming (442 - 913, n=106, ultimi 2 anni) | |
| Lenovo LOQ 15IRH8 Core i7 | |
| Schenker XMG Apex 15 (Late 23) | |
| Medion Erazer Crawler E40 - MD 62518 | |
| Media Intel Core i5-13500H (655 - 687, n=5) | |
| MSI Katana 15 B12VEK | |
| Asus TUF A15 FA507 | |
| Cinebench R15 / CPU Multi 64Bit | |
| Media della classe Gaming (1578 - 6330, n=105, ultimi 2 anni) | |
| Schenker XMG Apex 15 (Late 23) | |
| Medion Erazer Crawler E40 - MD 62518 | |
| Media Intel Core i5-13500H (2234 - 2475, n=5) | |
| Lenovo LOQ 15IRH8 Core i7 | |
| Asus TUF A15 FA507 | |
| MSI Katana 15 B12VEK | |
| Cinebench R15 / CPU Single 64Bit | |
| Media della classe Gaming (188.8 - 350, n=106, ultimi 2 anni) | |
| Schenker XMG Apex 15 (Late 23) | |
| Lenovo LOQ 15IRH8 Core i7 | |
| Media Intel Core i5-13500H (243 - 261, n=5) | |
| Asus TUF A15 FA507 | |
| Medion Erazer Crawler E40 - MD 62518 | |
| MSI Katana 15 B12VEK | |
| Blender / v2.79 BMW27 CPU | |
| Lenovo LOQ 15IRH8 Core i7 | |
| Media Intel Core i5-13500H (205 - 263, n=6) | |
| MSI Katana 15 B12VEK | |
| Asus TUF A15 FA507 | |
| Medion Erazer Crawler E40 - MD 62518 | |
| Schenker XMG Apex 15 (Late 23) | |
| Media della classe Gaming (79 - 330, n=104, ultimi 2 anni) | |
| 7-Zip 18.03 / 7z b 4 | |
| Media della classe Gaming (33491 - 148086, n=105, ultimi 2 anni) | |
| Schenker XMG Apex 15 (Late 23) | |
| Asus TUF A15 FA507 | |
| MSI Katana 15 B12VEK | |
| Medion Erazer Crawler E40 - MD 62518 | |
| Lenovo LOQ 15IRH8 Core i7 | |
| Media Intel Core i5-13500H (50846 - 58567, n=6) | |
| 7-Zip 18.03 / 7z b 4 -mmt1 | |
| Schenker XMG Apex 15 (Late 23) | |
| Media della classe Gaming (4199 - 7436, n=105, ultimi 2 anni) | |
| Lenovo LOQ 15IRH8 Core i7 | |
| Asus TUF A15 FA507 | |
| Media Intel Core i5-13500H (5500 - 5885, n=6) | |
| MSI Katana 15 B12VEK | |
| Medion Erazer Crawler E40 - MD 62518 | |
| Geekbench 5.5 / Multi-Core | |
| Media della classe Gaming (6460 - 28263, n=105, ultimi 2 anni) | |
| Schenker XMG Apex 15 (Late 23) | |
| Lenovo LOQ 15IRH8 Core i7 | |
| MSI Katana 15 B12VEK | |
| Medion Erazer Crawler E40 - MD 62518 | |
| Media Intel Core i5-13500H (9312 - 11465, n=5) | |
| Asus TUF A15 FA507 | |
| Geekbench 5.5 / Single-Core | |
| Media della classe Gaming (986 - 2474, n=105, ultimi 2 anni) | |
| Schenker XMG Apex 15 (Late 23) | |
| Lenovo LOQ 15IRH8 Core i7 | |
| Media Intel Core i5-13500H (1674 - 1762, n=5) | |
| Medion Erazer Crawler E40 - MD 62518 | |
| MSI Katana 15 B12VEK | |
| Asus TUF A15 FA507 | |
| HWBOT x265 Benchmark v2.2 / 4k Preset | |
| Media della classe Gaming (11.5 - 44.4, n=105, ultimi 2 anni) | |
| Schenker XMG Apex 15 (Late 23) | |
| Medion Erazer Crawler E40 - MD 62518 | |
| MSI Katana 15 B12VEK | |
| Asus TUF A15 FA507 | |
| Lenovo LOQ 15IRH8 Core i7 | |
| Media Intel Core i5-13500H (14.4 - 17.9, n=6) | |
| LibreOffice / 20 Documents To PDF | |
| Medion Erazer Crawler E40 - MD 62518 | |
| Media Intel Core i5-13500H (44 - 65.5, n=5) | |
| Asus TUF A15 FA507 | |
| Media della classe Gaming (33.2 - 88.8, n=105, ultimi 2 anni) | |
| MSI Katana 15 B12VEK | |
| Schenker XMG Apex 15 (Late 23) | |
| Lenovo LOQ 15IRH8 Core i7 | |
| R Benchmark 2.5 / Overall mean | |
| Asus TUF A15 FA507 | |
| MSI Katana 15 B12VEK | |
| Media Intel Core i5-13500H (0.471 - 0.51, n=6) | |
| Medion Erazer Crawler E40 - MD 62518 | |
| Lenovo LOQ 15IRH8 Core i7 | |
| Schenker XMG Apex 15 (Late 23) | |
| Media della classe Gaming (0.3439 - 0.759, n=106, ultimi 2 anni) | |
* ... Meglio usare valori piccoli
AIDA64: FP32 Ray-Trace | FPU Julia | CPU SHA3 | CPU Queen | FPU SinJulia | FPU Mandel | CPU AES | CPU ZLib | FP64 Ray-Trace | CPU PhotoWorxx
| Performance rating | |
| Media della classe Gaming | |
| Schenker XMG Apex 15 (Late 23) | |
| Asus TUF A15 FA507 | |
| MSI Katana 15 B12VEK | |
| Medion Erazer Crawler E40 - MD 62518 | |
| Media Intel Core i5-13500H | |
| Lenovo LOQ 15IRH8 Core i7 | |
| AIDA64 / FP32 Ray-Trace | |
| Media della classe Gaming (10227 - 85542, n=105, ultimi 2 anni) | |
| Schenker XMG Apex 15 (Late 23) | |
| Asus TUF A15 FA507 | |
| MSI Katana 15 B12VEK | |
| Medion Erazer Crawler E40 - MD 62518 | |
| Media Intel Core i5-13500H (11081 - 15390, n=6) | |
| Lenovo LOQ 15IRH8 Core i7 | |
| AIDA64 / FPU Julia | |
| Media della classe Gaming (51376 - 238426, n=105, ultimi 2 anni) | |
| Schenker XMG Apex 15 (Late 23) | |
| Asus TUF A15 FA507 | |
| MSI Katana 15 B12VEK | |
| Medion Erazer Crawler E40 - MD 62518 | |
| Media Intel Core i5-13500H (56813 - 74251, n=6) | |
| Lenovo LOQ 15IRH8 Core i7 | |
| AIDA64 / CPU SHA3 | |
| Media della classe Gaming (2180 - 10115, n=105, ultimi 2 anni) | |
| Schenker XMG Apex 15 (Late 23) | |
| Medion Erazer Crawler E40 - MD 62518 | |
| Asus TUF A15 FA507 | |
| MSI Katana 15 B12VEK | |
| Media Intel Core i5-13500H (2621 - 3623, n=6) | |
| Lenovo LOQ 15IRH8 Core i7 | |
| AIDA64 / CPU Queen | |
| Media della classe Gaming (49785 - 173351, n=90, ultimi 2 anni) | |
| Schenker XMG Apex 15 (Late 23) | |
| Asus TUF A15 FA507 | |
| MSI Katana 15 B12VEK | |
| Medion Erazer Crawler E40 - MD 62518 | |
| Media Intel Core i5-13500H (77835 - 85727, n=6) | |
| Lenovo LOQ 15IRH8 Core i7 | |
| AIDA64 / FPU SinJulia | |
| Schenker XMG Apex 15 (Late 23) | |
| Media della classe Gaming (4424 - 33636, n=105, ultimi 2 anni) | |
| Asus TUF A15 FA507 | |
| MSI Katana 15 B12VEK | |
| Medion Erazer Crawler E40 - MD 62518 | |
| Media Intel Core i5-13500H (7249 - 8086, n=6) | |
| Lenovo LOQ 15IRH8 Core i7 | |
| AIDA64 / FPU Mandel | |
| Media della classe Gaming (25115 - 128721, n=105, ultimi 2 anni) | |
| Schenker XMG Apex 15 (Late 23) | |
| Asus TUF A15 FA507 | |
| MSI Katana 15 B12VEK | |
| Medion Erazer Crawler E40 - MD 62518 | |
| Media Intel Core i5-13500H (27820 - 38336, n=6) | |
| Lenovo LOQ 15IRH8 Core i7 | |
| AIDA64 / CPU AES | |
| Schenker XMG Apex 15 (Late 23) | |
| Media della classe Gaming (39258 - 247074, n=105, ultimi 2 anni) | |
| Media Intel Core i5-13500H (62657 - 120493, n=6) | |
| MSI Katana 15 B12VEK | |
| Asus TUF A15 FA507 | |
| Medion Erazer Crawler E40 - MD 62518 | |
| Lenovo LOQ 15IRH8 Core i7 | |
| AIDA64 / CPU ZLib | |
| Media della classe Gaming (574 - 2531, n=105, ultimi 2 anni) | |
| Schenker XMG Apex 15 (Late 23) | |
| Medion Erazer Crawler E40 - MD 62518 | |
| Media Intel Core i5-13500H (782 - 992, n=6) | |
| MSI Katana 15 B12VEK | |
| Lenovo LOQ 15IRH8 Core i7 | |
| Asus TUF A15 FA507 | |
| AIDA64 / FP64 Ray-Trace | |
| Media della classe Gaming (5509 - 45446, n=105, ultimi 2 anni) | |
| Schenker XMG Apex 15 (Late 23) | |
| Asus TUF A15 FA507 | |
| MSI Katana 15 B12VEK | |
| Medion Erazer Crawler E40 - MD 62518 | |
| Media Intel Core i5-13500H (5955 - 8495, n=6) | |
| Lenovo LOQ 15IRH8 Core i7 | |
| AIDA64 / CPU PhotoWorxx | |
| Media della classe Gaming (12271 - 89891, n=105, ultimi 2 anni) | |
| MSI Katana 15 B12VEK | |
| Medion Erazer Crawler E40 - MD 62518 | |
| Schenker XMG Apex 15 (Late 23) | |
| Lenovo LOQ 15IRH8 Core i7 | |
| Media Intel Core i5-13500H (20212 - 37618, n=6) | |
| Asus TUF A15 FA507 | |
Prestazioni del sistema
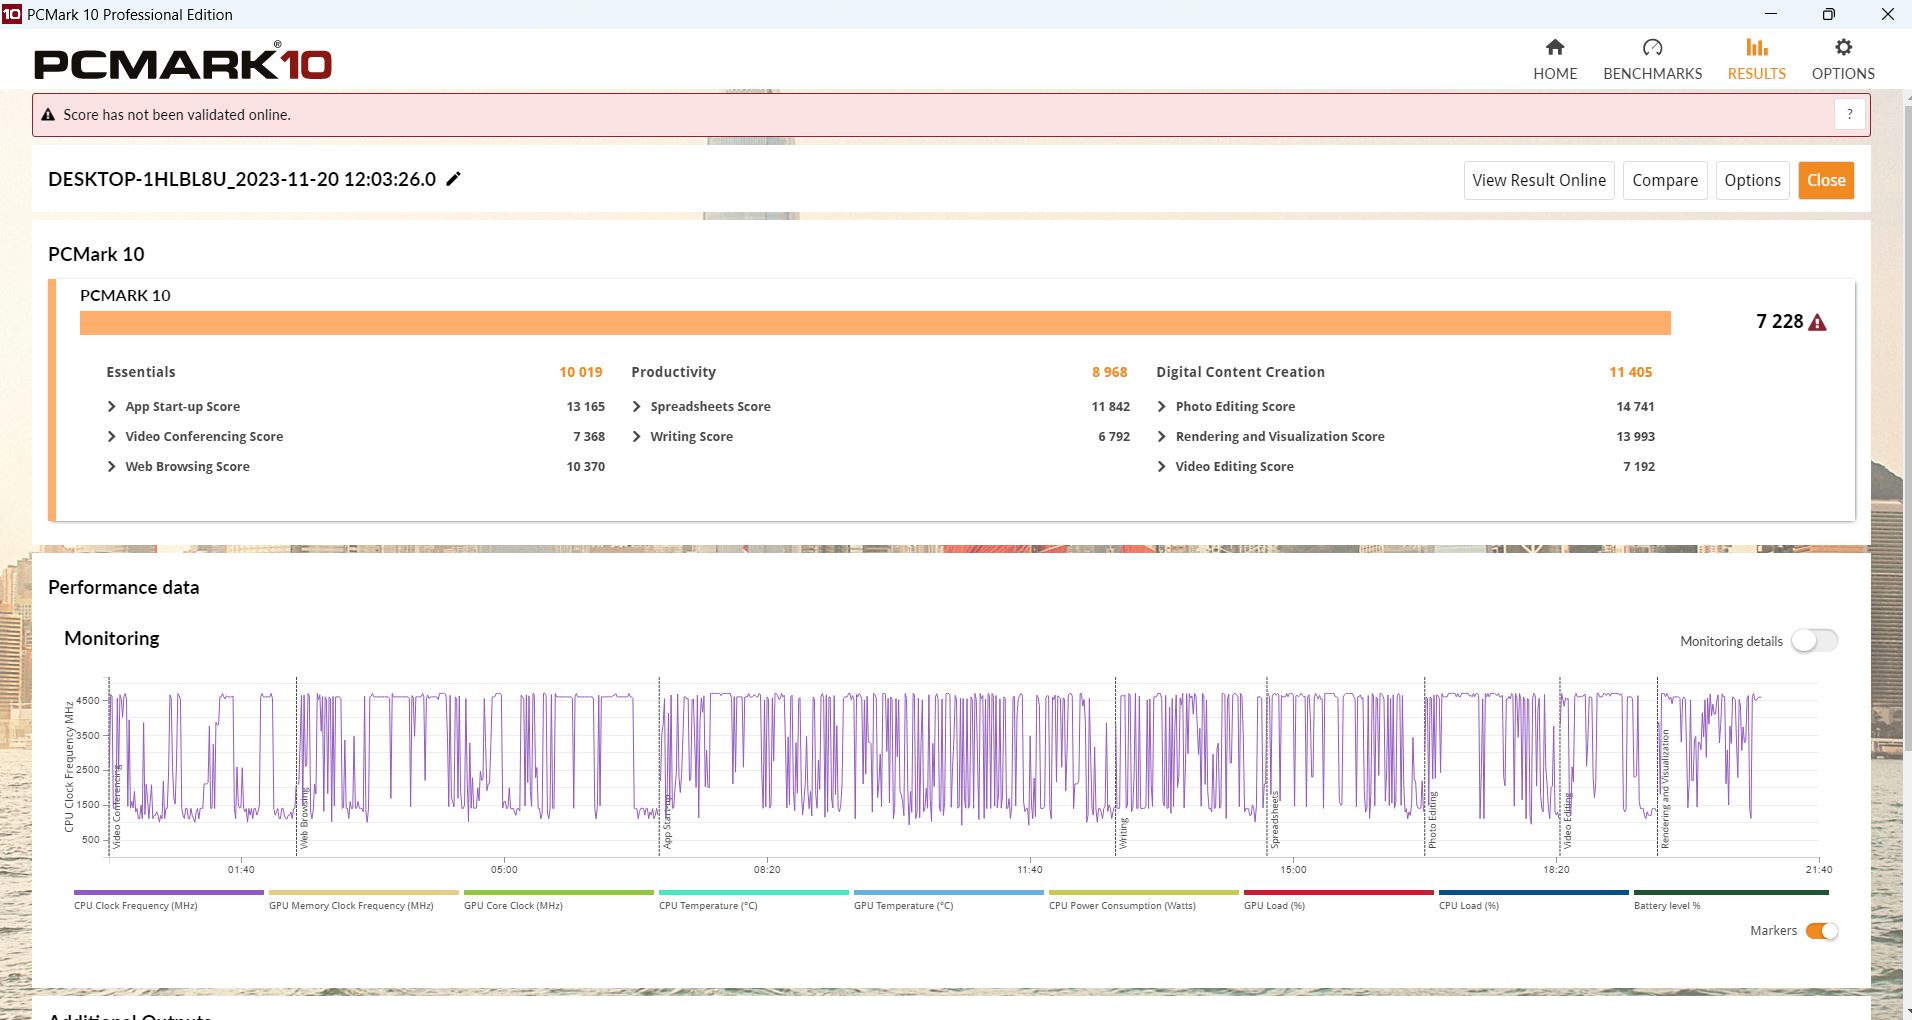
In PCMark 10, l' XMG Apex 15 e Lenovo LOQ 15 sono leggermente in vantaggio, soprattutto in Produttività ed Essentials. Crawler è uguale in Creazione di contenuti digitali. Solo il LOQ 15 è leggermente più veloce in Crossmark.
CrossMark: Overall | Productivity | Creativity | Responsiveness
| PCMark 10 / Score | |
| Media della classe Gaming (5828 - 12414, n=93, ultimi 2 anni) | |
| Schenker XMG Apex 15 (Late 23) | |
| Lenovo LOQ 15IRH8 Core i7 | |
| Medion Erazer Crawler E40 - MD 62518 | |
| Asus TUF A15 FA507 | |
| Media Intel Core i5-13500H, NVIDIA GeForce RTX 4050 Laptop GPU (6812 - 7228, n=2) | |
| MSI Katana 15 B12VEK | |
| PCMark 10 / Essentials | |
| Lenovo LOQ 15IRH8 Core i7 | |
| Schenker XMG Apex 15 (Late 23) | |
| Media della classe Gaming (8810 - 11935, n=97, ultimi 2 anni) | |
| Asus TUF A15 FA507 | |
| MSI Katana 15 B12VEK | |
| Medion Erazer Crawler E40 - MD 62518 | |
| Media Intel Core i5-13500H, NVIDIA GeForce RTX 4050 Laptop GPU (9521 - 10019, n=2) | |
| PCMark 10 / Productivity | |
| Media della classe Gaming (6845 - 25323, n=95, ultimi 2 anni) | |
| Schenker XMG Apex 15 (Late 23) | |
| MSI Katana 15 B12VEK | |
| Lenovo LOQ 15IRH8 Core i7 | |
| Asus TUF A15 FA507 | |
| Medion Erazer Crawler E40 - MD 62518 | |
| Media Intel Core i5-13500H, NVIDIA GeForce RTX 4050 Laptop GPU (8890 - 8968, n=2) | |
| PCMark 10 / Digital Content Creation | |
| Media della classe Gaming (7602 - 19954, n=95, ultimi 2 anni) | |
| Lenovo LOQ 15IRH8 Core i7 | |
| Schenker XMG Apex 15 (Late 23) | |
| Medion Erazer Crawler E40 - MD 62518 | |
| Media Intel Core i5-13500H, NVIDIA GeForce RTX 4050 Laptop GPU (10134 - 11405, n=2) | |
| Asus TUF A15 FA507 | |
| MSI Katana 15 B12VEK | |
| CrossMark / Overall | |
| Media della classe Gaming (1366 - 2409, n=94, ultimi 2 anni) | |
| Lenovo LOQ 15IRH8 Core i7 | |
| Medion Erazer Crawler E40 - MD 62518 | |
| Media Intel Core i5-13500H, NVIDIA GeForce RTX 4050 Laptop GPU (n=1) | |
| Schenker XMG Apex 15 (Late 23) | |
| MSI Katana 15 B12VEK | |
| Asus TUF A15 FA507 | |
| CrossMark / Productivity | |
| Media della classe Gaming (1386 - 2254, n=94, ultimi 2 anni) | |
| Lenovo LOQ 15IRH8 Core i7 | |
| Medion Erazer Crawler E40 - MD 62518 | |
| Media Intel Core i5-13500H, NVIDIA GeForce RTX 4050 Laptop GPU (n=1) | |
| Schenker XMG Apex 15 (Late 23) | |
| MSI Katana 15 B12VEK | |
| Asus TUF A15 FA507 | |
| CrossMark / Creativity | |
| Media della classe Gaming (1343 - 2786, n=94, ultimi 2 anni) | |
| Lenovo LOQ 15IRH8 Core i7 | |
| Schenker XMG Apex 15 (Late 23) | |
| Medion Erazer Crawler E40 - MD 62518 | |
| Media Intel Core i5-13500H, NVIDIA GeForce RTX 4050 Laptop GPU (n=1) | |
| MSI Katana 15 B12VEK | |
| Asus TUF A15 FA507 | |
| CrossMark / Responsiveness | |
| Lenovo LOQ 15IRH8 Core i7 | |
| Medion Erazer Crawler E40 - MD 62518 | |
| Media Intel Core i5-13500H, NVIDIA GeForce RTX 4050 Laptop GPU (n=1) | |
| Media della classe Gaming (1226 - 2334, n=94, ultimi 2 anni) | |
| MSI Katana 15 B12VEK | |
| Schenker XMG Apex 15 (Late 23) | |
| Asus TUF A15 FA507 | |
| PCMark 10 Score | 7228 punti | |
Aiuto | ||
| AIDA64 / Memory Copy | |
| Media della classe Gaming (21750 - 129946, n=105, ultimi 2 anni) | |
| Schenker XMG Apex 15 (Late 23) | |
| Medion Erazer Crawler E40 - MD 62518 | |
| MSI Katana 15 B12VEK | |
| Lenovo LOQ 15IRH8 Core i7 | |
| Media Intel Core i5-13500H (36916 - 57830, n=6) | |
| Asus TUF A15 FA507 | |
| AIDA64 / Memory Read | |
| Media della classe Gaming (22956 - 118858, n=105, ultimi 2 anni) | |
| MSI Katana 15 B12VEK | |
| Medion Erazer Crawler E40 - MD 62518 | |
| Lenovo LOQ 15IRH8 Core i7 | |
| Schenker XMG Apex 15 (Late 23) | |
| Media Intel Core i5-13500H (41676 - 65633, n=6) | |
| Asus TUF A15 FA507 | |
| AIDA64 / Memory Write | |
| Schenker XMG Apex 15 (Late 23) | |
| Media della classe Gaming (22297 - 135096, n=105, ultimi 2 anni) | |
| Medion Erazer Crawler E40 - MD 62518 | |
| MSI Katana 15 B12VEK | |
| Asus TUF A15 FA507 | |
| Lenovo LOQ 15IRH8 Core i7 | |
| Media Intel Core i5-13500H (36826 - 60523, n=6) | |
| AIDA64 / Memory Latency | |
| Lenovo LOQ 15IRH8 Core i7 | |
| Media della classe Gaming (75.3 - 259, n=105, ultimi 2 anni) | |
| Medion Erazer Crawler E40 - MD 62518 | |
| MSI Katana 15 B12VEK | |
| Media Intel Core i5-13500H (86.2 - 96.1, n=6) | |
| Schenker XMG Apex 15 (Late 23) | |
| Asus TUF A15 FA507 | |
* ... Meglio usare valori piccoli
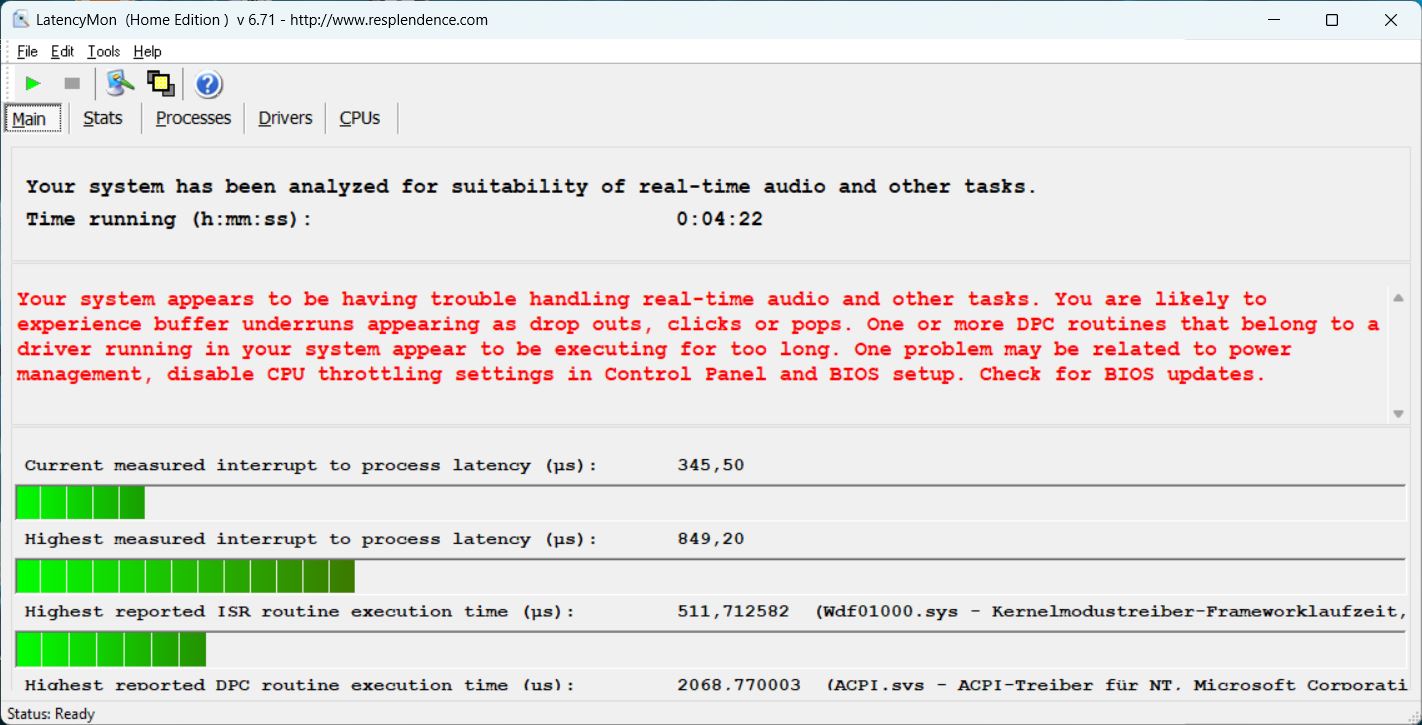
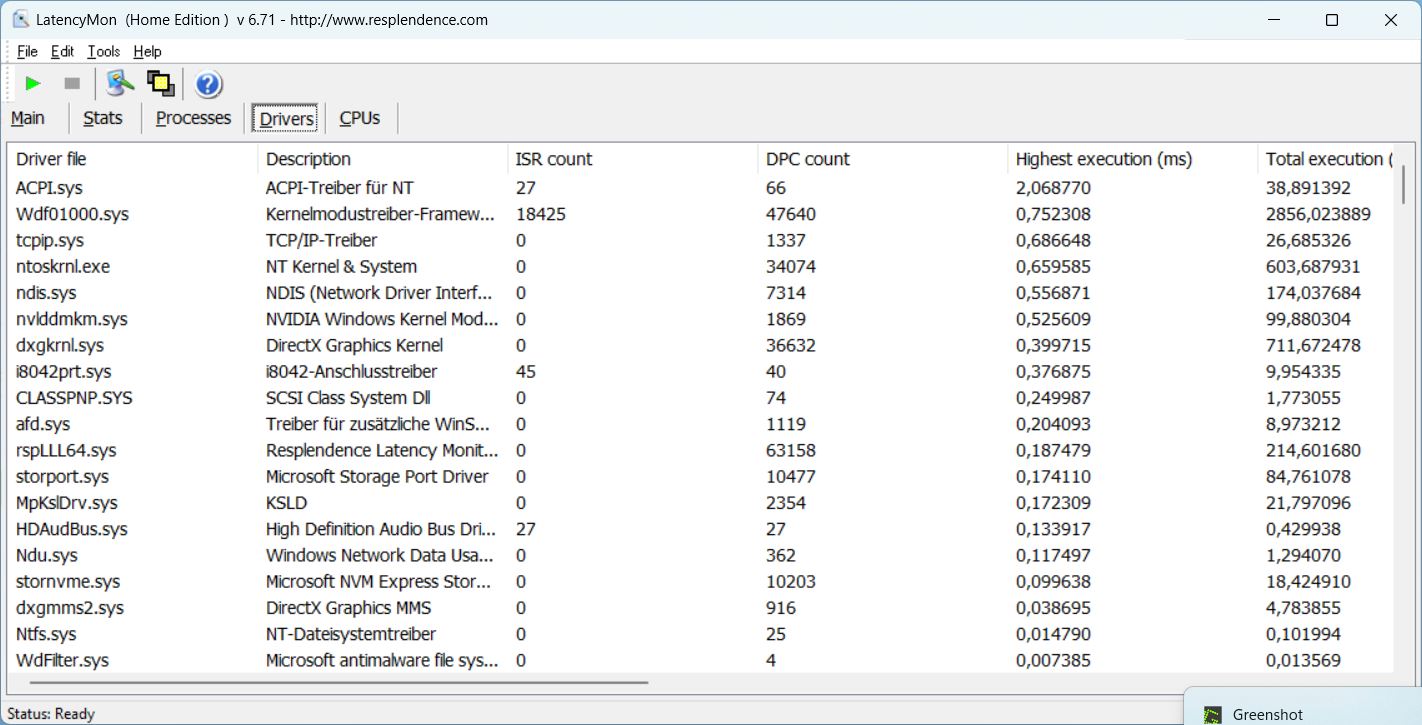
Latenza DPC
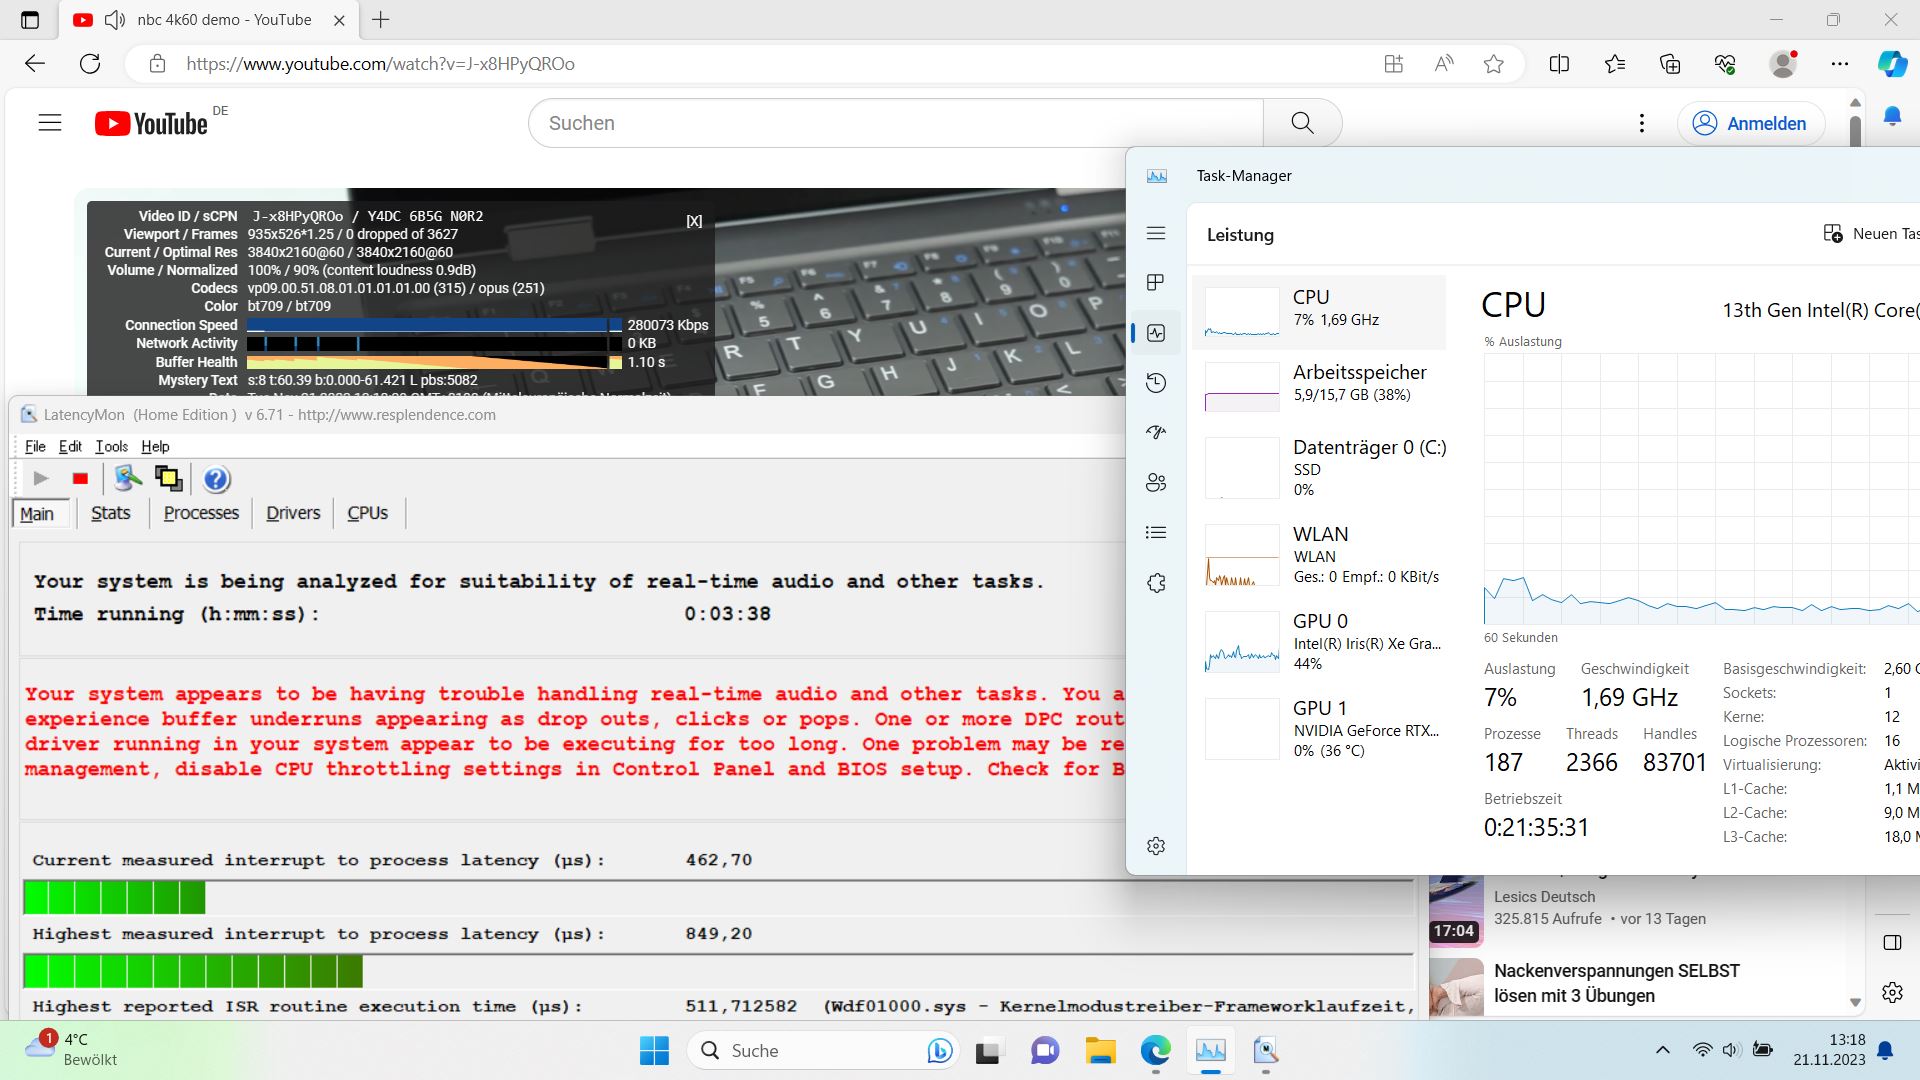
Non ci sono problemi quando si apre il browser o più schede. Tuttavia, LatencyMon rileva alcuni problemi durante la riproduzione del nostro video YouTube a 4K/60 fps. Almeno questo viene riprodotto senza alcuna caduta di fotogrammi. Il valore di latenza aumenta leggermente con Prime95.
| DPC Latencies / LatencyMon - interrupt to process latency (max), Web, Youtube, Prime95 | |
| MSI Katana 15 B12VEK | |
| Medion Erazer Crawler E40 - MD 62518 | |
| Lenovo LOQ 15IRH8 Core i7 | |
| Schenker XMG Apex 15 (Late 23) | |
* ... Meglio usare valori piccoli
Dispositivi di archiviazione
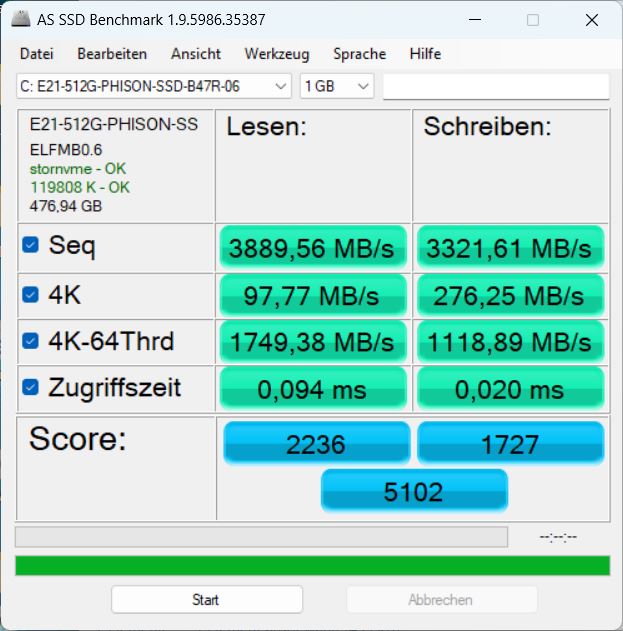
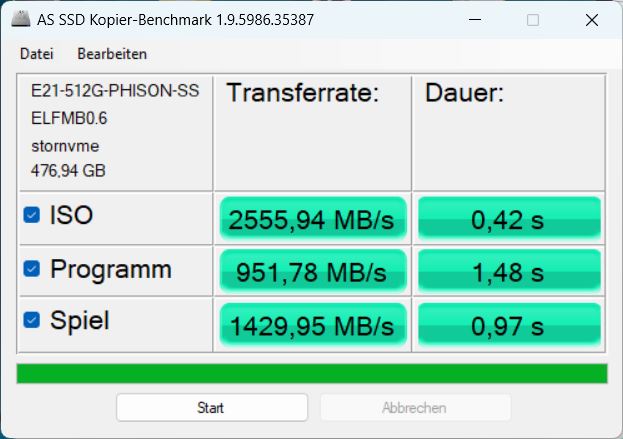
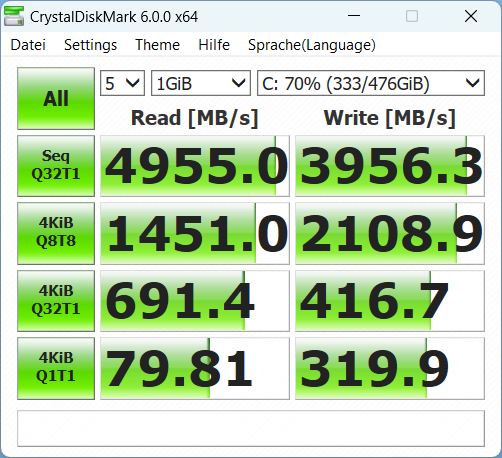
Medion utilizza un SSD NVMe da 512 GB di Phison. Sebbene non si avvicini alla velocità del Samsung 990 Pro nell'XMG Apex 15, supera lo storage degli altri tre concorrenti e le sue prestazioni sono molto costanti per un periodo di tempo più lungo. Ci sono altri confronti tra SSD nella nostra lista dei migliori SSD.

* ... Meglio usare valori piccoli
Continuous power read: DiskSpd Read Loop, Queue Depth 8
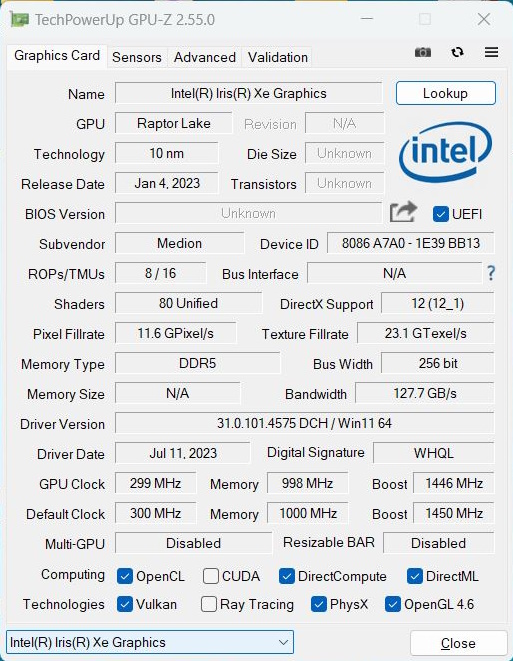
Scheda grafica
Nel nostro crawler E40, un RTX 4050 con una potenza massima di 100 W.
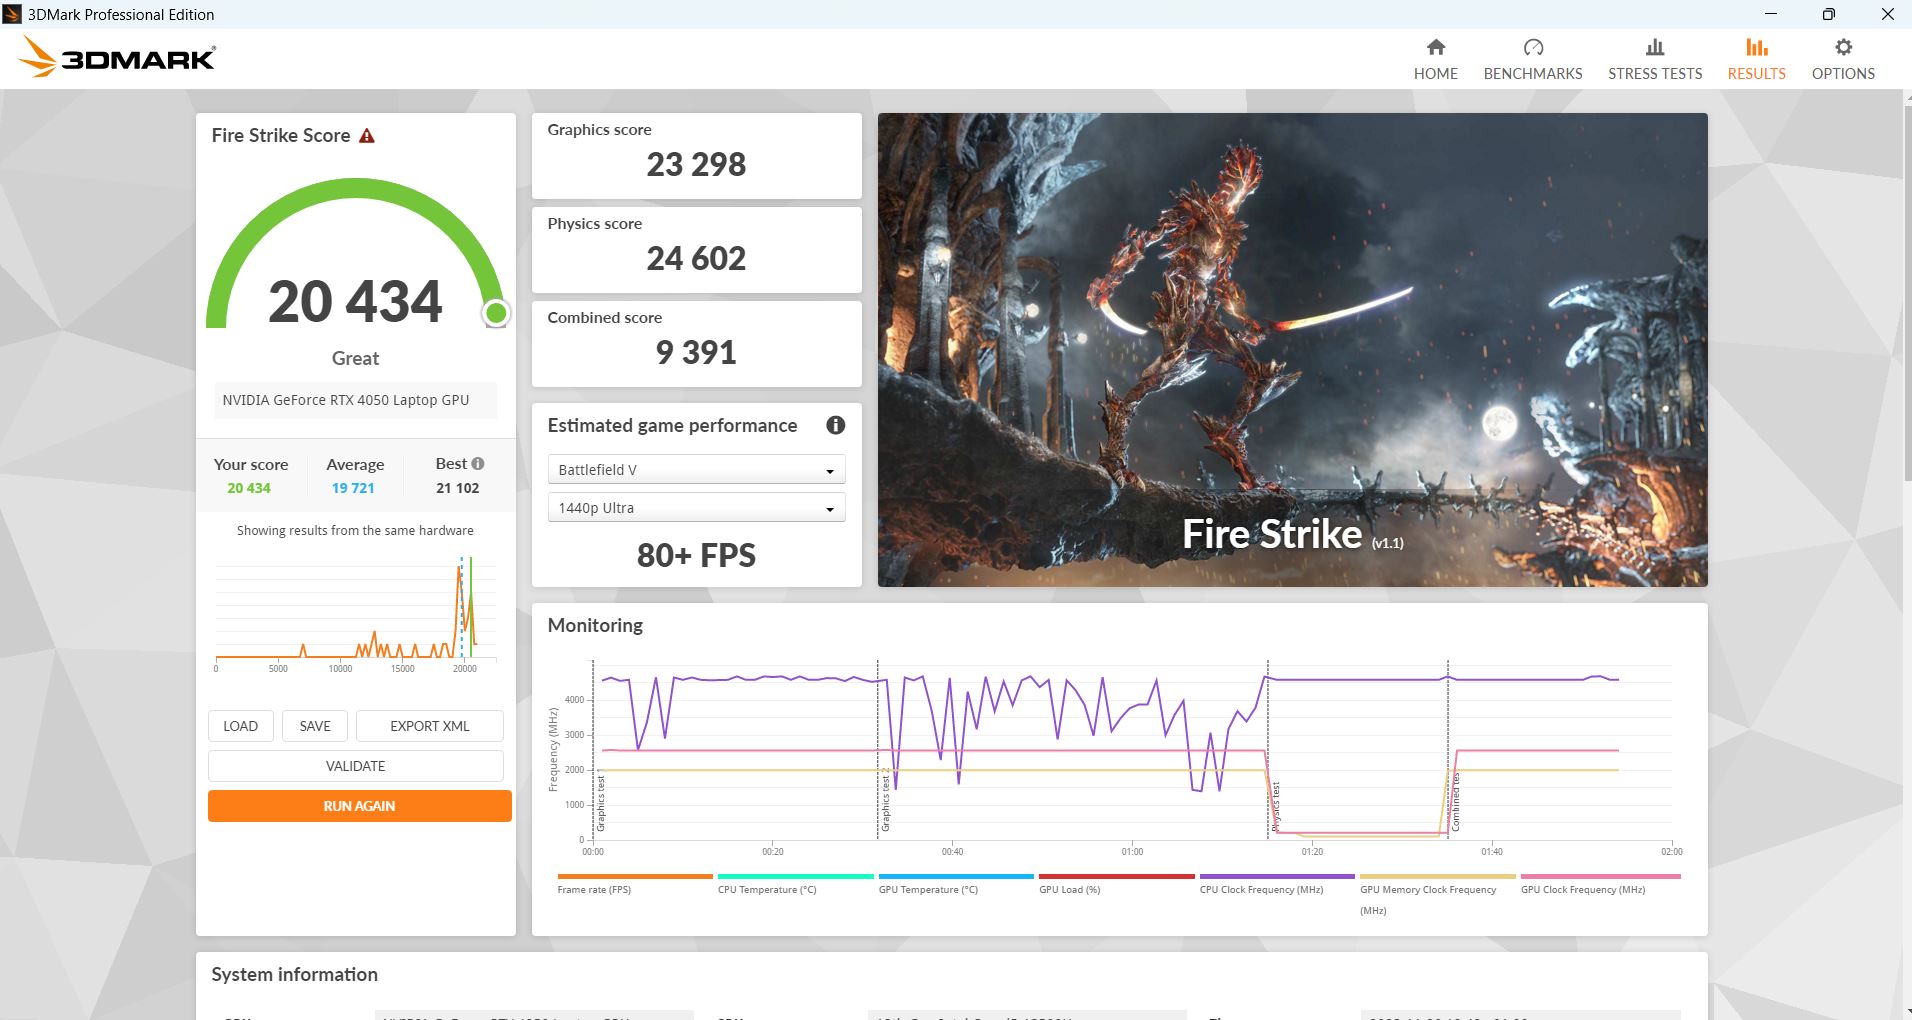
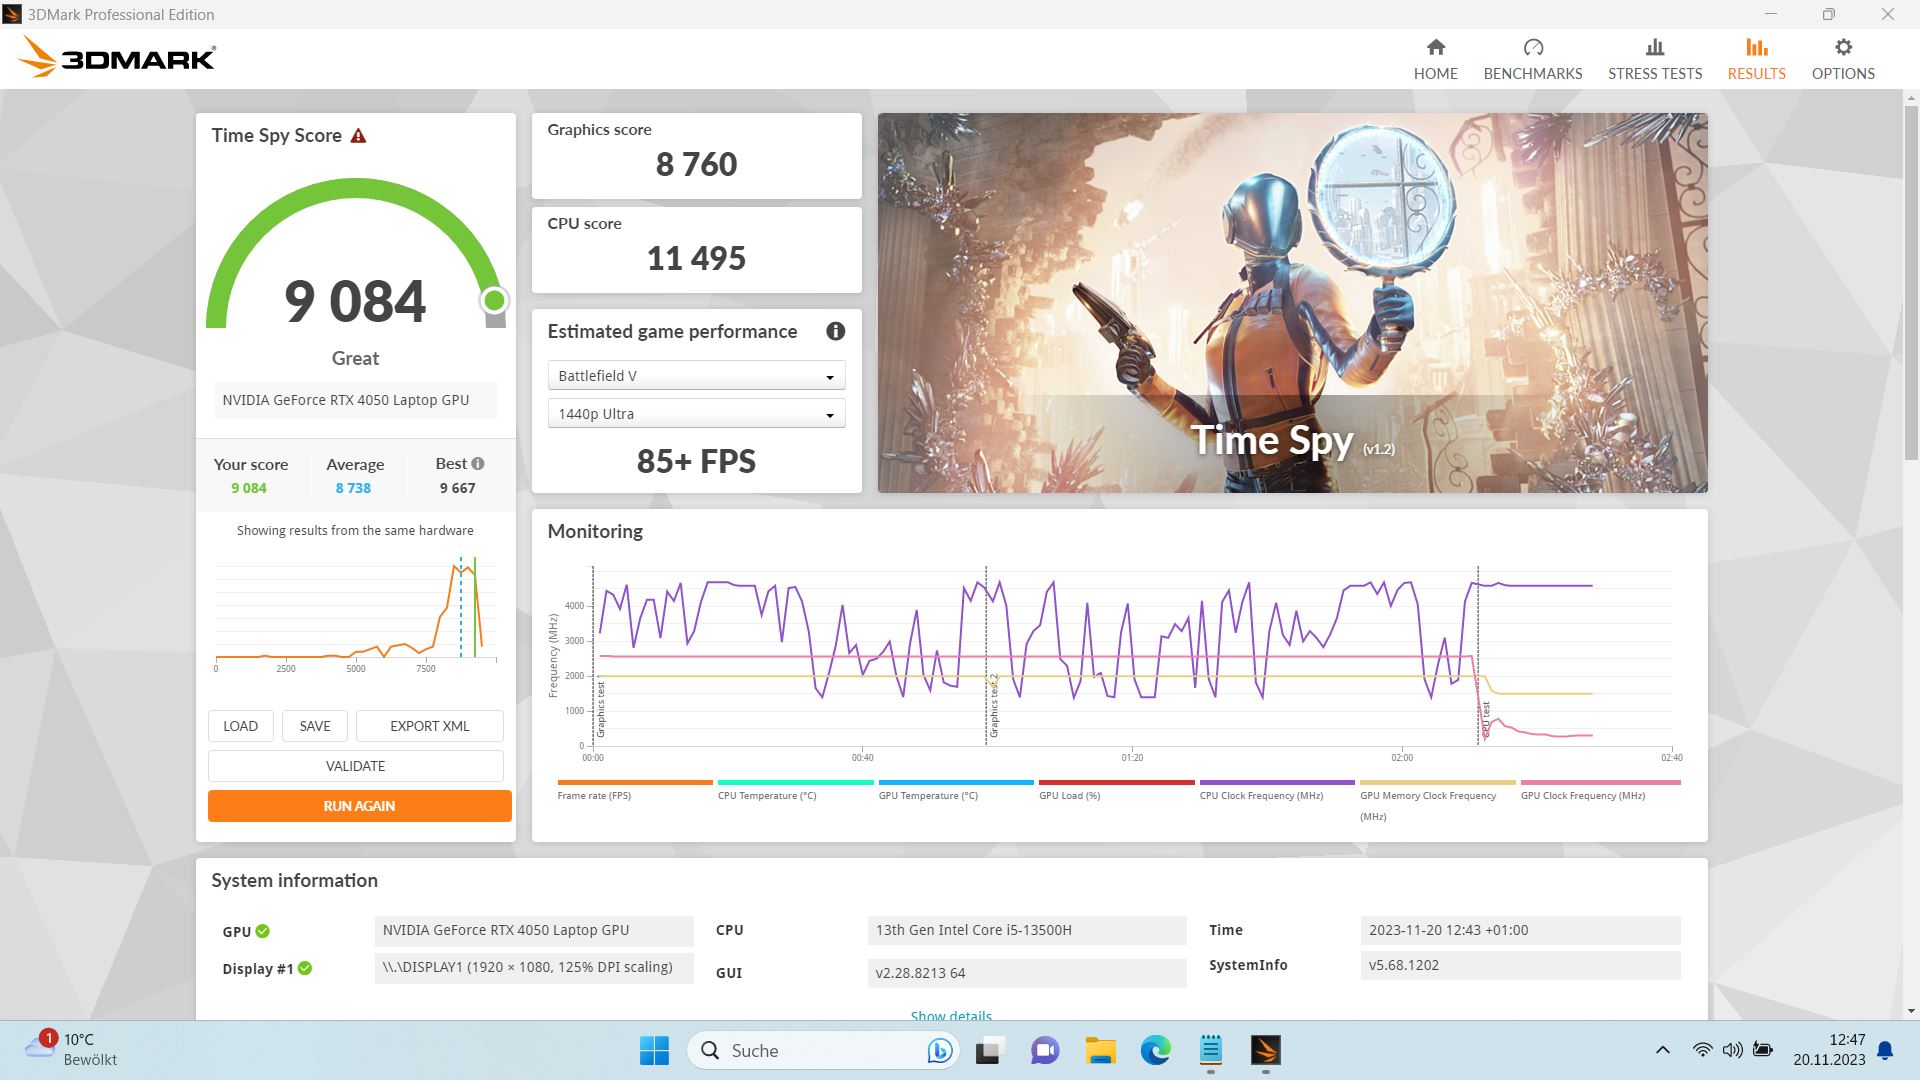
L'E40 si comporta molto bene nei benchmark 3DMark, è leggermente superiore a una RTX 4050 media e alla pari con XMG Apex 15 e MSI Katana 15, anch'essi forti in questa categoria.
In modalità batteria, le prestazioni 3D in Fire Strike scendono di ben il 70%.
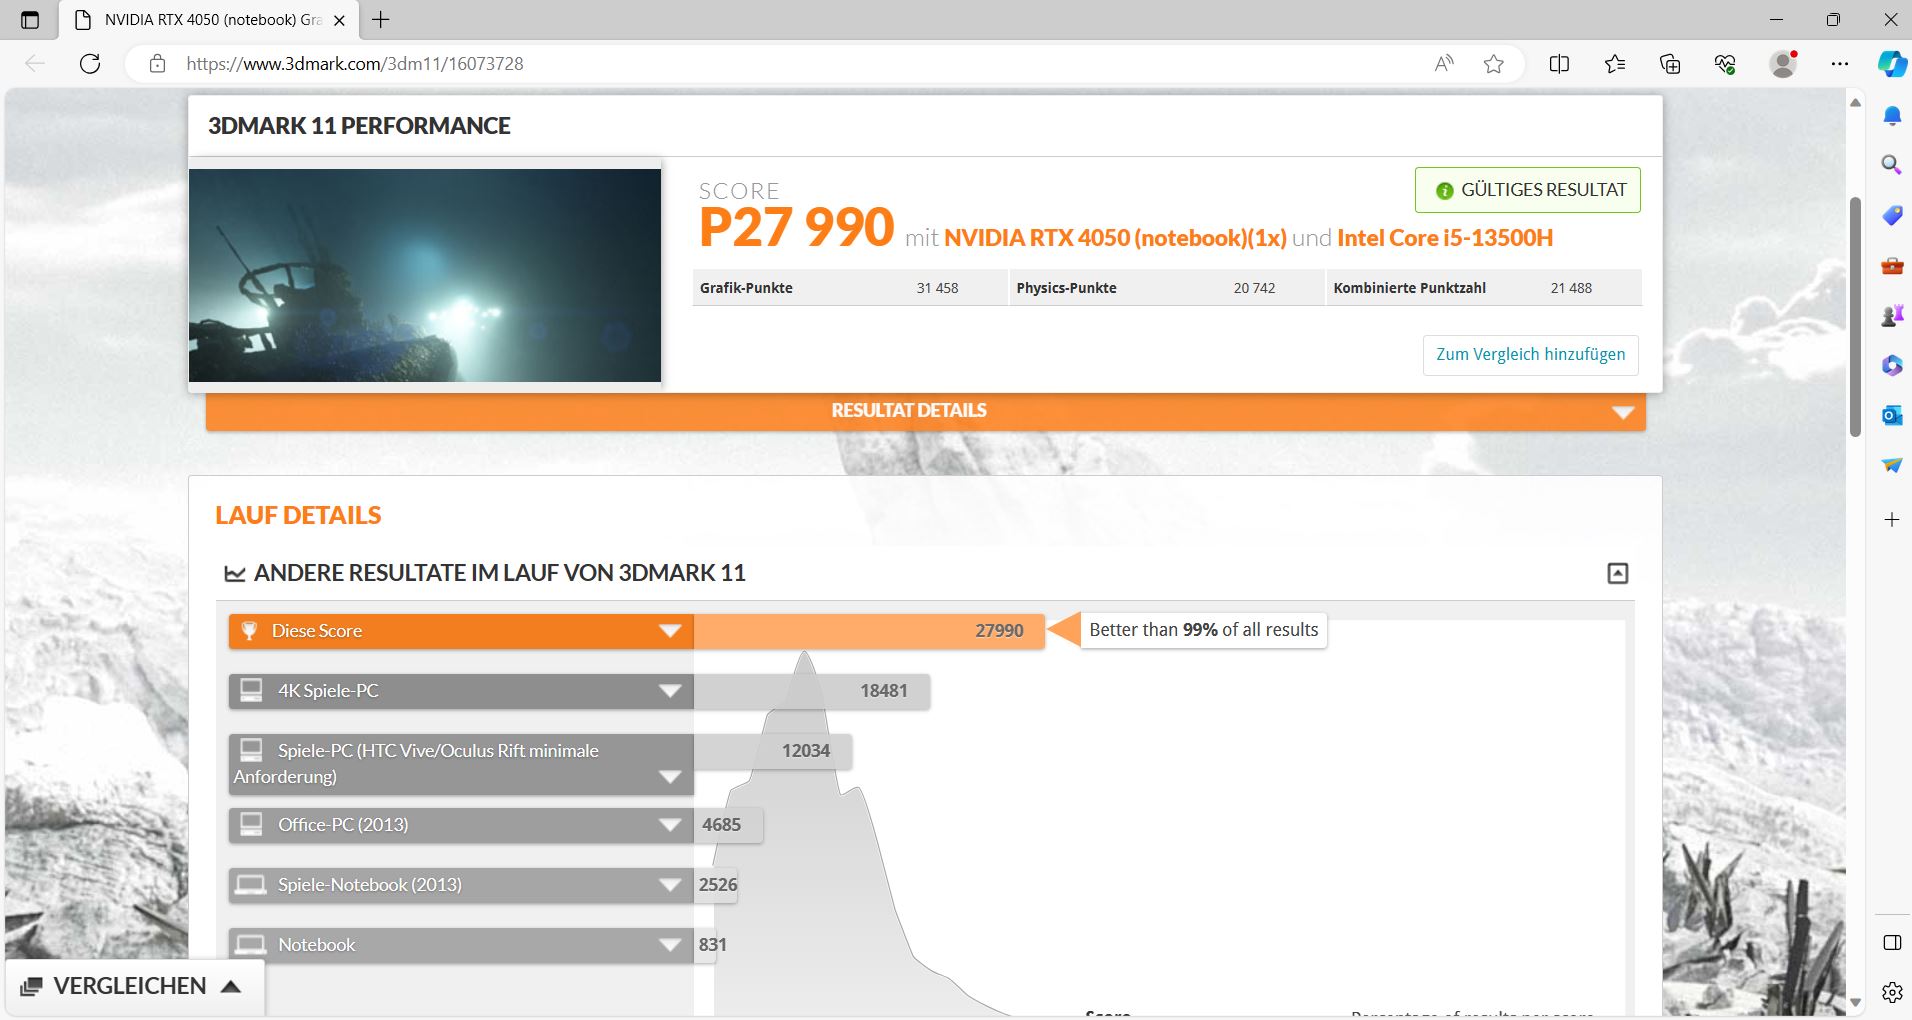
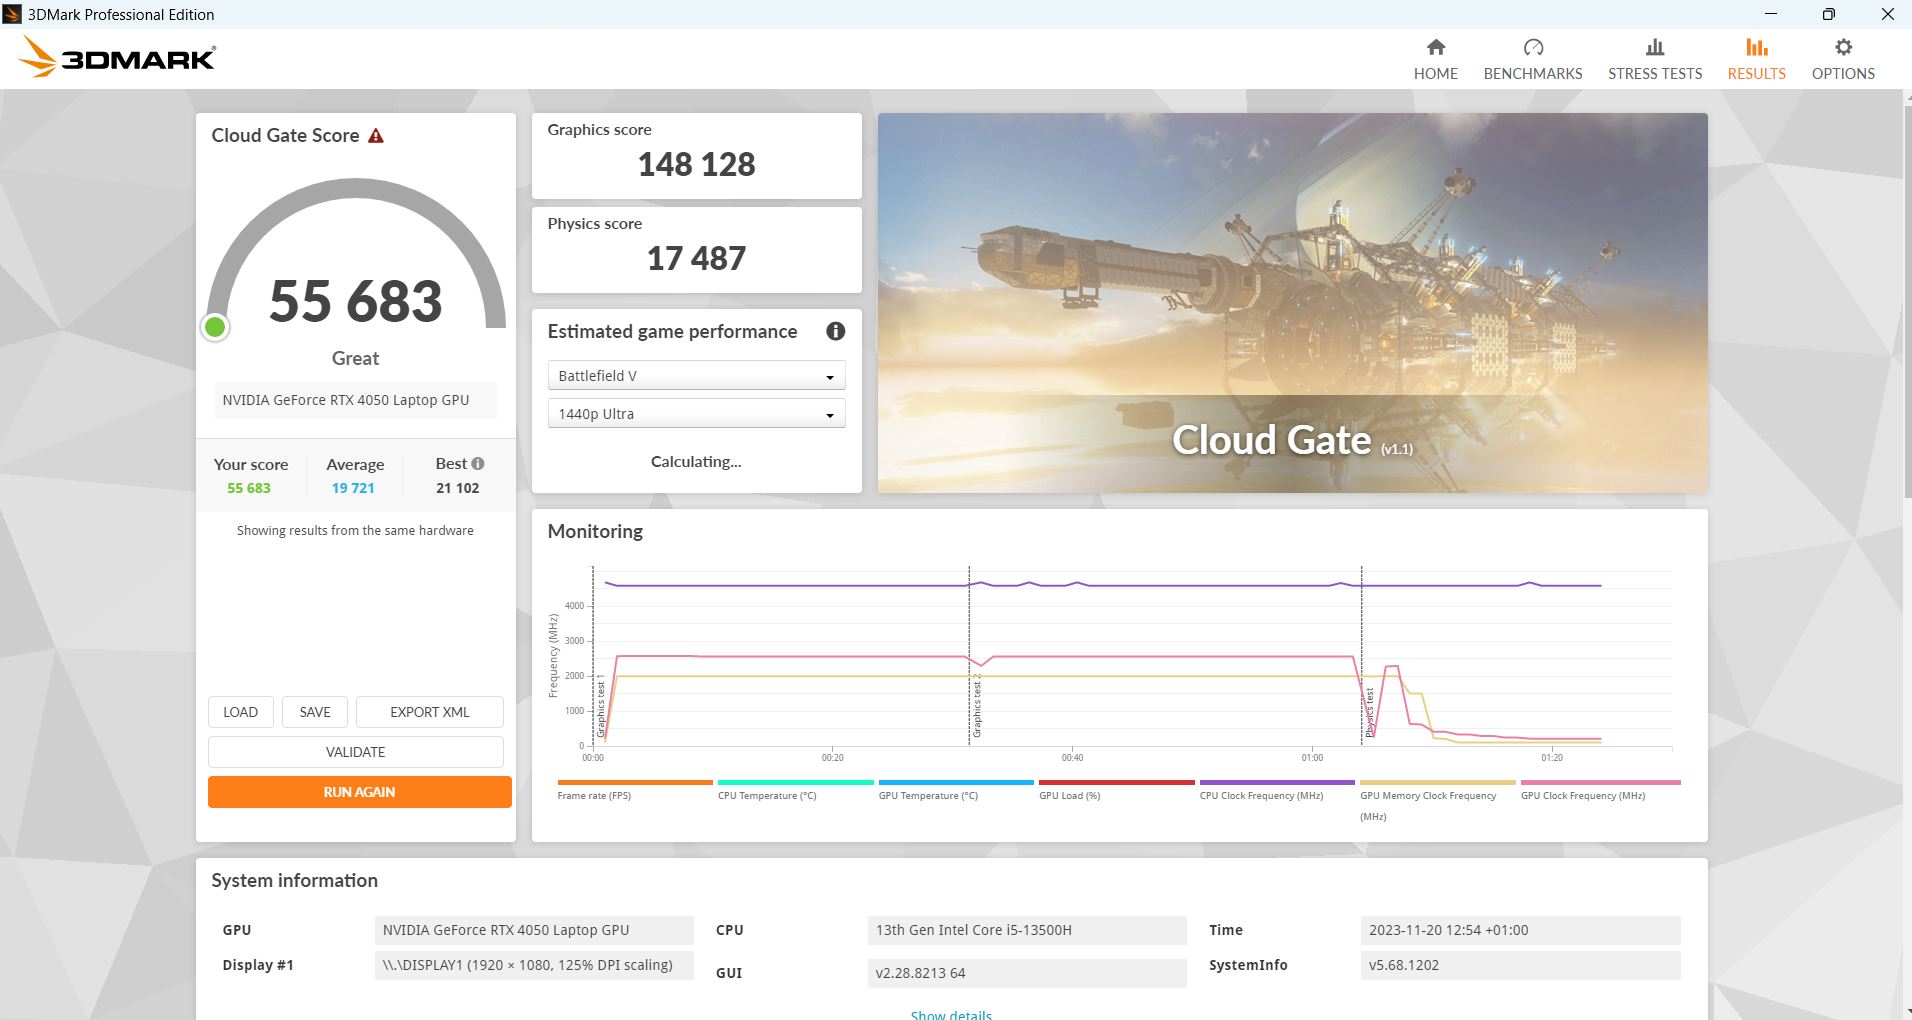
| 3DMark 11 Performance | 27990 punti | |
| 3DMark Cloud Gate Standard Score | 55683 punti | |
| 3DMark Fire Strike Score | 20434 punti | |
| 3DMark Time Spy Score | 9084 punti | |
Aiuto | ||
* ... Meglio usare valori piccoli
Gioco d'azzardo
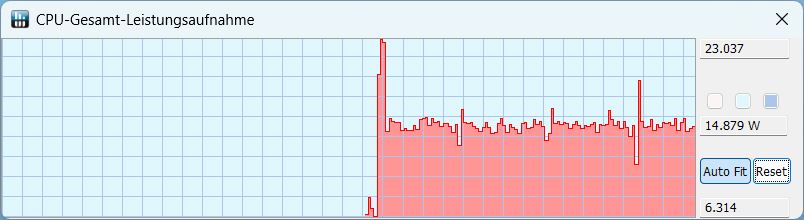
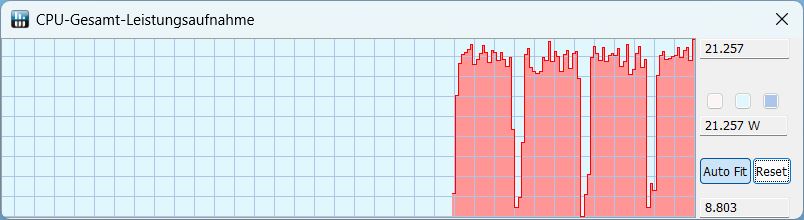
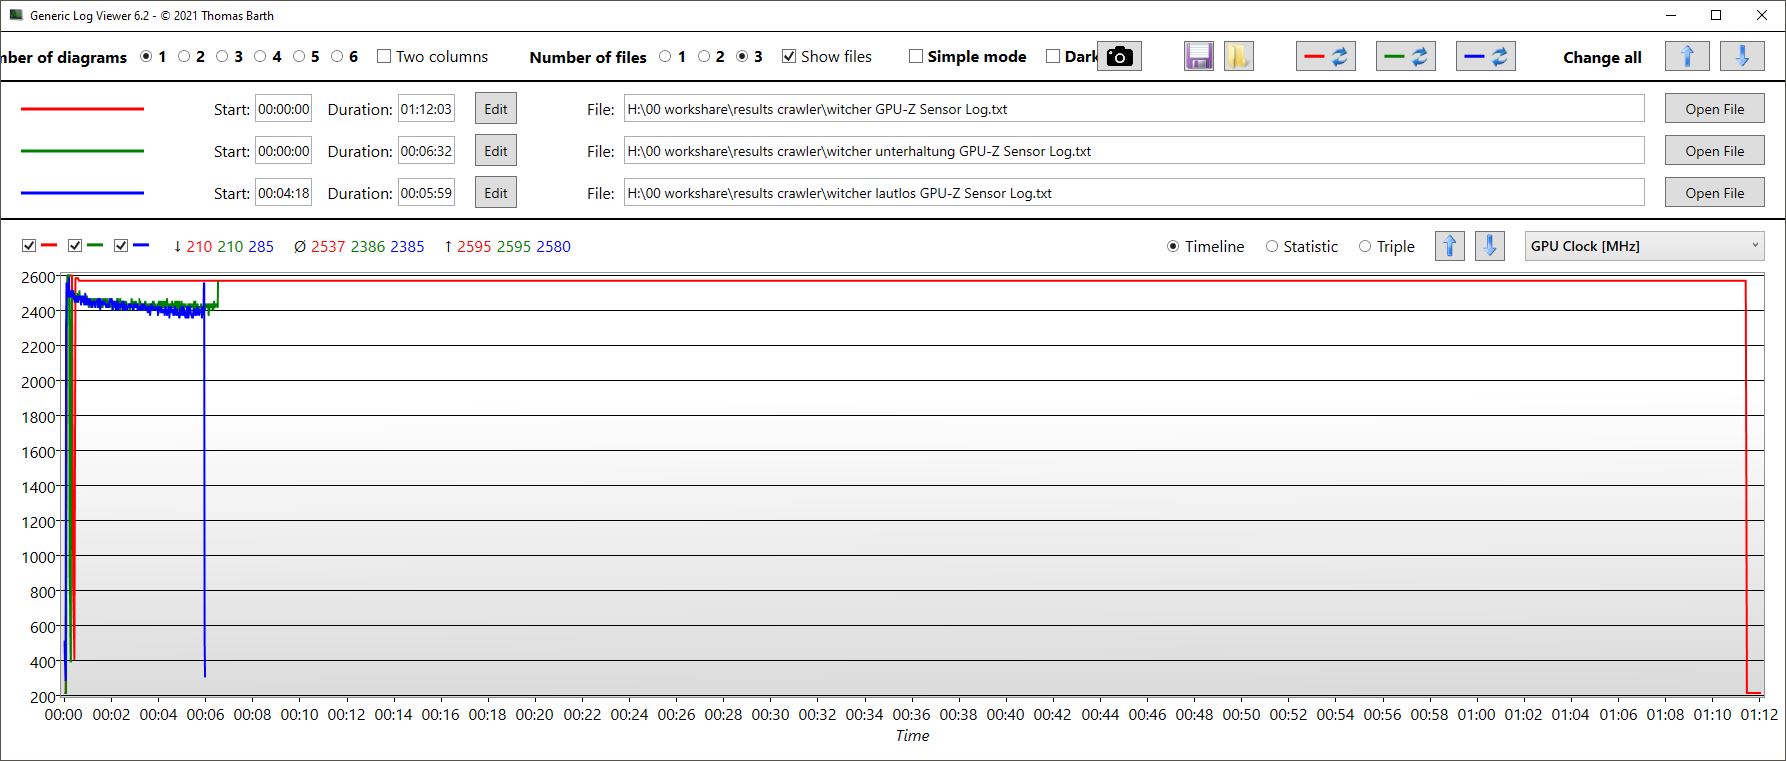
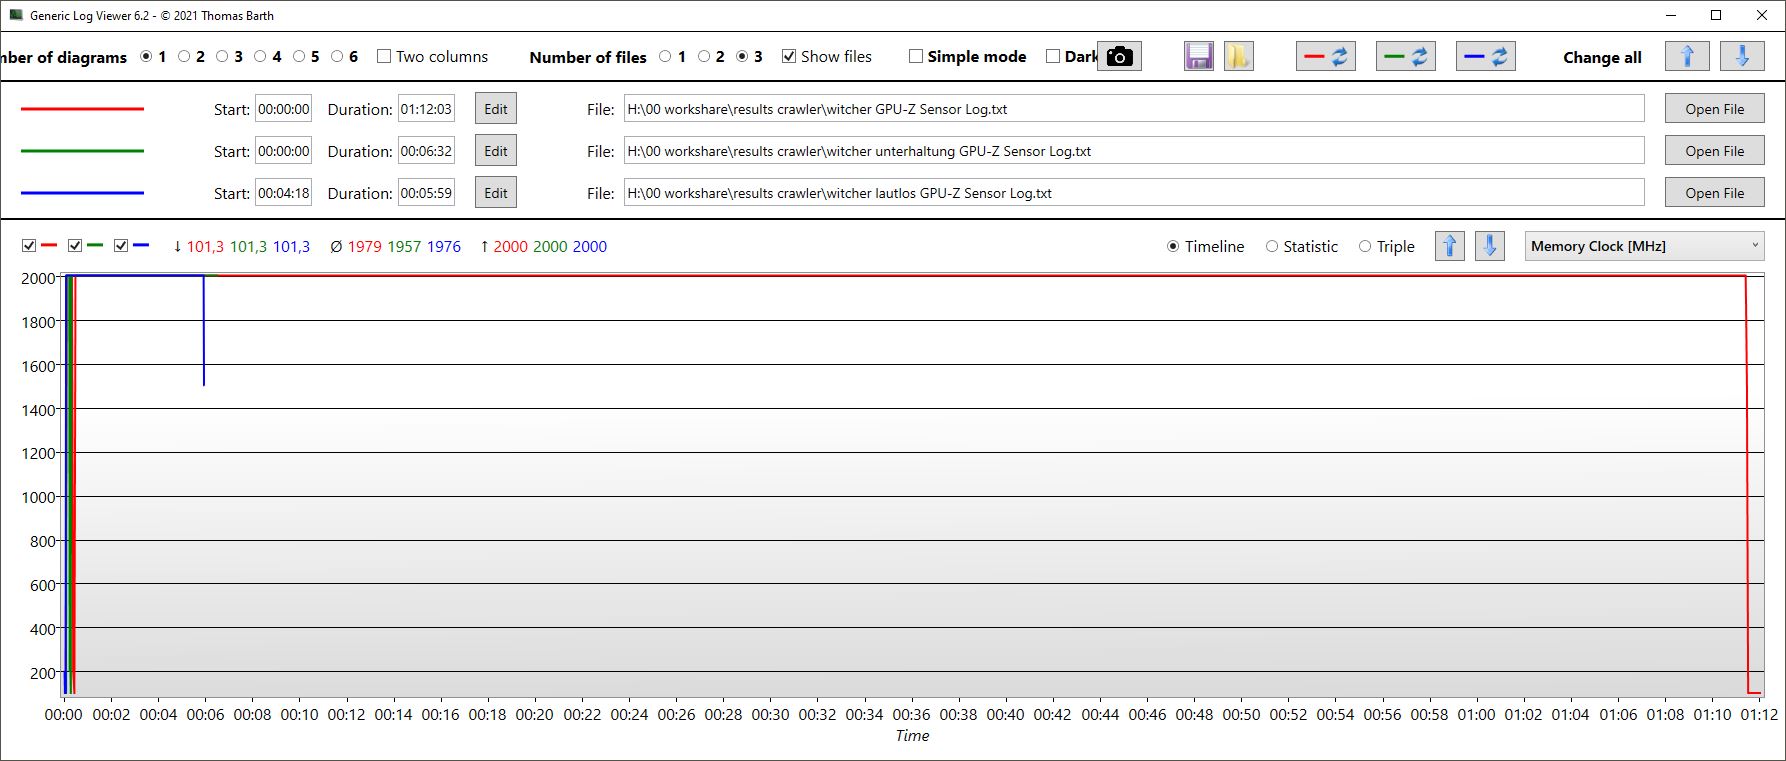
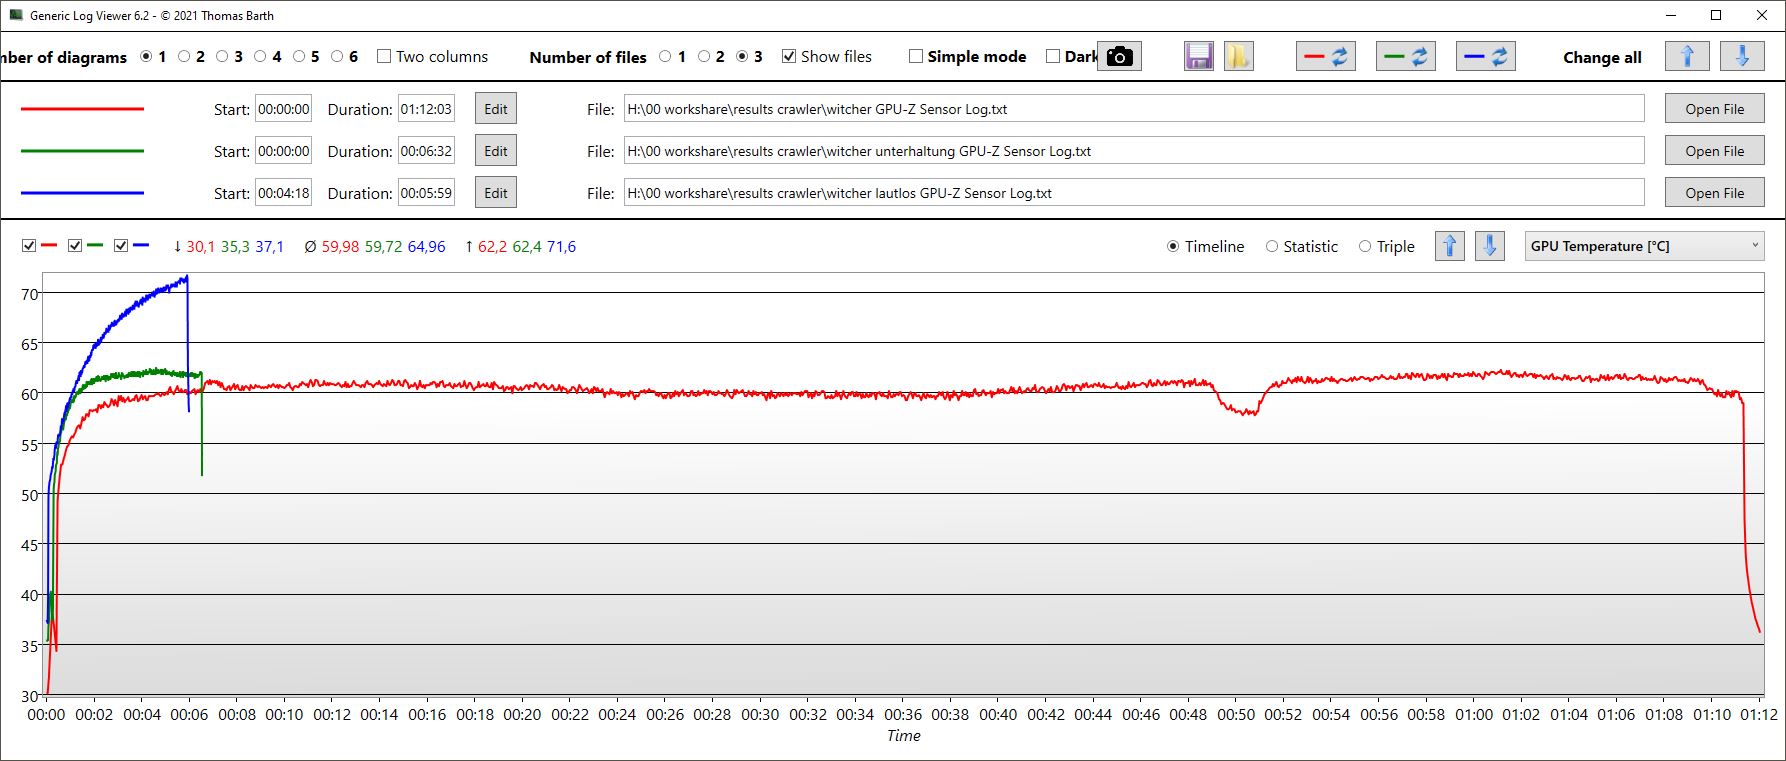
Nei nostri dati di log per Witcher 3 (vedere gli screenshot qui sotto), si può notare che il clock della GPU e il consumo energetico in modalità intrattenimento e silenziosa sono quasi esattamente gli stessi e solo leggermente inferiori rispetto alla modalità gioco. Di conseguenza, le frequenze dei fotogrammi non differiscono quasi mai. L'unica differenza tra le modalità è il comportamento della ventola, che porta a uno sviluppo diverso del volume e della temperatura. In modalità silenziosa, la GPU si riscalda di più rispetto alle altre modalità. In modalità di gioco, il frame rate di Witcher 3 è molto costante.
Rispetto alla concorrenza, l'E40 si comporta bene. In particolare, si piazza al primo posto in Far Cry 5. In Witcher 3, invece, è ultimo, ma le differenze sono minime. Nel risultato di gioco complessivo, la concorrenza è vicina, il LOQ 15 è leggermente migliore del nostro crawler, il Katana 15 è circa uguale e l'Apex 15 e soprattutto l'Asus TUF A15 sono più deboli.
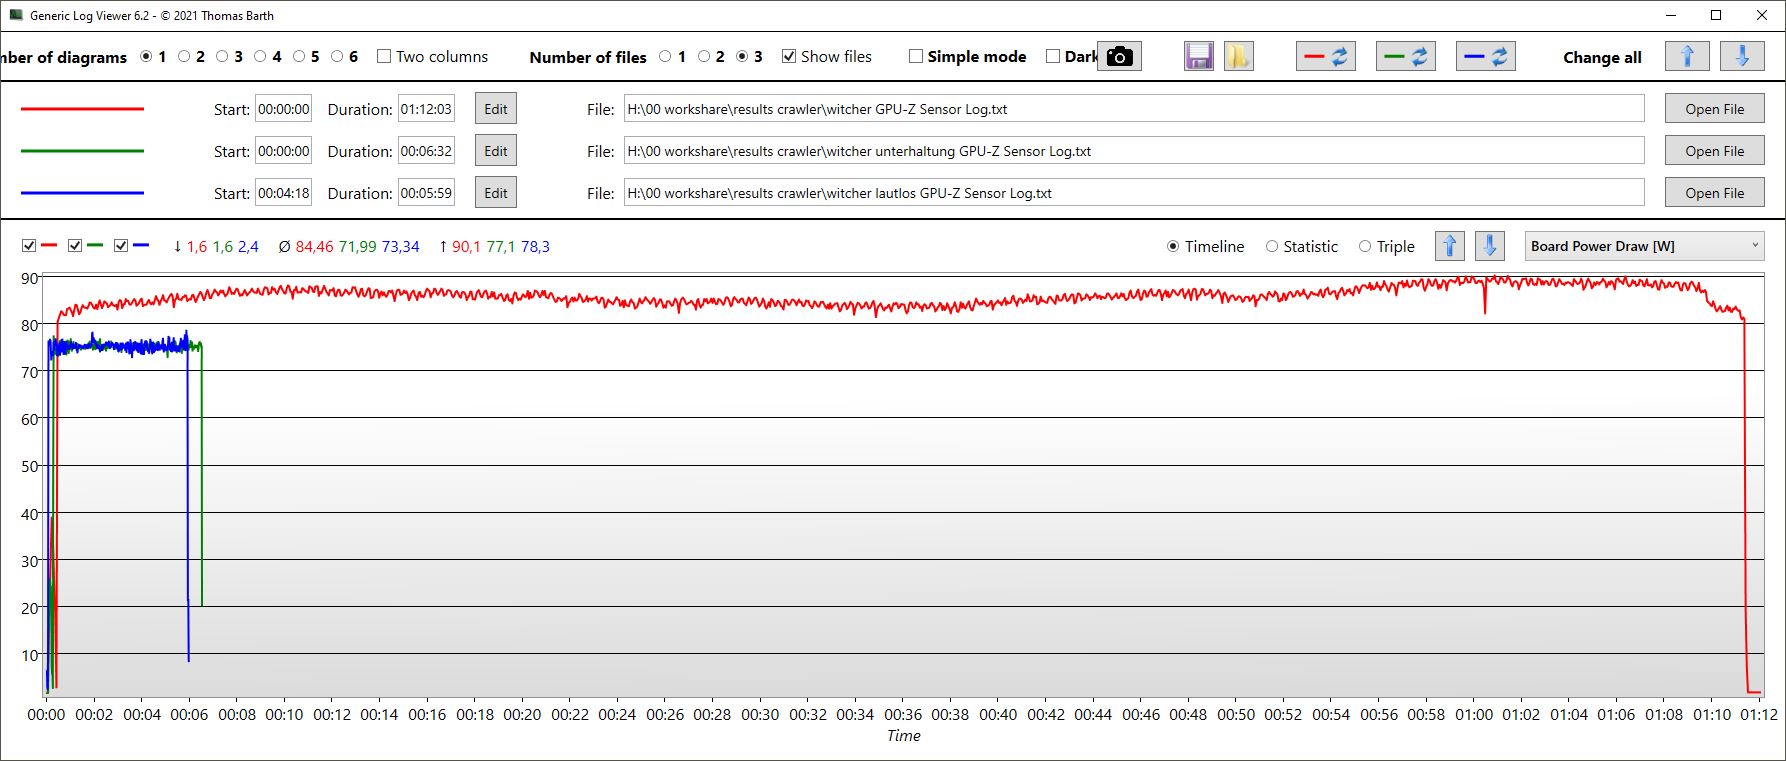
| Modalità/Witcher 3 Misurazione GPU | FPS medi | Orologio GPU | Orologio Memoria | Temperatura media | Consumo energetico |
|---|---|---|---|---|---|
| Gaming | 79,5 | 2.595 MHz | 2.000 MHz | 60 °C | 85 W |
| Intrattenimento | 77 | 2.400 MHz | 2.000 MHz | circa 62 °C | 72 W |
| Silenzioso | 78 | 2.400 MHz | 2.000 MHz | circa 75 °C | 73 W |
| Performance rating - Percent | |
| Media della classe Gaming | |
| Lenovo LOQ 15IRH8 Core i7 | |
| Medion Erazer Crawler E40 - MD 62518 | |
| MSI Katana 15 B12VEK | |
| Schenker XMG Apex 15 (Late 23) -1! | |
| Asus TUF A15 FA507 | |
| The Witcher 3 - 1920x1080 Ultra Graphics & Postprocessing (HBAO+) | |
| Media della classe Gaming (104.7 - 240, n=7, ultimi 2 anni) | |
| Lenovo LOQ 15IRH8 Core i7 | |
| Schenker XMG Apex 15 (Late 23) | |
| MSI Katana 15 B12VEK | |
| Asus TUF A15 FA507 | |
| Medion Erazer Crawler E40 - MD 62518 | |
| GTA V - 1920x1080 Highest AA:4xMSAA + FX AF:16x | |
| Media della classe Gaming (48.3 - 186.9, n=94, ultimi 2 anni) | |
| Medion Erazer Crawler E40 - MD 62518 | |
| Lenovo LOQ 15IRH8 Core i7 | |
| MSI Katana 15 B12VEK | |
| Asus TUF A15 FA507 | |
| Final Fantasy XV Benchmark - 1920x1080 High Quality | |
| Media della classe Gaming (41 - 215, n=95, ultimi 2 anni) | |
| Schenker XMG Apex 15 (Late 23) | |
| Medion Erazer Crawler E40 - MD 62518 | |
| Lenovo LOQ 15IRH8 Core i7 | |
| MSI Katana 15 B12VEK | |
| Asus TUF A15 FA507 | |
| Strange Brigade - 1920x1080 ultra AA:ultra AF:16 | |
| Media della classe Gaming (76.3 - 458, n=87, ultimi 2 anni) | |
| Lenovo LOQ 15IRH8 Core i7 | |
| MSI Katana 15 B12VEK | |
| Schenker XMG Apex 15 (Late 23) | |
| Asus TUF A15 FA507 | |
| Medion Erazer Crawler E40 - MD 62518 | |
| Dota 2 Reborn - 1920x1080 ultra (3/3) best looking | |
| Lenovo LOQ 15IRH8 Core i7 | |
| Media della classe Gaming (84.8 - 248, n=107, ultimi 2 anni) | |
| MSI Katana 15 B12VEK | |
| Medion Erazer Crawler E40 - MD 62518 | |
| Schenker XMG Apex 15 (Late 23) | |
| Asus TUF A15 FA507 | |
| X-Plane 11.11 - 1920x1080 high (fps_test=3) | |
| Lenovo LOQ 15IRH8 Core i7 | |
| Media della classe Gaming (55.5 - 143.5, n=109, ultimi 2 anni) | |
| Medion Erazer Crawler E40 - MD 62518 | |
| MSI Katana 15 B12VEK | |
| Schenker XMG Apex 15 (Late 23) | |
| Asus TUF A15 FA507 | |
Witcher 3 FPS chart
| basso | medio | alto | ultra | |
|---|---|---|---|---|
| GTA V (2015) | 182.2 | 176.4 | 169.1 | 97.7 |
| The Witcher 3 (2015) | 369 | 283 | 170 | 81 |
| Dota 2 Reborn (2015) | 162.7 | 152.7 | 147.9 | 140.2 |
| Final Fantasy XV Benchmark (2018) | 183.5 | 122.9 | 84.6 | |
| X-Plane 11.11 (2018) | 128.5 | 121.8 | 98.6 | |
| Far Cry 5 (2018) | 146 | 140 | 133 | 124 |
| Strange Brigade (2018) | 391 | 205 | 167.6 | 146.9 |
Emissioni ed energia - Sistema di raffreddamento aggressivo e rumoroso
Rumore del sistema
Crawler non è affatto un giocatore silenzioso. Rispetto alla concorrenza, è il giocatore più rumoroso: abbiamo misurato fino a 56 dB nello stress test e ancora più di 51 dB sotto Witcher 3; la concorrenza di solito rimane ben al di sotto dei 50 dB. Lo stesso vale per un'esecuzione 3DMark06: Mentre altri portatili rimangono completamente silenziosi qui nelle fasi e fanno ruotare le ventole in modo abbastanza silenzioso solo nella seconda metà del test, nell'E40 ruotano già a 50 dB.
Il sistema di raffreddamento è troppo aggressivo e rumoroso per noi. Come si può vedere nella prossima sezione, le temperature sono così basse che qui sarebbe possibile avere ventole più silenziose. Consigliamo di giocare in modalità intrattenimento o addirittura in modalità silenziosa.
Almeno in modalità idle, l'E40 rimane solitamente silenzioso, solo quando i processi in background generano un carico superiore a quello desiderato in modalità idle, le ventole si accendono. Ma anche se Crawler E40 è stato esposto a un carico maggiore, le ventole non si calmano completamente. Anche in modalità silenziosa, le ventole non si spengono nel prossimo futuro.
| Modalità/Witcher 3 misurazione | Volume | Consumo del sistema |
|---|---|---|
| Gioco | 51,46 dB | 155 W |
| Intrattenimento | 48,21 | 139 W |
| Silenzioso | 31,37 dB | 117 W |
Rumorosità
| Idle |
| 23 / 23 / 28.02 dB(A) |
| Sotto carico |
| 50.21 / 56.79 dB(A) |
 | ||
30 dB silenzioso 40 dB(A) udibile 50 dB(A) rumoroso |
||
min: | ||
| Medion Erazer Crawler E40 - MD 62518 GeForce RTX 4050 Laptop GPU, i5-13500H, Phison PS5021-E21 512GB | Lenovo LOQ 15IRH8 Core i7 GeForce RTX 4050 Laptop GPU, i7-13620H, Kioxia BG5 KBG50ZNT512G | Asus TUF A15 FA507 GeForce RTX 4050 Laptop GPU, R7 7735HS, Micron 2400 MTFDKBA512QFM | Schenker XMG Apex 15 (Late 23) GeForce RTX 4050 Laptop GPU, R7 7840HS, Samsung 990 Pro 1 TB | MSI Katana 15 B12VEK GeForce RTX 4050 Laptop GPU, i7-12650H, Micron 2400 MTFDKBA1T0QFM | |
|---|---|---|---|---|---|
| Noise | -5% | 14% | -2% | 6% | |
| off /ambiente * (dB) | 23 | 23.69 -3% | 23.3 -1% | 24 -4% | 24 -4% |
| Idle Minimum * (dB) | 23 | 29.03 -26% | 23.3 -1% | 25 -9% | 24 -4% |
| Idle Average * (dB) | 23 | 29.03 -26% | 23.3 -1% | 29 -26% | 24 -4% |
| Idle Maximum * (dB) | 28.02 | 29.03 -4% | 23.3 17% | 33 -18% | 24 14% |
| Load Average * (dB) | 50.21 | 48.7 3% | 29.6 41% | 36 28% | 37.71 25% |
| Witcher 3 ultra * (dB) | 51.46 | 48.5 6% | 43 16% | 48 7% | 45.75 11% |
| Load Maximum * (dB) | 56.79 | 48.7 14% | 43 24% | 53 7% | 54.55 4% |
* ... Meglio usare valori piccoli
Temperatura
Grazie all'aggressivo sistema di raffreddamento, le temperature superficiali sono quasi sorprendentemente basse. Anche sotto carico massimo, queste salgono a malapena sopra i 96,8 °F in modalità gaming (temperatura ambiente 64,4 °F). C'è ancora molto spazio per un sistema di raffreddamento più silenzioso.
(+) La temperatura massima sul lato superiore è di 36 °C / 97 F, rispetto alla media di 40.4 °C / 105 F, che varia da 21.2 a 68.8 °C per questa classe Gaming.
(+) Il lato inferiore si riscalda fino ad un massimo di 36 °C / 97 F, rispetto alla media di 43.2 °C / 110 F
(+) In idle, la temperatura media del lato superiore è di 23.7 °C / 75 F, rispetto alla media deld ispositivo di 33.9 °C / 93 F.
(+) Riproducendo The Witcher 3, la temperatura media per il lato superiore e' di 27.4 °C / 81 F, rispetto alla media del dispositivo di 33.9 °C / 93 F.
(+) I poggiapolsi e il touchpad sono piu' freddi della temperatura della pelle con un massimo di 24 °C / 75.2 F e sono quindi freddi al tatto.
(+) La temperatura media della zona del palmo della mano di dispositivi simili e'stata di 28.8 °C / 83.8 F (+4.8 °C / 8.6 F).
| Medion Erazer Crawler E40 - MD 62518 Intel Core i5-13500H, NVIDIA GeForce RTX 4050 Laptop GPU | Lenovo LOQ 15IRH8 Core i7 Intel Core i7-13620H, NVIDIA GeForce RTX 4050 Laptop GPU | Asus TUF A15 FA507 AMD Ryzen 7 7735HS, NVIDIA GeForce RTX 4050 Laptop GPU | Schenker XMG Apex 15 (Late 23) AMD Ryzen 7 7840HS, NVIDIA GeForce RTX 4050 Laptop GPU | MSI Katana 15 B12VEK Intel Core i7-12650H, NVIDIA GeForce RTX 4050 Laptop GPU | |
|---|---|---|---|---|---|
| Heat | -40% | -17% | -31% | -35% | |
| Maximum Upper Side * (°C) | 36 | 46.4 -29% | 48.9 -36% | 52 -44% | 47 -31% |
| Maximum Bottom * (°C) | 36 | 59.2 -64% | 44.6 -24% | 47 -31% | 48 -33% |
| Idle Upper Side * (°C) | 26 | 34.4 -32% | 27.1 -4% | 33 -27% | 35 -35% |
| Idle Bottom * (°C) | 27 | 36.2 -34% | 27.5 -2% | 33 -22% | 38 -41% |
* ... Meglio usare valori piccoli
Altoparlanti
Gli altoparlanti stereo si trovano agli angoli anteriori e irradiano verso il basso. Gli alti sono bilanciati, ma i bassi sono quasi inesistenti. Consigliamo di collegare le cuffie tramite l'uscita jack.
Medion Erazer Crawler E40 - MD 62518 analisi audio
(±) | potenza degli altiparlanti media ma buona (81.47 dB)
Bassi 100 - 315 Hz
(-) | quasi nessun basso - in media 32.7% inferiori alla media
(±) | la linearità dei bassi è media (11% delta rispetto alla precedente frequenza)
Medi 400 - 2000 Hz
(+) | medi bilanciati - solo only 4.6% rispetto alla media
(±) | linearità dei medi adeguata (7.1% delta rispetto alla precedente frequenza)
Alti 2 - 16 kHz
(+) | Alti bilanciati - appena 3.1% dalla media
(+) | alti lineari (5.7% delta rispetto alla precedente frequenza)
Nel complesso 100 - 16.000 Hz
(±) | la linearità complessiva del suono è media (21.8% di differenza rispetto alla media
Rispetto alla stessa classe
» 78% di tutti i dispositivi testati in questa classe è stato migliore, 6% simile, 16% peggiore
» Il migliore ha avuto un delta di 6%, medio di 18%, peggiore di 132%
Rispetto a tutti i dispositivi testati
» 62% di tutti i dispositivi testati in questa classe è stato migliore, 7% similare, 31% peggiore
» Il migliore ha avuto un delta di 4%, medio di 23%, peggiore di 134%
Lenovo LOQ 15IRH8 Core i7 analisi audio
(±) | potenza degli altiparlanti media ma buona (75.9 dB)
Bassi 100 - 315 Hz
(-) | quasi nessun basso - in media 18.6% inferiori alla media
(±) | la linearità dei bassi è media (10.2% delta rispetto alla precedente frequenza)
Medi 400 - 2000 Hz
(+) | medi bilanciati - solo only 2.2% rispetto alla media
(+) | medi lineari (3.1% delta rispetto alla precedente frequenza)
Alti 2 - 16 kHz
(+) | Alti bilanciati - appena 2.3% dalla media
(+) | alti lineari (4.4% delta rispetto alla precedente frequenza)
Nel complesso 100 - 16.000 Hz
(+) | suono nel complesso lineare (13.7% differenza dalla media)
Rispetto alla stessa classe
» 21% di tutti i dispositivi testati in questa classe è stato migliore, 7% simile, 72% peggiore
» Il migliore ha avuto un delta di 6%, medio di 18%, peggiore di 132%
Rispetto a tutti i dispositivi testati
» 15% di tutti i dispositivi testati in questa classe è stato migliore, 4% similare, 81% peggiore
» Il migliore ha avuto un delta di 4%, medio di 23%, peggiore di 134%
Consumo di energia
Il consumo energetico è un po' elevato in idle e nello stress test, ma non si distingue molto. Sotto carico normale, il consumo rientra nella media della concorrenza. Nel gioco, è alla pari con il Lenovo LOQ 15, ma superiore agli altri concorrenti.
Abbiamo misurato un consumo massimo temporaneo di 202,5 W durante il nostro test di stress simultaneo di CPU e GPU. L'alimentatore da 230 W di LiteOn non dovrebbe avere problemi.
| Off / Standby | |
| Idle | |
| Sotto carico |
|
Leggenda:
min: | |
| Medion Erazer Crawler E40 - MD 62518 GeForce RTX 4050 Laptop GPU, i5-13500H, Phison PS5021-E21 512GB | Lenovo LOQ 15IRH8 Core i7 GeForce RTX 4050 Laptop GPU, i7-13620H, Kioxia BG5 KBG50ZNT512G | Asus TUF A15 FA507 GeForce RTX 4050 Laptop GPU, R7 7735HS, Micron 2400 MTFDKBA512QFM | Schenker XMG Apex 15 (Late 23) GeForce RTX 4050 Laptop GPU, R7 7840HS, Samsung 990 Pro 1 TB | MSI Katana 15 B12VEK GeForce RTX 4050 Laptop GPU, i7-12650H, Micron 2400 MTFDKBA1T0QFM | |
|---|---|---|---|---|---|
| Power Consumption | 1% | 23% | 15% | 18% | |
| Idle 150cd/m2 * (Watt) | 15.3 | 9.48 38% | 10.8 29% | 9.8 36% | |
| 3DMark06 Return To Proxycon * (Watt) | 88 | 94.5 -7% | 84 5% | ||
| Witcher 3 ultra * (Watt) | 155 | 154.4 -0% | 136.6 12% | 136.5 12% | 128 17% |
| 1280x720 Prime95 28.10 and Furmark 1.25 * (Watt) | 190 | 169.2 11% | 156.7 18% | 181 5% | 165 13% |
* ... Meglio usare valori piccoli
Power consumption Witcher 3 / stress test
Power consumption with external monitor
Durata della batteria
Medion utilizza una batteria da 54 Wh. Solo MSI Katana ha una batteria altrettanto piccola, ma dura comunque un po' di più in tutti i test. Il resto della concorrenza ha batterie da almeno 60 Wh, con l'Asus TUF A15 che ha addirittura una batteria da 90 Wh. In breve: il Medion ha i tempi di esecuzione più brevi in un confronto diretto. Nel nostro test di video o di navigazione con luminosità ridotta, il portatile raggiunge un'autonomia di circa 4 ore: non è esaltante.
| Medion Erazer Crawler E40 - MD 62518 i5-13500H, GeForce RTX 4050 Laptop GPU, 54 Wh | Lenovo LOQ 15IRH8 Core i7 i7-13620H, GeForce RTX 4050 Laptop GPU, 60 Wh | Asus TUF A15 FA507 R7 7735HS, GeForce RTX 4050 Laptop GPU, 90 Wh | Schenker XMG Apex 15 (Late 23) R7 7840HS, GeForce RTX 4050 Laptop GPU, 62.32 Wh | MSI Katana 15 B12VEK i7-12650H, GeForce RTX 4050 Laptop GPU, 53.5 Wh | Media della classe Gaming | |
|---|---|---|---|---|---|---|
| Autonomia della batteria | 50% | 130% | 73% | 14% | 70% | |
| H.264 (h) | 3.9 | 6.1 56% | 12.5 221% | 8.3 113% | 4.4 13% | 8.32 ? 113% |
| WiFi v1.3 (h) | 4.1 | 5.9 44% | 11.7 185% | 7.1 73% | 4.3 5% | 7.11 ? 73% |
| Load (h) | 1.2 | 1 -17% | 1.6 33% | 1.5 25% | 1.502 ? 25% | |
| Reader / Idle (h) | 8.4 | 8.27 ? |
Pro
Contro
Verdetto - Giocatore economico con compromessi ma buone prestazioni

Al prezzo di circa 1300 dollari, Medion Crawler E40 offre un'opzione economica per un computer portatile da gioco con RTX 4050. Sebbene rientri nella fascia economica, sono disponibili modelli ancora più economici, il che richiede un'analisi più approfondita del rapporto prezzo-prestazioni. Crawler E40 rivela le sue origini economiche con caratteristiche come l'i5-13500H invece dell'i7-13700H, un display del 2019, una webcam 720p e uno slot USB 2.0, tra gli altri aspetti. Di conseguenza, potrebbe non soddisfare le aspettative dei giocatori con esigenze elevate. Tuttavia, le prestazioni della CPU e della GPU sono lodevoli e l'SSD si comporta bene. Il display, sebbene non sia il più recente, è sufficientemente luminoso a 350 nit, reattivo e offre una frequenza di aggiornamento di 144 Hz, anche se non copre completamente gli spazi di colore tipici.
Anche se ci sono alcuni punti critici, molti di essi sono accettabili in un computer portatile economico. D'altra parte, la durata della batteria notevolmente debole e il sistema di raffreddamento eccessivamente rumoroso sono preoccupazioni più rilevanti. L'ottimizzazione del software potrebbe risolvere il problema del sistema di raffreddamento, in quanto sembra esserci un margine di miglioramento date le basse temperature.
In sintesi, Medion Crawler E40 è un portatile da gioco economico con alcuni compromessi, ma le prestazioni dei suoi componenti sono lodevoli. Le critiche principali riguardano il sistema di raffreddamento rumoroso e aggressivo e la scarsa durata della batteria.
Ciascuno dei concorrenti discussi nel test ha i suoi meriti, e le differenze tra loro sono relativamente minori. L'Asus TUF A15, pur offrendo prestazioni leggermente inferiori, si distingue per l'impressionante autonomia della batteria. Se la durata della batteria prolungata con prestazioni comparabili è una priorità e se è disposto a spendere un po' di più, il Lenovo LOQ 15 potrebbe essere una scelta adeguata, nonostante abbia alcuni svantaggi. È fondamentale notare che non c'è un chiaro vincitore, soprattutto se si considera che l'XMG Apex 15 ha un prezzo superiore di circa 550 dollari.
Prezzo e disponibilità
Il Medion Erazer Crawler E40 costa circa ~US$1300 direttamente da Medion.
Medion Erazer Crawler E40 - MD 62518
- 11/28/2023 v7 (old)
Christian Hintze
Transparency
La selezione dei dispositivi da recensire viene effettuata dalla nostra redazione. Il campione di prova è stato fornito all'autore come prestito dal produttore o dal rivenditore ai fini di questa recensione. L'istituto di credito non ha avuto alcuna influenza su questa recensione, né il produttore ne ha ricevuto una copia prima della pubblicazione. Non vi era alcun obbligo di pubblicare questa recensione. In quanto società mediatica indipendente, Notebookcheck non è soggetta all'autorità di produttori, rivenditori o editori.
Ecco come Notebookcheck esegue i test
Ogni anno, Notebookcheck esamina in modo indipendente centinaia di laptop e smartphone utilizzando procedure standardizzate per garantire che tutti i risultati siano comparabili. Da circa 20 anni sviluppiamo continuamente i nostri metodi di prova e nel frattempo stabiliamo gli standard di settore. Nei nostri laboratori di prova, tecnici ed editori esperti utilizzano apparecchiature di misurazione di alta qualità. Questi test comportano un processo di validazione in più fasi. Il nostro complesso sistema di valutazione si basa su centinaia di misurazioni e parametri di riferimento ben fondati, che mantengono l'obiettività.Price comparison

