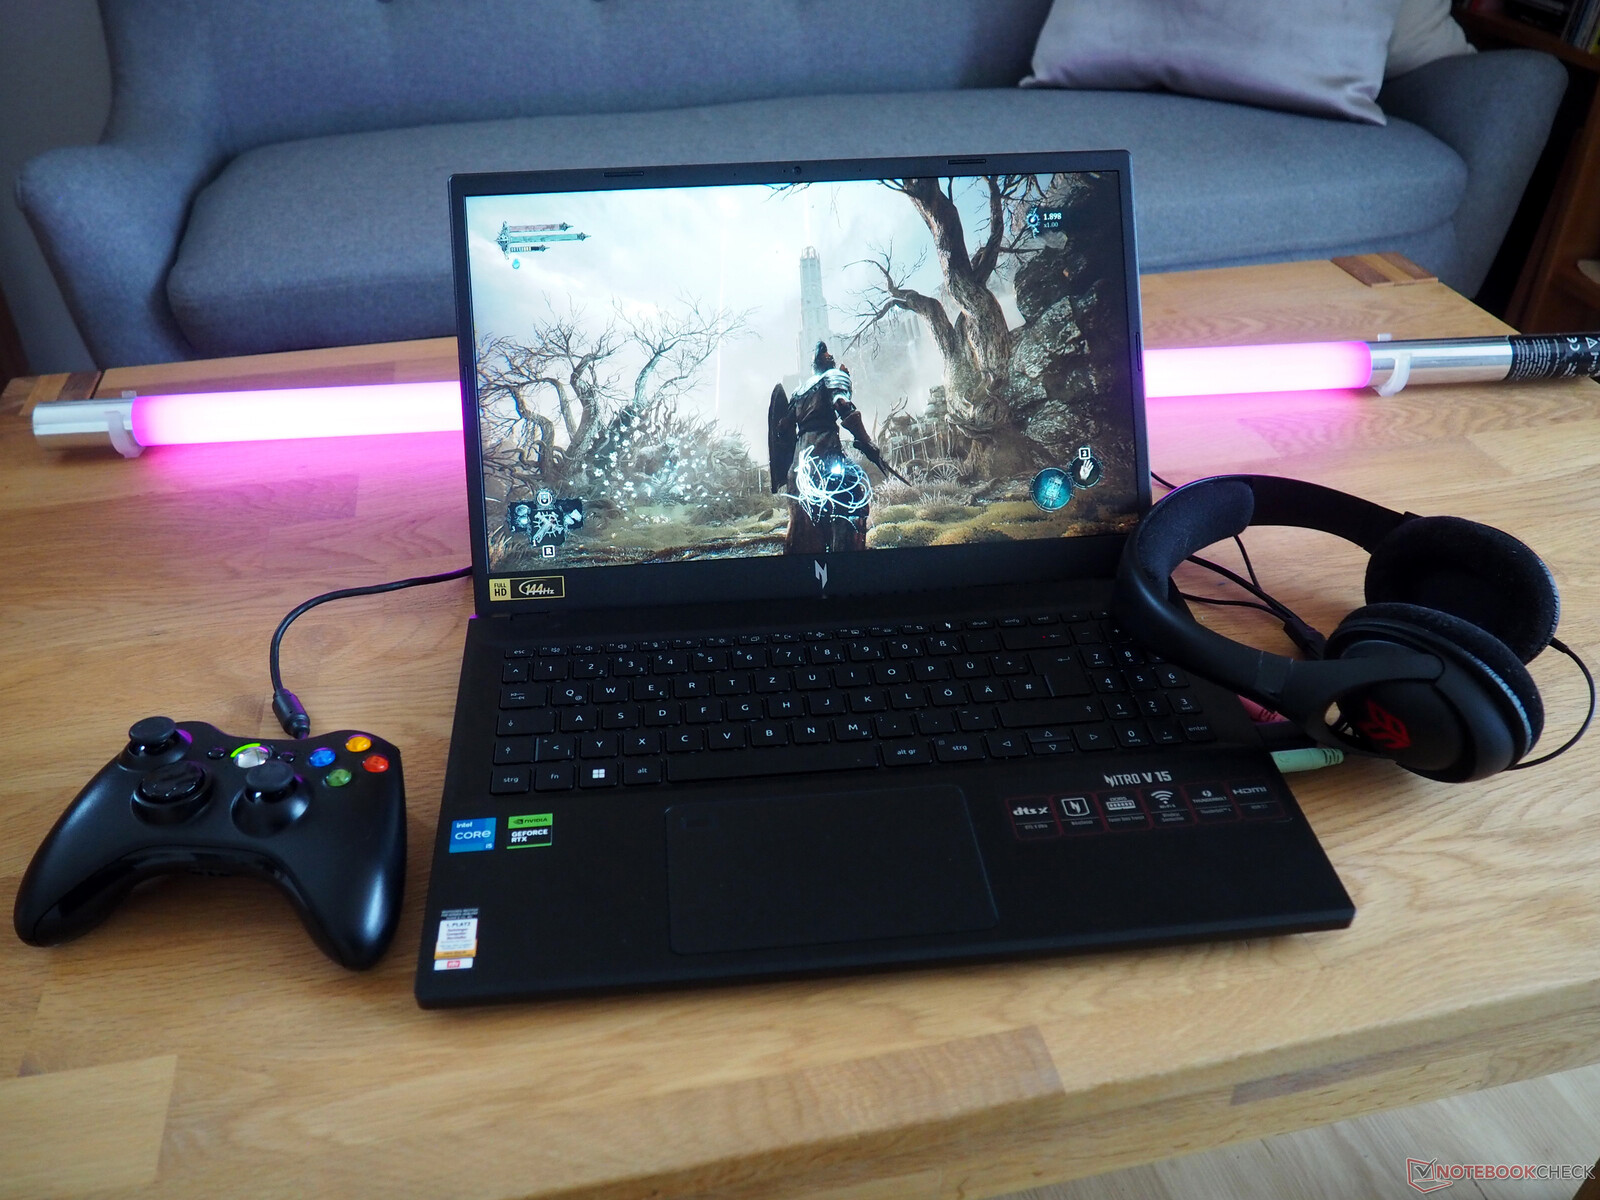
Recensione dell'Acer Nitro V 15 ANV15-51: gaming Laptop economico con RTX 4050
In Germania sono disponibili due varianti principali della Nitro V 15. Mentre il modello base presentato in questa recensione costa circa 900 euro (980 dollari) ed è dotato di un processore Core i5-13420H (12 thread) e un SSD da 512 GB, il modello più costoso le costerà circa 200 euro (218 dollari) in più e vanta un Core i7-13620H Core i7-13620H (16 thread) e un disco da 1 TB. Entrambe le varianti sono configurate con gli stessi 16 GB di RAM DDR5 e con un'unità dedicata GeForce RTX 4050. Utilizzano anche un display IPS opaco con la solita risoluzione Full HD (1.920 x 1.080) e la capacità di 144 Hz.
Nitro V 15 è in concorrenza con altri portatili da gioco economici da 15 pollici con GeForce RTX 4050, come ad esempio il modello Medion Erazer Crawler E40il Lenovo LOQ 15IRH8, l'Asus TUF A15 FA507 e il Schenker XMG Apex 15 Late 23, tutti elencati nelle tabelle seguenti a scopo di confronto.
Potenziali concorrenti a confrontos
Punteggio | Data | Modello | Peso | Altezza | Dimensione | Risoluzione | Prezzo |
|---|---|---|---|---|---|---|---|
| 82.8 % v7 (old) | 01/2024 | Acer Nitro V 15 ANV15-51-582S i5-13420H, GeForce RTX 4050 Laptop GPU | 2.1 kg | 23.5 mm | 15.60" | 1920x1080 | |
| 85.4 % v7 (old) | 12/2023 | Medion Erazer Crawler E40 - MD 62518 i5-13500H, GeForce RTX 4050 Laptop GPU | 2.3 kg | 28 mm | 15.60" | 1920x1080 | |
| 85.9 % v7 (old) | 10/2023 | Lenovo LOQ 15IRH8 Core i7 i7-13620H, GeForce RTX 4050 Laptop GPU | 2.4 kg | 25.2 mm | 15.60" | 2560x1440 | |
| 86.3 % v7 (old) | 06/2023 | Asus TUF A15 FA507 R7 7735HS, GeForce RTX 4050 Laptop GPU | 2.2 kg | 24.9 mm | 15.60" | 1920x1080 | |
| 86.2 % v7 (old) | 10/2023 | Schenker XMG Apex 15 (Late 23) R7 7840HS, GeForce RTX 4050 Laptop GPU | 2.2 kg | 26.7 mm | 15.60" | 2560x1440 |
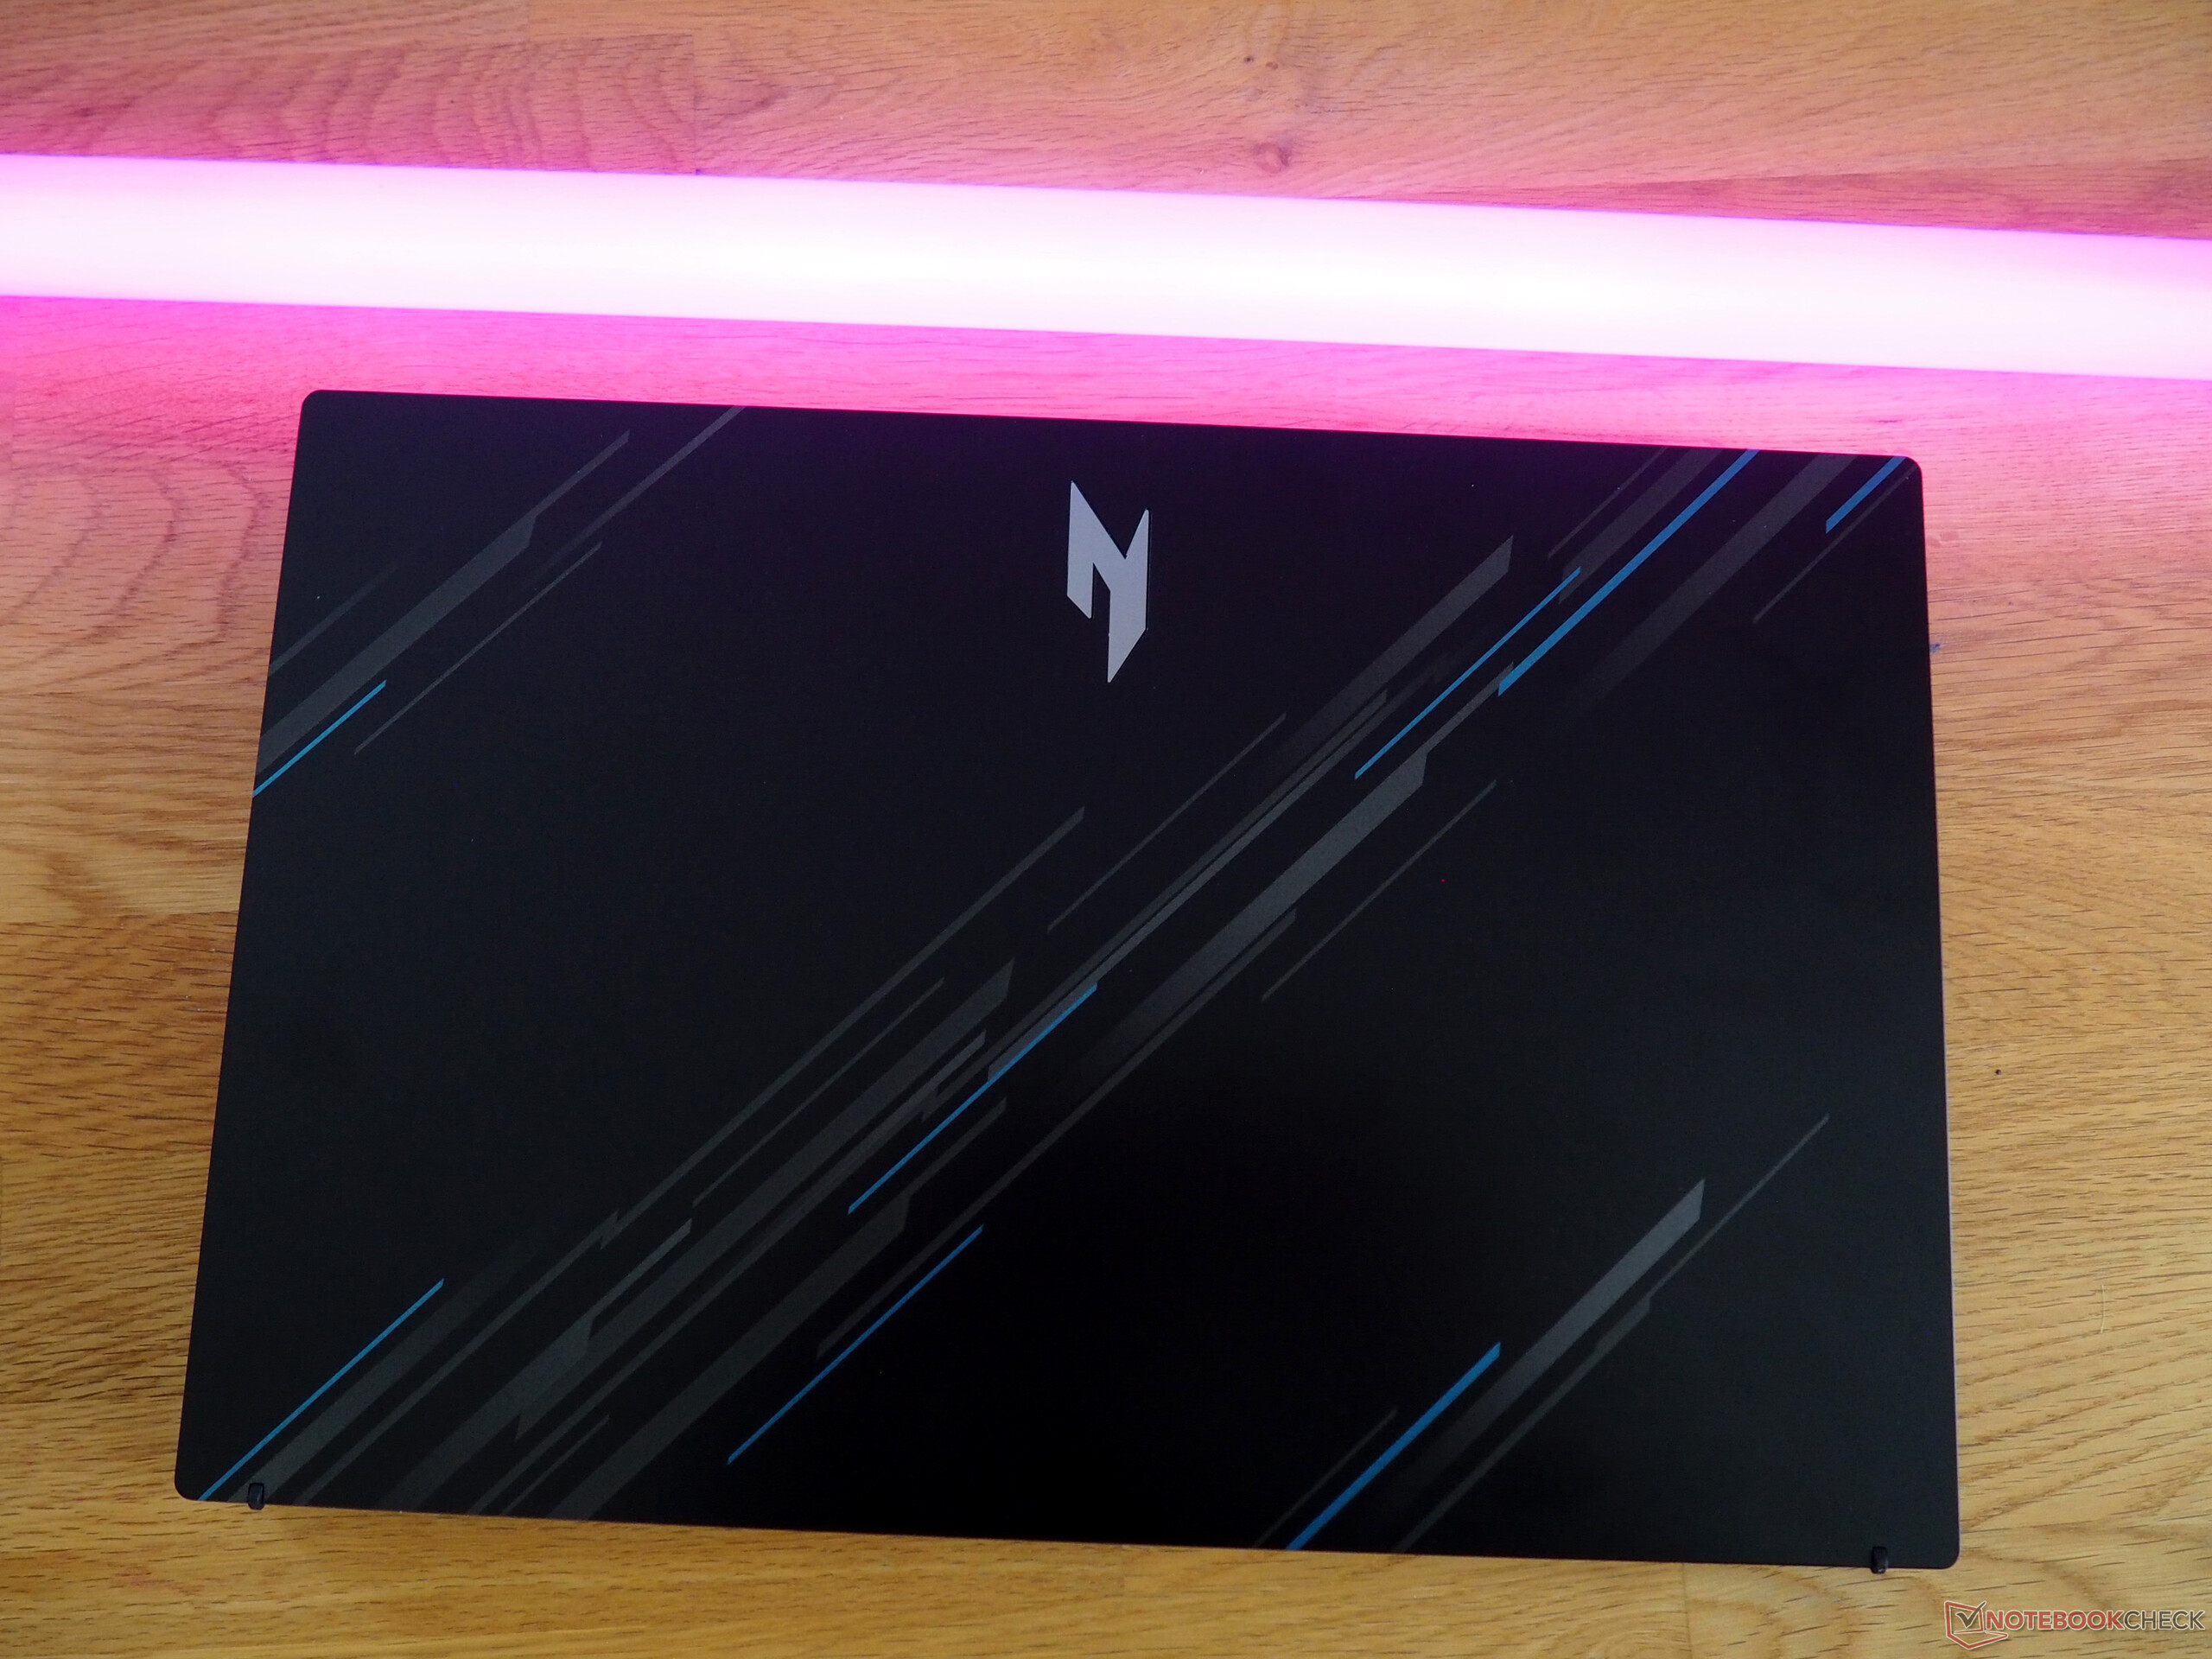
Caso
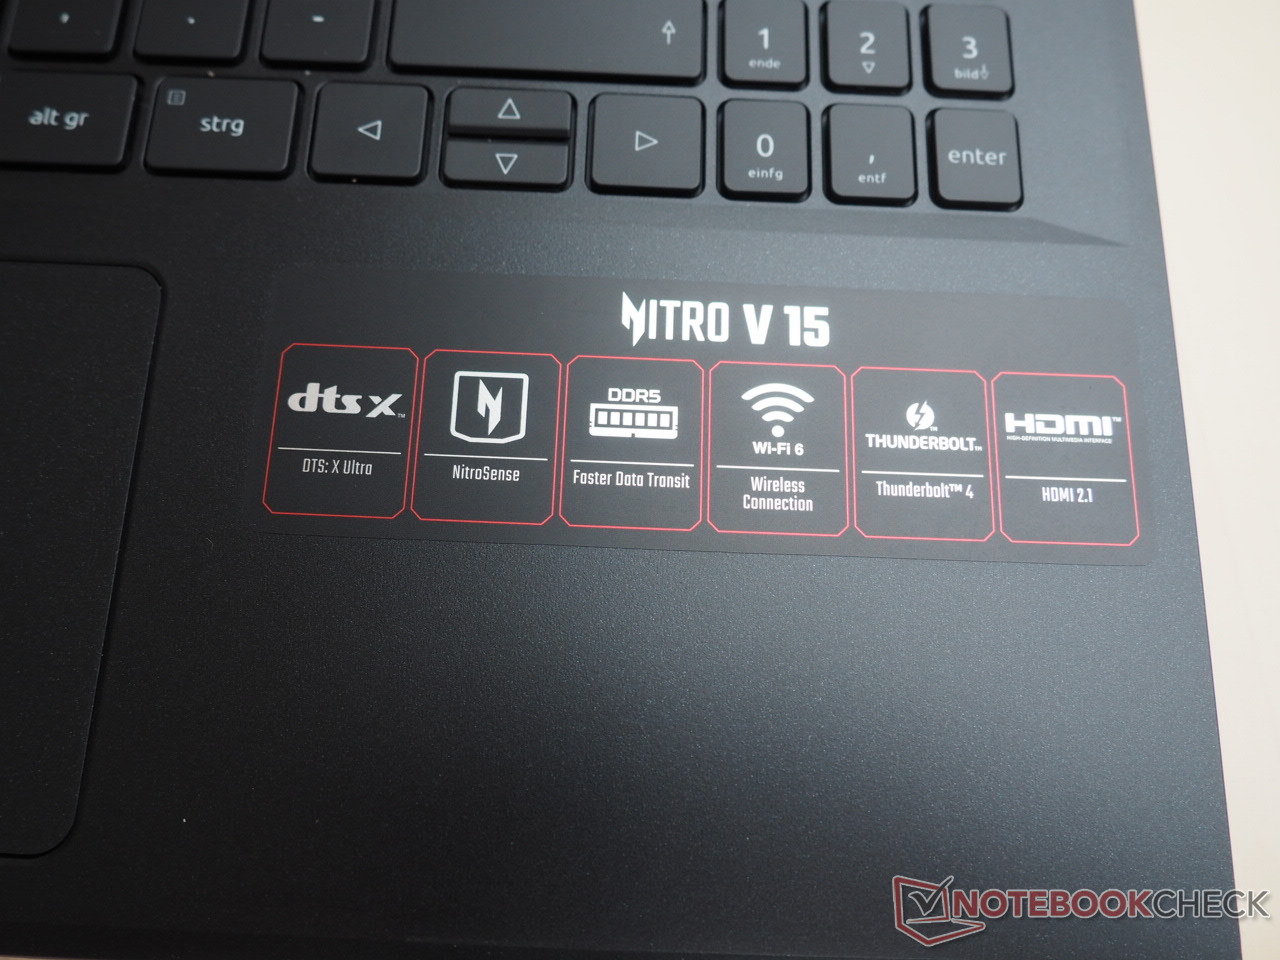
Il V 15 è esteticamente piacevole. Il design grigio-blu del coperchio, in particolare, rappresenta una boccata d'aria fresca. Tuttavia, non deve aspettarsi troppo dallo chassis in termini di qualità. Come molti altri dispositivi in questa fascia di prezzo, gli acquirenti devono accontentarsi di uno chassis in plastica un po' fragile e non molto robusto. Almeno il portatile da 15 pollici ha una struttura e una finitura pulite e un angolo di apertura massimo solido (circa 140°), anche se le cerniere potrebbero essere un po' più rigide e meno 'traballanti'.
Uno dei maggiori punti di forza del Nitro è il suo peso moderato: con circa 2,1 kg (4,6 lb), è il dispositivo più leggero del nostro confronto (i concorrenti pesano tra 2,2 e 2,4 kg, o 4,8 e 6,2 lb). Inoltre, il dispositivo non appare ingombrante grazie alla sua silhouette snella.
Specifiche
Interfacce
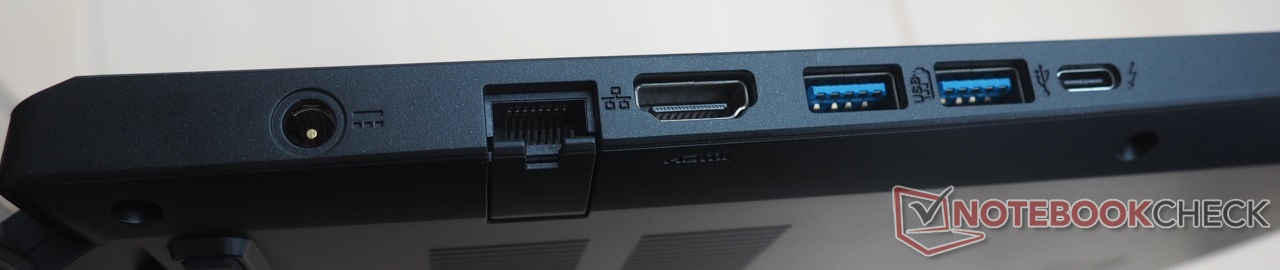
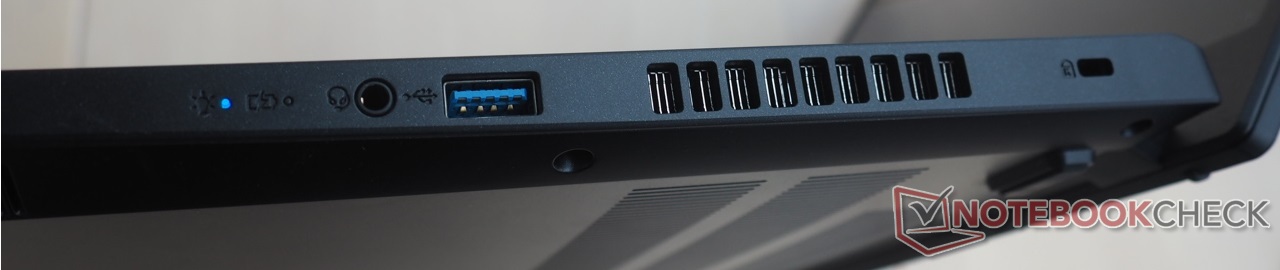
Se si ignora la mancanza di un lettore di schede, la selezione di porte può essere definita adeguata. Anche se avremmo preferito vedere una porta USB-C in più, le tre porte USB-A 3.0 e una porta Thunderbolt 4 sono comunque decenti per un portatile da gioco economico. Nitro V 15 dispone anche di una porta Ethernet pieghevole, un'uscita HDMI 2.1, un jack audio e uno slot Kensington. Le interfacce sono distribuite abbastanza bene sul dispositivo. Tuttavia, alcune porte avrebbero potuto essere posizionate leggermente più indietro per facilitare l'uso del mouse.
Connettività
Le prestazioni Wi-Fi sono mediocri al massimo. Il modulo wireless Intel integrato (Wi-Fi 6 AX203) non offre prestazioni di prim'ordine nell'invio e nella ricezione dei dati, ma le velocità che abbiamo ottenuto sono abbastanza stabili.
Webcam
Allo stesso modo, con il portatile riceverà solo una webcam standard e non notevole. Come spesso accade con le webcam dei portatili, le immagini mancano di nitidezza e di precisione cromatica.


Accessori
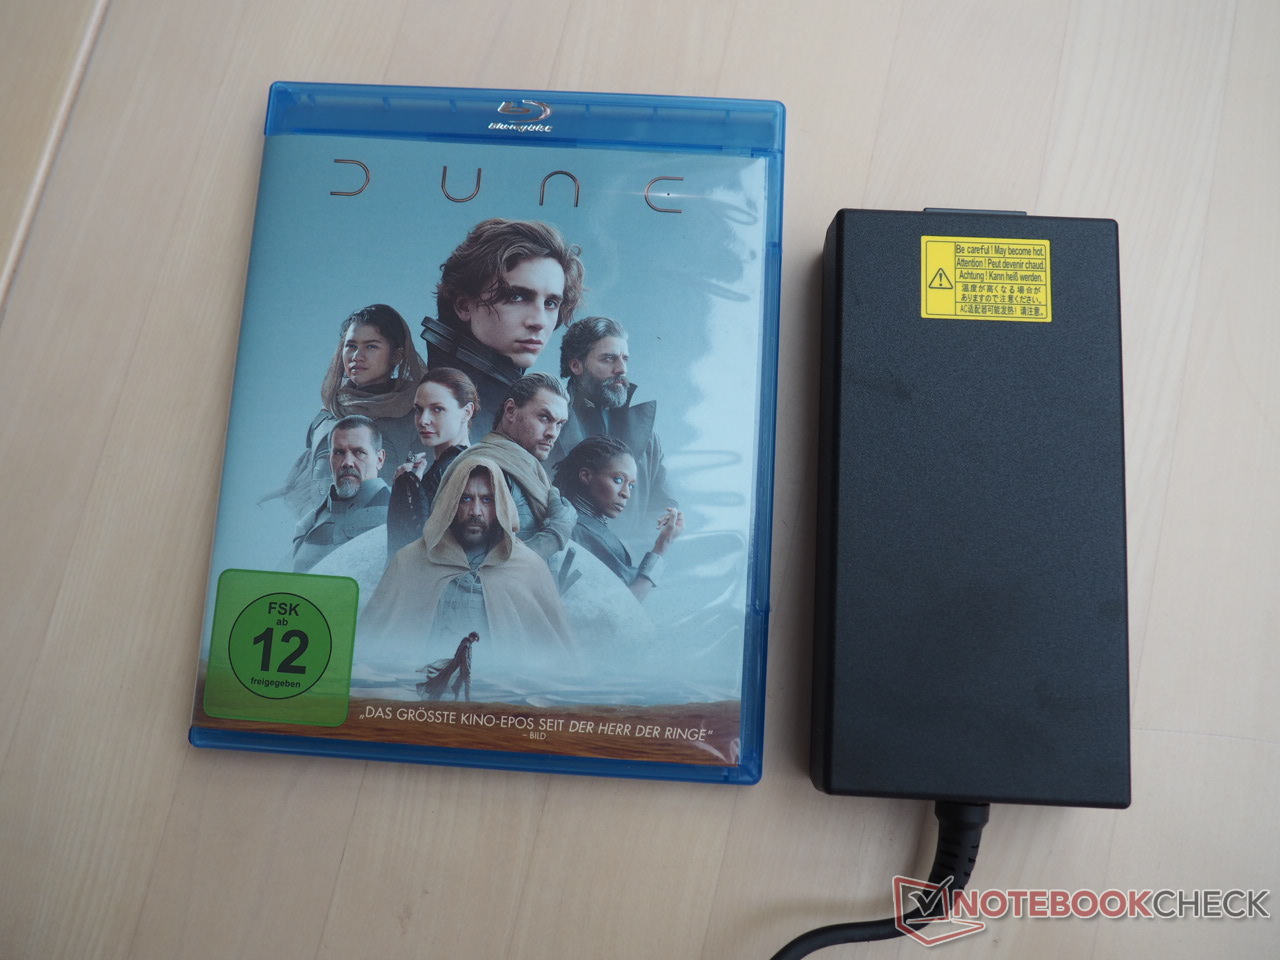
Oltre a una serie di documenti, nella confezione troverà anche un adattatore CA da 135 watt, piacevolmente compatto e leggero.
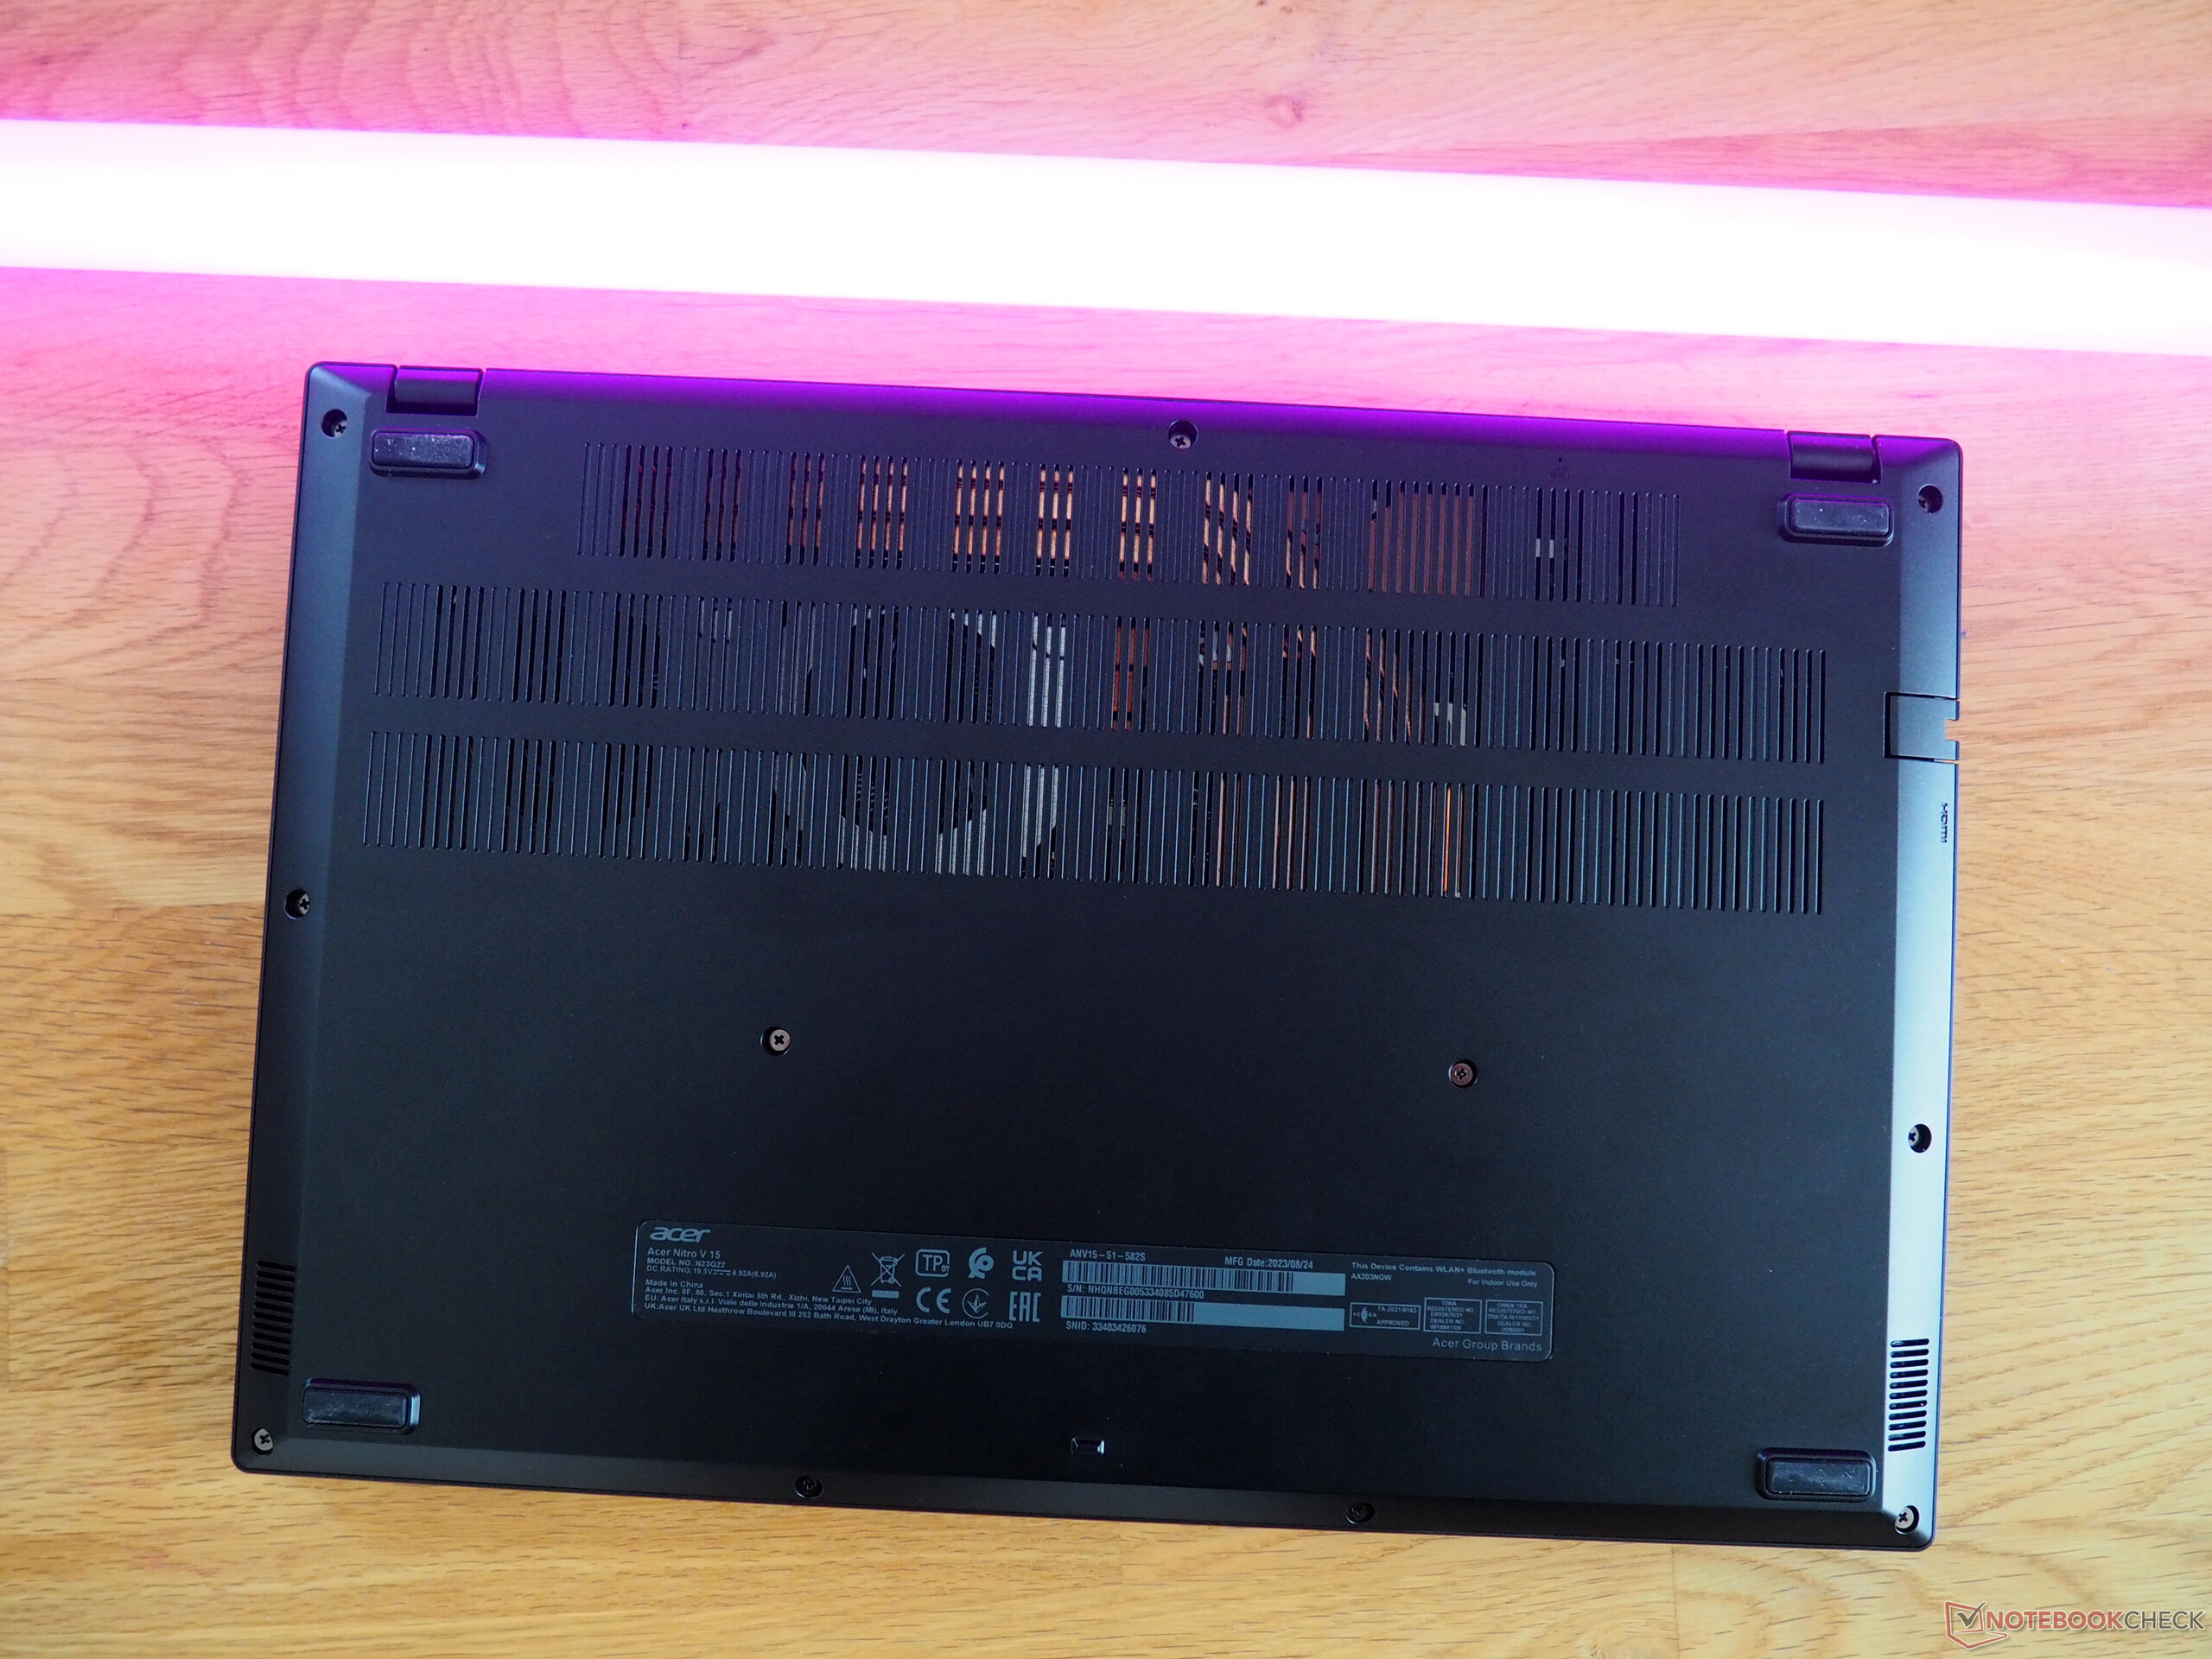
Manutenzione
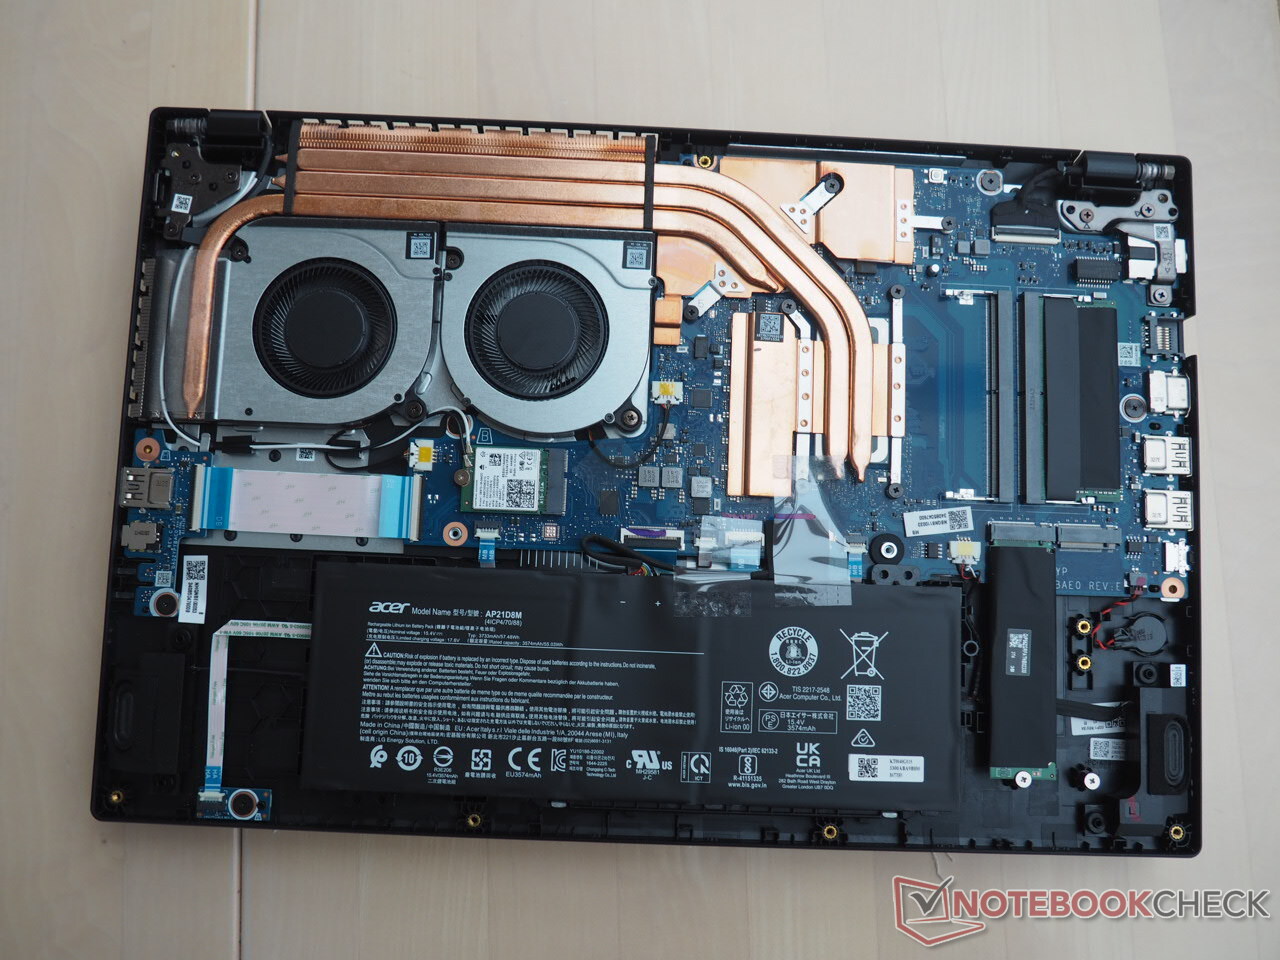
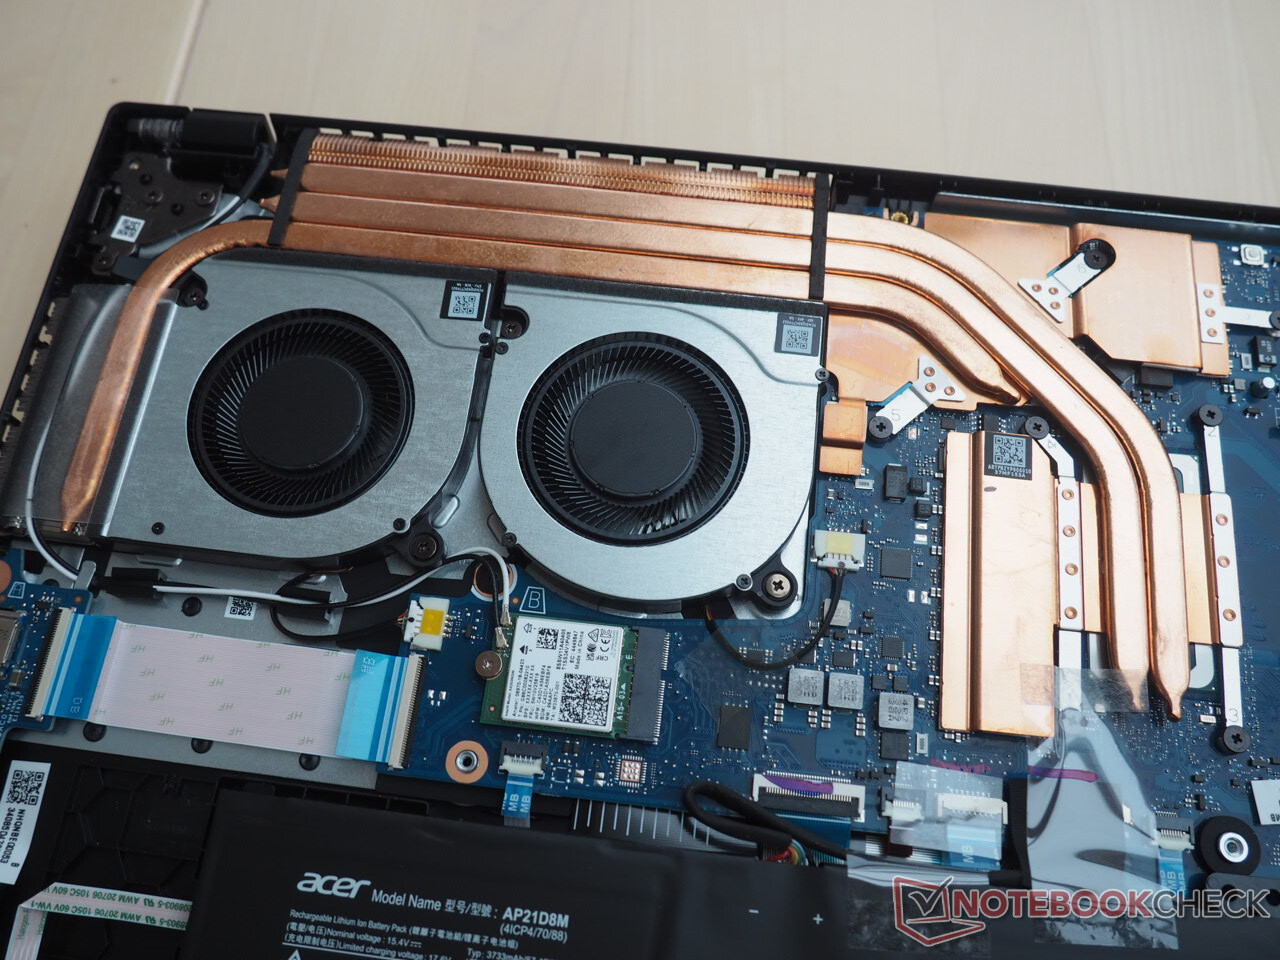
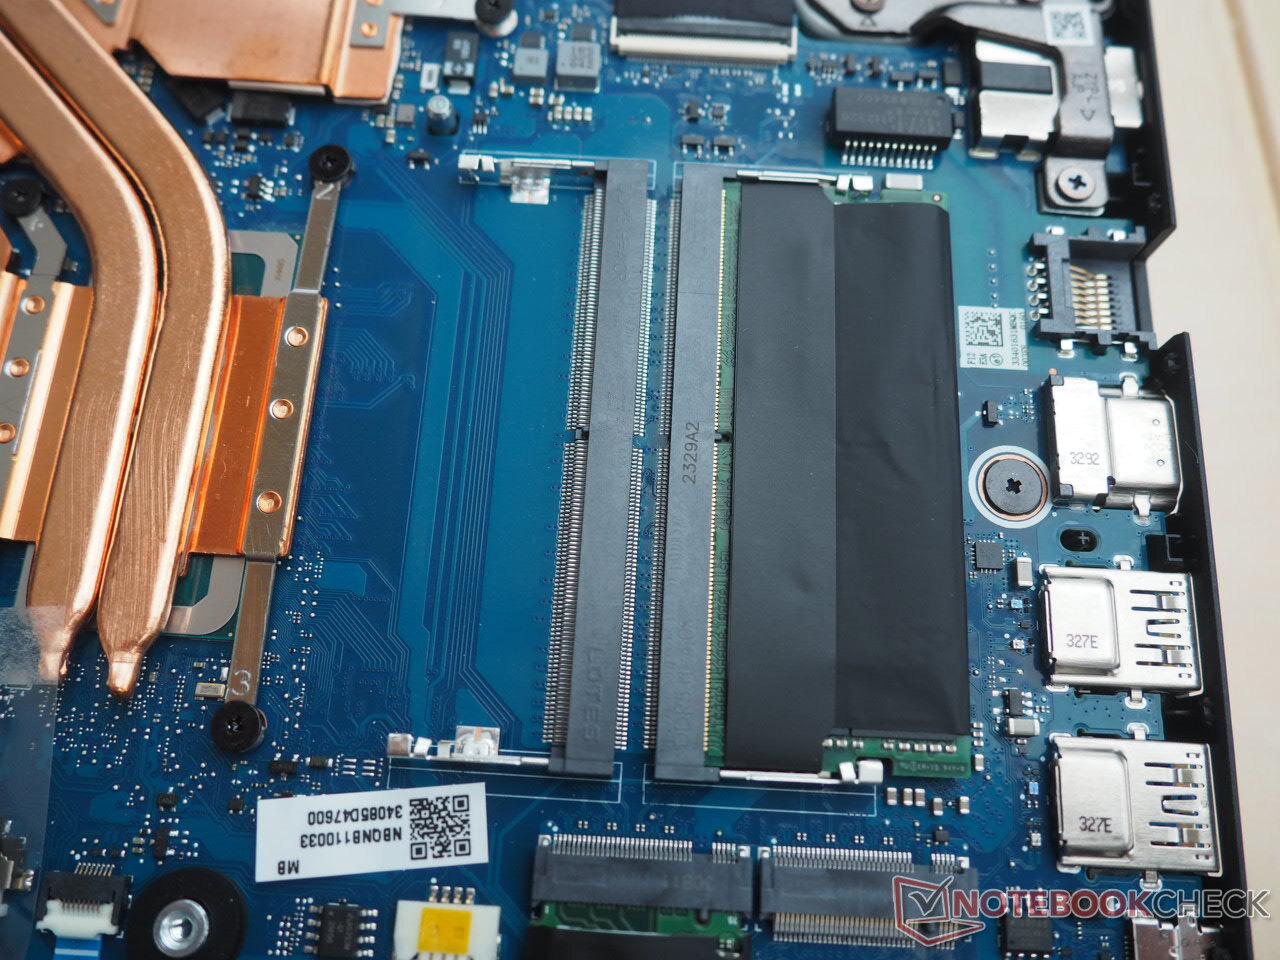
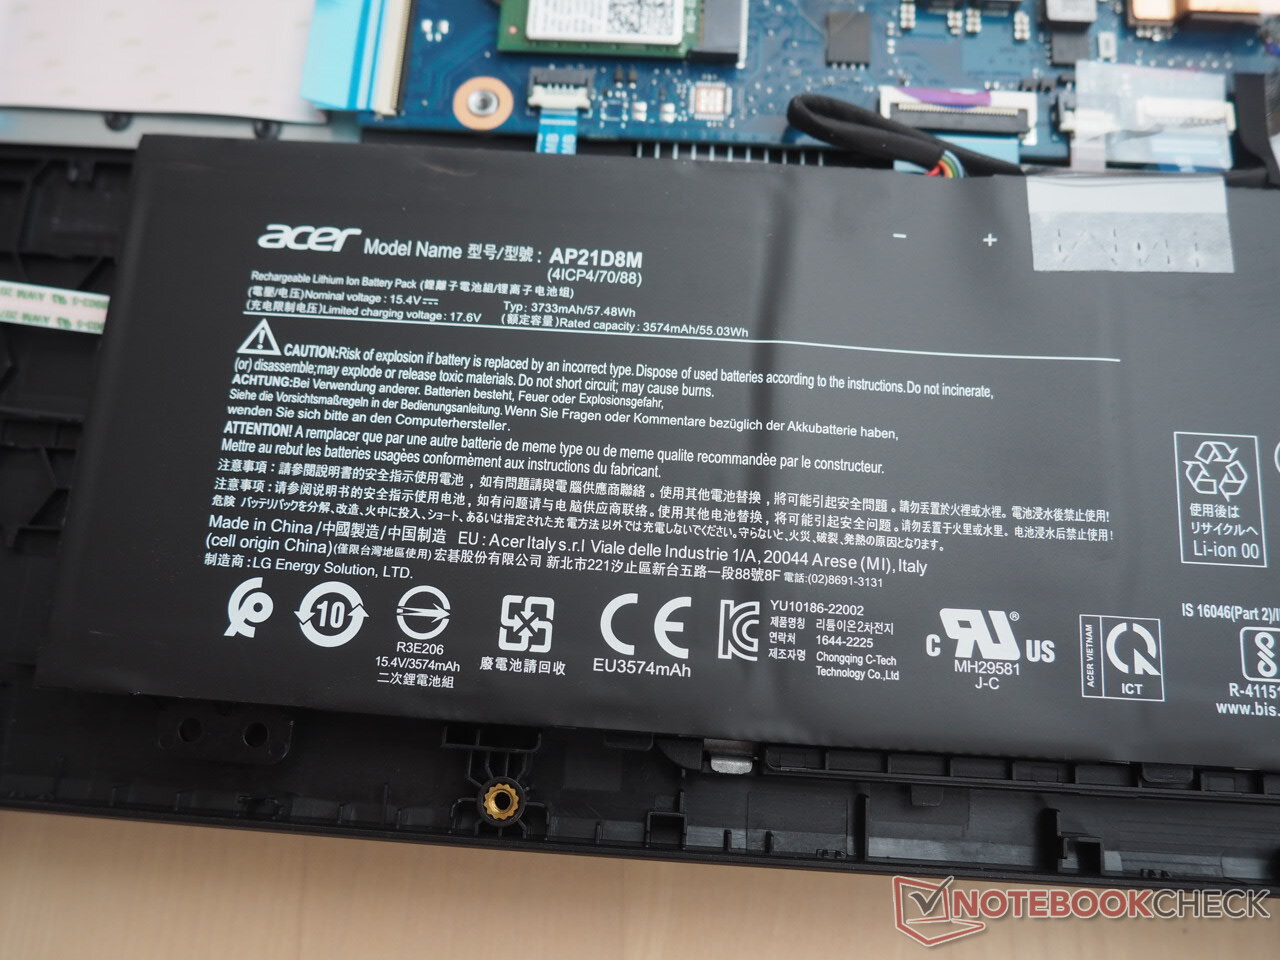
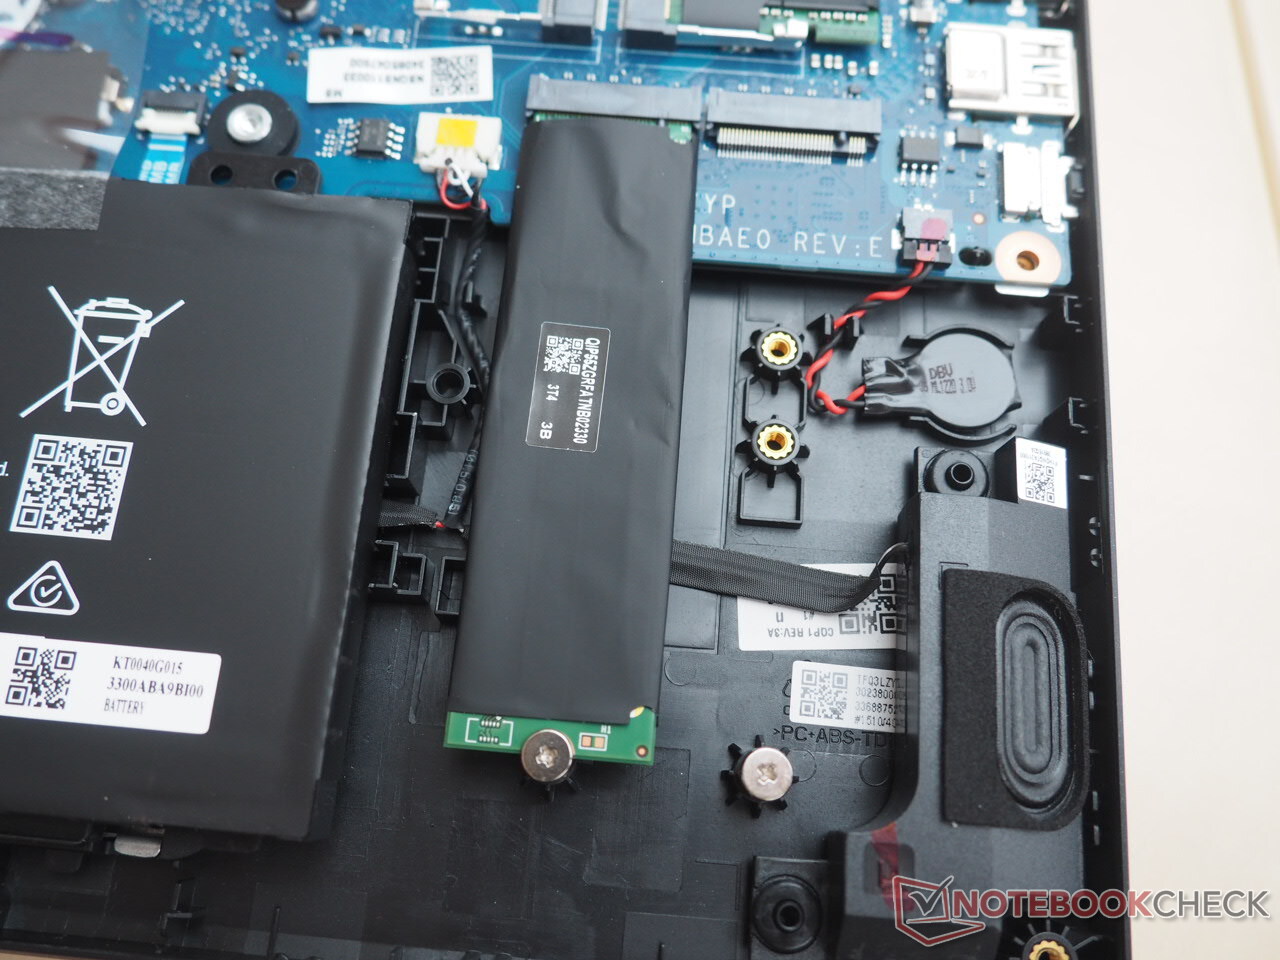
Un vantaggio di Nitro è la sua facilità di manutenzione. Nonostante il fatto che il coperchio inferiore sia tenuto abbastanza saldamente anche dopo aver rimosso le undici viti del telaio, una volta entrato nel portatile da 15 pollici, avrà accesso a uno slot M.2 libero e a uno slot RAM vuoto (vedere le foto). Anche se la configurazione a RAM singola nella nostra unità di recensione può avere un impatto negativo sulle prestazioni in alcune situazioni. Una cosa da notare: la batteria non è avvitata e può teoricamente cadere dal telaio quando si apre il portatile.
Garanzia
Acer offre una garanzia di due anni sul Nitro V 15 in Germania. Tuttavia, il periodo di garanzia può variare a seconda della regione.
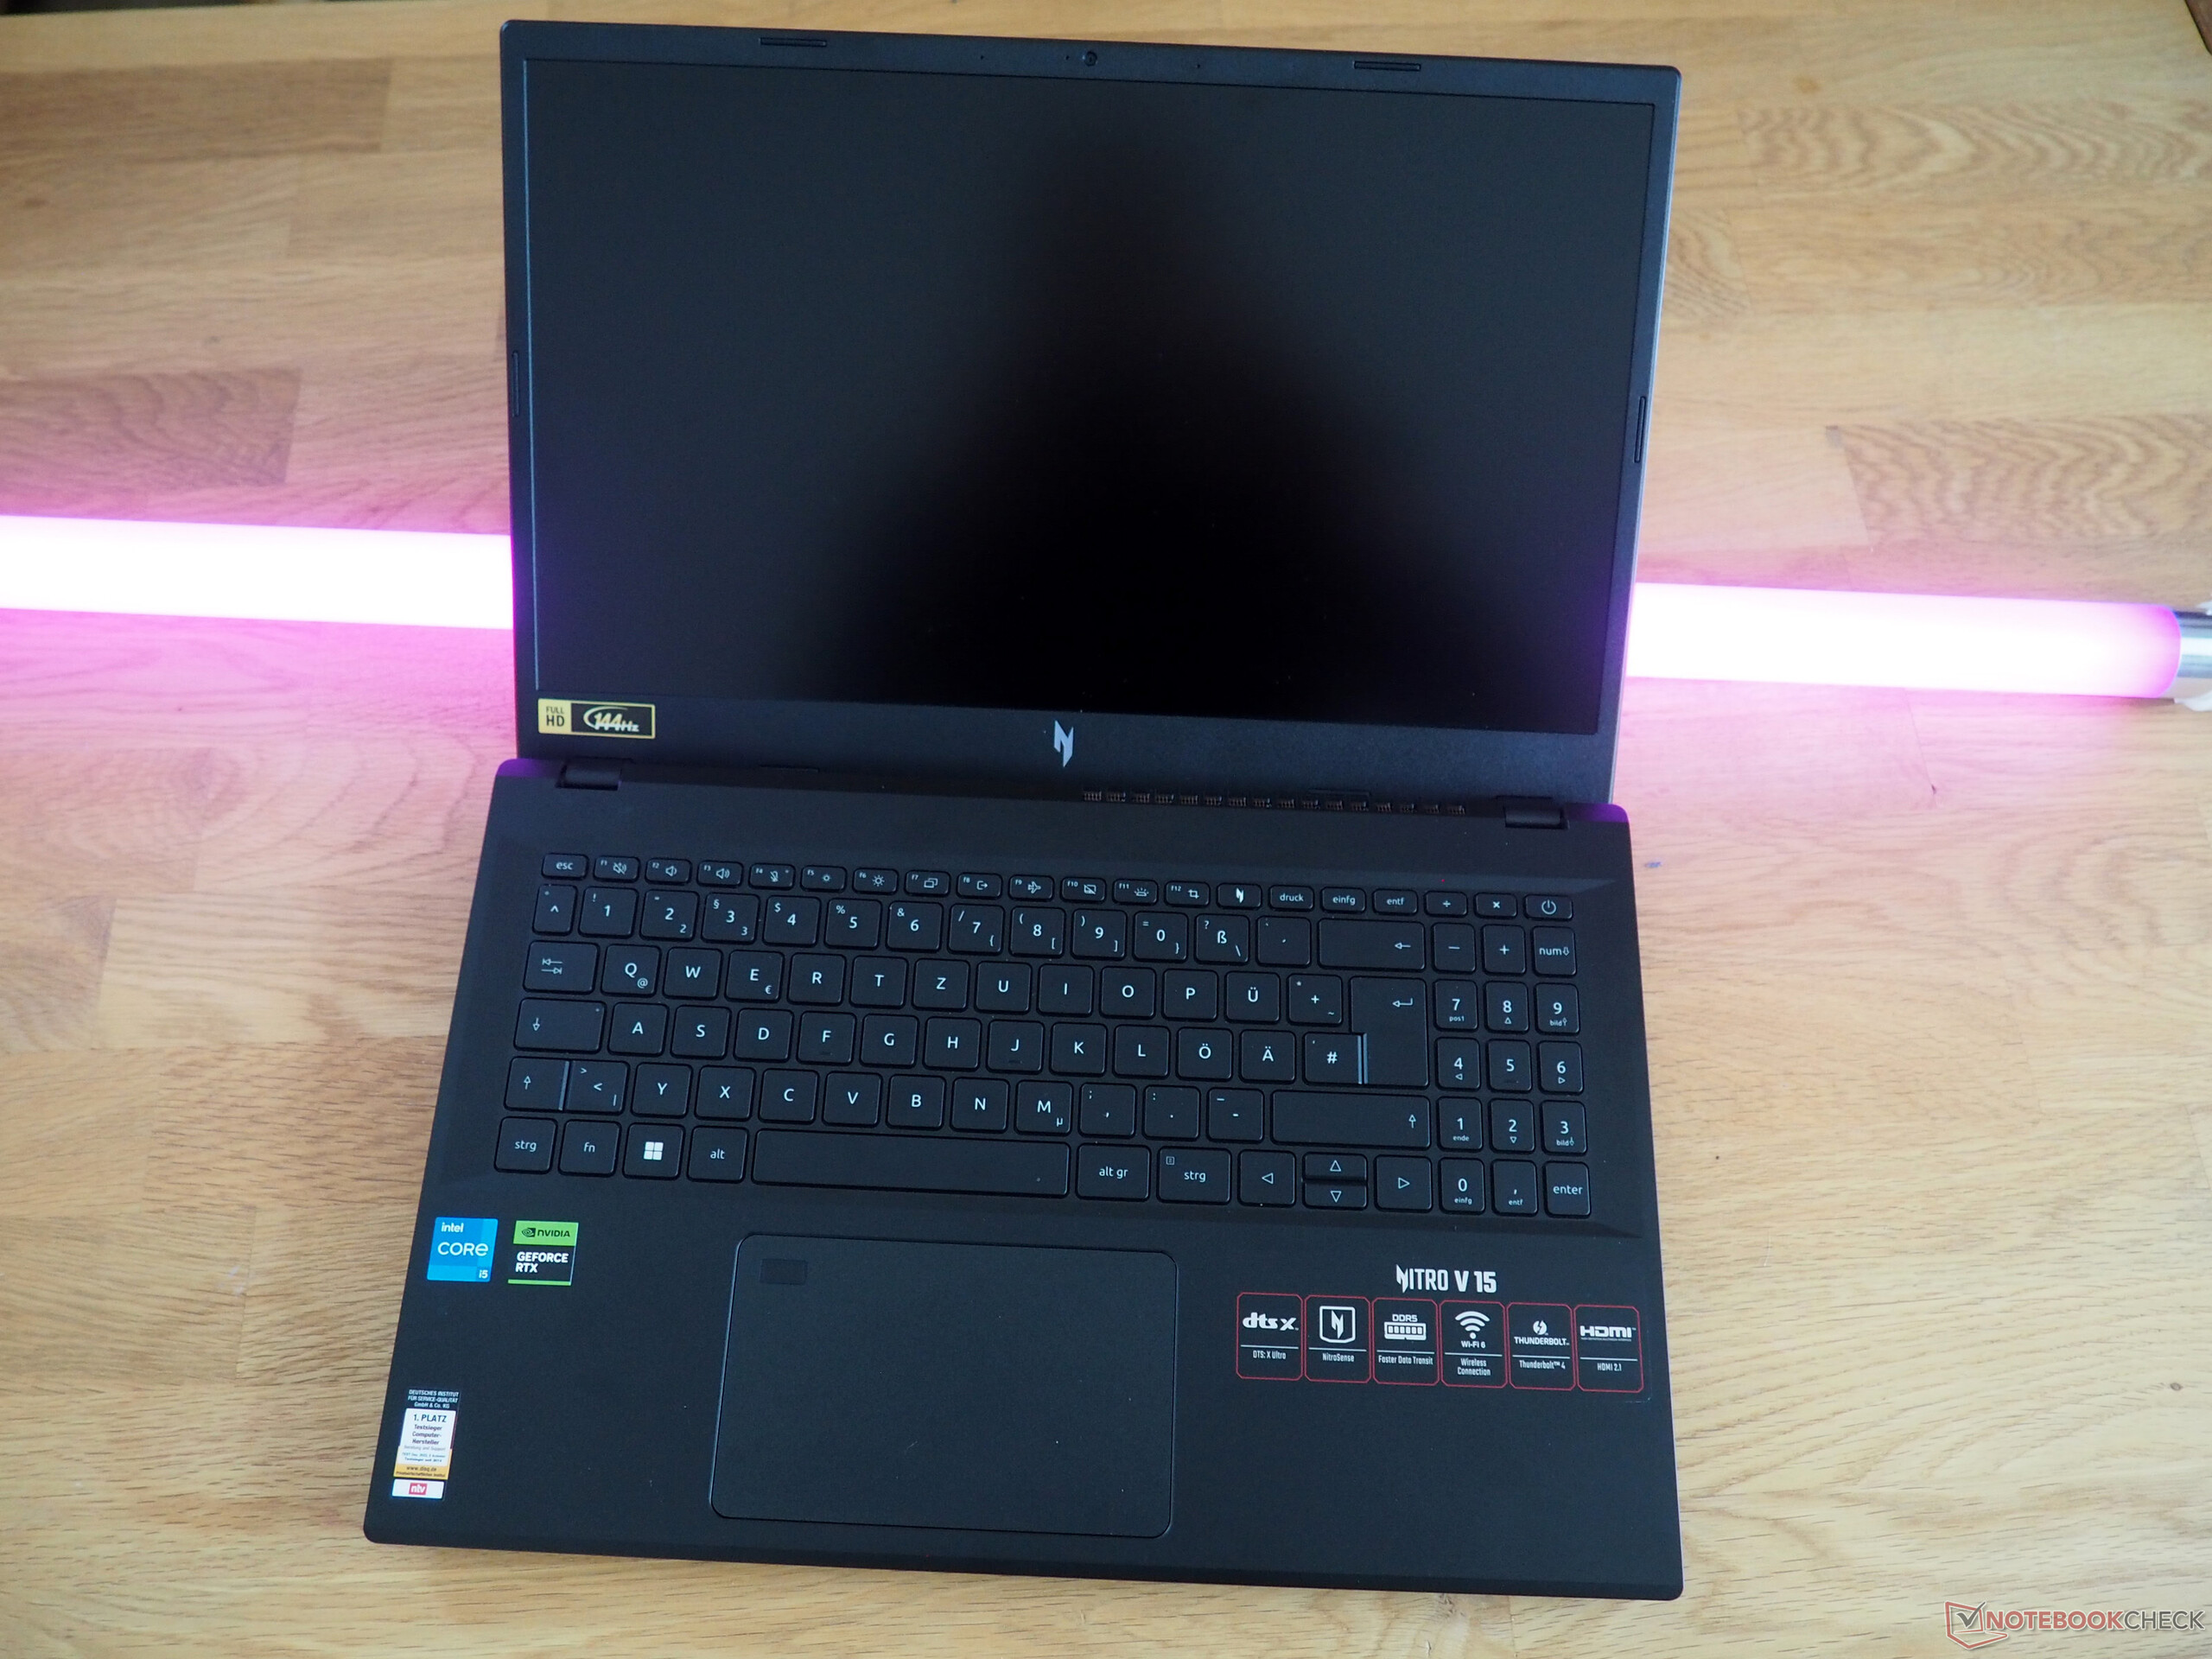
Dispositivi di ingresso
Tastiera
I dispositivi di input non sono né terribili né superbi. Come la maggior parte dei computer portatili con tastiere convenzionali, la digitazione sul Nitro risulta un po' molle a causa della mancanza di feedback tattile. Acer avrebbe potuto fare meglio anche con il layout. Ad esempio, c'è spazio sufficiente per un tastierino numerico standard a quattro colonne, anziché a tre colonne. È anche un peccato che i tasti freccia non siano eccezionali e appena adatti al gioco e che il pulsante di accensione non sia posizionato separatamente. Anche i tasti funzione, che sono quasi insignificanti, non aiutano. Tra gli aspetti positivi che meritano di essere menzionati ci sono la retroilluminazione bianca con luminosità regolabile e il pulsante dedicato per aprire il software di sintonizzazione (NitroSense).
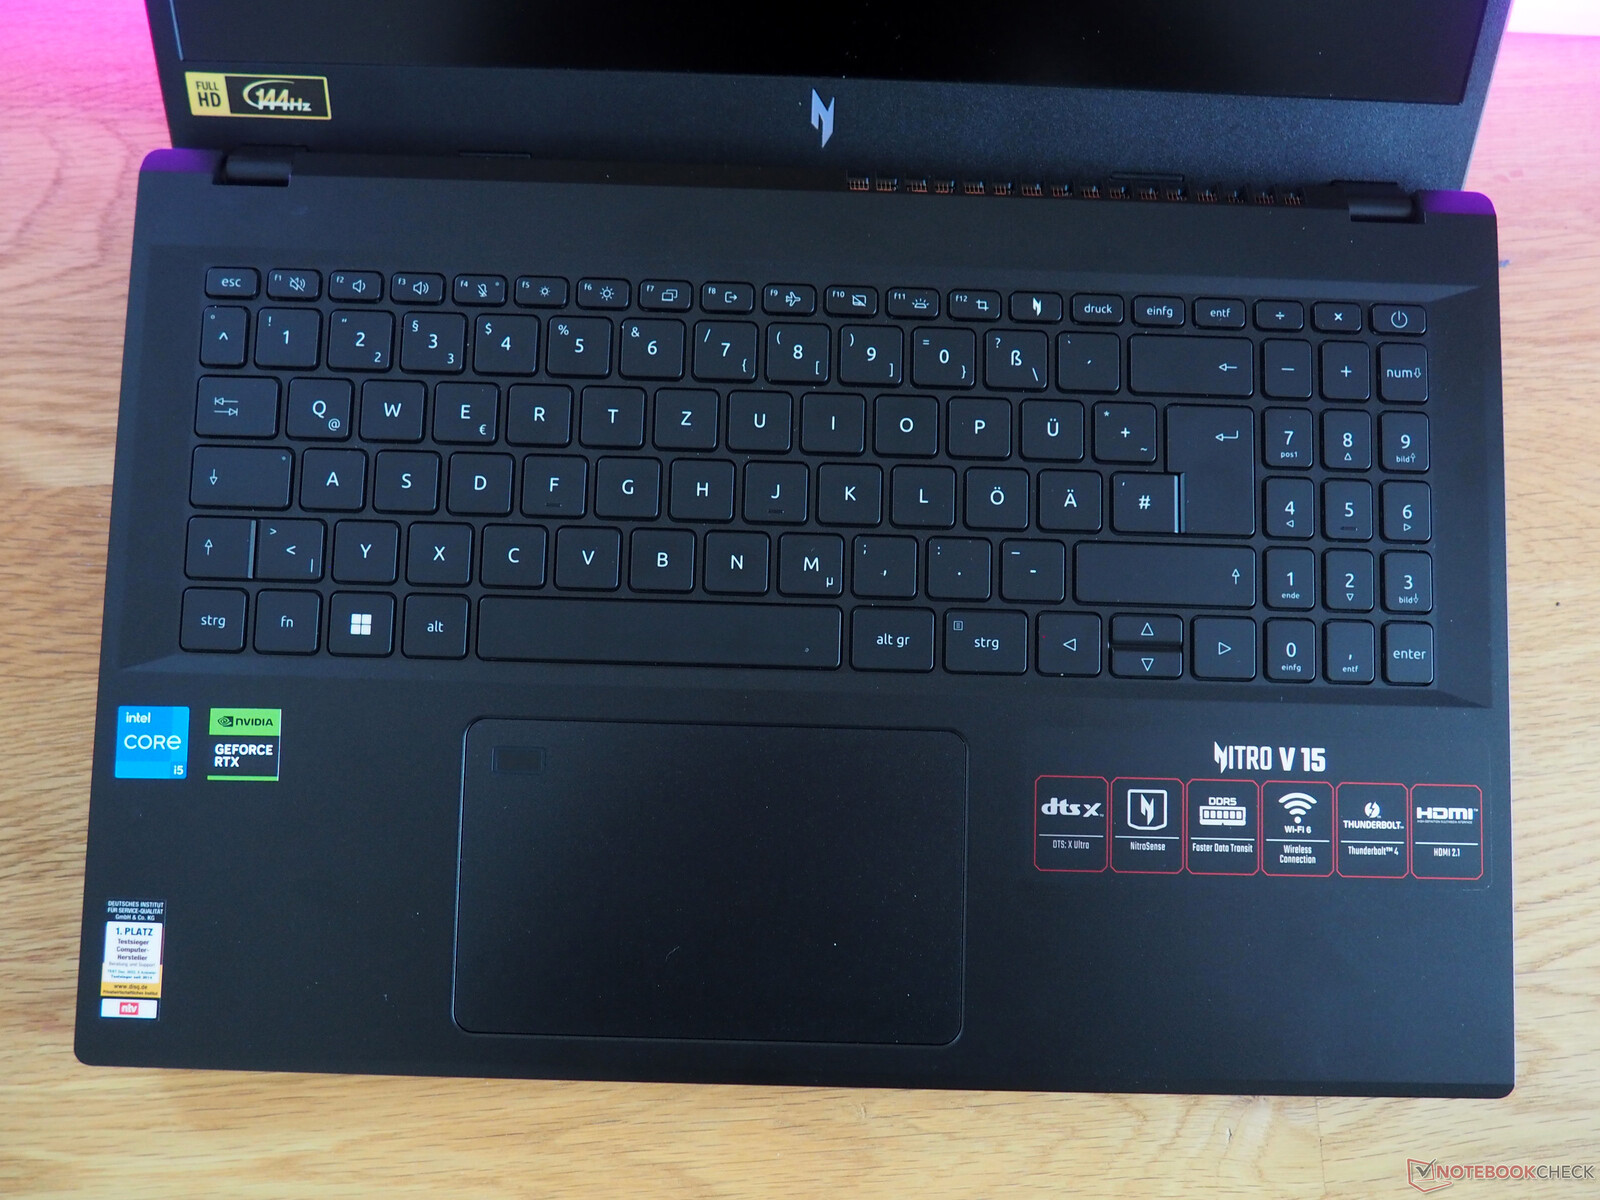
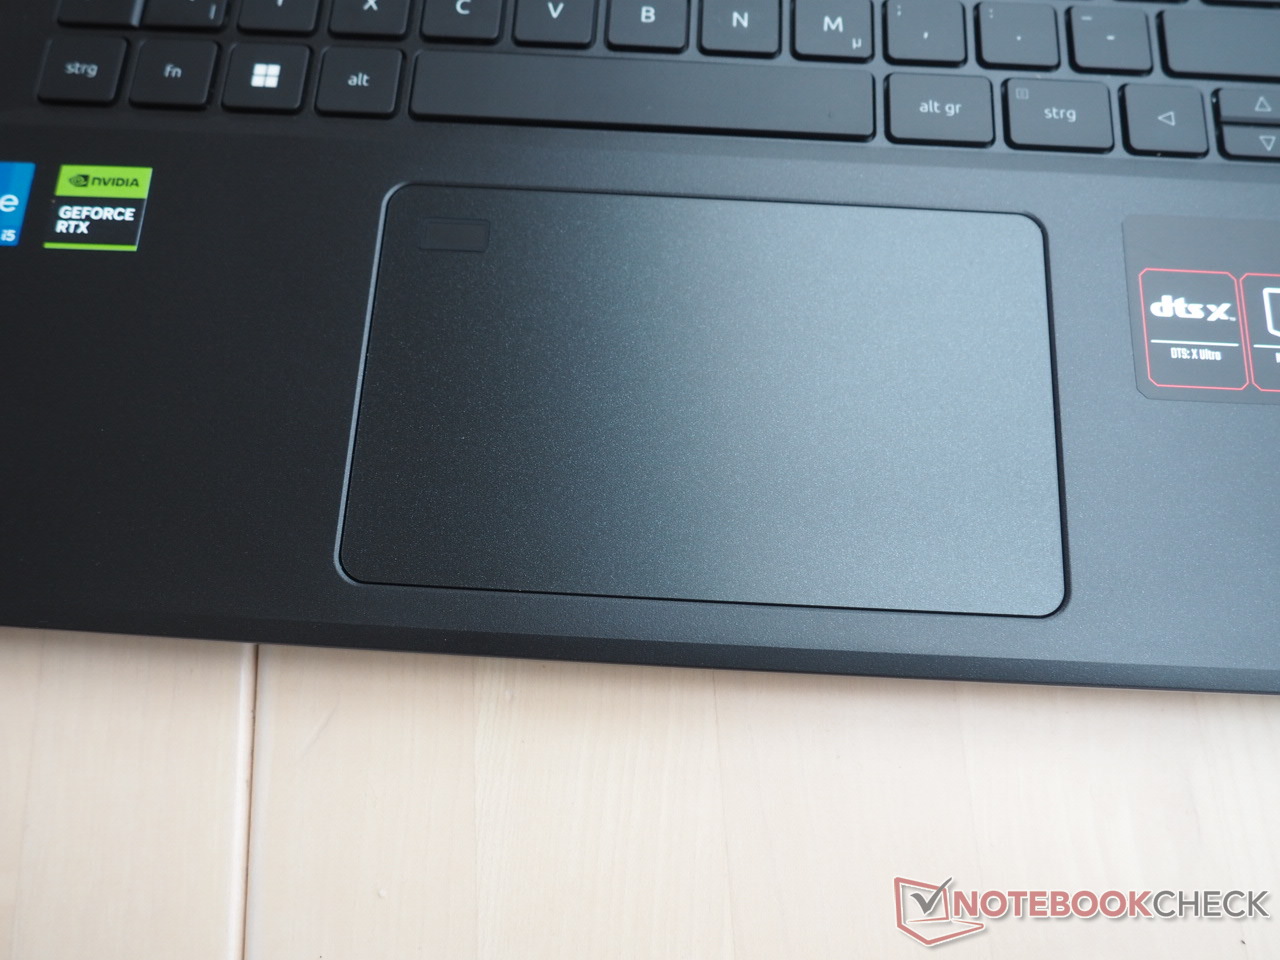
Touchpad
Il touchpad si distingue soprattutto per lo scanner di impronte digitali integrato nell'angolo superiore sinistro. Il mouse sostitutivo è piuttosto mediocre in termini di qualità. Il livello di precisione e di scorrevolezza è ragionevole senza essere strabiliante. La situazione è simile per quanto riguarda il supporto multi-touch e la sensazione delle superfici di clic. A seconda di quanto si preme il touchpad, purtroppo ha la tendenza a vibrare.
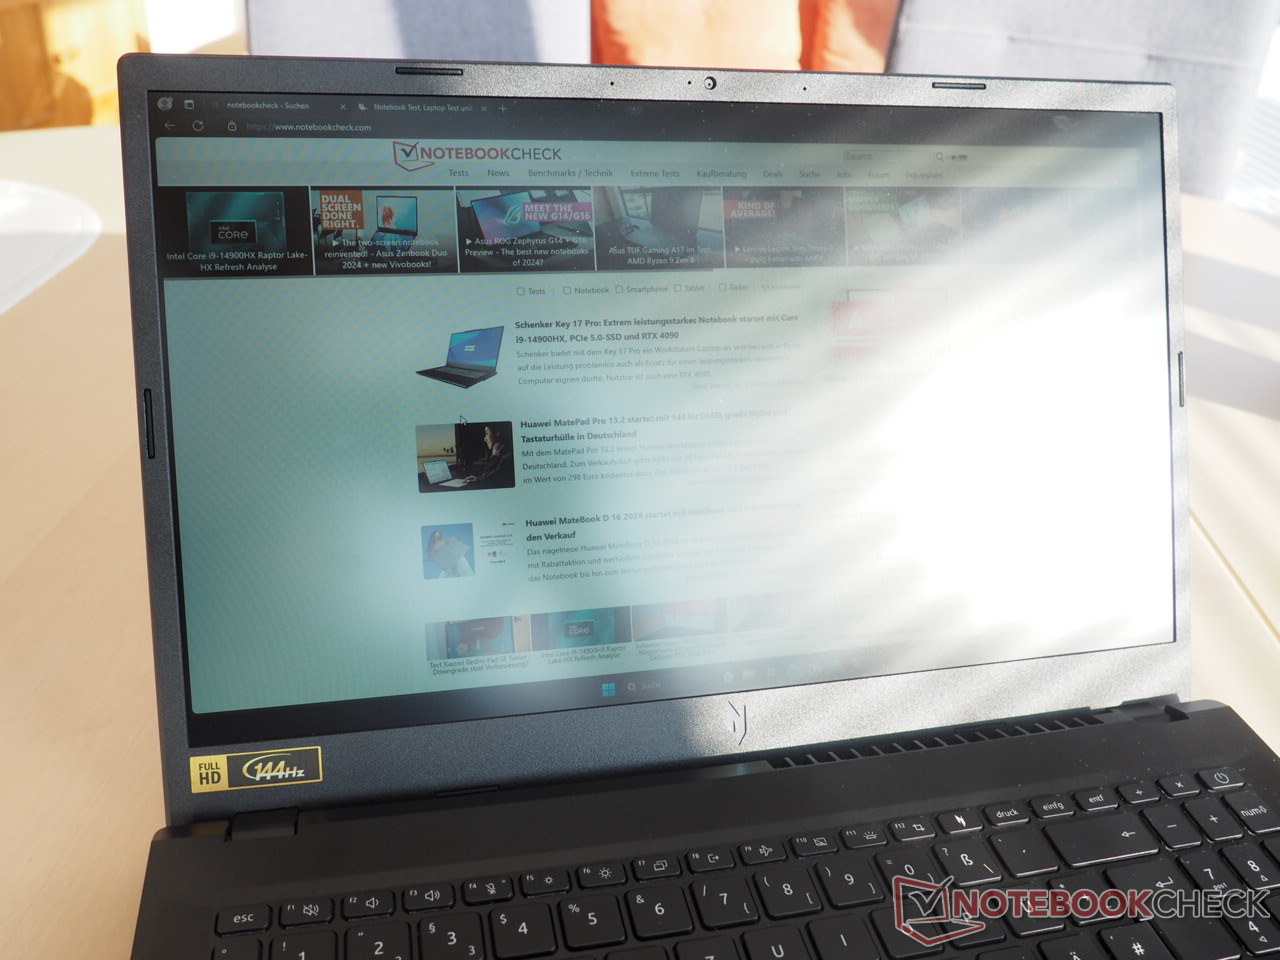
Display
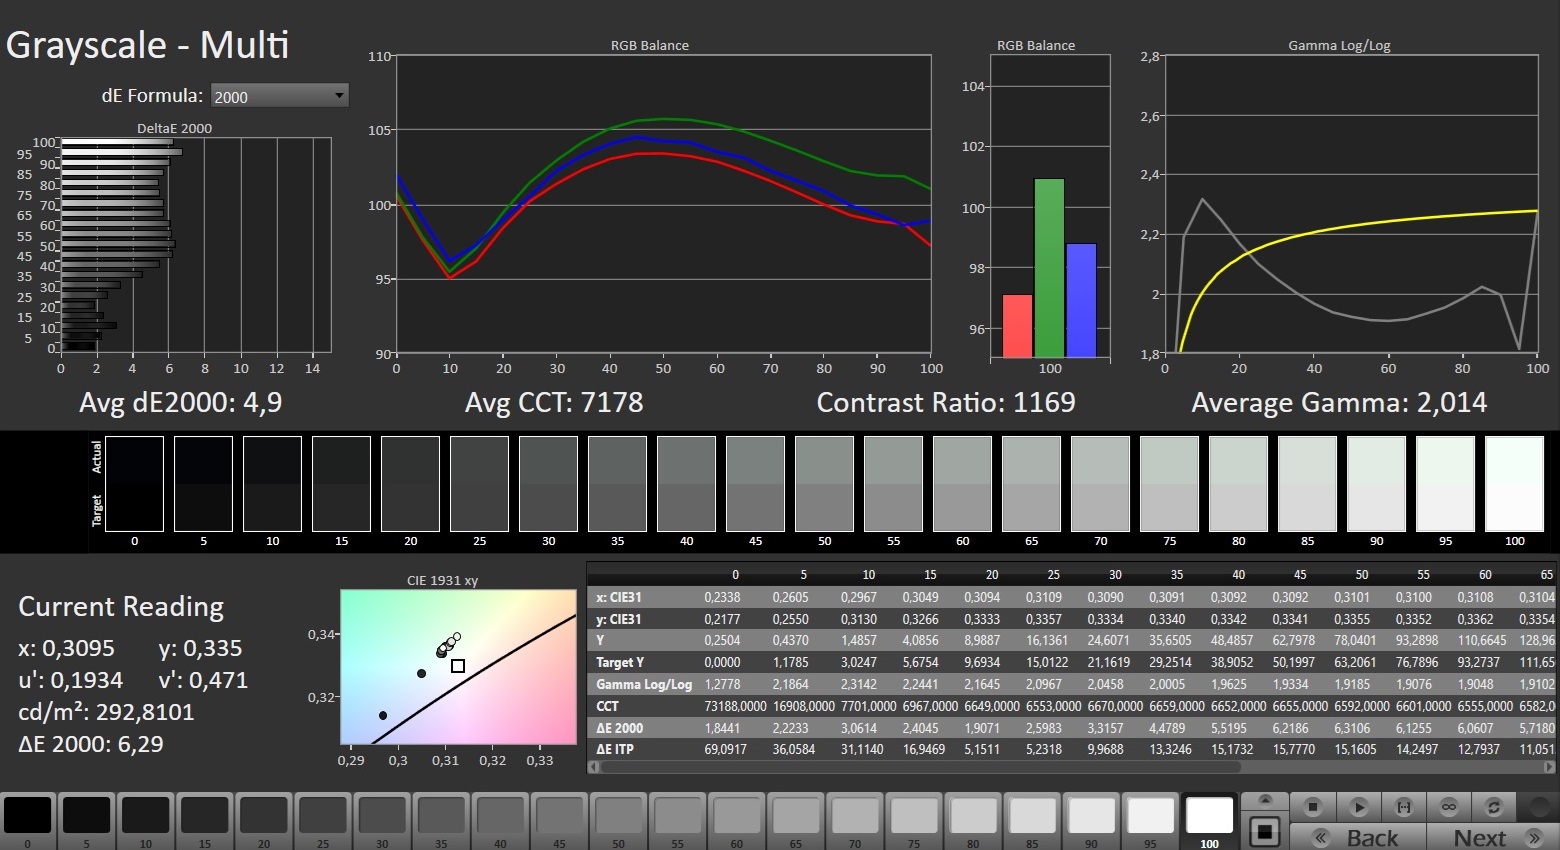
Il display di bassa qualità di Nitro V 15 è uno dei suoi maggiori punti deboli. A prima vista, i risultati ottenuti non sembrano troppo deludenti: il livello di nero di 0,25 cd/m² e il rapporto di contrasto di 1168:1 sono simili a quelli che si possono ottenere dai concorrenti o da un tipico pannello IPS. Questo vale anche per l'angolo di visione.
| |||||||||||||||||||||||||
Distribuzione della luminosità: 80 %
Al centro con la batteria: 292 cd/m²
Contrasto: 1168:1 (Nero: 0.25 cd/m²)
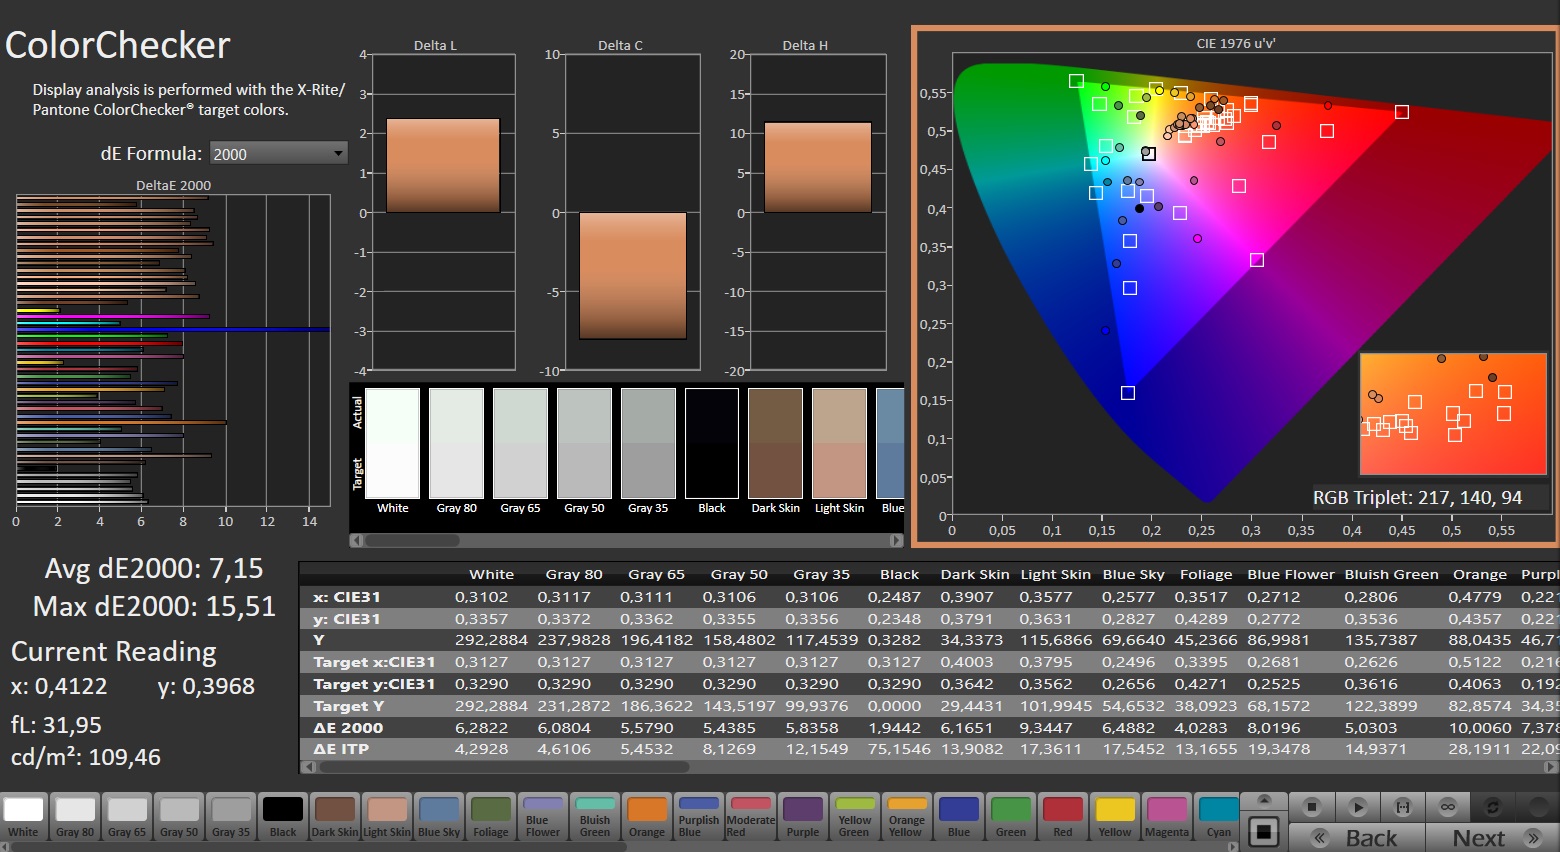
ΔE ColorChecker Calman: 7.15 | ∀{0.5-29.43 Ø4.73}
calibrated: 4.13
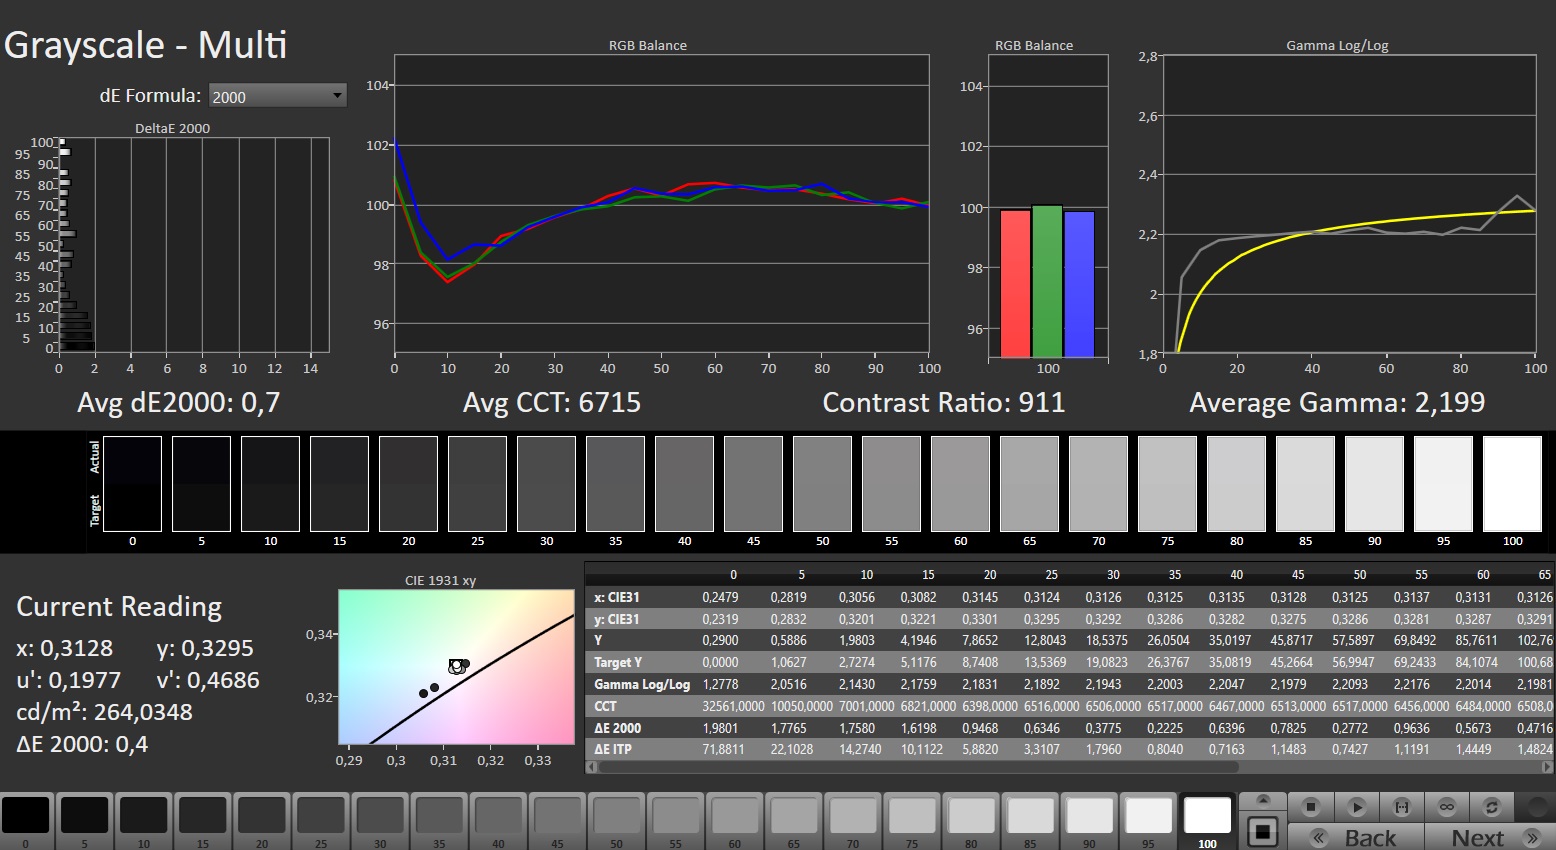
ΔE Greyscale Calman: 4.9 | ∀{0.09-98 Ø4.97}
41.4% AdobeRGB 1998 (Argyll 3D)
60% sRGB (Argyll 3D)
40% Display P3 (Argyll 3D)
Gamma: 2.014
CCT: 7178 K
| Acer Nitro V 15 ANV15-51-582S LG LP156WFJ-SPB4 (LGD0742), IPS, 1920x1080, 15.6" | Medion Erazer Crawler E40 - MD 62518 BOE HF NV156FHM-N4G, IPS, 1920x1080, 15.6" | Lenovo LOQ 15IRH8 Core i7 BOE CQ NE156QHM-NY4, IPS, 2560x1440, 15.6" | Asus TUF A15 FA507 N156HMA-GA1, IPS, 1920x1080, 15.6" | Schenker XMG Apex 15 (Late 23) BOE CQ NE156QHM-NY2, IPS, 2560x1440, 15.6" | |
|---|---|---|---|---|---|
| Display | 52% | 64% | 61% | 66% | |
| Display P3 Coverage (%) | 40 | 61.4 54% | 66.3 66% | 64.9 62% | 67.5 69% |
| sRGB Coverage (%) | 60 | 89.7 50% | 96.6 61% | 96.5 61% | 97.6 63% |
| AdobeRGB 1998 Coverage (%) | 41.4 | 63.2 53% | 67.7 64% | 66.6 61% | 68.9 66% |
| Response Times | 70% | 76% | 15% | 64% | |
| Response Time Grey 50% / Grey 80% * (ms) | 34.2 ? | 8 ? 77% | 5 ? 85% | 30.4 ? 11% | 13.2 ? 61% |
| Response Time Black / White * (ms) | 25.8 ? | 9.6 ? 63% | 8.41 ? 67% | 20.8 ? 19% | 8.8 ? 66% |
| PWM Frequency (Hz) | |||||
| Screen | 17% | 23% | 41% | 24% | |
| Brightness middle (cd/m²) | 292 | 364 25% | 373 28% | 288 -1% | 336 15% |
| Brightness (cd/m²) | 263 | 351 33% | 365 39% | 271 3% | 307 17% |
| Brightness Distribution (%) | 80 | 91 14% | 90 13% | 91 14% | 77 -4% |
| Black Level * (cd/m²) | 0.25 | 0.43 -72% | 0.33 -32% | 0.17 32% | 0.38 -52% |
| Contrast (:1) | 1168 | 847 -27% | 1130 -3% | 1694 45% | 884 -24% |
| Colorchecker dE 2000 * | 7.15 | 3.98 44% | 4.19 41% | 1.9 73% | 1.96 73% |
| Colorchecker dE 2000 max. * | 15.51 | 6.38 59% | 8.47 45% | 3.3 79% | 5.07 67% |
| Colorchecker dE 2000 calibrated * | 4.13 | 1.36 67% | 1.07 74% | 0.9 78% | 1.27 69% |
| Greyscale dE 2000 * | 4.9 | 4.39 10% | 5 -2% | 2.7 45% | 2.3 53% |
| Gamma | 2.014 109% | 2.58 85% | 1.93 114% | 2.32 95% | 2.017 109% |
| CCT | 7178 91% | 7316 89% | 7520 86% | 6535 99% | 6644 98% |
| Media totale (Programma / Settaggio) | 46% /
32% | 54% /
39% | 39% /
42% | 51% /
39% |
* ... Meglio usare valori piccoli
Tuttavia, a uno sguardo più attento si noteranno alcune carenze. Innanzitutto, la luminosità media di picco di 263 cd/m² è adeguata solo per l'uso in interni; il portatile da 15 pollici non fa affatto una buona figura in ambienti esterni.
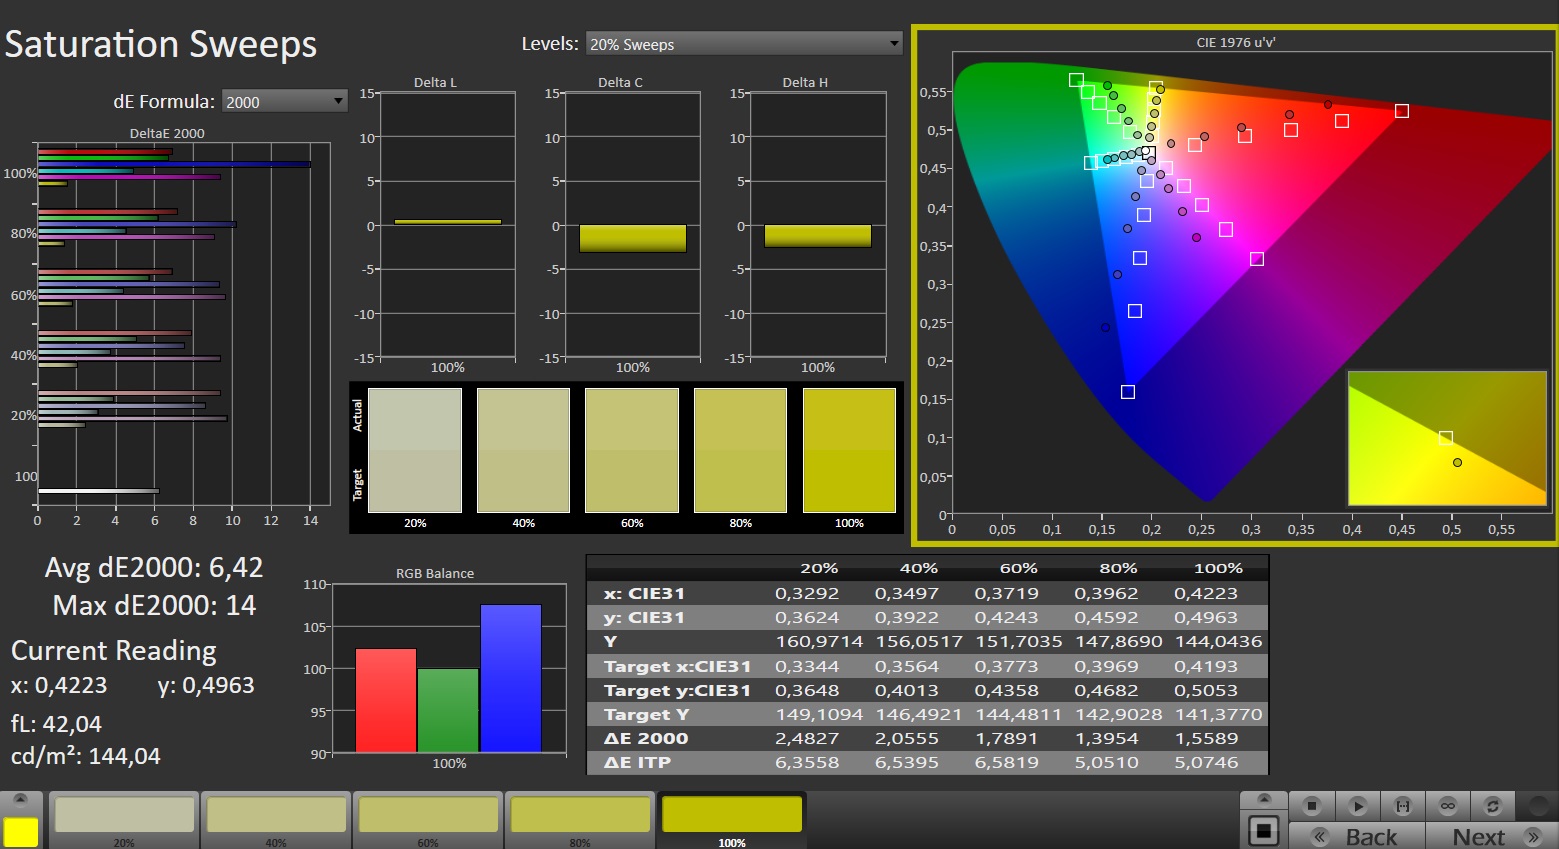
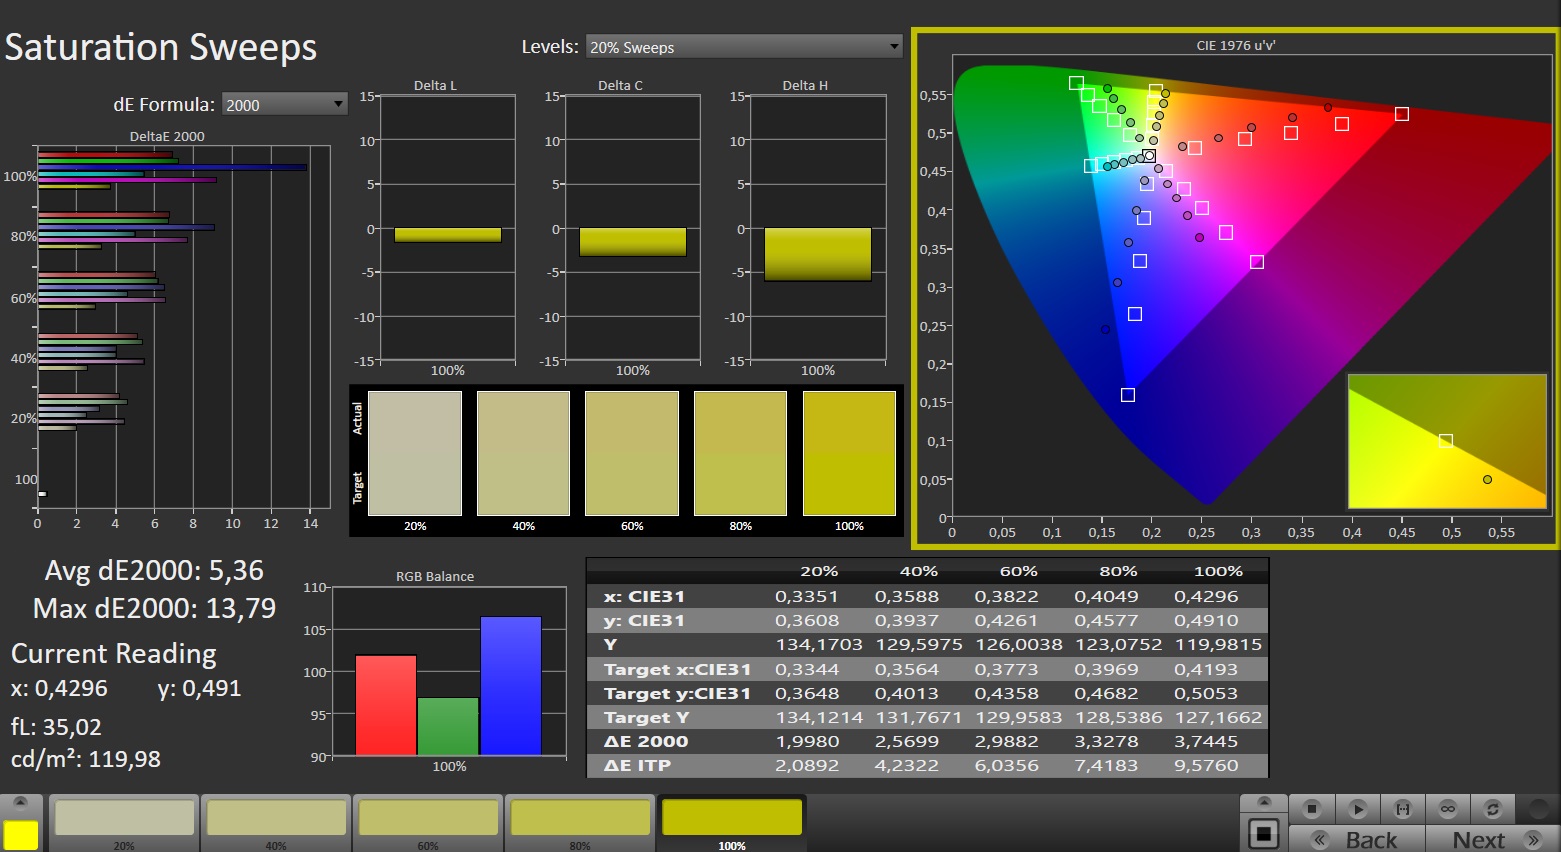
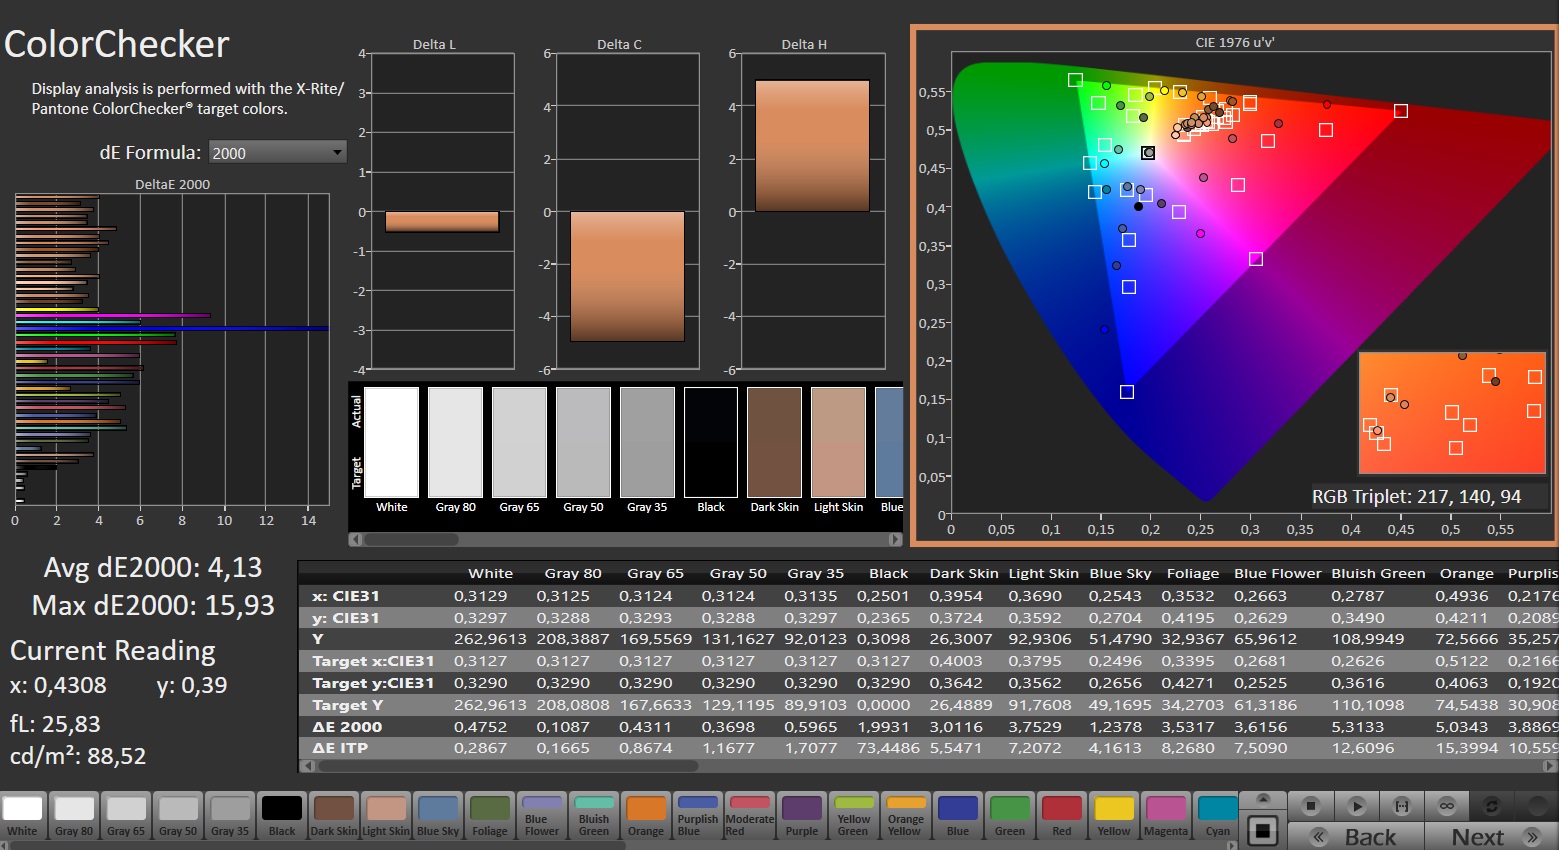
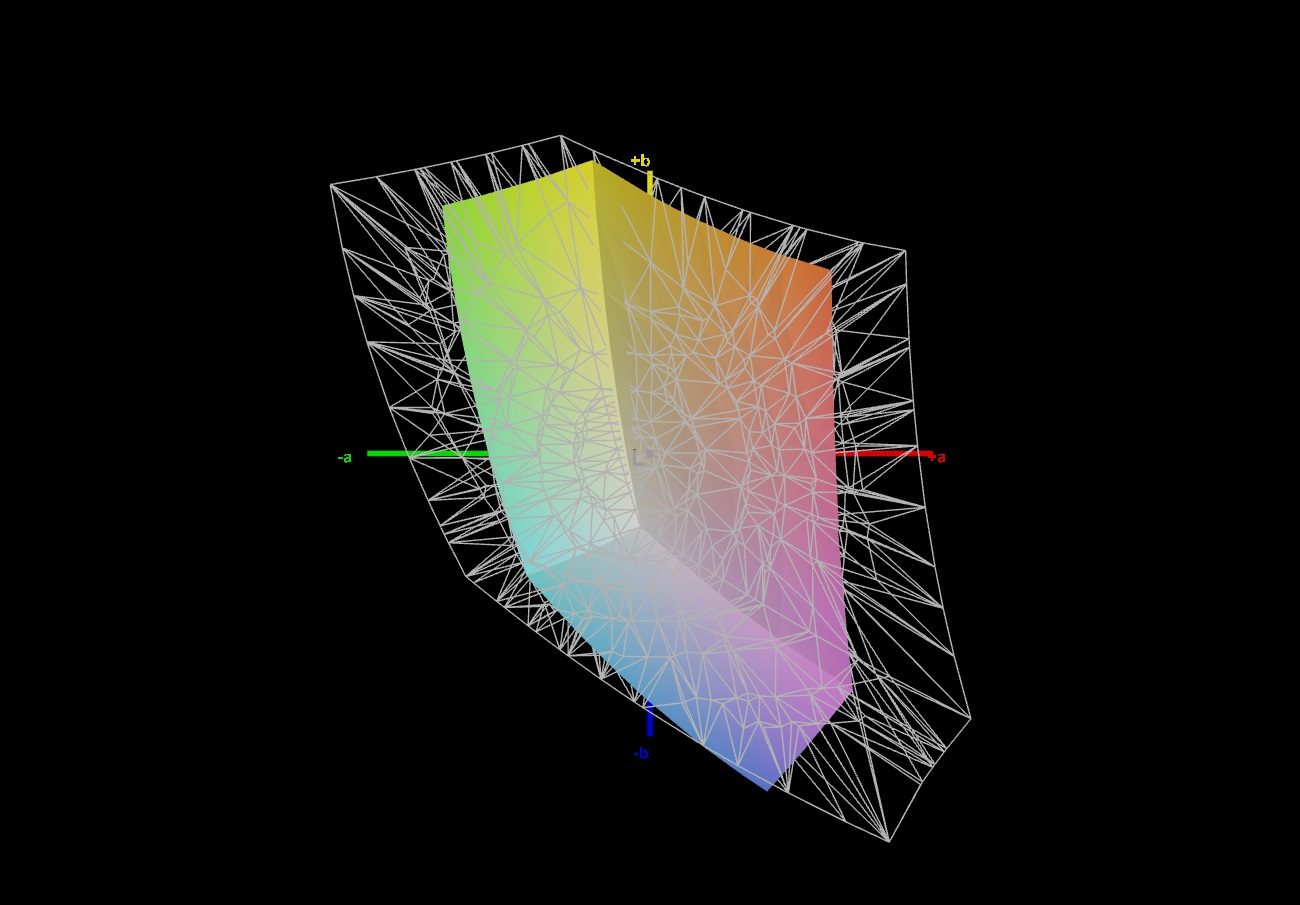
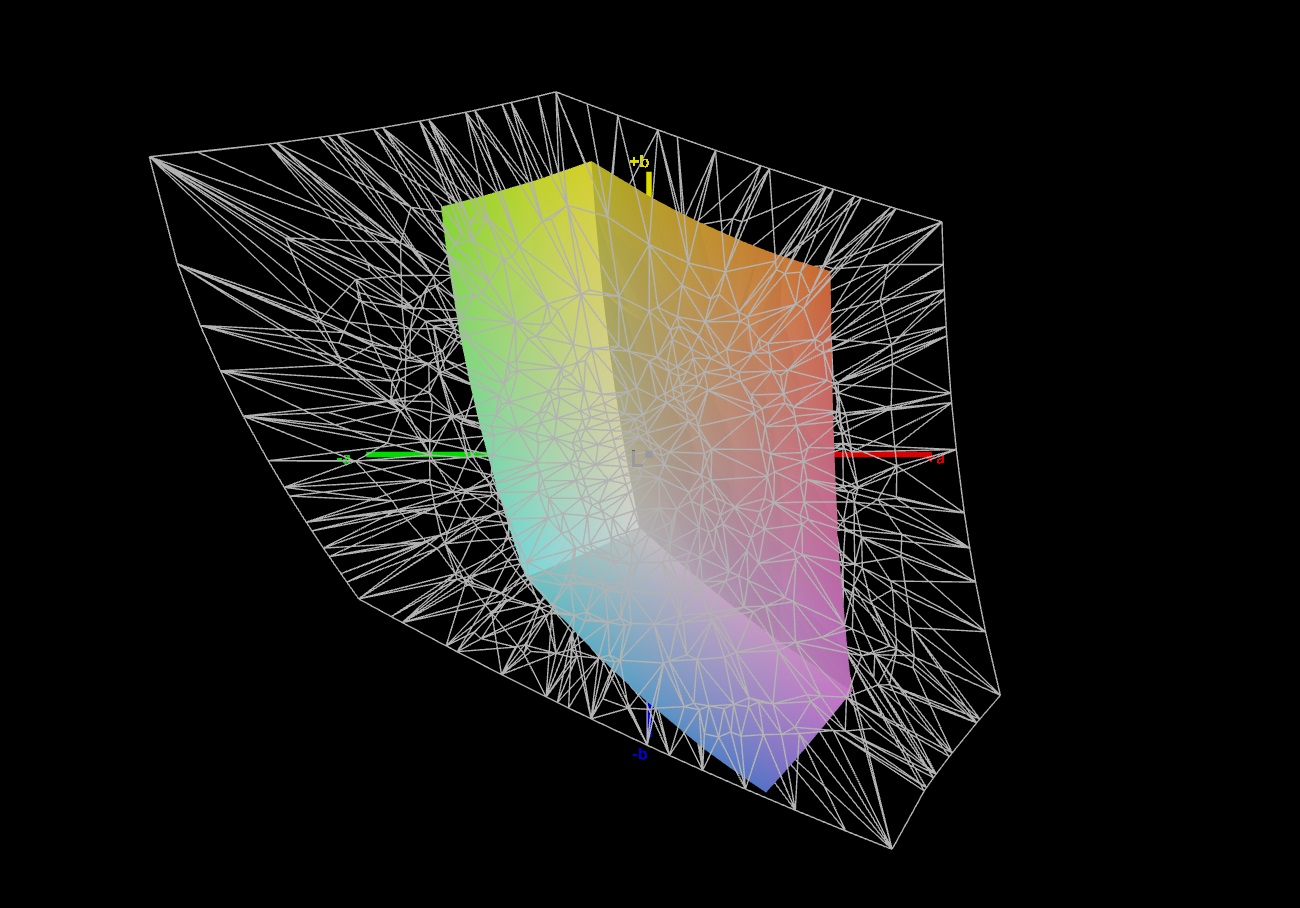
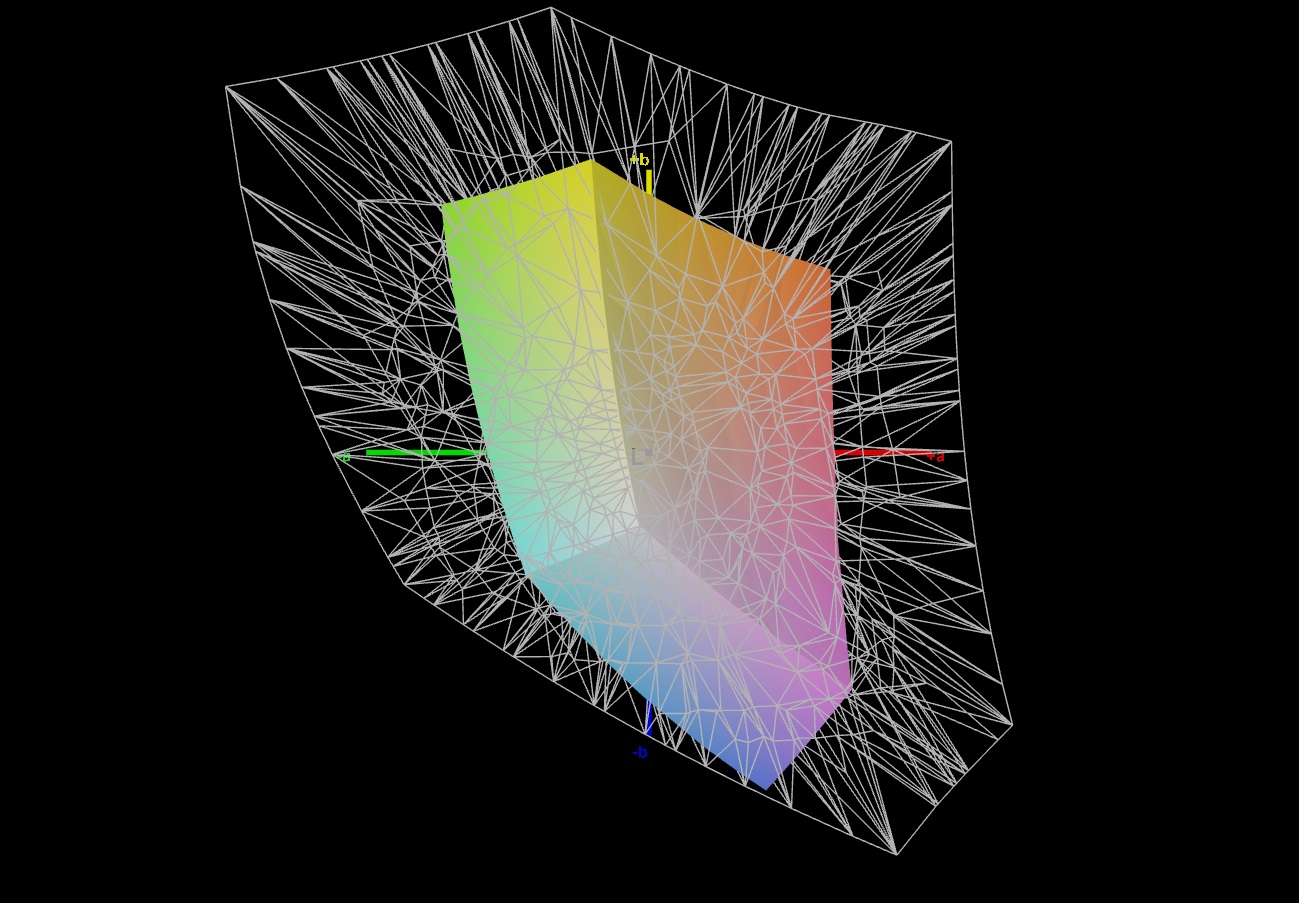
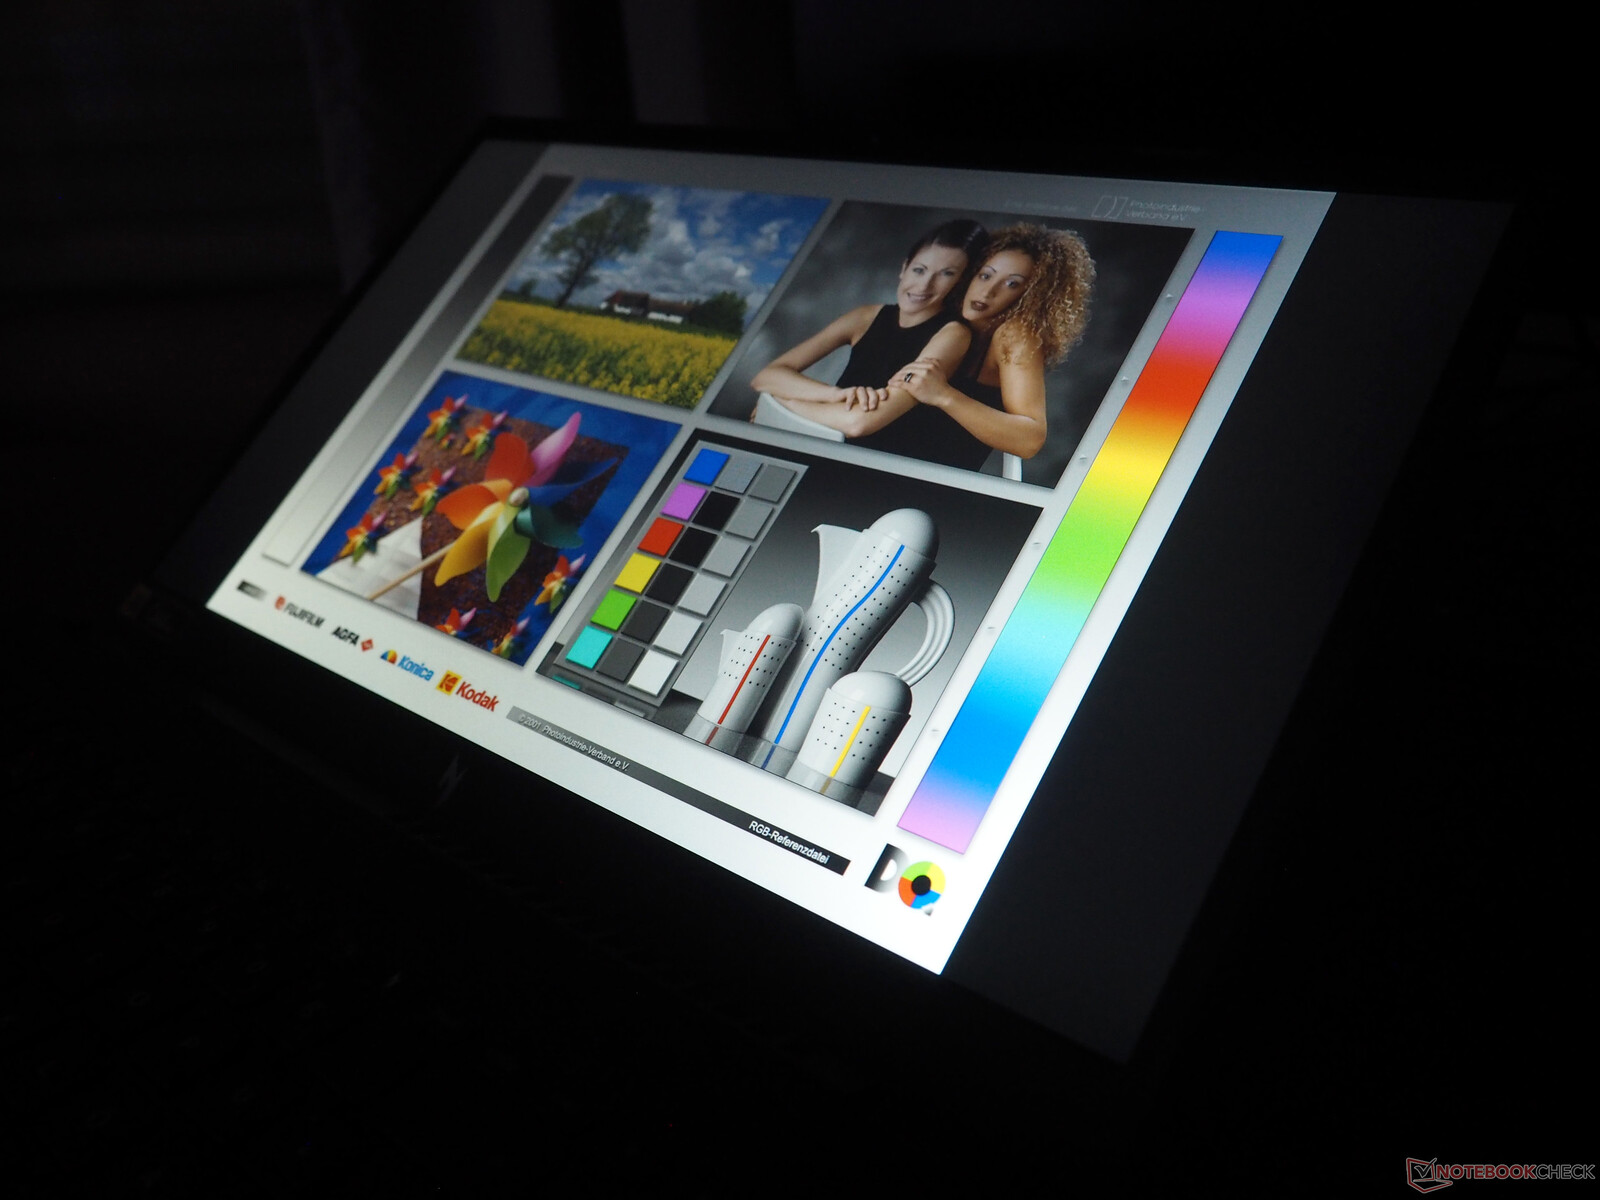
Il Nitro V 15 offre anche una copertura cromatica molto limitata: il 60% di copertura sRGB e circa il 40% di AdobeRGB e DCI-P3 non è sufficiente nel 2024, nemmeno per un notebook da gioco economico.
I concorrenti dimostrano come fare le cose molto meglio. L'Acer Nitro ha conquistato l'ultimo posto anche per quanto riguarda la precisione del colore e il tempo di risposta.
Tempi di risposta del Display
| ↔ Tempi di risposta dal Nero al Bianco | ||
|---|---|---|
| 25.8 ms ... aumenta ↗ e diminuisce ↘ combinato | ↗ 13.8 ms Incremento | 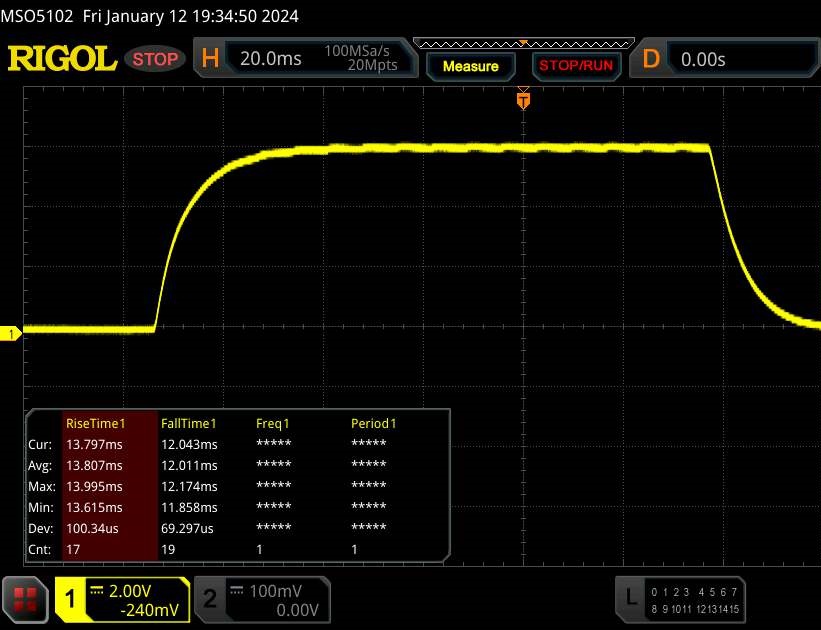 |
| ↘ 12 ms Calo | ||
| Lo schermo mostra tempi di risposta relativamente lenti nei nostri tests e potrebbe essere troppo lento per i gamers. In confronto, tutti i dispositivi di test variano da 0.1 (minimo) a 240 (massimo) ms. » 62 % di tutti i dispositivi è migliore. Questo significa che i tempi di risposta rilevati sono peggiori rispetto alla media di tutti i dispositivi testati (19.9 ms). | ||
| ↔ Tempo di risposta dal 50% Grigio all'80% Grigio | ||
| 34.2 ms ... aumenta ↗ e diminuisce ↘ combinato | ↗ 15.8 ms Incremento | 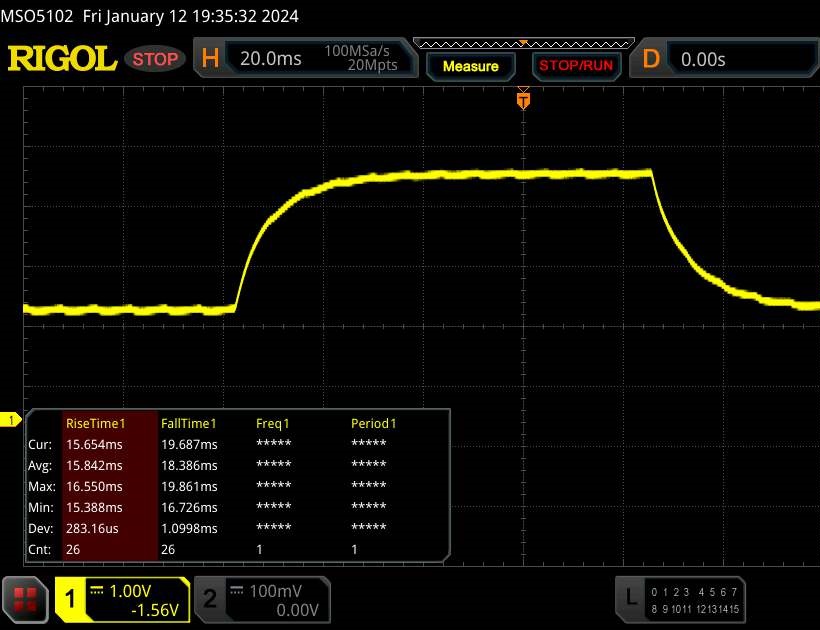 |
| ↘ 18.4 ms Calo | ||
| Lo schermo mostra tempi di risposta lenti nei nostri tests e sarà insoddisfacente per i gamers. In confronto, tutti i dispositivi di test variano da 0.165 (minimo) a 636 (massimo) ms. » 48 % di tutti i dispositivi è migliore. Questo significa che i tempi di risposta rilevati sono simili alla media di tutti i dispositivi testati (31.1 ms). | ||
Sfarfallio dello schermo / PWM (Pulse-Width Modulation)
| flickering dello schermo / PWM non rilevato |  | ||
In confronto: 52 % di tutti i dispositivi testati non utilizza PWM per ridurre la luminosita' del display. Se è rilevato PWM, una media di 7784 (minimo: 5 - massimo: 343500) Hz è stata rilevata. | |||
Prestazioni
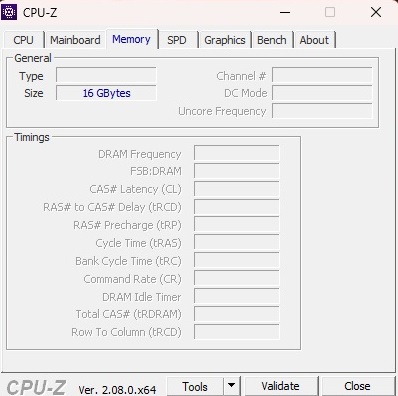
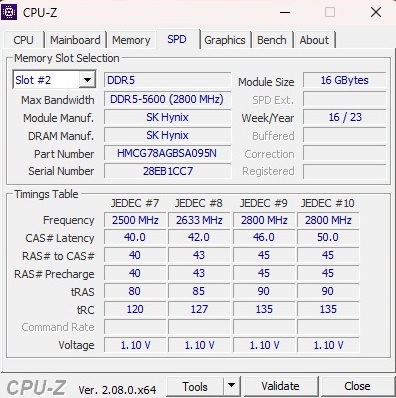
Nitro V 15 è un dispositivo di fascia media in termini di prestazioni della CPU e della GPU. I 16 GB di RAM sono abbastanza ragionevoli se si considera il prezzo del portatile, ma l'SSD è un po' inferiore con la sua capacità di soli 512 GB.
Condizioni del test
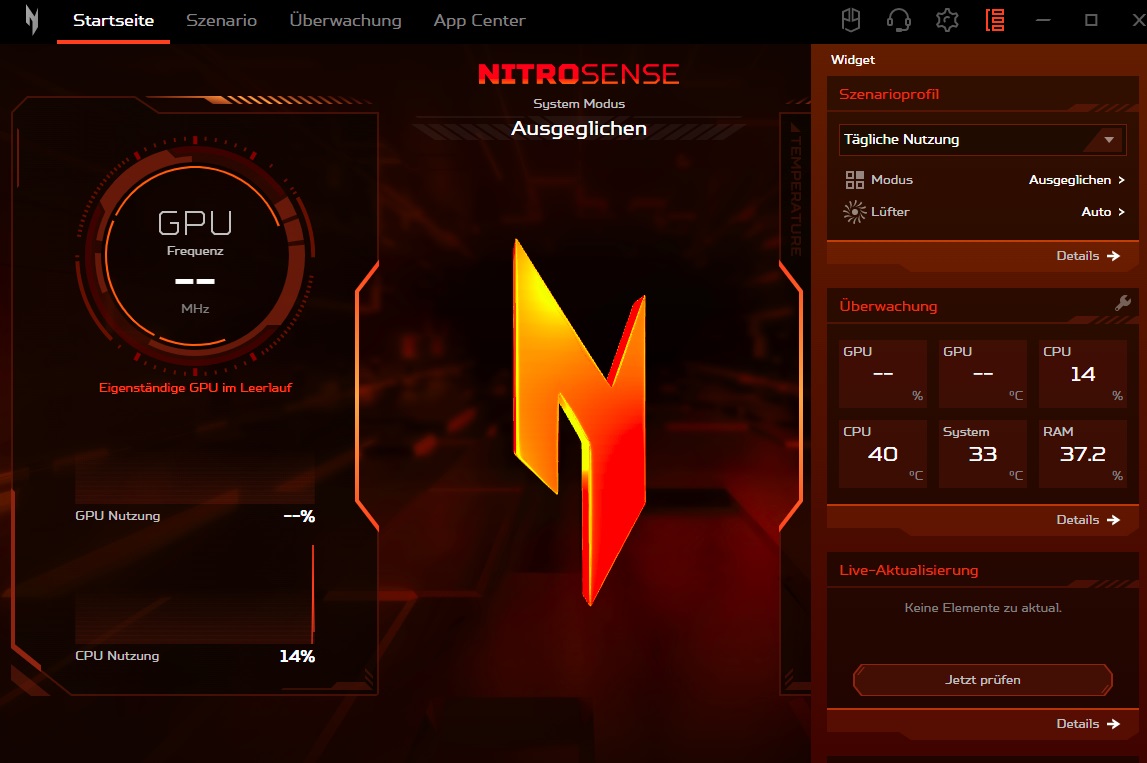
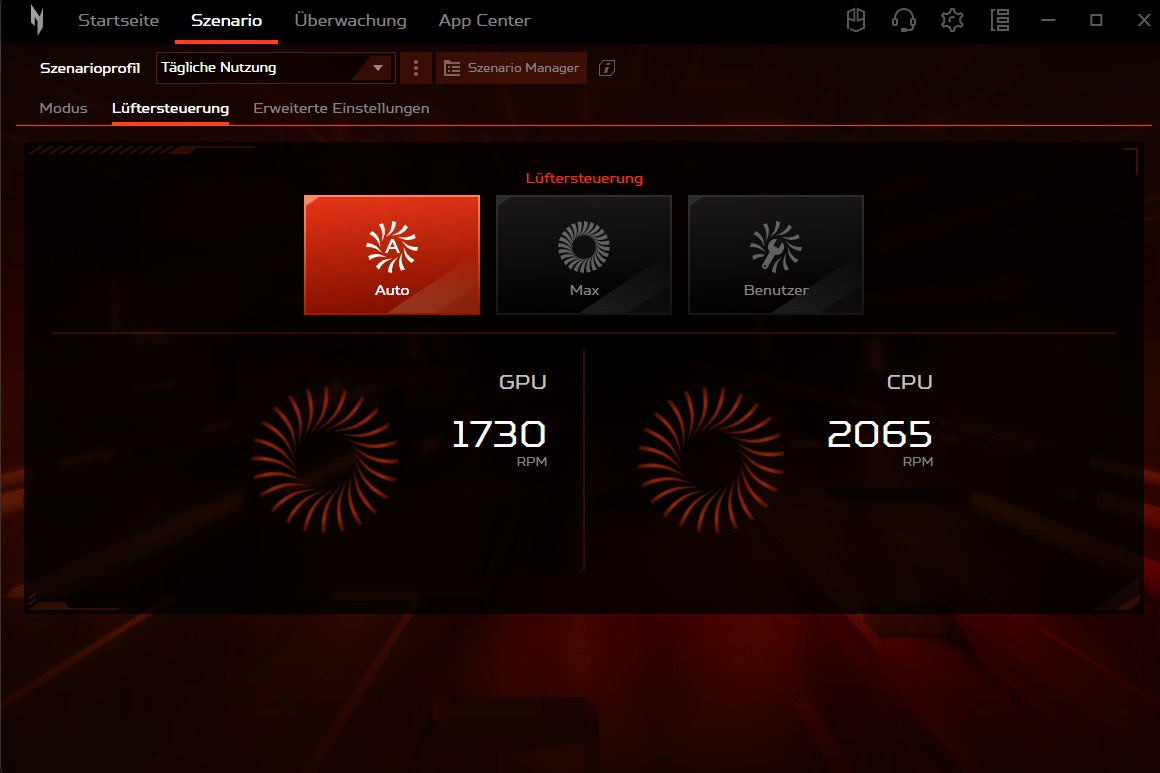
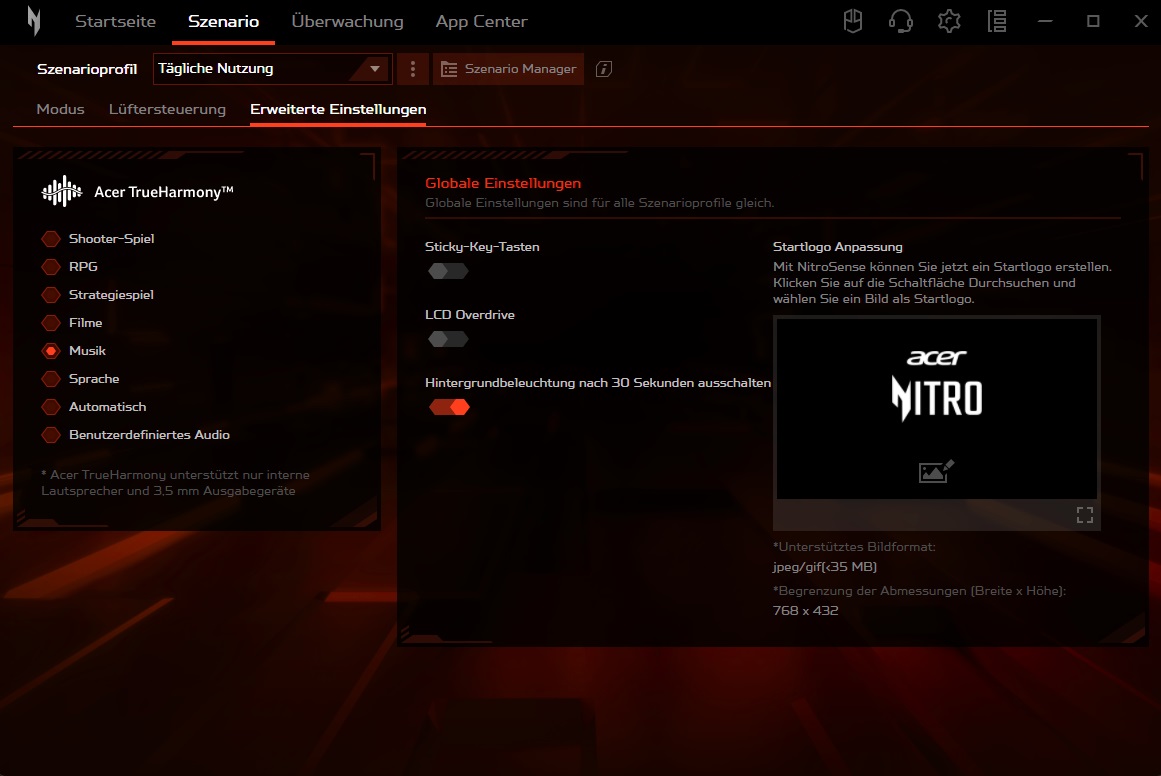
L'applicazione NitroSense preinstallata consente agli utenti di regolare varie impostazioni di sistema. La scheda "Scenario" è particolarmente interessante per l'uso nella vita reale. Permette di modificare il piano energetico (menu "Modalità") e il comportamento della ventola (menu "Controllo ventola"). Le nostre misurazioni sono state eseguite in modalità Bilanciata e con il controllo automatico della ventola, poiché il portatile funziona in modo considerevolmente più rumoroso ma non molto più veloce in modalità Prestazioni.
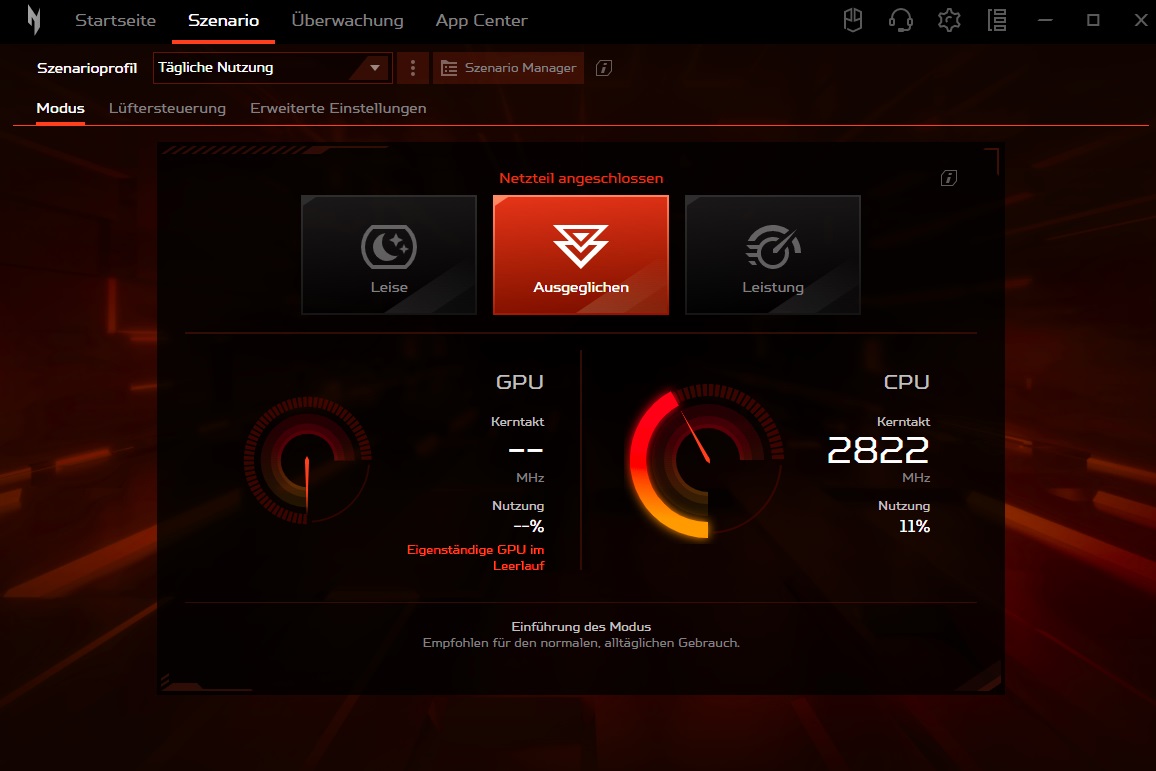
| NitroSense | Tranquillo | Bilanciato | Prestazioni |
| CPU PL1 (HWiNFO) | 35 W | 45 W | 55 W |
| CPU PL2 (HWiNFO) | 64 W | 115 W | 115 W |
| Rumore (Witcher 3, FHD/Ultra) | 37 dB(A) | 49 dB(A) | 59 dB(A) |
| Prestazioni (Witcher 3, FHD/Ultra) | ~62 FPS | ~78 FPS | ~82 FPS |
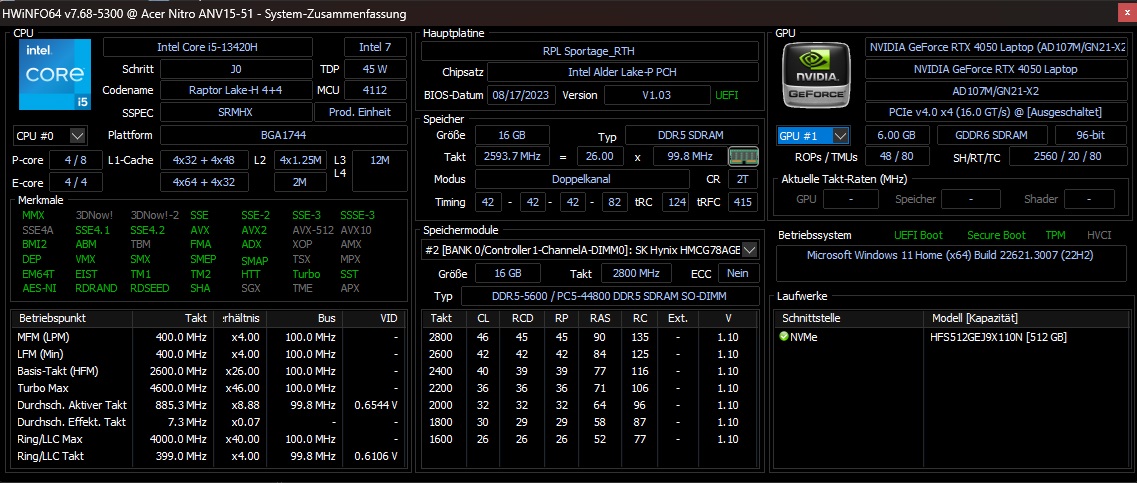
Processore
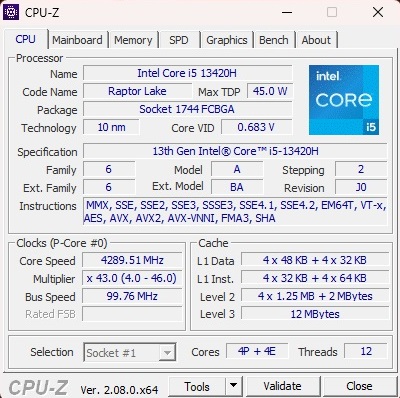
Il Core i5-13420H è un processore della linea Raptor Lake di Intel (10 nm) che presenta quattro core di prestazioni (con Hyper-Threading) e quattro core di efficienza (senza HT). Nella nostra serie di benchmark, la CPU non è stata solo superata dai suoi fratelli più costosi Core i5-13500H e Core i7-13620H, come ci si aspettava, ma è stata battuta anche dai suoi concorrenti AMD Ryzen 7 7735HS e Ryzen 7 7840HS. Detto questo, le prestazioni della CPU sono più che sufficienti per il gioco, perché la maggior parte dei giochi, come sappiamo, sono legati alla GPU.
Cinebench R15 Multi Sustained Load
* ... Meglio usare valori piccoli
AIDA64: FP32 Ray-Trace | FPU Julia | CPU SHA3 | CPU Queen | FPU SinJulia | FPU Mandel | CPU AES | CPU ZLib | FP64 Ray-Trace | CPU PhotoWorxx
| Performance rating | |
| Media della classe Gaming | |
| Schenker XMG Apex 15 (Late 23) | |
| Asus TUF A15 FA507 | |
| Medion Erazer Crawler E40 - MD 62518 | |
| Lenovo LOQ 15IRH8 Core i7 | |
| Acer Nitro V 15 ANV15-51-582S | |
| Media Intel Core i5-13420H | |
| AIDA64 / FP32 Ray-Trace | |
| Media della classe Gaming (10227 - 85542, n=107, ultimi 2 anni) | |
| Schenker XMG Apex 15 (Late 23) | |
| Asus TUF A15 FA507 | |
| Medion Erazer Crawler E40 - MD 62518 | |
| Acer Nitro V 15 ANV15-51-582S | |
| Lenovo LOQ 15IRH8 Core i7 | |
| Media Intel Core i5-13420H (7922 - 12134, n=5) | |
| AIDA64 / FPU Julia | |
| Media della classe Gaming (51376 - 238426, n=107, ultimi 2 anni) | |
| Schenker XMG Apex 15 (Late 23) | |
| Asus TUF A15 FA507 | |
| Medion Erazer Crawler E40 - MD 62518 | |
| Lenovo LOQ 15IRH8 Core i7 | |
| Acer Nitro V 15 ANV15-51-582S | |
| Media Intel Core i5-13420H (40587 - 59715, n=5) | |
| AIDA64 / CPU SHA3 | |
| Media della classe Gaming (2180 - 9817, n=107, ultimi 2 anni) | |
| Schenker XMG Apex 15 (Late 23) | |
| Medion Erazer Crawler E40 - MD 62518 | |
| Asus TUF A15 FA507 | |
| Acer Nitro V 15 ANV15-51-582S | |
| Lenovo LOQ 15IRH8 Core i7 | |
| Media Intel Core i5-13420H (1724 - 2634, n=5) | |
| AIDA64 / CPU Queen | |
| Media della classe Gaming (49785 - 173351, n=98, ultimi 2 anni) | |
| Schenker XMG Apex 15 (Late 23) | |
| Asus TUF A15 FA507 | |
| Medion Erazer Crawler E40 - MD 62518 | |
| Lenovo LOQ 15IRH8 Core i7 | |
| Media Intel Core i5-13420H (69803 - 74956, n=5) | |
| Acer Nitro V 15 ANV15-51-582S | |
| AIDA64 / FPU SinJulia | |
| Schenker XMG Apex 15 (Late 23) | |
| Media della classe Gaming (4424 - 33636, n=107, ultimi 2 anni) | |
| Asus TUF A15 FA507 | |
| Medion Erazer Crawler E40 - MD 62518 | |
| Lenovo LOQ 15IRH8 Core i7 | |
| Acer Nitro V 15 ANV15-51-582S | |
| Media Intel Core i5-13420H (5485 - 6644, n=5) | |
| AIDA64 / FPU Mandel | |
| Media della classe Gaming (25115 - 128721, n=107, ultimi 2 anni) | |
| Schenker XMG Apex 15 (Late 23) | |
| Asus TUF A15 FA507 | |
| Medion Erazer Crawler E40 - MD 62518 | |
| Lenovo LOQ 15IRH8 Core i7 | |
| Acer Nitro V 15 ANV15-51-582S | |
| Media Intel Core i5-13420H (19684 - 30163, n=5) | |
| AIDA64 / CPU AES | |
| Schenker XMG Apex 15 (Late 23) | |
| Media della classe Gaming (39258 - 247074, n=107, ultimi 2 anni) | |
| Acer Nitro V 15 ANV15-51-582S | |
| Asus TUF A15 FA507 | |
| Medion Erazer Crawler E40 - MD 62518 | |
| Media Intel Core i5-13420H (35531 - 93100, n=5) | |
| Lenovo LOQ 15IRH8 Core i7 | |
| AIDA64 / CPU ZLib | |
| Media della classe Gaming (574 - 2531, n=107, ultimi 2 anni) | |
| Schenker XMG Apex 15 (Late 23) | |
| Medion Erazer Crawler E40 - MD 62518 | |
| Lenovo LOQ 15IRH8 Core i7 | |
| Acer Nitro V 15 ANV15-51-582S | |
| Media Intel Core i5-13420H (509 - 746, n=5) | |
| Asus TUF A15 FA507 | |
| AIDA64 / FP64 Ray-Trace | |
| Media della classe Gaming (5509 - 45446, n=107, ultimi 2 anni) | |
| Schenker XMG Apex 15 (Late 23) | |
| Asus TUF A15 FA507 | |
| Medion Erazer Crawler E40 - MD 62518 | |
| Lenovo LOQ 15IRH8 Core i7 | |
| Acer Nitro V 15 ANV15-51-582S | |
| Media Intel Core i5-13420H (4283 - 6627, n=5) | |
| AIDA64 / CPU PhotoWorxx | |
| Media della classe Gaming (12271 - 89891, n=107, ultimi 2 anni) | |
| Medion Erazer Crawler E40 - MD 62518 | |
| Schenker XMG Apex 15 (Late 23) | |
| Lenovo LOQ 15IRH8 Core i7 | |
| Asus TUF A15 FA507 | |
| Acer Nitro V 15 ANV15-51-582S | |
| Media Intel Core i5-13420H (12330 - 37044, n=5) | |
Prestazioni del sistema
Nitro V 15 non riesce ad eguagliare i suoi concorrenti nelle prestazioni di sistema, anche se le differenze in PCMark 10 non sono così grandi come quelle nei test della CPU.
CrossMark: Overall | Productivity | Creativity | Responsiveness
WebXPRT 3: Overall
WebXPRT 4: Overall
Mozilla Kraken 1.1: Total
| PCMark 10 / Score | |
| Media della classe Gaming (5828 - 11574, n=94, ultimi 2 anni) | |
| Schenker XMG Apex 15 (Late 23) | |
| Lenovo LOQ 15IRH8 Core i7 | |
| Medion Erazer Crawler E40 - MD 62518 | |
| Asus TUF A15 FA507 | |
| Acer Nitro V 15 ANV15-51-582S | |
| Media Intel Core i5-13420H, NVIDIA GeForce RTX 4050 Laptop GPU (n=1) | |
| PCMark 10 / Essentials | |
| Lenovo LOQ 15IRH8 Core i7 | |
| Schenker XMG Apex 15 (Late 23) | |
| Media della classe Gaming (8810 - 12600, n=98, ultimi 2 anni) | |
| Asus TUF A15 FA507 | |
| Medion Erazer Crawler E40 - MD 62518 | |
| Acer Nitro V 15 ANV15-51-582S | |
| Media Intel Core i5-13420H, NVIDIA GeForce RTX 4050 Laptop GPU (n=1) | |
| PCMark 10 / Productivity | |
| Media della classe Gaming (6845 - 18766, n=96, ultimi 2 anni) | |
| Schenker XMG Apex 15 (Late 23) | |
| Lenovo LOQ 15IRH8 Core i7 | |
| Asus TUF A15 FA507 | |
| Medion Erazer Crawler E40 - MD 62518 | |
| Acer Nitro V 15 ANV15-51-582S | |
| Media Intel Core i5-13420H, NVIDIA GeForce RTX 4050 Laptop GPU (n=1) | |
| PCMark 10 / Digital Content Creation | |
| Media della classe Gaming (7602 - 19657, n=96, ultimi 2 anni) | |
| Lenovo LOQ 15IRH8 Core i7 | |
| Schenker XMG Apex 15 (Late 23) | |
| Medion Erazer Crawler E40 - MD 62518 | |
| Asus TUF A15 FA507 | |
| Acer Nitro V 15 ANV15-51-582S | |
| Media Intel Core i5-13420H, NVIDIA GeForce RTX 4050 Laptop GPU (n=1) | |
| CrossMark / Overall | |
| Media della classe Gaming (1366 - 2409, n=96, ultimi 2 anni) | |
| Lenovo LOQ 15IRH8 Core i7 | |
| Medion Erazer Crawler E40 - MD 62518 | |
| Schenker XMG Apex 15 (Late 23) | |
| Asus TUF A15 FA507 | |
| CrossMark / Productivity | |
| Media della classe Gaming (1386 - 2254, n=96, ultimi 2 anni) | |
| Lenovo LOQ 15IRH8 Core i7 | |
| Medion Erazer Crawler E40 - MD 62518 | |
| Schenker XMG Apex 15 (Late 23) | |
| Asus TUF A15 FA507 | |
| CrossMark / Creativity | |
| Media della classe Gaming (1343 - 2729, n=96, ultimi 2 anni) | |
| Lenovo LOQ 15IRH8 Core i7 | |
| Schenker XMG Apex 15 (Late 23) | |
| Medion Erazer Crawler E40 - MD 62518 | |
| Asus TUF A15 FA507 | |
| CrossMark / Responsiveness | |
| Lenovo LOQ 15IRH8 Core i7 | |
| Medion Erazer Crawler E40 - MD 62518 | |
| Media della classe Gaming (1226 - 2334, n=96, ultimi 2 anni) | |
| Schenker XMG Apex 15 (Late 23) | |
| Asus TUF A15 FA507 | |
| WebXPRT 3 / Overall | |
| Media della classe Gaming (242 - 532, n=99, ultimi 2 anni) | |
| Schenker XMG Apex 15 (Late 23) | |
| Asus TUF A15 FA507 | |
| Lenovo LOQ 15IRH8 Core i7 | |
| Medion Erazer Crawler E40 - MD 62518 | |
| Acer Nitro V 15 ANV15-51-582S | |
| Media Intel Core i5-13420H, NVIDIA GeForce RTX 4050 Laptop GPU (n=1) | |
| WebXPRT 4 / Overall | |
| Media della classe Gaming (176.4 - 354, n=99, ultimi 2 anni) | |
| Lenovo LOQ 15IRH8 Core i7 | |
| Acer Nitro V 15 ANV15-51-582S | |
| Media Intel Core i5-13420H, NVIDIA GeForce RTX 4050 Laptop GPU (n=1) | |
| Medion Erazer Crawler E40 - MD 62518 | |
| Asus TUF A15 FA507 | |
| Mozilla Kraken 1.1 / Total | |
| Asus TUF A15 FA507 | |
| Acer Nitro V 15 ANV15-51-582S | |
| Media Intel Core i5-13420H, NVIDIA GeForce RTX 4050 Laptop GPU (n=1) | |
| Medion Erazer Crawler E40 - MD 62518 | |
| Schenker XMG Apex 15 (Late 23) | |
| Lenovo LOQ 15IRH8 Core i7 | |
| Media della classe Gaming (391 - 590, n=104, ultimi 2 anni) | |
* ... Meglio usare valori piccoli
| PCMark 10 Score | 6569 punti | |
Aiuto | ||
| AIDA64 / Memory Copy | |
| Media della classe Gaming (21750 - 129946, n=107, ultimi 2 anni) | |
| Schenker XMG Apex 15 (Late 23) | |
| Medion Erazer Crawler E40 - MD 62518 | |
| Lenovo LOQ 15IRH8 Core i7 | |
| Asus TUF A15 FA507 | |
| Acer Nitro V 15 ANV15-51-582S | |
| Media Intel Core i5-13420H (22003 - 59609, n=5) | |
| AIDA64 / Memory Read | |
| Media della classe Gaming (22956 - 118858, n=107, ultimi 2 anni) | |
| Medion Erazer Crawler E40 - MD 62518 | |
| Lenovo LOQ 15IRH8 Core i7 | |
| Schenker XMG Apex 15 (Late 23) | |
| Asus TUF A15 FA507 | |
| Acer Nitro V 15 ANV15-51-582S | |
| Media Intel Core i5-13420H (23499 - 68085, n=5) | |
| AIDA64 / Memory Write | |
| Schenker XMG Apex 15 (Late 23) | |
| Media della classe Gaming (22297 - 135096, n=107, ultimi 2 anni) | |
| Medion Erazer Crawler E40 - MD 62518 | |
| Asus TUF A15 FA507 | |
| Lenovo LOQ 15IRH8 Core i7 | |
| Acer Nitro V 15 ANV15-51-582S | |
| Media Intel Core i5-13420H (21429 - 62529, n=5) | |
| AIDA64 / Memory Latency | |
| Lenovo LOQ 15IRH8 Core i7 | |
| Media della classe Gaming (75.3 - 259, n=107, ultimi 2 anni) | |
| Media Intel Core i5-13420H (90.2 - 103.6, n=5) | |
| Medion Erazer Crawler E40 - MD 62518 | |
| Acer Nitro V 15 ANV15-51-582S | |
| Schenker XMG Apex 15 (Late 23) | |
| Asus TUF A15 FA507 | |
* ... Meglio usare valori piccoli
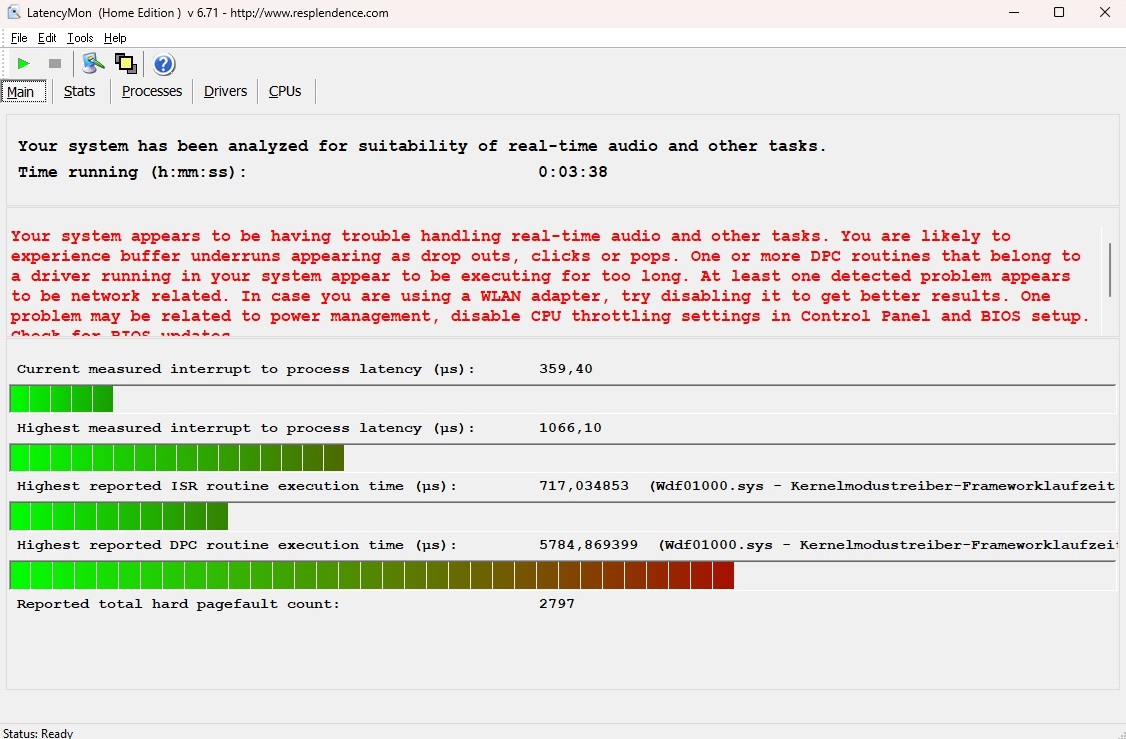
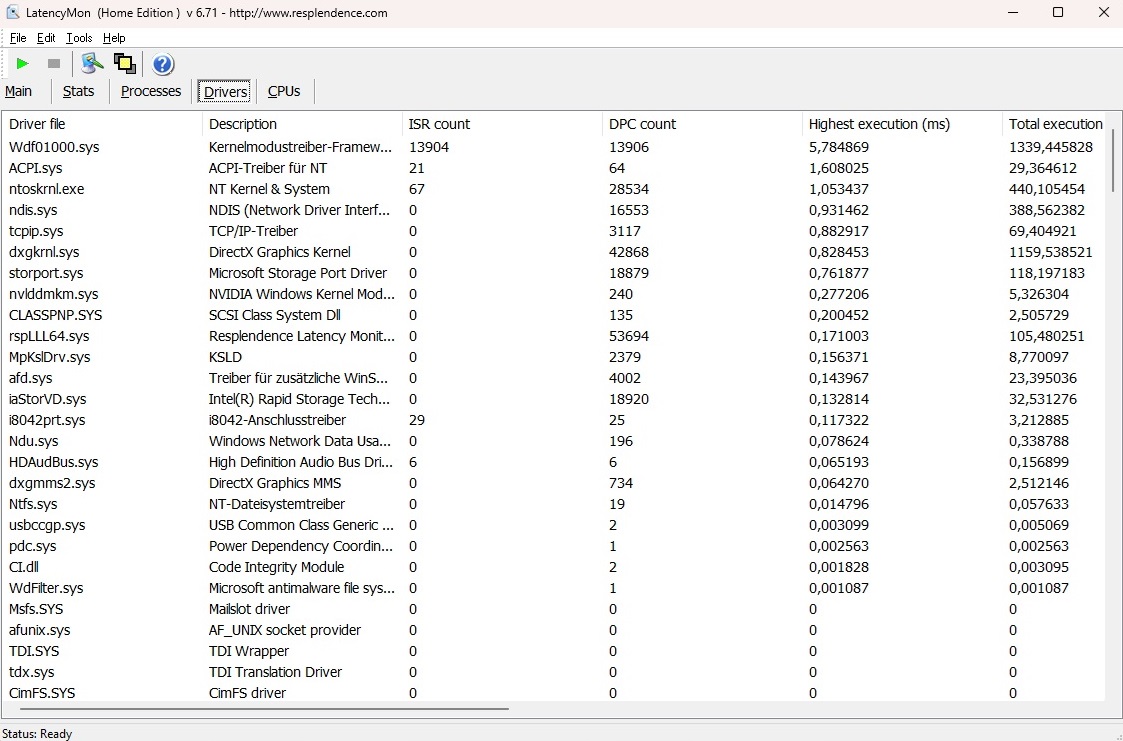
Latenza DPC
Secondo LatencyMon, Nitro V 15 è solo parzialmente adatto alle applicazioni sensibili alla latenza, come l'editing audio e video in tempo reale. Tuttavia, questo problema riguarda molti computer portatili ed è rilevante solo per alcuni utenti.
| DPC Latencies / LatencyMon - interrupt to process latency (max), Web, Youtube, Prime95 | |
| Acer Nitro V 15 ANV15-51-582S | |
| Medion Erazer Crawler E40 - MD 62518 | |
| Lenovo LOQ 15IRH8 Core i7 | |
| Schenker XMG Apex 15 (Late 23) | |
* ... Meglio usare valori piccoli
Memoria di massa
L'unità di archiviazione M.2 nella nostra unità di recensione è prodotta da SK hynix e offre solide prestazioni di lettura e scrittura per un dispositivo NVMe. Tuttavia, come l'SSD nel modello Lenovo LOQ LOQ 15IRH8, soffre di un certo livello di cali di prestazioni e fluttuazioni sotto carico sostenuto.

* ... Meglio usare valori piccoli
Sustained Load Read: DiskSpd Read Loop, Queue Depth 8
Scheda grafica
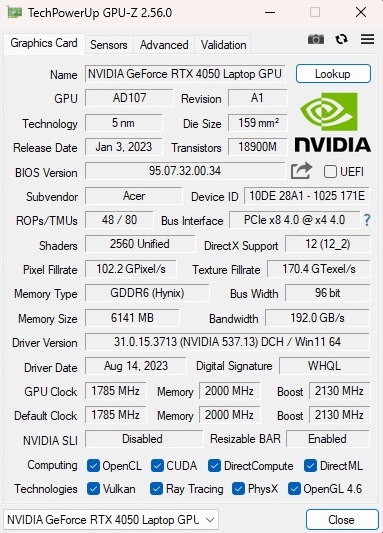
Sebbene i concorrenti abbiano fornito risultati leggermente migliori nei benchmark grafici sintetici, la RTX 4050 nella Nitro V 15 offre comunque un livello di prestazioni simile a quello che abbiamo visto in media da questa GPU. Il modello di fascia media della generazione Ada Lovelace offre 2.560 unità di shading, ma non ha una configurazione di memoria particolarmente generosa, avendo solo 6 GB di VRAM GDDR6 e un'interfaccia a 96 bit. Acer ha impostato il TGP a 75 watt (60 watt più 15 watt di Dynamic Boost), che è piuttosto basso per una RTX 4050.
| 3DMark 11 Performance | 24506 punti | |
| 3DMark Ice Storm Standard Score | 133723 punti | |
| 3DMark Cloud Gate Standard Score | 50705 punti | |
| 3DMark Fire Strike Score | 18795 punti | |
| 3DMark Time Spy Score | 7944 punti | |
Aiuto | ||
* ... Meglio usare valori piccoli
Prestazioni di gioco
Finché si mantiene la risoluzione interna a Full HD (cioè 1080p) e non si esagera con le impostazioni, la RTX 4050 è in grado di gestire anche i giochi moderni. Le impostazioni medio-alte non dovrebbero essere un problema; solo quando si arriva alle impostazioni ultra, a volte le cose possono diventare difficili (ad esempio in Lords of the Fallen o Avatar: Frontiers of Pandora). Analogamente a quanto abbiamo visto nei benchmark grafici, altri portatili RTX 4050 con TGP più elevato spesso hanno prestazioni migliori di Nitro.
| The Witcher 3 - 1920x1080 Ultra Graphics & Postprocessing (HBAO+) | |
| Media della classe Gaming (95 - 240, n=8, ultimi 2 anni) | |
| Lenovo LOQ 15IRH8 Core i7 | |
| Schenker XMG Apex 15 (Late 23) | |
| Asus TUF A15 FA507 | |
| Medion Erazer Crawler E40 - MD 62518 | |
| Acer Nitro V 15 ANV15-51-582S | |
| Media NVIDIA GeForce RTX 4050 Laptop GPU (18.5 - 94.7, n=40) | |
| Avatar Frontiers of Pandora - 1920x1080 Ultra Preset AA:T | |
| Media della classe Gaming (n=1ultimi 2 anni) | |
| Medion Erazer Scout E20 | |
| Acer Nitro V 15 ANV15-51-582S | |
| Media NVIDIA GeForce RTX 4050 Laptop GPU (35 - 35, n=2) | |
| The Finals - 1920x1080 Epic Preset | |
| Medion Erazer Scout E20 | |
| Media NVIDIA GeForce RTX 4050 Laptop GPU (91.8 - 99.2, n=2) | |
| Acer Nitro V 15 ANV15-51-582S | |
| Media della classe Gaming (n=1ultimi 2 anni) | |
| EA Sports WRC - 1920x1080 Ultra Preset AA:Epic AF:16x | |
| Medion Erazer Scout E20 | |
| Media NVIDIA GeForce RTX 4050 Laptop GPU (61 - 67.3, n=2) | |
| Acer Nitro V 15 ANV15-51-582S | |
| Media della classe Gaming (n=1ultimi 2 anni) | |
| Assassin's Creed Mirage - 1920x1080 Ultra High Preset (Adaptive Quality Off) | |
| XMG Focus 15 E23 | |
| Media NVIDIA GeForce RTX 4050 Laptop GPU (63 - 70, n=2) | |
| Acer Nitro V 15 ANV15-51-582S | |
| Ready or Not - 1920x1080 Epic Preset | |
| Medion Erazer Scout E20 | |
| Media NVIDIA GeForce RTX 4050 Laptop GPU (95.1 - 107.1, n=2) | |
| Acer Nitro V 15 ANV15-51-582S | |
| Lords of the Fallen - 1920x1080 Ultra Preset | |
| XMG Focus 15 E23 | |
| Media NVIDIA GeForce RTX 4050 Laptop GPU (27.3 - 32.1, n=2) | |
| Acer Nitro V 15 ANV15-51-582S | |
| Counter-Strike 2 - 1920x1080 Very High Preset | |
| Media della classe Gaming (26.2 - 275, n=5, ultimi 2 anni) | |
| Medion Erazer Scout E20 | |
| Media NVIDIA GeForce RTX 4050 Laptop GPU (80.9 - 110.2, n=2) | |
| Acer Nitro V 15 ANV15-51-582S | |
| Total War Pharaoh - 1920x1080 Ultra Preset | |
| Media della classe Gaming (42.9 - 161.4, n=2, ultimi 2 anni) | |
| XMG Focus 15 E23 | |
| Media NVIDIA GeForce RTX 4050 Laptop GPU (59.7 - 101, n=3) | |
| Acer Nitro V 15 ANV15-51-582S | |
Non abbiamo riscontrato alcun problema di rilievo durante il nostro test di stabilità (esecuzione di The Witcher 3 in FHD/Ultra per un'ora). Anche se la frequenza dei fotogrammi è diminuita leggermente nel corso del test, non ci sono stati cali di prestazioni insoliti o simili.
Witcher 3 FPS chart
| basso | medio | alto | ultra | |
|---|---|---|---|---|
| GTA V (2015) | 177.3 | 158.2 | 86.9 | |
| The Witcher 3 (2015) | 78 | |||
| Dota 2 Reborn (2015) | 153.7 | 143.6 | 136.5 | 120.3 |
| Final Fantasy XV Benchmark (2018) | 104.3 | 76.5 | ||
| X-Plane 11.11 (2018) | 114.3 | 94.5 | 77 | |
| Far Cry 5 (2018) | 128 | 118 | 102 | |
| Strange Brigade (2018) | 189.5 | 155.2 | 135.2 | |
| Counter-Strike 2 (2023) | 127 | 112.4 | 80.9 | |
| Assassin's Creed Mirage (2023) | 89 | 84 | 63 | |
| Total War Pharaoh (2023) | 147 | 84.1 | 59.7 | |
| Lords of the Fallen (2023) | 54.1 | 38.6 | 27.3 | |
| EA Sports WRC (2023) | 71.2 | 66.6 | 61 | |
| Avatar Frontiers of Pandora (2023) | 55 | 47 | 35 | |
| The Finals (2023) | 130.2 | 113.7 | 91.8 | |
| Ready or Not (2023) | 148.3 | 134.2 | 95.1 |
Emissioni
Emissioni di rumore
Rispetto alla quantità di calore generato, Nitro V 15 è inutilmente rumoroso quando si eseguono applicazioni 3D. Abbiamo misurato circa 49 dB(A) di rumore durante il gioco (modalità Bilanciata), che è chiaramente udibile e potrebbe essere abbastanza forte da infastidire alcuni utenti. Detto questo, il portatile non è troppo diverso dai concorrenti in questo senso. Al minimo, le due ventole interne sono completamente ferme o funzionano a un livello di rumore moderato di 29-30 dB(A).
Rumorosità
| Idle |
| 25 / 29 / 30 dB(A) |
| Sotto carico |
| 49 / 51 dB(A) |
 | ||
30 dB silenzioso 40 dB(A) udibile 50 dB(A) rumoroso |
||
min: | ||
| Acer Nitro V 15 ANV15-51-582S GeForce RTX 4050 Laptop GPU, i5-13420H | Medion Erazer Crawler E40 - MD 62518 GeForce RTX 4050 Laptop GPU, i5-13500H | Lenovo LOQ 15IRH8 Core i7 GeForce RTX 4050 Laptop GPU, i7-13620H | Asus TUF A15 FA507 GeForce RTX 4050 Laptop GPU, R7 7735HS | Schenker XMG Apex 15 (Late 23) GeForce RTX 4050 Laptop GPU, R7 7840HS | |
|---|---|---|---|---|---|
| Noise | 4% | -0% | 18% | 3% | |
| off /ambiente * (dB) | 25 | 23 8% | 23.69 5% | 23.3 7% | 24 4% |
| Idle Minimum * (dB) | 25 | 23 8% | 29.03 -16% | 23.3 7% | 25 -0% |
| Idle Average * (dB) | 29 | 23 21% | 29.03 -0% | 23.3 20% | 29 -0% |
| Idle Maximum * (dB) | 30 | 28.02 7% | 29.03 3% | 23.3 22% | 33 -10% |
| Load Average * (dB) | 49 | 50.21 -2% | 48.7 1% | 29.6 40% | 36 27% |
| Witcher 3 ultra * (dB) | 49 | 51.46 -5% | 48.5 1% | 43 12% | 48 2% |
| Load Maximum * (dB) | 51 | 56.79 -11% | 48.7 5% | 43 16% | 53 -4% |
* ... Meglio usare valori piccoli
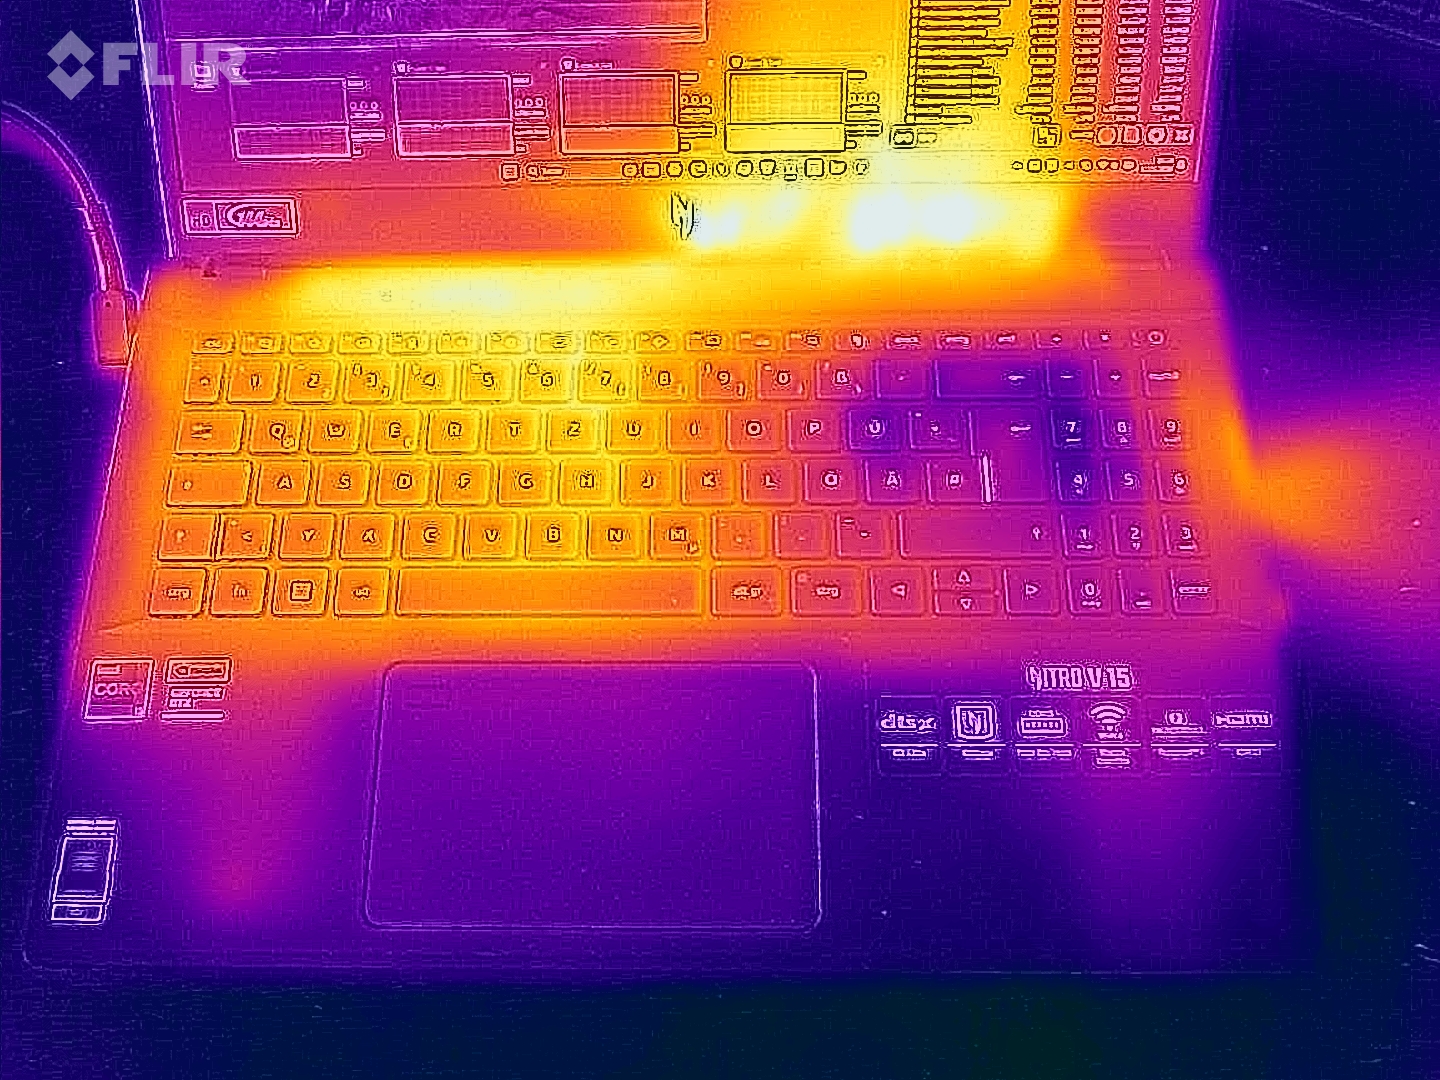
Temperatura
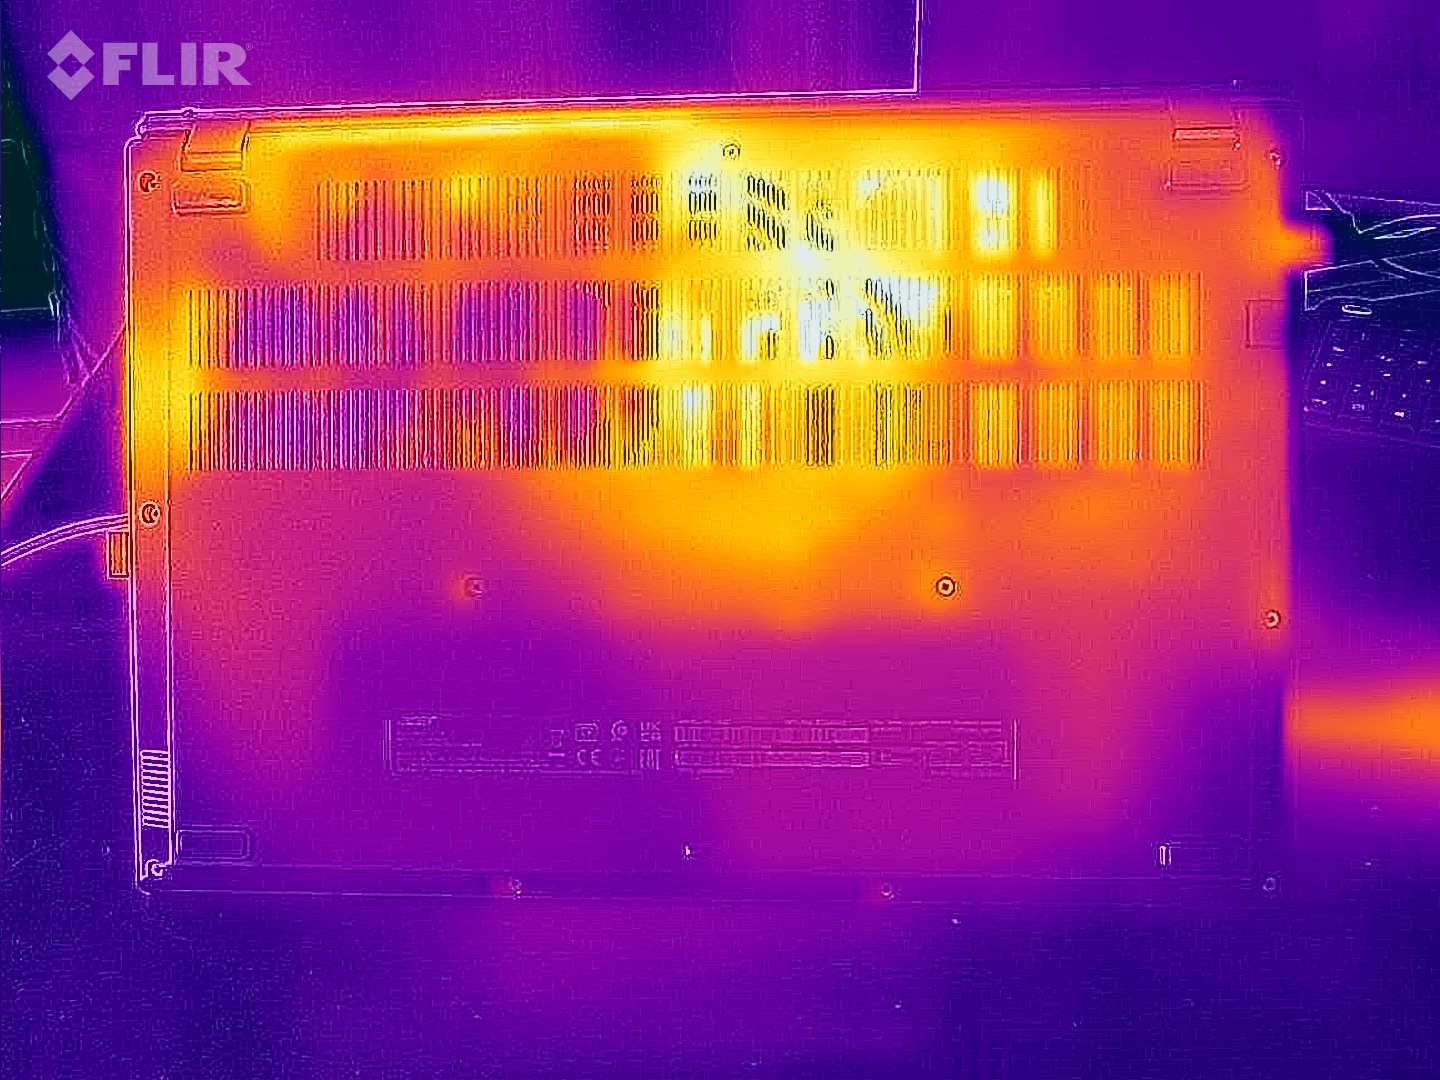
Il Nitro V 15 non si surriscalda. Anche dopo 60 minuti di stress test (esecuzione di FurMark e Prime95), la superficie del portatile è rimasta al di sotto dei 50°C (122°F). L'intero chassis si mantiene fresco al minimo - il nostro termometro ha registrato solo temperature tra 22 e 28°C (71,6 e 82,4°F).
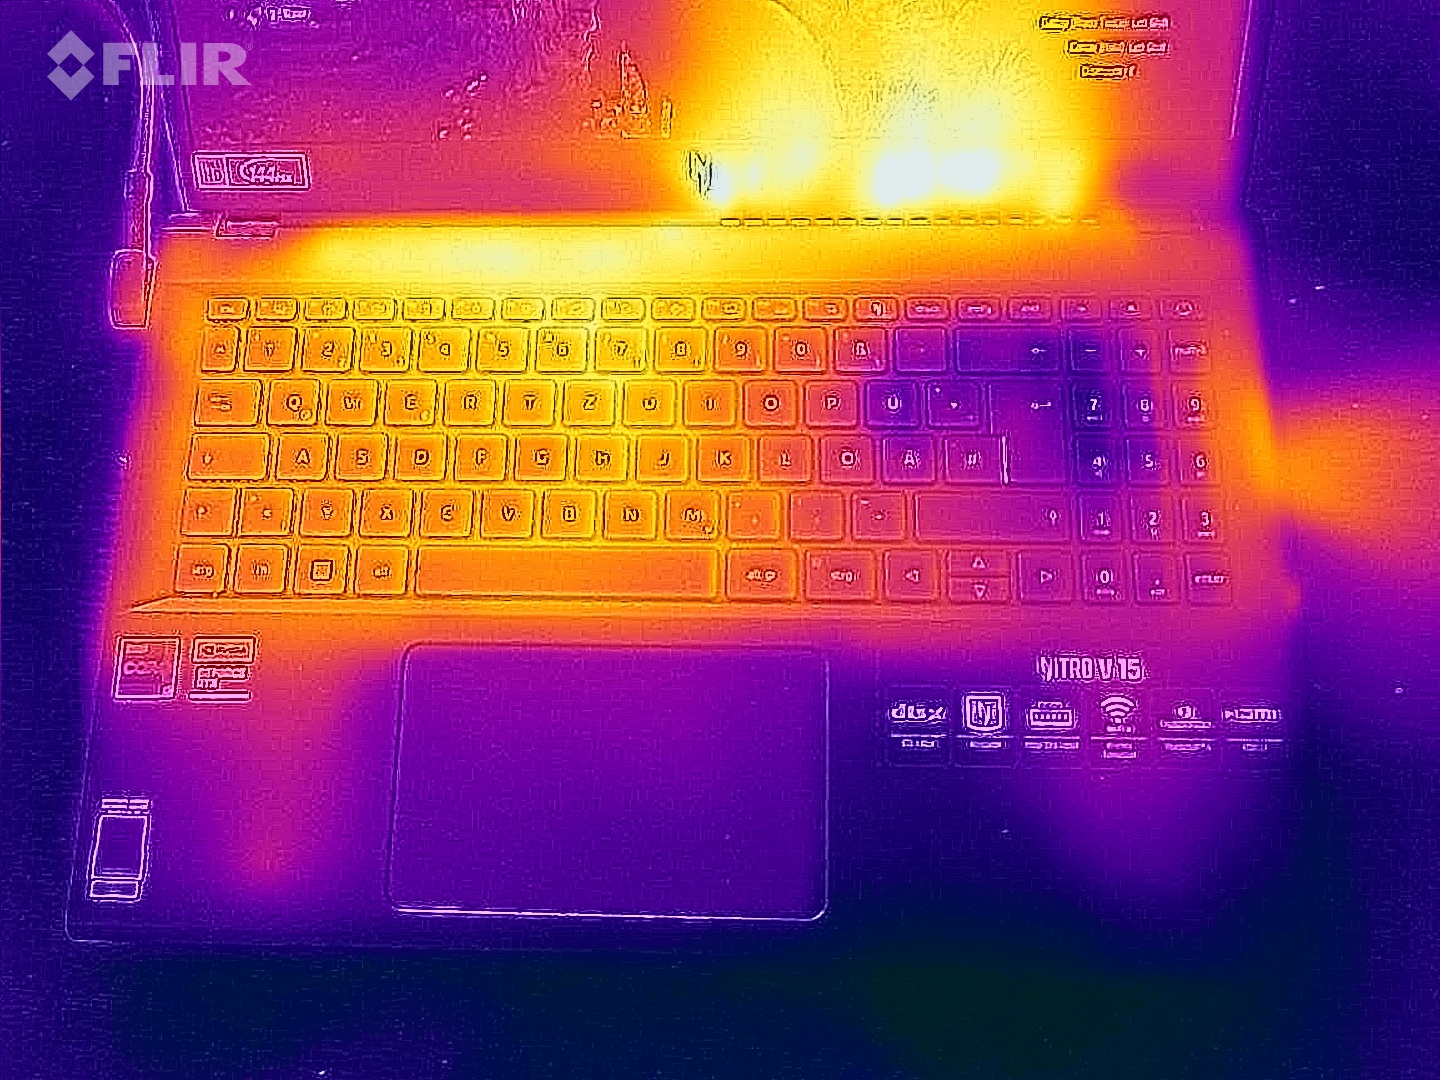
(-) La temperatura massima sul lato superiore è di 46 °C / 115 F, rispetto alla media di 40.4 °C / 105 F, che varia da 21.2 a 68.8 °C per questa classe Gaming.
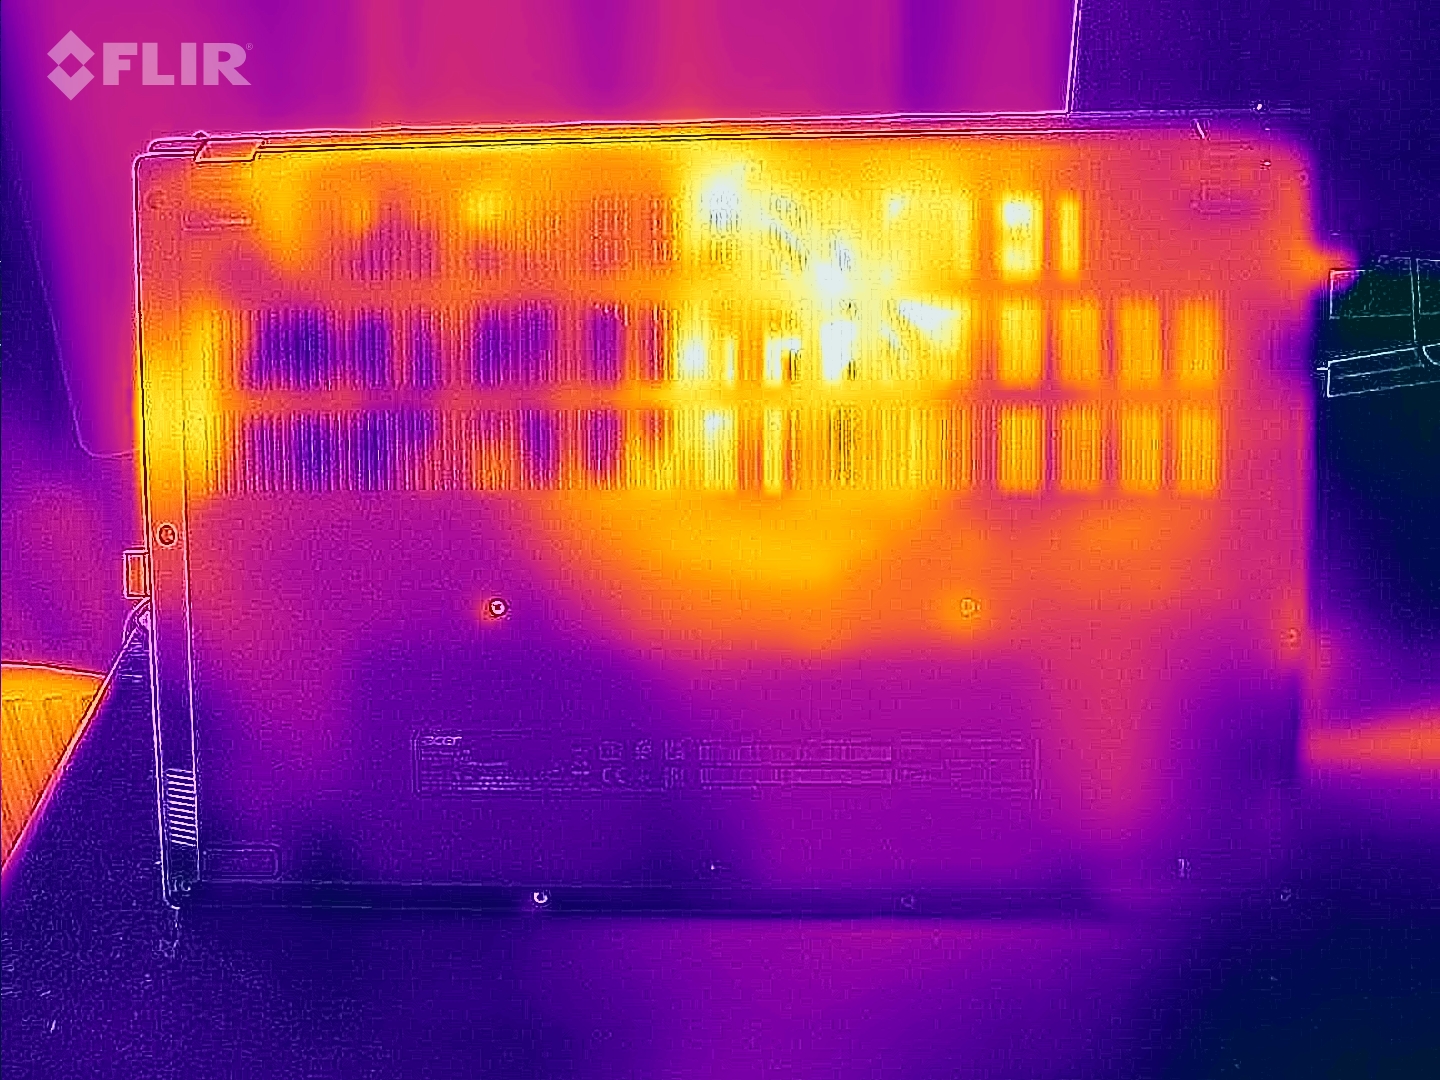
(-) Il lato inferiore si riscalda fino ad un massimo di 48 °C / 118 F, rispetto alla media di 43.2 °C / 110 F
(+) In idle, la temperatura media del lato superiore è di 25.1 °C / 77 F, rispetto alla media deld ispositivo di 33.9 °C / 93 F.
(-) Riproducendo The Witcher 3, la temperatura media per il lato superiore e' di 39.4 °C / 103 F, rispetto alla media del dispositivo di 33.9 °C / 93 F.
(±) I poggiapolsi e il touchpad possono diventare molto caldi al tatto con un massimo di 36 °C / 96.8 F.
(-) La temperatura media della zona del palmo della mano di dispositivi simili e'stata di 28.8 °C / 83.8 F (-7.2 °C / -13 F).
| Acer Nitro V 15 ANV15-51-582S GeForce RTX 4050 Laptop GPU, i5-13420H | Medion Erazer Crawler E40 - MD 62518 GeForce RTX 4050 Laptop GPU, i5-13500H | Lenovo LOQ 15IRH8 Core i7 GeForce RTX 4050 Laptop GPU, i7-13620H | Asus TUF A15 FA507 GeForce RTX 4050 Laptop GPU, R7 7735HS | Schenker XMG Apex 15 (Late 23) GeForce RTX 4050 Laptop GPU, R7 7840HS | |
|---|---|---|---|---|---|
| Heat | 14% | -20% | 1% | -13% | |
| Maximum Upper Side * (°C) | 46 | 36 22% | 46.4 -1% | 48.9 -6% | 52 -13% |
| Maximum Bottom * (°C) | 48 | 36 25% | 59.2 -23% | 44.6 7% | 47 2% |
| Idle Upper Side * (°C) | 27 | 26 4% | 34.4 -27% | 27.1 -0% | 33 -22% |
| Idle Bottom * (°C) | 28 | 27 4% | 36.2 -29% | 27.5 2% | 33 -18% |
* ... Meglio usare valori piccoli
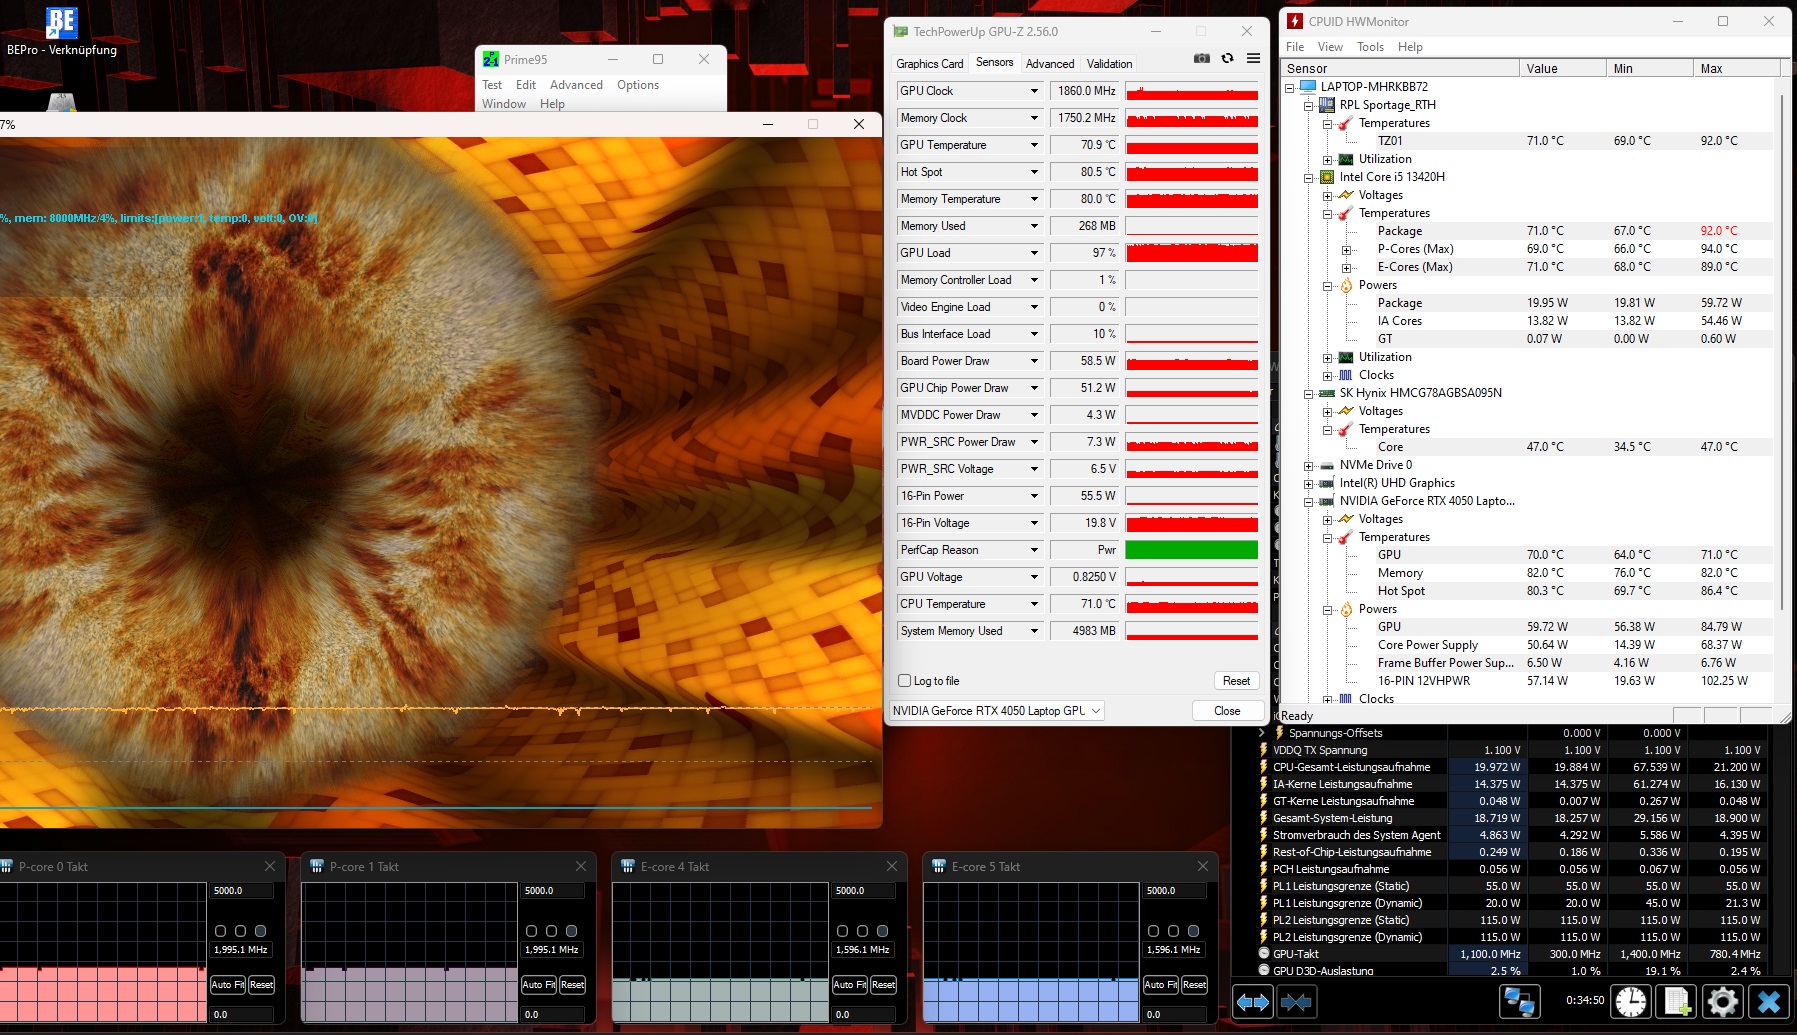
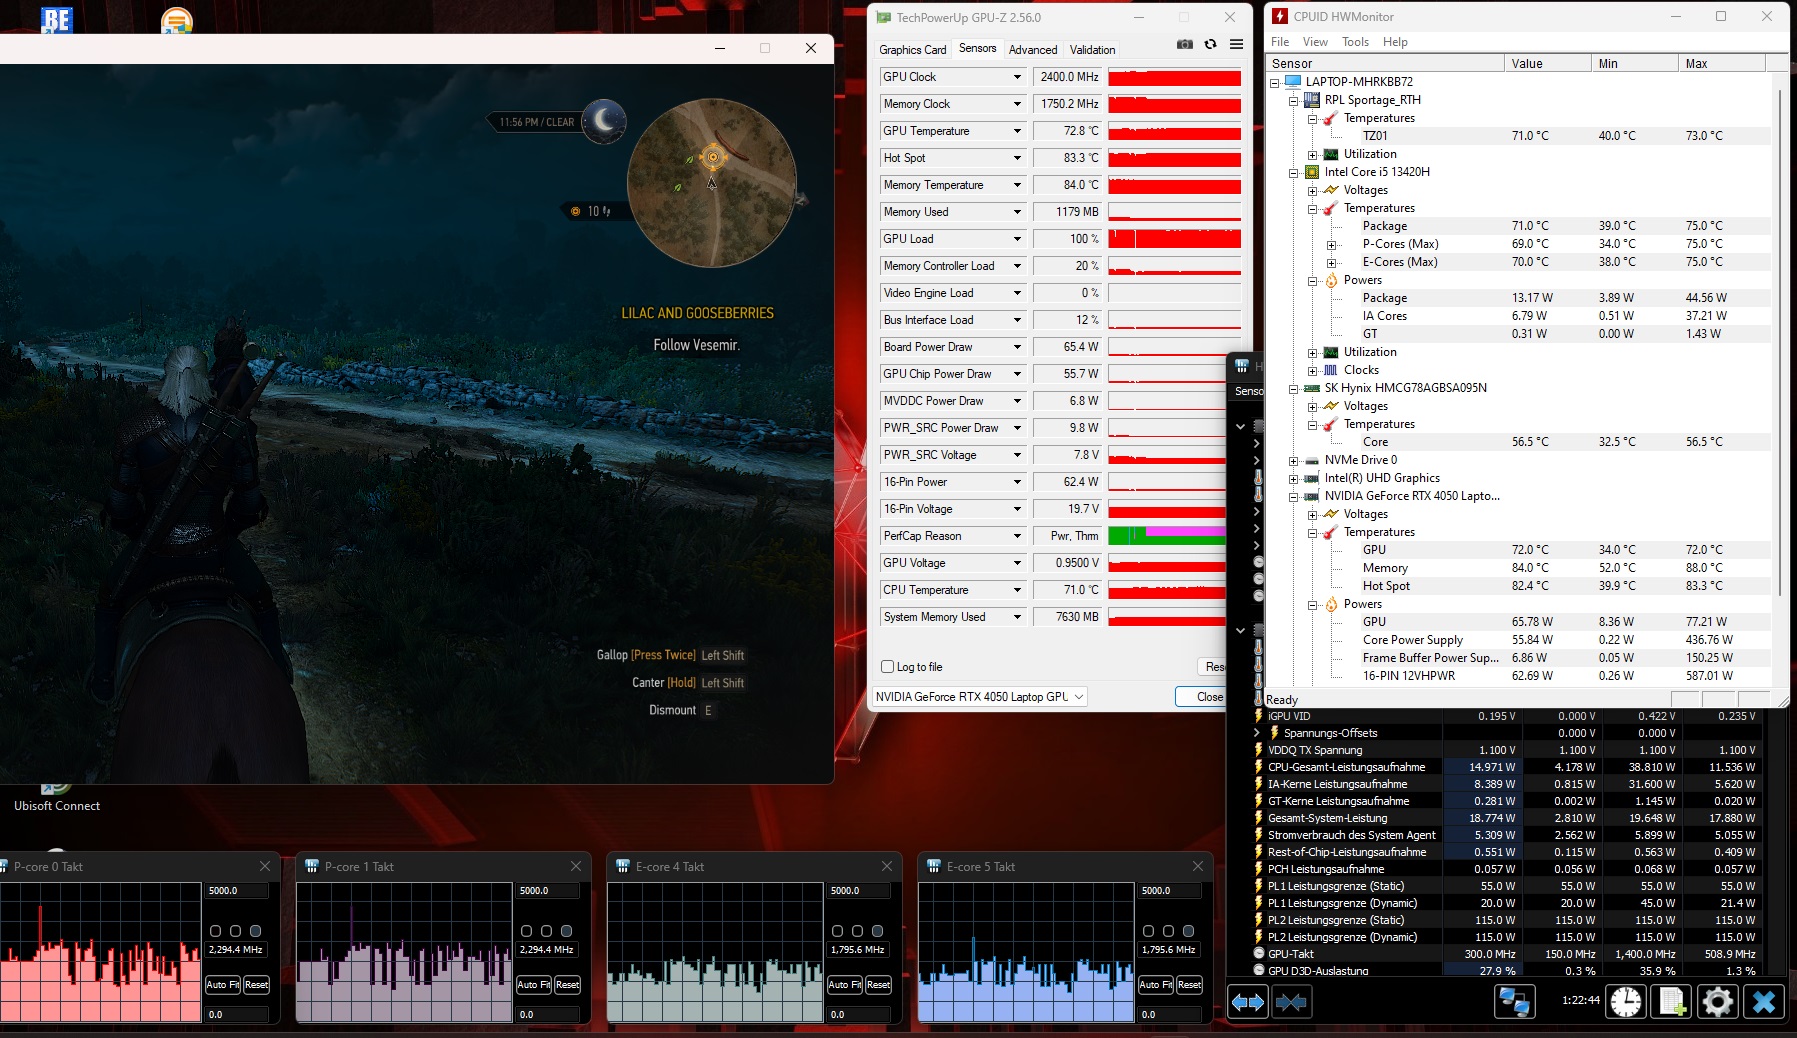
Test da sforzo
Anche i componenti del portatile non si surriscaldano a pieno carico. La CPU e la GPU hanno funzionato a una temperatura media di 71°C (159,8°F), un valore relativamente buono che non desta alcuna preoccupazione o critica. Anche il test di 60 minuti di Witcher 3 ha dato risultati simili.
Altoparlanti
Il Nitro V 15 offre un suono da decente a buono per un notebook, ma, come spesso accade, mancano i bassi. Il volume massimo di 83 dB(A) è comunque abbastanza buono.
Acer Nitro V 15 ANV15-51-582S analisi audio
(+) | gli altoparlanti sono relativamente potenti (83 dB)
Bassi 100 - 315 Hz
(-) | quasi nessun basso - in media 26.5% inferiori alla media
(±) | la linearità dei bassi è media (13.9% delta rispetto alla precedente frequenza)
Medi 400 - 2000 Hz
(+) | medi bilanciati - solo only 3.2% rispetto alla media
(+) | medi lineari (4.2% delta rispetto alla precedente frequenza)
Alti 2 - 16 kHz
(+) | Alti bilanciati - appena 1.6% dalla media
(+) | alti lineari (3.3% delta rispetto alla precedente frequenza)
Nel complesso 100 - 16.000 Hz
(±) | la linearità complessiva del suono è media (15.9% di differenza rispetto alla media
Rispetto alla stessa classe
» 38% di tutti i dispositivi testati in questa classe è stato migliore, 7% simile, 56% peggiore
» Il migliore ha avuto un delta di 6%, medio di 18%, peggiore di 132%
Rispetto a tutti i dispositivi testati
» 25% di tutti i dispositivi testati in questa classe è stato migliore, 5% similare, 70% peggiore
» Il migliore ha avuto un delta di 4%, medio di 24%, peggiore di 134%
Asus TUF A15 FA507 analisi audio
(±) | potenza degli altiparlanti media ma buona (79.3 dB)
Bassi 100 - 315 Hz
(±) | bassi ridotti - in media 13.7% inferiori alla media
(+) | bassi in lineaa (6.2% delta rispetto alla precedente frequenza)
Medi 400 - 2000 Hz
(±) | medi elevati - circa 7.6% superiore alla media
(±) | linearità dei medi adeguata (7.3% delta rispetto alla precedente frequenza)
Alti 2 - 16 kHz
(+) | Alti bilanciati - appena 2.1% dalla media
(±) | la linearità degli alti è media (7.5% delta rispetto alla precedente frequenza)
Nel complesso 100 - 16.000 Hz
(±) | la linearità complessiva del suono è media (17.2% di differenza rispetto alla media
Rispetto alla stessa classe
» 46% di tutti i dispositivi testati in questa classe è stato migliore, 11% simile, 42% peggiore
» Il migliore ha avuto un delta di 6%, medio di 18%, peggiore di 132%
Rispetto a tutti i dispositivi testati
» 32% di tutti i dispositivi testati in questa classe è stato migliore, 8% similare, 60% peggiore
» Il migliore ha avuto un delta di 4%, medio di 24%, peggiore di 134%
Gestione dell'energia
Consumo di energia
Grazie anche alla commutazione della grafica, il portatile da 15 pollici richiede una quantità di energia piuttosto bassa. Ha il consumo energetico più basso del nostro confronto, con un consumo di soli 7-11 watt al minimo e 76-136 watt nelle applicazioni 3D. Alcuni degli altri dispositivi del confronto consumano molto di più.
| Off / Standby | |
| Idle | |
| Sotto carico |
|
Leggenda:
min: | |
| Acer Nitro V 15 ANV15-51-582S GeForce RTX 4050 Laptop GPU, i5-13420H | Medion Erazer Crawler E40 - MD 62518 GeForce RTX 4050 Laptop GPU, i5-13500H | Lenovo LOQ 15IRH8 Core i7 GeForce RTX 4050 Laptop GPU, i7-13620H | Asus TUF A15 FA507 GeForce RTX 4050 Laptop GPU, R7 7735HS | Schenker XMG Apex 15 (Late 23) GeForce RTX 4050 Laptop GPU, R7 7840HS | Media della classe Gaming | |
|---|---|---|---|---|---|---|
| Power Consumption | -50% | -107% | -26% | -20% | -95% | |
| Idle Minimum * (Watt) | 7 | 10 -43% | 18.52 -165% | 8 -14% | 6 14% | 13.2 ? -89% |
| Idle Average * (Watt) | 8 | 15.3 -91% | 22.54 -182% | 12.1 -51% | 11 -38% | 18.9 ? -136% |
| Idle Maximum * (Watt) | 11 | 15.5 -41% | 29.79 -171% | 12.5 -14% | 14 -27% | 24.3 ? -121% |
| Load Average * (Watt) | 76 | 88 -16% | 94.5 -24% | 74.9 1% | 65 14% | 108.3 ? -43% |
| Witcher 3 ultra * (Watt) | 98.2 | 155 -58% | 154.4 -57% | 136.6 -39% | 136.5 -39% | |
| Load Maximum * (Watt) | 136 | 202.47 -49% | 190.4 -40% | 185 -36% | 195 -43% | 254 ? -87% |
* ... Meglio usare valori piccoli
Power consumption Witcher 3 / Stresstest
Power consumption with external monitor
Durata della batteria
Al contrario, il Nitro V 15 è in grado di offrire un'ottima durata della batteria e lo fa nonostante la sua batteria abbia una capacità piuttosto modesta di 57 Wh. Nel nostro test Wi-Fi (luminosità ridotta a 150 cd/m²), il notebook Acer è durato circa 9,5 ore - un risultato di tutto rispetto per questa classe di laptop.
| Acer Nitro V 15 ANV15-51-582S i5-13420H, GeForce RTX 4050 Laptop GPU, 57 Wh | Medion Erazer Crawler E40 - MD 62518 i5-13500H, GeForce RTX 4050 Laptop GPU, 54 Wh | Lenovo LOQ 15IRH8 Core i7 i7-13620H, GeForce RTX 4050 Laptop GPU, 60 Wh | Asus TUF A15 FA507 R7 7735HS, GeForce RTX 4050 Laptop GPU, 90 Wh | Schenker XMG Apex 15 (Late 23) R7 7840HS, GeForce RTX 4050 Laptop GPU, 62.32 Wh | Media della classe Gaming | |
|---|---|---|---|---|---|---|
| Autonomia della batteria | -43% | -37% | -9% | -30% | -33% | |
| Reader / Idle (h) | 21.5 | 8.4 -61% | 8.71 ? -59% | |||
| WiFi v1.3 (h) | 9.4 | 4.1 -56% | 5.9 -37% | 11.7 24% | 7.1 -24% | 7.04 ? -25% |
| Load (h) | 1.7 | 1.2 -29% | 1 -41% | 1.6 -6% | 1.47 ? -14% | |
| H.264 (h) | 3.9 | 6.1 | 12.5 | 8.3 | 8.26 ? |
Pro
Contro
Il verdetto
I punti di forza e i difetti dell'Acer Nitro V 15 sono emersi durante i nostri test.
Sebbene il portatile abbia un design elegante, un telaio relativamente compatto e una durata della batteria impressionante, il display non è all'altezza degli standard attuali (soprattutto per quanto riguarda la copertura del colore e la luminosità).
Le prestazioni del Core i5-13420H e di GeForce RTX 4050 sono all'incirca quelle che ci si può aspettare da un computer portatile che costa circa 1.000 euro (1.085 dollari).
I giocatori attenti al prezzo ottengono una piattaforma di gioco solida, in grado di sfornare frame rate utilizzabili, almeno in Full HD.
Comodamente, il portatile dispone di uno slot RAM libero e di un secondo slot M.2 pronto per futuri aggiornamenti. Anche la selezione di porte è aggiornata grazie a Thunderbolt 4, anche se in alcuni punti c'è ancora margine di miglioramento.
I concorrenti citati nella recensione, come Lenovo LOQ 15IRH8 e Asus TUF A15 FA507, hanno ottenuto punteggi complessivi leggermente superiori grazie ai loro display superiori.
Prezzo e disponibilità
L'Acer Nitro V 15 ANV15-51-582S con un Core i5-13420H e GeForce RTX 4050 è disponibile presso vari negozi online (ad esempio notebooksbilliger.de) a circa 900 euro. Su Amazon US, il modello con il più veloce Core i7-13620H può essere acquistato a circa US$950.
Acer Nitro V 15 ANV15-51-582S
- 01/16/2024 v7 (old)
Florian Glaser
Transparency
La selezione dei dispositivi da recensire viene effettuata dalla nostra redazione. Il campione di prova è stato fornito all'autore come prestito dal produttore o dal rivenditore ai fini di questa recensione. L'istituto di credito non ha avuto alcuna influenza su questa recensione, né il produttore ne ha ricevuto una copia prima della pubblicazione. Non vi era alcun obbligo di pubblicare questa recensione. In quanto società mediatica indipendente, Notebookcheck non è soggetta all'autorità di produttori, rivenditori o editori.
Ecco come Notebookcheck esegue i test
Ogni anno, Notebookcheck esamina in modo indipendente centinaia di laptop e smartphone utilizzando procedure standardizzate per garantire che tutti i risultati siano comparabili. Da circa 20 anni sviluppiamo continuamente i nostri metodi di prova e nel frattempo stabiliamo gli standard di settore. Nei nostri laboratori di prova, tecnici ed editori esperti utilizzano apparecchiature di misurazione di alta qualità. Questi test comportano un processo di validazione in più fasi. Il nostro complesso sistema di valutazione si basa su centinaia di misurazioni e parametri di riferimento ben fondati, che mantengono l'obiettività.Price comparison

