Recensione dell'Intel NUC X15 LAPAC71H: Il computer portatile multimediale con un Intel Arc A730M a partire da 1.050 dollari
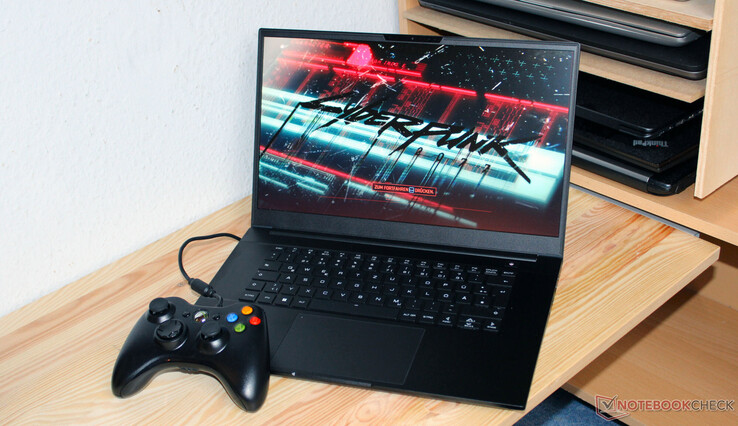
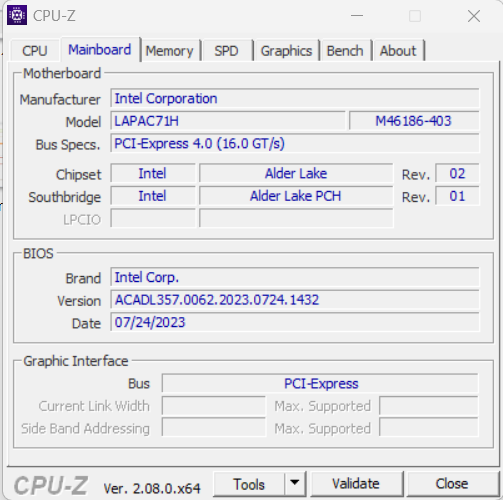
Dopo essere stato annunciato per l'autunno del 2022, l'Intel NUC X15 - un computer portatile per giocatori e creatori - vede finalmente la luce un anno dopo. Dovrebbe trattarsi per lo più di un caso di eliminazione di merci: L'X15, così come la serie NUC nel suo complesso, è già stata dismessa da Intel. Il computer portatile distribuito da Schenker Core i7-12700H, Arc A730Me il pannello FHD sono impostati, mentre la RAM e l'SSD possono essere selezionati.
I concorrenti includono dispositivi come Asus TUF A15 FA507, Gigabyte G5 KE, MSI Cyborg 15 A12VF, Dell Inspiron 16 Plus 7630 e Asus VivoBook Pro 16.
Potenziali concorrenti a confronto
Punteggio | Data | Modello | Peso | Altezza | Dimensione | Risoluzione | Prezzo |
|---|---|---|---|---|---|---|---|
| 84.4 % v7 (old) | 10/2023 | Intel NUC X15 LAPAC71H i7-12700H, A730M | 2.2 kg | 26.7 mm | 15.60" | 1920x1080 | |
| 86.3 % v7 (old) | 06/2023 | Asus TUF A15 FA507 R7 7735HS, GeForce RTX 4050 Laptop GPU | 2.2 kg | 24.9 mm | 15.60" | 1920x1080 | |
| 81.8 % v7 (old) | 04/2023 | Gigabyte G5 KE i5-12500H, GeForce RTX 3060 Laptop GPU | 2 kg | 23.9 mm | 15.60" | 1920x1080 | |
| 87.1 % v7 (old) | 08/2023 | Dell Inspiron 16 Plus 7630 i7-13700H, GeForce RTX 4060 Laptop GPU | 2.2 kg | 19.95 mm | 16.00" | 2560x1600 | |
| 86.3 % v7 (old) | 05/2023 | Asus VivoBook Pro 16 i7-12700H, GeForce RTX 3050 Ti Laptop GPU | 1.9 kg | 20 mm | 16.00" | 2560x1600 | |
| 82.4 % v7 (old) | 04/2023 | MSI Cyborg 15 A12VF i7-12650H, GeForce RTX 4060 Laptop GPU | 2 kg | 22.9 mm | 15.60" | 1920x1080 |
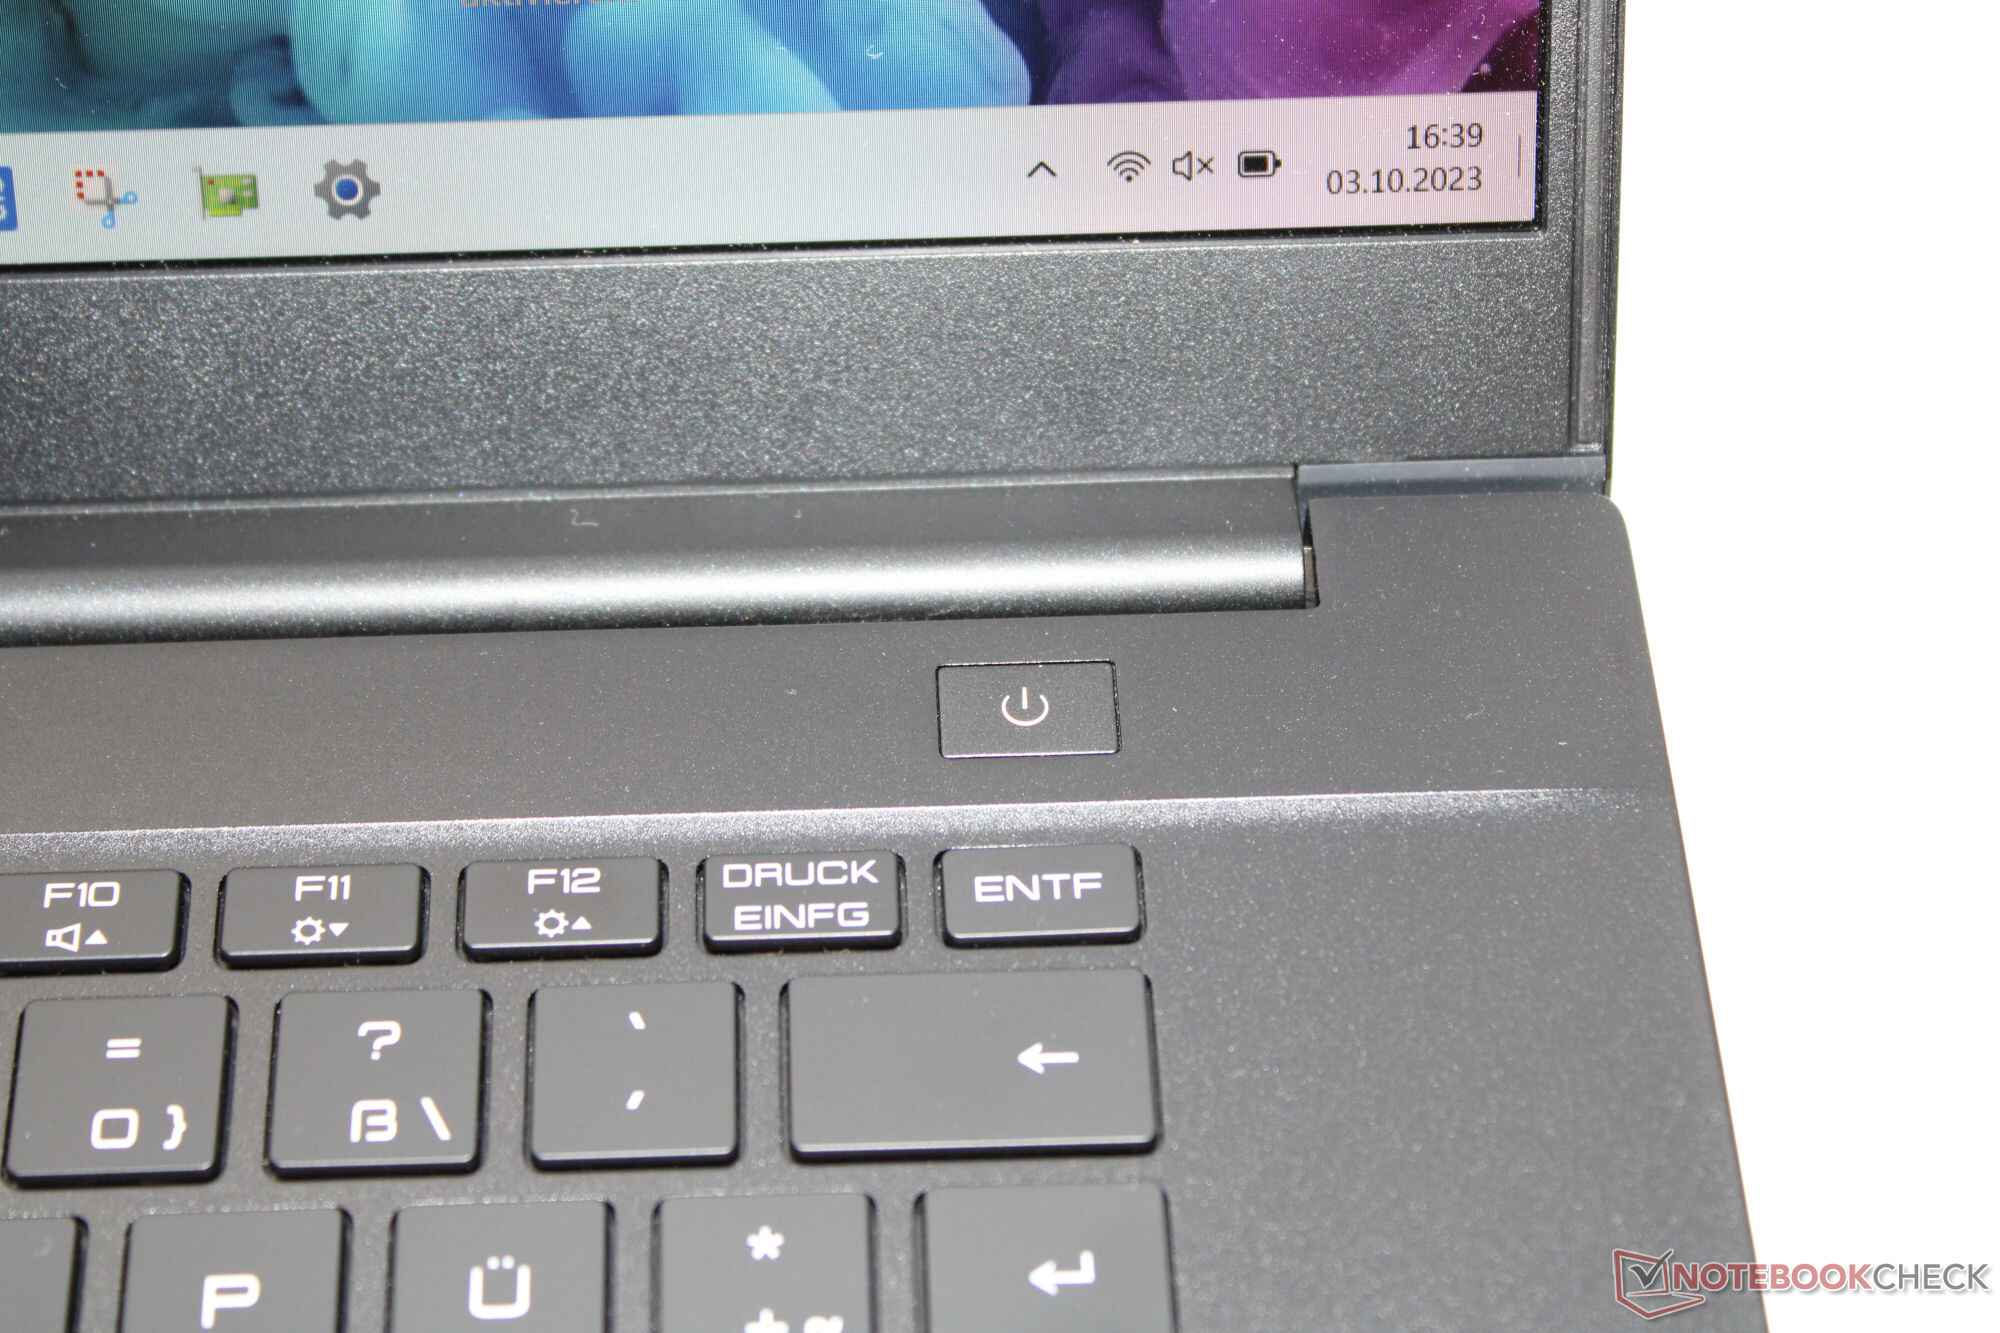
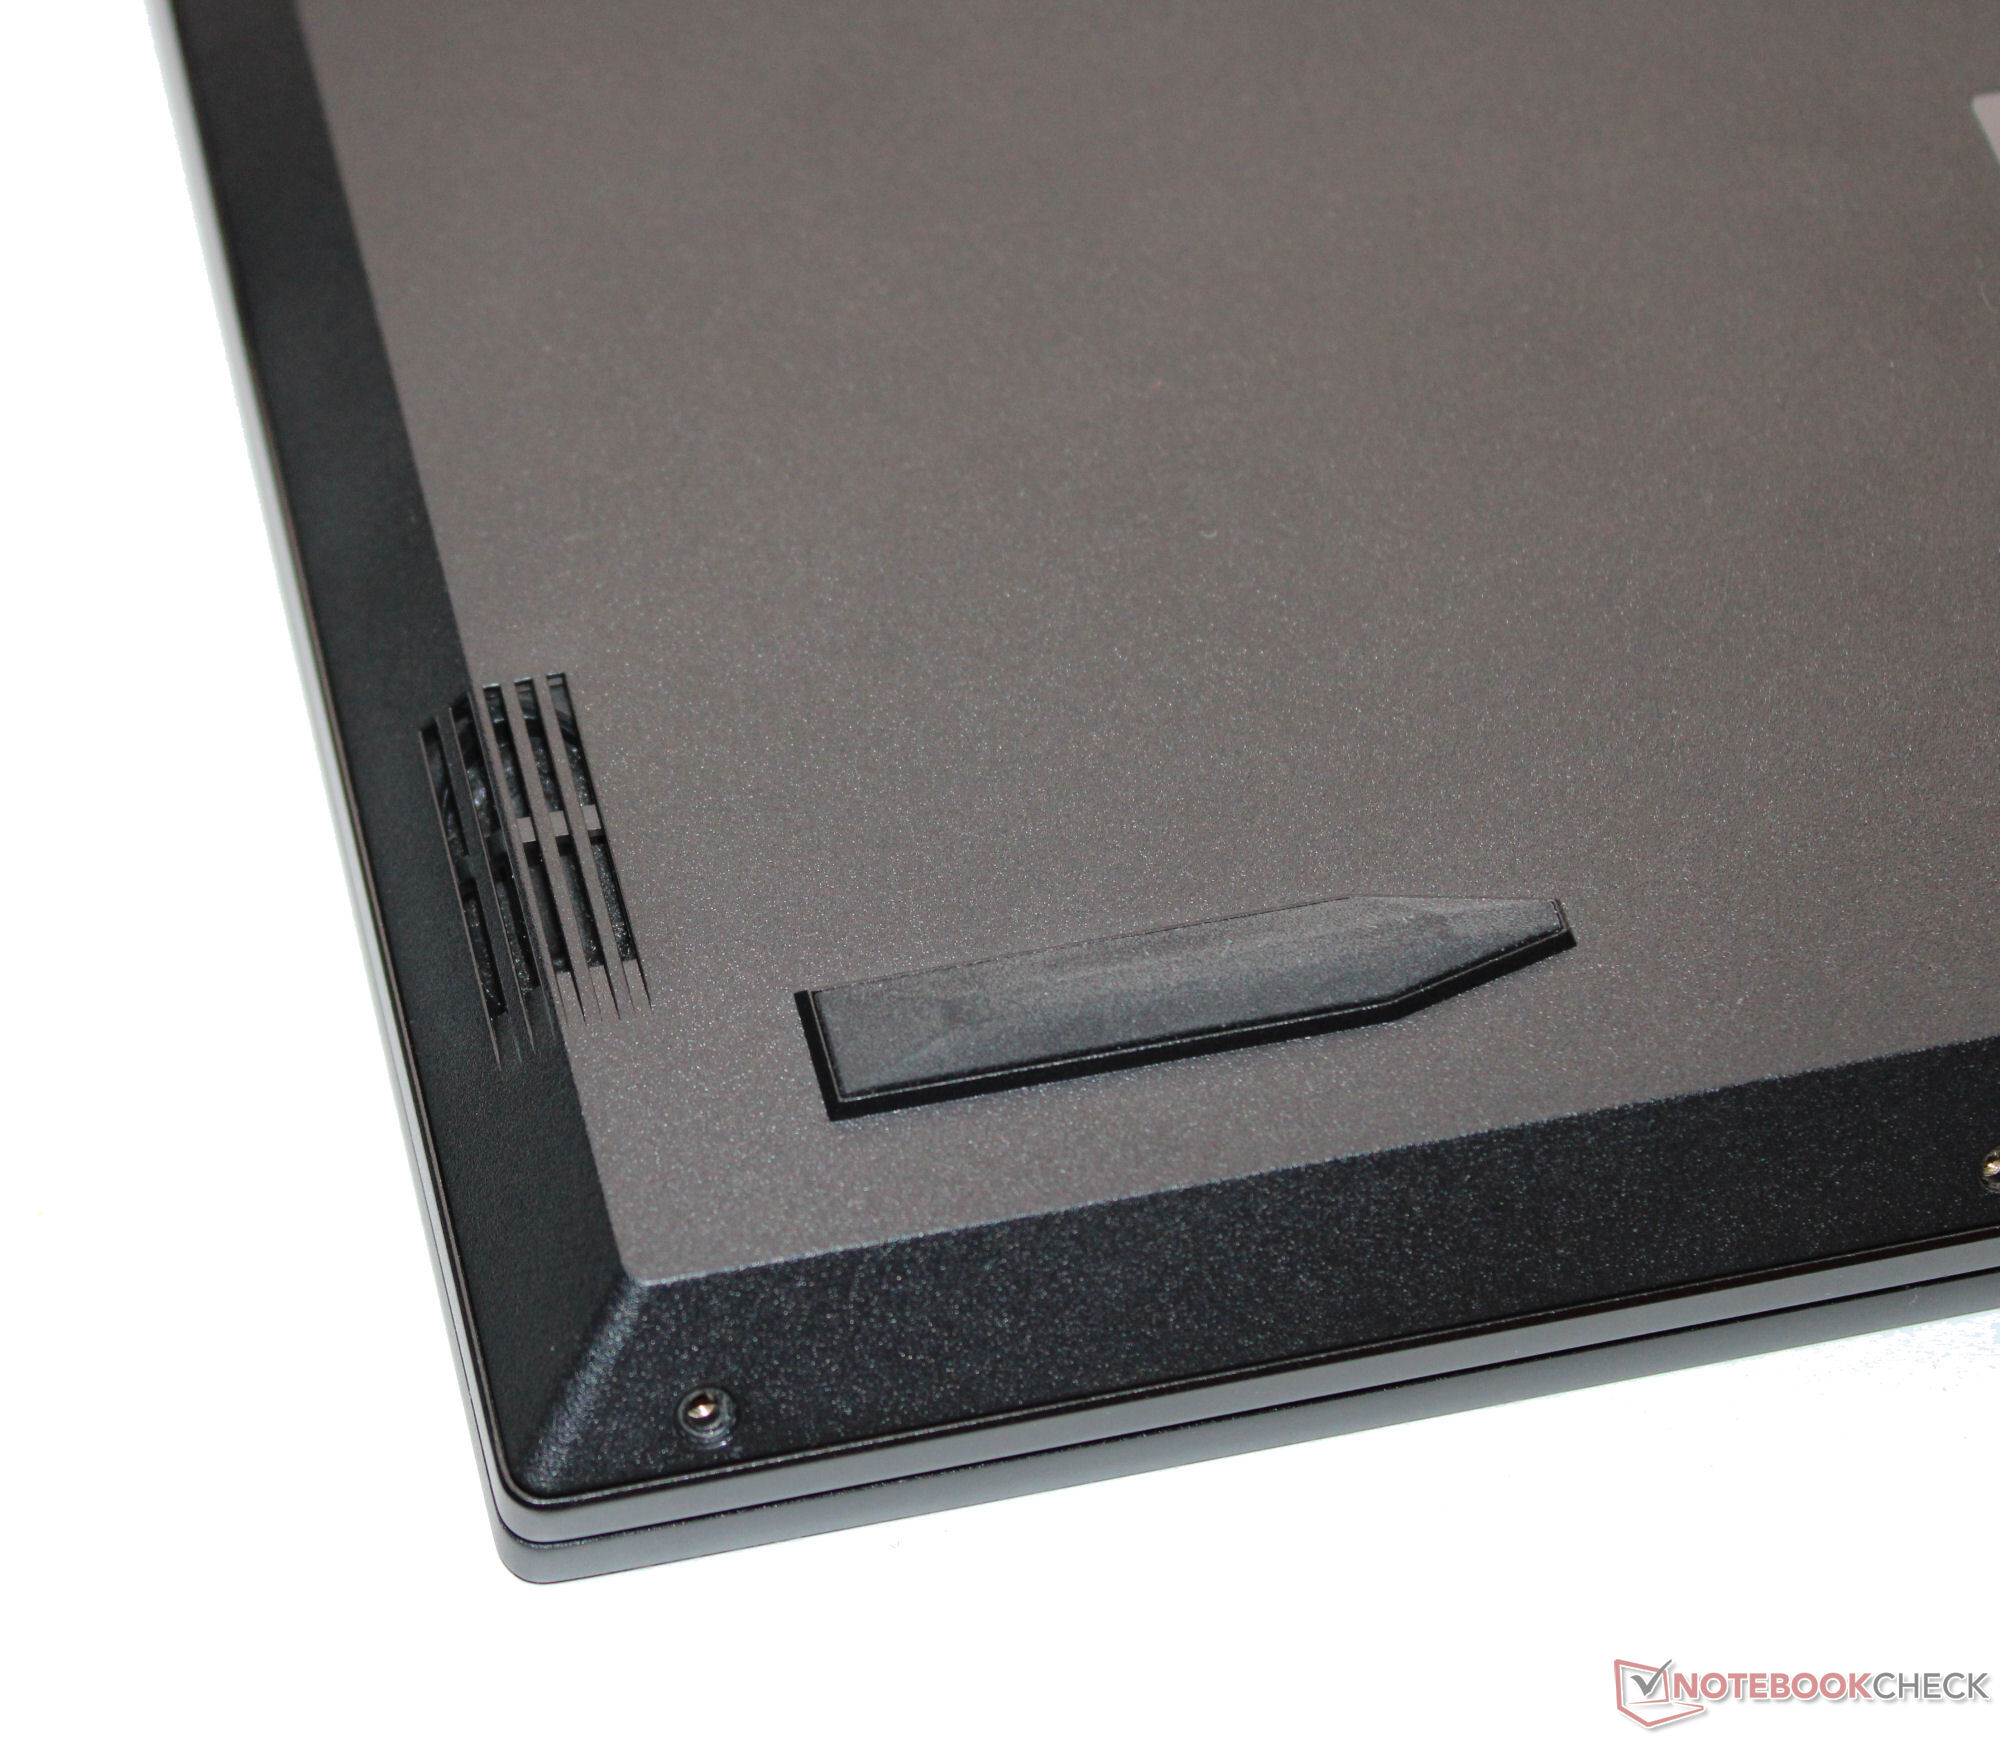
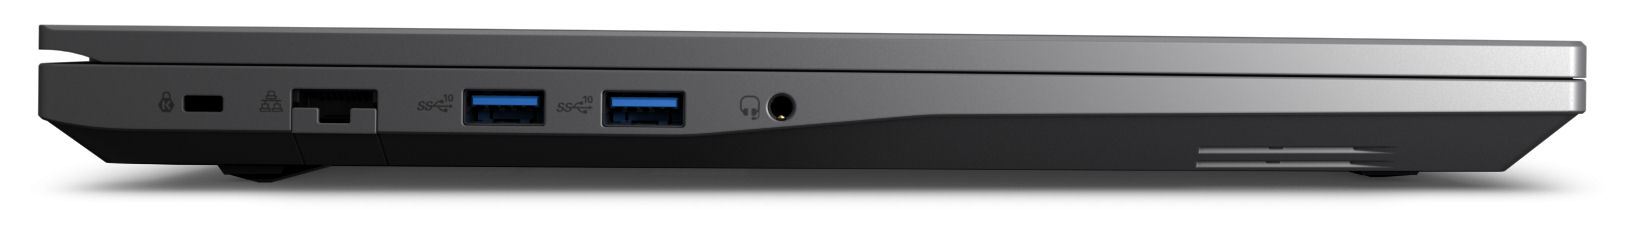
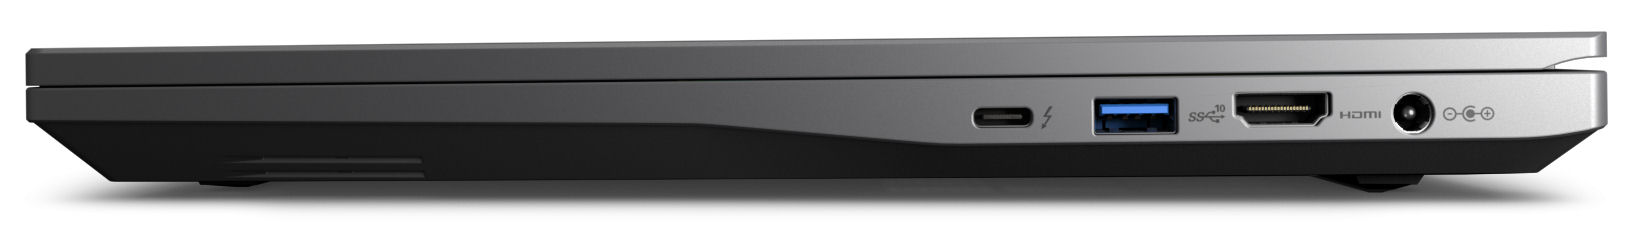
Case e connettività - L'Intel NUC è dotato di Thunderbolt 4
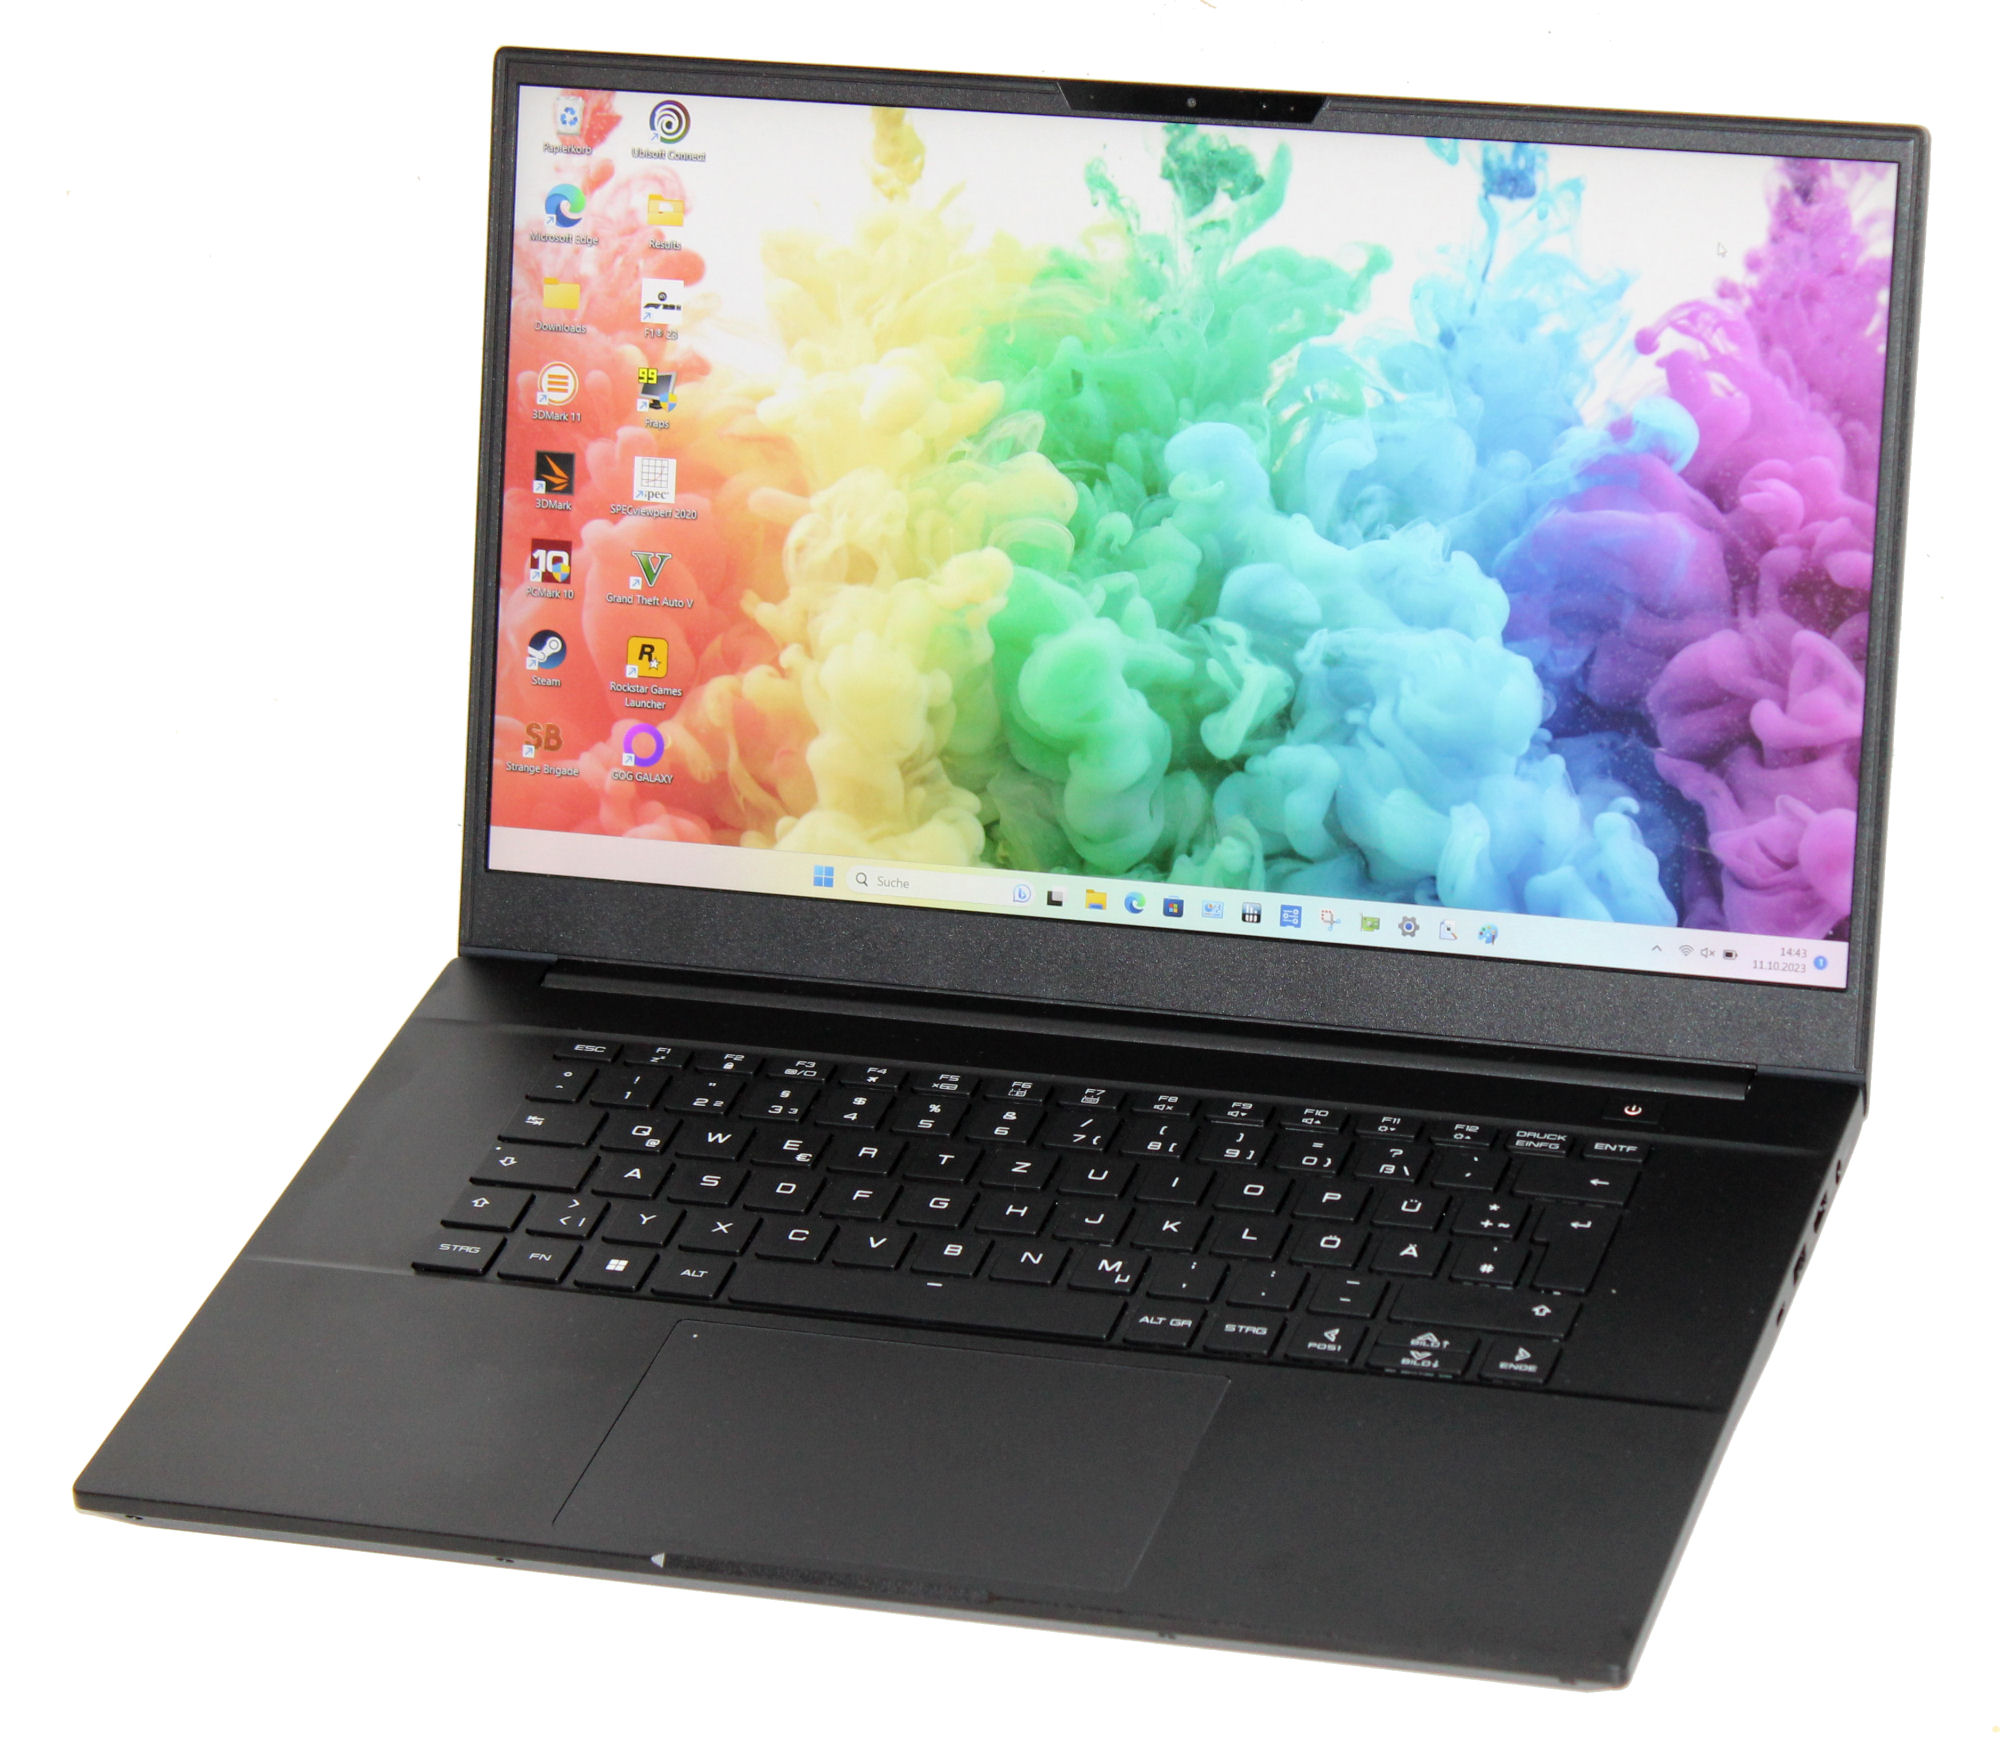
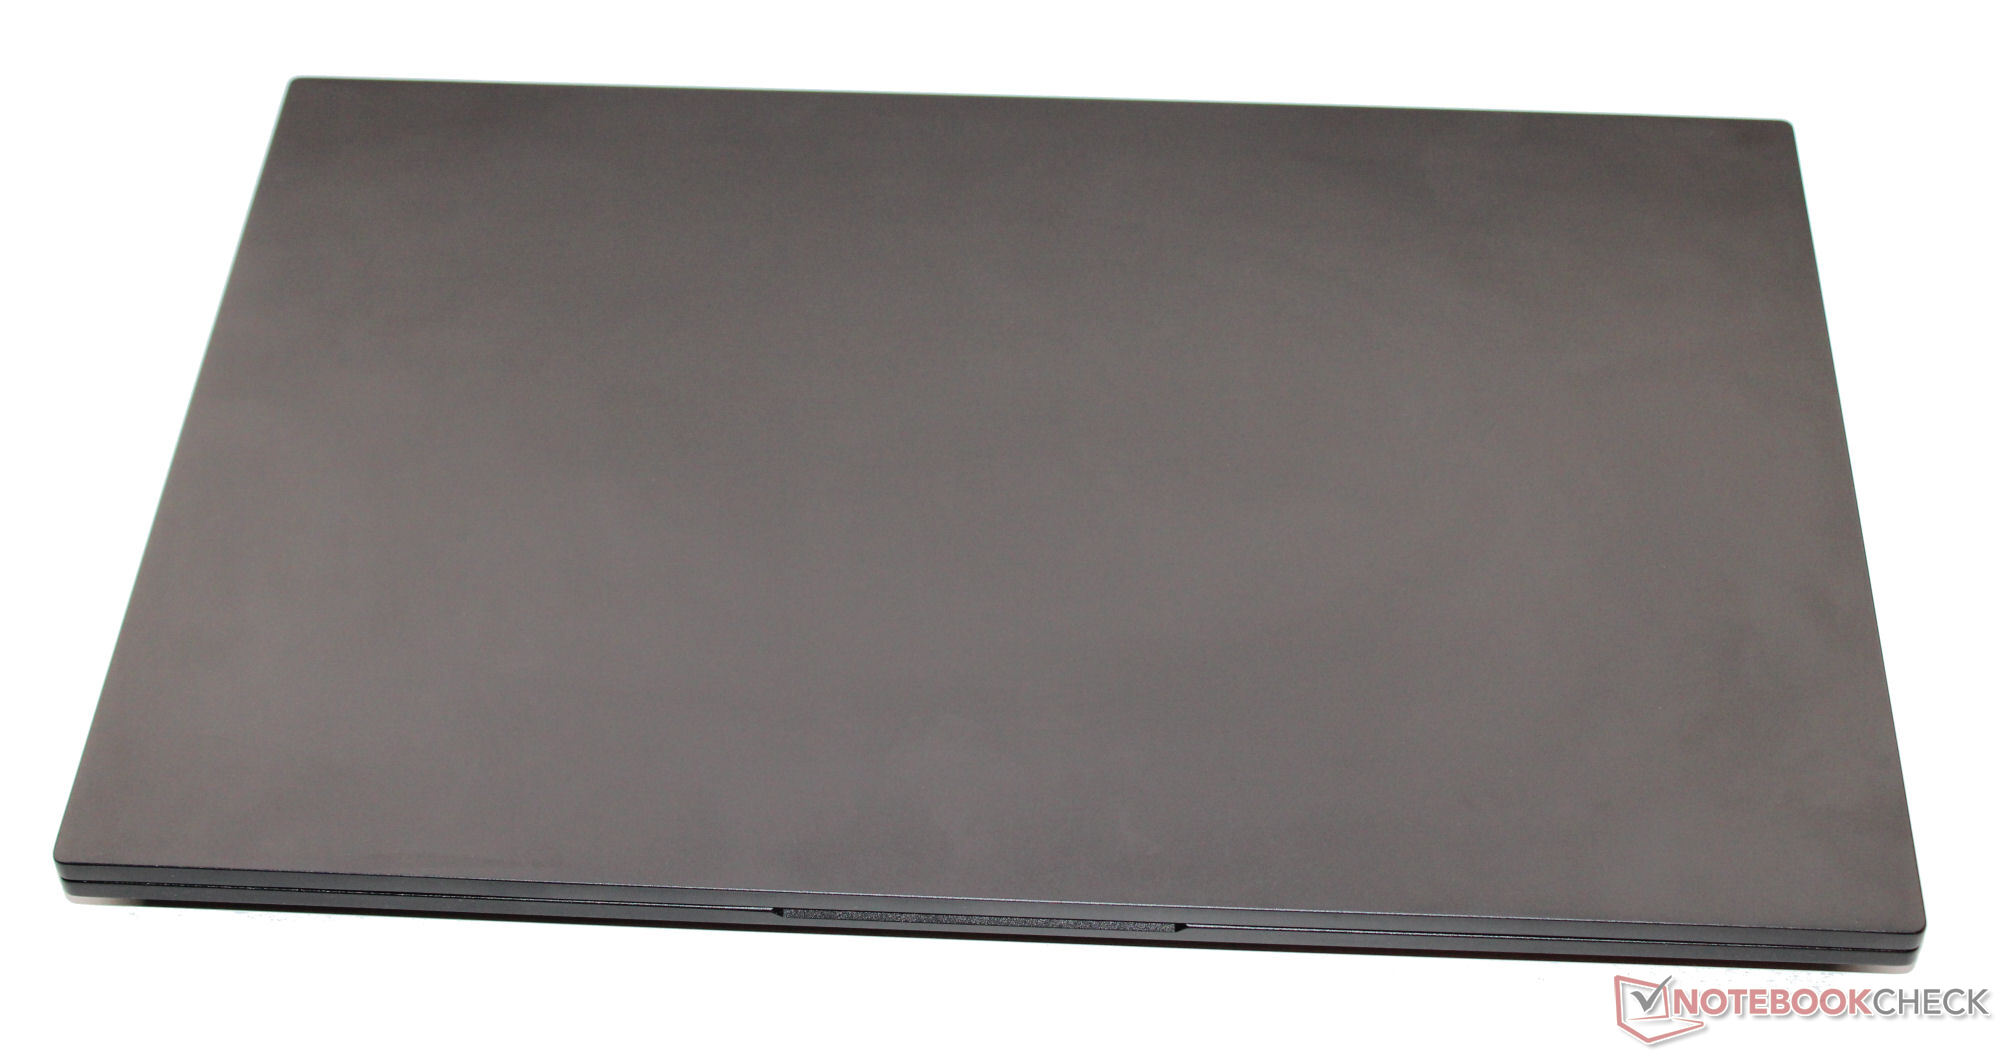
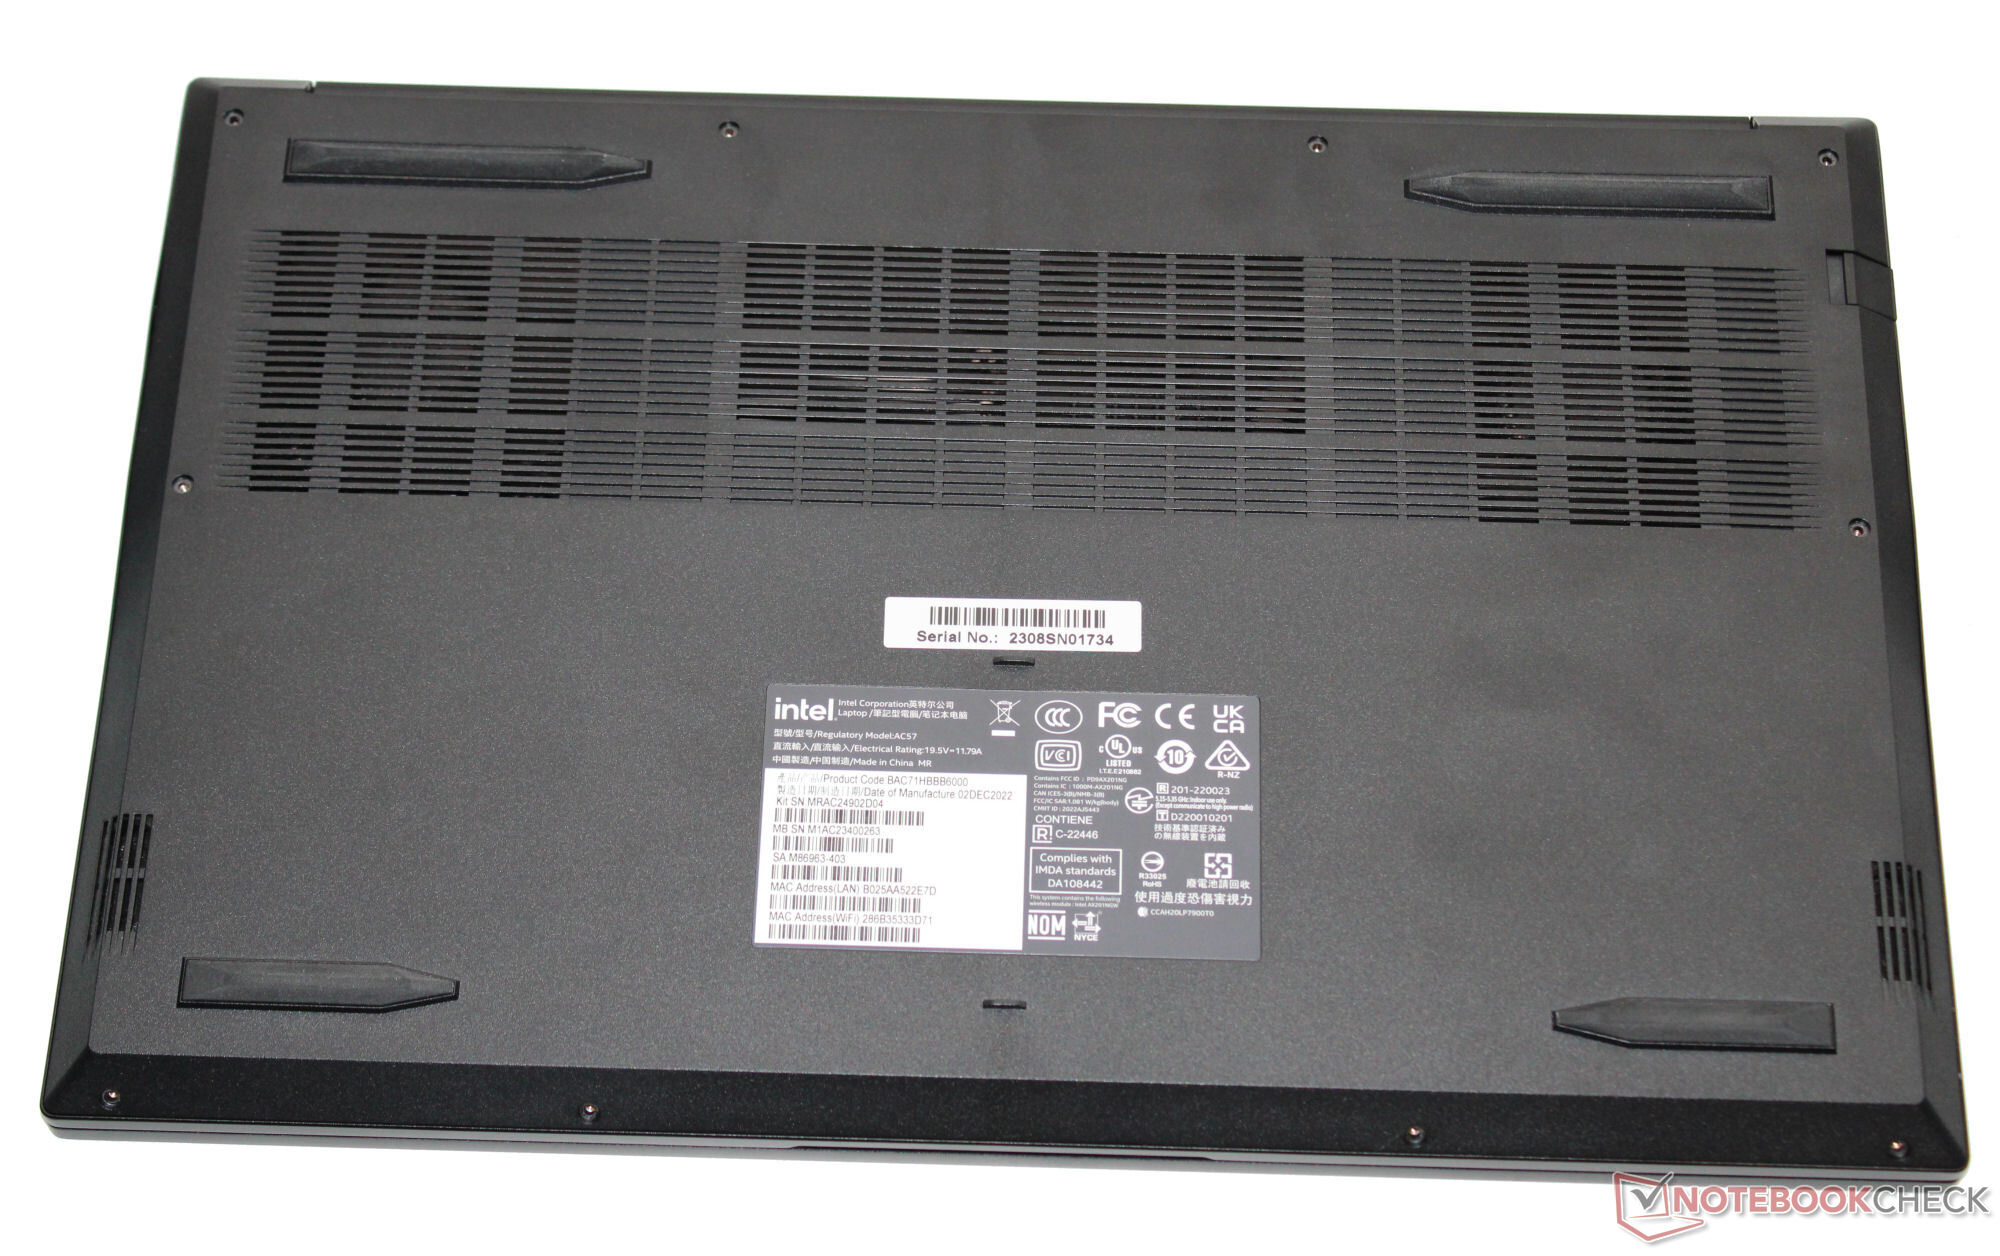
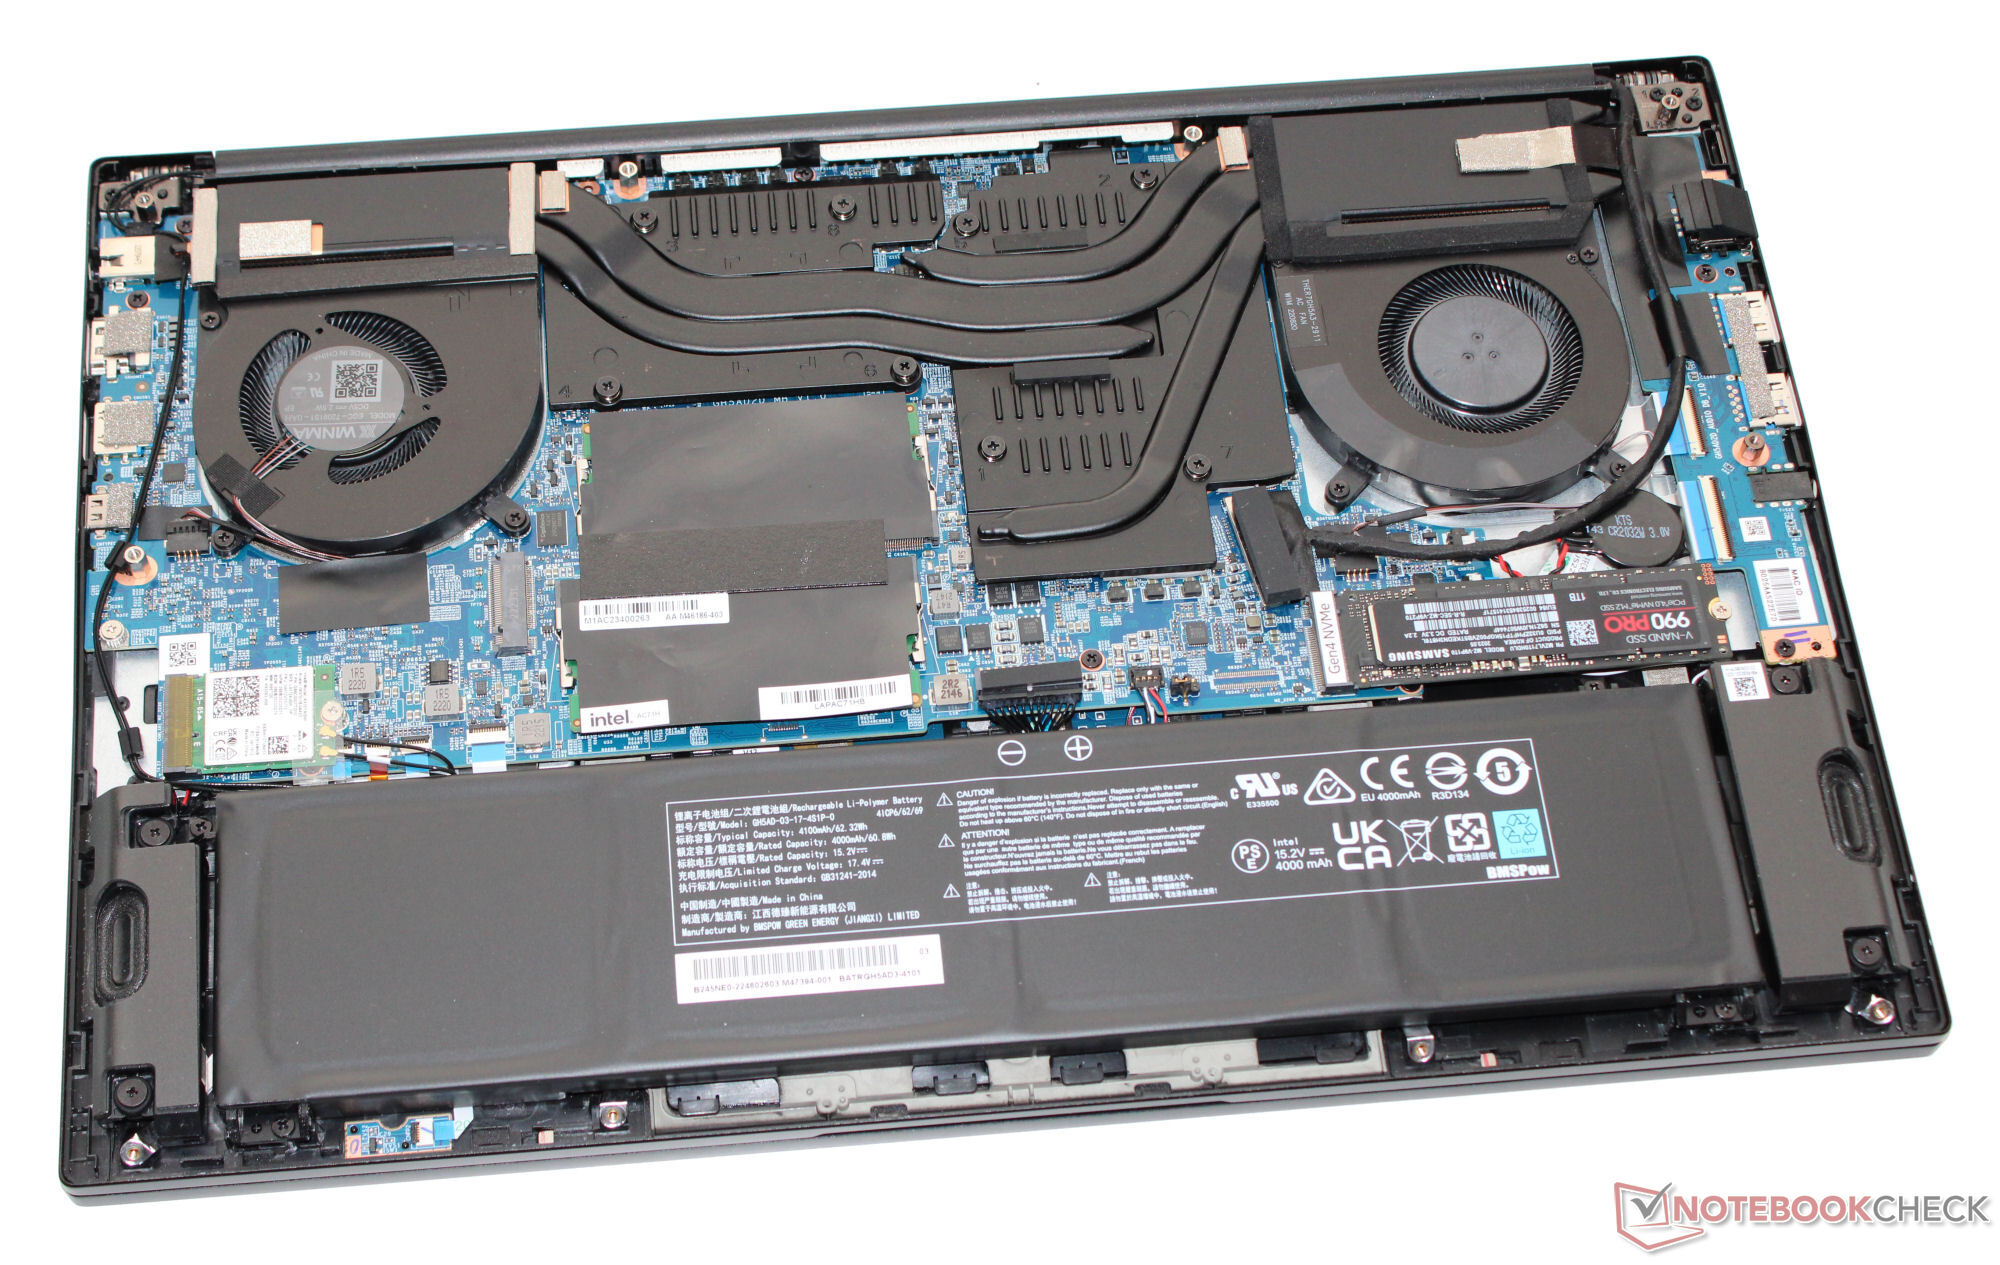
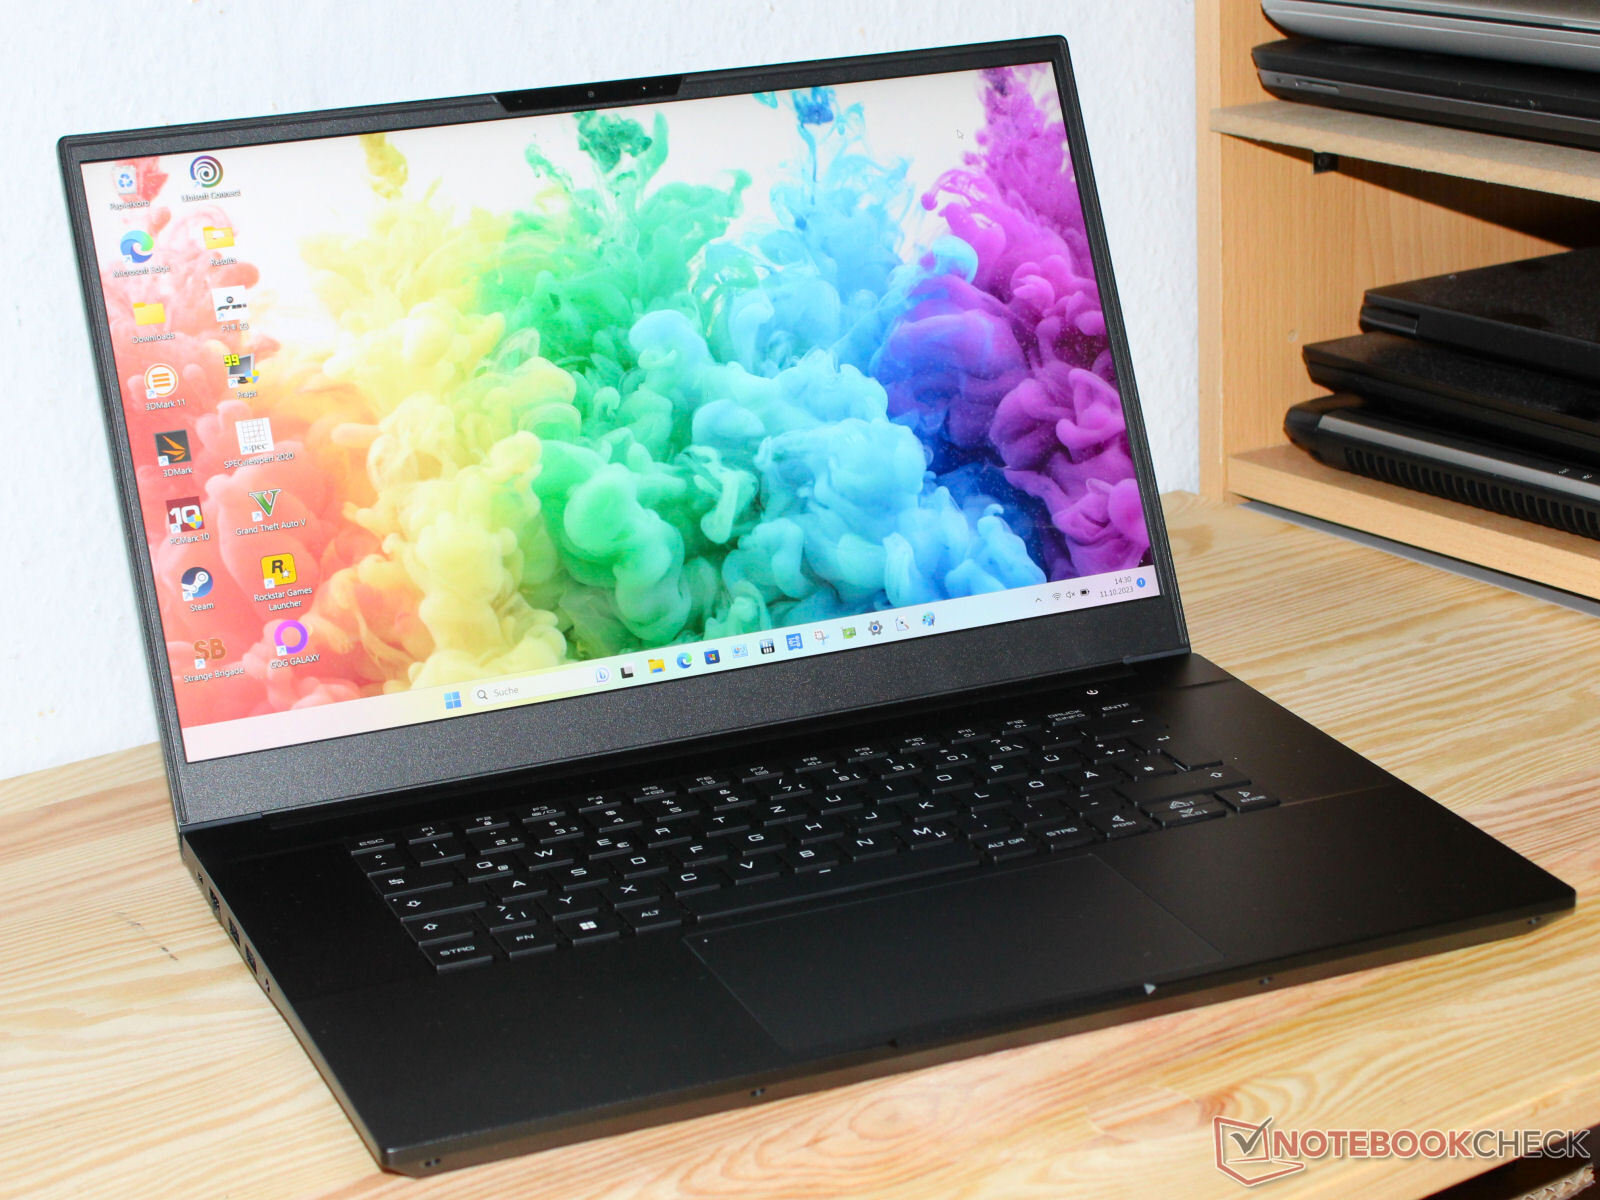
Il retro del coperchio e la parte superiore del case nero opaco sono in alluminio, mentre la parte inferiore della cornice del display è in plastica. Non abbiamo notato alcun problema di costruzione. Intel si affida a un case elegante e spoglio, che non dovrebbe attirare troppo l'attenzione in un ambiente professionale. Dopo aver smontato la parte inferiore del case, è possibile accedere alla batteria (avvitata, non incollata) e al resto dei componenti interni del portatile.
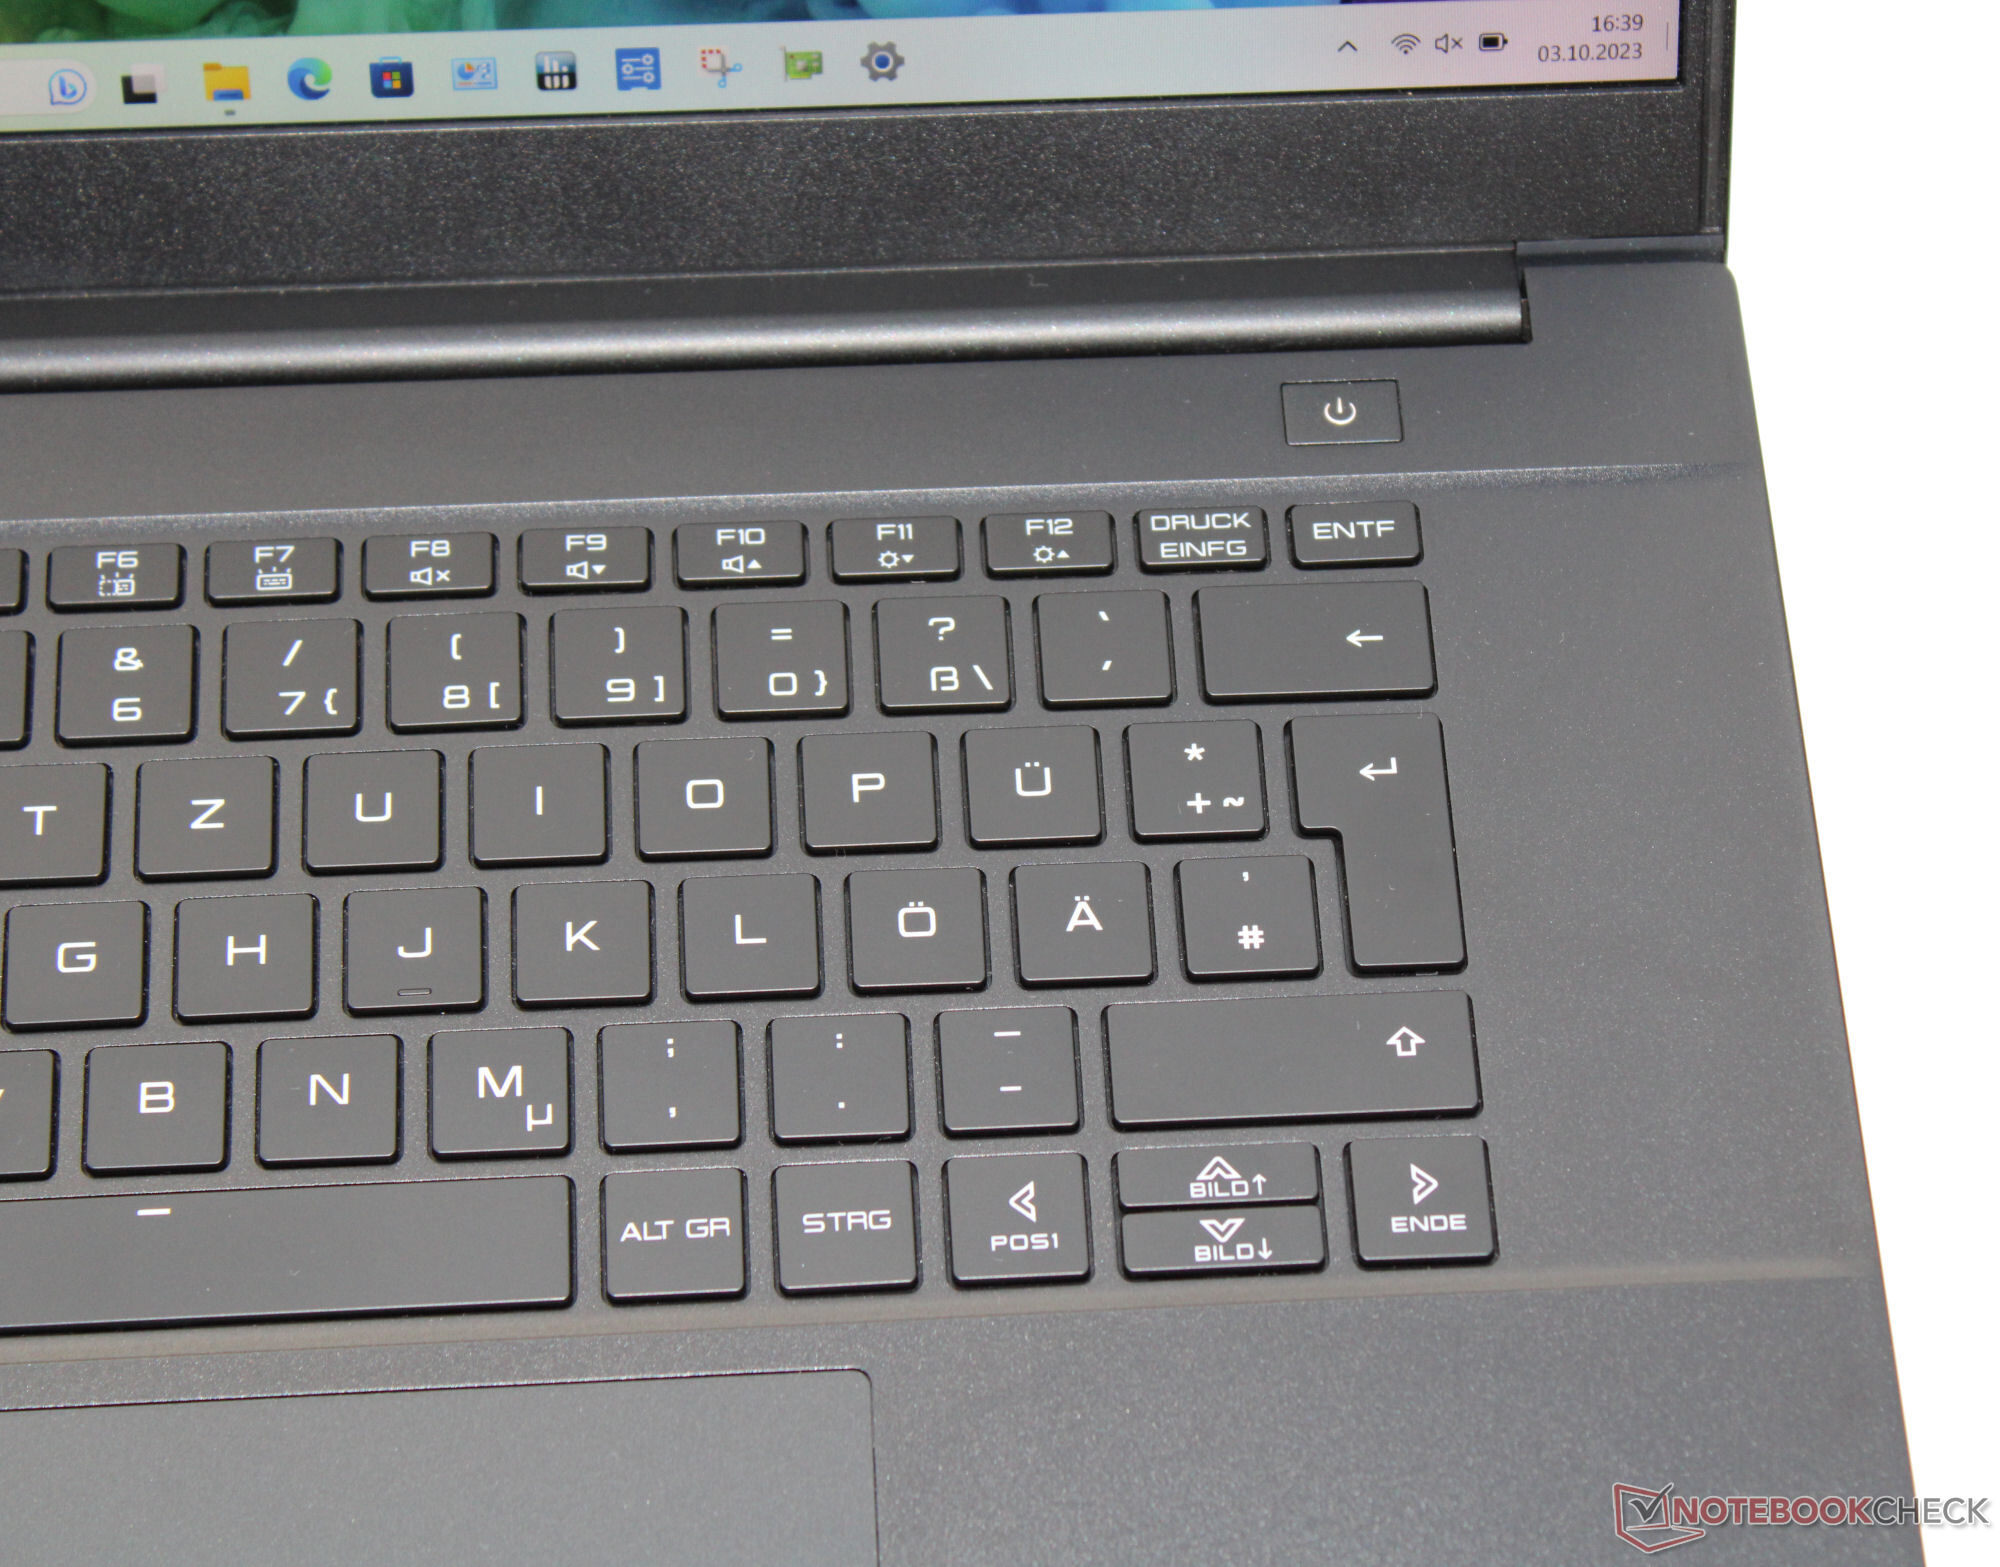
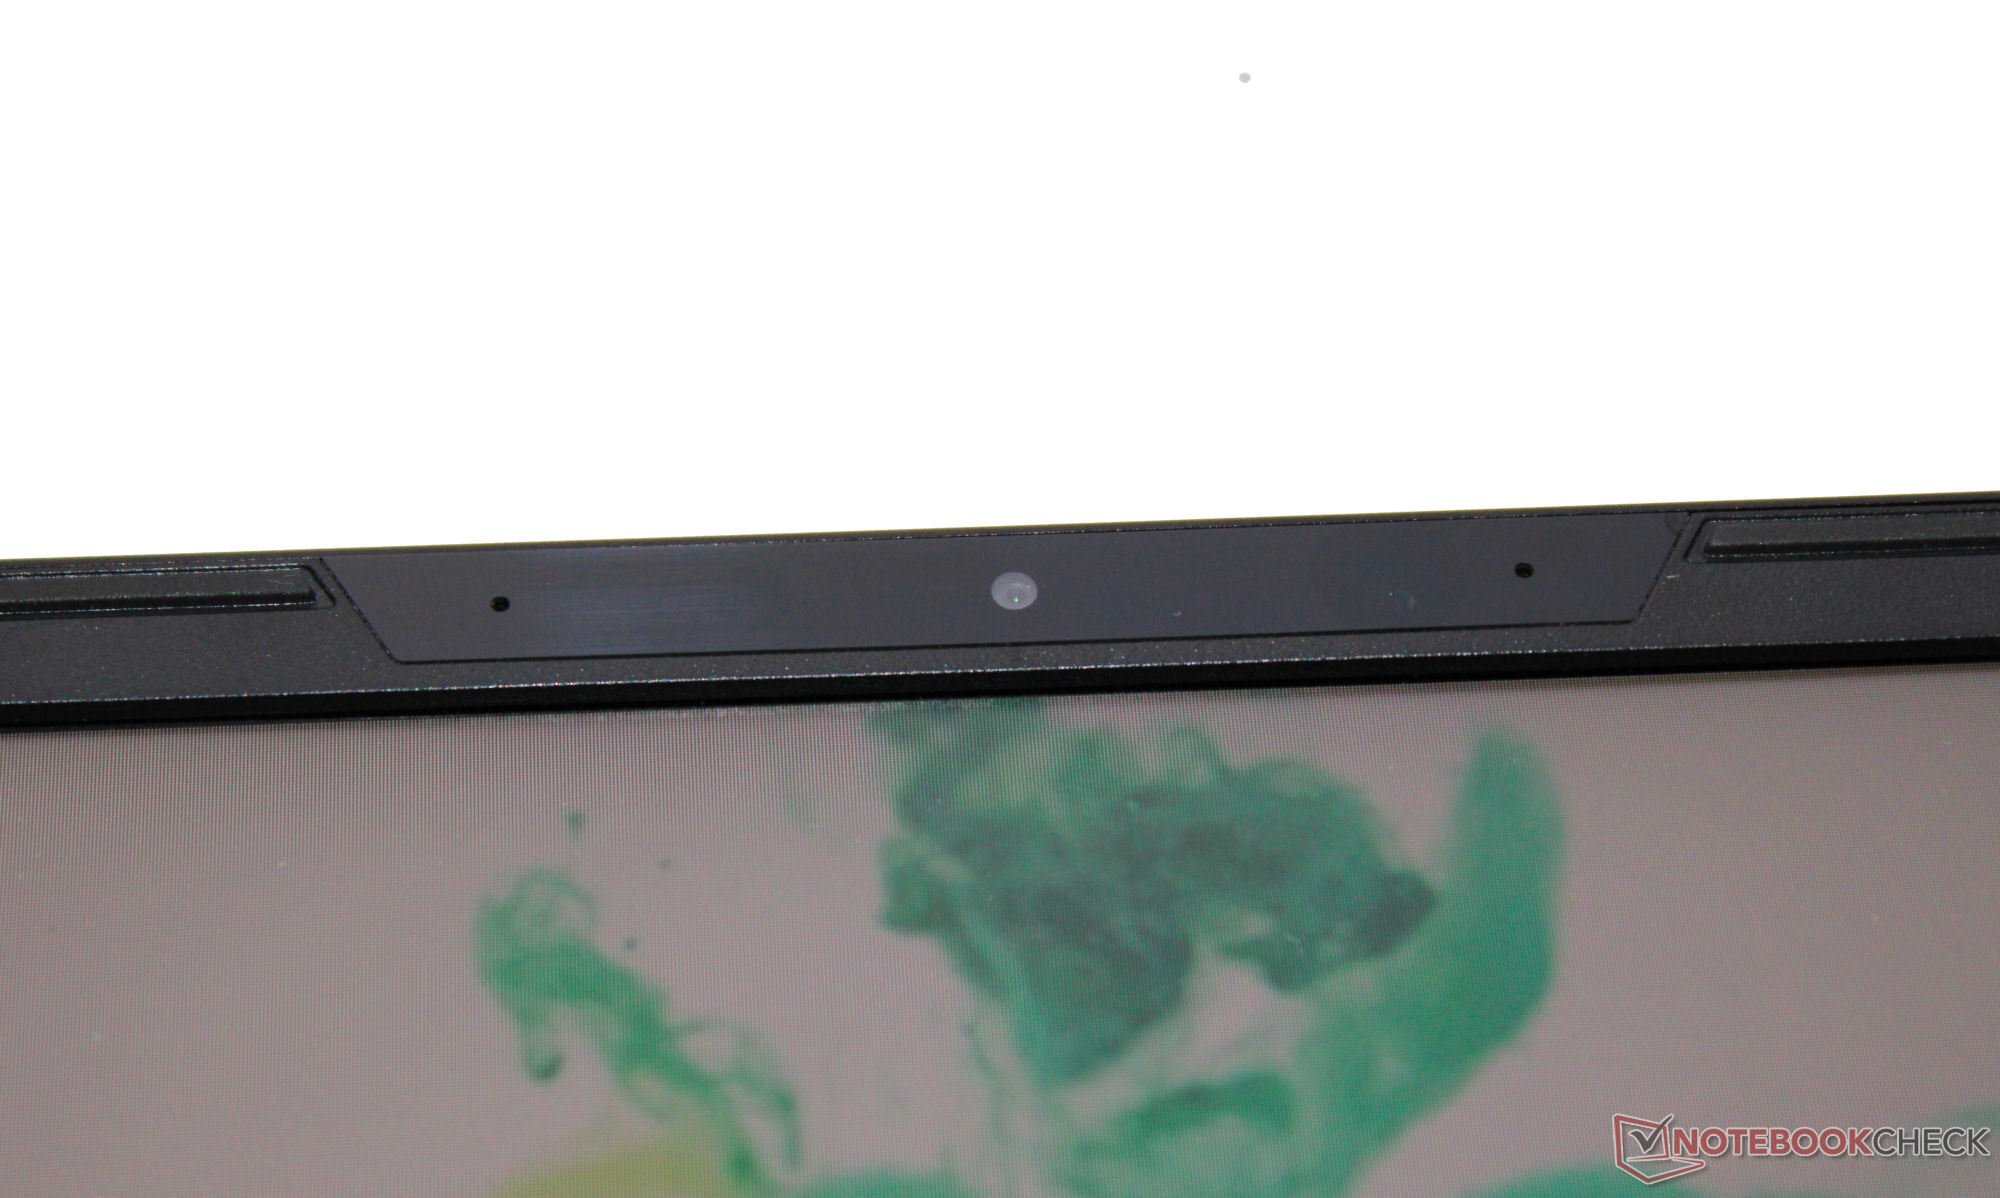
LAPAC71H dispone di tre porte USB-A (USB 3.2 Gen 1) e una porta USB-C (Thunderbolt 4/USB 4). Quest'ultima non supporta Power Delivery, ma può emettere un segnale DisplayPort. In totale, il portatile dispone di due uscite video (1x HDMI, 1x DP). Intel non ha dotato il dispositivo di un lettore di schede SD. La sua webcam (0,9 MP, max. 1.280 x 720 pixel, senza copertura) offre risultati piuttosto standard.
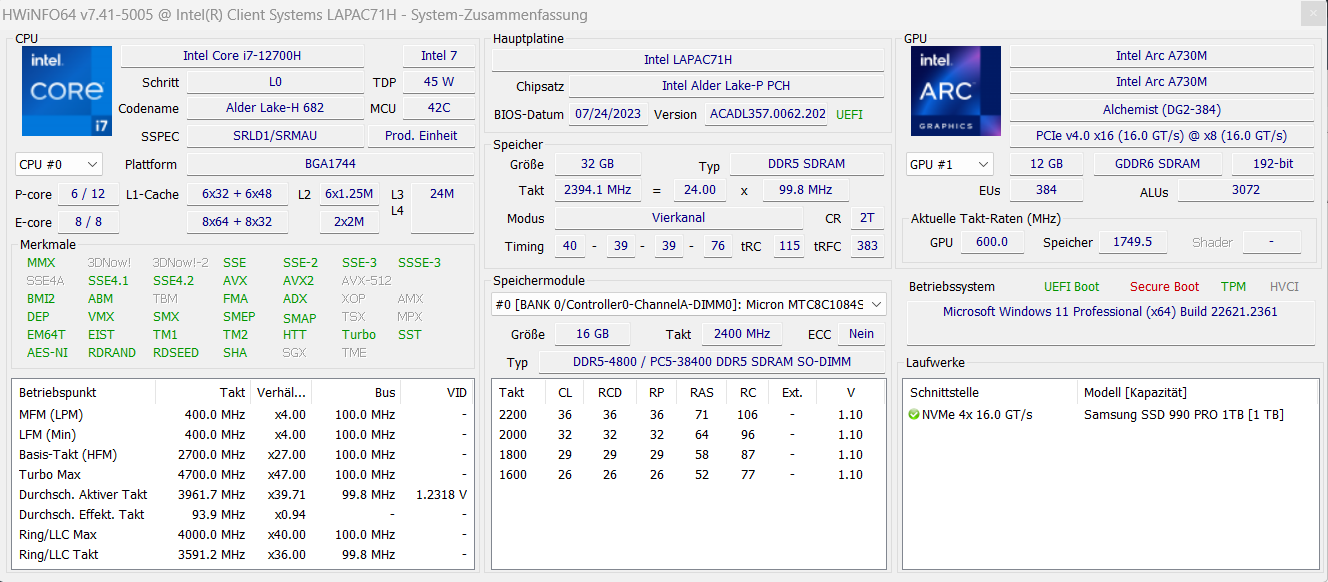
In condizioni ottimali (nessun dispositivo WiFi nelle vicinanze, breve distanza tra il laptop e il PC server), può raggiungere eccellenti velocità di trasmissione dati WiFi. Il portatile utilizza un chip WiFi 6E (Intel AX201). Anche le connessioni cablate sono gestite da un controller Intel (I225-V; 2,5 GBit/s).
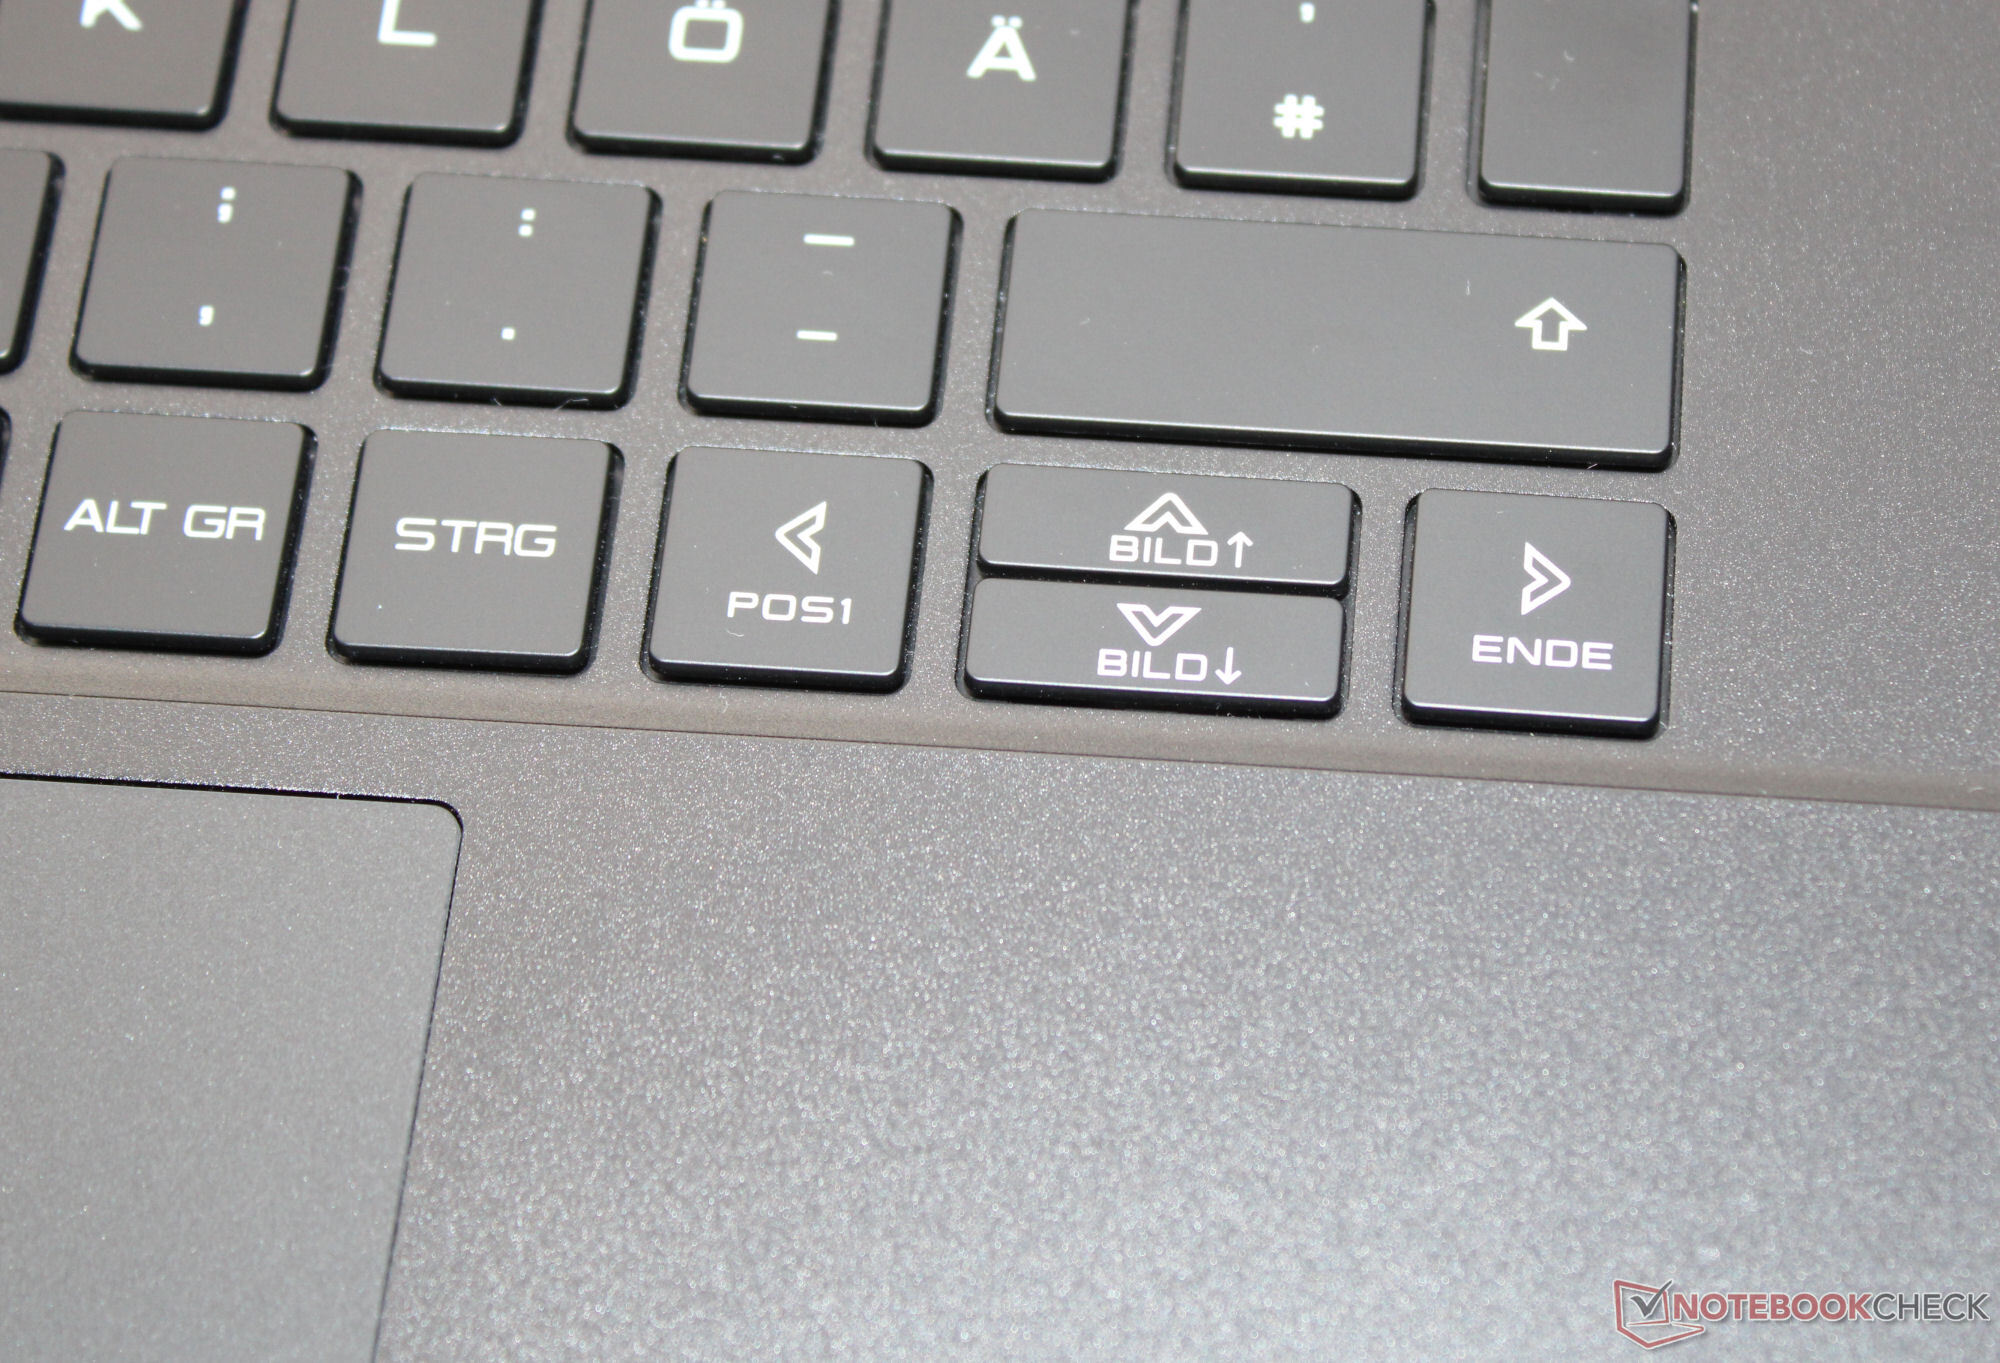


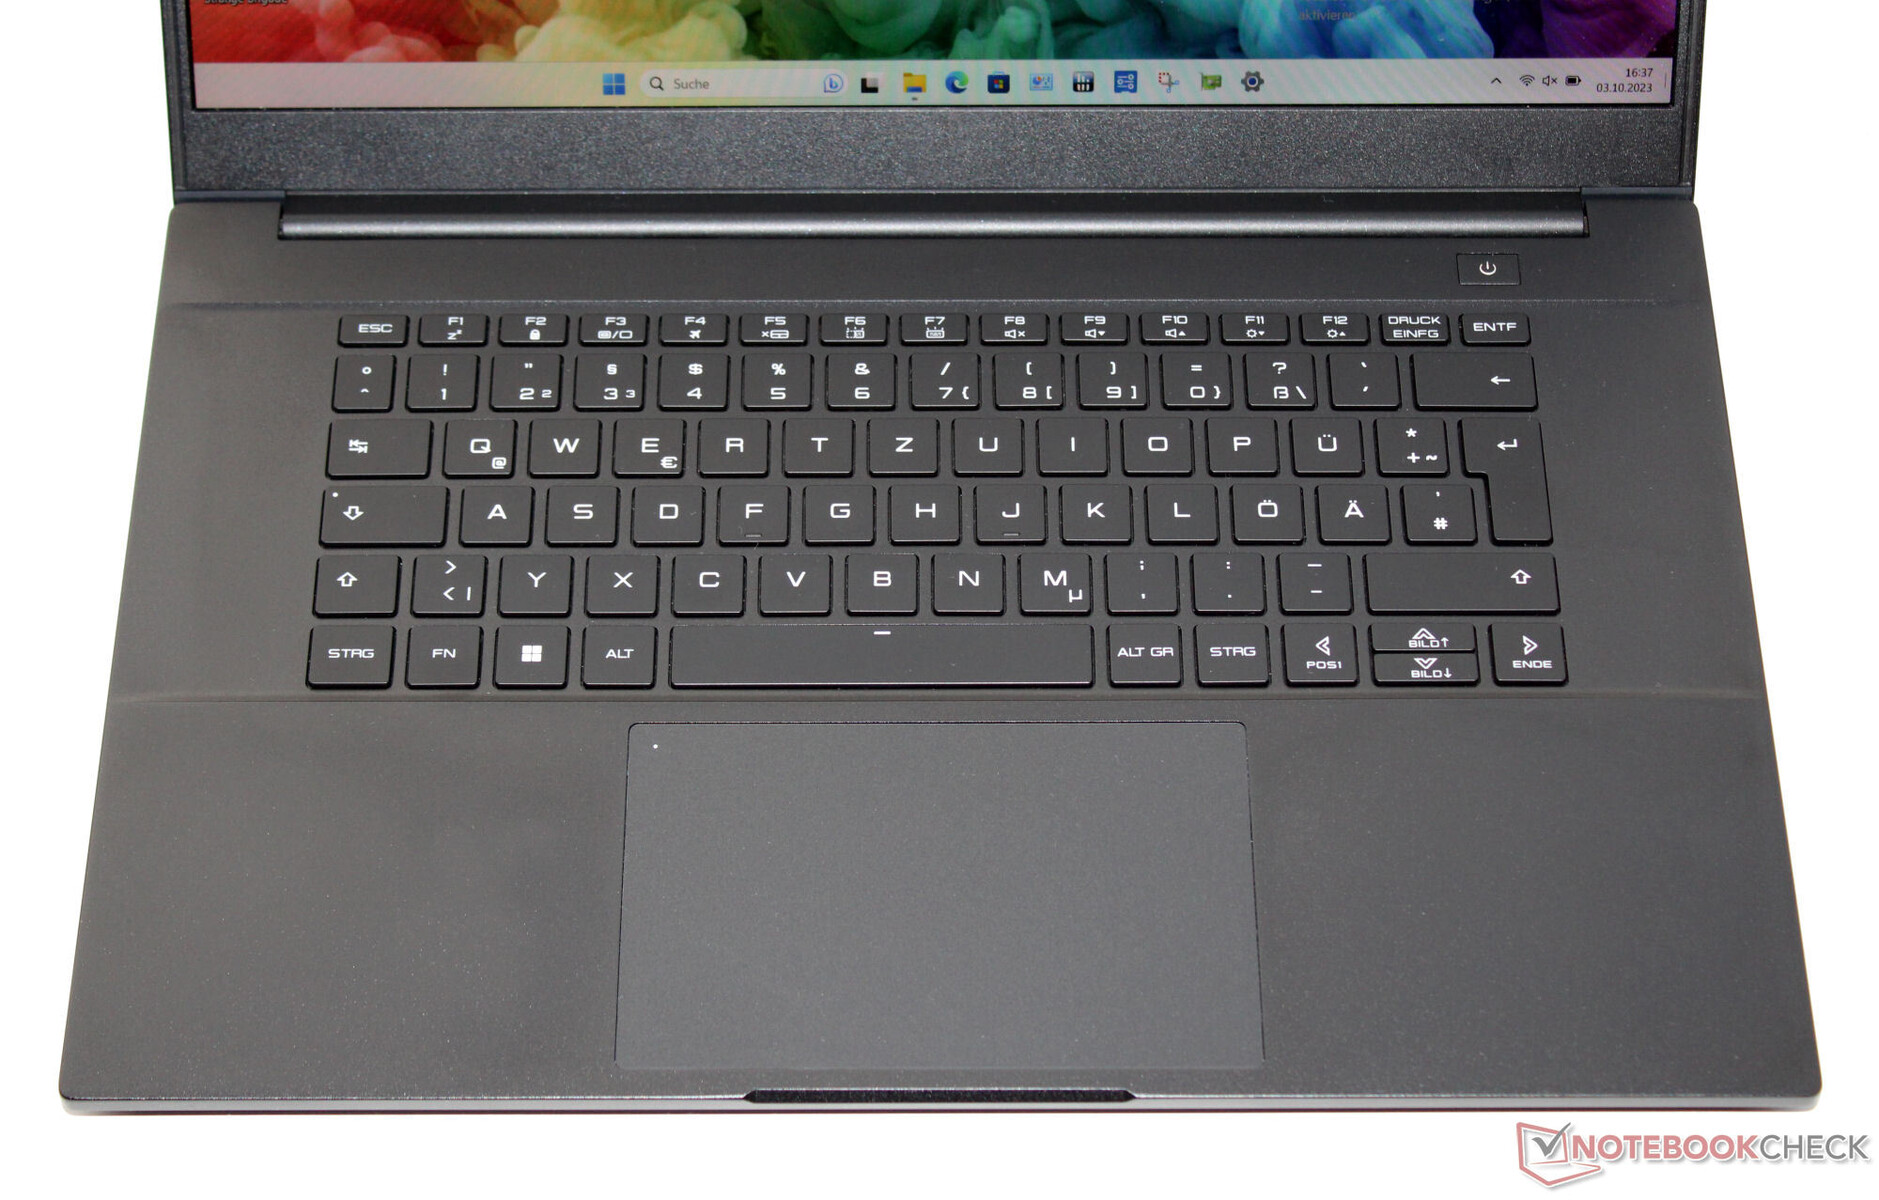
Dispositivi di input - Una tastiera con illuminazione RGB
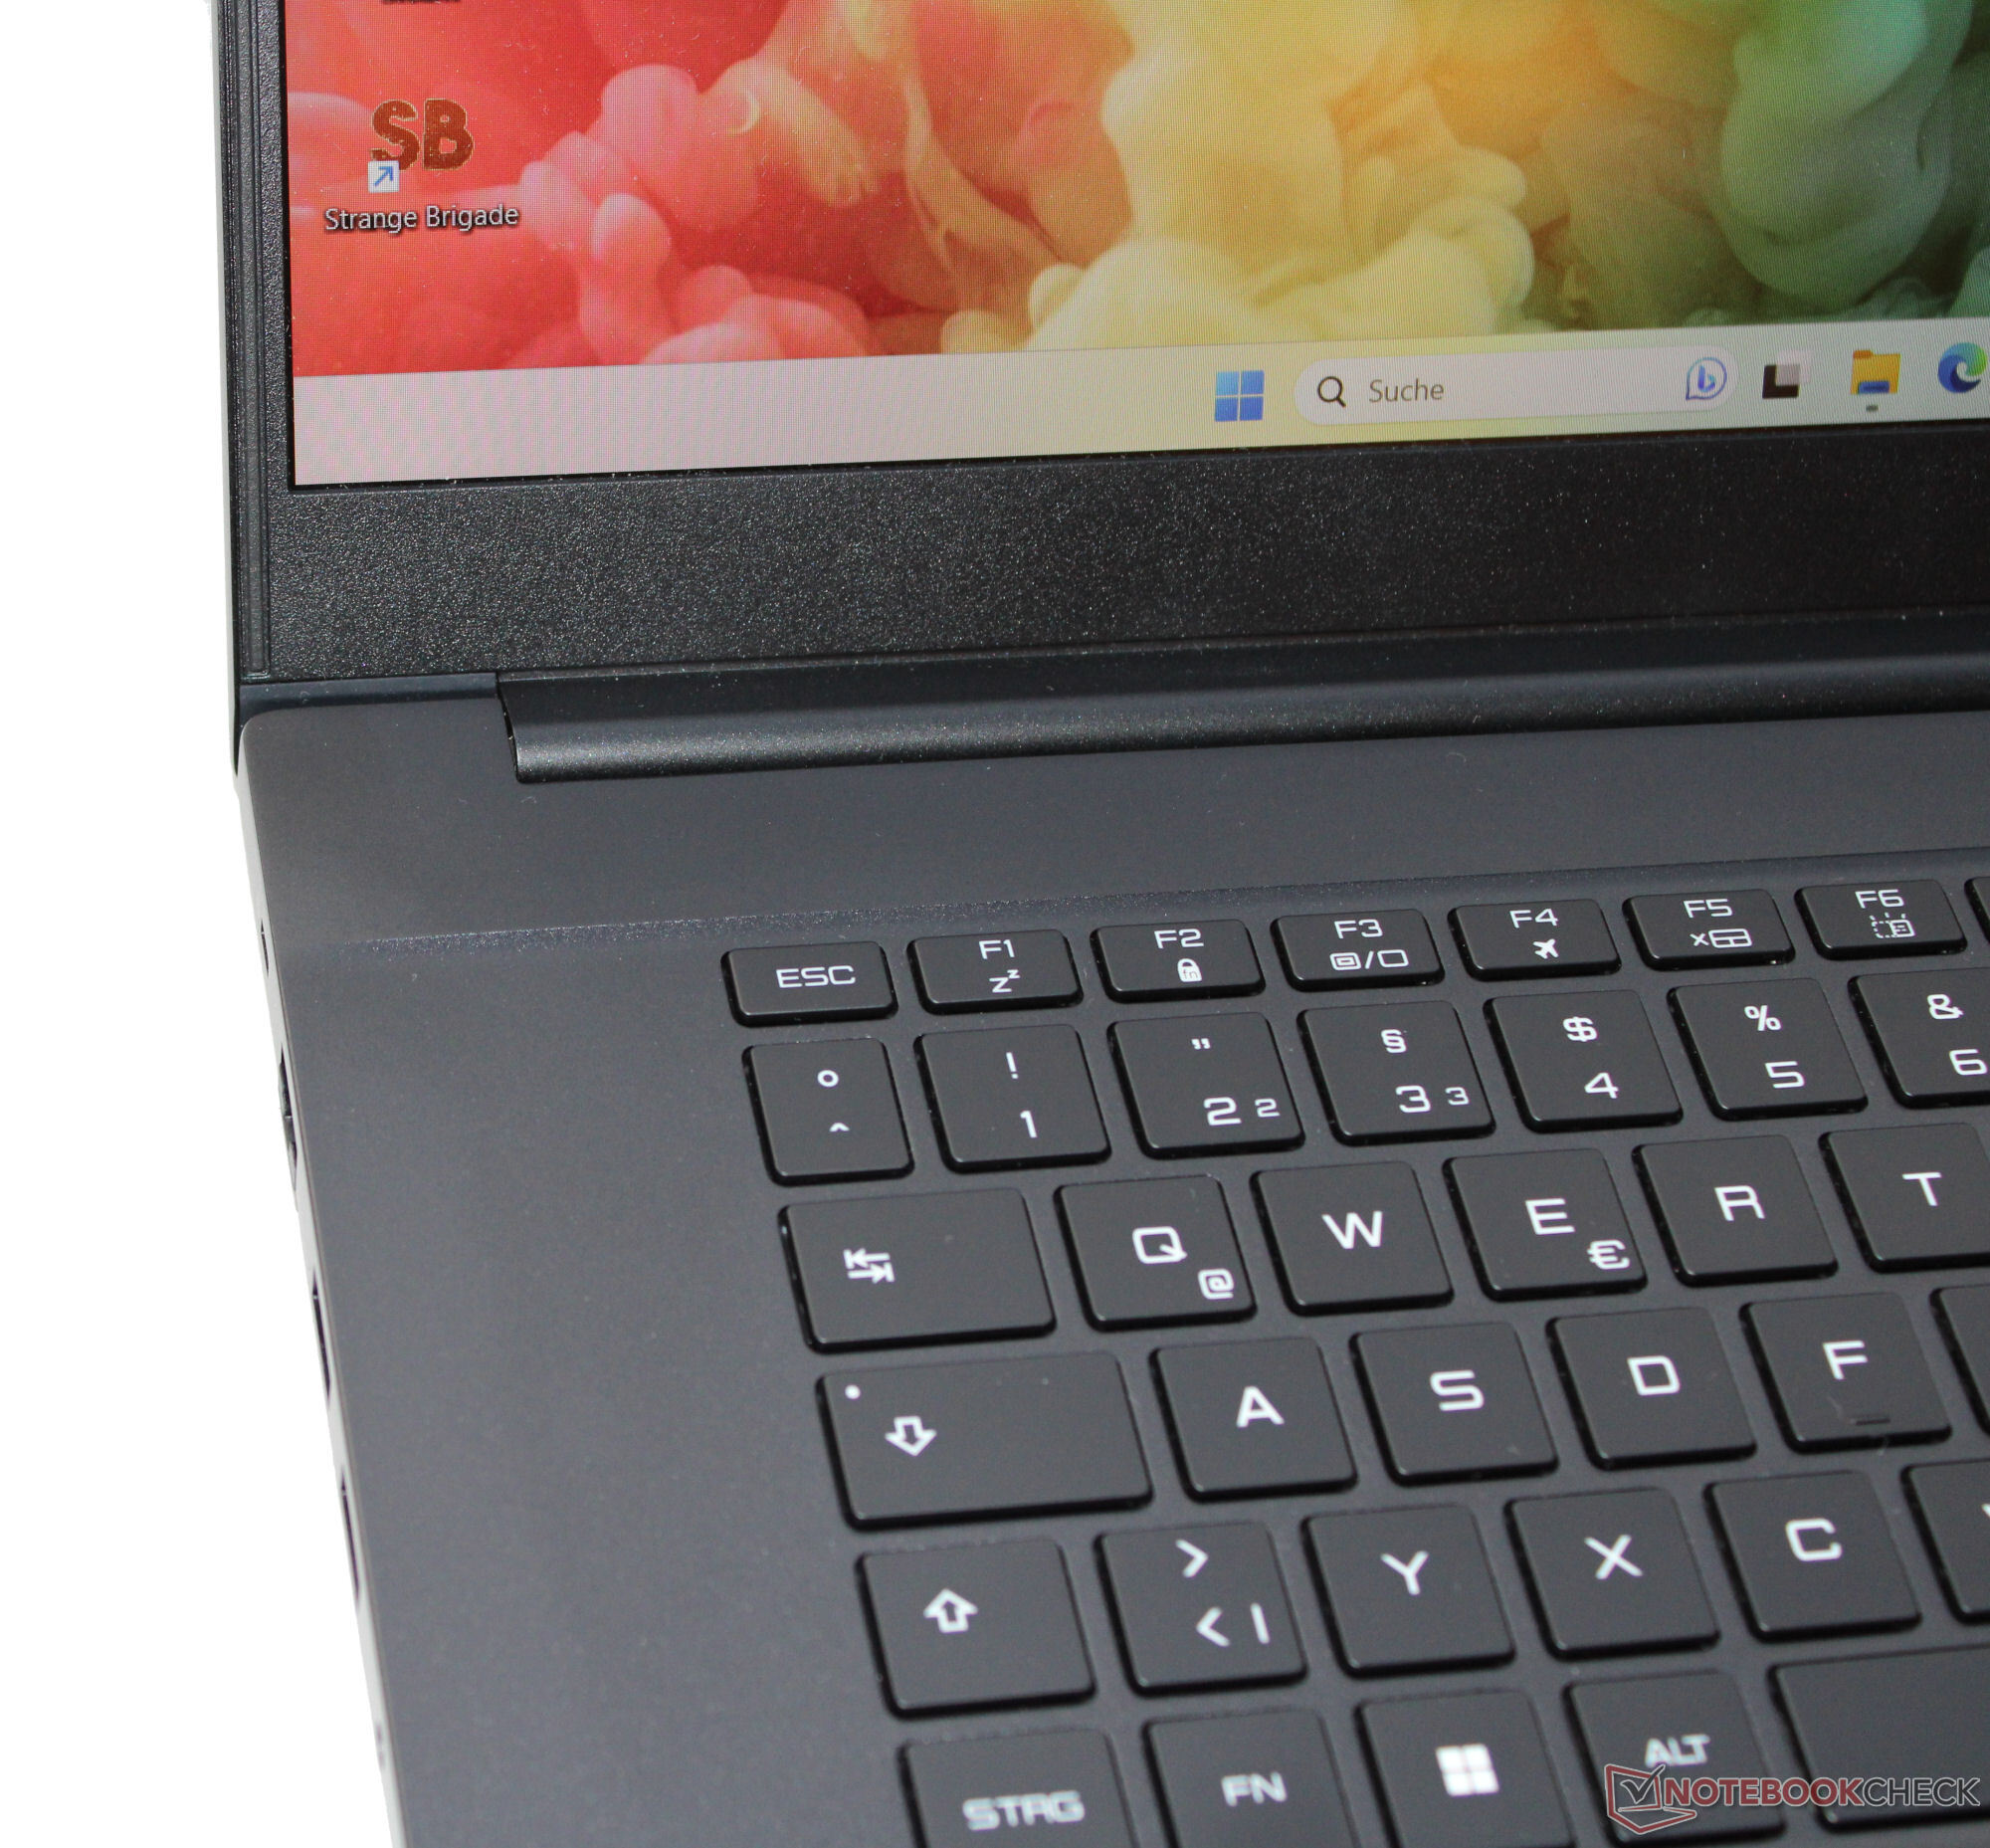
La tastiera chiclet del portatile (illuminazione RGB) non presenta un tastierino numerico, anche se ci sarebbe spazio sufficiente per uno. I suoi tasti uniformi e lisci hanno un'inclinazione media e un punto di pressione chiaro. La resistenza dei tasti potrebbe essere un po' più nitida. La tastiera non si deforma quando si digita. In totale, Intel ha fornito una tastiera adatta all'uso quotidiano. Un clickpad (circa 13,3 x 8,3 cm) è installato come sostituto del mouse e presenta un'alzata breve e un punto di pressione chiaro.
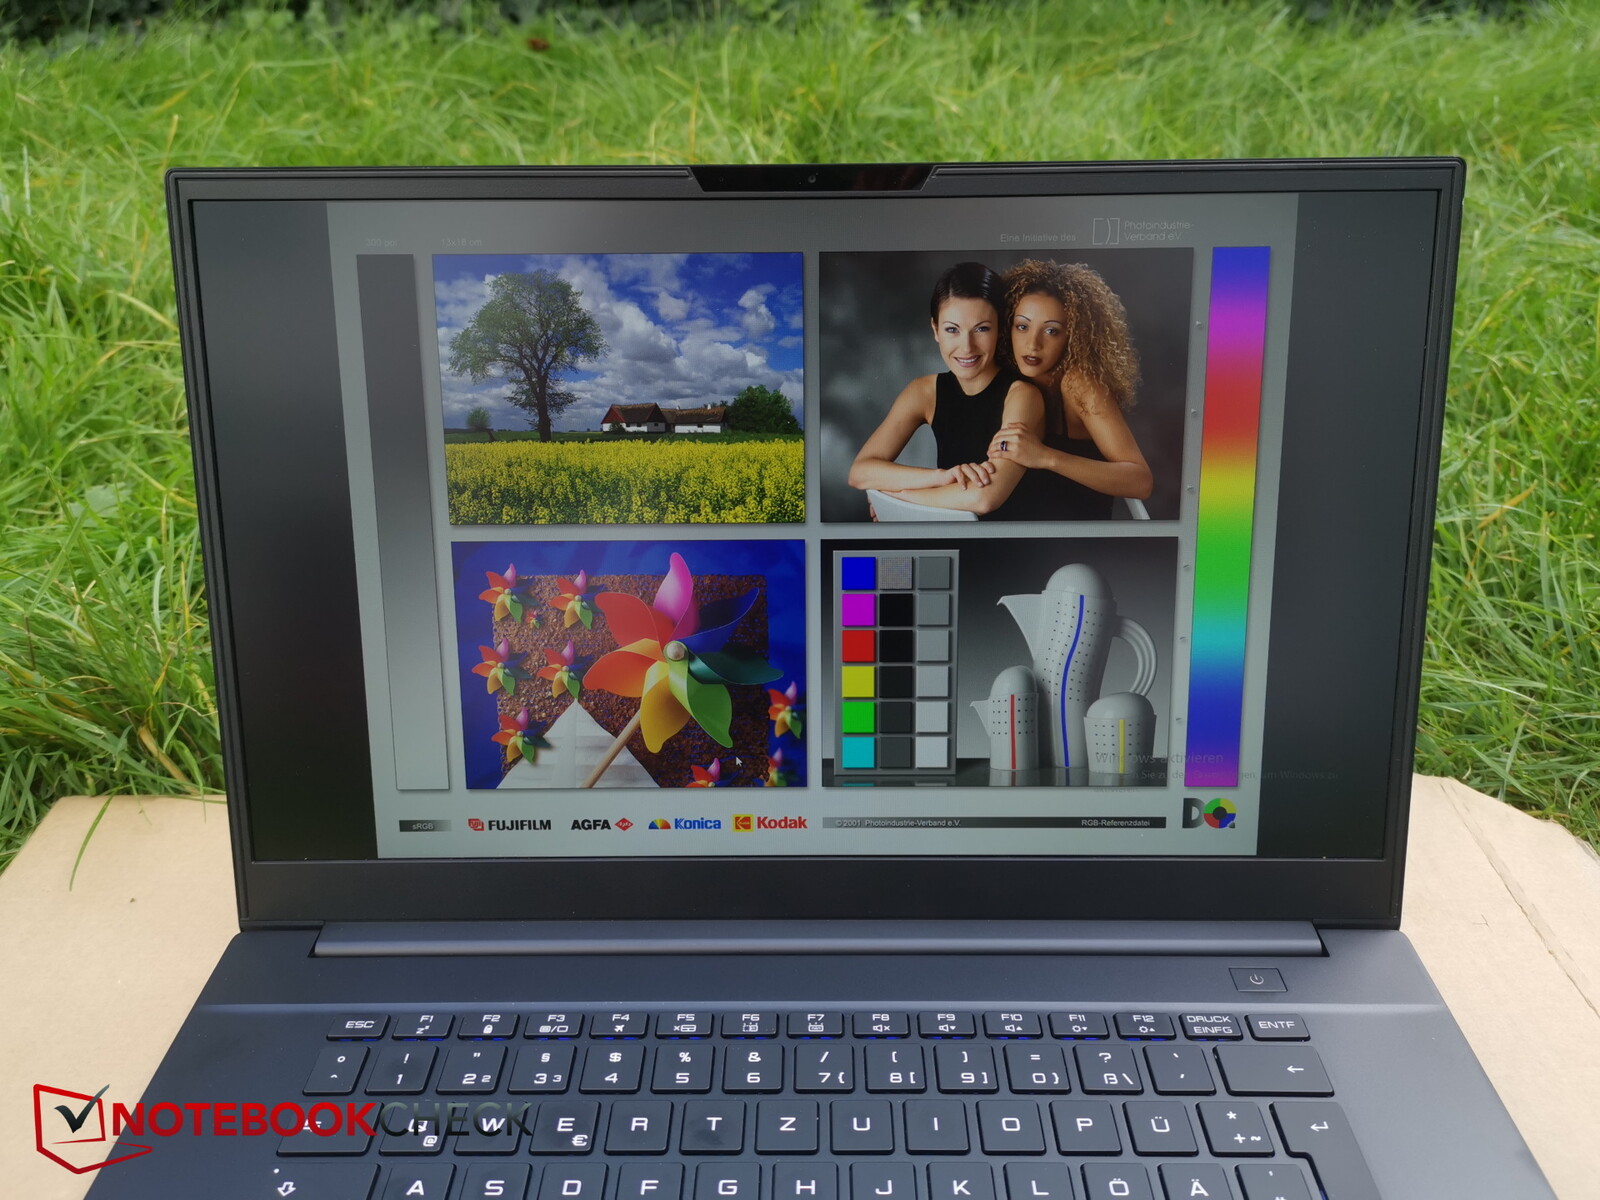
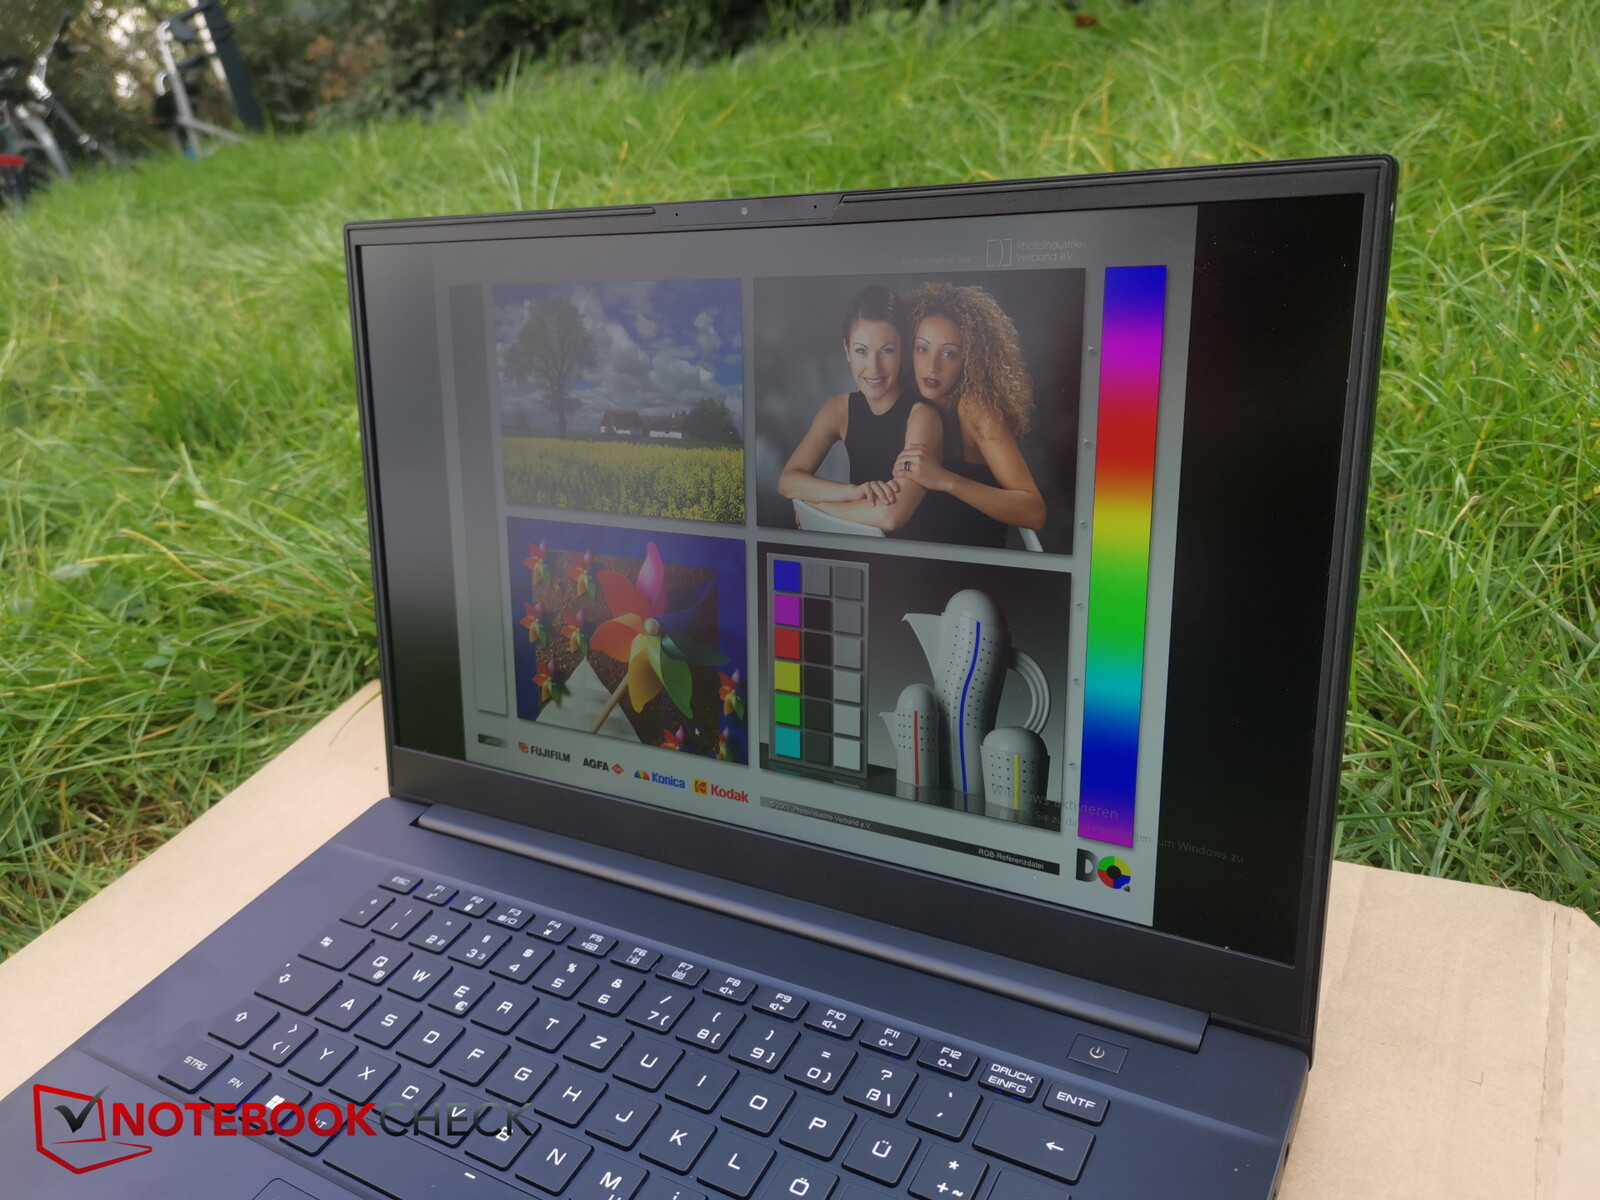
Display - Il LAPAC71H è dotato di un pannello FHD ad alto contrasto
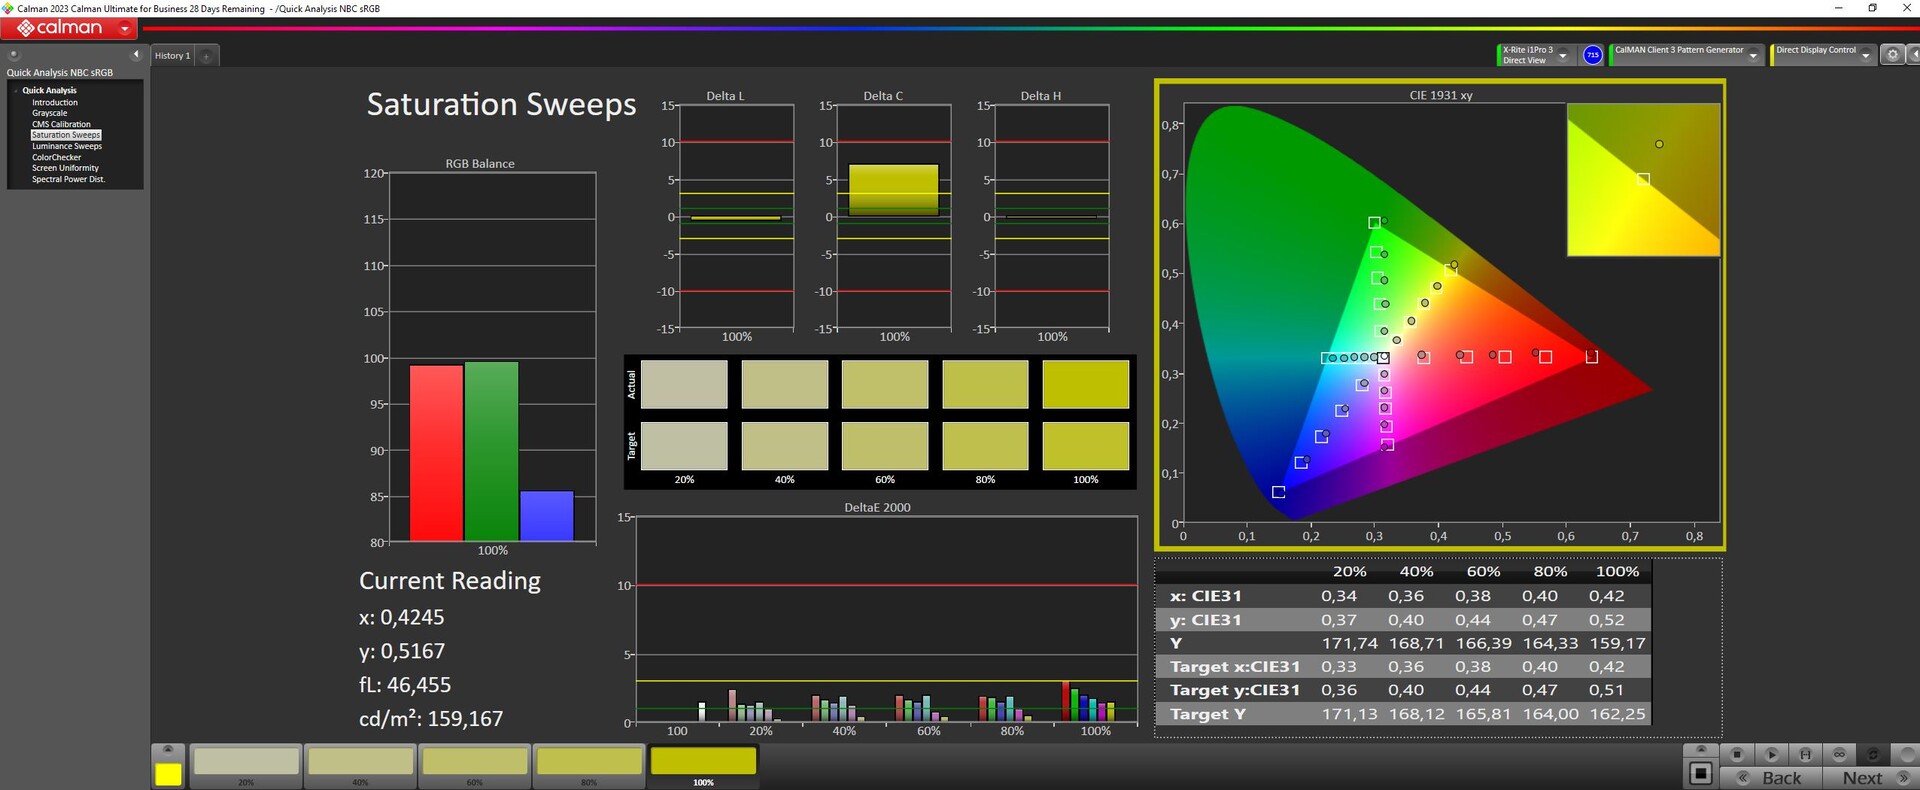
Il pannello a 144 Hz a reazione rapida con un rapporto d'aspetto di 16:9 non mostra alcuno sfarfallio PWM a qualsiasi livello di luminosità. Gli obiettivi di luminosità e contrasto del display da 15,6 pollici (1.920 x 1.080 pixel) sono stati raggiunti (> 300 cd/m² e 1.000:1). Il valore di contrasto relativamente alto merita di essere menzionato. Non sono disponibili altre opzioni di display.

| |||||||||||||||||||||||||
Distribuzione della luminosità: 86 %
Al centro con la batteria: 366 cd/m²
Contrasto: 2147:1 (Nero: 0.17 cd/m²)
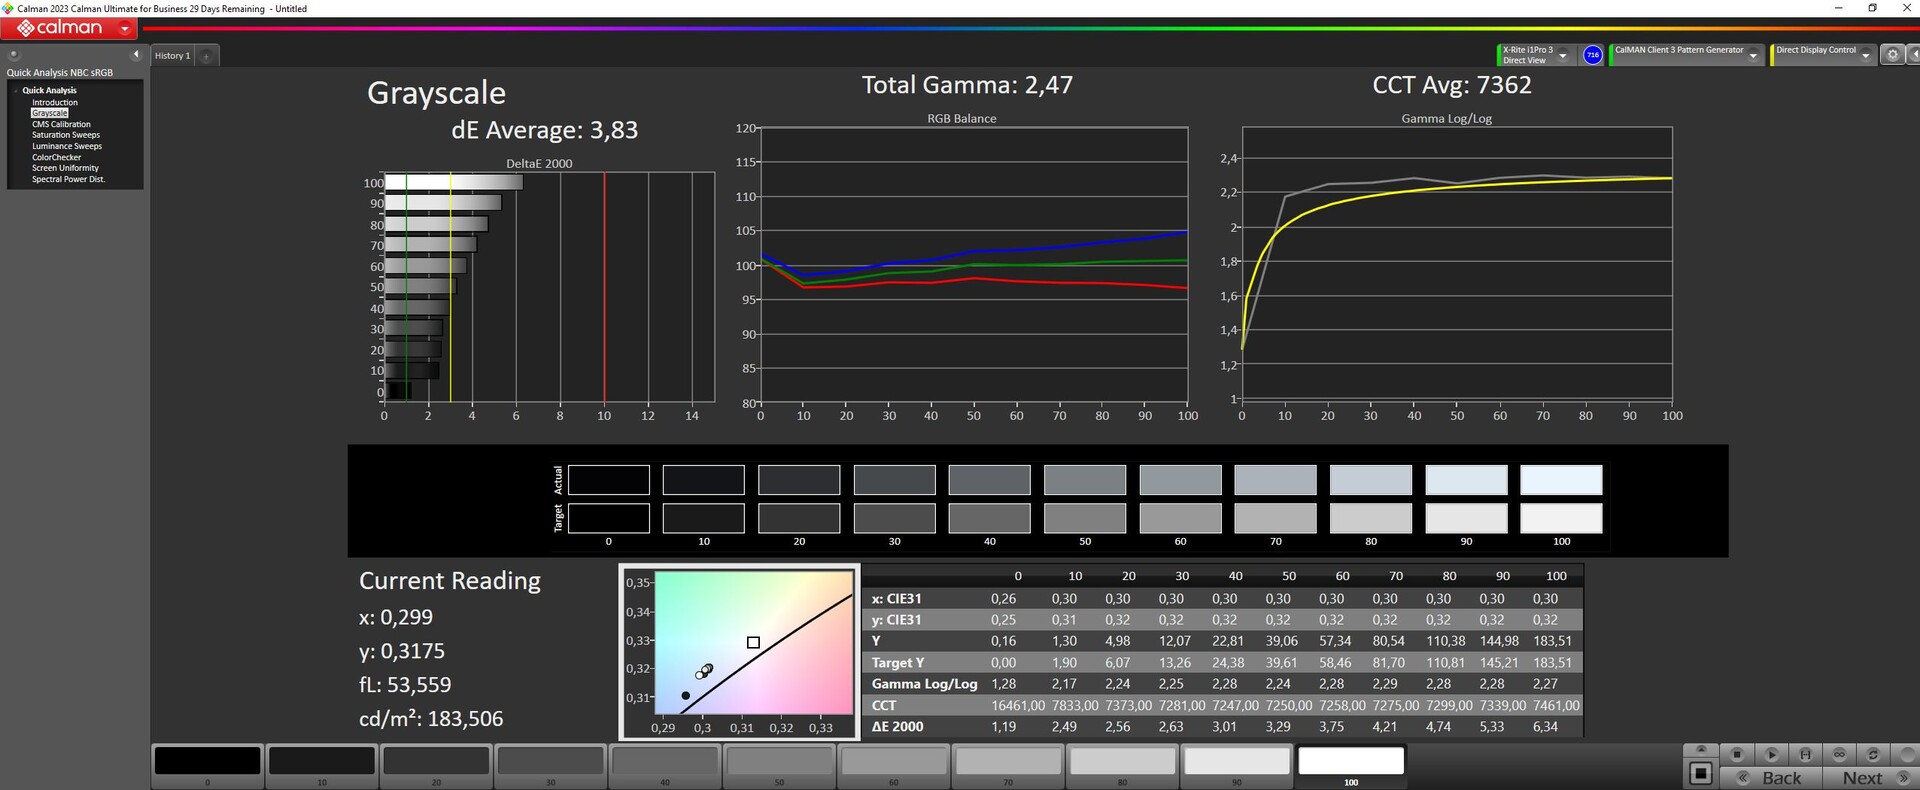
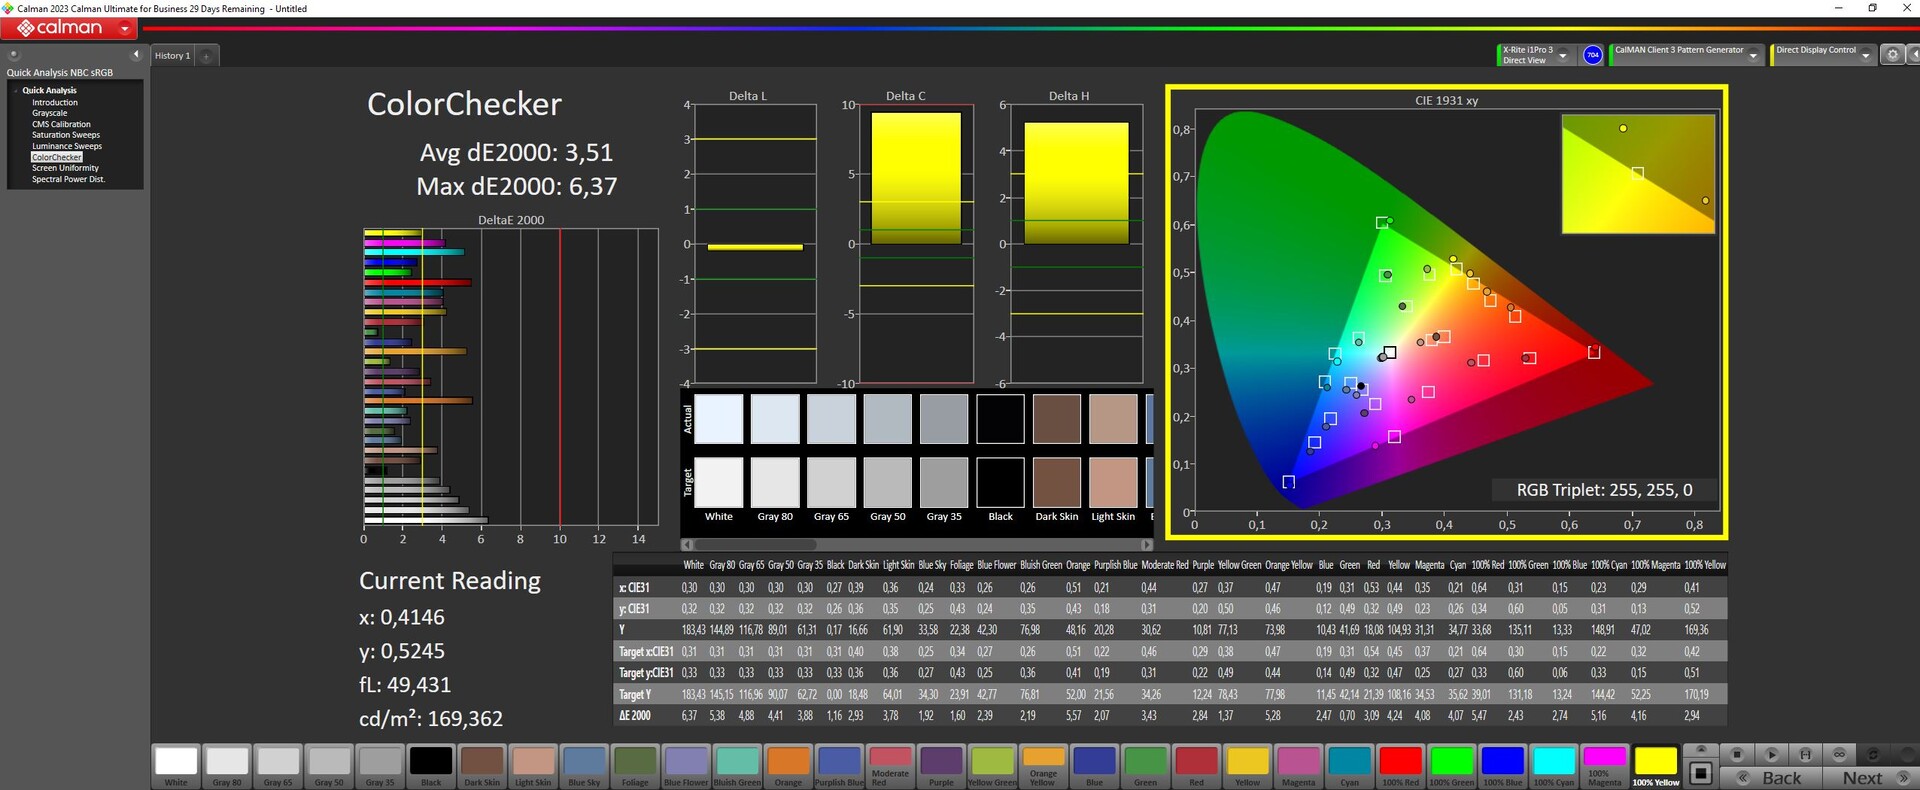
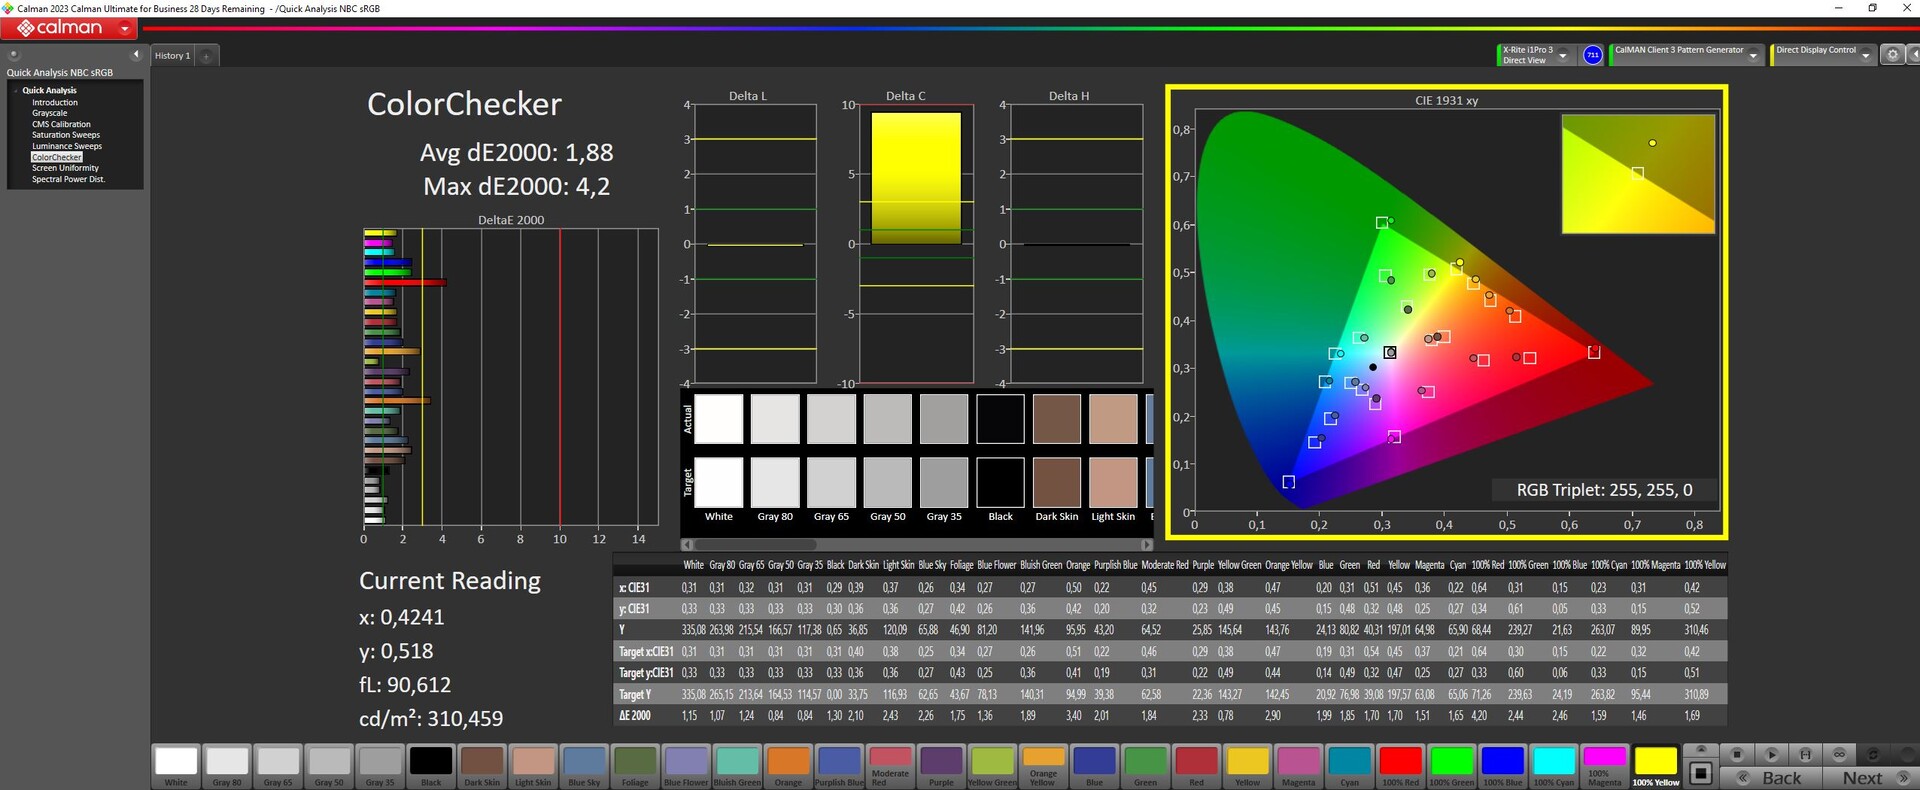
ΔE ColorChecker Calman: 3.51 | ∀{0.5-29.43 Ø4.73}
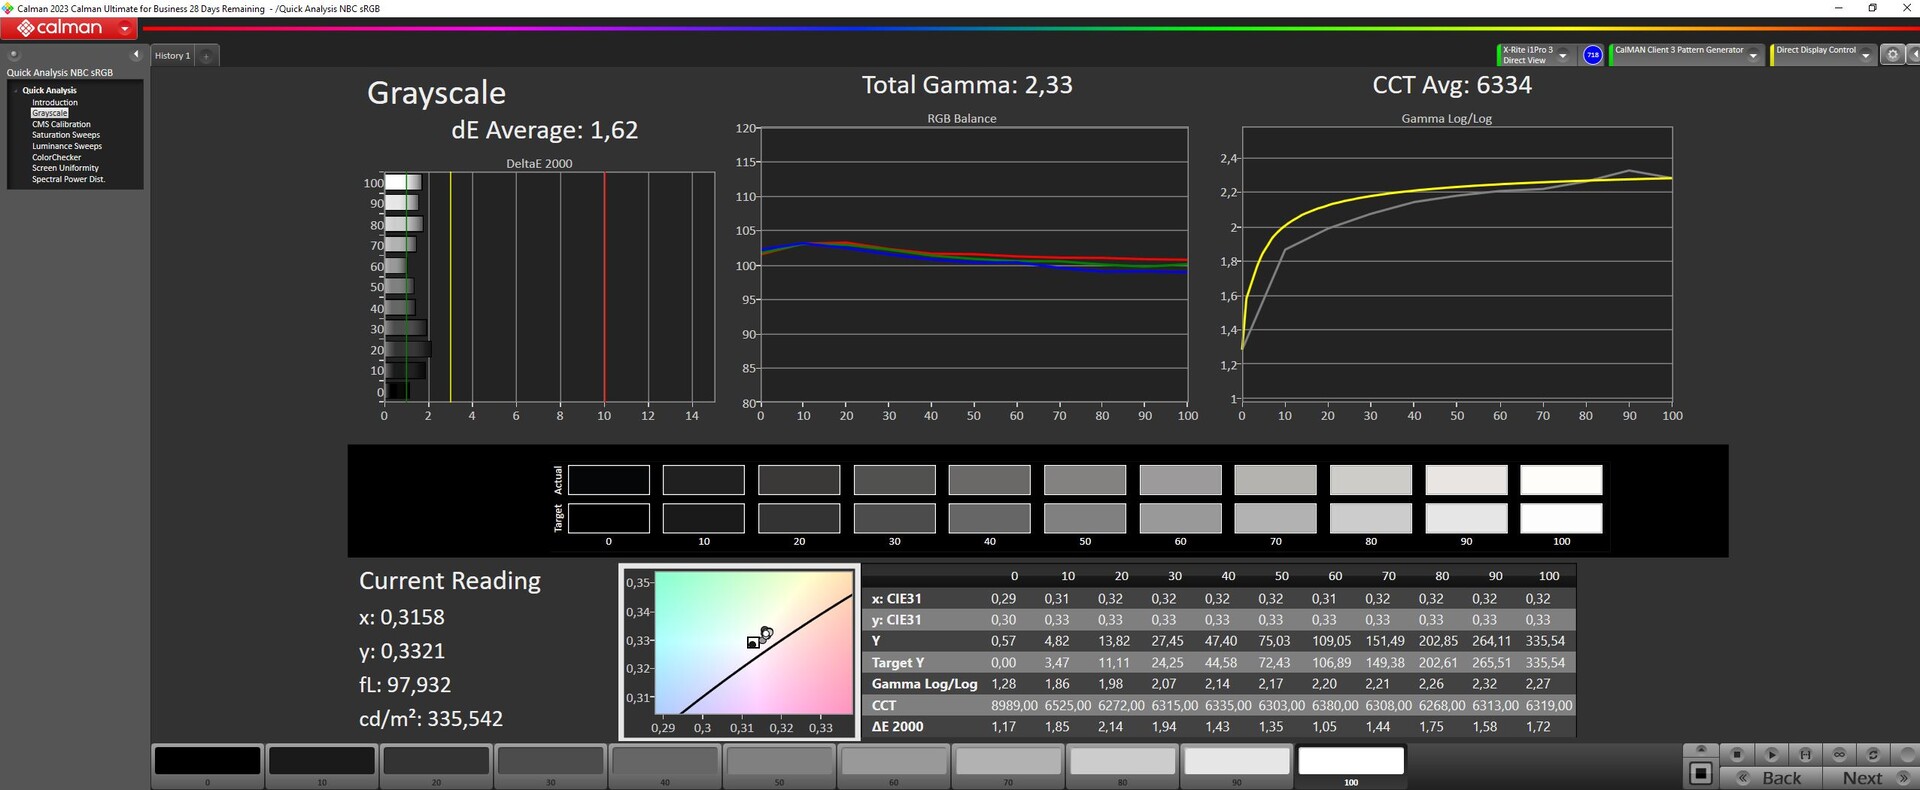
calibrated: 1.88
ΔE Greyscale Calman: 3.83 | ∀{0.09-98 Ø4.97}
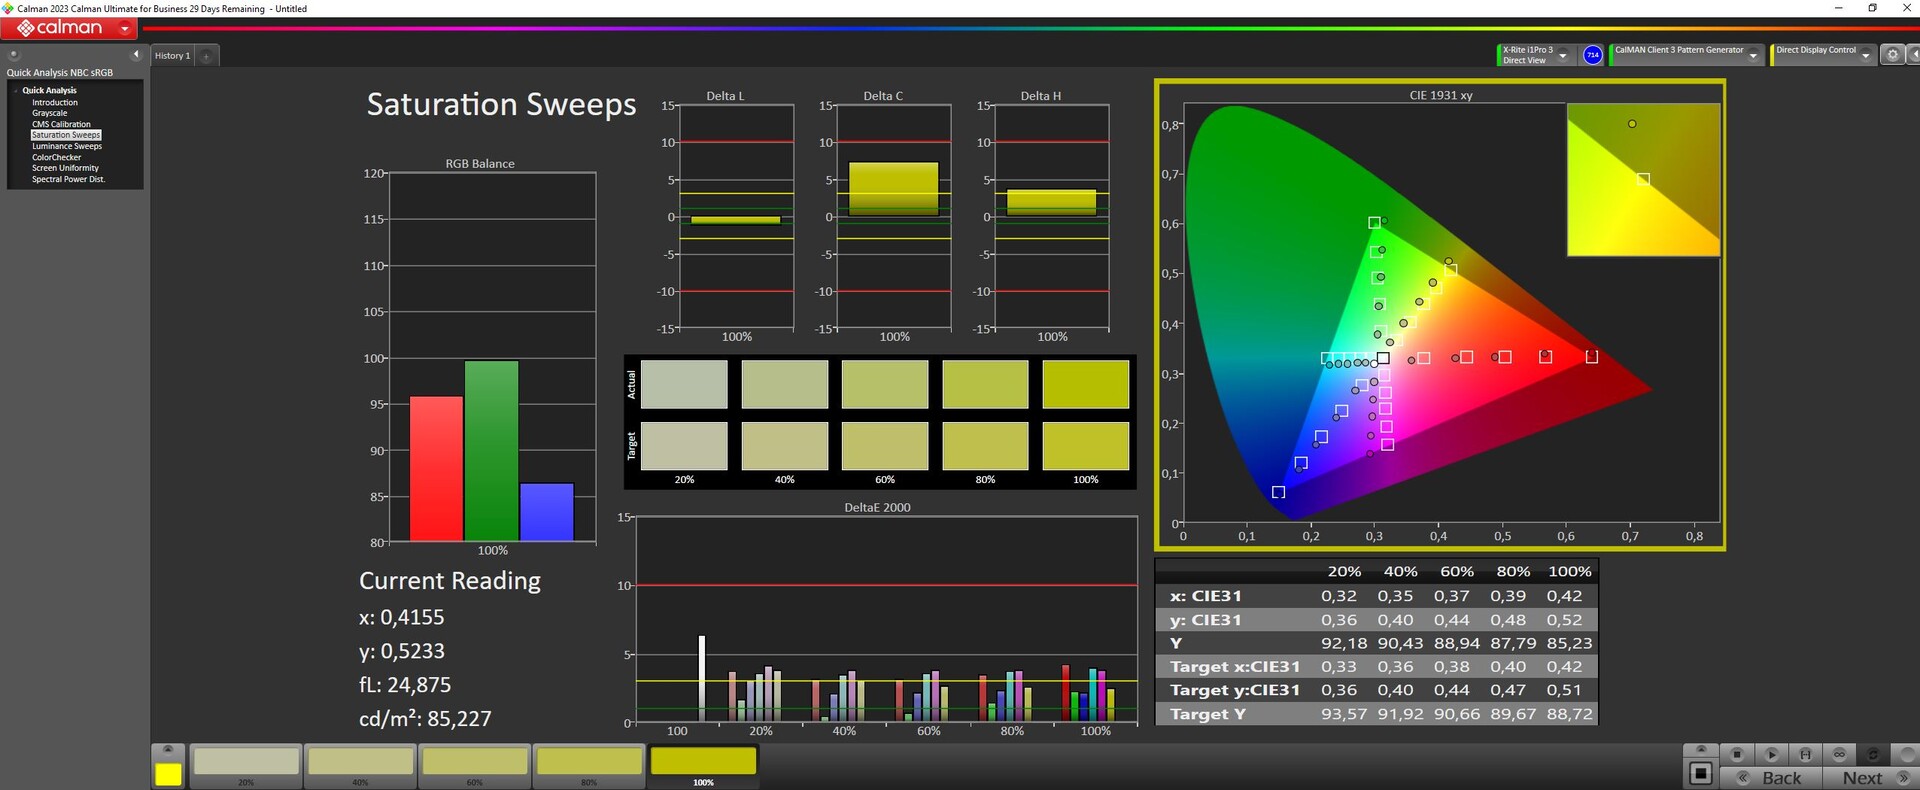
66.3% AdobeRGB 1998 (Argyll 3D)
92.6% sRGB (Argyll 3D)
64.9% Display P3 (Argyll 3D)
Gamma: 2.47
CCT: 7362 K
| Intel NUC X15 LAPAC71H BOE HF NV156FHM-N4G, IPS, 1920x1080, 15.6" | Asus TUF A15 FA507 N156HMA-GA1, IPS, 1920x1080, 15.6" | Gigabyte G5 KE Chi Mei N156HRA-EA1, IPS, 1920x1080, 15.6" | Dell Inspiron 16 Plus 7630 LG Philips 160WQ2, IPS, 2560x1600, 16" | Asus VivoBook Pro 16 Au Optronics B160QAN02.L, IPS, 2560x1600, 16" | MSI Cyborg 15 A12VF AU Optronics B156HAN15.1, IPS, 1920x1080, 15.6" | |
|---|---|---|---|---|---|---|
| Display | 1% | -36% | 8% | 30% | -34% | |
| Display P3 Coverage (%) | 64.9 | 64.9 0% | 40.7 -37% | 70.1 8% | 98.5 52% | 42.3 -35% |
| sRGB Coverage (%) | 92.6 | 96.5 4% | 61 -34% | 99.6 8% | 99.9 8% | 62.6 -32% |
| AdobeRGB 1998 Coverage (%) | 66.3 | 66.6 0% | 42.1 -37% | 72.3 9% | 86.1 30% | 43.7 -34% |
| Response Times | -238% | -199% | -291% | 32% | -137% | |
| Response Time Grey 50% / Grey 80% * (ms) | 7.8 ? | 30.4 ? -290% | 26.64 ? -242% | 35 ? -349% | 2 ? 74% | 22 ? -182% |
| Response Time Black / White * (ms) | 7.3 ? | 20.8 ? -185% | 18.65 ? -155% | 24.2 ? -232% | 8 ? -10% | 14 ? -92% |
| PWM Frequency (Hz) | ||||||
| Screen | 13% | -67% | -10% | 5% | -27% | |
| Brightness middle (cd/m²) | 365 | 288 -21% | 269 -26% | 299.4 -18% | 504 38% | 247 -32% |
| Brightness (cd/m²) | 356 | 271 -24% | 248 -30% | 290 -19% | 465 31% | 234 -34% |
| Brightness Distribution (%) | 86 | 91 6% | 85 -1% | 92 7% | 87 1% | 89 3% |
| Black Level * (cd/m²) | 0.17 | 0.17 -0% | 0.5 -194% | 0.21 -24% | 0.35 -106% | 0.25 -47% |
| Contrast (:1) | 2147 | 1694 -21% | 538 -75% | 1426 -34% | 1440 -33% | 988 -54% |
| Colorchecker dE 2000 * | 3.51 | 1.9 46% | 4.54 -29% | 4.25 -21% | 1.83 48% | 3.78 -8% |
| Colorchecker dE 2000 max. * | 6.37 | 3.3 48% | 17.28 -171% | 6.71 -5% | 5.51 14% | 6.42 -1% |
| Colorchecker dE 2000 calibrated * | 1.88 | 0.9 52% | 3.34 -78% | 0.52 72% | 1.34 29% | 3.94 -110% |
| Greyscale dE 2000 * | 3.83 | 2.7 30% | 3.8 1% | 5.5 -44% | 3.02 21% | 2.16 44% |
| Gamma | 2.47 89% | 2.32 95% | 2.17 101% | 2.35 94% | 2.39 92% | 2.33 94% |
| CCT | 7362 88% | 6535 99% | 7408 88% | 6368 102% | 6688 97% | 6906 94% |
| Media totale (Programma / Settaggio) | -75% /
-25% | -101% /
-79% | -98% /
-46% | 22% /
14% | -66% /
-44% |
* ... Meglio usare valori piccoli
Ex funziona, il display mostra una rappresentazione del colore relativamente buona: Con una deviazione di circa 3,5, il suo obiettivo (DeltaE < 3) è stato mancato di poco. La calibrazione dello schermo abbassa la deviazione a 1,9 e porta a toni di grigio più equilibrati. Il pannello è in grado di coprire quasi completamente lo spazio colore sRGB, ma non AdobeRGB o DCI P3. La maggior parte dei pannelli della concorrenza presenta un quadro simile. Solo ilVivoBookè in grado di coprire lo spazio colore P3.
Tempi di risposta del Display
| ↔ Tempi di risposta dal Nero al Bianco | ||
|---|---|---|
| 7.3 ms ... aumenta ↗ e diminuisce ↘ combinato | ↗ 3.3 ms Incremento | 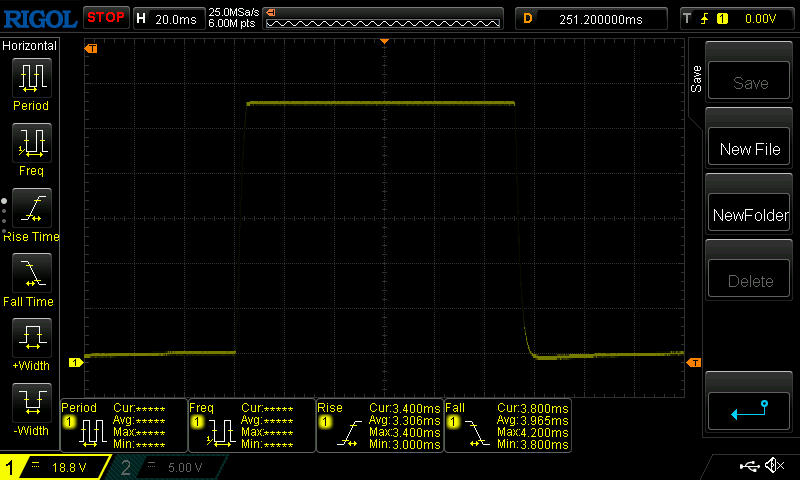 |
| ↘ 4 ms Calo | ||
| Lo schermo ha mostrato valori di risposta molto veloci nei nostri tests ed è molto adatto per i gaming veloce. In confronto, tutti i dispositivi di test variano da 0.1 (minimo) a 240 (massimo) ms. » 21 % di tutti i dispositivi è migliore. Questo significa che i tempi di risposta rilevati sono migliori rispettto alla media di tutti i dispositivi testati (19.9 ms). | ||
| ↔ Tempo di risposta dal 50% Grigio all'80% Grigio | ||
| 7.8 ms ... aumenta ↗ e diminuisce ↘ combinato | ↗ 3.9 ms Incremento | 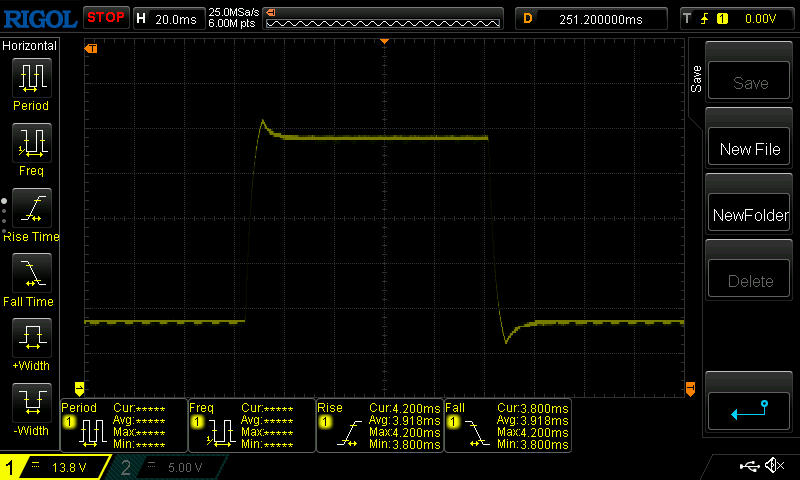 |
| ↘ 3.9 ms Calo | ||
| Lo schermo ha mostrato valori di risposta molto veloci nei nostri tests ed è molto adatto per i gaming veloce. In confronto, tutti i dispositivi di test variano da 0.165 (minimo) a 636 (massimo) ms. » 20 % di tutti i dispositivi è migliore. Questo significa che i tempi di risposta rilevati sono migliori rispettto alla media di tutti i dispositivi testati (31.1 ms). | ||
Sfarfallio dello schermo / PWM (Pulse-Width Modulation)
| flickering dello schermo / PWM non rilevato |  | ||
In confronto: 52 % di tutti i dispositivi testati non utilizza PWM per ridurre la luminosita' del display. Se è rilevato PWM, una media di 7791 (minimo: 5 - massimo: 343500) Hz è stata rilevata. | |||
Il pannello IPS, stabile nell'angolo di visione, rimane leggibile da ogni angolazione. All'esterno, può leggere dal display a condizione che il sole non sia troppo luminoso.

Prestazioni - Un team Intel alimenta il portatile da gioco
ACore i7-12700He Arc A730Malimentano l'Intel NUC X15 LAPAC71H, orientato ai giocatori e ai creatori. Altre opzioni non sono disponibili. Il portatile è attualmente disponibile a partire da circa 1.050 dollari. La variante attuale costa circa 1.280 dollari. È possibile che si debbano mettere in conto costi aggiuntivi per una licenza di Windows.
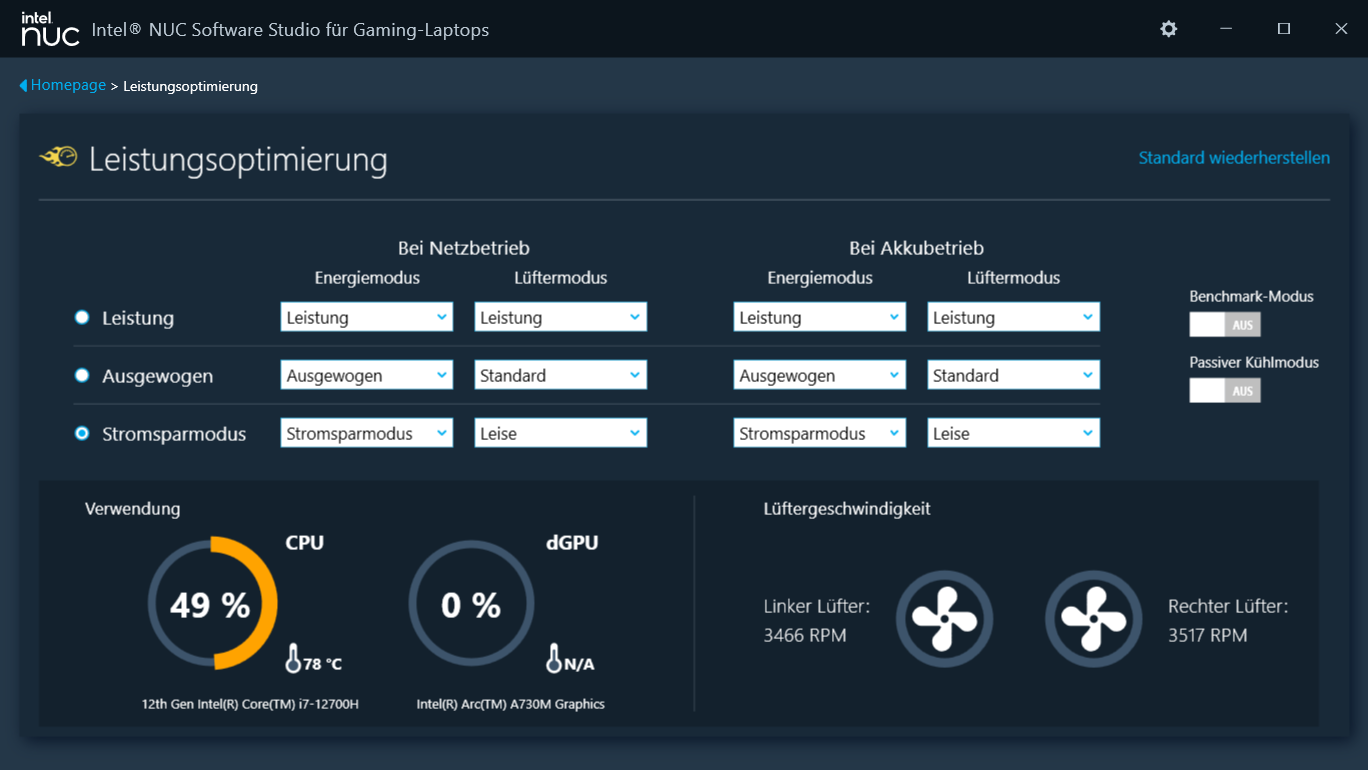
Condizioni di test
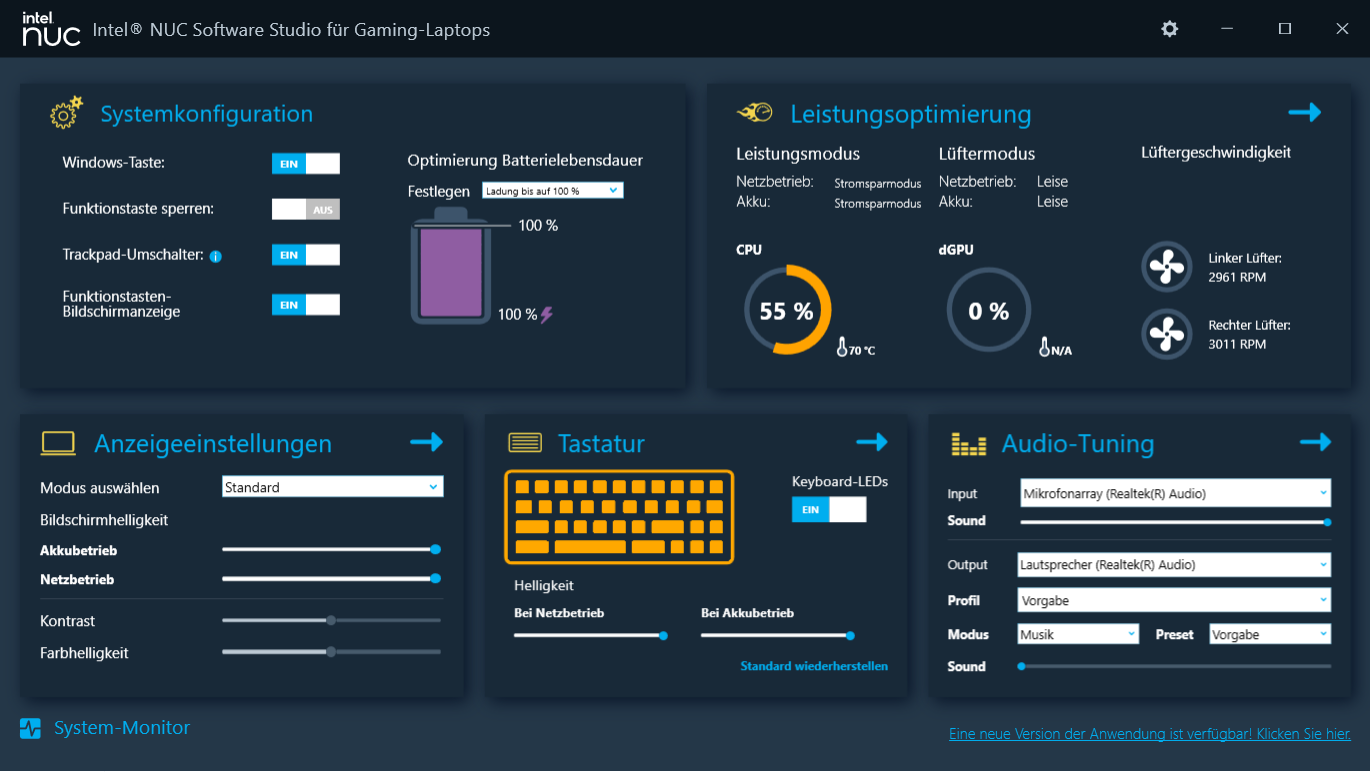
Intel NUC Software Studio (Control Center) offre tre profili per influenzare le prestazioni e il controllo della ventola (vedere tabella). Per eseguire questo test sono stati utilizzati i profili "Prestazioni" (benchmark) e "Modalità risparmio energetico" (test della batteria). Le prestazioni massime sono disponibili solo dopo aver attivato l'opzione "Modalità Benchmark". Tuttavia, le ventole funzionano permanentemente alla massima potenza.
| Prestazioni | Bilanciato | Modalità Risparmio energetico | Modalità Benchmark | |
|---|---|---|---|---|
| Limite di potenza 1 (HWInfo) | 45 watt | 35 watt | 35 watt | 45 watt |
| Limite di potenza 2 (HWInfo) | 90 watt | 80 watt | 65 watt | 90 watt |
| TGP (Controllo arco) | 75 watt | 65 watt | 55 watt | 85 watt |
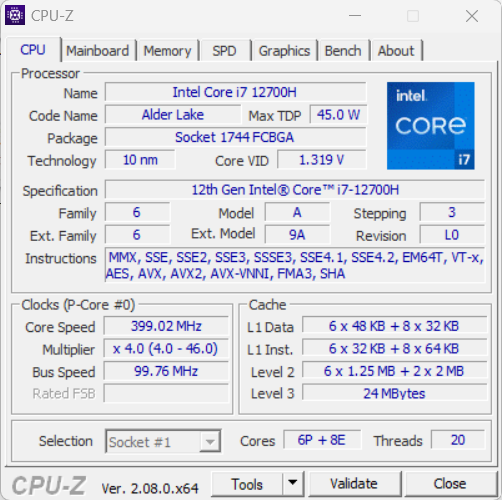
Processore
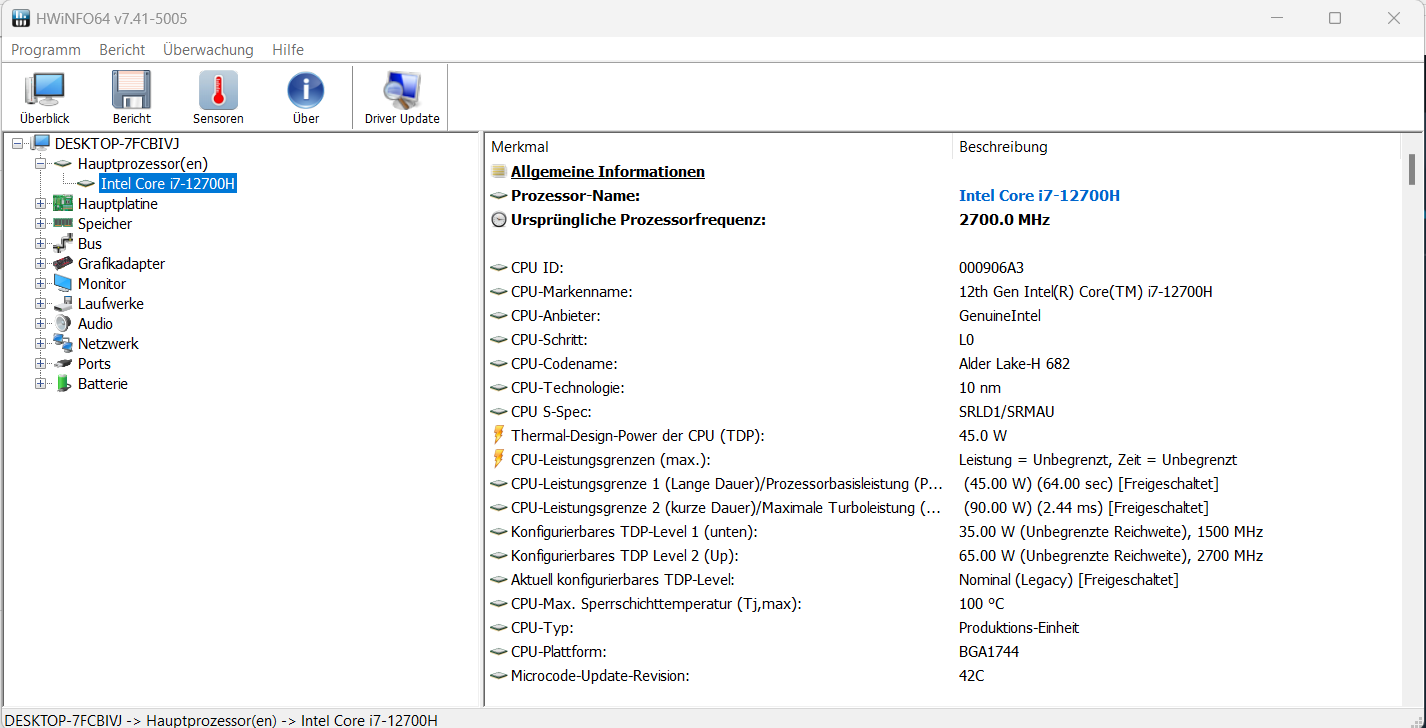
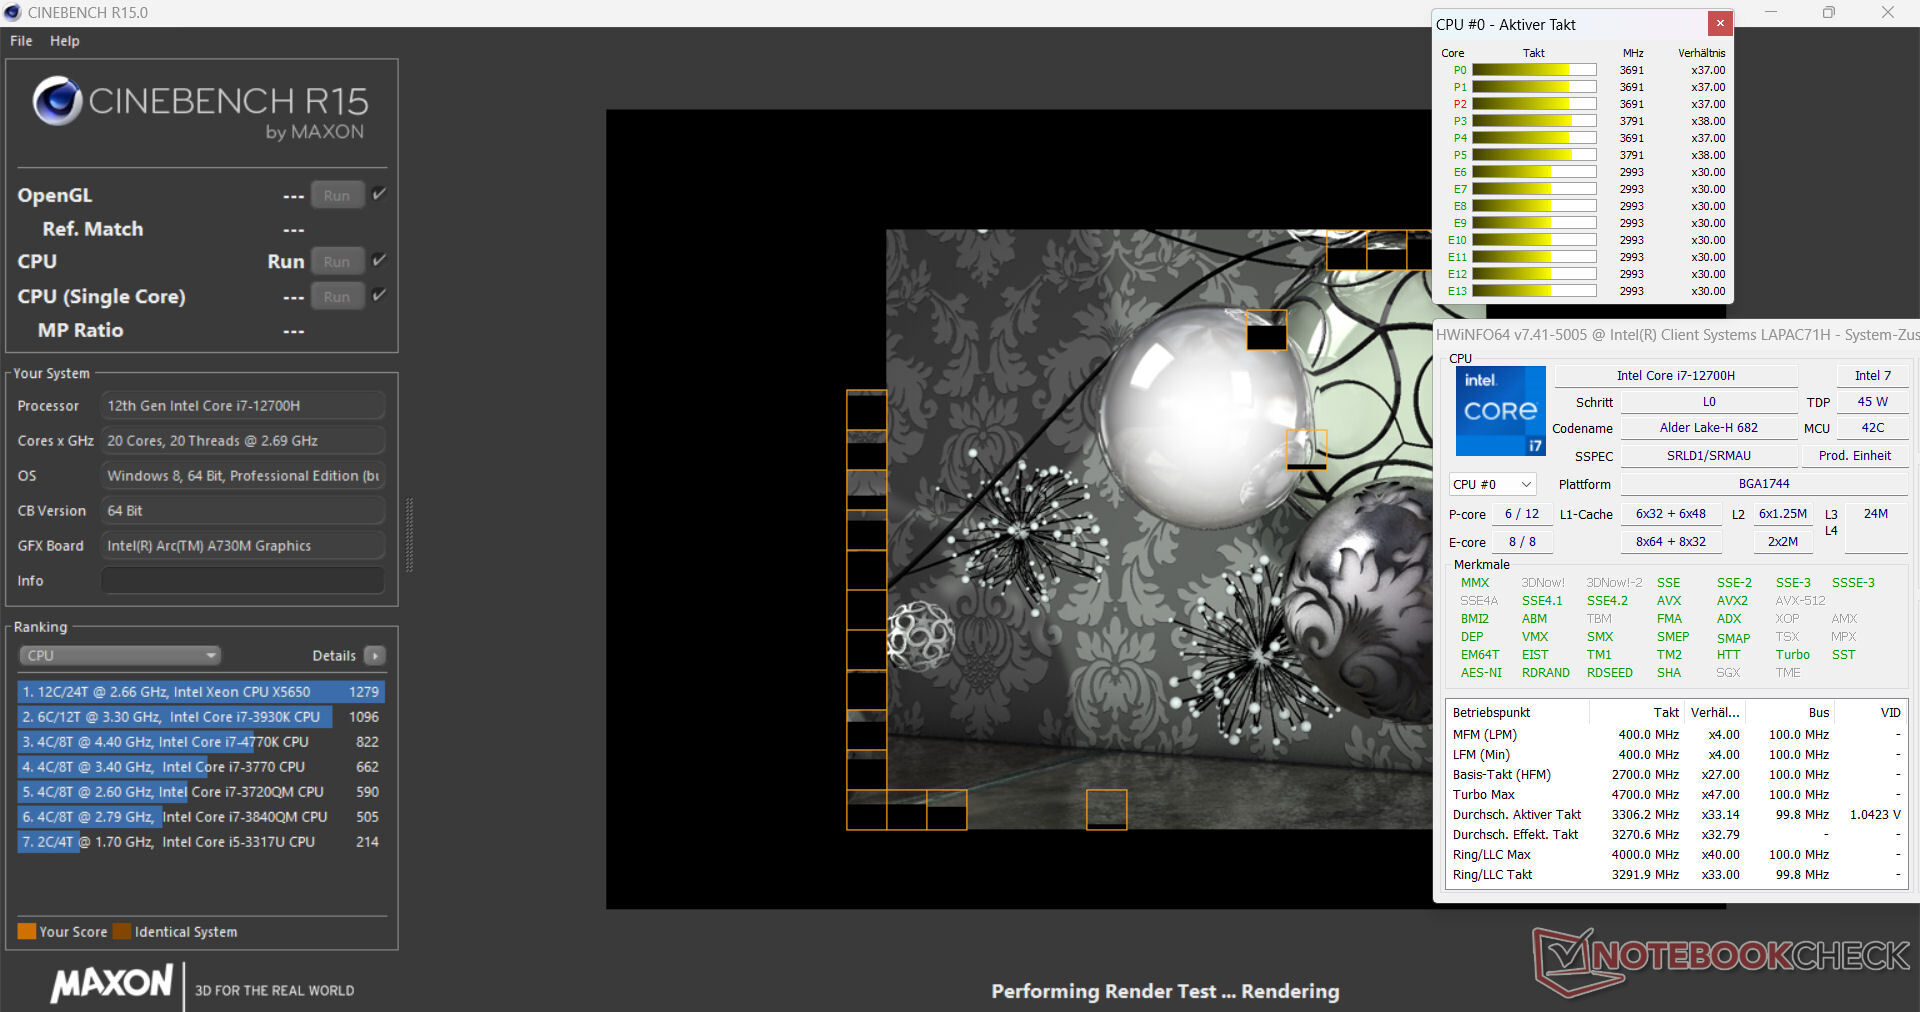
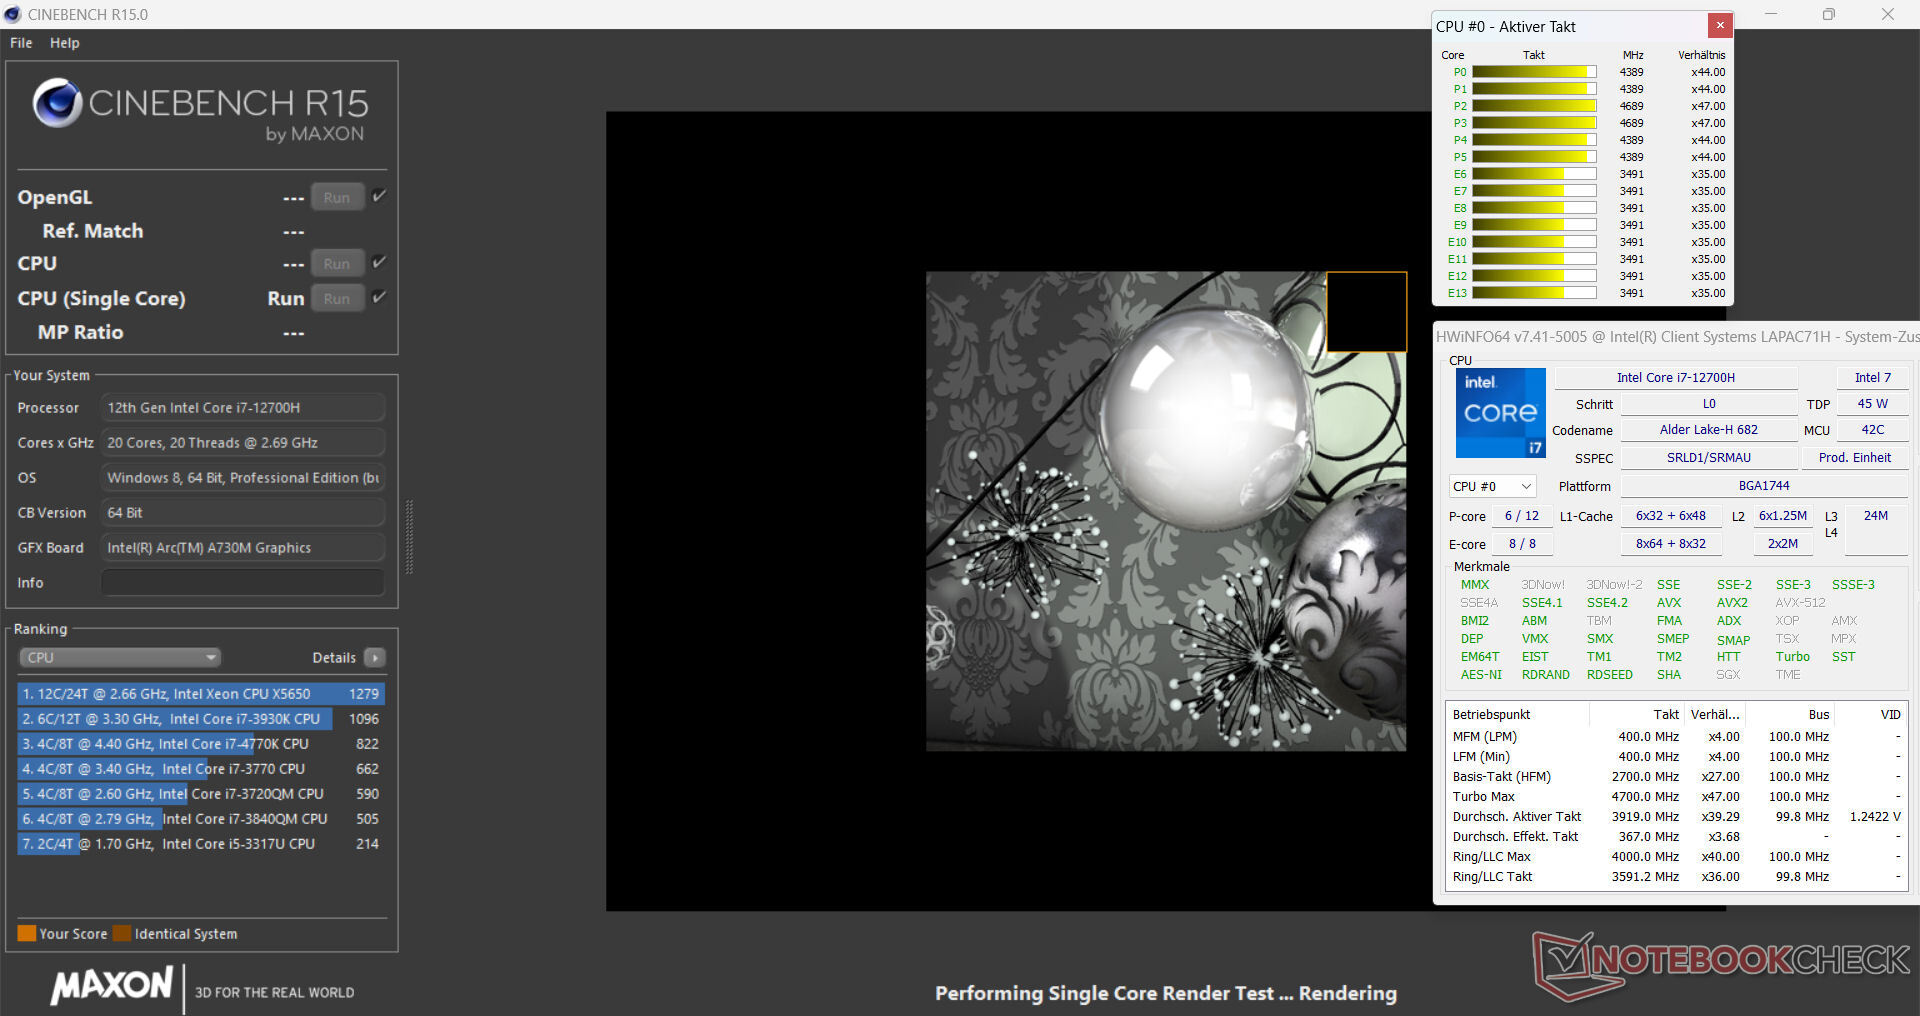
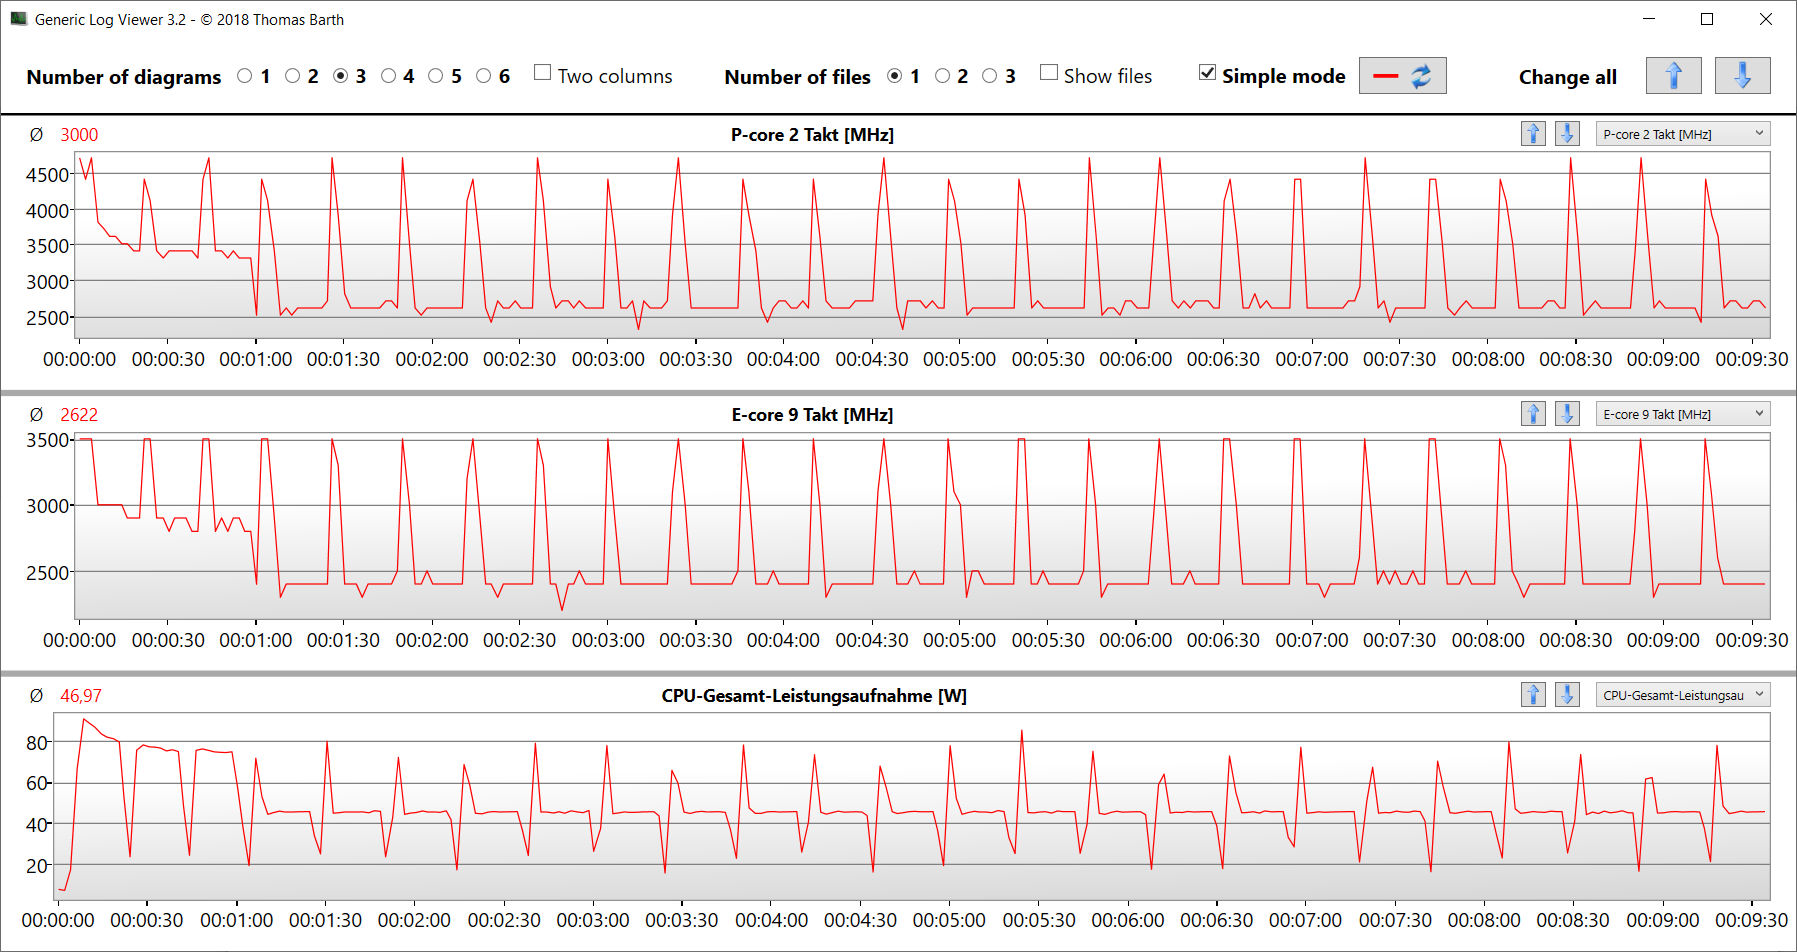
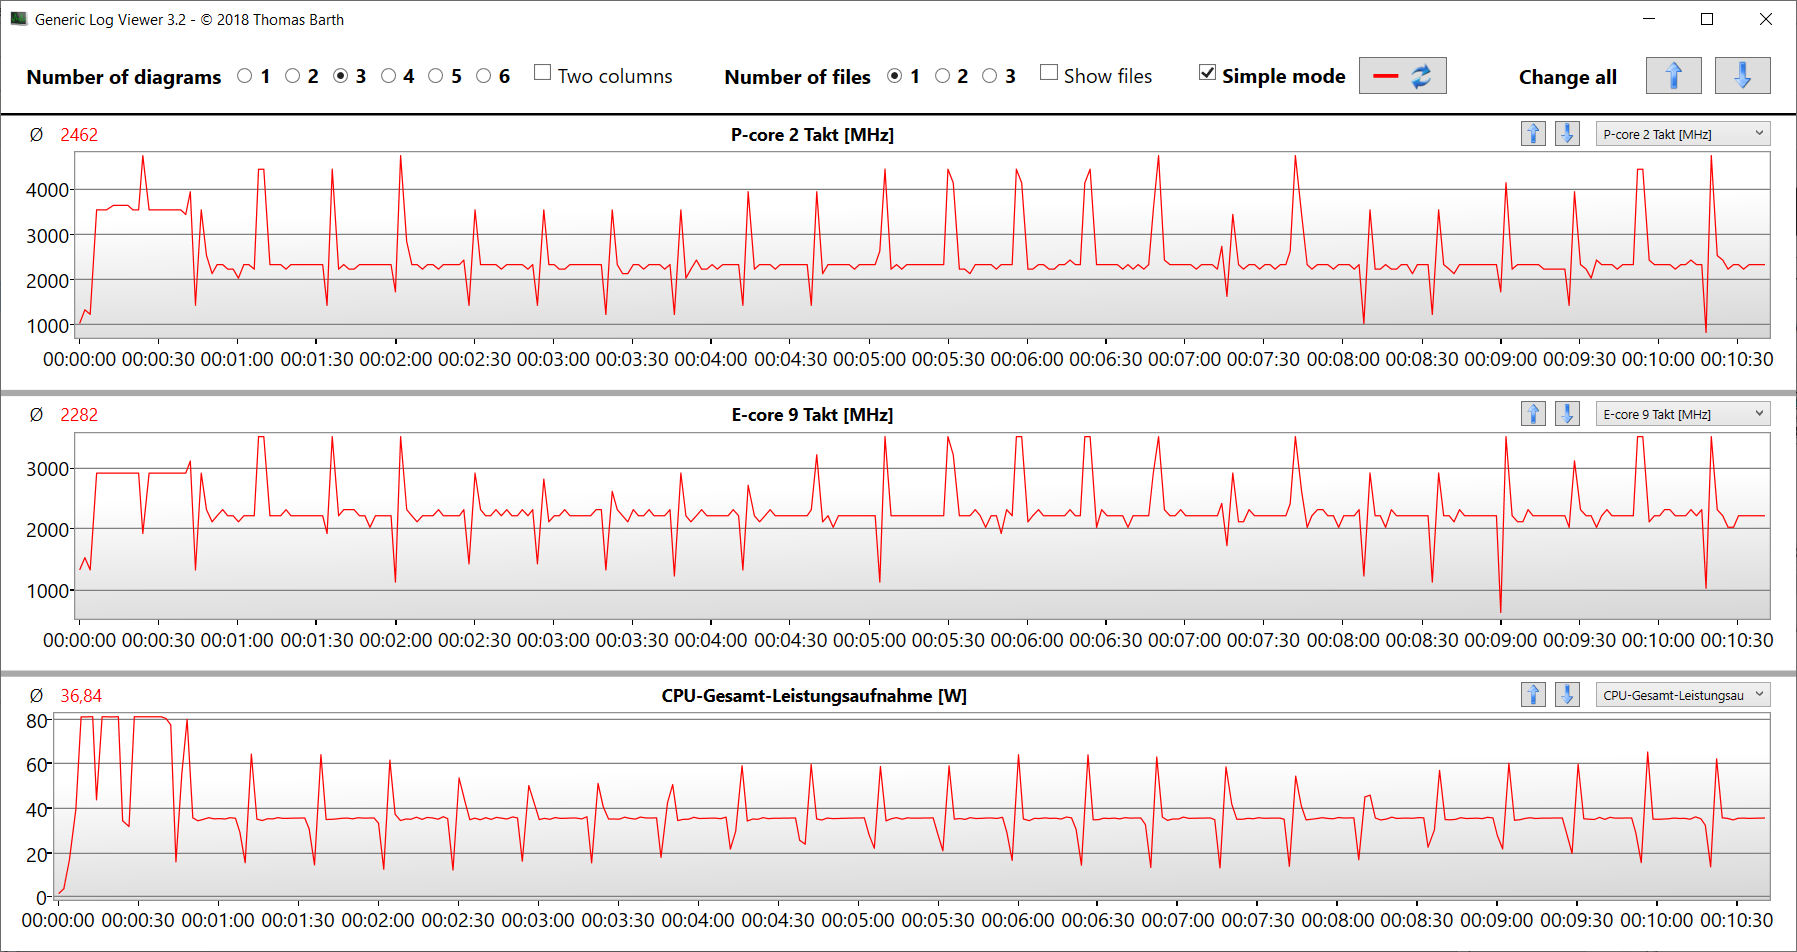
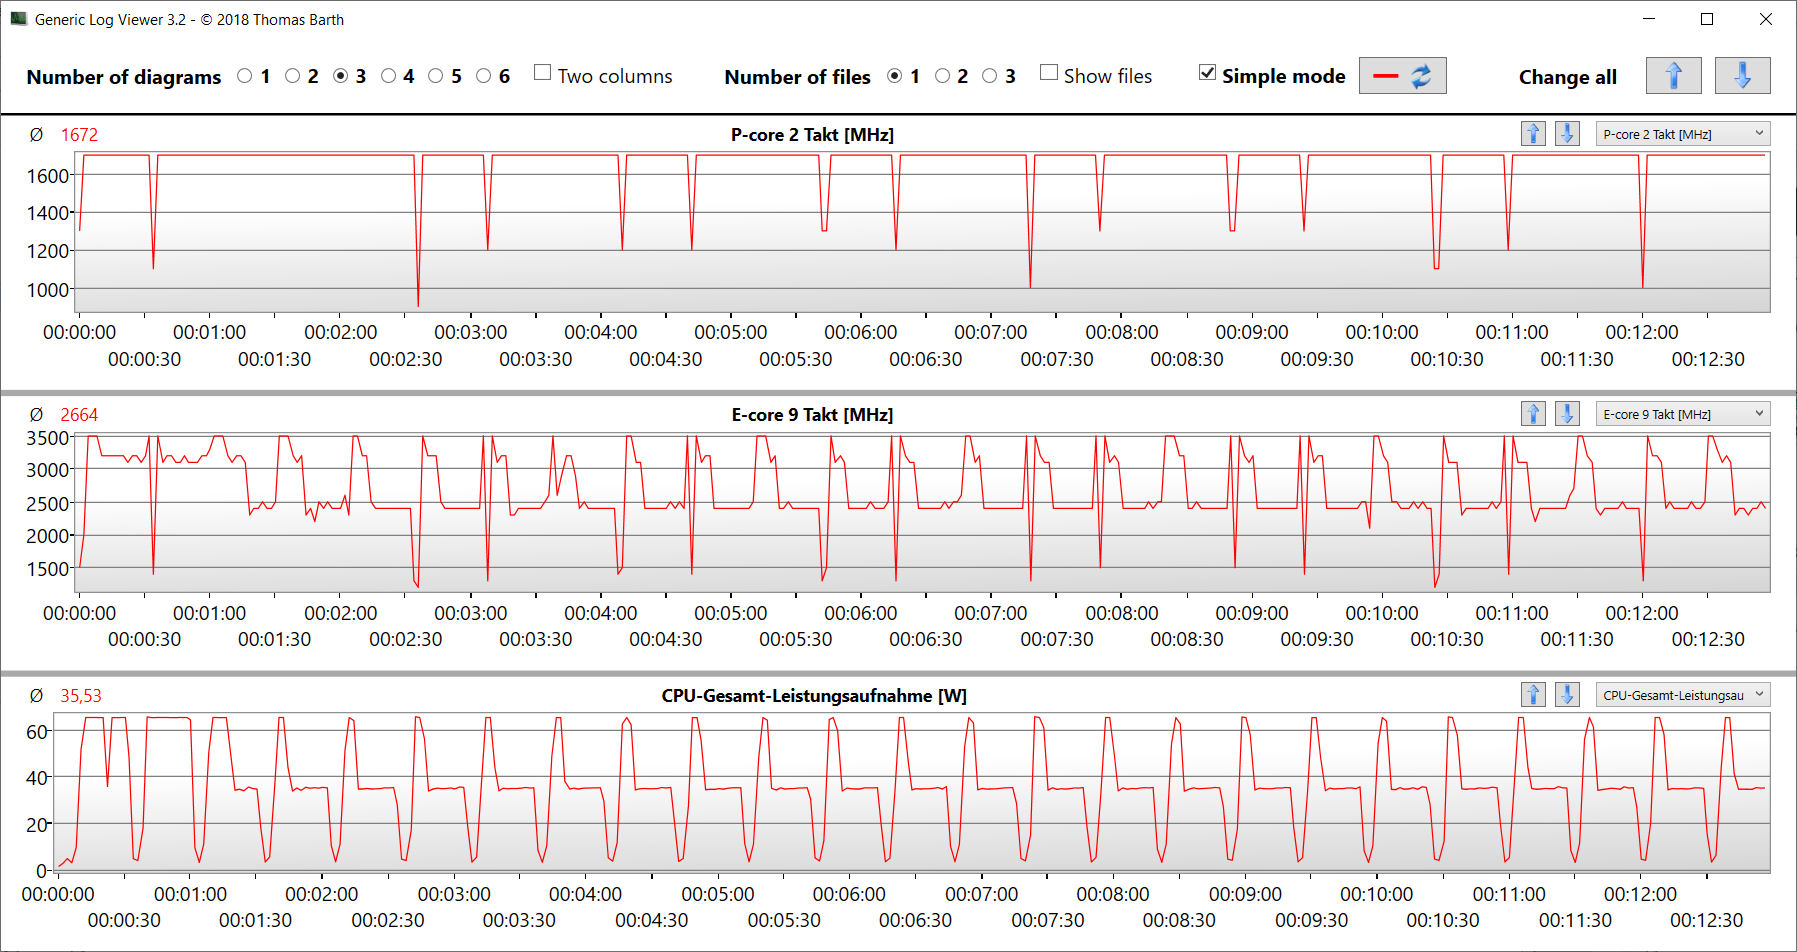
I 14 core della CPU Core i7-12700H (6P, 8E) raggiungono velocità di clock massime di 4,7 GHz (P) e 3,5 GHz (E). Le prestazioni multi-thread continue (CB15 Loop) hanno portato il clock del turbo a scendere dalla prima alla seconda esecuzione. In seguito, è rimasto stabile.
I risultati del benchmark erano leggermente superiori alla media della CPU quando era collegato alla rete elettrica. In modalità batteria, le prestazioni single-thread più rilevanti (213 punti) sono diminuite in misura minore rispetto alle prestazioni multi-thread (1.012 punti).
Cinebench R15 Multi continuous test
* ... Meglio usare valori piccoli
AIDA64: FP32 Ray-Trace | FPU Julia | CPU SHA3 | CPU Queen | FPU SinJulia | FPU Mandel | CPU AES | CPU ZLib | FP64 Ray-Trace | CPU PhotoWorxx
| Performance rating | |
| Media della classe Multimedia | |
| Asus TUF A15 FA507 | |
| Intel NUC X15 LAPAC71H | |
| Dell Inspiron 16 Plus 7630 | |
| Gigabyte G5 KE | |
| Asus VivoBook Pro 16 | |
| MSI Cyborg 15 A12VF | |
| Media Intel Core i7-12700H | |
| AIDA64 / FP32 Ray-Trace | |
| Media della classe Multimedia (2214 - 50388, n=60, ultimi 2 anni) | |
| Asus TUF A15 FA507 | |
| Asus VivoBook Pro 16 | |
| Dell Inspiron 16 Plus 7630 | |
| Intel NUC X15 LAPAC71H | |
| MSI Cyborg 15 A12VF | |
| Gigabyte G5 KE | |
| Media Intel Core i7-12700H (2585 - 17957, n=64) | |
| AIDA64 / FPU Julia | |
| Asus TUF A15 FA507 | |
| Media della classe Multimedia (12867 - 201874, n=61, ultimi 2 anni) | |
| Asus VivoBook Pro 16 | |
| MSI Cyborg 15 A12VF | |
| Dell Inspiron 16 Plus 7630 | |
| Gigabyte G5 KE | |
| Intel NUC X15 LAPAC71H | |
| Media Intel Core i7-12700H (12439 - 90760, n=64) | |
| AIDA64 / CPU SHA3 | |
| Media della classe Multimedia (653 - 8623, n=61, ultimi 2 anni) | |
| Asus TUF A15 FA507 | |
| Asus VivoBook Pro 16 | |
| Gigabyte G5 KE | |
| Media Intel Core i7-12700H (833 - 4242, n=64) | |
| Dell Inspiron 16 Plus 7630 | |
| Intel NUC X15 LAPAC71H | |
| MSI Cyborg 15 A12VF | |
| AIDA64 / CPU Queen | |
| Dell Inspiron 16 Plus 7630 | |
| Asus TUF A15 FA507 | |
| Asus VivoBook Pro 16 | |
| Intel NUC X15 LAPAC71H | |
| Media Intel Core i7-12700H (57923 - 103202, n=63) | |
| MSI Cyborg 15 A12VF | |
| Gigabyte G5 KE | |
| Media della classe Multimedia (13483 - 181505, n=49, ultimi 2 anni) | |
| AIDA64 / FPU SinJulia | |
| Asus TUF A15 FA507 | |
| Media della classe Multimedia (1240 - 28794, n=61, ultimi 2 anni) | |
| Media Intel Core i7-12700H (3249 - 9939, n=64) | |
| Asus VivoBook Pro 16 | |
| Dell Inspiron 16 Plus 7630 | |
| MSI Cyborg 15 A12VF | |
| Intel NUC X15 LAPAC71H | |
| Gigabyte G5 KE | |
| AIDA64 / FPU Mandel | |
| Asus TUF A15 FA507 | |
| Media della classe Multimedia (6395 - 105740, n=60, ultimi 2 anni) | |
| Asus VivoBook Pro 16 | |
| Dell Inspiron 16 Plus 7630 | |
| Gigabyte G5 KE | |
| Intel NUC X15 LAPAC71H | |
| MSI Cyborg 15 A12VF | |
| Media Intel Core i7-12700H (7135 - 44760, n=64) | |
| AIDA64 / CPU AES | |
| Intel NUC X15 LAPAC71H | |
| Gigabyte G5 KE | |
| Media Intel Core i7-12700H (31839 - 144360, n=64) | |
| Media della classe Multimedia (13243 - 126790, n=61, ultimi 2 anni) | |
| Asus TUF A15 FA507 | |
| Asus VivoBook Pro 16 | |
| MSI Cyborg 15 A12VF | |
| Dell Inspiron 16 Plus 7630 | |
| AIDA64 / CPU ZLib | |
| Media della classe Multimedia (167.2 - 2022, n=61, ultimi 2 anni) | |
| Media Intel Core i7-12700H (305 - 1171, n=64) | |
| Asus VivoBook Pro 16 | |
| Gigabyte G5 KE | |
| MSI Cyborg 15 A12VF | |
| Intel NUC X15 LAPAC71H | |
| Dell Inspiron 16 Plus 7630 | |
| Asus TUF A15 FA507 | |
| AIDA64 / FP64 Ray-Trace | |
| Media della classe Multimedia (1014 - 26875, n=61, ultimi 2 anni) | |
| Asus TUF A15 FA507 | |
| Asus VivoBook Pro 16 | |
| Dell Inspiron 16 Plus 7630 | |
| Gigabyte G5 KE | |
| Intel NUC X15 LAPAC71H | |
| MSI Cyborg 15 A12VF | |
| Media Intel Core i7-12700H (1437 - 9692, n=64) | |
| AIDA64 / CPU PhotoWorxx | |
| Media della classe Multimedia (12860 - 88154, n=61, ultimi 2 anni) | |
| Intel NUC X15 LAPAC71H | |
| Dell Inspiron 16 Plus 7630 | |
| MSI Cyborg 15 A12VF | |
| Media Intel Core i7-12700H (12863 - 52207, n=64) | |
| Gigabyte G5 KE | |
| Asus TUF A15 FA507 | |
| Asus VivoBook Pro 16 | |
Prestazioni del sistema
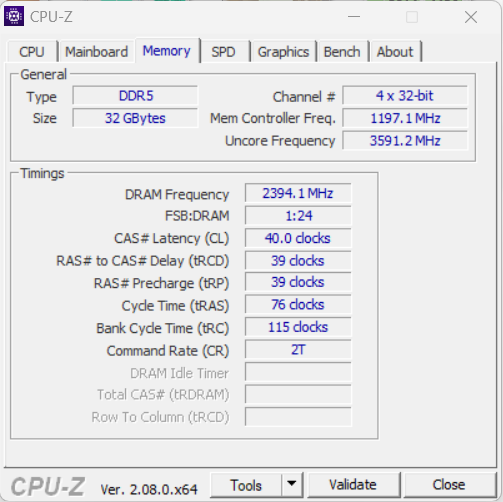
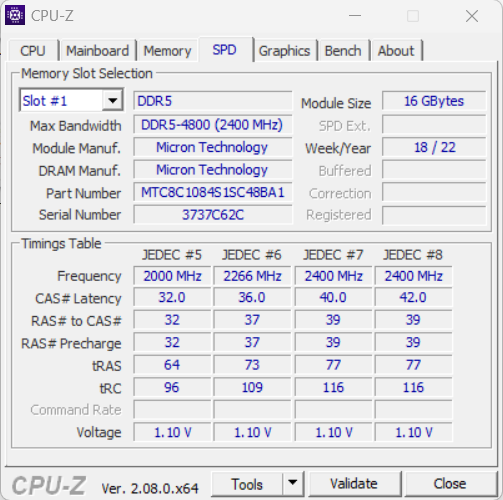
Il sistema fluido non manca di potenza di calcolo. Il portatile gestisce i giochi, lo streaming e il rendering senza problemi. Le velocità di trasferimento della RAM sono nella norma per una RAM DDR5-4800.
CrossMark: Overall | Productivity | Creativity | Responsiveness
| PCMark 10 / Score | |
| Media della classe Multimedia (4325 - 10386, n=58, ultimi 2 anni) | |
| Dell Inspiron 16 Plus 7630 | |
| Asus TUF A15 FA507 | |
| Gigabyte G5 KE | |
| MSI Cyborg 15 A12VF | |
| Intel NUC X15 LAPAC71H | |
| Media Intel Core i7-12700H, Intel Arc A730M (6830 - 6845, n=2) | |
| Asus VivoBook Pro 16 | |
| PCMark 10 / Essentials | |
| Dell Inspiron 16 Plus 7630 | |
| Gigabyte G5 KE | |
| Media Intel Core i7-12700H, Intel Arc A730M (10529 - 11116, n=2) | |
| MSI Cyborg 15 A12VF | |
| Asus TUF A15 FA507 | |
| Intel NUC X15 LAPAC71H | |
| Media della classe Multimedia (8025 - 11664, n=57, ultimi 2 anni) | |
| Asus VivoBook Pro 16 | |
| PCMark 10 / Productivity | |
| Media della classe Multimedia (7323 - 18233, n=57, ultimi 2 anni) | |
| MSI Cyborg 15 A12VF | |
| Gigabyte G5 KE | |
| Dell Inspiron 16 Plus 7630 | |
| Asus TUF A15 FA507 | |
| Asus VivoBook Pro 16 | |
| Media Intel Core i7-12700H, Intel Arc A730M (7070 - 7260, n=2) | |
| Intel NUC X15 LAPAC71H | |
| PCMark 10 / Digital Content Creation | |
| Intel NUC X15 LAPAC71H | |
| Dell Inspiron 16 Plus 7630 | |
| Media Intel Core i7-12700H, Intel Arc A730M (10714 - 11691, n=2) | |
| Media della classe Multimedia (3651 - 16240, n=57, ultimi 2 anni) | |
| Asus TUF A15 FA507 | |
| Gigabyte G5 KE | |
| Asus VivoBook Pro 16 | |
| MSI Cyborg 15 A12VF | |
| CrossMark / Overall | |
| Intel NUC X15 LAPAC71H | |
| Media Intel Core i7-12700H, Intel Arc A730M (n=1) | |
| Media della classe Multimedia (866 - 2728, n=67, ultimi 2 anni) | |
| Dell Inspiron 16 Plus 7630 | |
| MSI Cyborg 15 A12VF | |
| Gigabyte G5 KE | |
| Asus VivoBook Pro 16 | |
| Asus TUF A15 FA507 | |
| CrossMark / Productivity | |
| Intel NUC X15 LAPAC71H | |
| Media Intel Core i7-12700H, Intel Arc A730M (n=1) | |
| Dell Inspiron 16 Plus 7630 | |
| Media della classe Multimedia (931 - 2489, n=67, ultimi 2 anni) | |
| Gigabyte G5 KE | |
| MSI Cyborg 15 A12VF | |
| Asus VivoBook Pro 16 | |
| Asus TUF A15 FA507 | |
| CrossMark / Creativity | |
| Media della classe Multimedia (907 - 3465, n=67, ultimi 2 anni) | |
| Dell Inspiron 16 Plus 7630 | |
| Intel NUC X15 LAPAC71H | |
| Media Intel Core i7-12700H, Intel Arc A730M (n=1) | |
| MSI Cyborg 15 A12VF | |
| Gigabyte G5 KE | |
| Asus TUF A15 FA507 | |
| Asus VivoBook Pro 16 | |
| CrossMark / Responsiveness | |
| Intel NUC X15 LAPAC71H | |
| Media Intel Core i7-12700H, Intel Arc A730M (n=1) | |
| Gigabyte G5 KE | |
| Asus VivoBook Pro 16 | |
| MSI Cyborg 15 A12VF | |
| Dell Inspiron 16 Plus 7630 | |
| Media della classe Multimedia (605 - 2024, n=67, ultimi 2 anni) | |
| Asus TUF A15 FA507 | |
| PCMark 10 Score | 6845 punti | |
Aiuto | ||
| AIDA64 / Memory Copy | |
| Media della classe Multimedia (21158 - 132135, n=61, ultimi 2 anni) | |
| Intel NUC X15 LAPAC71H | |
| Dell Inspiron 16 Plus 7630 | |
| MSI Cyborg 15 A12VF | |
| Media Intel Core i7-12700H (25615 - 80511, n=64) | |
| Asus TUF A15 FA507 | |
| Gigabyte G5 KE | |
| Asus VivoBook Pro 16 | |
| AIDA64 / Memory Read | |
| Media della classe Multimedia (19699 - 174586, n=61, ultimi 2 anni) | |
| Dell Inspiron 16 Plus 7630 | |
| Intel NUC X15 LAPAC71H | |
| MSI Cyborg 15 A12VF | |
| Media Intel Core i7-12700H (25586 - 79442, n=64) | |
| Asus TUF A15 FA507 | |
| Gigabyte G5 KE | |
| Asus VivoBook Pro 16 | |
| AIDA64 / Memory Write | |
| Media della classe Multimedia (17733 - 134998, n=61, ultimi 2 anni) | |
| Intel NUC X15 LAPAC71H | |
| Dell Inspiron 16 Plus 7630 | |
| MSI Cyborg 15 A12VF | |
| Asus TUF A15 FA507 | |
| Media Intel Core i7-12700H (23679 - 88660, n=64) | |
| Gigabyte G5 KE | |
| Asus VivoBook Pro 16 | |
| AIDA64 / Memory Latency | |
| Media della classe Multimedia (7 - 535, n=60, ultimi 2 anni) | |
| Gigabyte G5 KE | |
| Dell Inspiron 16 Plus 7630 | |
| Asus VivoBook Pro 16 | |
| MSI Cyborg 15 A12VF | |
| Intel NUC X15 LAPAC71H | |
| Asus TUF A15 FA507 | |
| Media Intel Core i7-12700H (76.2 - 133.9, n=62) | |
* ... Meglio usare valori piccoli
Latenza DPC
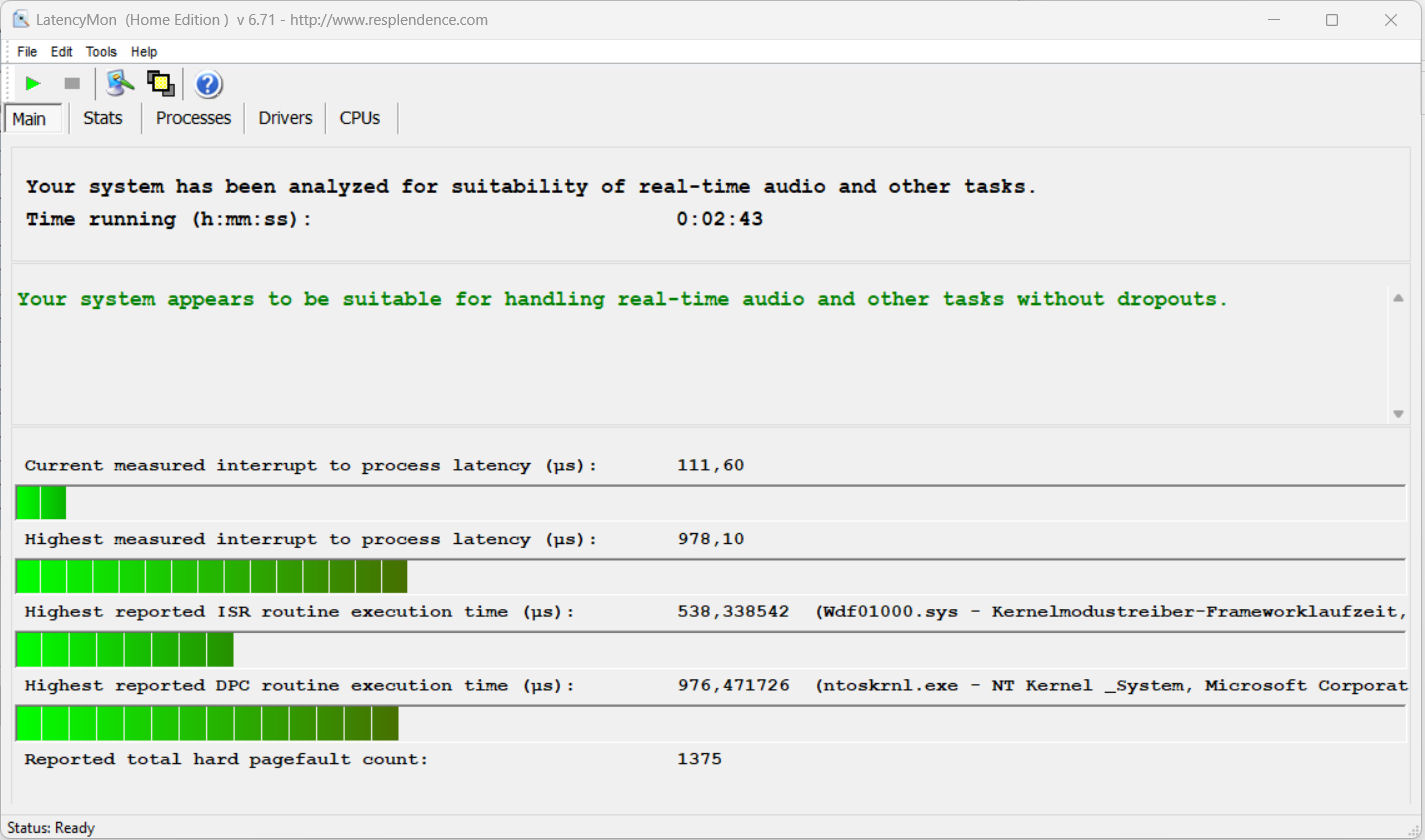
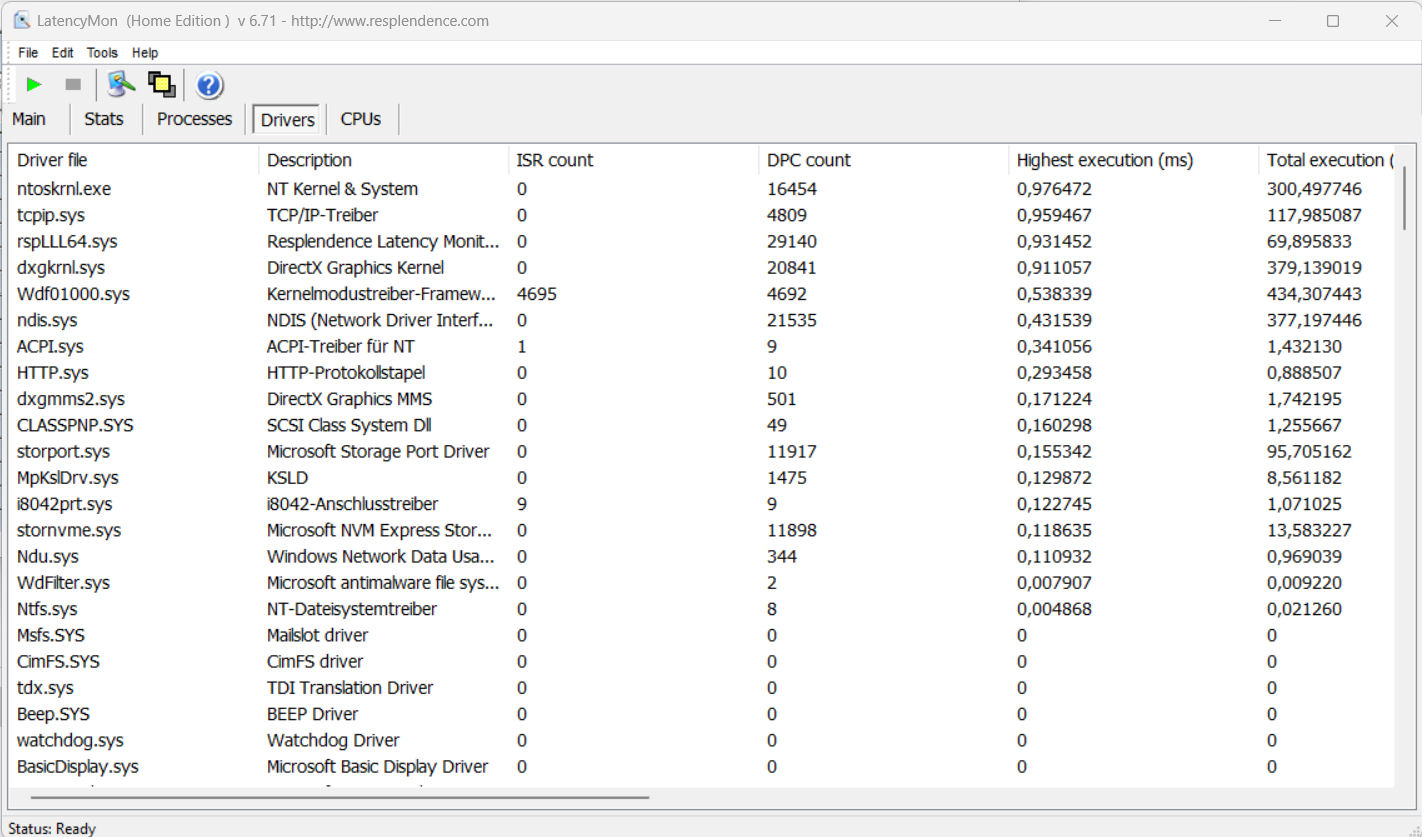
Il test standardizzato di monitoraggio della latenza (navigazione web, riproduzione video 4k, Prime95 ad alto carico) non ha rivelato alcuna anomalia. Il sistema sembra essere adatto all'editing video e audio in tempo reale. I futuri aggiornamenti del software potrebbero portare a miglioramenti o addirittura a degradazioni.
| DPC Latencies / LatencyMon - interrupt to process latency (max), Web, Youtube, Prime95 | |
| Asus VivoBook Pro 16 | |
| MSI Cyborg 15 A12VF | |
| Dell Inspiron 16 Plus 7630 | |
| Gigabyte G5 KE | |
| Intel NUC X15 LAPAC71H | |
* ... Meglio usare valori piccoli
Dispositivi di archiviazione
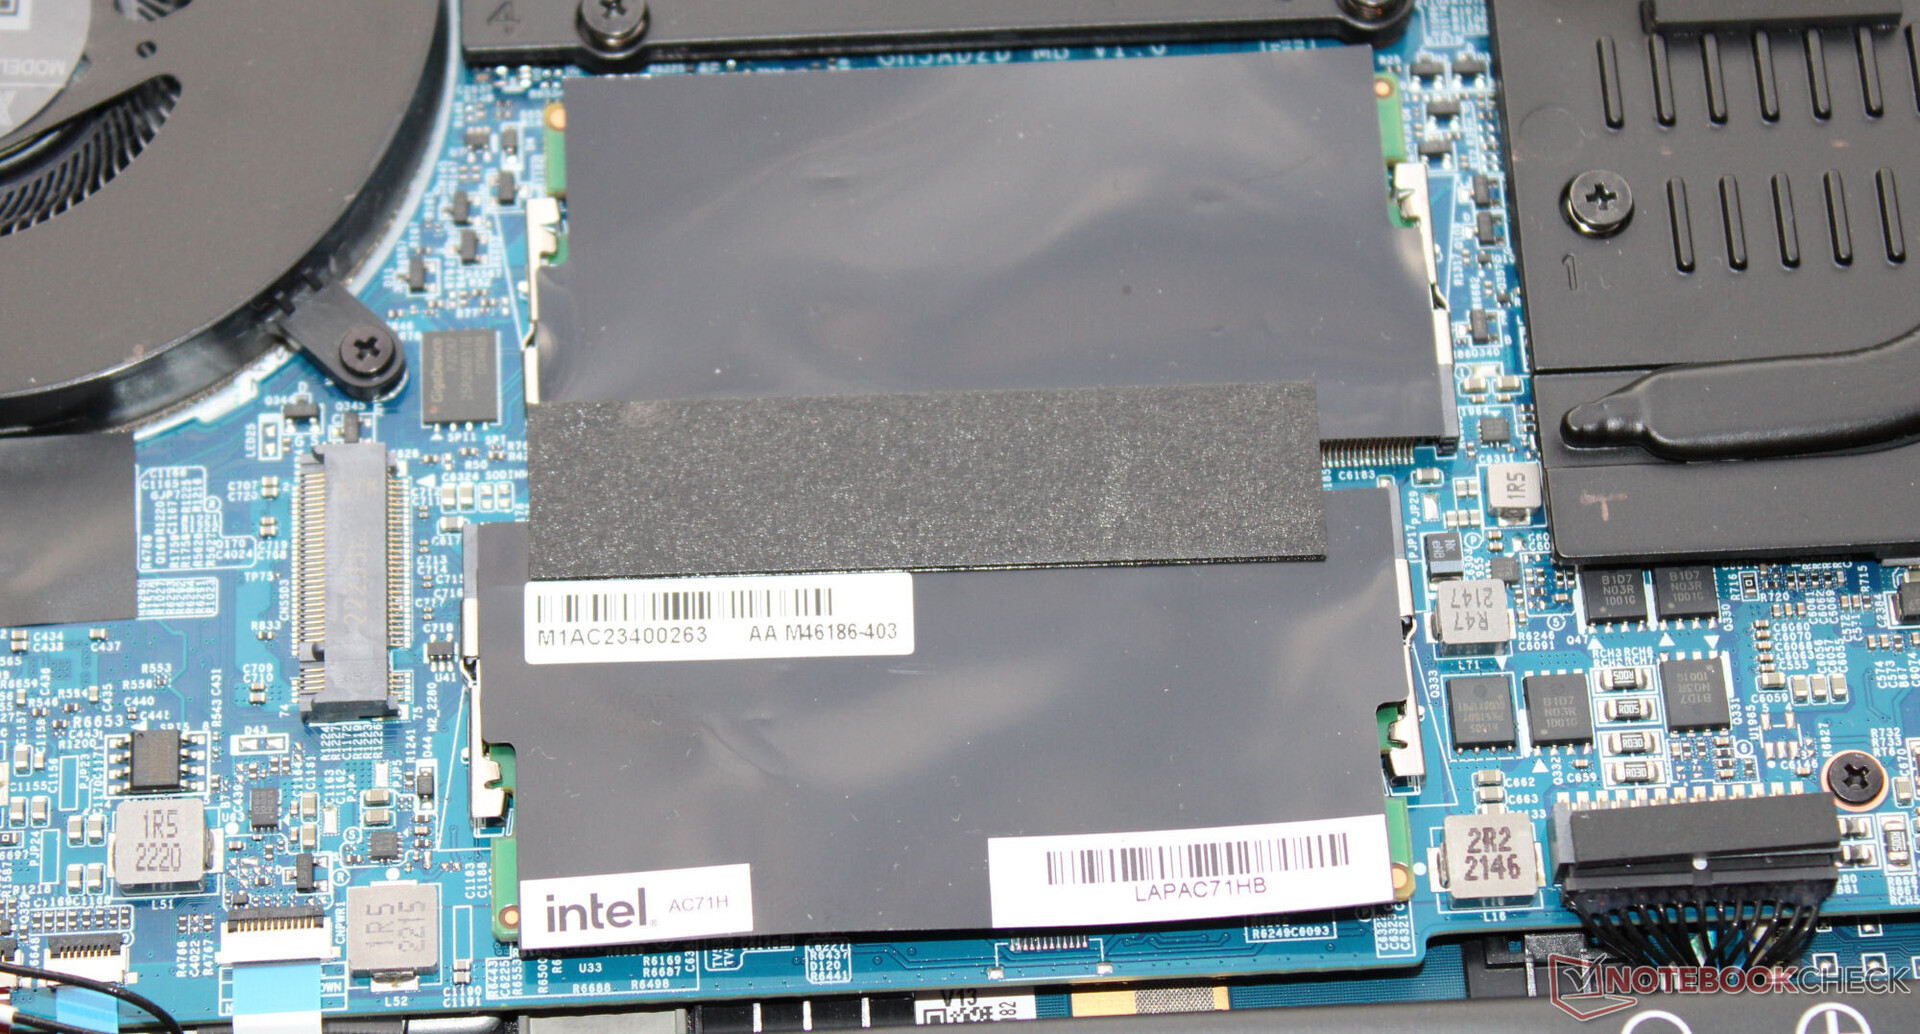
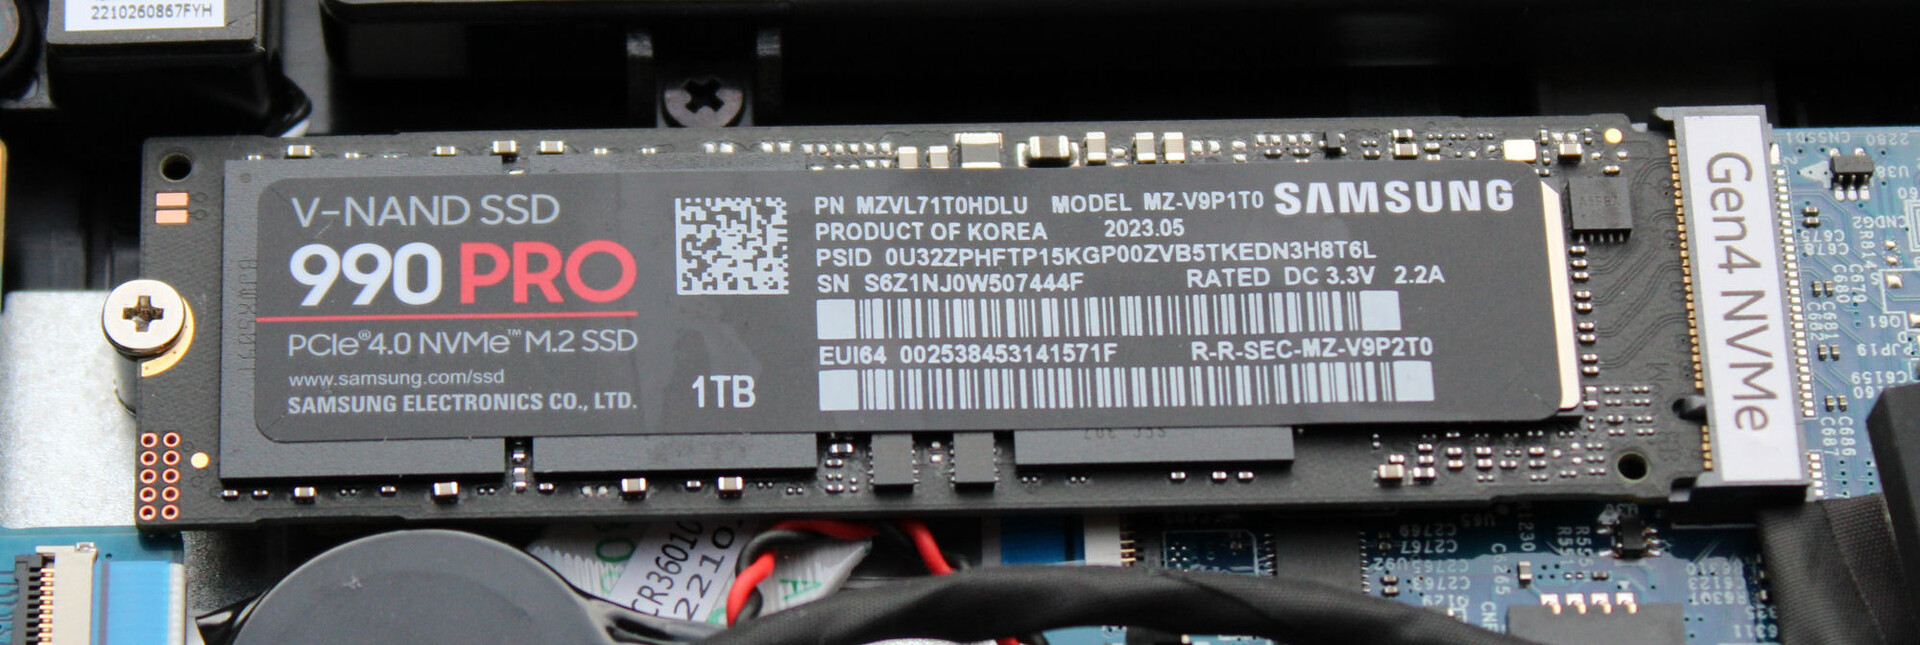
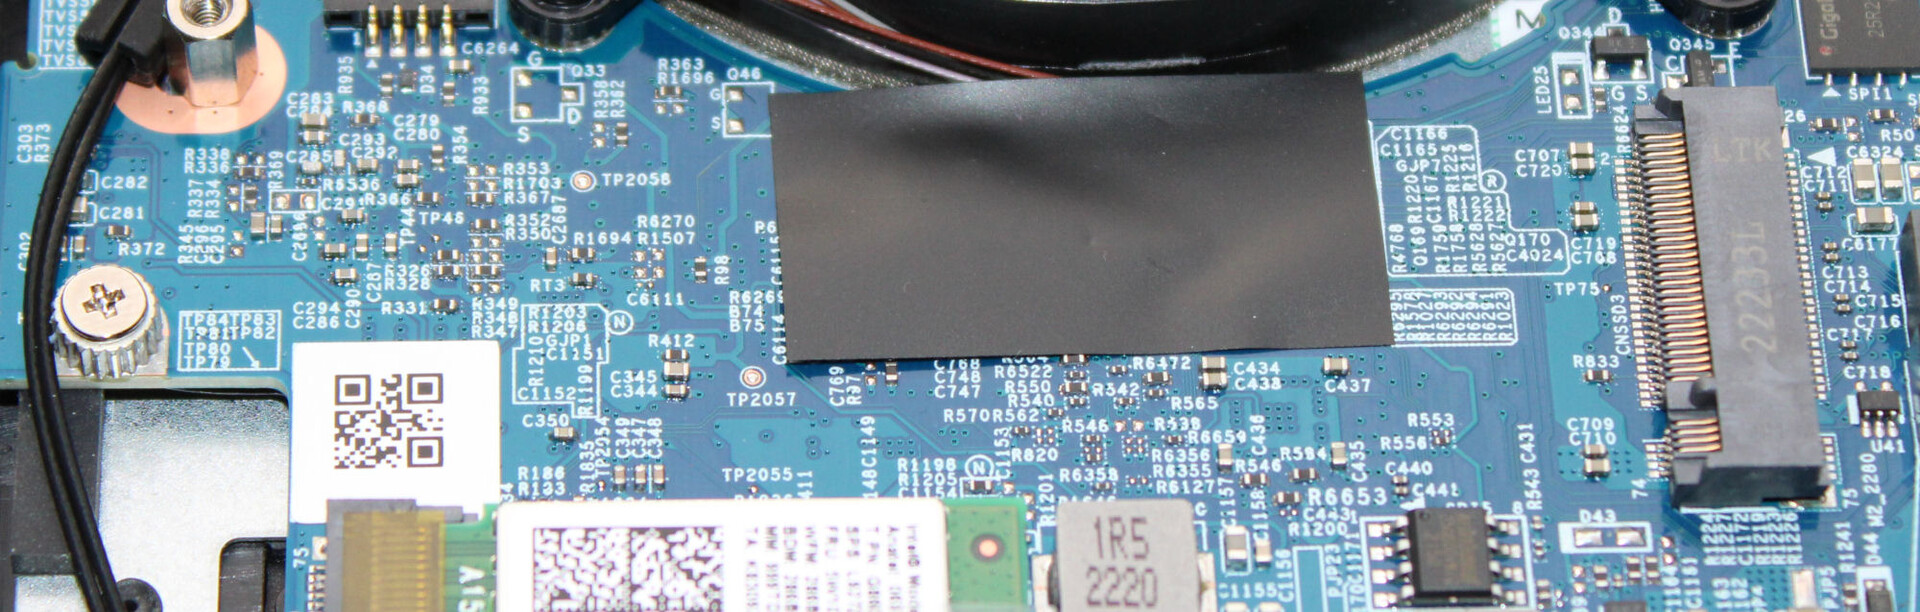
Il portatile può ospitare due SSD M.2-2280 (1x PCIe 4.0, 1x PCIe 3.0/SATA). È supportato il RAID-0/1. L'SSD Samsung (1 TB, PCIe 4, M.2-2280) all'interno del nostro dispositivo di prova ha fornito eccellenti velocità di trasferimento. Positivo: Non si è verificato il throttling termico.

* ... Meglio usare valori piccoli
Reading continuous performance: DiskSpd Read Loop, Queue Depth 8
Scheda grafica
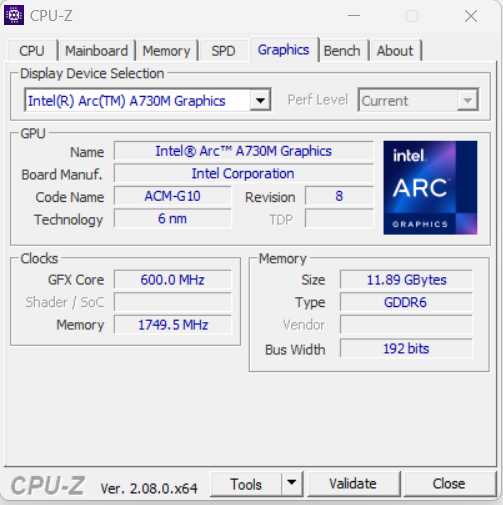
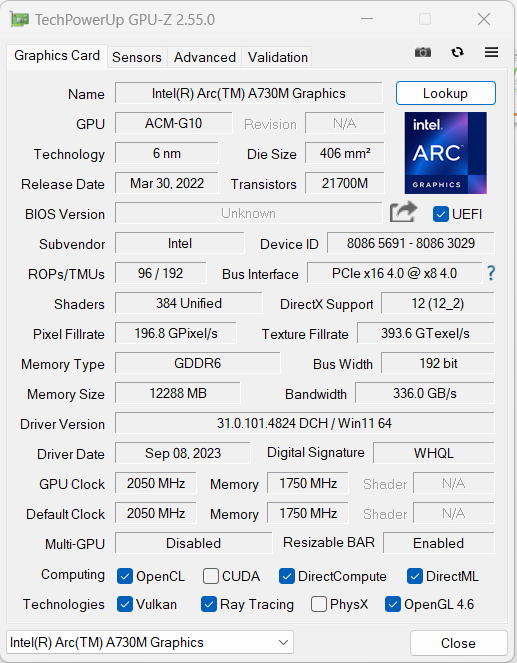
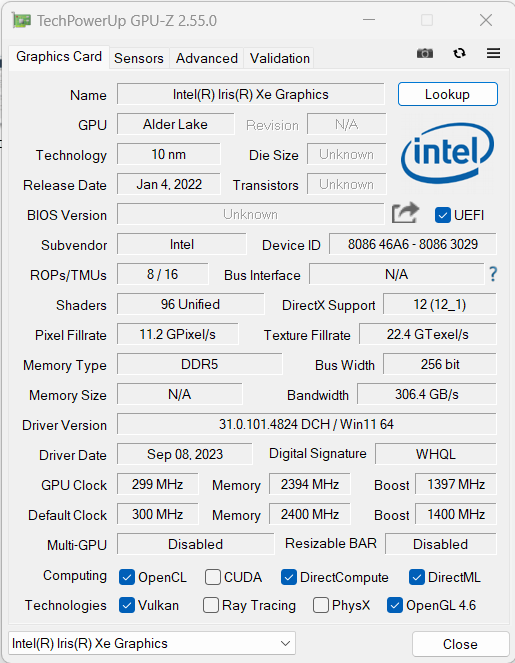
IlArc A730M- la seconda DGPU mobile più potente di Intel - ha un TGP massimo di 85 watt, si affida alla memoria GDDR6 superveloce (12.288 GB) e può raggiungere una frequenza di clock massima di 2,05 GHz. Il core grafico è adatto ai giochi FHD con impostazioni medio-alte. I giochi meno esigenti consentono di ottenere di più.
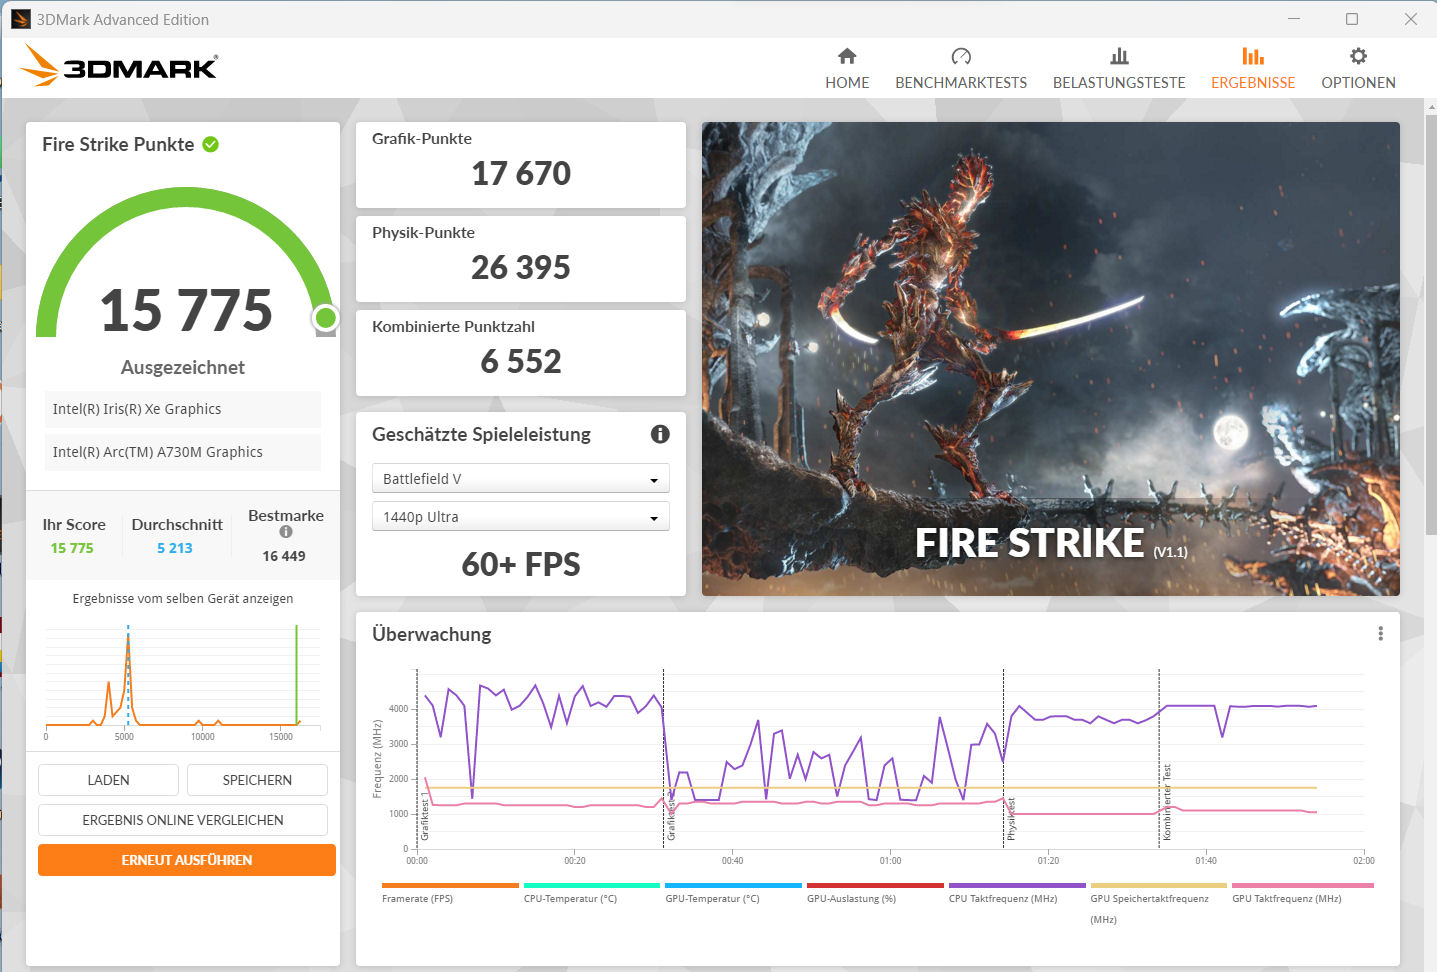
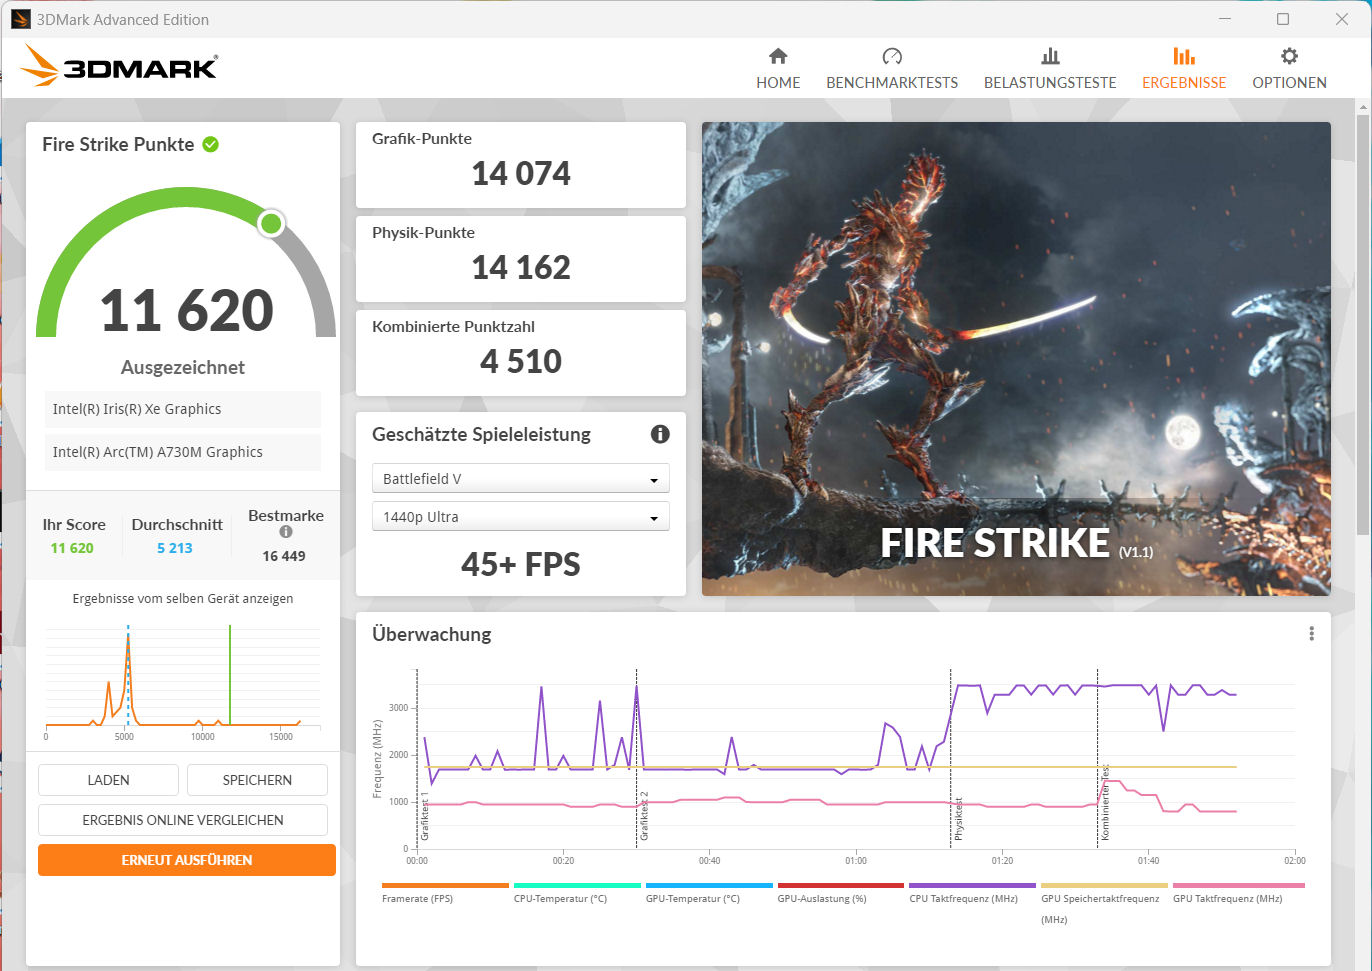
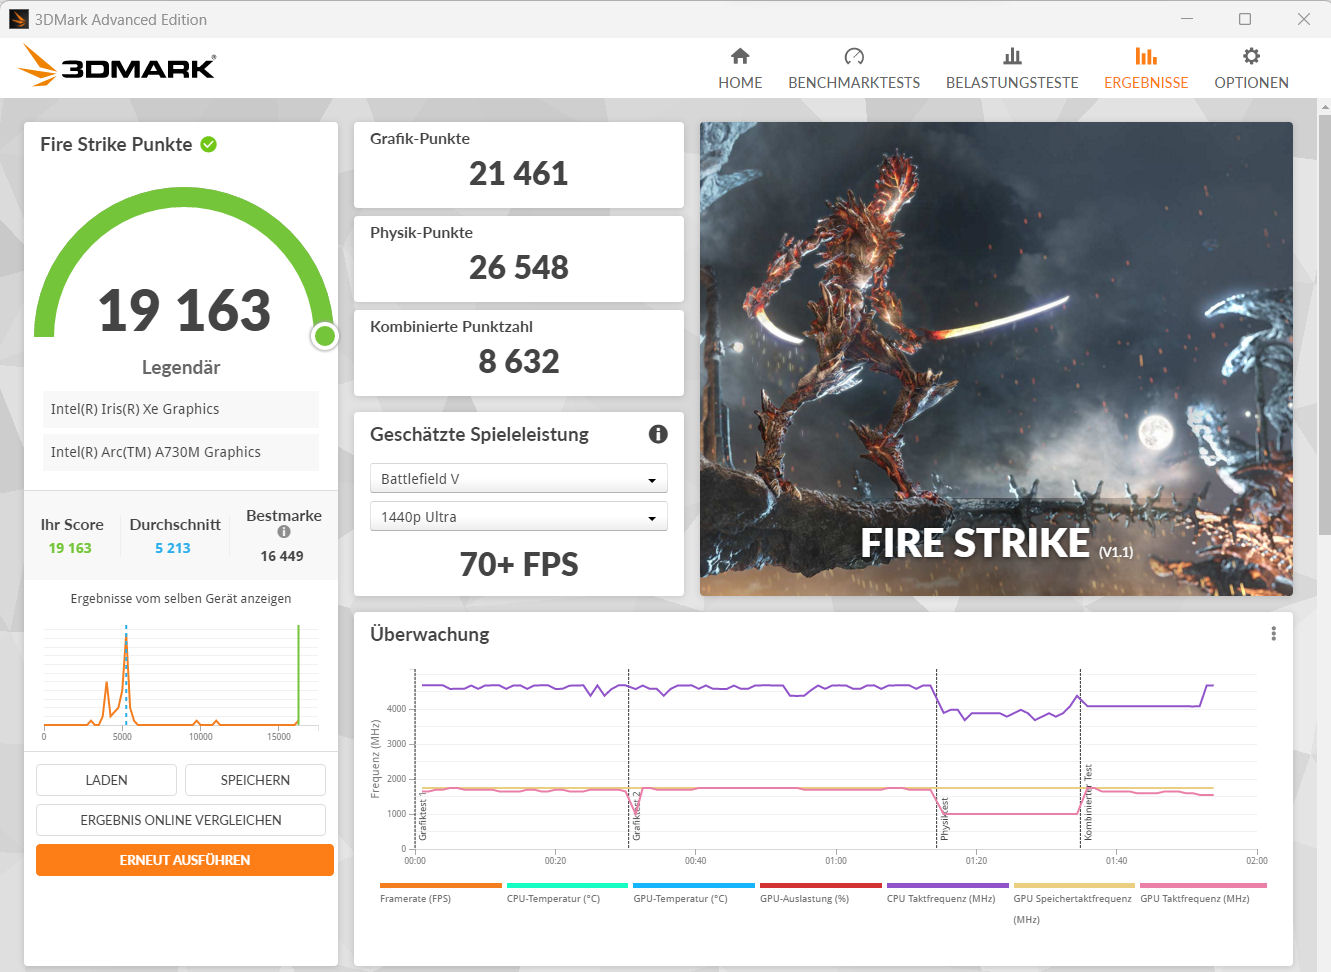
Le prestazioni della GPU dipendono molto dalla modalità di prestazioni utilizzata: Il profilo "Prestazioni" ha portato a risultati di benchmark inferiori (benchmark sintetici) o alla pari (pratica di gioco) con la media della GPU determinata in precedenza. Le prestazioni massime sono state ottenute quando era attiva la modalità "Benchmark" (TGP: 85 watt). Nel complesso, la GPU si è classificata tra laGeForce RTX 3050 eRTX 3060 in termini di prestazioni.
| 3DMark Performance rating - Percent | |
| Asus TUF A15 FA507 -1! | |
| Gigabyte G5 KE | |
| MSI Cyborg 15 A12VF | |
| Dell Inspiron 16 Plus 7630 -1! | |
| Media Intel Arc A730M | |
| Intel NUC X15 LAPAC71H | |
| Media della classe Multimedia | |
| Asus VivoBook Pro 16 | |
| 3DMark 11 Performance | 23160 punti | |
| 3DMark Cloud Gate Standard Score | 46415 punti | |
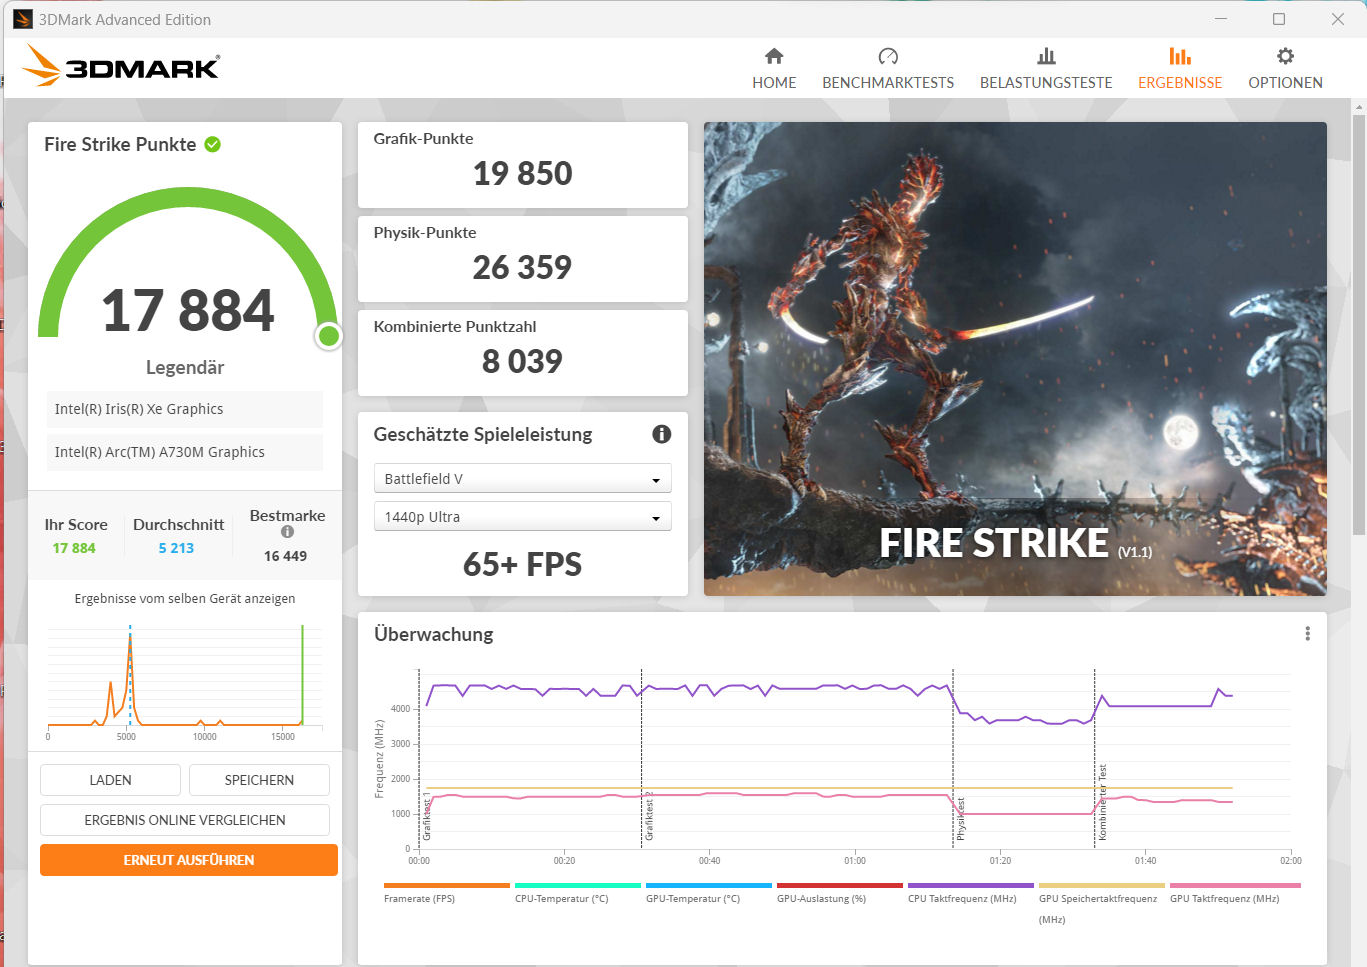
| 3DMark Fire Strike Score | 17884 punti | |
| 3DMark Time Spy Score | 7653 punti | |
Aiuto | ||
* ... Meglio usare valori piccoli
| The Witcher 3 - 1920x1080 Ultra Graphics & Postprocessing (HBAO+) | |
| Dell Inspiron 16 Plus 7630 | |
| Gigabyte G5 KE | |
| Asus TUF A15 FA507 | |
| MSI Cyborg 15 A12VF | |
| Media della classe Multimedia (11 - 121, n=13, ultimi 2 anni) | |
| Asus VivoBook Pro 16 | |
| Media Intel Arc A730M (39.8 - 49.4, n=2) | |
| Intel NUC X15 LAPAC71H | |
| GTA V - 1920x1080 Highest AA:4xMSAA + FX AF:16x | |
| Gigabyte G5 KE | |
| MSI Cyborg 15 A12VF | |
| Asus TUF A15 FA507 | |
| Media della classe Multimedia (7.92 - 141.6, n=63, ultimi 2 anni) | |
| Asus VivoBook Pro 16 | |
| Media Intel Arc A730M (40.1 - 43.1, n=3) | |
| Intel NUC X15 LAPAC71H | |
| Final Fantasy XV Benchmark - 1920x1080 High Quality | |
| Gigabyte G5 KE | |
| Dell Inspiron 16 Plus 7630 | |
| Asus TUF A15 FA507 | |
| MSI Cyborg 15 A12VF | |
| Media della classe Multimedia (7.61 - 144.4, n=66, ultimi 2 anni) | |
| Asus VivoBook Pro 16 | |
| Media Intel Arc A730M (41.1 - 49.7, n=3) | |
| Intel NUC X15 LAPAC71H | |
| Strange Brigade - 1920x1080 ultra AA:ultra AF:16 | |
| Dell Inspiron 16 Plus 7630 | |
| Gigabyte G5 KE | |
| Asus TUF A15 FA507 | |
| MSI Cyborg 15 A12VF | |
| Media Intel Arc A730M (116.6 - 137.7, n=3) | |
| Intel NUC X15 LAPAC71H | |
| Media della classe Multimedia (13.3 - 303, n=66, ultimi 2 anni) | |
| Asus VivoBook Pro 16 | |
| Dota 2 Reborn - 1920x1080 ultra (3/3) best looking | |
| Dell Inspiron 16 Plus 7630 | |
| Gigabyte G5 KE | |
| MSI Cyborg 15 A12VF | |
| Asus TUF A15 FA507 | |
| Asus VivoBook Pro 16 | |
| Intel NUC X15 LAPAC71H | |
| Media della classe Multimedia (29 - 179.9, n=68, ultimi 2 anni) | |
| Media Intel Arc A730M (80.4 - 91.9, n=3) | |
Witcher 3 FPS diagram
| basso | medio | alto | ultra | |
|---|---|---|---|---|
| GTA V (2015) | 177.4 | 170.6 | 94.3 | 40.1 |
| The Witcher 3 (2015) | 267.3 | 190.3 | 106.9 | 39.8 |
| Dota 2 Reborn (2015) | 102.2 | 101.6 | 96.8 | 91.9 |
| Final Fantasy XV Benchmark (2018) | 98.5 | 67.9 | 41.1 | |
| X-Plane 11.11 (2018) | 70.7 | 55.8 | 47.6 | |
| Strange Brigade (2018) | 377 | 167.8 | 140 | 116.6 |
| Control (2019) | 145.7 | 66 | 51.1 | |
| Flight Simulator 2020 (2020) | 69.3 | 44.2 | 33.7 | 25.7 |
| Cyberpunk 2077 1.6 (2022) | 70.5 | 57.5 | 50.4 | 47 |
| Uncharted Legacy of Thieves Collection (2022) | 31.3 | 35.3 | 27.6 | 26.7 |
| Call of Duty Modern Warfare 2 2022 (2022) | 77 | 65 | 56 | 55 |
| Spider-Man Miles Morales (2022) | 60.5 | 58 | 53.4 | 51.4 |
| The Callisto Protocol (2022) | 80.2 | 72.6 | 67.9 | 47.5 |
| Need for Speed Unbound (2022) | 59.8 | 52.5 | 44.7 | 37.9 |
| High On Life (2023) | 147.9 | 110.1 | 80.9 | 64.7 |
| The Witcher 3 v4 (2023) | 126.2 | 102.8 | 51.2 | 44.4 |
| Dead Space Remake (2023) | 48.2 | 46.7 | 42.2 | 41.3 |
| Hogwarts Legacy (2023) | 69.6 | 48.6 | 43.7 | 34.3 |
| Returnal (2023) | 55 | 53 | 49 | 41 |
| Atomic Heart (2023) | 100.1 | 73.3 | 51.1 | 37.5 |
| Company of Heroes 3 (2023) | 111.3 | 90.6 | 74 | 72.8 |
| Sons of the Forest (2023) | 53.1 | 35.2 | 34.9 | 34.2 |
| Resident Evil 4 Remake (2023) | 86.4 | 64.9 | 60 | 41.3 |
| The Last of Us (2023) | 34.3 | 32.2 | 31.3 | 28.7 |
| Star Wars Jedi Survivor (2023) | 44 | 39.4 | 36.7 | 34.7 |
| Diablo 4 (2023) | 129.7 | 115.6 | 104.5 | 87.8 |
| F1 23 (2023) | 164.9 | 150.3 | 109.6 | 33.1 |
| Ratchet & Clank Rift Apart (2023) | 55.4 | 50.7 | 42.5 | 42.1 |
| Atlas Fallen (2023) | 78 | 74.1 | 70.4 | 59.2 |
| Starfield (2023) | 34 | 30.1 | 24.8 | 22 |
| The Crew Motorfest (2023) | 60 | 57 | 50 | 46 |
| Lies of P (2023) | 97 | 85.8 | 75.1 | 67 |
| Baldur's Gate 3 (2023) | 74.6 | 63 | 55.1 | 52.8 |
| Cyberpunk 2077 (2023) | 71.6 | 57 | 50 | 47.7 |
| EA Sports FC 24 (2023) | 121.8 | |||
| Assassin's Creed Mirage (2023) | 60 | 55 | 55 | 44 |
| Total War Pharaoh (2023) | 207.4 | 121.7 | 74.9 | 60.9 |
| Lords of the Fallen (2023) | 45.1 | 40.1 | 36.8 | 35.4 |
Emissioni e potenza - Il NUC X15 offre tempi di esecuzione scarsi
Emissioni di rumore
Quando si gioca, le emissioni acustiche del portatile aumentano fino a 51 dB(A) ("Performance"). la modalità "Benchmark" porta a emissioni ancora più forti, poiché le ventole funzionano costantemente alla massima velocità. In modalità idle e nell'uso quotidiano (ufficio, internet), il NUC è molto più silenzioso. Tuttavia: Una delle due ventole funziona costantemente a bassa velocità. Attivando l'impostazione "Modalità di raffreddamento passivo" all'interno del NUC Software Studio, questo può essere evitato.
Rumorosità
| Idle |
| 23 / 24 / 24 dB(A) |
| Sotto carico |
| 50.61 / 50.89 dB(A) |
 | ||
30 dB silenzioso 40 dB(A) udibile 50 dB(A) rumoroso |
||
min: | ||
| Intel NUC X15 LAPAC71H A730M, i7-12700H, Samsung 990 Pro 1 TB | Asus TUF A15 FA507 GeForce RTX 4050 Laptop GPU, R7 7735HS, Micron 2400 MTFDKBA512QFM | Gigabyte G5 KE GeForce RTX 3060 Laptop GPU, i5-12500H, Gigabyte AG4512G-SI B10 | Dell Inspiron 16 Plus 7630 GeForce RTX 4060 Laptop GPU, i7-13700H, WD PC SN740 SDDPTQD-1T00 | Asus VivoBook Pro 16 GeForce RTX 3050 Ti Laptop GPU, i7-12700H, Intel SSD 670p SSDPEKNU010TZ | MSI Cyborg 15 A12VF GeForce RTX 4060 Laptop GPU, i7-12650H, Samsung PM9B1 1024GB MZVL41T0HBLB | |
|---|---|---|---|---|---|---|
| Noise | 11% | -15% | 4% | -10% | -28% | |
| off /ambiente * (dB) | 23 | 23.3 -1% | 19.52 15% | 23.2 -1% | 25.2 -10% | 27 -17% |
| Idle Minimum * (dB) | 23 | 23.3 -1% | 31.05 -35% | 23.2 -1% | 25.2 -10% | 27 -17% |
| Idle Average * (dB) | 24 | 23.3 3% | 31.05 -29% | 23.2 3% | 25.2 -5% | 37.5 -56% |
| Idle Maximum * (dB) | 24 | 23.3 3% | 31.05 -29% | 23.2 3% | 25.2 -5% | 38 -58% |
| Load Average * (dB) | 50.61 | 29.6 42% | 55.66 -10% | 35.1 31% | 55.1 -9% | 56.3 -11% |
| Witcher 3 ultra * (dB) | 50.65 | 43 15% | 55.7 -10% | 52.5 -4% | ||
| Load Maximum * (dB) | 50.89 | 43 16% | 55.51 -9% | 52.5 -3% | 61.5 -21% | 56.3 -11% |
* ... Meglio usare valori piccoli
Temperatura
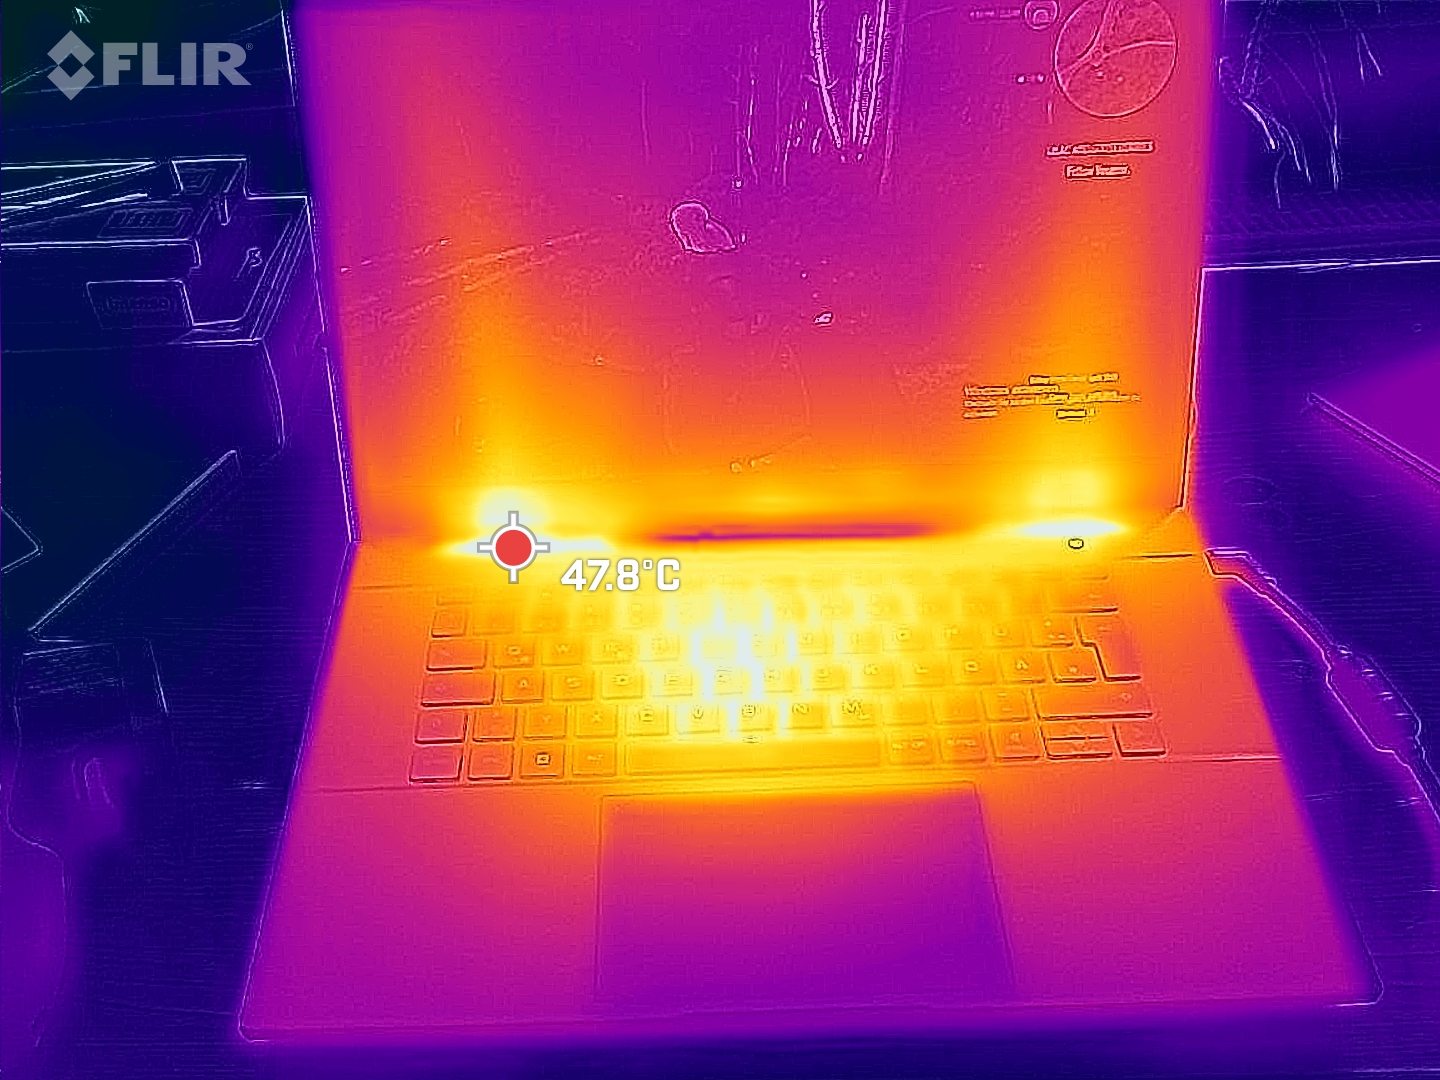
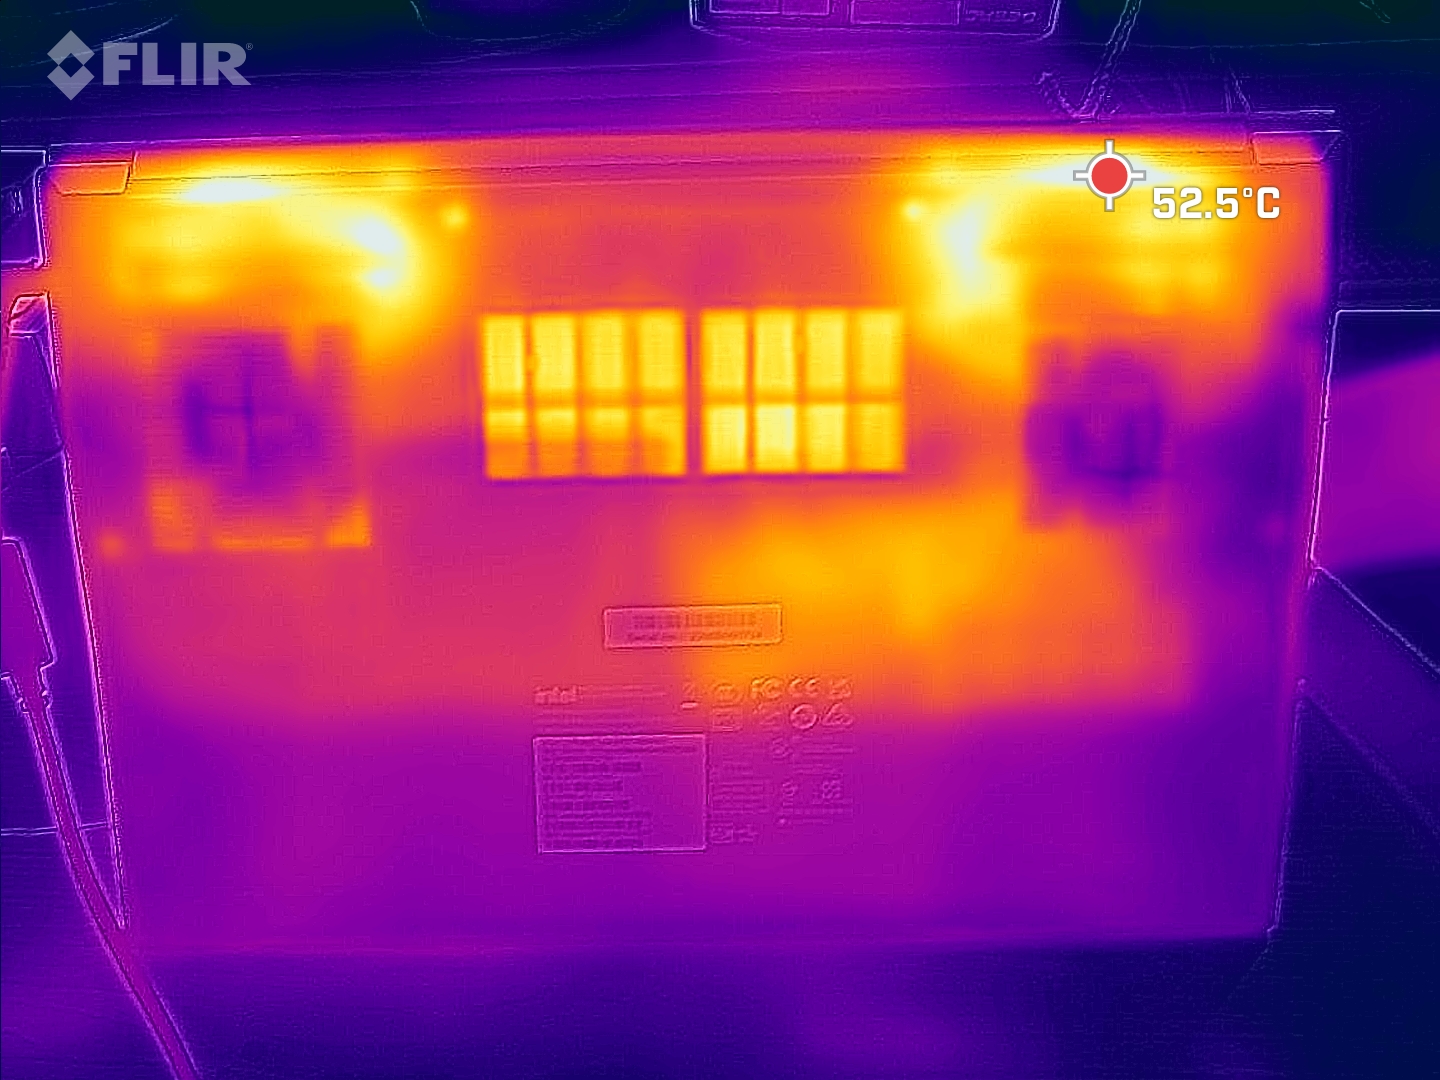
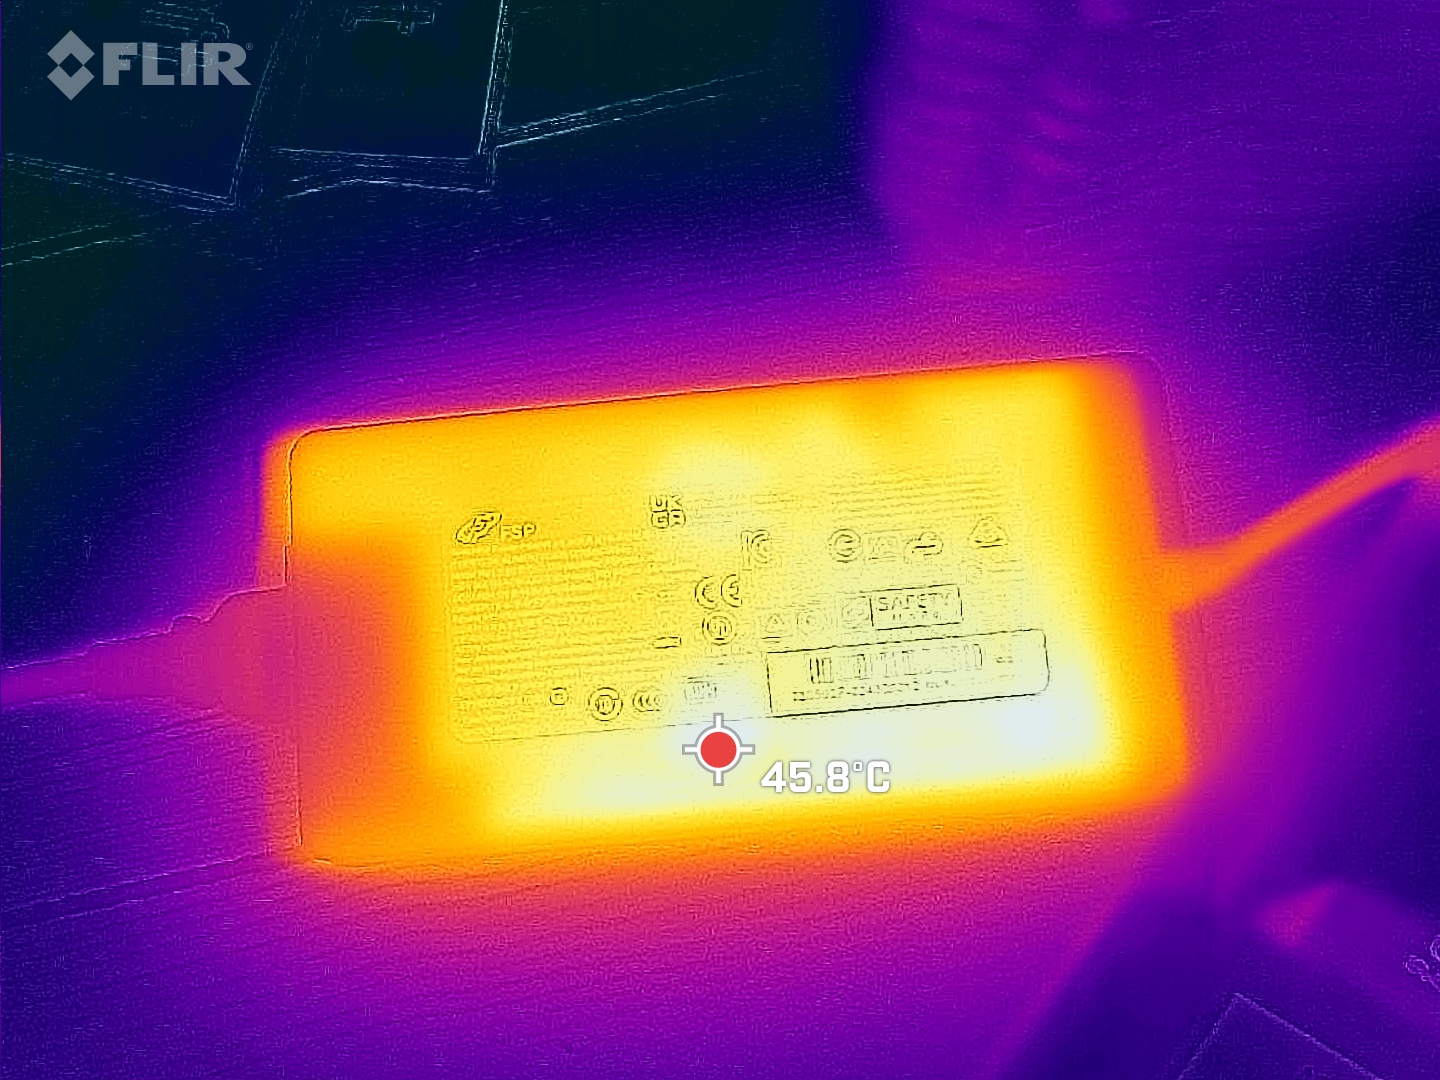
I carichi elevati (stress test, Witcher 3 test) provocano un notevole riscaldamento del portatile in alcune aree. Nel complesso, i valori non hanno mai raggiunto livelli critici. Le temperature del case rimangono nella zona verde nell'uso quotidiano (ufficio, internet).
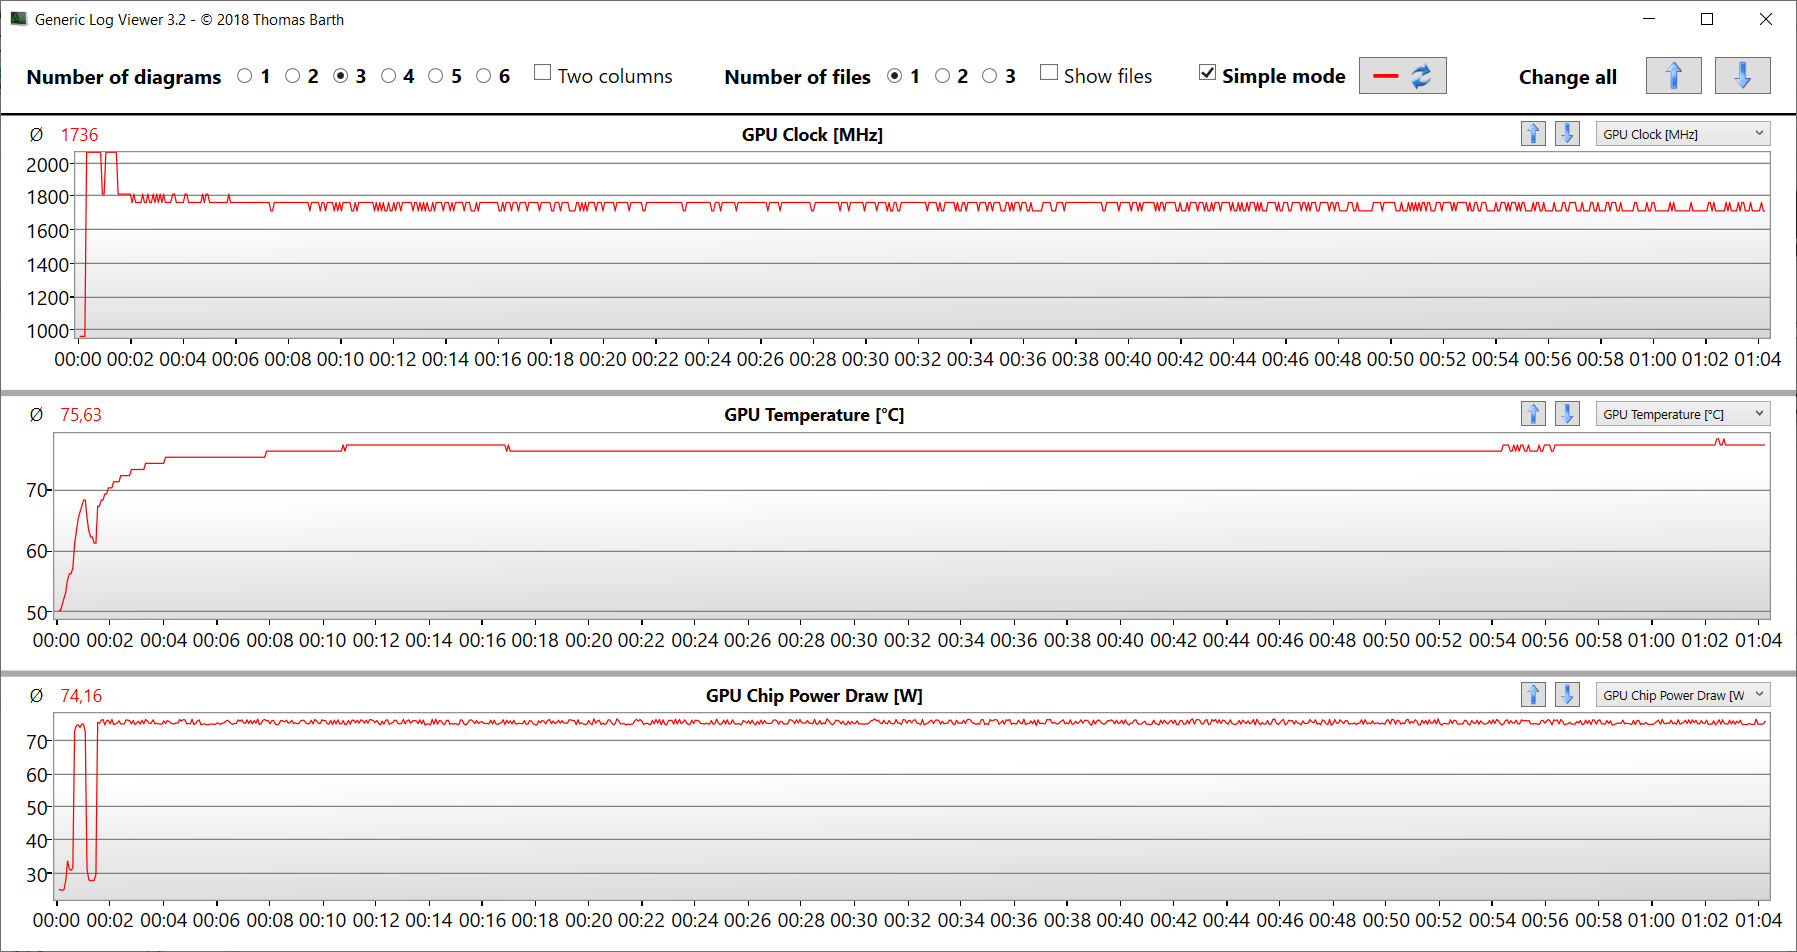
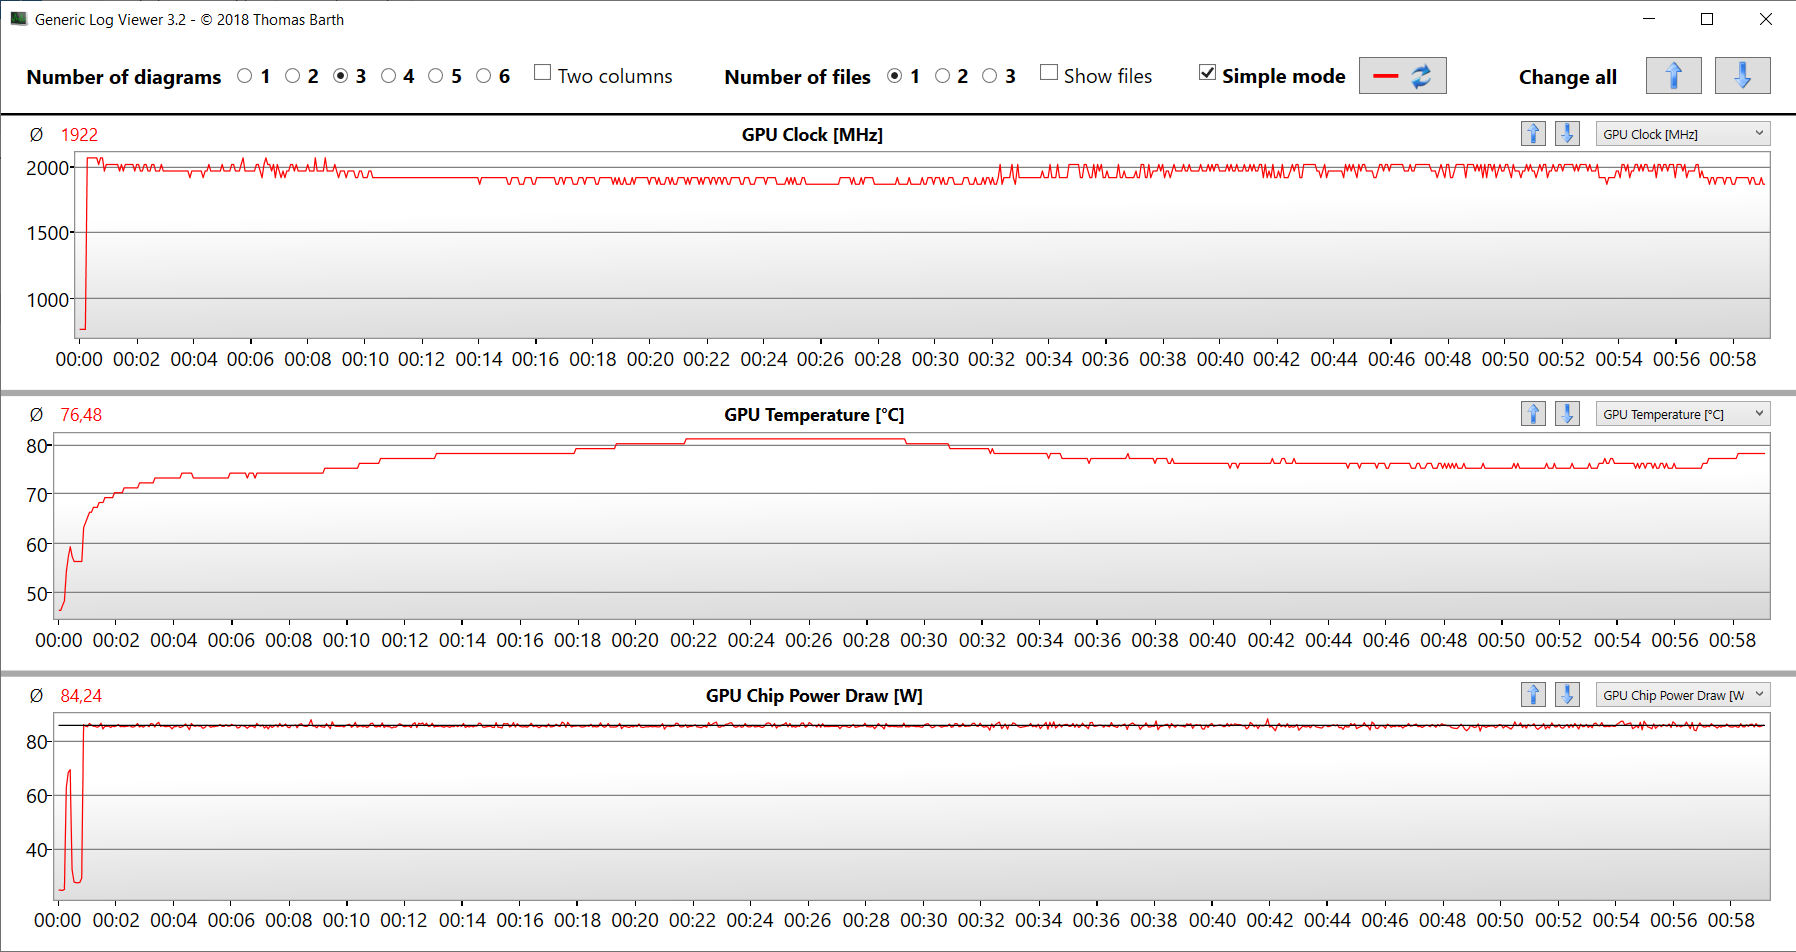
Il test di stress (Prime95 e Furmark in funzionamento continuo) simula uno scenario estremo per testare la stabilità del sistema sotto pieno carico. Le frequenze di clock della CPU e della GPU hanno fluttuato nell'intervallo medio.
(-) La temperatura massima sul lato superiore è di 59 °C / 138 F, rispetto alla media di 36.8 °C / 98 F, che varia da 21 a 71 °C per questa classe Multimedia.
(-) Il lato inferiore si riscalda fino ad un massimo di 51 °C / 124 F, rispetto alla media di 39.1 °C / 102 F
(+) In idle, la temperatura media del lato superiore è di 27.3 °C / 81 F, rispetto alla media deld ispositivo di 31.3 °C / 88 F.
(-) Riproducendo The Witcher 3, la temperatura media per il lato superiore e' di 40.9 °C / 106 F, rispetto alla media del dispositivo di 31.3 °C / 88 F.
(±) I poggiapolsi e il touchpad possono diventare molto caldi al tatto con un massimo di 36 °C / 96.8 F.
(-) La temperatura media della zona del palmo della mano di dispositivi simili e'stata di 28.7 °C / 83.7 F (-7.3 °C / -13.1 F).
| Intel NUC X15 LAPAC71H Intel Core i7-12700H, Intel Arc A730M | Asus TUF A15 FA507 AMD Ryzen 7 7735HS, NVIDIA GeForce RTX 4050 Laptop GPU | Gigabyte G5 KE Intel Core i5-12500H, NVIDIA GeForce RTX 3060 Laptop GPU | Dell Inspiron 16 Plus 7630 Intel Core i7-13700H, NVIDIA GeForce RTX 4060 Laptop GPU | Asus VivoBook Pro 16 Intel Core i7-12700H, NVIDIA GeForce RTX 3050 Ti Laptop GPU | MSI Cyborg 15 A12VF Intel Core i7-12650H, NVIDIA GeForce RTX 4060 Laptop GPU | |
|---|---|---|---|---|---|---|
| Heat | 10% | -12% | -2% | -6% | 13% | |
| Maximum Upper Side * (°C) | 59 | 48.9 17% | 52.6 11% | 47.8 19% | 44.2 25% | 47.5 19% |
| Maximum Bottom * (°C) | 51 | 44.6 13% | 62.4 -22% | 42.2 17% | 53 -4% | 35.5 30% |
| Idle Upper Side * (°C) | 28 | 27.1 3% | 33.6 -20% | 35.2 -26% | 32.1 -15% | 27.7 1% |
| Idle Bottom * (°C) | 30 | 27.5 8% | 34.8 -16% | 35 -17% | 38.4 -28% | 29.5 2% |
* ... Meglio usare valori piccoli
Altoparlanti
Gli altoparlanti stereo producono un suono decente, ma con pochi bassi.
Intel NUC X15 LAPAC71H analisi audio
(±) | potenza degli altiparlanti media ma buona (79.38 dB)
Bassi 100 - 315 Hz
(-) | quasi nessun basso - in media 17.1% inferiori alla media
(±) | la linearità dei bassi è media (14.2% delta rispetto alla precedente frequenza)
Medi 400 - 2000 Hz
(+) | medi bilanciati - solo only 1.7% rispetto alla media
(+) | medi lineari (3.8% delta rispetto alla precedente frequenza)
Alti 2 - 16 kHz
(+) | Alti bilanciati - appena 2.2% dalla media
(+) | alti lineari (5.4% delta rispetto alla precedente frequenza)
Nel complesso 100 - 16.000 Hz
(+) | suono nel complesso lineare (12.1% differenza dalla media)
Rispetto alla stessa classe
» 22% di tutti i dispositivi testati in questa classe è stato migliore, 3% simile, 76% peggiore
» Il migliore ha avuto un delta di 5%, medio di 17%, peggiore di 45%
Rispetto a tutti i dispositivi testati
» 9% di tutti i dispositivi testati in questa classe è stato migliore, 2% similare, 88% peggiore
» Il migliore ha avuto un delta di 4%, medio di 24%, peggiore di 134%
Dell Inspiron 16 Plus 7630 analisi audio
(±) | potenza degli altiparlanti media ma buona (81.8 dB)
Bassi 100 - 315 Hz
(-) | quasi nessun basso - in media 17% inferiori alla media
(±) | la linearità dei bassi è media (8.4% delta rispetto alla precedente frequenza)
Medi 400 - 2000 Hz
(±) | medi elevati - circa 6.3% superiore alla media
(+) | medi lineari (6.2% delta rispetto alla precedente frequenza)
Alti 2 - 16 kHz
(+) | Alti bilanciati - appena 2.2% dalla media
(+) | alti lineari (5.6% delta rispetto alla precedente frequenza)
Nel complesso 100 - 16.000 Hz
(±) | la linearità complessiva del suono è media (15.9% di differenza rispetto alla media
Rispetto alla stessa classe
» 40% di tutti i dispositivi testati in questa classe è stato migliore, 6% simile, 54% peggiore
» Il migliore ha avuto un delta di 5%, medio di 17%, peggiore di 45%
Rispetto a tutti i dispositivi testati
» 25% di tutti i dispositivi testati in questa classe è stato migliore, 5% similare, 70% peggiore
» Il migliore ha avuto un delta di 4%, medio di 24%, peggiore di 134%
Consumo di energia
Il consumo energetico del portatile è al livello previsto per l'hardware installato. Il test di stress e il Witcher 3 test sono stati eseguiti con livelli di consumo energetico (leggermente) fluttuanti. L'alimentatore incluso (230 watt) è sufficientemente dimensionato.
A giudicare dalle prestazioni per watt, il dispositivo è molto avido di energia. Per un confronto: L'MSI CyborgMSI Cyborg ha bisogno di circa la metà dell'energia sotto carico, ma offre prestazioni di gioco nettamente superiori. LaGeForce RTX 4060 all'interno del laptop MSI, che è limitato a un TGP di 45 watt, funziona in modo molto più efficiente rispetto all'Arc 730M.
| Off / Standby | |
| Idle | |
| Sotto carico |
|
Leggenda:
min: | |
| Intel NUC X15 LAPAC71H Intel Core i7-12700H, Intel Arc A730M | Asus TUF A15 FA507 AMD Ryzen 7 7735HS, NVIDIA GeForce RTX 4050 Laptop GPU | Gigabyte G5 KE Intel Core i5-12500H, NVIDIA GeForce RTX 3060 Laptop GPU | Dell Inspiron 16 Plus 7630 Intel Core i7-13700H, NVIDIA GeForce RTX 4060 Laptop GPU | Asus VivoBook Pro 16 Intel Core i7-12700H, NVIDIA GeForce RTX 3050 Ti Laptop GPU | MSI Cyborg 15 A12VF Intel Core i7-12650H, NVIDIA GeForce RTX 4060 Laptop GPU | |
|---|---|---|---|---|---|---|
| Power Consumption | 12% | -1% | -18% | 1% | 32% | |
| Idle Minimum * (Watt) | 7.5 | 8 -7% | 7.66 -2% | 15.6 -108% | 8.7 -16% | 6 20% |
| Idle Average * (Watt) | 11.9 | 12.1 -2% | 10.3 13% | 17.7 -49% | 13.1 -10% | 8.8 26% |
| Idle Maximum * (Watt) | 13.9 | 12.5 10% | 16.05 -15% | 20.6 -48% | 18.3 -32% | 11.9 14% |
| Load Average * (Watt) | 137 | 74.9 45% | 115.8 15% | 87.4 36% | 116 15% | 89 35% |
| Witcher 3 ultra * (Watt) | 166 | 136.6 18% | 168.7 -2% | 121.7 27% | 117.6 29% | 90.3 46% |
| Load Maximum * (Watt) | 203 | 185 9% | 234.6 -16% | 138 32% | 162 20% | 99 51% |
* ... Meglio usare valori piccoli
Power consumption Witcher 3 / stress test
Power consumption with external monitor
Tempi di esecuzione
Il dispositivo da 15,6 pollici ha ottenuto tempi di esecuzione di 5:44 ore nel nostro test realistico sulla WLAN (mappando il carico quando si richiamano le pagine web utilizzando uno script): un valore decente ma non eccezionale.
Pro
Contro
Verdetto - Non c'è alcun affare da fare in questo caso
Intel si rivolge ai giocatori e ai lavoratori creativi con il suo NUC X15. Ciò significa che l'editing di video e immagini, lo streaming, il rendering e il gioco fanno parte dei campi di utilizzo del portatile. ACore i7-12700HeArc A730Mforniscono la potenza necessaria - entrambi i chip funzionano a velocità di clock costantemente elevate.
L'Intel NUC X15 non impressiona né delude. Tuttavia, tenendo conto delle prestazioni della CPU e dell'elevato consumo energetico, il prezzo del portatile è semplicemente troppo alto.
La sua inefficiente GPU Arc offre prestazioni inferiori per watt rispetto ai suoi concorrenti comparabili. Come in tutte le GPU attuali (RX7000, RTX 4000), l'A730M presenta core di ray-tracing e supporto AV1 (decodifica e codifica) - caratteristiche necessarie in un laptop per creatori.
Le emissioni del dispositivo sono tipiche per questa classe. I tempi di esecuzione pratica di quasi 6 ore possono essere considerati decenti. La sua porta USB-C (Thunderbolt 4) non supporta Power Delivery, ma può emettere un segnale DisplayPort. Inoltre, il portatile dispone di opzioni di espansione (soluzione docking, GPU esterna). Nel complesso, il display FHD installato (15,6 pollici, IPS, 144 Hz) ci ha lasciato una buona impressione.
Un'alternativa potrebbe essere ilAsus VivoBook Pro 16: Presenta prestazioni di calcolo leggermente inferiori in totale, ma beneficia di tempi di esecuzione più lunghi, di Power Delivery e di uno schermo 16:10. L'Aorus 15 9KF-E3DE383SH potrebbe essere una buona alternativa economica. Grazie alla sua GeForce RTX 4060 (TGP: 140 watt), offre prestazioni di gioco molto migliori rispetto all'X15. Attualmente è possibile trovarlo online a circa 1.040 dollari. Abbiamo già testato unaversione più potentedell'Aorus 15.
Prezzo e disponibilità
L'Intel NUC X15 LAPAC71H può essere configurato individualmente e ordinato tramite il negozio online di Schenker. L'attuale dispositivo di prova può essere acquistato per circa 1.280 dollari. La variante base (16 GB di RAM, 500 GB di SSD) può essere acquistata per circa 1.050 dollari.
Intel NUC X15 LAPAC71H
- 10/13/2023 v7 (old)
Sascha Mölck
Transparency
La selezione dei dispositivi da recensire viene effettuata dalla nostra redazione. Il campione di prova è stato fornito all'autore come prestito dal produttore o dal rivenditore ai fini di questa recensione. L'istituto di credito non ha avuto alcuna influenza su questa recensione, né il produttore ne ha ricevuto una copia prima della pubblicazione. Non vi era alcun obbligo di pubblicare questa recensione. In quanto società mediatica indipendente, Notebookcheck non è soggetta all'autorità di produttori, rivenditori o editori.
Ecco come Notebookcheck esegue i test
Ogni anno, Notebookcheck esamina in modo indipendente centinaia di laptop e smartphone utilizzando procedure standardizzate per garantire che tutti i risultati siano comparabili. Da circa 20 anni sviluppiamo continuamente i nostri metodi di prova e nel frattempo stabiliamo gli standard di settore. Nei nostri laboratori di prova, tecnici ed editori esperti utilizzano apparecchiature di misurazione di alta qualità. Questi test comportano un processo di validazione in più fasi. Il nostro complesso sistema di valutazione si basa su centinaia di misurazioni e parametri di riferimento ben fondati, che mantengono l'obiettività.Price comparison

