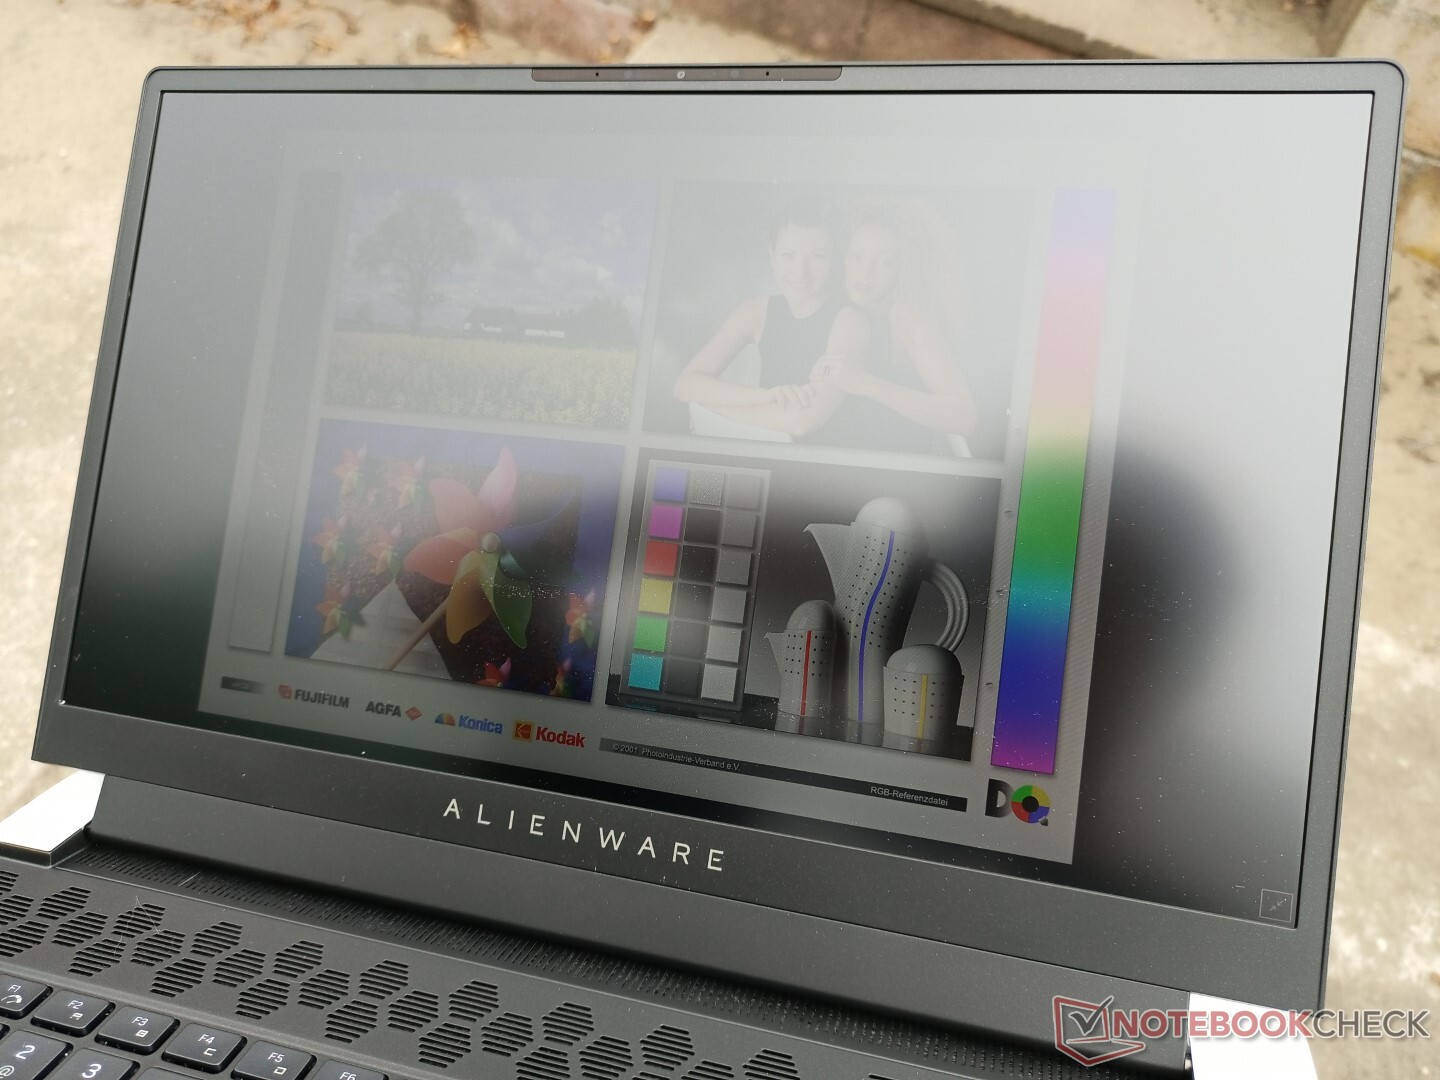
Recensione del portatile Alienware x15 R1: L'UFO più sottile di Dell è atterrato
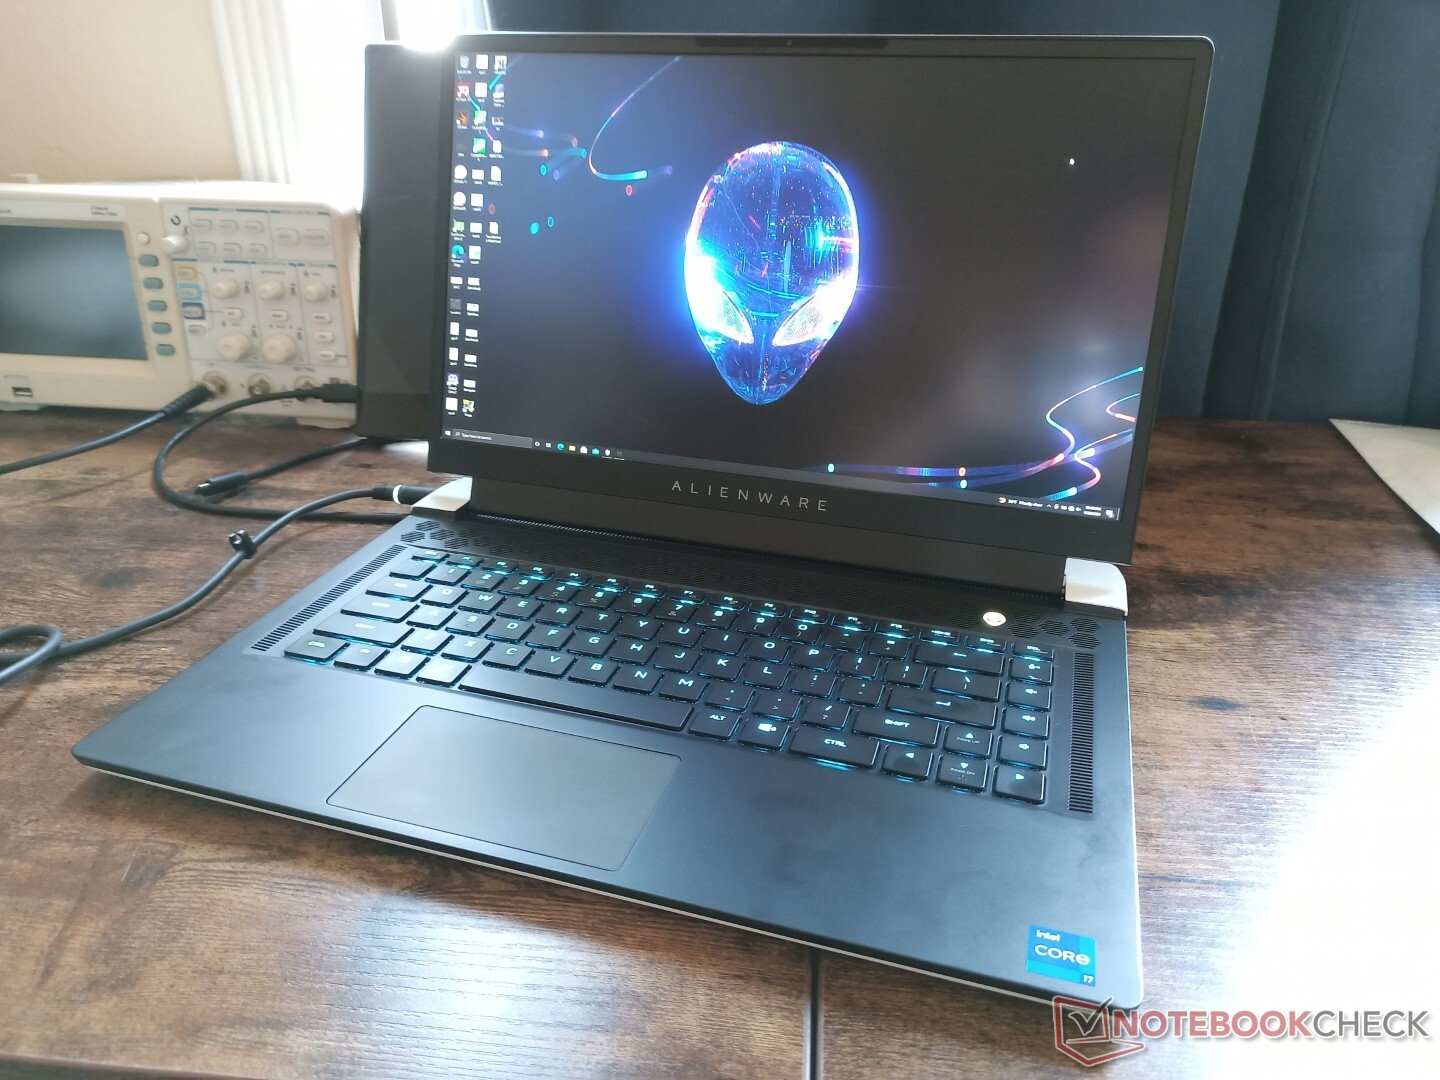
L'Alienware x15 R1 dà il via ad una nuova generazione di portatili Alienware da 15.6 pollici per sostituire la vecchia serie Alienware m15. Come dettagliato nell annuncio originalel'ultimo modello rinnova completamente il design dello chassis Legend introdotto sull Alienware m15 R2 per un look più sottile ed elegante.
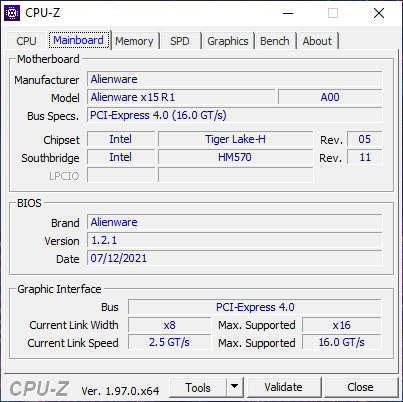
Le SKU attuali vanno dalla CPU Core i7-11800H dell'undicesima generazione con GeForce RTX 3060 grafica e display FHD a 165 Hz per circa $2000 USD fino al Core i9-11900H con RTX 3070 e display FHD a 360 Hz per circa $3000 USD. Dell sta progettando di lanciare opzioni RTX 3080 nei prossimi mesi. La nostra configurazione in esame è una SKU media con i7-11800H, RTX 3070 e display QHD a 240 Hz per circa 2700 dollari.
I concorrenti dell'Alienware x15 R1 includono altri portatili da gioco ultrasottili da 15,6 pollici come Razer Blade 15, MSI GS66, Asus Zephyrus S15, Acer Predator Triton 700, o Aorus 15G. Una versione più grande da 17.3 pollici dell'x15 R1 è disponibile chiamata Alienware x17 R1.
Altre recensioni di Dell:
potential competitors in comparison
Punteggio | Data | Modello | Peso | Altezza | Dimensione | Risoluzione | Prezzo |
|---|---|---|---|---|---|---|---|
| 87.2 % v7 (old) | 10/2021 | Alienware x15 RTX 3070 P111F i7-11800H, GeForce RTX 3070 Laptop GPU | 2.4 kg | 15.9 mm | 15.60" | 2560x1440 | |
| 86.1 % v7 (old) | 06/2021 | Alienware m15 R4 RTX 3080 i9-10980HK, GeForce RTX 3080 Laptop GPU | 2.4 kg | 20 mm | 15.60" | 1920x1080 | |
| 84 % v7 (old) | 02/2021 | MSI GS66 Stealth 10UG i7-10870H, GeForce RTX 3070 Laptop GPU | 2.1 kg | 19.8 mm | 15.60" | 1920x1080 | |
| 88.9 % v7 (old) | 07/2021 | Razer Blade 15 Advanced (Mid 2021) i7-11800H, GeForce RTX 3080 Laptop GPU | 2 kg | 16.99 mm | 15.60" | 1920x1080 | |
| 82.9 % v7 (old) | 10/2020 | Asus Zephyrus S15 GX502L i7-10875H, GeForce RTX 2070 Super Mobile | 2.1 kg | 19 mm | 15.60" | 1920x1080 | |
| 83.8 % v7 (old) | 07/2021 | Acer Predator Helios 300 PH315-53-786B i7-10750H, GeForce RTX 3070 Laptop GPU | 2.2 kg | 22.9 mm | 15.60" | 1920x1080 |
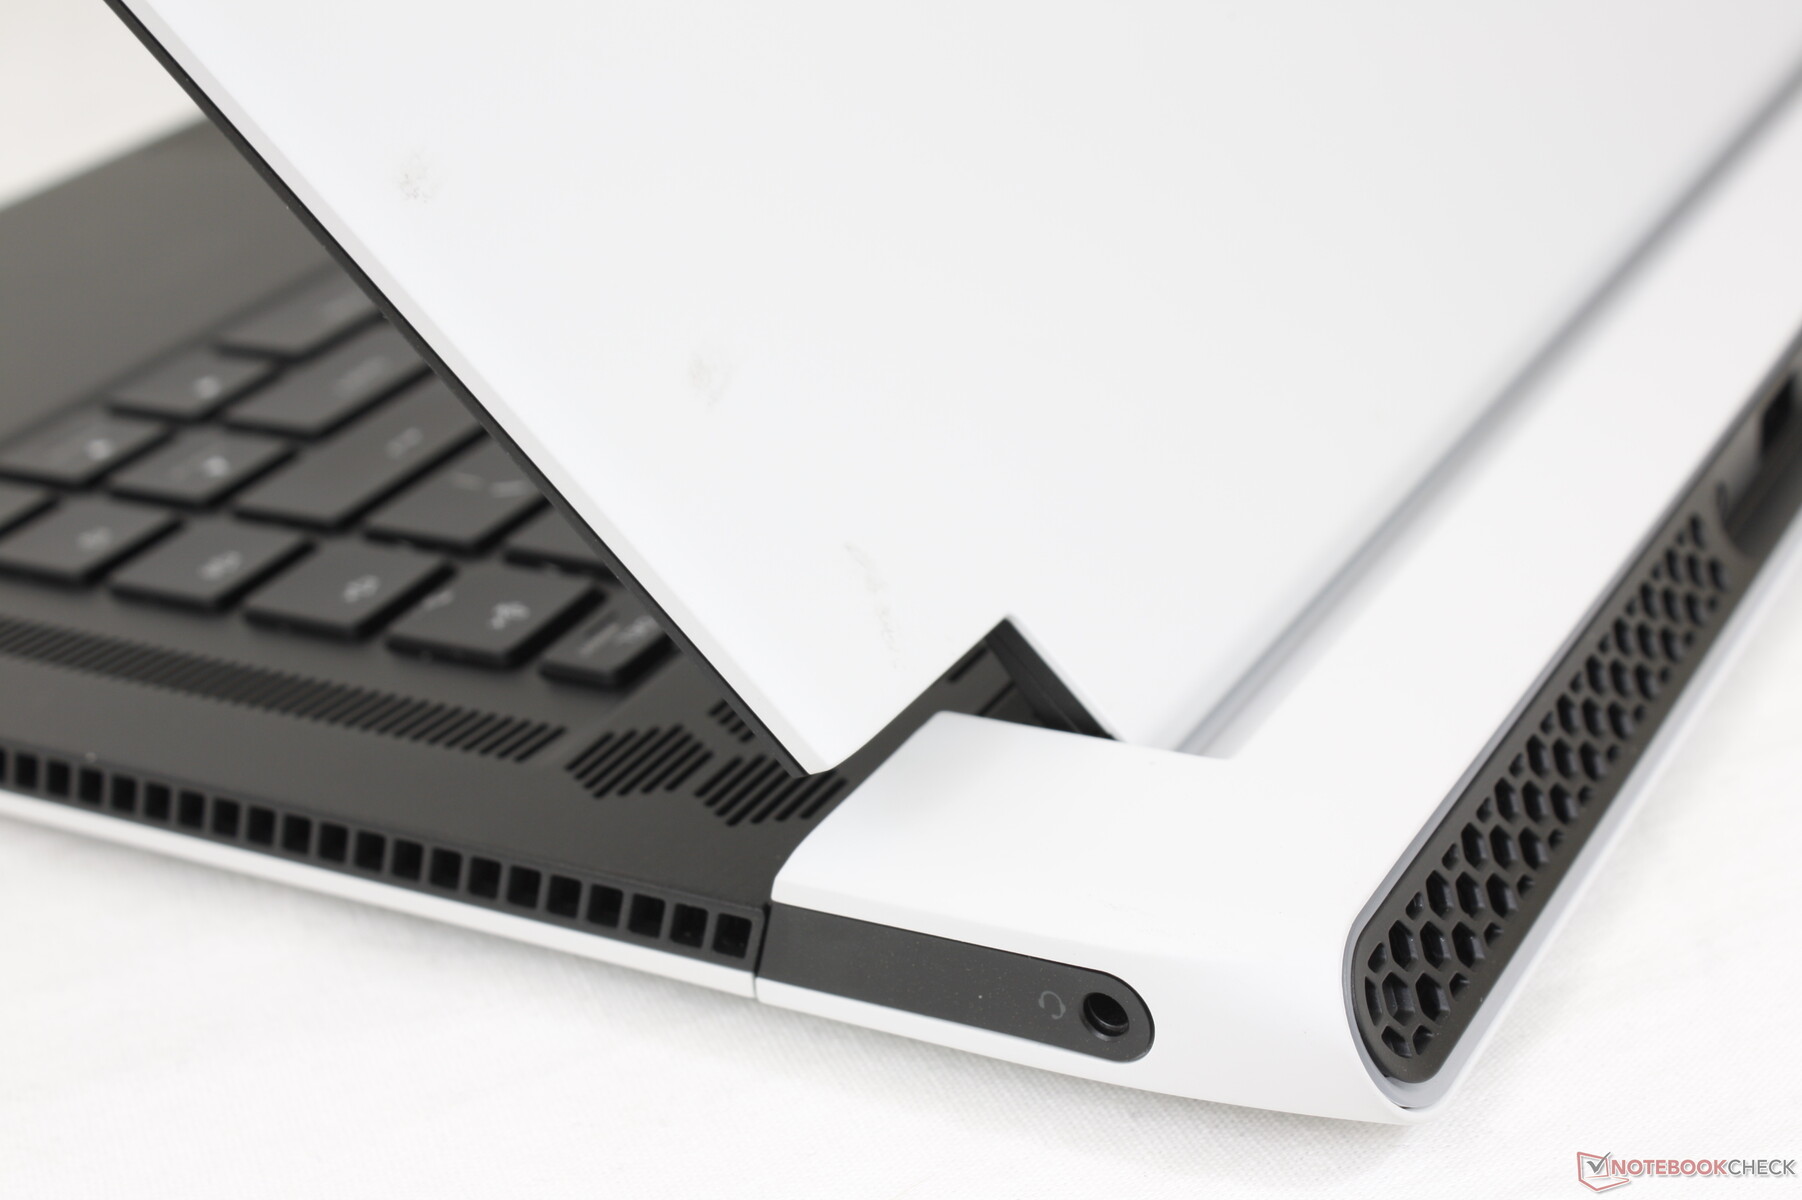
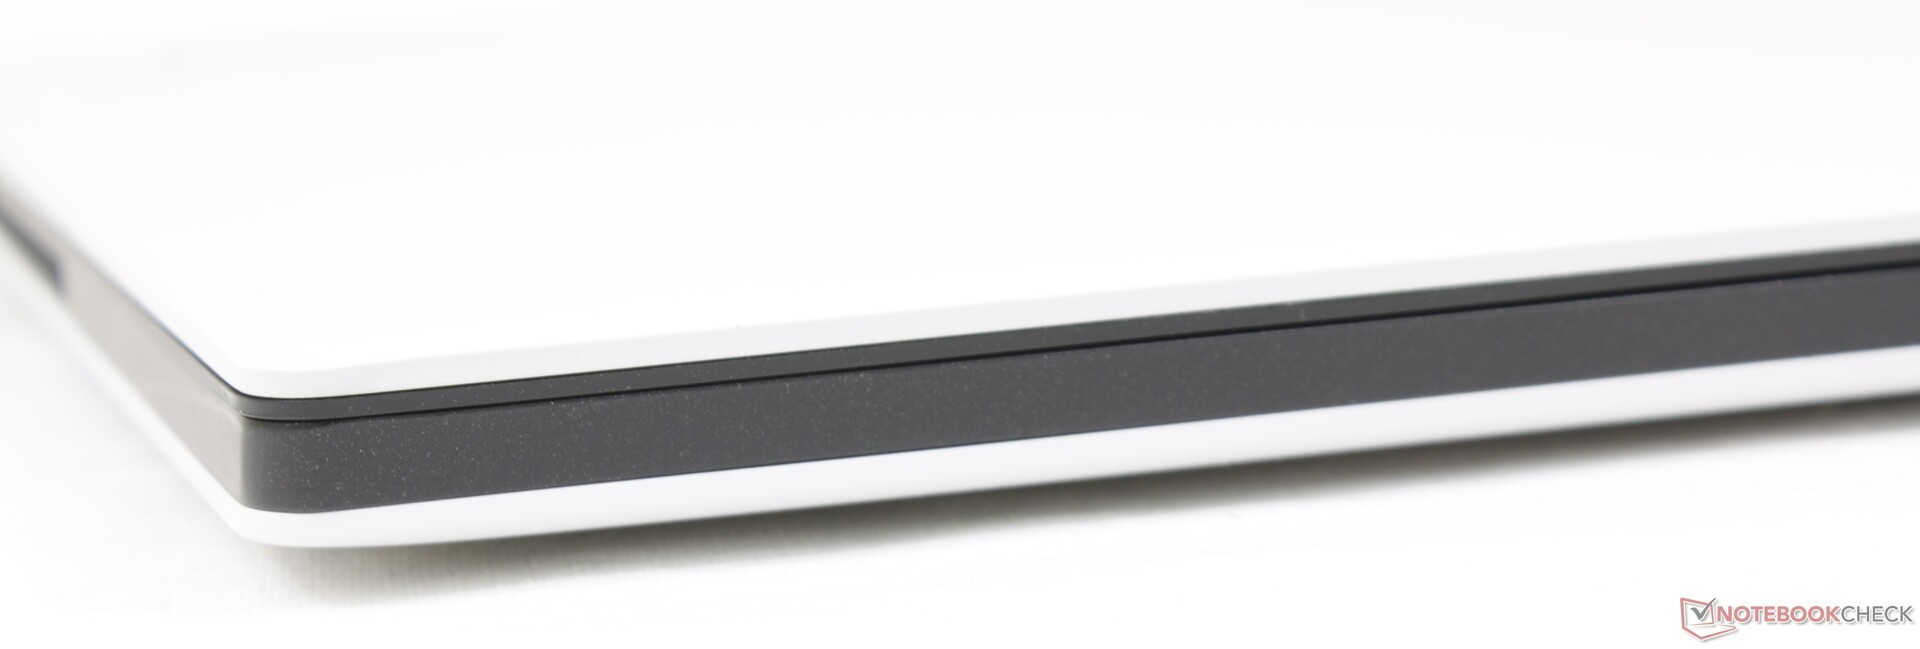
Custodia - più sottile ma più larga
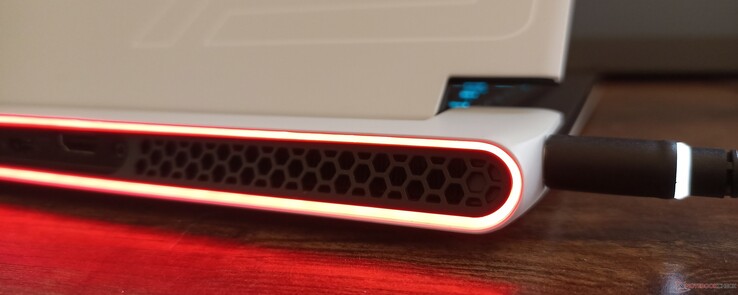
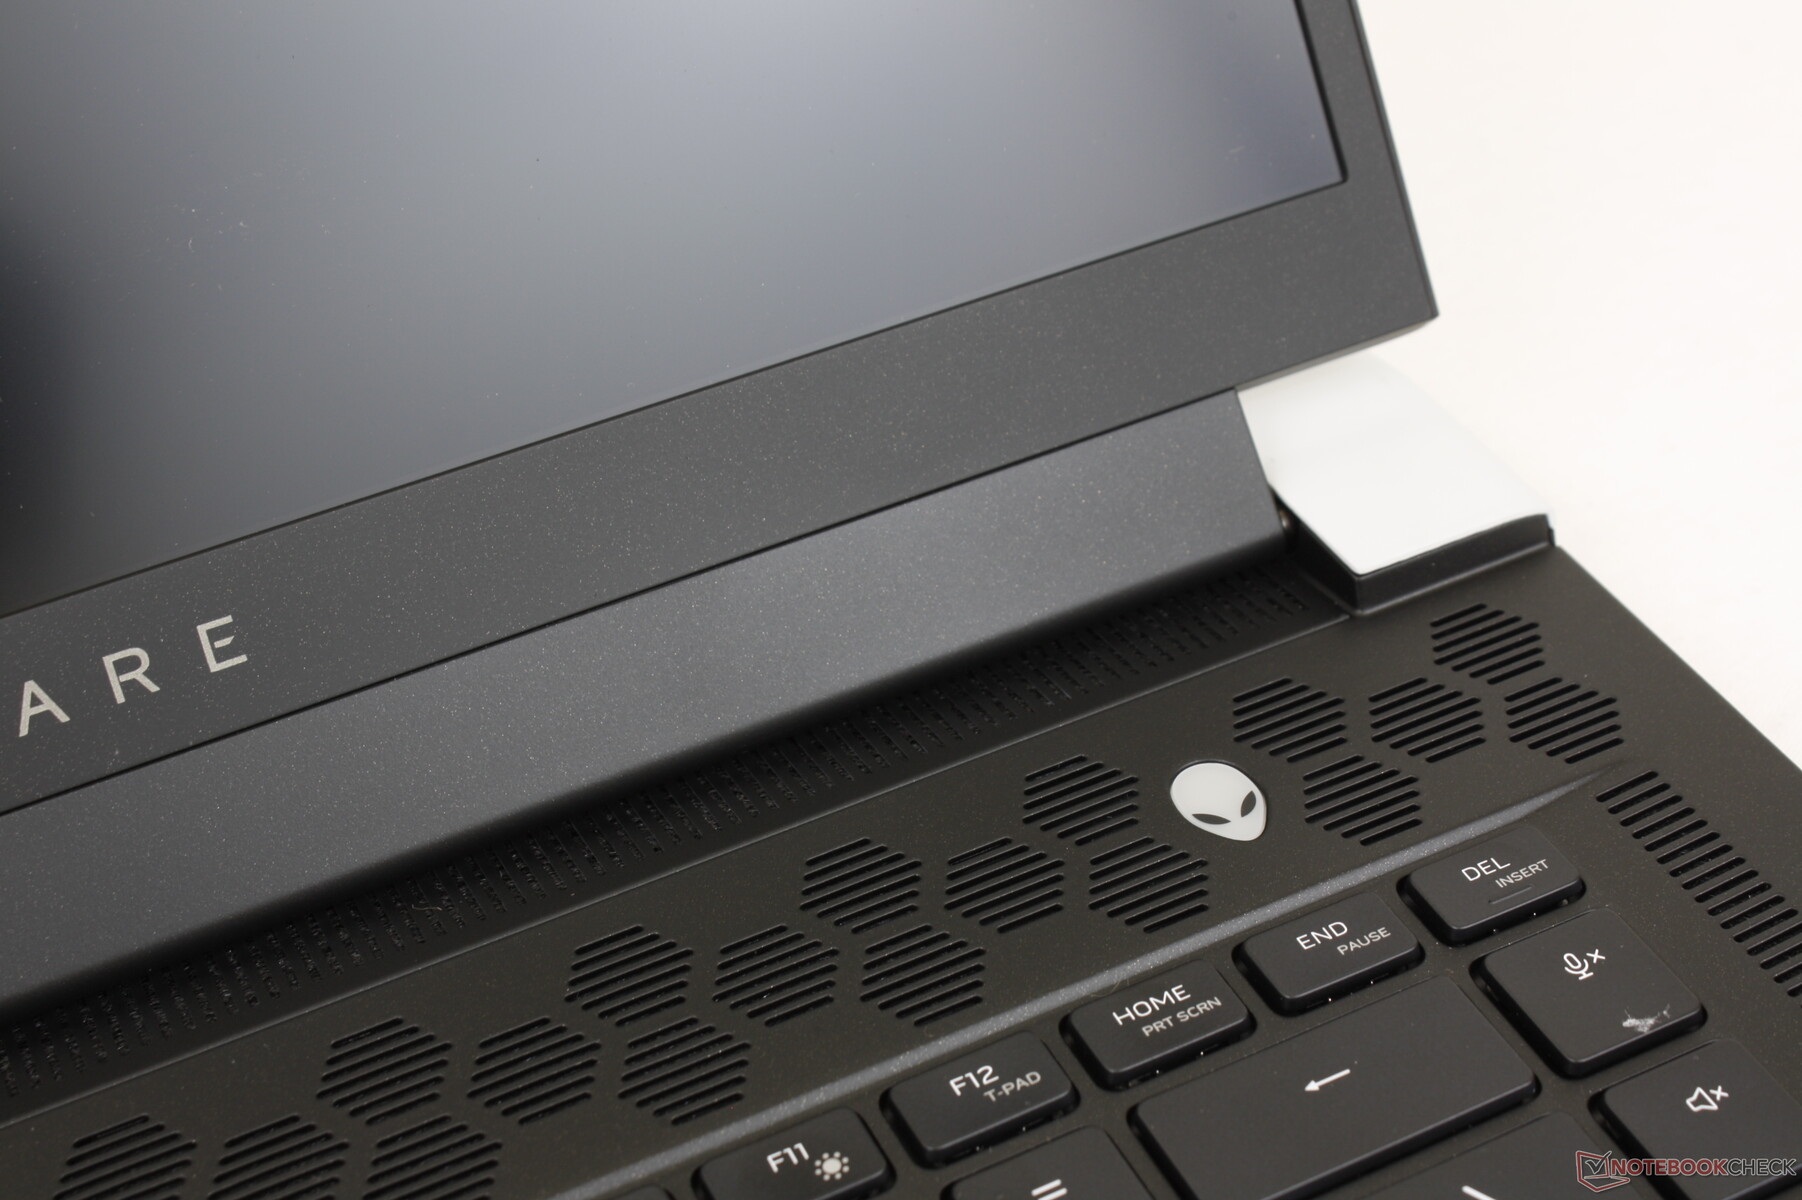
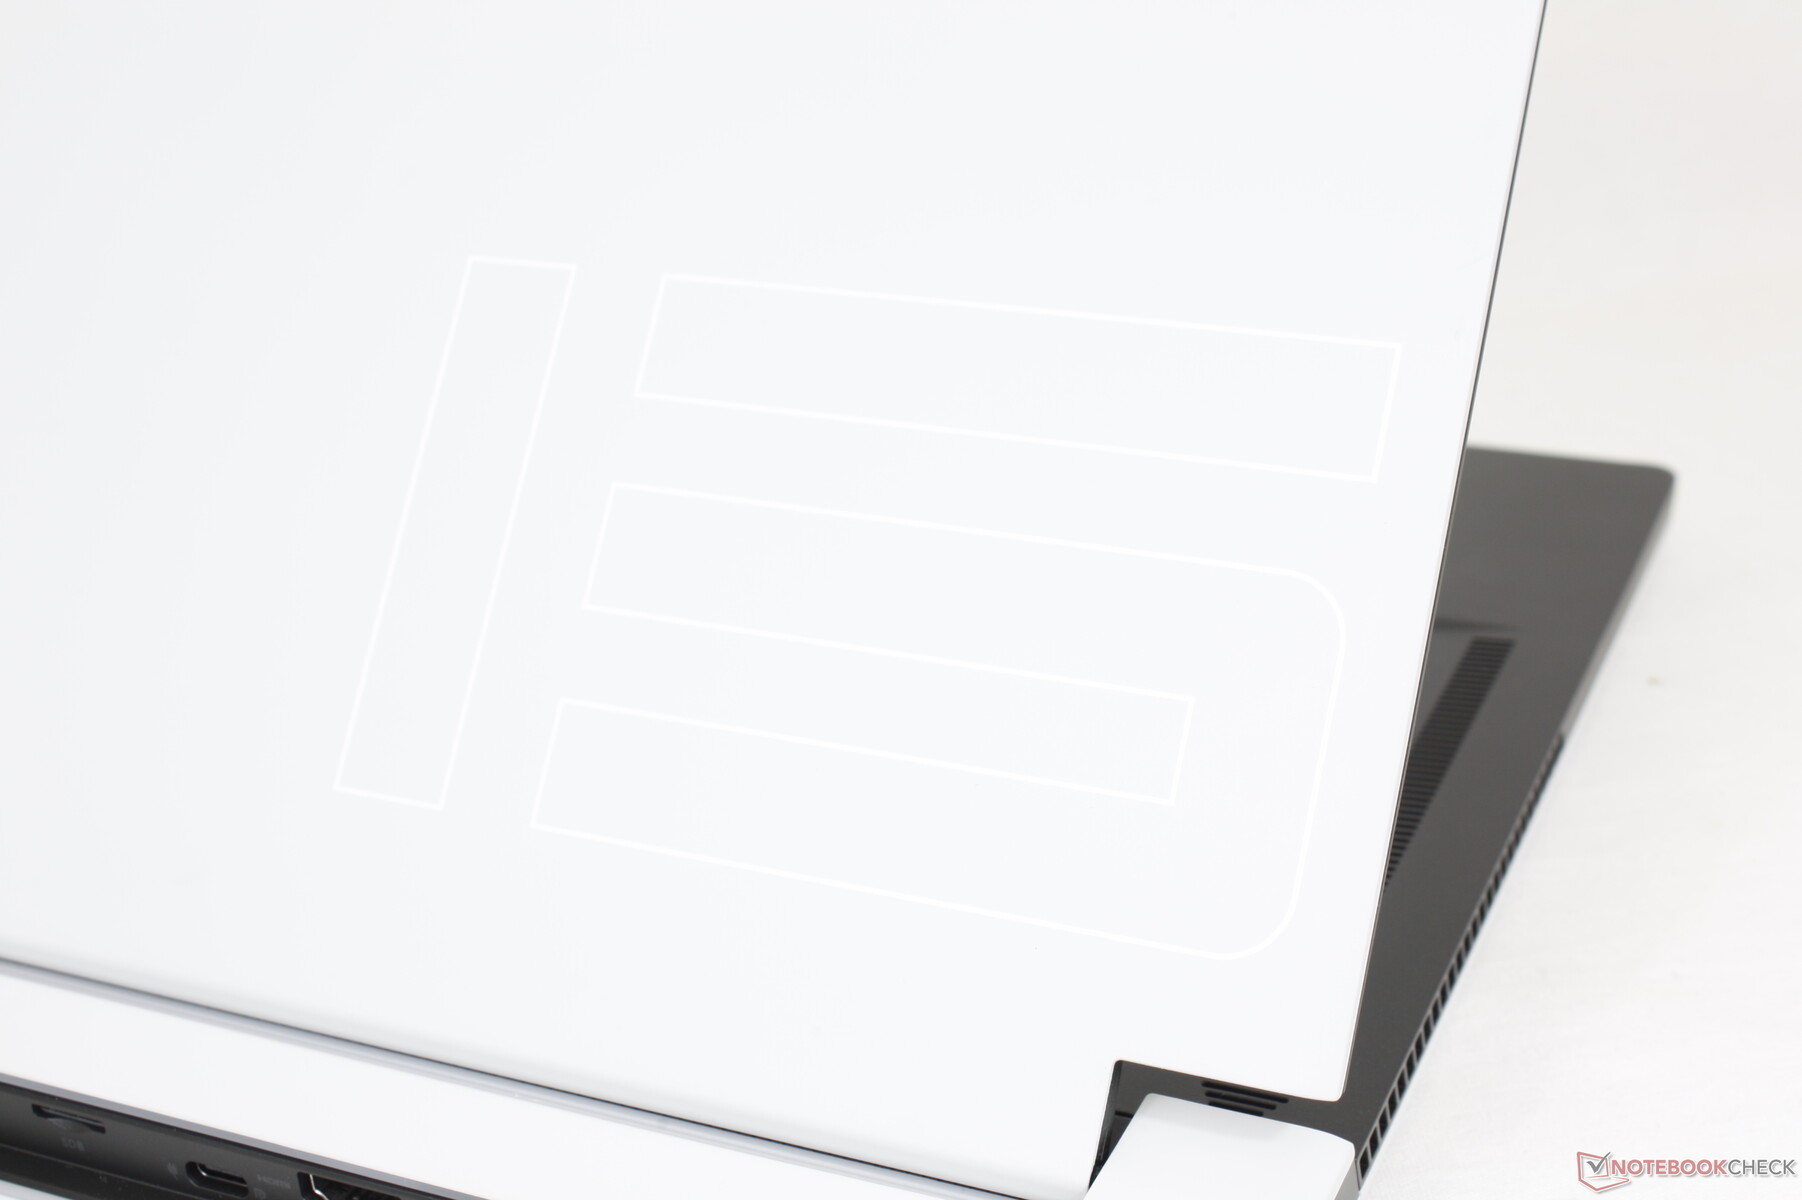
Il nuovo chassis può essere meglio descritto come un Alienware m15 R2 ma più piatto poiché l'x15 R1 è quasi lo stesso in termini di lunghezza e larghezza e usa quasi gli stessi materiali per una sensazione simile. Non ci sono più le pacchiane barre di plastica lucida lungo il bordo anteriore e la lunetta inferiore per una costruzione più uniforme e opaca. Lo chassis è abbastanza vicino all'aspetto di un Ultrabook pur mantenendo tutti gli aspetti originali del design dell'm15 R2 Legend come le griglie a nido d'ape e l'anello LED RGB posteriore.
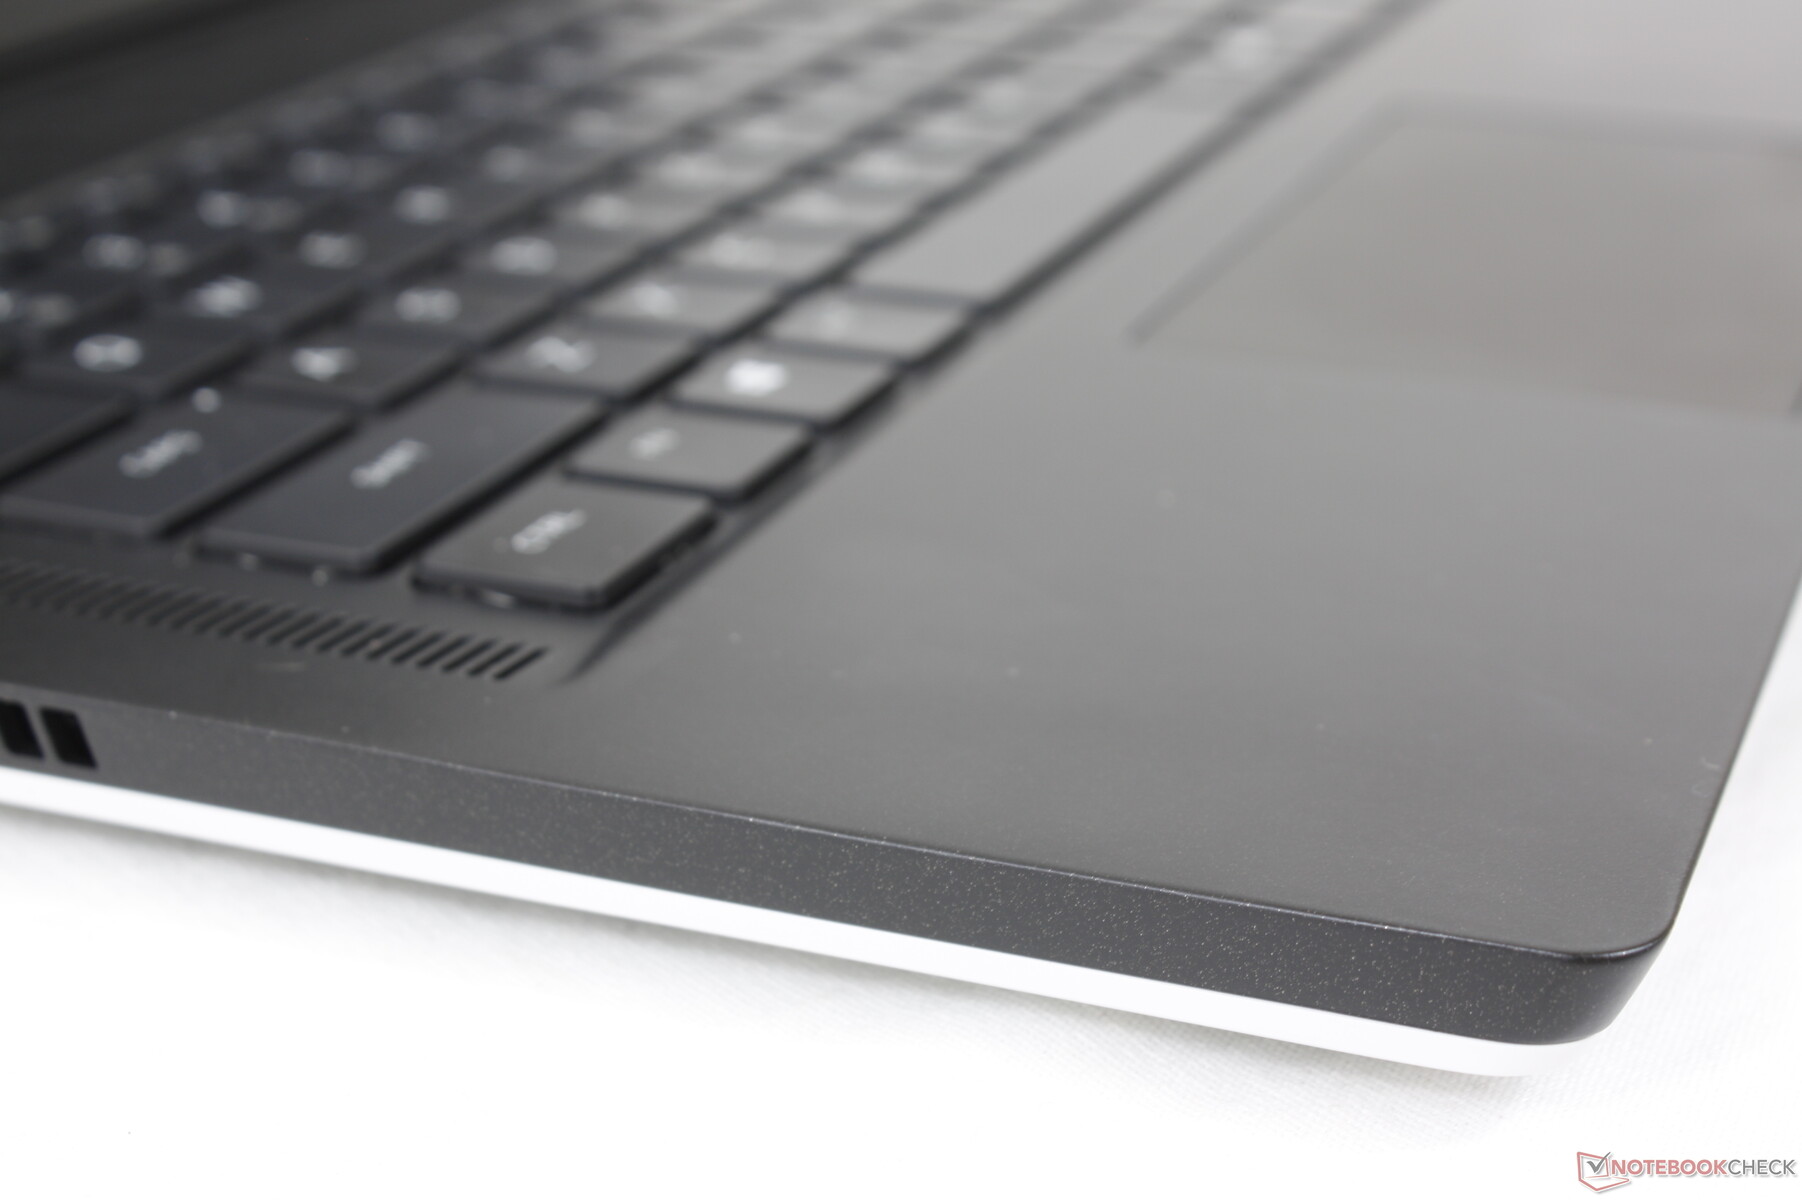
La rigidità dello chassis è leggermente inferiore a quella dell'm15 R2/R3/R4/R5. Sia la base che il coperchio si flettono più facilmente dai loro rispettivi angoli e con un po' più di scricchiolii rispetto al vecchio design più spesso. Applicando una pressione sul centro della tastiera o sul coperchio esterno si avrà anche un po' di flessione. Troviamo che la costruzione complessiva sia paragonabile al MSI GS66 pur essendo qualche passo in meno rispetto al Razer Blade 15.
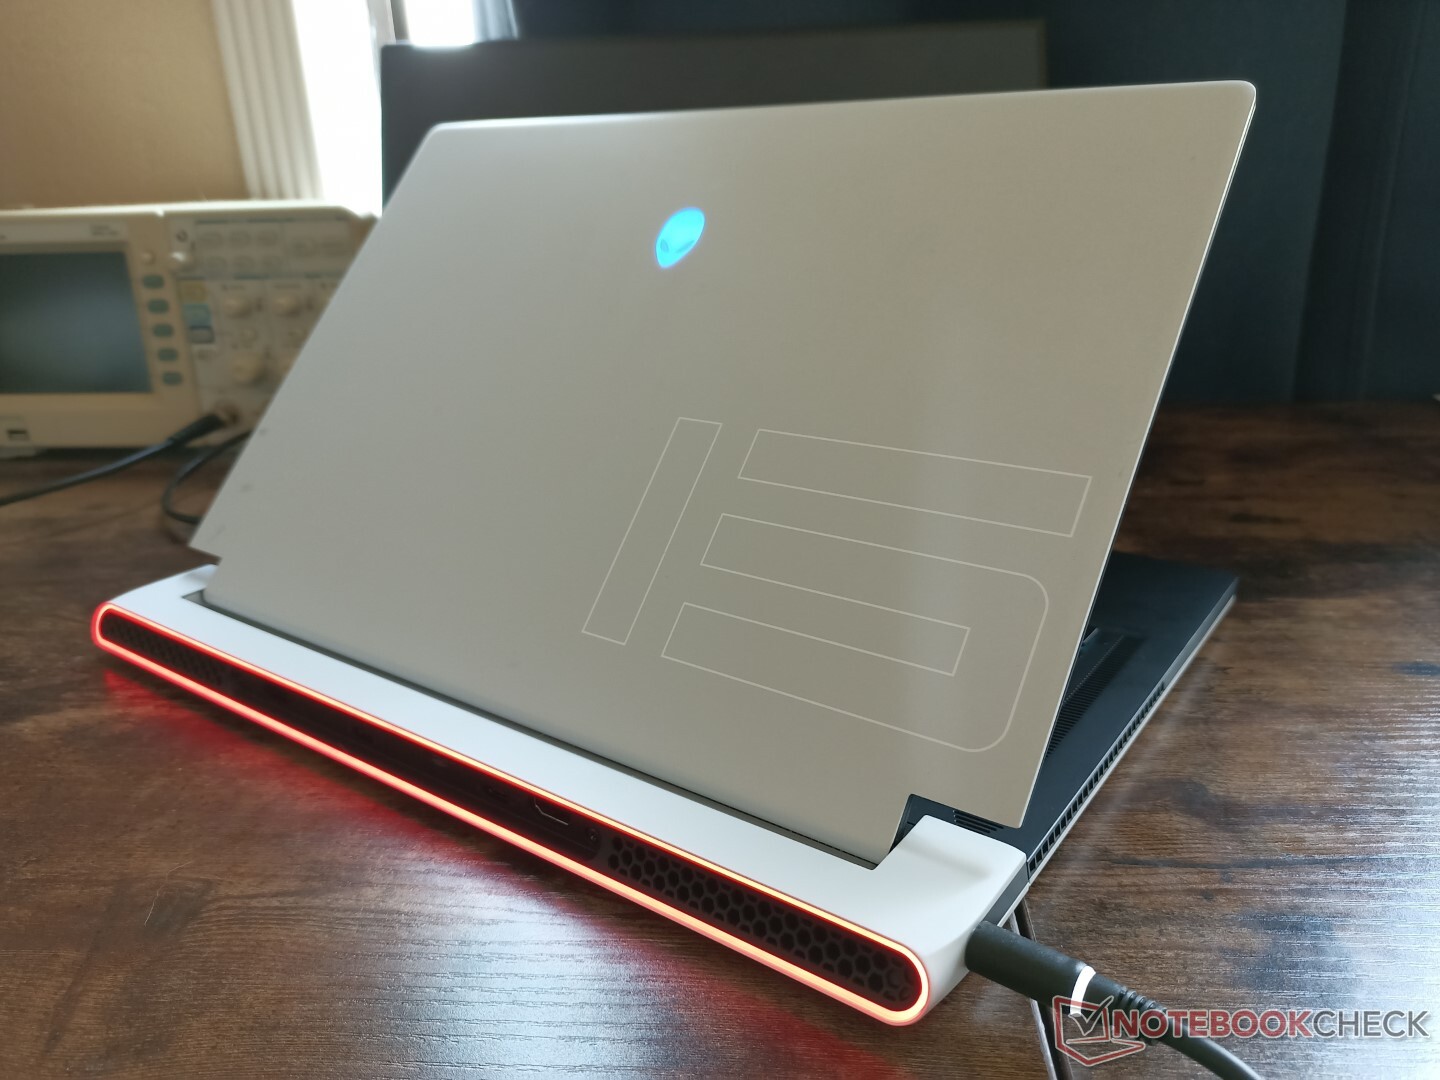
A differenza dell'Alienware x17 R1 che è in realtà leggermente più spesso e più pesante del vecchio Alienware m17 R4 che sostituisce, l'Alienware x15 R1 è più sottile dell'Alienware m15 R5 mentre pesa circa lo stesso. Questo significa anche che l'x15 continua ad essere uno dei più grandi e pesanti computer portatili da gioco ultrasottili nella sua categoria di dimensioni come i modelli concorrenti come lo Zephyrus S15 o il Razer Blade 15 sono più piccoli e più leggeri con margini percettibili. Il grande ingombro dell'x15 è forse il prezzo da pagare per un profilo così sottile
Alcune SKU con il pannello FHD 165Hz saranno più spesse della nostra SKU QHD per frazioni di millimetro (16,3 contro 15,9 mm).
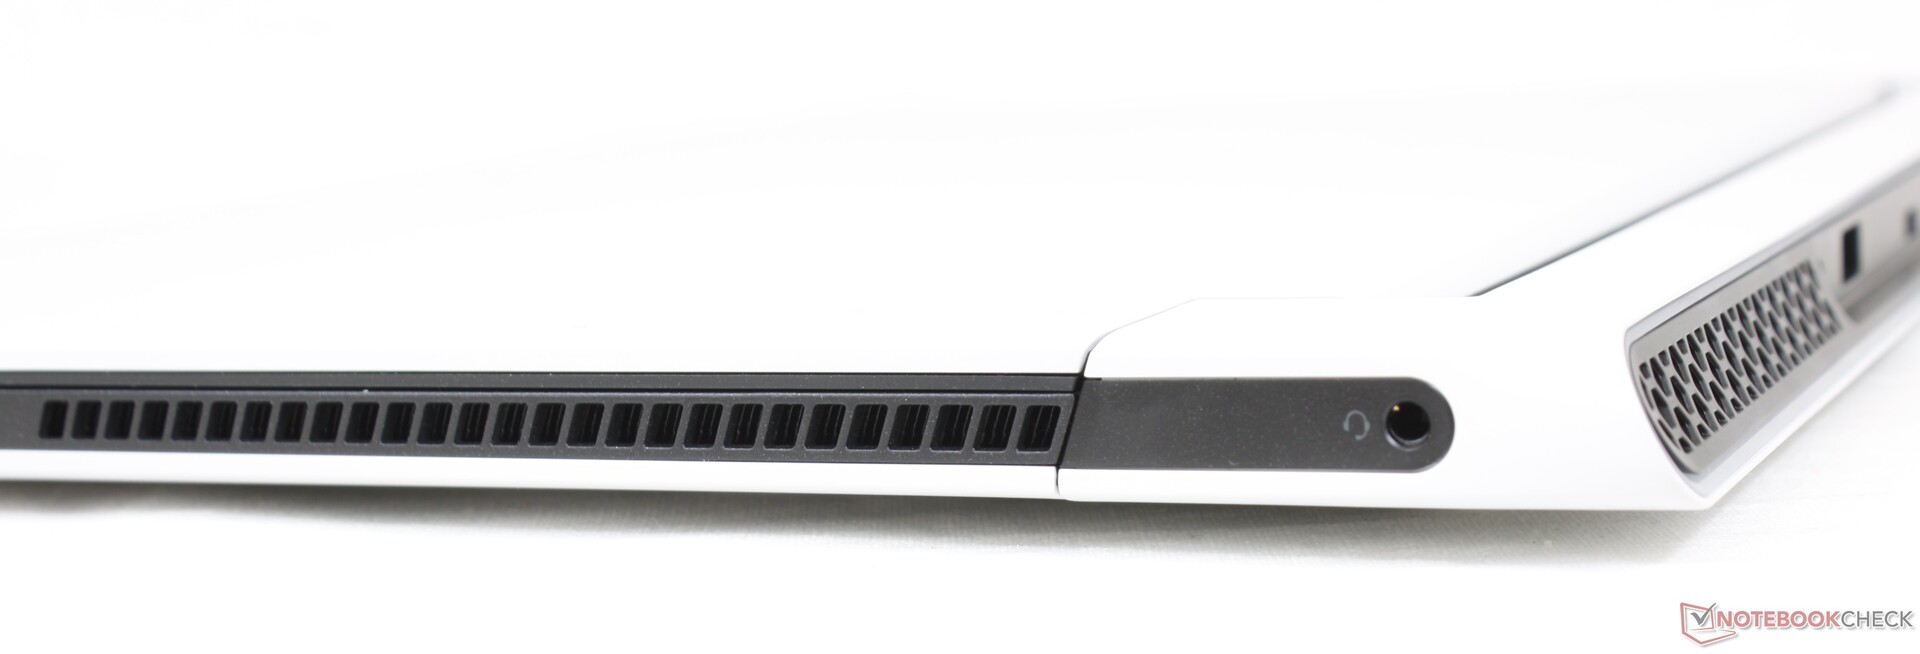
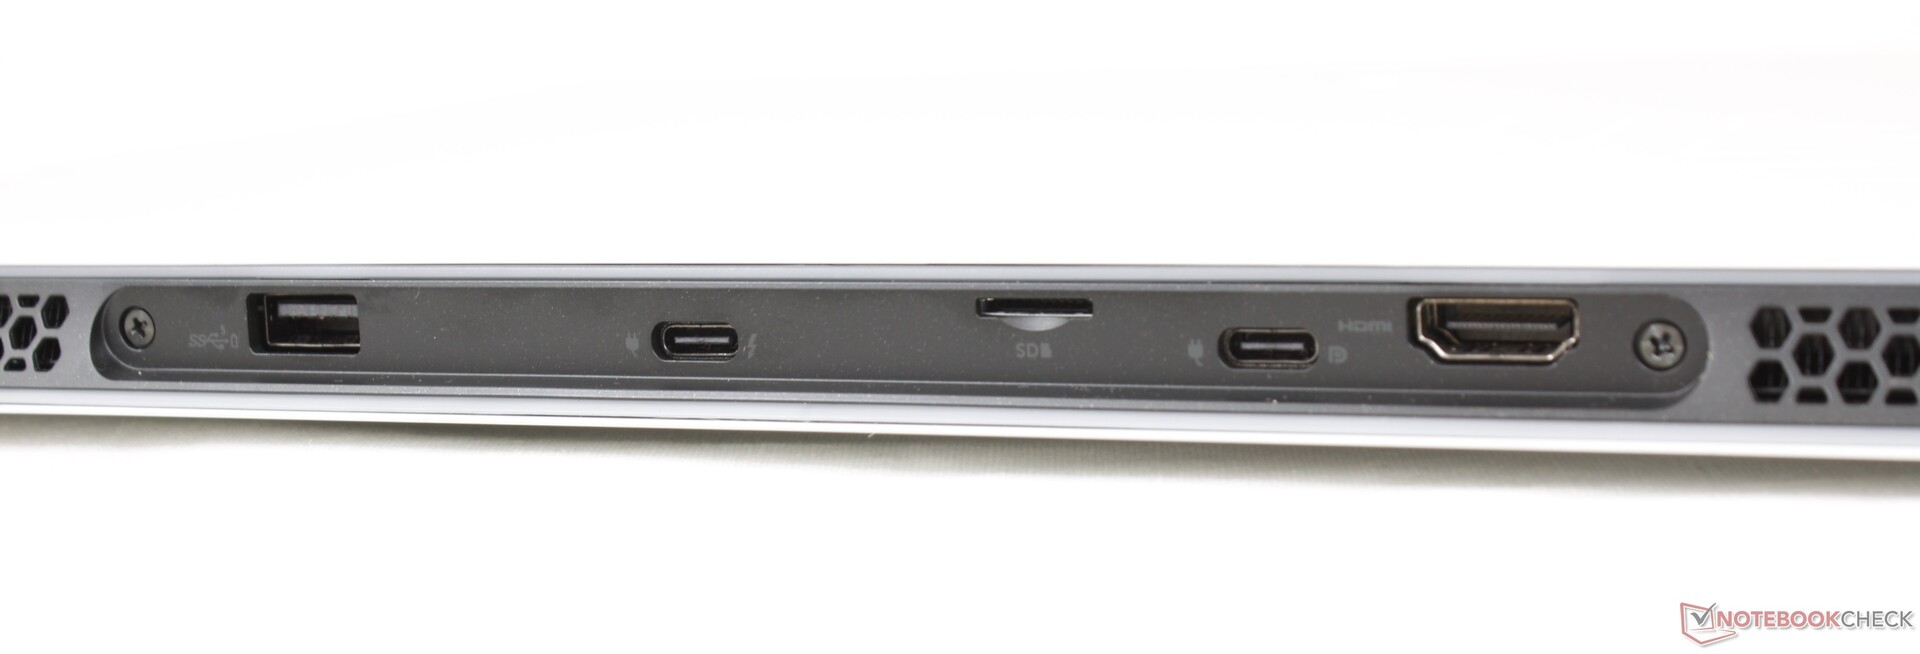
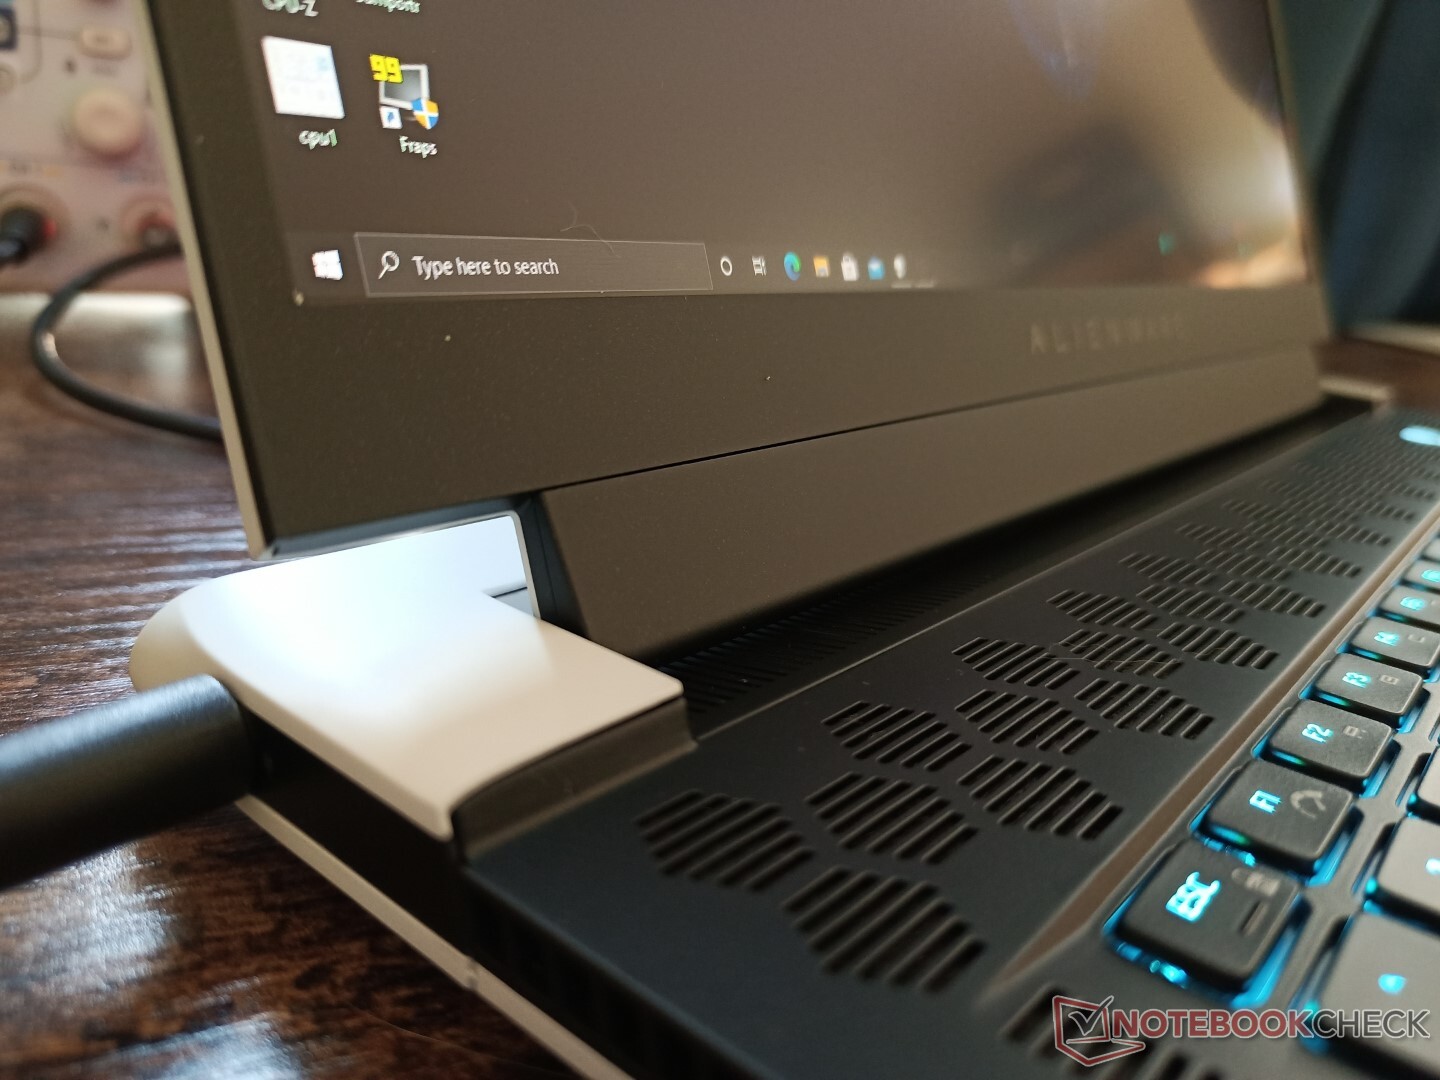
Connettività - Più e meno di prima
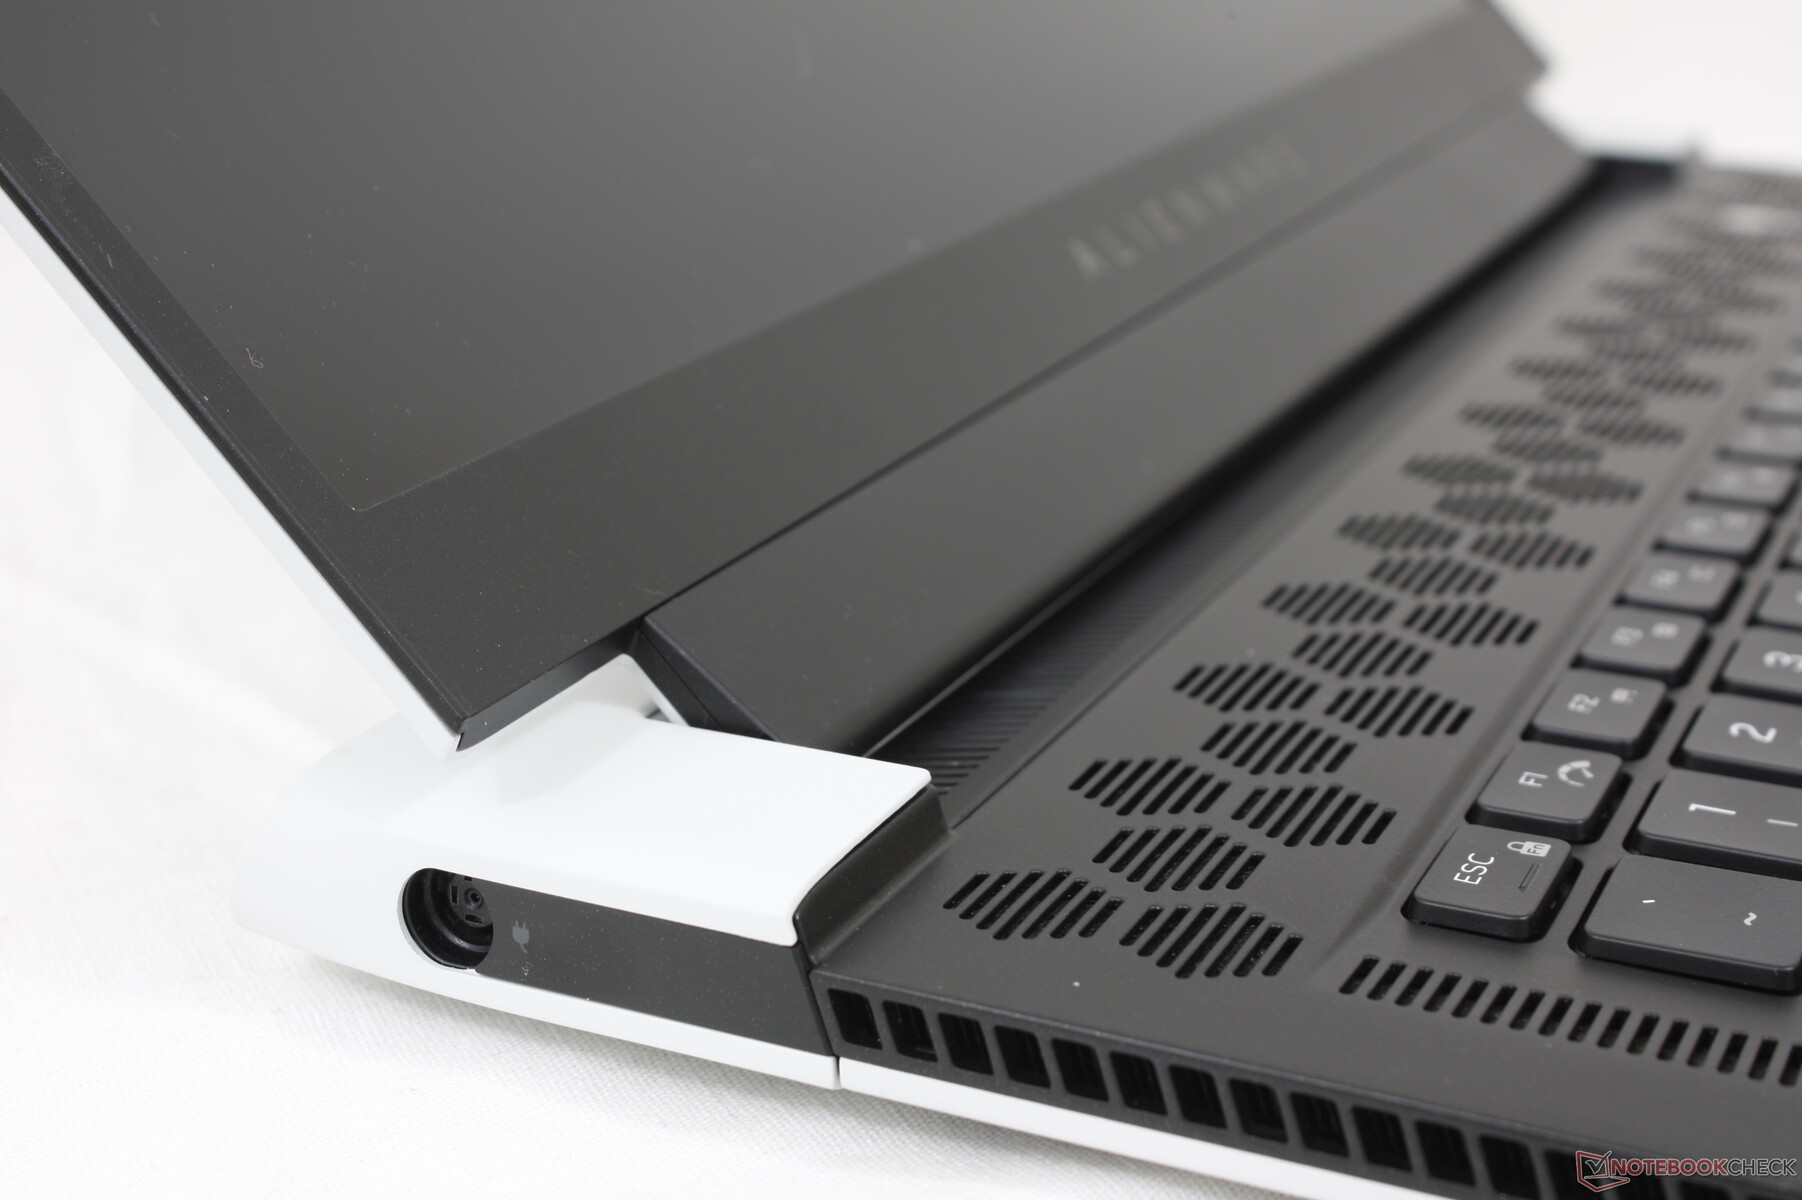
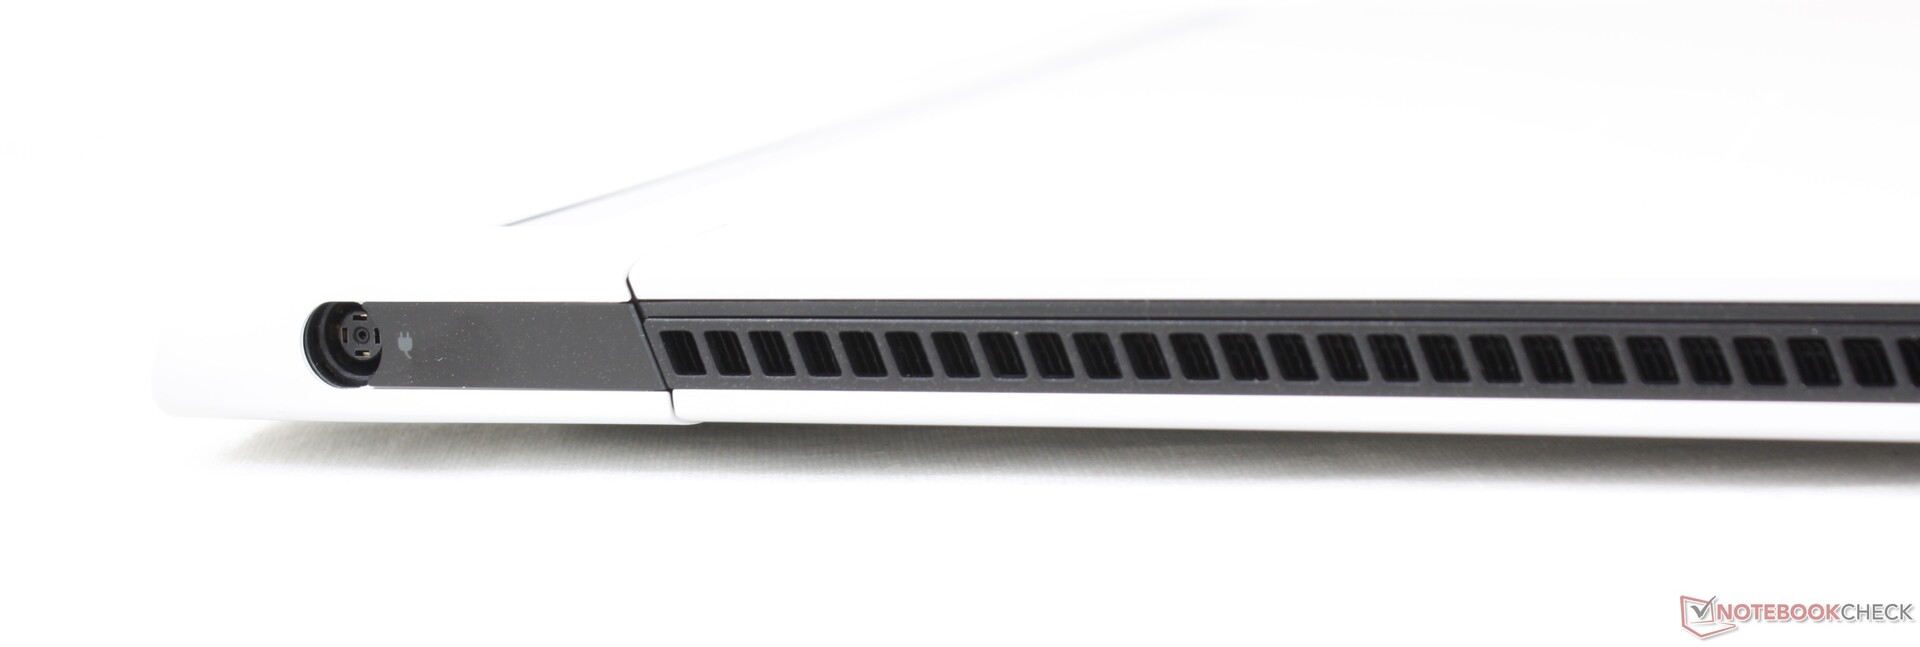
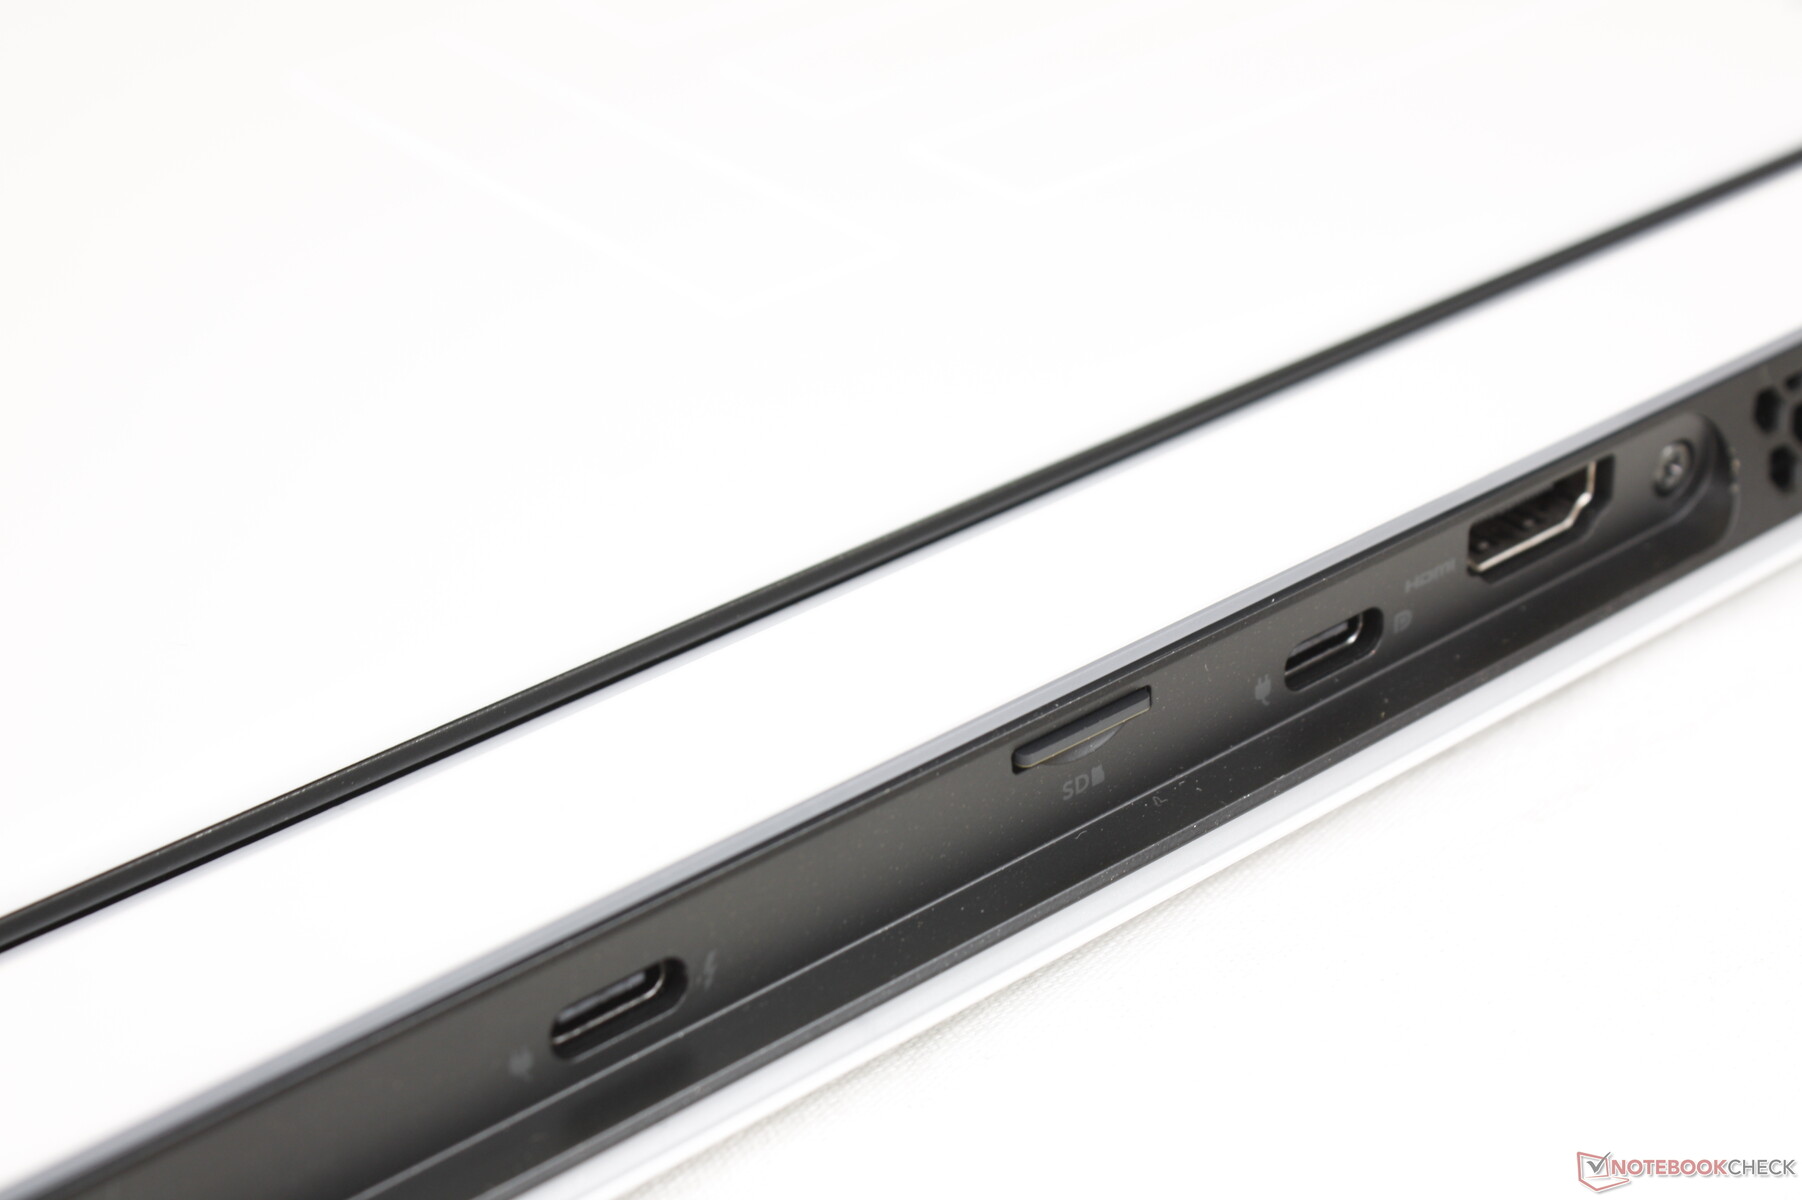
Le opzioni delle porte sono state tagliate dal vecchio Alienware m15 R4. I proprietari ora hanno solo una porta USB-A invece di tre, mentre RJ-45, mini DisplayPort, e la porta Graphics Amplifier sono state tutte eliminate. Il sistema guadagna una seconda porta USB-C che è probabilmente più versatile a seconda dello scenario
Quasi tutte le porte sono lungo la parte posteriore del telaio che può rendere difficile l'accessibilità. Inoltre, queste porte possono essere difficili da vedere poiché non si illuminano o hanno simboli facili da leggere.
Lettore di schede SD
Ci congratuliamo con Dell per aver integrato un lettore MicroSD, dato che la maggior parte dei portatili da gioco ultrasottili da 15,6 pollici non ne hanno uno, inclusi Asus Zephyrus S15, MSI GS66 o Razer Blade 15. Le velocità di trasferimento sono molto veloci con la nostra scheda di test UHS-II a circa 200 MB/s.
| SD Card Reader | |
| average JPG Copy Test (av. of 3 runs) | |
| Alienware x15 RTX 3070 P111F (AV Pro V60) | |
| Alienware m15 R4 RTX 3080 (AV PRO microSD 128 GB V60) | |
| maximum AS SSD Seq Read Test (1GB) | |
| Alienware x15 RTX 3070 P111F (AV Pro V60) | |
| Alienware m15 R4 RTX 3080 (AV PRO microSD 128 GB V60) | |
Comunicazione - W-Fi 6E Standard
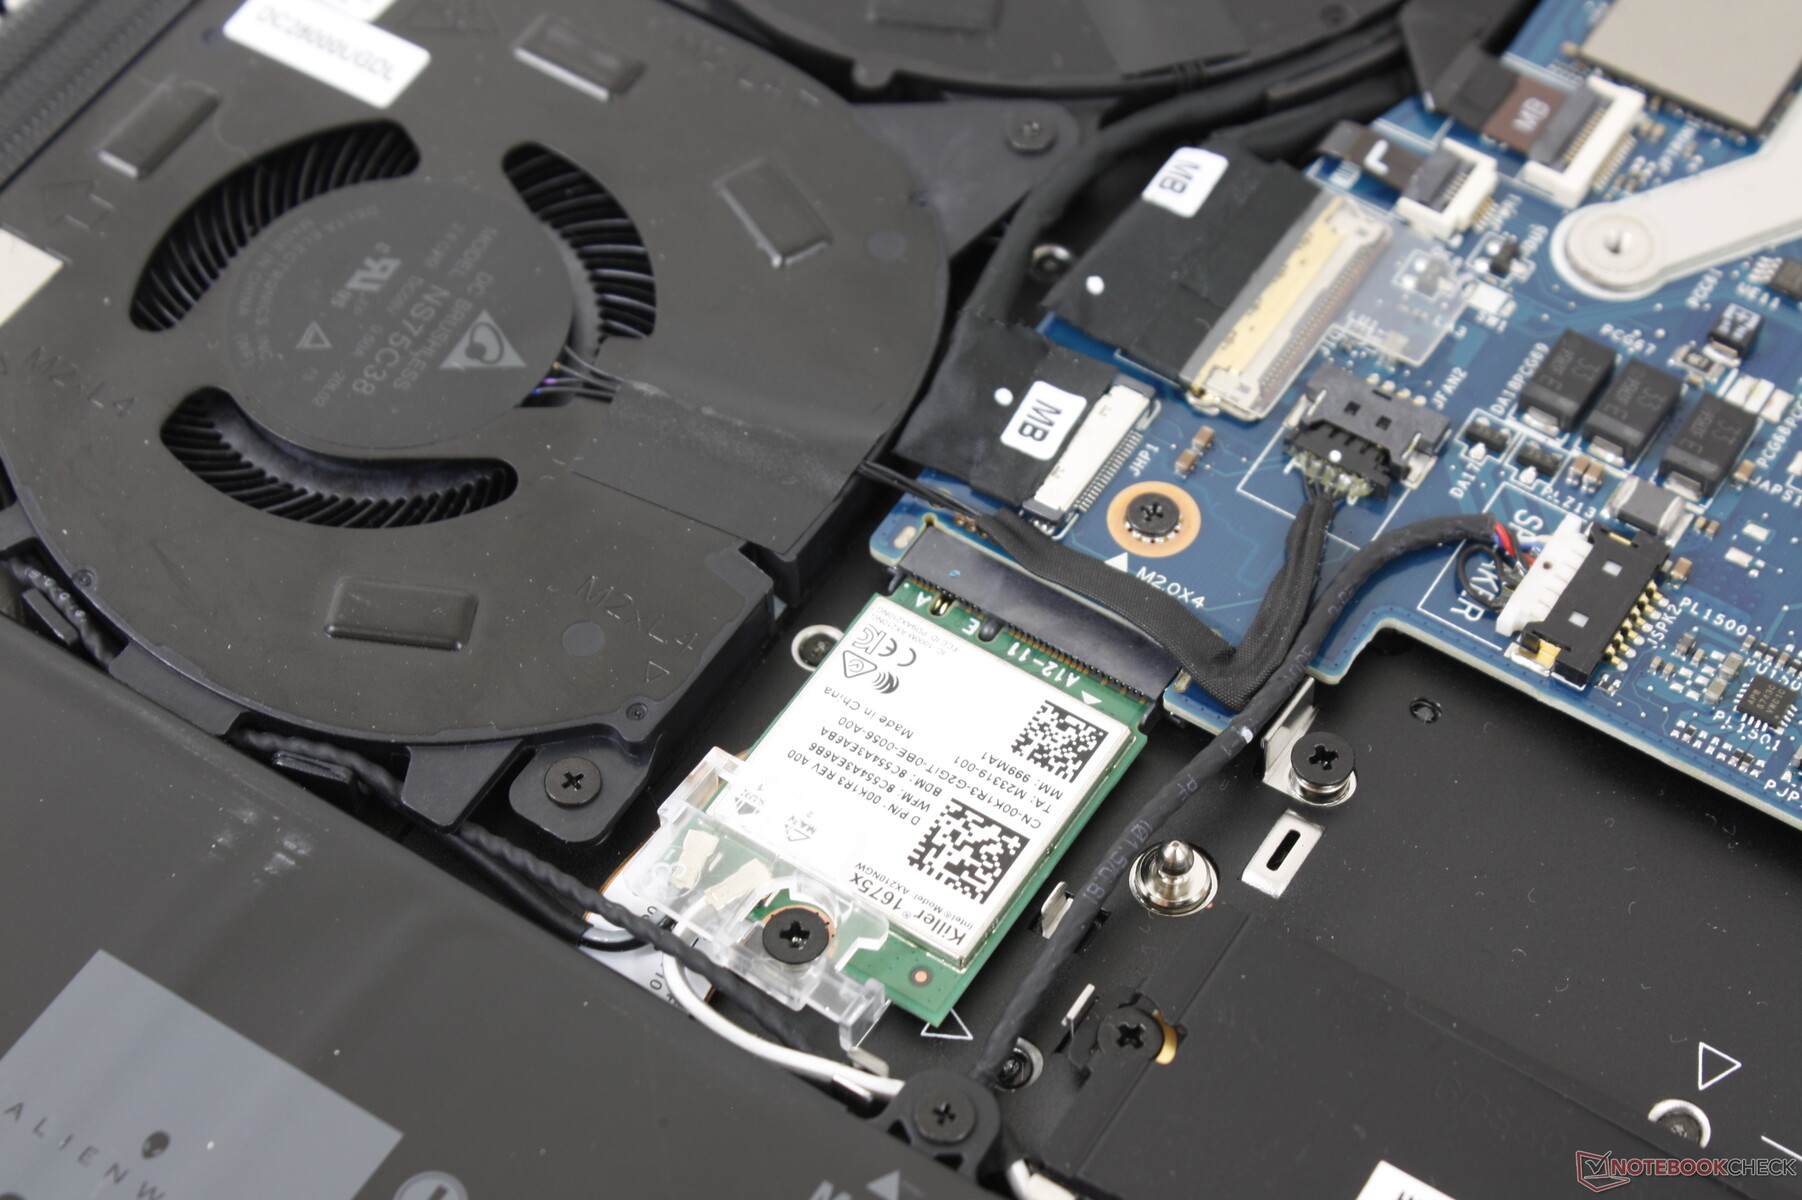
Tutte le SKU vengono con il modulo WLAN Killer Wi-Fi 6E AX1675x per sostituire il Killer AX1650w dello scorso anno. A differenza dell'Intel AX210, questi moduli Killer sono compatibili con la Killer Performance Suite e tutte le sue caratteristiche software.
Webcam
La qualità della fotocamera rimane scarsa a soli 720p e senza otturatore della webcam. L'IR è incluso per il supporto di Windows Hello.


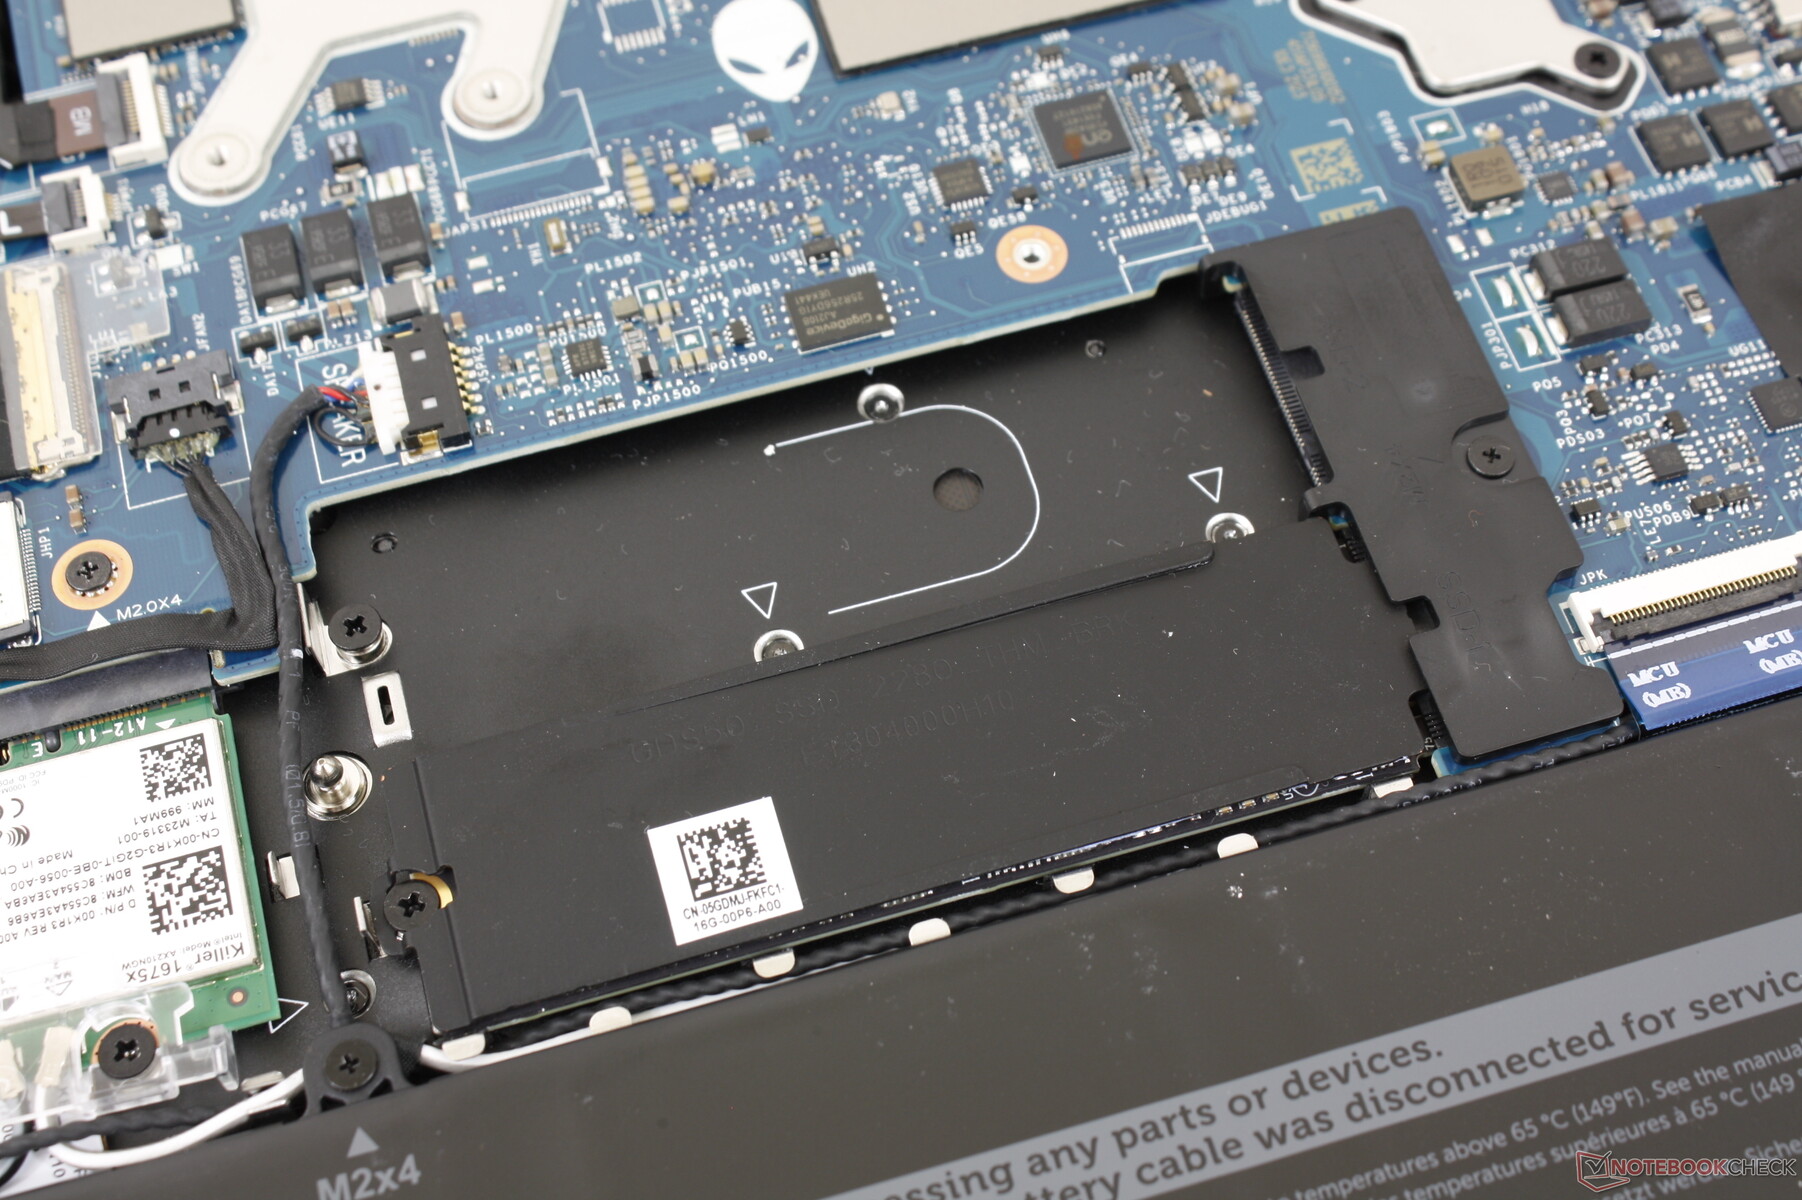
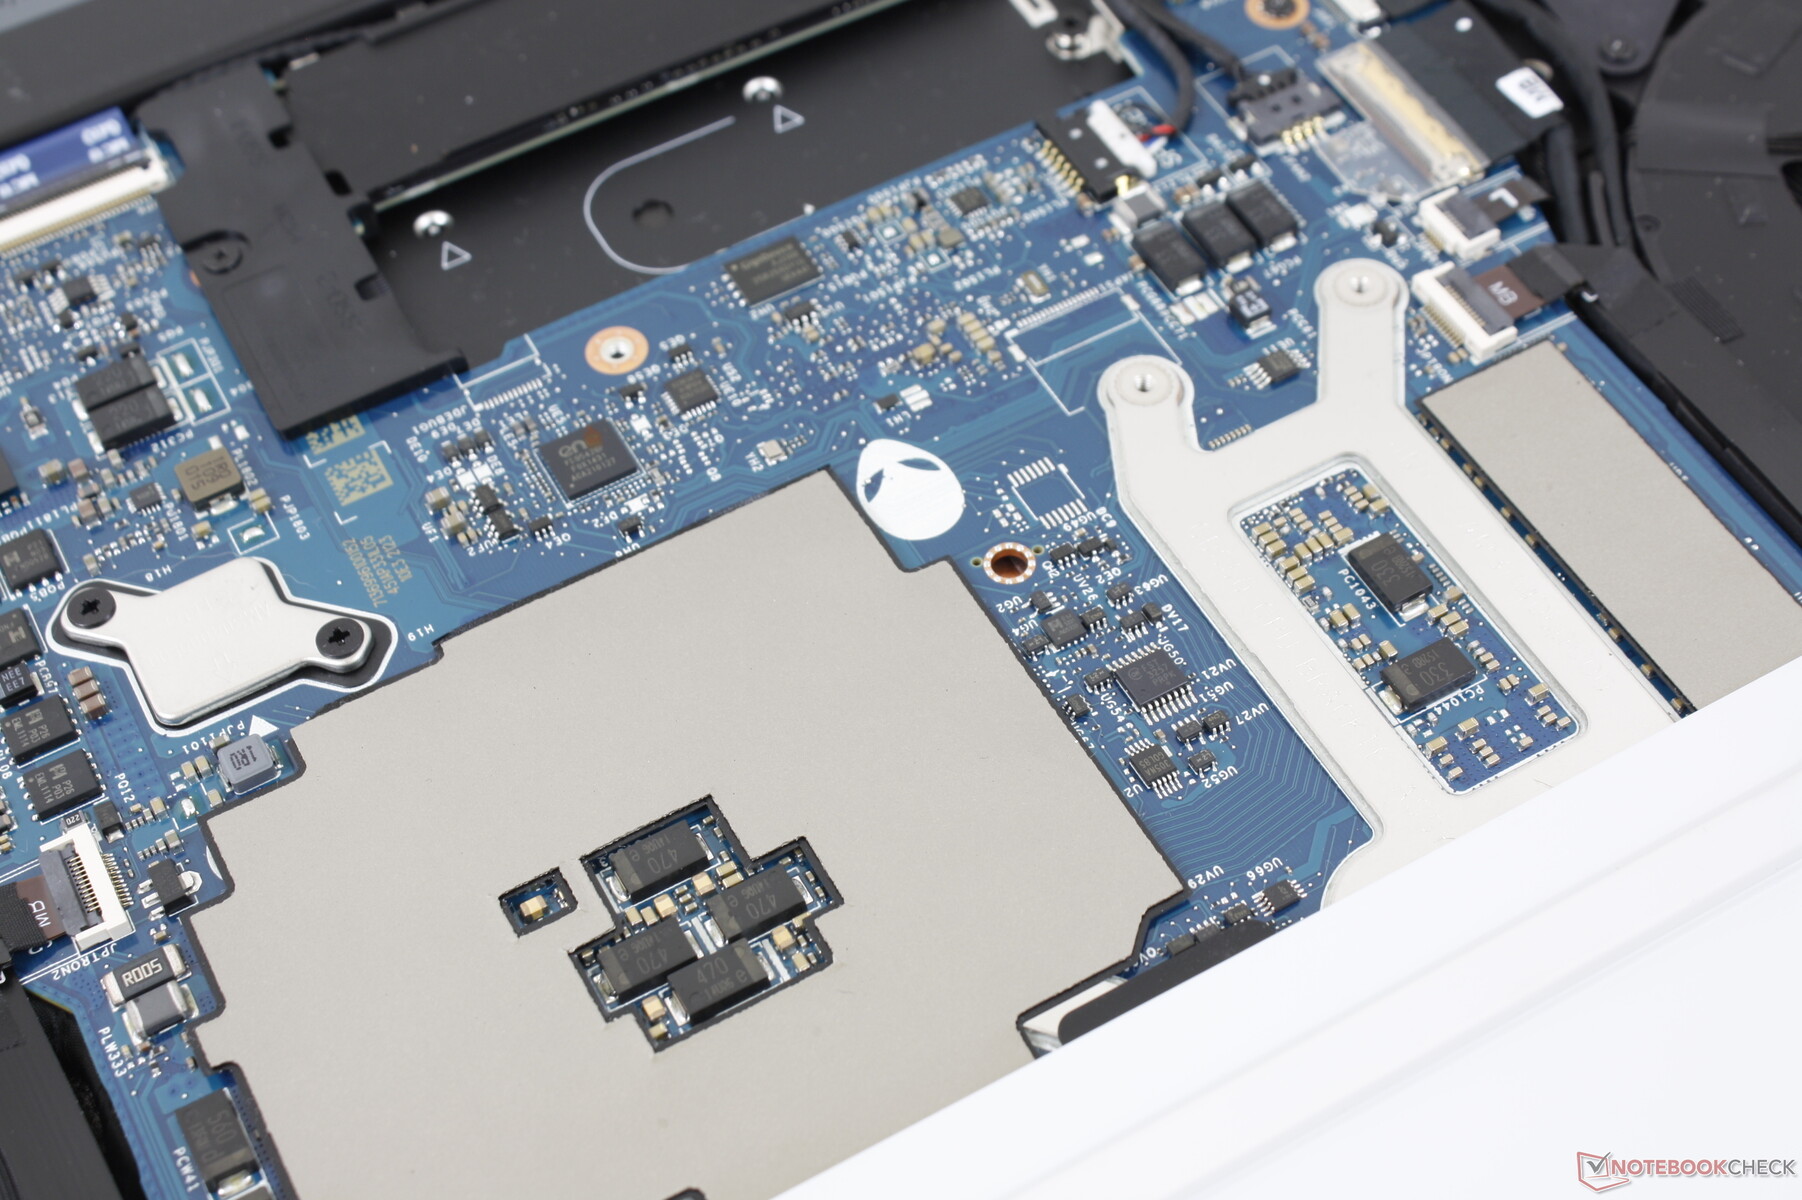
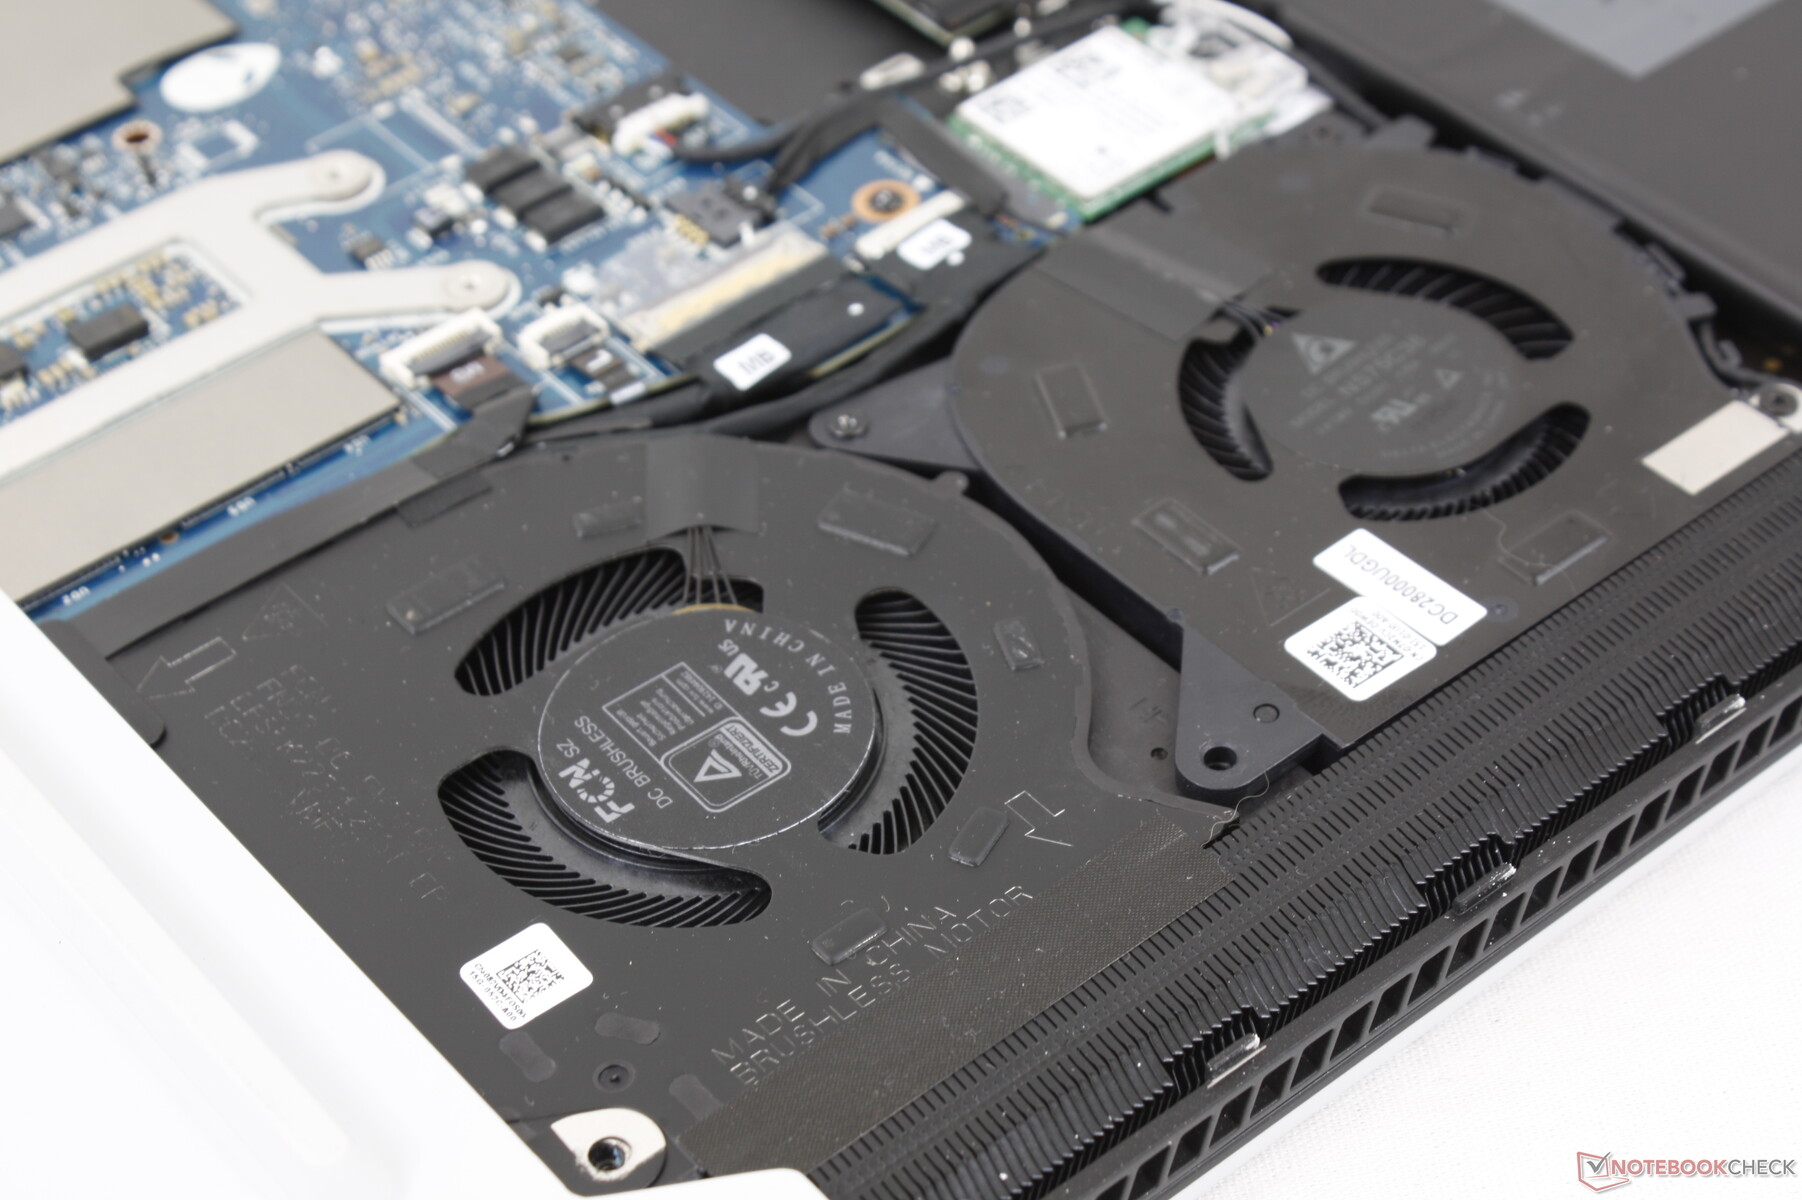
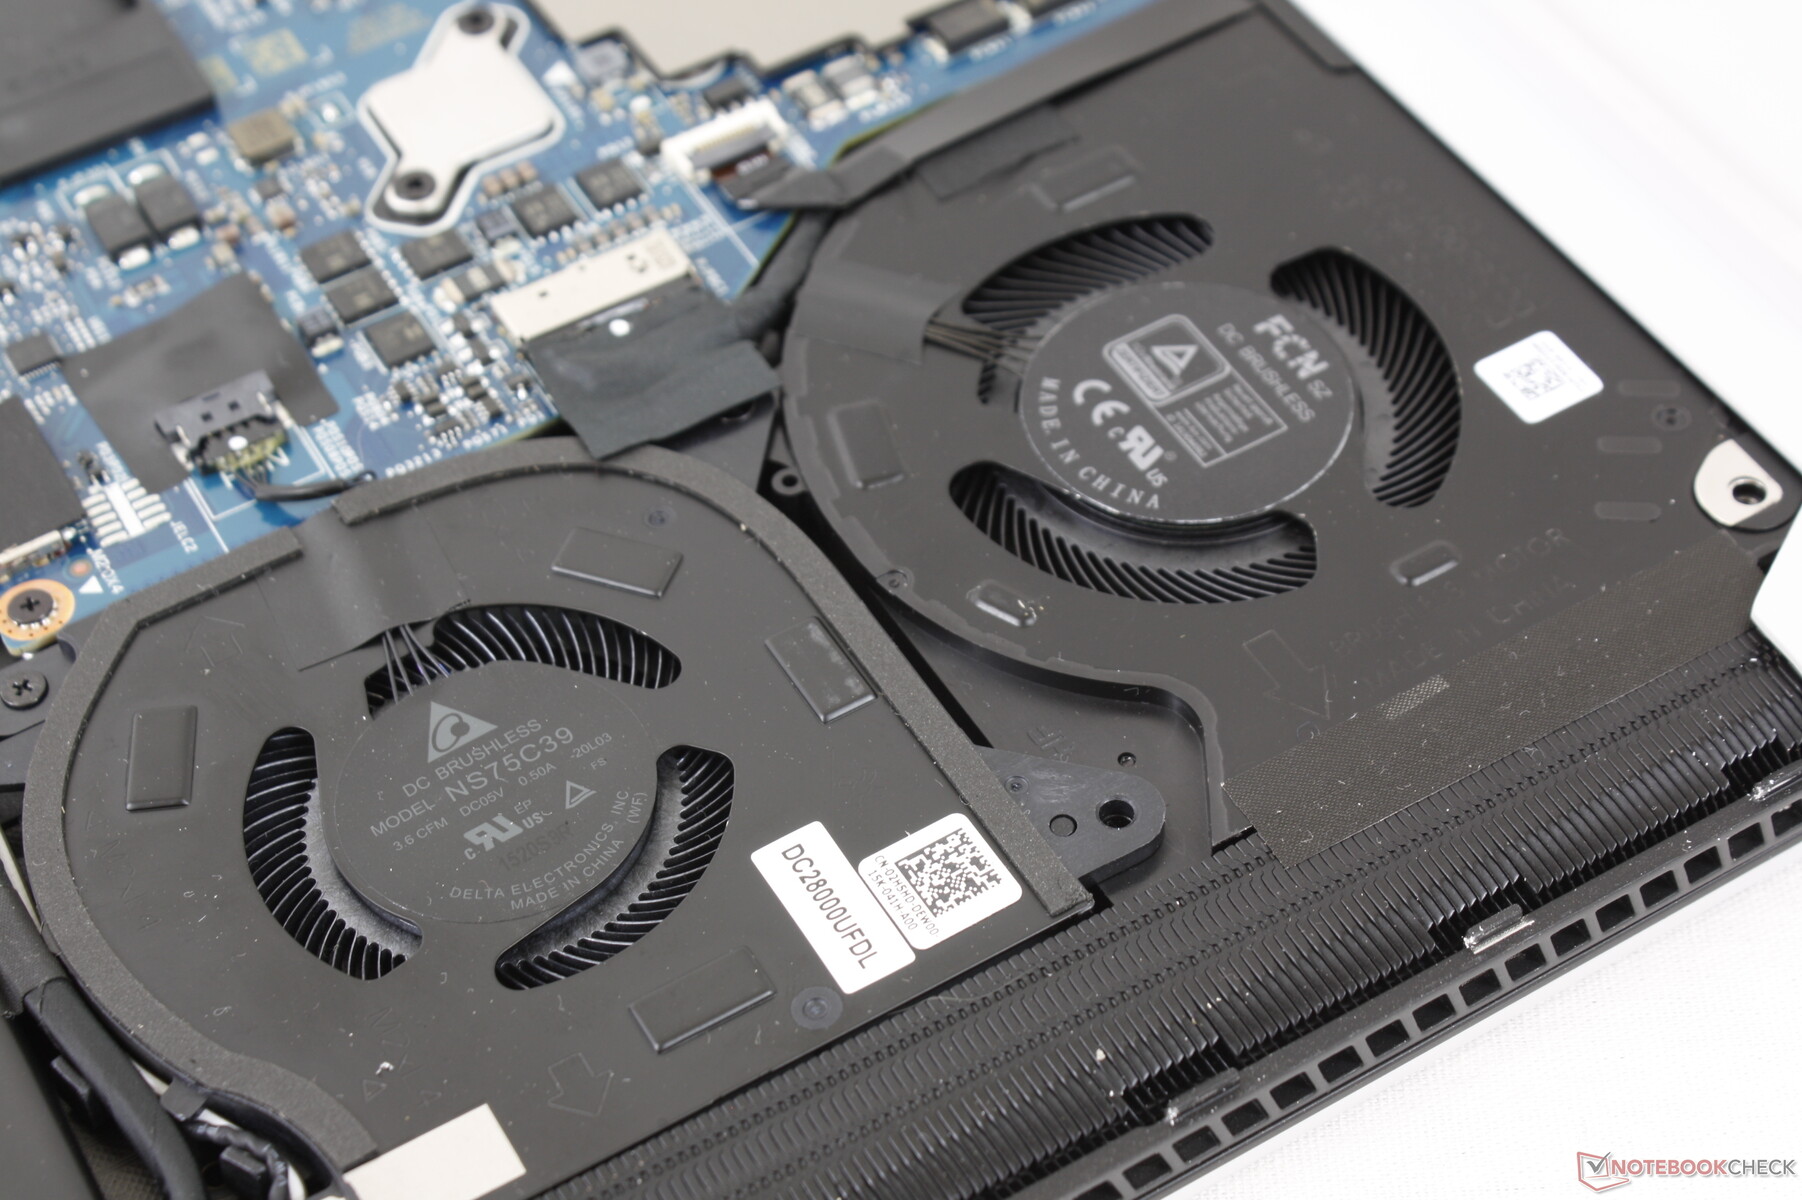
Manutenzione
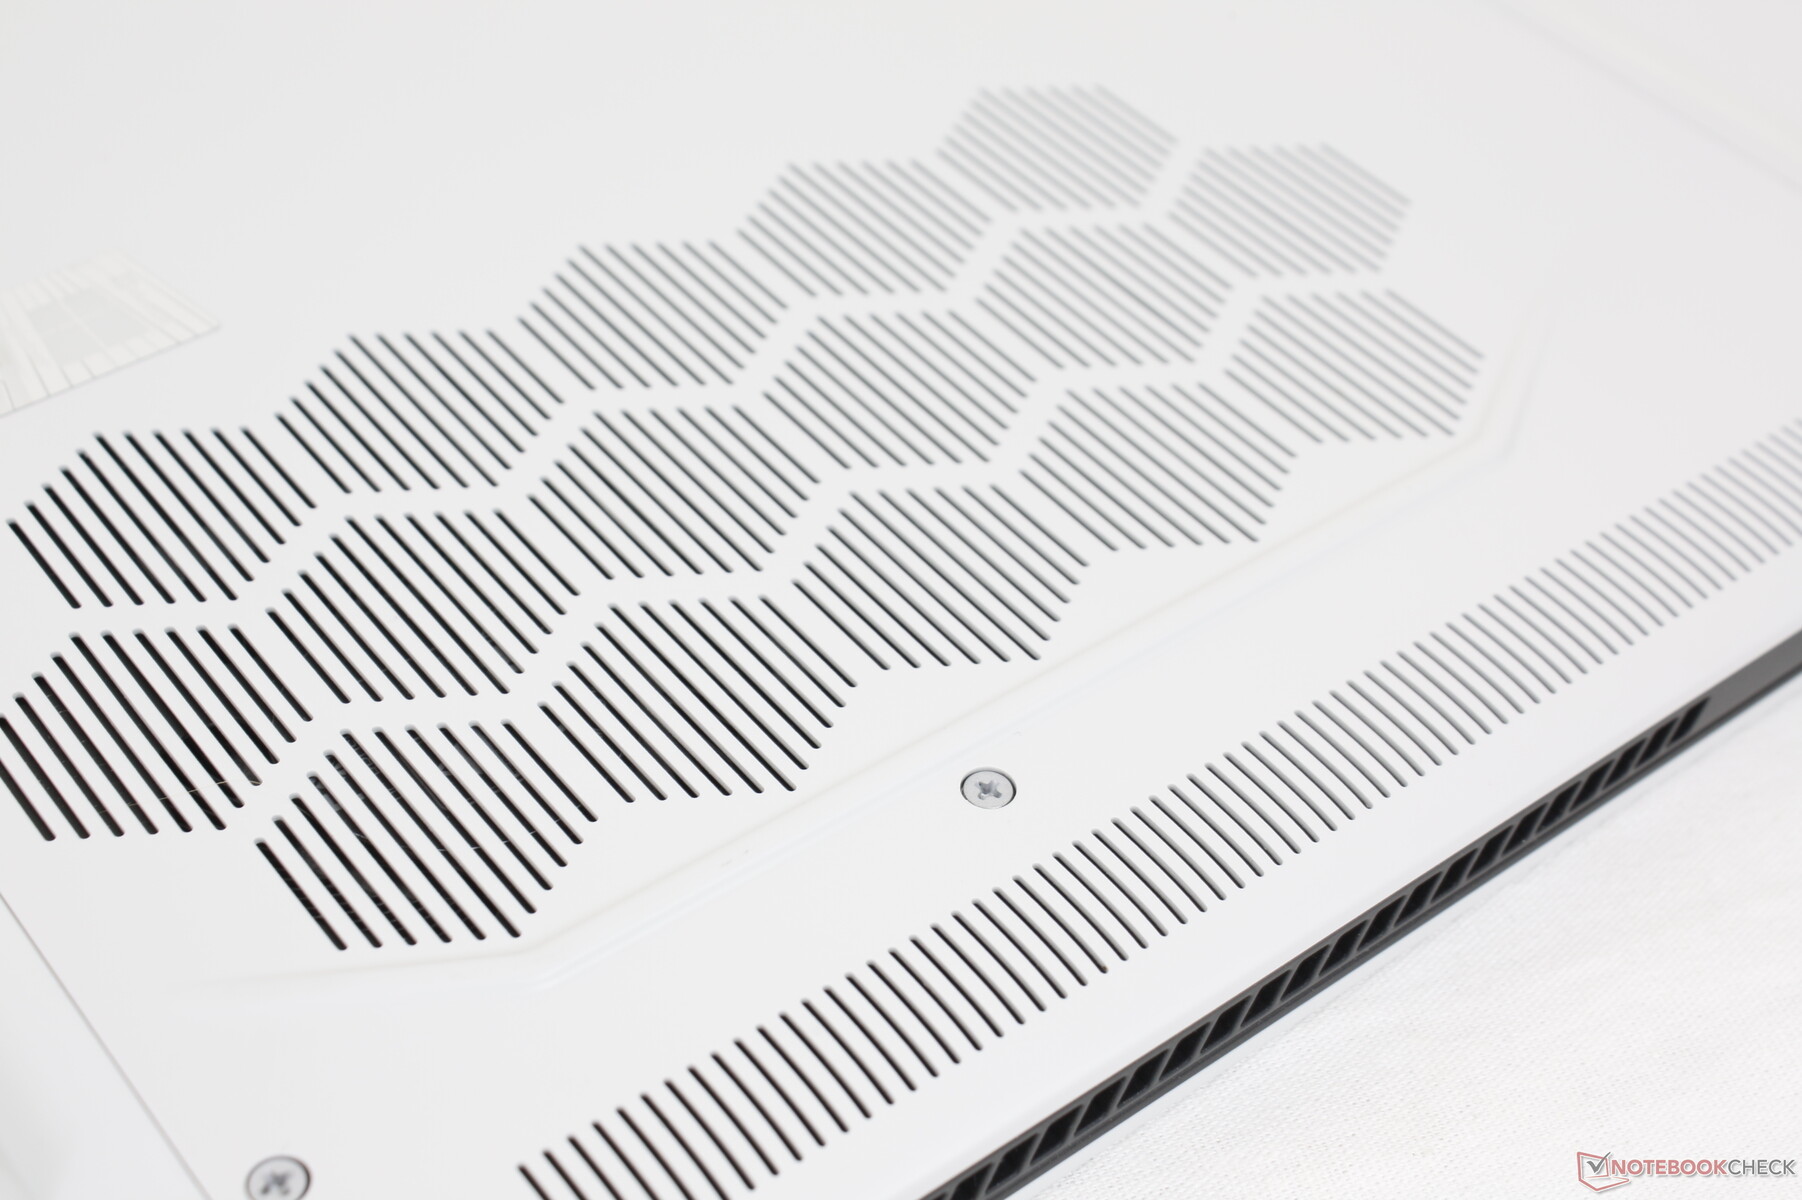
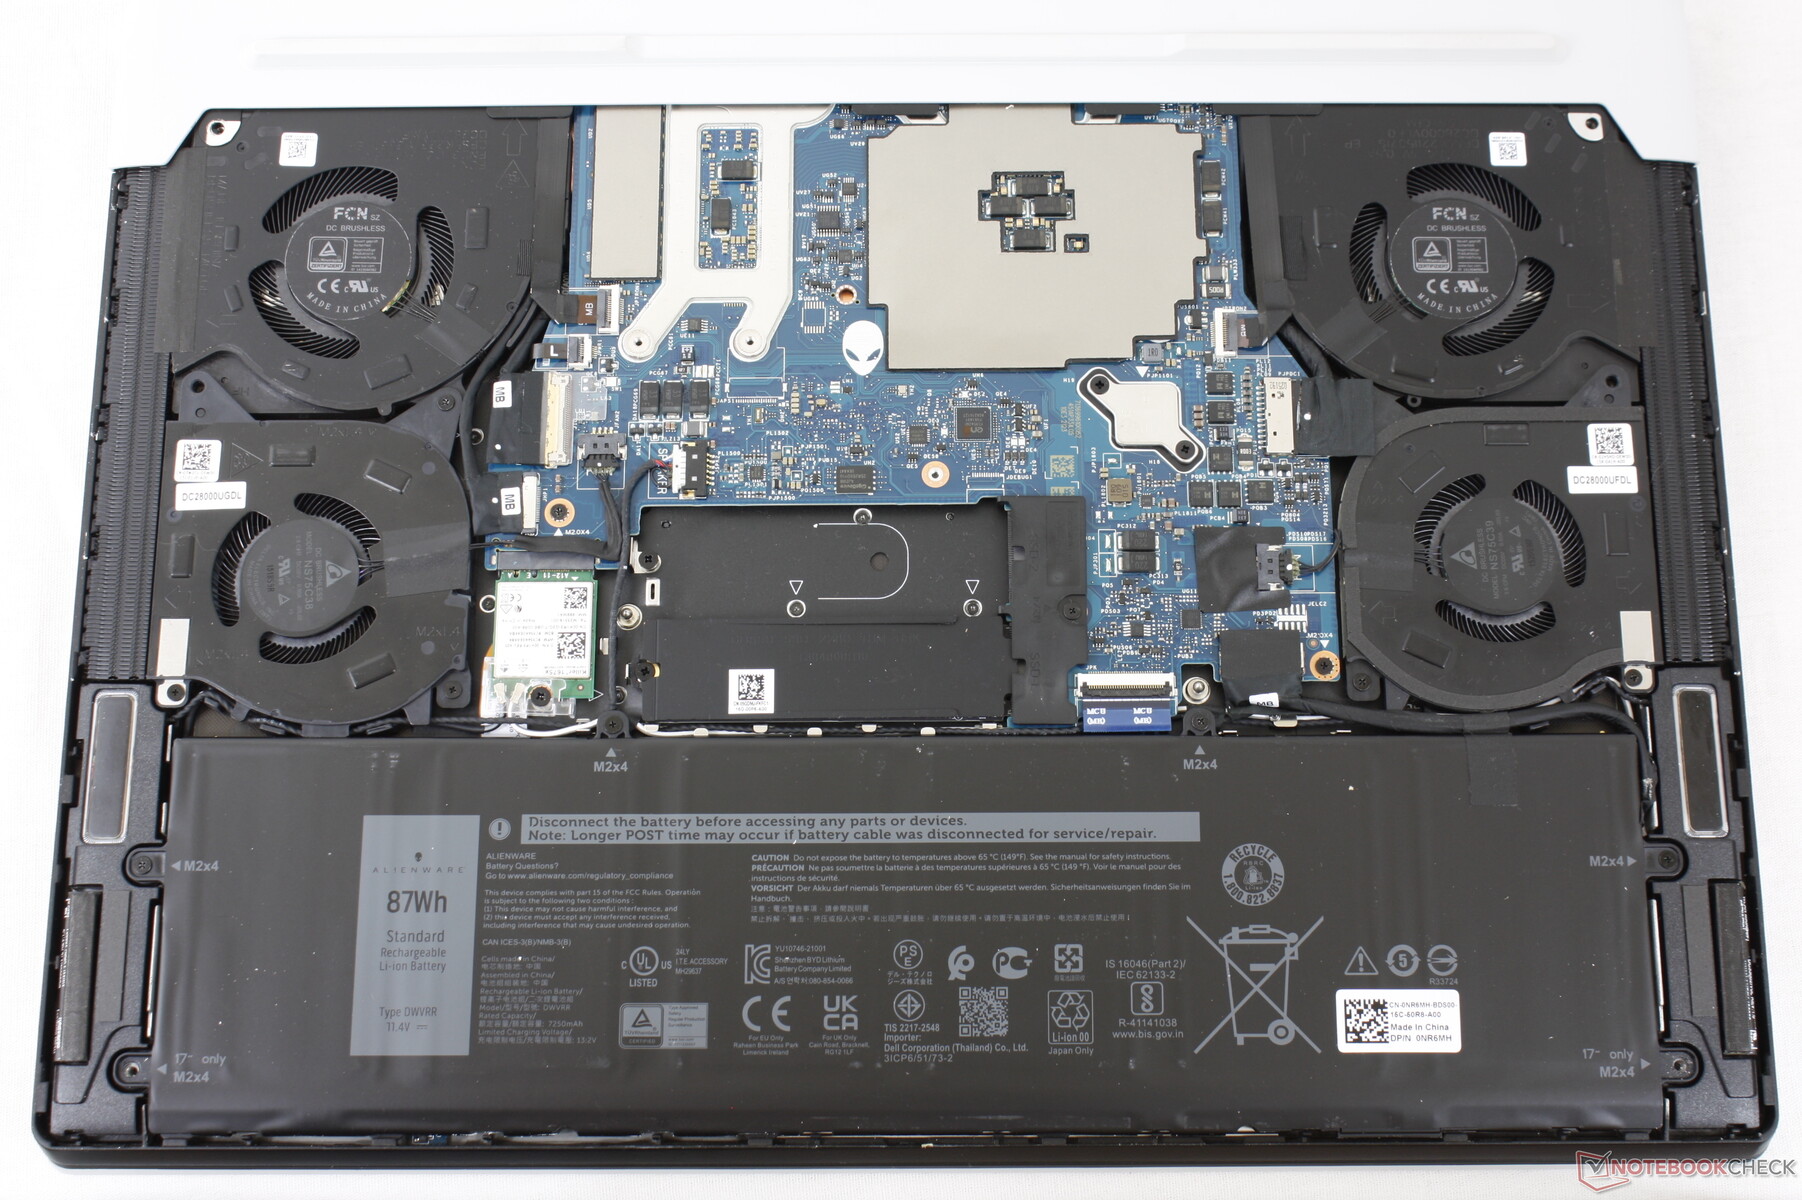
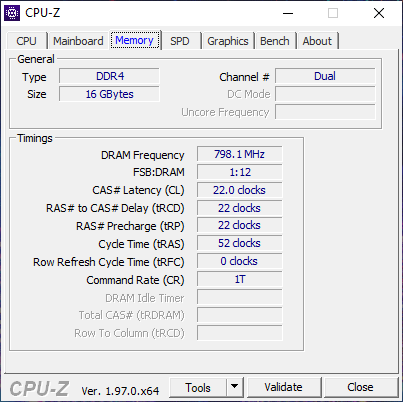
Il pannello inferiore è fissato da solo sei viti Philips per una facile manutenzione e aggiornamenti. La RAM è saldata, tuttavia, e così gli utenti saranno in grado di aggiornare solo gli SSD M.2. I modelli concorrenti come il Razer Blade 15 o MSI GS66 hanno slot SODIMM per gli aggiornamenti degli utenti in confronto.
Accessori e garanzia
Non ci sono extra nella scatola a parte l'adattatore AC e la documentazione. La solita garanzia limitata di un anno si applica con molti extra se ordinata da Dell.
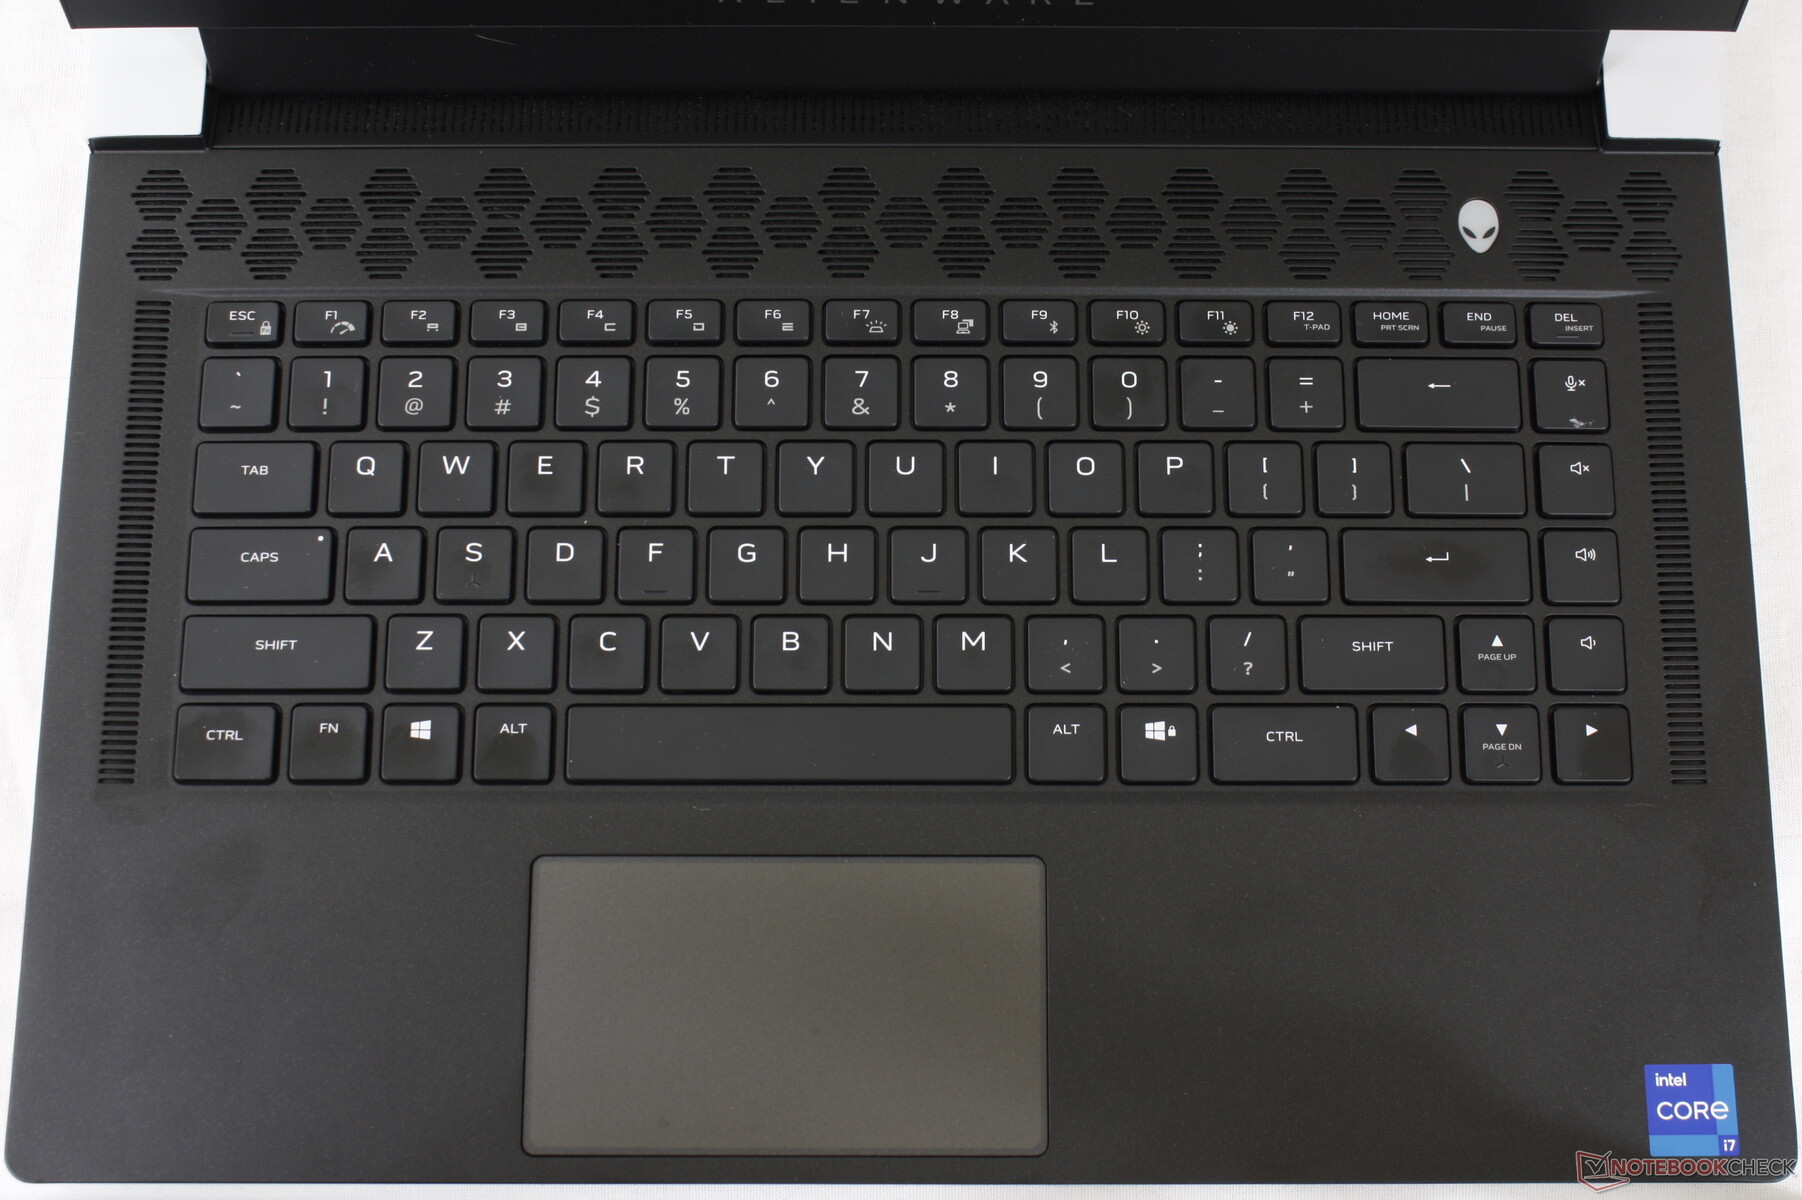
Dispositivi di input - Tasti croccanti
Tastiera
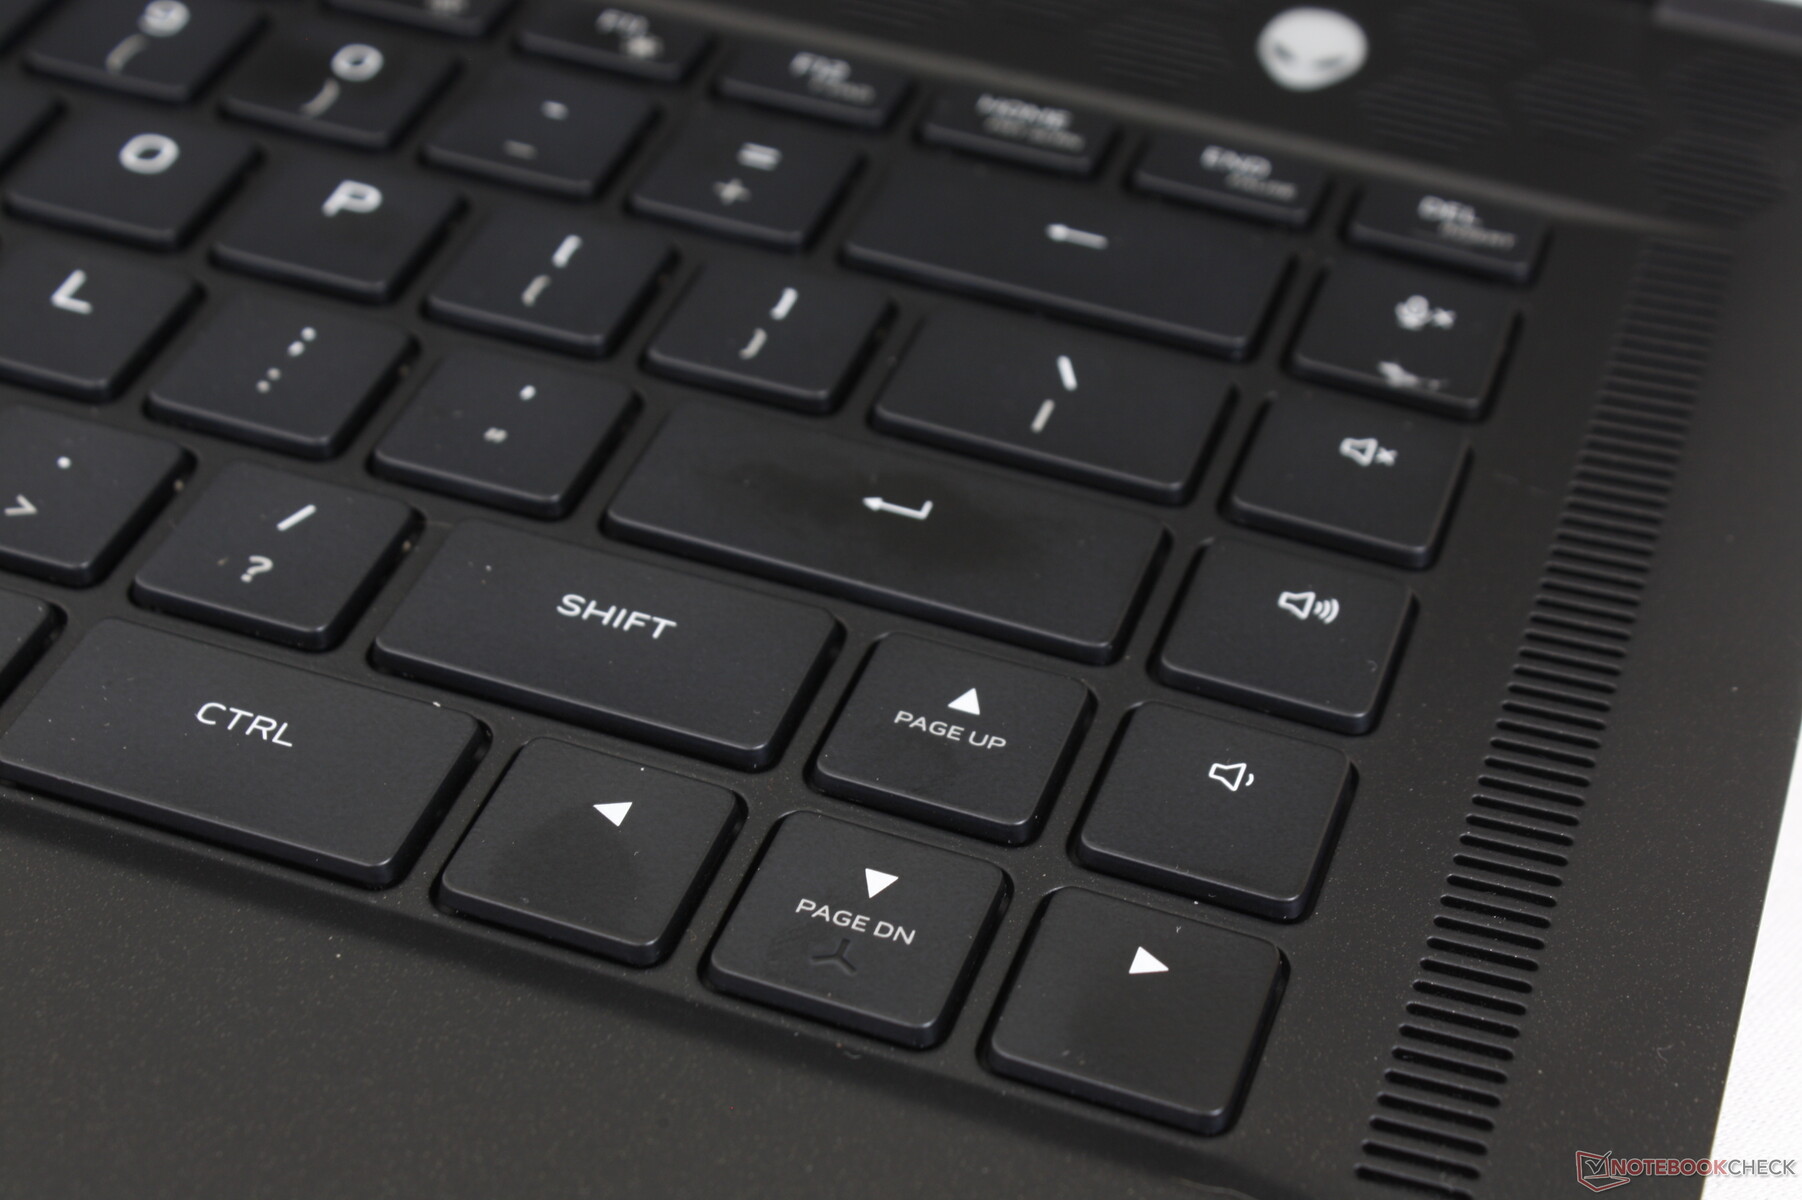
La x15 utilizza tasti standard a membrana con retroilluminazione RGB per tasto, che è un aggiornamento rispetto all'illuminazione quad-zona dell'Alienware m15 R4. Il feedback è più nitido e solido del previsto con la sua corsa dei tasti di 1,5 mm per evitare i tasti morbidi e troppo poco profondi della maggior parte degli Ultrabook. Troviamo che il sistema sia più comodo per digitare rispetto alla serie Asus Zephyrus o al Razer Blade 15. I tasti Invio e Spazio sono significativamente più rumorosi dei più silenziosi tasti QWERTY, comunque
I simboli dei tasti secondari sono fastidiosamente non illuminati a differenza della vecchia serie m15. Anche la tastiera x17 R1 ha questo stesso problema.
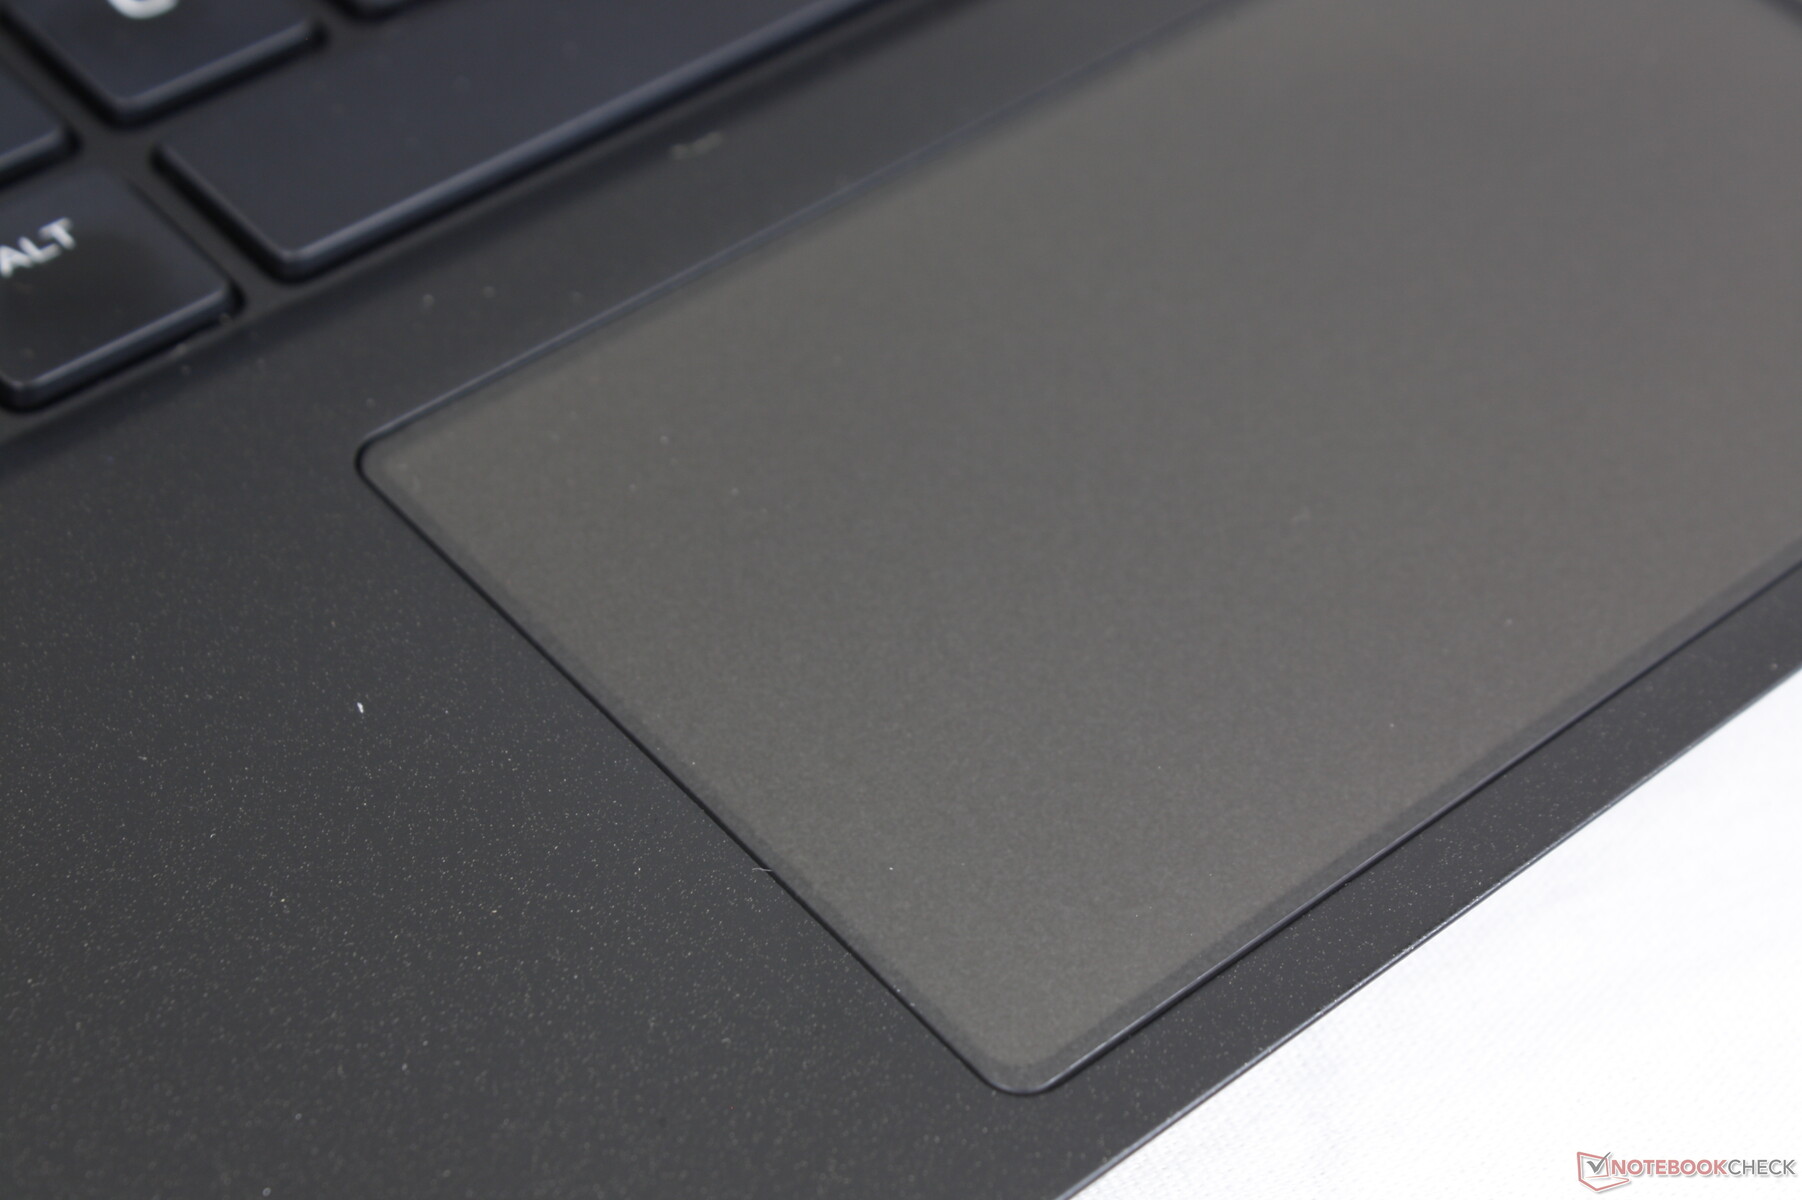
Touchpad
La superficie del clickpad non è cambiata rispetto al modello dell'anno scorso con soli 10,5 x 6 cm. La trazione è fluida quando si scivola a velocità medie o più veloci, mentre le velocità più basse hanno un po' di aderenza per un clic più accurato. Sfortunatamente, il clic continua ad essere sul lato spugnoso per un feedback un po' insoddisfacente. Inoltre, il colore grigio scuro accentua le impronte digitali molto più facilmente rispetto al clickpad bianco della serie Alienware m15 dello scorso anno

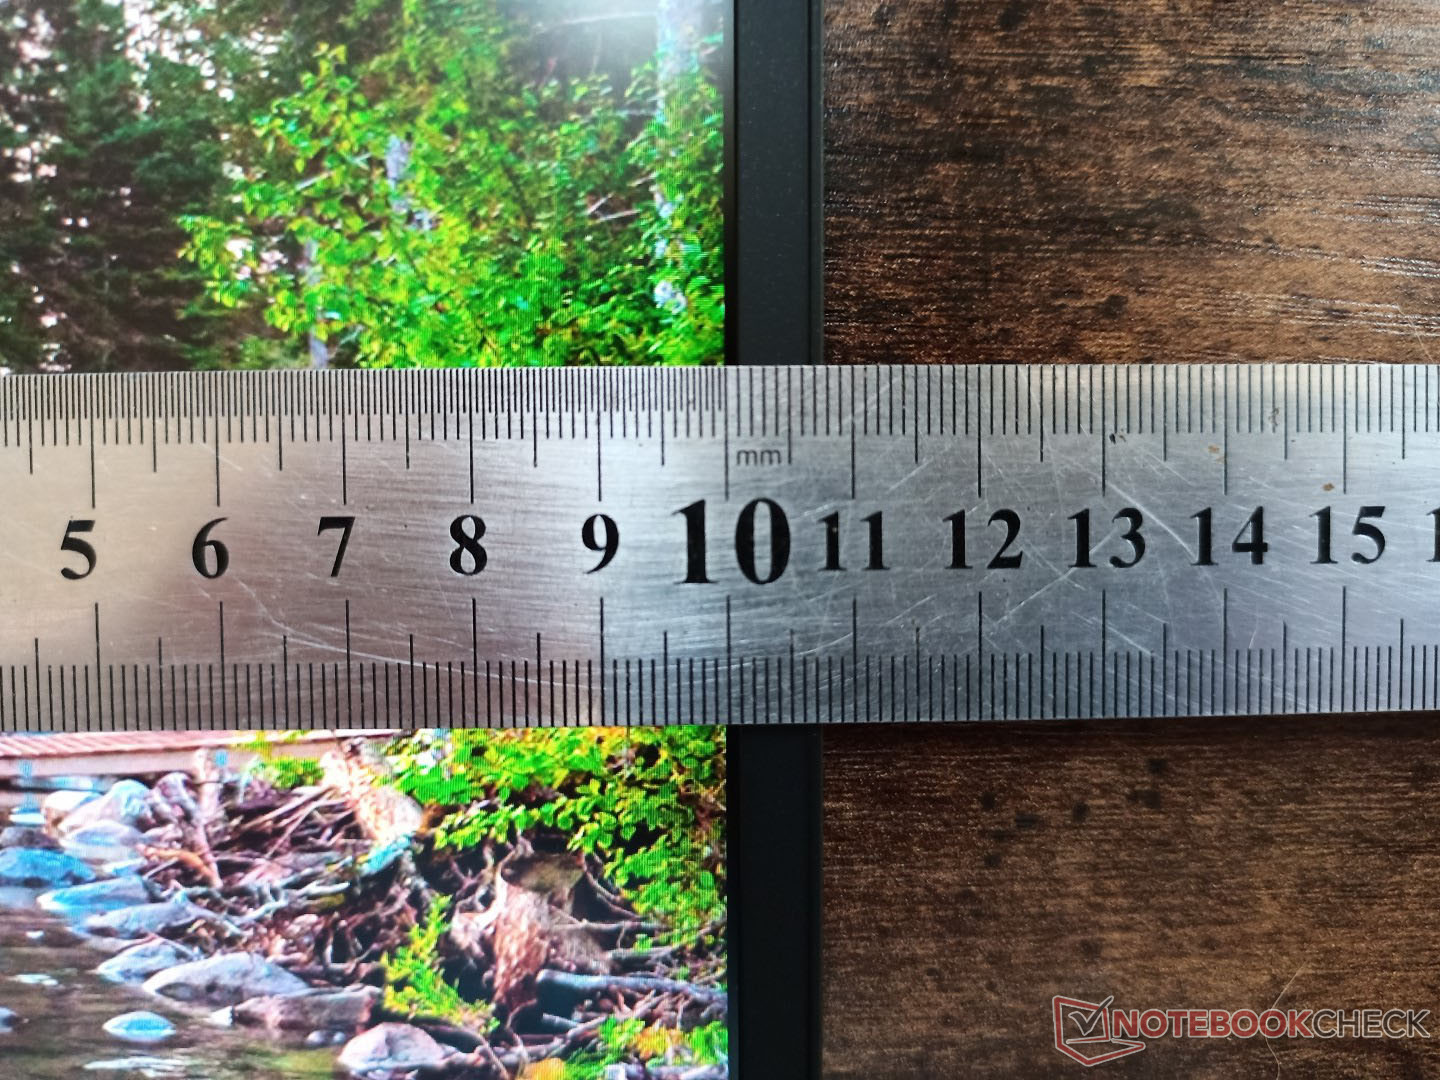
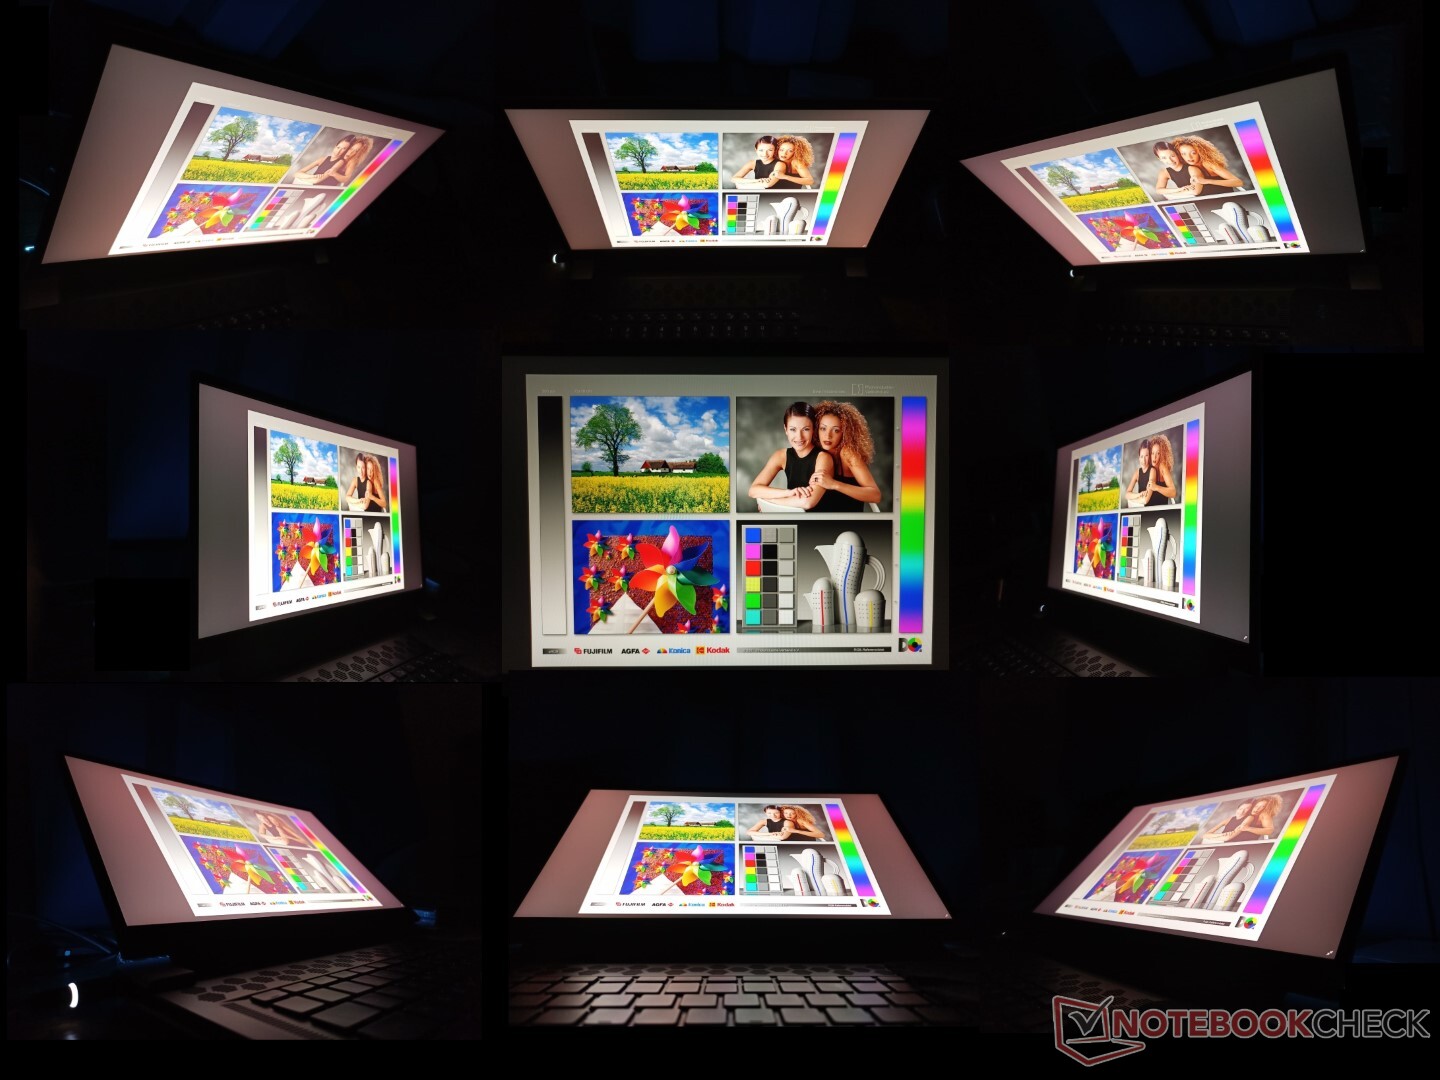
Display - Niente più opzioni OLED
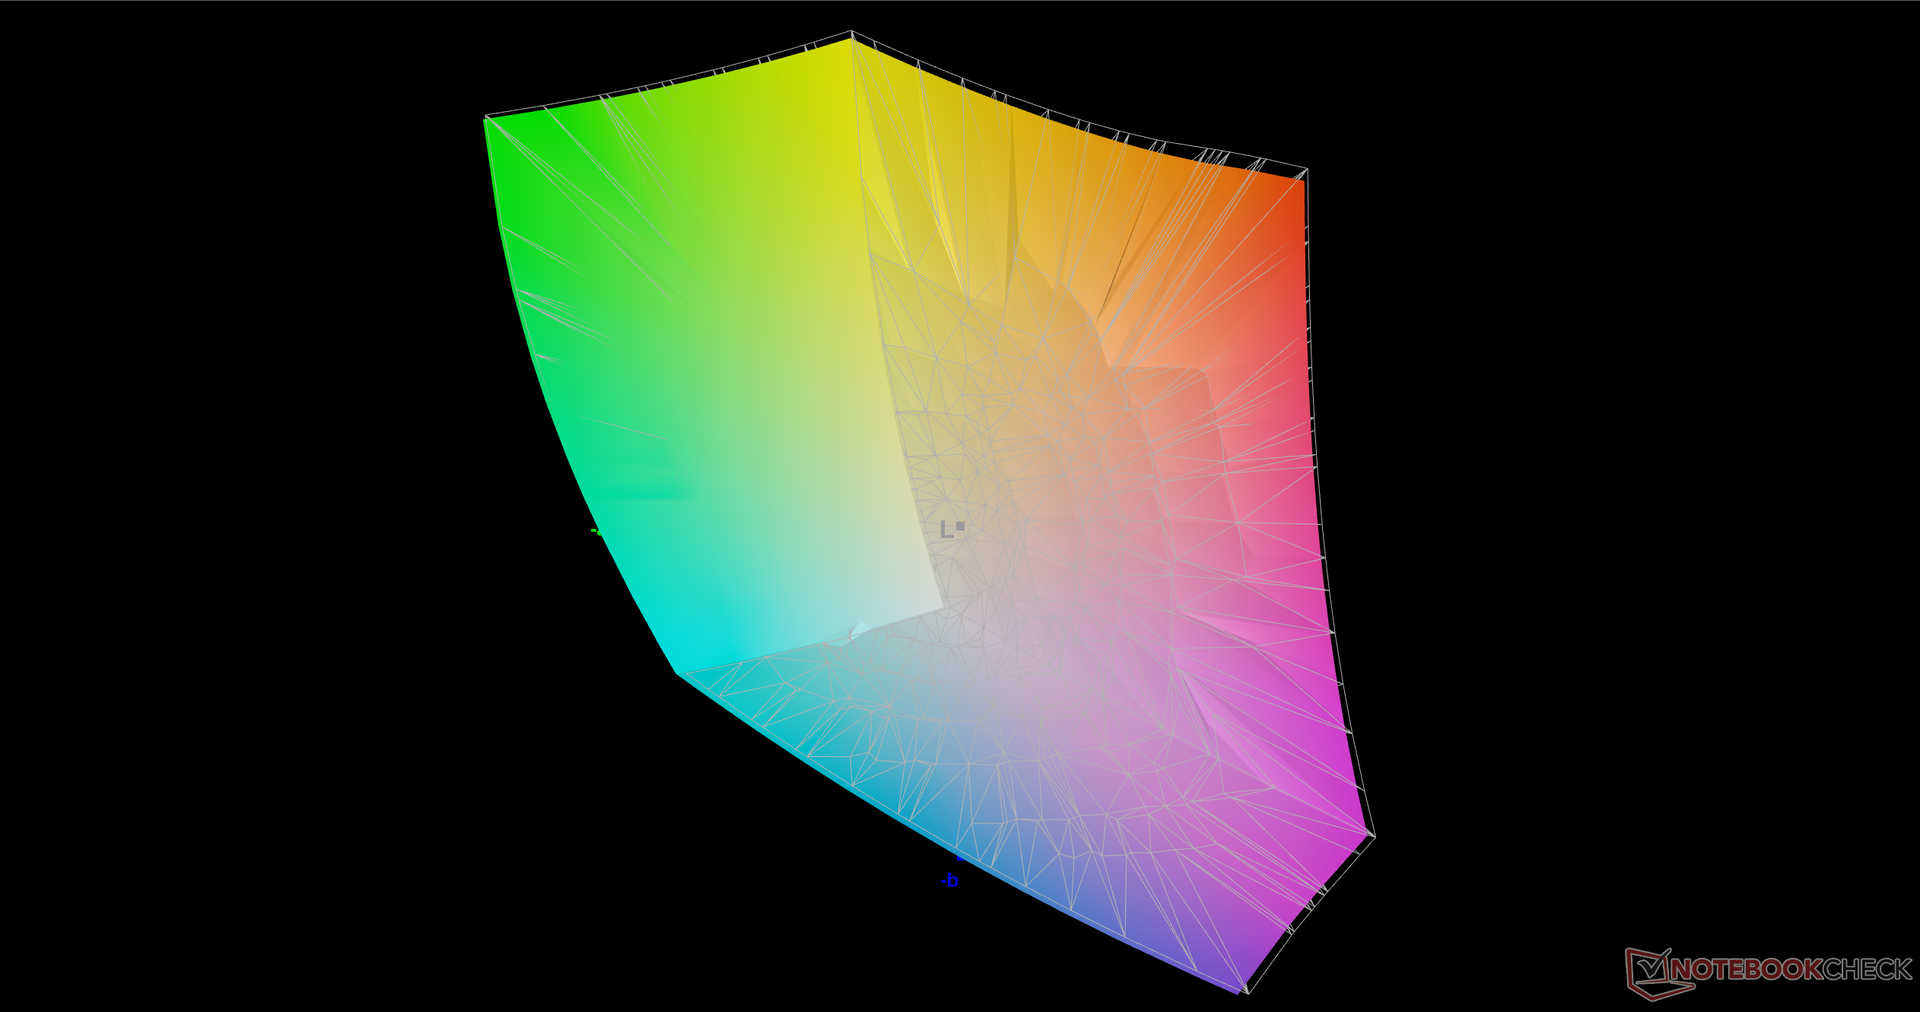
Il pannello IPS LG Philips 156QHG 1440p è il primo ad apparire nel nostro database. I suoi attributi sono eccellenti con tempi di risposta rapidi di 6 ms, velocità di aggiornamento di 240 Hz, ampia copertura del colore a quasi il 100 per cento di DCI-P3, e una retroilluminazione luminosa di 400 nit che è più luminosa di molti altri portatili da gioco da 15,6 pollici tra cui il nuovoMSI GS66. Forse il suo più grande svantaggio è il suo rapporto di contrasto non eccezionale di circa 900:1, che è più mediocre considerando il prezzo richiesto.
| |||||||||||||||||||||||||
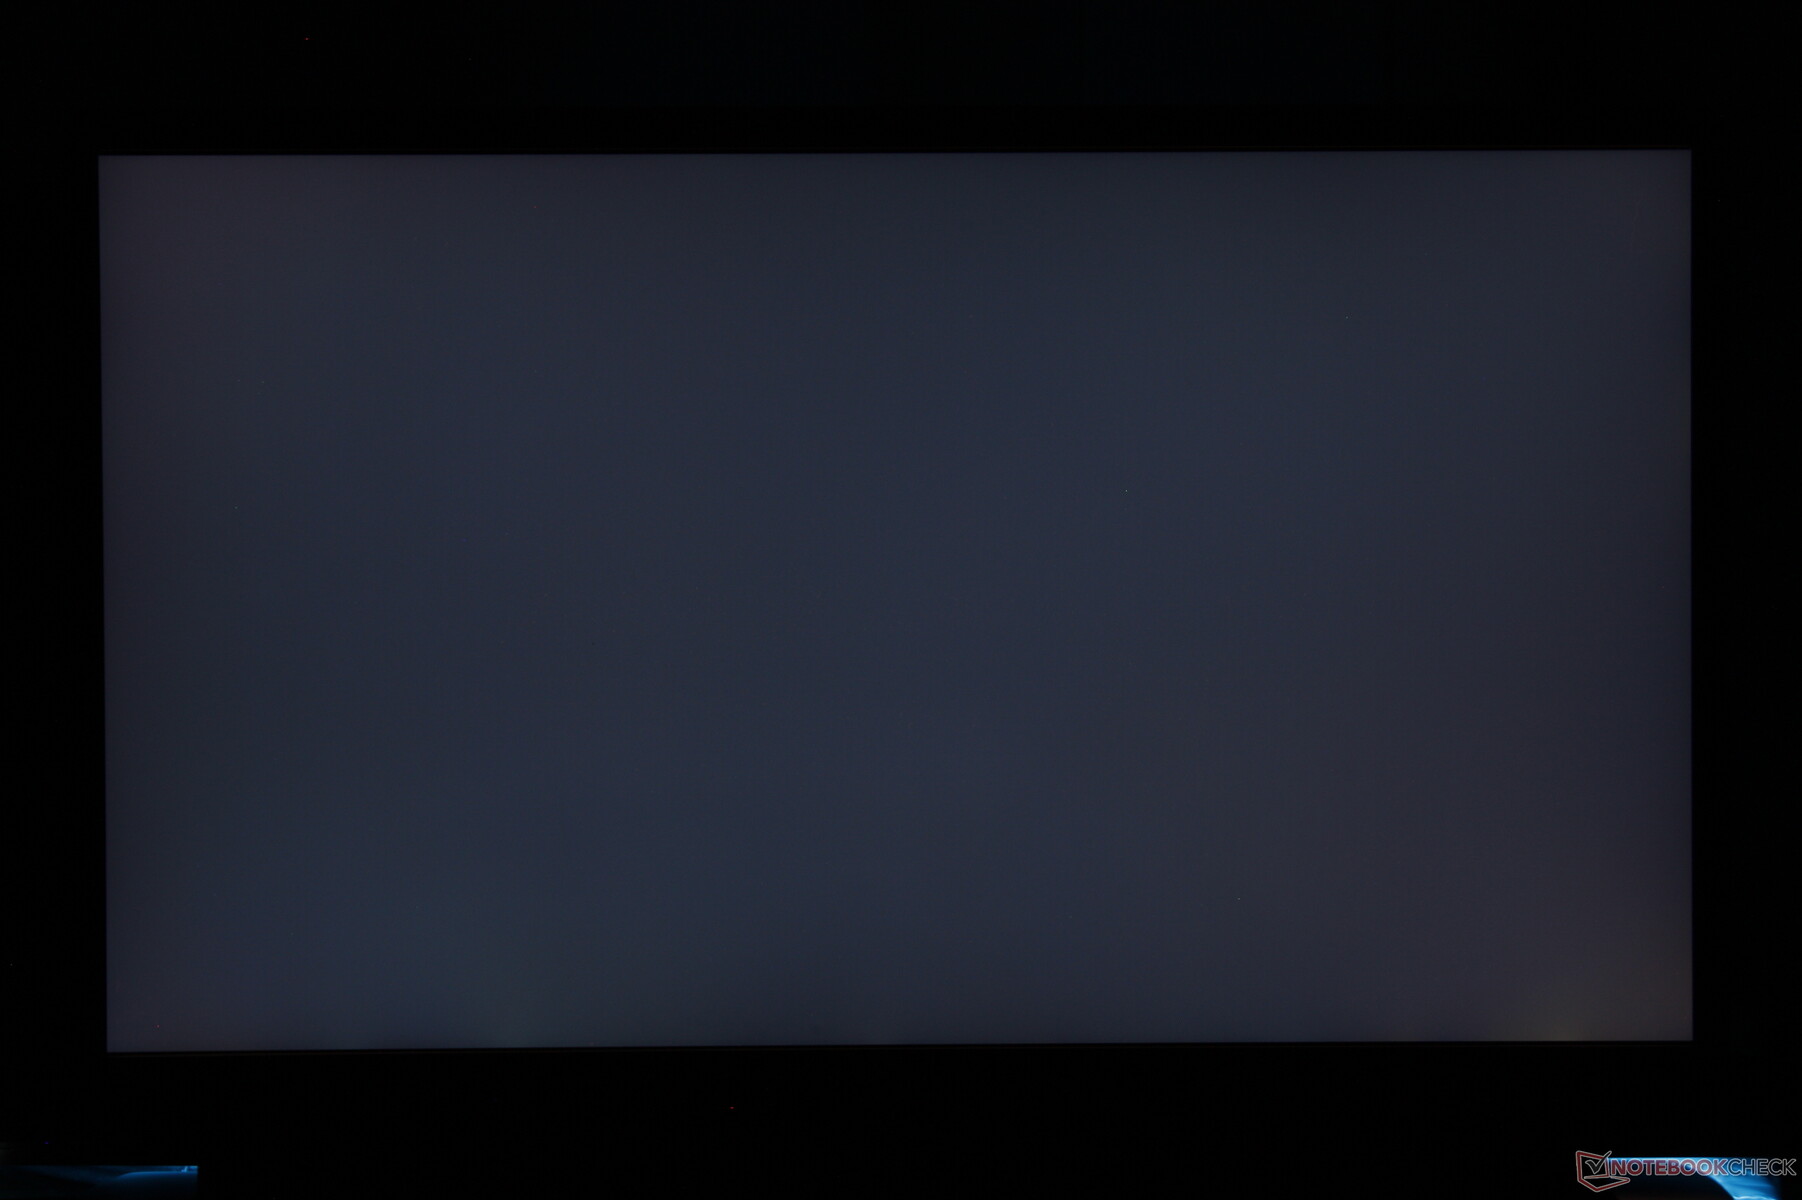
Distribuzione della luminosità: 88 %
Al centro con la batteria: 409.5 cd/m²
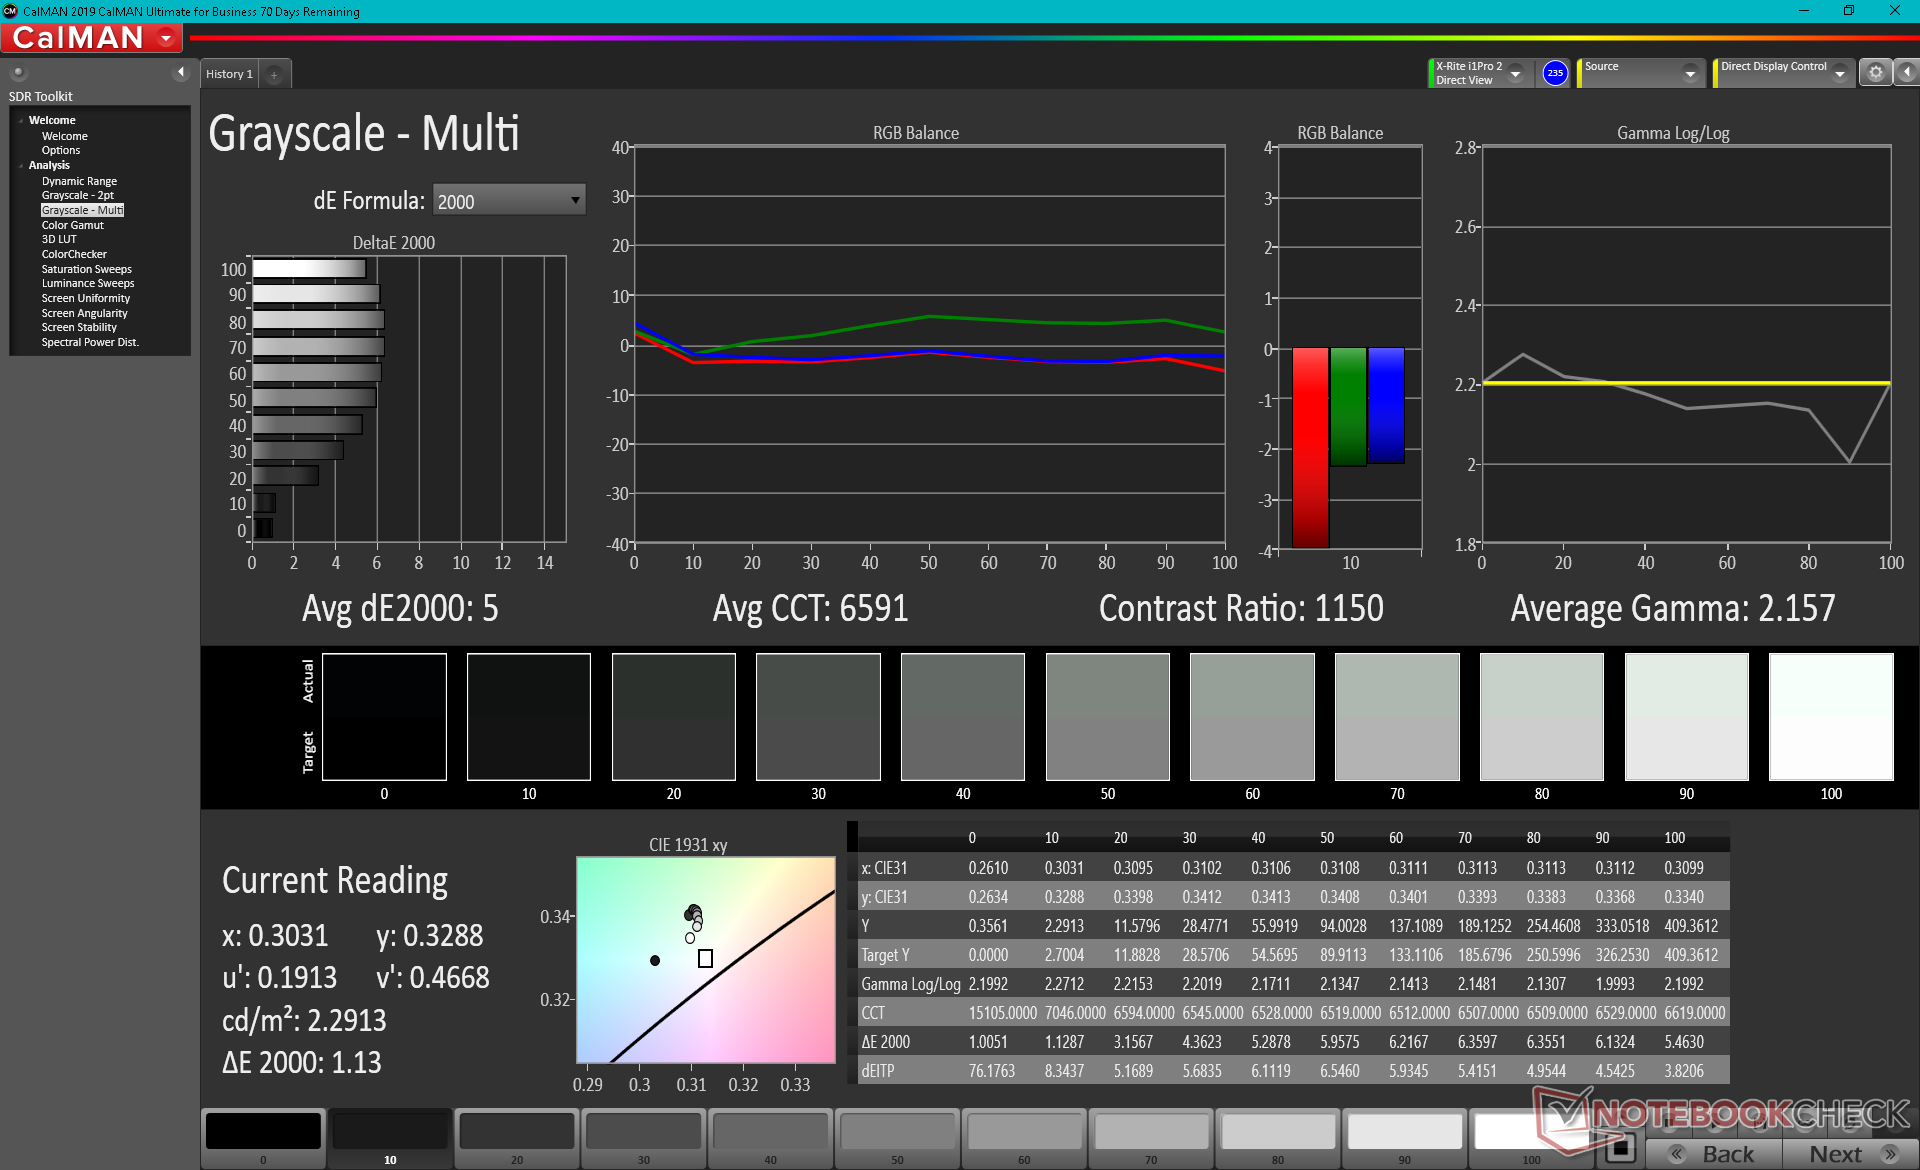
Contrasto: 871:1 (Nero: 0.47 cd/m²)
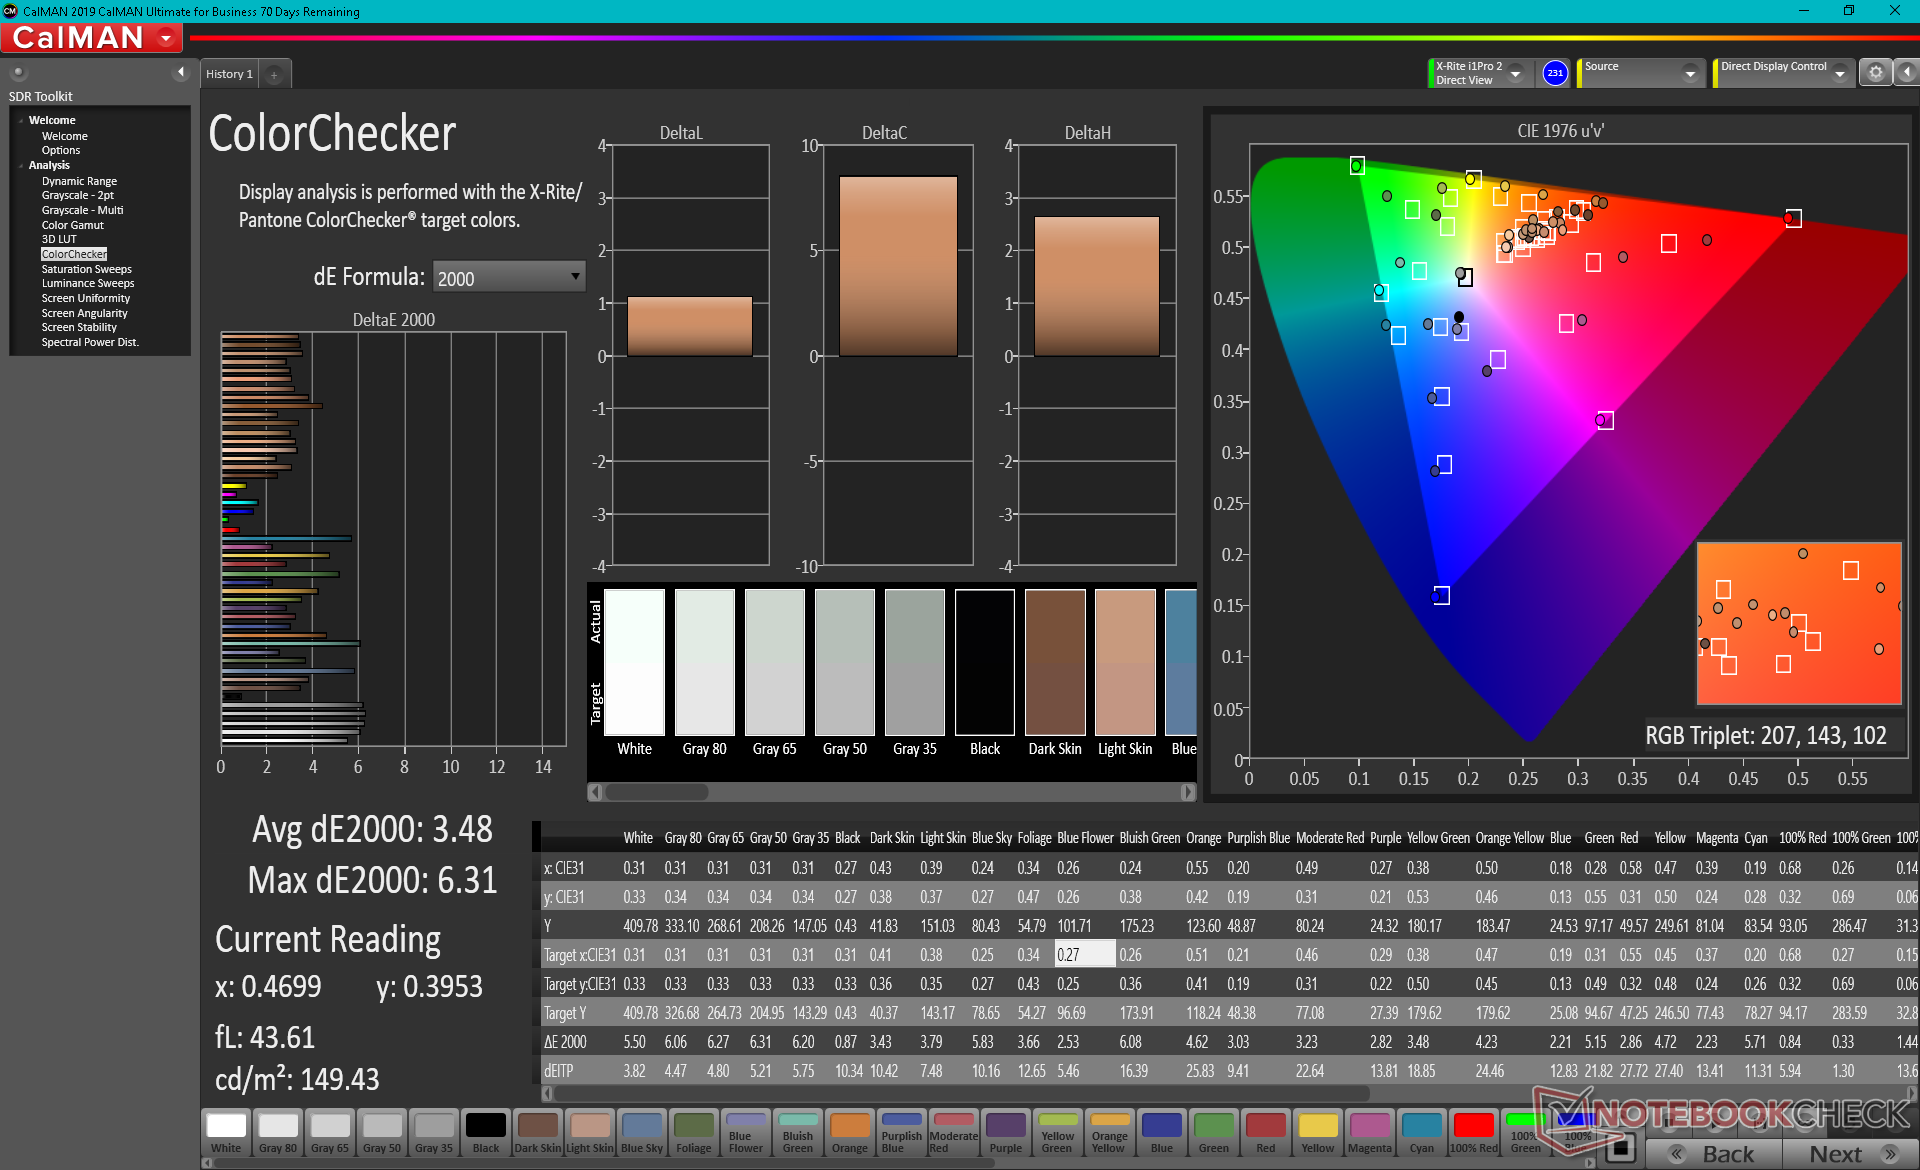
ΔE ColorChecker Calman: 3.48 | ∀{0.5-29.43 Ø4.72}
calibrated: 0.89
ΔE Greyscale Calman: 5 | ∀{0.09-98 Ø4.97}
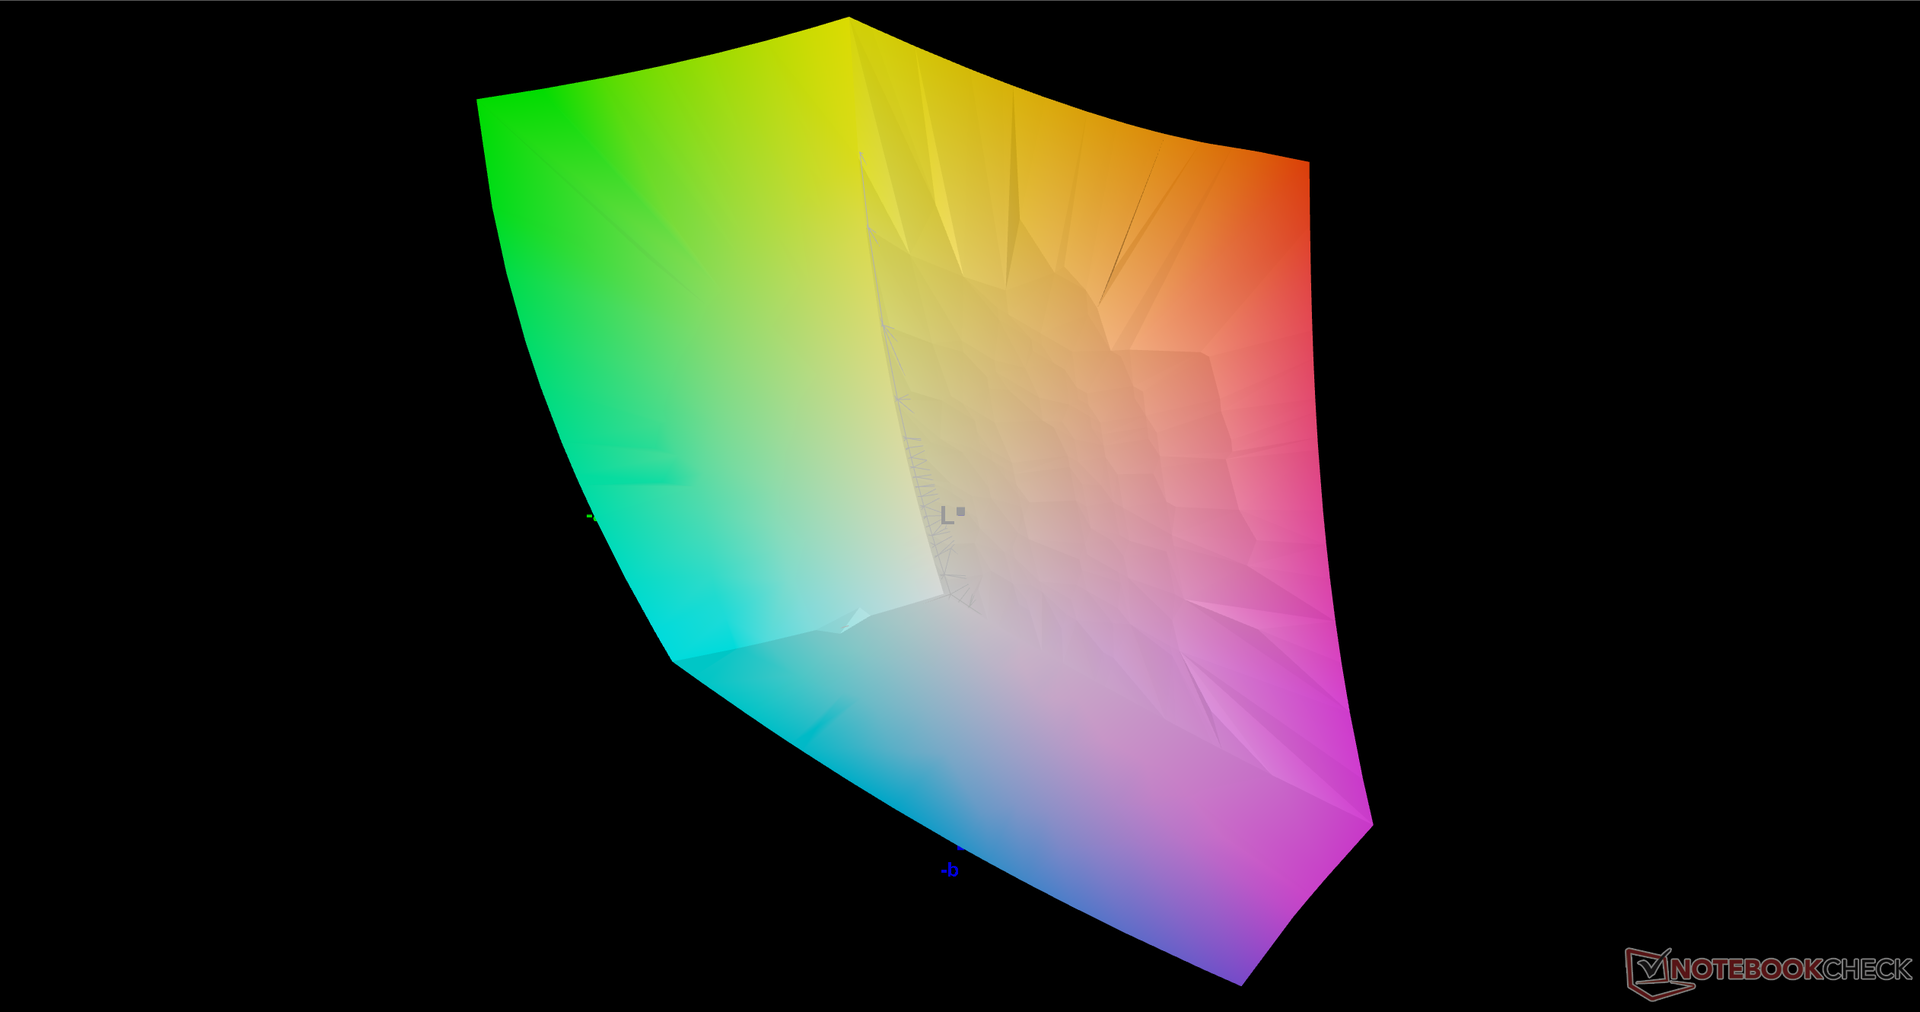
99.9% sRGB (Argyll 3D)
97.8% Display P3 (Argyll 3D)
Gamma: 2.16
CCT: 6591 K
| Alienware x15 RTX 3070 P111F LG Philips 156QHG, IPS, 15.6", 2560x1440 | Alienware m15 R4 RTX 3080 LG Philips LGD066E (156WFG), IPS, 15.6", 1920x1080 | MSI GS66 Stealth 10UG AU Optronics B156HAN12.0, IPS, 15.6", 1920x1080 | Razer Blade 15 Advanced (Mid 2021) TL156VDXP02-0, IPS, 15.6", 1920x1080 | Asus Zephyrus S15 GX502L B156HAN12.0 (AUOBC8C), IPS, 15.6", 1920x1080 | Acer Predator Helios 300 PH315-53-786B Sharp LQ156M1JW09, IPS, 15.6", 1920x1080 | |
|---|---|---|---|---|---|---|
| Display | -14% | -17% | -18% | -15% | -16% | |
| Display P3 Coverage (%) | 97.8 | 70.1 -28% | 67.7 -31% | 66.9 -32% | 69.7 -29% | 68.4 -30% |
| sRGB Coverage (%) | 99.9 | 99.8 0% | 98.4 -2% | 97.1 -3% | 99.7 0% | 99.4 -1% |
| AdobeRGB 1998 Coverage (%) | 71.5 | 69.1 | 69 | 71.1 | 70.4 | |
| Response Times | 23% | -16% | 35% | -5% | -8% | |
| Response Time Grey 50% / Grey 80% * (ms) | 12 ? | 7.6 ? 37% | 14.4 ? -20% | 4.2 ? 65% | 14 ? -17% | 15.2 ? -27% |
| Response Time Black / White * (ms) | 10.4 ? | 9.6 ? 8% | 11.6 ? -12% | 10 ? 4% | 9.6 ? 8% | 9.2 ? 12% |
| PWM Frequency (Hz) | 23580 ? | |||||
| Screen | 19% | -1% | 12% | 9% | 3% | |
| Brightness middle (cd/m²) | 409.5 | 347 -15% | 259.5 -37% | 353.4 -14% | 283 -31% | 312 -24% |
| Brightness (cd/m²) | 390 | 318 -18% | 264 -32% | 340 -13% | 289 -26% | 290 -26% |
| Brightness Distribution (%) | 88 | 86 -2% | 90 2% | 92 5% | 90 2% | 87 -1% |
| Black Level * (cd/m²) | 0.47 | 0.31 34% | 0.25 47% | 0.31 34% | 0.24 49% | 0.32 32% |
| Contrast (:1) | 871 | 1119 28% | 1038 19% | 1140 31% | 1179 35% | 975 12% |
| Colorchecker dE 2000 * | 3.48 | 1.68 52% | 2.52 28% | 2.17 38% | 2.26 35% | 3.03 13% |
| Colorchecker dE 2000 max. * | 6.31 | 3.03 52% | 5.55 12% | 5.69 10% | 5.64 11% | 6.81 -8% |
| Colorchecker dE 2000 calibrated * | 0.89 | 1.08 -21% | 1.93 -117% | 1.05 -18% | 1.11 -25% | 0.71 20% |
| Greyscale dE 2000 * | 5 | 1.8 64% | 1.7 66% | 3.4 32% | 3.4 32% | 4.7 6% |
| Gamma | 2.16 102% | 2.262 97% | 2.04 108% | 2.2 100% | 2.228 99% | 2.177 101% |
| CCT | 6591 99% | 6592 99% | 6414 101% | 6830 95% | 7249 90% | 6676 97% |
| Color Space (Percent of AdobeRGB 1998) (%) | 71 | 63.3 | 71 | |||
| Color Space (Percent of sRGB) (%) | 94 | 98.8 | 93 | |||
| Media totale (Programma / Settaggio) | 9% /
15% | -11% /
-6% | 10% /
11% | -4% /
3% | -7% /
-2% |
* ... Meglio usare valori piccoli
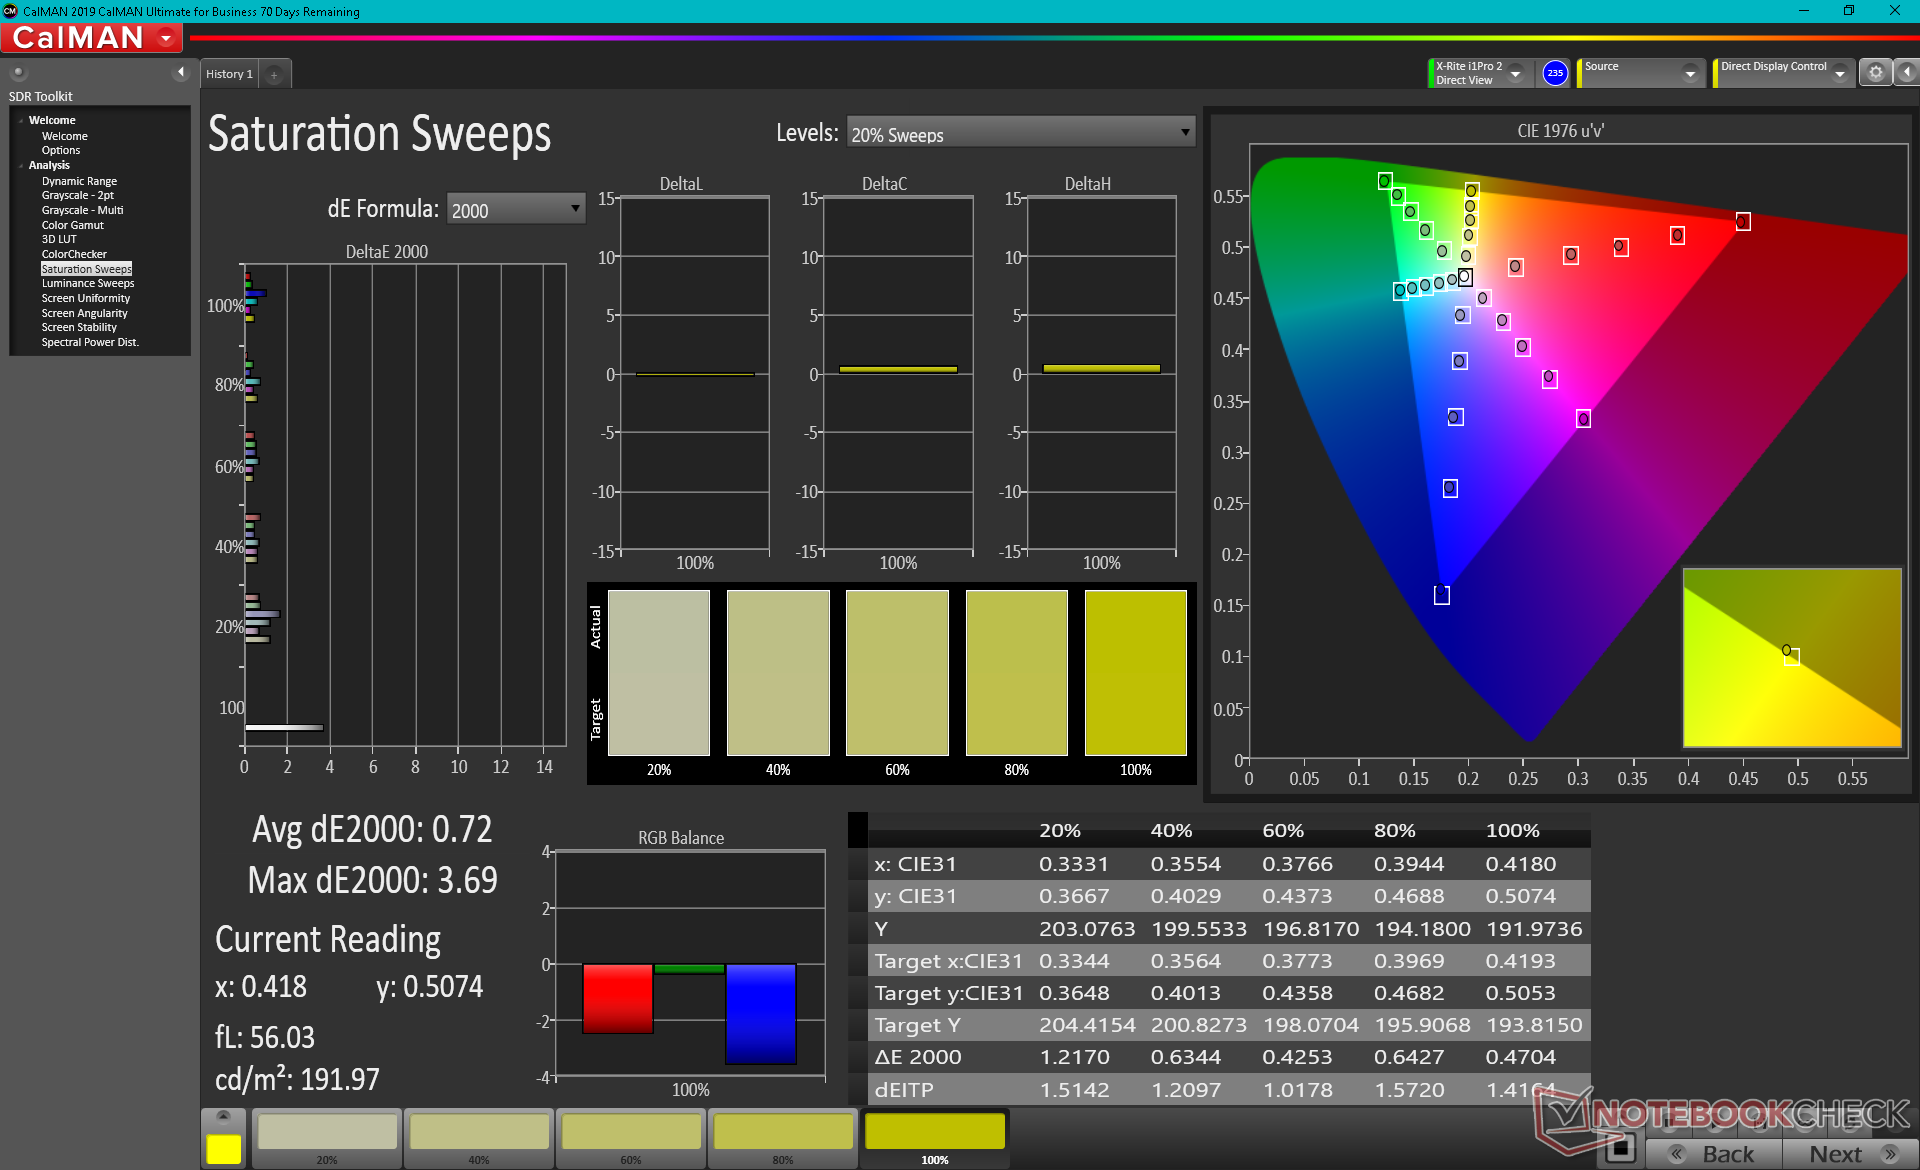
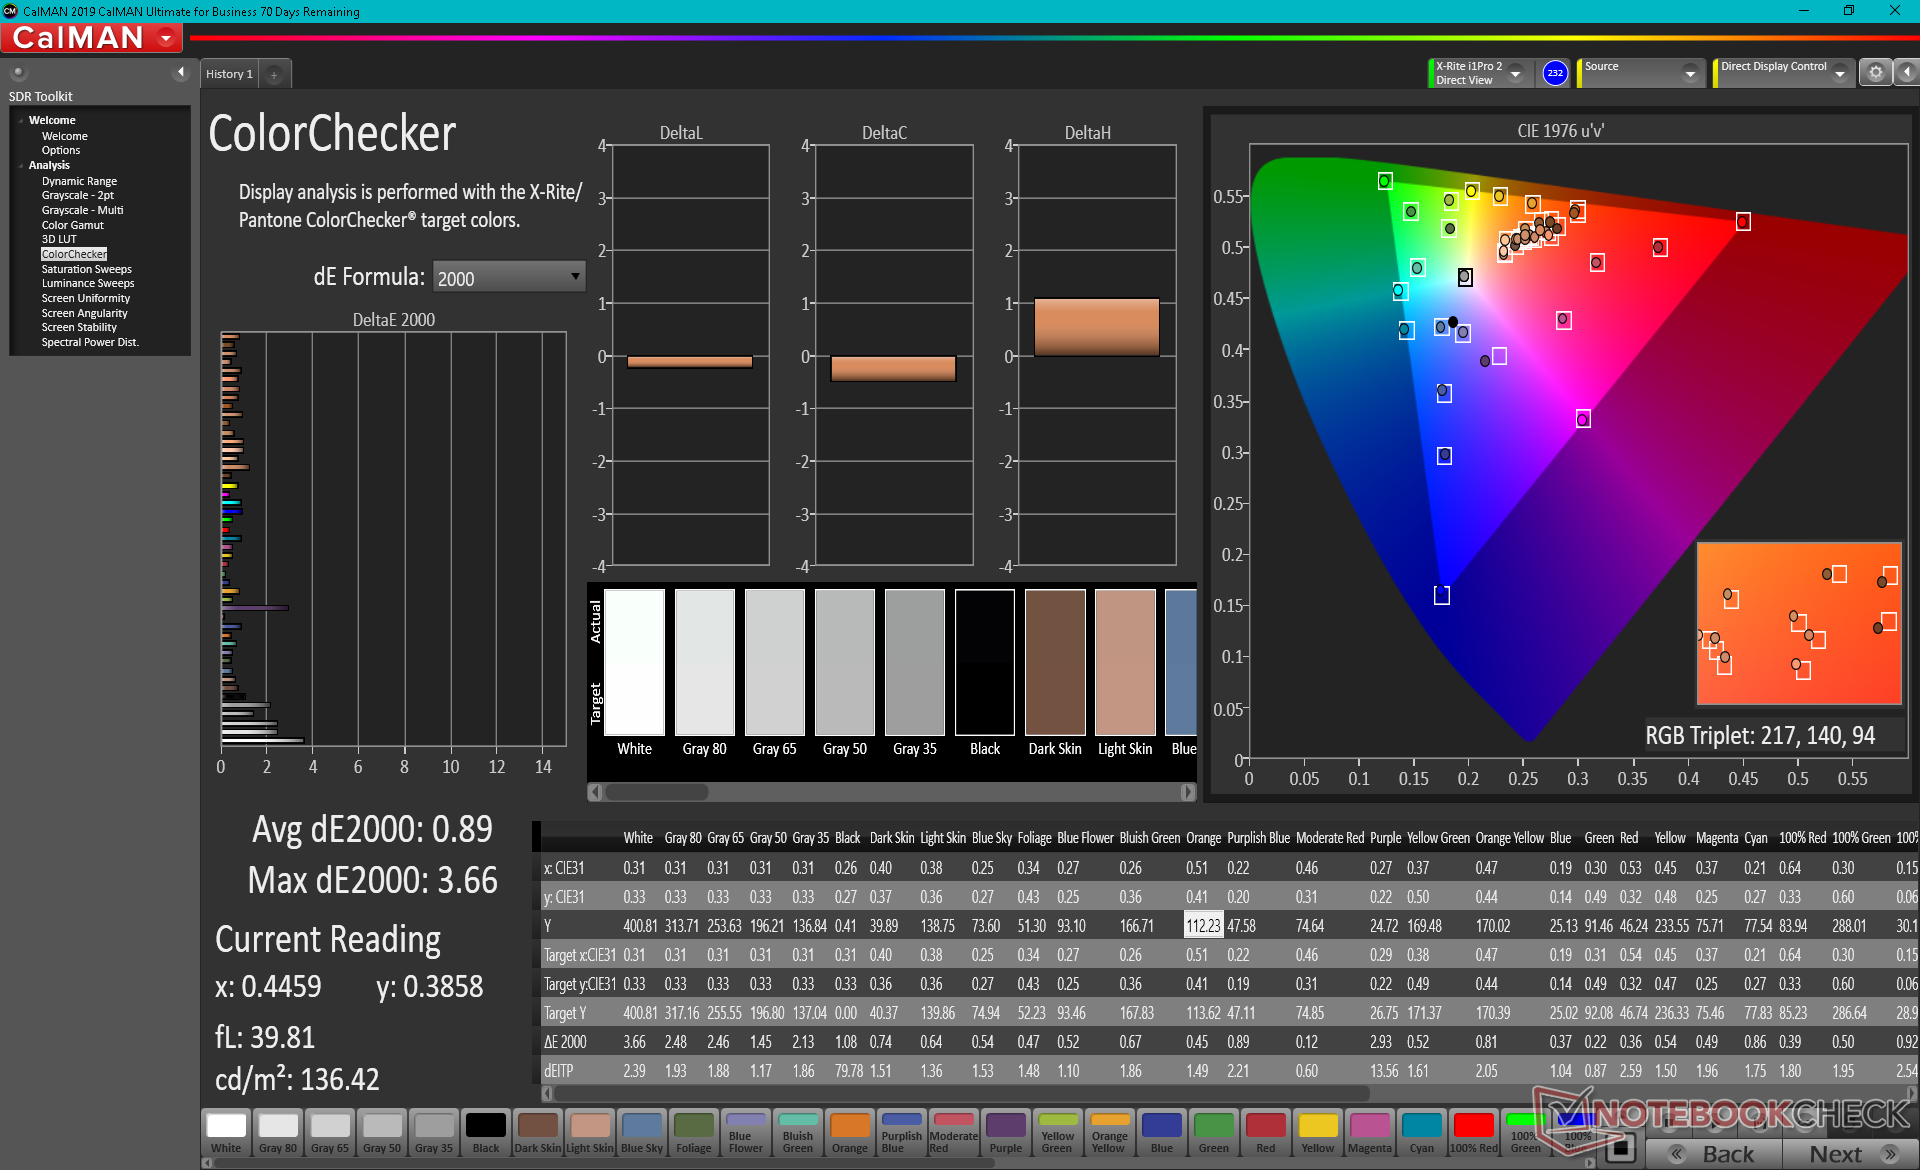
Dell pubblicizza il 99% di copertura DCI-P3 che possiamo confermare con le nostre misurazioni indipendenti. Questo pannello a 8-bit è quindi adatto sia per il gioco che per la maggior parte dell'editing grafico con i suoi colori profondi e tempi di risposta veloci.
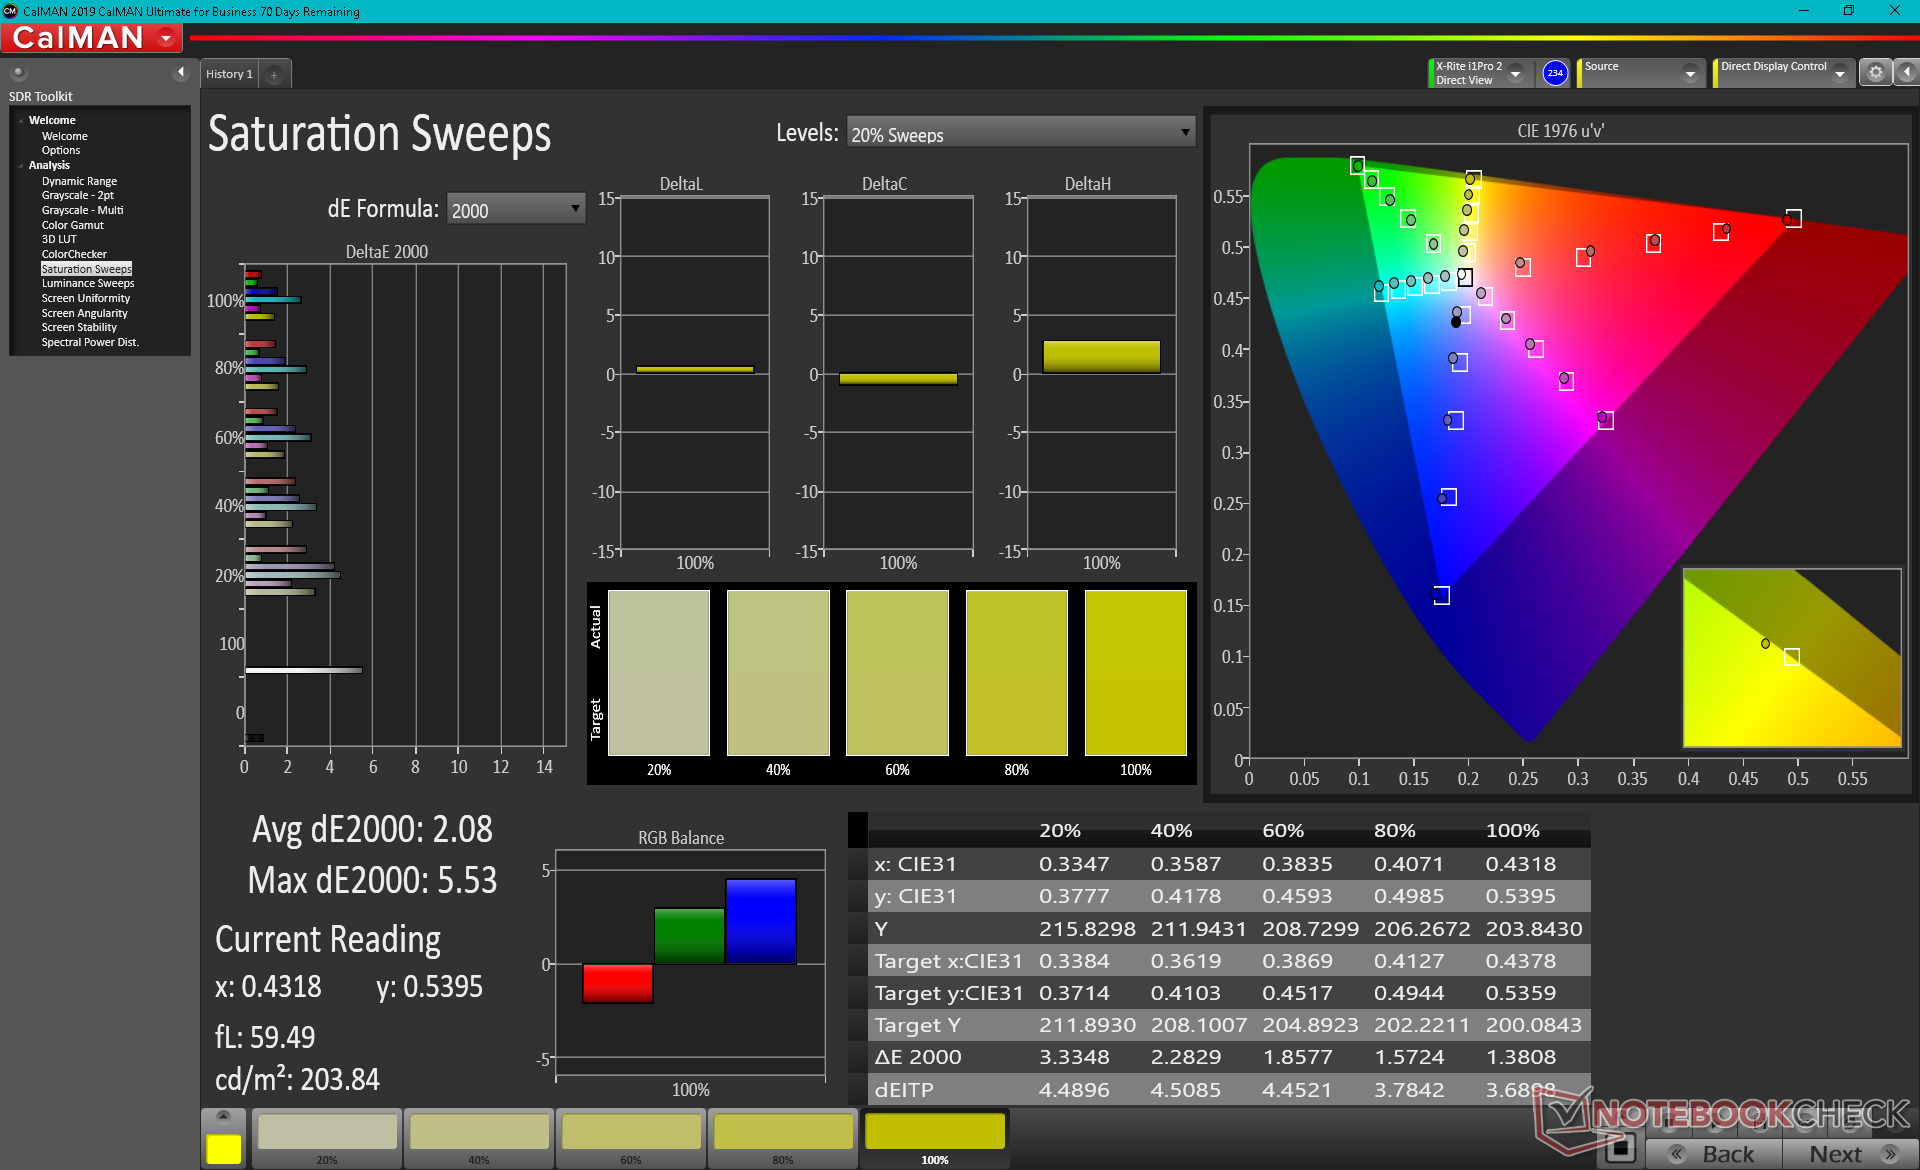
Il display è calibrato decentemente fuori dalla scatola con valori medi di scala di grigi e colore deltaE di 5 e 3,48, rispettivamente. Ulteriori sforzi di calibrazione possono portare questi valori verso il basso a causa della suddetta ampia copertura del colore, come mostrato dai nostri risultati CalMan qui sotto.

Tempi di risposta del Display
| ↔ Tempi di risposta dal Nero al Bianco | ||
|---|---|---|
| 10.4 ms ... aumenta ↗ e diminuisce ↘ combinato | ↗ 6 ms Incremento | 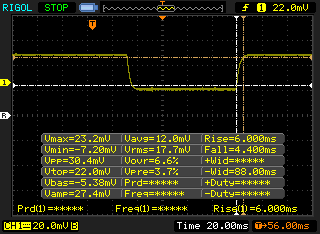 |
| ↘ 4.4 ms Calo | ||
| Lo schermo mostra buoni tempi di risposta durante i nostri tests, ma potrebbe essere troppo lento per i gamers competitivi. In confronto, tutti i dispositivi di test variano da 0.1 (minimo) a 240 (massimo) ms. » 28 % di tutti i dispositivi è migliore. Questo significa che i tempi di risposta rilevati sono migliori rispettto alla media di tutti i dispositivi testati (19.8 ms). | ||
| ↔ Tempo di risposta dal 50% Grigio all'80% Grigio | ||
| 12 ms ... aumenta ↗ e diminuisce ↘ combinato | ↗ 6 ms Incremento | 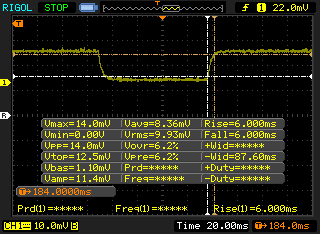 |
| ↘ 6 ms Calo | ||
| Lo schermo mostra buoni tempi di risposta durante i nostri tests, ma potrebbe essere troppo lento per i gamers competitivi. In confronto, tutti i dispositivi di test variano da 0.165 (minimo) a 636 (massimo) ms. » 25 % di tutti i dispositivi è migliore. Questo significa che i tempi di risposta rilevati sono migliori rispettto alla media di tutti i dispositivi testati (31 ms). | ||
Sfarfallio dello schermo / PWM (Pulse-Width Modulation)
| flickering dello schermo / PWM non rilevato |  | ||
In confronto: 52 % di tutti i dispositivi testati non utilizza PWM per ridurre la luminosita' del display. Se è rilevato PWM, una media di 7750 (minimo: 5 - massimo: 343500) Hz è stata rilevata. | |||
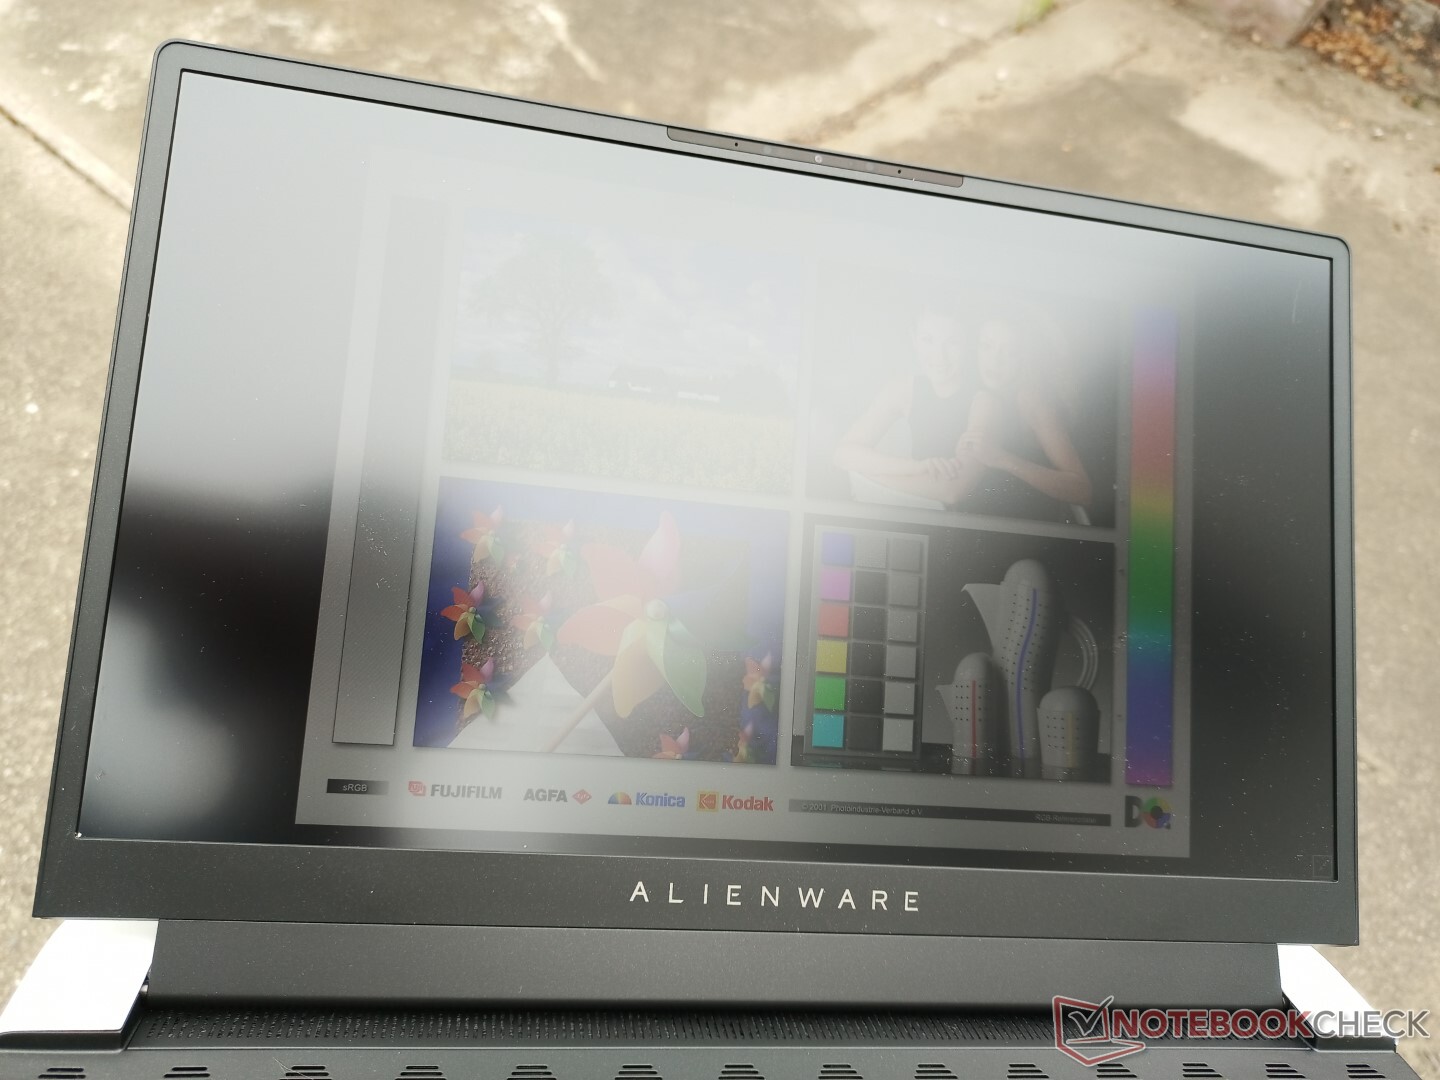
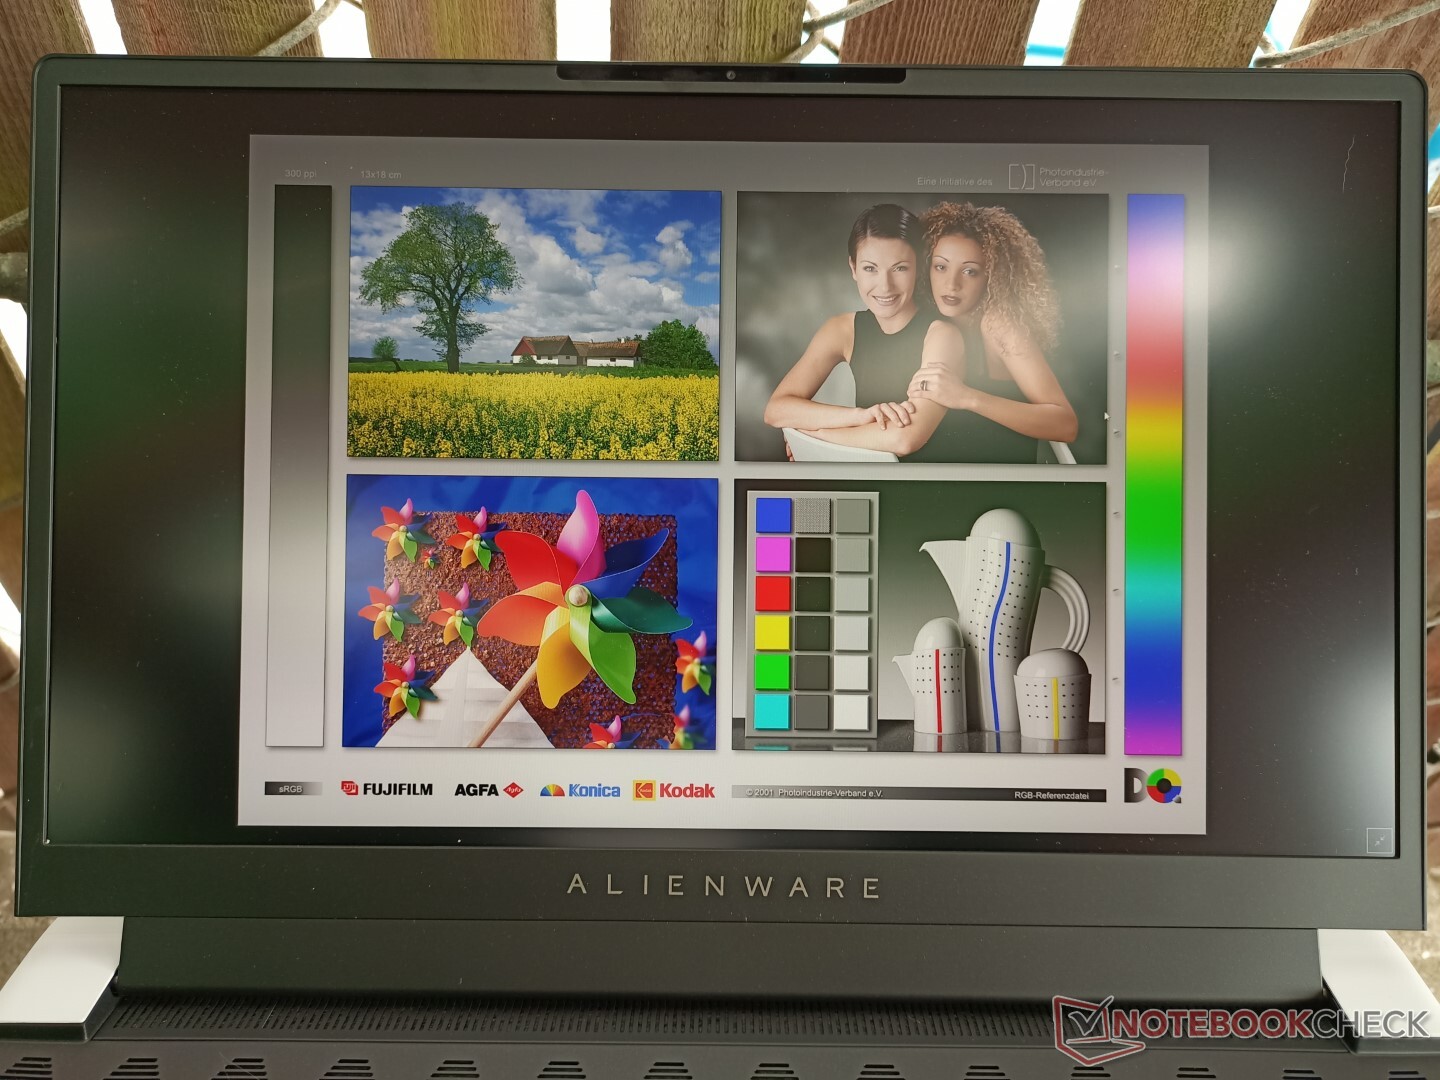
La visibilità all'aperto è migliore che su molti altri portatili da gioco semplicemente a causa della retroilluminazione più luminosa da 400 nit rispetto alla media di 300 nit per la categoria. Il display è utilizzabile quando è all'ombra, come sul Dell XPS 15ma gli utenti dovrebbero comunque evitare la luce diretta del sole quando possibile.
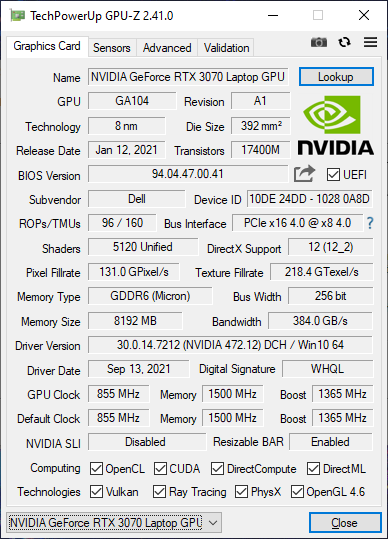
Prestazioni - GPU TGP ottiene un leggero downgrade
Gli utenti possono scegliere tra l'11° gen Tiger Lake Core i7-11800H o Core i9-11900H con GeForce RTX 3060, RTX 3070, o RTX 3080 Ampere grafica che punta a 90 W, 110 W, o 110 W TGP, rispettivamente. Questo è in realtà un downgrade dal modello Alienware m15 R4 dove la GPU poteva raggiungere fino a 140 W TGP. È una GPU Max-Q a tutti gli effetti anche se "Max-Q" non fa più parte del nome.
Dynamic Boost 2.0, WhisperMode 2.0, e Advanced Optimus con G-Sync sono tutti supportati. In effetti, l'Alienware x15 è uno dei pochissimi portatili da gioco con Advanced Optimus. Tenete a mente che la caratteristica è disponibile solo sulle SKU 240 Hz QHD e 360 Hz FHD. Gli utenti dovrebbero anche installare il l'ultimo BIOS 1.3.0 che permette l'esecuzione solo in modalità GPU discreta.
La nostra unità di test è stata impostata in modalità High Performance tramite il software Alienware Command Center prima di eseguire i nostri benchmark qui sotto per ottenere i migliori punteggi possibili.
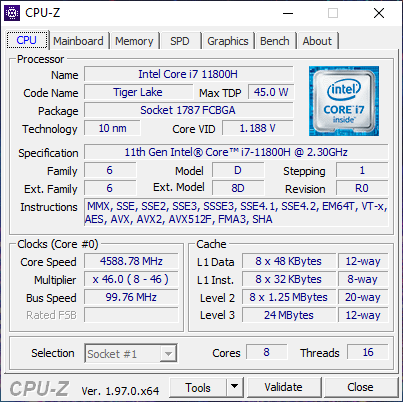
Processore - Più veloce del previsto
Le prestazioni della CPU sono eccellenti con risultati multi-thread che sono il 15 per cento più veloci rispetto alla media dei laptop nel nostro database equipaggiati con lo stesso Core i7-11800H CPU, compreso il Razer Blade 15. Questo mette il nostro sistema testa a testa con il concorrente Ryzen 9 5900HX che è normalmente più veloce dell'i7-11800H. La sostenibilità delle prestazioni è anche eccellente come mostrato dai nostri costanti risultati CineBench R15 xT qui sotto
Passando al Core i9-11900H dovrebbe portare solo vantaggi di prestazioni molto marginali rispetto al nostro i7-11800H sulla base delle nostre esperienze con il processore su altri portatili come l Asus Zephyrus S17.
Cinebench R15 Multi Loop
Cinebench R23: Multi Core | Single Core
Cinebench R15: CPU Multi 64Bit | CPU Single 64Bit
Blender: v2.79 BMW27 CPU
7-Zip 18.03: 7z b 4 -mmt1 | 7z b 4
Geekbench 5.5: Single-Core | Multi-Core
HWBOT x265 Benchmark v2.2: 4k Preset
LibreOffice : 20 Documents To PDF
R Benchmark 2.5: Overall mean
| Cinebench R23 / Multi Core | |
| Alienware x15 RTX 3070 P111F | |
| Asus ROG Strix Scar 15 G533QS | |
| Asus ROG Zephyrus S17 GX703HSD | |
| Acer Nitro 5 AN515-45-R1JH | |
| Media Intel Core i7-11800H (6508 - 14088, n=48) | |
| Alienware m15 R4 RTX 3080 | |
| MSI GS66 Stealth 10UG | |
| Razer Blade 15 Advanced Model Early 2021 | |
| Cinebench R23 / Single Core | |
| Asus ROG Zephyrus S17 GX703HSD | |
| Alienware x15 RTX 3070 P111F | |
| Media Intel Core i7-11800H (1386 - 1522, n=45) | |
| Asus ROG Strix Scar 15 G533QS | |
| Acer Nitro 5 AN515-45-R1JH | |
| MSI GS66 Stealth 10UG | |
| Alienware m15 R4 RTX 3080 | |
| Razer Blade 15 Advanced Model Early 2021 | |
| Geekbench 5.5 / Single-Core | |
| Asus ROG Zephyrus S17 GX703HSD | |
| Media Intel Core i7-11800H (1429 - 1625, n=40) | |
| Acer Nitro 5 AN515-45-R1JH | |
| Alienware m15 R4 RTX 3080 | |
| Razer Blade 15 Advanced Model Early 2021 | |
| MSI GS66 Stealth 10UG | |
| Dell G5 15 SE 5505 P89F | |
| Schenker XMG Pro 15 | |
| Geekbench 5.5 / Multi-Core | |
| Asus ROG Zephyrus S17 GX703HSD | |
| Media Intel Core i7-11800H (4655 - 9851, n=40) | |
| Alienware m15 R4 RTX 3080 | |
| Dell G5 15 SE 5505 P89F | |
| MSI GS66 Stealth 10UG | |
| Acer Nitro 5 AN515-45-R1JH | |
| Razer Blade 15 Advanced Model Early 2021 | |
| Schenker XMG Pro 15 | |
| HWBOT x265 Benchmark v2.2 / 4k Preset | |
| Asus ROG Zephyrus S17 GX703HSD | |
| Alienware x15 RTX 3070 P111F | |
| Asus ROG Strix Scar 15 G533QS | |
| Acer Nitro 5 AN515-45-R1JH | |
| Media Intel Core i7-11800H (7.38 - 17.4, n=46) | |
| Alienware m15 R4 RTX 3080 | |
| Dell G5 15 SE 5505 P89F | |
| MSI GS66 Stealth 10UG | |
| Razer Blade 15 Advanced Model Early 2021 | |
| Schenker XMG Pro 15 | |
| LibreOffice / 20 Documents To PDF | |
| Alienware m15 R4 RTX 3080 | |
| Acer Nitro 5 AN515-45-R1JH | |
| Dell G5 15 SE 5505 P89F | |
| Razer Blade 15 Advanced Model Early 2021 | |
| Asus ROG Strix Scar 15 G533QS | |
| Alienware x15 RTX 3070 P111F | |
| MSI GS66 Stealth 10UG | |
| Media Intel Core i7-11800H (38.6 - 59.9, n=45) | |
| Asus ROG Zephyrus S17 GX703HSD | |
* ... Meglio usare valori piccoli
Prestazioni del sistema
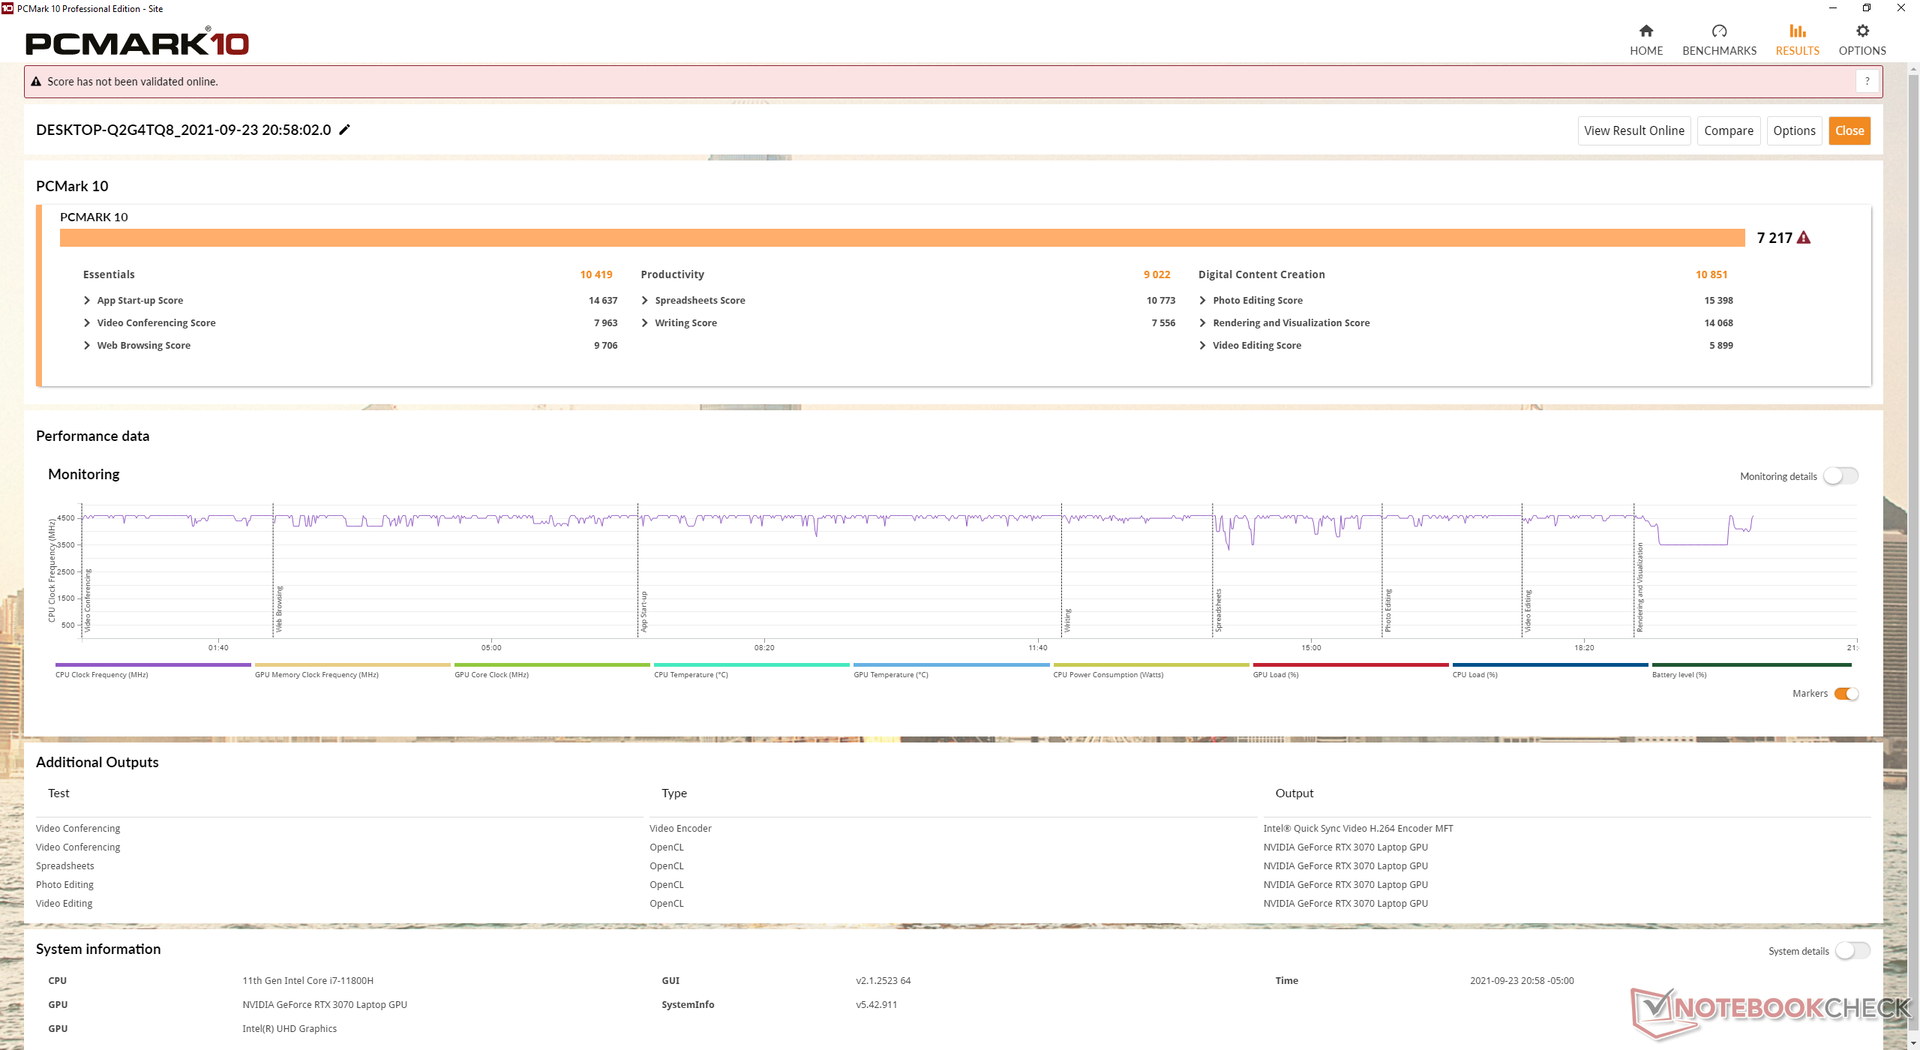
I punteggi di PCMark 10 sono eccellenti con risultati che sono costantemente davanti all'Alienware m15 R4 dell'anno scorso, tranne che per la categoria produttività, dato che il nostro m15 R4 era dotato di unità RAID 0 più veloci.
Abbiamo riscontrato un problema con la nostra unità di test in cui lo schermo diventava improvvisamente nero quando si cambiavano i profili termici tramite il software Alienware Command Center e quindi era necessario un riavvio duro. Anche se non siamo in grado di ripetere in modo affidabile il problema, vale la pena menzionare comunque soprattutto perché la nostra unità di test x17 la scorsa settimana non ha avuto questi problemi.
| PCMark 10 / Score | |
| Razer Blade 15 Advanced (Mid 2021) | |
| Alienware x15 RTX 3070 P111F | |
| Alienware m15 R4 RTX 3080 | |
| Media Intel Core i7-11800H, NVIDIA GeForce RTX 3070 Laptop GPU (6126 - 7311, n=11) | |
| MSI GS66 Stealth 10UG | |
| Acer Predator Helios 300 PH315-53-786B | |
| Asus Zephyrus S15 GX502L | |
| PCMark 10 / Essentials | |
| Razer Blade 15 Advanced (Mid 2021) | |
| Alienware x15 RTX 3070 P111F | |
| Media Intel Core i7-11800H, NVIDIA GeForce RTX 3070 Laptop GPU (9248 - 10832, n=11) | |
| Alienware m15 R4 RTX 3080 | |
| Asus Zephyrus S15 GX502L | |
| MSI GS66 Stealth 10UG | |
| Acer Predator Helios 300 PH315-53-786B | |
| PCMark 10 / Productivity | |
| Alienware m15 R4 RTX 3080 | |
| Media Intel Core i7-11800H, NVIDIA GeForce RTX 3070 Laptop GPU (8571 - 9669, n=11) | |
| Alienware x15 RTX 3070 P111F | |
| Razer Blade 15 Advanced (Mid 2021) | |
| Asus Zephyrus S15 GX502L | |
| Acer Predator Helios 300 PH315-53-786B | |
| MSI GS66 Stealth 10UG | |
| PCMark 10 / Digital Content Creation | |
| Alienware x15 RTX 3070 P111F | |
| Razer Blade 15 Advanced (Mid 2021) | |
| Alienware m15 R4 RTX 3080 | |
| Media Intel Core i7-11800H, NVIDIA GeForce RTX 3070 Laptop GPU (7627 - 10851, n=11) | |
| MSI GS66 Stealth 10UG | |
| Acer Predator Helios 300 PH315-53-786B | |
| Asus Zephyrus S15 GX502L | |
| PCMark 10 Score | 7217 punti | |
Aiuto | ||
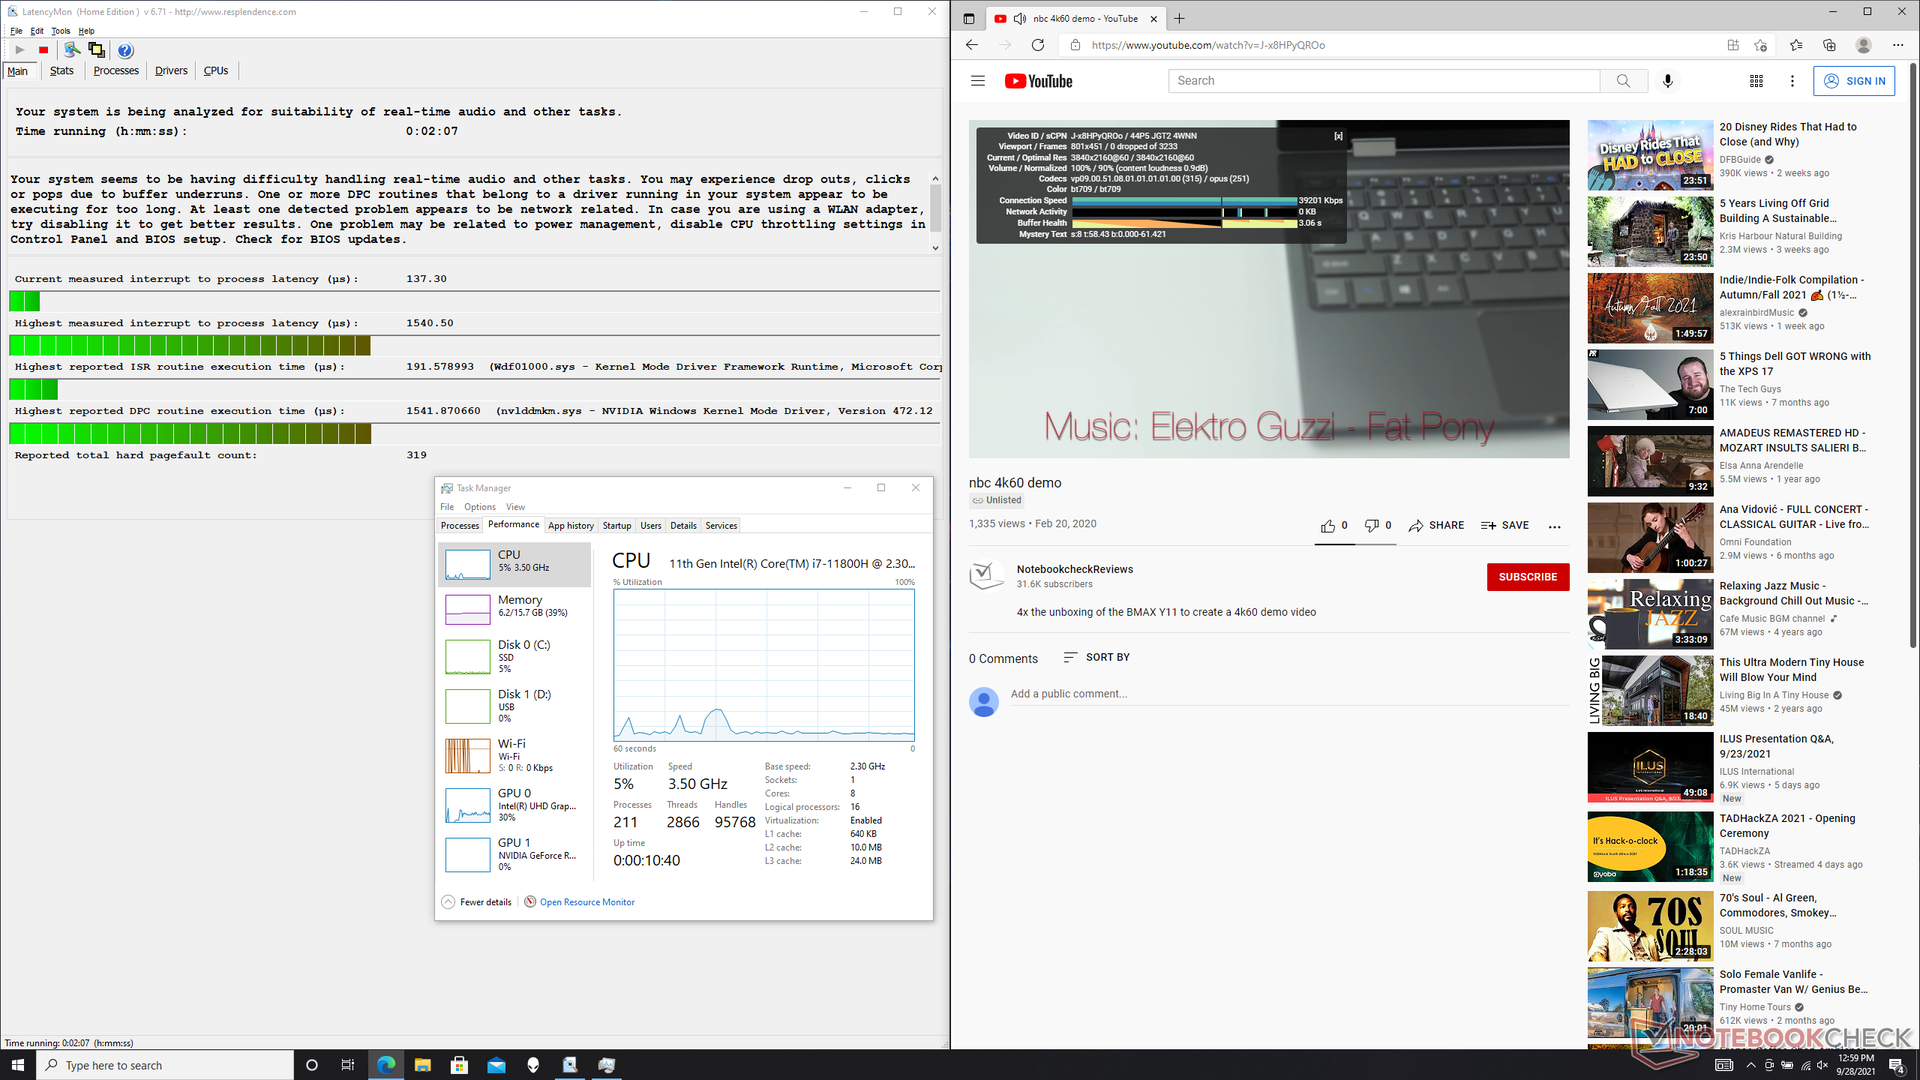
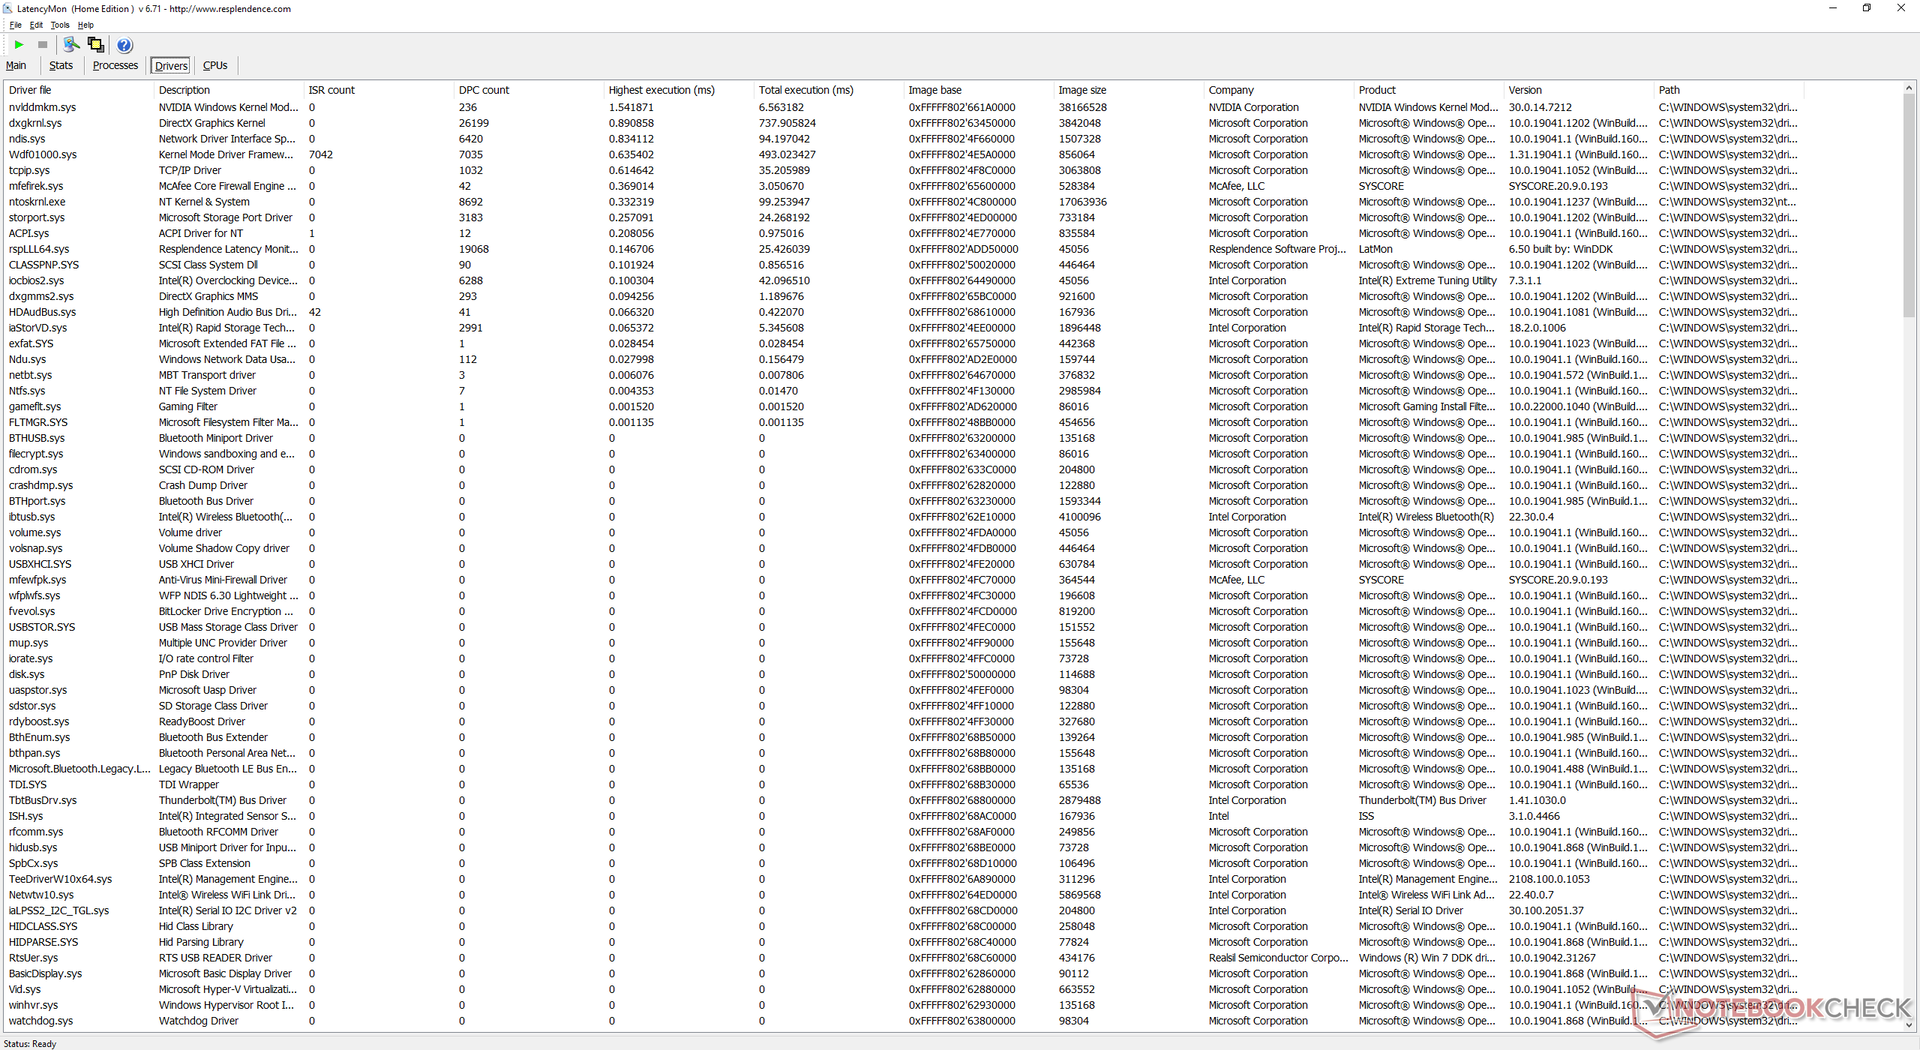
Latenza DPC
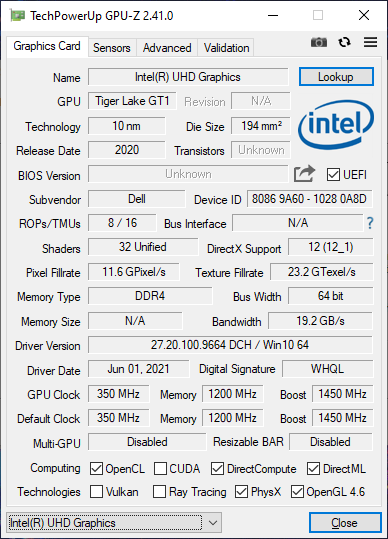
LatencyMon mostra piccoli problemi di latenza DPC quando si aprono più schede del browser sulla nostra homepage e quando si esegue Prime95 per stressare la CPU. La riproduzione di video 4K a 60 FPS è altrimenti perfetta, senza perdita di frame in modalità iGPU.
| DPC Latencies / LatencyMon - interrupt to process latency (max), Web, Youtube, Prime95 | |
| Asus Zephyrus S15 GX502L | |
| Razer Blade 15 Advanced (Mid 2021) | |
| Alienware x15 RTX 3070 P111F | |
| Alienware m15 R4 RTX 3080 | |
| MSI GS66 Stealth 10UG | |
| Acer Predator Helios 300 PH315-53-786B | |
* ... Meglio usare valori piccoli
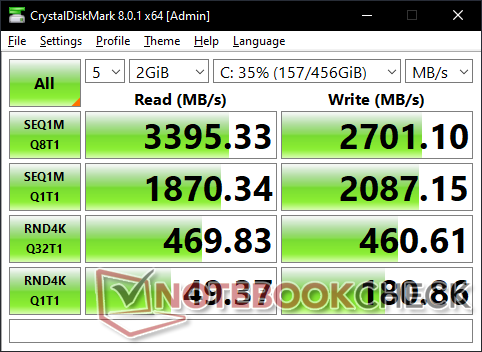
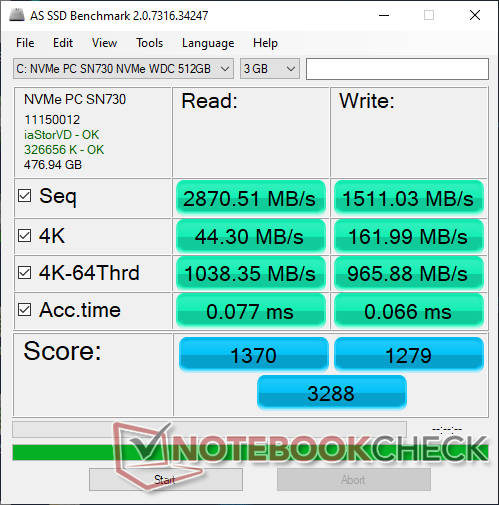
Dispositivi di archiviazione - Supporto PCIe4 x4
Gli utenti possono installare fino a due unità M.2 in configurazione RAID 0. Solo uno slot è compatibile con PCIe4, tuttavia, mentre l'altro può supportare fino a PCIe3 proprio come sull'Alienware x17 R1. Le attuali SKU del x15 R1 vengono spedite solo con SSD PCIe3 NVMe, come i 512 GB WD SN730 sulla nostra unità di test. Le velocità di trasferimento sono generalmente paragonabili al Samsung PM981a che si trova su altre macchine da gioco di fascia alta come la serie Razer Blade.
| Alienware x15 RTX 3070 P111F WDC PC SN730 SDBPNTY-512G | Alienware m15 R4 RTX 3080 2x WDC PC SN730 SDBPNTY-512G (RAID 0) | MSI GS66 Stealth 10UG WDC PC SN730 SDBPNTY-1T00 | Razer Blade 15 Advanced (Mid 2021) SSSTC CA6-8D1024 | Acer Predator Helios 300 PH315-53-786B Samsung PM981a MZVLB1T0HBLR | |
|---|---|---|---|---|---|
| AS SSD | 29% | 37% | 90% | 34% | |
| Seq Read (MB/s) | 2871 | 2888 1% | 2198 -23% | 5739 100% | 2792 -3% |
| Seq Write (MB/s) | 1511 | 2786 84% | 2596 72% | 4201 178% | 2311 53% |
| 4K Read (MB/s) | 44.3 | 41.98 -5% | 43.81 -1% | 53.8 21% | 48.34 9% |
| 4K Write (MB/s) | 162 | 108 -33% | 115.5 -29% | 179.2 11% | 93.9 -42% |
| 4K-64 Read (MB/s) | 1038 | 1396 34% | 1692 63% | 2959 185% | 1516 46% |
| 4K-64 Write (MB/s) | 966 | 1234 28% | 2162 124% | 1891 96% | 1940 101% |
| Access Time Read * (ms) | 0.077 | 0.056 27% | 0.056 27% | 0.027 65% | |
| Access Time Write * (ms) | 0.066 | 0.035 47% | 0.098 -48% | 0.154 -133% | 0.04 39% |
| Score Read (Points) | 1370 | 1727 26% | 1956 43% | 3587 162% | 1843 35% |
| Score Write (Points) | 1279 | 1621 27% | 2537 98% | 2490 95% | 2265 77% |
| Score Total (Points) | 3288 | 4227 29% | 5513 68% | 7821 138% | 5030 53% |
| Copy ISO MB/s (MB/s) | 1962 | 1868 -5% | 2236 14% | 3027 54% | 1921 -2% |
| Copy Program MB/s (MB/s) | 407.9 | 812 99% | 690 69% | 1177 189% | 581 42% |
| Copy Game MB/s (MB/s) | 1105 | 1596 44% | 1546 40% | 2170 96% | 1454 32% |
| CrystalDiskMark 5.2 / 6 | -1% | 4% | 81% | -29% | |
| Write 4K (MB/s) | 179.6 | 114.2 -36% | 163.1 -9% | 295.6 65% | 76.2 -58% |
| Read 4K (MB/s) | 49.21 | 43.77 -11% | 48.97 0% | 85.7 74% | 34.32 -30% |
| Write Seq (MB/s) | 2062 | 2607 26% | 4149 101% | 776 -62% | |
| Read Seq (MB/s) | 1849 | 2316 25% | 4203 127% | 2169 17% | |
| Write 4K Q32T1 (MB/s) | 462.9 | 464.5 0% | 338 -27% | 715 54% | 357.3 -23% |
| Read 4K Q32T1 (MB/s) | 470.2 | 546 16% | 475.6 1% | 709 51% | 429.6 -9% |
| Write Seq Q32T1 (MB/s) | 2702 | 3233 20% | 3090 14% | 4681 73% | 788 -71% |
| Read Seq Q32T1 (MB/s) | 3371 | 3473 3% | 3421 1% | 6905 105% | 3542 5% |
| Write 4K Q8T8 (MB/s) | 1375 | ||||
| Read 4K Q8T8 (MB/s) | 1447 | ||||
| Media totale (Programma / Settaggio) | 14% /
20% | 21% /
25% | 86% /
87% | 3% /
10% |
* ... Meglio usare valori piccoli

Disk Throttling: DiskSpd Read Loop, Queue Depth 8
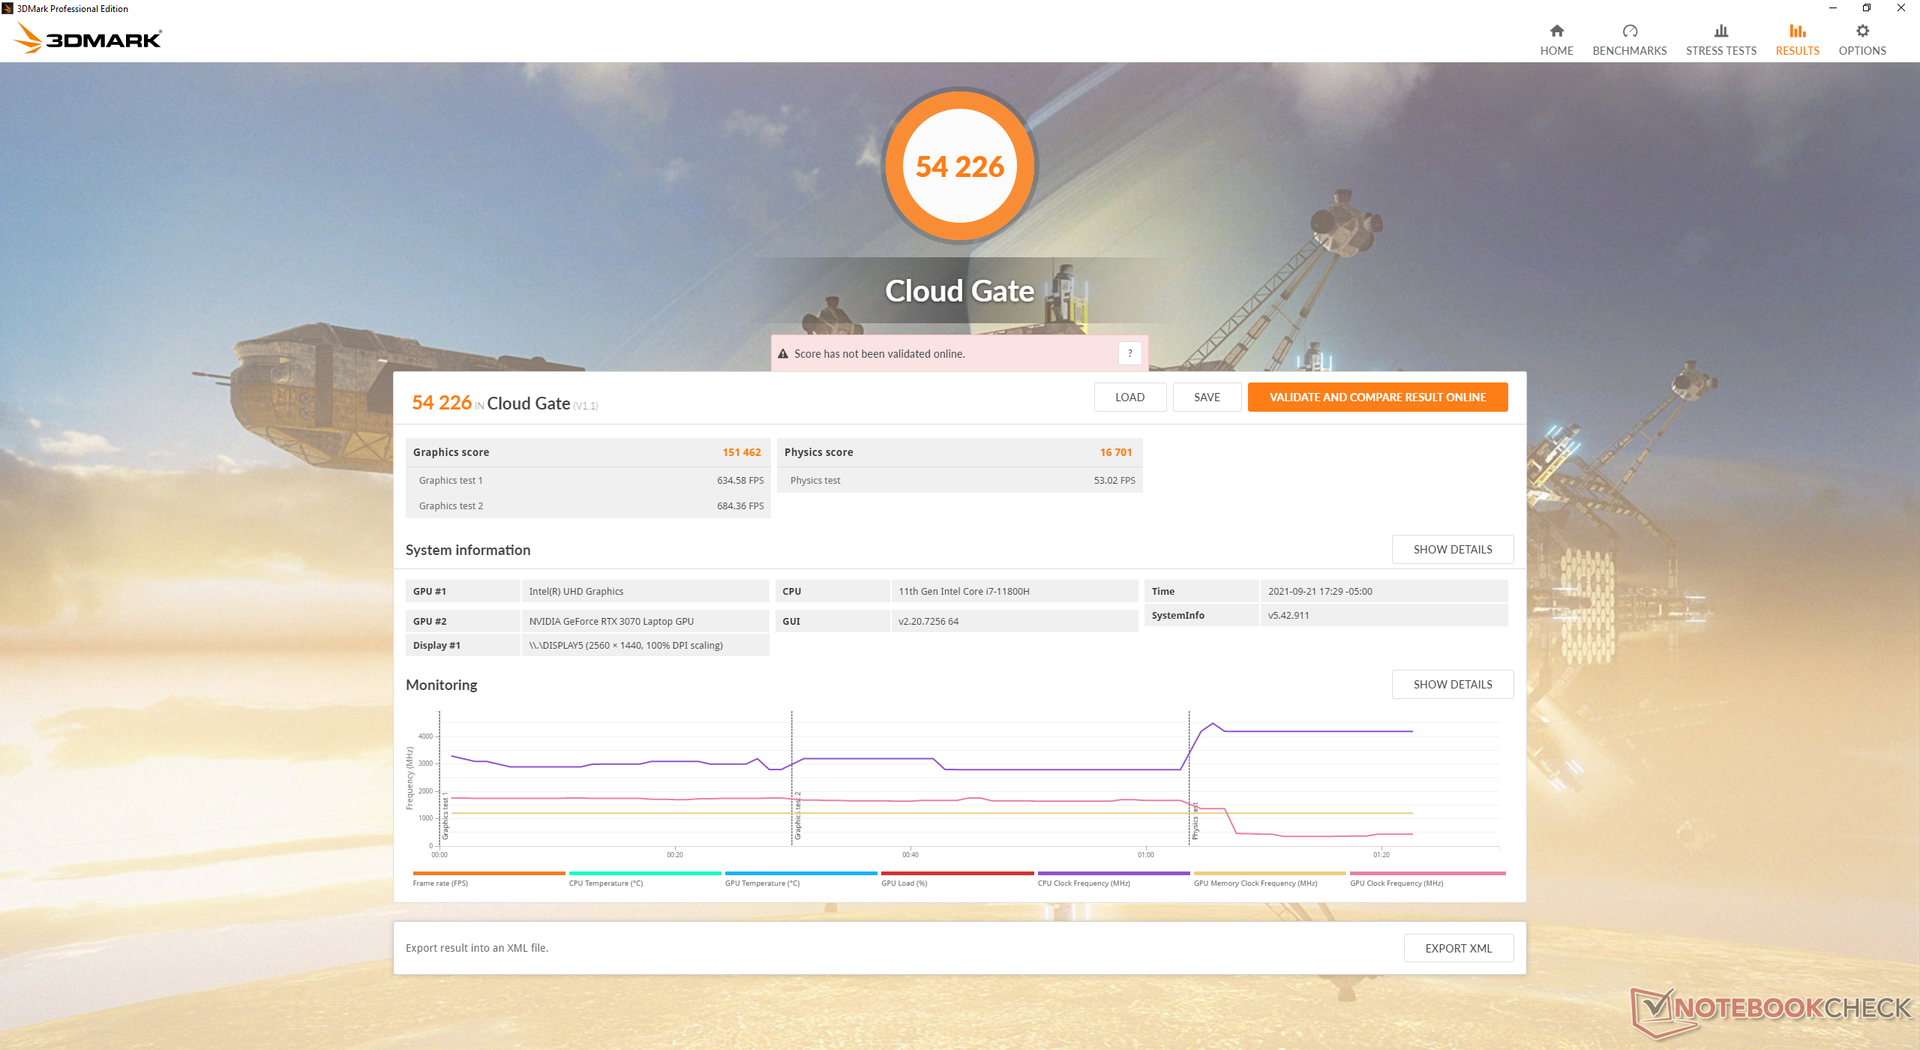
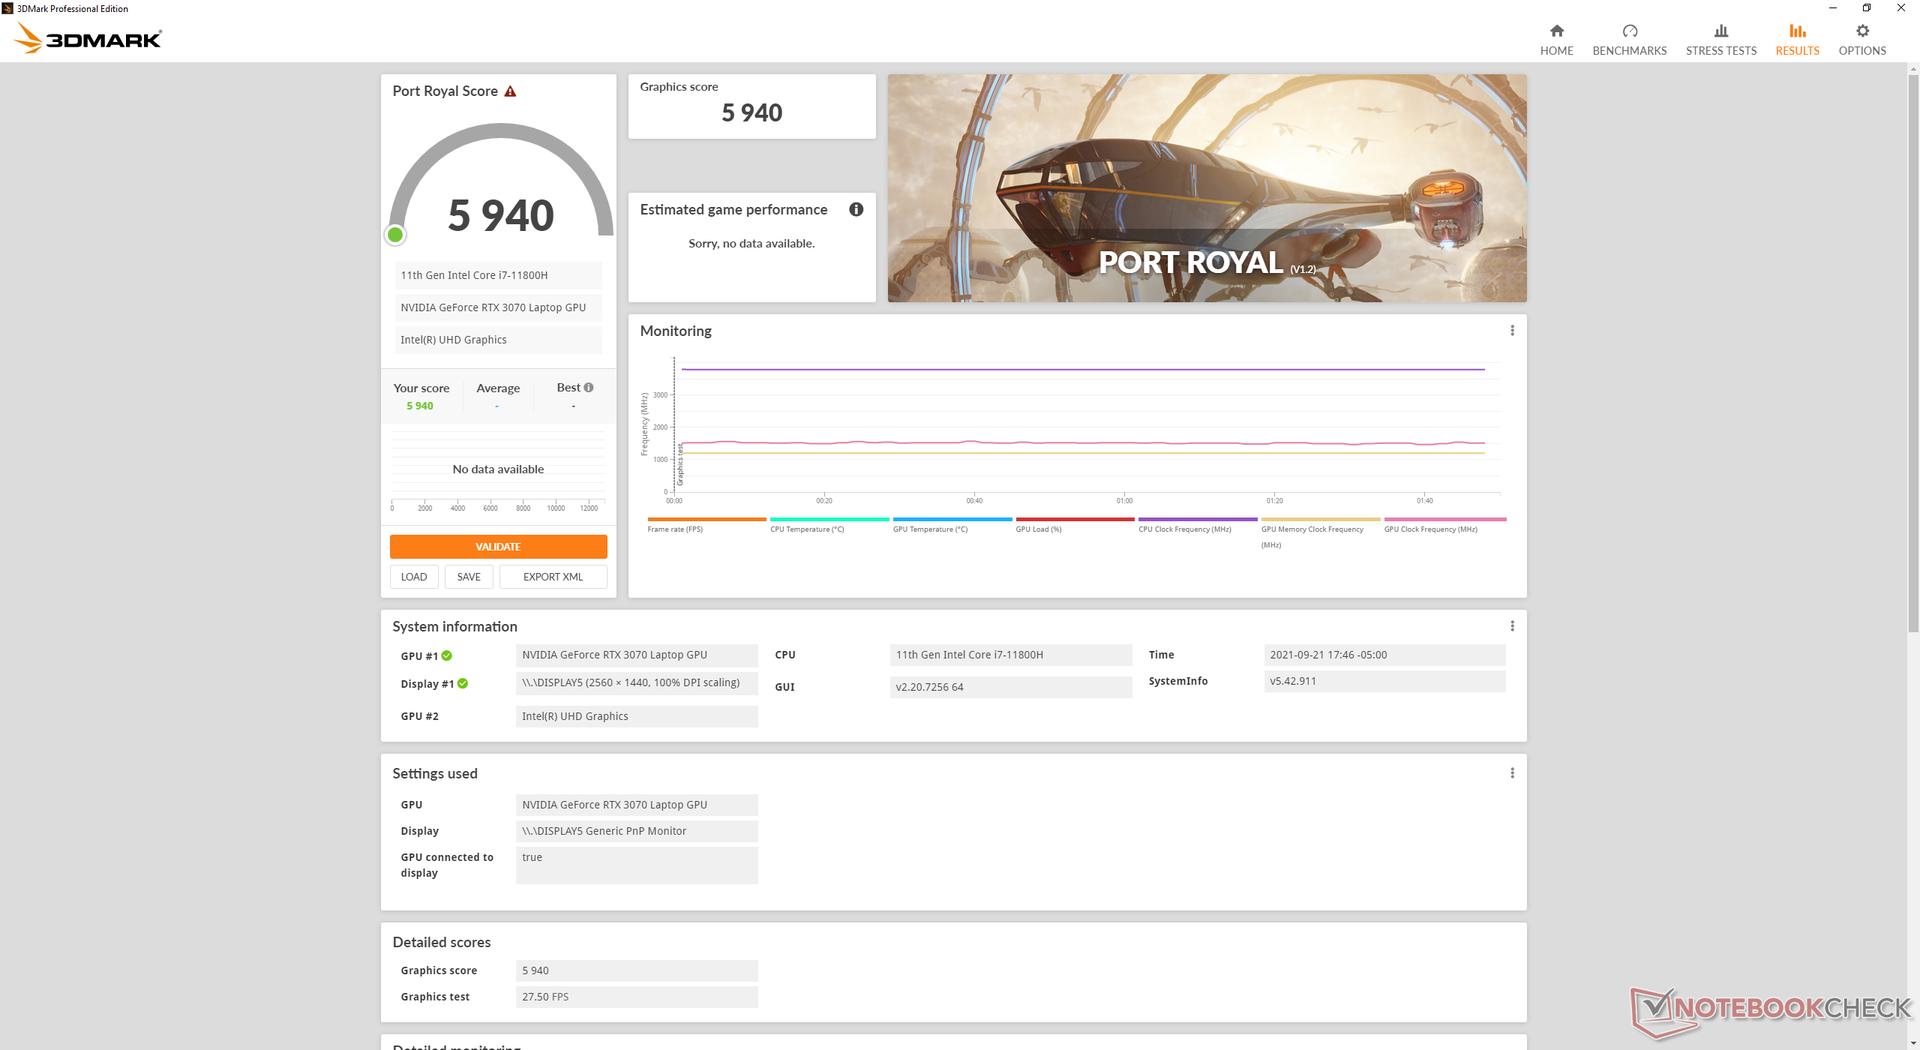
Prestazioni della GPU
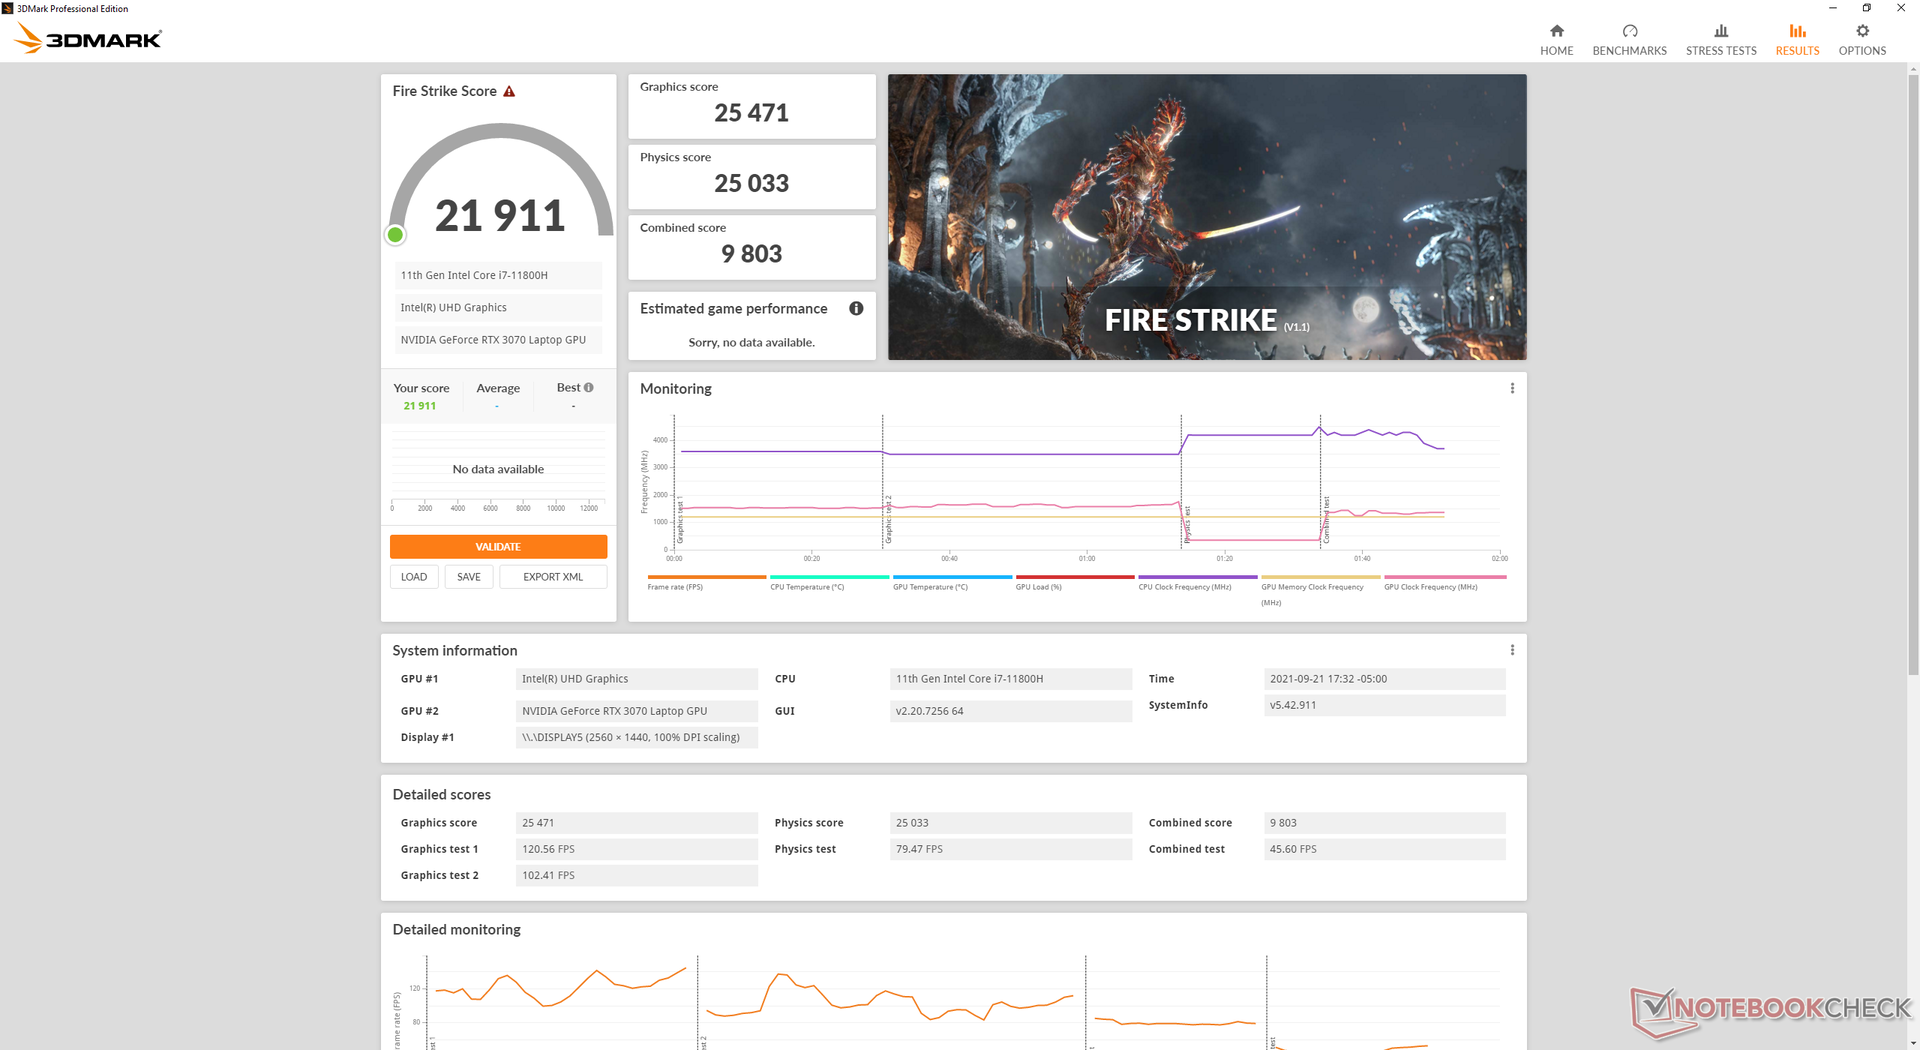
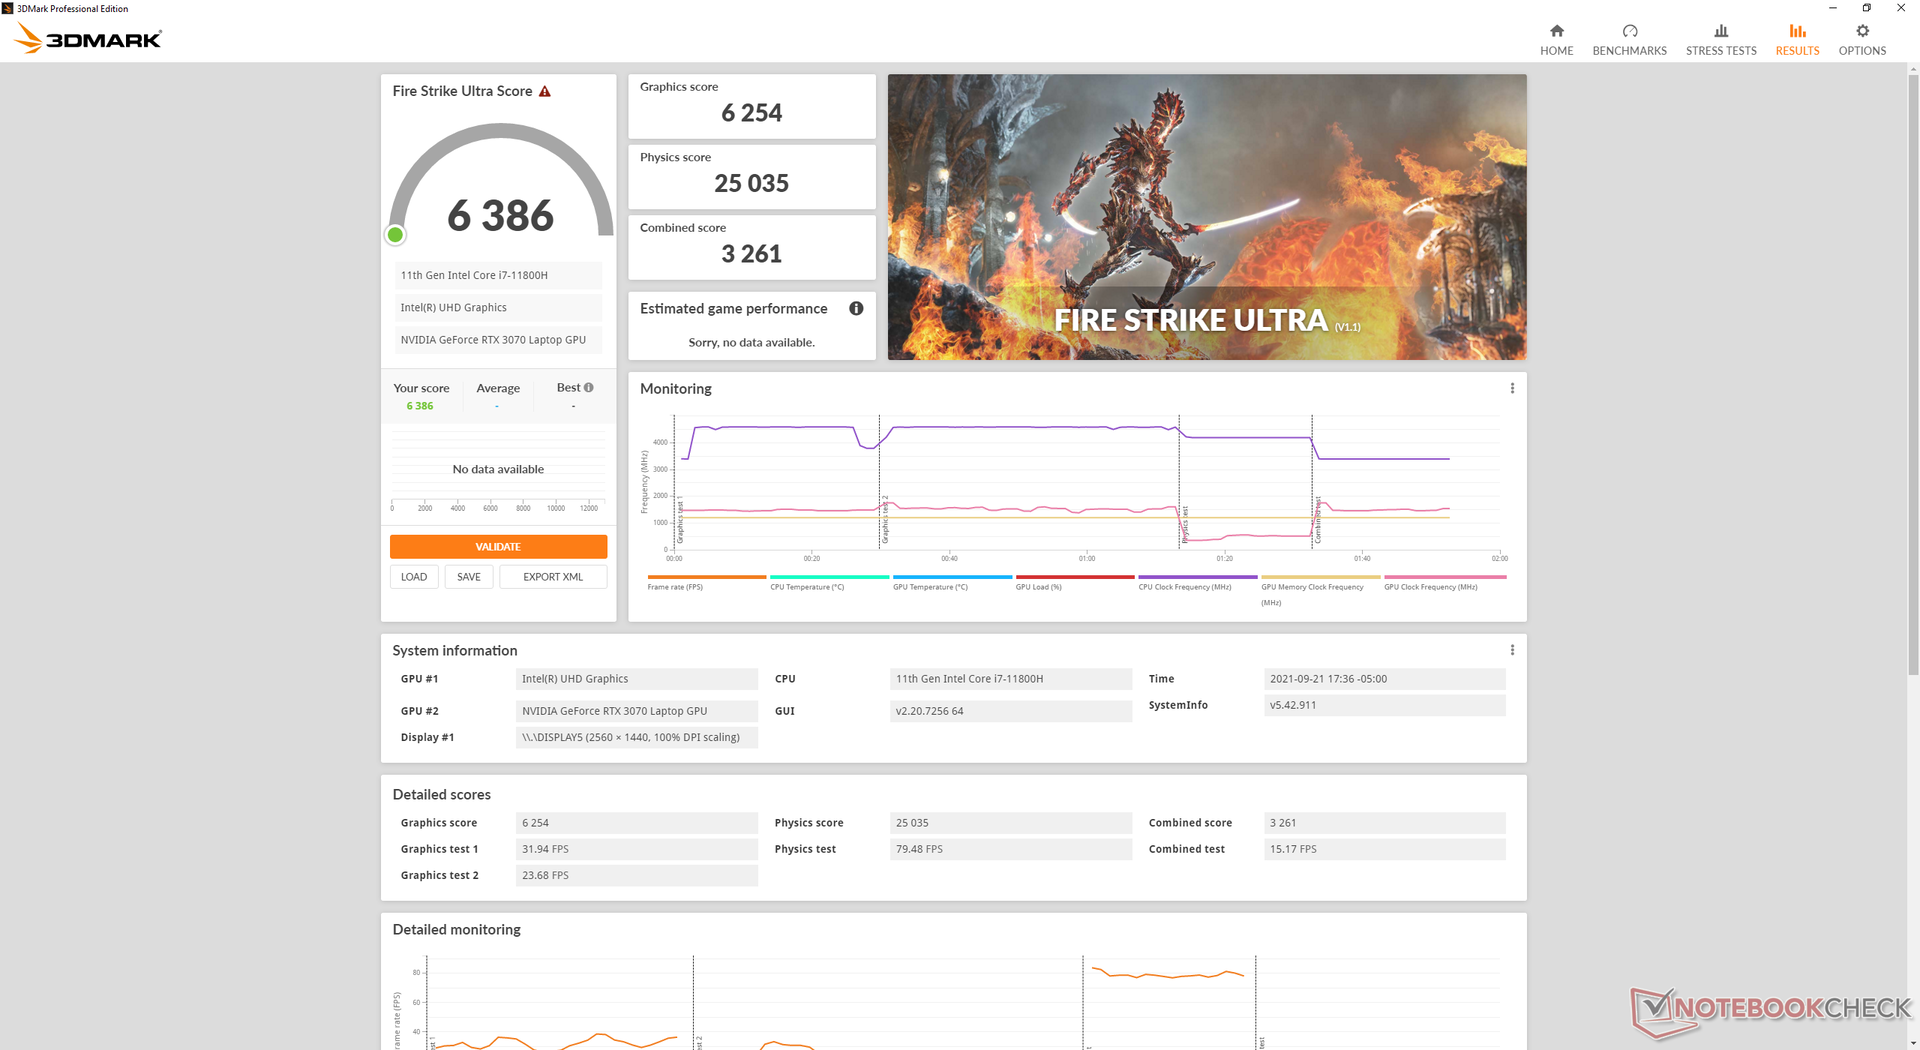
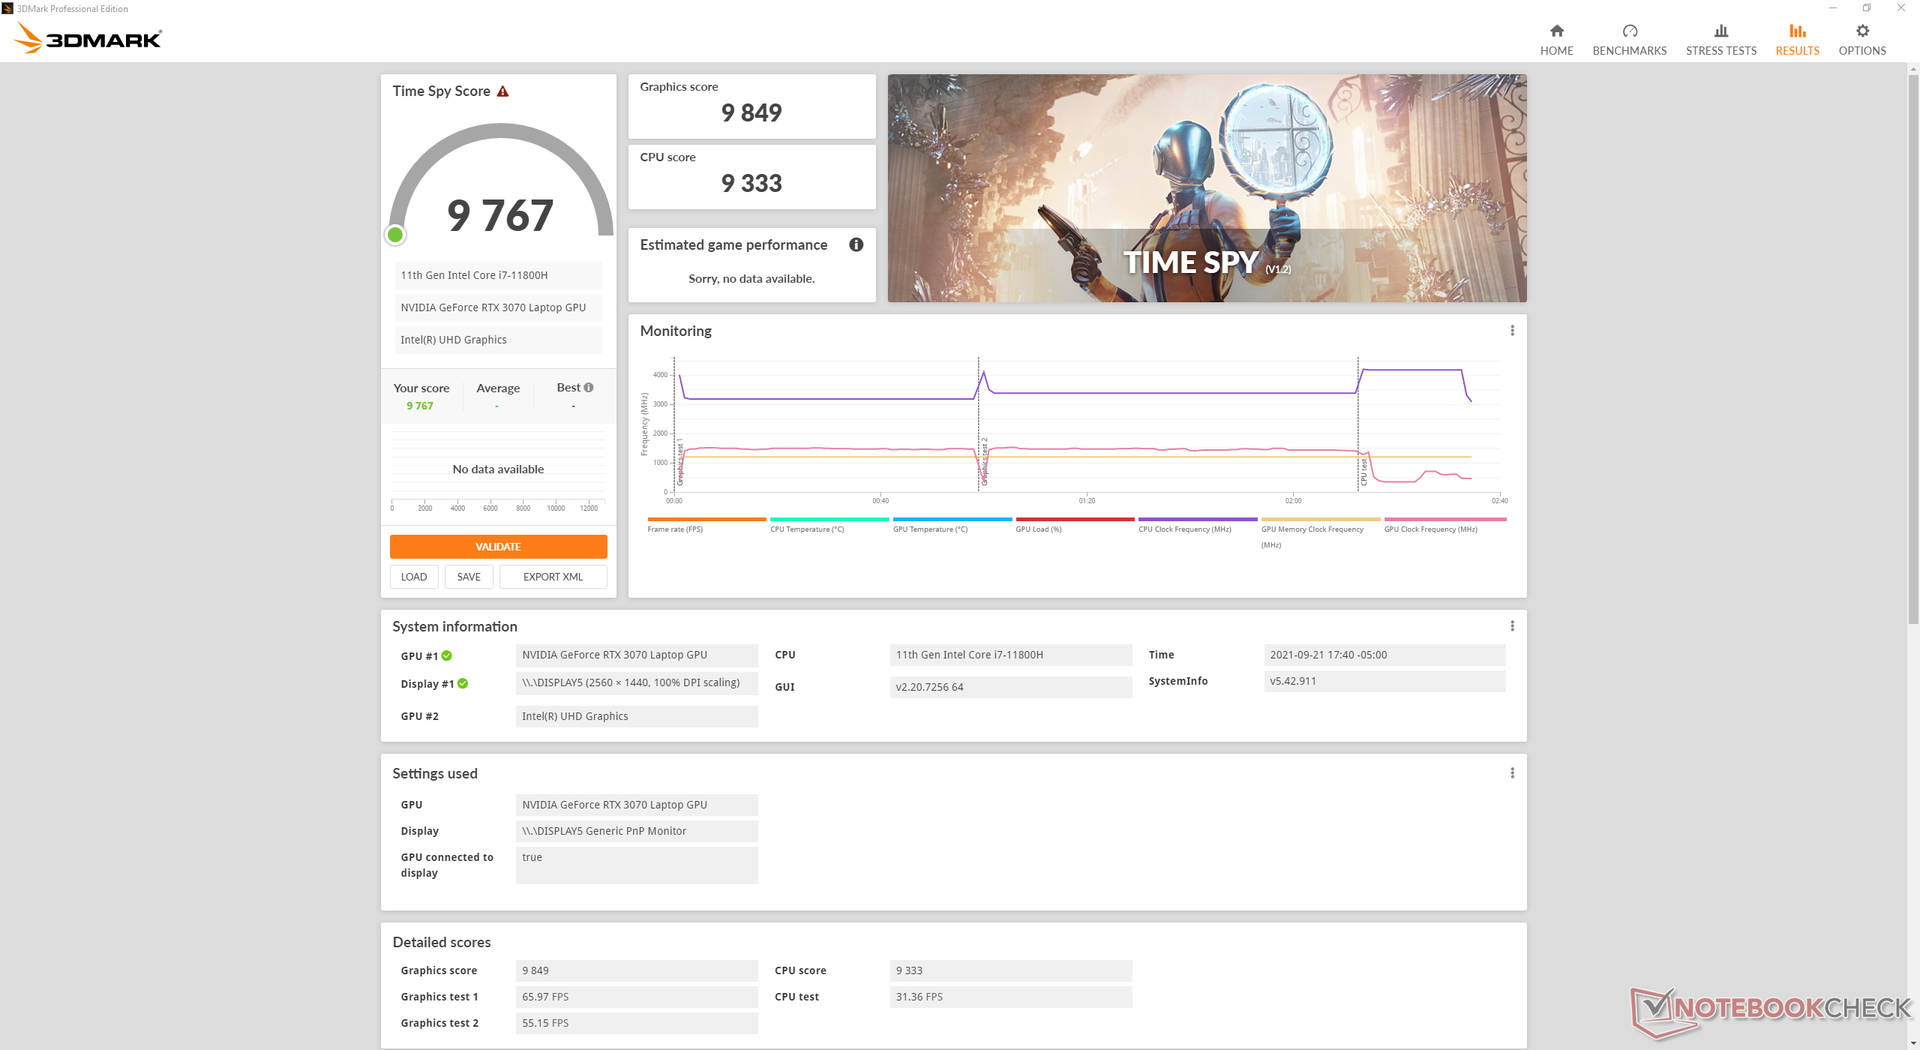
Il nostro mobile GeForce RTX 3070 sta funzionando dove ci aspettiamo che sia rispetto ad altri portatili con la stessa GPU. Sfortunatamente, questo è un po' deludente perché il vecchio Alienware m15 R4 con RTX 3070 avrebbe costantemente superato il nostro nuovo x15 R1 del 10% in tutti i benchmark 3DMark. Sospettiamo che il target TGP relativamente più basso dell'x15 R1 (110 W contro 140 W) sia responsabile delle prestazioni grafiche più lente.
L'aggiornamento alla RTX 3080 SKU non dovrebbe aumentare le prestazioni grafiche in modo significativo rispetto alla nostra RTX 3070, soprattutto perché mira esattamente allo stesso limite di 110 W TGP. Invece, i maggiori guadagni saranno tra la RTX 3060 e 3070.
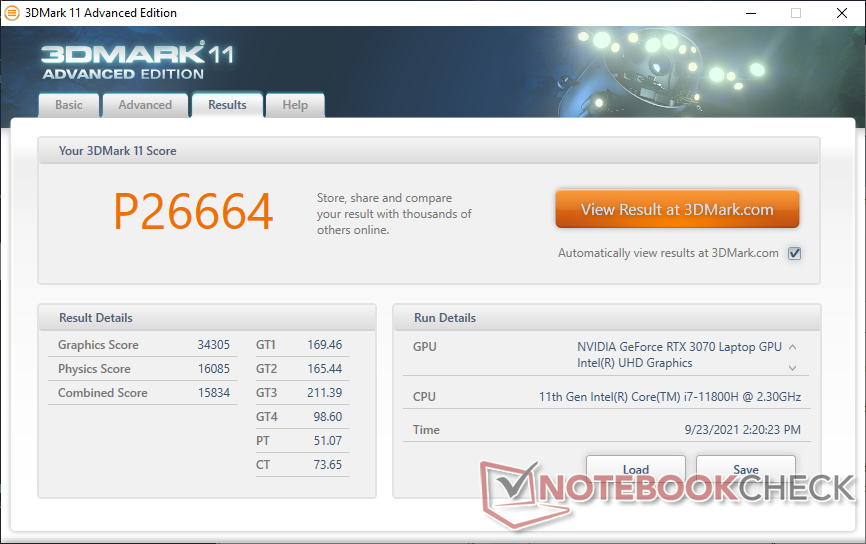
| 3DMark 11 Performance | 26664 punti | |
| 3DMark Cloud Gate Standard Score | 54226 punti | |
| 3DMark Fire Strike Score | 21911 punti | |
| 3DMark Time Spy Score | 9767 punti | |
Aiuto | ||
Witcher 3 FPS Chart
| basso | medio | alto | ultra | QHD | |
|---|---|---|---|---|---|
| GTA V (2015) | 181 | 174 | 166 | 95.8 | 83.7 |
| The Witcher 3 (2015) | 415.4 | 279.4 | 197.7 | 100.2 | |
| Dota 2 Reborn (2015) | 167 | 148 | 143 | 130 | |
| Final Fantasy XV Benchmark (2018) | 150 | 123 | 93.7 | 73.8 | |
| X-Plane 11.11 (2018) | 129 | 114 | 89.9 | ||
| Far Cry 5 (2018) | 143 | 125 | 118 | 113 | 96 |
| Strange Brigade (2018) | 467 | 253 | 206 | 178 | 132 |
Emissions
Rumore di sistema - Forte solo quando si gioca
L'Alienware x15 R1 usa la stessa pasta termica al gallio-silicone per la sua CPU e le impostazioni della ventola dell'Alienware Command Center (Quiet, Performance, e Full Speed) che si trovano sull'x17 R1. Applicazioni poco impegnative come la navigazione web o lo streaming video possono indurre un rumore della ventola di soli 26-31 dB(A) contro uno sfondo silenzioso di 24.1 dB(A) per essere quasi impercettibile e molto più silenzioso di quello che abbiamo osservato sull'Alienware m15 R4 dove le ventole pulsavano più frequentemente.
Quando si gioca, il rumore delle ventole sarebbe vicino a quello che abbiamo registrato sull'x17 R1 a quasi 50 dB(A) su entrambe le modalità Balanced o Performance. Se le ventole sono impostate in modalità Full Speed, allora il rumore massimo delle ventole aumenterebbe a 55 dB(A). L'x15 R1 non è necessariamente più silenzioso o più rumoroso della maggior parte degli altri portatili da gioco da 15,6 pollici in questo senso, nonostante abbia più ventole di molti altri.
| Alienware x15 RTX 3070 P111F GeForce RTX 3070 Laptop GPU, i7-11800H, WDC PC SN730 SDBPNTY-512G | Alienware m15 R4 RTX 3080 GeForce RTX 3080 Laptop GPU, i9-10980HK, 2x WDC PC SN730 SDBPNTY-512G (RAID 0) | MSI GS66 Stealth 10UG GeForce RTX 3070 Laptop GPU, i7-10870H, WDC PC SN730 SDBPNTY-1T00 | Razer Blade 15 Advanced (Mid 2021) GeForce RTX 3080 Laptop GPU, i7-11800H, SSSTC CA6-8D1024 | Asus Zephyrus S15 GX502L GeForce RTX 2070 Super Mobile, i7-10875H, WDC PC SN730 SDBPNTY-1T00 | Acer Predator Helios 300 PH315-53-786B GeForce RTX 3070 Laptop GPU, i7-10750H, Samsung PM981a MZVLB1T0HBLR | |
|---|---|---|---|---|---|---|
| Noise | -10% | -21% | -2% | -23% | -11% | |
| off /ambiente * (dB) | 24.1 | 25 -4% | 26.2 -9% | 25.1 -4% | 25 -4% | 25 -4% |
| Idle Minimum * (dB) | 26.6 | 25 6% | 34 -28% | 25.3 5% | 28 -5% | 25 6% |
| Idle Average * (dB) | 26.6 | 29 -9% | 34 -28% | 25.3 5% | 31 -17% | 27 -2% |
| Idle Maximum * (dB) | 26.6 | 33 -24% | 34 -28% | 25.3 5% | 36 -35% | 35 -32% |
| Load Average * (dB) | 30.9 | 48 -55% | 47.2 -53% | 42 -36% | 56 -81% | 46 -49% |
| Witcher 3 ultra * (dB) | 49.9 | 46 8% | 46.3 7% | 45.6 9% | 55 -10% | 49 2% |
| Load Maximum * (dB) | 53.5 | 49 8% | 58.2 -9% | 51.6 4% | 57 -7% | 51 5% |
* ... Meglio usare valori piccoli
Rumorosità
| Idle |
| 26.6 / 26.6 / 26.6 dB(A) |
| Sotto carico |
| 30.9 / 53.5 dB(A) |
 | ||
30 dB silenzioso 40 dB(A) udibile 50 dB(A) rumoroso |
||
min: | ||
Temperatura - Posteriore caldo
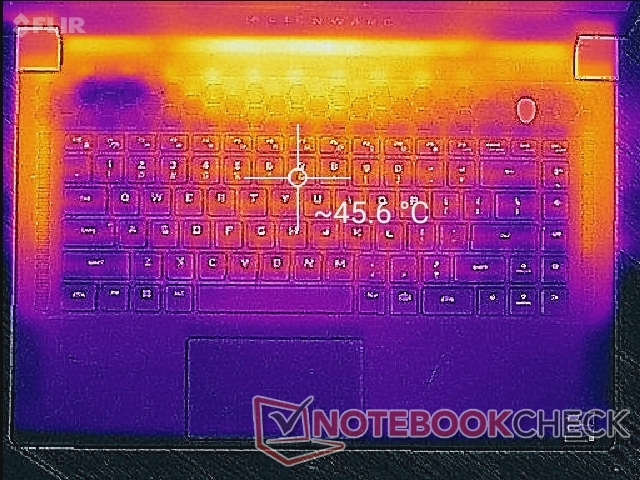
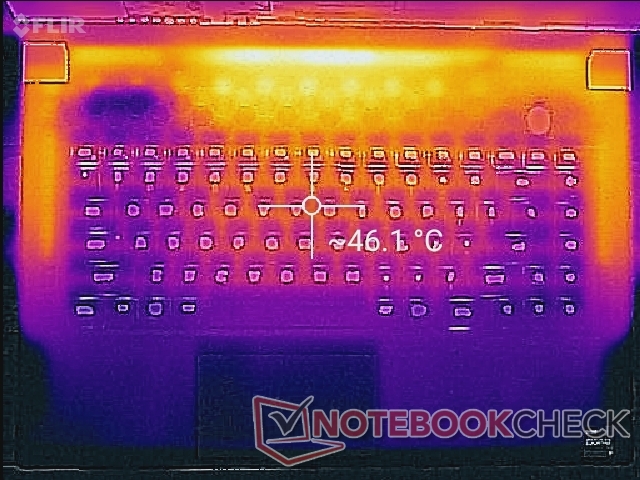
I vecchi portatili Alienware m15 avevano poggiapolsi molto caldi che si avvicinavano ai 40 C quando si eseguivano i giochi. Fortunatamente, i poggiapolsi dell'x15 R1 sono significativamente più freddi in confronto di circa 8 C per mani e dita più comode. Si noti che mentre i tasti WASD non sono caldi come prima, le superfici tra i bordi del telaio e i bordi della tastiera possono essere molto calde poiché ci sono tubi di calore in rame sotto.
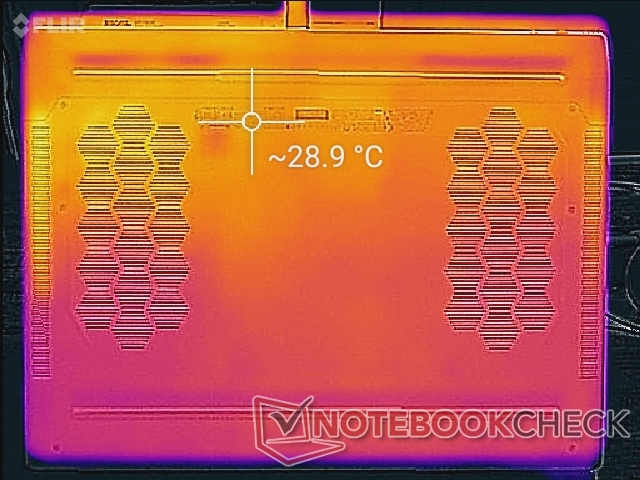
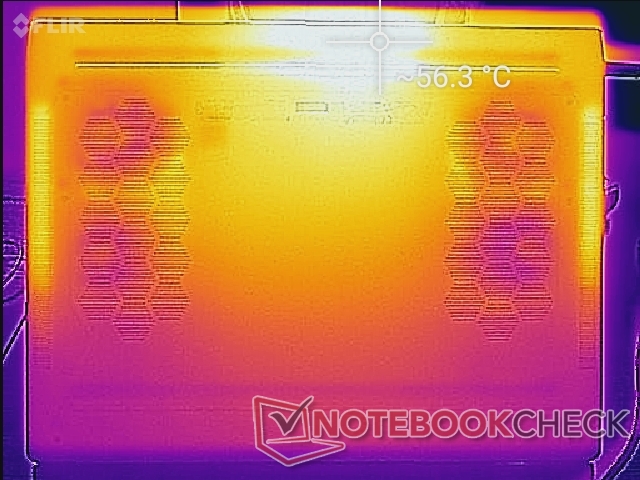
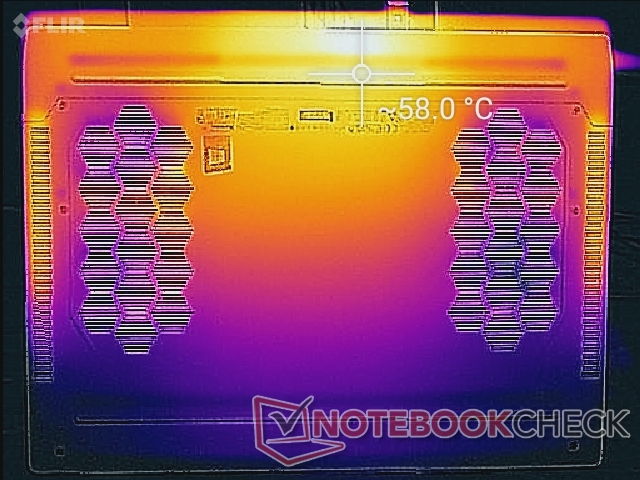
I punti caldi sulla parte superiore e inferiore dello chassis possono raggiungere quasi 60 C ciascuno, che sono simili ai massimi che abbiamo registrato sul vecchio design m15. Fortunatamente, questi punti sono verso la parte posteriore dove è improbabile che le mani tocchino.
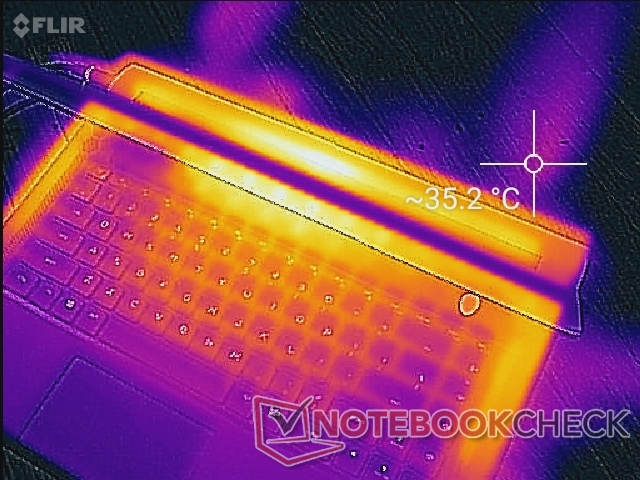
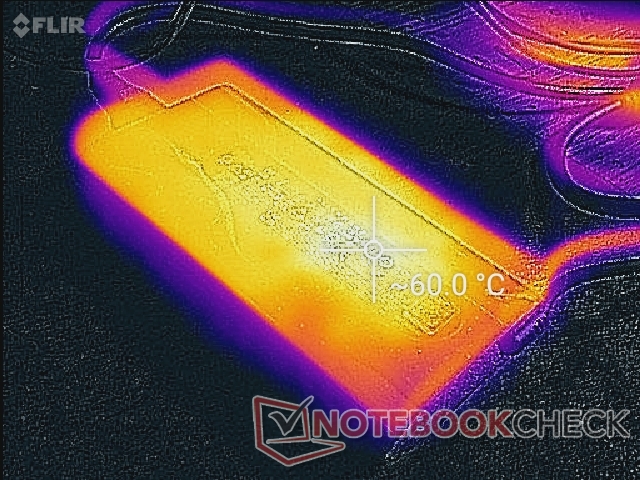
(-) La temperatura massima sul lato superiore è di 59.2 °C / 139 F, rispetto alla media di 40.4 °C / 105 F, che varia da 21.2 a 68.8 °C per questa classe Gaming.
(-) Il lato inferiore si riscalda fino ad un massimo di 58 °C / 136 F, rispetto alla media di 43.2 °C / 110 F
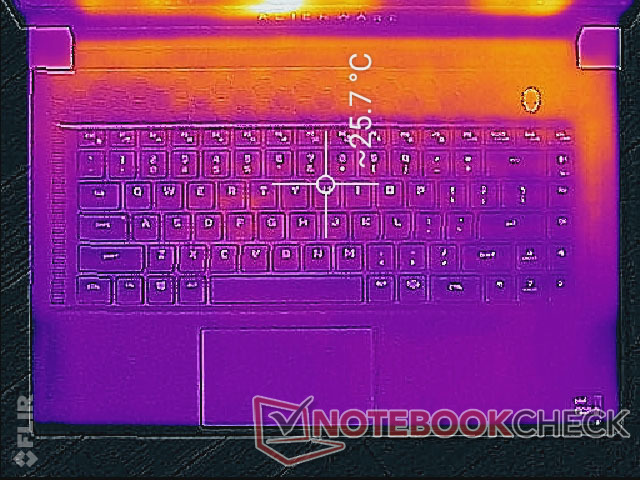
(+) In idle, la temperatura media del lato superiore è di 26.2 °C / 79 F, rispetto alla media deld ispositivo di 33.9 °C / 93 F.
(-) Riproducendo The Witcher 3, la temperatura media per il lato superiore e' di 43.2 °C / 110 F, rispetto alla media del dispositivo di 33.9 °C / 93 F.
(+) I poggiapolsi e il touchpad raggiungono la temperatura massima della pelle (32.2 °C / 90 F) e quindi non sono caldi.
(-) La temperatura media della zona del palmo della mano di dispositivi simili e'stata di 28.8 °C / 83.8 F (-3.4 °C / -6.2 F).
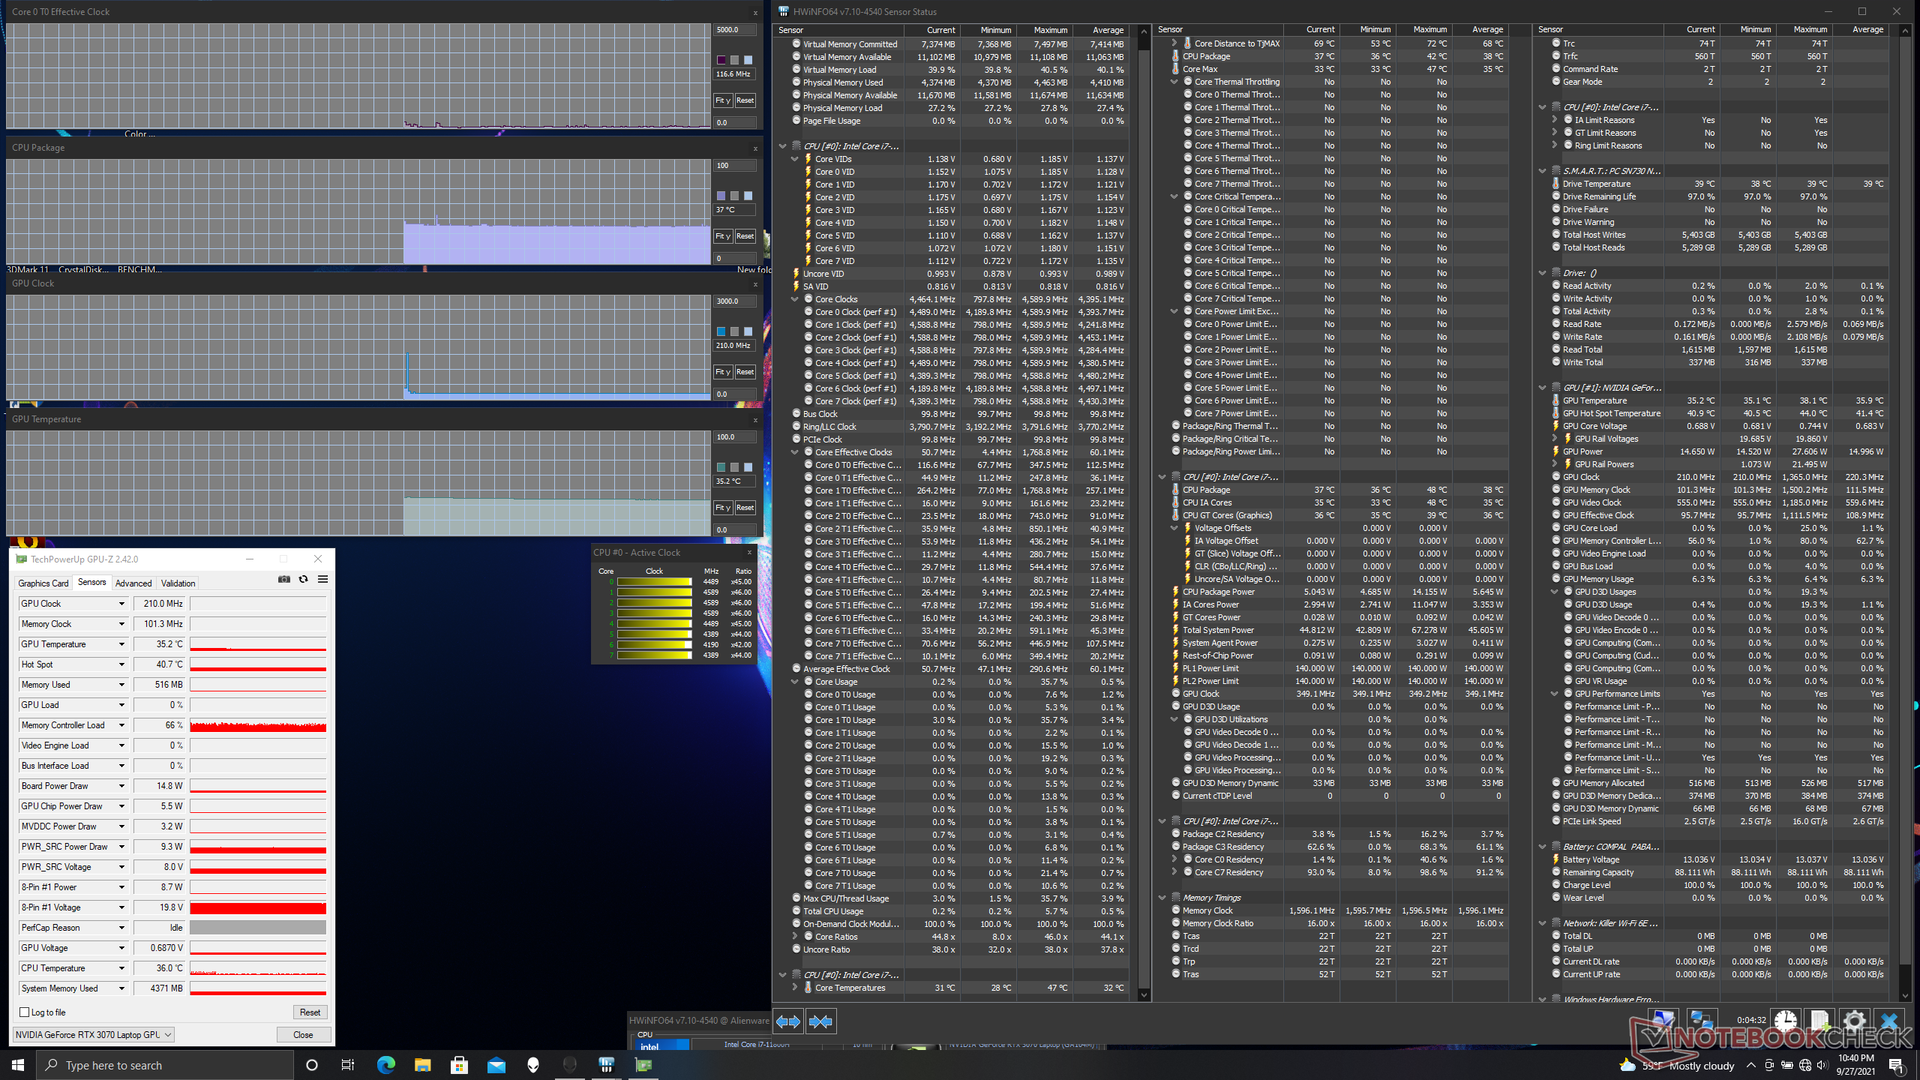
Test di stress
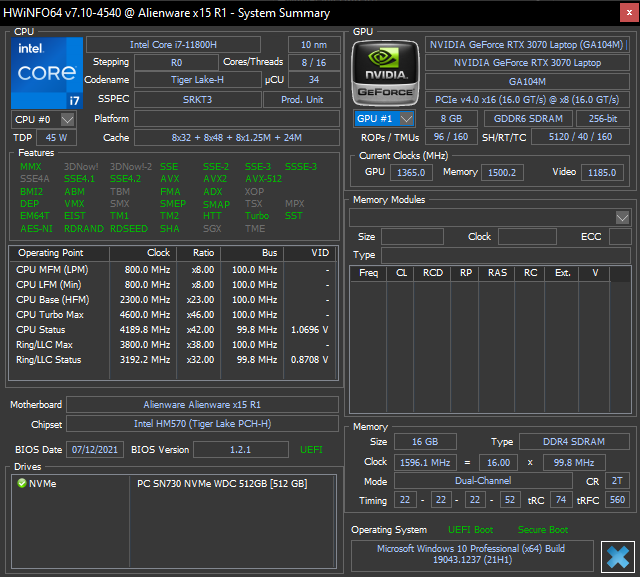
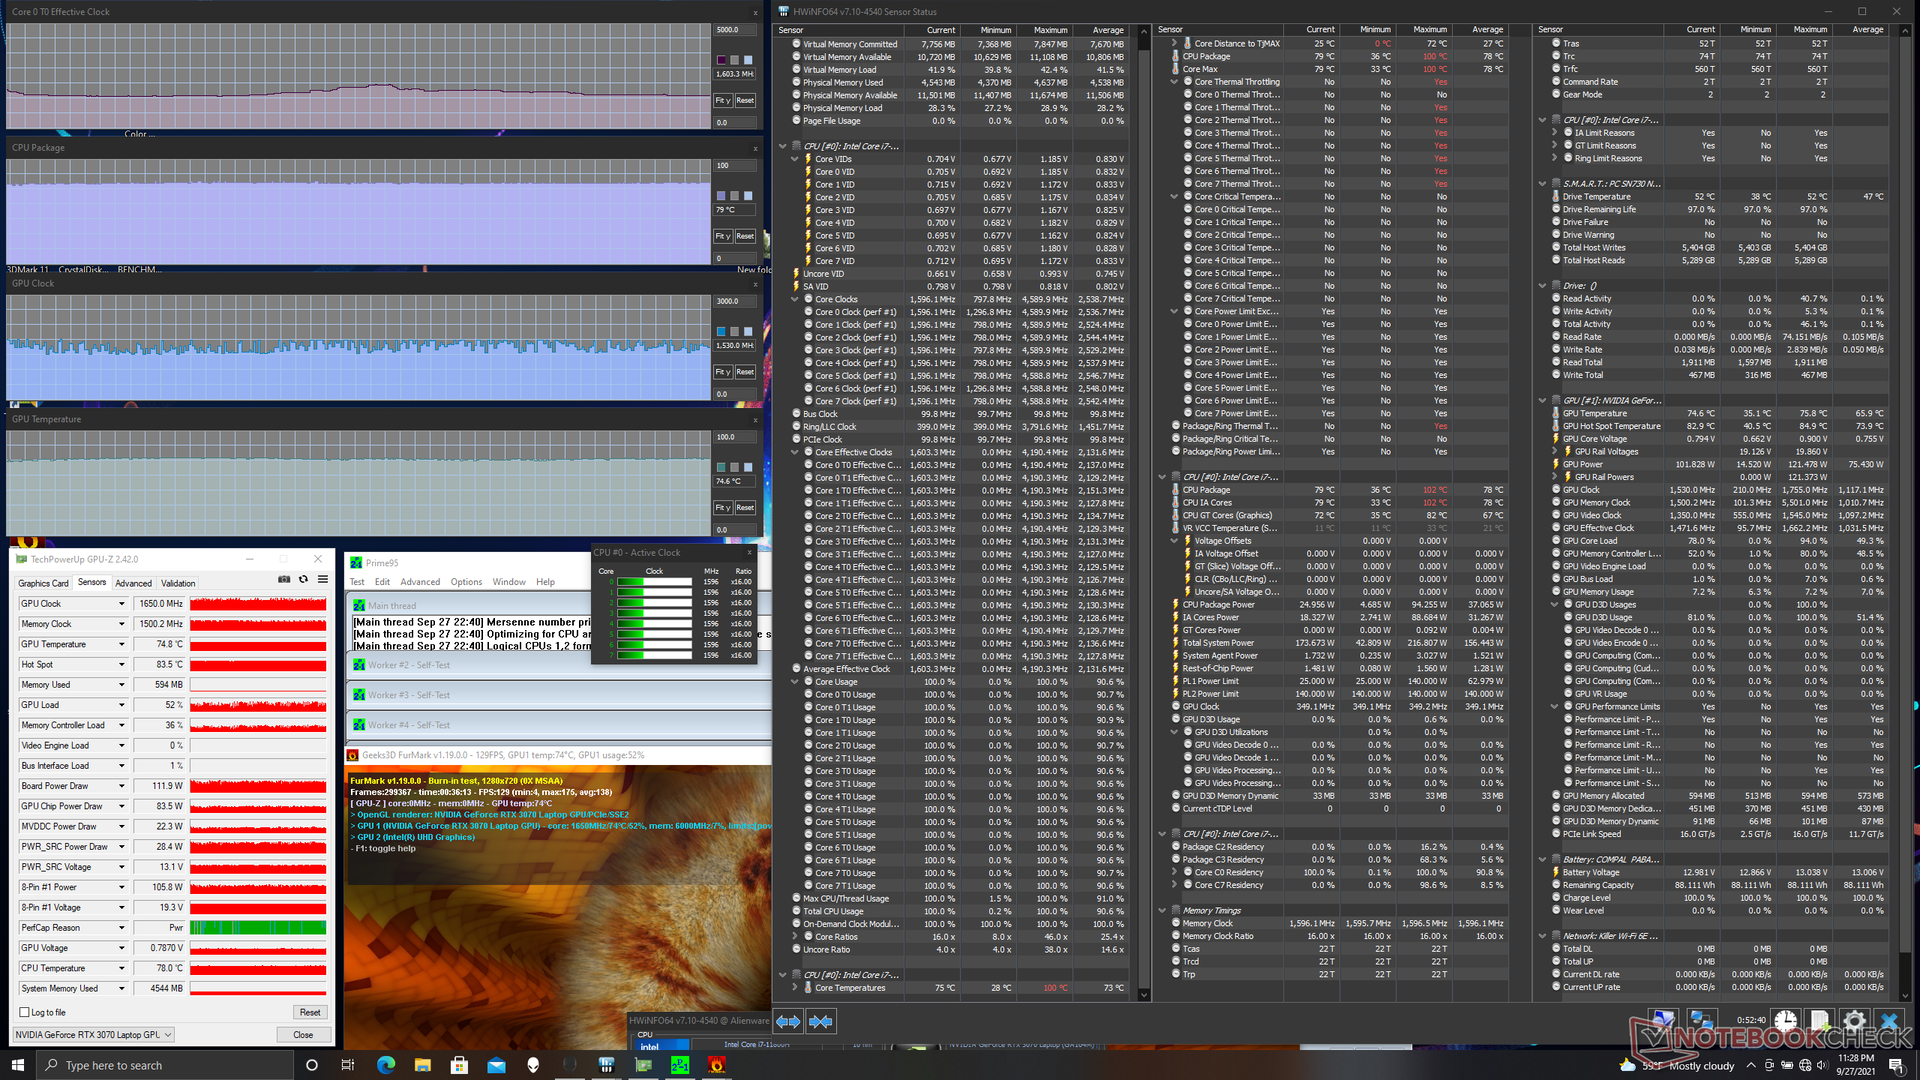
Quando si esegue Prime95 per stressare la CPU, le frequenze di clock e la temperatura si alternano tra 3.5 e 4.2 GHz e tra 90 C e 100 C, rispettivamente, con la potenza del pacchetto CPU che varia tra 79 W e 95 W. Questo comportamento ciclico può essere osservato anche sull'Alienware x17 R1 quando sottoposto alle stesse condizioni. Il processore qui gira sia più veloce che più caldo rispetto alla maggior parte degli altri portatili con la stessa CPU, come sul Razer Blade 15 modello avanzato dove la sua CPU i7-11800H si stabilizzerebbe a "soli" 2,9 GHz e 83 C
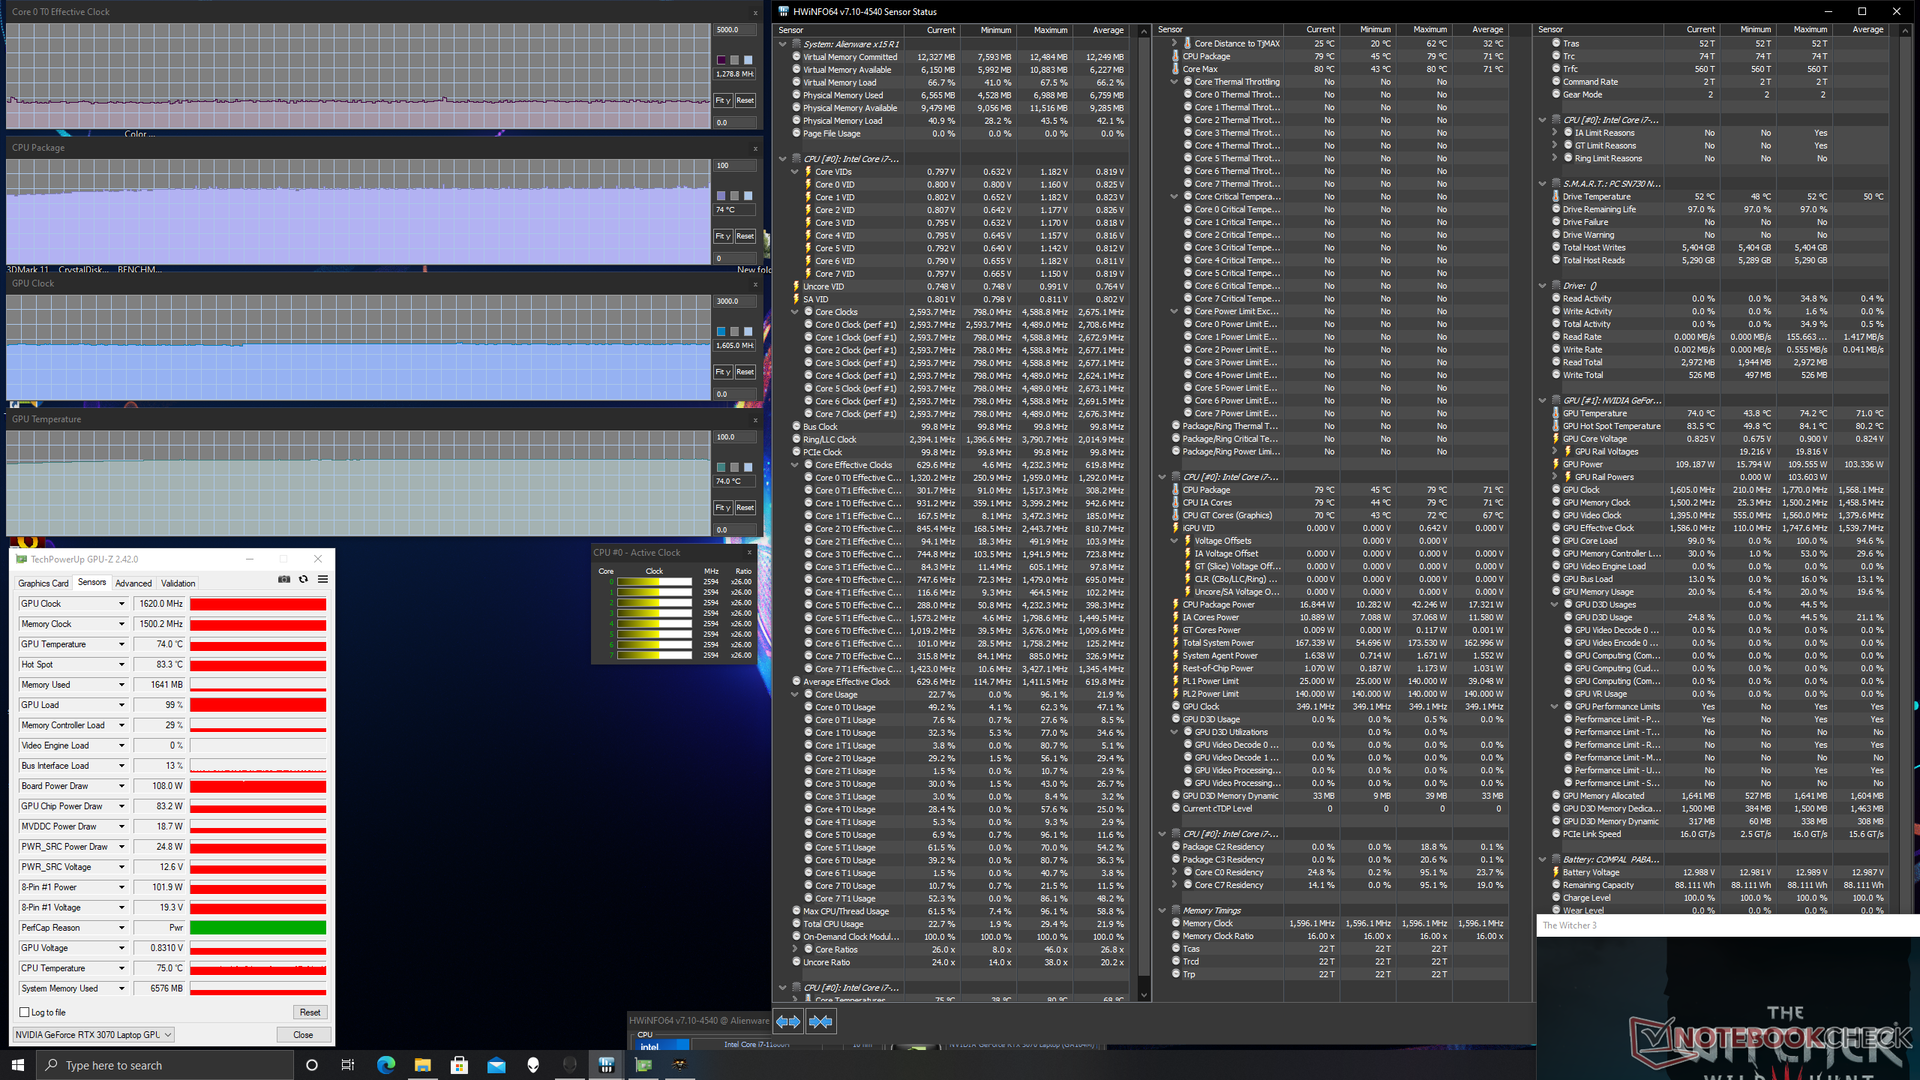
La GPU qui si stabilizzerebbe a 1605 MHz e 74 C quando funziona Witcher 3, rispettivamente, rispetto ai 1680 MHz e 80 C dell'Alienware m15 R4 RTX 3070. La frequenza di clock della memoria in particolare è notevolmente più veloce sul vecchio m15 R4 rispetto al nostro nuovo x15 R1 (1750 MHz contro 1500 MHz secondo GPU-Z). I clock leggermente più veloci sul vecchio modello Alienware hanno senso considerando i risultati di 3DMark leggermente più veloci di cui sopra.
TGP si stabilizza a 108 W quando è in funzione Witcher 3 che è molto vicino all'obiettivo massimo di 110 W. Dell valuta la GPU a 90 W con un turbo da 20 W, ma sembra che lo chassis non abbia problemi a mantenere un livello di prestazioni vicino alla gamma di fascia alta del chip grafico quando si gioca.
L'alimentazione a batteria limita fortemente le prestazioni grafiche. Un test su Fire Strike con le batterie restituirebbe punteggi di fisica e grafica di 24234 e 16281 punti, rispettivamente, rispetto a 25033 e 25471 punti con l'alimentazione di rete.

| Clock della CPU (GHz)Clock della GPU(MHz)Temperatura media dellaCPU (°C)Temperaturamedia dellaGPU (°C) |
| Sistema inattivo |
| Prime95 Stress |
| Prime95 + FurMark Stress |
| Witcher 3 Stress |
Altoparlanti - Qualità audio tipo Ultrabook
 vicino agli angoli anteriori. La qualità dell'audio è decente, ma manca sia il volume che l'intensità")

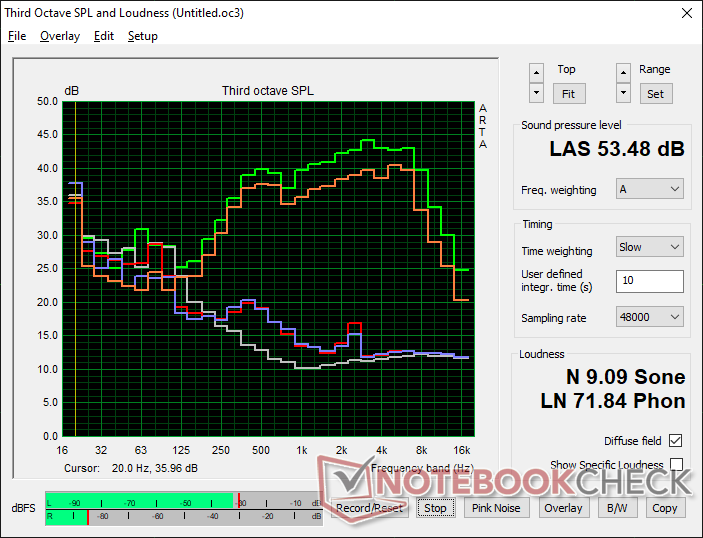
Alienware x15 RTX 3070 P111F analisi audio
(+) | gli altoparlanti sono relativamente potenti (82.7 dB)
Bassi 100 - 315 Hz
(-) | quasi nessun basso - in media 24.2% inferiori alla media
(±) | la linearità dei bassi è media (11.8% delta rispetto alla precedente frequenza)
Medi 400 - 2000 Hz
(±) | medi elevati - circa 10.3% superiore alla media
(±) | linearità dei medi adeguata (8.8% delta rispetto alla precedente frequenza)
Alti 2 - 16 kHz
(±) | alti elevati - circa 6.1% superiori alla media
(±) | la linearità degli alti è media (8.6% delta rispetto alla precedente frequenza)
Nel complesso 100 - 16.000 Hz
(±) | la linearità complessiva del suono è media (29.3% di differenza rispetto alla media
Rispetto alla stessa classe
» 95% di tutti i dispositivi testati in questa classe è stato migliore, 2% simile, 3% peggiore
» Il migliore ha avuto un delta di 6%, medio di 18%, peggiore di 132%
Rispetto a tutti i dispositivi testati
» 87% di tutti i dispositivi testati in questa classe è stato migliore, 3% similare, 10% peggiore
» Il migliore ha avuto un delta di 4%, medio di 23%, peggiore di 134%
Apple MacBook 12 (Early 2016) 1.1 GHz analisi audio
(+) | gli altoparlanti sono relativamente potenti (83.6 dB)
Bassi 100 - 315 Hz
(±) | bassi ridotti - in media 11.3% inferiori alla media
(±) | la linearità dei bassi è media (14.2% delta rispetto alla precedente frequenza)
Medi 400 - 2000 Hz
(+) | medi bilanciati - solo only 2.4% rispetto alla media
(+) | medi lineari (5.5% delta rispetto alla precedente frequenza)
Alti 2 - 16 kHz
(+) | Alti bilanciati - appena 2% dalla media
(+) | alti lineari (4.5% delta rispetto alla precedente frequenza)
Nel complesso 100 - 16.000 Hz
(+) | suono nel complesso lineare (10.2% differenza dalla media)
Rispetto alla stessa classe
» 7% di tutti i dispositivi testati in questa classe è stato migliore, 2% simile, 91% peggiore
» Il migliore ha avuto un delta di 5%, medio di 18%, peggiore di 53%
Rispetto a tutti i dispositivi testati
» 5% di tutti i dispositivi testati in questa classe è stato migliore, 1% similare, 94% peggiore
» Il migliore ha avuto un delta di 4%, medio di 23%, peggiore di 134%
Energy Management
Consumo di energia
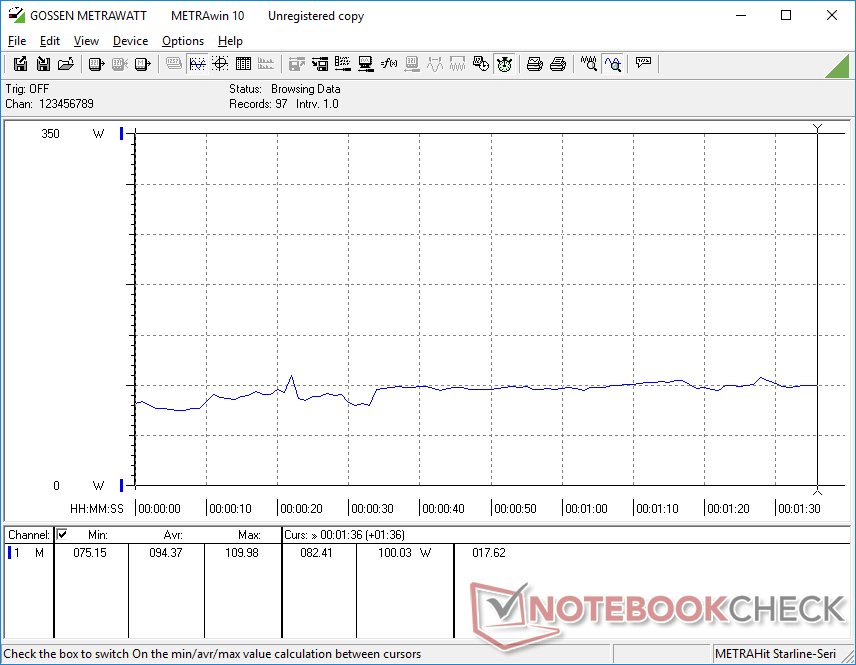
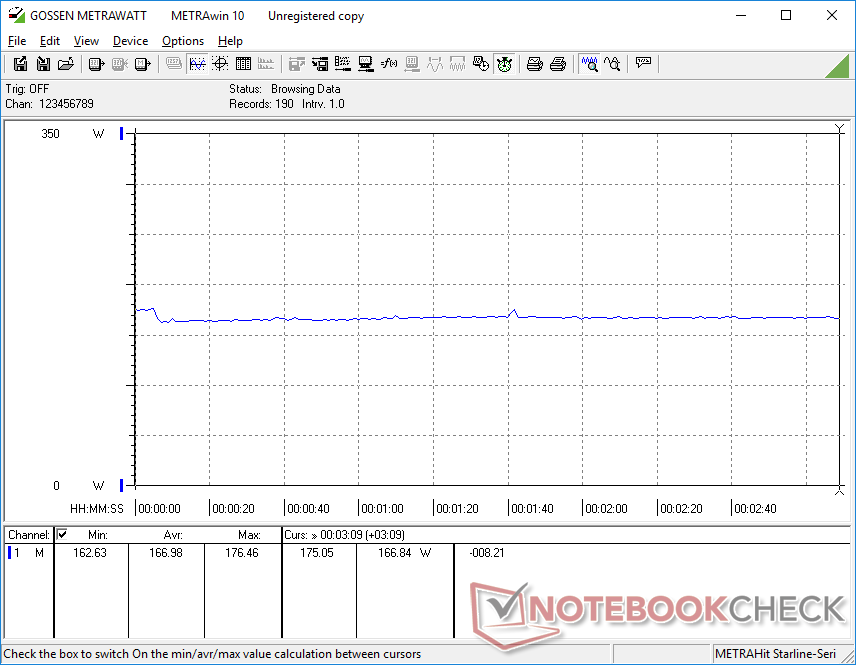
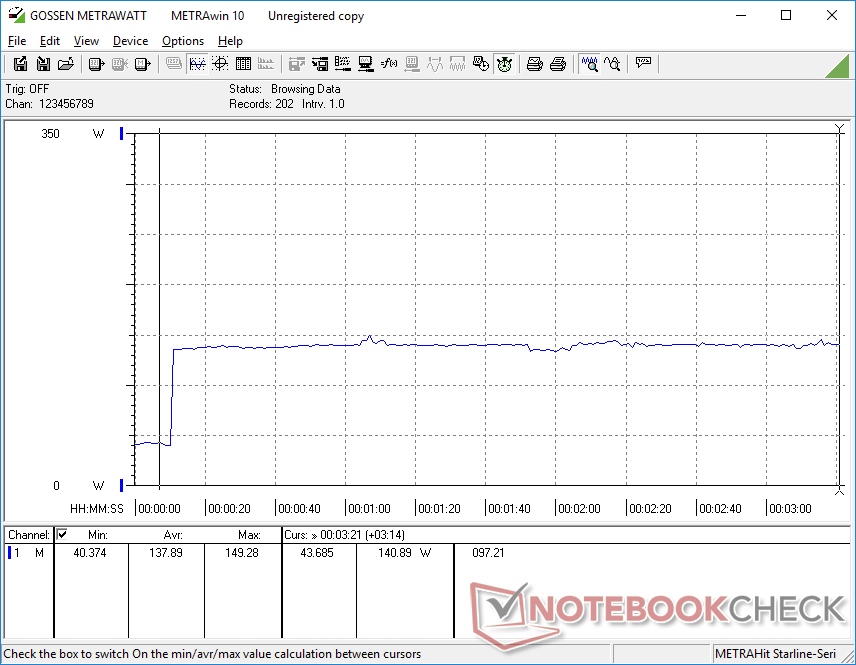
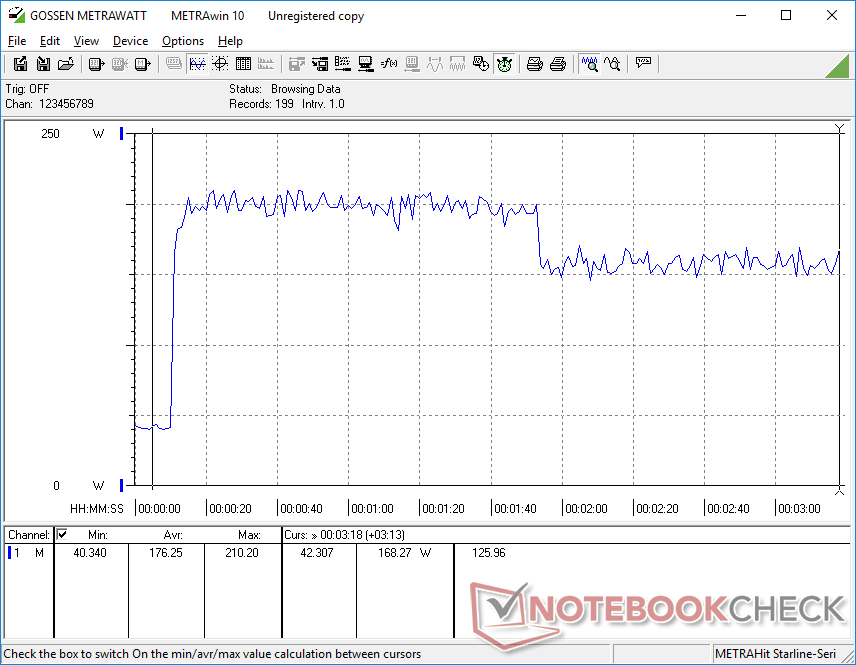
Il consumo di energia è migliorato significativamente rispetto all'Alienware m15 R4 dello scorso anno. L'inattività sul desktop senza applicazioni in esecuzione consuma solo 16 W rispetto a più di due volte quello del vecchio modello. Inoltre, l'esecuzione di Witcher 3 consumerebbe circa 167 W rispetto ai 194 W dell'm15 R4 equipaggiato con la stessa GPU RTX 3070 per rappresentare un risparmio energetico del 14 per cento, anche se con un deficit di prestazioni del 10 per cento. Forse non a caso, la differenza tra 194 W e 167 W è quasi uguale alla differenza di TGP tra i due portatili
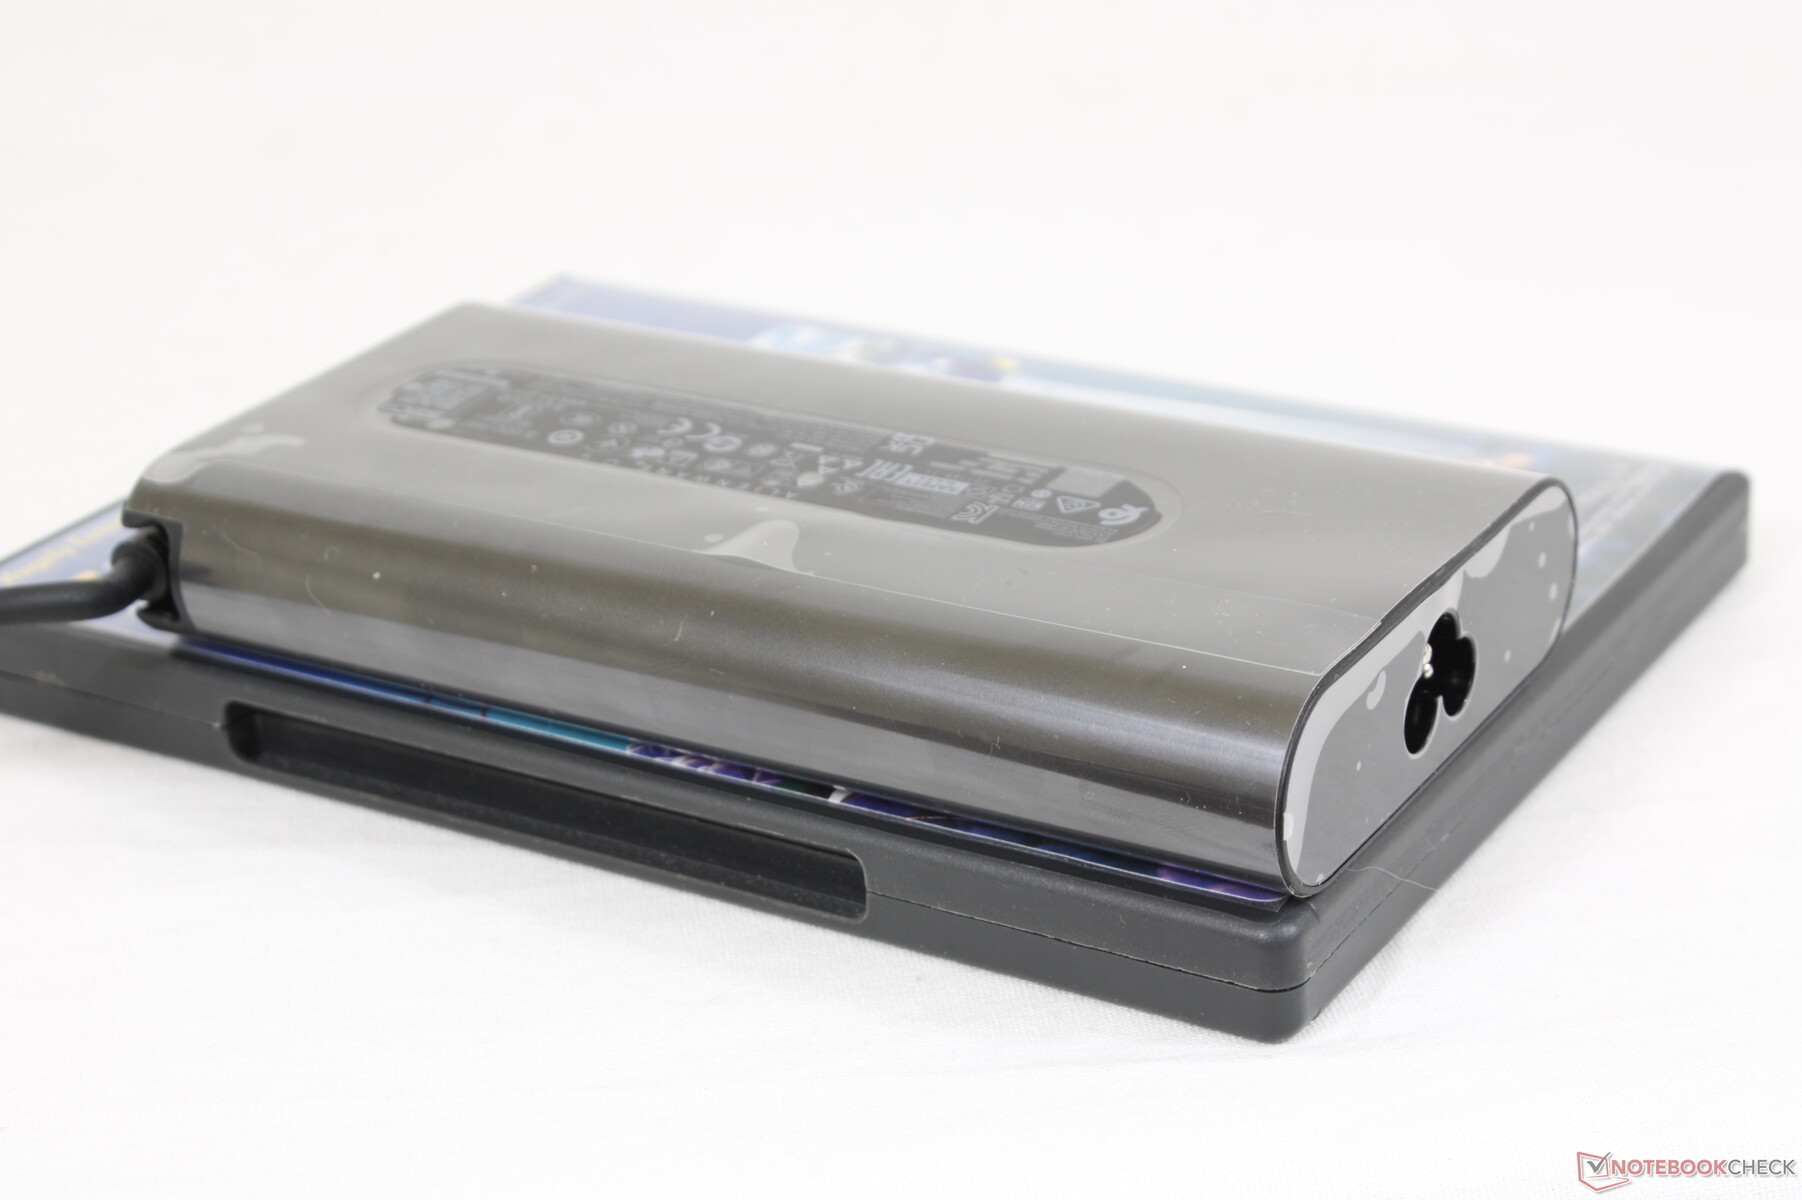
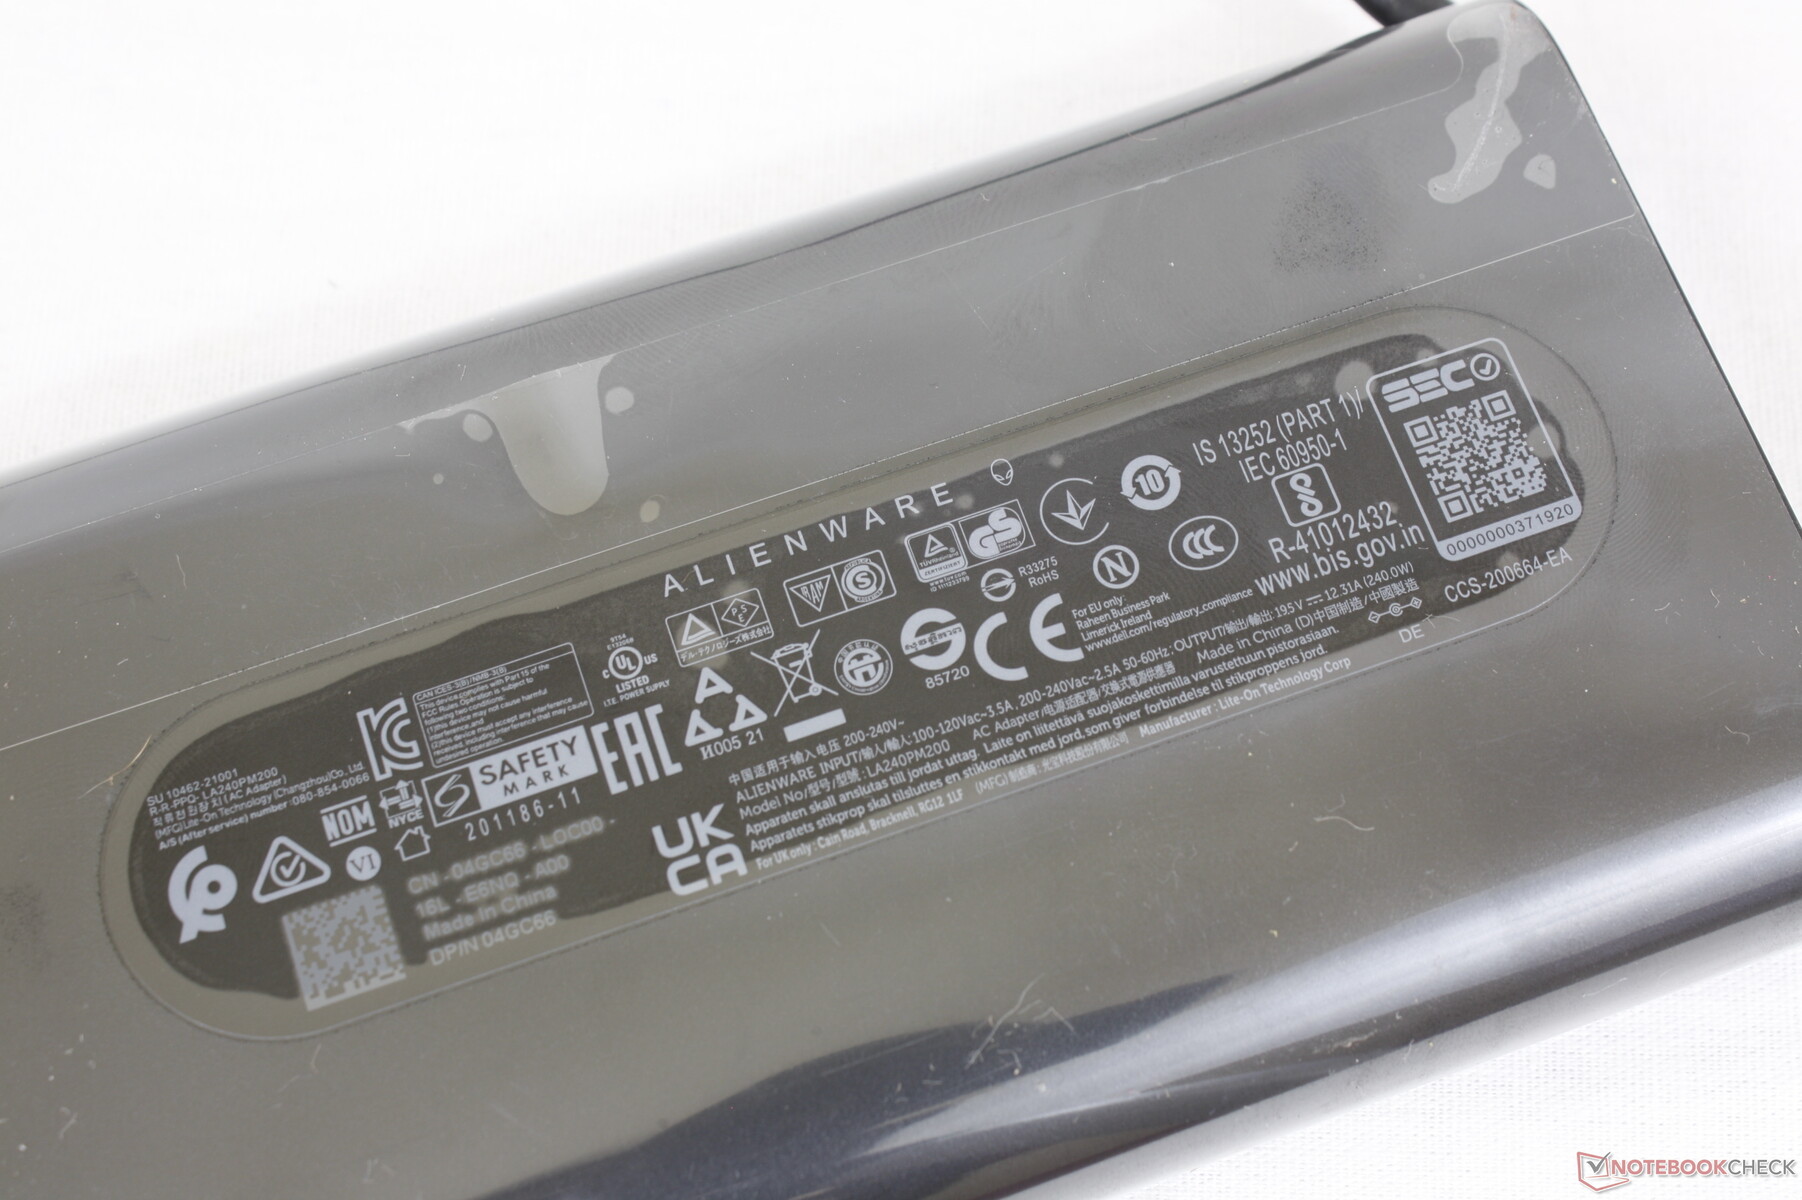
Siamo in grado di registrare un consumo massimo temporaneo di 184 W dall'adattatore AC 240 W di medie dimensioni (~15,2 x 7,6 x 2,4 cm). Questo stesso adattatore AC viene anche fornito con alcune SKU di fascia bassa dell'Alienware x17 R1.
| Off / Standby | |
| Idle | |
| Sotto carico |
|
Leggenda:
min: | |
| Alienware x15 RTX 3070 P111F i7-11800H, GeForce RTX 3070 Laptop GPU, WDC PC SN730 SDBPNTY-512G, IPS, 2560x1440, 15.6" | Alienware m15 R4 i9-10980HK, GeForce RTX 3070 Laptop GPU, Micron 2300 1TB MTFDHBA1T0TDV, IPS, 1920x1080, 15.6" | MSI GS66 Stealth 10UG i7-10870H, GeForce RTX 3070 Laptop GPU, WDC PC SN730 SDBPNTY-1T00, IPS, 1920x1080, 15.6" | Razer Blade 15 Advanced (Mid 2021) i7-11800H, GeForce RTX 3080 Laptop GPU, SSSTC CA6-8D1024, IPS, 1920x1080, 15.6" | Asus Zephyrus S15 GX502L i7-10875H, GeForce RTX 2070 Super Mobile, WDC PC SN730 SDBPNTY-1T00, IPS, 1920x1080, 15.6" | Acer Predator Helios 300 PH315-53-786B i7-10750H, GeForce RTX 3070 Laptop GPU, Samsung PM981a MZVLB1T0HBLR, IPS, 1920x1080, 15.6" | |
|---|---|---|---|---|---|---|
| Power Consumption | -54% | 8% | -10% | 8% | 25% | |
| Idle Minimum * (Watt) | 15.7 | 35 -123% | 12.9 18% | 19.5 -24% | 7 55% | 4 75% |
| Idle Average * (Watt) | 20.3 | 39 -92% | 15.4 24% | 23.3 -15% | 13 36% | 11 46% |
| Idle Maximum * (Watt) | 43 | 48 -12% | 27.1 37% | 40.1 7% | 25 42% | 24 44% |
| Load Average * (Watt) | 94.4 | 135 -43% | 98.2 -4% | 98.9 -5% | 148 -57% | 91 4% |
| Witcher 3 ultra * (Watt) | 167 | 194 -16% | 164.9 1% | 174 -4% | 175 -5% | 164 2% |
| Load Maximum * (Watt) | 183.4 | 252 -37% | 232.9 -27% | 214 -17% | 232 -26% | 220 -20% |
* ... Meglio usare valori piccoli
Power Consumption Witcher 3 / Stresstest
Durata della batteria - molto più lunga di prima
Molto simile al salto dall'Alienware m17 all'x17, il salto dall'Alienware m15 all'x15 ha anche portato a significativi guadagni nella durata complessiva della batteria grazie alla migliore efficienza energetica di cui sopra. Abbiamo registrato un'autonomia totale WLAN di poco più di 6 ore rispetto a meno di 2 ore sull'Alienware m15 R4 anche se la capacità della batteria rimane quasi la stessa a 87 Wh ciascuno.
La ricarica da vuoto a pieno è veloce a circa 75 minuti con l'adattatore AC barrel incluso. La ricarica con USB-C è supportata anche se con un tasso di carica più lento.
| Alienware x15 RTX 3070 P111F i7-11800H, GeForce RTX 3070 Laptop GPU, 87 Wh | Alienware m15 R4 RTX 3080 i9-10980HK, GeForce RTX 3080 Laptop GPU, 86 Wh | MSI GS66 Stealth 10UG i7-10870H, GeForce RTX 3070 Laptop GPU, 99.9 Wh | Razer Blade 15 Advanced (Mid 2021) i7-11800H, GeForce RTX 3080 Laptop GPU, 80 Wh | Asus Zephyrus S15 GX502L i7-10875H, GeForce RTX 2070 Super Mobile, 76 Wh | Acer Predator Helios 300 PH315-53-786B i7-10750H, GeForce RTX 3070 Laptop GPU, 58.75 Wh | |
|---|---|---|---|---|---|---|
| Autonomia della batteria | -41% | 57% | -3% | 2% | 27% | |
| Reader / Idle (h) | 9.7 | 10.8 11% | 8.7 -10% | 10.6 9% | ||
| WiFi v1.3 (h) | 6.1 | 1.8 -70% | 7.1 16% | 5.9 -3% | 3 -51% | 6.4 5% |
| Load (h) | 0.9 | 0.8 -11% | 2.2 144% | 1.5 67% | 1.5 67% | |
| Witcher 3 ultra (h) | 0.8 |
Pro
Contro
Verdetto - Un enorme balzo in avanti, pochi passi indietro
Dell ha cercato di creare non solo il più sottile portatile Alienware da 15,6 pollici, ma anche il più sottile portatile da gioco da 15,6 pollici con grafica GeForce RTX attualmente disponibile. L'Alienware x15 R1 merita un riconoscimento in questo aspetto, ma viene con una manciata di svantaggi di cui gli utenti dovrebbero essere consapevoli.
In primo luogo, la GPU TGP è stata messa a punto da 140 W sull'Alienware m15 R4 a soli 90 - 110 W sul più recente x15 R1 per prestazioni grafiche leggermente più lente anno dopo anno. In secondo luogo, il sistema è più pesante e più grande nell'ingombro di molti portatili da gioco da 15,6 pollici concorrenti come il Razer Blade 15 o MSI GS66 nonostante l'attenzione extra al raffreddamento. In terzo luogo, gli utenti non sono in grado di aggiornare la RAM, il che potrebbe irritare gli appassionati. E infine, l'insolito posizionamento delle porte può essere sfavorevole a molti utenti
L'Alienware x15 R1 è più sottile, più snello, più fresco e più duraturo dell'Alienware m15 R5. Non è necessariamente più veloce, tuttavia, in termini di potenziale grafico grezzo.
Gen-to-gen, tuttavia, l'x15 R1 è notevolmente migliorato rispetto alla serie m15 in molti altri modi. La durata della batteria, il consumo di energia, il comportamento della ventola e le temperature di superficie in particolare sono tutti molto migliori questa volta, anche se il nuovo design è più sottile e con molte delle stesse opzioni di visualizzazione. Sia le prestazioni del processore che il feedback dei tasti sono anche migliori del previsto. Se vi interessa massimizzare le prestazioni della CPU senza accontentarvi di modelli più spessi come l Area-51m o Serie MSI GTallora l'Alienware x15 sarebbe la vostra migliore soluzione. Se hai intenzione di viaggiare spesso, allora il più leggero e compatto Blade 15 può offrire prestazioni di gioco molto simili.
Prezzo e disponibilità
Newegg sta attualmente trasportando solo una SKU dell'Alienware x15 R1 per $3149 USD mentre Best Buy ne ha diversi in stock tra $2399 e $2999 USD. Per la maggior parte delle opzioni, gli utenti potrebbero voler acquistare direttamente da Dell.
Alienware x15 RTX 3070 P111F
- 09/30/2021 v7 (old)
Allen Ngo
Price comparison

