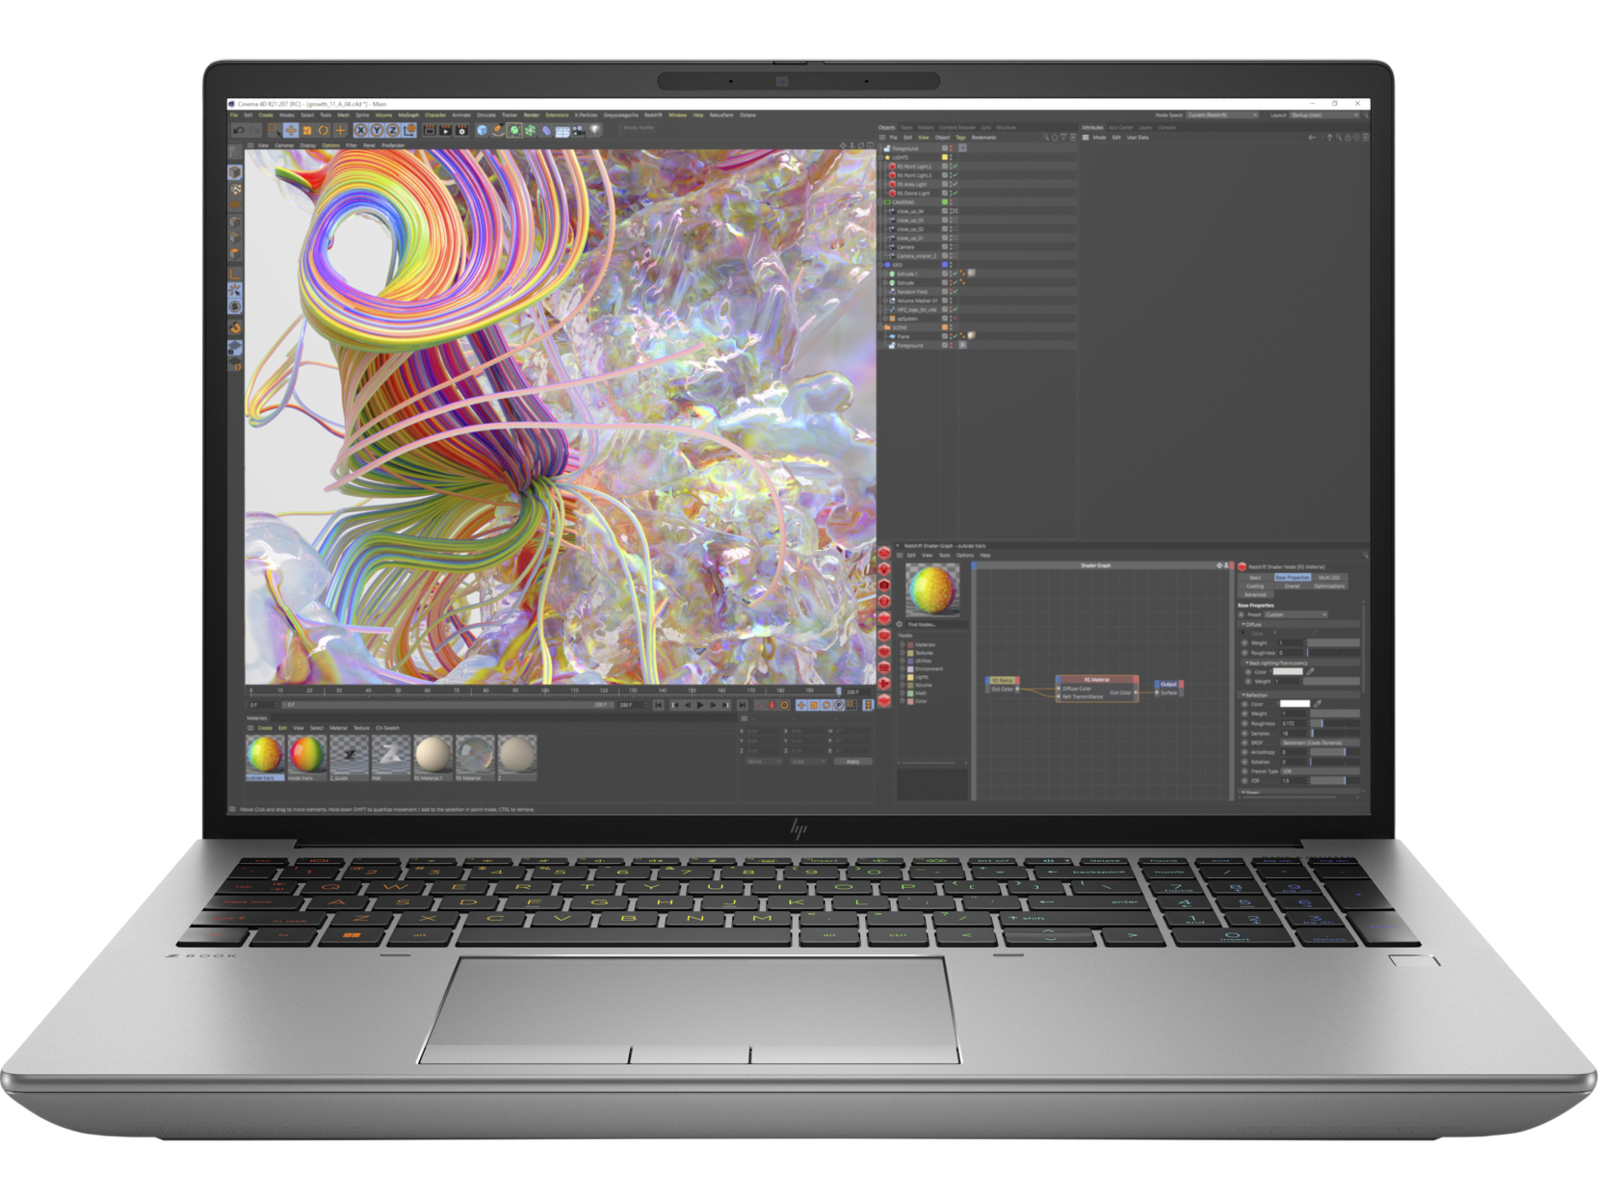
Recensione della workstation HP ZBook Fury 16 G9: un'alternativa a Dell Precision 7670 e ThinkPad P16 G1

La serie ZBook Fury ospita le workstation mobili più performanti di HP, in contrasto con la serie ZBook Studio di fascia media Serie ZBook Studio e alla serie ultrasottile ZBook Firefly.
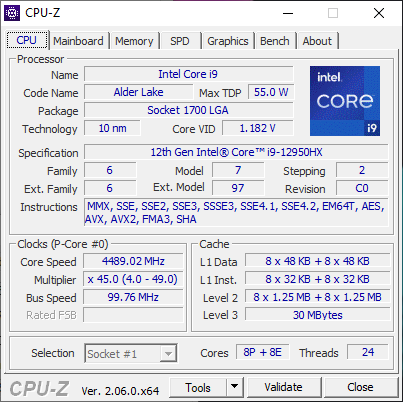
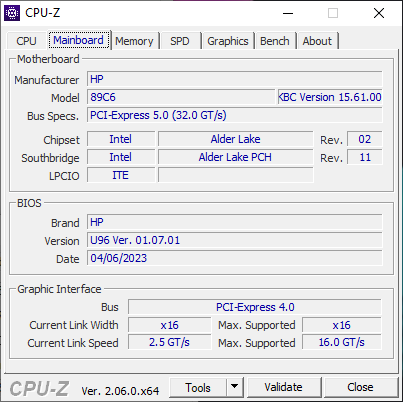
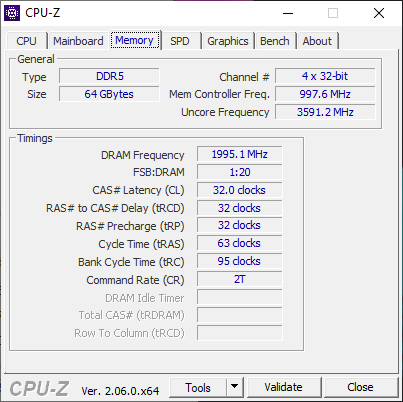
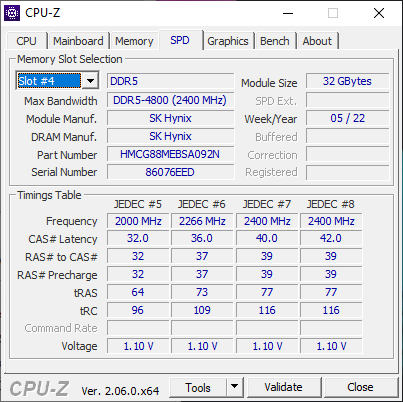
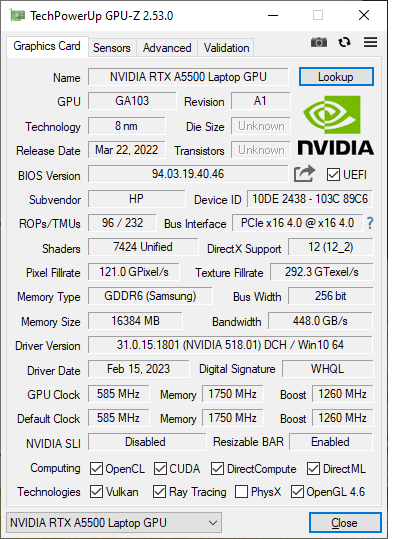
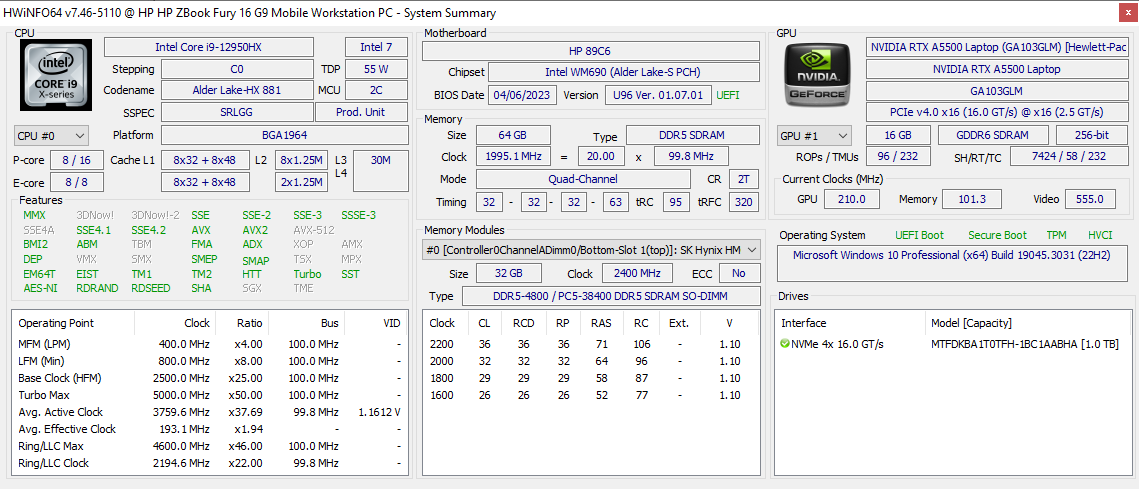
La nostra unità in prova è una configurazione di fascia alta del Fury 16 G9 con CPU Alder Lake-H Core i9-12950HX di 12a generazione, GPU RTX A5500 Ampere, 64 GB di RAM e display IPS 3840 x 2400 al prezzo di poco più di 4000 dollari. Le opzioni di configurazione sono molto ampie, con pannelli LTE, 5G e persino OLED, come elencato qui https://www.hp.com/us-en/shop/pdp/hp-zbook-fury-16-g9-customizable-609l4av-mb#techSpecs. Si noti che è disponibile anche lo ZBook Fury G10 con le nuove opzioni Intel di 13a generazione, ma lo chassis rimane identico al nostro Fury G9.
Tra le alternative allo ZBook Fury 16 G9 vi sono altre workstation mobili da 16 pollici di punta come il modello Dell Precision 7670, MSI CreatorPro Z16P, Asus ProArt StudioBook 16, o Lenovo ThinkPad P16 G1.
Altre recensioni di HP:
Potenziali concorrenti a confronto
Punteggio | Data | Modello | Peso | Altezza | Dimensione | Risoluzione | Prezzo |
|---|---|---|---|---|---|---|---|
| 91 % v7 (old) | 06/2023 | HP ZBook Fury 16 G9 i9-12950HX, RTX A5500 Laptop GPU | 2.6 kg | 28.5 mm | 16.00" | 3840x2400 | |
| 90.1 % v7 (old) | 11/2022 | HP ZBook Studio 16 G9 62U04EA i7-12800H, RTX A2000 Laptop GPU | 1.8 kg | 19 mm | 16.00" | 3840x2400 | |
| 82.9 % v7 (old) | 10/2022 | HP ZBook Firefly 16 G9-6B897EA i7-1265U, T550 Laptop GPU | 2 kg | 19.2 mm | 16.00" | 1920x1200 | |
| 91 % v7 (old) | 02/2023 | Lenovo ThinkPad P16 G1 RTX A5500 i9-12950HX, RTX A5500 Laptop GPU | 3 kg | 30.23 mm | 16.00" | 3840x2400 | |
| 89.1 % v7 (old) | 12/2022 | Dell Precision 7000 7670 Performance i9-12950HX, RTX A5500 Laptop GPU | 2.8 kg | 25.95 mm | 16.00" | 3840x2400 | |
| 84.3 % v7 (old) | 11/2022 | MSI CreatorPro Z16P B12UKST i7-12700H, RTX A3000 Laptop GPU | 2.4 kg | 19 mm | 16.00" | 2560x1600 |
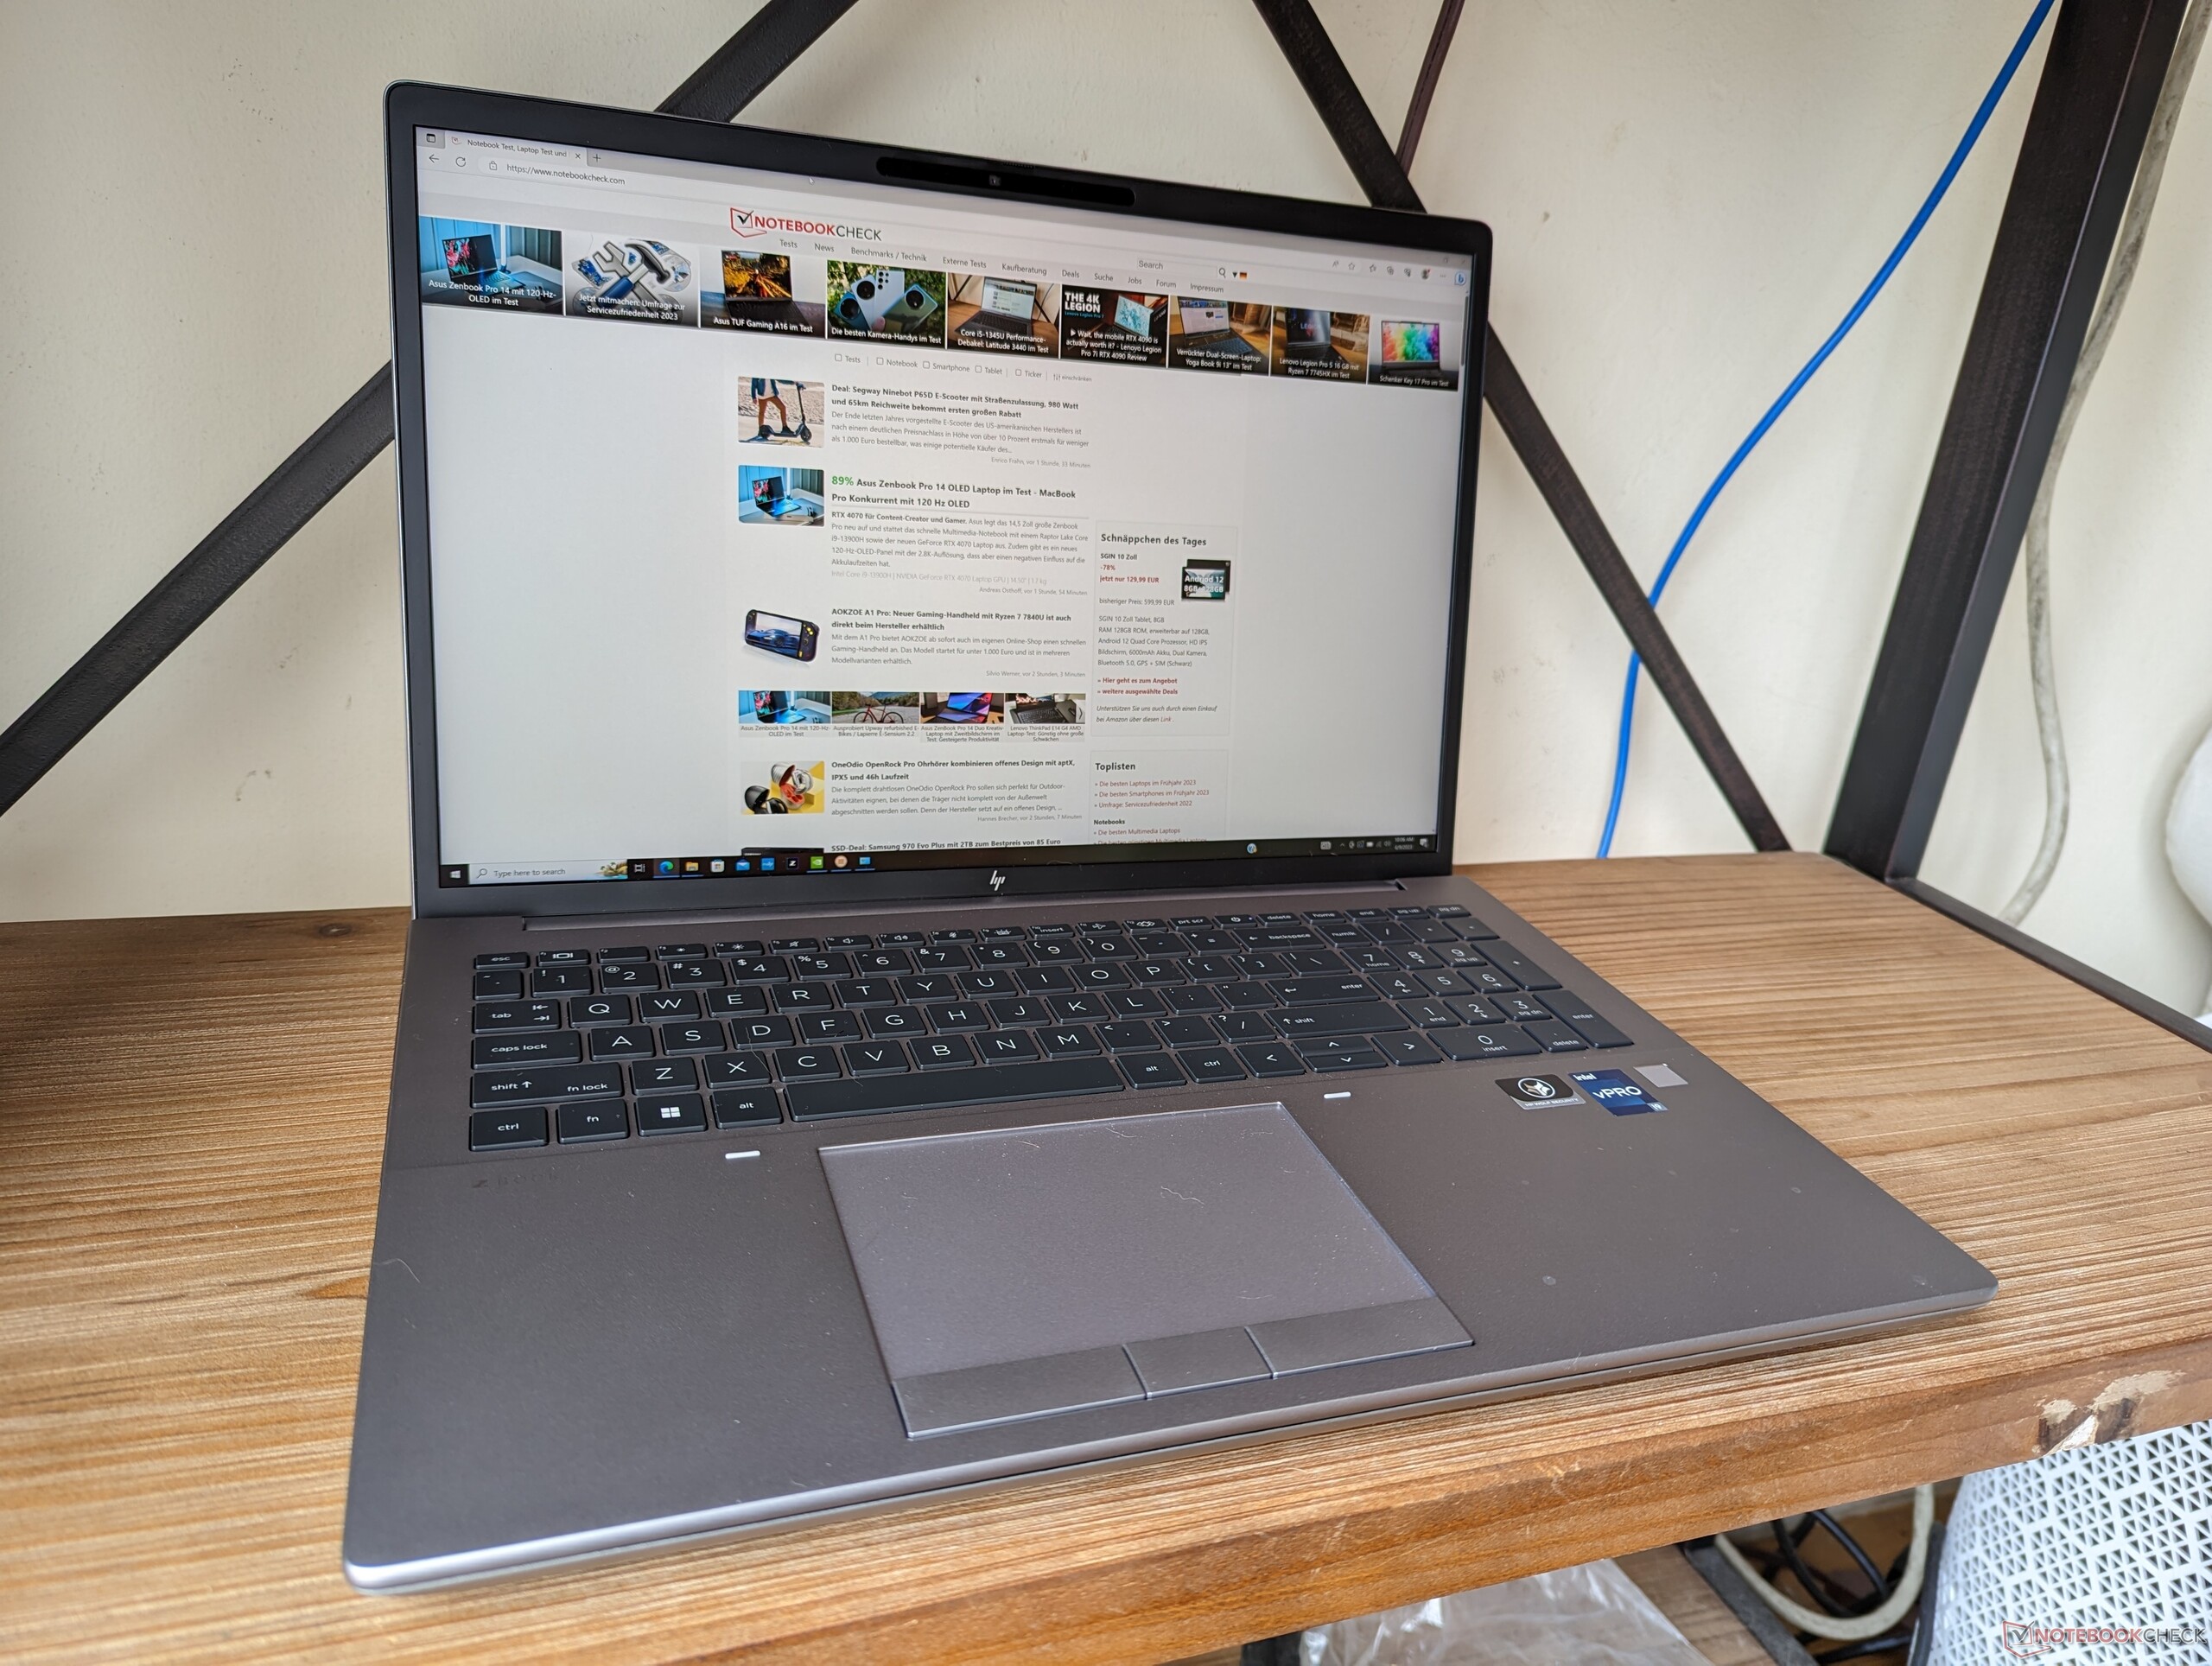
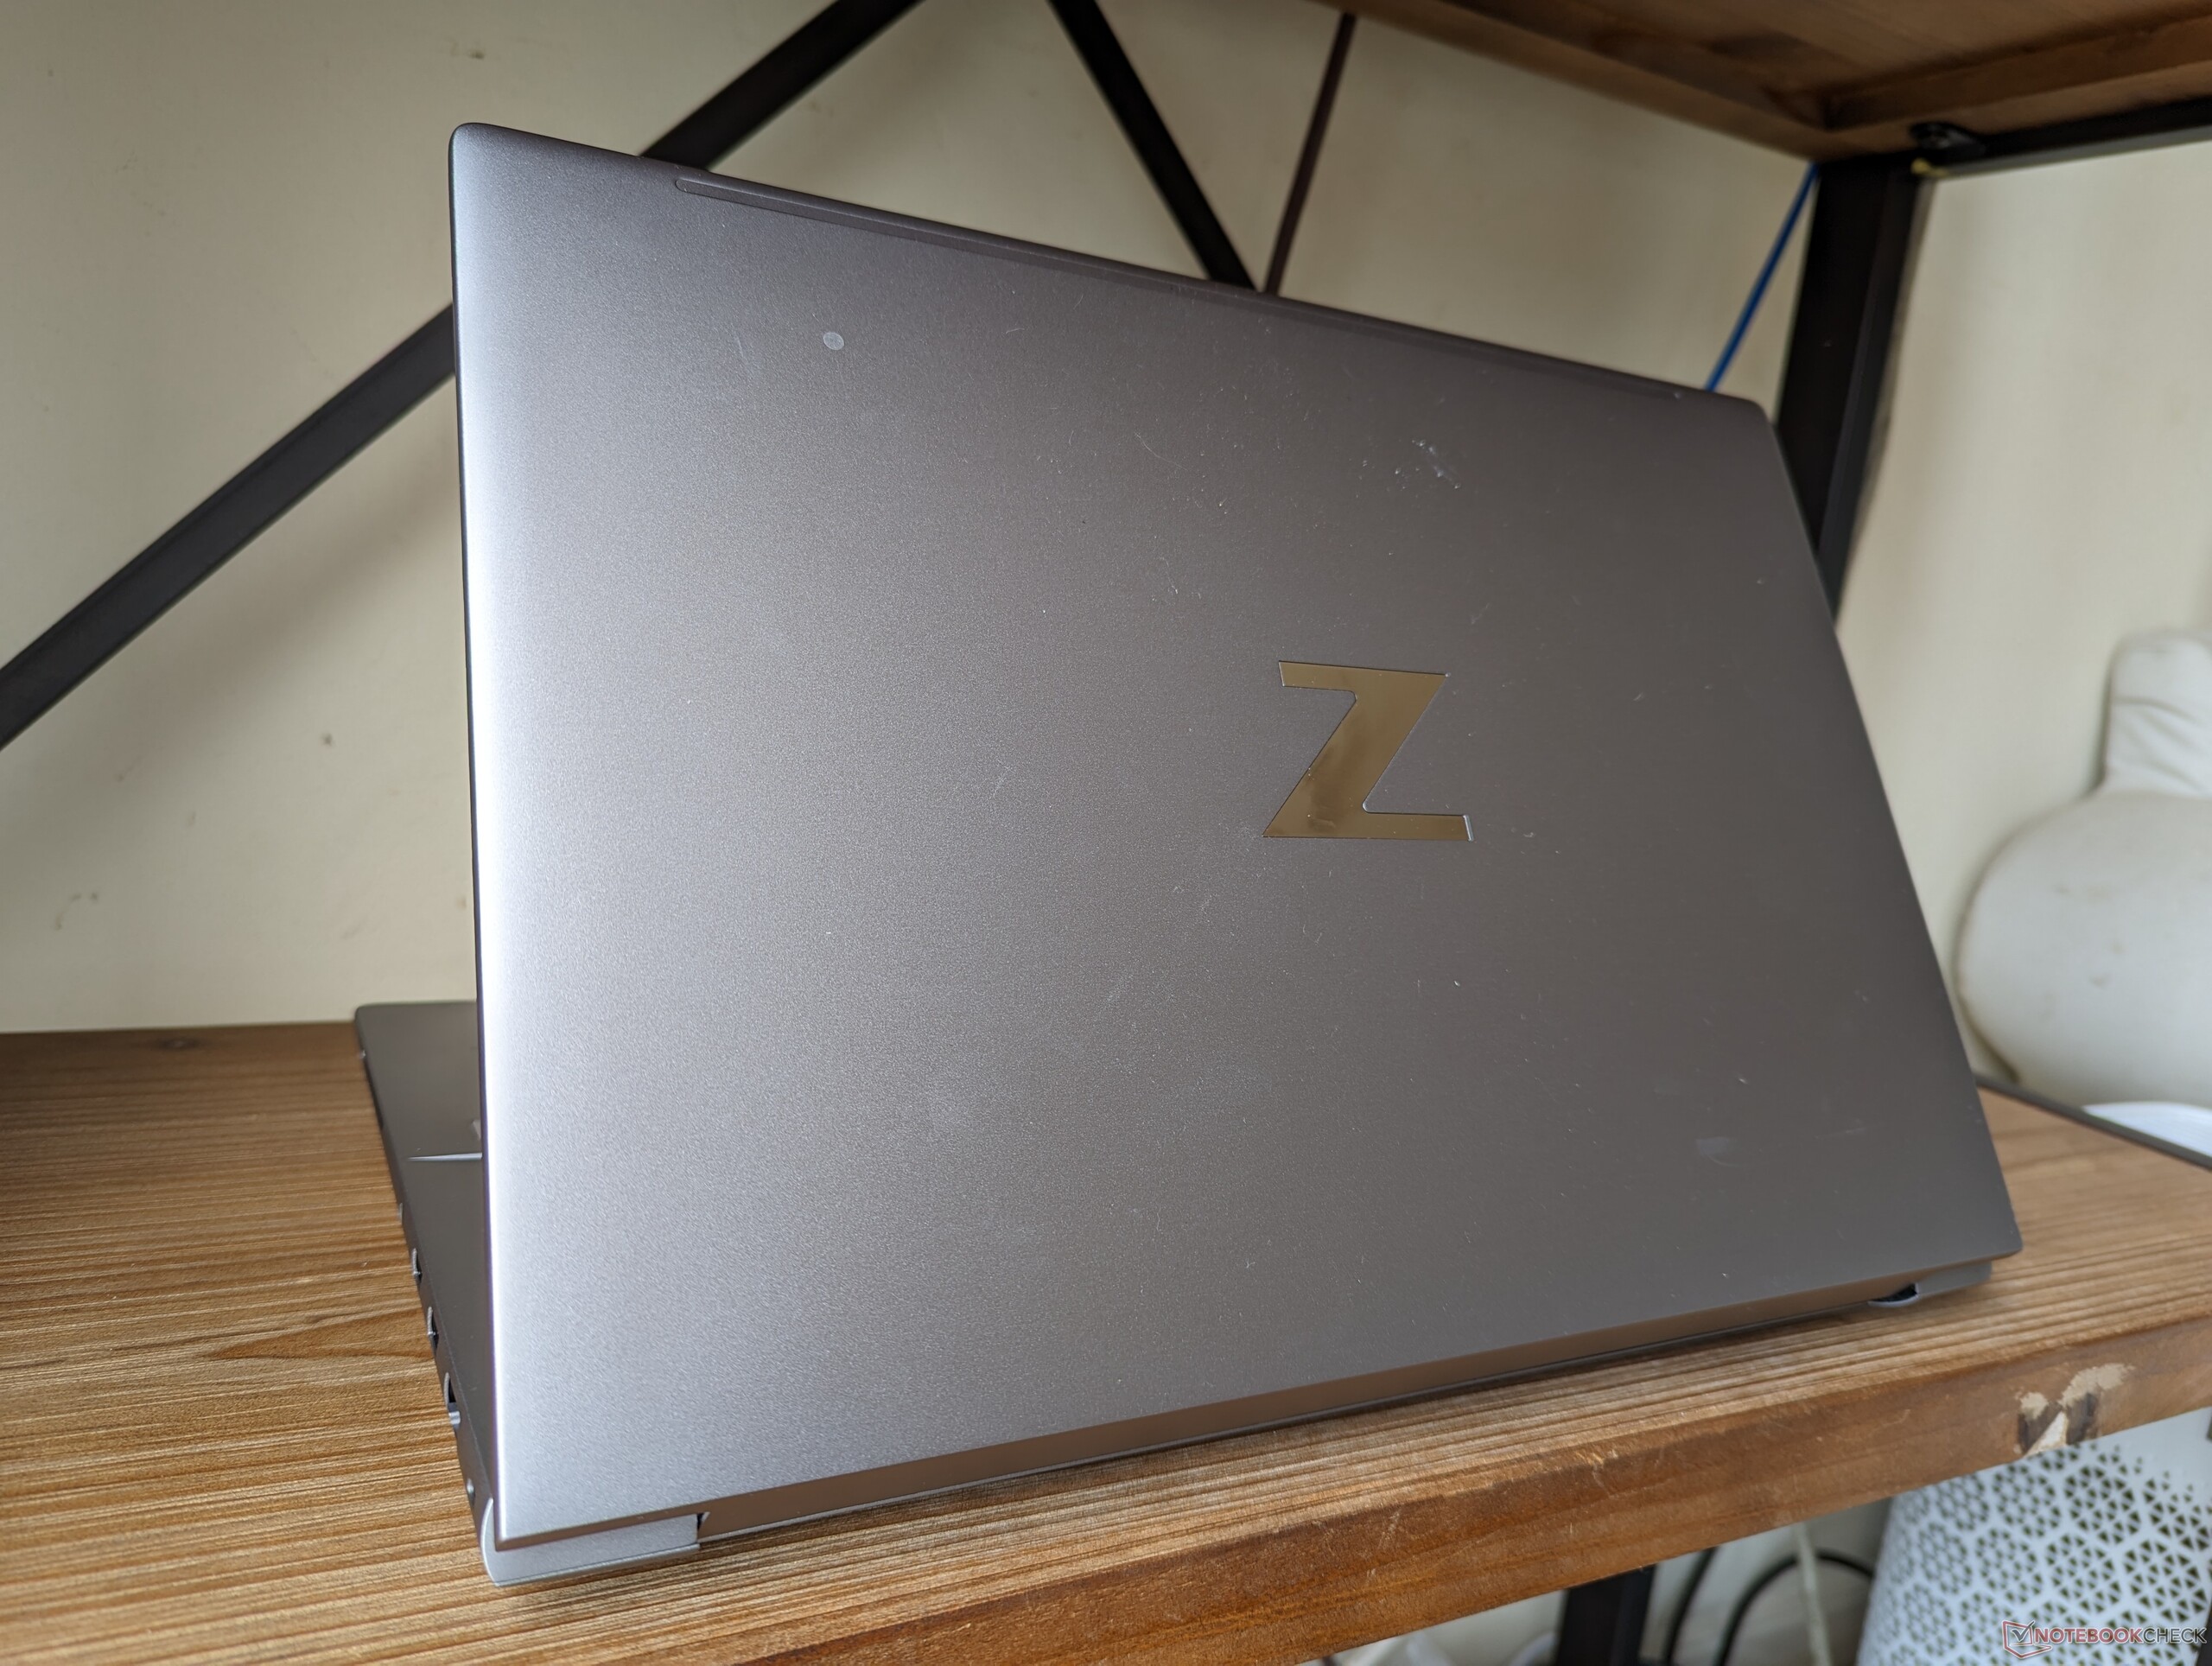
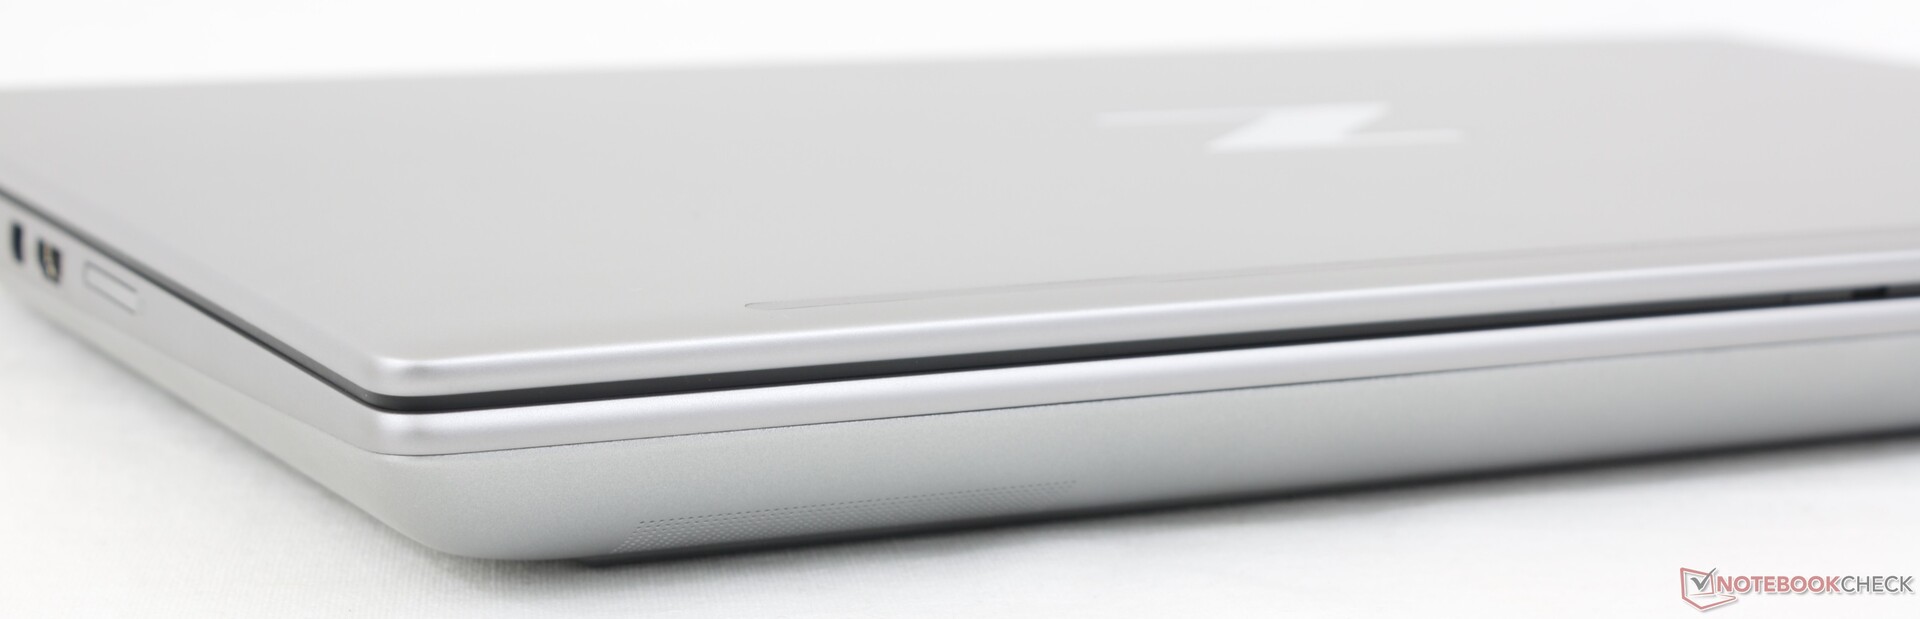
Custodia - ZBook classico
Lo chassis è costituito dagli stessi materiali in lega di alluminio che i possessori di ZBook già conoscono. Le torsioni, le deformazioni e gli scricchiolii sono minimi e paragonabili a quelli del modello 7670 Precision 7670 per una prima impressione forte e nessuna area problematica. La flessione è più evidente quando si esercita una pressione sul centro del coperchio esterno, dove si trova il logo "Z", ma non è una causa di problemi a lungo termine.
L'HP è notevolmente più leggero sia delThinkPad P16 G1 e Precision 7670, anche se sono tutti dotati di CPU e GPU simili. Tuttavia, ciò avviene a scapito delle prestazioni, come dimostrano i nostri confronti di benchmark qui sotto. Per qualcosa di più portatile, gli utenti possono prendere in considerazione lo ZBook Firefly 16 G9 o lo ZBook Studio 16 G9, molto più sottili.
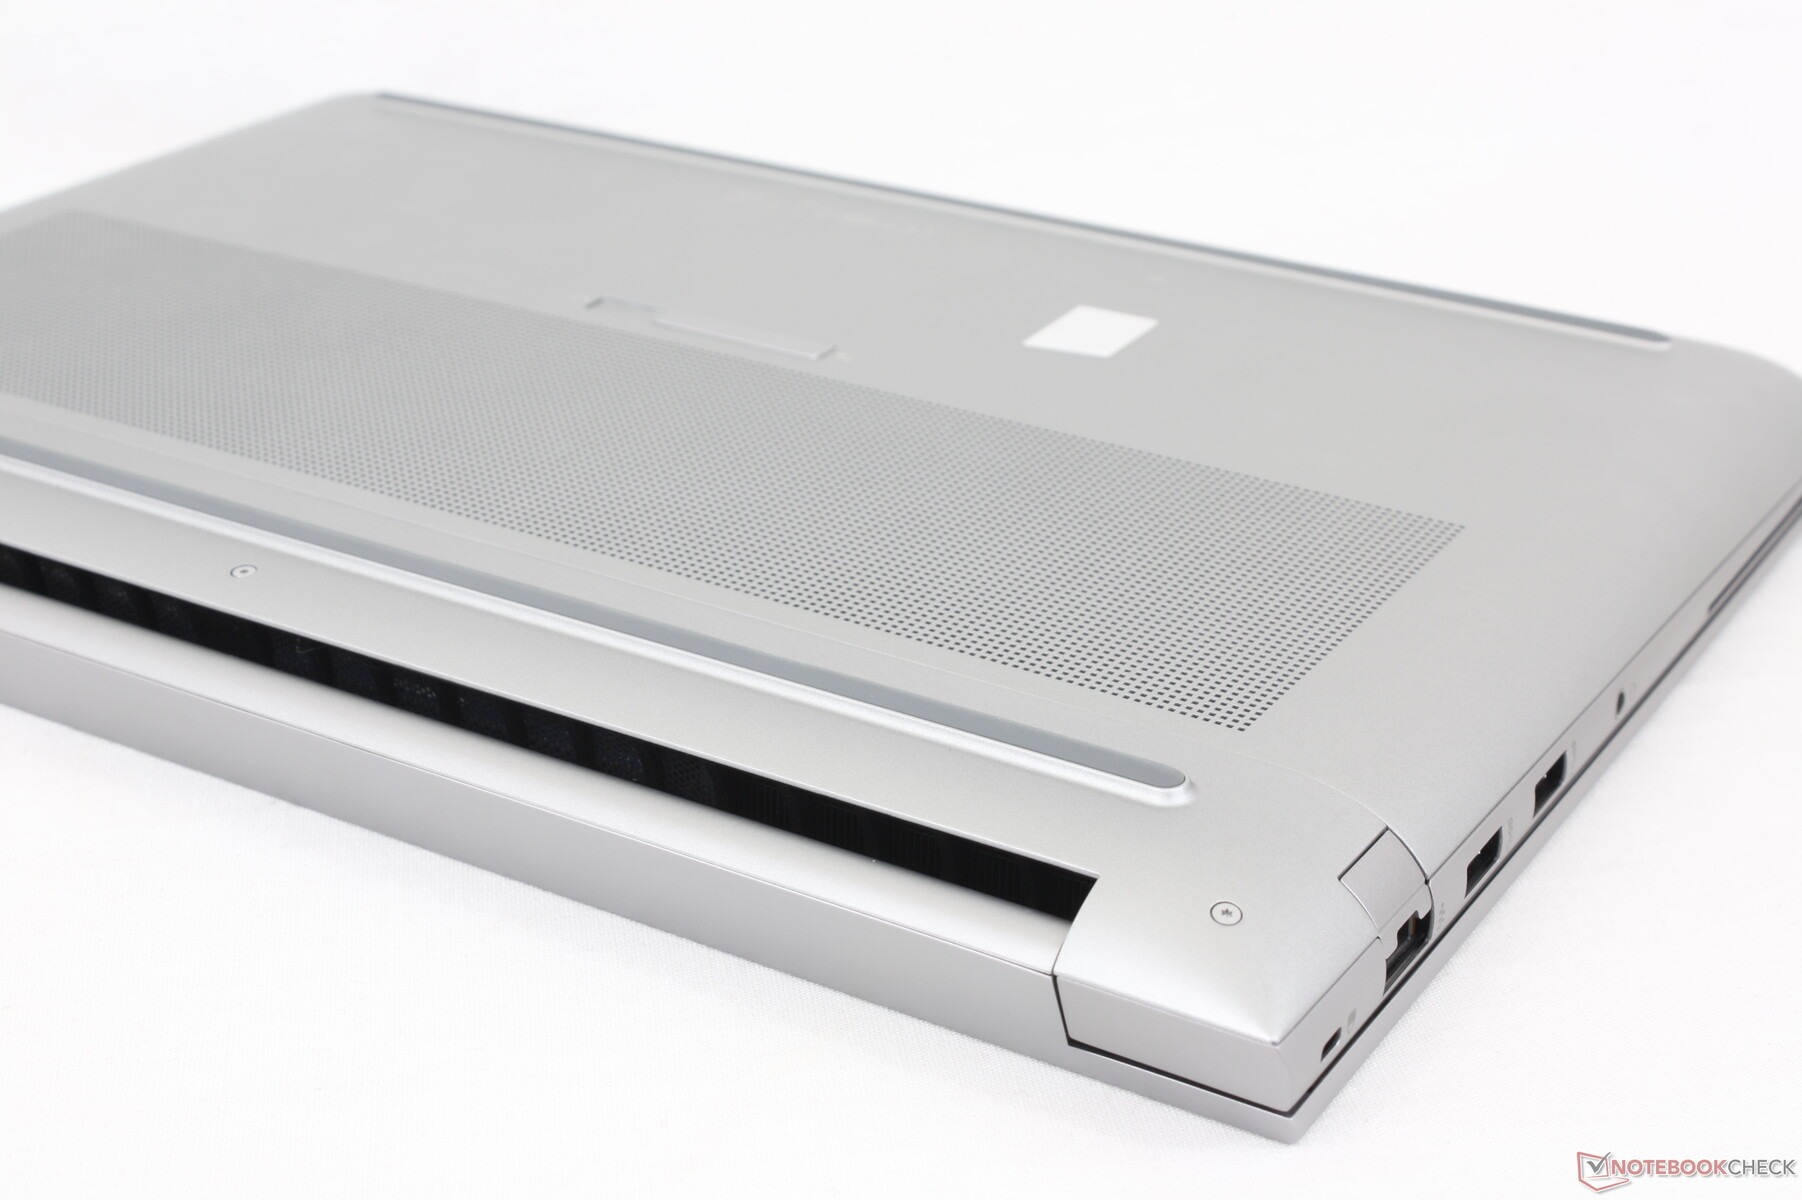
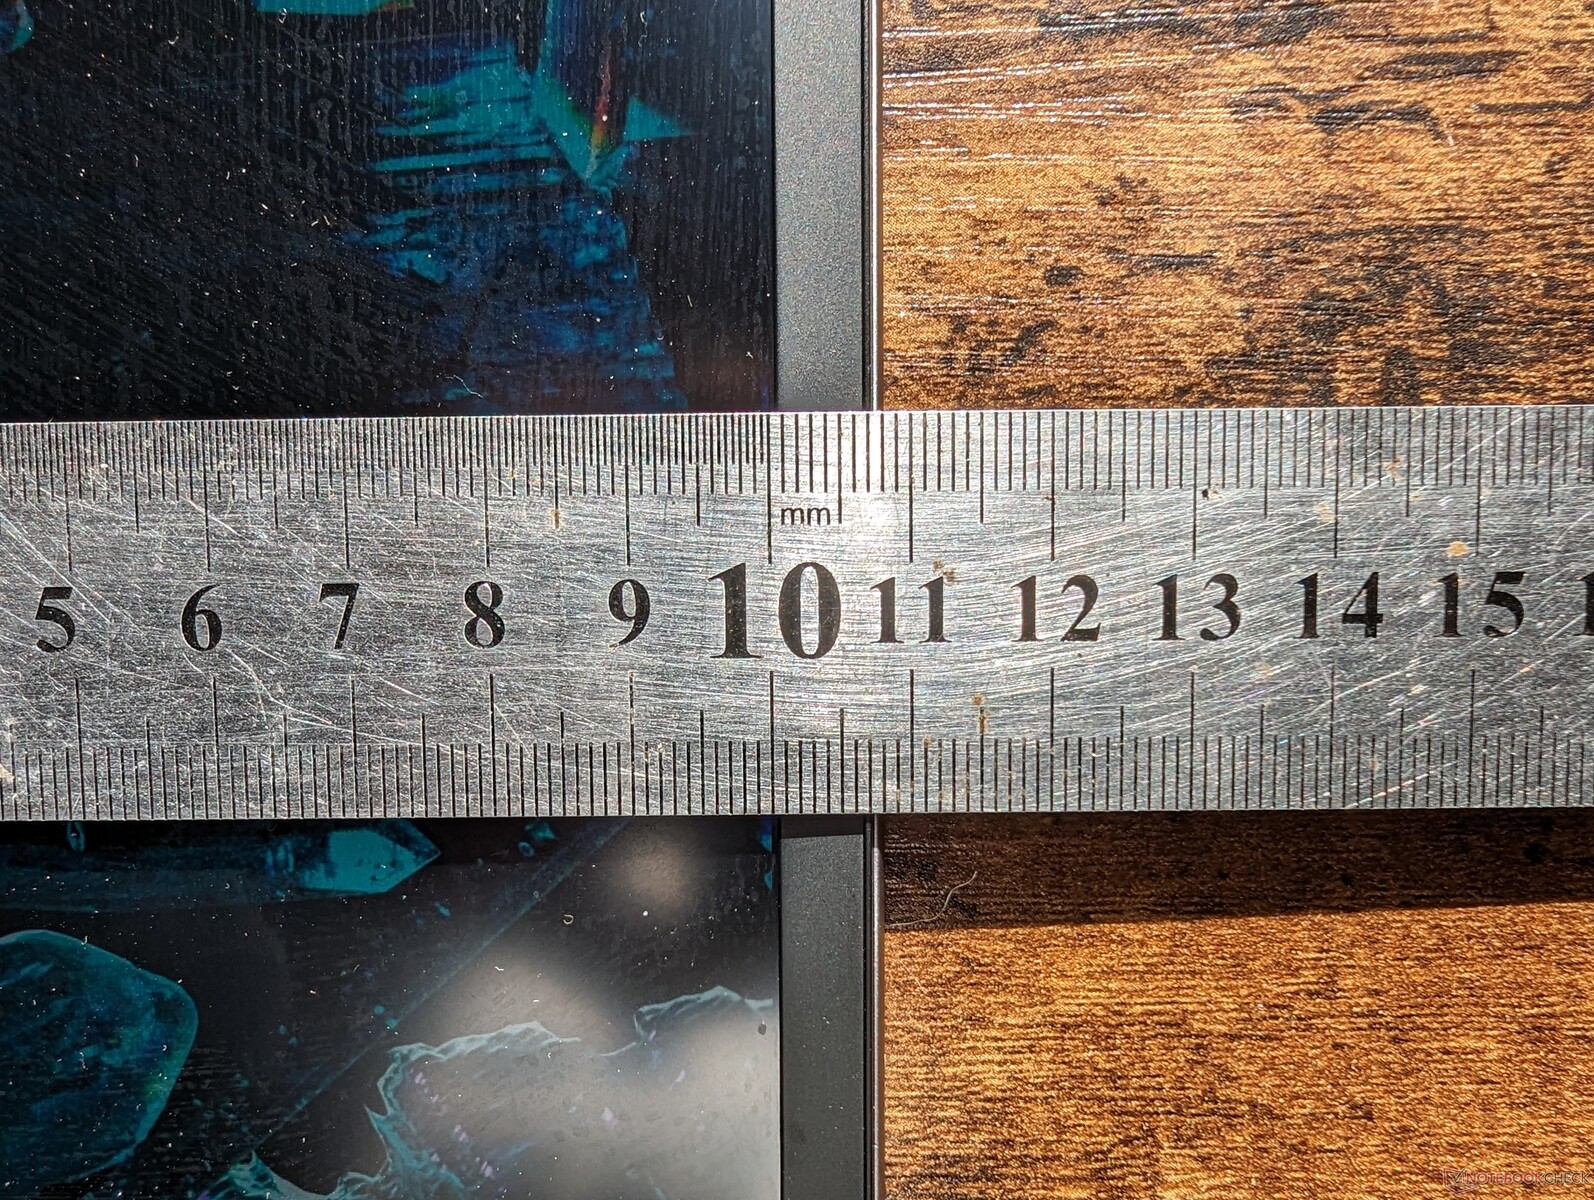
La cornice inferiore del Fury G9 è sorprendentemente stretta per una workstation e contribuisce a rendere il modello più corto in lunghezza rispetto alla maggior parte delle altre alternative da 16 pollici.
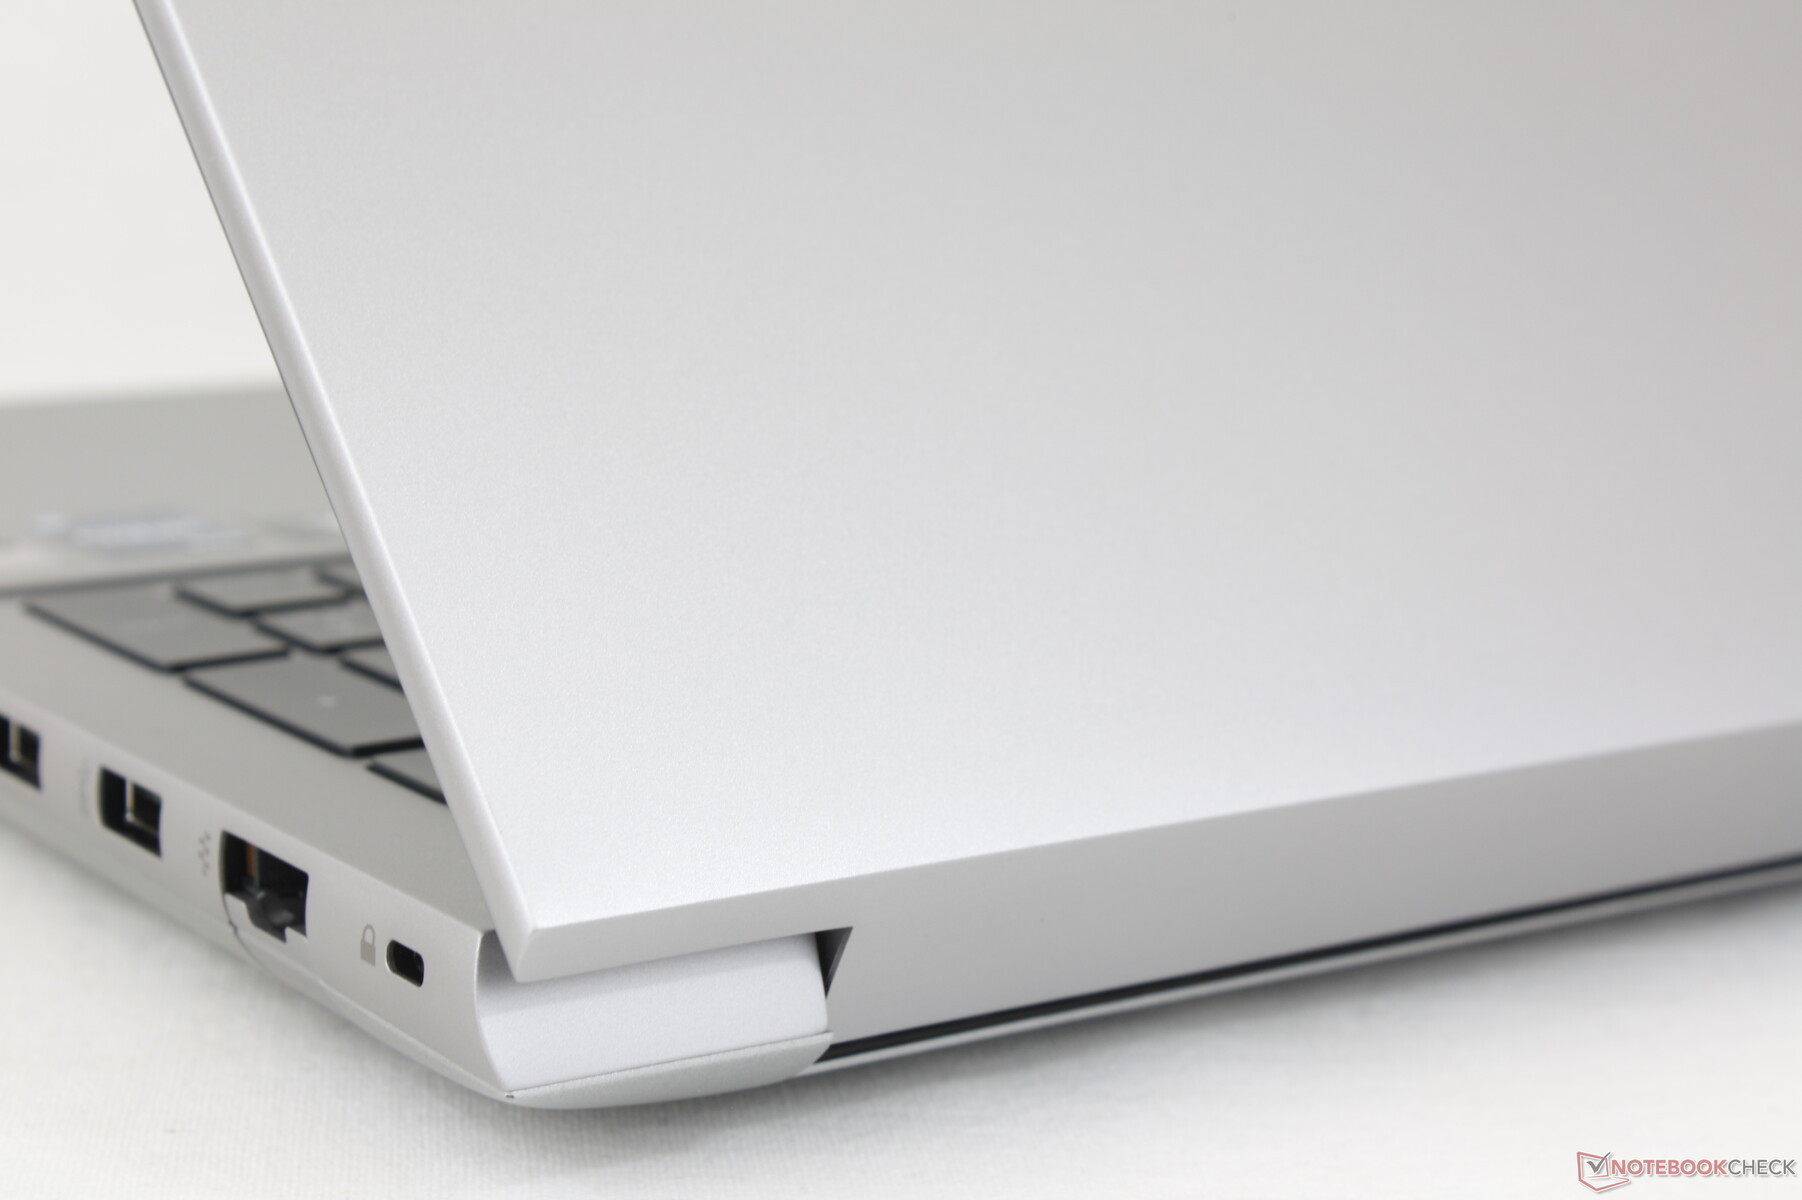
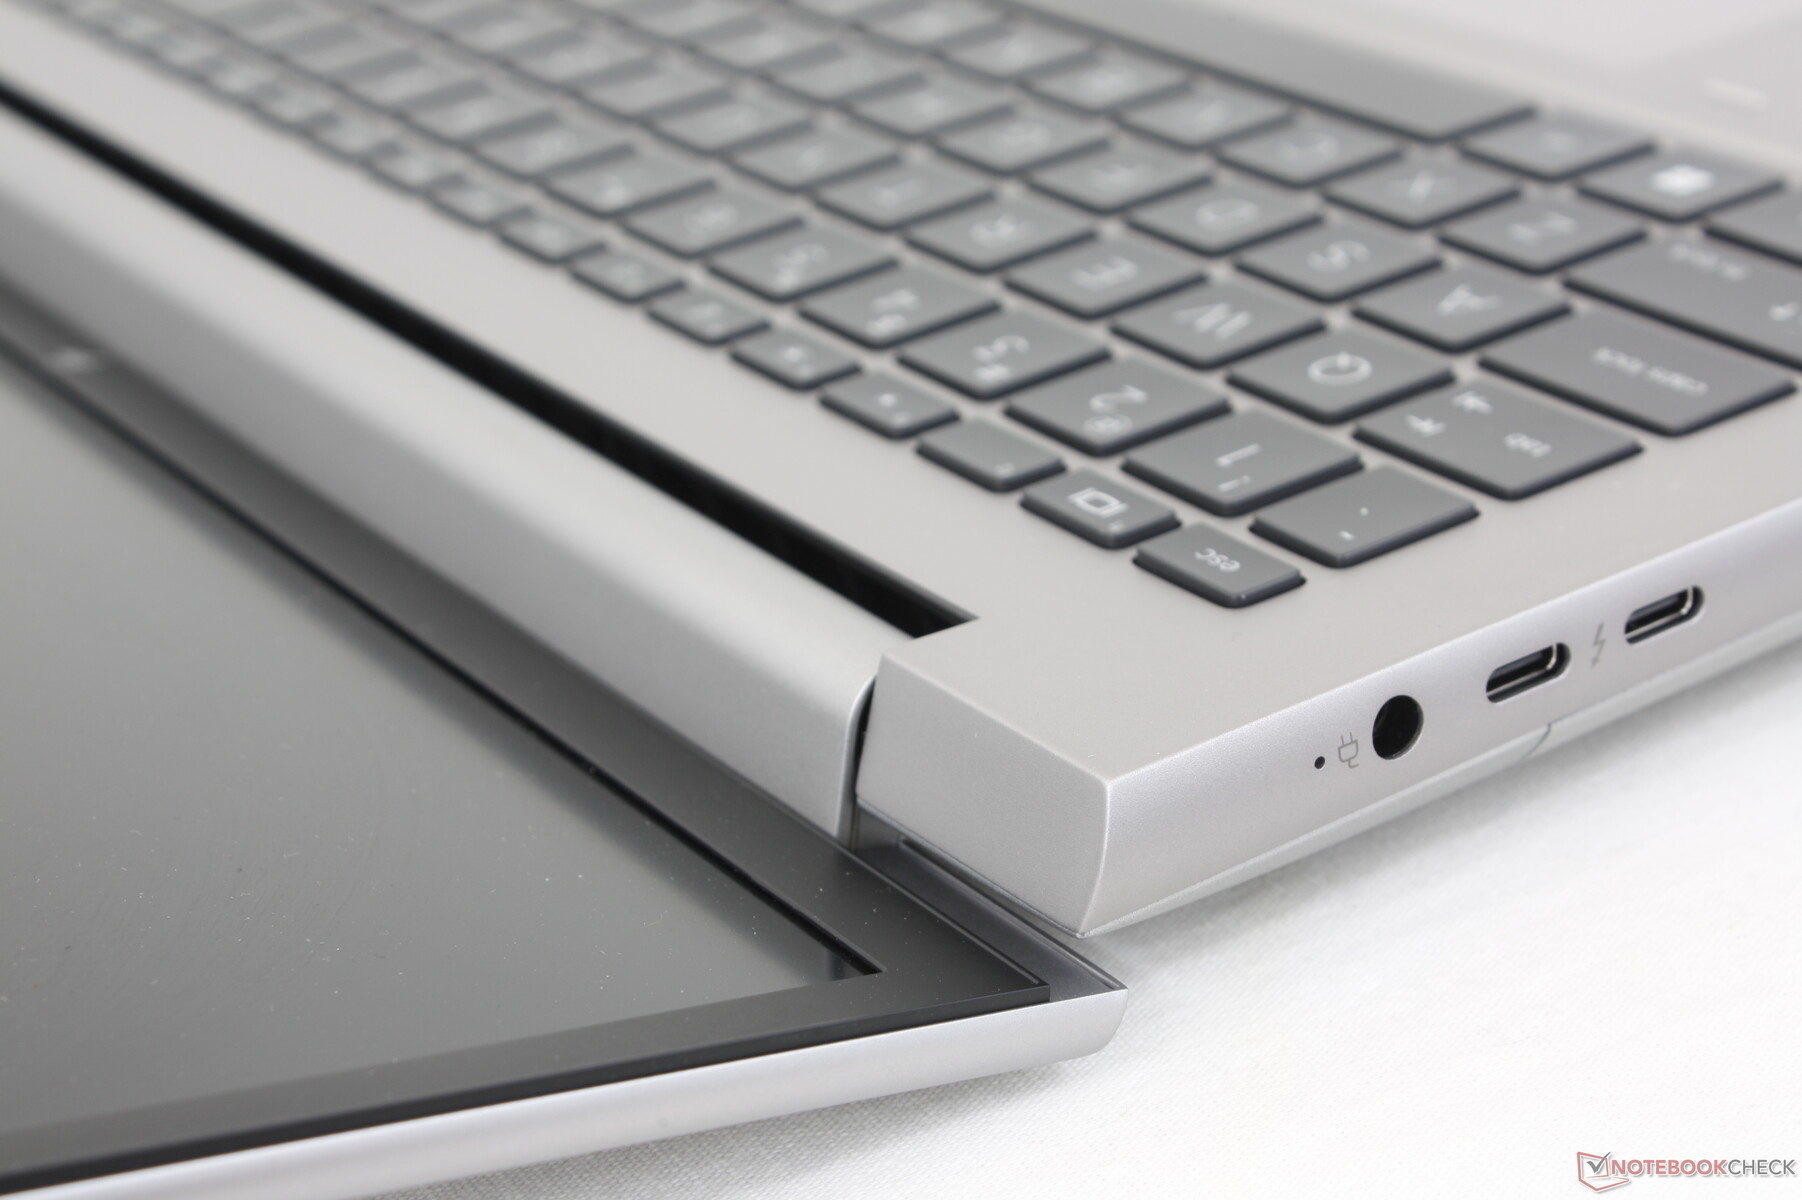
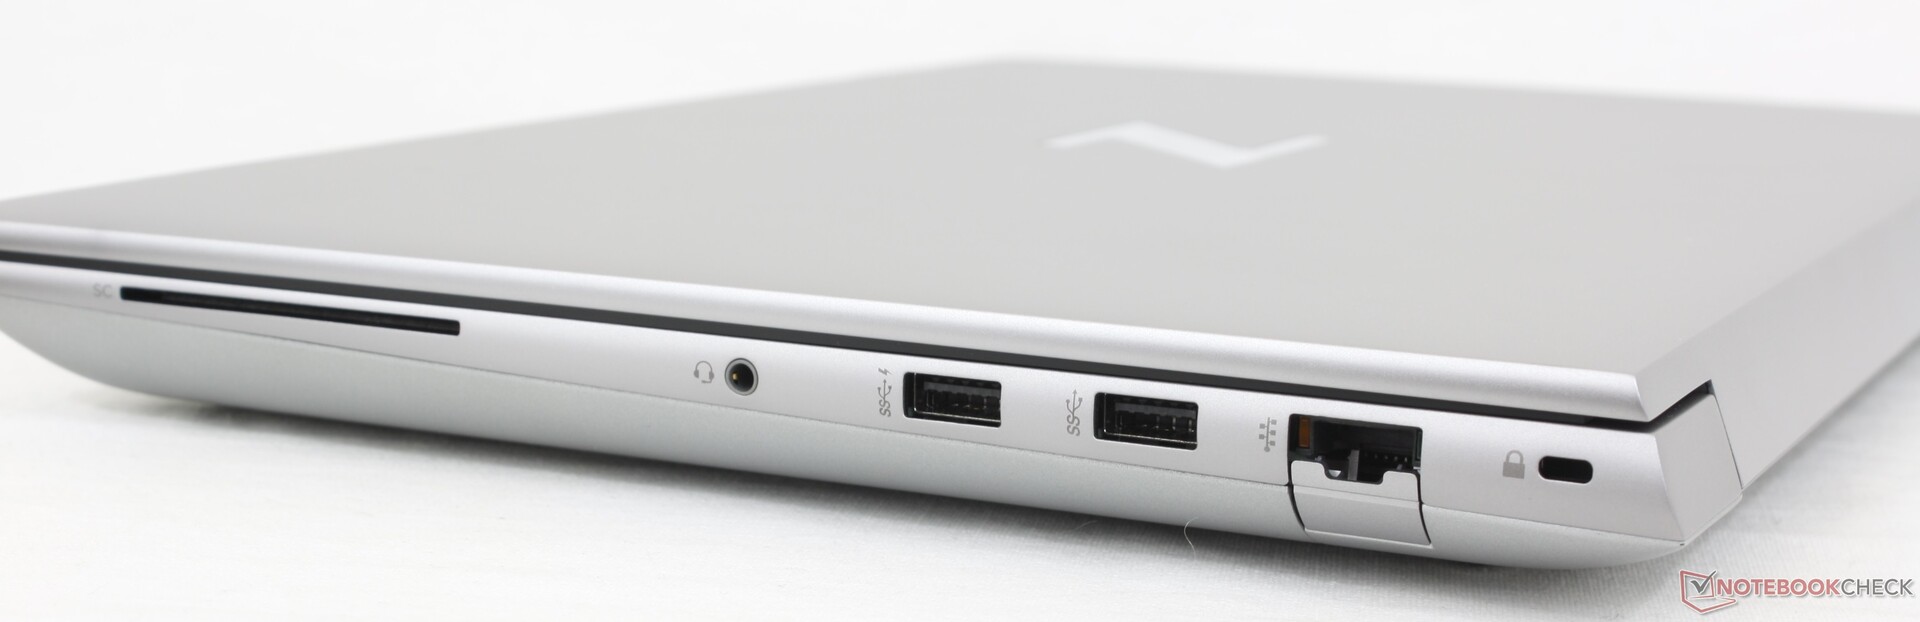
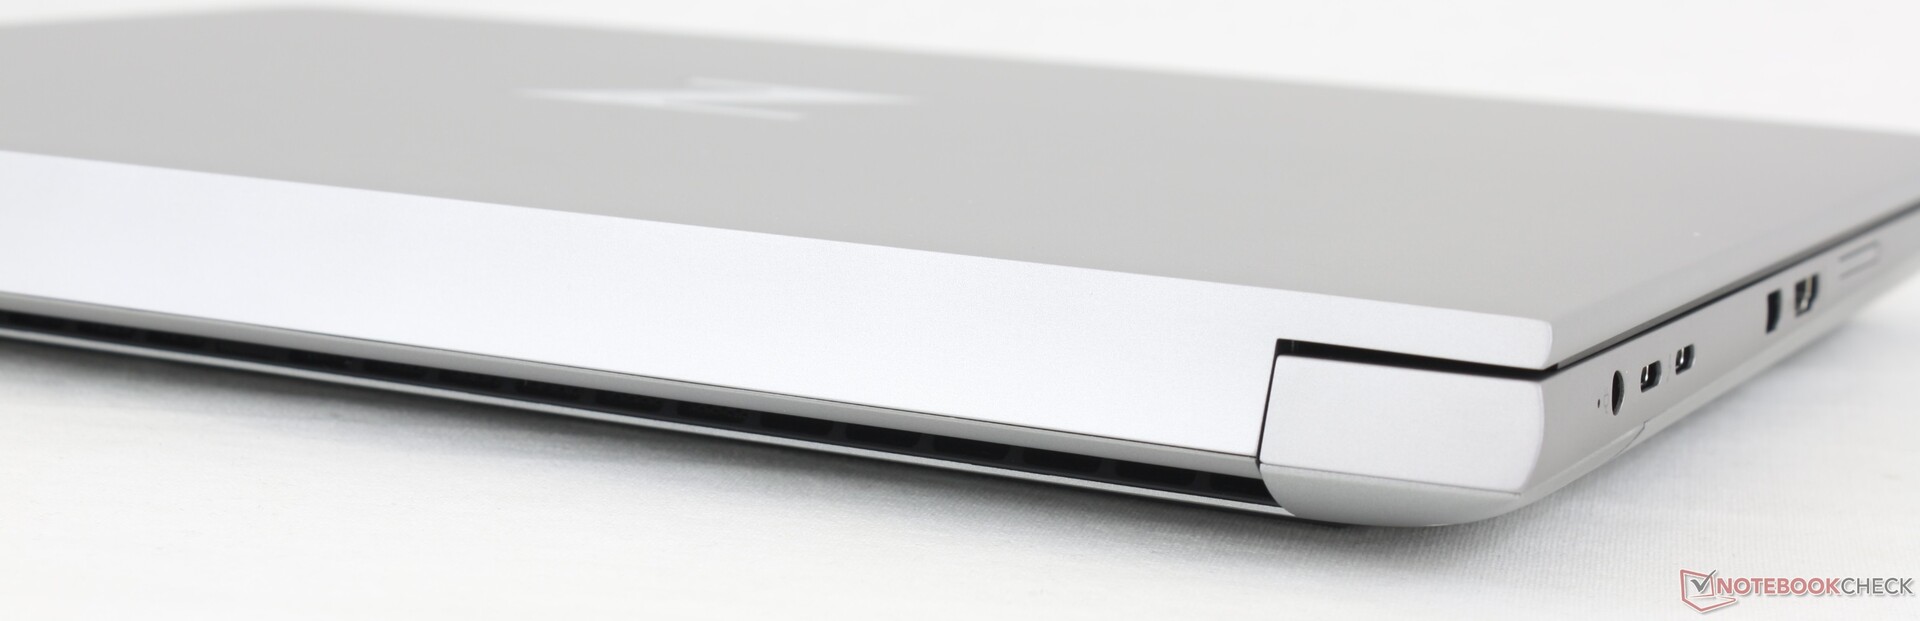
Connettività
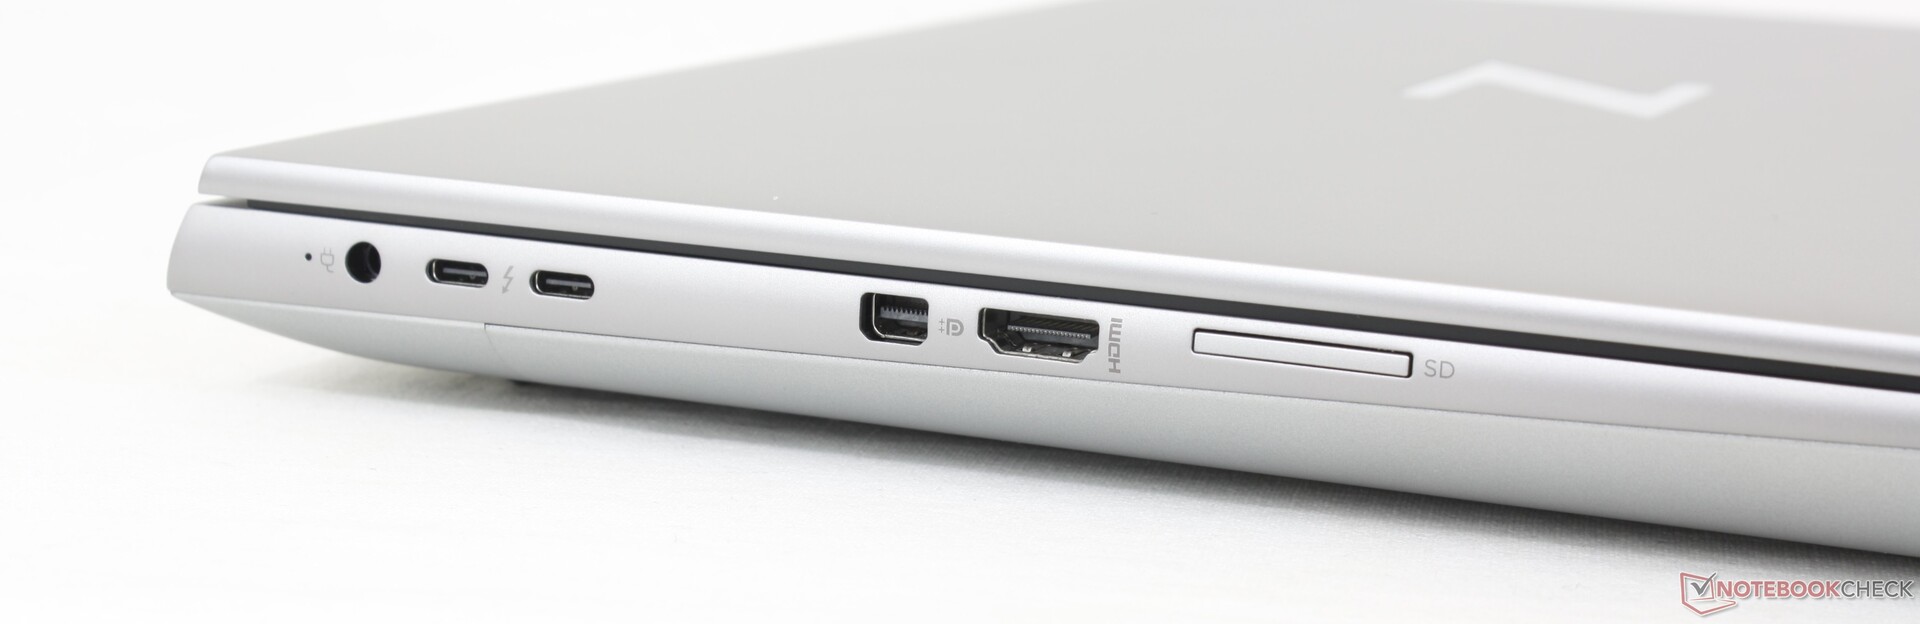
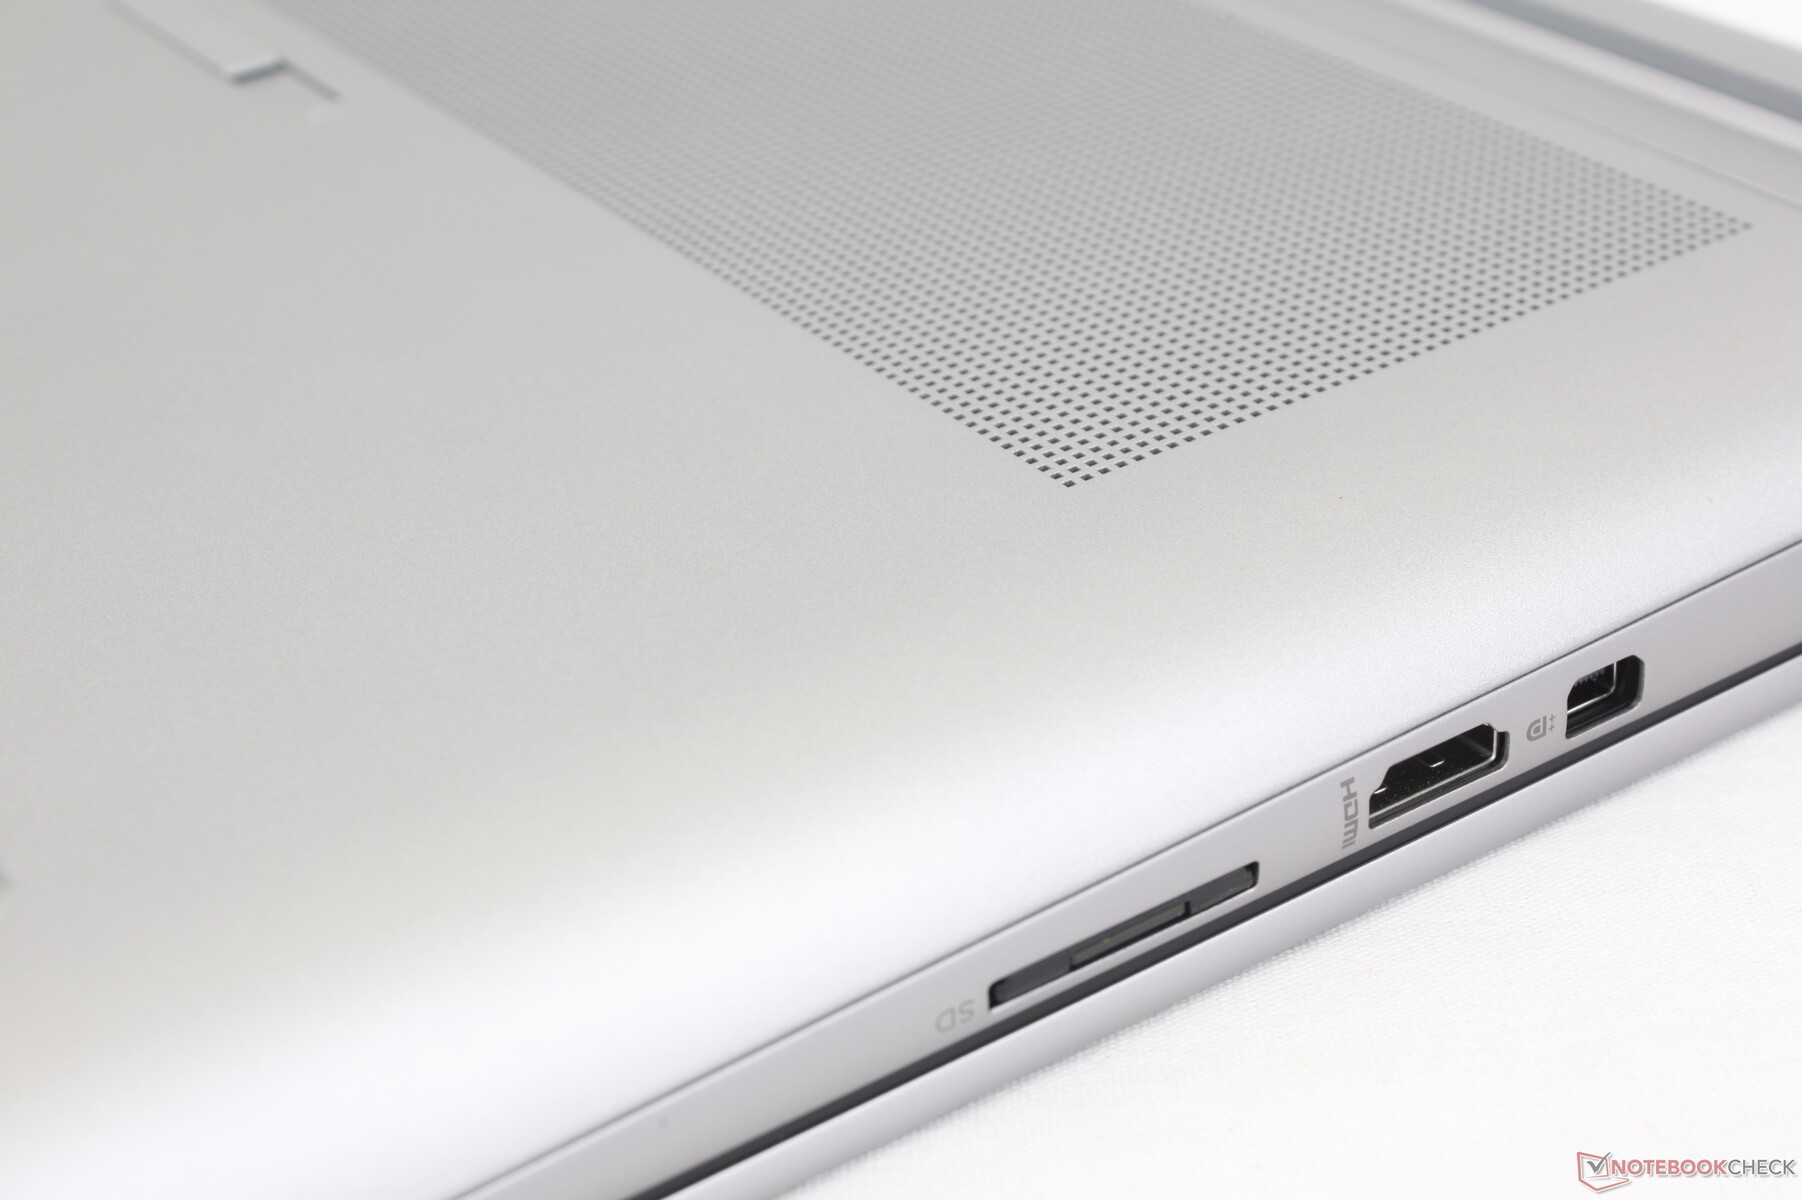
Il nostro HP include tutte le porte presenti su Precision 7670, ma con una mini-DisplayPort integrata al posto di una terza porta USB-C. In effetti, questa è una delle poche workstation mobili con un'opzione mini-DisplayPort.
Il posizionamento delle porte avrebbe potuto essere migliore per quanto riguarda le due porte USB-C, poiché sono molto strette tra loro accanto alla porta dell'adattatore CA. Collegare alcuni adattatori o cavi a una porta, ad esempio, potrebbe bloccare l'accesso alle altre due porte.
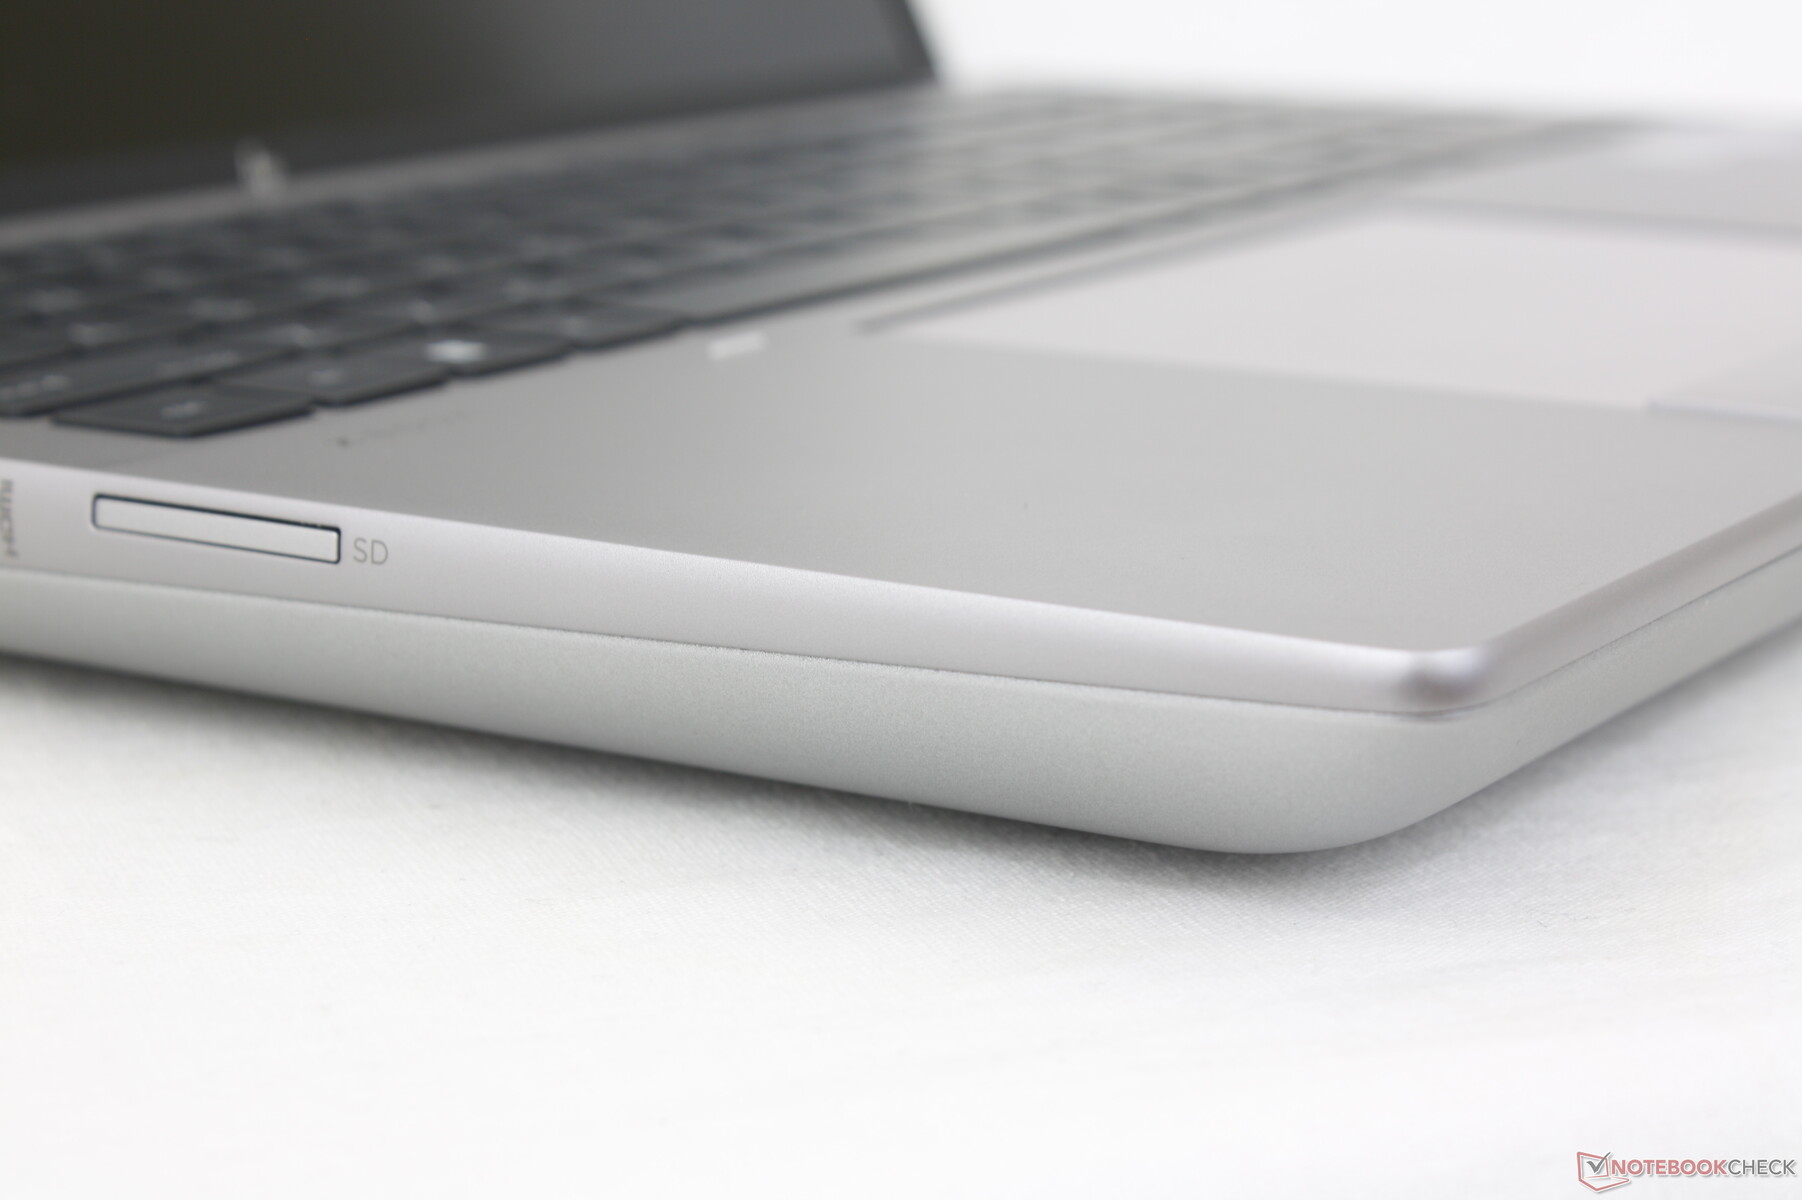
Lettore di schede SD
Le velocità di trasferimento si attestano a circa 80 MB/s con la nostra scheda di prova PNY EliteX-PRO60, anche se la scheda è in grado di trasferire velocità fino a 280 MB/s. In confronto, il lettore SD integrato nel Precision 7670 è due volte più veloce. Gli utenti che si affidano alle schede SD per il trasferimento di video e file potrebbero rimanere delusi dal Fury 16 G9 sotto questo aspetto.
| SD Card Reader | |
| average JPG Copy Test (av. of 3 runs) | |
| Dell Precision 7000 7670 Performance (Toshiba Exceria Pro SDXC 64 GB UHS-II) | |
| MSI CreatorPro Z16P B12UKST (AV Pro V60) | |
| HP ZBook Fury 16 G9 (PNY EliteX-PRO60) | |
| Lenovo ThinkPad P16 G1 RTX A5500 (Toshiba Exceria Pro SDXC 64 GB UHS-II) | |
| HP ZBook Studio 16 G9 62U04EA (Angelbird AV PRO V60) | |
| maximum AS SSD Seq Read Test (1GB) | |
| Dell Precision 7000 7670 Performance (Toshiba Exceria Pro SDXC 64 GB UHS-II) | |
| HP ZBook Fury 16 G9 (PNY EliteX-PRO60) | |
| MSI CreatorPro Z16P B12UKST (AV Pro V60) | |
| Lenovo ThinkPad P16 G1 RTX A5500 (Toshiba Exceria Pro SDXC 64 GB UHS-II) | |
| HP ZBook Studio 16 G9 62U04EA (Angelbird AV PRO V60) | |
Comunicazione
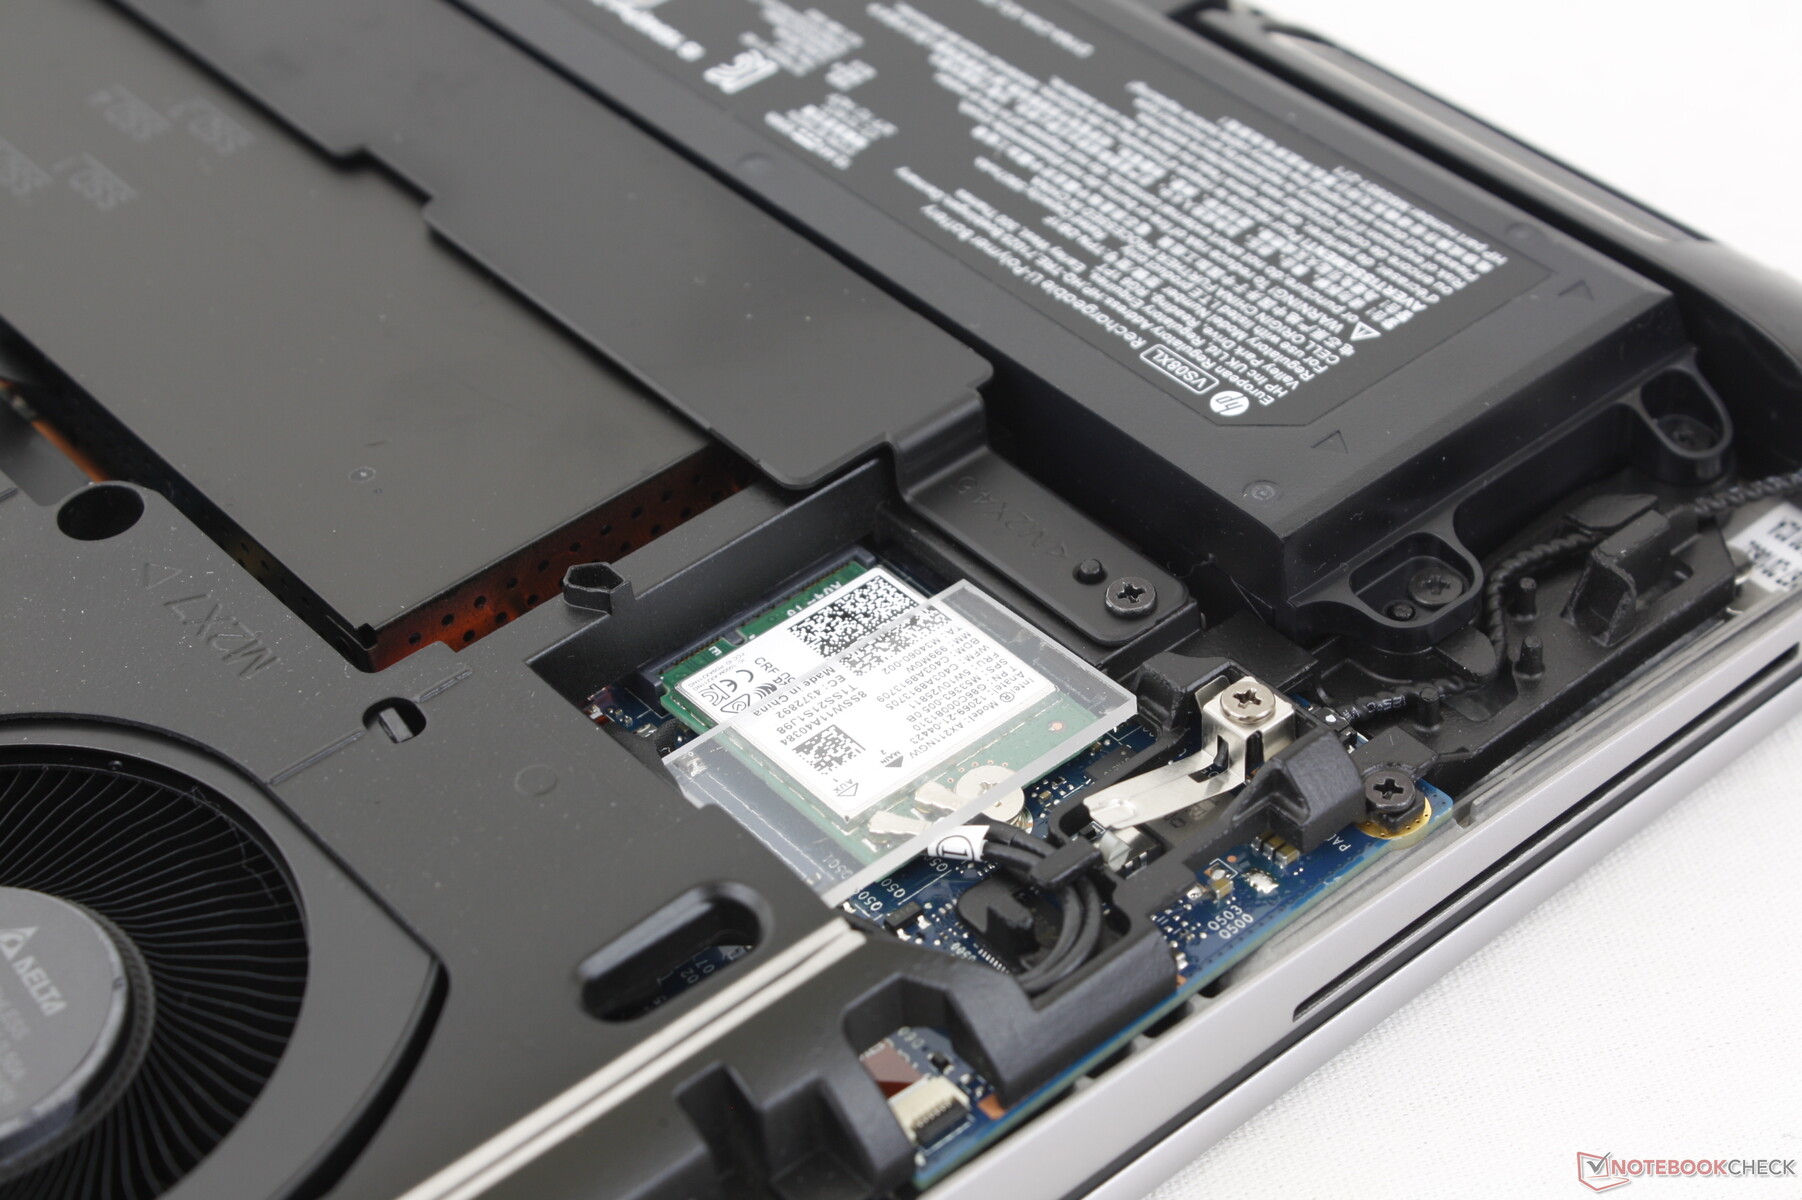
La nostra unità con Windows 10 è dotata di Intel AX211 per la connettività Wi-Fi 6E e Bluetooth 5.2. Sfortunatamente, il Wi-Fi 6E è disabilitato su Windows 10, in quanto Microsoft lo ha (stupidamente) reso esclusivo per Windows 11. Pertanto, è necessario configurare con Windows 11 se si desidera sfruttare i vantaggi del Wi-Fi a 6 GHz. Pertanto, è necessario configurare il dispositivo con Windows 11 se si desidera sfruttare i vantaggi del Wi-Fi a 6 GHz. Per il resto, non abbiamo riscontrato alcun problema di prestazioni quando è stato accoppiato alla nostra rete Wi-Fi 6 normale.
Webcam
Lo ZBook Fury 16 G9 ha ereditato la webcam da 5 MP dell'ultimo Spectre Spectre ed EliteBook. La qualità dell'immagine è più nitida rispetto alla maggior parte degli altri portatili, dove i sensori da 1 e 2 MP sono ancora comuni, compresi i concorrenti ThinkPad P16 e Precision 7670.
L'otturatore scorrevole e il sensore IR sono inclusi rispettivamente per la privacy e il supporto Hello.


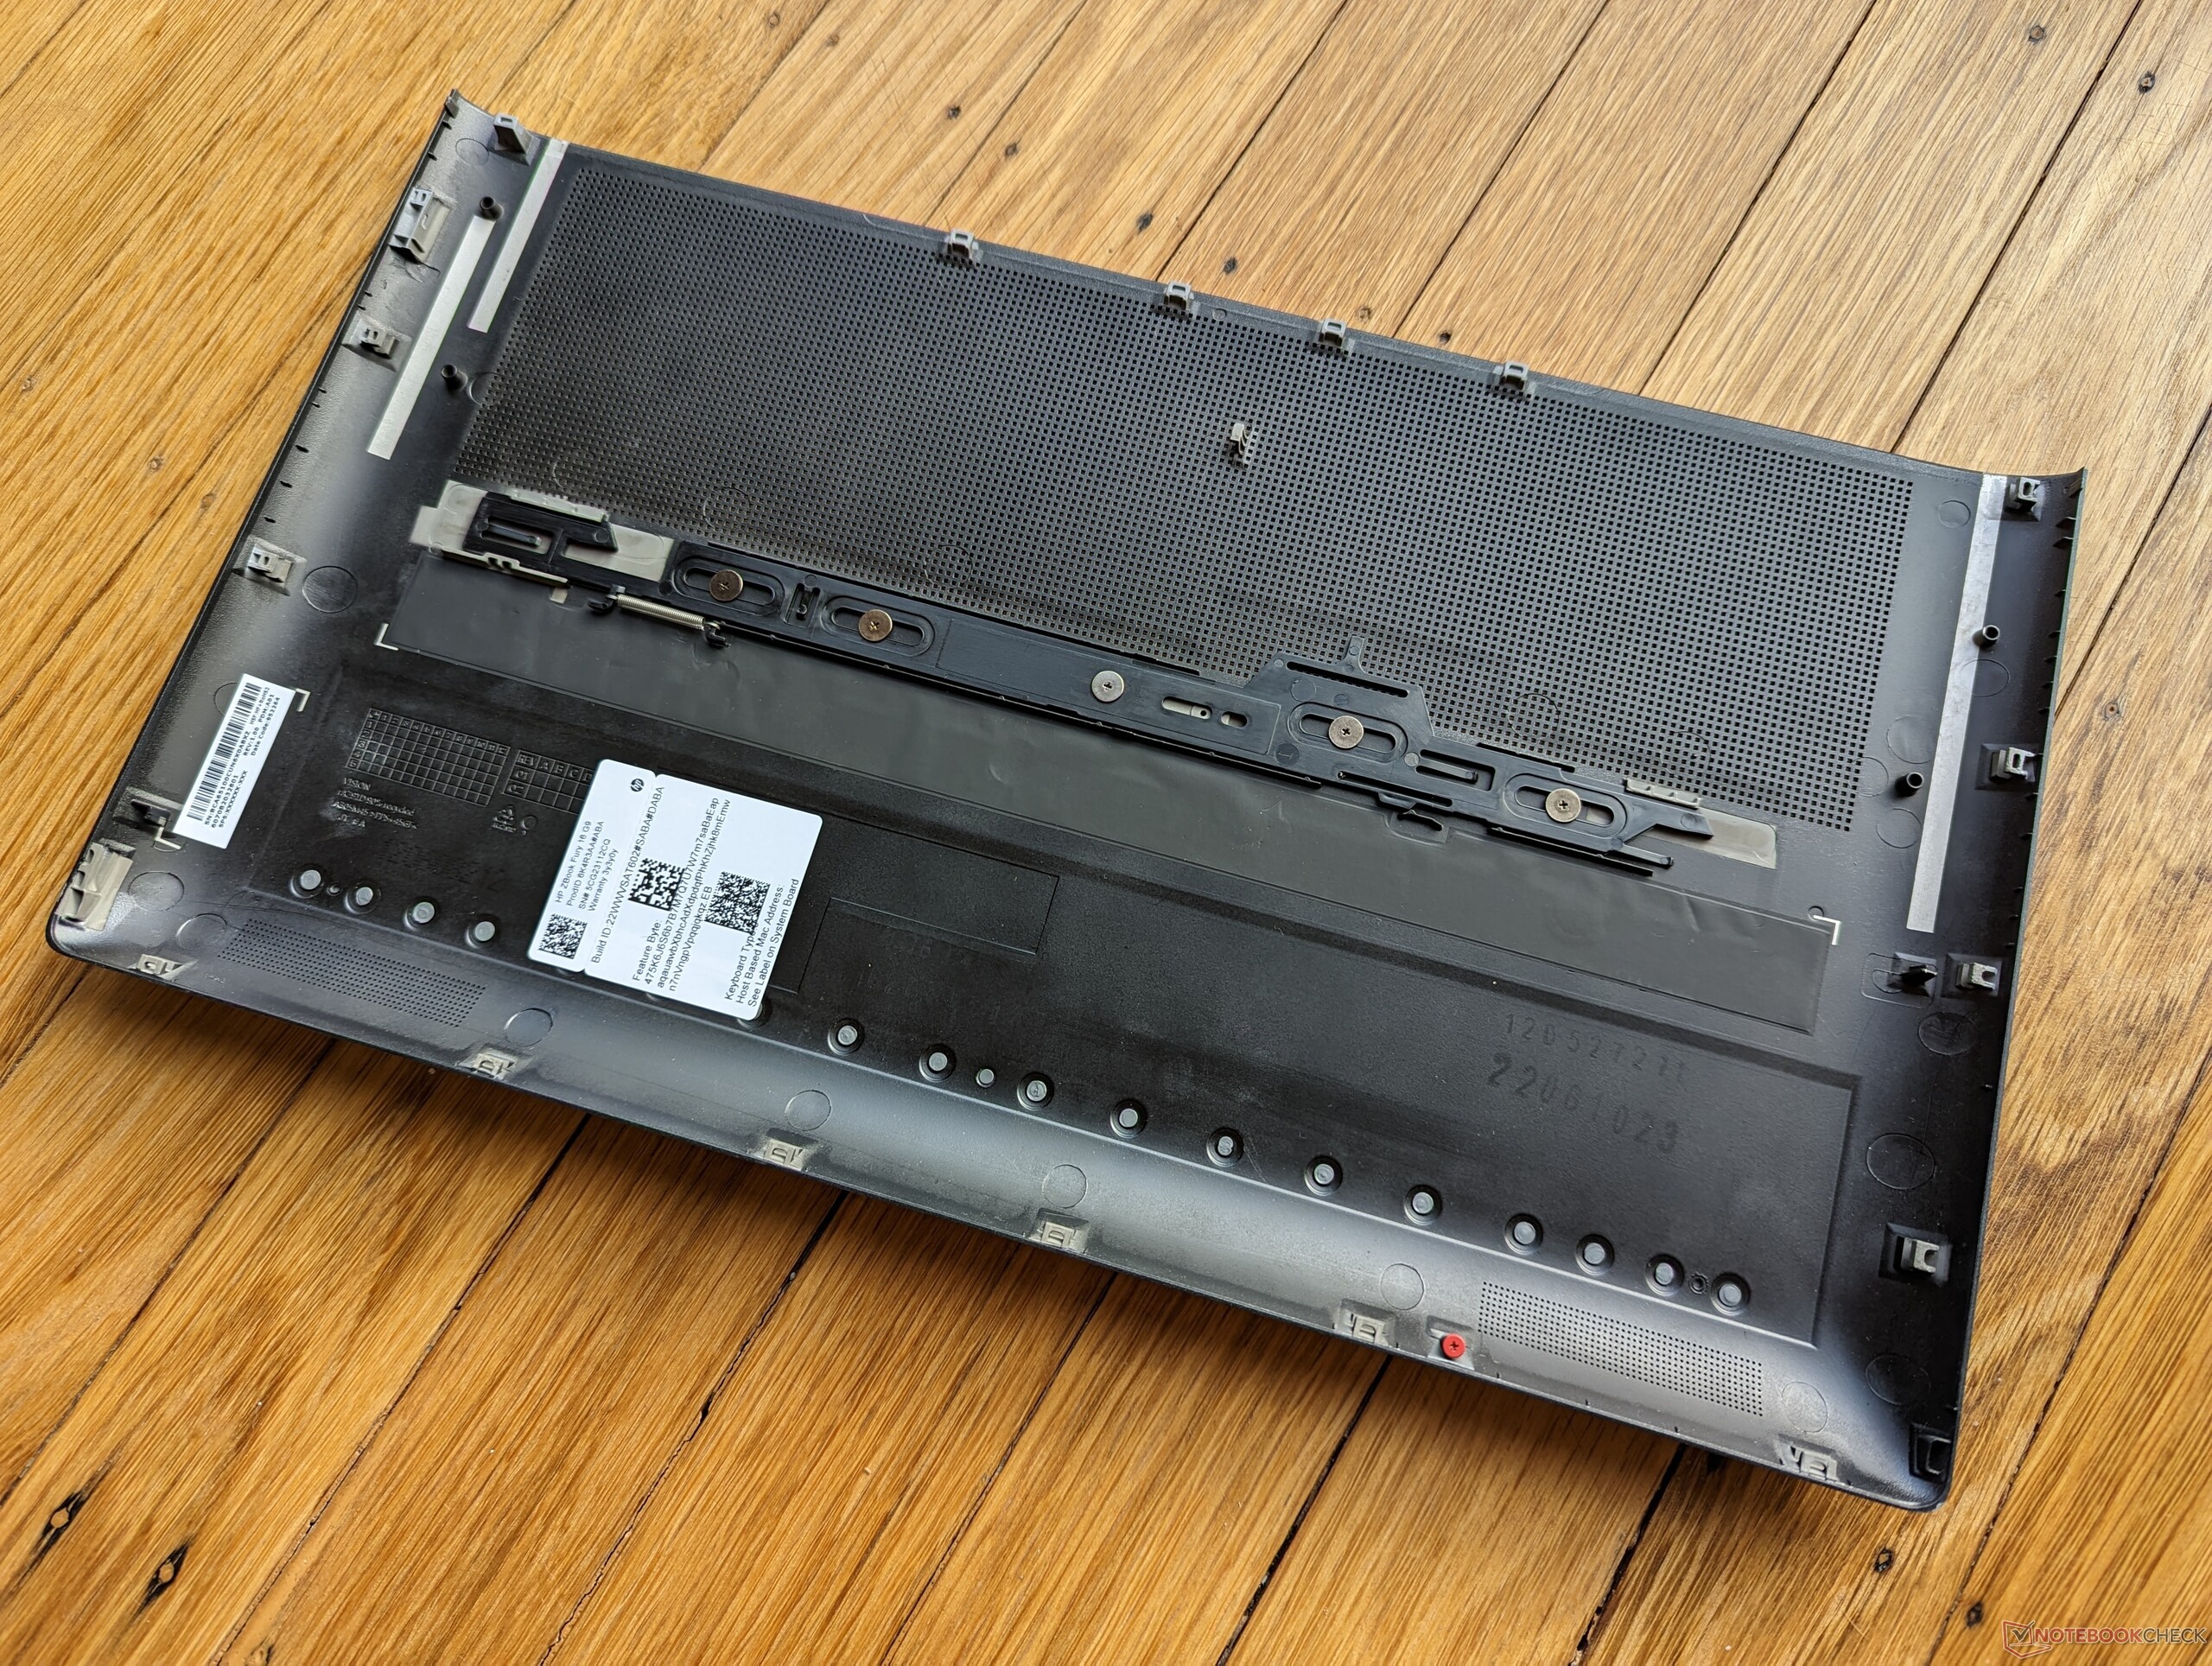
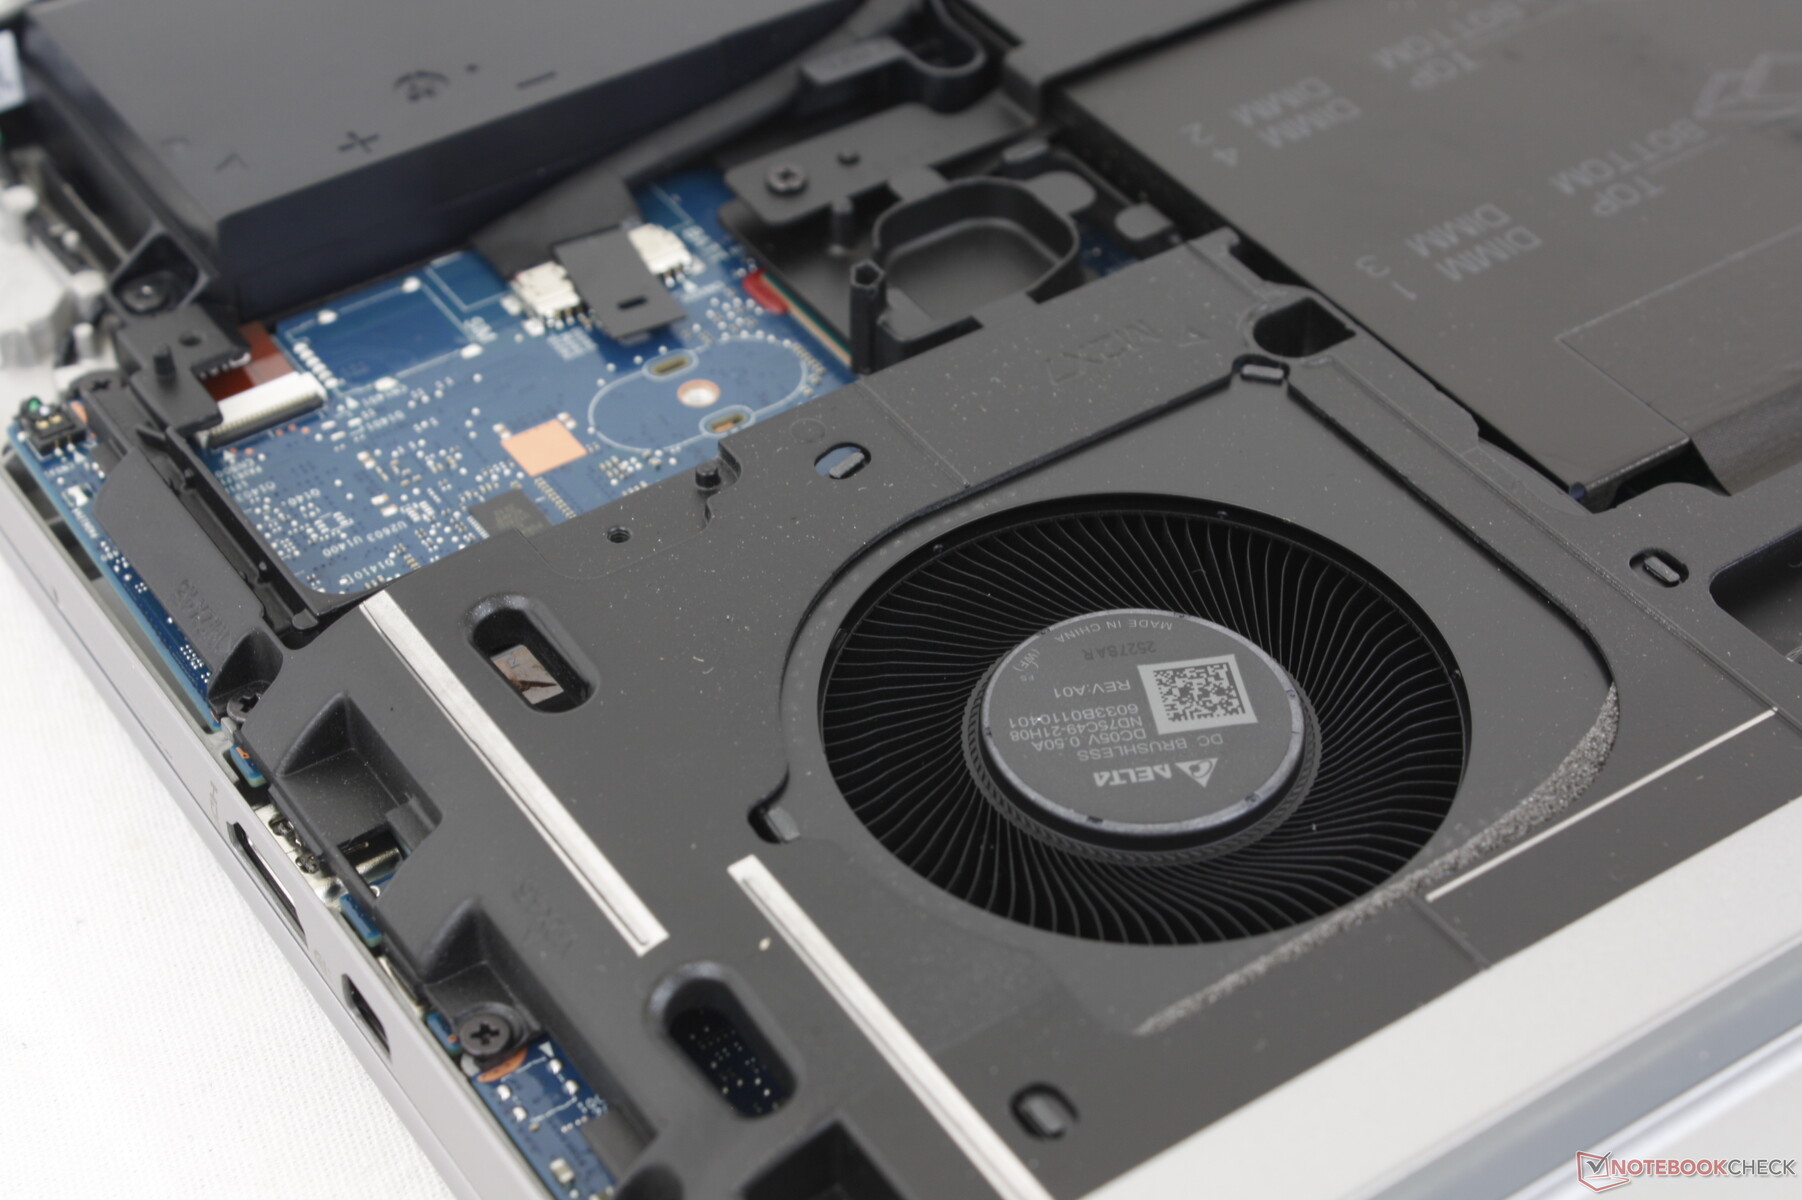
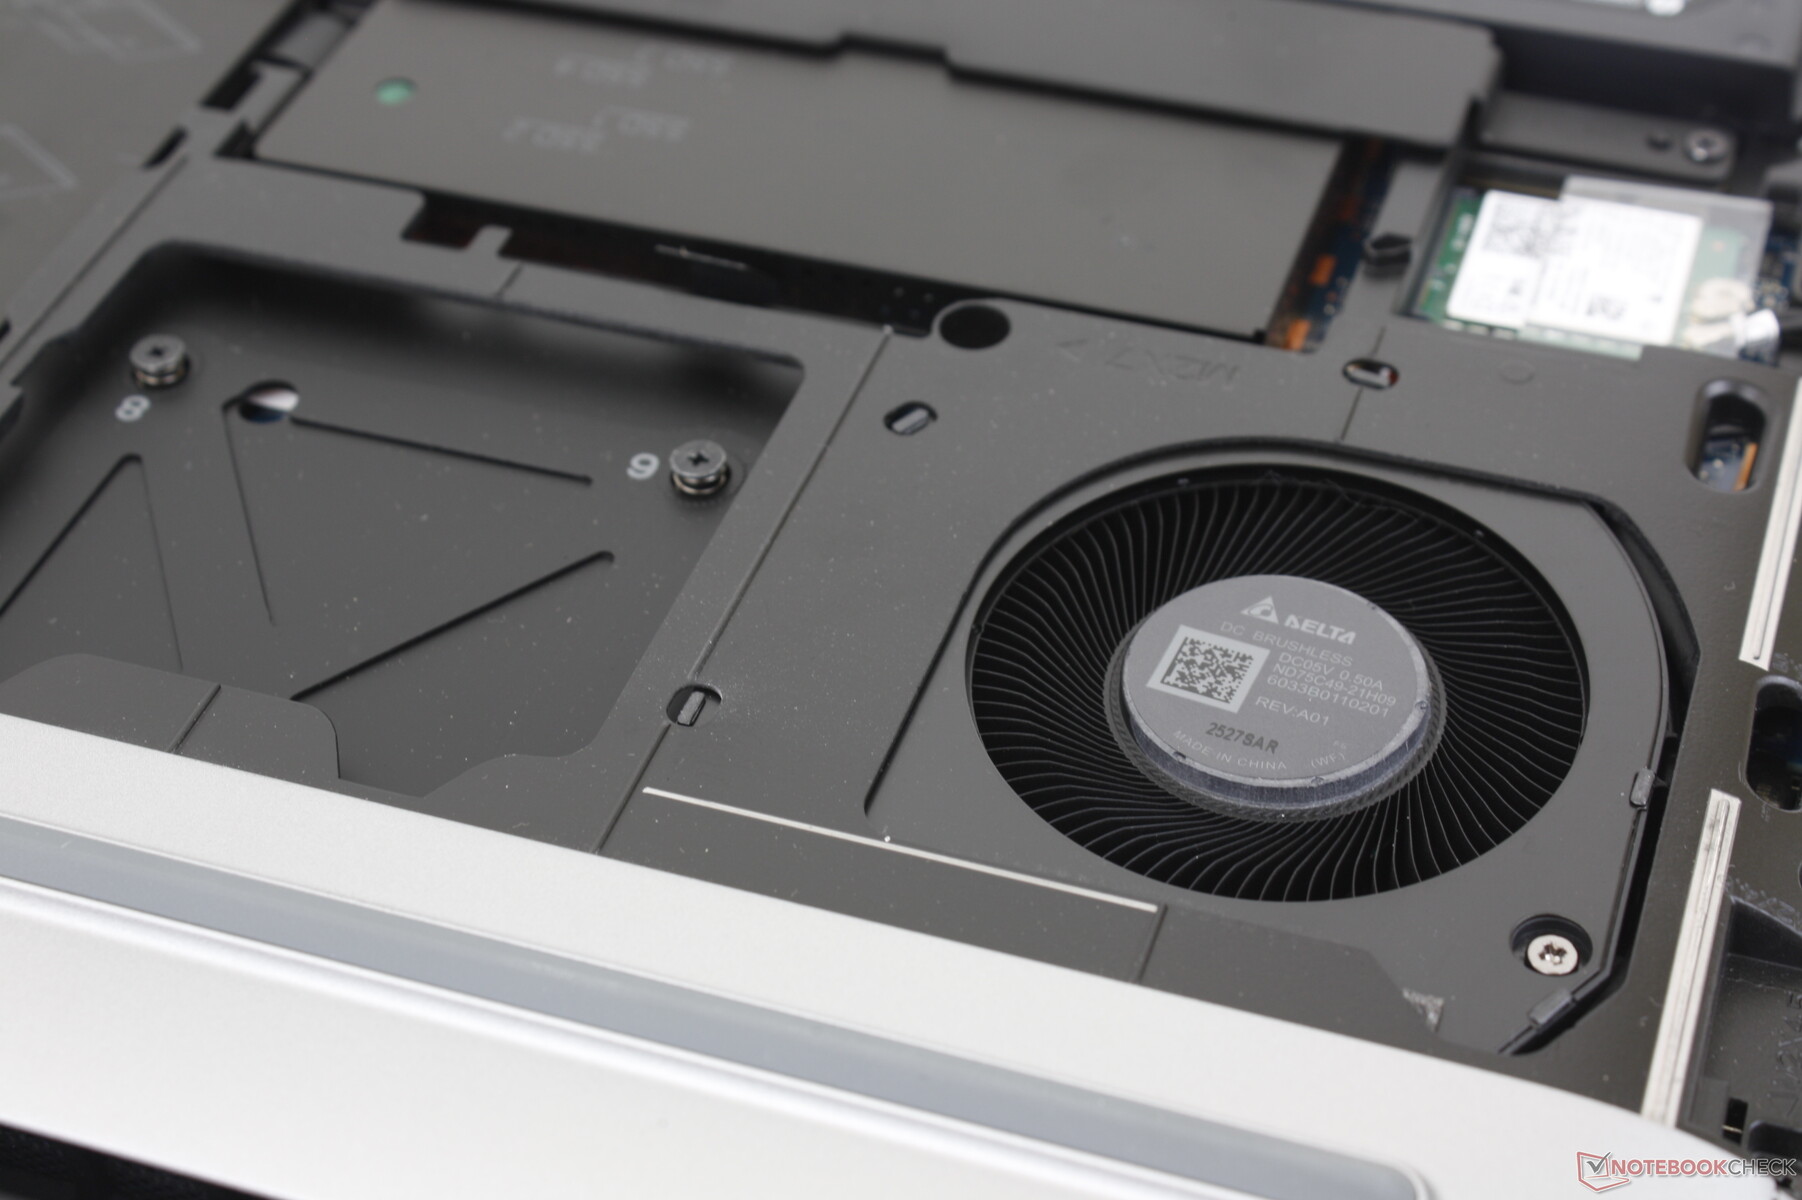
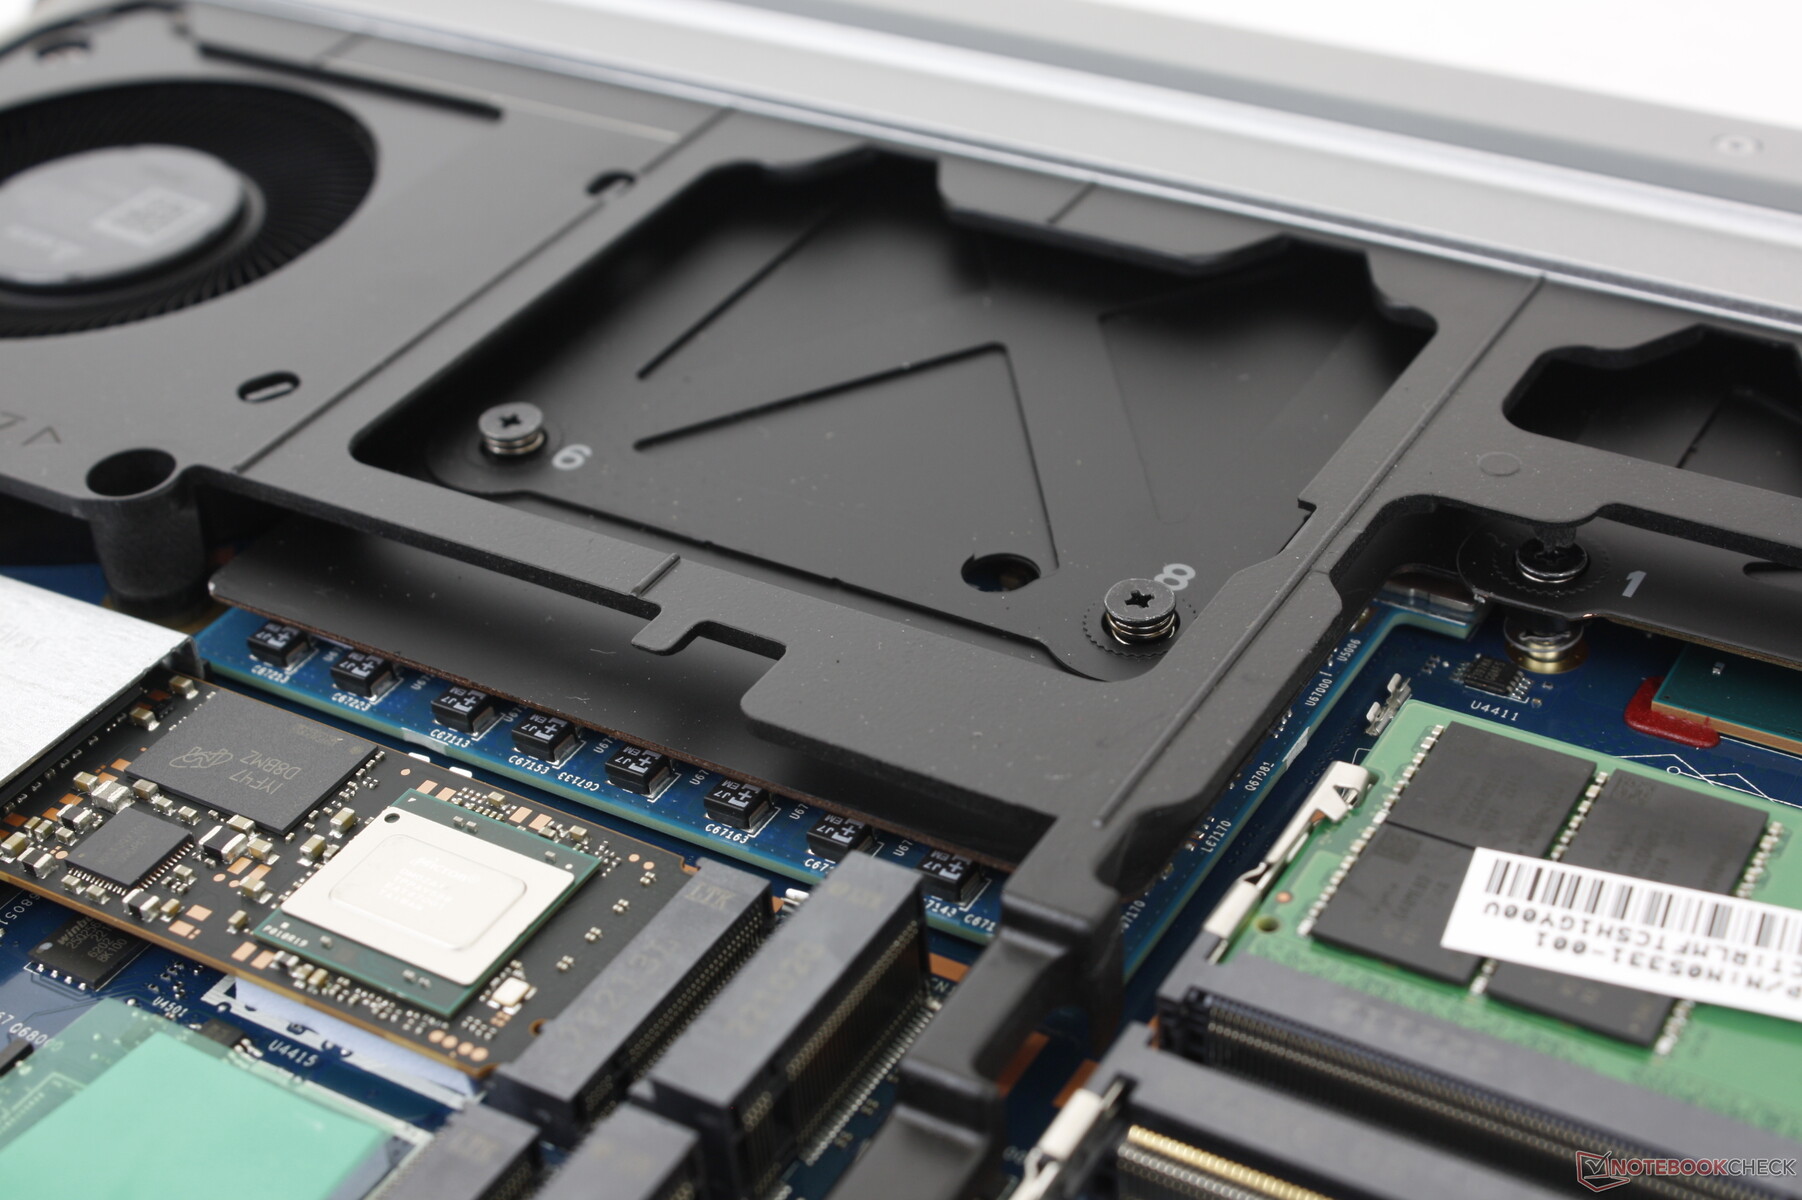
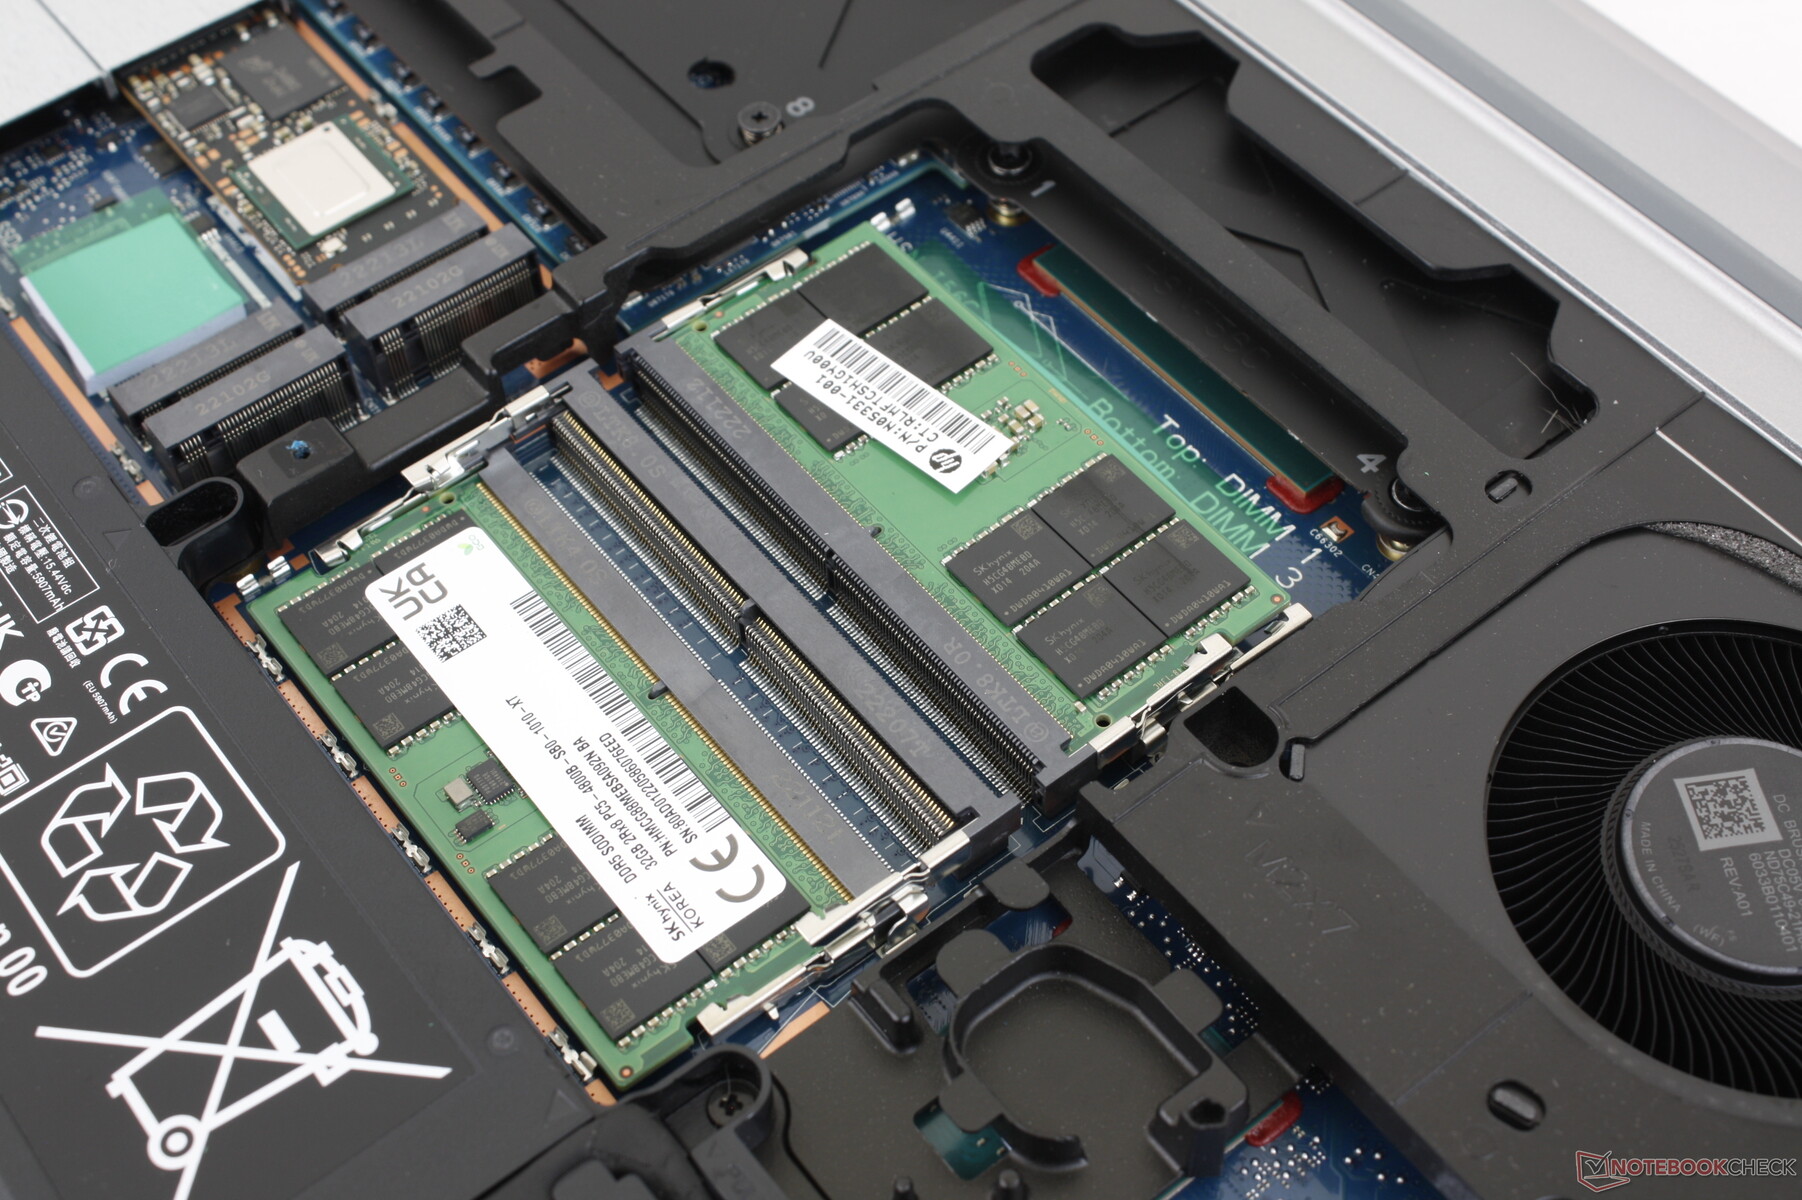
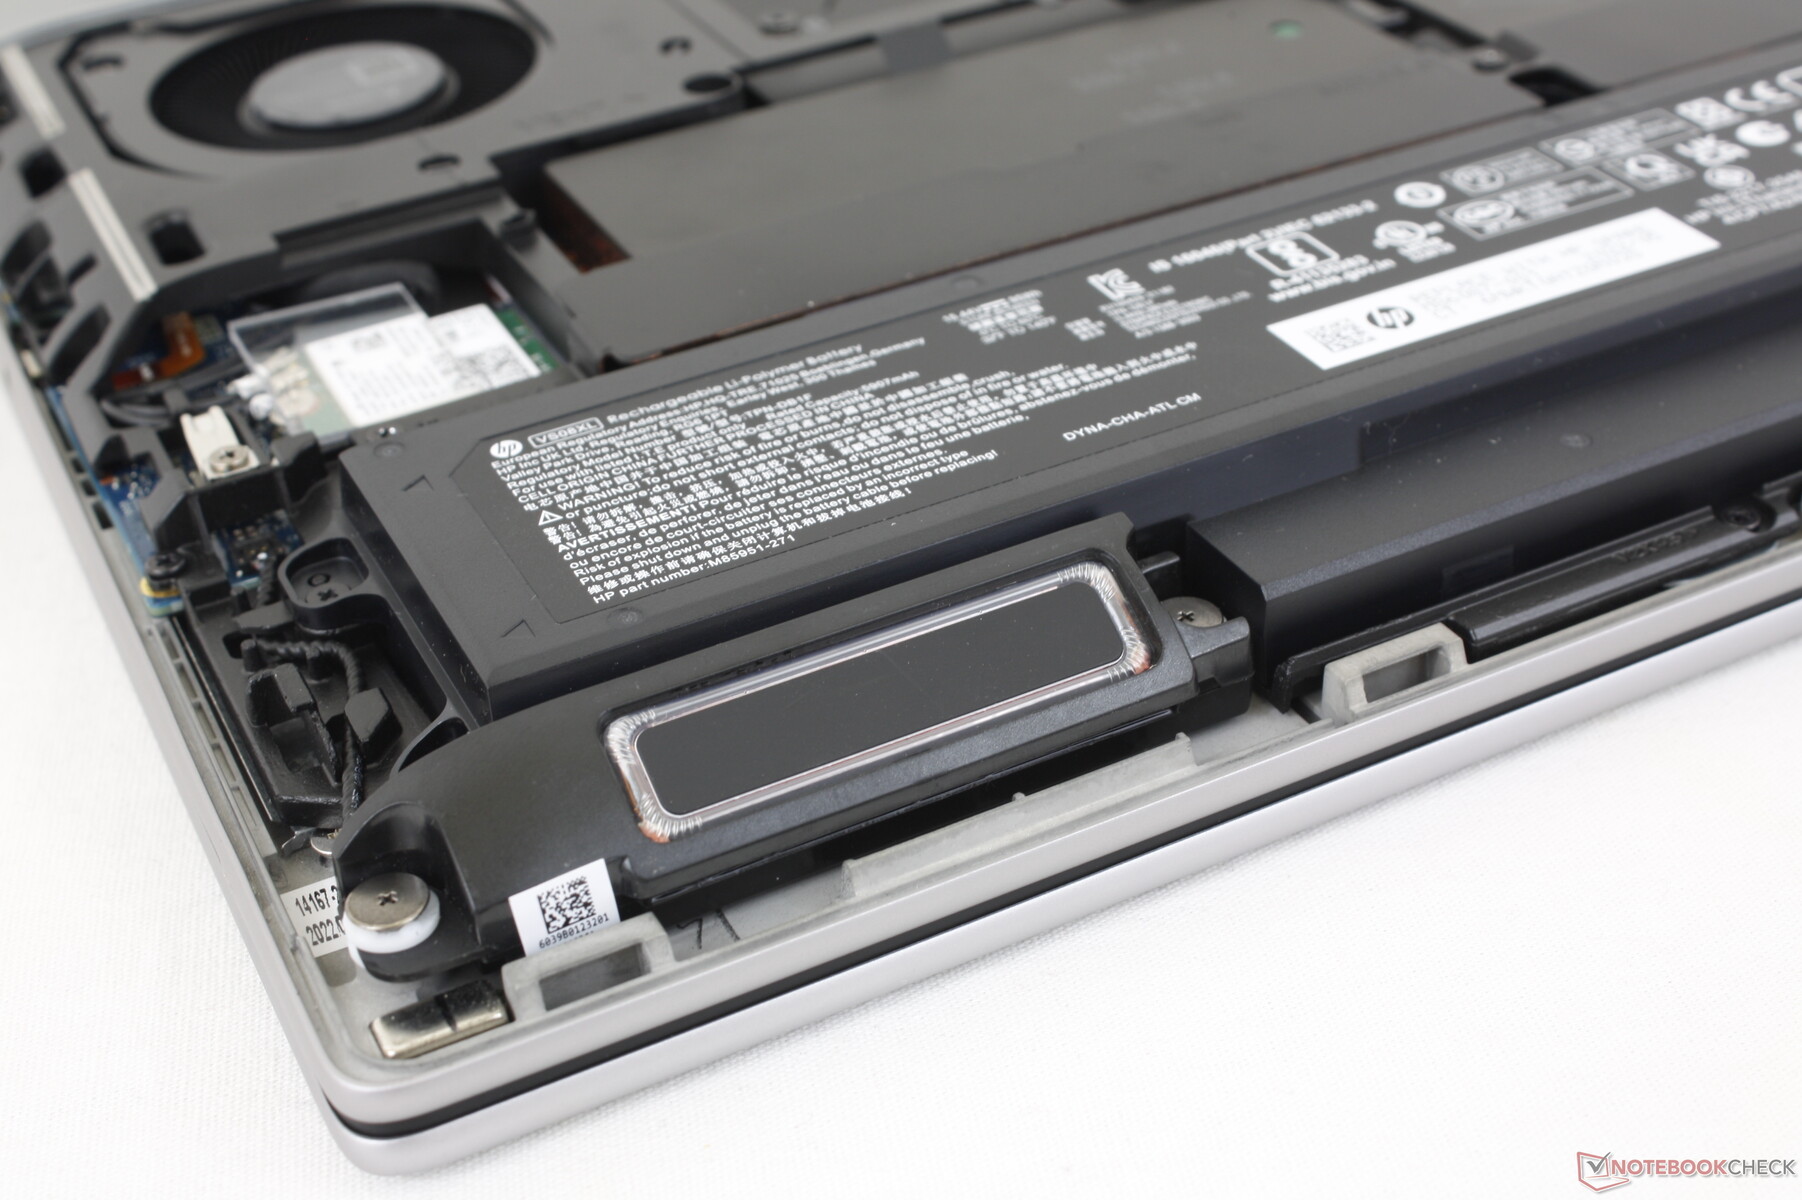
Manutenzione
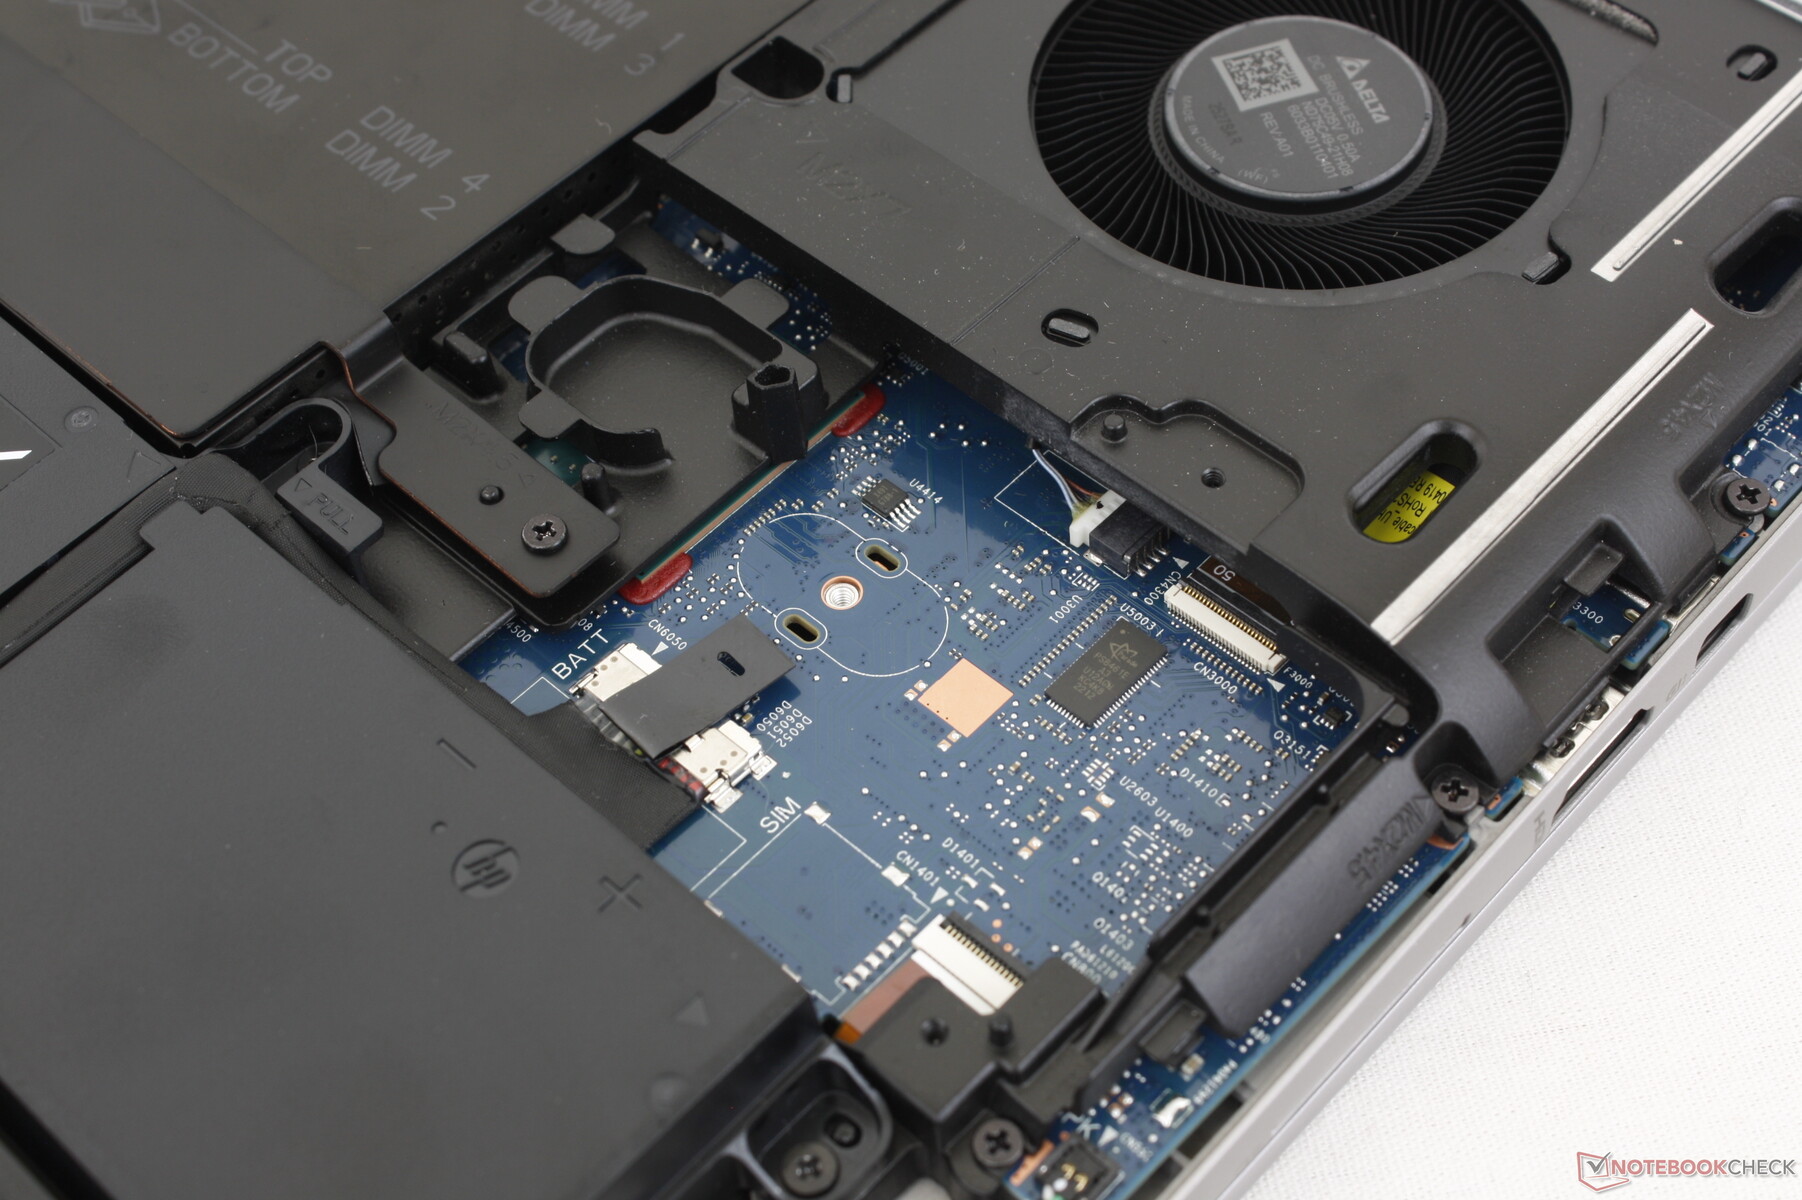
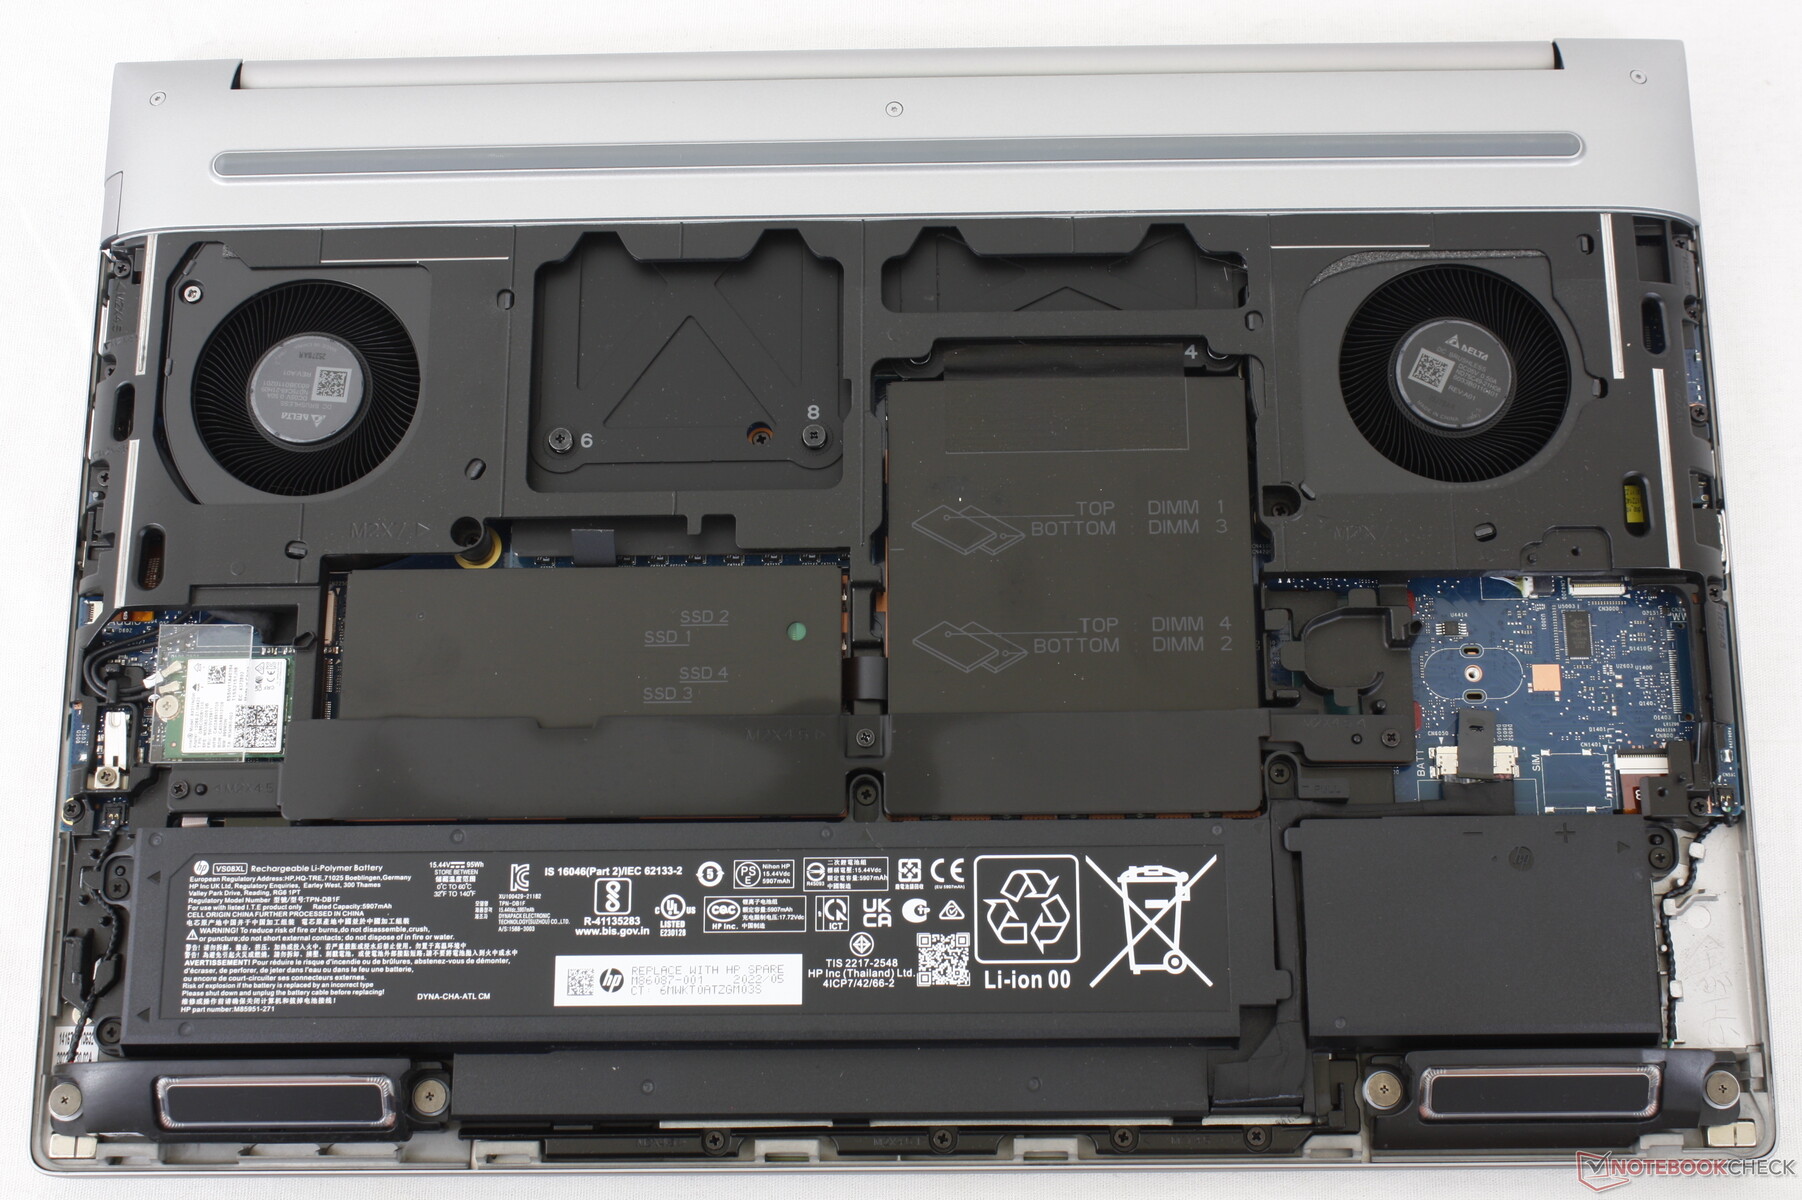
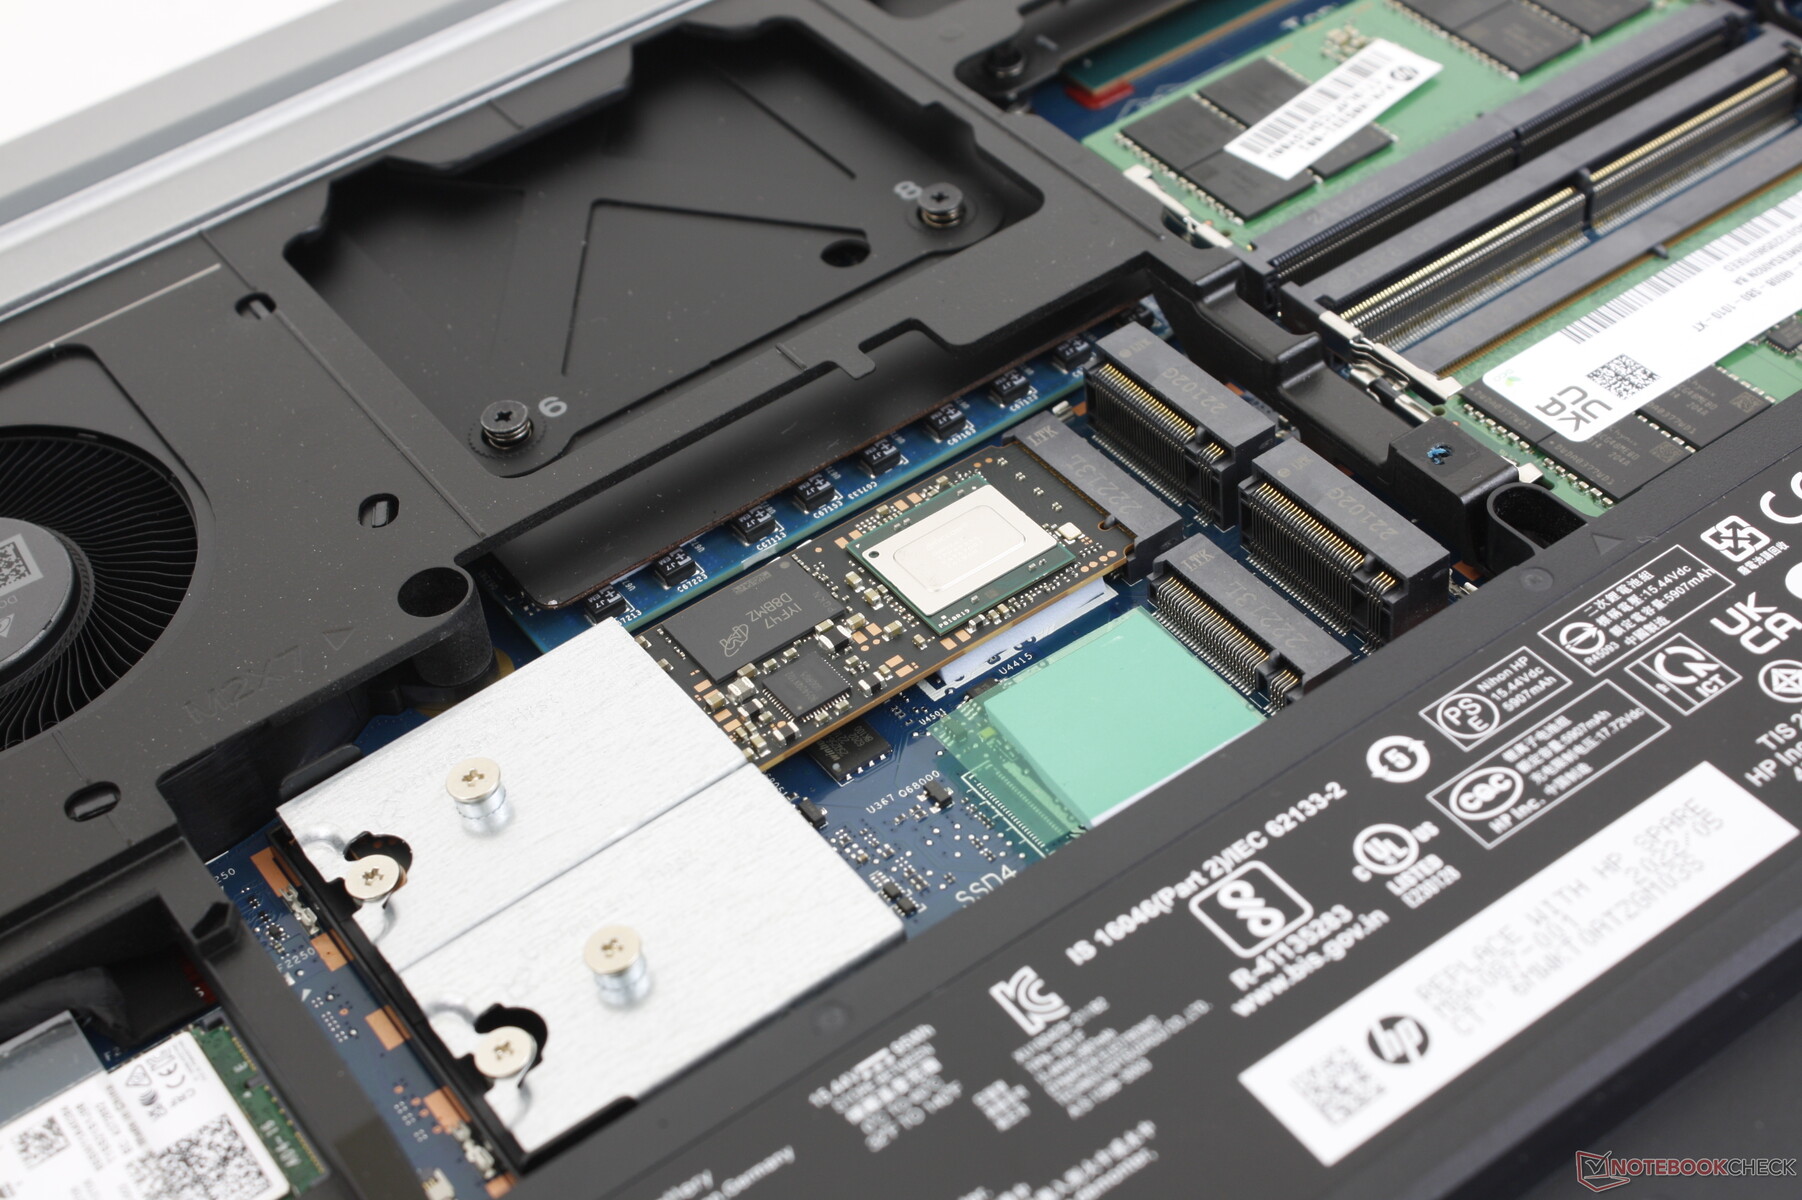
Il pannello inferiore è "senza utensili", in quanto si sfila facilmente senza l'ausilio di alcuno strumento. Purtroppo, è necessario un cacciavite perché gli alloggiamenti e gli slot SODIMM sono protetti da piastre di alluminio. Il modello supporta fino a 4 unità SSD M.2 2280 e 4 moduli RAM DDR5, più di quanto possano offrire Precision 7670 e ThinkPad P16.
Accessori e garanzia
La confezione non contiene altri extra, a parte il consueto adattatore CA e la documentazione cartacea. La garanzia limitata di tre anni è di serie se acquistata negli Stati Uniti.
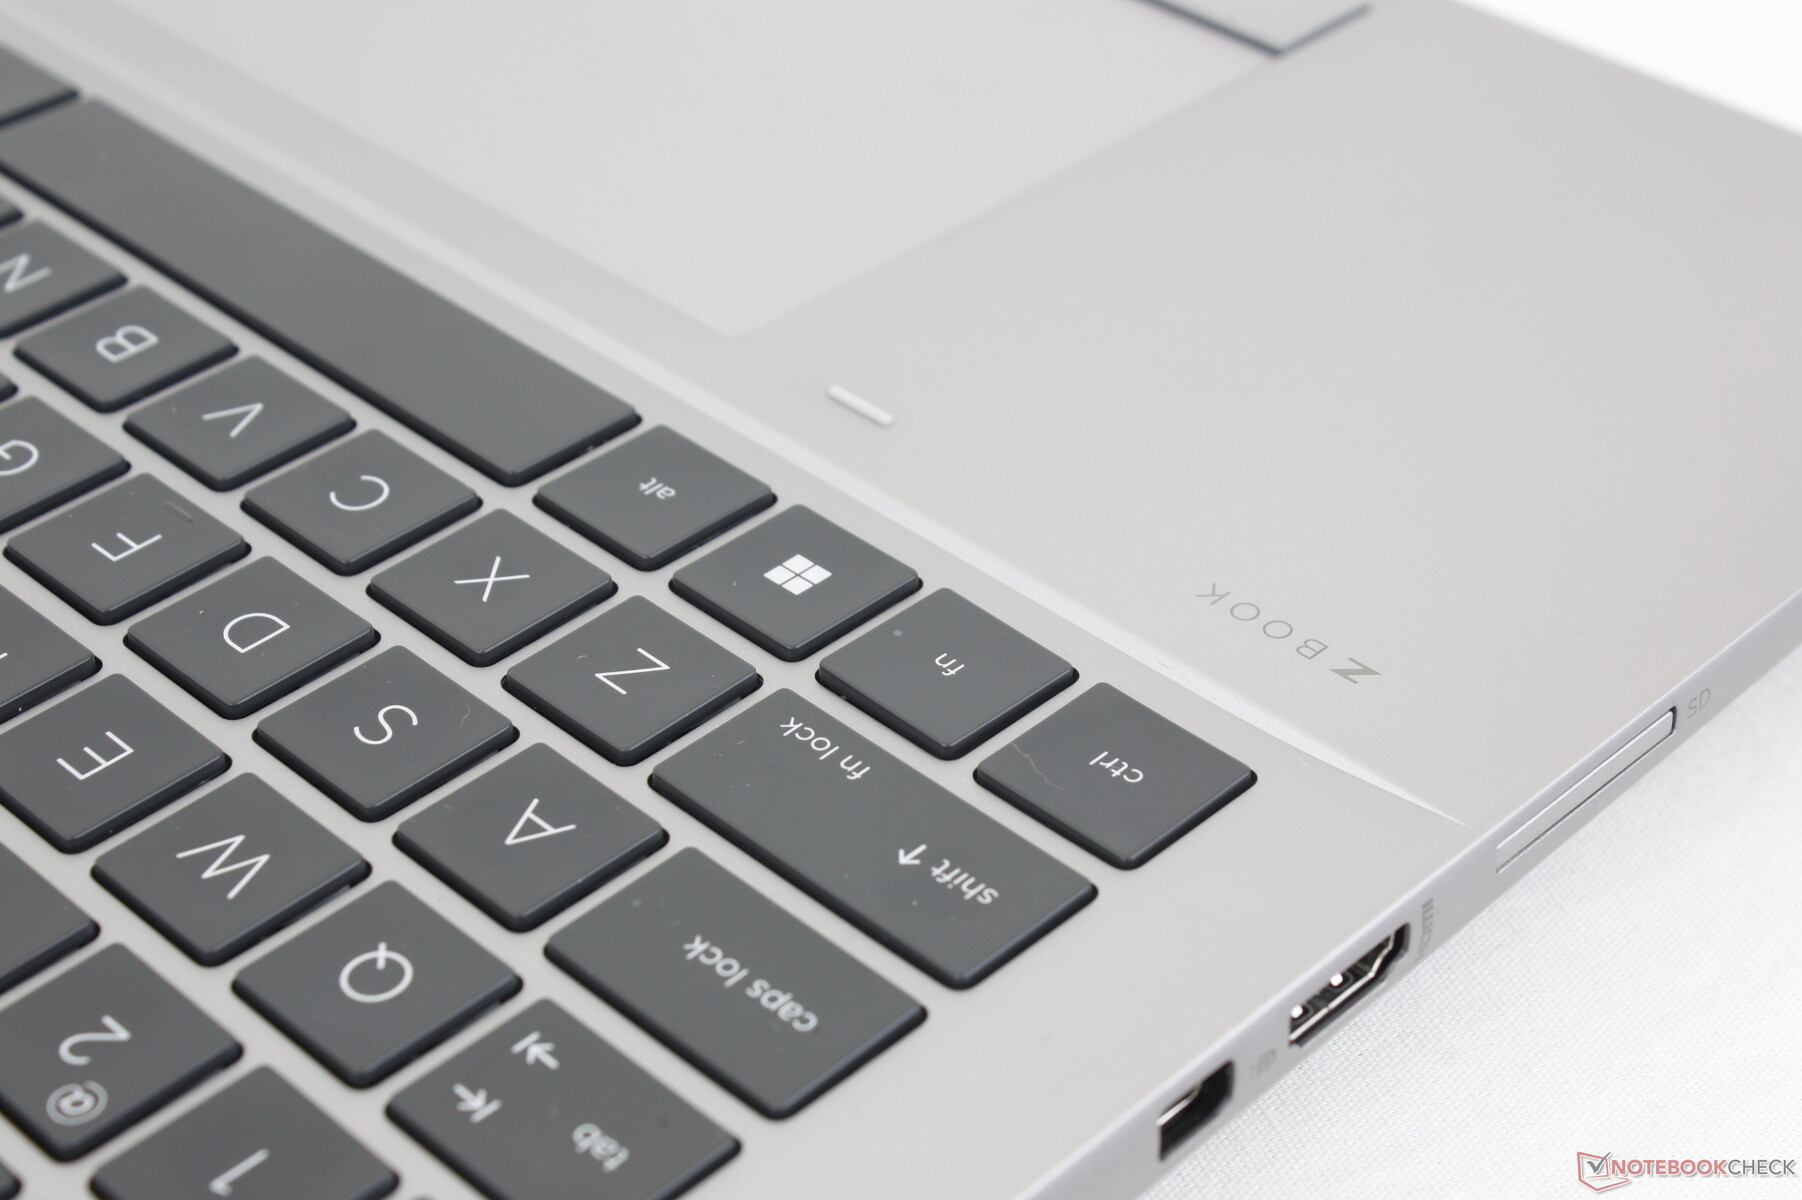
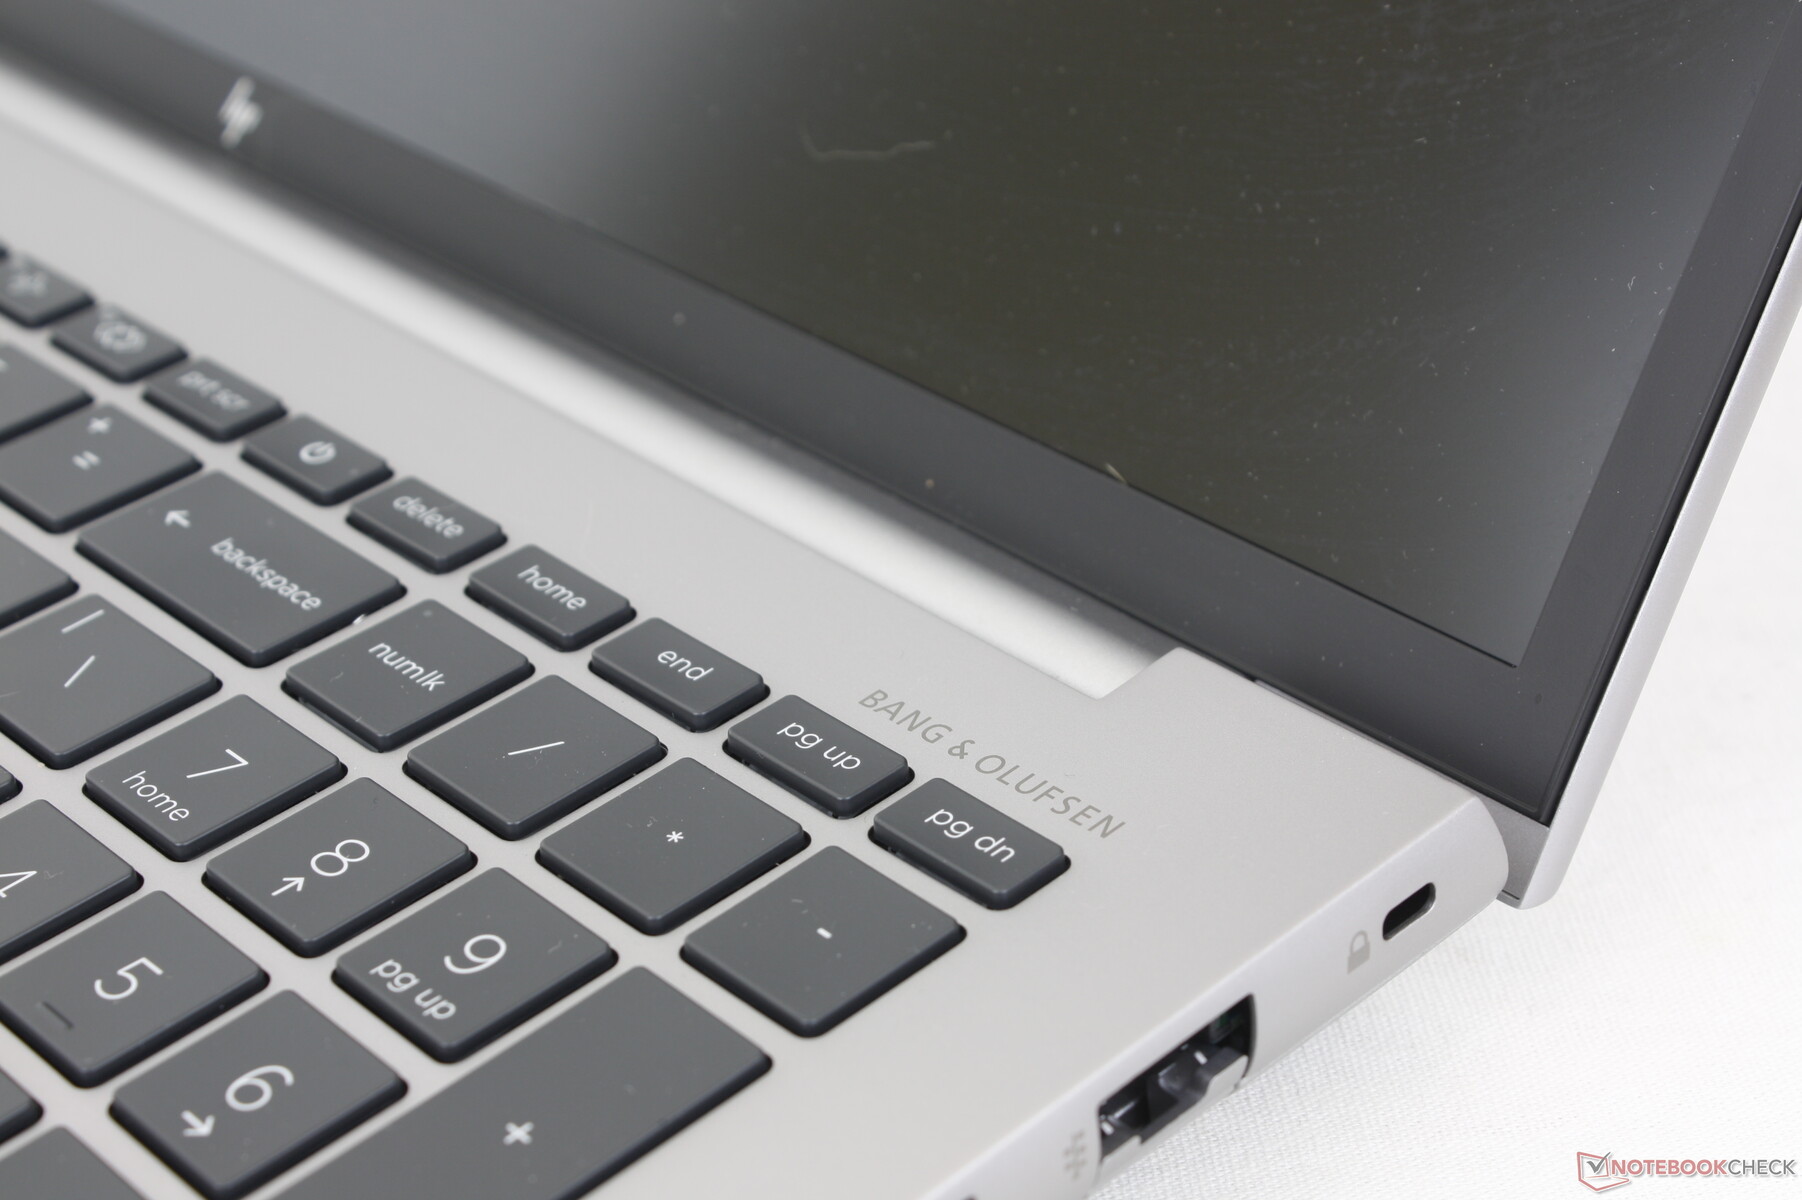
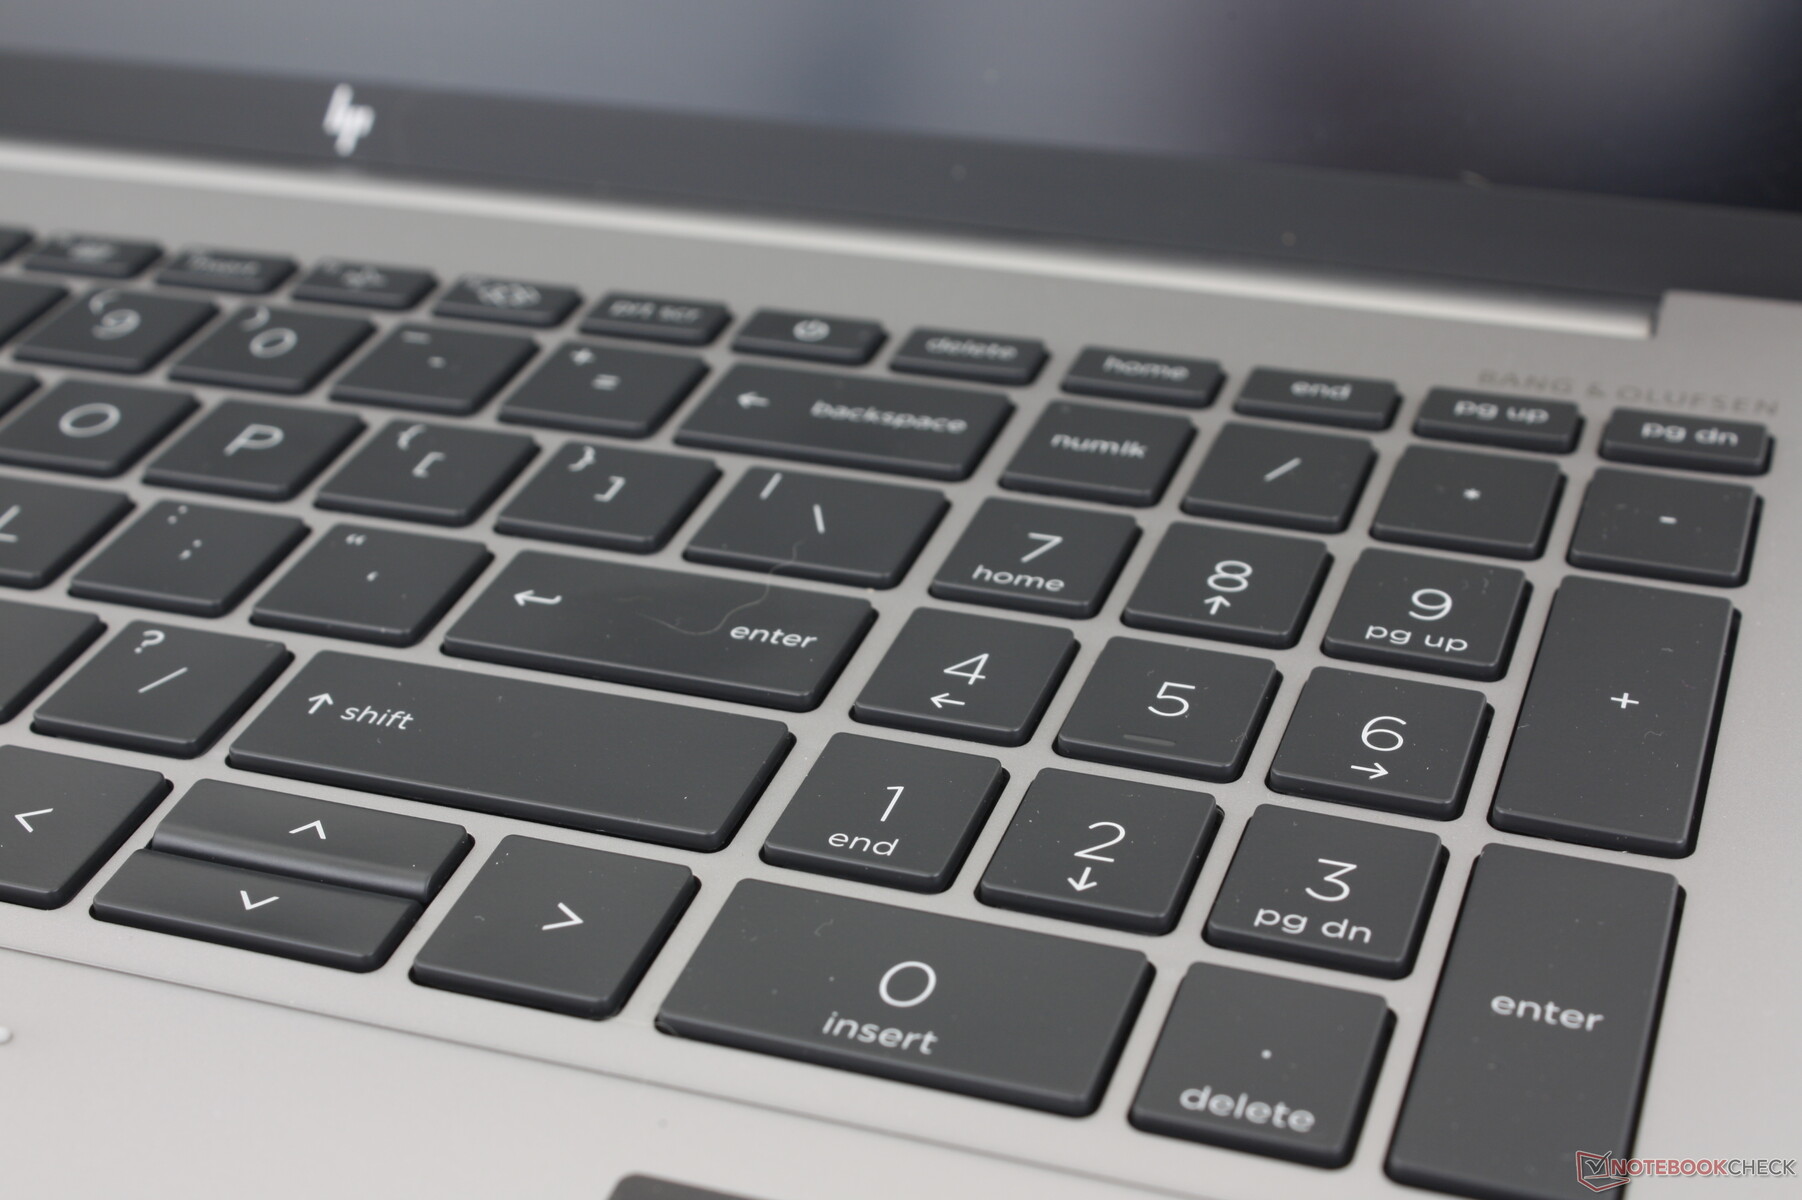
Dispositivi di input - Spaziosi e confortevoli
Tastiera
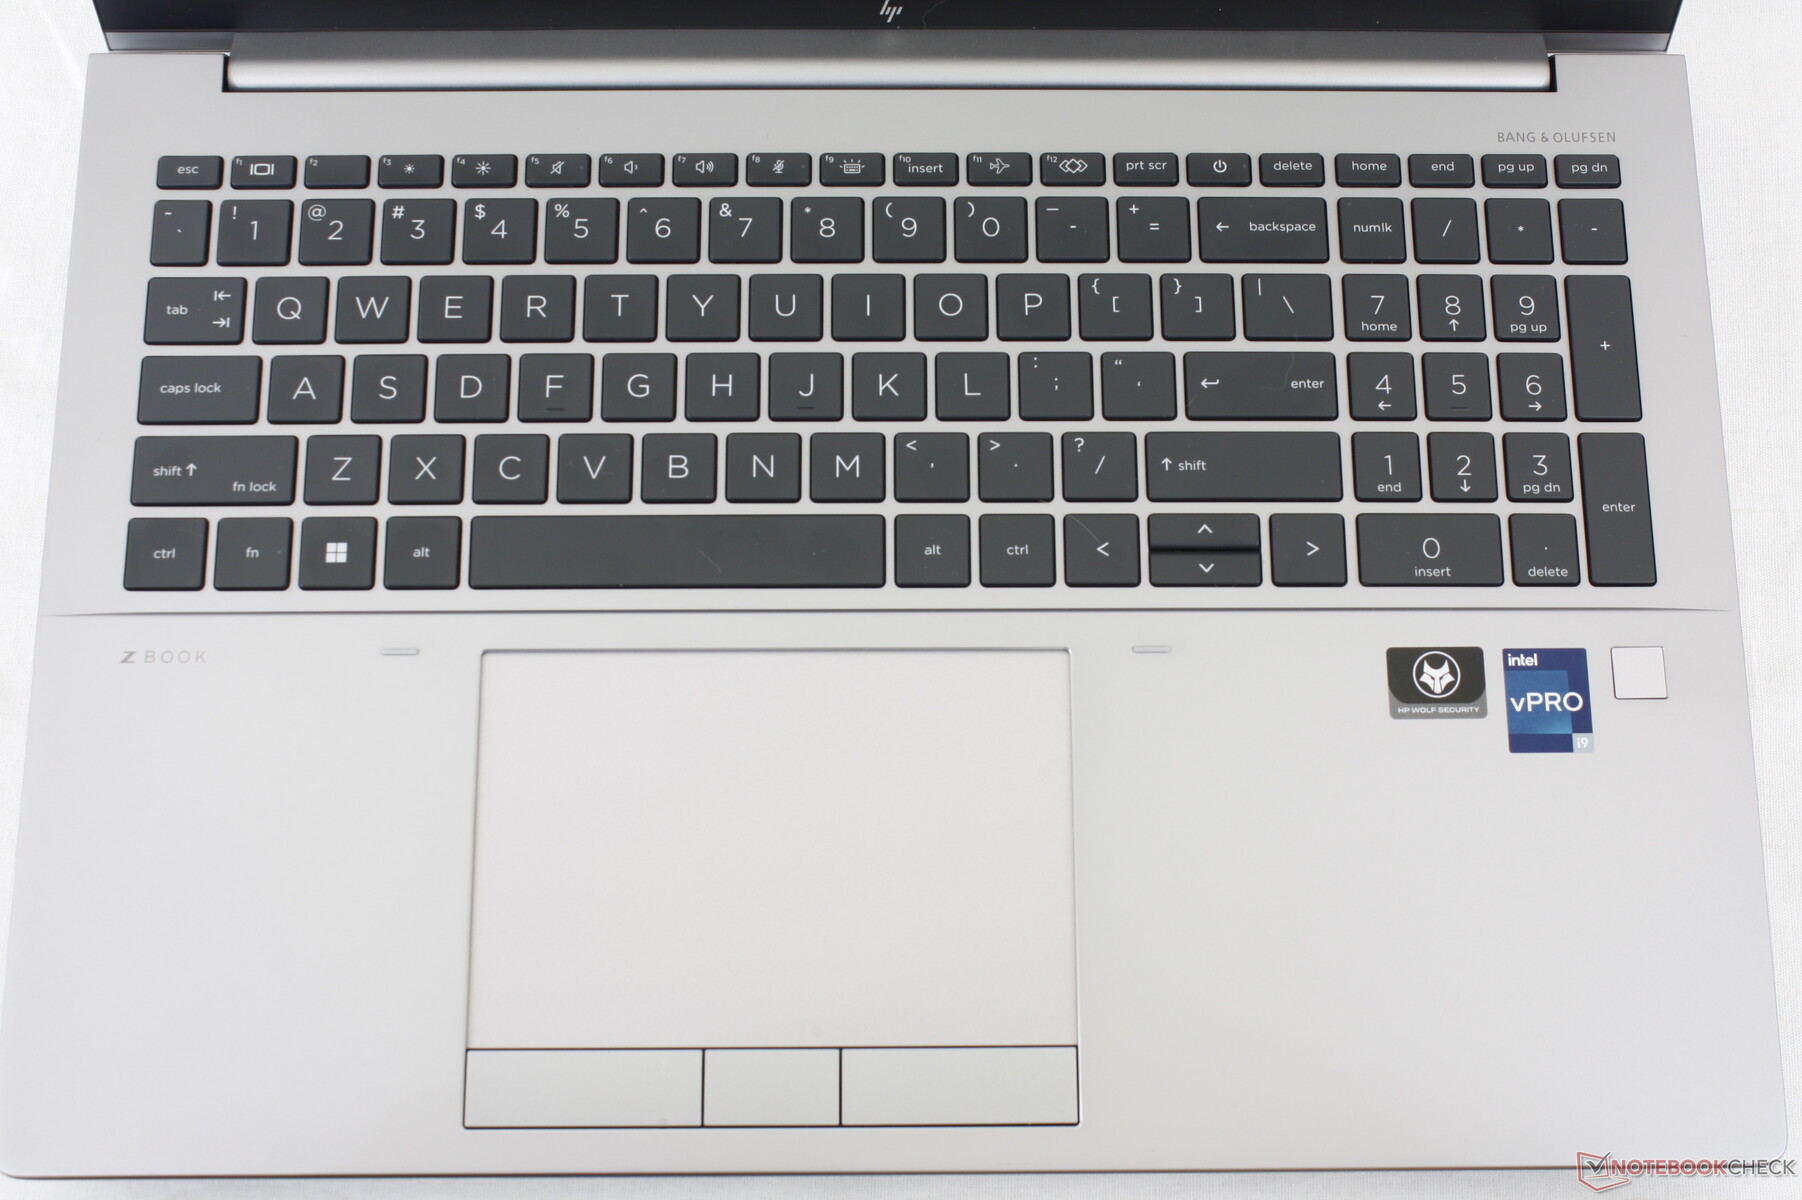
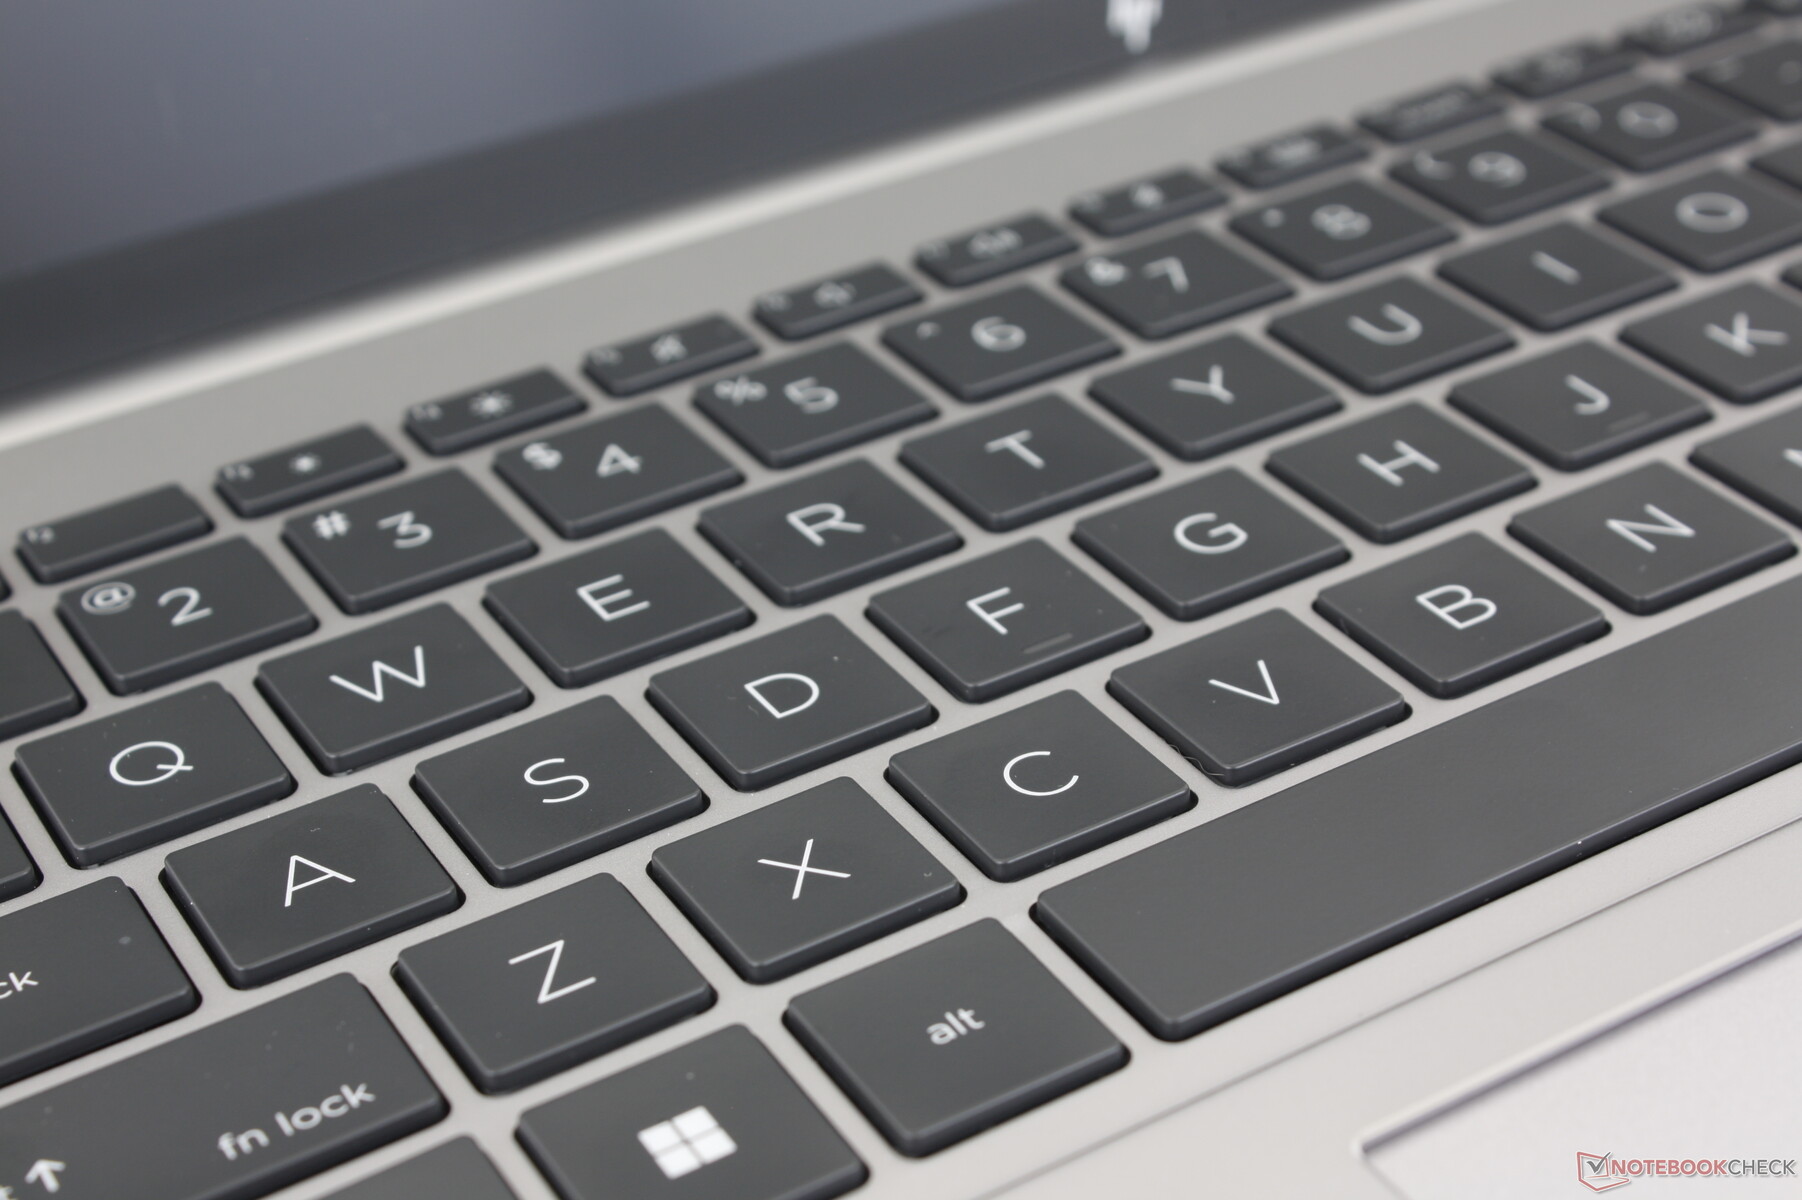
Le famiglie HP Spectre, EliteBook e ZBook hanno tutte alcune delle migliori tastiere delle rispettive categorie in termini di feedback e corsa. I tasti del Fury 16 G9 sono solidi e garantiscono un'esperienza di digitazione soddisfacente. Tuttavia, il rumore è più forte rispetto al ThinkPad P16 G1 o al Precision 7670, soprattutto quando si premono i tasti Spazio o Invio. I dattilografi che preferiscono tasti più silenziosi potrebbero voler provare la tastiera dello ZBook prima di impegnarsi.
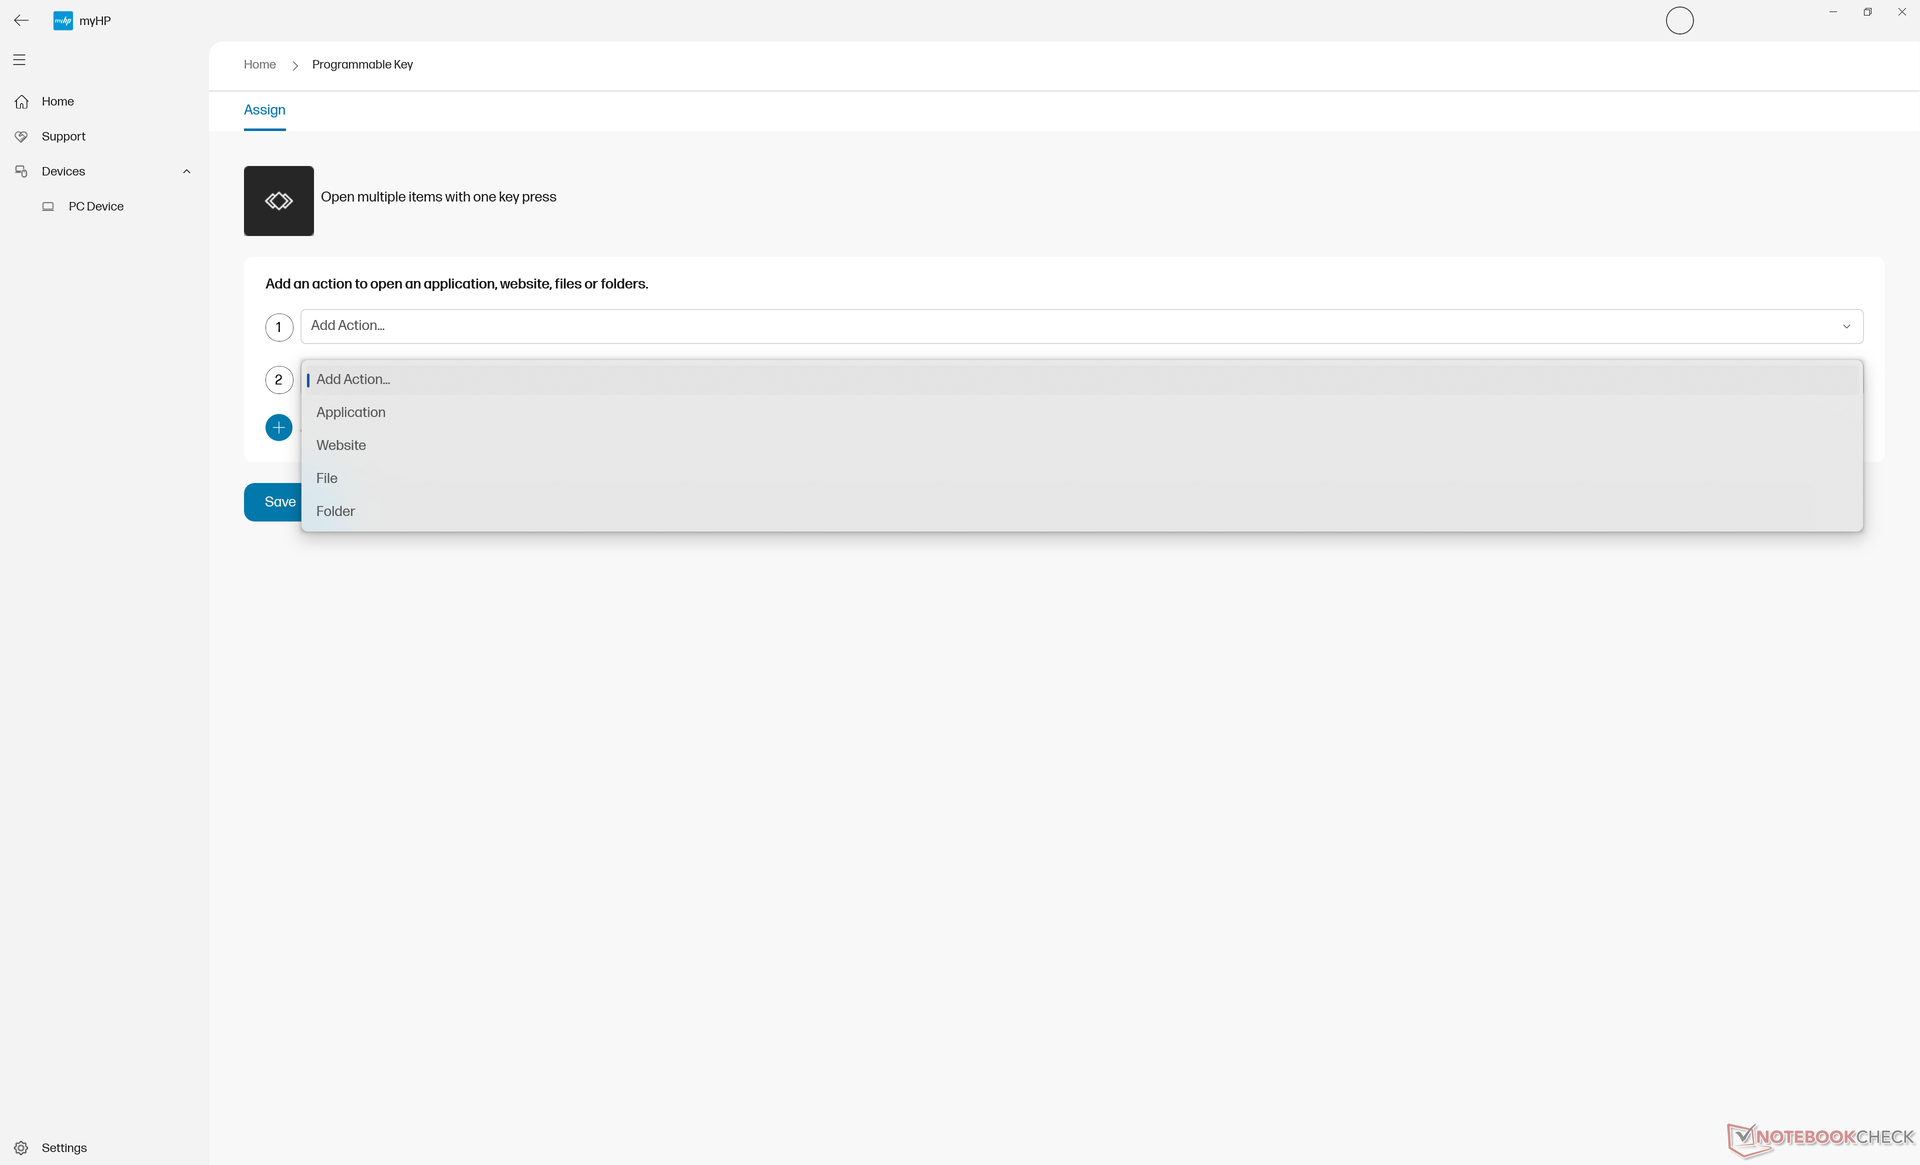
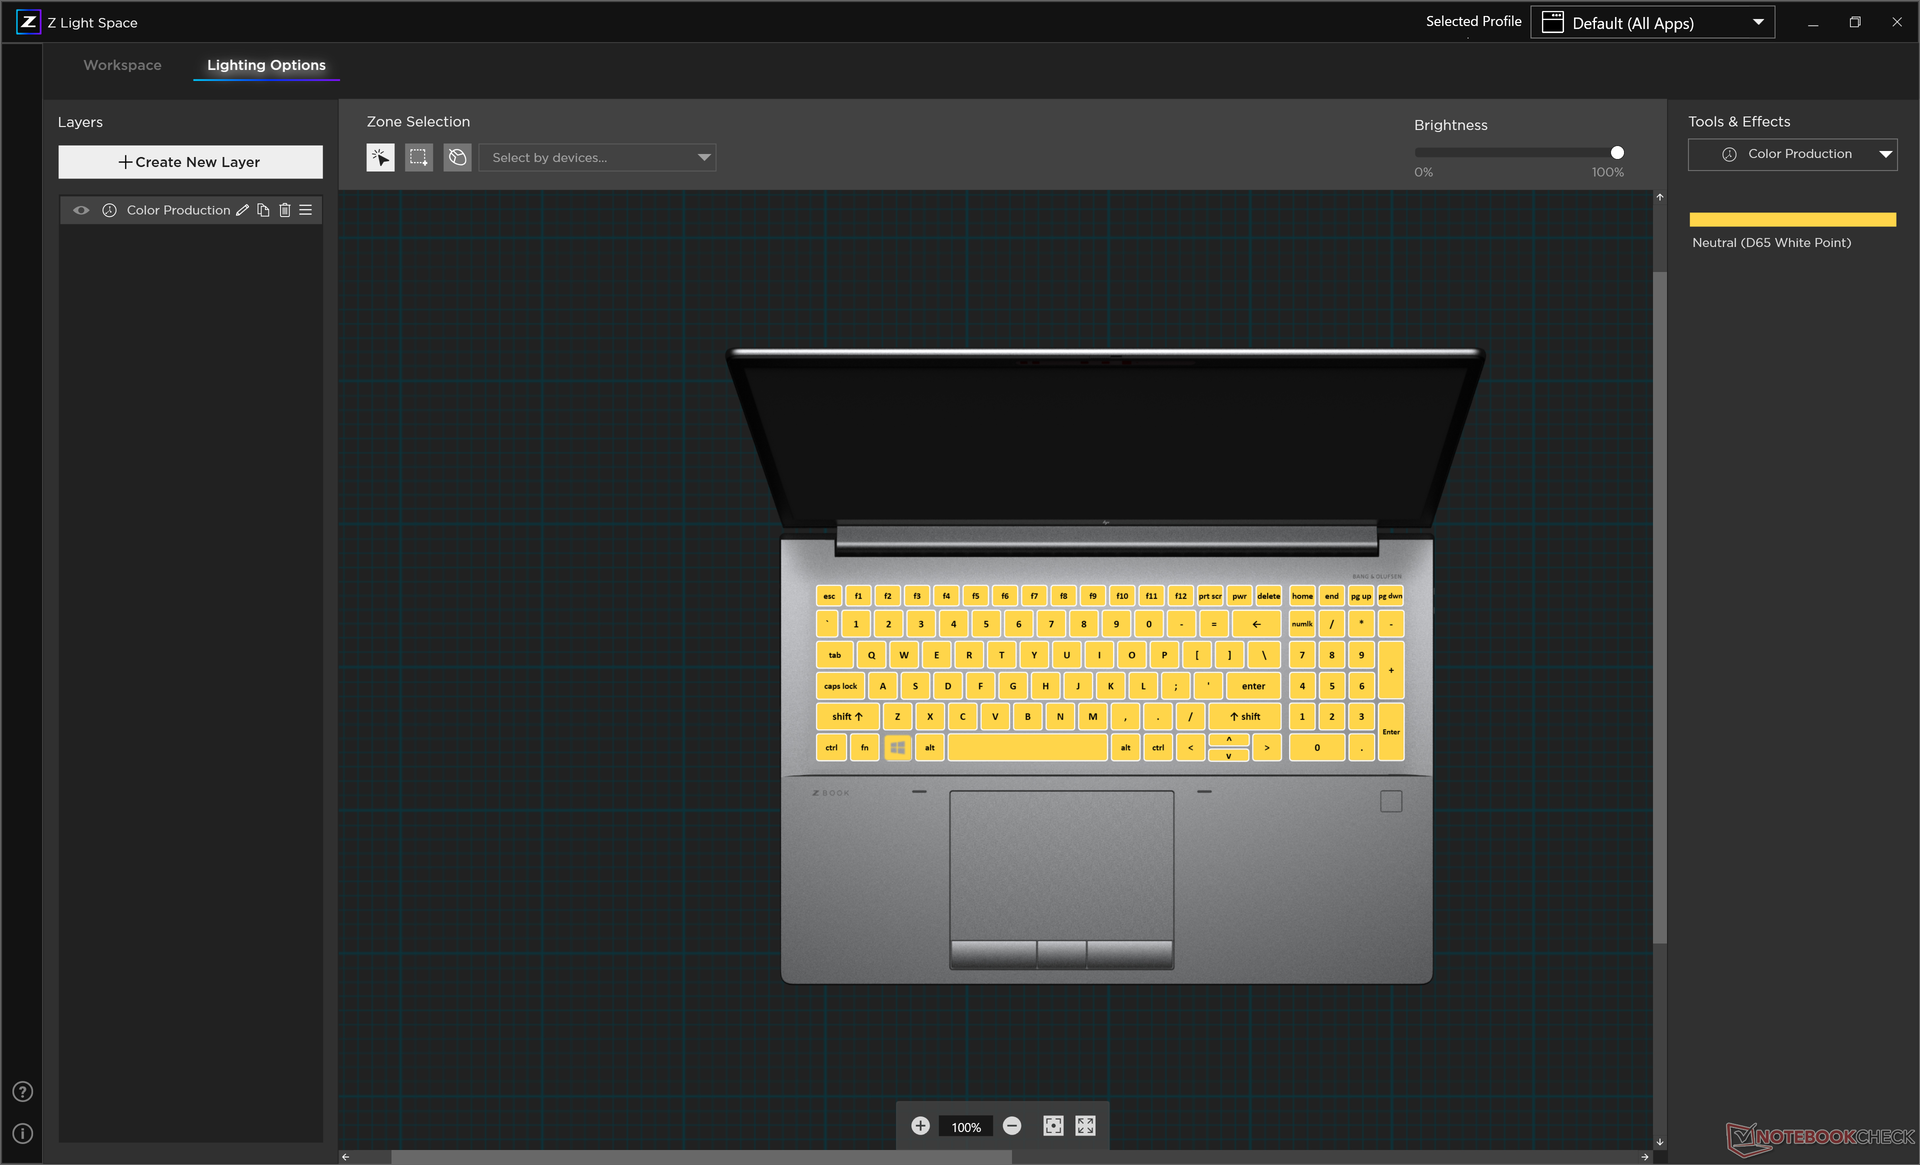
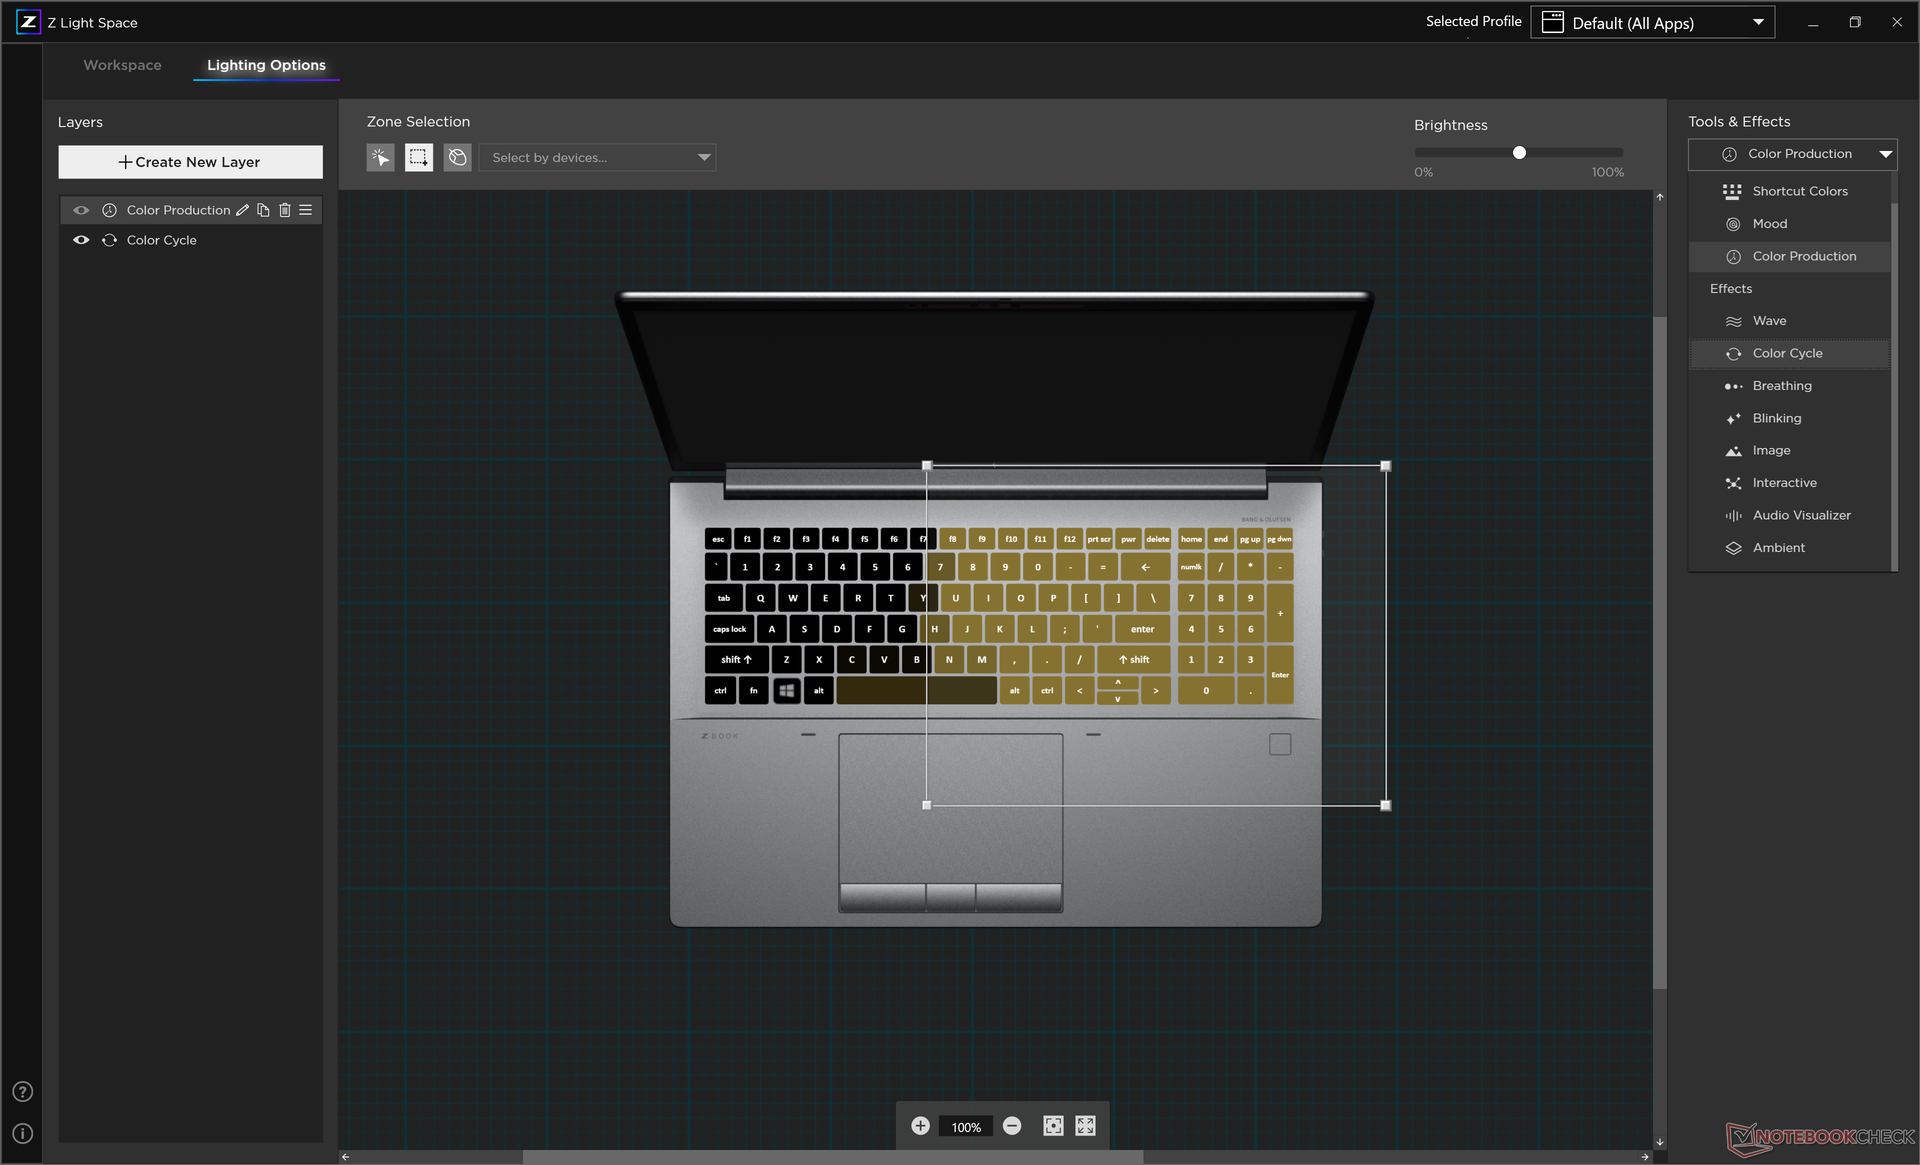
Tra le caratteristiche degne di nota della tastiera dello ZBook vi sono la retroilluminazione RGB per ogni tasto e il singolo tasto programmabile/personalizzabile. La maggior parte delle altre workstation non dispone ancora di funzioni ausiliarie simili.
Touchpad
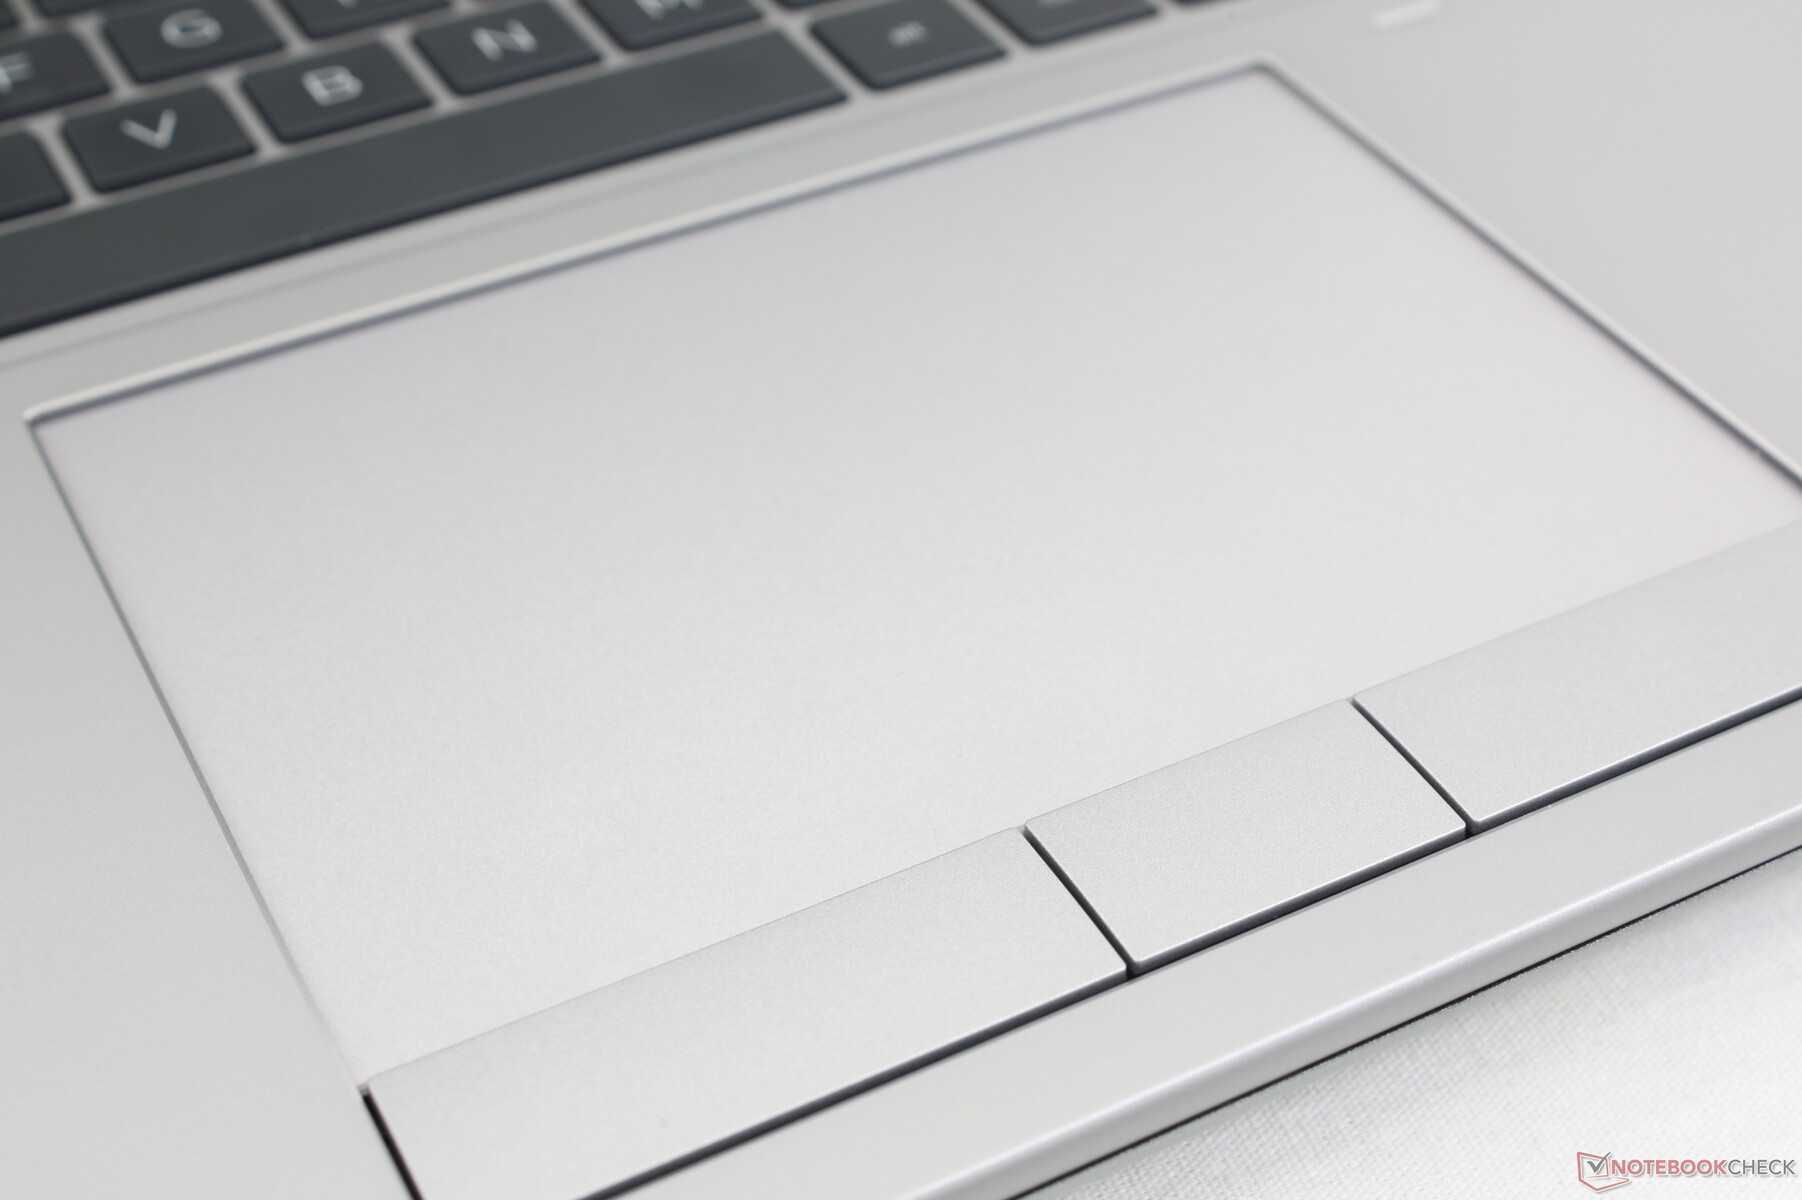
Il touchpad è uno dei migliori che abbiamo utilizzato su qualsiasi portatile, sia esso una workstation o altro. Non solo è più grande (12,4 x 8,3 cm) dei touchpad del ThinkPad P16 G1 (11,5 x 6,9 cm) o del Precision 7670 (11,5 x 8 cm), ma le sue proprietà di scorrimento sono fluide per un controllo affidabile del cursore a qualsiasi velocità. Nel frattempo, i pulsanti del mouse dedicati hanno una corsa più ampia rispetto alla maggior parte degli altri computer portatili, pur mantenendo un clic soddisfacente quando vengono premuti. In confronto, il modello Precision 7670 non dispone di pulsanti del mouse dedicati a favore di una soluzione con clickpad.
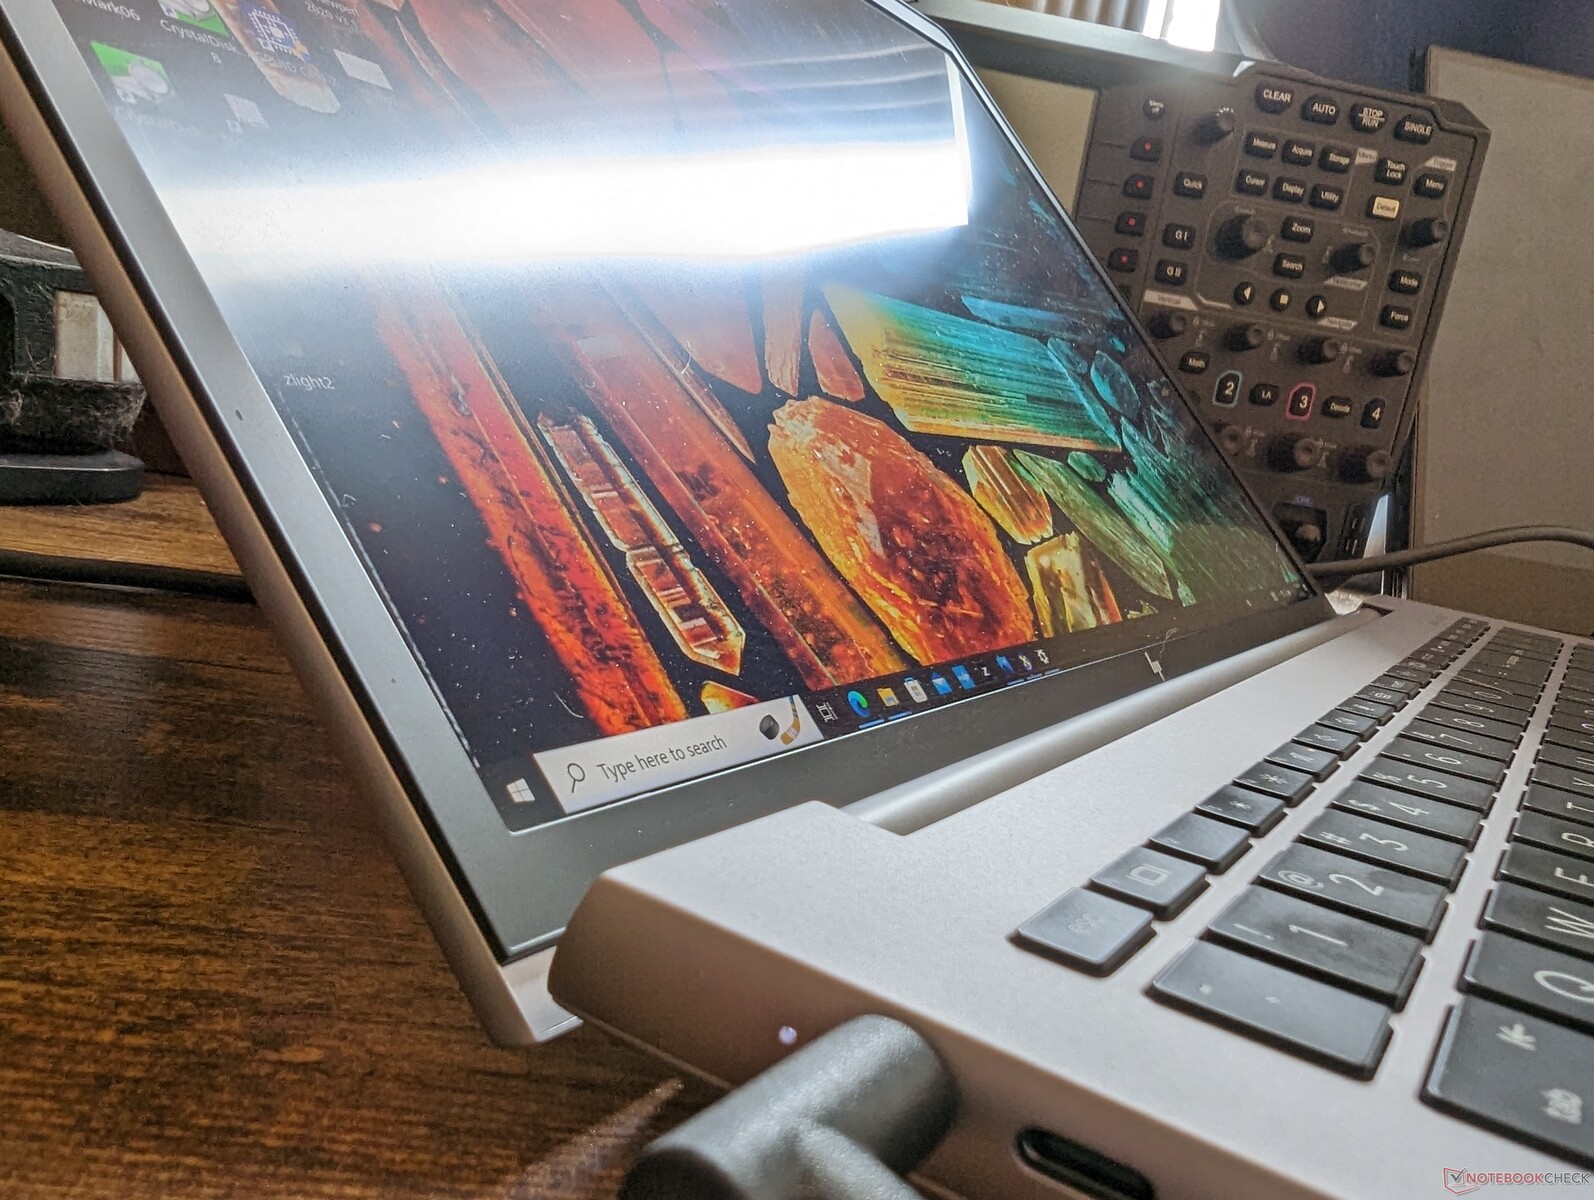
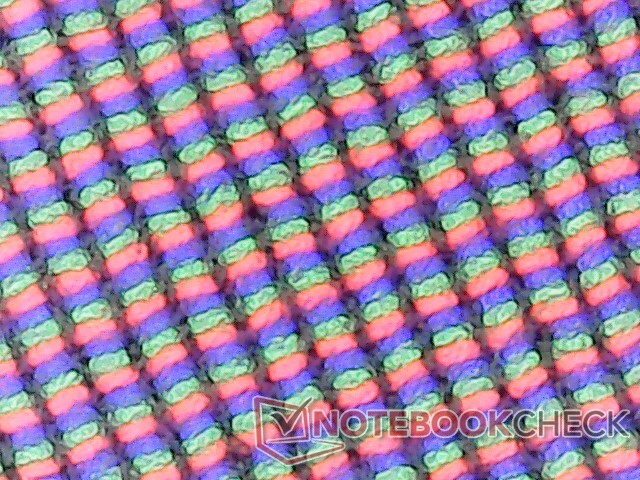
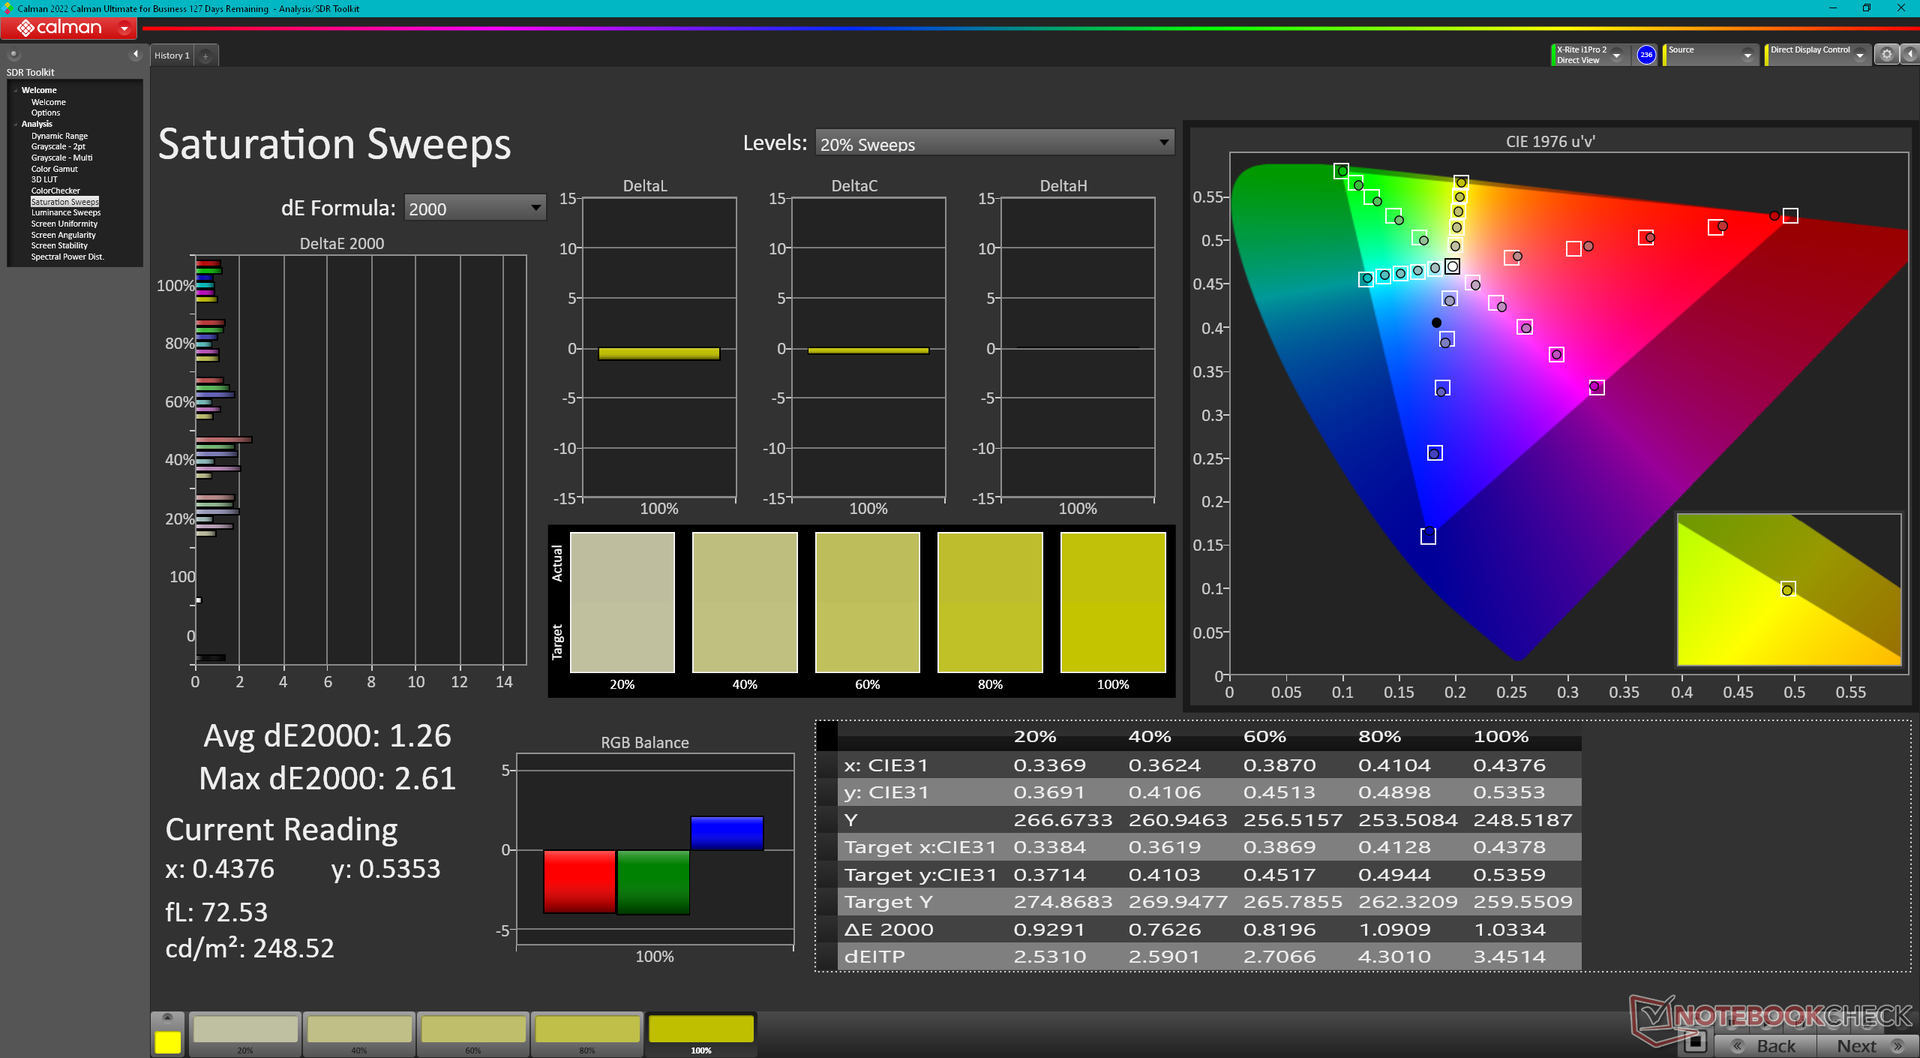
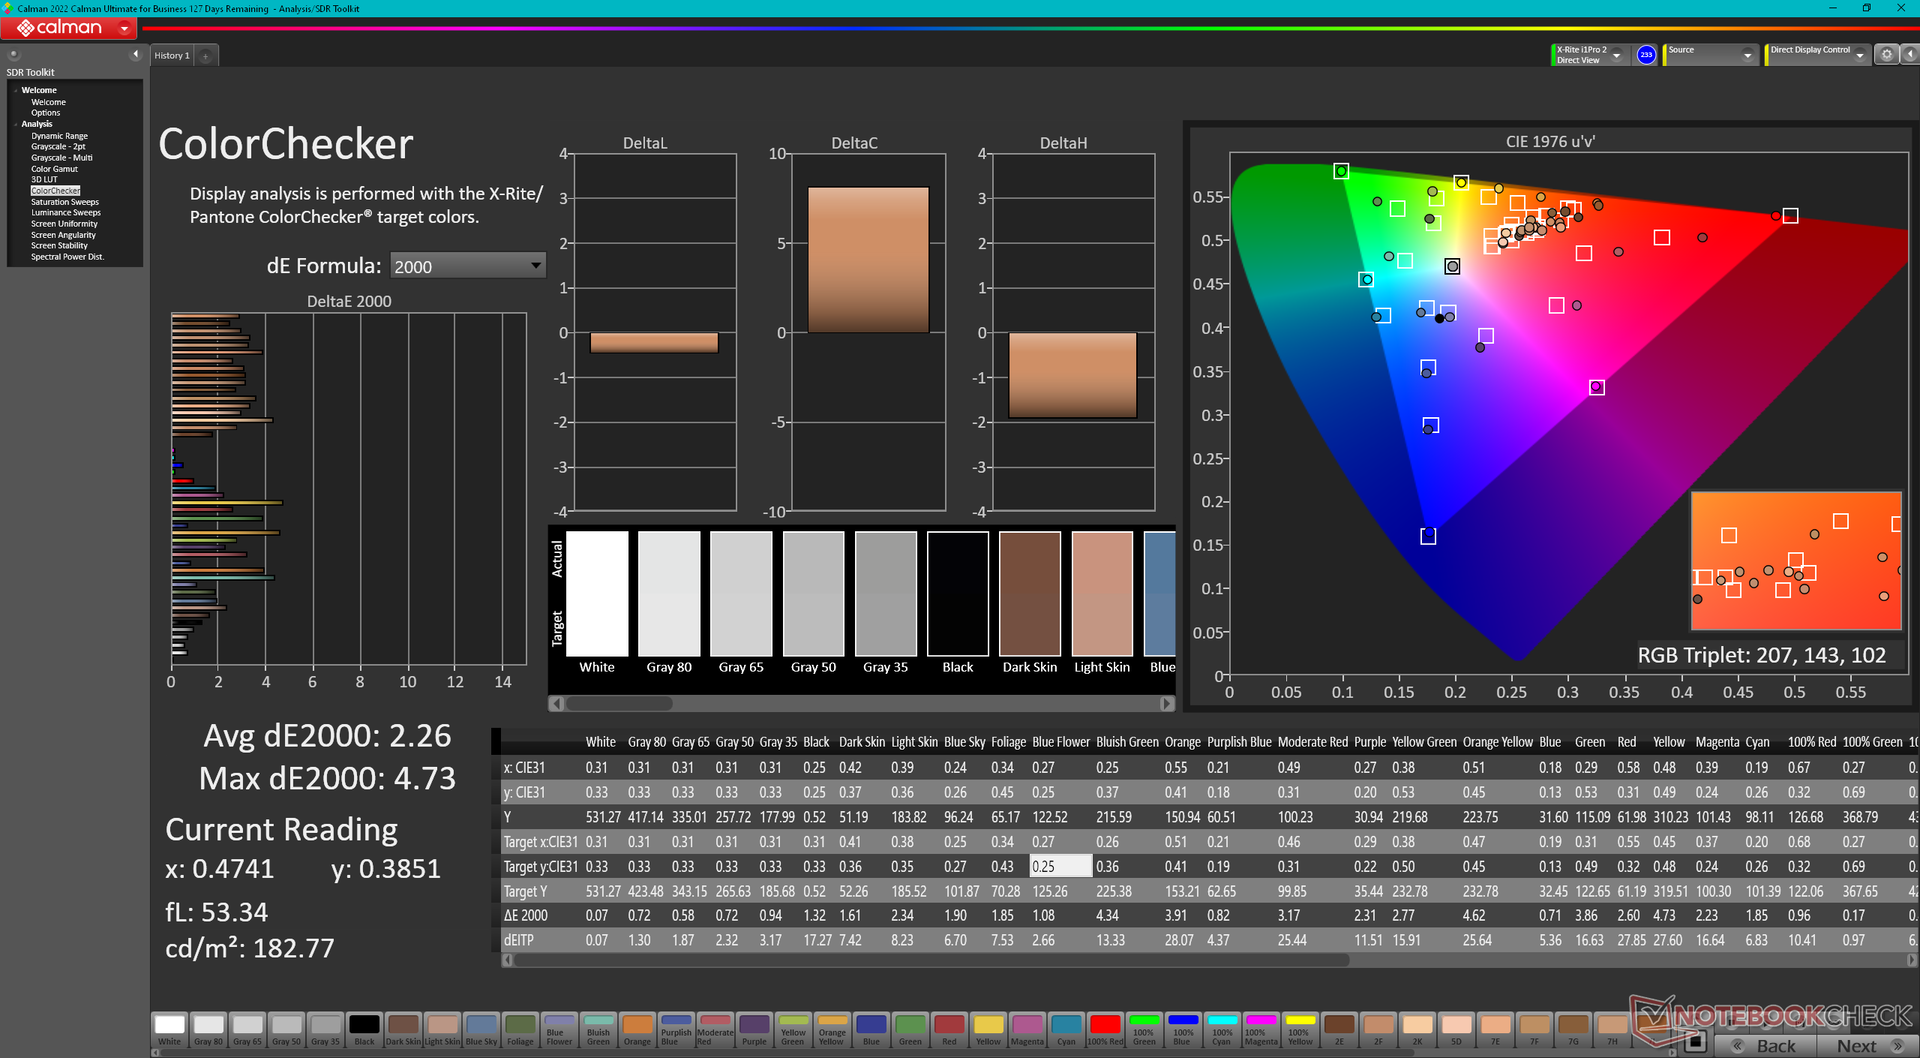
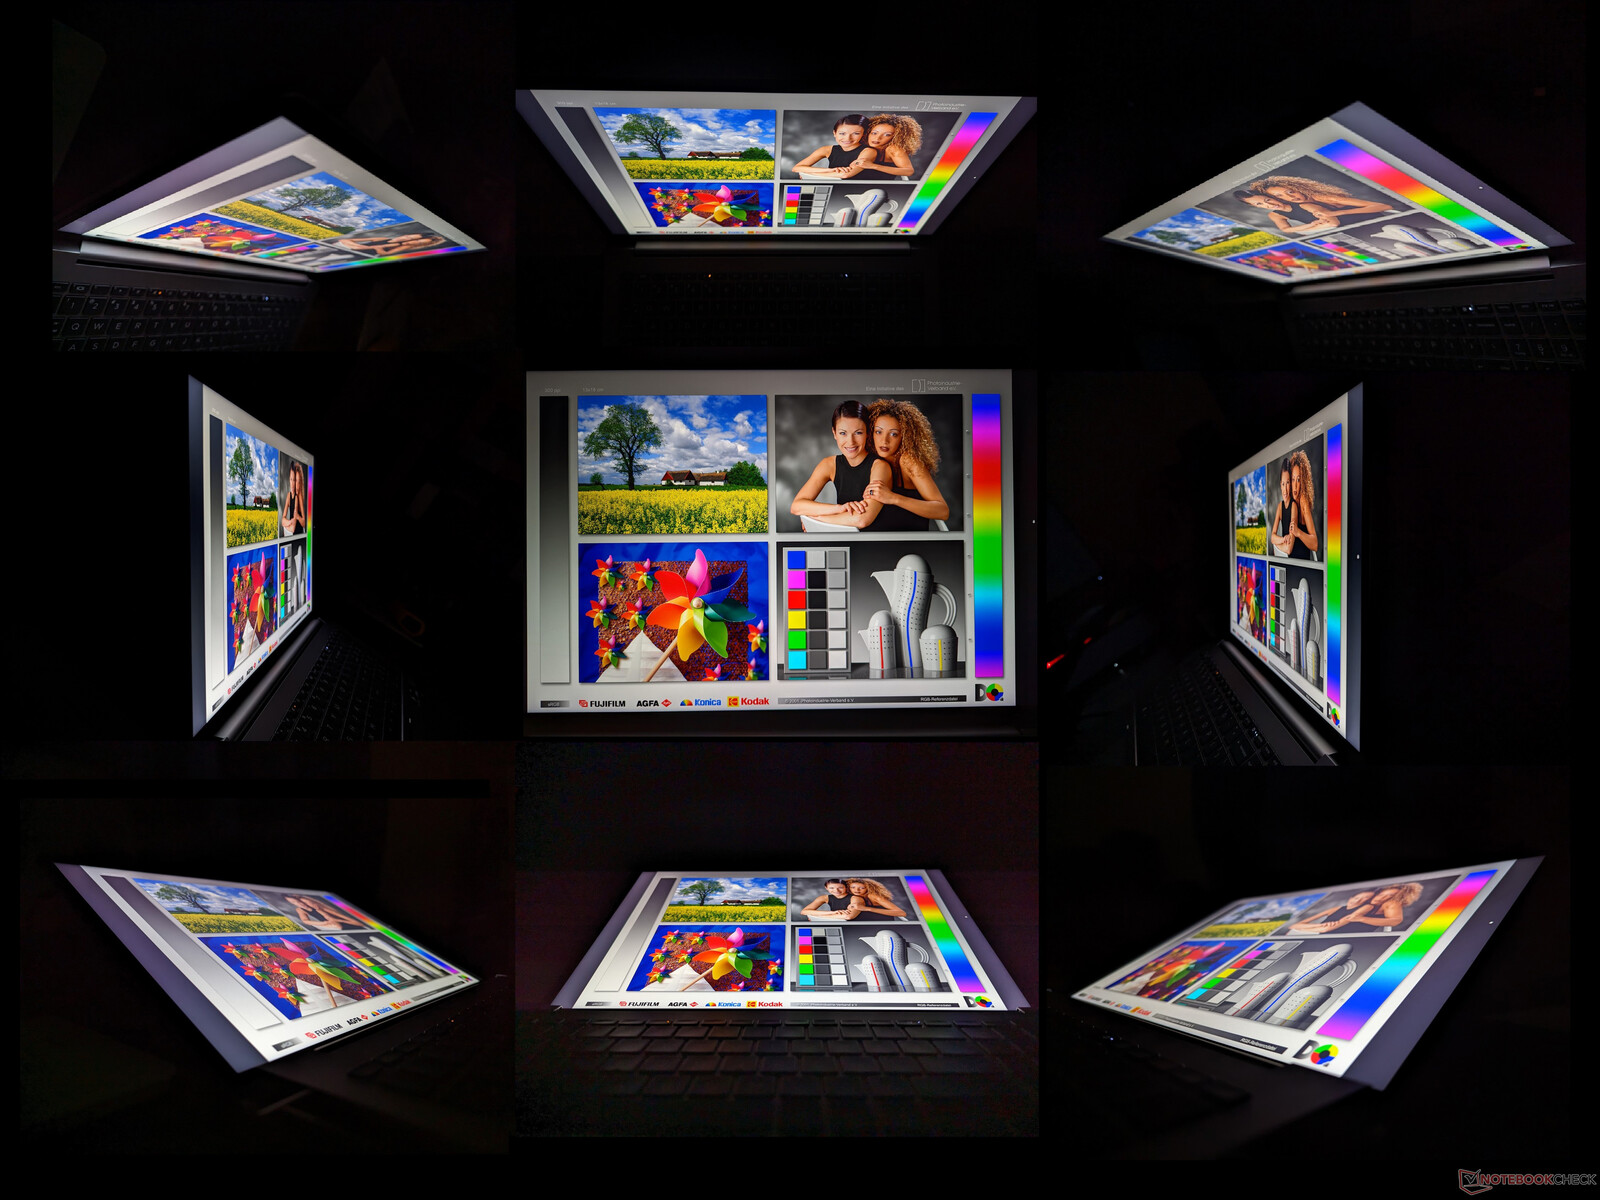
Display - Colori eccellenti con buoni tempi di risposta
HP utilizza le stesse opzioni di pannello BOE per molti dei suoi portatili da 16 pollici. Lo ZBook Studio 16 G9ad esempio, utilizza lo stesso pannello 4K 16:10 del nostro ZBook Fury 16 G9, come dimostrano le caratteristiche simili riportate nella tabella sottostante.
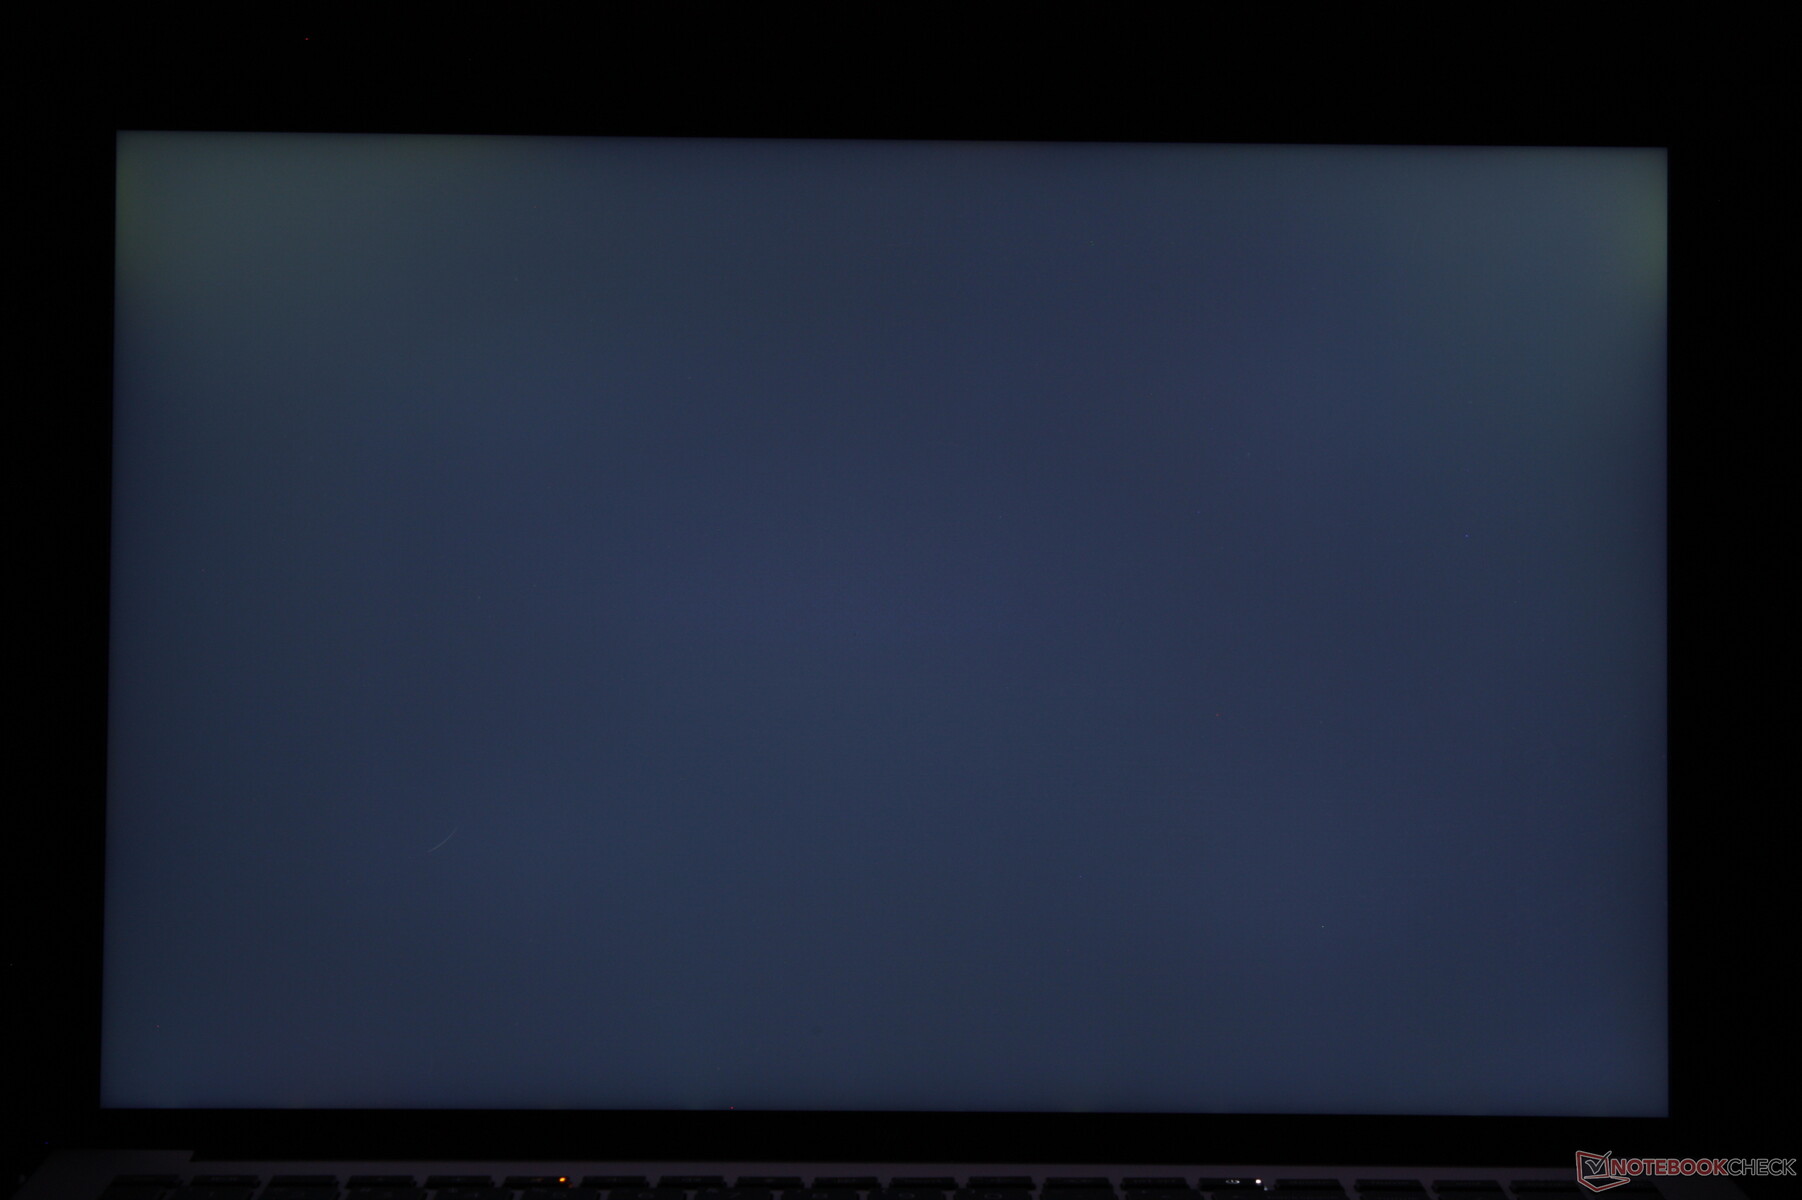
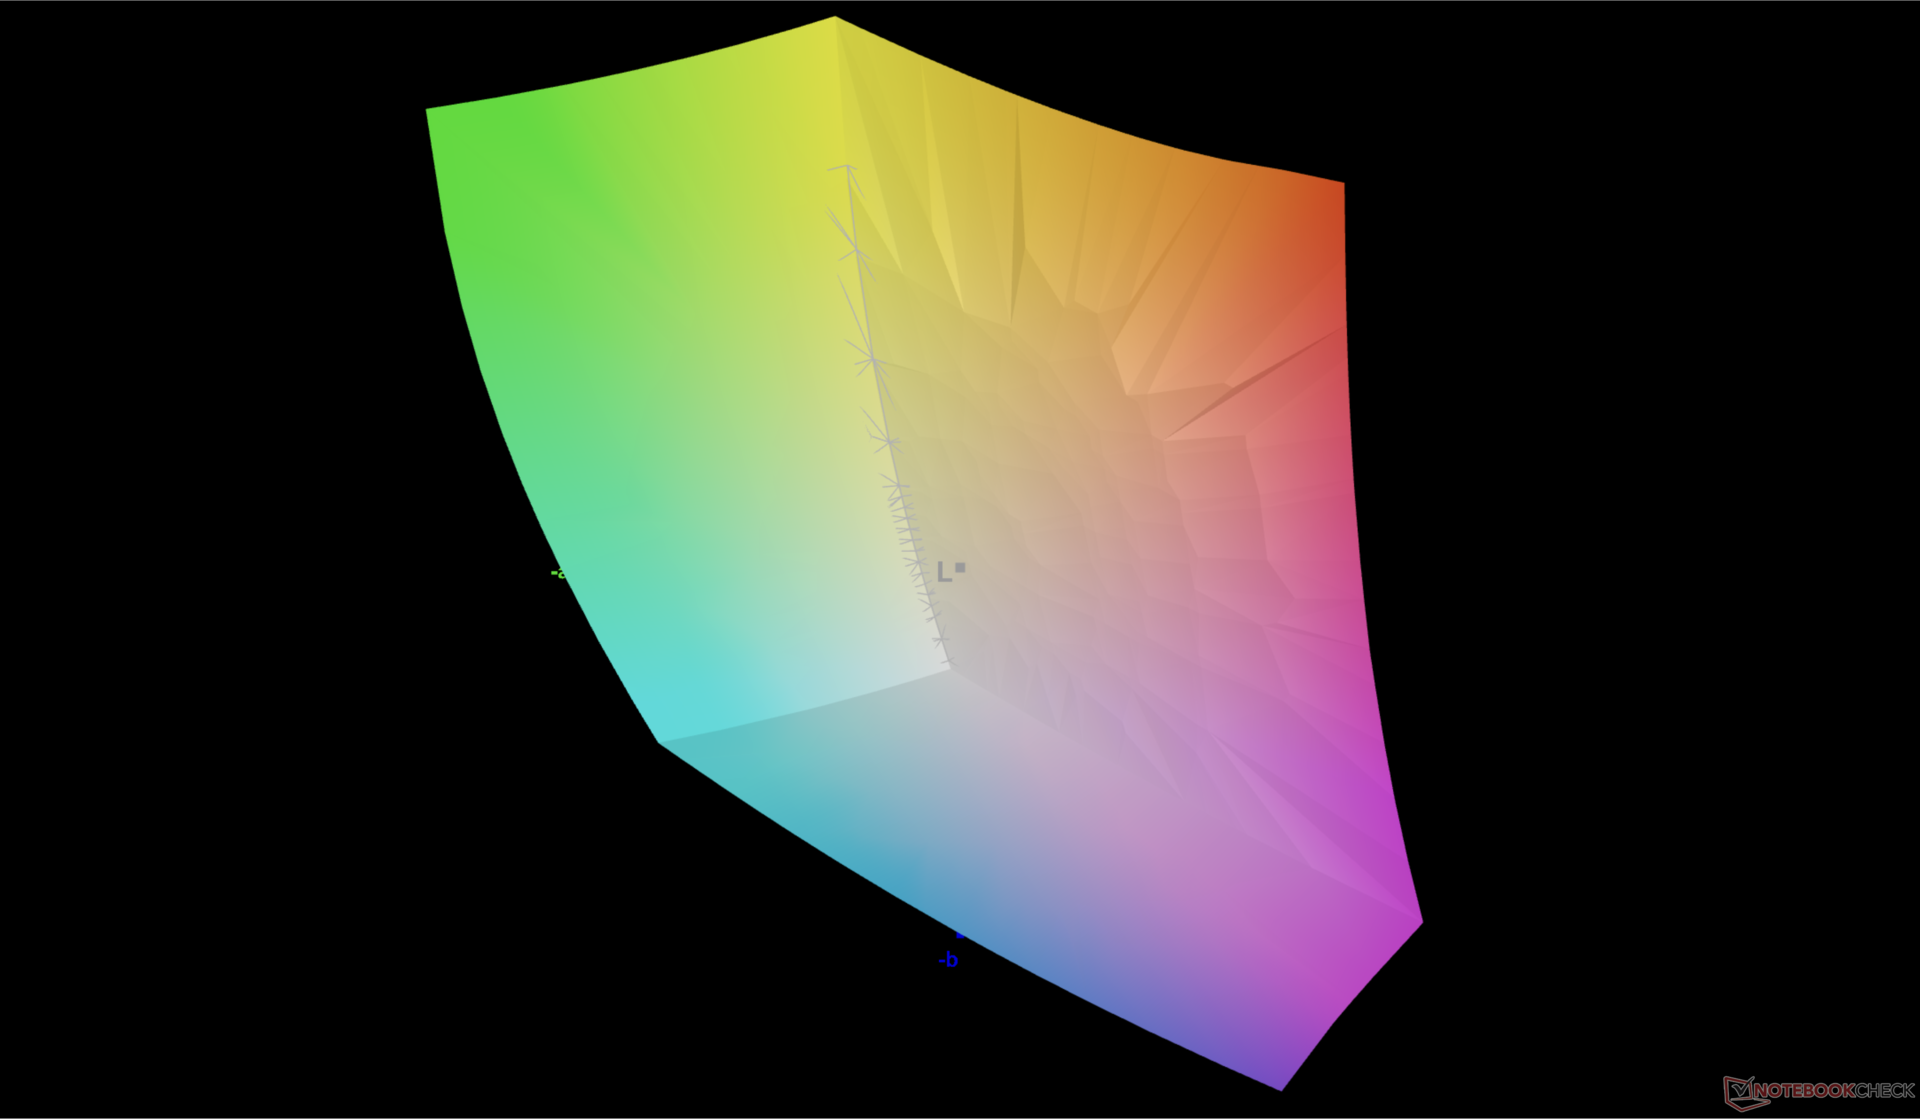
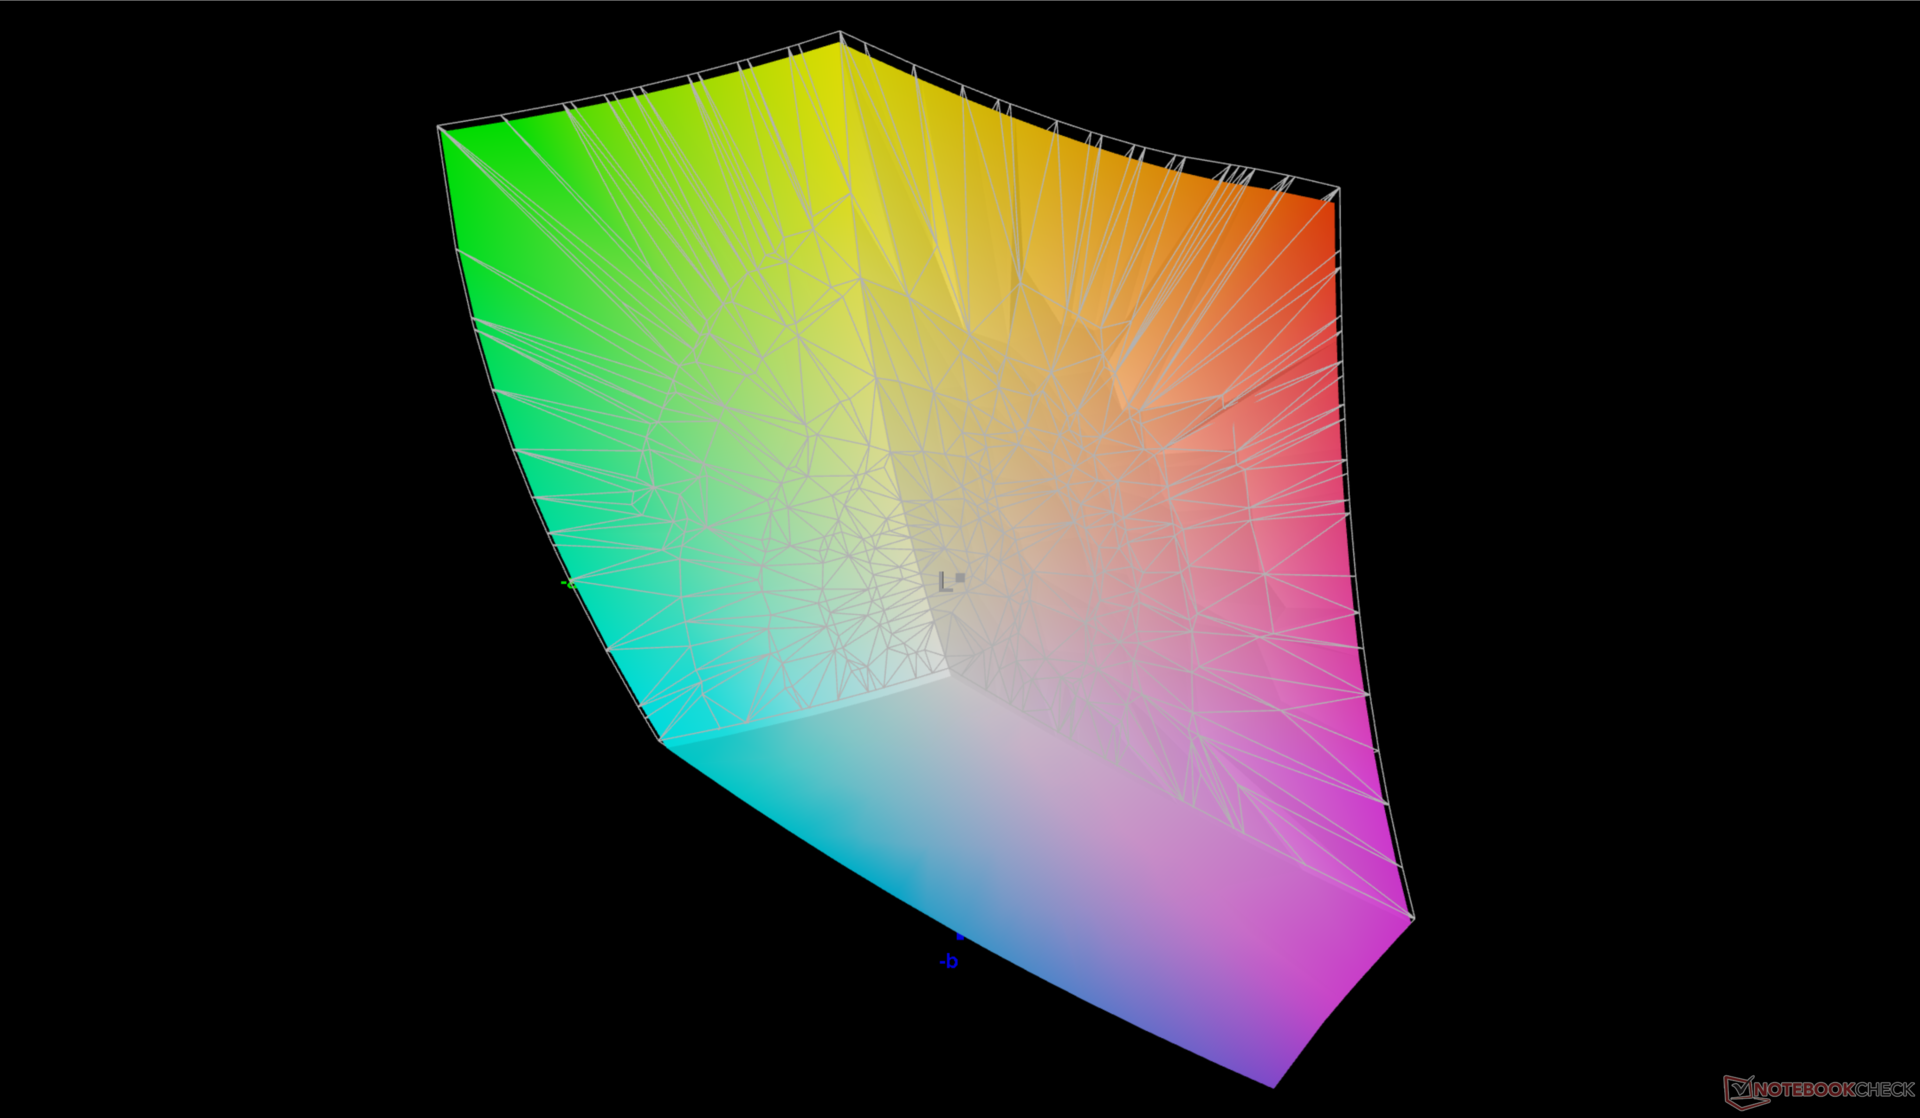
Il nostro particolare pannello IPS 4K è un'offerta di fascia alta, con i suoi ampi colori P3 e i buoni tempi di risposta del bianco-nero e del grigio-grigio, adatto sia alla creazione di contenuti che alle applicazioni di gioco. Tuttavia, l'overlay opaco non è così nitido come un'alternativa lucida e il rapporto di contrasto è limitato a soli ~1000:1. Fortunatamente, HP offre un'opzione OLED per risolvere direttamente queste due carenze.
| |||||||||||||||||||||||||
Distribuzione della luminosità: 83 %
Al centro con la batteria: 451.7 cd/m²
Contrasto: 931:1 (Nero: 0.57 cd/m²)
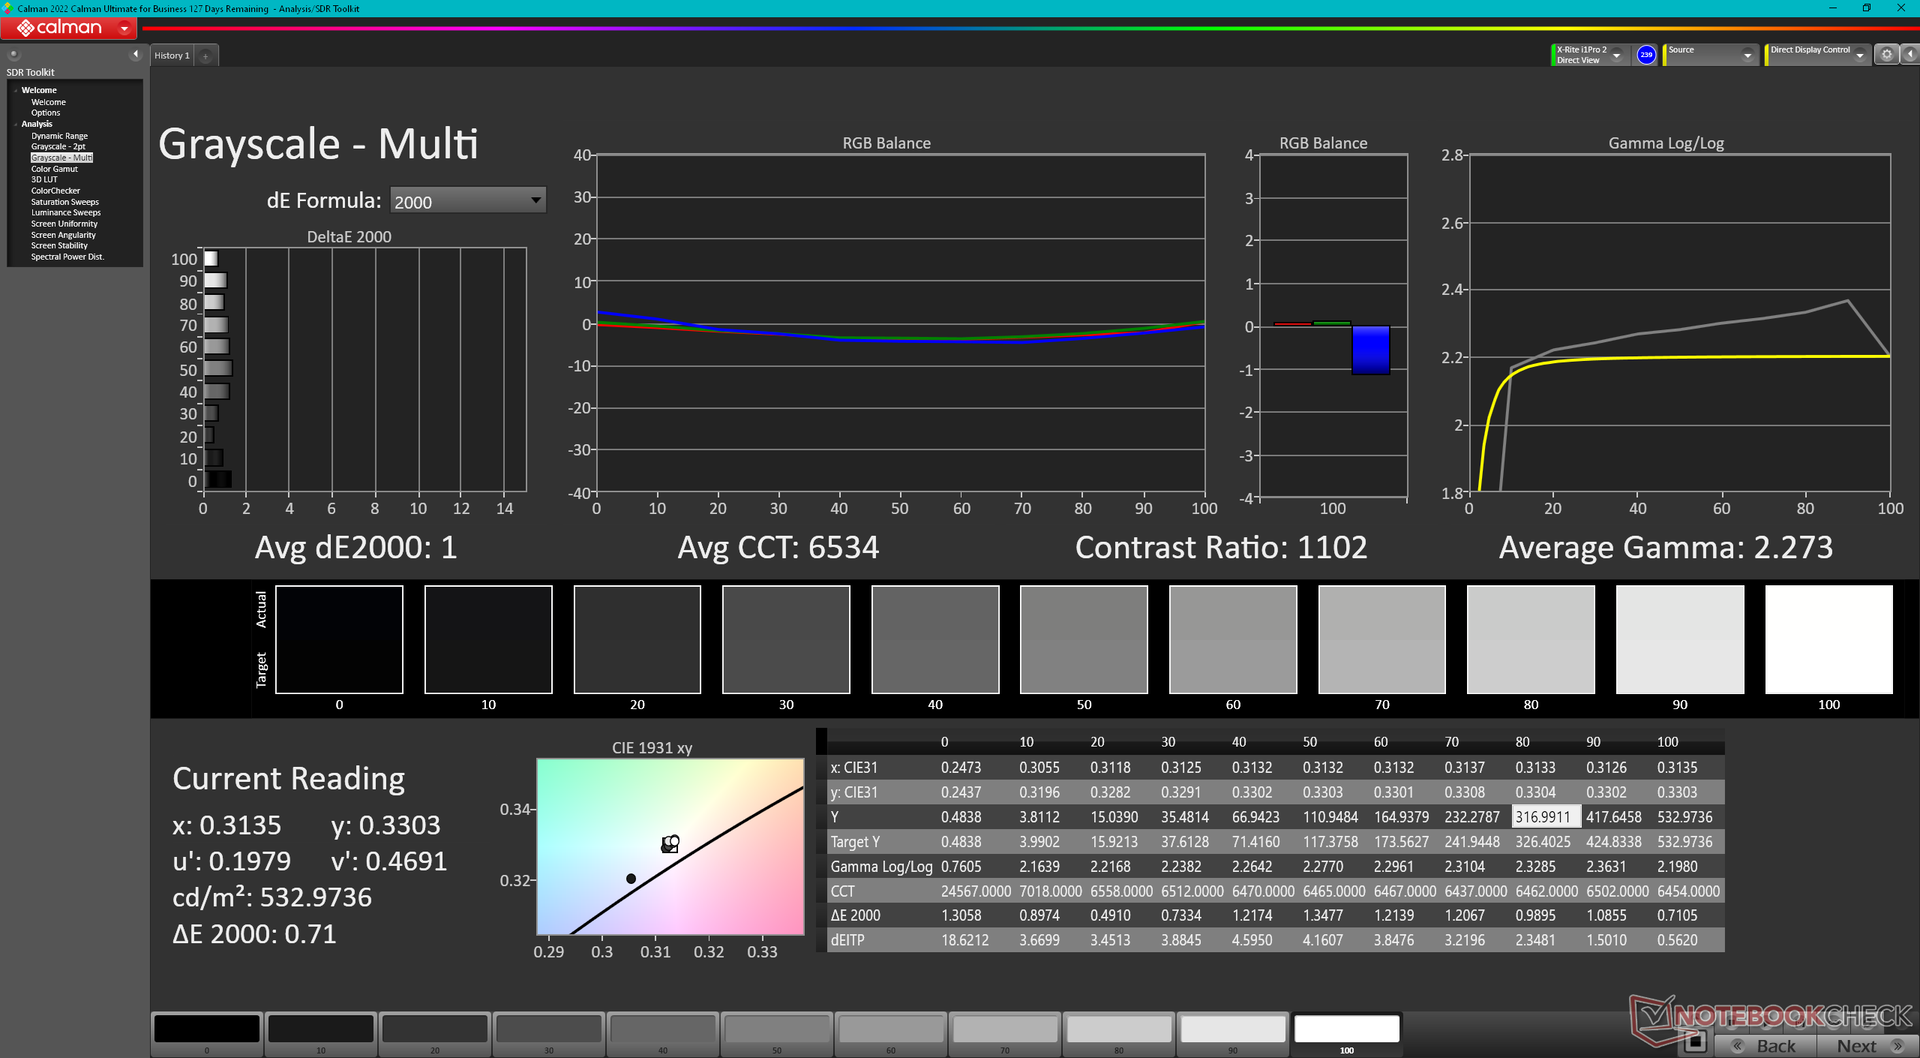
ΔE ColorChecker Calman: 2.26 | ∀{0.5-29.43 Ø4.73}
calibrated: 4.73
ΔE Greyscale Calman: 1 | ∀{0.09-98 Ø4.97}
86.3% AdobeRGB 1998 (Argyll 3D)
99.9% sRGB (Argyll 3D)
97.4% Display P3 (Argyll 3D)
Gamma: 2.28
CCT: 6543 K
| HP ZBook Fury 16 G9 BOE0A52, IPS, 3840x2400, 16" | HP ZBook Studio 16 G9 62U04EA BOE0A52, IPS, 3840x2400, 16" | HP ZBook Firefly 16 G9-6B897EA BOE0A02, IPS, 1920x1200, 16" | Lenovo ThinkPad P16 G1 RTX A5500 LP160UQ1-SPB1, IPS, 3840x2400, 16" | Dell Precision 7000 7670 Performance Samsung 160YV03, OLED, 3840x2400, 16" | MSI CreatorPro Z16P B12UKST B160QAN02.N, IPS, 2560x1600, 16" | |
|---|---|---|---|---|---|---|
| Display | 0% | -18% | -2% | 6% | 0% | |
| Display P3 Coverage (%) | 97.4 | 97.5 0% | 68.1 -30% | 82.9 -15% | 99.9 3% | 97.6 0% |
| sRGB Coverage (%) | 99.9 | 99.9 0% | 96.1 -4% | 98.9 -1% | 100 0% | 99.9 0% |
| AdobeRGB 1998 Coverage (%) | 86.3 | 86.3 0% | 70 -19% | 95.9 11% | 98.1 14% | 87.4 1% |
| Response Times | 9% | -206% | -281% | 83% | 11% | |
| Response Time Grey 50% / Grey 80% * (ms) | 13.7 ? | 15.3 ? -12% | 52.8 ? -285% | 45.6 ? -233% | 1.84 ? 87% | 12.8 ? 7% |
| Response Time Black / White * (ms) | 8.6 ? | 6.1 ? 29% | 19.5 ? -127% | 36.8 ? -328% | 1.92 ? 78% | 7.4 ? 14% |
| PWM Frequency (Hz) | 59.52 ? | |||||
| Screen | 18% | -40% | -12% | -61% | 5% | |
| Brightness middle (cd/m²) | 530.5 | 554 4% | 526 -1% | 601.9 13% | 325.2 -39% | 407 -23% |
| Brightness (cd/m²) | 476 | 516 8% | 499 5% | 569 20% | 328 -31% | 388 -18% |
| Brightness Distribution (%) | 83 | 84 1% | 93 12% | 77 -7% | 97 17% | 88 6% |
| Black Level * (cd/m²) | 0.57 | 0.47 18% | 0.31 46% | 0.47 18% | 0.36 37% | |
| Contrast (:1) | 931 | 1179 27% | 1697 82% | 1281 38% | 1131 21% | |
| Colorchecker dE 2000 * | 2.26 | 1 56% | 3.6 -59% | 2.45 -8% | 4.59 -103% | 1.3 42% |
| Colorchecker dE 2000 calibrated * | 4.73 | 0.6 87% | 2.6 45% | 0.7 85% | ||
| Greyscale dE 2000 * | 1 | 1.6 -60% | 5.5 -450% | 2.6 -160% | 2.5 -150% | 2.1 -110% |
| Gamma | 2.28 96% | 2.29 96% | 2.02 109% | 2.3 96% | 2.1 105% | 2.26 97% |
| CCT | 6543 99% | 6458 101% | 6527 100% | 6805 96% | 6541 99% | 6437 101% |
| Colorchecker dE 2000 max. * | 2.4 | 6.6 | 4.46 | 7.65 | 2.5 | |
| Media totale (Programma / Settaggio) | 9% /
12% | -88% /
-60% | -98% /
-54% | 9% /
-12% | 5% /
5% |
* ... Meglio usare valori piccoli
Il display è calibrato in base allo standard P3, con valori medi di DeltaE in scala di grigi e a colori pari rispettivamente a 1,0 e 2,26.
Tempi di risposta del Display
| ↔ Tempi di risposta dal Nero al Bianco | ||
|---|---|---|
| 8.6 ms ... aumenta ↗ e diminuisce ↘ combinato | ↗ 4.7 ms Incremento | 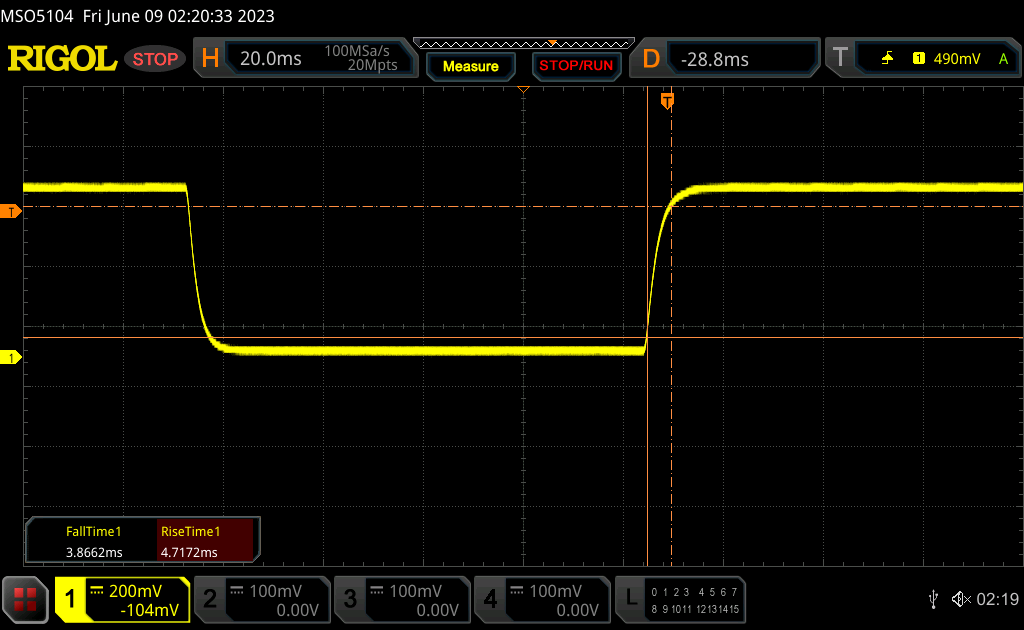 |
| ↘ 3.9 ms Calo | ||
| Lo schermo mostra veloci tempi di risposta durante i nostri tests e dovrebbe esere adatto al gaming In confronto, tutti i dispositivi di test variano da 0.1 (minimo) a 240 (massimo) ms. » 24 % di tutti i dispositivi è migliore. Questo significa che i tempi di risposta rilevati sono migliori rispettto alla media di tutti i dispositivi testati (19.9 ms). | ||
| ↔ Tempo di risposta dal 50% Grigio all'80% Grigio | ||
| 13.7 ms ... aumenta ↗ e diminuisce ↘ combinato | ↗ 6.6 ms Incremento | 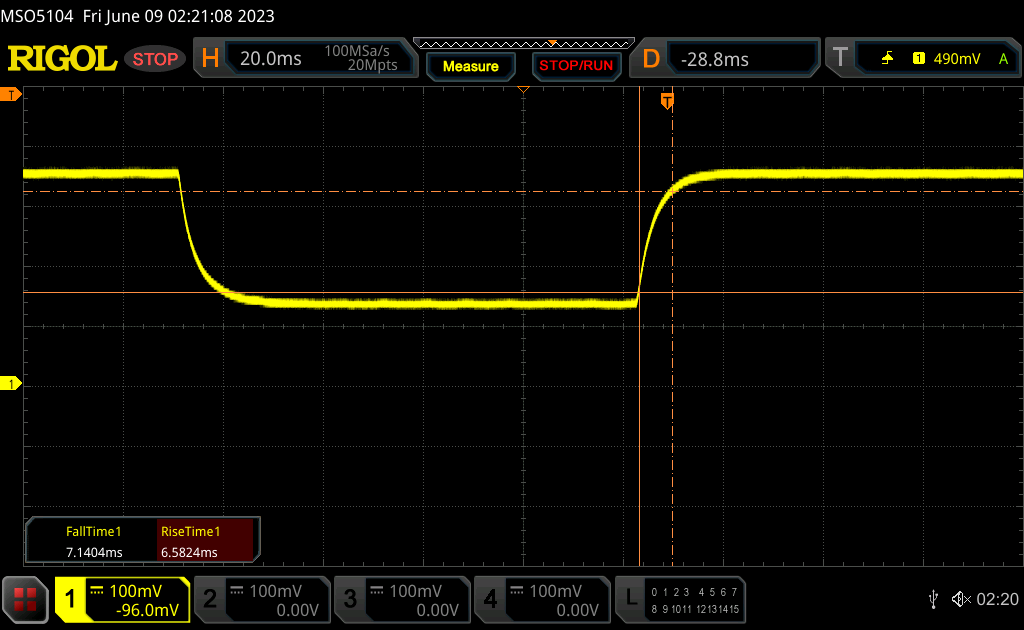 |
| ↘ 7.1 ms Calo | ||
| Lo schermo mostra buoni tempi di risposta durante i nostri tests, ma potrebbe essere troppo lento per i gamers competitivi. In confronto, tutti i dispositivi di test variano da 0.165 (minimo) a 636 (massimo) ms. » 27 % di tutti i dispositivi è migliore. Questo significa che i tempi di risposta rilevati sono migliori rispettto alla media di tutti i dispositivi testati (31.1 ms). | ||
Sfarfallio dello schermo / PWM (Pulse-Width Modulation)
| flickering dello schermo / PWM non rilevato | 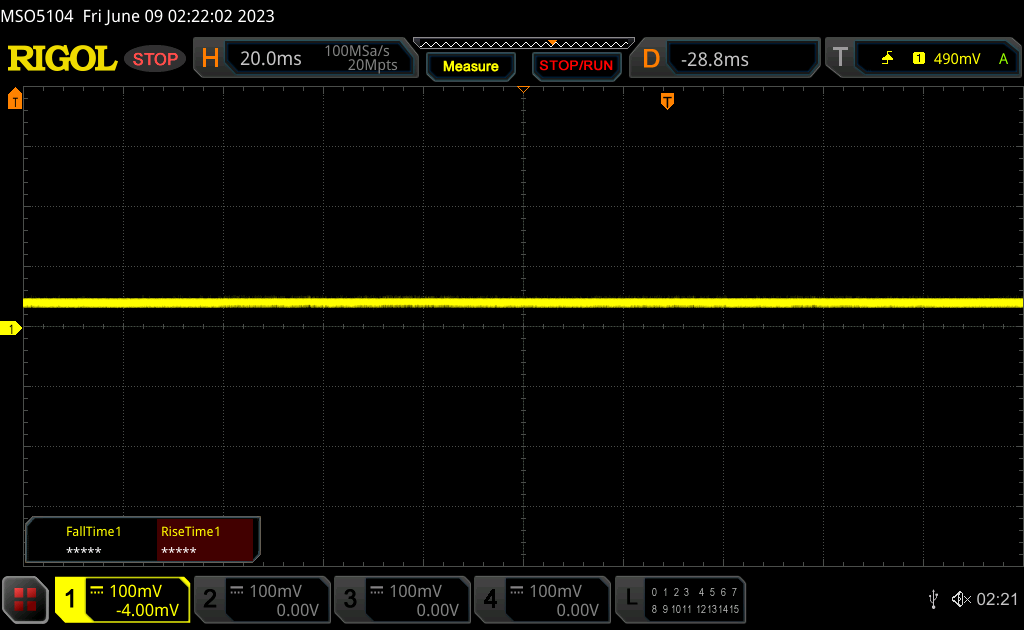 | ||
In confronto: 52 % di tutti i dispositivi testati non utilizza PWM per ridurre la luminosita' del display. Se è rilevato PWM, una media di 7798 (minimo: 5 - massimo: 343500) Hz è stata rilevata. | |||
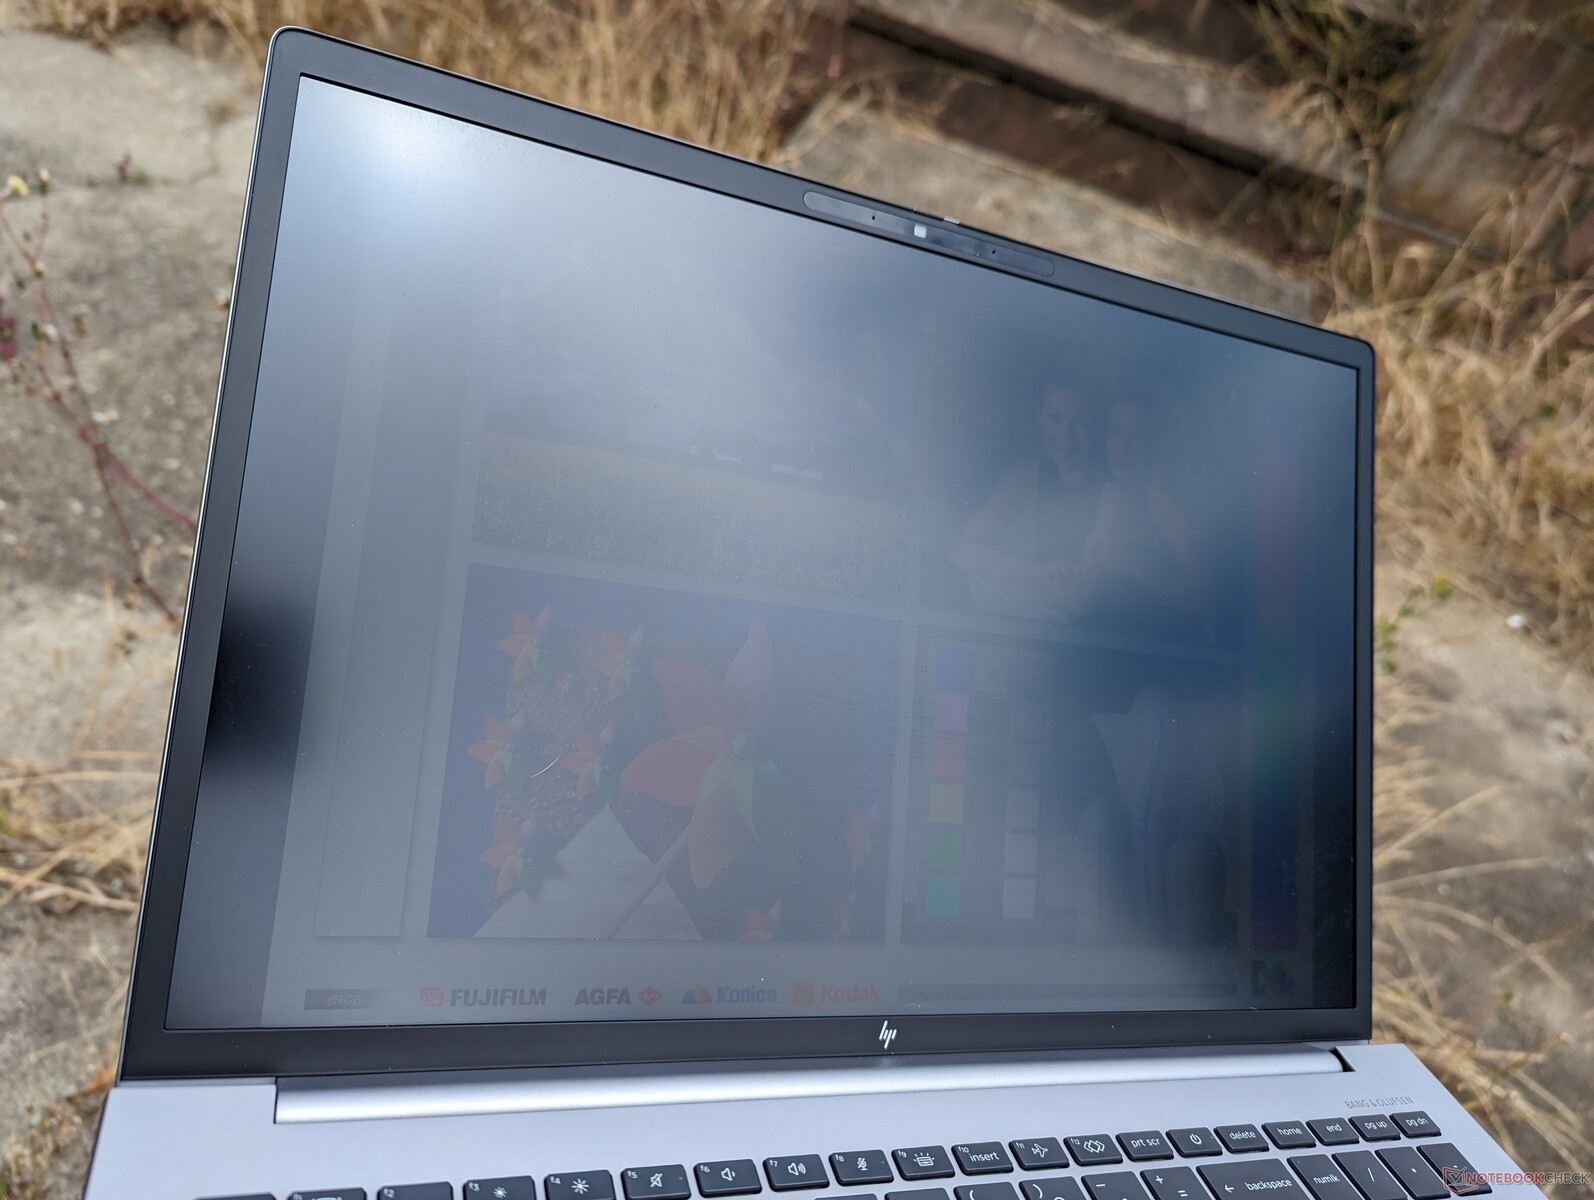
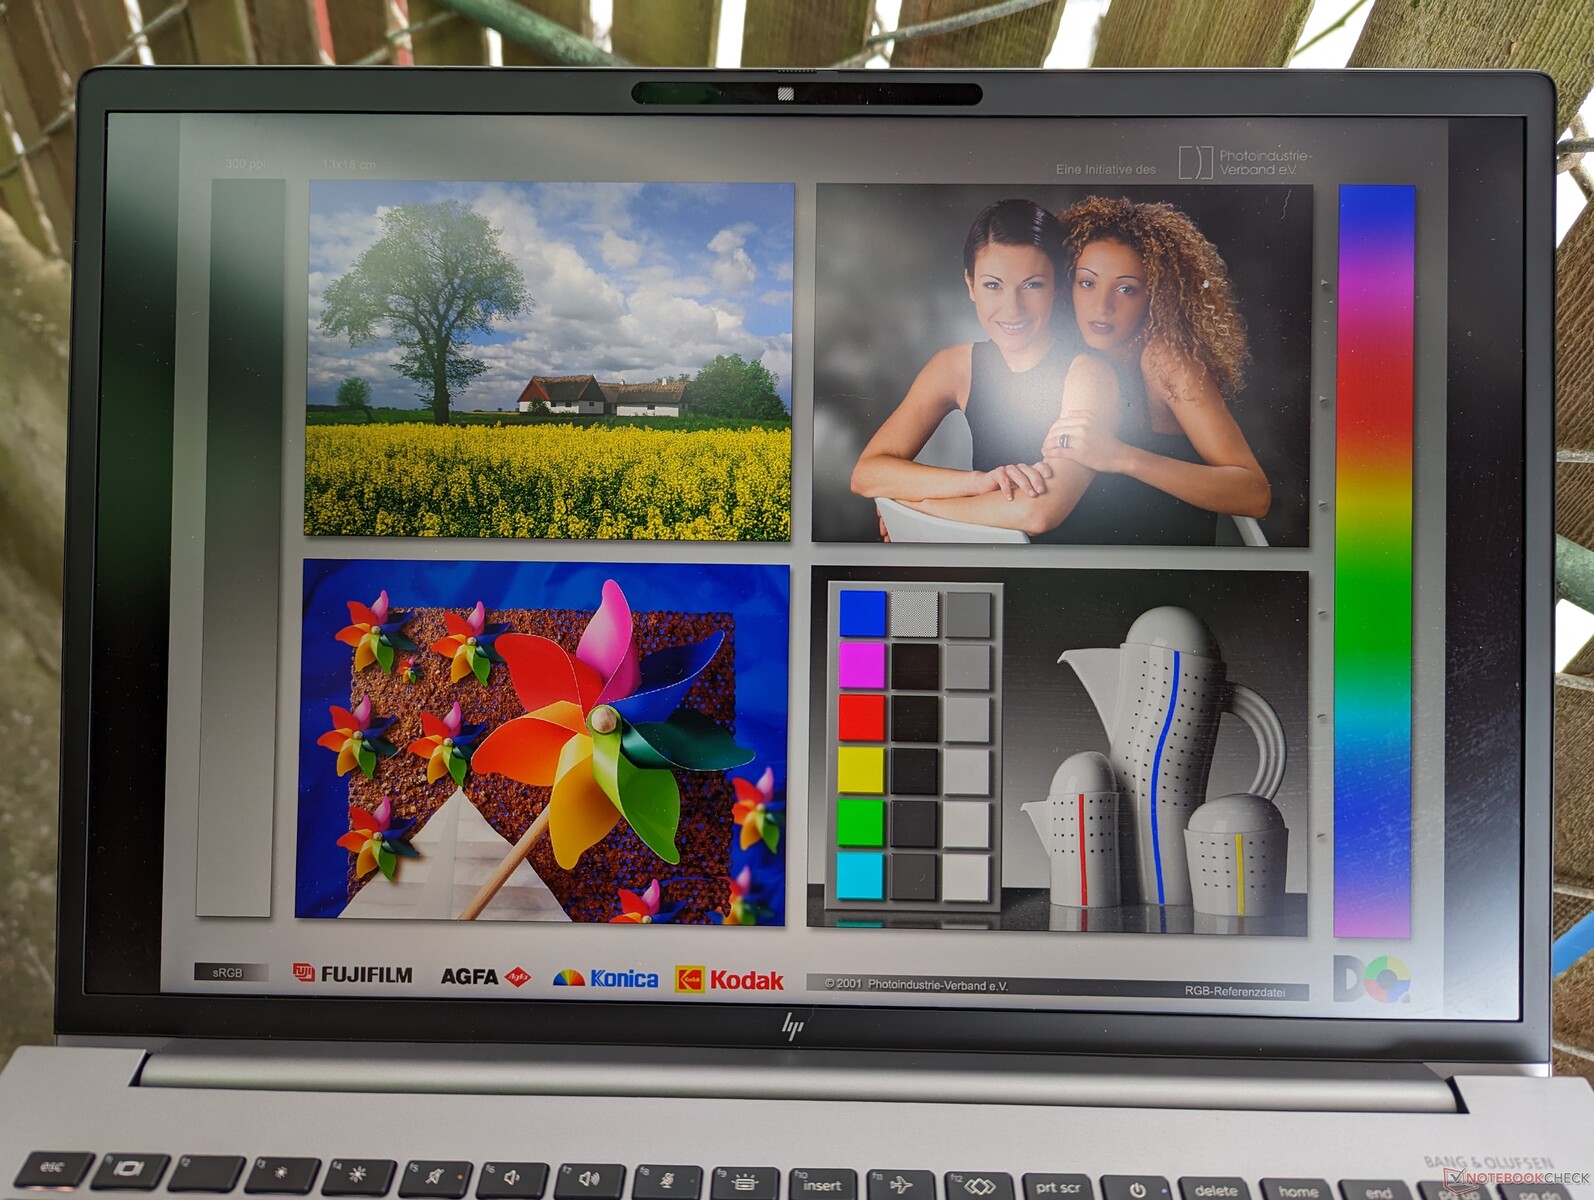
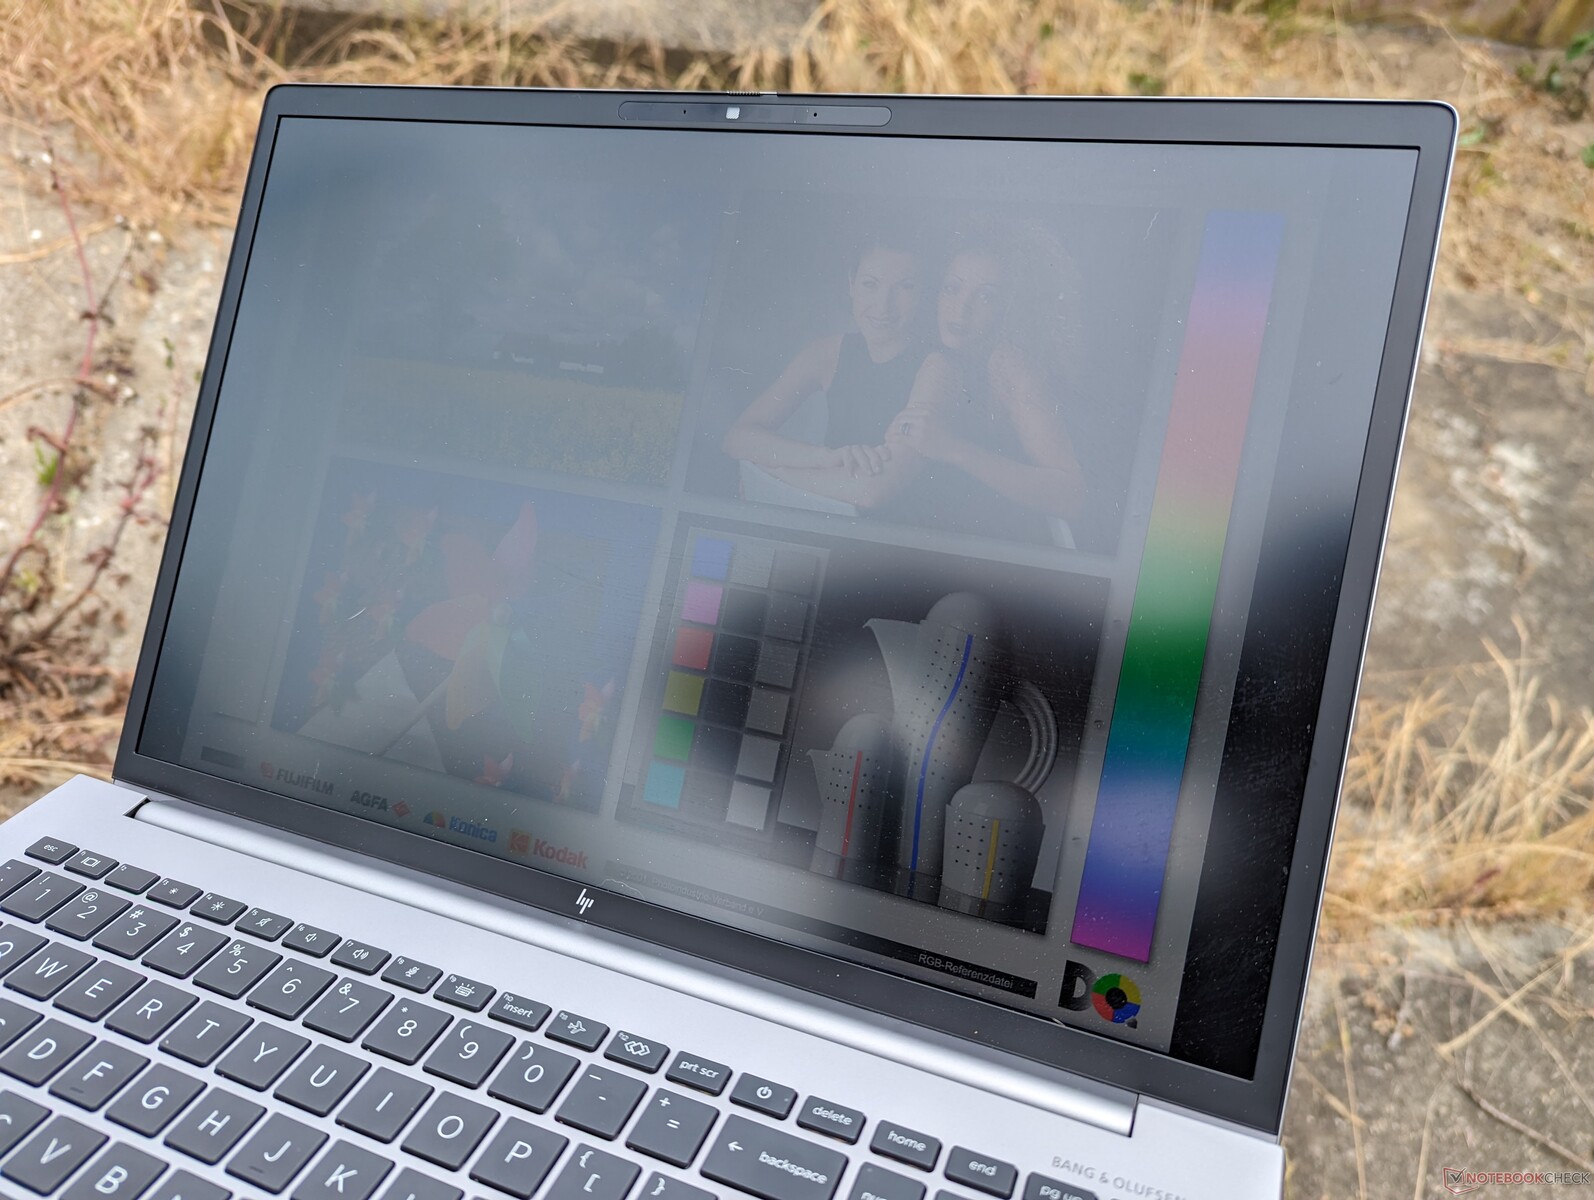
La visibilità all'aperto è discreta all'ombra e paragonabile a quella di molti Ultrabook consumer, dato che 400 nit è un obiettivo comune. HP offre un'opzione molto più luminosa da 1000 nit se la visibilità all'aperto è una priorità, ma i pannelli sono limitati a IPS e a una risoluzione di soli 1920 x 1200 per ora.
Vale la pena notare che il risparmio energetico del display è abilitato per impostazione predefinita, il che significa che la luminosità massima del display diminuirà fino a 80 nits se si utilizza la batteria. Per evitare che ciò accada, avviare Intel Graphics Command Center e accedere ai sottomenu System e Power per disattivare Display Power Savings.
Prestazioni - Intel Alder Lake-H di 12a generazione con Nvidia RTX Ampere
Condizioni di test
Abbiamo impostato la nostra unità in modalità Performance prima di eseguire i benchmark qui sotto. HP non ha altri profili di alimentazione oltre a quelli standard di Windows e non sono supportate funzioni avanzate come Optimus 2.0 o MUX.
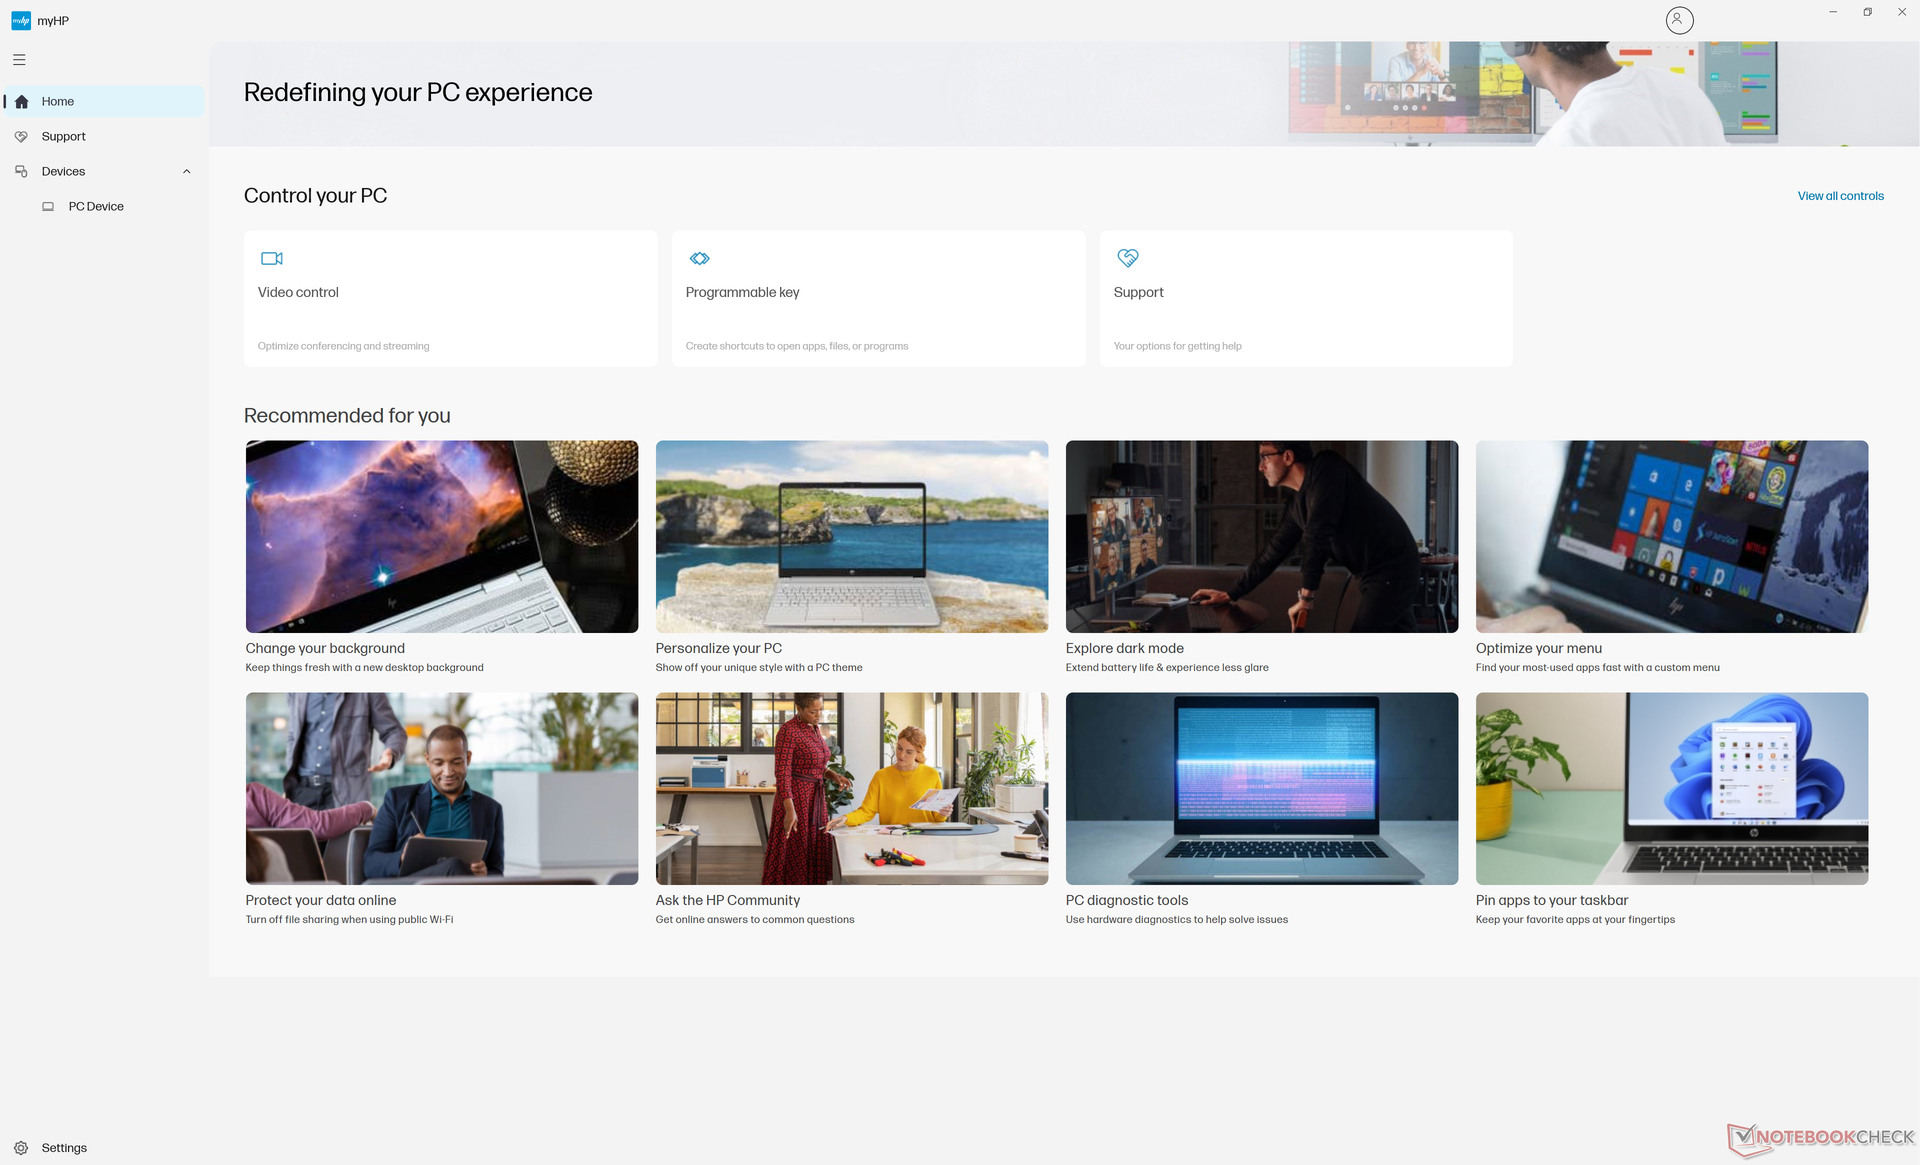
Si consiglia agli utenti di familiarizzare con MyHP e Z Light Space per gli aggiornamenti software specifici di HP e le impostazioni della tastiera RGB, rispettivamente.
Processore
Il Core i9-12950HX di 12a generazione Core i9-12950HX è stata una delle CPU mobili più veloci disponibili con supporto vPro ed ECC fino al lancio del Core i9-12950HX di 13a generazione Core i9-13950HX. Per quanto riguarda le opzioni di 13a generazione, la Fury 16 G10 ha recentemente iniziato ad essere commercializzata.
Il processore del nostro HP ha prestazioni leggermente inferiori di circa il 5% rispetto alla media dei portatili del nostro database equipaggiati con la stessa CPU Core i9-12950HX. Ancora peggio, la CPU sembra subire un throttling più marcato quando viene sottoposta a lunghi periodi di stress. Quando si esegue CineBench R15 xT in loop, ad esempio, le prestazioni calano di circa il 20% dopo il settimo o l'ottavo loop. Il ThinkPad P16 G1 Recensione della workstation Lenovo ThinkPad P16 G1 RTX A5500: Più veloce del Dell Precision 7670 sperimenta un grado di throttling della CPU meno marcato, come mostra il nostro grafico di confronto qui sotto.
Il passaggio alla configurazione Core i7-12850HX dal nostro Core i9-12950HX dovrebbe avere un impatto sulle prestazioni sia single che multi-thread di circa il 15-20%.
Cinebench R15 Multi Loop
Cinebench R23: Multi Core | Single Core
Cinebench R20: CPU (Multi Core) | CPU (Single Core)
Cinebench R15: CPU Multi 64Bit | CPU Single 64Bit
Blender: v2.79 BMW27 CPU
7-Zip 18.03: 7z b 4 | 7z b 4 -mmt1
Geekbench 5.5: Multi-Core | Single-Core
HWBOT x265 Benchmark v2.2: 4k Preset
LibreOffice : 20 Documents To PDF
R Benchmark 2.5: Overall mean
* ... Meglio usare valori piccoli
AIDA64: FP32 Ray-Trace | FPU Julia | CPU SHA3 | CPU Queen | FPU SinJulia | FPU Mandel | CPU AES | CPU ZLib | FP64 Ray-Trace | CPU PhotoWorxx
| Performance rating | |
| Media Intel Core i9-12950HX | |
| Lenovo ThinkPad P16 G1 RTX A5500 | |
| HP ZBook Fury 16 G9 | |
| MSI CreatorPro Z16P B12UKST | |
| HP ZBook Studio 16 G9 62U04EA | |
| Dell Precision 7000 7670 Performance | |
| HP ZBook Firefly 16 G9-6B897EA | |
| AIDA64 / FP32 Ray-Trace | |
| Lenovo ThinkPad P16 G1 RTX A5500 | |
| Media Intel Core i9-12950HX (15499 - 22868, n=7) | |
| HP ZBook Fury 16 G9 | |
| Dell Precision 7000 7670 Performance | |
| HP ZBook Studio 16 G9 62U04EA | |
| MSI CreatorPro Z16P B12UKST | |
| HP ZBook Firefly 16 G9-6B897EA | |
| AIDA64 / FPU Julia | |
| HP ZBook Fury 16 G9 | |
| Lenovo ThinkPad P16 G1 RTX A5500 | |
| Media Intel Core i9-12950HX (77846 - 115907, n=7) | |
| HP ZBook Studio 16 G9 62U04EA | |
| Dell Precision 7000 7670 Performance | |
| MSI CreatorPro Z16P B12UKST | |
| HP ZBook Firefly 16 G9-6B897EA | |
| AIDA64 / CPU SHA3 | |
| Lenovo ThinkPad P16 G1 RTX A5500 | |
| Media Intel Core i9-12950HX (3426 - 5069, n=7) | |
| HP ZBook Fury 16 G9 | |
| HP ZBook Studio 16 G9 62U04EA | |
| MSI CreatorPro Z16P B12UKST | |
| Dell Precision 7000 7670 Performance | |
| HP ZBook Firefly 16 G9-6B897EA | |
| AIDA64 / CPU Queen | |
| HP ZBook Studio 16 G9 62U04EA | |
| Media Intel Core i9-12950HX (102752 - 104726, n=7) | |
| Lenovo ThinkPad P16 G1 RTX A5500 | |
| Dell Precision 7000 7670 Performance | |
| HP ZBook Fury 16 G9 | |
| MSI CreatorPro Z16P B12UKST | |
| HP ZBook Firefly 16 G9-6B897EA | |
| AIDA64 / FPU SinJulia | |
| Lenovo ThinkPad P16 G1 RTX A5500 | |
| HP ZBook Fury 16 G9 | |
| Media Intel Core i9-12950HX (10134 - 12823, n=7) | |
| Dell Precision 7000 7670 Performance | |
| HP ZBook Studio 16 G9 62U04EA | |
| MSI CreatorPro Z16P B12UKST | |
| HP ZBook Firefly 16 G9-6B897EA | |
| AIDA64 / FPU Mandel | |
| HP ZBook Fury 16 G9 | |
| Lenovo ThinkPad P16 G1 RTX A5500 | |
| Media Intel Core i9-12950HX (37146 - 57340, n=7) | |
| HP ZBook Studio 16 G9 62U04EA | |
| Dell Precision 7000 7670 Performance | |
| MSI CreatorPro Z16P B12UKST | |
| HP ZBook Firefly 16 G9-6B897EA | |
| AIDA64 / CPU ZLib | |
| Lenovo ThinkPad P16 G1 RTX A5500 | |
| HP ZBook Fury 16 G9 | |
| Media Intel Core i9-12950HX (996 - 1417, n=7) | |
| HP ZBook Studio 16 G9 62U04EA | |
| MSI CreatorPro Z16P B12UKST | |
| Dell Precision 7000 7670 Performance | |
| HP ZBook Firefly 16 G9-6B897EA | |
| AIDA64 / FP64 Ray-Trace | |
| Lenovo ThinkPad P16 G1 RTX A5500 | |
| Media Intel Core i9-12950HX (8455 - 12432, n=7) | |
| HP ZBook Fury 16 G9 | |
| HP ZBook Studio 16 G9 62U04EA | |
| Dell Precision 7000 7670 Performance | |
| MSI CreatorPro Z16P B12UKST | |
| HP ZBook Firefly 16 G9-6B897EA | |
| AIDA64 / CPU PhotoWorxx | |
| MSI CreatorPro Z16P B12UKST | |
| Dell Precision 7000 7670 Performance | |
| Media Intel Core i9-12950HX (35479 - 42655, n=7) | |
| Lenovo ThinkPad P16 G1 RTX A5500 | |
| HP ZBook Fury 16 G9 | |
| HP ZBook Studio 16 G9 62U04EA | |
| HP ZBook Firefly 16 G9-6B897EA | |
Prestazioni del sistema
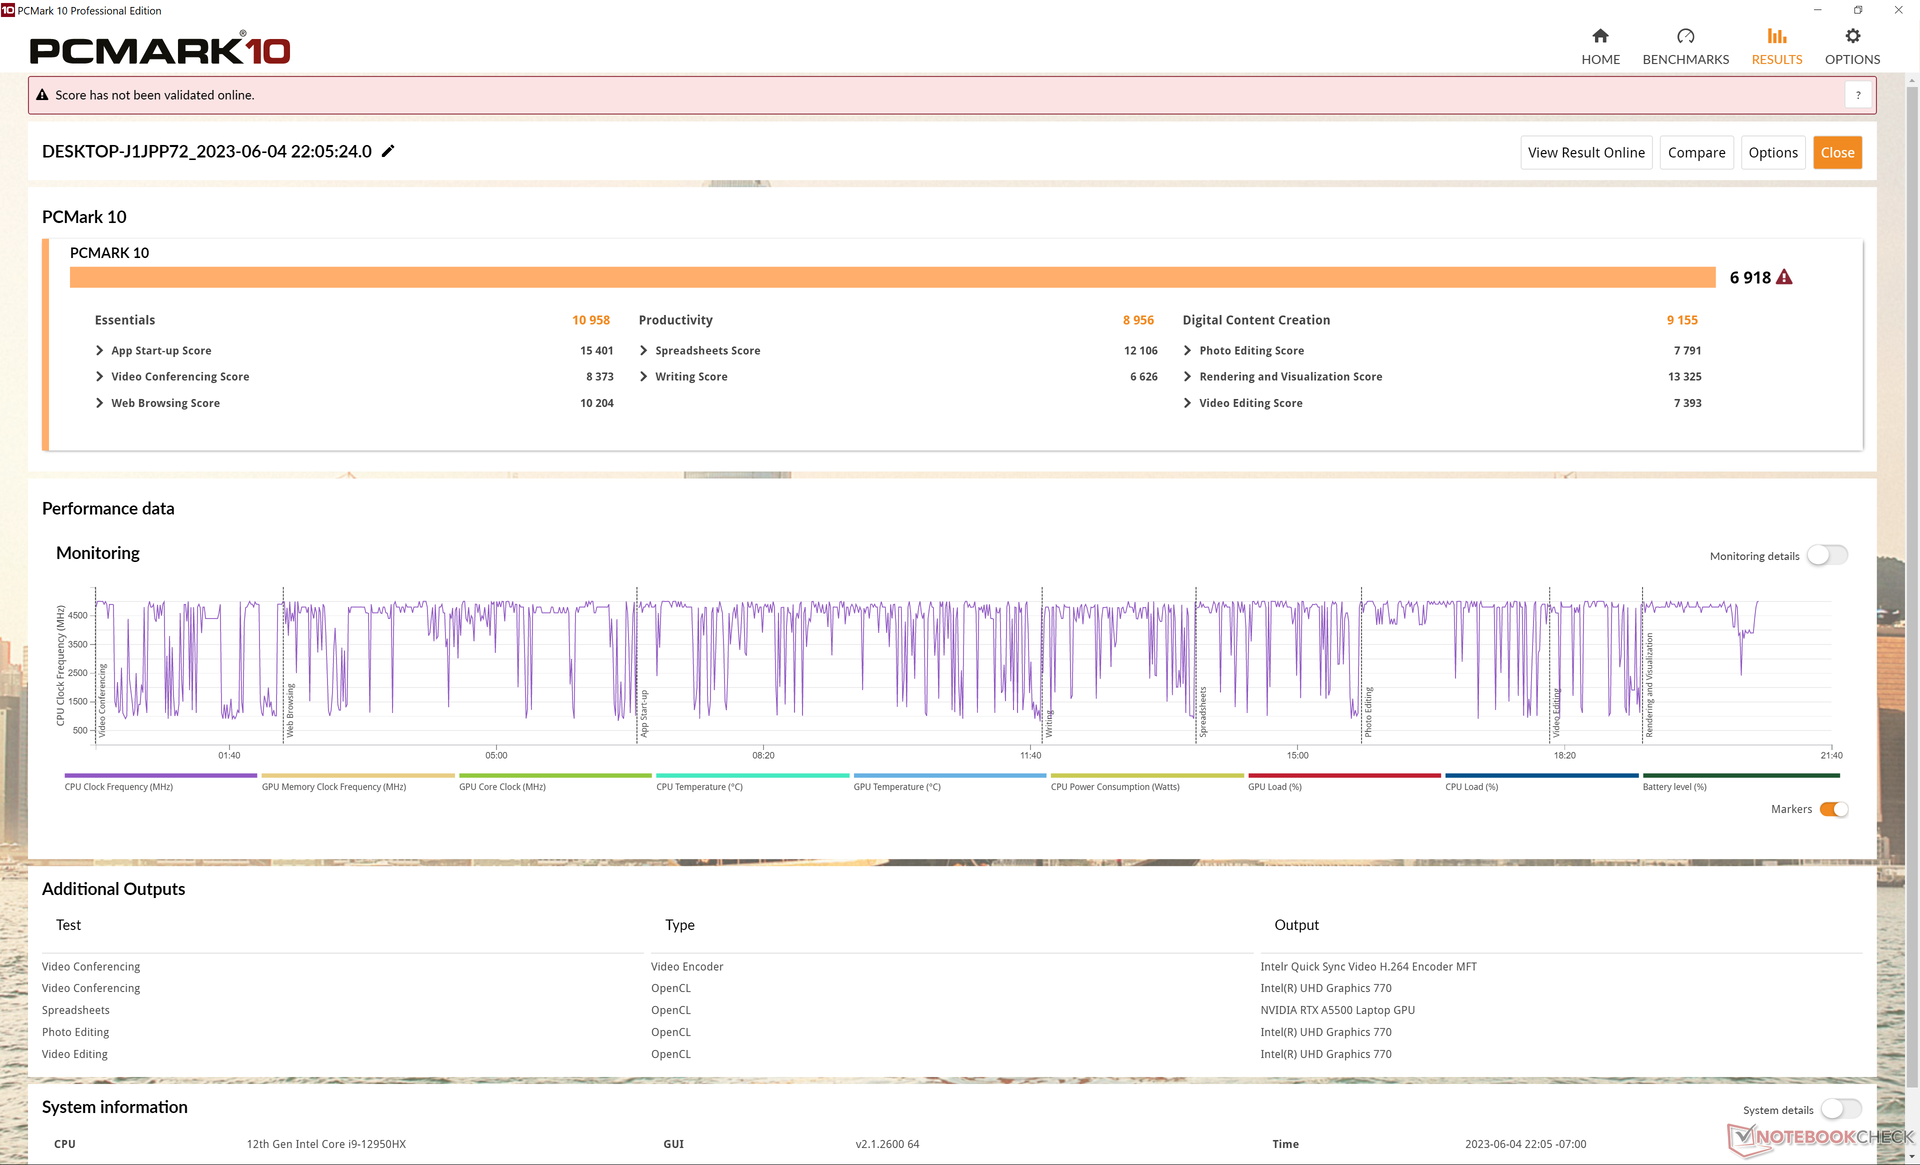
I risultati di PCMark sono paragonabili a quelli del Dell Precision 7670 e del Lenovo ThinkPad P16 G1. Si noti il vantaggio significativo rispetto al più piccolo ZBook Firefly 16 G9 nel sottotest Creazione di contenuti digitali, grazie alla più veloce GPU RTX A5500 del nostro Fury 16 G9.
CrossMark: Overall | Productivity | Creativity | Responsiveness
| PCMark 10 / Score | |
| Lenovo ThinkPad P16 G1 RTX A5500 | |
| MSI CreatorPro Z16P B12UKST | |
| Media Intel Core i9-12950HX, NVIDIA RTX A5500 Laptop GPU (6883 - 7236, n=3) | |
| HP ZBook Fury 16 G9 | |
| Dell Precision 7000 7670 Performance | |
| HP ZBook Studio 16 G9 62U04EA | |
| HP ZBook Firefly 16 G9-6B897EA | |
| PCMark 10 / Essentials | |
| Dell Precision 7000 7670 Performance | |
| Media Intel Core i9-12950HX, NVIDIA RTX A5500 Laptop GPU (10898 - 11465, n=3) | |
| HP ZBook Fury 16 G9 | |
| Lenovo ThinkPad P16 G1 RTX A5500 | |
| MSI CreatorPro Z16P B12UKST | |
| HP ZBook Firefly 16 G9-6B897EA | |
| HP ZBook Studio 16 G9 62U04EA | |
| PCMark 10 / Productivity | |
| Lenovo ThinkPad P16 G1 RTX A5500 | |
| MSI CreatorPro Z16P B12UKST | |
| HP ZBook Fury 16 G9 | |
| Media Intel Core i9-12950HX, NVIDIA RTX A5500 Laptop GPU (8054 - 9489, n=3) | |
| HP ZBook Firefly 16 G9-6B897EA | |
| Dell Precision 7000 7670 Performance | |
| HP ZBook Studio 16 G9 62U04EA | |
| PCMark 10 / Digital Content Creation | |
| Lenovo ThinkPad P16 G1 RTX A5500 | |
| MSI CreatorPro Z16P B12UKST | |
| Dell Precision 7000 7670 Performance | |
| Media Intel Core i9-12950HX, NVIDIA RTX A5500 Laptop GPU (9155 - 9944, n=3) | |
| HP ZBook Studio 16 G9 62U04EA | |
| HP ZBook Fury 16 G9 | |
| HP ZBook Firefly 16 G9-6B897EA | |
| CrossMark / Overall | |
| MSI CreatorPro Z16P B12UKST | |
| HP ZBook Fury 16 G9 | |
| Lenovo ThinkPad P16 G1 RTX A5500 | |
| Media Intel Core i9-12950HX, NVIDIA RTX A5500 Laptop GPU (1801 - 1889, n=3) | |
| HP ZBook Studio 16 G9 62U04EA | |
| Dell Precision 7000 7670 Performance | |
| HP ZBook Firefly 16 G9-6B897EA | |
| CrossMark / Productivity | |
| MSI CreatorPro Z16P B12UKST | |
| HP ZBook Fury 16 G9 | |
| Lenovo ThinkPad P16 G1 RTX A5500 | |
| Media Intel Core i9-12950HX, NVIDIA RTX A5500 Laptop GPU (1684 - 1785, n=3) | |
| HP ZBook Studio 16 G9 62U04EA | |
| Dell Precision 7000 7670 Performance | |
| HP ZBook Firefly 16 G9-6B897EA | |
| CrossMark / Creativity | |
| Lenovo ThinkPad P16 G1 RTX A5500 | |
| HP ZBook Fury 16 G9 | |
| Media Intel Core i9-12950HX, NVIDIA RTX A5500 Laptop GPU (2042 - 2192, n=3) | |
| HP ZBook Studio 16 G9 62U04EA | |
| MSI CreatorPro Z16P B12UKST | |
| Dell Precision 7000 7670 Performance | |
| HP ZBook Firefly 16 G9-6B897EA | |
| CrossMark / Responsiveness | |
| MSI CreatorPro Z16P B12UKST | |
| HP ZBook Fury 16 G9 | |
| HP ZBook Studio 16 G9 62U04EA | |
| Media Intel Core i9-12950HX, NVIDIA RTX A5500 Laptop GPU (1501 - 1585, n=3) | |
| Dell Precision 7000 7670 Performance | |
| Lenovo ThinkPad P16 G1 RTX A5500 | |
| HP ZBook Firefly 16 G9-6B897EA | |
| PCMark 10 Score | 6918 punti | |
Aiuto | ||
| AIDA64 / Memory Copy | |
| Dell Precision 7000 7670 Performance | |
| Media Intel Core i9-12950HX (59731 - 64732, n=7) | |
| Lenovo ThinkPad P16 G1 RTX A5500 | |
| MSI CreatorPro Z16P B12UKST | |
| HP ZBook Studio 16 G9 62U04EA | |
| HP ZBook Fury 16 G9 | |
| HP ZBook Firefly 16 G9-6B897EA | |
| AIDA64 / Memory Read | |
| Dell Precision 7000 7670 Performance | |
| Media Intel Core i9-12950HX (59744 - 70359, n=7) | |
| MSI CreatorPro Z16P B12UKST | |
| HP ZBook Studio 16 G9 62U04EA | |
| Lenovo ThinkPad P16 G1 RTX A5500 | |
| HP ZBook Fury 16 G9 | |
| HP ZBook Firefly 16 G9-6B897EA | |
| AIDA64 / Memory Write | |
| MSI CreatorPro Z16P B12UKST | |
| Dell Precision 7000 7670 Performance | |
| HP ZBook Studio 16 G9 62U04EA | |
| Media Intel Core i9-12950HX (57750 - 67899, n=7) | |
| HP ZBook Firefly 16 G9-6B897EA | |
| Lenovo ThinkPad P16 G1 RTX A5500 | |
| HP ZBook Fury 16 G9 | |
| AIDA64 / Memory Latency | |
| MSI CreatorPro Z16P B12UKST | |
| HP ZBook Fury 16 G9 | |
| Lenovo ThinkPad P16 G1 RTX A5500 | |
| HP ZBook Firefly 16 G9-6B897EA | |
| HP ZBook Studio 16 G9 62U04EA | |
| Media Intel Core i9-12950HX (84.5 - 92.2, n=7) | |
| Dell Precision 7000 7670 Performance | |
* ... Meglio usare valori piccoli
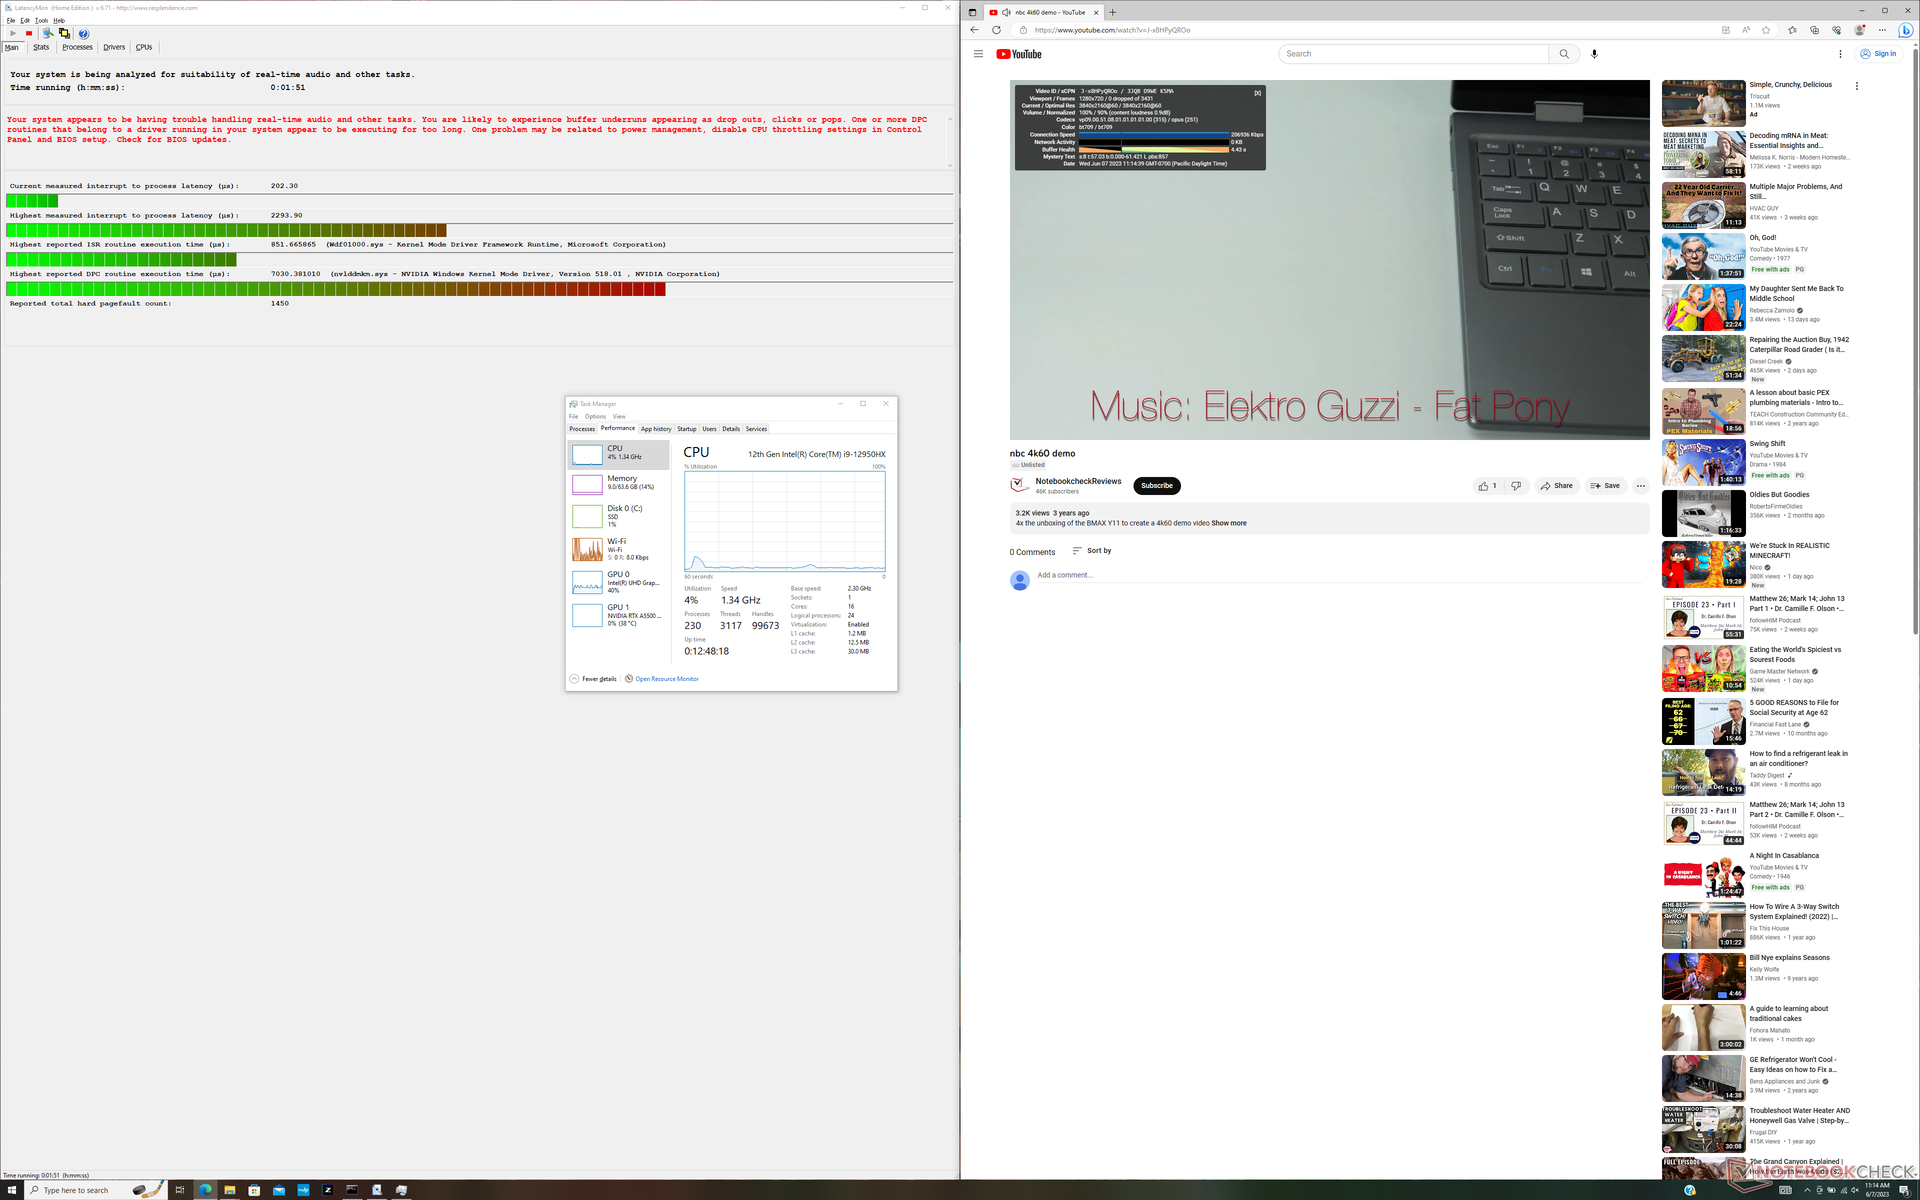
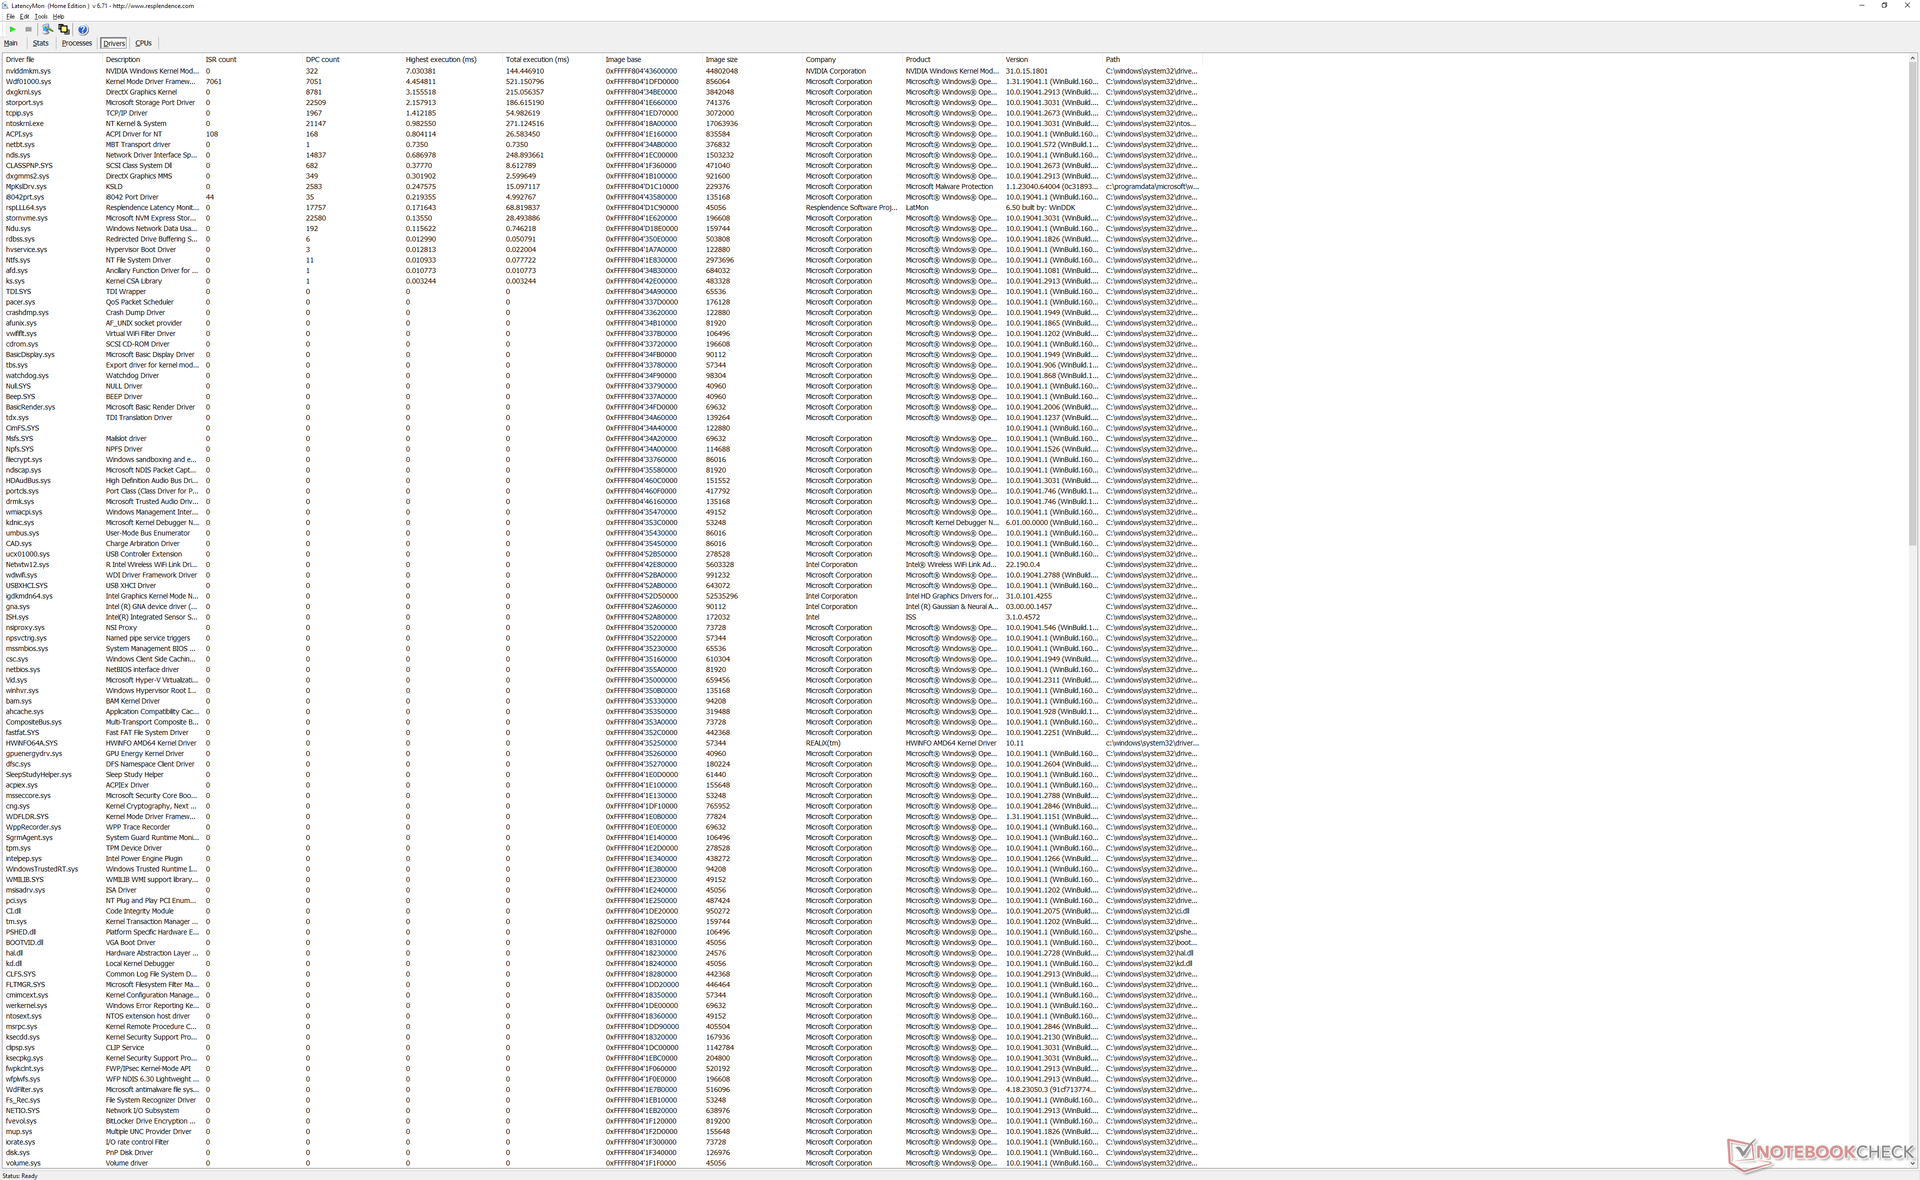
Latenza DPC
LatencyMon rivela problemi di DPC quando si aprono più schede del browser della nostra homepage. la riproduzione di video 4K a 60 FPS è invece perfetta, con zero cadute di fotogrammi durante i test.
| DPC Latencies / LatencyMon - interrupt to process latency (max), Web, Youtube, Prime95 | |
| HP ZBook Fury 16 G9 | |
| Dell Precision 7000 7670 Performance | |
| Lenovo ThinkPad P16 G1 RTX A5500 | |
| HP ZBook Studio 16 G9 62U04EA | |
| HP ZBook Firefly 16 G9-6B897EA | |
| MSI CreatorPro Z16P B12UKST | |
* ... Meglio usare valori piccoli
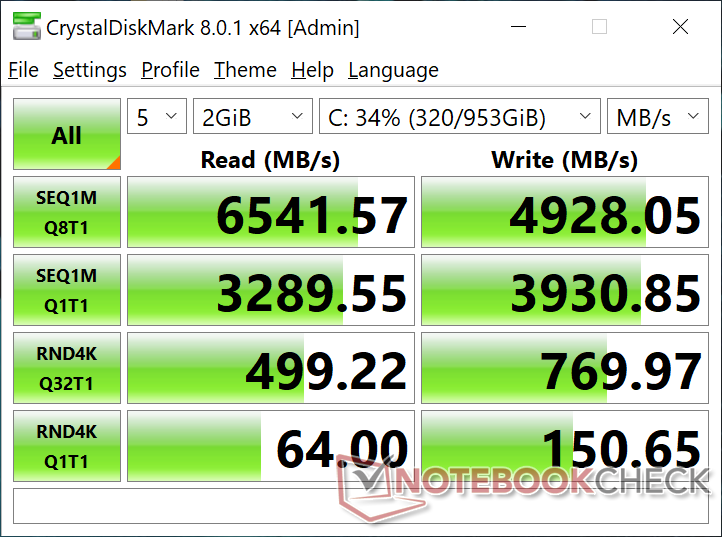
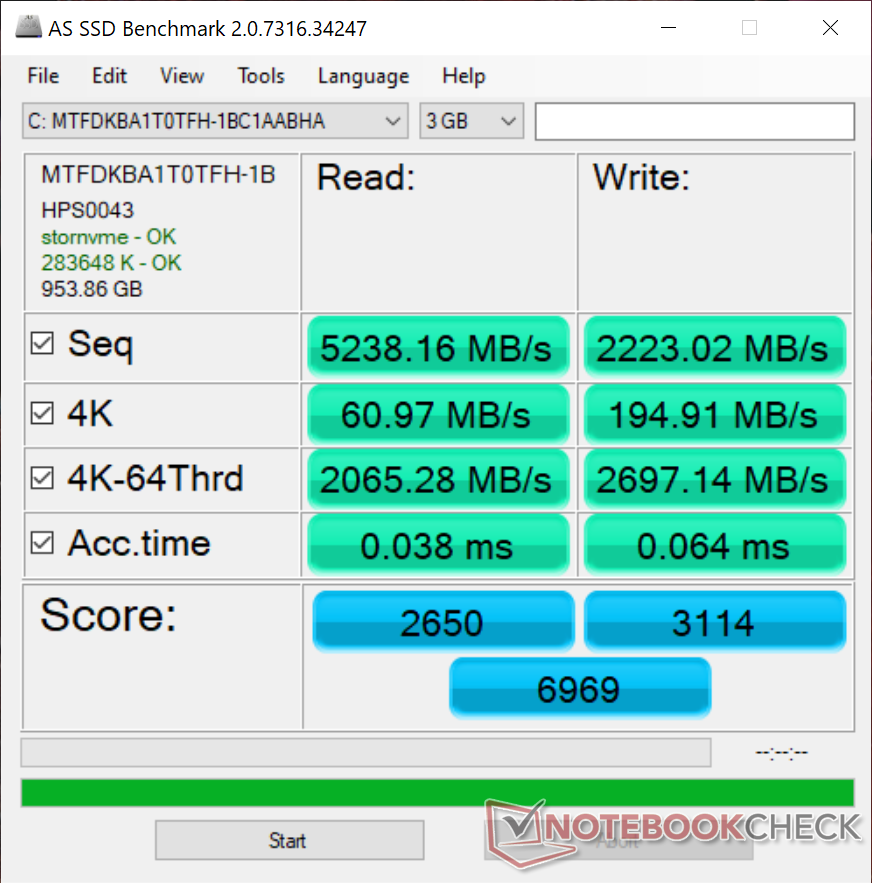
Dispositivi di archiviazione - Potenziale riduzione delle prestazioni
La nostra unità di prova viene fornita con lo stesso disco da 1 TBMicron 3400 MTFDKBA1T0TFH Che si trova nel modelloLenovo ThinkPad X1 Extreme G5. Sfortunatamente, l'unità SSD del nostro HP sembra soffrire di gravi problemi di rallentamento delle prestazioni, come mostra il grafico di confronto qui sotto. Quando si esegue DiskSpd in loop, la velocità di trasferimento crolla occasionalmente da 6500 MB/s a 1700 MB/s, mentre la stessa unità nel Lenovo funziona a 6500 MB/s per un tempo indefinito. Questo suggerisce che la Fury 16 potrebbe avere problemi di raffreddamento delle unità SSD. I risultati non sono migliorati nemmeno dopo aver moltiplicato i test.

* ... Meglio usare valori piccoli
Disk Throttling: DiskSpd Read Loop, Queue Depth 8
Prestazioni della GPU - 100 W TGP
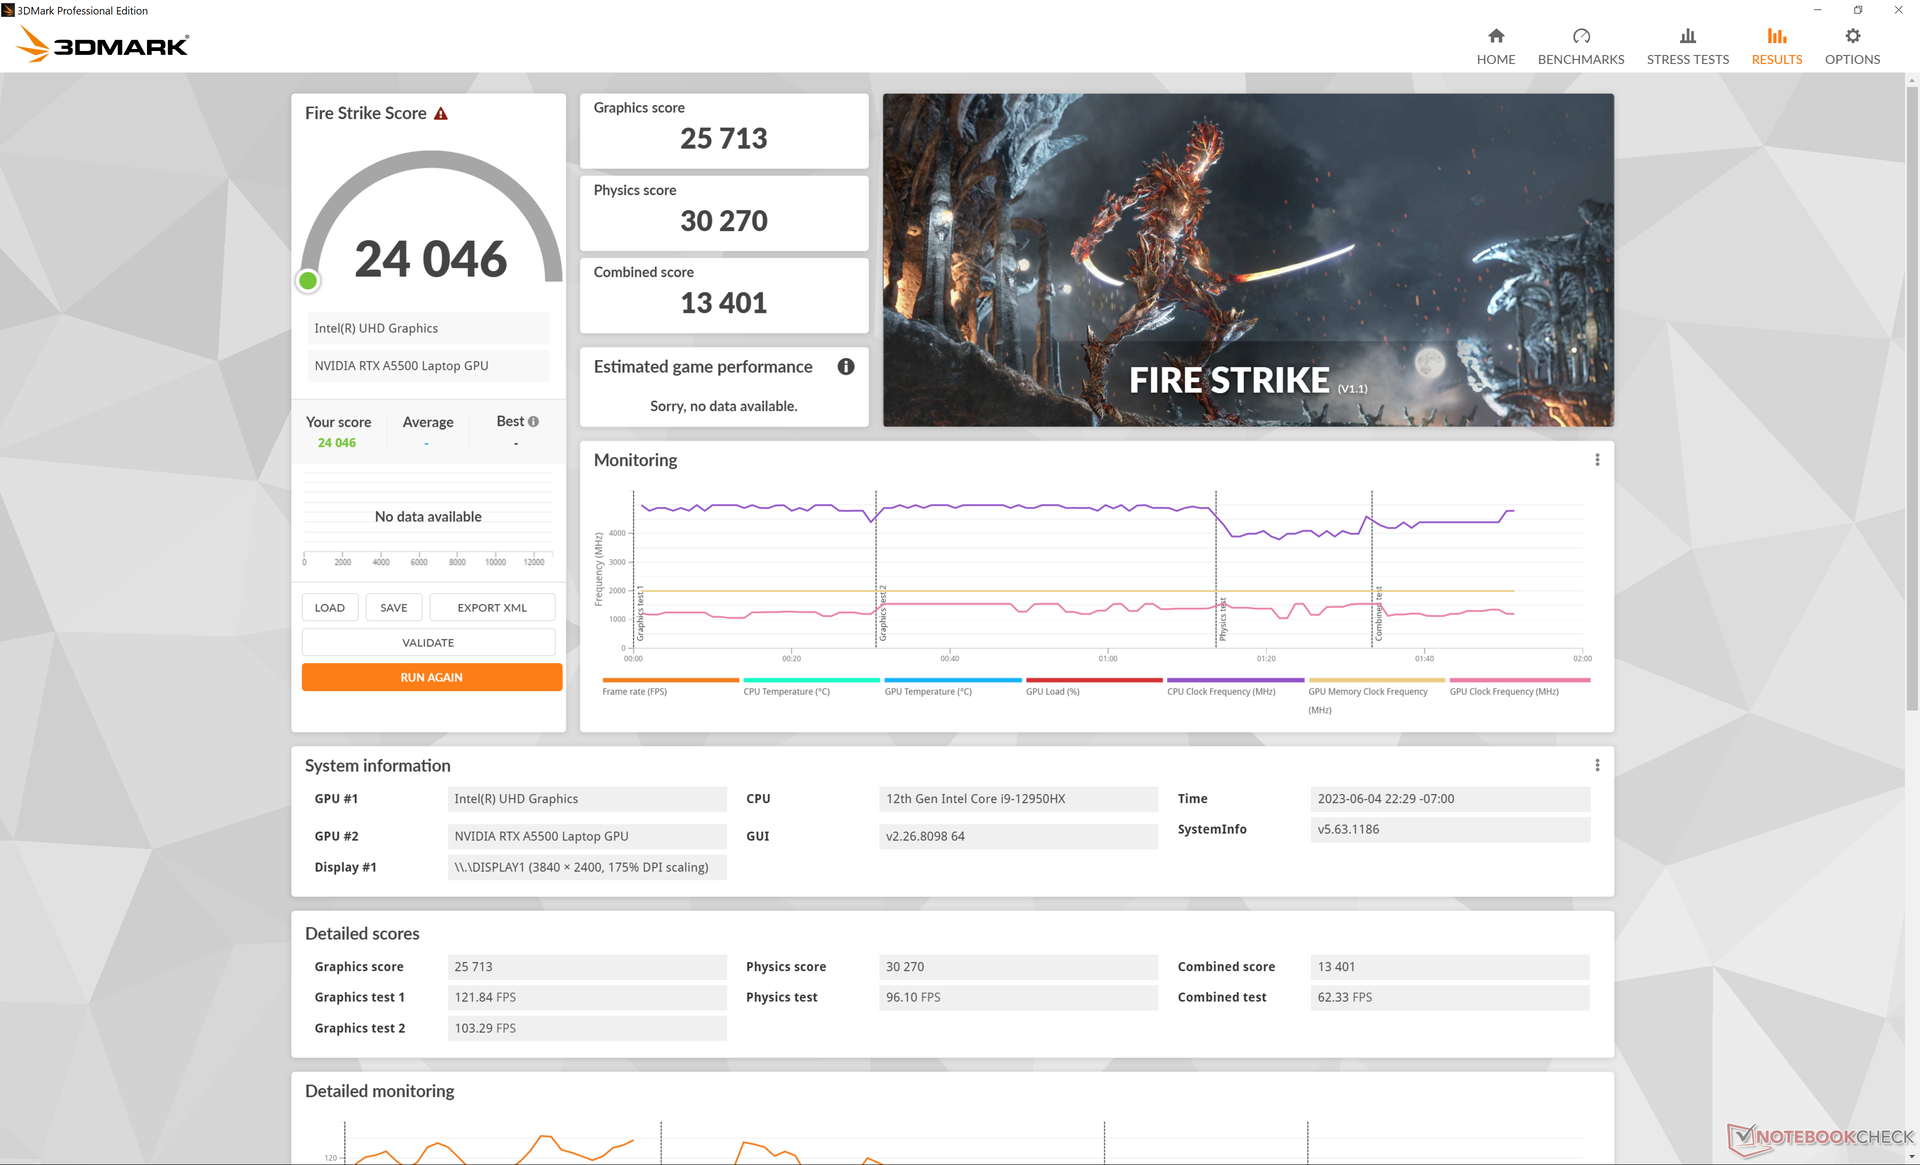
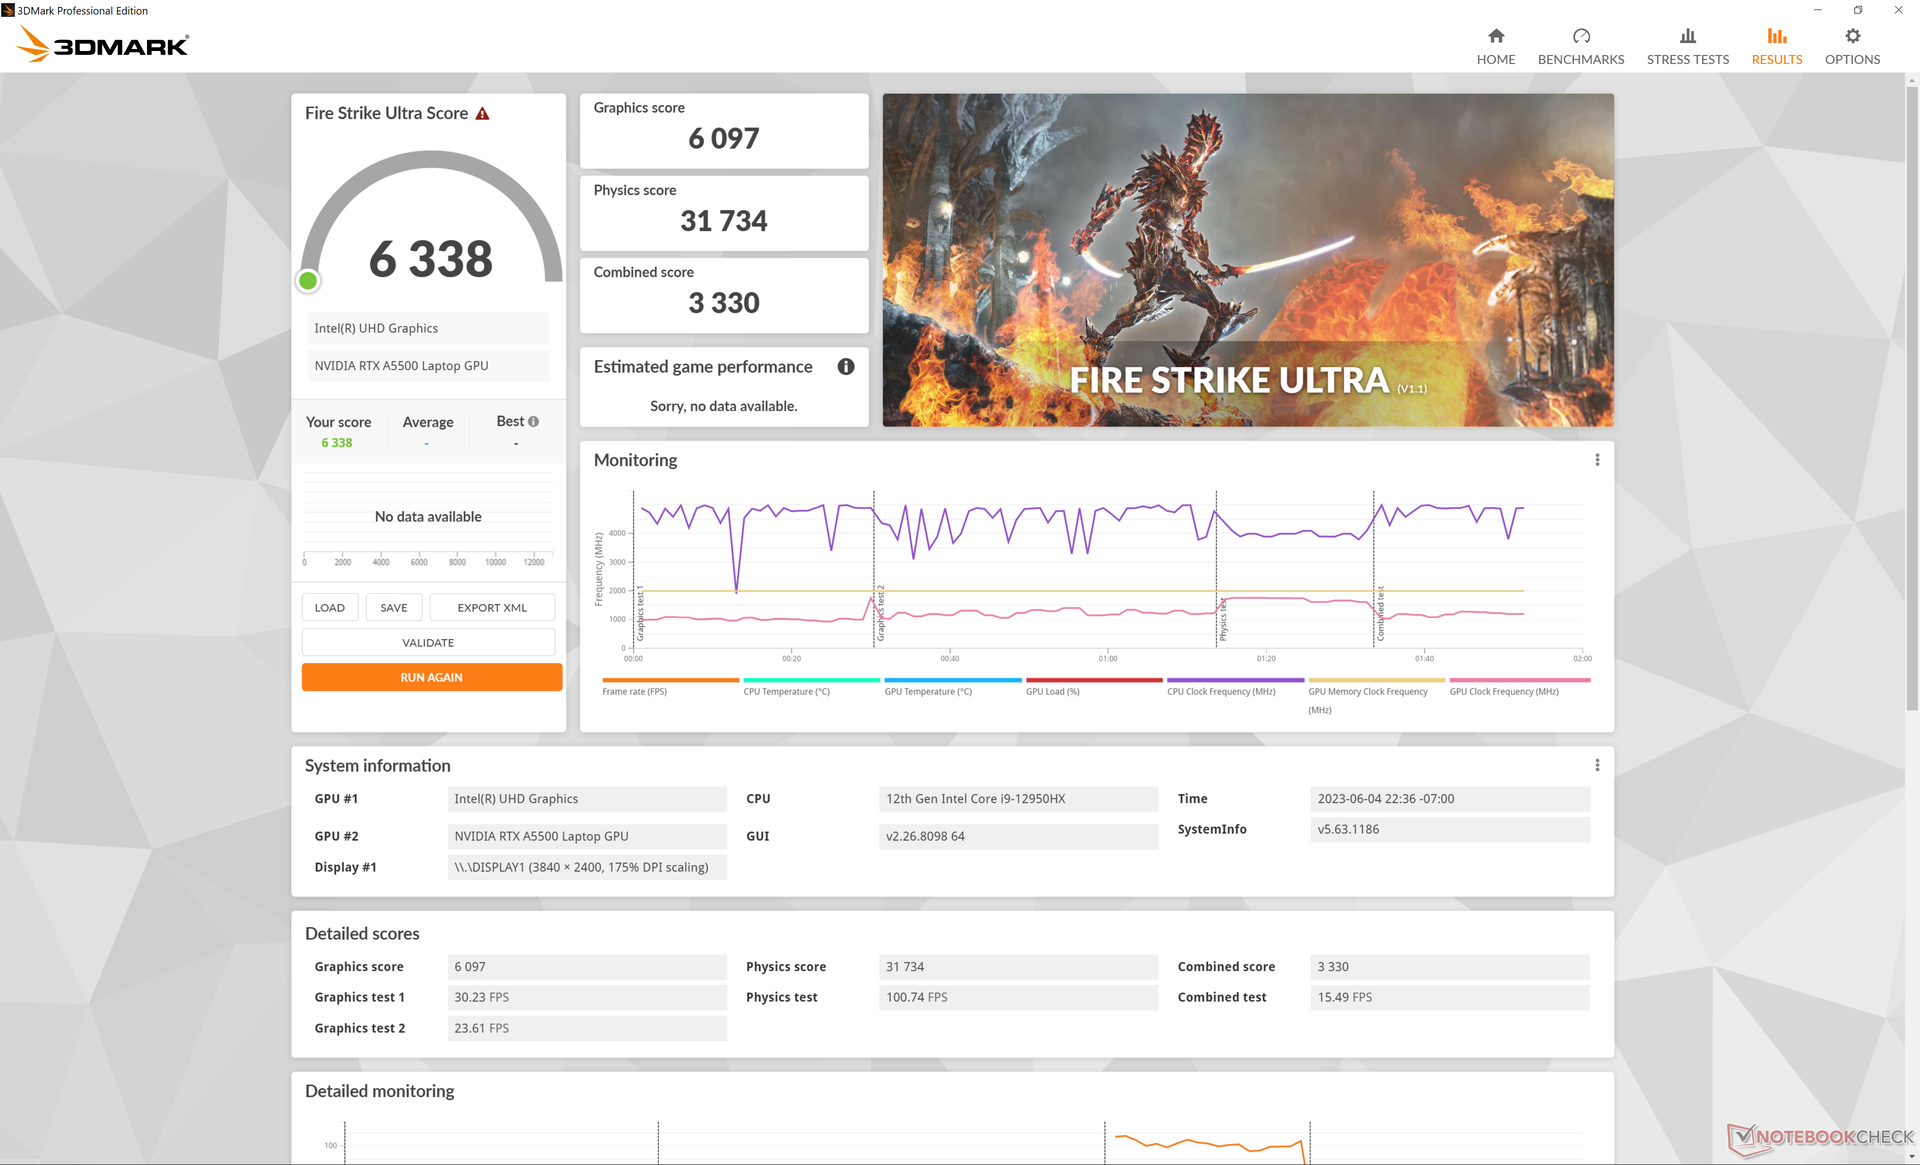
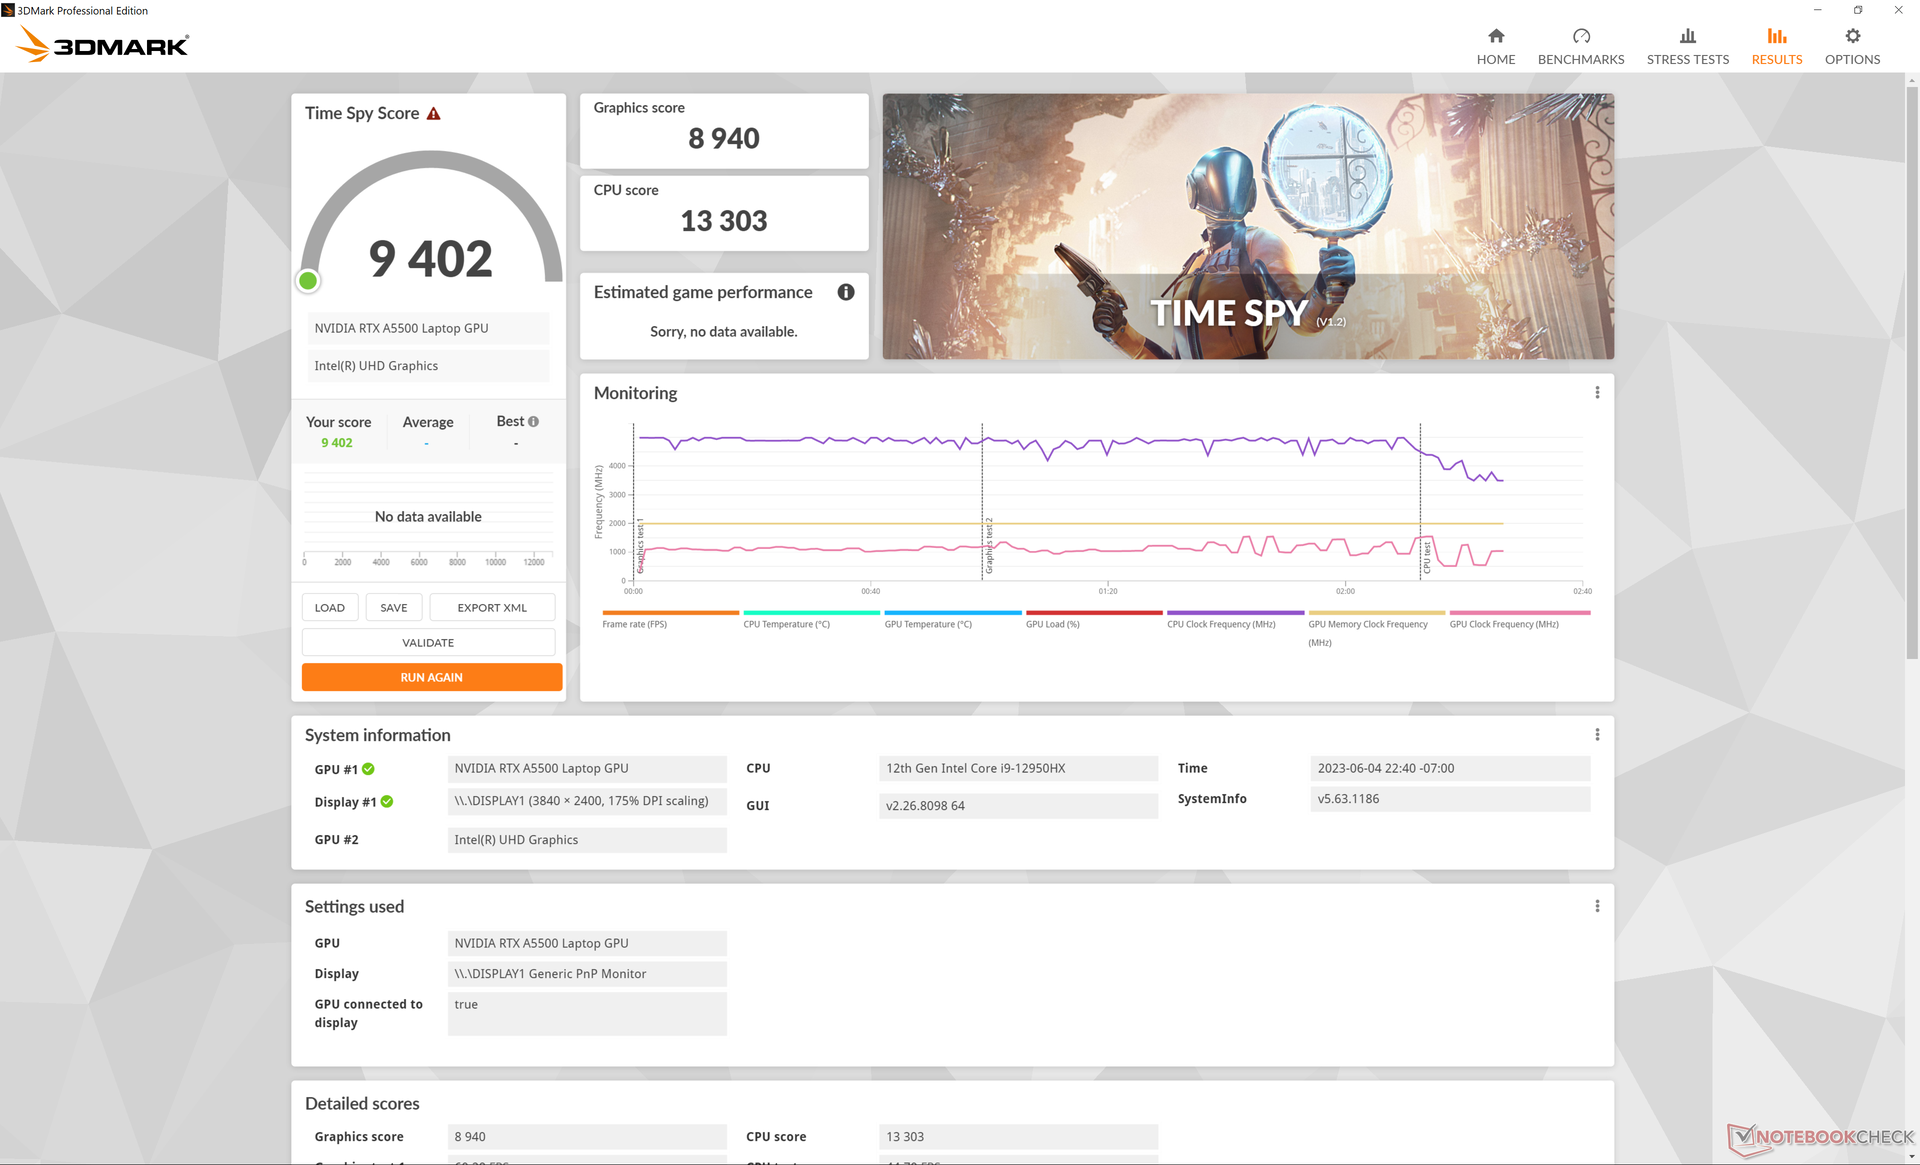
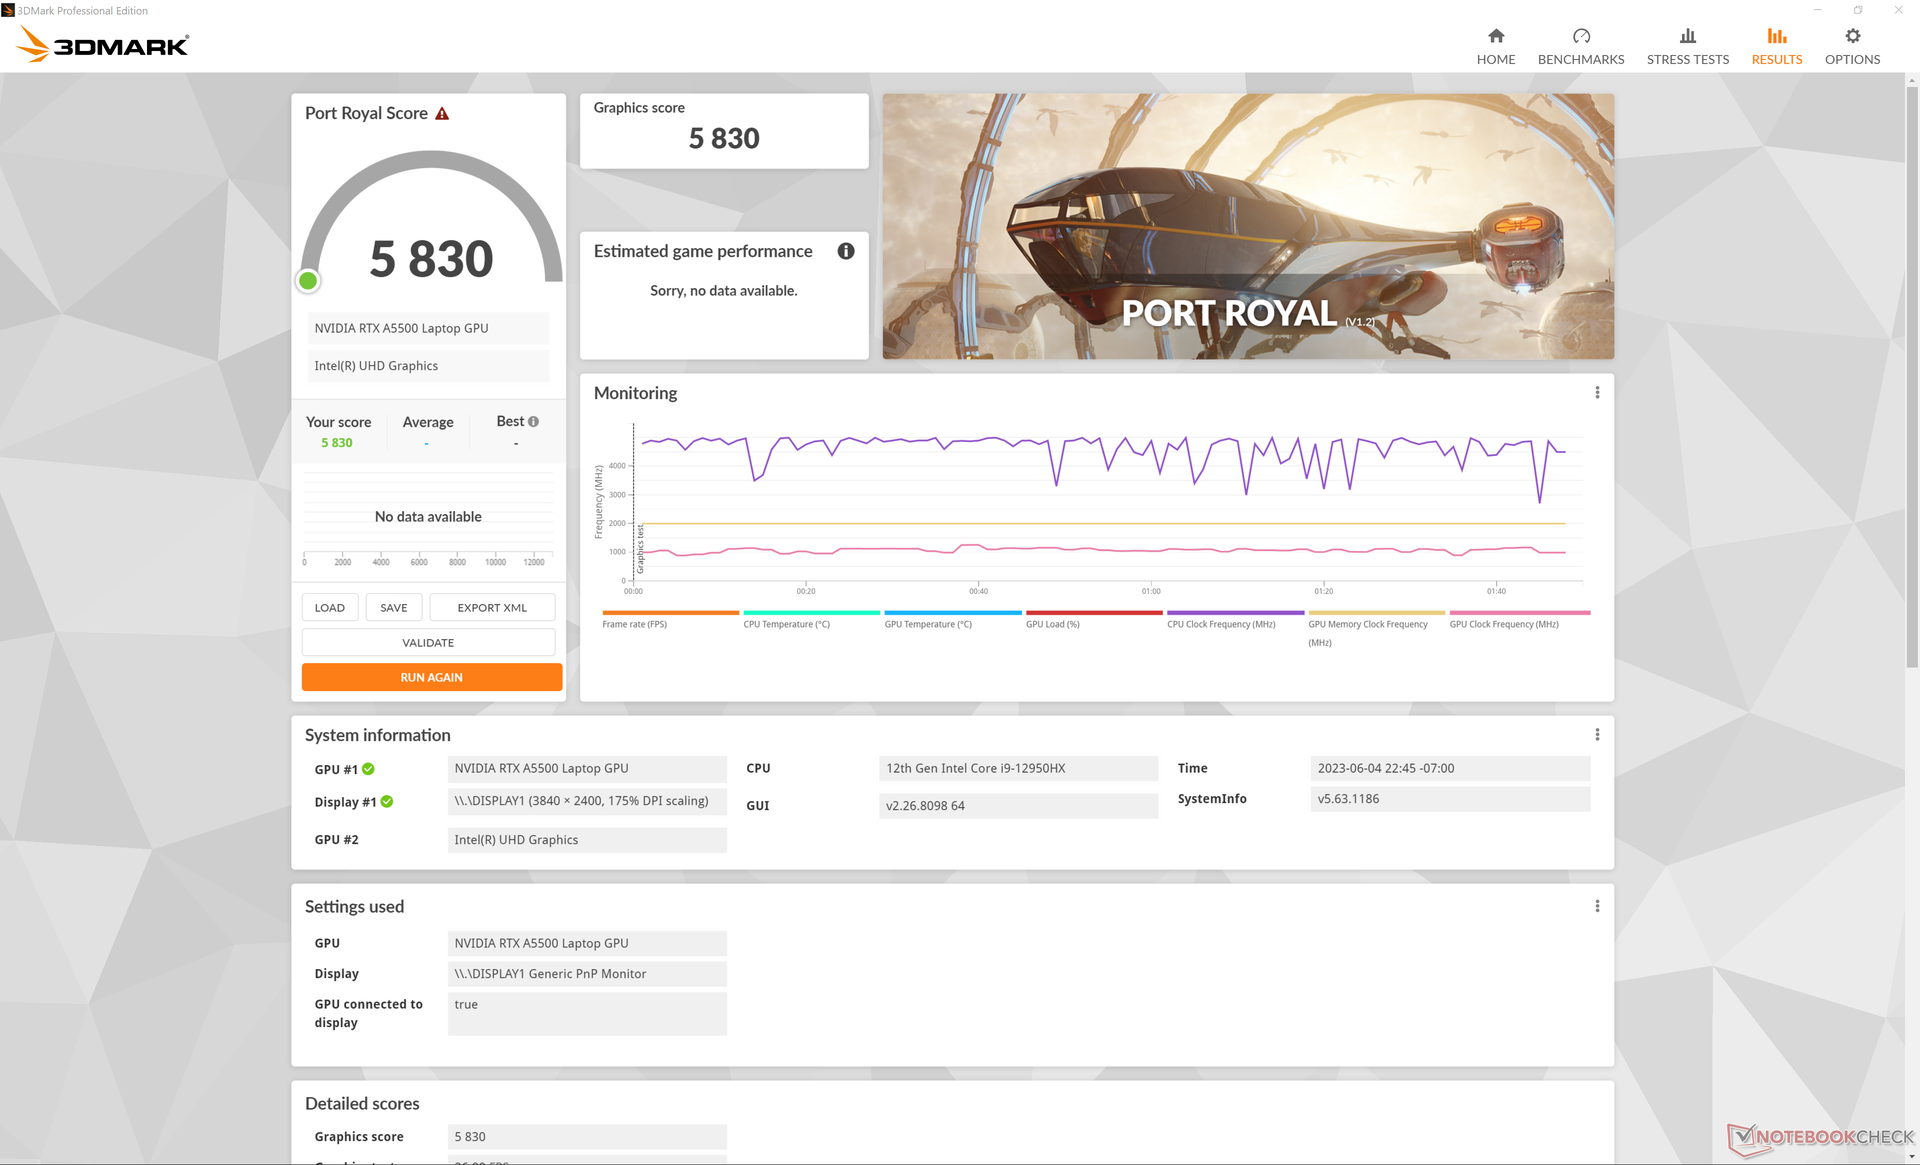
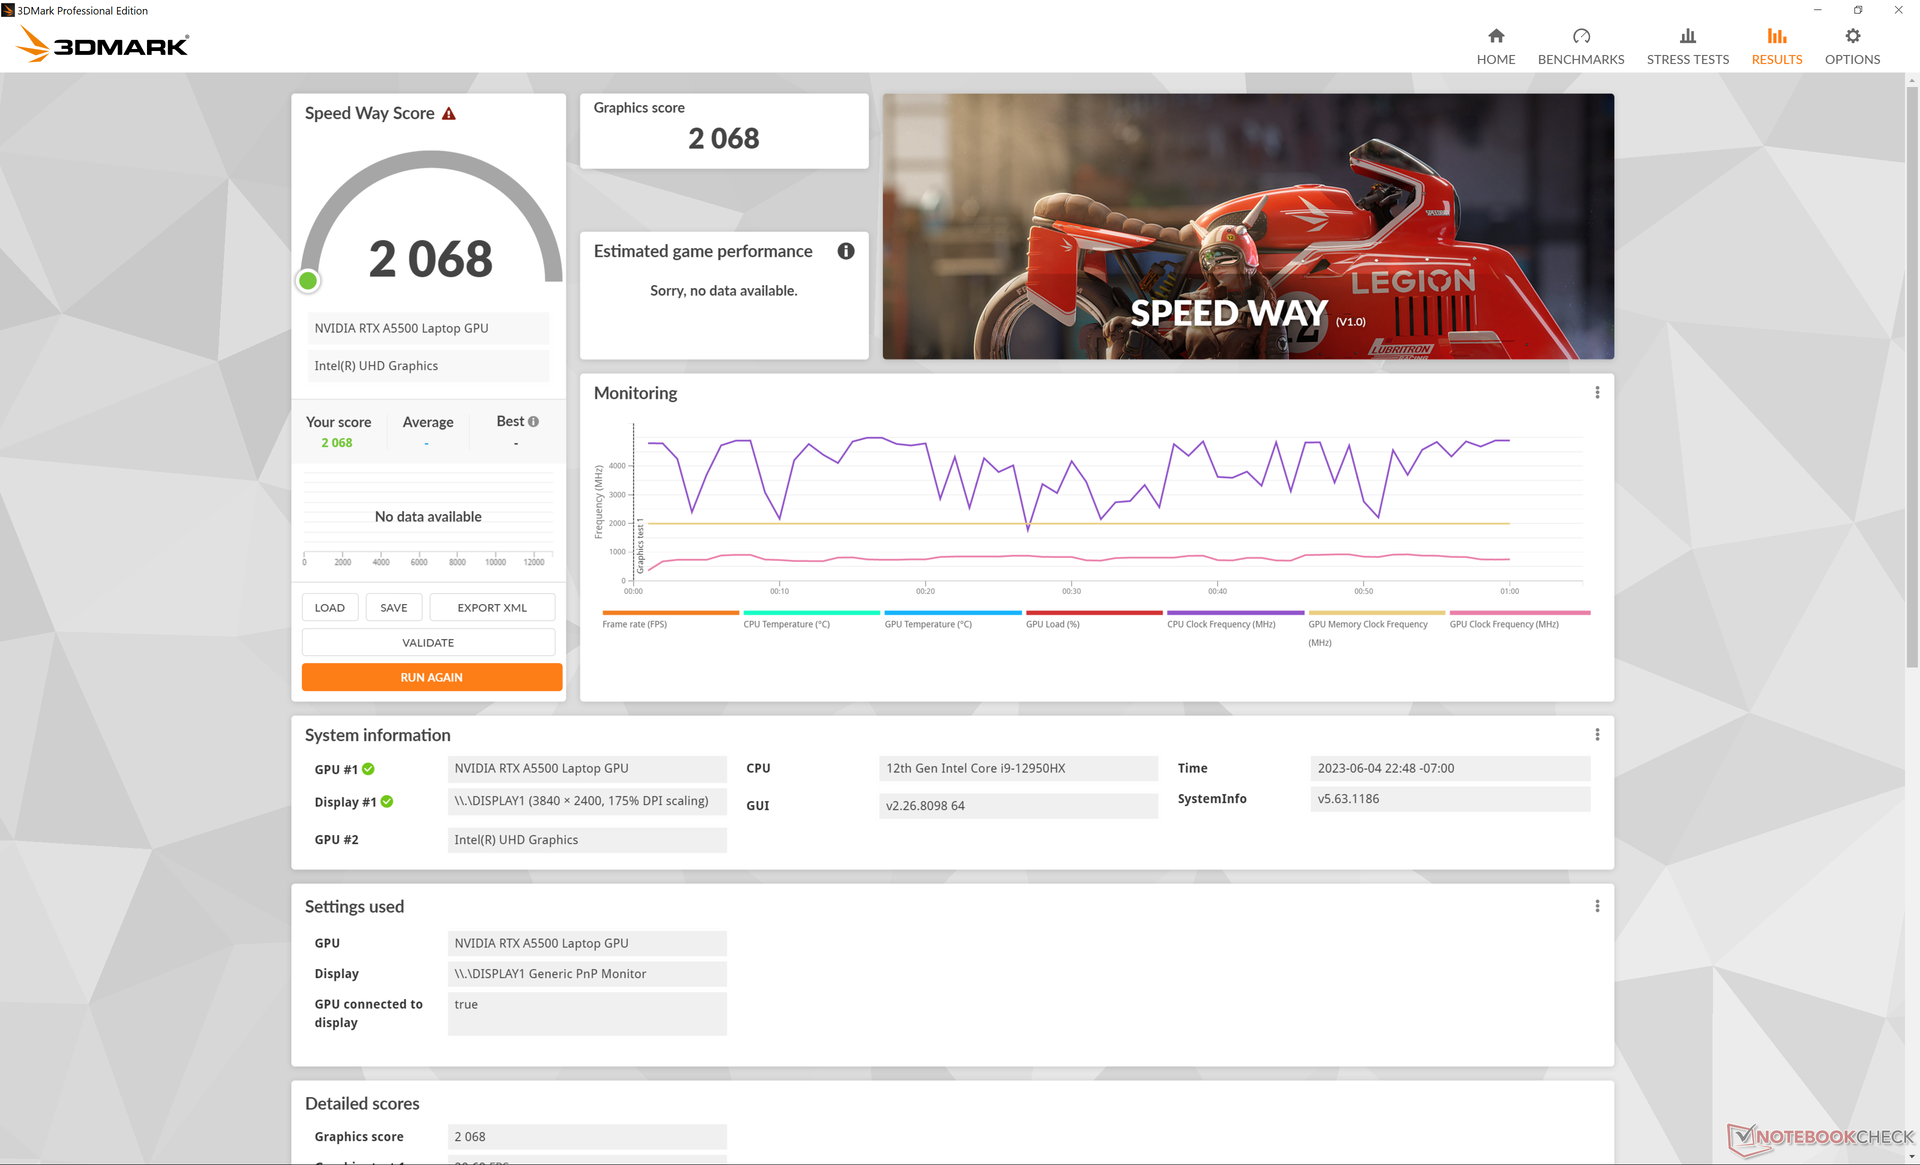
La RTX A5500 nel nostro HP ha un TGP di 100 W rispetto ai 130 W e 135 W dei ThinkPad P16 G1 e 7670 Precision 7670rispettivamente. Pertanto, le prestazioni grafiche dovrebbero essere leggermente inferiori sull'HP, anche se tutti e tre i sistemi utilizzano la stessa GPU RTX A5500. i risultati di 3DMark e SpecViewPerf lo confermano: il nostro HP è rimasto costantemente indietro rispetto ai modelli Dell e Lenovo fino al 15% in alcuni casi. È ancora una workstation molto veloce, ovviamente, ma non è l'opzione più veloce in circolazione.
Passando al modello RTX A3000 dalla configurazione top-end RTX A5500 si prevede una riduzione delle prestazioni grafiche del 20-30%.
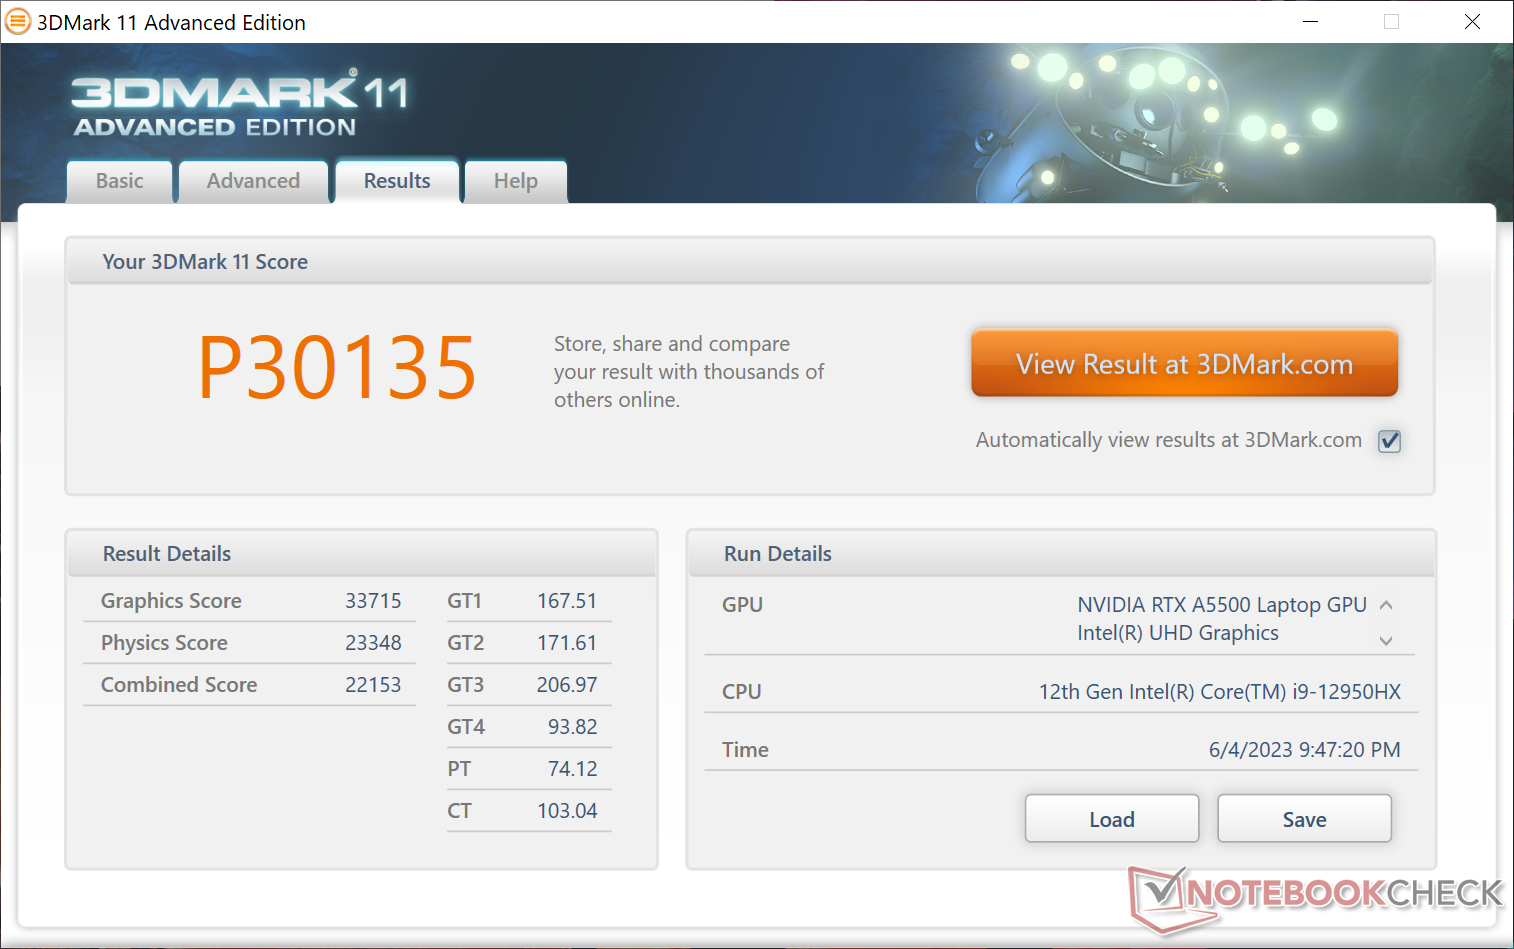
| 3DMark 11 Performance | 30135 punti | |
| 3DMark Fire Strike Score | 24046 punti | |
| 3DMark Time Spy Score | 9402 punti | |
Aiuto | ||
* ... Meglio usare valori piccoli
Prestazioni di gioco
Sebbene non sia una GPU da gioco, la RTX A5500 è più che in grado di giocare ai titoli più recenti a risoluzioni e impostazioni elevate. Gli utenti possono aspettarsi prestazioni di gioco pari alla mobile GeForce RTX 4070.
| Tiny Tina's Wonderlands | |
| 1920x1080 Low Preset (DX12) | |
| Lenovo Legion Pro 5 16IRX8 | |
| HP ZBook Fury 16 G9 | |
| Media NVIDIA RTX A5500 Laptop GPU (n=1) | |
| Dell XPS 17 9730 RTX 4070 | |
| 1920x1080 Medium Preset (DX12) | |
| Lenovo Legion Pro 5 16IRX8 | |
| HP ZBook Fury 16 G9 | |
| Media NVIDIA RTX A5500 Laptop GPU (n=1) | |
| Dell XPS 17 9730 RTX 4070 | |
| 1920x1080 High Preset (DX12) | |
| Lenovo Legion Pro 5 16IRX8 | |
| HP ZBook Fury 16 G9 | |
| Media NVIDIA RTX A5500 Laptop GPU (n=1) | |
| Dell XPS 17 9730 RTX 4070 | |
| 1920x1080 Badass Preset (DX12) | |
| Asus Zephyrus Duo 16 GX650PY-NM006W | |
| Lenovo Legion Pro 5 16IRX8 | |
| HP ZBook Fury 16 G9 | |
| Media NVIDIA RTX A5500 Laptop GPU (n=1) | |
| Dell XPS 17 9730 RTX 4070 | |
| 2560x1440 Badass Preset (DX12) | |
| Asus Zephyrus Duo 16 GX650PY-NM006W | |
| Lenovo Legion Pro 5 16IRX8 | |
| HP ZBook Fury 16 G9 | |
| Media NVIDIA RTX A5500 Laptop GPU (n=1) | |
| Dell XPS 17 9730 RTX 4070 | |
| 3840x2160 Badass Preset (DX12) | |
| Lenovo Legion Pro 5 16IRX8 | |
| HP ZBook Fury 16 G9 | |
| Media NVIDIA RTX A5500 Laptop GPU (n=1) | |
| Dell XPS 17 9730 RTX 4070 | |
Witcher 3 FPS Chart
| basso | medio | alto | ultra | QHD | 4K | |
|---|---|---|---|---|---|---|
| GTA V (2015) | 185.4 | 182.7 | 170.7 | 118.5 | 97.5 | 97.1 |
| The Witcher 3 (2015) | 447 | 308.5 | 169.3 | 92.8 | 62.2 | |
| Dota 2 Reborn (2015) | 191.3 | 173.1 | 162.4 | 150.7 | 116.1 | |
| Final Fantasy XV Benchmark (2018) | 180.1 | 131.6 | 103.5 | 75.1 | 39.4 | |
| X-Plane 11.11 (2018) | 151.3 | 130.9 | 103.6 | 81.9 | ||
| Strange Brigade (2018) | 447 | 235 | 190.2 | 168.6 | 122 | 67.6 |
| Cyberpunk 2077 1.6 (2022) | 128.7 | 114.4 | 87.6 | 69.8 | 41.4 | 18.1 |
| Tiny Tina's Wonderlands (2022) | 193.7 | 158.6 | 109.5 | 87.5 | 57.9 | 29.6 |
| F1 22 (2022) | 224 | 209 | 170.2 | 60.9 | 37.2 | 17.6 |
| Returnal (2023) | 70 | 68 | 64 | 59 | 42 | 20 |
Emissioni - Silenziosità a basso carico
Rumore del sistema
Il rumore della ventola è silenzioso quando si eseguono carichi non impegnativi. Tende a oscillare tra i 29 dB(A) e i 35 dB(A) con carichi medio-bassi, il che è appena percettibile nella maggior parte degli ambienti d'ufficio.
L'esecuzione di carichi più impegnativi, come i giochi, può indurre un rumore massimo della ventola di poco inferiore a 50 dB(A), che si avvicina a quello registrato sul ThinkPad P16 G1 o su Precision 7670. Ciononostante, ilThinkPad P16 G1 è in grado di rimanere più silenzioso per lunghi periodi. Durante l'esecuzione di 3DMark 06, ad esempio, il rumore della ventola del nostro HP raggiungeva i 36 dB(A) verso la fine della prima scena del benchmark, rispetto ai soli 29 dB(A) del Lenovo.
Rumorosità
| Idle |
| 22.7 / 22.7 / 28.8 dB(A) |
| Sotto carico |
| 36.2 / 49.3 dB(A) |
 | ||
30 dB silenzioso 40 dB(A) udibile 50 dB(A) rumoroso |
||
min: | ||
| HP ZBook Fury 16 G9 RTX A5500 Laptop GPU, i9-12950HX, Micron 3400 1TB MTFDKBA1T0TFH | HP ZBook Studio 16 G9 62U04EA RTX A2000 Laptop GPU, i7-12800H, Micron 3400 1TB MTFDKBA1T0TFH | HP ZBook Firefly 16 G9-6B897EA T550 Laptop GPU, i7-1265U, Samsung PM9A1 MZVL21T0HCLR | Lenovo ThinkPad P16 G1 RTX A5500 RTX A5500 Laptop GPU, i9-12950HX, WDC PC SN810 2TB | Dell Precision 7000 7670 Performance RTX A5500 Laptop GPU, i9-12950HX | MSI CreatorPro Z16P B12UKST RTX A3000 Laptop GPU, i7-12700H, Samsung PM9A1 MZVL21T0HCLR | |
|---|---|---|---|---|---|---|
| Noise | -4% | 4% | 4% | -9% | -6% | |
| off /ambiente * (dB) | 22.6 | 24 -6% | 23.8 -5% | 23.1 -2% | 23.9 -6% | 24.1 -7% |
| Idle Minimum * (dB) | 22.7 | 24 -6% | 23.8 -5% | 23.1 -2% | 24 -6% | 27.1 -19% |
| Idle Average * (dB) | 22.7 | 27.7 -22% | 23.8 -5% | 23.1 -2% | 24 -6% | 27.1 -19% |
| Idle Maximum * (dB) | 28.8 | 27.7 4% | 23.8 17% | 23.1 20% | 38 -32% | 27.1 6% |
| Load Average * (dB) | 36.2 | 39.8 -10% | 39.4 -9% | 28.9 20% | 46.3 -28% | 42.9 -19% |
| Witcher 3 ultra * (dB) | 49.5 | 44.3 11% | 40.5 18% | 51.6 -4% | 41.9 15% | 44 11% |
| Load Maximum * (dB) | 49.3 | 47.7 3% | 41.4 16% | 51.4 -4% | 47.9 3% | 47 5% |
* ... Meglio usare valori piccoli
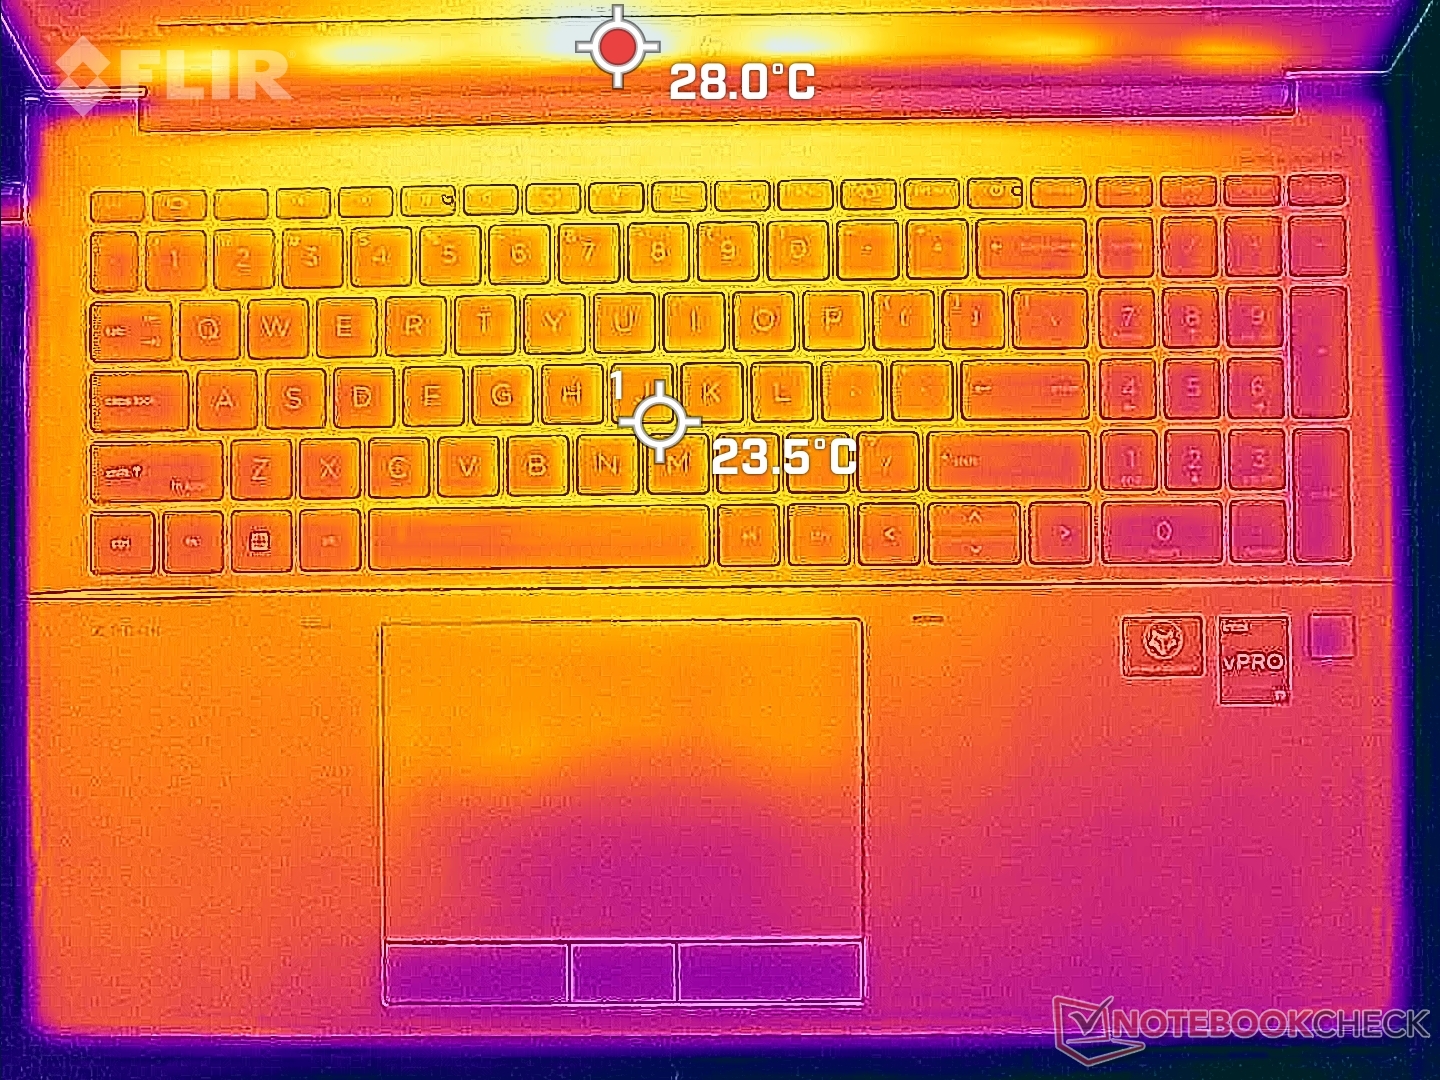
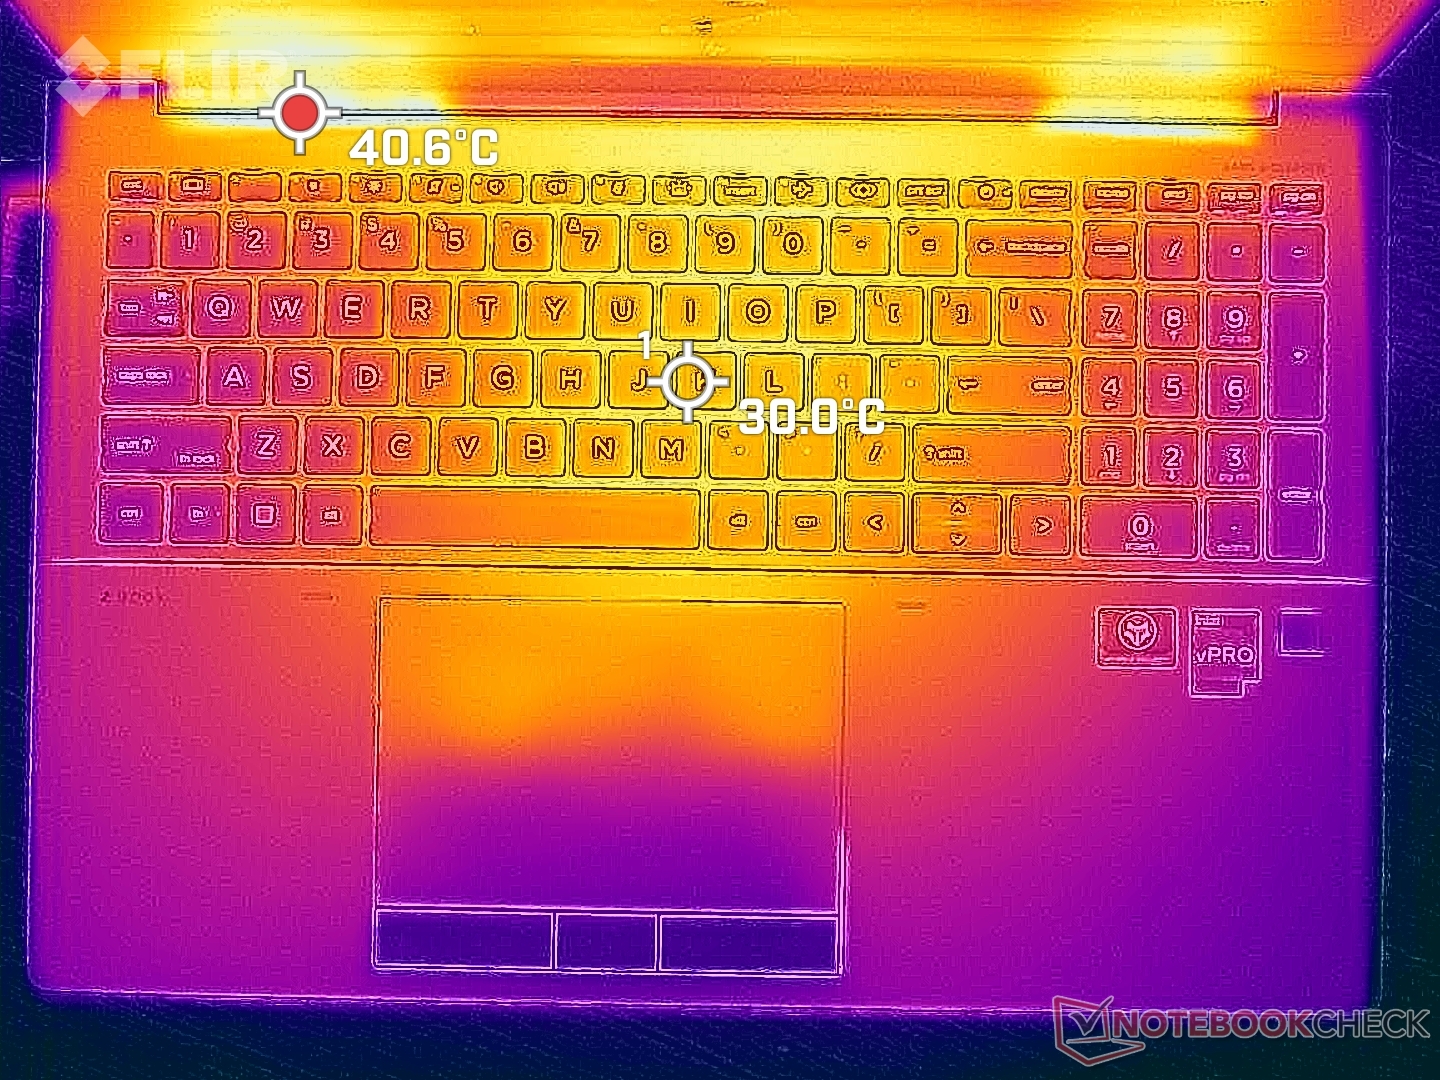
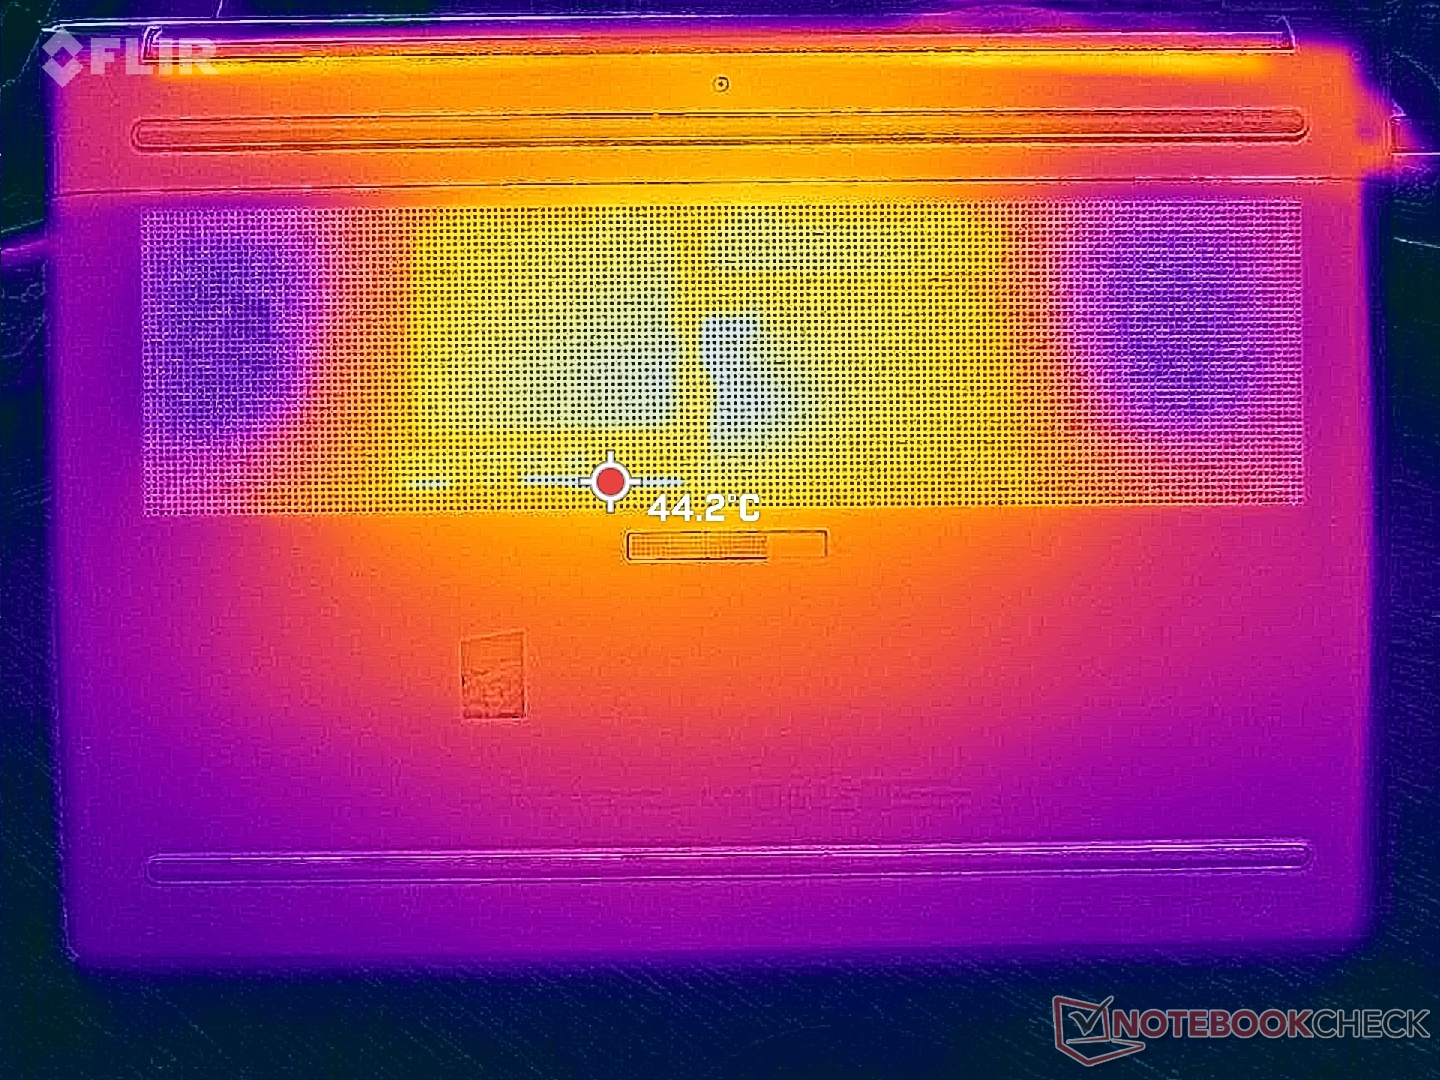
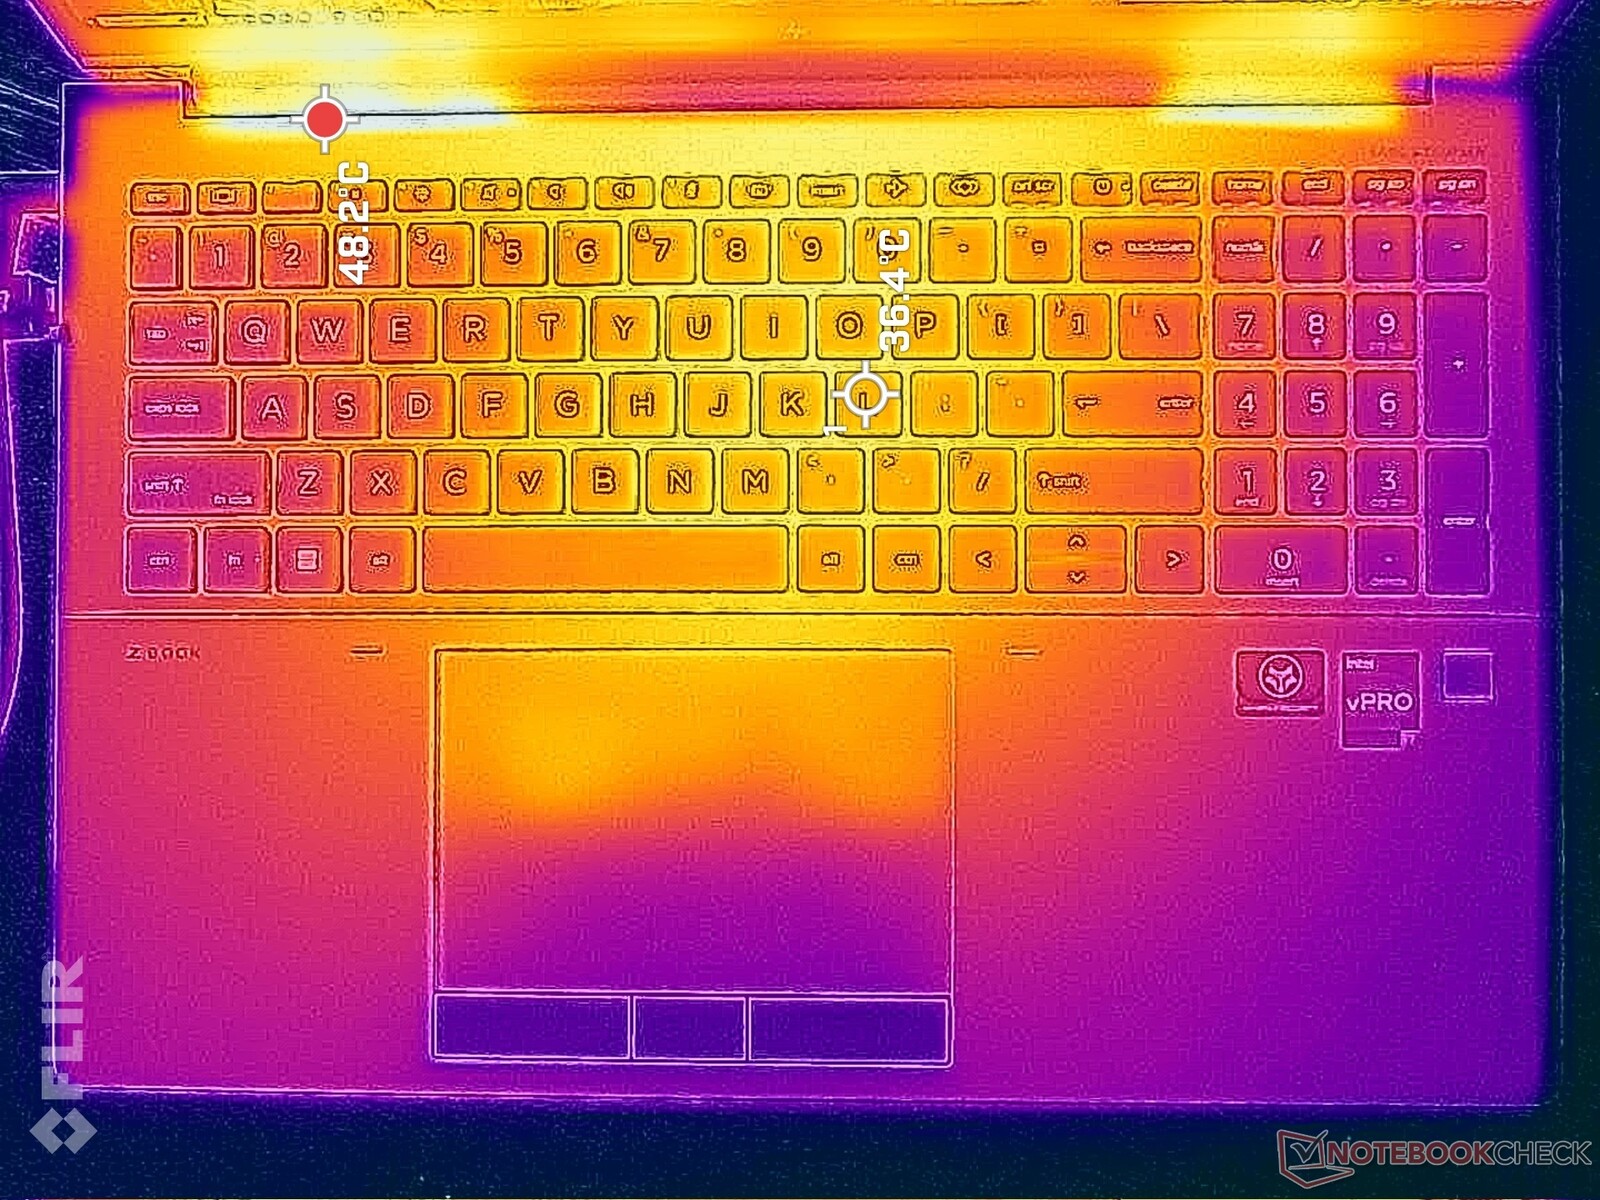
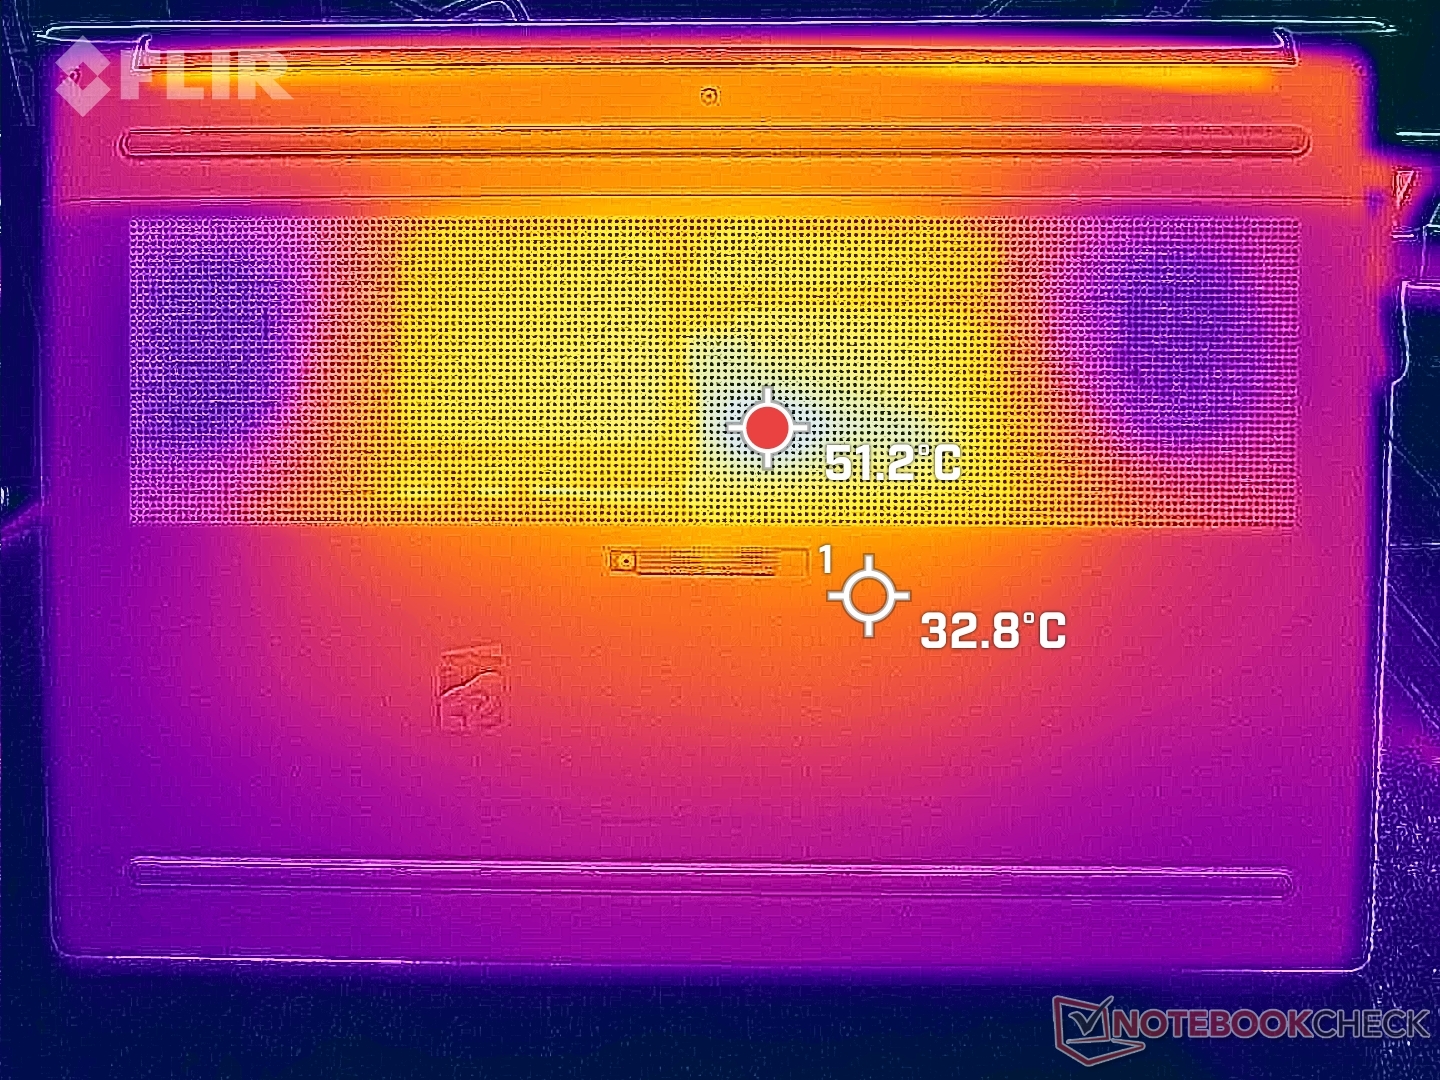
Temperatura - Palmo caldo sotto carico
Le temperature della superficie tendono ad essere più calde verso il centro della tastiera, dove possono superare i 36 C in caso di carichi di elaborazione estremi. L'andamento delle temperature è più simmetrico rispetto a Precision 7670 o ThinkPad P16, ma il touchpad e i palmari possono diventare più caldi di quanto vorremmo. Quando si eseguono carichi impegnativi, ad esempio, il touchpad dell'HP può raggiungere oltre 35 C rispetto ai 30 C o meno delle alternative Lenovo e Dell citate in precedenza.
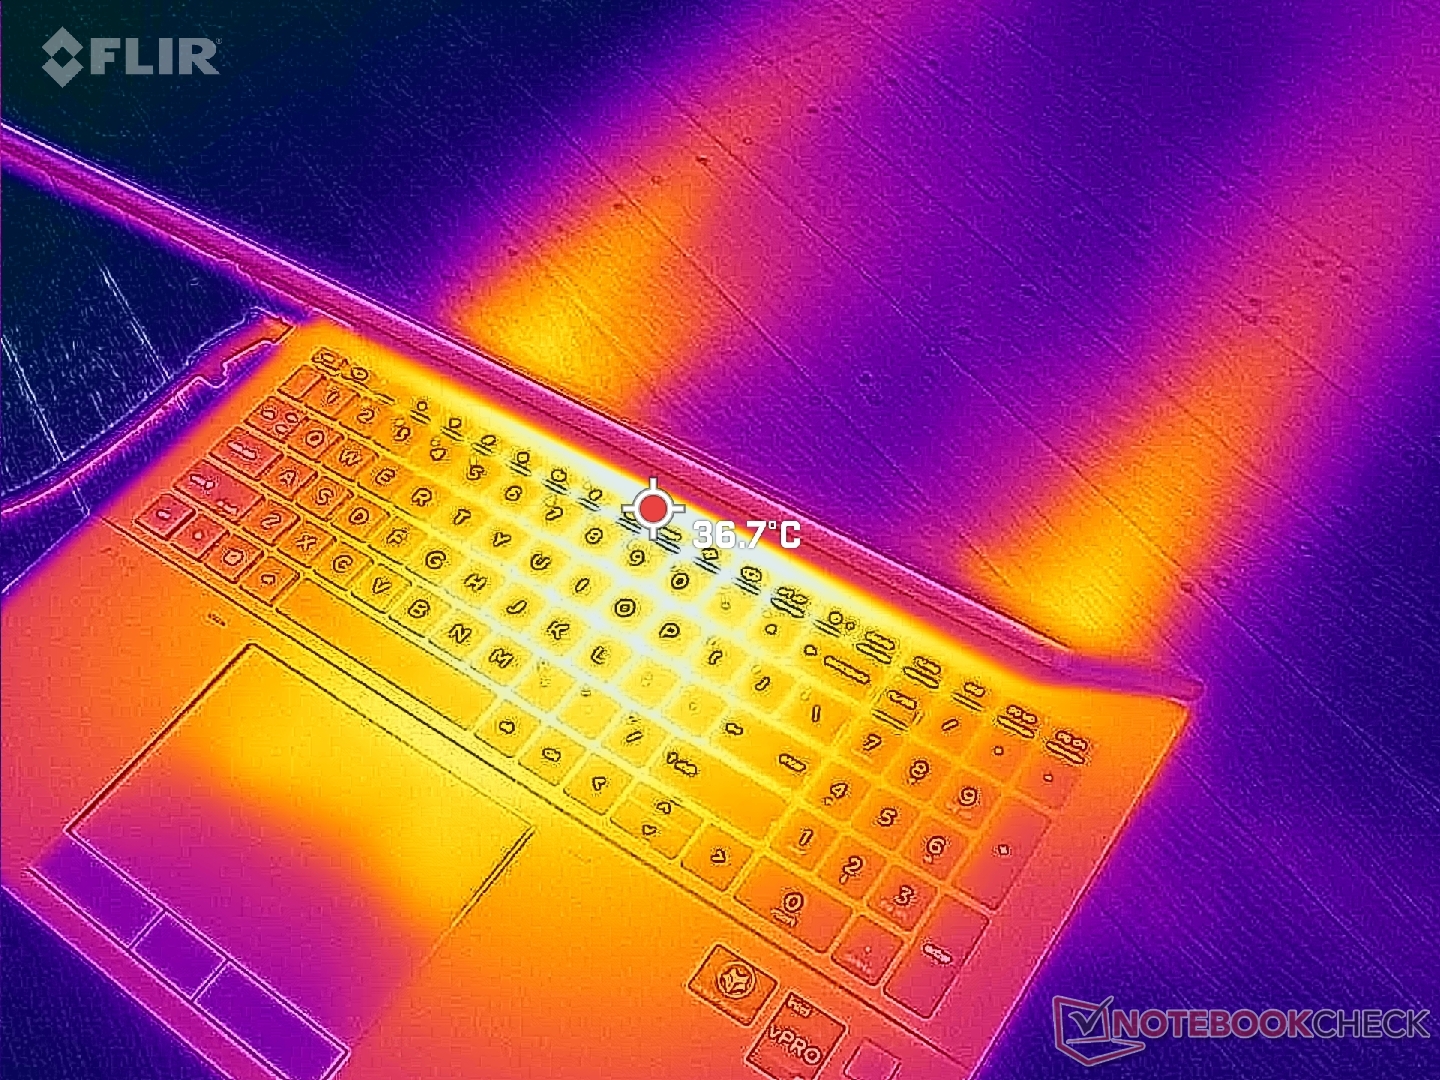
(±) La temperatura massima sul lato superiore è di 43.2 °C / 110 F, rispetto alla media di 38.2 °C / 101 F, che varia da 22.2 a 69.8 °C per questa classe Workstation.
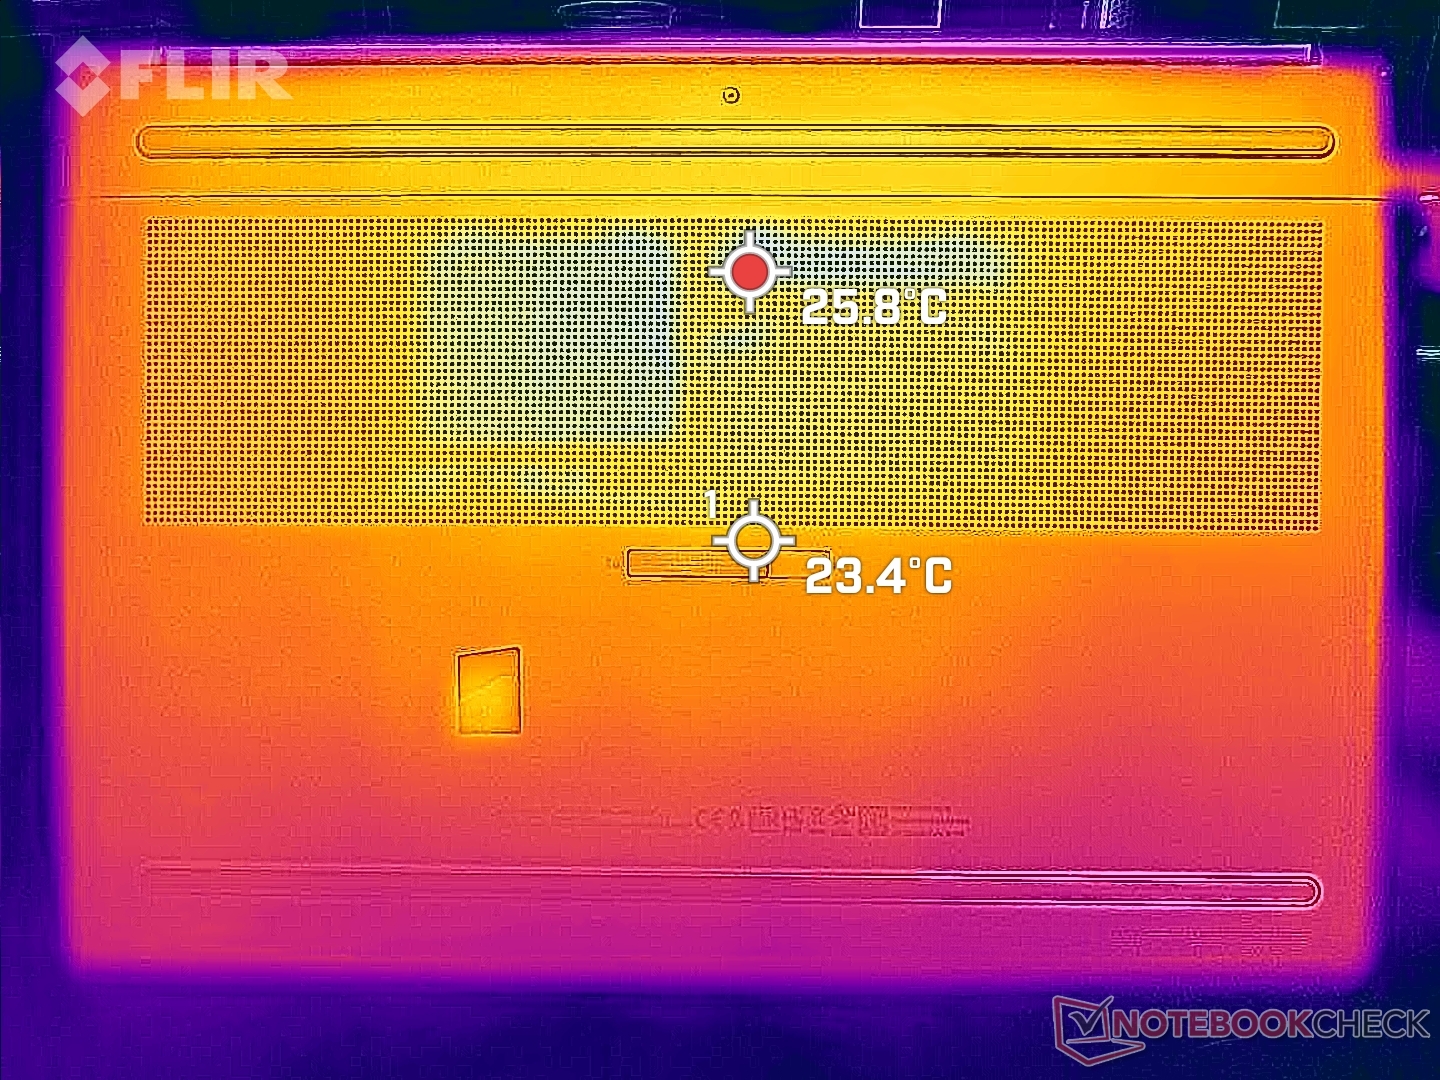
(-) Il lato inferiore si riscalda fino ad un massimo di 50.4 °C / 123 F, rispetto alla media di 41.1 °C / 106 F
(+) In idle, la temperatura media del lato superiore è di 27.1 °C / 81 F, rispetto alla media deld ispositivo di 32 °C / 90 F.
(±) Riproducendo The Witcher 3, la temperatura media per il lato superiore e' di 34 °C / 93 F, rispetto alla media del dispositivo di 32 °C / 90 F.
(+) I poggiapolsi e il touchpad raggiungono la temperatura massima della pelle (35.6 °C / 96.1 F) e quindi non sono caldi.
(-) La temperatura media della zona del palmo della mano di dispositivi simili e'stata di 27.8 °C / 82 F (-7.8 °C / -14.1 F).
| HP ZBook Fury 16 G9 Intel Core i9-12950HX, NVIDIA RTX A5500 Laptop GPU | HP ZBook Studio 16 G9 62U04EA Intel Core i7-12800H, NVIDIA RTX A2000 Laptop GPU | HP ZBook Firefly 16 G9-6B897EA Intel Core i7-1265U, NVIDIA T550 Laptop GPU | Lenovo ThinkPad P16 G1 RTX A5500 Intel Core i9-12950HX, NVIDIA RTX A5500 Laptop GPU | Dell Precision 7000 7670 Performance Intel Core i9-12950HX, NVIDIA RTX A5500 Laptop GPU | MSI CreatorPro Z16P B12UKST Intel Core i7-12700H, NVIDIA RTX A3000 Laptop GPU | |
|---|---|---|---|---|---|---|
| Heat | -1% | -4% | -12% | -15% | -12% | |
| Maximum Upper Side * (°C) | 43.2 | 38.7 10% | 42.1 3% | 44.8 -4% | 53 -23% | 56.3 -30% |
| Maximum Bottom * (°C) | 50.4 | 53.4 -6% | 48 5% | 49.8 1% | 43.2 14% | 68.3 -36% |
| Idle Upper Side * (°C) | 28.6 | 27.3 5% | 29.9 -5% | 30.6 -7% | 36.8 -29% | 25.2 12% |
| Idle Bottom * (°C) | 28.2 | 31.6 -12% | 32.9 -17% | 38.6 -37% | 33.8 -20% | 25.9 8% |
* ... Meglio usare valori piccoli
Stress test
Quando si esegue Prime95 per stressare la CPU, la velocità di clock e l'assorbimento di potenza della scheda raggiungono rispettivamente 3,1 GHz e 96 W, durando solo un paio di minuti o fino a quando la temperatura del core raggiunge gli 89 C. Successivamente, la CPU scende ulteriormente prima di stabilizzarsi a 2,4 GHz, 76 C e 71 W. Ripetendo questo test sul ThinkPad P16 G1 con lo stesso identico Core i9-12950HX Avrebbe portato a una frequenza di clock stabile più alta (3,0 GHz) e a un consumo di energia (81 W), al costo di una temperatura del core molto più alta (100 C). HP sta adottando un approccio più riservato in questo senso, che si allinea con i risultati di CineBench di cui sopra.
L'esecuzione Witcher 3 per rappresentare un carico grafico elevato, si otterrebbe una frequenza di clock della GPU, una temperatura e un assorbimento di potenza della scheda stabili rispettivamente a 1297 MHz, 70 C e 92 W. Ripetendo questo test sul ThinkPad P16 G1 si otterrebbero valori stabili più elevati su tutta la scheda, pari a 1477 MHz, 78 C e 129 W. Anche il clock della memoria della GPU sarebbe più elevato sul ThinkPad.
Il funzionamento a batteria limita le prestazioni anche quando si utilizza il profilo Performance. Un test di Fire Strike a batteria restituirebbe punteggi di Fisica e Grafica rispettivamente di 22837 e 5625 punti, rispetto a 30270 e 25713 punti con alimentazione a rete.
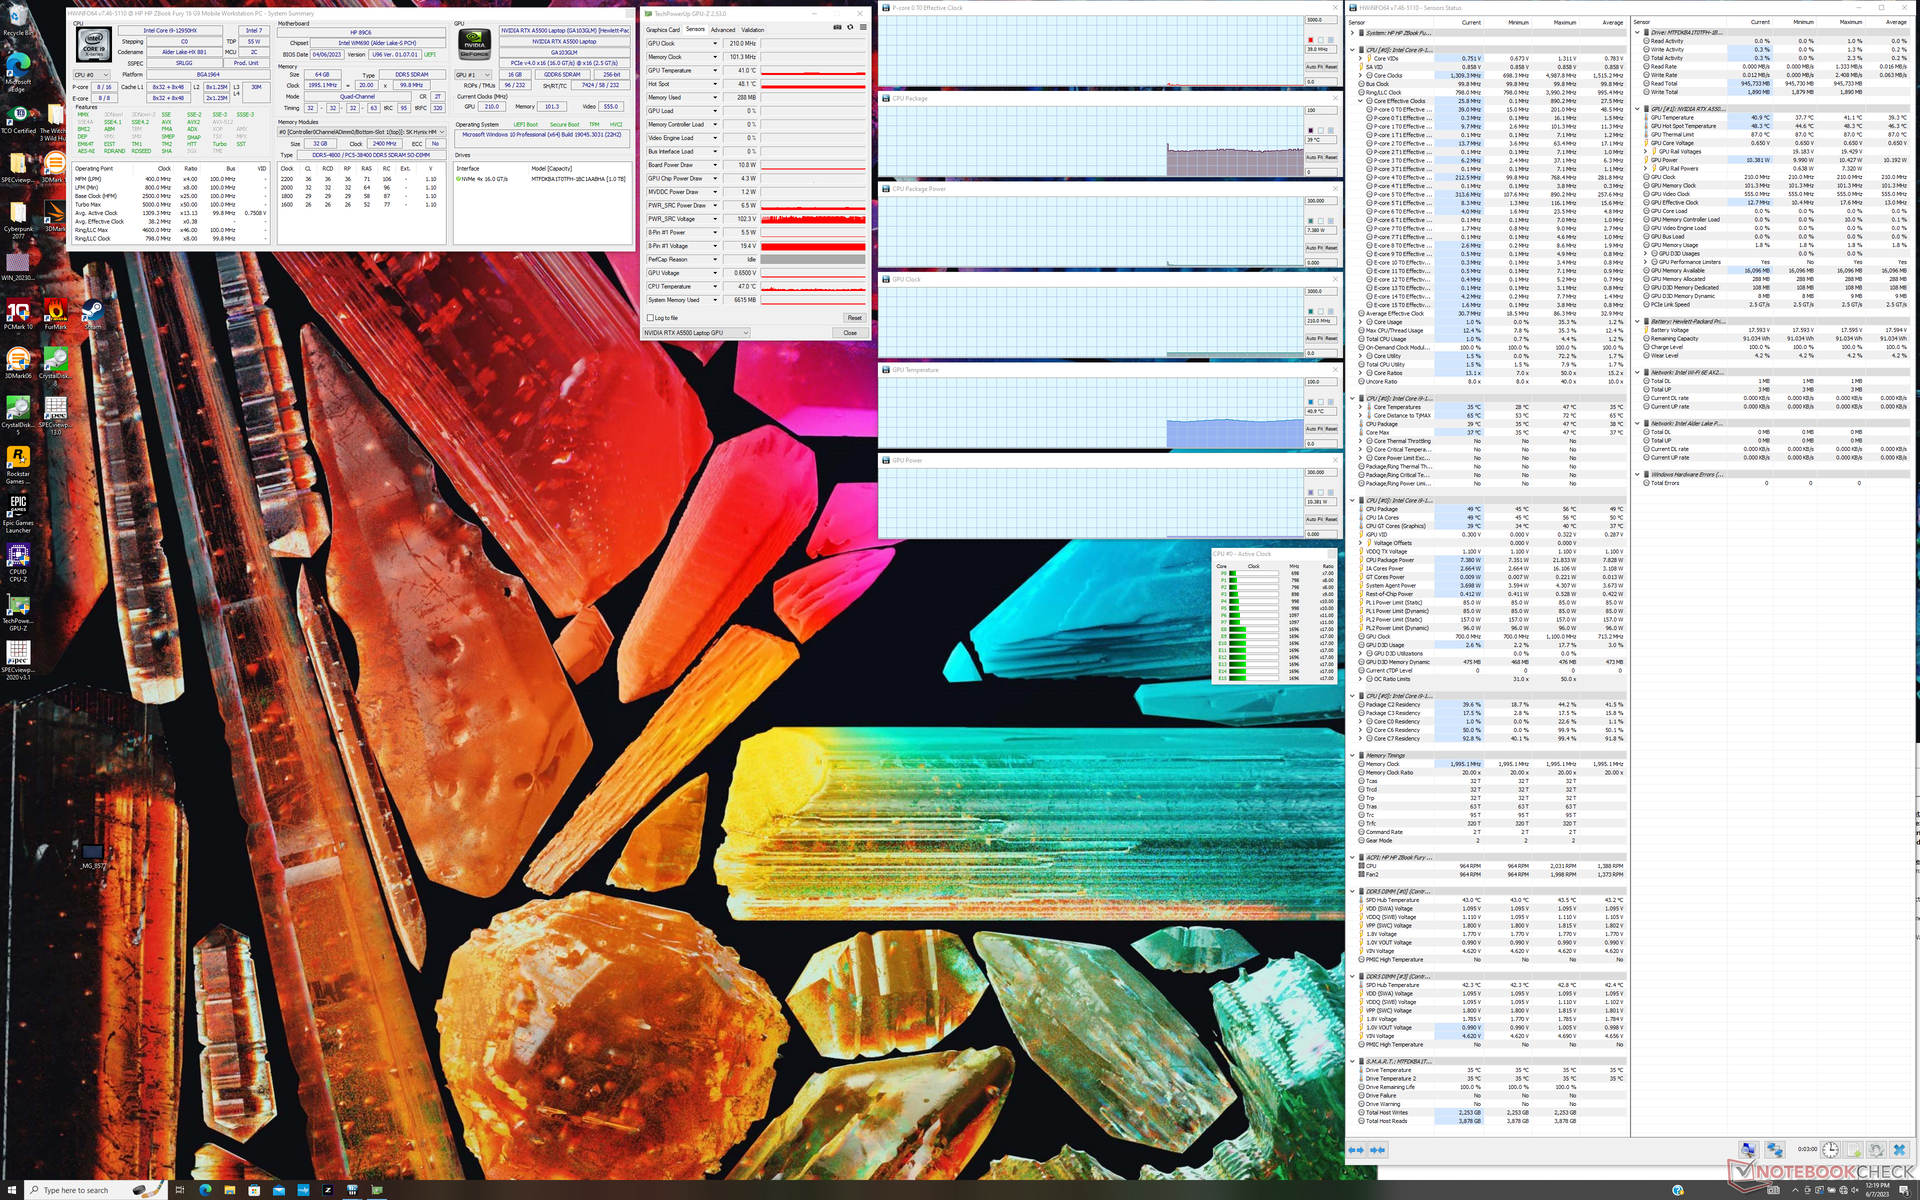
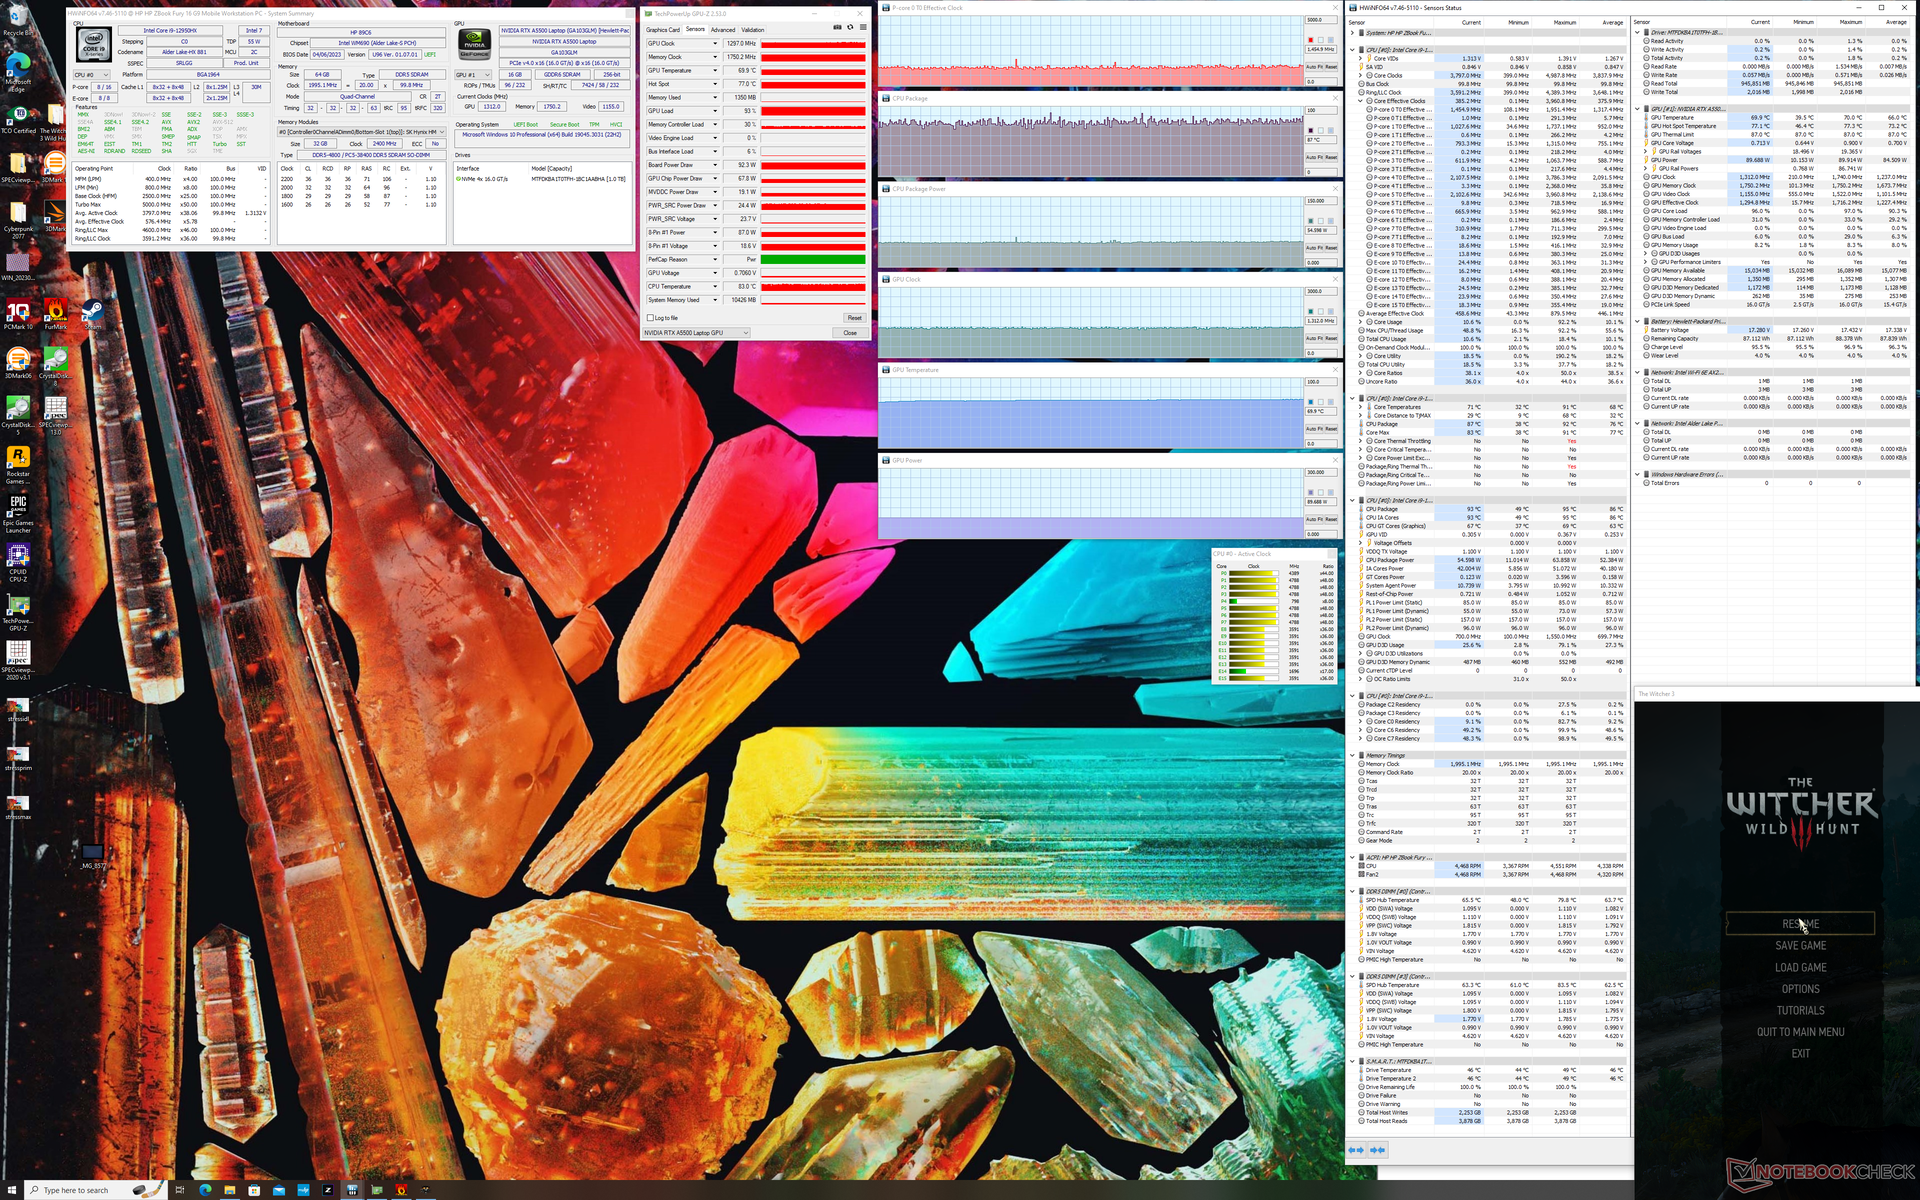
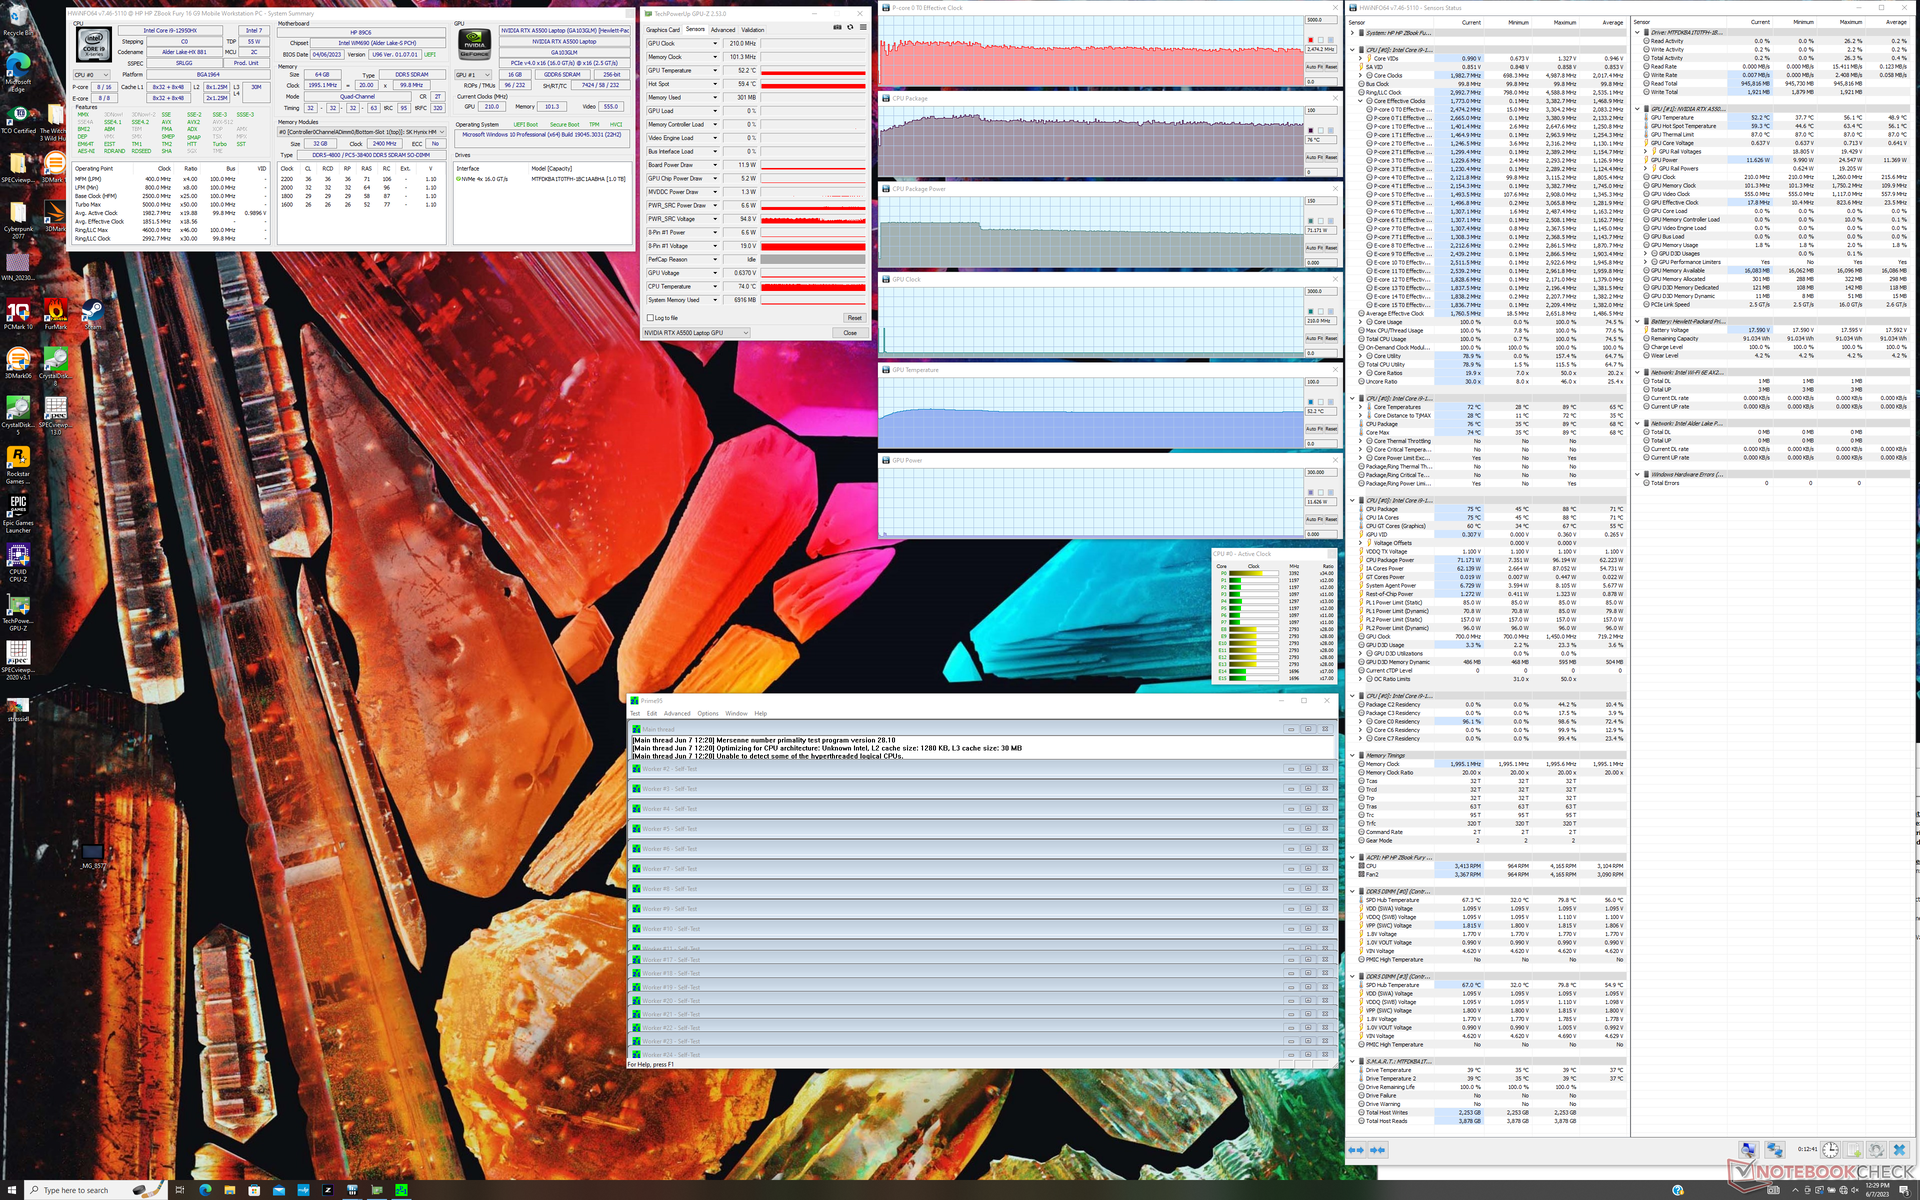
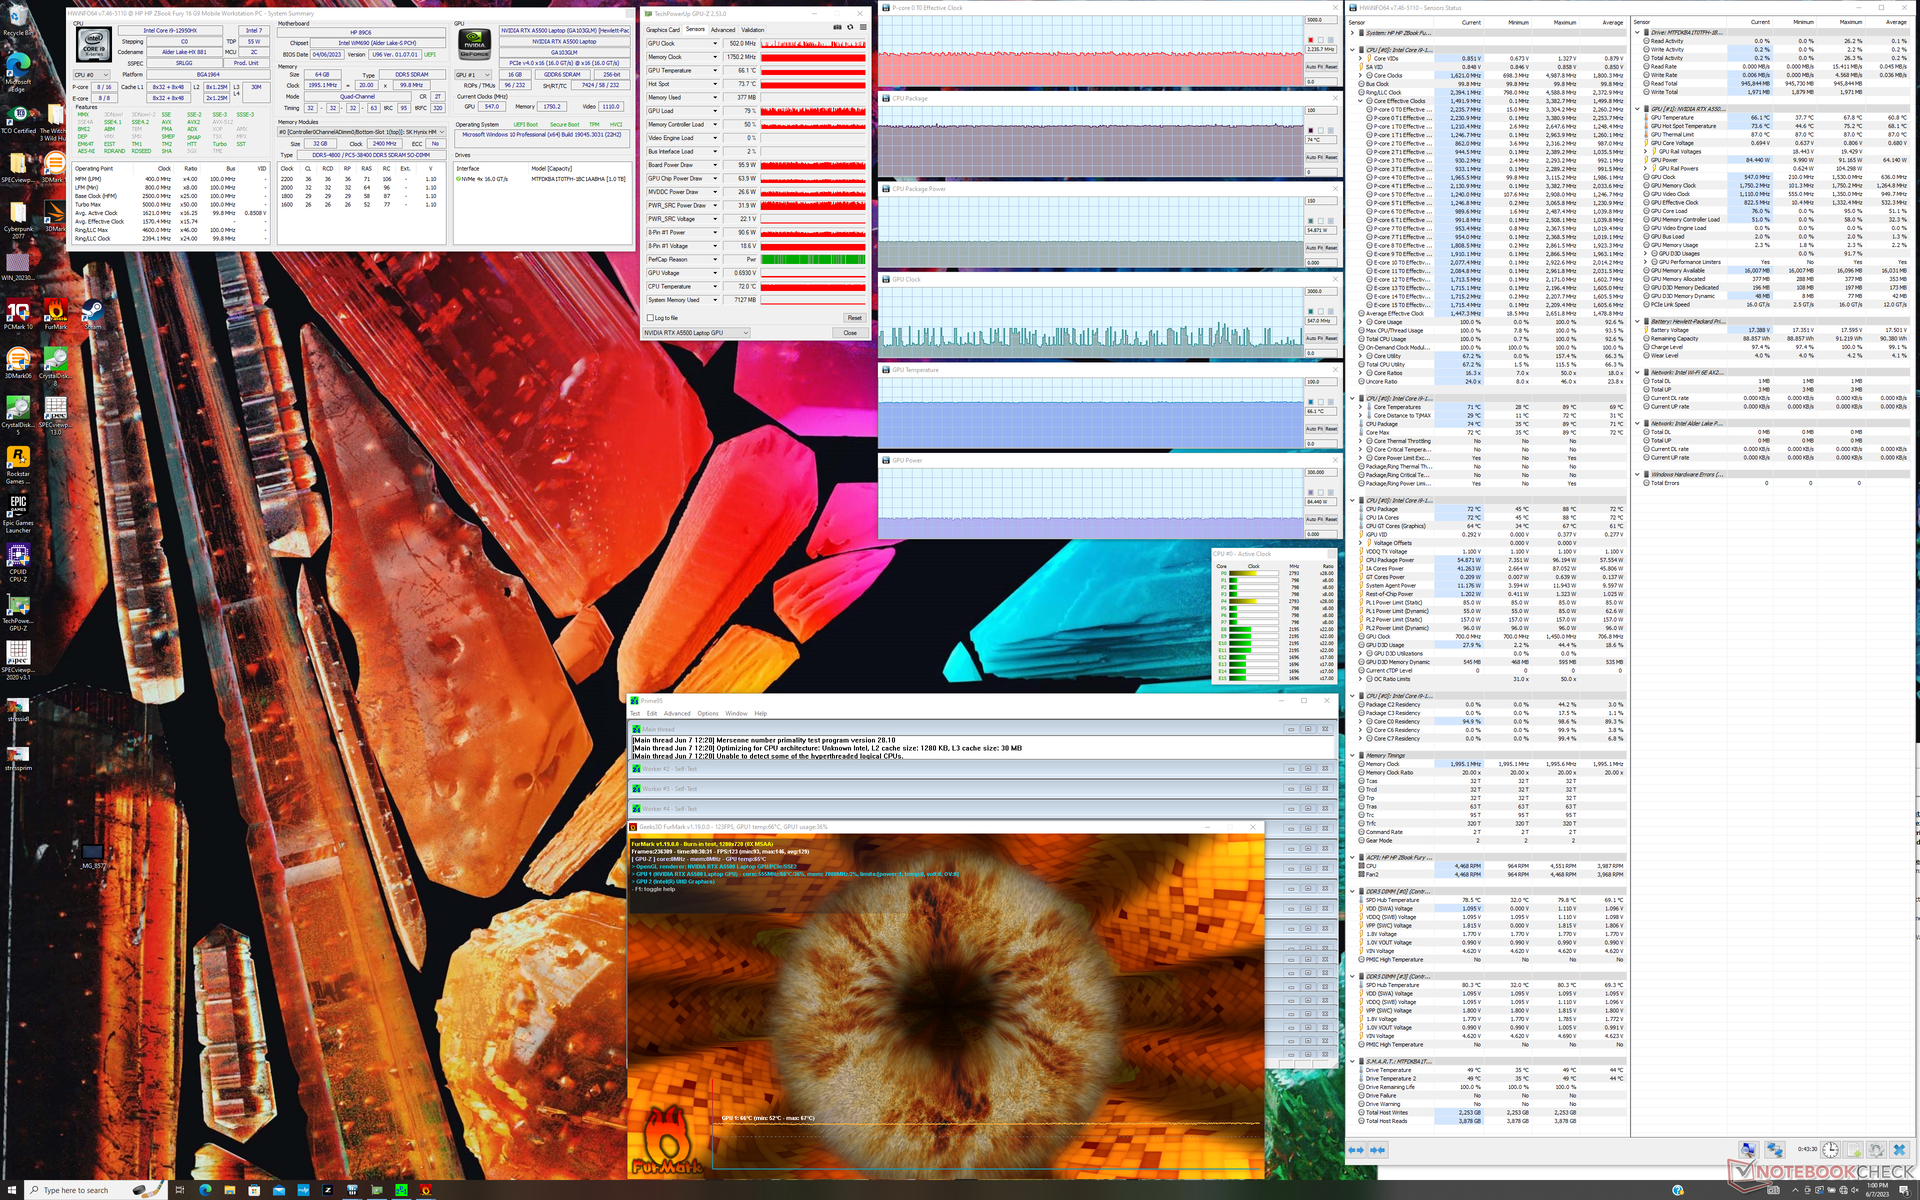
| Clock della CPU (GHz) | Clock della GPU (MHz) | Temperatura media della CPU (°C) | Temperatura media della GPU (°C) | |
| Sistema inattivo | -- | -- | 39 | 41 |
| Stress Prime95 | 2,5 - 2,7 | -- | 76 | 52 |
| Prime95 + FurMark Stress | 2,2 - 2,3 | 547 - 1200 | 74 | 66 |
| Witcher 3 Stress | ~1.4 | 1297 | 87 | 70 |
Altoparlanti
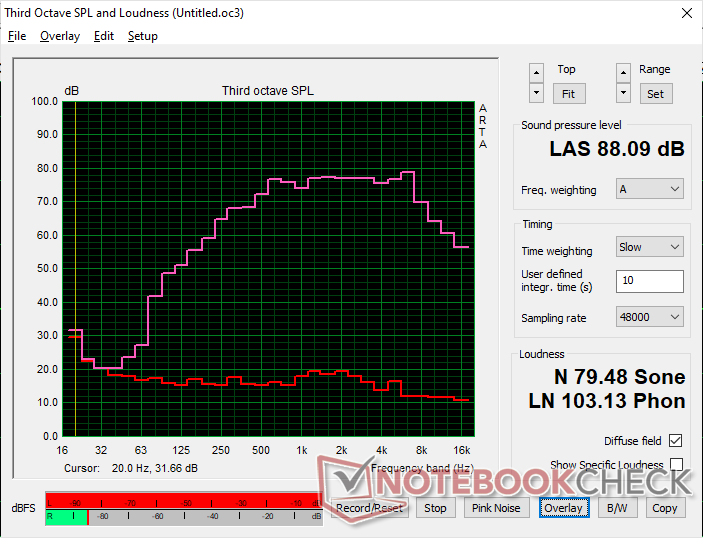
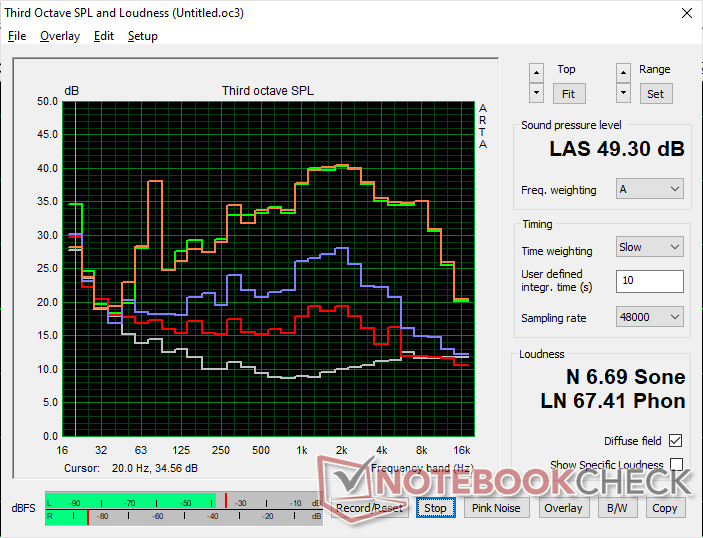
HP ZBook Fury 16 G9 analisi audio
(+) | gli altoparlanti sono relativamente potenti (88.1 dB)
Bassi 100 - 315 Hz
(-) | quasi nessun basso - in media 16.1% inferiori alla media
(±) | la linearità dei bassi è media (7.5% delta rispetto alla precedente frequenza)
Medi 400 - 2000 Hz
(+) | medi bilanciati - solo only 2.7% rispetto alla media
(+) | medi lineari (3.2% delta rispetto alla precedente frequenza)
Alti 2 - 16 kHz
(+) | Alti bilanciati - appena 4.2% dalla media
(+) | alti lineari (4.9% delta rispetto alla precedente frequenza)
Nel complesso 100 - 16.000 Hz
(+) | suono nel complesso lineare (13.5% differenza dalla media)
Rispetto alla stessa classe
» 26% di tutti i dispositivi testati in questa classe è stato migliore, 5% simile, 70% peggiore
» Il migliore ha avuto un delta di 7%, medio di 17%, peggiore di 35%
Rispetto a tutti i dispositivi testati
» 14% di tutti i dispositivi testati in questa classe è stato migliore, 4% similare, 82% peggiore
» Il migliore ha avuto un delta di 4%, medio di 24%, peggiore di 134%
Apple MacBook Pro 16 2021 M1 Pro analisi audio
(+) | gli altoparlanti sono relativamente potenti (84.7 dB)
Bassi 100 - 315 Hz
(+) | bassi buoni - solo 3.8% dalla media
(+) | bassi in lineaa (5.2% delta rispetto alla precedente frequenza)
Medi 400 - 2000 Hz
(+) | medi bilanciati - solo only 1.3% rispetto alla media
(+) | medi lineari (2.1% delta rispetto alla precedente frequenza)
Alti 2 - 16 kHz
(+) | Alti bilanciati - appena 1.9% dalla media
(+) | alti lineari (2.7% delta rispetto alla precedente frequenza)
Nel complesso 100 - 16.000 Hz
(+) | suono nel complesso lineare (4.6% differenza dalla media)
Rispetto alla stessa classe
» 0% di tutti i dispositivi testati in questa classe è stato migliore, 0% simile, 100% peggiore
» Il migliore ha avuto un delta di 5%, medio di 17%, peggiore di 45%
Rispetto a tutti i dispositivi testati
» 0% di tutti i dispositivi testati in questa classe è stato migliore, 0% similare, 100% peggiore
» Il migliore ha avuto un delta di 4%, medio di 24%, peggiore di 134%
Gestione dell'energia
Consumo di energia
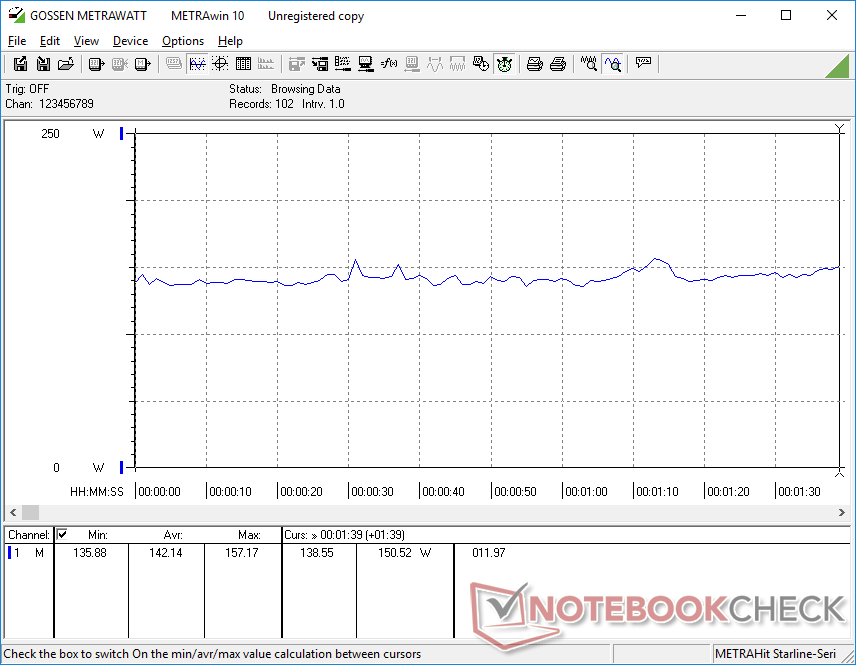
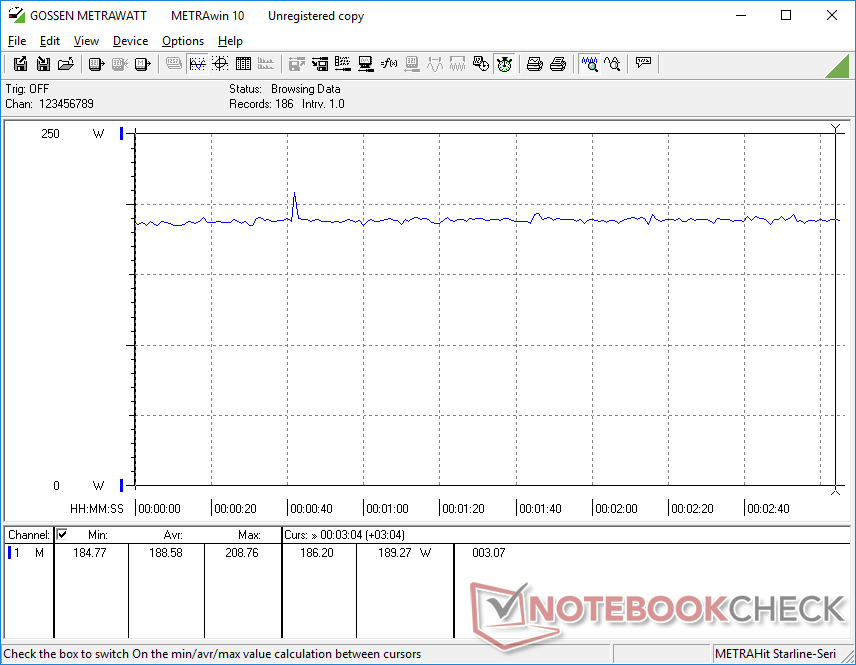
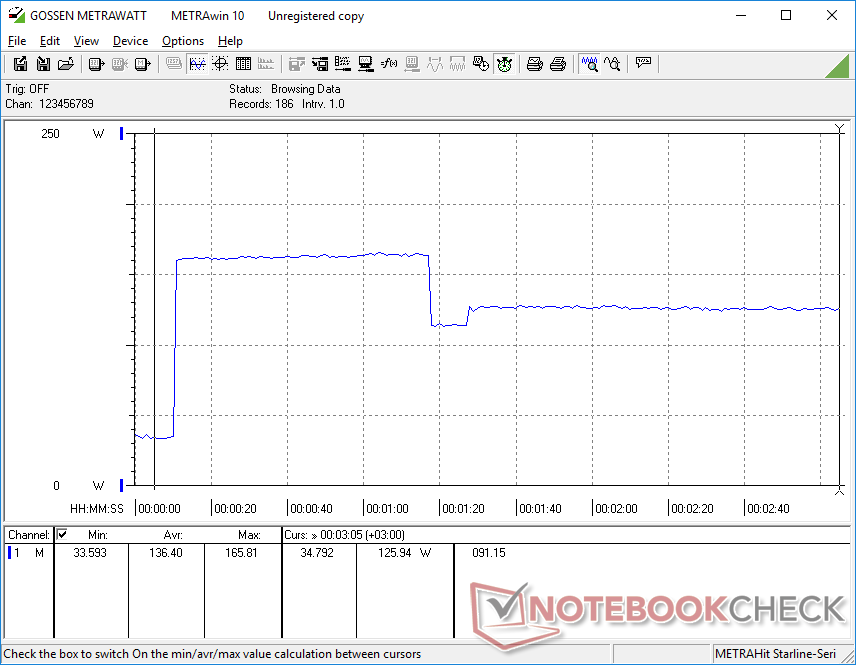
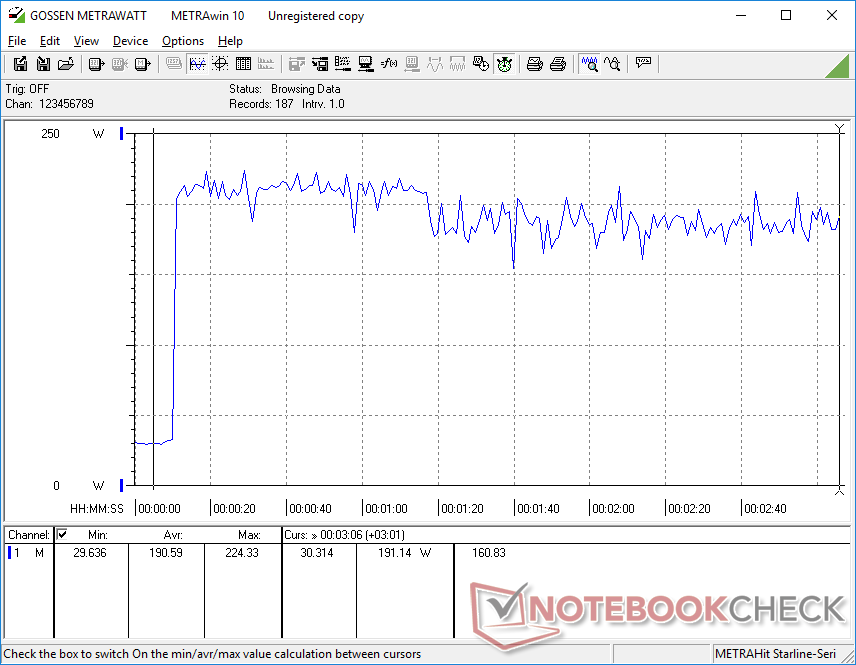
Il consumo di energia è relativamente elevato in tutti i modelli. Il funzionamento al minimo su desktop, ad esempio, consuma poco più di 19 W anche con il profilo Power Saver e l'impostazione di luminosità minima, rispetto ai 7 W o 16 W del ThinkPad P16 G1 o del Precision 7670, rispettivamente. L'esecuzione di carichi più impegnativi come Witcher 3 consumerebbe 189 W o quasi 30 W in più rispetto al Precision 7670, anche se il Dell offre prestazioni grafiche leggermente superiori.
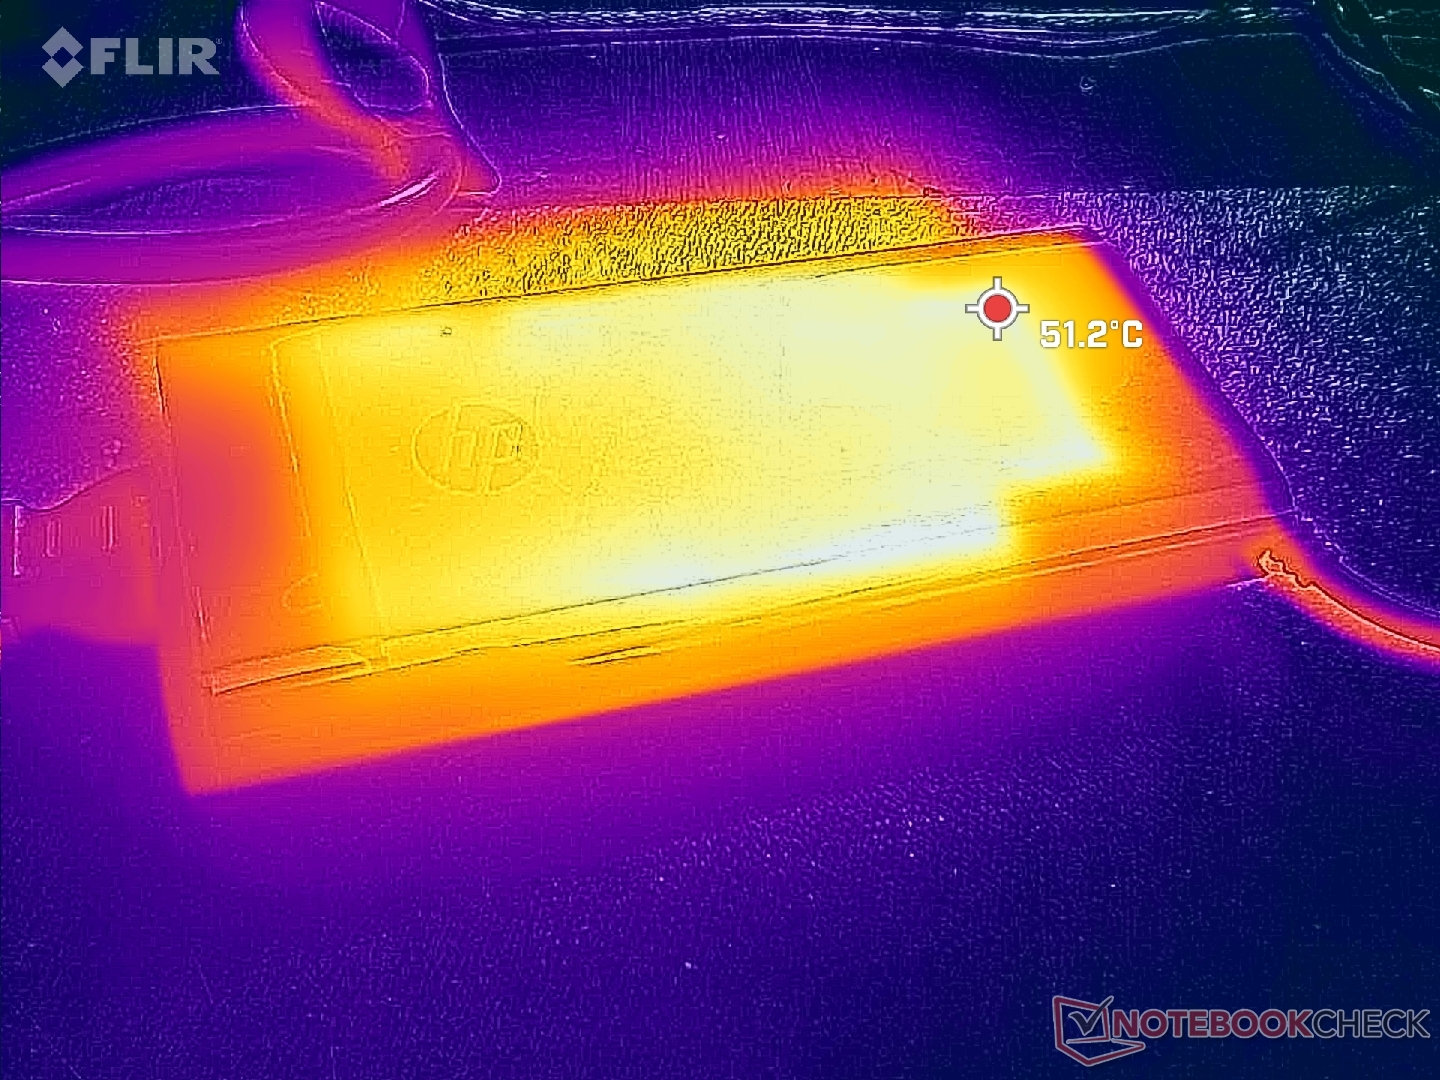
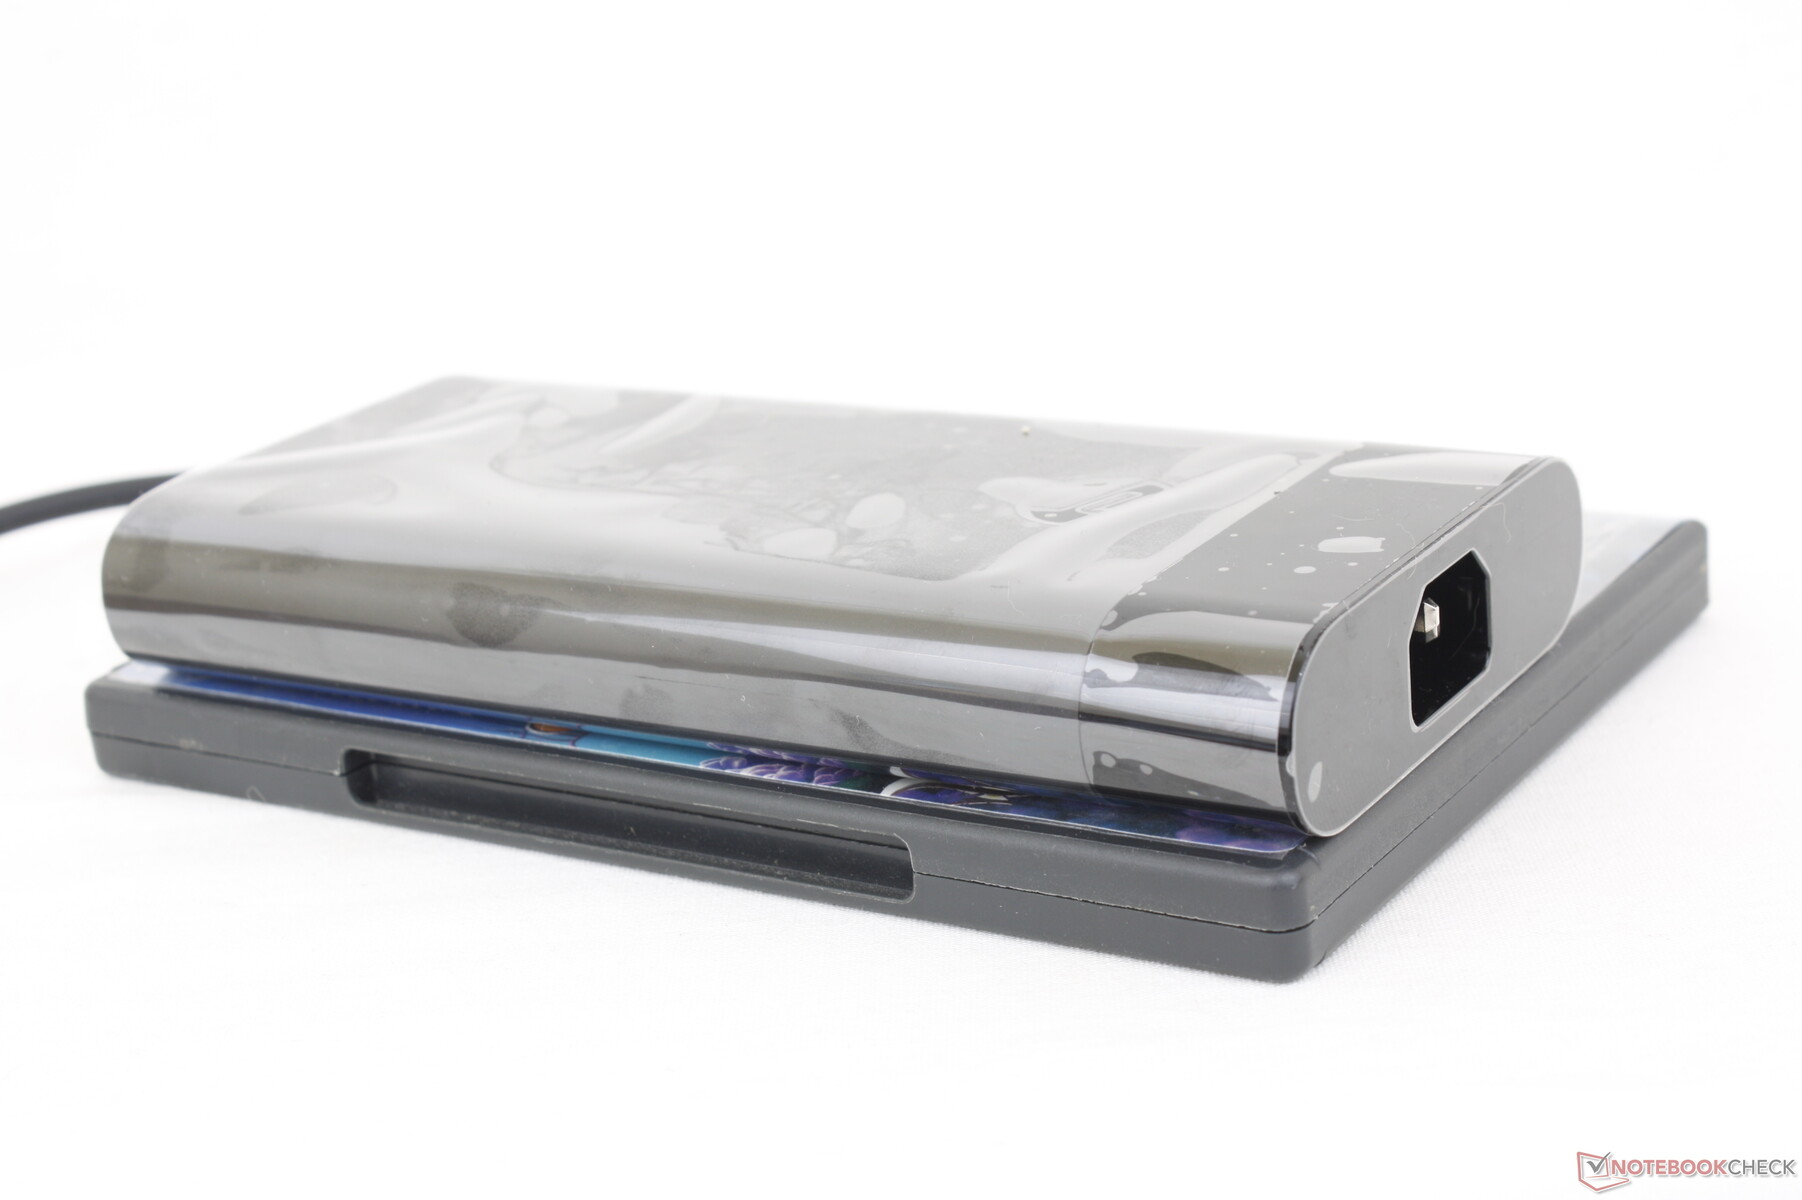
Siamo riusciti a registrare un consumo massimo temporaneo di 224 W dall'adattatore CA di medie dimensioni (~18 x 8,9 x 2,7 cm) da 230 W quando la CPU e la GPU sono utilizzate al 100%. La ricarica sarebbe quindi lenta se si gestissero carichi così elevati simultaneamente. Ripetendo questo test su Precision 7670 o ThinkPad P16 G1 si otterrebbero livelli di consumo temporaneo molto più elevati, pari a circa 300 W ciascuno, poiché hanno obiettivi TGP/TDP più elevati e quindi massimali Turbo Boost più alti.
| Off / Standby | |
| Idle | |
| Sotto carico |
|
Leggenda:
min: | |
| HP ZBook Fury 16 G9 i9-12950HX, RTX A5500 Laptop GPU, Micron 3400 1TB MTFDKBA1T0TFH, IPS, 3840x2400, 16" | HP ZBook Studio 16 G9 62U04EA i7-12800H, RTX A2000 Laptop GPU, Micron 3400 1TB MTFDKBA1T0TFH, IPS, 3840x2400, 16" | HP ZBook Firefly 16 G9-6B897EA i7-1265U, T550 Laptop GPU, Samsung PM9A1 MZVL21T0HCLR, IPS, 1920x1200, 16" | Lenovo ThinkPad P16 G1 RTX A5500 i9-12950HX, RTX A5500 Laptop GPU, WDC PC SN810 2TB, IPS, 3840x2400, 16" | Dell Precision 7000 7670 Performance i9-12950HX, RTX A5500 Laptop GPU, , OLED, 3840x2400, 16" | MSI CreatorPro Z16P B12UKST i7-12700H, RTX A3000 Laptop GPU, Samsung PM9A1 MZVL21T0HCLR, IPS, 2560x1600, 16" | |
|---|---|---|---|---|---|---|
| Power Consumption | 40% | 71% | 10% | -8% | 35% | |
| Idle Minimum * (Watt) | 19.5 | 7.2 63% | 4.5 77% | 7.5 62% | 16.4 16% | 10.8 45% |
| Idle Average * (Watt) | 29 | 18.1 38% | 8 72% | 20.1 31% | 35.9 -24% | 16.3 44% |
| Idle Maximum * (Watt) | 40.7 | 18.5 55% | 8.7 79% | 40 2% | 47 -15% | 16.9 58% |
| Load Average * (Watt) | 142.1 | 112.8 21% | 48.3 66% | 137 4% | 147.1 -4% | 111.7 21% |
| Witcher 3 ultra * (Watt) | 188.6 | 106.7 43% | 45.3 76% | 208 -10% | 158.8 16% | 152.1 19% |
| Load Maximum * (Watt) | 224.4 | 186 17% | 94.7 58% | 285.9 -27% | 311 -39% | 177.4 21% |
* ... Meglio usare valori piccoli
Power Consumption Witcher 3 / Stresstest
Power Consumption external Monitor
Durata della batteria - Tempi di esecuzione irregolari
L'autonomia WLAN di 6 ore è paragonabile a quella delloZBook Studio 16 G9 e del ThinkPad P16 G1, mentre è superiore di oltre un'ora rispetto al modello Precision 7670. Il più sottile ZBook Firefly 16 G9 può durare quasi due volte di più, poiché utilizza una CPU Core serie U più lenta.
La ricarica della batteria da 95 Wh da vuota a piena capacità è rapida e dura poco più di un'ora con l'adattatore CA in dotazione. Il sistema può essere ricaricato anche tramite adattatori USB-C di terze parti, ma la compatibilità non è garantita per le capacità più piccole. Ad esempio, collegando il nostro adattatore USB-C da 65 W al Fury 16 G9, il pop-up di Windows segnalava una potenza insufficiente per la ricarica. D'altra parte, il nostro adattatore CA USB-C da 130 W caricava il sistema senza problemi. Le prestazioni si riducono se la ricarica avviene tramite USB-C, come prevedibile.
Stranamente, la durata della batteria al minimo in modalità Risparmio energetico e con l'impostazione di luminosità più bassa è risultata inferiore rispetto alle impostazioni WLAN bilanciate, anche dopo diversi test. Si tratta probabilmente di un bug del modello che indica una cattiva gestione delle risorse in background o degli stati della CPU legati alle impostazioni del profilo energetico di Windows.
| HP ZBook Fury 16 G9 i9-12950HX, RTX A5500 Laptop GPU, 95 Wh | HP ZBook Studio 16 G9 62U04EA i7-12800H, RTX A2000 Laptop GPU, 86 Wh | HP ZBook Firefly 16 G9-6B897EA i7-1265U, T550 Laptop GPU, 76 Wh | Lenovo ThinkPad P16 G1 RTX A5500 i9-12950HX, RTX A5500 Laptop GPU, 94 Wh | Dell Precision 7000 7670 Performance i9-12950HX, RTX A5500 Laptop GPU, 93 Wh | MSI CreatorPro Z16P B12UKST i7-12700H, RTX A3000 Laptop GPU, 90 Wh | |
|---|---|---|---|---|---|---|
| Autonomia della batteria | -2% | 92% | -3% | -22% | -3% | |
| Reader / Idle (h) | 5.3 | |||||
| WiFi v1.3 (h) | 6 | 6.3 5% | 13 117% | 5.8 -3% | 4.7 -22% | 5.8 -3% |
| Load (h) | 1.2 | 1.1 -8% | 2 67% | |||
| H.264 (h) | 8.5 | 18.4 |
Pro
Contro
Verdetto - Buone prestazioni, ma Lenovo e Dell lo fanno più velocemente
Lo ZBook Fury 16 G9 offre caratteristiche non disponibili sulla maggior parte delle altre workstation mobili. Il pannello super-luminoso a 1000 nit, l'OLED opzionale, l'illuminazione RGB per ogni tasto, il tasto programmabile dedicato e il supporto per un massimo di 4 SSD e 4 moduli SODIMM sono tutte caratteristiche che gli appassionati possono apprezzare. Nel frattempo, la comoda tastiera e il touchpad sono qualcosa che vorremmo che altri produttori potessero emulare.
Il principale inconveniente che impedisce allo ZBook Fury 16 G9 di essere immediatamente raccomandato è il throttling delle prestazioni più marcato rispetto al Lenovo ThinkPad P16 G1 o Dell Precision 7670. Se è vero che l'HP può supportare 4 unità interne, le prestazioni di queste unità tendono a diminuire quando sono sottoposte a stress. È inoltre deludente che l'RTX A5500 punti a un TGP di soli 100 W quando i modelli Lenovo e Dell sopra citati puntano ciascuno a ~130 W per prestazioni più elevate. Anche la CPU ha prestazioni leggermente inferiori rispetto ad altri modelli con la stessa opzione di processore.
L'HP ZBook Fury 16 G9 è più leggero e più ricco di funzioni di molte altre workstation da 16 pollici. Tuttavia, le prestazioni ne risentono leggermente, a causa di obiettivi TGP e TDP inferiori e di un raffreddamento insufficiente dell'SSD.
Se le caratteristiche ausiliarie di cui sopra non vi interessano, farete meglio a massimizzare le prestazioni scegliendo il ThinkPad P16 G1 o Precision 7670. Se invece non vi dispiace ridurre le prestazioni per queste caratteristiche, allora vale la pena prendere in considerazione il più leggero HP Fury.
Prezzo e disponibilità
HP sta distribuendo il suo ZBook Fury 16 G9 a partire da 1490 dollari per la configurazione base fino a oltre 4000 dollari per la nostra configurazione di prova. È disponibile anche il modello Fury 16 G10.
HP ZBook Fury 16 G9
- 06/09/2023 v7 (old)
Allen Ngo
Transparency
La selezione dei dispositivi da recensire viene effettuata dalla nostra redazione. Il campione di prova è stato fornito all'autore come prestito dal produttore o dal rivenditore ai fini di questa recensione. L'istituto di credito non ha avuto alcuna influenza su questa recensione, né il produttore ne ha ricevuto una copia prima della pubblicazione. Non vi era alcun obbligo di pubblicare questa recensione. In quanto società mediatica indipendente, Notebookcheck non è soggetta all'autorità di produttori, rivenditori o editori.
Ecco come Notebookcheck esegue i test
Ogni anno, Notebookcheck esamina in modo indipendente centinaia di laptop e smartphone utilizzando procedure standardizzate per garantire che tutti i risultati siano comparabili. Da circa 20 anni sviluppiamo continuamente i nostri metodi di prova e nel frattempo stabiliamo gli standard di settore. Nei nostri laboratori di prova, tecnici ed editori esperti utilizzano apparecchiature di misurazione di alta qualità. Questi test comportano un processo di validazione in più fasi. Il nostro complesso sistema di valutazione si basa su centinaia di misurazioni e parametri di riferimento ben fondati, che mantengono l'obiettività.Price comparison

