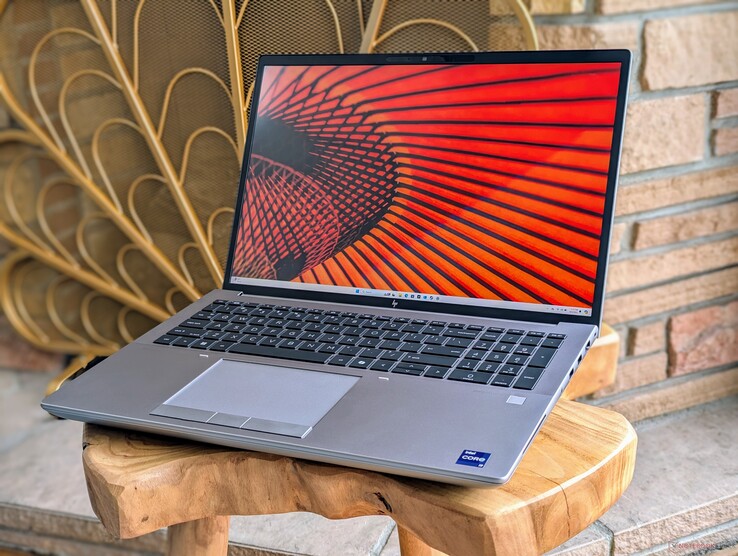
Recensione della workstation HP ZBook Fury 16 G11: debutto delle prestazioni della Nvidia RTX 3500 Ada
Lo ZBook Fury 16 G11 del 2024 succede allo ZBook Fury 16 G11 del 2023 2023 Fury 16 G10 sostituendo le CPU Raptor Lake-HX con le più recenti opzioni Raptor Lake-HX Refresh. Per il resto, lo chassis rimane identico al Fury 16 G10 o al Fury 16 G9, così come molte delle opzioni configurabili. Le consigliamo di consultare la nostra recensione della Fury 16 G9 per saperne di più sulle caratteristiche fisiche del modello.
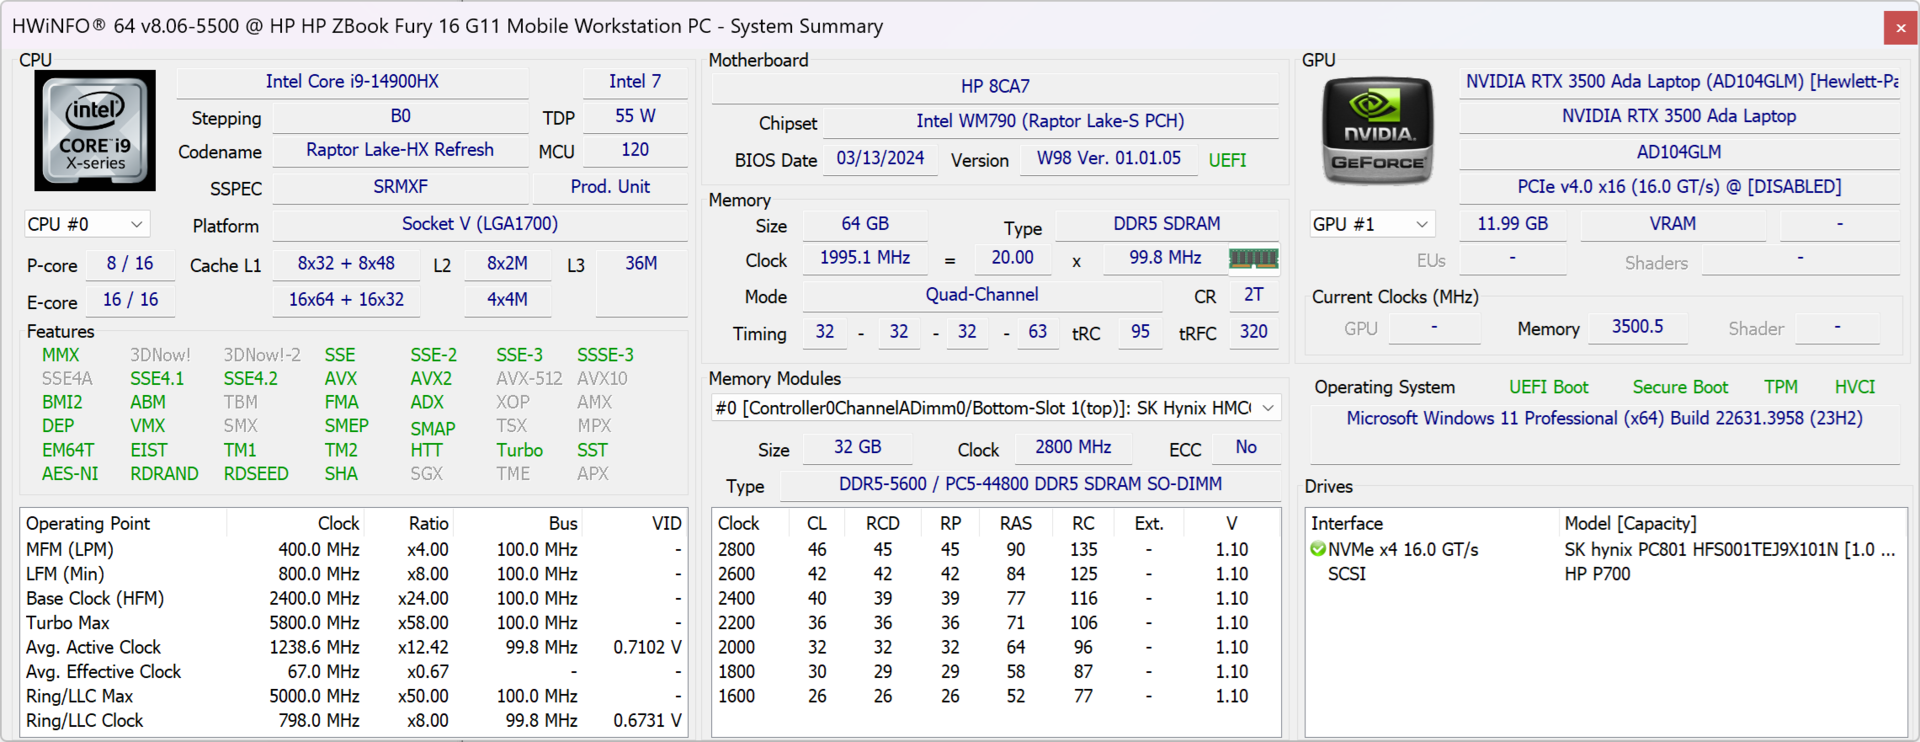
La nostra unità di prova è una configurazione di fascia medio-alta con CPU Core i9-14900HX, GPU RTX 3500 Ada e display IPS 3840 x 2400 a 120 Hz per circa 3300 dollari. Le altre SKU partono dal Core i5-13600HX fino all'RTX 5000 Ada e al touchscreen OLED da 2400p. Non ci sono opzioni di CPU Meteor Lake.
I concorrenti dello ZBook Fury 16 G11 includono altre workstation da 16 pollici come il modello Dell Precision 5690, Lenovo ThinkPad P16 G2o Asus ProArt Studiobook 16.
Altre recensioni HP:
Potenziali concorrenti a confrontos
Punteggio | Versione | Data | Modello | Peso | Altezza | Dimensione | Risoluzione | Prezzo |
|---|---|---|---|---|---|---|---|---|
| 85.9 % | v8 | 08/2024 | HP ZBook Fury 16 G11 i9-14900HX, RTX 3500 Ada Generation Laptop | 2.6 kg | 28.5 mm | 16.00" | 3840x2400 | |
| 92.3 % v7 (old) | v7 (old) | 09/2023 | HP ZBook Fury 16 G10 i9-13950HX, RTX 5000 Ada Generation Laptop | 2.6 kg | 28.5 mm | 16.00" | 3840x2400 | |
| 91 % v7 (old) | v7 (old) | 06/2023 | HP ZBook Fury 16 G9 i9-12950HX, RTX A5500 Laptop GPU | 2.6 kg | 28.5 mm | 16.00" | 3840x2400 | |
| 88.3 % v7 (old) | v7 (old) | 05/2024 | Dell Precision 5690 Ultra 9 185H, RTX 5000 Ada Generation Laptop | 2.3 kg | 22.17 mm | 16.00" | 3840x2400 | |
| 90.2 % v7 (old) | v7 (old) | 03/2024 | Lenovo ThinkPad P16 G2 21FA000FGE i7-13700HX, RTX 2000 Ada Generation Laptop | 3 kg | 30.23 mm | 16.00" | 2560x1600 | |
| 90.1 % v7 (old) | v7 (old) | 12/2023 | Lenovo ThinkPad P1 G6 21FV001KUS i7-13800H, GeForce RTX 4080 Laptop GPU | 1.9 kg | 17.5 mm | 16.00" | 3480x2400 | |
| 86.1 % v7 (old) | v7 (old) | 06/2023 | Asus ProArt Studiobook 16 OLED H7604 i9-13980HX, GeForce RTX 4070 Laptop GPU | 2.4 kg | 23.9 mm | 16.00" | 3200x2000 |
Informazioni: Abbiamo aggiornato il nostro sistema di valutazione e i risultati della versione 8 non sono confrontabili con i risultati della versione 7. Altre informazioni sono gerarchicamente verfügbar.
Nota: abbiamo recentemente aggiornato il nostro sistema di valutazione e i risultati della versione 8 non sono confrontabili con quelli della versione 7. Ulteriori informazioni sono disponibili qui .
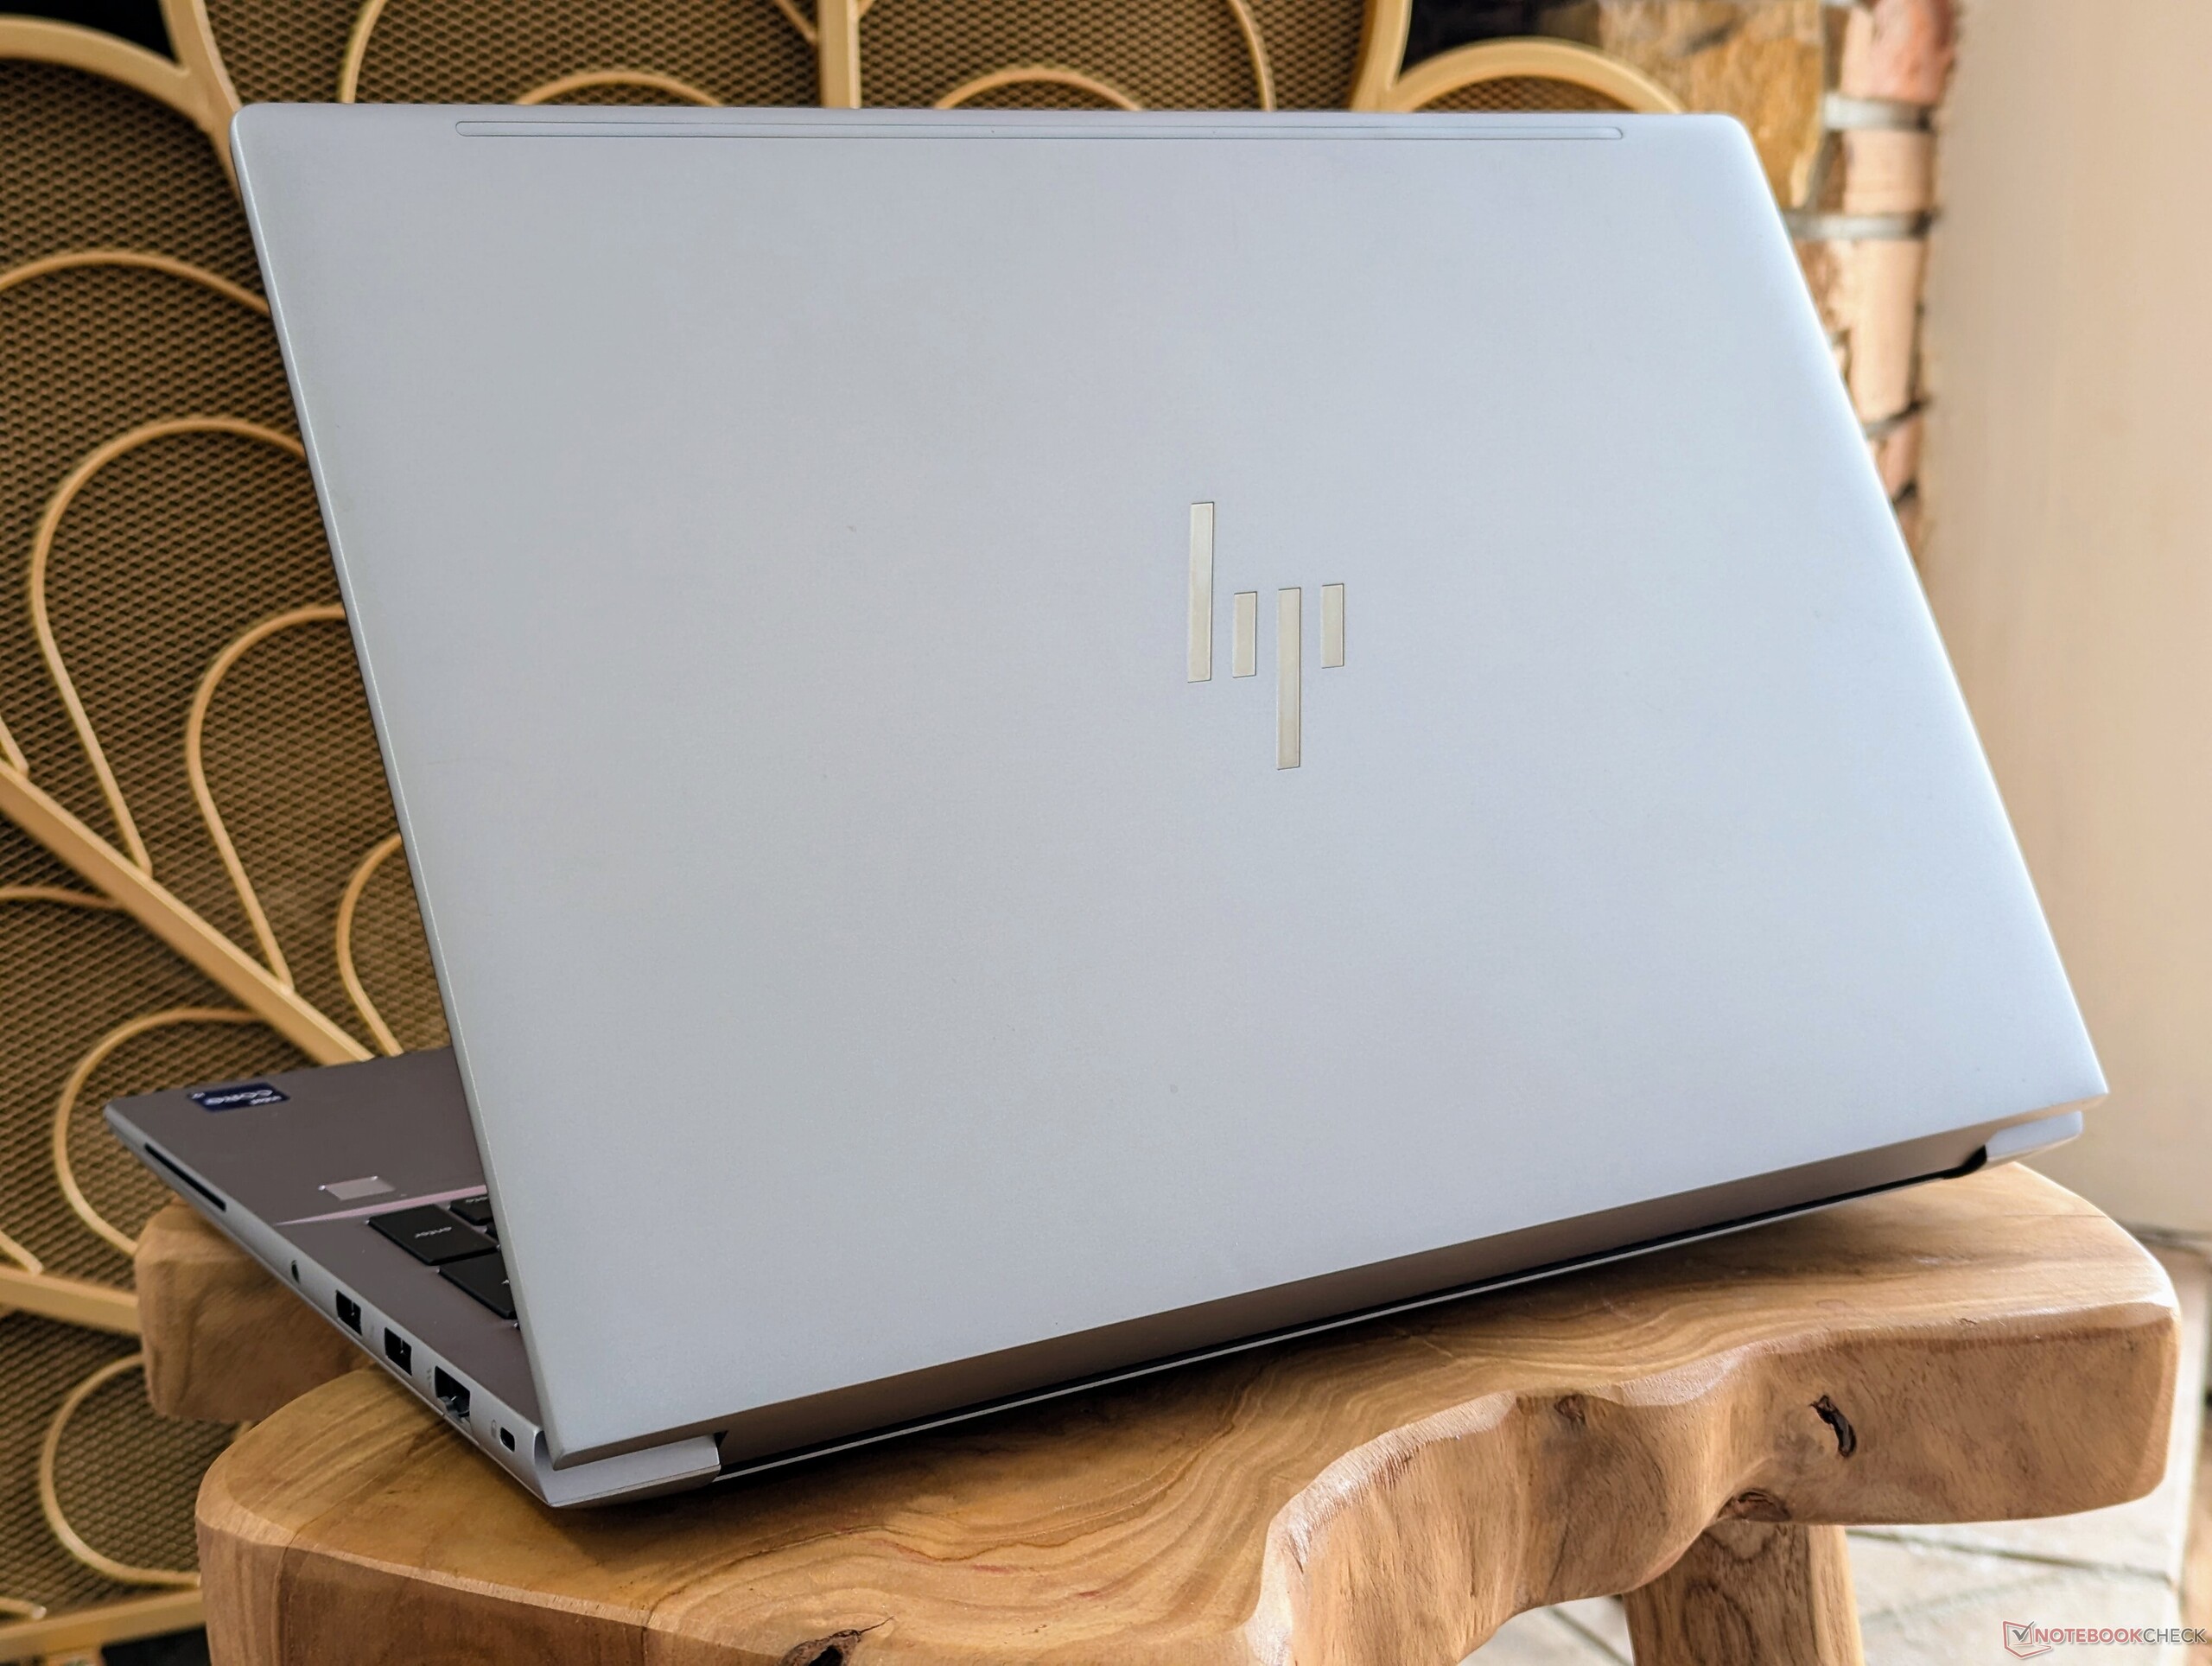
Caso
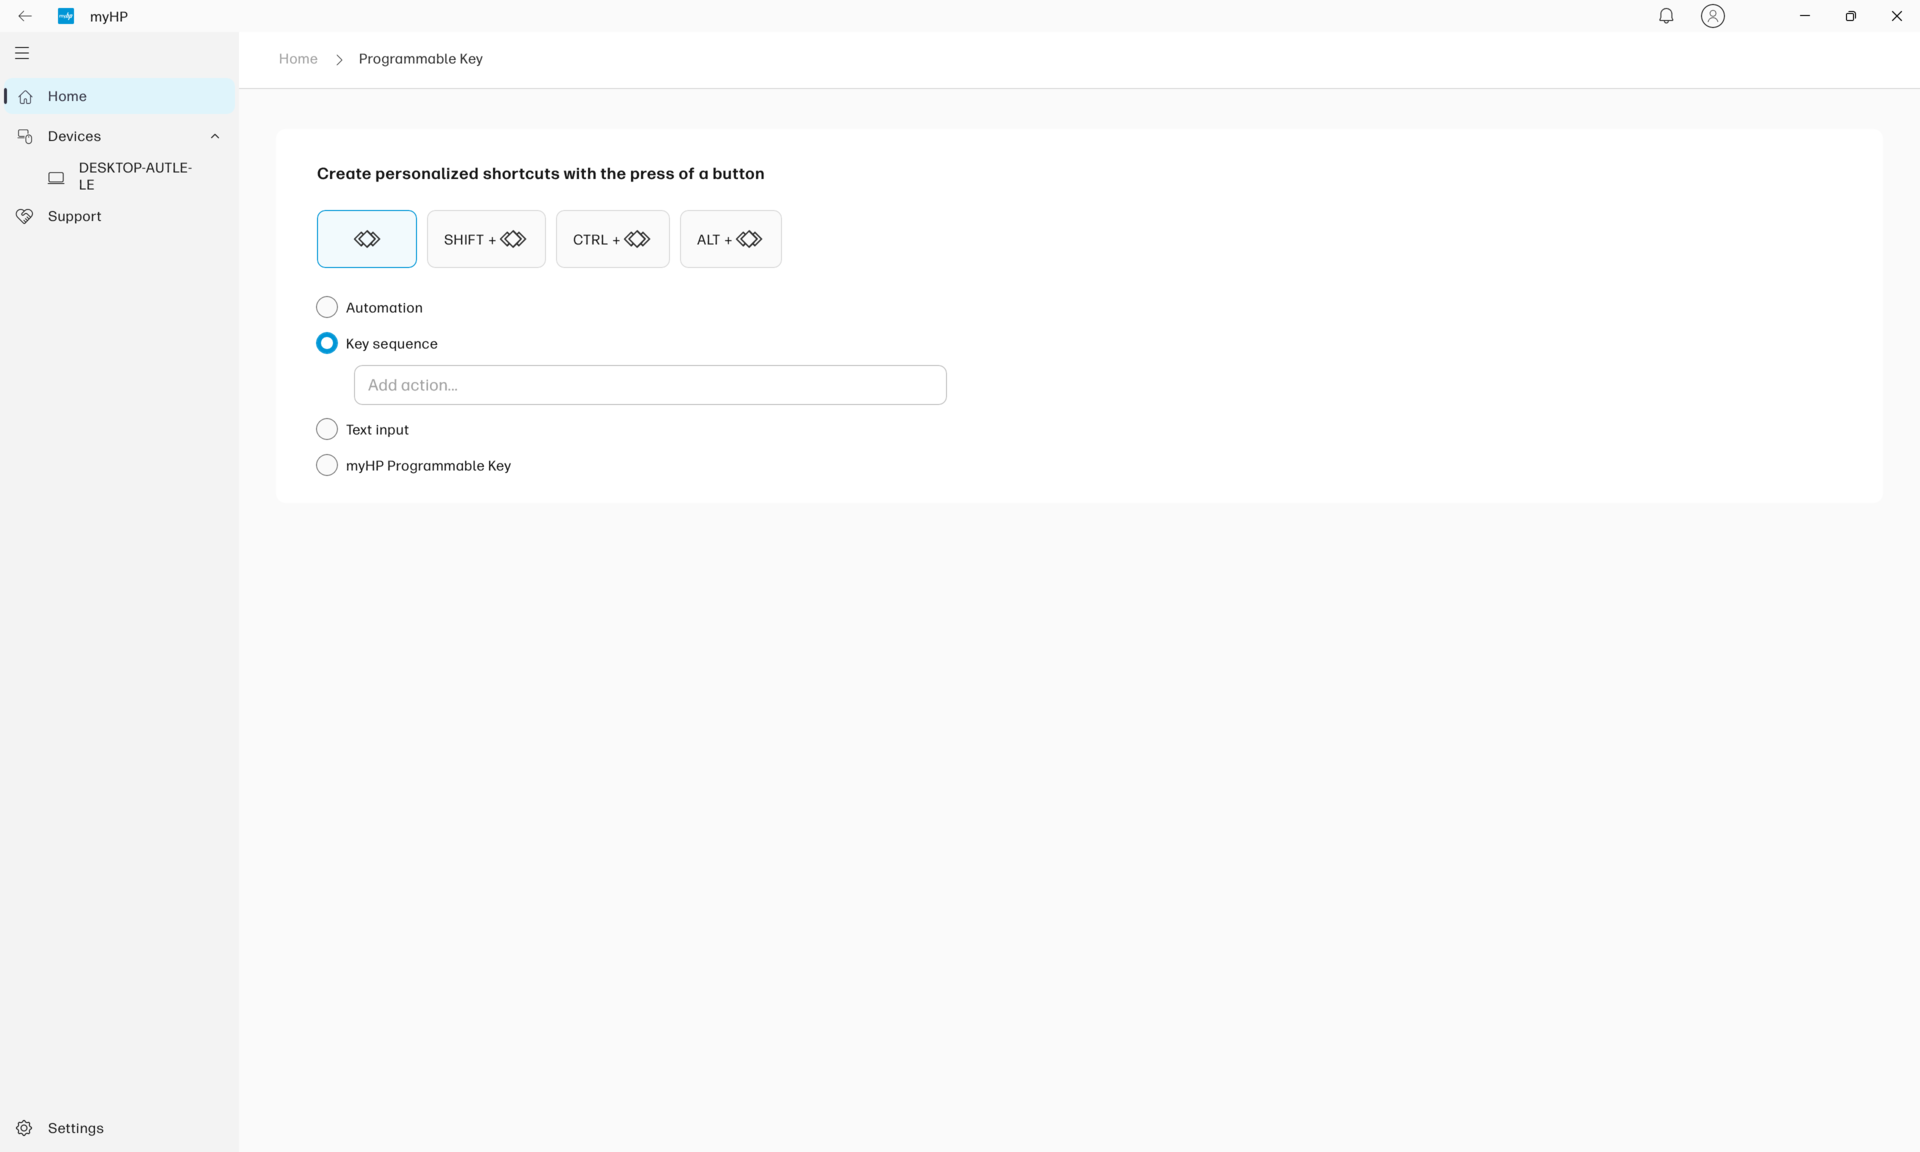
Un modo semplice per distinguere lo ZBook Fury 16 G11 dalle versioni precedenti è cercare il tasto Co-Pilot sulla tastiera. Per il resto, il design del telaio rimane lo stesso di prima.
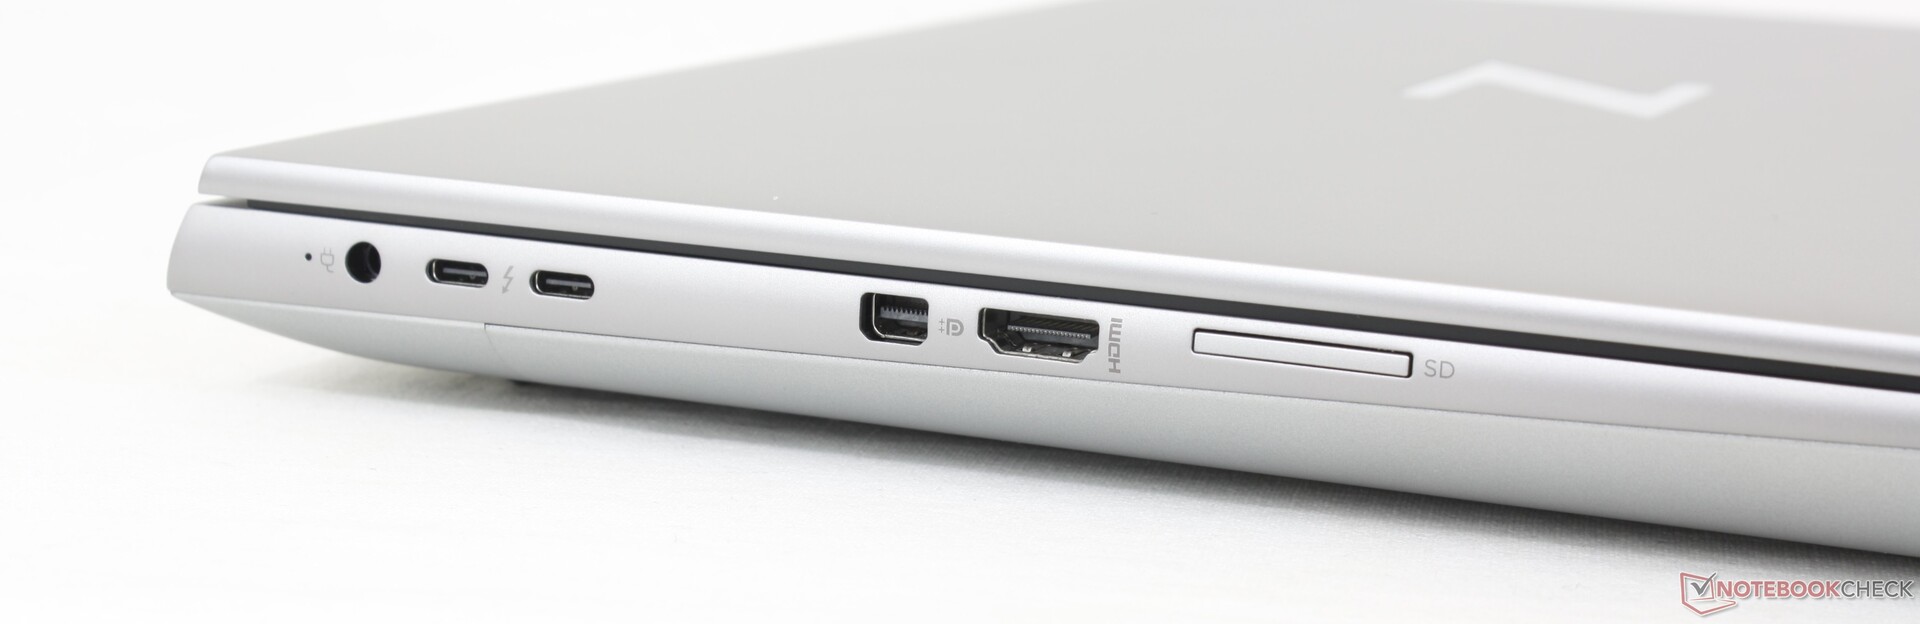
Connettività
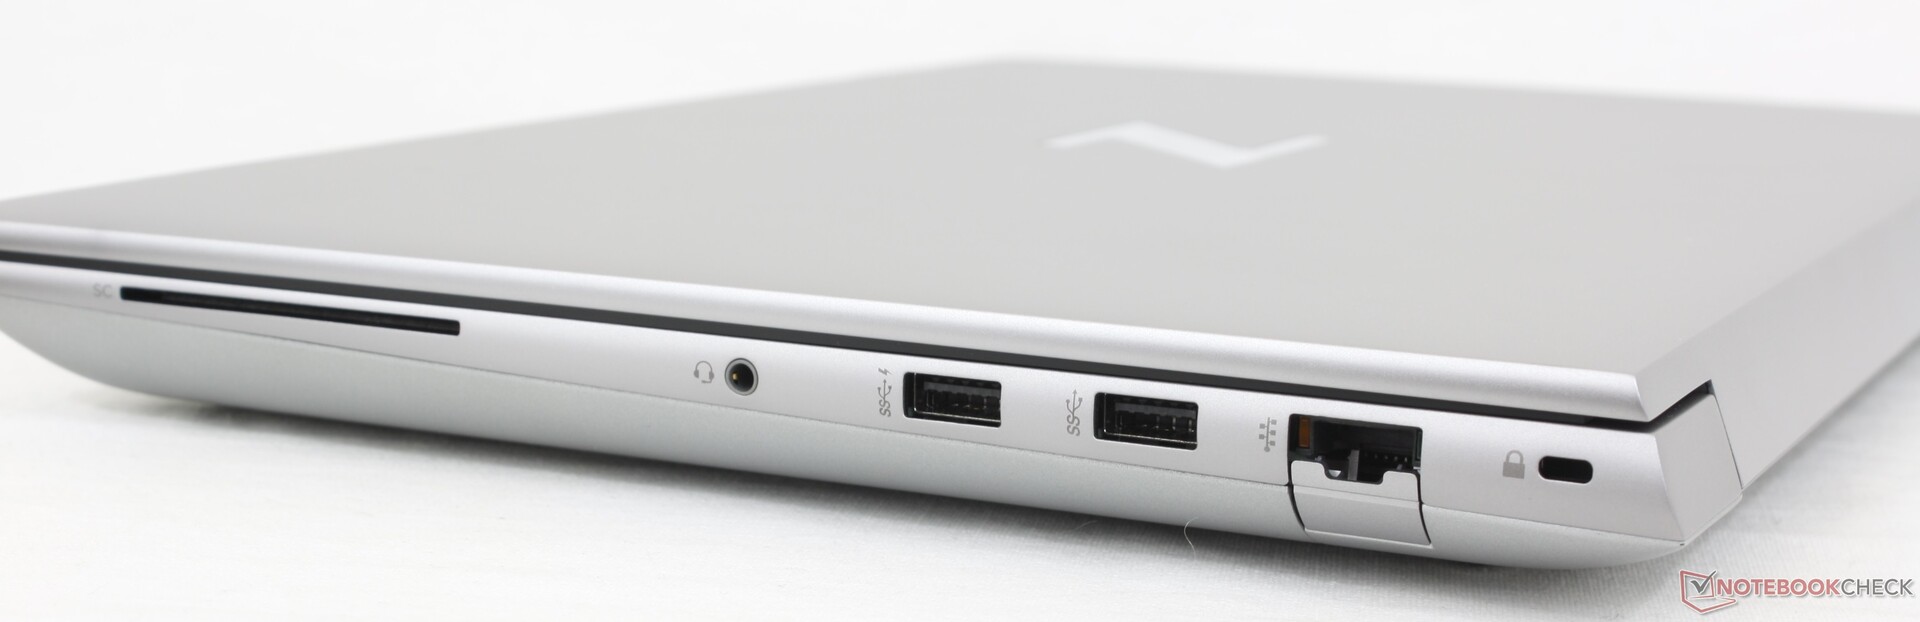
Lettore di schede SD
| SD Card Reader | |
| average JPG Copy Test (av. of 3 runs) | |
| Lenovo ThinkPad P1 G6 21FV001KUS (Toshiba Exceria Pro SDXC 64 GB UHS-II) | |
| HP ZBook Fury 16 G11 (Toshiba Exceria Pro SDXC 64 GB UHS-II) | |
| HP ZBook Fury 16 G10 (Toshiba Exceria Pro SDXC 64 GB UHS-II) | |
| HP ZBook Fury 16 G9 (PNY EliteX-PRO60) | |
| Asus ProArt Studiobook 16 OLED H7604 (Angelibird AV Pro V60) | |
| Lenovo ThinkPad P16 G2 21FA000FGE | |
| maximum AS SSD Seq Read Test (1GB) | |
| HP ZBook Fury 16 G11 (Toshiba Exceria Pro SDXC 64 GB UHS-II) | |
| Lenovo ThinkPad P1 G6 21FV001KUS (Toshiba Exceria Pro SDXC 64 GB UHS-II) | |
| HP ZBook Fury 16 G10 (Toshiba Exceria Pro SDXC 64 GB UHS-II) | |
| HP ZBook Fury 16 G9 (PNY EliteX-PRO60) | |
| Lenovo ThinkPad P16 G2 21FA000FGE | |
| Asus ProArt Studiobook 16 OLED H7604 (Angelibird AV Pro V60) | |
Comunicazione
La WLAN è stata aggiornata dall'Intel AX211 al BE200 per il corretto supporto del Wi-Fi 7. In pratica, tuttavia, la maggior parte degli utenti continuerà a collegarsi ai punti di accesso Wi-Fi 6 o 6E.
Webcam


Manutenzione
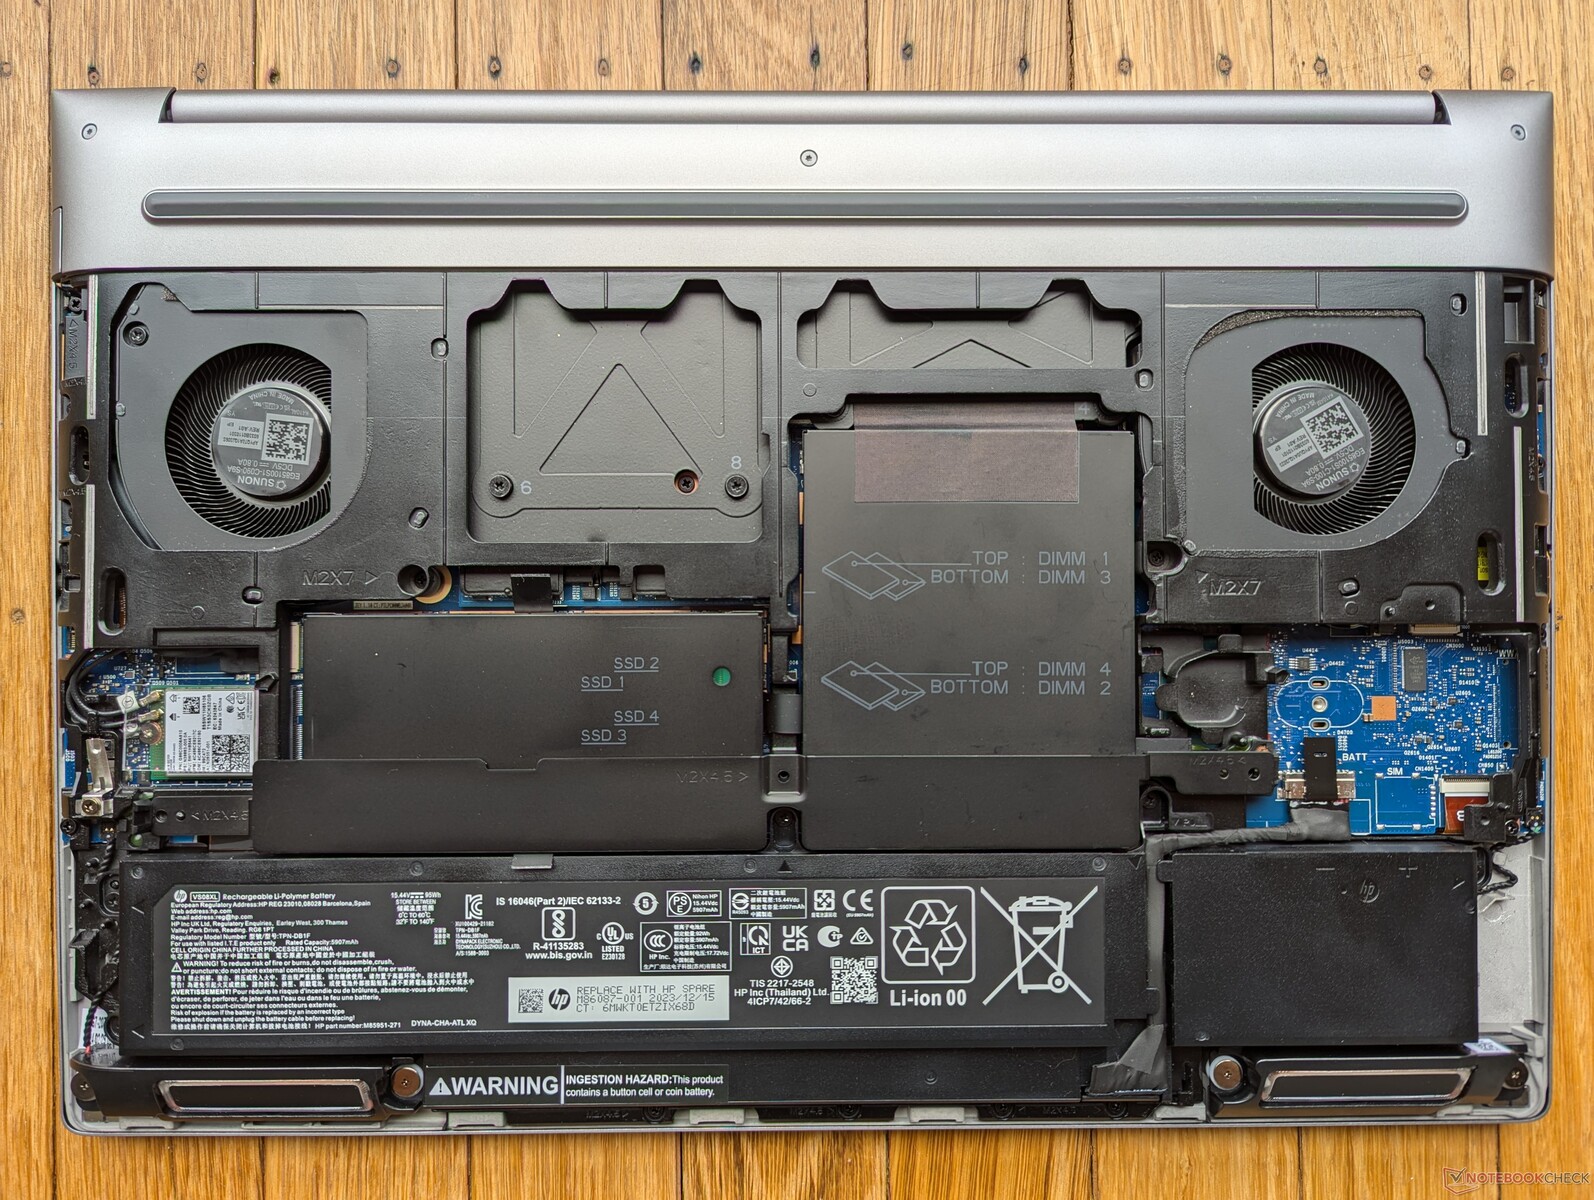
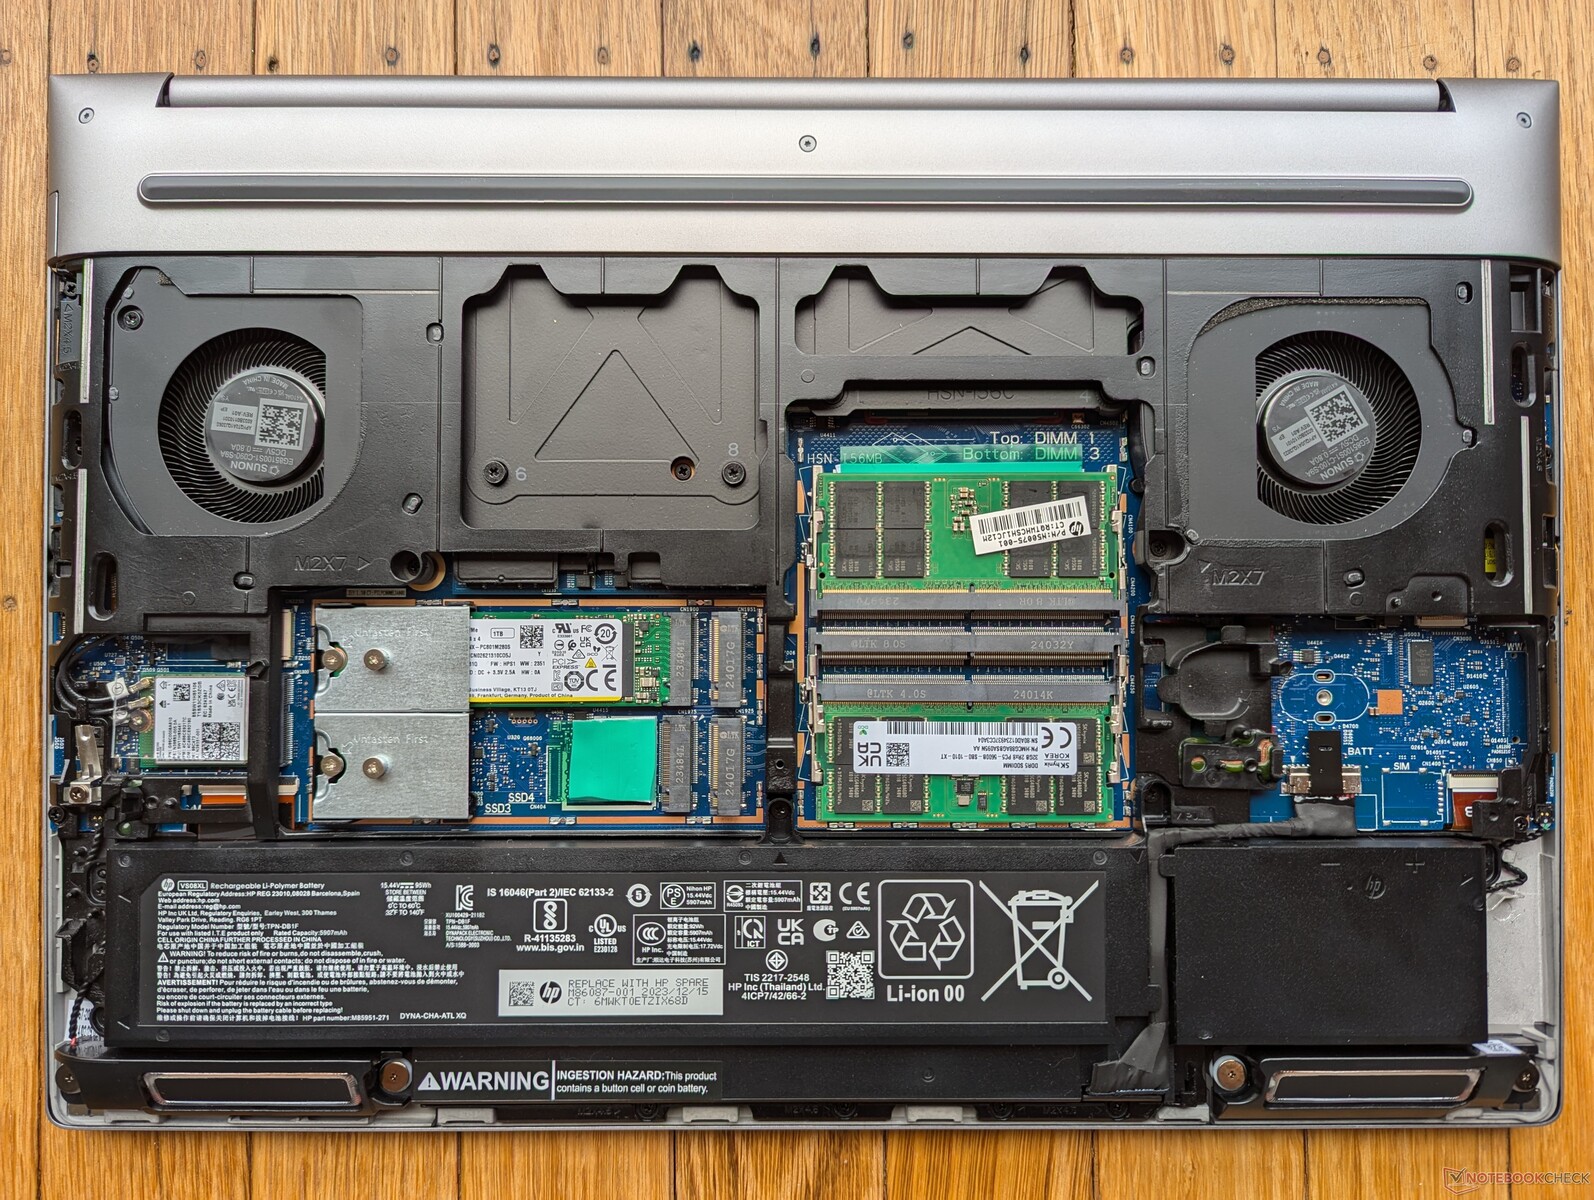
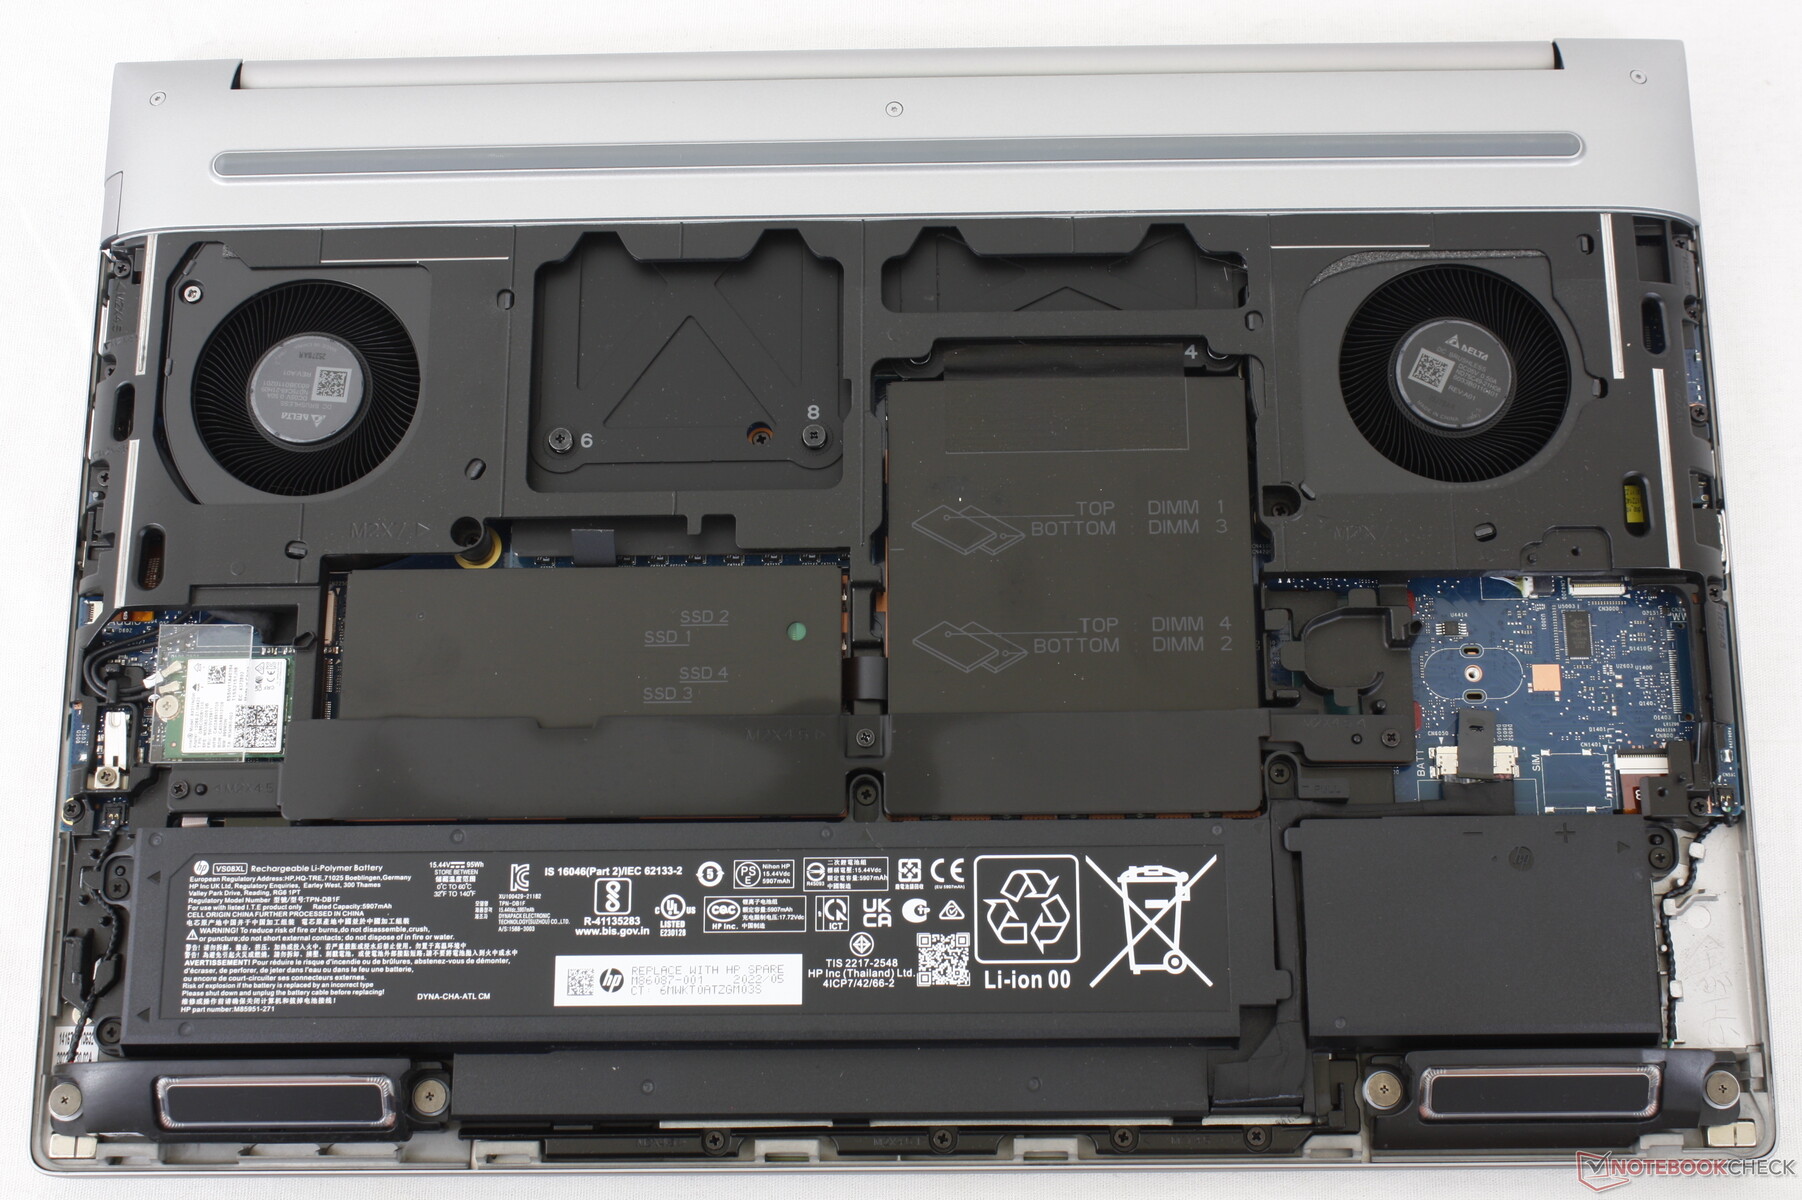
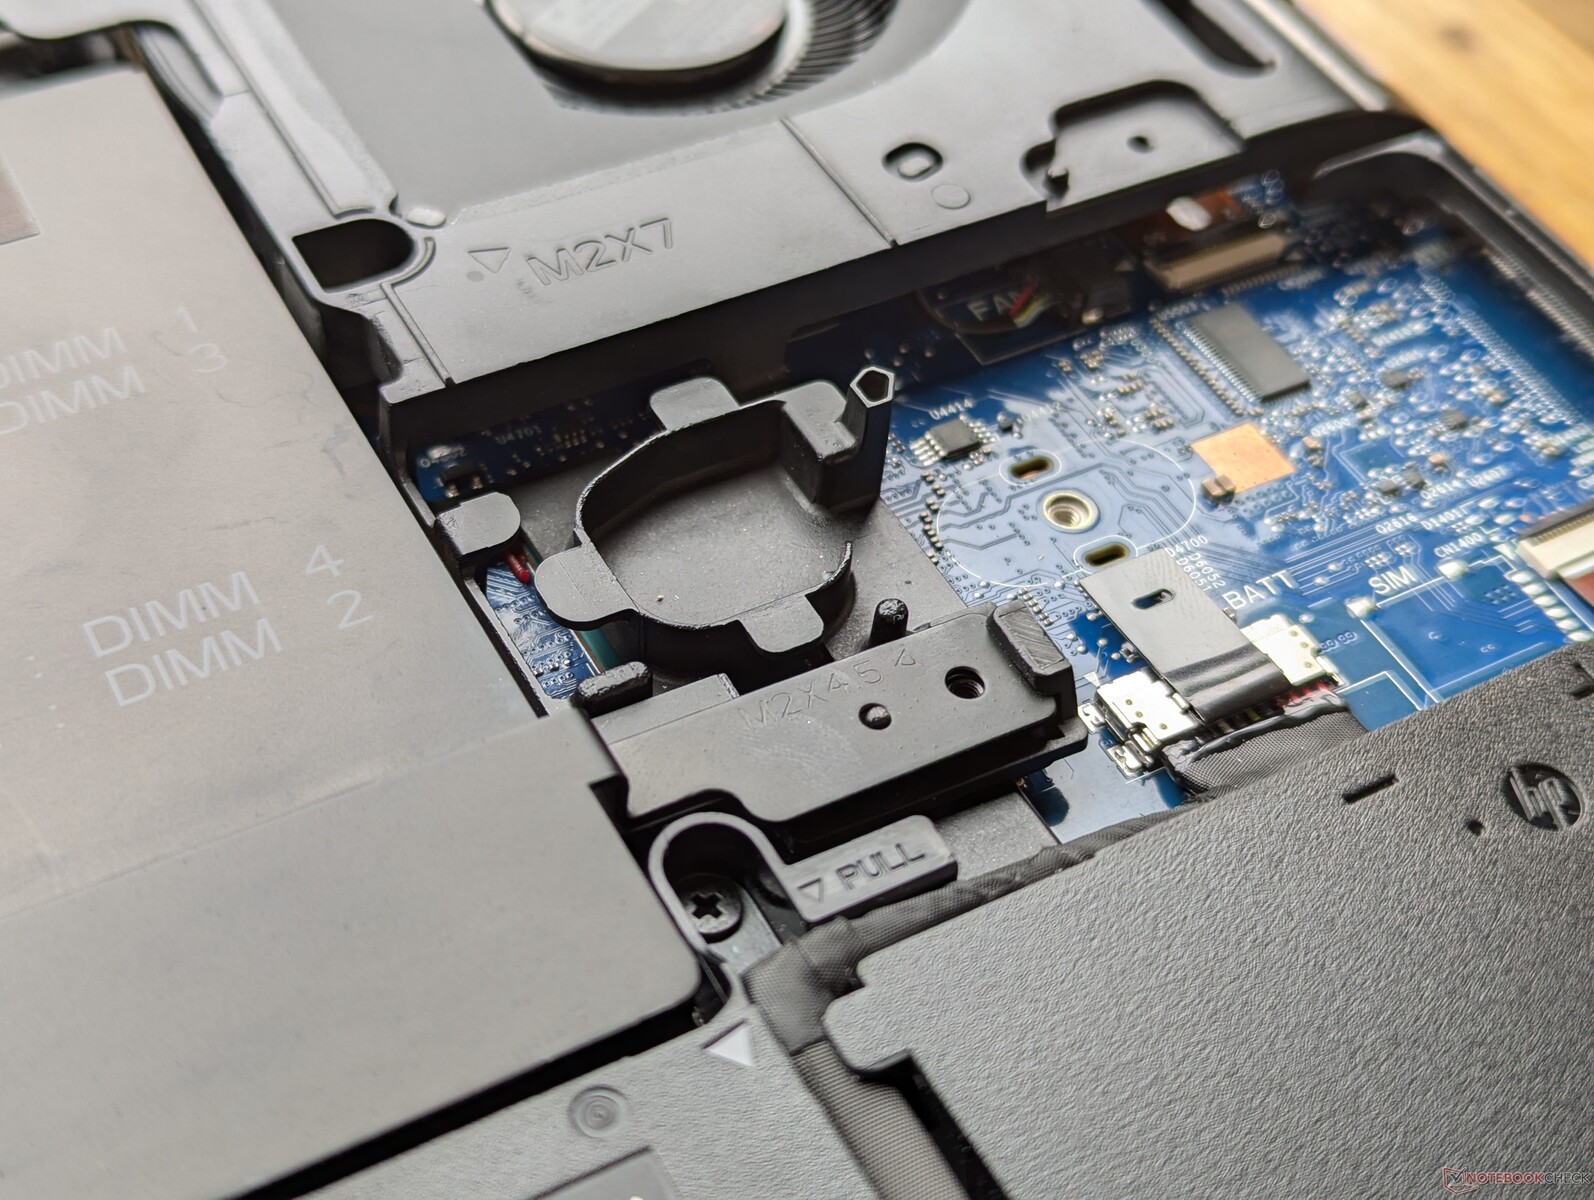
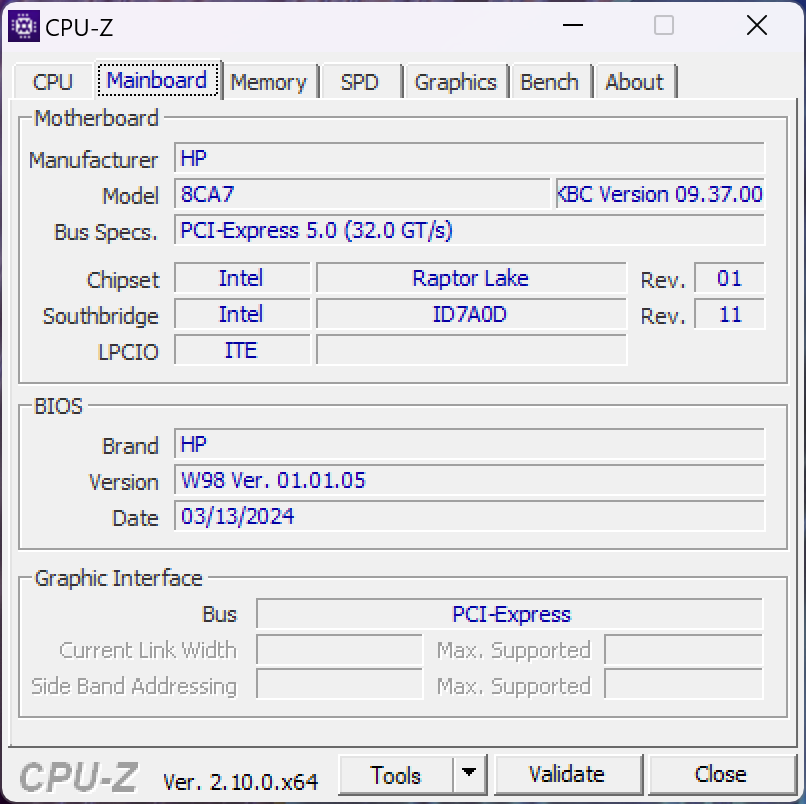
HP ha vantato una manutenzione senza attrezzi per la sua serie Fury 16 sin dal modello G9 all'inizio dello scorso anno. Mentre il pannello inferiore scivolava via senza attrezzi, i moduli RAM e SODIMM erano ancora protetti da una copertura in alluminio che richiedeva un cacciavite per essere rimossa. Questa copertura in alluminio è stata ridisegnata con dei fermi al posto delle viti sul modello G11, il che significa che gli utenti possono ora installare i moduli RAM senza alcuno strumento.
Le unità SSD, tuttavia, sono ancora fissate alla scheda madre con delle viti e quindi è necessario un cacciavite per sostituire le unità. Il sistema può supportare fino a quattro SSD e quattro moduli RAM.
Sostenibilità
L'imballaggio è completamente riciclabile e consiste principalmente di carta. L'adattatore CA è l'unico articolo che viene avvolto in plastica.
Accessori e garanzia
La confezione al dettaglio non include altri extra oltre all'adattatore CA e alla documentazione cartacea. La garanzia del produttore di tre anni è standard se acquistata negli Stati Uniti.
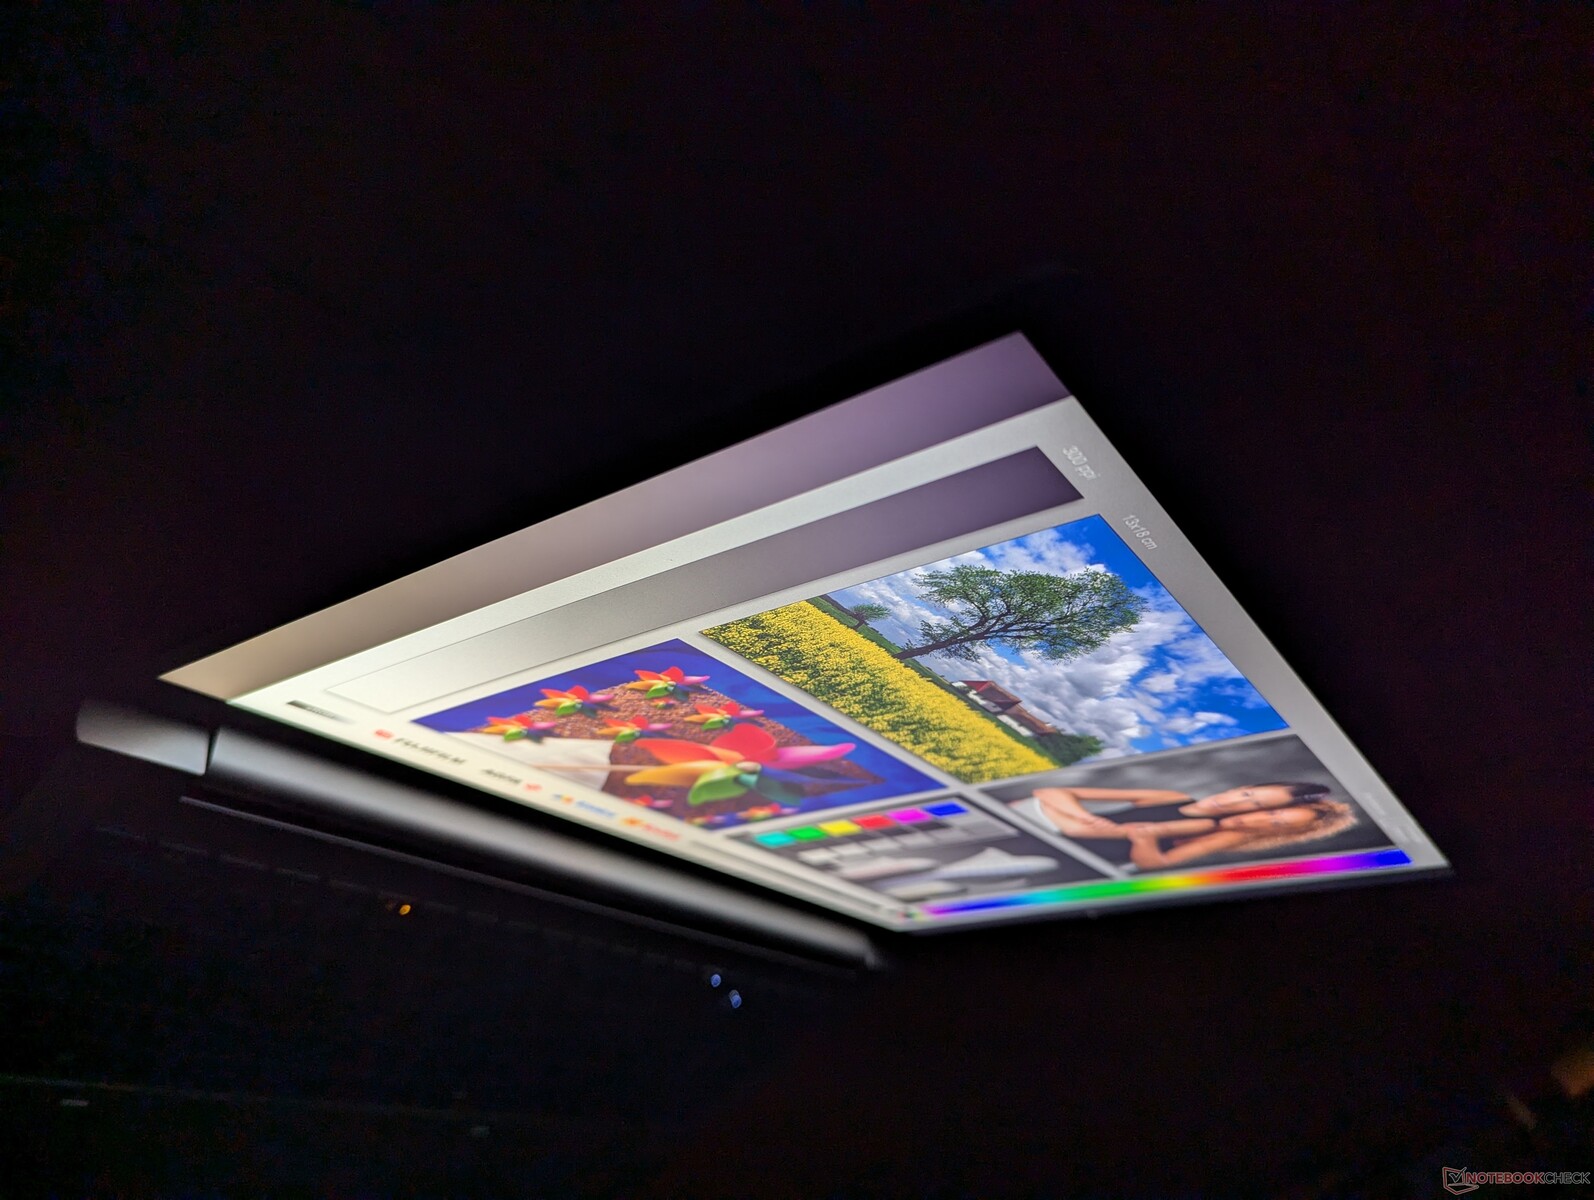
Display
Sono disponibili cinque opzioni di display, come segue. La nostra unità di prova specifica è dotata del pannello in grassetto.
- 3840 x 2400, OLED, touchscreen, lucido, 400 nits, 100% DCI-P3, 60 Hz
- 3840 x 2400, IPS, non touch, opaco, 500 nits, 100% DCI-P3, 120 Hz
- 1920 x 1200, IPS, non touch, opaco, 400 nits, 100% sRGB, 60 Hz
- 1920 x 1200, IPS, non touch, opaco, 1000 nits, 100% sRGB, 60 Hz, Sure View Integrated
- 1920 x 1200, IPS, touchscreen, lucido, 400 nits, 100% sRGB, 60 Hz
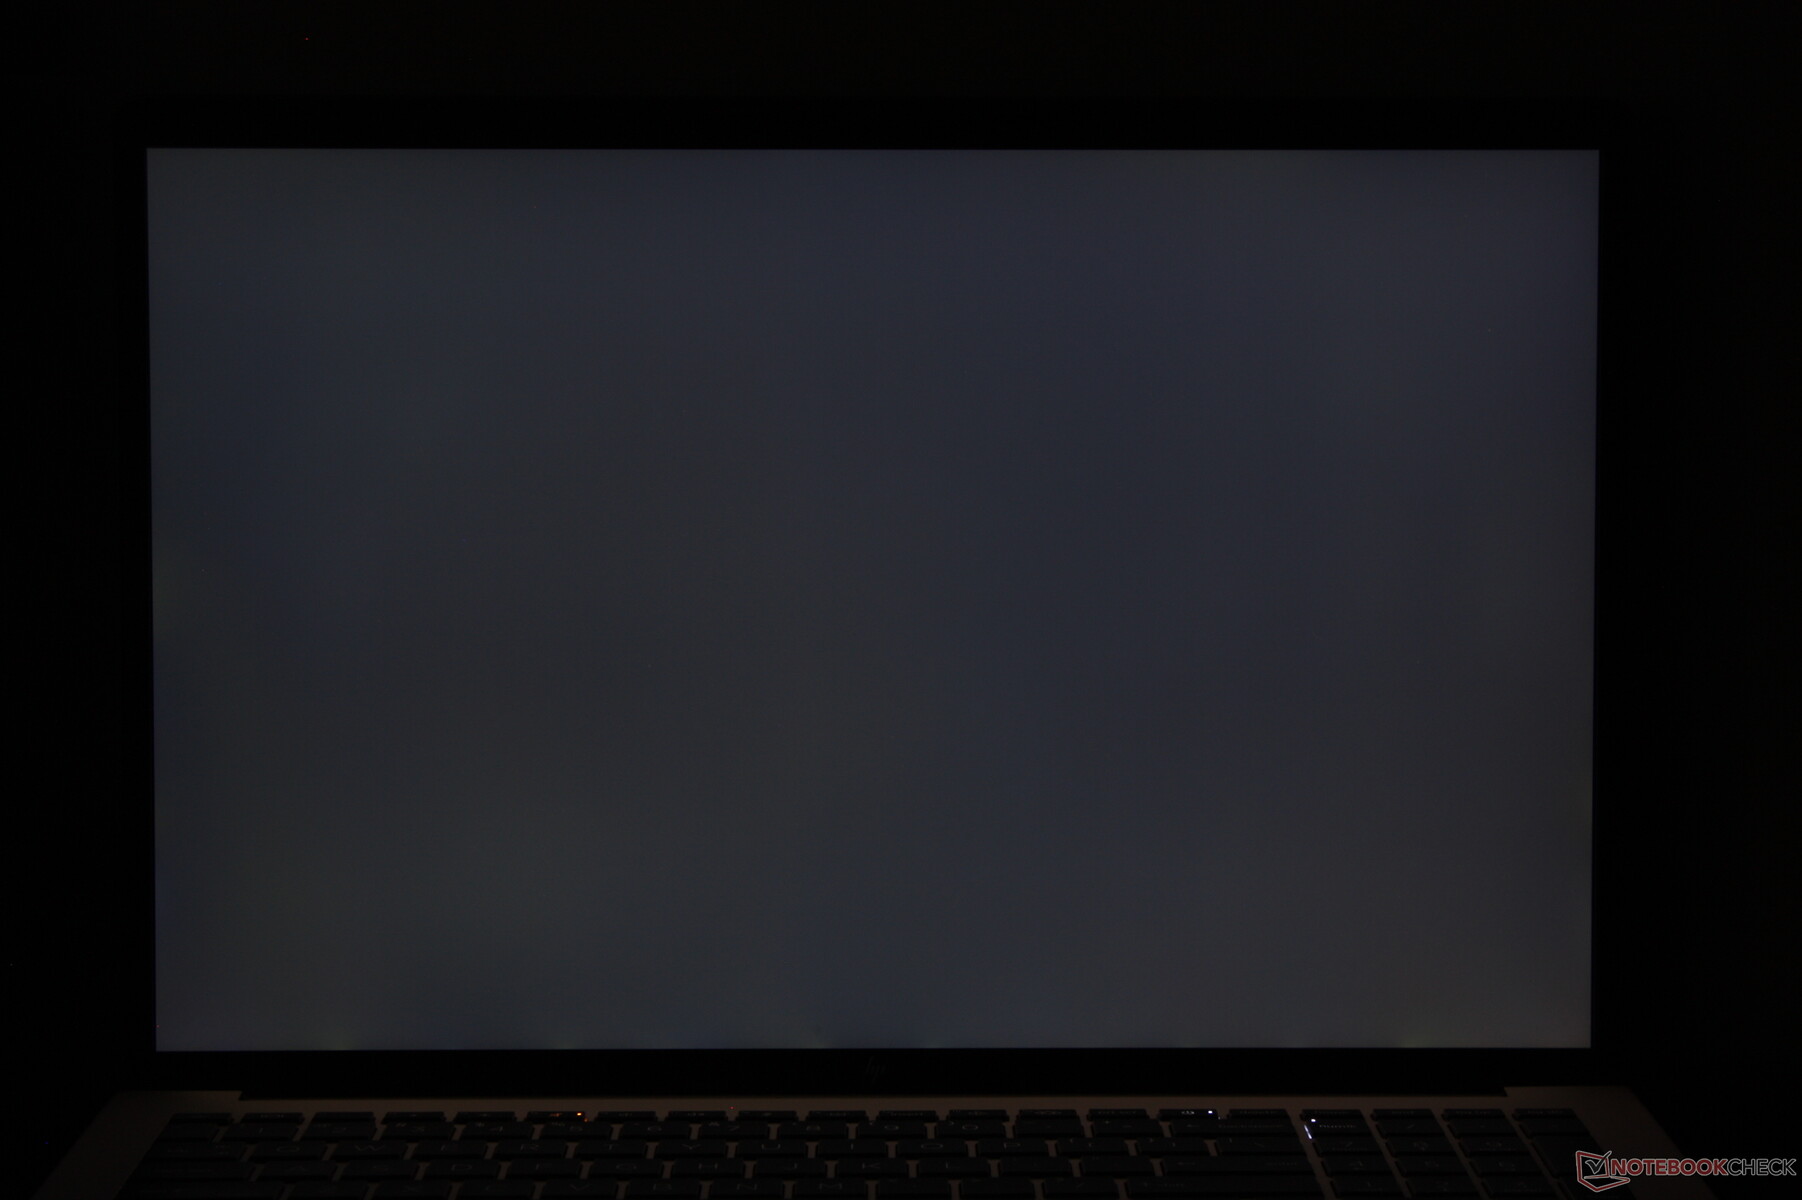
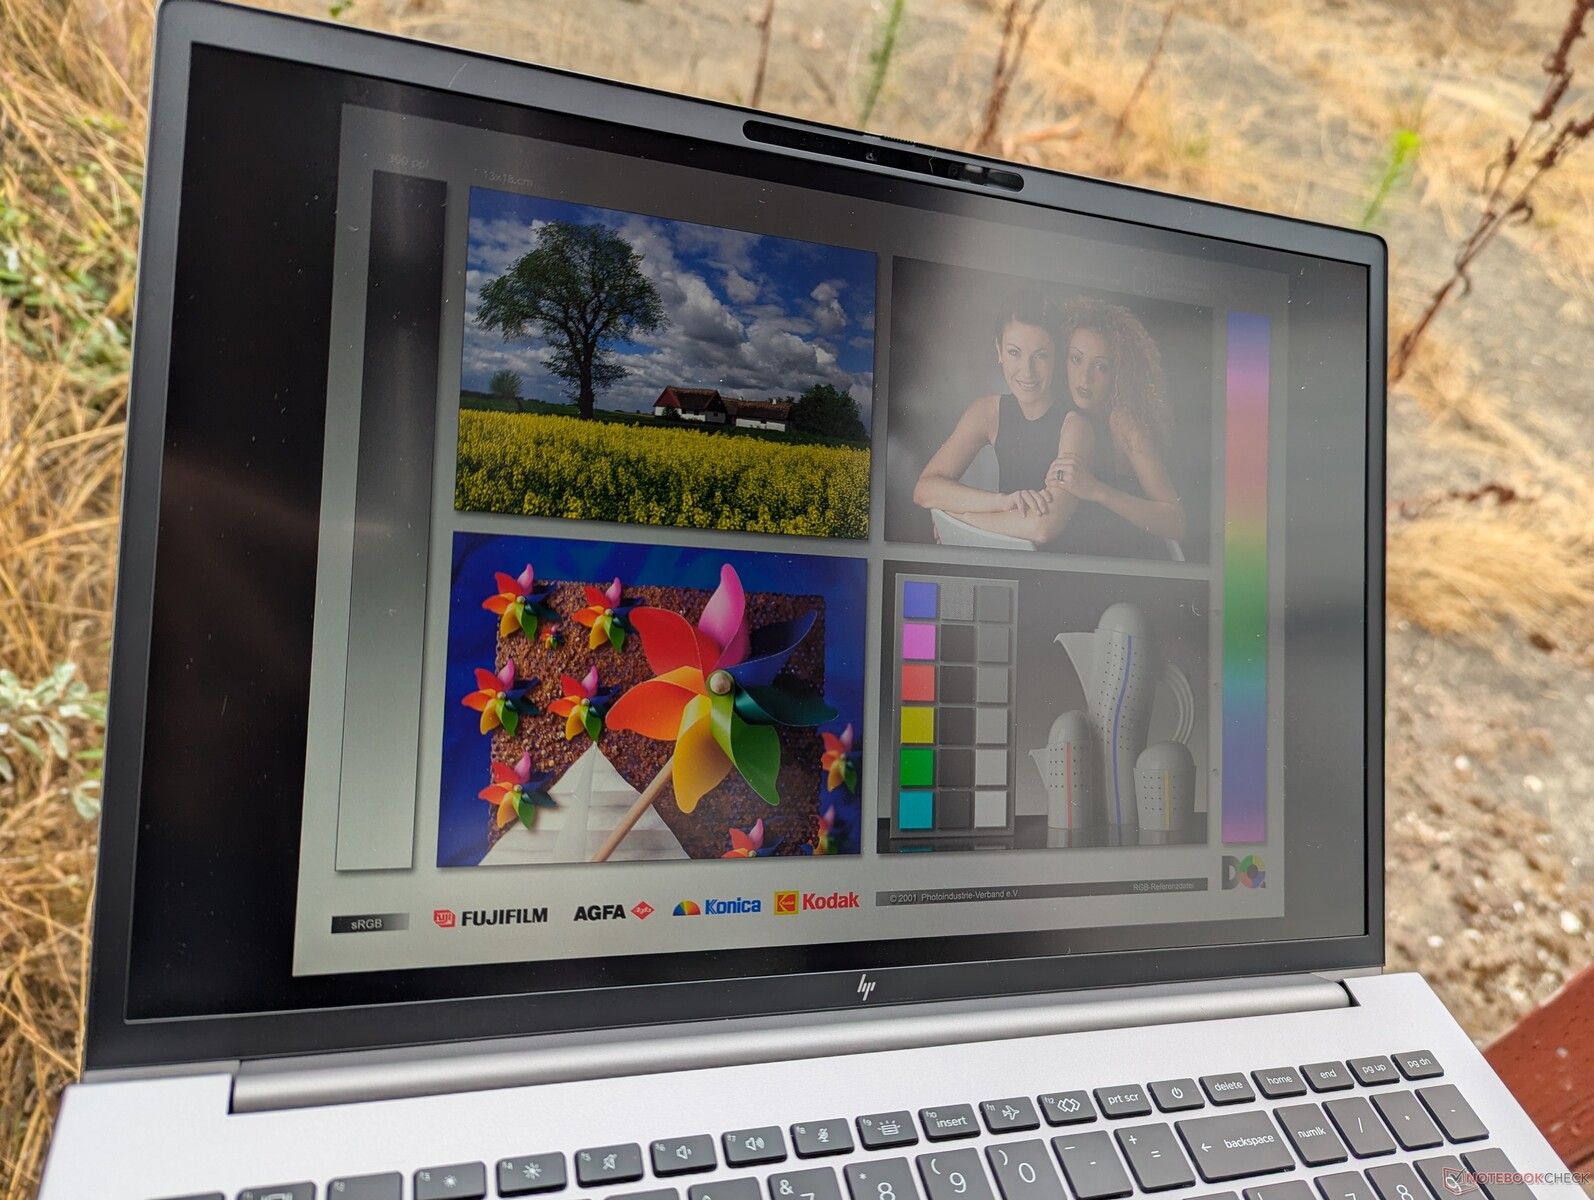
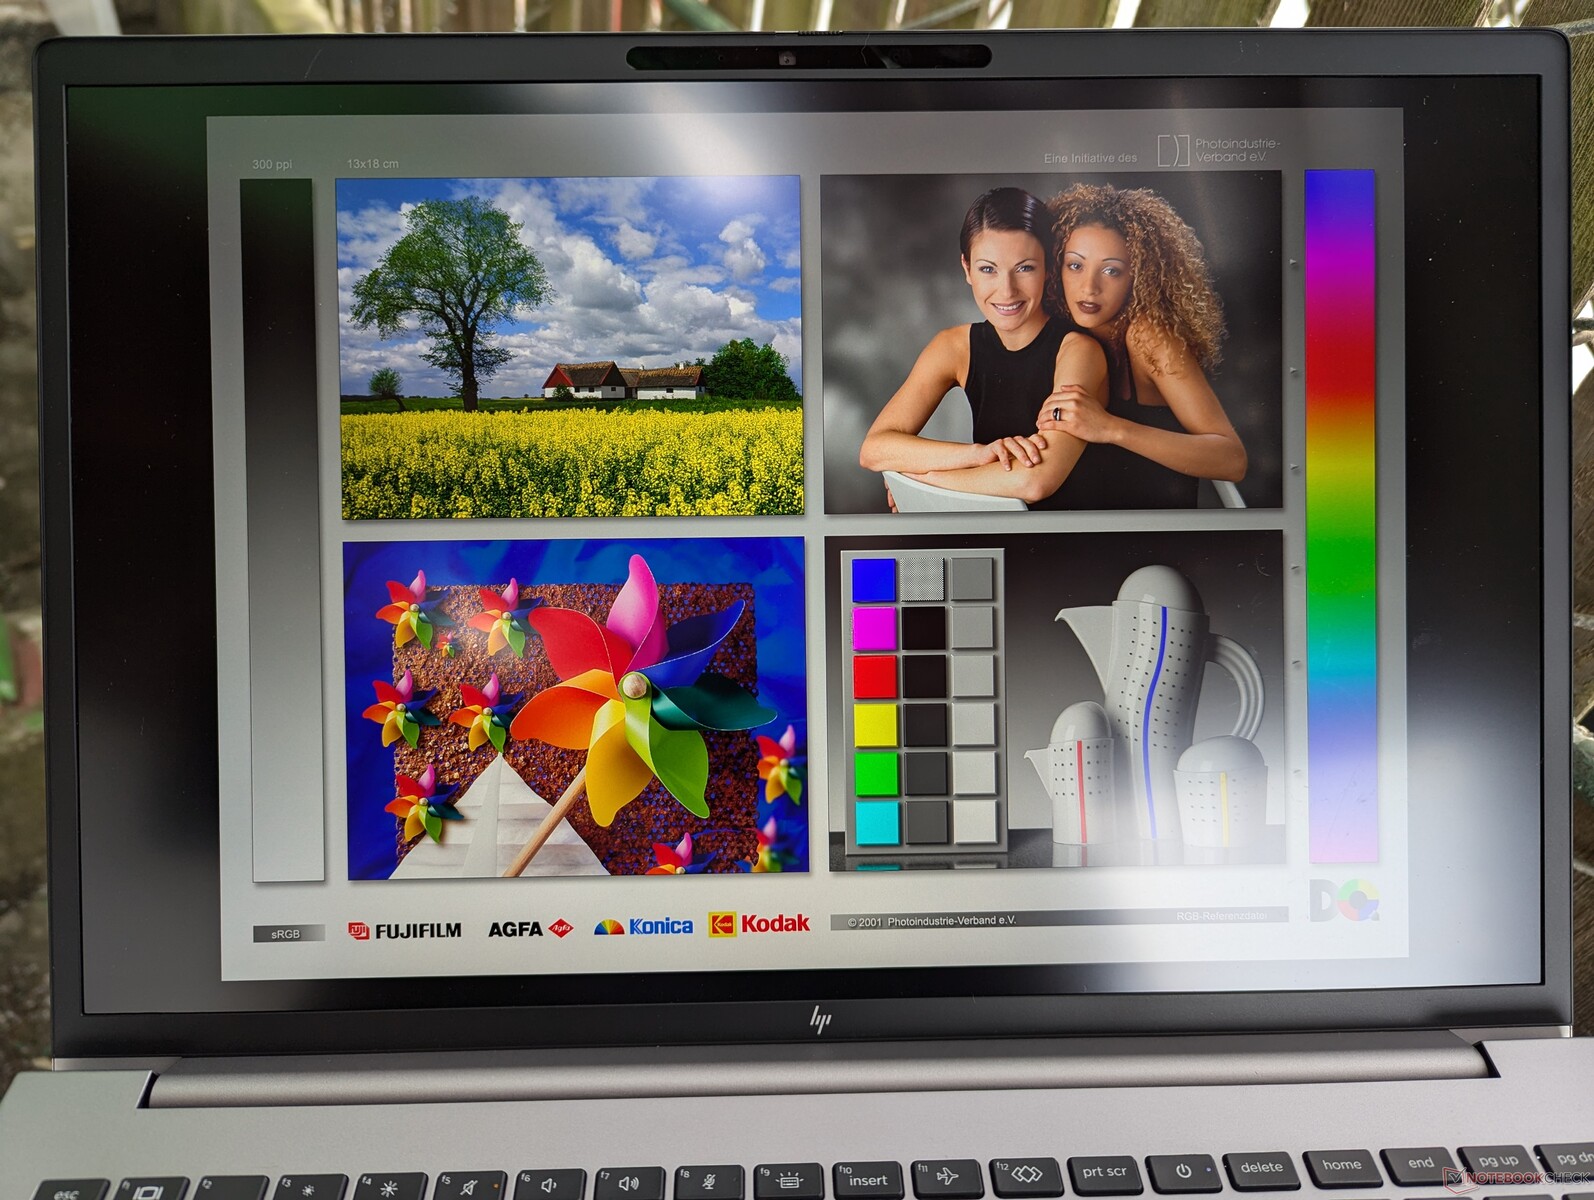
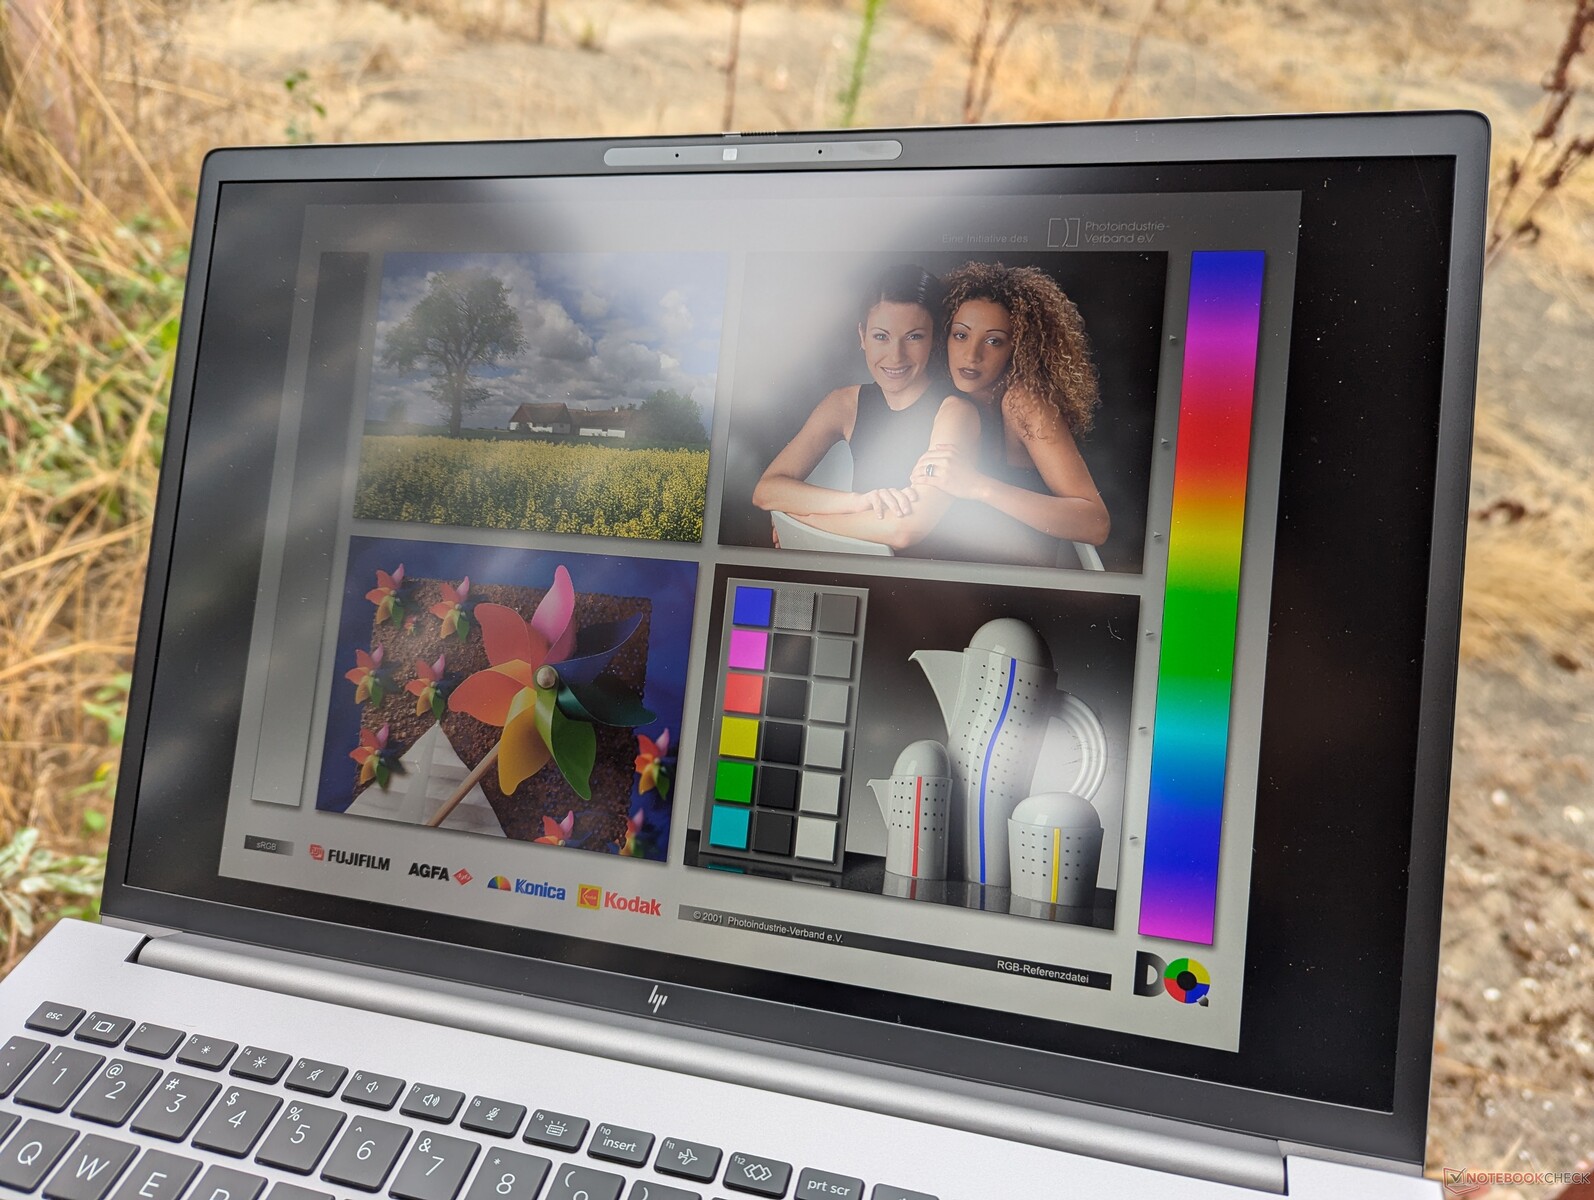
Questo particolare pannello è lo stesso che è stato fornito con il nostro ZBook Fury 16 G10 e quindi l'esperienza visiva rimane identica. Gli acquirenti che intendono utilizzare il portatile all'aperto potrebbero voler prendere in considerazione l'opzione a 1000 nit, ma questo pannello è purtroppo legato a Sure View, che limita notevolmente gli angoli di visione, rendendo lo schermo più difficile da condividere con gli altri. Nel frattempo, l'opzione OLED offrirà livelli di nero di gran lunga superiori per soddisfare gli artisti digitali e le applicazioni di editing multimediale, ma la sua sovrapposizione lucida e la scarsa frequenza di aggiornamento a 60 Hz possono essere un ostacolo.
La frequenza di aggiornamento dinamica di Windows è supportata solo fino a 60 Hz sul nostro pannello configurato.
| |||||||||||||||||||||||||
Distribuzione della luminosità: 83 %
Al centro con la batteria: 457.6 cd/m²
Contrasto: 1064:1 (Nero: 0.43 cd/m²)
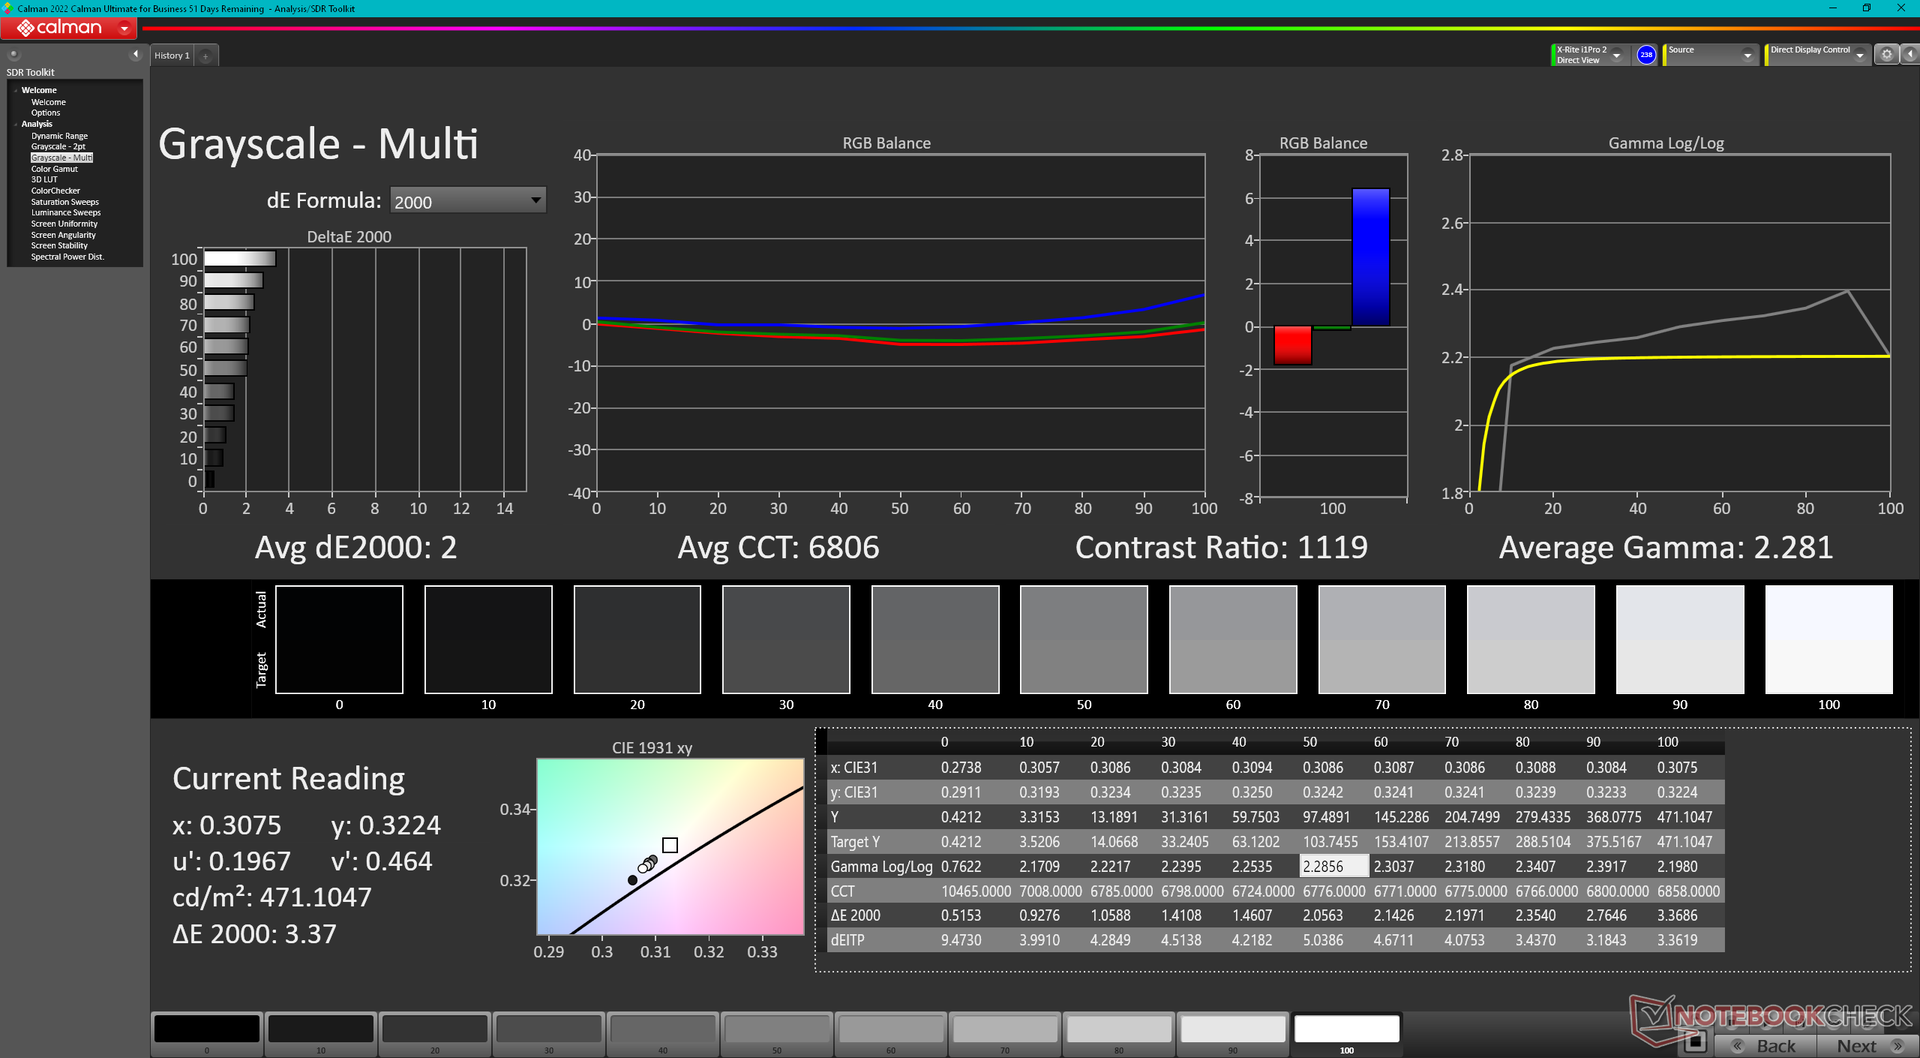
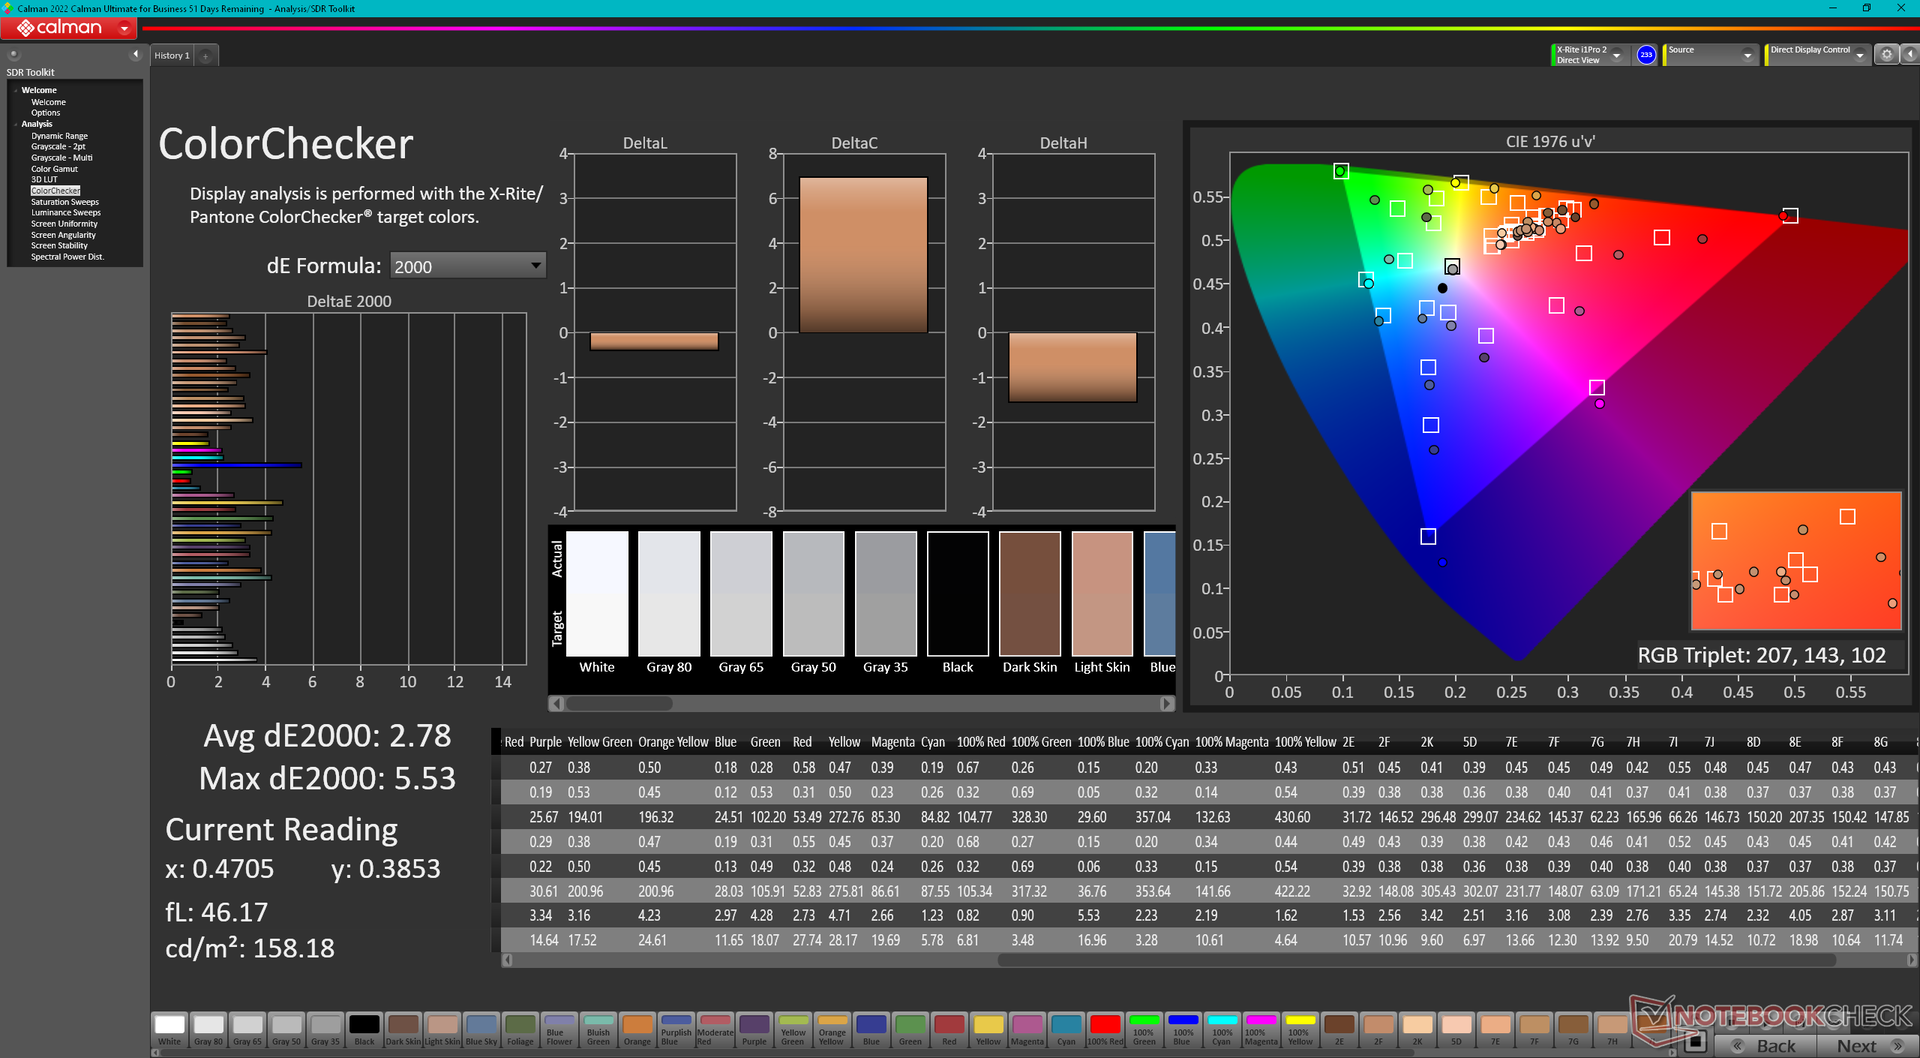
ΔE ColorChecker Calman: 2.78 | ∀{0.5-29.43 Ø4.72}
calibrated: 1.37
ΔE Greyscale Calman: 2 | ∀{0.09-98 Ø4.97}
86% AdobeRGB 1998 (Argyll 3D)
99.9% sRGB (Argyll 3D)
98.4% Display P3 (Argyll 3D)
Gamma: 2.28
CCT: 6806 K
| HP ZBook Fury 16 G11 AUO87A8, IPS, 3840x2400, 16", 120 Hz | HP ZBook Fury 16 G10 AUO87A8, IPS, 3840x2400, 16", 120 Hz | HP ZBook Fury 16 G9 BOE0A52, IPS, 3840x2400, 16", 60 Hz | Dell Precision 5690 Samsung 160YV03, OLED, 3840x2400, 16", 60 Hz | Lenovo ThinkPad P16 G2 21FA000FGE MNG007DA1-9, IPS LED, 2560x1600, 16", 165 Hz | Lenovo ThinkPad P1 G6 21FV001KUS Samsung ATNA60YV04-0, OLED, 3480x2400, 16", 60 Hz | Asus ProArt Studiobook 16 OLED H7604 ATNA60BX01-1, OLED, 3200x2000, 16", 120 Hz | |
|---|---|---|---|---|---|---|---|
| Display | 0% | -0% | 4% | -15% | 5% | 2% | |
| Display P3 Coverage (%) | 98.4 | 98 0% | 97.4 -1% | 99.8 1% | 71 -28% | 99.8 1% | 99.6 1% |
| sRGB Coverage (%) | 99.9 | 99.9 0% | 99.9 0% | 100 0% | 99.2 -1% | 100 0% | 100 0% |
| AdobeRGB 1998 Coverage (%) | 86 | 86.2 0% | 86.3 0% | 96.6 12% | 73.2 -15% | 97.9 14% | 89.4 4% |
| Response Times | -9% | -11% | 83% | -16% | 82% | 93% | |
| Response Time Grey 50% / Grey 80% * (ms) | 11.4 ? | 11.9 ? -4% | 13.7 ? -20% | 1.7 ? 85% | 12.8 ? -12% | 1.69 ? 85% | 0.59 ? 95% |
| Response Time Black / White * (ms) | 8.4 ? | 9.6 ? -14% | 8.6 ? -2% | 1.7 ? 80% | 10.1 ? -20% | 1.73 ? 79% | 0.79 ? 91% |
| PWM Frequency (Hz) | 60 ? | 60 ? | 240 ? | ||||
| Screen | 19% | -25% | -8% | -7% | 19% | 179% | |
| Brightness middle (cd/m²) | 457.6 | 514.6 12% | 530.5 16% | 348.1 -24% | 510 11% | 375.1 -18% | 349 -24% |
| Brightness (cd/m²) | 466 | 495 6% | 476 2% | 351 -25% | 517 11% | 379 -19% | 350 -25% |
| Brightness Distribution (%) | 83 | 90 8% | 83 0% | 97 17% | 89 7% | 98 18% | 95 14% |
| Black Level * (cd/m²) | 0.43 | 0.46 -7% | 0.57 -33% | 0.37 14% | 0.02 95% | ||
| Contrast (:1) | 1064 | 1119 5% | 931 -12% | 1378 30% | 17450 1540% | ||
| Colorchecker dE 2000 * | 2.78 | 2.4 14% | 2.26 19% | 4.18 -50% | 2.6 6% | 1.16 58% | 2.1 24% |
| Colorchecker dE 2000 max. * | 5.53 | 4.86 12% | 6.68 -21% | 5.2 6% | 2.94 47% | 5.5 1% | |
| Colorchecker dE 2000 calibrated * | 1.37 | 0.4 71% | 4.73 -245% | 0.97 29% | 2.3 -68% | 2.1 -53% | |
| Greyscale dE 2000 * | 2 | 1 50% | 1 50% | 1.7 15% | 3.6 -80% | 1.4 30% | 1.2 40% |
| Gamma | 2.28 96% | 2.3 96% | 2.28 96% | 2.2 100% | 2.26 97% | 2.2 100% | 2.19 100% |
| CCT | 6806 96% | 6553 99% | 6543 99% | 6198 105% | 5969 109% | 6325 103% | 6545 99% |
| Media totale (Programma / Settaggio) | 3% /
11% | -12% /
-17% | 26% /
10% | -13% /
-10% | 35% /
27% | 91% /
129% |
* ... Meglio usare valori piccoli
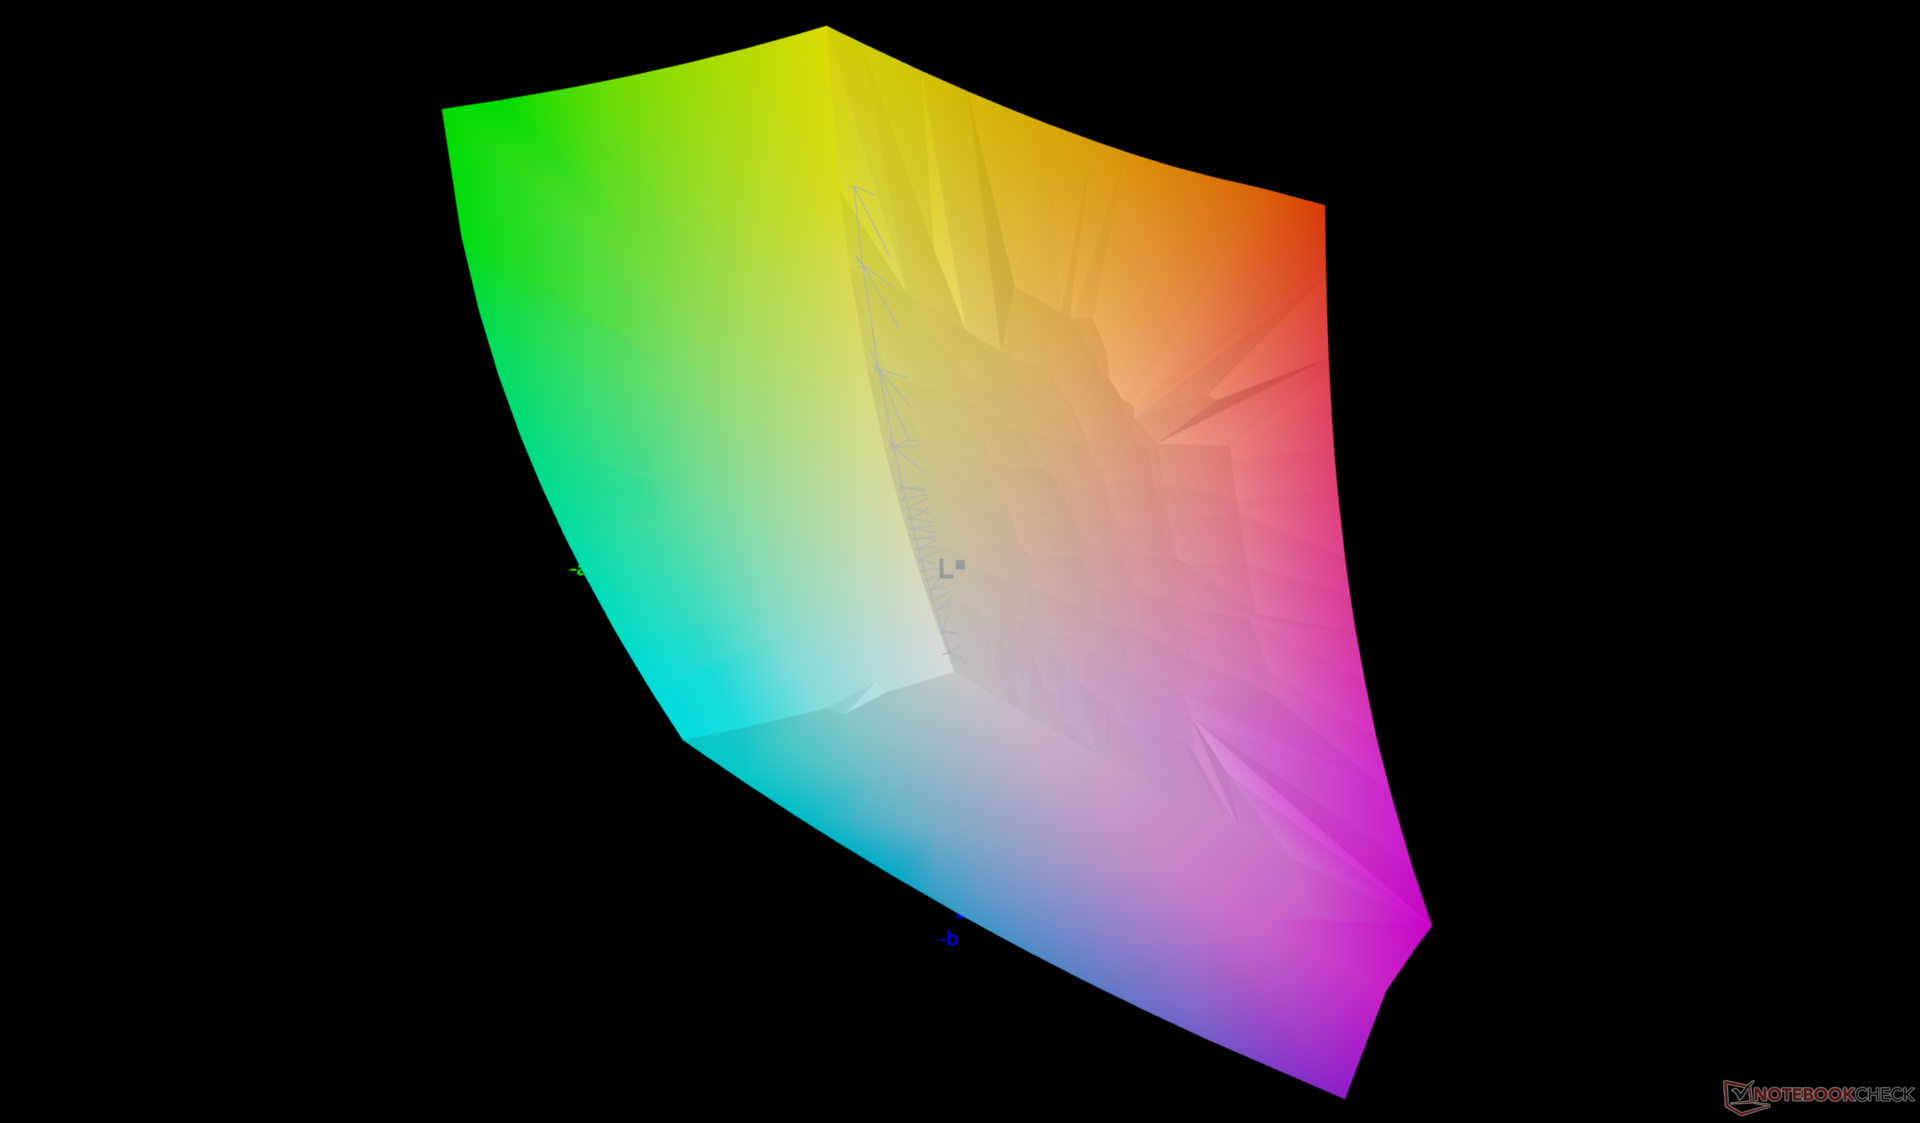
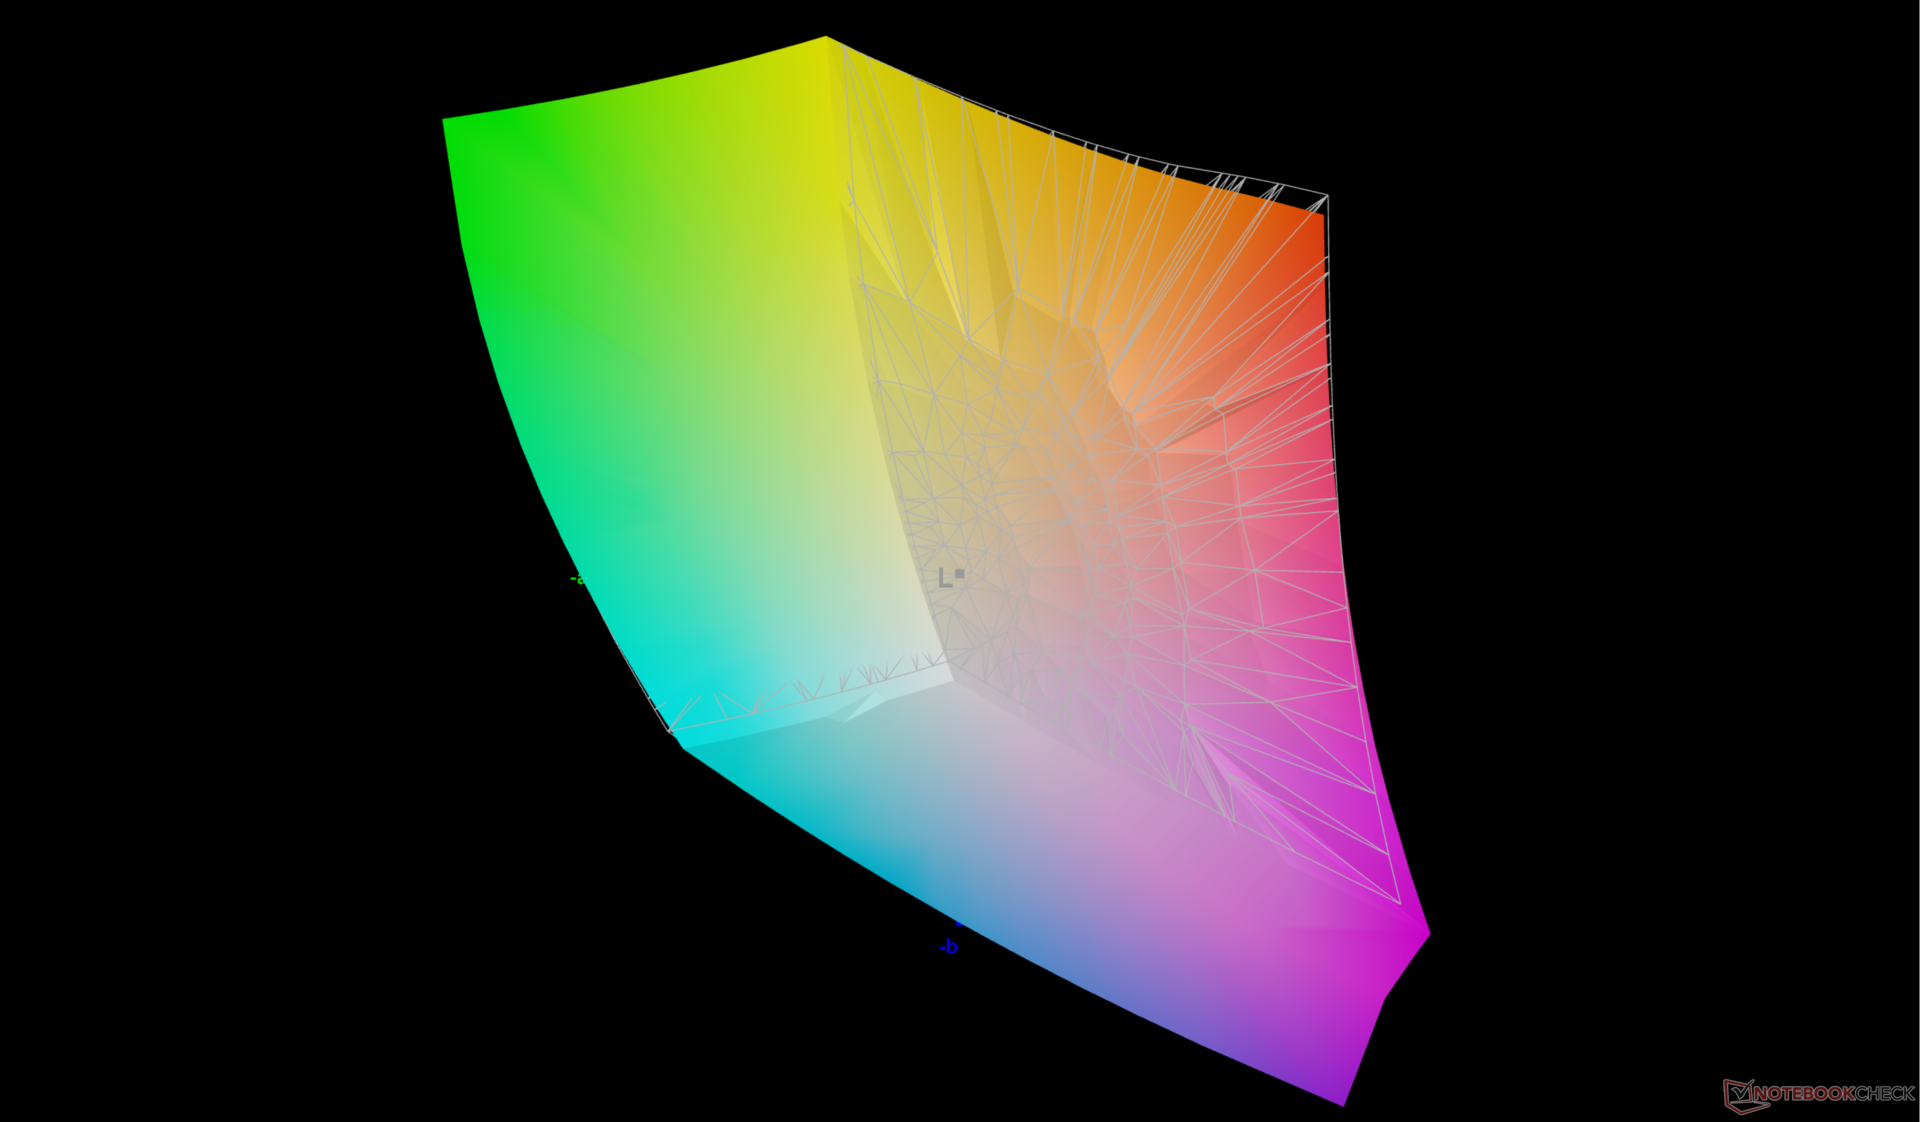
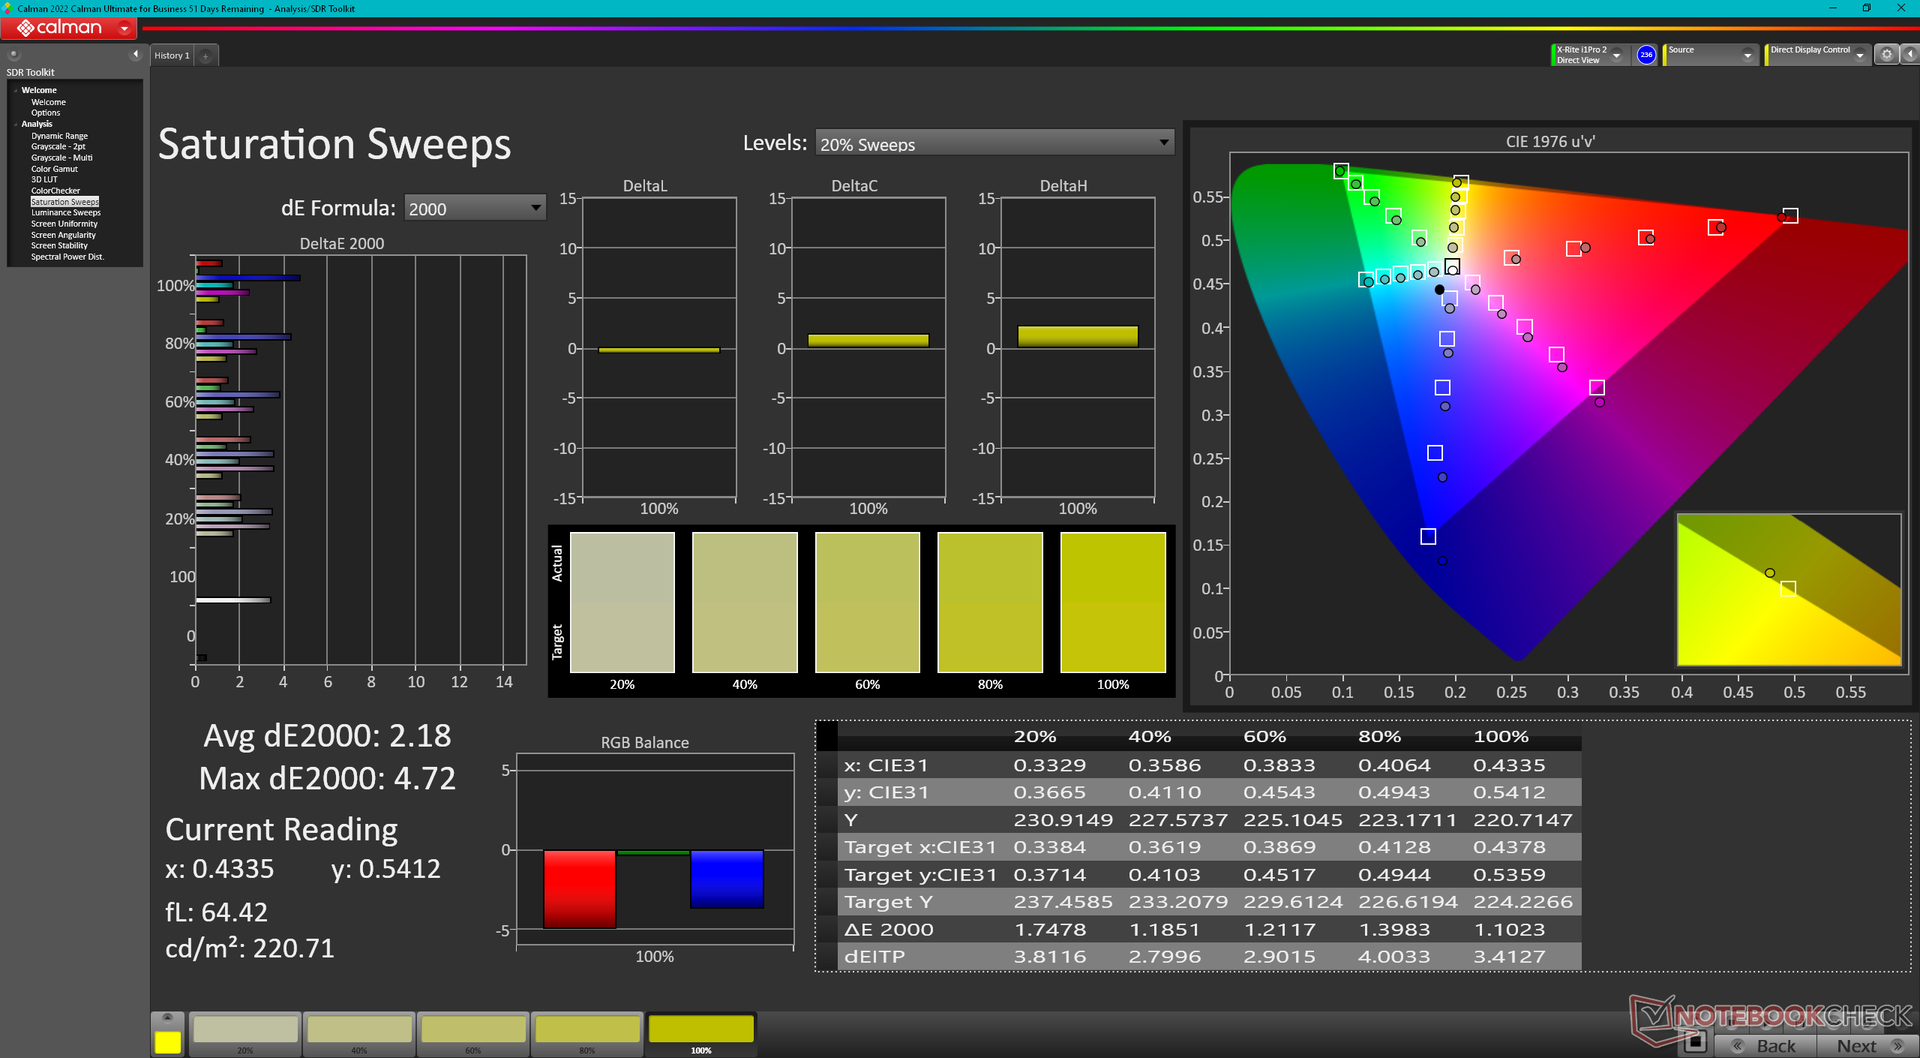
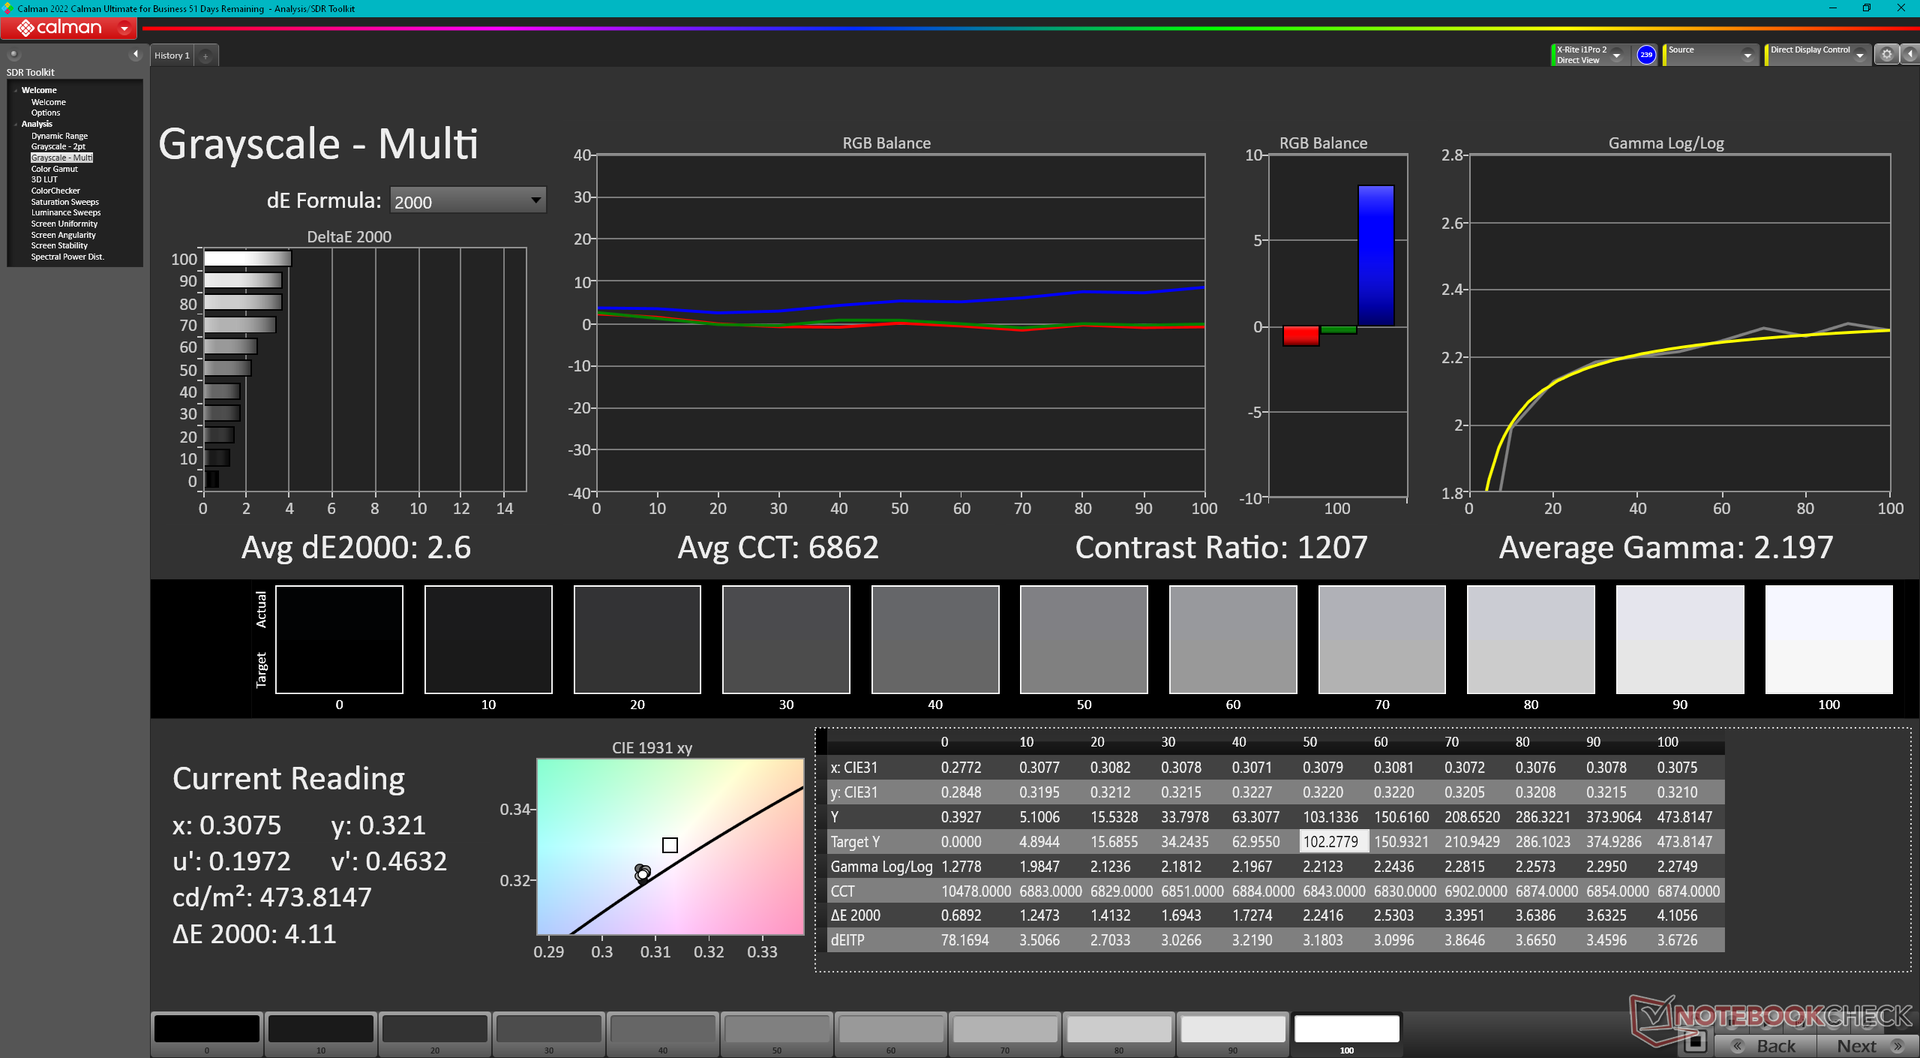
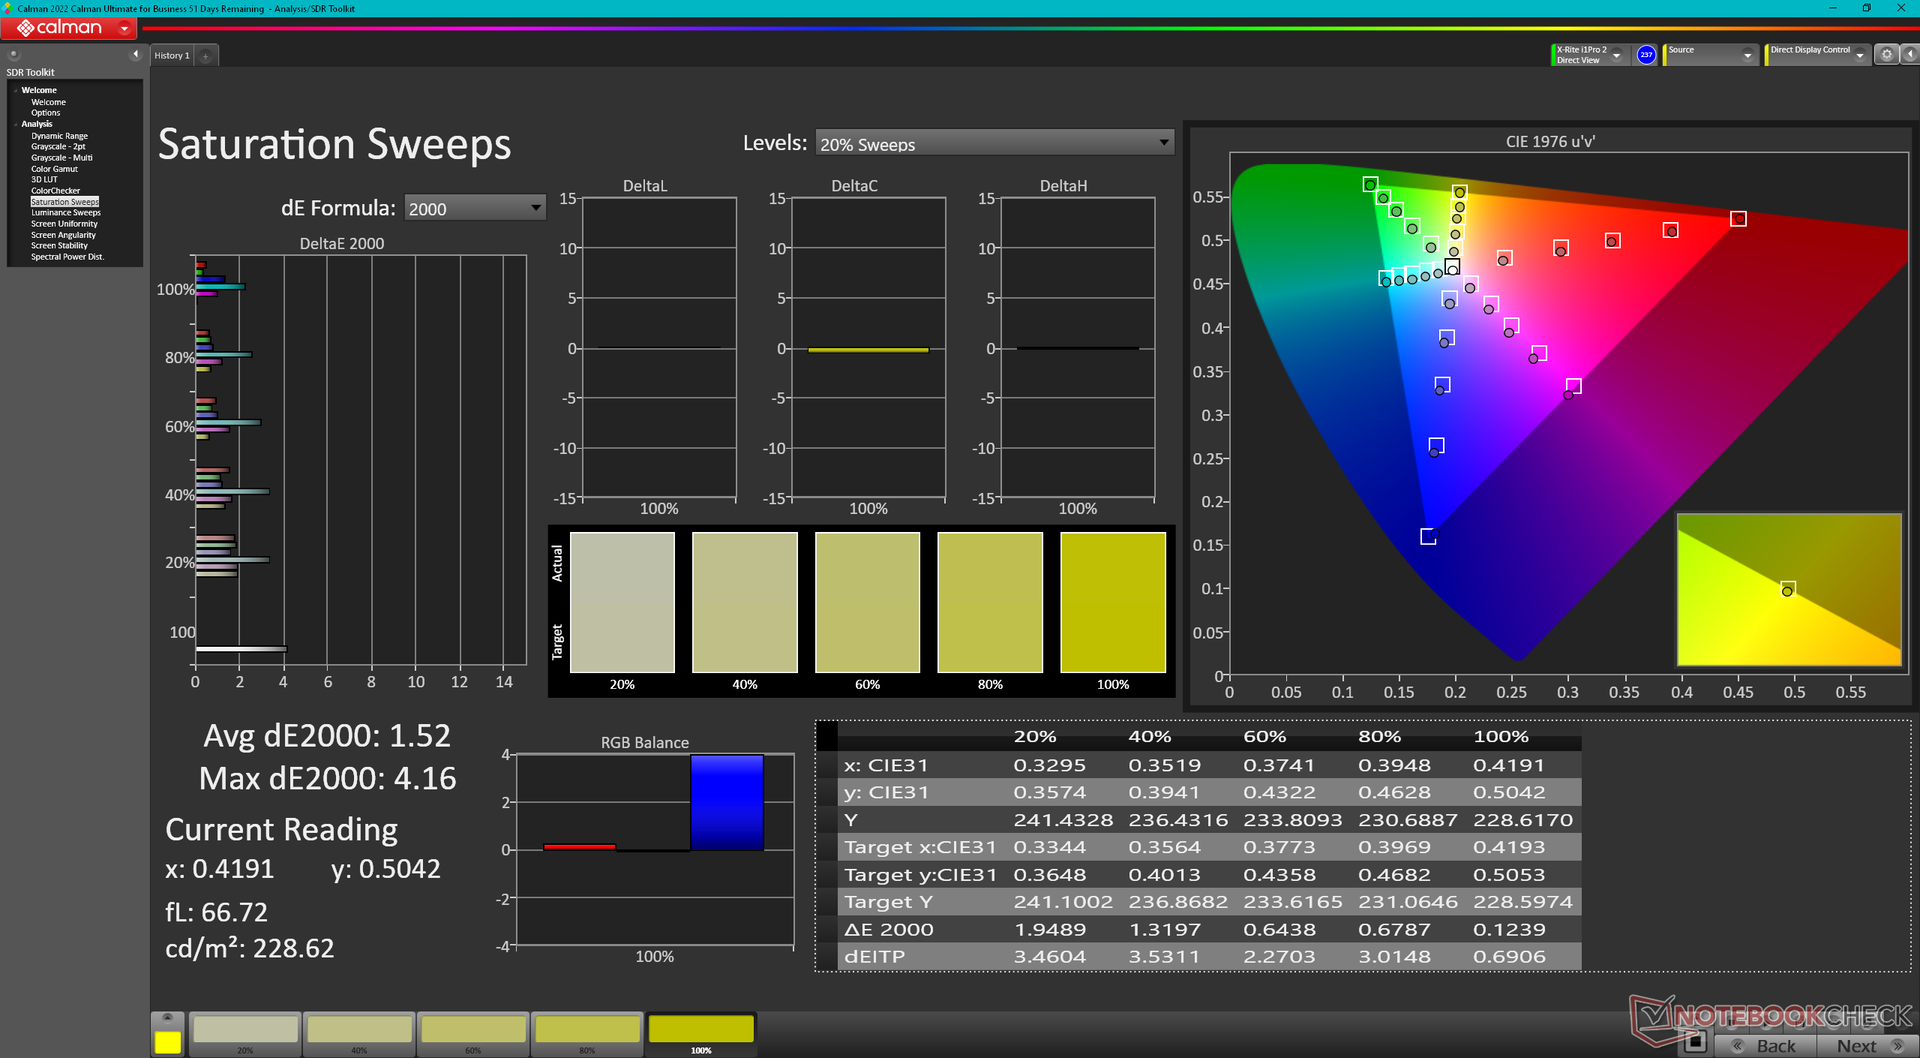
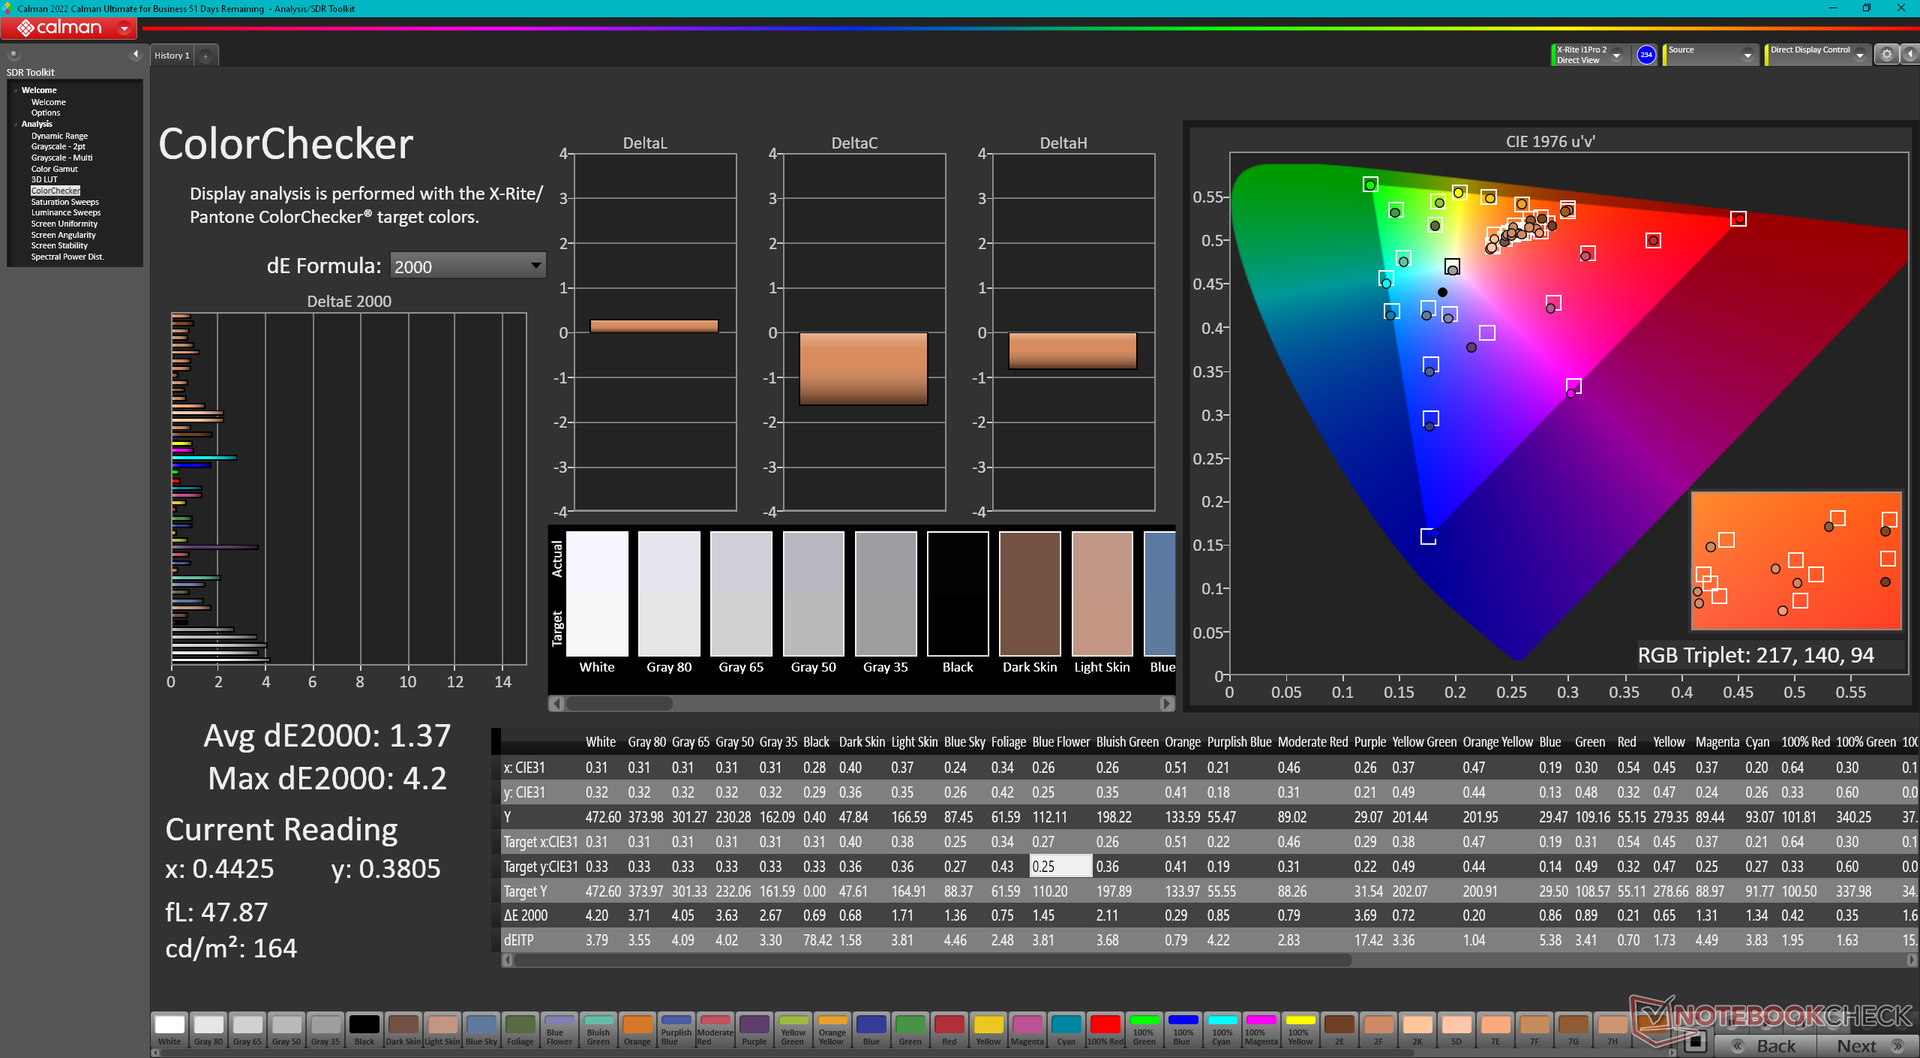
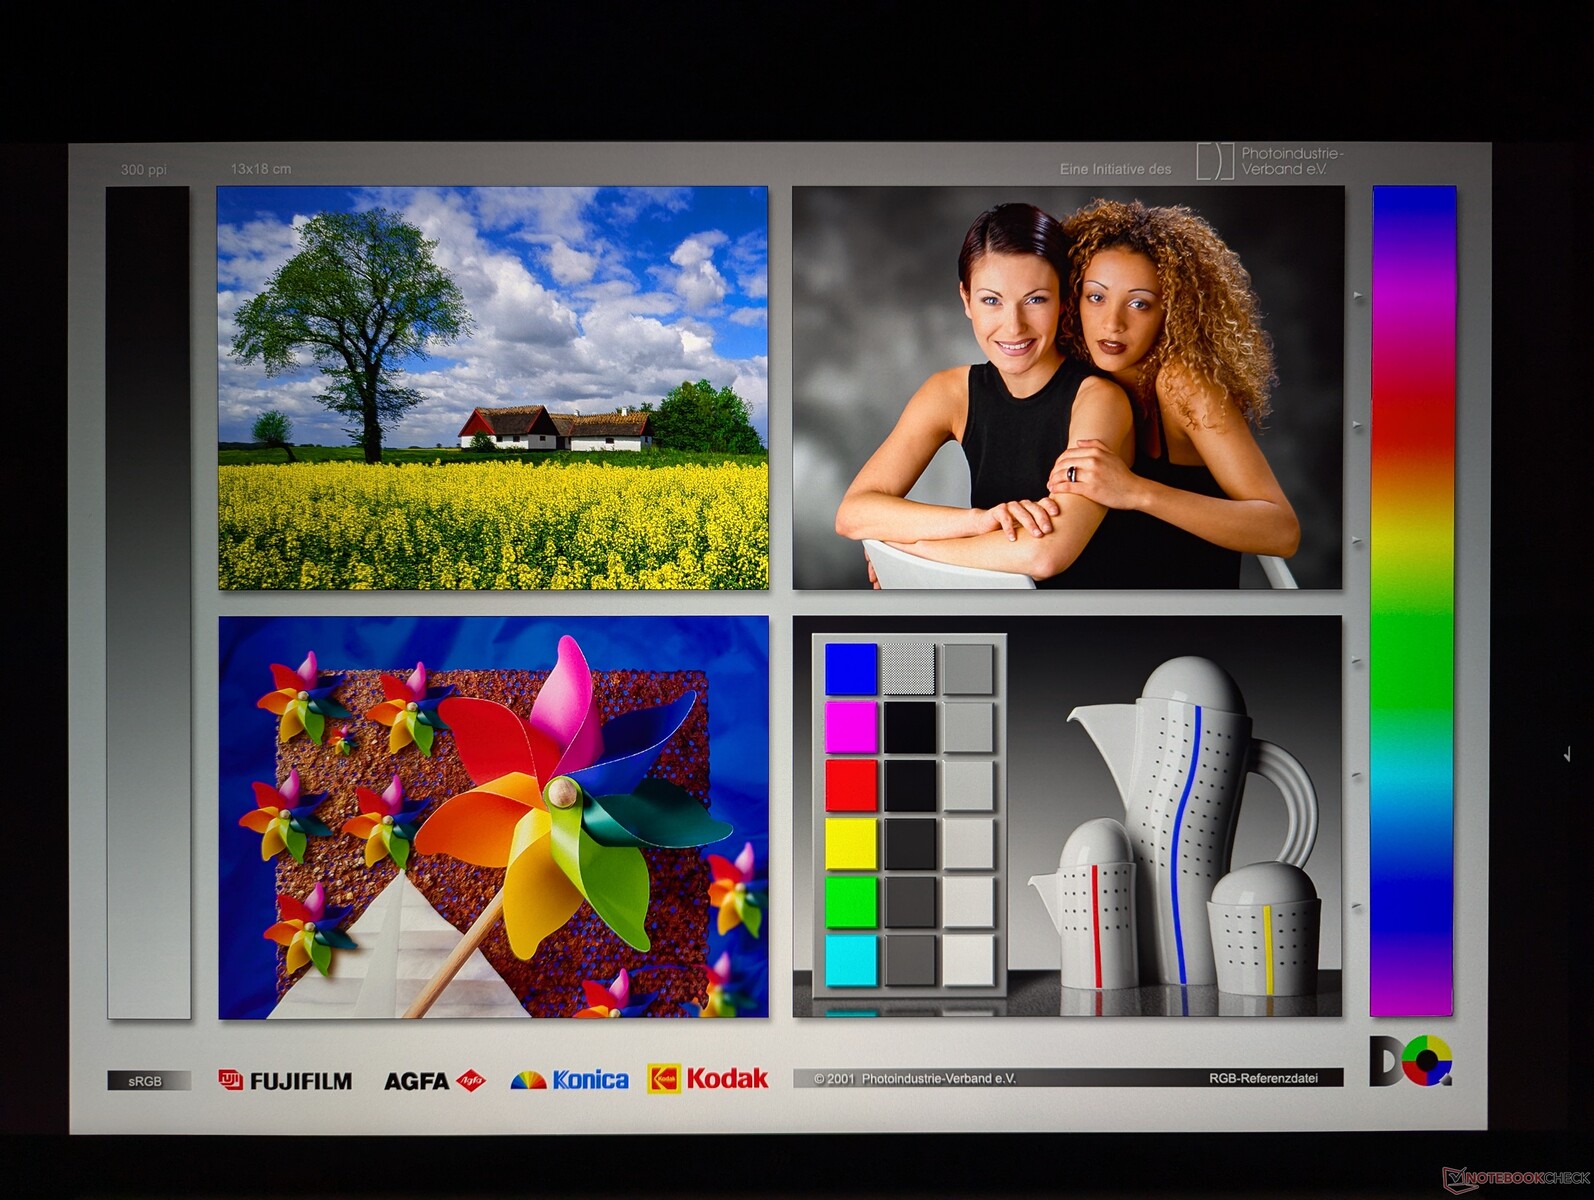
Il display è ben calibrato rispetto allo standard P3, con valori medi deltaE della scala di grigi e del colore di appena 2 e 2,18, rispettivamente. Calibrare ulteriormente il pannello con il nostro colorimetro X-Rite migliorerebbe solo leggermente l'accuratezza, tanto da risultare inutile per la maggior parte degli utenti.
Tempi di risposta del Display
| ↔ Tempi di risposta dal Nero al Bianco | ||
|---|---|---|
| 8.4 ms ... aumenta ↗ e diminuisce ↘ combinato | ↗ 4.7 ms Incremento | 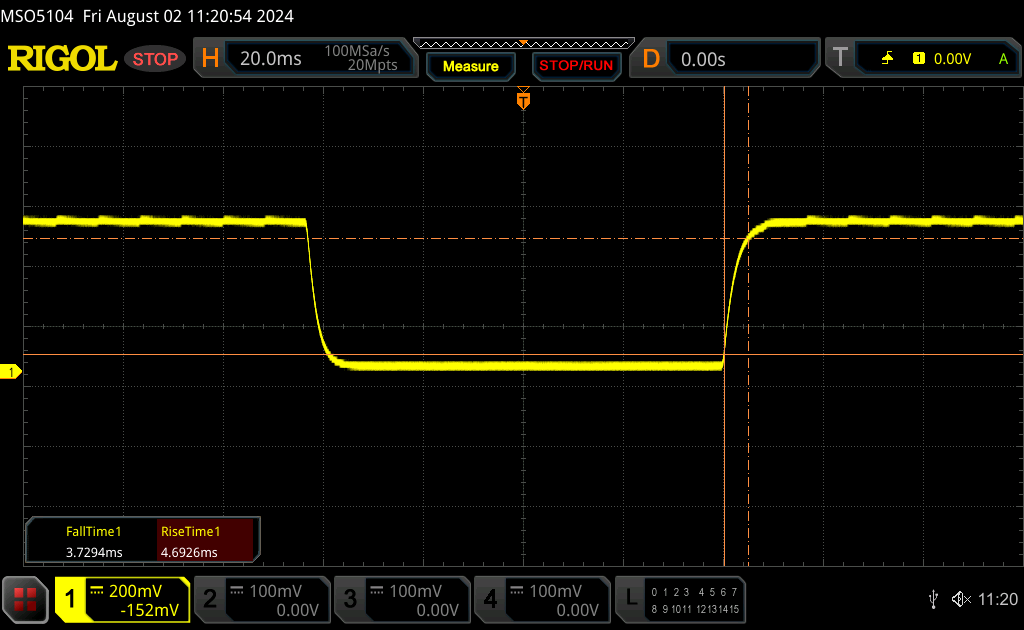 |
| ↘ 3.7 ms Calo | ||
| Lo schermo mostra veloci tempi di risposta durante i nostri tests e dovrebbe esere adatto al gaming In confronto, tutti i dispositivi di test variano da 0.1 (minimo) a 240 (massimo) ms. » 24 % di tutti i dispositivi è migliore. Questo significa che i tempi di risposta rilevati sono migliori rispettto alla media di tutti i dispositivi testati (19.8 ms). | ||
| ↔ Tempo di risposta dal 50% Grigio all'80% Grigio | ||
| 11.4 ms ... aumenta ↗ e diminuisce ↘ combinato | ↗ 5.3 ms Incremento | 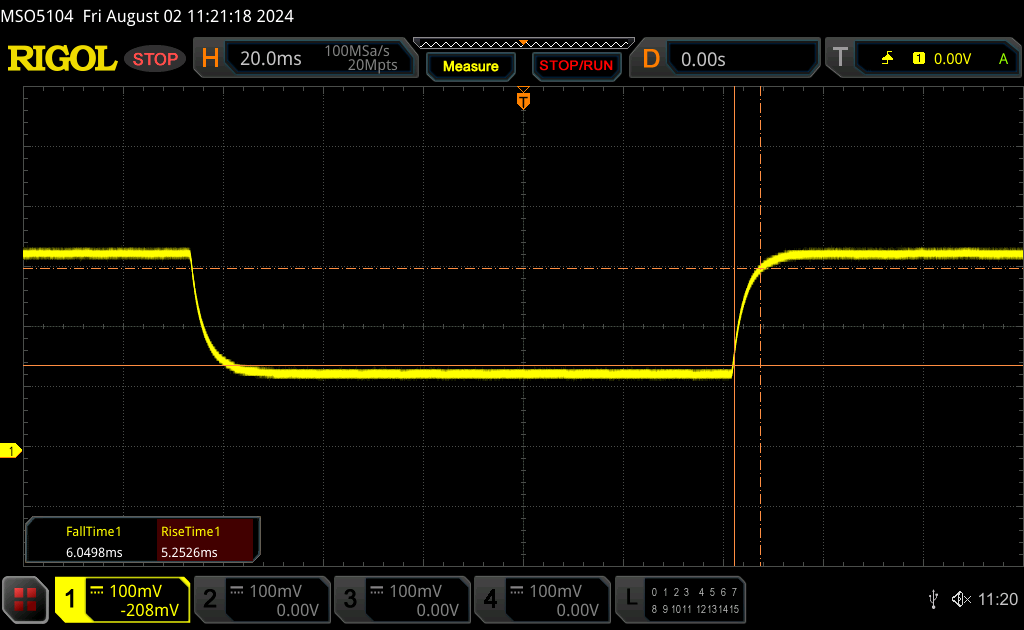 |
| ↘ 6.1 ms Calo | ||
| Lo schermo mostra buoni tempi di risposta durante i nostri tests, ma potrebbe essere troppo lento per i gamers competitivi. In confronto, tutti i dispositivi di test variano da 0.165 (minimo) a 636 (massimo) ms. » 25 % di tutti i dispositivi è migliore. Questo significa che i tempi di risposta rilevati sono migliori rispettto alla media di tutti i dispositivi testati (31 ms). | ||
Sfarfallio dello schermo / PWM (Pulse-Width Modulation)
| flickering dello schermo / PWM non rilevato |  | ||
In confronto: 52 % di tutti i dispositivi testati non utilizza PWM per ridurre la luminosita' del display. Se è rilevato PWM, una media di 7778 (minimo: 5 - massimo: 343500) Hz è stata rilevata. | |||
Prestazioni - Potenziale di aumento del turbo più elevato
Condizioni del test
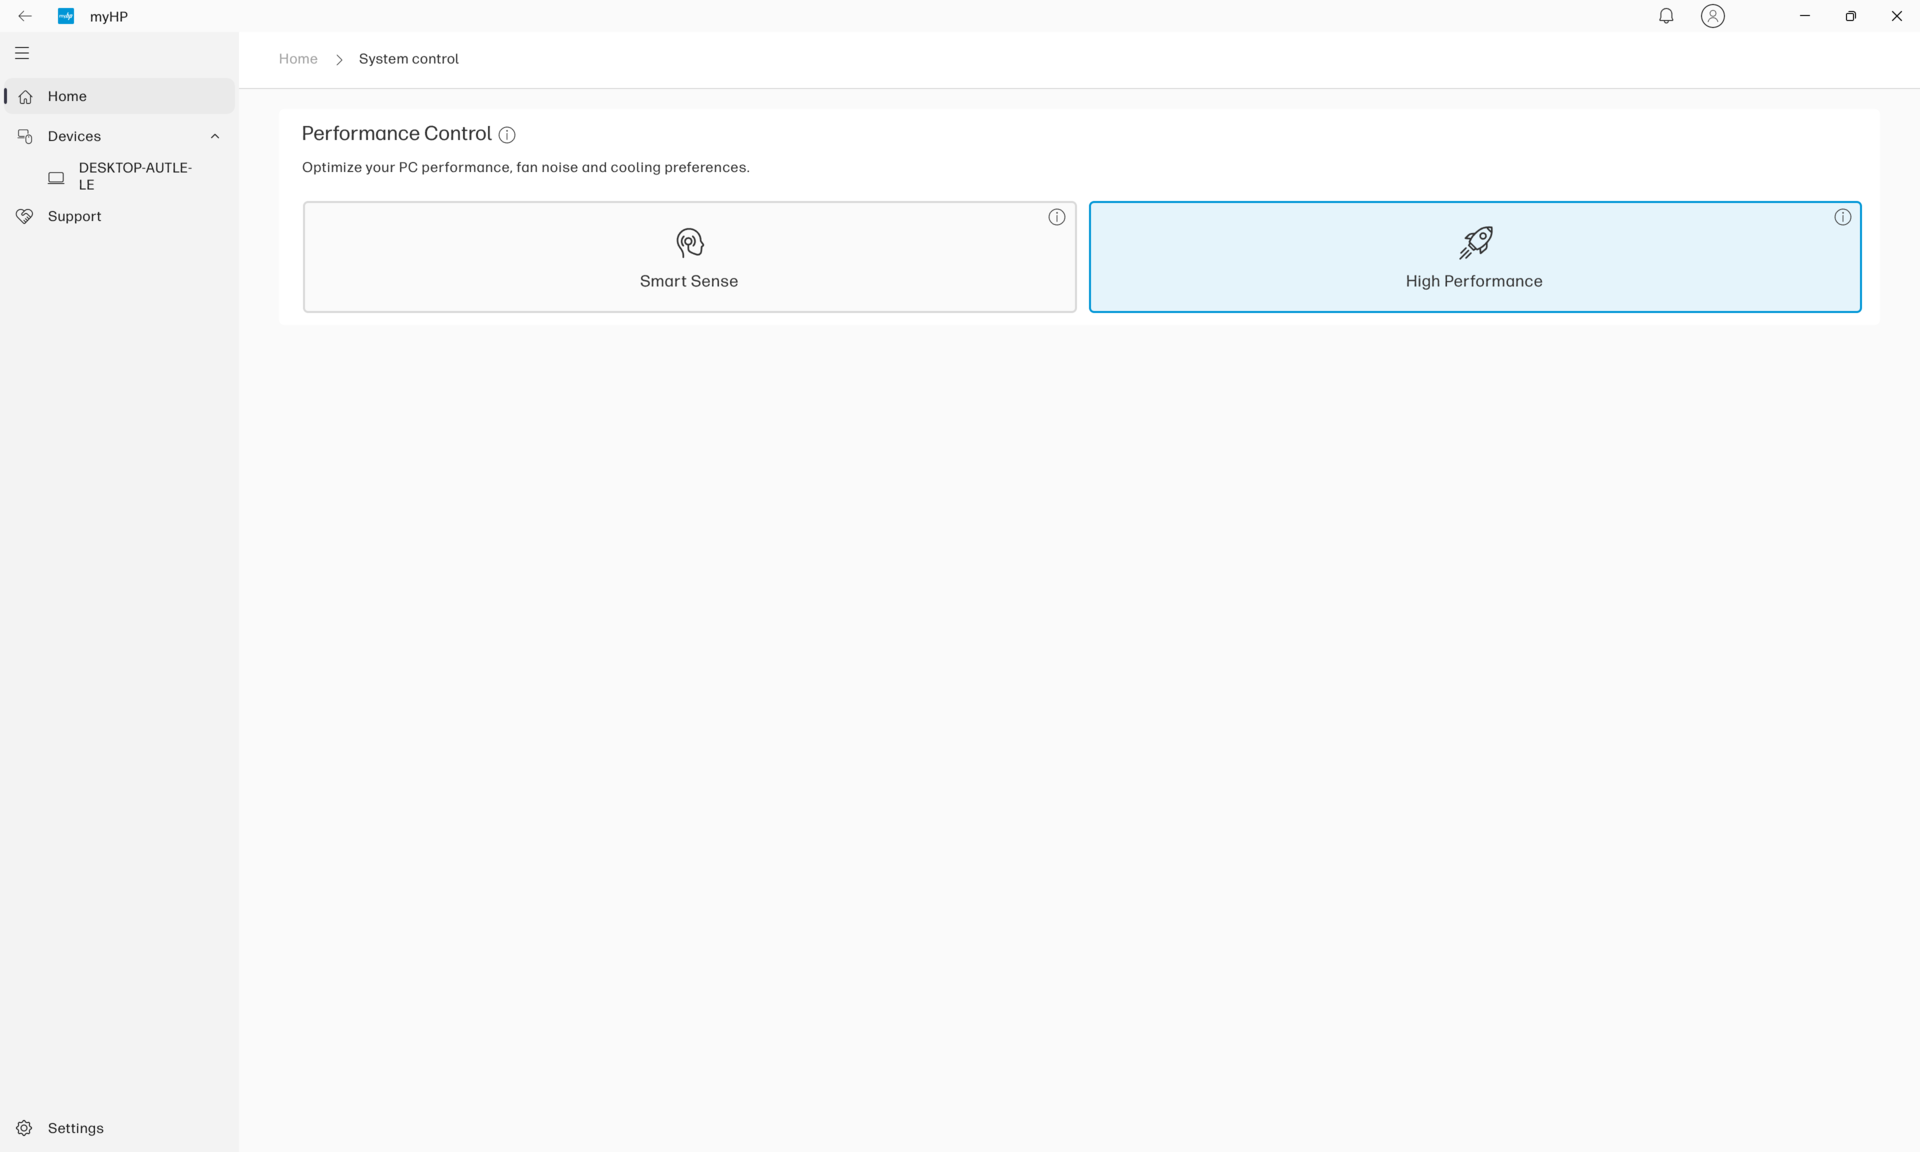
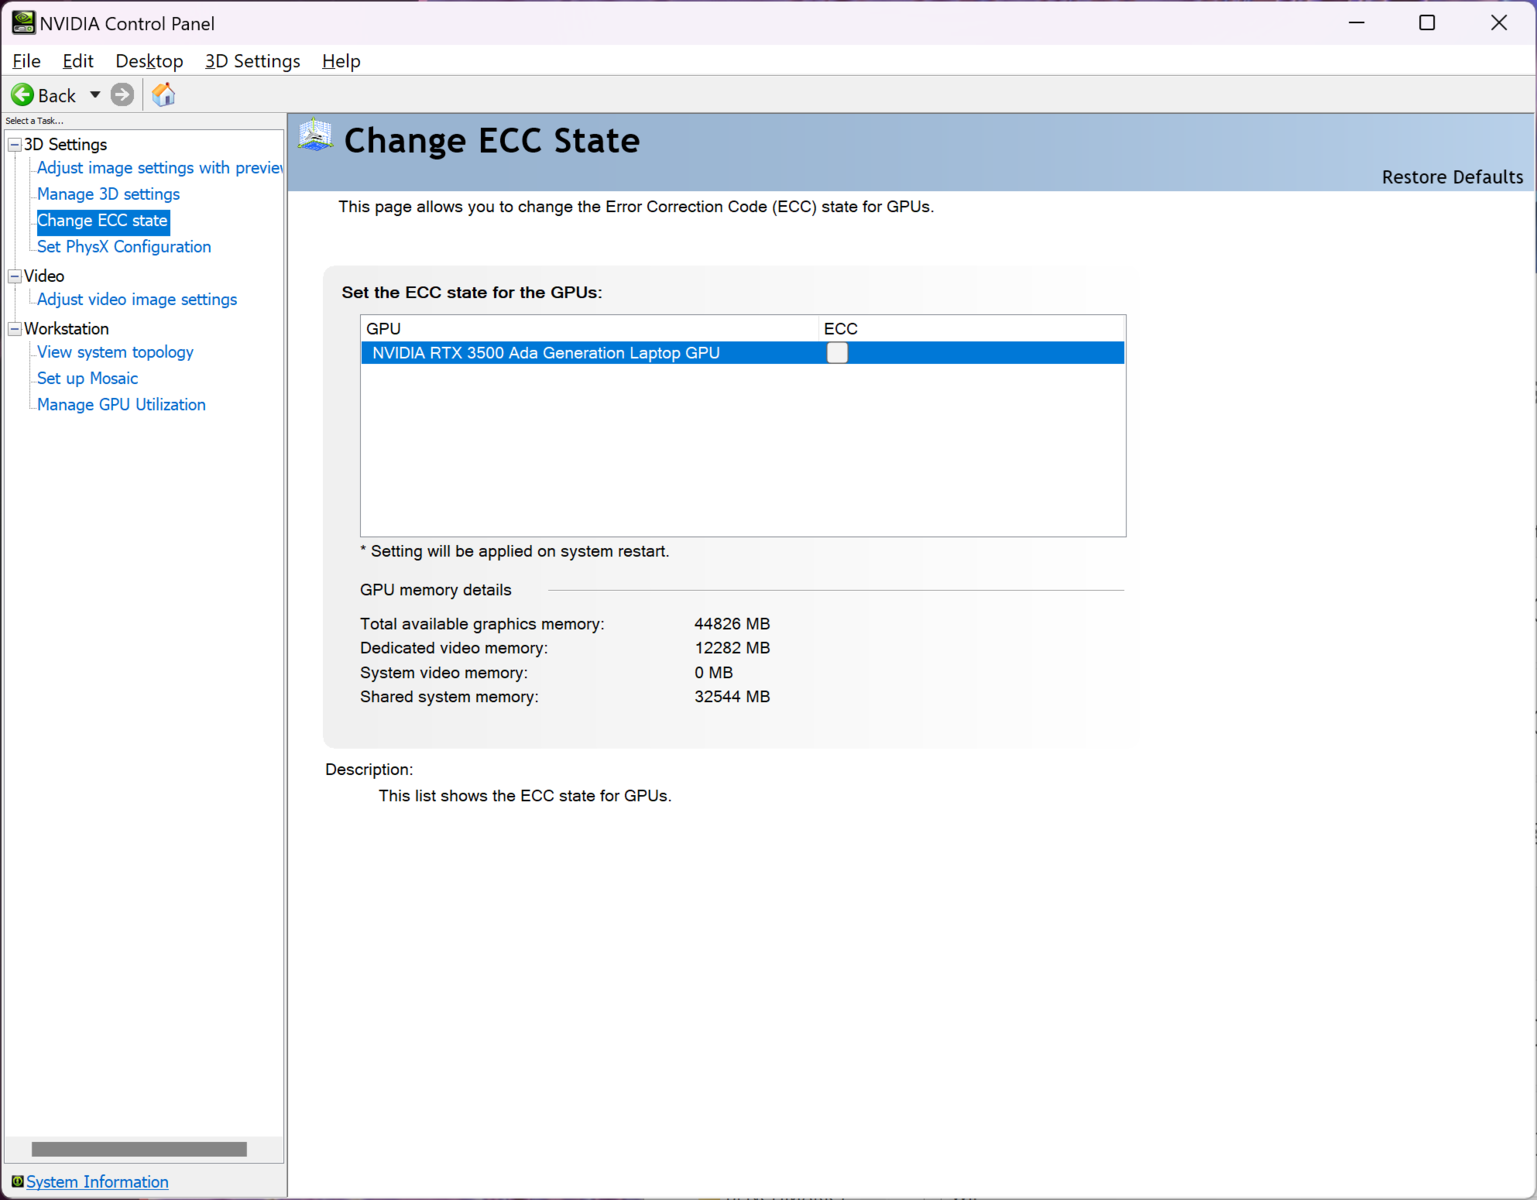
Abbiamo impostato sia Windows che MyHP sulla modalità Prestazioni prima di eseguire i benchmark qui sotto. Abbiamo anche disattivato la modalità ECC della GPU tramite il Pannello di controllo Nvidia.
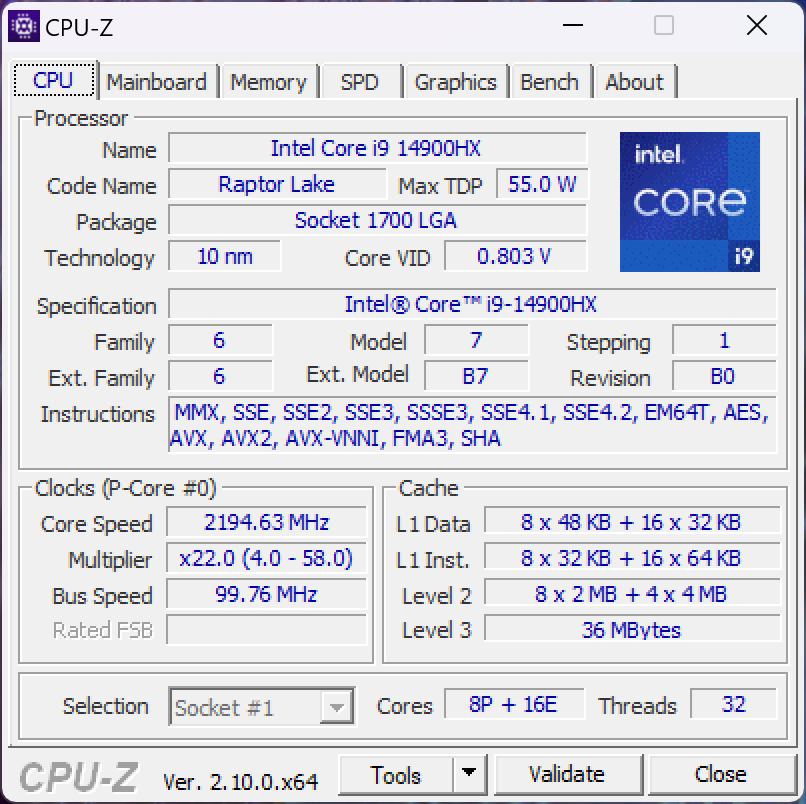
Processore
Salto dal Core i9-12950HX nello ZBook Fury 16 G9 al Core i9-13950HX nello ZBook Fury 16 G10 ha portato un aumento significativo delle prestazioni. Purtroppo, non si può dire lo stesso quando si passa dal Core i9-13950HX nel Fury 16 G10 al Core i9-14900HX nella nostra configurazione Fury 16 G11. I guadagni sono molto più ridotti, di circa il 10-15%, prima di tenere conto del throttling. Una volta tenuto conto del throttling, le prestazioni complessive del processore sarebbero essenzialmente identiche a quelle del Core i9-13950HX, come dimostrano i risultati del test CineBench R15 xT di seguito. Il Core i9-14900HX utilizza la stessa architettura di base del Core i9-13950HX e quindi può essere considerato un rebrand delle opzioni dello scorso anno. Pertanto, il tetto massimo Turbo Boost più elevato è il suo principale vantaggio rispetto al processore uscente, anche se le velocità Turbo Boost più elevate sono di breve durata.
Il Lenovo Legion 9 16IRX9che viene fornito con lo stesso Core i9-14900HX del nostro HP, funzionerebbe fino al 20 percento più velocemente, probabilmente grazie alla sua soluzione di raffreddamento più capace di sostenere velocità di clock Turbo Boost più elevate.
Cinebench R15 Multi Loop
Cinebench R23: Multi Core | Single Core
Cinebench R20: CPU (Multi Core) | CPU (Single Core)
Cinebench R15: CPU Multi 64Bit | CPU Single 64Bit
Blender: v2.79 BMW27 CPU
7-Zip 18.03: 7z b 4 | 7z b 4 -mmt1
Geekbench 6.7: Multi-Core | Single-Core
Geekbench 5.5: Multi-Core | Single-Core
HWBOT x265 Benchmark v2.2: 4k Preset
LibreOffice : 20 Documents To PDF
R Benchmark 2.5: Overall mean
| Geekbench 6.7 / Multi-Core | |
| Media Intel Core i9-14900HX (13158 - 19665, n=37) | |
| HP ZBook Fury 16 G10 | |
| HP ZBook Fury 16 G11 | |
| Dell Precision 5000 5680 | |
| Dell Precision 5690 | |
| Lenovo ThinkPad P1 G6 21FV001KUS | |
| Lenovo ThinkPad P1 G6-21FV000DGE | |
| Lenovo ThinkPad P16v G1 AMD | |
| Geekbench 6.7 / Single-Core | |
| Media Intel Core i9-14900HX (2419 - 3129, n=37) | |
| HP ZBook Fury 16 G10 | |
| HP ZBook Fury 16 G11 | |
| Lenovo ThinkPad P1 G6 21FV001KUS | |
| Lenovo ThinkPad P1 G6-21FV000DGE | |
| Dell Precision 5000 5680 | |
| Lenovo ThinkPad P16v G1 AMD | |
| Dell Precision 5690 | |
Cinebench R23: Multi Core | Single Core
Cinebench R20: CPU (Multi Core) | CPU (Single Core)
Cinebench R15: CPU Multi 64Bit | CPU Single 64Bit
Blender: v2.79 BMW27 CPU
7-Zip 18.03: 7z b 4 | 7z b 4 -mmt1
Geekbench 6.7: Multi-Core | Single-Core
Geekbench 5.5: Multi-Core | Single-Core
HWBOT x265 Benchmark v2.2: 4k Preset
LibreOffice : 20 Documents To PDF
R Benchmark 2.5: Overall mean
* ... Meglio usare valori piccoli
AIDA64: FP32 Ray-Trace | FPU Julia | CPU SHA3 | CPU Queen | FPU SinJulia | FPU Mandel | CPU AES | CPU ZLib | FP64 Ray-Trace | CPU PhotoWorxx
| Performance rating | |
| Asus ProArt Studiobook 16 OLED H7604 | |
| Media Intel Core i9-14900HX | |
| HP ZBook Fury 16 G10 | |
| HP ZBook Fury 16 G11 | |
| Dell Precision 5690 | |
| Lenovo ThinkPad P16 G2 21FA000FGE | |
| HP ZBook Fury 16 G9 | |
| Lenovo ThinkPad P1 G6 21FV001KUS | |
| AIDA64 / FP32 Ray-Trace | |
| Asus ProArt Studiobook 16 OLED H7604 | |
| Media Intel Core i9-14900HX (13098 - 33474, n=36) | |
| HP ZBook Fury 16 G10 | |
| HP ZBook Fury 16 G11 | |
| Dell Precision 5690 | |
| Lenovo ThinkPad P16 G2 21FA000FGE | |
| HP ZBook Fury 16 G9 | |
| Lenovo ThinkPad P1 G6 21FV001KUS | |
| AIDA64 / FPU SinJulia | |
| Asus ProArt Studiobook 16 OLED H7604 | |
| Media Intel Core i9-14900HX (10475 - 18517, n=36) | |
| HP ZBook Fury 16 G11 | |
| HP ZBook Fury 16 G10 | |
| Lenovo ThinkPad P16 G2 21FA000FGE | |
| HP ZBook Fury 16 G9 | |
| Dell Precision 5690 | |
| Lenovo ThinkPad P1 G6 21FV001KUS | |
| AIDA64 / FPU Mandel | |
| Asus ProArt Studiobook 16 OLED H7604 | |
| Media Intel Core i9-14900HX (32543 - 83662, n=36) | |
| HP ZBook Fury 16 G10 | |
| HP ZBook Fury 16 G11 | |
| Dell Precision 5690 | |
| HP ZBook Fury 16 G9 | |
| Lenovo ThinkPad P16 G2 21FA000FGE | |
| Lenovo ThinkPad P1 G6 21FV001KUS | |
| AIDA64 / FP64 Ray-Trace | |
| Asus ProArt Studiobook 16 OLED H7604 | |
| Media Intel Core i9-14900HX (6809 - 18349, n=36) | |
| HP ZBook Fury 16 G10 | |
| HP ZBook Fury 16 G11 | |
| Lenovo ThinkPad P16 G2 21FA000FGE | |
| Dell Precision 5690 | |
| Lenovo ThinkPad P1 G6 21FV001KUS | |
| HP ZBook Fury 16 G9 | |
| AIDA64 / CPU PhotoWorxx | |
| Dell Precision 5690 | |
| Asus ProArt Studiobook 16 OLED H7604 | |
| Media Intel Core i9-14900HX (23903 - 54702, n=36) | |
| HP ZBook Fury 16 G10 | |
| HP ZBook Fury 16 G9 | |
| HP ZBook Fury 16 G11 | |
| Lenovo ThinkPad P16 G2 21FA000FGE | |
| Lenovo ThinkPad P1 G6 21FV001KUS | |
Test da sforzo
Quando si esegue Prime95 per stressare la CPU, la velocità di clock del core e l'assorbimento di potenza del pacchetto arrivano a 3,7 GHz e 139 W, rispettivamente, e durano al massimo un minuto, con una temperatura del core che arriva a 99 C. Alla fine la CPU si stabilizza a 2,3 GHz e 69 W per mantenere una temperatura del core più gestibile di 82 C. Il calo relativamente forte delle prestazioni nel corso del tempo porta ai punteggi progressivamente più bassi del loop CineBench R15 xT, notati sopra.
Le temperature della CPU e della GPU, quando si eseguono carichi più elevati come i giochi, si stabilizzano quasi alle stesse letture che abbiamo registrato sullo ZBook Fury 16 G10 dello scorso anno, nonostante le differenze di prestazioni.
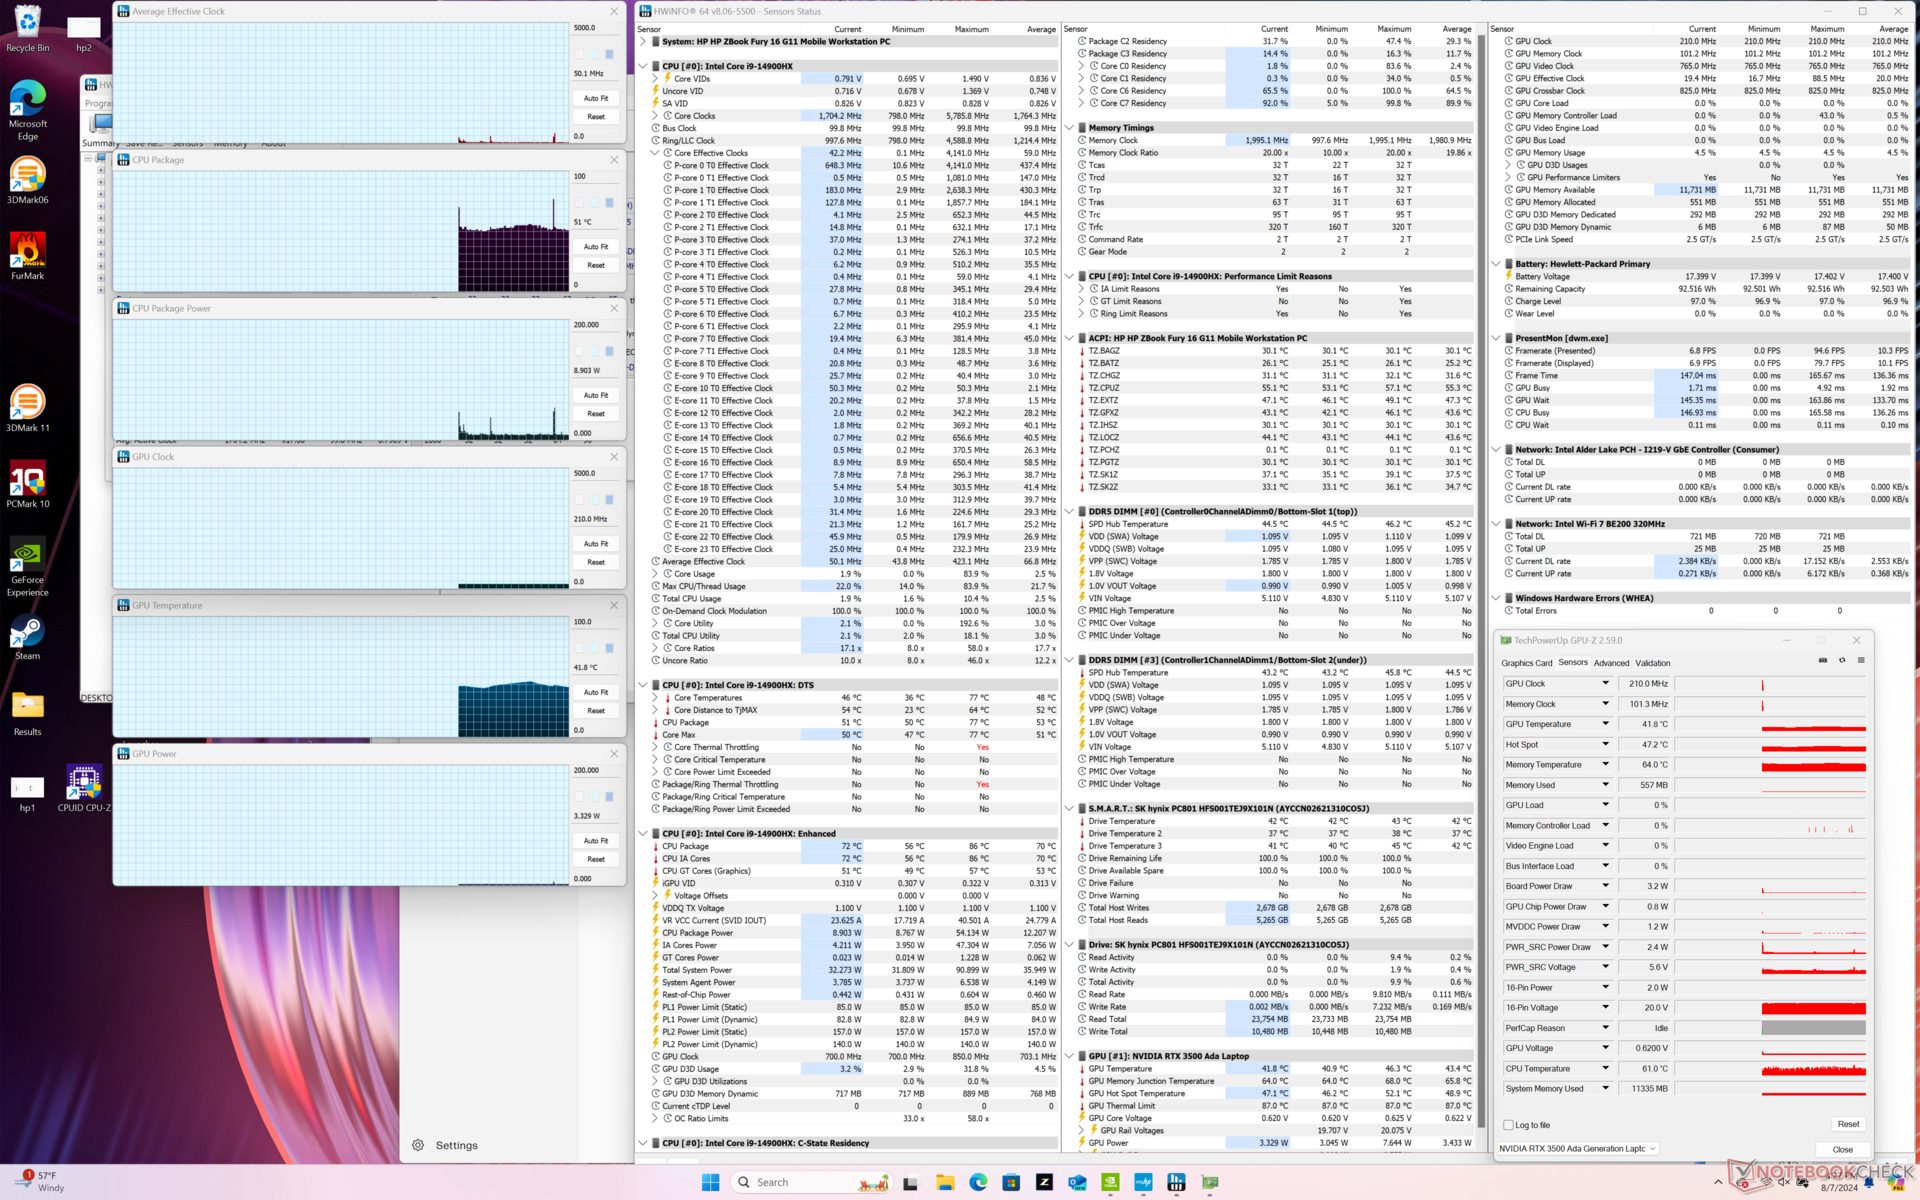
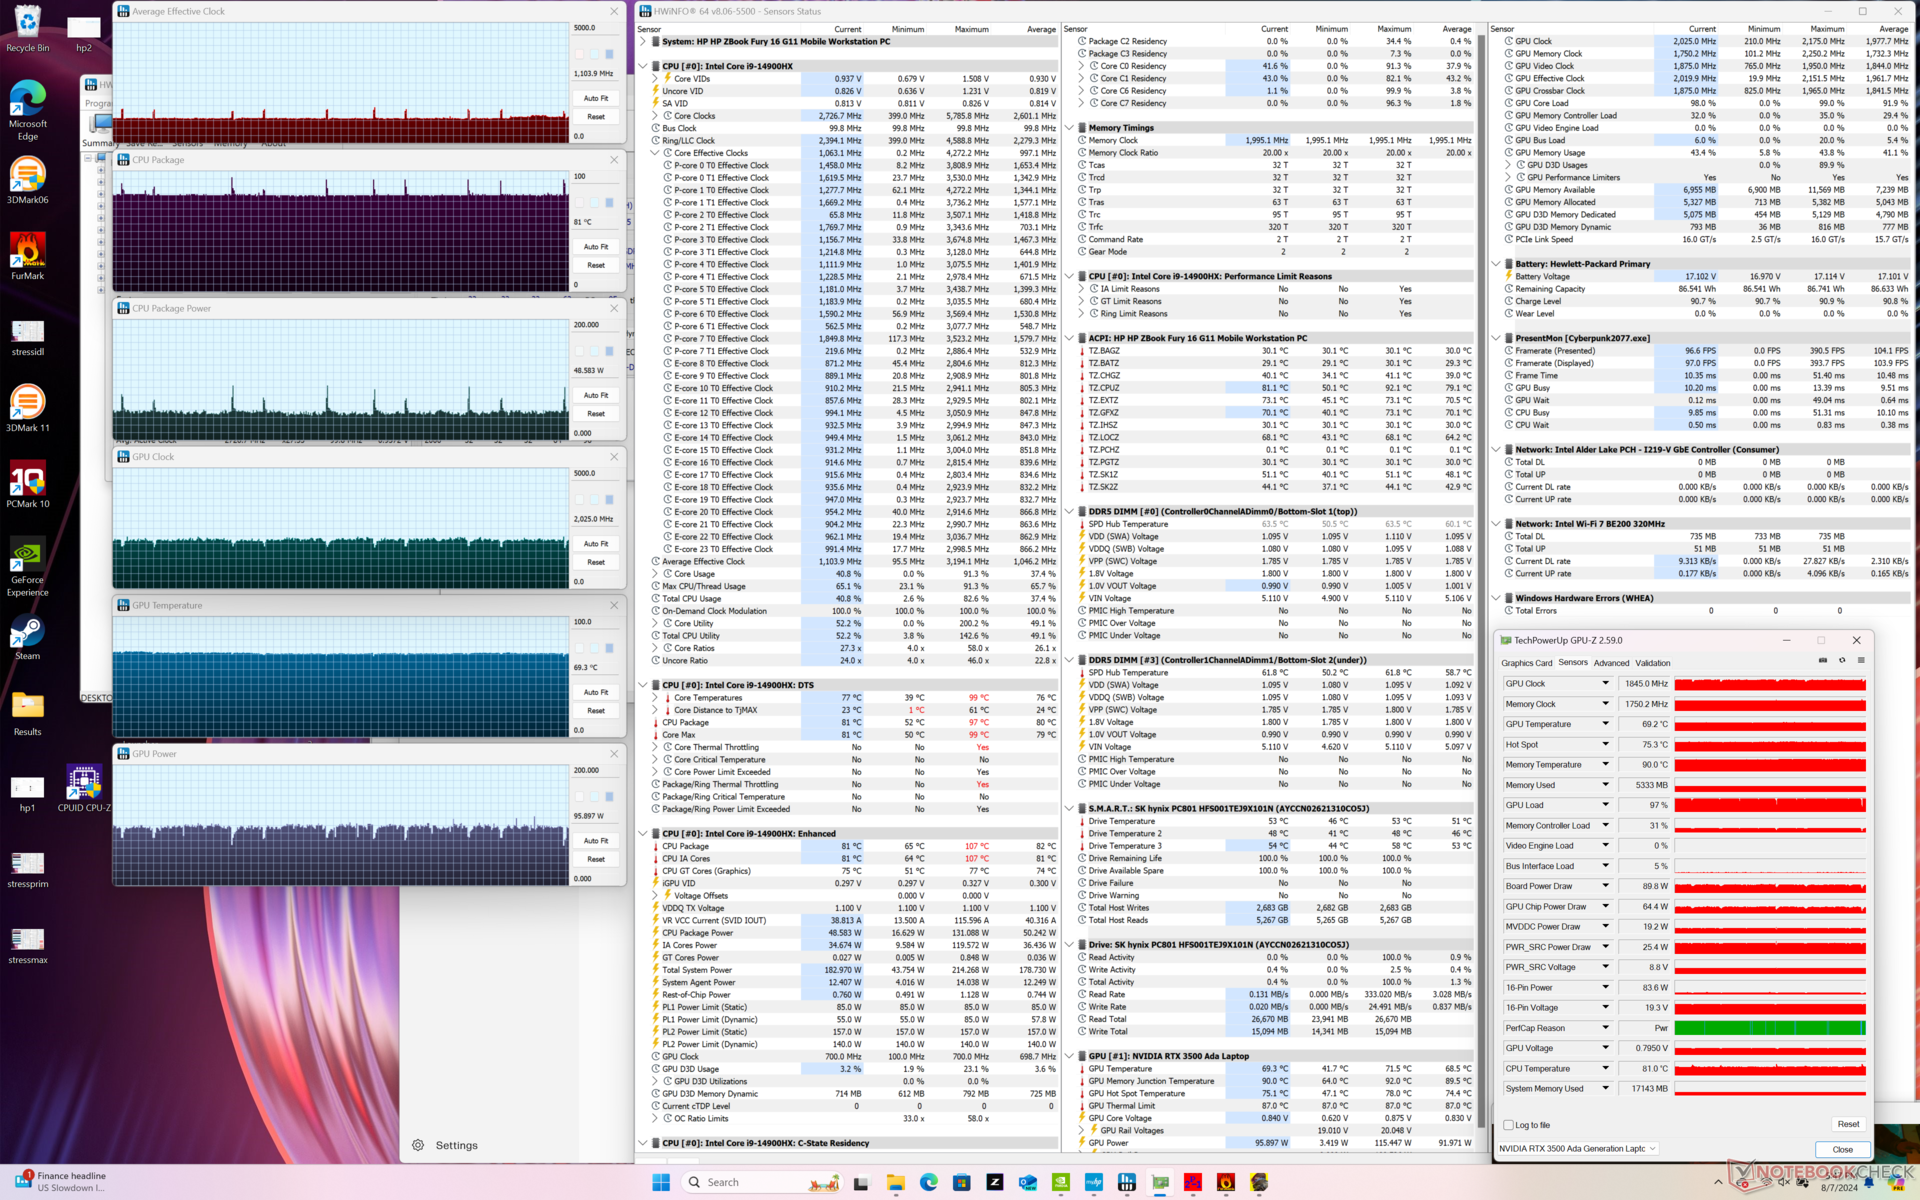
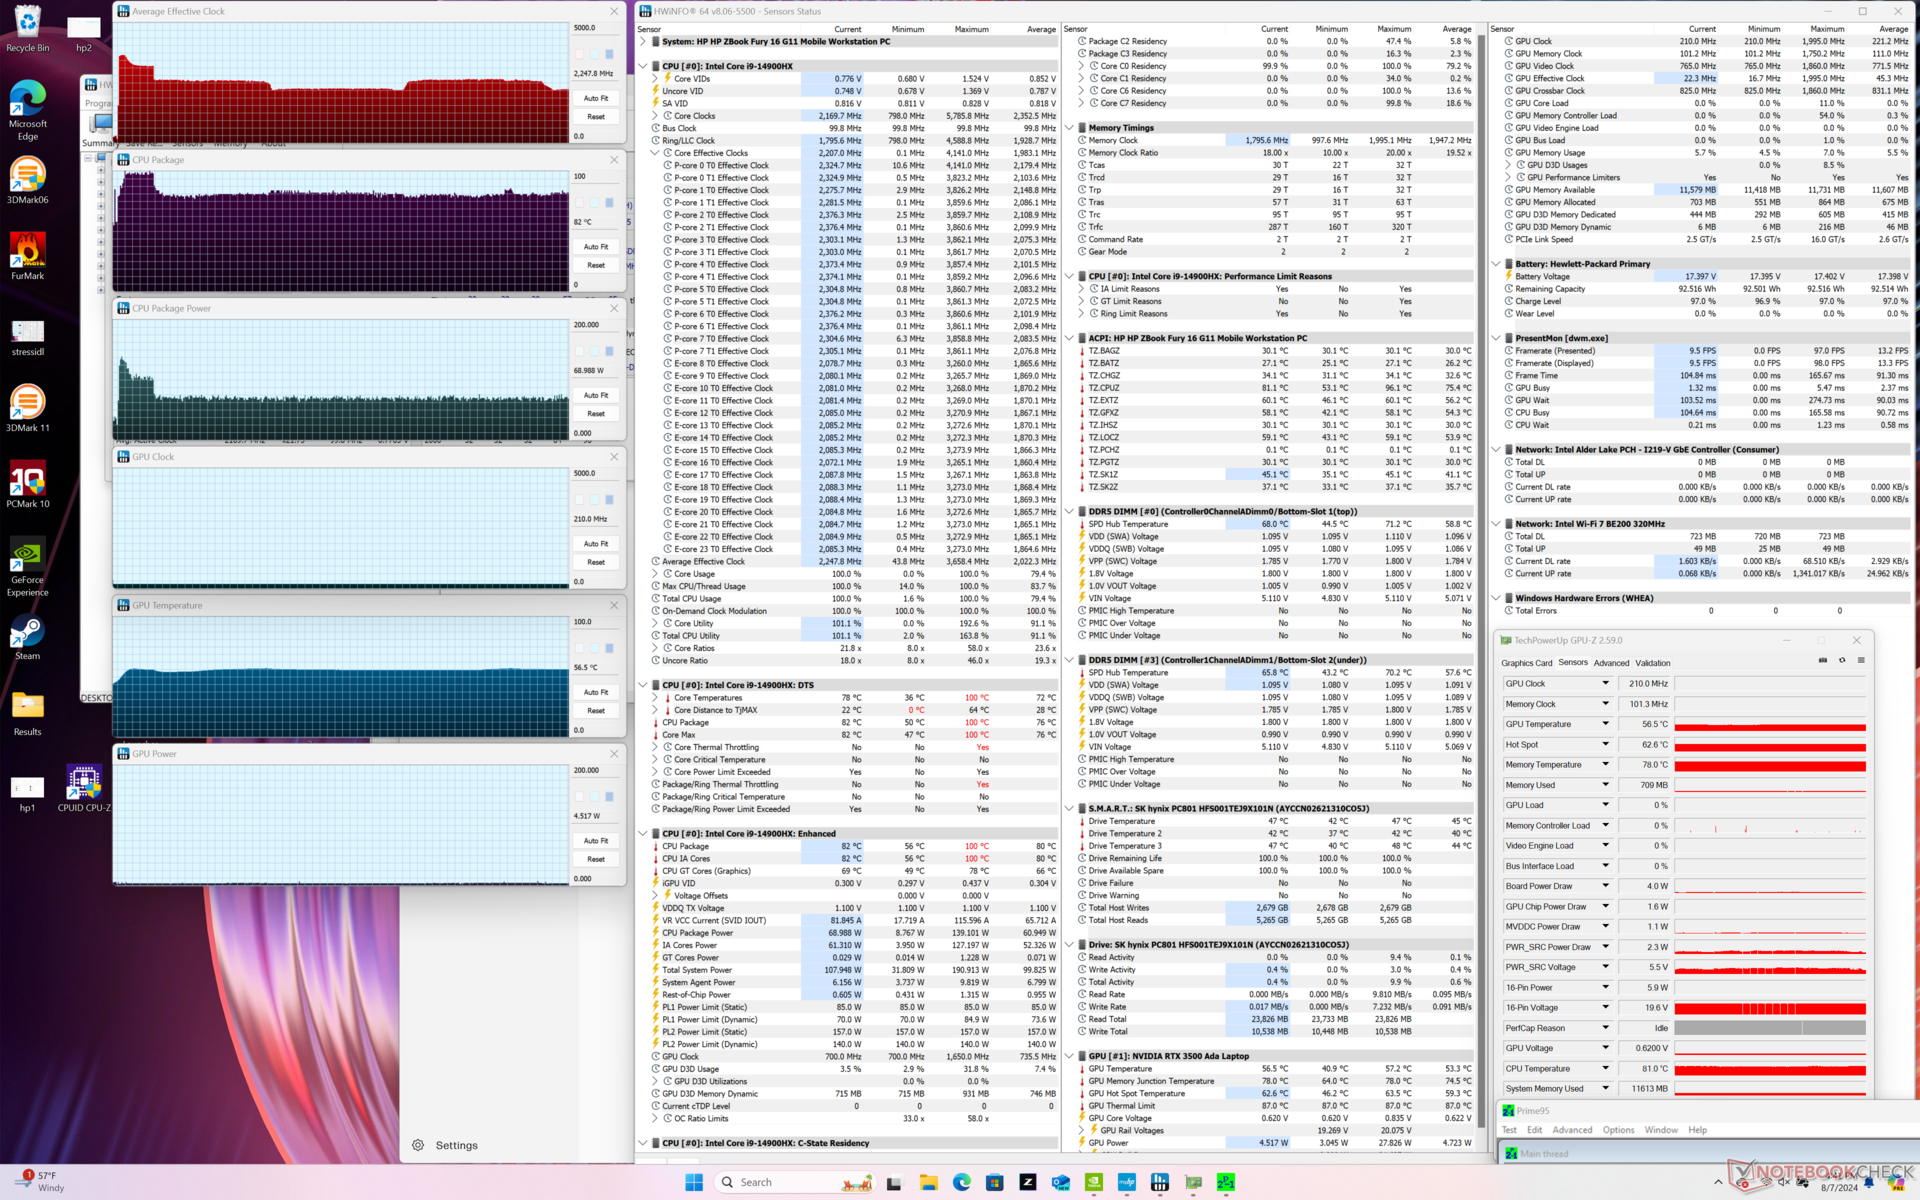
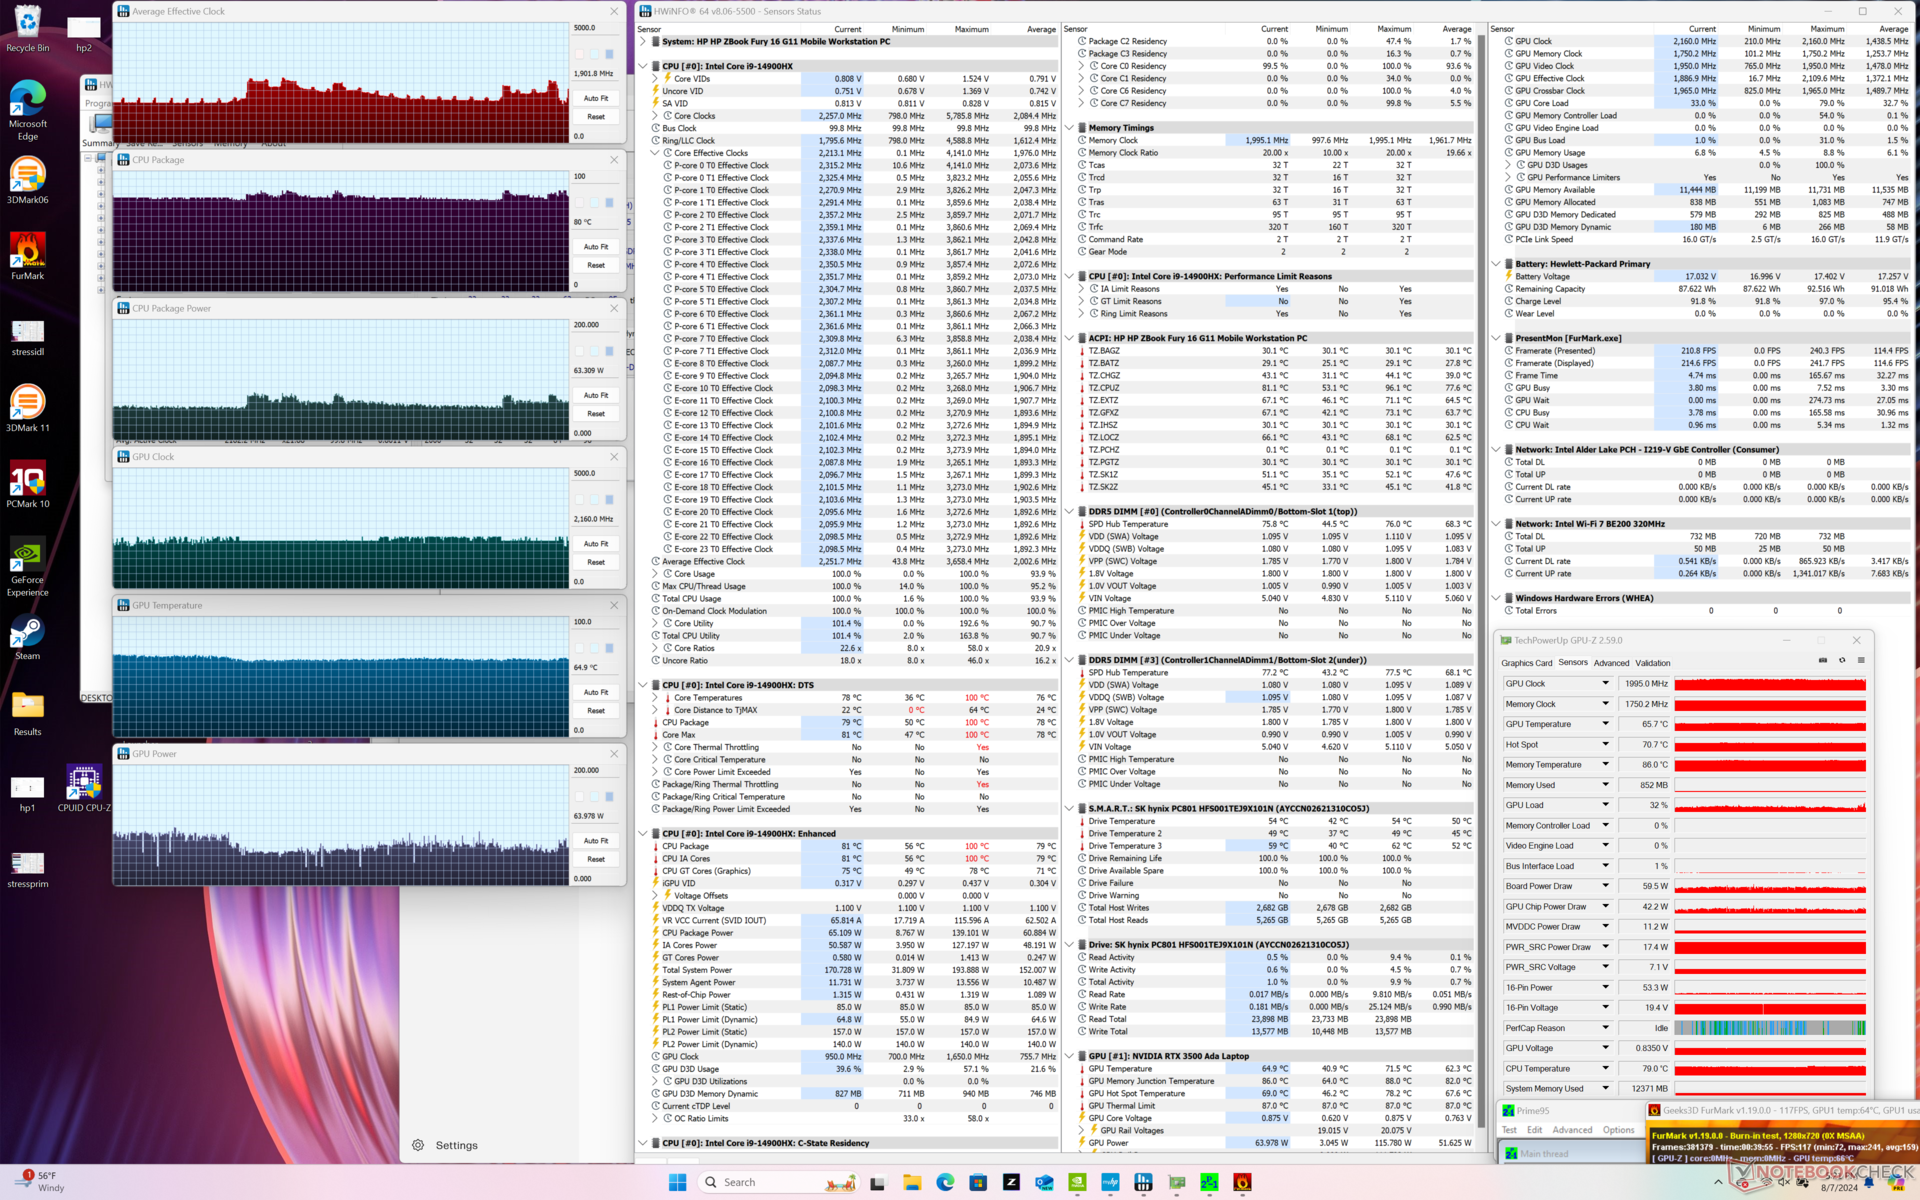
| Clock medio della CPU (GHz) | Clock della GPU (MHz) | Temperatura media della CPU (°C) | Temperatura media della GPU (°C) | |
| Sistema inattivo | -- | -- | 51 | 42 |
| Stress Prime95 | 2,2 - 2,6 | -- | 82 | 57 |
| Prime95 + FurMark Stress | 1,8 | 1995 | 81 | 65 |
| Cyberpunk 2077 Stress | 1.1 | 1845 | 81 | 69 |
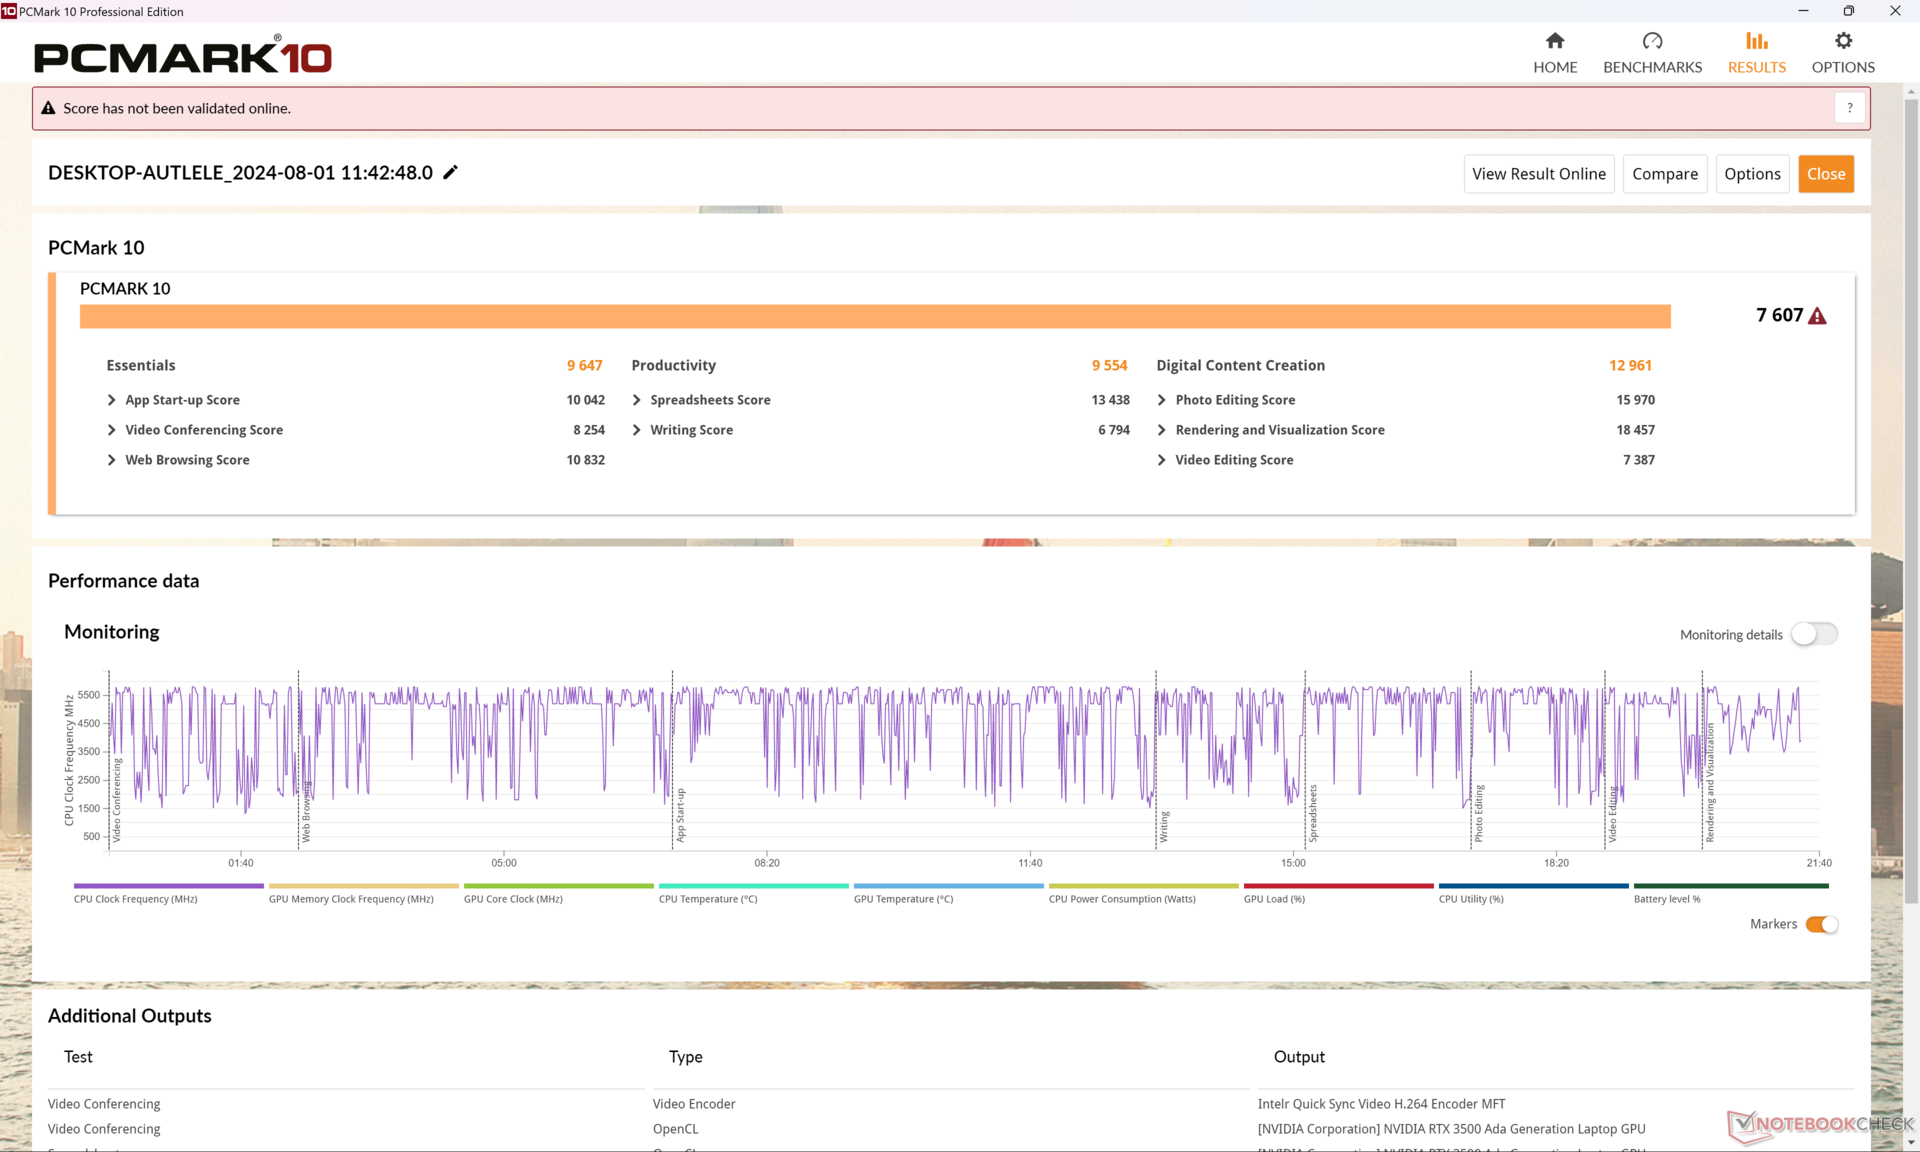
Prestazioni del sistema
I risultati di PCMark sono simili a quelli che abbiamo registrato sullo ZBook Fury 16 G10 dello scorso anno e suggeriscono che lo ZBook Fury 16 G11 non sarà più veloce del suo predecessore nell'esecuzione della maggior parte delle attività quotidiane.
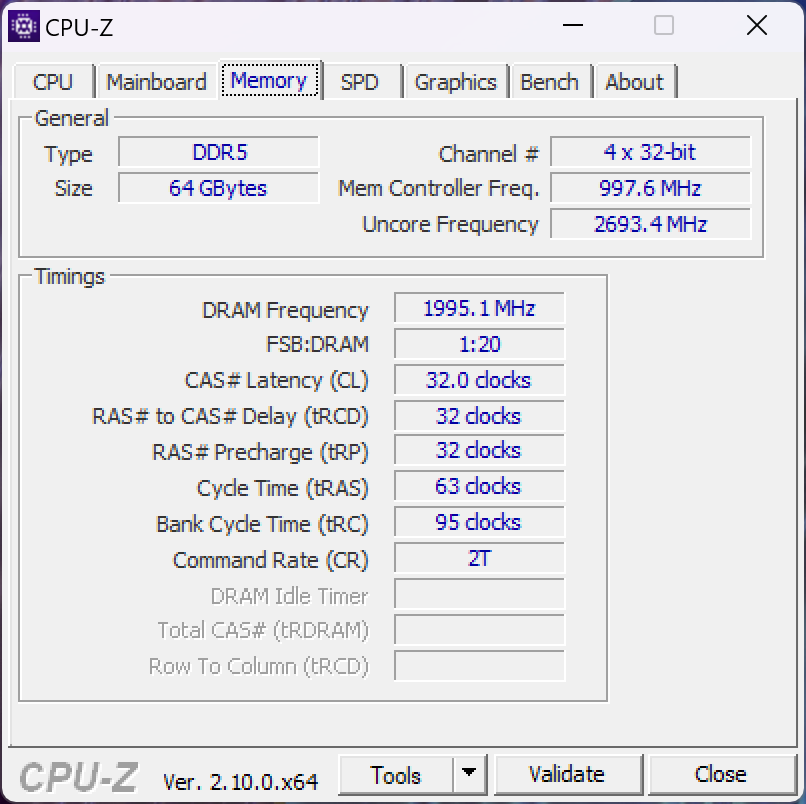
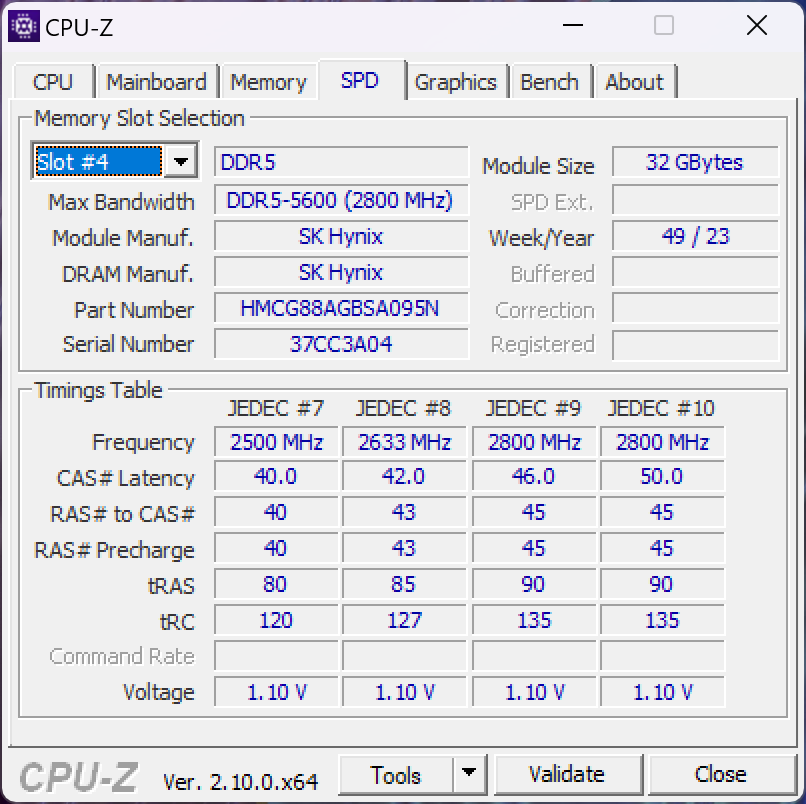
Tenga presente che la velocità massima della RAM è limitata a soli 4000 MT/s se configurata con 128 GB di memoria, a causa dei limiti dello standard SODIMM. Il modello supporta sia la RAM ECC che la RAM non-ECC.
CrossMark: Overall | Productivity | Creativity | Responsiveness
WebXPRT 3: Overall
WebXPRT 4: Overall
Mozilla Kraken 1.1: Total
| PCMark 10 / Score | |
| HP ZBook Fury 16 G10 | |
| Dell Precision 5690 | |
| Lenovo ThinkPad P1 G6 21FV001KUS | |
| HP ZBook Fury 16 G11 | |
| Media Intel Core i9-14900HX, NVIDIA RTX 3500 Ada Generation Laptop (n=1) | |
| Asus ProArt Studiobook 16 OLED H7604 | |
| Lenovo ThinkPad P16 G2 21FA000FGE | |
| HP ZBook Fury 16 G9 | |
| PCMark 10 / Essentials | |
| Lenovo ThinkPad P1 G6 21FV001KUS | |
| HP ZBook Fury 16 G10 | |
| Dell Precision 5690 | |
| Lenovo ThinkPad P16 G2 21FA000FGE | |
| HP ZBook Fury 16 G9 | |
| Asus ProArt Studiobook 16 OLED H7604 | |
| HP ZBook Fury 16 G11 | |
| Media Intel Core i9-14900HX, NVIDIA RTX 3500 Ada Generation Laptop (n=1) | |
| PCMark 10 / Productivity | |
| Dell Precision 5690 | |
| Lenovo ThinkPad P1 G6 21FV001KUS | |
| Asus ProArt Studiobook 16 OLED H7604 | |
| HP ZBook Fury 16 G11 | |
| Media Intel Core i9-14900HX, NVIDIA RTX 3500 Ada Generation Laptop (n=1) | |
| Lenovo ThinkPad P16 G2 21FA000FGE | |
| HP ZBook Fury 16 G10 | |
| HP ZBook Fury 16 G9 | |
| PCMark 10 / Digital Content Creation | |
| HP ZBook Fury 16 G10 | |
| HP ZBook Fury 16 G11 | |
| Media Intel Core i9-14900HX, NVIDIA RTX 3500 Ada Generation Laptop (n=1) | |
| Lenovo ThinkPad P1 G6 21FV001KUS | |
| Dell Precision 5690 | |
| Asus ProArt Studiobook 16 OLED H7604 | |
| Lenovo ThinkPad P16 G2 21FA000FGE | |
| HP ZBook Fury 16 G9 | |
| CrossMark / Overall | |
| Asus ProArt Studiobook 16 OLED H7604 | |
| HP ZBook Fury 16 G11 | |
| Media Intel Core i9-14900HX, NVIDIA RTX 3500 Ada Generation Laptop (n=1) | |
| HP ZBook Fury 16 G10 | |
| HP ZBook Fury 16 G9 | |
| Lenovo ThinkPad P16 G2 21FA000FGE | |
| Lenovo ThinkPad P1 G6 21FV001KUS | |
| Dell Precision 5690 | |
| CrossMark / Productivity | |
| Asus ProArt Studiobook 16 OLED H7604 | |
| HP ZBook Fury 16 G11 | |
| Media Intel Core i9-14900HX, NVIDIA RTX 3500 Ada Generation Laptop (n=1) | |
| HP ZBook Fury 16 G10 | |
| HP ZBook Fury 16 G9 | |
| Dell Precision 5690 | |
| Lenovo ThinkPad P1 G6 21FV001KUS | |
| Lenovo ThinkPad P16 G2 21FA000FGE | |
| CrossMark / Creativity | |
| Asus ProArt Studiobook 16 OLED H7604 | |
| HP ZBook Fury 16 G11 | |
| Media Intel Core i9-14900HX, NVIDIA RTX 3500 Ada Generation Laptop (n=1) | |
| Lenovo ThinkPad P16 G2 21FA000FGE | |
| HP ZBook Fury 16 G9 | |
| HP ZBook Fury 16 G10 | |
| Lenovo ThinkPad P1 G6 21FV001KUS | |
| Dell Precision 5690 | |
| CrossMark / Responsiveness | |
| Asus ProArt Studiobook 16 OLED H7604 | |
| HP ZBook Fury 16 G11 | |
| Media Intel Core i9-14900HX, NVIDIA RTX 3500 Ada Generation Laptop (n=1) | |
| HP ZBook Fury 16 G10 | |
| HP ZBook Fury 16 G9 | |
| Dell Precision 5690 | |
| Lenovo ThinkPad P1 G6 21FV001KUS | |
| Lenovo ThinkPad P16 G2 21FA000FGE | |
| WebXPRT 3 / Overall | |
| HP ZBook Fury 16 G10 | |
| Asus ProArt Studiobook 16 OLED H7604 | |
| Lenovo ThinkPad P16 G2 21FA000FGE | |
| HP ZBook Fury 16 G11 | |
| Media Intel Core i9-14900HX, NVIDIA RTX 3500 Ada Generation Laptop (n=1) | |
| Lenovo ThinkPad P1 G6 21FV001KUS | |
| HP ZBook Fury 16 G9 | |
| Dell Precision 5690 | |
| WebXPRT 4 / Overall | |
| HP ZBook Fury 16 G11 | |
| Media Intel Core i9-14900HX, NVIDIA RTX 3500 Ada Generation Laptop (n=1) | |
| HP ZBook Fury 16 G10 | |
| Asus ProArt Studiobook 16 OLED H7604 | |
| Lenovo ThinkPad P1 G6 21FV001KUS | |
| HP ZBook Fury 16 G9 | |
| Dell Precision 5690 | |
| Mozilla Kraken 1.1 / Total | |
| Dell Precision 5690 | |
| HP ZBook Fury 16 G9 | |
| Lenovo ThinkPad P16 G2 21FA000FGE | |
| Lenovo ThinkPad P1 G6 21FV001KUS | |
| HP ZBook Fury 16 G10 | |
| HP ZBook Fury 16 G11 | |
| Media Intel Core i9-14900HX, NVIDIA RTX 3500 Ada Generation Laptop (n=1) | |
| Asus ProArt Studiobook 16 OLED H7604 | |
* ... Meglio usare valori piccoli
| PCMark 10 Score | 7607 punti | |
Aiuto | ||
| AIDA64 / Memory Copy | |
| Dell Precision 5690 | |
| Media Intel Core i9-14900HX (38028 - 83392, n=36) | |
| Asus ProArt Studiobook 16 OLED H7604 | |
| HP ZBook Fury 16 G10 | |
| HP ZBook Fury 16 G9 | |
| HP ZBook Fury 16 G11 | |
| Lenovo ThinkPad P16 G2 21FA000FGE | |
| Lenovo ThinkPad P1 G6 21FV001KUS | |
| AIDA64 / Memory Read | |
| Dell Precision 5690 | |
| Media Intel Core i9-14900HX (43306 - 87568, n=36) | |
| Asus ProArt Studiobook 16 OLED H7604 | |
| HP ZBook Fury 16 G10 | |
| HP ZBook Fury 16 G11 | |
| HP ZBook Fury 16 G9 | |
| Lenovo ThinkPad P16 G2 21FA000FGE | |
| Lenovo ThinkPad P1 G6 21FV001KUS | |
| AIDA64 / Memory Write | |
| Dell Precision 5690 | |
| Media Intel Core i9-14900HX (37146 - 80589, n=36) | |
| Asus ProArt Studiobook 16 OLED H7604 | |
| HP ZBook Fury 16 G10 | |
| HP ZBook Fury 16 G9 | |
| Lenovo ThinkPad P16 G2 21FA000FGE | |
| HP ZBook Fury 16 G11 | |
| Lenovo ThinkPad P1 G6 21FV001KUS | |
| AIDA64 / Memory Latency | |
| Dell Precision 5690 | |
| HP ZBook Fury 16 G10 | |
| Lenovo ThinkPad P16 G2 21FA000FGE | |
| HP ZBook Fury 16 G11 | |
| HP ZBook Fury 16 G9 | |
| Asus ProArt Studiobook 16 OLED H7604 | |
| Lenovo ThinkPad P1 G6 21FV001KUS | |
| Media Intel Core i9-14900HX (76.1 - 105, n=36) | |
* ... Meglio usare valori piccoli
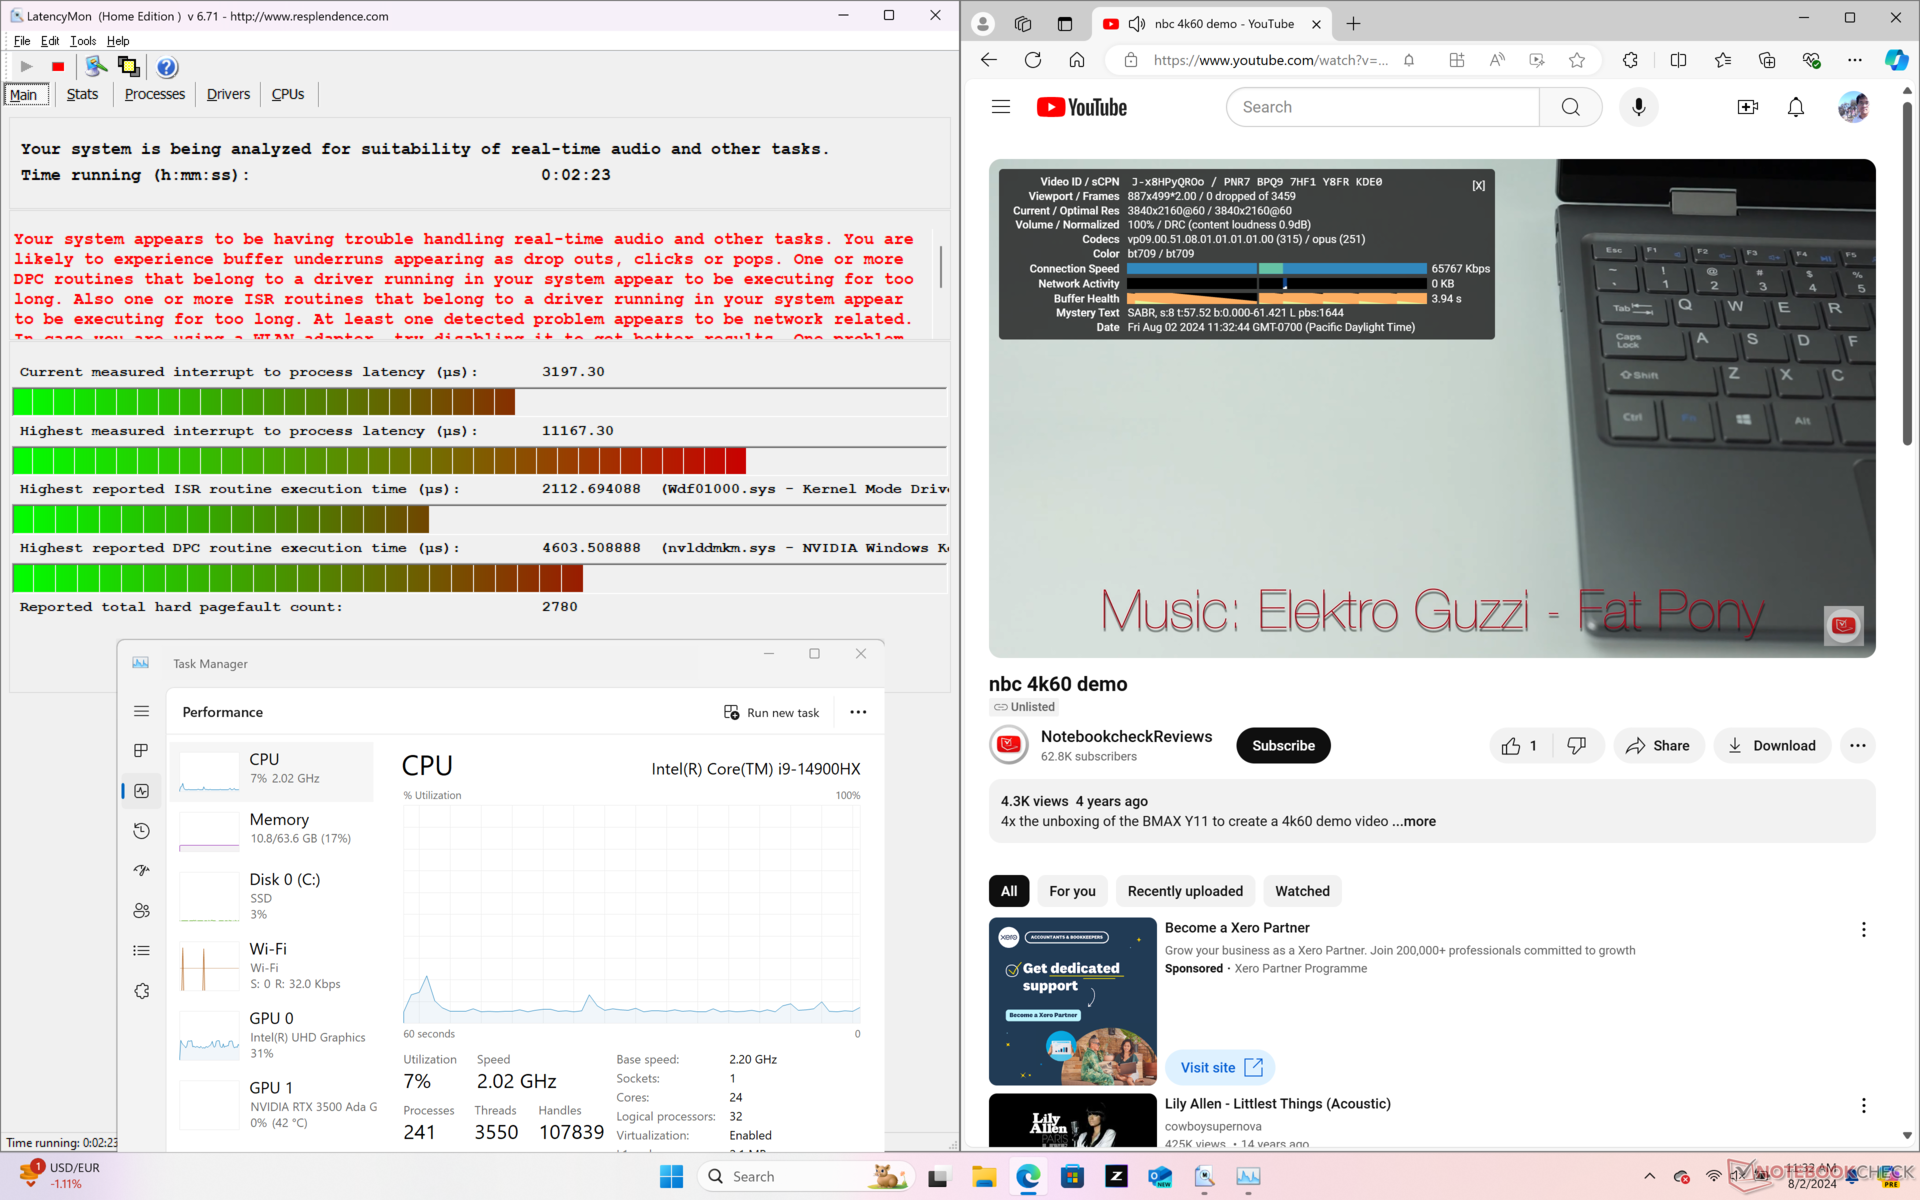
Latenza DPC
LatencyMon rivela problemi di DPC quando si aprono più schede del browser della nostra homepage. la riproduzione di video 4K a 60 FPS è invece perfetta, senza alcuna perdita di fotogrammi.

| DPC Latencies / LatencyMon - interrupt to process latency (max), Web, Youtube, Prime95 | |
| HP ZBook Fury 16 G11 | |
| HP ZBook Fury 16 G10 | |
| HP ZBook Fury 16 G9 | |
| Asus ProArt Studiobook 16 OLED H7604 | |
| Lenovo ThinkPad P1 G6 21FV001KUS | |
| Lenovo ThinkPad P16 G2 21FA000FGE | |
| Dell Precision 5690 | |
* ... Meglio usare valori piccoli
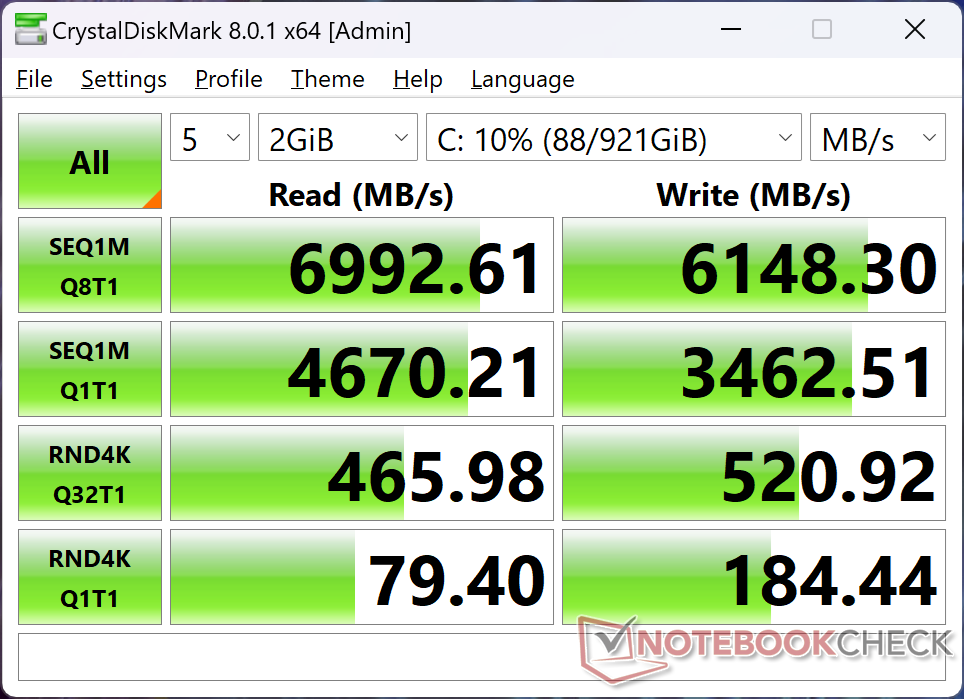
Dispositivi di archiviazione
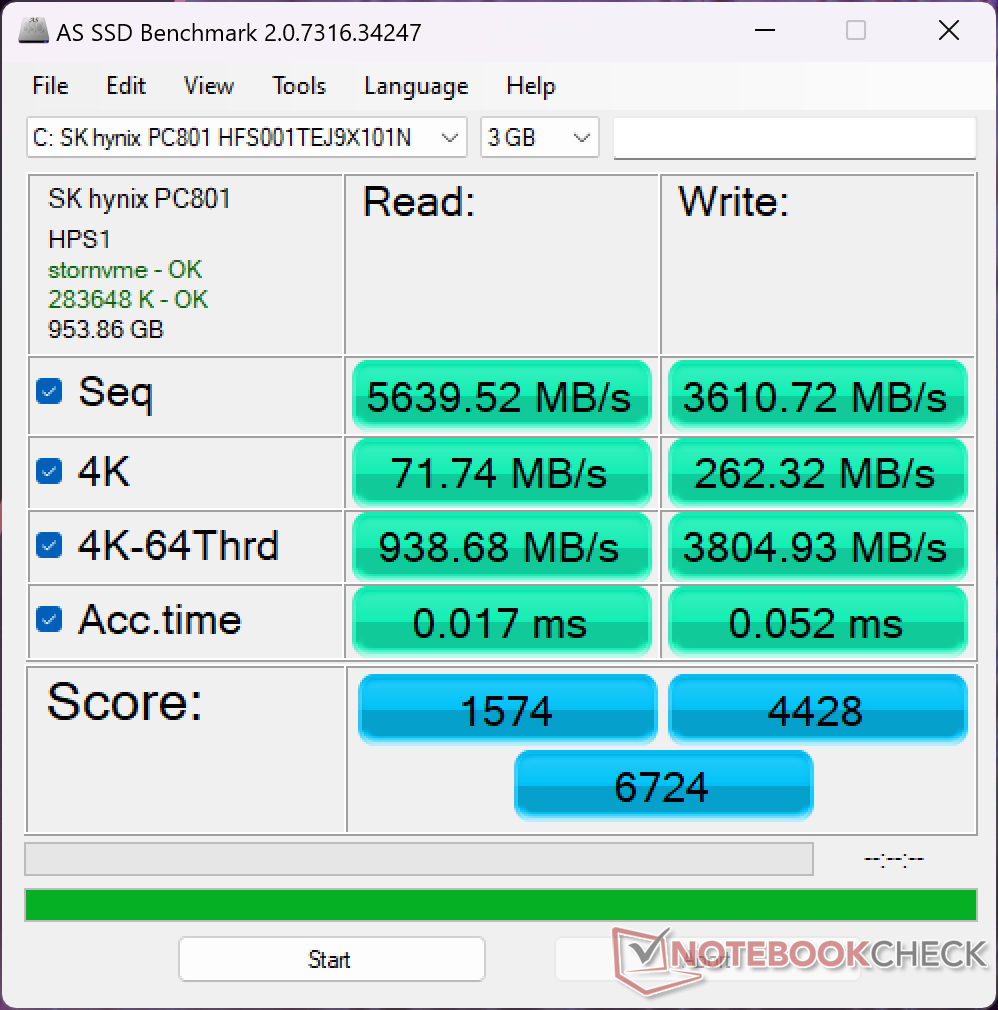
La nostra unità di prova viene fornita con lo stesso modello da 1 TB SK Hynix PC801 HFS001TEJ9X101N PCIe4 M.2 presente sullo ZBook Fury 16 G10 dello scorso anno. Purtroppo, anche l'unità soffre degli stessi problemi di strozzamento delle prestazioni. Quando si esegue DiskSpd in loop, le velocità di trasferimento iniziano ad essere molto elevate, quasi 7000 MB/s, per poi scendere a 3400 MB/s solo pochi minuti dopo, come mostra il grafico sottostante. Questo può essere attribuito a un raffreddamento insufficiente delle unità, ma forse è il prezzo da pagare per il supporto di un numero maggiore di unità individuali rispetto alla maggior parte degli altri computer portatili.

* ... Meglio usare valori piccoli
Disk Throttling: DiskSpd Read Loop, Queue Depth 8
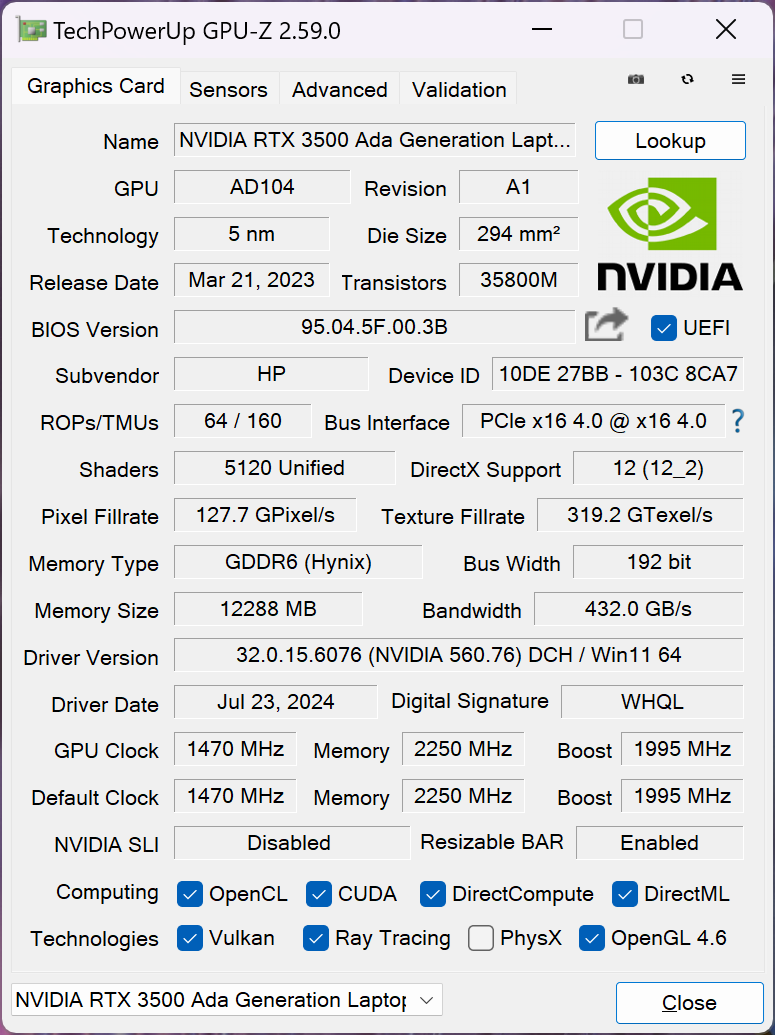
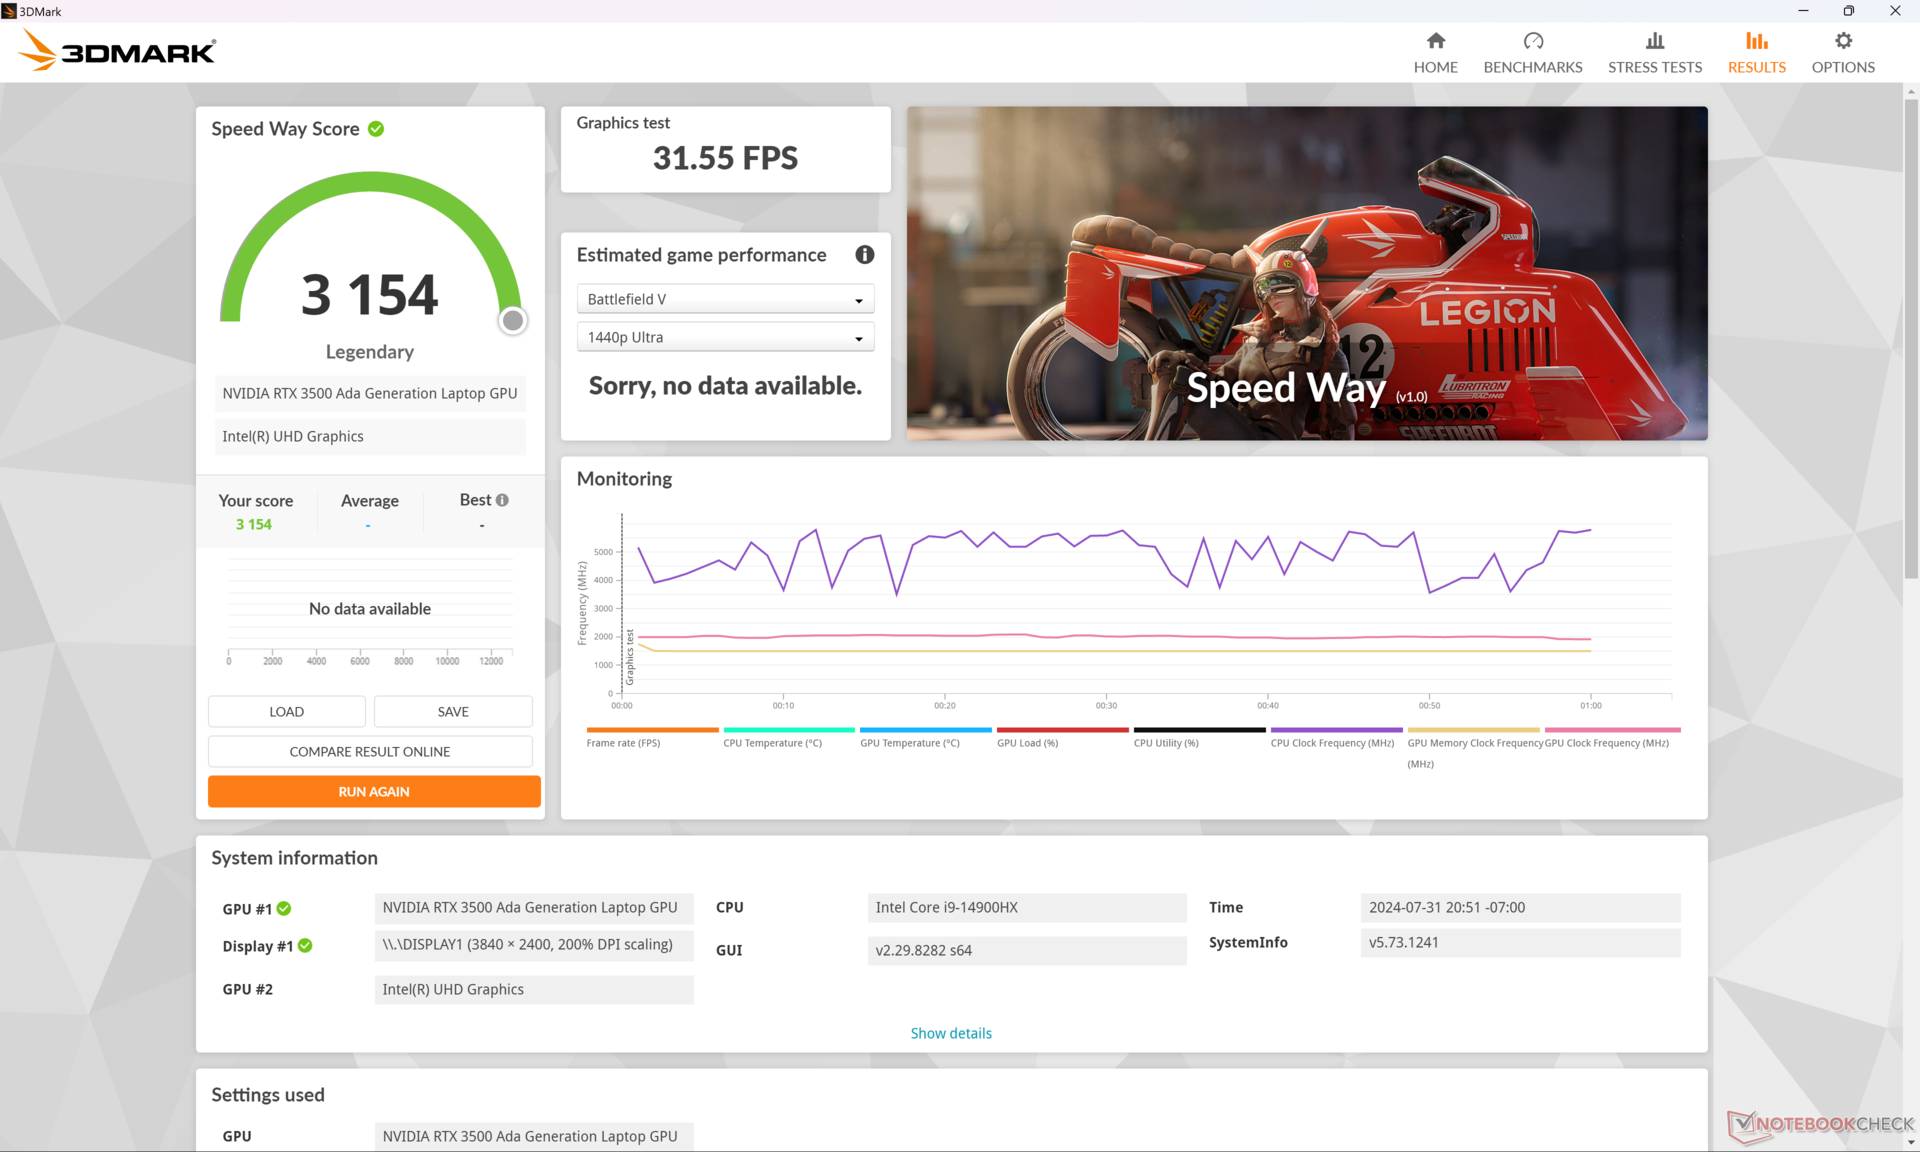
Prestazioni della GPU
Gli utenti possono aspettarsi che la RTX 3500 Ada di ottenere prestazioni più lente del 20-30 percento rispetto a quelle dell'RTX 5000 Ada RTX 5000 Ada. Poiché Nvidia non ha ancora introdotto una nuova generazione di GPU mobili, lo ZBook Fury 16 G11 viene fornito con le stesse opzioni di GPU del modello dell'anno scorso, senza guadagni di prestazioni degni di nota. La RTA 5000 Ada rimane la GPU per workstation mobile più veloce disponibile.
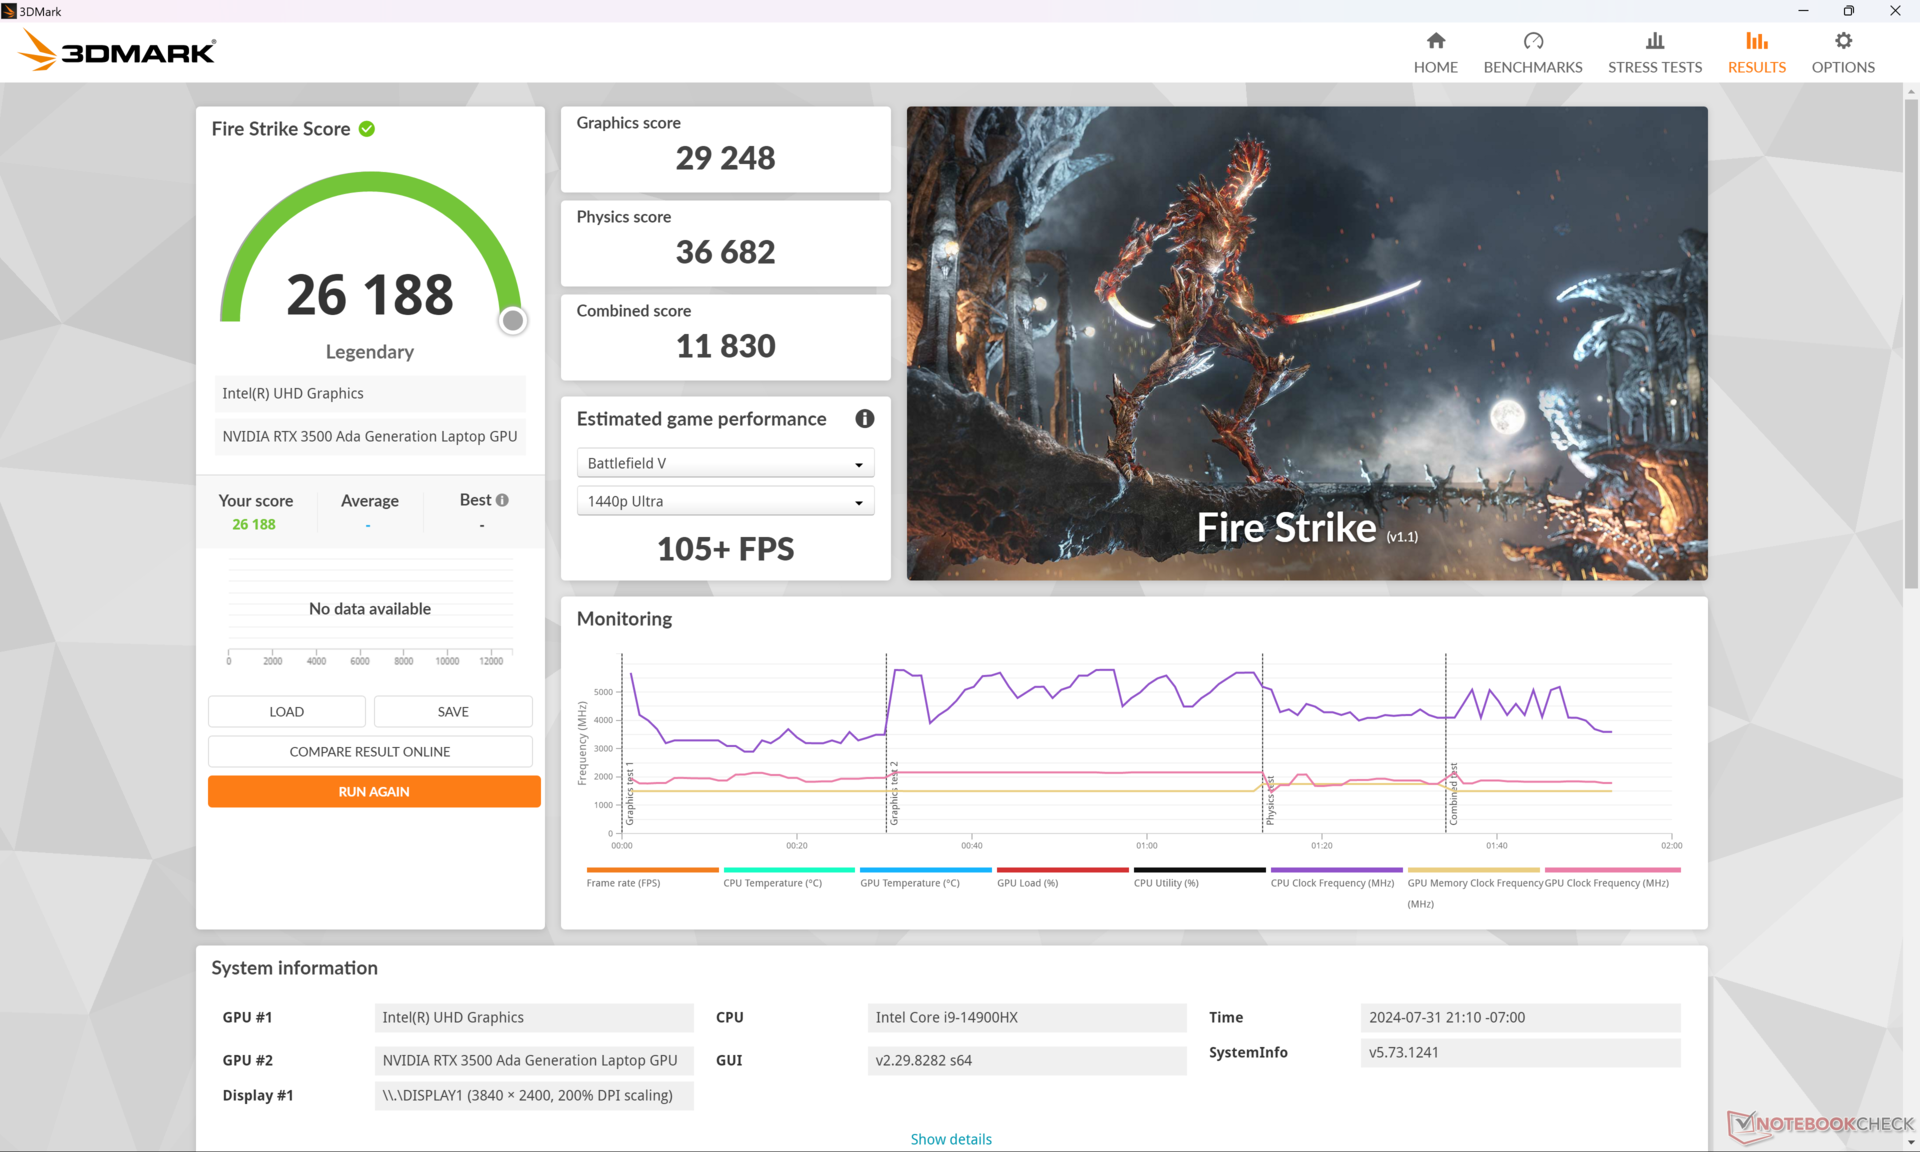
| Profilo di potenza | Punteggio grafico | Punteggio di fisica | Punteggio combinato |
| Modalità Prestazioni | 29248 | 36682 | 11830 |
| Modalità equilibrata | 28214 (-4%) | 33094 (-10%) | 10246 (-13%) |
| Alimentazione a batteria | 16618 (-43%) | 25118 (-32%) | 4101 (-65%) |
L'esecuzione in modalità Bilanciata invece che in modalità Prestazioni avrebbe un impatto sulle prestazioni fino al 10-15%, come mostra la nostra tabella Fire Strike qui sopra. Il deficit di prestazioni aumenta ancora di più se si utilizza l'alimentazione a batteria, come ci si aspetta dalla maggior parte dei computer portatili ad alte prestazioni.
| 3DMark Performance rating - Percent | |
| HP ZBook Fury 16 G10 -2! | |
| Dell Precision 5690 -2! | |
| Dell Precision 5000 5680 -2! | |
| HP ZBook Fury 16 G11 | |
| Media NVIDIA RTX 3500 Ada Generation Laptop | |
| Lenovo ThinkPad P1 G6 21FV001KUS -2! | |
| Lenovo ThinkPad P1 G6-21FV000DGE -17! | |
| HP ZBook Fury 16 G9 -2! | |
| Lenovo ThinkPad P16 G2 21FA000FGE -17! | |
| MSI CreatorPro Z16P B12UKST -17! | |
| Asus ProArt Studiobook 16 OLED H7604 -17! | |
| Asus ExpertBook B6 Flip B6602FC2 -17! | |
| Lenovo ThinkPad P1 G4-20Y4S0KS00 -10! | |
| Lenovo ThinkPad P16v G1 AMD -17! | |
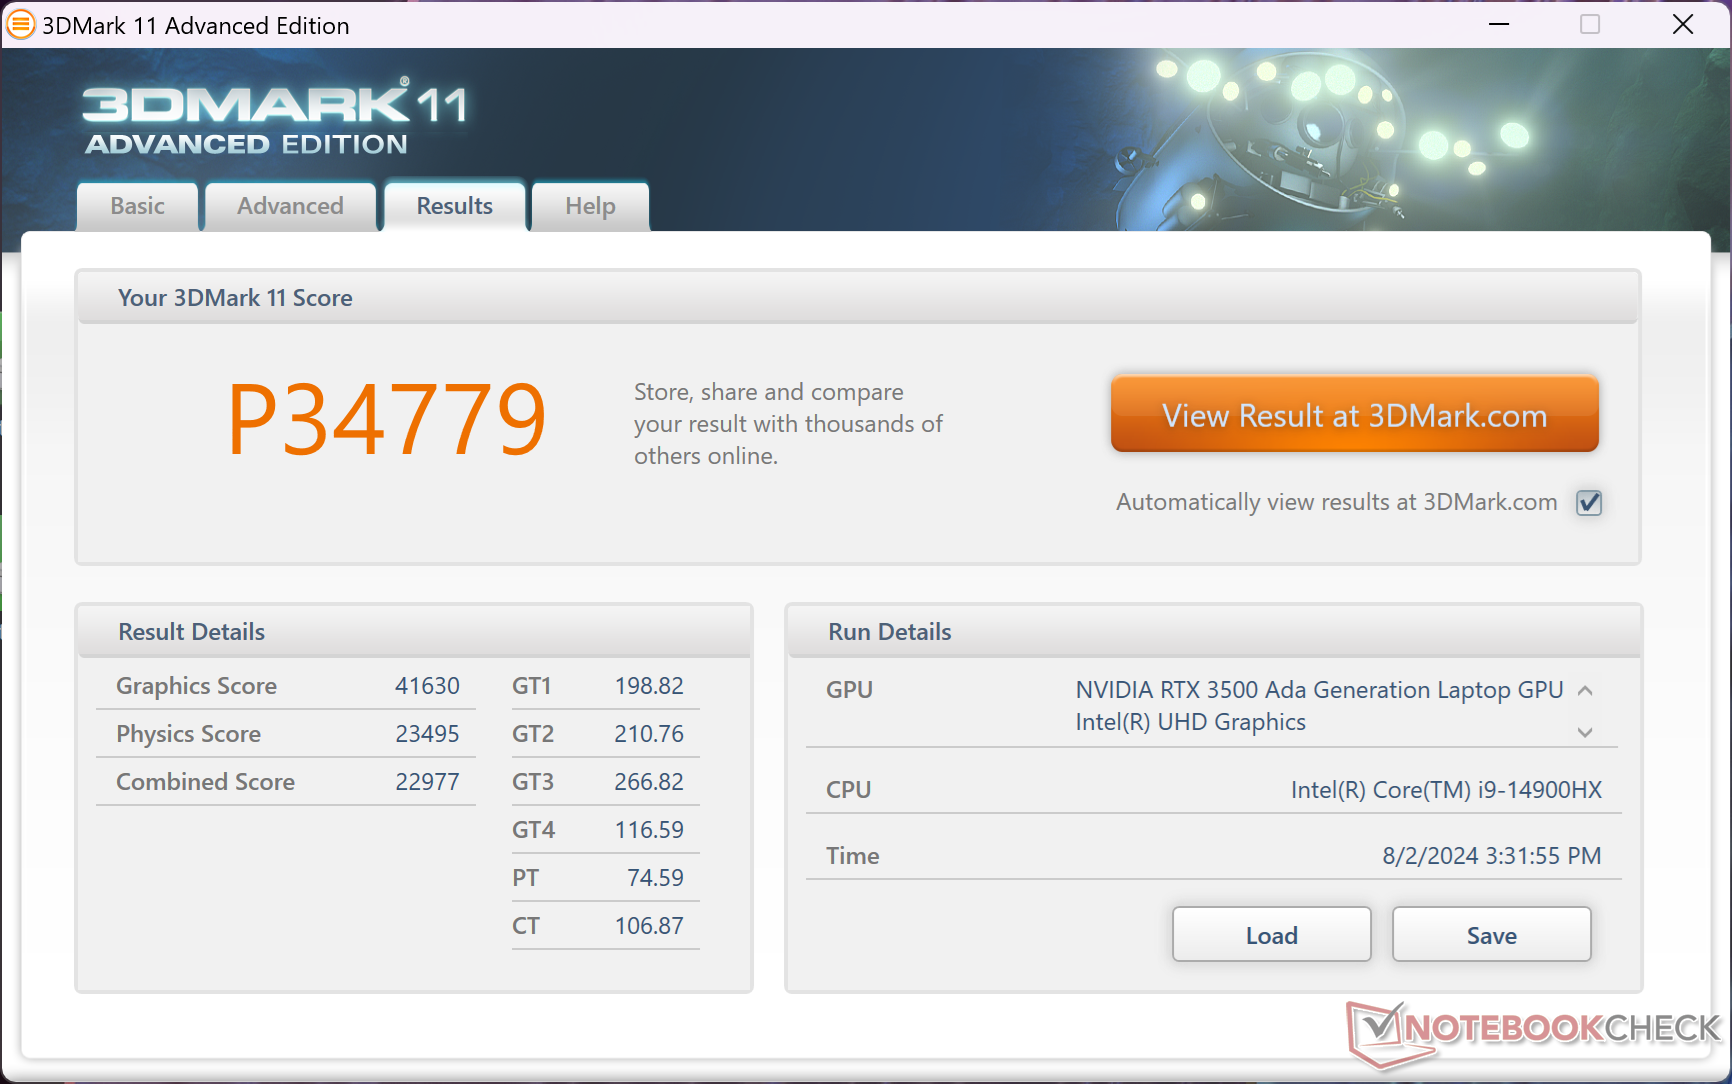
| 3DMark 11 Performance | 34779 punti | |
| 3DMark Fire Strike Score | 26188 punti | |
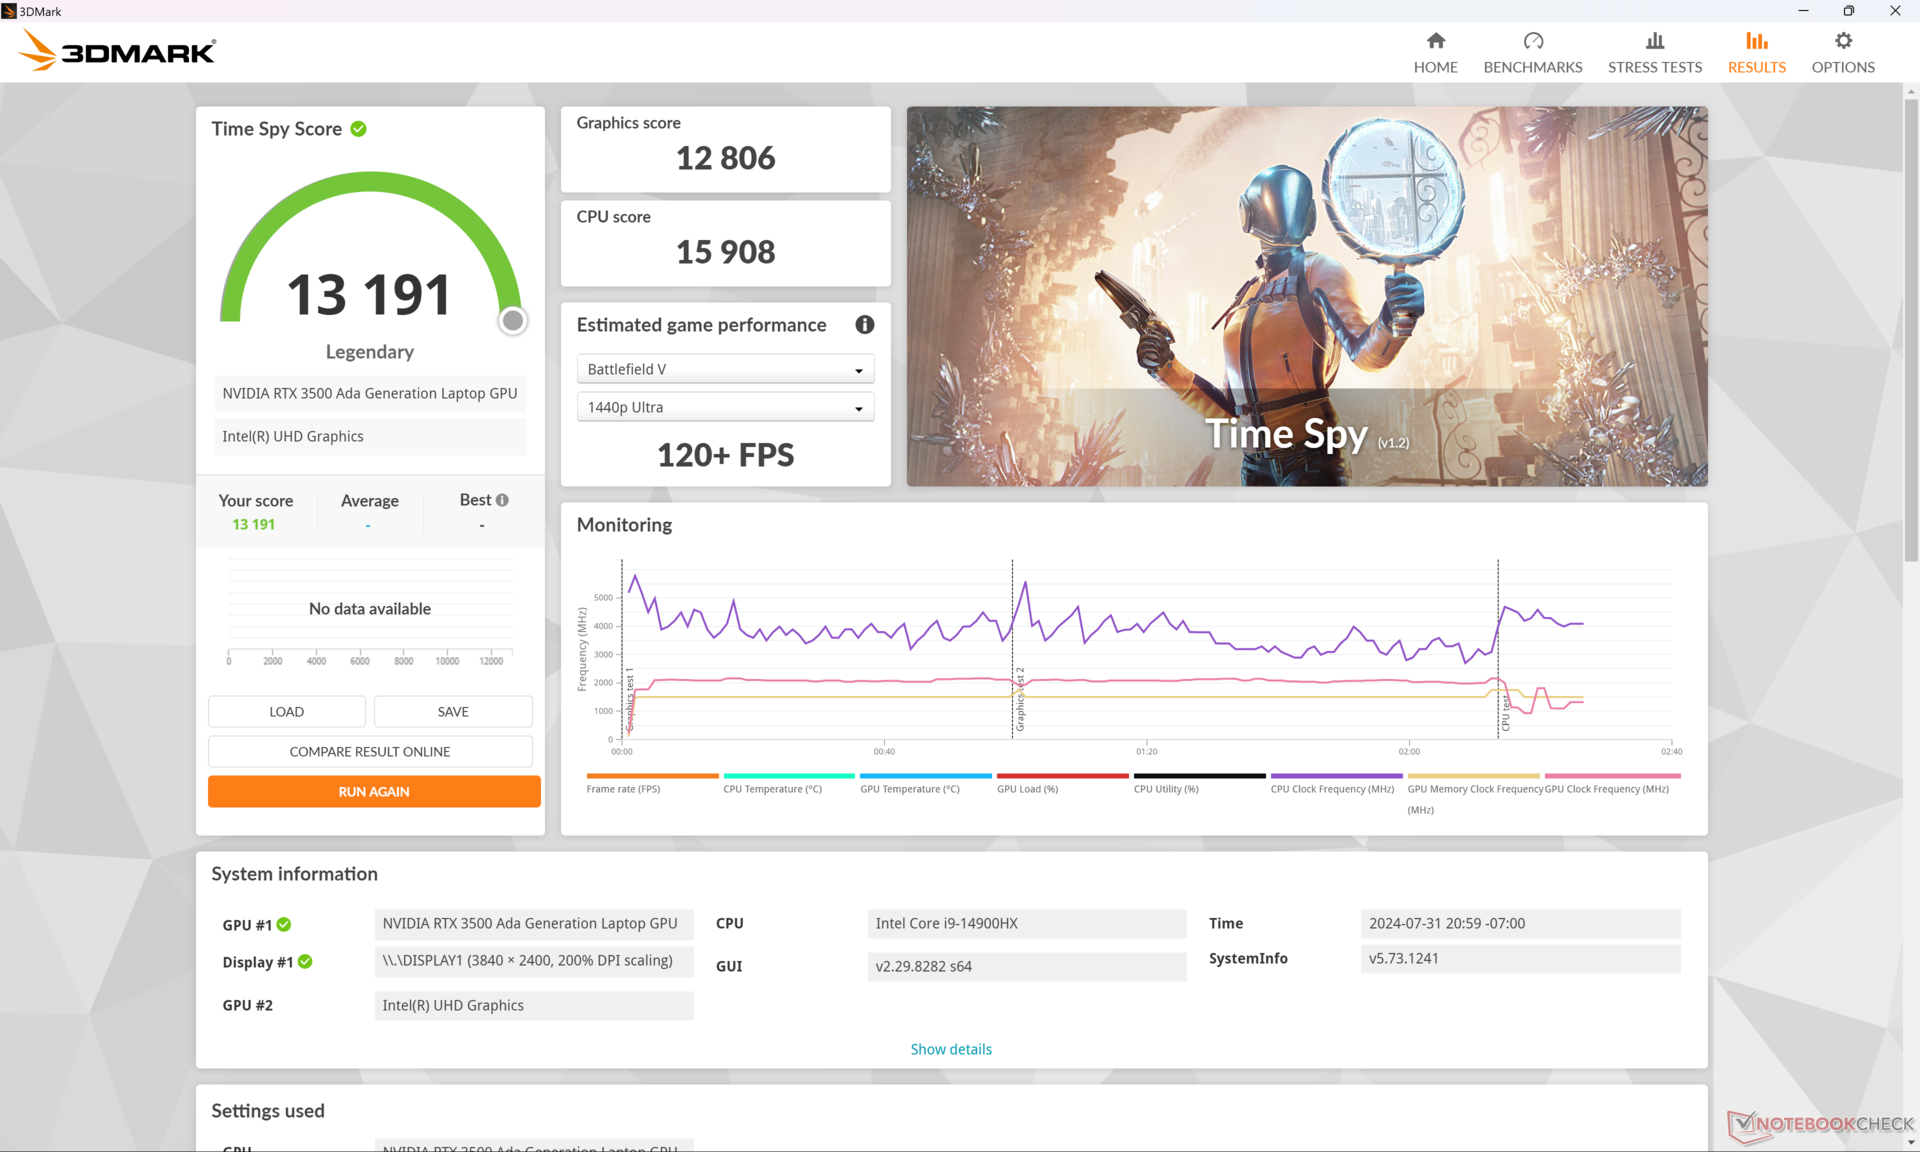
| 3DMark Time Spy Score | 13191 punti | |
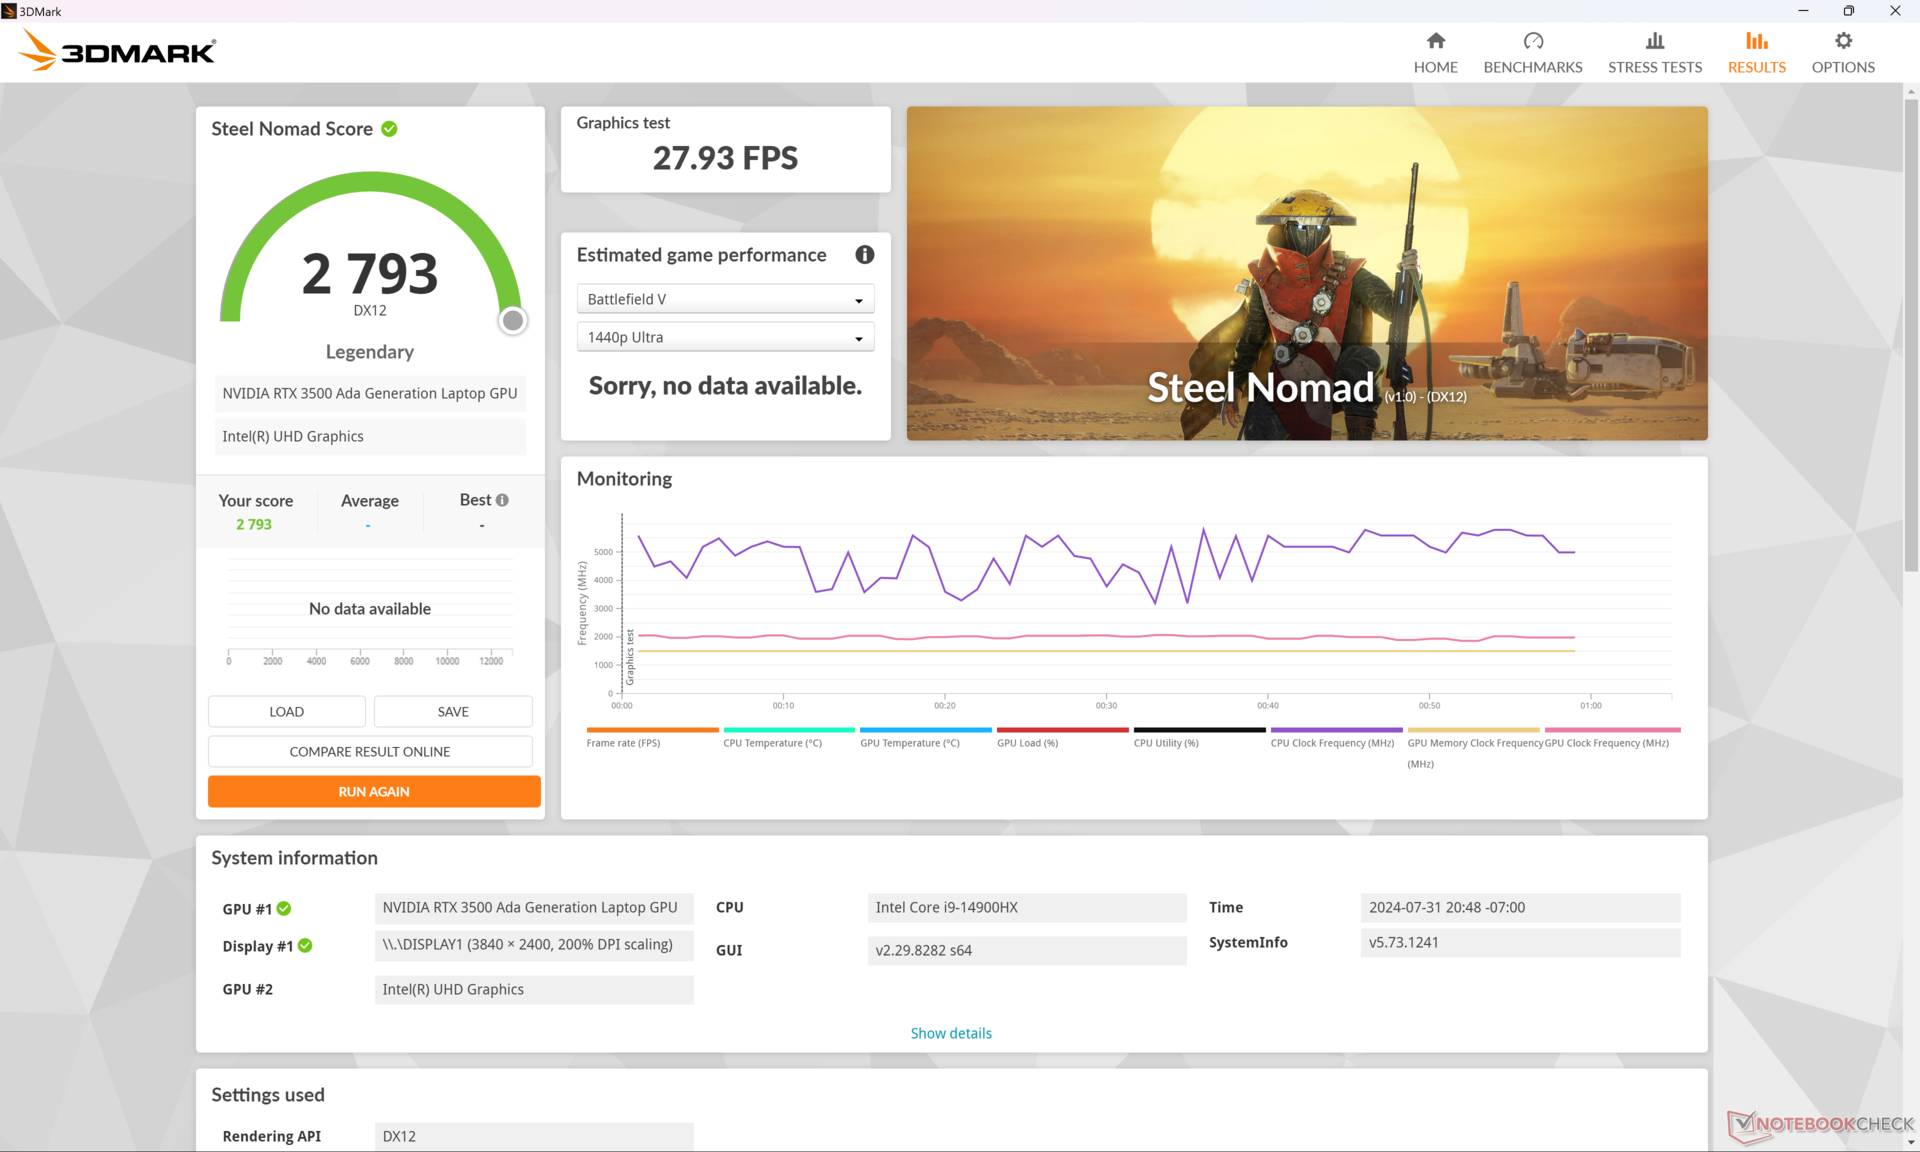
| 3DMark Steel Nomad Score | 2793 punti | |
Aiuto | ||
* ... Meglio usare valori piccoli
Prestazioni di gioco
Sebbene non sia stata progettata per il gioco, la RTX 3500 Ada ha prestazioni leggermente superiori a quelle della mobile GeForce RTX 4070 ma al di sotto della RTX 4080 mobile, soprattutto se si considera il numero di pipeline unificate, i core tensoriali e la larghezza di banda della memoria. Le prestazioni possono tuttavia rallentare gradualmente nel tempo quando vengono sollecitate, poiché le velocità di boost della GPU non sono indefinite. Ad esempio, quando si è al minimo su Cyberpunk 2077 con impostazioni Ultra a 1080p, le prestazioni iniziano a superare di poco i 70 FPS prima di diminuire gradualmente fino a raggiungere i 60 FPS dopo soli 30 minuti, come mostra il grafico qui sotto.
| Performance rating - Percent | |
| HP ZBook Fury 16 G10 -2! | |
| Lenovo ThinkPad P1 G6 21FV001KUS -1! | |
| HP ZBook Fury 16 G11 | |
| Asus ProArt Studiobook 16 OLED H7604 -1! | |
| Dell Precision 5690 -1! | |
| HP ZBook Fury 16 G9 -1! | |
| Lenovo ThinkPad P16 G2 21FA000FGE -1! | |
| GTA V - 1920x1080 Highest AA:4xMSAA + FX AF:16x | |
| Asus ProArt Studiobook 16 OLED H7604 | |
| Lenovo ThinkPad P1 G6 21FV001KUS | |
| HP ZBook Fury 16 G9 | |
| HP ZBook Fury 16 G11 | |
| Lenovo ThinkPad P16 G2 21FA000FGE | |
| Final Fantasy XV Benchmark - 1920x1080 High Quality | |
| HP ZBook Fury 16 G10 | |
| Lenovo ThinkPad P1 G6 21FV001KUS | |
| Dell Precision 5690 | |
| HP ZBook Fury 16 G11 | |
| Asus ProArt Studiobook 16 OLED H7604 | |
| HP ZBook Fury 16 G9 | |
| Lenovo ThinkPad P16 G2 21FA000FGE | |
| Strange Brigade - 1920x1080 ultra AA:ultra AF:16 | |
| HP ZBook Fury 16 G10 | |
| Dell Precision 5690 | |
| HP ZBook Fury 16 G11 | |
| HP ZBook Fury 16 G9 | |
| Lenovo ThinkPad P16 G2 21FA000FGE | |
| Asus ProArt Studiobook 16 OLED H7604 | |
| Dota 2 Reborn - 1920x1080 ultra (3/3) best looking | |
| Asus ProArt Studiobook 16 OLED H7604 | |
| HP ZBook Fury 16 G10 | |
| HP ZBook Fury 16 G11 | |
| HP ZBook Fury 16 G9 | |
| Lenovo ThinkPad P16 G2 21FA000FGE | |
| Lenovo ThinkPad P1 G6 21FV001KUS | |
| Dell Precision 5690 | |
| Cyberpunk 2077 - 1920x1080 Ultra Preset (FSR off) | |
| Dell Precision 5690 | |
| Lenovo ThinkPad P1 G6 21FV001KUS | |
| HP ZBook Fury 16 G11 | |
| Baldur's Gate 3 | |
| 1920x1080 Ultra Preset AA:T | |
| Dell Precision 5690 | |
| Lenovo ThinkPad P1 G6 21FV001KUS | |
| HP ZBook Fury 16 G11 | |
| Media NVIDIA RTX 3500 Ada Generation Laptop (n=1) | |
| 2560x1440 Ultra Preset AA:T | |
| Dell Precision 5690 | |
| Lenovo ThinkPad P1 G6 21FV001KUS | |
| HP ZBook Fury 16 G11 | |
| Media NVIDIA RTX 3500 Ada Generation Laptop (n=1) | |
| 3840x2160 Ultra Preset AA:T | |
| Dell Precision 5690 | |
| Lenovo ThinkPad P1 G6 21FV001KUS | |
| HP ZBook Fury 16 G11 | |
| Media NVIDIA RTX 3500 Ada Generation Laptop (n=1) | |
Cyberpunk 2077 ultra FPS Chart
| basso | medio | alto | ultra | QHD | 4K | |
|---|---|---|---|---|---|---|
| GTA V (2015) | 184.3 | 181 | 170.1 | 115.5 | 97.5 | 59.6 |
| Dota 2 Reborn (2015) | 201 | 177.7 | 162.1 | 153.9 | 134.4 | |
| Final Fantasy XV Benchmark (2018) | 200 | 167.6 | 128.9 | 97.5 | 54.2 | |
| X-Plane 11.11 (2018) | 144.6 | 137.8 | 110.9 | 92.7 | ||
| Far Cry 5 (2018) | 133 | 135 | 127 | 109 | 62 | |
| Strange Brigade (2018) | 411 | 296 | 235 | 223 | 159.2 | 78.6 |
| Tiny Tina's Wonderlands (2022) | 232.5 | 195.4 | 137.9 | 109.3 | 74.4 | 41.6 |
| F1 22 (2022) | 228 | 223 | 182.8 | 72.9 | 48.3 | 24 |
| Baldur's Gate 3 (2023) | 164.8 | 136.2 | 118.6 | 117.3 | 80.2 | 41.2 |
| Cyberpunk 2077 (2023) | 121.2 | 113.1 | 101.8 | 90.3 | 60.2 | 21.3 |
Emissioni
Rumore del sistema
Il rumore e il comportamento della ventola sono più o meno gli stessi che abbiamo registrato sul modello dello scorso anno, se non leggermente più rumorosi quando si eseguono carichi più elevati. Le ventole continuano a pulsare occasionalmente anche quando sono al minimo sul desktop, anche quando sono impostate in modalità Bilanciata senza applicazioni in esecuzione. Peggio ancora, la nostra unità specifica soffre di un notevole fruscio della bobina che persiste per tutto il periodo del test.
Rumorosità
| Idle |
| 23.2 / 23.2 / 29.5 dB(A) |
| Sotto carico |
| 43 / 48.2 dB(A) |
 | ||
30 dB silenzioso 40 dB(A) udibile 50 dB(A) rumoroso |
||
min: | ||
| HP ZBook Fury 16 G11 RTX 3500 Ada Generation Laptop, i9-14900HX, SK hynix PC801 HFS001TEJ9X101N | HP ZBook Fury 16 G10 RTX 5000 Ada Generation Laptop, i9-13950HX, SK hynix PC801 HFS001TEJ9X101N | HP ZBook Fury 16 G9 RTX A5500 Laptop GPU, i9-12950HX, Micron 3400 1TB MTFDKBA1T0TFH | Dell Precision 5690 RTX 5000 Ada Generation Laptop, Ultra 9 185H, 2x Samsung PM9A1 1TB (RAID 0) | Lenovo ThinkPad P16 G2 21FA000FGE RTX 2000 Ada Generation Laptop, i7-13700HX, SK hynix PC801 HFS001TEJ9X162N | Lenovo ThinkPad P1 G6 21FV001KUS GeForce RTX 4080 Laptop GPU, i7-13800H, Kioxia XG8 KXG8AZNV1T02 | Asus ProArt Studiobook 16 OLED H7604 GeForce RTX 4070 Laptop GPU, i9-13980HX, Phison EM2804TBMTCB47 | |
|---|---|---|---|---|---|---|---|
| Noise | 3% | 4% | -3% | -4% | 9% | -5% | |
| off /ambiente * (dB) | 23.2 | 22.9 1% | 22.6 3% | 23.4 -1% | 23.5 -1% | 22.5 3% | 24.5 -6% |
| Idle Minimum * (dB) | 23.2 | 22.9 1% | 22.7 2% | 23.6 -2% | 23.5 -1% | 22.5 3% | 24.5 -6% |
| Idle Average * (dB) | 23.2 | 22.9 1% | 22.7 2% | 24.9 -7% | 29.2 -26% | 22.5 3% | 24.5 -6% |
| Idle Maximum * (dB) | 29.5 | 28.5 3% | 28.8 2% | 30.9 -5% | 29.5 -0% | 22.5 24% | 24.5 17% |
| Load Average * (dB) | 43 | 40.6 6% | 36.2 16% | 40.4 6% | 32.7 24% | 28.7 33% | 47.6 -11% |
| Cyberpunk 2077 ultra * (dB) | 48.2 | ||||||
| Load Maximum * (dB) | 48.2 | 45.8 5% | 49.3 -2% | 51.9 -8% | 56.6 -17% | 54.4 -13% | 56.7 -18% |
| Witcher 3 ultra * (dB) | 44.1 | 49.5 | 48.3 | 50.6 | 47.5 | 55.9 |
* ... Meglio usare valori piccoli
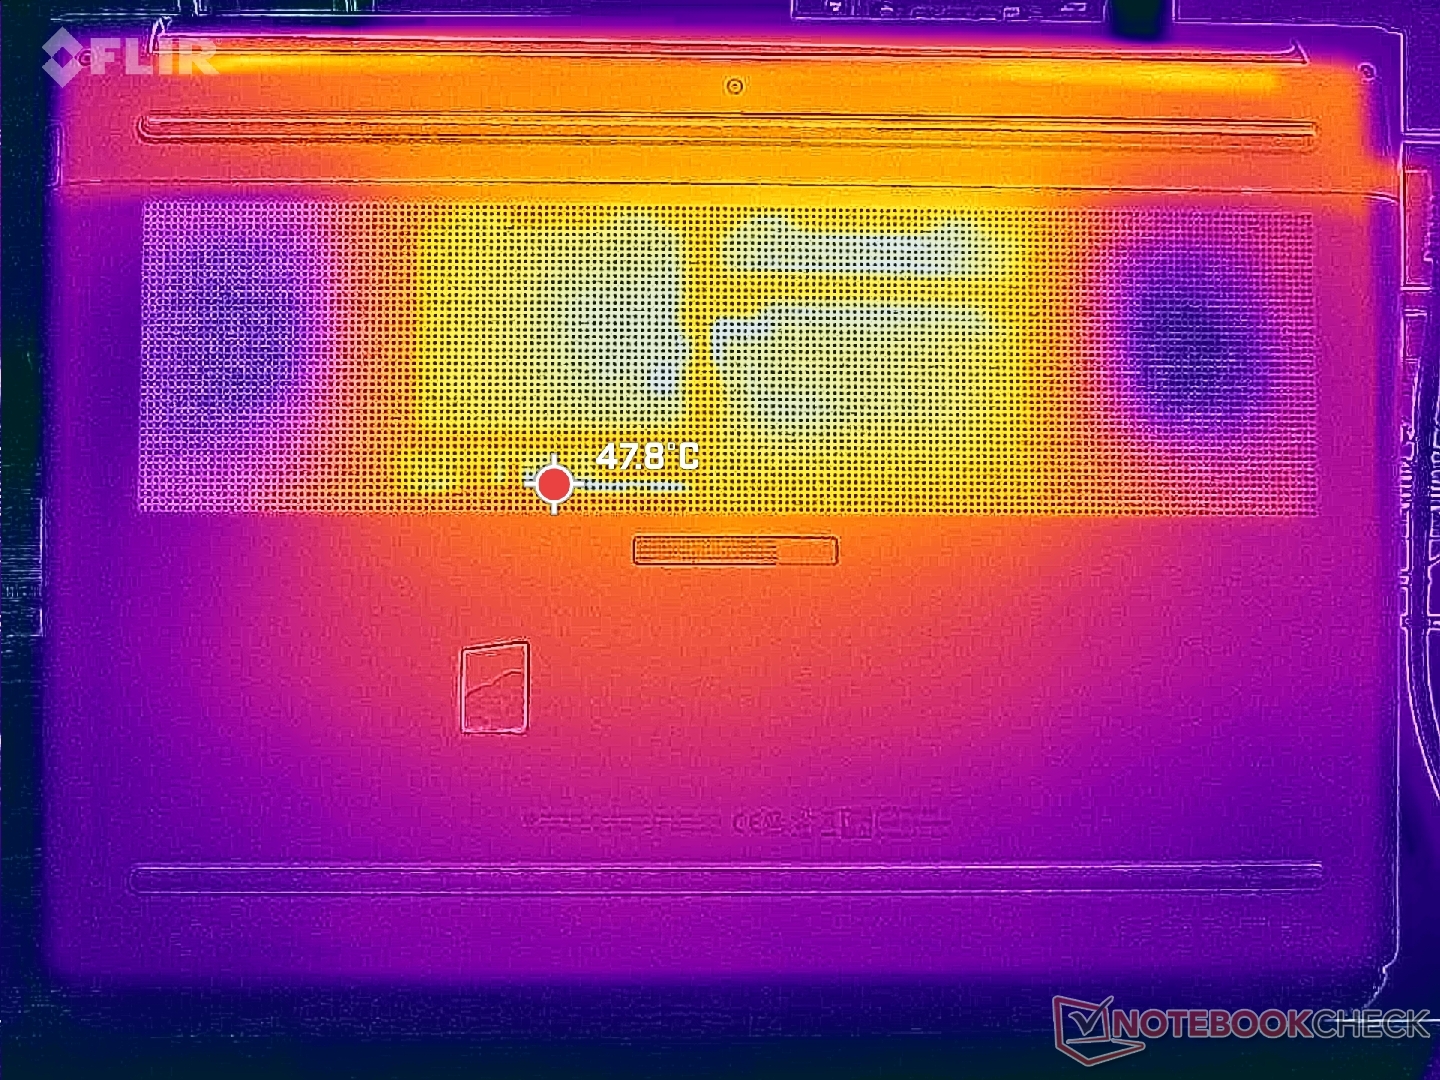
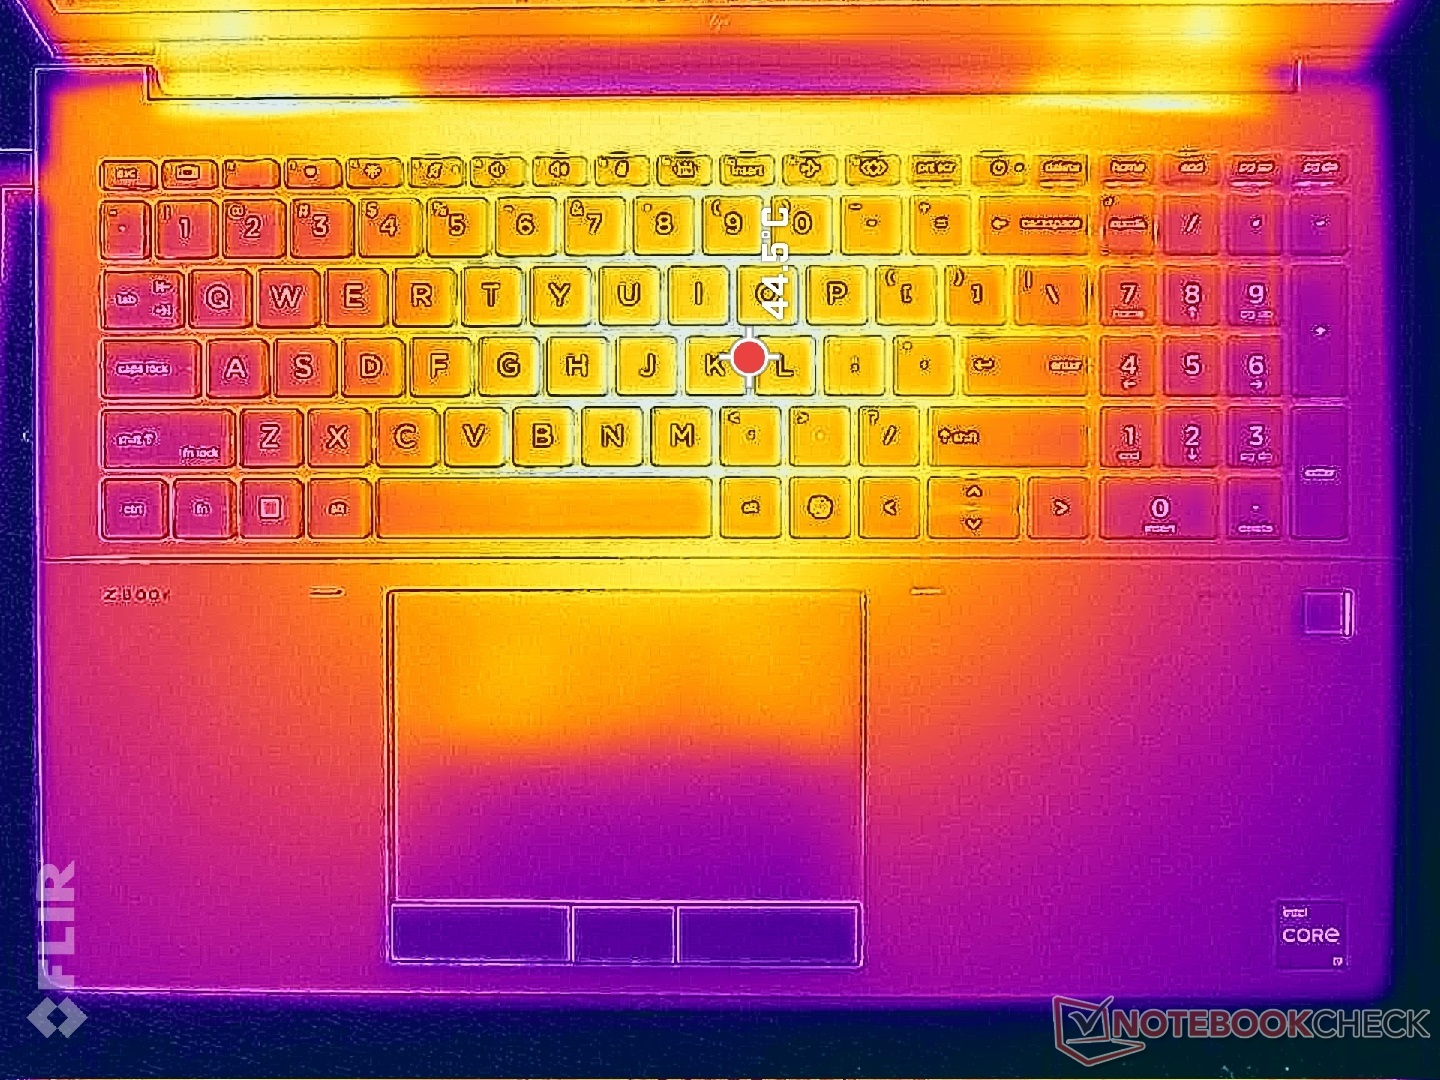
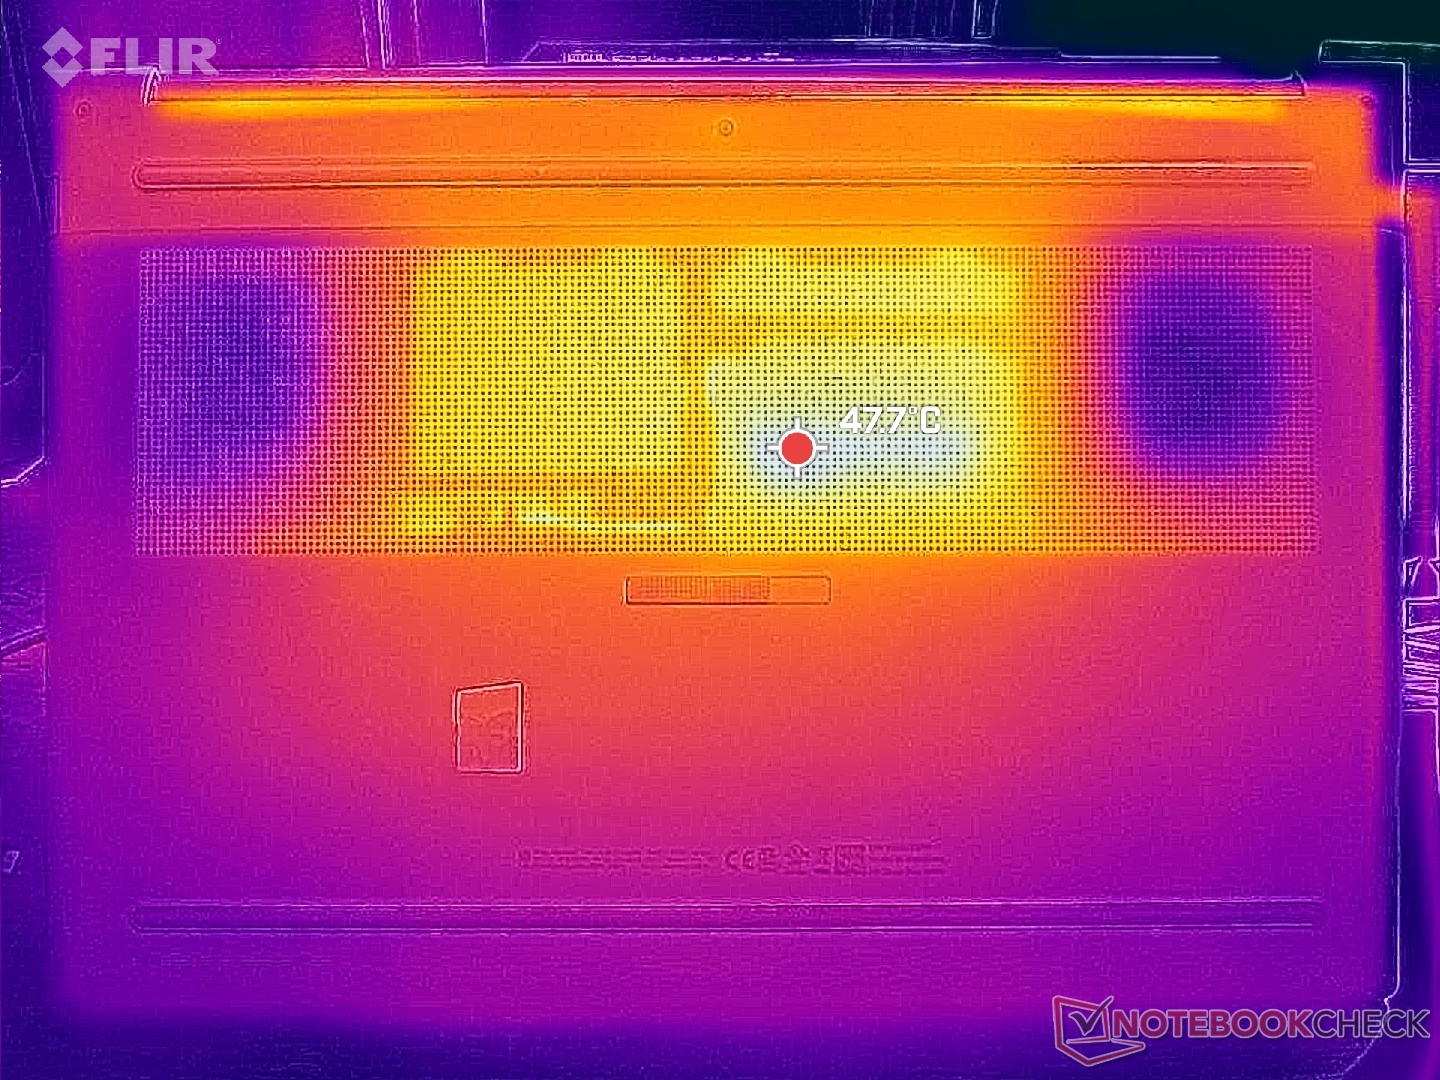
Temperatura
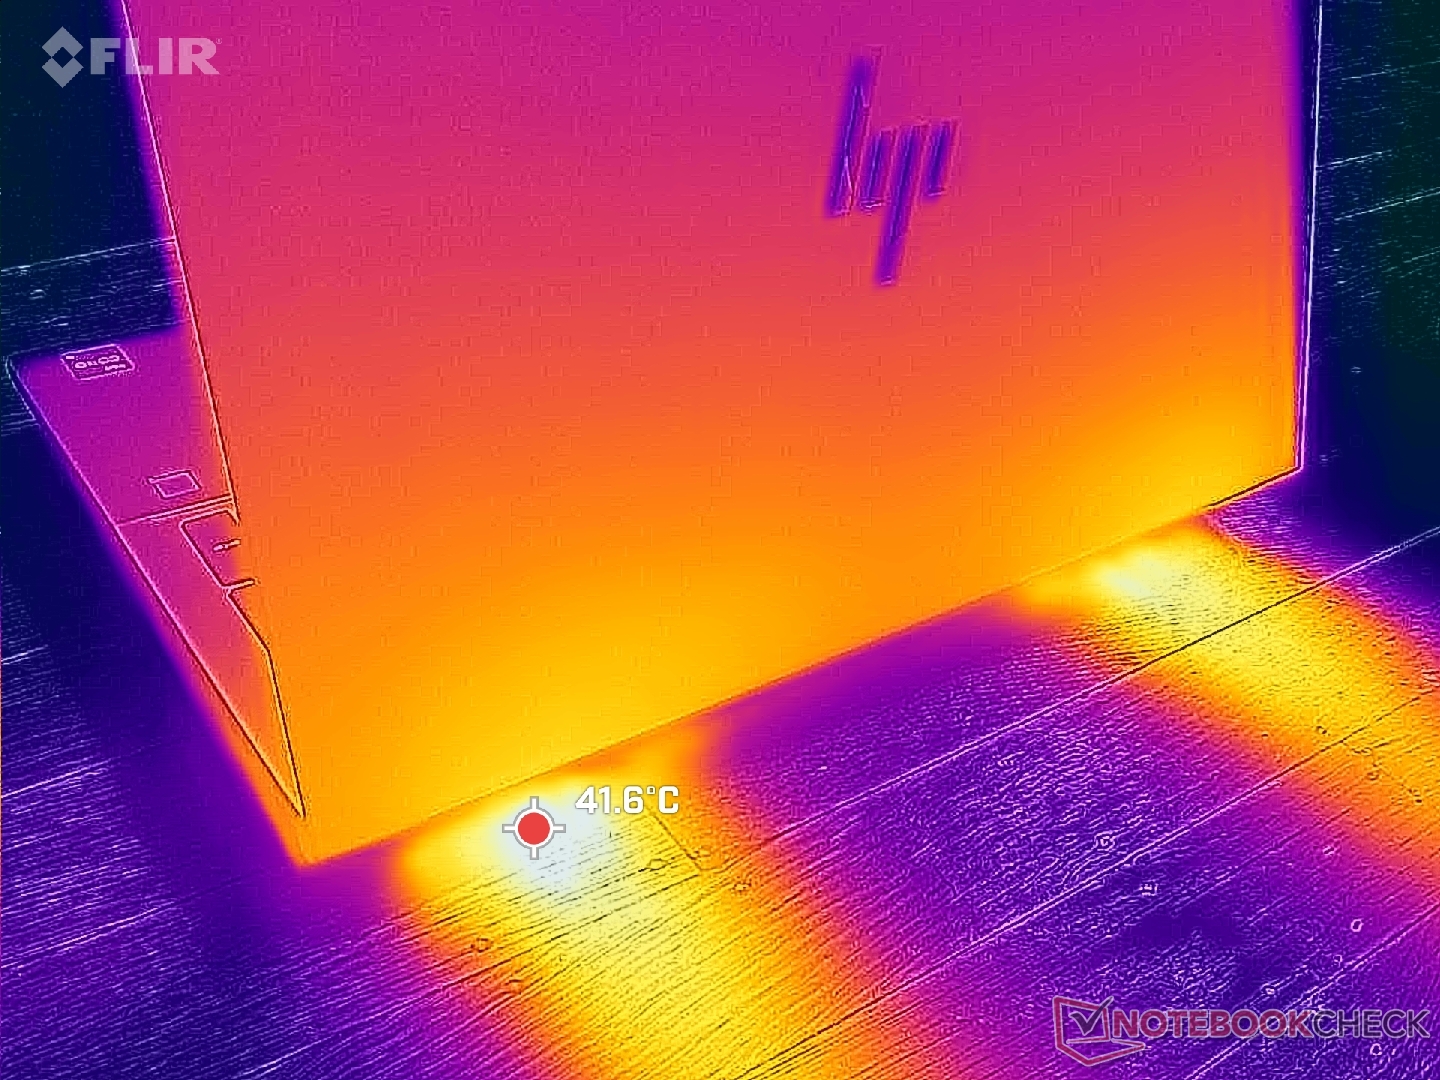
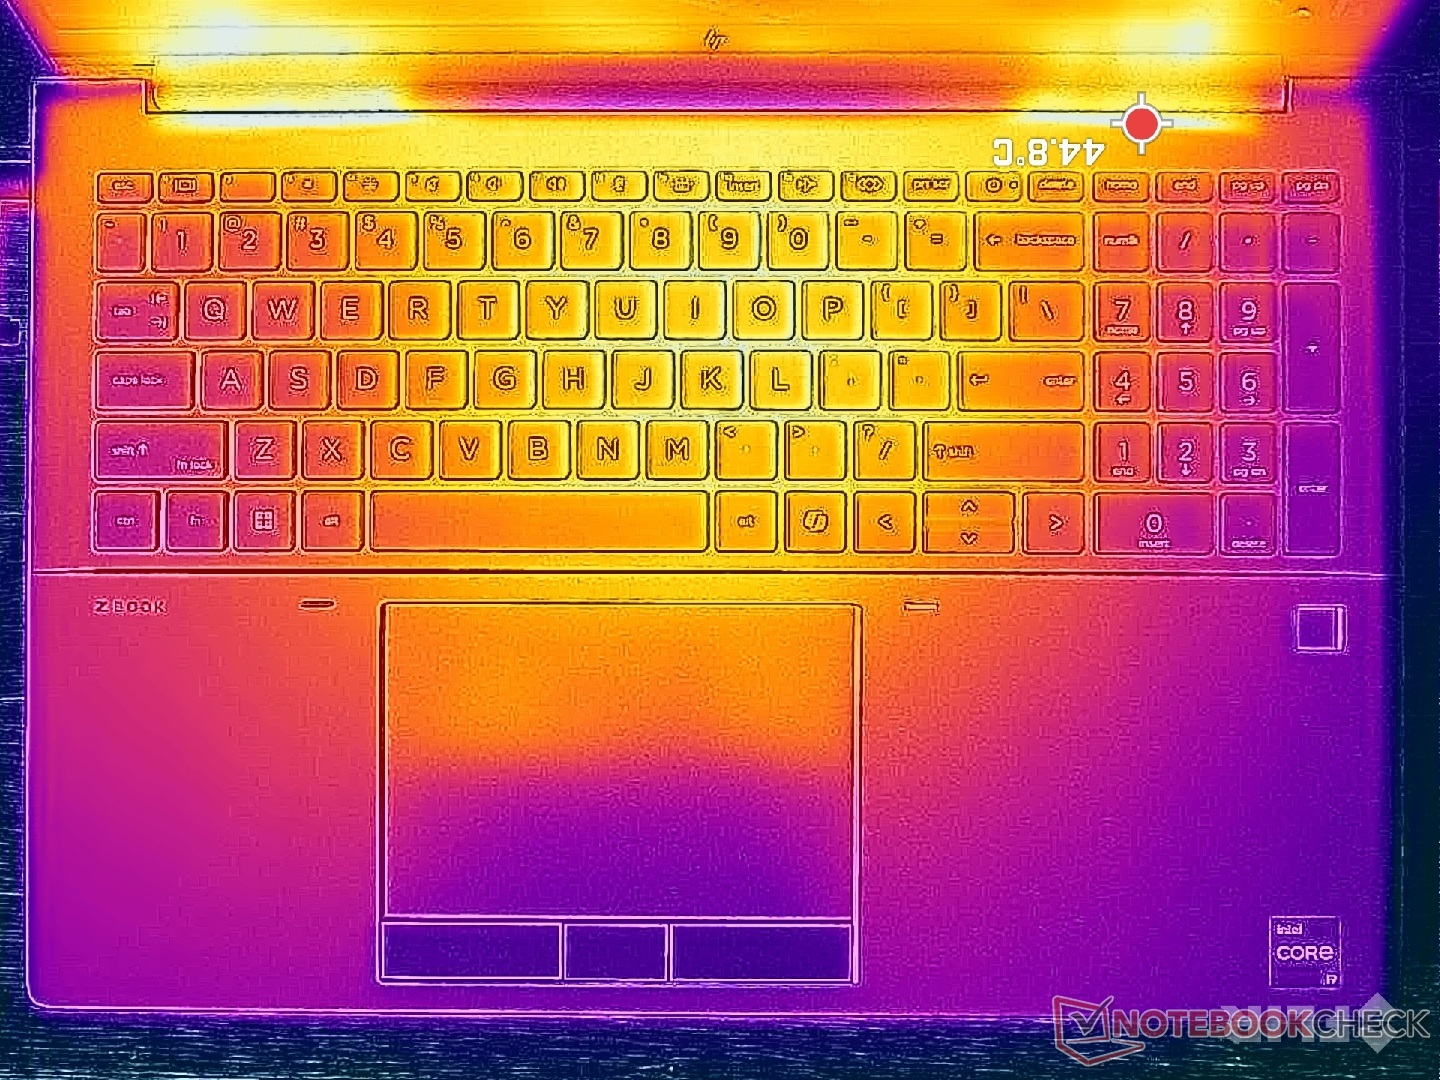
(±) La temperatura massima sul lato superiore è di 42.2 °C / 108 F, rispetto alla media di 38.2 °C / 101 F, che varia da 22.2 a 69.8 °C per questa classe Workstation.
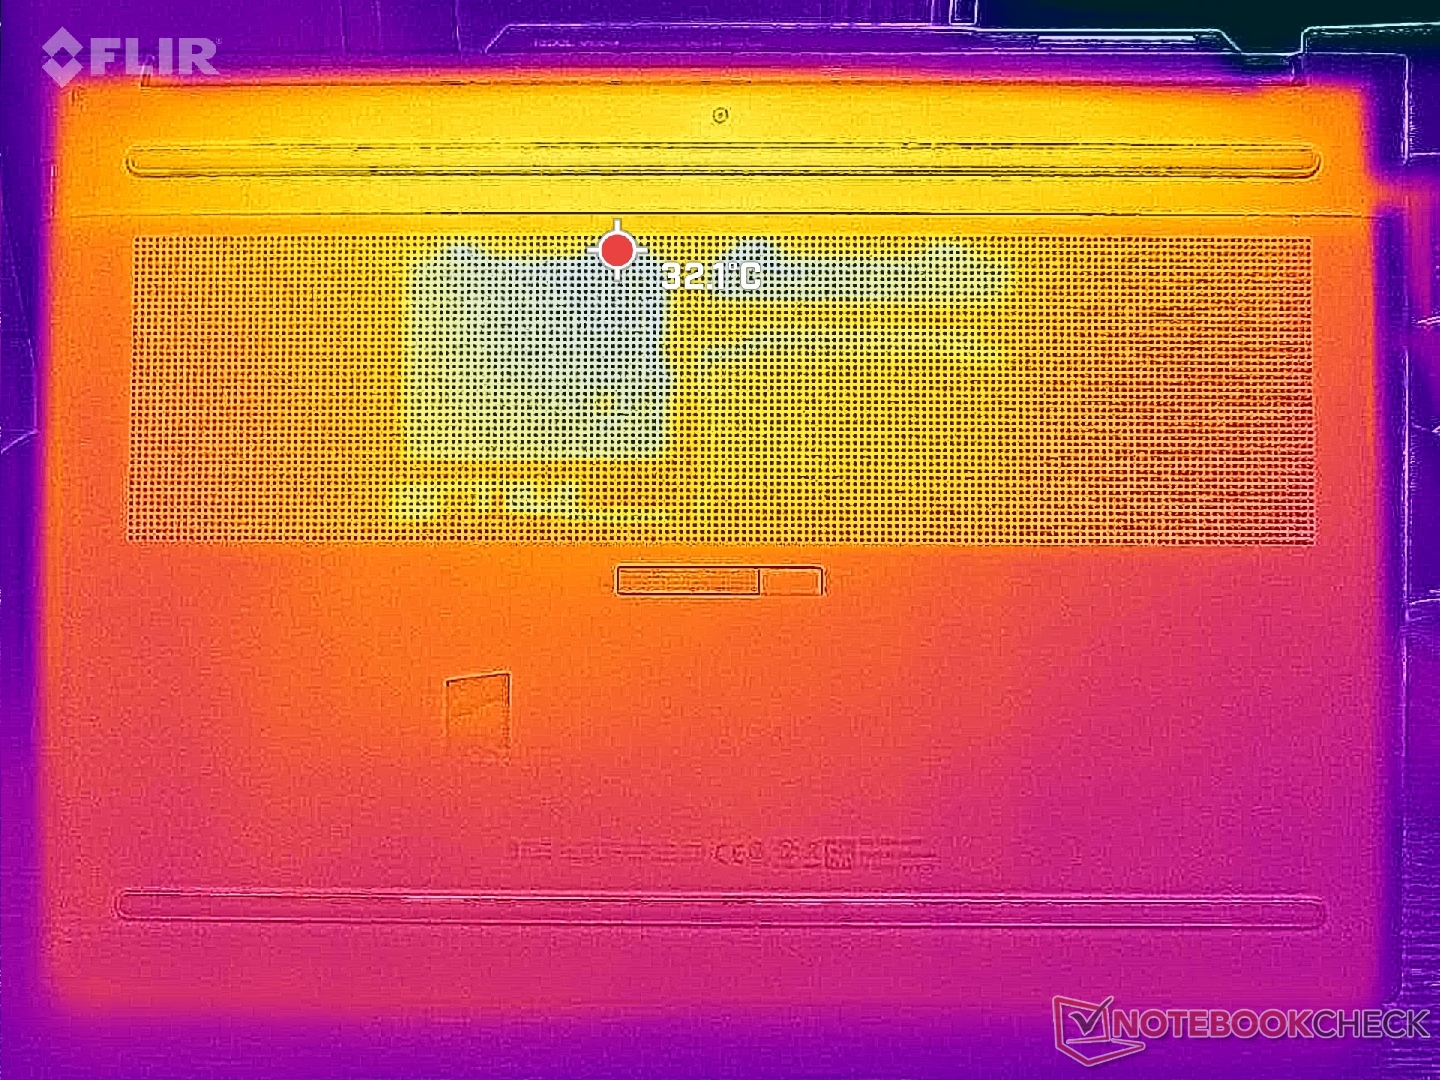
(-) Il lato inferiore si riscalda fino ad un massimo di 48 °C / 118 F, rispetto alla media di 41.1 °C / 106 F
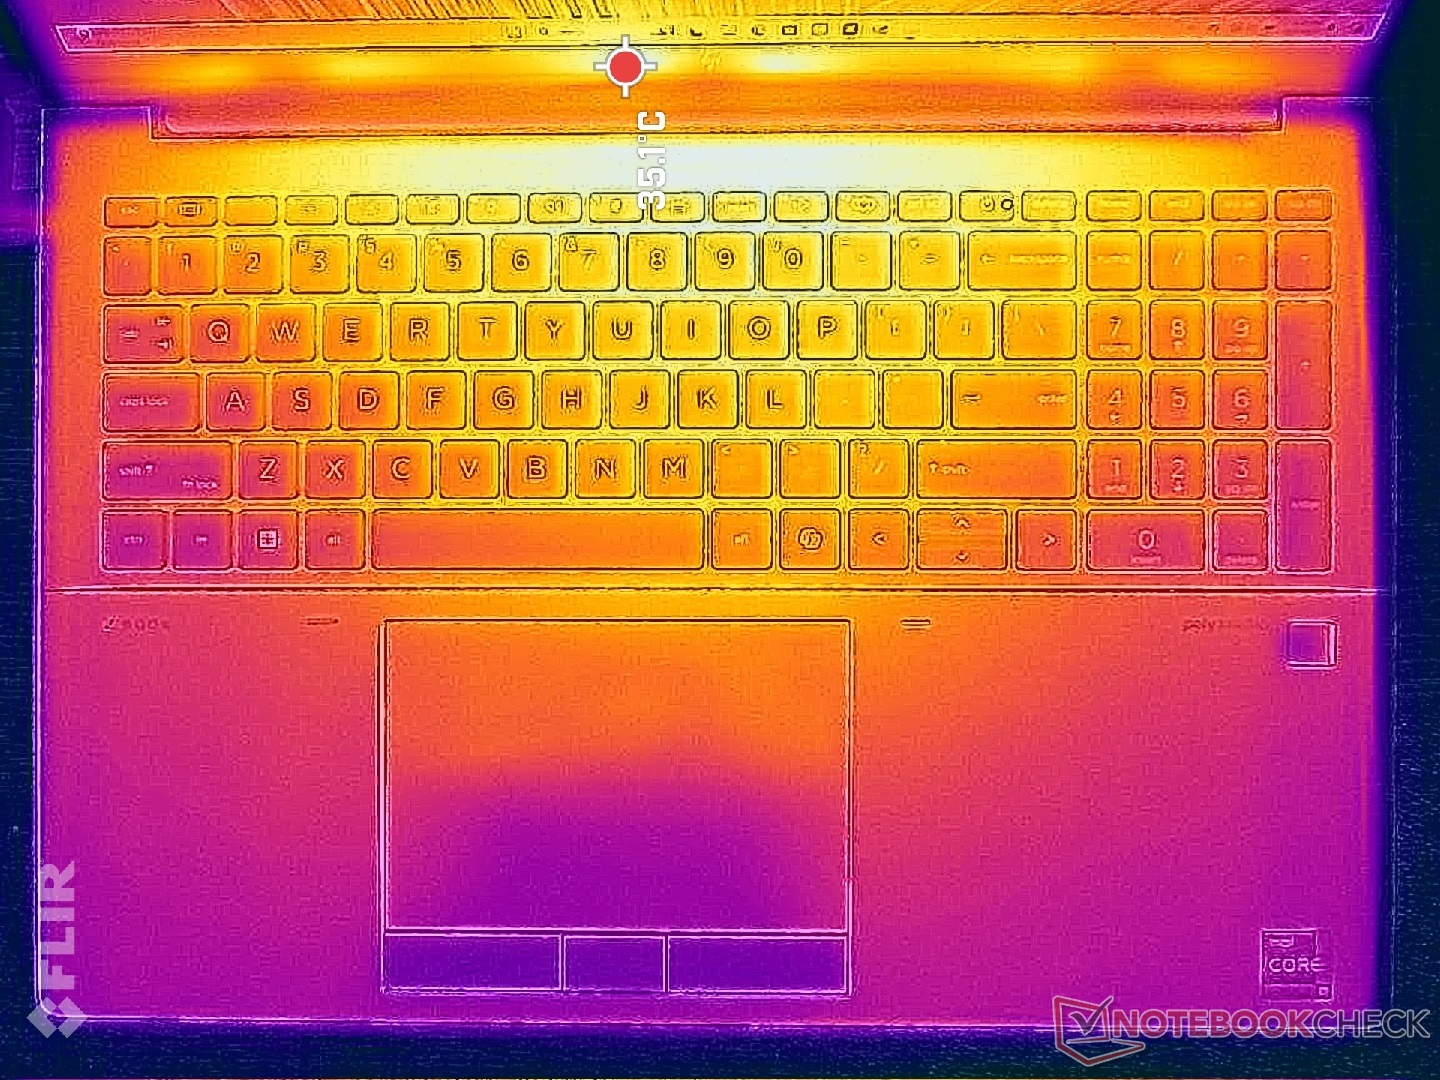
(±) In idle, la temperatura media del lato superiore è di 33.8 °C / 93 F, rispetto alla media deld ispositivo di 32 °C / 90 F.
(-) 3: The average temperature for the upper side is 38.5 °C / 101 F, compared to the average of 32 °C / 90 F for the class Workstation.
(±) I poggiapolsi e il touchpad possono diventare molto caldi al tatto con un massimo di 37.6 °C / 99.7 F.
(-) La temperatura media della zona del palmo della mano di dispositivi simili e'stata di 27.8 °C / 82 F (-9.8 °C / -17.7 F).
| HP ZBook Fury 16 G11 Intel Core i9-14900HX, NVIDIA RTX 3500 Ada Generation Laptop | HP ZBook Fury 16 G10 Intel Core i9-13950HX, NVIDIA RTX 5000 Ada Generation Laptop | HP ZBook Fury 16 G9 Intel Core i9-12950HX, NVIDIA RTX A5500 Laptop GPU | Dell Precision 5690 Intel Core Ultra 9 185H, NVIDIA RTX 5000 Ada Generation Laptop | Lenovo ThinkPad P16 G2 21FA000FGE Intel Core i7-13700HX, NVIDIA RTX 2000 Ada Generation Laptop | Lenovo ThinkPad P1 G6 21FV001KUS Intel Core i7-13800H, NVIDIA GeForce RTX 4080 Laptop GPU | Asus ProArt Studiobook 16 OLED H7604 Intel Core i9-13980HX, NVIDIA GeForce RTX 4070 Laptop GPU | |
|---|---|---|---|---|---|---|---|
| Heat | 3% | 10% | 13% | 15% | 4% | 3% | |
| Maximum Upper Side * (°C) | 42.2 | 44.8 -6% | 43.2 -2% | 46.6 -10% | 47.2 -12% | 42 -0% | 44.1 -5% |
| Maximum Bottom * (°C) | 48 | 50 -4% | 50.4 -5% | 33 31% | 39.5 18% | 45.2 6% | 48 -0% |
| Idle Upper Side * (°C) | 37 | 34.4 7% | 28.6 23% | 32.4 12% | 28.1 24% | 33 11% | 32.7 12% |
| Idle Bottom * (°C) | 36.8 | 31.8 14% | 28.2 23% | 29.4 20% | 25.3 31% | 37 -1% | 34.9 5% |
* ... Meglio usare valori piccoli
Altoparlanti
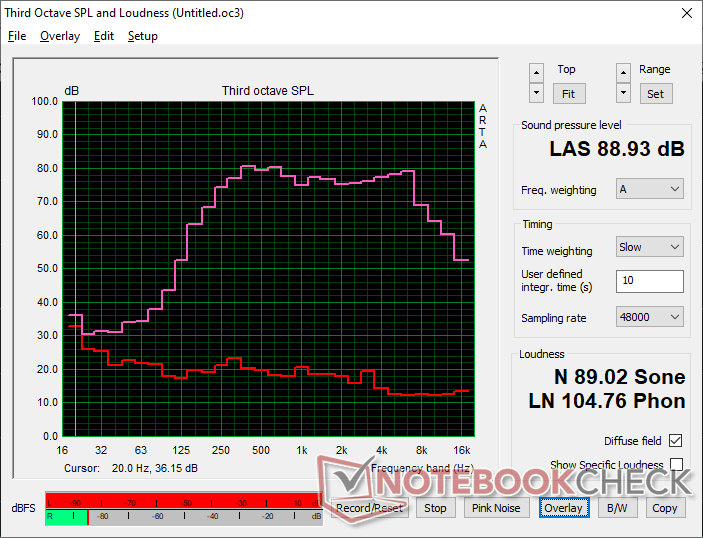
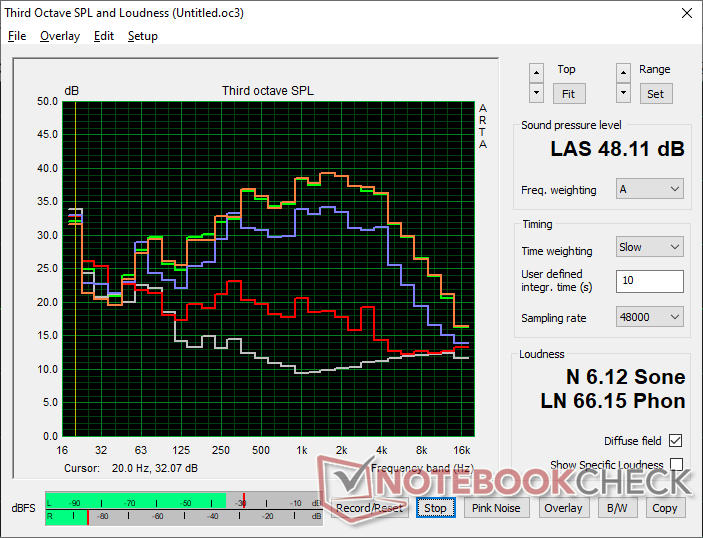
HP ZBook Fury 16 G11 analisi audio
(+) | gli altoparlanti sono relativamente potenti (88.9 dB)
Bassi 100 - 315 Hz
(±) | bassi ridotti - in media 13.3% inferiori alla media
(±) | la linearità dei bassi è media (11.2% delta rispetto alla precedente frequenza)
Medi 400 - 2000 Hz
(+) | medi bilanciati - solo only 2.2% rispetto alla media
(+) | medi lineari (3.2% delta rispetto alla precedente frequenza)
Alti 2 - 16 kHz
(+) | Alti bilanciati - appena 3.7% dalla media
(+) | alti lineari (4.6% delta rispetto alla precedente frequenza)
Nel complesso 100 - 16.000 Hz
(+) | suono nel complesso lineare (12.9% differenza dalla media)
Rispetto alla stessa classe
» 21% di tutti i dispositivi testati in questa classe è stato migliore, 6% simile, 72% peggiore
» Il migliore ha avuto un delta di 7%, medio di 17%, peggiore di 35%
Rispetto a tutti i dispositivi testati
» 12% di tutti i dispositivi testati in questa classe è stato migliore, 3% similare, 85% peggiore
» Il migliore ha avuto un delta di 4%, medio di 24%, peggiore di 134%
Apple MacBook Pro 16 2021 M1 Pro analisi audio
(+) | gli altoparlanti sono relativamente potenti (84.7 dB)
Bassi 100 - 315 Hz
(+) | bassi buoni - solo 3.8% dalla media
(+) | bassi in lineaa (5.2% delta rispetto alla precedente frequenza)
Medi 400 - 2000 Hz
(+) | medi bilanciati - solo only 1.3% rispetto alla media
(+) | medi lineari (2.1% delta rispetto alla precedente frequenza)
Alti 2 - 16 kHz
(+) | Alti bilanciati - appena 1.9% dalla media
(+) | alti lineari (2.7% delta rispetto alla precedente frequenza)
Nel complesso 100 - 16.000 Hz
(+) | suono nel complesso lineare (4.6% differenza dalla media)
Rispetto alla stessa classe
» 0% di tutti i dispositivi testati in questa classe è stato migliore, 0% simile, 100% peggiore
» Il migliore ha avuto un delta di 5%, medio di 17%, peggiore di 45%
Rispetto a tutti i dispositivi testati
» 0% di tutti i dispositivi testati in questa classe è stato migliore, 0% similare, 100% peggiore
» Il migliore ha avuto un delta di 4%, medio di 24%, peggiore di 134%
Gestione dell'energia
Consumo di energia
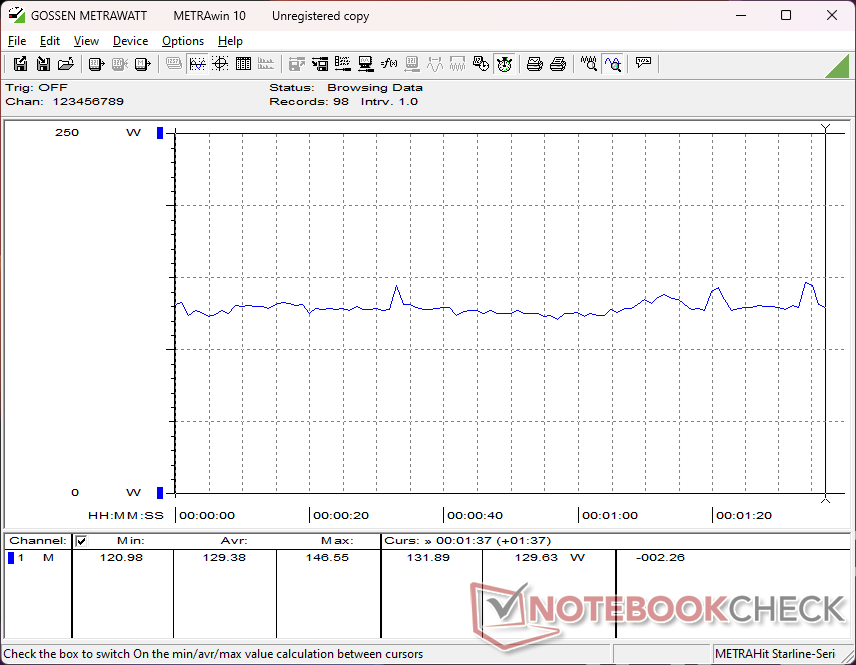
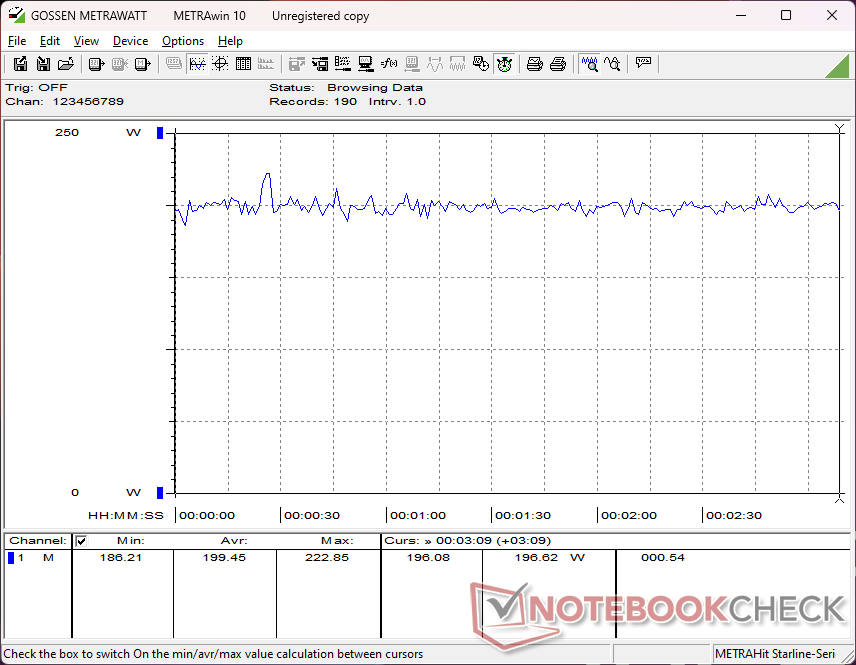
Il sistema è più efficiente quando è al minimo sul desktop rispetto al nostro ZBook Fury 16 G10 configurazione. Altrimenti, il consumo diventa quasi lo stesso quando si eseguono carichi più impegnativi come i giochi, anche se le GPU configurate sono diverse tra i nostri due esempi. Le prestazioni per watt aumentano quindi quando si selezionano configurazioni di GPU di fascia alta rispetto alla nostra RTX 3500 Ada di fascia media.
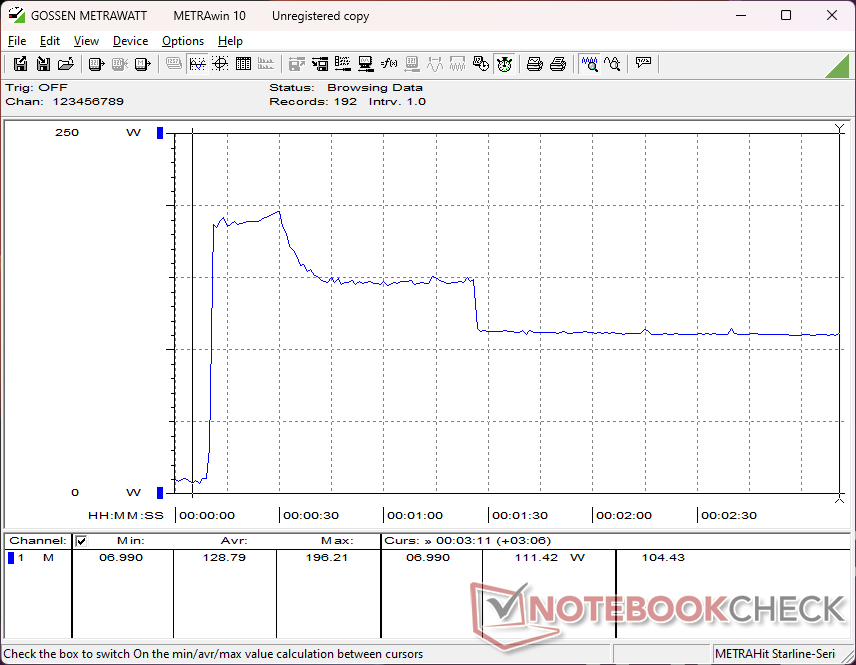
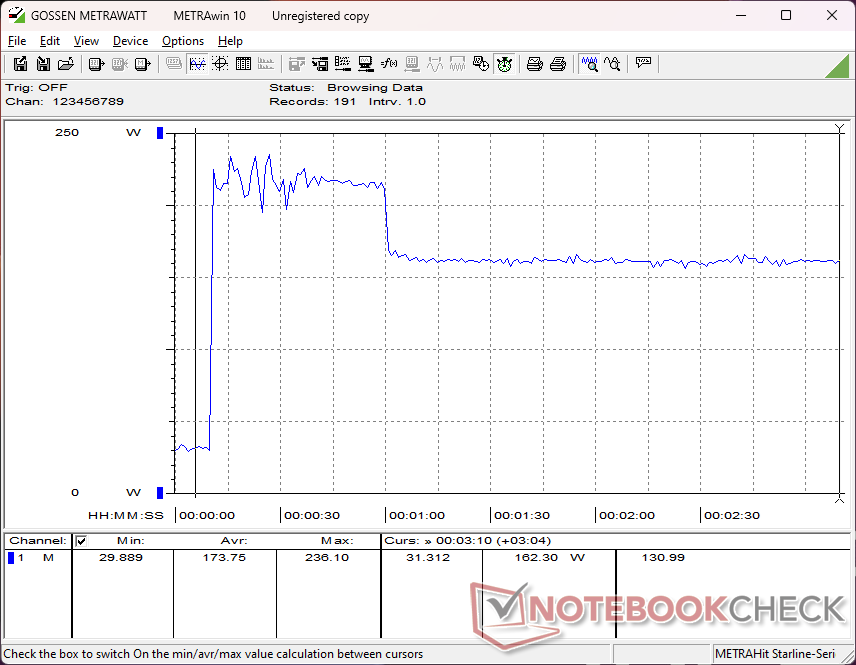
Il consumo durante l'esecuzione di Prime95 o CineBench R15 xT sarebbe sensibilmente più alto sulla nostra unità rispetto al modello dello scorso anno, grazie al potenziale Turbo Boost più elevato del nostro processore Core i9-14900HX. Dopo circa un minuto, tuttavia, il consumo scendeva fino ad essere quasi in linea con quello misurato sul modello dello scorso anno, come mostra il grafico di confronto qui sotto, che si allinea con le nostre osservazioni sul loop di CineBench R15 xT riportate sopra. Pertanto, il nostro potenziale Turbo Boost iniziale più elevato è il vantaggio chiave tra il più recente Core i9-14900HX e il più vecchio Core i9-13950HX.
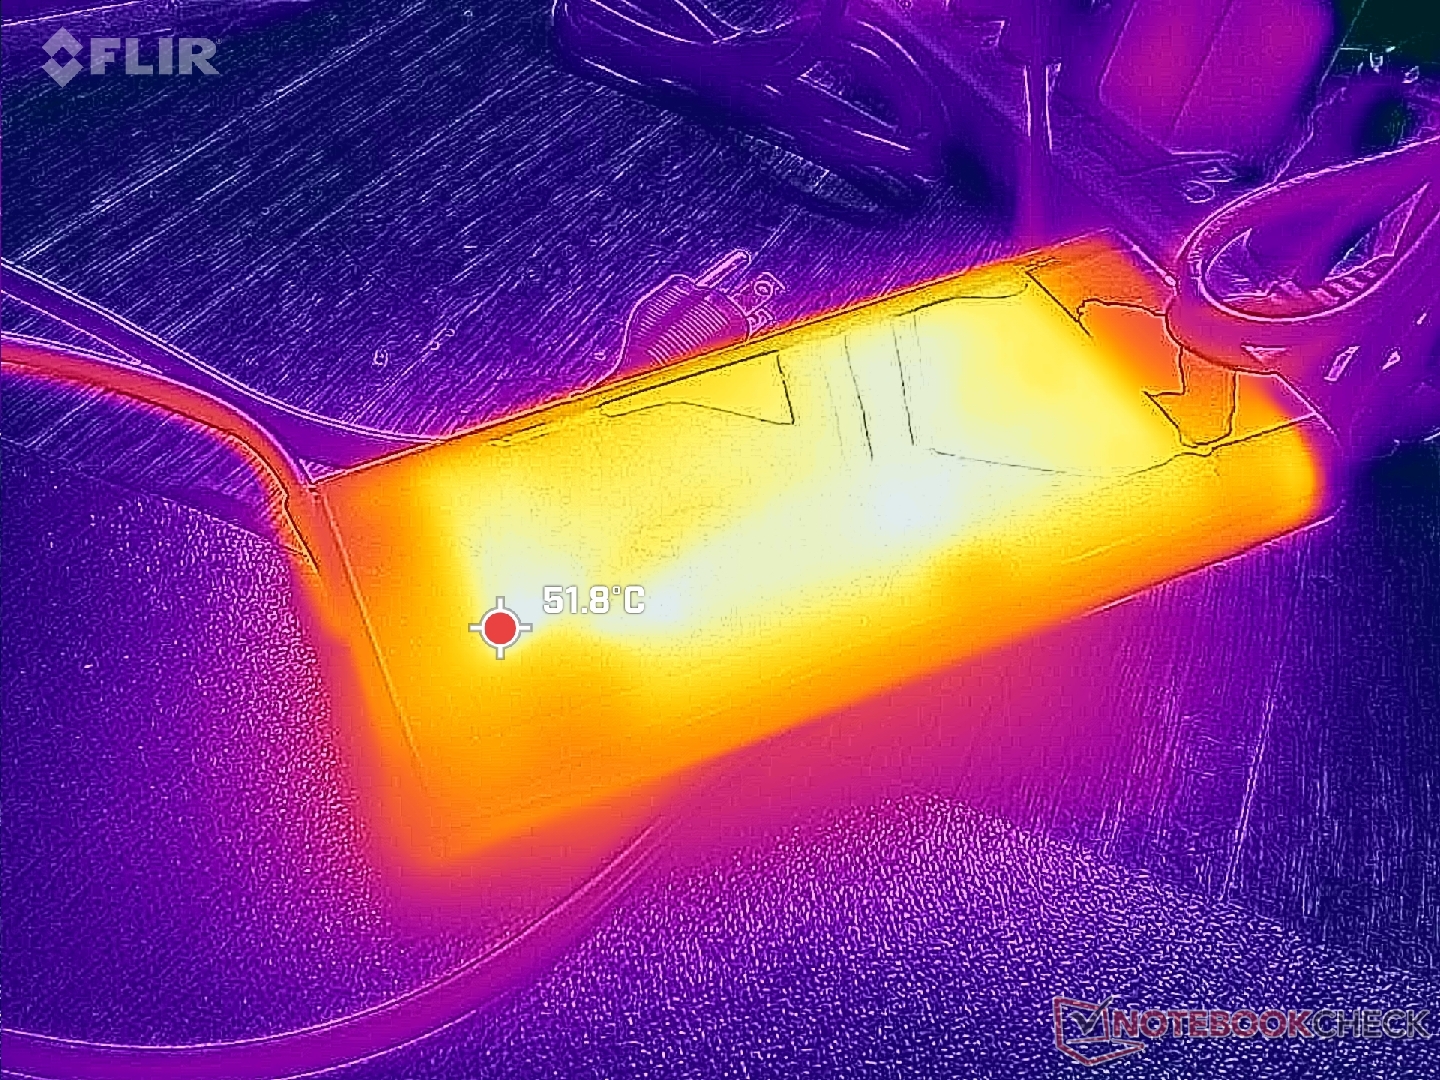
Siamo in grado di registrare un consumo massimo di 236 W dall'adattatore CA da 230 W di grandi dimensioni (~18 x 8,8 x 2,5 cm) quando la CPU e la GPU sono ciascuna al 100 percento di utilizzo.
| Off / Standby | |
| Idle | |
| Sotto carico |
|
Leggenda:
min: | |
| HP ZBook Fury 16 G11 i9-14900HX, RTX 3500 Ada Generation Laptop, SK hynix PC801 HFS001TEJ9X101N, IPS, 3840x2400, 16" | HP ZBook Fury 16 G10 i9-13950HX, RTX 5000 Ada Generation Laptop, SK hynix PC801 HFS001TEJ9X101N, IPS, 3840x2400, 16" | HP ZBook Fury 16 G9 i9-12950HX, RTX A5500 Laptop GPU, Micron 3400 1TB MTFDKBA1T0TFH, IPS, 3840x2400, 16" | Dell Precision 5690 Ultra 9 185H, RTX 5000 Ada Generation Laptop, 2x Samsung PM9A1 1TB (RAID 0), OLED, 3840x2400, 16" | Lenovo ThinkPad P16 G2 21FA000FGE i7-13700HX, RTX 2000 Ada Generation Laptop, SK hynix PC801 HFS001TEJ9X162N, IPS LED, 2560x1600, 16" | Lenovo ThinkPad P1 G6 21FV001KUS i7-13800H, GeForce RTX 4080 Laptop GPU, Kioxia XG8 KXG8AZNV1T02, OLED, 3480x2400, 16" | Asus ProArt Studiobook 16 OLED H7604 i9-13980HX, GeForce RTX 4070 Laptop GPU, Phison EM2804TBMTCB47, OLED, 3200x2000, 16" | |
|---|---|---|---|---|---|---|---|
| Power Consumption | -34% | -77% | -1% | 4% | 7% | -24% | |
| Idle Minimum * (Watt) | 8.6 | 15.3 -78% | 19.5 -127% | 7.9 8% | 9.3 -8% | 8 7% | 12.8 -49% |
| Idle Average * (Watt) | 14.8 | 18.2 -23% | 29 -96% | 12 19% | 14.1 5% | 9.5 36% | 19.9 -34% |
| Idle Maximum * (Watt) | 15.7 | 28 -78% | 40.7 -159% | 28.6 -82% | 15.5 1% | 23.7 -51% | 20.3 -29% |
| Load Average * (Watt) | 129.4 | 137.9 -7% | 142.1 -10% | 98.8 24% | 133.6 -3% | 97.2 25% | 131.4 -2% |
| Cyberpunk 2077 ultra external monitor * (Watt) | 192.6 | ||||||
| Cyberpunk 2077 ultra * (Watt) | 199.4 | ||||||
| Load Maximum * (Watt) | 236.1 | 202 14% | 224.4 5% | 174.8 26% | 179.6 24% | 197.2 16% | 246.8 -5% |
| Witcher 3 ultra * (Watt) | 189.4 | 188.6 | 144.5 | 144.9 | 144 | 196.5 |
* ... Meglio usare valori piccoli
Power Consumption Cyberpunk / Stress Test
Power Consumption external Monitor
Durata della batteria
I tempi di esecuzione sono molto simili a quelli dello ZBook Fury 16 G11 dello scorso anno, se non leggermente più brevi, probabilmente a causa del tetto massimo di Turbo Boost più elevato per la CPU Raptor Lake-HX Refresh. Modelli concorrenti come Precision 5690 o ThinkPad P16 G2 possono durare almeno un'ora in più.
La ricarica da vuoto a pieno regime con l'adattatore CA a barile incluso è relativamente veloce, poco più di 60 minuti.
| HP ZBook Fury 16 G11 i9-14900HX, RTX 3500 Ada Generation Laptop, 95 Wh | HP ZBook Fury 16 G10 i9-13950HX, RTX 5000 Ada Generation Laptop, 95 Wh | HP ZBook Fury 16 G9 i9-12950HX, RTX A5500 Laptop GPU, 95 Wh | Dell Precision 5690 Ultra 9 185H, RTX 5000 Ada Generation Laptop, 98 Wh | Lenovo ThinkPad P16 G2 21FA000FGE i7-13700HX, RTX 2000 Ada Generation Laptop, 94 Wh | Lenovo ThinkPad P1 G6 21FV001KUS i7-13800H, GeForce RTX 4080 Laptop GPU, 90 Wh | Asus ProArt Studiobook 16 OLED H7604 i9-13980HX, GeForce RTX 4070 Laptop GPU, 90 Wh | |
|---|---|---|---|---|---|---|---|
| Autonomia della batteria | 9% | -10% | 37% | 28% | -37% | -16% | |
| WiFi v1.3 (h) | 6.7 | 7.3 9% | 6 -10% | 9.2 37% | 8.6 28% | 4.2 -37% | 5.6 -16% |
| Reader / Idle (h) | 5.3 | ||||||
| Load (h) | 1.2 | 1.1 | |||||
| H.264 (h) | 6 |
Pro
Contro
Verdetto - Un design forte trascinato da una spinta turbo limitata
Ci piace il design di ZBook Fury 16 G11. Pur rimanendo identico a quello del Fury 16 G9, la facilità di manutenzione, le ampie opzioni configurabili, il supporto della RAM ECC e la tastiera e il touchpad confortevoli soddisfano tutti gli utenti della workstation.
Invece, i problemi principali dello ZBook Fury 16 G11 risiedono nelle sue prestazioni. Quando un altro portatile come il Lenovo Legion 9 16IRX9 è in grado di far funzionare la stessa CPU Core i9-14900HX fino al 20 percento più velocemente del nostro ZBook, allora la soluzione di raffreddamento dell'HP potrebbe richiedere un aggiornamento per supportare velocità Turbo Boost più elevate e più a lungo. Allo stesso modo, le unità SSD M.2 potrebbero beneficiare di diffusori di calore per lo stesso motivo, in quanto si strozzerebbero quando sono sollecitate. Queste limitazioni mettono in risalto i vantaggi della CPU Core i9 e dell'SSD PCIe4, che possono potenzialmente offrire prestazioni più elevate rispetto alle macchine concorrenti di Dell o Lenovo.
Lo ZBook Fury 16 G11 è solo un aggiornamento minore rispetto allo ZBook Fury G10 dello scorso anno. Sebbene l'aspetto e la sensazione siano ancora ottimi, le prestazioni tendono a rallentare negli scenari di utilizzo più intensi.
Infine, è un po' spiacevole che il modello non offra opzioni Meteor Lake per l'accelerazione AI locale. Certo, questa funzione probabilmente interessa solo un piccolo sottoinsieme di utenti di workstation, ma avrebbe aiutato a distinguere ulteriormente la Fury 16 G11 dalla Fury 16 G10. È possibile ottenere essenzialmente le stesse prestazioni e funzioni dalla Fury 16 G10, che ha appena un anno di vita Fury 16 G10 come dalla più recente Fury 16 G11.
Prezzo e disponibilità
Lo ZBook Fury 16 G11 è attualmente in vendita a circa 3400 dollari, se configurato con il Core i9-14900HX e RTX 3500 Ada, fino a oltre 5500 dollari se completamente configurato con RTX 5000 Ada.
Informazioni: Abbiamo aggiornato il nostro sistema di valutazione e i risultati della versione 8 non sono confrontabili con i risultati della versione 7. Altre informazioni sono gerarchicamente verfügbar.
Nota: abbiamo recentemente aggiornato il nostro sistema di valutazione e i risultati della versione 8 non sono confrontabili con quelli della versione 7. Ulteriori informazioni sono disponibili qui .
HP ZBook Fury 16 G11
- 08/12/2024 v8
Allen Ngo
 Total Sustainability Score:
 Transparency
La selezione dei dispositivi da recensire viene effettuata dalla nostra redazione. Il campione di prova è stato fornito all'autore come prestito dal produttore o dal rivenditore ai fini di questa recensione. L'istituto di credito non ha avuto alcuna influenza su questa recensione, né il produttore ne ha ricevuto una copia prima della pubblicazione. Non vi era alcun obbligo di pubblicare questa recensione. In quanto società mediatica indipendente, Notebookcheck non è soggetta all'autorità di produttori, rivenditori o editori.
Ecco come Notebookcheck esegue i test
Ogni anno, Notebookcheck esamina in modo indipendente centinaia di laptop e smartphone utilizzando procedure standardizzate per garantire che tutti i risultati siano comparabili. Da circa 20 anni sviluppiamo continuamente i nostri metodi di prova e nel frattempo stabiliamo gli standard di settore. Nei nostri laboratori di prova, tecnici ed editori esperti utilizzano apparecchiature di misurazione di alta qualità. Questi test comportano un processo di validazione in più fasi. Il nostro complesso sistema di valutazione si basa su centinaia di misurazioni e parametri di riferimento ben fondati, che mantengono l'obiettività.Price comparison

