Recensione del Lenovo ThinkPad P16v G1 AMD - Workstation entry-level con Zen4
Lenovo ha aggiunto un nuovo modello entry-level alla sua linea di workstation mobili con il ThinkPad P16v G1. Il laptop è disponibile con processori AMD o Intel, e si può scegliere tra grafica integrata e le GPU professionali Nvidia RTX A500, RTX 1000 e RTX 2000 Ada.
Il modello AMD più economico parte da circa 1.400 euro (1.533 dollari) e presenta un Ryzen 5 PRO 7560HS con Radeon 760M integrata, 8 GB di RAM, un SSD da 256 GB e un pannello da 1080p. La variante AMD con lo standard più alto arriva a 3.200 euro (3.503 dollari) e viene fornita con un Ryzen 9 PRO 7940HSrTX 2000 Ada, 64 GB di RAM, 4 TB di memoria SSD e un display 4K.
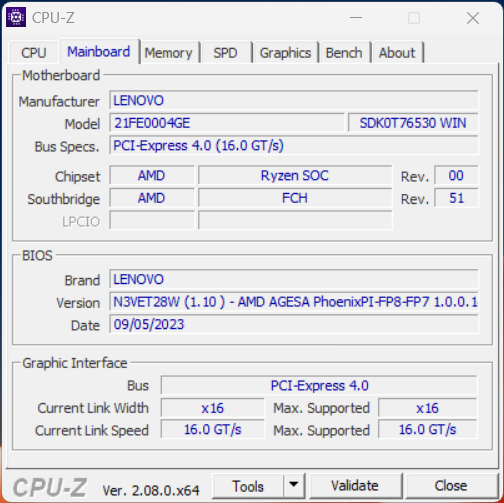
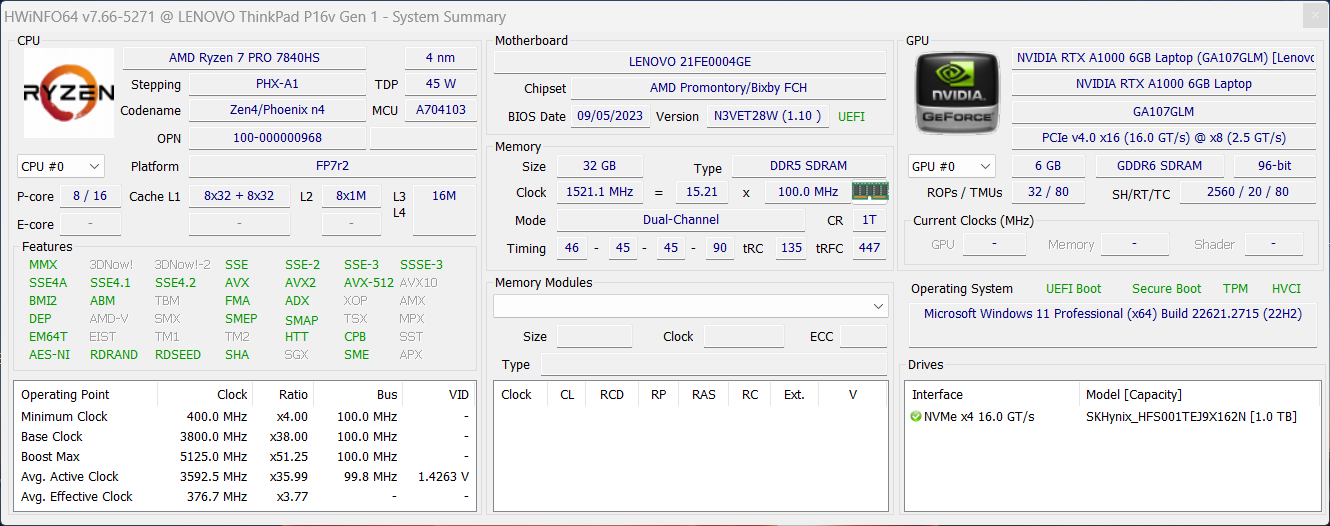
La nostra unità di recensione (numero di modello 21FE0004GE) costa 2.099 euro (2.298 dollari) ed è equipaggiata con un Ryzen 7 PRO 7840HSun'unità Nvidia RTX A1000, 32 GB di RAM, un SSD da 1 TB e un pannello Full HD con copertura sRGB completa.
Potenziali concorrenti a confronto
Punteggio | Data | Modello | Peso | Altezza | Dimensione | Risoluzione | Prezzo |
|---|---|---|---|---|---|---|---|
| 86.2 % v7 (old) | 01/2024 | Lenovo ThinkPad P16v G1 AMD R7 PRO 7840HS, RTX A1000 Laptop GPU | 2.3 kg | 24.7 mm | 16.00" | 1920x1200 | |
| 88.9 % v7 (old) | 12/2023 | HP ZBook Power 15 G10 R7 PRO 7840HS, RTX 2000 Ada Generation Laptop | 2 kg | 22.9 mm | 15.60" | 2560x1440 | |
| 87.8 % v7 (old) | 04/2023 | Lenovo ThinkPad P15v G3 21EM001AGE R7 PRO 6850H, RTX A2000 Laptop GPU | 2.2 kg | 22.7 mm | 15.60" | 3840x2160 | |
| 88.4 % v7 (old) | 10/2022 | Dell Precision 7670 i7-12850HX, RTX A2000 Laptop GPU | 2.7 kg | 24.7 mm | 16.00" | 3840x2400 | |
| 91.7 % v7 (old) | 10/2023 | Lenovo ThinkPad P1 G6-21FV000DGE i9-13900H, RTX 2000 Ada Generation Laptop | 1.9 kg | 17.5 mm | 16.00" | 2560x1600 | |
| 88.2 % v7 (old) | 02/2023 | Lenovo ThinkPad P16 G1 21D6001DMB i7-12850HX, RTX A2000 Laptop GPU | 3 kg | 30.23 mm | 16.00" | 2560x1600 |
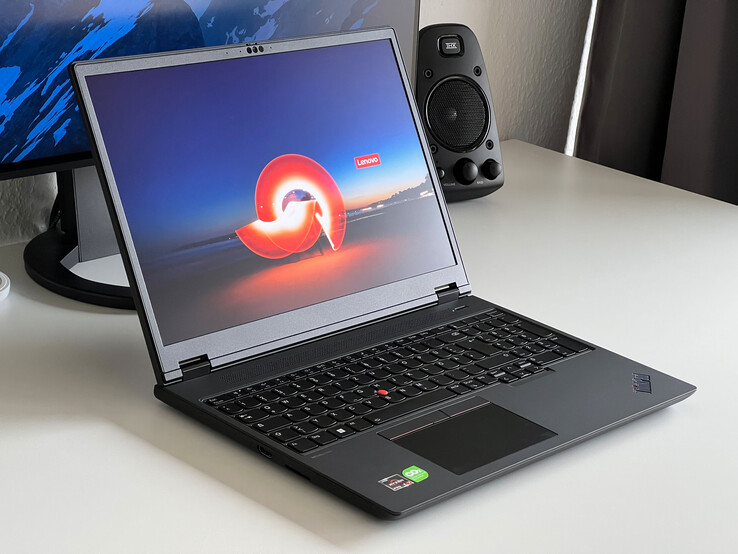
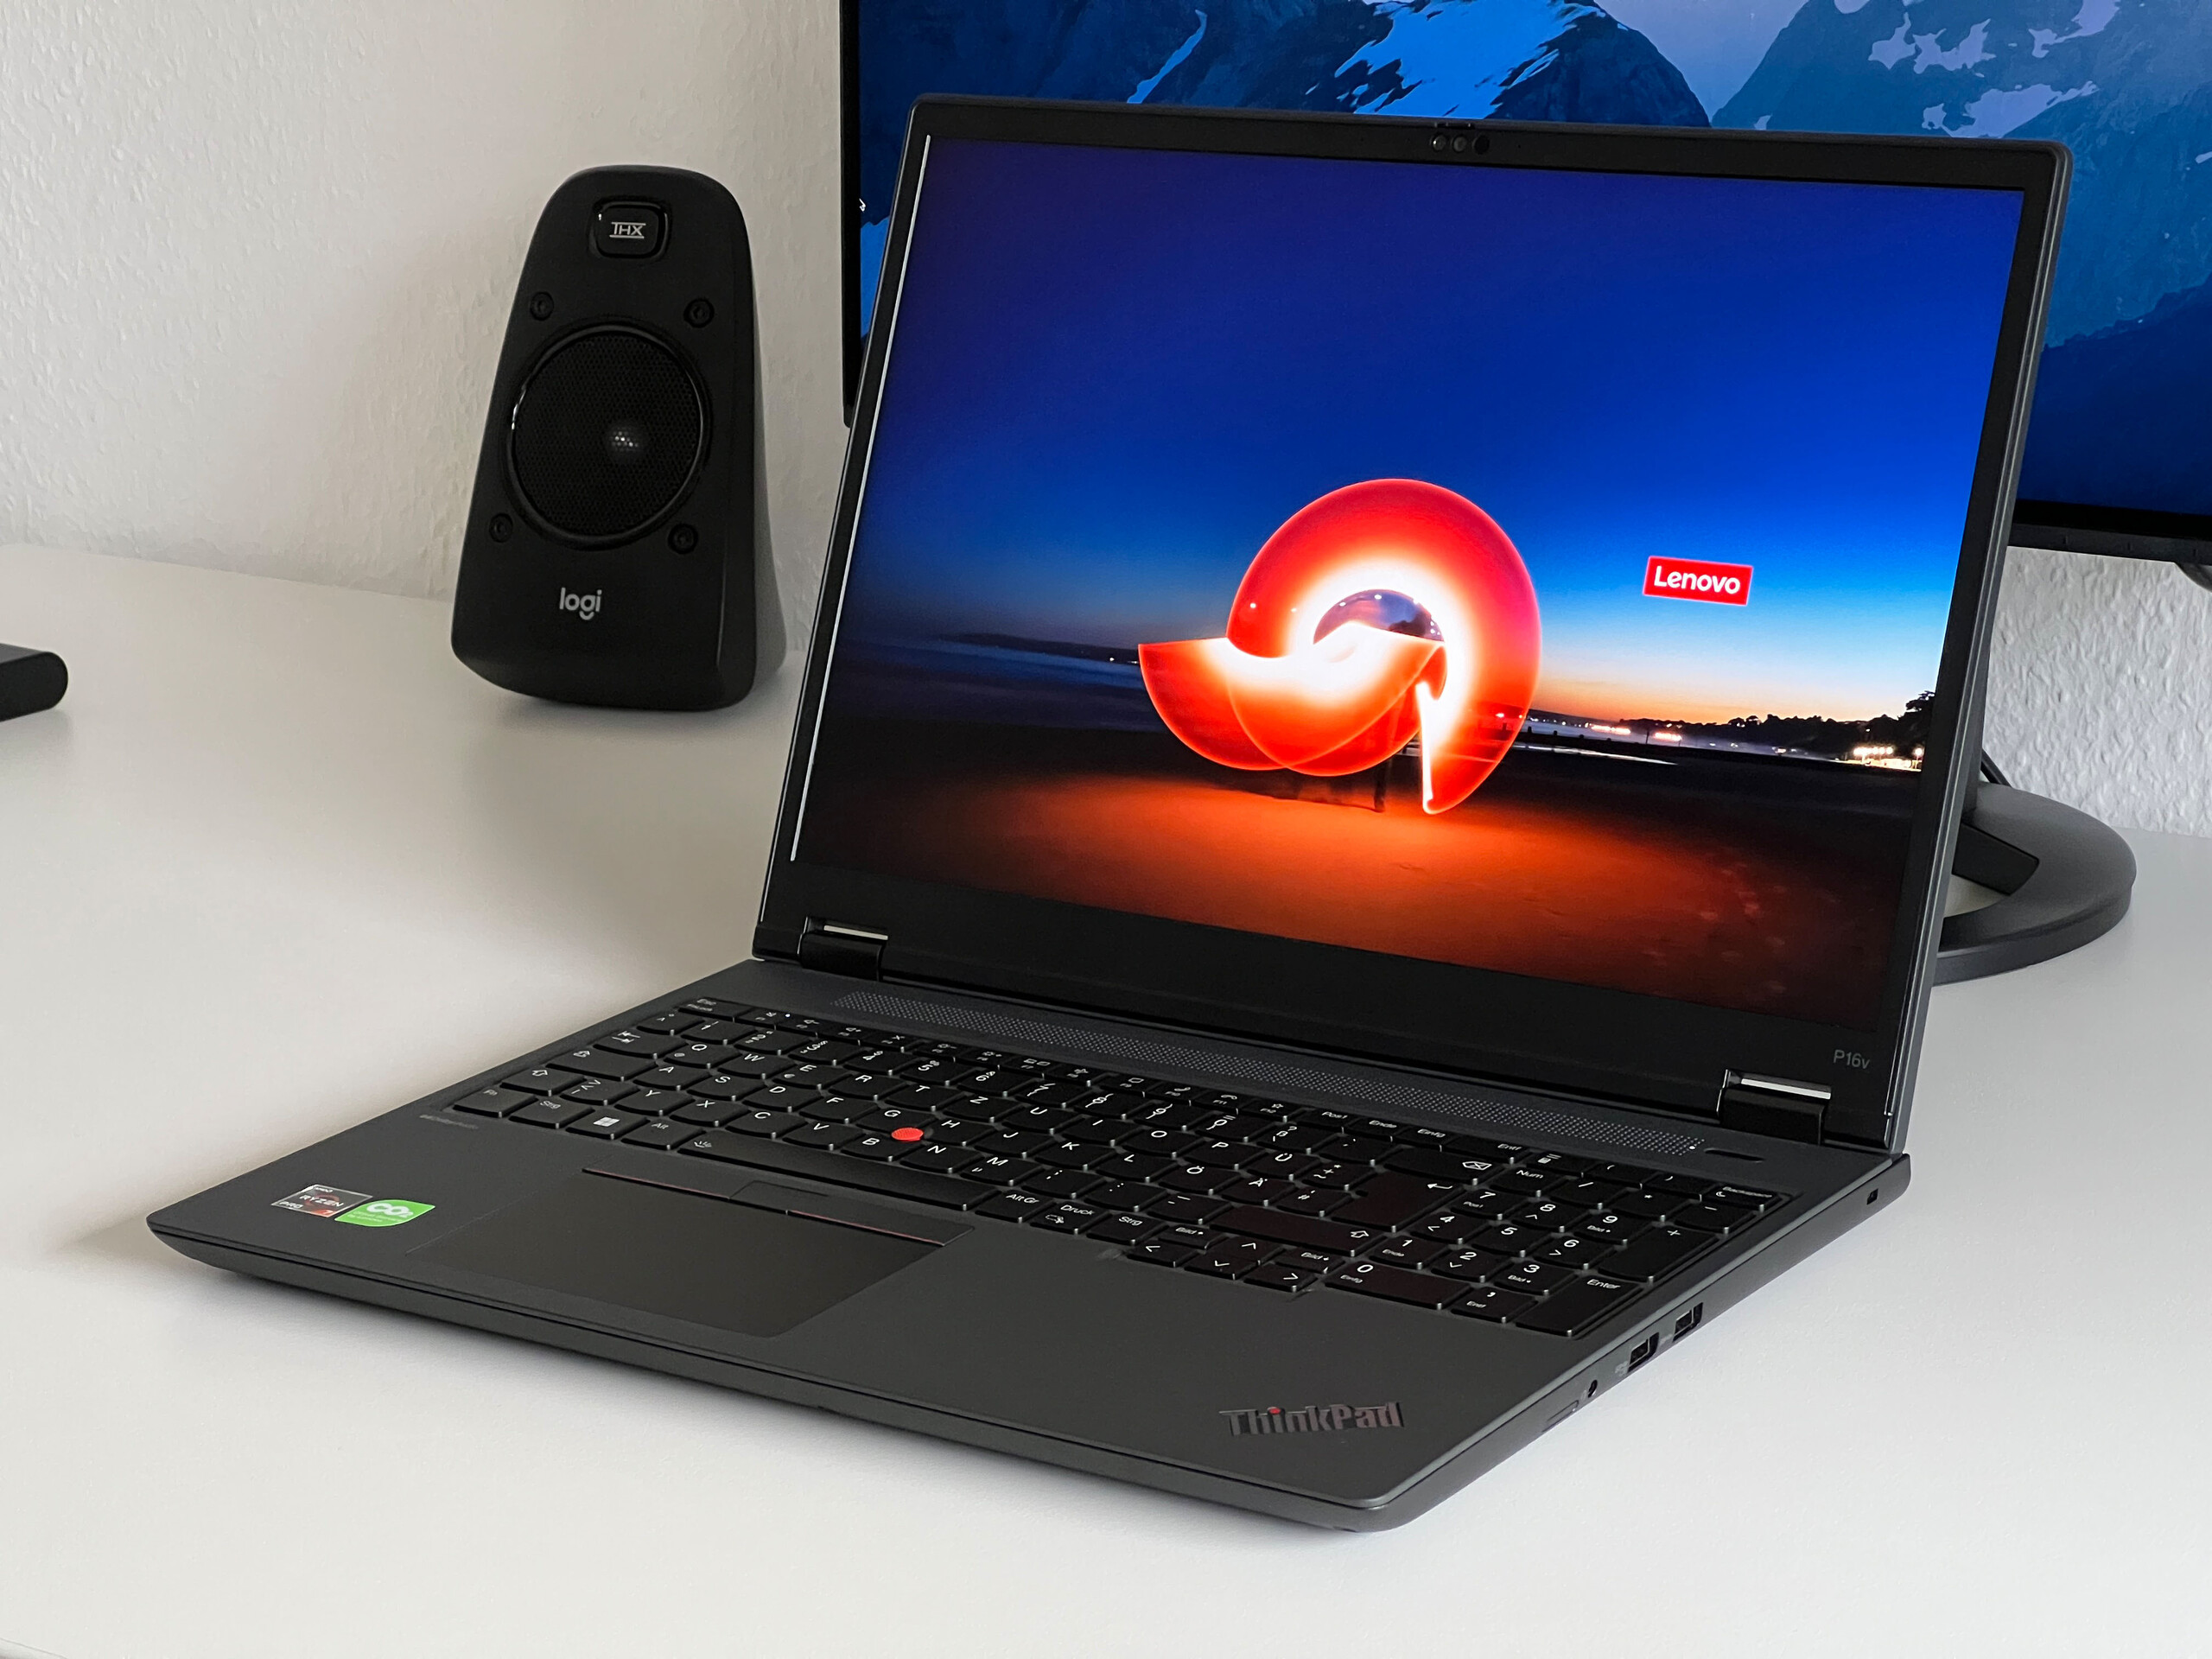
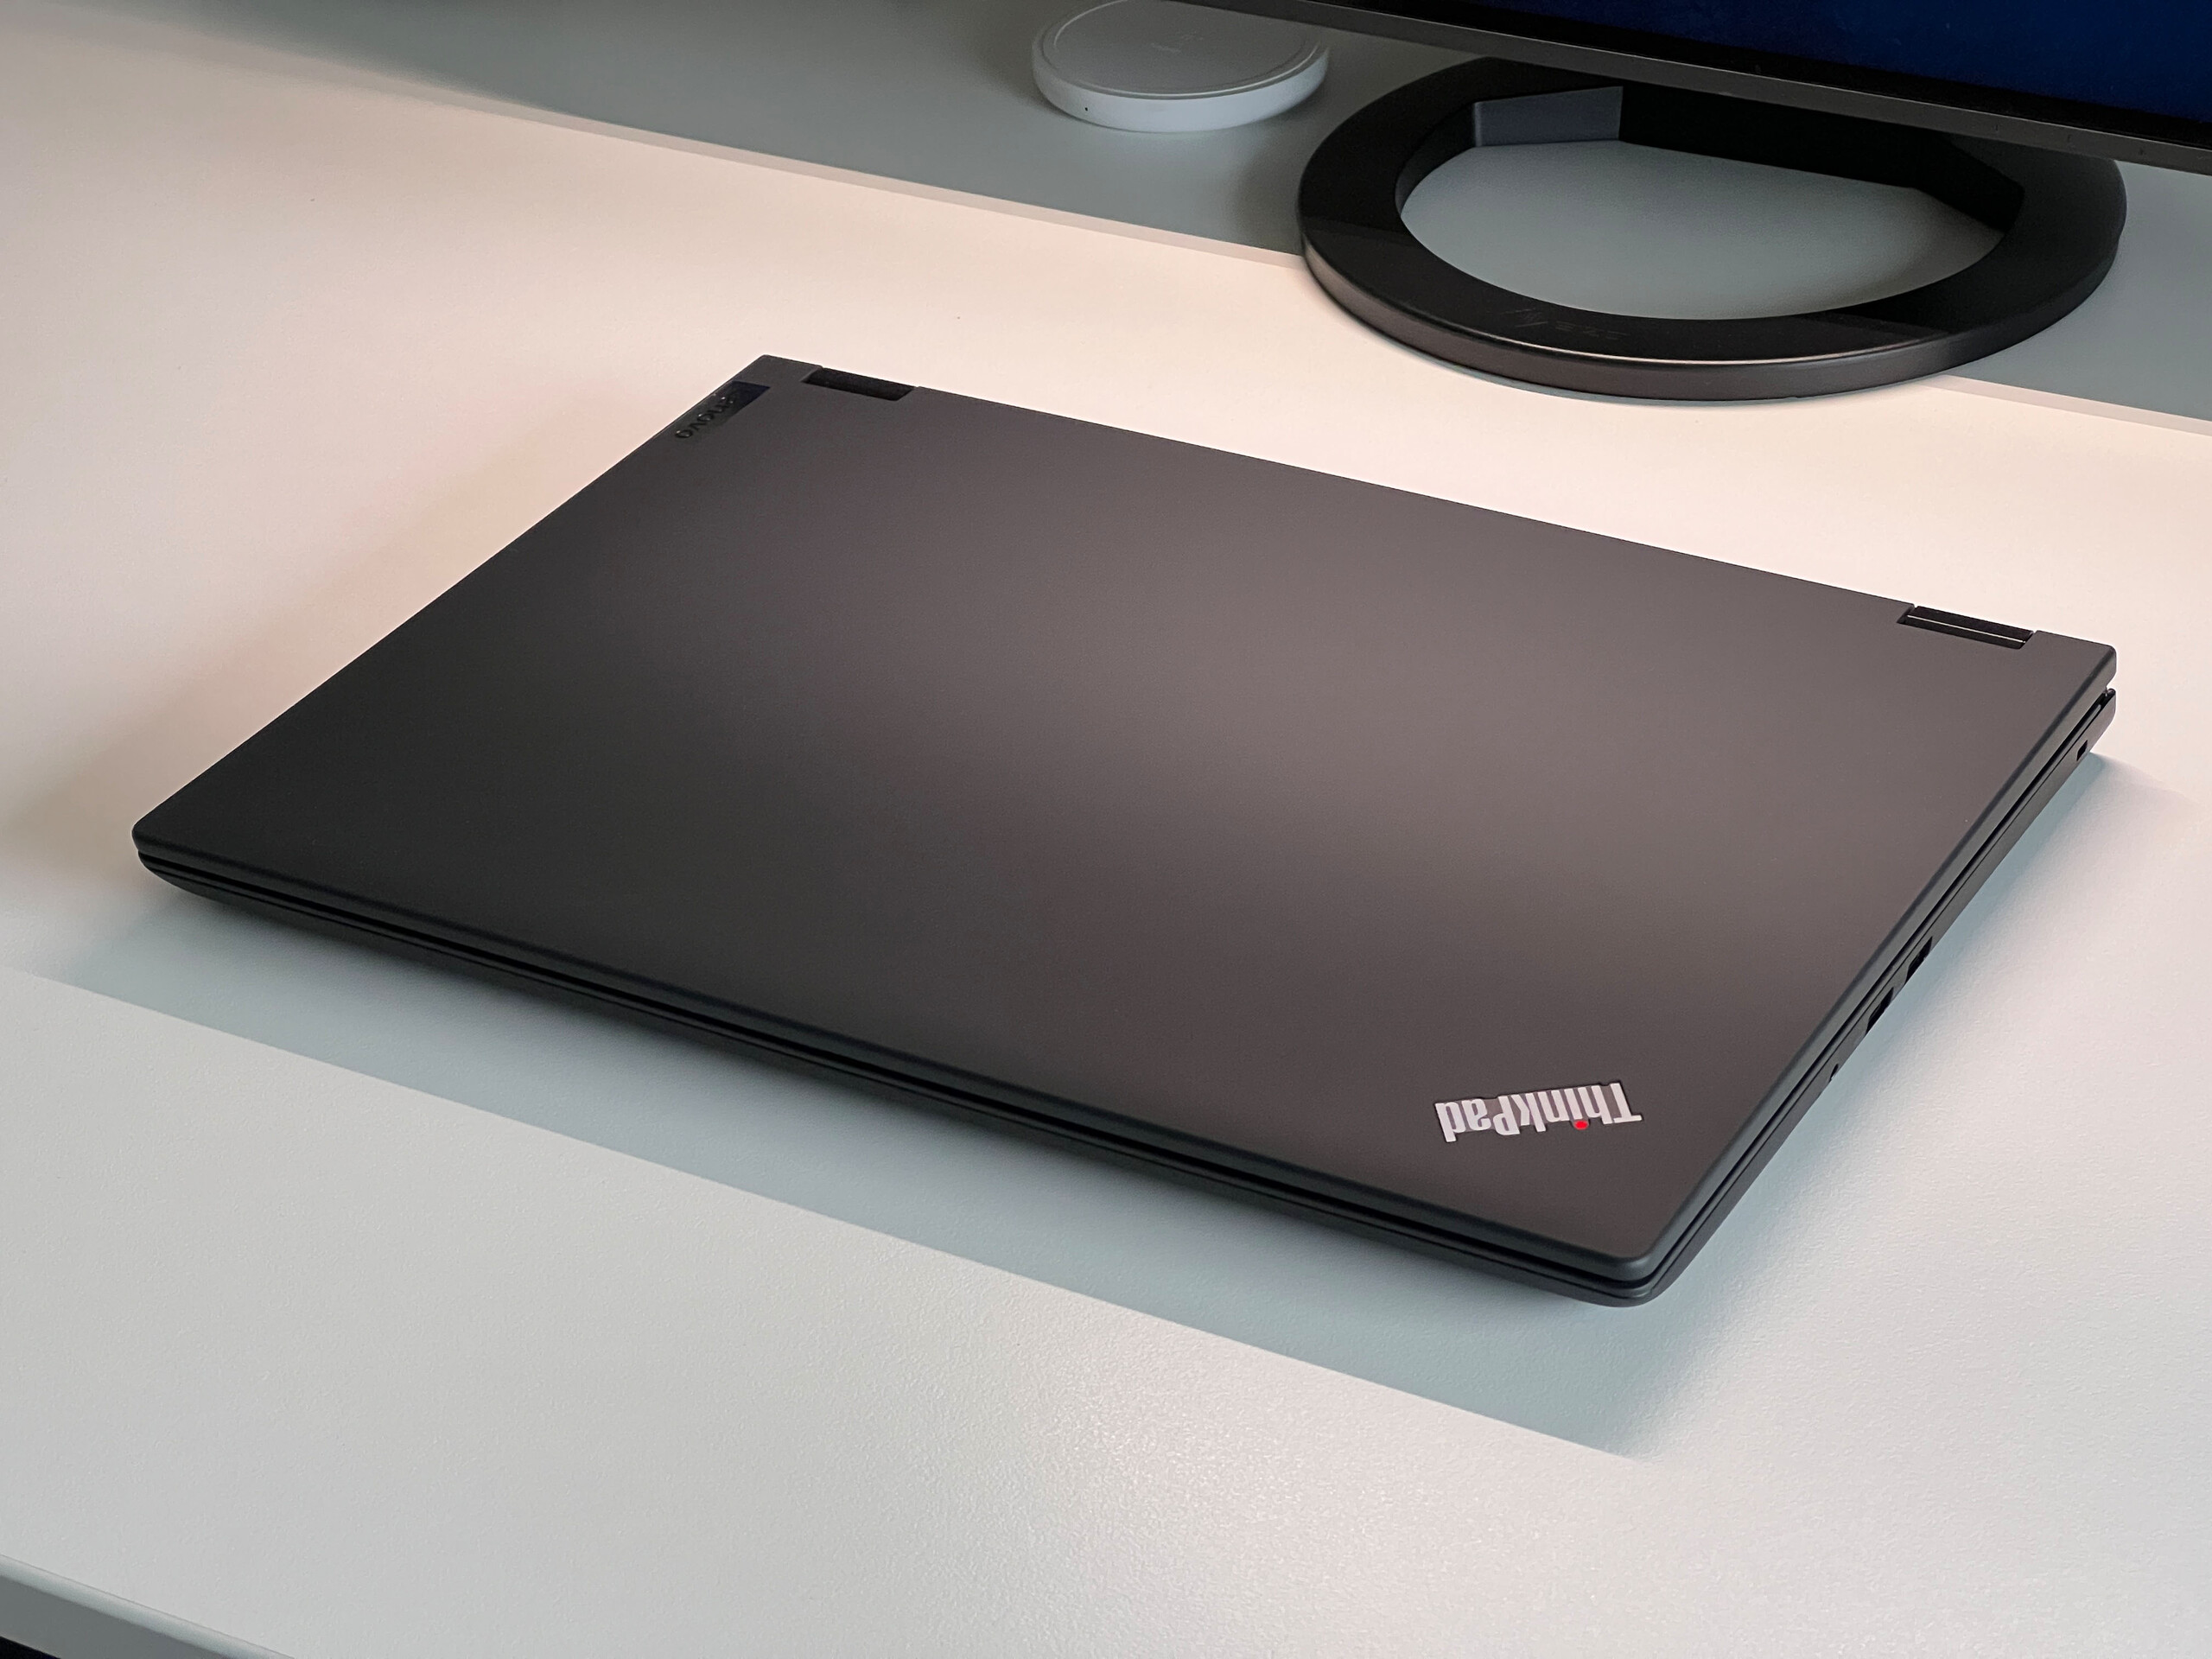
Custodia - ThinkPad in plastica con accenti rossi
La natura entry-level del portatile è chiaramente evidente nella scelta dei materiali. Lenovo ha dotato il ThinkPad P16v G1 di uno chassis completamente in plastica. Tuttavia, sia il coperchio che la parte superiore della sezione di base sono piacevoli e non sono particolarmente sensibili alle impronte digitali. D'altra parte, il telaio inferiore e la cornice dello schermo sono più ruvidi e sembrano più economici. In termini di vestibilità e finitura, il concorrente HP ZBook Power ha sicuramente un vantaggio grazie al suo telaio in metallo.
Oltre ai consueti elementi rossi, come il TrackPoint e le linee d'accento rosse sui pulsanti del mouse dedicati, Lenovo ha fatto un ulteriore passo avanti con il P16v G1 aggiungendo un'altra linea d'accento rossa sul retro del dispositivo. Naturalmente, il gusto personale è sempre soggettivo, ma non siamo sicuri che questo sia appropriato per una workstation mobile.
Il portatile è fondamentalmente robusto, ma gli svantaggi sono inevitabili rispetto ai modelli ThinkPad più costosi. Il centro della sezione di base può essere spinto leggermente verso l'interno e anche il coperchio presenta una certa flessione. Detto questo, non si verificano scricchiolii o distorsioni dell'immagine. Le cerniere sono regolate abbastanza bene, ma si notano delle oscillazioni quando si regola l'angolo del display. Inoltre, lo schermo non può essere ripiegato completamente di 180 gradi.
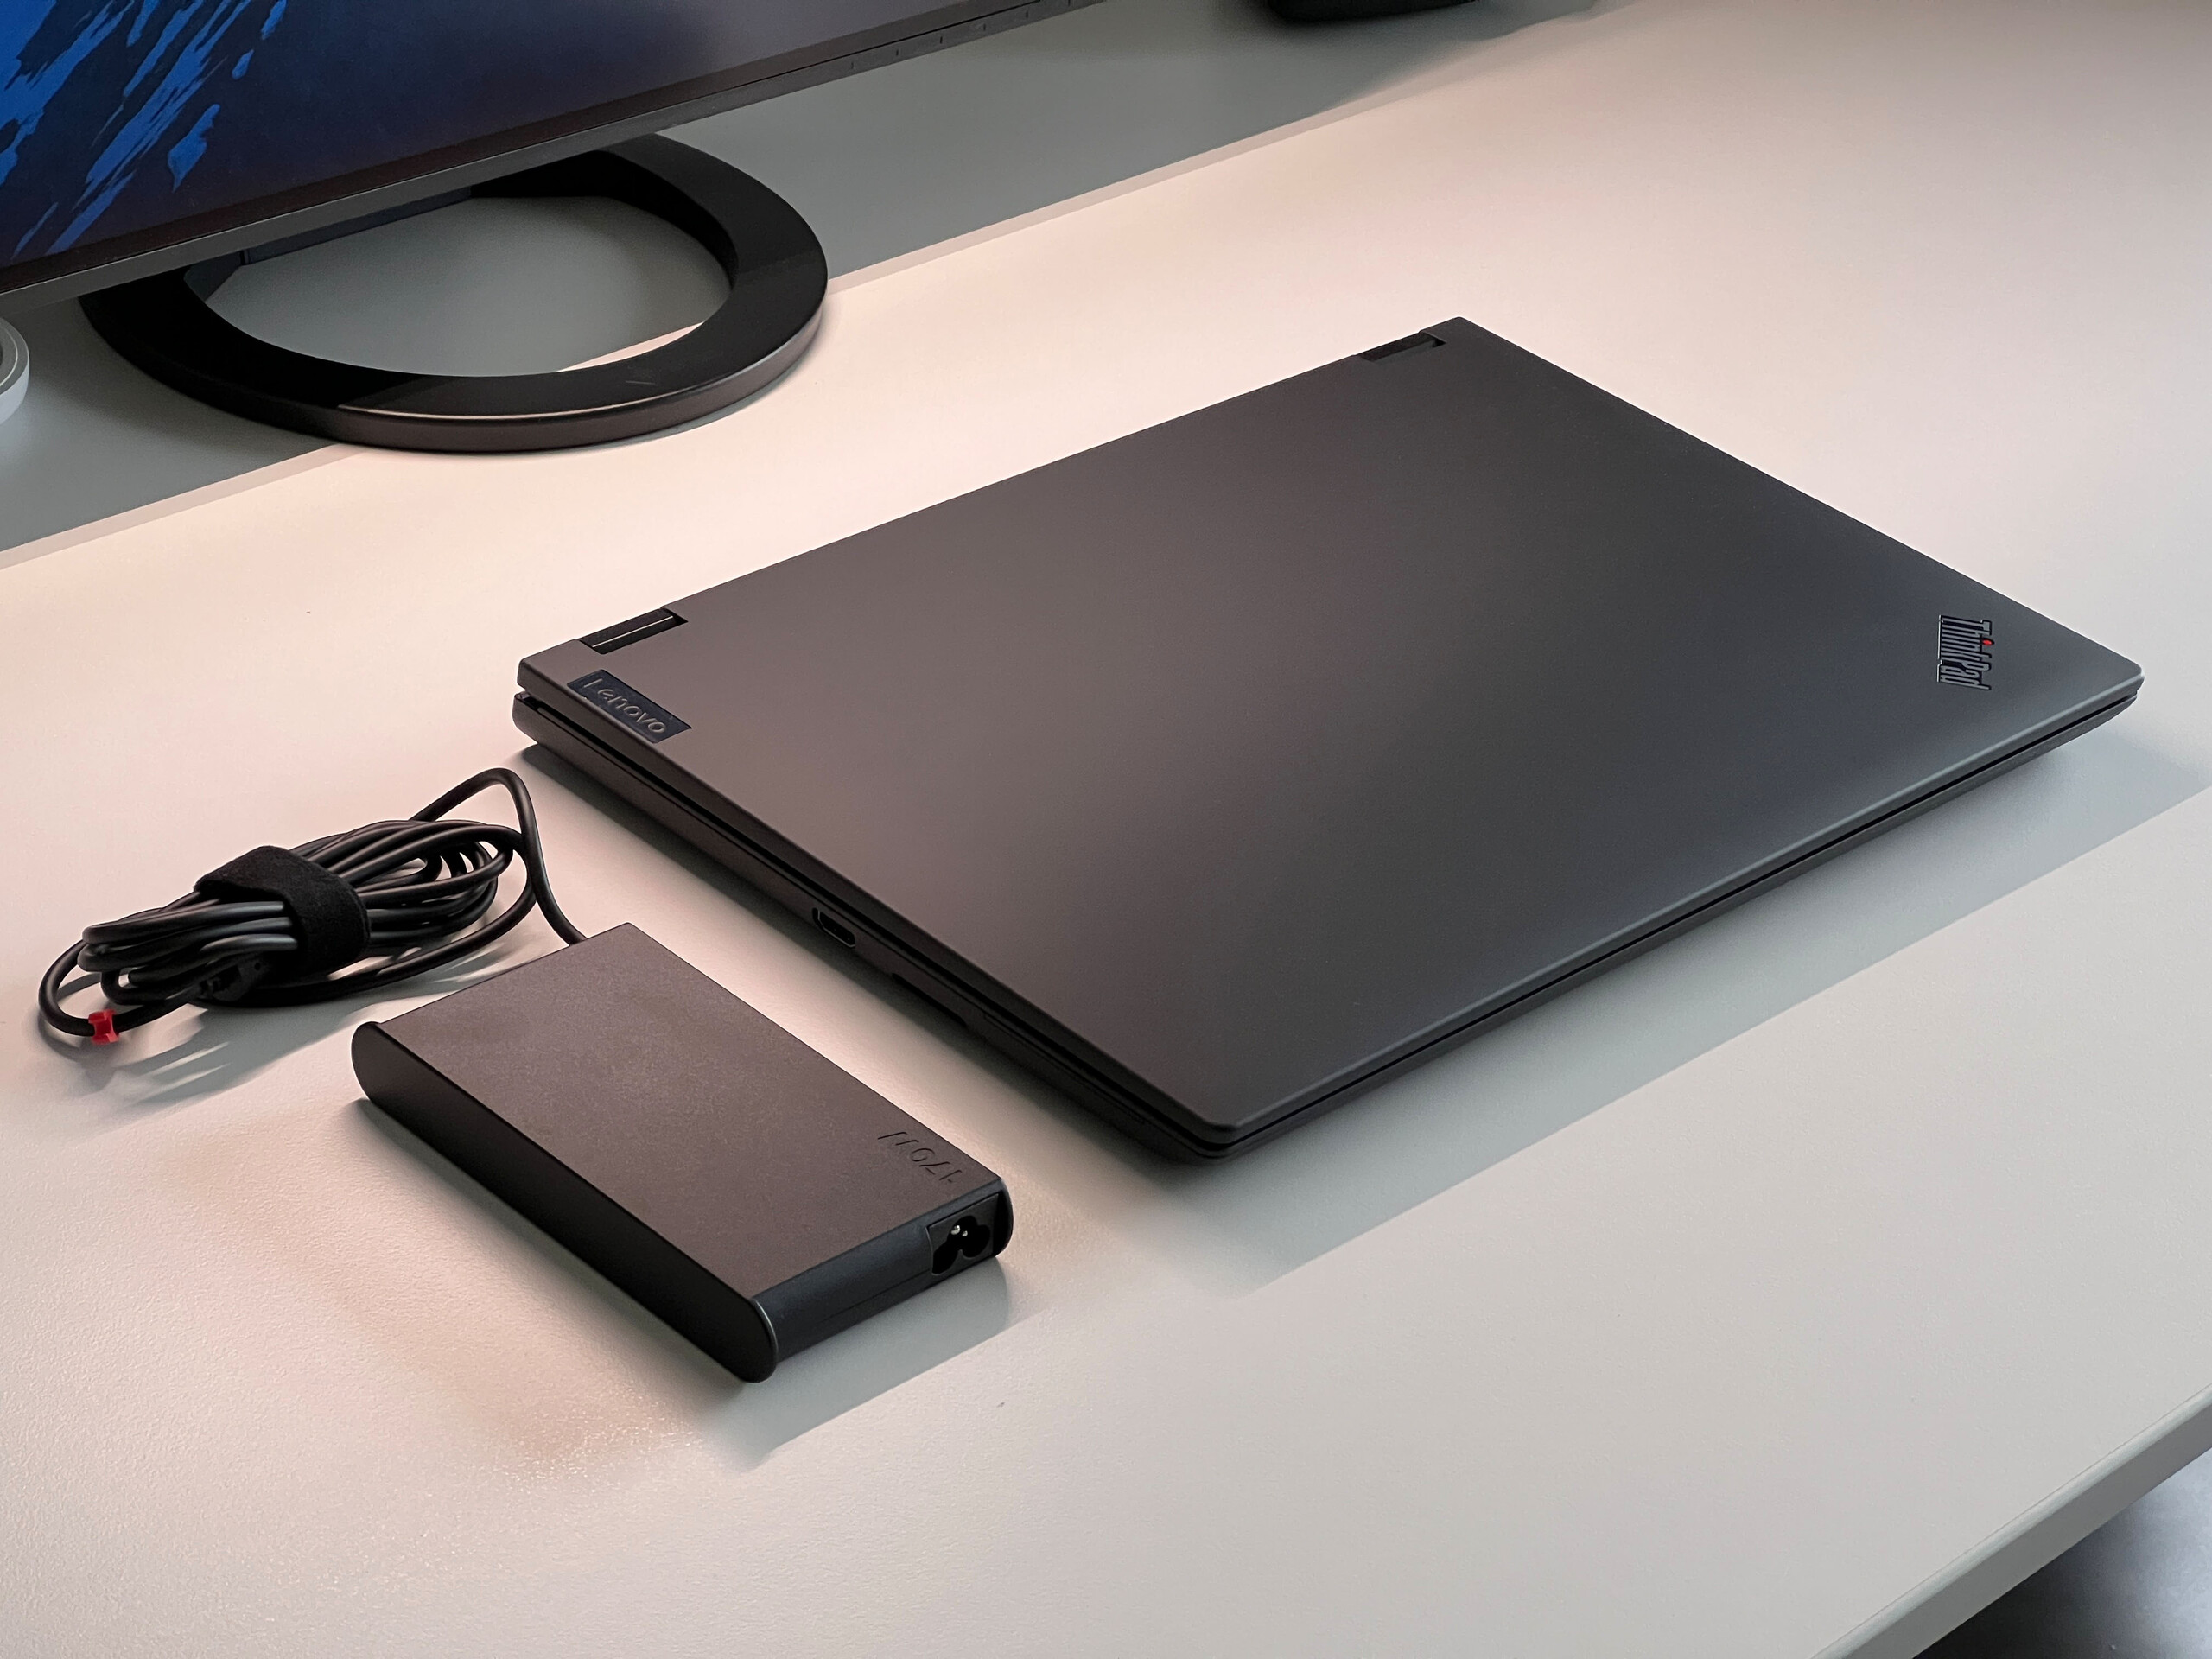
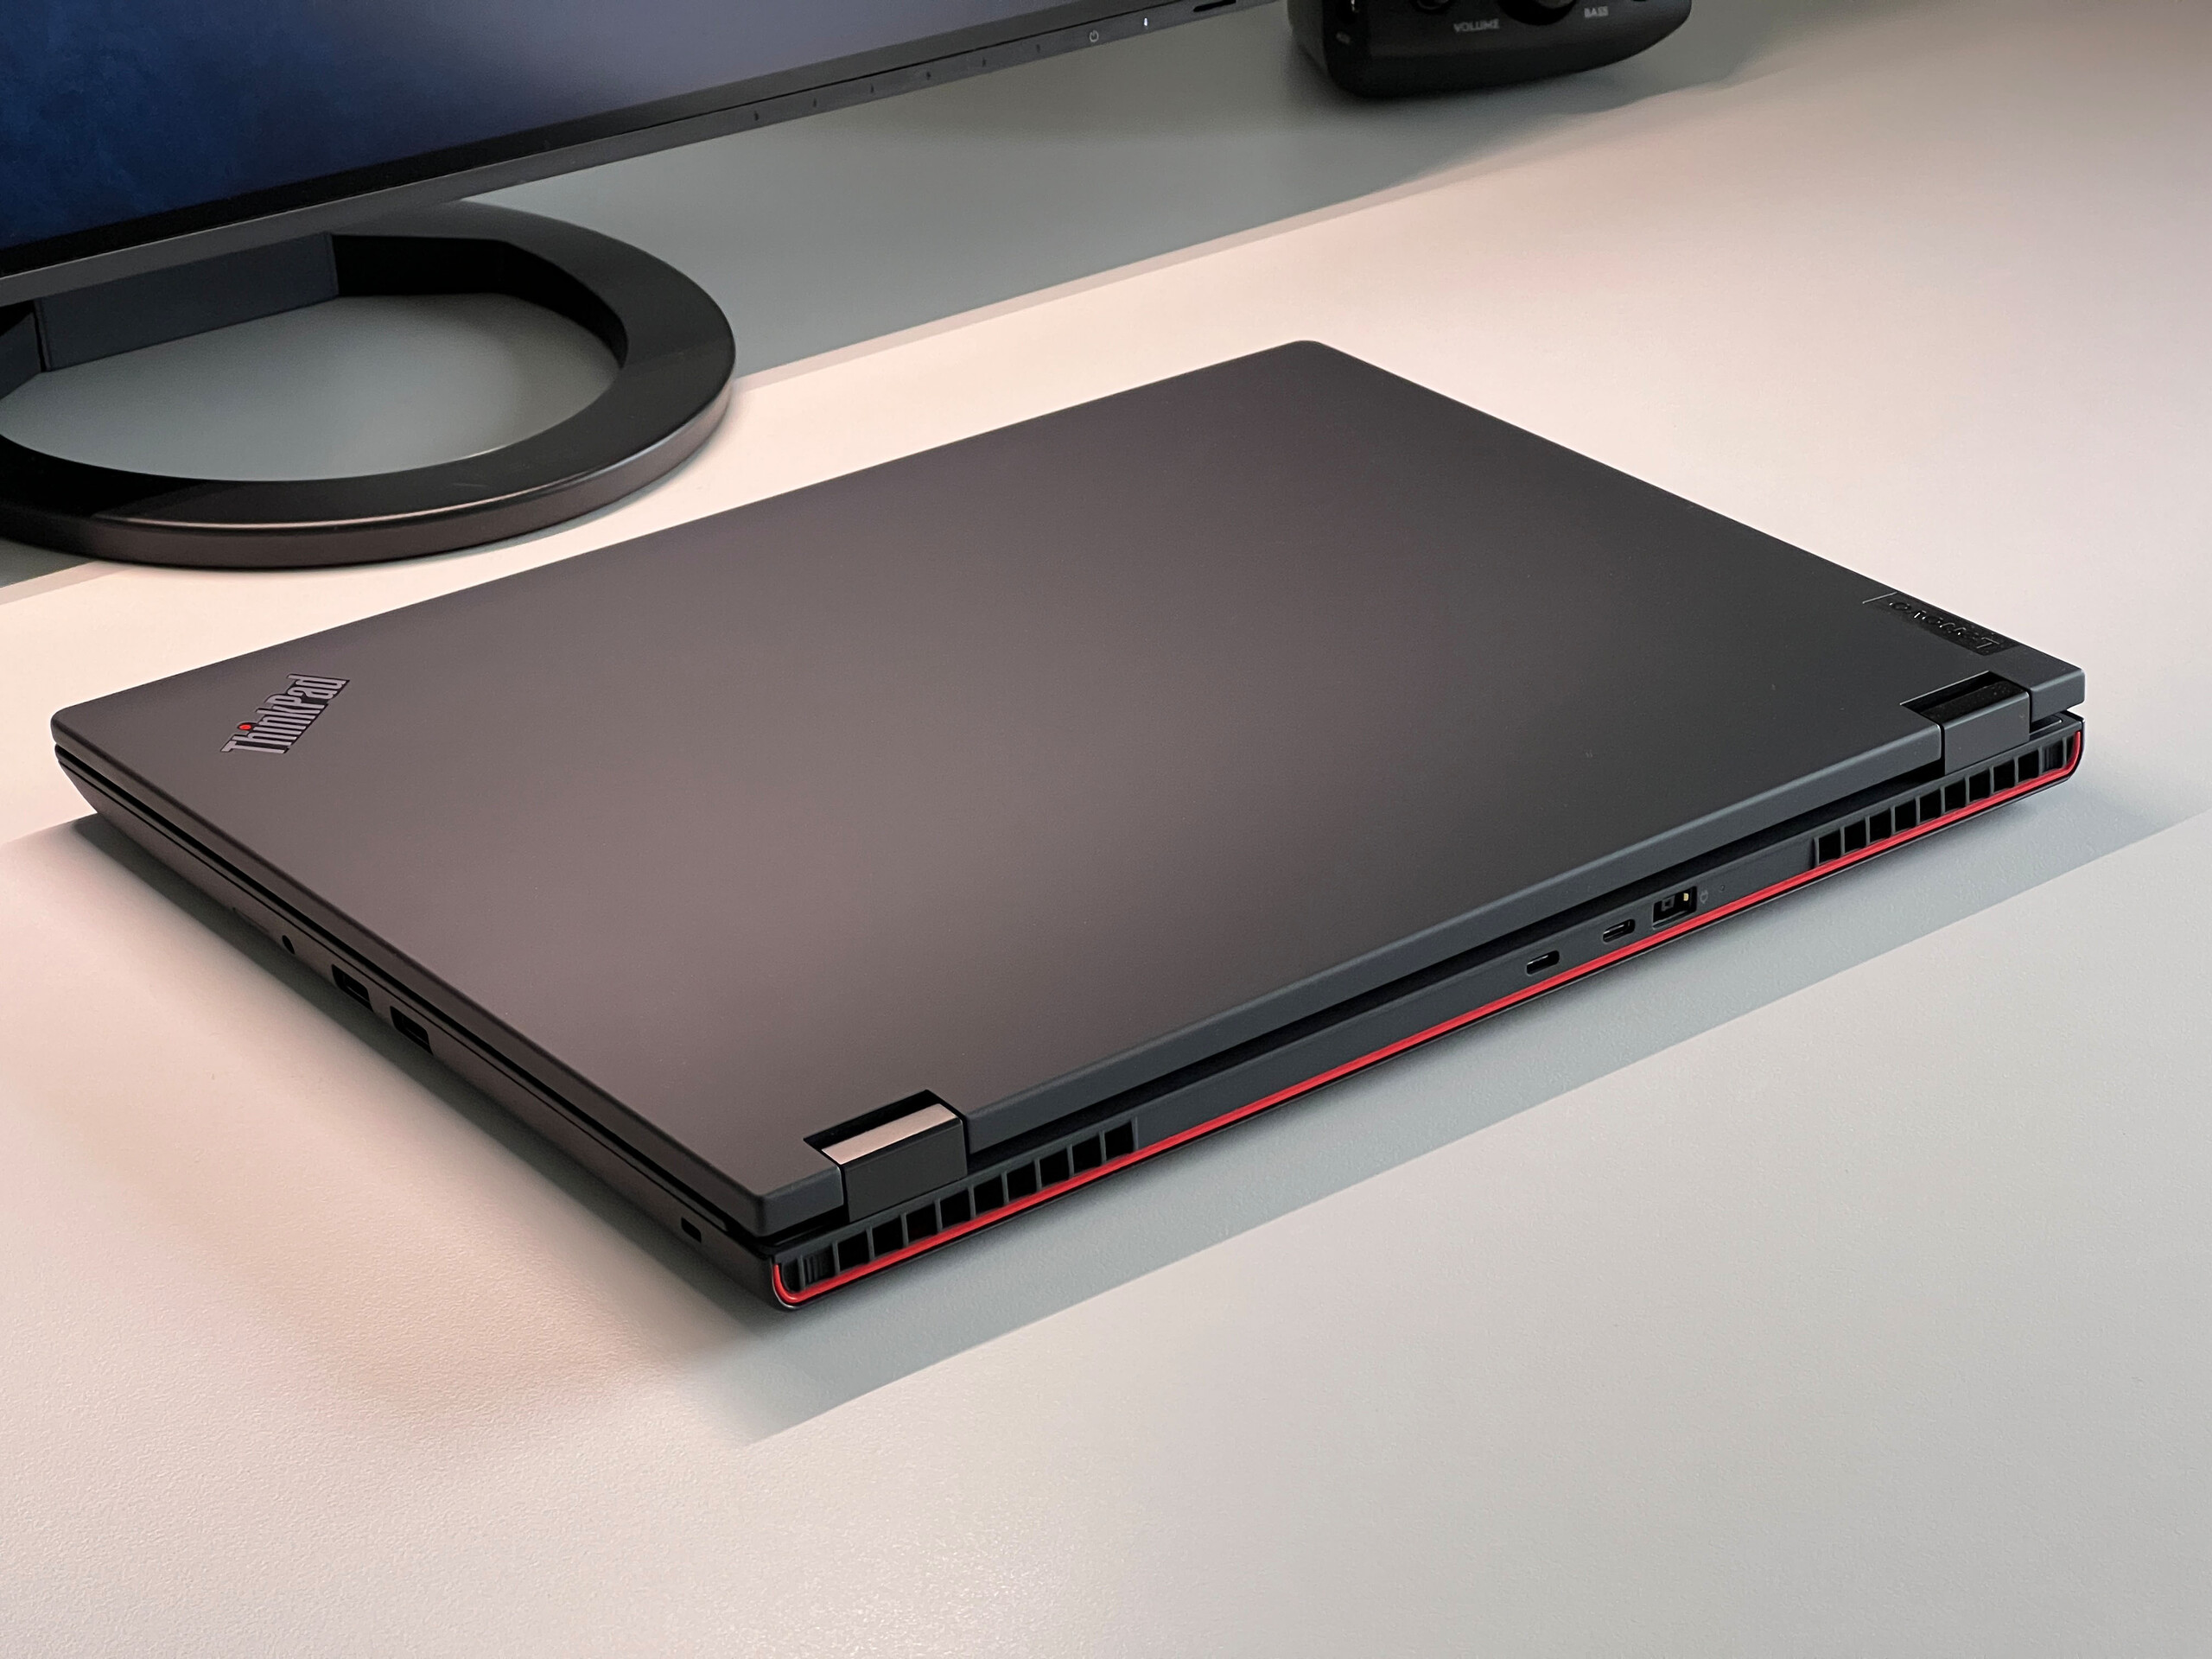
In termini di dimensioni e peso, il nuovo P16v G1 si colloca quasi esattamente tra il sottile ThinkPad P1 G6 e la robusta workstation ThinkPad P16. Il caricatore da 170 watt pesa 554 g (1,22 libbre) insieme al cavo di alimentazione.
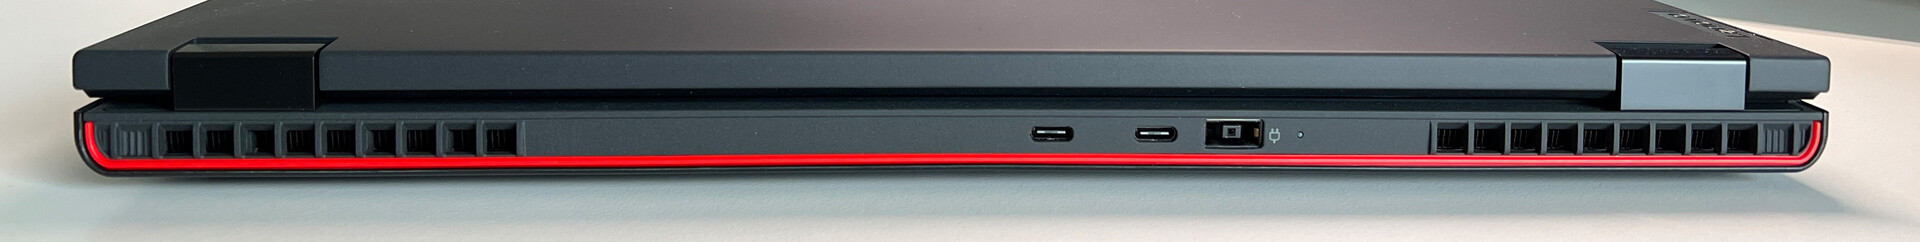
Specifiche - Versione AMD con USB4
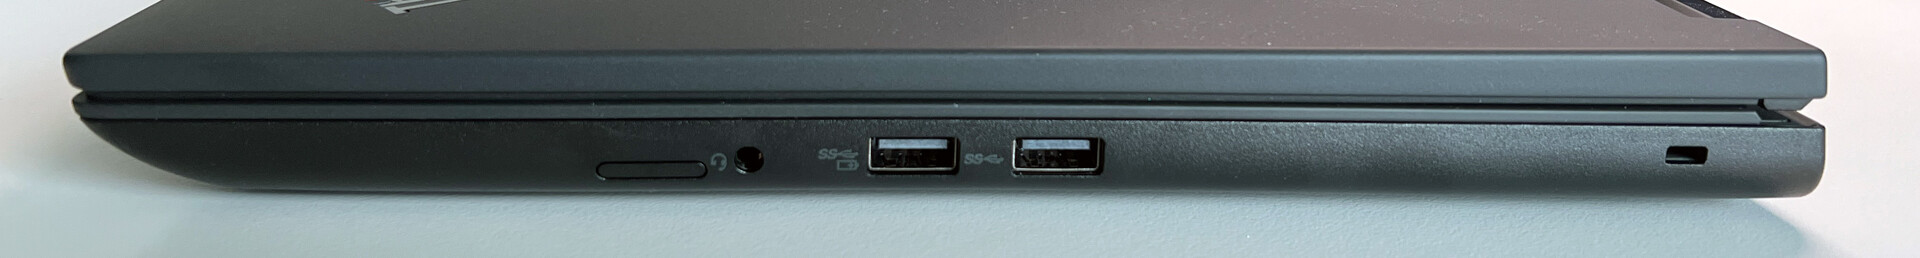
La workstation basata su AMD dispone di due moderne porte USB-C con supporto USB4, entrambe situate sul retro del portatile. Le interfacce sono distribuite su tutti e tre i lati, anche se questa disposizione non è ideale. Avremmo preferito che l'uscita HDMI si trovasse sul retro; sarebbe stato anche opportuno avere almeno una porta USB a sinistra. Il ThinkPad P16v G1 può essere dotato di un lettore di SmartCard opzionale. Tuttavia, gli utenti dovranno fare a meno di una porta Ethernet dedicata, che può essere aggiunta solo utilizzando un adattatore USB-C.
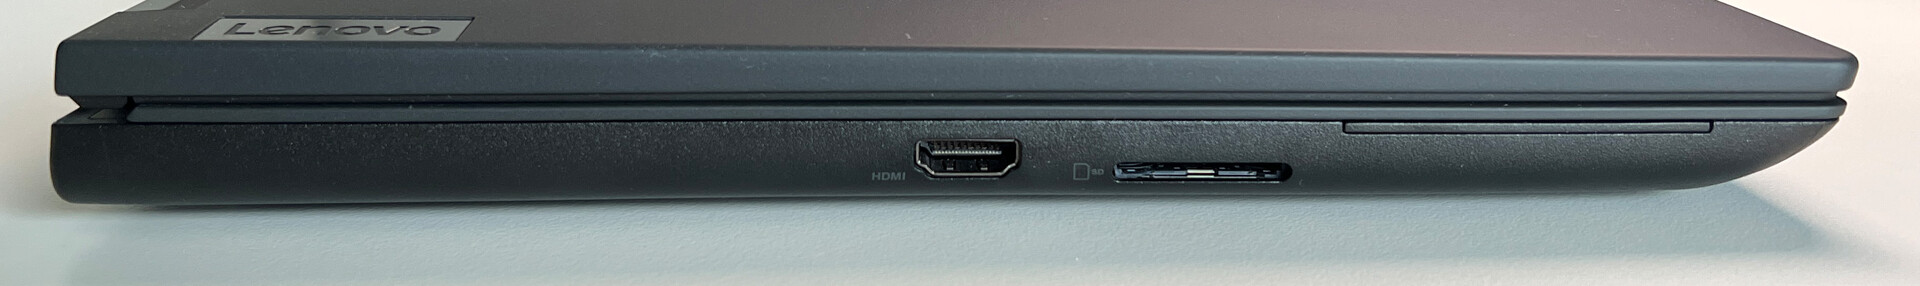
Lettore di schede SD
Il lettore di schede SD sulla sinistra ha un meccanismo a molla. Una scheda SD sporge leggermente quando viene inserita. Utilizzando la nostra scheda di riferimento (Angelbird AV Pro V60), siamo riusciti a raggiungere velocità medie di trasferimento nell'ordine di 70-90 MB/s.
| SD Card Reader | |
| average JPG Copy Test (av. of 3 runs) | |
| Dell Precision 7670 (Toshiba Exceria Pro SDXC 64 GB UHS-II) | |
| Media della classe Workstation (49.6 - 681, n=14, ultimi 2 anni) | |
| Lenovo ThinkPad P15v G3 21EM001AGE (AV Pro V60) | |
| Lenovo ThinkPad P1 G6-21FV000DGE (Angelbird AV Pro V60) | |
| Lenovo ThinkPad P16v G1 AMD (Angelbird AV Pro V60) | |
| Lenovo ThinkPad P16 G1 21D6001DMB (AV Pro V60) | |
| maximum AS SSD Seq Read Test (1GB) | |
| Media della classe Workstation (87.6 - 1455, n=14, ultimi 2 anni) | |
| Lenovo ThinkPad P15v G3 21EM001AGE (AV Pro V60) | |
| Dell Precision 7670 (Toshiba Exceria Pro SDXC 64 GB UHS-II) | |
| Lenovo ThinkPad P16v G1 AMD (Angelbird AV Pro V60) | |
| Lenovo ThinkPad P1 G6-21FV000DGE (Angelbird AV Pro V60) | |
| Lenovo ThinkPad P16 G1 21D6001DMB (AV Pro V60) | |
Connettività
Il ThinkPad AMD è dotato di un modulo Qualcomm Wi-Fi 6E (WCN685x) che supporta l'attuale standard Wi-Fi 6 e il Bluetooth 5.2. Ha fornito velocità di trasferimento molto elevate e stabili quando è stato collegato al nostro router di riferimento Asus. Ha fornito velocità di trasferimento molto elevate e stabili quando è stato collegato al nostro router di riferimento Asus.
Il ThinkPad P16v G1 può anche essere configurato con un modulo WWAN (4G LTE) prima dell'ordine, ma non è possibile aggiungerlo in seguito perché non sono installati di serie né il lettore di schede SIM né le antenne necessarie.
| Networking | |
| Lenovo ThinkPad P16v G1 AMD | |
| iperf3 transmit AXE11000 | |
| iperf3 receive AXE11000 | |
| HP ZBook Power 15 G10 | |
| iperf3 transmit AXE11000 | |
| iperf3 receive AXE11000 | |
| iperf3 transmit AXE11000 6GHz | |
| iperf3 receive AXE11000 6GHz | |
| Lenovo ThinkPad P15v G3 21EM001AGE | |
| iperf3 transmit AXE11000 | |
| iperf3 receive AXE11000 | |
| iperf3 transmit AXE11000 6GHz | |
| iperf3 receive AXE11000 6GHz | |
| Dell Precision 7670 | |
| iperf3 transmit AXE11000 6GHz | |
| iperf3 receive AXE11000 6GHz | |
| Lenovo ThinkPad P1 G6-21FV000DGE | |
| iperf3 transmit AXE11000 | |
| iperf3 receive AXE11000 | |
| Lenovo ThinkPad P16 G1 21D6001DMB | |
| iperf3 transmit AXE11000 | |
| iperf3 receive AXE11000 | |
Webcam
Sebbene Lenovo abbia installato una webcam da 5MP, la qualità delle immagini non è particolarmente elevata. Anche in buone condizioni di illuminazione, le immagini non appaiono affatto migliori di quelle scattate dalle webcam da 1080p. A bordo è presente anche una telecamera IR per il riconoscimento facciale Windows Hello.


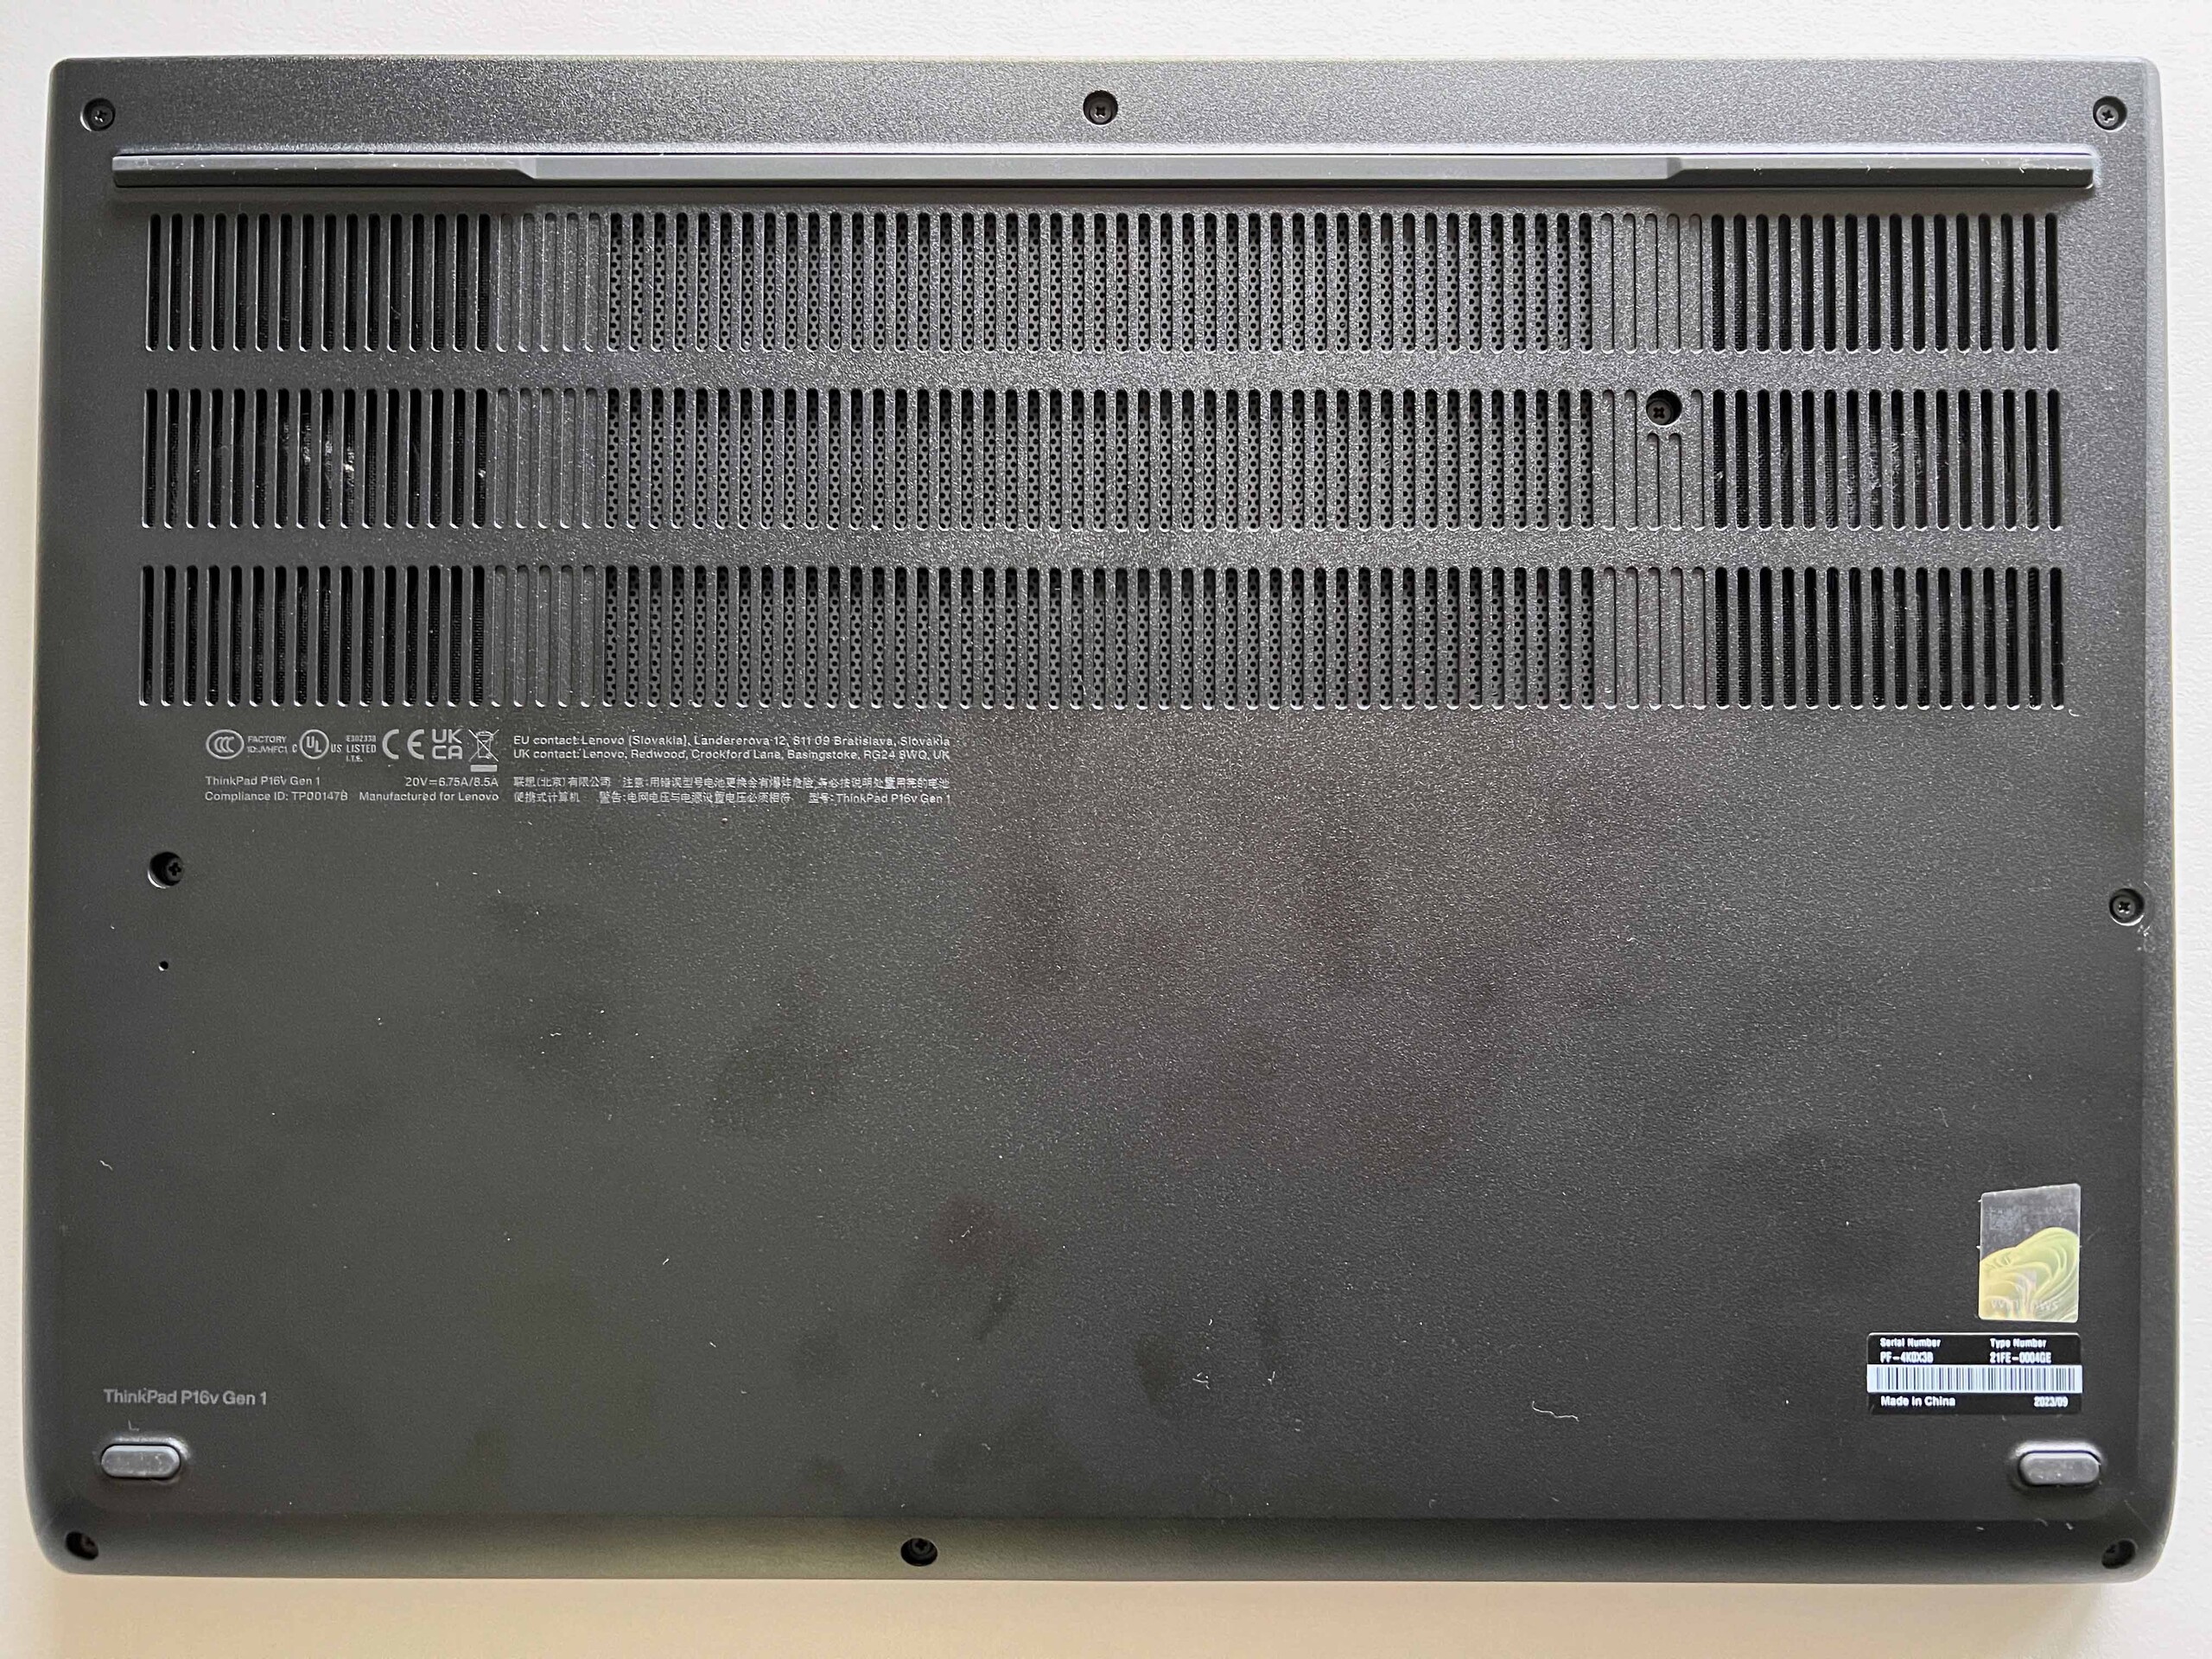
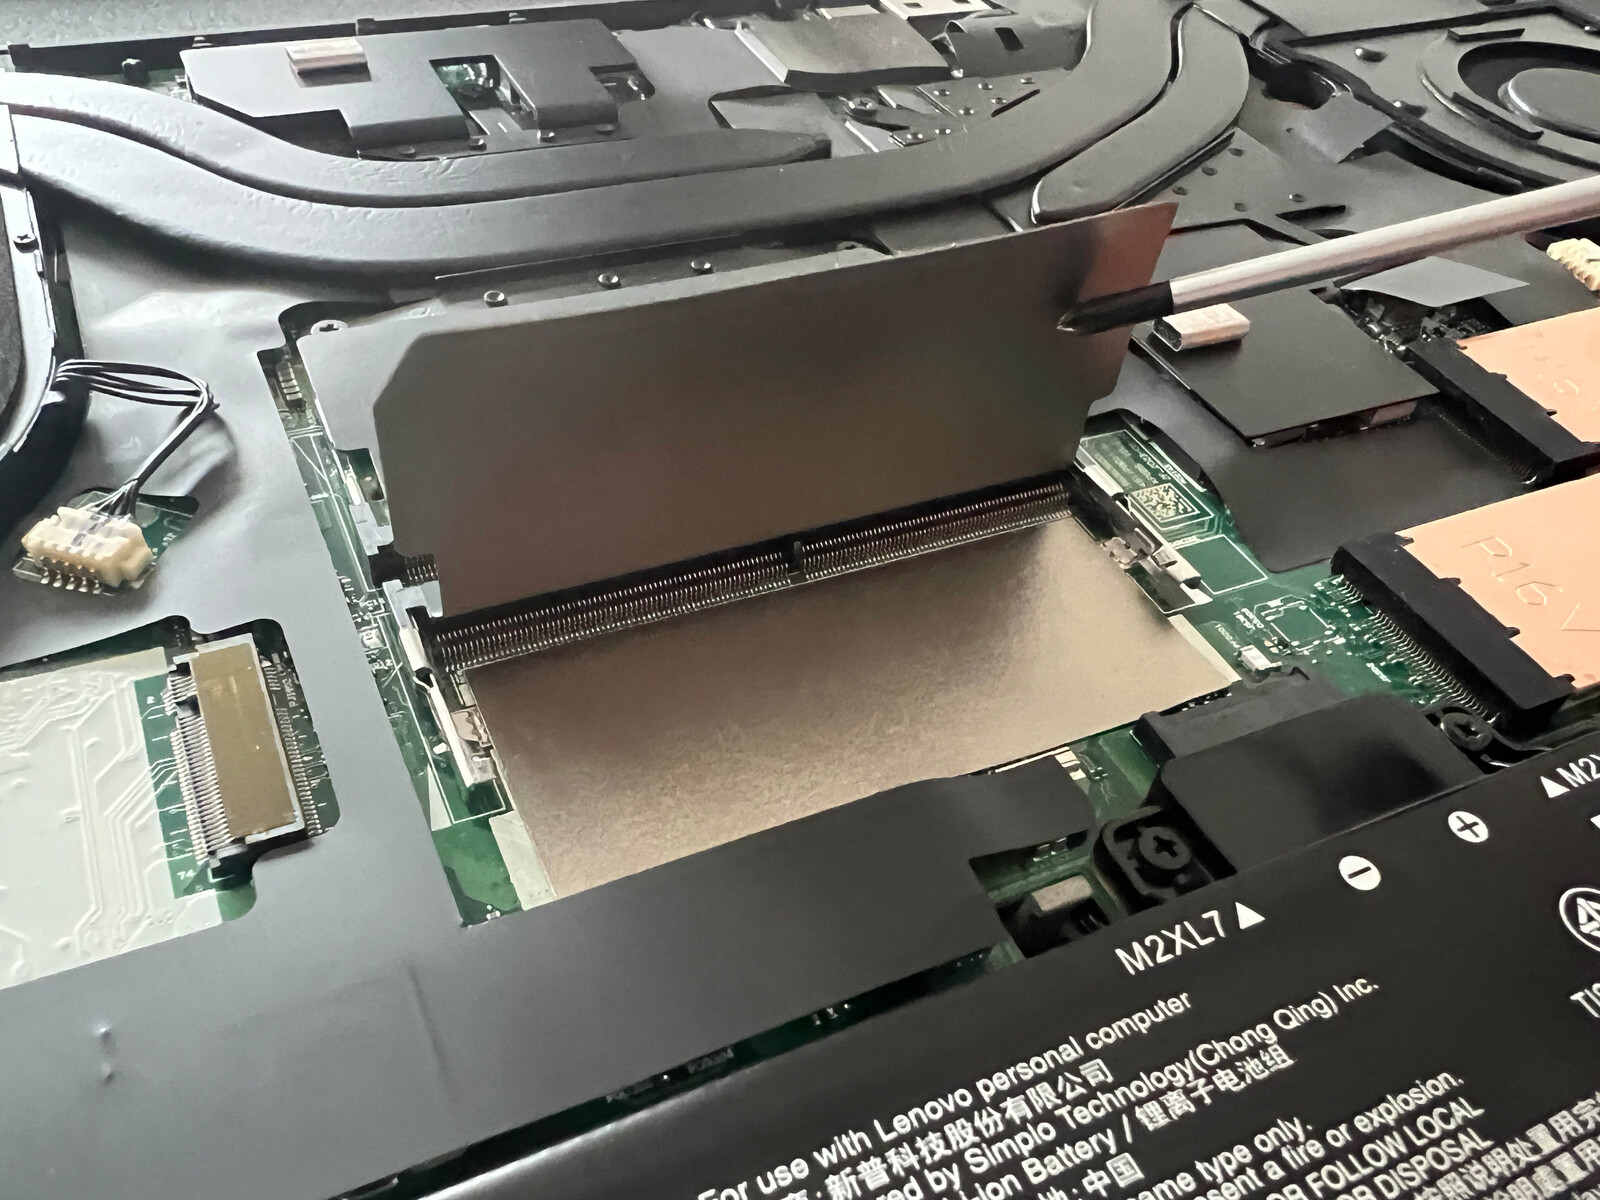
Manutenzione
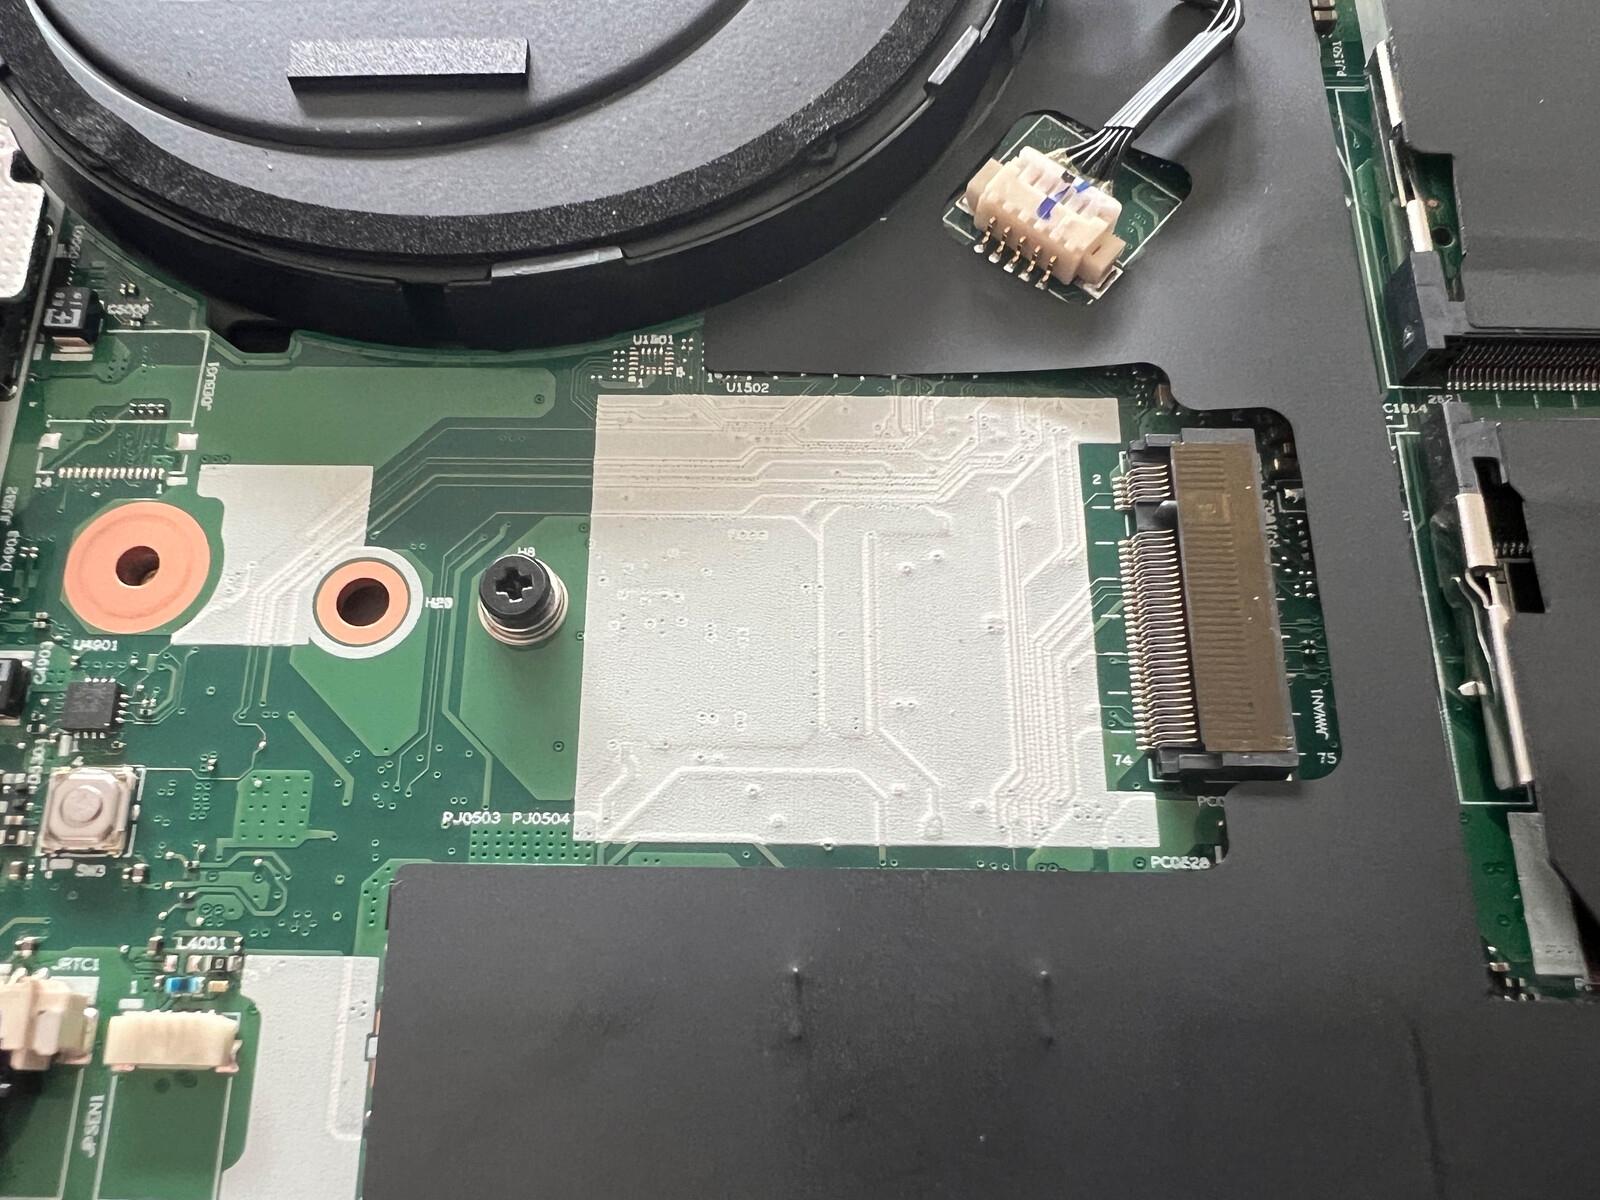
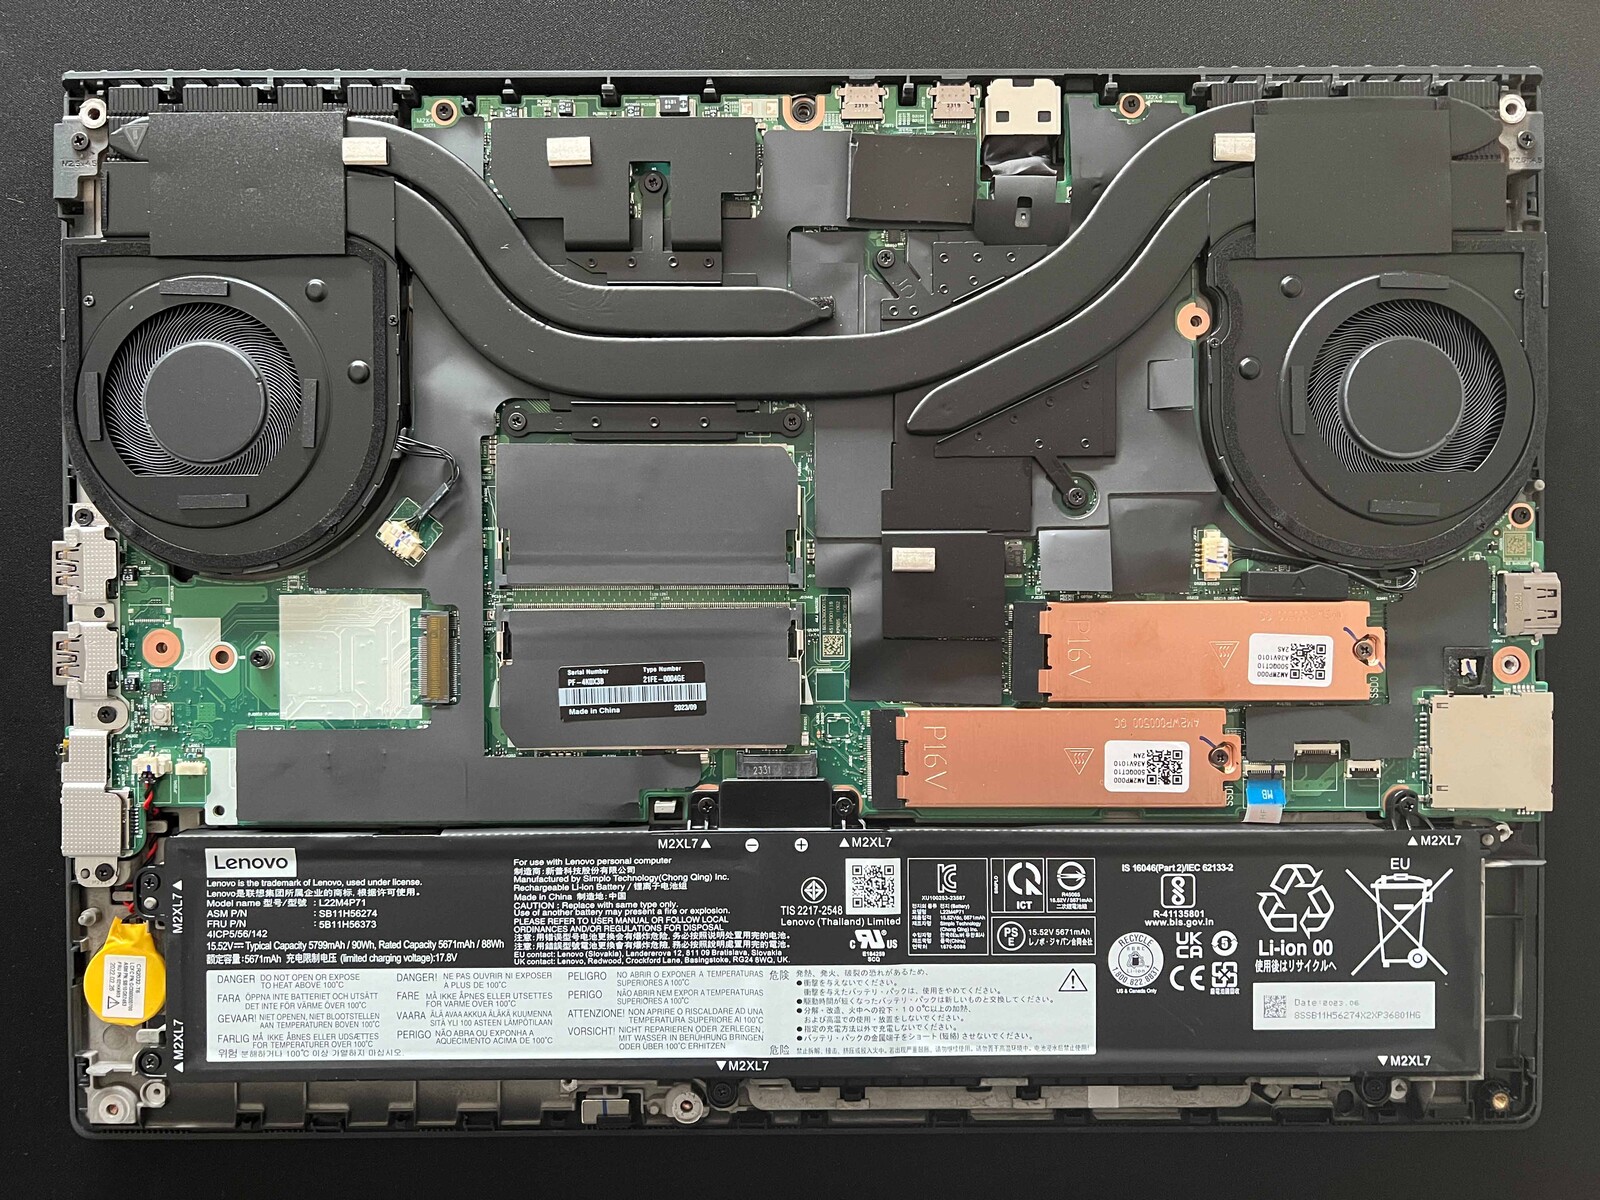
La cassa inferiore è fissata in posizione con alcune viti Phillips e può essere rimossa completamente. La manutenibilità è complessivamente buona. Oltre ai due slot SO-DIMM per la RAM, ci sono due slot per le unità SSD M.2 2280. Le ventole sono abbastanza facili da pulire e la batteria è solo avvitata. Tuttavia, il modulo wireless è saldato e non può essere sostituito.
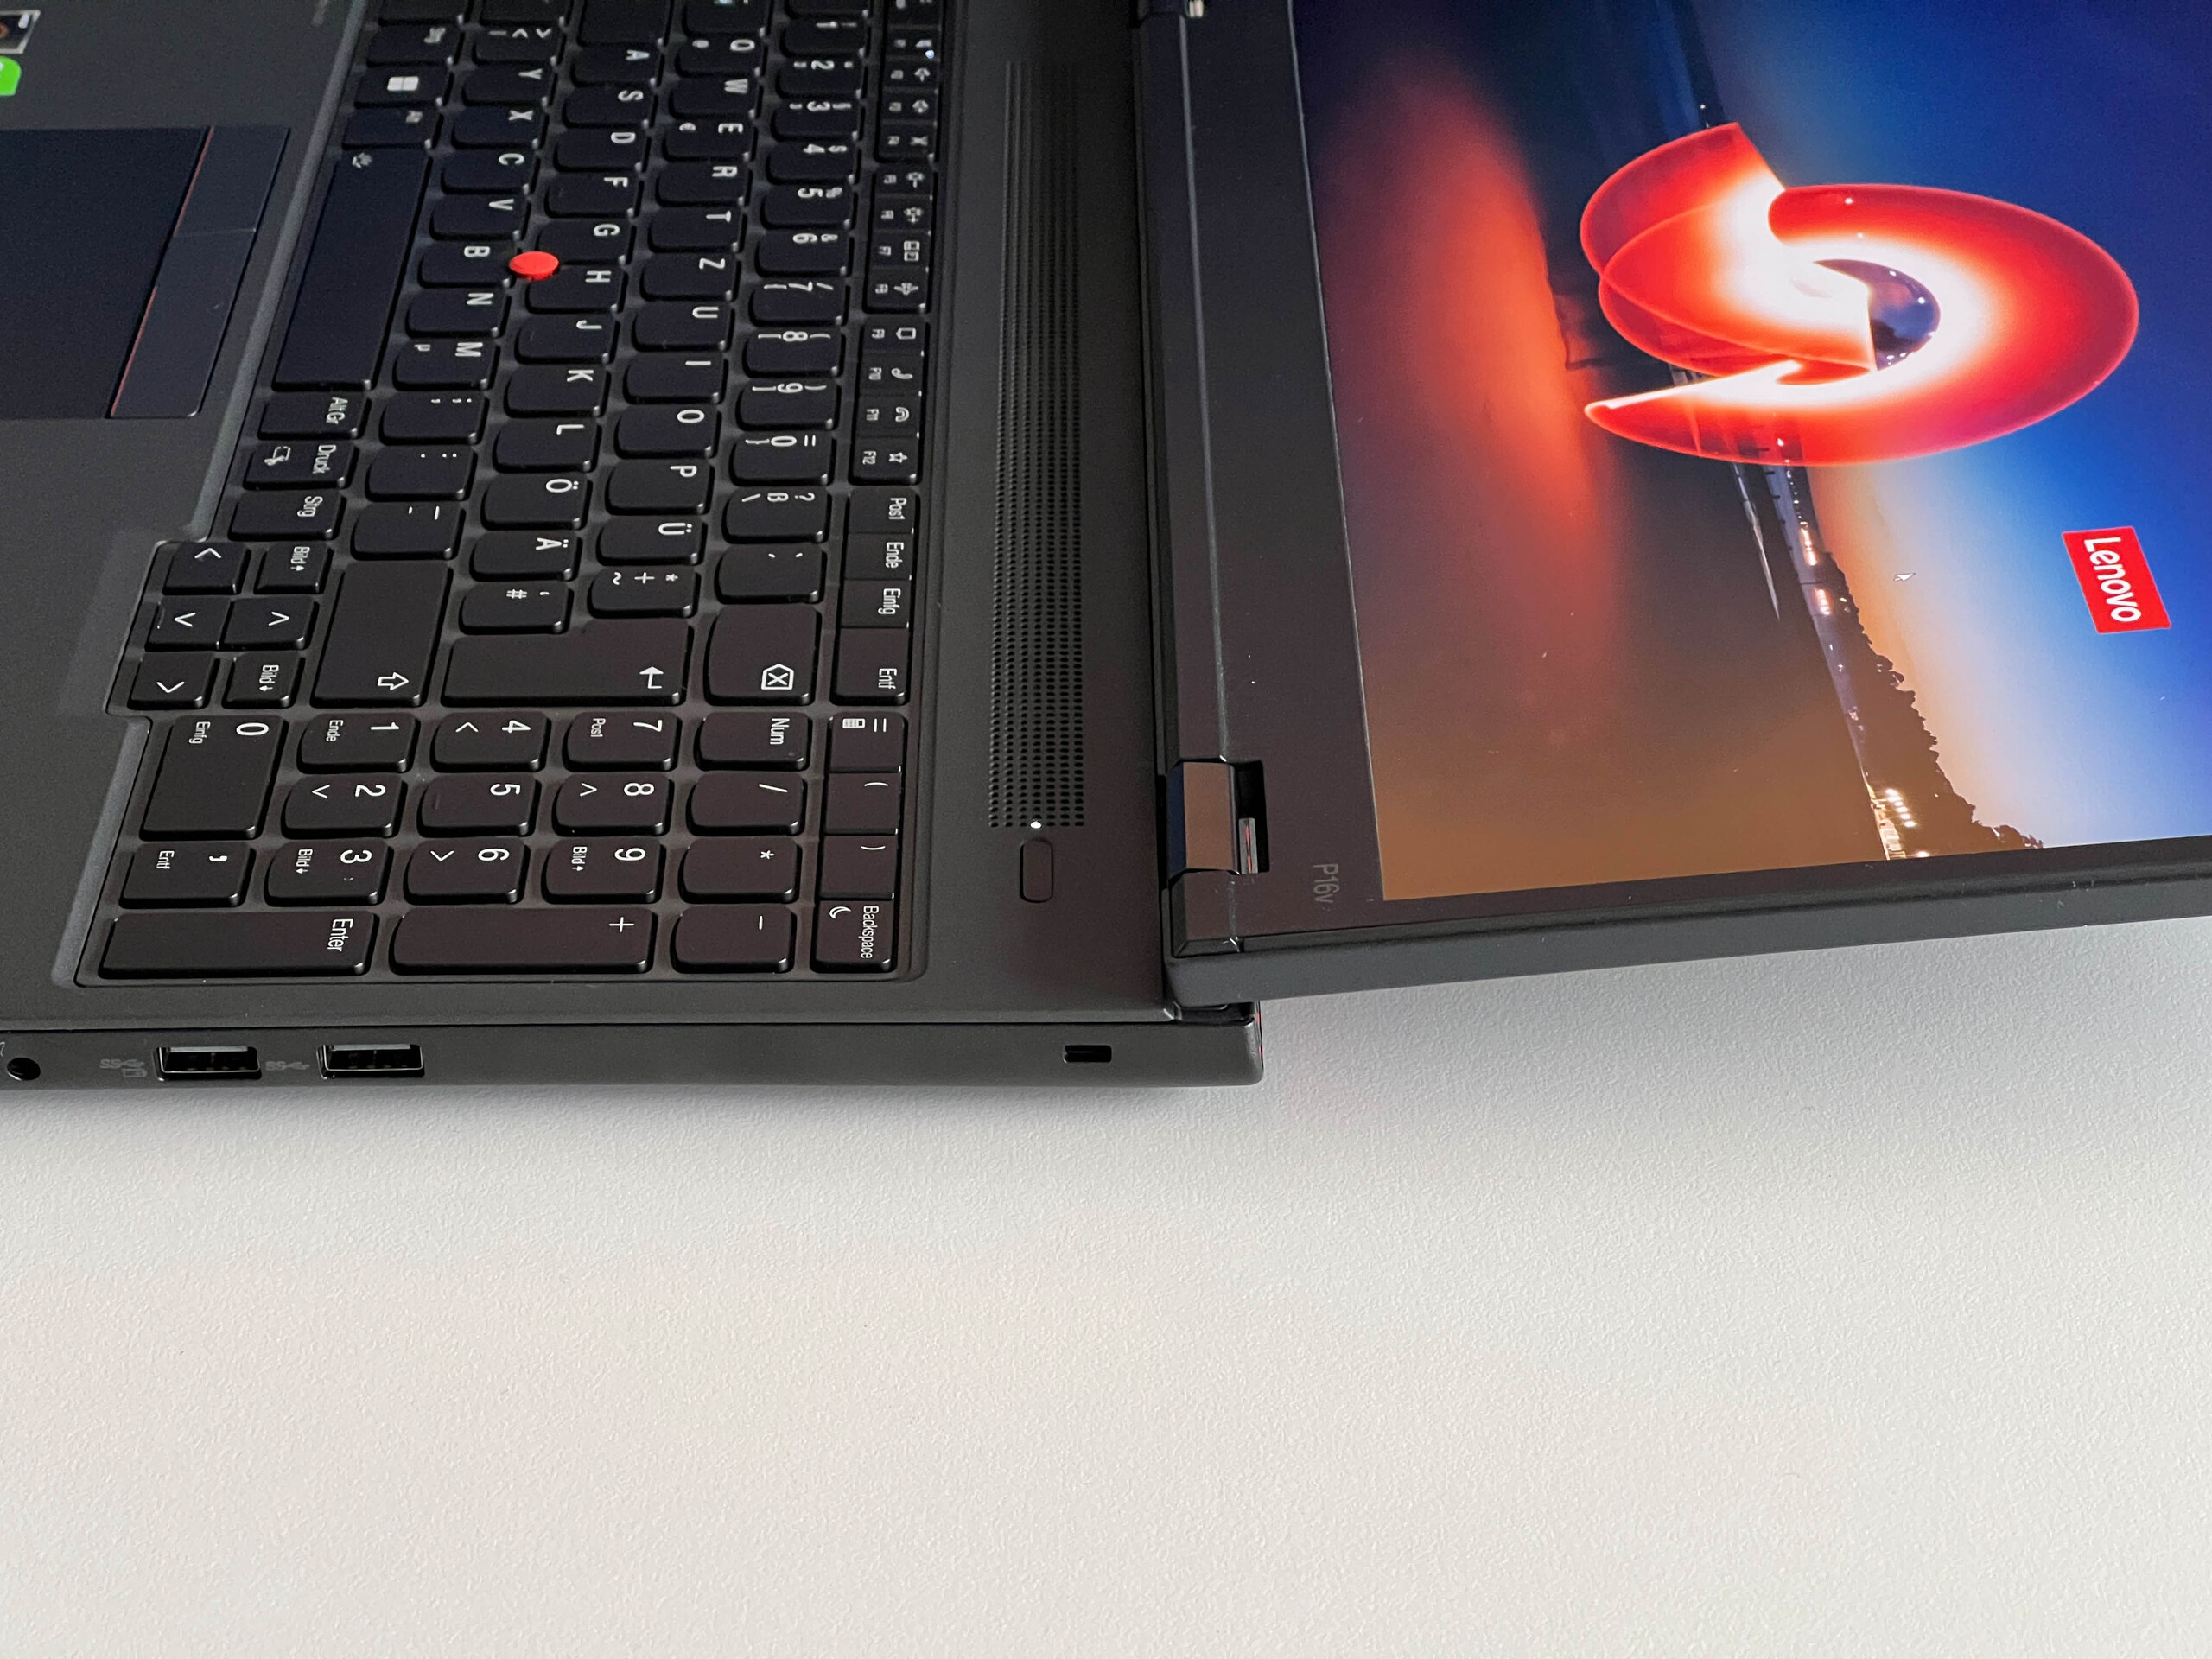
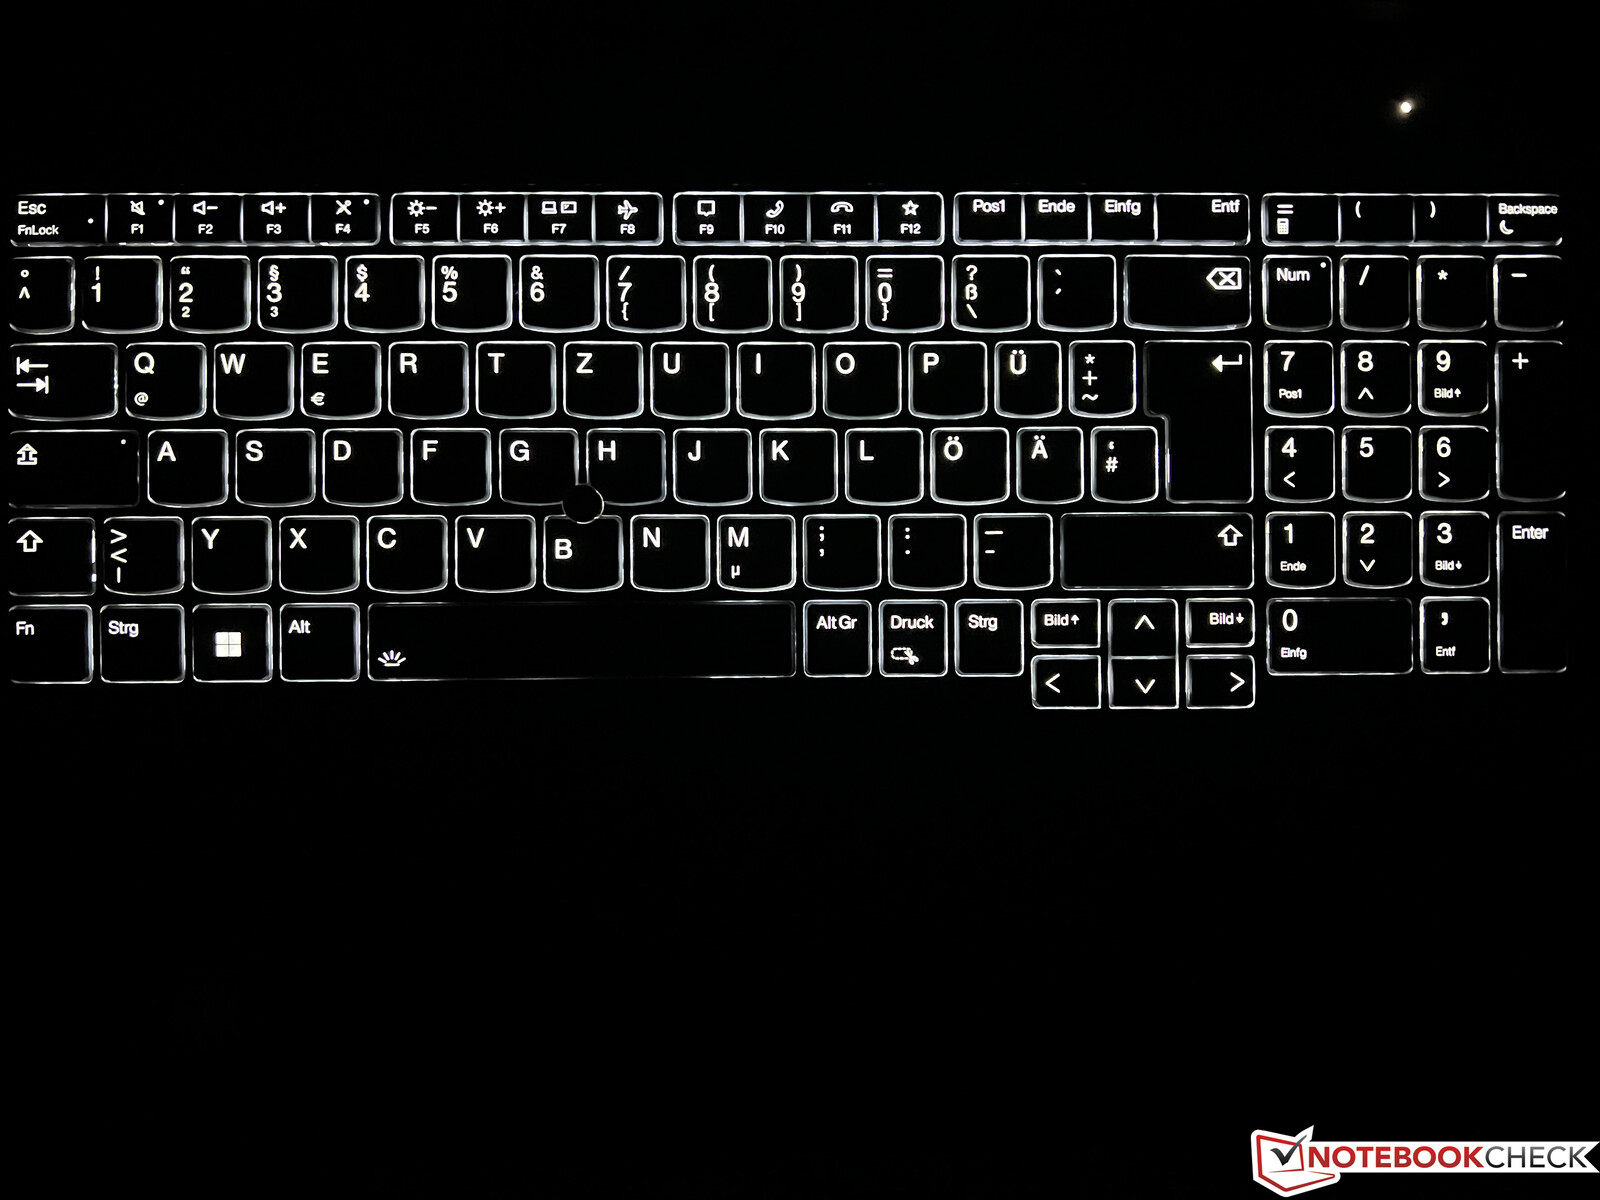
Dispositivi di input - Corsa da 1,5 mm e tastierino numerico
I dispositivi di input del P16v G1 sono simili a quelli del P16 normale per quanto riguarda il layout e il meccanismo, a parte il fatto che la tastiera del P16v è nera anziché grigio scuro. La corsa dei tasti misura circa 1,5 mm ed è quindi in linea con l'attuale standard ThinkPad. Detto questo, è un peccato che Lenovo abbia smesso di utilizzare le tastiere molto superiori con una corsa di 1,8 mm anche sulle workstation di grandi dimensioni. Nel complesso, la tastiera non è affatto terribile, ma in definitiva il P16v G1 non ha più alcun vantaggio rispetto a dispositivi concorrenti come l'HP ZBook Power G10 in questo senso. La tastiera del ThinkPad ha una retroilluminazione bianca con due livelli di luminosità; il pulsante di accensione (in alto a destra) funge anche da scanner di impronte digitali.
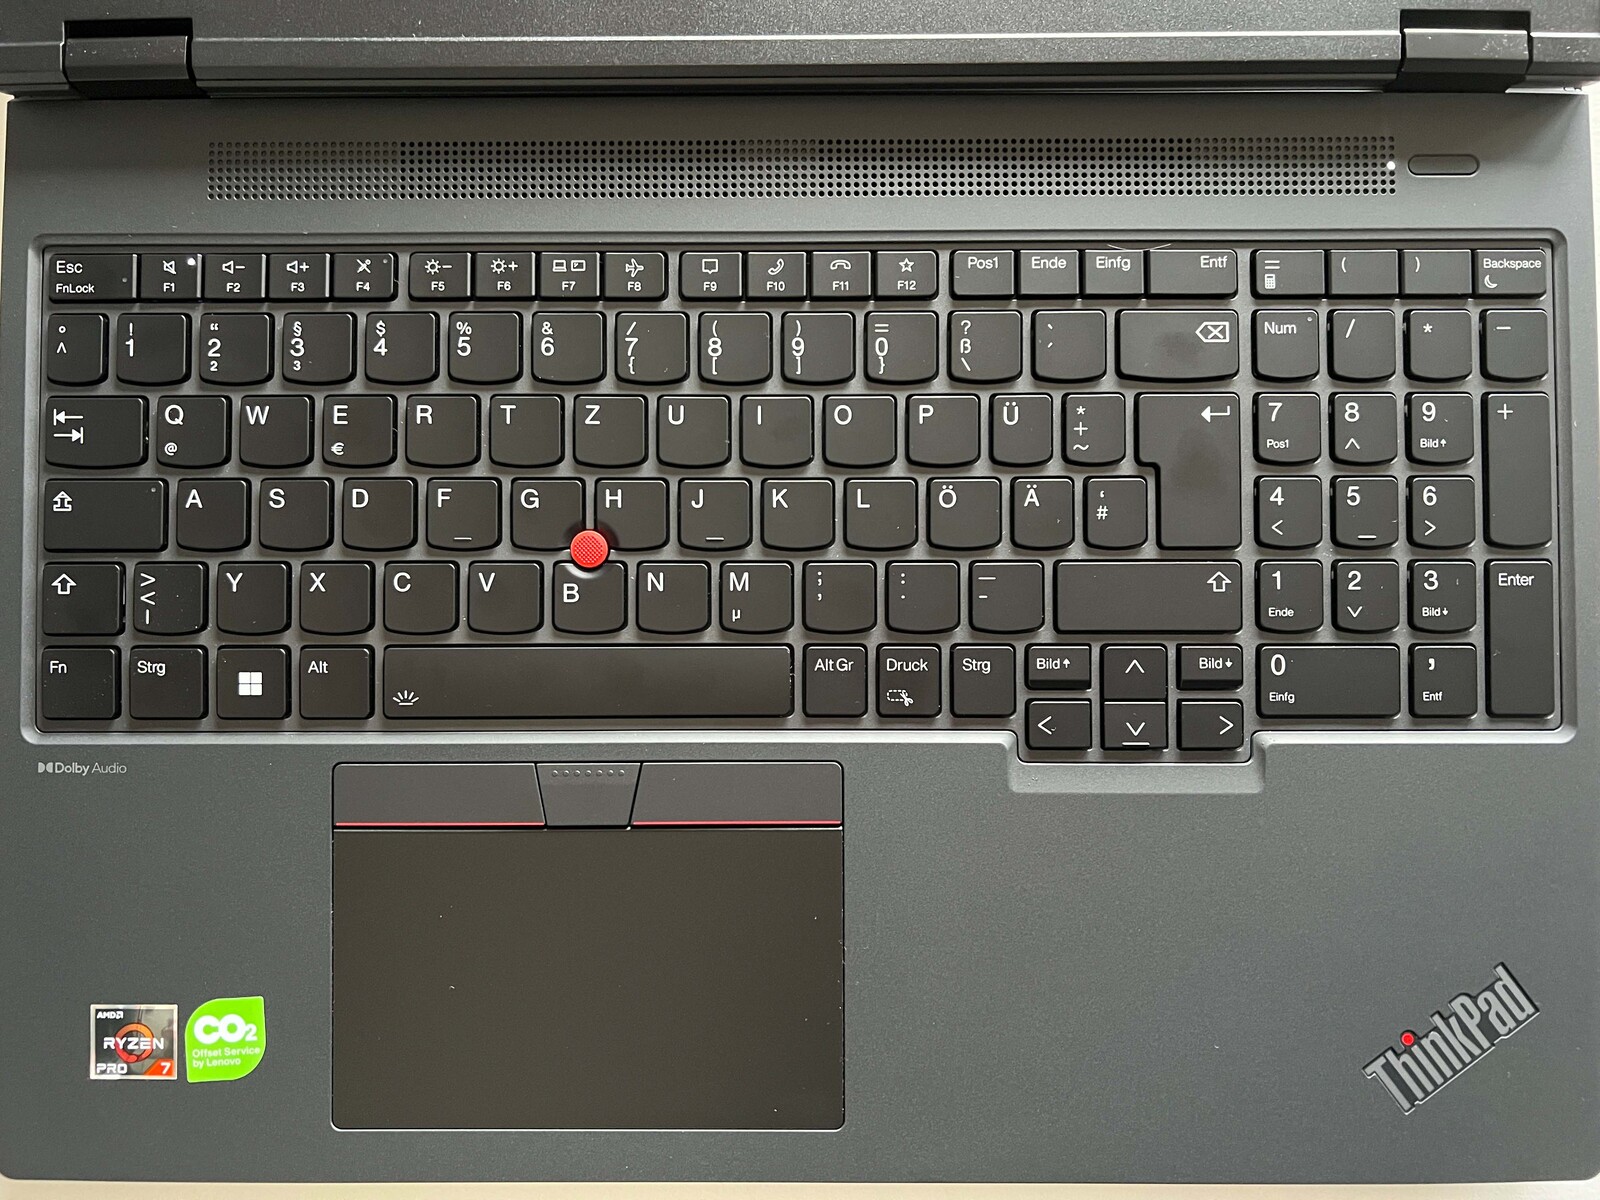
Gli utenti possono spostare il puntatore del mouse utilizzando il ClickPad o il TrackPoint. Il ClickPad è leggermente spostato a sinistra e offre spazio sufficiente per gli input (11,5 x 6,8 cm, o 4,5 x 2,7 pollici), ma prevedibilmente è stato riservato un po' di spazio per i pulsanti dedicati del TrackPoint. Il pad funziona bene e non ci ha dato problemi, anche se i suoni di scatto sono piuttosto forti. Questo vale anche per i pulsanti del TrackPoint precedentemente menzionati, che sembrano molto economici. Ma il TrackPoint in sé funziona perfettamente una volta che ci si abitua.
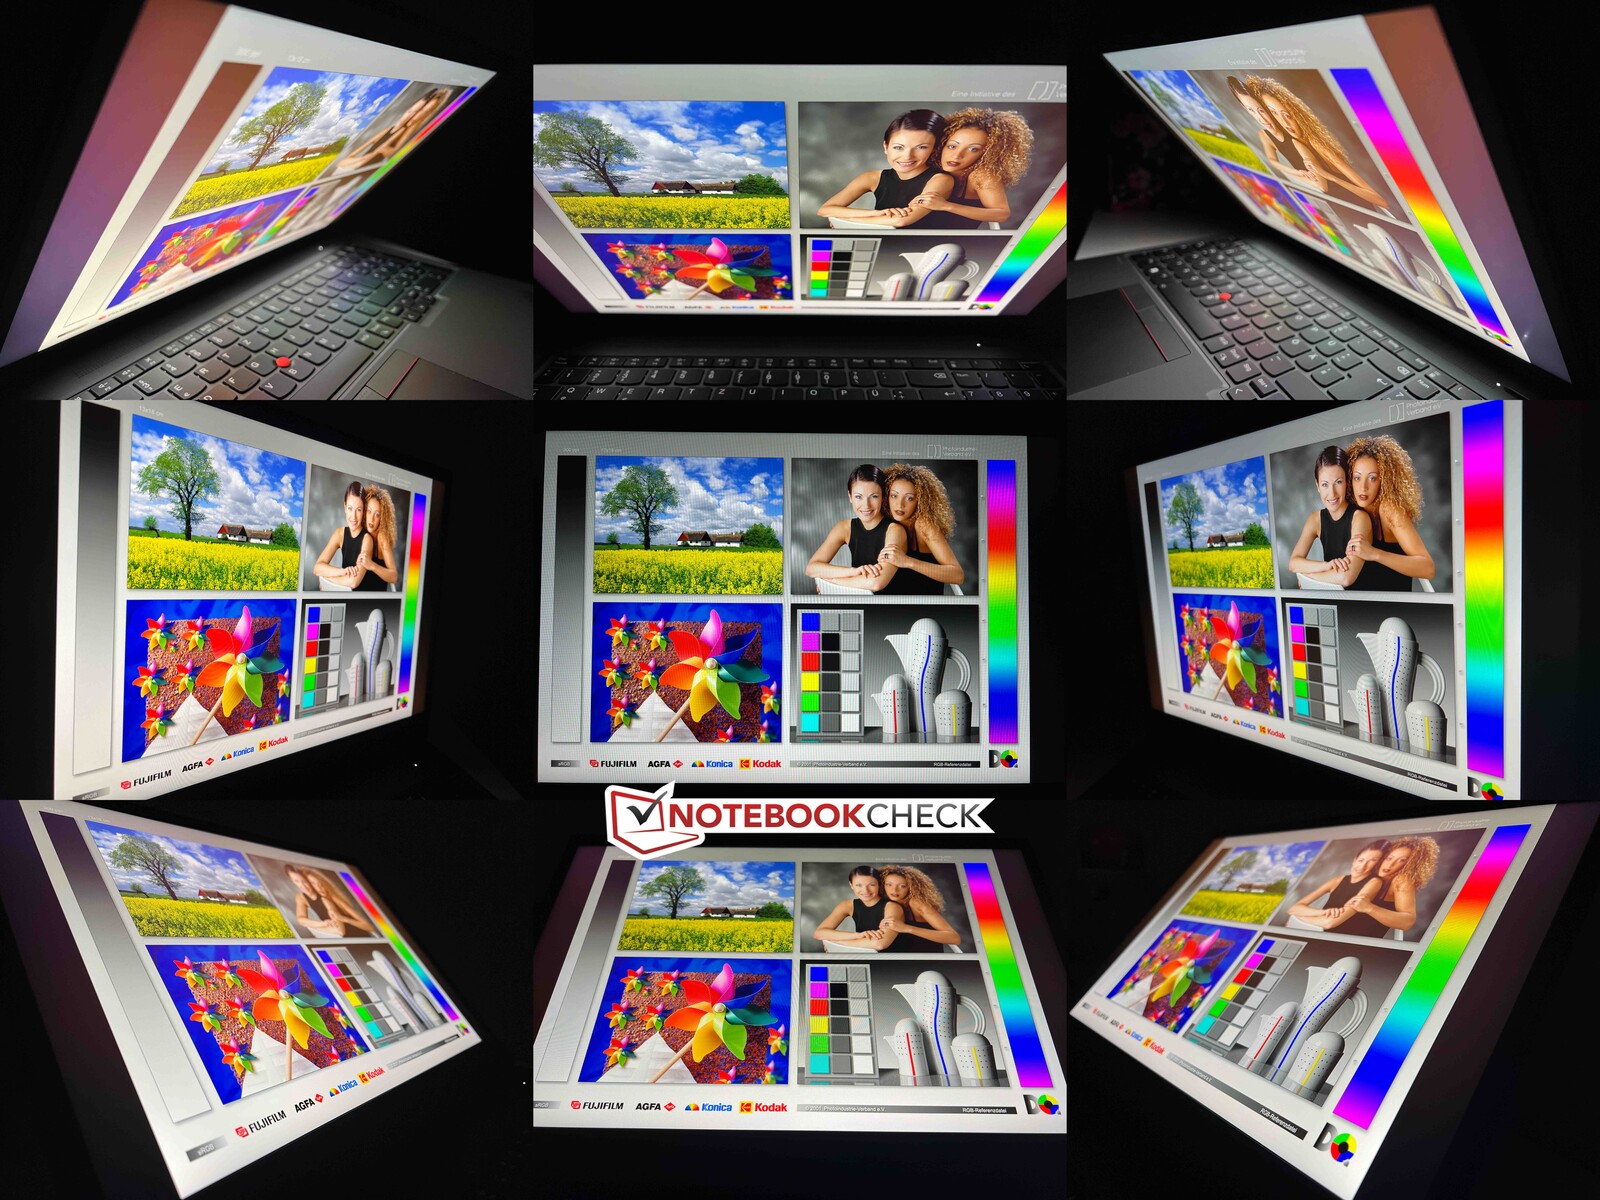
Display - Pannello IPS opaco
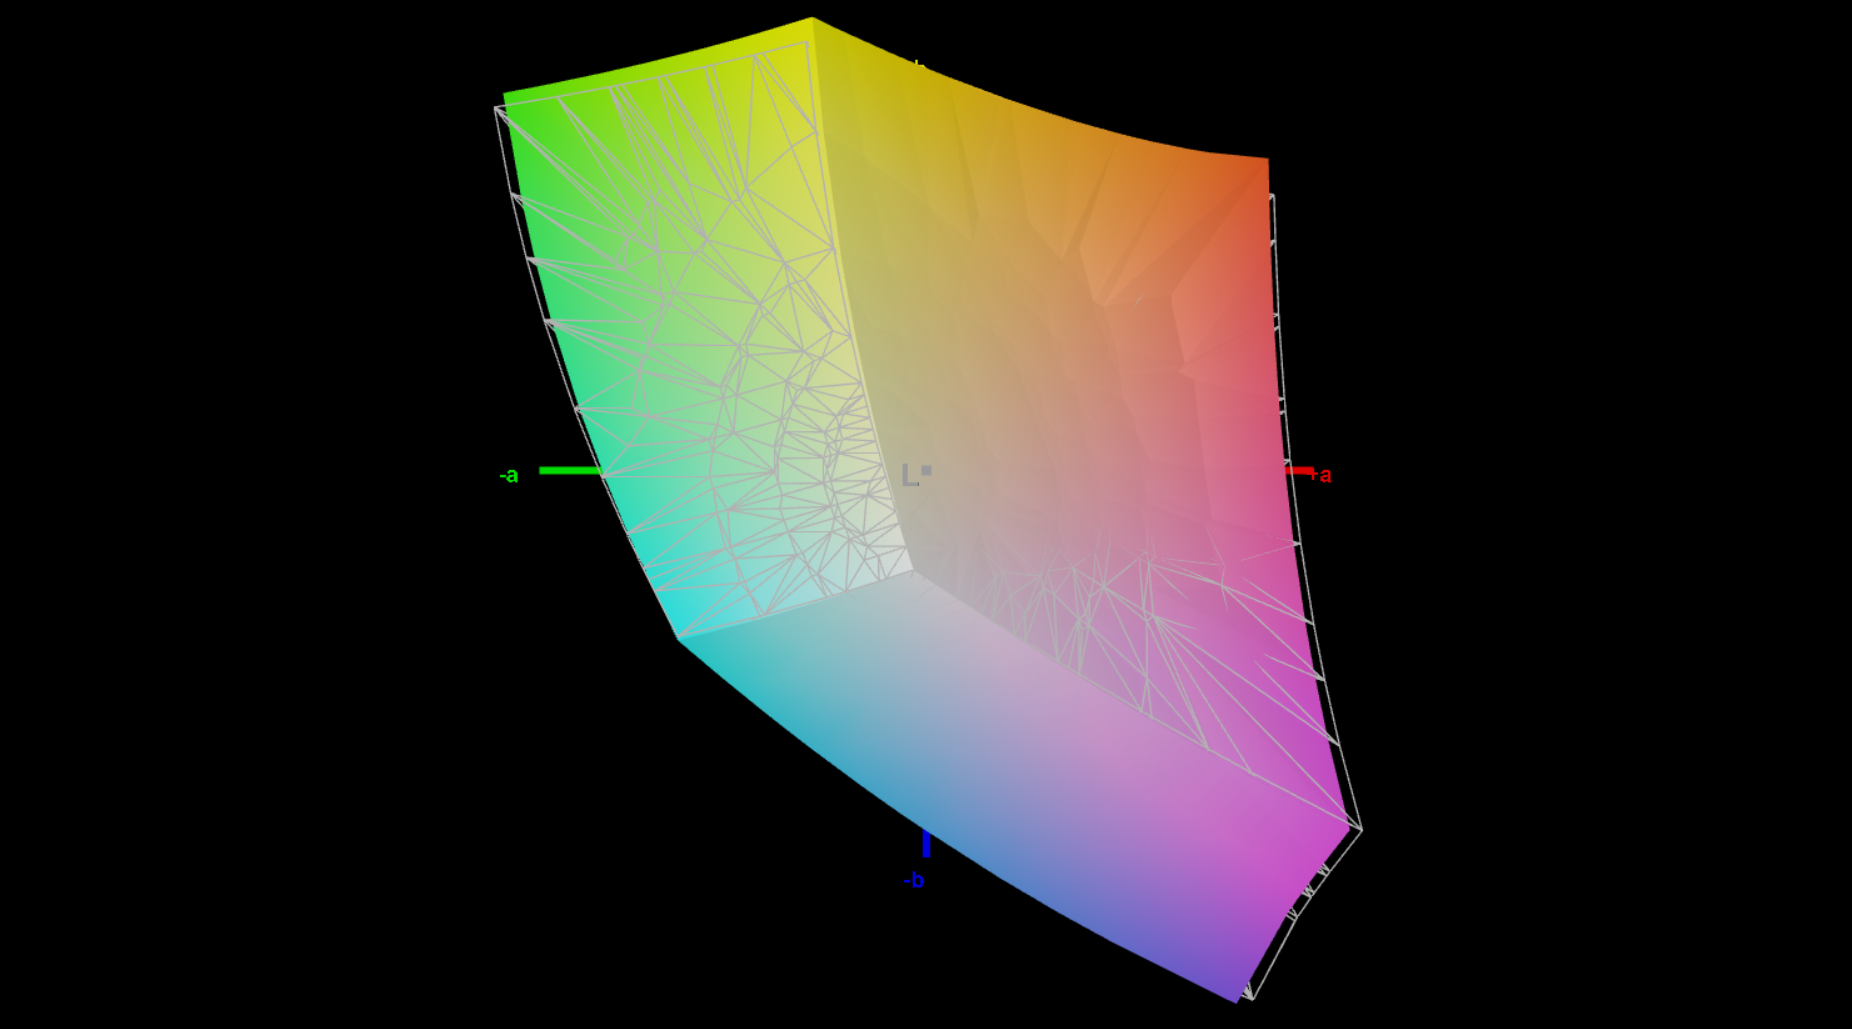
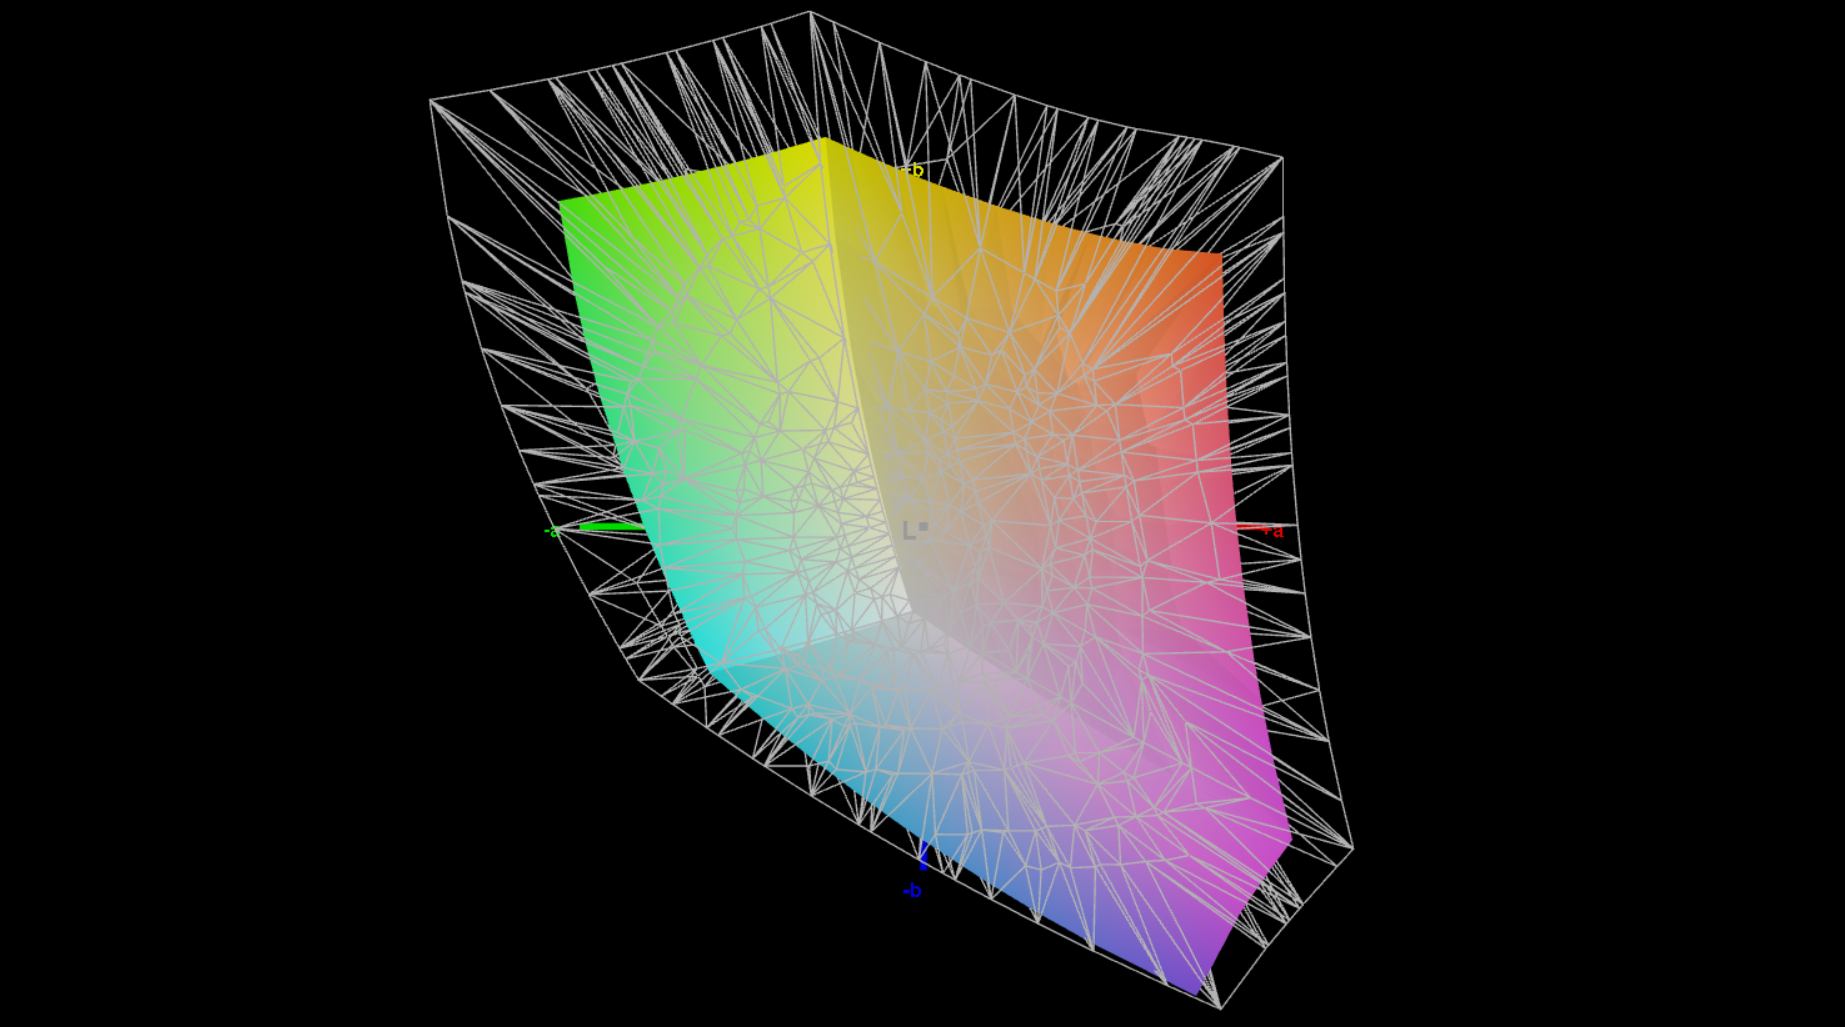
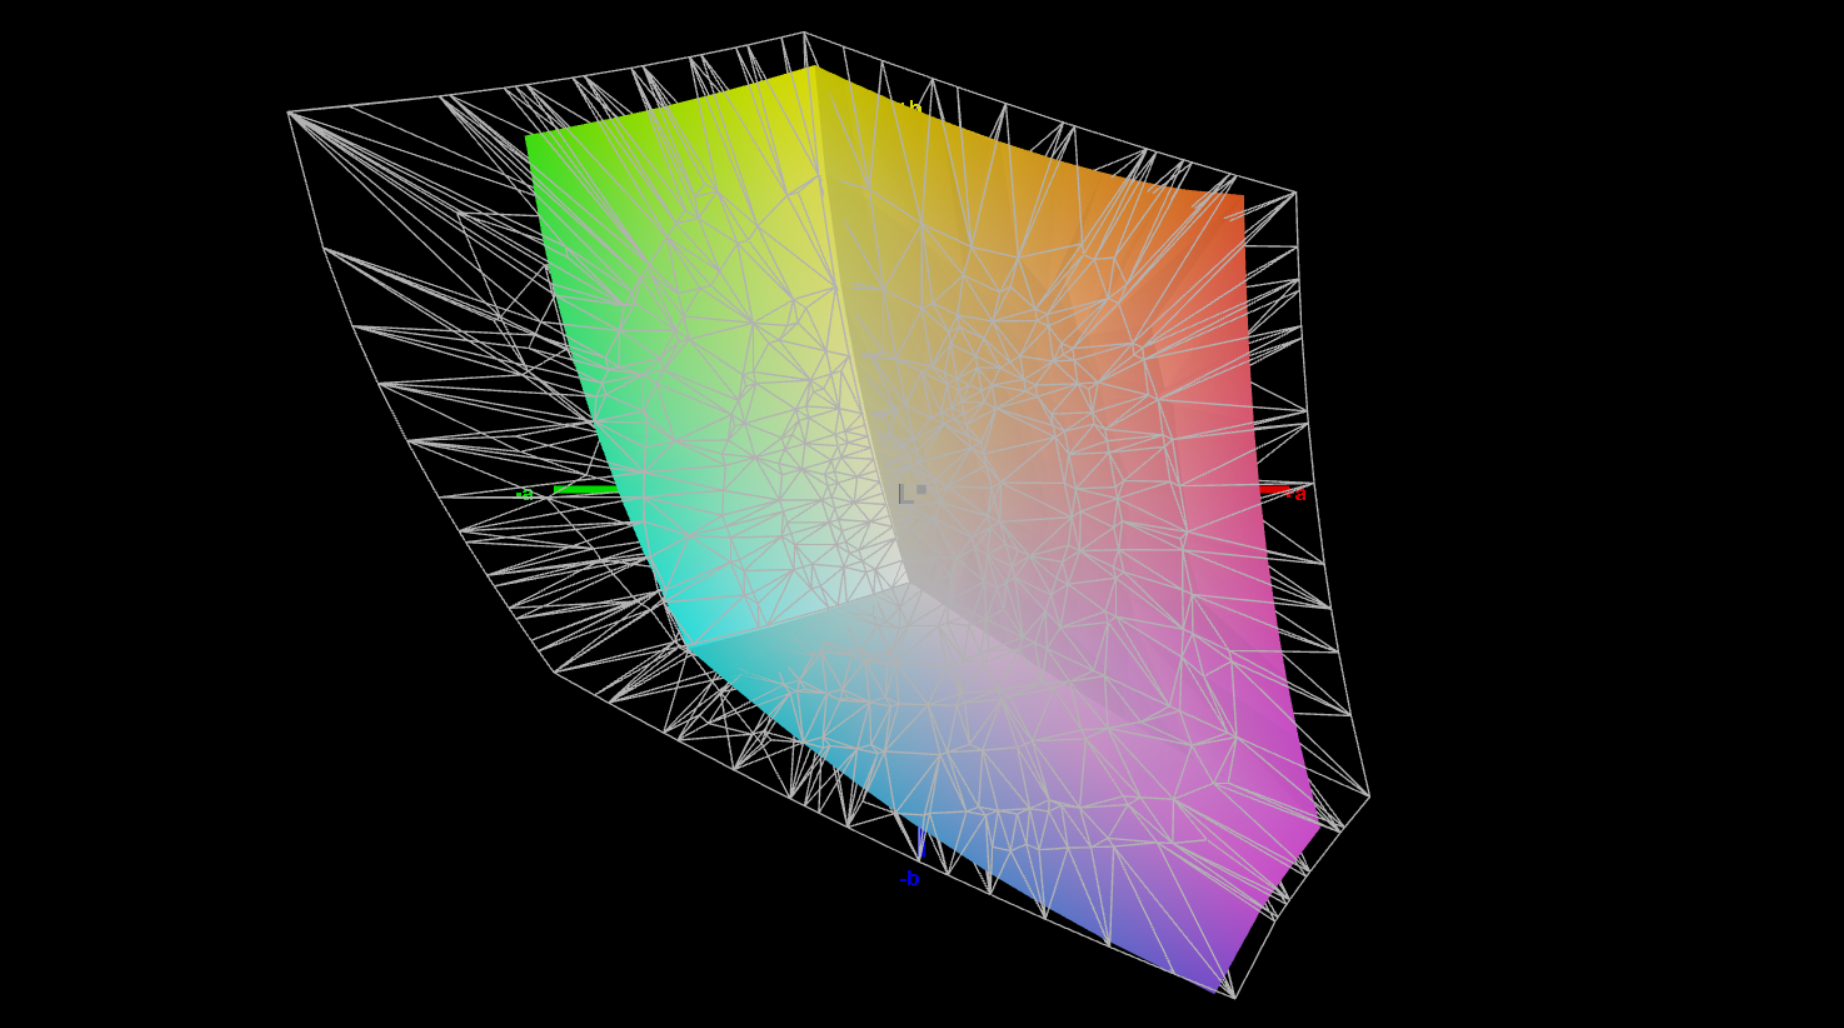
Lenovo offre un totale di quattro opzioni di display per il ThinkPad P16v G1. Per impostazione predefinita, il portatile è dotato di un pannello IPS opaco con una risoluzione di 1.920 x 1.200, una luminosità di picco di 300 nit e una copertura NTSC del 45%. È inoltre possibile scegliere di avere questo display con funzionalità touchscreen. La nostra unità di recensione è dotata del modello opzionale Full HD con copertura sRGB al 100%. Esiste anche un'opzione di pannello 4K con luminosità di picco di 800 nits, copertura completa DCI-P3, calibrazione di fabbrica e supporto HDR.
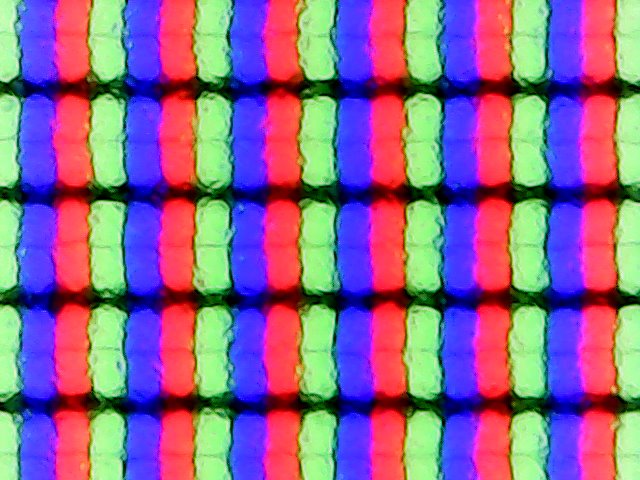
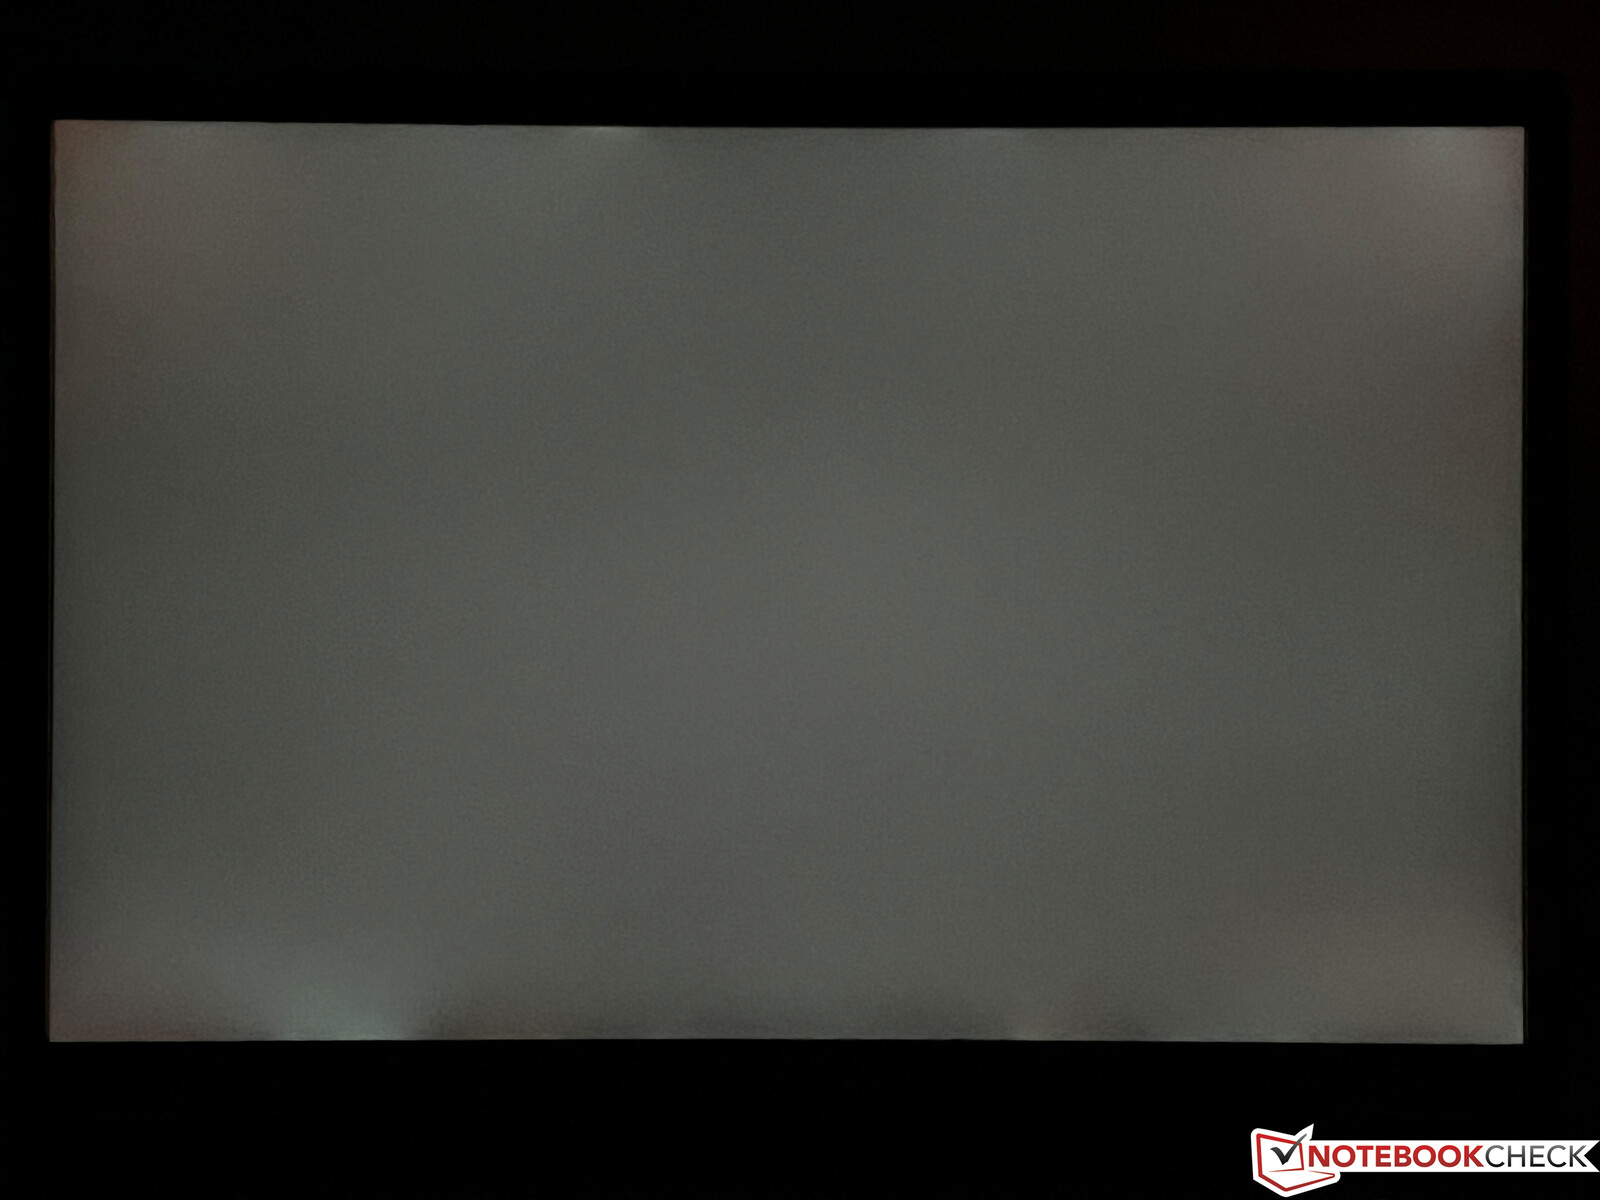
Il pannello a 60 Hz della nostra unità di recensione è prodotto da BOE e offre una qualità d'immagine rispettabile ai nostri occhi. I colori sono adeguatamente vivaci e i contenuti appaiono abbastanza nitidi sullo schermo da 16 pollici. Anche le aree luminose non appaiono sgranate. Tuttavia, i tempi di risposta sono un po' lenti e si noterà anche un leggero ghosting del monitor nell'uso quotidiano, ad esempio quando si sposta il cursore del mouse. Il pannello non utilizza il PWM e presenta solo una minima retroilluminazione alla massima luminosità e su uno sfondo scuro.
La nostra unità di recensione è riuscita a raggiungere un picco medio di luminosità leggermente superiore a 340 cd/m², superando così la luminosità pubblicizzata di 300 cd/m². Questo, insieme al basso livello di nero, si traduce in un superbo rapporto di contrasto massimo superiore a 2.000:1.
| |||||||||||||||||||||||||
Distribuzione della luminosità: 92 %
Al centro con la batteria: 354 cd/m²
Contrasto: 2088:1 (Nero: 0.17 cd/m²)
ΔE ColorChecker Calman: 2.9 | ∀{0.5-29.43 Ø4.71}
calibrated: 1
ΔE Greyscale Calman: 4.7 | ∀{0.09-98 Ø4.96}
69.8% AdobeRGB 1998 (Argyll 3D)
97.7% sRGB (Argyll 3D)
67.8% Display P3 (Argyll 3D)
Gamma: 2.12
CCT: 6356 K
| Lenovo ThinkPad P16v G1 AMD NE160WUM-N64, IPS, 1920x1200, 16" | HP ZBook Power 15 G10 BOE0B6A, IPS, 2560x1440, 15.6" | Lenovo ThinkPad P15v G3 21EM001AGE NE156QUM-N6C, IPS LED, 3840x2160, 15.6" | Dell Precision 7670 Samsung 160YV03, OLED, 3840x2400, 16" | Lenovo ThinkPad P1 G6-21FV000DGE NE160QDM-NY1, IPS, 2560x1600, 16" | Lenovo ThinkPad P16 G1 21D6001DMB NE160QDM-N63 , IPS LED, 2560x1600, 16" | |
|---|---|---|---|---|---|---|
| Display | 0% | 26% | 30% | 0% | 4% | |
| Display P3 Coverage (%) | 67.8 | 68.2 1% | 89.9 33% | 99.9 47% | 68.1 0% | 71.5 5% |
| sRGB Coverage (%) | 97.7 | 95.6 -2% | 100 2% | 100 2% | 97.5 0% | 100 2% |
| AdobeRGB 1998 Coverage (%) | 69.8 | 70.5 1% | 99.9 43% | 97.5 40% | 70.2 1% | 73.3 5% |
| Response Times | 67% | 2% | 94% | 68% | 12% | |
| Response Time Grey 50% / Grey 80% * (ms) | 50.6 ? | 13 ? 74% | 46.7 ? 8% | 1.9 ? 96% | 13.7 ? 73% | 37.7 ? 25% |
| Response Time Black / White * (ms) | 26 ? | 10.4 ? 60% | 27.3 ? -5% | 2 ? 92% | 9.6 ? 63% | 26.3 ? -1% |
| PWM Frequency (Hz) | 59.5 ? | |||||
| Screen | -21% | -20% | -1% | 14% | 4% | |
| Brightness middle (cd/m²) | 355 | 313.8 -12% | 588 66% | 340.1 -4% | 521 47% | 424 19% |
| Brightness (cd/m²) | 344 | 302 -12% | 536 56% | 342 -1% | 484 41% | 398 16% |
| Brightness Distribution (%) | 92 | 83 -10% | 83 -10% | 98 7% | 89 -3% | 90 -2% |
| Black Level * (cd/m²) | 0.17 | 0.29 -71% | 0.38 -124% | 0.36 -112% | 0.24 -41% | |
| Contrast (:1) | 2088 | 1082 -48% | 1547 -26% | 1447 -31% | 1767 -15% | |
| Colorchecker dE 2000 * | 2.9 | 3.27 -13% | 3.9 -34% | 2.5 14% | 1.2 59% | 2.6 10% |
| Colorchecker dE 2000 max. * | 5.6 | 7.81 -39% | 8.8 -57% | 8.19 -46% | 2.5 55% | 4.9 12% |
| Colorchecker dE 2000 calibrated * | 1 | 0.56 44% | 1 -0% | 1 -0% | 0.8 20% | |
| Greyscale dE 2000 * | 4.7 | 5.9 -26% | 7.1 -51% | 3.5 26% | 1.4 70% | 4.1 13% |
| Gamma | 2.12 104% | 2.18 101% | 2.12 104% | 2.12 104% | 2.25 98% | 2.13 103% |
| CCT | 6356 102% | 6323 103% | 7268 89% | 6704 97% | 6682 97% | 7252 90% |
| Media totale (Programma / Settaggio) | 15% /
-4% | 3% /
-7% | 41% /
25% | 27% /
19% | 7% /
5% |
* ... Meglio usare valori piccoli
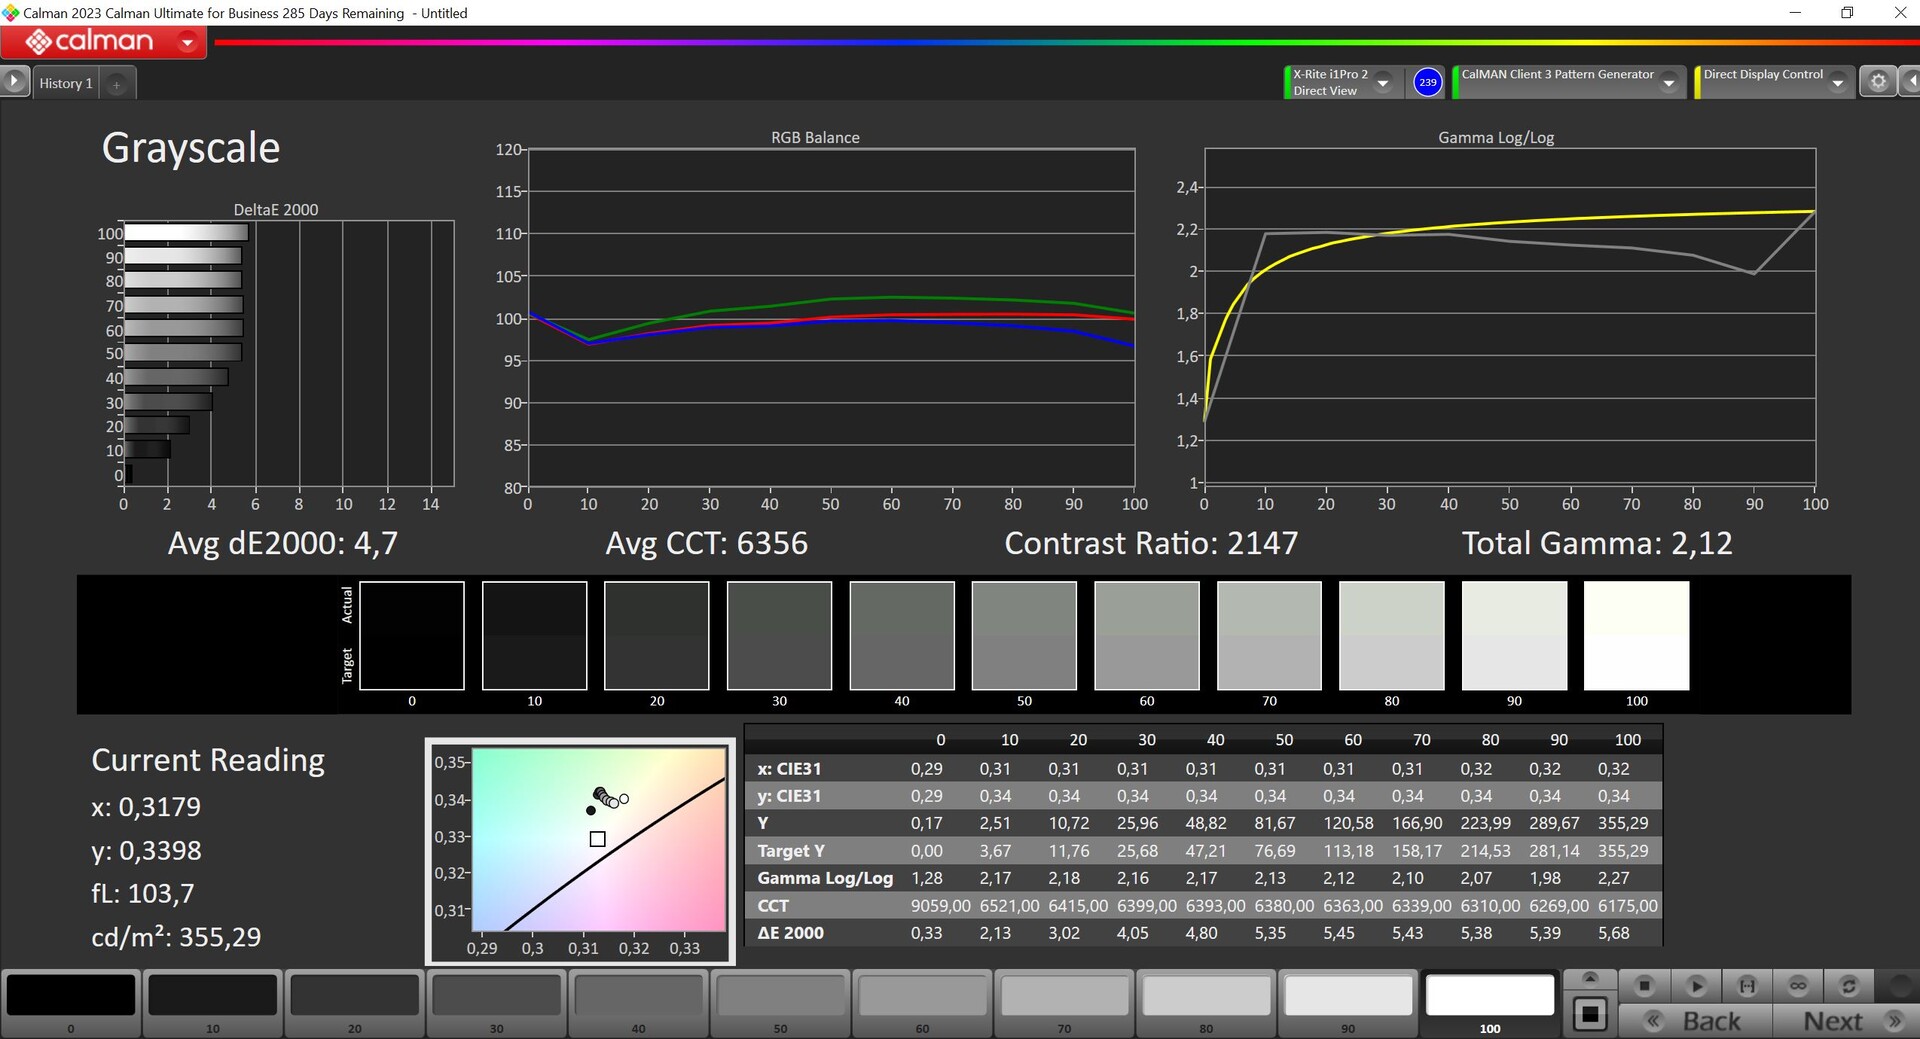
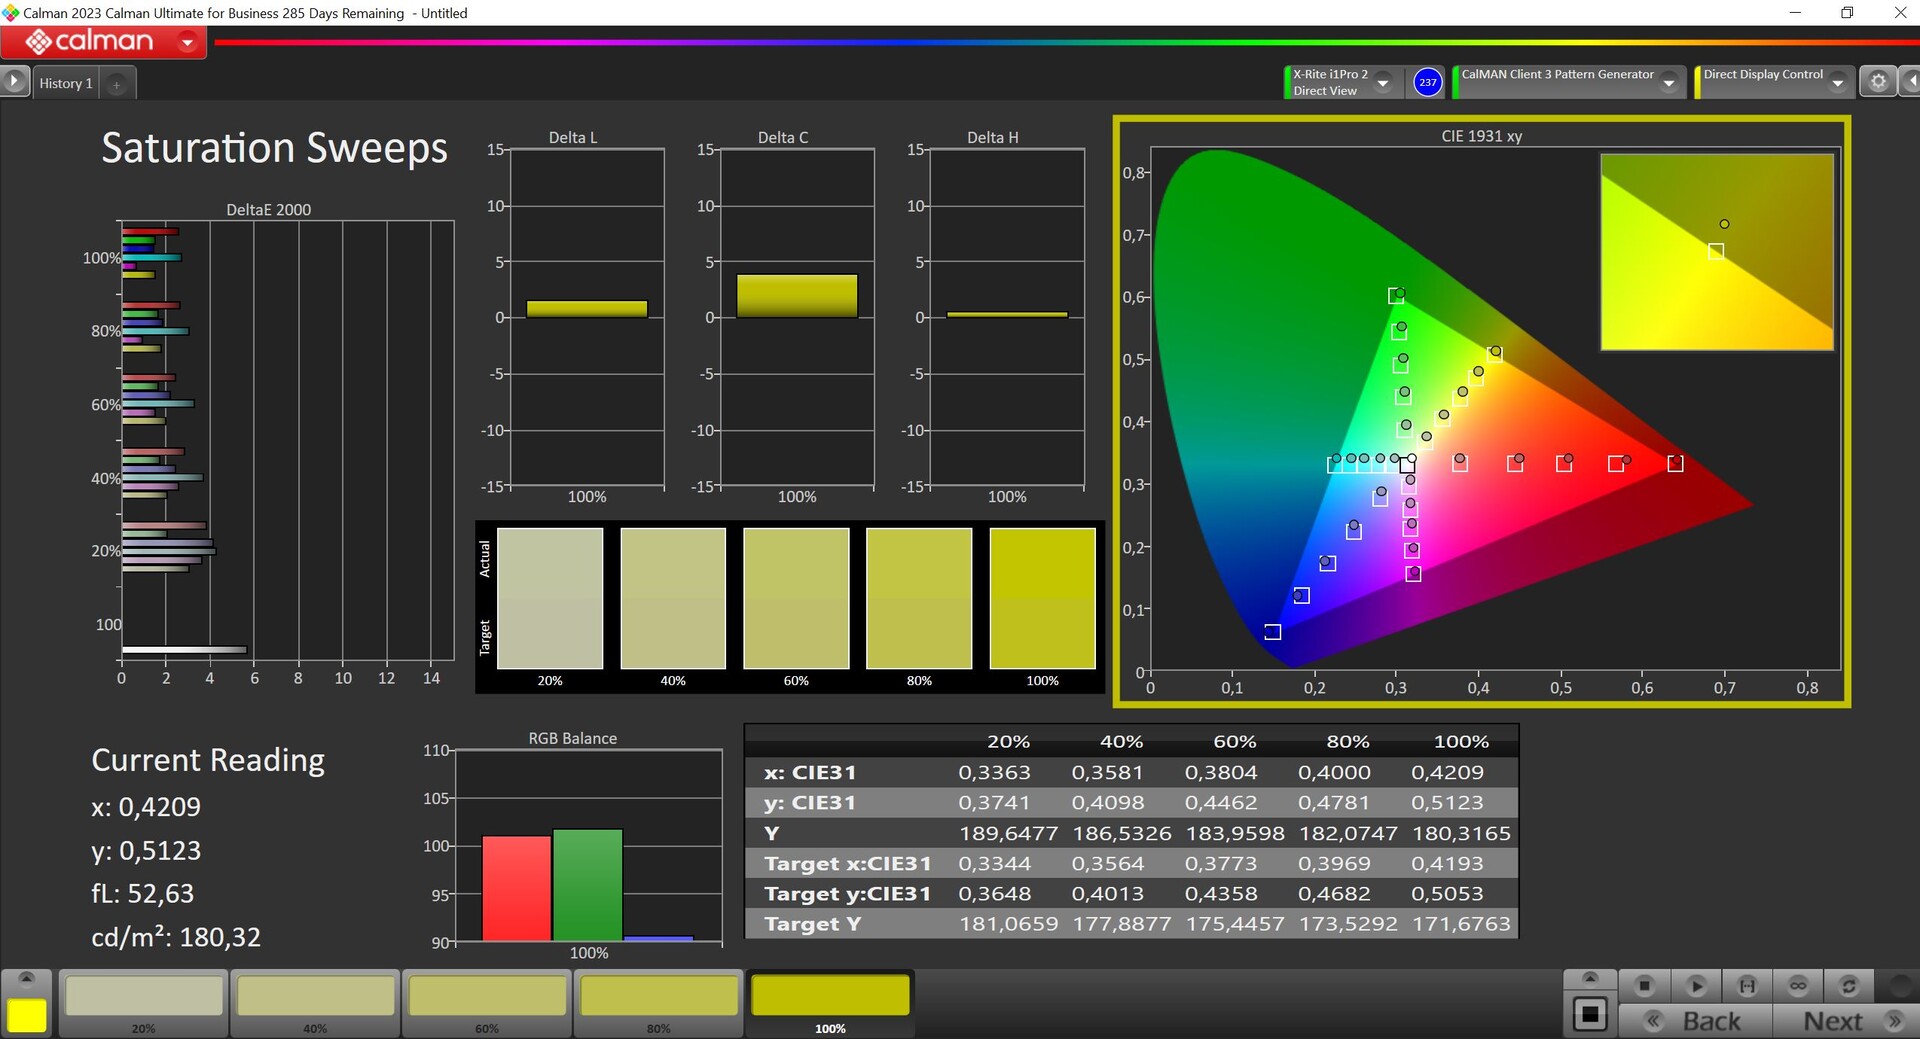
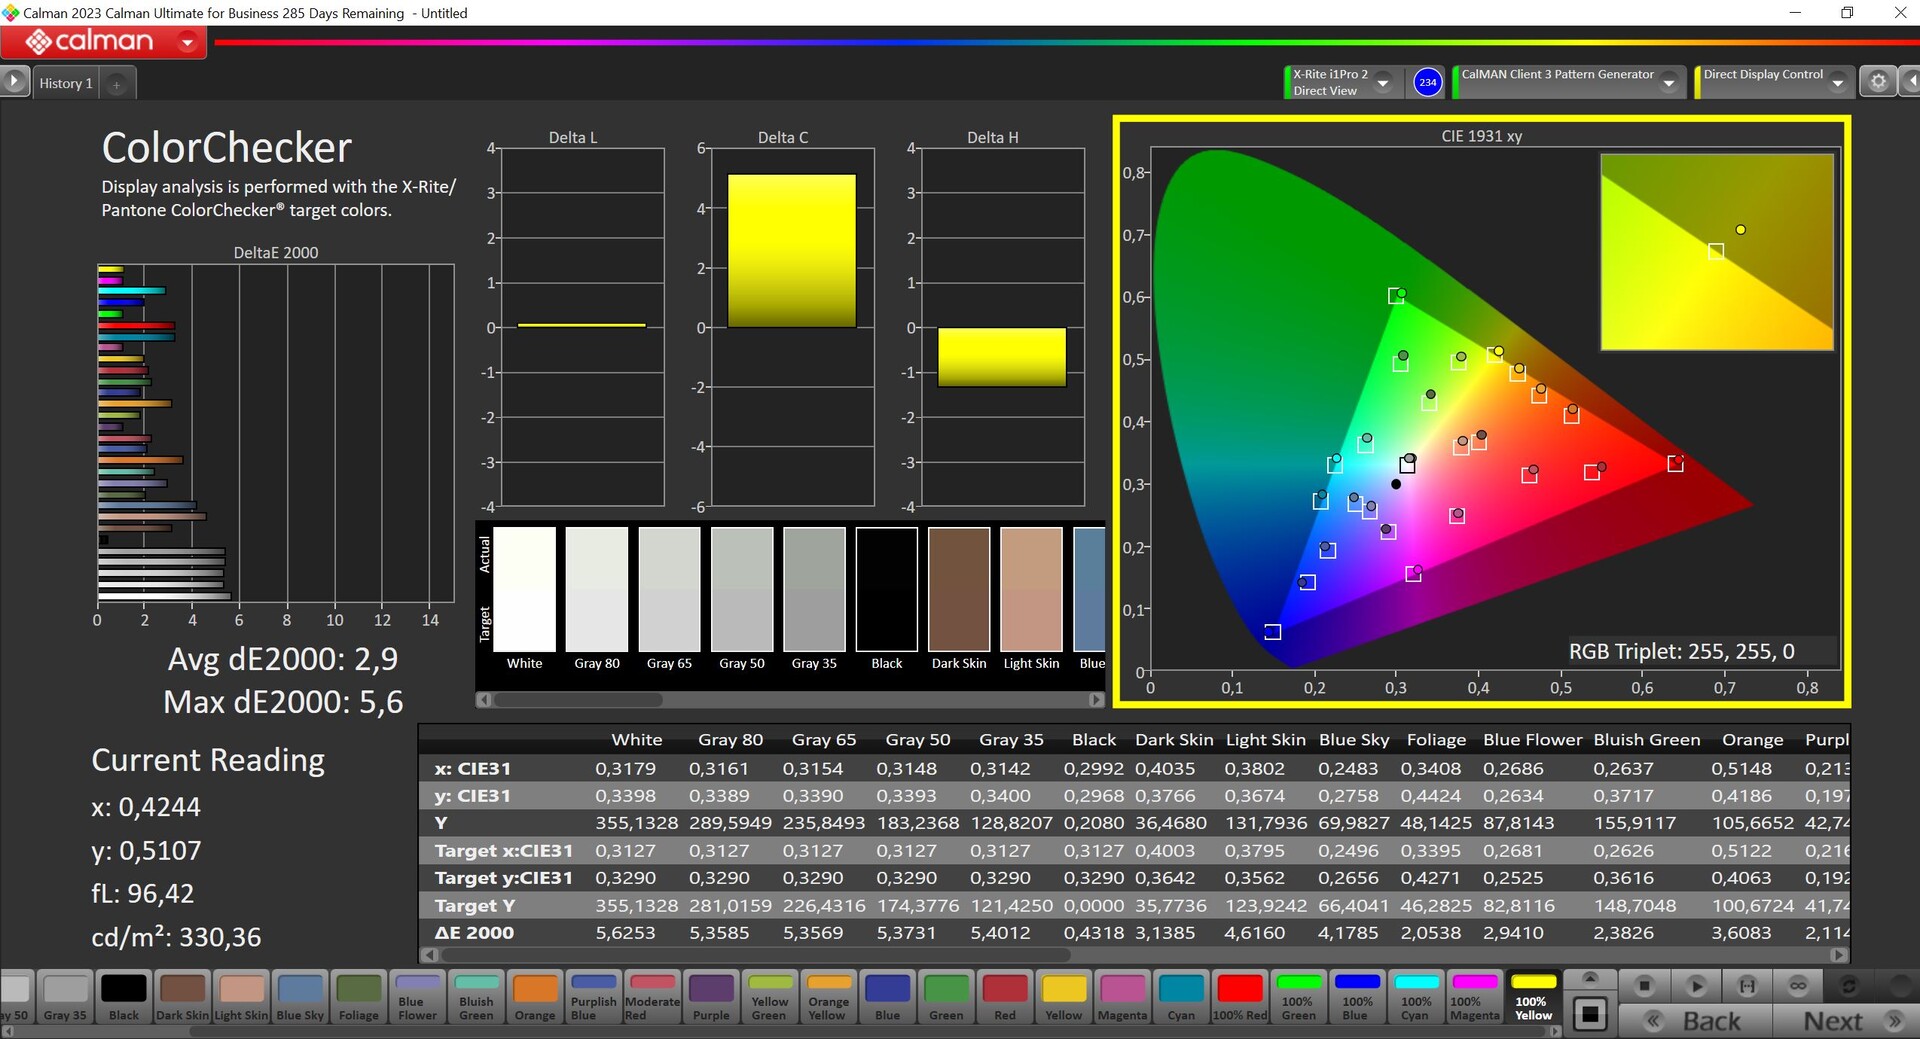
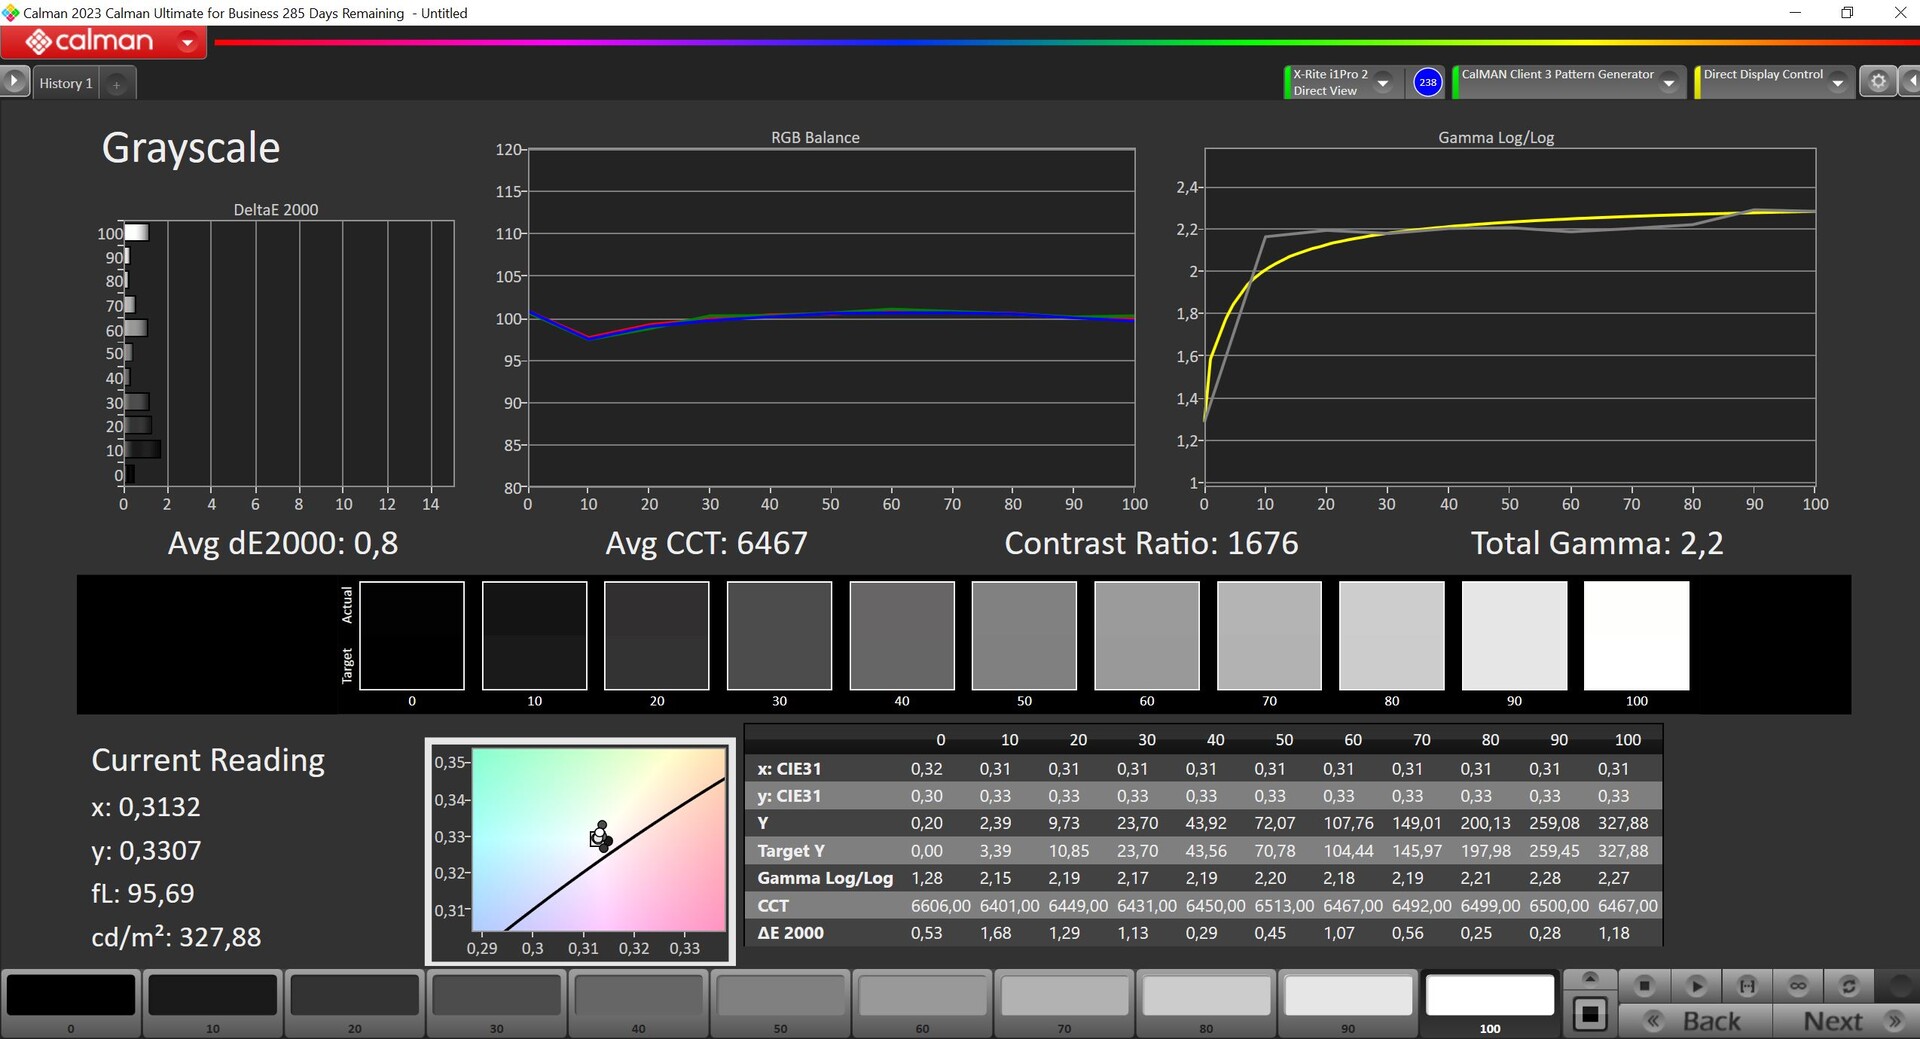
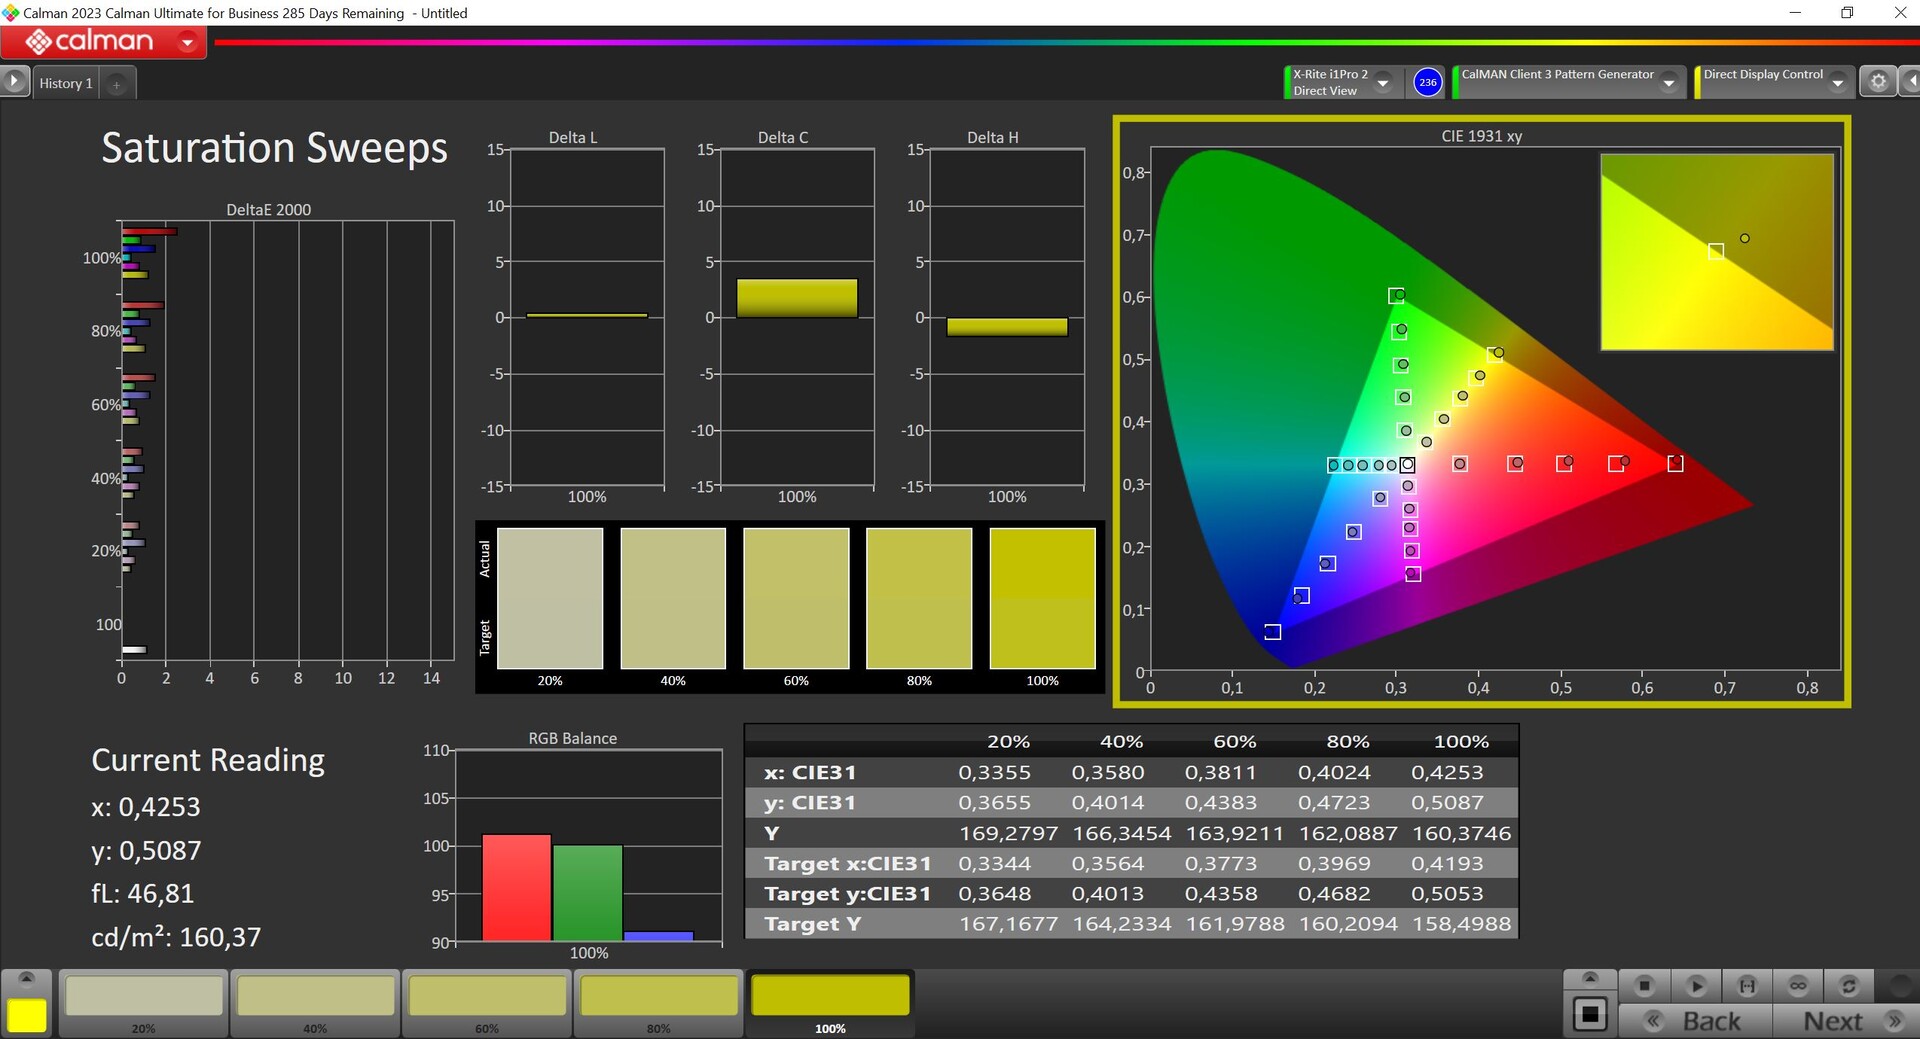
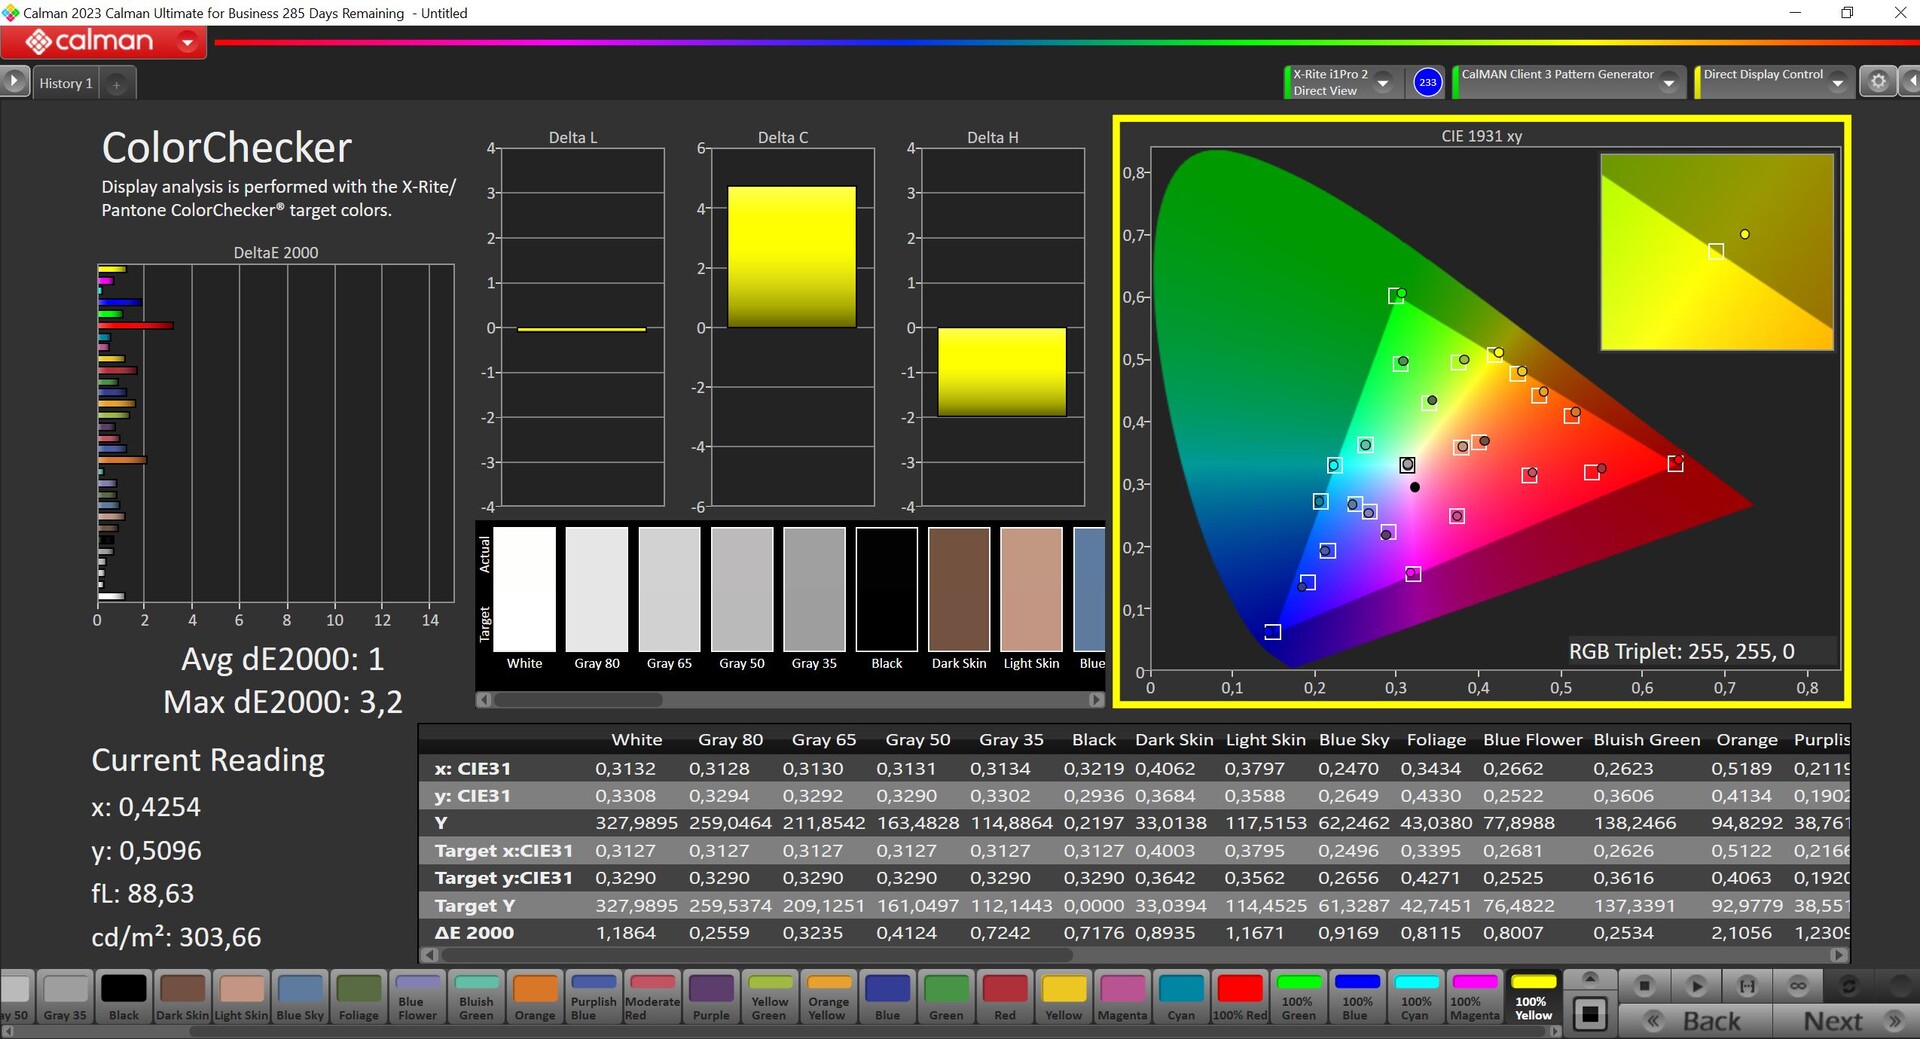
Abbiamo misurato il pannello utilizzando il software professionale CalMAN (X-Rite i1 Pro2) e abbiamo riscontrato che c'è ancora margine di miglioramento fin dall'inizio. Abbiamo identificato una leggera sfumatura verde e deviazioni della scala di grigi superiori al nostro valore target di 3. C'erano anche alcuni valori anomali per quanto riguarda i colori. Dopo aver eseguito la nostra calibrazione (il profilo corrispondente è disponibile come download gratuito qui sopra), siamo riusciti a migliorare notevolmente la riproduzione dei colori del display. Solo il 100% di rosso era marginalmente al di sopra del valore target, con un DeltaE 2000 di 3,2. Tuttavia, in combinazione con la copertura sRGB quasi completa, è ancora possibile modificare foto e video sul display.
Tempi di risposta del Display
| ↔ Tempi di risposta dal Nero al Bianco | ||
|---|---|---|
| 26 ms ... aumenta ↗ e diminuisce ↘ combinato | ↗ 12.7 ms Incremento | 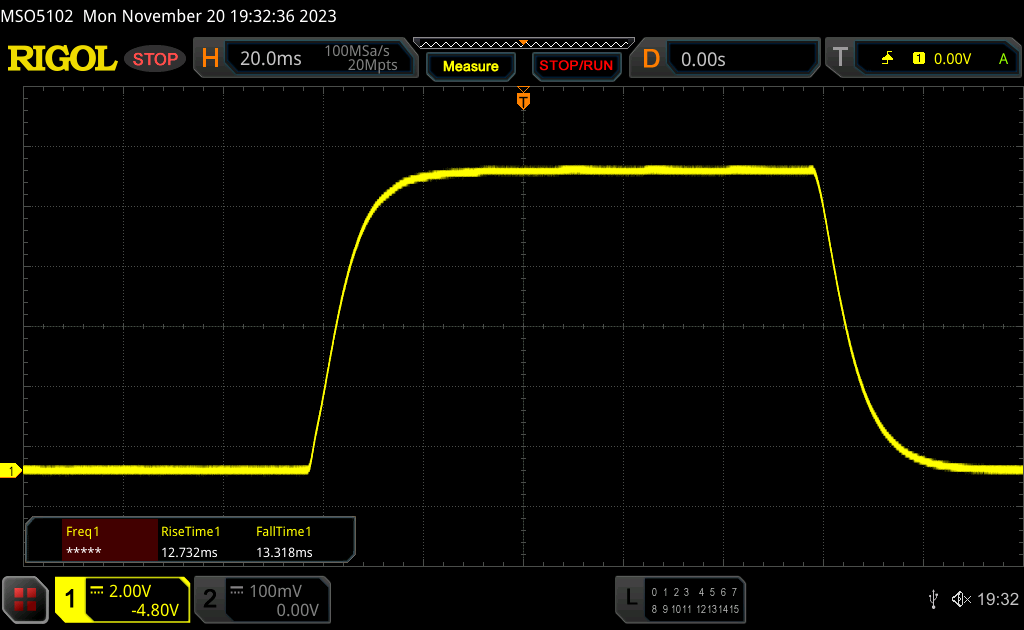 |
| ↘ 13.3 ms Calo | ||
| Lo schermo mostra tempi di risposta relativamente lenti nei nostri tests e potrebbe essere troppo lento per i gamers. In confronto, tutti i dispositivi di test variano da 0.1 (minimo) a 240 (massimo) ms. » 63 % di tutti i dispositivi è migliore. Questo significa che i tempi di risposta rilevati sono peggiori rispetto alla media di tutti i dispositivi testati (19.8 ms). | ||
| ↔ Tempo di risposta dal 50% Grigio all'80% Grigio | ||
| 50.6 ms ... aumenta ↗ e diminuisce ↘ combinato | ↗ 23 ms Incremento | 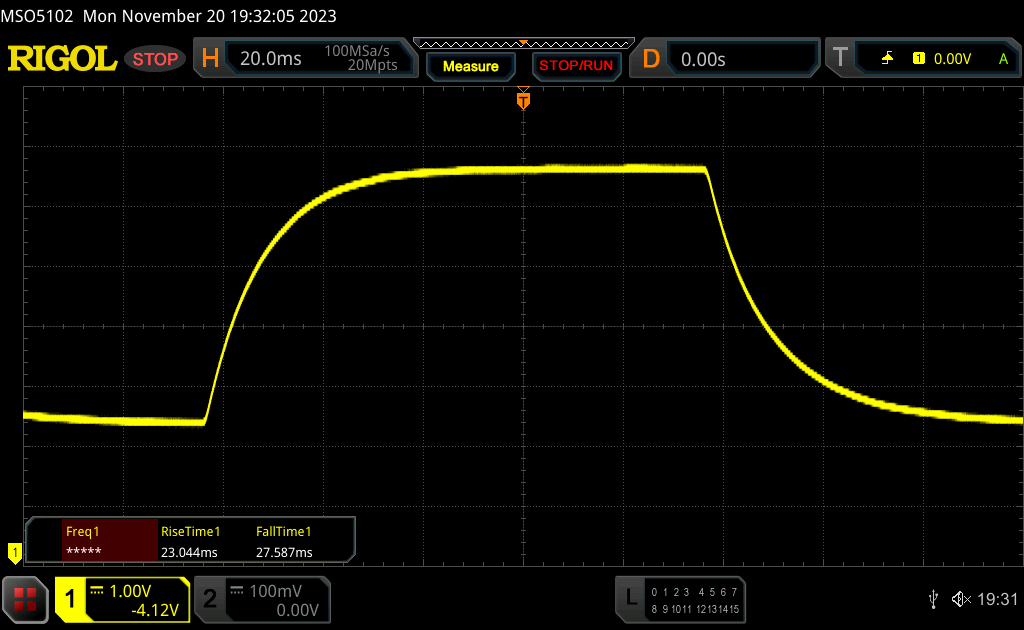 |
| ↘ 27.6 ms Calo | ||
| Lo schermo mostra tempi di risposta lenti nei nostri tests e sarà insoddisfacente per i gamers. In confronto, tutti i dispositivi di test variano da 0.165 (minimo) a 636 (massimo) ms. » 87 % di tutti i dispositivi è migliore. Questo significa che i tempi di risposta rilevati sono peggiori rispetto alla media di tutti i dispositivi testati (31 ms). | ||
Sfarfallio dello schermo / PWM (Pulse-Width Modulation)
| flickering dello schermo / PWM non rilevato | 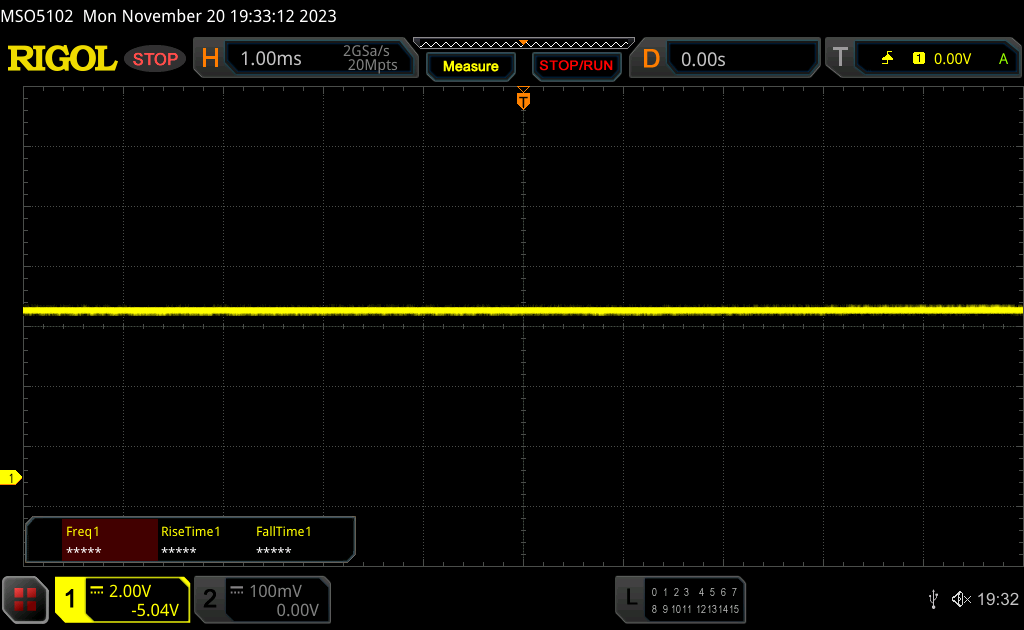 | ||
In confronto: 52 % di tutti i dispositivi testati non utilizza PWM per ridurre la luminosita' del display. Se è rilevato PWM, una media di 7747 (minimo: 5 - massimo: 343500) Hz è stata rilevata. | |||
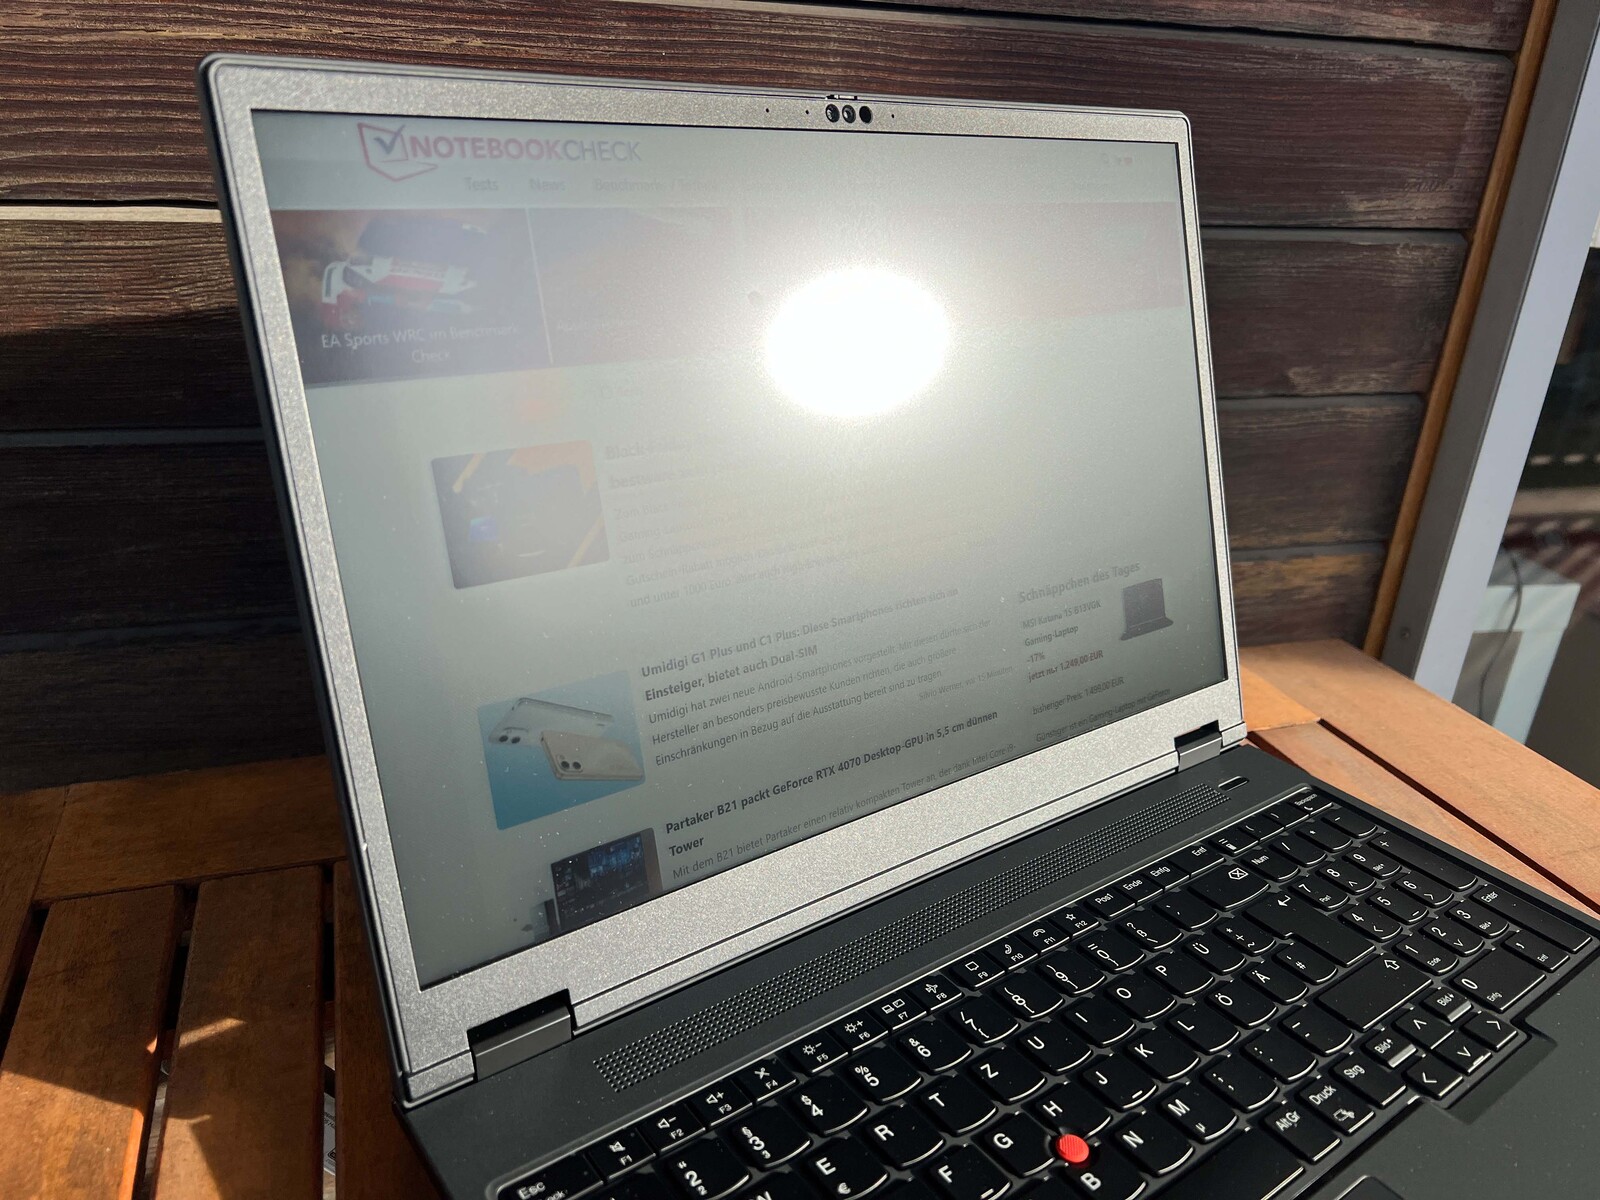
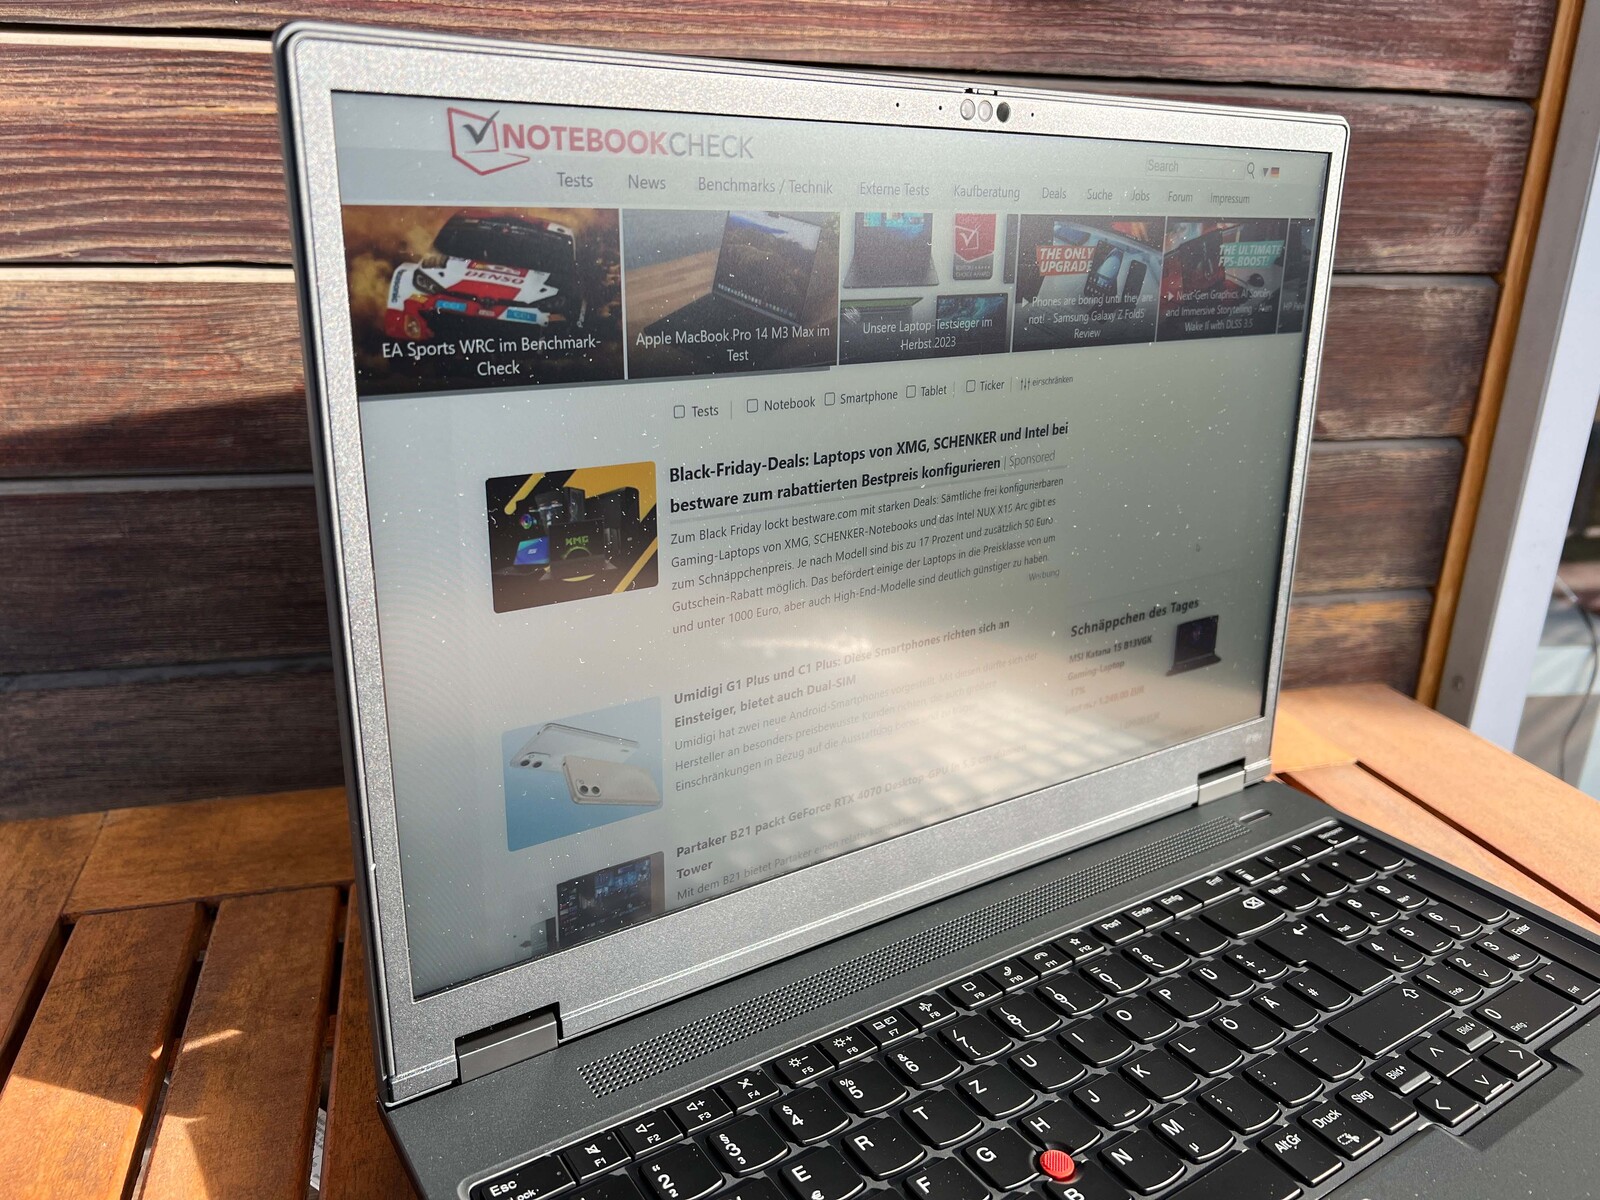

L'utilizzo del display opaco all'aperto non è generalmente un problema. La luminosità dello schermo viene spinta al limite solo in ambienti molto luminosi o alla luce diretta del sole. Il pannello IPS ha un angolo di visione decente.
Prestazioni - Ryzen Pro & RTX A1000
Condizioni del test
Da tempo Lenovo non fornisce modalità di prestazioni aggiuntive sui suoi ThinkPad, scegliendo invece di integrare le proprie impostazioni direttamente nelle modalità di alimentazione di Windows - molto conveniente per gli utenti. Abbiamo eseguito le seguenti misurazioni e benchmark con il portatile in modalità Best performance.
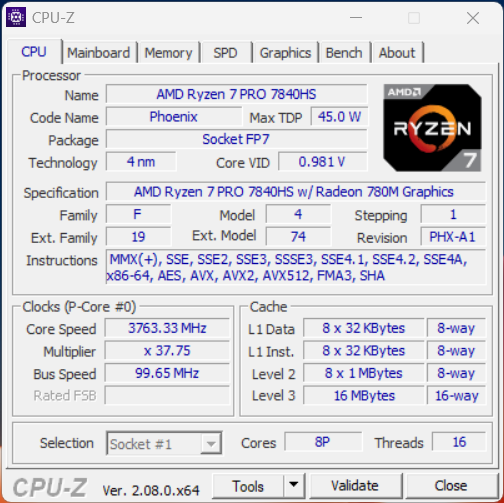
Processore - Ryzen 7 PRO 7840HS
Il Ryzen 7 PRO 7840HS offre funzioni di sicurezza avanzate (paragonabili a Intel vPro), ma per il resto è simile al Ryzen 7 7840HS normale. Ciò significa che la CPU dispone di 8 core Zen4 (massimo 16 thread) con una frequenza massima di 5,1 GHz. I suoi limiti di potenza sono fissati a 64/54 watt, proprio come il processore dello ZBook Power 15 G10 (anch'esso un Ryzen 7 PRO 7840HS). Le CPU Intel concorrenti richiedono una potenza sostanzialmente maggiore. Complessivamente, il processore AMD offre prestazioni eccellenti ed è persino leggermente superiore al Core i7-12850HX nel modello Dell Precision 7670. Gli altri dispositivi del nostro confronto offrono complessivamente maggiori prestazioni della CPU. Detto questo, il P16v G1 ha registrato un enorme aumento delle prestazioni del 35% rispetto al ThinkPad P15v G3 con un Ryzen 7 PRO 6850H.
Le prestazioni rimangono stabili sotto carico, ma il processore ha a disposizione solo 18 watt scarsi quando funziona a batteria. Le prestazioni sono quindi notevolmente limitate nei test multi-core (calo del 40% in CB R23 Multi). Altri risultati dei benchmark della CPU sono disponibili su qui.
Cinebench R15 Multi sustained load
Cinebench R23: Multi Core | Single Core
Cinebench R20: CPU (Multi Core) | CPU (Single Core)
Cinebench R15: CPU Multi 64Bit | CPU Single 64Bit
Blender: v2.79 BMW27 CPU
7-Zip 18.03: 7z b 4 | 7z b 4 -mmt1
Geekbench 5.5: Multi-Core | Single-Core
HWBOT x265 Benchmark v2.2: 4k Preset
LibreOffice : 20 Documents To PDF
R Benchmark 2.5: Overall mean
| CPU Performance rating | |
| Media della classe Workstation | |
| Lenovo ThinkPad P1 G6-21FV000DGE | |
| Lenovo ThinkPad P16 G1 21D6001DMB | |
| HP ZBook Power 15 G10 | |
| Media AMD Ryzen 7 PRO 7840HS | |
| Lenovo ThinkPad P16v G1 AMD | |
| Dell Precision 7670 | |
| Lenovo ThinkPad P15v G3 21EM001AGE | |
| Cinebench R23 / Multi Core | |
| Media della classe Workstation (14621 - 38520, n=23, ultimi 2 anni) | |
| Lenovo ThinkPad P1 G6-21FV000DGE | |
| Lenovo ThinkPad P16 G1 21D6001DMB | |
| HP ZBook Power 15 G10 | |
| Dell Precision 7670 | |
| Media AMD Ryzen 7 PRO 7840HS (14240 - 15863, n=2) | |
| Lenovo ThinkPad P16v G1 AMD | |
| Lenovo ThinkPad P15v G3 21EM001AGE | |
| Cinebench R23 / Single Core | |
| Lenovo ThinkPad P1 G6-21FV000DGE | |
| Media della classe Workstation (1712 - 2228, n=23, ultimi 2 anni) | |
| Lenovo ThinkPad P16 G1 21D6001DMB | |
| HP ZBook Power 15 G10 | |
| Media AMD Ryzen 7 PRO 7840HS (1691 - 1774, n=2) | |
| Lenovo ThinkPad P16v G1 AMD | |
| Dell Precision 7670 | |
| Lenovo ThinkPad P15v G3 21EM001AGE | |
| Cinebench R20 / CPU (Multi Core) | |
| Media della classe Workstation (5760 - 15043, n=23, ultimi 2 anni) | |
| Lenovo ThinkPad P1 G6-21FV000DGE | |
| Lenovo ThinkPad P16 G1 21D6001DMB | |
| HP ZBook Power 15 G10 | |
| Dell Precision 7670 | |
| Media AMD Ryzen 7 PRO 7840HS (5327 - 6235, n=2) | |
| Lenovo ThinkPad P16v G1 AMD | |
| Lenovo ThinkPad P15v G3 21EM001AGE | |
| Lenovo ThinkPad P15v G3 21EM001AGE | |
| Cinebench R20 / CPU (Single Core) | |
| Lenovo ThinkPad P1 G6-21FV000DGE | |
| Media della classe Workstation (671 - 857, n=23, ultimi 2 anni) | |
| Lenovo ThinkPad P16 G1 21D6001DMB | |
| HP ZBook Power 15 G10 | |
| Dell Precision 7670 | |
| Media AMD Ryzen 7 PRO 7840HS (651 - 693, n=2) | |
| Lenovo ThinkPad P16v G1 AMD | |
| Lenovo ThinkPad P15v G3 21EM001AGE | |
| Lenovo ThinkPad P15v G3 21EM001AGE | |
| Cinebench R15 / CPU Multi 64Bit | |
| Media della classe Workstation (2489 - 5810, n=23, ultimi 2 anni) | |
| Lenovo ThinkPad P16 G1 21D6001DMB | |
| Lenovo ThinkPad P1 G6-21FV000DGE | |
| HP ZBook Power 15 G10 | |
| Media AMD Ryzen 7 PRO 7840HS (2361 - 2519, n=2) | |
| Dell Precision 7670 | |
| Lenovo ThinkPad P16v G1 AMD | |
| Lenovo ThinkPad P15v G3 21EM001AGE | |
| Cinebench R15 / CPU Single 64Bit | |
| Media della classe Workstation (191.4 - 328, n=23, ultimi 2 anni) | |
| Lenovo ThinkPad P1 G6-21FV000DGE | |
| HP ZBook Power 15 G10 | |
| Media AMD Ryzen 7 PRO 7840HS (262 - 276, n=2) | |
| Lenovo ThinkPad P16 G1 21D6001DMB | |
| Lenovo ThinkPad P16v G1 AMD | |
| Dell Precision 7670 | |
| Lenovo ThinkPad P15v G3 21EM001AGE | |
| Blender / v2.79 BMW27 CPU | |
| Lenovo ThinkPad P15v G3 21EM001AGE | |
| Dell Precision 7670 | |
| Lenovo ThinkPad P16v G1 AMD | |
| Media AMD Ryzen 7 PRO 7840HS (201 - 205, n=2) | |
| HP ZBook Power 15 G10 | |
| Lenovo ThinkPad P1 G6-21FV000DGE | |
| Lenovo ThinkPad P16 G1 21D6001DMB | |
| Media della classe Workstation (91 - 222, n=23, ultimi 2 anni) | |
| 7-Zip 18.03 / 7z b 4 | |
| Media della classe Workstation (60489 - 116969, n=23, ultimi 2 anni) | |
| Lenovo ThinkPad P1 G6-21FV000DGE | |
| HP ZBook Power 15 G10 | |
| Lenovo ThinkPad P16 G1 21D6001DMB | |
| Media AMD Ryzen 7 PRO 7840HS (62497 - 70387, n=2) | |
| Lenovo ThinkPad P16v G1 AMD | |
| Dell Precision 7670 | |
| Lenovo ThinkPad P15v G3 21EM001AGE | |
| 7-Zip 18.03 / 7z b 4 -mmt1 | |
| Lenovo ThinkPad P1 G6-21FV000DGE | |
| Lenovo ThinkPad P16v G1 AMD | |
| Media AMD Ryzen 7 PRO 7840HS (6493 - 6498, n=2) | |
| HP ZBook Power 15 G10 | |
| Media della classe Workstation (5126 - 6960, n=23, ultimi 2 anni) | |
| Lenovo ThinkPad P16 G1 21D6001DMB | |
| Dell Precision 7670 | |
| Lenovo ThinkPad P15v G3 21EM001AGE | |
| Geekbench 5.5 / Multi-Core | |
| Media della classe Workstation (11542 - 25554, n=23, ultimi 2 anni) | |
| Lenovo ThinkPad P16 G1 21D6001DMB | |
| HP ZBook Power 15 G10 | |
| Lenovo ThinkPad P1 G6-21FV000DGE | |
| Dell Precision 7670 | |
| Media AMD Ryzen 7 PRO 7840HS (10034 - 12039, n=2) | |
| Lenovo ThinkPad P16v G1 AMD | |
| Lenovo ThinkPad P15v G3 21EM001AGE | |
| Geekbench 5.5 / Single-Core | |
| Media della classe Workstation (1783 - 2183, n=23, ultimi 2 anni) | |
| Lenovo ThinkPad P1 G6-21FV000DGE | |
| HP ZBook Power 15 G10 | |
| Media AMD Ryzen 7 PRO 7840HS (1822 - 1953, n=2) | |
| Lenovo ThinkPad P16v G1 AMD | |
| Lenovo ThinkPad P16 G1 21D6001DMB | |
| Dell Precision 7670 | |
| Lenovo ThinkPad P15v G3 21EM001AGE | |
| HWBOT x265 Benchmark v2.2 / 4k Preset | |
| Media della classe Workstation (17.8 - 40.5, n=23, ultimi 2 anni) | |
| HP ZBook Power 15 G10 | |
| Lenovo ThinkPad P1 G6-21FV000DGE | |
| Media AMD Ryzen 7 PRO 7840HS (18.1 - 19.9, n=2) | |
| Lenovo ThinkPad P16v G1 AMD | |
| Dell Precision 7670 | |
| Lenovo ThinkPad P16 G1 21D6001DMB | |
| Lenovo ThinkPad P15v G3 21EM001AGE | |
| LibreOffice / 20 Documents To PDF | |
| Lenovo ThinkPad P15v G3 21EM001AGE | |
| HP ZBook Power 15 G10 | |
| Media AMD Ryzen 7 PRO 7840HS (45.9 - 54.7, n=2) | |
| Dell Precision 7670 | |
| Media della classe Workstation (37.1 - 74.7, n=23, ultimi 2 anni) | |
| Lenovo ThinkPad P1 G6-21FV000DGE | |
| Lenovo ThinkPad P16 G1 21D6001DMB | |
| Lenovo ThinkPad P16v G1 AMD | |
| R Benchmark 2.5 / Overall mean | |
| Lenovo ThinkPad P15v G3 21EM001AGE | |
| Dell Precision 7670 | |
| Lenovo ThinkPad P16 G1 21D6001DMB | |
| HP ZBook Power 15 G10 | |
| Media AMD Ryzen 7 PRO 7840HS (0.44 - 0.4487, n=2) | |
| Lenovo ThinkPad P16v G1 AMD | |
| Media della classe Workstation (0.3825 - 0.603, n=23, ultimi 2 anni) | |
| Lenovo ThinkPad P1 G6-21FV000DGE | |
* ... Meglio usare valori piccoli
AIDA64: FP32 Ray-Trace | FPU Julia | CPU SHA3 | CPU Queen | FPU SinJulia | FPU Mandel | CPU AES | CPU ZLib | FP64 Ray-Trace | CPU PhotoWorxx
| Performance rating | |
| Media della classe Workstation | |
| HP ZBook Power 15 G10 | |
| Media AMD Ryzen 7 PRO 7840HS | |
| Lenovo ThinkPad P16v G1 AMD | |
| Lenovo ThinkPad P16 G1 21D6001DMB | |
| Lenovo ThinkPad P15v G3 21EM001AGE | |
| Lenovo ThinkPad P1 G6-21FV000DGE | |
| Dell Precision 7670 | |
| AIDA64 / FP32 Ray-Trace | |
| Media della classe Workstation (16730 - 61611, n=23, ultimi 2 anni) | |
| HP ZBook Power 15 G10 | |
| Media AMD Ryzen 7 PRO 7840HS (25606 - 25776, n=2) | |
| Lenovo ThinkPad P16v G1 AMD | |
| Lenovo ThinkPad P16 G1 21D6001DMB | |
| Lenovo ThinkPad P1 G6-21FV000DGE | |
| Lenovo ThinkPad P15v G3 21EM001AGE | |
| Dell Precision 7670 | |
| AIDA64 / FPU Julia | |
| Media della classe Workstation (89597 - 186971, n=23, ultimi 2 anni) | |
| HP ZBook Power 15 G10 | |
| Media AMD Ryzen 7 PRO 7840HS (107907 - 109059, n=2) | |
| Lenovo ThinkPad P16v G1 AMD | |
| Lenovo ThinkPad P15v G3 21EM001AGE | |
| Lenovo ThinkPad P16 G1 21D6001DMB | |
| Lenovo ThinkPad P1 G6-21FV000DGE | |
| Dell Precision 7670 | |
| AIDA64 / CPU SHA3 | |
| Media della classe Workstation (4178 - 8975, n=23, ultimi 2 anni) | |
| HP ZBook Power 15 G10 | |
| Media AMD Ryzen 7 PRO 7840HS (4631 - 4656, n=2) | |
| Lenovo ThinkPad P16v G1 AMD | |
| Lenovo ThinkPad P16 G1 21D6001DMB | |
| Lenovo ThinkPad P1 G6-21FV000DGE | |
| Lenovo ThinkPad P15v G3 21EM001AGE | |
| Dell Precision 7670 | |
| AIDA64 / CPU Queen | |
| Lenovo ThinkPad P1 G6-21FV000DGE | |
| HP ZBook Power 15 G10 | |
| Media della classe Workstation (60778 - 144411, n=23, ultimi 2 anni) | |
| Media AMD Ryzen 7 PRO 7840HS (97729 - 115640, n=2) | |
| Lenovo ThinkPad P15v G3 21EM001AGE | |
| Lenovo ThinkPad P16v G1 AMD | |
| Lenovo ThinkPad P16 G1 21D6001DMB | |
| Dell Precision 7670 | |
| AIDA64 / FPU SinJulia | |
| HP ZBook Power 15 G10 | |
| Media AMD Ryzen 7 PRO 7840HS (14693 - 14742, n=2) | |
| Lenovo ThinkPad P16v G1 AMD | |
| Media della classe Workstation (8165 - 29343, n=23, ultimi 2 anni) | |
| Lenovo ThinkPad P15v G3 21EM001AGE | |
| Lenovo ThinkPad P16 G1 21D6001DMB | |
| Lenovo ThinkPad P1 G6-21FV000DGE | |
| Dell Precision 7670 | |
| AIDA64 / FPU Mandel | |
| Media della classe Workstation (44497 - 98153, n=23, ultimi 2 anni) | |
| HP ZBook Power 15 G10 | |
| Media AMD Ryzen 7 PRO 7840HS (57502 - 58181, n=2) | |
| Lenovo ThinkPad P16v G1 AMD | |
| Lenovo ThinkPad P15v G3 21EM001AGE | |
| Lenovo ThinkPad P16 G1 21D6001DMB | |
| Lenovo ThinkPad P1 G6-21FV000DGE | |
| Dell Precision 7670 | |
| AIDA64 / CPU AES | |
| Lenovo ThinkPad P15v G3 21EM001AGE | |
| Media della classe Workstation (73133 - 187841, n=23, ultimi 2 anni) | |
| HP ZBook Power 15 G10 | |
| Media AMD Ryzen 7 PRO 7840HS (84454 - 85341, n=2) | |
| Lenovo ThinkPad P16v G1 AMD | |
| Lenovo ThinkPad P16 G1 21D6001DMB | |
| Lenovo ThinkPad P1 G6-21FV000DGE | |
| Dell Precision 7670 | |
| AIDA64 / CPU ZLib | |
| Media della classe Workstation (929 - 2148, n=23, ultimi 2 anni) | |
| Lenovo ThinkPad P1 G6-21FV000DGE | |
| Lenovo ThinkPad P16 G1 21D6001DMB | |
| HP ZBook Power 15 G10 | |
| Media AMD Ryzen 7 PRO 7840HS (1032 - 1043, n=2) | |
| Lenovo ThinkPad P16v G1 AMD | |
| Dell Precision 7670 | |
| Lenovo ThinkPad P15v G3 21EM001AGE | |
| AIDA64 / FP64 Ray-Trace | |
| Media della classe Workstation (8545 - 32891, n=23, ultimi 2 anni) | |
| HP ZBook Power 15 G10 | |
| Media AMD Ryzen 7 PRO 7840HS (13545 - 13800, n=2) | |
| Lenovo ThinkPad P16v G1 AMD | |
| Lenovo ThinkPad P16 G1 21D6001DMB | |
| Lenovo ThinkPad P1 G6-21FV000DGE | |
| Lenovo ThinkPad P15v G3 21EM001AGE | |
| Dell Precision 7670 | |
| AIDA64 / CPU PhotoWorxx | |
| Media della classe Workstation (37151 - 93684, n=23, ultimi 2 anni) | |
| HP ZBook Power 15 G10 | |
| Dell Precision 7670 | |
| Media AMD Ryzen 7 PRO 7840HS (24325 - 42810, n=2) | |
| Lenovo ThinkPad P16 G1 21D6001DMB | |
| Lenovo ThinkPad P1 G6-21FV000DGE | |
| Lenovo ThinkPad P16v G1 AMD | |
| Lenovo ThinkPad P15v G3 21EM001AGE | |
Prestazioni del sistema
In base alle nostre impressioni, il ThinkPad P16v G1 ha prestazioni fantastiche come ci si aspettava ed è molto reattivo a tutti i tipi di input. I risultati dei benchmark sono complessivamente buoni e non abbiamo riscontrato alcun problema di stabilità del sistema durante i nostri test.
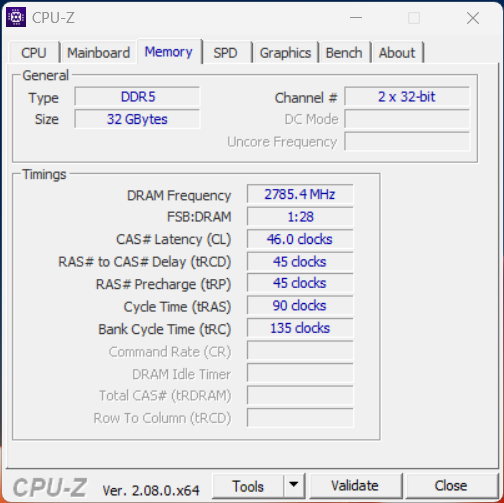
Poiché la nostra unità di recensione era dotata di un modulo RAM, la memoria di sistema funziona solo in configurazione a canale singolo. Di conseguenza, il portatile non ha prodotto grandi risultati nei nostri benchmark sulla memoria.
CrossMark: Overall | Productivity | Creativity | Responsiveness
WebXPRT 3: Overall
WebXPRT 4: Overall
Mozilla Kraken 1.1: Total
| PCMark 10 / Score | |
| Media della classe Workstation (6563 - 10409, n=19, ultimi 2 anni) | |
| HP ZBook Power 15 G10 | |
| Lenovo ThinkPad P1 G6-21FV000DGE | |
| Lenovo ThinkPad P16v G1 AMD | |
| Media AMD Ryzen 7 PRO 7840HS, NVIDIA RTX A1000 Laptop GPU (n=1) | |
| Dell Precision 7670 | |
| Lenovo ThinkPad P15v G3 21EM001AGE | |
| Lenovo ThinkPad P16 G1 21D6001DMB | |
| PCMark 10 / Essentials | |
| Lenovo ThinkPad P1 G6-21FV000DGE | |
| HP ZBook Power 15 G10 | |
| Dell Precision 7670 | |
| Media della classe Workstation (9622 - 11157, n=19, ultimi 2 anni) | |
| Lenovo ThinkPad P16v G1 AMD | |
| Media AMD Ryzen 7 PRO 7840HS, NVIDIA RTX A1000 Laptop GPU (n=1) | |
| Lenovo ThinkPad P16 G1 21D6001DMB | |
| Lenovo ThinkPad P15v G3 21EM001AGE | |
| PCMark 10 / Productivity | |
| Media della classe Workstation (8789 - 20616, n=19, ultimi 2 anni) | |
| Lenovo ThinkPad P1 G6-21FV000DGE | |
| Lenovo ThinkPad P16v G1 AMD | |
| Media AMD Ryzen 7 PRO 7840HS, NVIDIA RTX A1000 Laptop GPU (n=1) | |
| HP ZBook Power 15 G10 | |
| Lenovo ThinkPad P16 G1 21D6001DMB | |
| Dell Precision 7670 | |
| Lenovo ThinkPad P15v G3 21EM001AGE | |
| PCMark 10 / Digital Content Creation | |
| Media della classe Workstation (8108 - 15631, n=19, ultimi 2 anni) | |
| HP ZBook Power 15 G10 | |
| Lenovo ThinkPad P1 G6-21FV000DGE | |
| Lenovo ThinkPad P16v G1 AMD | |
| Media AMD Ryzen 7 PRO 7840HS, NVIDIA RTX A1000 Laptop GPU (n=1) | |
| Lenovo ThinkPad P15v G3 21EM001AGE | |
| Dell Precision 7670 | |
| Lenovo ThinkPad P16 G1 21D6001DMB | |
| CrossMark / Overall | |
| Media della classe Workstation (1307 - 2267, n=22, ultimi 2 anni) | |
| Lenovo ThinkPad P1 G6-21FV000DGE | |
| Lenovo ThinkPad P16 G1 21D6001DMB | |
| HP ZBook Power 15 G10 | |
| Lenovo ThinkPad P16v G1 AMD | |
| Media AMD Ryzen 7 PRO 7840HS, NVIDIA RTX A1000 Laptop GPU (n=1) | |
| Dell Precision 7670 | |
| Lenovo ThinkPad P15v G3 21EM001AGE | |
| CrossMark / Productivity | |
| Lenovo ThinkPad P1 G6-21FV000DGE | |
| Media della classe Workstation (1130 - 2122, n=22, ultimi 2 anni) | |
| Lenovo ThinkPad P16 G1 21D6001DMB | |
| HP ZBook Power 15 G10 | |
| Lenovo ThinkPad P16v G1 AMD | |
| Media AMD Ryzen 7 PRO 7840HS, NVIDIA RTX A1000 Laptop GPU (n=1) | |
| Dell Precision 7670 | |
| Lenovo ThinkPad P15v G3 21EM001AGE | |
| CrossMark / Creativity | |
| Media della classe Workstation (1657 - 2725, n=22, ultimi 2 anni) | |
| Lenovo ThinkPad P1 G6-21FV000DGE | |
| Lenovo ThinkPad P16 G1 21D6001DMB | |
| HP ZBook Power 15 G10 | |
| Dell Precision 7670 | |
| Lenovo ThinkPad P16v G1 AMD | |
| Media AMD Ryzen 7 PRO 7840HS, NVIDIA RTX A1000 Laptop GPU (n=1) | |
| Lenovo ThinkPad P15v G3 21EM001AGE | |
| CrossMark / Responsiveness | |
| Media della classe Workstation (993 - 2096, n=22, ultimi 2 anni) | |
| Lenovo ThinkPad P1 G6-21FV000DGE | |
| Lenovo ThinkPad P16 G1 21D6001DMB | |
| Lenovo ThinkPad P16v G1 AMD | |
| Media AMD Ryzen 7 PRO 7840HS, NVIDIA RTX A1000 Laptop GPU (n=1) | |
| HP ZBook Power 15 G10 | |
| Lenovo ThinkPad P15v G3 21EM001AGE | |
| Dell Precision 7670 | |
| WebXPRT 3 / Overall | |
| Lenovo ThinkPad P16v G1 AMD | |
| Media AMD Ryzen 7 PRO 7840HS, NVIDIA RTX A1000 Laptop GPU (n=1) | |
| Lenovo ThinkPad P1 G6-21FV000DGE | |
| Media della classe Workstation (260 - 360, n=23, ultimi 2 anni) | |
| HP ZBook Power 15 G10 | |
| Dell Precision 7670 | |
| Lenovo ThinkPad P16 G1 21D6001DMB | |
| Lenovo ThinkPad P15v G3 21EM001AGE | |
| WebXPRT 4 / Overall | |
| Lenovo ThinkPad P1 G6-21FV000DGE | |
| Media della classe Workstation (189.2 - 326, n=23, ultimi 2 anni) | |
| Lenovo ThinkPad P16v G1 AMD | |
| Media AMD Ryzen 7 PRO 7840HS, NVIDIA RTX A1000 Laptop GPU (n=1) | |
| Dell Precision 7670 | |
| HP ZBook Power 15 G10 | |
| Lenovo ThinkPad P16 G1 21D6001DMB | |
| Lenovo ThinkPad P15v G3 21EM001AGE | |
| Mozilla Kraken 1.1 / Total | |
| Lenovo ThinkPad P15v G3 21EM001AGE | |
| HP ZBook Power 15 G10 | |
| Lenovo ThinkPad P16v G1 AMD | |
| Media AMD Ryzen 7 PRO 7840HS, NVIDIA RTX A1000 Laptop GPU (n=1) | |
| Dell Precision 7670 | |
| Lenovo ThinkPad P16 G1 21D6001DMB | |
| Lenovo ThinkPad P1 G6-21FV000DGE | |
| Media della classe Workstation (411 - 538, n=23, ultimi 2 anni) | |
* ... Meglio usare valori piccoli
| PCMark 10 Score | 6999 punti | |
Aiuto | ||
| AIDA64 / Memory Copy | |
| Media della classe Workstation (56003 - 164795, n=23, ultimi 2 anni) | |
| HP ZBook Power 15 G10 | |
| Dell Precision 7670 | |
| Lenovo ThinkPad P16 G1 21D6001DMB | |
| Media AMD Ryzen 7 PRO 7840HS (34323 - 67943, n=2) | |
| Lenovo ThinkPad P1 G6-21FV000DGE | |
| Lenovo ThinkPad P16v G1 AMD | |
| Lenovo ThinkPad P15v G3 21EM001AGE | |
| AIDA64 / Memory Read | |
| Media della classe Workstation (55795 - 121563, n=23, ultimi 2 anni) | |
| Dell Precision 7670 | |
| HP ZBook Power 15 G10 | |
| Lenovo ThinkPad P16 G1 21D6001DMB | |
| Media AMD Ryzen 7 PRO 7840HS (30787 - 61660, n=2) | |
| Lenovo ThinkPad P1 G6-21FV000DGE | |
| Lenovo ThinkPad P15v G3 21EM001AGE | |
| Lenovo ThinkPad P16v G1 AMD | |
| AIDA64 / Memory Write | |
| Media della classe Workstation (55663 - 214520, n=23, ultimi 2 anni) | |
| HP ZBook Power 15 G10 | |
| Dell Precision 7670 | |
| Media AMD Ryzen 7 PRO 7840HS (39362 - 83167, n=2) | |
| Lenovo ThinkPad P16 G1 21D6001DMB | |
| Lenovo ThinkPad P16v G1 AMD | |
| Lenovo ThinkPad P1 G6-21FV000DGE | |
| Lenovo ThinkPad P15v G3 21EM001AGE | |
| AIDA64 / Memory Latency | |
| Media della classe Workstation (84.5 - 165.2, n=23, ultimi 2 anni) | |
| Lenovo ThinkPad P16v G1 AMD | |
| Media AMD Ryzen 7 PRO 7840HS (99.6 - 101.2, n=2) | |
| HP ZBook Power 15 G10 | |
| Lenovo ThinkPad P16 G1 21D6001DMB | |
| Lenovo ThinkPad P15v G3 21EM001AGE | |
| Dell Precision 7670 | |
| Lenovo ThinkPad P1 G6-21FV000DGE | |
* ... Meglio usare valori piccoli
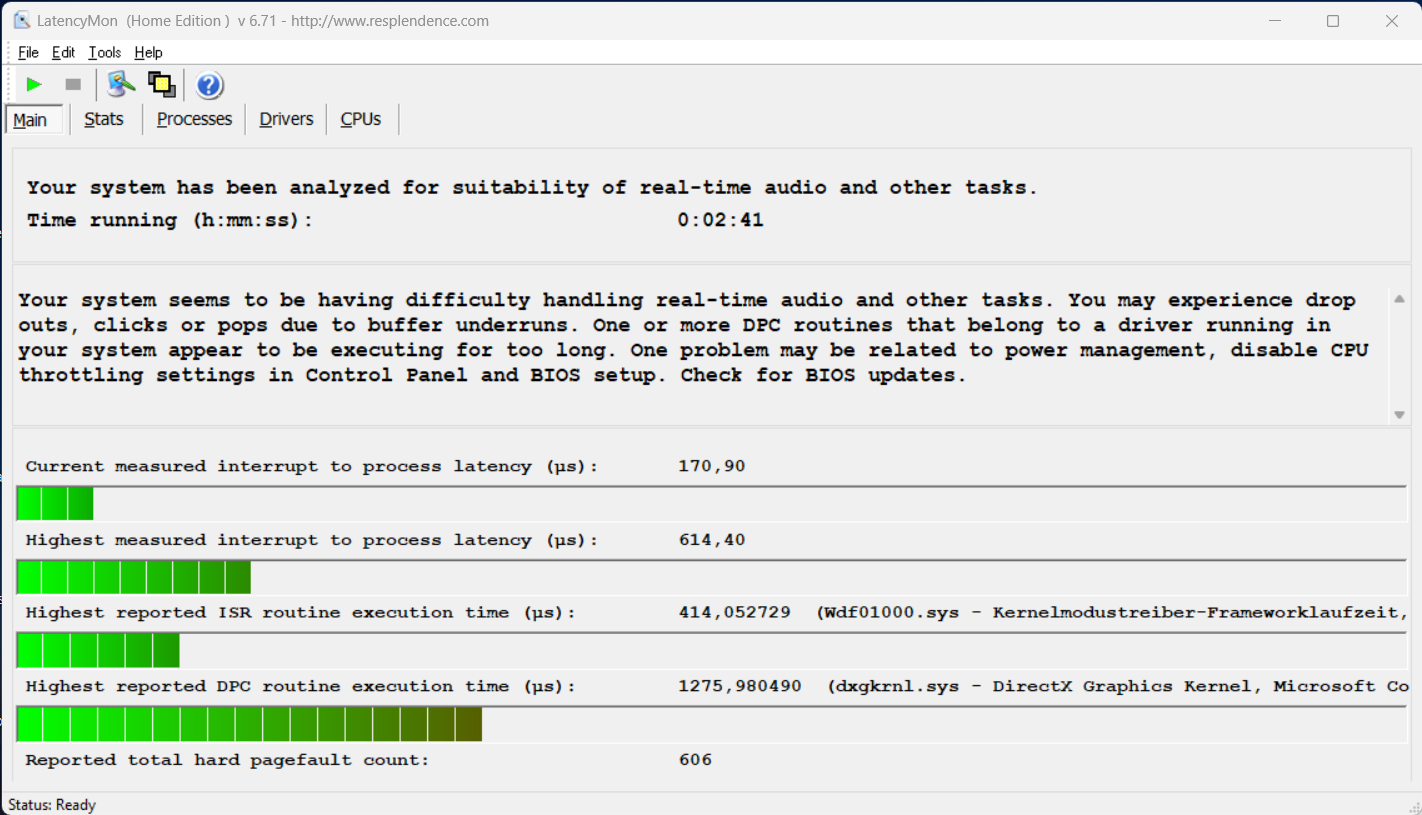
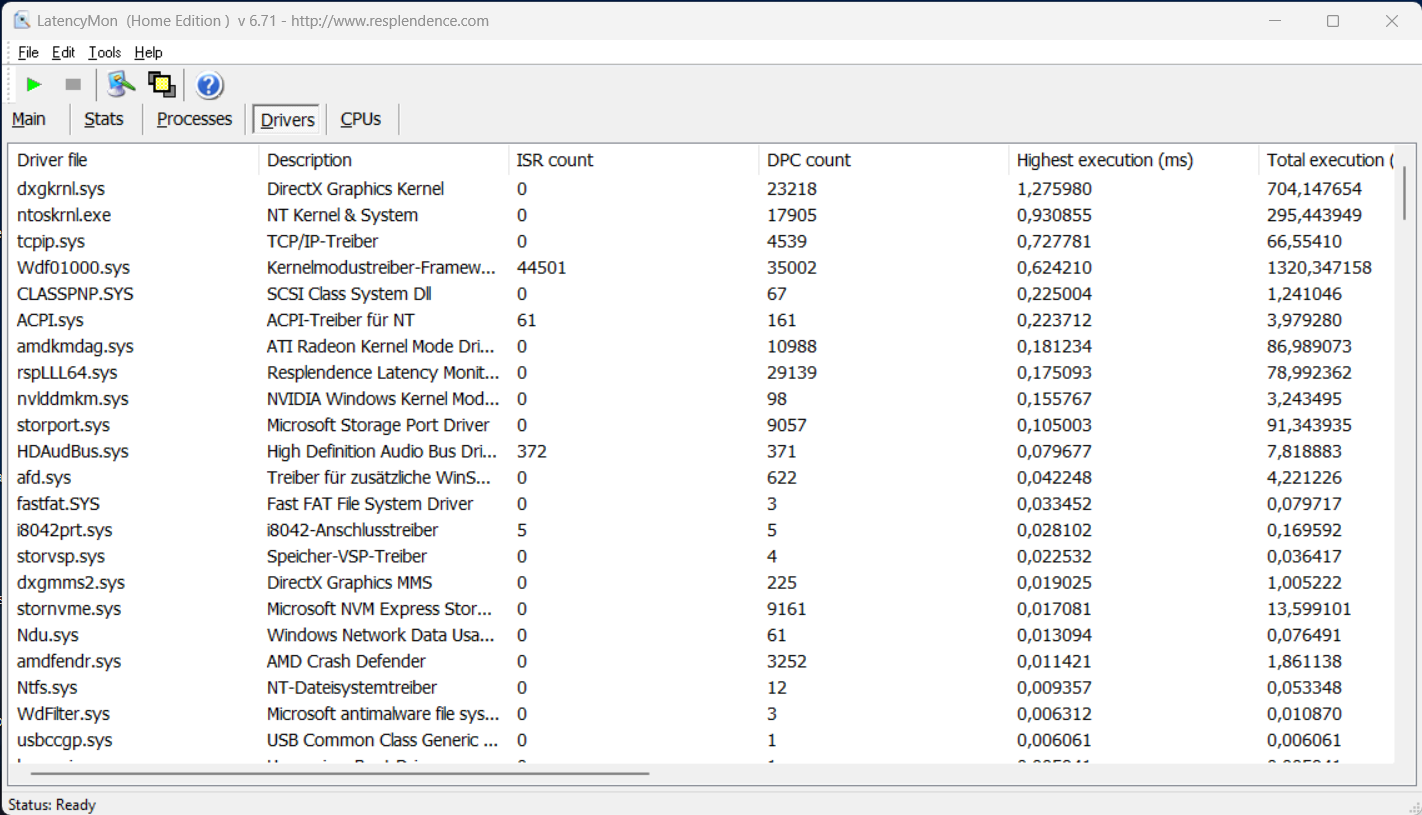
Latenza DPC
Nel nostro test di latenza standardizzato (navigazione web, riproduzione di YouTube 4K, carico della CPU), l'unità recensita non ha mostrato alcun problema quando funzionava con la versione del BIOS esistente. Solo un driver ha mostrato una leggera deviazione, ma questo non dovrebbe essere un problema quando si utilizzano applicazioni audio in tempo reale.
| DPC Latencies / LatencyMon - interrupt to process latency (max), Web, Youtube, Prime95 | |
| Lenovo ThinkPad P1 G6-21FV000DGE | |
| HP ZBook Power 15 G10 | |
| Dell Precision 7670 | |
| Lenovo ThinkPad P16 G1 21D6001DMB | |
| Lenovo ThinkPad P16v G1 AMD | |
| Lenovo ThinkPad P15v G3 21EM001AGE | |
* ... Meglio usare valori piccoli
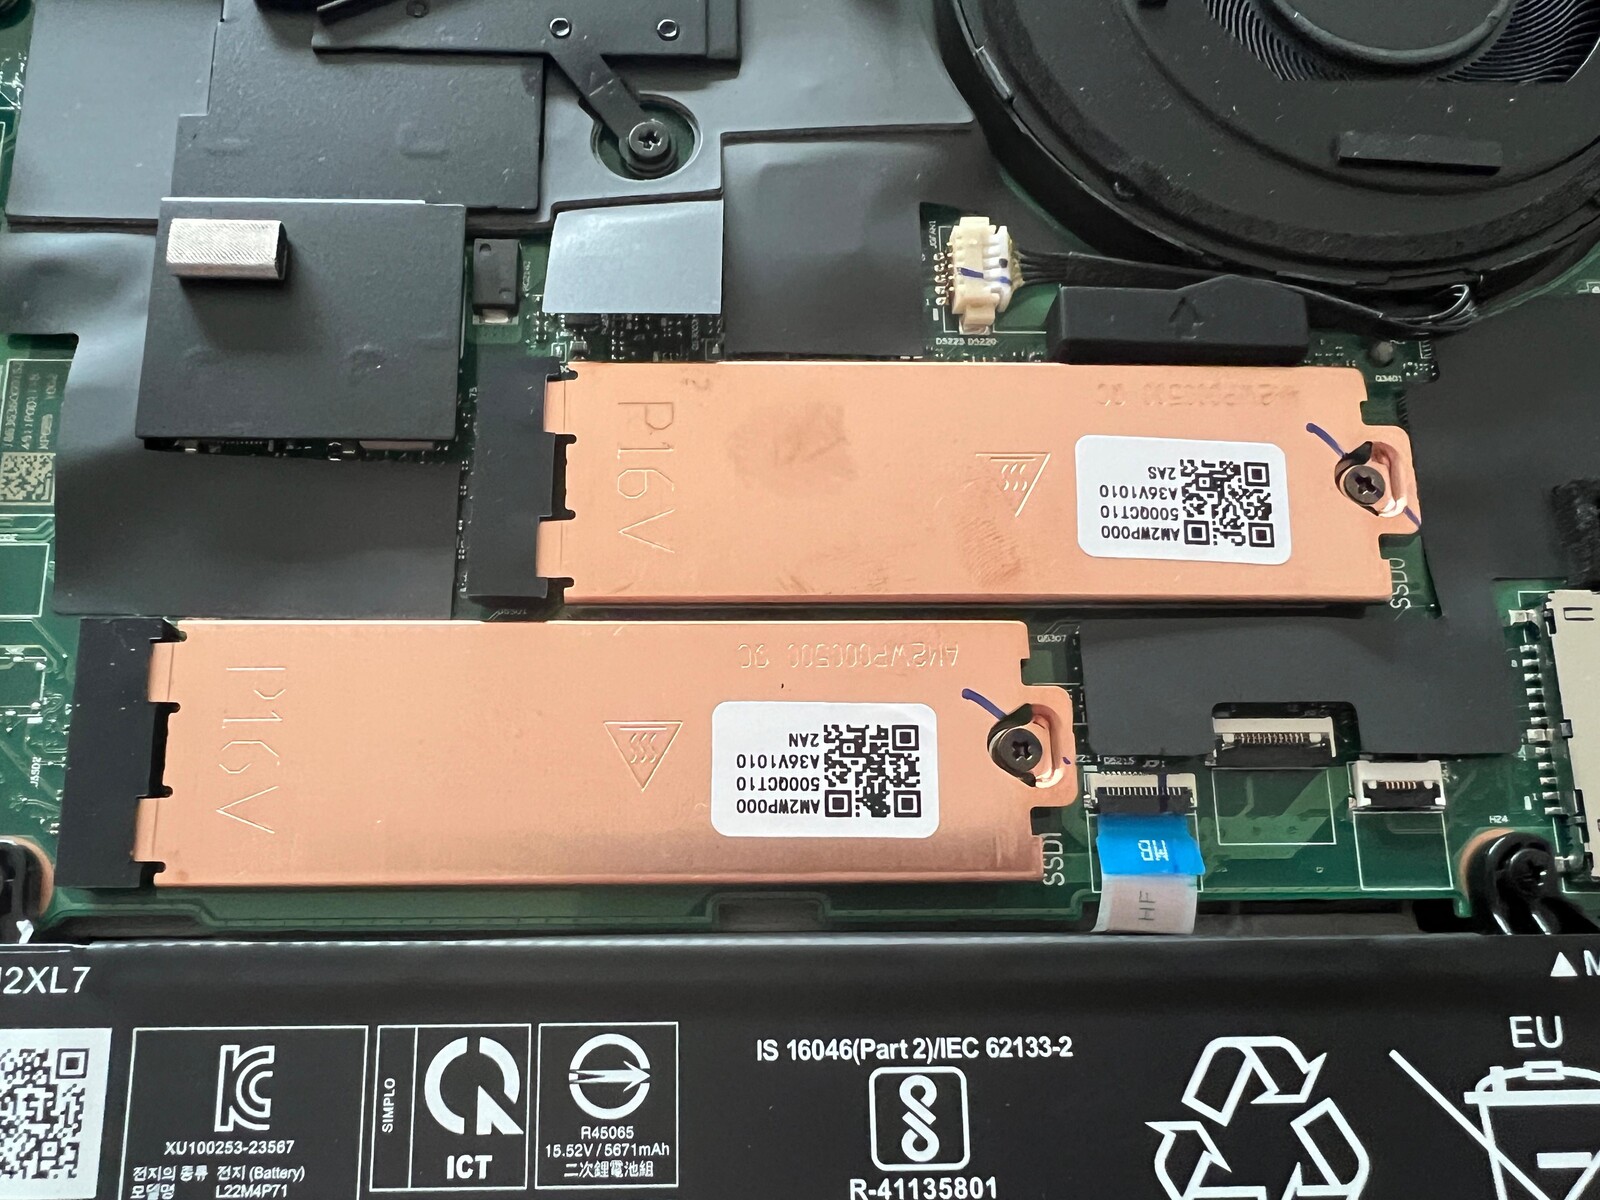
Memoria di massa
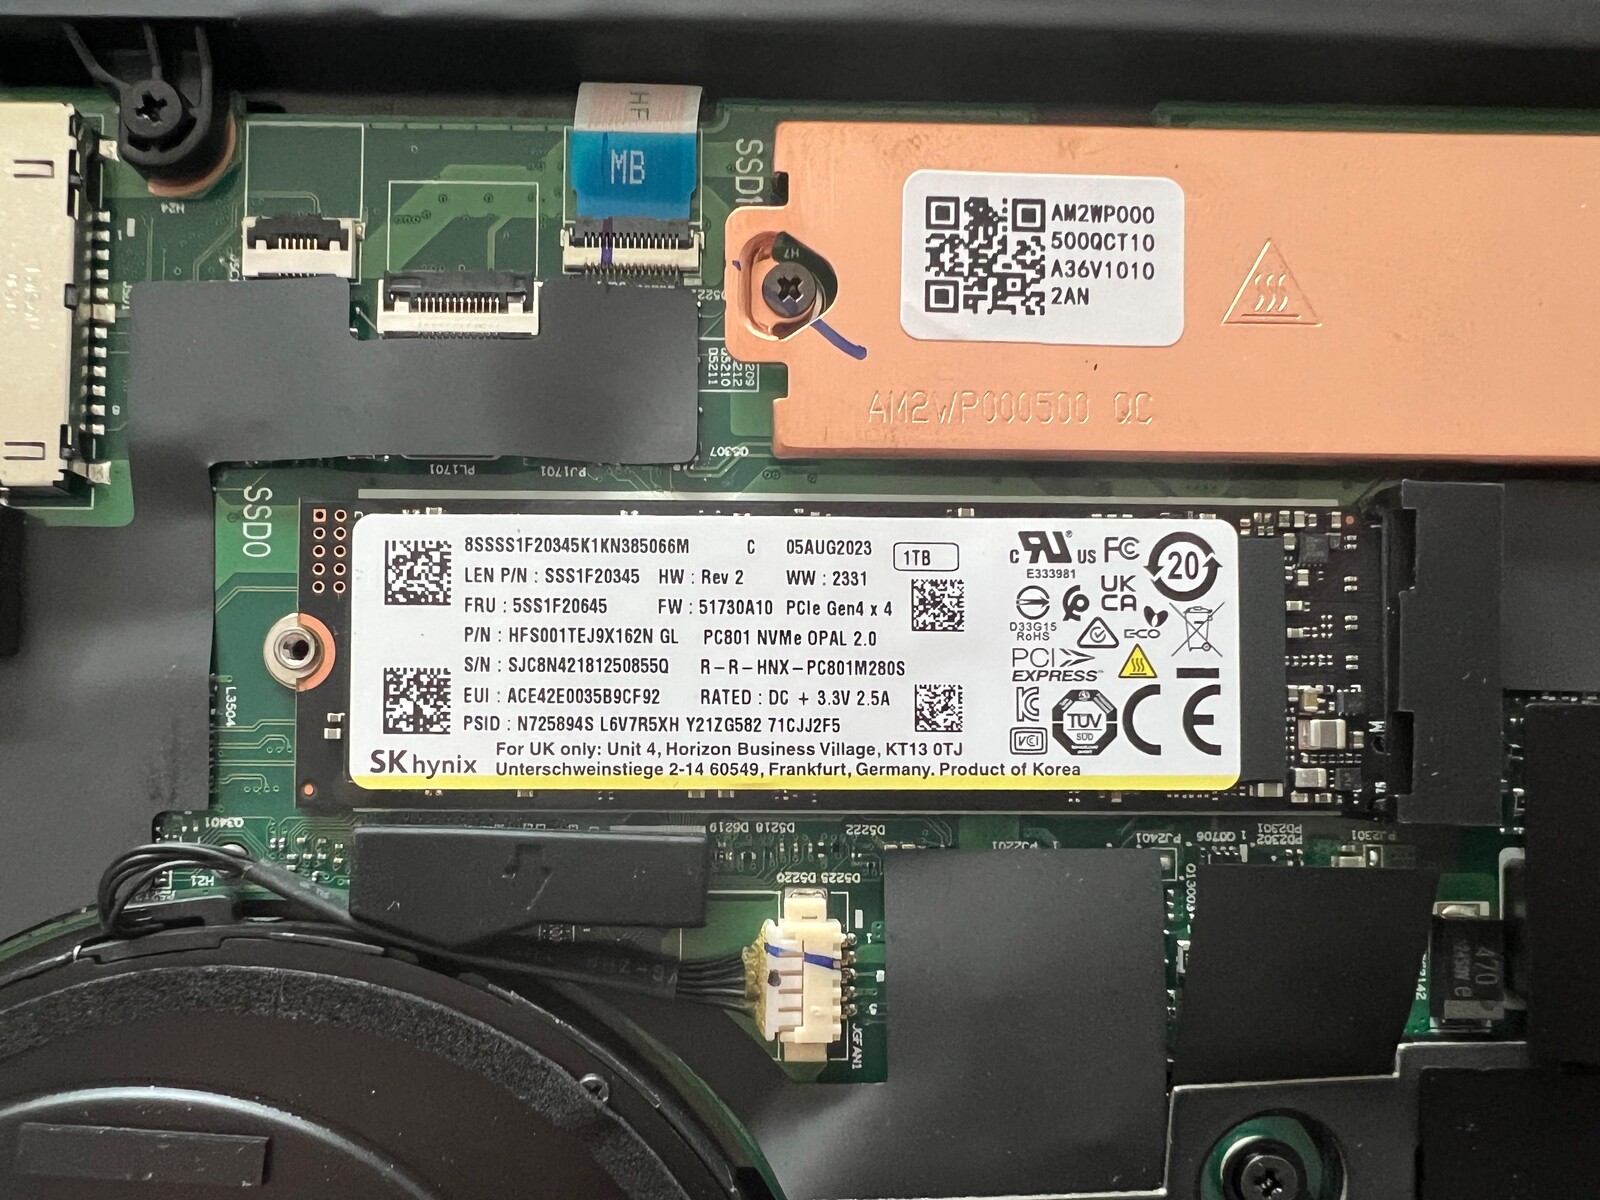
Il ThinkPad P16v G1 offre due slot PCIe 4.0 veloci per SSD M.2 2280. La nostra unità di recensione viene fornita con la versione da 1 TB dell'SK Hynix PC801. Dopo la configurazione iniziale, rimangono circa 899 GB di spazio utilizzabile. Con oltre 7 GB/s, le velocità di trasferimento massime sono superbe. Grazie al dissipatore supplementare, le prestazioni dell'unità rimangono perfettamente stabili anche sotto carico prolungato. Può trovare altri risultati dei benchmark SSD su qui.

* ... Meglio usare valori piccoli
Sustained load read: DiskSpd Read Loop, Queue Depth 8
Scheda grafica
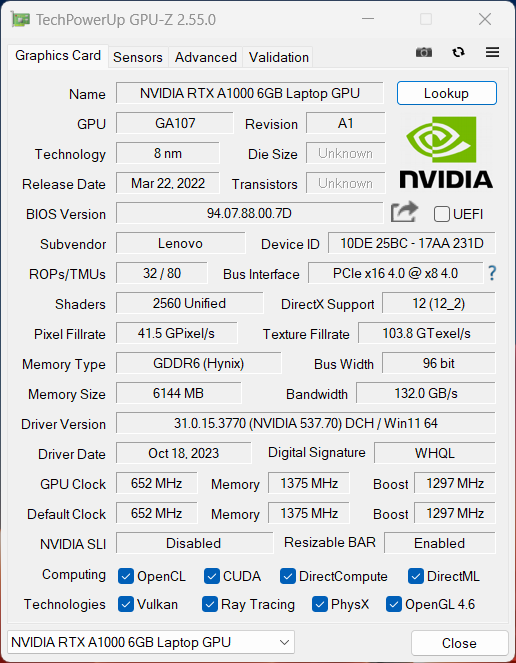
La scheda integrata Radeon 780M sul chip AMD gestisce l'elaborazione grafica durante le attività più semplici. Per i lavori più impegnativi, il sistema passerà automaticamente alla scheda dedicata RTX A1000 Laptop. Questa scheda è una GPU professionale Nvidia che purtroppo non è ancora basata sull'attuale architettura Ada Lovelace. Invece, utilizza lo stesso chip GA107 che si trova anche nella GPU consumer GeForce RTX 3050.
La RTX A1000 nel laptop ha 6 GB di VRAM e un TGP di 45 watt, il che significa che è una variante relativamente lenta (il TGP può variare da 35 a 95 watt per la A1000). Ha circa lo stesso livello di prestazioni della precedente RTX A2000 con 4 GB di VRAM e un TGP simile (vedere P15v G3 con 40 watt), ma è molto più lenta della nuova RTX 2000 Ada (paragonabile alla GeForce RTX 4060 Laptop).
Le prestazioni della GPU rimangono assolutamente stabili sotto carico sostenuto, anche se la scheda grafica deve accontentarsi di 40 watt di potenza quando il laptop funziona a batteria. Ciò causa un calo delle prestazioni grafiche di circa il 7%. Altri risultati dei benchmark delle GPU sono disponibili in la nostra sezione tecnica.
| 3DMark 11 - 1280x720 Performance GPU | |
| Media della classe Workstation (12535 - 69594, n=23, ultimi 2 anni) | |
| Lenovo ThinkPad P1 G6-21FV000DGE | |
| HP ZBook Power 15 G10 | |
| Dell Precision 7670 | |
| Lenovo ThinkPad P16 21D6001DMB A2000 Retest | |
| Lenovo ThinkPad P16v G1 AMD | |
| Media NVIDIA RTX A1000 Laptop GPU (14402 - 15867, n=2) | |
| Lenovo ThinkPad P15v G3 21EM001AGE | |
| 3DMark | |
| 1920x1080 Fire Strike Graphics | |
| Media della classe Workstation (8293 - 52560, n=23, ultimi 2 anni) | |
| Lenovo ThinkPad P1 G6-21FV000DGE | |
| HP ZBook Power 15 G10 | |
| Lenovo ThinkPad P16 21D6001DMB A2000 Retest | |
| Dell Precision 7670 | |
| Lenovo ThinkPad P16v G1 AMD | |
| Media NVIDIA RTX A1000 Laptop GPU (10914 - 11728, n=2) | |
| Lenovo ThinkPad P15v G3 21EM001AGE | |
| 2560x1440 Time Spy Graphics | |
| Media della classe Workstation (2725 - 24806, n=23, ultimi 2 anni) | |
| Lenovo ThinkPad P1 G6-21FV000DGE | |
| HP ZBook Power 15 G10 | |
| Dell Precision 7670 | |
| Lenovo ThinkPad P16 21D6001DMB A2000 Retest | |
| Lenovo ThinkPad P16v G1 AMD | |
| Media NVIDIA RTX A1000 Laptop GPU (4101 - 4410, n=2) | |
| Lenovo ThinkPad P15v G3 21EM001AGE | |
| 3DMark 06 Standard Score | 48018 punti | |
| 3DMark Vantage P Result | 58312 punti | |
| 3DMark 11 Performance | 15795 punti | |
| 3DMark Fire Strike Score | 10679 punti | |
| 3DMark Time Spy Score | 4835 punti | |
Aiuto | ||
| Blender / v3.3 Classroom HIP/AMD | |
| Lenovo ThinkPad P15v G3 21EM001AGE | |
| Blender / v3.3 Classroom OPTIX/RTX | |
| Lenovo ThinkPad P16v G1 AMD | |
| Media NVIDIA RTX A1000 Laptop GPU (61 - 65, n=2) | |
| Lenovo ThinkPad P16 G1 21D6001DMB | |
| Lenovo ThinkPad P15v G3 21EM001AGE | |
| Lenovo ThinkPad P16 21D6001DMB A2000 Retest | |
| Dell Precision 7670 | |
| Lenovo ThinkPad P1 G6-21FV000DGE | |
| HP ZBook Power 15 G10 | |
| Media della classe Workstation (10 - 43, n=17, ultimi 2 anni) | |
| Blender / v3.3 Classroom CUDA | |
| Media NVIDIA RTX A1000 Laptop GPU (108 - 112, n=2) | |
| Lenovo ThinkPad P16v G1 AMD | |
| Lenovo ThinkPad P15v G3 21EM001AGE | |
| Lenovo ThinkPad P16 G1 21D6001DMB | |
| Dell Precision 7670 | |
| Lenovo ThinkPad P16 21D6001DMB A2000 Retest | |
| Lenovo ThinkPad P1 G6-21FV000DGE | |
| HP ZBook Power 15 G10 | |
| Media della classe Workstation (16 - 74, n=17, ultimi 2 anni) | |
| Blender / v3.3 Classroom CPU | |
| Lenovo ThinkPad P15v G3 21EM001AGE | |
| Media NVIDIA RTX A1000 Laptop GPU (329 - 448, n=2) | |
| Dell Precision 7670 | |
| Lenovo ThinkPad P1 G6-21FV000DGE | |
| Lenovo ThinkPad P16v G1 AMD | |
| HP ZBook Power 15 G10 | |
| Lenovo ThinkPad P16 21D6001DMB A2000 Retest | |
| Lenovo ThinkPad P16 G1 21D6001DMB | |
| Media della classe Workstation (148 - 364, n=23, ultimi 2 anni) | |
* ... Meglio usare valori piccoli
Prestazioni di gioco
Allo stesso modo, non avrà problemi a giocare con i driver professionali di Nvidia; abbiamo riscontrato zero problemi durante i nostri test. Le prestazioni di gioco della RTX A1000 sono più o meno alla pari con una RTX 3050 con 6 GB di VRAM o una RTX 3050 Ti. Molti titoli più vecchi possono quindi girare senza problemi a 1080p e con impostazioni alte o massime. Tuttavia, coloro che desiderano giocare a giochi più impegnativi dovrebbero optare per la RTX 2000 Ada opzionale.
| Performance rating - Percent | |
| Media della classe Workstation | |
| Lenovo ThinkPad P1 G6-21FV000DGE | |
| Lenovo ThinkPad P16 21D6001DMB A2000 Retest | |
| HP ZBook Power 15 G10 | |
| Dell Precision 7670 | |
| Lenovo ThinkPad P16 G1 21D6001DMB -1! | |
| Lenovo ThinkPad P16v G1 AMD | |
| Lenovo ThinkPad P15v G3 21EM001AGE | |
| The Witcher 3 - 1920x1080 Ultra Graphics & Postprocessing (HBAO+) | |
| Media della classe Workstation (n=1ultimi 2 anni) | |
| Lenovo ThinkPad P1 G6-21FV000DGE | |
| HP ZBook Power 15 G10 | |
| Lenovo ThinkPad P16 21D6001DMB A2000 Retest | |
| Dell Precision 7670 | |
| Lenovo ThinkPad P15v G3 21EM001AGE | |
| Lenovo ThinkPad P16 G1 21D6001DMB | |
| Lenovo ThinkPad P16v G1 AMD | |
| GTA V - 1920x1080 Highest AA:4xMSAA + FX AF:16x | |
| Lenovo ThinkPad P1 G6-21FV000DGE | |
| Media della classe Workstation (18.1 - 156.1, n=23, ultimi 2 anni) | |
| HP ZBook Power 15 G10 | |
| Lenovo ThinkPad P16 21D6001DMB A2000 Retest | |
| Dell Precision 7670 | |
| Lenovo ThinkPad P16v G1 AMD | |
| Lenovo ThinkPad P15v G3 21EM001AGE | |
| Final Fantasy XV Benchmark - 1920x1080 High Quality | |
| Media della classe Workstation (26.4 - 197.6, n=23, ultimi 2 anni) | |
| Lenovo ThinkPad P1 G6-21FV000DGE | |
| HP ZBook Power 15 G10 | |
| Dell Precision 7670 | |
| Lenovo ThinkPad P16 21D6001DMB A2000 Retest | |
| Lenovo ThinkPad P16v G1 AMD | |
| Lenovo ThinkPad P15v G3 21EM001AGE | |
| Lenovo ThinkPad P16 G1 21D6001DMB | |
| Strange Brigade - 1920x1080 ultra AA:ultra AF:16 | |
| Media della classe Workstation (93.2 - 418, n=17, ultimi 2 anni) | |
| Lenovo ThinkPad P1 G6-21FV000DGE | |
| HP ZBook Power 15 G10 | |
| Lenovo ThinkPad P16 21D6001DMB A2000 Retest | |
| Dell Precision 7670 | |
| Lenovo ThinkPad P16v G1 AMD | |
| Lenovo ThinkPad P15v G3 21EM001AGE | |
| Lenovo ThinkPad P16 G1 21D6001DMB | |
| Dota 2 Reborn - 1920x1080 ultra (3/3) best looking | |
| Lenovo ThinkPad P16 21D6001DMB A2000 Retest | |
| Lenovo ThinkPad P16 G1 21D6001DMB | |
| Lenovo ThinkPad P1 G6-21FV000DGE | |
| Media della classe Workstation (50.7 - 178.4, n=23, ultimi 2 anni) | |
| HP ZBook Power 15 G10 | |
| Dell Precision 7670 | |
| Lenovo ThinkPad P16v G1 AMD | |
| Lenovo ThinkPad P15v G3 21EM001AGE | |
| X-Plane 11.11 - 1920x1080 high (fps_test=3) | |
| Lenovo ThinkPad P16 21D6001DMB A2000 Retest | |
| Lenovo ThinkPad P1 G6-21FV000DGE | |
| Lenovo ThinkPad P16 G1 21D6001DMB | |
| Dell Precision 7670 | |
| Media della classe Workstation (30.5 - 139.7, n=23, ultimi 2 anni) | |
| Lenovo ThinkPad P16v G1 AMD | |
| Lenovo ThinkPad P15v G3 21EM001AGE | |
| HP ZBook Power 15 G10 | |
| The Witcher 3 - 1920x1080 Ultra Graphics & Postprocessing (HBAO+) | |
| Media della classe Workstation (n=1ultimi 2 anni) | |
| Lenovo ThinkPad P1 G6-21FV000DGE | |
| HP ZBook Power 15 G10 | |
| Lenovo ThinkPad P16 21D6001DMB A2000 Retest | |
| Dell Precision 7670 | |
| Lenovo ThinkPad P15v G3 21EM001AGE | |
| Lenovo ThinkPad P16 G1 21D6001DMB | |
| Lenovo ThinkPad P16v G1 AMD | |
| Media NVIDIA RTX A1000 Laptop GPU (42.7 - 43.2, n=2) | |
| Far Cry 5 - 1920x1080 Ultra Preset AA:T | |
| Lenovo ThinkPad P1 G6-21FV000DGE | |
| Media della classe Workstation (37 - 128, n=9, ultimi 2 anni) | |
| HP ZBook Power 15 G10 | |
| Lenovo ThinkPad P16v G1 AMD | |
| Media NVIDIA RTX A1000 Laptop GPU (n=1) | |
| F1 22 - 1920x1080 Ultra High Preset AA:T AF:16x | |
| Media della classe Workstation (46.2 - 95.5, n=5, ultimi 2 anni) | |
| Lenovo ThinkPad P1 G6-21FV000DGE | |
| HP ZBook Power 15 G10 | |
| Lenovo ThinkPad P16 21D6001DMB A2000 Retest | |
| Lenovo ThinkPad P16v G1 AMD | |
| Lenovo ThinkPad P15v G3 21EM001AGE | |
| Media NVIDIA RTX A1000 Laptop GPU (22 - 30.6, n=2) | |
| F1 23 - 1920x1080 Ultra High Preset AA:T AF:16x | |
| Lenovo ThinkPad P1 G6-21FV000DGE | |
| Lenovo ThinkPad P16v G1 AMD | |
| Media NVIDIA RTX A1000 Laptop GPU (n=1) | |
Witcher 3 FPS chart
| basso | medio | alto | ultra | |
|---|---|---|---|---|
| GTA V (2015) | 168.2 | 129.4 | 62.7 | |
| The Witcher 3 (2015) | 257 | 165 | 87 | 43.2 |
| Dota 2 Reborn (2015) | 139.4 | 128.7 | 125 | 118.2 |
| Final Fantasy XV Benchmark (2018) | 129.2 | 67.9 | 48.3 | |
| X-Plane 11.11 (2018) | 99.8 | 88.6 | 71.9 | |
| Far Cry 5 (2018) | 132 | 85 | 79 | 73 |
| Strange Brigade (2018) | 261 | 111.4 | 90.2 | 78.4 |
| F1 2021 (2021) | 288 | 163.1 | 128.9 | 62.1 |
| F1 22 (2022) | 160.7 | 145.8 | 104.3 | 30.6 |
| F1 23 (2023) | 154.7 | 139.3 | 93.8 | 27 |
| Cyberpunk 2077 (2023) | 66.4 | 49.8 | 41.6 | 34.7 |
Emissioni - Workstation con altoparlanti scadenti
Emissioni di rumore
Le due ventole del ThinkPad P16v G1 rimangono generalmente inattive durante le attività di base. Il rumore della ventola rimane persino piacevolmente silenzioso (36 dB(A) secondo la nostra misurazione) quando si sottopone a carico solo il processore o la scheda grafica. Abbiamo misurato circa 44 dB(A) di rumore durante il gioco, ma le ventole tendono a iniziare a ronzare leggermente a 40 dB(A) e oltre. La workstation mobile è diventata molto rumorosa durante lo stress test, raggiungendo circa 50 dB(A). La nostra unità di recensione non ha prodotto altri rumori elettronici.
Rumorosità
| Idle |
| 24.3 / 24.3 / 24.3 dB(A) |
| Sotto carico |
| 35.7 / 50.2 dB(A) |
 | ||
30 dB silenzioso 40 dB(A) udibile 50 dB(A) rumoroso |
||
min: | ||
| Lenovo ThinkPad P16v G1 AMD RTX A1000 Laptop GPU, R7 PRO 7840HS, SK hynix PC801 HFS001TEJ9X101N | HP ZBook Power 15 G10 RTX 2000 Ada Generation Laptop, R7 PRO 7840HS, WDC PC SN810 2TB | Lenovo ThinkPad P15v G3 21EM001AGE RTX A2000 Laptop GPU, R7 PRO 6850H, SK Hynix PC711 1TB HFS001TDE9X081N | Dell Precision 7670 RTX A2000 Laptop GPU, i7-12850HX, SK Hynix HFS001TEJ9X115N | Lenovo ThinkPad P1 G6-21FV000DGE RTX 2000 Ada Generation Laptop, i9-13900H, SK Hynix PC711 1TB HFS001TDE9X084N | Lenovo ThinkPad P16 21D6001DMB A2000 Retest RTX A2000 Laptop GPU, i7-12850HX, Micron 3400 1TB MTFDKBA1T0TFH | |
|---|---|---|---|---|---|---|
| Noise | 4% | 9% | -4% | -4% | -14% | |
| off /ambiente * (dB) | 24.3 | 24.2 -0% | 23.2 5% | 22.7 7% | 24.5 -1% | 24.7 -2% |
| Idle Minimum * (dB) | 24.3 | 24.4 -0% | 23.2 5% | 22.9 6% | 24.5 -1% | 24.7 -2% |
| Idle Average * (dB) | 24.3 | 24.4 -0% | 23.2 5% | 22.9 6% | 24.5 -1% | 26.2 -8% |
| Idle Maximum * (dB) | 24.3 | 24.4 -0% | 23.2 5% | 24.5 -1% | 24.5 -1% | 31.2 -28% |
| Load Average * (dB) | 35.7 | 27.4 23% | 35 2% | 48.7 -36% | 48 -34% | 48.3 -35% |
| Witcher 3 ultra * (dB) | 43.7 | 43.3 1% | 37.9 13% | 45.2 -3% | 40.7 7% | 52.7 -21% |
| Load Maximum * (dB) | 50.2 | 46.8 7% | 37.5 25% | 52.1 -4% | 48 4% | 52.7 -5% |
* ... Meglio usare valori piccoli
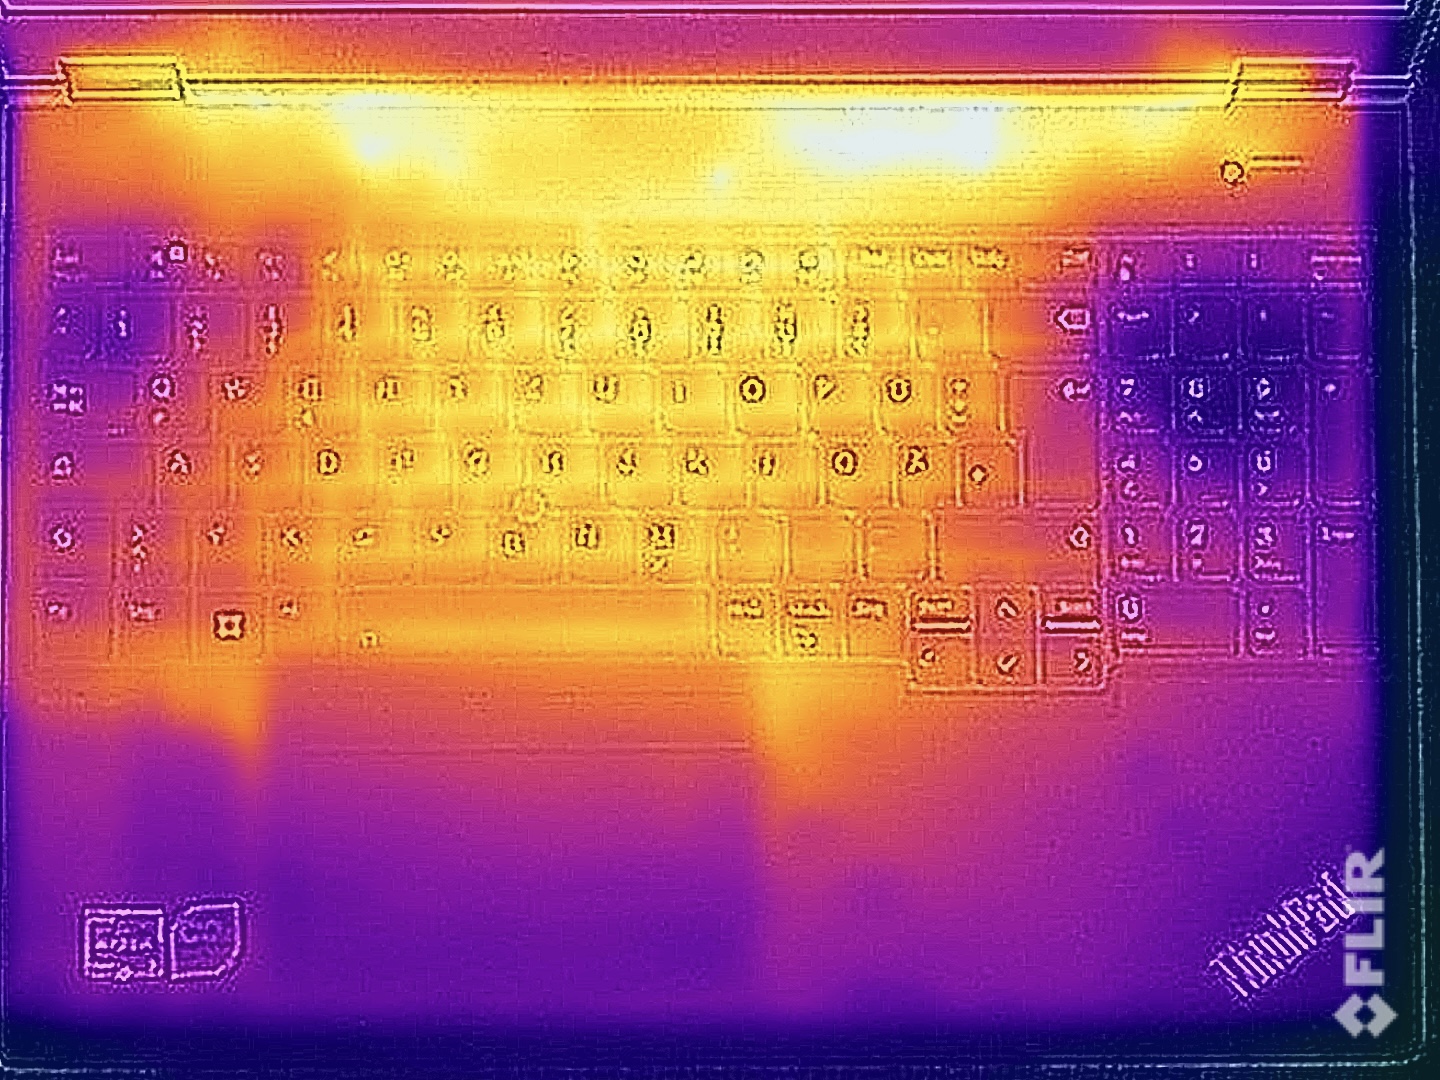
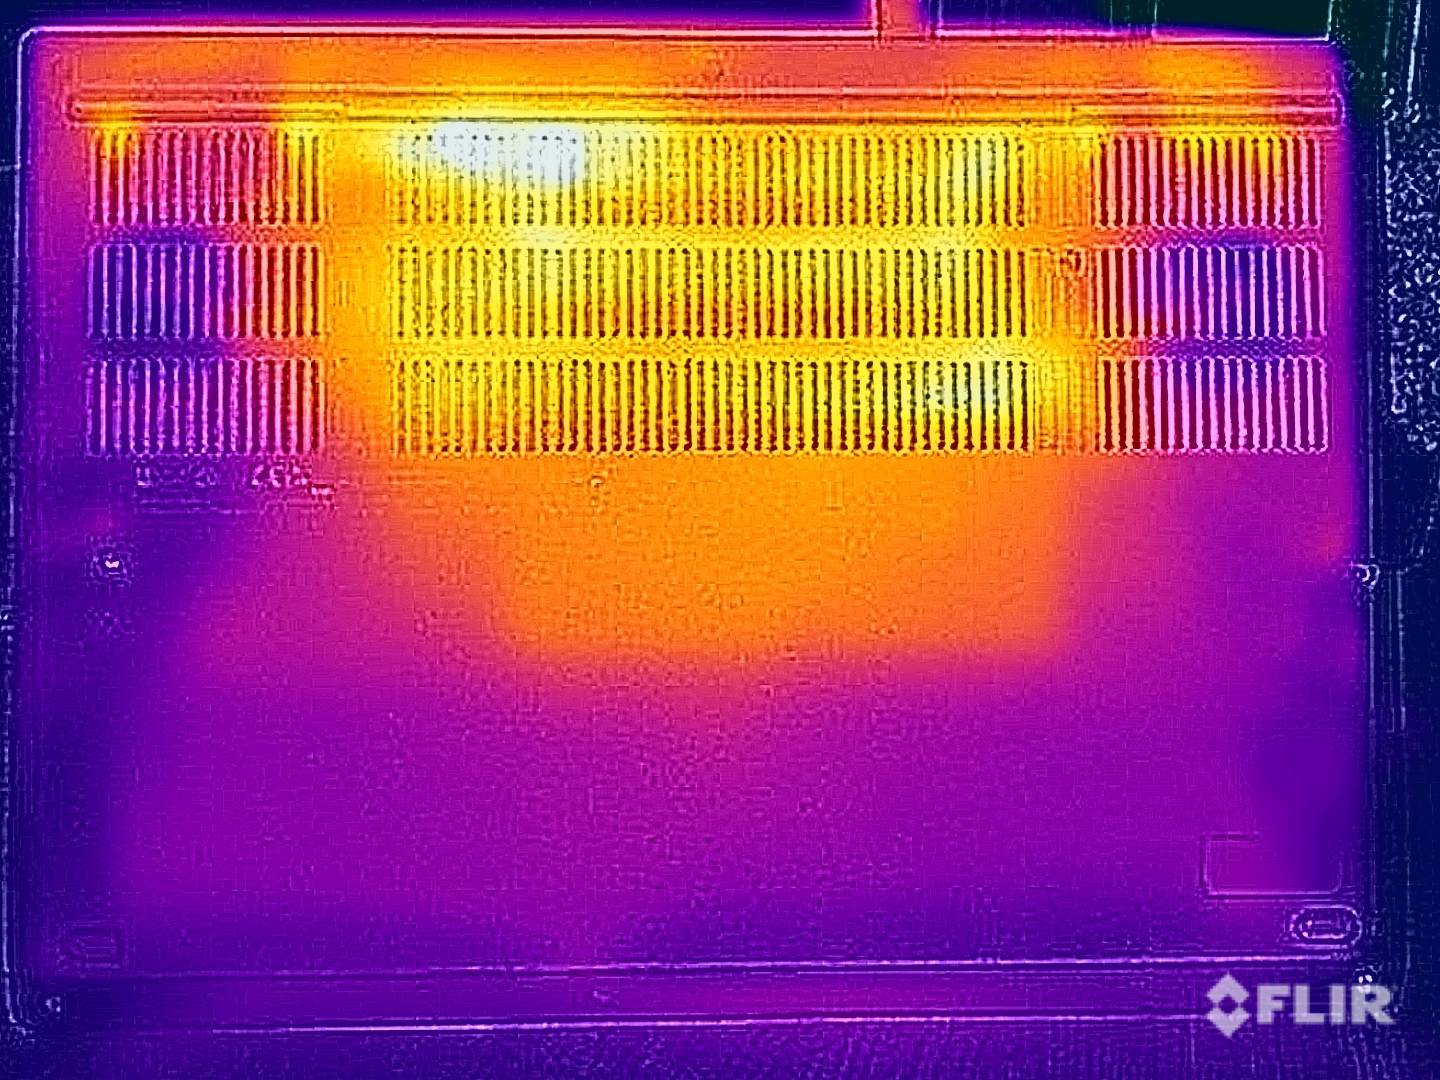
Temperatura
Non ci sono problemi con le temperature di superficie a basso carico. Tuttavia, la situazione cambia quando si applica il carico sia alla CPU che alla GPU. Soprattutto nella parte inferiore del dispositivo, abbiamo misurato temperature superiori a 55°C (131°F) in alcuni punti, il che significa che dovrebbe assolutamente evitare il contatto diretto della pelle con queste aree. Detto questo, la parte superiore della sezione di base è rimasta più fresca e le temperature sono state mantenute al di sotto dei 40°C (104°F) quasi ovunque sulla tastiera. Pertanto, è possibile digitare correttamente sulla tastiera anche a pieno carico.
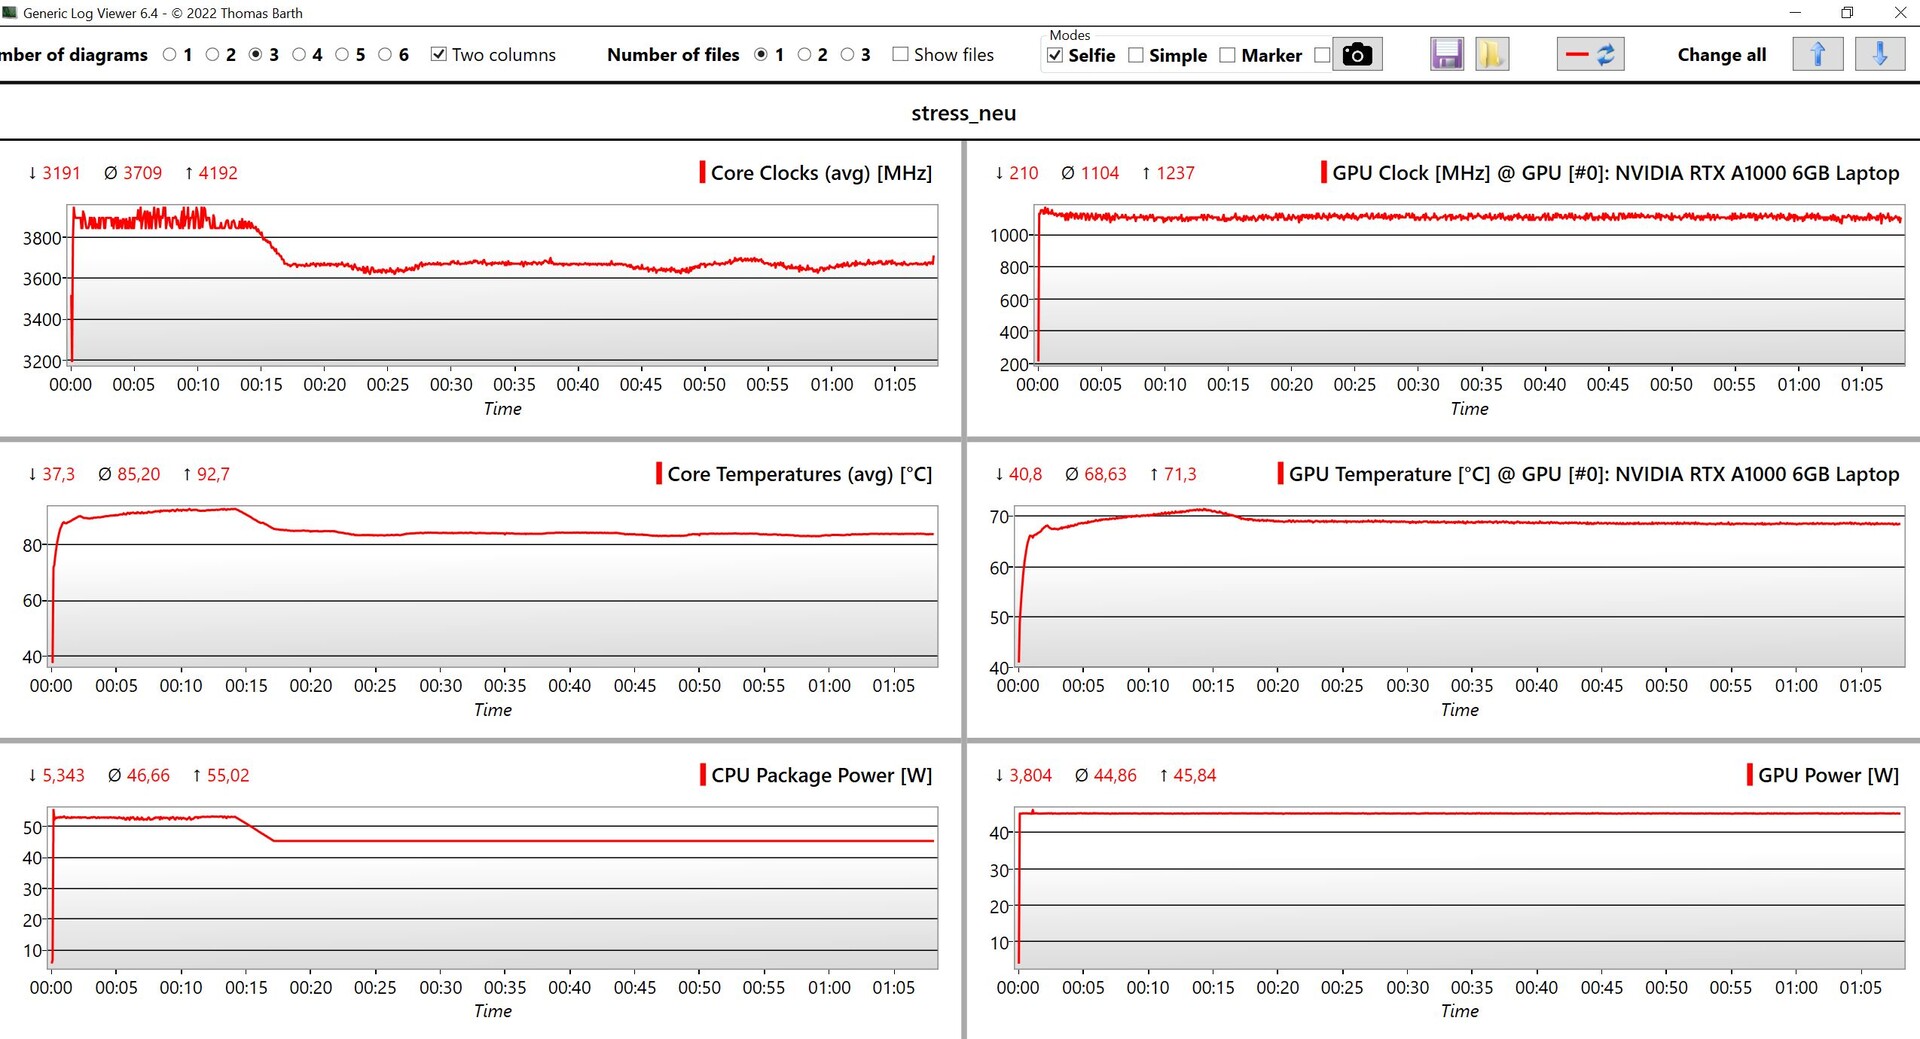
La potenza della GPU si è mantenuta stabile a 45 watt durante lo stress test, mentre il processore ha funzionato a 54 watt per circa 12 minuti prima di stabilizzarsi a 45 watt. Con la batteria, la GPU ha consumato ancora 40 watt di potenza, ma il processore è sceso ulteriormente a 18 watt.
(±) La temperatura massima sul lato superiore è di 40.9 °C / 106 F, rispetto alla media di 38.2 °C / 101 F, che varia da 22.2 a 69.8 °C per questa classe Workstation.
(-) Il lato inferiore si riscalda fino ad un massimo di 57.9 °C / 136 F, rispetto alla media di 41.1 °C / 106 F
(+) In idle, la temperatura media del lato superiore è di 23.9 °C / 75 F, rispetto alla media deld ispositivo di 32 °C / 90 F.
(±) Riproducendo The Witcher 3, la temperatura media per il lato superiore e' di 32.7 °C / 91 F, rispetto alla media del dispositivo di 32 °C / 90 F.
(+) I poggiapolsi e il touchpad raggiungono la temperatura massima della pelle (34.3 °C / 93.7 F) e quindi non sono caldi.
(-) La temperatura media della zona del palmo della mano di dispositivi simili e'stata di 27.8 °C / 82 F (-6.5 °C / -11.7 F).
| Lenovo ThinkPad P16v G1 AMD AMD Ryzen 7 PRO 7840HS, NVIDIA RTX A1000 Laptop GPU | HP ZBook Power 15 G10 AMD Ryzen 7 PRO 7840HS, NVIDIA RTX 2000 Ada Generation Laptop | Lenovo ThinkPad P15v G3 21EM001AGE AMD Ryzen 7 PRO 6850H, NVIDIA RTX A2000 Laptop GPU | Dell Precision 7670 Intel Core i7-12850HX, NVIDIA RTX A2000 Laptop GPU | Lenovo ThinkPad P1 G6-21FV000DGE Intel Core i9-13900H, NVIDIA RTX 2000 Ada Generation Laptop | Lenovo ThinkPad P16 21D6001DMB A2000 Retest Intel Core i7-12850HX, NVIDIA RTX A2000 Laptop GPU | |
|---|---|---|---|---|---|---|
| Heat | -1% | -2% | -16% | -9% | -13% | |
| Maximum Upper Side * (°C) | 40.9 | 42.4 -4% | 48.7 -19% | 51 -25% | 47.1 -15% | 44 -8% |
| Maximum Bottom * (°C) | 57.9 | 47.8 17% | 50.5 13% | 45.8 21% | 56.5 2% | 46.8 19% |
| Idle Upper Side * (°C) | 24.5 | 26.8 -9% | 25 -2% | 31.8 -30% | 28.1 -15% | 31.8 -30% |
| Idle Bottom * (°C) | 25.5 | 27.2 -7% | 25.4 -0% | 32.6 -28% | 27.6 -8% | 33.5 -31% |
* ... Meglio usare valori piccoli
Altoparlanti
I due altoparlanti stereo sono complessivamente pessimi. Sebbene i medi e gli alti suonino puliti, il che è utile per riprodurre le voci, i moduli degli altoparlanti mancano semplicemente di potenza e dinamica. Inoltre, i bassi sono praticamente inesistenti.
Lenovo ThinkPad P16v G1 AMD analisi audio
(±) | potenza degli altiparlanti media ma buona (74.9 dB)
Bassi 100 - 315 Hz
(-) | quasi nessun basso - in media 19.8% inferiori alla media
(±) | la linearità dei bassi è media (8.8% delta rispetto alla precedente frequenza)
Medi 400 - 2000 Hz
(+) | medi bilanciati - solo only 3.8% rispetto alla media
(+) | medi lineari (5.4% delta rispetto alla precedente frequenza)
Alti 2 - 16 kHz
(+) | Alti bilanciati - appena 3.3% dalla media
(+) | alti lineari (5% delta rispetto alla precedente frequenza)
Nel complesso 100 - 16.000 Hz
(±) | la linearità complessiva del suono è media (18.6% di differenza rispetto alla media
Rispetto alla stessa classe
» 63% di tutti i dispositivi testati in questa classe è stato migliore, 7% simile, 30% peggiore
» Il migliore ha avuto un delta di 7%, medio di 17%, peggiore di 35%
Rispetto a tutti i dispositivi testati
» 42% di tutti i dispositivi testati in questa classe è stato migliore, 8% similare, 50% peggiore
» Il migliore ha avuto un delta di 4%, medio di 23%, peggiore di 134%
HP ZBook Power 15 G10 analisi audio
(±) | potenza degli altiparlanti media ma buona (74.4 dB)
Bassi 100 - 315 Hz
(-) | quasi nessun basso - in media 24.9% inferiori alla media
(±) | la linearità dei bassi è media (11.1% delta rispetto alla precedente frequenza)
Medi 400 - 2000 Hz
(+) | medi bilanciati - solo only 1.8% rispetto alla media
(+) | medi lineari (4.6% delta rispetto alla precedente frequenza)
Alti 2 - 16 kHz
(+) | Alti bilanciati - appena 2.9% dalla media
(+) | alti lineari (4.3% delta rispetto alla precedente frequenza)
Nel complesso 100 - 16.000 Hz
(±) | la linearità complessiva del suono è media (19.6% di differenza rispetto alla media
Rispetto alla stessa classe
» 70% di tutti i dispositivi testati in questa classe è stato migliore, 6% simile, 25% peggiore
» Il migliore ha avuto un delta di 7%, medio di 17%, peggiore di 35%
Rispetto a tutti i dispositivi testati
» 49% di tutti i dispositivi testati in questa classe è stato migliore, 7% similare, 44% peggiore
» Il migliore ha avuto un delta di 4%, medio di 23%, peggiore di 134%
Gestione dell'energia - Lunga durata della batteria
Consumo di energia
Il consumo di energia al minimo non ha superato i 6,7 watt, un valore estremamente basso per un dispositivo da 16 pollici. Al contrario, non sorprende che il ThinkPad abbia richiesto circa 150 watt durante lo stress test, anche se è sceso rapidamente a circa 135 watt. L'adattatore da 170 watt incluso è quindi abbastanza potente per il portatile.
| Off / Standby | |
| Idle | |
| Sotto carico |
|
Leggenda:
min: | |
| Lenovo ThinkPad P16v G1 AMD R7 PRO 7840HS, RTX A1000 Laptop GPU, SK hynix PC801 HFS001TEJ9X101N, IPS, 1920x1200, 16" | HP ZBook Power 15 G10 R7 PRO 7840HS, RTX 2000 Ada Generation Laptop, WDC PC SN810 2TB, IPS, 2560x1440, 15.6" | Lenovo ThinkPad P15v G3 21EM001AGE R7 PRO 6850H, RTX A2000 Laptop GPU, SK Hynix PC711 1TB HFS001TDE9X081N, IPS LED, 3840x2160, 15.6" | Dell Precision 7670 i7-12850HX, RTX A2000 Laptop GPU, SK Hynix HFS001TEJ9X115N, OLED, 3840x2400, 16" | Lenovo ThinkPad P1 G6-21FV000DGE i9-13900H, RTX 2000 Ada Generation Laptop, SK Hynix PC711 1TB HFS001TDE9X084N, IPS, 2560x1600, 16" | Lenovo ThinkPad P16 G1 21D6001DMB i7-12850HX, RTX A2000 Laptop GPU, Micron 3400 1TB MTFDKBA1T0TFH, IPS LED, 2560x1600, 16" | Media NVIDIA RTX A1000 Laptop GPU | Media della classe Workstation | |
|---|---|---|---|---|---|---|---|---|
| Power Consumption | -40% | -52% | -115% | -74% | -39% | -26% | -94% | |
| Idle Minimum * (Watt) | 4.1 | 5.3 -29% | 6.3 -54% | 7.5 -83% | 8.3 -102% | 5.1 -24% | 4.2 ? -2% | 9.11 ? -122% |
| Idle Average * (Watt) | 6.5 | 9.9 -52% | 13.9 -114% | 9.5 -46% | 14.5 -123% | 9.2 -42% | 7.7 ? -18% | 13.8 ? -112% |
| Idle Maximum * (Watt) | 6.7 | 16.7 -149% | 14.5 -116% | 28.4 -324% | 15.3 -128% | 9.9 -48% | 12.8 ? -91% | 17.9 ? -167% |
| Load Average * (Watt) | 65.2 | 61.3 6% | 82.8 -27% | 139.1 -113% | 91.8 -41% | 124.1 -90% | 79.6 ? -22% | 96 ? -47% |
| Witcher 3 ultra * (Watt) | 77.2 | 87.9 -14% | 88.8 -15% | 134 -74% | 104.7 -36% | 87.7 -14% | ||
| Load Maximum * (Watt) | 147 | 145.3 1% | 124.8 15% | 220.8 -50% | 164.5 -12% | 168.9 -15% | 142.3 ? 3% | 180.3 ? -23% |
* ... Meglio usare valori piccoli
Power consumption Witcher 3 / Stresstest
Power consumption with external monitor
Durata della batteria
La combinazione di un basso consumo energetico e di una batteria da 90 Wh ha permesso un'autonomia molto lunga durante i nostri test. Il ThinkPad è durato quasi 18 ore nel nostro test video a 150 cd/m² (equivalente al 71% della luminosità massima sulla nostra unità di prova) e quasi 15 ore nel nostro test Wi-Fi. Anche con la luminosità dello schermo alzata al massimo, siamo riusciti a ottenere 12 ore dal dispositivo. Si tratta di risultati eccellenti, che i dispositivi della concorrenza non riescono a raggiungere. Sotto carico massimo, la batteria si è scaricata completamente in poco più di un'ora. Ci sono volute circa 2 ore per ricaricare completamente il portatile quando era in funzione, con la batteria che ha recuperato l'80% della sua carica dopo 65 minuti.
| Lenovo ThinkPad P16v G1 AMD R7 PRO 7840HS, RTX A1000 Laptop GPU, 90 Wh | HP ZBook Power 15 G10 R7 PRO 7840HS, RTX 2000 Ada Generation Laptop, 83 Wh | Lenovo ThinkPad P15v G3 21EM001AGE R7 PRO 6850H, RTX A2000 Laptop GPU, 68 Wh | Dell Precision 7670 i7-12850HX, RTX A2000 Laptop GPU, 83 Wh | Lenovo ThinkPad P1 G6-21FV000DGE i9-13900H, RTX 2000 Ada Generation Laptop, 90 Wh | Lenovo ThinkPad P16 G1 21D6001DMB i7-12850HX, RTX A2000 Laptop GPU, 94 Wh | Media della classe Workstation | |
|---|---|---|---|---|---|---|---|
| Autonomia della batteria | -33% | -10% | -22% | -25% | 14% | -18% | |
| H.264 (h) | 17.8 | 10.7 -40% | 11.2 -37% | 10.1 ? -43% | |||
| WiFi v1.3 (h) | 15 | 10 -33% | 6.9 -54% | 5.9 -61% | 9.5 -37% | 9.4 -37% | 8.55 ? -43% |
| Load (h) | 1.1 | 1.8 64% | 1.3 18% | 1.1 0% | 1.8 64% | 1.441 ? 31% |
Pro
Contro
Verdetto - ThinkPad P16v G1 è un'ottima workstation


Lenovo ha lanciato il ThinkPad P16v G1 per sostituire il vecchio ThinkPad P15v con un modello da 16 pollici leggermente più grande. L'idea di base della workstation entry-level rimane la stessa: si tratta di una porta d'ingresso relativamente conveniente nel mondo del lavoro professionale. Le prestazioni necessarie della CPU sono fornite da un chip AMD Zen4 attuale, che offre ottime prestazioni nonostante i limiti di potenza un po' bassi, pari a un massimo di 64 watt. Ma le workstation di fascia alta, come il ThinkPad P16 con CPU HX di Intel, offrono una potenza di elaborazione ancora maggiore. Un altro punto critico è che le prestazioni della CPU si riducono notevolmente quando il portatile funziona a batteria.
Allo stesso modo, le uniche opzioni di scheda grafica disponibili sono modelli di fascia bassa di Nvidia (RTX A500, RTX A1000 o RTX 2000 Ada). Ma è anche possibile rinunciare completamente a una GPU dedicata. Le prestazioni della RTX A1000 con 6 GB di RAM sono complessivamente decenti, anche se si tratta di una variante relativamente lenta con un TGP di 45 watt. Dato il grande fattore di forma da 16 pollici del portatile, si sarebbe potuto ottenere di più.
Il ThinkPad P16v G1 è il nuovo modello entry-level di Lenovo nel segmento delle workstation. Le sue prestazioni sono adeguate, anche se, inutile dirlo, bisogna accettare dei compromessi in alcune aree (ad esempio la qualità dello chassis, le prestazioni di raffreddamento) rispetto al più costoso ThinkPad P16.
Essendo interamente realizzato in plastica, lo chassis mostra chiaramente che il P16v G1 è un dispositivo entry-level. Il dispositivo ha una buona manutenibilità da parte dell'utente e dispone di due slot SO-DIMM e di spazio per due SSD M.2 2280. Tuttavia, non è possibile aggiungere un modulo WWAN perché Lenovo non ha preinstallato le antenne necessarie o il lettore di schede SIM. La tastiera offre una qualità ThinkPad moderna e il display Full HD presenta una copertura sRGB completa ed è una scelta decente per le attività normali. C'è anche un'opzione di pannello 4K (800 cd/m², P3 & HDR) se desidera qualcosa di meglio.
Il più grande concorrente del ThinkPad P16v G1 è senza dubbio l'HP ZBook Power G10 HP ZBook Power G10che ha una sensazione di maggiore qualità grazie al suo telaio in metallo. Entrambi i portatili possono essere dotati di specifiche simili, ma per il resto non differiscono molto. Tuttavia, l'HP utilizza ancora un display 16:9 e non riesce a tenere il passo con il ThinkPad in termini di durata della batteria. Dell offre il Precision 3581 in questa fascia di prezzo, ma non abbiamo ancora avuto l'opportunità di provare questo dispositivo.
Prezzo e disponibilità
In Germania, il ThinkPad P16v G1 come da specifiche è disponibile presso Campuspoint per 2.099 euro (2.298 dollari). Può anche visitare il sito Lenovo Germany o Lenovo US per configurare il suo ThinkPad P16v G1. Per questo portatile sono disponibili anche sconti per studenti e insegnanti.
Lenovo ThinkPad P16v G1 AMD
- 01/03/2024 v7 (old)
Andreas Osthoff
Transparency
La selezione dei dispositivi da recensire viene effettuata dalla nostra redazione. Il campione di prova è stato fornito all'autore come prestito dal produttore o dal rivenditore ai fini di questa recensione. L'istituto di credito non ha avuto alcuna influenza su questa recensione, né il produttore ne ha ricevuto una copia prima della pubblicazione. Non vi era alcun obbligo di pubblicare questa recensione. In quanto società mediatica indipendente, Notebookcheck non è soggetta all'autorità di produttori, rivenditori o editori.
Ecco come Notebookcheck esegue i test
Ogni anno, Notebookcheck esamina in modo indipendente centinaia di laptop e smartphone utilizzando procedure standardizzate per garantire che tutti i risultati siano comparabili. Da circa 20 anni sviluppiamo continuamente i nostri metodi di prova e nel frattempo stabiliamo gli standard di settore. Nei nostri laboratori di prova, tecnici ed editori esperti utilizzano apparecchiature di misurazione di alta qualità. Questi test comportano un processo di validazione in più fasi. Il nostro complesso sistema di valutazione si basa su centinaia di misurazioni e parametri di riferimento ben fondati, che mantengono l'obiettività.Price comparison

