Recensione del portatile Lenovo ThinkPad P16 G1: Una workstation HX55 potente e di nuova concezione
Dal 2015, Lenovo ha due modelli nel segmento delle workstation classiche e mobili, dove l'attenzione è rivolta principalmente alle prestazioni. Più di recente, questi modelli hanno preso il nome diLenovo ThinkPad P15 Gen 2e Lenovo ThinkPad P17Lenovo ThinkPad P17 Gen 2. Come suggerisce il nome, ogni dispositivo era dotato di un display da 15 e 17 pollici. Nel 2022, Lenovo ha deciso di porre fine a questa dualità di workstation e ora offre un'unica workstation mobile full-fat: il Lenovo ThinkPad P16 Gen 1, che sostituisce entrambi i modelli precedenti. In particolare, un confronto con i suoi concorrenti diretti di Dell e Asus mostrerà come se la cava con dispositivi simili in cui le prestazioni mobili sono una priorità.
Potenziali concorrenti a confronto
Punteggio | Data | Modello | Peso | Altezza | Dimensione | Risoluzione | Prezzo |
|---|---|---|---|---|---|---|---|
| 88.2 % v7 (old) | 02/2023 | Lenovo ThinkPad P16 G1 21D6001DMB i7-12850HX, RTX A2000 Laptop GPU | 3 kg | 30.23 mm | 16.00" | 2560x1600 | |
| 87.2 % v7 (old) | 10/2021 | Lenovo ThinkPad P15 G2-20YQ001JGE i7-11800H, RTX A3000 Laptop GPU | 2.9 kg | 31.5 mm | 15.60" | 1920x1080 | |
| 87.8 % v7 (old) | 10/2021 | Lenovo ThinkPad P17 G2-20YU0025G i7-11800H, RTX A2000 Laptop GPU | 3.6 kg | 28.38 mm | 17.30" | 1920x1080 | |
| 89.7 % v7 (old) | 02/2022 | HP ZBook Fury 17 G8-4A6A9EA i9-11950H, RTX A3000 Laptop GPU | 2.9 kg | 27 mm | 17.30" | 3840x2160 | |
| 88.4 % v7 (old) | 10/2022 | Dell Precision 7670 i7-12850HX, RTX A2000 Laptop GPU | 2.7 kg | 24.7 mm | 16.00" | 3840x2400 | |
| 89.6 % v7 (old) | 01/2023 | Asus ExpertBook B6 Flip B6602FC2 i9-12950HX, RTX A2000 Laptop GPU | 2.8 kg | 27.2 mm | 16.00" | 2560x1600 |
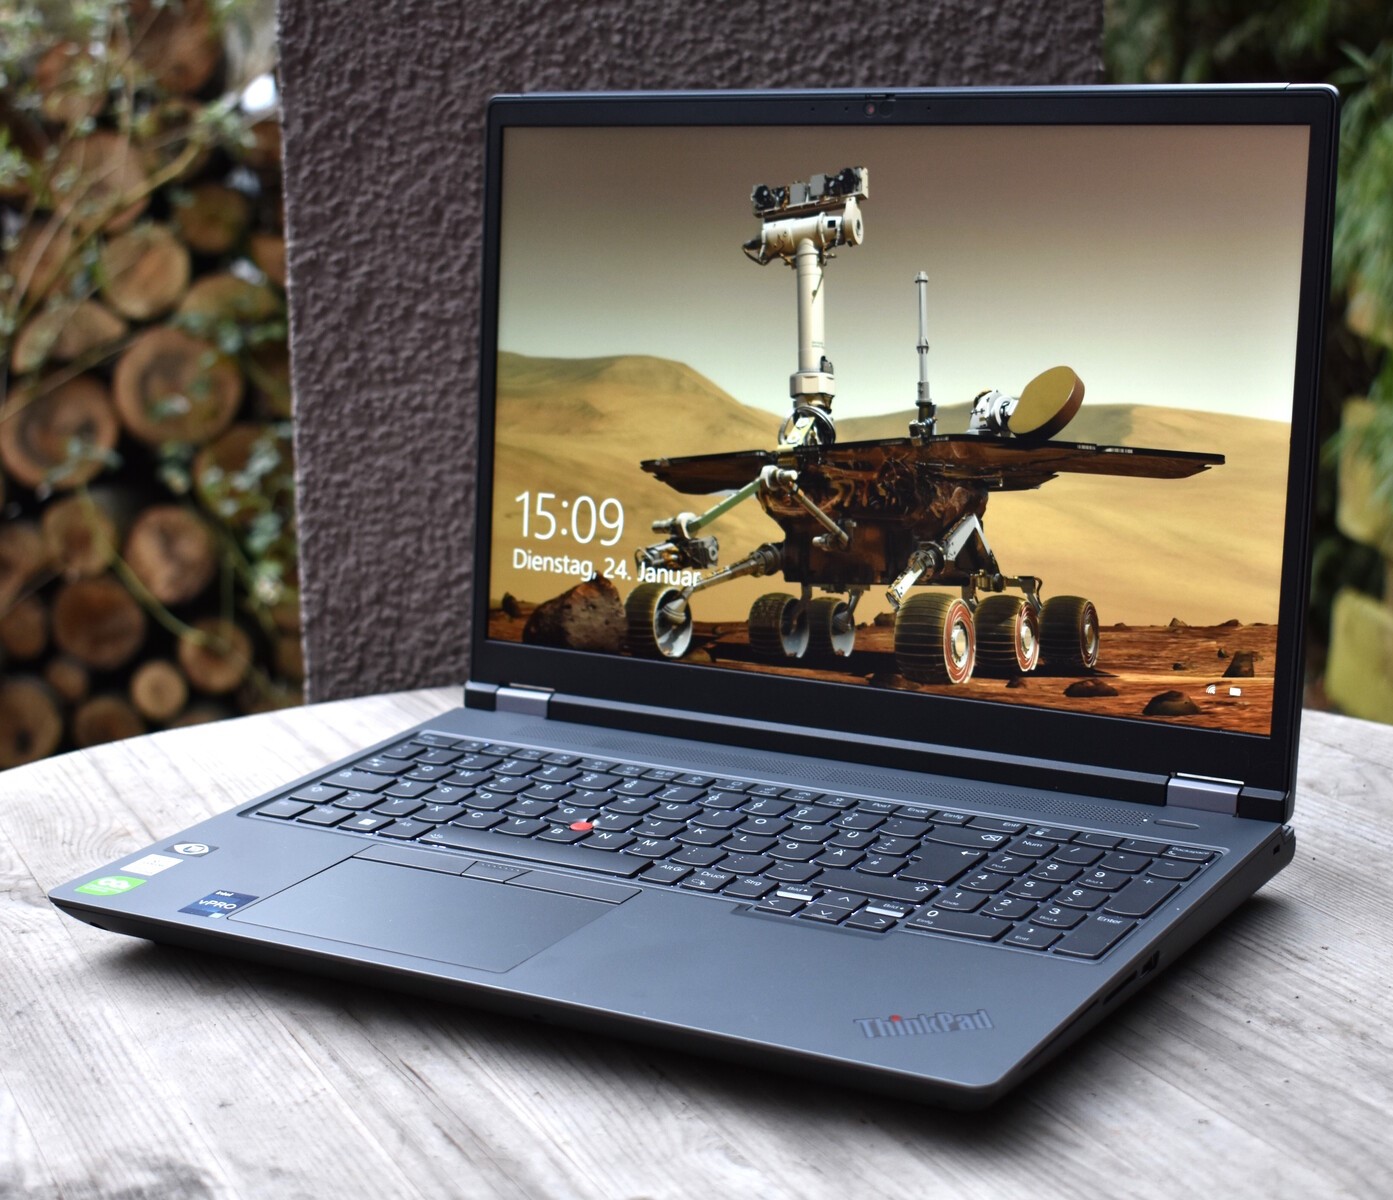
Custodia: Coperchio in alluminio grigio con telaio in magnesio
Dalla nascita della serie ThinkPad P, il modelloP15e P17sono stati la rappresentazione più classica del design ThinkPad. Con la loro struttura squadrata in plastica con telaio in magnesio e il classico meccanismo a cerniera sulla base, erano i portatili ThinkPad che si avvicinavano di più a modelli come il classicoLenovo ThinkPad T60. Per i fan dei ThinkPad si tratta certamente di una caratteristica positiva, ma il design potrebbe anche essere considerato superato, soprattutto per quanto riguarda le ampie cornici del display.
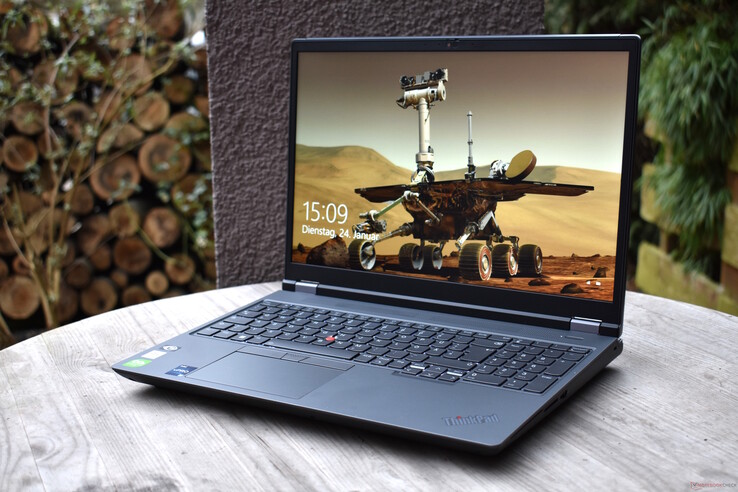
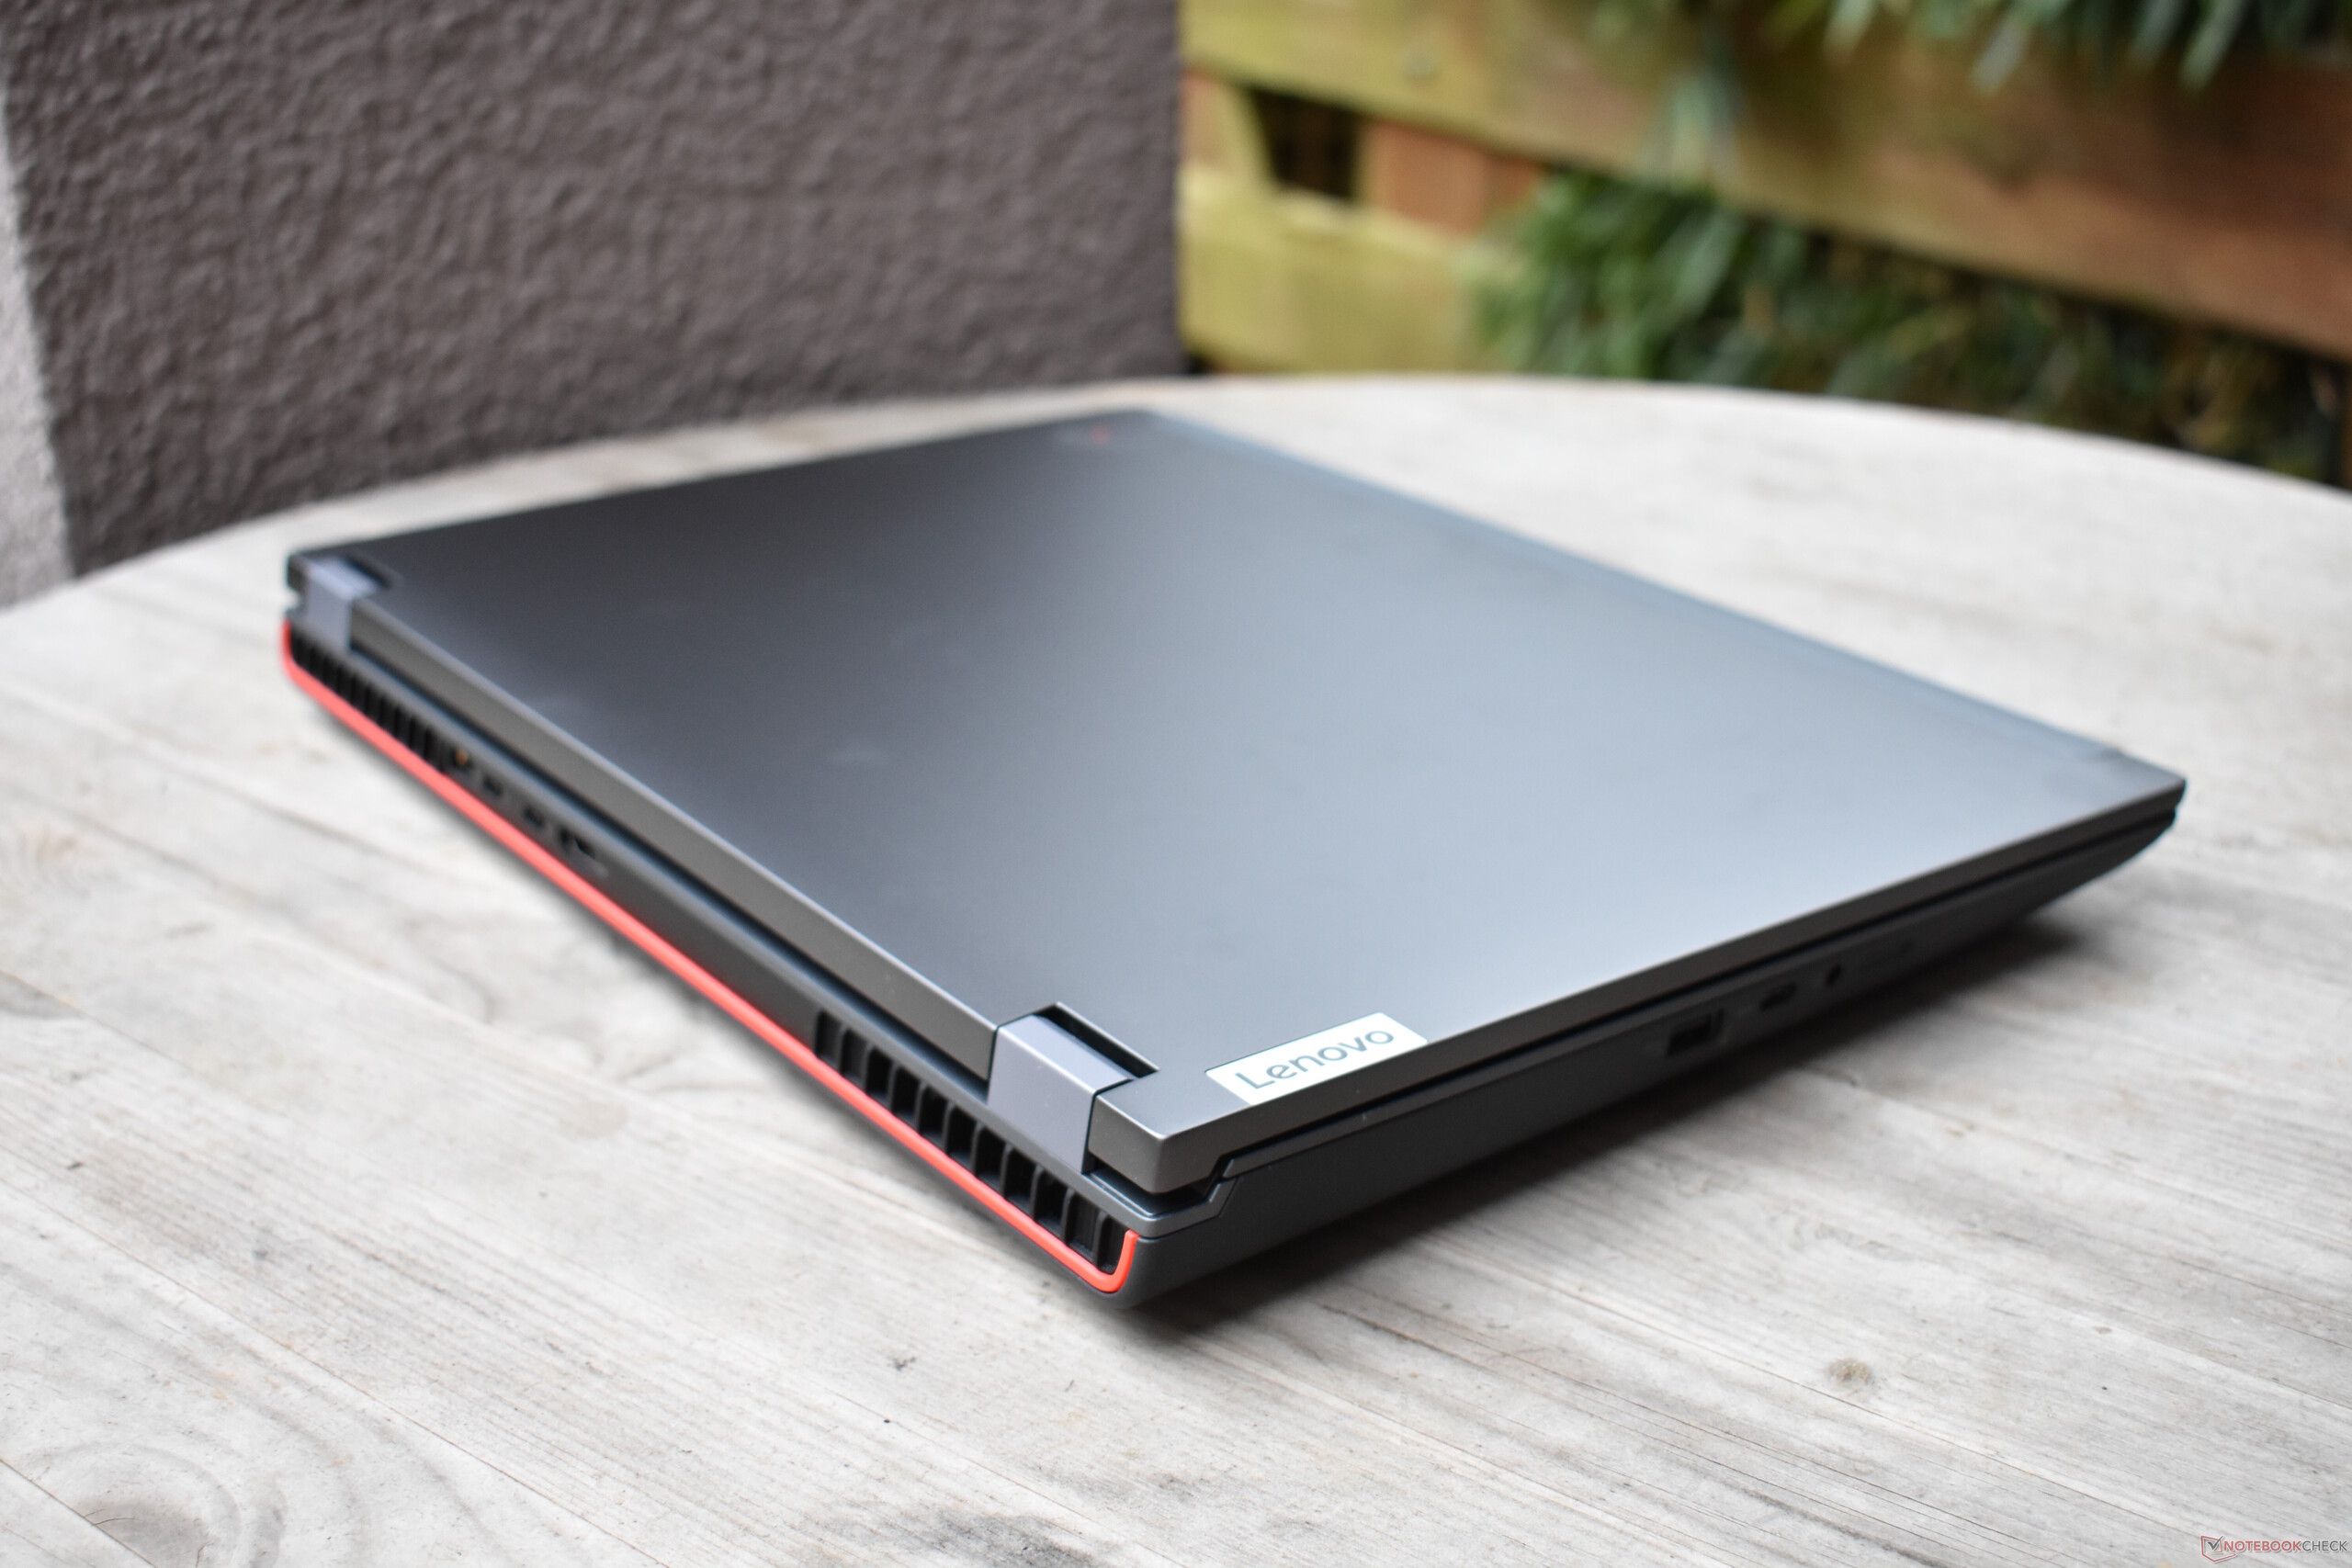
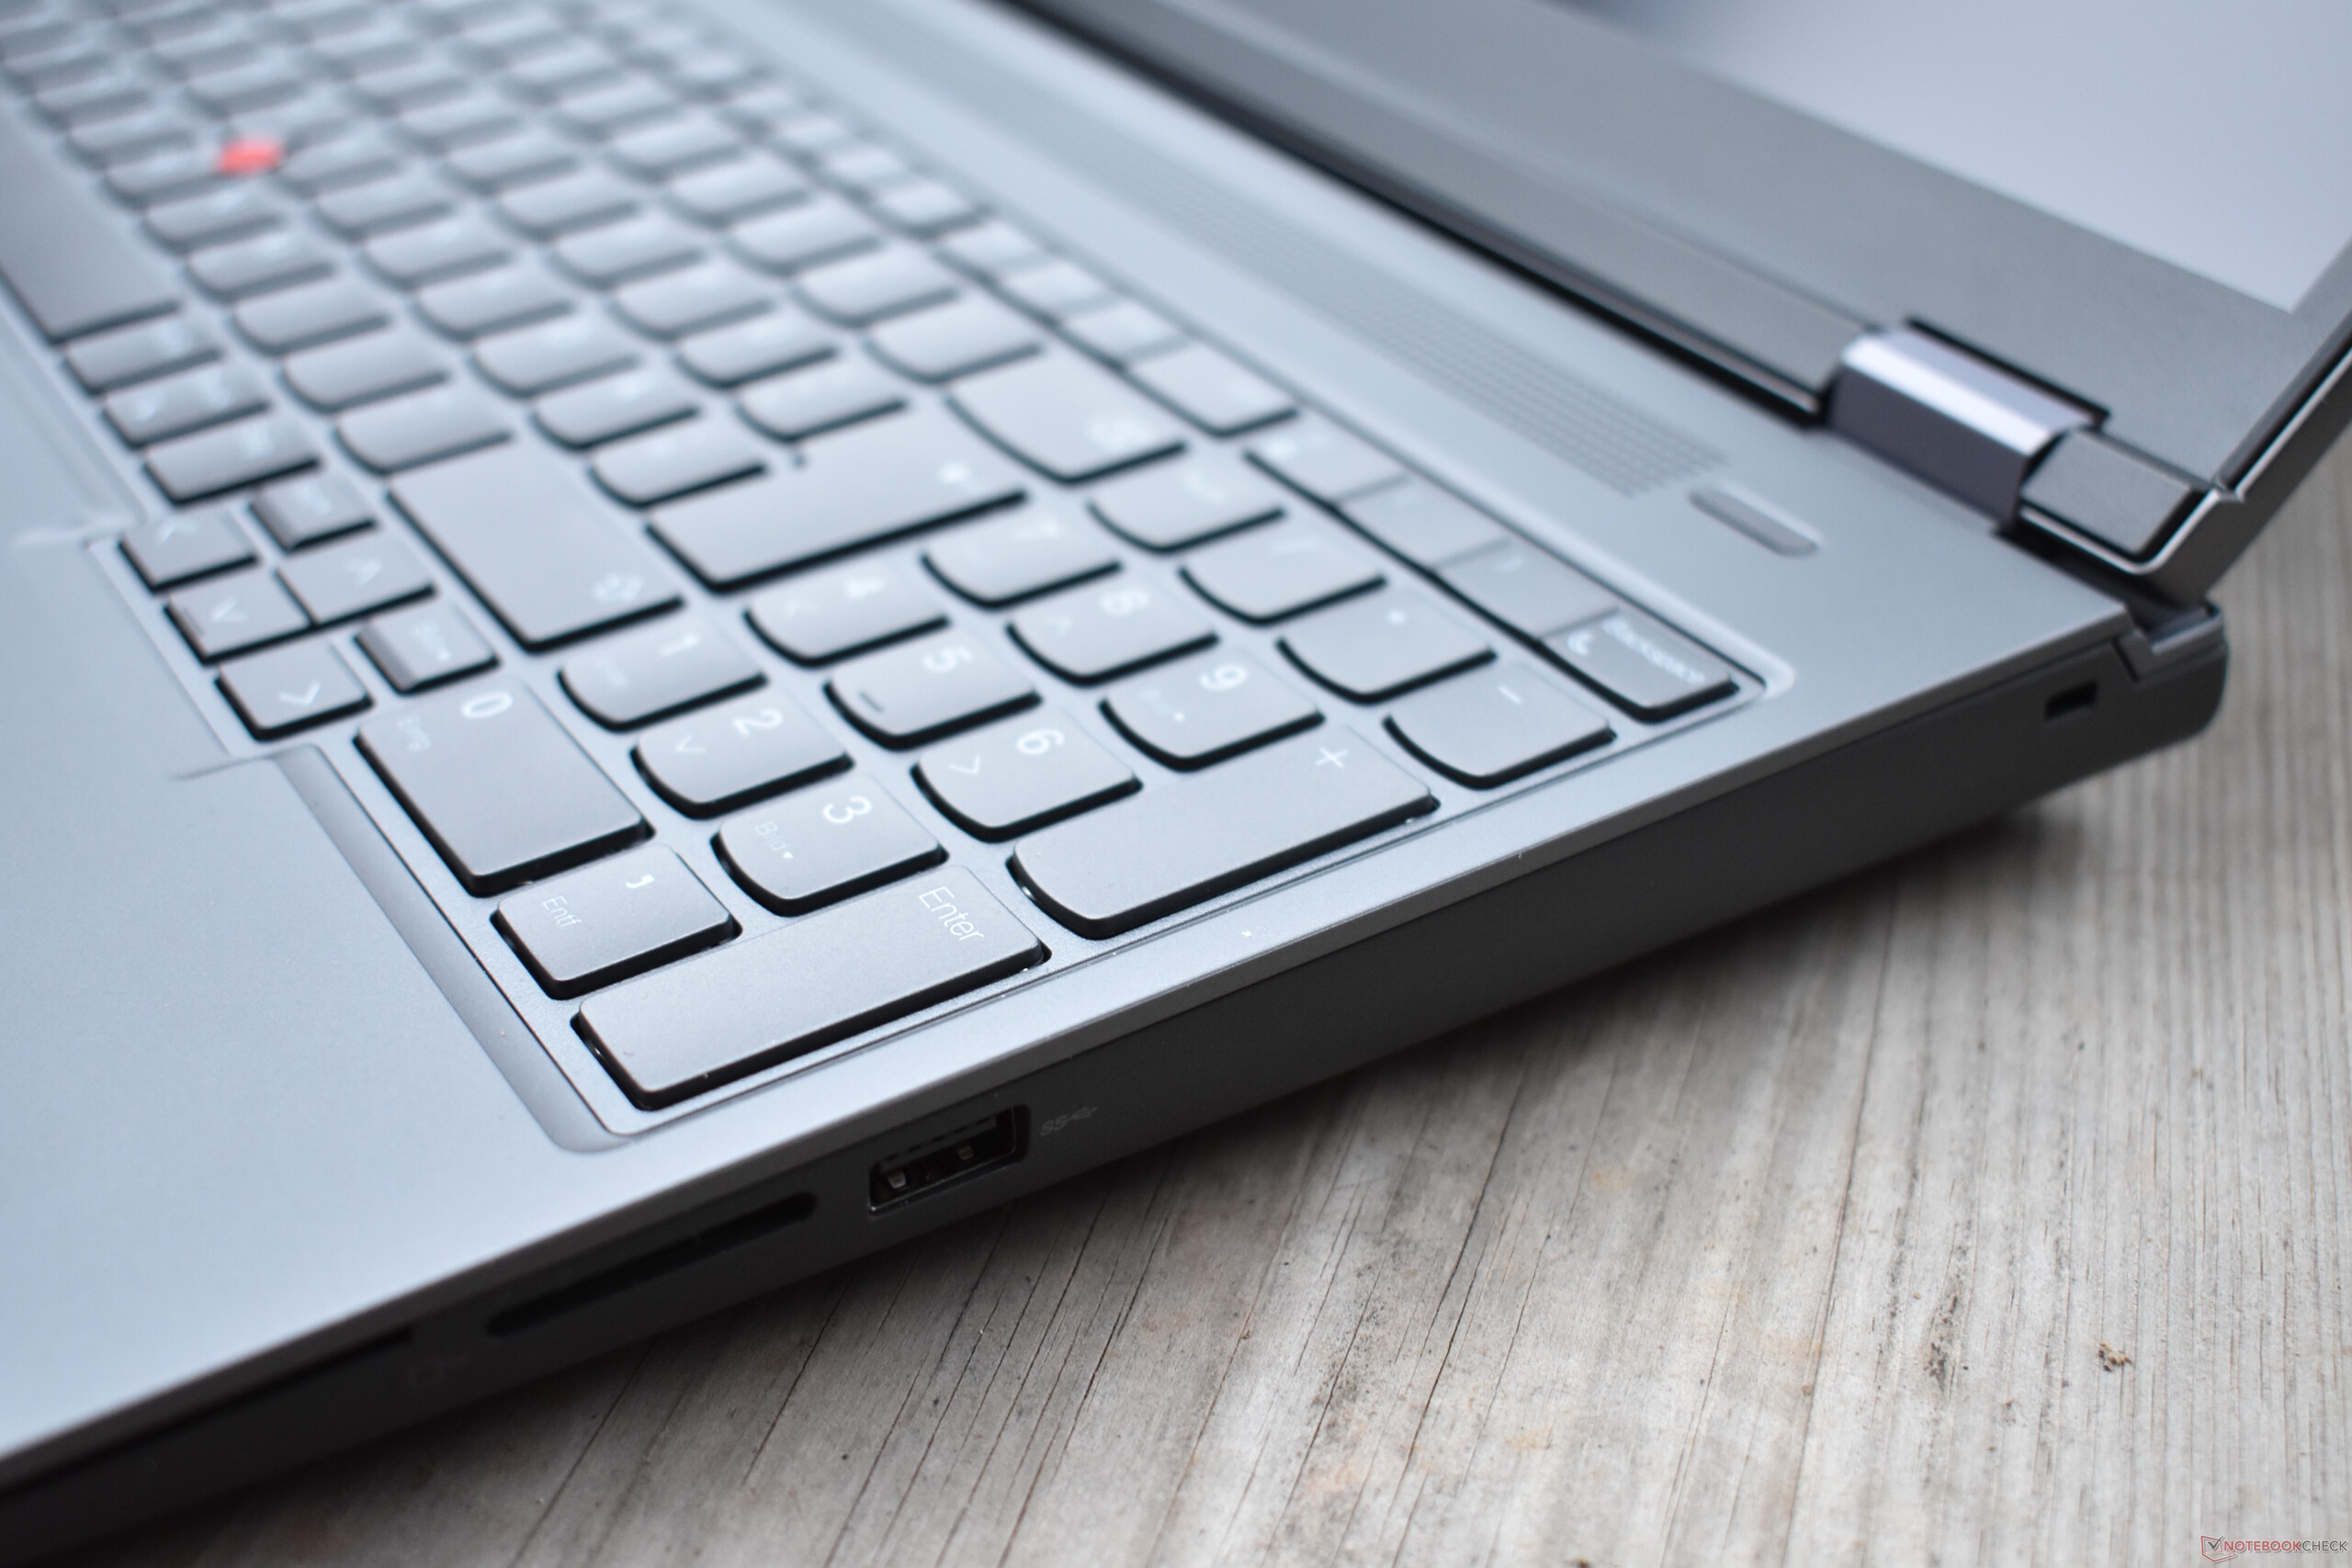
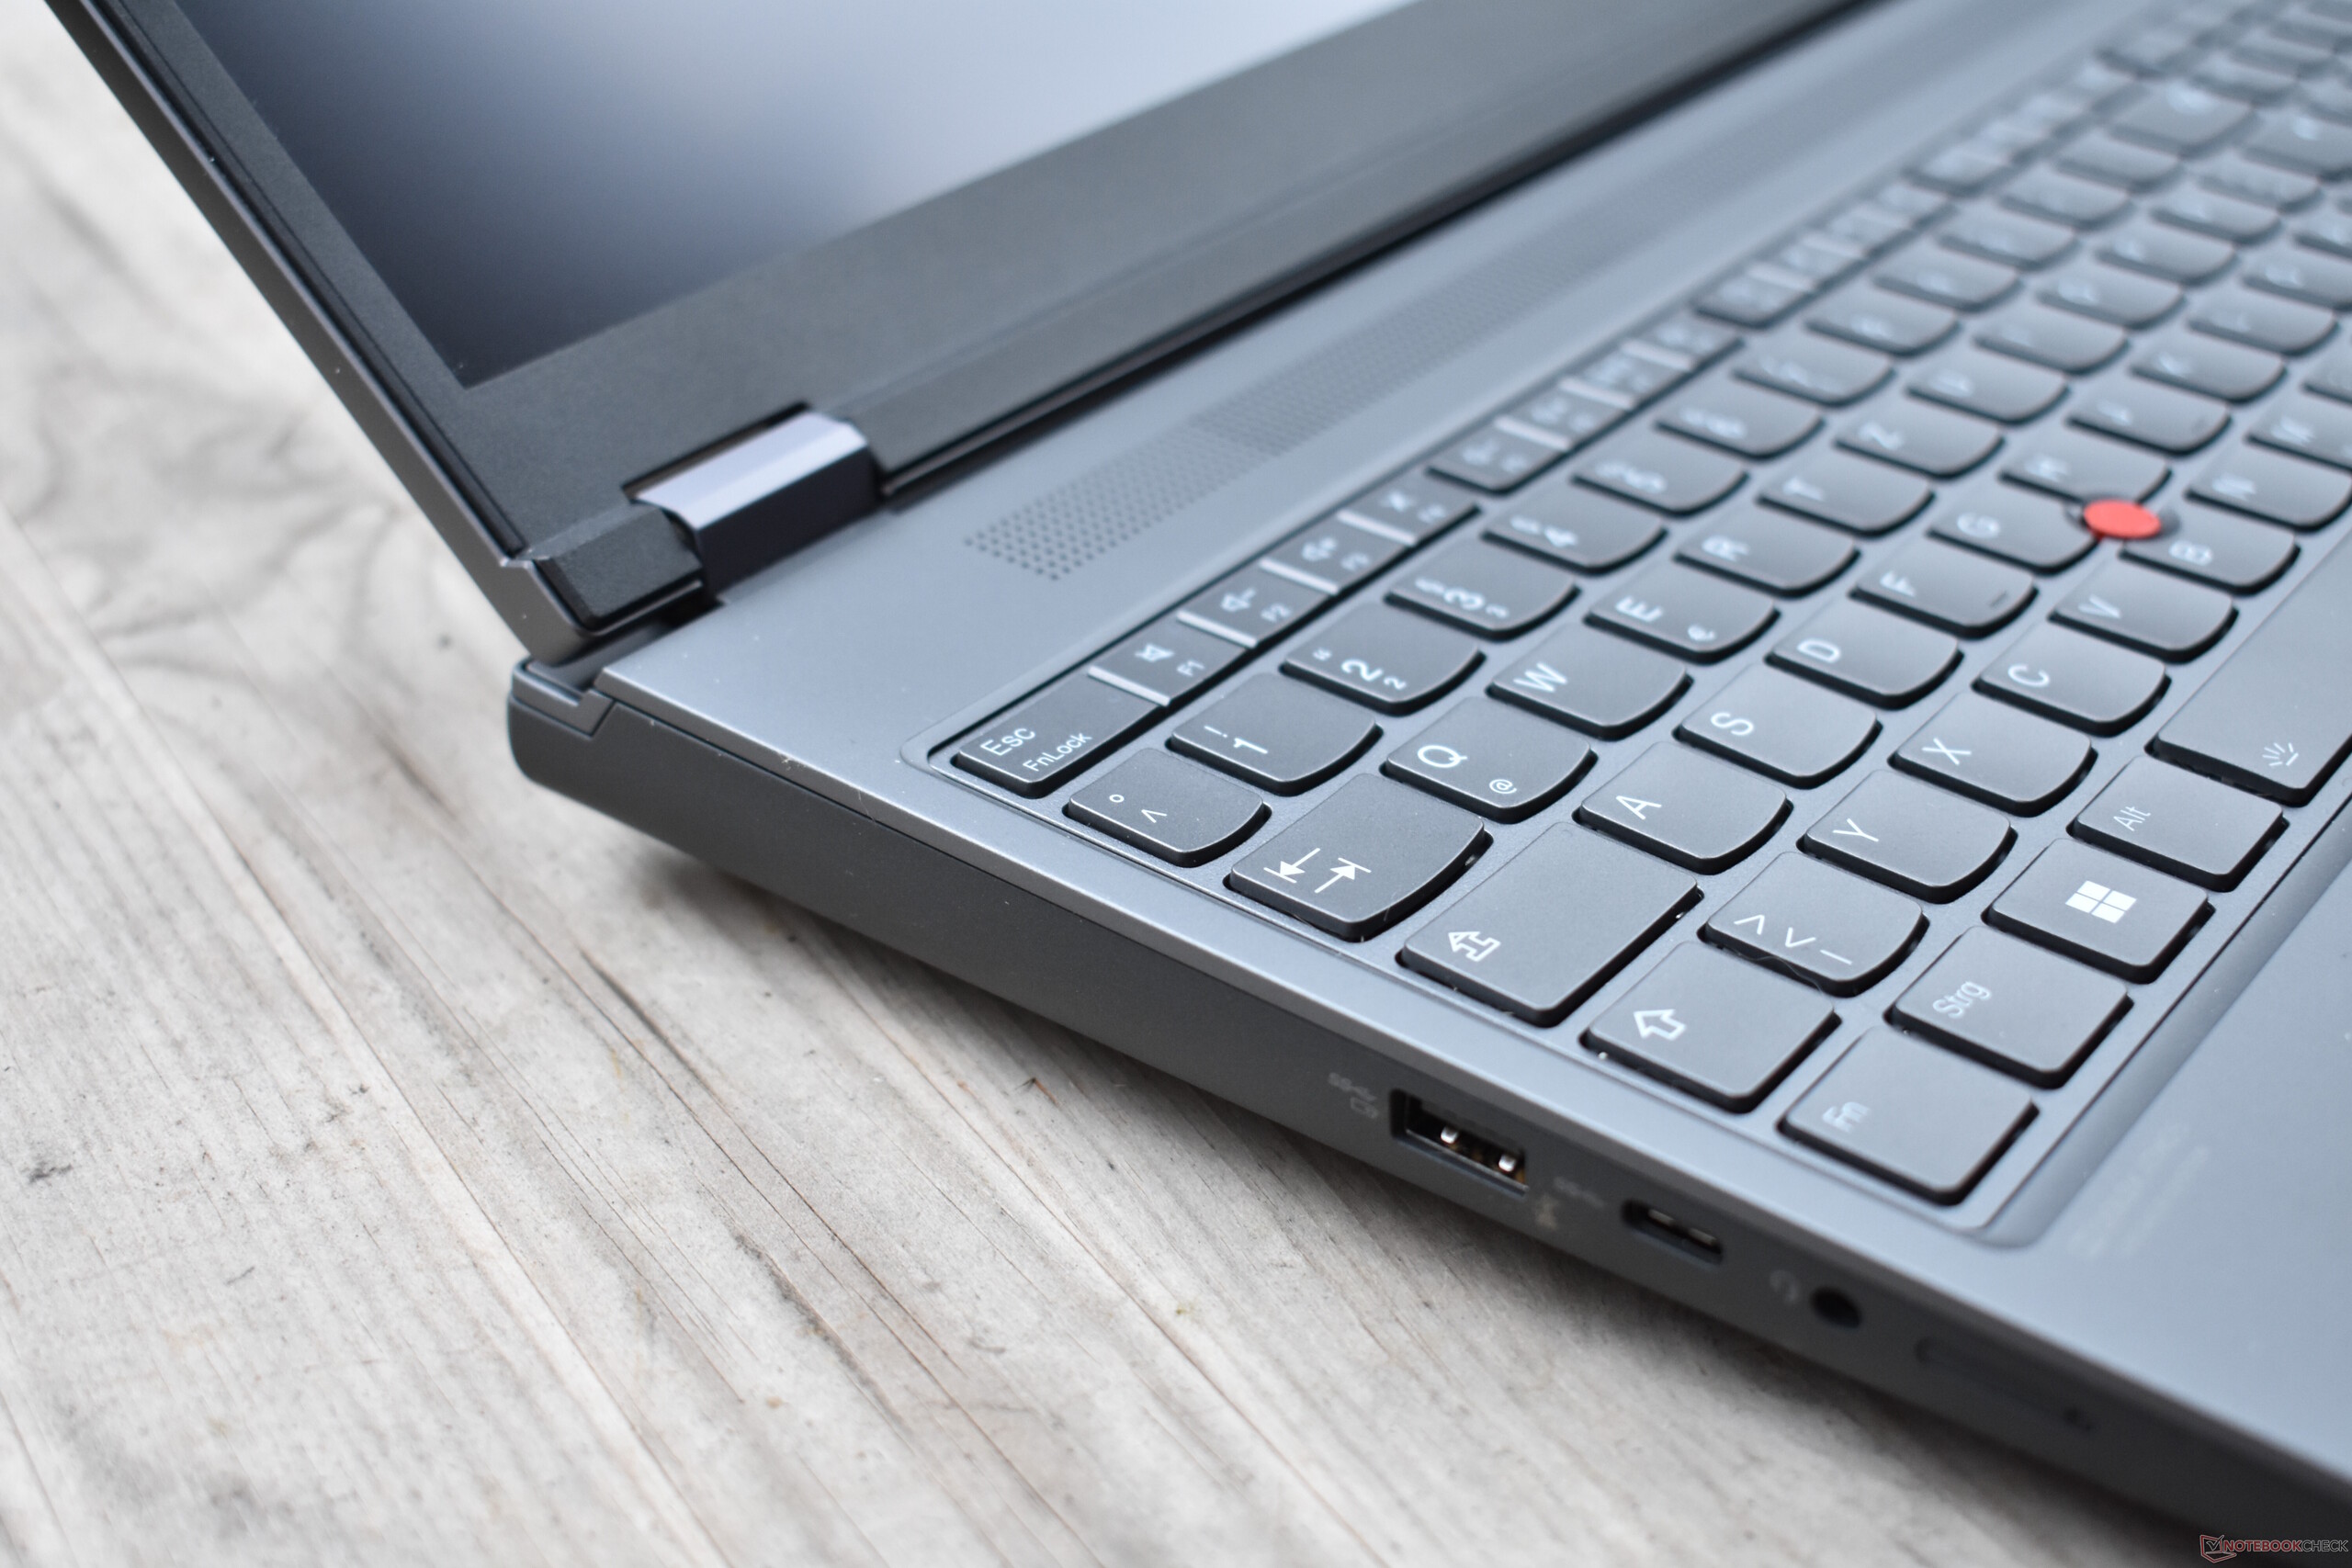
Il ThinkPad P16 cambia molte cose. Il palm rest, la tastiera e la cover del display sono interamente in "Storm Gray". I bordi arrotondati assicurano una forma leggermente meno squadrata. Per quanto riguarda la parte posteriore del dispositivo, Lenovo si è dimostrata desiderosa di sperimentare, dato che quest'area è impreziosita da riflessi rossi. Il P16 ha anche un aspetto più moderno rispetto al suo predecessore, poiché le cornici del display sono molto più sottili. Tuttavia, per un dispositivo moderno, sono ancora relativamente grandi, in particolare nella parte inferiore del display.
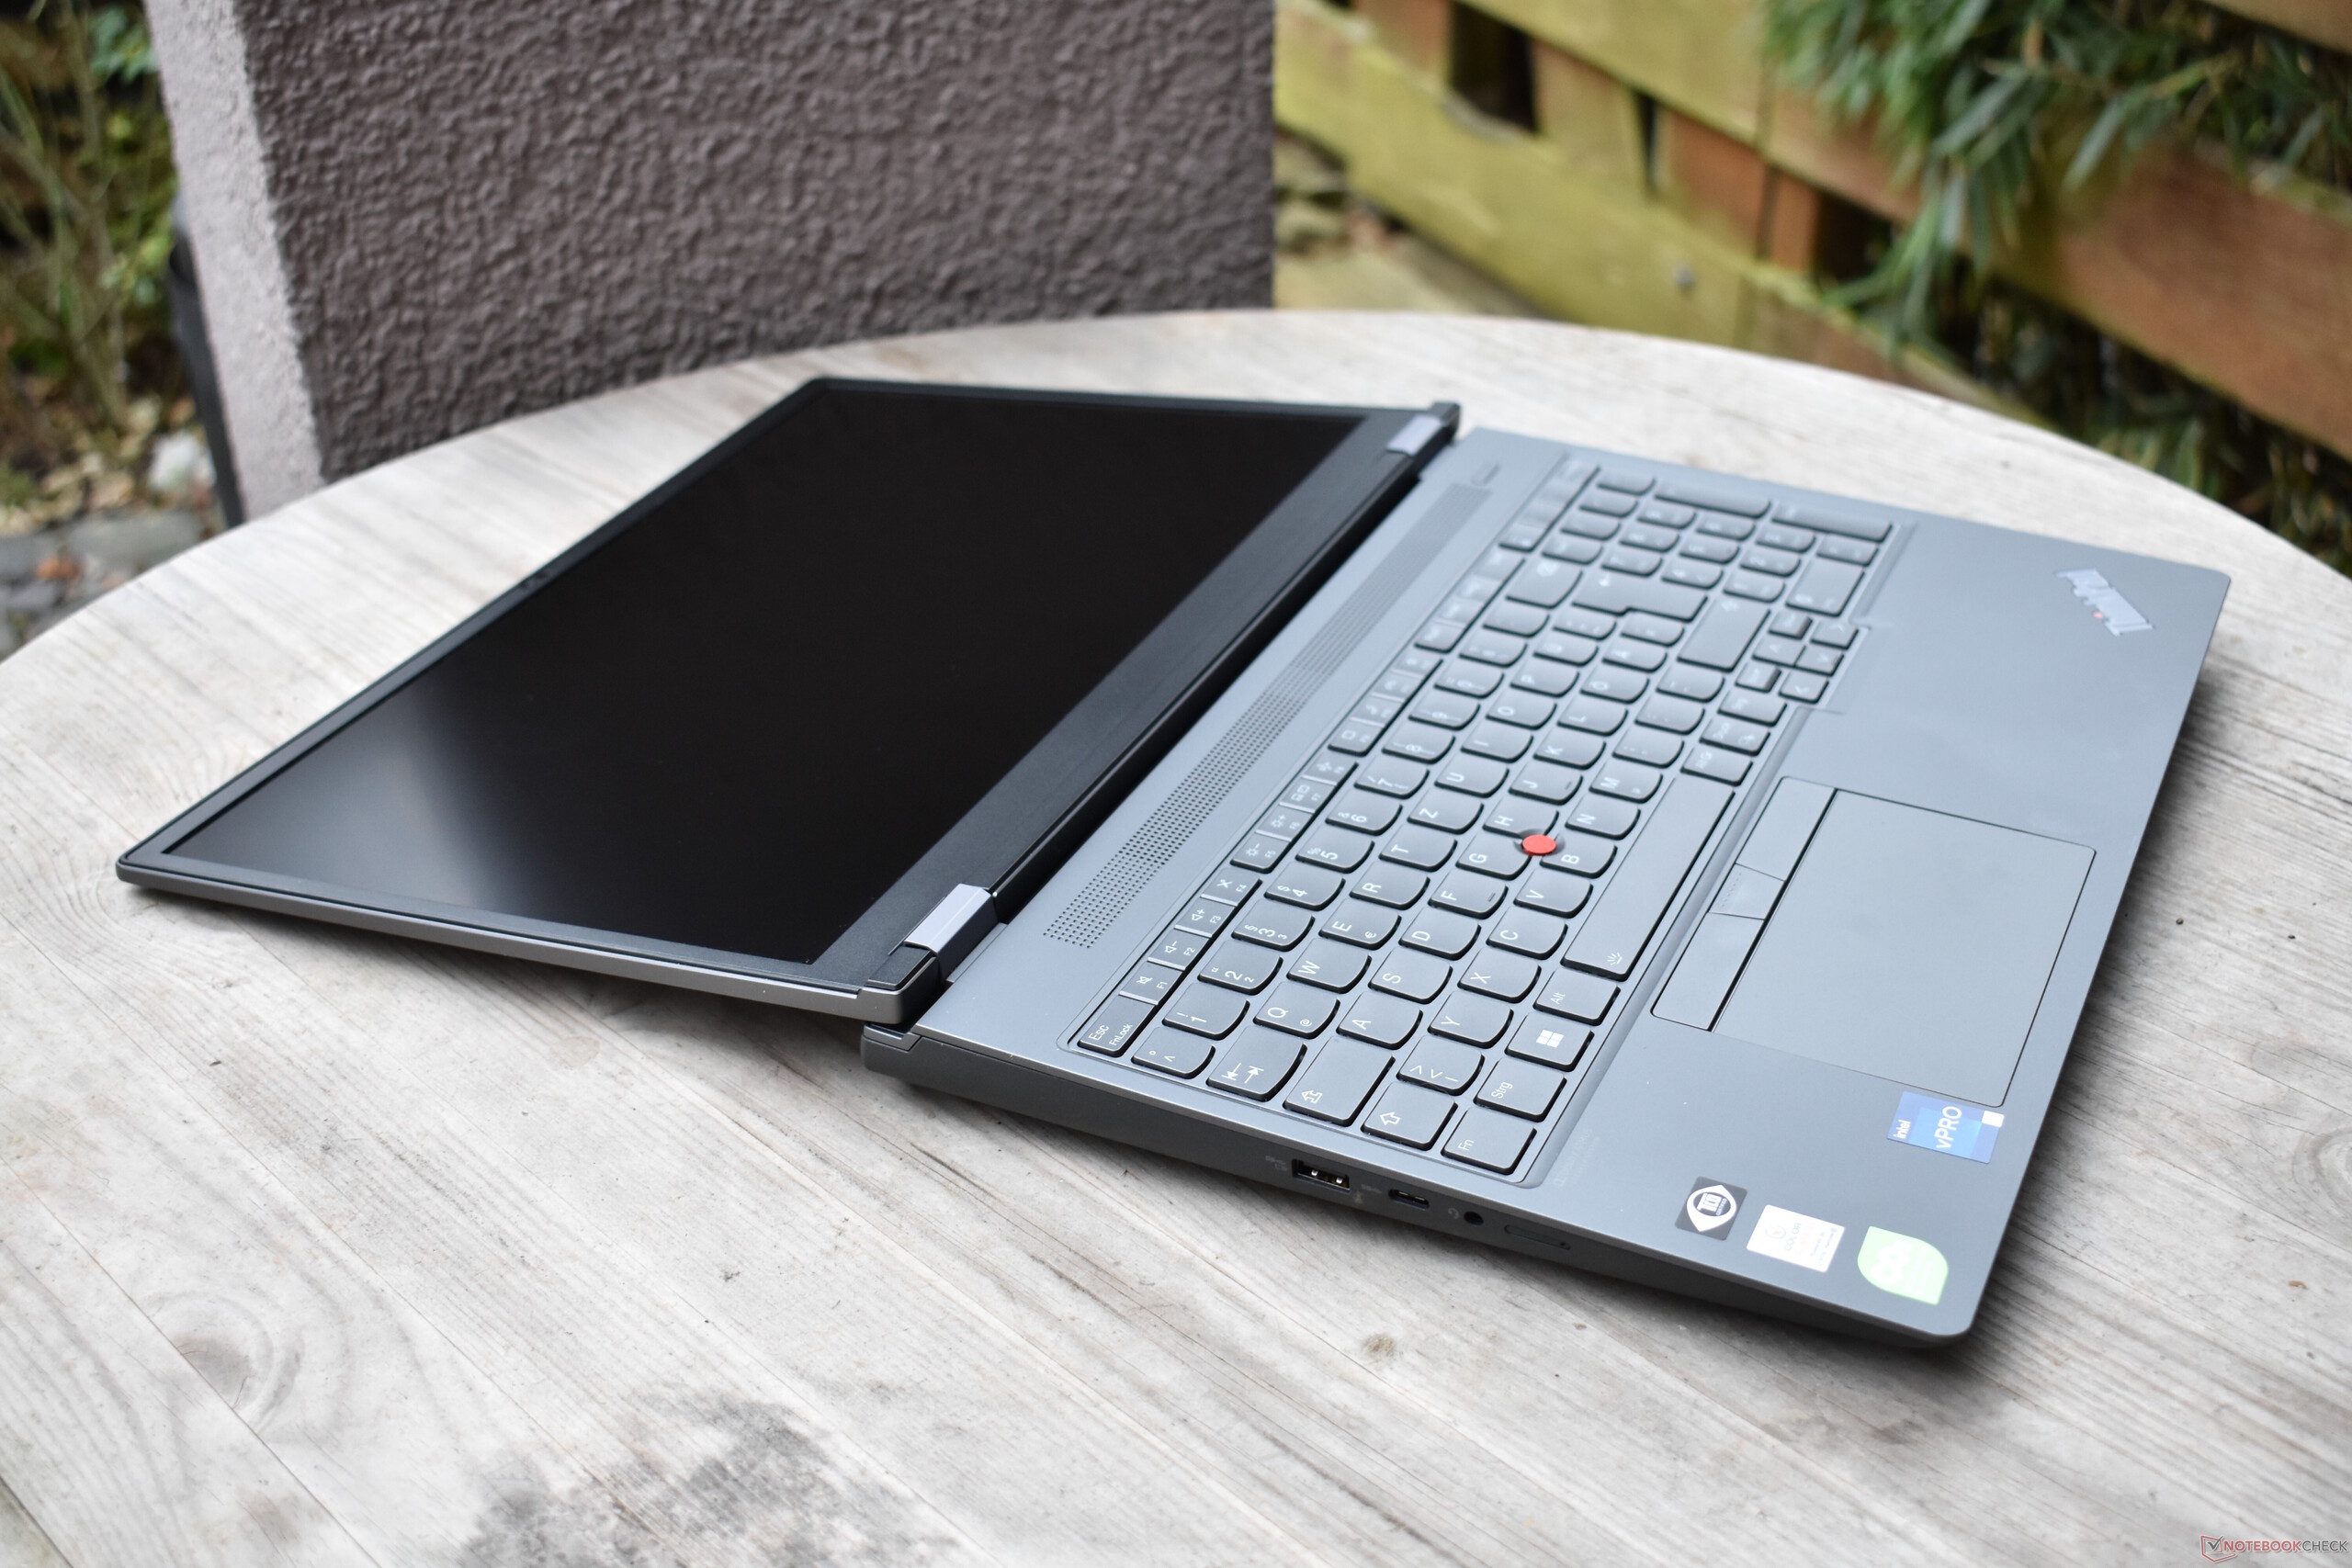
L'unità di base è realizzata in plastica in fibra di vetro rinforzata da un telaio in magnesio, proprio come i modelli precedenti. Le superfici hanno un rivestimento vellutato e la plastica grigia è meno soggetta alle impronte digitali rispetto a quella nera presente nei precedenti modelli ThinkPad. La base non può essere attorcigliata e l'unica area debole è il lettore di smart card, dove il palm rest si flette leggermente. Lenovo ha scelto di utilizzare l'alluminio per la copertura del display e, allo stesso modo, ha ricevuto un ulteriore rinforzo sotto forma di una gabbia di magnesio. La stabilità della cover del display è molto migliorata rispetto al P15 e al P17.
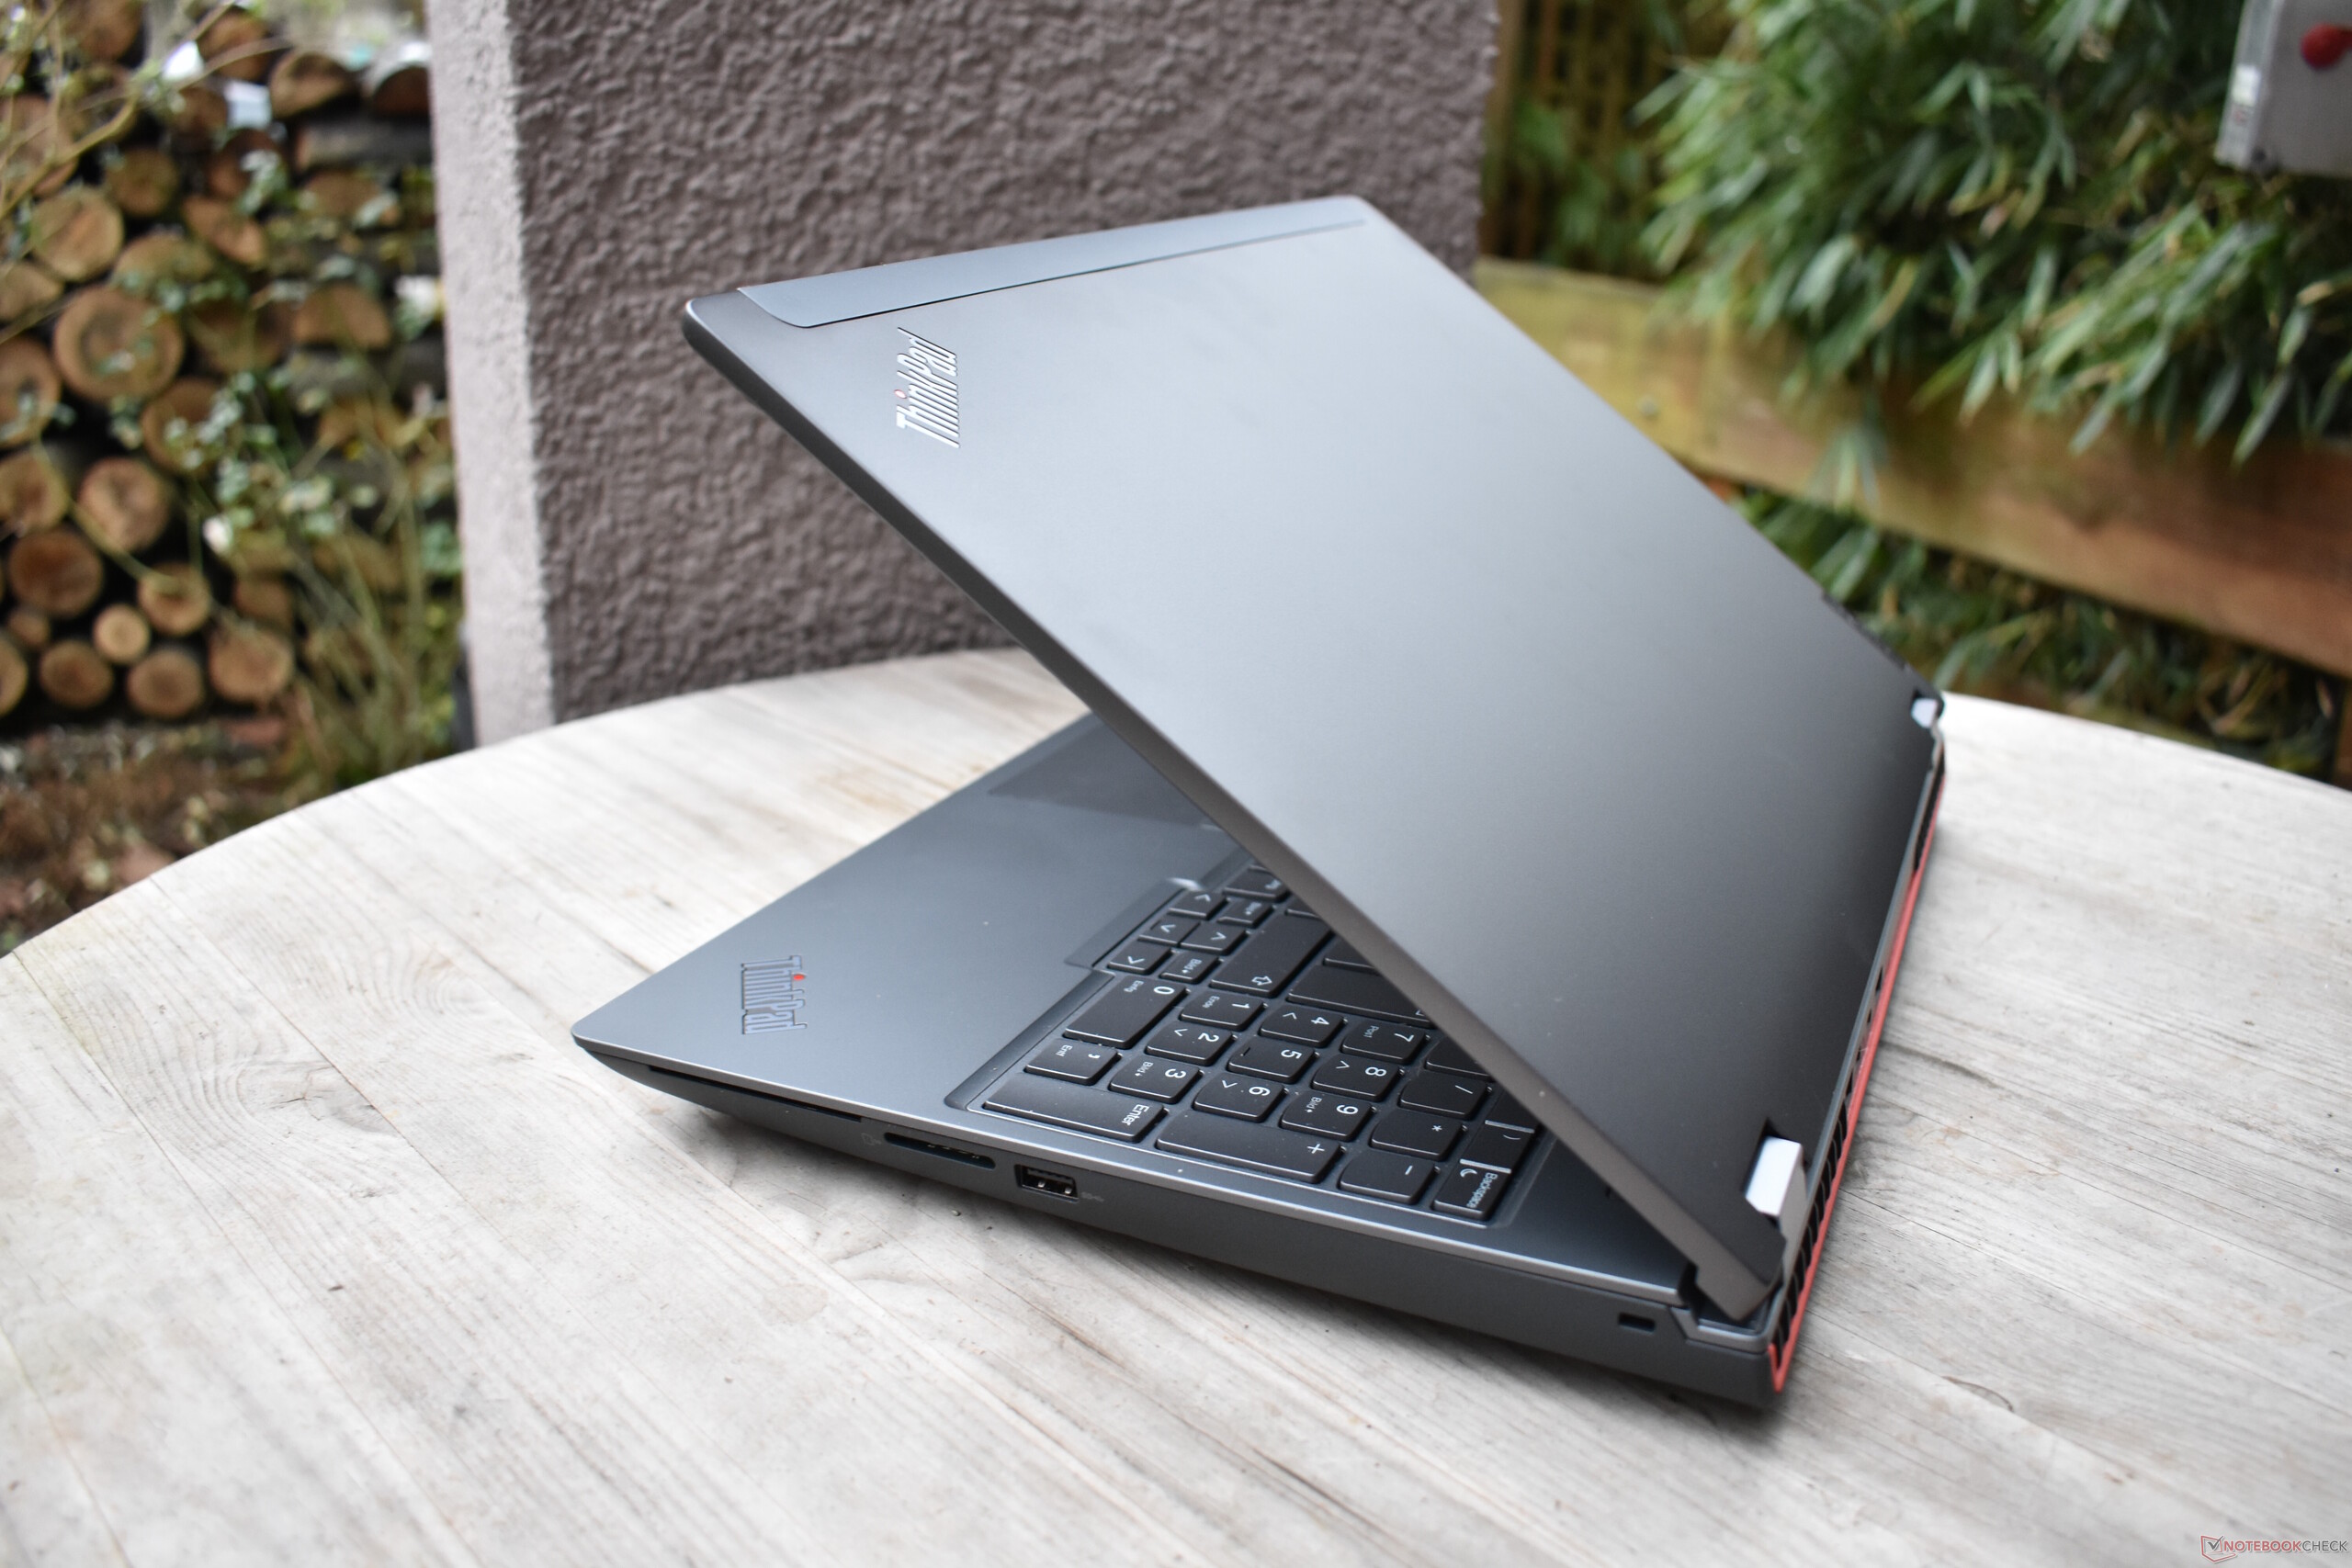
Le cerniere grandi, superiore e inferiore, con i loro tappi argentati, sono praticamente identiche a quelle di questi modelli e mantengono il display in posizione senza alcun accenno di oscillazione. Il display può essere aperto con una sola mano con un angolo di oltre 180 gradi.
Più un ThinkPad P15 G3 che un P17 G3: in termini di dimensioni e peso, il Lenovo ThinkPad P16 G1 è molto più vicino al suo predecessore più piccolo che a quello più grande.
È interessante anche il confronto con il Dell Precision 7670: La workstation Dell da 16 pollici è più mobile sotto tutti i punti di vista, in quanto non solo è più piccola, ma anche più sottile e leggera. Con Precision 7770, Dell continua a offrire una variante LCD da 17 pollici ancora più grande e potente.
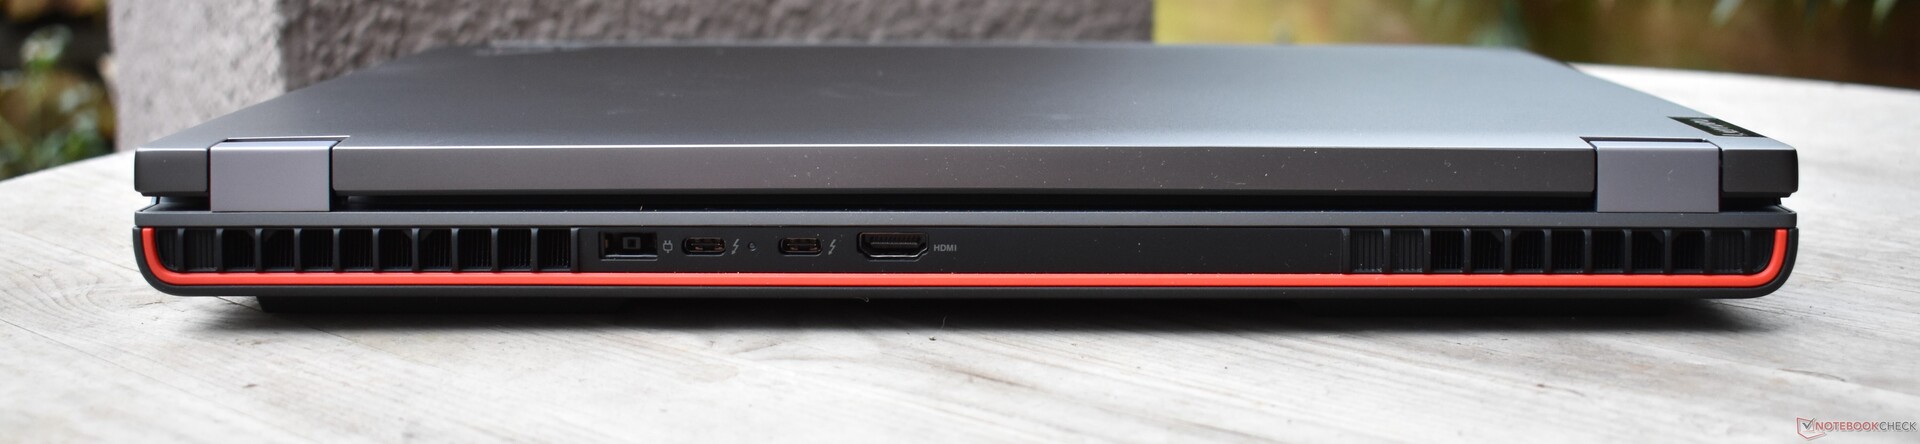
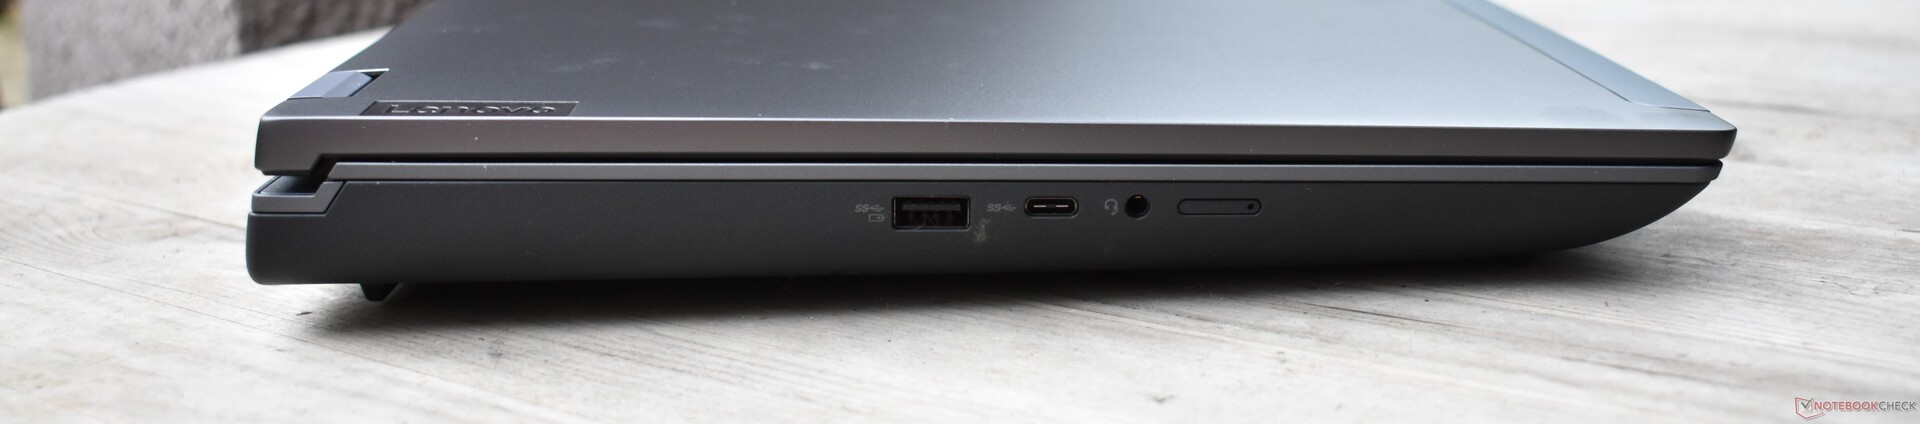
Caratteristiche: Un ThinkPad P16 senza RJ45
Lenovo ha aggiornato il design senza modificare drasticamente le opzioni di connettività. Oltre alla posizione delle porte, è stata apportata una sola modifica: La funzionalità Ethernet RJ45 è stata abbandonata. Per l'utilizzo di Internet via cavo è disponibile un dock o una delle porte Thunderbolt.
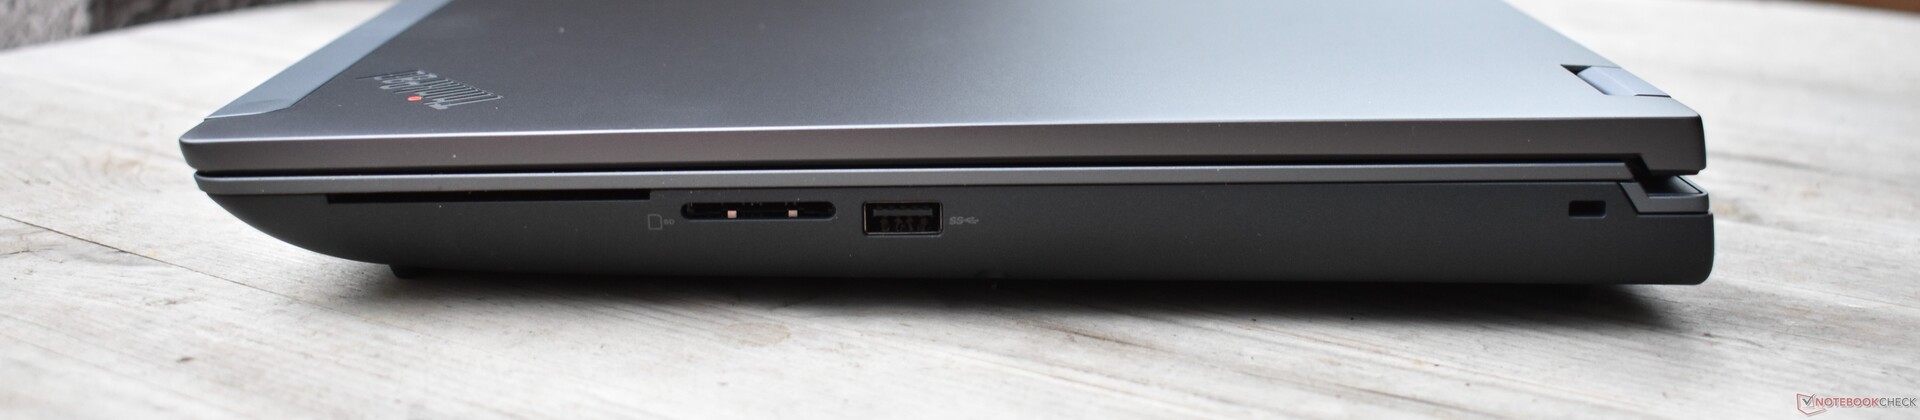
Lettore di schede SD
I risultati dei benchmark del lettore di schede SD - che abbiamo testato con la nostra scheda microSD AV Pro di riferimento da 128 GB - sono sorprendentemente negativi. I punteggi sono ben al di sotto della media per un dispositivo di classe workstation e per il suo predecessore.
| SD Card Reader | |
| average JPG Copy Test (av. of 3 runs) | |
| Lenovo ThinkPad P15 G2-20YQ001JGE (AV Pro V60) | |
| Dell Precision 7670 (Toshiba Exceria Pro SDXC 64 GB UHS-II) | |
| Lenovo ThinkPad P17 G2-20YU0025G (Toshiba Exceria Pro SDXC 64 GB UHS-II) | |
| Media della classe Workstation (49.6 - 681, n=14, ultimi 2 anni) | |
| HP ZBook Fury 17 G8-4A6A9EA (Angelbird AV Pro V60) | |
| Lenovo ThinkPad P16 G1 21D6001DMB (AV Pro V60) | |
| maximum AS SSD Seq Read Test (1GB) | |
| Media della classe Workstation (87.6 - 1455, n=14, ultimi 2 anni) | |
| Lenovo ThinkPad P15 G2-20YQ001JGE (AV Pro V60) | |
| Lenovo ThinkPad P17 G2-20YU0025G (Toshiba Exceria Pro SDXC 64 GB UHS-II) | |
| Dell Precision 7670 (Toshiba Exceria Pro SDXC 64 GB UHS-II) | |
| HP ZBook Fury 17 G8-4A6A9EA (Angelbird AV Pro V60) | |
| Lenovo ThinkPad P16 G1 21D6001DMB (AV Pro V60) | |
Comunicazione
Le prestazioni della scheda Intel AX211WiFi-6E sono migliori rispetto alla AX210 presente nei modelli precedenti ThinkPad P15 e P17. Soprattutto, si comporta bene nell'area della ricezione, ma l'invio di dati è un po' più lento e meno stabile.
Il nostro modello in prova non possedeva un modulo WWAN (4G LTE), ma può esserne dotato.
| Networking | |
| Lenovo ThinkPad P16 G1 21D6001DMB | |
| iperf3 transmit AXE11000 | |
| iperf3 receive AXE11000 | |
| Lenovo ThinkPad P15 G2-20YQ001JGE | |
| iperf3 transmit AX12 | |
| iperf3 receive AX12 | |
| Lenovo ThinkPad P17 G2-20YU0025G | |
| iperf3 transmit AX12 | |
| iperf3 receive AX12 | |
| HP ZBook Fury 17 G8-4A6A9EA | |
| iperf3 transmit AX12 | |
| iperf3 receive AX12 | |
| Dell Precision 7670 | |
| iperf3 transmit AXE11000 6GHz | |
| iperf3 receive AXE11000 6GHz | |
| Asus ExpertBook B6 Flip B6602FC2 | |
| iperf3 transmit AXE11000 6GHz | |
| iperf3 receive AXE11000 6GHz | |
| iperf3 transmit AXE11000 | |
| iperf3 receive AXE11000 | |
Webcam
Nel complesso, la webcam a 1080p produce immagini slavate, sfocate e rumorose.


Sicurezza
Oltre al lettore di impronte digitali integrato nel pulsante di accensione, il Lenovo ThinkPad P16 2022 dispone di una fotocamera a infrarossi compatibile con Windows Hello. Il lucchetto Kensington può offrire protezione e c'è anche un lettore di smartcard opzionale. Il Lenovo ThinkPad P16 ha un chip TPM dedicato e la webcam possiede un otturatore meccanico.
Accessori
A parte l'alimentatore da 170 watt, completo di connettore Slim Tip, il portatile è privo di accessori aggiuntivi. L'accessorio opzionale più importante dovrebbe essere un dock come il ThinkPad Thunderbolt 4 Workstation dock di https://lenovo.vzew.net/c/2597802/218864/3808?subId1=news&u=https%3A%2F%2Fwww.lenovo.com%2Fus%2Fen%2Fp%2Faccessories-and-software%2Fdocking%2Fdocking_thunderbolt-docks-(universal-cable-docks)%2F40b00300us%3ForgRef%3Dhttps%25253A%25252F%25252Fwww.google.com%25252F
Manutenzione
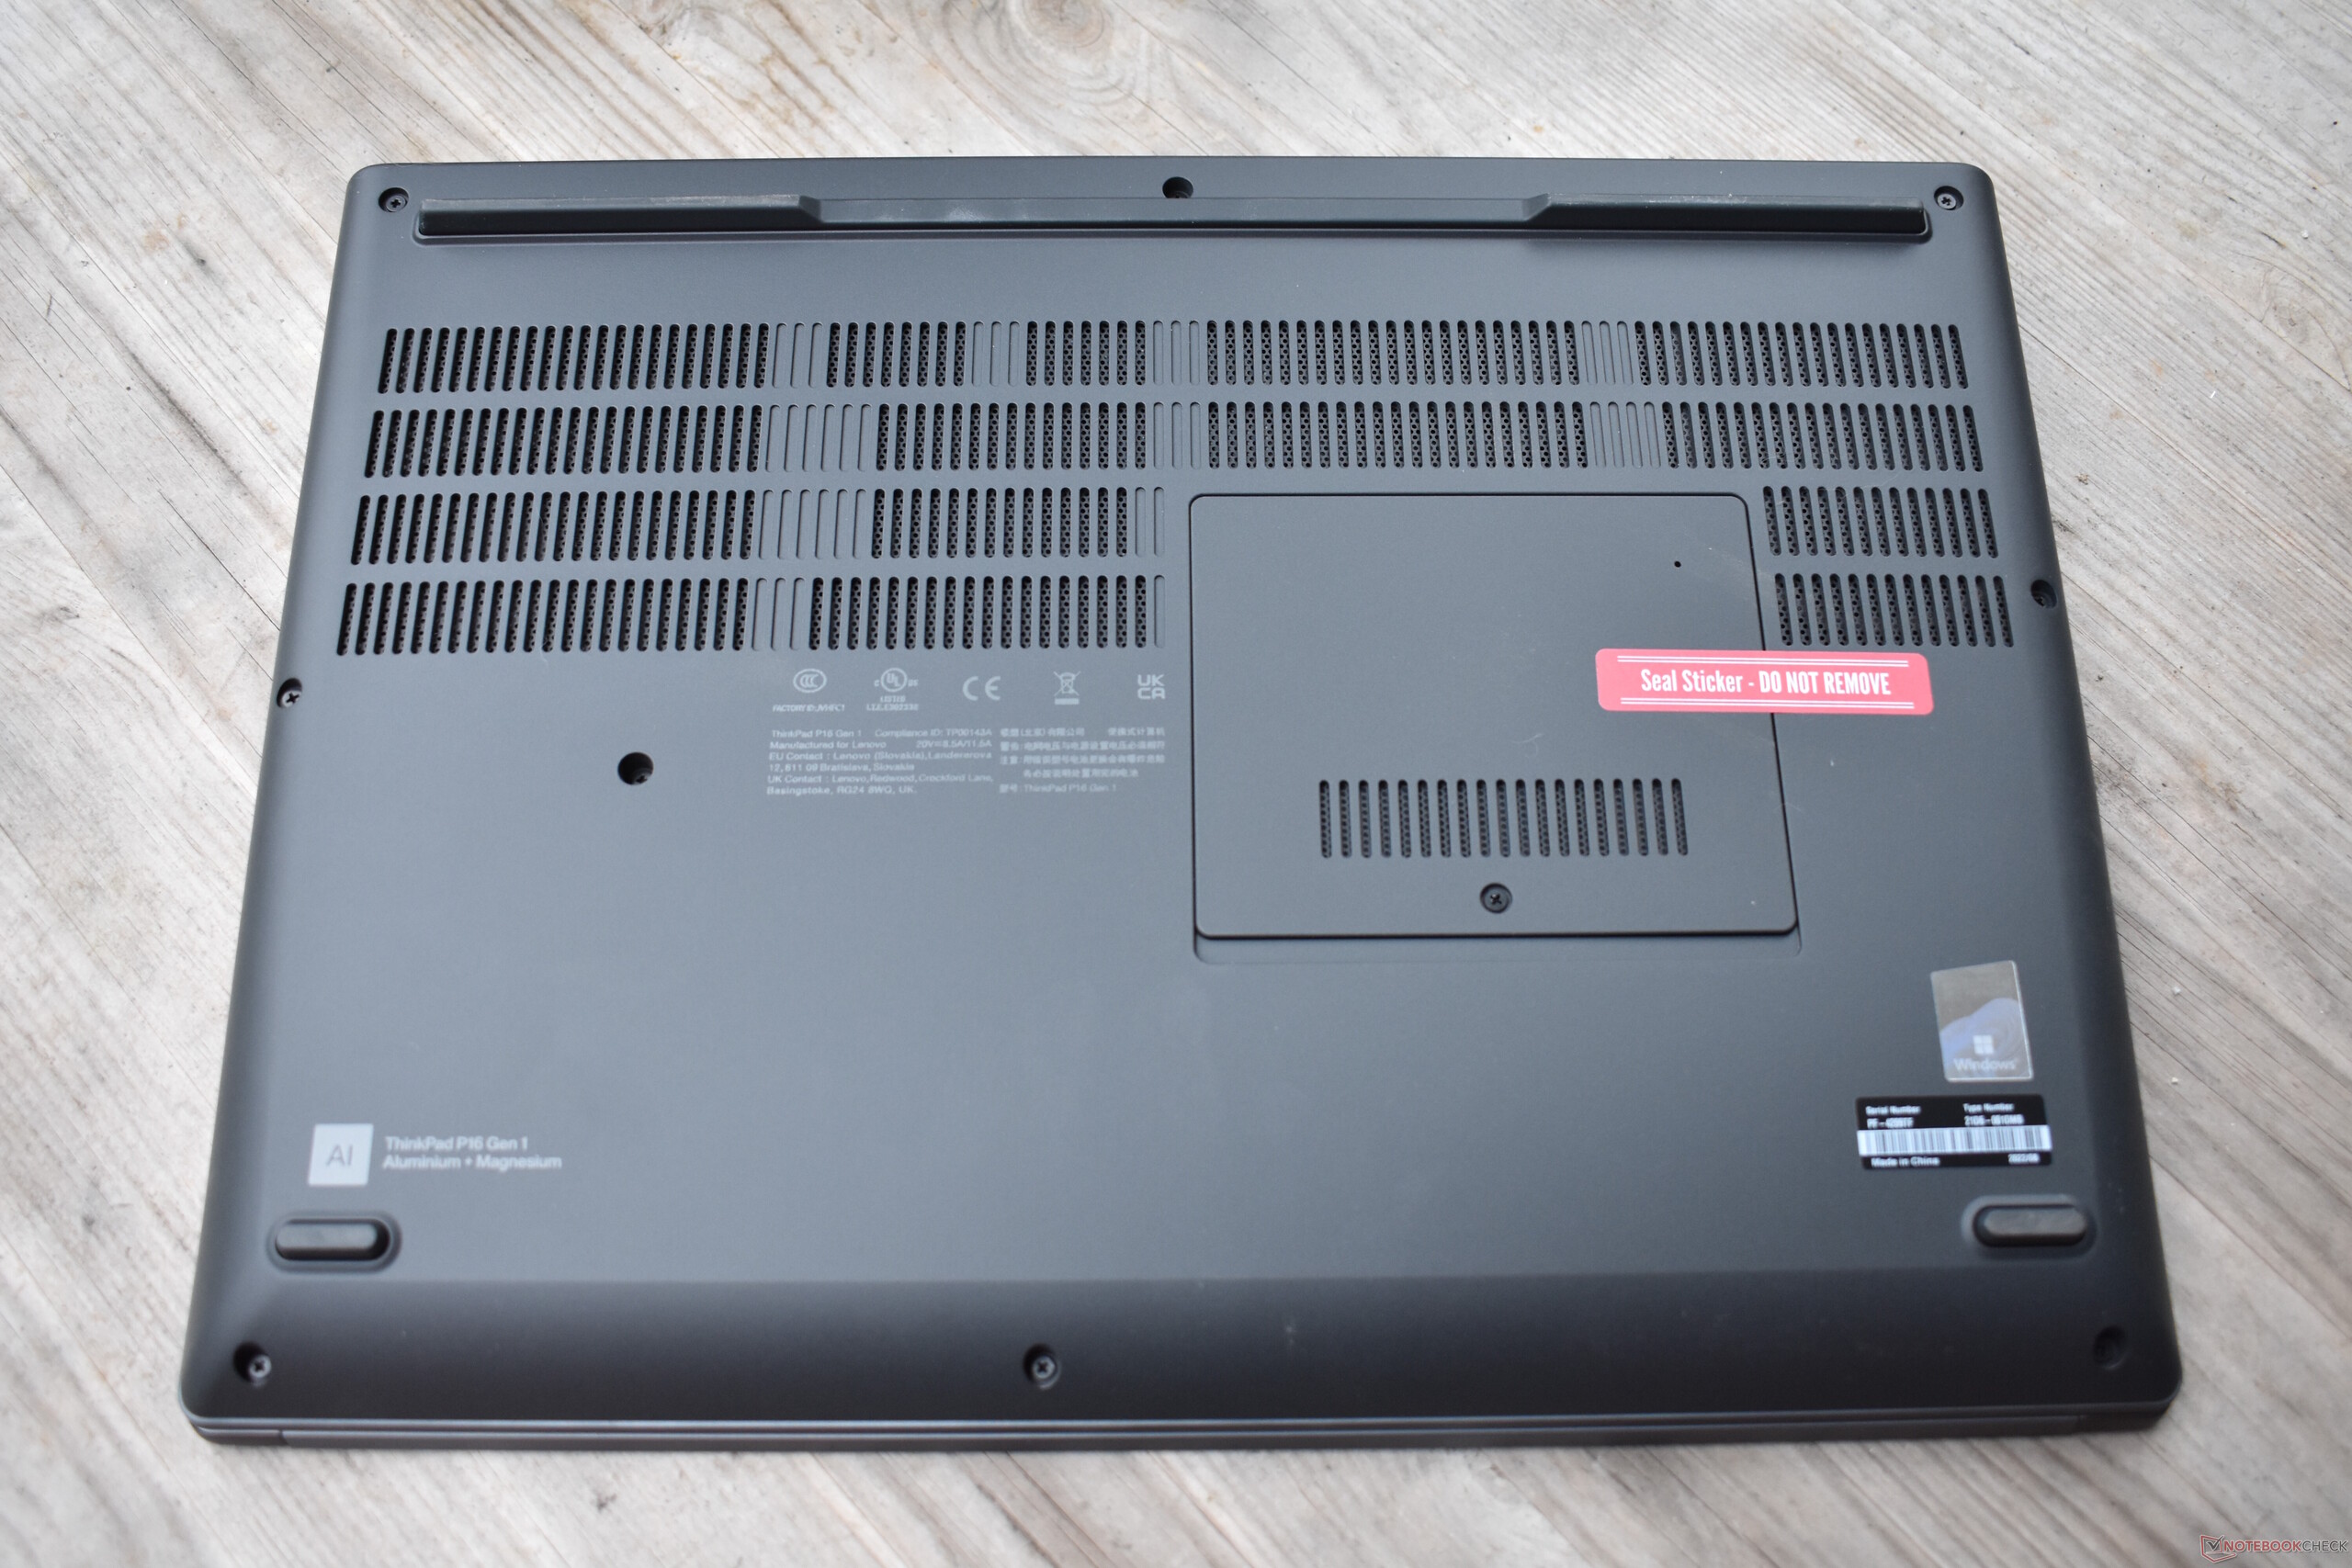
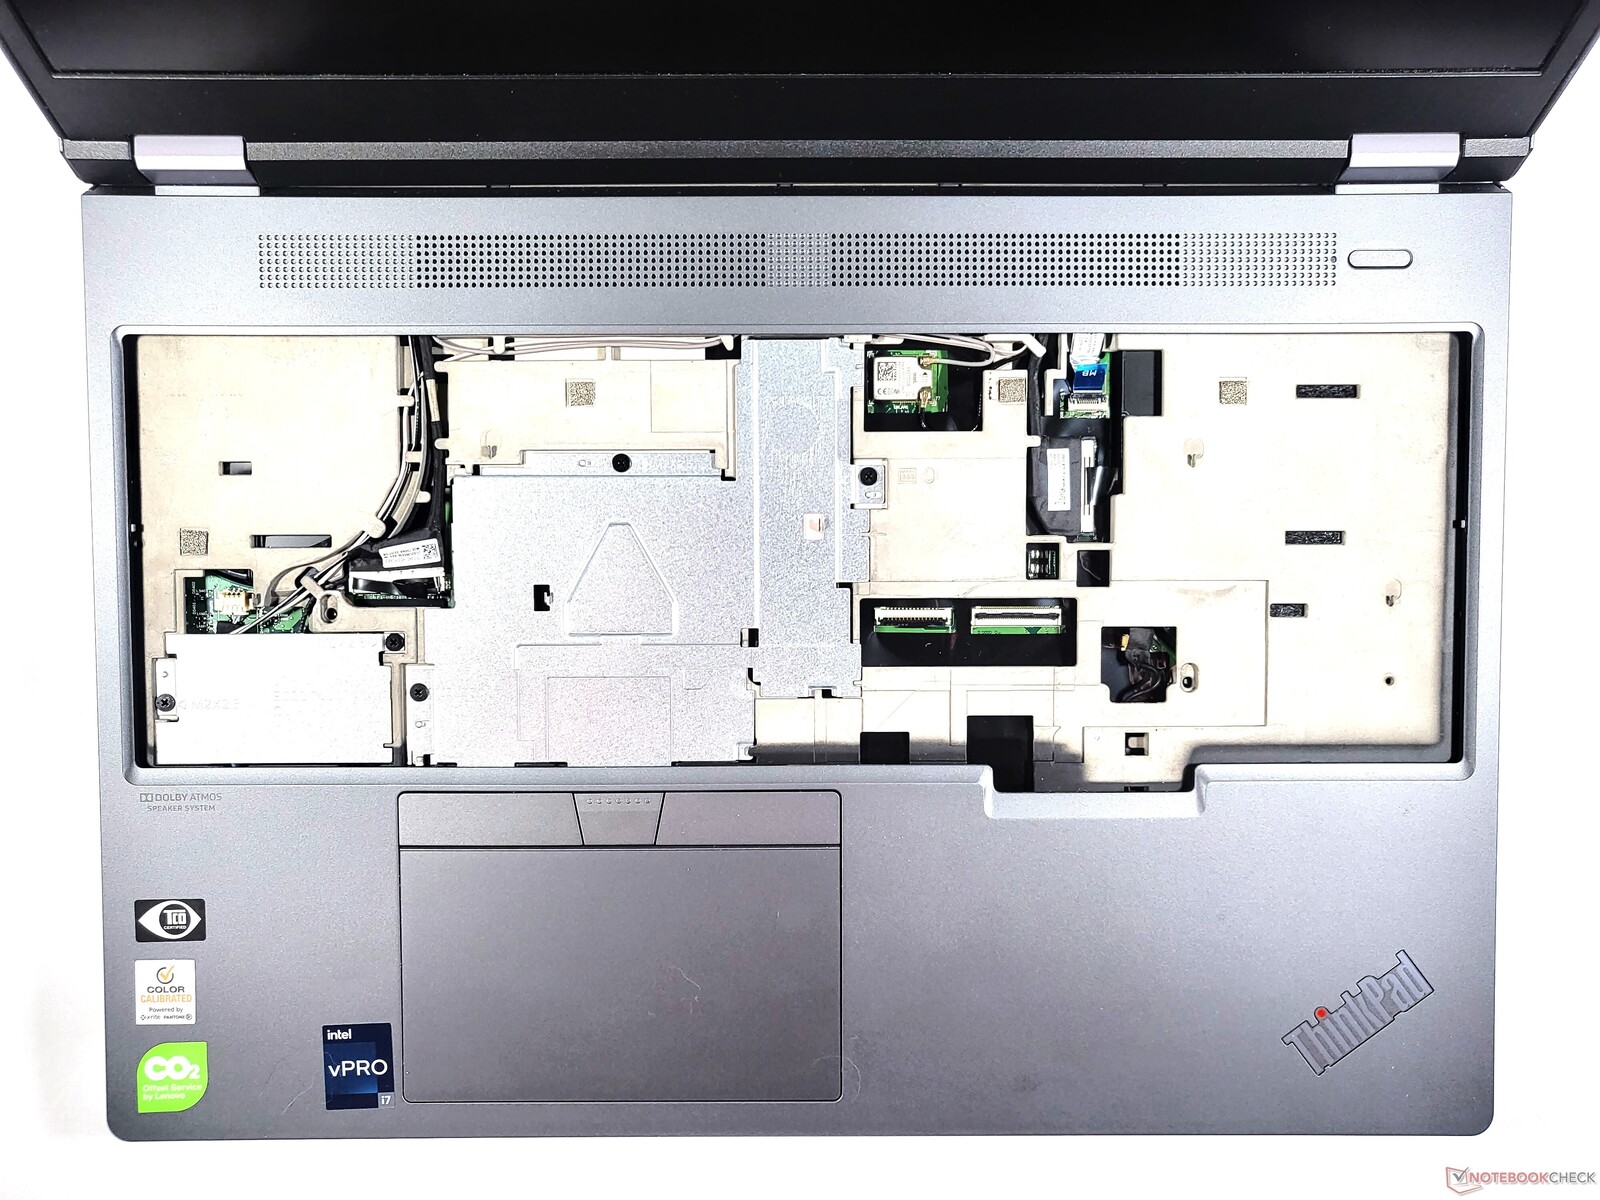
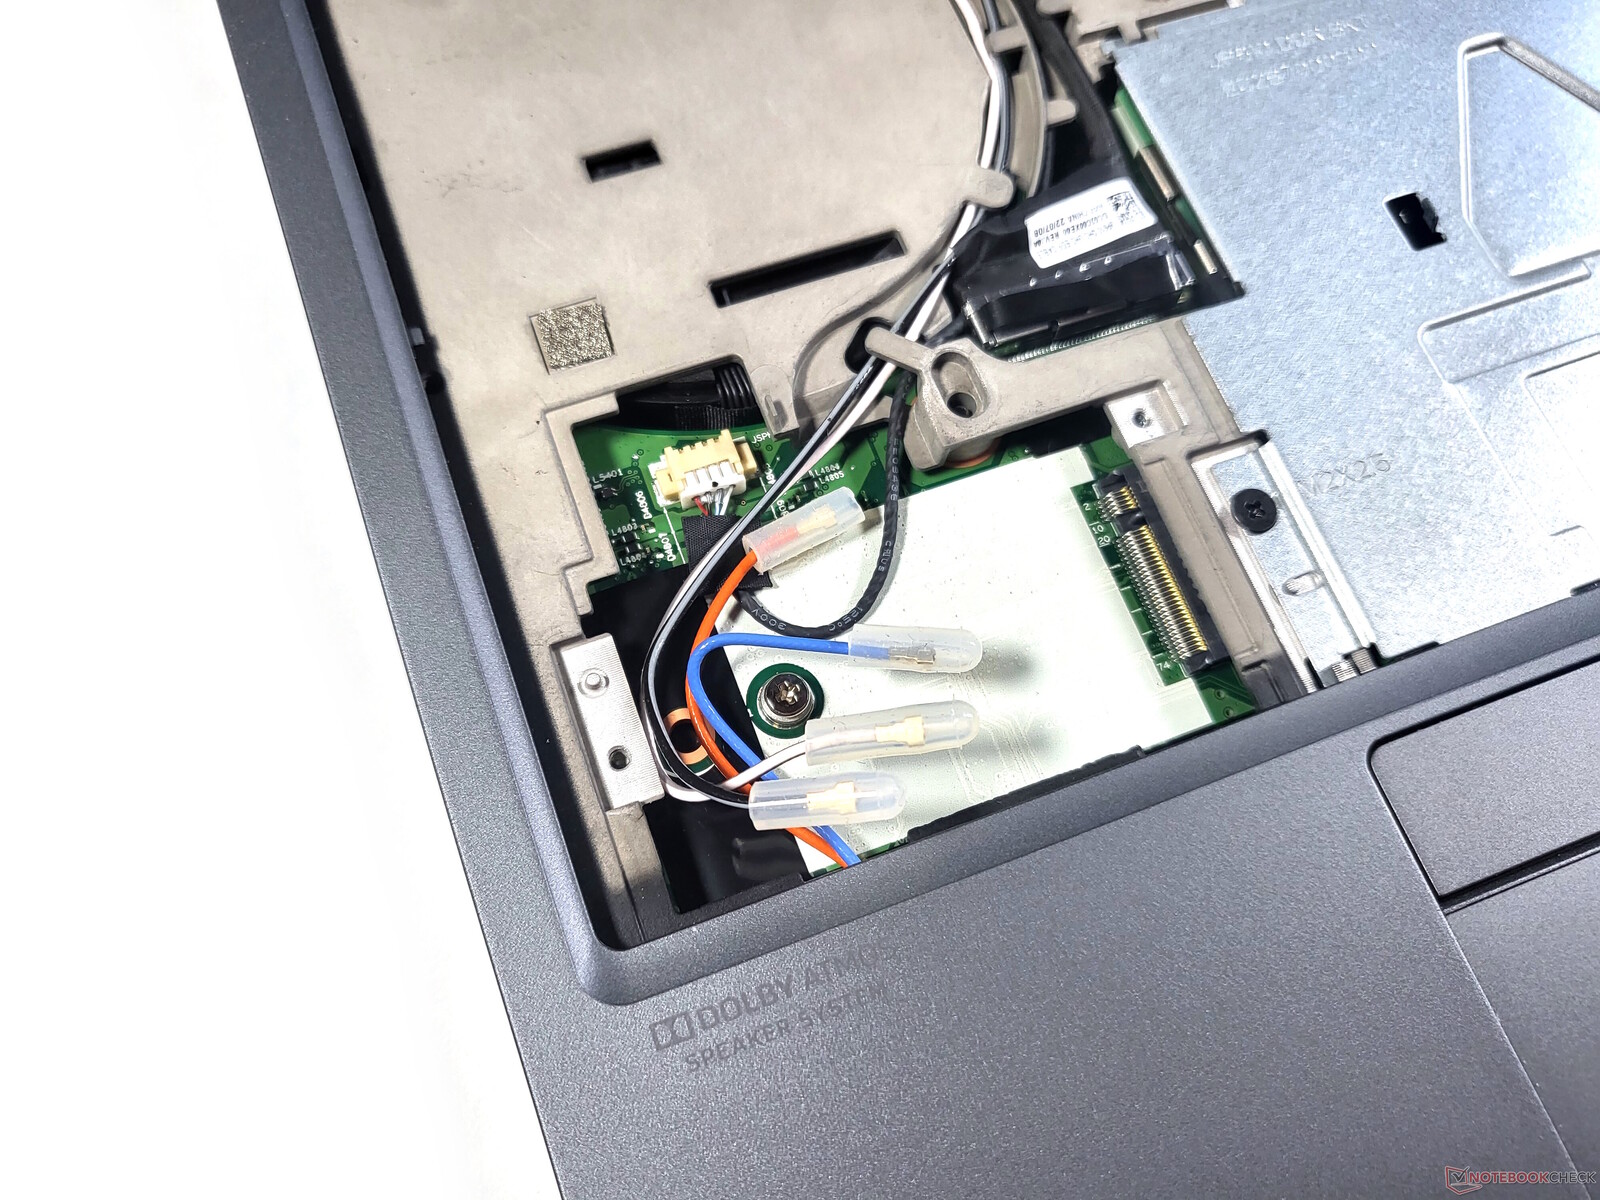
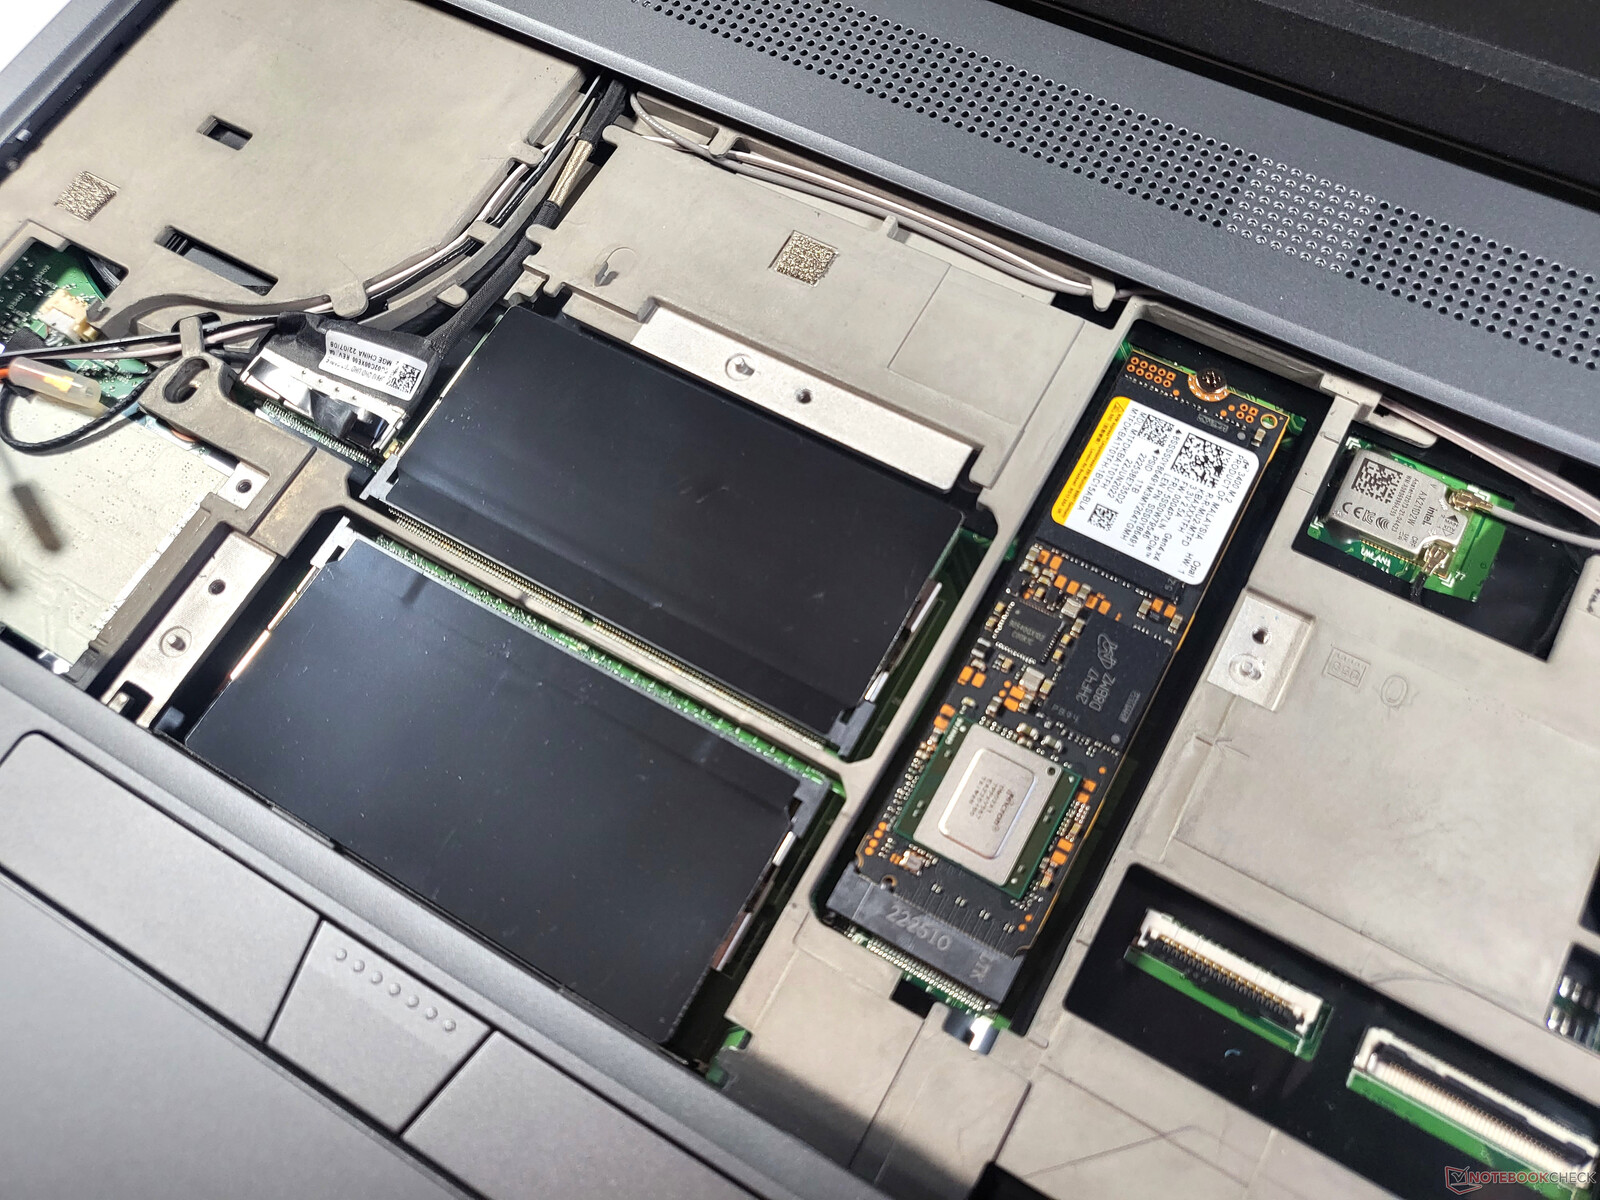
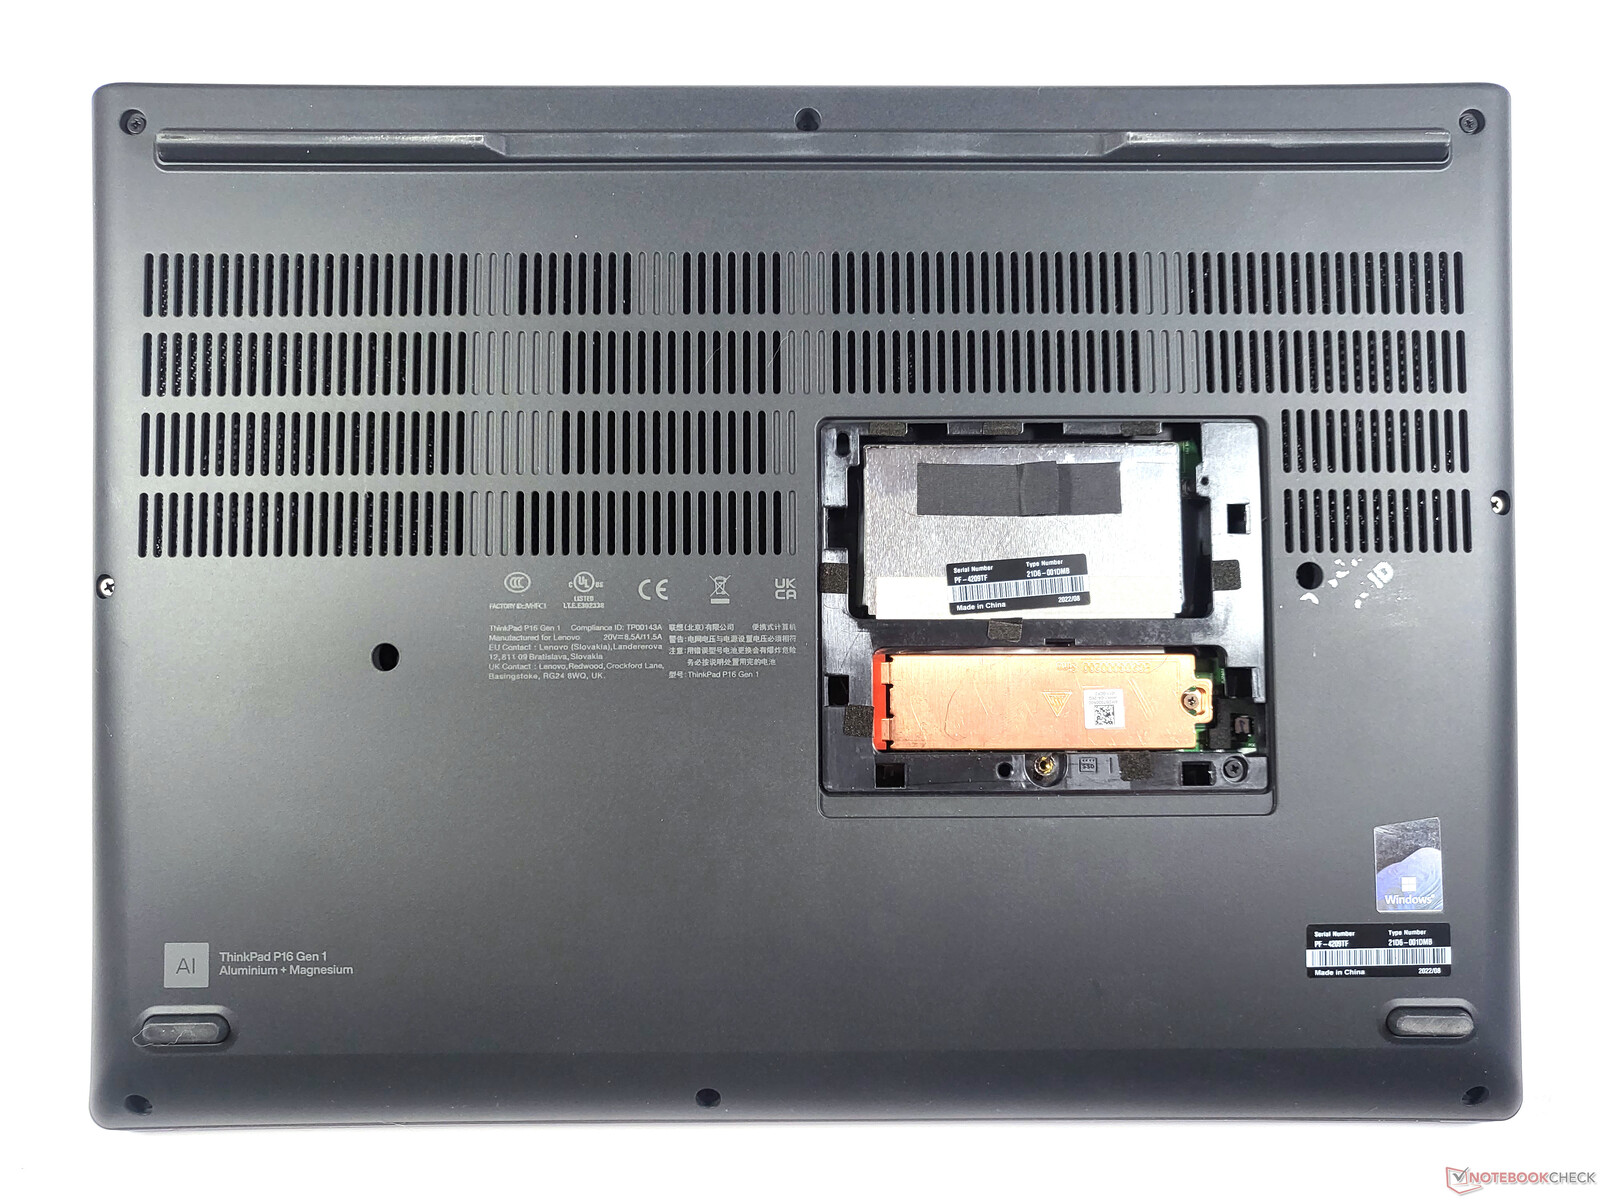
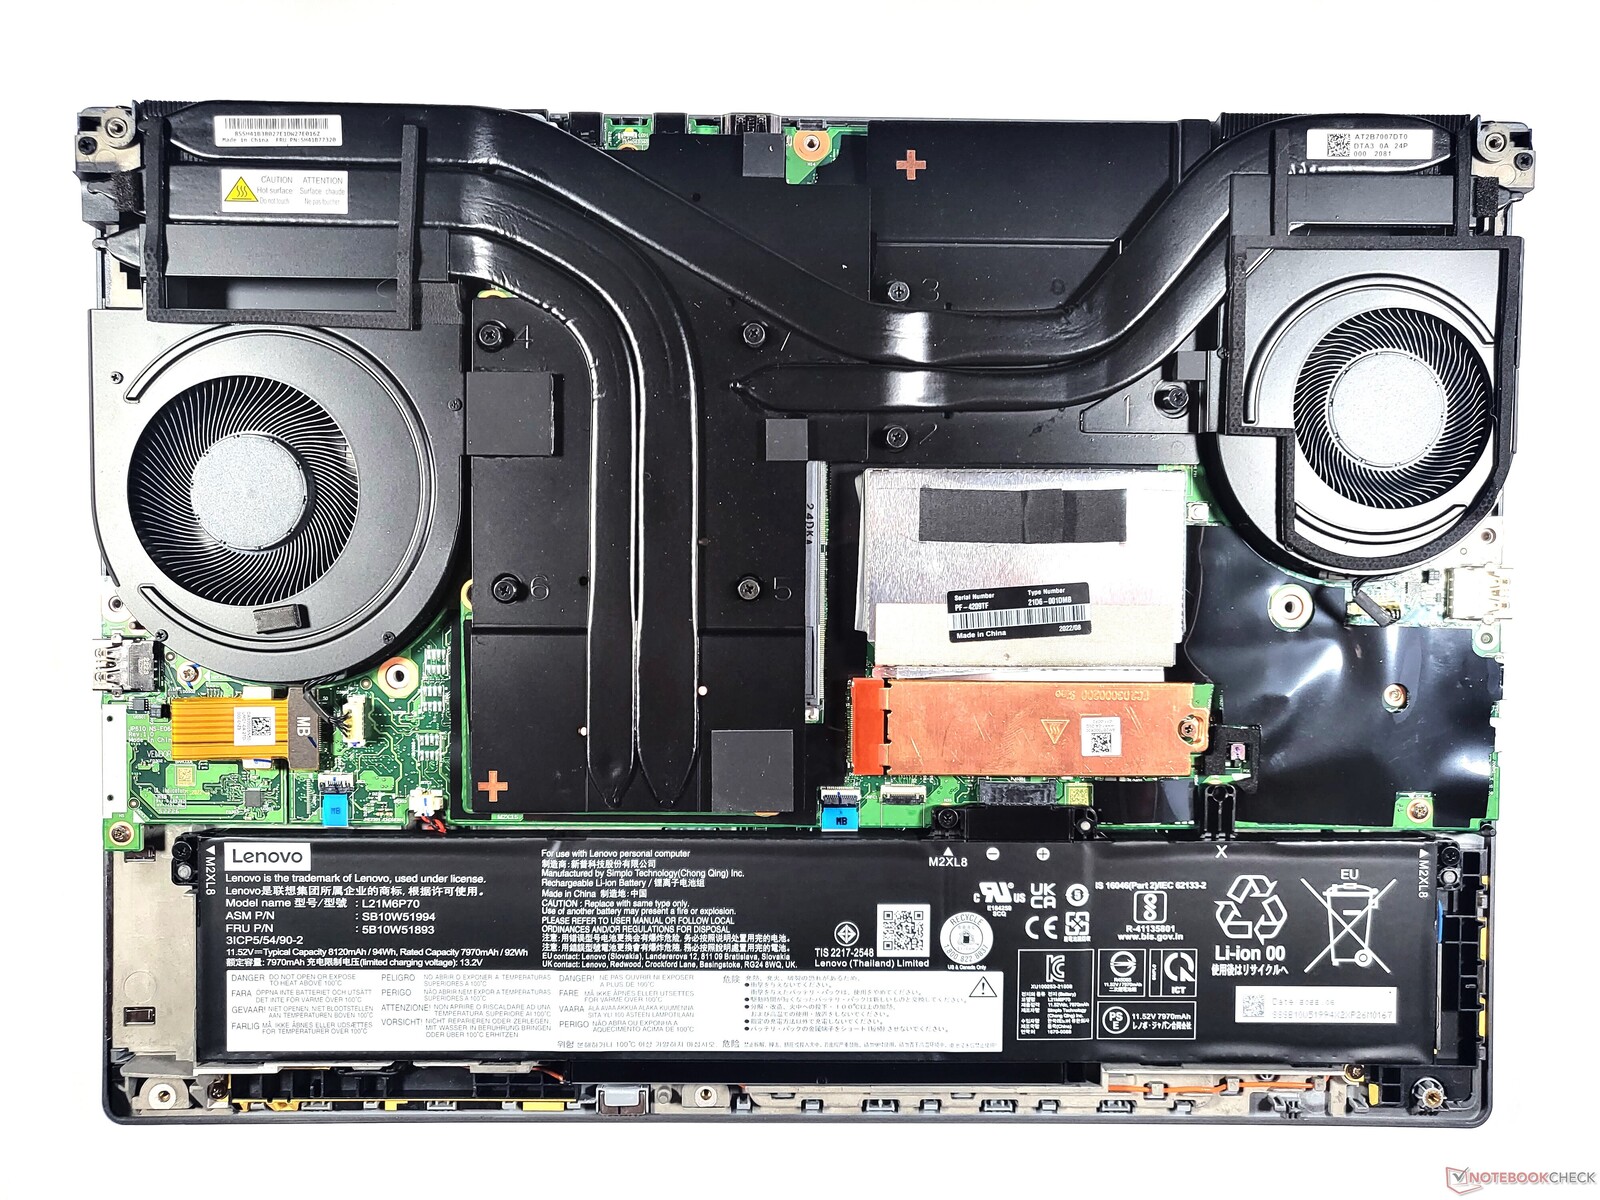
Lenovo ha reso molto semplice raggiungere due dei quattro slot per la RAM, in quanto è sufficiente rimuovere il piccolo coperchio sul fondo del dispositivo. Qui si trova anche uno slot M.2 2280 libero. È leggermente più difficile accedere agli altri slot per la RAM, al secondo slot M.2, al modulo WiFi saldato e allo slot WWAN: la tastiera deve farsi spazio. L'ultimo ostacolo si presenta sotto forma di due coperture metalliche. In totale, altre dieci viti a croce fissate con ganci di plastica si trovano sul fondo del portatile. Rimuovendo questa parte, si ha una chiara visione dell'ampio sistema di raffreddamento con un totale di due ventole e della batteria interna.
Tutte queste operazioni possono essere eseguite senza invalidare la garanzia. Con il Manuale di manutenzione hardware https://download.lenovo.com/pccbbs/mobiles_pdf/p16_gen1_hmm_en.pdf , Lenovo ha fornito una serie di istruzioni adeguate.
Garanzia
Il notebook business Lenovo ThinkPad P16 Gen 1 viene fornito con una garanzia di 3 anni. Con un sovrapprezzo, la garanzia può essere estesa a cinque anni. Il nostro dispositivo in prova è dotato di assistenza Premier con servizio in loco. Tuttavia, la maggior parte delle configurazioni del ThinkPad P16 richiede un supplemento per usufruire di questa funzione. I clienti hanno diritto a queste opzioni di assistenza estesa solo in Germania. A livello internazionale è disponibile la garanzia Bring In.
Dispositivi di input: Il ThinkPad P ha ora una corsa dei tasti di 1,5 mm
Tastiera
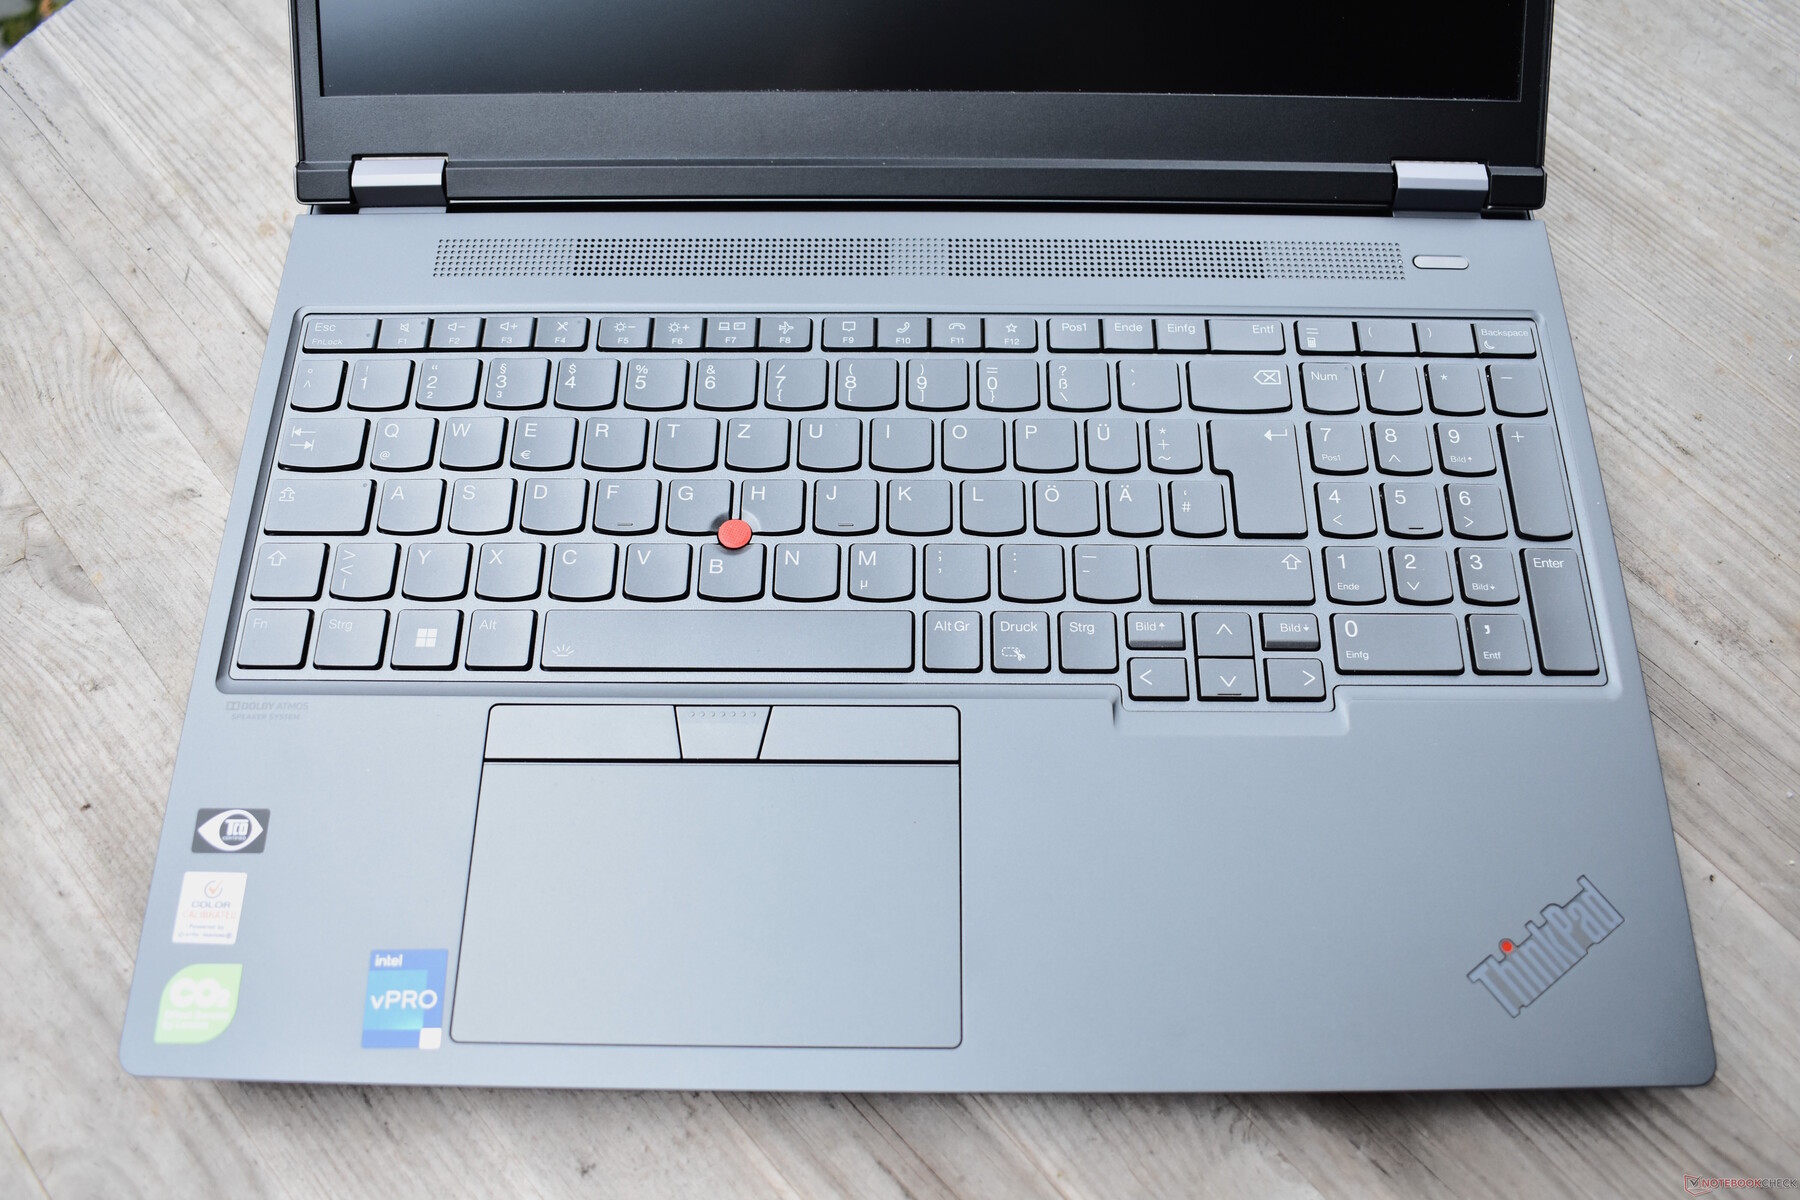
A partire dal colore, Lenovo ha completamente rinnovato la tastiera del ThinkPad P16. La tastiera è ora di colore grigio e, a nostro avviso, non ha un aspetto così pregiato. Sebbene questo sia un punto di critica relativamente insignificante, la decisione di ridurre la corsa dei tasti della tastiera retroilluminata da 1,8 a soli 1,5 mm e l'altezza ridotta dei tasti pesano molto: Di conseguenza, la tastiera del ThinkPad perde un po' del fascino speciale che aveva prima. Ciononostante, abbiamo ancora a che fare con un'ottima tastiera che offre un'esperienza di digitazione meravigliosamente piacevole, anche se ora non c'è molto che separa il dispositivo Lenovo dai suoi concorrenti HP e Dell. È un mistero perché Lenovo abbia scelto di accorciare la corsa dei tasti in una workstation così grande e spessa.
Lenovo non ha apportato alcuna modifica al layout e tutto è rimasto come prima. Un cambiamento è di natura ottica: i tasti esterni sono ora quadrati anziché arrotondati. Poiché non si tratta di tasti lettera, questo non ha avuto un impatto negativo sull'esperienza di digitazione. Come i tasti arrotondati, anche quelli quadrati hanno una forma leggermente concava.
Touchpad e TrackPoint
Il touchpad del Lenovo ThinkPad P16 G1 appare più ampio rispetto ai modelli precedenti e, in larghezza, è cresciuto di 11,5 cm. La superficie è in plastica, ancora più liscia rispetto al modello precedente. In termini di maneggevolezza, il touchpad è molto buono e traduce in modo eccellente i gesti multitouch. Tuttavia, il feedback aptico non è all'altezza dei trackpad in vetro. Trattandosi di un trackpad meccanico, è possibile fare clic solo sulla parte inferiore del pad. Il meccanismo di clic è piuttosto opaco, ma non fa rumore né traballa.
Il TrackPoint continua a rappresentare una valida alternativa al touchpad se il puntatore del mouse deve essere spostato rapidamente durante la digitazione. Rispetto al suo predecessore, la levetta di puntamento rossa con cappuccio in gomma è rimasta invariata. Al contrario, Lenovo ha ridisegnato i tasti dedicati al TrackPoint, che ora hanno un aspetto più moderno senza perdere nulla in termini di usabilità.
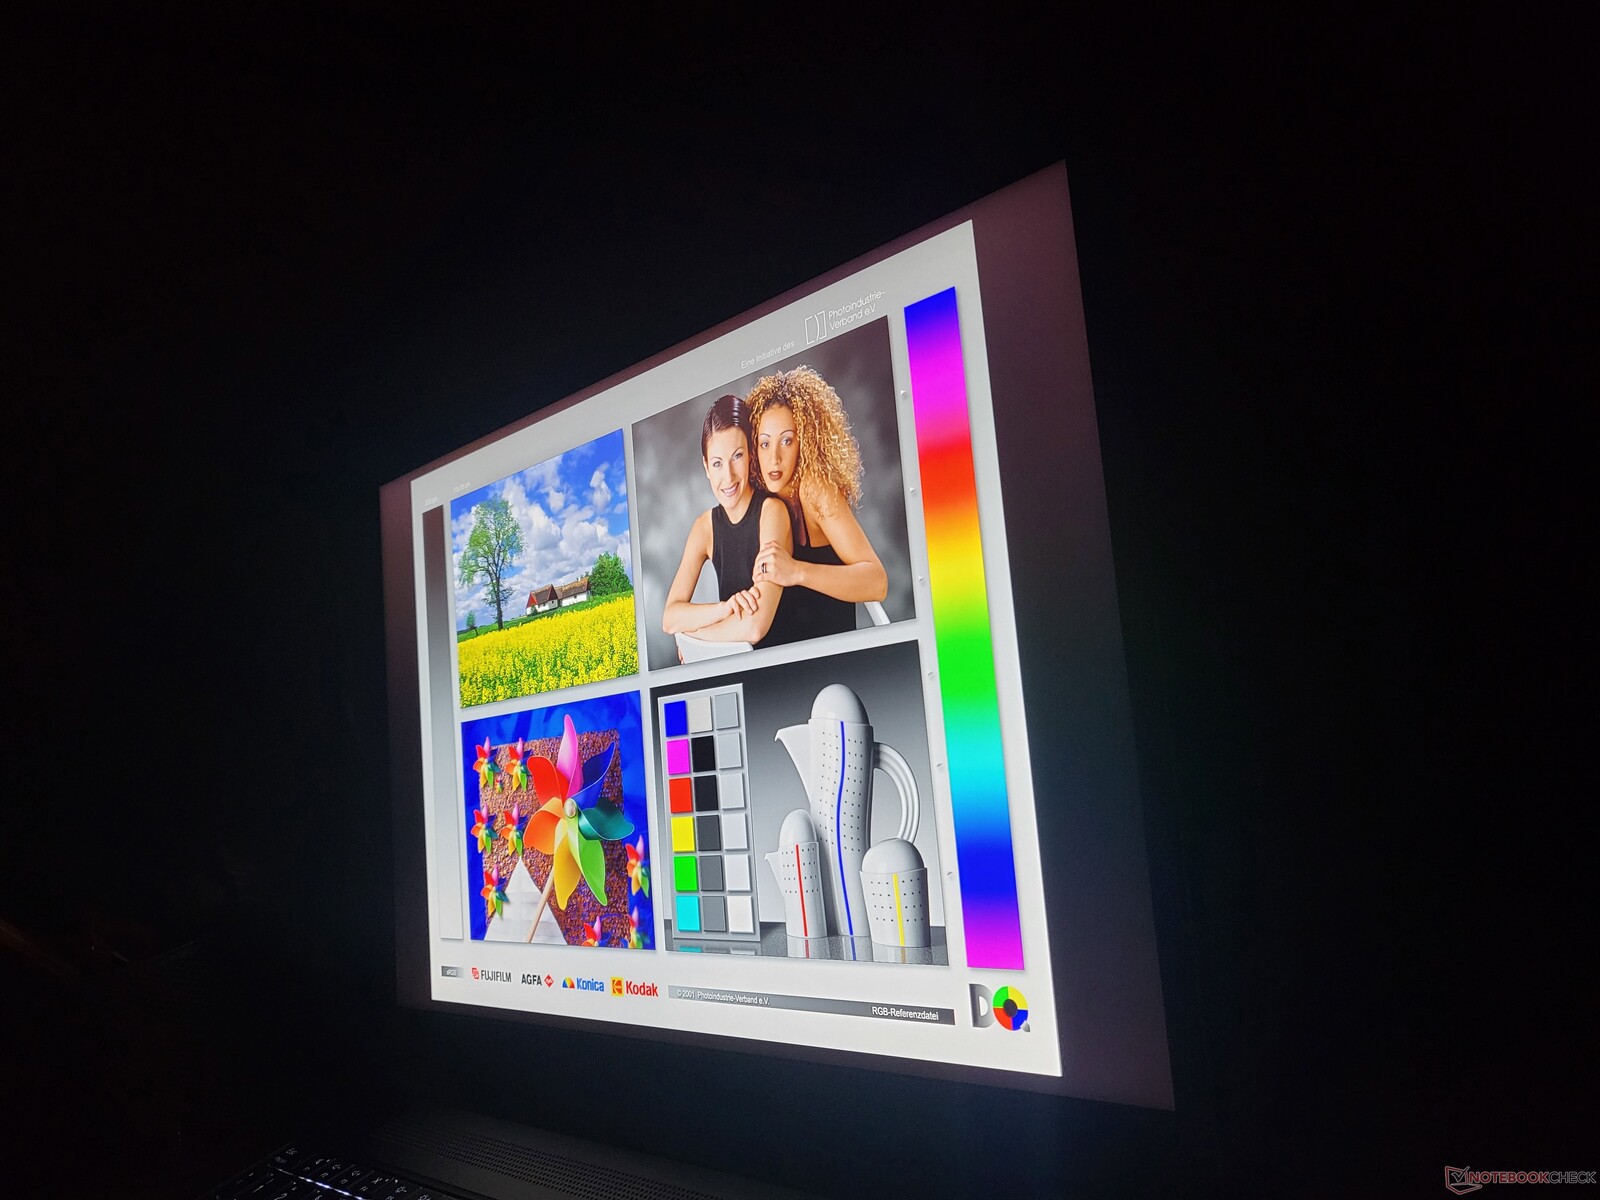
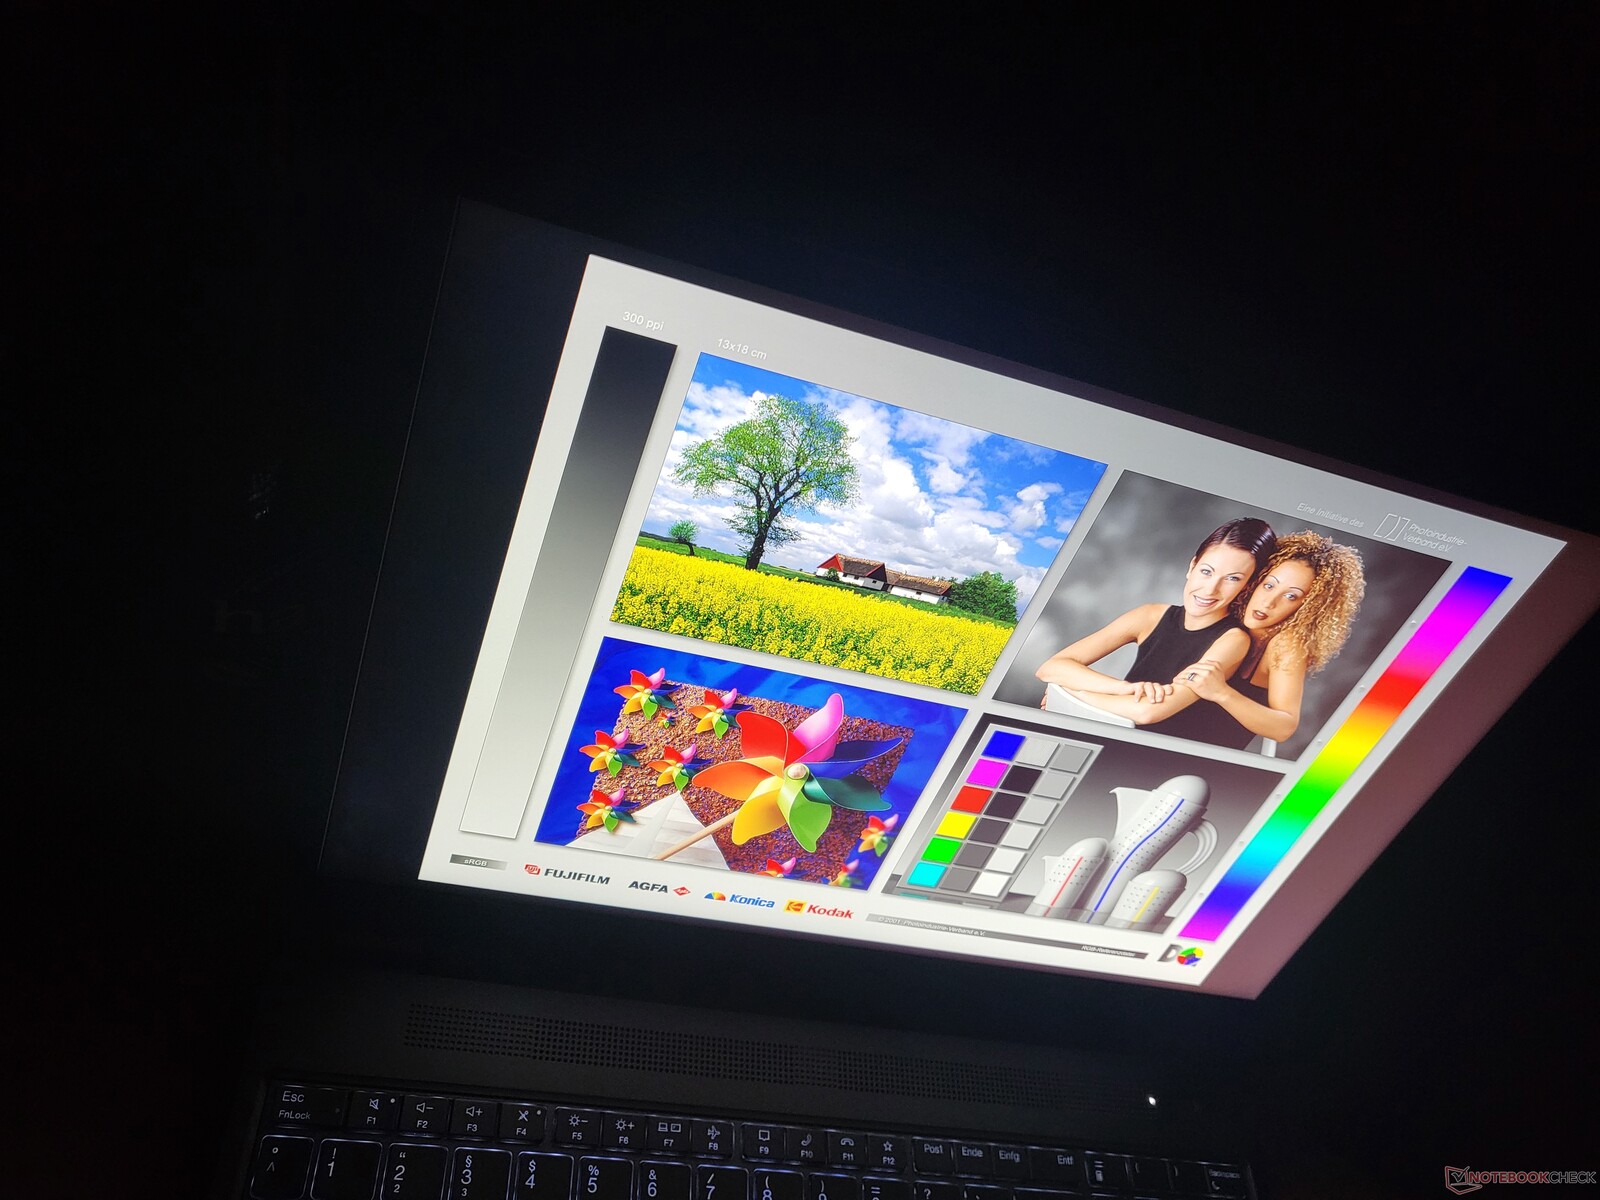
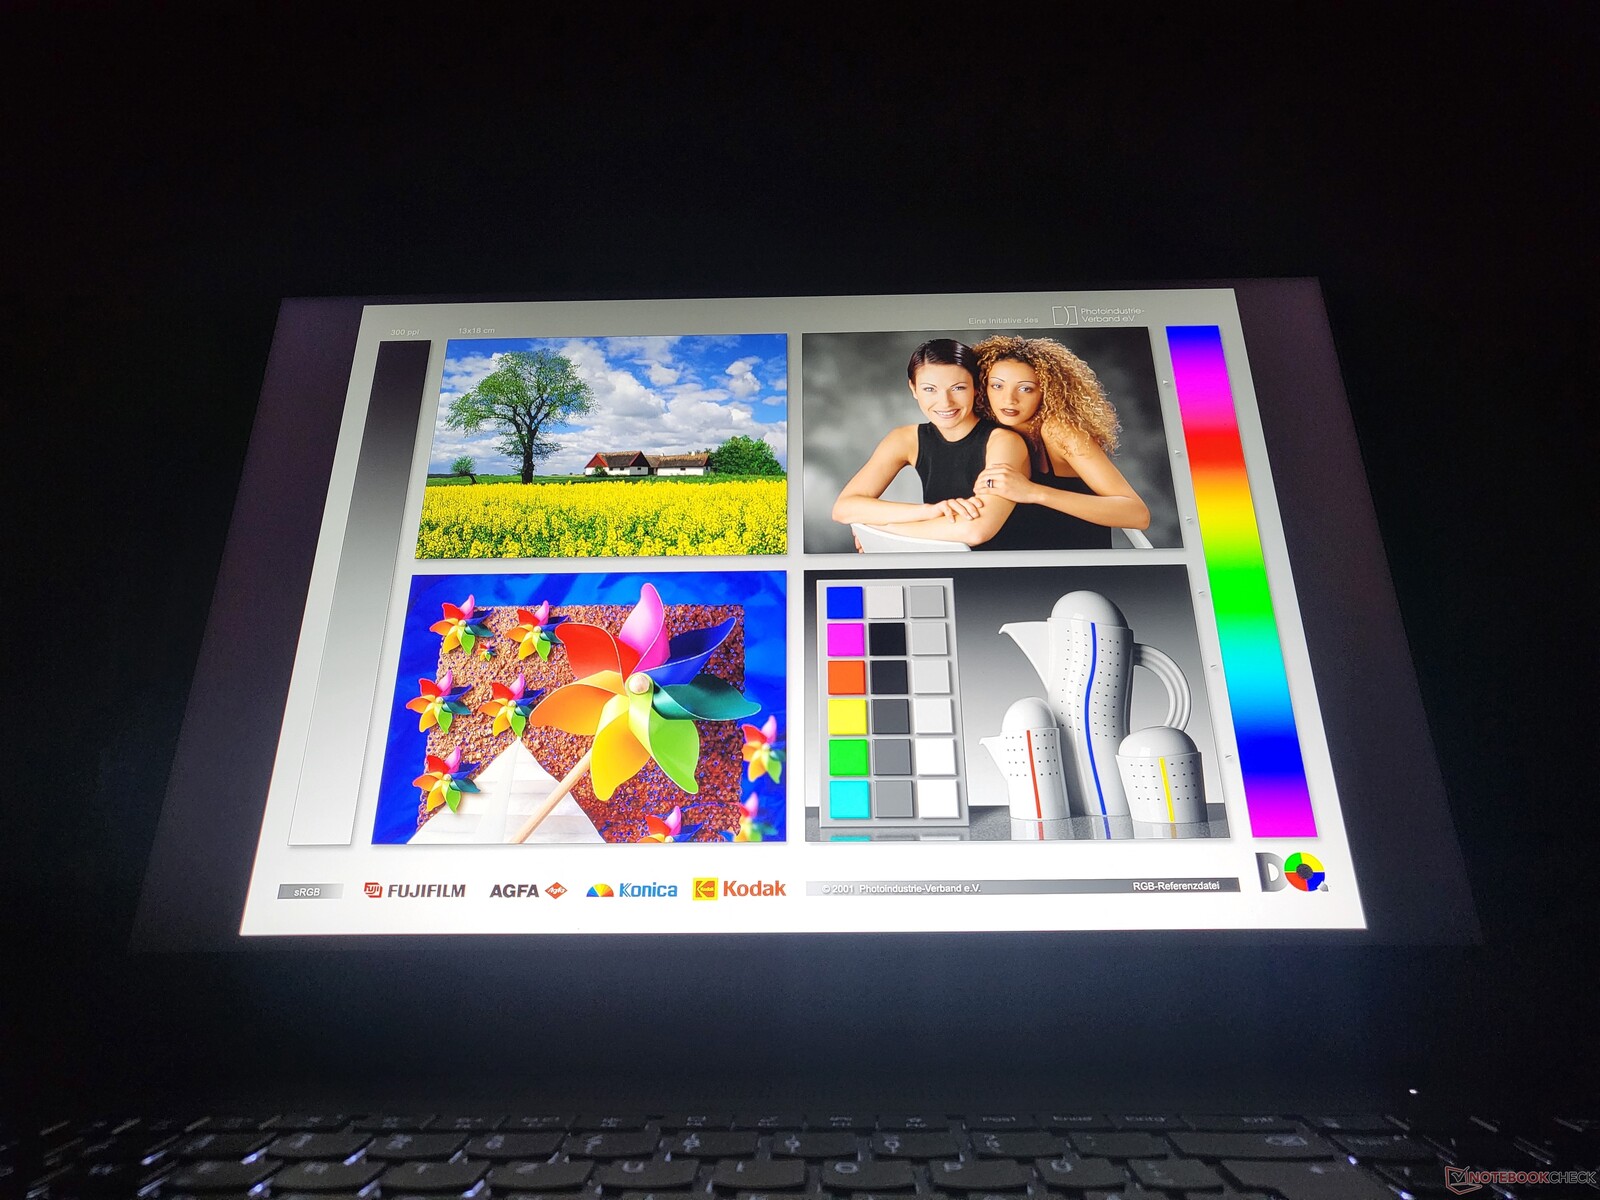
Display: Una nuova opzione LCD WQXGA per la workstation Thinkpad
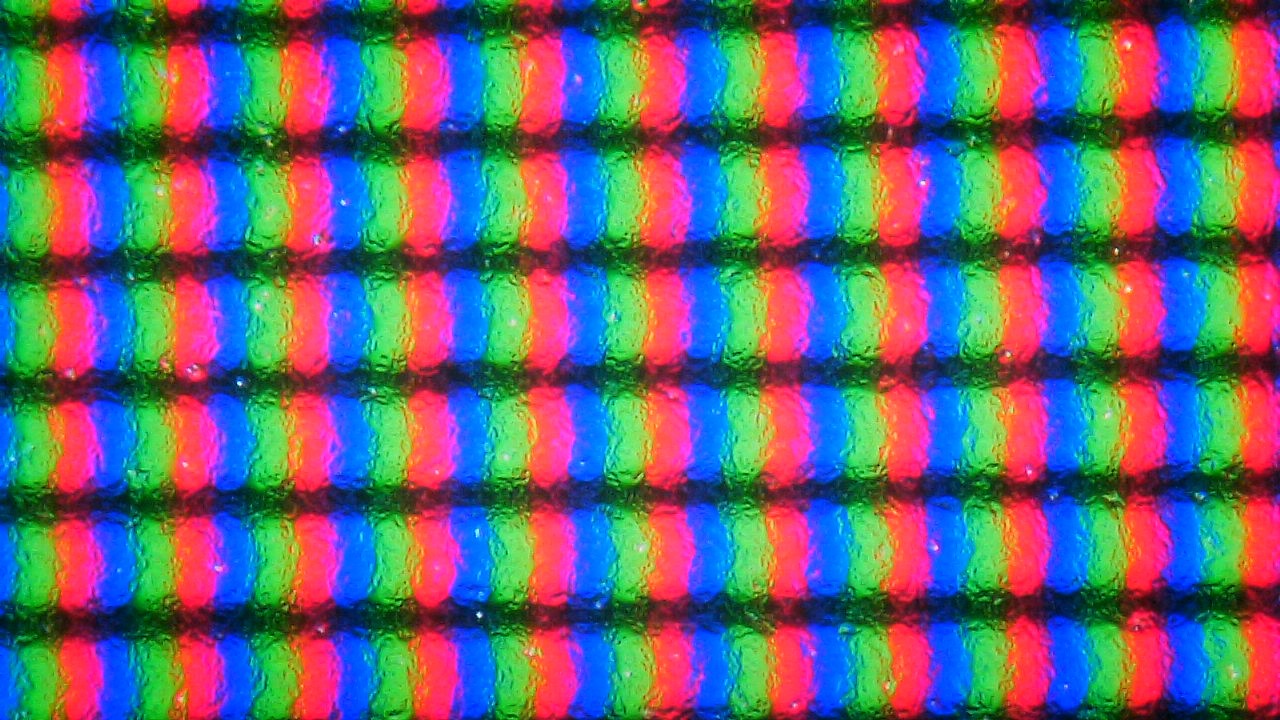
Come di consueto per i portatili ThinkPad, il Lenovo ThinkPad P16 2022 offre una selezione di opzioni di display che coprono una varietà di applicazioni e categorie di prezzo. Tutti hanno in comune il rapporto di aspetto 16:10 e i pannelli da 16 pollici:
- WUXGA (1920 x 1200), IPS, 300 cd/m², 100 % sRGB, opaco
- WQXGA (2560 x 1600), IPS, 400 cd/m², 100 % sRGB, opaco
- WQUXGA (3840 x 2400), IPS, 600 cd/m², 100 % AdobeRGB, opaco
- WQUXGA (3840 x 2400), OLED, 400 cd/m², 100 % DCI-P3, antiriflesso, multi-touch
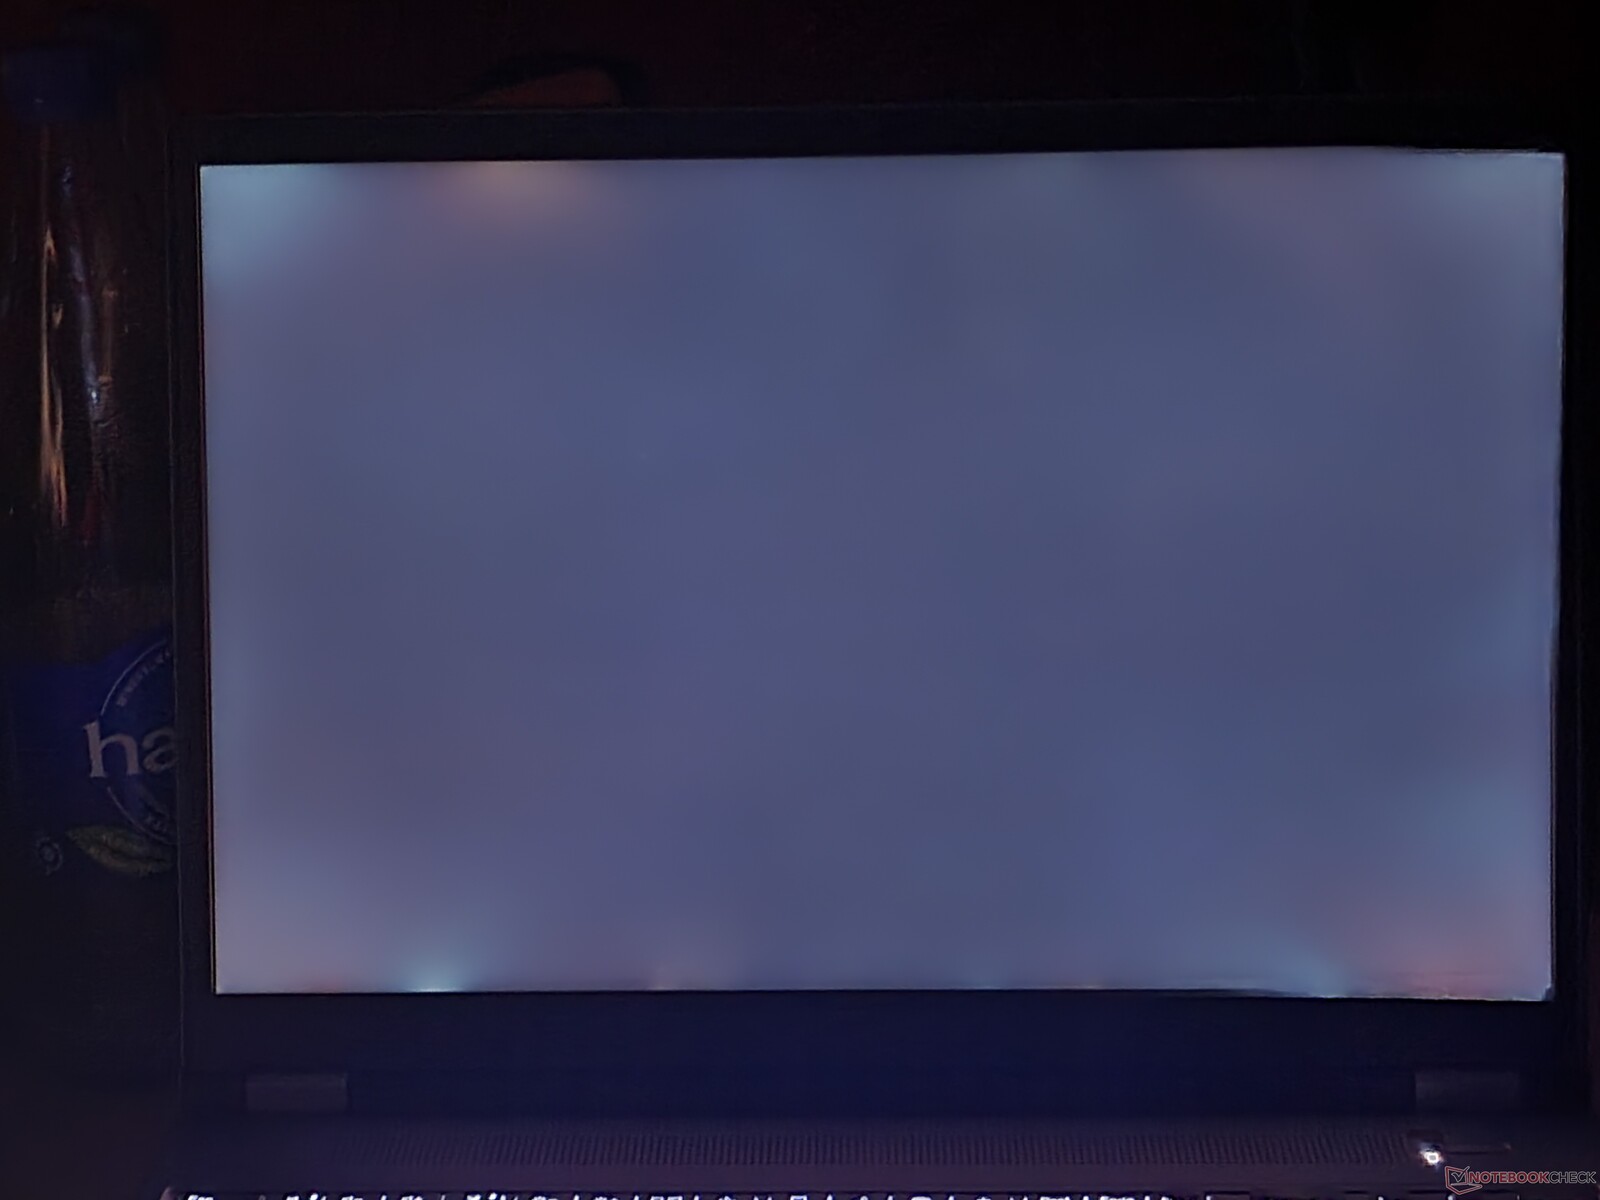
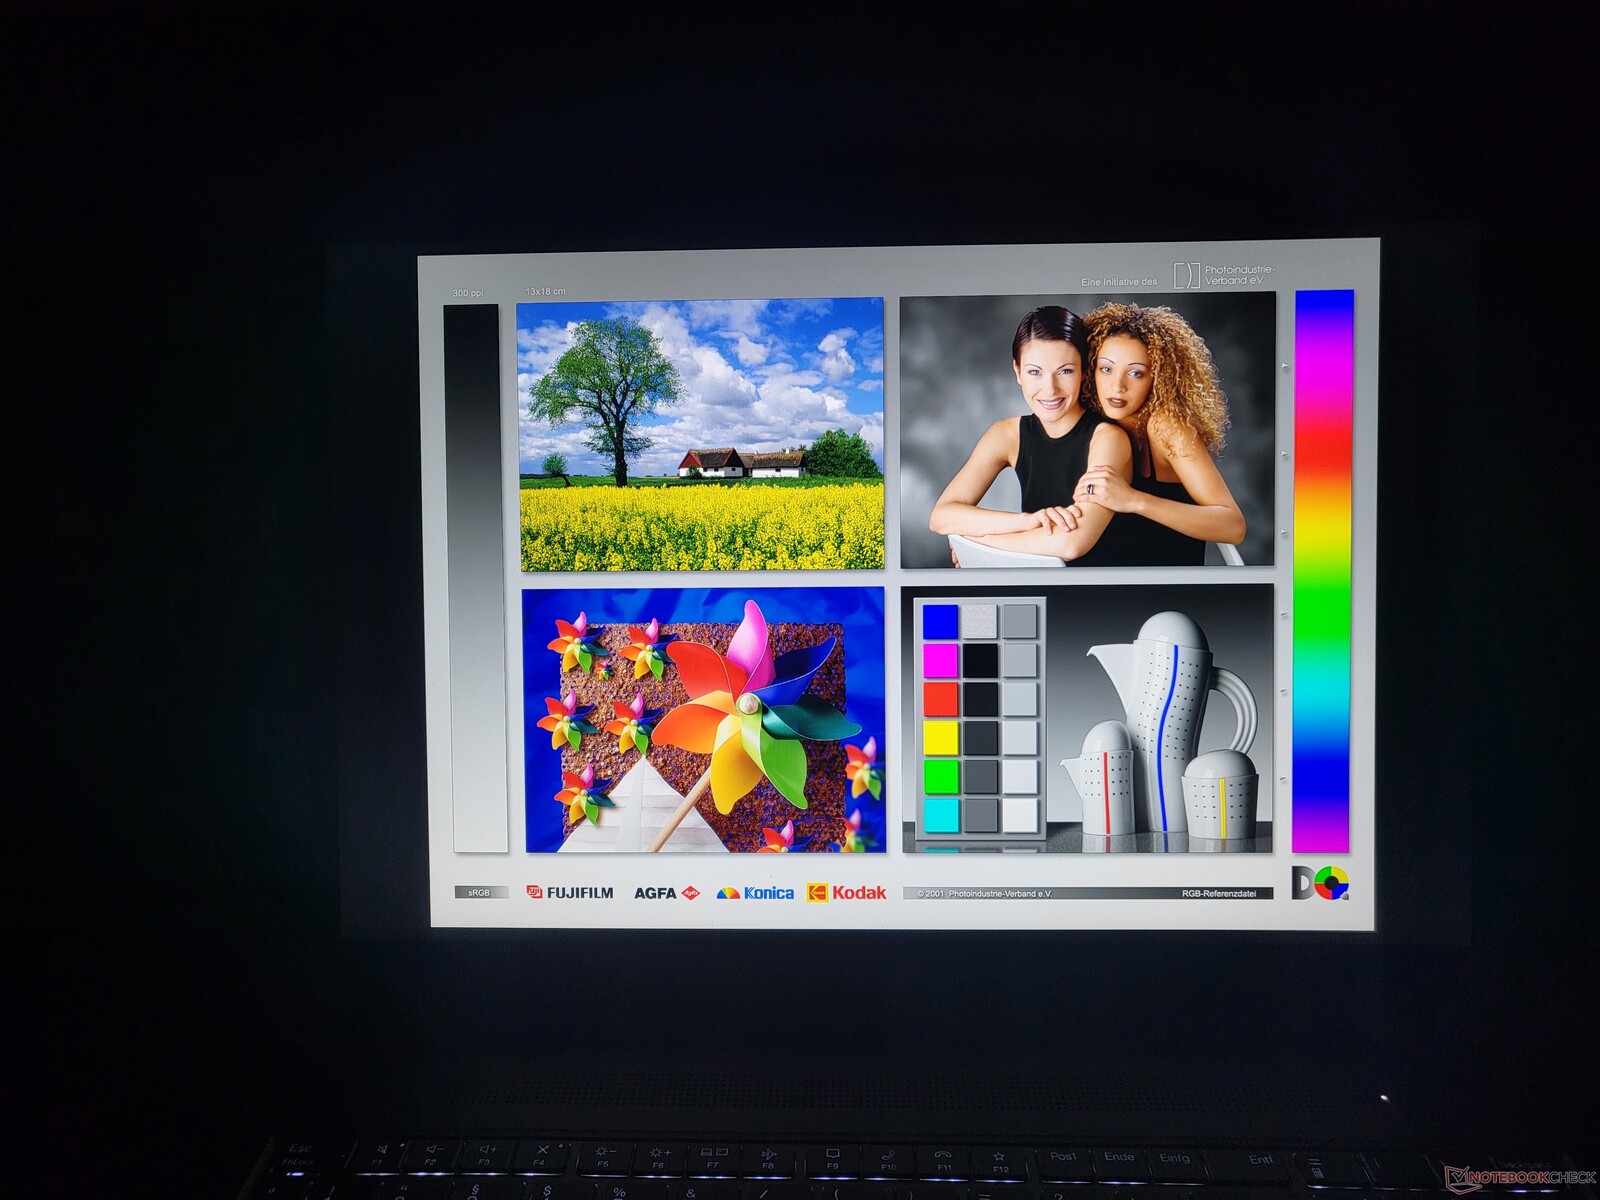
Il livello di risoluzione medio di 2,5K presente nel P16 è una novità, in quanto i P15 e P17 erano disponibili solo in 16:9 con Full-HD (1920 x 1080) o 4K UHD (3840 x 2160). Il display WQXGA integrato offre i 400 cd/m² pubblicizzati quasi subito, con una media di 398 cd/m². Rispetto alle sue controparti dirette, si colloca a metà del gruppo. Il display dell'Asus ExpertBook B6 Flip è marginalmente più luminoso.
| |||||||||||||||||||||||||
Distribuzione della luminosità: 90 %
Al centro con la batteria: 424 cd/m²
Contrasto: 1767:1 (Nero: 0.24 cd/m²)
ΔE ColorChecker Calman: 2.6 | ∀{0.5-29.43 Ø4.71}
calibrated: 0.8
ΔE Greyscale Calman: 4.1 | ∀{0.09-98 Ø4.96}
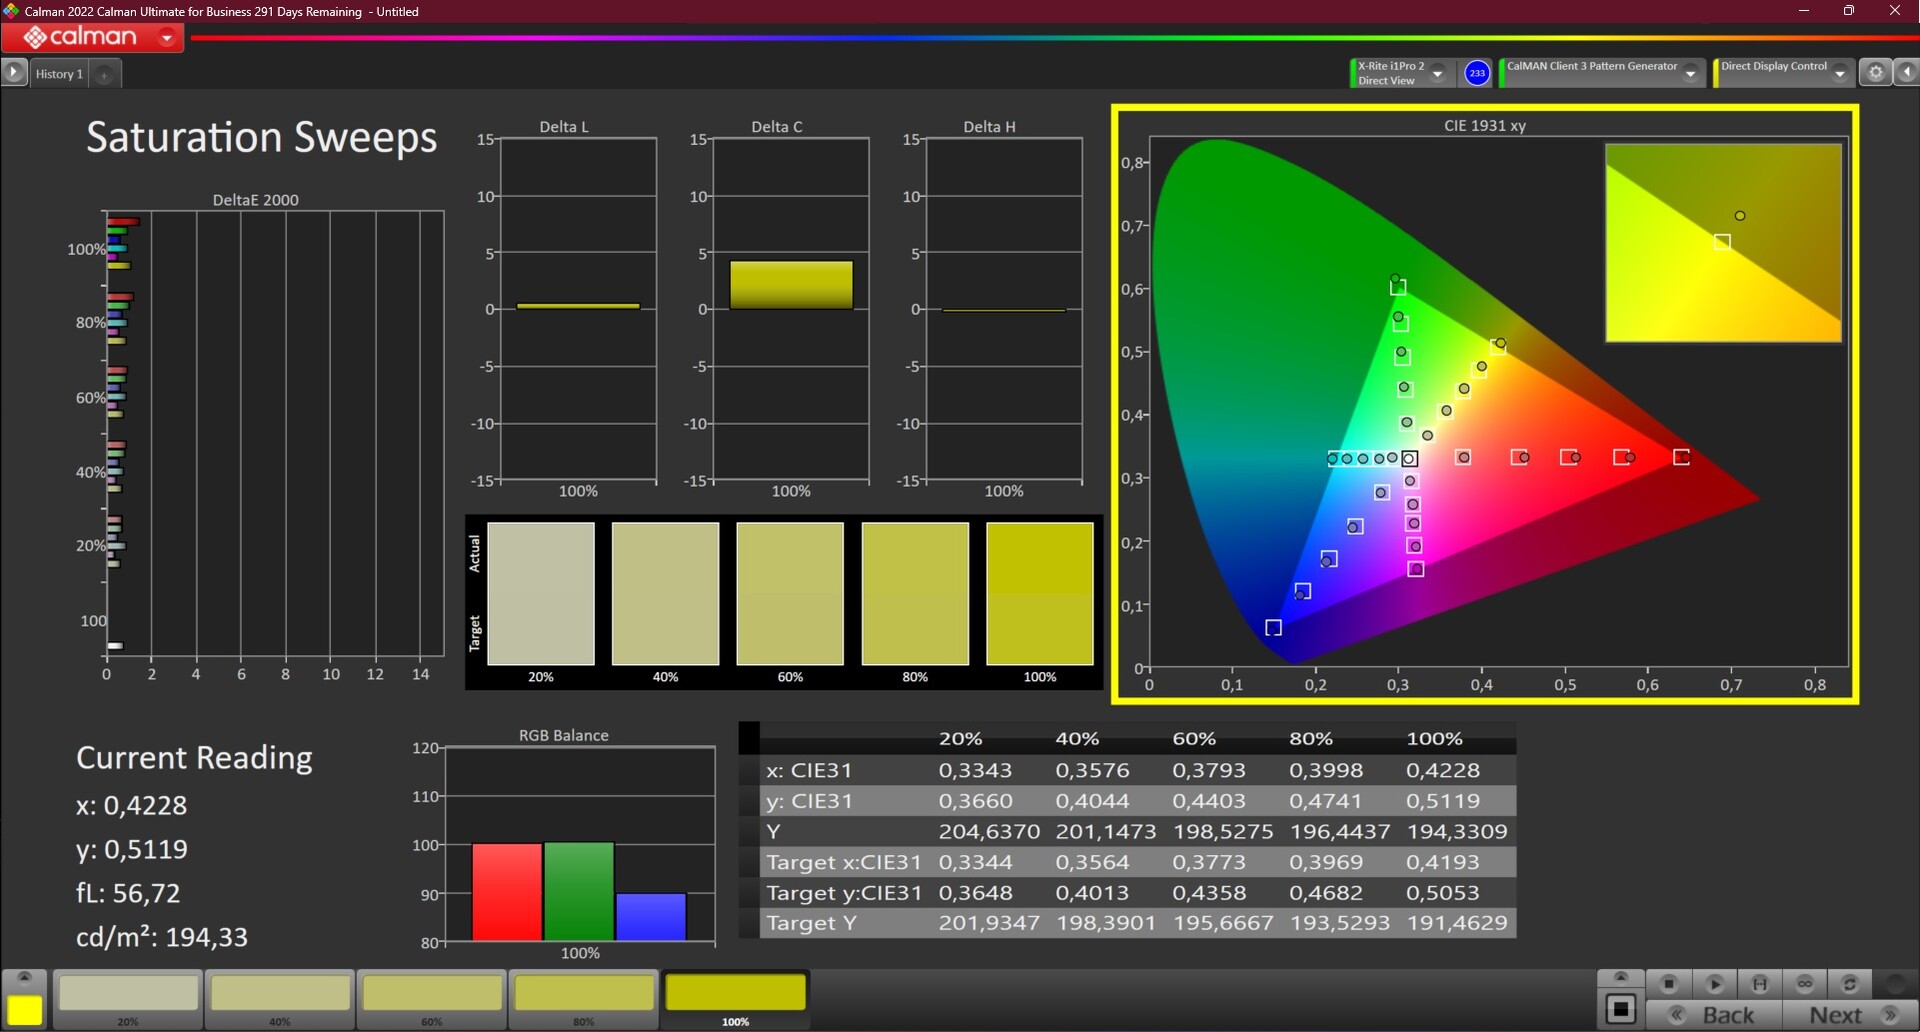
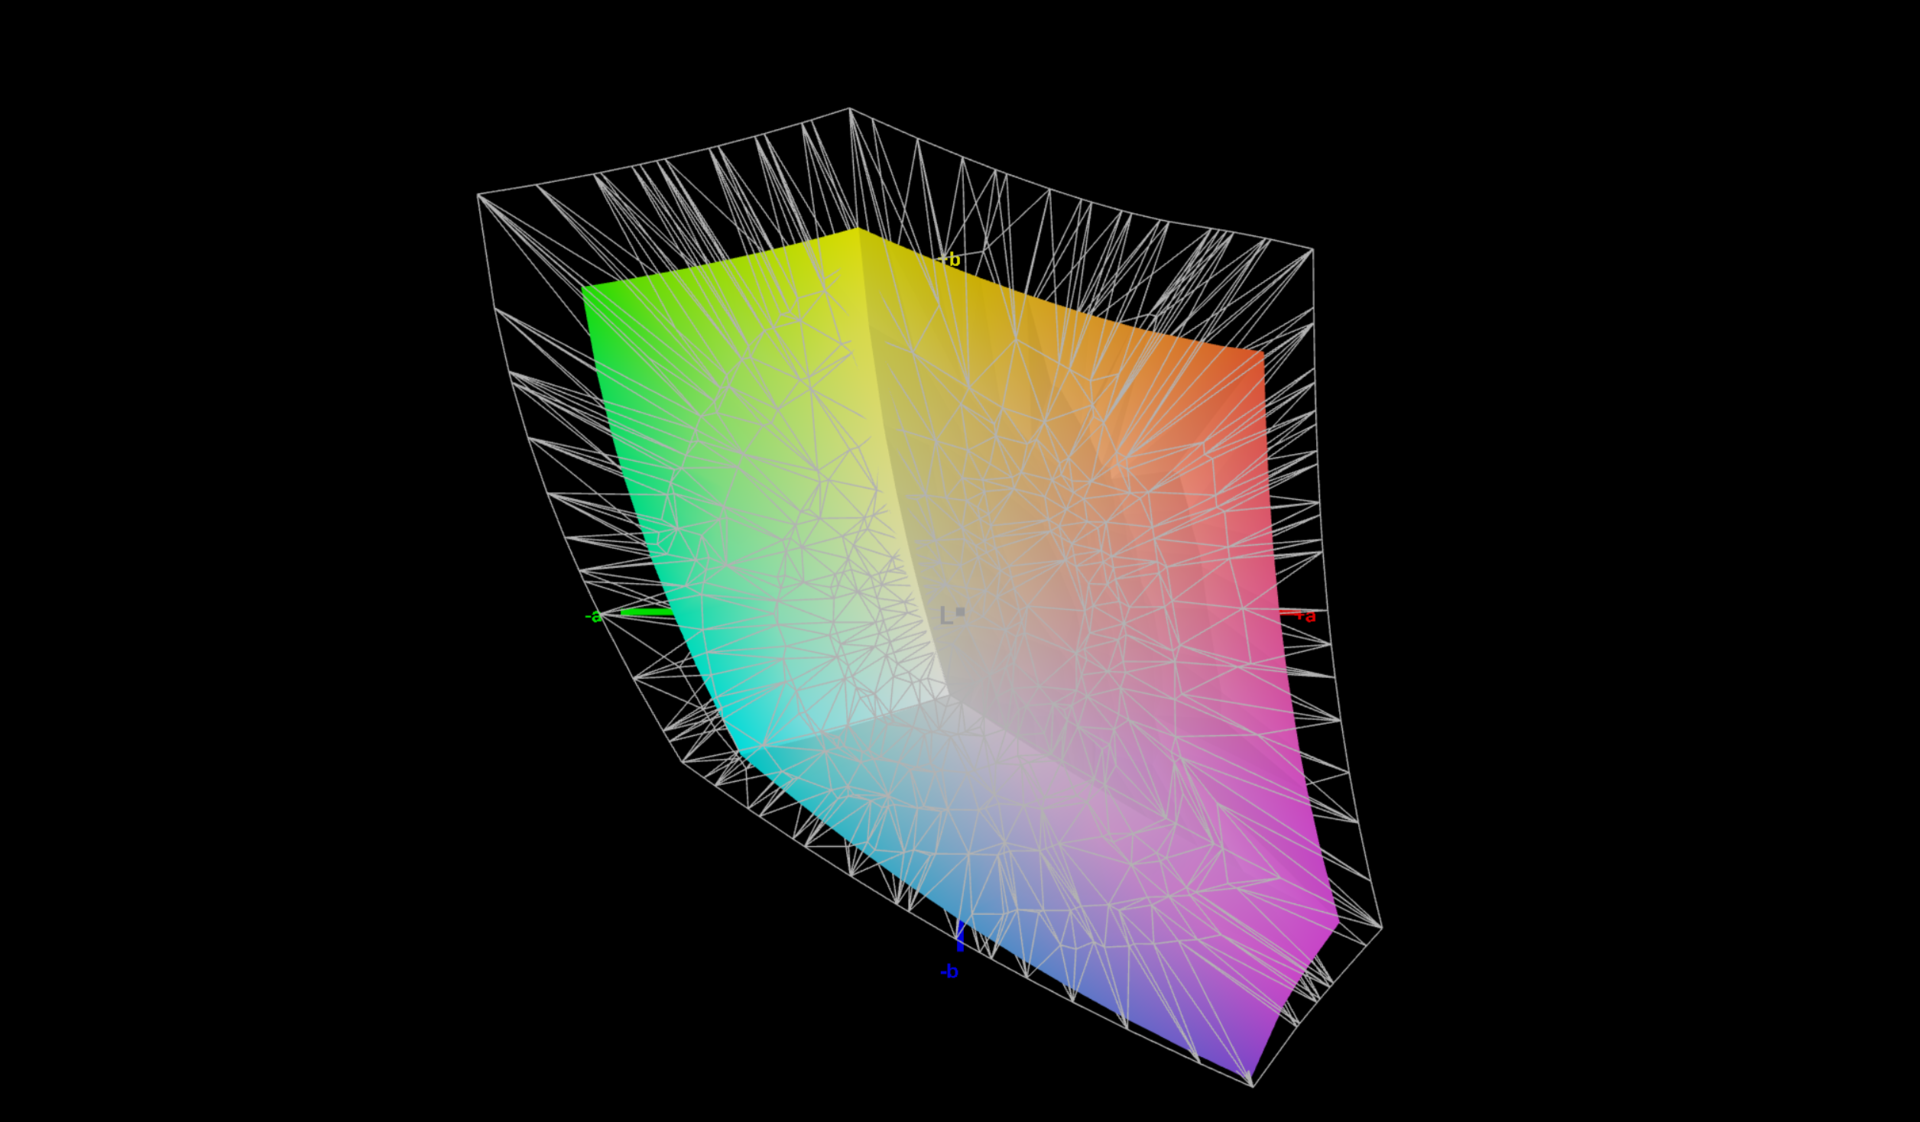
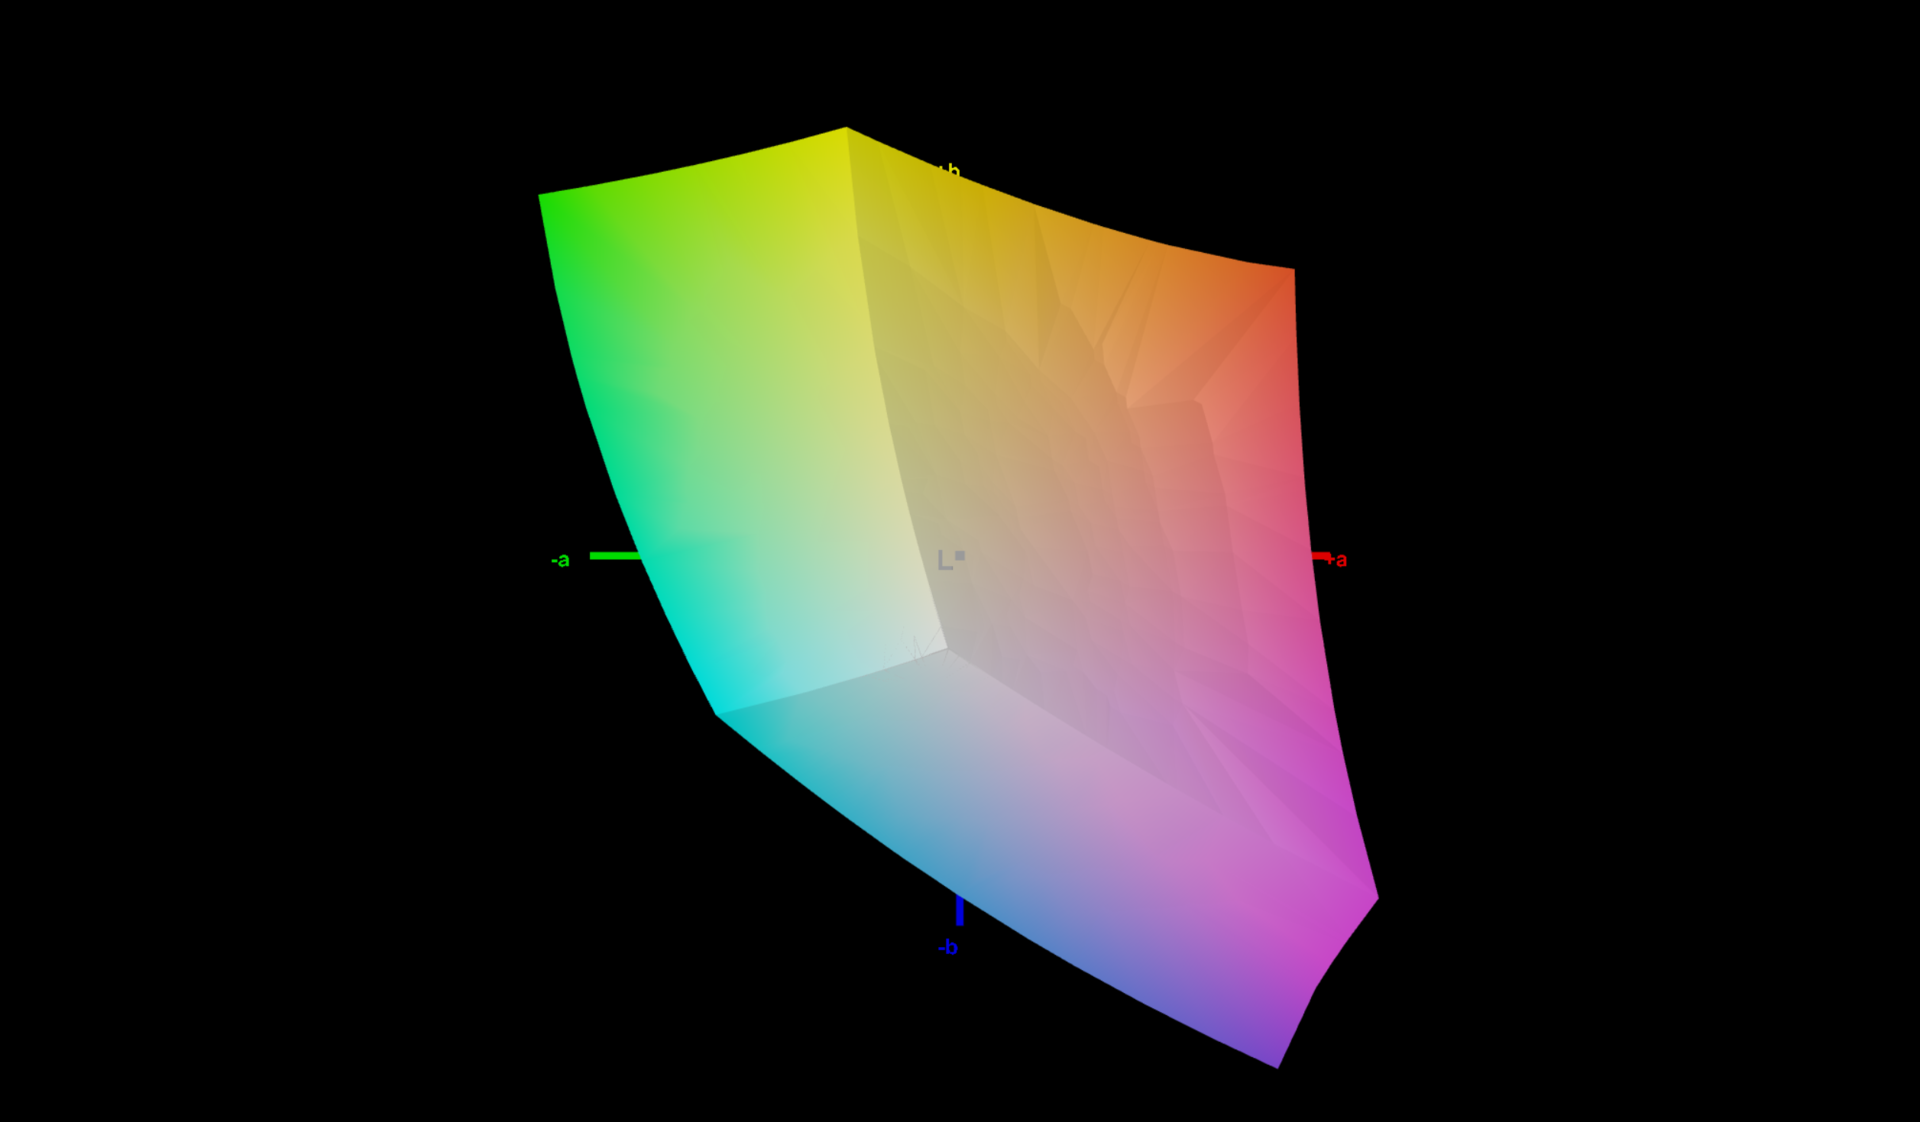
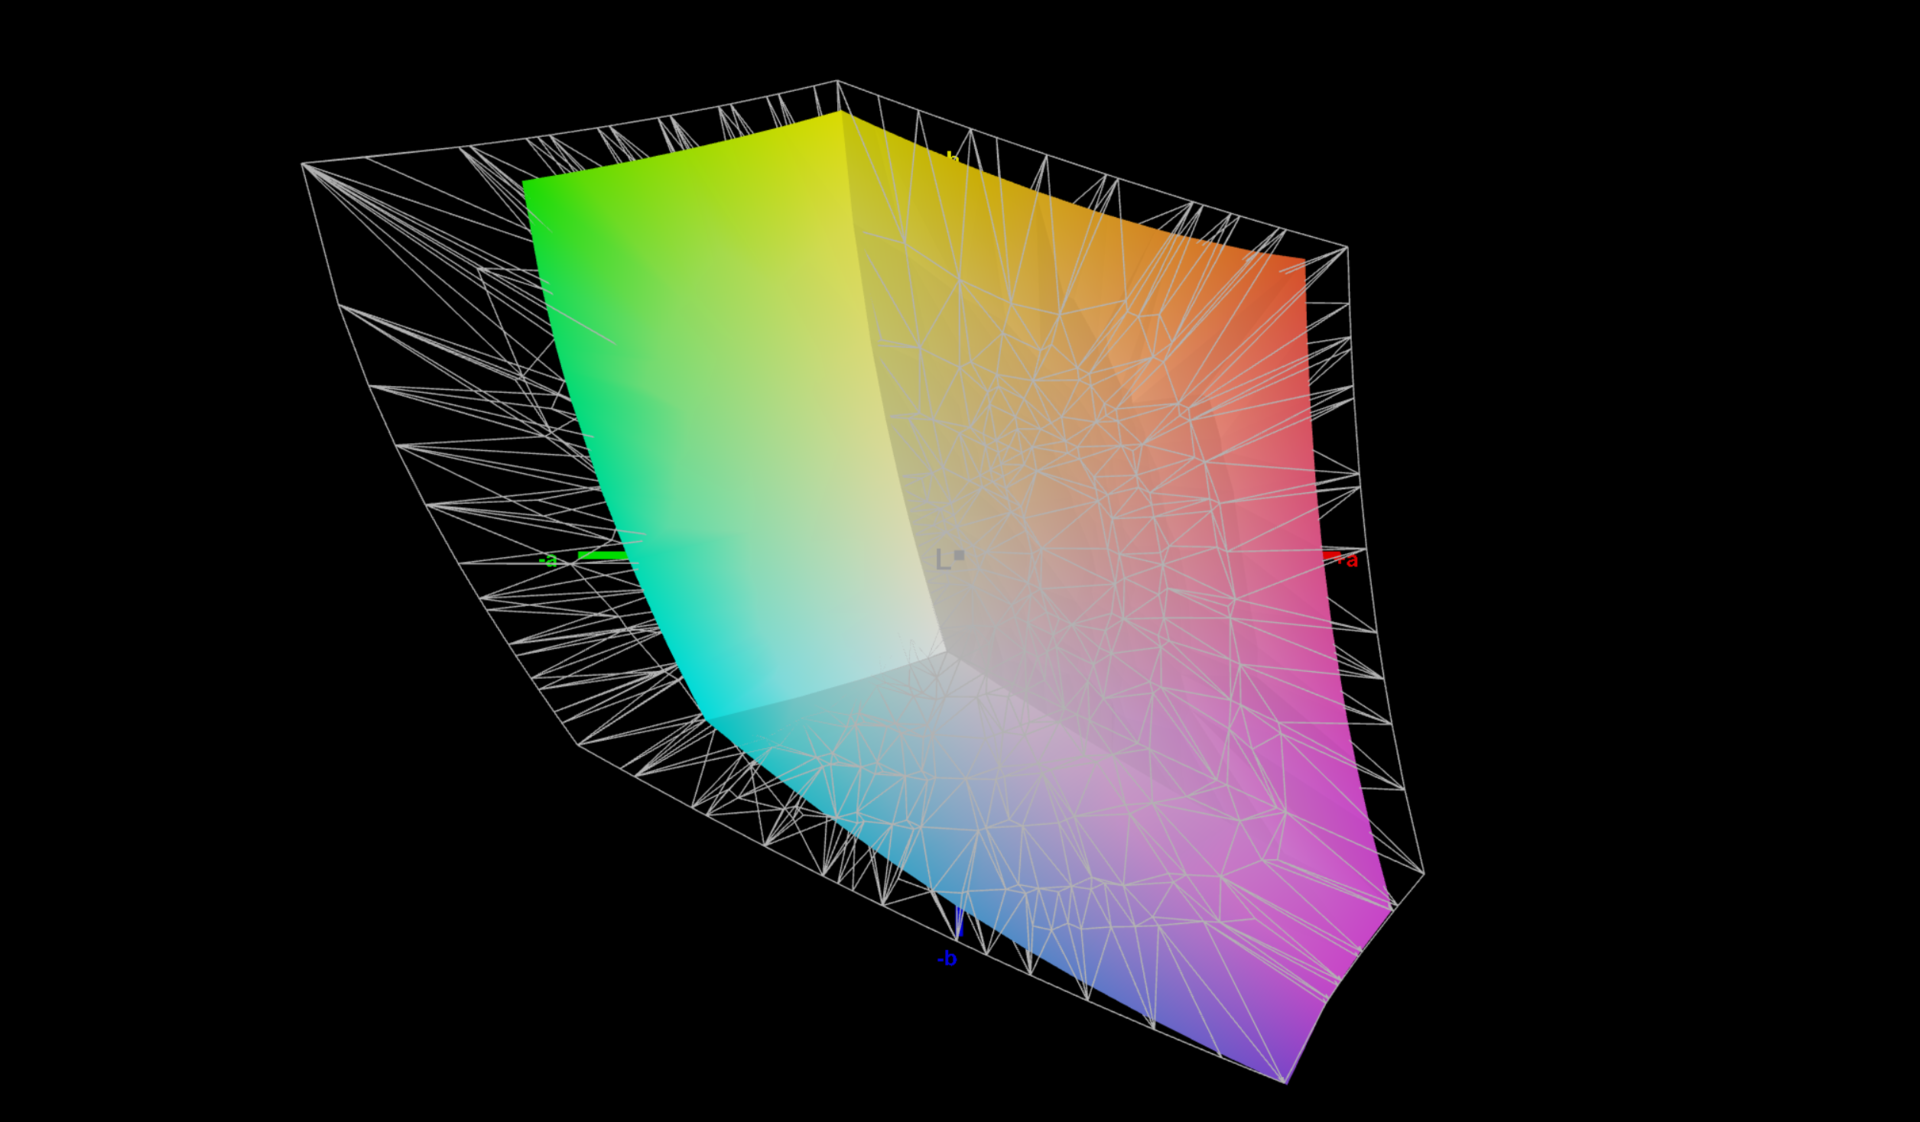
73.3% AdobeRGB 1998 (Argyll 3D)
100% sRGB (Argyll 3D)
71.5% Display P3 (Argyll 3D)
Gamma: 2.13
CCT: 7252 K
| Lenovo ThinkPad P16 G1 21D6001DMB NE160QDM-N63 , IPS LED, 2560x1600, 16" | Lenovo ThinkPad P15 G2-20YQ001JGE N156HCE_GN1, IPS, 1920x1080, 15.6" | Lenovo ThinkPad P17 G2-20YU0025G LP173WF4-SPF7, IPS LED, 1920x1080, 17.3" | HP ZBook Fury 17 G8-4A6A9EA AUOCD8C, IPS, 3840x2160, 17.3" | Dell Precision 7670 Samsung 160YV03, OLED, 3840x2400, 16" | Asus ExpertBook B6 Flip B6602FC2 AU Optronics Model: AUOE495, IPS, 2560x1600, 16" | |
|---|---|---|---|---|---|---|
| Display | -3% | -10% | 19% | 24% | 18% | |
| Display P3 Coverage (%) | 71.5 | 68.6 -4% | 67.9 -5% | 99.1 39% | 99.9 40% | 97.9 37% |
| sRGB Coverage (%) | 100 | 99.8 0% | 87.3 -13% | 100 0% | 100 0% | 99.89 0% |
| AdobeRGB 1998 Coverage (%) | 73.3 | 70.6 -4% | 63.9 -13% | 86.8 18% | 97.5 33% | 85.52 17% |
| Response Times | 20% | 6% | -41% | 94% | 20% | |
| Response Time Grey 50% / Grey 80% * (ms) | 37.7 ? | 37.6 ? -0% | 39.2 ? -4% | 67.6 ? -79% | 1.9 ? 95% | 36 ? 5% |
| Response Time Black / White * (ms) | 26.3 ? | 16 ? 39% | 22.4 ? 15% | 26.8 ? -2% | 2 ? 92% | 17 ? 35% |
| PWM Frequency (Hz) | 26040 ? | 59.5 ? | ||||
| Screen | -3% | -77% | 27% | -12% | -27% | |
| Brightness middle (cd/m²) | 424 | 498 17% | 361 -15% | 568 34% | 340.1 -20% | 440 4% |
| Brightness (cd/m²) | 398 | 490 23% | 334 -16% | 564 42% | 342 -14% | 418 5% |
| Brightness Distribution (%) | 90 | 95 6% | 87 -3% | 88 -2% | 98 9% | 82 -9% |
| Black Level * (cd/m²) | 0.24 | 0.39 -63% | 0.35 -46% | 0.33 -38% | 0.3 -25% | |
| Contrast (:1) | 1767 | 1277 -28% | 1031 -42% | 1721 -3% | 1467 -17% | |
| Colorchecker dE 2000 * | 2.6 | 2.1 19% | 5.4 -108% | 1 62% | 2.5 4% | 2.81 -8% |
| Colorchecker dE 2000 max. * | 4.9 | 5.6 -14% | 9.9 -102% | 2.4 51% | 8.19 -67% | 4.62 6% |
| Colorchecker dE 2000 calibrated * | 0.8 | 0.8 -0% | 3.2 -300% | 0.5 37% | 2.99 -274% | |
| Greyscale dE 2000 * | 4.1 | 3.4 17% | 6.5 -59% | 1.7 59% | 3.5 15% | 0.91 78% |
| Gamma | 2.13 103% | 2.32 95% | 2.23 99% | 2.18 101% | 2.12 104% | 2.2 100% |
| CCT | 7252 90% | 7162 91% | 7351 88% | 6461 101% | 6704 97% | 6600 98% |
| Media totale (Programma / Settaggio) | 5% /
1% | -27% /
-51% | 2% /
16% | 35% /
17% | 4% /
-10% |
* ... Meglio usare valori piccoli
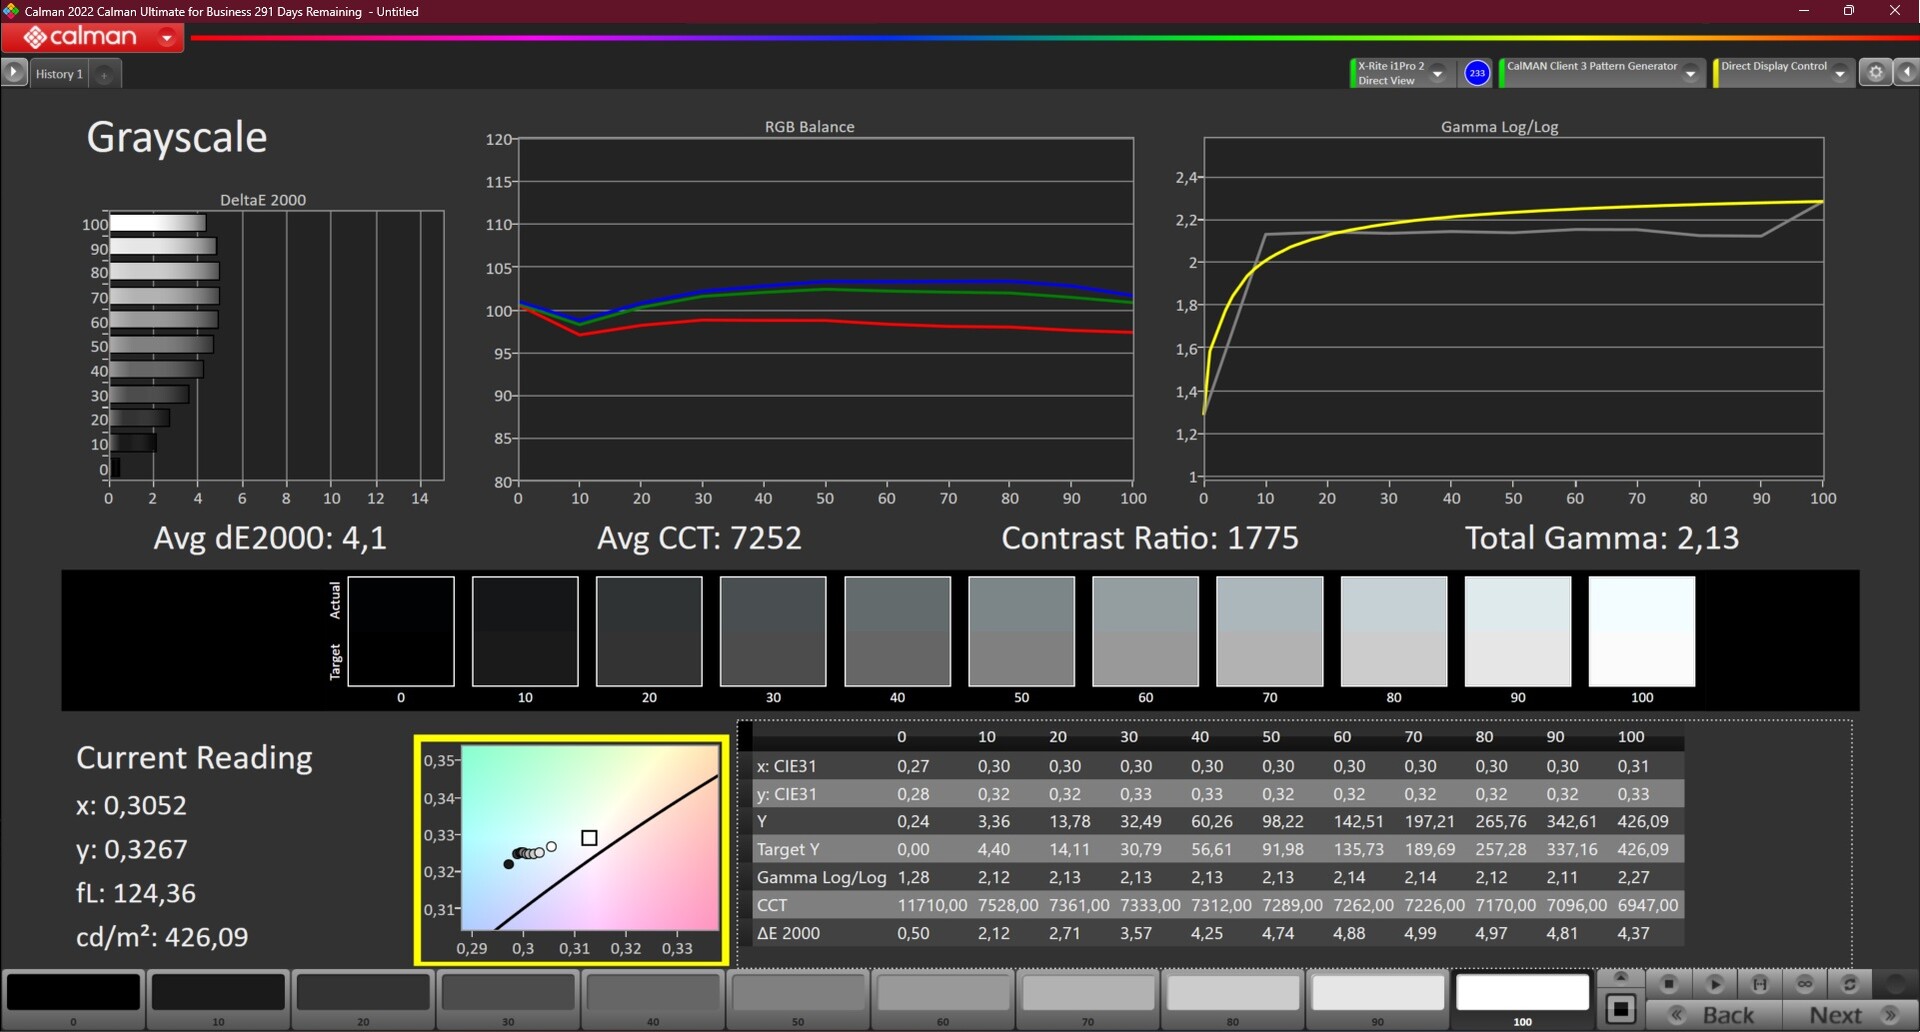
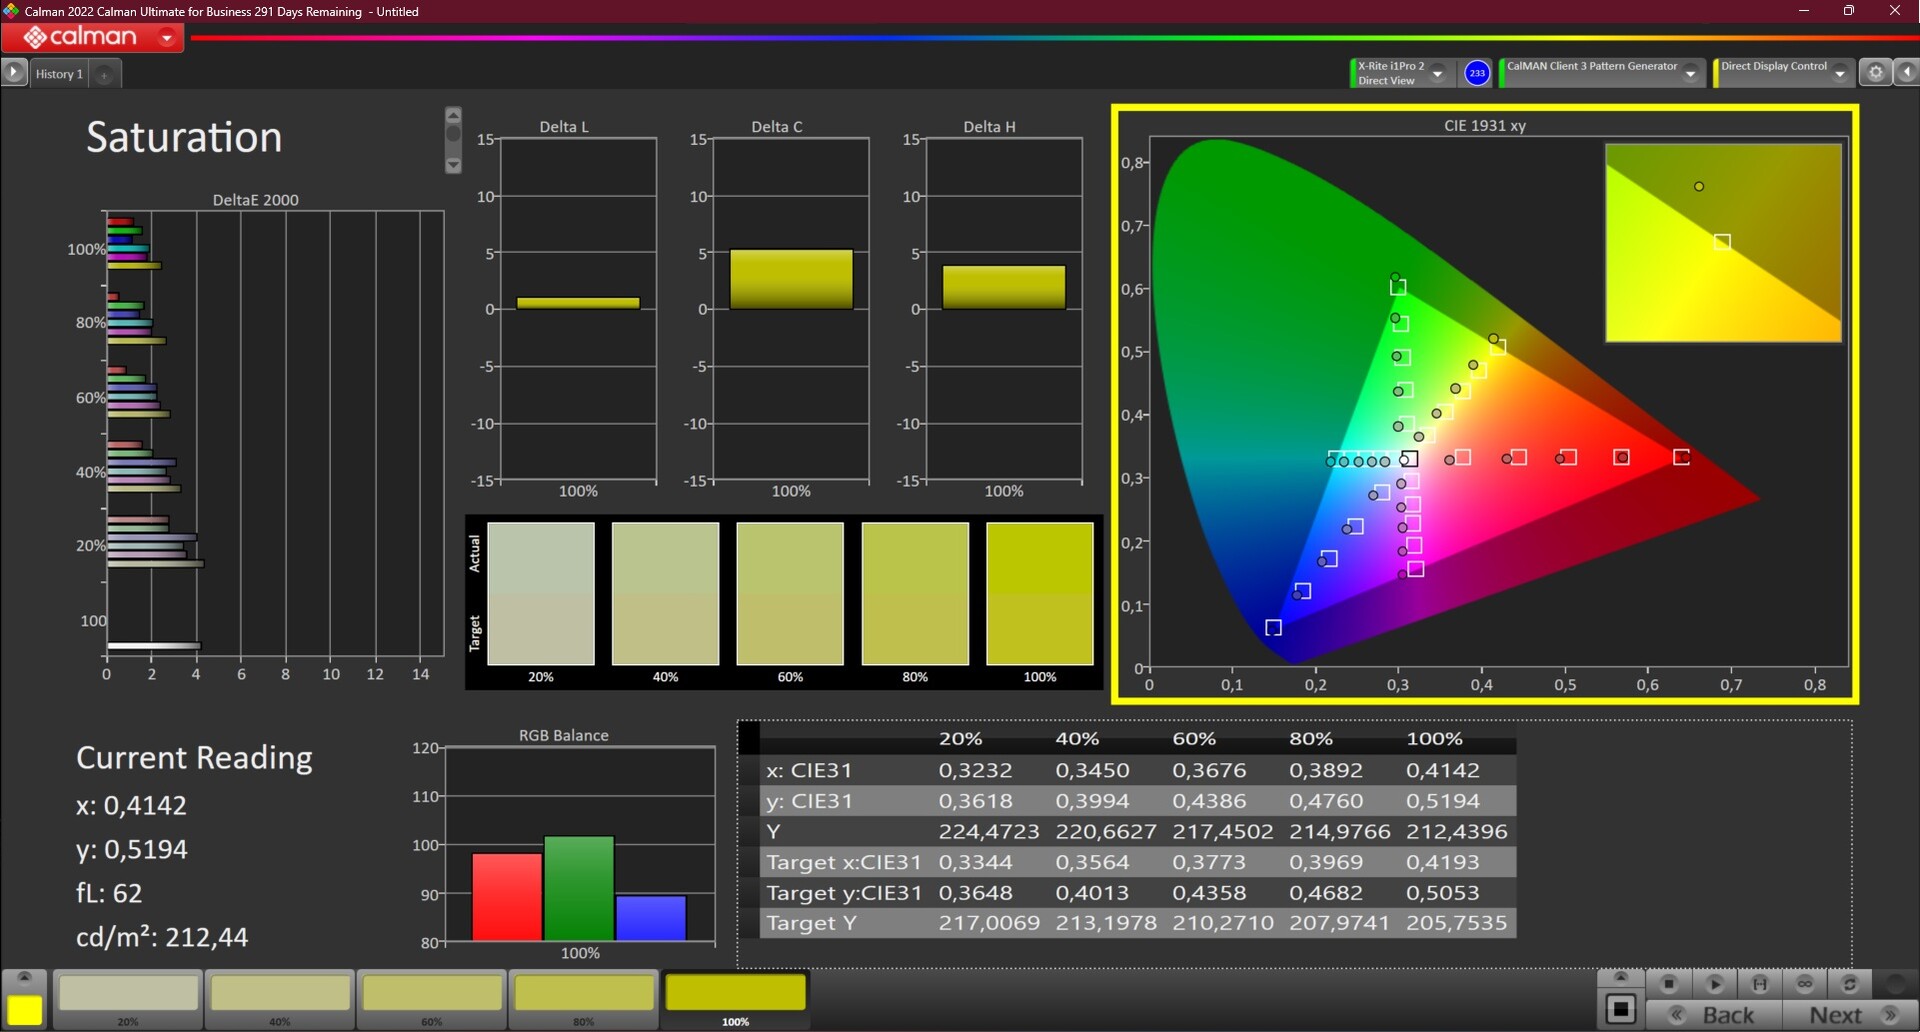
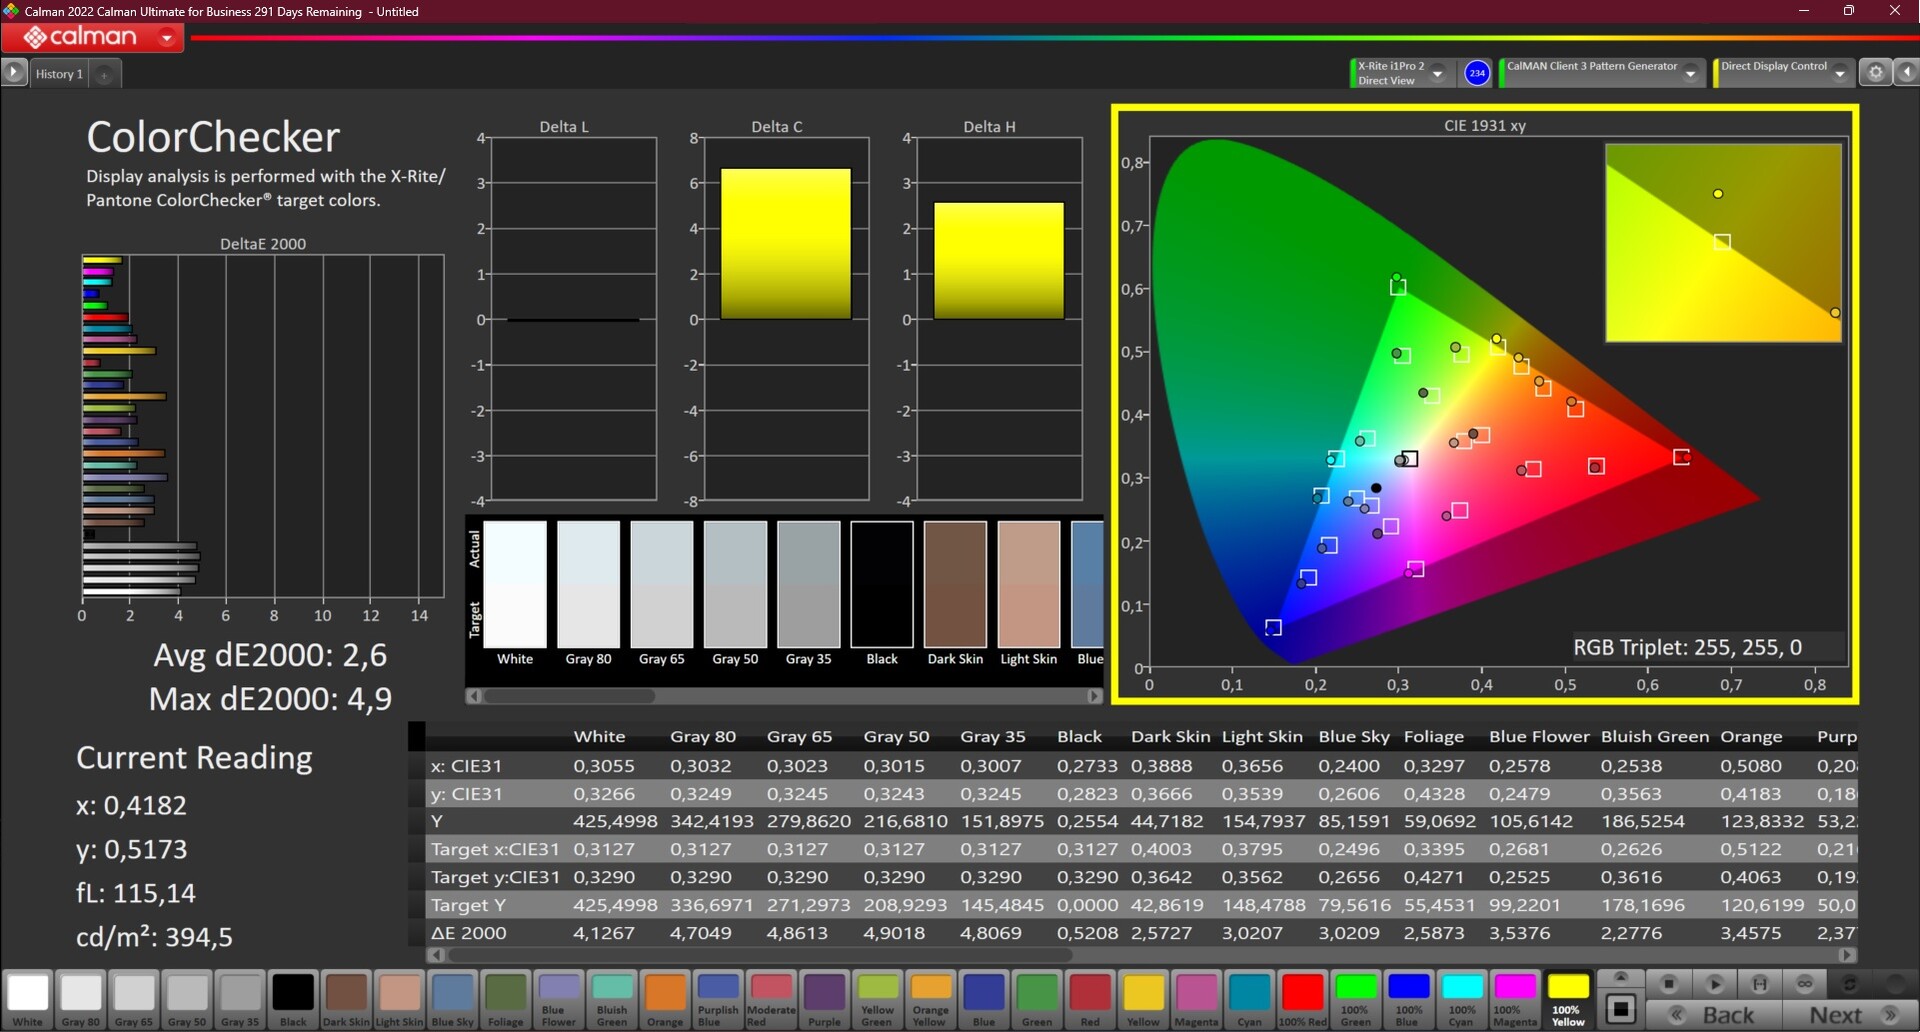
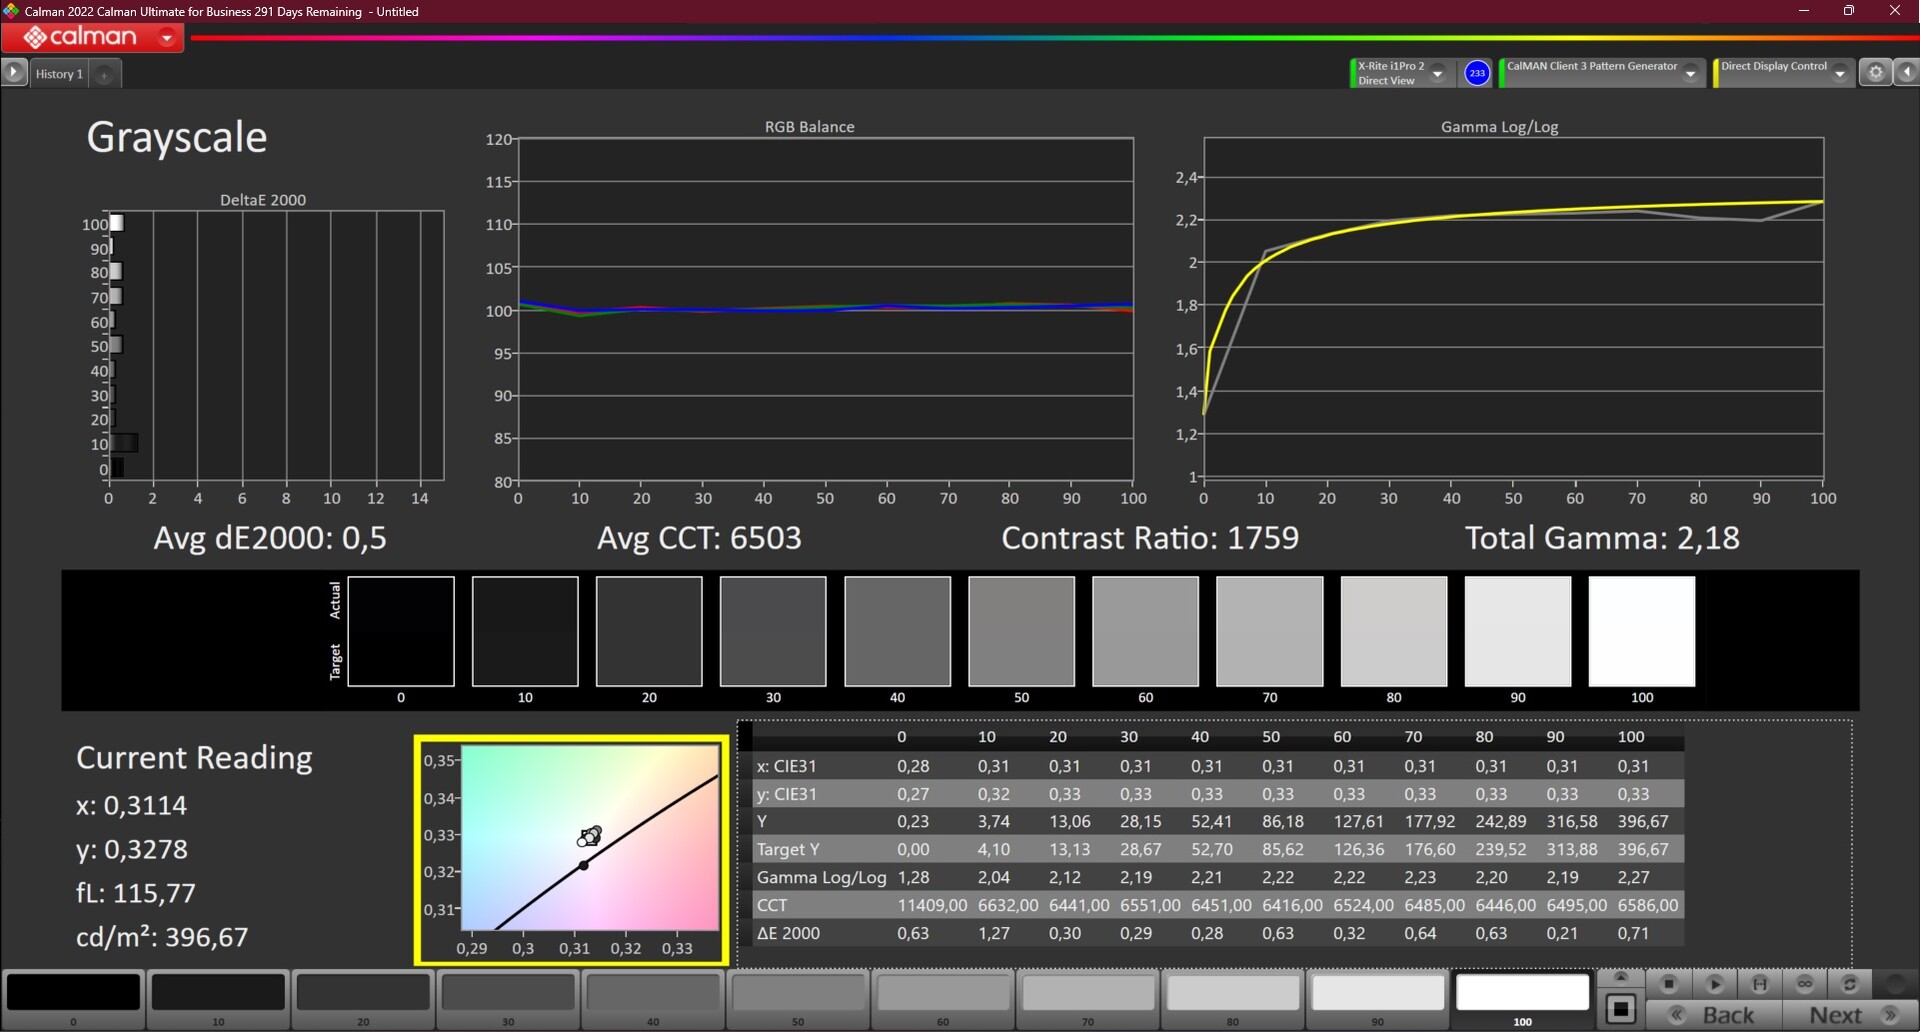
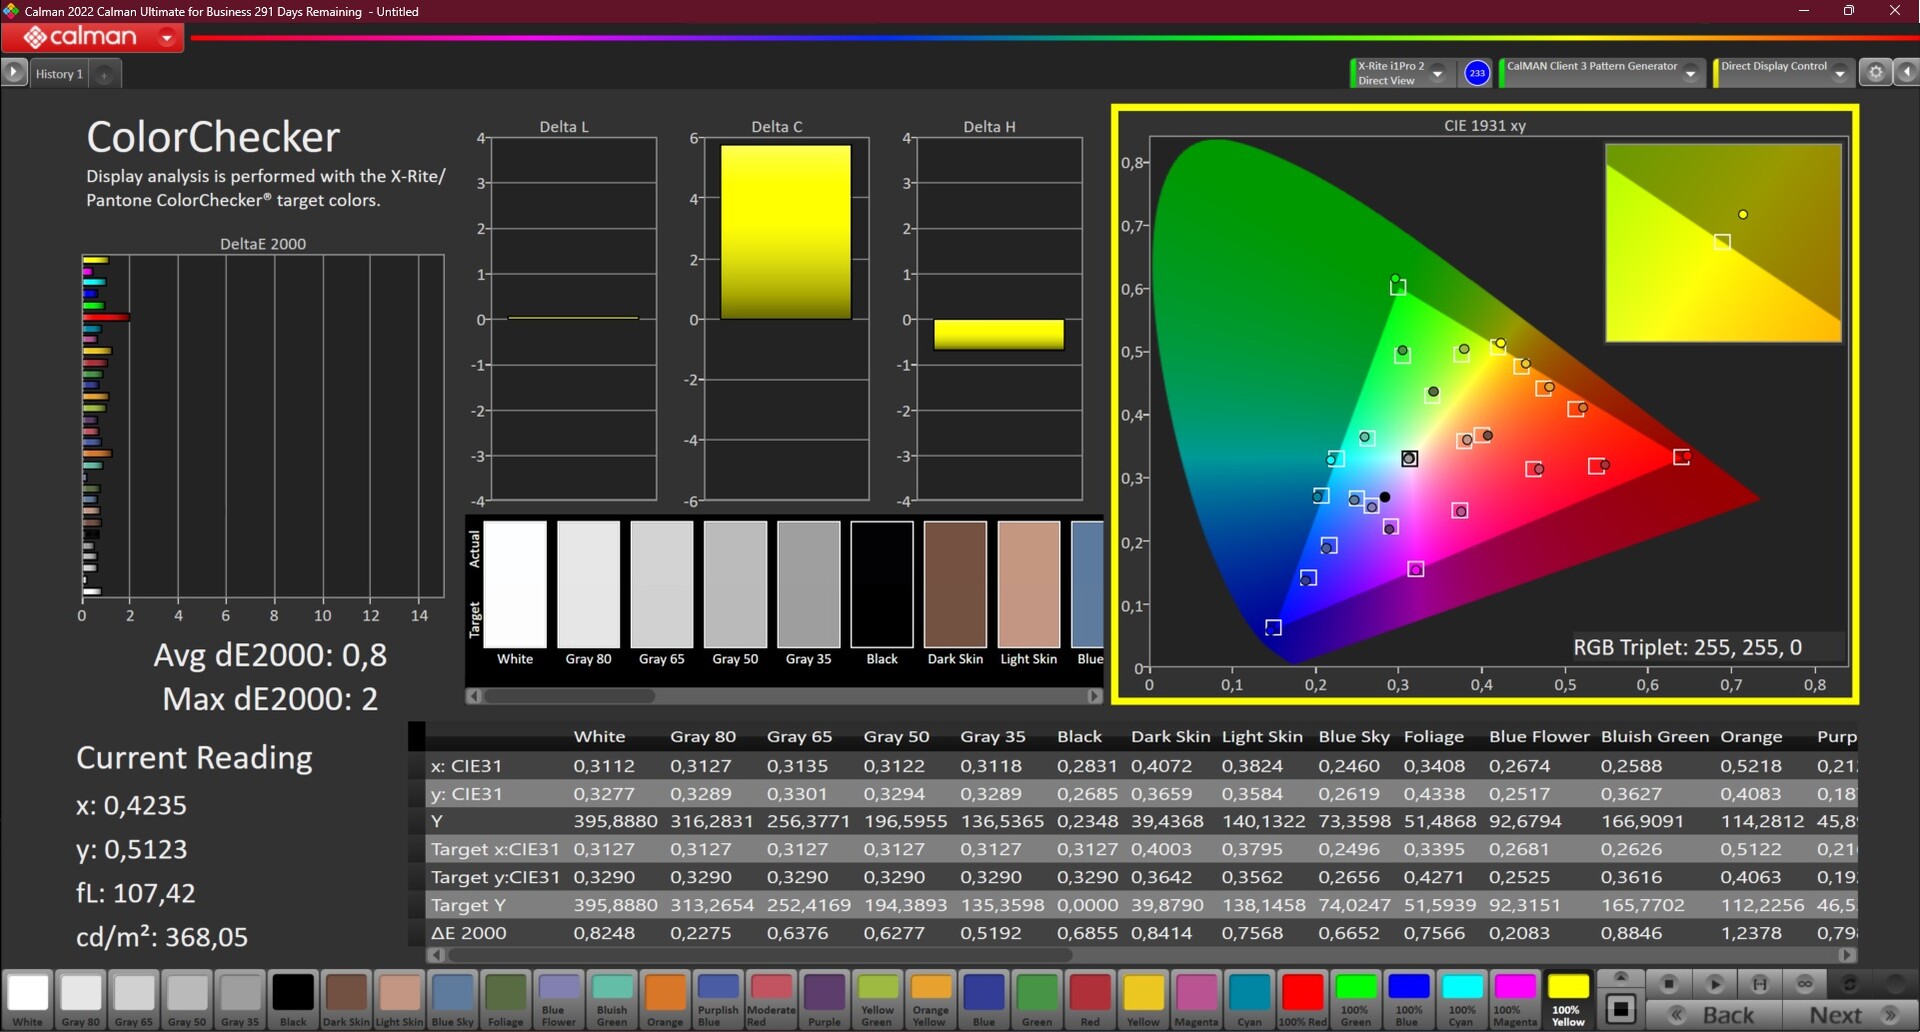
I colori erano impostati un po' troppo freddi, cosa che abbiamo potuto misurare utilizzando CalMan e il colorimetro X-Rite i1Pro 2. La calibrazione ha contribuito a correggere questo problema e a ottenere un eccellente valore di DeltaE pari a 0,8. Come sempre, il profilo che abbiamo creato è disponibile per il download gratuito.
Una volta calibrato, il display può essere utilizzato anche per la semplice elaborazione delle immagini, poiché copre completamente lo spazio colore sRGB. Per spazi colore più ampi, è necessario selezionare una delle opzioni WQUXGA.
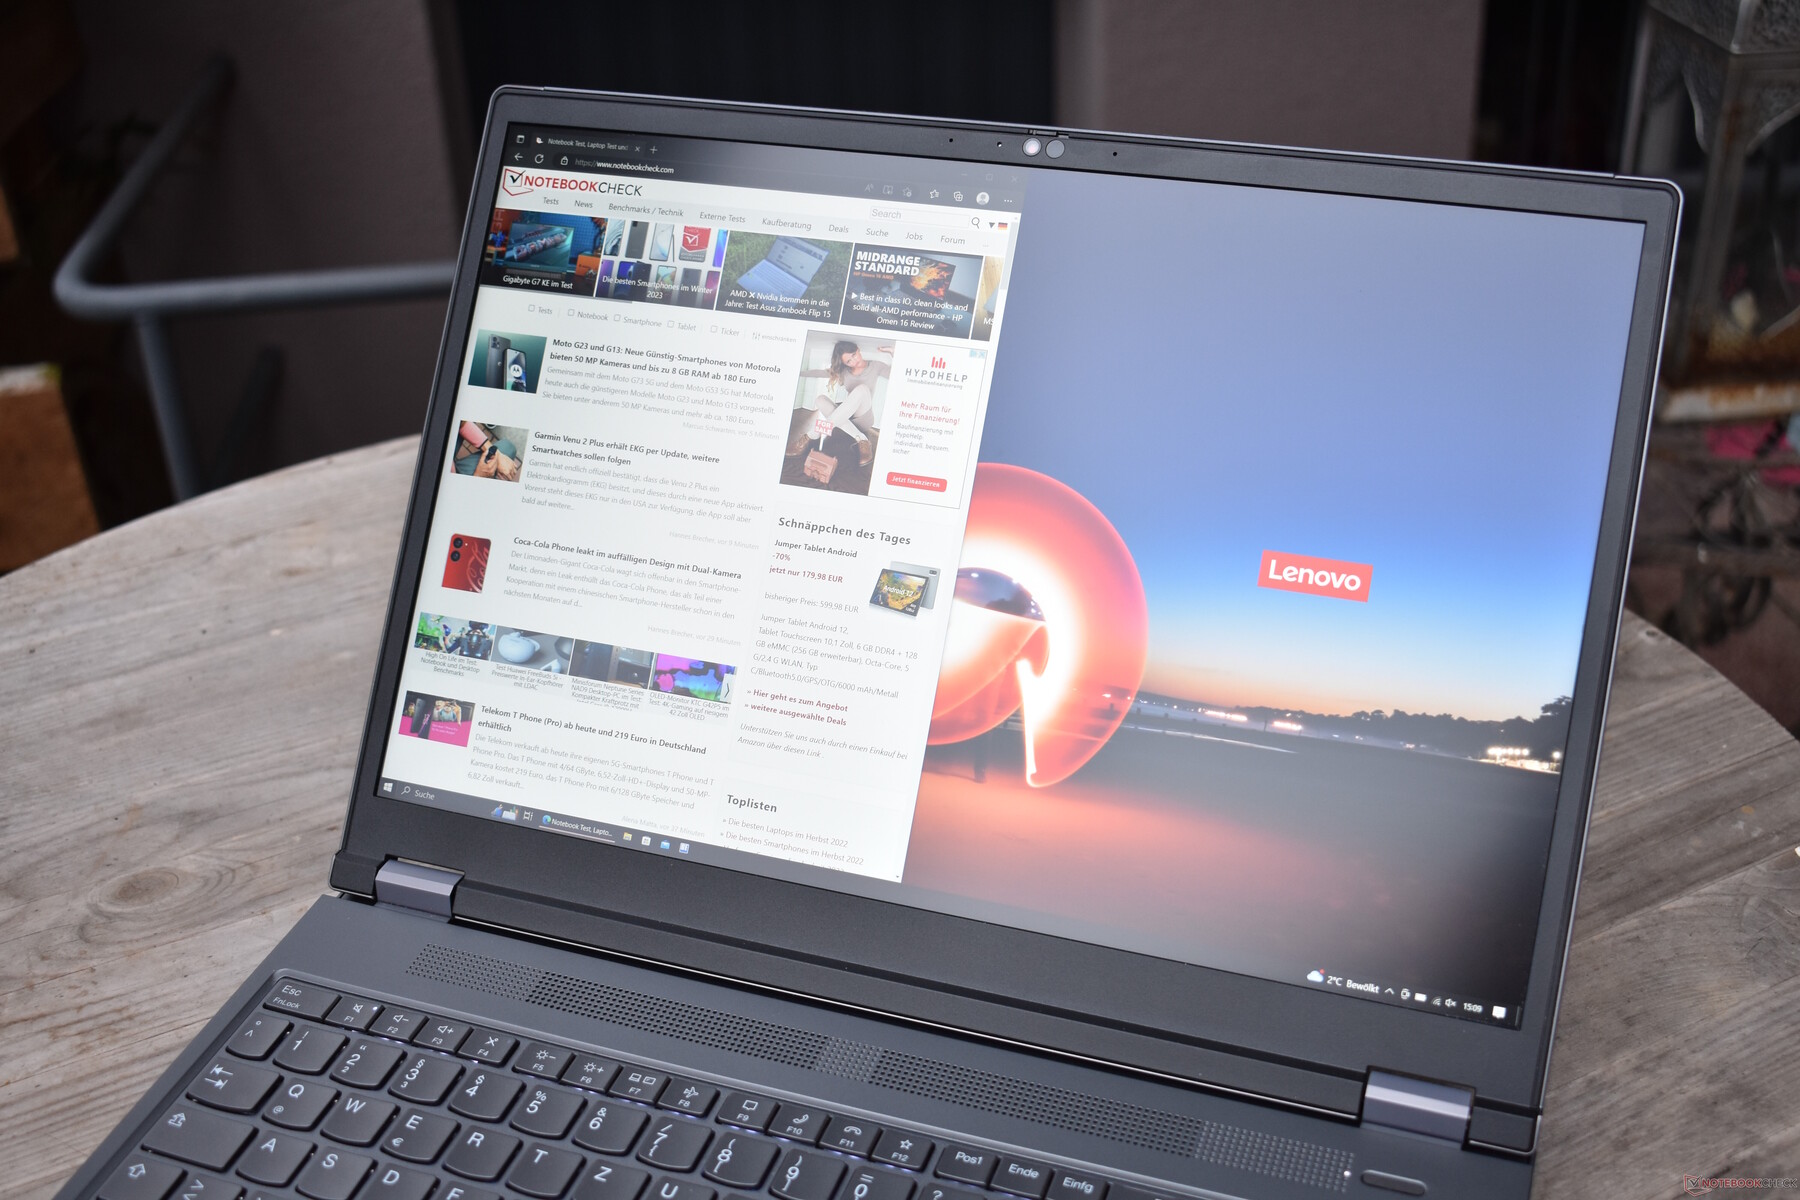
All'aperto, il Lenovo ThinkPad P16 G1 si comporta molto bene grazie ai buoni livelli di luminosità del display opaco.
Tempi di risposta del Display
| ↔ Tempi di risposta dal Nero al Bianco | ||
|---|---|---|
| 26.3 ms ... aumenta ↗ e diminuisce ↘ combinato | ↗ 14 ms Incremento |  |
| ↘ 12.3 ms Calo | ||
| Lo schermo mostra tempi di risposta relativamente lenti nei nostri tests e potrebbe essere troppo lento per i gamers. In confronto, tutti i dispositivi di test variano da 0.1 (minimo) a 240 (massimo) ms. » 66 % di tutti i dispositivi è migliore. Questo significa che i tempi di risposta rilevati sono peggiori rispetto alla media di tutti i dispositivi testati (19.8 ms). | ||
| ↔ Tempo di risposta dal 50% Grigio all'80% Grigio | ||
| 37.7 ms ... aumenta ↗ e diminuisce ↘ combinato | ↗ 18.6 ms Incremento |  |
| ↘ 19.1 ms Calo | ||
| Lo schermo mostra tempi di risposta lenti nei nostri tests e sarà insoddisfacente per i gamers. In confronto, tutti i dispositivi di test variano da 0.165 (minimo) a 636 (massimo) ms. » 55 % di tutti i dispositivi è migliore. Questo significa che i tempi di risposta rilevati sono peggiori rispetto alla media di tutti i dispositivi testati (30.9 ms). | ||
Sfarfallio dello schermo / PWM (Pulse-Width Modulation)
| flickering dello schermo / PWM non rilevato |  | ||
In confronto: 52 % di tutti i dispositivi testati non utilizza PWM per ridurre la luminosita' del display. Se è rilevato PWM, una media di 7748 (minimo: 5 - massimo: 343500) Hz è stata rilevata. | |||
Prestazioni: Una potente CPU Intel e una GPU Nvidia piuttosto debole
Lenovo offre il ThinkPad P16 G1 in un'ampia gamma di configurazioni. Tutte contengono un processore Intel della serie Alder Lake HX, con la possibilità di scegliere tra i seguenti processoriIntel Core i5-12600HX, i7-12800HX, i7-12850HX, i9-12900HXcosì come il modelloi9-12950HX. Sfortunatamente, le CPU Xeon non sono più disponibili e il loro compito viene ora svolto dalle CPU che terminano con 50. Poiché Lenovo non salda le sue GPU, ognuno di questi processori può essere configurato con una delle seguenti GPU: Intel ARC Pro A30M, Nvidia RTX A1000, RTX A2000, RTX A3000, RTX A4500 e RTX A5500.
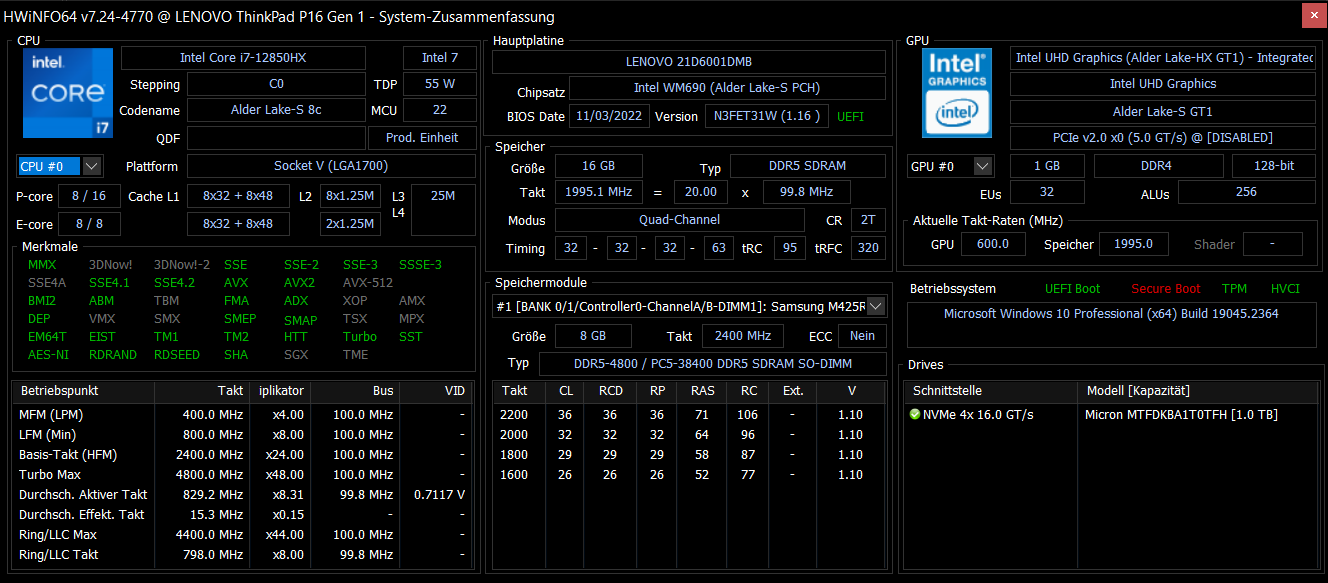
Le possibili varianti non finiscono qui, poiché il Lenovo ThinkPad P16 G1 dispone di quattro slot per la RAM. Questo permette di avere fino a 128 GB di RAM DDR5-3600, mentre per le CPU modello 50 è disponibile anche la RAM ECC. Ci sono in totale due slot per SSD ed entrambi possono accettare SSD M.2 2280. La capacità massima di memoria di massa che Lenovo vende nel suo portatile ThinkPad è fino a otto terabyte e si presenta sotto forma di due SSD da 4 terabyte.
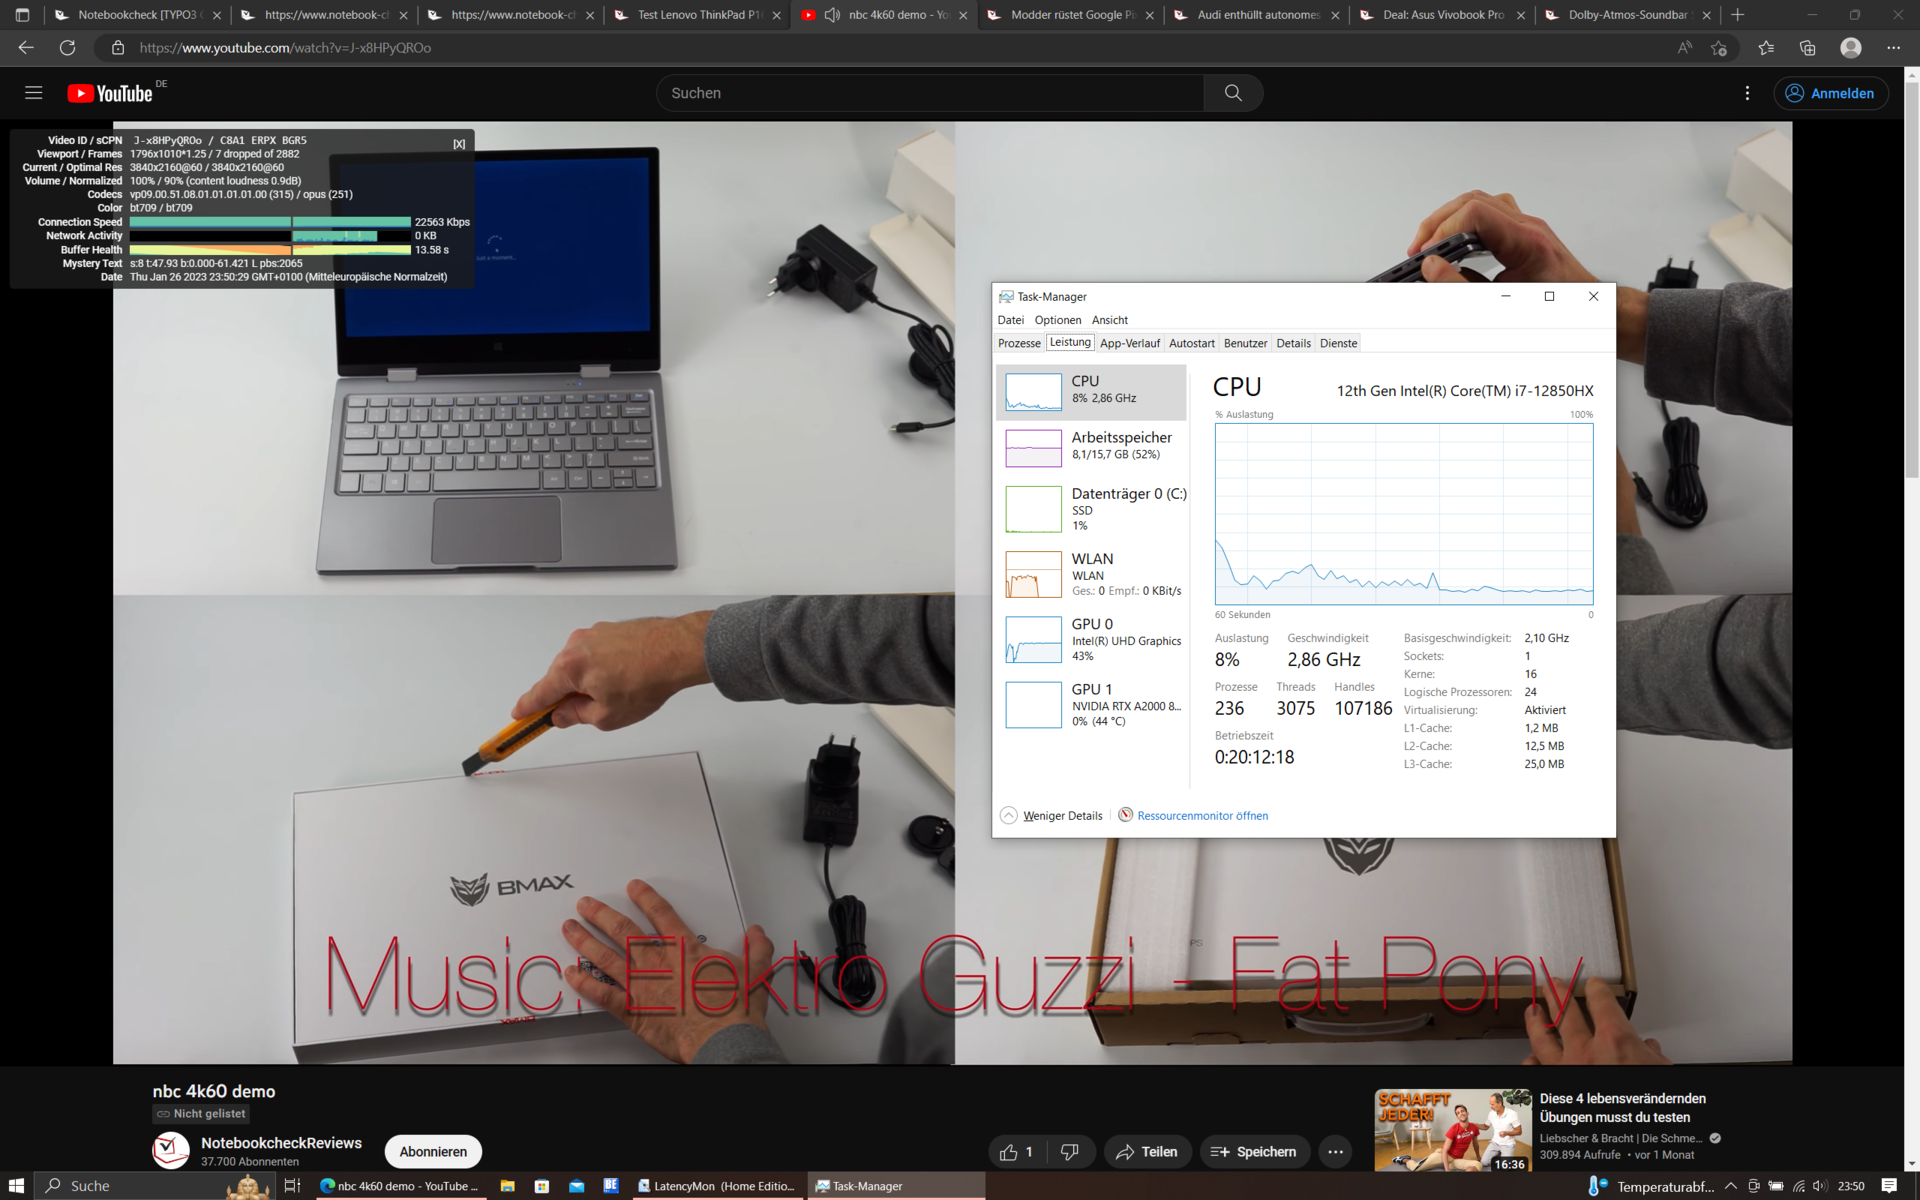
Condizioni di prova
Lenovo utilizza le modalità di consumo energetico di Windows per i suoi ThinkPad. Per un breve periodo, il processore può consumare fino a 125 watt, ma è limitato a 95 watt per periodi più lunghi. Se si seleziona la modalità di alimentazione "Prestazioni migliori" invece di "Prestazioni migliori", il consumo si attesta brevemente a 100 watt e a 80 watt sotto carico continuo. Utilizzando la modalità "Più efficienza della batteria", le limitazioni sono molto più severe, con il turbo a 70 watt e il consumo prolungato a 30 watt. A parte il test della batteria WiFi, i nostri test sono stati eseguiti utilizzando la modalità "Best Performance".
Una caratteristica speciale del nostro dispositivo in prova: È ancora dotato di Windows 10 Pro. Per la maggior parte dei test, questo non è un problema, ma questa vecchia versione di Windows è stata responsabile di un punteggio molto basso in Cinebench R15. Per questo motivo abbiamo deciso di non eseguire il ciclo Cinebench R15 con questo dispositivo.
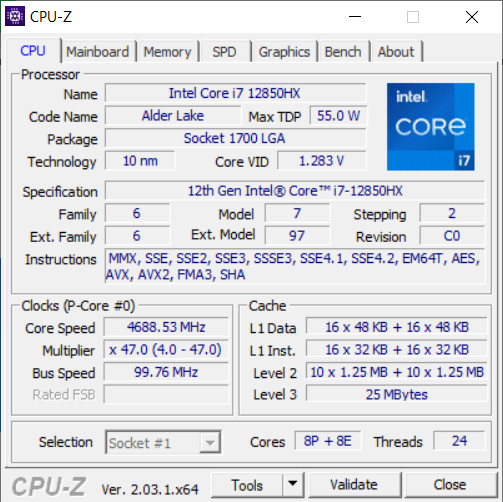
Processore
IlIntel Core i7-12850HXè un processore con un totale di 16 core. Poiché l'architettura "Alder Lake" possiede una struttura asimmetrica, otto di questi core sono i potenti core P (da 2,1 a 4,8 GHz) e gli altri otto core sono gli efficienti core E (da 1,5 a 3,4 GHz). Grazie all'hyperthreading, il processore dispone di oltre 24 thread. Essendo un membro della serie HX55, il TDP tipico si aggira intorno ai 55 watt. Per un confronto dettagliato con altri processori attuali, consultate il nostro Elenco delle CPU.
Le prestazioni della CPU del sistema sono eccellenti e superiori alla media per questo processore. Il ThinkPad P16 batte il Dell Precision 7670 in modo abbastanza convincente. Tuttavia, l'Asus ExpertBook B6 Flip è più veloce grazie al suo i9. È interessante notare che X1 Extreme G5 è quasi alla pari con il P16, sebbene abbia solo sei core P. Rispetto ai modelli P15 G2 e P17 G2, le prestazioni della CPU sono migliori del 31-35%.
In modalità batteria, il ThinkPad P16 ha ottenuto 14,844 punti in Cinebench R23. Senza un alimentatore collegato, le prestazioni della CPU sono inferiori di circa il 15%.
Cinebench R23 Multi Endurance Test
Cinebench R23: Multi Core | Single Core
Cinebench R20: CPU (Multi Core) | CPU (Single Core)
Cinebench R15: CPU Multi 64Bit | CPU Single 64Bit
Blender: v2.79 BMW27 CPU
7-Zip 18.03: 7z b 4 | 7z b 4 -mmt1
Geekbench 5.5: Multi-Core | Single-Core
HWBOT x265 Benchmark v2.2: 4k Preset
LibreOffice : 20 Documents To PDF
R Benchmark 2.5: Overall mean
| CPU Performance rating | |
| Media della classe Workstation | |
| Asus ExpertBook B6 Flip B6602FC2 | |
| Lenovo ThinkPad P16 G1 21D6001DMB | |
| Lenovo ThinkPad X1 Extreme G5-21DE003RGE | |
| Media Intel Core i7-12850HX | |
| Dell Precision 7670 | |
| HP ZBook Fury 17 G8-4A6A9EA | |
| Lenovo ThinkPad Z16 G1 21D5S00T00 | |
| Lenovo ThinkPad P17 G2-20YU0025G | |
| Lenovo ThinkPad P15 G2-20YQ001JGE | |
| Cinebench R23 / Multi Core | |
| Media della classe Workstation (14621 - 38520, n=23, ultimi 2 anni) | |
| Asus ExpertBook B6 Flip B6602FC2 | |
| Lenovo ThinkPad X1 Extreme G5-21DE003RGE | |
| Lenovo ThinkPad P16 G1 21D6001DMB | |
| Media Intel Core i7-12850HX (15093 - 17510, n=2) | |
| Dell Precision 7670 | |
| HP ZBook Fury 17 G8-4A6A9EA | |
| Lenovo ThinkPad P17 G2-20YU0025G | |
| Lenovo ThinkPad Z16 G1 21D5S00T00 | |
| Lenovo ThinkPad P15 G2-20YQ001JGE | |
| Cinebench R23 / Single Core | |
| Media della classe Workstation (1712 - 2228, n=23, ultimi 2 anni) | |
| Asus ExpertBook B6 Flip B6602FC2 | |
| Lenovo ThinkPad P16 G1 21D6001DMB | |
| Lenovo ThinkPad X1 Extreme G5-21DE003RGE | |
| Media Intel Core i7-12850HX (1596 - 1845, n=2) | |
| HP ZBook Fury 17 G8-4A6A9EA | |
| Dell Precision 7670 | |
| Lenovo ThinkPad P17 G2-20YU0025G | |
| Lenovo ThinkPad P15 G2-20YQ001JGE | |
| Lenovo ThinkPad Z16 G1 21D5S00T00 | |
| Cinebench R20 / CPU (Multi Core) | |
| Media della classe Workstation (5760 - 15043, n=23, ultimi 2 anni) | |
| Asus ExpertBook B6 Flip B6602FC2 | |
| Lenovo ThinkPad X1 Extreme G5-21DE003RGE | |
| Lenovo ThinkPad P16 G1 21D6001DMB | |
| Media Intel Core i7-12850HX (6217 - 6764, n=2) | |
| Dell Precision 7670 | |
| Lenovo ThinkPad P17 G2-20YU0025G | |
| HP ZBook Fury 17 G8-4A6A9EA | |
| Lenovo ThinkPad Z16 G1 21D5S00T00 | |
| Lenovo ThinkPad P15 G2-20YQ001JGE | |
| Cinebench R20 / CPU (Single Core) | |
| Media della classe Workstation (671 - 857, n=23, ultimi 2 anni) | |
| Asus ExpertBook B6 Flip B6602FC2 | |
| Lenovo ThinkPad P16 G1 21D6001DMB | |
| Lenovo ThinkPad X1 Extreme G5-21DE003RGE | |
| Media Intel Core i7-12850HX (687 - 708, n=2) | |
| Dell Precision 7670 | |
| HP ZBook Fury 17 G8-4A6A9EA | |
| Lenovo ThinkPad Z16 G1 21D5S00T00 | |
| Lenovo ThinkPad P17 G2-20YU0025G | |
| Lenovo ThinkPad P15 G2-20YQ001JGE | |
| Cinebench R15 / CPU Multi 64Bit | |
| Media della classe Workstation (2489 - 5810, n=23, ultimi 2 anni) | |
| Asus ExpertBook B6 Flip B6602FC2 | |
| Lenovo ThinkPad P16 G1 21D6001DMB | |
| Lenovo ThinkPad X1 Extreme G5-21DE003RGE | |
| Media Intel Core i7-12850HX (2432 - 2926, n=2) | |
| Dell Precision 7670 | |
| Lenovo ThinkPad P17 G2-20YU0025G | |
| HP ZBook Fury 17 G8-4A6A9EA | |
| Lenovo ThinkPad Z16 G1 21D5S00T00 | |
| Lenovo ThinkPad P15 G2-20YQ001JGE | |
| Cinebench R15 / CPU Single 64Bit | |
| Media della classe Workstation (191.4 - 328, n=23, ultimi 2 anni) | |
| Asus ExpertBook B6 Flip B6602FC2 | |
| Lenovo ThinkPad P16 G1 21D6001DMB | |
| Media Intel Core i7-12850HX (253 - 268, n=2) | |
| Lenovo ThinkPad X1 Extreme G5-21DE003RGE | |
| Dell Precision 7670 | |
| HP ZBook Fury 17 G8-4A6A9EA | |
| Lenovo ThinkPad Z16 G1 21D5S00T00 | |
| Lenovo ThinkPad P17 G2-20YU0025G | |
| Lenovo ThinkPad P15 G2-20YQ001JGE | |
| Blender / v2.79 BMW27 CPU | |
| Lenovo ThinkPad P15 G2-20YQ001JGE | |
| Lenovo ThinkPad P17 G2-20YU0025G | |
| HP ZBook Fury 17 G8-4A6A9EA | |
| Lenovo ThinkPad Z16 G1 21D5S00T00 | |
| Dell Precision 7670 | |
| Media Intel Core i7-12850HX (181 - 205, n=2) | |
| Asus ExpertBook B6 Flip B6602FC2 | |
| Lenovo ThinkPad X1 Extreme G5-21DE003RGE | |
| Lenovo ThinkPad P16 G1 21D6001DMB | |
| Media della classe Workstation (91 - 222, n=23, ultimi 2 anni) | |
| 7-Zip 18.03 / 7z b 4 | |
| Media della classe Workstation (60489 - 116969, n=23, ultimi 2 anni) | |
| Asus ExpertBook B6 Flip B6602FC2 | |
| Lenovo ThinkPad P16 G1 21D6001DMB | |
| Lenovo ThinkPad X1 Extreme G5-21DE003RGE | |
| Media Intel Core i7-12850HX (53893 - 69464, n=2) | |
| Lenovo ThinkPad Z16 G1 21D5S00T00 | |
| Dell Precision 7670 | |
| HP ZBook Fury 17 G8-4A6A9EA | |
| Lenovo ThinkPad P15 G2-20YQ001JGE | |
| Lenovo ThinkPad P17 G2-20YU0025G | |
| 7-Zip 18.03 / 7z b 4 -mmt1 | |
| Media della classe Workstation (5126 - 6960, n=23, ultimi 2 anni) | |
| Asus ExpertBook B6 Flip B6602FC2 | |
| HP ZBook Fury 17 G8-4A6A9EA | |
| Lenovo ThinkPad P16 G1 21D6001DMB | |
| Lenovo ThinkPad X1 Extreme G5-21DE003RGE | |
| Media Intel Core i7-12850HX (5608 - 5916, n=2) | |
| Dell Precision 7670 | |
| Lenovo ThinkPad P15 G2-20YQ001JGE | |
| Lenovo ThinkPad P17 G2-20YU0025G | |
| Lenovo ThinkPad Z16 G1 21D5S00T00 | |
| Geekbench 5.5 / Multi-Core | |
| Media della classe Workstation (11542 - 25554, n=23, ultimi 2 anni) | |
| Asus ExpertBook B6 Flip B6602FC2 | |
| Lenovo ThinkPad P16 G1 21D6001DMB | |
| Media Intel Core i7-12850HX (11509 - 13095, n=2) | |
| Lenovo ThinkPad X1 Extreme G5-21DE003RGE | |
| Dell Precision 7670 | |
| Lenovo ThinkPad P15 G2-20YQ001JGE | |
| Lenovo ThinkPad Z16 G1 21D5S00T00 | |
| HP ZBook Fury 17 G8-4A6A9EA | |
| Lenovo ThinkPad P17 G2-20YU0025G | |
| Geekbench 5.5 / Single-Core | |
| Media della classe Workstation (1783 - 2183, n=23, ultimi 2 anni) | |
| Asus ExpertBook B6 Flip B6602FC2 | |
| Lenovo ThinkPad X1 Extreme G5-21DE003RGE | |
| Lenovo ThinkPad P16 G1 21D6001DMB | |
| Media Intel Core i7-12850HX (1777 - 1787, n=2) | |
| Dell Precision 7670 | |
| HP ZBook Fury 17 G8-4A6A9EA | |
| Lenovo ThinkPad P15 G2-20YQ001JGE | |
| Lenovo ThinkPad P17 G2-20YU0025G | |
| Lenovo ThinkPad Z16 G1 21D5S00T00 | |
| HWBOT x265 Benchmark v2.2 / 4k Preset | |
| Media della classe Workstation (17.8 - 40.5, n=23, ultimi 2 anni) | |
| Asus ExpertBook B6 Flip B6602FC2 | |
| Dell Precision 7670 | |
| Media Intel Core i7-12850HX (17.2 - 17.3, n=2) | |
| Lenovo ThinkPad P16 G1 21D6001DMB | |
| Lenovo ThinkPad X1 Extreme G5-21DE003RGE | |
| Lenovo ThinkPad Z16 G1 21D5S00T00 | |
| Lenovo ThinkPad P17 G2-20YU0025G | |
| HP ZBook Fury 17 G8-4A6A9EA | |
| Lenovo ThinkPad P15 G2-20YQ001JGE | |
| LibreOffice / 20 Documents To PDF | |
| HP ZBook Fury 17 G8-4A6A9EA | |
| Lenovo ThinkPad P17 G2-20YU0025G | |
| Lenovo ThinkPad Z16 G1 21D5S00T00 | |
| Dell Precision 7670 | |
| Lenovo ThinkPad P15 G2-20YQ001JGE | |
| Media Intel Core i7-12850HX (46.9 - 48.6, n=2) | |
| Media della classe Workstation (37.1 - 74.7, n=23, ultimi 2 anni) | |
| Lenovo ThinkPad P16 G1 21D6001DMB | |
| Asus ExpertBook B6 Flip B6602FC2 | |
| Lenovo ThinkPad X1 Extreme G5-21DE003RGE | |
| R Benchmark 2.5 / Overall mean | |
| Lenovo ThinkPad P17 G2-20YU0025G | |
| Lenovo ThinkPad P15 G2-20YQ001JGE | |
| HP ZBook Fury 17 G8-4A6A9EA | |
| Lenovo ThinkPad Z16 G1 21D5S00T00 | |
| Dell Precision 7670 | |
| Lenovo ThinkPad X1 Extreme G5-21DE003RGE | |
| Media Intel Core i7-12850HX (0.45 - 0.4698, n=2) | |
| Asus ExpertBook B6 Flip B6602FC2 | |
| Lenovo ThinkPad P16 G1 21D6001DMB | |
| Media della classe Workstation (0.3825 - 0.603, n=23, ultimi 2 anni) | |
* ... Meglio usare valori piccoli
AIDA64: FP32 Ray-Trace | FPU Julia | CPU SHA3 | CPU Queen | FPU SinJulia | FPU Mandel | CPU AES | CPU ZLib | FP64 Ray-Trace | CPU PhotoWorxx
| Performance rating | |
| Media della classe Workstation | |
| Lenovo ThinkPad P16 G1 21D6001DMB | |
| Asus ExpertBook B6 Flip B6602FC2 | |
| Media Intel Core i7-12850HX | |
| HP ZBook Fury 17 G8-4A6A9EA | |
| Dell Precision 7670 | |
| AIDA64 / FP32 Ray-Trace | |
| Media della classe Workstation (16730 - 61611, n=23, ultimi 2 anni) | |
| Lenovo ThinkPad P16 G1 21D6001DMB | |
| Asus ExpertBook B6 Flip B6602FC2 | |
| HP ZBook Fury 17 G8-4A6A9EA | |
| Media Intel Core i7-12850HX (12983 - 16752, n=2) | |
| Dell Precision 7670 | |
| AIDA64 / FPU Julia | |
| Media della classe Workstation (89597 - 186971, n=23, ultimi 2 anni) | |
| Lenovo ThinkPad P16 G1 21D6001DMB | |
| Asus ExpertBook B6 Flip B6602FC2 | |
| Media Intel Core i7-12850HX (68219 - 87231, n=2) | |
| Dell Precision 7670 | |
| HP ZBook Fury 17 G8-4A6A9EA | |
| AIDA64 / CPU SHA3 | |
| Media della classe Workstation (4178 - 8975, n=23, ultimi 2 anni) | |
| HP ZBook Fury 17 G8-4A6A9EA | |
| Lenovo ThinkPad P16 G1 21D6001DMB | |
| Asus ExpertBook B6 Flip B6602FC2 | |
| Media Intel Core i7-12850HX (3098 - 3818, n=2) | |
| Dell Precision 7670 | |
| AIDA64 / CPU Queen | |
| Media della classe Workstation (60778 - 144411, n=23, ultimi 2 anni) | |
| Asus ExpertBook B6 Flip B6602FC2 | |
| HP ZBook Fury 17 G8-4A6A9EA | |
| Lenovo ThinkPad P16 G1 21D6001DMB | |
| Media Intel Core i7-12850HX (26716 - 95664, n=2) | |
| Dell Precision 7670 | |
| AIDA64 / FPU SinJulia | |
| Media della classe Workstation (8165 - 29343, n=23, ultimi 2 anni) | |
| Lenovo ThinkPad P16 G1 21D6001DMB | |
| Asus ExpertBook B6 Flip B6602FC2 | |
| Media Intel Core i7-12850HX (9869 - 11286, n=2) | |
| HP ZBook Fury 17 G8-4A6A9EA | |
| Dell Precision 7670 | |
| AIDA64 / FPU Mandel | |
| Media della classe Workstation (44497 - 98153, n=23, ultimi 2 anni) | |
| Lenovo ThinkPad P16 G1 21D6001DMB | |
| Asus ExpertBook B6 Flip B6602FC2 | |
| HP ZBook Fury 17 G8-4A6A9EA | |
| Media Intel Core i7-12850HX (34218 - 42580, n=2) | |
| Dell Precision 7670 | |
| AIDA64 / CPU AES | |
| Media della classe Workstation (73133 - 187841, n=23, ultimi 2 anni) | |
| HP ZBook Fury 17 G8-4A6A9EA | |
| Lenovo ThinkPad P16 G1 21D6001DMB | |
| Asus ExpertBook B6 Flip B6602FC2 | |
| Media Intel Core i7-12850HX (63362 - 80775, n=2) | |
| Dell Precision 7670 | |
| AIDA64 / CPU ZLib | |
| Media della classe Workstation (929 - 2148, n=23, ultimi 2 anni) | |
| Lenovo ThinkPad P16 G1 21D6001DMB | |
| Asus ExpertBook B6 Flip B6602FC2 | |
| Media Intel Core i7-12850HX (817 - 1102, n=2) | |
| Dell Precision 7670 | |
| HP ZBook Fury 17 G8-4A6A9EA | |
| AIDA64 / FP64 Ray-Trace | |
| Media della classe Workstation (8545 - 32891, n=23, ultimi 2 anni) | |
| Lenovo ThinkPad P16 G1 21D6001DMB | |
| Asus ExpertBook B6 Flip B6602FC2 | |
| HP ZBook Fury 17 G8-4A6A9EA | |
| Media Intel Core i7-12850HX (7671 - 9145, n=2) | |
| Dell Precision 7670 | |
| AIDA64 / CPU PhotoWorxx | |
| Media della classe Workstation (37151 - 93684, n=23, ultimi 2 anni) | |
| Dell Precision 7670 | |
| Media Intel Core i7-12850HX (33415 - 42035, n=2) | |
| Asus ExpertBook B6 Flip B6602FC2 | |
| Lenovo ThinkPad P16 G1 21D6001DMB | |
| HP ZBook Fury 17 G8-4A6A9EA | |
Prestazioni del sistema
Sebbene i punteggi di PCMark 10 siano relativamente più bassi, il Lenovo ThinkPad P16 G1 offre ottime prestazioni nell'uso quotidiano, come è logico che sia considerando i potenti componenti. Di conseguenza, CrossMark risulta essere notevolmente migliore.
CrossMark: Overall | Productivity | Creativity | Responsiveness
| PCMark 10 / Score | |
| Media della classe Workstation (6563 - 10409, n=19, ultimi 2 anni) | |
| Asus ExpertBook B6 Flip B6602FC2 | |
| Dell Precision 7670 | |
| Lenovo ThinkPad P15 G2-20YQ001JGE | |
| Media Intel Core i7-12850HX, NVIDIA RTX A2000 Laptop GPU (6226 - 6663, n=2) | |
| Lenovo ThinkPad P17 G2-20YU0025G | |
| Lenovo ThinkPad P16 G1 21D6001DMB | |
| HP ZBook Fury 17 G8-4A6A9EA | |
| PCMark 10 / Essentials | |
| Asus ExpertBook B6 Flip B6602FC2 | |
| Dell Precision 7670 | |
| Media della classe Workstation (9622 - 11157, n=19, ultimi 2 anni) | |
| Media Intel Core i7-12850HX, NVIDIA RTX A2000 Laptop GPU (10128 - 10555, n=2) | |
| Lenovo ThinkPad P15 G2-20YQ001JGE | |
| Lenovo ThinkPad P16 G1 21D6001DMB | |
| Lenovo ThinkPad P17 G2-20YU0025G | |
| HP ZBook Fury 17 G8-4A6A9EA | |
| PCMark 10 / Productivity | |
| Media della classe Workstation (8789 - 20616, n=19, ultimi 2 anni) | |
| Asus ExpertBook B6 Flip B6602FC2 | |
| Lenovo ThinkPad P16 G1 21D6001DMB | |
| Media Intel Core i7-12850HX, NVIDIA RTX A2000 Laptop GPU (9008 - 9349, n=2) | |
| Dell Precision 7670 | |
| Lenovo ThinkPad P15 G2-20YQ001JGE | |
| Lenovo ThinkPad P17 G2-20YU0025G | |
| HP ZBook Fury 17 G8-4A6A9EA | |
| PCMark 10 / Digital Content Creation | |
| Media della classe Workstation (8108 - 15631, n=19, ultimi 2 anni) | |
| HP ZBook Fury 17 G8-4A6A9EA | |
| Asus ExpertBook B6 Flip B6602FC2 | |
| Lenovo ThinkPad P15 G2-20YQ001JGE | |
| Lenovo ThinkPad P17 G2-20YU0025G | |
| Dell Precision 7670 | |
| Media Intel Core i7-12850HX, NVIDIA RTX A2000 Laptop GPU (6918 - 8443, n=2) | |
| Lenovo ThinkPad P16 G1 21D6001DMB | |
| CrossMark / Overall | |
| Asus ExpertBook B6 Flip B6602FC2 | |
| Media della classe Workstation (1307 - 2267, n=22, ultimi 2 anni) | |
| Lenovo ThinkPad P16 G1 21D6001DMB | |
| Media Intel Core i7-12850HX, NVIDIA RTX A2000 Laptop GPU (1509 - 1720, n=2) | |
| Dell Precision 7670 | |
| HP ZBook Fury 17 G8-4A6A9EA | |
| CrossMark / Productivity | |
| Asus ExpertBook B6 Flip B6602FC2 | |
| Media della classe Workstation (1130 - 2122, n=22, ultimi 2 anni) | |
| Lenovo ThinkPad P16 G1 21D6001DMB | |
| Media Intel Core i7-12850HX, NVIDIA RTX A2000 Laptop GPU (1445 - 1611, n=2) | |
| HP ZBook Fury 17 G8-4A6A9EA | |
| Dell Precision 7670 | |
| CrossMark / Creativity | |
| Media della classe Workstation (1657 - 2725, n=22, ultimi 2 anni) | |
| Asus ExpertBook B6 Flip B6602FC2 | |
| Lenovo ThinkPad P16 G1 21D6001DMB | |
| Media Intel Core i7-12850HX, NVIDIA RTX A2000 Laptop GPU (1682 - 1943, n=2) | |
| Dell Precision 7670 | |
| HP ZBook Fury 17 G8-4A6A9EA | |
| CrossMark / Responsiveness | |
| Asus ExpertBook B6 Flip B6602FC2 | |
| Media della classe Workstation (993 - 2096, n=22, ultimi 2 anni) | |
| Lenovo ThinkPad P16 G1 21D6001DMB | |
| Media Intel Core i7-12850HX, NVIDIA RTX A2000 Laptop GPU (1238 - 1454, n=2) | |
| Dell Precision 7670 | |
| HP ZBook Fury 17 G8-4A6A9EA | |
| PCMark 10 Score | 6226 punti | |
Aiuto | ||
| AIDA64 / Memory Copy | |
| Media della classe Workstation (56003 - 164795, n=23, ultimi 2 anni) | |
| Dell Precision 7670 | |
| Asus ExpertBook B6 Flip B6602FC2 | |
| Media Intel Core i7-12850HX (53840 - 62841, n=2) | |
| Lenovo ThinkPad P16 G1 21D6001DMB | |
| HP ZBook Fury 17 G8-4A6A9EA | |
| AIDA64 / Memory Read | |
| Media della classe Workstation (55795 - 121563, n=23, ultimi 2 anni) | |
| Dell Precision 7670 | |
| Media Intel Core i7-12850HX (58944 - 68747, n=2) | |
| Asus ExpertBook B6 Flip B6602FC2 | |
| Lenovo ThinkPad P16 G1 21D6001DMB | |
| HP ZBook Fury 17 G8-4A6A9EA | |
| AIDA64 / Memory Write | |
| Media della classe Workstation (55663 - 214520, n=23, ultimi 2 anni) | |
| Dell Precision 7670 | |
| Asus ExpertBook B6 Flip B6602FC2 | |
| Media Intel Core i7-12850HX (52160 - 64365, n=2) | |
| Lenovo ThinkPad P16 G1 21D6001DMB | |
| HP ZBook Fury 17 G8-4A6A9EA | |
| AIDA64 / Memory Latency | |
| Media della classe Workstation (84.5 - 165.2, n=23, ultimi 2 anni) | |
| Lenovo ThinkPad P16 G1 21D6001DMB | |
| Asus ExpertBook B6 Flip B6602FC2 | |
| Media Intel Core i7-12850HX (88.5 - 95.4, n=2) | |
| Dell Precision 7670 | |
| HP ZBook Fury 17 G8-4A6A9EA | |
| Lenovo ThinkPad P17 G2-20YU0025G | |
| Lenovo ThinkPad P15 G2-20YQ001JGE | |
* ... Meglio usare valori piccoli
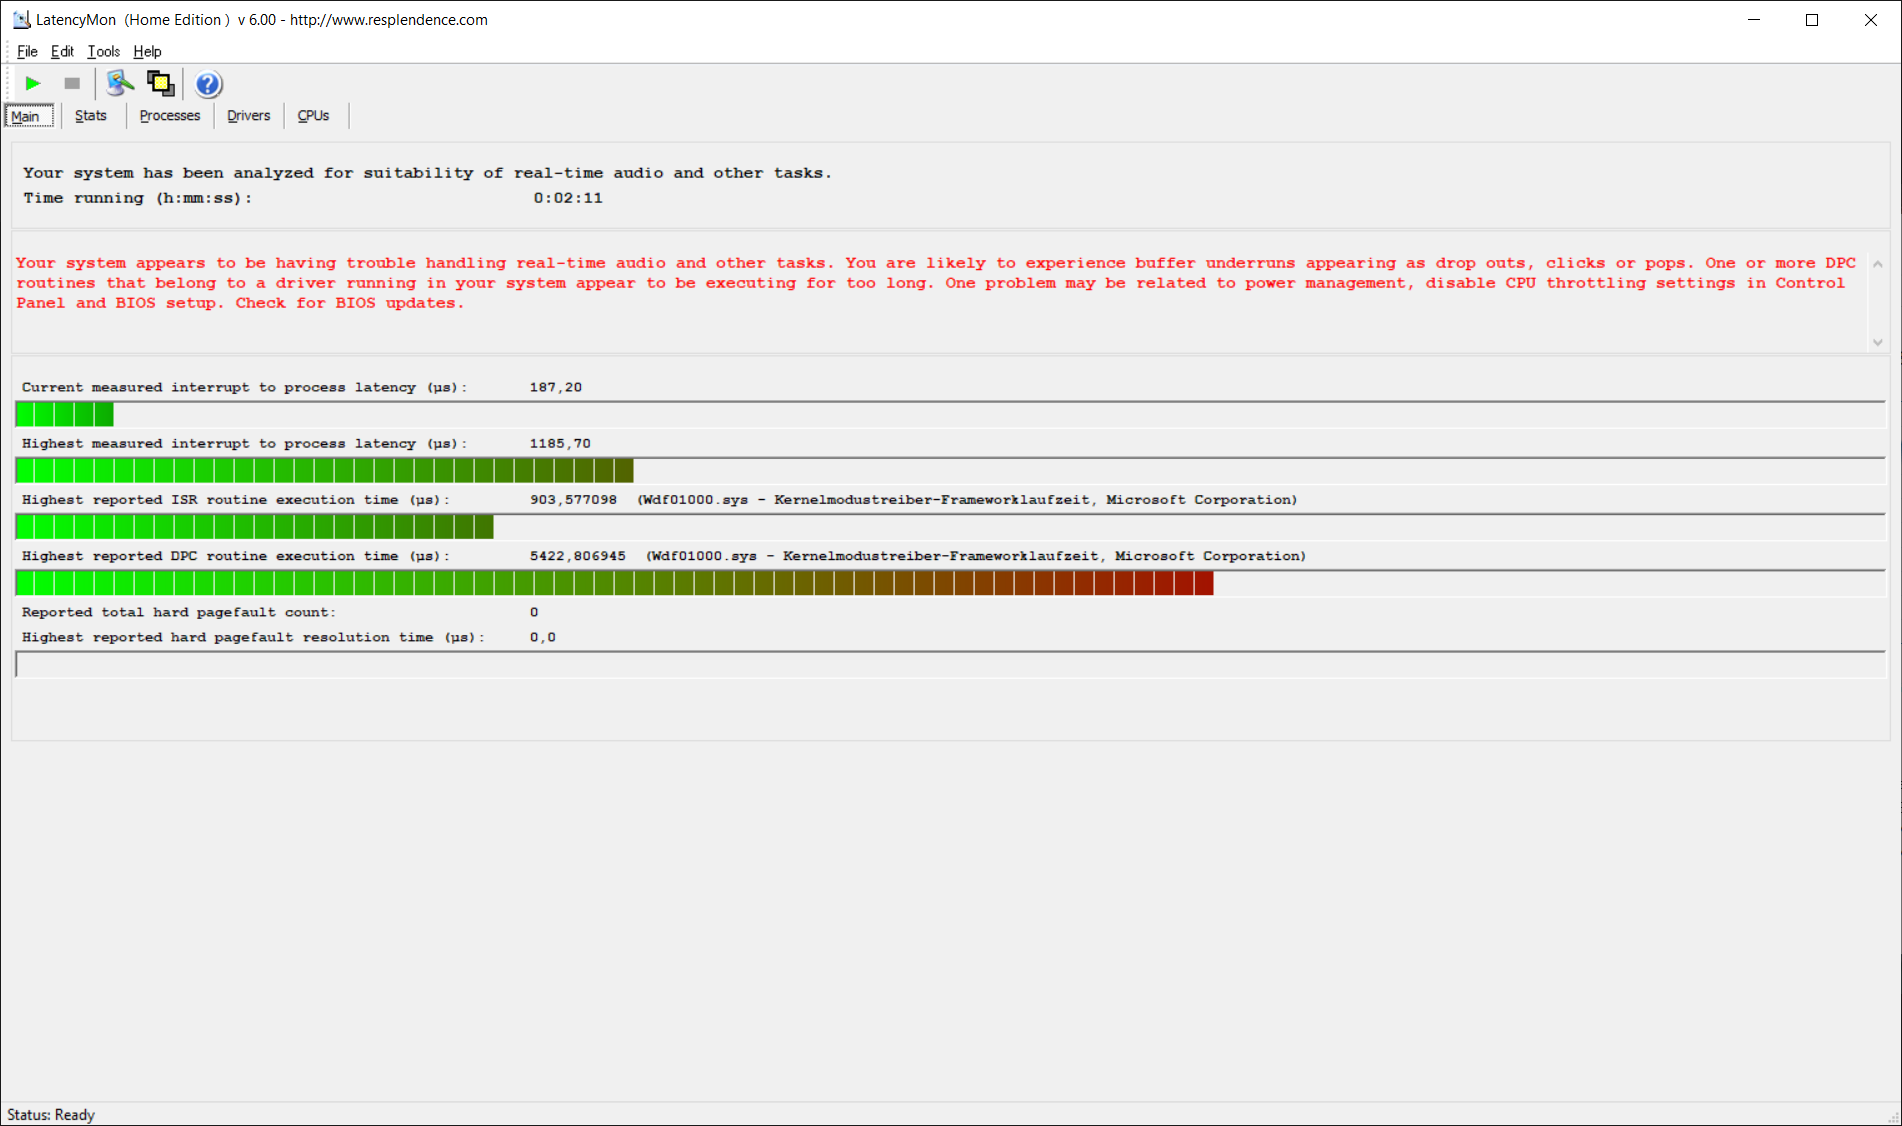
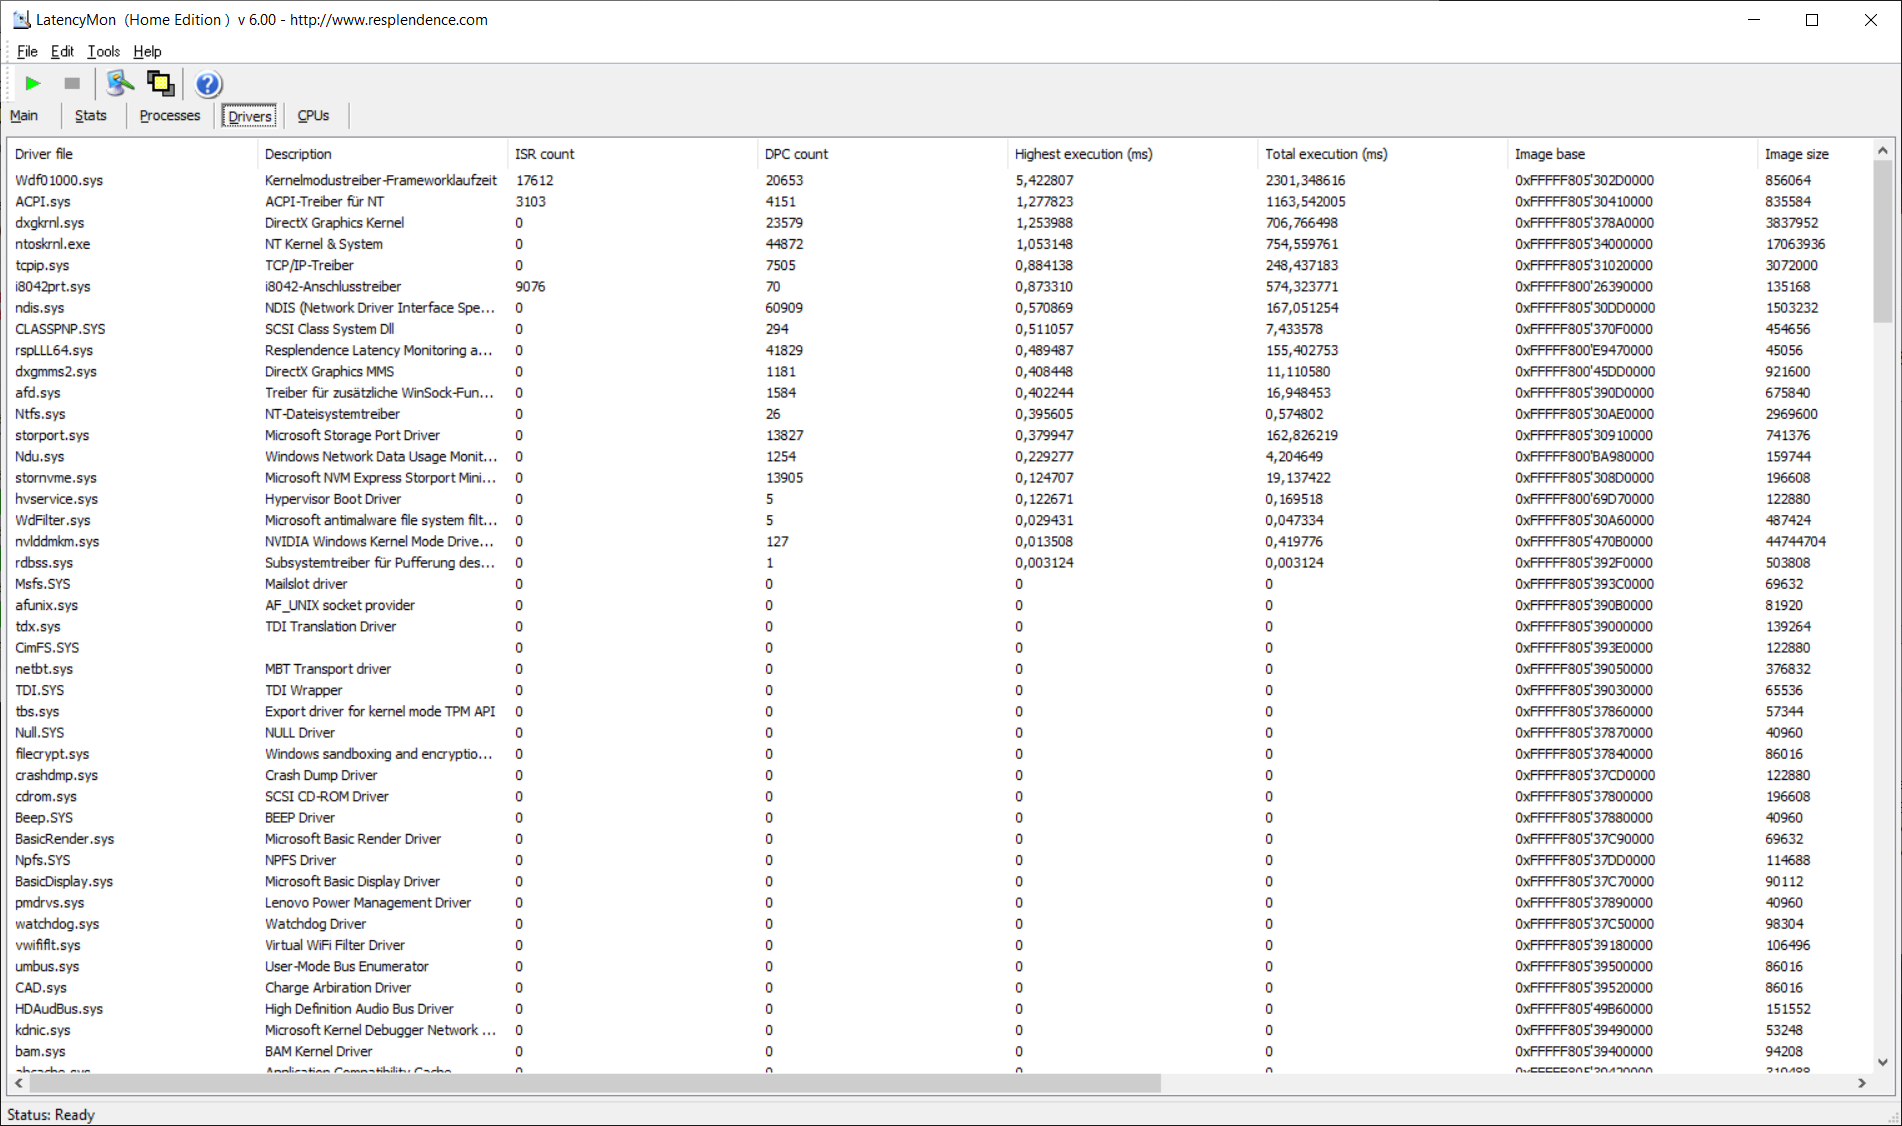
Latenze DPC
Le latenze DPC sono significativamente inferiori rispetto al suo predecessore, ma ancora troppo elevate. Tuttavia, la situazione può cambiare in qualsiasi momento con l'aiuto degli aggiornamenti dei driver.
| DPC Latencies / LatencyMon - interrupt to process latency (max), Web, Youtube, Prime95 | |
| Lenovo ThinkPad P17 G2-20YU0025G | |
| Lenovo ThinkPad P15 G2-20YQ001JGE | |
| Asus ExpertBook B6 Flip B6602FC2 | |
| Dell Precision 7670 | |
| Lenovo ThinkPad P16 G1 21D6001DMB | |
| HP ZBook Studio 16 G9 62U04EA | |
* ... Meglio usare valori piccoli
Memoria di massa
L'SSD del Lenovo ThinkPad P16 G1 è di Micron, ha una capacità di un terabyte ed è un SSD NVMe PCIe 4.0 molto veloce nel formato M.2 2280. L'unità SSD è più lenta dell'unità SSD Samsung presente nell'Asus ExpertBook, ma più veloce degli altri concorrenti.

* ... Meglio usare valori piccoli
Continuous Performance Read: DiskSpd Read Loop, Queue Depth 8
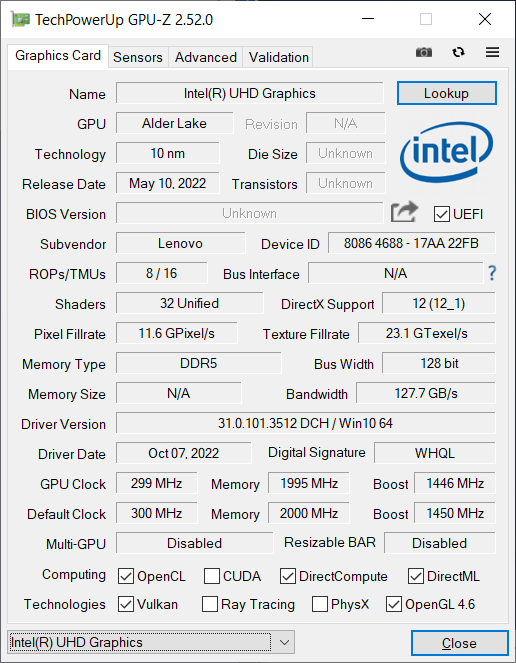
Scheda grafica
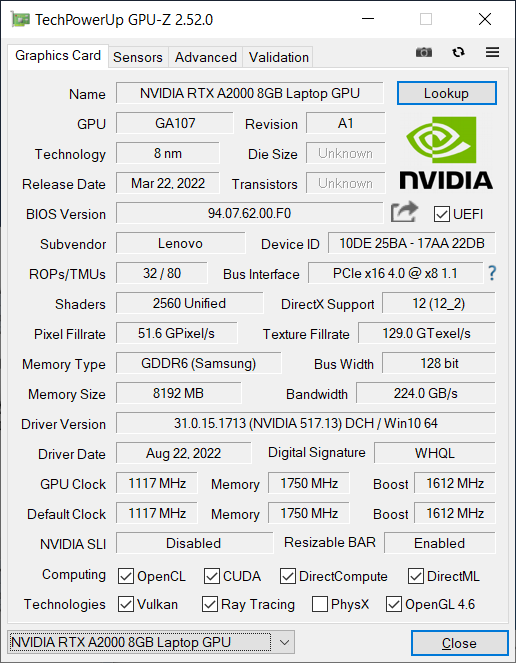
LaNvidia RTX A2000 è una GPU di generazione Ampere della serie professionale RTX di Nvidia, precedentemente nota come "Quadro". Le 2560 unità shader hanno una velocità di clock massima di 1,678 GHz. Il TDP tipico di questo chip grafico è compreso tra 35 e 95 watt; RTX A2000 ha 8 GB di RAM dedicata collegata a un bus di memoria a 128 bit. LaElenco delle GPUè una risorsa eccellente per i confronti di benchmark con altri chip grafici.
La RTX A2000 nel Lenovo ThinkPad P16 può consumare fino a 60 watt, il che la rende una delle opzioni entry-level, mentre la migliore GPU successiva, la RTX A3000, può consumare fino a 115 watt. In accordo con il consumo limitato, le prestazioni della RTX A2000 non sono particolarmente eccezionali. Tra tutte le workstation confrontate, il Lenovo ThinkPad P16 ha ottenuto le prestazioni peggiori, indipendentemente dal test 3DMark o dal benchmark SPECviewperf specifico per le workstation. In particolare, ilDell Precision 7670e l'Asus ExpertBook B6 Flip Asus ExpertBook B6 Fliphanno ottenuto risultati migliori con quasi le stesse GPU, che in questi portatili funzionano rispettivamente con un TDP di 90 e 95 watt.
Questo risultato si riflette anche nel test di Blender: Nei test di accelerazione GPU, il ThinkPad P16 G1 è più lento della concorrenza. Tuttavia, nel test della CPU di Blender, è la workstation mobile più veloce.
Come per il processore, le prestazioni della GPU sono limitate in modalità batteria, con un calo di circa il 15% rispetto al funzionamento con alimentazione.
| 3DMark 11 Performance | 15998 punti | |
| 3DMark Cloud Gate Standard Score | 40815 punti | |
| 3DMark Fire Strike Score | 10381 punti | |
| 3DMark Time Spy Score | 5184 punti | |
Aiuto | ||
* ... Meglio usare valori piccoli
Prestazioni di gioco
Come workstation mobile, il Lenovo ThinkPad P16 non è un portatile da gioco. Tuttavia, anche i giochi più recenti sono possibili, se non in 4K. Come nei benchmark sintetici, la concorrenza diretta è più veloce del P16. Il basso TDP è reso ancora più difficile dal fatto che il P16 non riesce a mantenere costanti le prestazioni della GPU sotto carico costante.
| The Witcher 3 - 1920x1080 Ultra Graphics & Postprocessing (HBAO+) | |
| Media della classe Workstation (n=1ultimi 2 anni) | |
| Lenovo ThinkPad P15 G2-20YQ001JGE | |
| Asus ExpertBook B6 Flip B6602FC2 | |
| HP ZBook Fury 17 G8-4A6A9EA | |
| Dell Precision 7670 | |
| Lenovo ThinkPad P17 G2-20YU0025G | |
| Lenovo ThinkPad P16 G1 21D6001DMB | |
Witcher 3 FPS diagram
| basso | medio | alto | ultra | QHD | |
|---|---|---|---|---|---|
| The Witcher 3 (2015) | 273 | 150.5 | 79.7 | 43.6 | |
| Dota 2 Reborn (2015) | 177.5 | 160.8 | 149.3 | 139.5 | |
| Final Fantasy XV Benchmark (2018) | 96.7 | 51.9 | 38.3 | 31.1 | |
| X-Plane 11.11 (2018) | 140.3 | 119.2 | 95.6 | ||
| Strange Brigade (2018) | 280 | 118.6 | 91.1 | 77.8 | 54.3 |
Emissioni: La ventola è rumorosa ma il portatile ThinkPad rimane fresco
Emissioni acustiche
Quando è inattivo, le ventole del Lenovo ThinkPad P16 sono silenziose. Con 56,3 dB(a) sotto carico, possono diventare rumorose, persino più delle controparti dirette del portatile. Tuttavia, questo non è il caso di tutte le applicazioni. Nel test di Witcher 3, le ventole hanno funzionato in modo relativamente silenzioso, misurando solo 34,1 dB(a).
Non siamo riusciti a rilevare alcun rumore di bobina nel portatile Lenovo.
Rumorosità
| Idle |
| 23.2 / 23.2 / 23.2 dB(A) |
| Sotto carico |
| 47.8 / 56.3 dB(A) |
 | ||
30 dB silenzioso 40 dB(A) udibile 50 dB(A) rumoroso |
||
min: | ||
| Lenovo ThinkPad P16 G1 21D6001DMB RTX A2000 Laptop GPU, i7-12850HX, Micron 3400 1TB MTFDKBA1T0TFH | Lenovo ThinkPad P15 G2-20YQ001JGE RTX A3000 Laptop GPU, i7-11800H, Kioxia XG7 KXG7AZNV512G | Lenovo ThinkPad P17 G2-20YU0025G RTX A2000 Laptop GPU, i7-11800H, Kioxia XG7 KXG7AZNV512G | HP ZBook Fury 17 G8-4A6A9EA RTX A3000 Laptop GPU, i9-11950H, Toshiba XG6 KXG60ZNV1T02 | Dell Precision 7670 RTX A2000 Laptop GPU, i7-12850HX, SK Hynix HFS001TEJ9X115N | Asus ExpertBook B6 Flip B6602FC2 RTX A2000 Laptop GPU, i9-12950HX, Samsung PM9A1 MZVL21T0HCLR | |
|---|---|---|---|---|---|---|
| Noise | -6% | -4% | -5% | -4% | -22% | |
| off /ambiente * (dB) | 23.2 | 24.3 -5% | 26.4 -14% | 24.5 -6% | 22.7 2% | 26 -12% |
| Idle Minimum * (dB) | 23.2 | 24.3 -5% | 26.4 -14% | 24.5 -6% | 22.9 1% | 32.4 -40% |
| Idle Average * (dB) | 23.2 | 24.3 -5% | 26.4 -14% | 24.5 -6% | 22.9 1% | 32.4 -40% |
| Idle Maximum * (dB) | 23.2 | 28.6 -23% | 26.4 -14% | 26.8 -16% | 24.5 -6% | 32.4 -40% |
| Load Average * (dB) | 47.8 | 47.5 1% | 38.1 20% | 41.8 13% | 48.7 -2% | 51.9 -9% |
| Witcher 3 ultra * (dB) | 34.1 | 38.1 -12% | 44.9 -32% | 45.2 -33% | ||
| Load Maximum * (dB) | 56.3 | 54.9 2% | 45 20% | 47.1 16% | 52.1 7% | 52.1 7% |
* ... Meglio usare valori piccoli
Temperatura
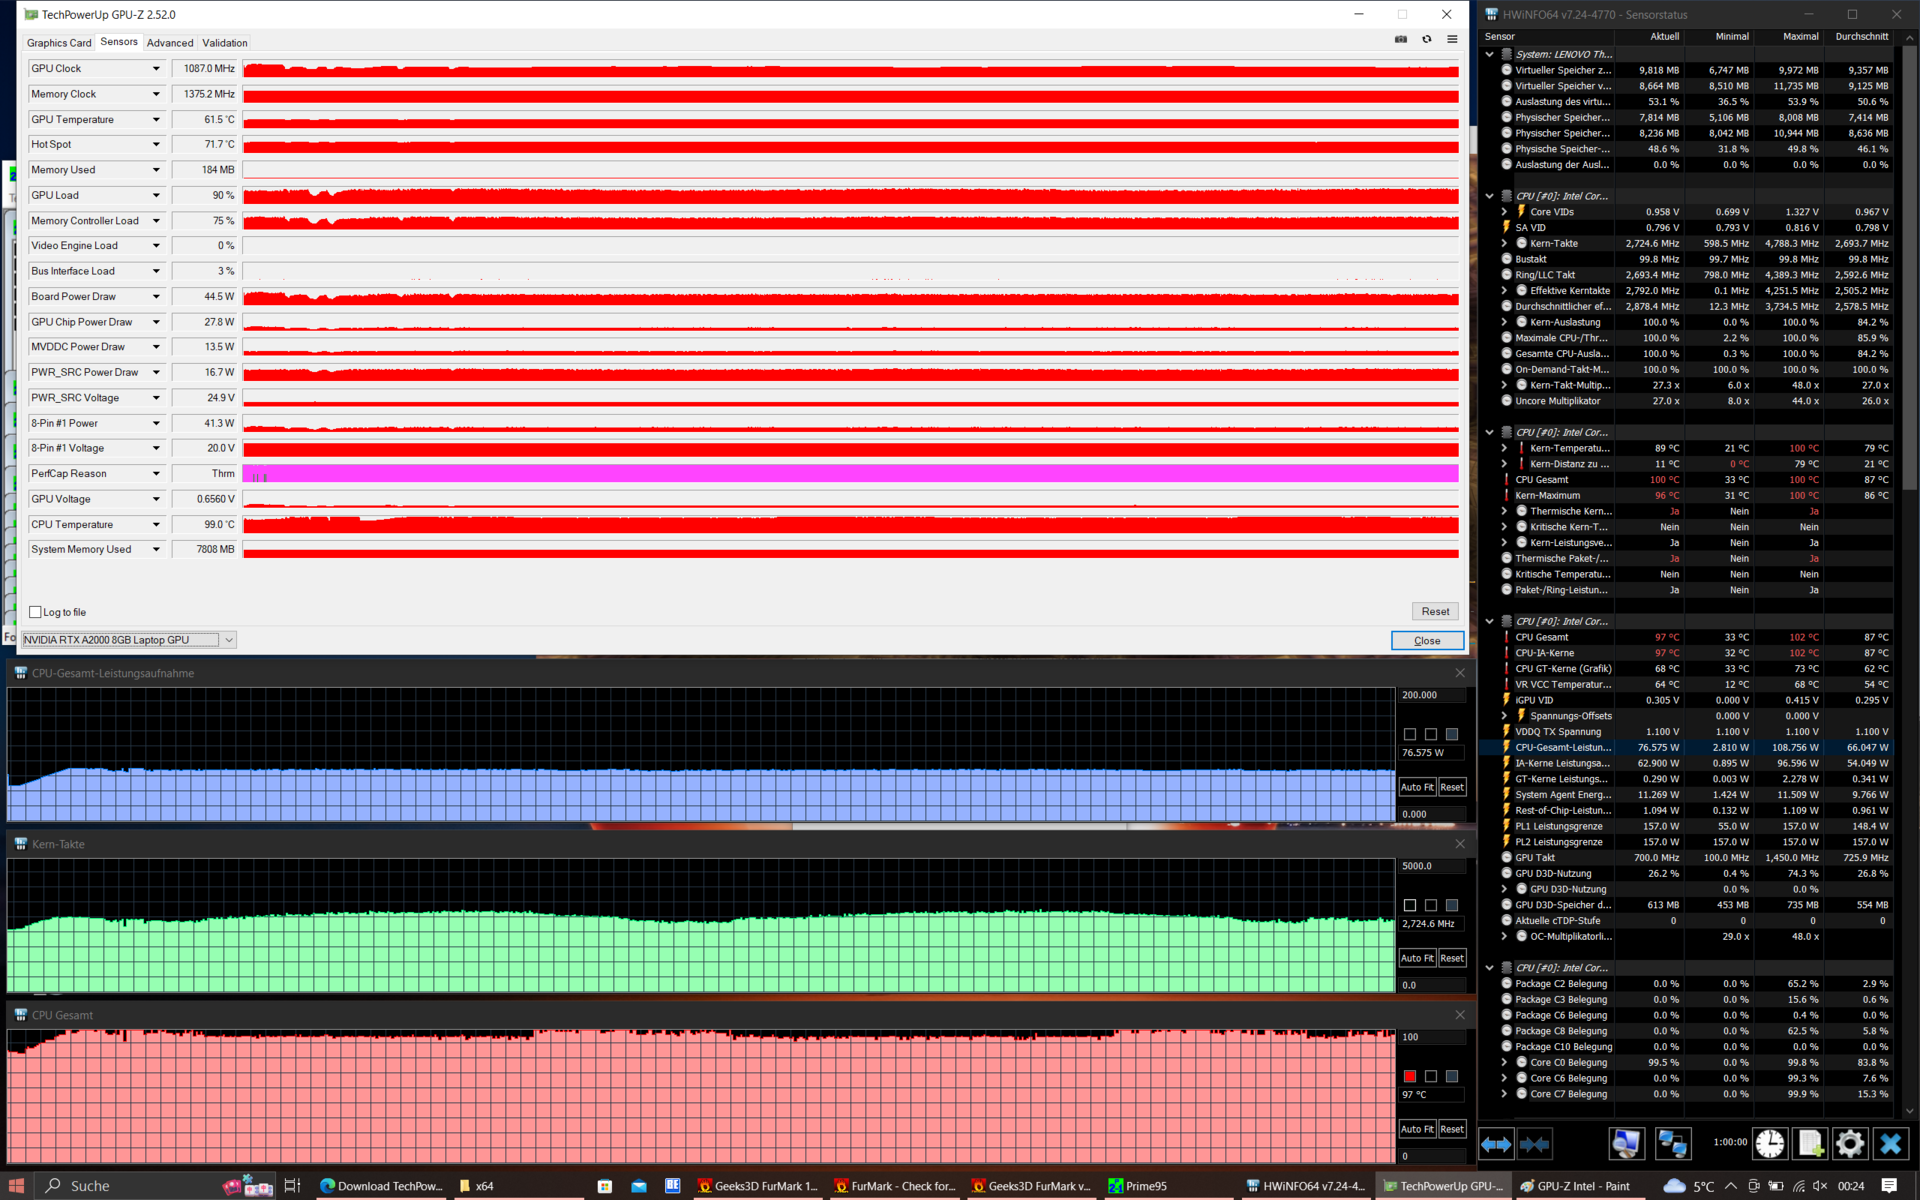
Il case spazioso, con la sua struttura a gabbia e la camera di vapore, assicura una distribuzione relativamente uniforme del calore disperso. Di conseguenza, il poggiapolsi del Lenovo ThinkPad P16 si scalda un po', ma le temperature massime rimangono entro limiti accettabili. Nel test di stress, la temperatura dell'hotspot ha misurato 43,1 gradi e può essere considerata un buon risultato.
Sebbene il processore non sia stato sottoposto a throttling durante lo stress test, le prestazioni della GPU sono diminuite: Dopo un'ora, è in grado di consumare solo 45 watt anziché 60.
(±) La temperatura massima sul lato superiore è di 43.1 °C / 110 F, rispetto alla media di 38.2 °C / 101 F, che varia da 22.2 a 69.8 °C per questa classe Workstation.
(+) Il lato inferiore si riscalda fino ad un massimo di 39.9 °C / 104 F, rispetto alla media di 41.1 °C / 106 F
(+) In idle, la temperatura media del lato superiore è di 24.7 °C / 76 F, rispetto alla media deld ispositivo di 32 °C / 90 F.
(+) Riproducendo The Witcher 3, la temperatura media per il lato superiore e' di 31.2 °C / 88 F, rispetto alla media del dispositivo di 32 °C / 90 F.
(±) I poggiapolsi e il touchpad possono diventare molto caldi al tatto con un massimo di 36.7 °C / 98.1 F.
(-) La temperatura media della zona del palmo della mano di dispositivi simili e'stata di 27.8 °C / 82 F (-8.9 °C / -16.1 F).
| Lenovo ThinkPad P16 G1 21D6001DMB Intel Core i7-12850HX, NVIDIA RTX A2000 Laptop GPU | Lenovo ThinkPad P15 G2-20YQ001JGE Intel Core i7-11800H, NVIDIA RTX A3000 Laptop GPU | Lenovo ThinkPad P17 G2-20YU0025G Intel Core i7-11800H, NVIDIA RTX A2000 Laptop GPU | HP ZBook Fury 17 G8-4A6A9EA Intel Core i9-11950H, NVIDIA RTX A3000 Laptop GPU | Dell Precision 7670 Intel Core i7-12850HX, NVIDIA RTX A2000 Laptop GPU | Asus ExpertBook B6 Flip B6602FC2 Intel Core i9-12950HX, NVIDIA RTX A2000 Laptop GPU | |
|---|---|---|---|---|---|---|
| Heat | -21% | -12% | -12% | -18% | -15% | |
| Maximum Upper Side * (°C) | 43.1 | 49.7 -15% | 49.6 -15% | 41.9 3% | 51 -18% | 48.4 -12% |
| Maximum Bottom * (°C) | 39.9 | 63.2 -58% | 52.1 -31% | 52.9 -33% | 45.8 -15% | 52.3 -31% |
| Idle Upper Side * (°C) | 26 | 27.1 -4% | 26 -0% | 28.2 -8% | 31.8 -22% | 27.8 -7% |
| Idle Bottom * (°C) | 27.6 | 29.8 -8% | 27.6 -0% | 30.7 -11% | 32.6 -18% | 30.3 -10% |
* ... Meglio usare valori piccoli
Altoparlanti
Gli altoparlanti stereo si trovano nella parte superiore della tastiera. Rispetto alThinkPad P15 G2gli altoparlanti sono un po' più silenziosi, ma producono un suono più equilibrato con bassi aggiuntivi. Sebbene la qualità del suono sia buona per un portatile, non è comunque all'altezza di un sistema audio esterno.
Lenovo ThinkPad P16 G1 21D6001DMB analisi audio
(±) | potenza degli altiparlanti media ma buona (73.8 dB)
Bassi 100 - 315 Hz
(±) | bassi ridotti - in media 9.7% inferiori alla media
(±) | la linearità dei bassi è media (12.8% delta rispetto alla precedente frequenza)
Medi 400 - 2000 Hz
(+) | medi bilanciati - solo only 2.9% rispetto alla media
(+) | medi lineari (6.3% delta rispetto alla precedente frequenza)
Alti 2 - 16 kHz
(+) | Alti bilanciati - appena 3.1% dalla media
(+) | alti lineari (4.3% delta rispetto alla precedente frequenza)
Nel complesso 100 - 16.000 Hz
(+) | suono nel complesso lineare (13% differenza dalla media)
Rispetto alla stessa classe
» 22% di tutti i dispositivi testati in questa classe è stato migliore, 6% simile, 72% peggiore
» Il migliore ha avuto un delta di 7%, medio di 17%, peggiore di 35%
Rispetto a tutti i dispositivi testati
» 13% di tutti i dispositivi testati in questa classe è stato migliore, 2% similare, 85% peggiore
» Il migliore ha avuto un delta di 4%, medio di 23%, peggiore di 134%
Lenovo ThinkPad P15 G2-20YQ001JGE analisi audio
(±) | potenza degli altiparlanti media ma buona (78 dB)
Bassi 100 - 315 Hz
(-) | quasi nessun basso - in media 15.5% inferiori alla media
(±) | la linearità dei bassi è media (9.6% delta rispetto alla precedente frequenza)
Medi 400 - 2000 Hz
(±) | medi elevati - circa 7.5% superiore alla media
(+) | medi lineari (6.6% delta rispetto alla precedente frequenza)
Alti 2 - 16 kHz
(+) | Alti bilanciati - appena 2.4% dalla media
(+) | alti lineari (5.8% delta rispetto alla precedente frequenza)
Nel complesso 100 - 16.000 Hz
(±) | la linearità complessiva del suono è media (20.6% di differenza rispetto alla media
Rispetto alla stessa classe
» 74% di tutti i dispositivi testati in questa classe è stato migliore, 6% simile, 21% peggiore
» Il migliore ha avuto un delta di 7%, medio di 17%, peggiore di 35%
Rispetto a tutti i dispositivi testati
» 55% di tutti i dispositivi testati in questa classe è stato migliore, 8% similare, 37% peggiore
» Il migliore ha avuto un delta di 4%, medio di 23%, peggiore di 134%
Gestione dell'alimentazione: La GPU ha un impatto negativo sulla gestione dell'alimentazione
Consumo di energia
Il Lenovo ThinkPad P16 funziona in modo più efficiente rispetto a dispositivi analoghi. Anche quando è inattivo, è più efficiente dal punto di vista energetico rispetto alla concorrenza. Tuttavia, a onor del vero, va anche detto che i portatili simili di HP e Dell hanno display 4K. Allo stesso modo, nonostante l'LCD WQXGA a risoluzione più elevata, è più efficiente del P15 e del P17 con i loro pannelli Full HD.
L'alimentatore Slim Tip eroga 170 watt, un valore piuttosto alto rispetto al consumo massimo di 168,9 watt.
| Off / Standby | |
| Idle | |
| Sotto carico |
|
Leggenda:
min: | |
| Lenovo ThinkPad P16 G1 21D6001DMB i7-12850HX, RTX A2000 Laptop GPU, Micron 3400 1TB MTFDKBA1T0TFH, IPS LED, 2560x1600, 16" | Lenovo ThinkPad P15 G2-20YQ001JGE i7-11800H, RTX A3000 Laptop GPU, Kioxia XG7 KXG7AZNV512G, IPS, 1920x1080, 15.6" | Lenovo ThinkPad P17 G2-20YU0025G i7-11800H, RTX A2000 Laptop GPU, Kioxia XG7 KXG7AZNV512G, IPS LED, 1920x1080, 17.3" | HP ZBook Fury 17 G8-4A6A9EA i9-11950H, RTX A3000 Laptop GPU, Toshiba XG6 KXG60ZNV1T02, IPS, 3840x2160, 17.3" | Dell Precision 7670 i7-12850HX, RTX A2000 Laptop GPU, SK Hynix HFS001TEJ9X115N, OLED, 3840x2400, 16" | Asus ExpertBook B6 Flip B6602FC2 i9-12950HX, RTX A2000 Laptop GPU, Samsung PM9A1 MZVL21T0HCLR, IPS, 2560x1600, 16" | Media NVIDIA RTX A2000 Laptop GPU | Media della classe Workstation | |
|---|---|---|---|---|---|---|---|---|
| Power Consumption | -23% | -15% | -49% | -56% | -67% | -24% | -39% | |
| Idle Minimum * (Watt) | 5.1 | 6.3 -24% | 6.1 -20% | 7.6 -49% | 7.5 -47% | 10.5 -106% | 6.6 ? -29% | 9.11 ? -79% |
| Idle Average * (Watt) | 9.2 | 10.7 -16% | 10.9 -18% | 16.7 -82% | 9.5 -3% | 11.9 -29% | 11.8 ? -28% | 13.8 ? -50% |
| Idle Maximum * (Watt) | 9.9 | 11.6 -17% | 12.3 -24% | 17.5 -77% | 28.4 -187% | 18 -82% | 16.7 ? -69% | 17.9 ? -81% |
| Load Average * (Watt) | 124.1 | 99.3 20% | 106.3 14% | 117 6% | 139.1 -12% | 182 -47% | 116.3 ? 6% | 96 ? 23% |
| Witcher 3 ultra * (Watt) | 87.7 | 154 -76% | 124 -41% | 150 -71% | 134 -53% | 177.5 -102% | ||
| Load Maximum * (Watt) | 168.9 | 210 -24% | 168.9 -0% | 202 -20% | 220.8 -31% | 229 -36% | 171.2 ? -1% | 180.3 ? -7% |
* ... Meglio usare valori piccoli
Power consumption Witcher 3 / stress test
Power consumption with an external monitor
Durata della batteria
Lenovo non ha apportato modifiche alla batteria interna ai polimeri di litio da 94 wattora. Di conseguenza, l'autonomia della batteria è simile a quella dei suoi predecessori, con circa nove ore nel test WiFi (luminosità del display 150 cd/m²). Il ThinkPad P16 ha un chiaro vantaggio rispetto al modello Dell Precision 7670che non dura altrettanto nel test WiFi a causa della batteria più piccola da 83 watt/ora e del display 4K.
| Lenovo ThinkPad P16 G1 21D6001DMB i7-12850HX, RTX A2000 Laptop GPU, 94 Wh | Lenovo ThinkPad P15 G2-20YQ001JGE i7-11800H, RTX A3000 Laptop GPU, 94 Wh | Lenovo ThinkPad P17 G2-20YU0025G i7-11800H, RTX A2000 Laptop GPU, 94 Wh | HP ZBook Fury 17 G8-4A6A9EA i9-11950H, RTX A3000 Laptop GPU, 94 Wh | Dell Precision 7670 i7-12850HX, RTX A2000 Laptop GPU, 83 Wh | Asus ExpertBook B6 Flip B6602FC2 i9-12950HX, RTX A2000 Laptop GPU, 90 Wh | Media della classe Workstation | |
|---|---|---|---|---|---|---|---|
| Autonomia della batteria | -12% | -9% | -5% | -33% | -7% | -15% | |
| WiFi v1.3 (h) | 9.4 | 9.9 5% | 9.8 4% | 7.4 -21% | 5.9 -37% | 8.7 -7% | 8.55 ? -9% |
| Load (h) | 1.8 | 1.3 -28% | 1.4 -22% | 2 11% | 1.3 -28% | 1.7 -6% | 1.441 ? -20% |
Pro
Contro
Verdetto: la nuova workstation ThinkPad è esposta dal chip grafico
Con il ThinkPad P16 Gen 1, Lenovo ha fatto un grande passo avanti, passando da due workstation da 15 e 17 pollici a un unico modello da 16 pollici: una semplificazione rara ma gradita della linea. Allo stesso tempo, Lenovo ha anche osato dare una scossa al precedente linguaggio di design della serie ThinkPad P. Il risultato è un prodotto di qualità. Nel complesso, il risultato è un'ottima workstation che, tuttavia, non è esente da difetti.
Uno dei punti di forza del portatile Lenovo è, senza dubbio, la sua espandibilità. Solo questo tipo di workstation può offrire fino a quattro slot per la RAM. Il dispositivo è inoltre ricco di funzionalità ed è predisposto per la WWAN. Tuttavia, sentiamo la mancanza della porta Ethernet RJ45. Se il nuovo design sia un miglioramento ottico è una questione di gusti, ma il nuovo coperchio del display rinforzato in metallo è senza dubbio molto solido. Il display opaco WQXGA convince per l'elevata luminosità, ma è un peccato che Lenovo non offra il pannello da 165 Hz presente nel modelloX1 Extreme Gen 5. I dispositivi di input del ThinkPad P16 continuano a essere molto buoni, ma la ridotta corsa dei tasti non lo pone allo stesso livello del suo predecessore, ilThinkPad P17.
Quando si parla di workstation mobili, le prestazioni sono fondamentali. Qui possiamo notare che le prestazioni del processore sono state migliorate in modo significativo. Tuttavia, questo non vale per la GPU: inutilmente, Lenovo ha lasciato la RTX A2000 a un consumo di soli 60 watt. Stranamente, le ventole non funzionano in modo potente sotto il puro carico della CPU, quindi per questo motivo le prestazioni del portatile sotto carico sono strozzate. A proposito di ventole: Sotto carico sostenuto, il raffreddamento attivo funziona in modo molto rumoroso. Tuttavia, questo ha il vantaggio che in quasi tutte le aree, il ThinkPad P16 rimane considerevolmente più fresco rispetto ai suoi bollenti modelli precedenti, il P15 e il P17.
Le prestazioni della CPU sono potenti, ma la GPU rimane indietro in questa versione del ThinkPad P16.
In sintesi, il nostro modello recensito, il Lenovo ThinkPad P16 G1, è una scelta eccellente quando si chiede di eseguire compiti pesanti per la CPU. Se la GPU è importante, dovreste evitare di acquistare la versione RTX-A2000. Tuttavia, questo non significa che un ThinkPad P16 con una delle GPU più potenti soffra dello stesso problema: la nostra recensione del modello Nvidia RTX A5500 è ora online.
Per chi cerca una workstation più mobile, un'alternativa interessante potrebbe essere Dell Precision 7670, con il suo case più sottile e compatto. Asus ExpertBook B6 Flip combina la potenza di una workstation con un design convertibile e potrebbe essere una scelta interessante per gli utenti che lavorano spesso con uno stilo.
Prezzo e disponibilità
Le prestazioni elevate hanno un prezzo: Il ThinkPad P16 costa almeno 2.050 dollari USA e i modelli meglio equipaggiati arrivano a oltre 3500 dollari USA. Un dispositivo simile al nostro modello in prova costa circa 2.800 dollari su Amazon.
Lenovo ThinkPad P16 G1 21D6001DMB
- 01/27/2023 v7 (old)
Benjamin Herzig
Price comparison

