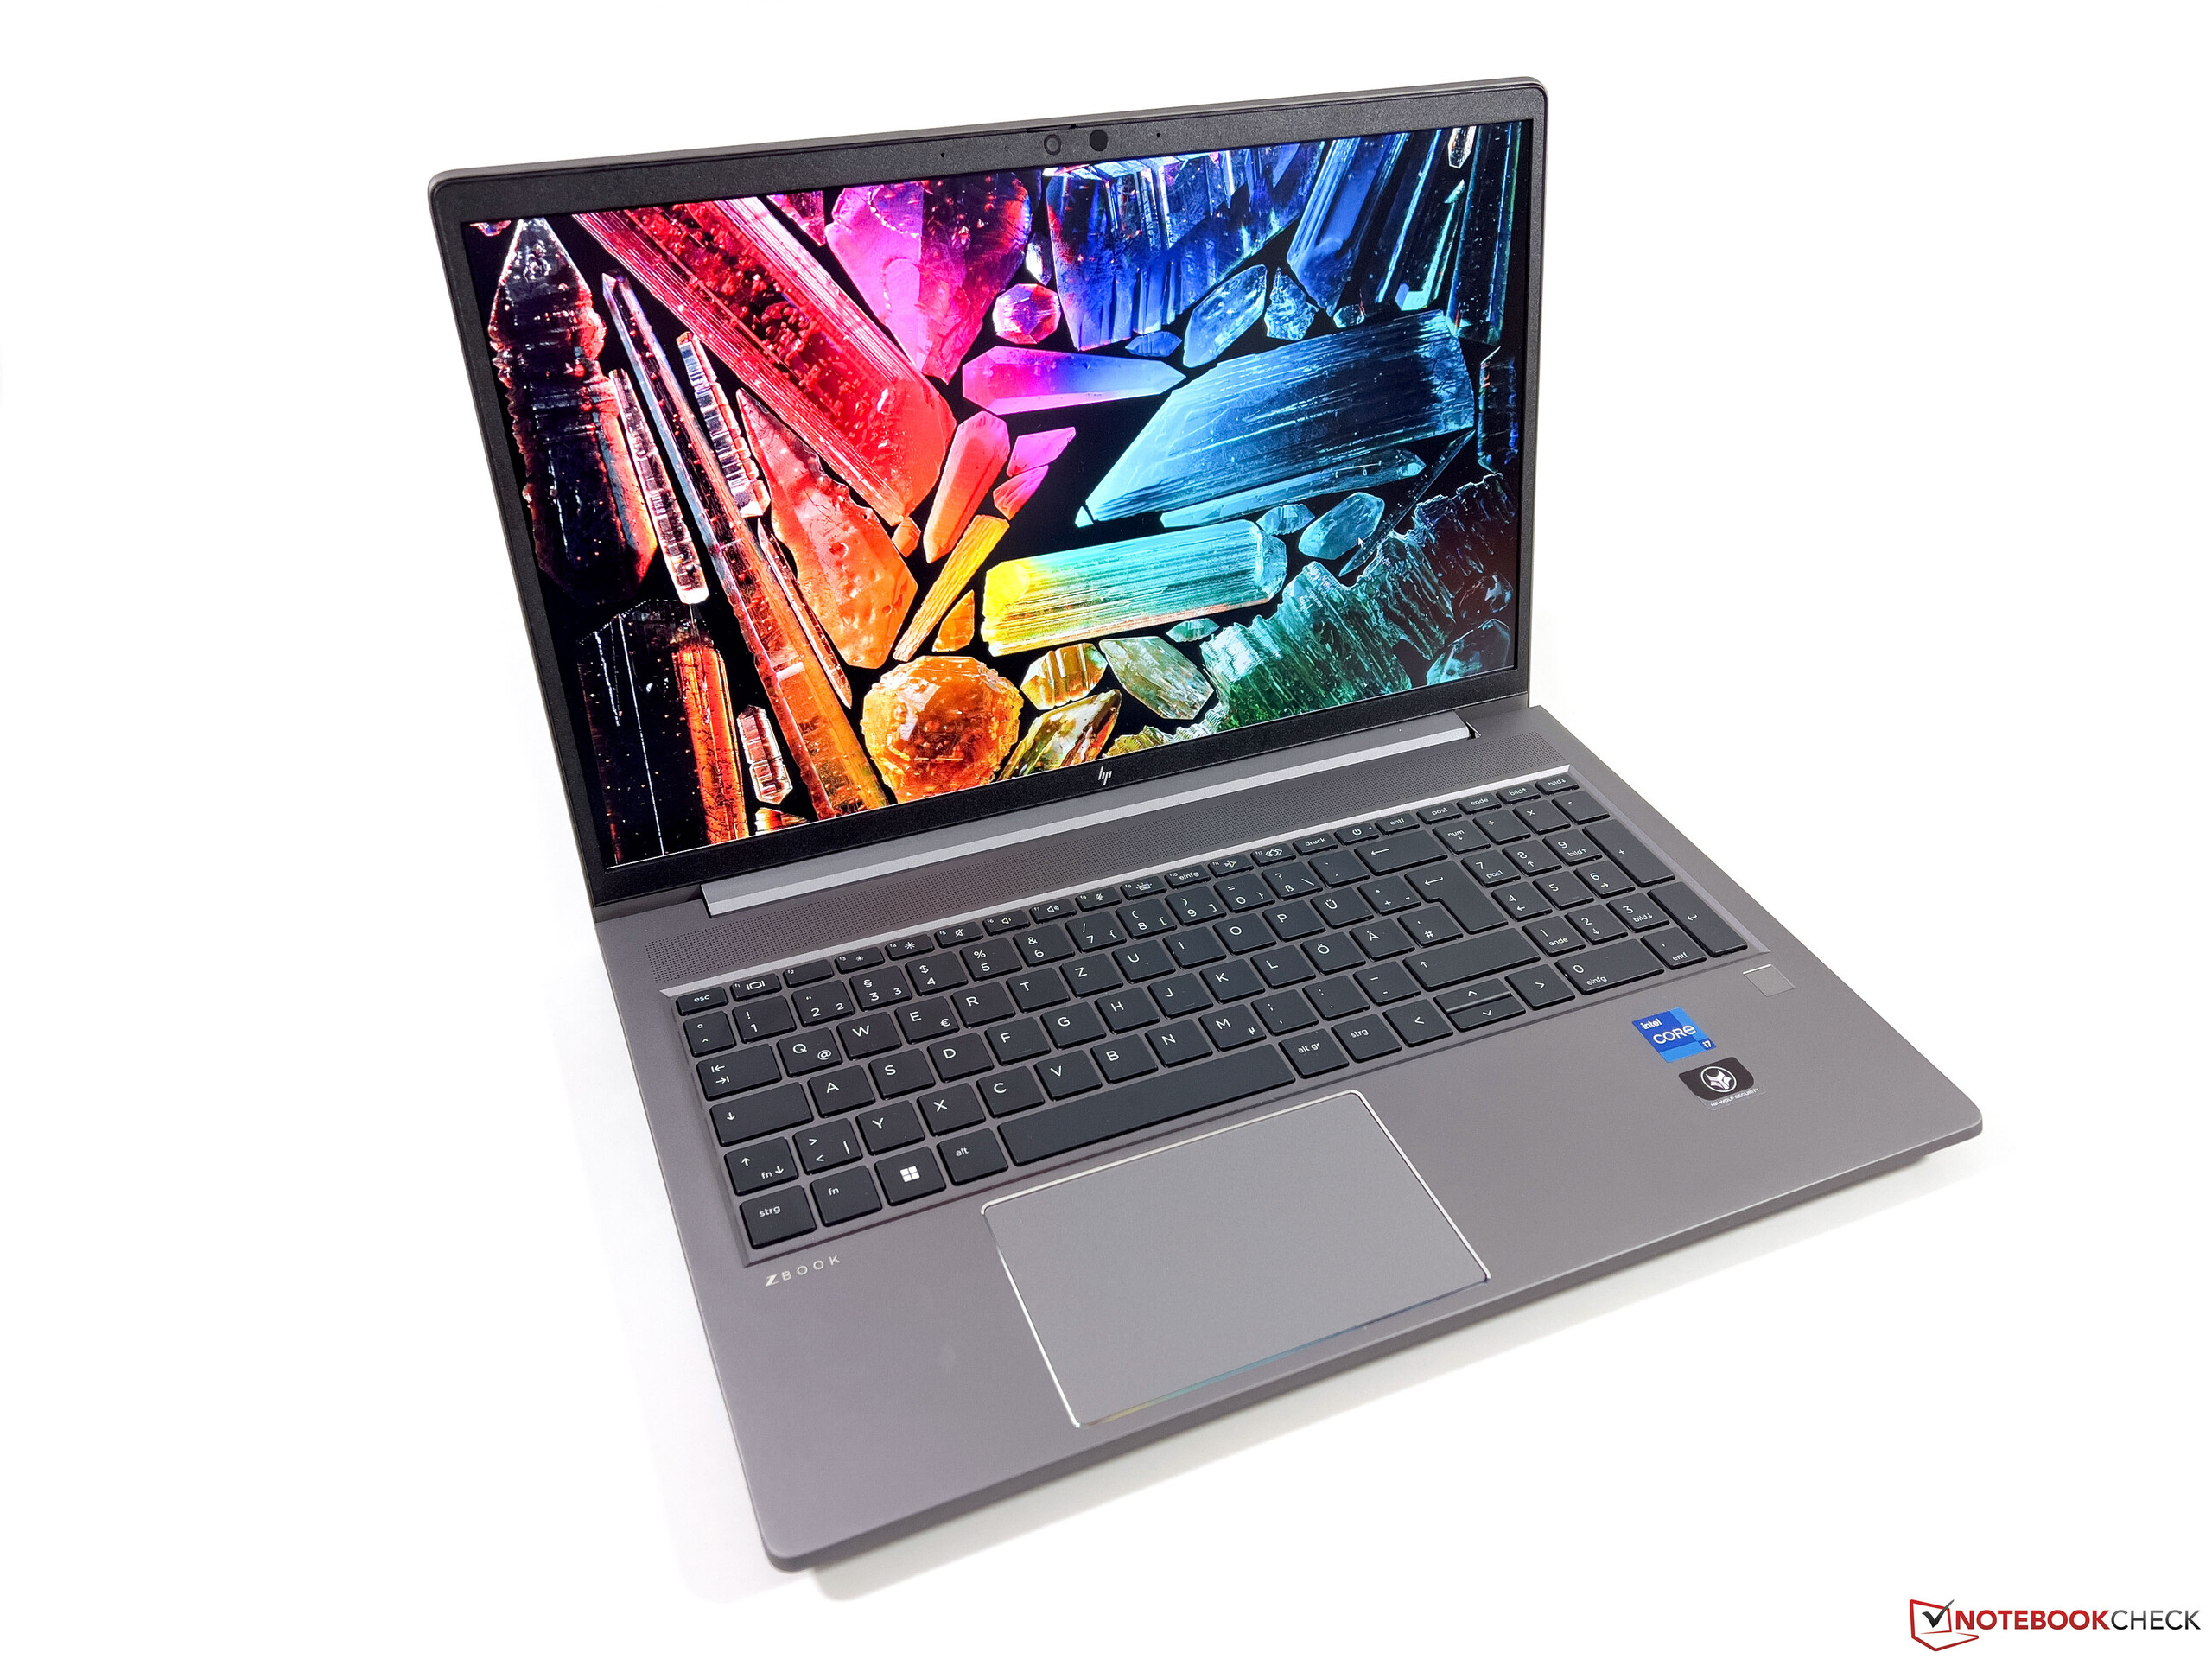
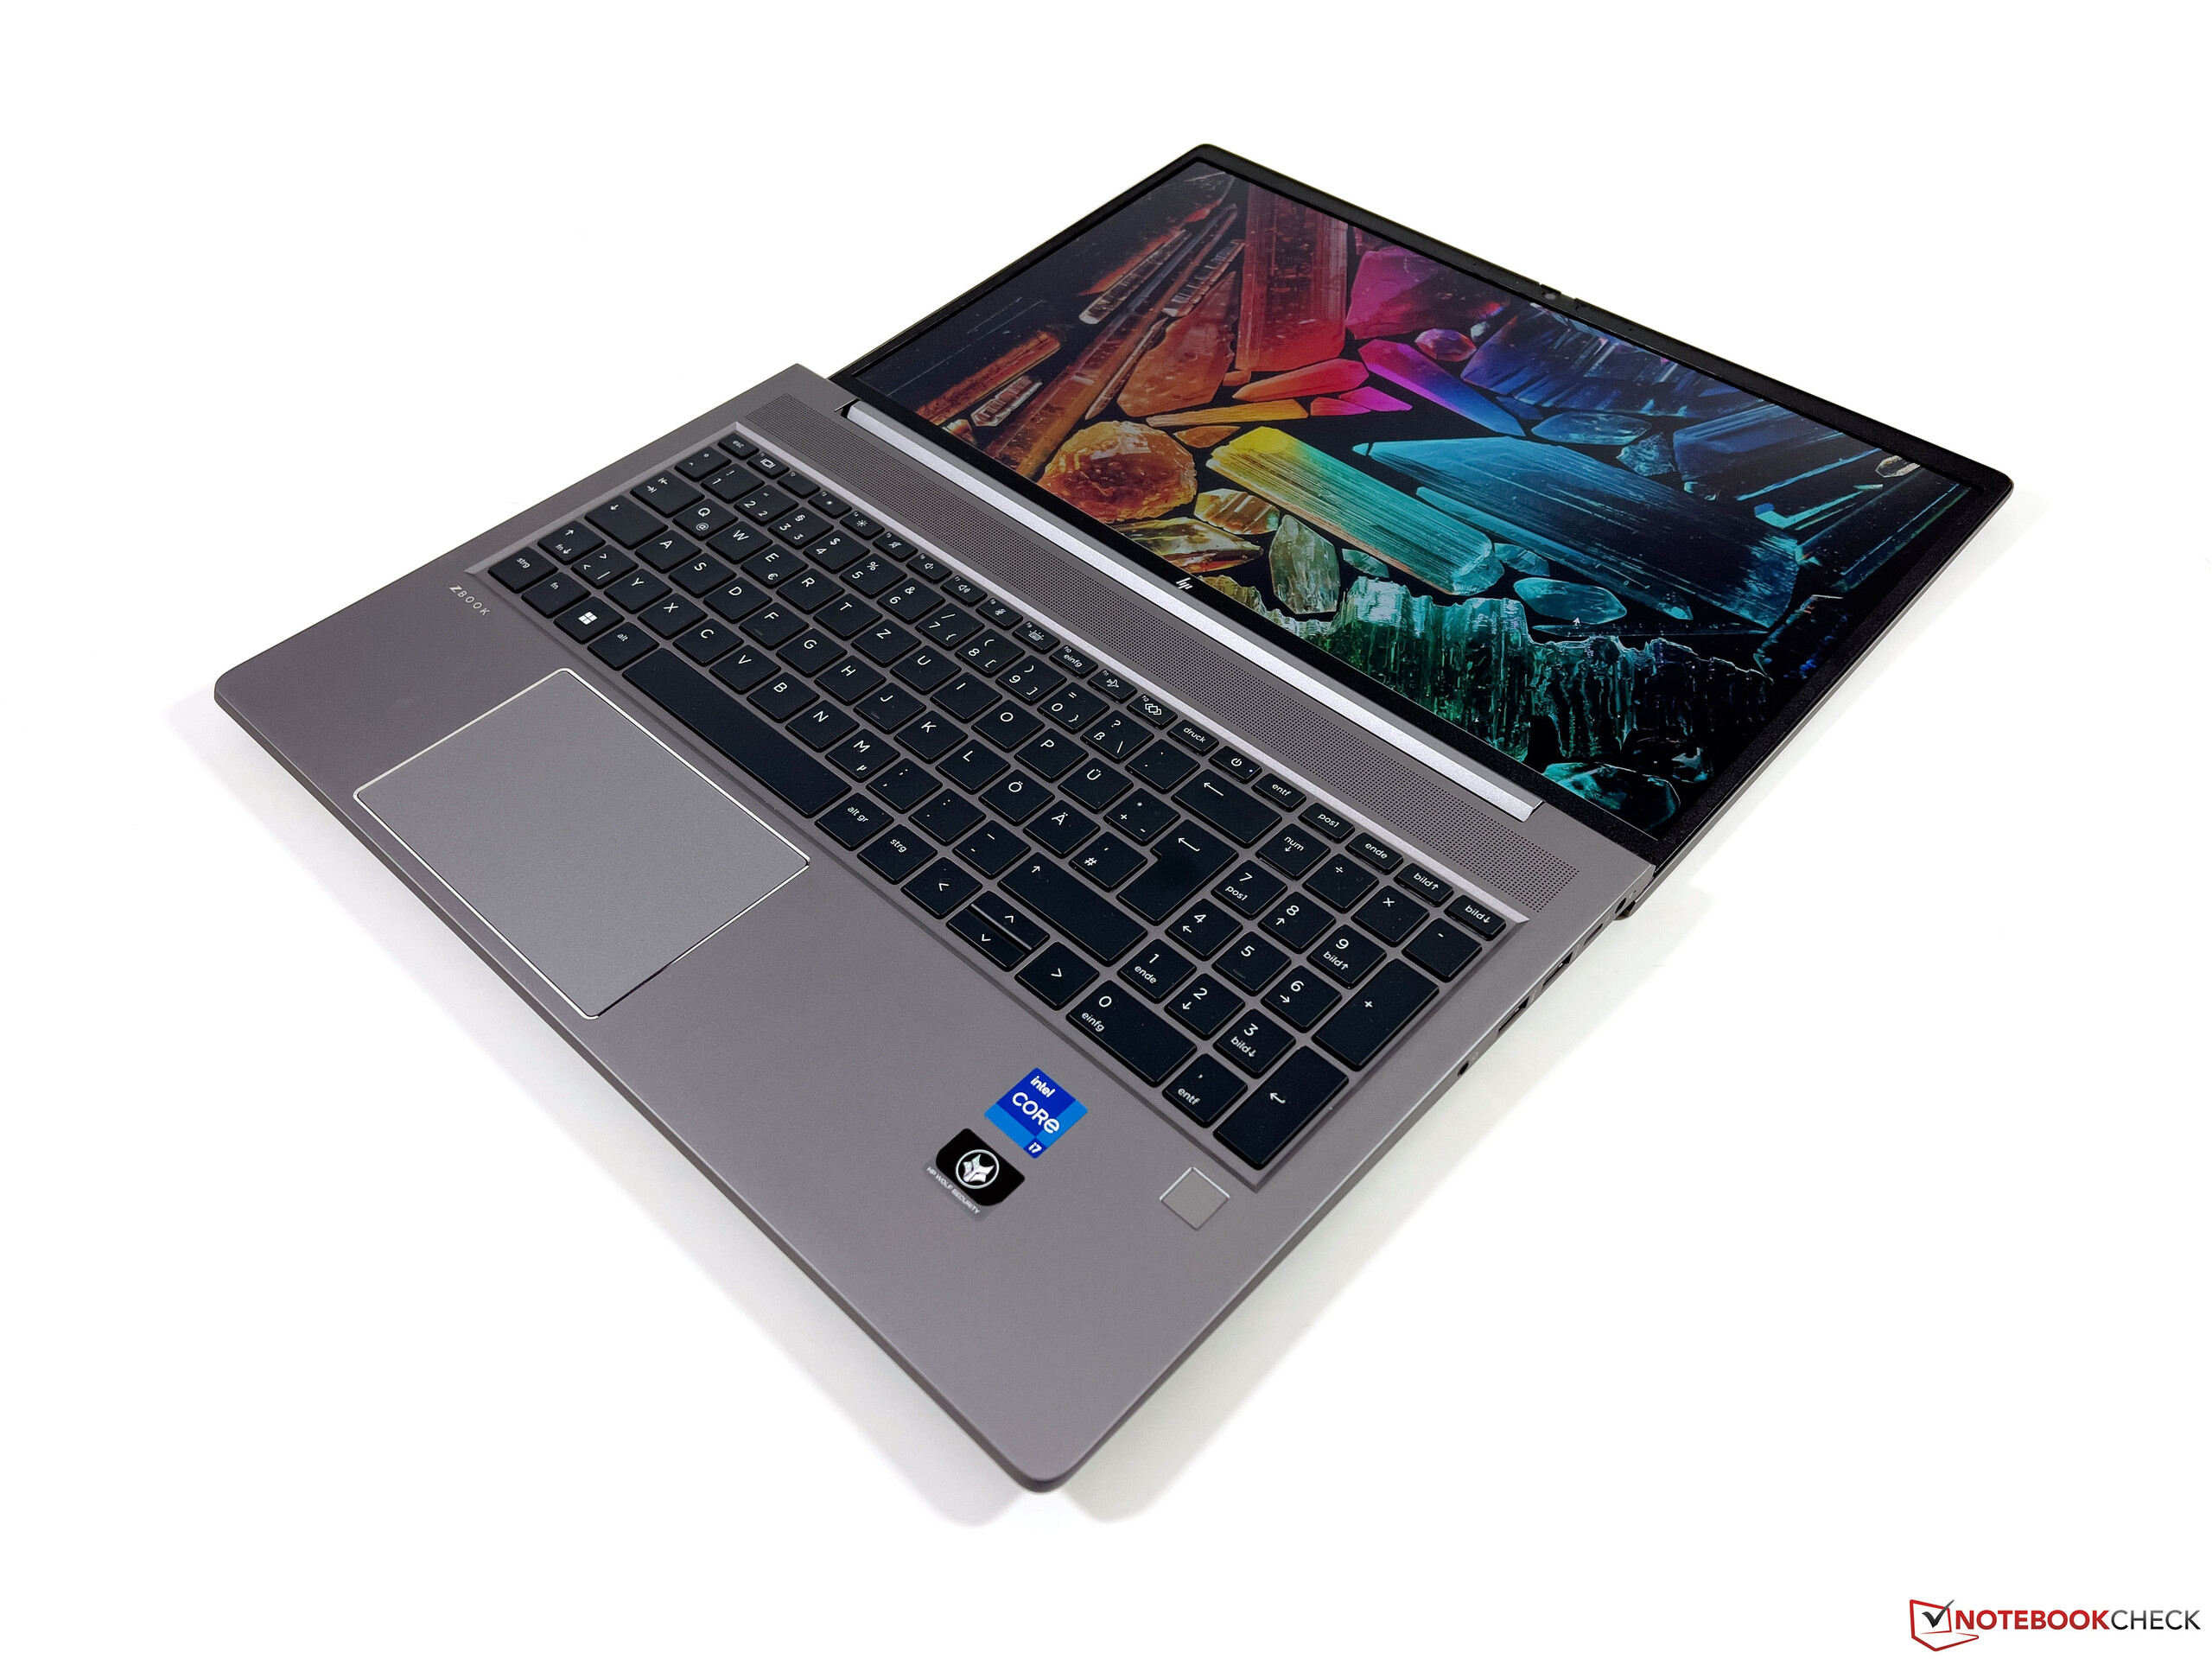
Recensione della workstation HP ZBook Power 15 G10: Eccellente alternativa al ThinkPad P15v

HP ZBook Power 15 G10 sostituisce lo ZBook Power 15 G9 dell'anno scorso, sostituendo le CPU Intel Alder Lake di 12a generazione con le più recenti Raptor Lake di 13a generazione e AMD Ryzen Zen 4. Per il resto, lo chassis è identico a quello dello ZBook Power 15 G9 o ZBook Power 15 G8 e quindi consigliamo di consultare le nostre recensioni precedenti per saperne di più sulle caratteristiche fisiche del modello.
La nostra specifica unità di recensione è la configurazione AMD di fascia più alta con CPU Ryzen 7 Pro 7940HS, GPU Nvidia RTX 2000 Ada, display IPS 1440p e 64 GB di RAM DDR5-5600 per circa 2600 dollari. Sono disponibili anche SKU inferiori, a partire da Ryzen 5 7640HS, display 1080p e solo grafica integrata, a partire da 1600 dollari. Si noti che le configurazioni con CPU Intel si chiamano ZBook Power 15 G10, mentre quelle con CPU AMD sono vendute come ZBook Power 15 G10 A.
Le alternative allo ZBook Power 15 G10 includono altre workstation ultrasottili come Dell Precision 5560, Lenovo ThinkPad P15v G3, o Asus ExpertBook B6 Flip.
Altre recensioni HP:
Potenziali concorrenti a confronto
Punteggio | Data | Modello | Peso | Altezza | Dimensione | Risoluzione | Prezzo |
|---|---|---|---|---|---|---|---|
| 88.9 % v7 (old) | 12/2023 | HP ZBook Power 15 G10 R7 PRO 7840HS, RTX 2000 Ada Generation Laptop | 2 kg | 22.9 mm | 15.60" | 2560x1440 | |
| 87.4 % v7 (old) | 01/2023 | HP ZBook Power 15 G9 6B8C4EA i7-12700H, RTX A2000 Laptop GPU | 2 kg | 22.8 mm | 15.60" | 3840x2160 | |
| 87.8 % v7 (old) | 04/2023 | Lenovo ThinkPad P15v G3 21EM001AGE R7 PRO 6850H, RTX A2000 Laptop GPU | 2.2 kg | 22.7 mm | 15.60" | 3840x2160 | |
| 88.3 % v7 (old) | 10/2021 | Dell Precision 5000 5560 i7-11850H, RTX A2000 Laptop GPU | 2 kg | 18 mm | 15.60" | 3840x2400 | |
| 91.7 % v7 (old) | 10/2023 | Lenovo ThinkPad P1 G6-21FV000DGE i9-13900H, RTX 2000 Ada Generation Laptop | 1.9 kg | 17.5 mm | 16.00" | 2560x1600 | |
| 89.6 % v7 (old) | 01/2023 | Asus ExpertBook B6 Flip B6602FC2 i9-12950HX, RTX A2000 Laptop GPU | 2.8 kg | 27.2 mm | 16.00" | 2560x1600 |
Caso
Comunicazione
| Networking | |
| iperf3 transmit AX12 | |
| Dell Precision 5000 5560 | |
| iperf3 receive AX12 | |
| Dell Precision 5000 5560 | |
| iperf3 transmit AXE11000 | |
| HP ZBook Power 15 G10 | |
| Lenovo ThinkPad P1 G6-21FV000DGE | |
| Asus ExpertBook B6 Flip B6602FC2 | |
| Lenovo ThinkPad P15v G3 21EM001AGE | |
| iperf3 receive AXE11000 | |
| Lenovo ThinkPad P1 G6-21FV000DGE | |
| Lenovo ThinkPad P15v G3 21EM001AGE | |
| Asus ExpertBook B6 Flip B6602FC2 | |
| HP ZBook Power 15 G10 | |
| iperf3 transmit AXE11000 6GHz | |
| HP ZBook Power 15 G9 6B8C4EA | |
| HP ZBook Power 15 G10 | |
| Asus ExpertBook B6 Flip B6602FC2 | |
| Lenovo ThinkPad P15v G3 21EM001AGE | |
| iperf3 receive AXE11000 6GHz | |
| HP ZBook Power 15 G9 6B8C4EA | |
| Asus ExpertBook B6 Flip B6602FC2 | |
| Lenovo ThinkPad P15v G3 21EM001AGE | |
| HP ZBook Power 15 G10 | |
Webcam
Mentre il nostro ZBook Power G9 era configurato con una webcam da 1 MP, il nostro Power G10 è dotato di una webcam da 5 MP, per un'immagine molto più nitida. Le funzioni IR e l'otturatore fisico rimangono invariate.


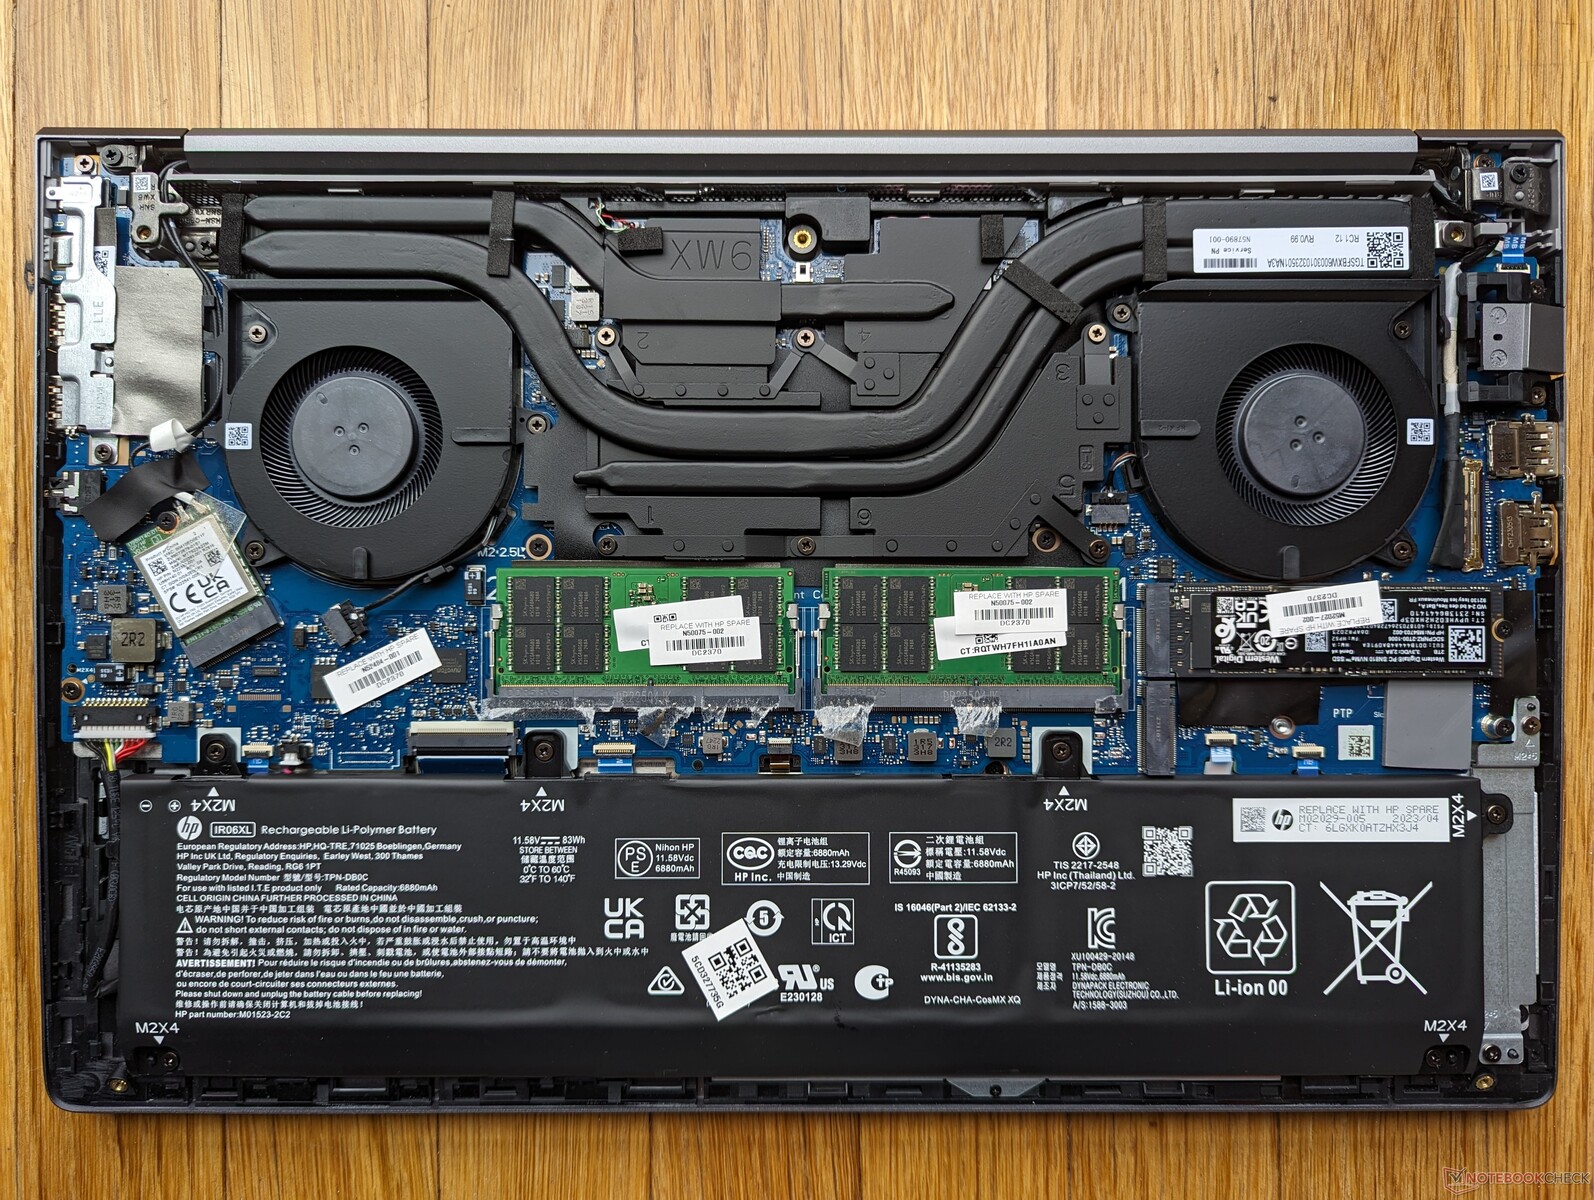
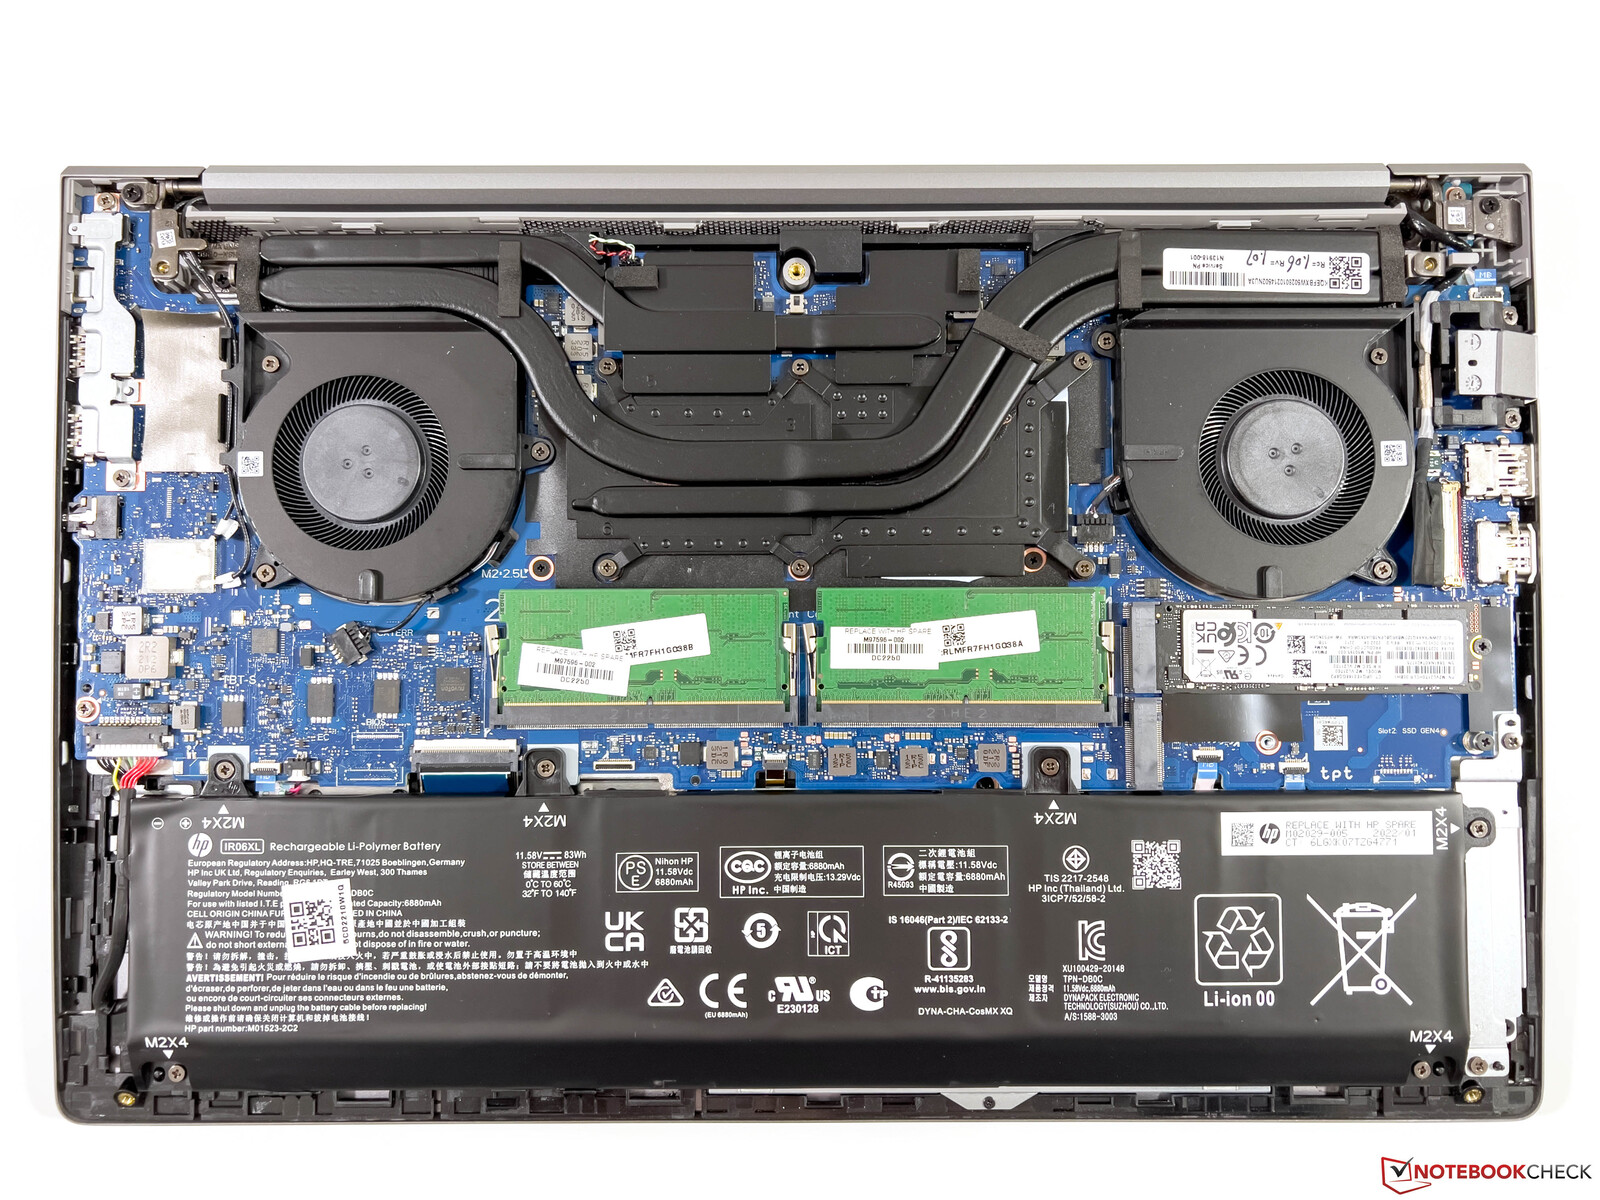
Manutenzione
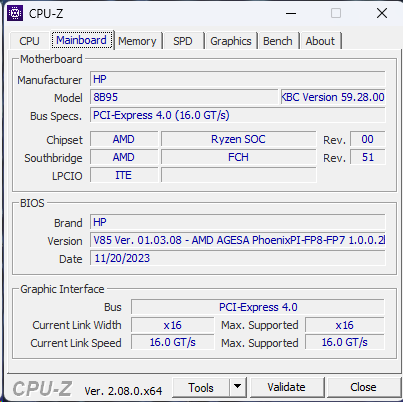
HP ha apportato un piccolo ma notevole cambiamento: il modulo WLAN M.2 è ora sostituibile, mentre era saldato sullo ZBook Power 15 G9 dello scorso anno. Quasi tutto il resto rimane intatto, compresi i due slot DDR5 SODIMM e i due slot M.2 PCIe4 x4.
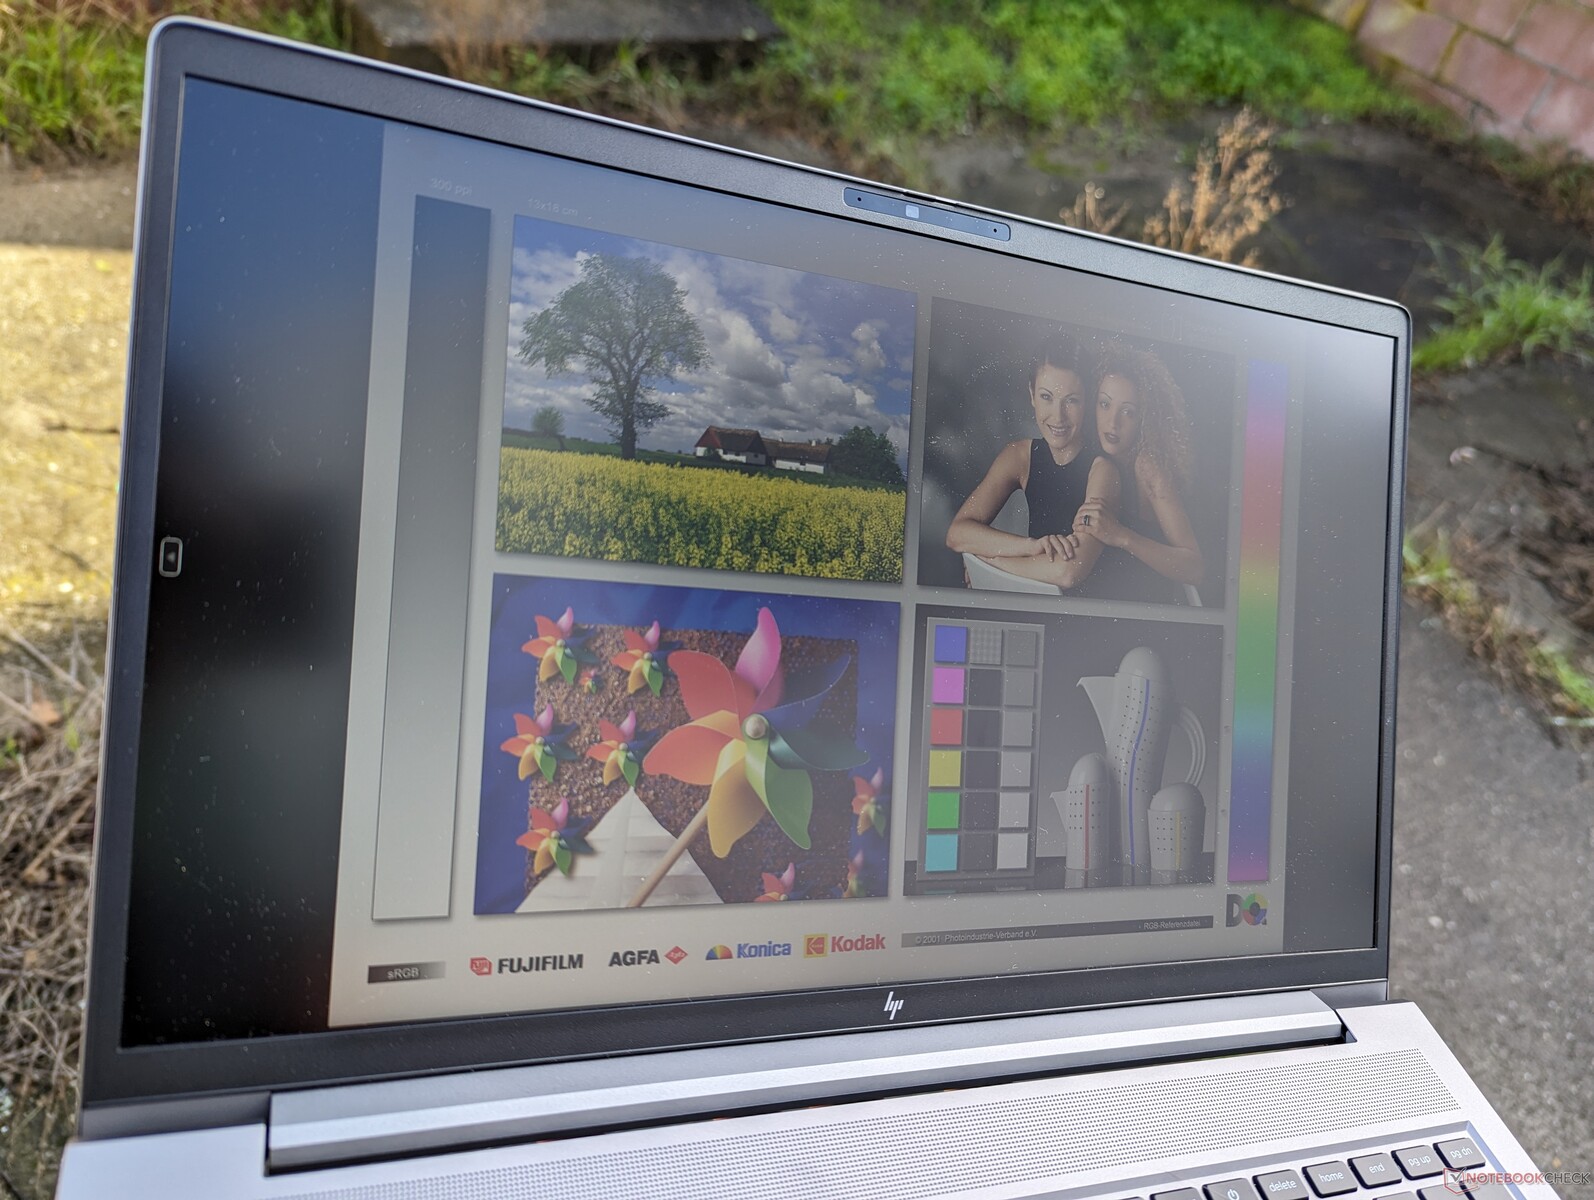
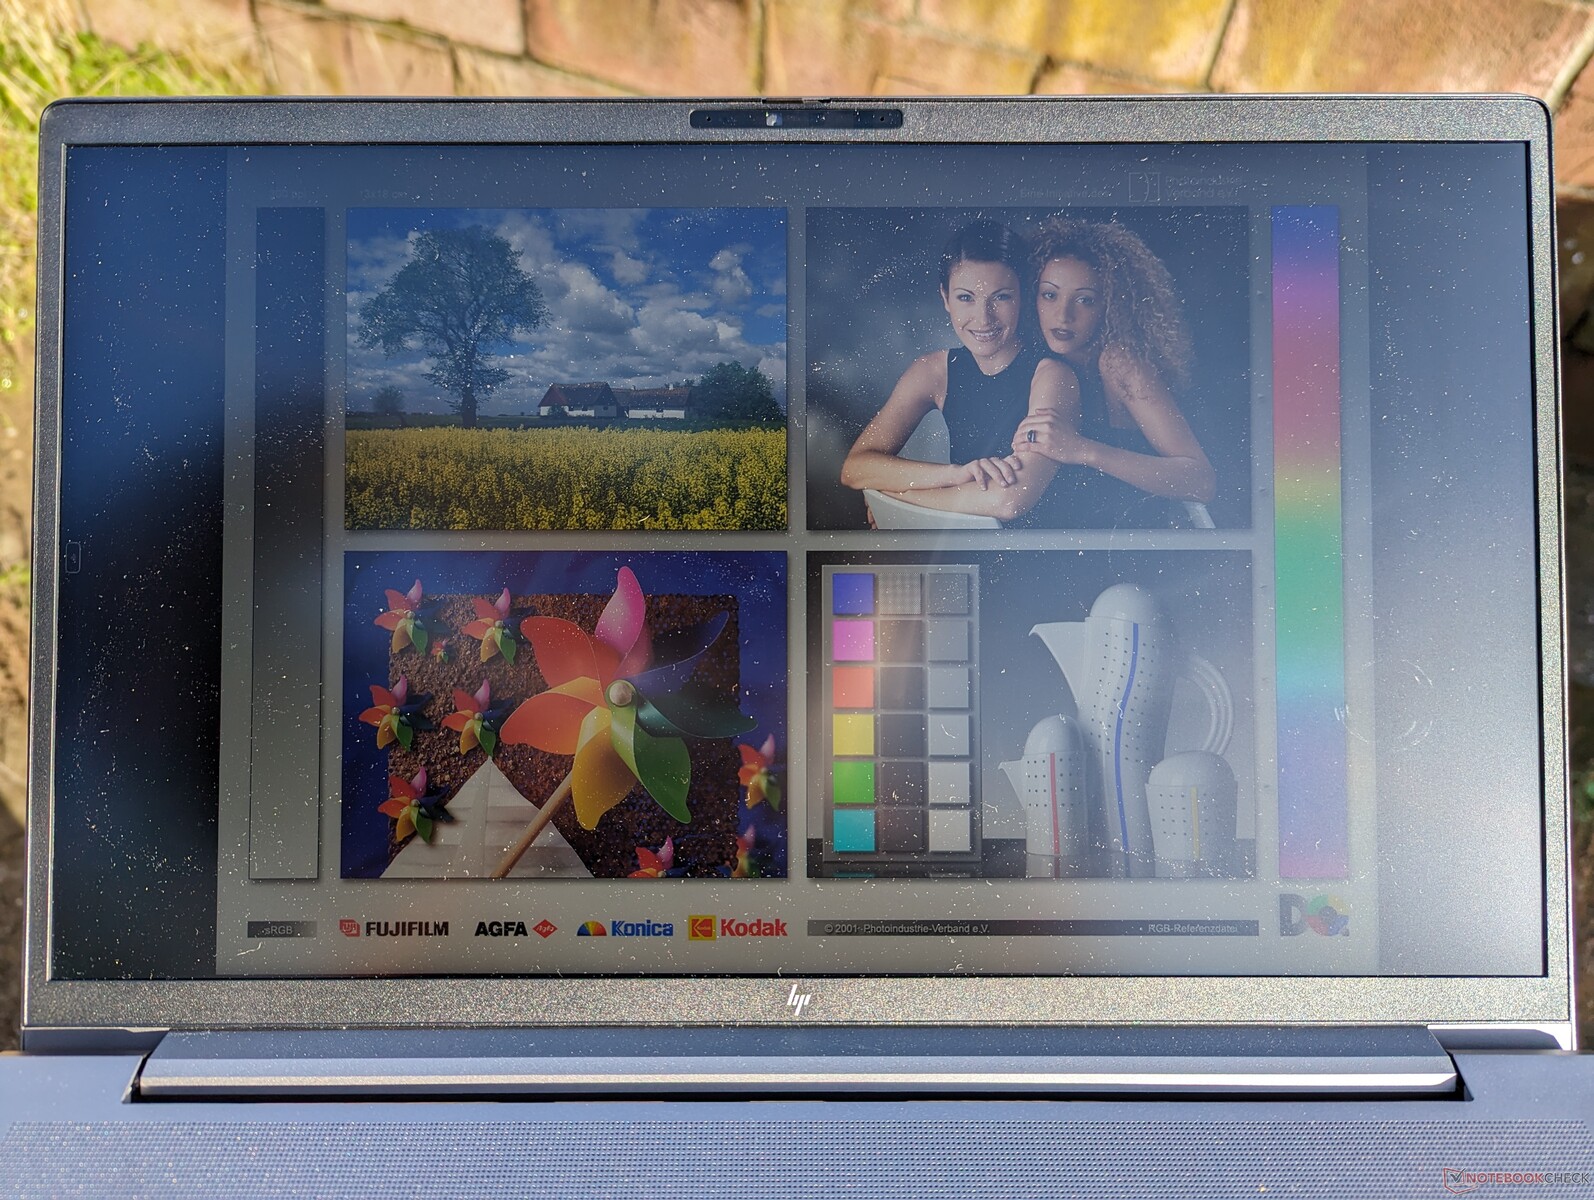
Display
Il modello offre quattro opzioni di display opaco, come segue:
- 1080p, 250 nit, 60% sRGB, touchscreen
- 1080p, 250 nits, 60% sRGB, non touchscreen
- 1080p, 400 nits, 100% sRGB, non touchscreen
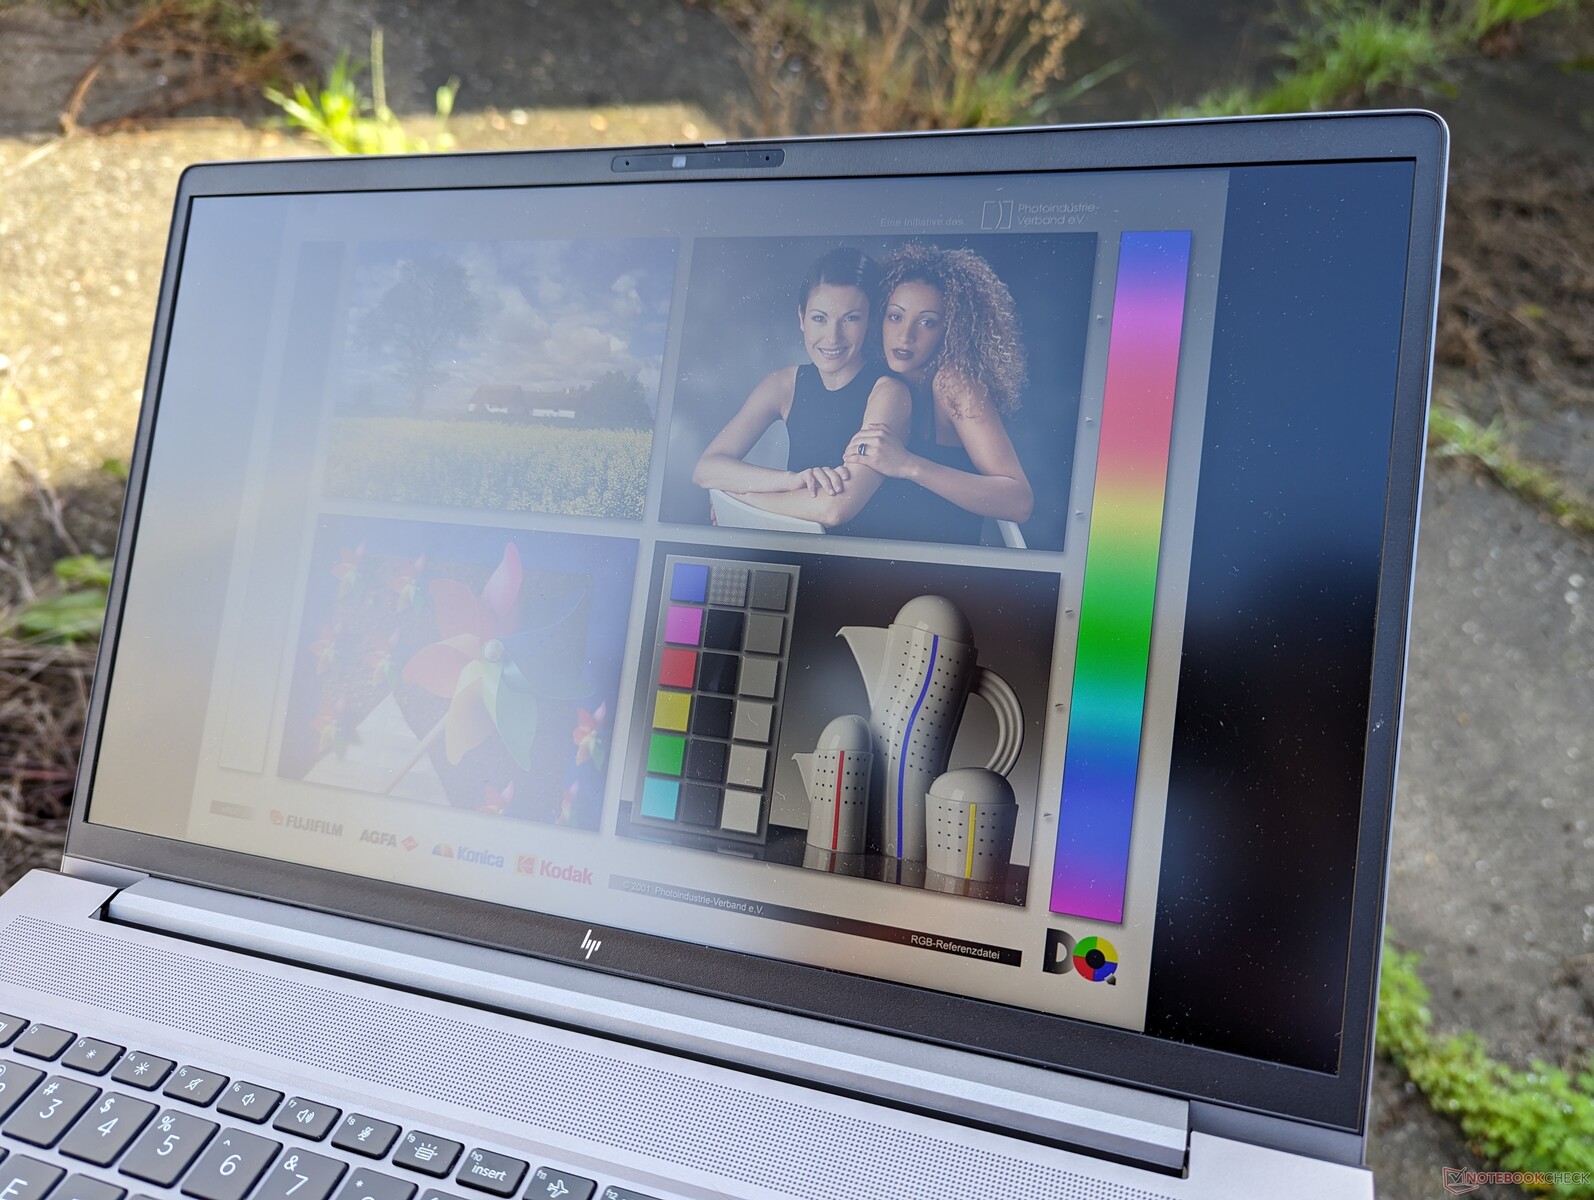
- 1440p, 300 nits, 100% sRGB, non touch, 120 Hz
A meno che il touchscreen non sia un must, consigliamo di evitare le due opzioni da 250 nit, in quanto ciascuna copre solo il 45% di NTSC, con colori sensibilmente più scuri.
Per ragioni sconosciute, HP non offre opzioni 4K per nessuna configurazione di ZBook Power G10, anche se in precedenza erano disponibili su ZBook Power G9. Sospettiamo che ciò possa essere dovuto a problemi di approvvigionamento, in quanto i produttori stanno abbandonando i pannelli 16:9 da 15,6 pollici per passare a quelli 16:10 da 16 pollici.
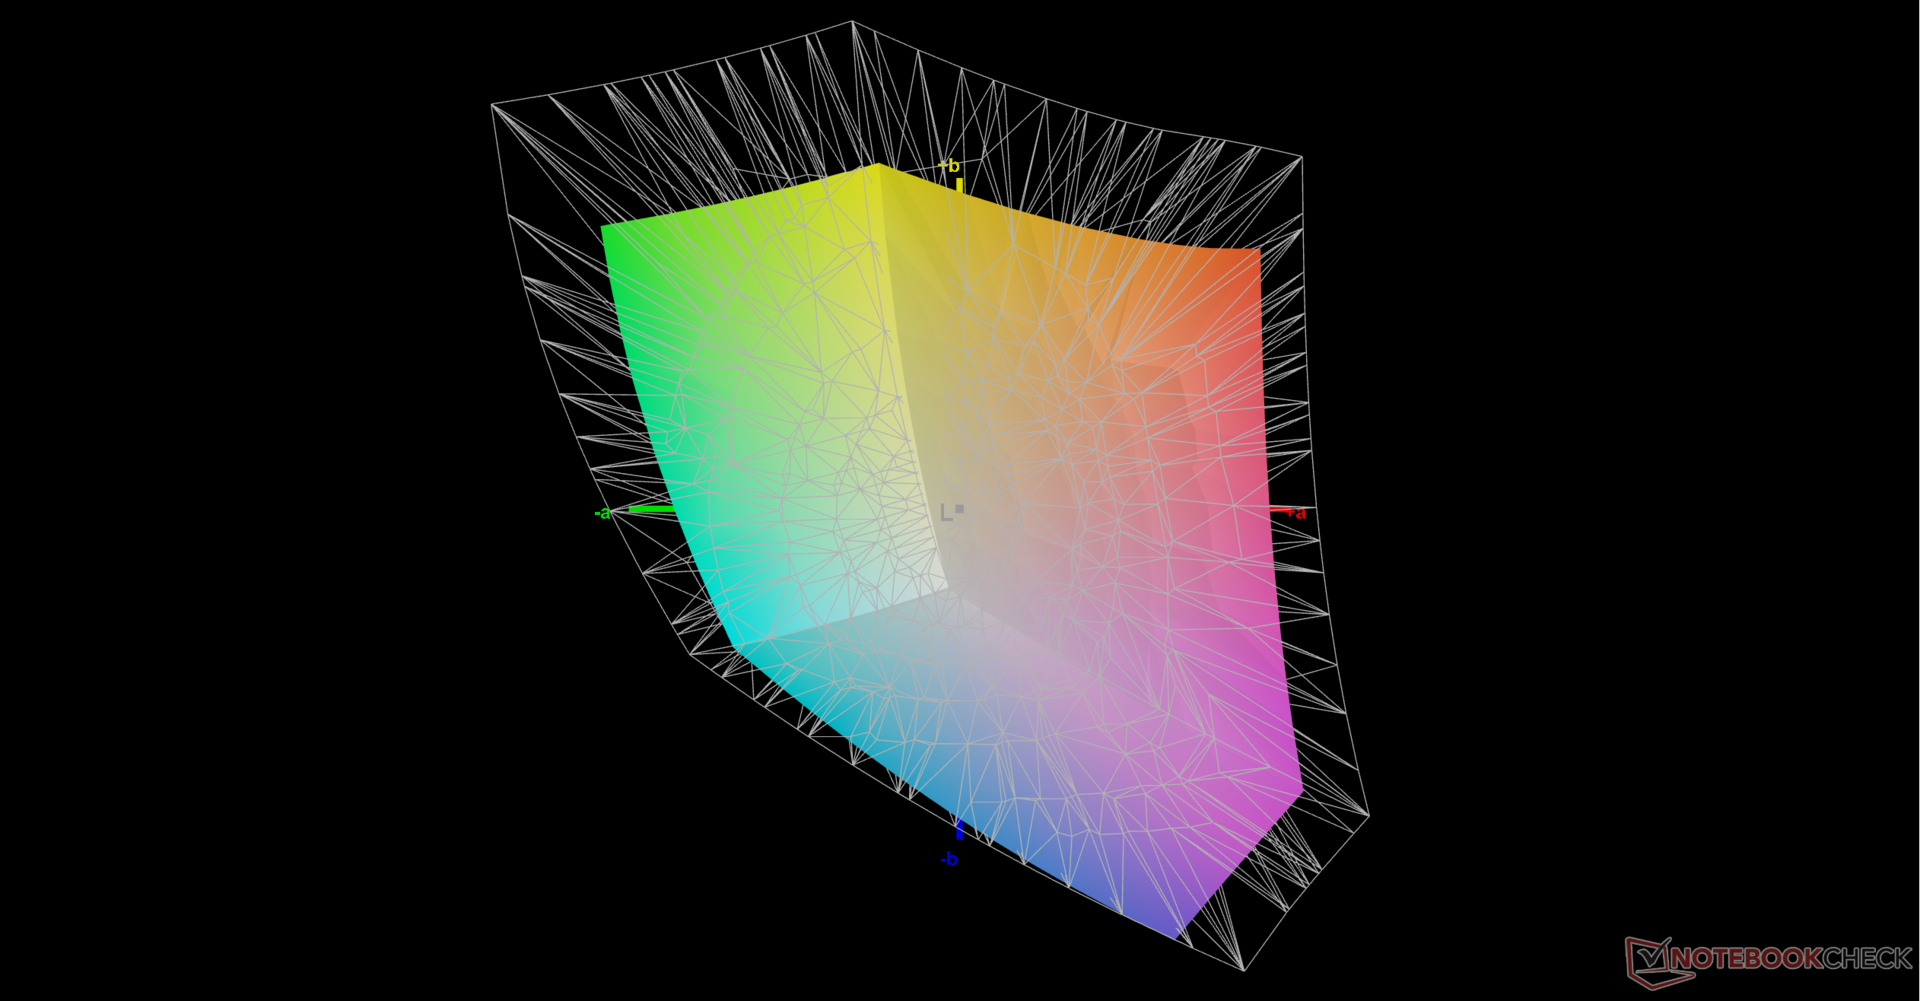
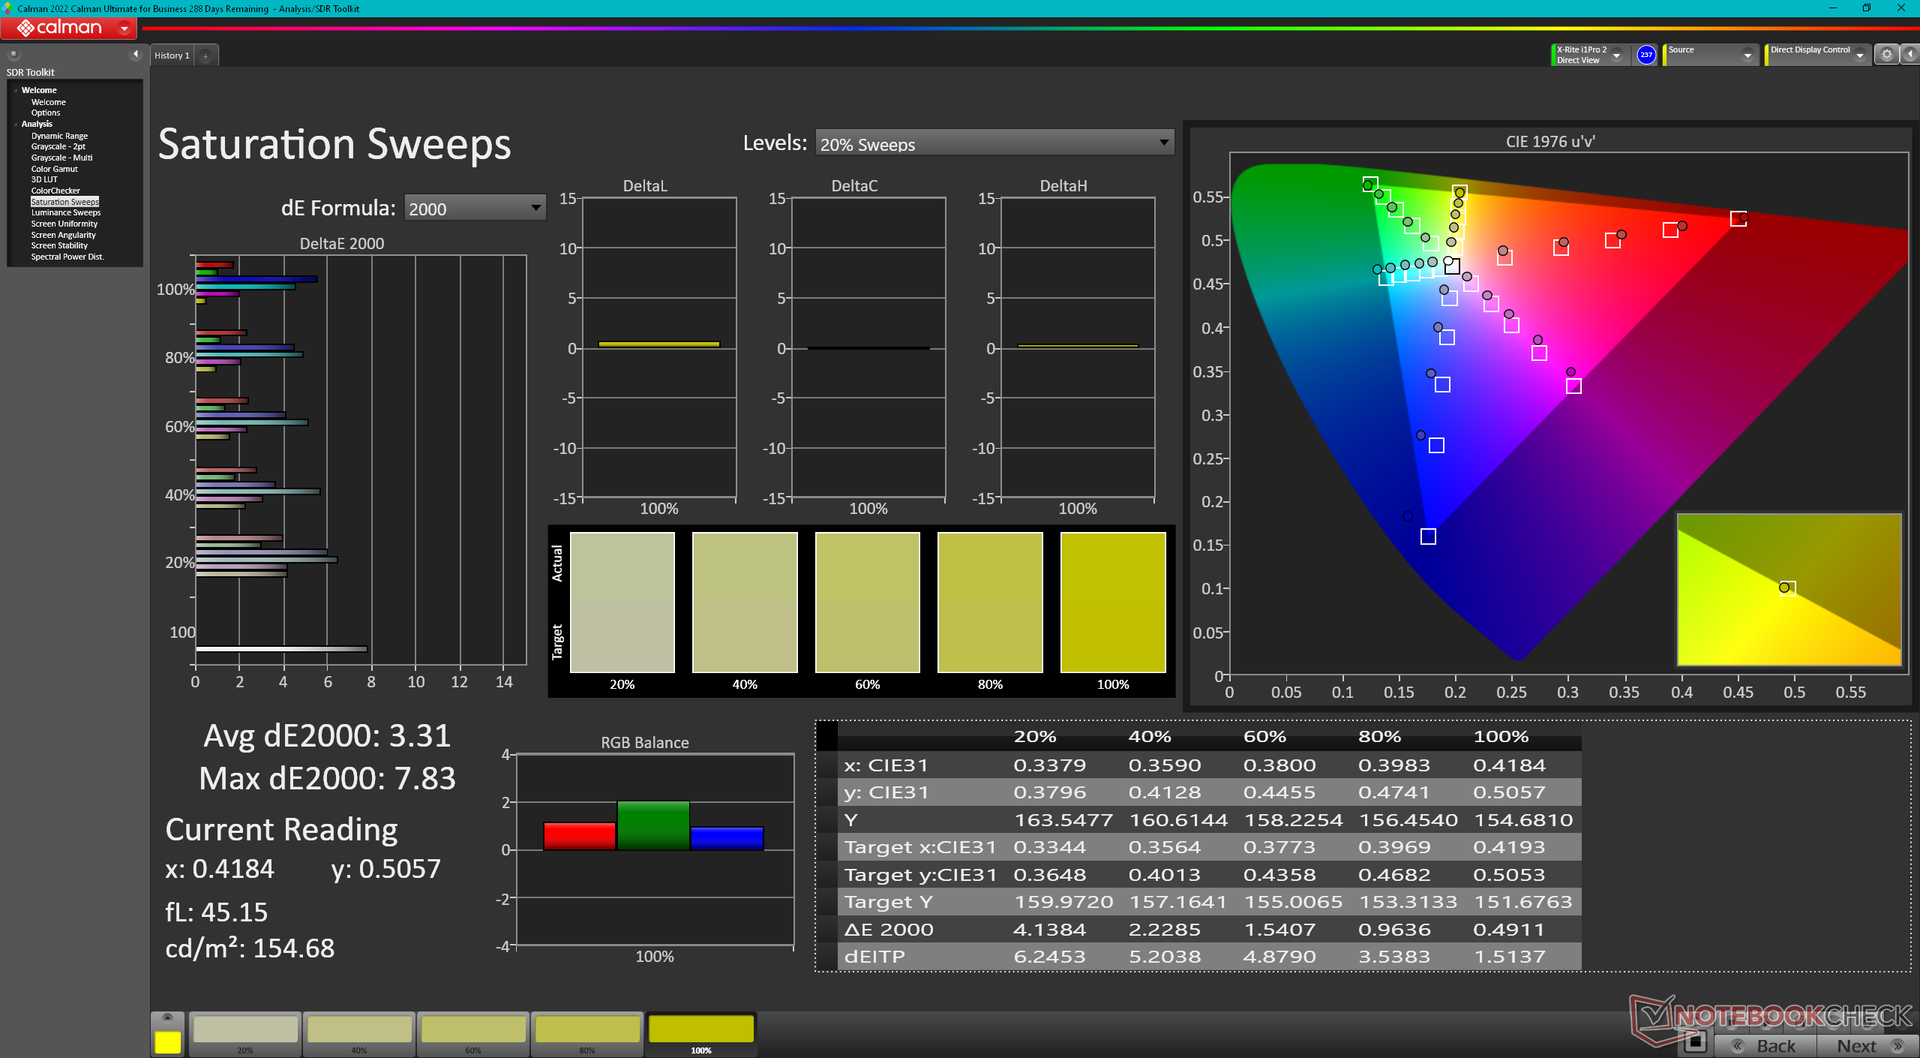
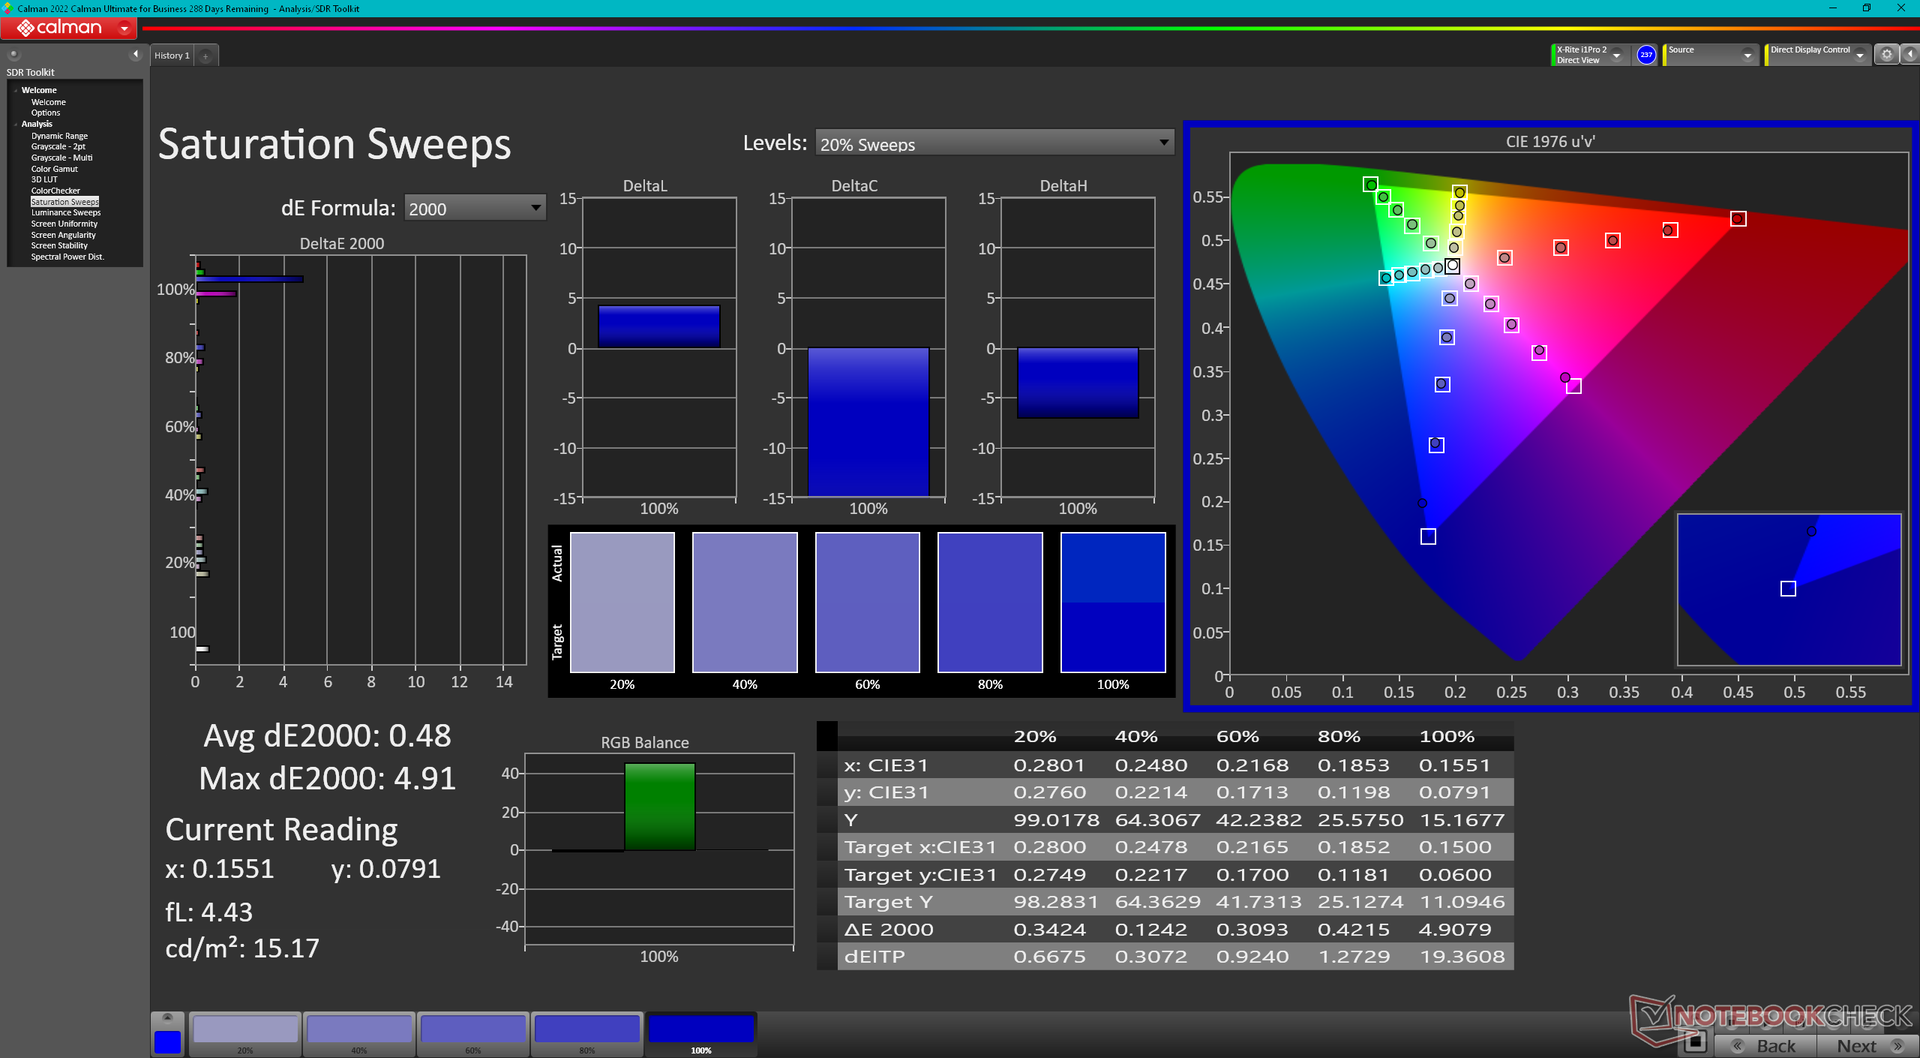
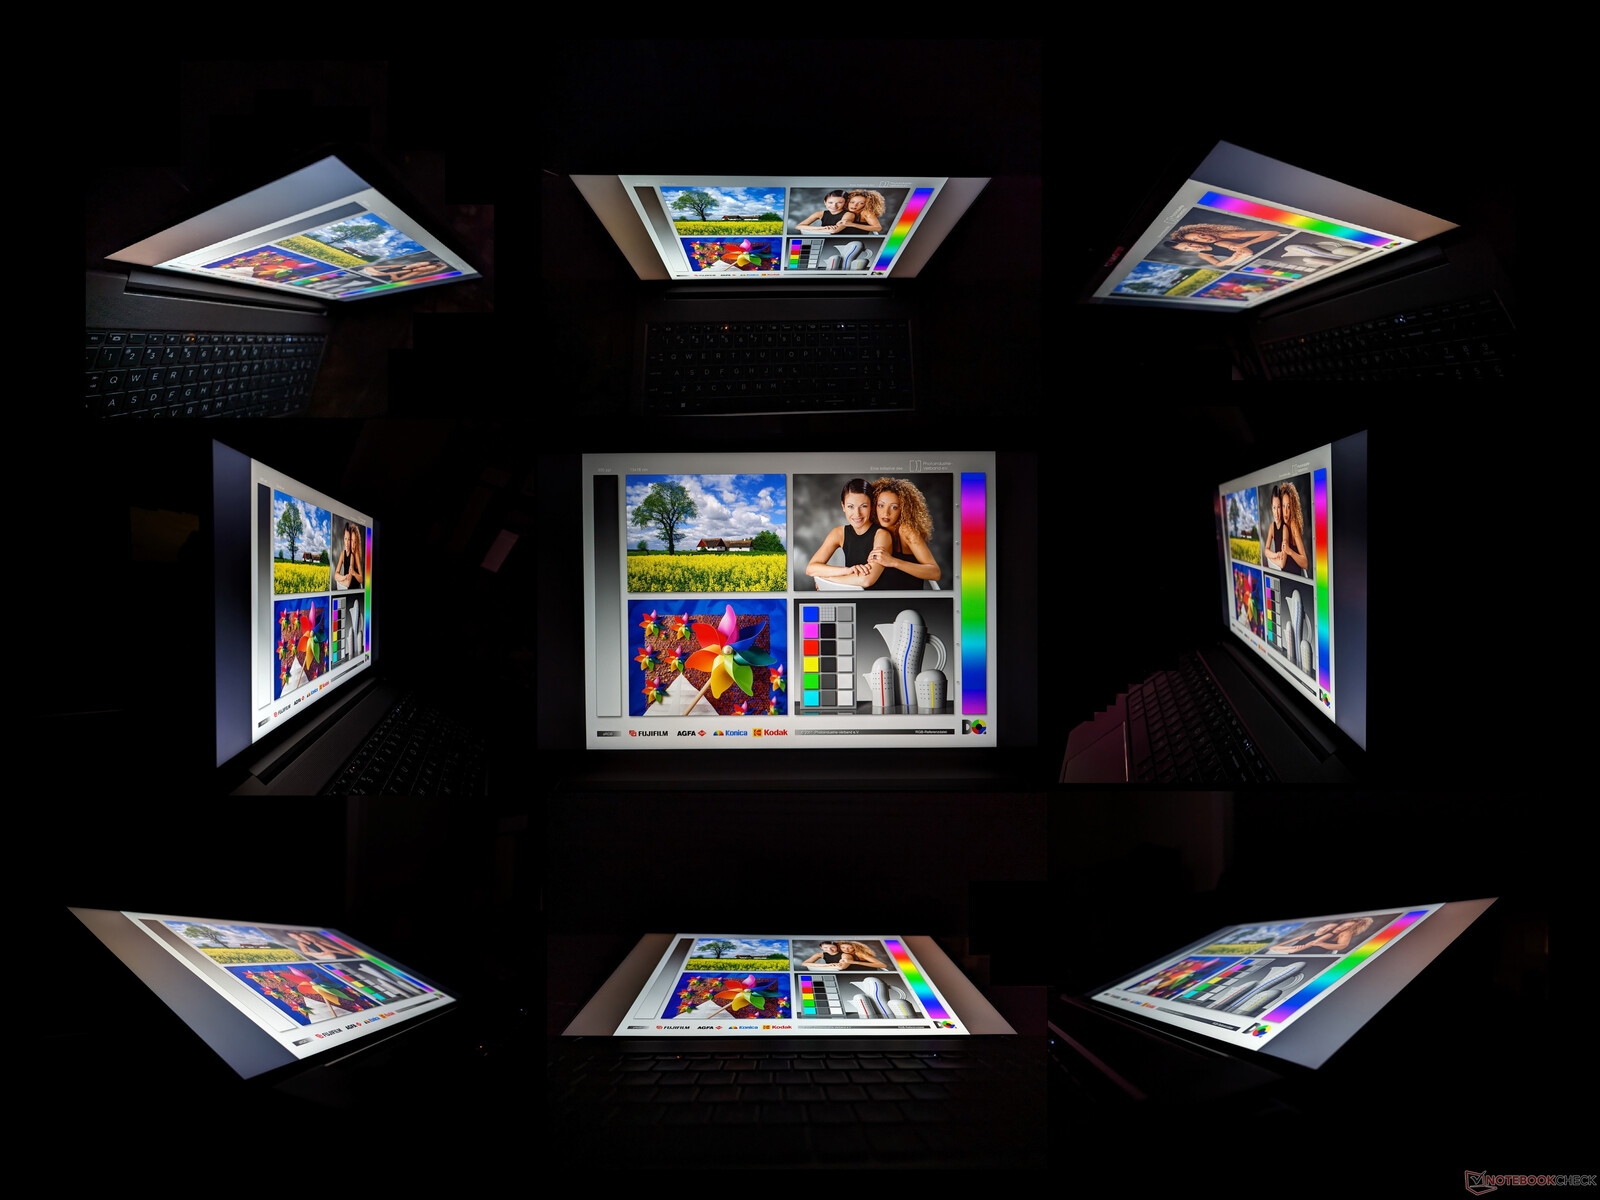
Il nostro pannello 1440p è comunque eccellente con la sua velocità di aggiornamento, i tempi di risposta rapidi e i colori sRGB accurati, adatti alla creazione di contenuti e anche al gioco. Non sarà OLED o 4K, ma è comunque uno dei migliori display IPS da 15,6 pollici in circolazione.

| |||||||||||||||||||||||||
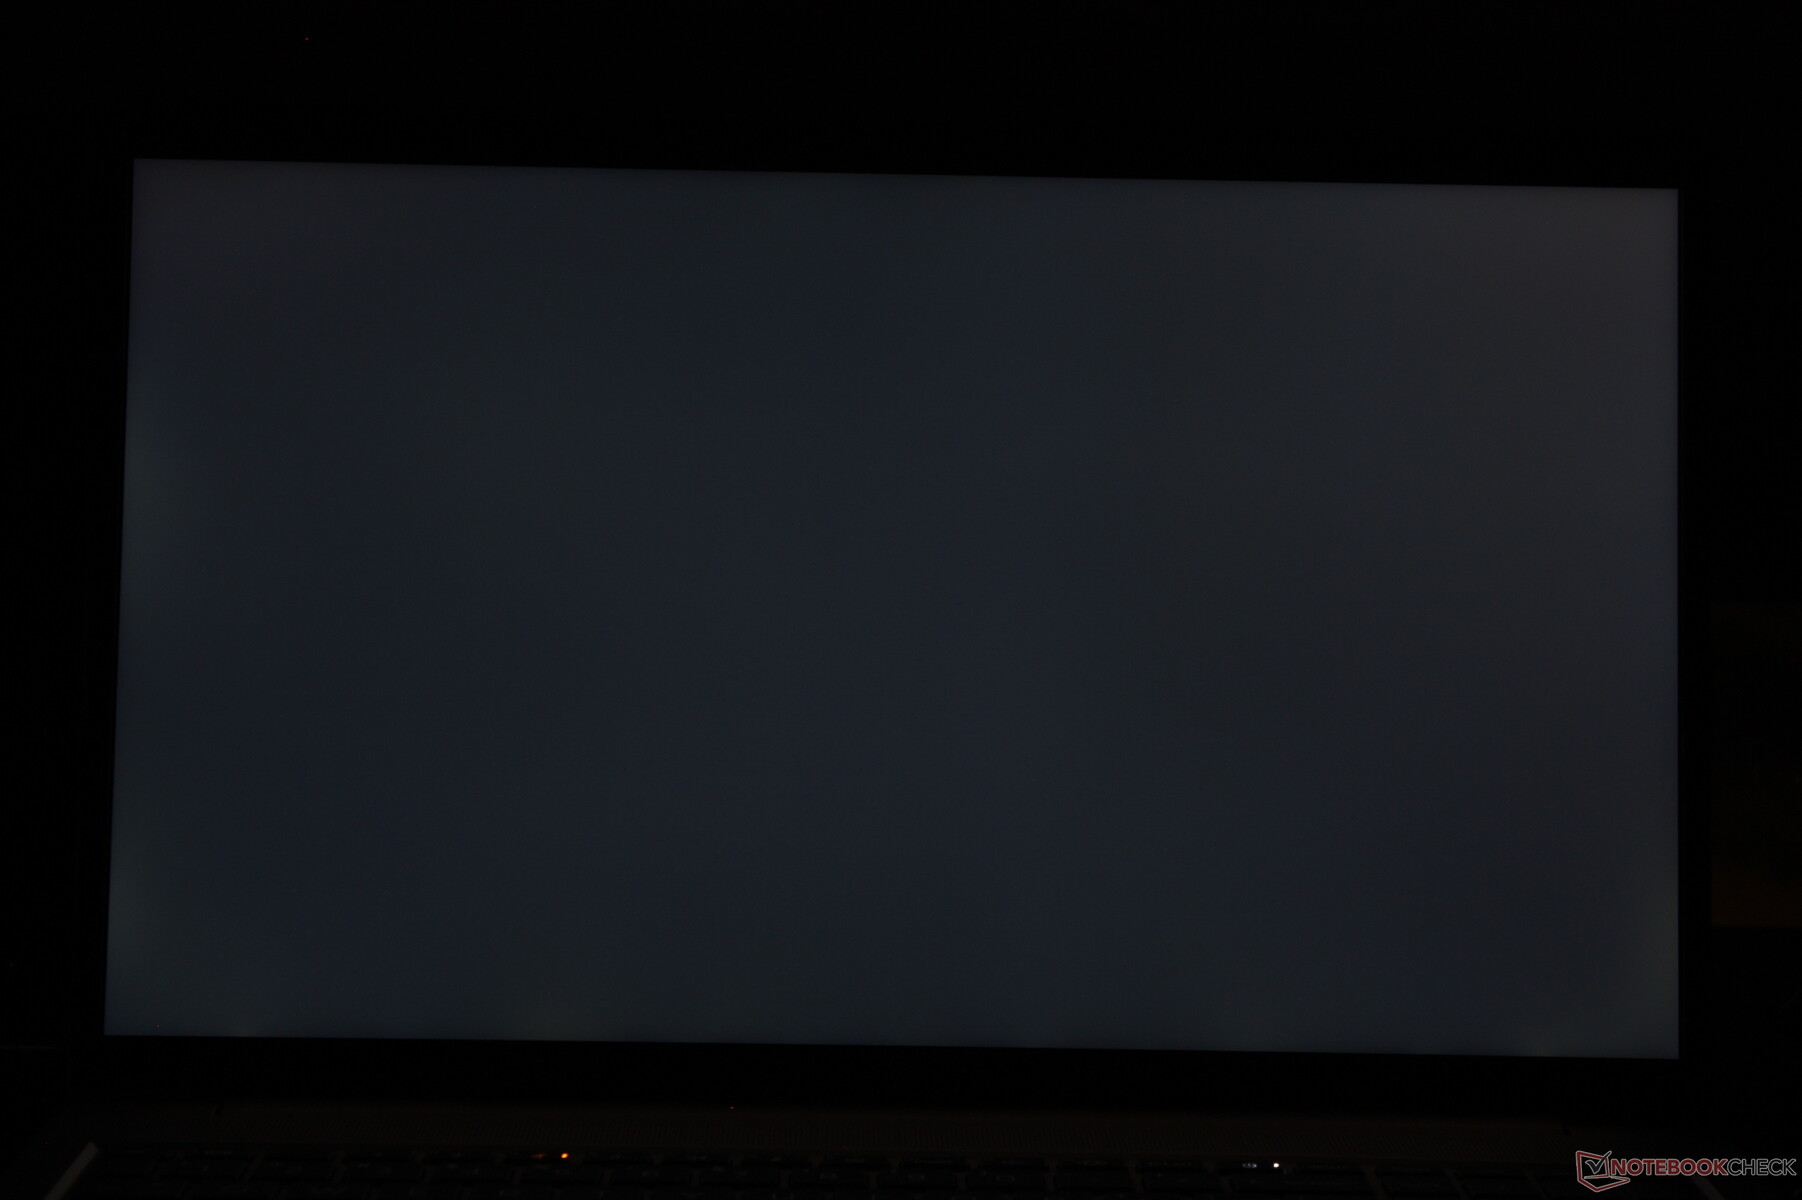
Distribuzione della luminosità: 83 %
Al centro con la batteria: 313.8 cd/m²
Contrasto: 1082:1 (Nero: 0.29 cd/m²)
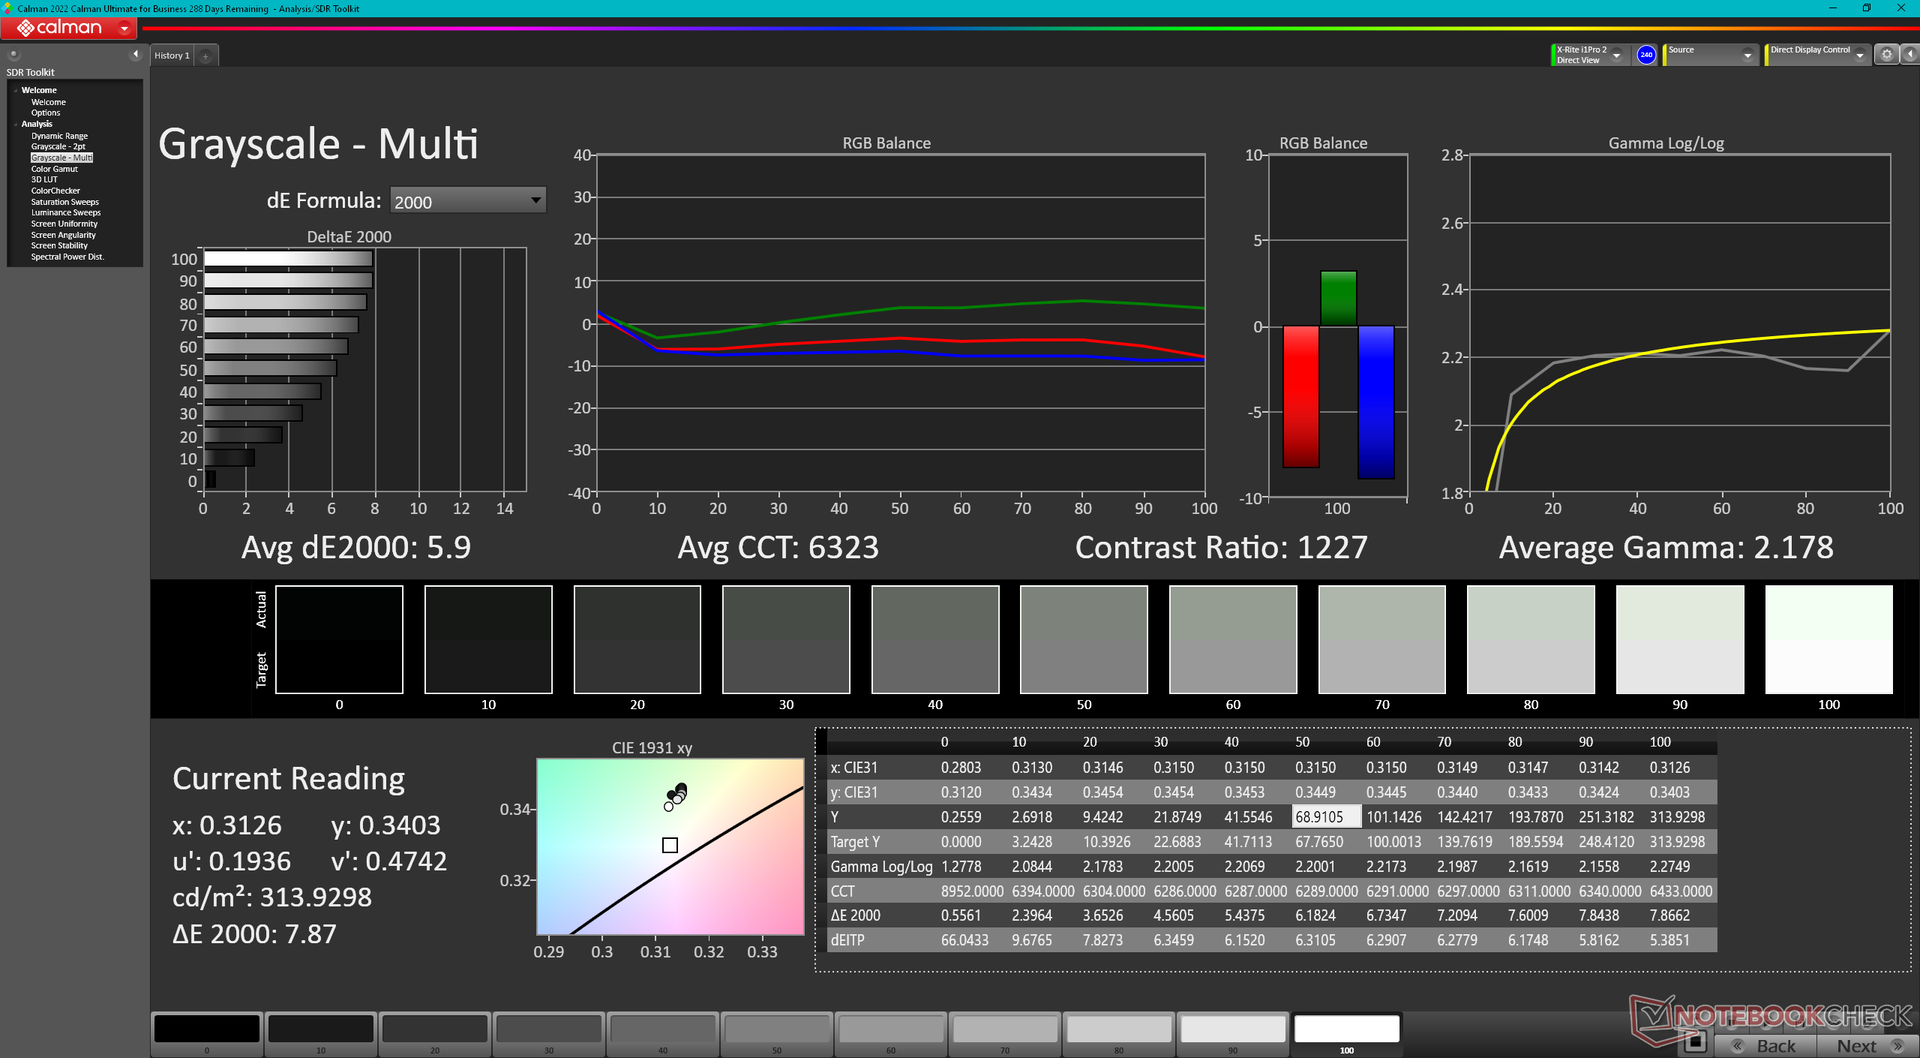
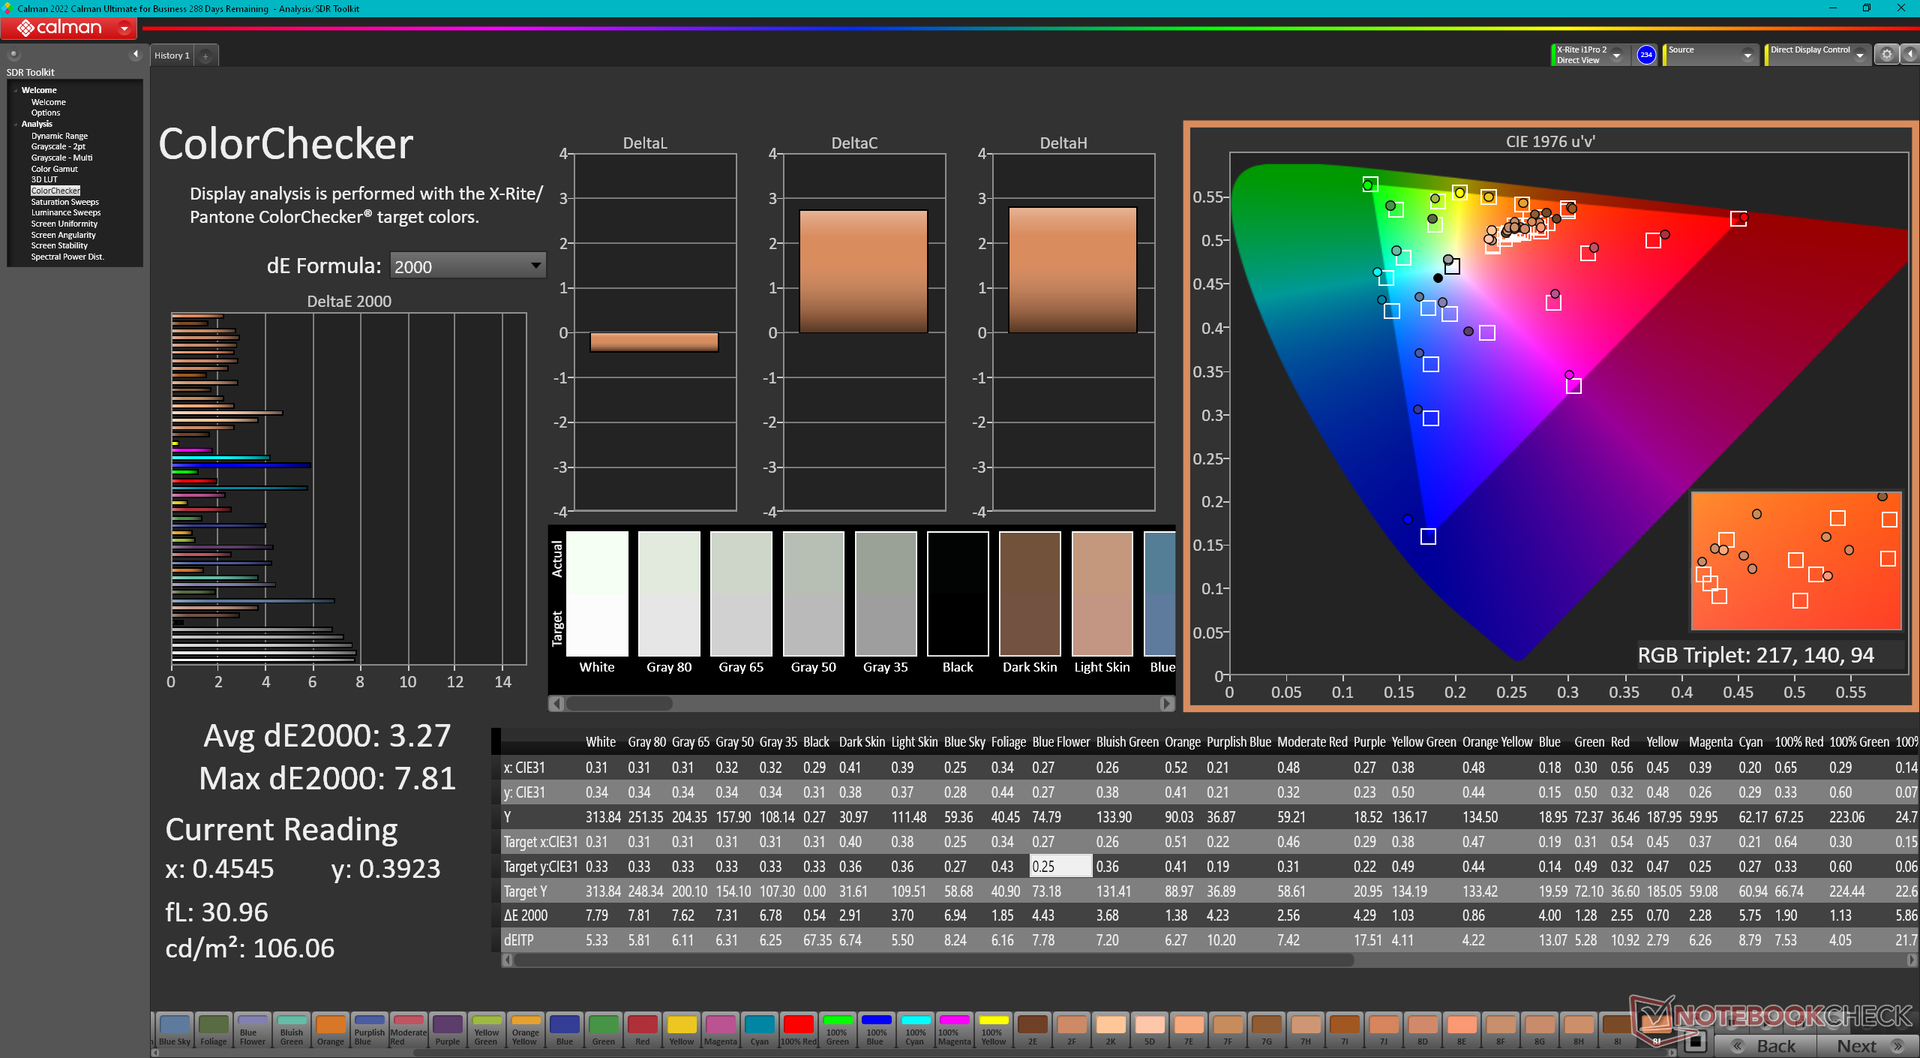
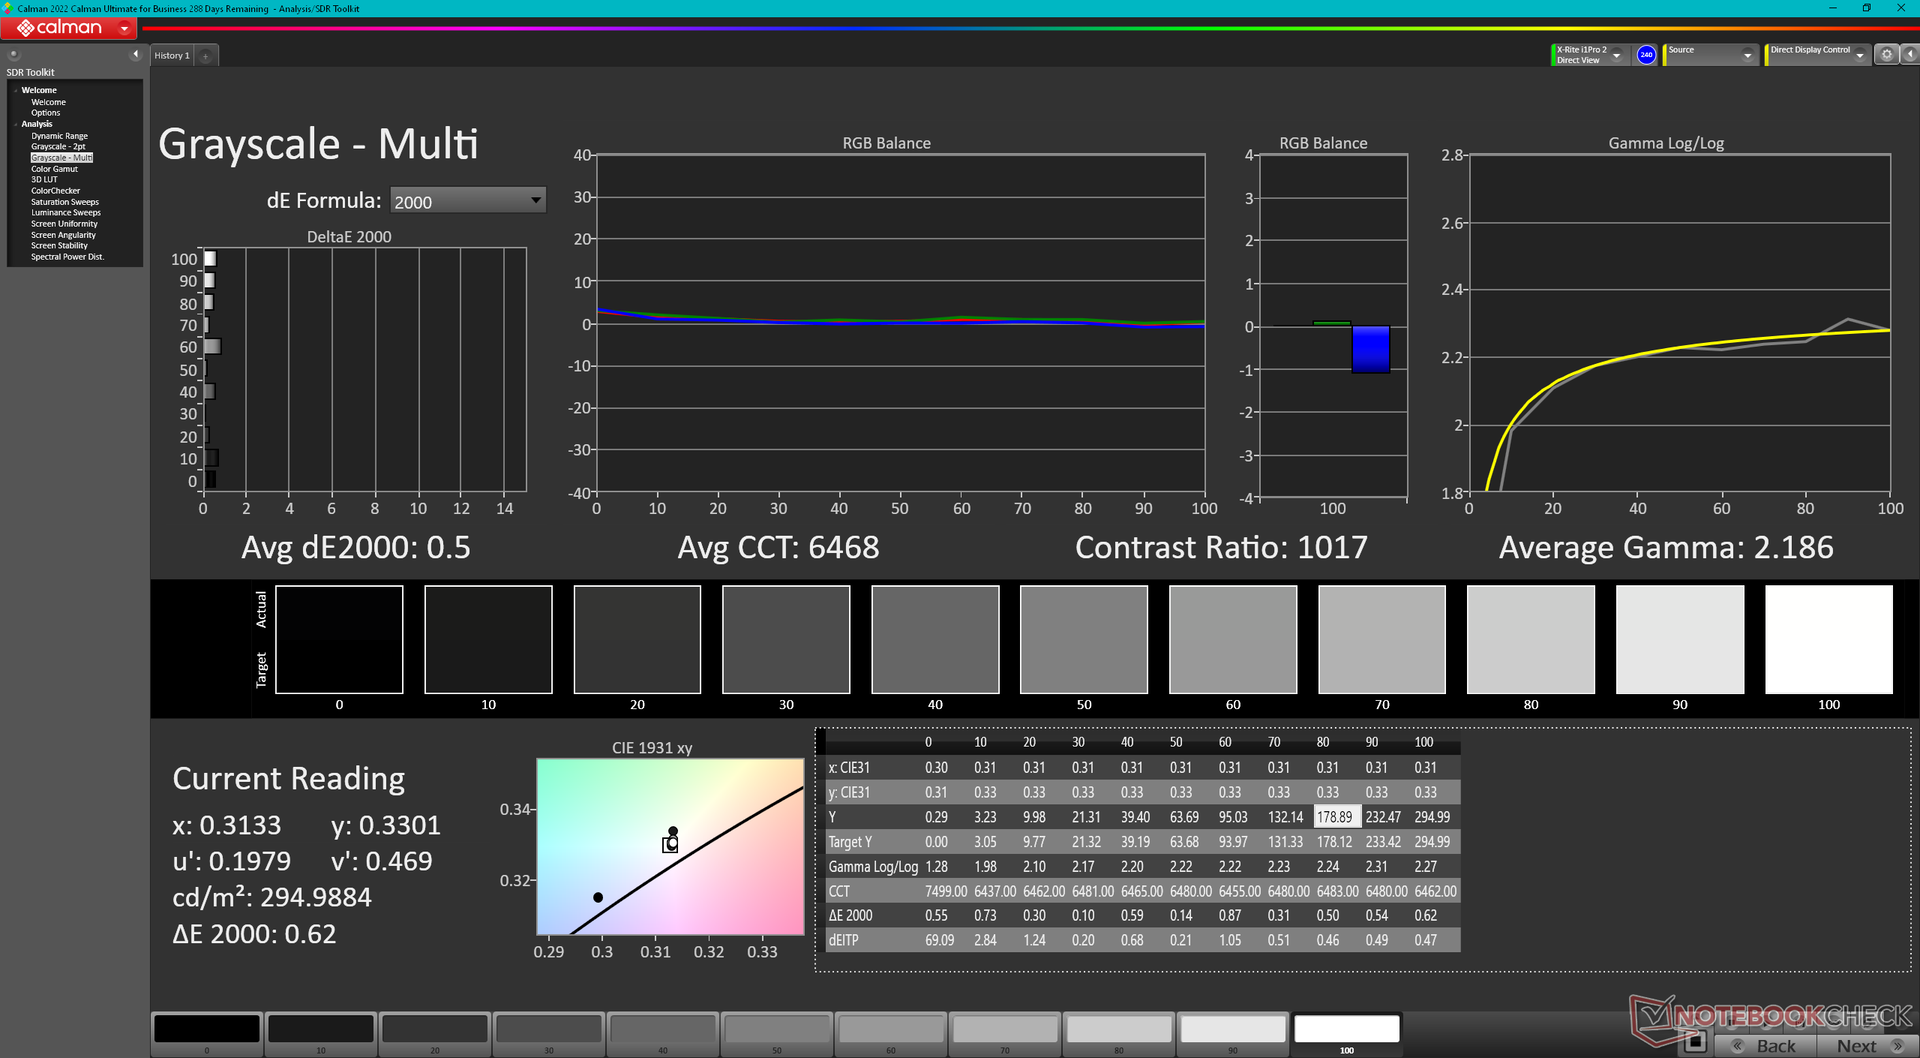
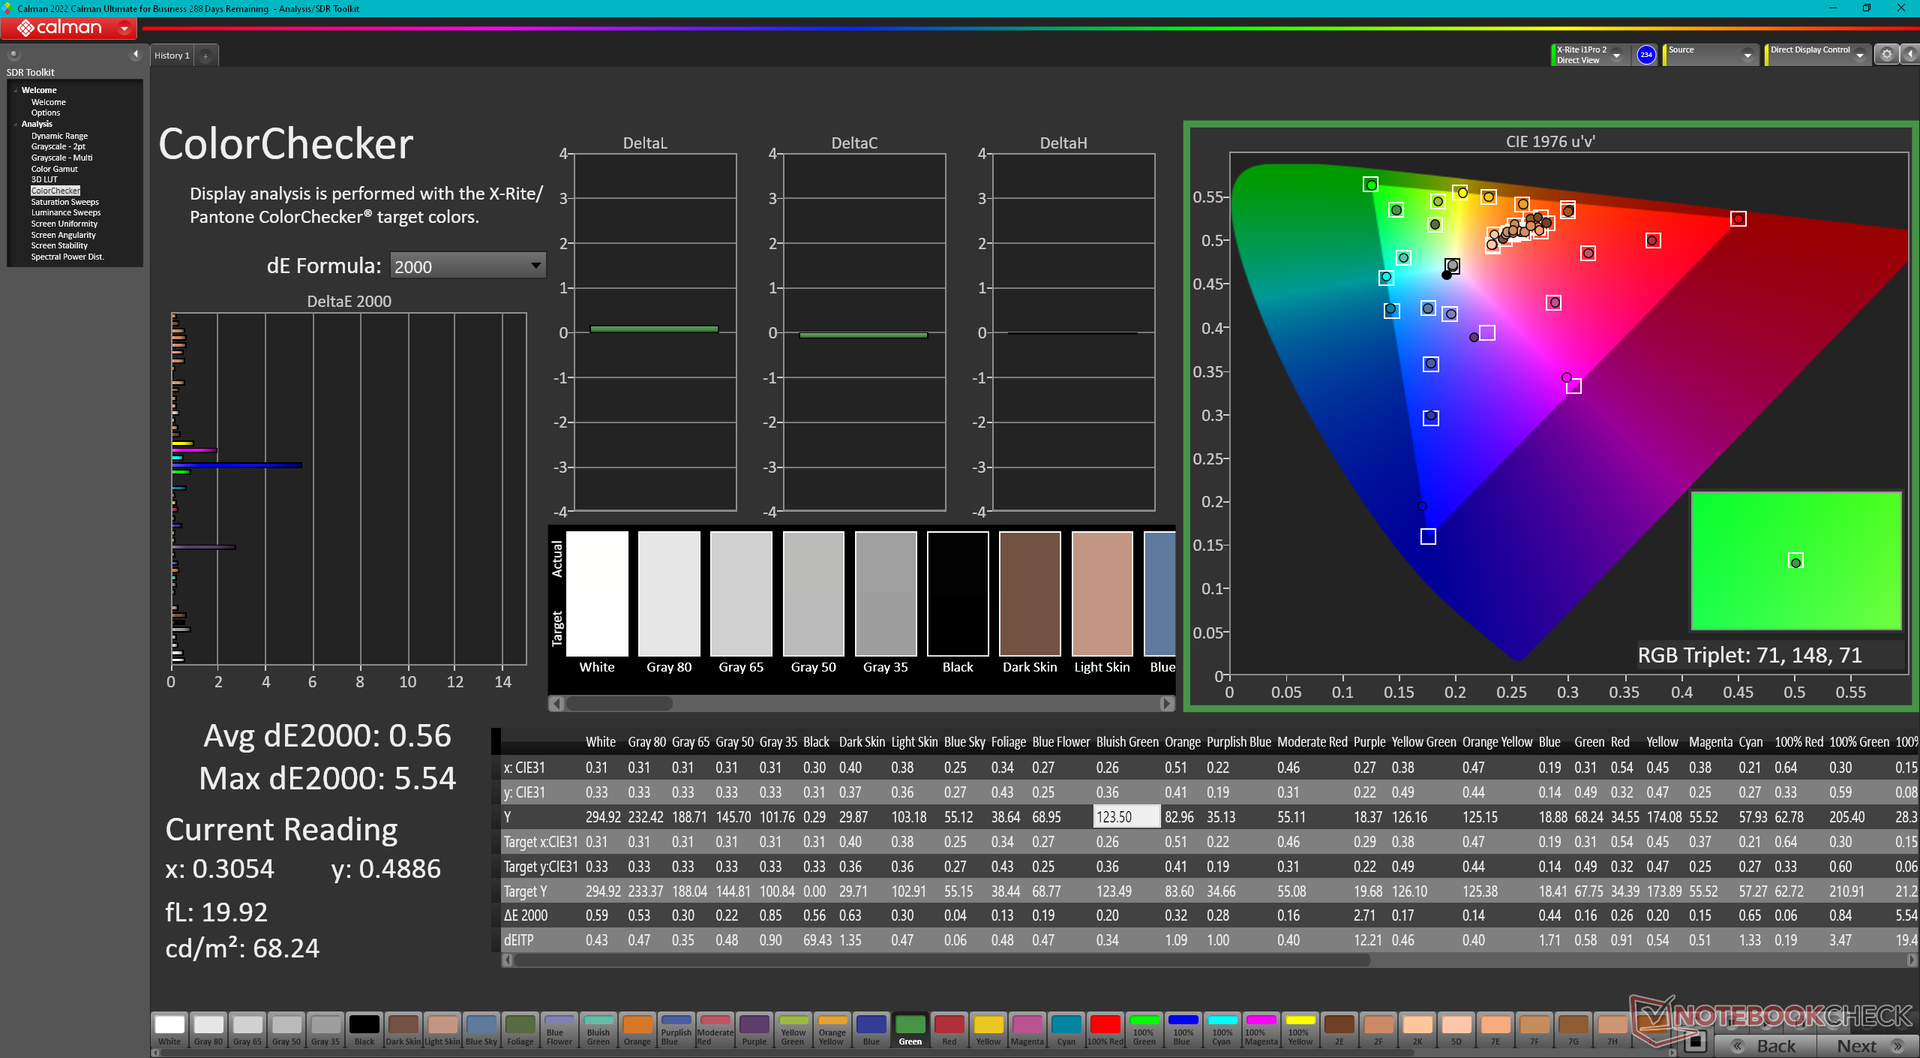
ΔE ColorChecker Calman: 3.27 | ∀{0.5-29.43 Ø4.71}
calibrated: 0.56
ΔE Greyscale Calman: 5.9 | ∀{0.09-98 Ø4.96}
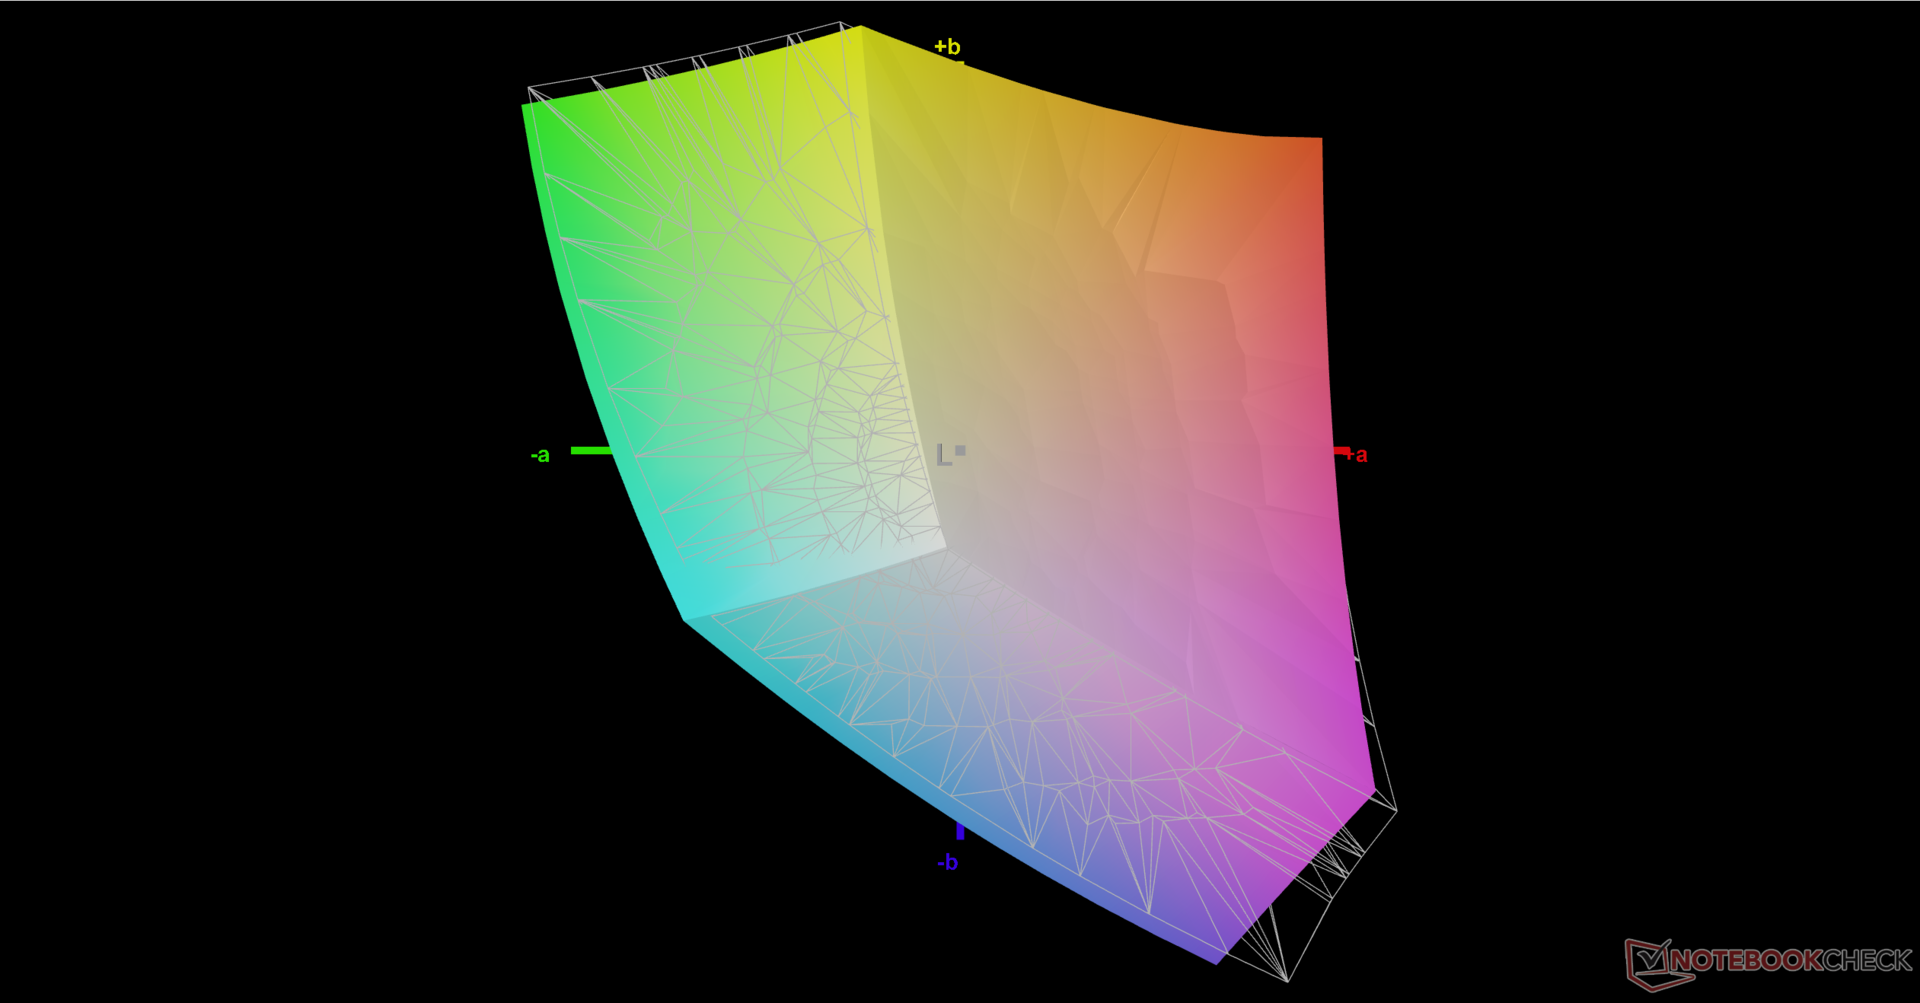
70.5% AdobeRGB 1998 (Argyll 3D)
95.6% sRGB (Argyll 3D)
68.2% Display P3 (Argyll 3D)
Gamma: 2.18
CCT: 6323 K
| HP ZBook Power 15 G10 BOE0B6A, IPS, 2560x1440, 15.6" | HP ZBook Power 15 G9 6B8C4EA LGD073F, IPS, 3840x2160, 15.6" | Lenovo ThinkPad P15v G3 21EM001AGE NE156QUM-N6C, IPS LED, 3840x2160, 15.6" | Dell Precision 5000 5560 Sharp LQ156R1, IPS, 3840x2400, 15.6" | Lenovo ThinkPad P1 G6-21FV000DGE NE160QDM-NY1, IPS, 2560x1600, 16" | Asus ExpertBook B6 Flip B6602FC2 AU Optronics Model: AUOE495, IPS, 2560x1600, 16" | |
|---|---|---|---|---|---|---|
| Display | 1% | 26% | 29% | 1% | 23% | |
| Display P3 Coverage (%) | 68.2 | 69.1 1% | 89.9 32% | 94.9 39% | 68.1 0% | 97.9 44% |
| sRGB Coverage (%) | 95.6 | 97.7 2% | 100 5% | 100 5% | 97.5 2% | 99.89 4% |
| AdobeRGB 1998 Coverage (%) | 70.5 | 69.6 -1% | 99.9 42% | 100 42% | 70.2 0% | 85.52 21% |
| Response Times | -214% | -211% | -228% | 2% | -120% | |
| Response Time Grey 50% / Grey 80% * (ms) | 13 ? | 45.8 ? -252% | 46.7 ? -259% | 47.2 ? -263% | 13.7 ? -5% | 36 ? -177% |
| Response Time Black / White * (ms) | 10.4 ? | 28.6 ? -175% | 27.3 ? -163% | 30.4 ? -192% | 9.6 ? 8% | 17 ? -63% |
| PWM Frequency (Hz) | ||||||
| Screen | 18% | 5% | 7% | 30% | -20% | |
| Brightness middle (cd/m²) | 313.8 | 392 25% | 588 87% | 501.5 60% | 521 66% | 440 40% |
| Brightness (cd/m²) | 302 | 388 28% | 536 77% | 467 55% | 484 60% | 418 38% |
| Brightness Distribution (%) | 83 | 88 6% | 83 0% | 83 0% | 89 7% | 82 -1% |
| Black Level * (cd/m²) | 0.29 | 0.15 48% | 0.38 -31% | 0.44 -52% | 0.36 -24% | 0.3 -3% |
| Contrast (:1) | 1082 | 2613 141% | 1547 43% | 1140 5% | 1447 34% | 1467 36% |
| Colorchecker dE 2000 * | 3.27 | 3.2 2% | 3.9 -19% | 4.73 -45% | 1.2 63% | 2.81 14% |
| Colorchecker dE 2000 max. * | 7.81 | 7 10% | 8.8 -13% | 8.45 -8% | 2.5 68% | 4.62 41% |
| Colorchecker dE 2000 calibrated * | 0.56 | 1.2 -114% | 1 -79% | 0.51 9% | 1 -79% | 2.99 -434% |
| Greyscale dE 2000 * | 5.9 | 4.9 17% | 7.1 -20% | 3.6 39% | 1.4 76% | 0.91 85% |
| Gamma | 2.18 101% | 2.13 103% | 2.12 104% | 2.08 106% | 2.25 98% | 2.2 100% |
| CCT | 6323 103% | 5982 109% | 7268 89% | 6447 101% | 6682 97% | 6600 98% |
| Media totale (Programma / Settaggio) | -65% /
-19% | -60% /
-21% | -64% /
-22% | 11% /
20% | -39% /
-25% |
* ... Meglio usare valori piccoli
HP non spedisce il modello pre-calibrato, il che è un peccato per un portatile di classe ZBook. I valori medi del DeltaE della scala di grigi e del colore fuori dalla scatola sarebbero rispettivamente di 5,9 e 3,27, con una temperatura del colore leggermente troppo calda. La calibrazione del display da parte nostra migliorerebbe i valori deltaE medi a soli 0,5 e 0,56. Il nostro file ICM calibrato è disponibile gratuitamente per il download qui sopra.
Tempi di risposta del Display
| ↔ Tempi di risposta dal Nero al Bianco | ||
|---|---|---|
| 10.4 ms ... aumenta ↗ e diminuisce ↘ combinato | ↗ 5.5 ms Incremento | 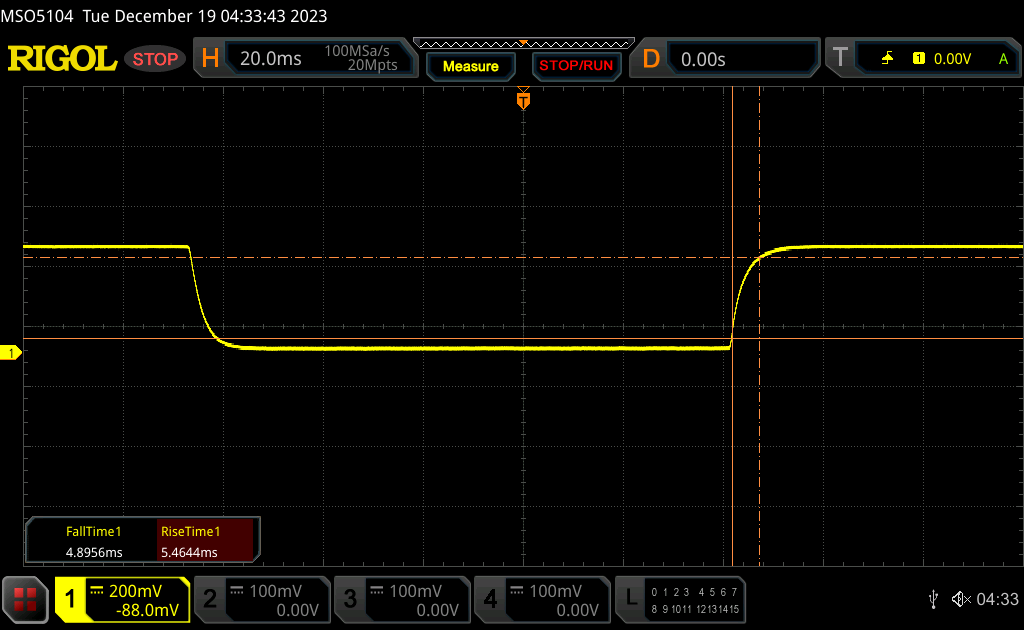 |
| ↘ 4.9 ms Calo | ||
| Lo schermo mostra buoni tempi di risposta durante i nostri tests, ma potrebbe essere troppo lento per i gamers competitivi. In confronto, tutti i dispositivi di test variano da 0.1 (minimo) a 240 (massimo) ms. » 28 % di tutti i dispositivi è migliore. Questo significa che i tempi di risposta rilevati sono migliori rispettto alla media di tutti i dispositivi testati (19.8 ms). | ||
| ↔ Tempo di risposta dal 50% Grigio all'80% Grigio | ||
| 13 ms ... aumenta ↗ e diminuisce ↘ combinato | ↗ 6.4 ms Incremento | 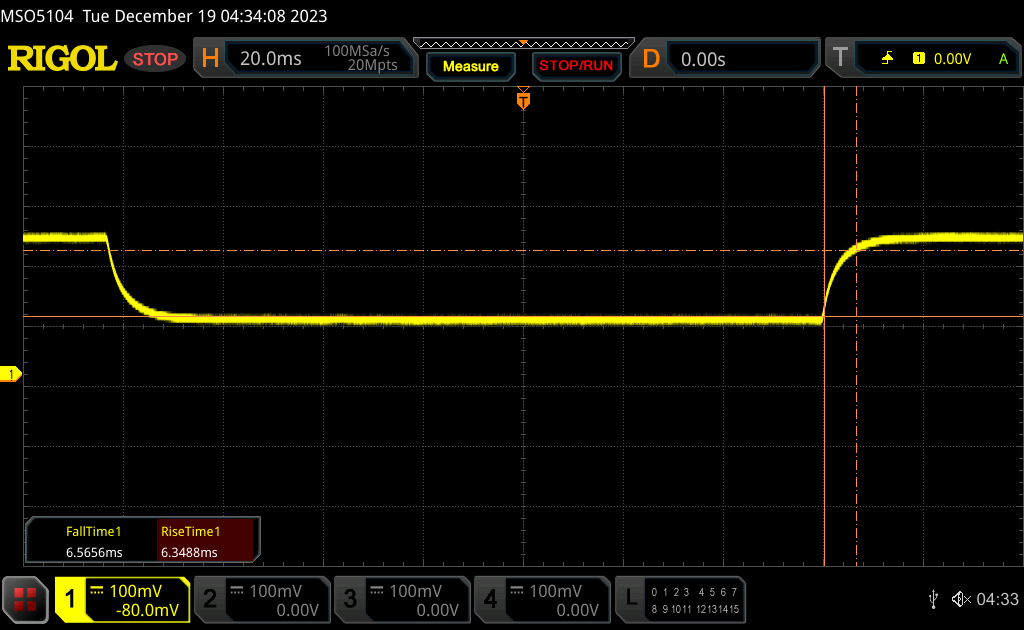 |
| ↘ 6.6 ms Calo | ||
| Lo schermo mostra buoni tempi di risposta durante i nostri tests, ma potrebbe essere troppo lento per i gamers competitivi. In confronto, tutti i dispositivi di test variano da 0.165 (minimo) a 636 (massimo) ms. » 27 % di tutti i dispositivi è migliore. Questo significa che i tempi di risposta rilevati sono migliori rispettto alla media di tutti i dispositivi testati (31 ms). | ||
Sfarfallio dello schermo / PWM (Pulse-Width Modulation)
| flickering dello schermo / PWM non rilevato | 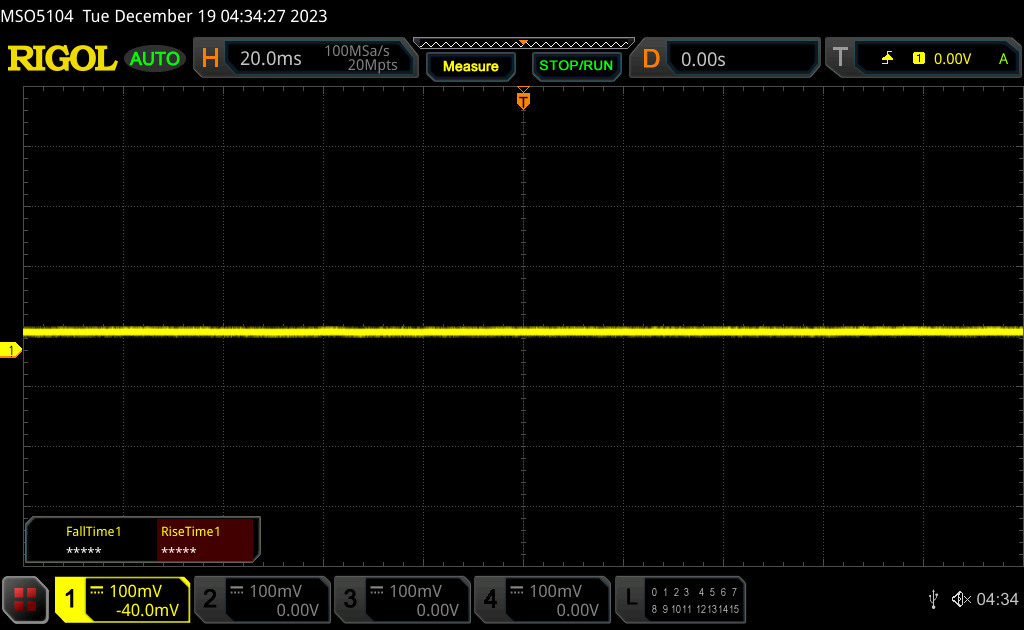 | ||
In confronto: 52 % di tutti i dispositivi testati non utilizza PWM per ridurre la luminosita' del display. Se è rilevato PWM, una media di 7757 (minimo: 5 - massimo: 343500) Hz è stata rilevata. | |||
Prestazioni
Condizioni del test
Abbiamo impostato sia Windows che il Pannello di controllo Nvidia sulla modalità Prestazioni prima di eseguire i benchmark qui sotto. Il sistema non sembra avere alcun profilo energetico aggiuntivo da parte di HP.
Optimus è supportato come ci si aspettava, ma non c'è una modalità ECC VRAM, a differenza di quanto accade sul più spesso ZBook Fury 16 G10 con la più veloce RTX 5000 Ada.
Processore
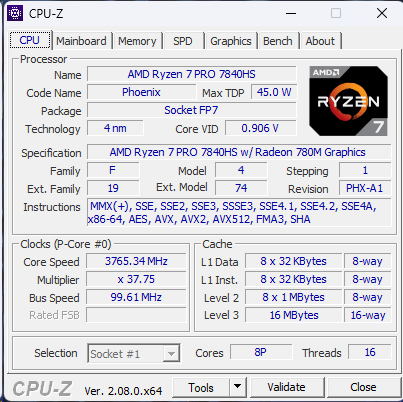
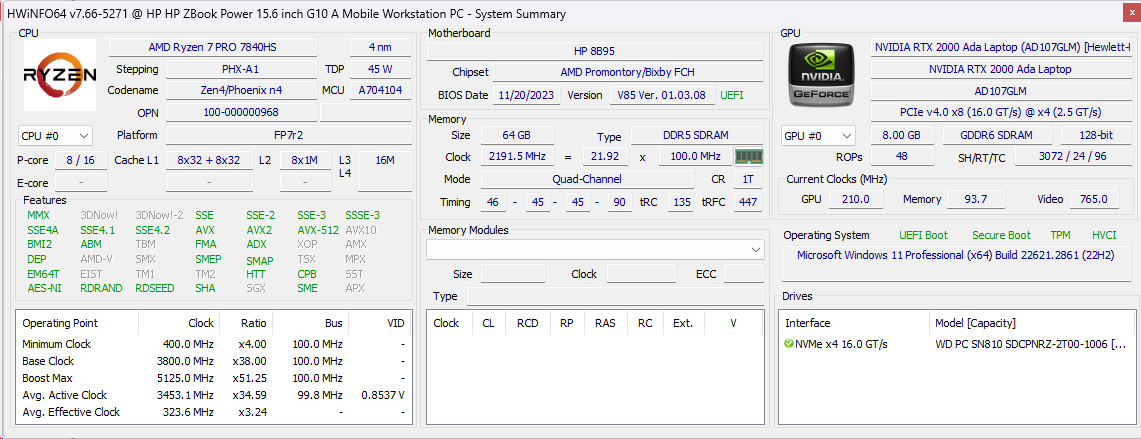
Il Ryzen 7 Pro 7840HS offre prestazioni multi-thread fino al 20 percento più veloci rispetto al Core i7-12700H dello ZBook Power 15 G9 dello scorso anno. Per ottenere prestazioni ancora più elevate, tuttavia, gli utenti dovrebbero configurare con l'Intel Core i9-13900H che può funzionare fino al 30 percento più velocemente del nostro Ryzen 7.
Il downgrade al Ryzen 5 Pro 7640HS dalla nostra configurazione Ryzen 7 Pro 7840HS dovrebbe avere un impatto sulle prestazioni del 25-30 percento. D'altra parte, l'aggiornamento al Ryzen 9 Pro 7940HS dovrebbe aumentare le prestazioni solo in modo marginale, dal 5 al 10 percento circa, in base al tempo trascorso con il Lenovo ThinkPad Z16 Gen 2. Pertanto, le prestazioni per dollaro diminuiscono in modo significativo se si configura con Ryzen 9 invece di Ryzen 7.
Cinebench R15 Multi Loop
Cinebench R23: Multi Core | Single Core
Cinebench R20: CPU (Multi Core) | CPU (Single Core)
Cinebench R15: CPU Multi 64Bit | CPU Single 64Bit
Blender: v2.79 BMW27 CPU
7-Zip 18.03: 7z b 4 | 7z b 4 -mmt1
Geekbench 5.5: Multi-Core | Single-Core
HWBOT x265 Benchmark v2.2: 4k Preset
LibreOffice : 20 Documents To PDF
R Benchmark 2.5: Overall mean
* ... Meglio usare valori piccoli
AIDA64: FP32 Ray-Trace | FPU Julia | CPU SHA3 | CPU Queen | FPU SinJulia | FPU Mandel | CPU AES | CPU ZLib | FP64 Ray-Trace | CPU PhotoWorxx
| Performance rating | |
| HP ZBook Power 15 G10 | |
| Media AMD Ryzen 7 PRO 7840HS | |
| Lenovo ThinkPad P1 G6-21FV000DGE | |
| Lenovo ThinkPad P15v G3 21EM001AGE | |
| Asus ExpertBook B6 Flip B6602FC2 | |
| HP ZBook Power 15 G9 6B8C4EA | |
| Dell Precision 5000 5560 -9! | |
| AIDA64 / FP32 Ray-Trace | |
| HP ZBook Power 15 G10 | |
| Media AMD Ryzen 7 PRO 7840HS (25606 - 25776, n=2) | |
| Lenovo ThinkPad P1 G6-21FV000DGE | |
| Asus ExpertBook B6 Flip B6602FC2 | |
| Lenovo ThinkPad P15v G3 21EM001AGE | |
| HP ZBook Power 15 G9 6B8C4EA | |
| AIDA64 / FPU Julia | |
| HP ZBook Power 15 G10 | |
| Media AMD Ryzen 7 PRO 7840HS (107907 - 109059, n=2) | |
| Lenovo ThinkPad P15v G3 21EM001AGE | |
| Lenovo ThinkPad P1 G6-21FV000DGE | |
| Asus ExpertBook B6 Flip B6602FC2 | |
| HP ZBook Power 15 G9 6B8C4EA | |
| AIDA64 / CPU SHA3 | |
| HP ZBook Power 15 G10 | |
| Media AMD Ryzen 7 PRO 7840HS (4631 - 4656, n=2) | |
| Lenovo ThinkPad P1 G6-21FV000DGE | |
| Asus ExpertBook B6 Flip B6602FC2 | |
| HP ZBook Power 15 G9 6B8C4EA | |
| Lenovo ThinkPad P15v G3 21EM001AGE | |
| AIDA64 / CPU Queen | |
| Lenovo ThinkPad P1 G6-21FV000DGE | |
| HP ZBook Power 15 G10 | |
| Media AMD Ryzen 7 PRO 7840HS (97729 - 115640, n=2) | |
| Asus ExpertBook B6 Flip B6602FC2 | |
| Lenovo ThinkPad P15v G3 21EM001AGE | |
| HP ZBook Power 15 G9 6B8C4EA | |
| AIDA64 / FPU SinJulia | |
| HP ZBook Power 15 G10 | |
| Media AMD Ryzen 7 PRO 7840HS (14693 - 14742, n=2) | |
| Lenovo ThinkPad P15v G3 21EM001AGE | |
| Asus ExpertBook B6 Flip B6602FC2 | |
| Lenovo ThinkPad P1 G6-21FV000DGE | |
| HP ZBook Power 15 G9 6B8C4EA | |
| AIDA64 / FPU Mandel | |
| HP ZBook Power 15 G10 | |
| Media AMD Ryzen 7 PRO 7840HS (57502 - 58181, n=2) | |
| Lenovo ThinkPad P15v G3 21EM001AGE | |
| Lenovo ThinkPad P1 G6-21FV000DGE | |
| Asus ExpertBook B6 Flip B6602FC2 | |
| HP ZBook Power 15 G9 6B8C4EA | |
| AIDA64 / CPU AES | |
| Lenovo ThinkPad P15v G3 21EM001AGE | |
| HP ZBook Power 15 G10 | |
| Media AMD Ryzen 7 PRO 7840HS (84454 - 85341, n=2) | |
| Lenovo ThinkPad P1 G6-21FV000DGE | |
| Asus ExpertBook B6 Flip B6602FC2 | |
| HP ZBook Power 15 G9 6B8C4EA | |
| AIDA64 / CPU ZLib | |
| Lenovo ThinkPad P1 G6-21FV000DGE | |
| HP ZBook Power 15 G10 | |
| Media AMD Ryzen 7 PRO 7840HS (1032 - 1043, n=2) | |
| Asus ExpertBook B6 Flip B6602FC2 | |
| HP ZBook Power 15 G9 6B8C4EA | |
| Lenovo ThinkPad P15v G3 21EM001AGE | |
| Dell Precision 5000 5560 | |
| AIDA64 / FP64 Ray-Trace | |
| HP ZBook Power 15 G10 | |
| Media AMD Ryzen 7 PRO 7840HS (13545 - 13800, n=2) | |
| Lenovo ThinkPad P1 G6-21FV000DGE | |
| Asus ExpertBook B6 Flip B6602FC2 | |
| Lenovo ThinkPad P15v G3 21EM001AGE | |
| HP ZBook Power 15 G9 6B8C4EA | |
| AIDA64 / CPU PhotoWorxx | |
| HP ZBook Power 15 G10 | |
| HP ZBook Power 15 G9 6B8C4EA | |
| Asus ExpertBook B6 Flip B6602FC2 | |
| Media AMD Ryzen 7 PRO 7840HS (24325 - 42810, n=2) | |
| Lenovo ThinkPad P1 G6-21FV000DGE | |
| Lenovo ThinkPad P15v G3 21EM001AGE | |
Prestazioni del sistema
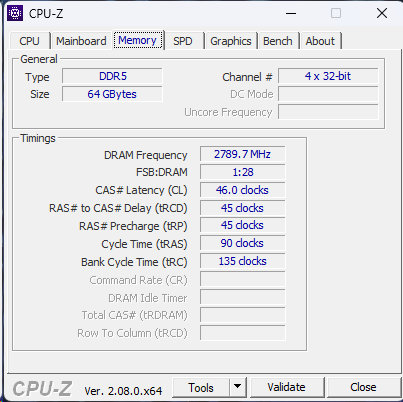
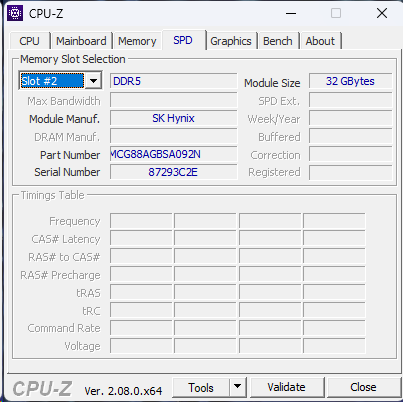
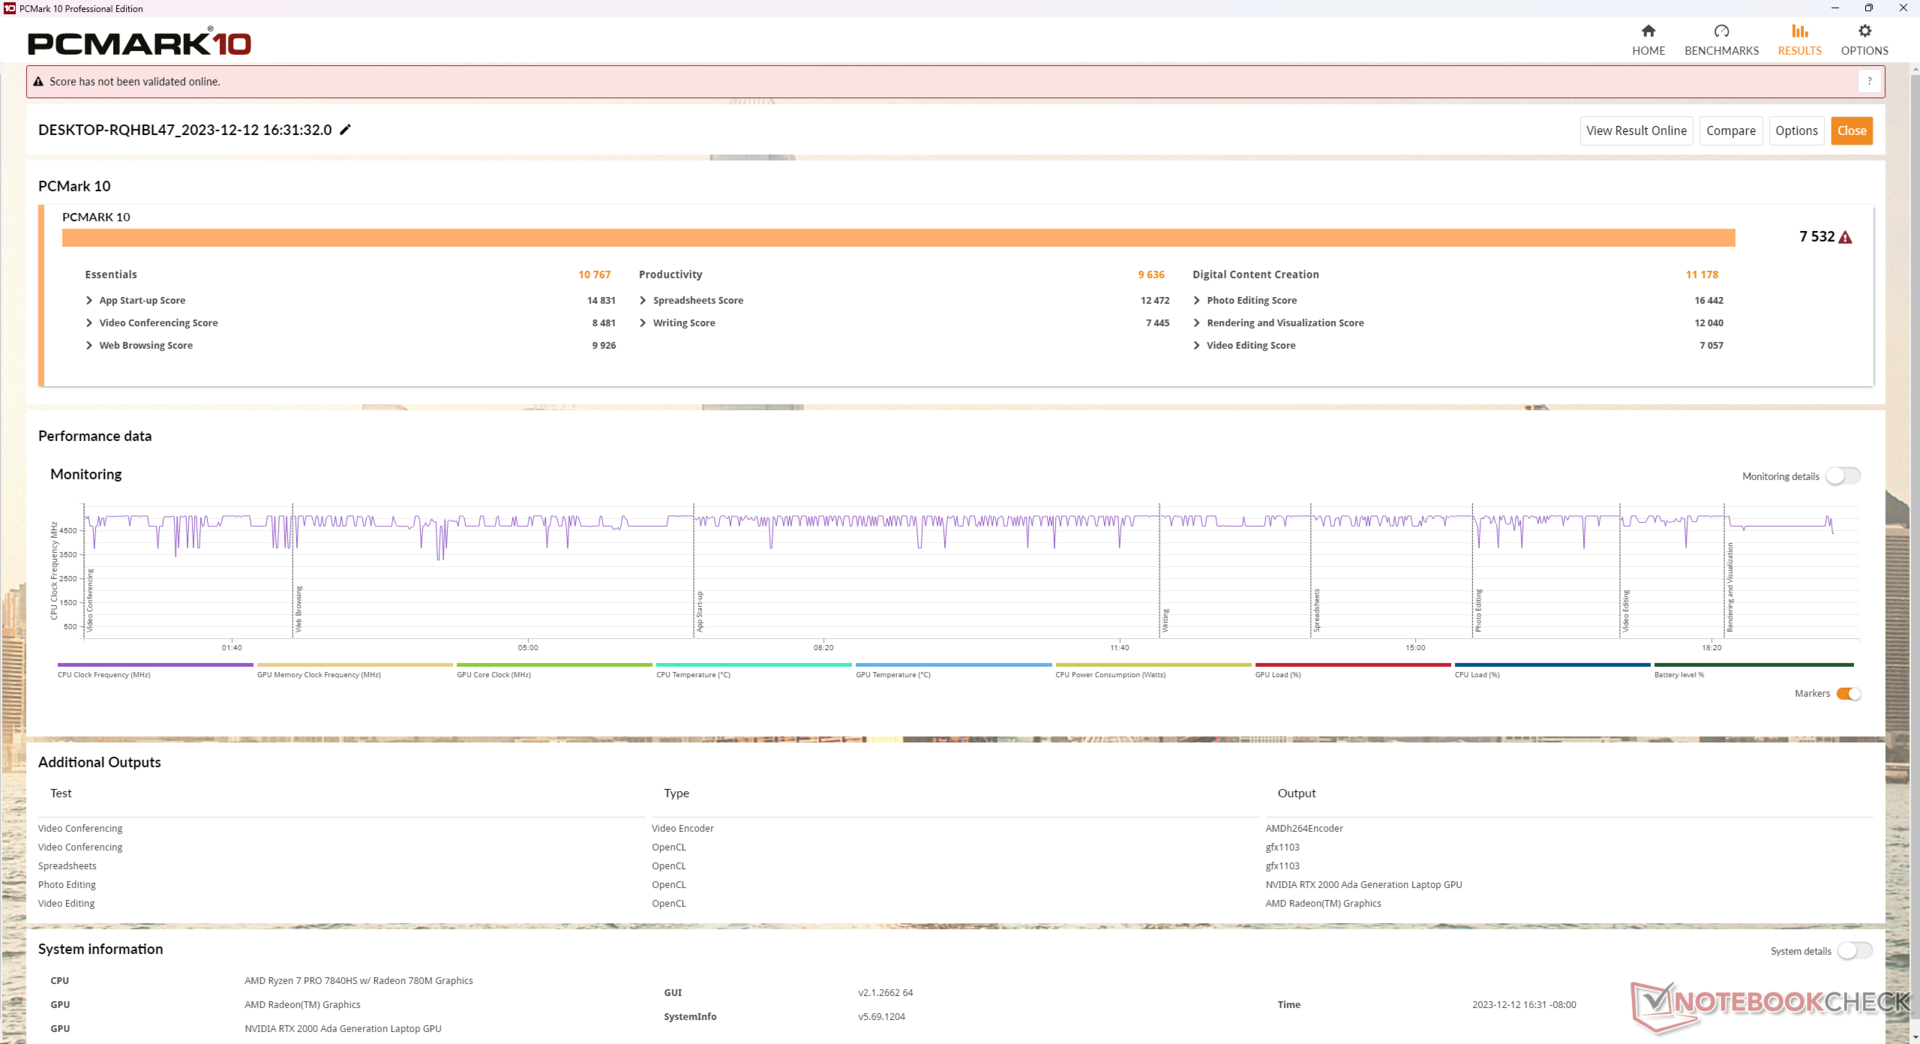
I risultati di PCMark sono eccellenti, con punteggi costantemente superiori a quelli di altre workstation che utilizzano la vecchia Nvidia RTX A2000, compreso lo ZBook Power 15 G9. Anche la veloce RAM da 5600 MHz è un punto di forza, come dimostrano gli alti punteggi della memoria AIDA64.
CrossMark: Overall | Productivity | Creativity | Responsiveness
WebXPRT 3: Overall
WebXPRT 4: Overall
Mozilla Kraken 1.1: Total
| PCMark 10 / Score | |
| HP ZBook Power 15 G10 | |
| Media AMD Ryzen 7 PRO 7840HS, NVIDIA RTX 2000 Ada Generation Laptop (n=1) | |
| Lenovo ThinkPad P1 G6-21FV000DGE | |
| Asus ExpertBook B6 Flip B6602FC2 | |
| Dell Precision 5000 5560 | |
| Lenovo ThinkPad P15v G3 21EM001AGE | |
| HP ZBook Power 15 G9 6B8C4EA | |
| PCMark 10 / Essentials | |
| Lenovo ThinkPad P1 G6-21FV000DGE | |
| Asus ExpertBook B6 Flip B6602FC2 | |
| HP ZBook Power 15 G10 | |
| Media AMD Ryzen 7 PRO 7840HS, NVIDIA RTX 2000 Ada Generation Laptop (n=1) | |
| Dell Precision 5000 5560 | |
| Lenovo ThinkPad P15v G3 21EM001AGE | |
| HP ZBook Power 15 G9 6B8C4EA | |
| PCMark 10 / Productivity | |
| Asus ExpertBook B6 Flip B6602FC2 | |
| Lenovo ThinkPad P1 G6-21FV000DGE | |
| HP ZBook Power 15 G10 | |
| Media AMD Ryzen 7 PRO 7840HS, NVIDIA RTX 2000 Ada Generation Laptop (n=1) | |
| Dell Precision 5000 5560 | |
| Lenovo ThinkPad P15v G3 21EM001AGE | |
| HP ZBook Power 15 G9 6B8C4EA | |
| PCMark 10 / Digital Content Creation | |
| HP ZBook Power 15 G10 | |
| Media AMD Ryzen 7 PRO 7840HS, NVIDIA RTX 2000 Ada Generation Laptop (n=1) | |
| Lenovo ThinkPad P1 G6-21FV000DGE | |
| Asus ExpertBook B6 Flip B6602FC2 | |
| Lenovo ThinkPad P15v G3 21EM001AGE | |
| HP ZBook Power 15 G9 6B8C4EA | |
| Dell Precision 5000 5560 | |
| CrossMark / Overall | |
| Asus ExpertBook B6 Flip B6602FC2 | |
| Lenovo ThinkPad P1 G6-21FV000DGE | |
| HP ZBook Power 15 G9 6B8C4EA | |
| HP ZBook Power 15 G10 | |
| Media AMD Ryzen 7 PRO 7840HS, NVIDIA RTX 2000 Ada Generation Laptop (n=1) | |
| Lenovo ThinkPad P15v G3 21EM001AGE | |
| CrossMark / Productivity | |
| Asus ExpertBook B6 Flip B6602FC2 | |
| Lenovo ThinkPad P1 G6-21FV000DGE | |
| HP ZBook Power 15 G10 | |
| Media AMD Ryzen 7 PRO 7840HS, NVIDIA RTX 2000 Ada Generation Laptop (n=1) | |
| HP ZBook Power 15 G9 6B8C4EA | |
| Lenovo ThinkPad P15v G3 21EM001AGE | |
| CrossMark / Creativity | |
| Asus ExpertBook B6 Flip B6602FC2 | |
| Lenovo ThinkPad P1 G6-21FV000DGE | |
| HP ZBook Power 15 G9 6B8C4EA | |
| HP ZBook Power 15 G10 | |
| Media AMD Ryzen 7 PRO 7840HS, NVIDIA RTX 2000 Ada Generation Laptop (n=1) | |
| Lenovo ThinkPad P15v G3 21EM001AGE | |
| CrossMark / Responsiveness | |
| Asus ExpertBook B6 Flip B6602FC2 | |
| Lenovo ThinkPad P1 G6-21FV000DGE | |
| HP ZBook Power 15 G9 6B8C4EA | |
| HP ZBook Power 15 G10 | |
| Media AMD Ryzen 7 PRO 7840HS, NVIDIA RTX 2000 Ada Generation Laptop (n=1) | |
| Lenovo ThinkPad P15v G3 21EM001AGE | |
| WebXPRT 3 / Overall | |
| Lenovo ThinkPad P1 G6-21FV000DGE | |
| HP ZBook Power 15 G10 | |
| Media AMD Ryzen 7 PRO 7840HS, NVIDIA RTX 2000 Ada Generation Laptop (n=1) | |
| Asus ExpertBook B6 Flip B6602FC2 | |
| HP ZBook Power 15 G9 6B8C4EA | |
| Dell Precision 5000 5560 | |
| Lenovo ThinkPad P15v G3 21EM001AGE | |
| WebXPRT 4 / Overall | |
| Lenovo ThinkPad P1 G6-21FV000DGE | |
| Asus ExpertBook B6 Flip B6602FC2 | |
| HP ZBook Power 15 G9 6B8C4EA | |
| HP ZBook Power 15 G10 | |
| Media AMD Ryzen 7 PRO 7840HS, NVIDIA RTX 2000 Ada Generation Laptop (n=1) | |
| Lenovo ThinkPad P15v G3 21EM001AGE | |
| Mozilla Kraken 1.1 / Total | |
| Lenovo ThinkPad P15v G3 21EM001AGE | |
| Dell Precision 5000 5560 | |
| HP ZBook Power 15 G10 | |
| Media AMD Ryzen 7 PRO 7840HS, NVIDIA RTX 2000 Ada Generation Laptop (n=1) | |
| HP ZBook Power 15 G9 6B8C4EA | |
| Asus ExpertBook B6 Flip B6602FC2 | |
| Lenovo ThinkPad P1 G6-21FV000DGE | |
* ... Meglio usare valori piccoli
| PCMark 10 Score | 7532 punti | |
Aiuto | ||
| AIDA64 / Memory Copy | |
| HP ZBook Power 15 G10 | |
| HP ZBook Power 15 G9 6B8C4EA | |
| Asus ExpertBook B6 Flip B6602FC2 | |
| Media AMD Ryzen 7 PRO 7840HS (34323 - 67943, n=2) | |
| Lenovo ThinkPad P1 G6-21FV000DGE | |
| Lenovo ThinkPad P15v G3 21EM001AGE | |
| AIDA64 / Memory Read | |
| HP ZBook Power 15 G9 6B8C4EA | |
| HP ZBook Power 15 G10 | |
| Asus ExpertBook B6 Flip B6602FC2 | |
| Media AMD Ryzen 7 PRO 7840HS (30787 - 61660, n=2) | |
| Lenovo ThinkPad P1 G6-21FV000DGE | |
| Lenovo ThinkPad P15v G3 21EM001AGE | |
| AIDA64 / Memory Write | |
| HP ZBook Power 15 G10 | |
| HP ZBook Power 15 G9 6B8C4EA | |
| Media AMD Ryzen 7 PRO 7840HS (39362 - 83167, n=2) | |
| Asus ExpertBook B6 Flip B6602FC2 | |
| Lenovo ThinkPad P1 G6-21FV000DGE | |
| Lenovo ThinkPad P15v G3 21EM001AGE | |
| AIDA64 / Memory Latency | |
| Media AMD Ryzen 7 PRO 7840HS (99.6 - 101.2, n=2) | |
| HP ZBook Power 15 G10 | |
| Lenovo ThinkPad P15v G3 21EM001AGE | |
| Asus ExpertBook B6 Flip B6602FC2 | |
| HP ZBook Power 15 G9 6B8C4EA | |
| Lenovo ThinkPad P1 G6-21FV000DGE | |
* ... Meglio usare valori piccoli
Latenza DPC
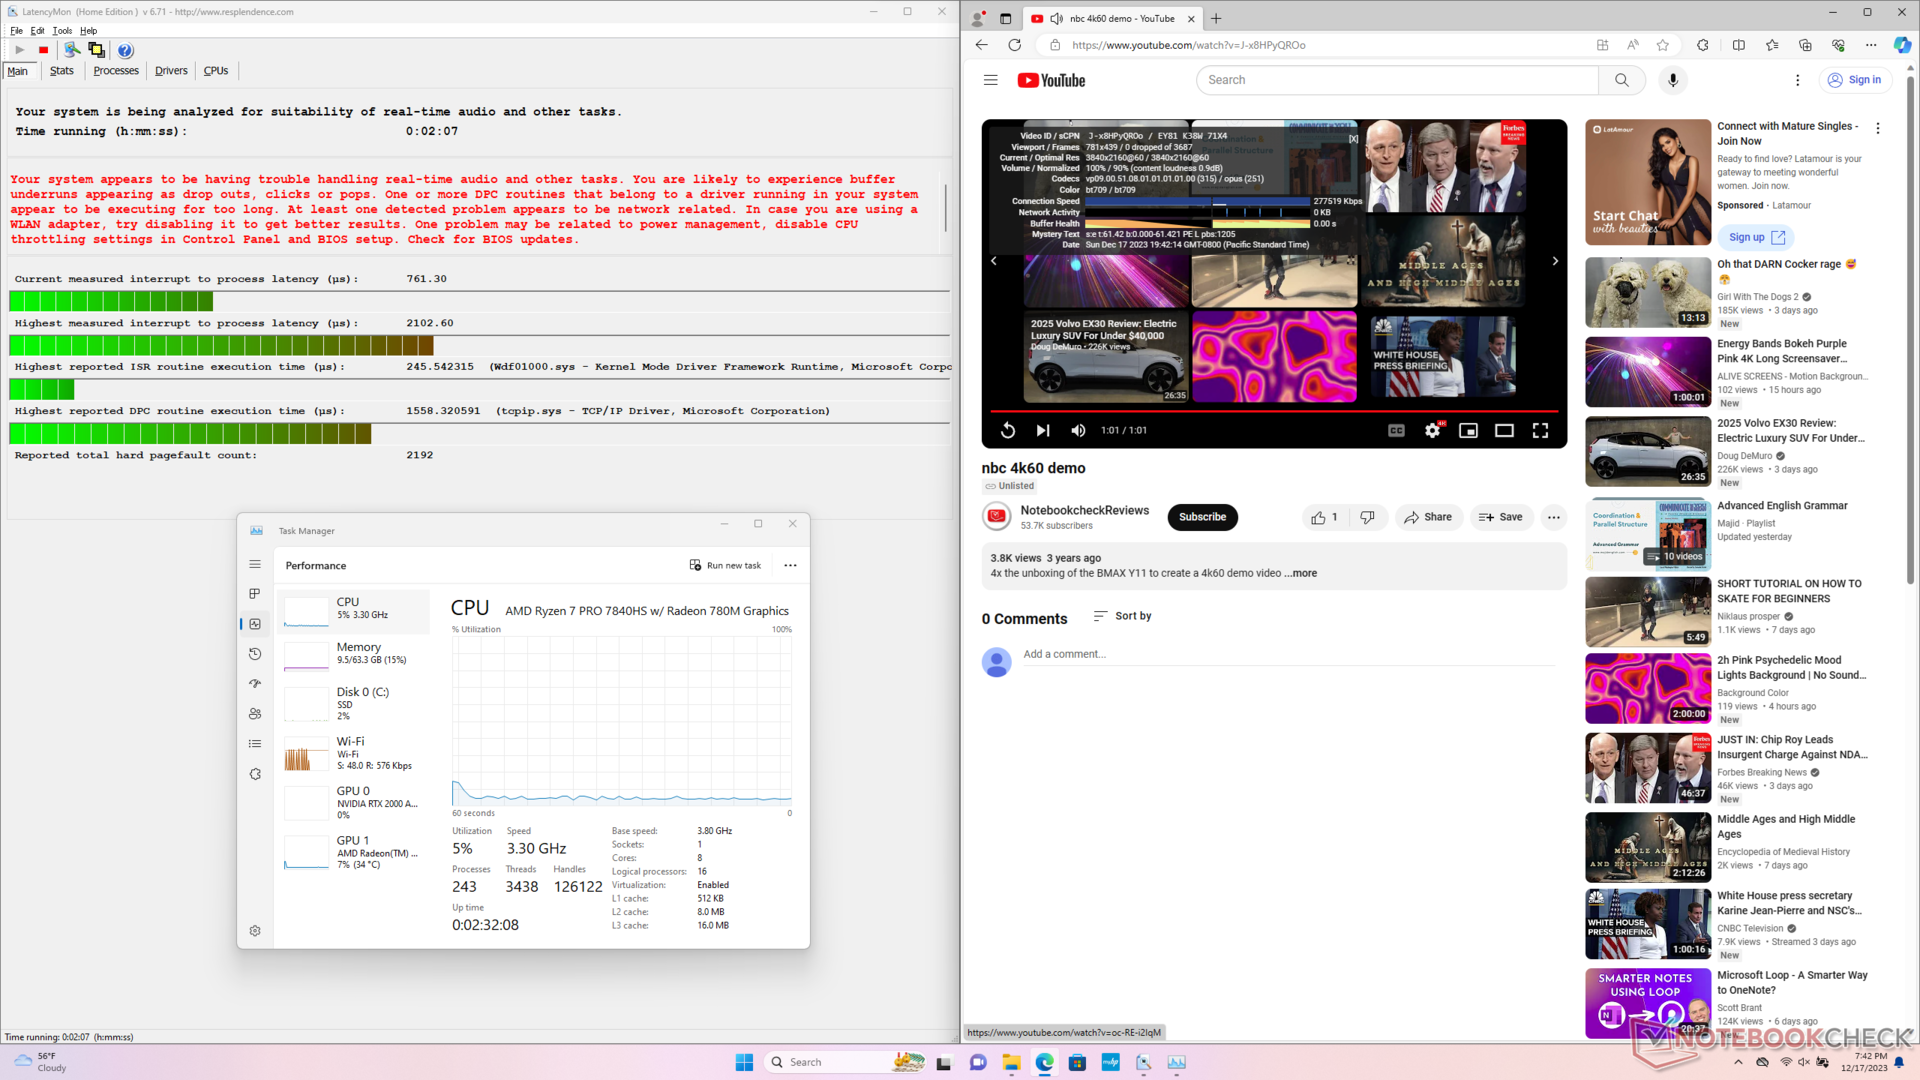
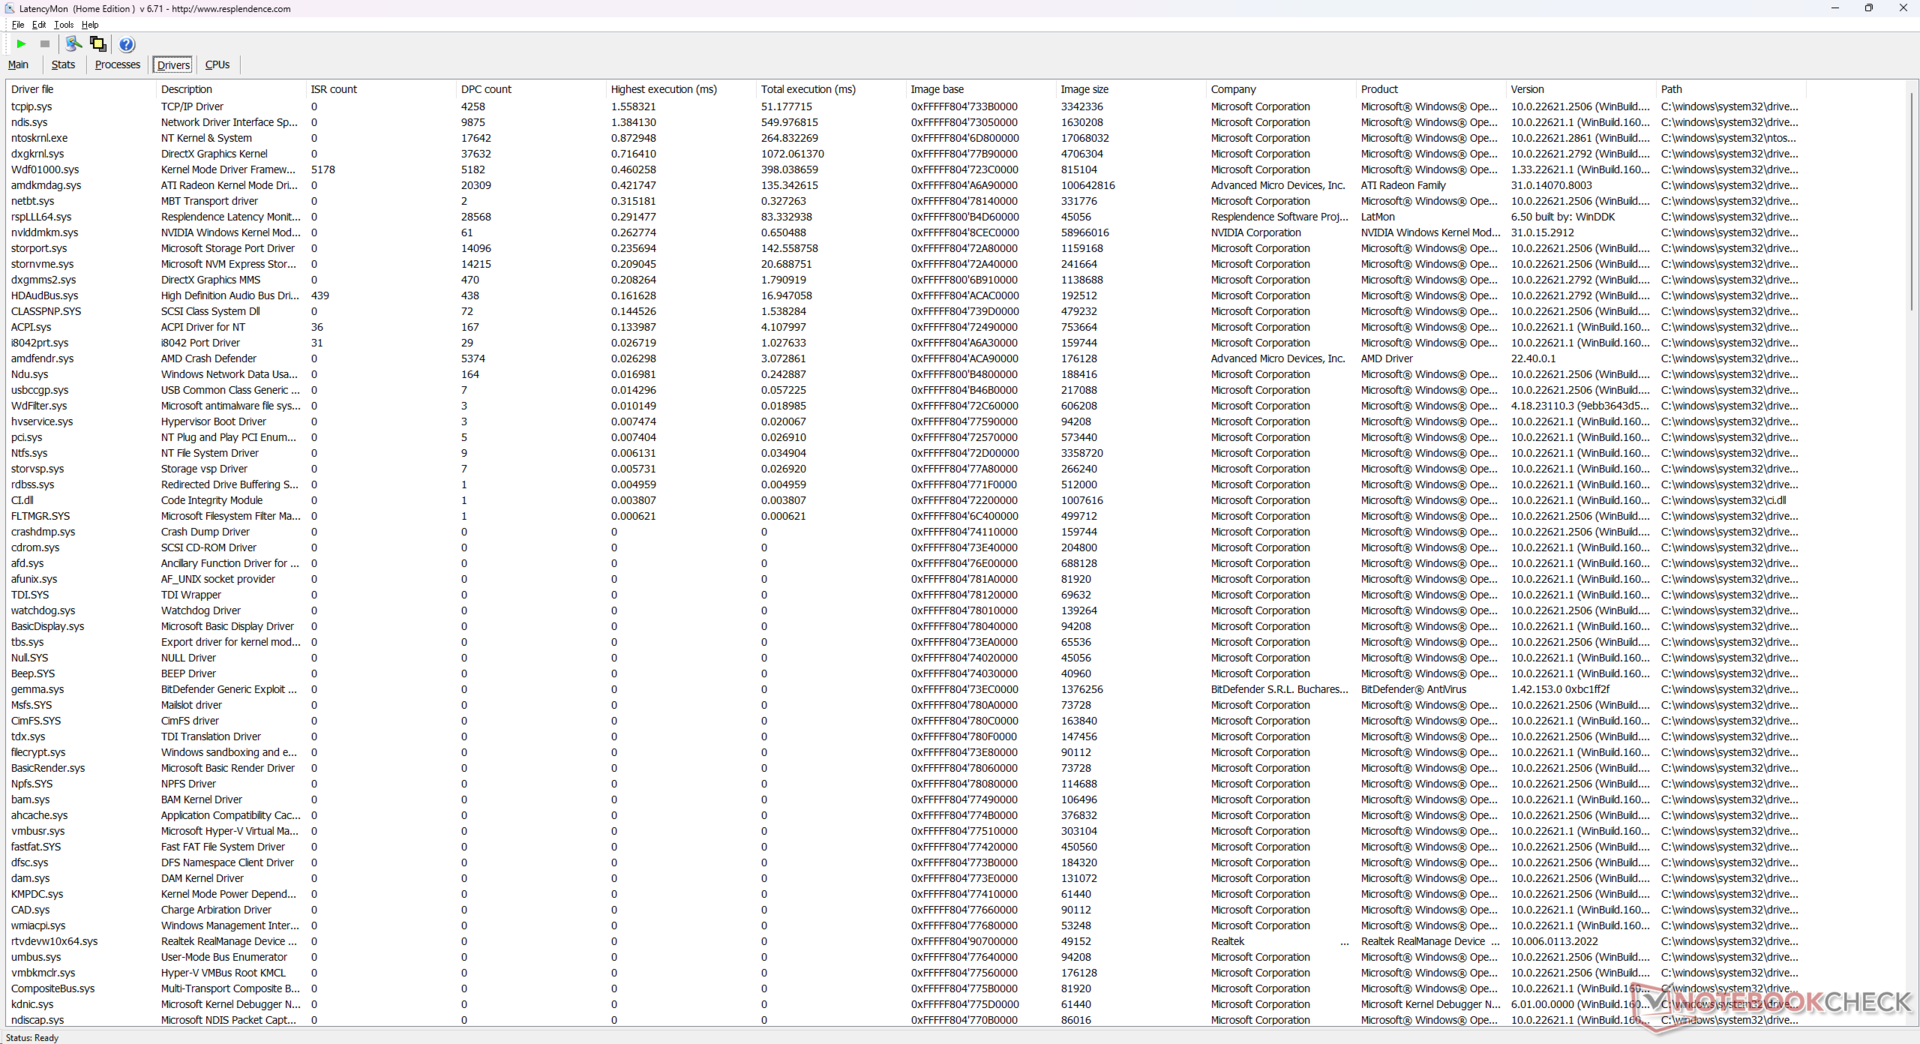
LatencyMon rivela problemi di DPC quando si aprono più schede del browser della nostra homepage. la riproduzione di video 4K a 60 FPS è invece perfetta, senza alcuna perdita di fotogrammi.
| DPC Latencies / LatencyMon - interrupt to process latency (max), Web, Youtube, Prime95 | |
| Lenovo ThinkPad P1 G6-21FV000DGE | |
| Asus ExpertBook B6 Flip B6602FC2 | |
| HP ZBook Power 15 G10 | |
| HP ZBook Power 15 G9 6B8C4EA | |
| Dell Precision 5000 5560 | |
| Lenovo ThinkPad P15v G3 21EM001AGE | |
* ... Meglio usare valori piccoli
Dispositivi di archiviazione
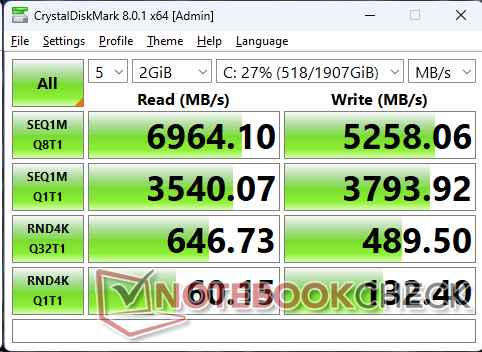
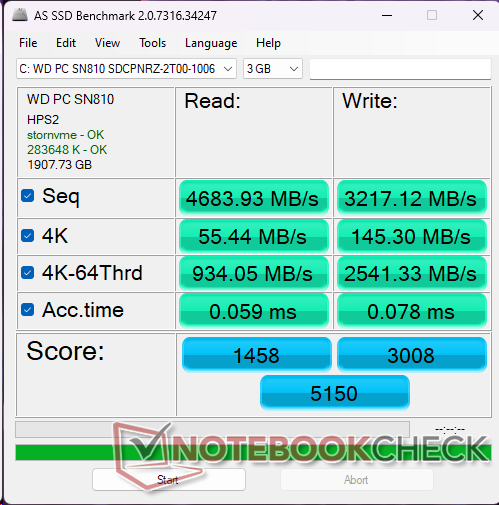
La nostra unità viene configurata con il WDC PC SN810 invece del modello Samsung PM9A1 dello scorso anno. In generale, l'unità WDC è più lenta della Samsung quando si tratta di leggere e scrivere piccoli blocchi da 4K ad alte profondità di coda. HP consente agli acquirenti di configurare con unità SED o non SED, ma HP non elenca esplicitamente i marchi di SSD in questione.

* ... Meglio usare valori piccoli
Disk Throttling: DiskSpd Read Loop, Queue Depth 8
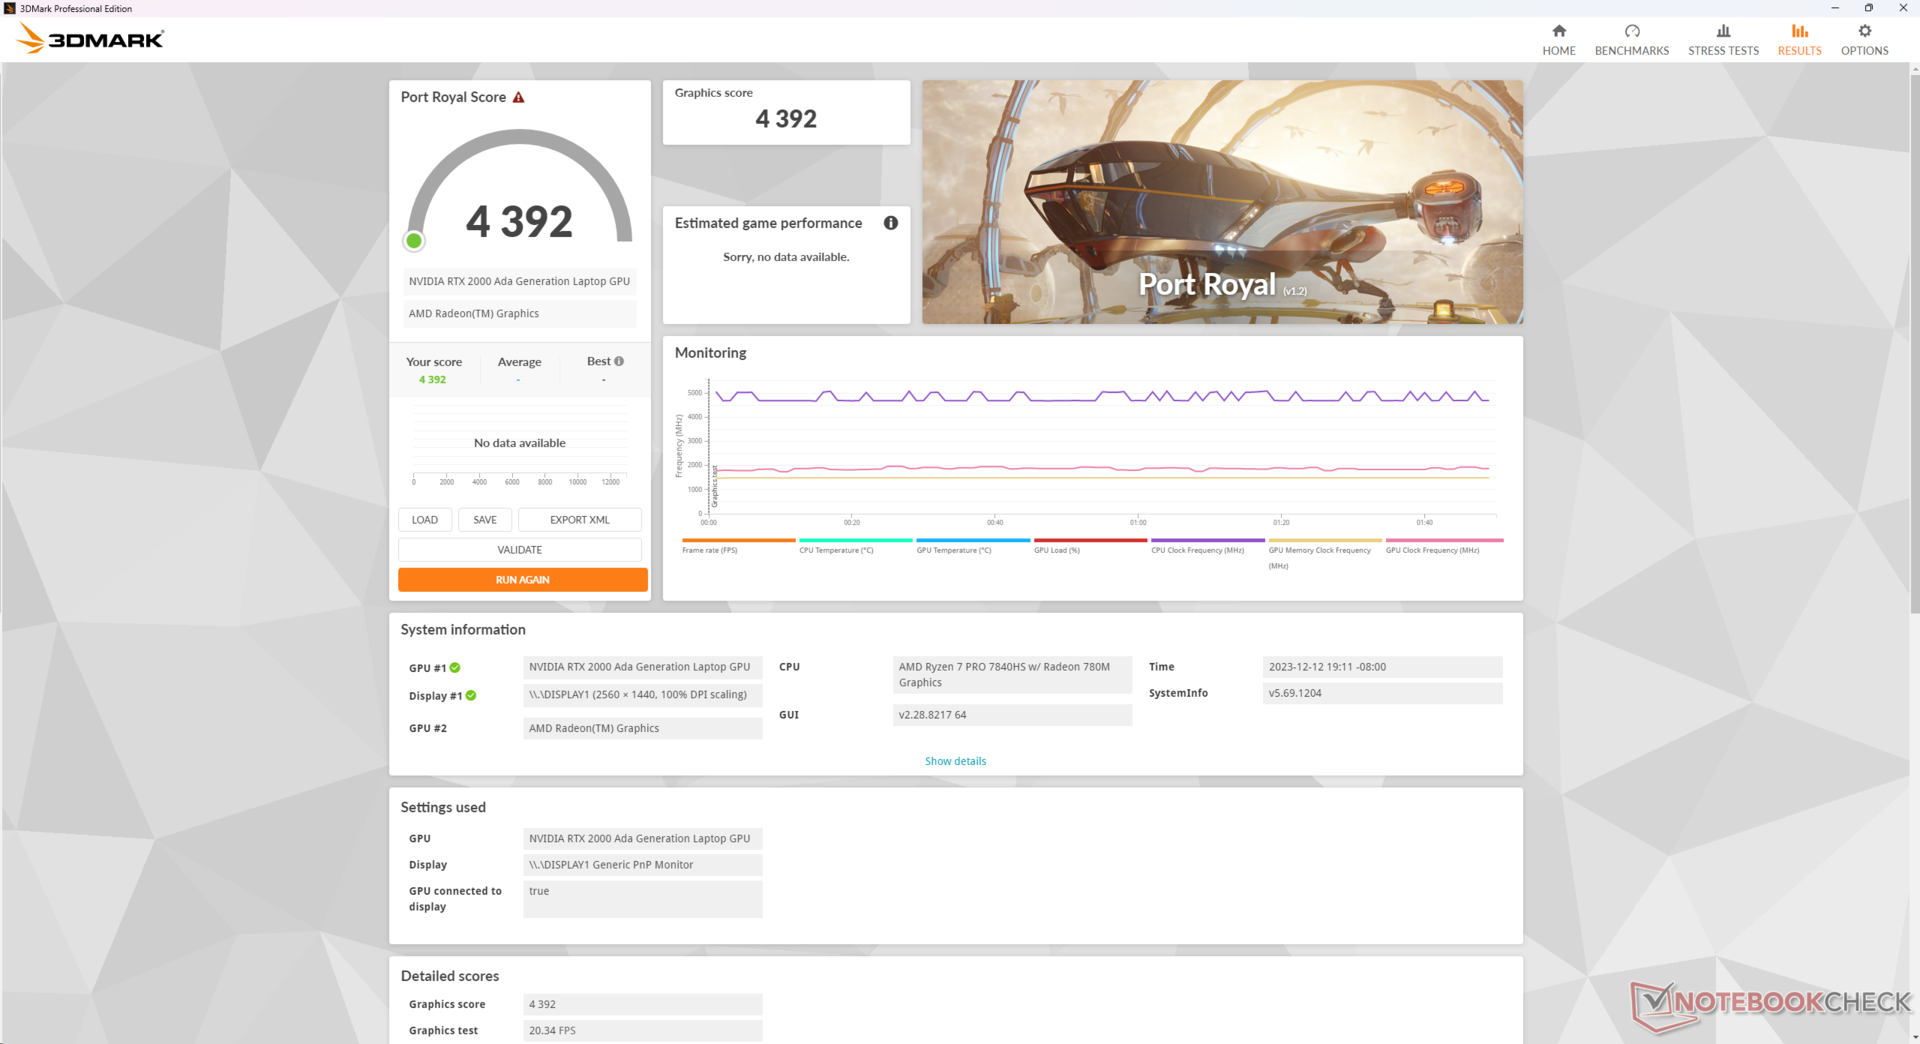
Prestazioni della GPU
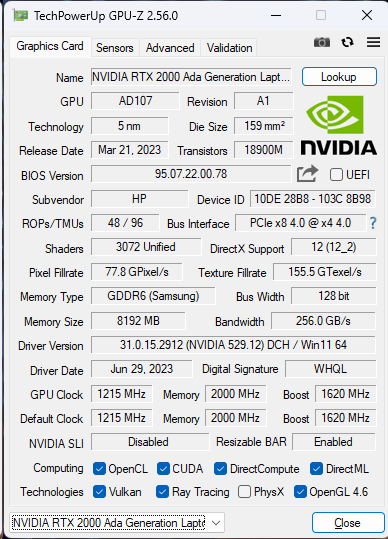
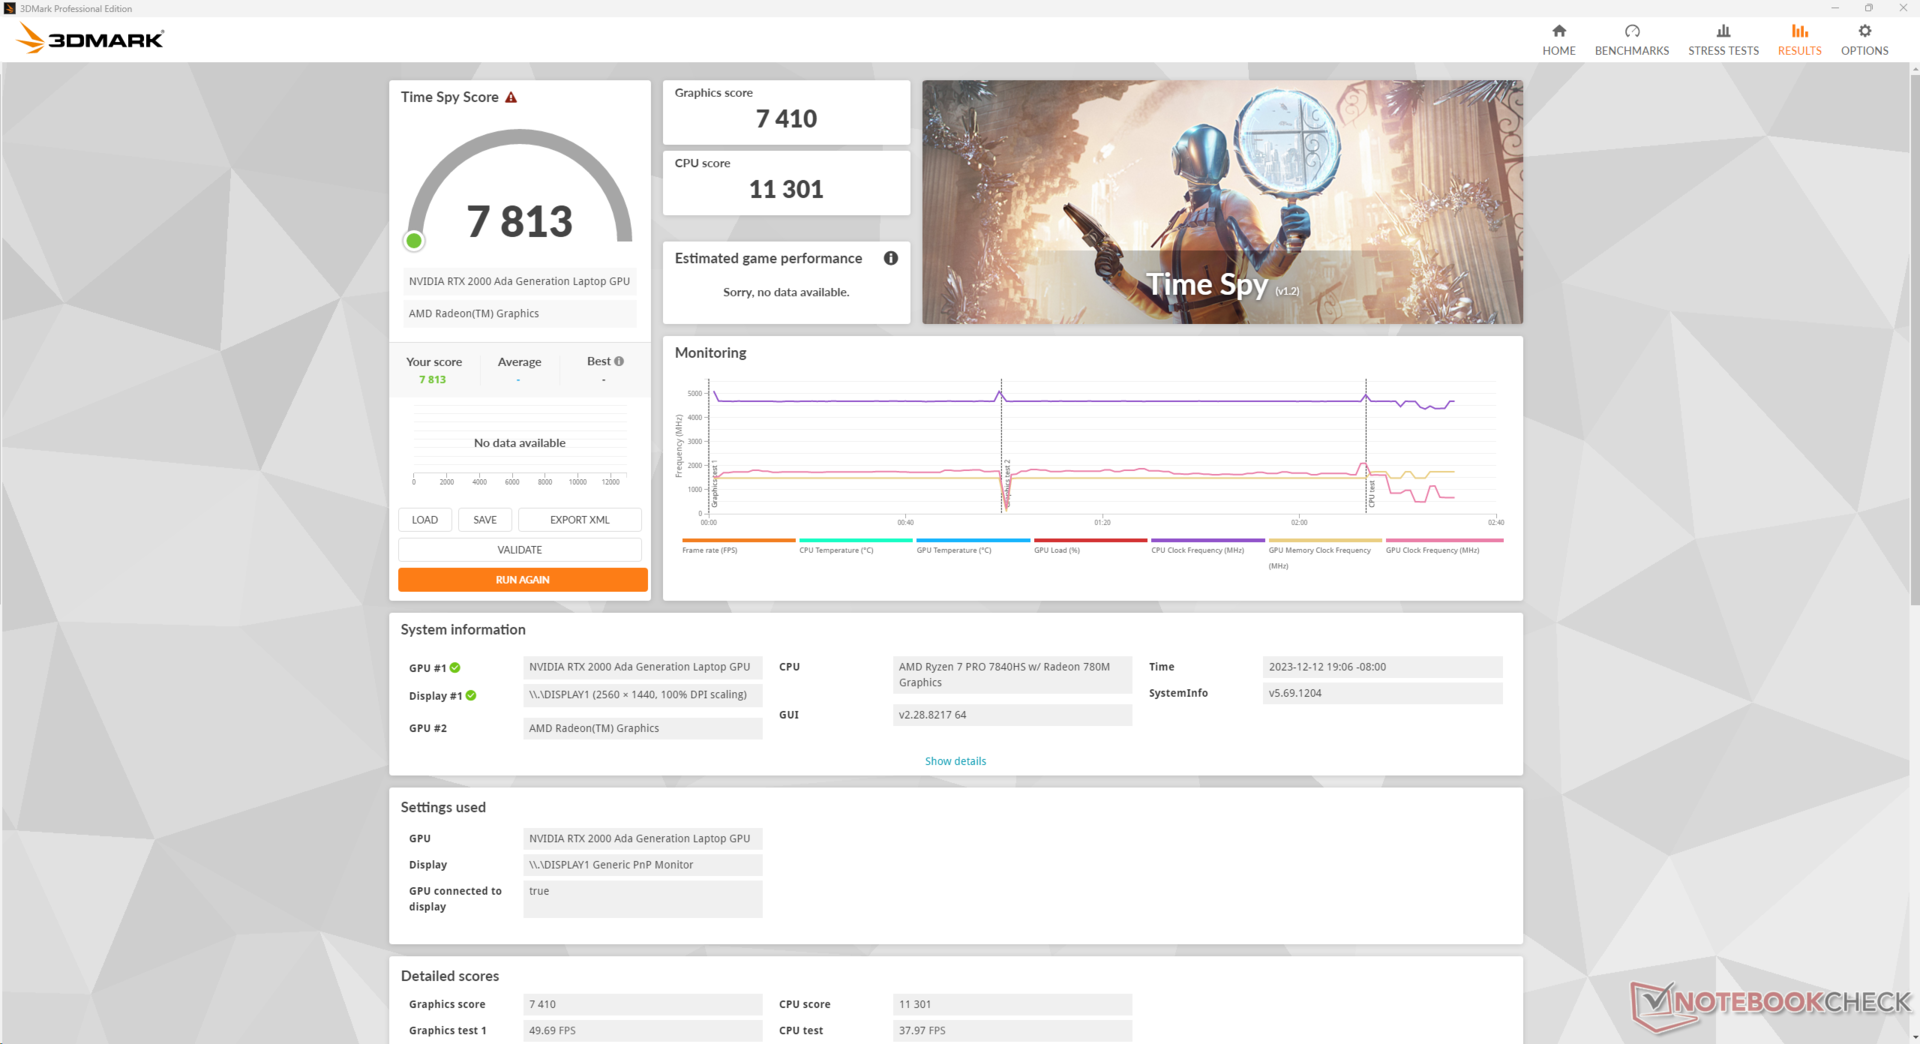
La Nvidia RTX 2000 Ada è un aggiornamento notevole rispetto alla RTX A2000 nello ZBook Power 15 G9 dello scorso anno e un motivo importante per scegliere il nuovo modello G10 rispetto alla versione precedente. La potenza grafica grezza è più veloce di circa il 55-65% e anche i risultati di SpecViewPerf sono costantemente superiori.
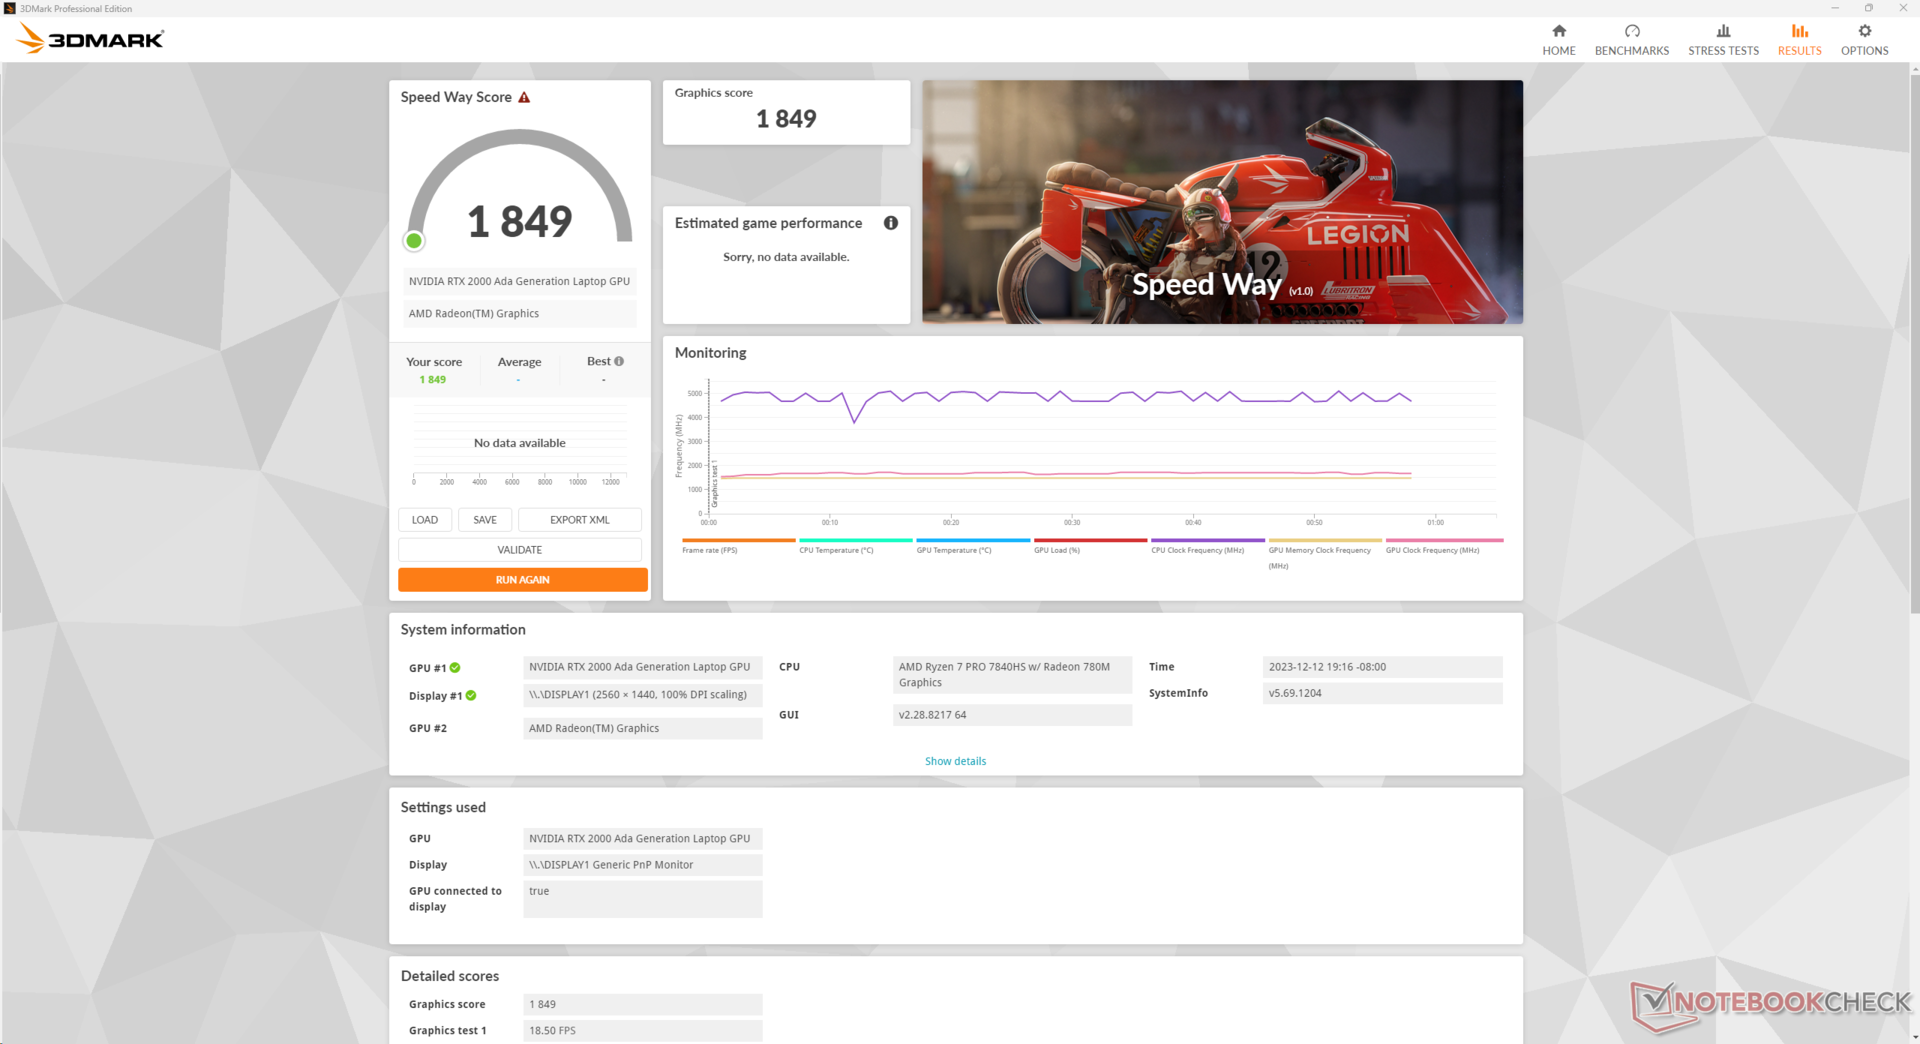
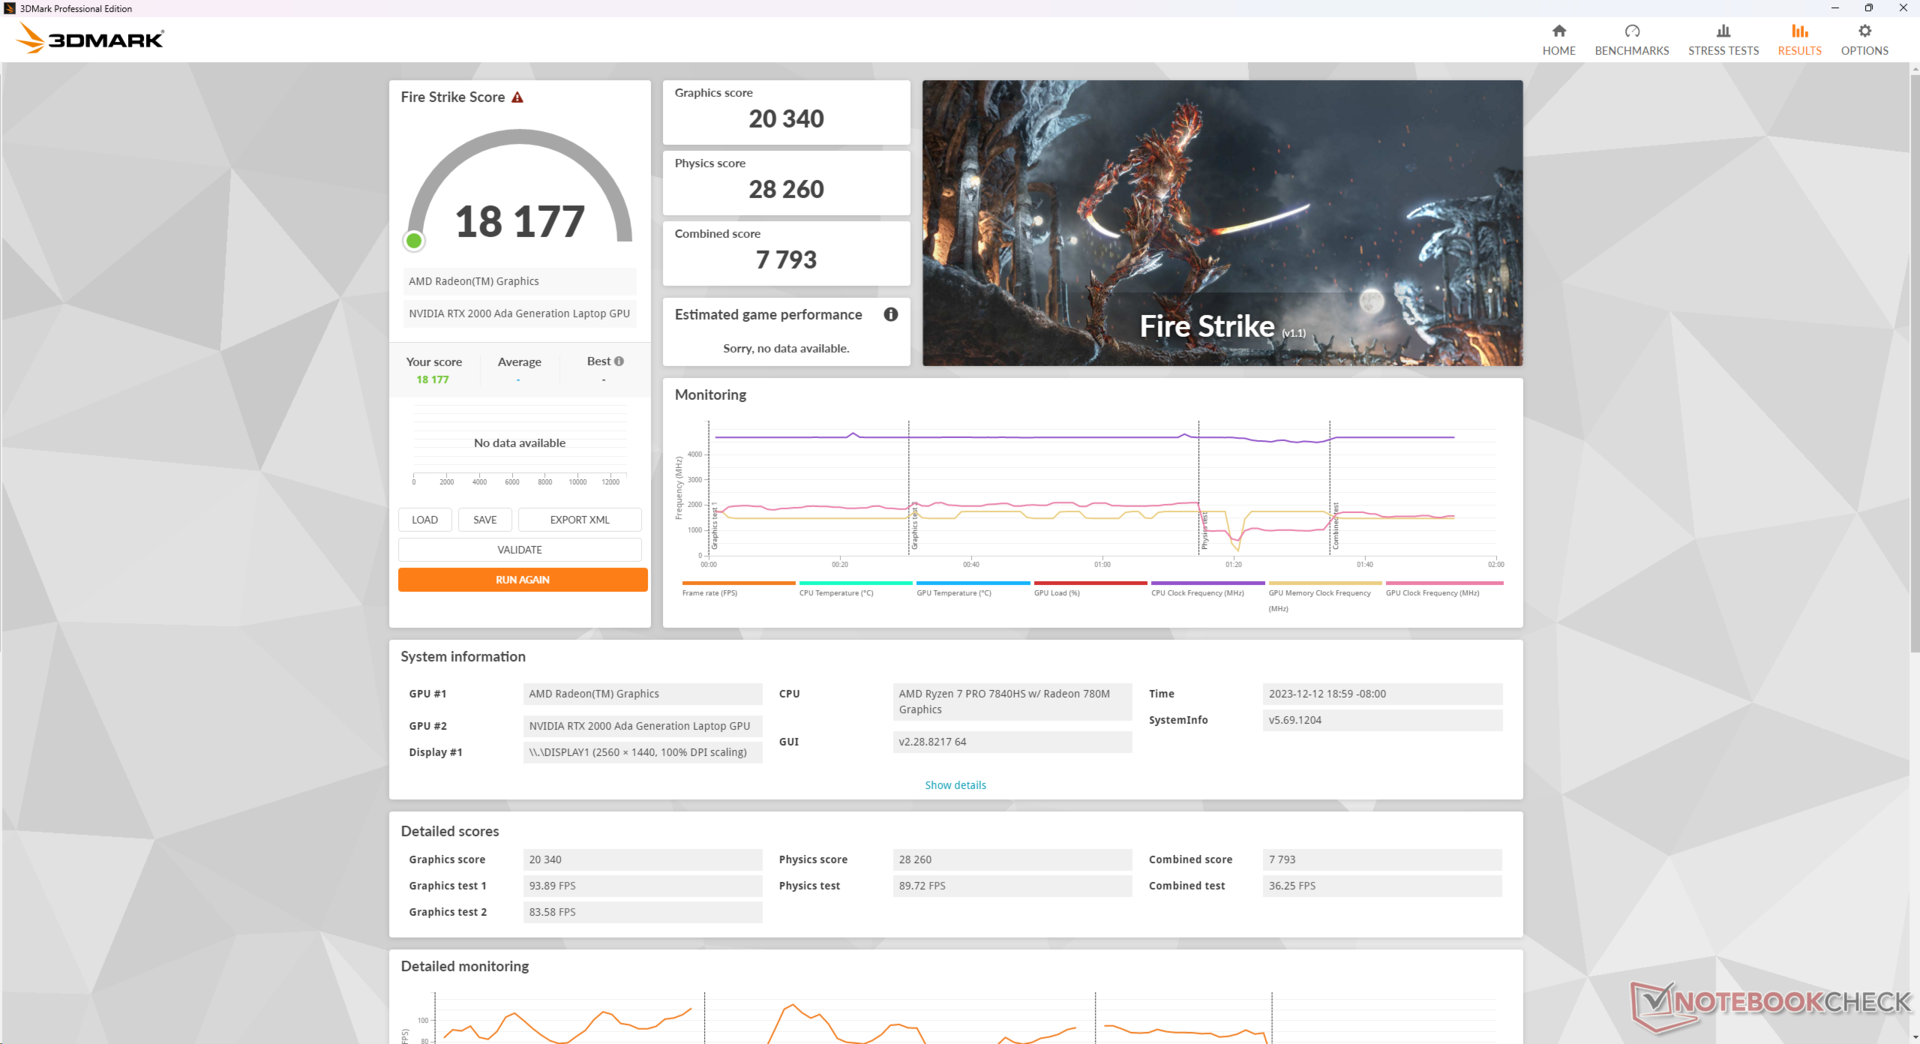
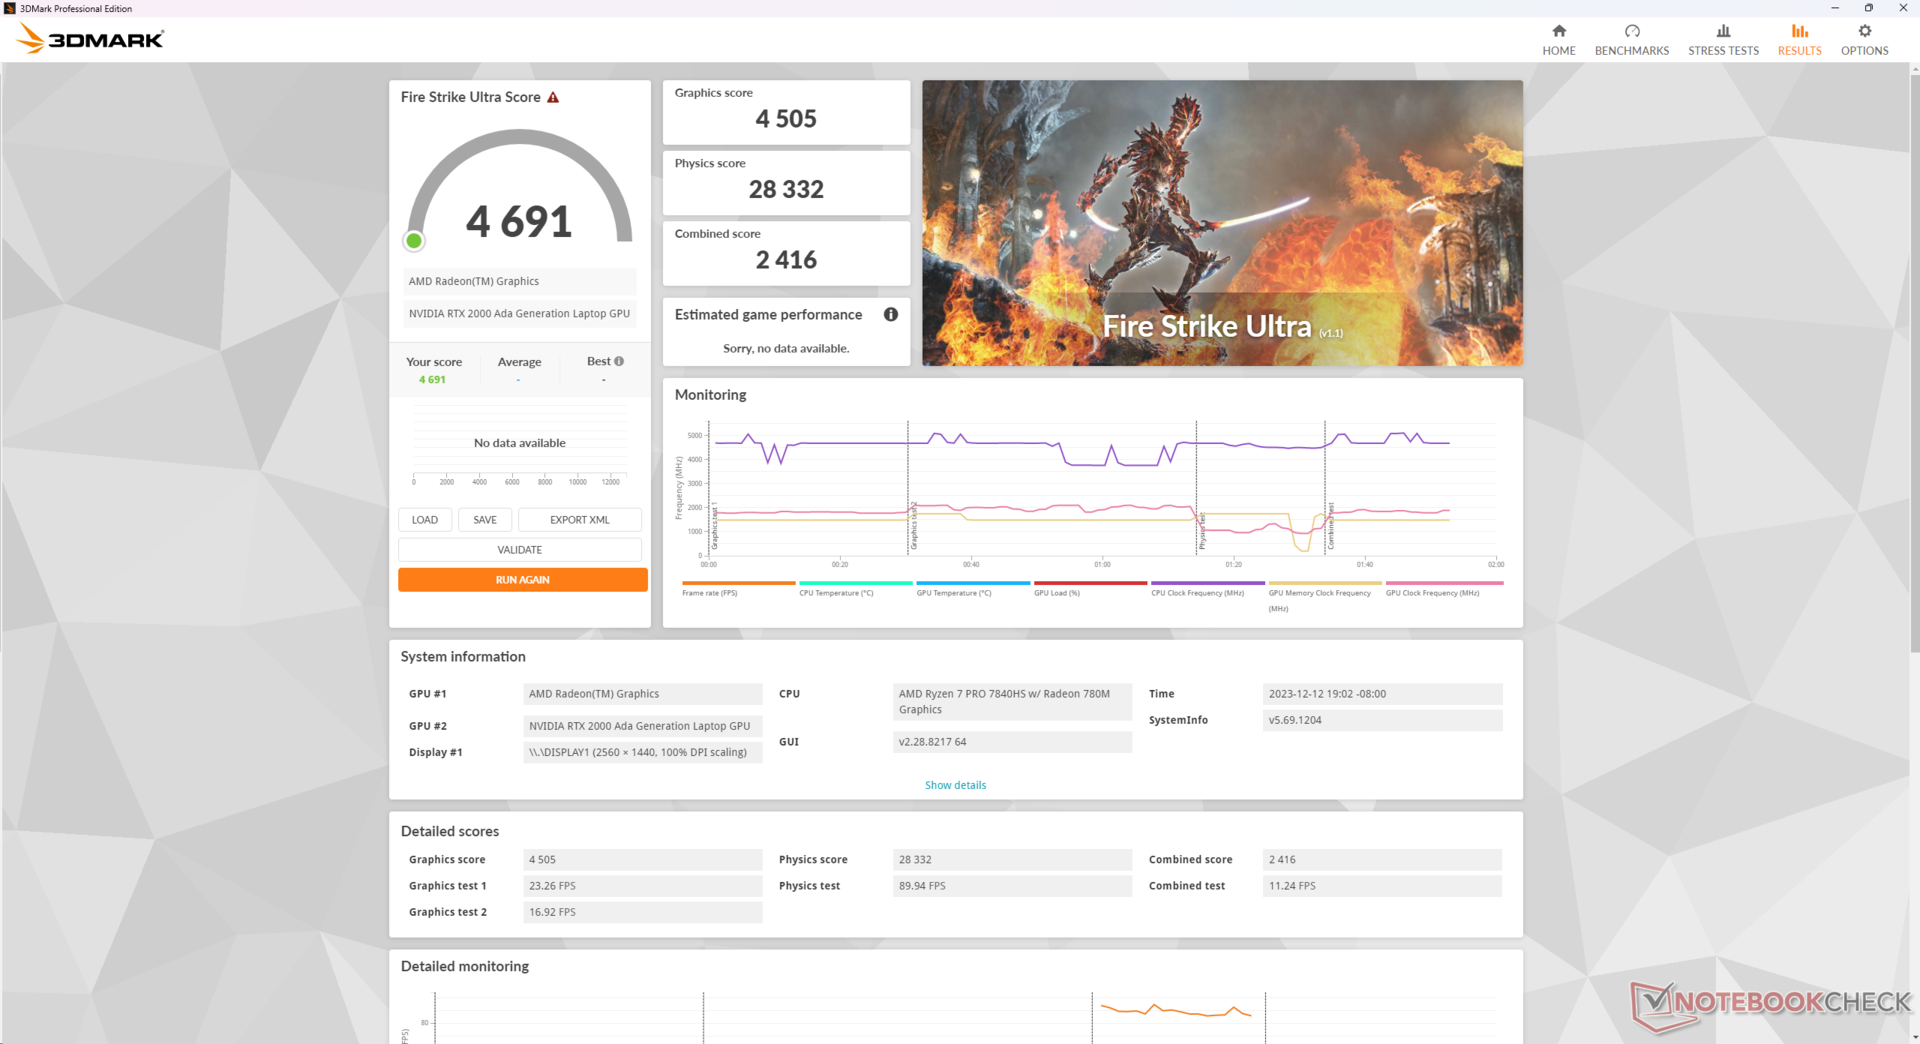
L'esecuzione in modalità Bilanciata invece che in modalità Prestazioni non sembra avere un impatto sulle prestazioni della CPU o della GPU, come dimostrano i risultati di Fire Strike qui sotto. L'esecuzione a batteria, tuttavia, riduce significativamente le prestazioni anche se impostata sulla modalità Prestazioni.
| Profilo di potenza | Punteggio di fisica | Punteggio grafico | Punteggio combinato |
| Modalità Prestazioni (su Main) | 28260 | 20340 | 7793 |
| Modalità Bilanciata (su rete elettrica) | 27579 (-0%) | 20812 (-0%) | 7877 (-0%) |
| Modalità Performance (a batteria) | 6105 (-78%) | 12744 (-37%) | 2392 (-69%) |
Purtroppo, HP offre il modello RTX 3000 Ada Solo per le configurazioni Intel dello ZBook Power 15 G10, mentre le configurazioni AMD sono limitate alla RTX 2000 Ada. La GPU 3000 Ada offre prestazioni più veloci del 5-15% rispetto alla 2000 Ada, in base al tempo trascorso con la GPU più piccola Dell Precision 5480.
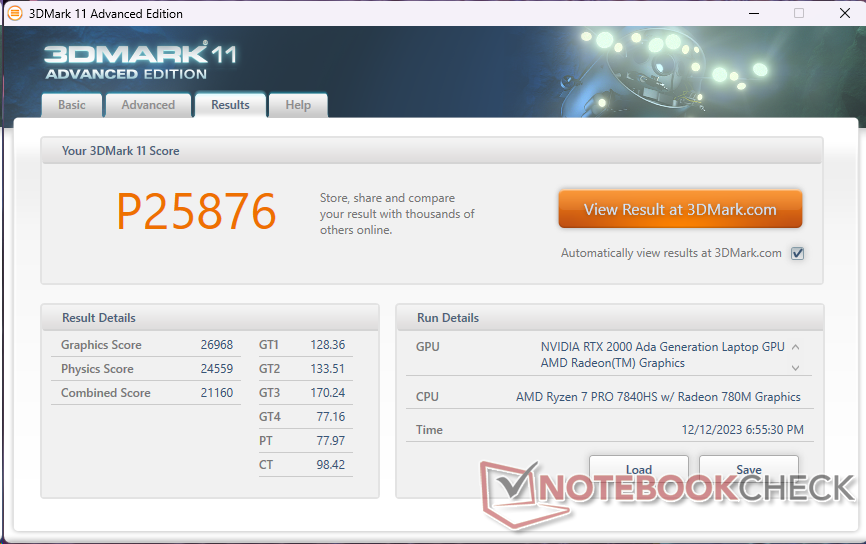
| 3DMark 11 Performance | 25876 punti | |
| 3DMark Fire Strike Score | 18177 punti | |
| 3DMark Time Spy Score | 7813 punti | |
Aiuto | ||
* ... Meglio usare valori piccoli
Prestazioni di gioco
Le prestazioni di gioco complessive sono molto simili a quelle della GeForce RTX 4050 anche se Ada 2000 integra più pipeline unificate, TMU, VRAM e una larghezza di banda di memoria più ampia. Giochi impegnativi come Cyberpunk 2077 sono giocabili a 1080p e con impostazioni estreme, ma sono necessarie impostazioni più basse se si gioca alla risoluzione nativa di 1440p.
| Cyberpunk 2077 | |
| 1920x1080 Low Preset (FSR off) | |
| HP ZBook Power 15 G10 | |
| Media NVIDIA RTX 2000 Ada Generation Laptop (81.1 - 85.4, n=2) | |
| Lenovo ThinkPad Z16 Gen 2 | |
| 1920x1080 Medium Preset (FSR off) | |
| HP ZBook Power 15 G10 | |
| Media NVIDIA RTX 2000 Ada Generation Laptop (61.4 - 64.5, n=2) | |
| Lenovo ThinkPad Z16 Gen 2 | |
| 1920x1080 High Preset (FSR off) | |
| HP ZBook Power 15 G10 | |
| Media NVIDIA RTX 2000 Ada Generation Laptop (51.7 - 55.2, n=2) | |
| Lenovo ThinkPad Z16 Gen 2 | |
| 1920x1080 Ultra Preset (FSR off) | |
| HP ZBook Power 15 G10 | |
| Media NVIDIA RTX 2000 Ada Generation Laptop (44.8 - 48.3, n=2) | |
| Lenovo ThinkPad Z16 Gen 2 | |
| 2560x1440 Ultra Preset (FSR off) | |
| HP ZBook Power 15 G10 | |
| Media NVIDIA RTX 2000 Ada Generation Laptop (29.7 - 29.9, n=2) | |
| Lenovo ThinkPad Z16 Gen 2 | |
| 1920x1080 Ray Tracing Ultra Preset (DLSS off) | |
| HP ZBook Power 15 G10 | |
| Media NVIDIA RTX 2000 Ada Generation Laptop (19.2 - 21.6, n=2) | |
| Lenovo ThinkPad Z16 Gen 2 | |
Witcher 3 FPS Chart
| basso | medio | alto | ultra | QHD | |
|---|---|---|---|---|---|
| GTA V (2015) | 178.1 | 170.6 | 157.7 | 86.2 | 60.6 |
| The Witcher 3 (2015) | 336.4 | 219 | 127.9 | 65.5 | |
| Dota 2 Reborn (2015) | 155 | 140.8 | 136.9 | 132 | |
| Final Fantasy XV Benchmark (2018) | 173.3 | 93.5 | 67.7 | 50.3 | |
| X-Plane 11.11 (2018) | 80.6 | 73 | 52.5 | ||
| Far Cry 5 (2018) | 151 | 110 | 102 | 95 | 63 |
| Strange Brigade (2018) | 332 | 183 | 148.4 | 132.5 | 94.1 |
| Tiny Tina's Wonderlands (2022) | 119.8 | 110.5 | 77.3 | 62.3 | 43.5 |
| F1 22 (2022) | 166.7 | 151.8 | 119.9 | 44.2 | 28.9 |
| Cyberpunk 2077 (2023) | 85.4 | 64.5 | 55.2 | 48.3 | 29.9 |
Emissioni
Rumore del sistema
Il rumore della ventola è essenzialmente identico a quello del modello dello scorso anno, con valori minimi e massimi simili, nonostante le differenze di prestazioni. Per quanto riguarda il valore, le ventole interne della nostra unità G10 sono in grado di rimanere più silenziose per un periodo leggermente più lungo rispetto alla nostra unità G9 durante l'esecuzione di 3DMark 06, ma questo dipende ovviamente dalle condizioni di temperatura iniziali.
Il rumore della ventola durante l'esecuzione Witcher 3 rimarrebbe invariata tra le modalità Bilanciata e Prestazioni, il che corrisponde ai risultati dei nostri test che mostrano differenze minime tra i due profili energetici.
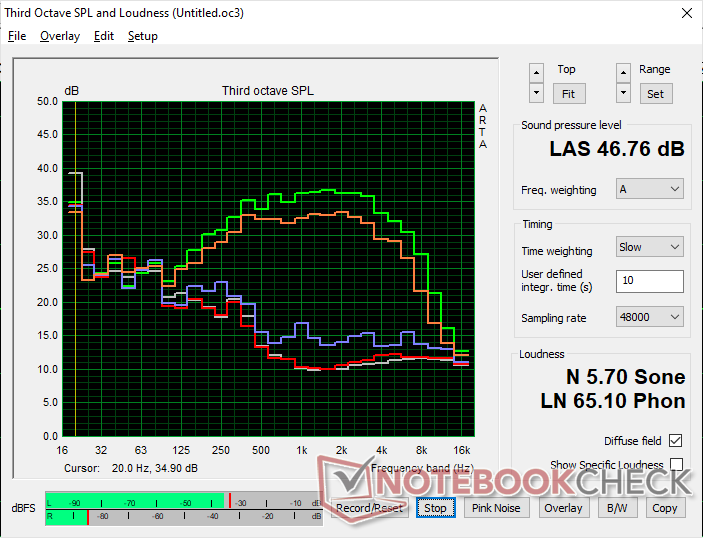
Rumorosità
| Idle |
| 24.4 / 24.4 / 24.4 dB(A) |
| Sotto carico |
| 27.4 / 46.8 dB(A) |
 | ||
30 dB silenzioso 40 dB(A) udibile 50 dB(A) rumoroso |
||
min: | ||
| HP ZBook Power 15 G10 RTX 2000 Ada Generation Laptop, R7 PRO 7840HS, WDC PC SN810 2TB | HP ZBook Power 15 G9 6B8C4EA RTX A2000 Laptop GPU, i7-12700H, Samsung PM9A1 MZVL21T0HCLR | Lenovo ThinkPad P15v G3 21EM001AGE RTX A2000 Laptop GPU, R7 PRO 6850H, SK Hynix PC711 1TB HFS001TDE9X081N | Dell Precision 5000 5560 RTX A2000 Laptop GPU, i7-11850H, Samsung PM9A1 MZVL22T0HBLB | Lenovo ThinkPad P1 G6-21FV000DGE RTX 2000 Ada Generation Laptop, i9-13900H, SK Hynix PC711 1TB HFS001TDE9X084N | Asus ExpertBook B6 Flip B6602FC2 RTX A2000 Laptop GPU, i9-12950HX, Samsung PM9A1 MZVL21T0HCLR | |
|---|---|---|---|---|---|---|
| Noise | -8% | 3% | 5% | -10% | -34% | |
| off /ambiente * (dB) | 24.2 | 23.8 2% | 23.2 4% | 23.4 3% | 24.5 -1% | 26 -7% |
| Idle Minimum * (dB) | 24.4 | 23.8 2% | 23.2 5% | 23.6 3% | 24.5 -0% | 32.4 -33% |
| Idle Average * (dB) | 24.4 | 23.8 2% | 23.2 5% | 23.6 3% | 24.5 -0% | 32.4 -33% |
| Idle Maximum * (dB) | 24.4 | 23.8 2% | 23.2 5% | 23.6 3% | 24.5 -0% | 32.4 -33% |
| Load Average * (dB) | 27.4 | 42.9 -57% | 35 -28% | 25.8 6% | 48 -75% | 51.9 -89% |
| Witcher 3 ultra * (dB) | 43.3 | 44.5 -3% | 37.9 12% | 40.1 7% | 40.7 6% | |
| Load Maximum * (dB) | 46.8 | 47.9 -2% | 37.5 20% | 41.4 12% | 48 -3% | 52.1 -11% |
* ... Meglio usare valori piccoli
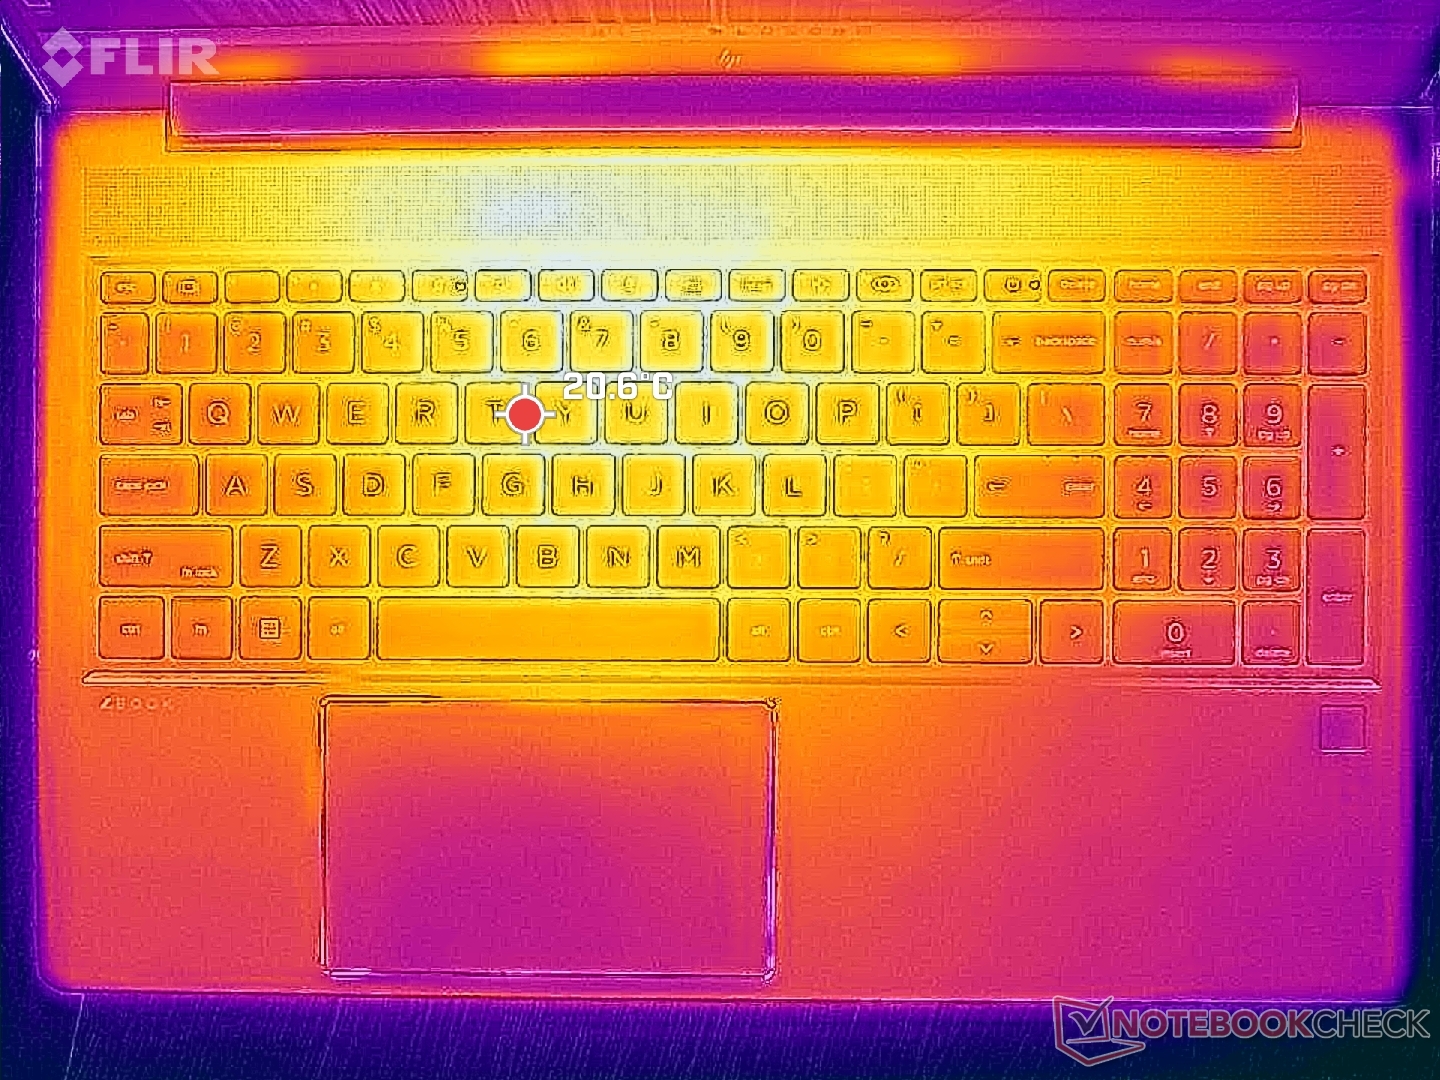
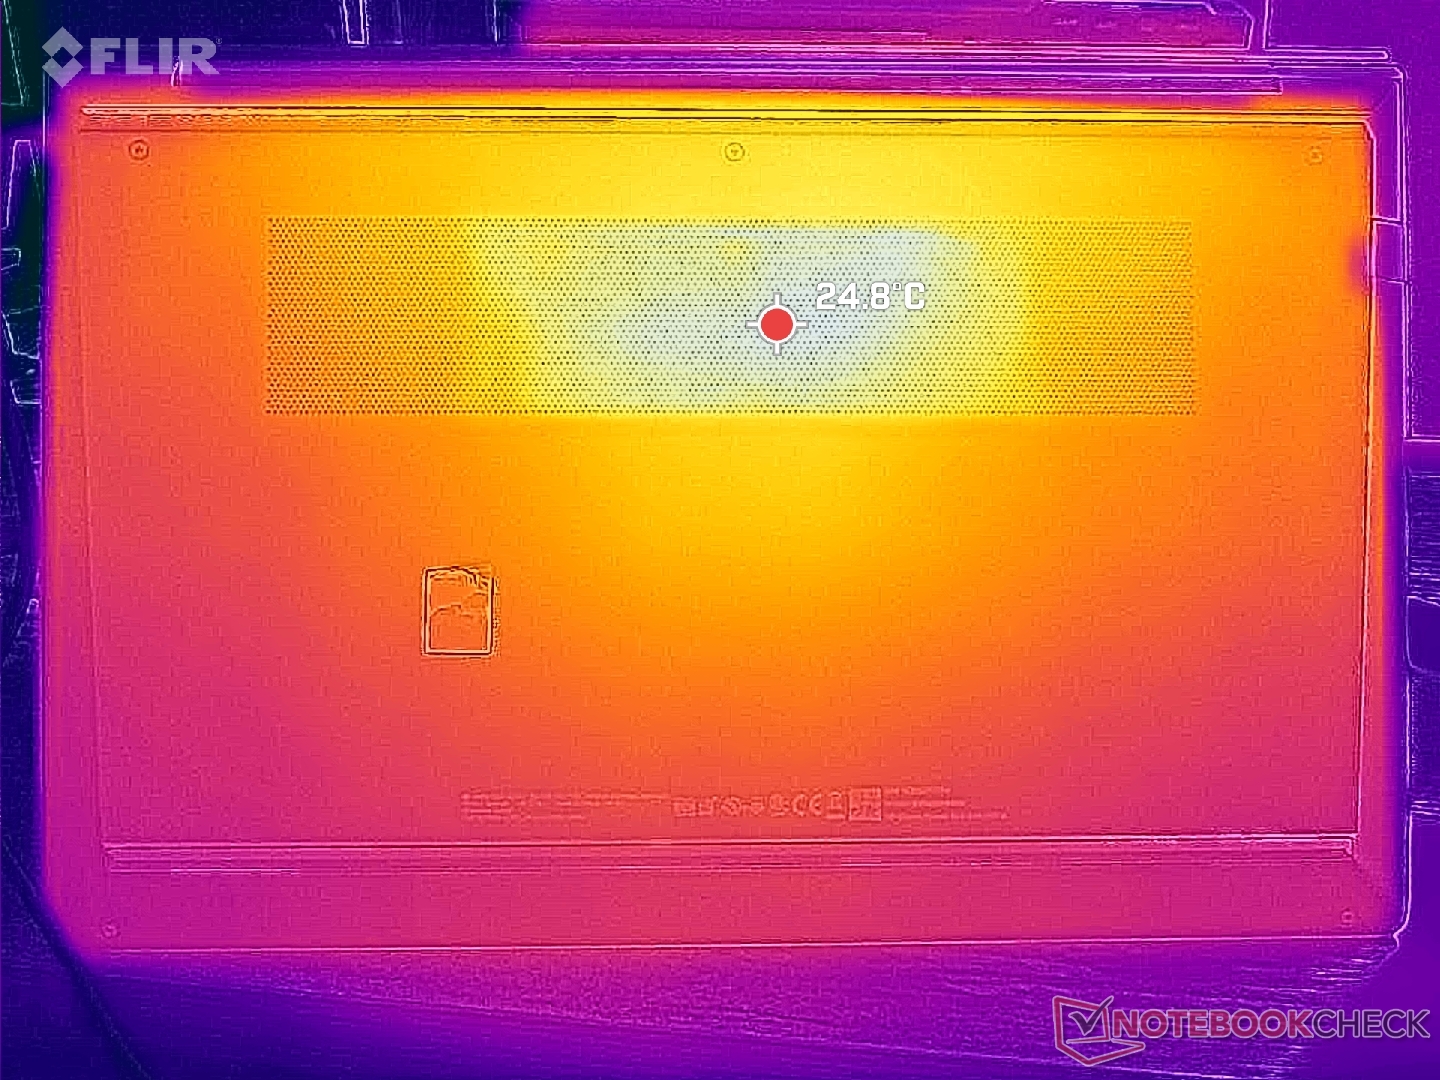
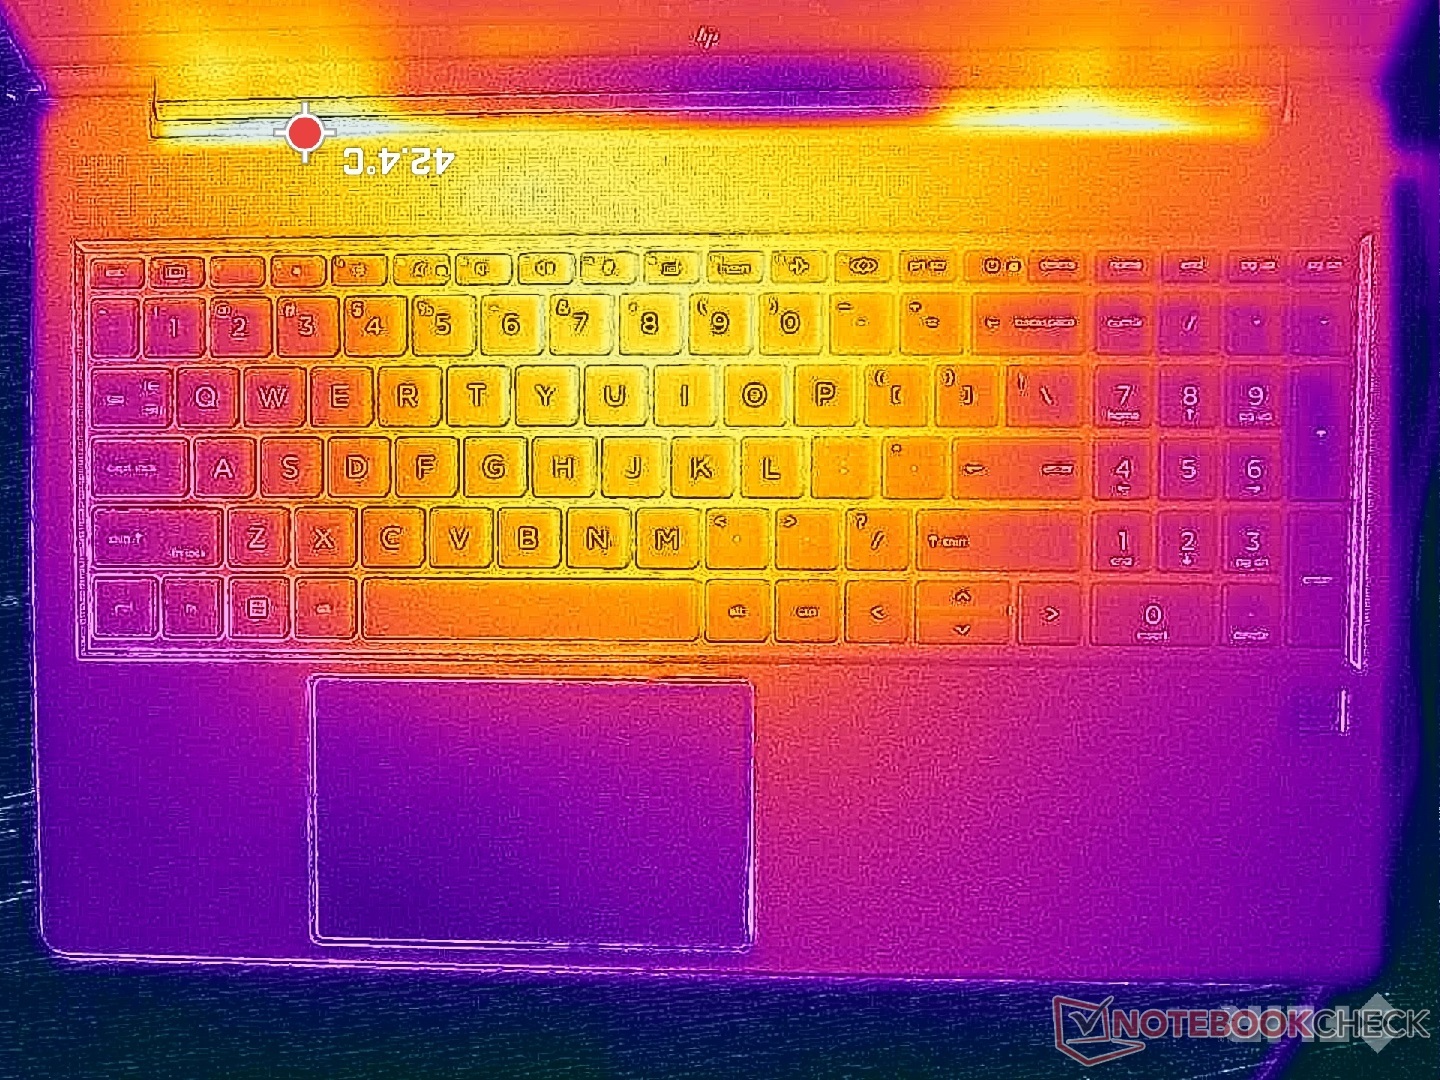
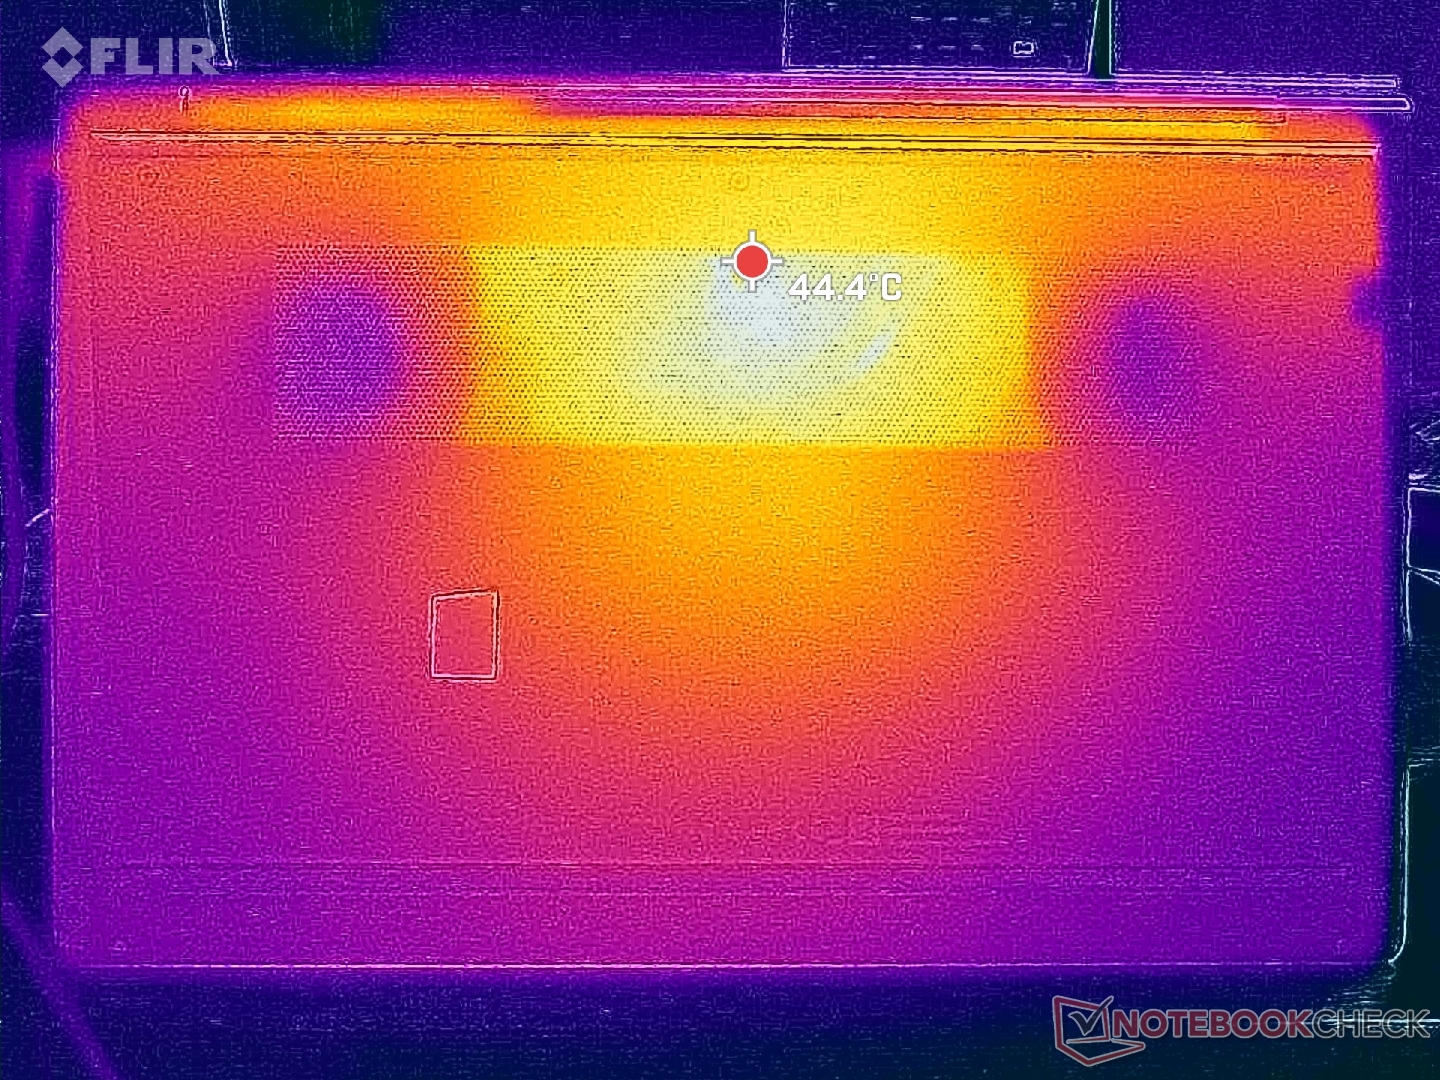
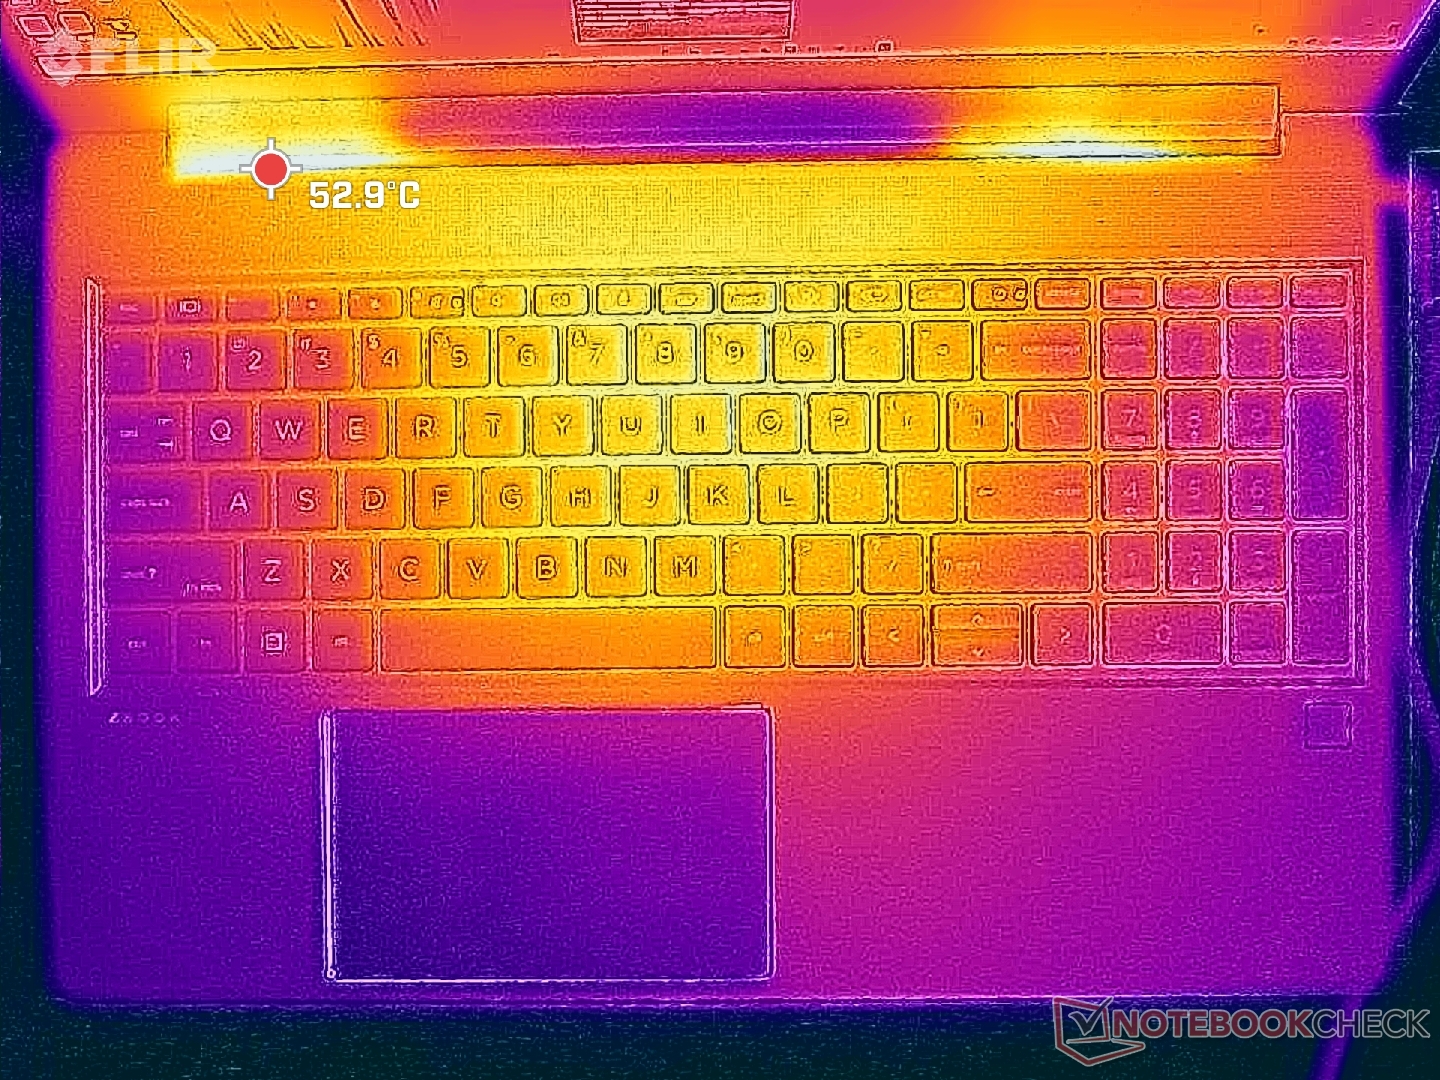
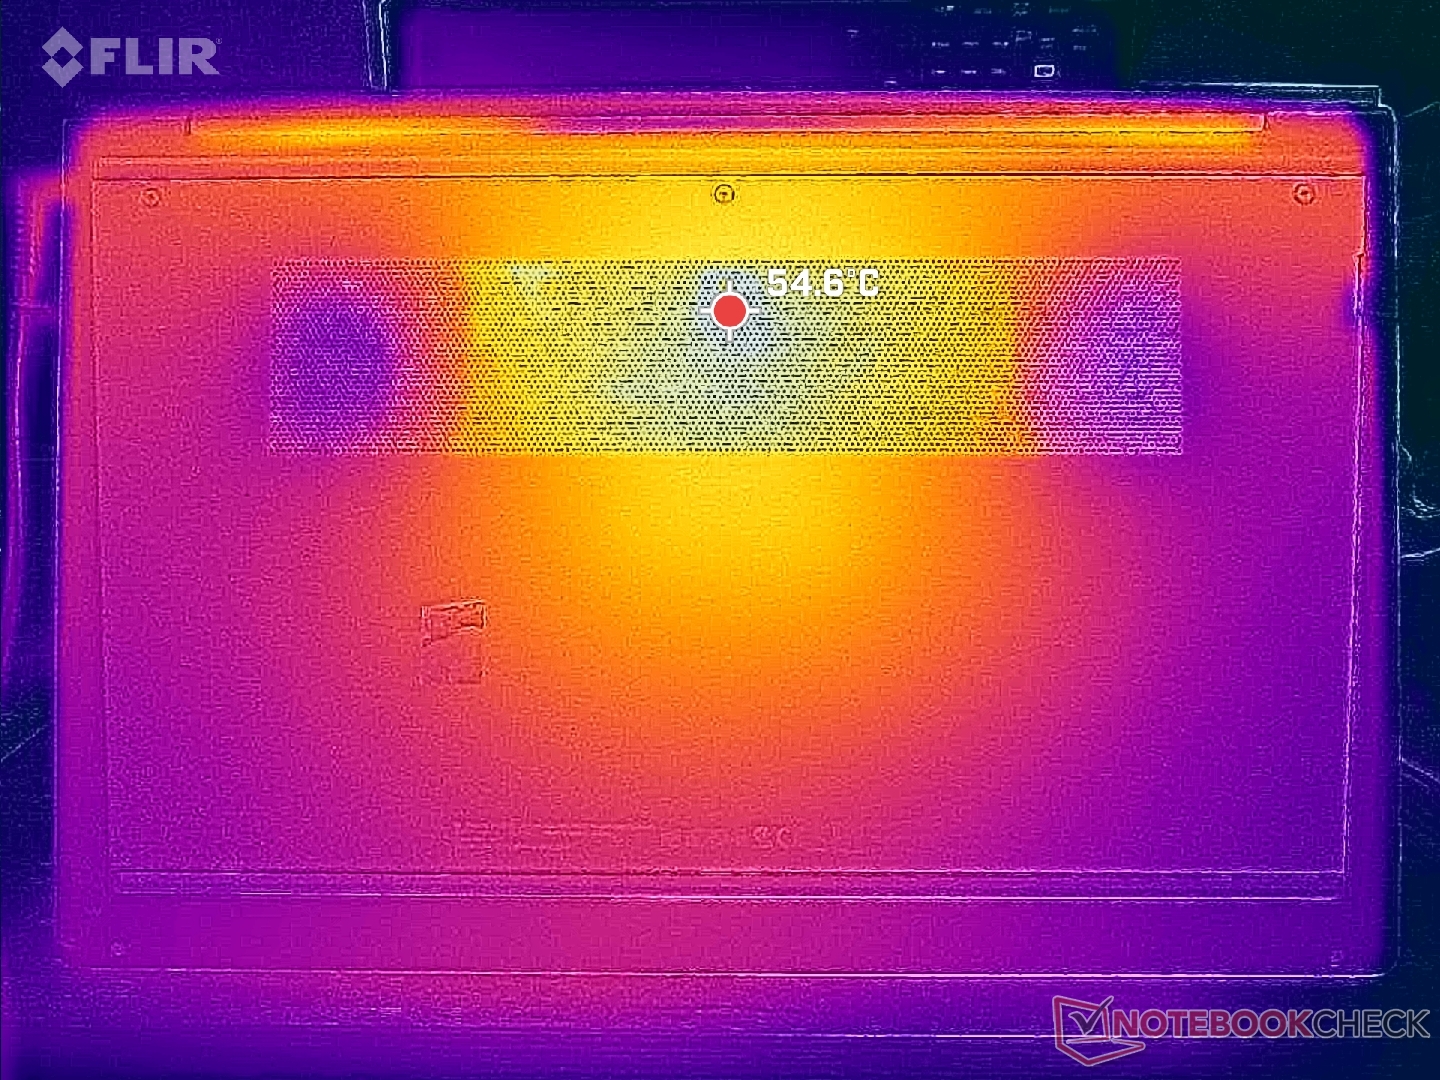
Temperatura
Le temperature di superficie sono più calde verso il centro e più fredde lungo i lati della tastiera o i bordi dello chassis. I punti caldi al centro e sul fondo della tastiera possono raggiungere oltre 42 C, che sono diversi gradi più freddi rispetto al concorrente ThinkPad P1 G6 con la stessa GPU RTX 2000.
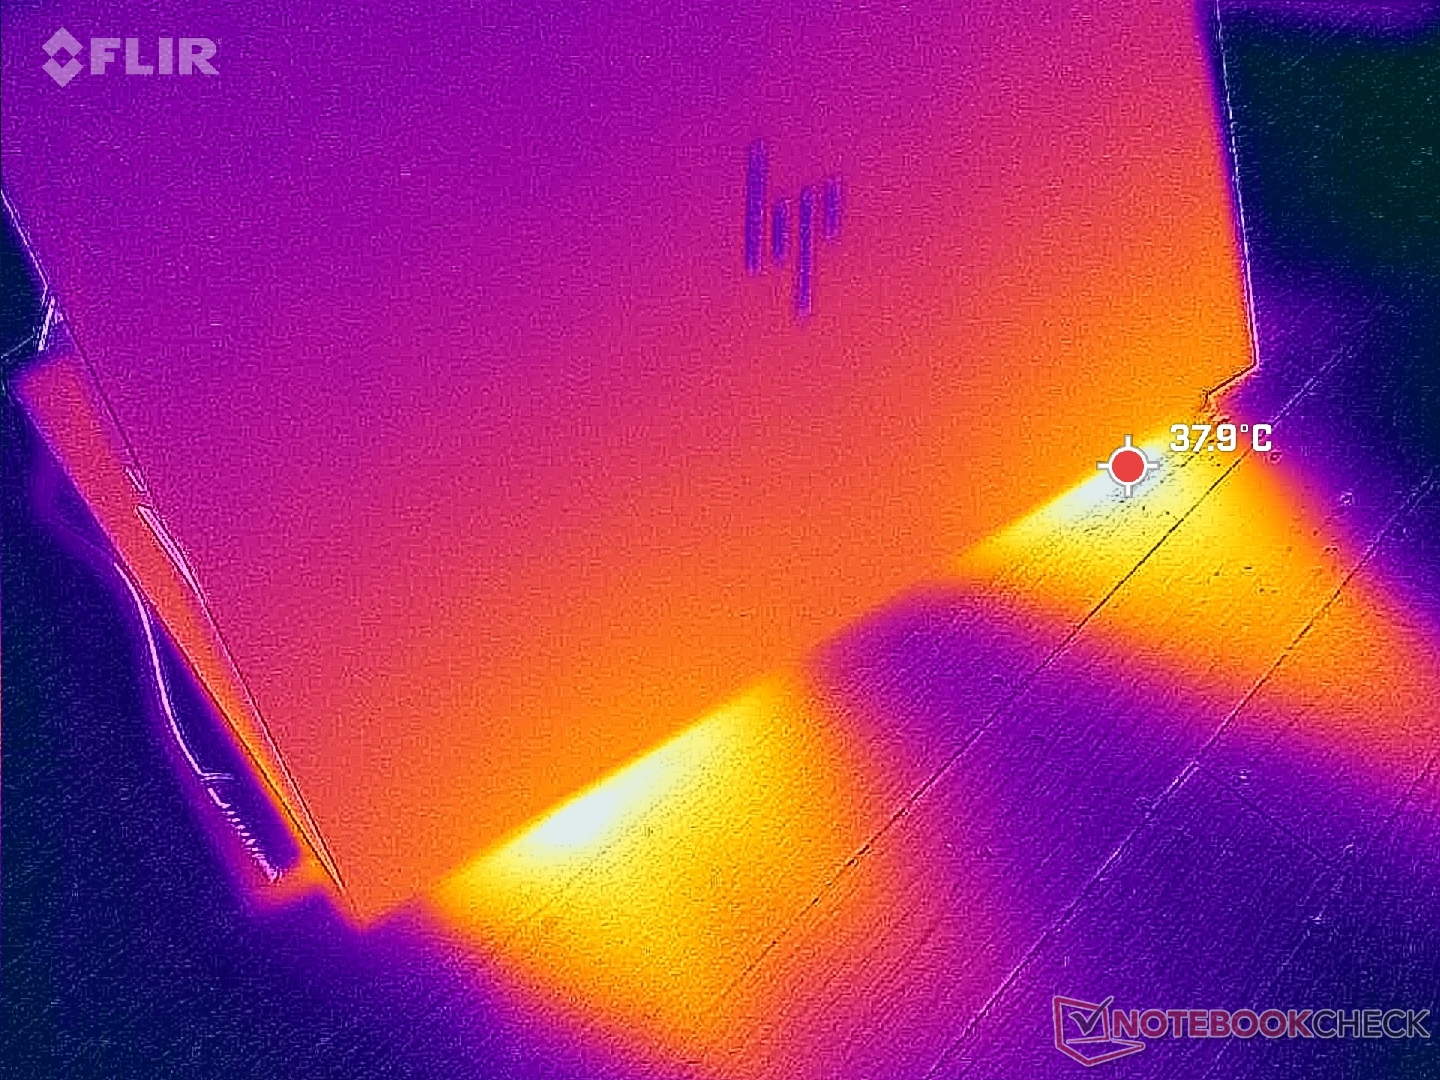
(±) La temperatura massima sul lato superiore è di 42.4 °C / 108 F, rispetto alla media di 38.2 °C / 101 F, che varia da 22.2 a 69.8 °C per questa classe Workstation.
(-) Il lato inferiore si riscalda fino ad un massimo di 47.8 °C / 118 F, rispetto alla media di 41.1 °C / 106 F
(+) In idle, la temperatura media del lato superiore è di 24.4 °C / 76 F, rispetto alla media deld ispositivo di 32 °C / 90 F.
(+) Riproducendo The Witcher 3, la temperatura media per il lato superiore e' di 31.2 °C / 88 F, rispetto alla media del dispositivo di 32 °C / 90 F.
(+) I poggiapolsi e il touchpad sono piu' freddi della temperatura della pelle con un massimo di 27.6 °C / 81.7 F e sono quindi freddi al tatto.
(±) La temperatura media della zona del palmo della mano di dispositivi simili e'stata di 27.8 °C / 82 F (+0.2 °C / 0.3 F).
| HP ZBook Power 15 G10 AMD Ryzen 7 PRO 7840HS, NVIDIA RTX 2000 Ada Generation Laptop | HP ZBook Power 15 G9 6B8C4EA Intel Core i7-12700H, NVIDIA RTX A2000 Laptop GPU | Lenovo ThinkPad P15v G3 21EM001AGE AMD Ryzen 7 PRO 6850H, NVIDIA RTX A2000 Laptop GPU | Dell Precision 5000 5560 Intel Core i7-11850H, NVIDIA RTX A2000 Laptop GPU | Lenovo ThinkPad P1 G6-21FV000DGE Intel Core i9-13900H, NVIDIA RTX 2000 Ada Generation Laptop | Asus ExpertBook B6 Flip B6602FC2 Intel Core i9-12950HX, NVIDIA RTX A2000 Laptop GPU | |
|---|---|---|---|---|---|---|
| Heat | 7% | -2% | -16% | -9% | -10% | |
| Maximum Upper Side * (°C) | 42.4 | 40.3 5% | 48.7 -15% | 48.2 -14% | 47.1 -11% | 48.4 -14% |
| Maximum Bottom * (°C) | 47.8 | 48.3 -1% | 50.5 -6% | 42.6 11% | 56.5 -18% | 52.3 -9% |
| Idle Upper Side * (°C) | 26.8 | 23.7 12% | 25 7% | 34.8 -30% | 28.1 -5% | 27.8 -4% |
| Idle Bottom * (°C) | 27.2 | 23.8 12% | 25.4 7% | 35.2 -29% | 27.6 -1% | 30.3 -11% |
* ... Meglio usare valori piccoli
Test da sforzo
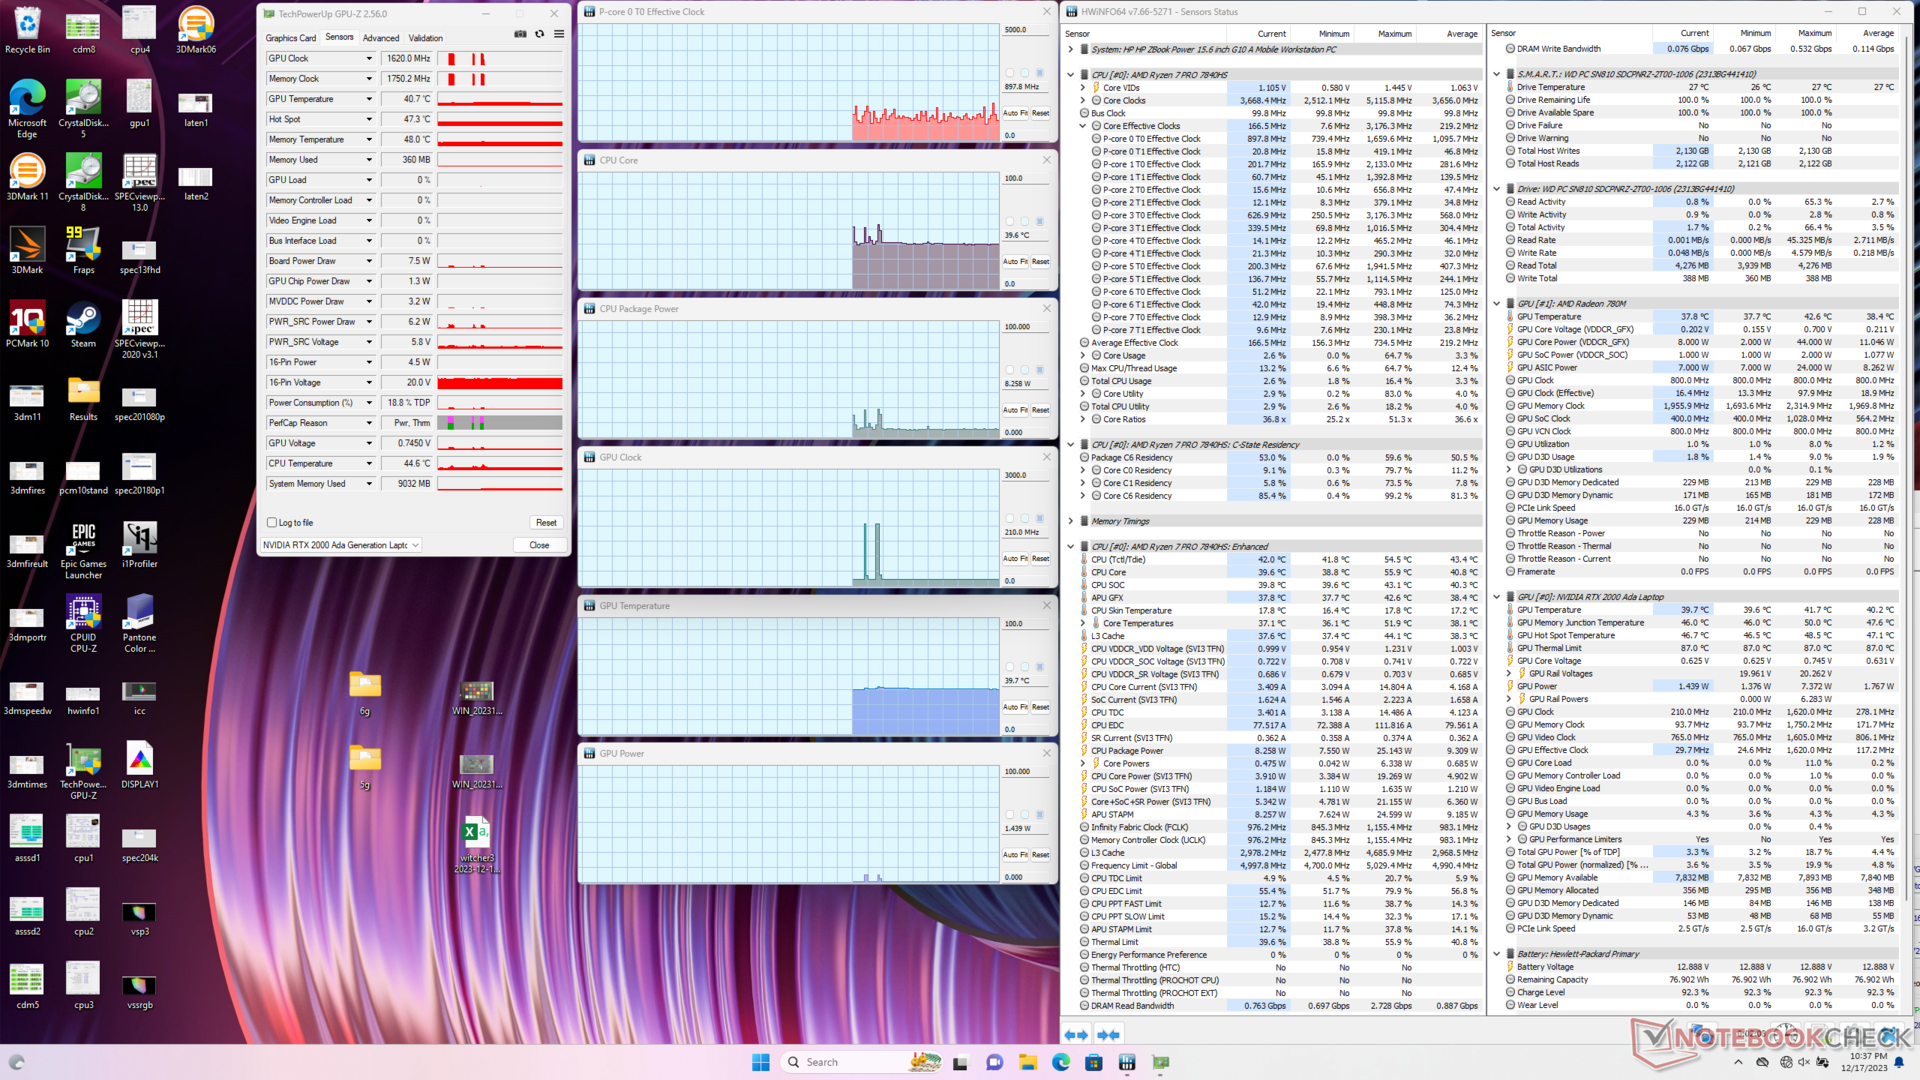
Quando è stata sollecitata con Prime95, la CPU è salita a 4,2 GHz e 65 W solo per i primi secondi, prima di scendere leggermente e stabilizzarsi a 4,0 GHz e 54 W. La temperatura del core è risultata piuttosto calda, a 87 C, ma questo potrebbe essere un dato di fatto quando si tratta di molti laptop con motore Zen 4. Ripetendo questo test sul ThinkPad Z16 G2per esempio, la sua CPU Ryzen 9 si stabilizzerebbe a un valore ancora più caldo di 100 C.
Eseguendo Witcher 3 in modalità Bilanciata non mostrerebbe differenze significative nelle temperature o nelle velocità di clock rispetto alla modalità Prestazioni, il che è in linea con le nostre osservazioni di Fire Strike nella sezione precedente. L'assorbimento di potenza della scheda GPU si aggirerebbe intorno ai 44 W contro l'obiettivo dei 50 W.
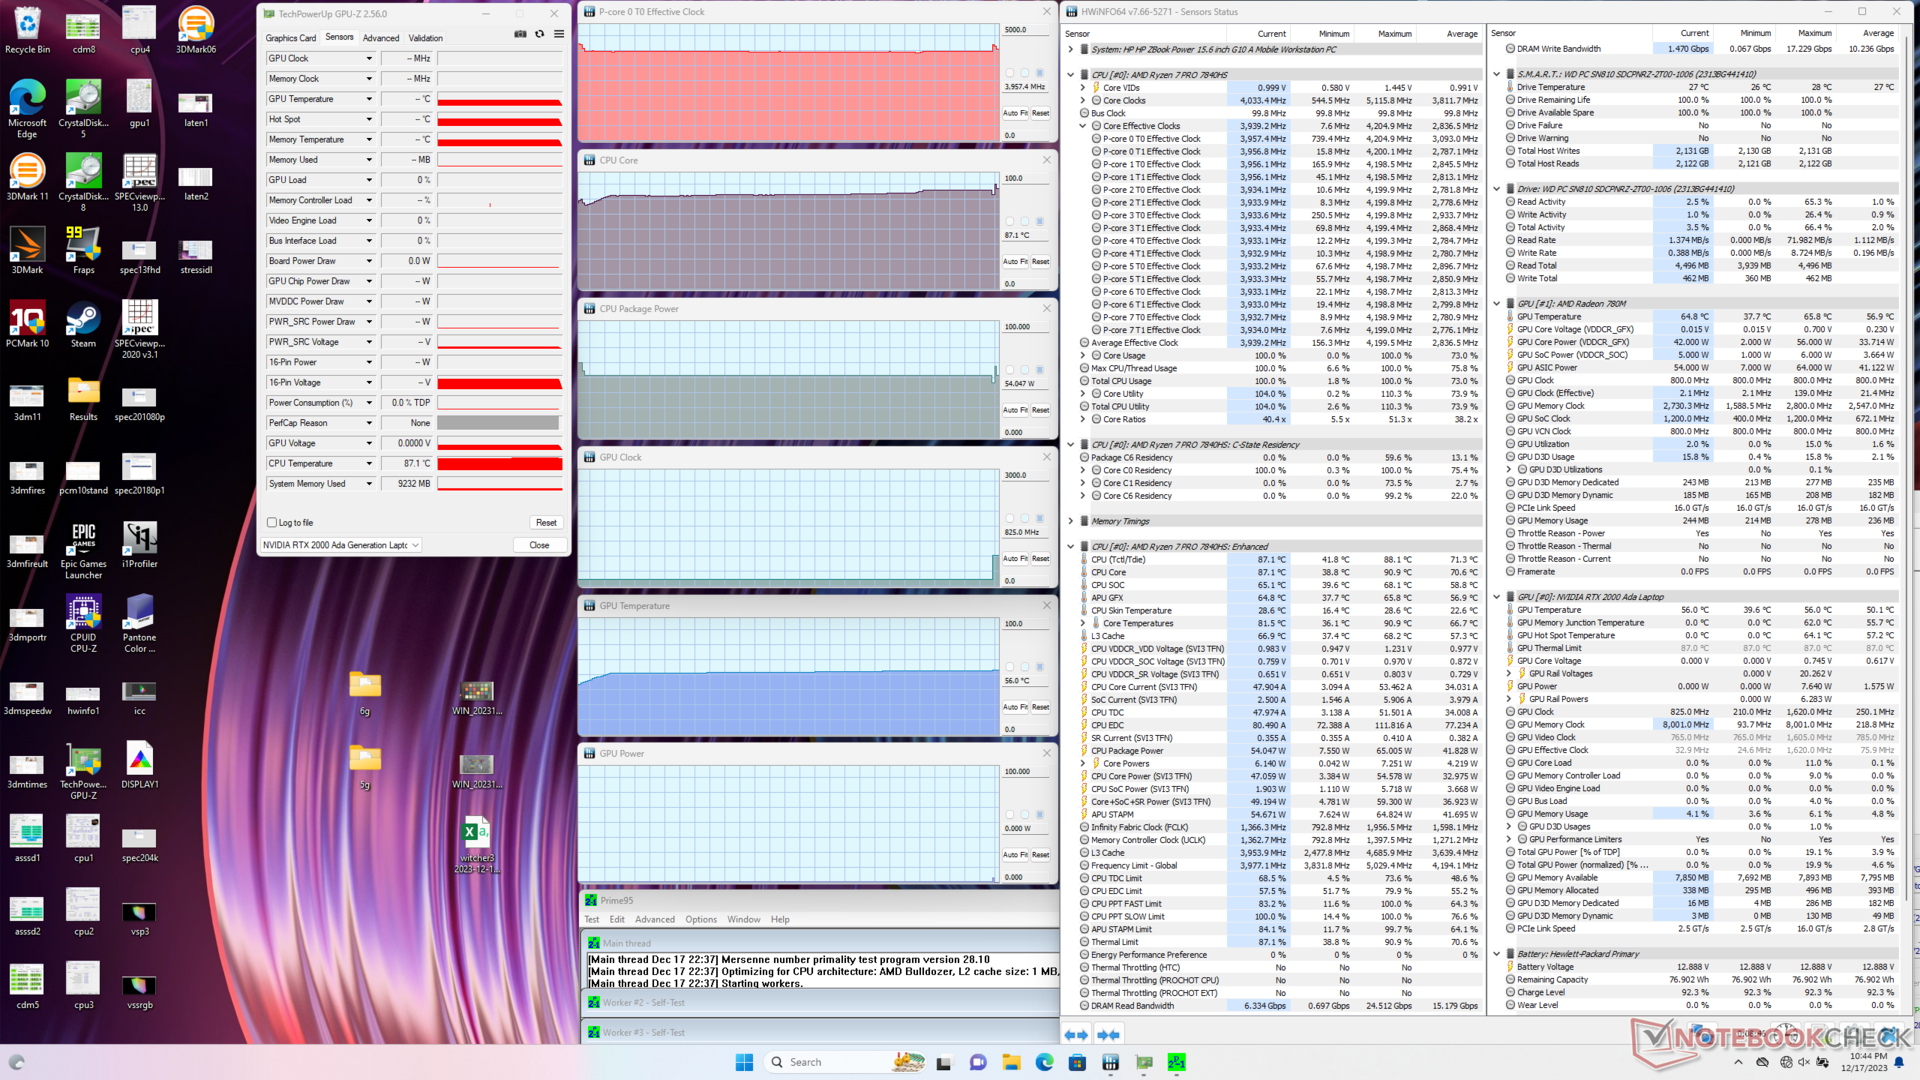
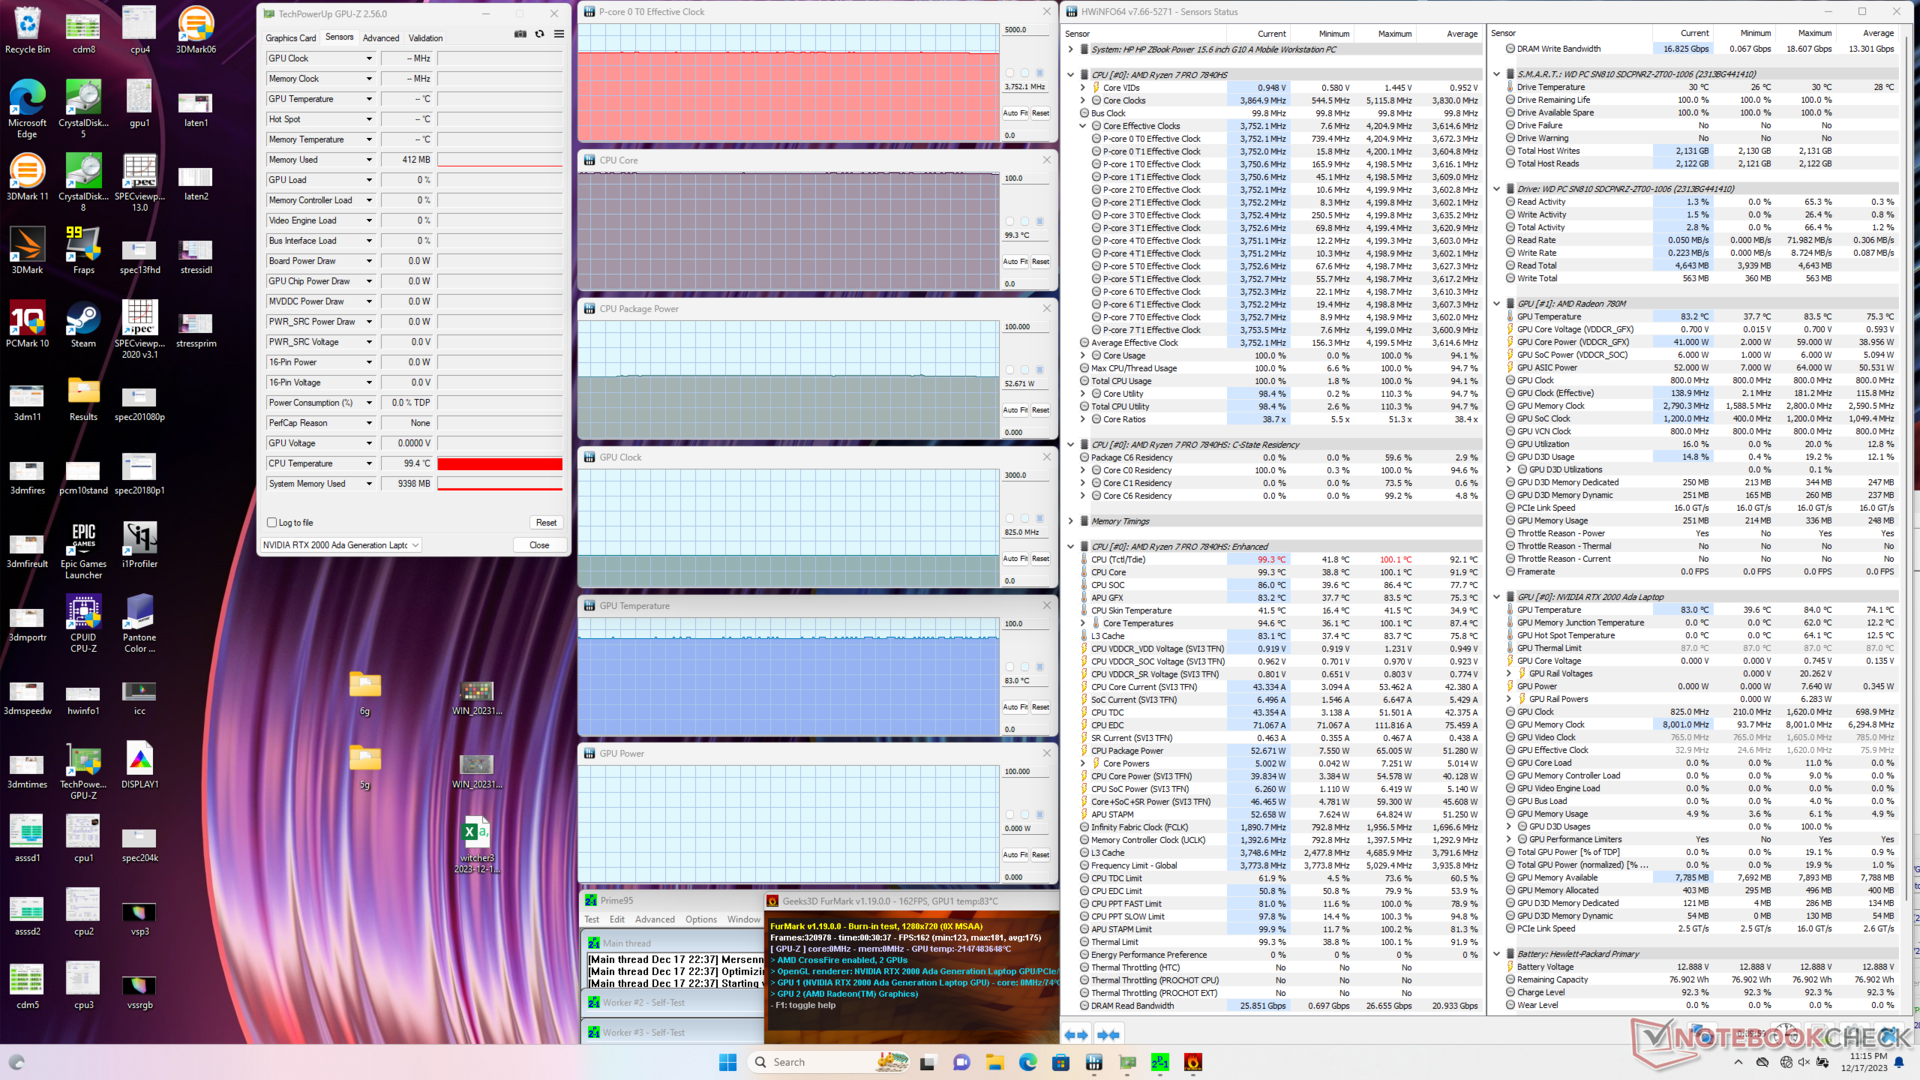
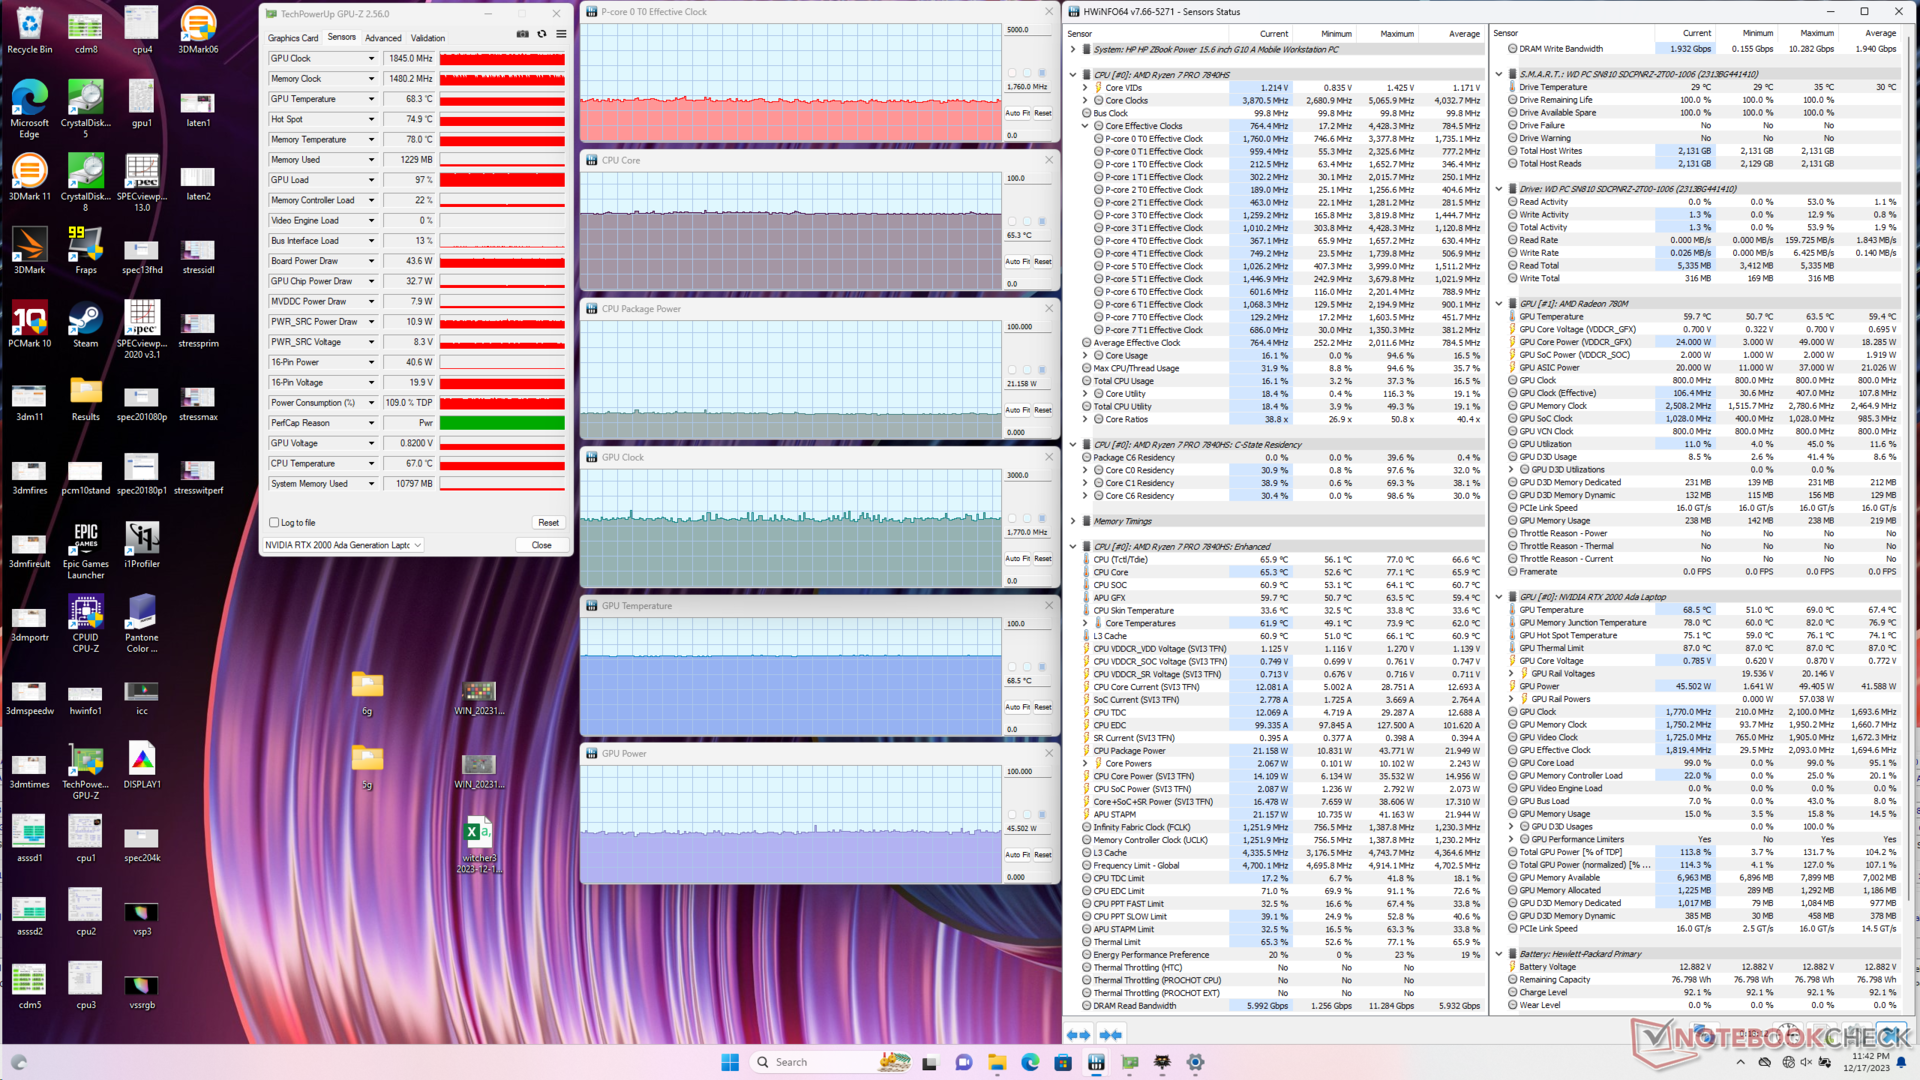
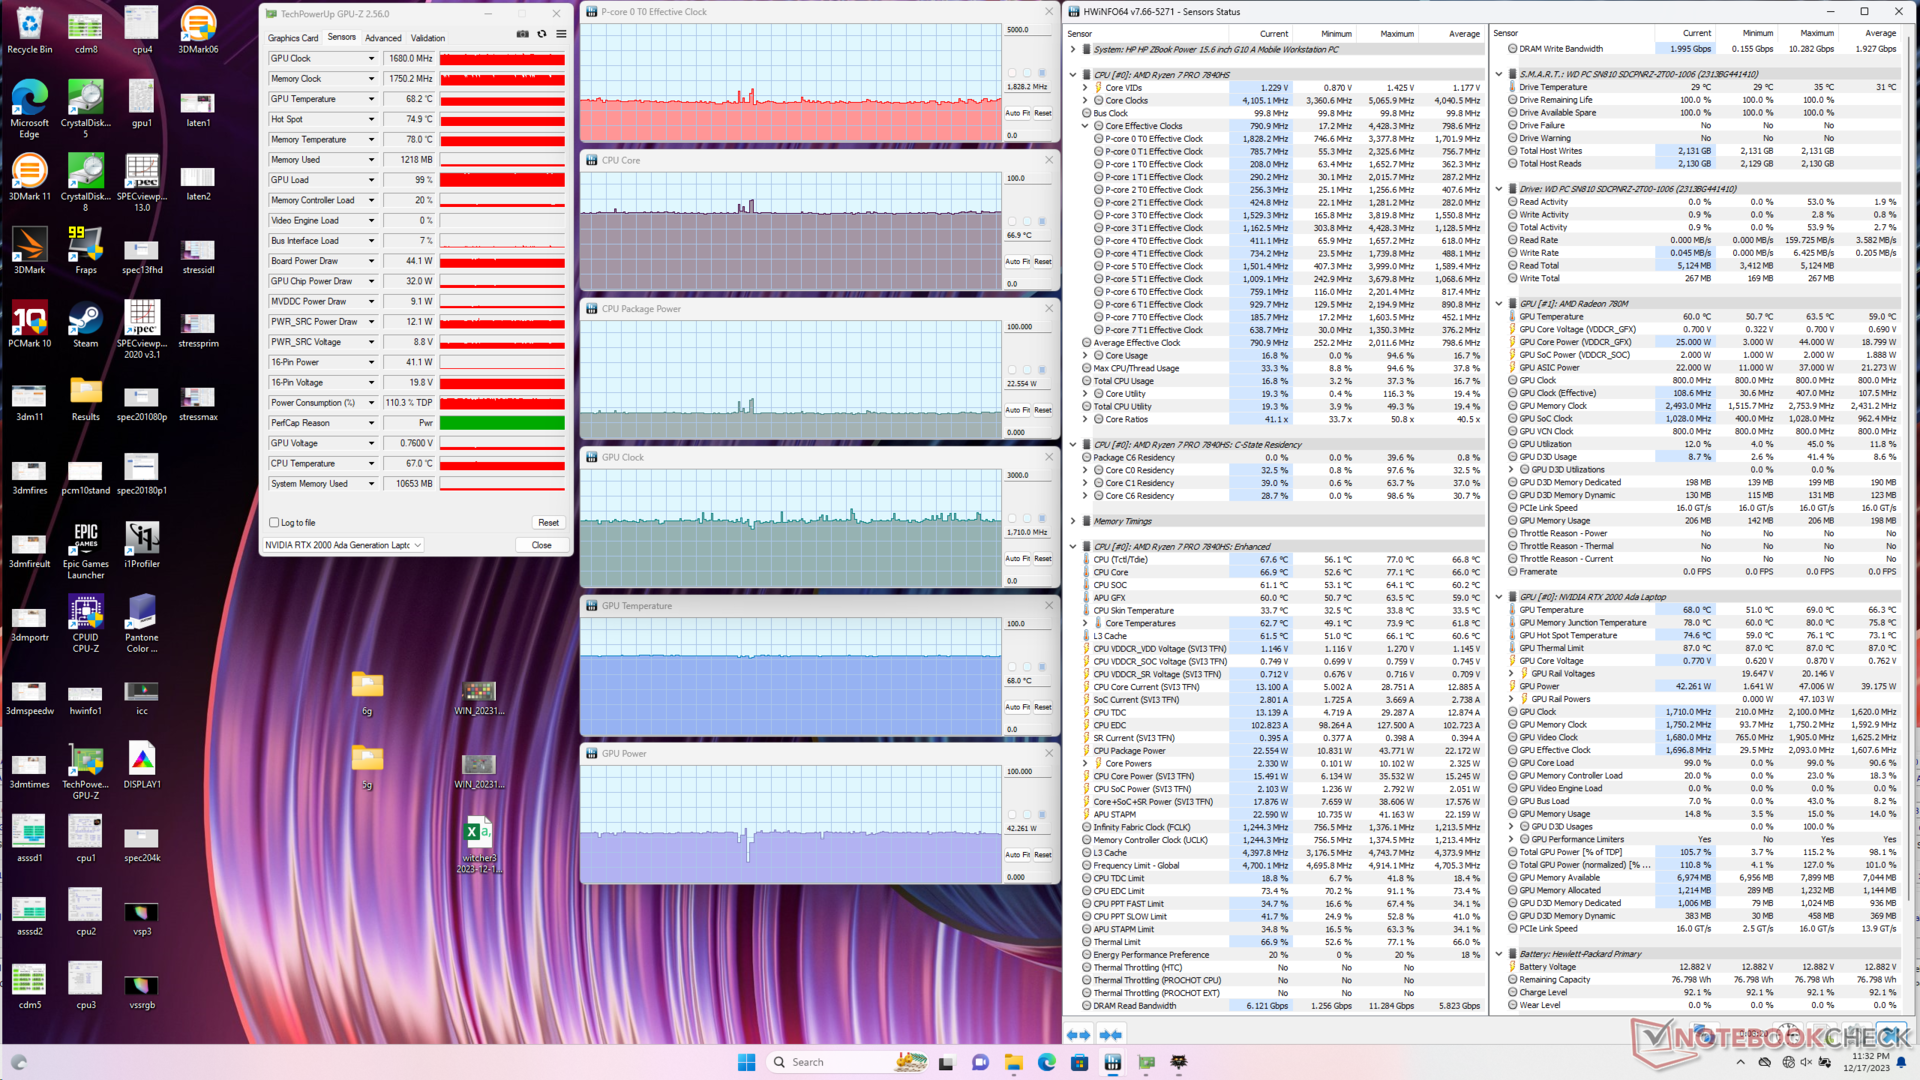
| Clock della CPU (GHz) | Clock della GPU (MHz) | Temperatura media della CPU (°C) | Temperatura media della GPU (°C) | |
| Sistema inattivo | -- | -- | 40 | 40 |
| Stress Prime95 | 4.0 | -- | 87 | 56 |
| Prime95 + FurMark Stress | 3,8 | 825 | 99 | 83 |
| Witcher 3 Stress (modalità bilanciata) | 1,8 | 1770 | 65 | 69 |
| Witcher 3 Stress (modalità Performance) | 1,8 | 1710 | 67 | 68 |
Gestione dell'energia
Consumo di energia
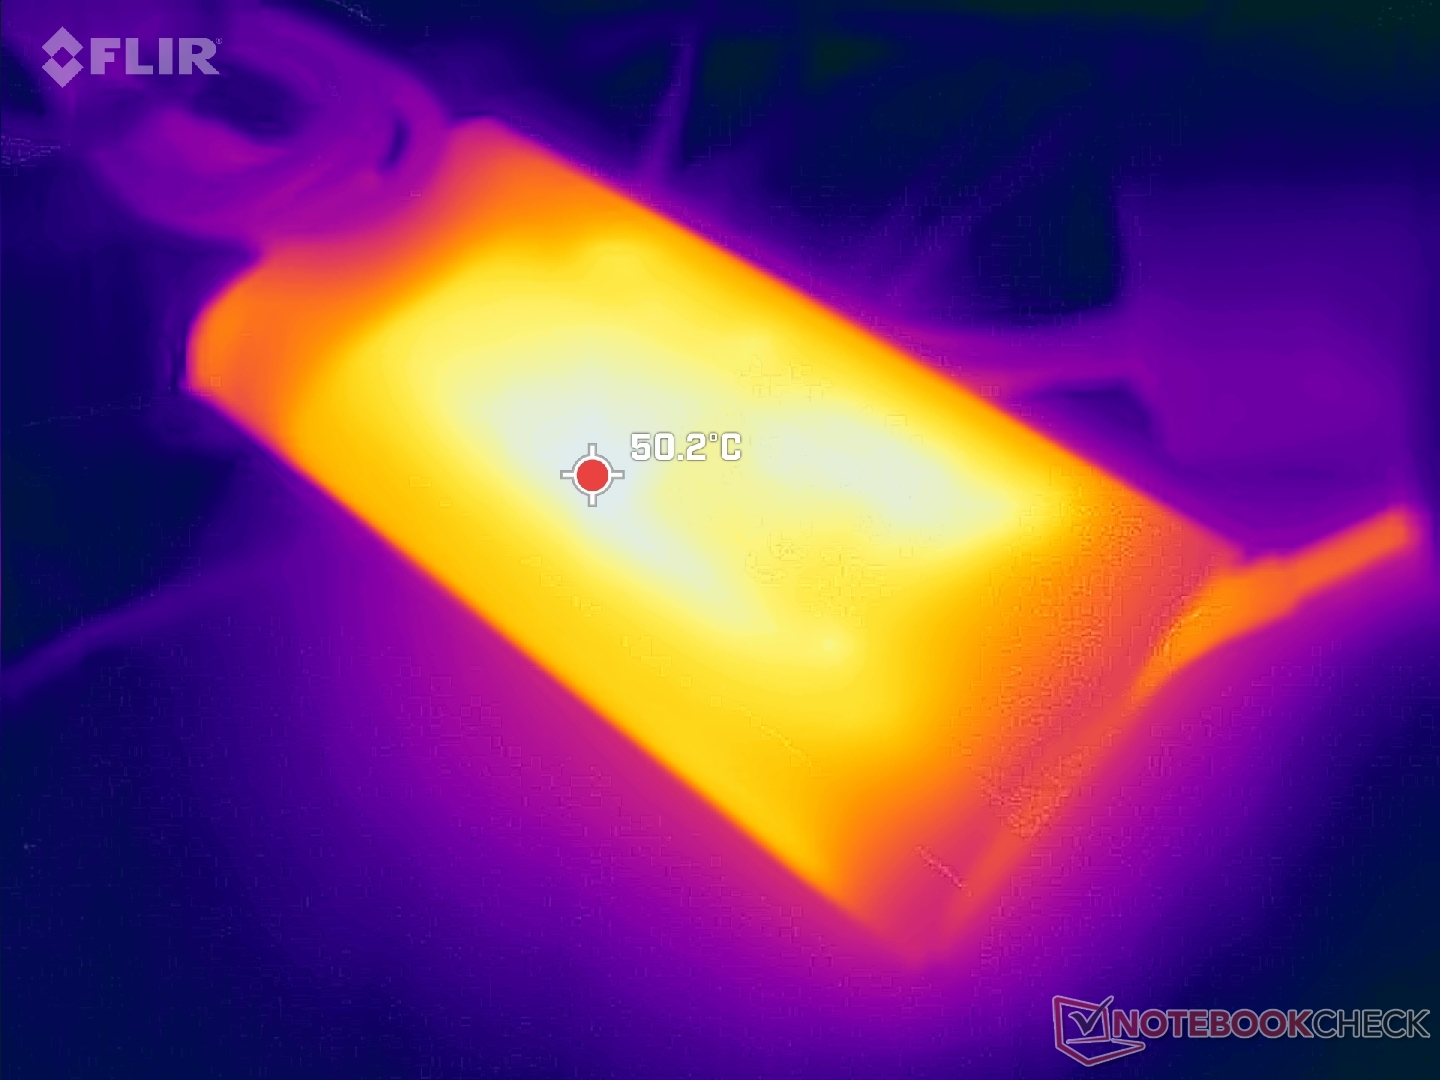
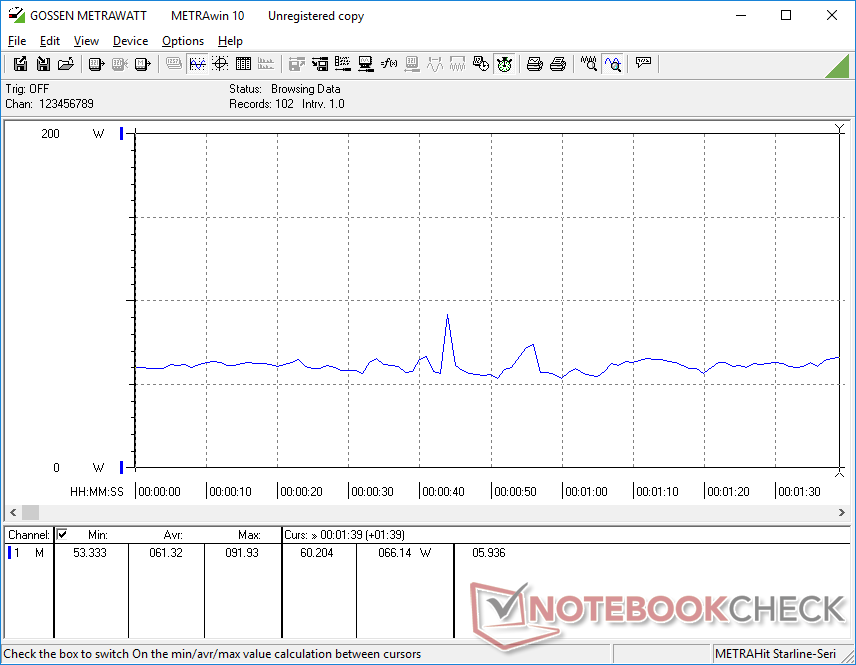
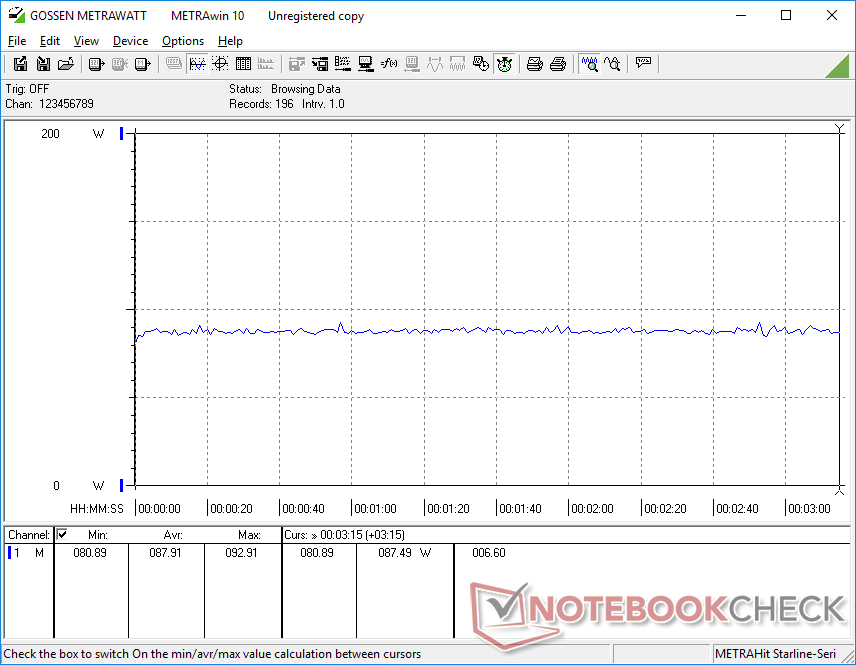
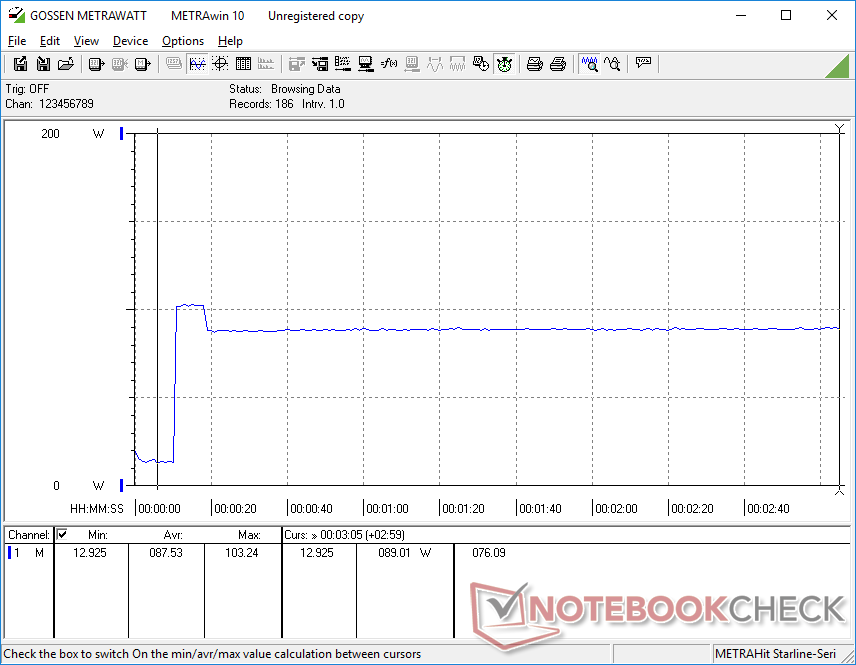
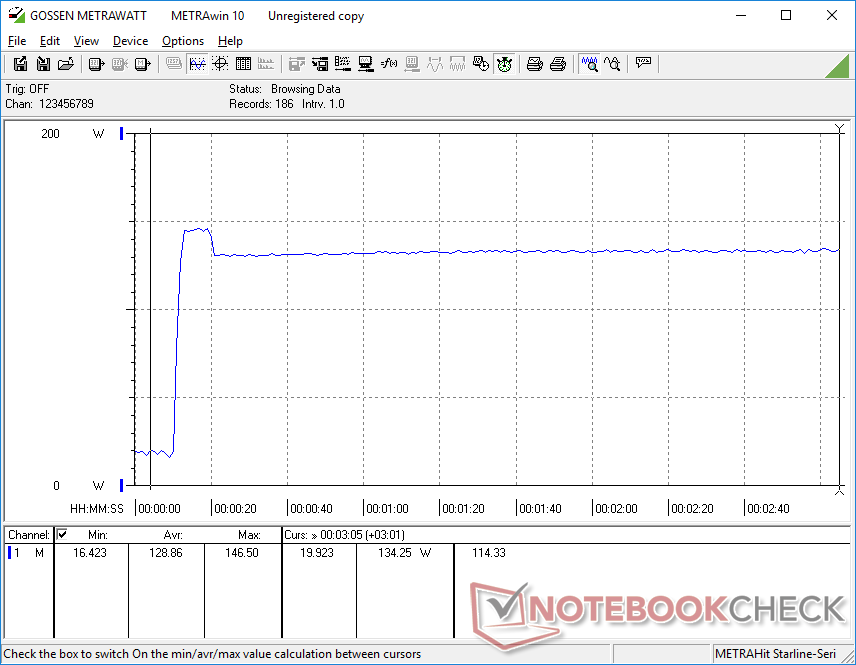
Il consumo energetico complessivo è superiore a quello del modello dello scorso anno, il che è correlato alle prestazioni più elevate della nostra configurazione. Tuttavia, le prestazioni per watt favoriscono ancora il nostro modello più recente, soprattutto per quanto riguarda le prestazioni grafiche. Ad esempio, l'esecuzione di Prime95 richiede il 16% di energia in più per prestazioni multi-thread più veloci del 20% rispetto al Core i7-12700H dello ZBook Power 15 G9, mentre l'esecuzione di FurMark richiederebbe solo il 14% di energia in più per prestazioni grafiche superiori del 65%.
L'adattatore CA di medie dimensioni (~13,8 x 6,5 x 2,3 cm) da 150 W non è cambiato, in quanto lo ZBook Power 15 G10 funziona con lo stesso inviluppo di energia dello ZBook Power 15 G9. La ricarica USB-C è comunque supportata; il nostro caricatore USB-C da 135 W di Lenovo, ad esempio, è compatibile con la nostra unità di test HP.
| Off / Standby | |
| Idle | |
| Sotto carico |
|
Leggenda:
min: | |
| HP ZBook Power 15 G10 R7 PRO 7840HS, RTX 2000 Ada Generation Laptop, WDC PC SN810 2TB, IPS, 2560x1440, 15.6" | HP ZBook Power 15 G9 6B8C4EA i7-12700H, RTX A2000 Laptop GPU, Samsung PM9A1 MZVL21T0HCLR, IPS, 3840x2160, 15.6" | Lenovo ThinkPad P15v G3 21EM001AGE R7 PRO 6850H, RTX A2000 Laptop GPU, SK Hynix PC711 1TB HFS001TDE9X081N, IPS LED, 3840x2160, 15.6" | Dell Precision 5000 5560 i7-11850H, RTX A2000 Laptop GPU, Samsung PM9A1 MZVL22T0HBLB, IPS, 3840x2400, 15.6" | Lenovo ThinkPad P1 G6-21FV000DGE i9-13900H, RTX 2000 Ada Generation Laptop, SK Hynix PC711 1TB HFS001TDE9X084N, IPS, 2560x1600, 16" | Asus ExpertBook B6 Flip B6602FC2 i9-12950HX, RTX A2000 Laptop GPU, Samsung PM9A1 MZVL21T0HCLR, IPS, 2560x1600, 16" | |
|---|---|---|---|---|---|---|
| Power Consumption | 11% | -11% | -24% | -30% | -81% | |
| Idle Minimum * (Watt) | 5.3 | 3.9 26% | 6.3 -19% | 6.2 -17% | 8.3 -57% | 10.5 -98% |
| Idle Average * (Watt) | 9.9 | 7.2 27% | 13.9 -40% | 13.9 -40% | 14.5 -46% | 11.9 -20% |
| Idle Maximum * (Watt) | 16.7 | 8.5 49% | 14.5 13% | 23.8 -43% | 15.3 8% | 18 -8% |
| Load Average * (Watt) | 61.3 | 87.2 -42% | 82.8 -35% | 95.7 -56% | 91.8 -50% | 182 -197% |
| Witcher 3 ultra * (Watt) | 87.9 | 86.8 1% | 88.8 -1% | 87 1% | 104.7 -19% | 177.5 -102% |
| Load Maximum * (Watt) | 145.3 | 139 4% | 124.8 14% | 132.6 9% | 164.5 -13% | 229 -58% |
* ... Meglio usare valori piccoli
Power Consumption Witcher 3 / Stresstest
Power Consumption external Monitor
Durata della batteria
I tempi di esecuzione sono quasi identici a quelli che abbiamo registrato sul modello dell'anno scorso, nonostante le differenze di CPU, GPU e display. Dieci ore di navigazione nel mondo reale sono simili a quelle di molti Ultrabook di livello consumer.
| HP ZBook Power 15 G10 R7 PRO 7840HS, RTX 2000 Ada Generation Laptop, 83 Wh | HP ZBook Power 15 G9 6B8C4EA i7-12700H, RTX A2000 Laptop GPU, 83 Wh | Lenovo ThinkPad P15v G3 21EM001AGE R7 PRO 6850H, RTX A2000 Laptop GPU, 68 Wh | Dell Precision 5000 5560 i7-11850H, RTX A2000 Laptop GPU, 86 Wh | Lenovo ThinkPad P1 G6-21FV000DGE i9-13900H, RTX 2000 Ada Generation Laptop, 90 Wh | Asus ExpertBook B6 Flip B6602FC2 i9-12950HX, RTX A2000 Laptop GPU, 90 Wh | |
|---|---|---|---|---|---|---|
| Autonomia della batteria | 0% | -31% | -37% | -5% | -13% | |
| WiFi v1.3 (h) | 10 | 10 0% | 6.9 -31% | 6.3 -37% | 9.5 -5% | 8.7 -13% |
| H.264 (h) | 10.7 | 11.2 | 5.8 | |||
| Load (h) | 1.8 | 1.8 | 1.1 | 1.7 | ||
| Reader / Idle (h) | 12 | 12.5 |
Pro
Contro
Verdetto - Se non è rotto, non lo aggiusti
Il design di ZBook Power 15 G10 si avvicina ai tre anni. È una delle poche workstation 16:19 da 15,6 pollici rimaste con CPU AMD Zen 4 Pro e GPU Nvidia RTX Ada, mentre la maggior parte delle altre in questa categoria è passata a fattori di forma 16:10 da 16 pollici con opzioni di display aggiuntive, tra cui OLED e 4K. Se il fattore di forma più alto e i display più recenti sono importanti per i suoi carichi di lavoro, allora potrebbe voler aspettare che HP aggiorni il design di ZBook Power o cercare alternative come il modello Lenovo ThinkPad P1 G6 invece. In caso contrario, lo ZBook Power 15 G10 è ancora un'opzione classica e affidabile.
Per le potenziali revisioni 16:10 in futuro, ci piacerebbe che HP facesse un passo in più, includendo il supporto della RAM ECC e della VRAM ECC e la ricarica completa solo tramite USB-C. Il caricatore proprietario a canna CA sta diventando sempre più difficile da giustificare, ora che Thunderbolt di prossima generazione può supportare una ricarica USB-C fino a 240 W.
Lo ZBook Power 15 G10 sarà probabilmente una delle ultime workstation da 15,6 pollici di HP prima che la serie venga aggiornata con un design più moderno in 16:10.
Il principale fattore di differenziazione tra lo ZBook Power 15 G9 e il G10 è che quest'ultimo è dotato di GPU Ada Lovelace, per prestazioni molto più elevate per watt rispetto alle vecchie GPU Ampere. Se le CPU e le GPU più recenti sono di valore, si consiglia di preferire il G10 al G9. Altrimenti, l'esperienza d'uso tra i modelli è sostanzialmente identica, compresa la durata della batteria.
Prezzo e disponibilità
HP sta spedendo lo ZBook Power 15 G10 a partire da 1600 dollari per la configurazione Ryzen 5 fino a 2100 dollari per la configurazione Ryzen 7 e Nvidia 2000 Ada o superiore.
HP ZBook Power 15 G10
- 12/20/2023 v7 (old)
Allen Ngo
Transparency
La selezione dei dispositivi da recensire viene effettuata dalla nostra redazione. Il campione di prova è stato fornito all'autore come prestito dal produttore o dal rivenditore ai fini di questa recensione. L'istituto di credito non ha avuto alcuna influenza su questa recensione, né il produttore ne ha ricevuto una copia prima della pubblicazione. Non vi era alcun obbligo di pubblicare questa recensione. In quanto società mediatica indipendente, Notebookcheck non è soggetta all'autorità di produttori, rivenditori o editori.
Ecco come Notebookcheck esegue i test
Ogni anno, Notebookcheck esamina in modo indipendente centinaia di laptop e smartphone utilizzando procedure standardizzate per garantire che tutti i risultati siano comparabili. Da circa 20 anni sviluppiamo continuamente i nostri metodi di prova e nel frattempo stabiliamo gli standard di settore. Nei nostri laboratori di prova, tecnici ed editori esperti utilizzano apparecchiature di misurazione di alta qualità. Questi test comportano un processo di validazione in più fasi. Il nostro complesso sistema di valutazione si basa su centinaia di misurazioni e parametri di riferimento ben fondati, che mantengono l'obiettività.Price comparison

