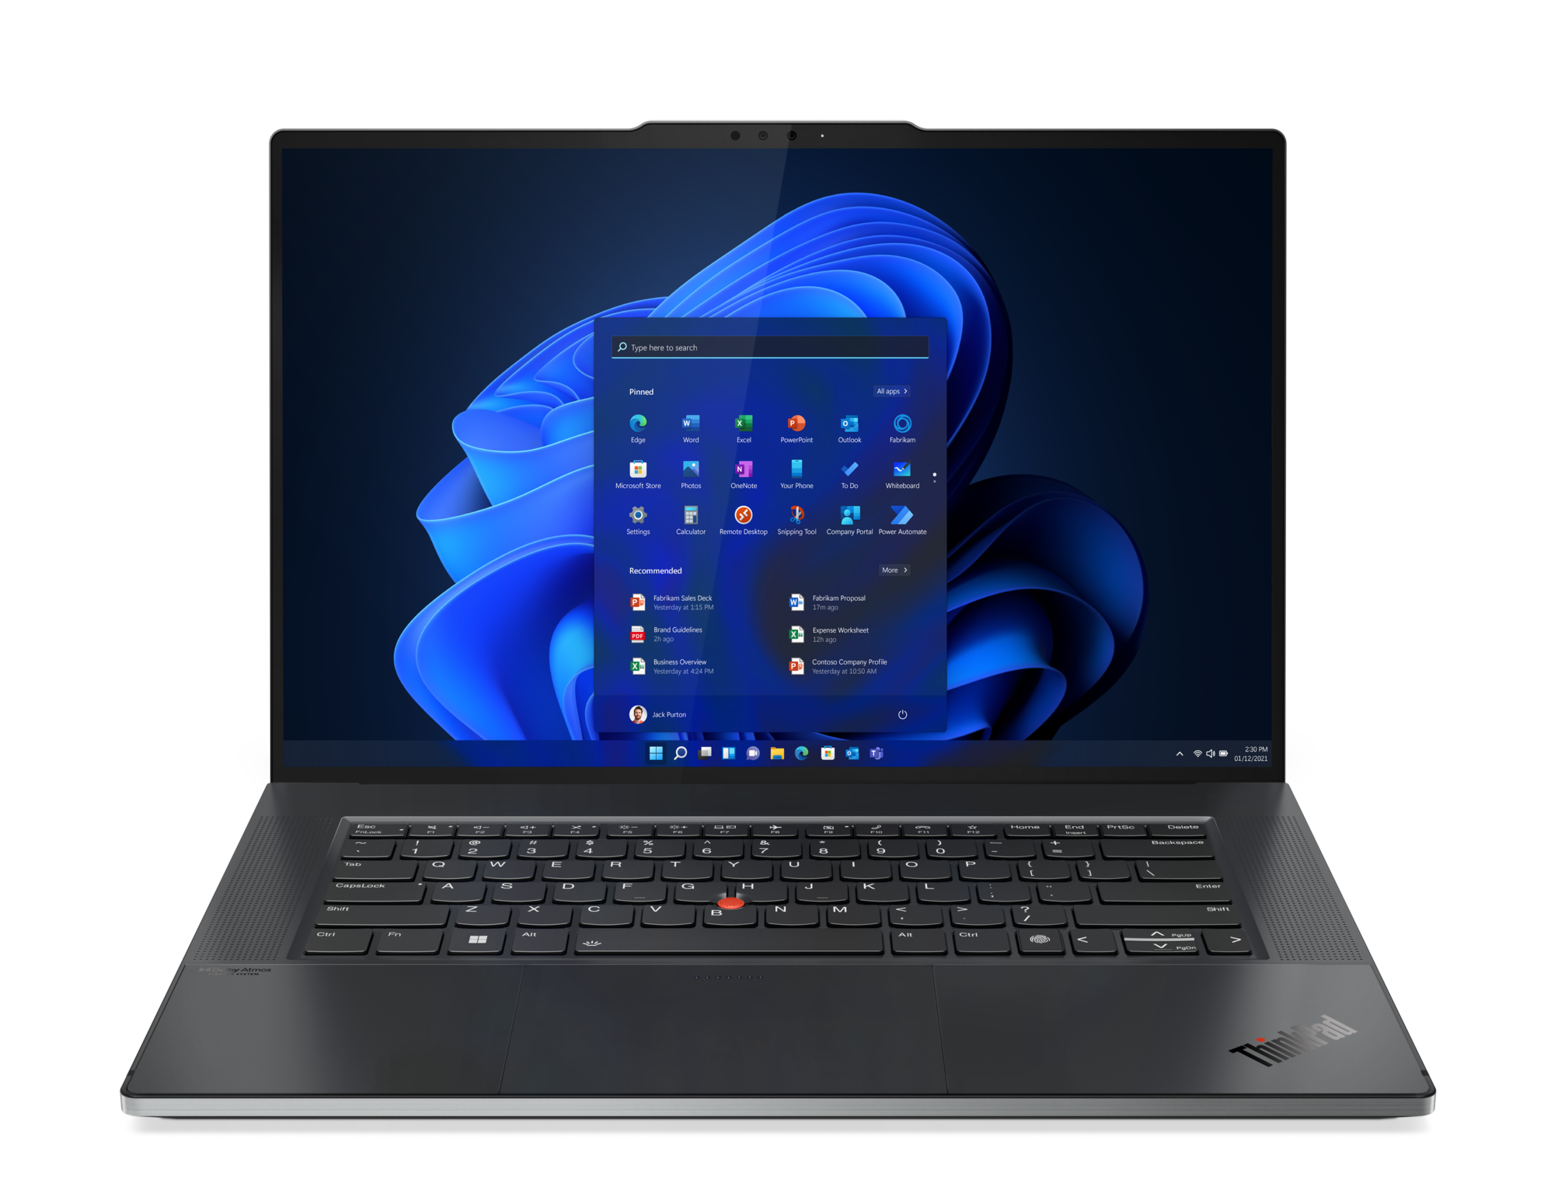
Recensione del portatile Lenovo ThinkPad Z16 Gen 2: Debutto delle prestazioni della Radeon RX 6550M

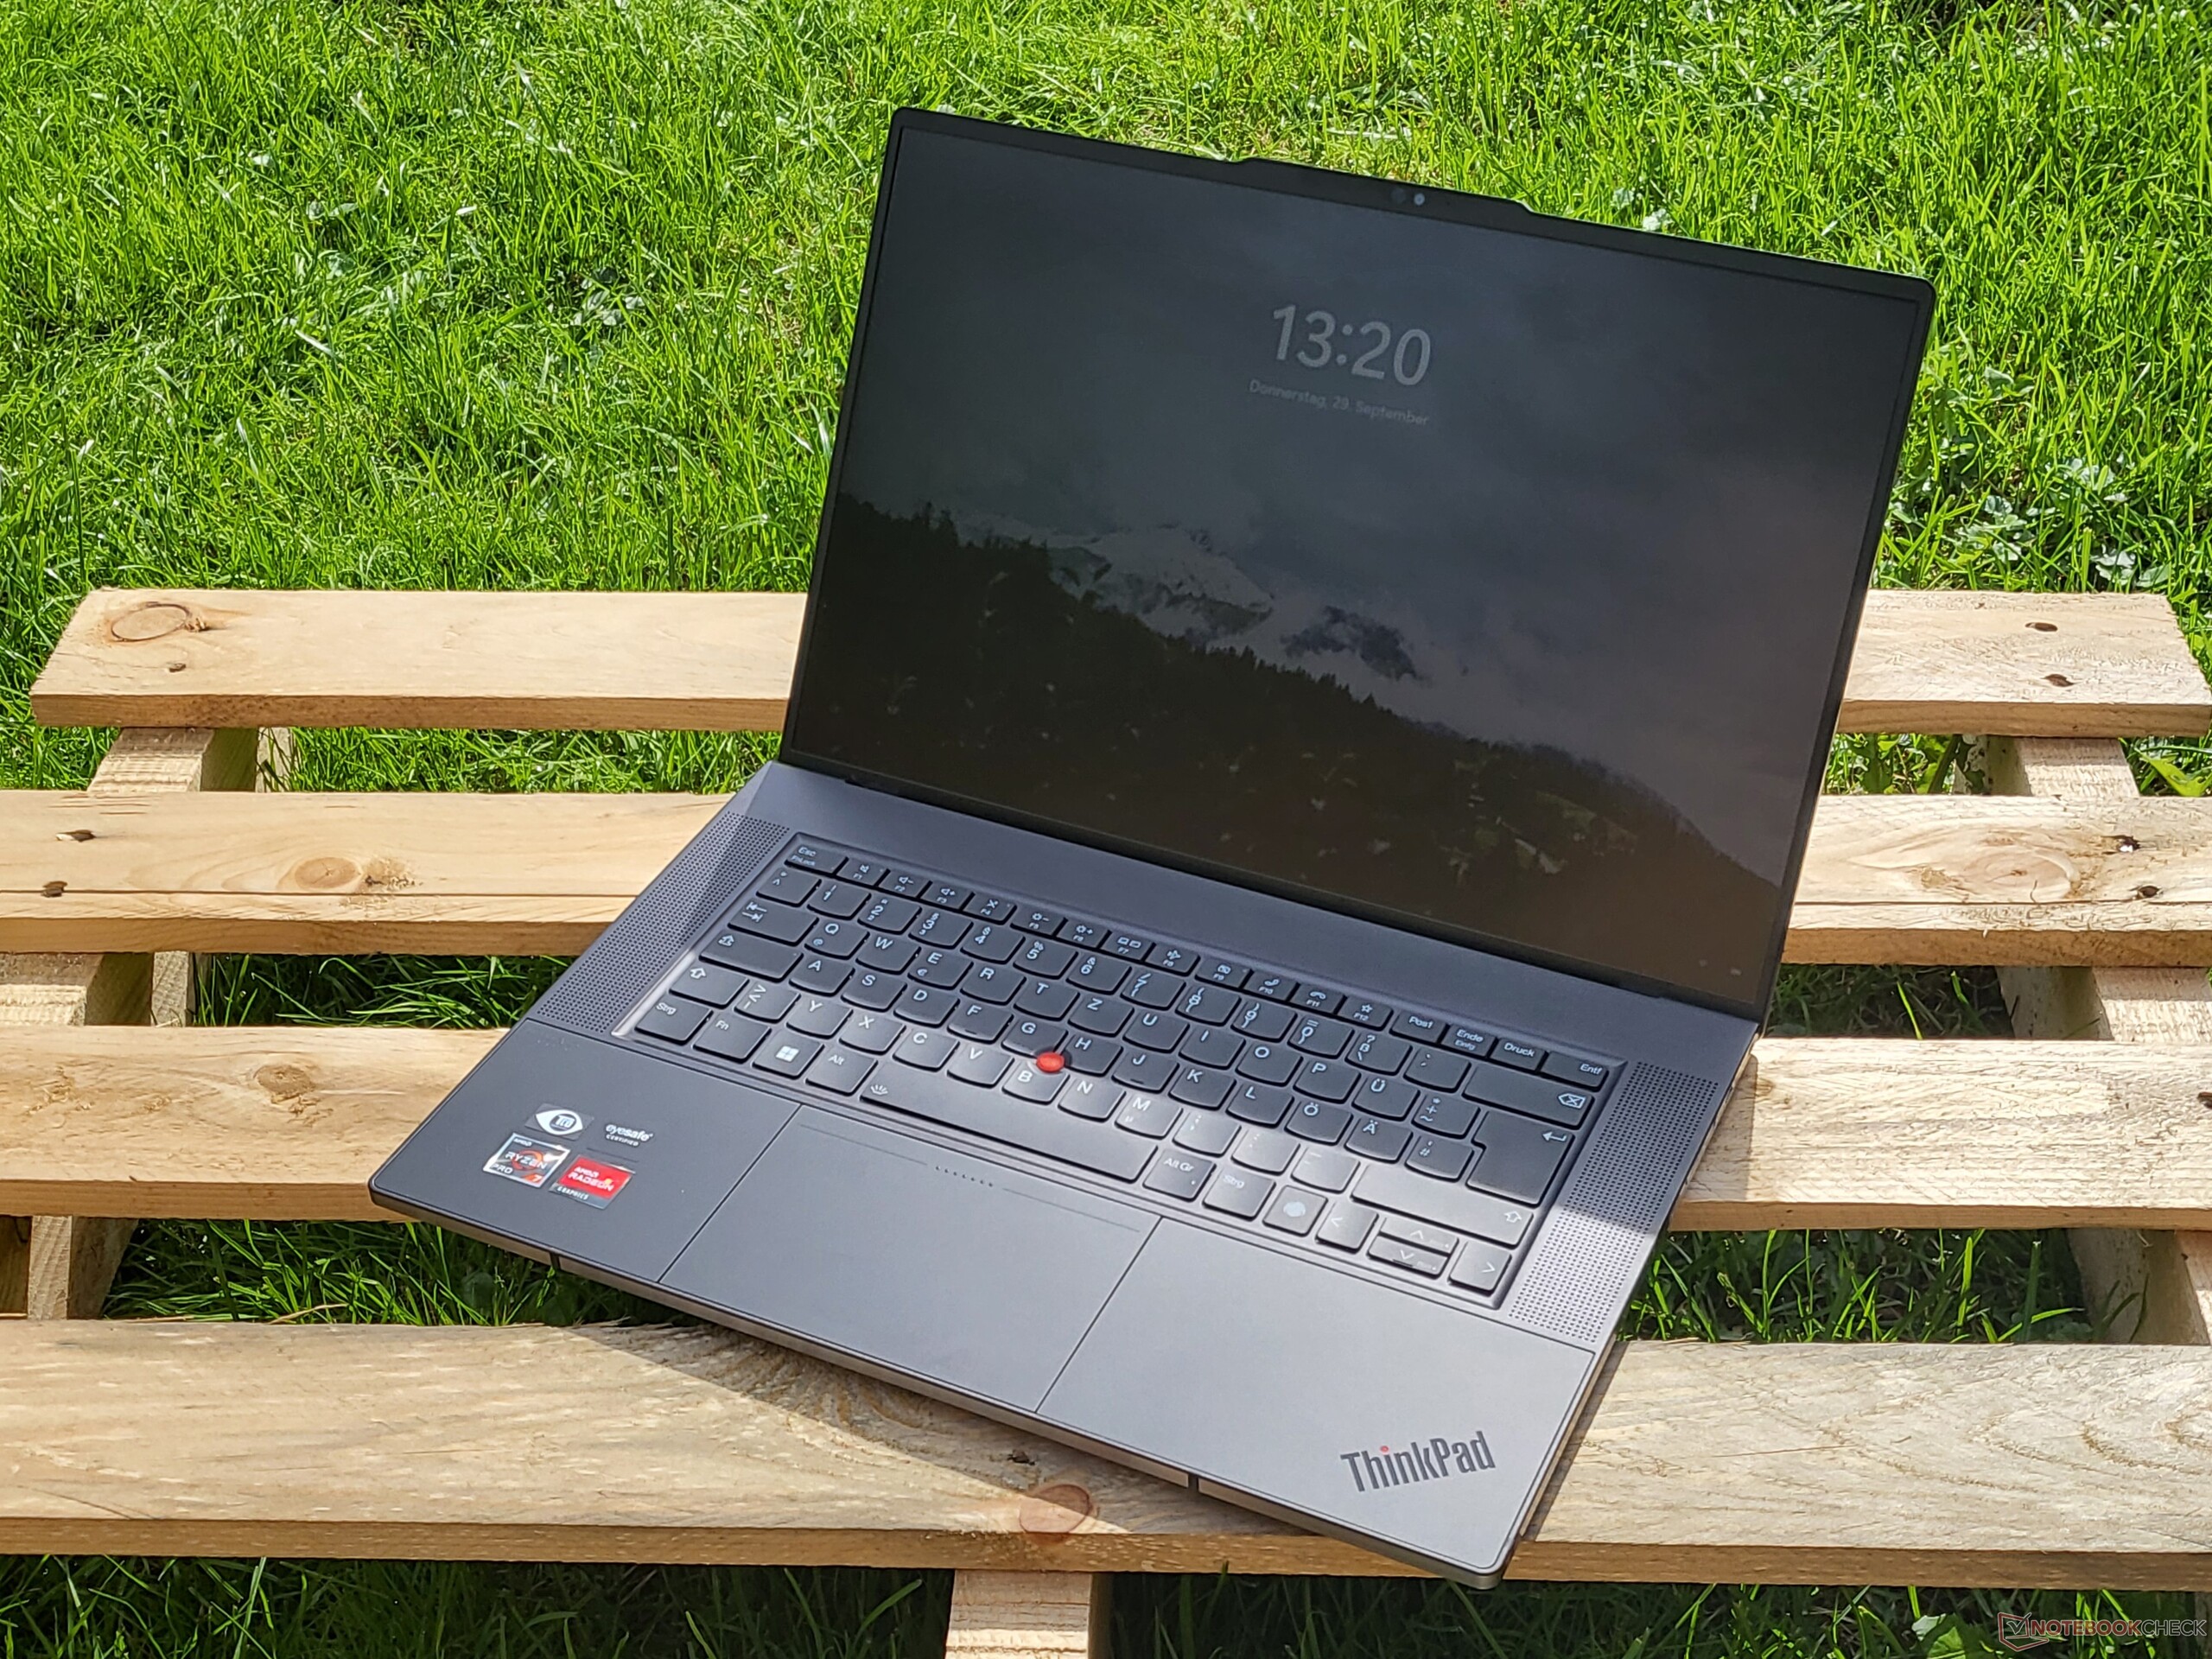
Il ThinkPad Z16 G2 succede al ThinkPad Z16 G1, vecchio di un anno, con nuove opzioni di CPU AMD Zen 4, una grafica Radeon RX più veloce e un nuovo touchscreen OLED da 2400p. Si tratta anche di uno dei pochissimi computer portatili con la non comune Radeon RX 6550M entry-level. Per il resto, il telaio è identico a quello del ThinkPad Z16 G1 e quindi consigliamo di consultare la nostra recensione sul modello di prima generazione per saperne di più sulle caratteristiche fisiche e sulle opzioni di connettività della serie.
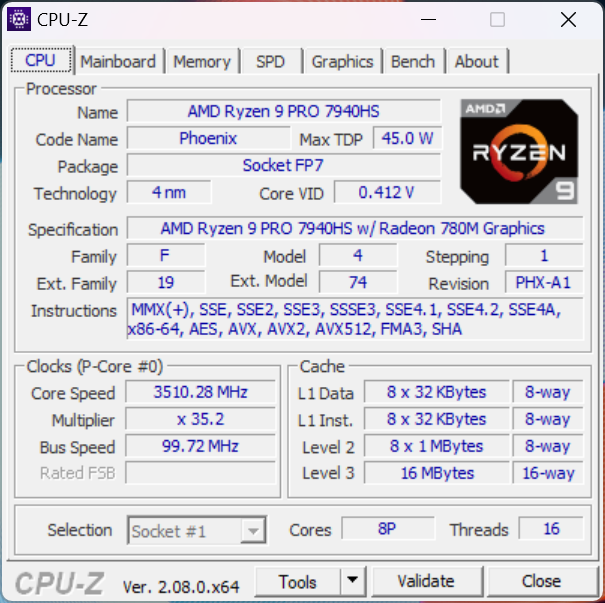
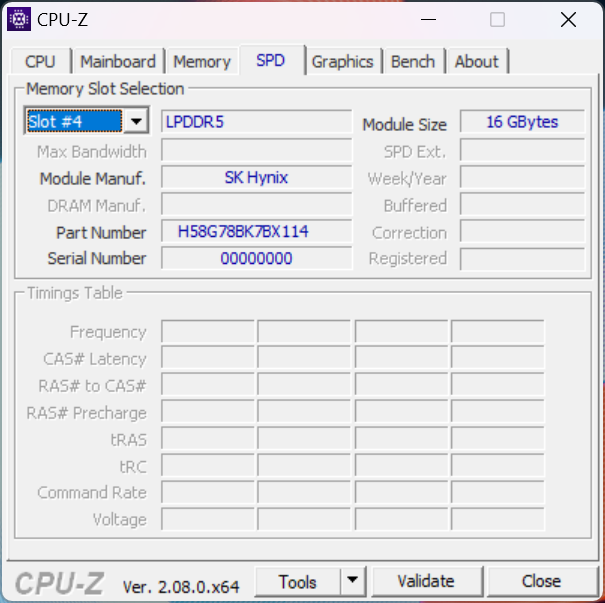
La nostra specifica unità di recensione è la configurazione di fascia più alta con Ryzen 9 Pro 7940HS, Radeon RX 6550M, touchscreen OLED e 64 GB di RAM per circa 2600 dollari. Le SKU minori partono da Ryzen 5 Pro 7640HS, grafica integrata e display IPS da 1200p per 1600 dollari. Il ThinkPad Z16 può essere considerato un computer portatile semi-professionale multimediale o per la creazione di contenuti, poiché monta CPU Ryzen Pro invece delle tipiche opzioni non-Pro.
Le alternative al ThinkPad Z16 G2 includono altri portatili di fascia alta da 16 pollici per creatori di contenuti, come il modello MSI Creator Z16P, Apple MacBook Pro 16, Asus Vivobook Pro 16Xo la serie Serie XPS di Dell.
Altre recensioni di Lenovo:
Potenziali concorrenti a confronto
Punteggio | Data | Modello | Peso | Altezza | Dimensione | Risoluzione | Prezzo |
|---|---|---|---|---|---|---|---|
| 88.6 % v7 (old) | 12/2023 | Lenovo ThinkPad Z16 Gen 2 R9 PRO 7940HS, Radeon RX 6550M | 1.8 kg | 15.8 mm | 16.00" | 3840x2400 | |
| 87.3 % v7 (old) | 10/2022 | Lenovo ThinkPad Z16 G1 21D5S00T00 R7 PRO 6850H, Radeon RX 6500M | 1.9 kg | 15.8 mm | 16.00" | 1920x1200 | |
| 85.7 % v7 (old) | 11/2023 | Lenovo ThinkBook 16 G6 ABP R5 7530U, Vega 7 | 1.8 kg | 17.5 mm | 16.00" | 1920x1200 | |
| 83.7 % v7 (old) | 06/2022 | MSI Creator Z16P B12UHST i9-12900H, GeForce RTX 3080 Ti Laptop GPU | 2.4 kg | 20.4 mm | 16.00" | 2560x1600 | |
| 93.7 % v7 (old) | 11/2023 | Apple MacBook Pro 16 2023 M3 Pro Apple M3 Pro 12-Core, M3 Pro 18-Core GPU | 2.1 kg | 16.9 mm | 16.20" | 3456x2234 | |
| 86.2 % v7 (old) | 07/2023 | Asus Vivobook Pro 16X K6604JV-MX016W i9-13980HX, GeForce RTX 4060 Laptop GPU | 2.1 kg | 22.8 mm | 16.00" | 3200x2000 |
Caso
Lettore di schede SD
| SD Card Reader | |
| average JPG Copy Test (av. of 3 runs) | |
| Lenovo ThinkPad Z16 Gen 2 (Toshiba Exceria Pro SDXC 64 GB UHS-II) | |
| Asus Vivobook Pro 16X K6604JV-MX016W | |
| Lenovo ThinkPad Z16 G1 21D5S00T00 | |
| Lenovo ThinkBook 16 G6 ABP (Angelbird AV Pro V60) | |
| MSI Creator Z16P B12UHST (AV PRO microSD 128 GB V60) | |
| maximum AS SSD Seq Read Test (1GB) | |
| Lenovo ThinkPad Z16 G1 21D5S00T00 | |
| Lenovo ThinkPad Z16 Gen 2 (Toshiba Exceria Pro SDXC 64 GB UHS-II) | |
| Asus Vivobook Pro 16X K6604JV-MX016W | |
| Lenovo ThinkBook 16 G6 ABP (Angelbird AV Pro V60) | |
Comunicazione
Lenovo ha sostituito il Qualcomm WCN685x del modello dello scorso anno con un MediaTek MT7922 sul modello di quest'anno. Le velocità di trasferimento rimangono costanti ed eccellenti quando è abbinato alle nostre reti Wi-Fi 6 o Wi-Fi 6E.
| Networking | |
| iperf3 transmit AXE11000 | |
| Lenovo ThinkPad Z16 G1 21D5S00T00 | |
| Asus Vivobook Pro 16X K6604JV-MX016W | |
| Lenovo ThinkPad Z16 Gen 2 | |
| Lenovo ThinkBook 16 G6 ABP | |
| iperf3 receive AXE11000 | |
| Lenovo ThinkPad Z16 G1 21D5S00T00 | |
| Asus Vivobook Pro 16X K6604JV-MX016W | |
| MSI Creator Z16P B12UHST | |
| Lenovo ThinkPad Z16 Gen 2 | |
| Lenovo ThinkBook 16 G6 ABP | |
| iperf3 transmit AXE11000 6GHz | |
| Lenovo ThinkPad Z16 G1 21D5S00T00 | |
| Asus Vivobook Pro 16X K6604JV-MX016W | |
| Lenovo ThinkPad Z16 Gen 2 | |
| iperf3 receive AXE11000 6GHz | |
| Lenovo ThinkPad Z16 G1 21D5S00T00 | |
| Asus Vivobook Pro 16X K6604JV-MX016W | |
| Lenovo ThinkPad Z16 Gen 2 | |
Webcam
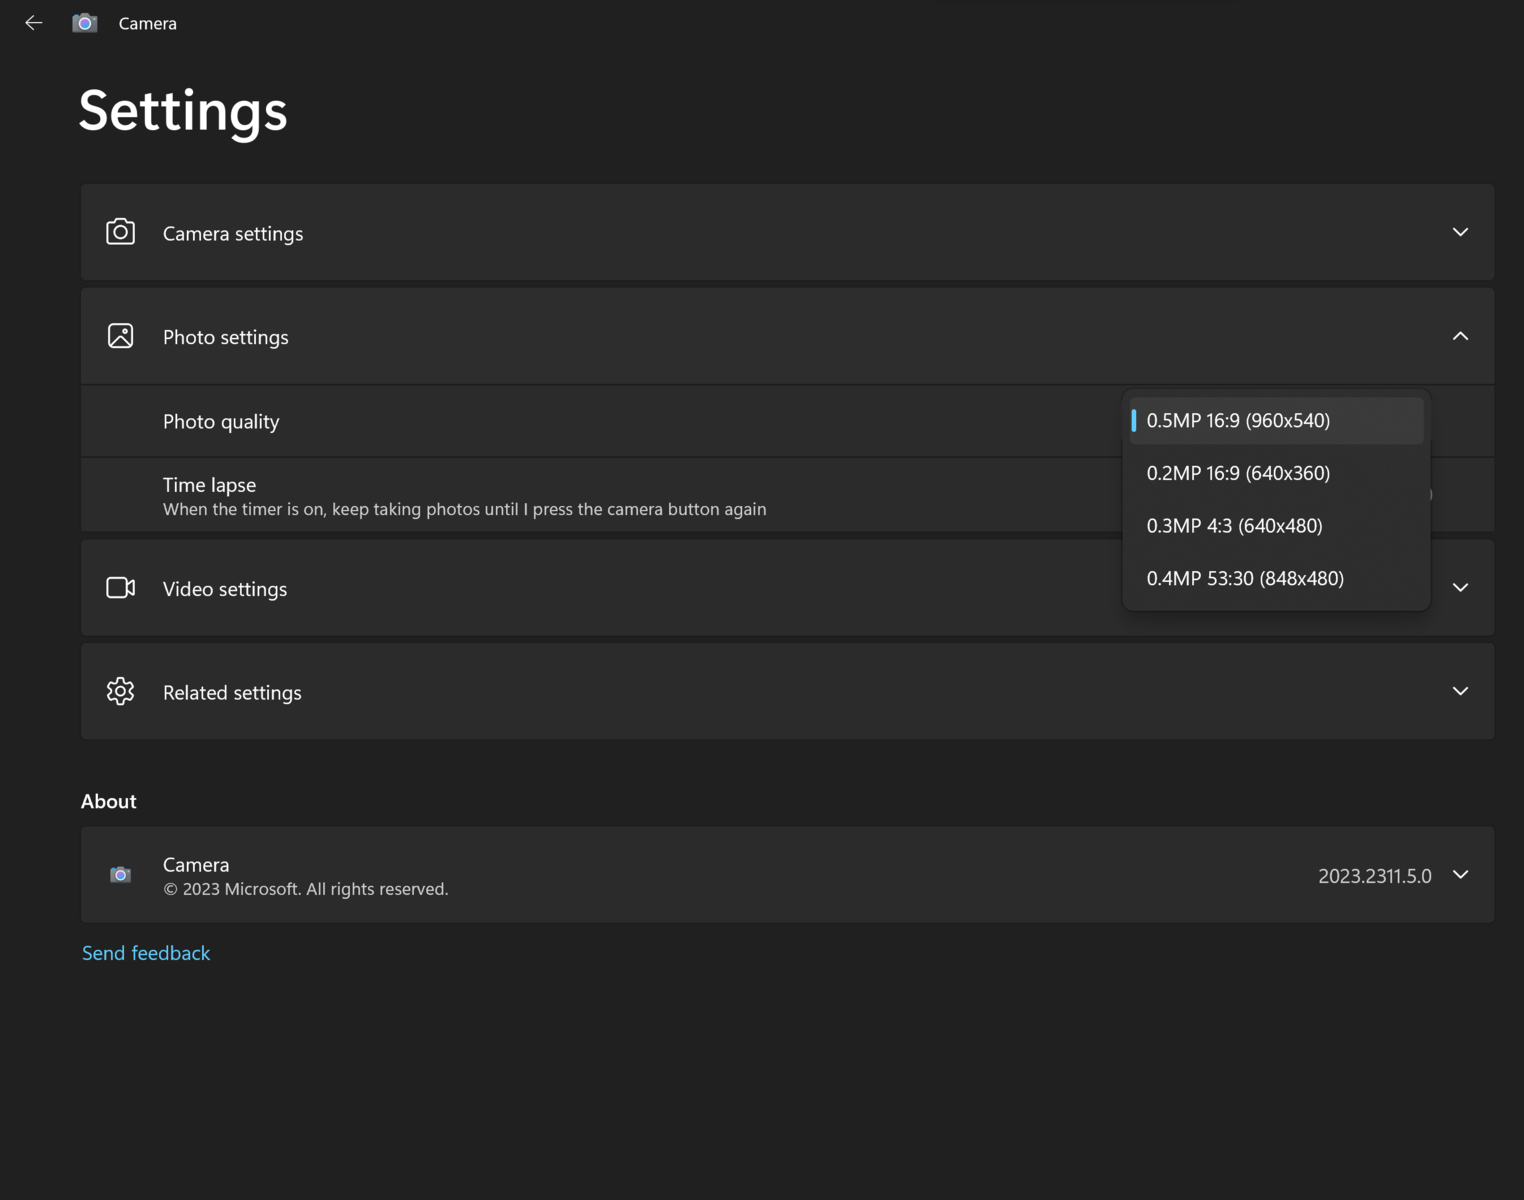
Sebbene Lenovo pubblicizzi una webcam da 2 MP, siamo in grado di selezionare solo fino a 0,5 MP con l'app fotocamera integrata, come mostra lo screenshot a destra. Abbiamo notificato a Lenovo il bug e aggiorneremo questa sezione se riceveremo una risposta.


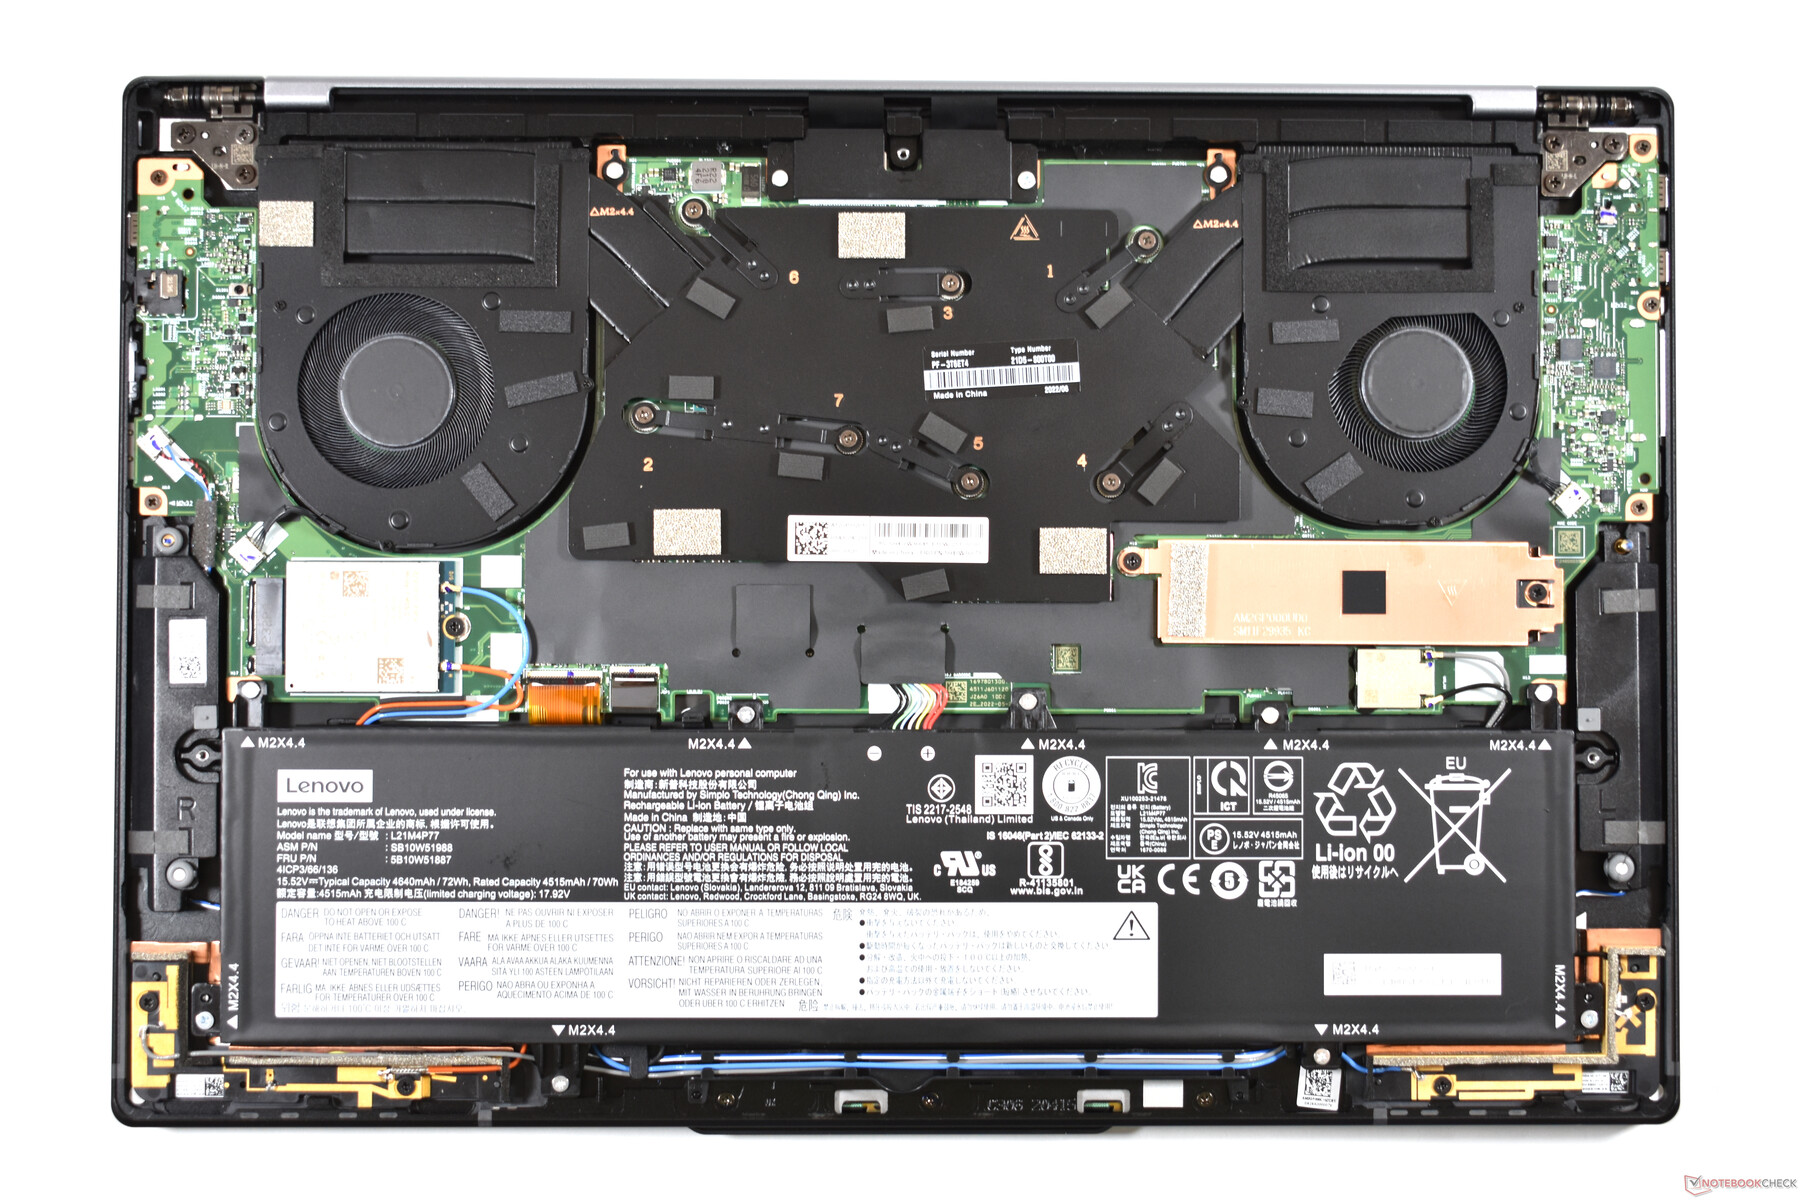
Manutenzione
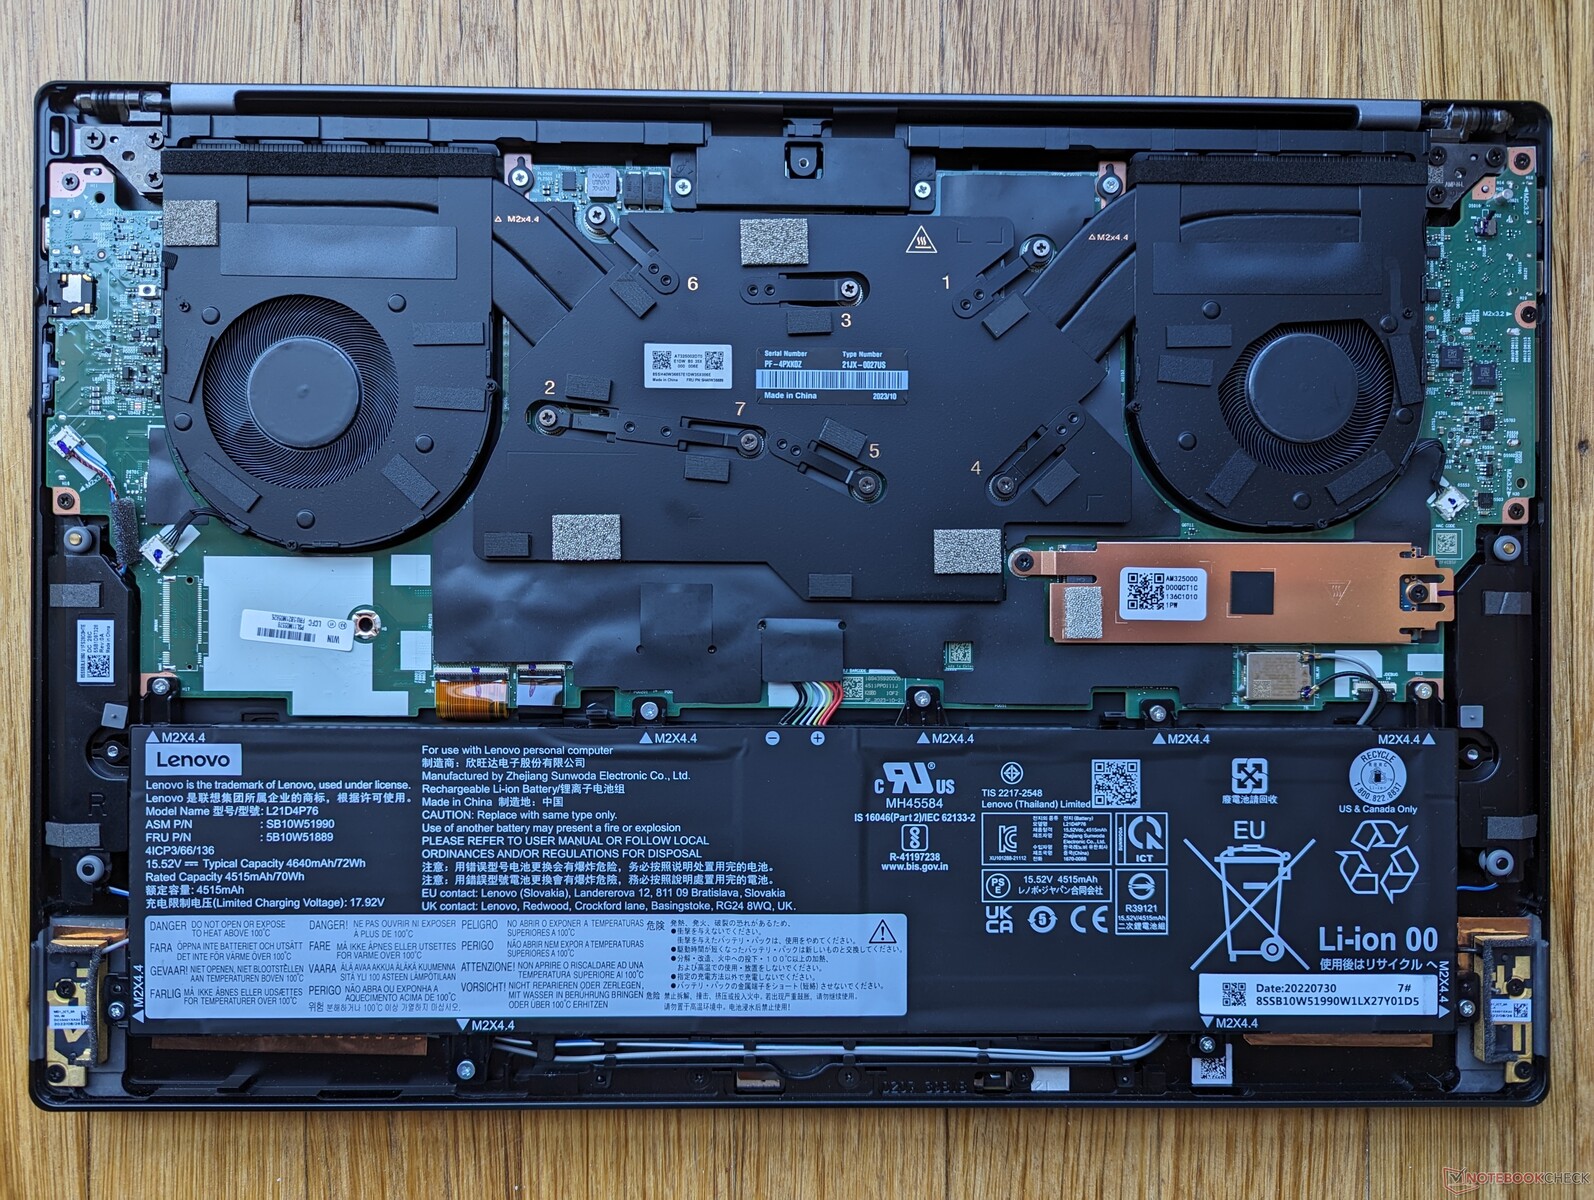
Rimuovendo il pannello inferiore non si notano grandi differenze interne tra la versione Gen 1 e Gen 2. La nostra configurazione Gen 2, tuttavia, non include il supporto WAN e quindi lo slot WAN M.2 e l'antenna sono assenti. Questo purtroppo significa che gli utenti non possono acquistare una SKU senza WAN con l'intenzione di aggiungere un modulo WAN in futuro.
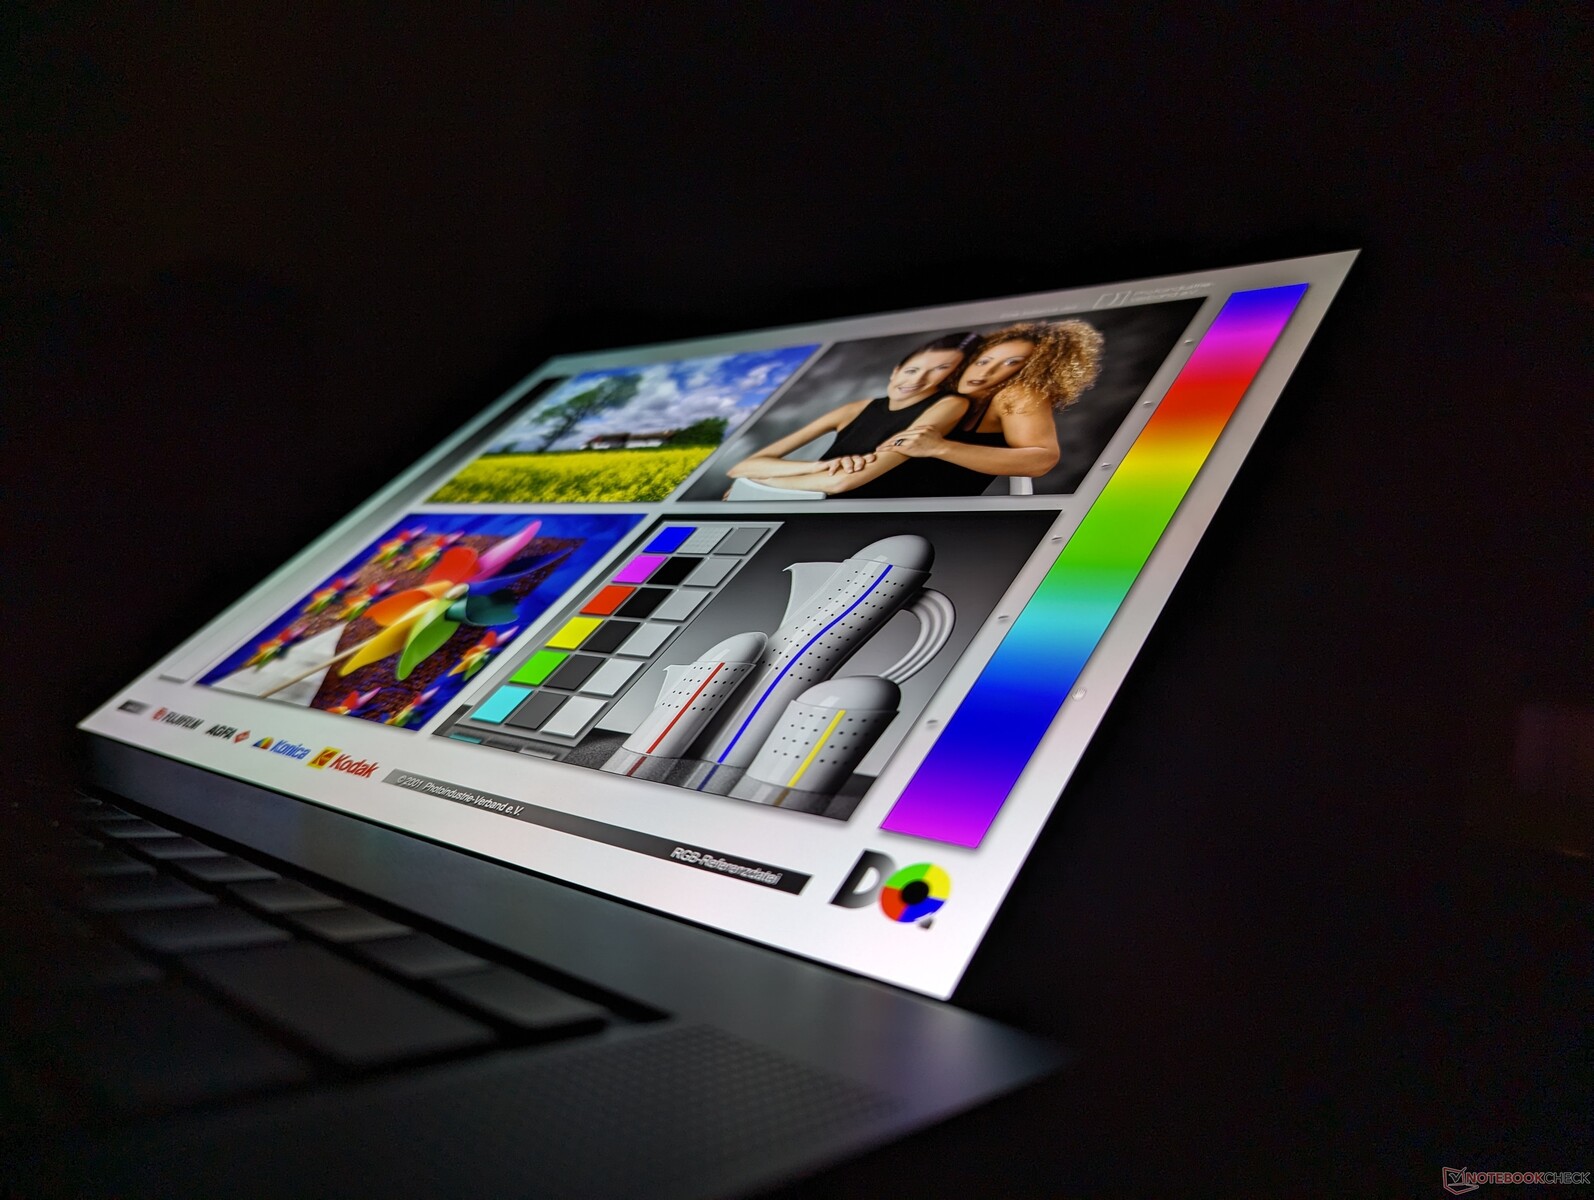
Display
Lenovo offre quattro opzioni di display, tutte a 60 Hz e senza supporto FreeSync:
- 1920 x 1200, IPS, opaco, non touch, 100% sRGB, 400 nits
- 1920 x 1200, IPS, lucido, touch, 100% sRGB, 400 nits
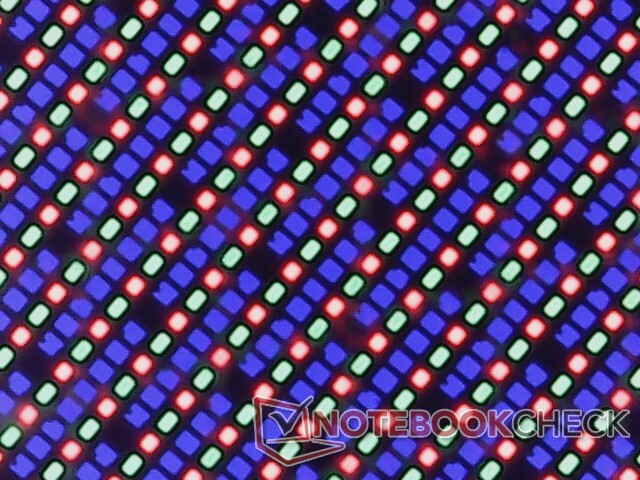
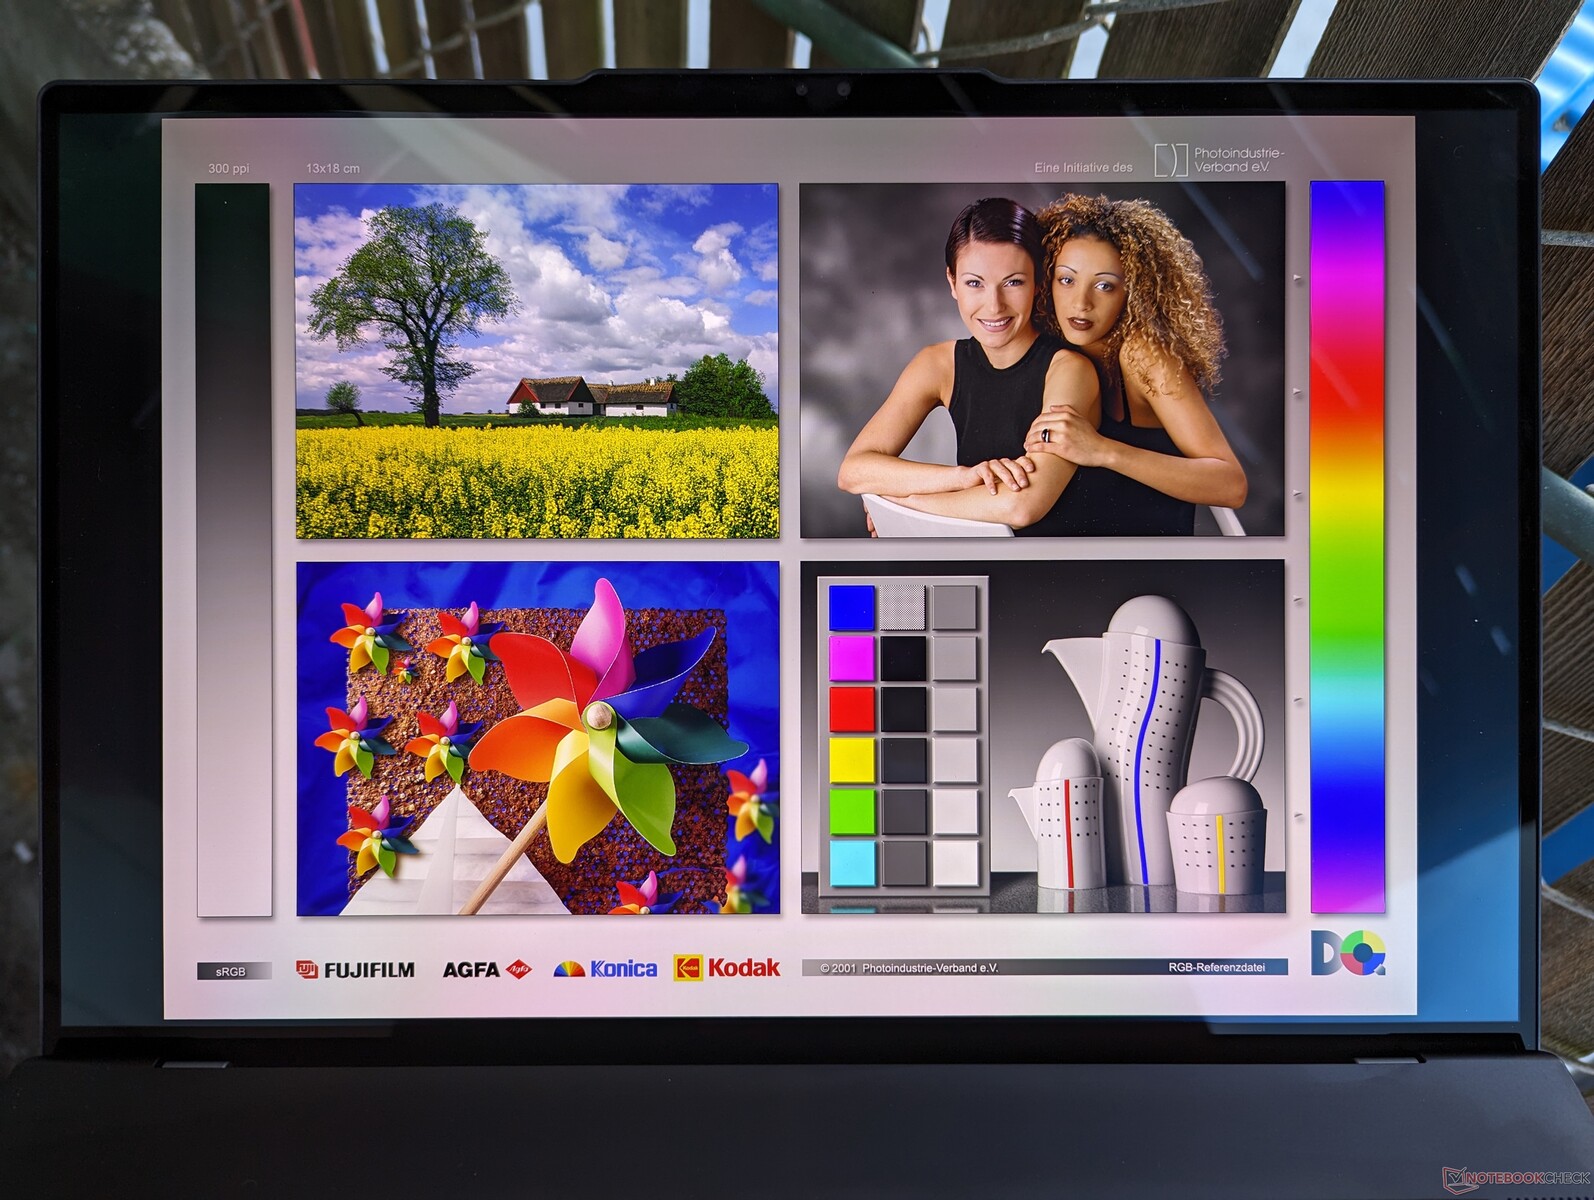
- 3840 x 2400, OLED, lucido, touch, 100% DCI-P3, 400 nits, HDR400
Lo stesso pannello OLED Samsung ATNA60YV04-0 della nostra unità di recensione si trova anche sul recente ThinkPad P1 G6 e quindi l'esperienza visiva è simile tra questi due modelli. Non è raro che un produttore distribuisca le stesse opzioni di pannello su più modelli.
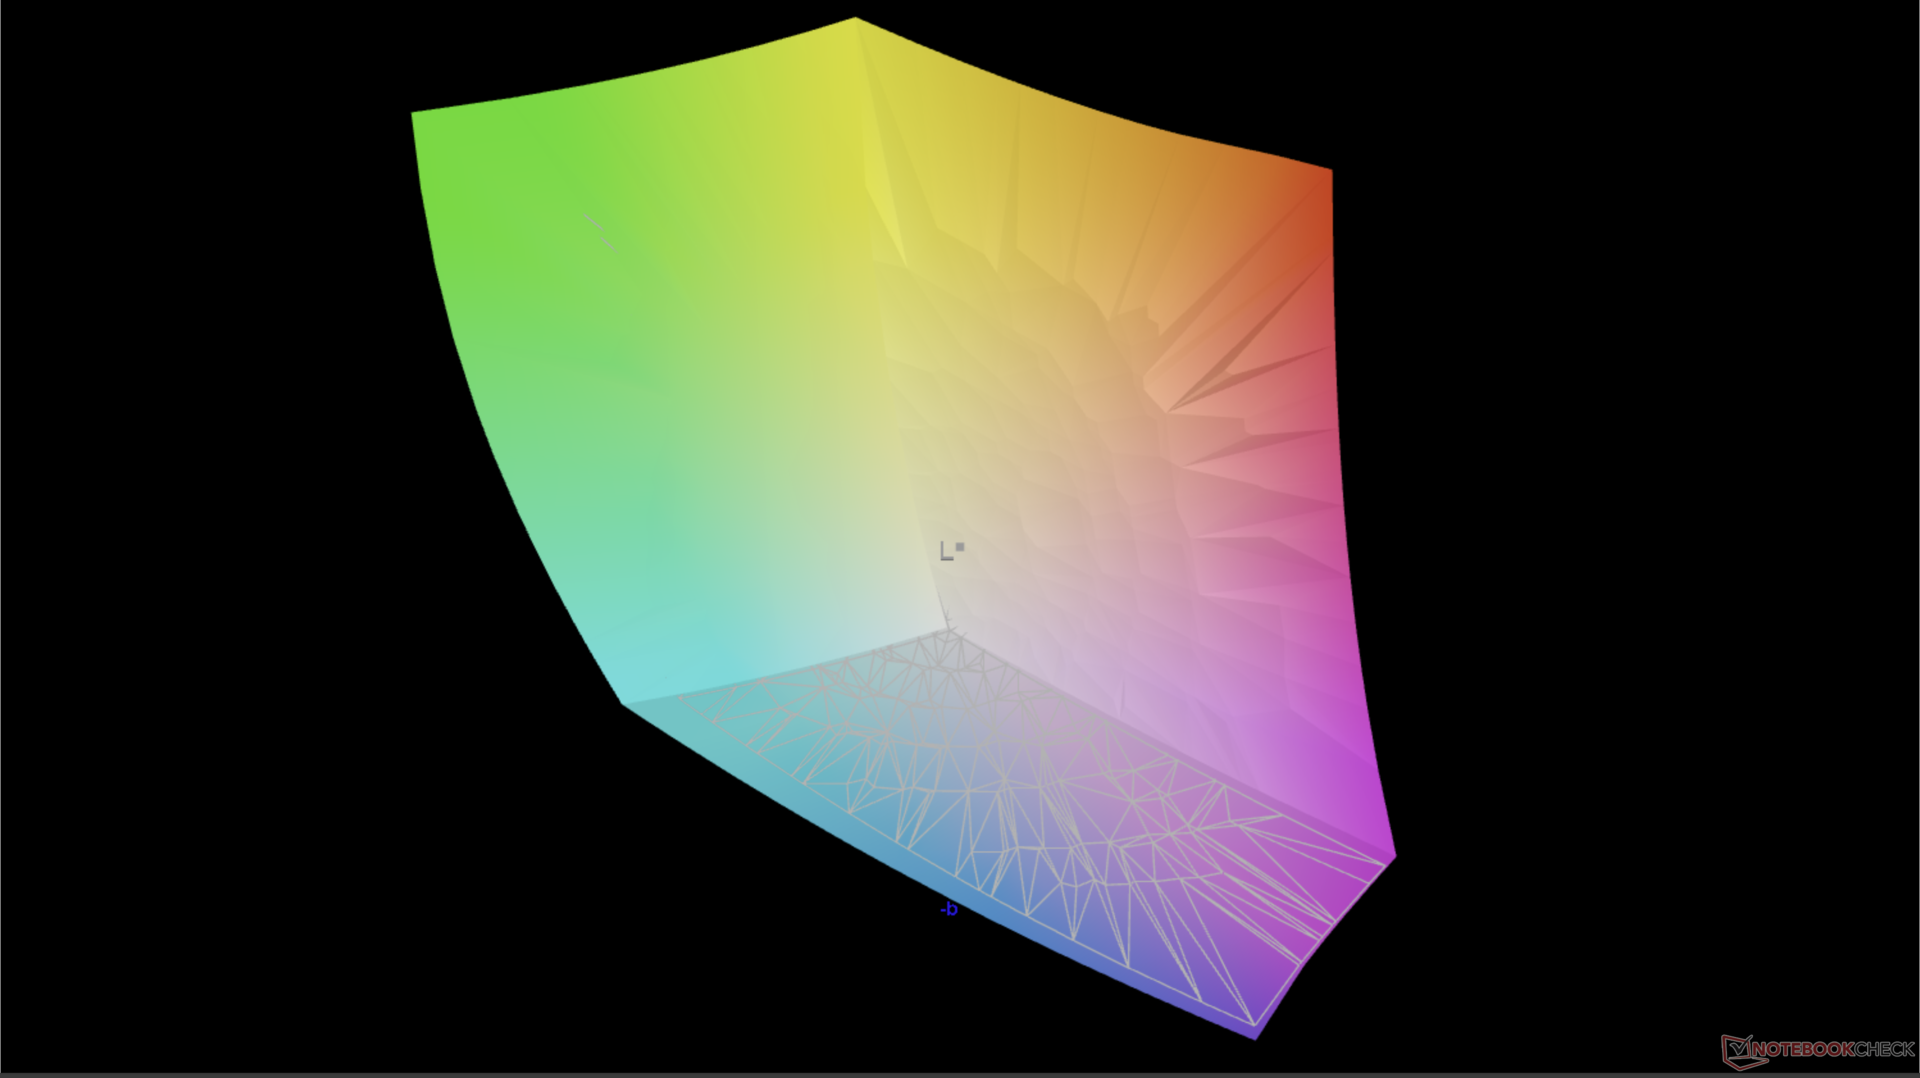
Rispetto al pannello da 1200p della nostra unità Gen 1, il pannello OLED offre livelli di nero più profondi, supporto HDR, tempi di risposta nero-bianco più rapidi, colori più vivaci e una risoluzione nativa più elevata. Indipendentemente dall'opzione, siamo lieti di vedere la copertura sRGB completa come standard, senza SKU di fascia bassa da evitare. Speriamo che le revisioni future includano pannelli ad alto refresh come la serie Asus VivoBook.

| |||||||||||||||||||||||||
Distribuzione della luminosità: 97 %
Al centro con la batteria: 390.1 cd/m²
Contrasto: ∞:1 (Nero: 0 cd/m²)
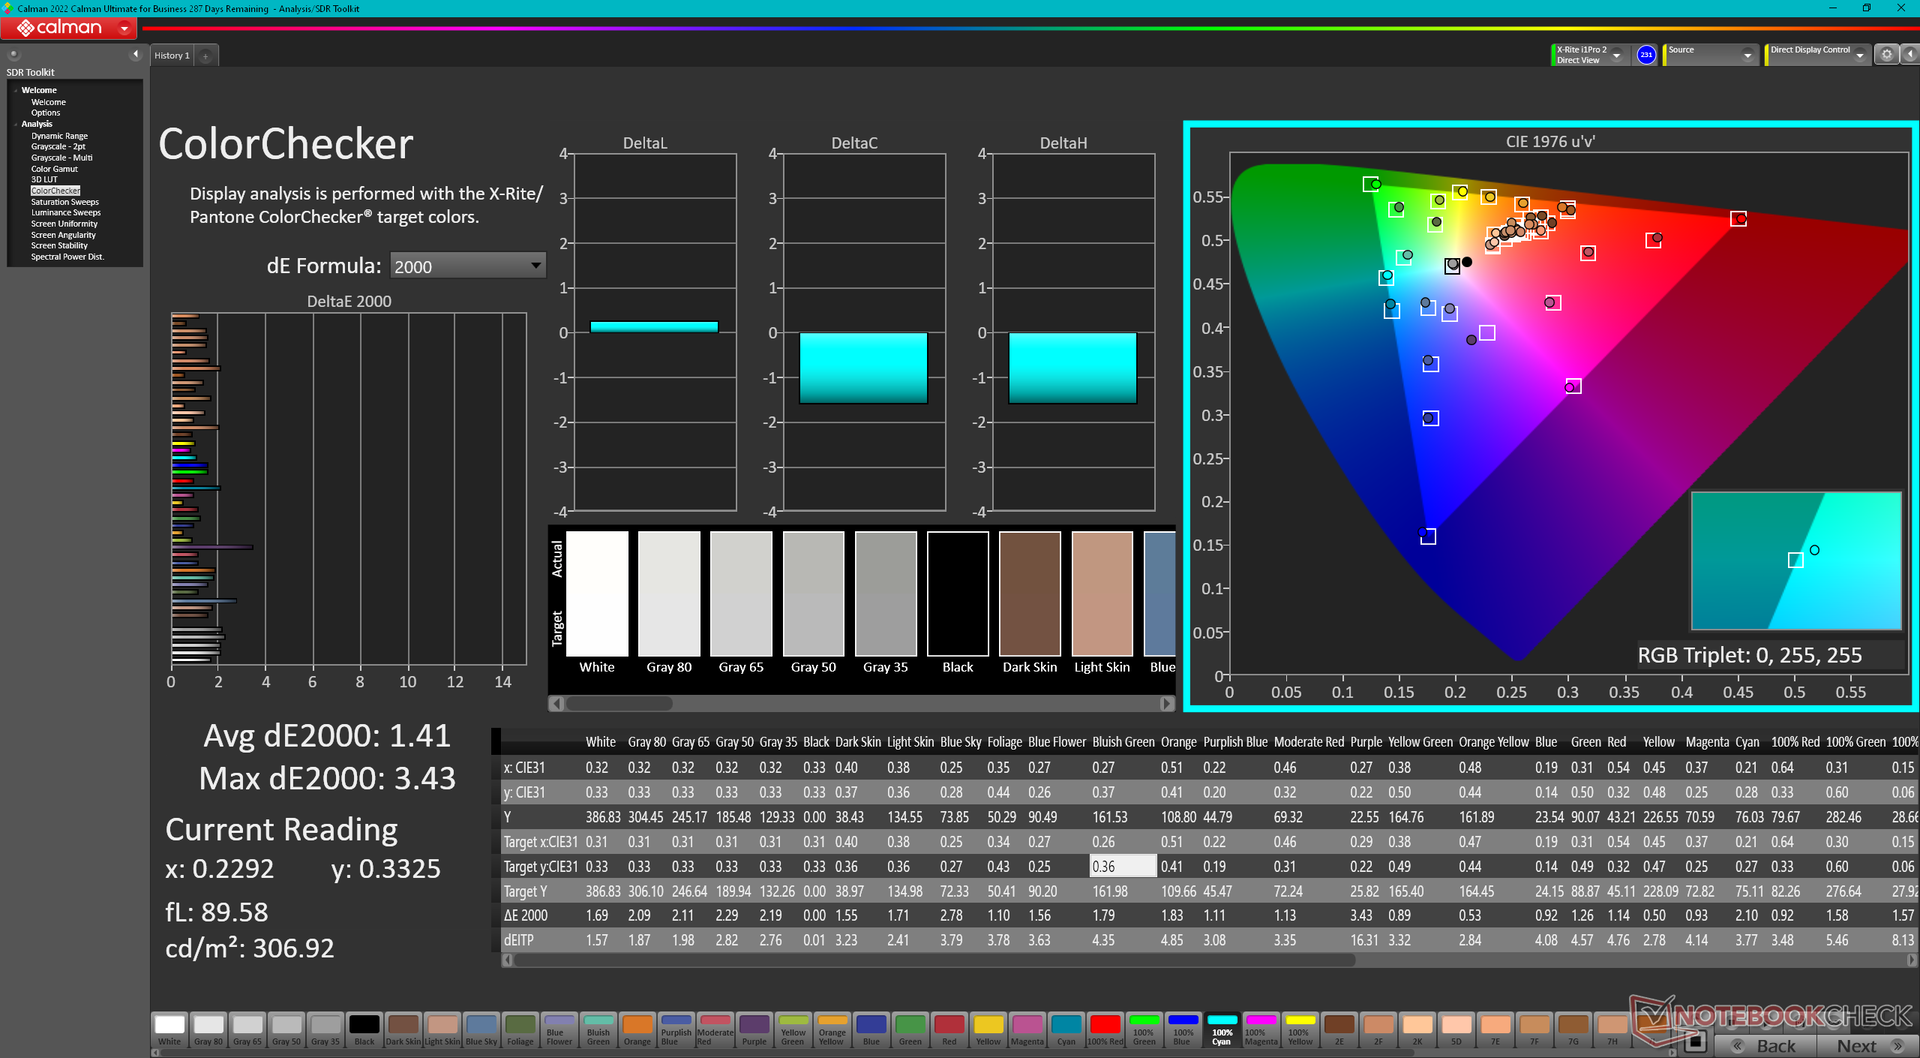
ΔE ColorChecker Calman: 1.41 | ∀{0.5-29.43 Ø4.72}
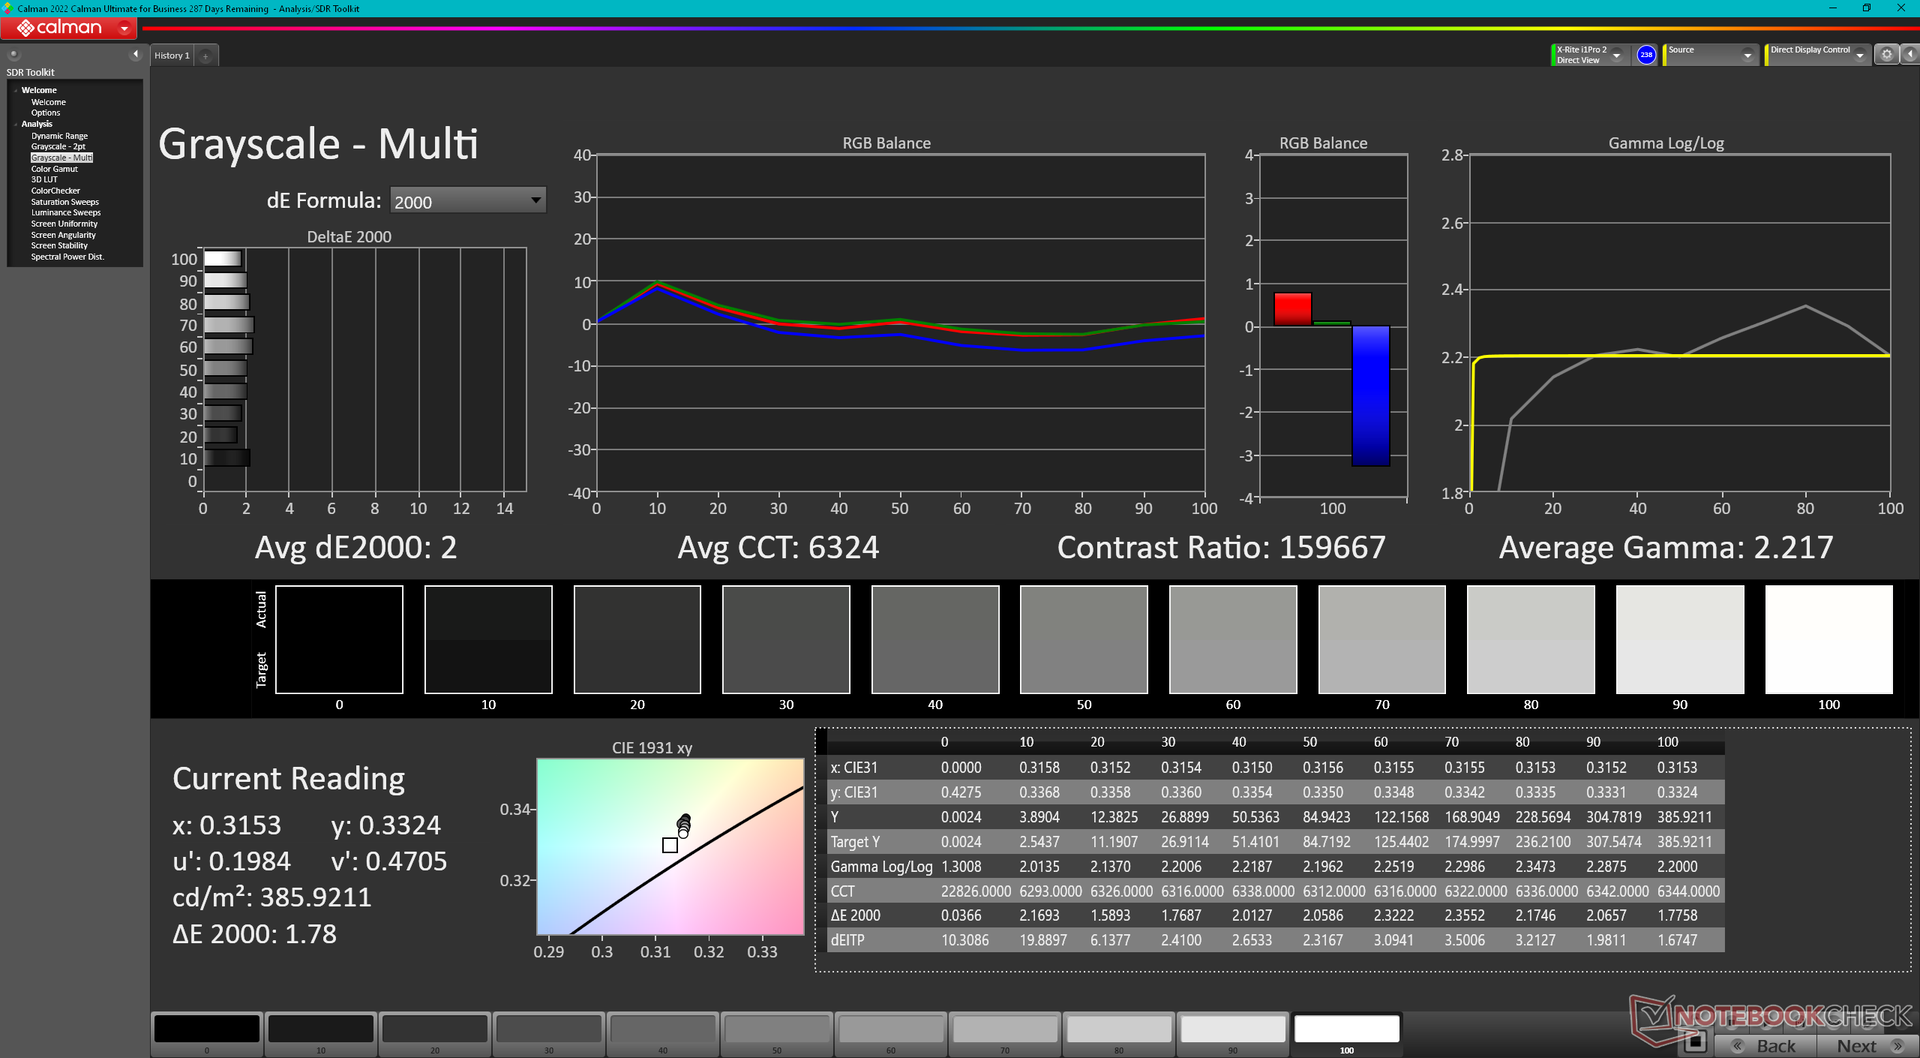
ΔE Greyscale Calman: 2 | ∀{0.09-98 Ø4.97}
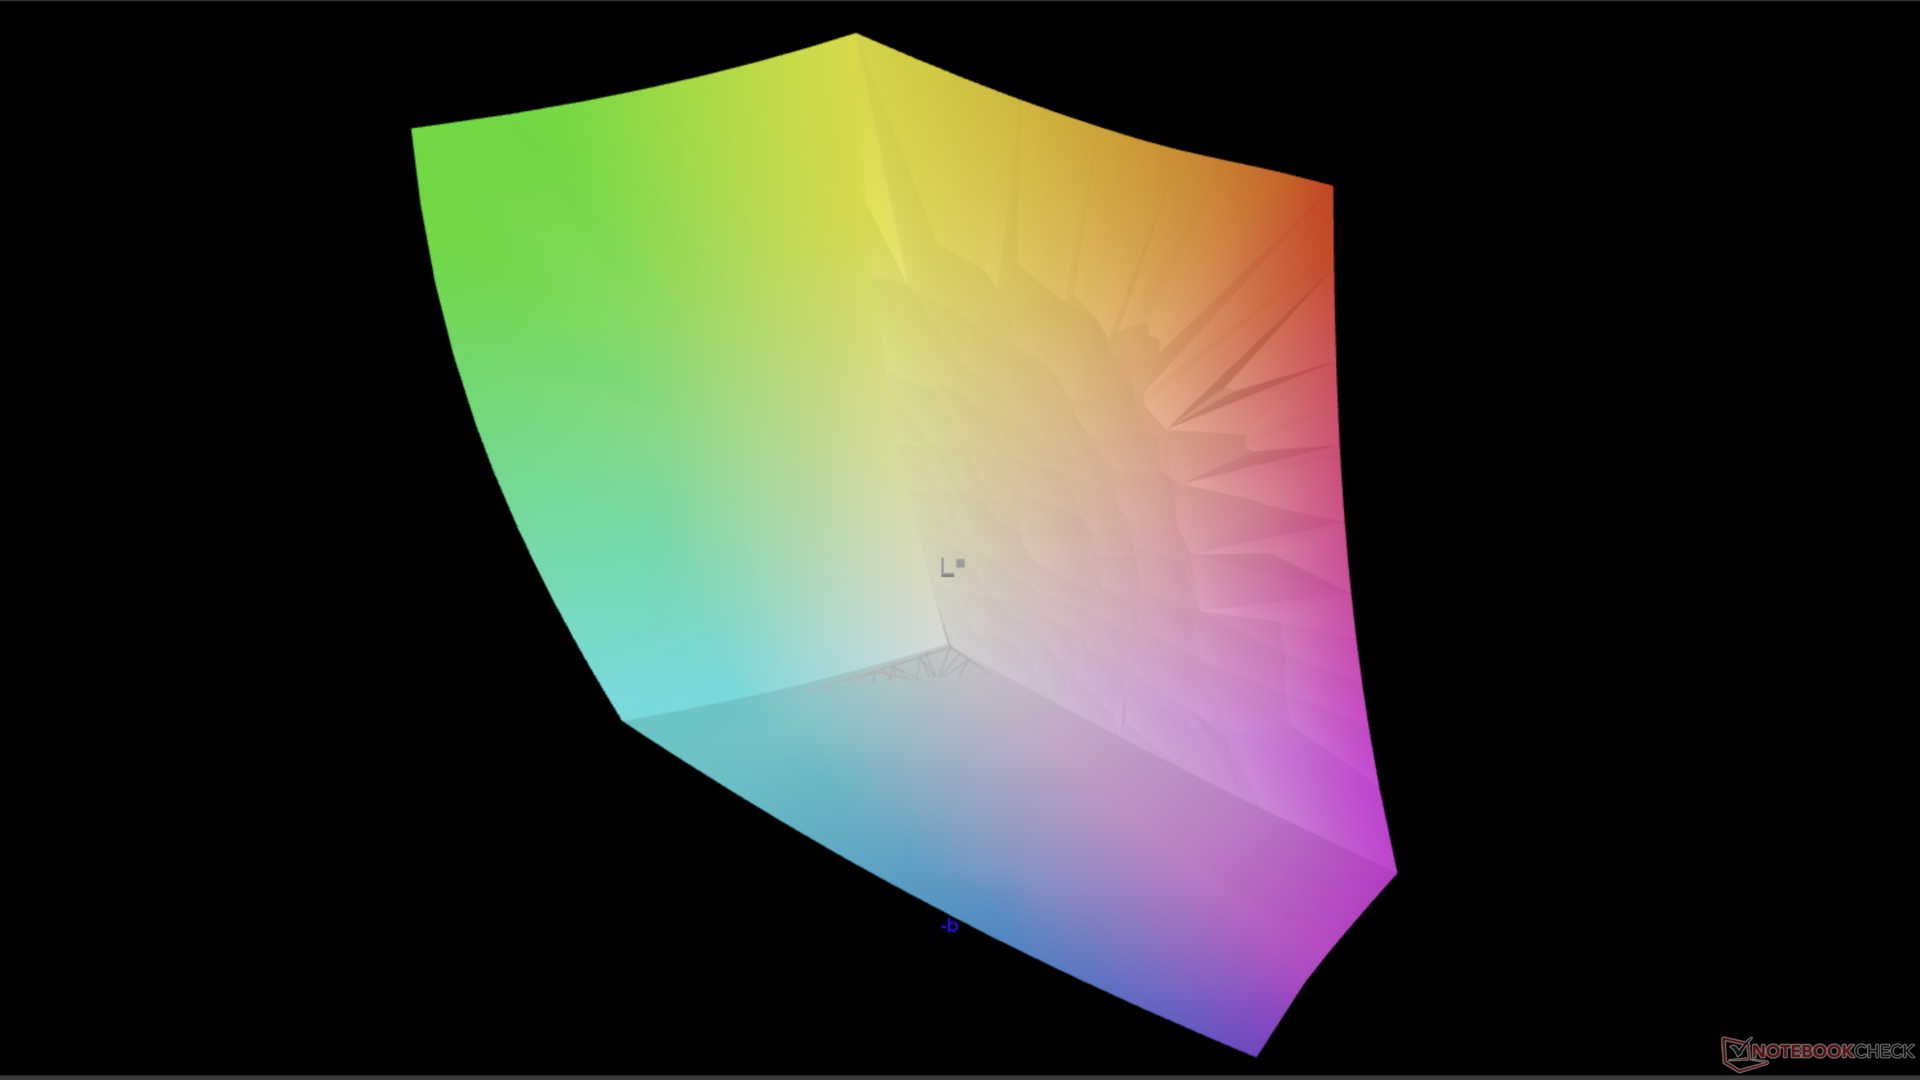
96.7% AdobeRGB 1998 (Argyll 3D)
100% sRGB (Argyll 3D)
99.7% Display P3 (Argyll 3D)
Gamma: 2.22
CCT: 6324 K
| Lenovo ThinkPad Z16 Gen 2 Samsung ATNA60YV04-0, OLED, 3840x2400, 16" | Lenovo ThinkPad Z16 G1 21D5S00T00 NE160WUM-N62 , IPS LED, 1920x1200, 16" | Lenovo ThinkBook 16 G6 ABP LEN160WUXGA, IPS, 1920x1200, 16" | MSI Creator Z16P B12UHST AUOD298, IPS True Pixel (~100% DCI-P3), 2560x1600, 16" | Asus Vivobook Pro 16X K6604JV-MX016W Samsung SDC4178 ATNA60BX01-1, OLED, 3200x2000, 16" | Apple MacBook Pro 16 2023 M3 Max Mini-LED, 3456x2234, 16" | |
|---|---|---|---|---|---|---|
| Display | -18% | -52% | -4% | -1% | -1% | |
| Display P3 Coverage (%) | 99.7 | 70 -30% | 40.4 -59% | 97.6 -2% | 98.4 -1% | 99.2 -1% |
| sRGB Coverage (%) | 100 | 99.7 0% | 59.8 -40% | 99.9 0% | 99.7 0% | |
| AdobeRGB 1998 Coverage (%) | 96.7 | 72.1 -25% | 42 -57% | 86.8 -10% | 95.8 -1% | |
| Response Times | -1637% | -1414% | -417% | 20% | -2852% | |
| Response Time Grey 50% / Grey 80% * (ms) | 1.86 ? | 40 ? -2051% | 32.8 ? -1663% | 12.9 ? -594% | 1.6 ? 14% | 66.9 ? -3497% |
| Response Time Black / White * (ms) | 1.89 ? | 25 ? -1223% | 23.9 ? -1165% | 6.4 ? -239% | 1.4 ? 26% | 43.6 ? -2207% |
| PWM Frequency (Hz) | 60 ? | 120 ? | 14877 | |||
| Screen | -3% | -185% | -23% | -5% | 25% | |
| Brightness middle (cd/m²) | 390.1 | 487 25% | 310 -21% | 428 10% | 347 -11% | 630 61% |
| Brightness (cd/m²) | 393 | 446 13% | 290 -26% | 394 0% | 346 -12% | 604 54% |
| Brightness Distribution (%) | 97 | 83 -14% | 86 -11% | 86 -11% | 97 0% | 94 -3% |
| Black Level * (cd/m²) | 0.31 | 0.22 | 0.42 | 0.06 | ||
| Colorchecker dE 2000 * | 1.41 | 1.8 -28% | 6.2 -340% | 1.67 -18% | 1.89 -34% | 1.2 15% |
| Colorchecker dE 2000 max. * | 3.43 | 3.3 4% | 24.7 -620% | 5.71 -66% | 3.26 5% | 2.8 18% |
| Greyscale dE 2000 * | 2 | 2.3 -15% | 3.8 -90% | 3.1 -55% | 1.55 22% | 1.9 5% |
| Gamma | 2.22 99% | 2.16 102% | 2.22 99% | 2.195 100% | 2.39 92% | 2.29 96% |
| CCT | 6324 103% | 6867 95% | 6011 108% | 6498 100% | 6458 101% | 6812 95% |
| Contrast (:1) | 1571 | 1409 | 1019 | 5783 | ||
| Colorchecker dE 2000 calibrated * | 0.8 | 5.3 | 0.71 | 1.97 | ||
| Media totale (Programma / Settaggio) | -553% /
-304% | -550% /
-372% | -148% /
-90% | 5% /
1% | -943% /
-617% |
* ... Meglio usare valori piccoli
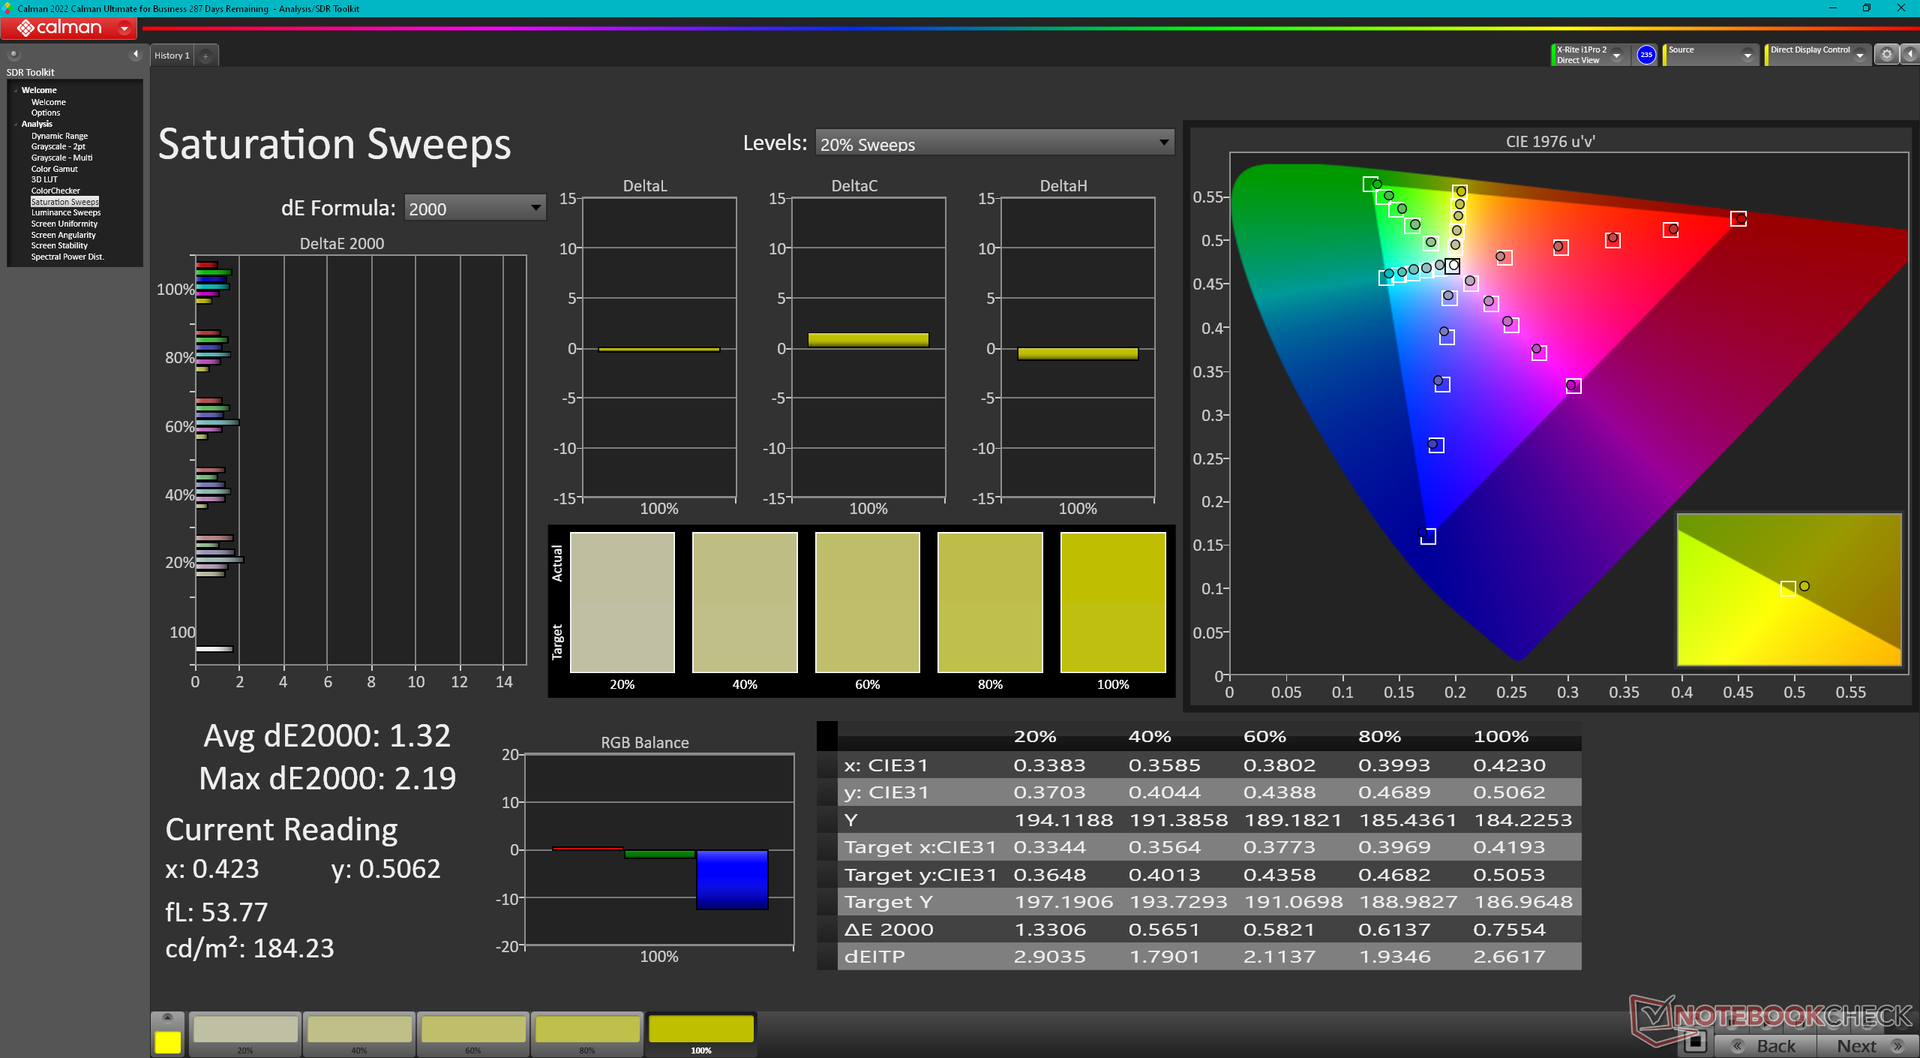
Il display OLED è ben calibrato, con valori medi di deltaE della scala di grigi e del colore di appena 2,0 e 1,41, rispettivamente. Una calibrazione finale non è quindi necessaria per la stragrande maggioranza degli utenti.
Tempi di risposta del Display
| ↔ Tempi di risposta dal Nero al Bianco | ||
|---|---|---|
| 1.89 ms ... aumenta ↗ e diminuisce ↘ combinato | ↗ ms Incremento | 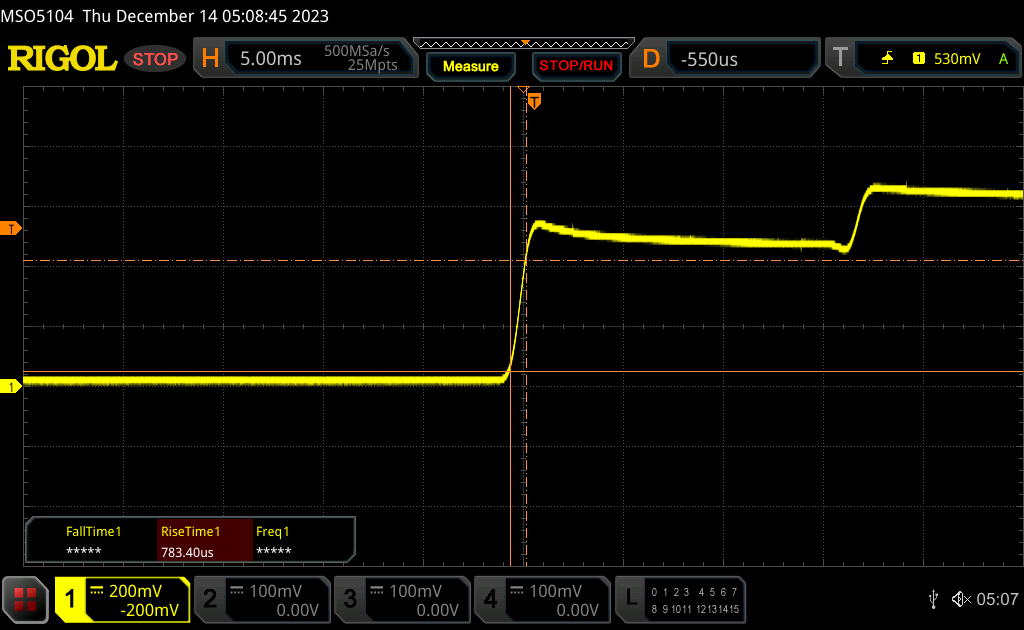 |
| ↘ 0.89 ms Calo | ||
| Lo schermo ha mostrato valori di risposta molto veloci nei nostri tests ed è molto adatto per i gaming veloce. In confronto, tutti i dispositivi di test variano da 0.1 (minimo) a 240 (massimo) ms. » 11 % di tutti i dispositivi è migliore. Questo significa che i tempi di risposta rilevati sono migliori rispettto alla media di tutti i dispositivi testati (19.8 ms). | ||
| ↔ Tempo di risposta dal 50% Grigio all'80% Grigio | ||
| 1.86 ms ... aumenta ↗ e diminuisce ↘ combinato | ↗ 0.96 ms Incremento | 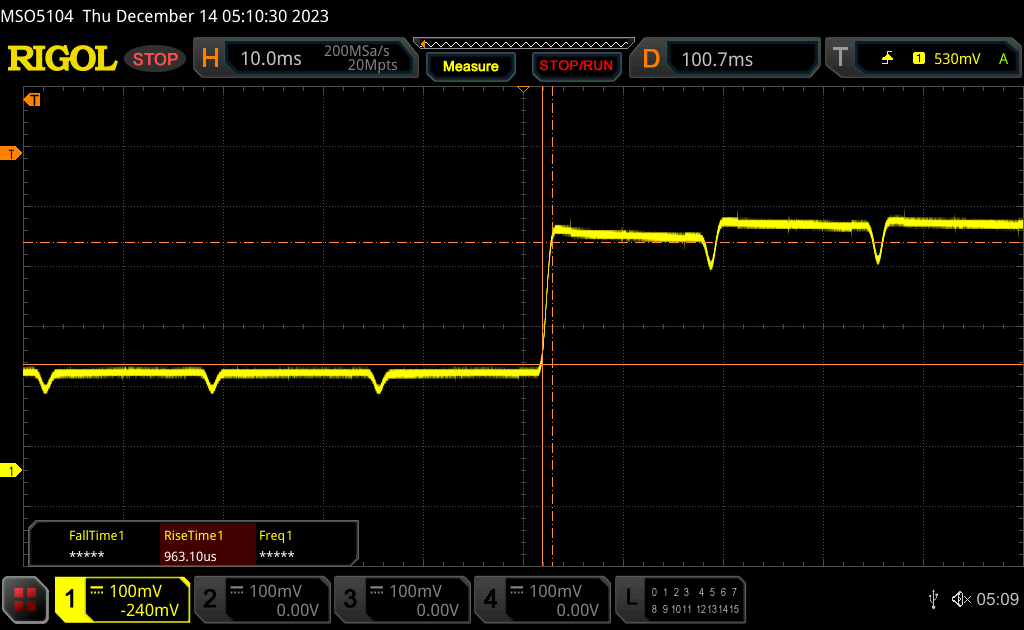 |
| ↘ 0.9 ms Calo | ||
| Lo schermo ha mostrato valori di risposta molto veloci nei nostri tests ed è molto adatto per i gaming veloce. In confronto, tutti i dispositivi di test variano da 0.165 (minimo) a 636 (massimo) ms. » 9 % di tutti i dispositivi è migliore. Questo significa che i tempi di risposta rilevati sono migliori rispettto alla media di tutti i dispositivi testati (31 ms). | ||
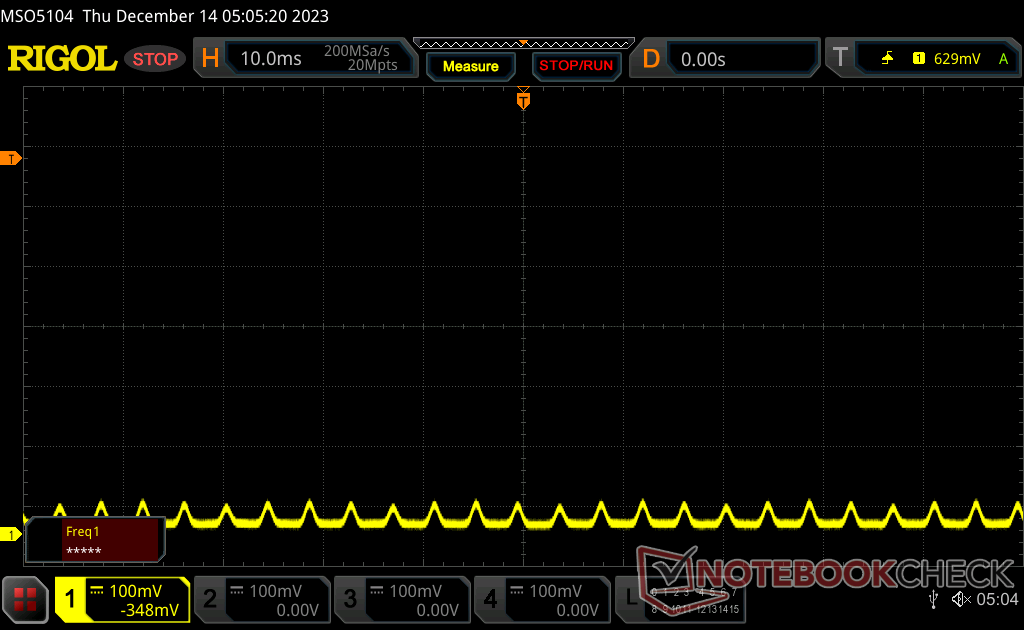
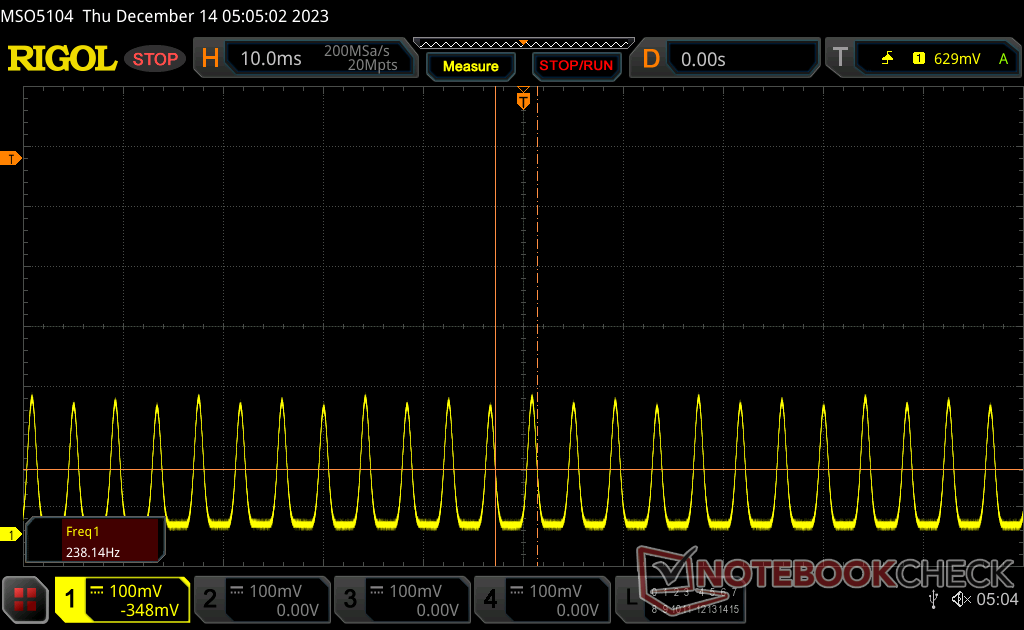
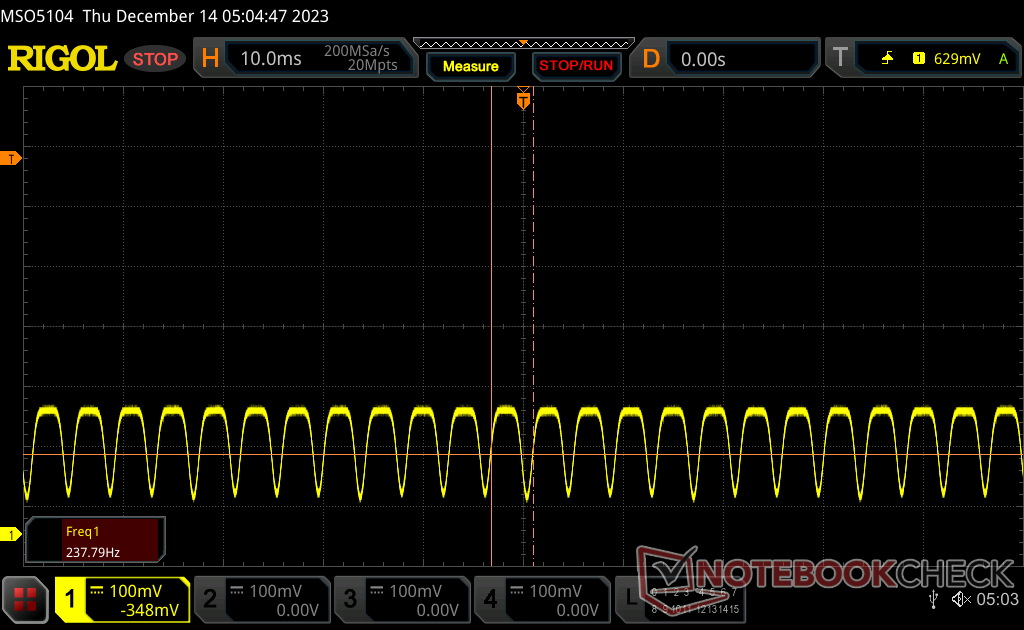
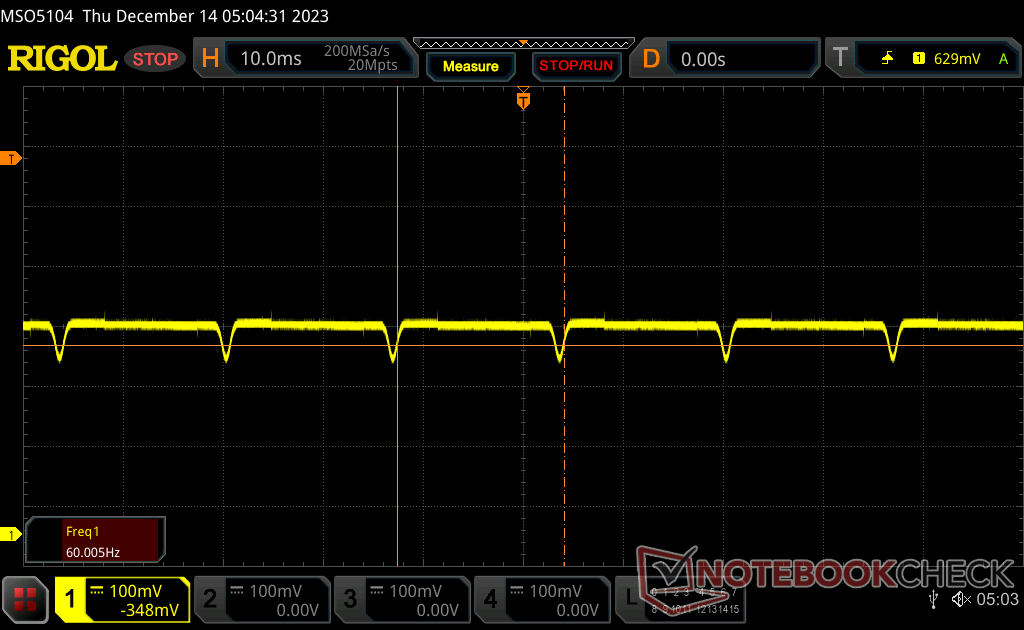
Sfarfallio dello schermo / PWM (Pulse-Width Modulation)
| flickering dello schermo / PWM rilevato | 60 Hz | ≤ 100 % settaggio luminosita' | 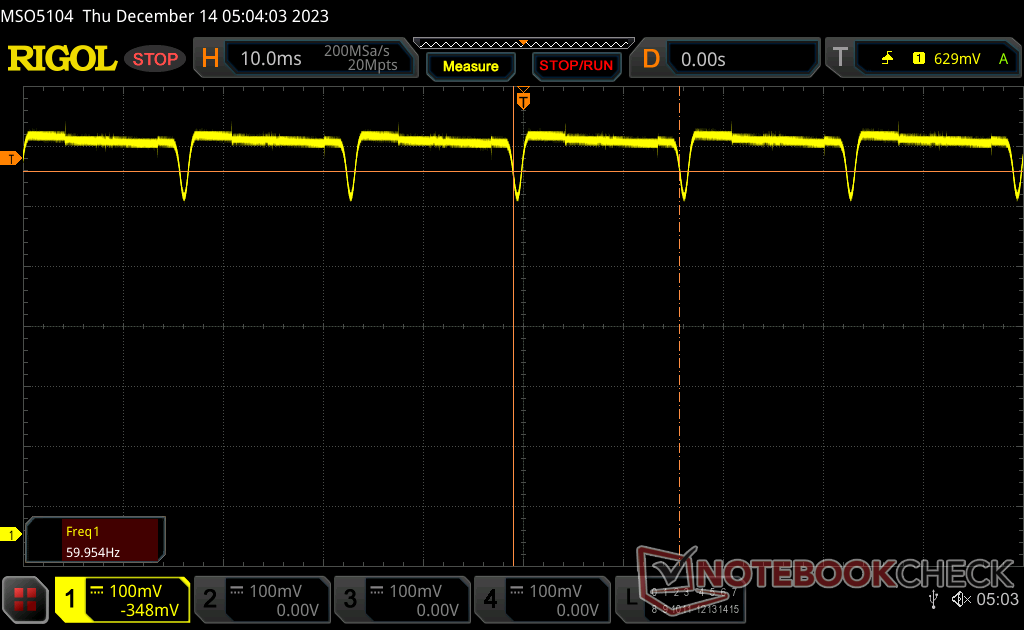 |
Il display sfarfalla a 60 Hz (Probabilmente a causa dell'uso di PWM) Flickering rilevato ad una luminosita' di 100 % o inferiore. Non dovrebbe verificarsi flickering o PWM sopra questo valore di luminosita'. La frequenza di 60 Hz è molto bassa, quindi il flickering potrebbe causare stanchezza agli occhi e mal di testa con un utilizzo prolungato. In confronto: 52 % di tutti i dispositivi testati non utilizza PWM per ridurre la luminosita' del display. Se è rilevato PWM, una media di 7781 (minimo: 5 - massimo: 343500) Hz è stata rilevata. | |||
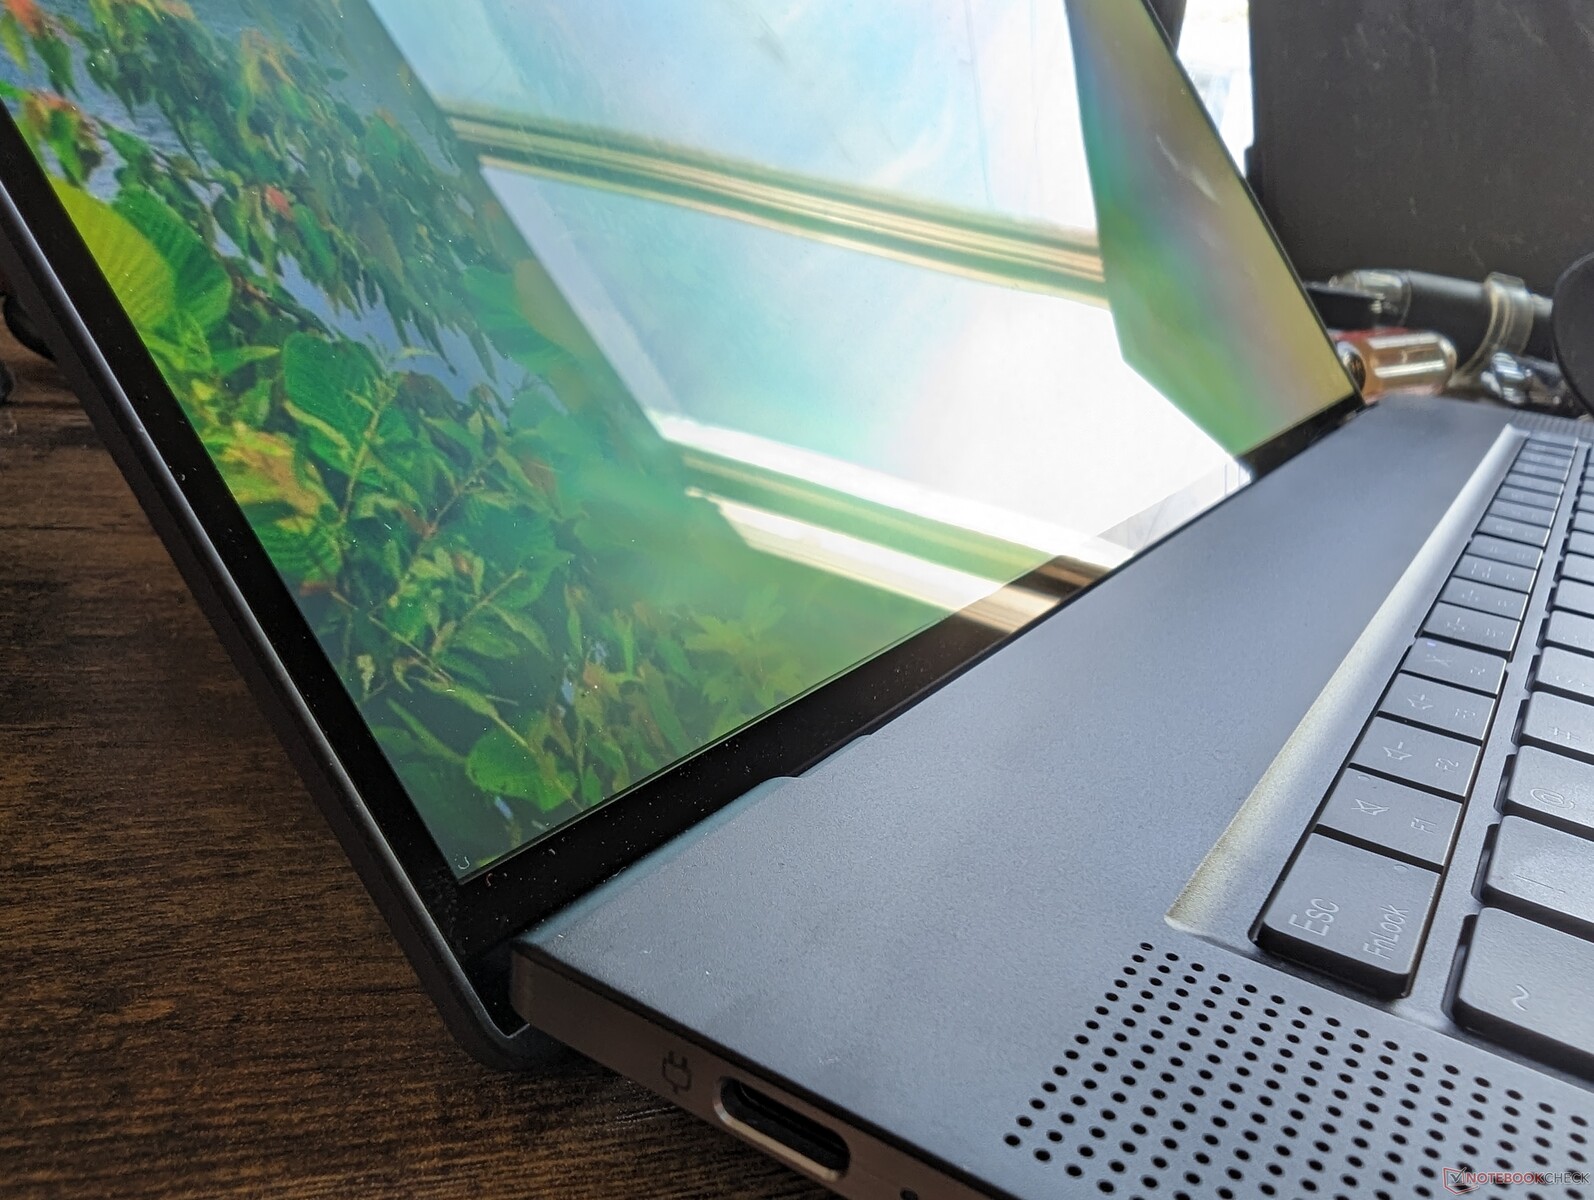
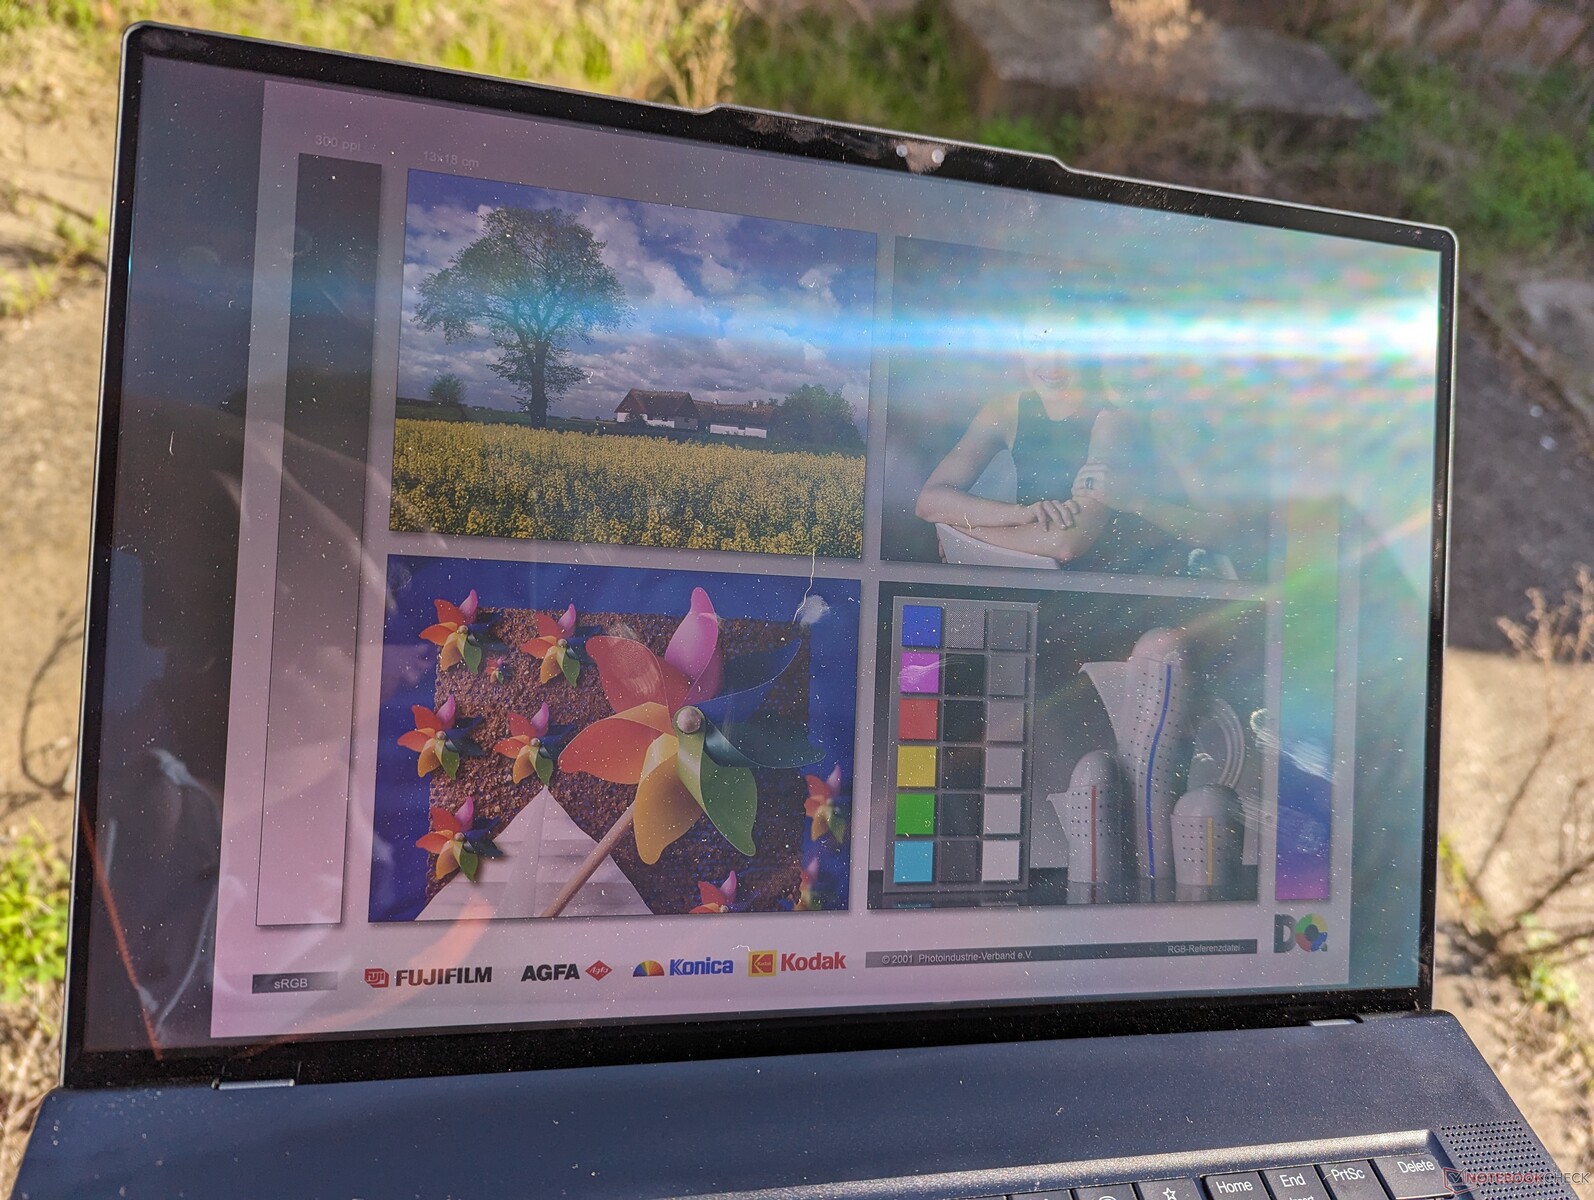
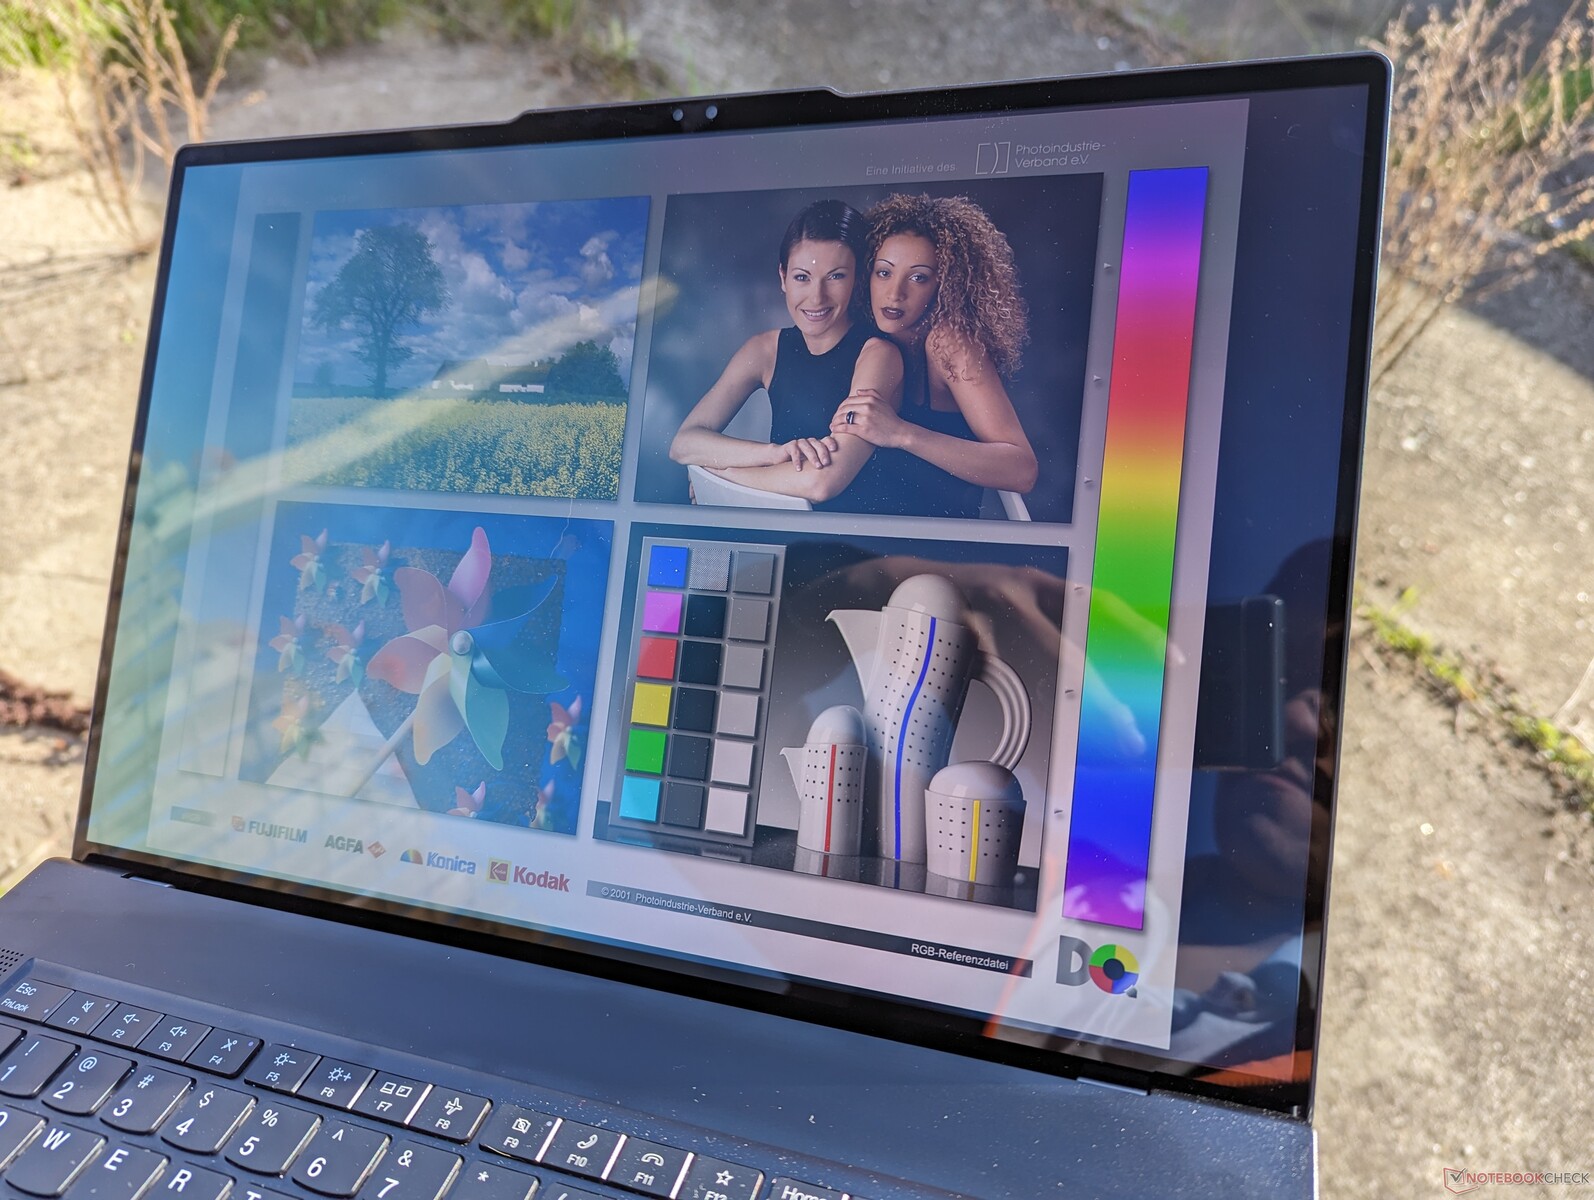
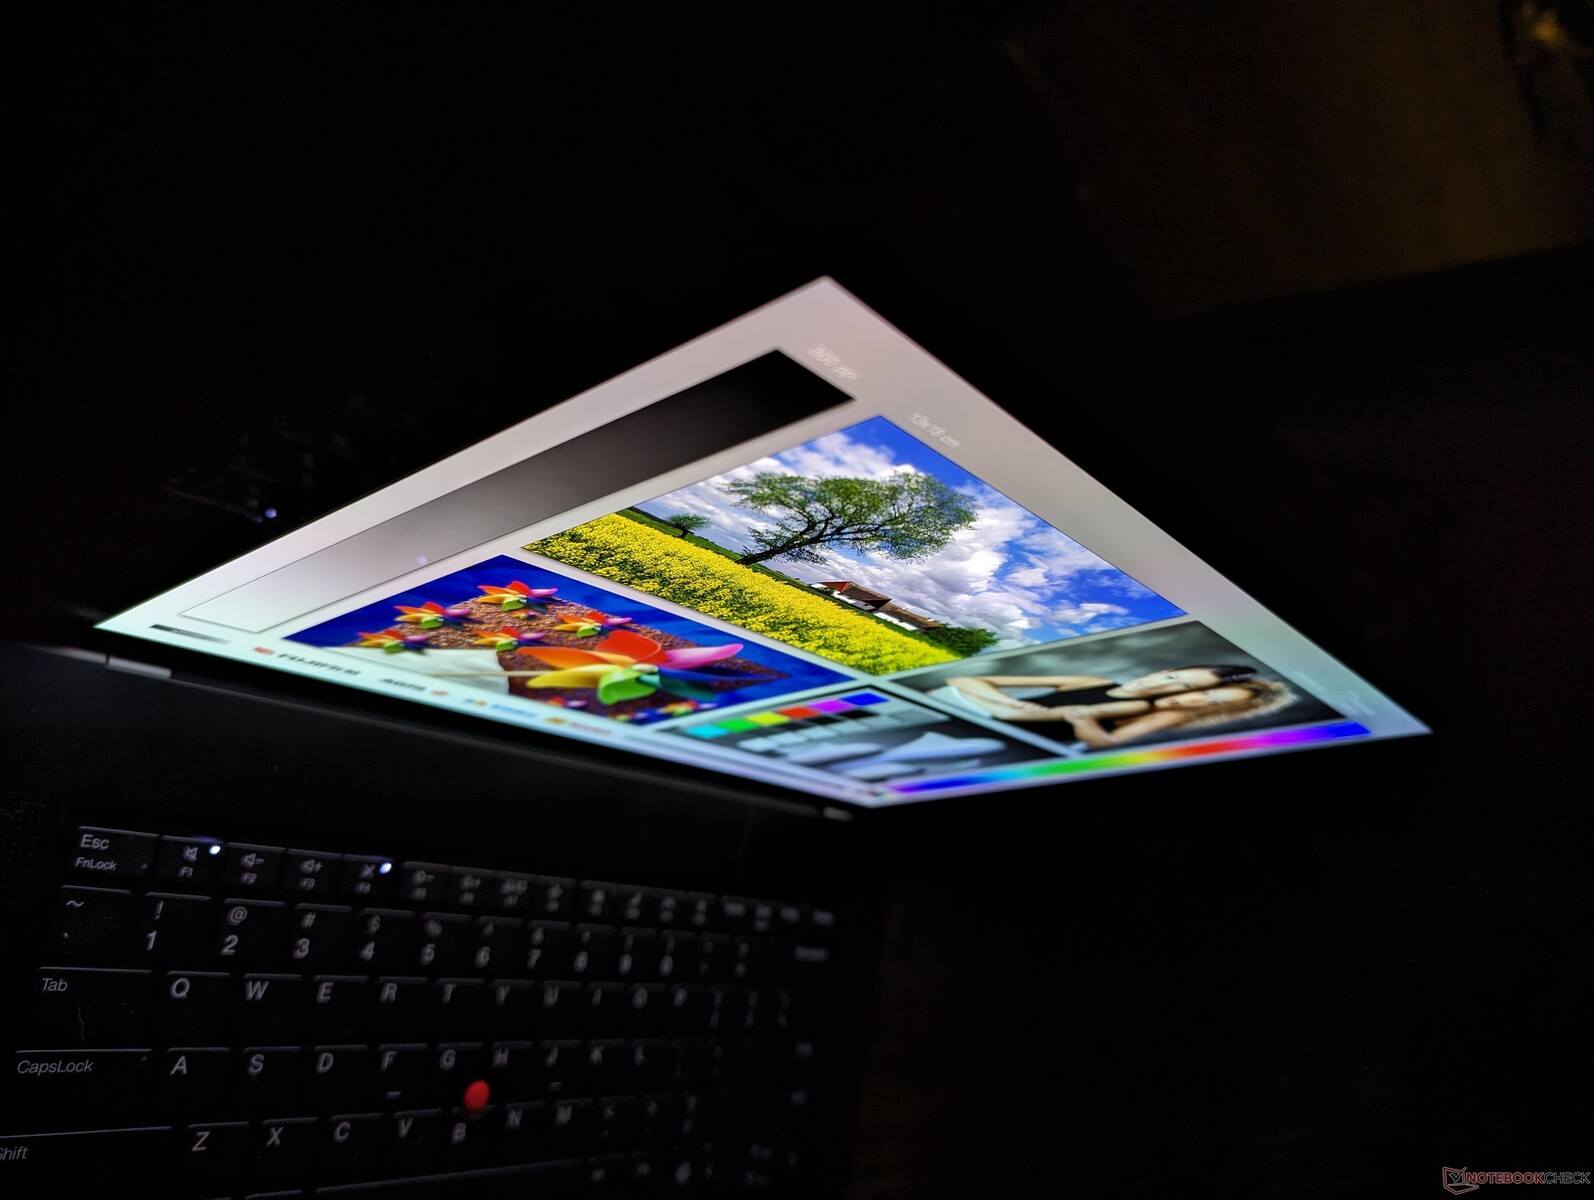
Gli angoli di visione sono più ampi rispetto all'IPS, mentre i livelli di nero più profondi aiutano a mantenere i colori in condizioni di illuminazione ambientale intensa. Tuttavia, i riflessi della sovrapposizione lucida sono inevitabili e la luminosità massima non è più brillante della configurazione IPS base da 1200p. In confronto, il display del MacBook Pro 16 è più luminoso del 50 percento, per una migliore visibilità all'aperto.
Prestazioni
Condizioni del test
Abbiamo impostato Windows in modalità Prestazioni prima di eseguire i benchmark qui sotto. Il software Lenovo Commercial Vantage preinstallato non include alcuna impostazione di profilo energetico aggiuntiva rispetto alla consueta selezione di Windows. Tuttavia, è fondamentale per gli aggiornamenti del BIOS e per regolare il comportamento di carica della batteria.
Processore
Il Ryzen 9 Pro 7940HS le prestazioni sono identiche a quelle di Ryzen 9 7940HS come si trova sul Asus TUF Gaming A16. Pertanto, gli utenti non dovranno sacrificare le prestazioni per sfruttare le funzioni Pro. Le prestazioni complessive sono paragonabili a quelle del 12° generazione dello scorso anno Core i9-12900H sia nei carichi di lavoro single-threaded che in quelli multi-threaded.
Le differenze di prestazioni tra il nostro Zen 4 Ryzen 9 Pro 7940HS e lo Zen 3+ Ryzen 7 Pro 6850H nel ThinkPad Z16 Gen 1 dello scorso anno possono essere piuttosto significative, dal 35 al 45% per i carichi di lavoro multi-threaded, grazie al maggior numero di core. Pertanto, l'aumento delle prestazioni con Zen 4 è uno dei motivi principali per scegliere la versione Gen 2 del ThinkPad Z16 invece della Gen 1.
Le configurazioni di fascia bassa offrono il Ryzen 7 Pro 7840HS o Ryzen 5 Pro 7640HS invece. L'opzione Ryzen 7 ha prestazioni quasi identiche a quelle dell'opzione Ryzen 9, in base al tempo trascorso con l'opzione Ryzen 9 Lenovo Legion Slim 5 16 e quindi si consiglia di scegliere una configurazione Ryzen 7 per risparmiare sui costi. In effetti, Ryzen 7 Pro 7840HS condivide lo stesso numero di core e le stesse caratteristiche di Ryzen 9 Pro 7940HS, con differenze minime di 100-200 MHz nelle frequenze di clock target.
Il downgrade alla configurazione Ryzen 5 Pro 7640HS dovrebbe avere un impatto più significativo sulle prestazioni del processore, di circa il 30-35 percento, in base al tempo trascorso con il modello HP ZBook Firefly 14 G10. I delta delle prestazioni tra le opzioni Ryzen 5, Ryzen 7 e Ryzen 9 sono quindi fortemente sbilanciati tra le SKU Ryzen 5 e Ryzen 7.
Cinebench R15 Multi Loop
Cinebench R23: Multi Core | Single Core
Cinebench R20: CPU (Multi Core) | CPU (Single Core)
Cinebench R15: CPU Multi 64Bit | CPU Single 64Bit
Blender: v2.79 BMW27 CPU
7-Zip 18.03: 7z b 4 | 7z b 4 -mmt1
Geekbench 5.5: Multi-Core | Single-Core
HWBOT x265 Benchmark v2.2: 4k Preset
LibreOffice : 20 Documents To PDF
R Benchmark 2.5: Overall mean
* ... Meglio usare valori piccoli
AIDA64: FP32 Ray-Trace | FPU Julia | CPU SHA3 | CPU Queen | FPU SinJulia | FPU Mandel | CPU AES | CPU ZLib | FP64 Ray-Trace | CPU PhotoWorxx
| Performance rating | |
| Lenovo ThinkPad Z16 Gen 2 | |
| Asus Vivobook Pro 16X K6604JV-MX016W | |
| Media AMD Ryzen 9 PRO 7940HS | |
| Lenovo ThinkPad Z16 G1 21D5S00T00 | |
| MSI Creator Z16P B12UHST | |
| Lenovo ThinkBook 16 G6 ABP | |
| AIDA64 / FP32 Ray-Trace | |
| Lenovo ThinkPad Z16 Gen 2 | |
| Media AMD Ryzen 9 PRO 7940HS (24034 - 27411, n=3) | |
| Asus Vivobook Pro 16X K6604JV-MX016W | |
| Lenovo ThinkPad Z16 G1 21D5S00T00 | |
| Lenovo ThinkBook 16 G6 ABP | |
| MSI Creator Z16P B12UHST | |
| AIDA64 / FPU Julia | |
| Lenovo ThinkPad Z16 Gen 2 | |
| Asus Vivobook Pro 16X K6604JV-MX016W | |
| Media AMD Ryzen 9 PRO 7940HS (101262 - 116960, n=3) | |
| Lenovo ThinkPad Z16 G1 21D5S00T00 | |
| Lenovo ThinkBook 16 G6 ABP | |
| MSI Creator Z16P B12UHST | |
| AIDA64 / CPU SHA3 | |
| Asus Vivobook Pro 16X K6604JV-MX016W | |
| Lenovo ThinkPad Z16 Gen 2 | |
| Media AMD Ryzen 9 PRO 7940HS (4418 - 4944, n=3) | |
| Lenovo ThinkPad Z16 G1 21D5S00T00 | |
| MSI Creator Z16P B12UHST | |
| Lenovo ThinkBook 16 G6 ABP | |
| AIDA64 / CPU Queen | |
| Asus Vivobook Pro 16X K6604JV-MX016W | |
| Lenovo ThinkPad Z16 Gen 2 | |
| Media AMD Ryzen 9 PRO 7940HS (112873 - 124565, n=3) | |
| MSI Creator Z16P B12UHST | |
| Lenovo ThinkPad Z16 G1 21D5S00T00 | |
| Lenovo ThinkBook 16 G6 ABP | |
| AIDA64 / FPU SinJulia | |
| Lenovo ThinkPad Z16 Gen 2 | |
| Media AMD Ryzen 9 PRO 7940HS (14147 - 15304, n=3) | |
| Asus Vivobook Pro 16X K6604JV-MX016W | |
| Lenovo ThinkPad Z16 G1 21D5S00T00 | |
| MSI Creator Z16P B12UHST | |
| Lenovo ThinkBook 16 G6 ABP | |
| AIDA64 / FPU Mandel | |
| Lenovo ThinkPad Z16 Gen 2 | |
| Media AMD Ryzen 9 PRO 7940HS (54003 - 62357, n=3) | |
| Asus Vivobook Pro 16X K6604JV-MX016W | |
| Lenovo ThinkPad Z16 G1 21D5S00T00 | |
| Lenovo ThinkBook 16 G6 ABP | |
| MSI Creator Z16P B12UHST | |
| AIDA64 / CPU AES | |
| Asus Vivobook Pro 16X K6604JV-MX016W | |
| MSI Creator Z16P B12UHST | |
| Lenovo ThinkPad Z16 Gen 2 | |
| Media AMD Ryzen 9 PRO 7940HS (76133 - 88705, n=3) | |
| Lenovo ThinkPad Z16 G1 21D5S00T00 | |
| Lenovo ThinkBook 16 G6 ABP | |
| AIDA64 / CPU ZLib | |
| Asus Vivobook Pro 16X K6604JV-MX016W | |
| MSI Creator Z16P B12UHST | |
| Lenovo ThinkPad Z16 Gen 2 | |
| Media AMD Ryzen 9 PRO 7940HS (976 - 1079, n=3) | |
| Lenovo ThinkPad Z16 G1 21D5S00T00 | |
| Lenovo ThinkBook 16 G6 ABP | |
| AIDA64 / FP64 Ray-Trace | |
| Lenovo ThinkPad Z16 Gen 2 | |
| Media AMD Ryzen 9 PRO 7940HS (12715 - 14590, n=3) | |
| Asus Vivobook Pro 16X K6604JV-MX016W | |
| Lenovo ThinkPad Z16 G1 21D5S00T00 | |
| Lenovo ThinkBook 16 G6 ABP | |
| MSI Creator Z16P B12UHST | |
| AIDA64 / CPU PhotoWorxx | |
| Asus Vivobook Pro 16X K6604JV-MX016W | |
| MSI Creator Z16P B12UHST | |
| Lenovo ThinkPad Z16 Gen 2 | |
| Media AMD Ryzen 9 PRO 7940HS (24030 - 37800, n=3) | |
| Lenovo ThinkPad Z16 G1 21D5S00T00 | |
| Lenovo ThinkBook 16 G6 ABP | |
Prestazioni del sistema
CrossMark: Overall | Productivity | Creativity | Responsiveness
WebXPRT 3: Overall
WebXPRT 4: Overall
Mozilla Kraken 1.1: Total
| PCMark 10 / Score | |
| MSI Creator Z16P B12UHST | |
| Lenovo ThinkPad Z16 Gen 2 | |
| Media AMD Ryzen 9 PRO 7940HS, AMD Radeon RX 6550M (n=1) | |
| Asus Vivobook Pro 16X K6604JV-MX016W | |
| Lenovo ThinkPad Z16 G1 21D5S00T00 | |
| Lenovo ThinkBook 16 G6 ABP | |
| PCMark 10 / Essentials | |
| Lenovo ThinkPad Z16 Gen 2 | |
| Media AMD Ryzen 9 PRO 7940HS, AMD Radeon RX 6550M (n=1) | |
| MSI Creator Z16P B12UHST | |
| Lenovo ThinkBook 16 G6 ABP | |
| Asus Vivobook Pro 16X K6604JV-MX016W | |
| Lenovo ThinkPad Z16 G1 21D5S00T00 | |
| PCMark 10 / Productivity | |
| MSI Creator Z16P B12UHST | |
| Lenovo ThinkPad Z16 Gen 2 | |
| Media AMD Ryzen 9 PRO 7940HS, AMD Radeon RX 6550M (n=1) | |
| Lenovo ThinkBook 16 G6 ABP | |
| Asus Vivobook Pro 16X K6604JV-MX016W | |
| Lenovo ThinkPad Z16 G1 21D5S00T00 | |
| PCMark 10 / Digital Content Creation | |
| MSI Creator Z16P B12UHST | |
| Lenovo ThinkPad Z16 Gen 2 | |
| Media AMD Ryzen 9 PRO 7940HS, AMD Radeon RX 6550M (n=1) | |
| Asus Vivobook Pro 16X K6604JV-MX016W | |
| Lenovo ThinkPad Z16 G1 21D5S00T00 | |
| Lenovo ThinkBook 16 G6 ABP | |
| CrossMark / Overall | |
| Asus Vivobook Pro 16X K6604JV-MX016W | |
| Apple MacBook Pro 16 2023 M3 Pro | |
| Lenovo ThinkPad Z16 Gen 2 | |
| Media AMD Ryzen 9 PRO 7940HS, AMD Radeon RX 6550M (n=1) | |
| Lenovo ThinkPad Z16 G1 21D5S00T00 | |
| Lenovo ThinkBook 16 G6 ABP | |
| CrossMark / Productivity | |
| Asus Vivobook Pro 16X K6604JV-MX016W | |
| Apple MacBook Pro 16 2023 M3 Pro | |
| Lenovo ThinkPad Z16 Gen 2 | |
| Media AMD Ryzen 9 PRO 7940HS, AMD Radeon RX 6550M (n=1) | |
| Lenovo ThinkPad Z16 G1 21D5S00T00 | |
| Lenovo ThinkBook 16 G6 ABP | |
| CrossMark / Creativity | |
| Apple MacBook Pro 16 2023 M3 Pro | |
| Asus Vivobook Pro 16X K6604JV-MX016W | |
| Lenovo ThinkPad Z16 Gen 2 | |
| Media AMD Ryzen 9 PRO 7940HS, AMD Radeon RX 6550M (n=1) | |
| Lenovo ThinkPad Z16 G1 21D5S00T00 | |
| Lenovo ThinkBook 16 G6 ABP | |
| CrossMark / Responsiveness | |
| Asus Vivobook Pro 16X K6604JV-MX016W | |
| Apple MacBook Pro 16 2023 M3 Pro | |
| Lenovo ThinkPad Z16 Gen 2 | |
| Media AMD Ryzen 9 PRO 7940HS, AMD Radeon RX 6550M (n=1) | |
| Lenovo ThinkPad Z16 G1 21D5S00T00 | |
| Lenovo ThinkBook 16 G6 ABP | |
| WebXPRT 3 / Overall | |
| Apple MacBook Pro 16 2023 M3 Pro | |
| MSI Creator Z16P B12UHST | |
| Lenovo ThinkPad Z16 Gen 2 | |
| Media AMD Ryzen 9 PRO 7940HS, AMD Radeon RX 6550M (n=1) | |
| Asus Vivobook Pro 16X K6604JV-MX016W | |
| Lenovo ThinkBook 16 G6 ABP | |
| Lenovo ThinkPad Z16 G1 21D5S00T00 | |
| WebXPRT 4 / Overall | |
| Lenovo ThinkPad Z16 Gen 2 | |
| Media AMD Ryzen 9 PRO 7940HS, AMD Radeon RX 6550M (n=1) | |
| Asus Vivobook Pro 16X K6604JV-MX016W | |
| Lenovo ThinkBook 16 G6 ABP | |
| Lenovo ThinkPad Z16 G1 21D5S00T00 | |
| Mozilla Kraken 1.1 / Total | |
| Lenovo ThinkBook 16 G6 ABP | |
| Lenovo ThinkPad Z16 G1 21D5S00T00 | |
| Lenovo ThinkPad Z16 Gen 2 | |
| Media AMD Ryzen 9 PRO 7940HS, AMD Radeon RX 6550M (n=1) | |
| Asus Vivobook Pro 16X K6604JV-MX016W | |
| MSI Creator Z16P B12UHST | |
| Apple MacBook Pro 16 2023 M3 Pro | |
* ... Meglio usare valori piccoli
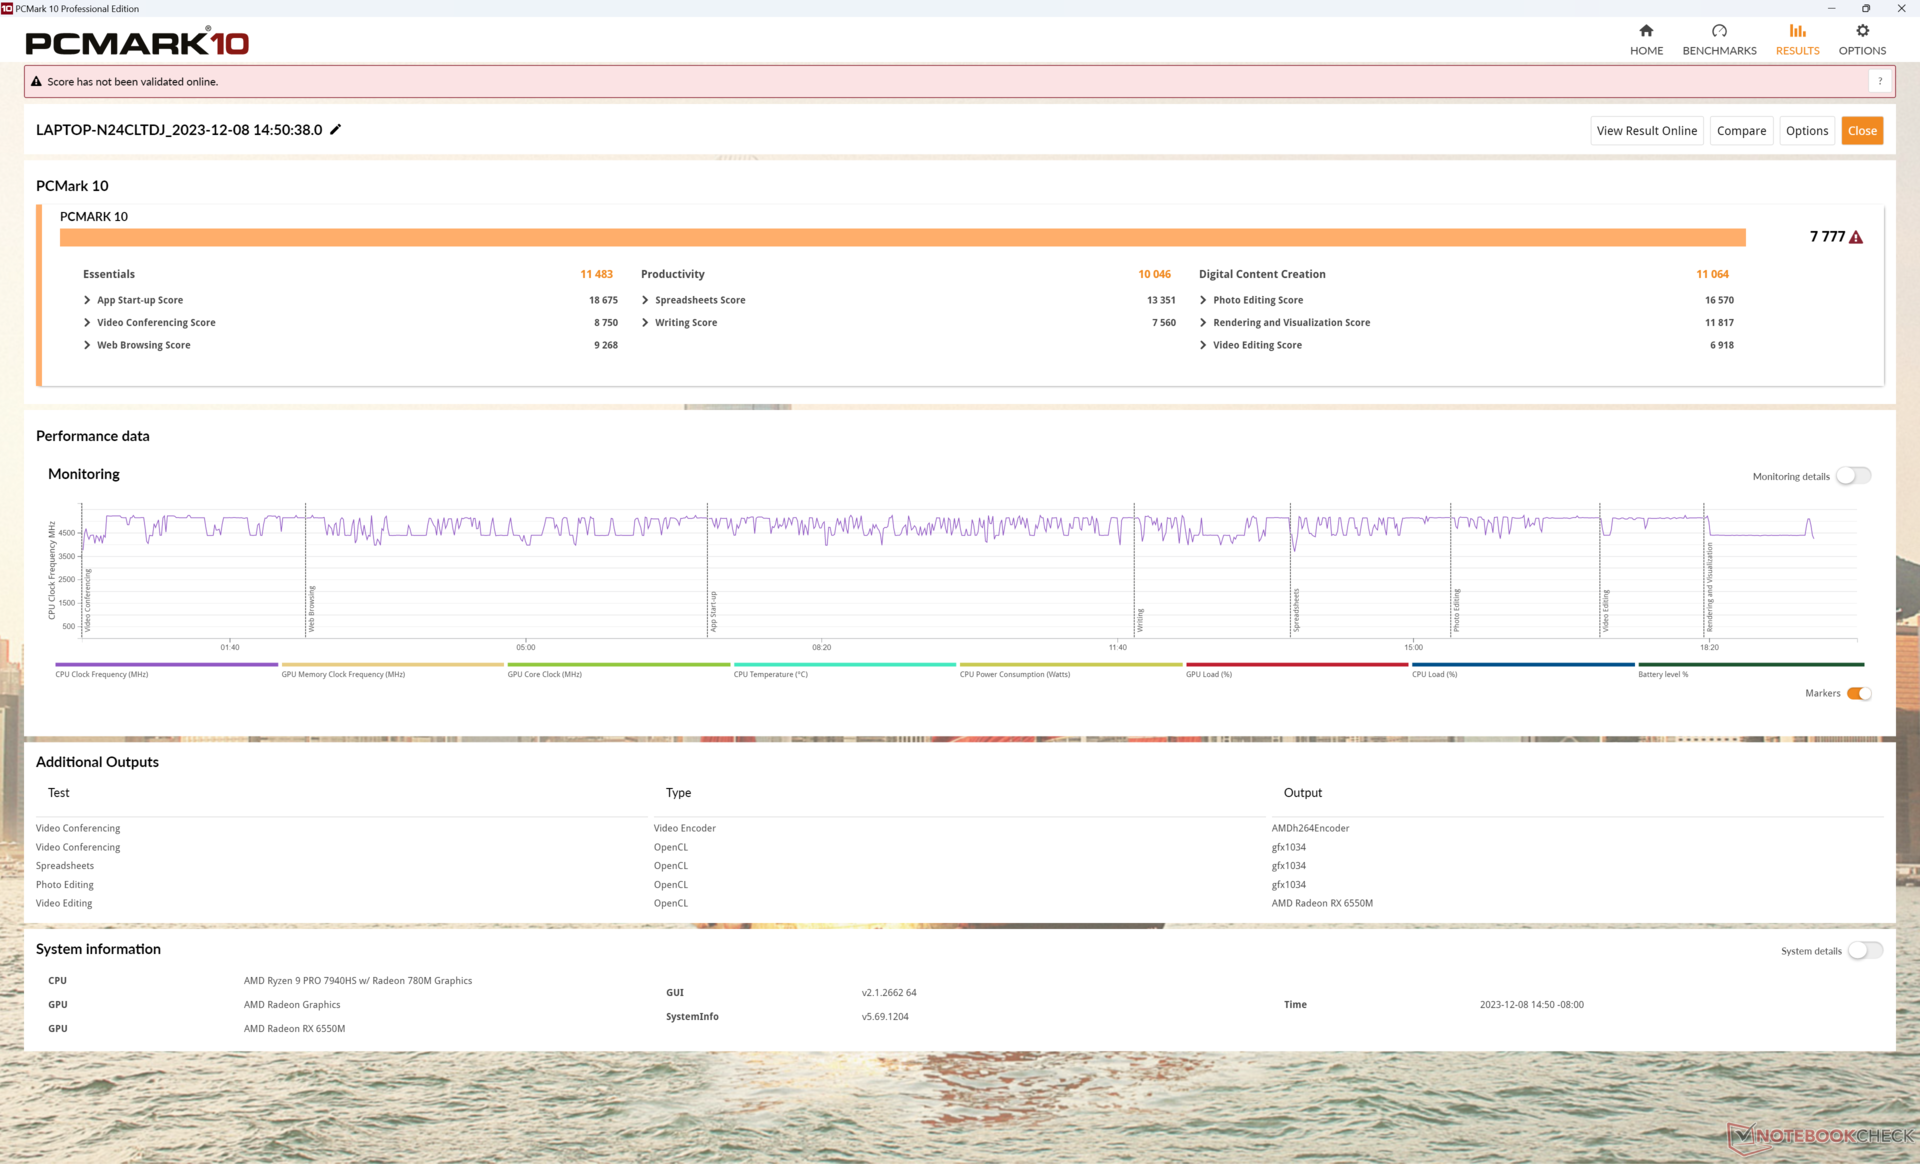
| PCMark 10 Score | 7777 punti | |
Aiuto | ||
| AIDA64 / Memory Copy | |
| Asus Vivobook Pro 16X K6604JV-MX016W | |
| Lenovo ThinkPad Z16 Gen 2 | |
| MSI Creator Z16P B12UHST | |
| Lenovo ThinkPad Z16 G1 21D5S00T00 | |
| Media AMD Ryzen 9 PRO 7940HS (34339 - 66740, n=3) | |
| Lenovo ThinkBook 16 G6 ABP | |
| AIDA64 / Memory Read | |
| Asus Vivobook Pro 16X K6604JV-MX016W | |
| MSI Creator Z16P B12UHST | |
| Lenovo ThinkPad Z16 Gen 2 | |
| Lenovo ThinkPad Z16 G1 21D5S00T00 | |
| Lenovo ThinkBook 16 G6 ABP | |
| Media AMD Ryzen 9 PRO 7940HS (30289 - 50398, n=3) | |
| AIDA64 / Memory Write | |
| Lenovo ThinkPad Z16 Gen 2 | |
| Asus Vivobook Pro 16X K6604JV-MX016W | |
| MSI Creator Z16P B12UHST | |
| Media AMD Ryzen 9 PRO 7940HS (39877 - 91516, n=3) | |
| Lenovo ThinkPad Z16 G1 21D5S00T00 | |
| Lenovo ThinkBook 16 G6 ABP | |
| AIDA64 / Memory Latency | |
| Lenovo ThinkPad Z16 G1 21D5S00T00 | |
| Lenovo ThinkPad Z16 Gen 2 | |
| Media AMD Ryzen 9 PRO 7940HS (102.2 - 121.3, n=3) | |
| Lenovo ThinkBook 16 G6 ABP | |
| MSI Creator Z16P B12UHST | |
| Asus Vivobook Pro 16X K6604JV-MX016W | |
* ... Meglio usare valori piccoli
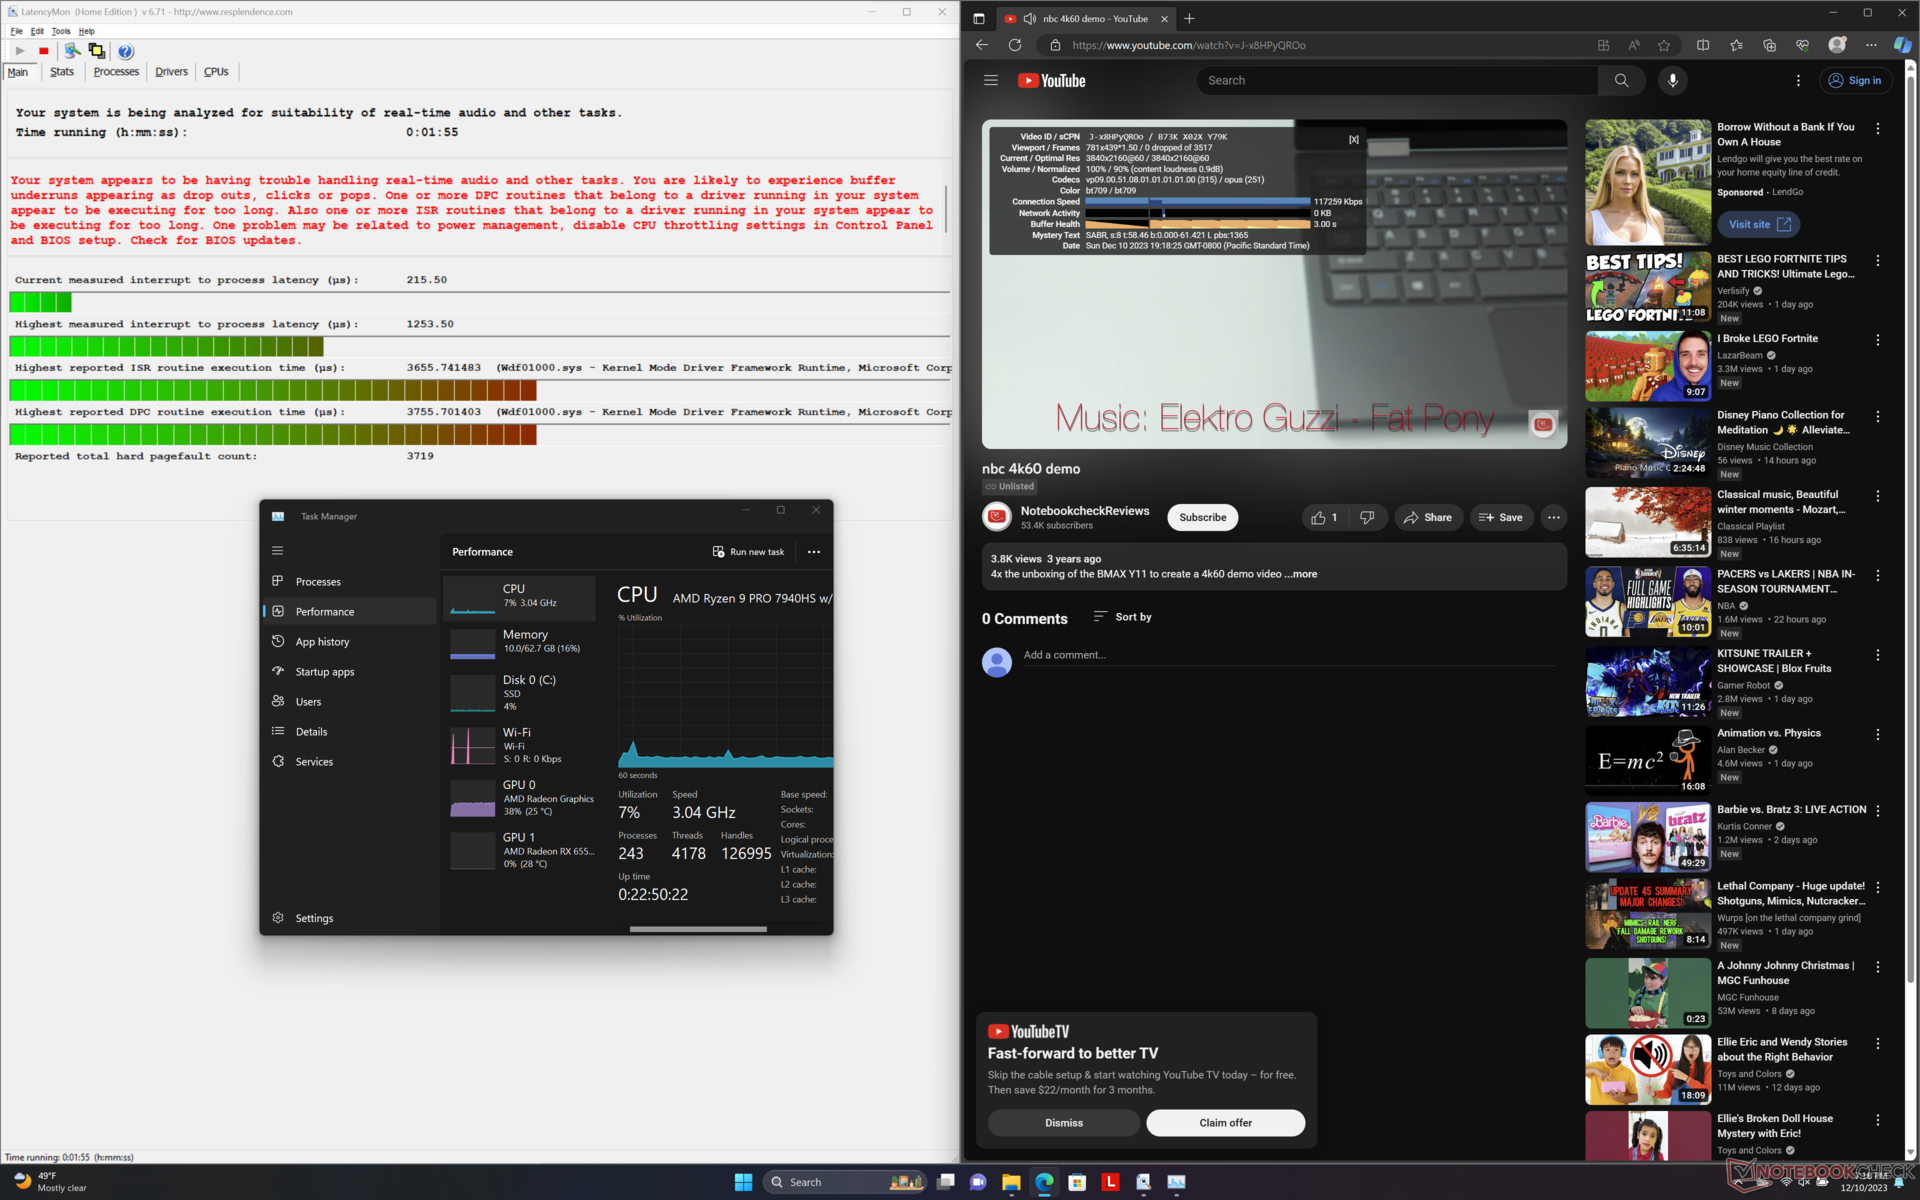
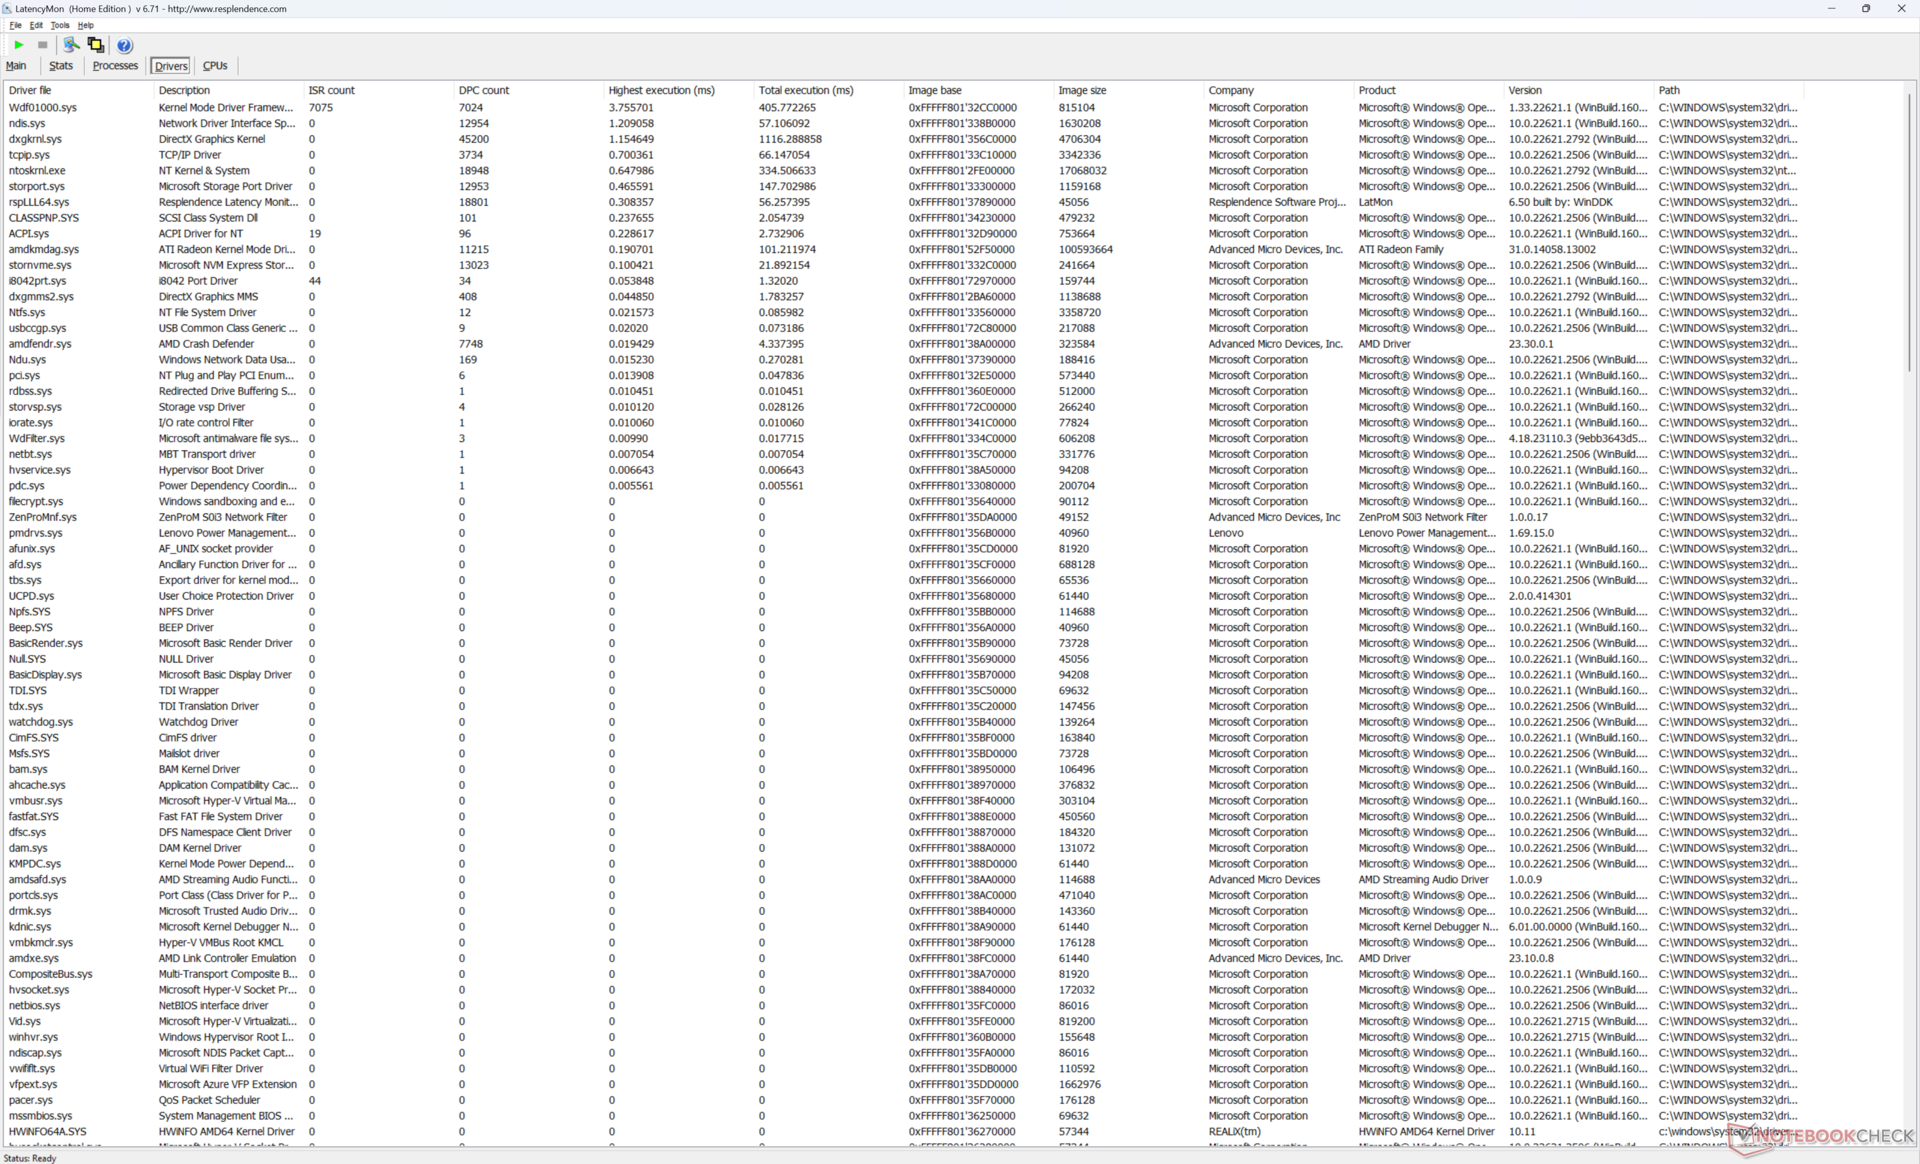
Latenza DPC
LatencyMon mostra lievi problemi di DPC quando si aprono più schede del browser della nostra homepage. la riproduzione di video 4K a 60 FPS è invece perfetta, senza alcuna caduta di fotogrammi, a differenza di quanto abbiamo sperimentato sul recente ThinkPad P1 G6.
| DPC Latencies / LatencyMon - interrupt to process latency (max), Web, Youtube, Prime95 | |
| Asus Vivobook Pro 16X K6604JV-MX016W | |
| Lenovo ThinkPad Z16 Gen 2 | |
| Lenovo ThinkBook 16 G6 ABP | |
| MSI Creator Z16P B12UHST | |
| Lenovo ThinkPad Z16 G1 21D5S00T00 | |
* ... Meglio usare valori piccoli
Dispositivi di archiviazione
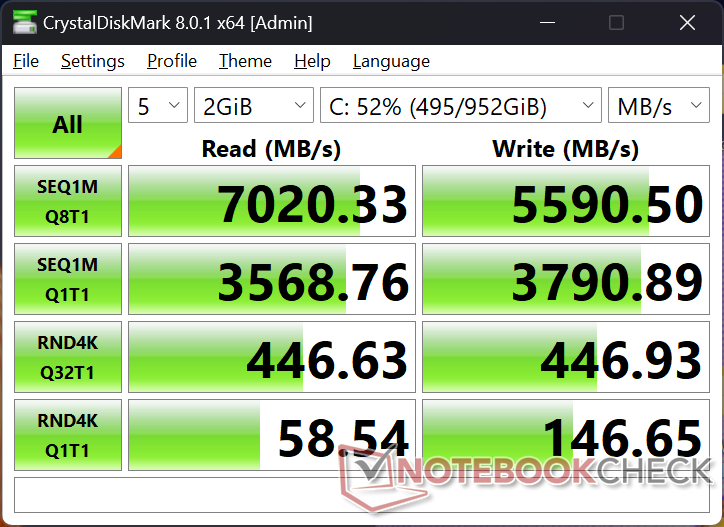
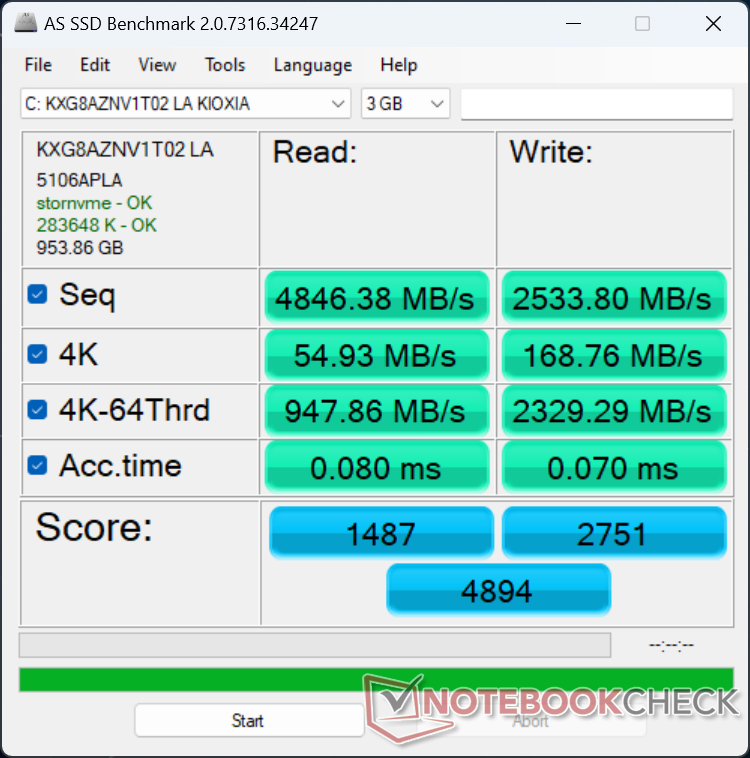
La nostra unità di prova viene fornita con il Kioxia XG8 mentre il nostro vecchio ThinkPad Z16 Gen 1 viene fornito con il Samsung PM9A1. Tuttavia, le due unità SSD sono unità PCIe4 x4 NVMe di fascia alta con velocità di lettura massime simili, pari a ~7000 MB/s ciascuna.
Sfortunatamente, anche l'unità Kioxia mostrava problemi di strozzamento delle prestazioni dopo pochi minuti di stress, proprio come l'unità Samsung sul nostro ThinkPad Z16 Gen 1, come mostra il grafico di confronto qui sotto. Le velocità di lettura si riducono da ~7000 MB/s a ~5800 MB/s nel corso del tempo, probabilmente a causa di una dissipazione termica insufficiente. L'inclusione di un pad termico di grandi dimensioni tra l'SSD e il coperchio inferiore in metallo potrebbe aiutare le prestazioni.
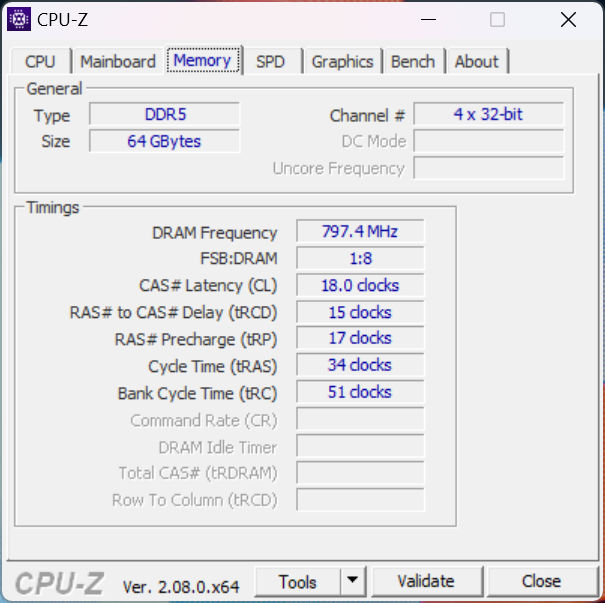
La RAM è saldata e non c'è il supporto per un secondo SSD, a differenza di quanto accade sul modello MSI Creator Z16P che integra due slot per la RAM e due slot per SSD M.2.

| Drive Performance rating - Percent | |
| MSI Creator Z16P B12UHST | |
| Lenovo ThinkPad Z16 G1 21D5S00T00 | |
| Lenovo ThinkPad Z16 Gen 2 | |
| Lenovo ThinkBook 16 G6 ABP | |
| Asus Vivobook Pro 16X K6604JV-MX016W | |
* ... Meglio usare valori piccoli
Disk Throttling: DiskSpd Read Loop, Queue Depth 8
Prestazioni della GPU
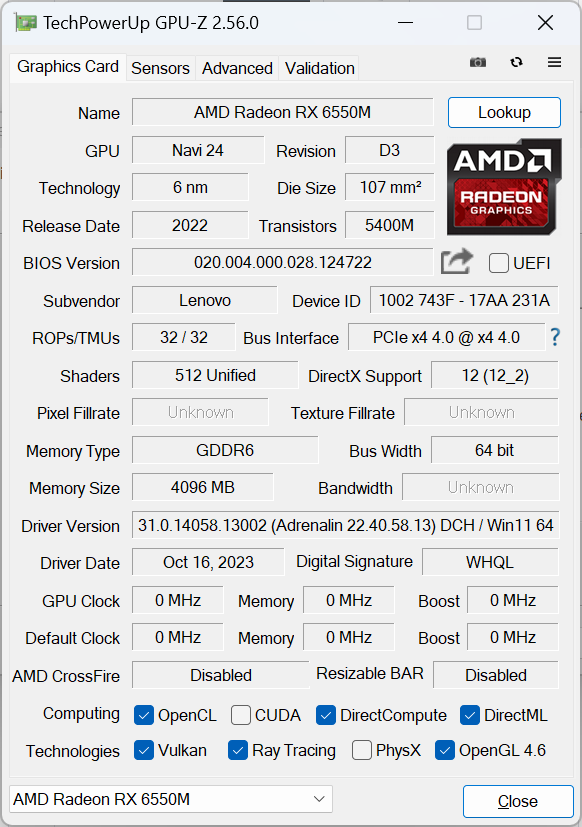
Il rapporto tra Radeon RX 6550M e RX 6500M è simile a quello tra GeForce RTX 3050 Ti e RTX 3050; le differenze sono minime e si aggirano in media intorno ai 10 punti percentuali. In effetti, le due GPU Radeon condividono la stessa larghezza del bus di memoria a 64 bit, l'architettura RDNA2, 1024 stream processor, 4 GB di VRAM GDDR6 e altro ancora. La Radeon RX 6550M raggiunge velocità di clock target leggermente superiori (2560 MHz contro 2191 MHz) e TGP massimo (60 W contro 55 W) rispetto alla 6500M, ma questo è tutto.
Il piccolo aumento delle frequenze di clock porta a un piccolo aumento dei punteggi dei benchmark, come mostra il grafico di confronto qui sotto.
L'esecuzione in modalità Bilanciata invece che in modalità Prestazioni influisce leggermente sulle prestazioni, come dimostrano i risultati di Fire Strike nella tabella sottostante. Il funzionamento a batteria ridurrebbe le prestazioni grafiche in modo molto più significativo rispetto alle prestazioni del processore.
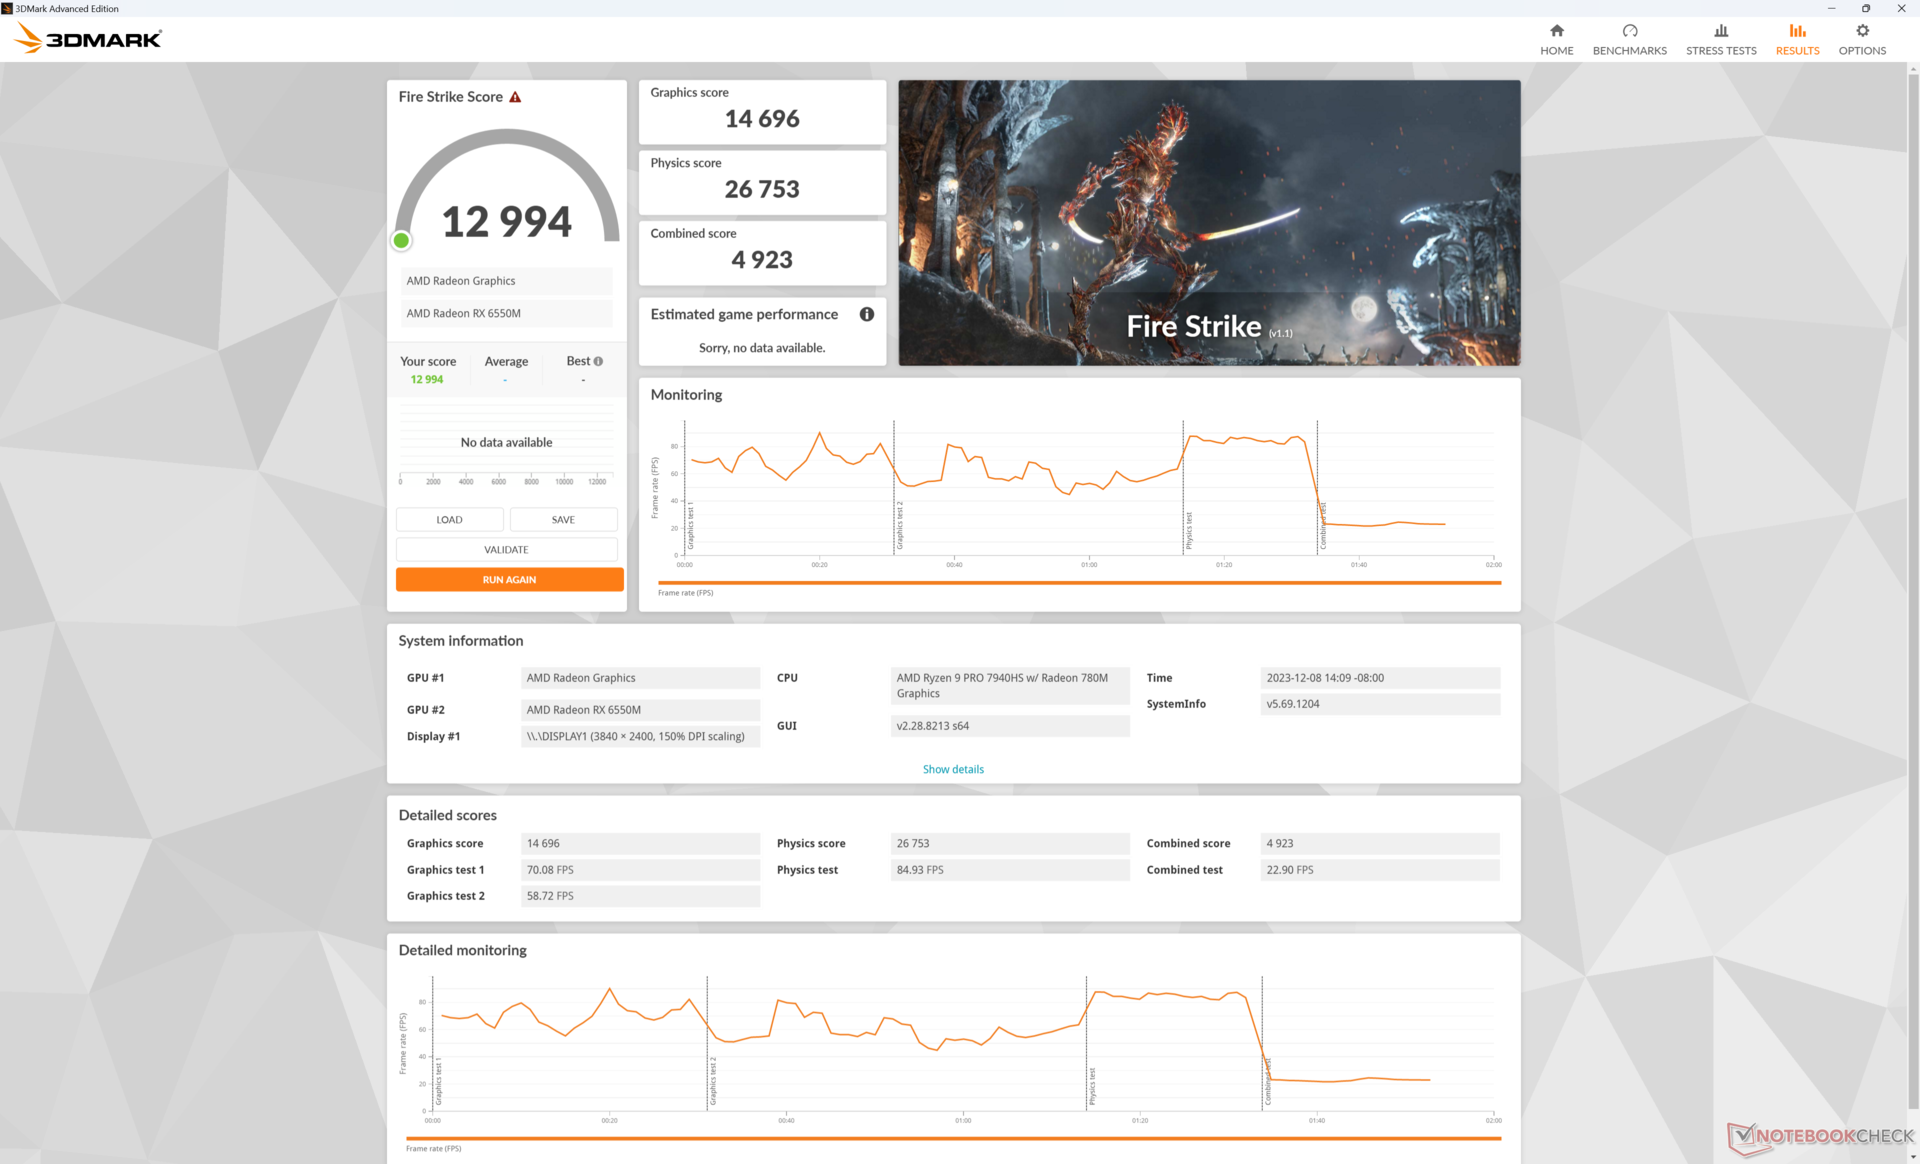
| Profilo energetico | Punteggio di fisica | Punteggio grafico | Punteggio combinato |
| Modalità Prestazioni | 26753 | 14696 | 4923 |
| Modalità equilibrata | 26333 (-2%) | 13975 (-5%) | 4776 (-3%) |
| Alimentazione a batteria | 25622 (-4%) | 9649 (-34%) | 3114 (-37%) |
Tenga presente che la Radeon RX 6550M basata su RDNA2 arriva subito dopo il lancio della Radeon RX 7900M di fascia alta basata su RDNA3, il che significa che presto arriveranno altre GPU RDNA3 di fascia media. RDNA3 è un miglioramento significativo rispetto a RDNA2 in termini di prestazioni, consumo energetico, supporto dell'upscaling AI e soprattutto capacità di ray-tracing.
| 3DMark Performance rating - Percent | |
| Asus Zephyrus Duo 16 GX650PY-NM006W | |
| Alienware m16 R1 AMD | |
| Lenovo ThinkPad P1 G6 21FV001KUS | |
| MSI Raider GE68 HX 13VG, i7-13700HX | |
| MSI Raider GE68HX 13VF | |
| HP Victus 16-r0076TX -1! | |
| MSI Creator Z16P B12UHST -1! | |
| Lenovo ThinkPad Z16 G1 21D5S00T00 -1! | |
| Asus VivoBook Pro 16 -1! | |
| Lenovo ThinkPad Z16 Gen 2 | |
| Media AMD Radeon RX 6550M | |
| HP Victus 15 fa0020nr | |
| Asus VivoBook Pro 16X OLED N7600PC-L2026X -1! | |
| LG Gram 2in1 16 16T90R - G.AA78G -1! | |
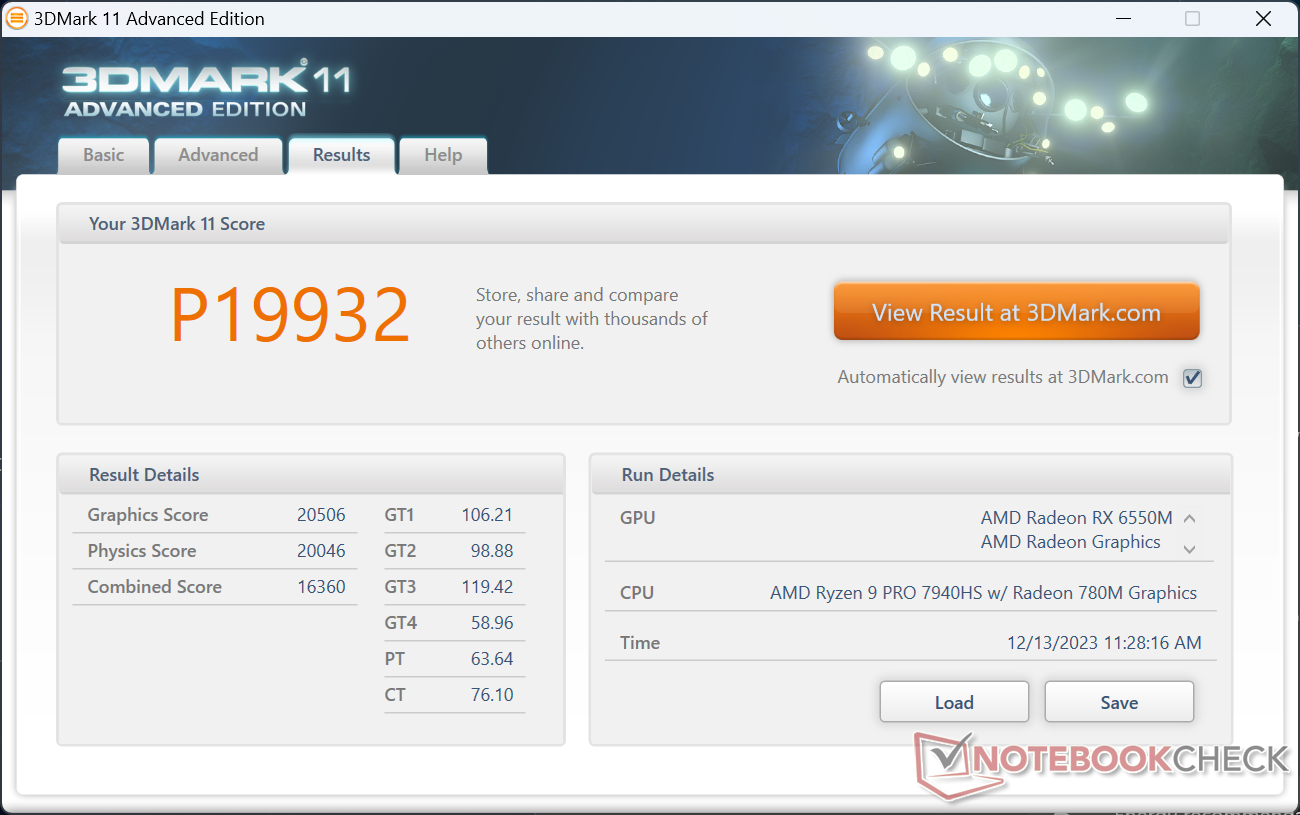
| 3DMark 11 Performance | 19932 punti | |
| 3DMark Fire Strike Score | 12994 punti | |
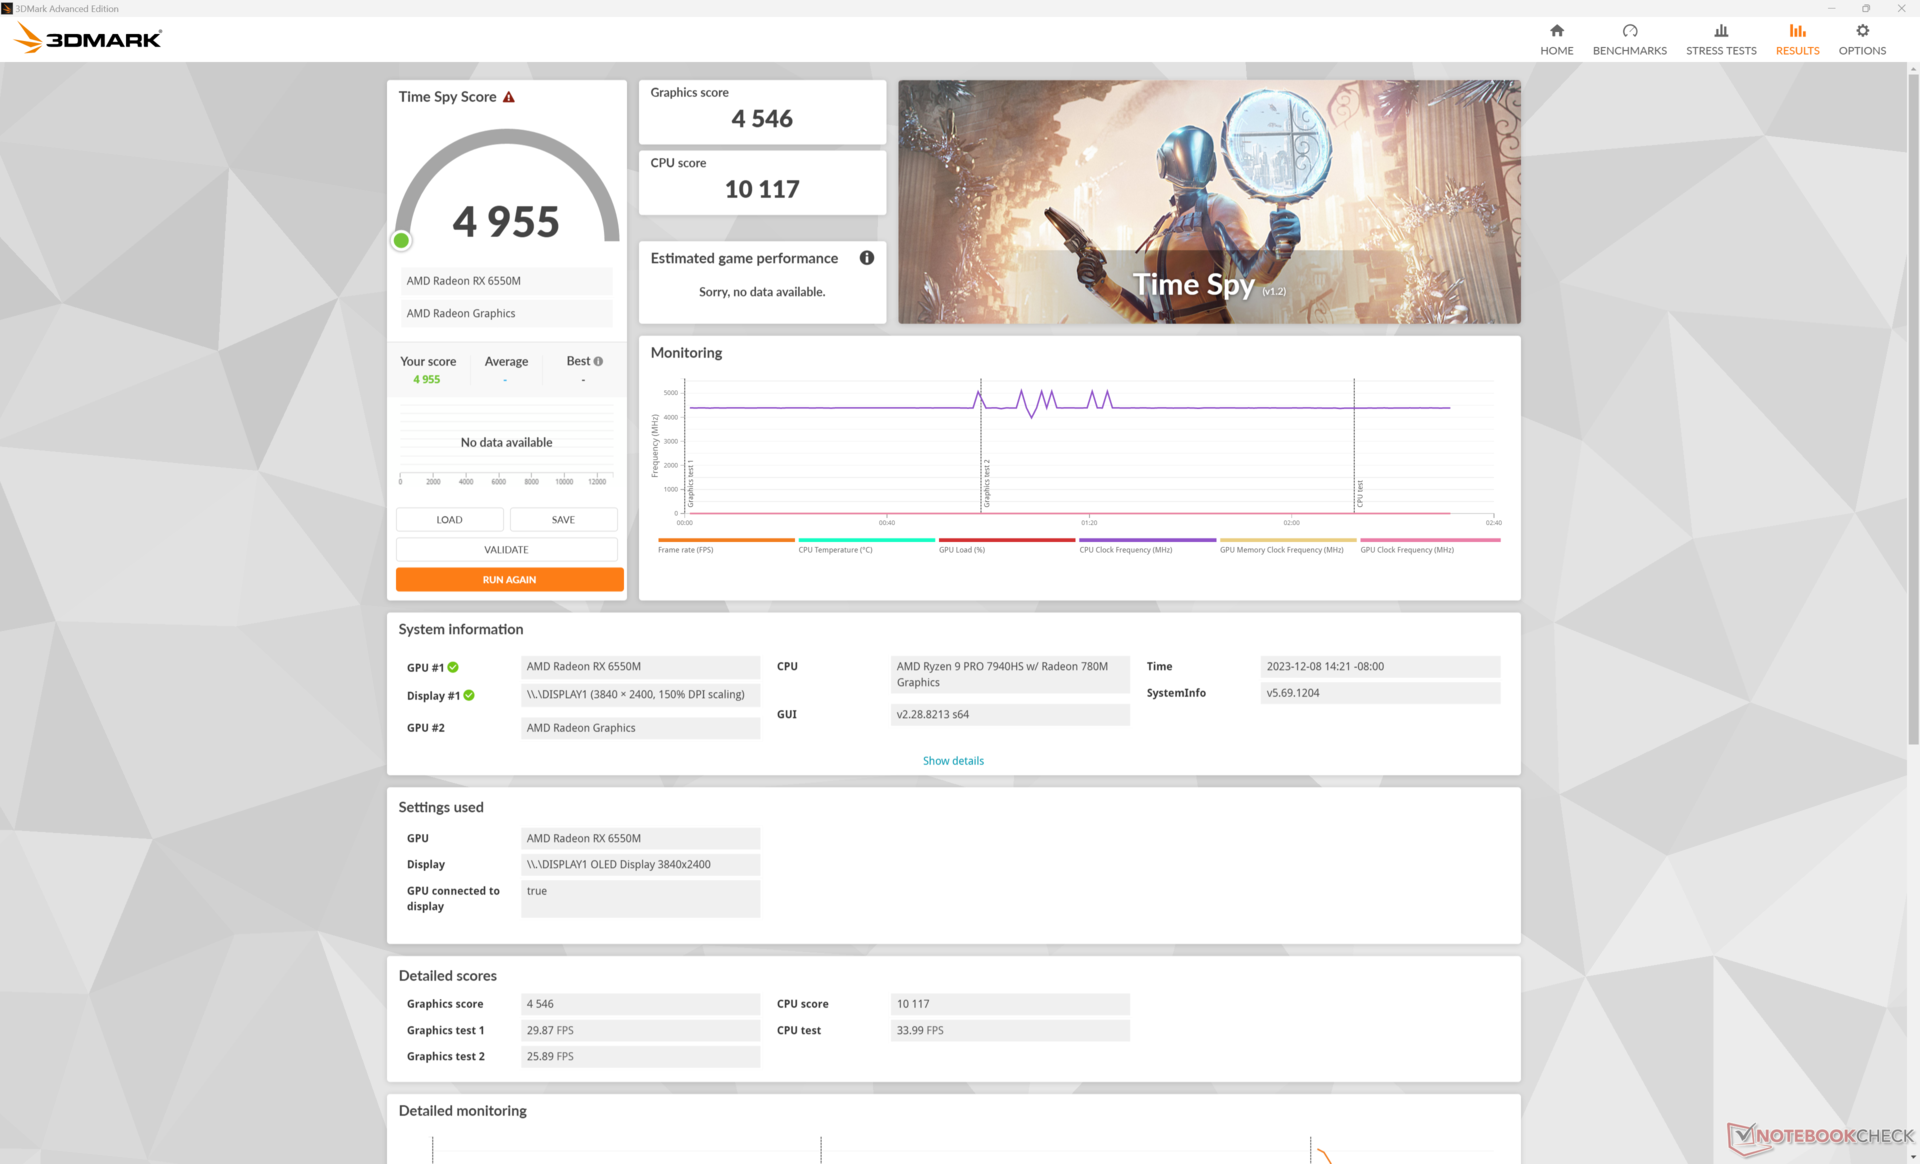
| 3DMark Time Spy Score | 4955 punti | |
Aiuto | ||
| Blender | |
| v3.3 Classroom METAL | |
| Apple MacBook Pro 16 2023 M3 Pro | |
| v3.3 Classroom HIP/AMD | |
| Lenovo ThinkPad Z16 G1 21D5S00T00 | |
| v3.3 Classroom OPTIX/RTX | |
| Asus VivoBook Pro 16 | |
| HP Victus 16-r0076TX | |
| MSI Raider GE68HX 13VF | |
| MSI Raider GE68 HX 13VG, i7-13700HX | |
| Alienware m16 R1 AMD | |
| Lenovo ThinkPad P1 G6 21FV001KUS | |
| Asus Zephyrus Duo 16 GX650PY-NM006W | |
| v3.3 Classroom CUDA | |
| Asus VivoBook Pro 16 | |
| HP Victus 16-r0076TX | |
| MSI Raider GE68HX 13VF | |
| MSI Raider GE68 HX 13VG, i7-13700HX | |
| Lenovo ThinkPad P1 G6 21FV001KUS | |
| Alienware m16 R1 AMD | |
| Asus Zephyrus Duo 16 GX650PY-NM006W | |
| v3.3 Classroom CPU | |
| LG Gram 2in1 16 16T90R - G.AA78G | |
| Lenovo ThinkPad Z16 G1 21D5S00T00 | |
| Asus VivoBook Pro 16 | |
| HP Victus 16-r0076TX | |
| Lenovo ThinkPad P1 G6 21FV001KUS | |
| Apple MacBook Pro 16 2023 M3 Pro | |
| Lenovo ThinkPad Z16 Gen 2 | |
| Media AMD Radeon RX 6550M (n=1) | |
| MSI Raider GE68 HX 13VG, i7-13700HX | |
| MSI Raider GE68HX 13VF | |
| Alienware m16 R1 AMD | |
| Asus Zephyrus Duo 16 GX650PY-NM006W | |
* ... Meglio usare valori piccoli
Prestazioni di gioco
Le prestazioni di gioco possono variare da quasi identiche a quelle della Radeon RX 6500M fino al 30% in più, a seconda del titolo e delle impostazioni. Ad esempio, Final Fantasy XV ha prestazioni quasi identiche tra i nostri modelli Radeon RX 6550M e 6500M, mentre altri titoli come Far Cry 5 o F1 22 possono essere più veloci del 15-30 percento. Nel frattempo, Tiny Tina's Wonderlands può funzionare fino al 30 percento più velocemente solo con impostazioni grafiche più elevate. I risultati dipendono quindi molto dall'applicazione, ma i vantaggi in termini di prestazioni sono generalmente superiori a quelli che i punteggi 3DMark suggerirebbero, il che è un'ottima notizia per i giocatori.
È interessante notare che le prestazioni complessive sono in linea con quelle del MacBook Pro 16 M3 Pro quando si testano i giochi più recenti, come Cyberpunk 2077 e Baldur's Gate 3. Se si considera che la nostra Radeon è una GPU discreta più grande, questo la dice lunga sull'efficienza della soluzione SoC integrata Apple.
| Performance rating - Percent | |
| Asus Zephyrus Duo 16 GX650PY-NM006W | |
| Alienware m16 R1 AMD -1! | |
| Lenovo ThinkPad P1 G6 21FV001KUS -1! | |
| MSI Raider GE68 HX 13VG, i7-13700HX | |
| MSI Raider GE68HX 13VF -1! | |
| MSI Creator Z16P B12UHST | |
| HP Victus 16-r0076TX -1! | |
| Lenovo ThinkPad Z16 Gen 2 -1! | |
| Apple MacBook Pro 16 2023 M3 Pro -4! | |
| Lenovo ThinkPad Z16 G1 21D5S00T00 | |
| LG Gram 2in1 16 16T90R - G.AA78G | |
| The Witcher 3 - 1920x1080 Ultra Graphics & Postprocessing (HBAO+) | |
| Asus Zephyrus Duo 16 GX650PY-NM006W | |
| Alienware m16 R1 AMD | |
| Lenovo ThinkPad P1 G6 21FV001KUS | |
| MSI Raider GE68 HX 13VG, i7-13700HX | |
| MSI Raider GE68HX 13VF | |
| HP Victus 16-r0076TX | |
| MSI Creator Z16P B12UHST | |
| Lenovo ThinkPad Z16 Gen 2 | |
| Apple MacBook Pro 16 2023 M3 Pro | |
| Lenovo ThinkPad Z16 G1 21D5S00T00 | |
| LG Gram 2in1 16 16T90R - G.AA78G | |
| GTA V - 1920x1080 Highest AA:4xMSAA + FX AF:16x | |
| Asus Zephyrus Duo 16 GX650PY-NM006W | |
| Lenovo ThinkPad P1 G6 21FV001KUS | |
| MSI Raider GE68 HX 13VG, i7-13700HX | |
| MSI Creator Z16P B12UHST | |
| Apple MacBook Pro 16 2023 M3 Pro | |
| Lenovo ThinkPad Z16 G1 21D5S00T00 | |
| LG Gram 2in1 16 16T90R - G.AA78G | |
| Final Fantasy XV Benchmark - 1920x1080 High Quality | |
| Asus Zephyrus Duo 16 GX650PY-NM006W | |
| Alienware m16 R1 AMD | |
| Lenovo ThinkPad P1 G6 21FV001KUS | |
| MSI Raider GE68 HX 13VG, i7-13700HX | |
| MSI Raider GE68HX 13VF | |
| MSI Creator Z16P B12UHST | |
| HP Victus 16-r0076TX | |
| Lenovo ThinkPad Z16 Gen 2 | |
| Lenovo ThinkPad Z16 G1 21D5S00T00 | |
| LG Gram 2in1 16 16T90R - G.AA78G | |
| Strange Brigade - 1920x1080 ultra AA:ultra AF:16 | |
| Alienware m16 R1 AMD | |
| Asus Zephyrus Duo 16 GX650PY-NM006W | |
| MSI Raider GE68 HX 13VG, i7-13700HX | |
| MSI Raider GE68HX 13VF | |
| MSI Creator Z16P B12UHST | |
| HP Victus 16-r0076TX | |
| Lenovo ThinkPad Z16 Gen 2 | |
| Lenovo ThinkPad Z16 G1 21D5S00T00 | |
| LG Gram 2in1 16 16T90R - G.AA78G | |
| Dota 2 Reborn - 1920x1080 ultra (3/3) best looking | |
| MSI Raider GE68HX 13VF | |
| Asus Zephyrus Duo 16 GX650PY-NM006W | |
| MSI Raider GE68 HX 13VG, i7-13700HX | |
| Alienware m16 R1 AMD | |
| MSI Creator Z16P B12UHST | |
| Lenovo ThinkPad P1 G6 21FV001KUS | |
| HP Victus 16-r0076TX | |
| Lenovo ThinkPad Z16 Gen 2 | |
| Lenovo ThinkPad Z16 G1 21D5S00T00 | |
| LG Gram 2in1 16 16T90R - G.AA78G | |
| X-Plane 11.11 - 1920x1080 high (fps_test=3) | |
| MSI Raider GE68HX 13VF | |
| MSI Raider GE68 HX 13VG, i7-13700HX | |
| Lenovo ThinkPad P1 G6 21FV001KUS | |
| Asus Zephyrus Duo 16 GX650PY-NM006W | |
| Alienware m16 R1 AMD | |
| HP Victus 16-r0076TX | |
| MSI Creator Z16P B12UHST | |
| LG Gram 2in1 16 16T90R - G.AA78G | |
| Lenovo ThinkPad Z16 G1 21D5S00T00 | |
| Lenovo ThinkPad Z16 Gen 2 | |
| Cyberpunk 2077 | |
| 1280x720 Low Preset (FSR off) | |
| Lenovo ThinkPad Z16 Gen 2 | |
| Media AMD Radeon RX 6550M (n=1) | |
| LG Gram 2in1 16 16T90R - G.AA78G | |
| 1920x1080 Low Preset (FSR off) | |
| Lenovo ThinkPad Z16 Gen 2 | |
| Media AMD Radeon RX 6550M (n=1) | |
| Apple MacBook Pro 16 2023 M3 Pro | |
| LG Gram 2in1 16 16T90R - G.AA78G | |
| 1920x1080 Medium Preset (FSR off) | |
| Lenovo ThinkPad Z16 Gen 2 | |
| Media AMD Radeon RX 6550M (n=1) | |
| Apple MacBook Pro 16 2023 M3 Pro | |
| LG Gram 2in1 16 16T90R - G.AA78G | |
| 1920x1080 High Preset (FSR off) | |
| Lenovo ThinkPad P1 G6 21FV001KUS | |
| Apple MacBook Pro 16 2023 M3 Pro | |
| Lenovo ThinkPad Z16 Gen 2 | |
| Media AMD Radeon RX 6550M (n=1) | |
| LG Gram 2in1 16 16T90R - G.AA78G | |
| 1920x1080 Ultra Preset (FSR off) | |
| Lenovo ThinkPad P1 G6 21FV001KUS | |
| Apple MacBook Pro 16 2023 M3 Pro | |
| Lenovo ThinkPad Z16 Gen 2 | |
| Media AMD Radeon RX 6550M (n=1) | |
| LG Gram 2in1 16 16T90R - G.AA78G | |
| 2560x1440 Ultra Preset (FSR off) | |
| Lenovo ThinkPad P1 G6 21FV001KUS | |
| Lenovo ThinkPad Z16 Gen 2 | |
| Media AMD Radeon RX 6550M (n=1) | |
| Baldur's Gate 3 | |
| 1920x1080 Low Preset AA:SM | |
| Lenovo ThinkPad Z16 Gen 2 | |
| Media AMD Radeon RX 6550M (n=1) | |
| 1920x1080 Medium Preset AA:T | |
| Lenovo ThinkPad Z16 Gen 2 | |
| Media AMD Radeon RX 6550M (n=1) | |
| 1920x1080 High Preset AA:T | |
| Apple MacBook Pro 16 2023 M3 Pro | |
| Lenovo ThinkPad Z16 Gen 2 | |
| Media AMD Radeon RX 6550M (n=1) | |
| 1920x1080 Ultra Preset AA:T | |
| Lenovo ThinkPad P1 G6 21FV001KUS | |
| Apple MacBook Pro 16 2023 M3 Pro | |
| Lenovo ThinkPad Z16 Gen 2 | |
| Media AMD Radeon RX 6550M (n=1) | |
| 2560x1440 Ultra Preset AA:T | |
| Lenovo ThinkPad P1 G6 21FV001KUS | |
| Lenovo ThinkPad Z16 Gen 2 | |
| Media AMD Radeon RX 6550M (n=1) | |
Witcher 3 FPS Chart
| basso | medio | alto | ultra | QHD | |
|---|---|---|---|---|---|
| The Witcher 3 (2015) | 277.2 | 171.5 | 83.2 | 49.4 | |
| Dota 2 Reborn (2015) | 137.1 | 127.3 | 112.3 | 103 | |
| Final Fantasy XV Benchmark (2018) | 129.3 | 67.4 | 47.8 | 31.2 | |
| X-Plane 11.11 (2018) | 53.7 | 41.2 | 33 | ||
| Far Cry 5 (2018) | 115 | 91 | 84 | 79 | |
| Strange Brigade (2018) | 319 | 122.5 | 101.1 | 88.4 | |
| Tiny Tina's Wonderlands (2022) | 124.1 | 95.5 | 59.7 | 30.3 | 27.2 |
| F1 22 (2022) | 132.5 | 120.8 | 87.5 | 19.3 | 11.3 |
| Baldur's Gate 3 (2023) | 61.6 | 52.9 | 44.7 | 43 | 29 |
| Cyberpunk 2077 (2023) | 62.8 | 45.9 | 34.7 | 28.6 | 17.3 |
Emissioni
Rumore del sistema
Il comportamento del rumore della ventola dipende molto dal profilo energetico selezionato. Ad esempio, le ventole sono veramente silenziose solo quando si attiva il profilo Risparmio energetico, altrimenti sono sempre attive a quasi 30 dB(A), indipendentemente dal carico sullo schermo. Allo stesso modo, il rumore delle ventole se si gioca in modalità Bilanciata si aggira tra i 41 e i 45 dB(A) rispetto ai 52 dB(A) della modalità Prestazioni, una differenza significativa nonostante le piccole differenze di prestazioni tra i due profili, come già detto. La modalità Performance, in particolare, è notevolmente più rumorosa di molti altri computer portatili da 16 pollici, come il modello MSI Creator Z16P o il MacBook Pro 16.
Le pulsazioni della ventola sono comunque ridotte al minimo. Durante l'esecuzione di 3DMark 06, ad esempio, il rumore della ventola è rimasto costante a 29,5 dB(A) per tutta la prima scena del benchmark, senza picchi improvvisi.
Rumorosità
| Idle |
| 22.9 / 29.4 / 29.4 dB(A) |
| Sotto carico |
| 29.5 / 52 dB(A) |
 | ||
30 dB silenzioso 40 dB(A) udibile 50 dB(A) rumoroso |
||
min: | ||
| Lenovo ThinkPad Z16 Gen 2 Radeon RX 6550M, R9 PRO 7940HS, Kioxia XG8 KXG8AZNV1T02 | Lenovo ThinkPad Z16 G1 21D5S00T00 Radeon RX 6500M, R7 PRO 6850H, Samsung PM9A1 MZVL21T0HCLR | Lenovo ThinkBook 16 G6 ABP Vega 7, R5 7530U, SK hynix HFS512GEJ9X125N | MSI Creator Z16P B12UHST GeForce RTX 3080 Ti Laptop GPU, i9-12900H, Samsung PM9A1 MZVL22T0HBLB | Apple MacBook Pro 16 2023 M3 Pro M3 Pro 18-Core GPU, Apple M3 Pro 12-Core, Apple SSD AP0512Z | Asus Vivobook Pro 16X K6604JV-MX016W GeForce RTX 4060 Laptop GPU, i9-13980HX, Solidigm P41 Plus SSDPFKNU010TZ | |
|---|---|---|---|---|---|---|
| Noise | 9% | 11% | -8% | 12% | -18% | |
| off /ambiente * (dB) | 22.6 | 23.7 -5% | 24.3 -8% | 26 -15% | 24.4 -8% | 25.2 -12% |
| Idle Minimum * (dB) | 22.9 | 23.7 -3% | 24.3 -6% | 27 -18% | 24.4 -7% | 26.6 -16% |
| Idle Average * (dB) | 29.4 | 23.7 19% | 24.3 17% | 29 1% | 24.4 17% | 26.6 10% |
| Idle Maximum * (dB) | 29.4 | 23.7 19% | 24.3 17% | 31 -5% | 24.4 17% | 29.2 1% |
| Load Average * (dB) | 29.5 | 25.9 12% | 29.7 -1% | 43 -46% | 26.9 9% | 53.4 -81% |
| Witcher 3 ultra * (dB) | 52 | 46.9 10% | 32.1 38% | 43 17% | 25.1 52% | |
| Load Maximum * (dB) | 52 | 46.9 10% | 41.4 20% | 46 12% | 50.4 3% | 56.9 -9% |
* ... Meglio usare valori piccoli
Temperatura
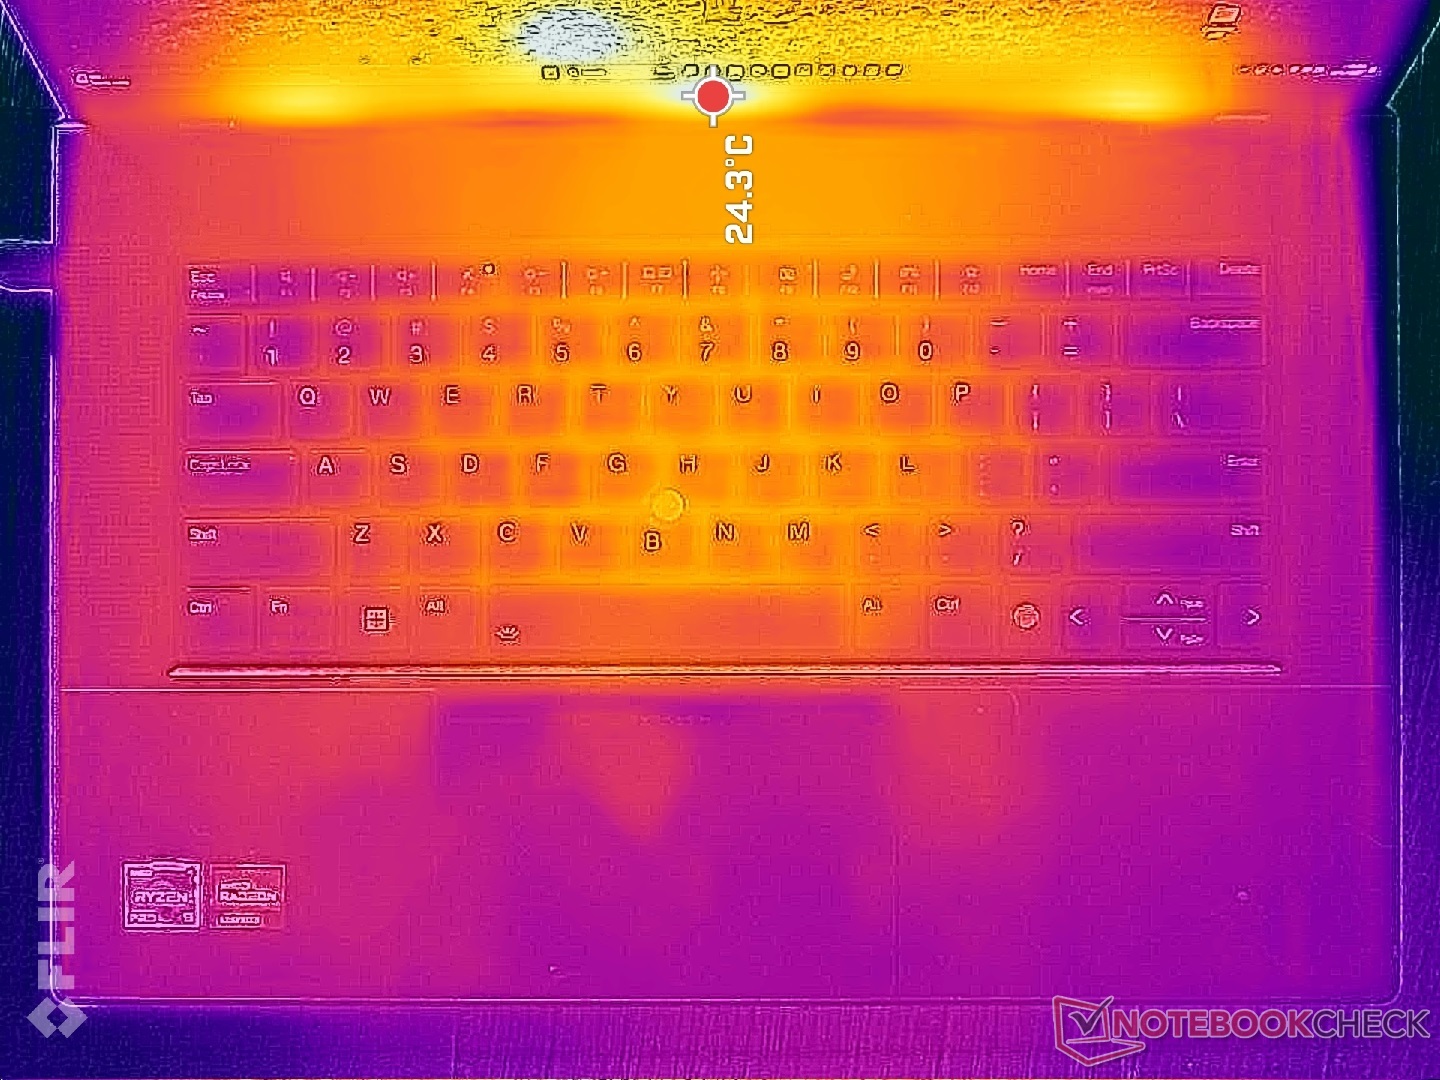
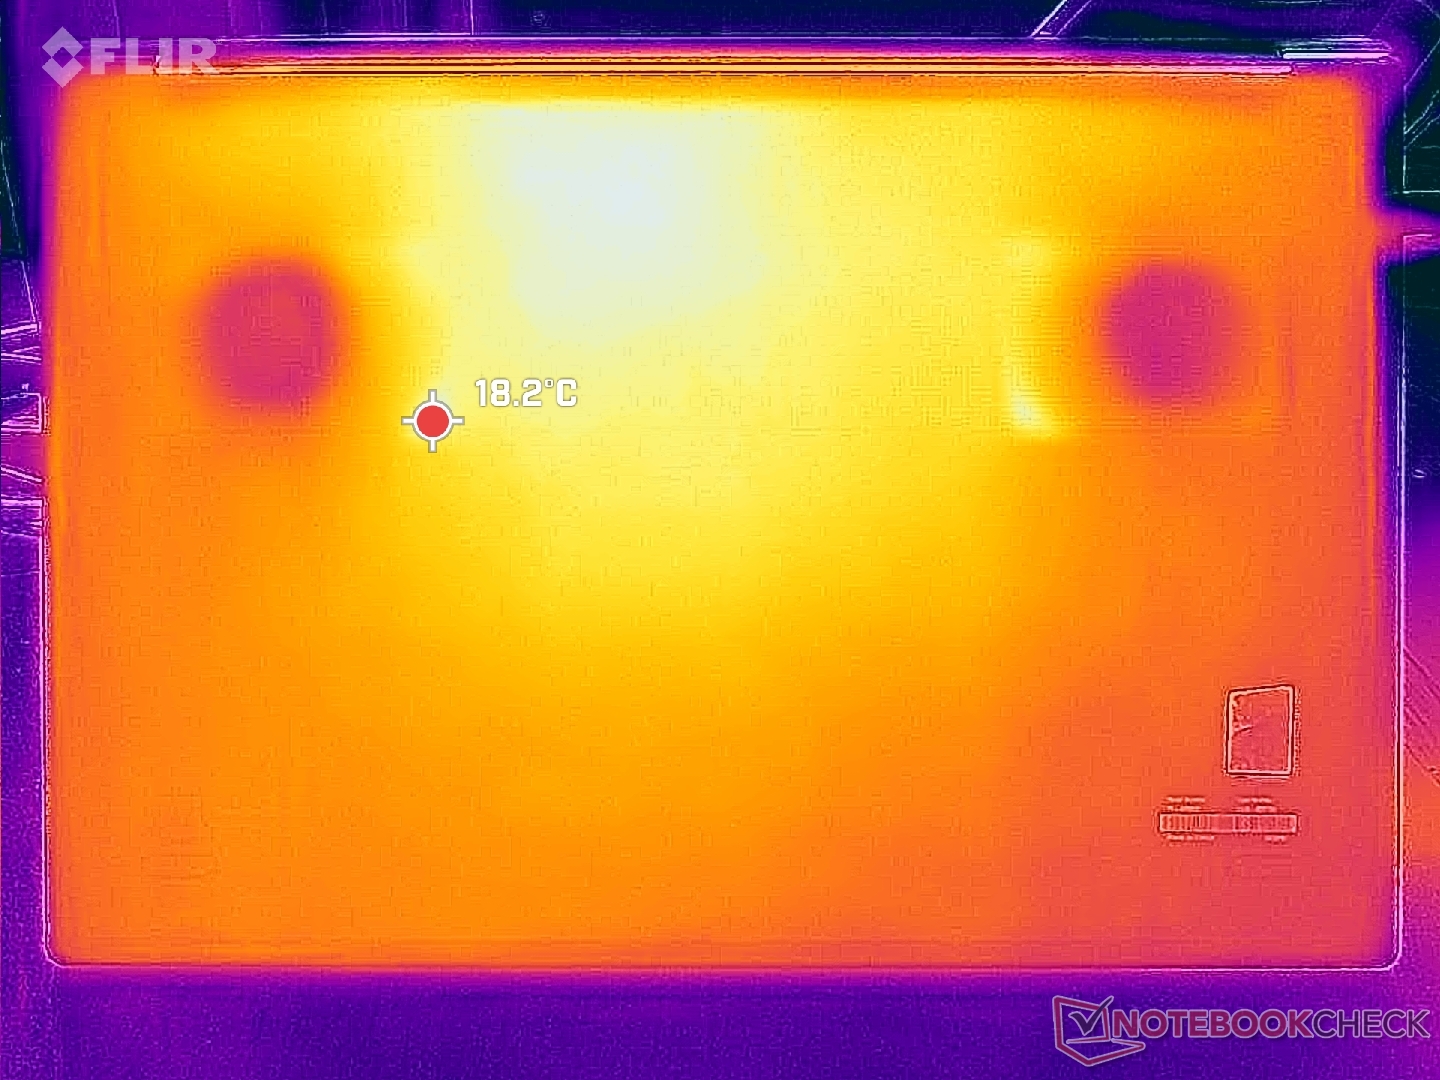
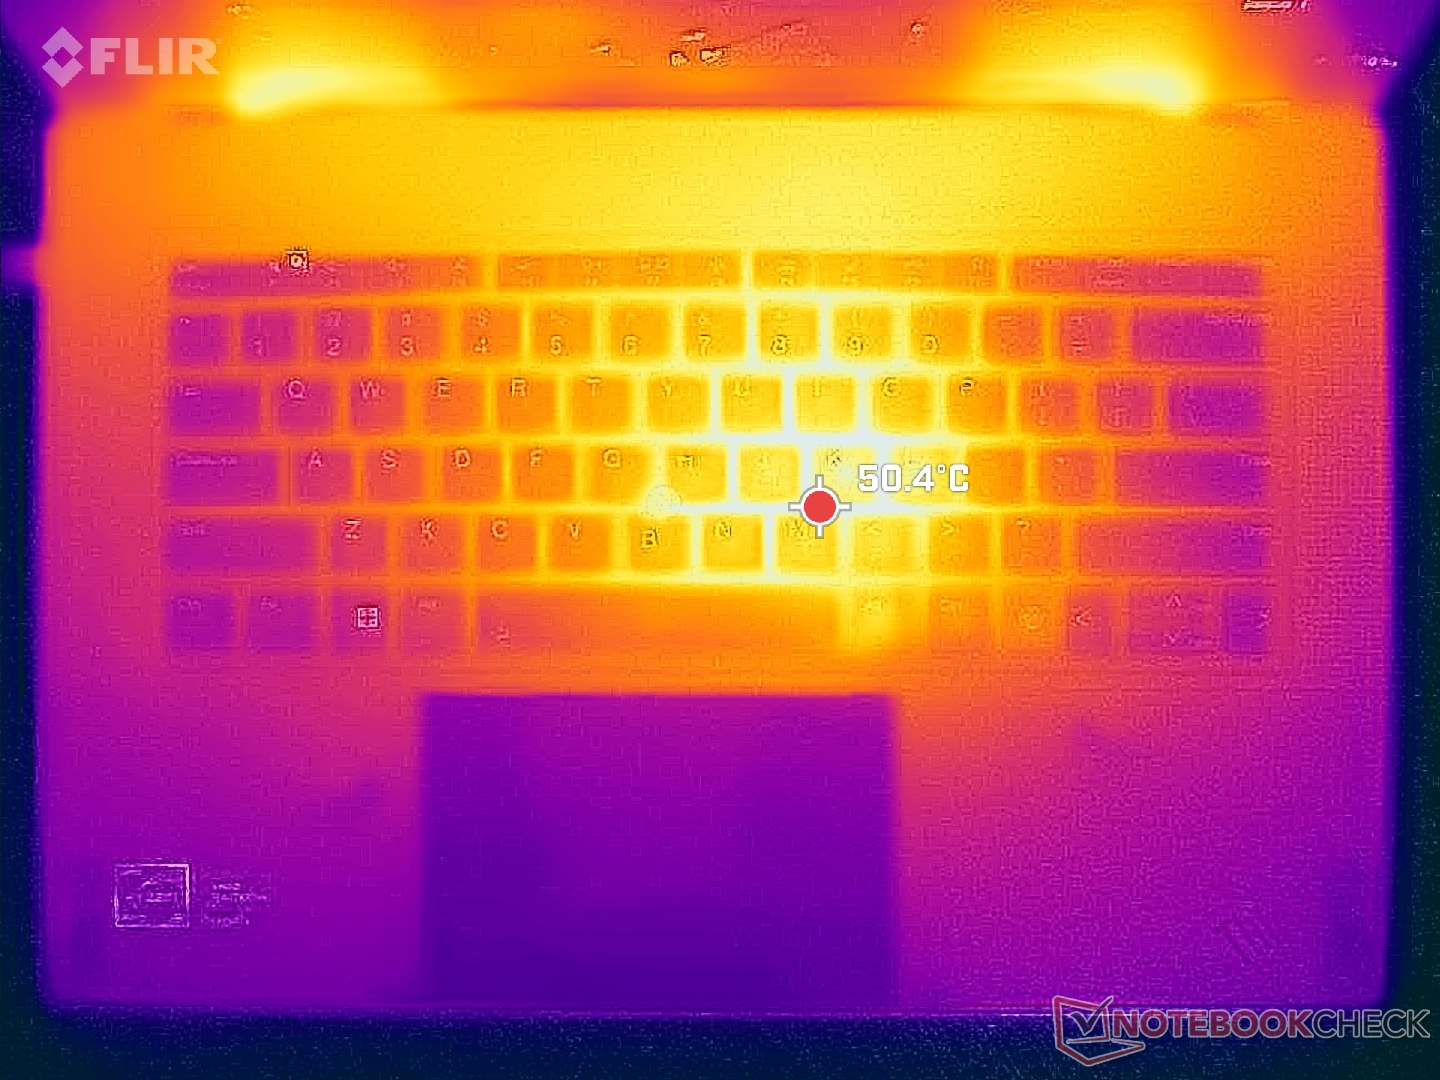
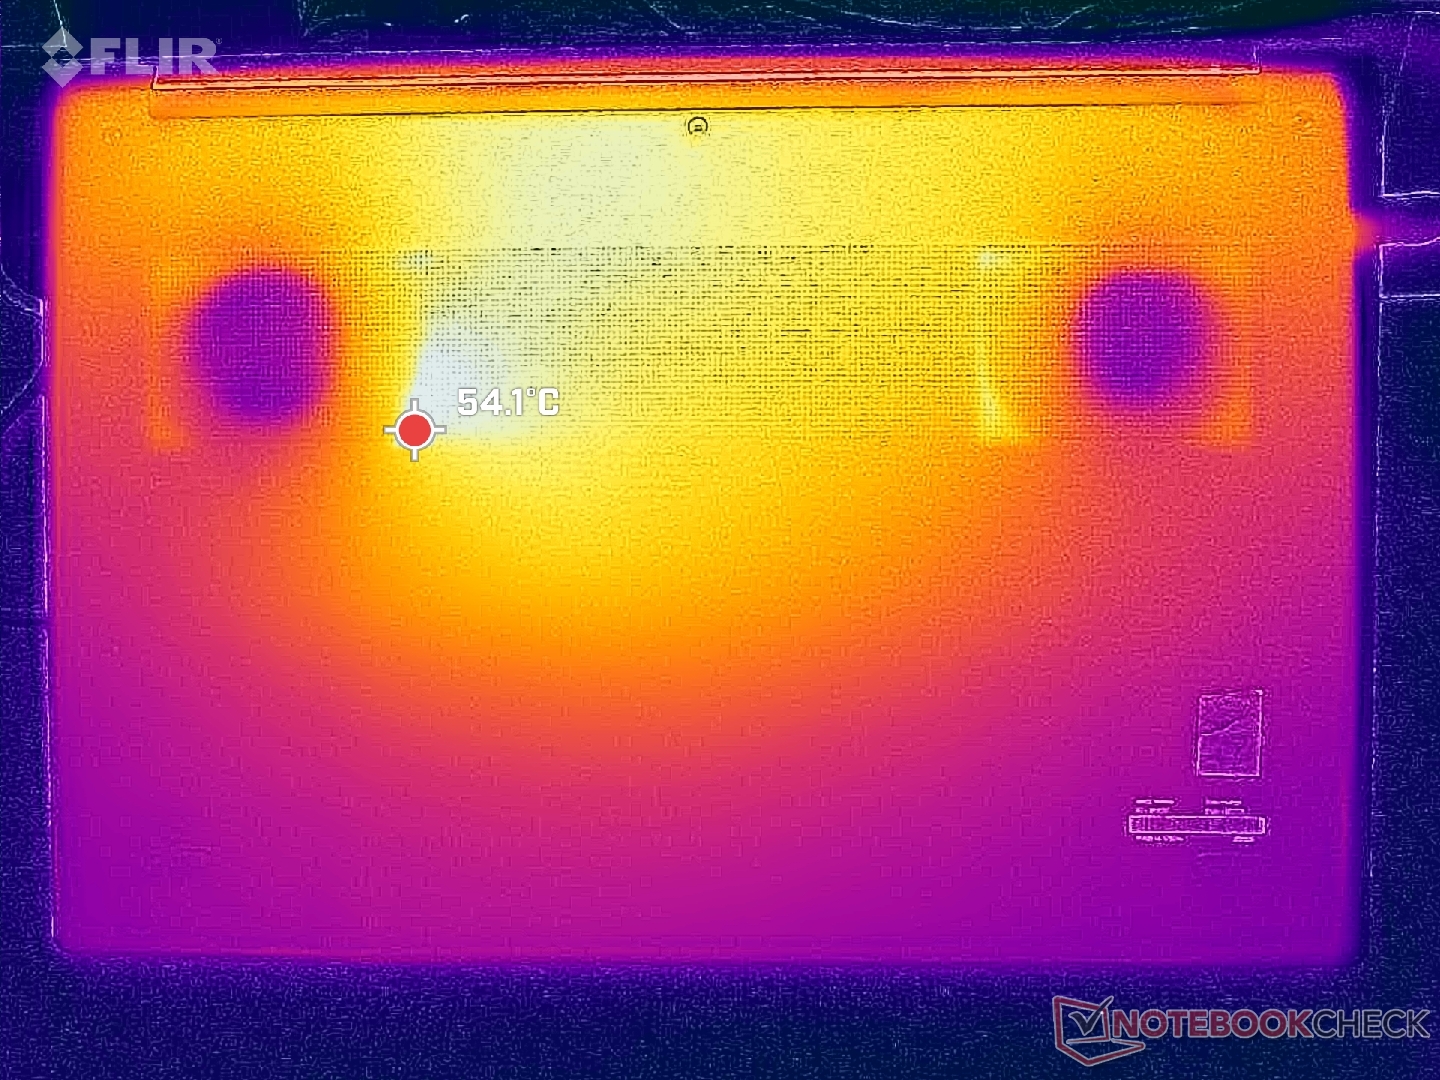
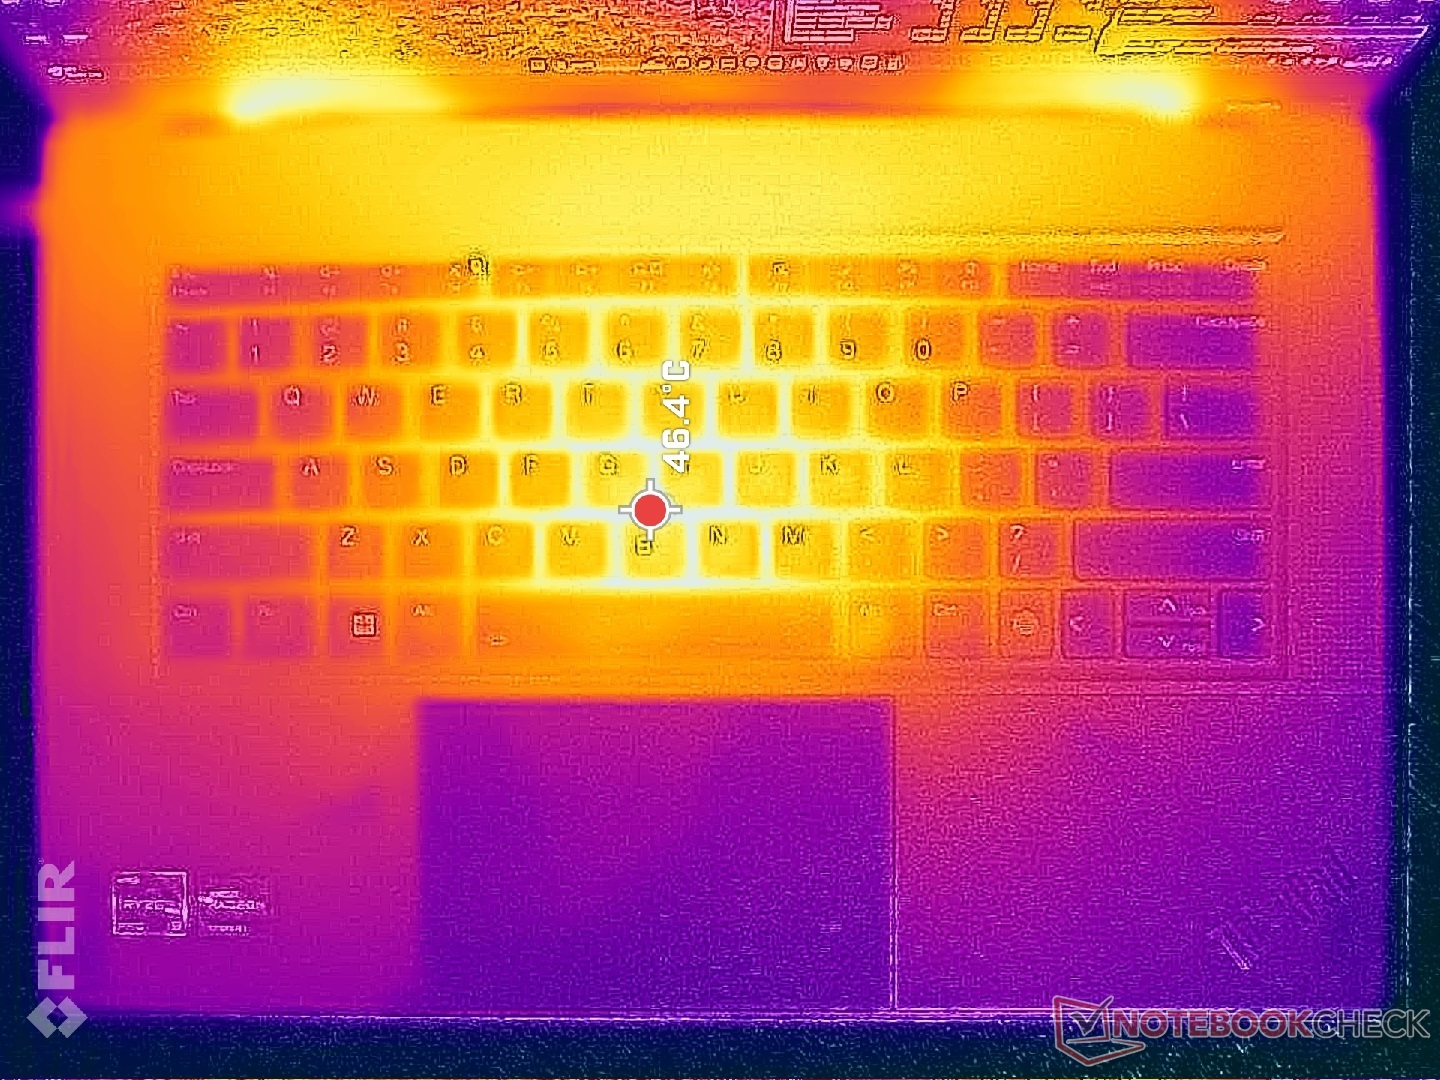
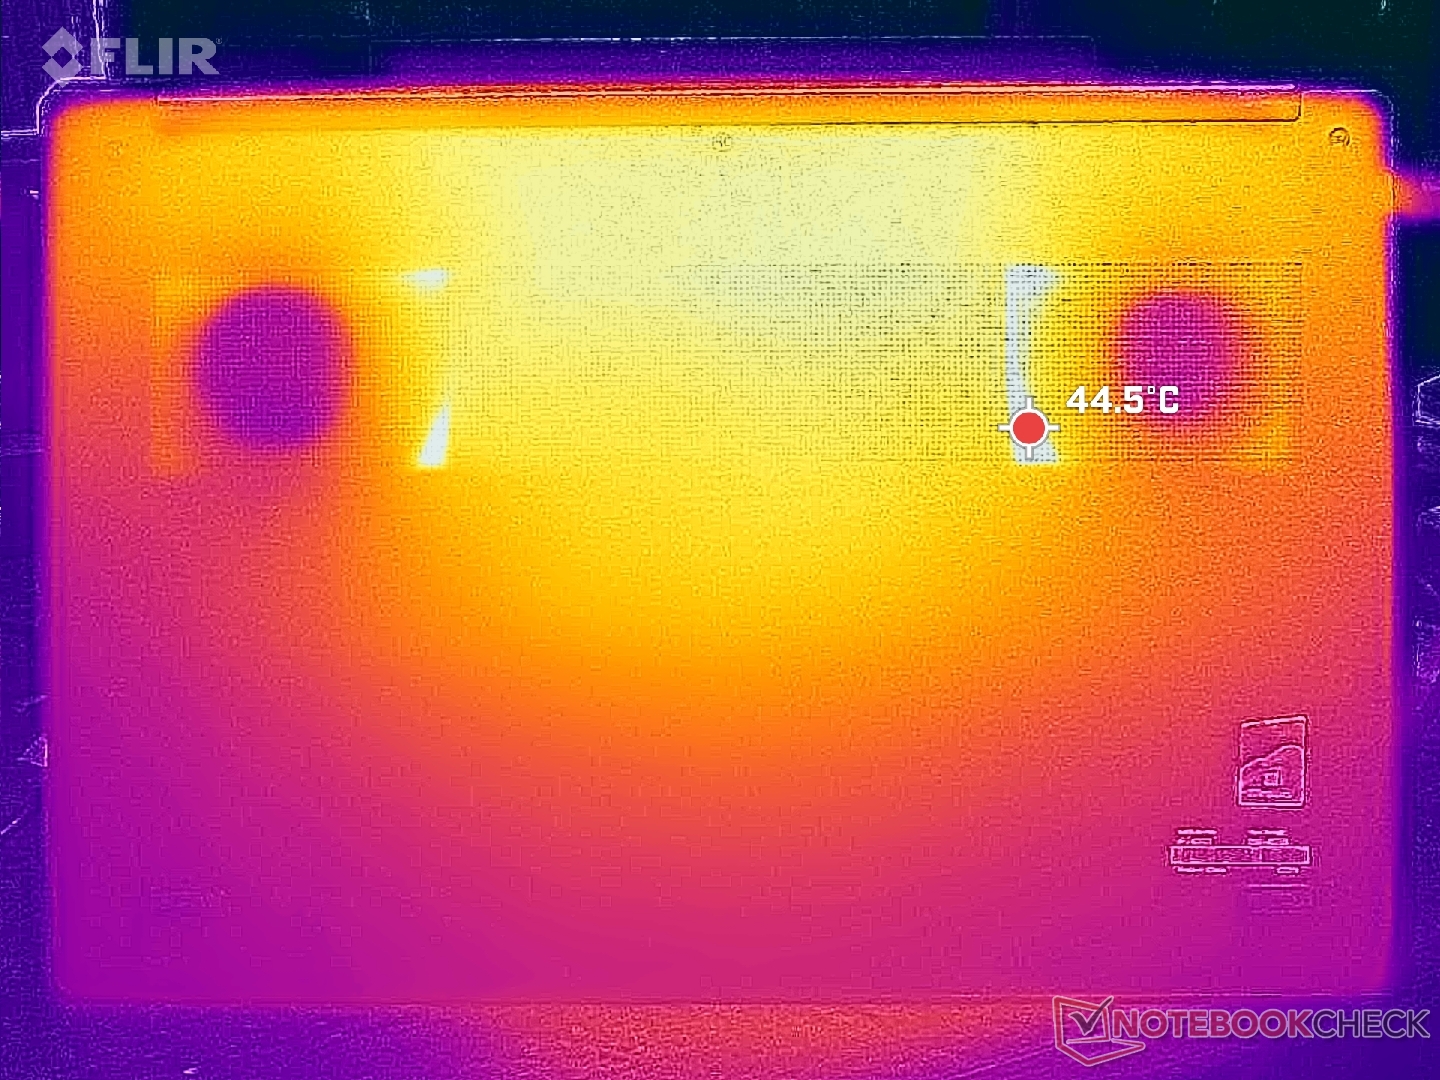
Le temperature di superficie salgono e scendono piuttosto rapidamente e con estremi più ampi, dato che la maggior parte dello chassis è in metallo. Quando si eseguono carichi impegnativi come i giochi, i punti caldi possono raggiungere i 47 C e i 43 C sul centro della tastiera e sulla piastra inferiore, rispettivamente, ma questo può essere ancora più caldo, superando i 50 C a seconda della temperatura ambientale, come abbiamo osservato sul ThinkPad Z16 Gen 1. I risultati sono comunque molto più freddi di quelli che abbiamo registrato sull' MSI Creator Z16P che diventava troppo caldo per il suo bene.
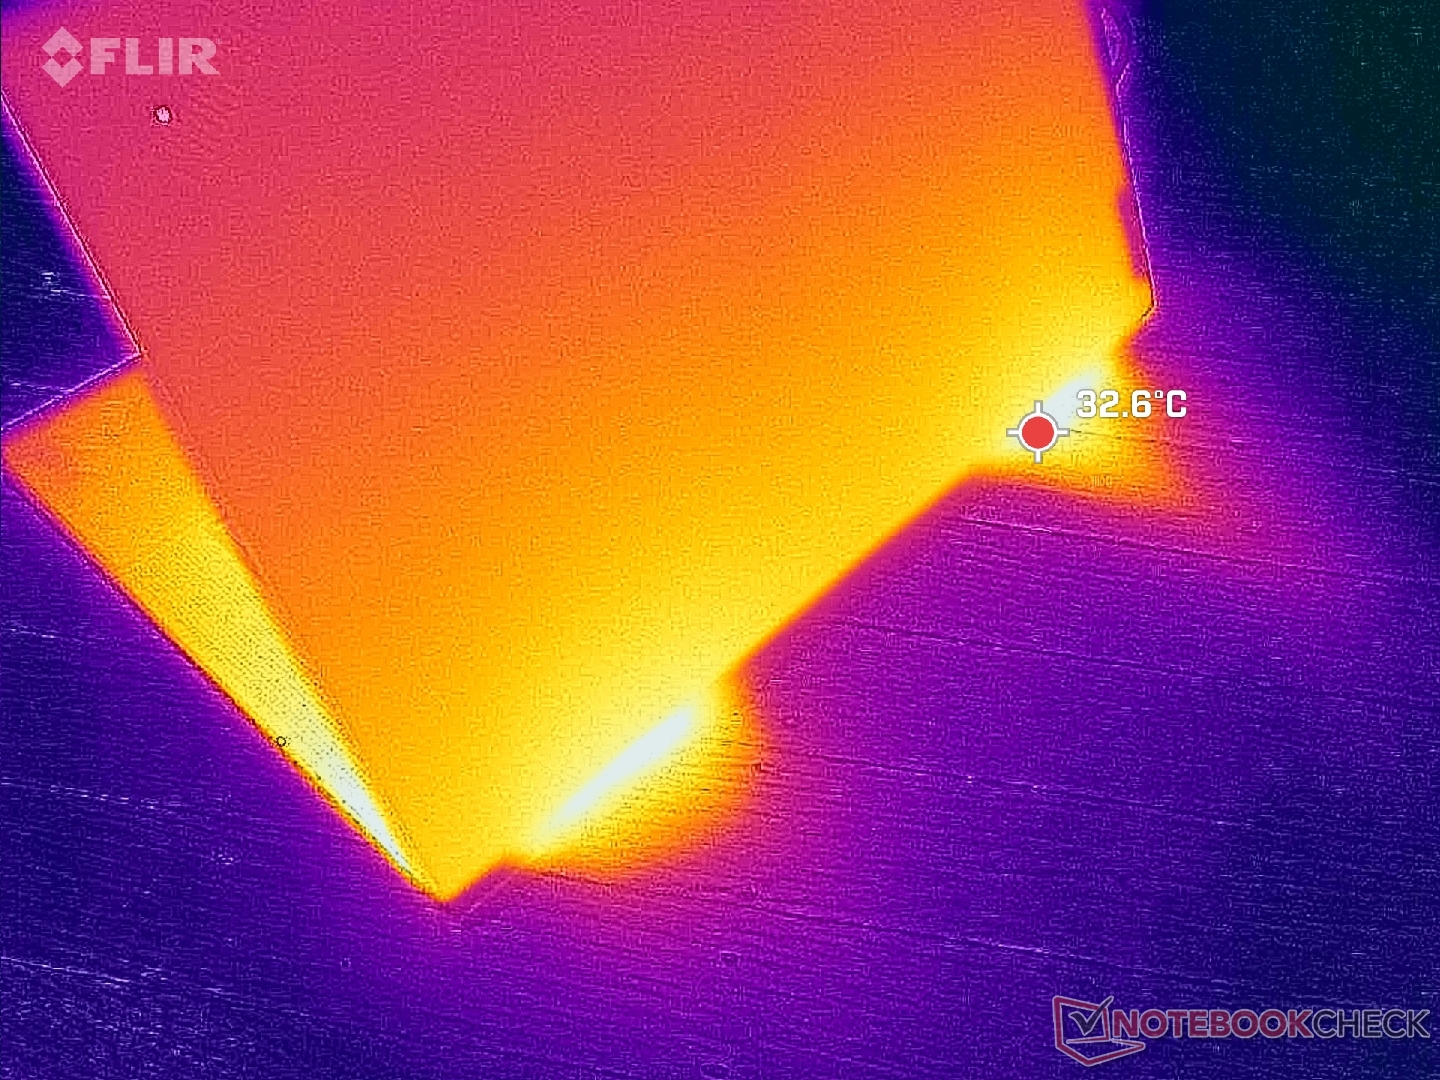
(±) La temperatura massima sul lato superiore è di 43 °C / 109 F, rispetto alla media di 36.8 °C / 98 F, che varia da 21 a 71 °C per questa classe Multimedia.
(±) Il lato inferiore si riscalda fino ad un massimo di 41.6 °C / 107 F, rispetto alla media di 39.1 °C / 102 F
(+) In idle, la temperatura media del lato superiore è di 20.3 °C / 69 F, rispetto alla media deld ispositivo di 31.3 °C / 88 F.
(-) Riproducendo The Witcher 3, la temperatura media per il lato superiore e' di 38.1 °C / 101 F, rispetto alla media del dispositivo di 31.3 °C / 88 F.
(+) I poggiapolsi e il touchpad sono piu' freddi della temperatura della pelle con un massimo di 30 °C / 86 F e sono quindi freddi al tatto.
(±) La temperatura media della zona del palmo della mano di dispositivi simili e'stata di 28.7 °C / 83.7 F (-1.3 °C / -2.3 F).
| Lenovo ThinkPad Z16 Gen 2 AMD Ryzen 9 PRO 7940HS, AMD Radeon RX 6550M | Lenovo ThinkPad Z16 G1 21D5S00T00 AMD Ryzen 7 PRO 6850H, AMD Radeon RX 6500M | Lenovo ThinkBook 16 G6 ABP AMD Ryzen 5 7530U, AMD Radeon RX Vega 7 | MSI Creator Z16P B12UHST Intel Core i9-12900H, NVIDIA GeForce RTX 3080 Ti Laptop GPU | Apple MacBook Pro 16 2023 M3 Pro Apple M3 Pro 12-Core, Apple M3 Pro 18-Core GPU | Asus Vivobook Pro 16X K6604JV-MX016W Intel Core i9-13980HX, NVIDIA GeForce RTX 4060 Laptop GPU | |
|---|---|---|---|---|---|---|
| Heat | -33% | -30% | -49% | -2% | -36% | |
| Maximum Upper Side * (°C) | 43 | 56.8 -32% | 40.8 5% | 67 -56% | 38.1 11% | 39.7 8% |
| Maximum Bottom * (°C) | 41.6 | 53.3 -28% | 50.5 -21% | 69 -66% | 37 11% | 60 -44% |
| Idle Upper Side * (°C) | 21.2 | 28.2 -33% | 29.3 -38% | 29 -37% | 24.2 -14% | 30.9 -46% |
| Idle Bottom * (°C) | 21.4 | 29.4 -37% | 35.2 -64% | 29 -36% | 24.6 -15% | 34.7 -62% |
* ... Meglio usare valori piccoli
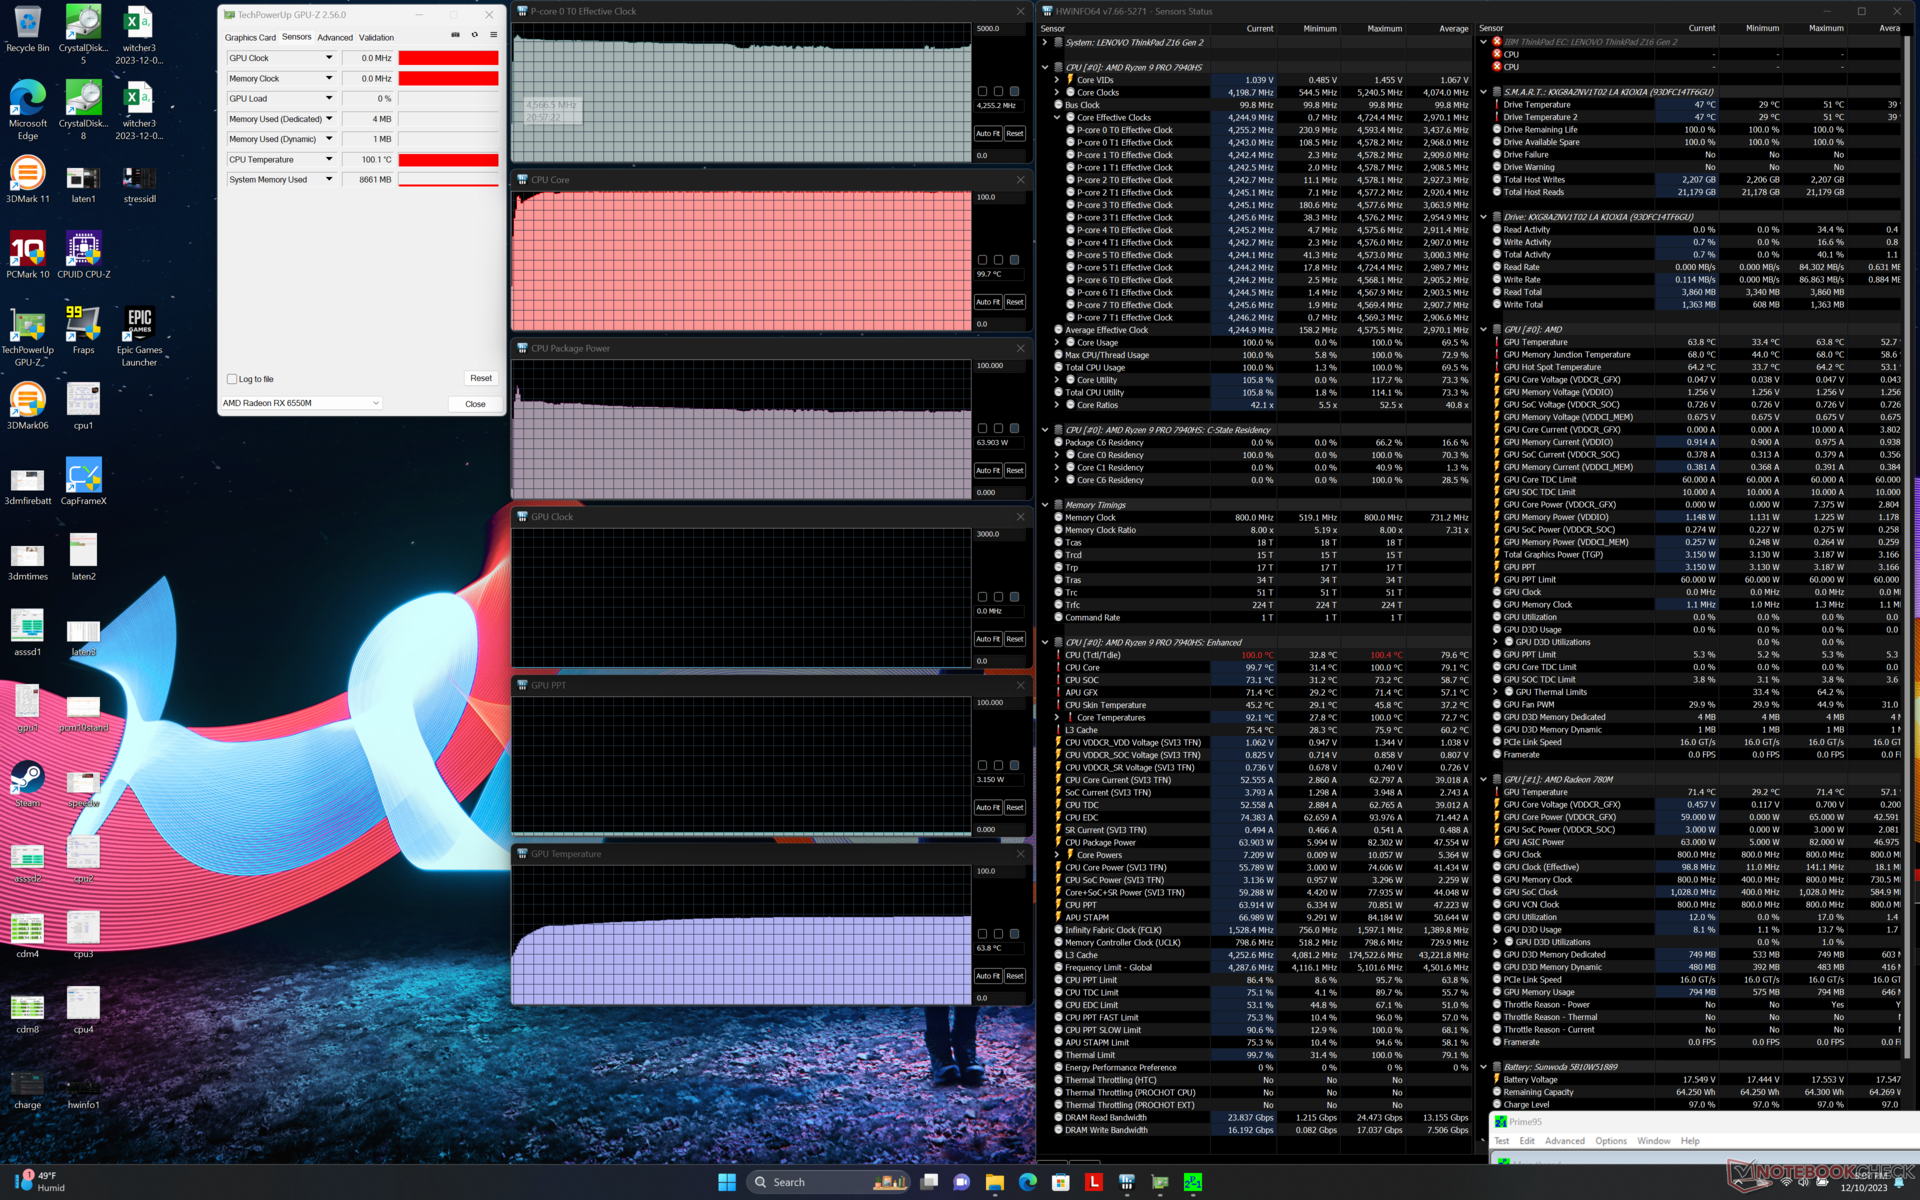
Test da sforzo
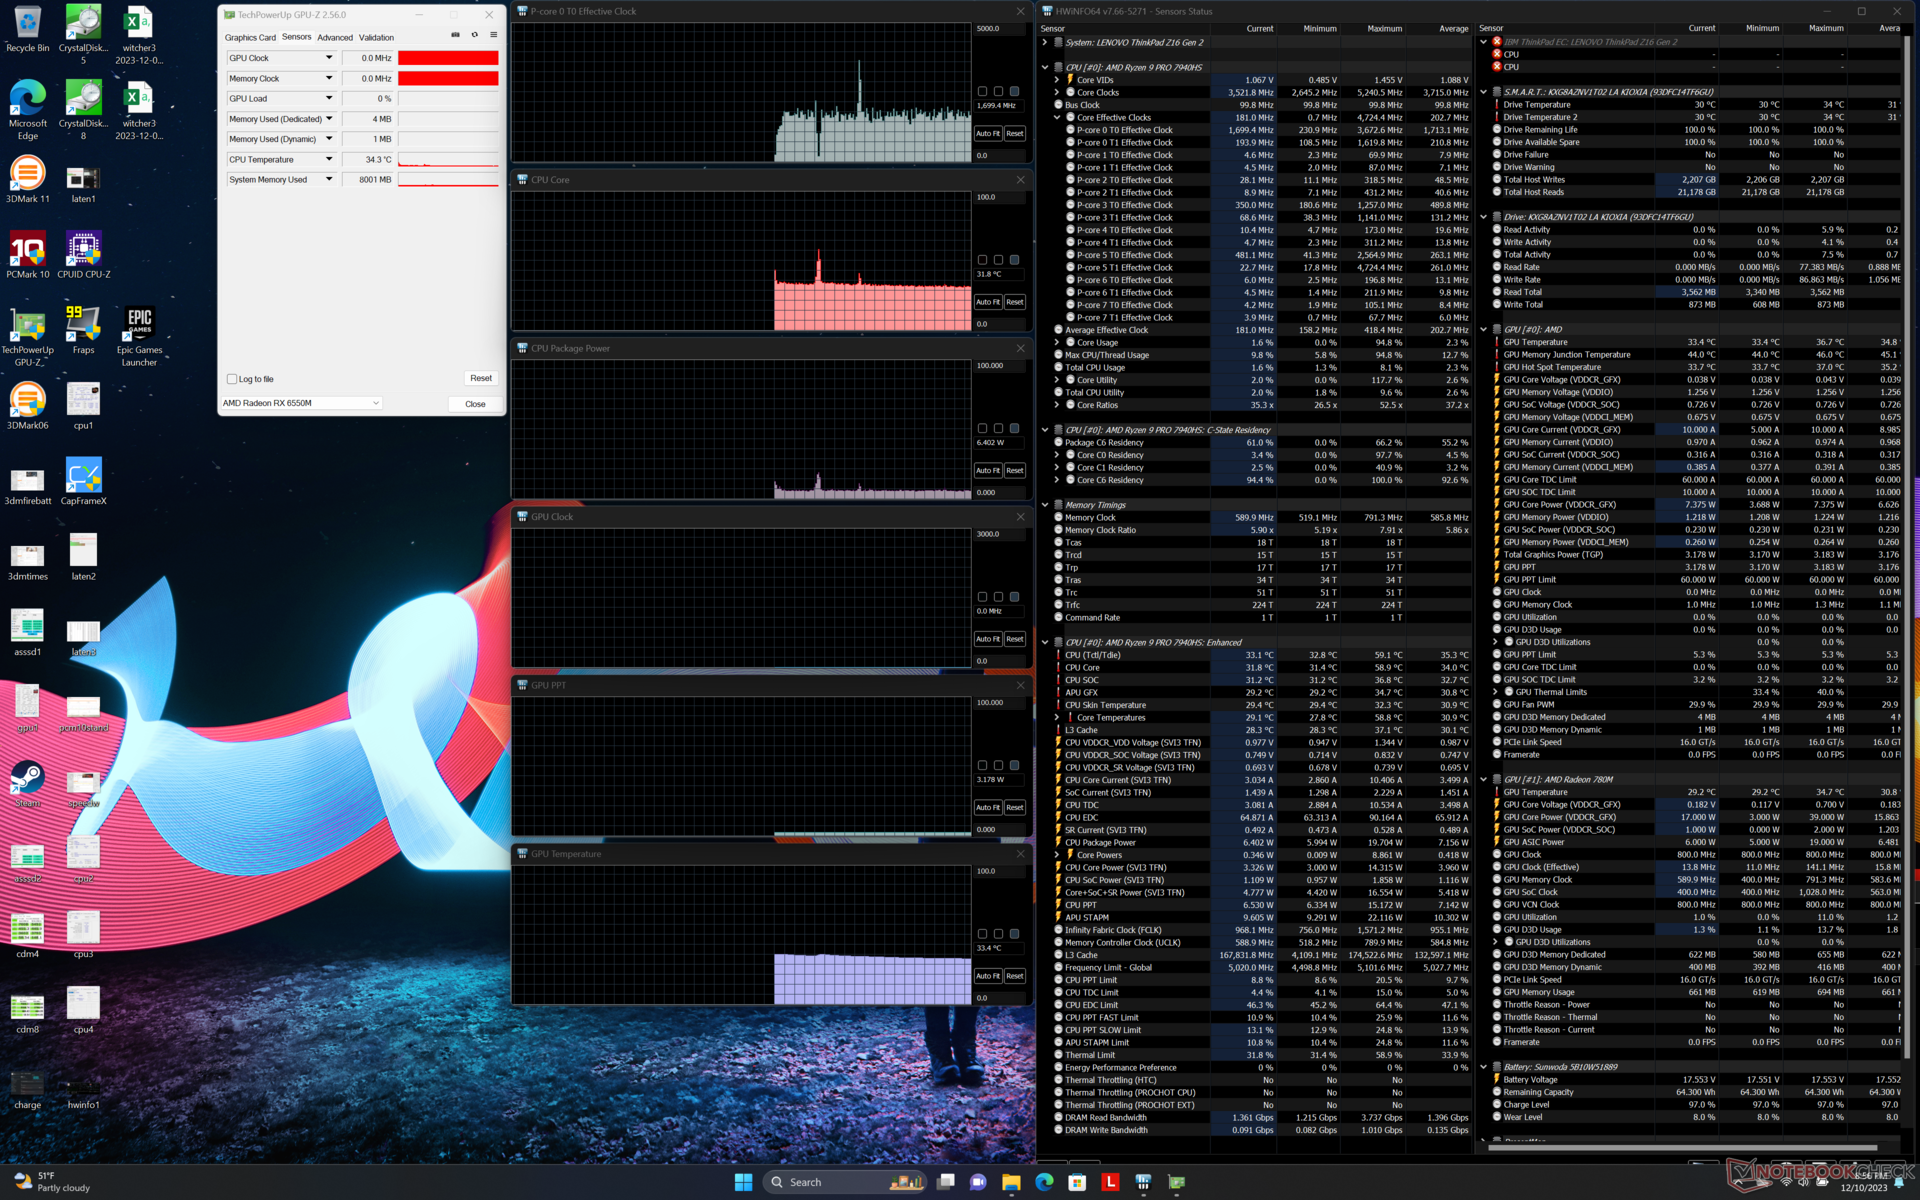
Quando si esegue lo stress Prime95, la CPU sale a 4,6 GHz e 82 W per pochi secondi, prima di scendere e stabilizzarsi a 4,4 GHz, 69 W e una temperatura di 100 C. È chiaro che la CPU funziona il più velocemente possibile entro i limiti della soluzione di raffreddamento sovrastante.
Le frequenze di clock della GPU e l'assorbimento di potenza della scheda quando si utilizza la modalità Performance si stabilizzano rispettivamente a 2630 MHz e 59 W, rispetto a 2133 MHz e 39 W quando si utilizza la modalità Balanced. In particolare, il deficit di prestazioni tra le due modalità in esecuzione Witcher 3 è minimo a pochi fotogrammi, anche se le differenze di rumore della ventola sono significative. Pertanto, gli utenti potrebbero considerare di giocare in modalità Bilanciata per le ventole molto più silenziose e le temperature del nucleo leggermente più basse.
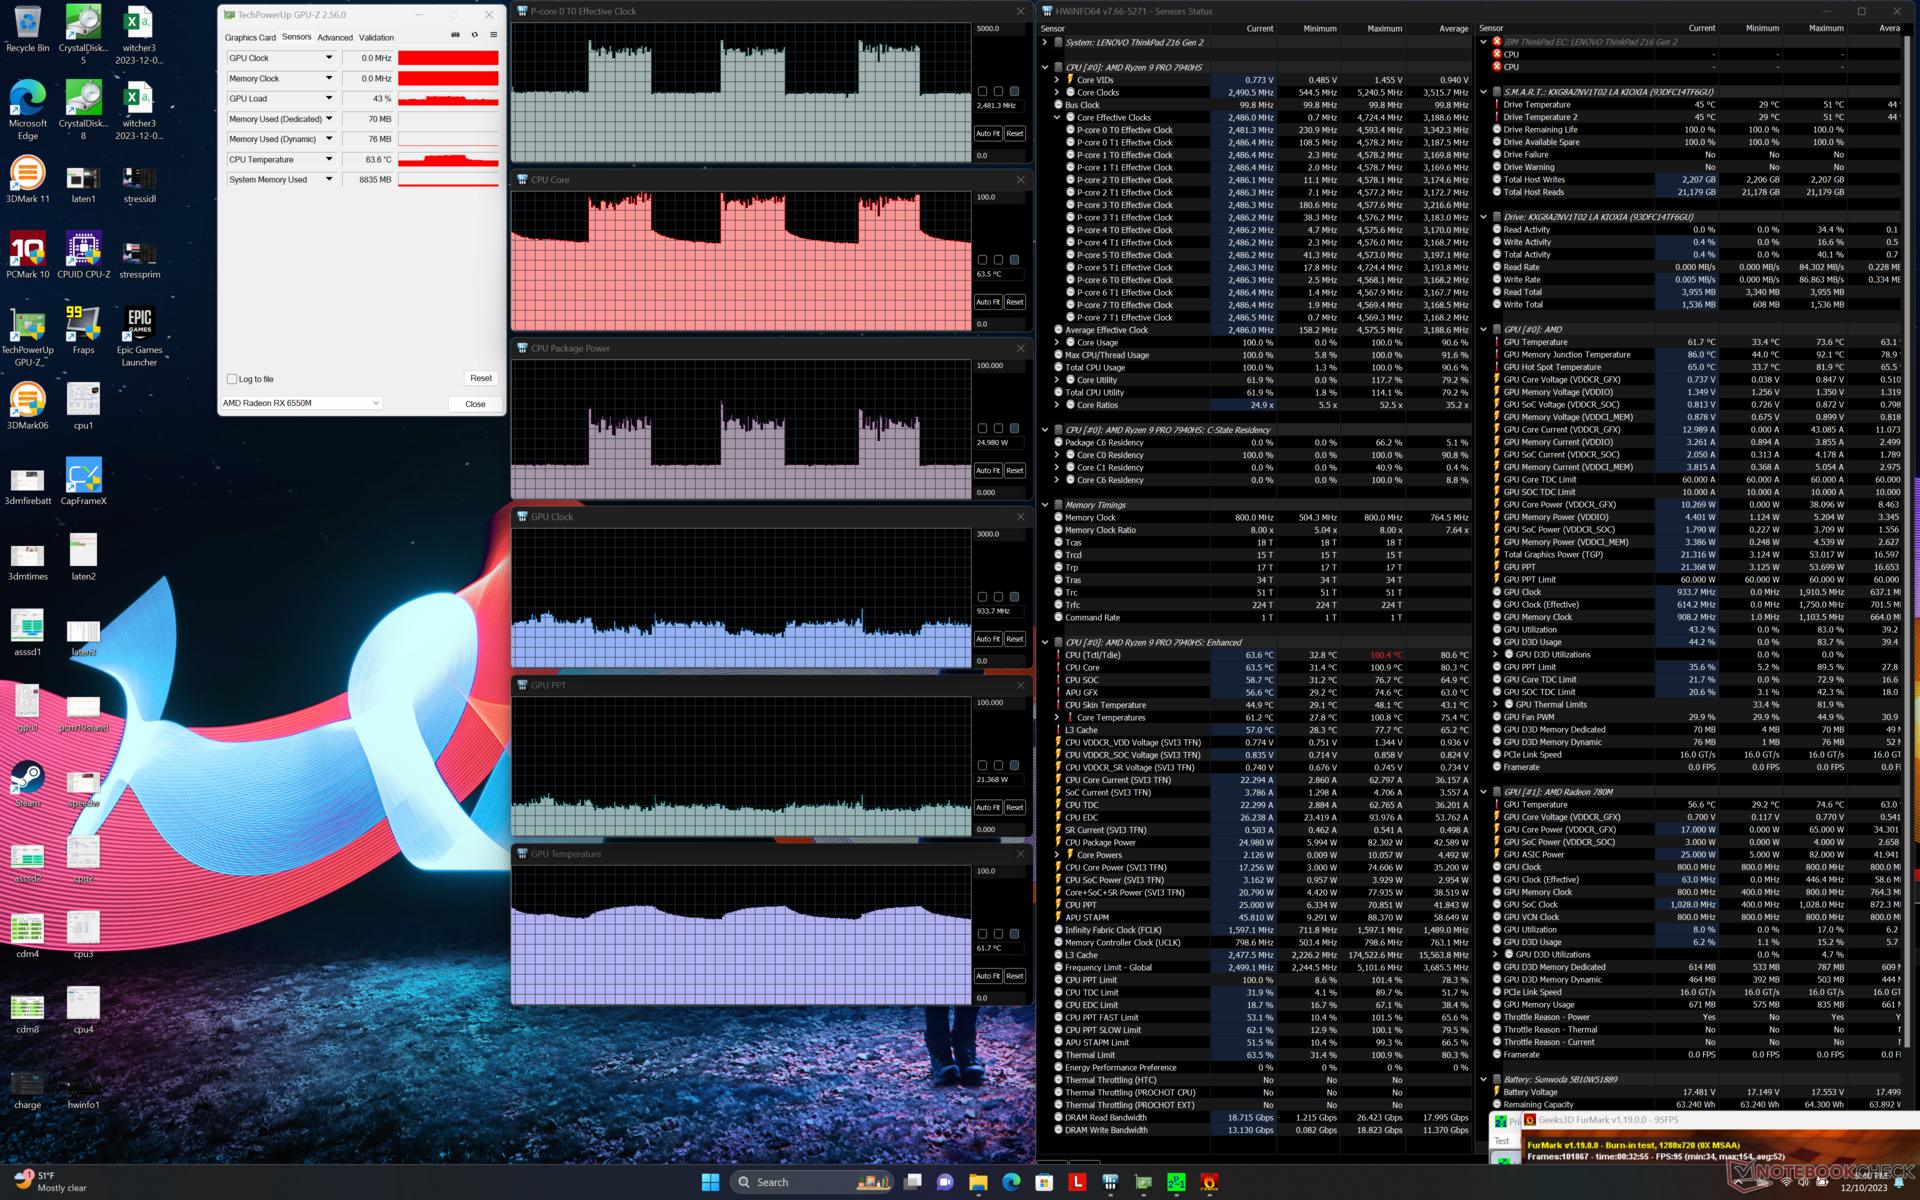
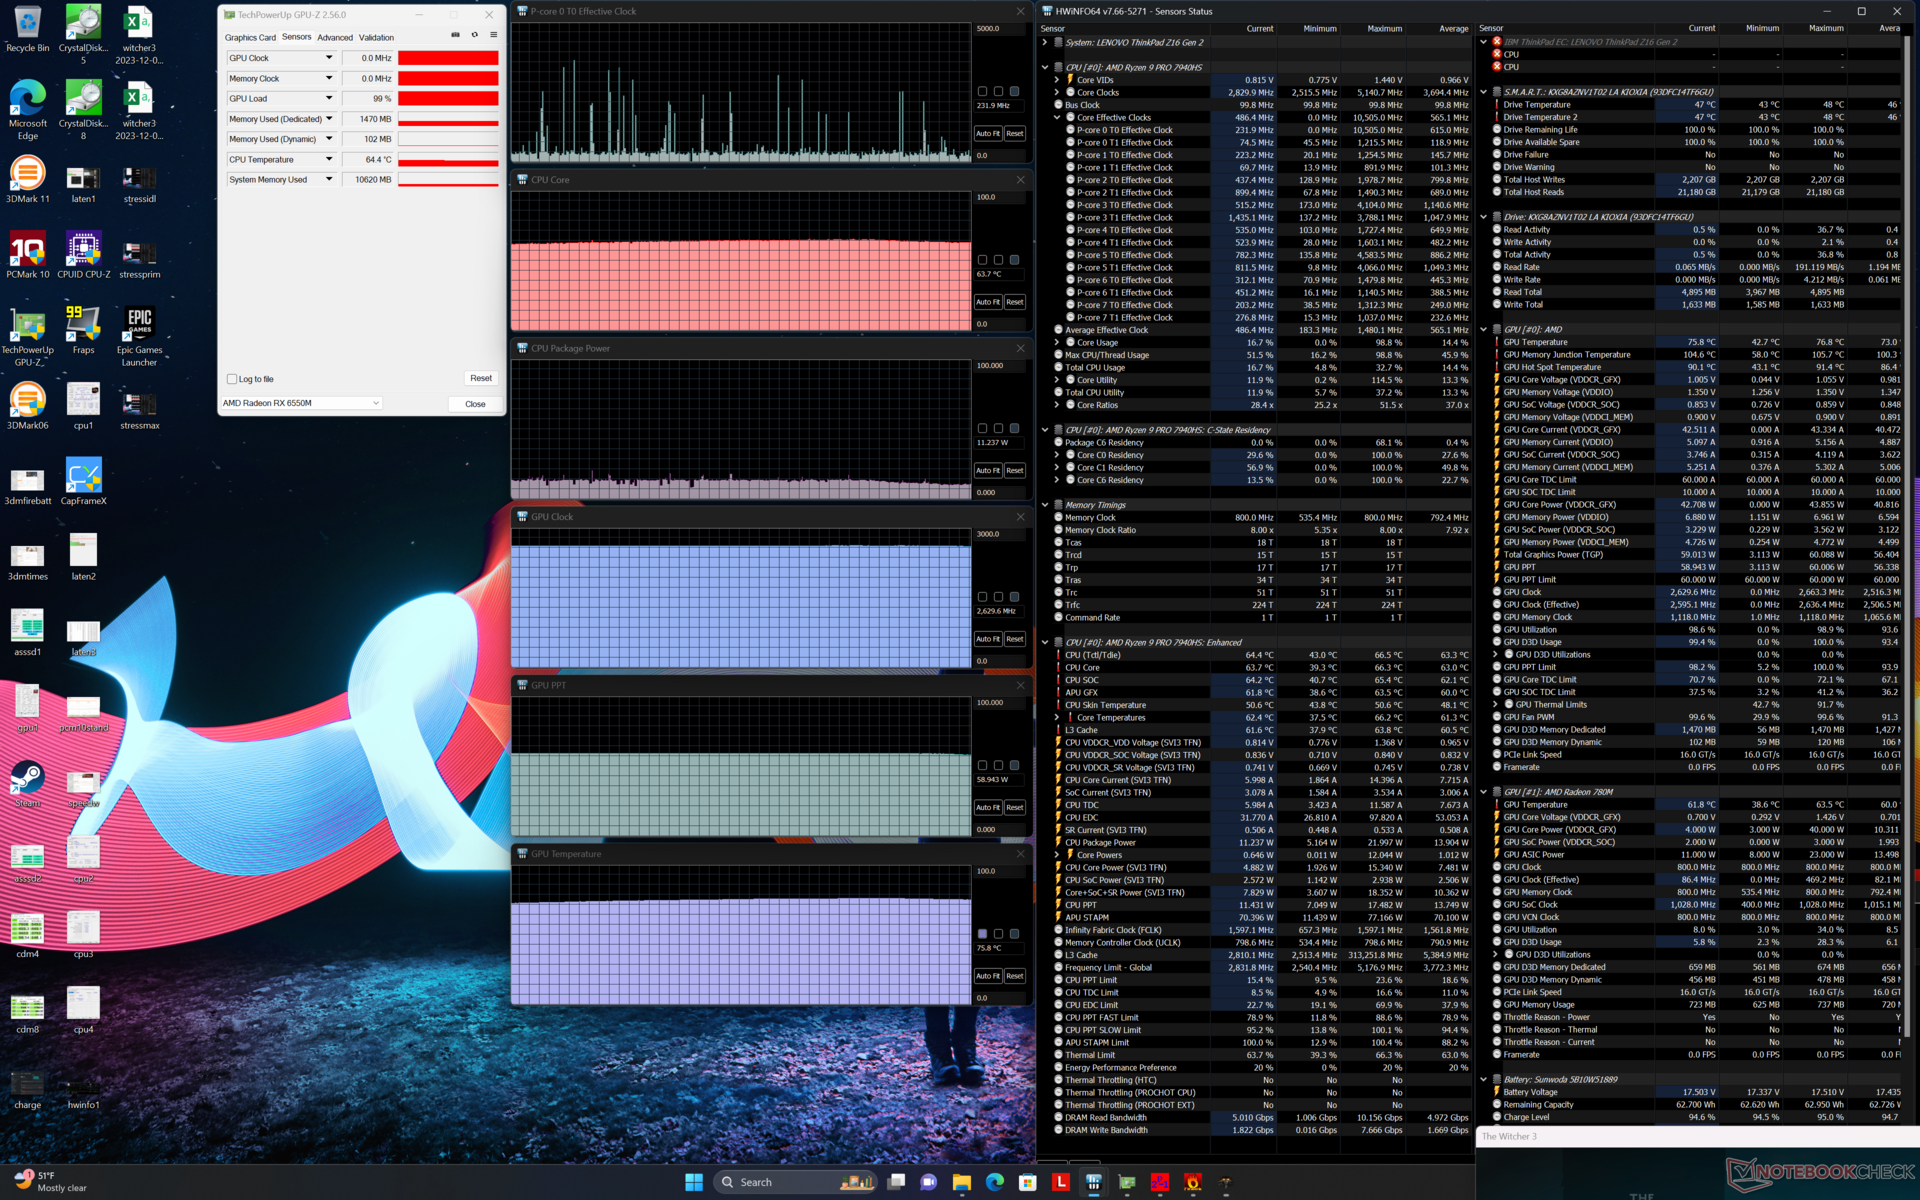
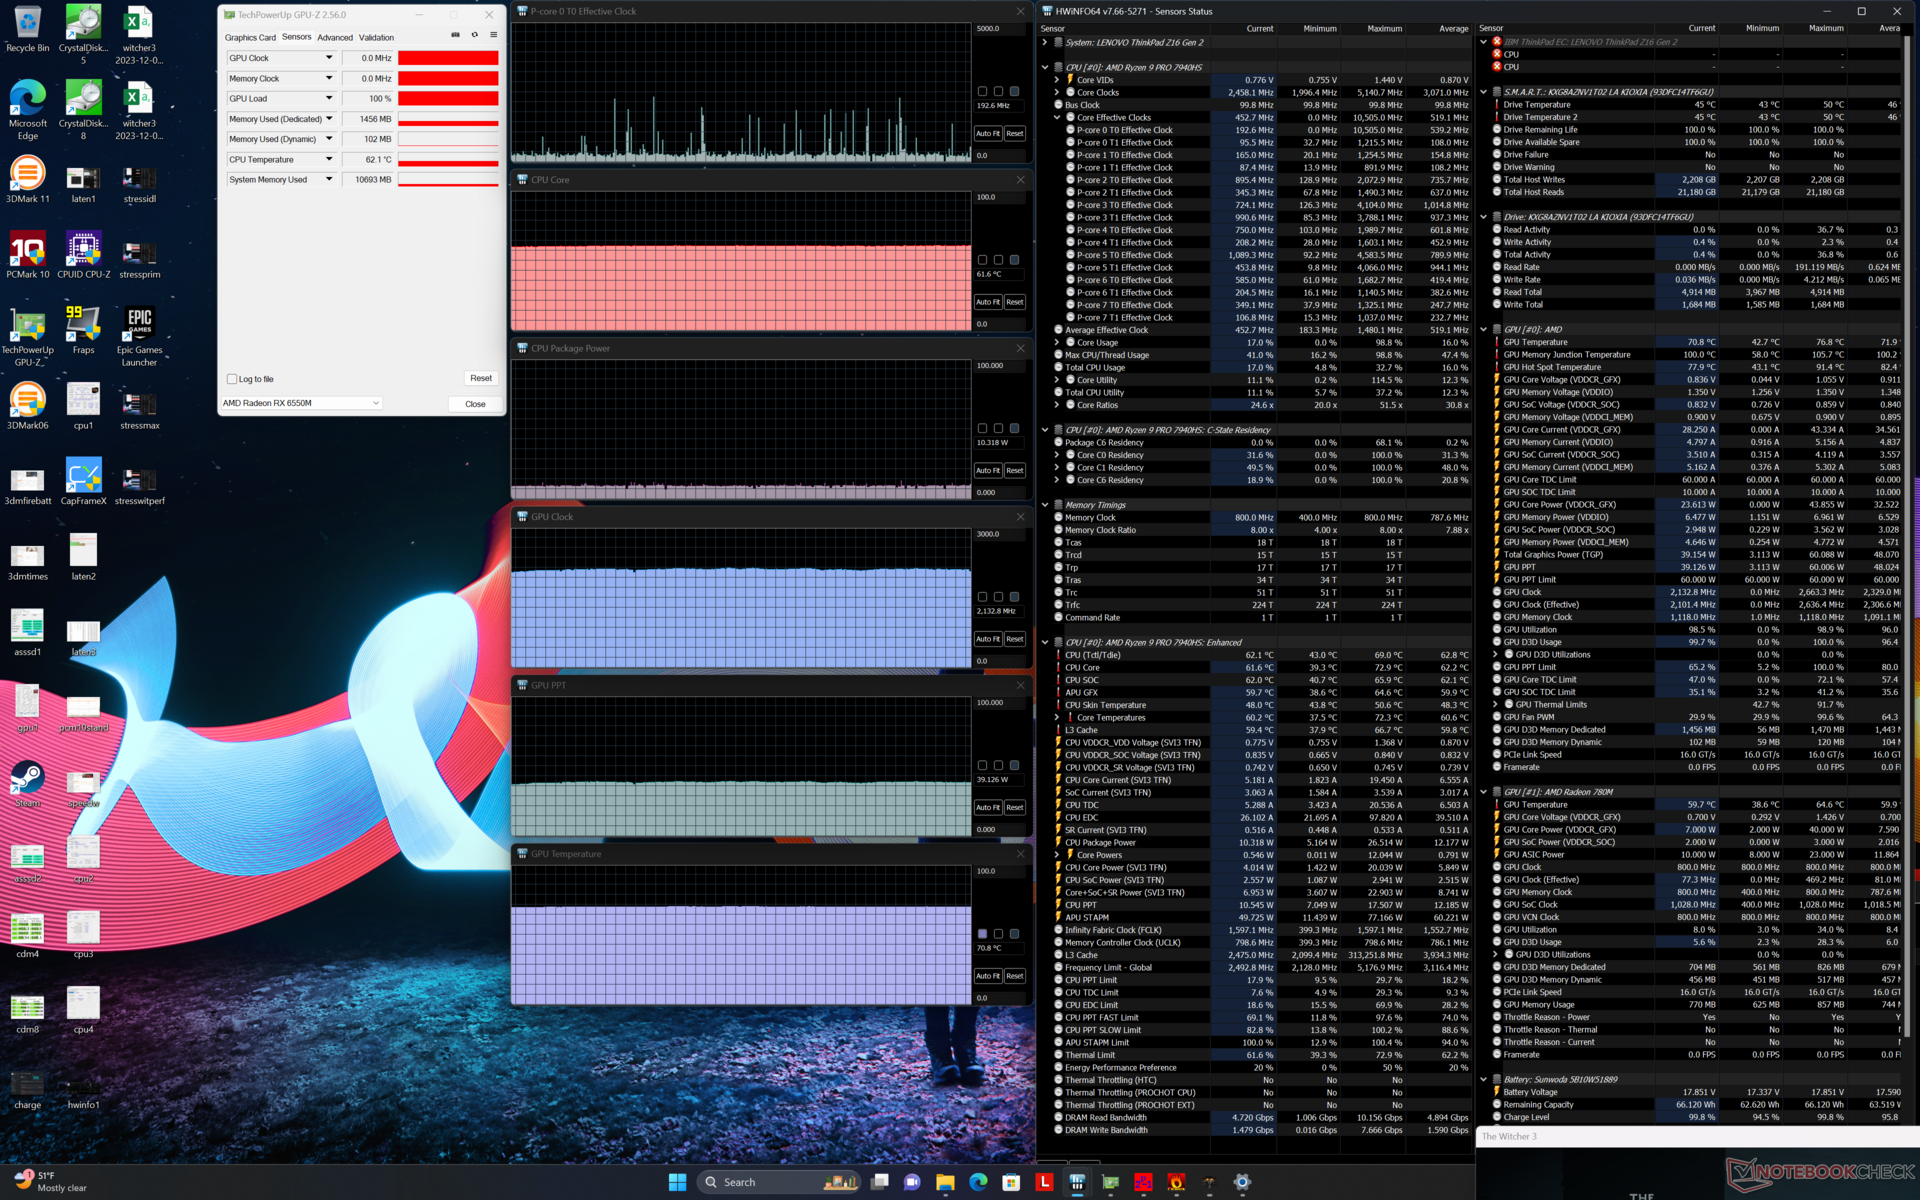
| Clock della CPU (GHz) | Clock della GPU (MHz) | Temperatura media della CPU (°C) | Temperatura media della GPU (°C) | |
| Sistema inattivo | -- | -- | 32 | 33 |
| Stress Prime95 | 4,2 | -- | 100 | 64 |
| Prime95 + FurMark Stress | 2,5 - 4,0 | 750 - 1000 | 64 - 100 | 62 - 72 |
| Witcher 3 Stress (modalità bilanciata) | ~0,2 | 2133 | 62 | 71 |
| Witcher 3 Stress (modalità Performance) | ~0,2 | 2630 | 64 | 76 |
Altoparlanti
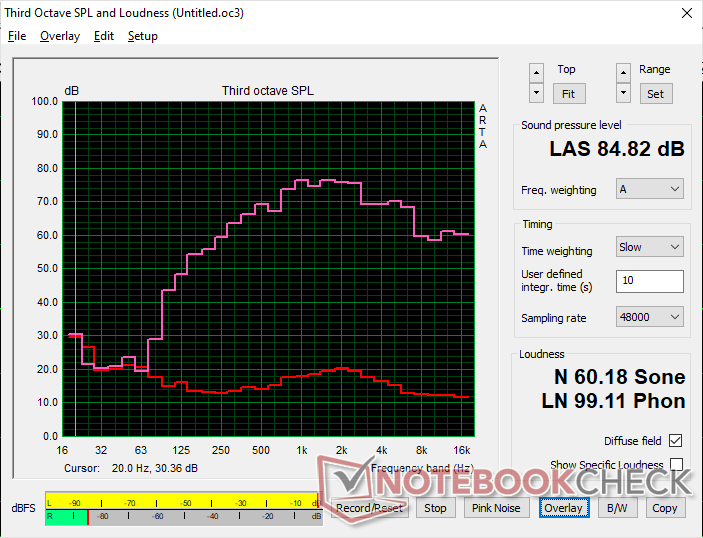
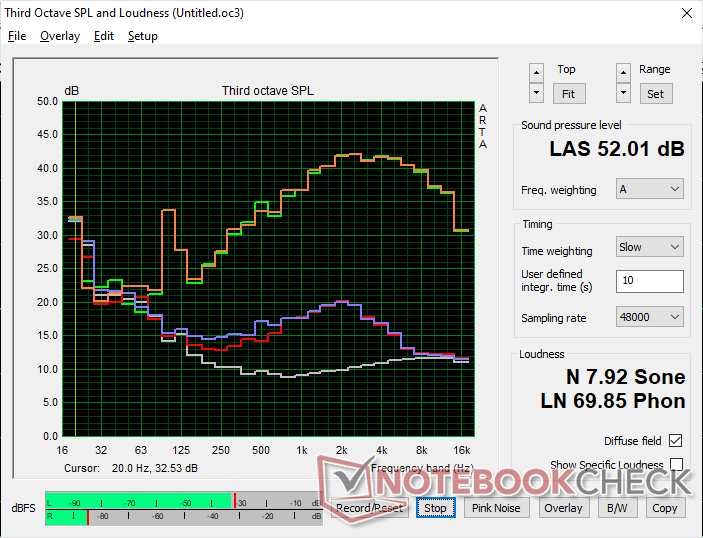
Lenovo ThinkPad Z16 Gen 2 analisi audio
(+) | gli altoparlanti sono relativamente potenti (84.8 dB)
Bassi 100 - 315 Hz
(±) | bassi ridotti - in media 13% inferiori alla media
(±) | la linearità dei bassi è media (11.1% delta rispetto alla precedente frequenza)
Medi 400 - 2000 Hz
(±) | medi elevati - circa 5.5% superiore alla media
(+) | medi lineari (4.9% delta rispetto alla precedente frequenza)
Alti 2 - 16 kHz
(+) | Alti bilanciati - appena 4.7% dalla media
(+) | alti lineari (5.2% delta rispetto alla precedente frequenza)
Nel complesso 100 - 16.000 Hz
(+) | suono nel complesso lineare (14.8% differenza dalla media)
Rispetto alla stessa classe
» 35% di tutti i dispositivi testati in questa classe è stato migliore, 4% simile, 61% peggiore
» Il migliore ha avuto un delta di 5%, medio di 17%, peggiore di 45%
Rispetto a tutti i dispositivi testati
» 20% di tutti i dispositivi testati in questa classe è stato migliore, 4% similare, 76% peggiore
» Il migliore ha avuto un delta di 4%, medio di 24%, peggiore di 134%
Apple MacBook Pro 16 2021 M1 Pro analisi audio
(+) | gli altoparlanti sono relativamente potenti (84.7 dB)
Bassi 100 - 315 Hz
(+) | bassi buoni - solo 3.8% dalla media
(+) | bassi in lineaa (5.2% delta rispetto alla precedente frequenza)
Medi 400 - 2000 Hz
(+) | medi bilanciati - solo only 1.3% rispetto alla media
(+) | medi lineari (2.1% delta rispetto alla precedente frequenza)
Alti 2 - 16 kHz
(+) | Alti bilanciati - appena 1.9% dalla media
(+) | alti lineari (2.7% delta rispetto alla precedente frequenza)
Nel complesso 100 - 16.000 Hz
(+) | suono nel complesso lineare (4.6% differenza dalla media)
Rispetto alla stessa classe
» 0% di tutti i dispositivi testati in questa classe è stato migliore, 0% simile, 100% peggiore
» Il migliore ha avuto un delta di 5%, medio di 17%, peggiore di 45%
Rispetto a tutti i dispositivi testati
» 0% di tutti i dispositivi testati in questa classe è stato migliore, 0% similare, 100% peggiore
» Il migliore ha avuto un delta di 4%, medio di 24%, peggiore di 134%
Gestione dell'energia
Consumo di energia
Il pannello OLED 4K ha un impatto notevole sul consumo energetico. Ad esempio, il consumo energetico è di soli 7 W quando è al minimo su uno schermo completamente nero, mentre uno schermo completamente bianco alla massima luminosità può richiedere quasi 19 W, rispetto ai soli 10 W della configurazione IPS. Le differenze di consumo energetico tra IPS e OLED sono analizzate più in dettaglio qui.
Il consumo durante l'esecuzione di attività intensive della CPU o della GPU è leggermente superiore a quello di ThinkPad Z16 Gen 1, anche dopo aver tenuto conto del pannello OLED più esigente. Tuttavia, le differenze sono minime rispetto ai grandi incrementi di prestazioni offerti dalla CPU Zen 4 Ryzen 9.
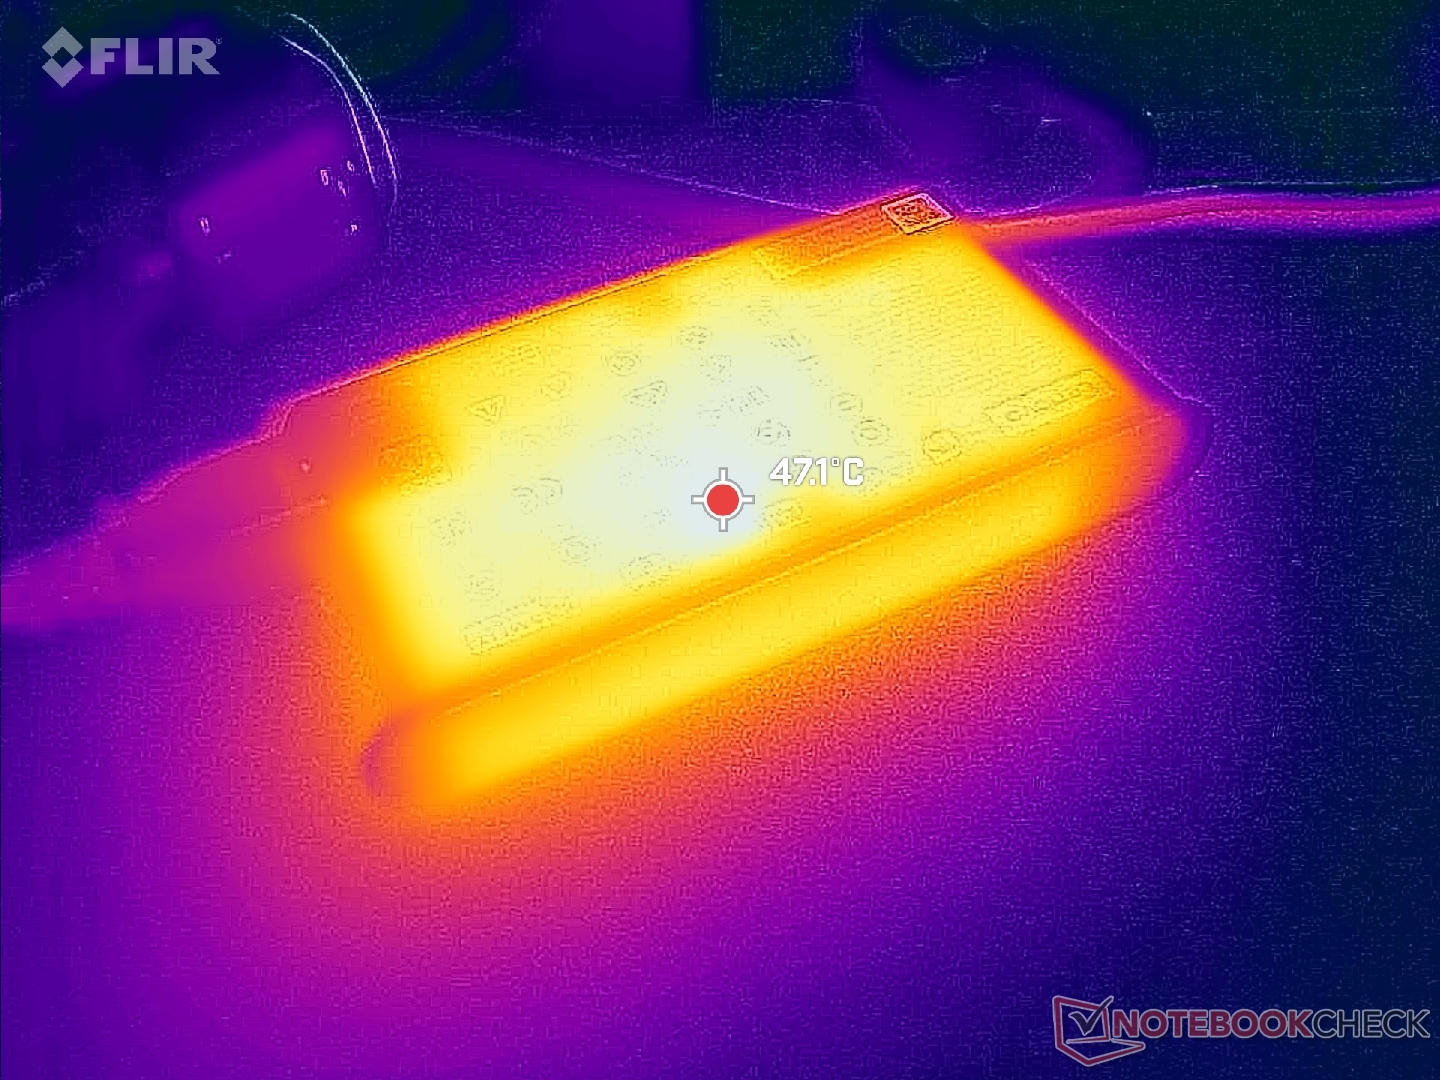
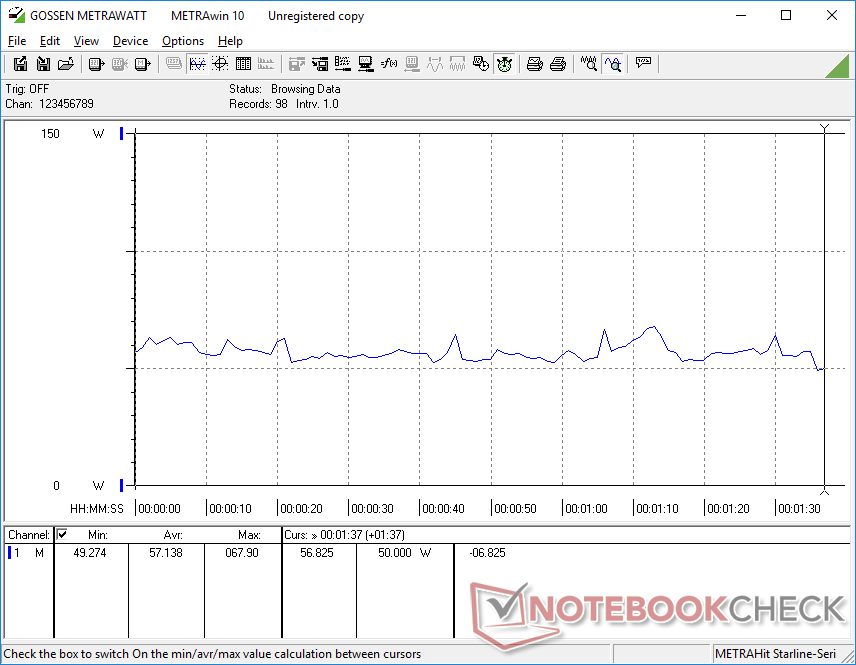
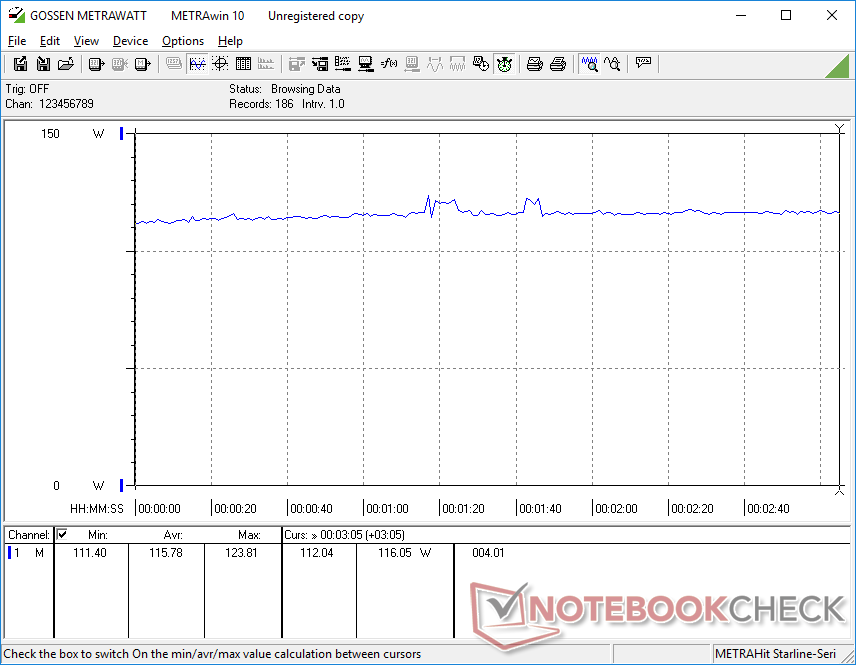
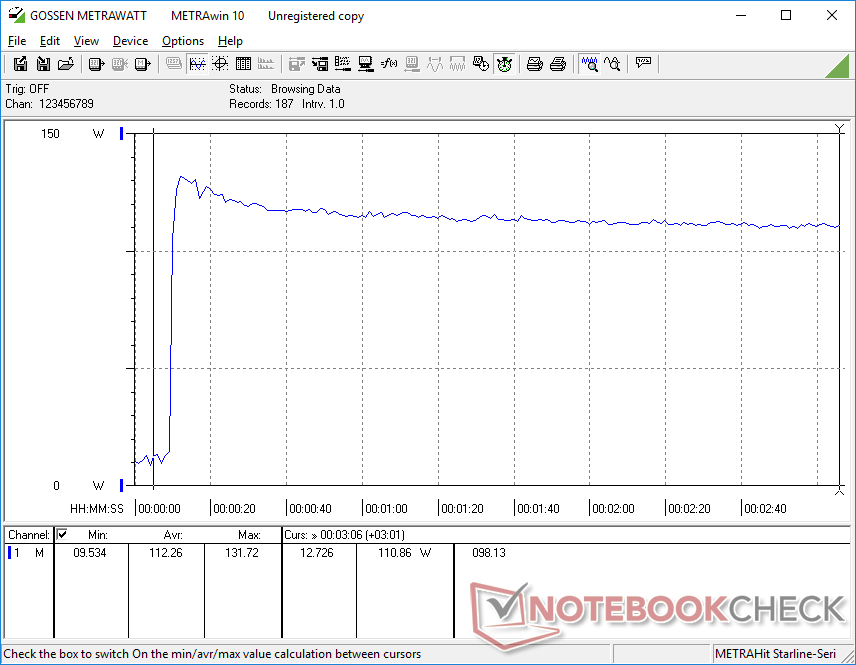
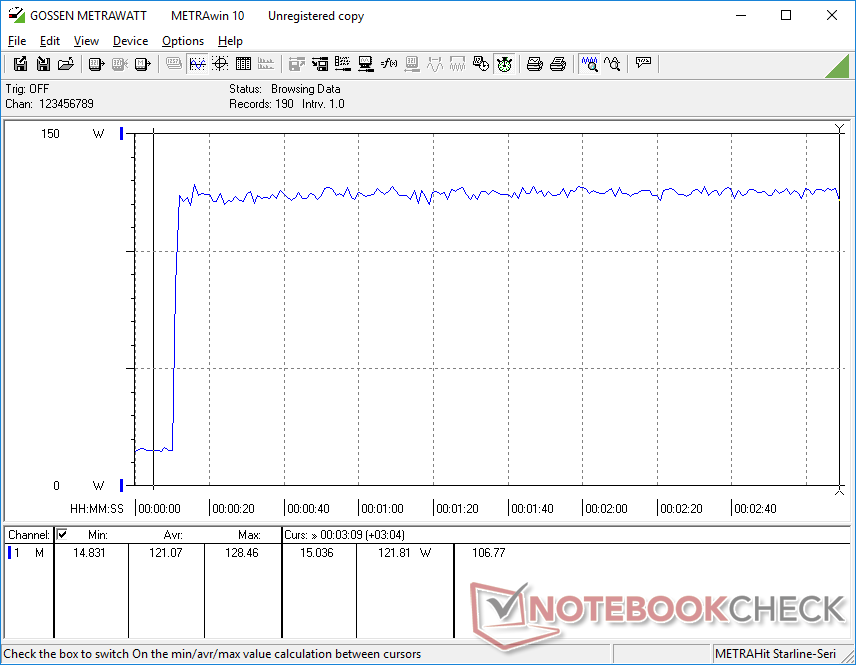
Siamo riusciti a misurare un consumo massimo di 132 W dall'adattatore AC USB-C di medie dimensioni (~14,6 x 7,7 x 2,3 cm) da 135 W. Il gioco richiede già quasi 120 W, il che significa che la velocità di ricarica rallenterà a dismisura se si eseguono carichi impegnativi contemporaneamente.
| Off / Standby | |
| Idle | |
| Sotto carico |
|
Leggenda:
min: | |
| Lenovo ThinkPad Z16 Gen 2 R9 PRO 7940HS, Radeon RX 6550M, Kioxia XG8 KXG8AZNV1T02, OLED, 3840x2400, 16" | Lenovo ThinkPad Z16 G1 21D5S00T00 R7 PRO 6850H, Radeon RX 6500M, Samsung PM9A1 MZVL21T0HCLR, IPS LED, 1920x1200, 16" | Lenovo ThinkBook 16 G6 ABP R5 7530U, Vega 7, SK hynix HFS512GEJ9X125N, IPS, 1920x1200, 16" | MSI Creator Z16P B12UHST i9-12900H, GeForce RTX 3080 Ti Laptop GPU, Samsung PM9A1 MZVL22T0HBLB, IPS True Pixel (~100% DCI-P3), 2560x1600, 16" | Asus Vivobook Pro 16X K6604JV-MX016W i9-13980HX, GeForce RTX 4060 Laptop GPU, Solidigm P41 Plus SSDPFKNU010TZ, OLED, 3200x2000, 16" | Apple MacBook Pro 16 2023 M3 Max Apple M3 Max 16-Core, M3 Max 40-Core GPU, Apple SSD AP8192Z, Mini-LED, 3456x2234, 16" | |
|---|---|---|---|---|---|---|
| Power Consumption | 15% | 45% | -60% | -71% | -17% | |
| Idle Minimum * (Watt) | 7.5 | 5.3 29% | 3.7 51% | 11 -47% | 13.8 -84% | 5.2 31% |
| Idle Average * (Watt) | 9.6 | 8.6 10% | 7.1 26% | 17 -77% | 16 -67% | 16.9 -76% |
| Idle Maximum * (Watt) | 18.5 | 9.5 49% | 7.7 58% | 26 -41% | 19 -3% | 17.2 7% |
| Load Average * (Watt) | 57.1 | 65.2 -14% | 43.9 23% | 124 -117% | 147 -157% | 90.5 -58% |
| Witcher 3 ultra * (Watt) | 115.8 | 93.6 19% | 40.8 65% | 133.5 -15% | 147.8 -28% | 109 6% |
| Load Maximum * (Watt) | 131.7 | 133.81 -2% | 66.6 49% | 212 -61% | 244 -85% | 145.2 -10% |
* ... Meglio usare valori piccoli
Power Consumption Witcher 3 / Stresstest
Power Consumption external Monitor
Durata della batteria
I tempi di esecuzione sono generalmente più brevi rispetto al modello dello scorso anno, soprattutto a causa del nostro pannello OLED più esigente. Poiché la maggior parte delle pagine web sono prevalentemente di colore bianco, il consumo di energia può essere superiore di 10 W, anche se le applicazioni attive sono poco esigenti, come indicato nella sezione Consumo di energia sopra. Siamo riusciti a registrare un'autonomia WLAN di sole 6 ore, rispetto alle 10 ore della configurazione IPS del ThinkPad Z16 o alle oltre 16 ore del MacBook Pro 16.
La ricarica da vuoto a pieno regime è più lenta del solito, con circa 2,5 ore rispetto alle 1,5-2 ore della maggior parte degli Ultrabook. Questo è uno dei pochi laptop con Ryzen 9 e grafica discreta ad essere alimentato da USB-C.
| Lenovo ThinkPad Z16 Gen 2 R9 PRO 7940HS, Radeon RX 6550M, 72 Wh | Lenovo ThinkPad Z16 G1 21D5S00T00 R7 PRO 6850H, Radeon RX 6500M, 72 Wh | Lenovo ThinkBook 16 G6 ABP R5 7530U, Vega 7, 45 Wh | MSI Creator Z16P B12UHST i9-12900H, GeForce RTX 3080 Ti Laptop GPU, 90 Wh | Asus Vivobook Pro 16X K6604JV-MX016W i9-13980HX, GeForce RTX 4060 Laptop GPU, 90 Wh | Apple MacBook Pro 16 2023 M3 Max Apple M3 Max 16-Core, M3 Max 40-Core GPU, 99.6 Wh | |
|---|---|---|---|---|---|---|
| Autonomia della batteria | 45% | 68% | -27% | -2% | 75% | |
| Reader / Idle (h) | 10.2 | |||||
| WiFi v1.3 (h) | 6 | 9.9 65% | 10.1 68% | 5.2 -13% | 6.5 8% | 16.7 178% |
| Load (h) | 1.7 | 2.1 24% | 1 -41% | 1.5 -12% | 1.2 -29% | |
| H.264 (h) | 11.9 | 11.6 | 5.8 | 5.3 | 20.4 |
Pro
Contro
Verdetto - Un grande design frenato da una GPU mediocre
Nella nostra recensione del modello originale Gen 1, abbiamo lodato il ThinkPad Z16 per la sua struttura robusta e attraente e per la tastiera e il trackpad confortevoli. Il modello Gen 2 mantiene tutti questi vantaggi, aggiungendo una CPU Ryzen Pro molto più veloce e un touchscreen OLED di alta qualità per prestazioni e colori notevolmente migliori, rispettivamente. Queste due aggiunte sono le ragioni principali per scegliere la versione Gen 2 rispetto alla Gen 1.
Il ThinkPad Z16 Gen 2 è decisamente elegante e sexy e la nuova CPU Zen 4 Pro non è da meno. La Radeon RX 6550M, tuttavia, è troppo poco e troppo tardi, soprattutto in questa fascia di prezzo.
La nuova Radeon RX 6550M aiuta anche a distinguere le due versioni del modello, ma le sue prestazioni non sono impressionanti, soprattutto se si considera il prezzo di oltre 1600 dollari. Non solo la GPU è di un'architettura AMD più vecchia, ma i laptop con GeForce RTX 3050 Ti si possono trovare a meno di mille dollari, pur offrendo un livello di prestazioni simile. La GPU Radeon è sicuramente uno degli aspetti più deboli della serie ThinkPad Z16.
Se non le interessa Ryzen Pro, allora il modello
Asus Vivobook Pro 16X o anche HP Spectre x360 serie 16 possono essere ottime alternative al ThinkPad Z16 Gen 2, in quanto offrono opzioni OLED simili e grafica discreta in telai sottili. Speriamo che le future revisioni di Lenovo includano GeForce RTX o le più recenti opzioni RDNA3.Prezzo e disponibilità
Lenovo sta distribuendo il ThinkPad Z16 Gen 2 a partire da 1.600 dollari per la configurazione Ryzen 5, GPU integrata e IPS a 1200p, fino a oltre 2.600 dollari come da recensione.
Lenovo ThinkPad Z16 Gen 2
- 12/16/2023 v7 (old)
Allen Ngo
Transparency
La selezione dei dispositivi da recensire viene effettuata dalla nostra redazione. Il campione di prova è stato fornito all'autore come prestito dal produttore o dal rivenditore ai fini di questa recensione. L'istituto di credito non ha avuto alcuna influenza su questa recensione, né il produttore ne ha ricevuto una copia prima della pubblicazione. Non vi era alcun obbligo di pubblicare questa recensione. In quanto società mediatica indipendente, Notebookcheck non è soggetta all'autorità di produttori, rivenditori o editori.
Ecco come Notebookcheck esegue i test
Ogni anno, Notebookcheck esamina in modo indipendente centinaia di laptop e smartphone utilizzando procedure standardizzate per garantire che tutti i risultati siano comparabili. Da circa 20 anni sviluppiamo continuamente i nostri metodi di prova e nel frattempo stabiliamo gli standard di settore. Nei nostri laboratori di prova, tecnici ed editori esperti utilizzano apparecchiature di misurazione di alta qualità. Questi test comportano un processo di validazione in più fasi. Il nostro complesso sistema di valutazione si basa su centinaia di misurazioni e parametri di riferimento ben fondati, che mantengono l'obiettività.Price comparison

