Recensione del Lenovo ThinkPad P1 G6: GeForce RTX 4080 da 80 W per una workstation ultrasottile

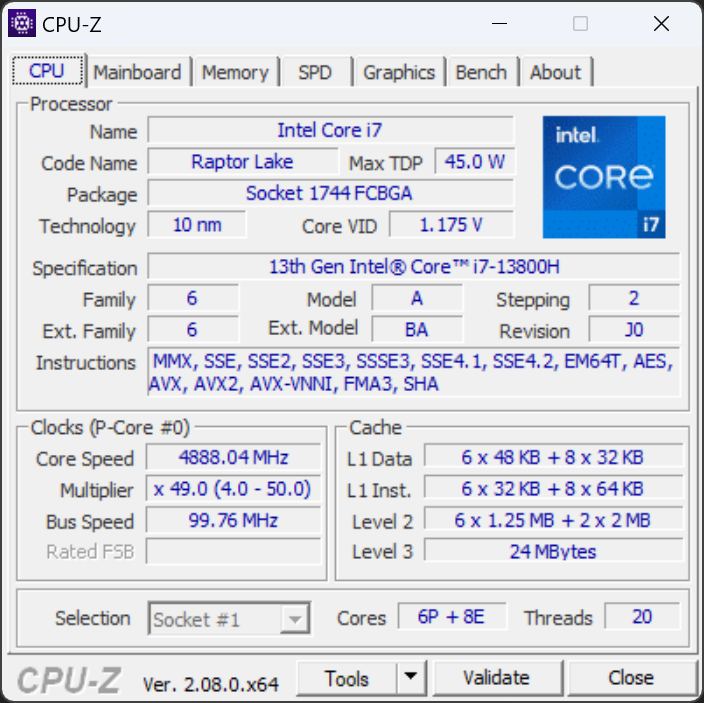
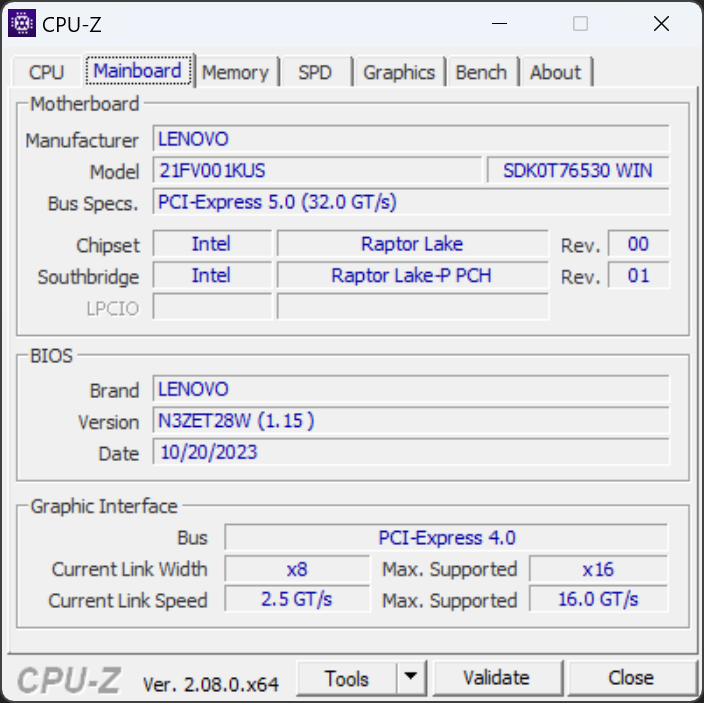
Recentemente abbiamo recensito il ThinkPad P1 G6 con la CPU Core i9-13900H, la GPU RTX 2000 e il display IPS da 1600p e abbiamo scoperto che si tratta di una workstation da 16 pollici molto competitiva. Questa volta, siamo pronti a verificare una seconda configurazione con il Core i7-13800H, la GPU RTX 4080 di GeForce e il display OLED a 2400p, per vedere come le diverse specifiche possono influire sulle prestazioni, sulla durata della batteria, sull'hardware interno e altro ancora.
Si noti che la serie ThinkPad P1 16 non deve essere confusa con la serie ThinkPad P16 Serie ThinkPad P16 che consiste in modelli più grandi e pesanti con opzioni più veloci della serie Core HX.
Altre recensioni Lenovo:
Potenziali concorrenti a confronto
Punteggio | Data | Modello | Peso | Altezza | Dimensione | Risoluzione | Prezzo |
|---|---|---|---|---|---|---|---|
| 90.1 % v7 (old) | 12/2023 | Lenovo ThinkPad P1 G6 21FV001KUS i7-13800H, GeForce RTX 4080 Laptop GPU | 1.9 kg | 17.5 mm | 16.00" | 3480x2400 | |
| 91.7 % v7 (old) | 10/2023 | Lenovo ThinkPad P1 G6-21FV000DGE i9-13900H, RTX 2000 Ada Generation Laptop | 1.9 kg | 17.5 mm | 16.00" | 2560x1600 | |
| 89.8 % v7 (old) | 11/2021 | Lenovo ThinkPad P1 G4-20Y4S0KS00 i7-11850H, GeForce RTX 3070 Laptop GPU | 2 kg | 17.7 mm | 16.00" | 3840x2400 | |
| 91 % v7 (old) | 02/2023 | Lenovo ThinkPad P16 G1 RTX A5500 i9-12950HX, RTX A5500 Laptop GPU | 3 kg | 30.23 mm | 16.00" | 3840x2400 | |
| 89 % v7 (old) | 08/2023 | Dell Precision 5000 5680 i9-13900H, RTX 5000 Ada Generation Laptop | 2.3 kg | 22.17 mm | 16.00" | 3840x2400 | |
| 92.3 % v7 (old) | 09/2023 | HP ZBook Fury 16 G10 i9-13950HX, RTX 5000 Ada Generation Laptop | 2.6 kg | 28.5 mm | 16.00" | 3840x2400 |
Lettore di schede SD
| SD Card Reader | |
| average JPG Copy Test (av. of 3 runs) | |
| Dell Precision 5000 5680 (Toshiba Exceria Pro SDXC 64 GB UHS-II) | |
| Lenovo ThinkPad P1 G6 21FV001KUS (Toshiba Exceria Pro SDXC 64 GB UHS-II) | |
| HP ZBook Fury 16 G10 (Toshiba Exceria Pro SDXC 64 GB UHS-II) | |
| Lenovo ThinkPad P1 G6-21FV000DGE (Angelbird AV Pro V60) | |
| Lenovo ThinkPad P16 G1 RTX A5500 (Toshiba Exceria Pro SDXC 64 GB UHS-II) | |
| maximum AS SSD Seq Read Test (1GB) | |
| Dell Precision 5000 5680 (Toshiba Exceria Pro SDXC 64 GB UHS-II) | |
| Lenovo ThinkPad P1 G6 21FV001KUS (Toshiba Exceria Pro SDXC 64 GB UHS-II) | |
| HP ZBook Fury 16 G10 (Toshiba Exceria Pro SDXC 64 GB UHS-II) | |
| Lenovo ThinkPad P1 G6-21FV000DGE (Angelbird AV Pro V60) | |
| Lenovo ThinkPad P16 G1 RTX A5500 (Toshiba Exceria Pro SDXC 64 GB UHS-II) | |
Comunicazione
Mentre le velocità di ricezione sono costanti, le velocità di trasmissione tendono ad essere più lente e con maggiori fluttuazioni del previsto, anche dopo aver ripetuto i test.
Webcam
L'unità è stata configurata con una webcam da 5 MP a 1440p, rispetto alla webcam da 2 MP a 1080p della nostra recensione originale con RTX 2000, per un'immagine più nitida.
L'IR e l'otturatore fisico sono di serie.


Manutenzione
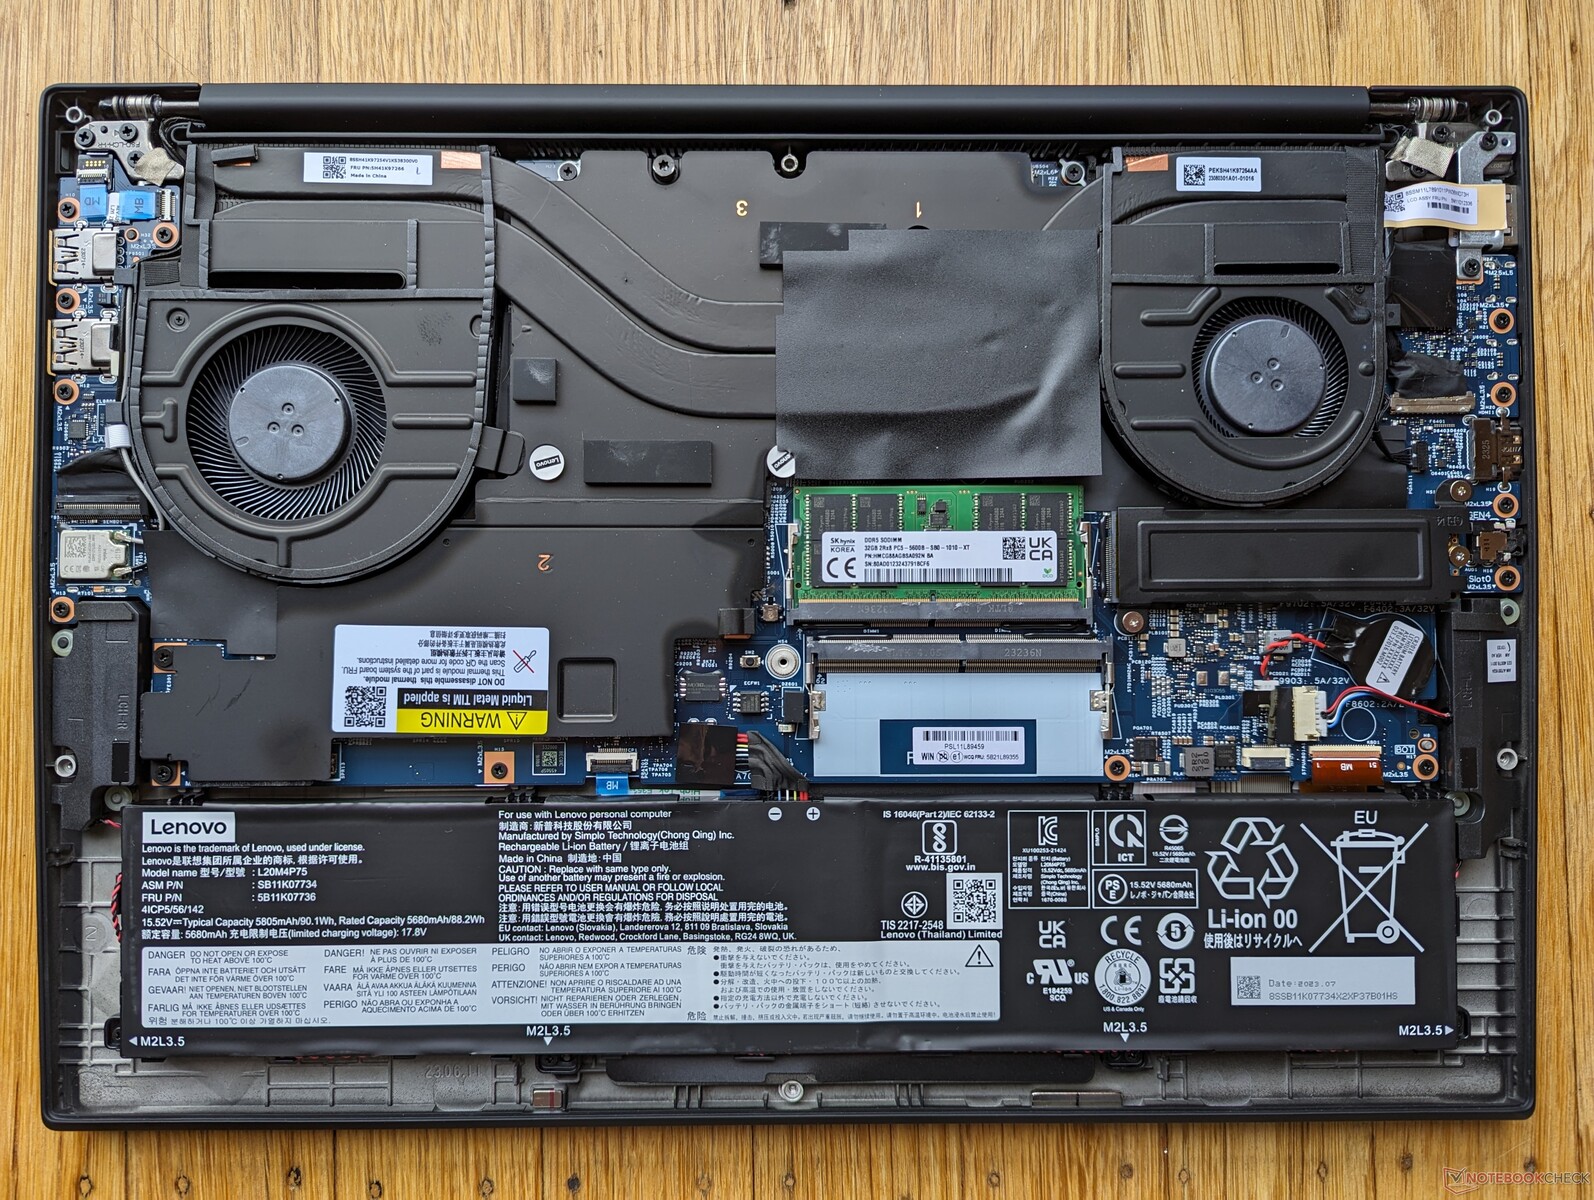
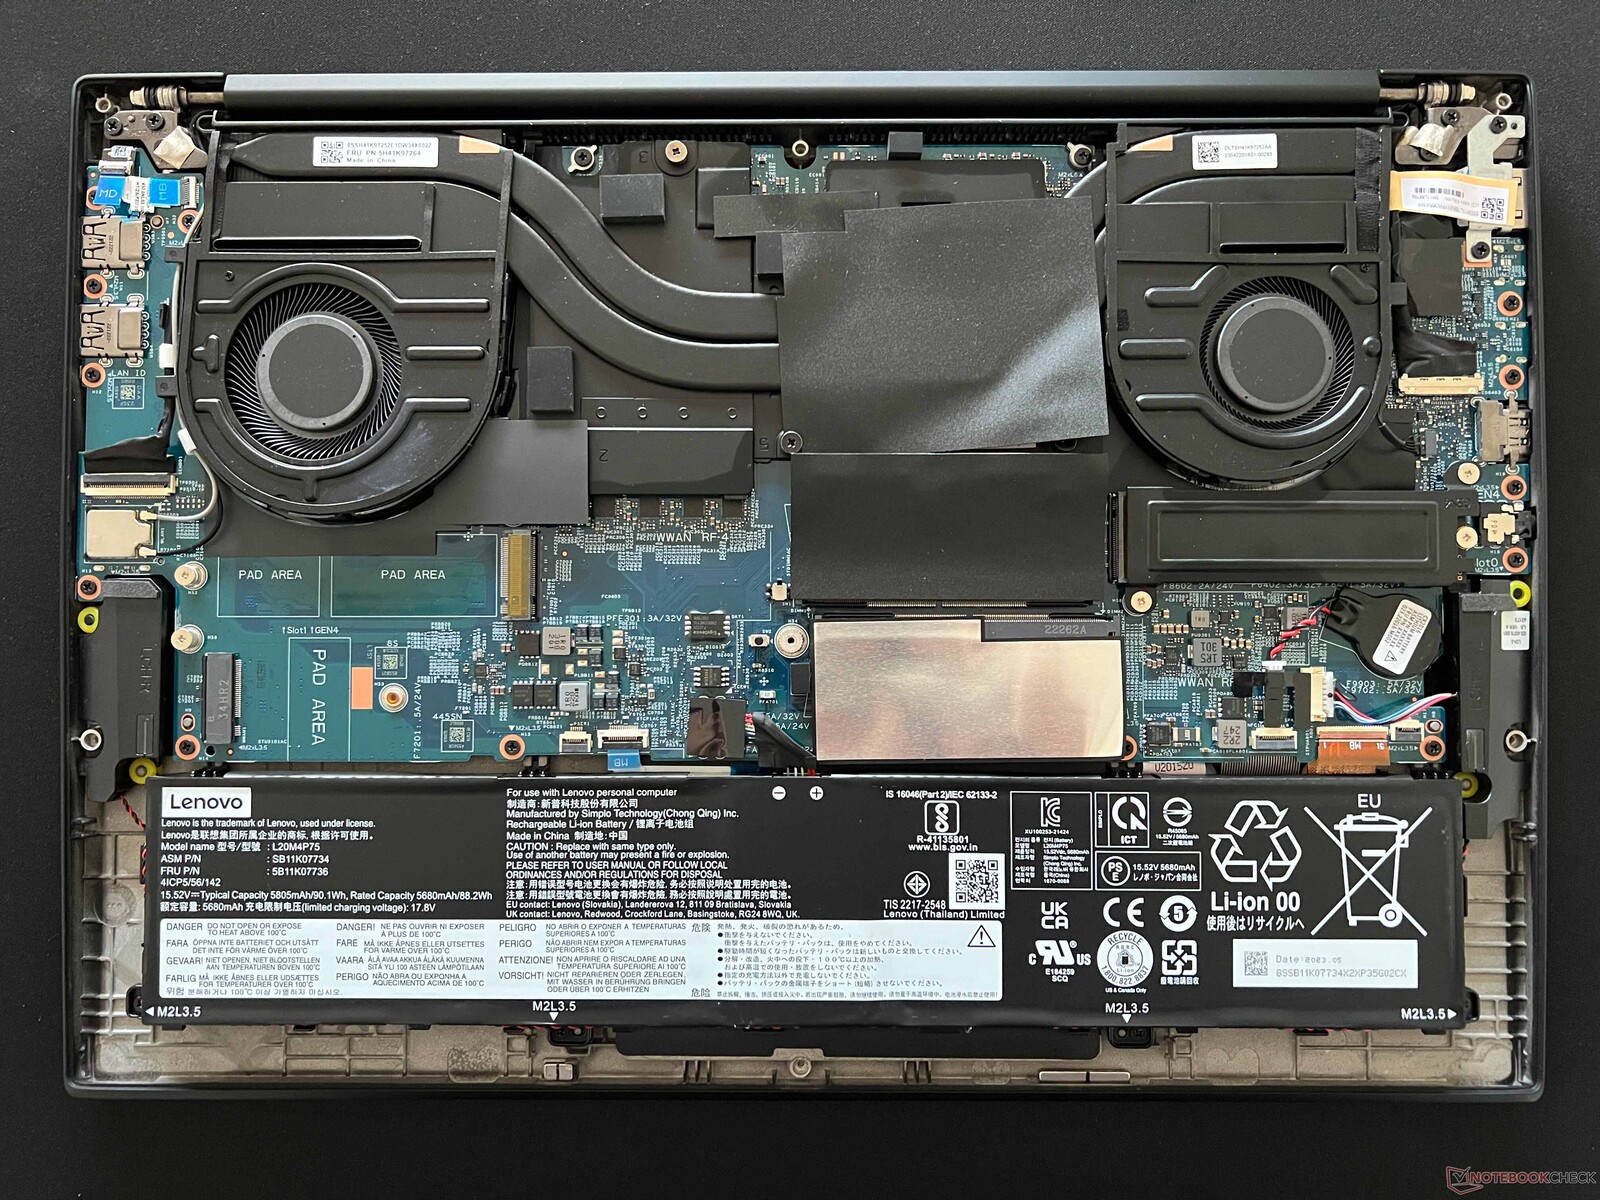
Rispetto alla configurazione ThinkPad P1 G6 RTX 2000, la configurazione RTX 4080 integra una soluzione di raffreddamento ampliata con una ventola più grande, per accogliere la GPU più esigente. Sfortunatamente, questo comporta la perdita di due slot di espansione, come mostrano le immagini di confronto qui sotto.
Accessori e garanzia
Non ci sono extra inclusi nella confezione, a parte il solito adattatore CA e la documentazione cartacea. Purtroppo, la garanzia limitata standard è di soli 12 mesi se acquistata negli Stati Uniti, rispetto ai 36 mesi di molti modelli Dell Precision.
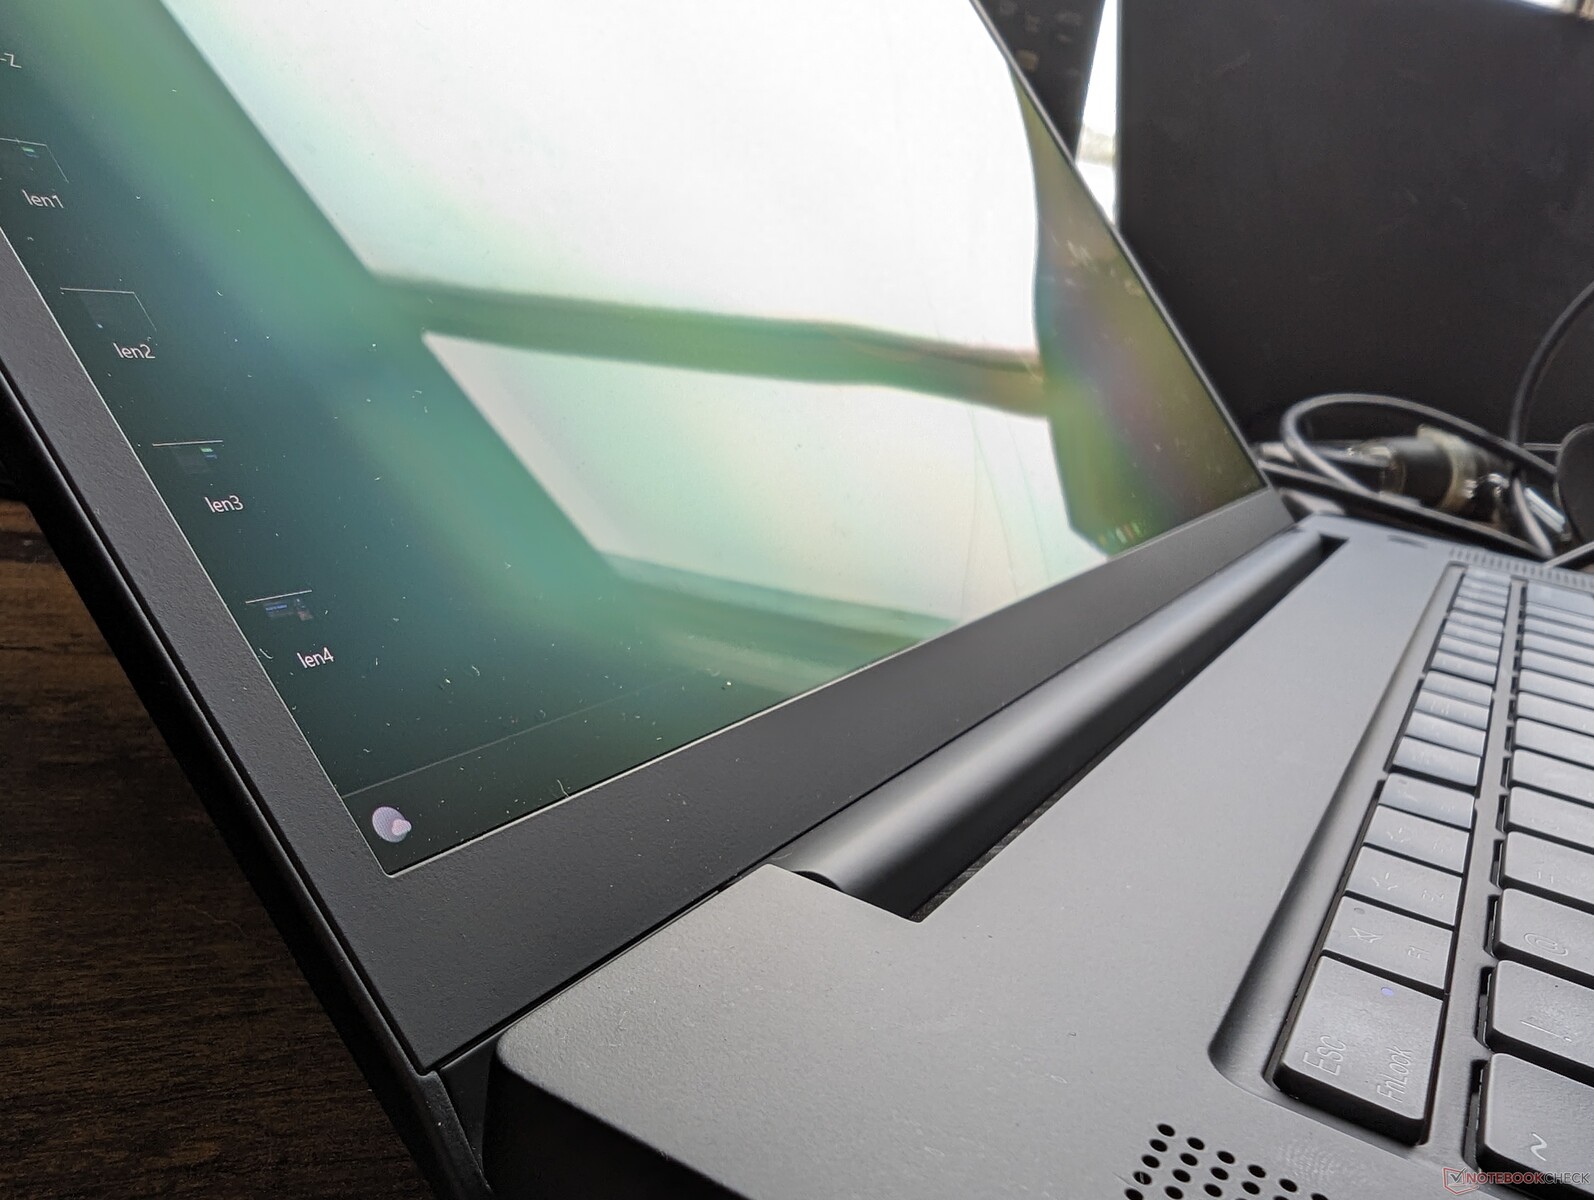
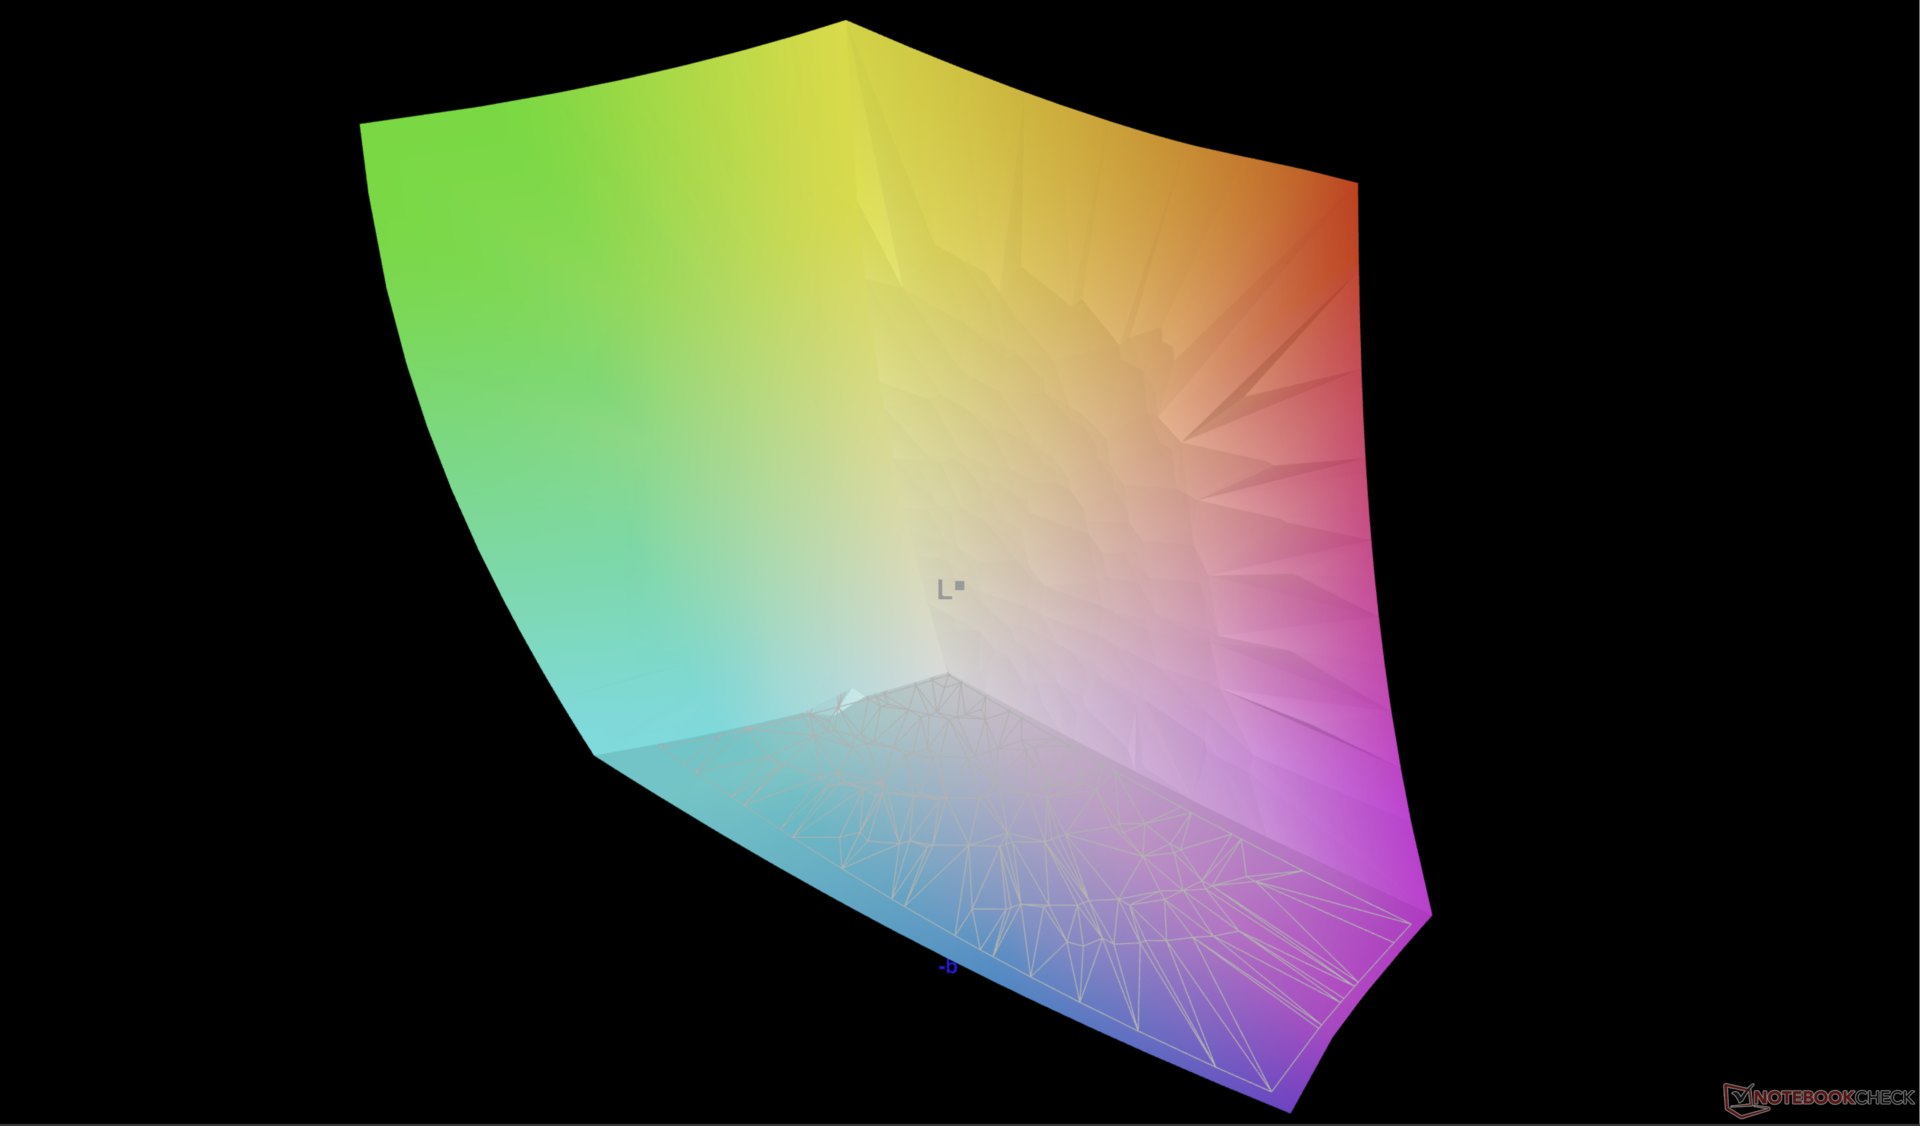
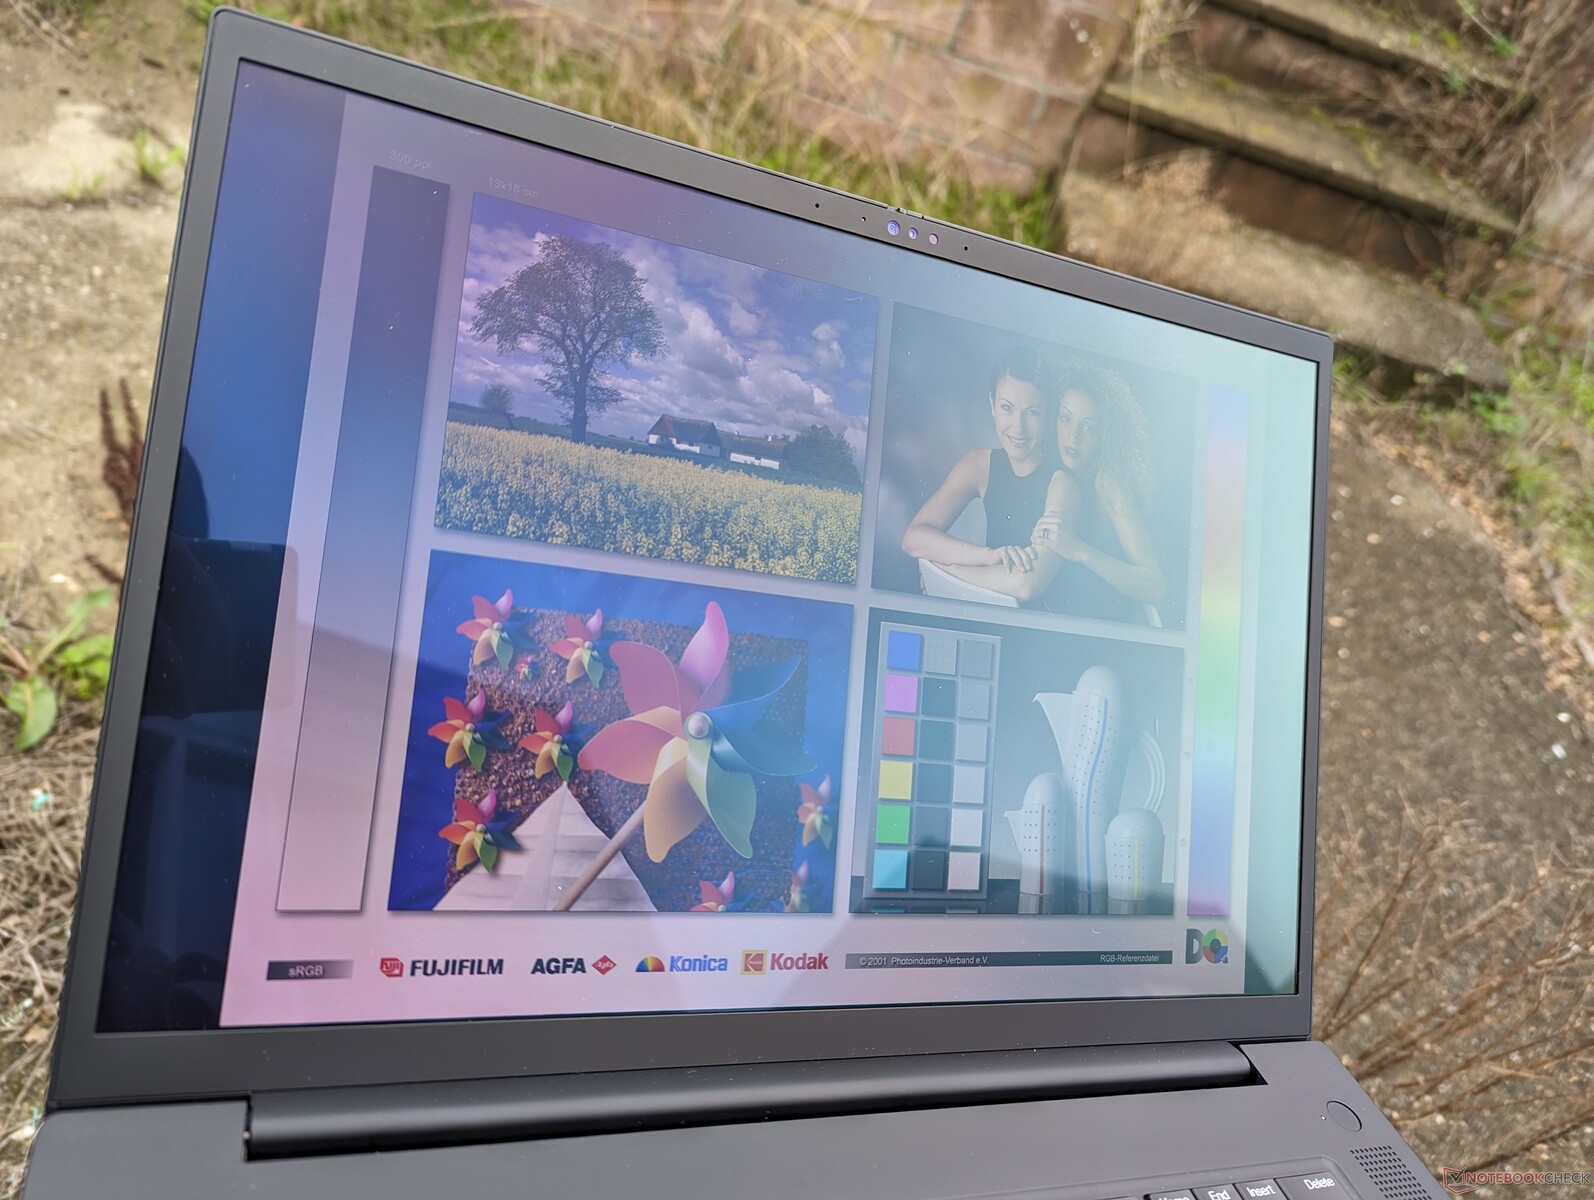
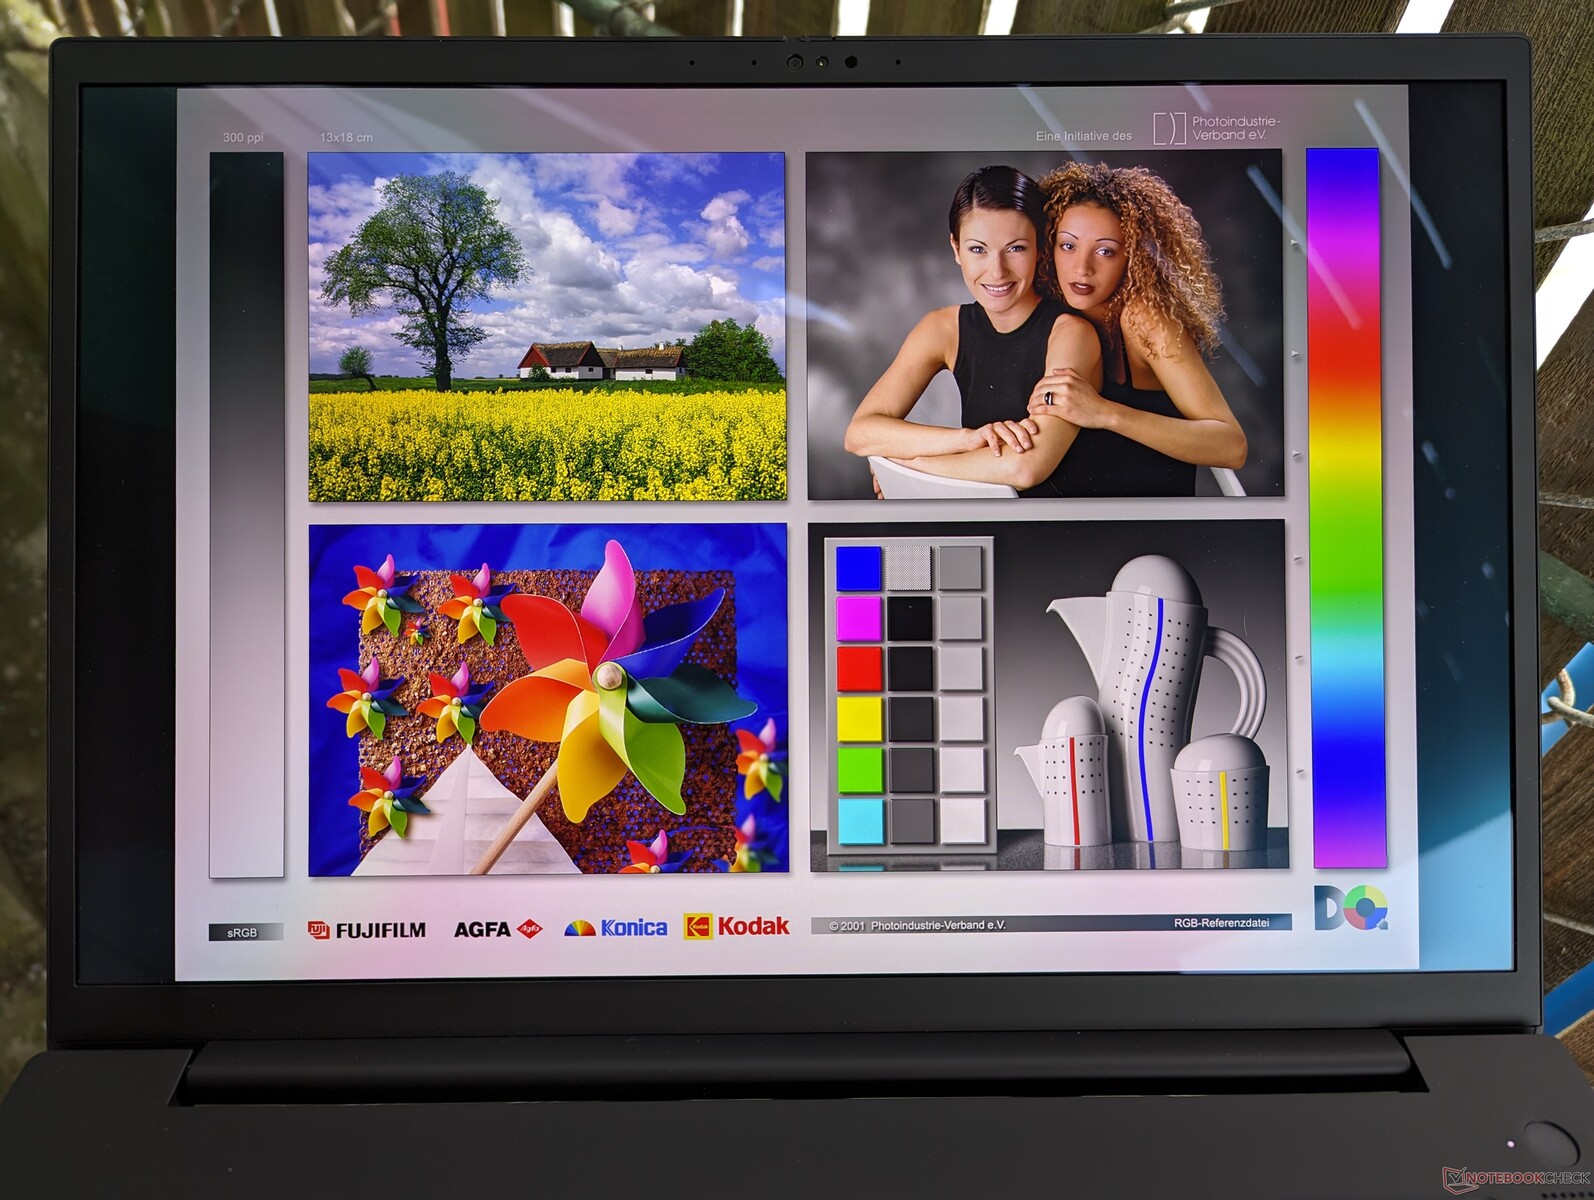
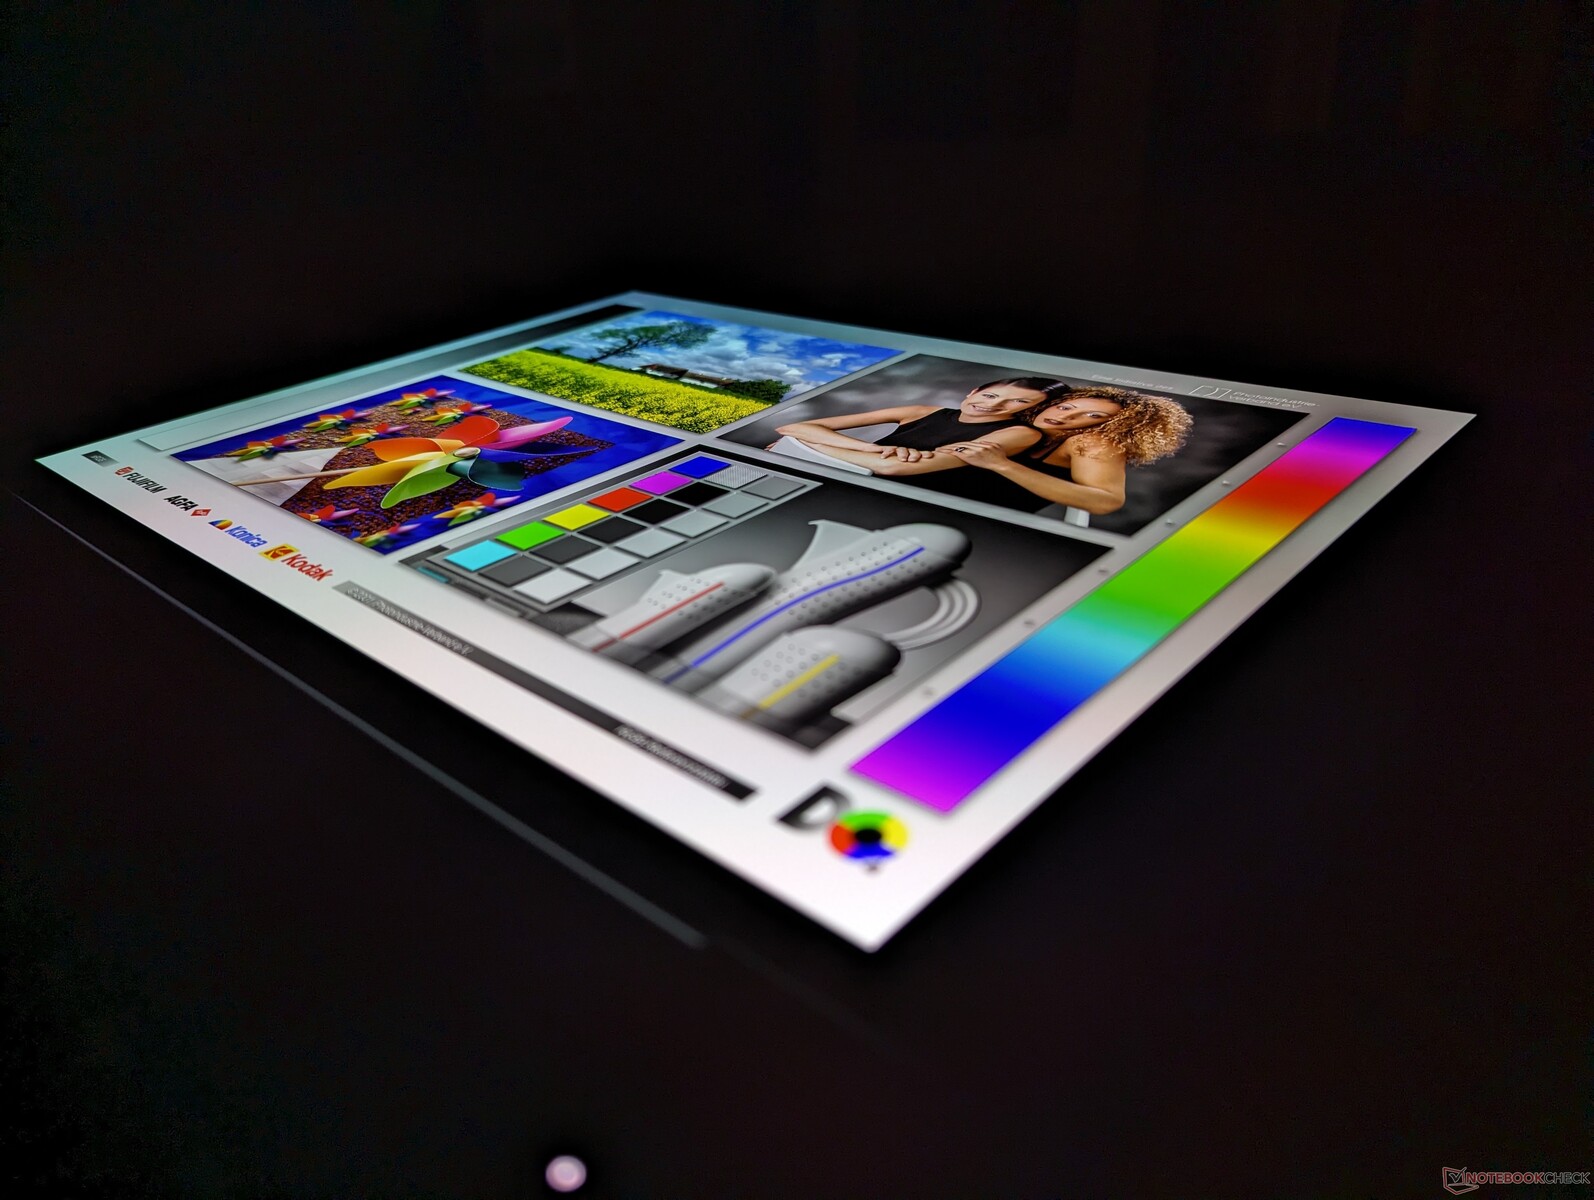
Display - HDR400 con colori DCI-P3
Il pannello OLED 4K offre colori superiori, tempi di risposta più rapidi, funzionalità touchscreen e una risoluzione nativa più densa rispetto al pannello IPS 2K della nostra precedente configurazione con RTX 2000. Tuttavia, questi vantaggi hanno il costo di una frequenza di aggiornamento nativa più lenta, pari a soli 60 Hz, e di una luminosità massima più debole, come mostra la nostra tabella sottostante. Pertanto, il pannello IPS potrebbe essere preferibile a seconda dell'applicazione. È un peccato che Lenovo non offra opzioni OLED a 120 Hz come il modello Vivobook Pro 16X.

| |||||||||||||||||||||||||
Distribuzione della luminosità: 98 %
Al centro con la batteria: 375.1 cd/m²
Contrasto: ∞:1 (Nero: 0 cd/m²)
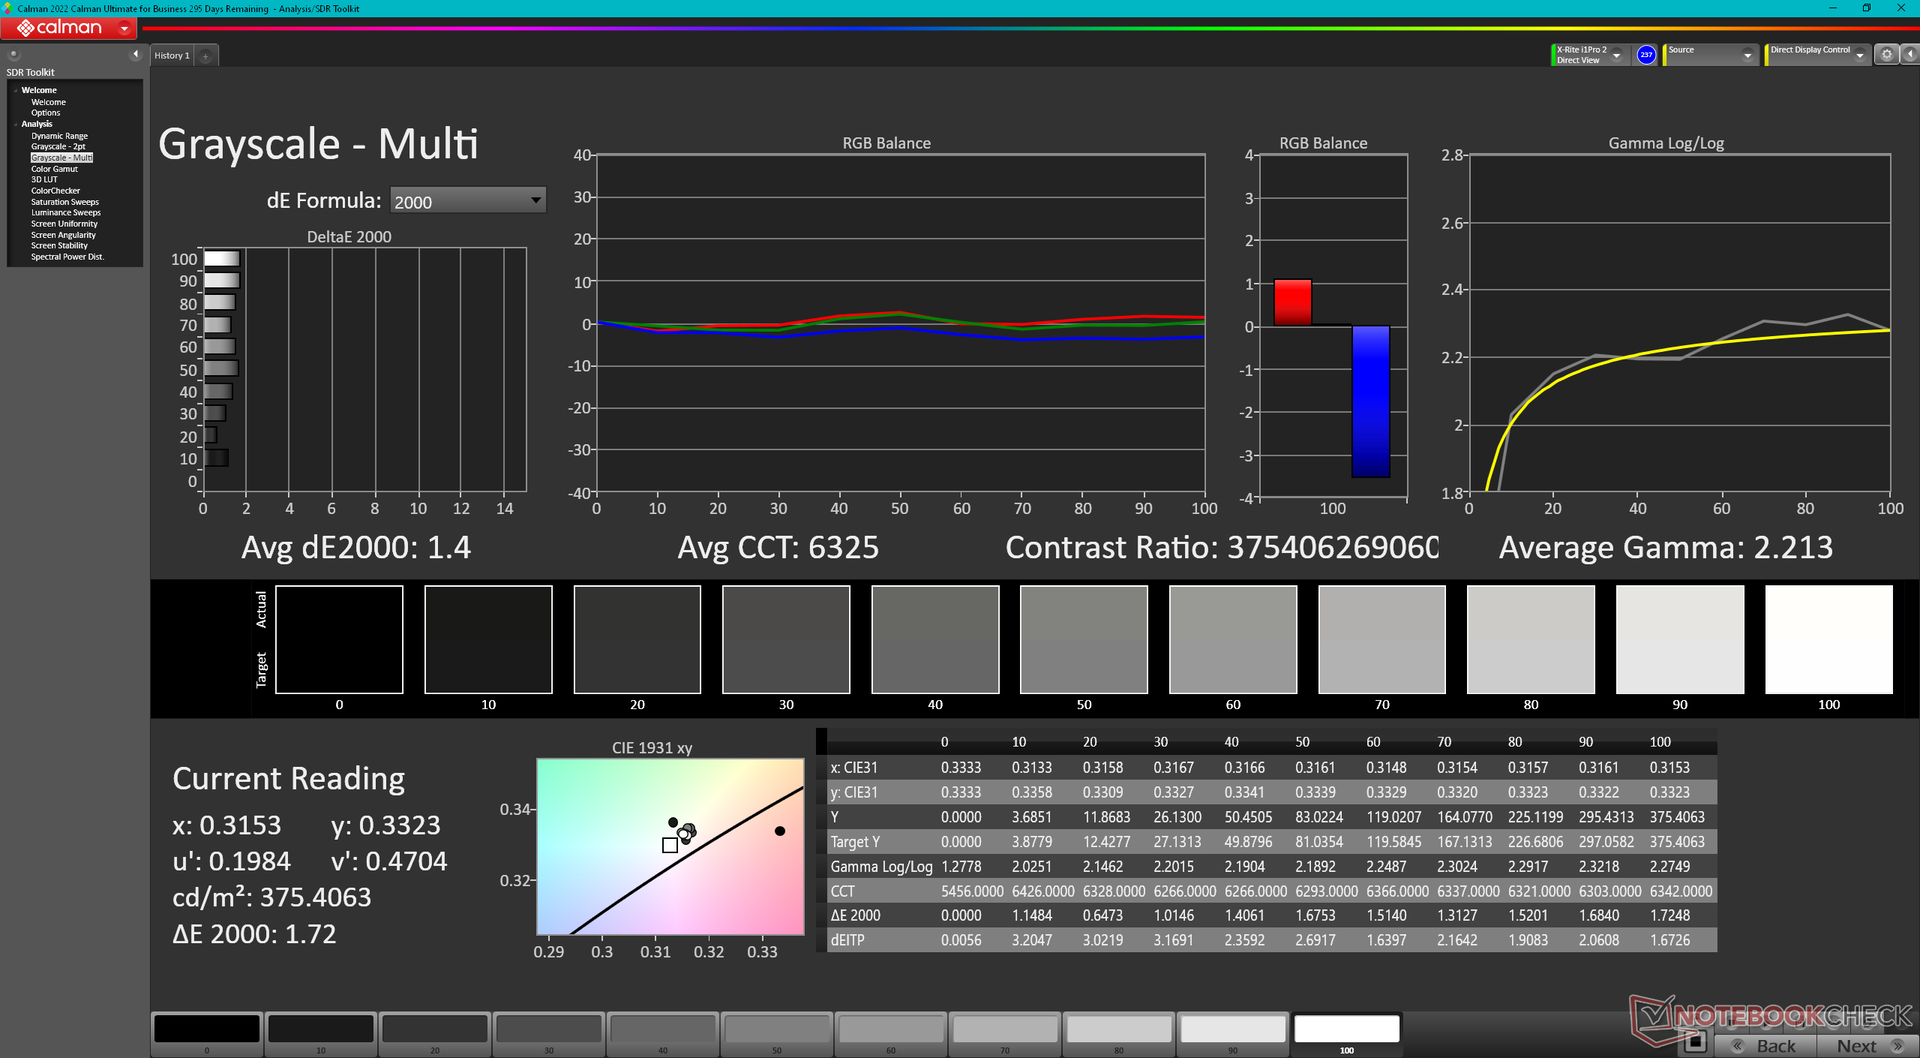
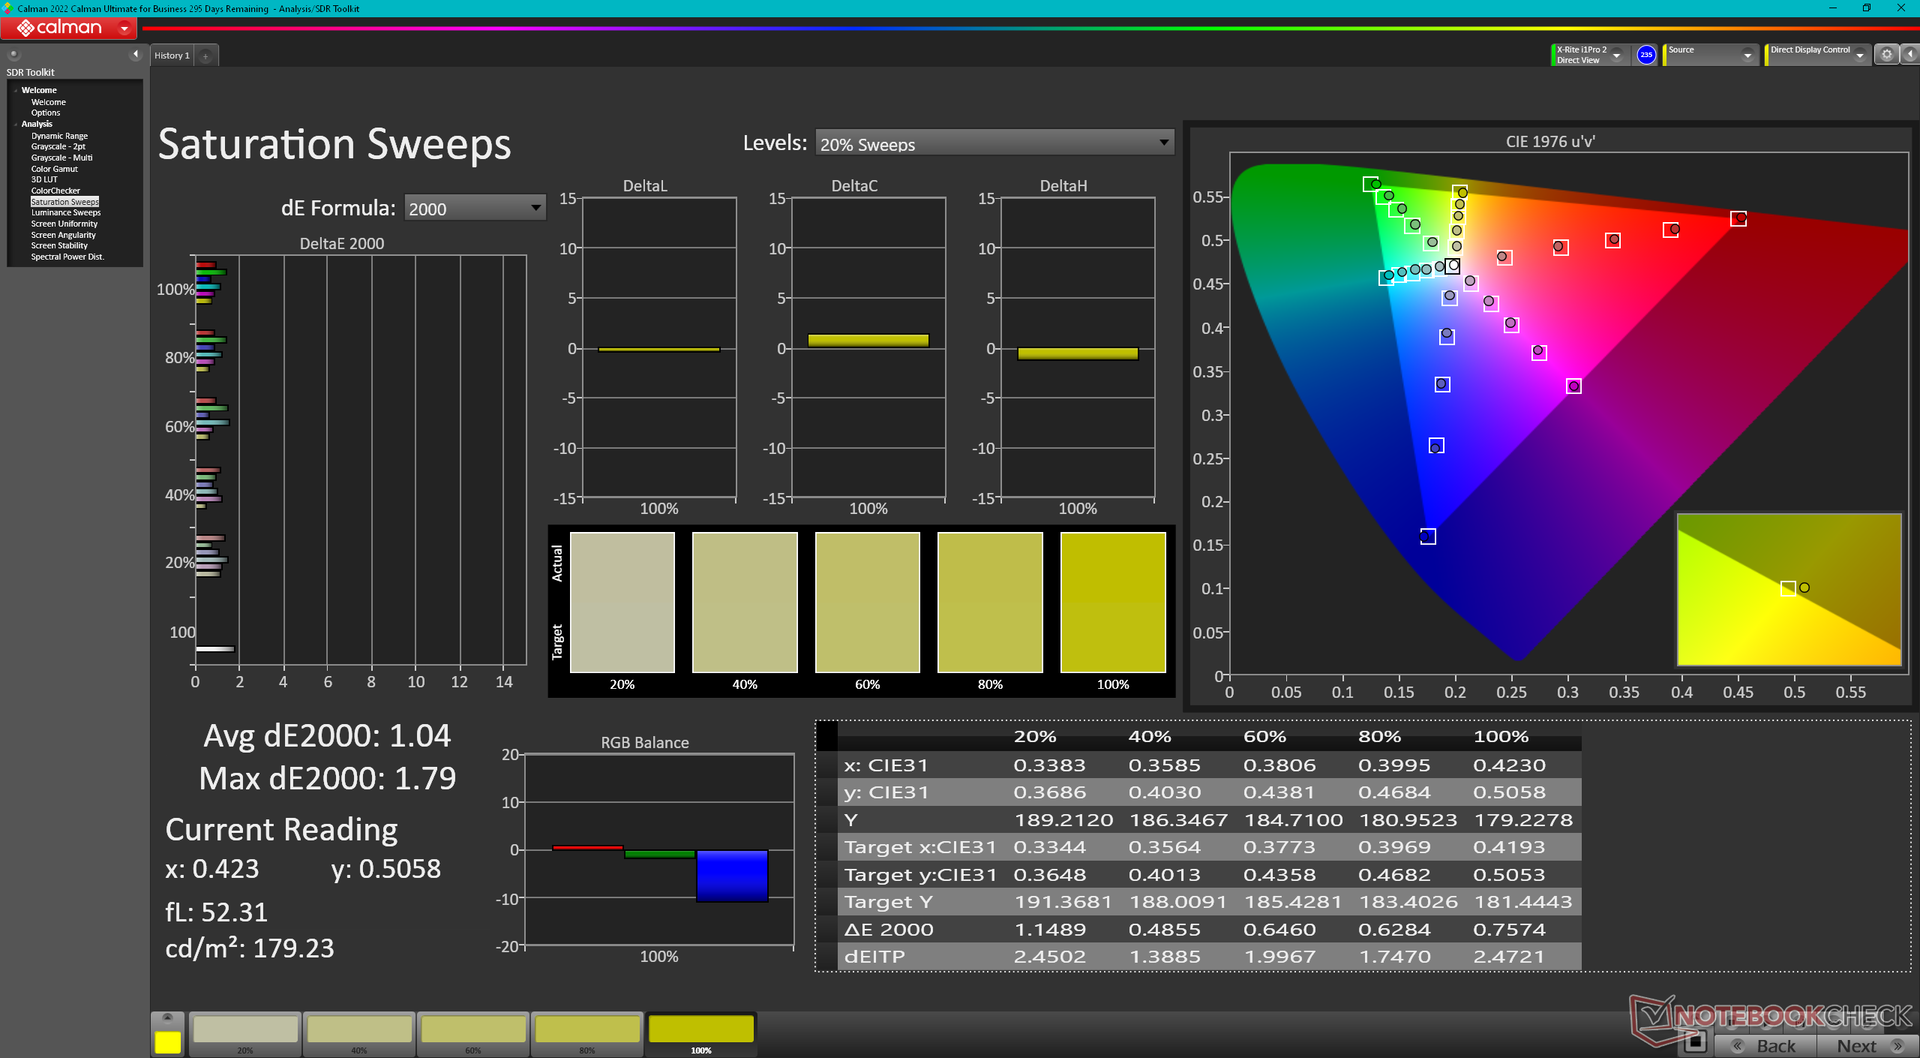
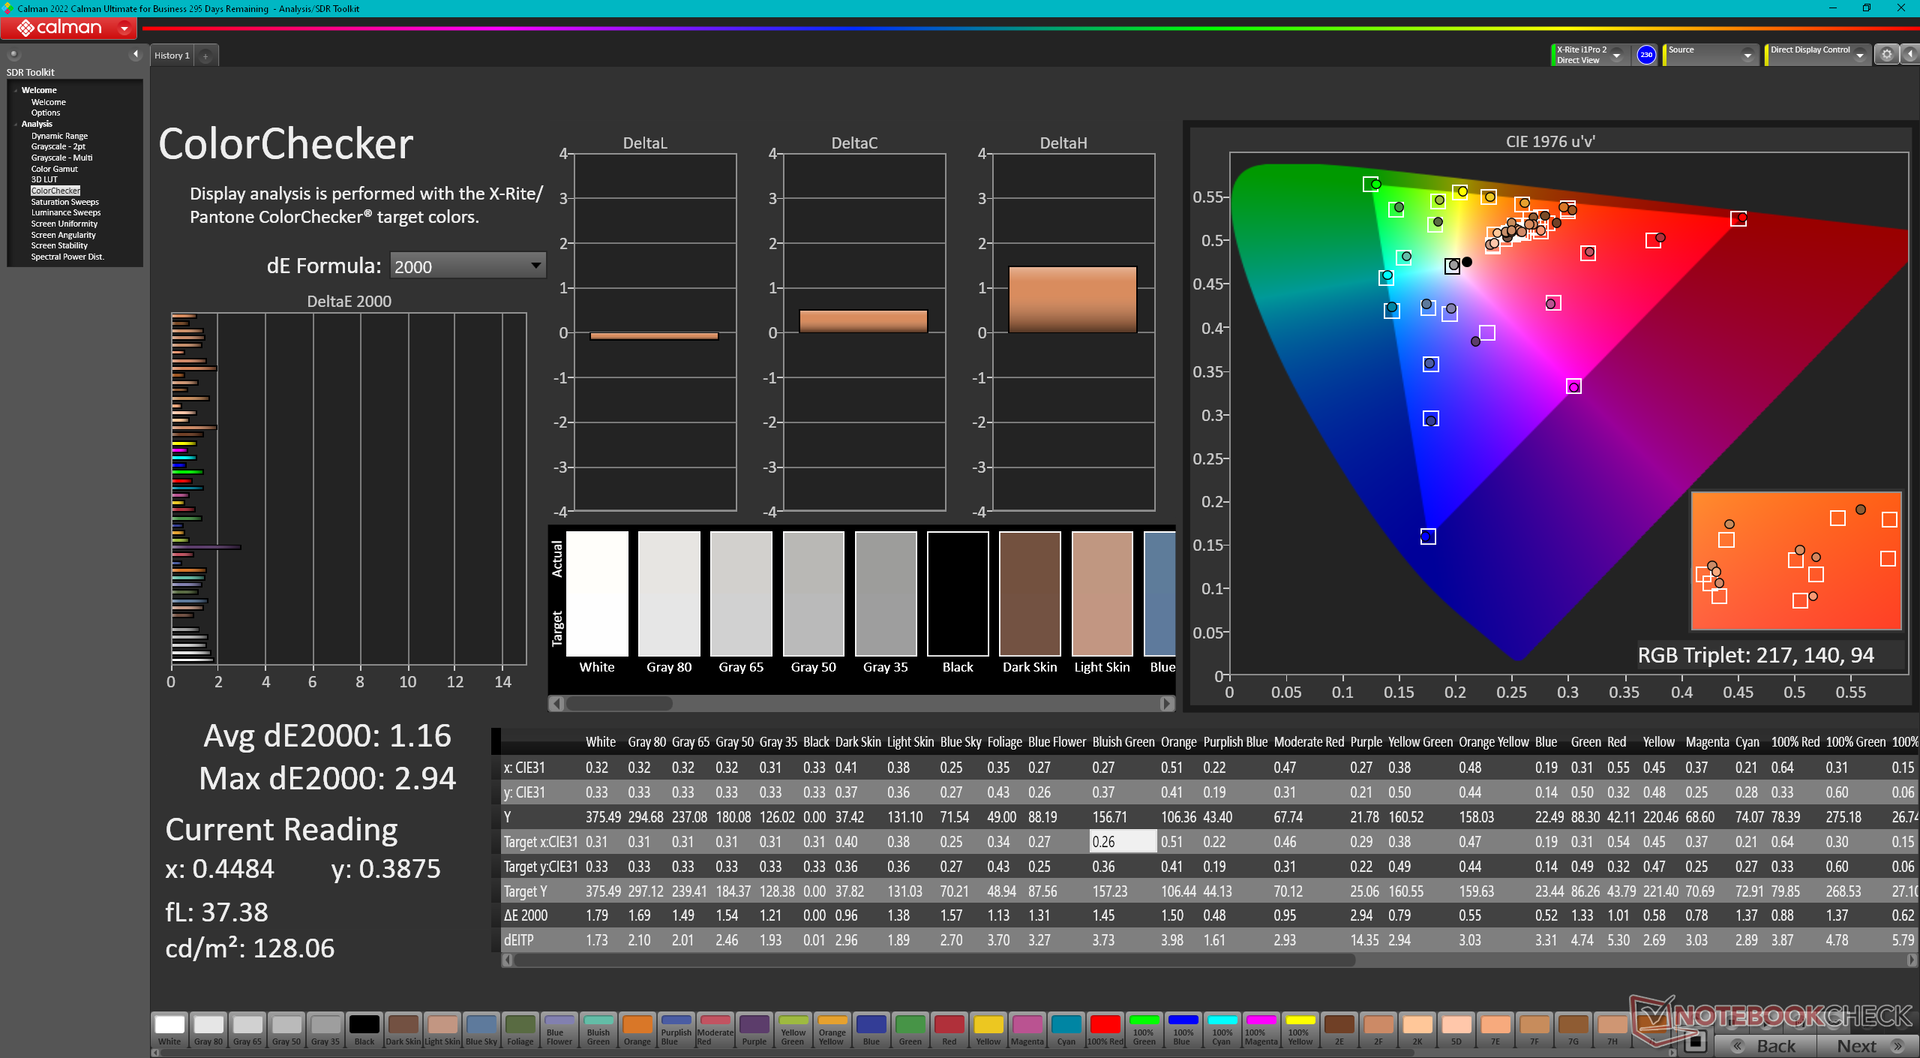
ΔE ColorChecker Calman: 1.16 | ∀{0.5-29.43 Ø4.71}
ΔE Greyscale Calman: 1.4 | ∀{0.09-98 Ø4.96}
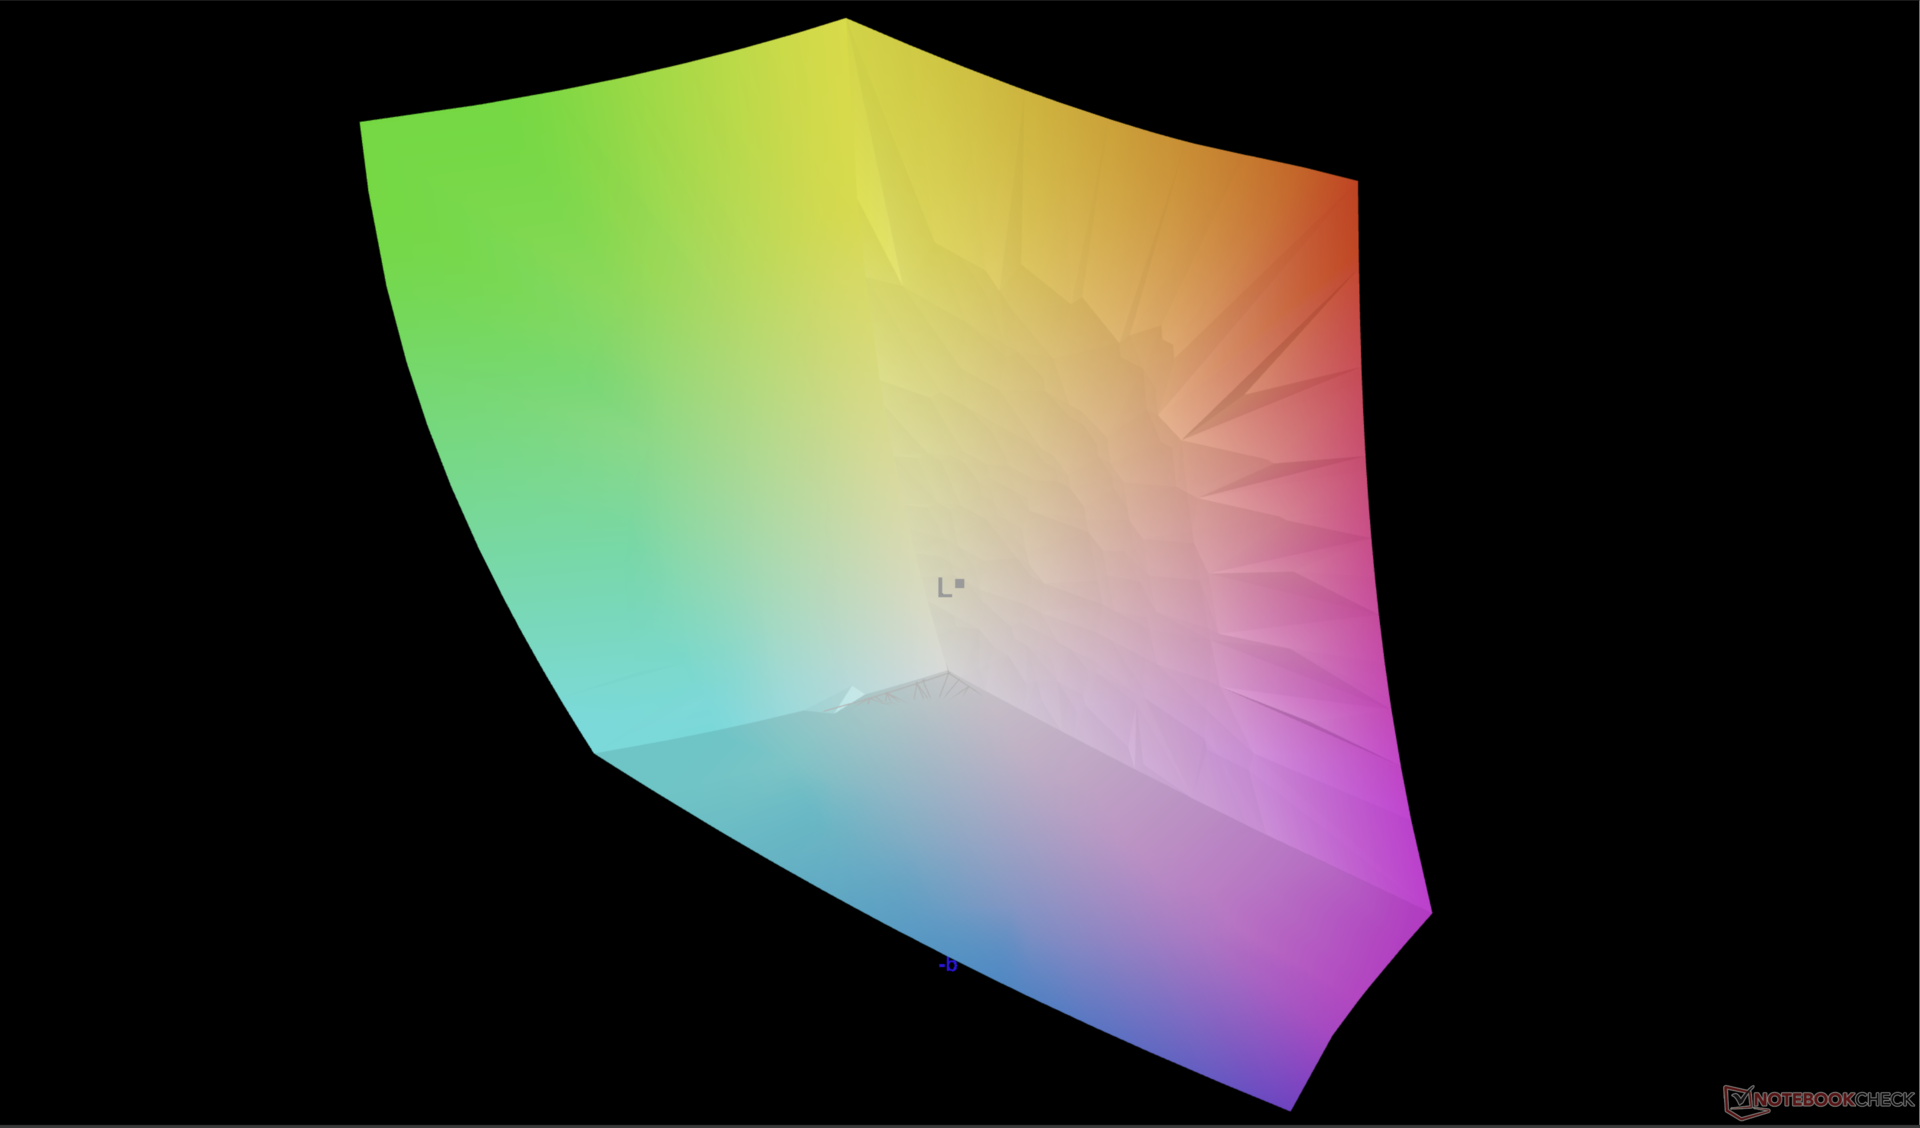
97.9% AdobeRGB 1998 (Argyll 3D)
100% sRGB (Argyll 3D)
99.8% Display P3 (Argyll 3D)
Gamma: 2.2
CCT: 6325 K
| Lenovo ThinkPad P1 G6 21FV001KUS Samsung ATNA60YV04-0, OLED, 3480x2400, 16" | Lenovo ThinkPad P1 G6-21FV000DGE NE160QDM-NY1, IPS, 2560x1600, 16" | Lenovo ThinkPad P1 G4-20Y4S0KS00 LP160UQ1-SPB1, IPS LED, 3840x2400, 16" | Lenovo ThinkPad P16 G1 RTX A5500 LP160UQ1-SPB1, IPS, 3840x2400, 16" | Dell Precision 5000 5680 Samsung 160YV03, OLED, 3840x2400, 16" | HP ZBook Fury 16 G10 AUO87A8, IPS, 3840x2400, 16" | |
|---|---|---|---|---|---|---|
| Display | -21% | -5% | -7% | 0% | -5% | |
| Display P3 Coverage (%) | 99.8 | 68.1 -32% | 85.7 -14% | 82.9 -17% | 99.9 0% | 98 -2% |
| sRGB Coverage (%) | 100 | 97.5 -2% | 99.4 -1% | 98.9 -1% | 100 0% | 99.9 0% |
| AdobeRGB 1998 Coverage (%) | 97.9 | 70.2 -28% | 98.9 1% | 95.9 -2% | 97.5 0% | 86.2 -12% |
| Response Times | -583% | -2435% | -2313% | -1% | -530% | |
| Response Time Grey 50% / Grey 80% * (ms) | 1.69 ? | 13.7 ? -711% | 55.2 ? -3166% | 45.6 ? -2598% | 1.68 ? 1% | 11.9 ? -604% |
| Response Time Black / White * (ms) | 1.73 ? | 9.6 ? -455% | 31.2 ? -1703% | 36.8 ? -2027% | 1.77 ? -2% | 9.6 ? -455% |
| PWM Frequency (Hz) | 60 ? | 60 ? | ||||
| Screen | 12% | -22% | -27% | -81% | -14% | |
| Brightness middle (cd/m²) | 375.1 | 521 39% | 630 68% | 601.9 60% | 345.7 -8% | 514.6 37% |
| Brightness (cd/m²) | 379 | 484 28% | 622 64% | 569 50% | 349 -8% | 495 31% |
| Brightness Distribution (%) | 98 | 89 -9% | 90 -8% | 77 -21% | 98 0% | 90 -8% |
| Black Level * (cd/m²) | 0.36 | 0.41 | 0.47 | 0.46 | ||
| Colorchecker dE 2000 * | 1.16 | 1.2 -3% | 2.2 -90% | 2.45 -111% | 3.59 -209% | 2.4 -107% |
| Colorchecker dE 2000 max. * | 2.94 | 2.5 15% | 5 -70% | 4.46 -52% | 7.02 -139% | 4.86 -65% |
| Greyscale dE 2000 * | 1.4 | 1.4 -0% | 2.7 -93% | 2.6 -86% | 3.1 -121% | 1 29% |
| Gamma | 2.2 100% | 2.25 98% | 2.26 97% | 2.3 96% | 2.13 103% | 2.3 96% |
| CCT | 6325 103% | 6682 97% | 6886 94% | 6805 96% | 6448 101% | 6553 99% |
| Contrast (:1) | 1447 | 1537 | 1281 | 1119 | ||
| Colorchecker dE 2000 calibrated * | 1 | 1 | 0.99 | 0.4 | ||
| Media totale (Programma / Settaggio) | -197% /
-105% | -821% /
-456% | -782% /
-437% | -27% /
-44% | -183% /
-105% |
* ... Meglio usare valori piccoli
Il display viene fornito pre-calibrato con valori medi di deltaE della scala di grigi e del colore di appena 1,4 e 1,16, rispettivamente. Un'ulteriore calibrazione non è quindi necessaria per la maggior parte degli utenti.
Tempi di risposta del Display
| ↔ Tempi di risposta dal Nero al Bianco | ||
|---|---|---|
| 1.73 ms ... aumenta ↗ e diminuisce ↘ combinato | ↗ 0.77 ms Incremento | 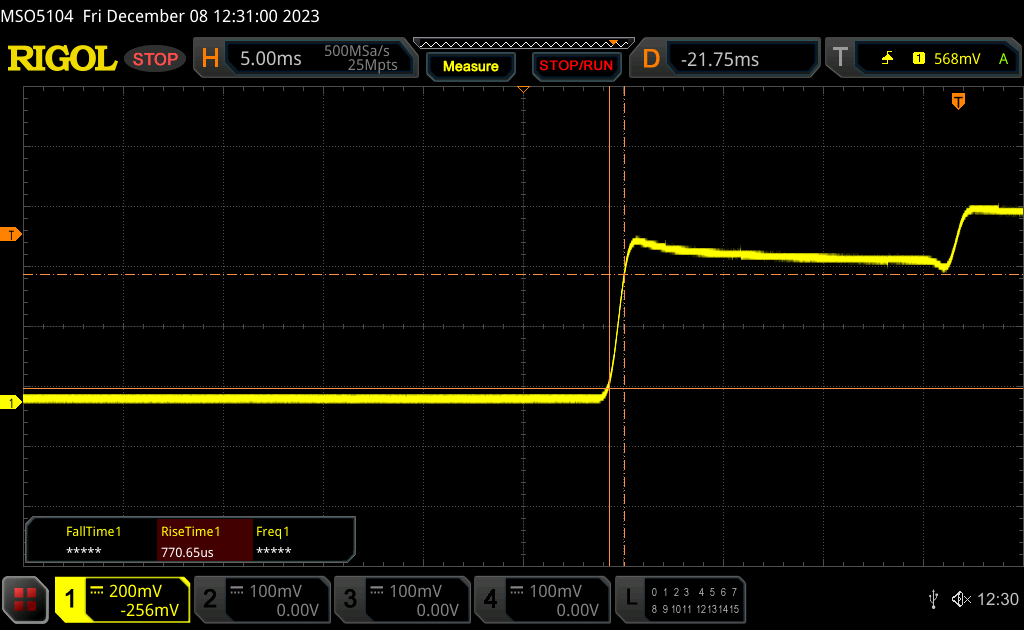 |
| ↘ 0.96 ms Calo | ||
| Lo schermo ha mostrato valori di risposta molto veloci nei nostri tests ed è molto adatto per i gaming veloce. In confronto, tutti i dispositivi di test variano da 0.1 (minimo) a 240 (massimo) ms. » 10 % di tutti i dispositivi è migliore. Questo significa che i tempi di risposta rilevati sono migliori rispettto alla media di tutti i dispositivi testati (19.8 ms). | ||
| ↔ Tempo di risposta dal 50% Grigio all'80% Grigio | ||
| 1.69 ms ... aumenta ↗ e diminuisce ↘ combinato | ↗ 0.89 ms Incremento | 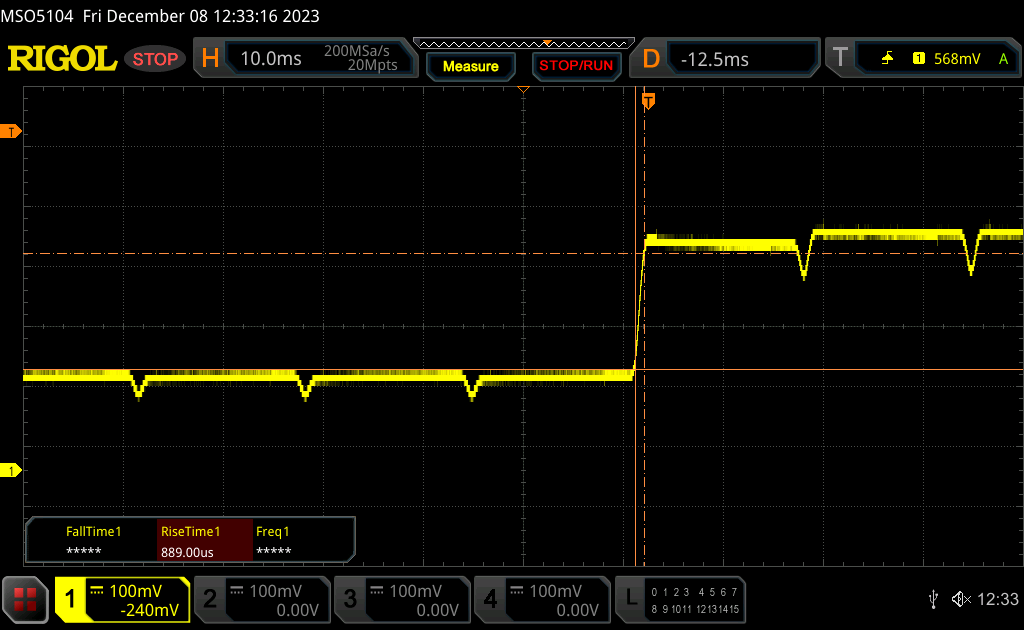 |
| ↘ 0.8 ms Calo | ||
| Lo schermo ha mostrato valori di risposta molto veloci nei nostri tests ed è molto adatto per i gaming veloce. In confronto, tutti i dispositivi di test variano da 0.165 (minimo) a 636 (massimo) ms. » 9 % di tutti i dispositivi è migliore. Questo significa che i tempi di risposta rilevati sono migliori rispettto alla media di tutti i dispositivi testati (31 ms). | ||
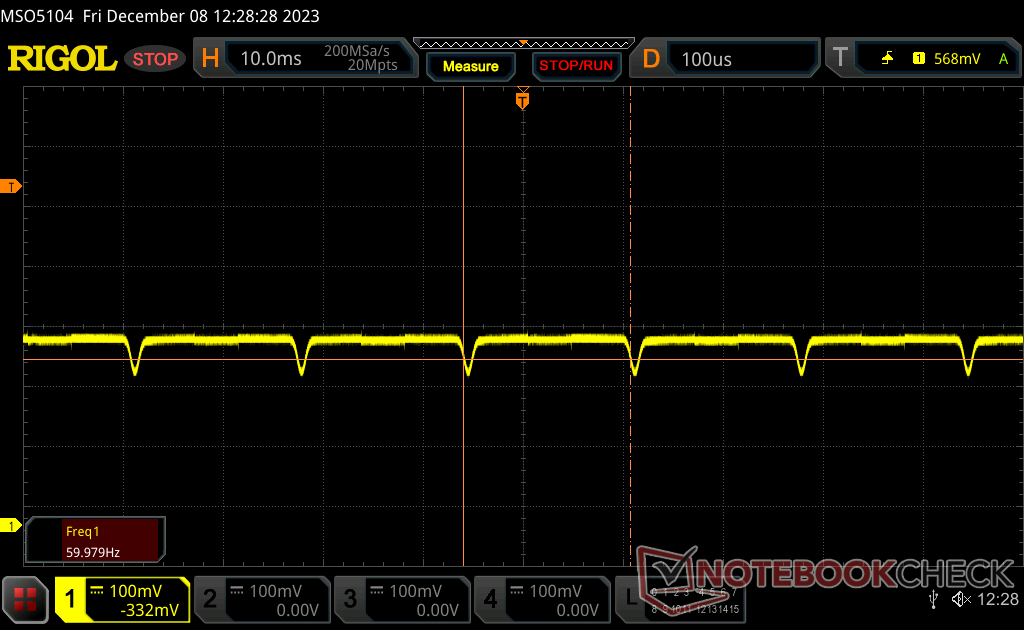
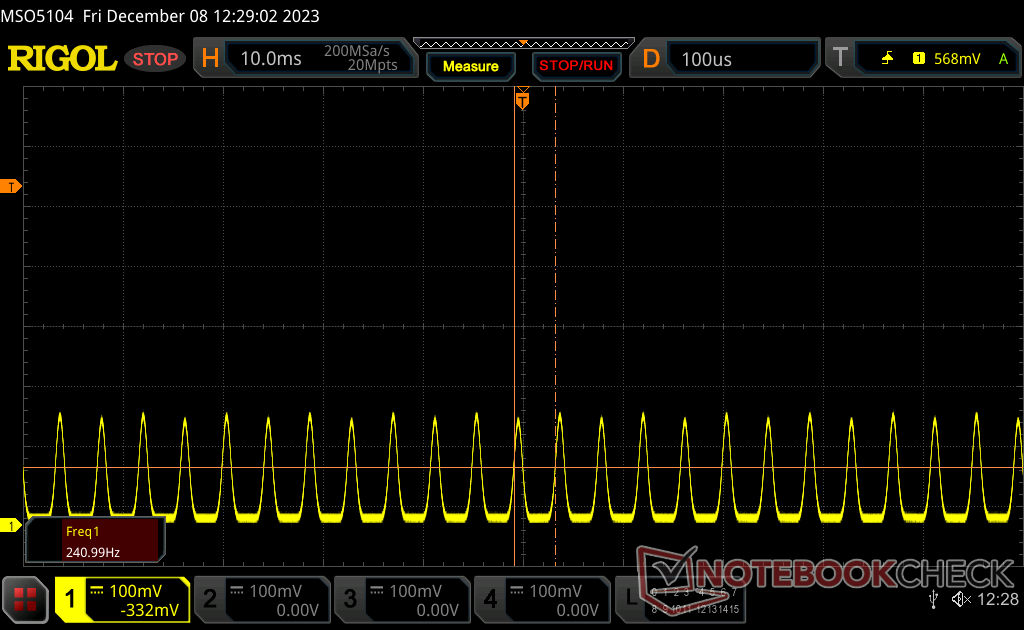
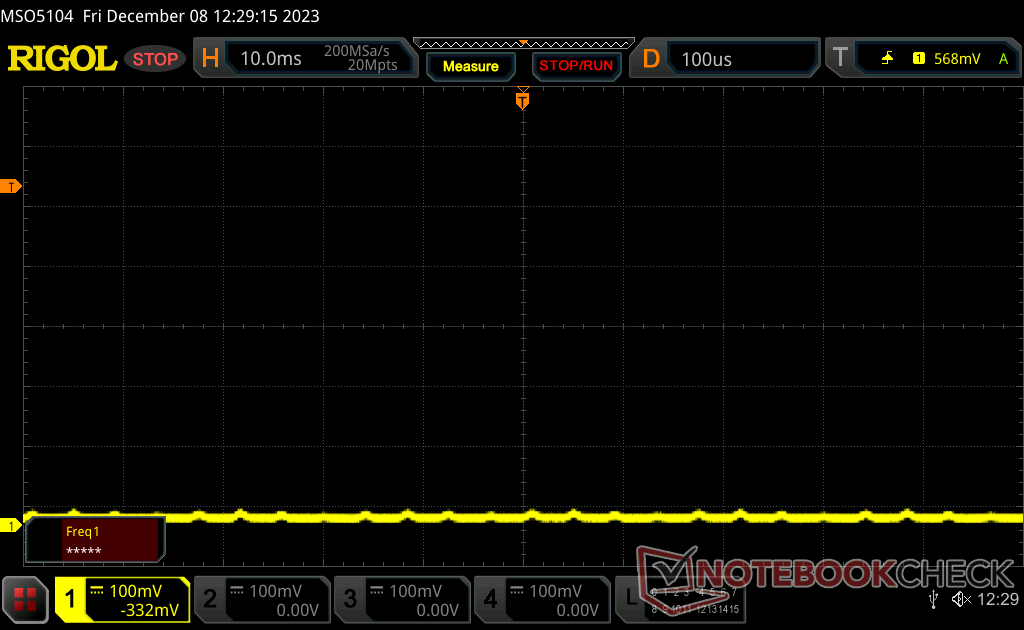
Sfarfallio dello schermo / PWM (Pulse-Width Modulation)
| flickering dello schermo / PWM rilevato | 60 Hz | ≤ 100 % settaggio luminosita' | 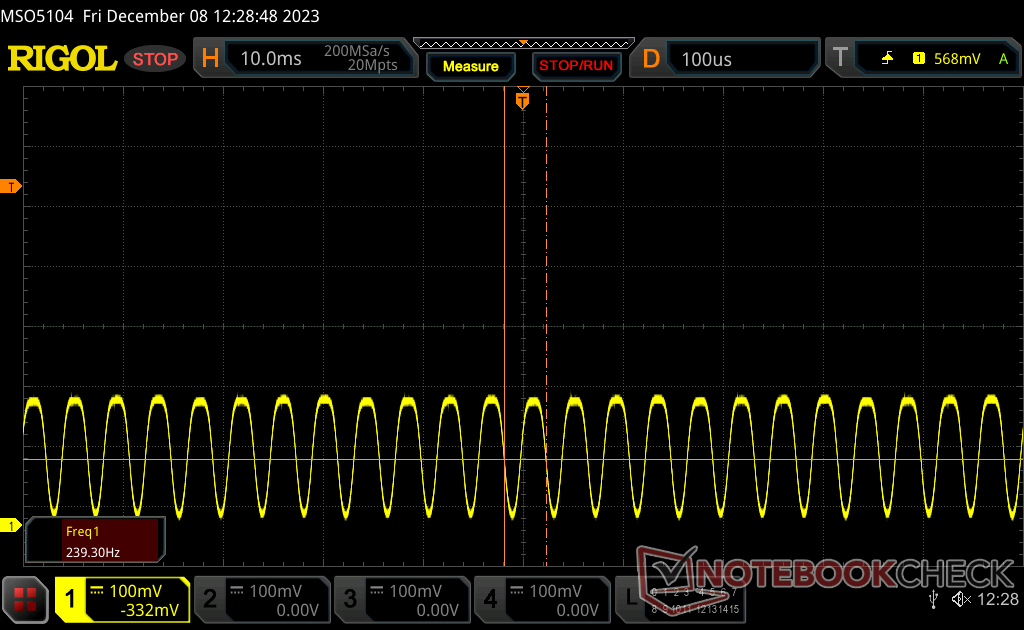 |
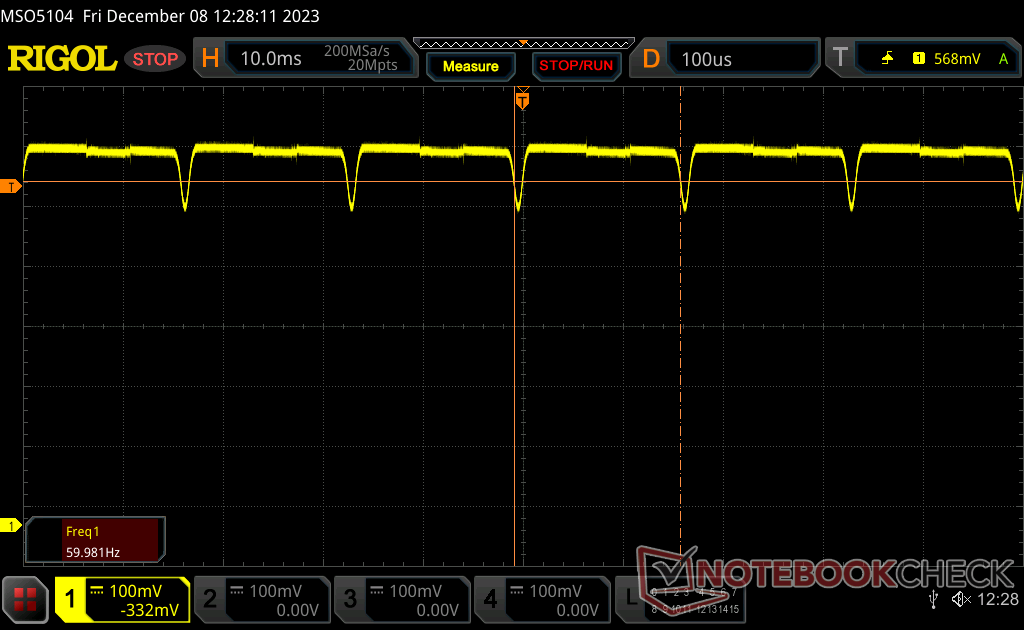
Il display sfarfalla a 60 Hz (Probabilmente a causa dell'uso di PWM) Flickering rilevato ad una luminosita' di 100 % o inferiore. Non dovrebbe verificarsi flickering o PWM sopra questo valore di luminosita'. La frequenza di 60 Hz è molto bassa, quindi il flickering potrebbe causare stanchezza agli occhi e mal di testa con un utilizzo prolungato. In confronto: 52 % di tutti i dispositivi testati non utilizza PWM per ridurre la luminosita' del display. Se è rilevato PWM, una media di 7754 (minimo: 5 - massimo: 343500) Hz è stata rilevata. | |||
La modulazione di larghezza di impulso è presente su tutti i livelli di luminosità, come ci si aspetta da un pannello OLED. Siamo in grado di rilevare una frequenza di 239 Hz da 0 al 57 percento di luminosità e 60 Hz dal 58 al 100 percento di luminosità.
Prestazioni
Condizioni del test
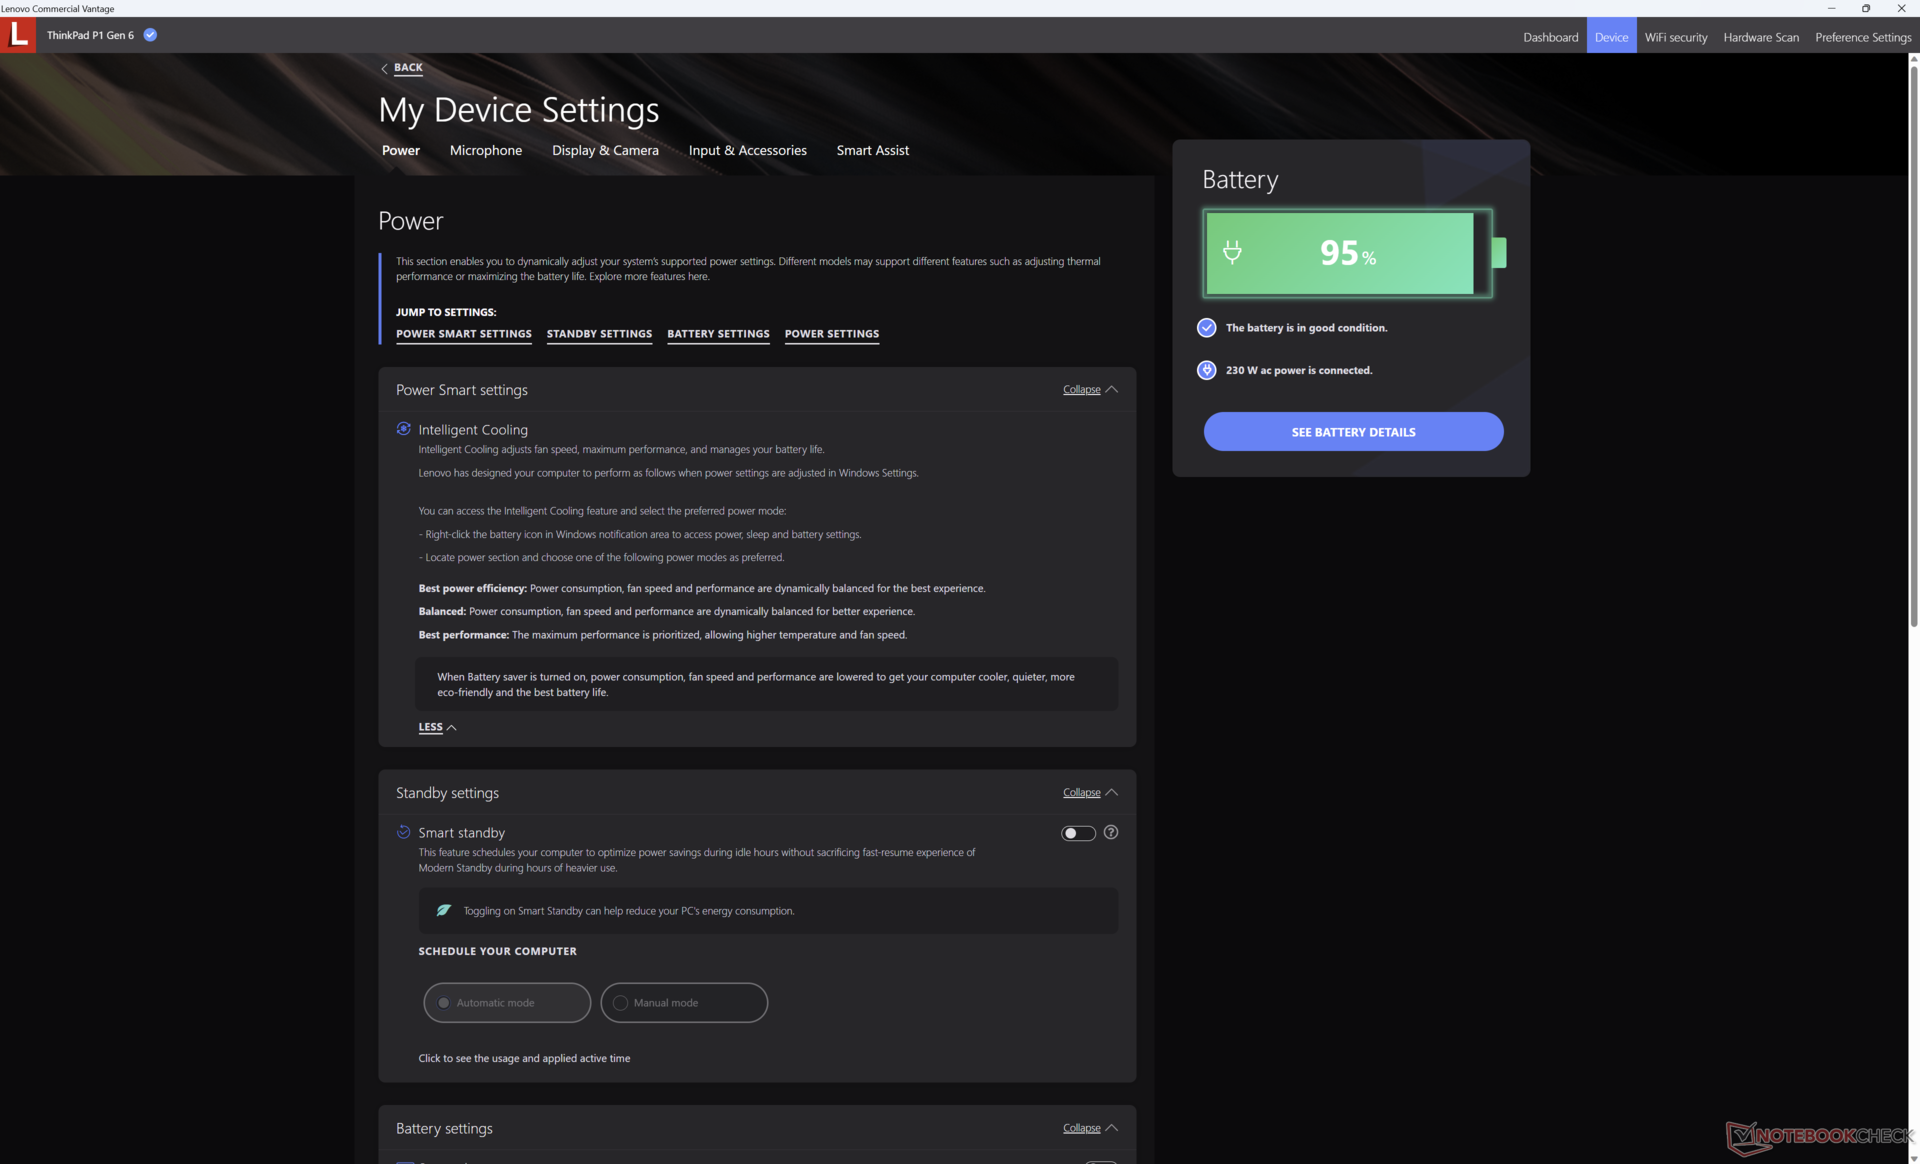
Abbiamo impostato Windows in modalità Prestazioni prima di eseguire i benchmark qui sotto. Lenovo Vantage non include alcun profilo energetico specializzato per mantenere le cose semplici.
È supportato solo Optimus 1.0, senza opzioni Advanced Optimus o MUX, il che è un po' deludente considerando la GPU RTX 4080 di fascia alta.
Processore
Il Core i7-13800H nella nostra unità è solo dal 3 al 5% più lento del Core i9-13900H anche dopo aver tenuto conto di qualsiasi comportamento di strozzamento. Questa differenza è essenzialmente trascurabile per la maggior parte degli utenti. Gli acquirenti a caccia di incrementi di prestazioni più tangibili dovrebbero invece considerare la serie ThinkPad P16, che viene fornita con CPU della serie Core HX.
Cinebench R15 Multi Loop
Cinebench R23: Multi Core | Single Core
Cinebench R20: CPU (Multi Core) | CPU (Single Core)
Cinebench R15: CPU Multi 64Bit | CPU Single 64Bit
Blender: v2.79 BMW27 CPU
7-Zip 18.03: 7z b 4 | 7z b 4 -mmt1
Geekbench 5.5: Multi-Core | Single-Core
HWBOT x265 Benchmark v2.2: 4k Preset
LibreOffice : 20 Documents To PDF
R Benchmark 2.5: Overall mean
| Cinebench R20 / CPU (Multi Core) | |
| Asus ProArt Studiobook 16 OLED H7604 | |
| HP ZBook Fury 16 G10 | |
| MSI Raider GE68 HX 13VG, i7-13700HX | |
| Lenovo ThinkPad P16 G1 RTX A5500 | |
| Dell Precision 5000 5680 | |
| Lenovo ThinkPad P1 G6-21FV000DGE | |
| Gigabyte Aero 16 YE5 | |
| Lenovo ThinkPad P1 G6 21FV001KUS | |
| Media Intel Core i7-13800H (n=1) | |
| Lenovo ThinkPad X1 Extreme G4-20Y5CTO1WW (3050 Ti) | |
| Lenovo ThinkPad P1 G4-20Y4S0KS00 | |
| LG Gram 2in1 16 16T90R - G.AA78G | |
| Lenovo ThinkPad E16 G1-21JUS08X00 | |
| Lenovo ThinkPad E16 G1 Core i5-1335U | |
| Cinebench R20 / CPU (Single Core) | |
| HP ZBook Fury 16 G10 | |
| Asus ProArt Studiobook 16 OLED H7604 | |
| Lenovo ThinkPad P1 G6-21FV000DGE | |
| Dell Precision 5000 5680 | |
| Lenovo ThinkPad P1 G6 21FV001KUS | |
| Media Intel Core i7-13800H (n=1) | |
| Lenovo ThinkPad P16 G1 RTX A5500 | |
| MSI Raider GE68 HX 13VG, i7-13700HX | |
| Gigabyte Aero 16 YE5 | |
| Lenovo ThinkPad E16 G1 Core i5-1335U | |
| LG Gram 2in1 16 16T90R - G.AA78G | |
| Lenovo ThinkPad P1 G4-20Y4S0KS00 | |
| Lenovo ThinkPad X1 Extreme G4-20Y5CTO1WW (3050 Ti) | |
| Lenovo ThinkPad E16 G1-21JUS08X00 | |
| Cinebench R15 / CPU Single 64Bit | |
| Asus ProArt Studiobook 16 OLED H7604 | |
| HP ZBook Fury 16 G10 | |
| Dell Precision 5000 5680 | |
| Lenovo ThinkPad P1 G6-21FV000DGE | |
| Lenovo ThinkPad P1 G6 21FV001KUS | |
| Media Intel Core i7-13800H (n=1) | |
| Gigabyte Aero 16 YE5 | |
| Lenovo ThinkPad P16 G1 RTX A5500 | |
| MSI Raider GE68 HX 13VG, i7-13700HX | |
| LG Gram 2in1 16 16T90R - G.AA78G | |
| Lenovo ThinkPad E16 G1 Core i5-1335U | |
| Lenovo ThinkPad P1 G4-20Y4S0KS00 | |
| Lenovo ThinkPad E16 G1-21JUS08X00 | |
| Lenovo ThinkPad X1 Extreme G4-20Y5CTO1WW (3050 Ti) | |
| HWBOT x265 Benchmark v2.2 / 4k Preset | |
| Asus ProArt Studiobook 16 OLED H7604 | |
| HP ZBook Fury 16 G10 | |
| MSI Raider GE68 HX 13VG, i7-13700HX | |
| Lenovo ThinkPad P16 G1 RTX A5500 | |
| Dell Precision 5000 5680 | |
| Lenovo ThinkPad P1 G6 21FV001KUS | |
| Media Intel Core i7-13800H (n=1) | |
| Lenovo ThinkPad P1 G6-21FV000DGE | |
| Gigabyte Aero 16 YE5 | |
| Lenovo ThinkPad P1 G4-20Y4S0KS00 | |
| Lenovo ThinkPad X1 Extreme G4-20Y5CTO1WW (3050 Ti) | |
| Lenovo ThinkPad E16 G1-21JUS08X00 | |
| LG Gram 2in1 16 16T90R - G.AA78G | |
| Lenovo ThinkPad E16 G1 Core i5-1335U | |
| LibreOffice / 20 Documents To PDF | |
| LG Gram 2in1 16 16T90R - G.AA78G | |
| MSI Raider GE68 HX 13VG, i7-13700HX | |
| Lenovo ThinkPad E16 G1 Core i5-1335U | |
| Lenovo ThinkPad E16 G1-21JUS08X00 | |
| Lenovo ThinkPad P1 G6-21FV000DGE | |
| Lenovo ThinkPad P1 G4-20Y4S0KS00 | |
| Lenovo ThinkPad P1 G6 21FV001KUS | |
| Media Intel Core i7-13800H (n=1) | |
| Asus ProArt Studiobook 16 OLED H7604 | |
| HP ZBook Fury 16 G10 | |
| Lenovo ThinkPad X1 Extreme G4-20Y5CTO1WW (3050 Ti) | |
| Dell Precision 5000 5680 | |
| Lenovo ThinkPad P16 G1 RTX A5500 | |
| Gigabyte Aero 16 YE5 | |
| R Benchmark 2.5 / Overall mean | |
| LG Gram 2in1 16 16T90R - G.AA78G | |
| Lenovo ThinkPad X1 Extreme G4-20Y5CTO1WW (3050 Ti) | |
| Lenovo ThinkPad P1 G4-20Y4S0KS00 | |
| Lenovo ThinkPad E16 G1-21JUS08X00 | |
| Lenovo ThinkPad P16 G1 RTX A5500 | |
| MSI Raider GE68 HX 13VG, i7-13700HX | |
| Lenovo ThinkPad P1 G6-21FV000DGE | |
| Gigabyte Aero 16 YE5 | |
| Dell Precision 5000 5680 | |
| Lenovo ThinkPad P1 G6 21FV001KUS | |
| Media Intel Core i7-13800H (n=1) | |
| HP ZBook Fury 16 G10 | |
| Asus ProArt Studiobook 16 OLED H7604 | |
Cinebench R23: Multi Core | Single Core
Cinebench R20: CPU (Multi Core) | CPU (Single Core)
Cinebench R15: CPU Multi 64Bit | CPU Single 64Bit
Blender: v2.79 BMW27 CPU
7-Zip 18.03: 7z b 4 | 7z b 4 -mmt1
Geekbench 5.5: Multi-Core | Single-Core
HWBOT x265 Benchmark v2.2: 4k Preset
LibreOffice : 20 Documents To PDF
R Benchmark 2.5: Overall mean
* ... Meglio usare valori piccoli
AIDA64: FP32 Ray-Trace | FPU Julia | CPU SHA3 | CPU Queen | FPU SinJulia | FPU Mandel | CPU AES | CPU ZLib | FP64 Ray-Trace | CPU PhotoWorxx
| Performance rating | |
| HP ZBook Fury 16 G10 | |
| Lenovo ThinkPad P16 G1 RTX A5500 | |
| Lenovo ThinkPad P1 G6 21FV001KUS | |
| Media Intel Core i7-13800H | |
| Dell Precision 5000 5680 | |
| Lenovo ThinkPad P1 G6-21FV000DGE | |
| Lenovo ThinkPad P1 G4-20Y4S0KS00 -9! | |
| AIDA64 / FP32 Ray-Trace | |
| HP ZBook Fury 16 G10 | |
| Lenovo ThinkPad P16 G1 RTX A5500 | |
| Lenovo ThinkPad P1 G6 21FV001KUS | |
| Media Intel Core i7-13800H (n=1) | |
| Lenovo ThinkPad P1 G6-21FV000DGE | |
| Dell Precision 5000 5680 | |
| AIDA64 / FPU Julia | |
| HP ZBook Fury 16 G10 | |
| Lenovo ThinkPad P16 G1 RTX A5500 | |
| Lenovo ThinkPad P1 G6 21FV001KUS | |
| Media Intel Core i7-13800H (n=1) | |
| Lenovo ThinkPad P1 G6-21FV000DGE | |
| Dell Precision 5000 5680 | |
| AIDA64 / CPU SHA3 | |
| HP ZBook Fury 16 G10 | |
| Lenovo ThinkPad P16 G1 RTX A5500 | |
| Lenovo ThinkPad P1 G6 21FV001KUS | |
| Media Intel Core i7-13800H (n=1) | |
| Lenovo ThinkPad P1 G6-21FV000DGE | |
| Dell Precision 5000 5680 | |
| AIDA64 / CPU Queen | |
| HP ZBook Fury 16 G10 | |
| Dell Precision 5000 5680 | |
| Lenovo ThinkPad P1 G6-21FV000DGE | |
| Lenovo ThinkPad P1 G6 21FV001KUS | |
| Media Intel Core i7-13800H (n=1) | |
| Lenovo ThinkPad P16 G1 RTX A5500 | |
| AIDA64 / FPU SinJulia | |
| HP ZBook Fury 16 G10 | |
| Lenovo ThinkPad P16 G1 RTX A5500 | |
| Lenovo ThinkPad P1 G6 21FV001KUS | |
| Media Intel Core i7-13800H (n=1) | |
| Lenovo ThinkPad P1 G6-21FV000DGE | |
| Dell Precision 5000 5680 | |
| AIDA64 / FPU Mandel | |
| HP ZBook Fury 16 G10 | |
| Lenovo ThinkPad P16 G1 RTX A5500 | |
| Lenovo ThinkPad P1 G6 21FV001KUS | |
| Media Intel Core i7-13800H (n=1) | |
| Lenovo ThinkPad P1 G6-21FV000DGE | |
| Dell Precision 5000 5680 | |
| AIDA64 / CPU AES | |
| HP ZBook Fury 16 G10 | |
| Lenovo ThinkPad P16 G1 RTX A5500 | |
| Lenovo ThinkPad P1 G6 21FV001KUS | |
| Media Intel Core i7-13800H (n=1) | |
| Lenovo ThinkPad P1 G6-21FV000DGE | |
| Dell Precision 5000 5680 | |
| AIDA64 / CPU ZLib | |
| HP ZBook Fury 16 G10 | |
| Lenovo ThinkPad P16 G1 RTX A5500 | |
| Lenovo ThinkPad P1 G6 21FV001KUS | |
| Media Intel Core i7-13800H (n=1) | |
| Lenovo ThinkPad P1 G6-21FV000DGE | |
| Dell Precision 5000 5680 | |
| Lenovo ThinkPad P1 G4-20Y4S0KS00 | |
| AIDA64 / FP64 Ray-Trace | |
| HP ZBook Fury 16 G10 | |
| Lenovo ThinkPad P16 G1 RTX A5500 | |
| Lenovo ThinkPad P1 G6 21FV001KUS | |
| Media Intel Core i7-13800H (n=1) | |
| Lenovo ThinkPad P1 G6-21FV000DGE | |
| Dell Precision 5000 5680 | |
| AIDA64 / CPU PhotoWorxx | |
| Dell Precision 5000 5680 | |
| Lenovo ThinkPad P16 G1 RTX A5500 | |
| HP ZBook Fury 16 G10 | |
| Lenovo ThinkPad P1 G6-21FV000DGE | |
| Lenovo ThinkPad P1 G6 21FV001KUS | |
| Media Intel Core i7-13800H (n=1) | |
Prestazioni del sistema
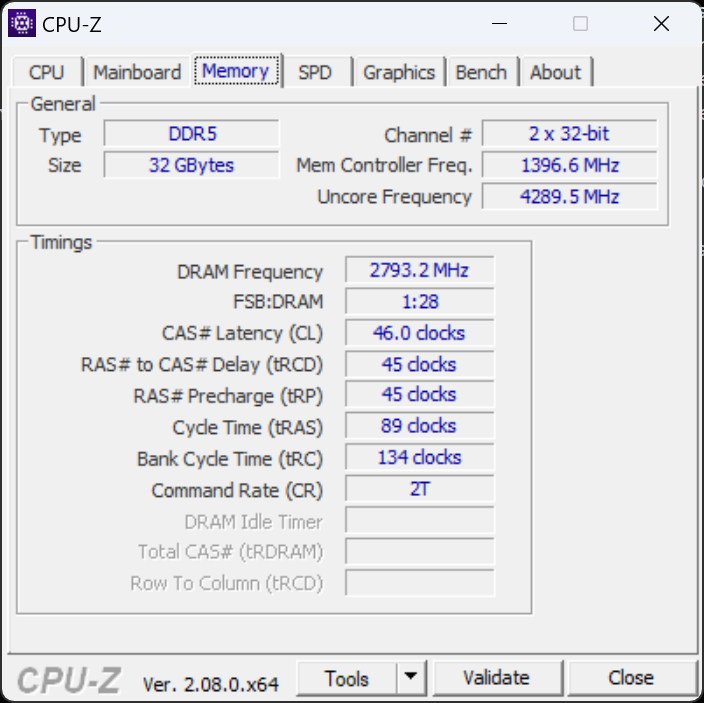
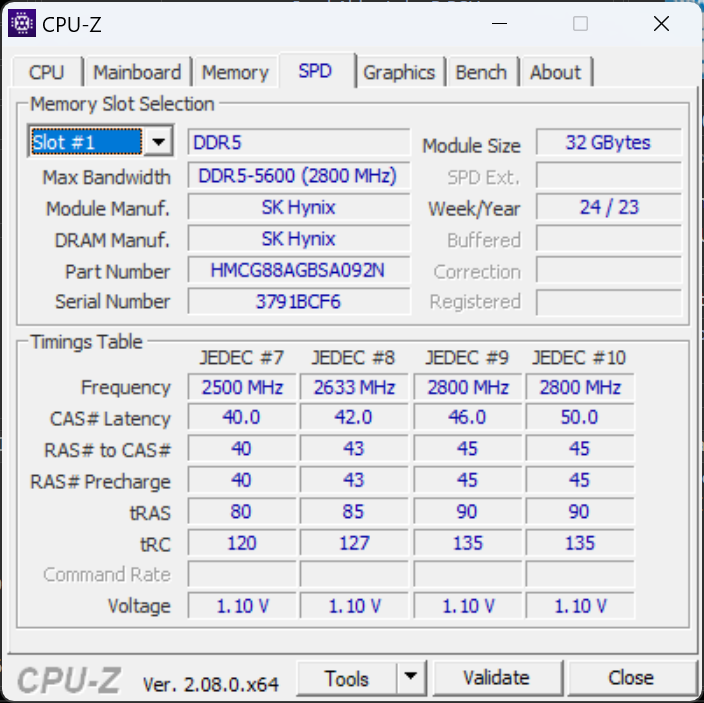
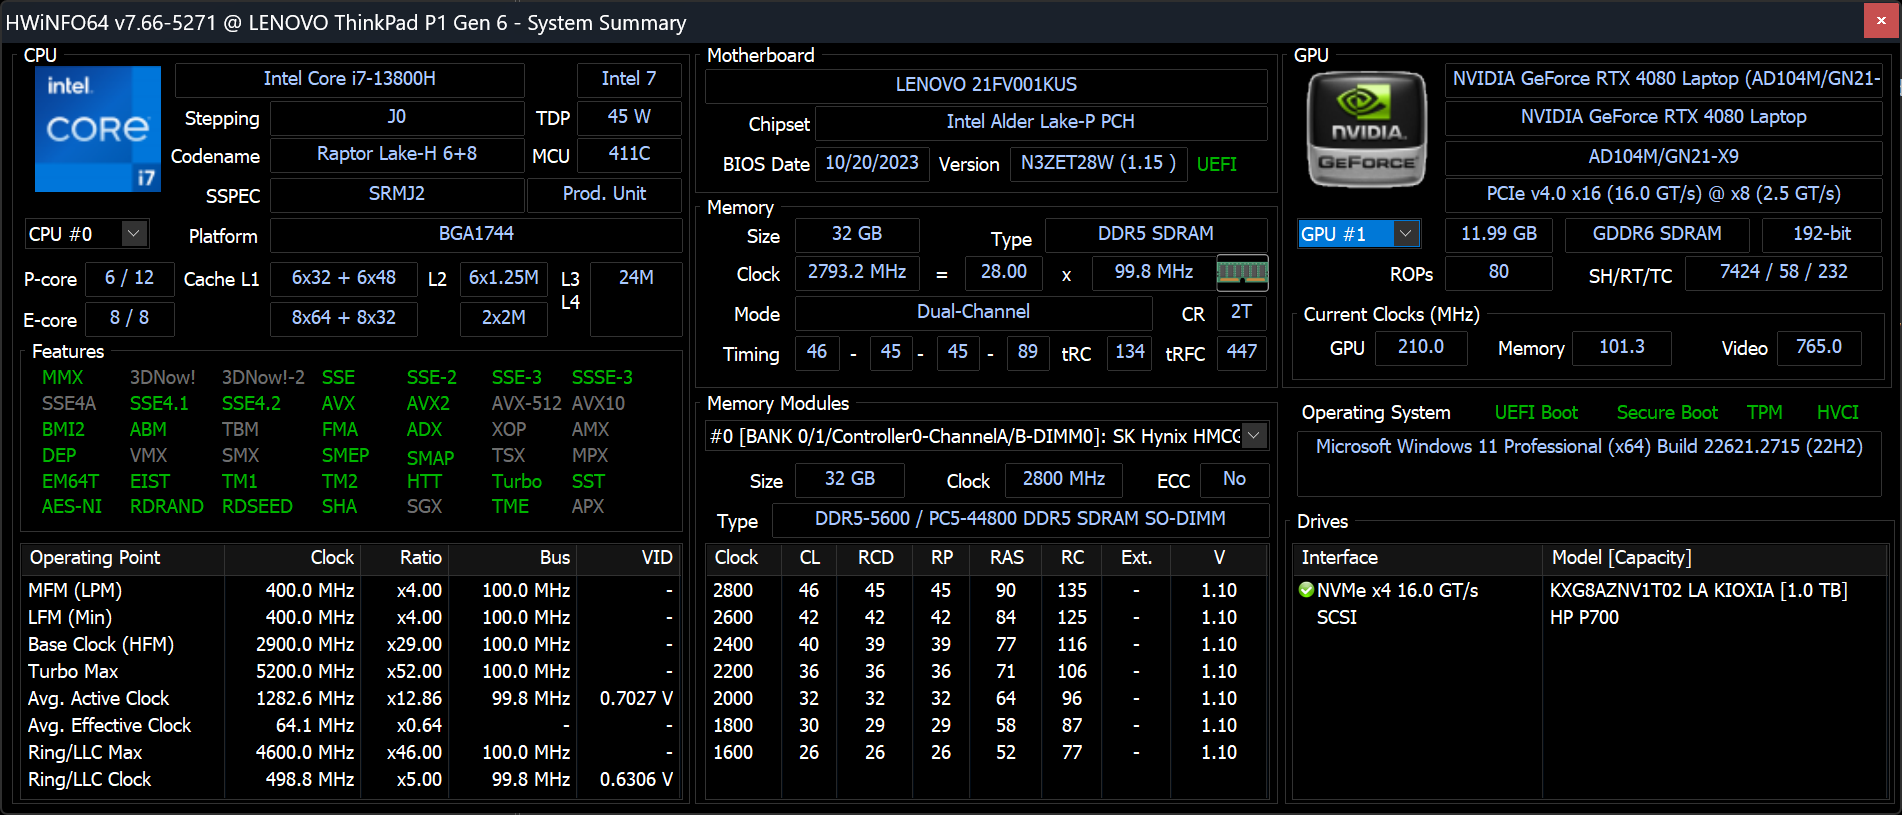
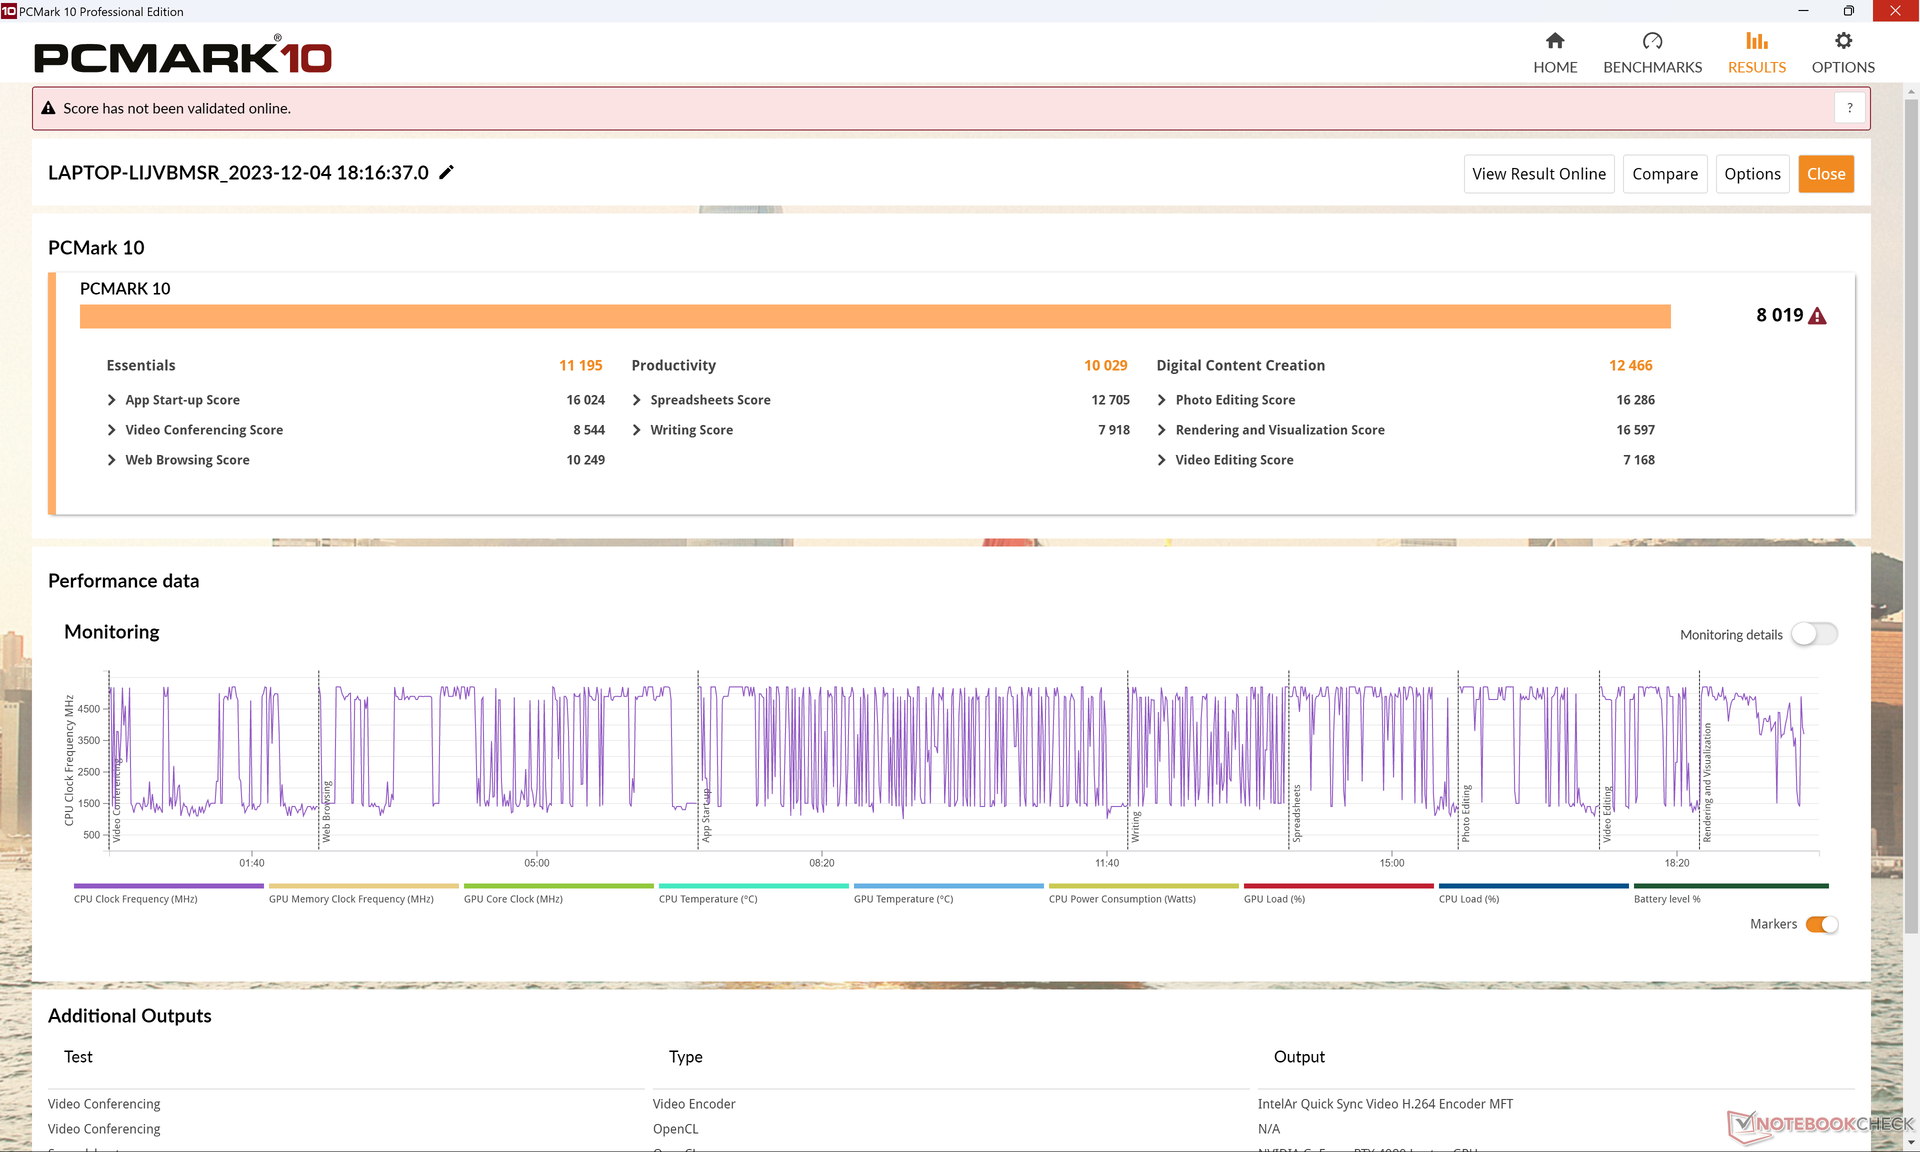
I punteggi di PCMark sono paragonabili, se non leggermente più veloci, rispetto alla configurazione del ThinkPad P1 G6 con RTX 2000, soprattutto grazie alla più veloce GPU RTX 4080. Si noti che le prestazioni della memoria sono lente, poiché la nostra unità è stata configurata con un solo modulo RAM in modalità a canale singolo anziché due.
CrossMark: Overall | Productivity | Creativity | Responsiveness
WebXPRT 3: Overall
WebXPRT 4: Overall
Mozilla Kraken 1.1: Total
| PCMark 10 / Score | |
| Dell Precision 5000 5680 | |
| HP ZBook Fury 16 G10 | |
| Lenovo ThinkPad P1 G6 21FV001KUS | |
| Media Intel Core i7-13800H, NVIDIA GeForce RTX 4080 Laptop GPU (n=1) | |
| Lenovo ThinkPad P1 G6-21FV000DGE | |
| Lenovo ThinkPad P16 G1 RTX A5500 | |
| Lenovo ThinkPad P1 G4-20Y4S0KS00 | |
| PCMark 10 / Essentials | |
| Dell Precision 5000 5680 | |
| Lenovo ThinkPad P1 G6 21FV001KUS | |
| Media Intel Core i7-13800H, NVIDIA GeForce RTX 4080 Laptop GPU (n=1) | |
| Lenovo ThinkPad P1 G6-21FV000DGE | |
| HP ZBook Fury 16 G10 | |
| Lenovo ThinkPad P16 G1 RTX A5500 | |
| Lenovo ThinkPad P1 G4-20Y4S0KS00 | |
| PCMark 10 / Productivity | |
| Dell Precision 5000 5680 | |
| Lenovo ThinkPad P1 G6 21FV001KUS | |
| Media Intel Core i7-13800H, NVIDIA GeForce RTX 4080 Laptop GPU (n=1) | |
| Lenovo ThinkPad P1 G6-21FV000DGE | |
| Lenovo ThinkPad P16 G1 RTX A5500 | |
| HP ZBook Fury 16 G10 | |
| Lenovo ThinkPad P1 G4-20Y4S0KS00 | |
| PCMark 10 / Digital Content Creation | |
| HP ZBook Fury 16 G10 | |
| Dell Precision 5000 5680 | |
| Lenovo ThinkPad P1 G6 21FV001KUS | |
| Media Intel Core i7-13800H, NVIDIA GeForce RTX 4080 Laptop GPU (n=1) | |
| Lenovo ThinkPad P1 G6-21FV000DGE | |
| Lenovo ThinkPad P1 G4-20Y4S0KS00 | |
| Lenovo ThinkPad P16 G1 RTX A5500 | |
| CrossMark / Overall | |
| Dell Precision 5000 5680 | |
| HP ZBook Fury 16 G10 | |
| Lenovo ThinkPad P16 G1 RTX A5500 | |
| Lenovo ThinkPad P1 G6-21FV000DGE | |
| Lenovo ThinkPad P1 G6 21FV001KUS | |
| Media Intel Core i7-13800H, NVIDIA GeForce RTX 4080 Laptop GPU (n=1) | |
| Lenovo ThinkPad P1 G4-20Y4S0KS00 | |
| CrossMark / Productivity | |
| HP ZBook Fury 16 G10 | |
| Dell Precision 5000 5680 | |
| Lenovo ThinkPad P1 G6-21FV000DGE | |
| Lenovo ThinkPad P16 G1 RTX A5500 | |
| Lenovo ThinkPad P1 G6 21FV001KUS | |
| Media Intel Core i7-13800H, NVIDIA GeForce RTX 4080 Laptop GPU (n=1) | |
| Lenovo ThinkPad P1 G4-20Y4S0KS00 | |
| CrossMark / Creativity | |
| Lenovo ThinkPad P16 G1 RTX A5500 | |
| Dell Precision 5000 5680 | |
| HP ZBook Fury 16 G10 | |
| Lenovo ThinkPad P1 G6 21FV001KUS | |
| Media Intel Core i7-13800H, NVIDIA GeForce RTX 4080 Laptop GPU (n=1) | |
| Lenovo ThinkPad P1 G6-21FV000DGE | |
| Lenovo ThinkPad P1 G4-20Y4S0KS00 | |
| CrossMark / Responsiveness | |
| HP ZBook Fury 16 G10 | |
| Lenovo ThinkPad P1 G6-21FV000DGE | |
| Dell Precision 5000 5680 | |
| Lenovo ThinkPad P1 G6 21FV001KUS | |
| Media Intel Core i7-13800H, NVIDIA GeForce RTX 4080 Laptop GPU (n=1) | |
| Lenovo ThinkPad P1 G4-20Y4S0KS00 | |
| Lenovo ThinkPad P16 G1 RTX A5500 | |
| WebXPRT 3 / Overall | |
| Dell Precision 5000 5680 | |
| HP ZBook Fury 16 G10 | |
| Lenovo ThinkPad P1 G6-21FV000DGE | |
| Lenovo ThinkPad P16 G1 RTX A5500 | |
| Lenovo ThinkPad P1 G6 21FV001KUS | |
| Media Intel Core i7-13800H, NVIDIA GeForce RTX 4080 Laptop GPU (n=1) | |
| Lenovo ThinkPad P1 G4-20Y4S0KS00 | |
| WebXPRT 4 / Overall | |
| Lenovo ThinkPad P1 G6-21FV000DGE | |
| HP ZBook Fury 16 G10 | |
| Dell Precision 5000 5680 | |
| Lenovo ThinkPad P1 G6 21FV001KUS | |
| Media Intel Core i7-13800H, NVIDIA GeForce RTX 4080 Laptop GPU (n=1) | |
| Lenovo ThinkPad P16 G1 RTX A5500 | |
| Mozilla Kraken 1.1 / Total | |
| Lenovo ThinkPad P1 G4-20Y4S0KS00 | |
| Lenovo ThinkPad P16 G1 RTX A5500 | |
| Lenovo ThinkPad P1 G6 21FV001KUS | |
| Media Intel Core i7-13800H, NVIDIA GeForce RTX 4080 Laptop GPU (n=1) | |
| Dell Precision 5000 5680 | |
| Lenovo ThinkPad P1 G6-21FV000DGE | |
| HP ZBook Fury 16 G10 | |
* ... Meglio usare valori piccoli
| PCMark 10 Score | 8019 punti | |
Aiuto | ||
| AIDA64 / Memory Copy | |
| Dell Precision 5000 5680 | |
| Lenovo ThinkPad P16 G1 RTX A5500 | |
| HP ZBook Fury 16 G10 | |
| Lenovo ThinkPad P1 G6-21FV000DGE | |
| Lenovo ThinkPad P1 G6 21FV001KUS | |
| Media Intel Core i7-13800H (n=1) | |
| AIDA64 / Memory Read | |
| Dell Precision 5000 5680 | |
| Lenovo ThinkPad P16 G1 RTX A5500 | |
| HP ZBook Fury 16 G10 | |
| Lenovo ThinkPad P1 G6 21FV001KUS | |
| Media Intel Core i7-13800H (n=1) | |
| Lenovo ThinkPad P1 G6-21FV000DGE | |
| AIDA64 / Memory Write | |
| Dell Precision 5000 5680 | |
| Lenovo ThinkPad P16 G1 RTX A5500 | |
| HP ZBook Fury 16 G10 | |
| Lenovo ThinkPad P1 G6 21FV001KUS | |
| Media Intel Core i7-13800H (n=1) | |
| Lenovo ThinkPad P1 G6-21FV000DGE | |
| AIDA64 / Memory Latency | |
| HP ZBook Fury 16 G10 | |
| Dell Precision 5000 5680 | |
| Lenovo ThinkPad P16 G1 RTX A5500 | |
| Lenovo ThinkPad P1 G6 21FV001KUS | |
| Media Intel Core i7-13800H (n=1) | |
| Lenovo ThinkPad P1 G6-21FV000DGE | |
| Lenovo ThinkPad P1 G4-20Y4S0KS00 | |
* ... Meglio usare valori piccoli
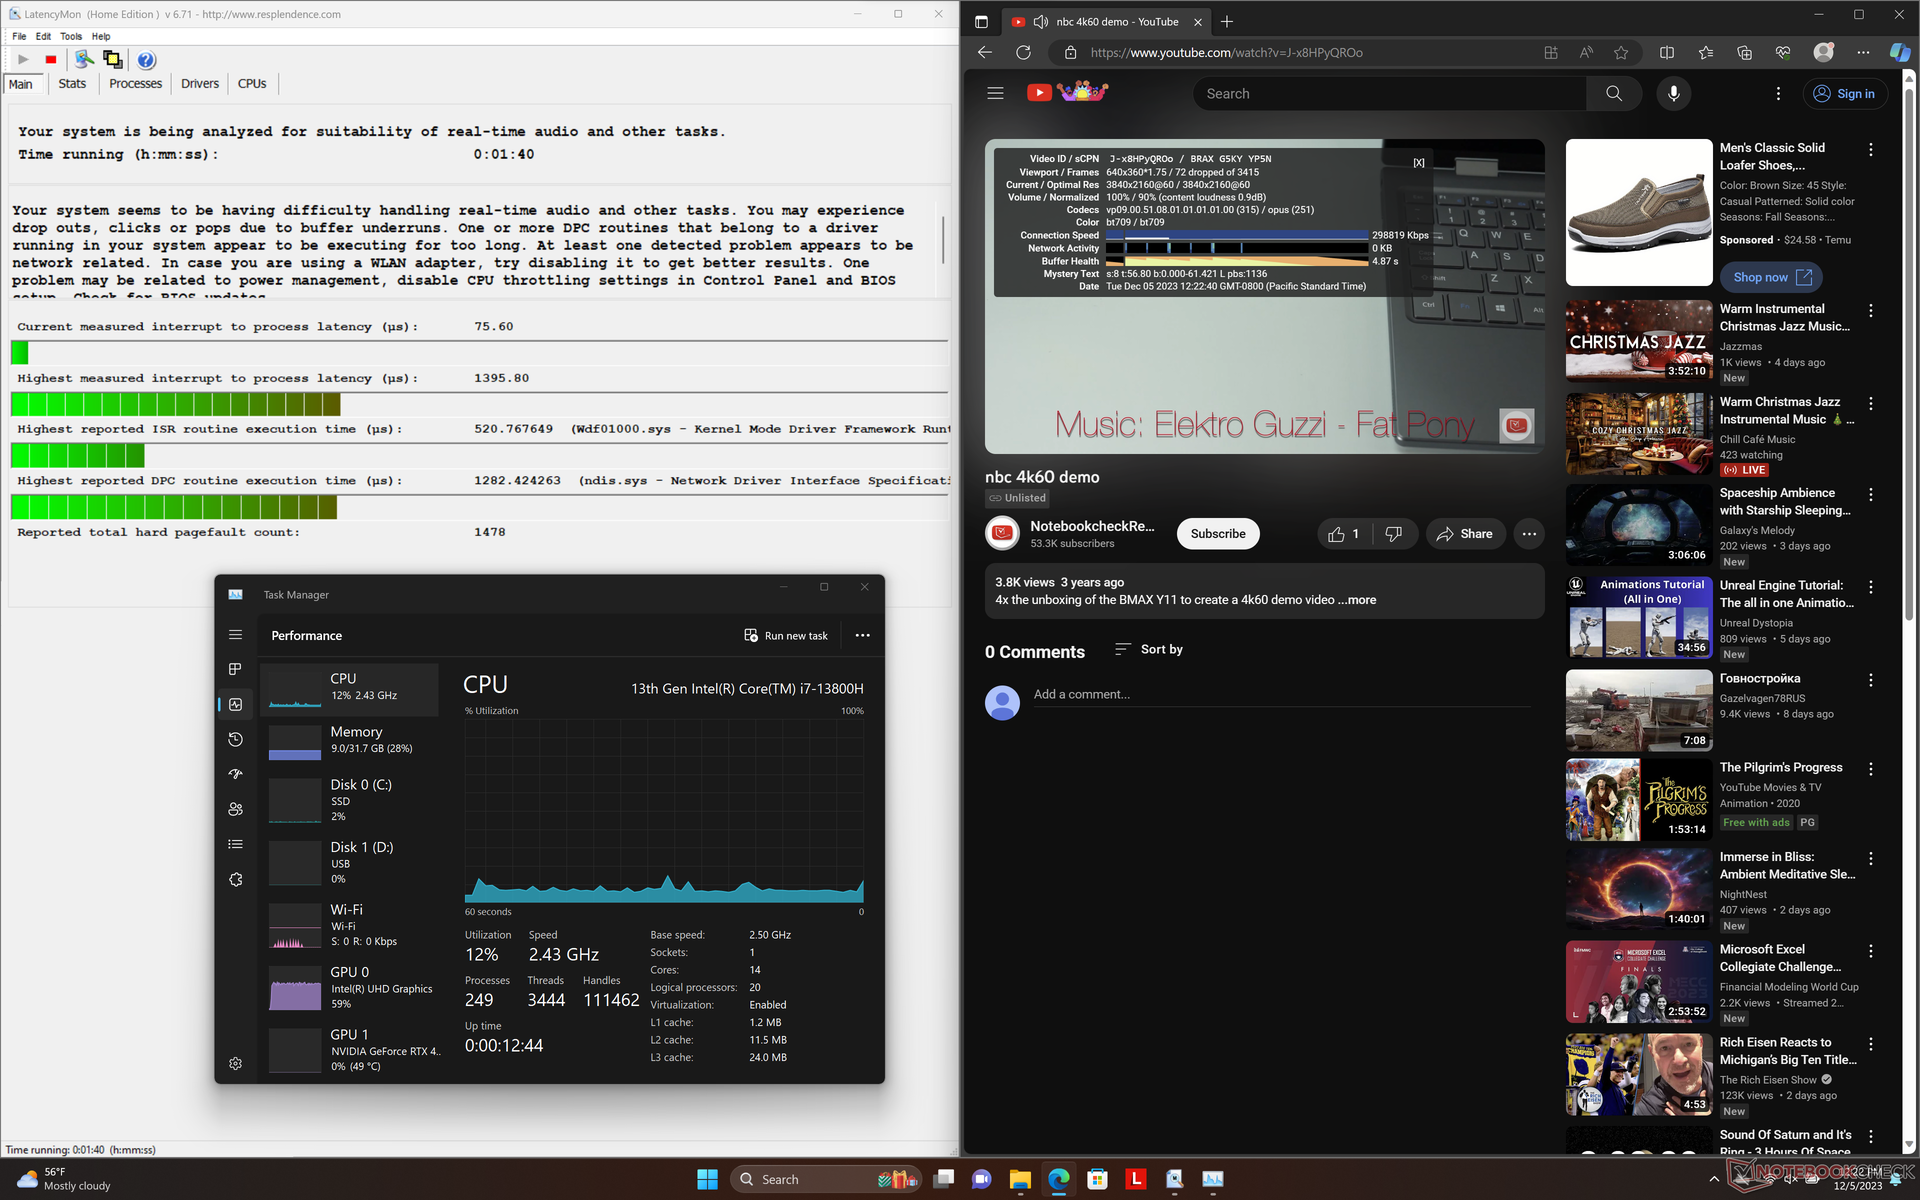
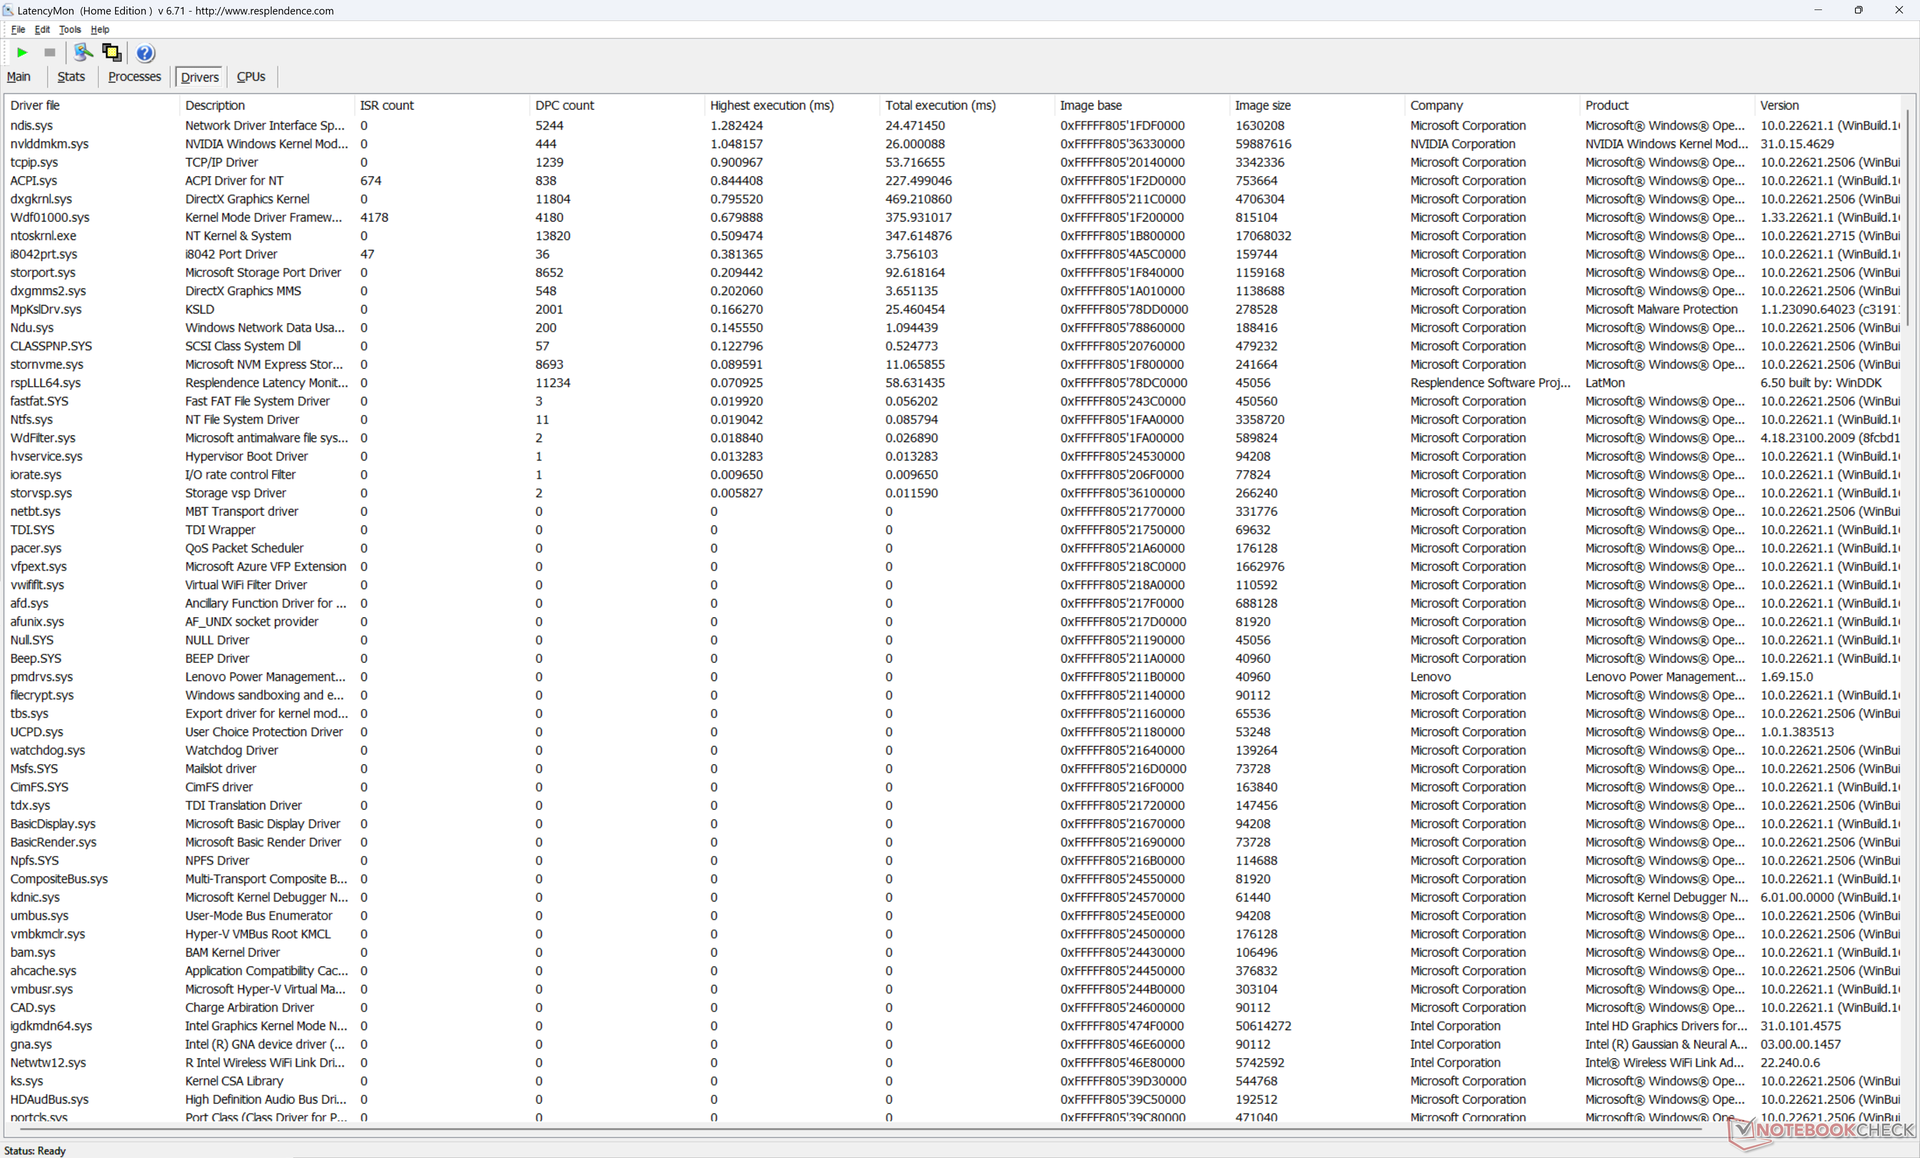
Latenza DPC
LatencyMon rivela problemi di DPC quando si aprono più schede del browser della nostra homepage e 75 fotogrammi caduti durante la riproduzione di un video 4K60 della durata di un minuto. Quest'ultimo è particolarmente deludente dato il prezzo e l'aspetto professionale del modello. Ciò suggerisce anche problemi di driver o una cattiva gestione delle applicazioni in background che potrebbero interrompere la finestra a fuoco.
| DPC Latencies / LatencyMon - interrupt to process latency (max), Web, Youtube, Prime95 | |
| HP ZBook Fury 16 G10 | |
| Lenovo ThinkPad P1 G6-21FV000DGE | |
| Dell Precision 5000 5680 | |
| Lenovo ThinkPad P16 G1 RTX A5500 | |
| Lenovo ThinkPad P1 G6 21FV001KUS | |
| Lenovo ThinkPad P1 G4-20Y4S0KS00 | |
* ... Meglio usare valori piccoli
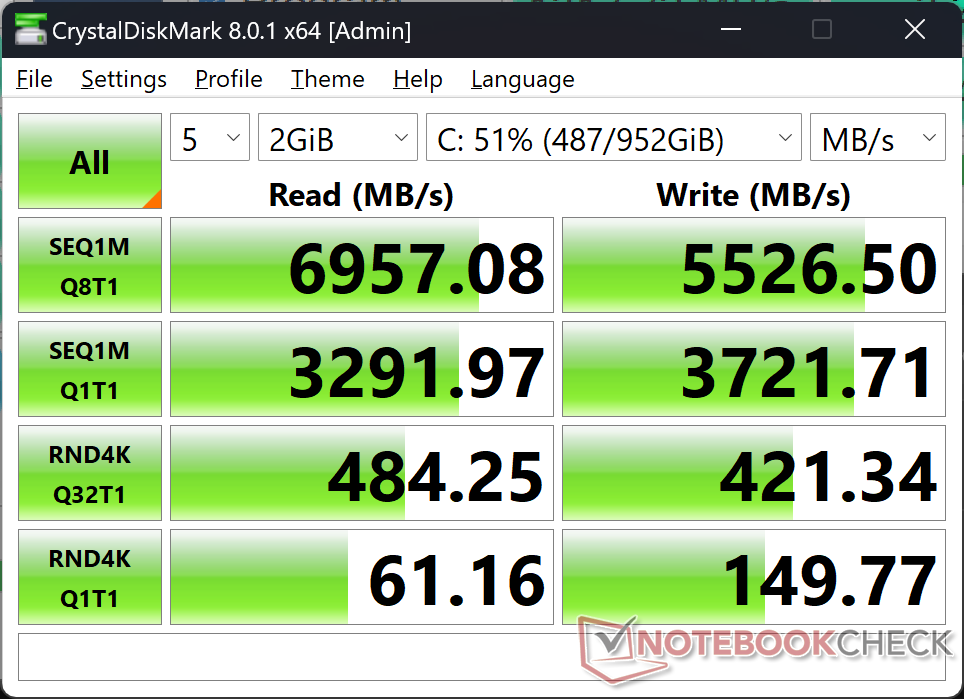
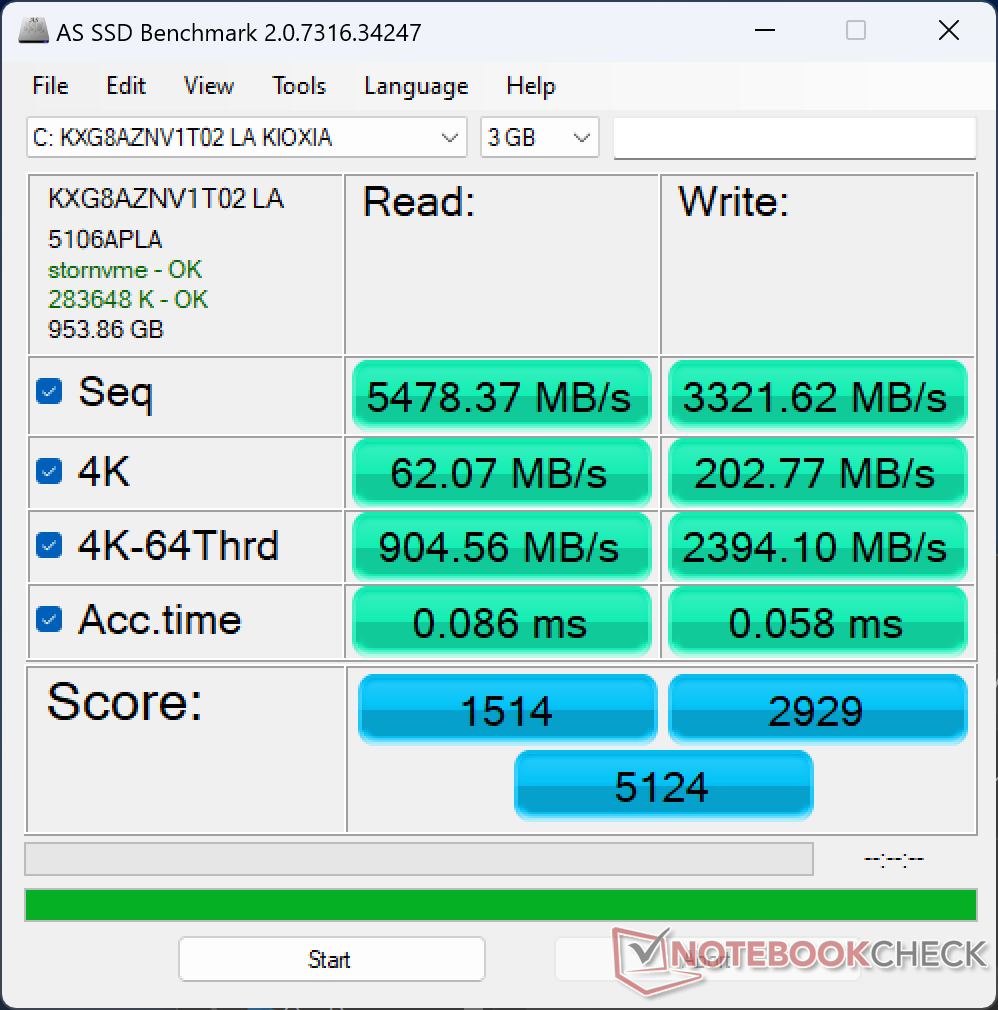
Dispositivi di archiviazione
La nostra unità di prova viene fornita con il Kioxia XG8 KXG8AZNV1T02 invece dell'SK Hynix PC711 sul nostro ThinkPad P1 G6 originale. Le prestazioni complessive sono generalmente più lente, in particolare durante la scrittura dei dati, ma le velocità di lettura sono comunque eccellenti, con un leggero rallentamento dopo circa 3 minuti di stress.
Si noti che alcune configurazioni del ThinkPad P1 G6 possono supportare più di un SSD M.2 interno. Tuttavia, questa particolare configurazione di recensione può supportare solo un'unità.

* ... Meglio usare valori piccoli
Disk Throttling: DiskSpd Read Loop, Queue Depth 8
Prestazioni della GPU
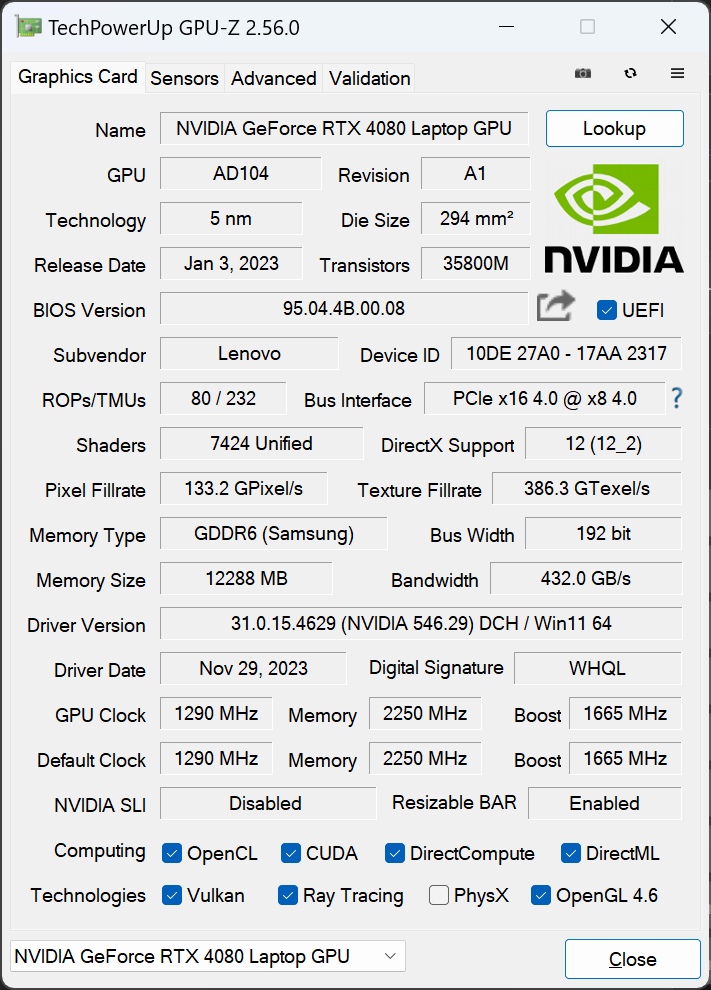
Il pannello di controllo Nvidia elenca una potenza grafica massima di 105 W. In realtà, tuttavia, siamo in grado di raggiungere solo un massimo di 80 W secondo GPU-Z. Le prestazioni complessive sono quindi più lente del 15-20% rispetto alla media dei laptop del nostro database con la stessa GPU mobile GeForce RTX 4080, in quanto questa particolare GPU è più comunemente in esecuzione con massimali di potenza più elevati.
In ogni caso, le prestazioni grafiche sono ancora molto superiori a quelle della RTX 2000 nella maggior parte dei benchmark, ad eccezione dei test Specviewperf Siemens NX e Medical. Per ottenere prestazioni più elevate, Lenovo offre RTX 5000 nella configurazione di fascia più alta.
L'esecuzione in modalità Bilanciata invece che in modalità Prestazioni influisce sulle prestazioni della GPU, mentre la CPU rimane in gran parte inalterata, come dimostrano i nostri Fire Strike risultati nella tabella sottostante.
| Profilo di potenza | Punteggio di fisica | Punteggio grafico | Punteggio combinato |
| Modalità Prestazioni | 29543 | 33402 | 12423 |
| Modalità equilibrata | 30978 (-0%) | 25806 (-23%) | 9616 (-23%) |
| Alimentazione a batteria | 21163 (-28%) | 18870 (-44%) | 4960 (-60%) |
| 3DMark Performance rating - Percent | |
| Razer Blade 16 Early 2023 RTX 4090 -34! | |
| HP ZBook Fury 16 G10 -1! | |
| Lenovo ThinkPad P16 G1 RTX A5500 -1! | |
| Media NVIDIA GeForce RTX 4080 Laptop GPU -1! | |
| Lenovo ThinkPad P1 G6 21FV001KUS -1! | |
| Lenovo ThinkPad P1 G6-21FV000DGE -17! | |
| Asus ProArt Studiobook 16 OLED H7604 -17! | |
| Gigabyte Aero 16 YE5 -2! | |
| Lenovo ThinkPad P1 G4-20Y4S0KS00 -11! | |
| Lenovo ThinkPad X1 Extreme G4-20Y5CTO1WW (3050 Ti) -36! | |
| LG Gram 2in1 16 16T90R - G.AA78G -36! | |
| 3DMark 11 Performance | 38087 punti | |
| 3DMark Fire Strike Score | 28105 punti | |
| 3DMark Time Spy Score | 13863 punti | |
Aiuto | ||
* ... Meglio usare valori piccoli
| F1 22 | |
| 1920x1080 Ultra High Preset AA:T AF:16x | |
| Media NVIDIA GeForce RTX 4080 Laptop GPU (72.3 - 124.2, n=15) | |
| HP ZBook Fury 16 G10 | |
| Lenovo ThinkPad P1 G6 21FV001KUS | |
| Asus ProArt Studiobook 16 OLED H7604 | |
| Lenovo ThinkPad P1 G6-21FV000DGE | |
| 2560x1440 Ultra High Preset AA:T AF:16x | |
| Media NVIDIA GeForce RTX 4080 Laptop GPU (55.4 - 79, n=13) | |
| HP ZBook Fury 16 G10 | |
| Lenovo ThinkPad P1 G6 21FV001KUS | |
| Asus ProArt Studiobook 16 OLED H7604 | |
| Lenovo ThinkPad P1 G6-21FV000DGE | |
| 3840x2160 Ultra High Preset AA:T AF:16x | |
| Media NVIDIA GeForce RTX 4080 Laptop GPU (25.8 - 39.8, n=10) | |
| HP ZBook Fury 16 G10 | |
| Lenovo ThinkPad P1 G6 21FV001KUS | |
| Tiny Tina's Wonderlands | |
| 1920x1080 Badass Preset (DX12) | |
| Media NVIDIA GeForce RTX 4080 Laptop GPU (112.9 - 167.1, n=9) | |
| HP ZBook Fury 16 G10 | |
| Lenovo ThinkPad P1 G6 21FV001KUS | |
| 2560x1440 Badass Preset (DX12) | |
| Media NVIDIA GeForce RTX 4080 Laptop GPU (85 - 114.8, n=9) | |
| HP ZBook Fury 16 G10 | |
| Lenovo ThinkPad P1 G6 21FV001KUS | |
| 3840x2160 Badass Preset (DX12) | |
| Media NVIDIA GeForce RTX 4080 Laptop GPU (46.4 - 60.9, n=9) | |
| HP ZBook Fury 16 G10 | |
| Lenovo ThinkPad P1 G6 21FV001KUS | |
| Baldur's Gate 3 | |
| 1920x1080 Ultra Preset AA:T | |
| Media NVIDIA GeForce RTX 4080 Laptop GPU (111.8 - 181.2, n=7) | |
| Lenovo ThinkPad P1 G6 21FV001KUS | |
| Apple MacBook Pro 16 2023 M3 Pro | |
| 2560x1440 Ultra Preset AA:T | |
| Media NVIDIA GeForce RTX 4080 Laptop GPU (88.3 - 129.3, n=7) | |
| Lenovo ThinkPad P1 G6 21FV001KUS | |
| 3840x2160 Ultra Preset AA:T | |
| Media NVIDIA GeForce RTX 4080 Laptop GPU (48.8 - 68.4, n=5) | |
| Lenovo ThinkPad P1 G6 21FV001KUS | |
| Cyberpunk 2077 | |
| 1920x1080 Ultra Preset (FSR off) | |
| Media NVIDIA GeForce RTX 4080 Laptop GPU (83.9 - 127.1, n=15) | |
| Lenovo ThinkPad P1 G6 21FV001KUS | |
| Apple MacBook Pro 16 2023 M3 Pro | |
| LG Gram 2in1 16 16T90R - G.AA78G | |
| 2560x1440 Ultra Preset (FSR off) | |
| Media NVIDIA GeForce RTX 4080 Laptop GPU (56.2 - 86.3, n=15) | |
| Lenovo ThinkPad P1 G6 21FV001KUS | |
| 3840x2160 Ultra Preset (FSR off) | |
| Media NVIDIA GeForce RTX 4080 Laptop GPU (25.8 - 39.8, n=8) | |
| Lenovo ThinkPad P1 G6 21FV001KUS | |
| 3840x2160 Ray Tracing Ultra Preset + DLSS3 Quality + FG | |
| Media NVIDIA GeForce RTX 4080 Laptop GPU (48.4 - 58.5, n=4) | |
| Lenovo ThinkPad P1 G6 21FV001KUS | |
Le frequenze dei fotogrammi al minimo su Witcher 3 sono rimasti costanti per tutto il tempo, tranne in un caso in cui le prestazioni sono scese a 90 FPS, come mostra il grafico sottostante. Il calo improvviso è probabilmente dovuto alla cattiva gestione delle applicazioni in background.
Witcher 3 FPS Chart
| basso | medio | alto | ultra | QHD | 4K | |
|---|---|---|---|---|---|---|
| GTA V (2015) | 120.3 | 106.4 | 120.3 | |||
| The Witcher 3 (2015) | 130.4 | 78.5 | ||||
| Dota 2 Reborn (2015) | 191.8 | 169 | 155.8 | 147.3 | 144.6 | |
| Final Fantasy XV Benchmark (2018) | 135.3 | 102.6 | 61.5 | |||
| X-Plane 11.11 (2018) | 171.1 | 150.8 | 118.6 | 103 | ||
| Far Cry 5 (2018) | 149 | 126 | 71 | |||
| Tiny Tina's Wonderlands (2022) | 118.6 | 85 | 46.4 | |||
| F1 22 (2022) | 202 | 81.5 | 55.4 | 29.7 | ||
| Baldur's Gate 3 (2023) | 124.8 | 88.7 | 48.8 | |||
| Cyberpunk 2077 (2023) | 103.8 | 90.9 | 59.9 | 25.8 |
Emissioni
Rumore del sistema
Il rumore della ventola è più forte rispetto alla configurazione con RTX 2000 quando si eseguono carichi impegnativi. Quando si esegue Witcher 3, ad esempio, il rumore della ventola oscilla tra 47 e 55 dB(A), rispetto ai soli 41-48 dB(A) della configurazione inferiore. Per il resto, il sistema fa un ottimo lavoro nel rimanere silenzioso per lunghi periodi quando si eseguono processi più semplici come i browser o lo streaming video.
Rumorosità
| Idle |
| 22.5 / 22.5 / 22.5 dB(A) |
| Sotto carico |
| 28.7 / 54.4 dB(A) |
 | ||
30 dB silenzioso 40 dB(A) udibile 50 dB(A) rumoroso |
||
min: | ||
| Lenovo ThinkPad P1 G6 21FV001KUS GeForce RTX 4080 Laptop GPU, i7-13800H, Kioxia XG8 KXG8AZNV1T02 | Lenovo ThinkPad P1 G6-21FV000DGE RTX 2000 Ada Generation Laptop, i9-13900H, SK Hynix PC711 1TB HFS001TDE9X084N | Lenovo ThinkPad P1 G4-20Y4S0KS00 GeForce RTX 3070 Laptop GPU, i7-11850H, Samsung PM9A1 MZVL21T0HCLR | Lenovo ThinkPad P16 G1 RTX A5500 RTX A5500 Laptop GPU, i9-12950HX, WDC PC SN810 2TB | Dell Precision 5000 5680 RTX 5000 Ada Generation Laptop, i9-13900H, 2x SK hynix PC801 HFS512GEJ9X101N RAID 0 | HP ZBook Fury 16 G10 RTX 5000 Ada Generation Laptop, i9-13950HX, SK hynix PC801 HFS001TEJ9X101N | |
|---|---|---|---|---|---|---|
| Noise | -11% | -9% | -2% | -5% | -7% | |
| off /ambiente * (dB) | 22.5 | 24.5 -9% | 23.8 -6% | 23.1 -3% | 22.8 -1% | 22.9 -2% |
| Idle Minimum * (dB) | 22.5 | 24.5 -9% | 23.8 -6% | 23.1 -3% | 23 -2% | 22.9 -2% |
| Idle Average * (dB) | 22.5 | 24.5 -9% | 23.8 -6% | 23.1 -3% | 23 -2% | 22.9 -2% |
| Idle Maximum * (dB) | 22.5 | 24.5 -9% | 28.3 -26% | 23.1 -3% | 23 -2% | 28.5 -27% |
| Load Average * (dB) | 28.7 | 48 -67% | 38.6 -34% | 28.9 -1% | 37.2 -30% | 40.6 -41% |
| Witcher 3 ultra * (dB) | 47.5 | 40.7 14% | 47.4 -0% | 51.6 -9% | 51 -7% | 44.1 7% |
| Load Maximum * (dB) | 54.4 | 48 12% | 47.4 13% | 51.4 6% | 51 6% | 45.8 16% |
* ... Meglio usare valori piccoli
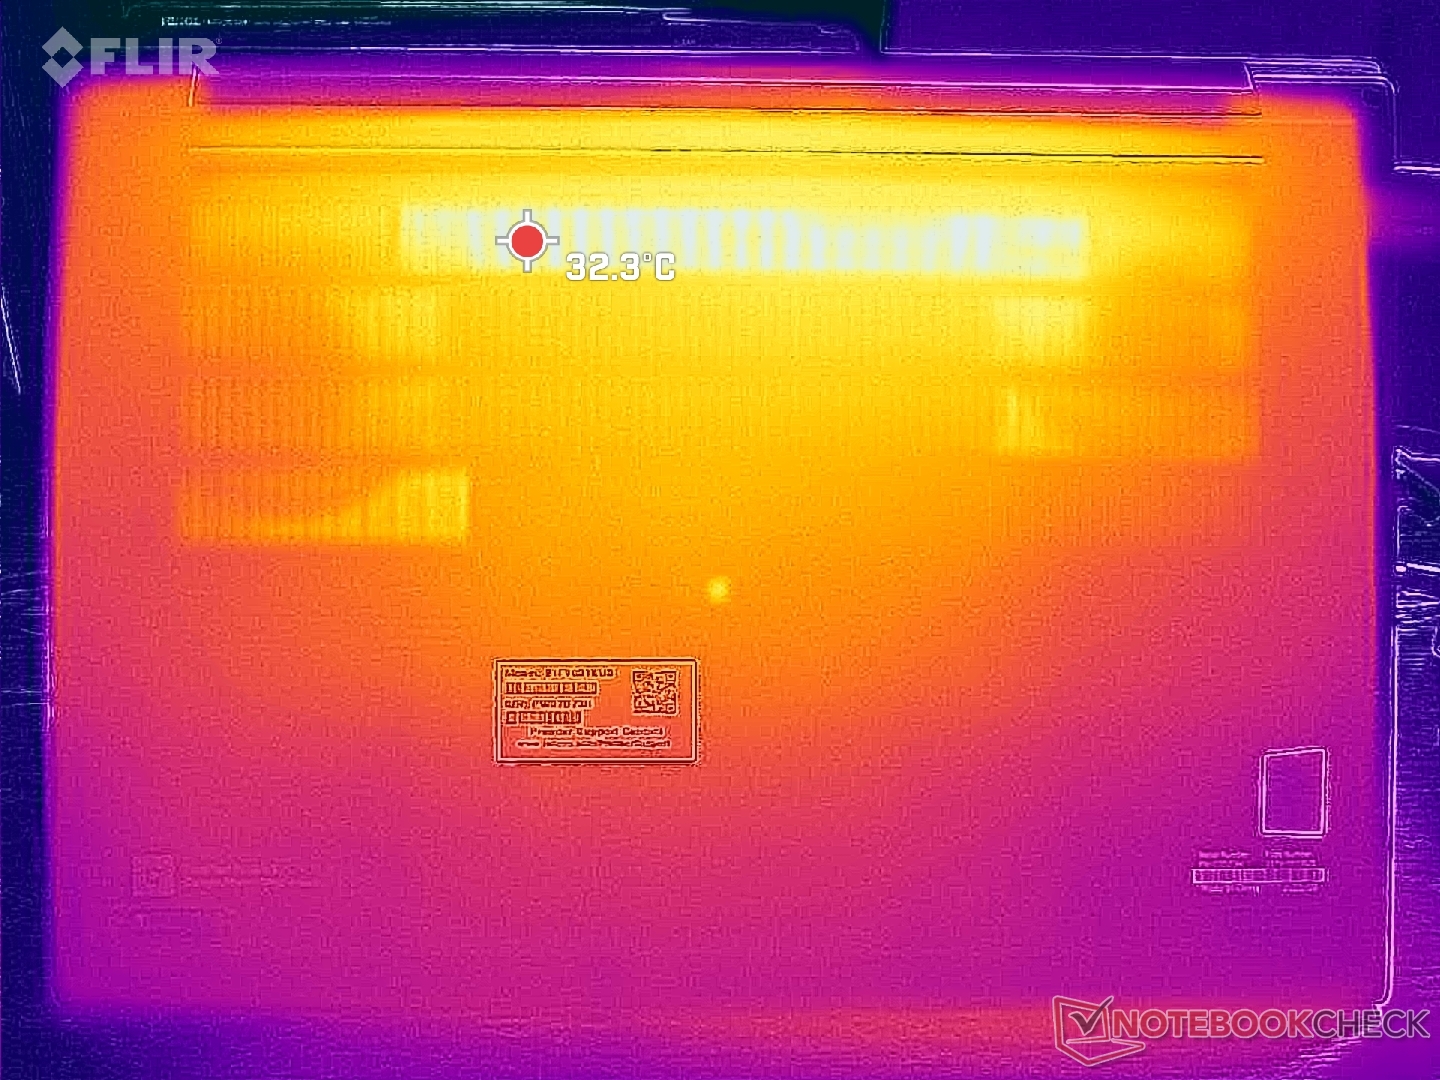
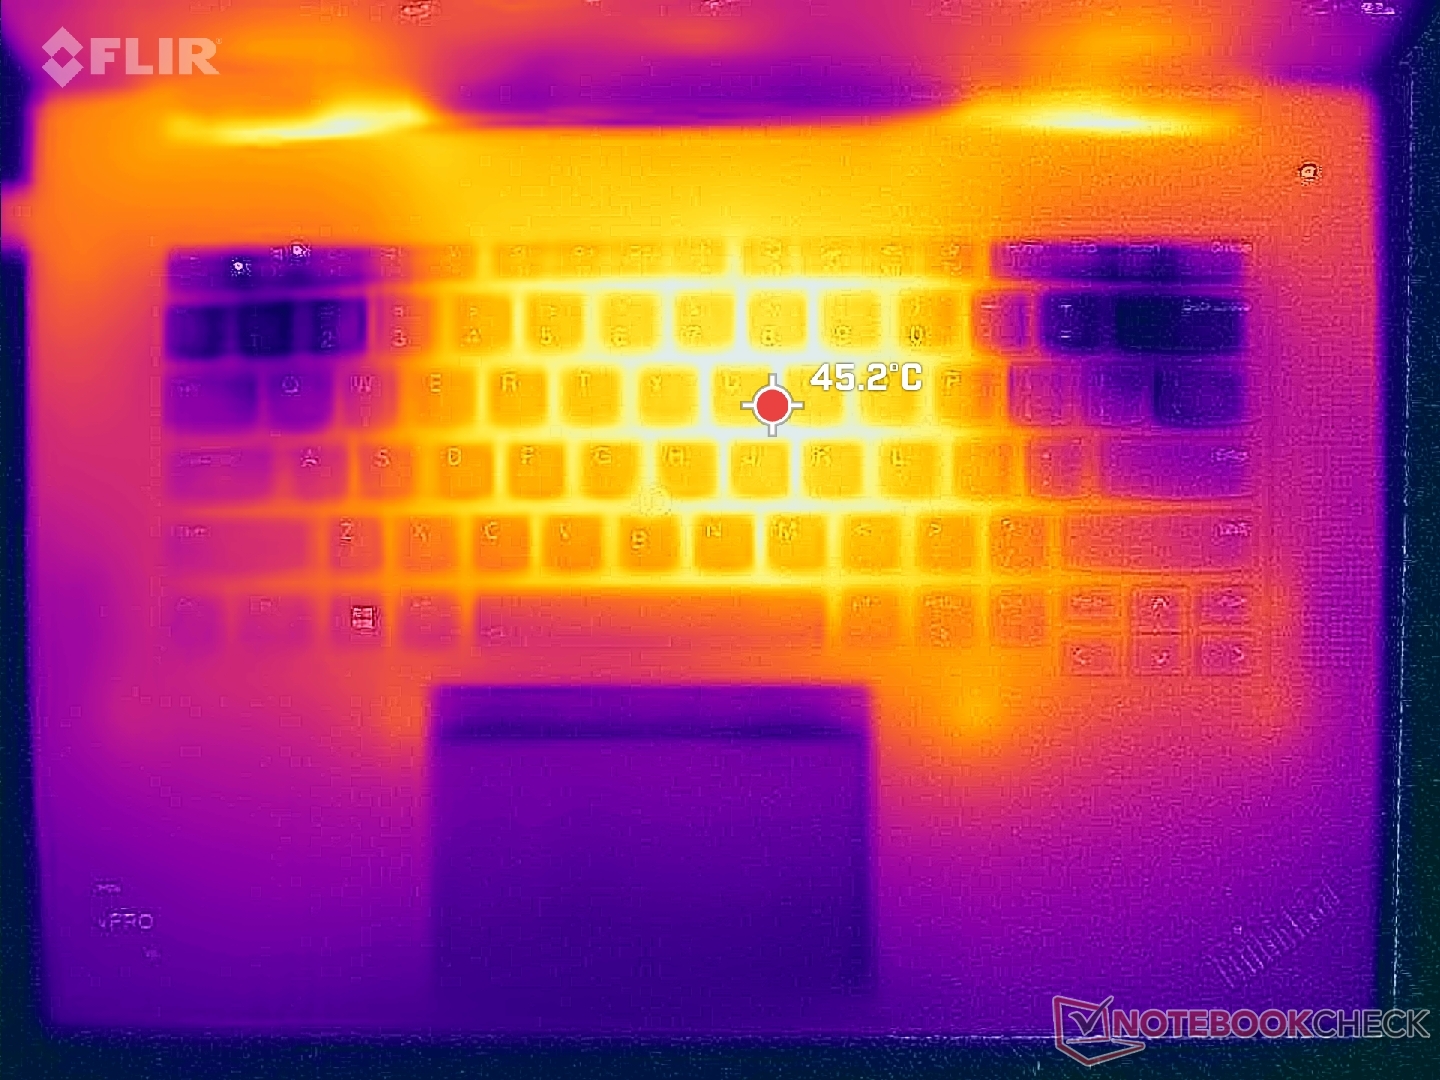
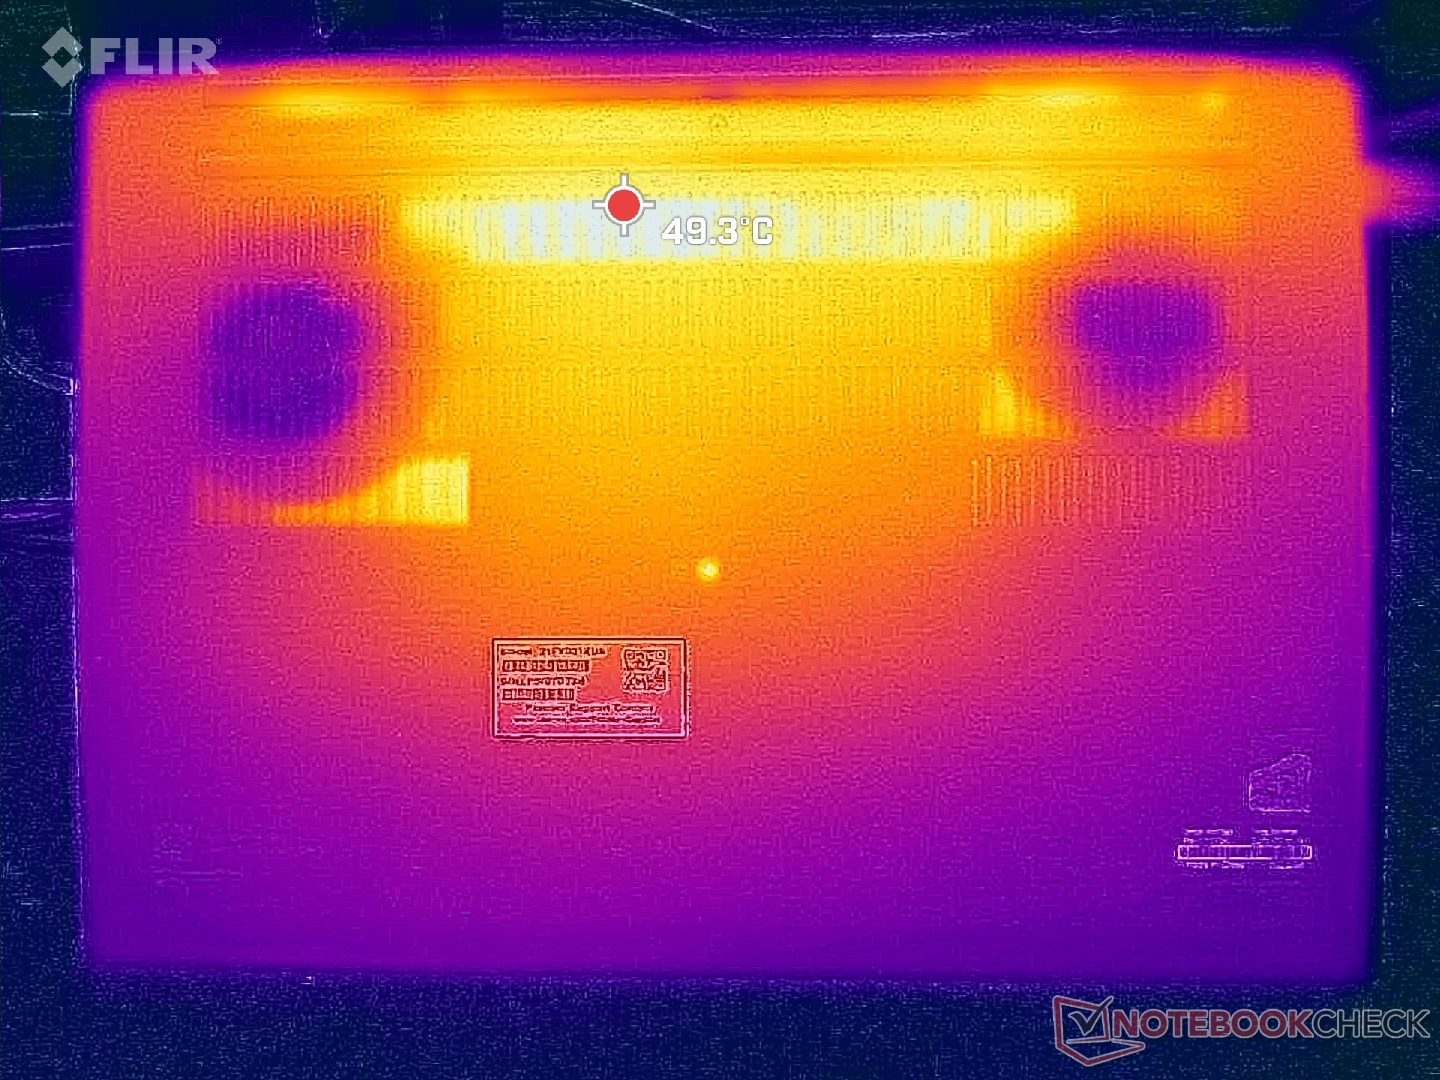
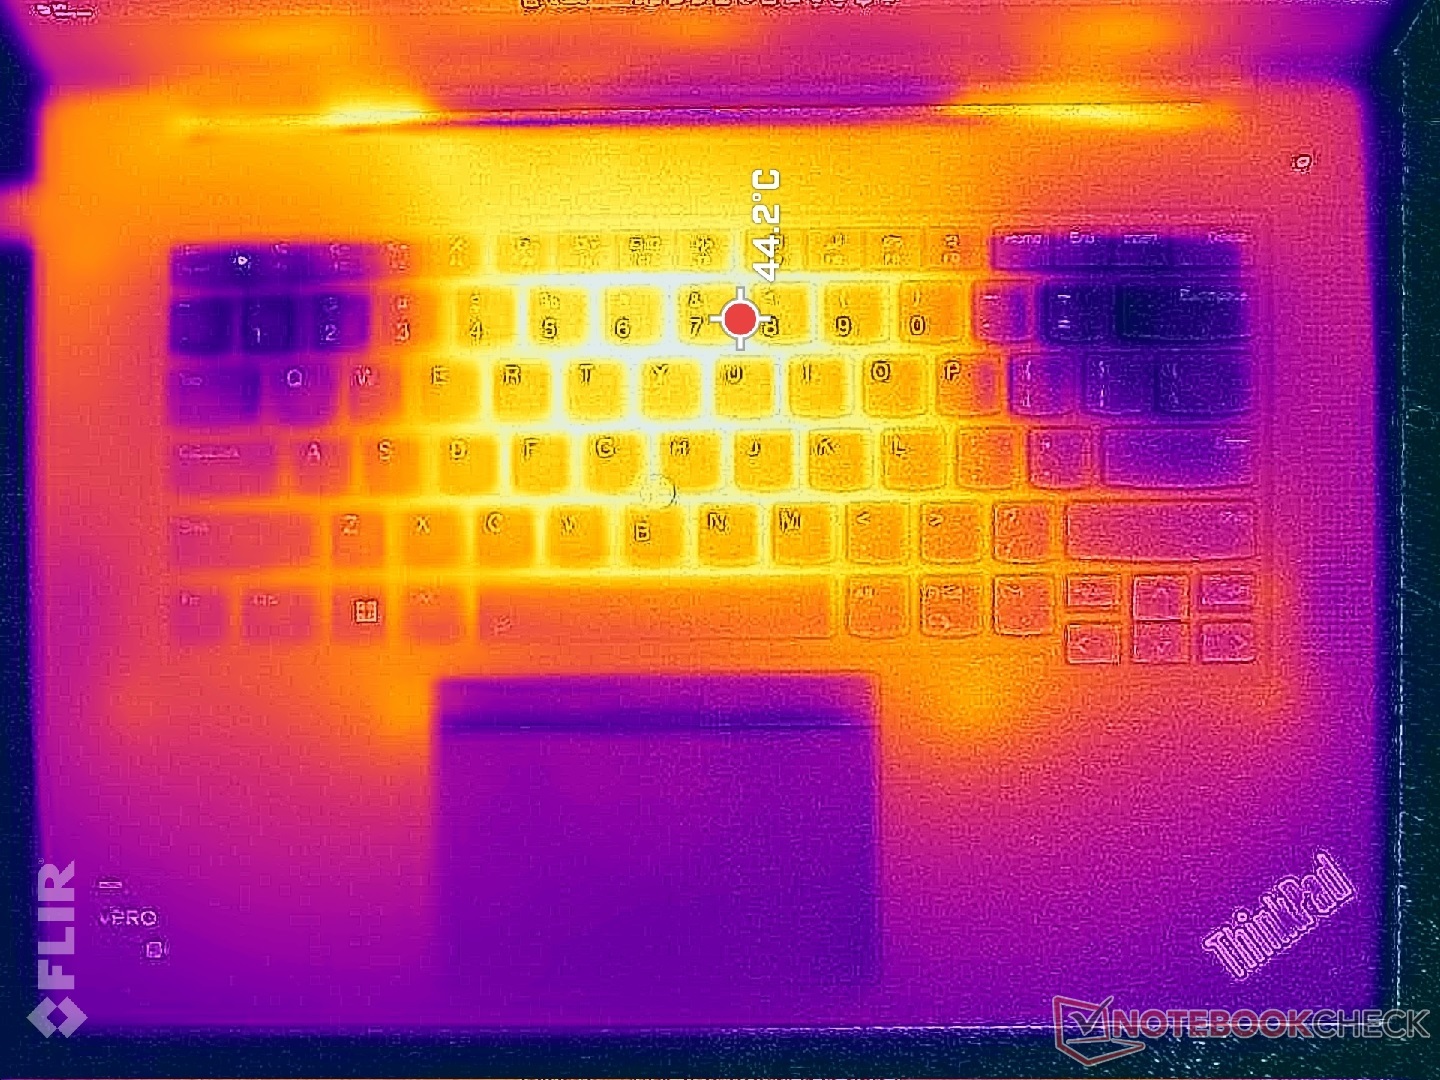
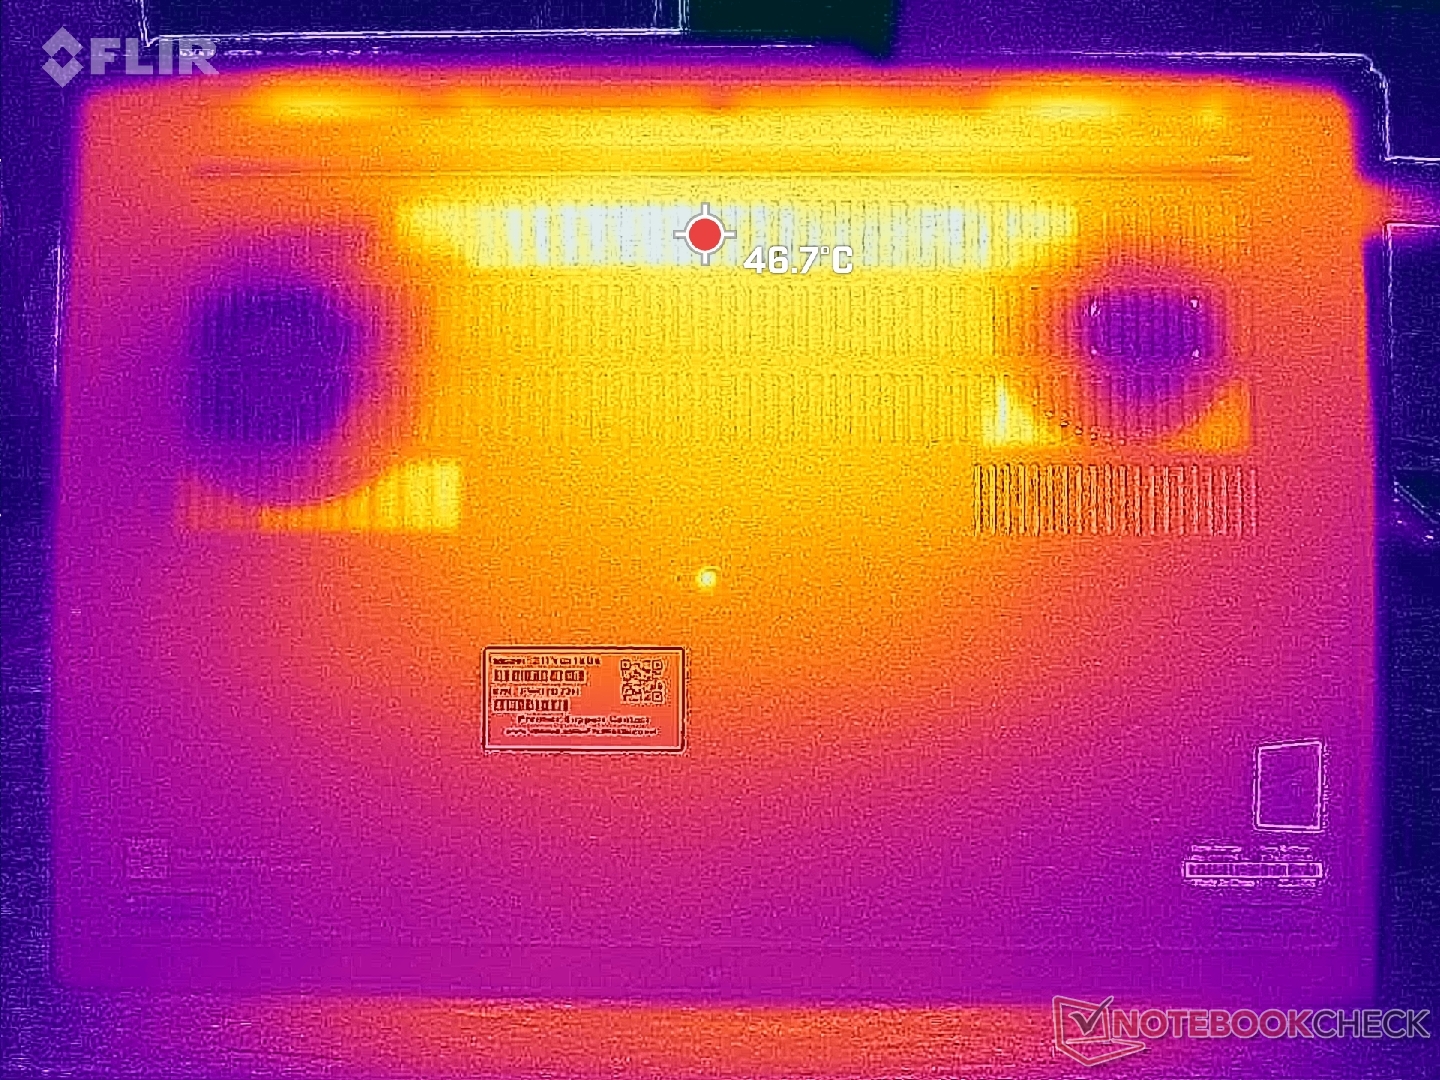
Temperatura
Le temperature della superficie possono essere piuttosto calde anche quando si è semplicemente al minimo sul desktop, poiché le ventole tendono ad essere letargiche fino a quando non si introducono carichi molto più elevati. I punti caldi sulla tastiera e sulla superficie inferiore possono raggiungere 45 C e 49 C, rispettivamente, rispetto ai 51 C e 32 C dei modelli concorrenti Dell Precision 5680.
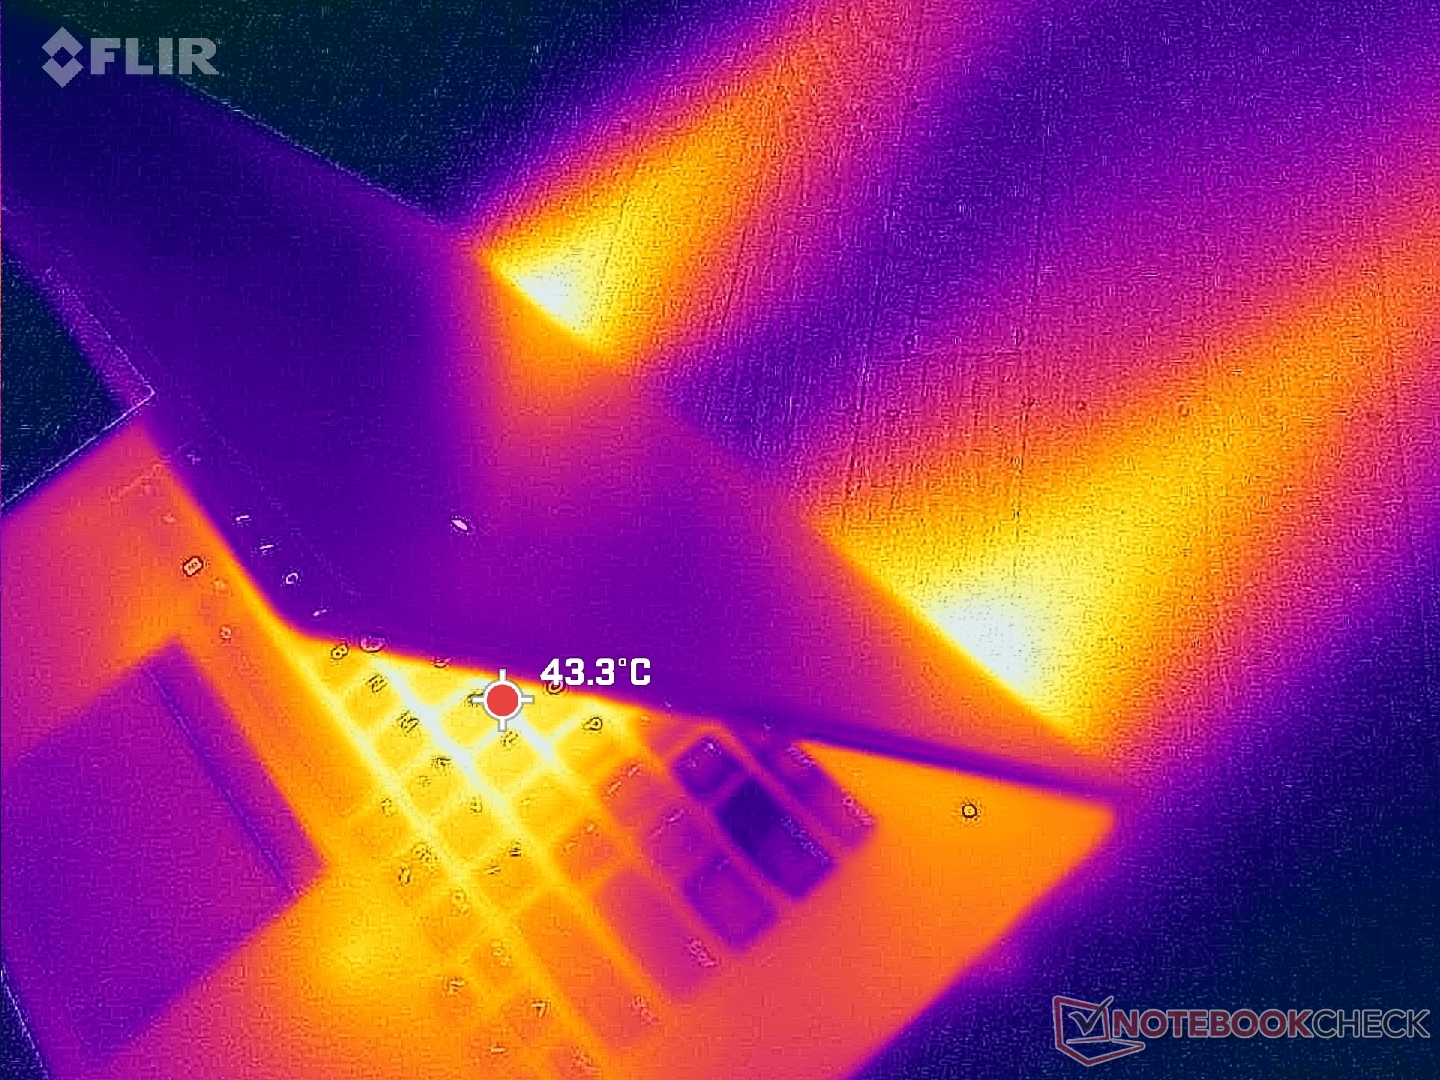
(±) La temperatura massima sul lato superiore è di 42 °C / 108 F, rispetto alla media di 38.2 °C / 101 F, che varia da 22.2 a 69.8 °C per questa classe Workstation.
(-) Il lato inferiore si riscalda fino ad un massimo di 45.2 °C / 113 F, rispetto alla media di 41.1 °C / 106 F
(+) In idle, la temperatura media del lato superiore è di 29 °C / 84 F, rispetto alla media deld ispositivo di 32 °C / 90 F.
(±) Riproducendo The Witcher 3, la temperatura media per il lato superiore e' di 36.1 °C / 97 F, rispetto alla media del dispositivo di 32 °C / 90 F.
(+) I poggiapolsi e il touchpad sono piu' freddi della temperatura della pelle con un massimo di 30.8 °C / 87.4 F e sono quindi freddi al tatto.
(-) La temperatura media della zona del palmo della mano di dispositivi simili e'stata di 27.8 °C / 82 F (-3 °C / -5.4 F).

| Lenovo ThinkPad P1 G6 21FV001KUS Intel Core i7-13800H, NVIDIA GeForce RTX 4080 Laptop GPU | Lenovo ThinkPad P1 G6-21FV000DGE Intel Core i9-13900H, NVIDIA RTX 2000 Ada Generation Laptop | Lenovo ThinkPad P1 G4-20Y4S0KS00 Intel Core i7-11850H, NVIDIA GeForce RTX 3070 Laptop GPU | Lenovo ThinkPad P16 G1 RTX A5500 Intel Core i9-12950HX, NVIDIA RTX A5500 Laptop GPU | Dell Precision 5000 5680 Intel Core i9-13900H, NVIDIA RTX 5000 Ada Generation Laptop | HP ZBook Fury 16 G10 Intel Core i9-13950HX, NVIDIA RTX 5000 Ada Generation Laptop | |
|---|---|---|---|---|---|---|
| Heat | 1% | -1% | -4% | 3% | -2% | |
| Maximum Upper Side * (°C) | 42 | 47.1 -12% | 51 -21% | 44.8 -7% | 50.2 -20% | 44.8 -7% |
| Maximum Bottom * (°C) | 45.2 | 56.5 -25% | 53.5 -18% | 49.8 -10% | 32 29% | 50 -11% |
| Idle Upper Side * (°C) | 33 | 28.1 15% | 28.8 13% | 30.6 7% | 37.4 -13% | 34.4 -4% |
| Idle Bottom * (°C) | 37 | 27.6 25% | 29.3 21% | 38.6 -4% | 31.2 16% | 31.8 14% |
* ... Meglio usare valori piccoli
Test da sforzo
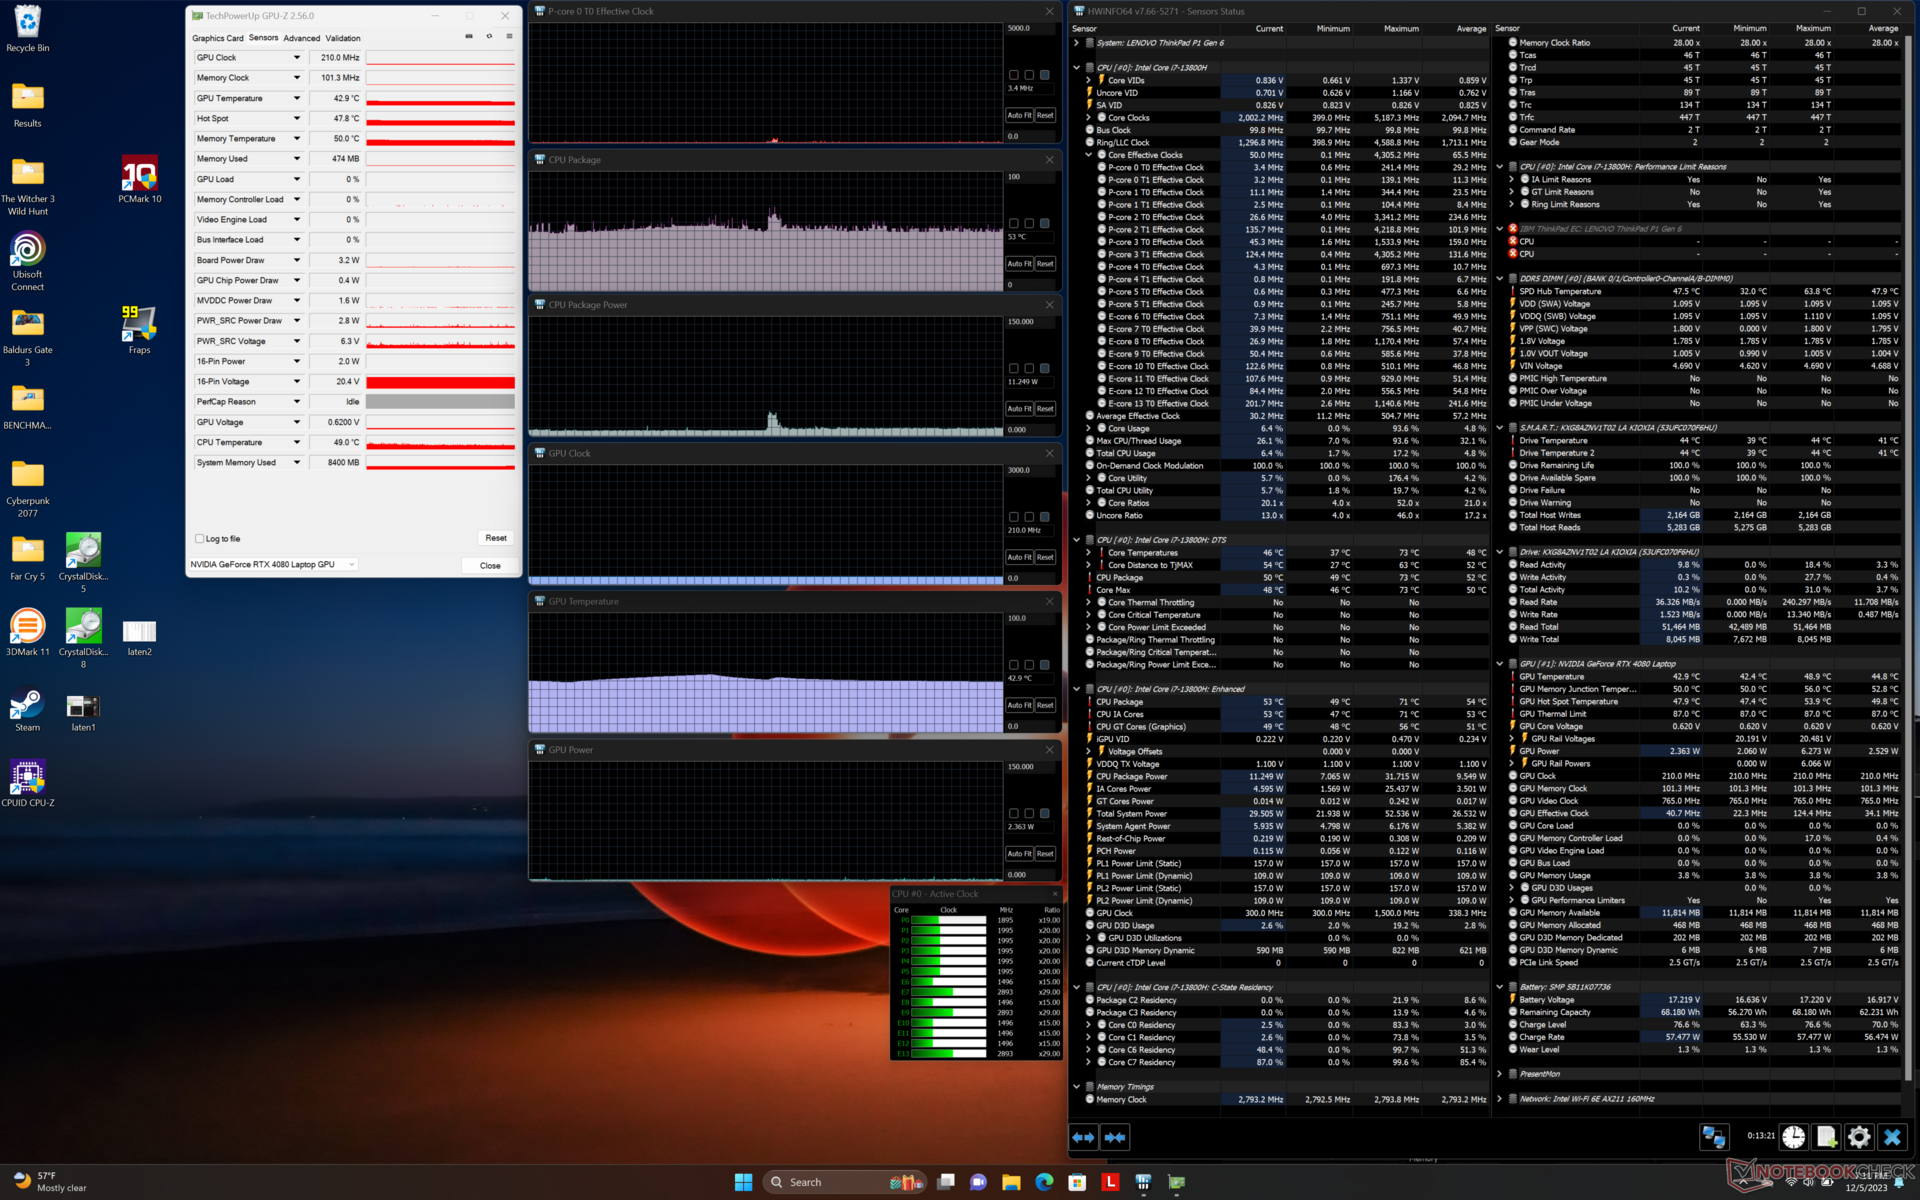
Sotto lo stress di Prime95, la CPU ha raggiunto un boost di 4,1 GHz e 111 W solo per i primi due secondi, prima di scendere e stabilizzarsi a 75 W e nell'intervallo da 2,5 a 3,1 GHz. In particolare, la temperatura del nucleo si stabilizzerebbe a 97 C, molto calda, suggerendo che il processore sta spingendo la soluzione di raffreddamento ai suoi limiti per massimizzare il potenziale Turbo Boost.
Le prestazioni grafiche si riducono se si esegue in modalità Bilanciata invece che in modalità Prestazioni, come menzionato in precedenza. Ad esempio, la GPU si stabilizzerebbe a 1890 MHz, 79 W e 77 C quando viene eseguita in modalità Performance Witcher 3 in modalità Performance, rispetto ai soli 1470 MHz, 52 W e 67 C della modalità Bilanciata.
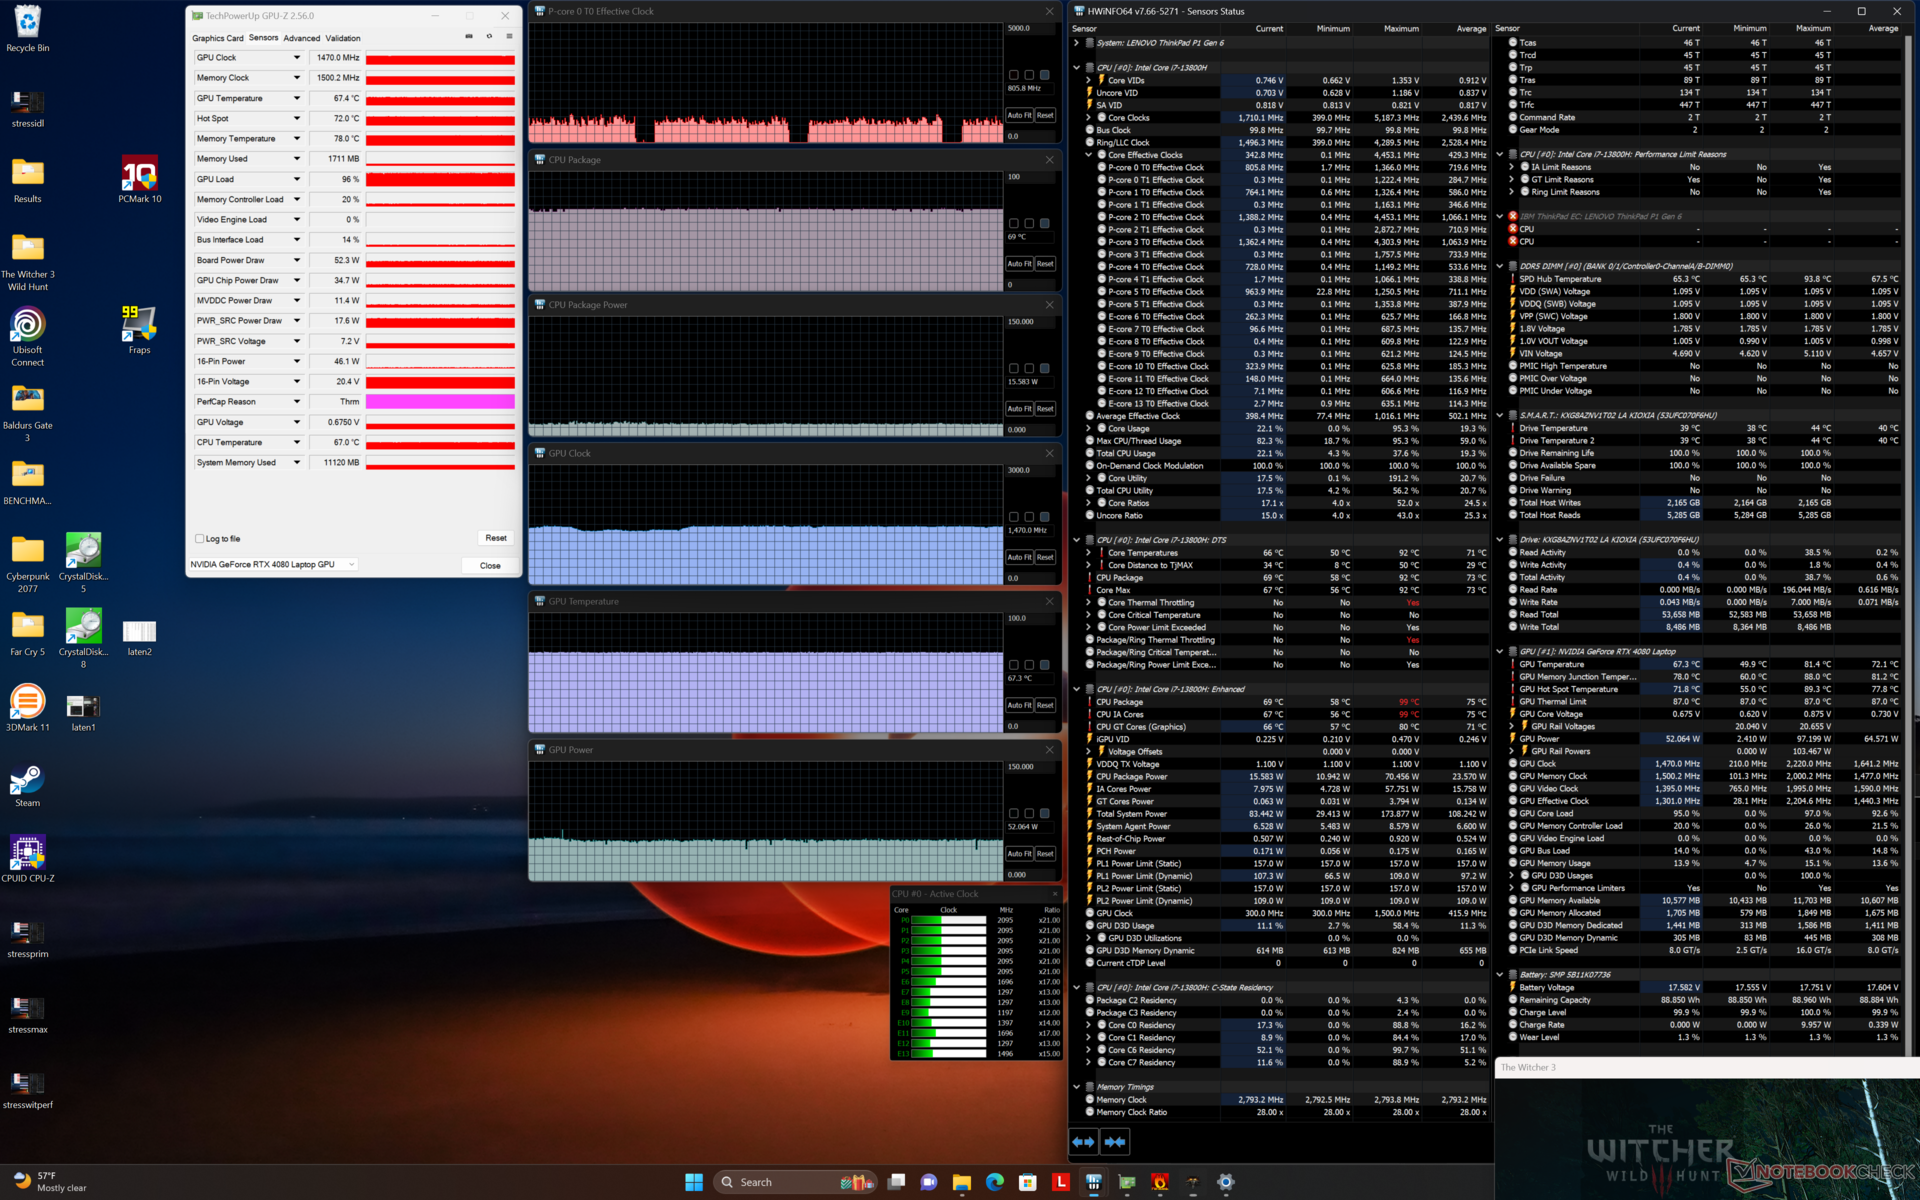
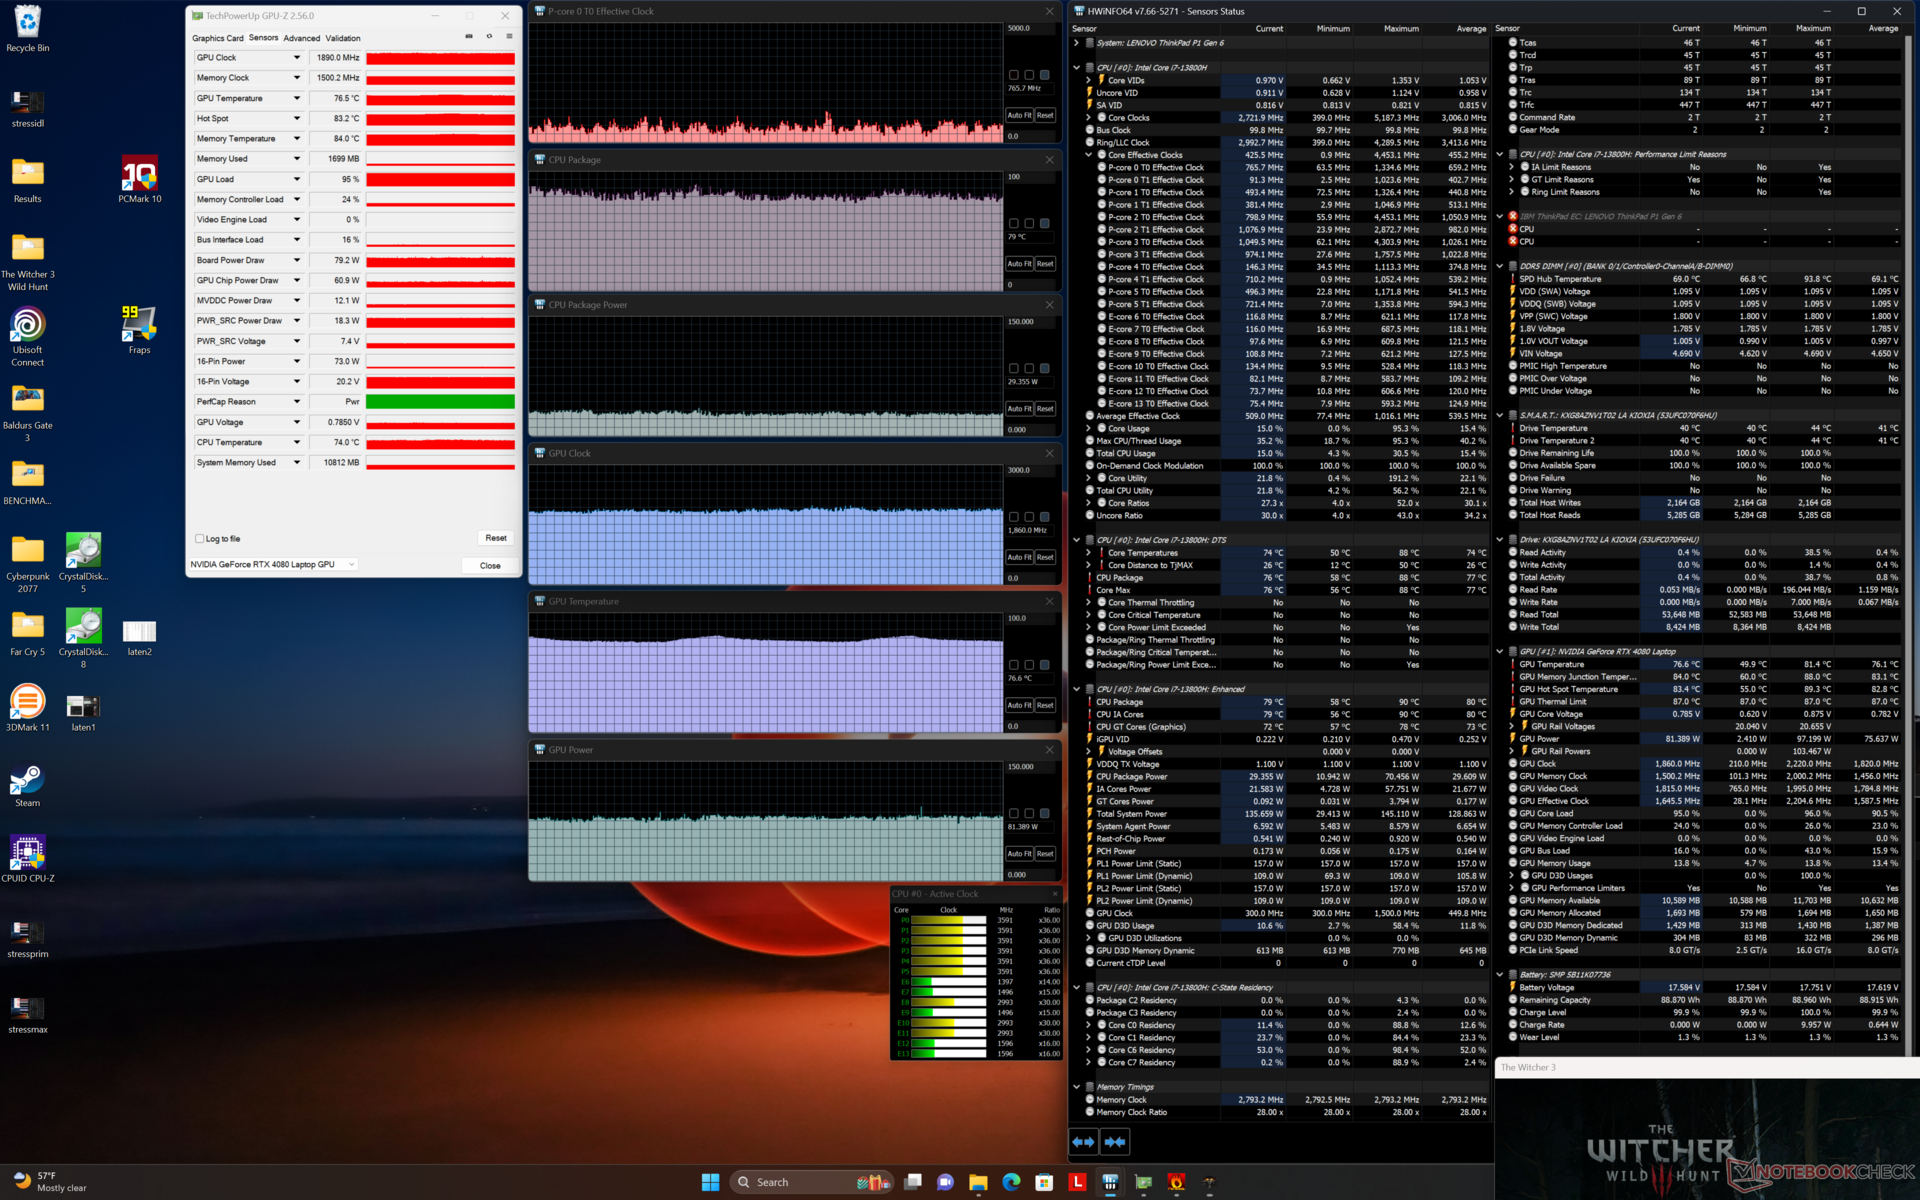
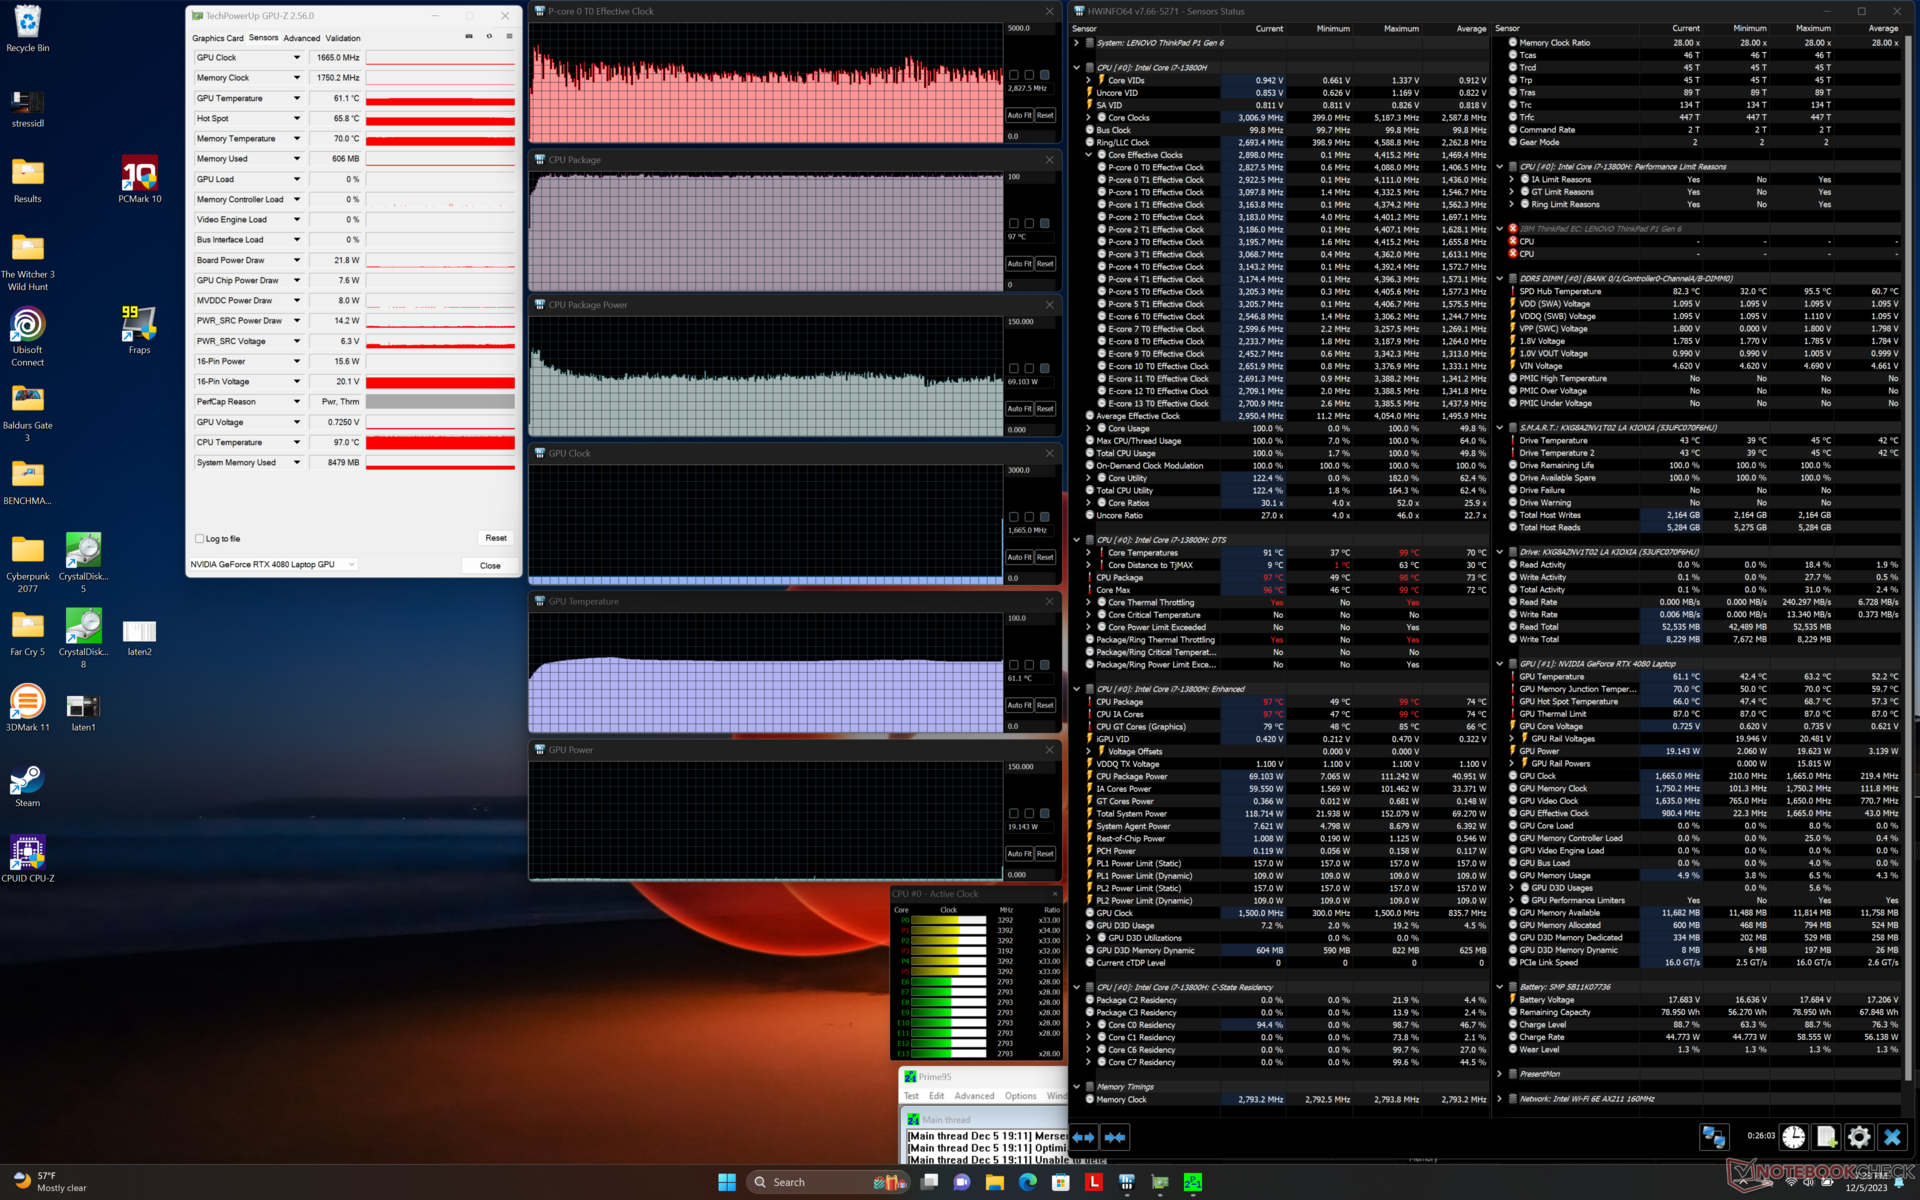
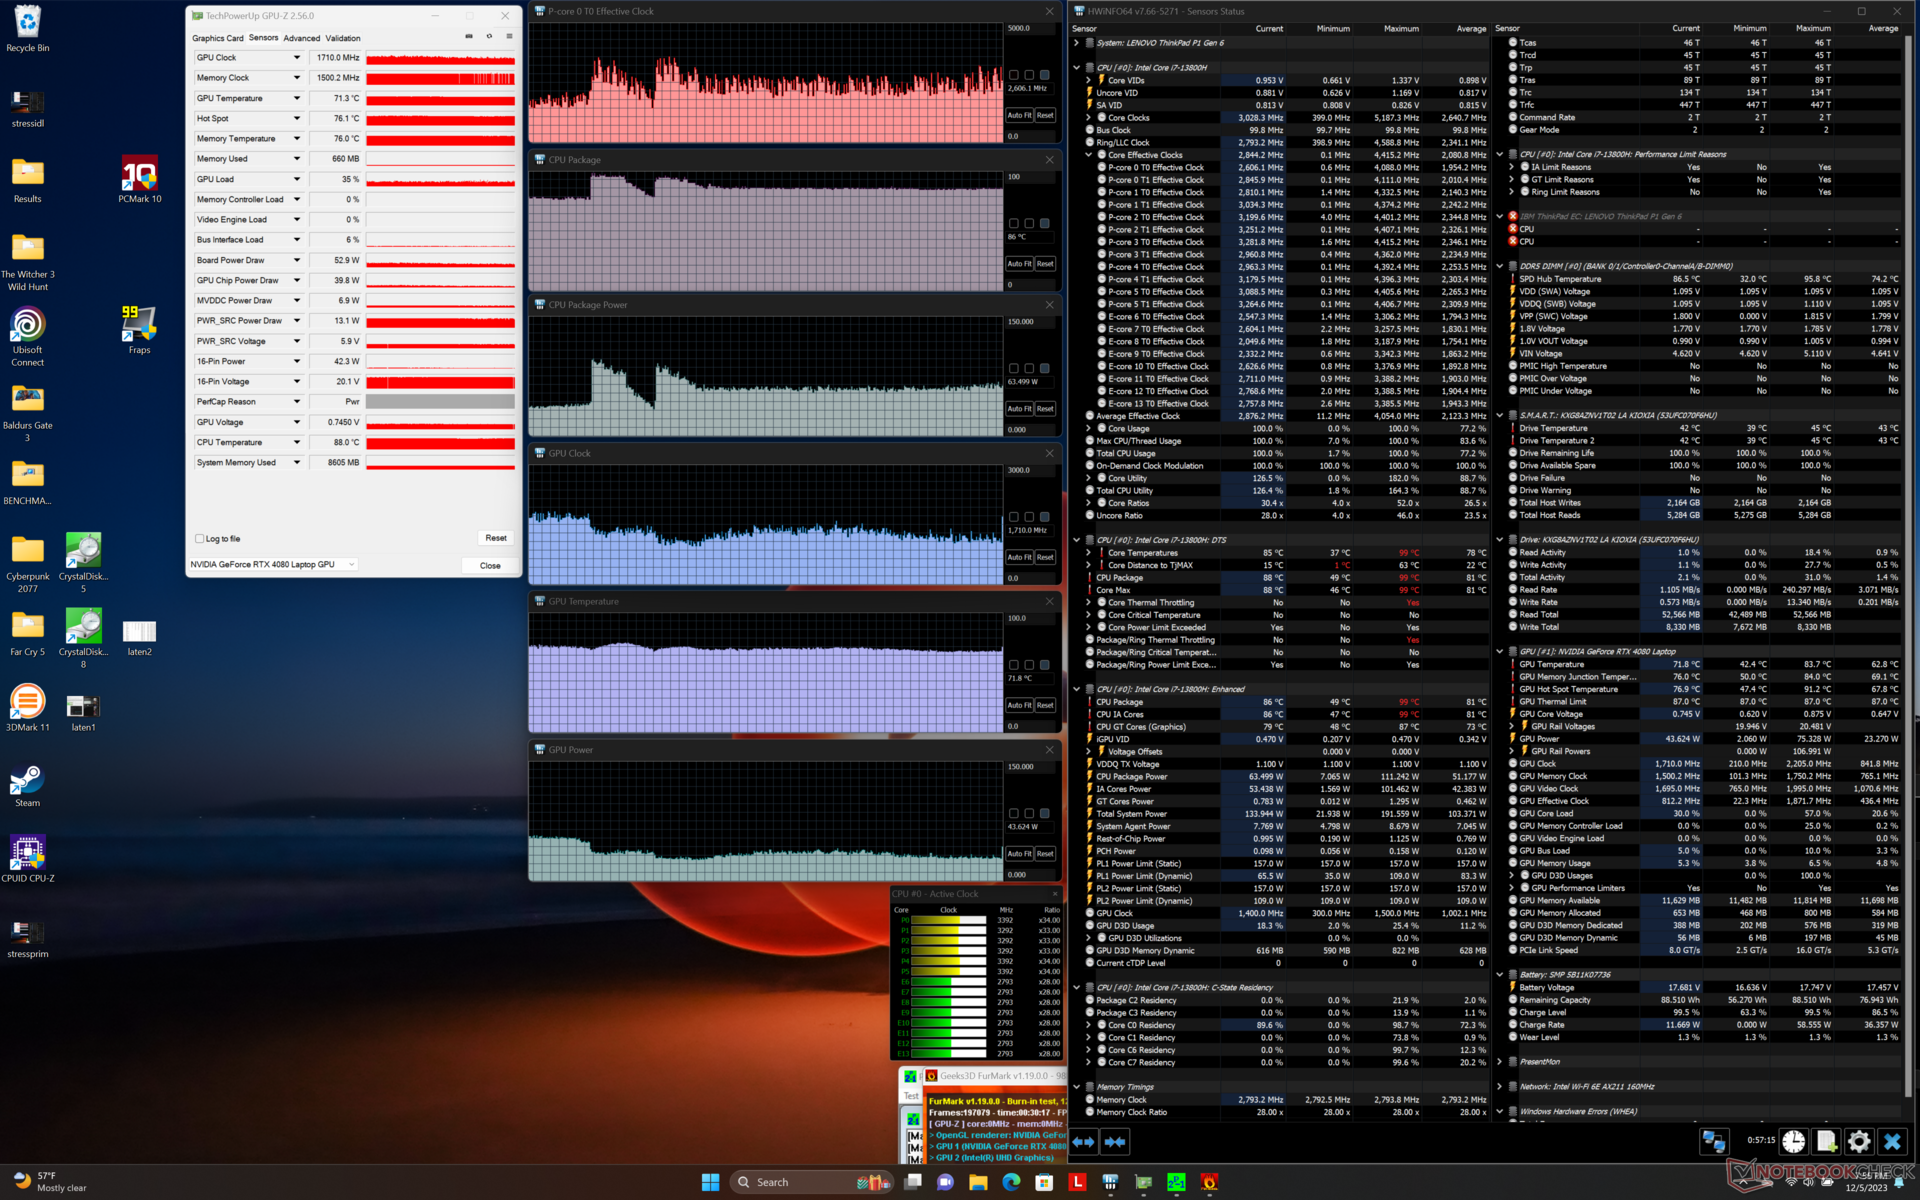
| Clock della CPU (GHz) | Clock della GPU (MHz) | Temperatura media della CPU (°C) | Temperatura media della GPU (°C) | |
| Sistema inattivo | -- | -- | 53 | 43 |
| Stress Prime95 | -- | -- | 2,5 - 3,1 | 97 |
| Prime95 + FurMark Stress | ~2,1 - 3,1 | ~1071 | 86 | 72 |
| Witcher 3 Stress (modalità bilanciata) | 0,8 | 1470 | 69 | 67 |
| Witcher 3 Stress (modalità Performance) | ~0,8 | 1890 | 79 | 77 |
Altoparlanti
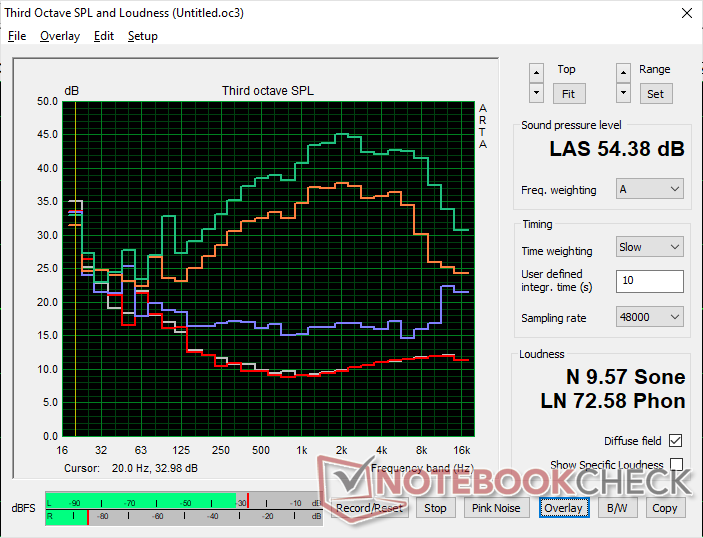
Lenovo ThinkPad P1 G6 21FV001KUS analisi audio
(+) | gli altoparlanti sono relativamente potenti (85.2 dB)
Bassi 100 - 315 Hz
(±) | bassi ridotti - in media 8% inferiori alla media
(±) | la linearità dei bassi è media (10.2% delta rispetto alla precedente frequenza)
Medi 400 - 2000 Hz
(±) | medi elevati - circa 7.7% superiore alla media
(+) | medi lineari (4.7% delta rispetto alla precedente frequenza)
Alti 2 - 16 kHz
(+) | Alti bilanciati - appena 4.2% dalla media
(+) | alti lineari (6.2% delta rispetto alla precedente frequenza)
Nel complesso 100 - 16.000 Hz
(+) | suono nel complesso lineare (13.2% differenza dalla media)
Rispetto alla stessa classe
» 23% di tutti i dispositivi testati in questa classe è stato migliore, 6% simile, 71% peggiore
» Il migliore ha avuto un delta di 7%, medio di 17%, peggiore di 35%
Rispetto a tutti i dispositivi testati
» 13% di tutti i dispositivi testati in questa classe è stato migliore, 3% similare, 84% peggiore
» Il migliore ha avuto un delta di 4%, medio di 23%, peggiore di 134%
Apple MacBook Pro 16 2021 M1 Pro analisi audio
(+) | gli altoparlanti sono relativamente potenti (84.7 dB)
Bassi 100 - 315 Hz
(+) | bassi buoni - solo 3.8% dalla media
(+) | bassi in lineaa (5.2% delta rispetto alla precedente frequenza)
Medi 400 - 2000 Hz
(+) | medi bilanciati - solo only 1.3% rispetto alla media
(+) | medi lineari (2.1% delta rispetto alla precedente frequenza)
Alti 2 - 16 kHz
(+) | Alti bilanciati - appena 1.9% dalla media
(+) | alti lineari (2.7% delta rispetto alla precedente frequenza)
Nel complesso 100 - 16.000 Hz
(+) | suono nel complesso lineare (4.6% differenza dalla media)
Rispetto alla stessa classe
» 0% di tutti i dispositivi testati in questa classe è stato migliore, 0% simile, 100% peggiore
» Il migliore ha avuto un delta di 5%, medio di 17%, peggiore di 45%
Rispetto a tutti i dispositivi testati
» 0% di tutti i dispositivi testati in questa classe è stato migliore, 0% similare, 100% peggiore
» Il migliore ha avuto un delta di 4%, medio di 23%, peggiore di 134%
Gestione dell'energia
Consumo di energia
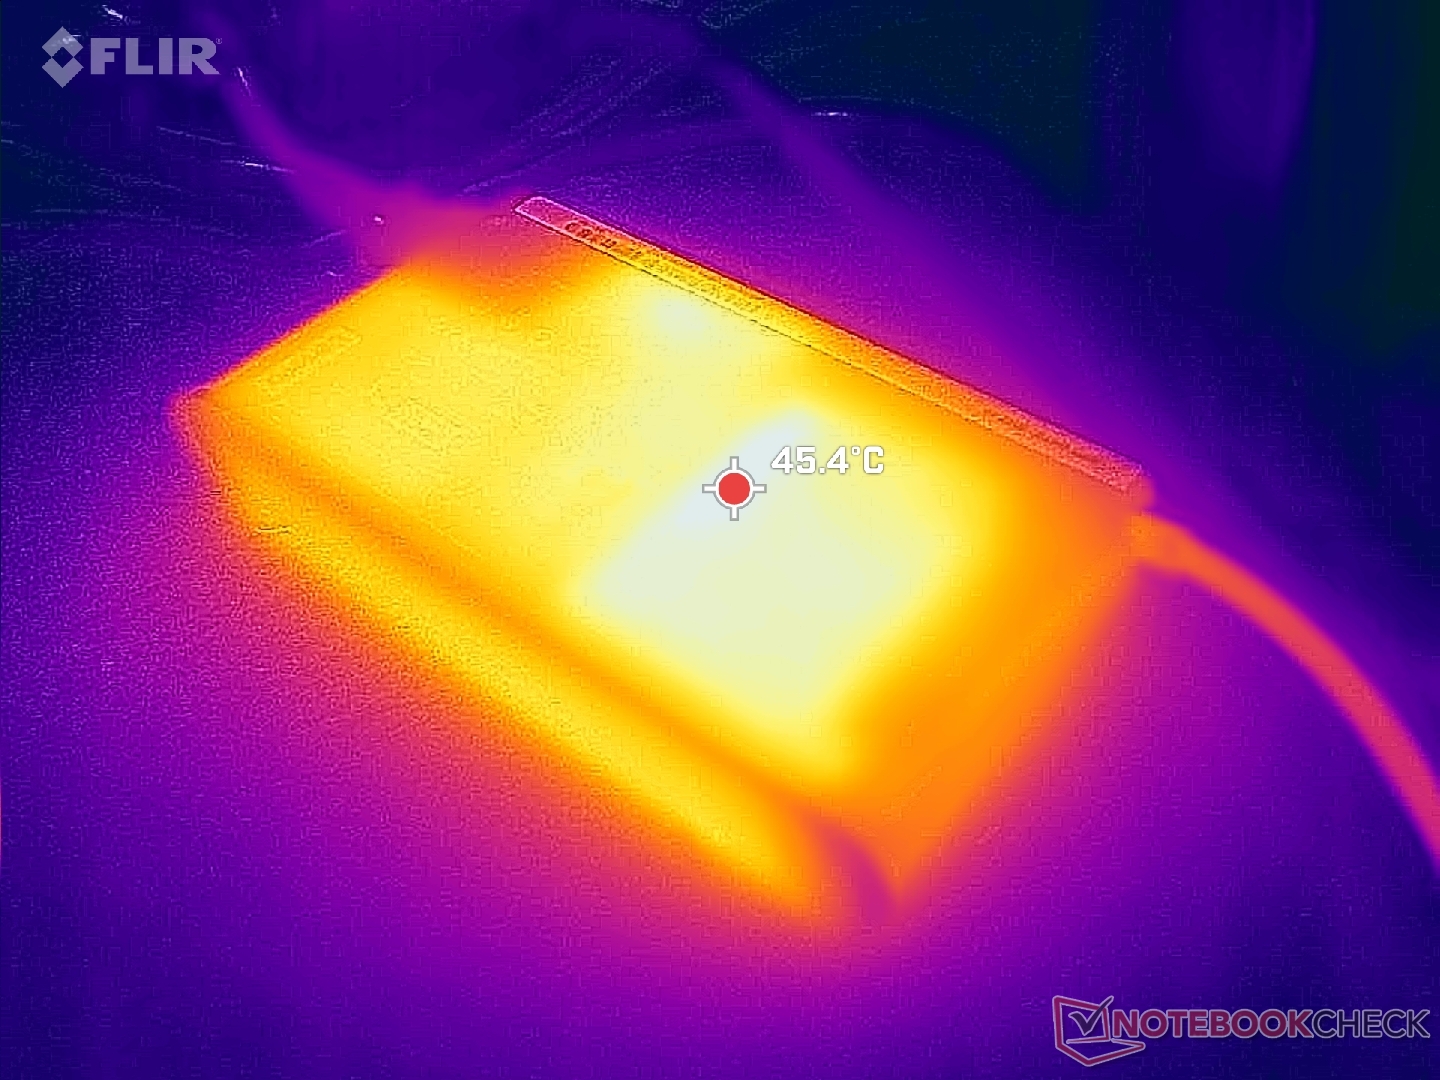
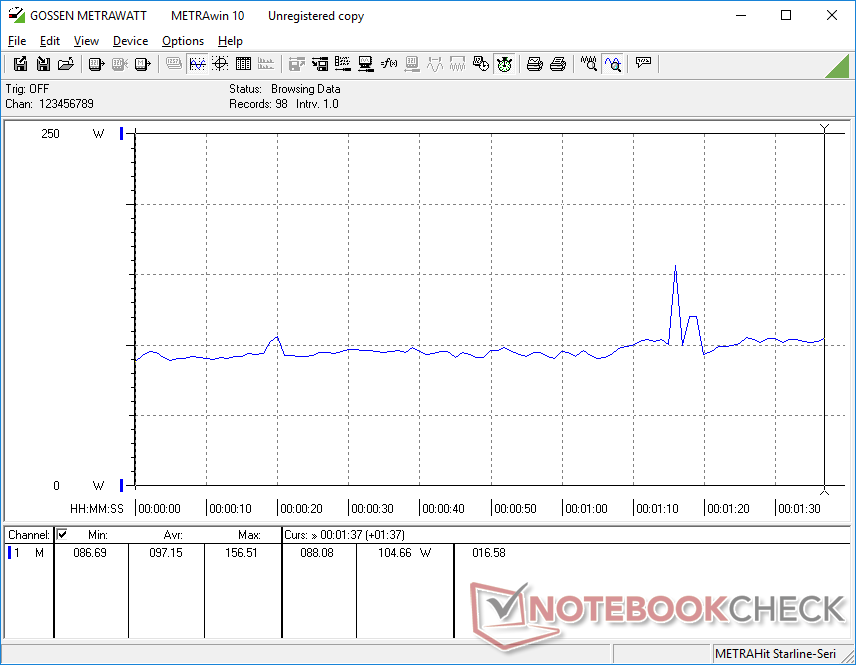
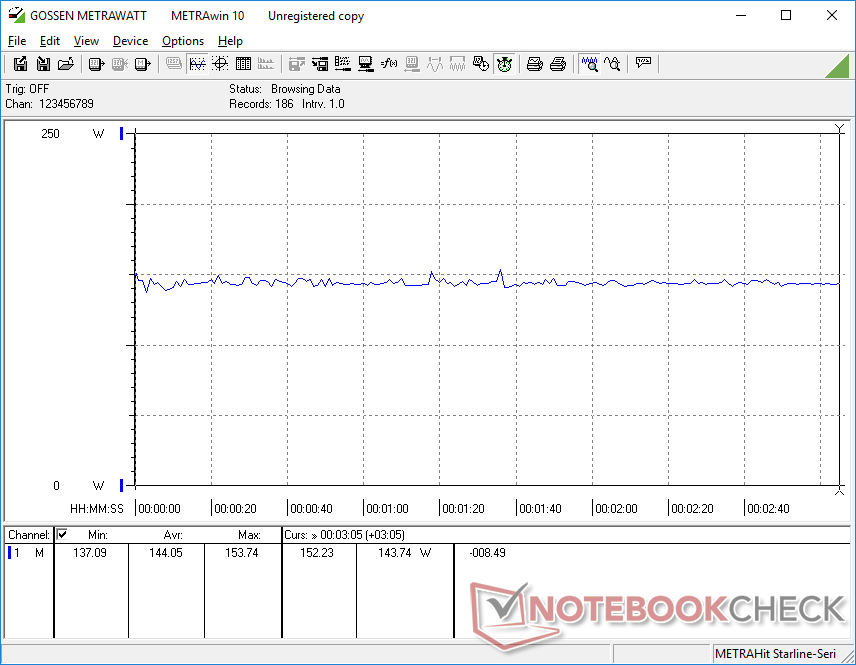
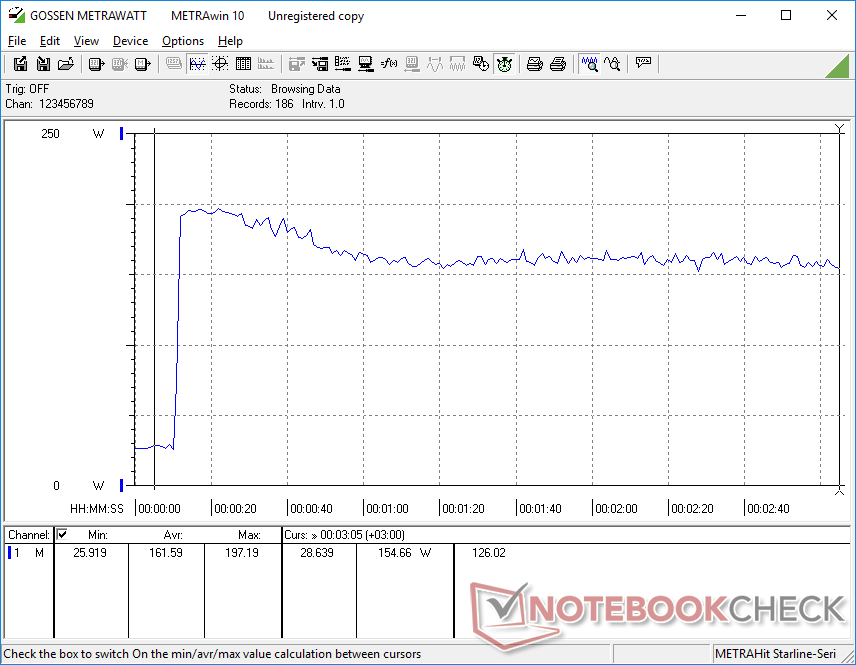
La nostra unità di prova è generalmente più esigente rispetto alla configurazione meno potente con RTX 2000, il che spiega la minore durata della batteria nella prossima sezione. Eseguire Witcher 3 per rappresentare carichi impegnativi, ad esempio, consumerebbe il 37% in più di energia.
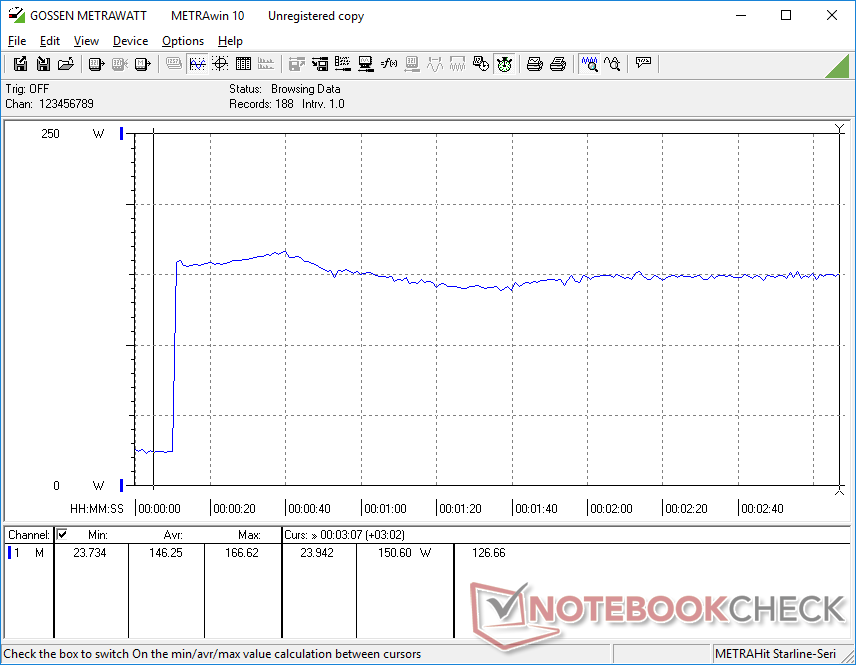
Siamo in grado di registrare un consumo massimo di 197 W dall'adattatore CA di medie dimensioni (~17 x 8,8 x 2,5 cm) da 230 W, quando la CPU e la GPU sono ciascuna al 100 percento di utilizzo.
| Off / Standby | |
| Idle | |
| Sotto carico |
|
Leggenda:
min: | |
| Lenovo ThinkPad P1 G6 21FV001KUS i7-13800H, GeForce RTX 4080 Laptop GPU, Kioxia XG8 KXG8AZNV1T02, OLED, 3480x2400, 16" | Lenovo ThinkPad P1 G6-21FV000DGE i9-13900H, RTX 2000 Ada Generation Laptop, SK Hynix PC711 1TB HFS001TDE9X084N, IPS, 2560x1600, 16" | Lenovo ThinkPad P1 G4-20Y4S0KS00 i7-11850H, GeForce RTX 3070 Laptop GPU, Samsung PM9A1 MZVL21T0HCLR, IPS LED, 3840x2400, 16" | Lenovo ThinkPad P16 G1 RTX A5500 i9-12950HX, RTX A5500 Laptop GPU, WDC PC SN810 2TB, IPS, 3840x2400, 16" | Dell Precision 5000 5680 i9-13900H, RTX 5000 Ada Generation Laptop, 2x SK hynix PC801 HFS512GEJ9X101N RAID 0, OLED, 3840x2400, 16" | HP ZBook Fury 16 G10 i9-13950HX, RTX 5000 Ada Generation Laptop, SK hynix PC801 HFS001TEJ9X101N, IPS, 3840x2400, 16" | |
|---|---|---|---|---|---|---|
| Power Consumption | 5% | -15% | -51% | 0% | -46% | |
| Idle Minimum * (Watt) | 8 | 8.3 -4% | 8.1 -1% | 7.5 6% | 8 -0% | 15.3 -91% |
| Idle Average * (Watt) | 9.5 | 14.5 -53% | 20.2 -113% | 20.1 -112% | 10.4 -9% | 18.2 -92% |
| Idle Maximum * (Watt) | 23.7 | 15.3 35% | 21.9 8% | 40 -69% | 30.5 -29% | 28 -18% |
| Load Average * (Watt) | 97.2 | 91.8 6% | 88.2 9% | 137 -41% | 75.4 22% | 137.9 -42% |
| Witcher 3 ultra * (Watt) | 144 | 104.7 27% | 149 -3% | 208 -44% | 134 7% | 189.4 -32% |
| Load Maximum * (Watt) | 197.2 | 164.5 17% | 170.6 13% | 285.9 -45% | 175 11% | 202 -2% |
* ... Meglio usare valori piccoli
Power Consumption Witcher 3 / Stresstest
Power Consumption external Monitor
Durata della batteria
I tempi di esecuzione sono significativamente più brevi rispetto alla configurazione con RTX 2000, di oltre la metà, a causa del display OLED più esigente e della GPU più veloce. Siamo riusciti a registrare solo poco più di 4 ore di navigazione WLAN nel mondo reale, anche con il profilo energetico Bilanciato.
| Lenovo ThinkPad P1 G6 21FV001KUS i7-13800H, GeForce RTX 4080 Laptop GPU, 90 Wh | Lenovo ThinkPad P1 G6-21FV000DGE i9-13900H, RTX 2000 Ada Generation Laptop, 90 Wh | Lenovo ThinkPad P1 G4-20Y4S0KS00 i7-11850H, GeForce RTX 3070 Laptop GPU, 90 Wh | Lenovo ThinkPad P16 G1 RTX A5500 i9-12950HX, RTX A5500 Laptop GPU, 94 Wh | Dell Precision 5000 5680 i9-13900H, RTX 5000 Ada Generation Laptop, 98 Wh | HP ZBook Fury 16 G10 i9-13950HX, RTX 5000 Ada Generation Laptop, 95 Wh | |
|---|---|---|---|---|---|---|
| Autonomia della batteria | 126% | 67% | 38% | 136% | 74% | |
| WiFi v1.3 (h) | 4.2 | 9.5 126% | 7 67% | 5.8 38% | 9.9 136% | 7.3 74% |
| H.264 (h) | 11.2 | 7.2 | ||||
| Load (h) | 1.1 | 1.2 | 1.7 | |||
| Reader / Idle (h) | 17.9 |
Pro
Contro
Verdetto - Prestazioni più veloci a scapito della durata della batteria
Il ThinkPad P1 G6 offre un'ampia gamma di livelli di configurazione, tra cui IPS, OLED, Core i7, Core i9 e opzioni di GPU GeForce RTX o RTX Ada. In base al tempo trascorso con due configurazioni molto diverse, le due opzioni di processore (Core i7-13800H vs. Core i9-13900H) presentano differenze minime tra loro, il che significa che sarebbe saggio scegliere il Core i7 più economico e poi spendere i dollari in più altrove.
Per quanto riguarda il display, è un testa a testa tra IPS a 1600p e OLED a 2400p. Il primo offre una frequenza di aggiornamento nativa più veloce e una luminosità massima più elevata, mentre il secondo offre touchscreen, colori DCI-P3, ghosting minimo e supporto HDR400. I modelli futuri potrebbero incorporare pannelli OLED a 120 Hz, che stanno diventando sempre più comuni su modelli come l'Asus VivoBook Asus VivoBook.
Il ThinkPad P1 G6 offre prestazioni elevate per volume, anche se al costo della durata della batteria, delle ventole più rumorose e degli aggiornamenti limitati rispetto alle configurazioni minori.
La configurazione di opzioni di GPU più veloci, come RTX 5000 o la nostra RTX 4080, invece della RTX 2000, comporta alcuni svantaggi. Gli aggiornamenti dell'archiviazione interna diventano più limitati, il rumore della ventola diventa più forte sotto carico e la durata della batteria subisce un colpo notevole. Dobbiamo anche menzionare i balbettii della frequenza dei fotogrammi durante lo streaming video e il tetto massimo di 80 W TGP, relativamente basso. Nonostante ciò, il ThinkPad P1 G6 è una delle workstation mobili più veloci delle sue dimensioni e del suo peso. Per qualcosa di ragionevolmente più veloce, deve prendere in considerazione il più robusto ThinkPad P16 invece.
Prezzo e disponibilità
Lenovo sta distribuendo il ThinkPad P1 G6 in diverse configurazioni a partire da 1680 dollari per la configurazione base Core i7/RTX A1000/1200p IPS fino a 2700 dollari e oltre se configurato con RTX 4080.
Lenovo ThinkPad P1 G6 21FV001KUS
- 12/08/2023 v7 (old)
Allen Ngo
Transparency
La selezione dei dispositivi da recensire viene effettuata dalla nostra redazione. Il campione di prova è stato fornito all'autore come prestito dal produttore o dal rivenditore ai fini di questa recensione. L'istituto di credito non ha avuto alcuna influenza su questa recensione, né il produttore ne ha ricevuto una copia prima della pubblicazione. Non vi era alcun obbligo di pubblicare questa recensione. In quanto società mediatica indipendente, Notebookcheck non è soggetta all'autorità di produttori, rivenditori o editori.
Ecco come Notebookcheck esegue i test
Ogni anno, Notebookcheck esamina in modo indipendente centinaia di laptop e smartphone utilizzando procedure standardizzate per garantire che tutti i risultati siano comparabili. Da circa 20 anni sviluppiamo continuamente i nostri metodi di prova e nel frattempo stabiliamo gli standard di settore. Nei nostri laboratori di prova, tecnici ed editori esperti utilizzano apparecchiature di misurazione di alta qualità. Questi test comportano un processo di validazione in più fasi. Il nostro complesso sistema di valutazione si basa su centinaia di misurazioni e parametri di riferimento ben fondati, che mantengono l'obiettività.Price comparison

