Recensione del Lenovo ThinkPad E16 G1 Intel: Il Core i5 è testa a testa con l'AMD Ryzen 7

La serie ThinkPad E è costituita da modelli accessibili per gli utenti business, in contrasto con la serie ThinkPad T, più lussuosa, e con la serie ThinkPad X, più nitida. Quest'anno è stata introdotta la famiglia ThinkPad E16 da 16 pollici, che si affianca alle opzioni esistenti ThinkPad E14 da 14 pollici e ThinkPad E15 da 15 pollici. Al momento del lancio sono disponibili due versioni del ThinkPad E16 con processori Intel o AMD. Abbiamo recentemente recensito la versione ThinkPad E16 AMD Ryzen 7 e quindi è giunto il momento di verificare la versione ThinkPad E16 Intel Core i5 per vedere come le loro differenze si confrontano.
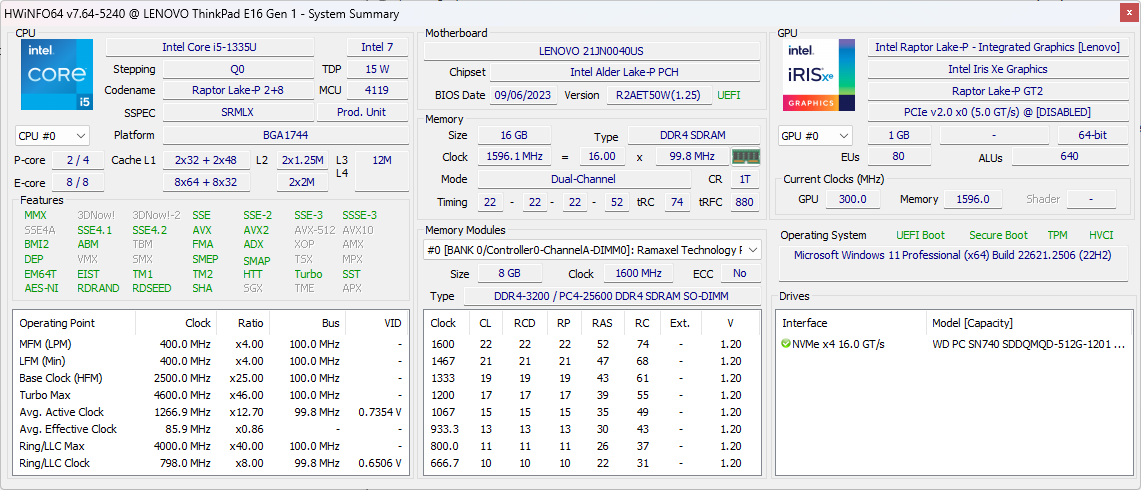
La nostra specifica unità di recensione Intel è una configurazione di fascia bassa con Core i5-1335U e schermo touchscreen da 1200p per circa 800-900 dollari al dettaglio. Altre configurazioni possono arrivare al Core i7-1365U, al Core i7-1360P o persino al Core i7-13700H con grafica discreta GeForce MX550 e un display a 1600p a risoluzione più elevata, per prezzi molto più alti. Tali opzioni non sono ancora disponibili al momento della pubblicazione.
Le alternative al ThinkPad E16 includono altri computer portatili multimediali o business da 16 pollici come Acer TravelMate P4, Samsung Galaxy Book3 Pro 16, o LG Gram 16. Le consigliamo di consultare la nostra recensione ThinkPad E16 G1 versione AMD poiché la nostra versione Intel condivide lo stesso design del telaio e le stesse caratteristiche fisiche.
Altre recensioni Lenovo:
Potenziali concorrenti a confronto
Punteggio | Data | Modello | Peso | Altezza | Dimensione | Risoluzione | Prezzo |
|---|---|---|---|---|---|---|---|
| 85.5 % v7 (old) | 11/2023 | Lenovo ThinkPad E16 G1 Core i5-1335U i5-1335U, Iris Xe G7 80EUs | 1.8 kg | 19.85 mm | 16.00" | 1920x1200 | |
| 88.1 % v7 (old) | 09/2023 | Lenovo ThinkPad E16 G1-21JUS08X00 R7 7730U, Vega 8 | 1.8 kg | 19.85 mm | 16.00" | 2560x1600 | |
| 84.6 % v7 (old) | 07/2023 | Dell Inspiron 16 7635 2-in-1 R5 7530U, Vega 7 | 2 kg | 18.99 mm | 16.00" | 1920x1200 | |
| 86 % v7 (old) | 04/2023 | Acer TravelMate P4 TMP416-51-55KN i5-1240P, Iris Xe G7 80EUs | 1.6 kg | 18.5 mm | 16.00" | 1920x1200 | |
| 85.6 % v7 (old) | 05/2023 | Samsung Galaxy Book3 Pro 16 i5-1340P, Iris Xe G7 80EUs | 1.6 kg | 12.5 mm | 16.00" | 2880x1800 | |
| 86.6 % v7 (old) | 01/2023 | LG Gram 16Z90Q i7-1260P, Iris Xe G7 96EUs | 1.2 kg | 16.8 mm | 16.00" | 2560x1600 |
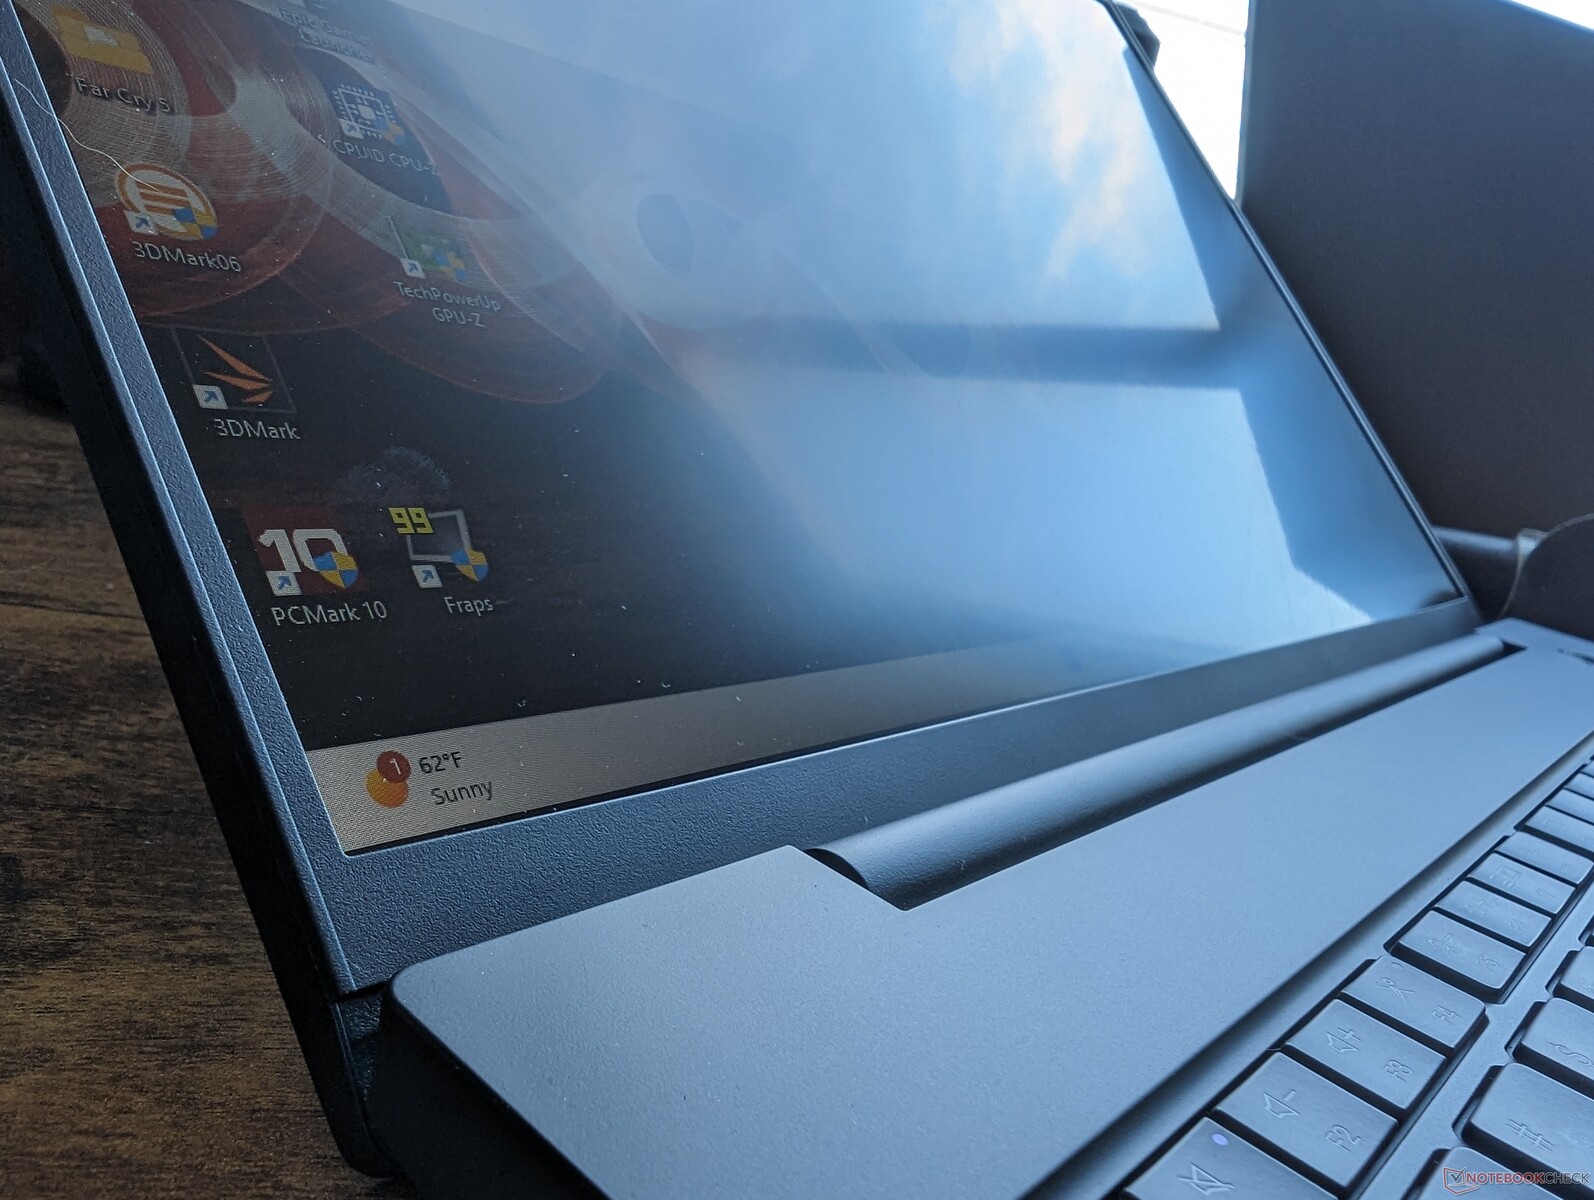
Caso
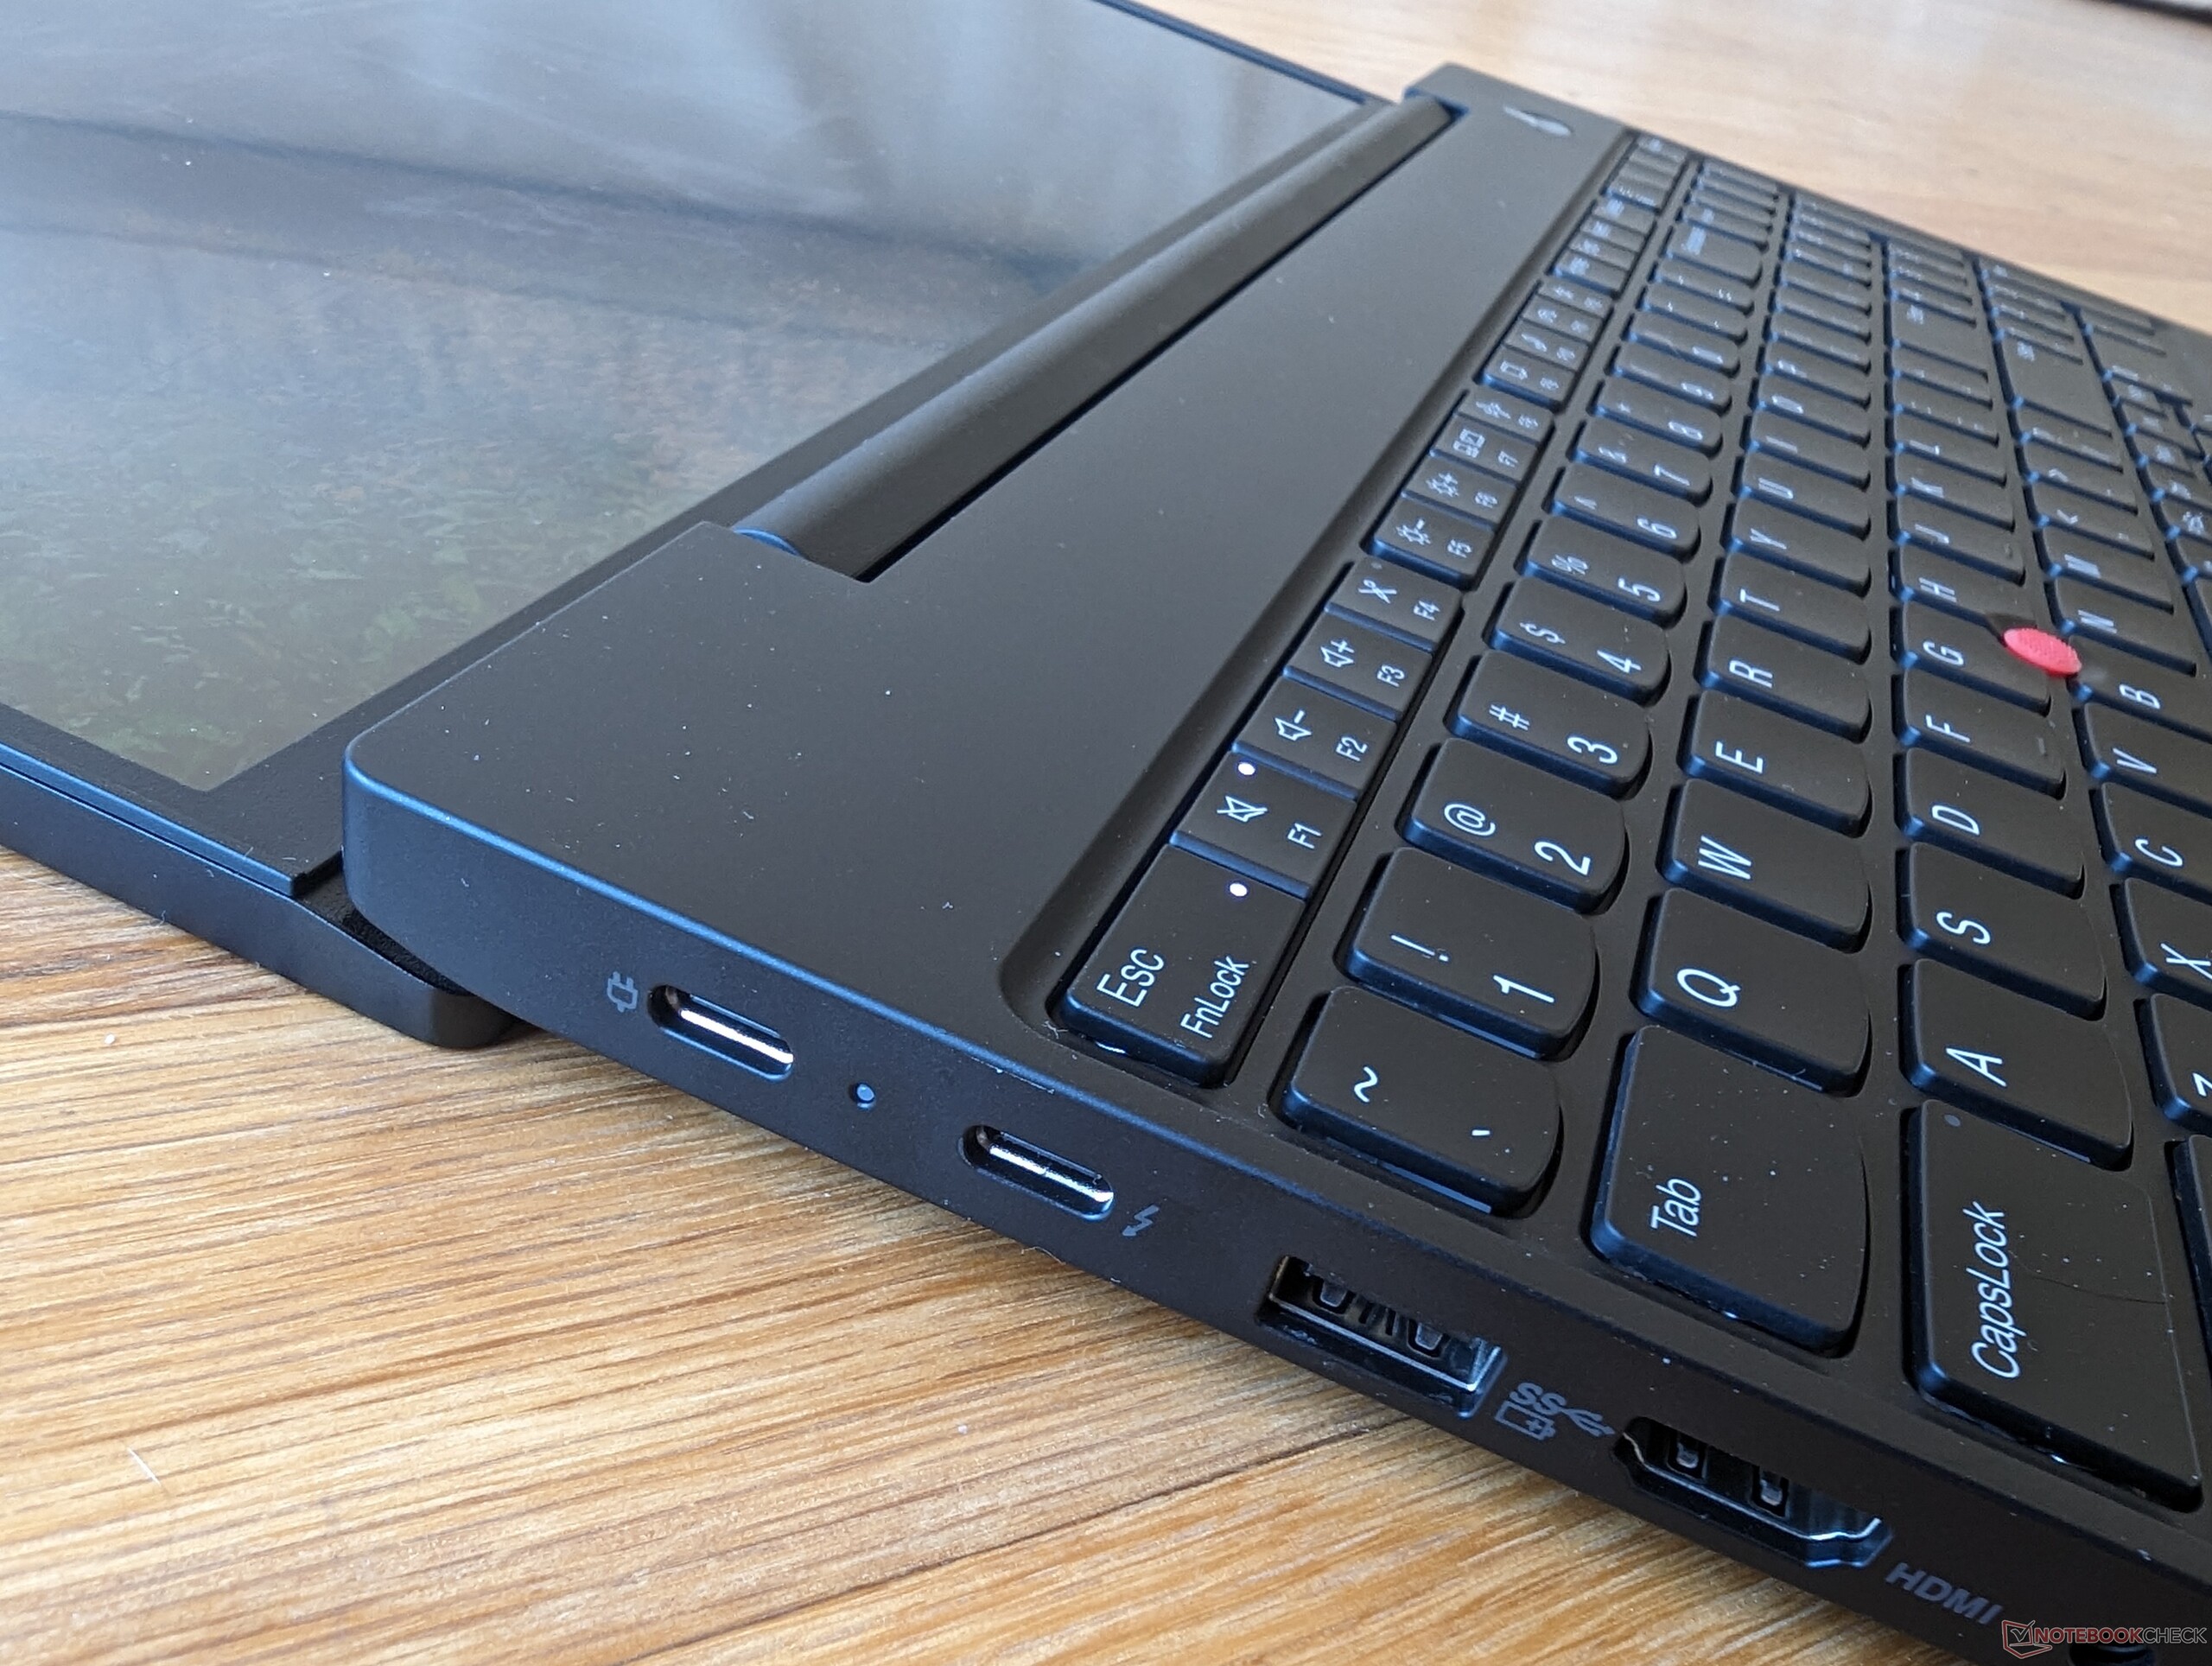
Il modo più semplice per identificare una versione Intel da una versione AMD è cercare il logo Thunderbolt lungo il bordo sinistro. Thunderbolt è supportato solo dalle versioni Intel, poiché le attuali versioni AMD non sono dotate di USB4.
Comunicazione
Webcam


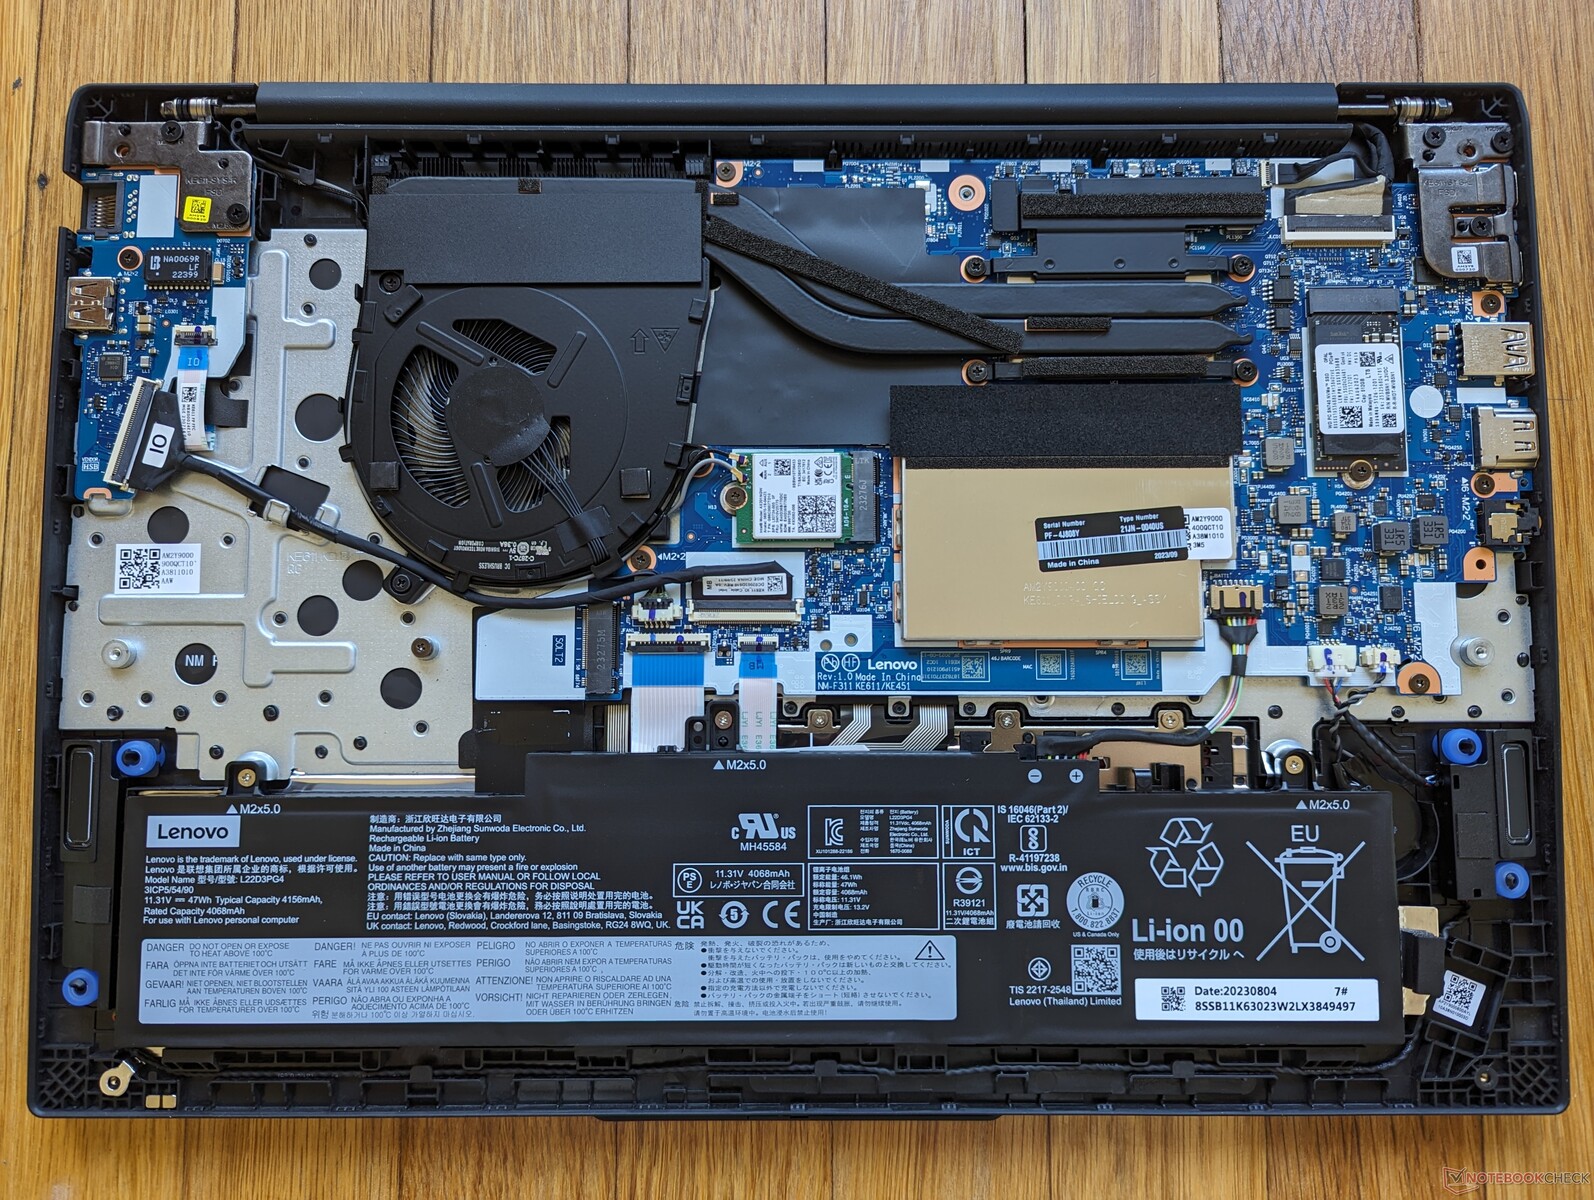
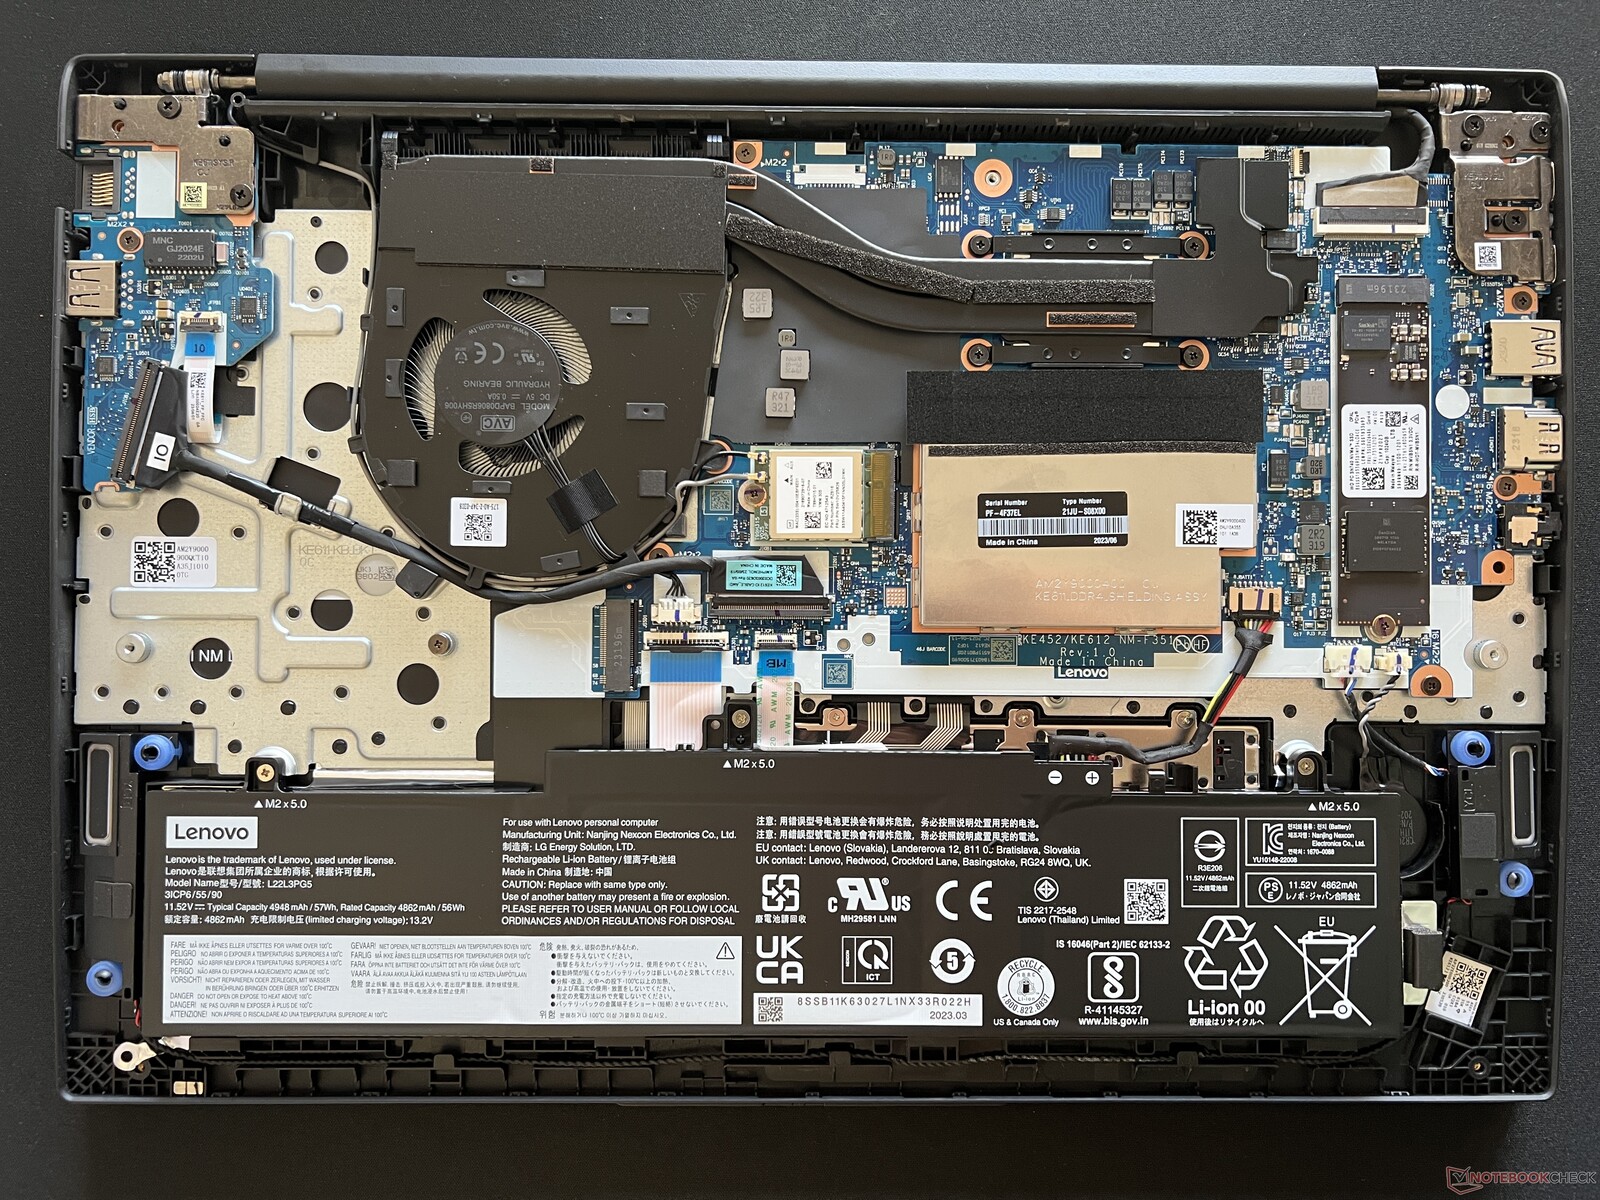
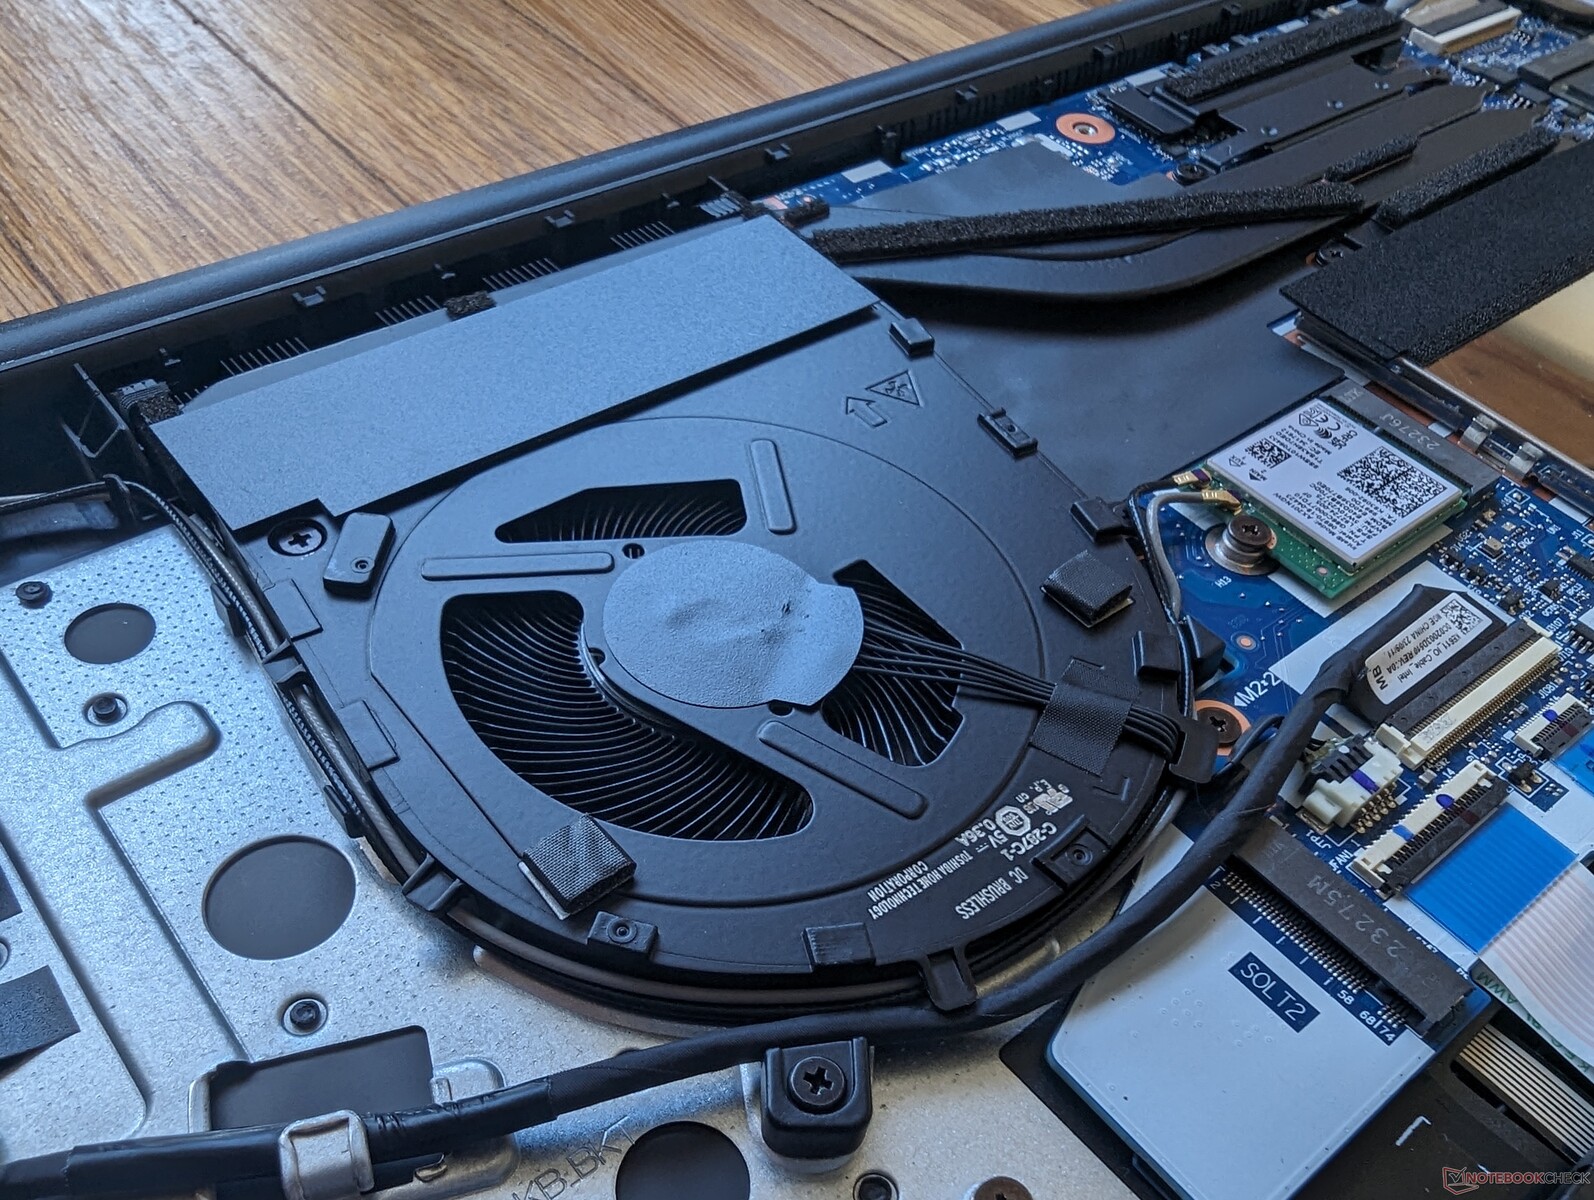
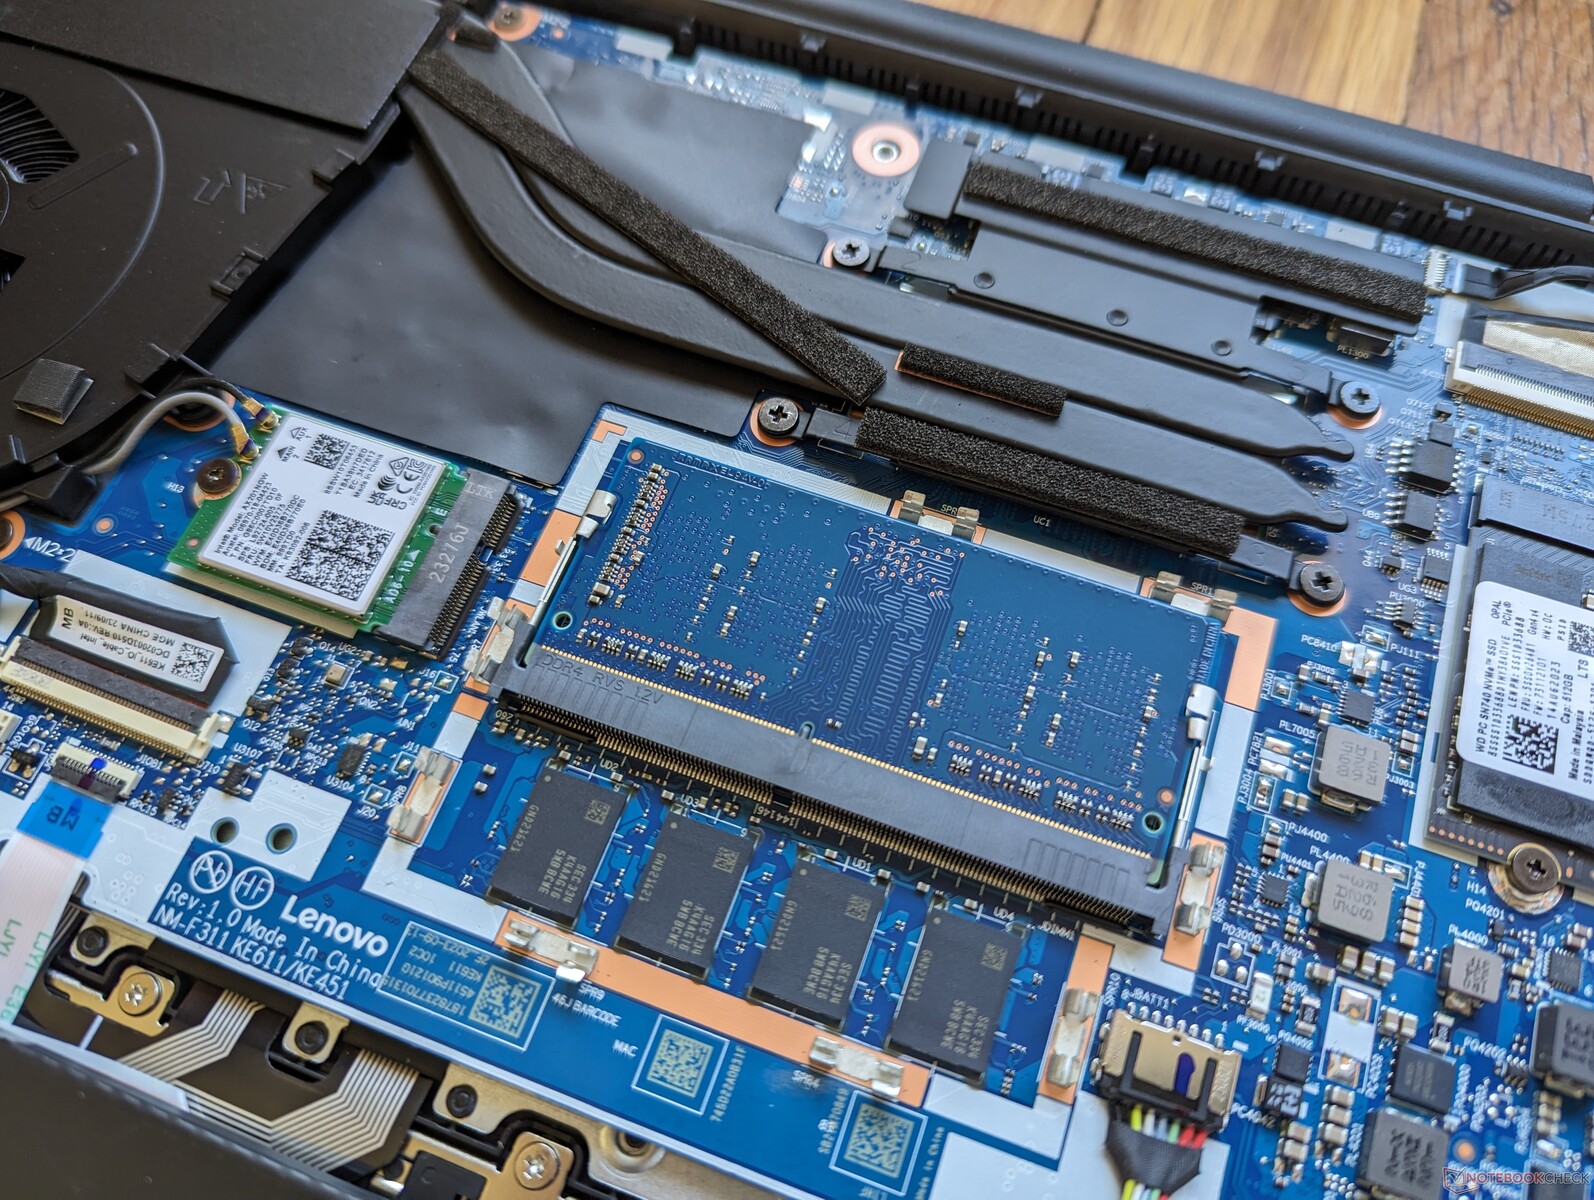
Manutenzione
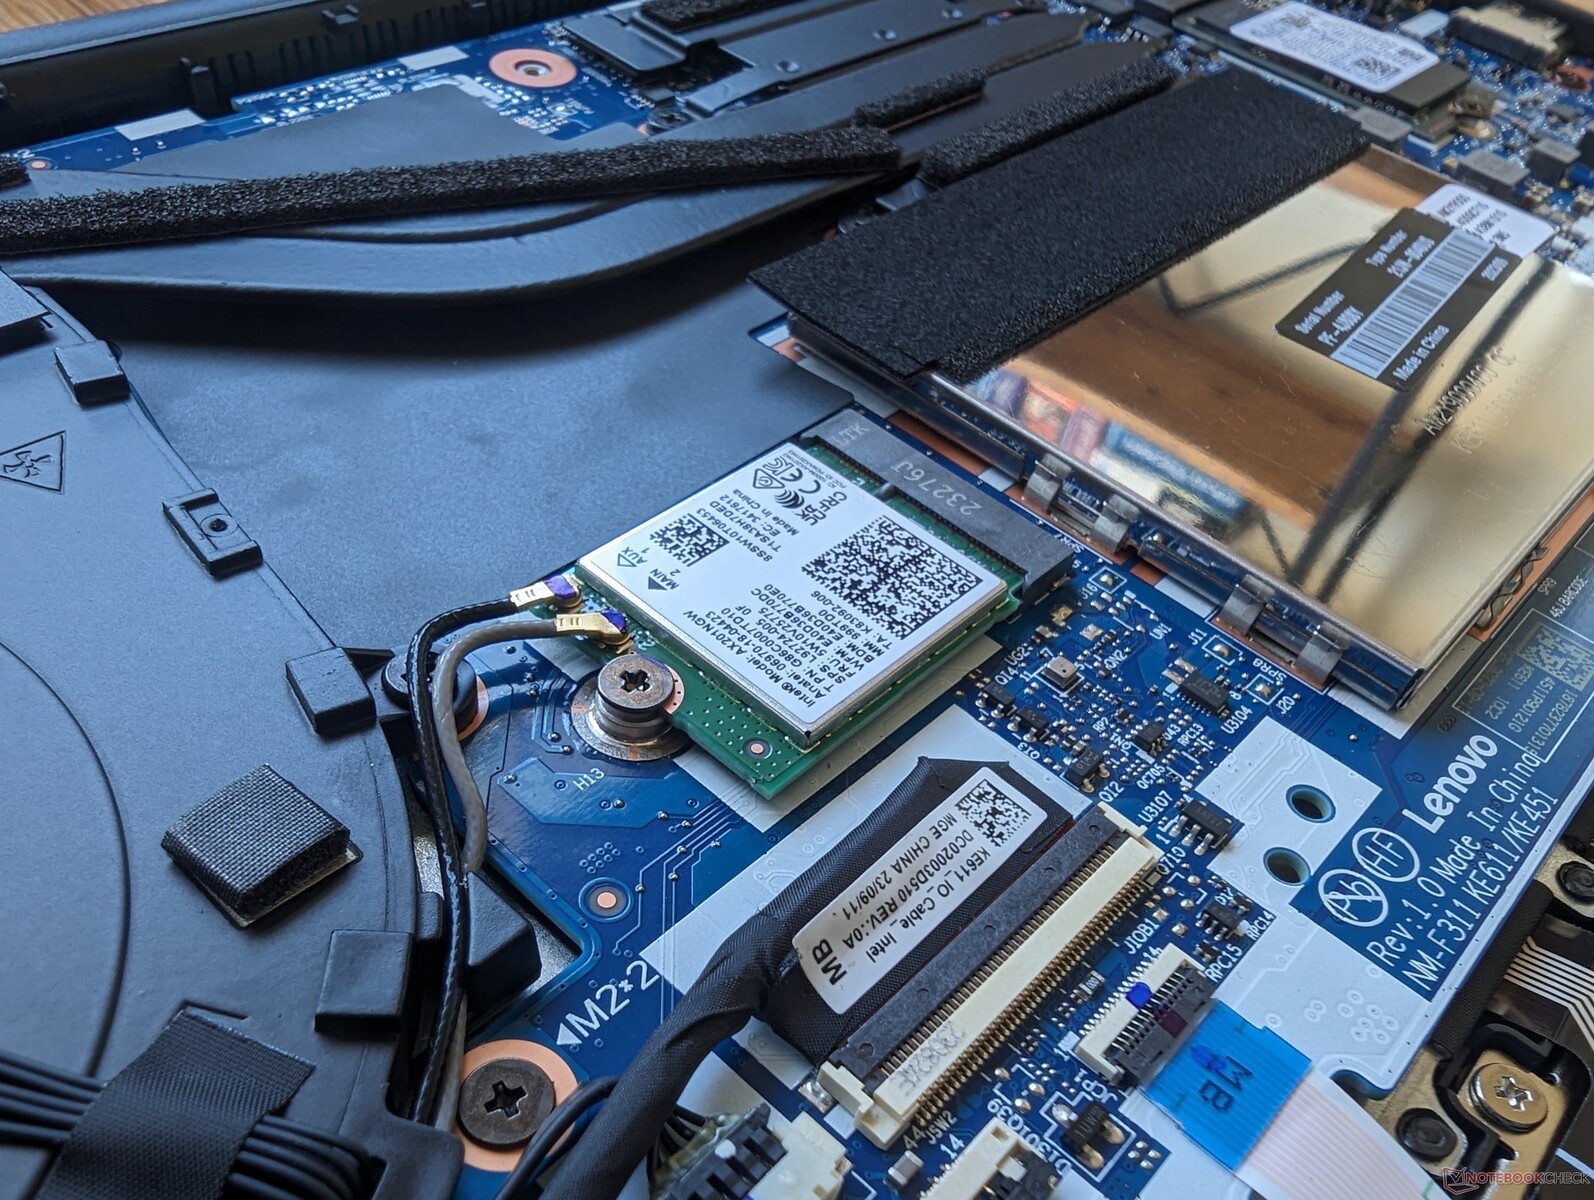
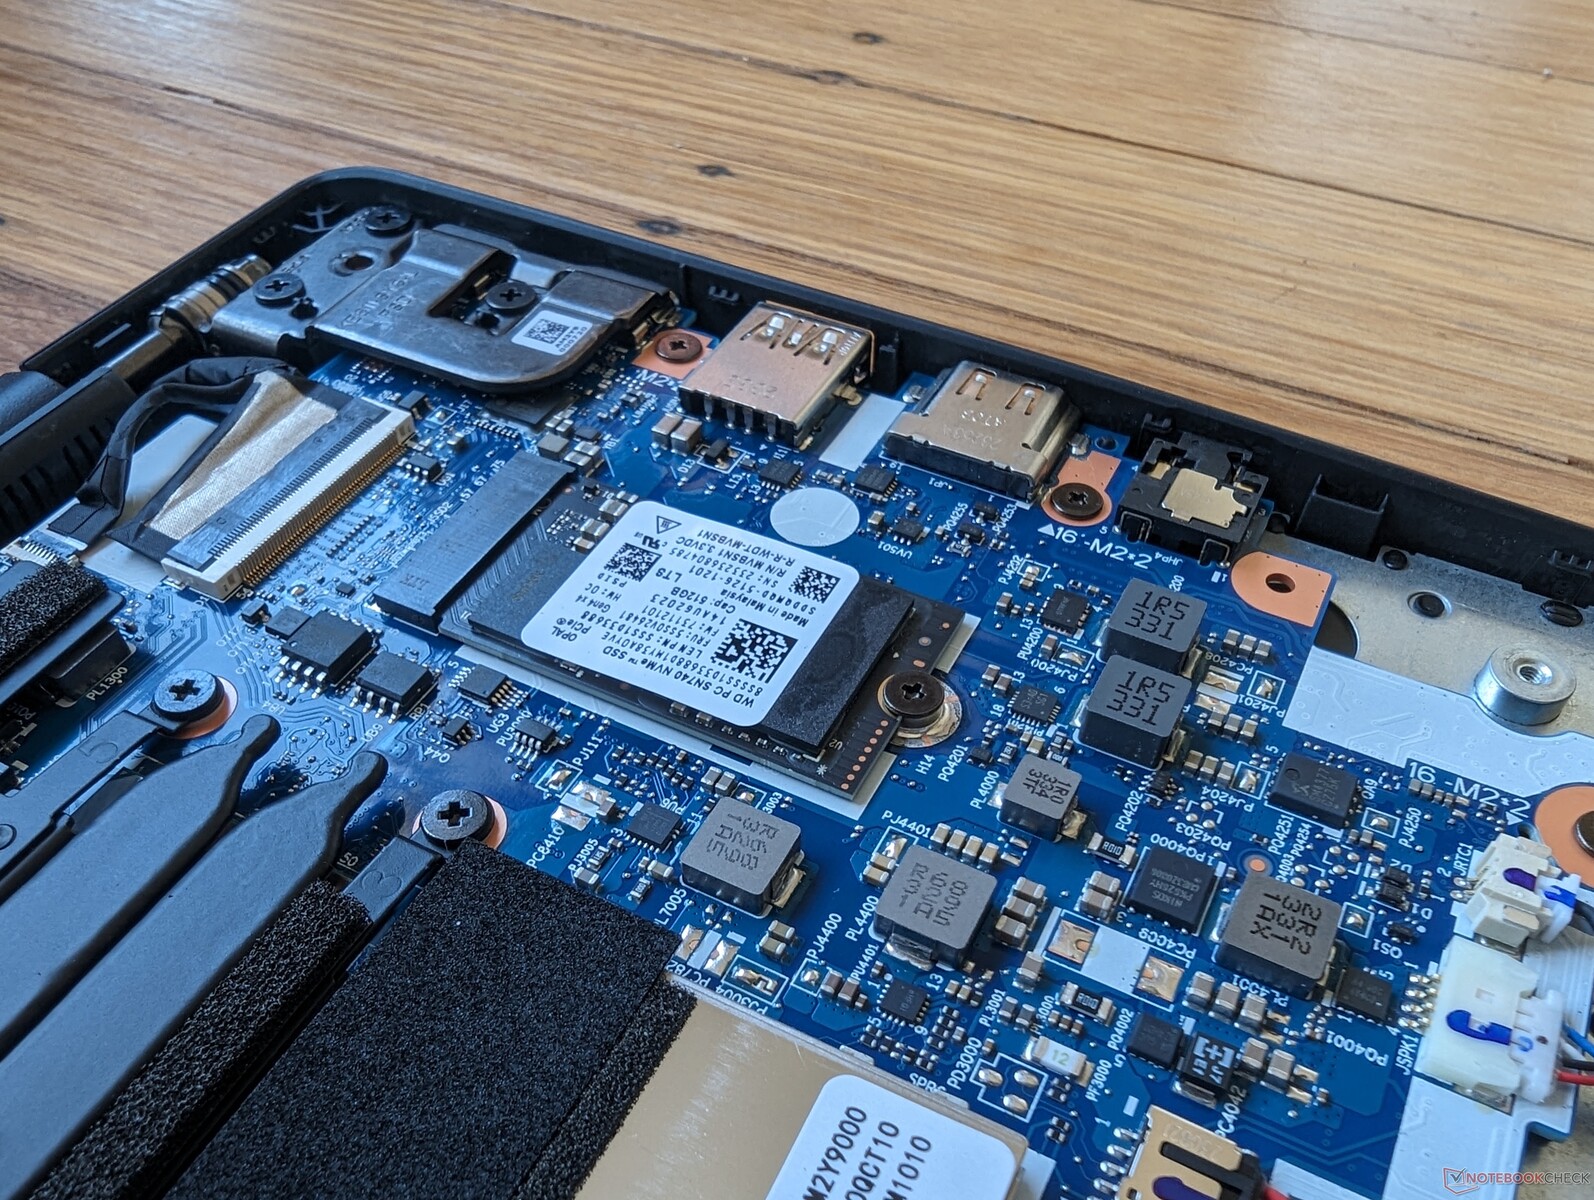
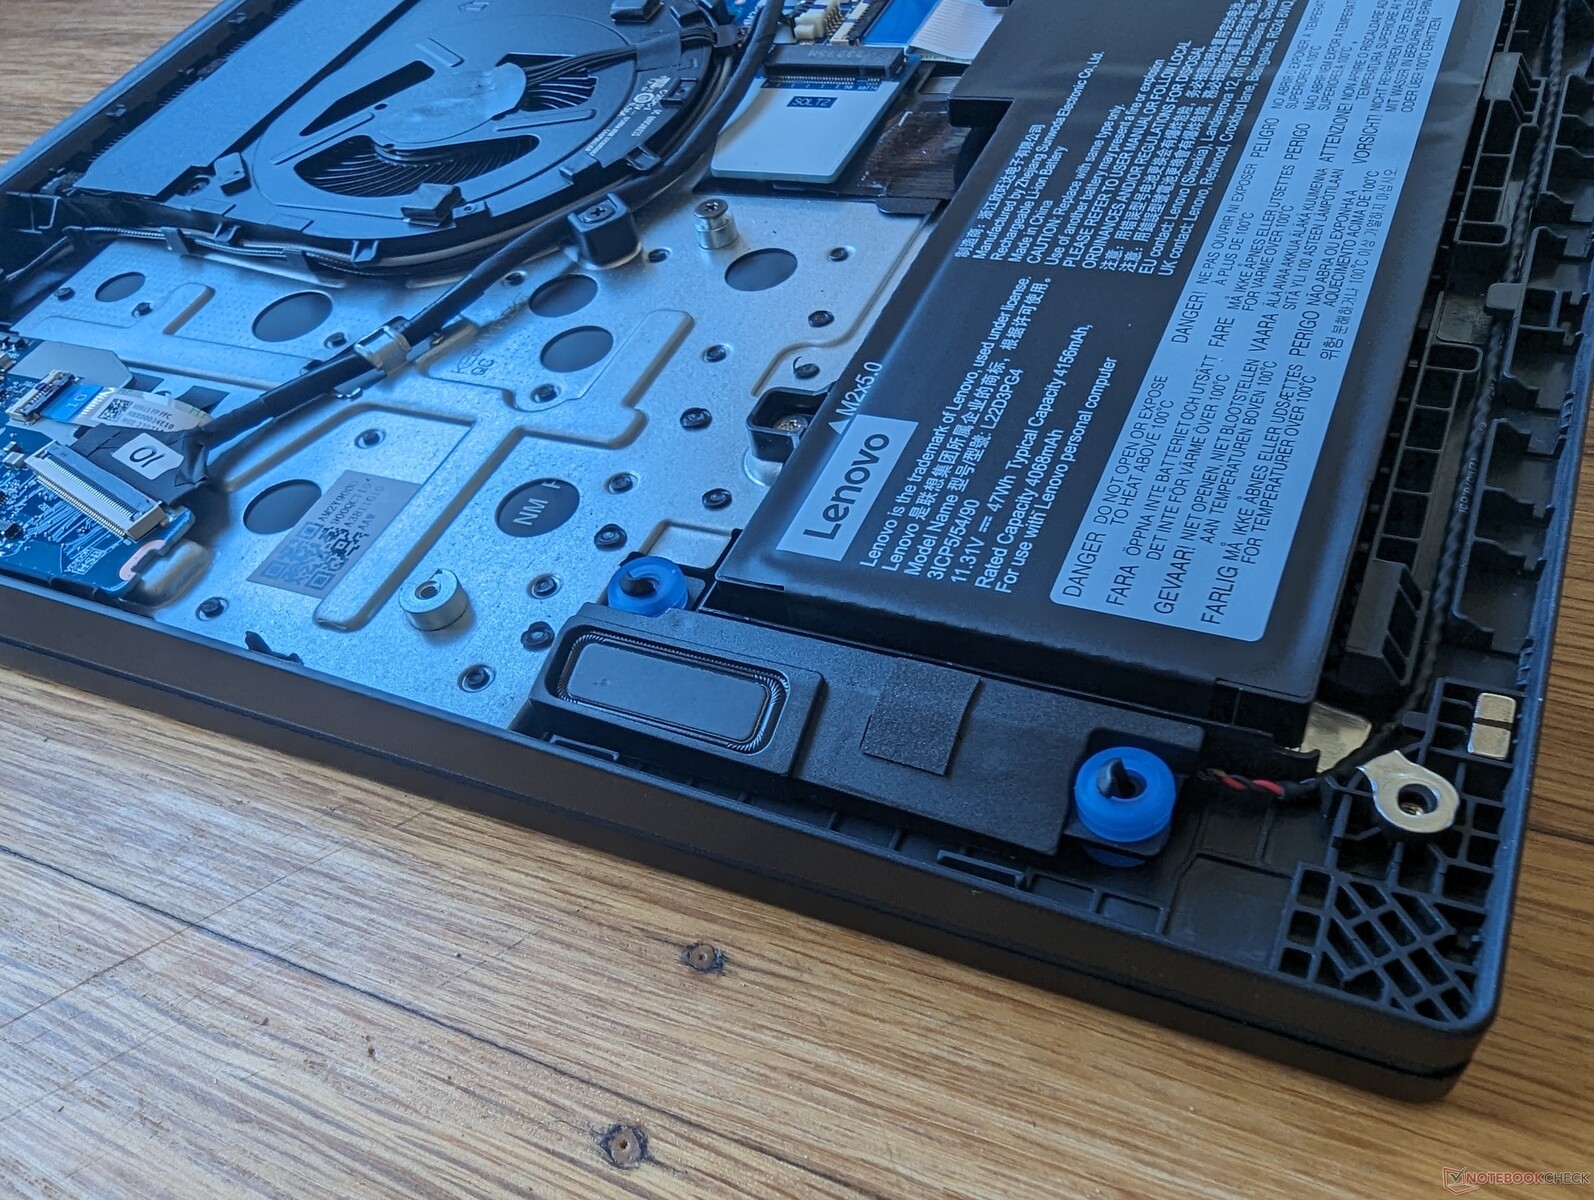
Entrambe le versioni Intel e AMD supportano fino a due SSD M.2 ciascuna. La versione Intel, tuttavia, supporta solo unità fino a 42 mm di lunghezza, mentre la versione AMD può supportare un'unità fino a 80 mm. Questo è simile a quello che abbiamo osservato tra il più piccolo 14 pollici ThinkPad E14 G5 Versioni Intel e AMD.
Garanzia
Se acquistato negli Stati Uniti, si applica una garanzia limitata di un anno del produttore. I modelli ThinkPad di fascia più alta della serie T o della serie X hanno in genere una garanzia standard di tre anni.
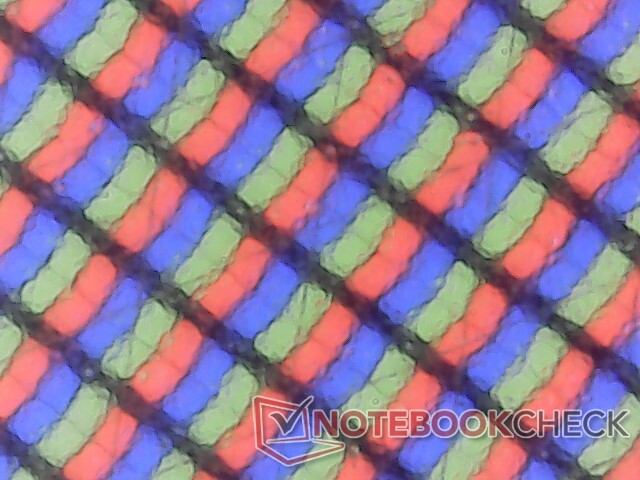
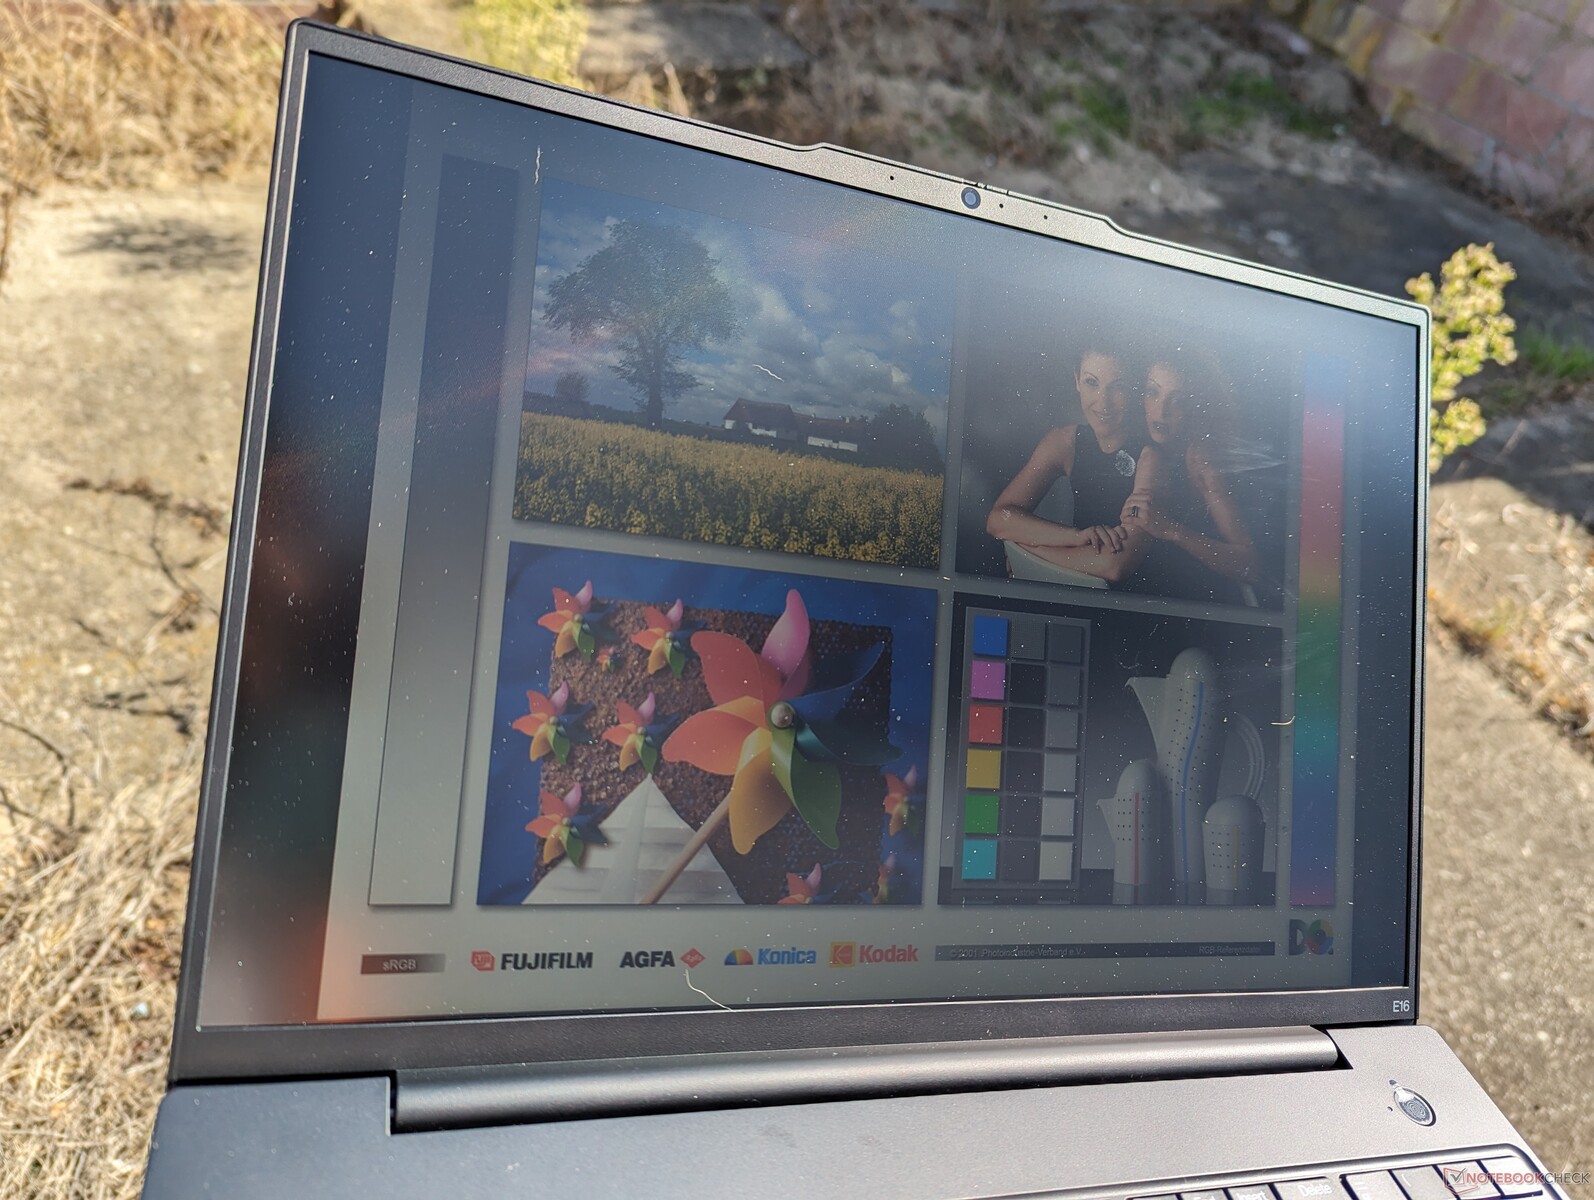
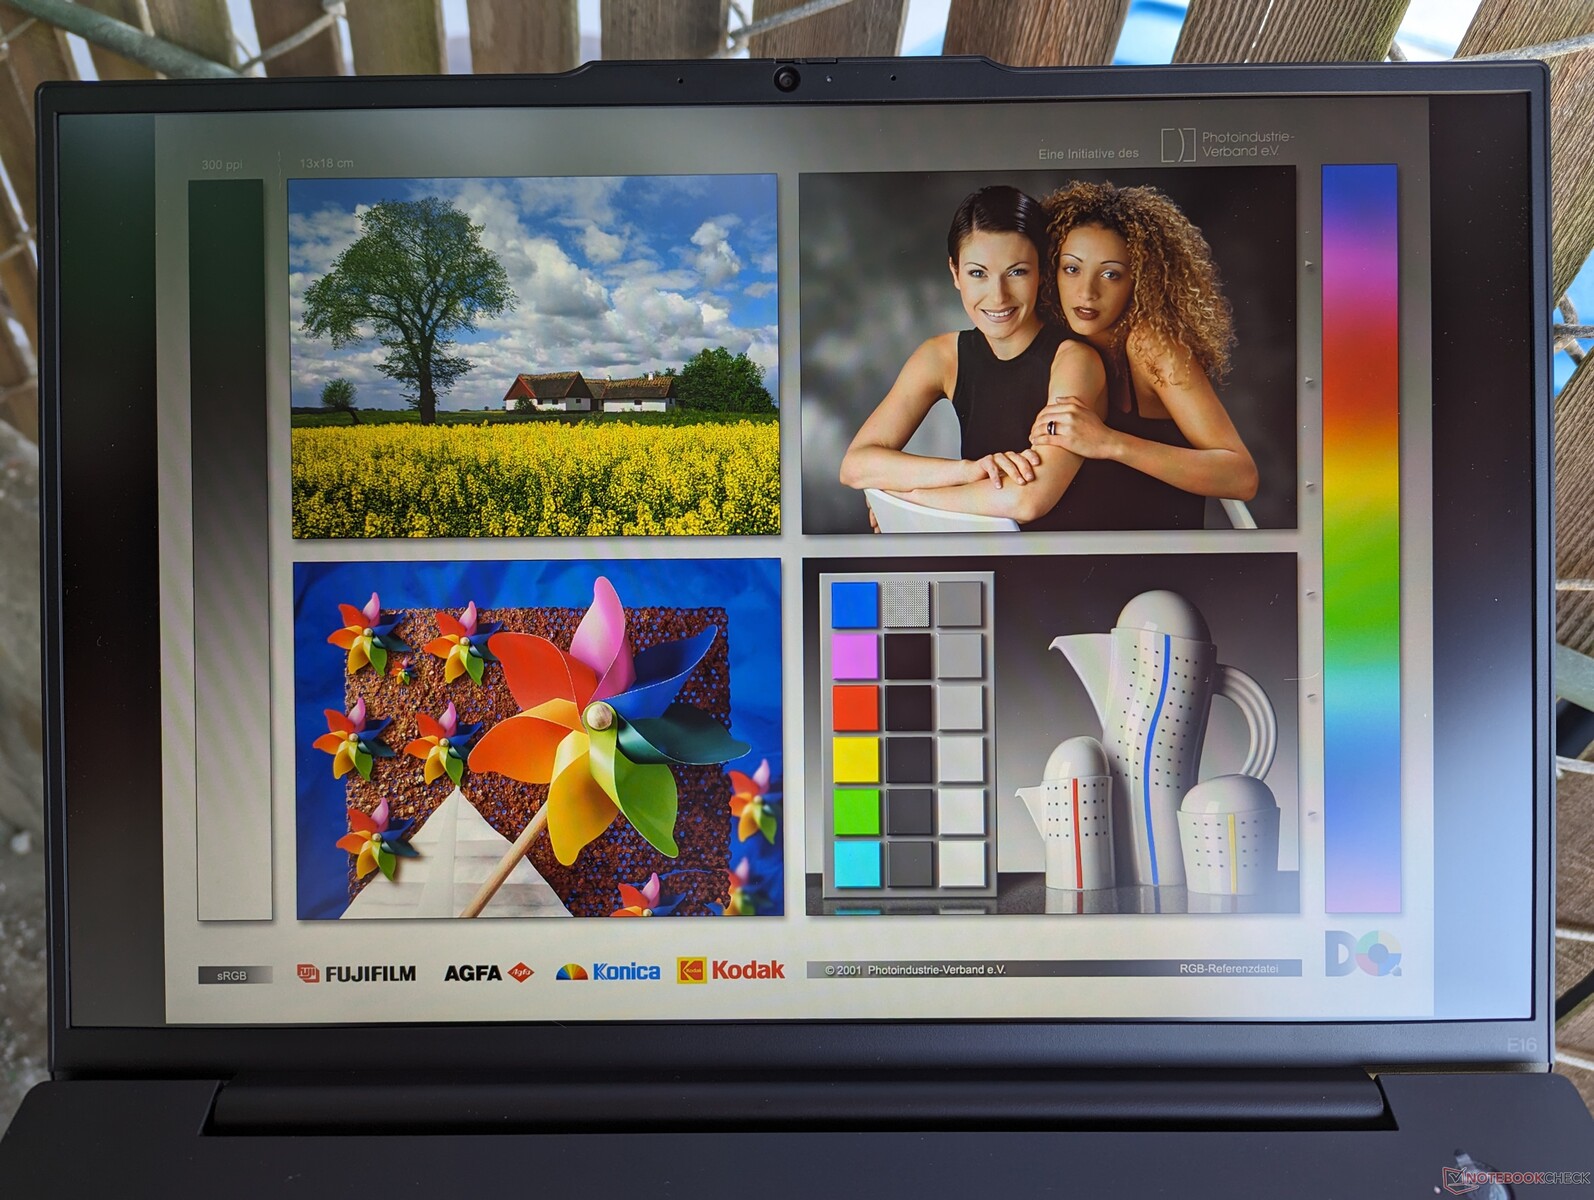
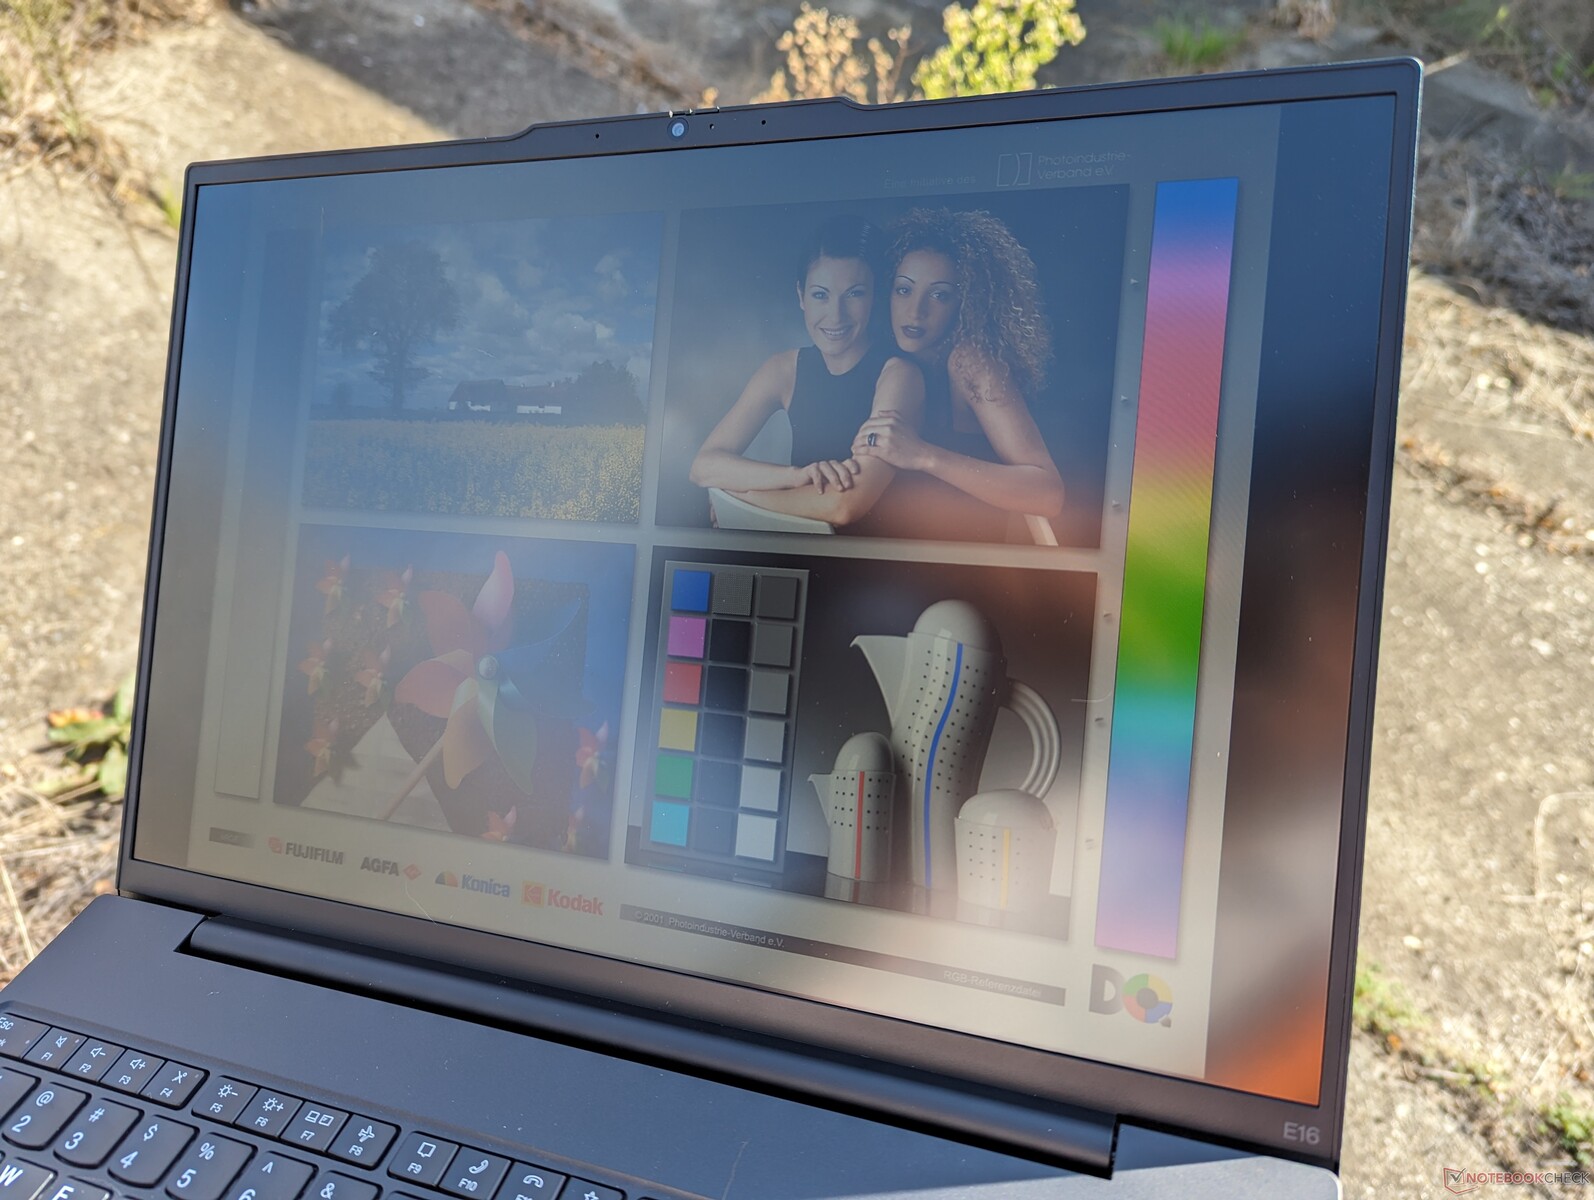
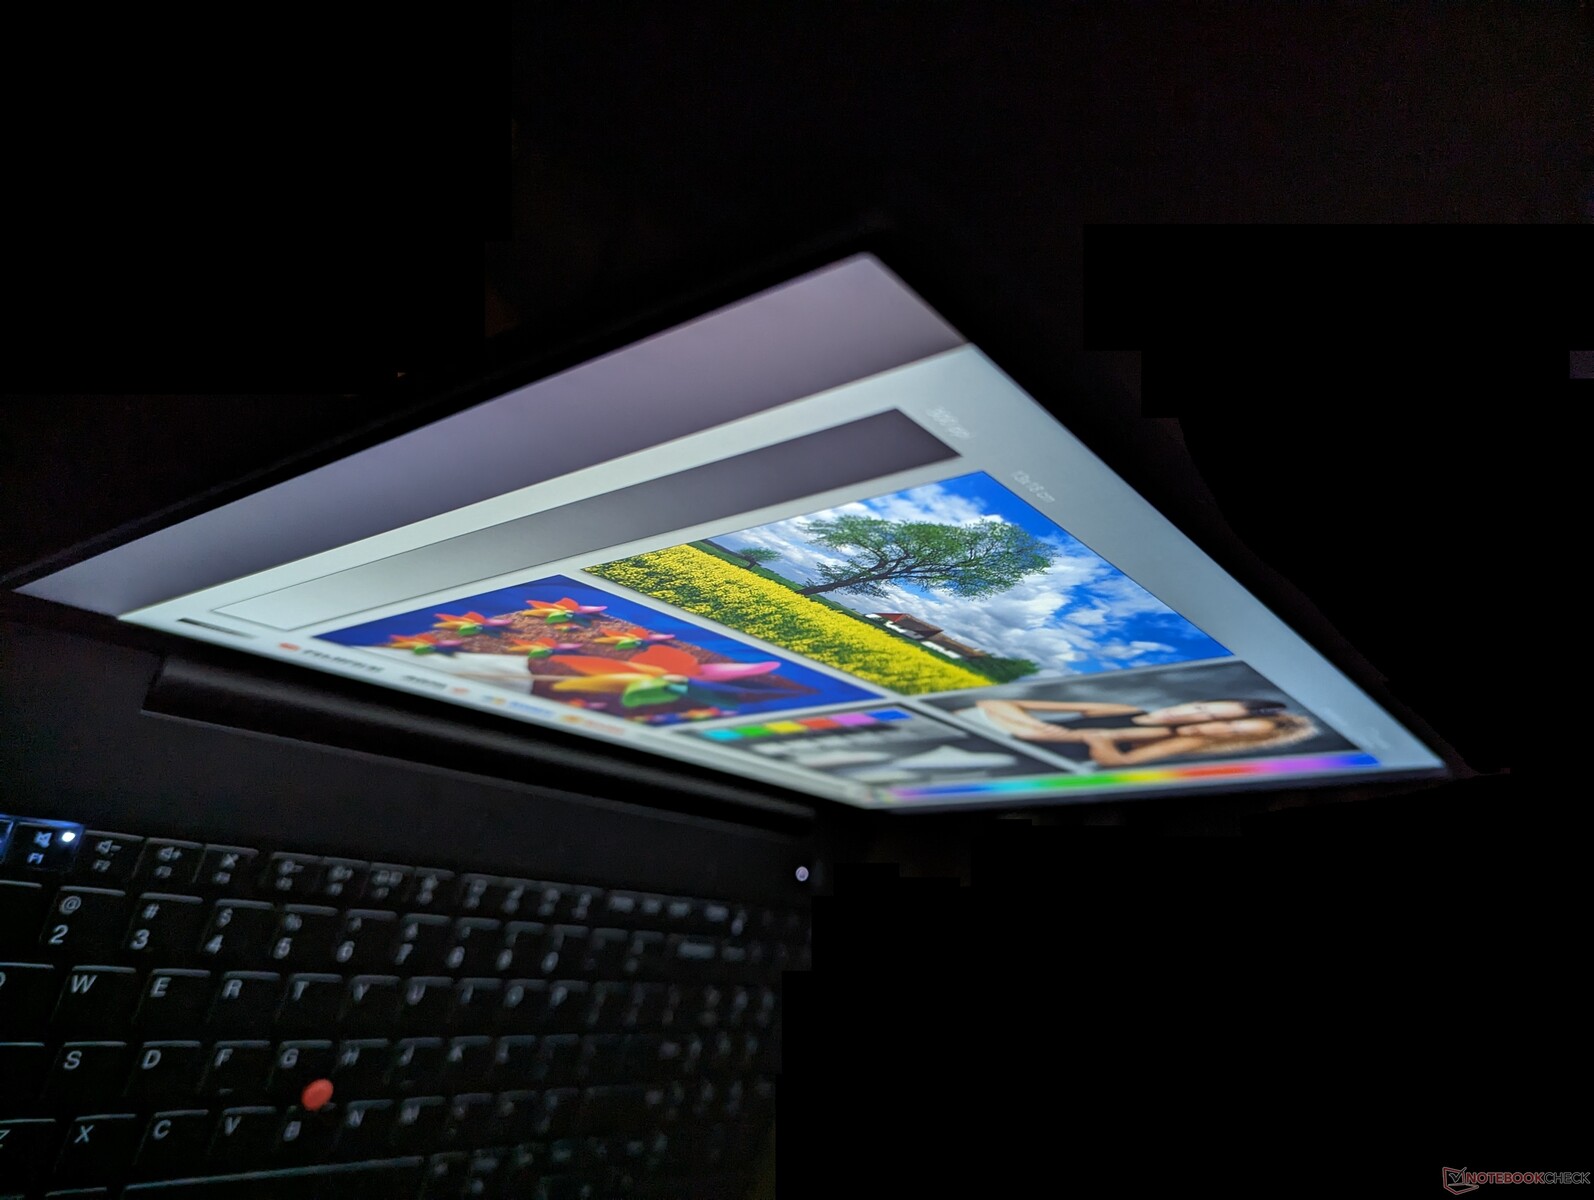
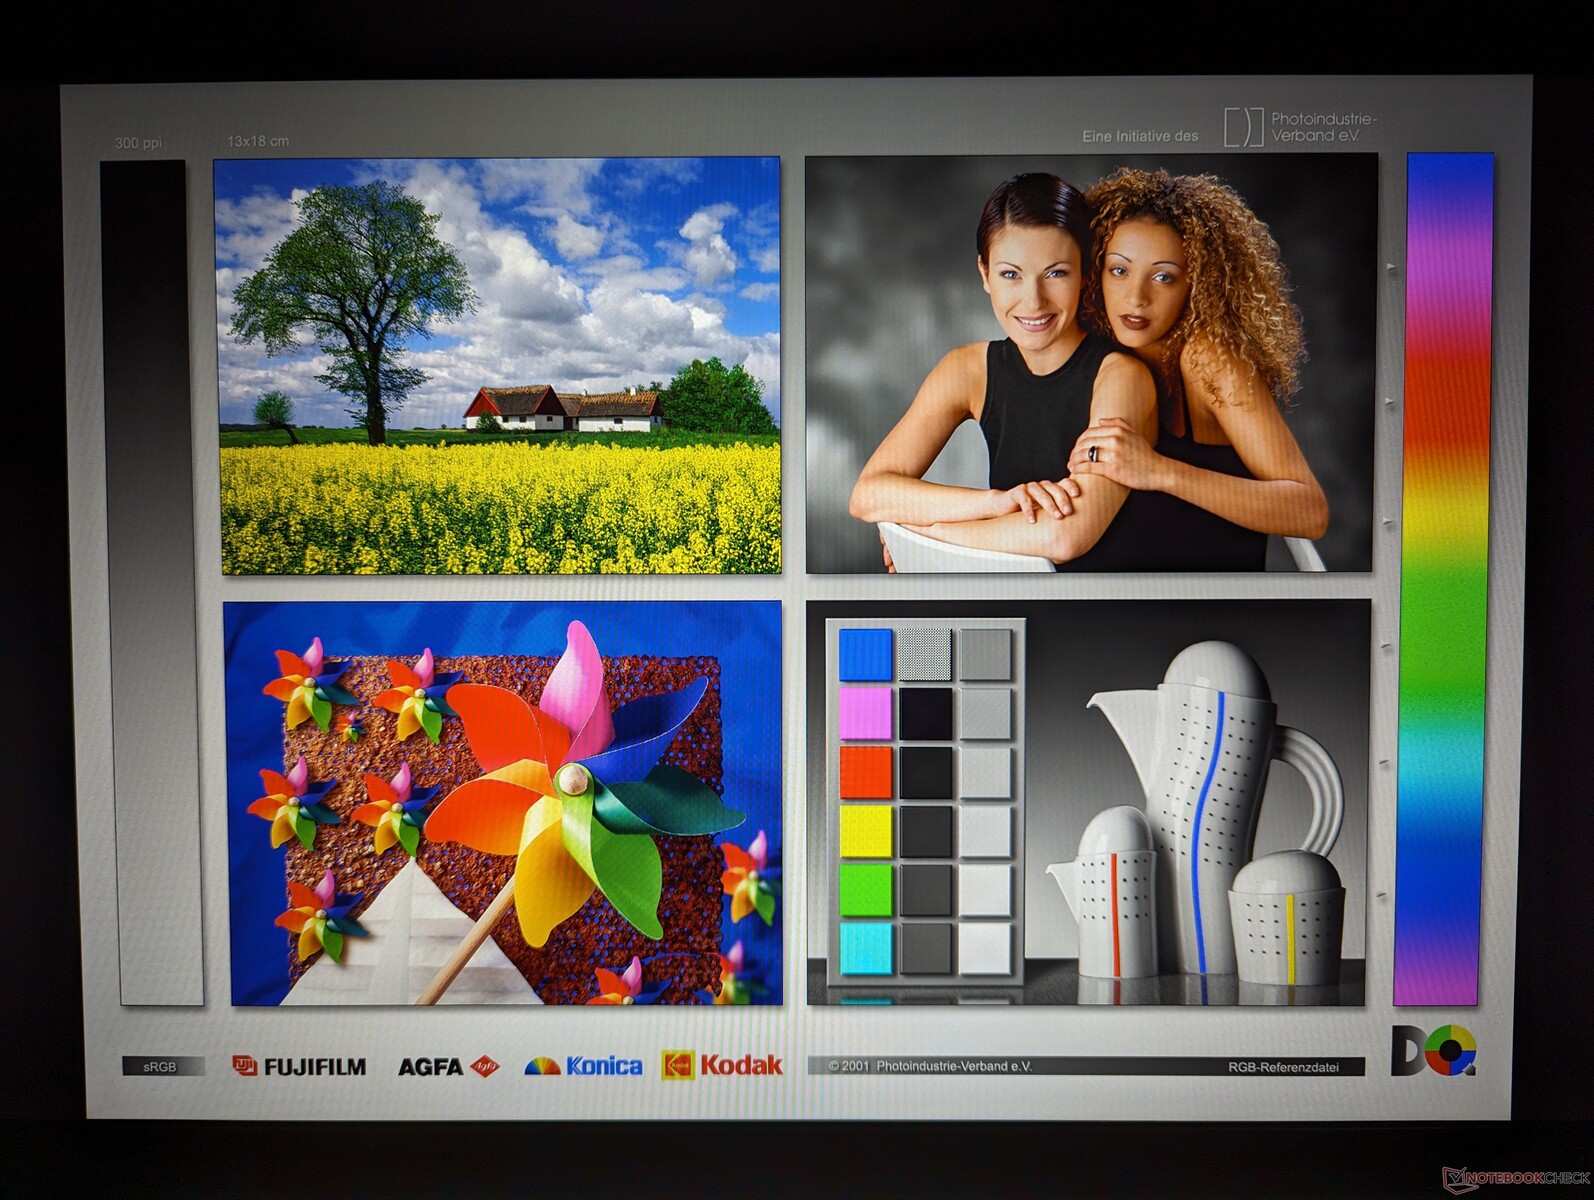
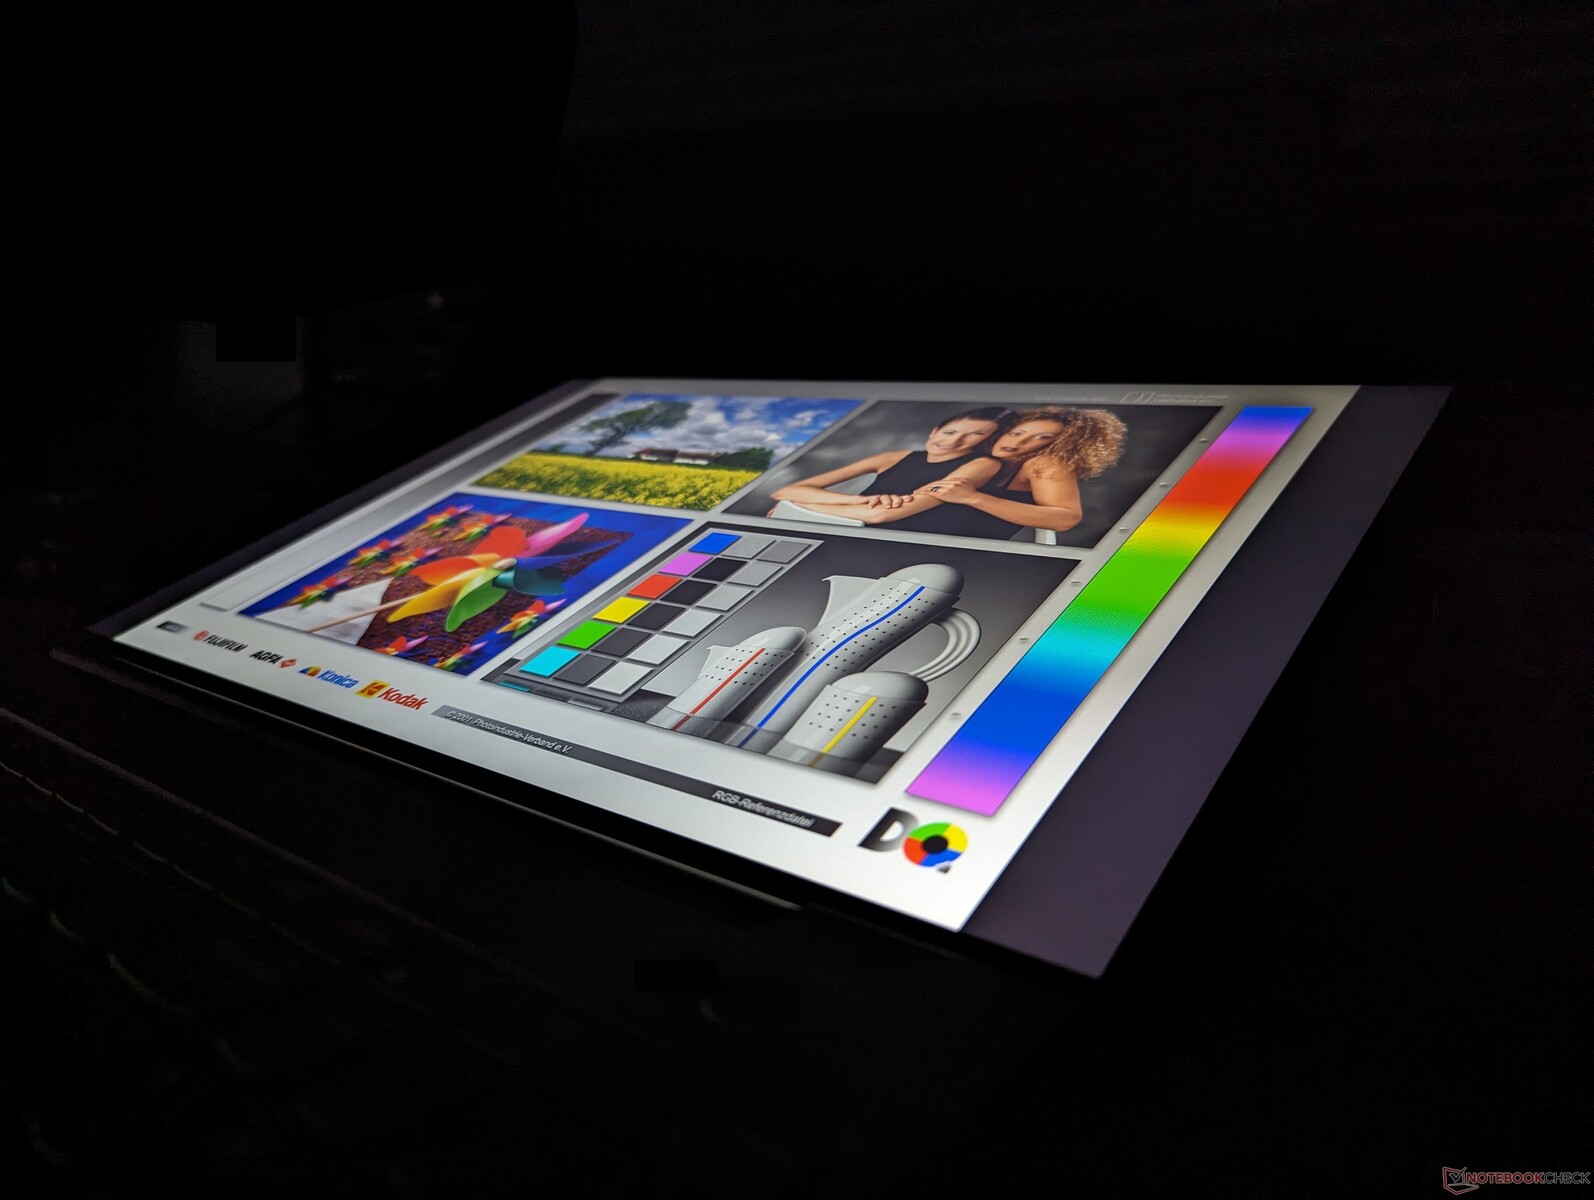
Display
Sono disponibili quattro opzioni IPS opache, come segue:
- 1200p, 60% sRGB, 300 nits, 60 Hz, non touch
- 1200p, 60% sRGB, 300 nits, 60 Hz, touch
- 1200p, 100% sRGB, 300 nits, 60 Hz, non touch
- 1600p, 100% sRGB, 400 nits, 60 Hz, non touch
La nostra specifica unità di recensione Intel è dotata dell'opzione in grassetto sopra, mentre la nostra unità AMD è dotata dell'opzione 1600p. La qualità dell'immagine è come la notte e il giorno tra le nostre unità Intel e AMD, in quanto quest'ultima appare più nitida, più vibrante e con tempi di risposta più rapidi, per un'esperienza visiva notevolmente migliore. Consigliamo di evitare la nostra opzione di pannello specifico, a meno che la funzionalità touchscreen non sia un must.

| |||||||||||||||||||||||||
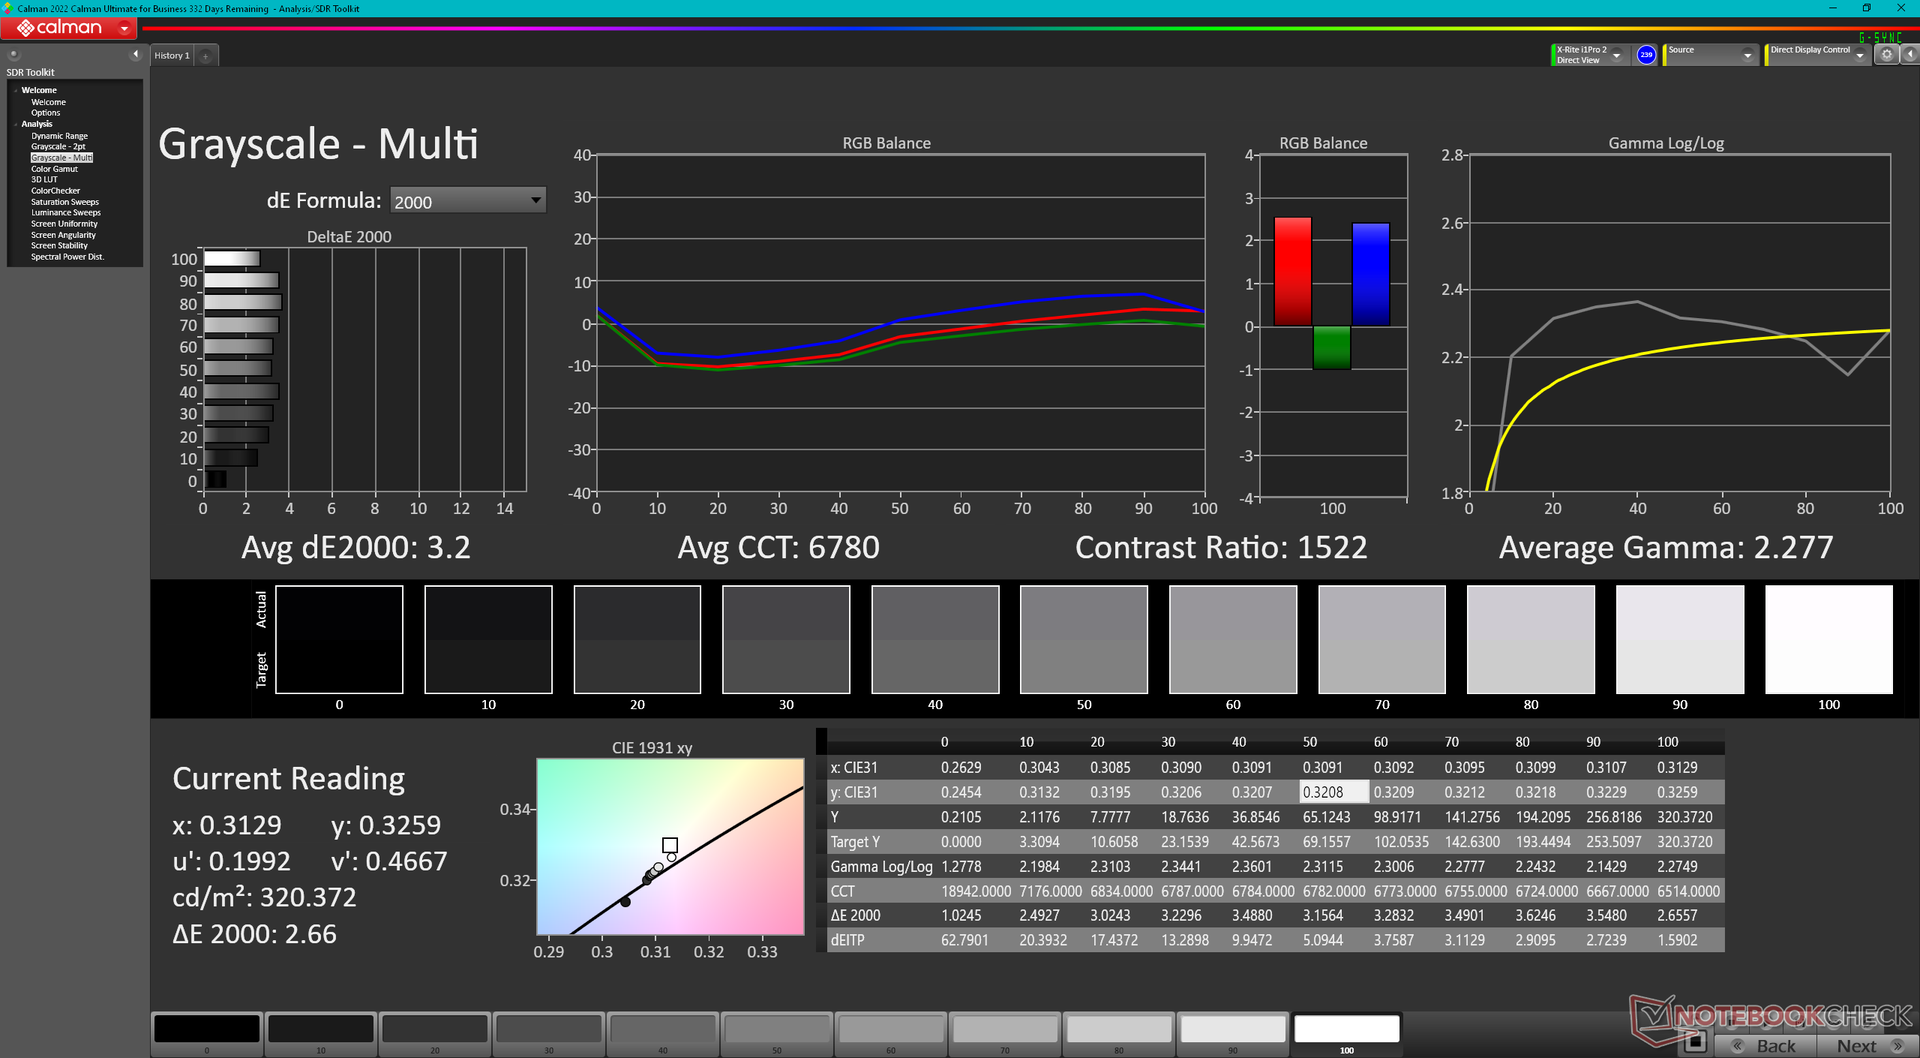
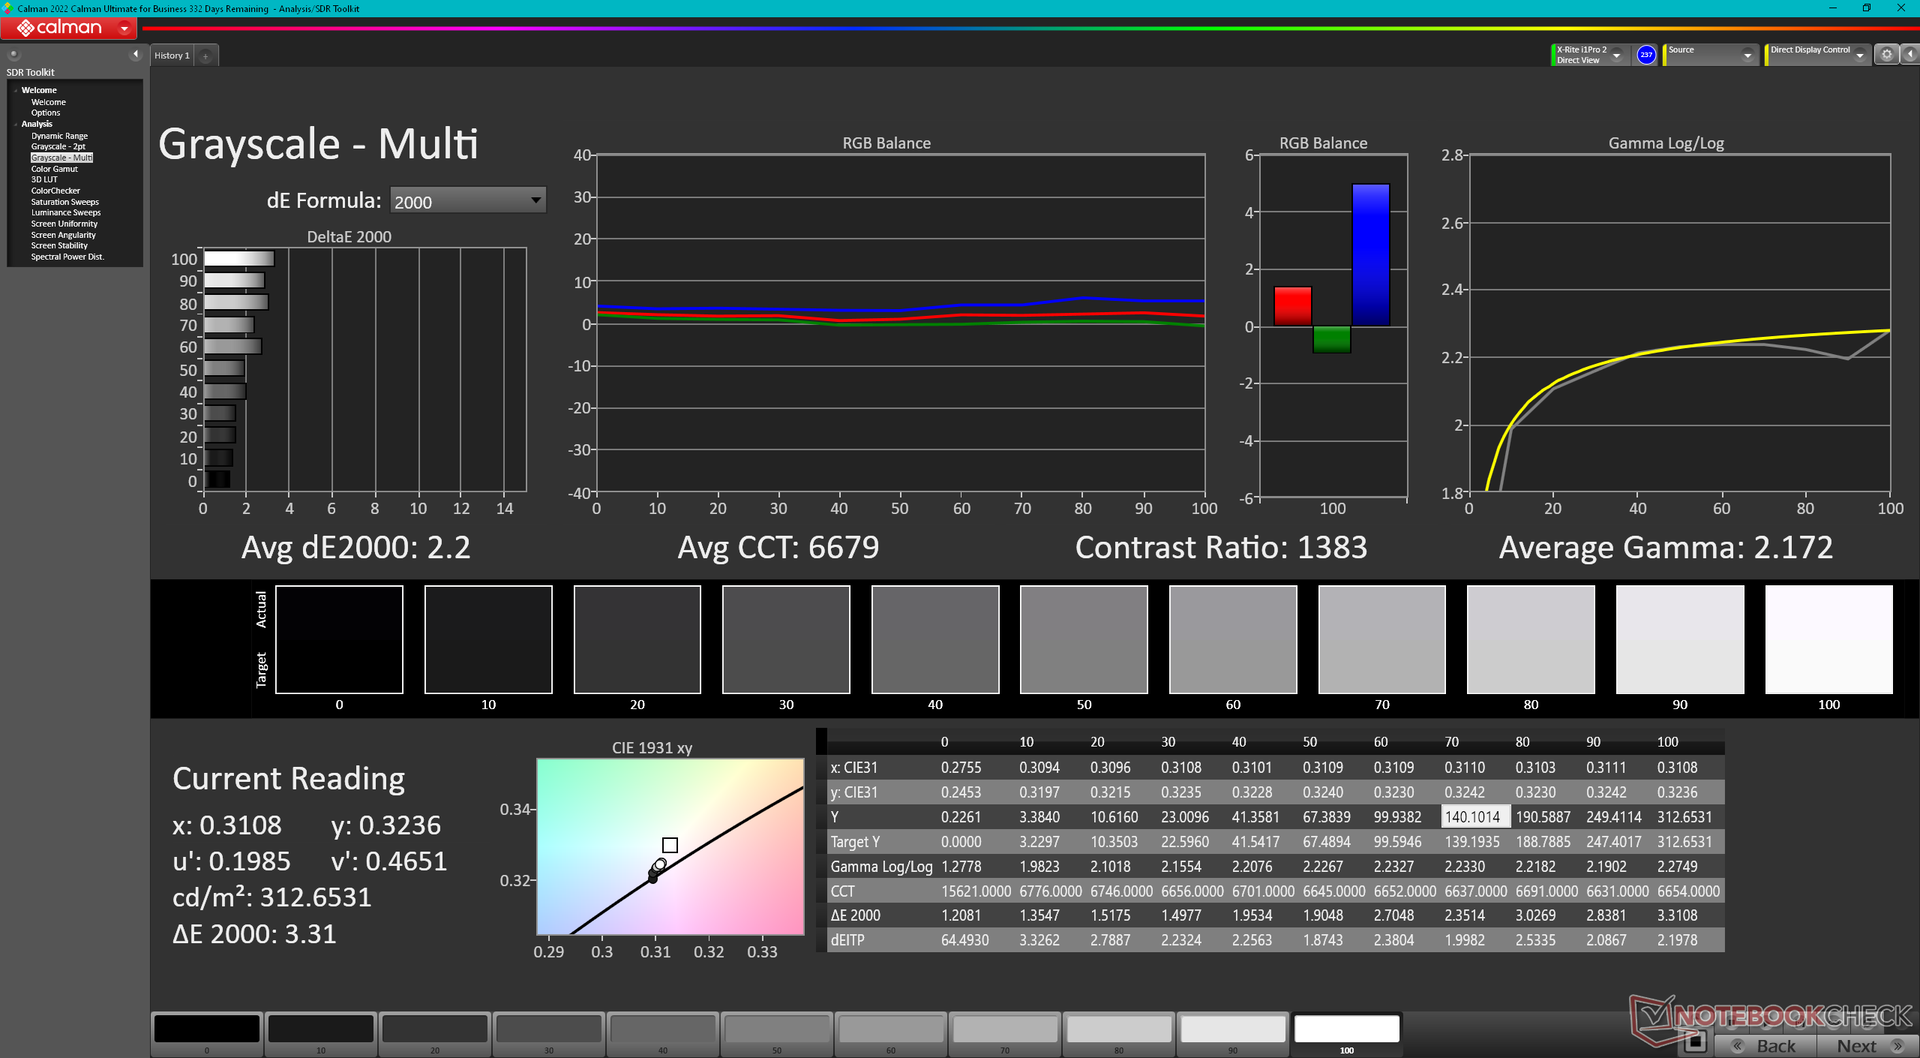
Distribuzione della luminosità: 91 %
Al centro con la batteria: 318.6 cd/m²
Contrasto: 1099:1 (Nero: 0.29 cd/m²)
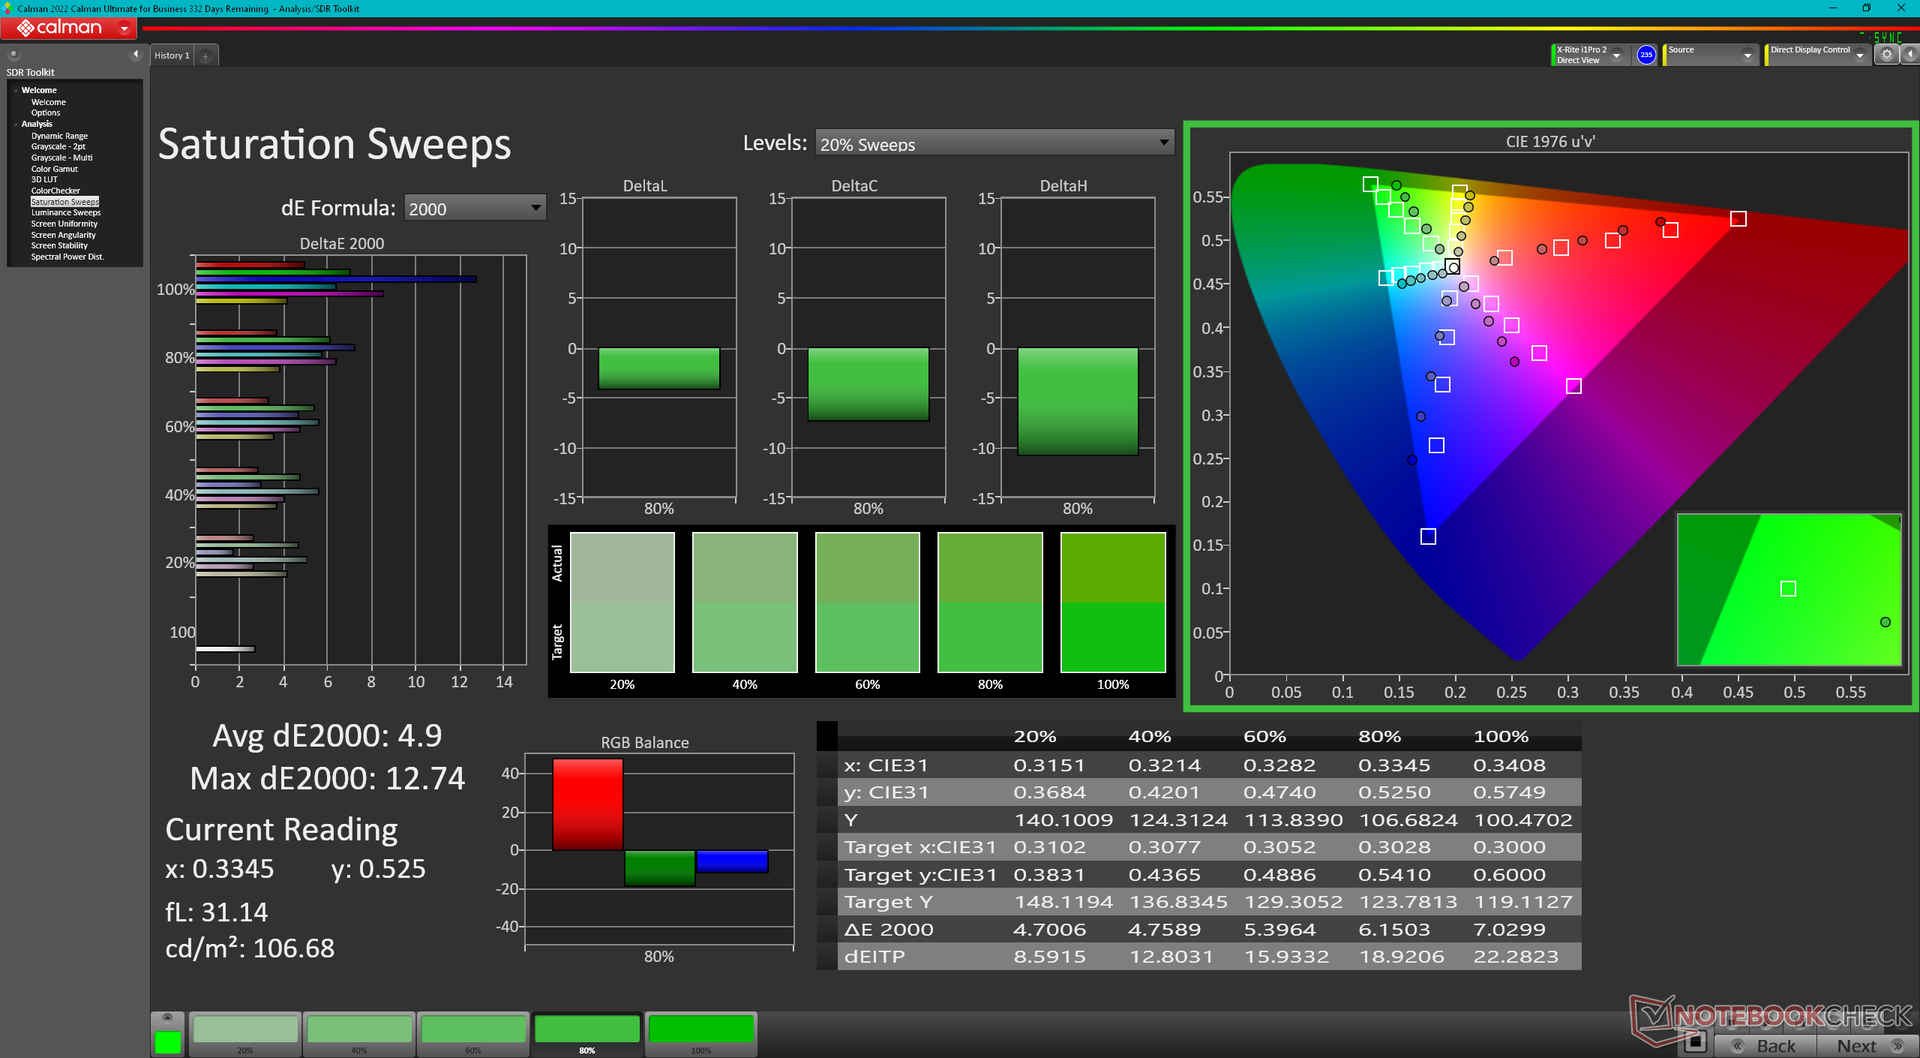
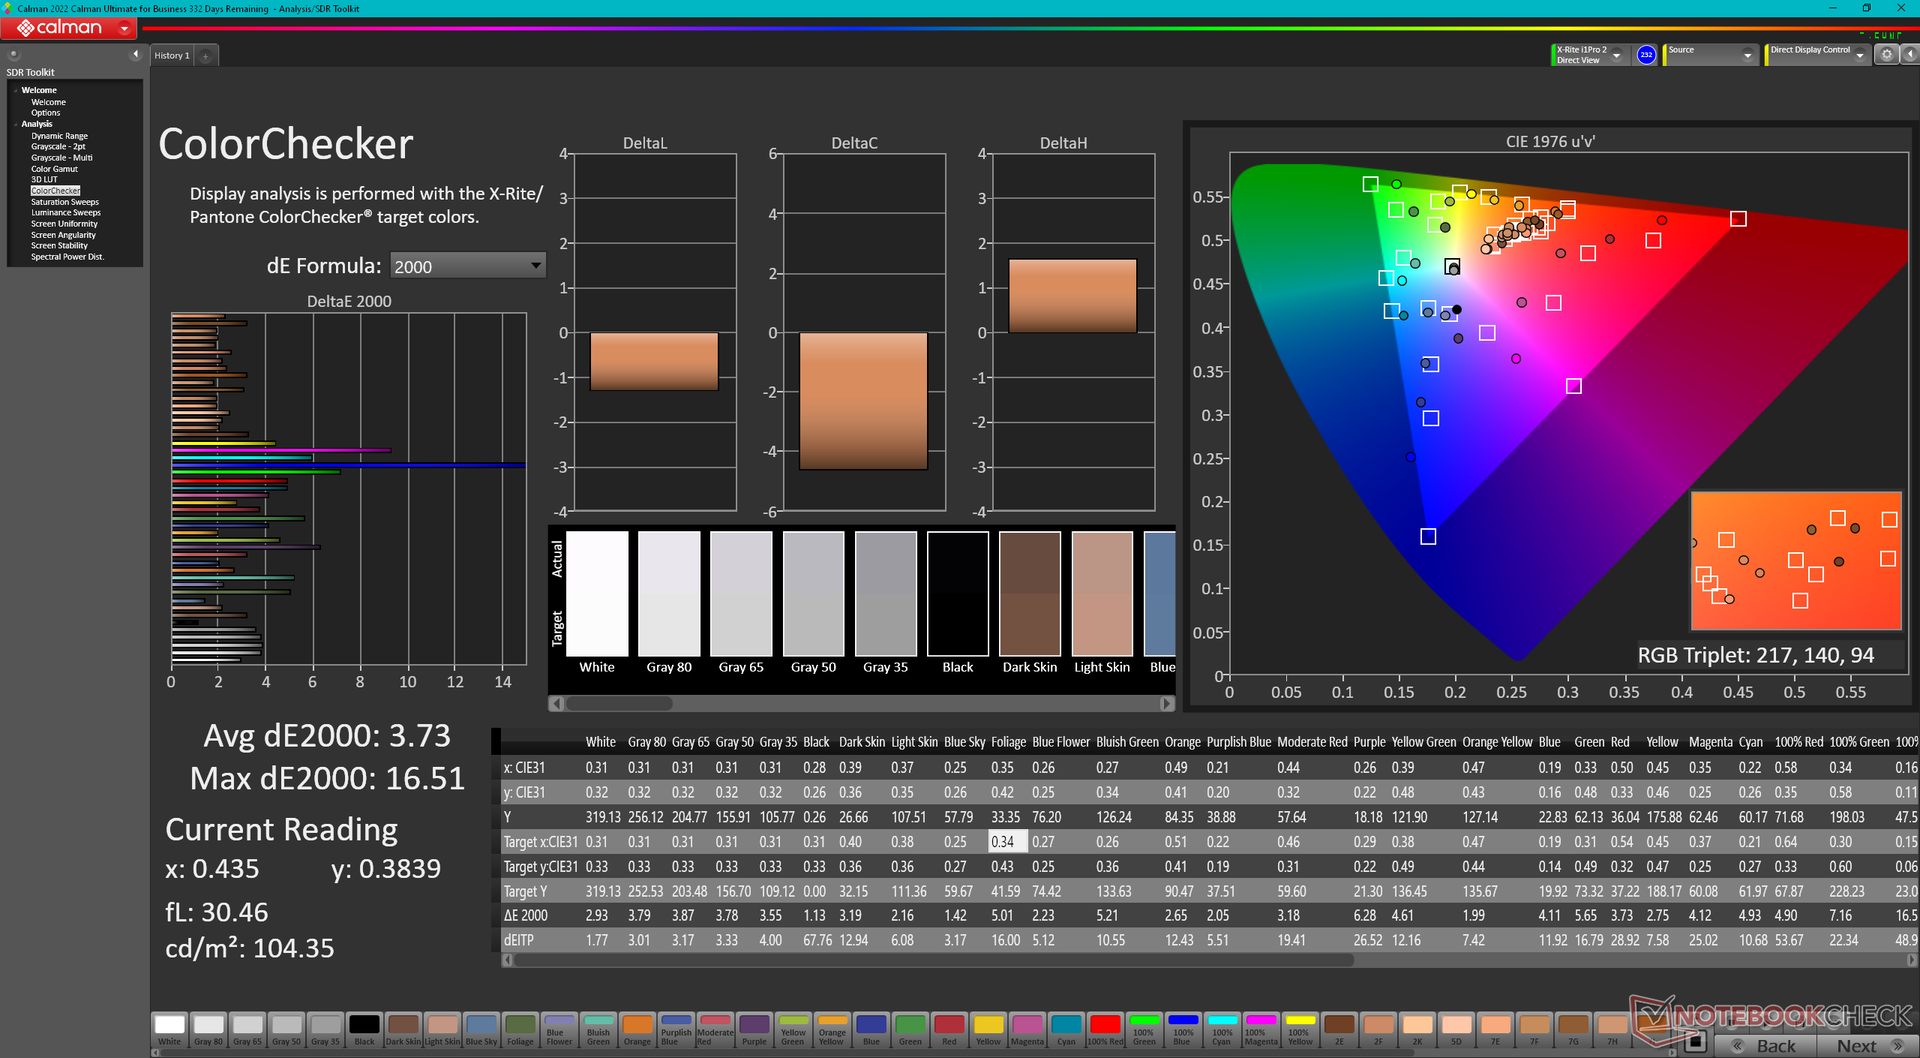
ΔE ColorChecker Calman: 3.73 | ∀{0.5-29.43 Ø4.71}
calibrated: 2.03
ΔE Greyscale Calman: 3.2 | ∀{0.09-98 Ø4.96}
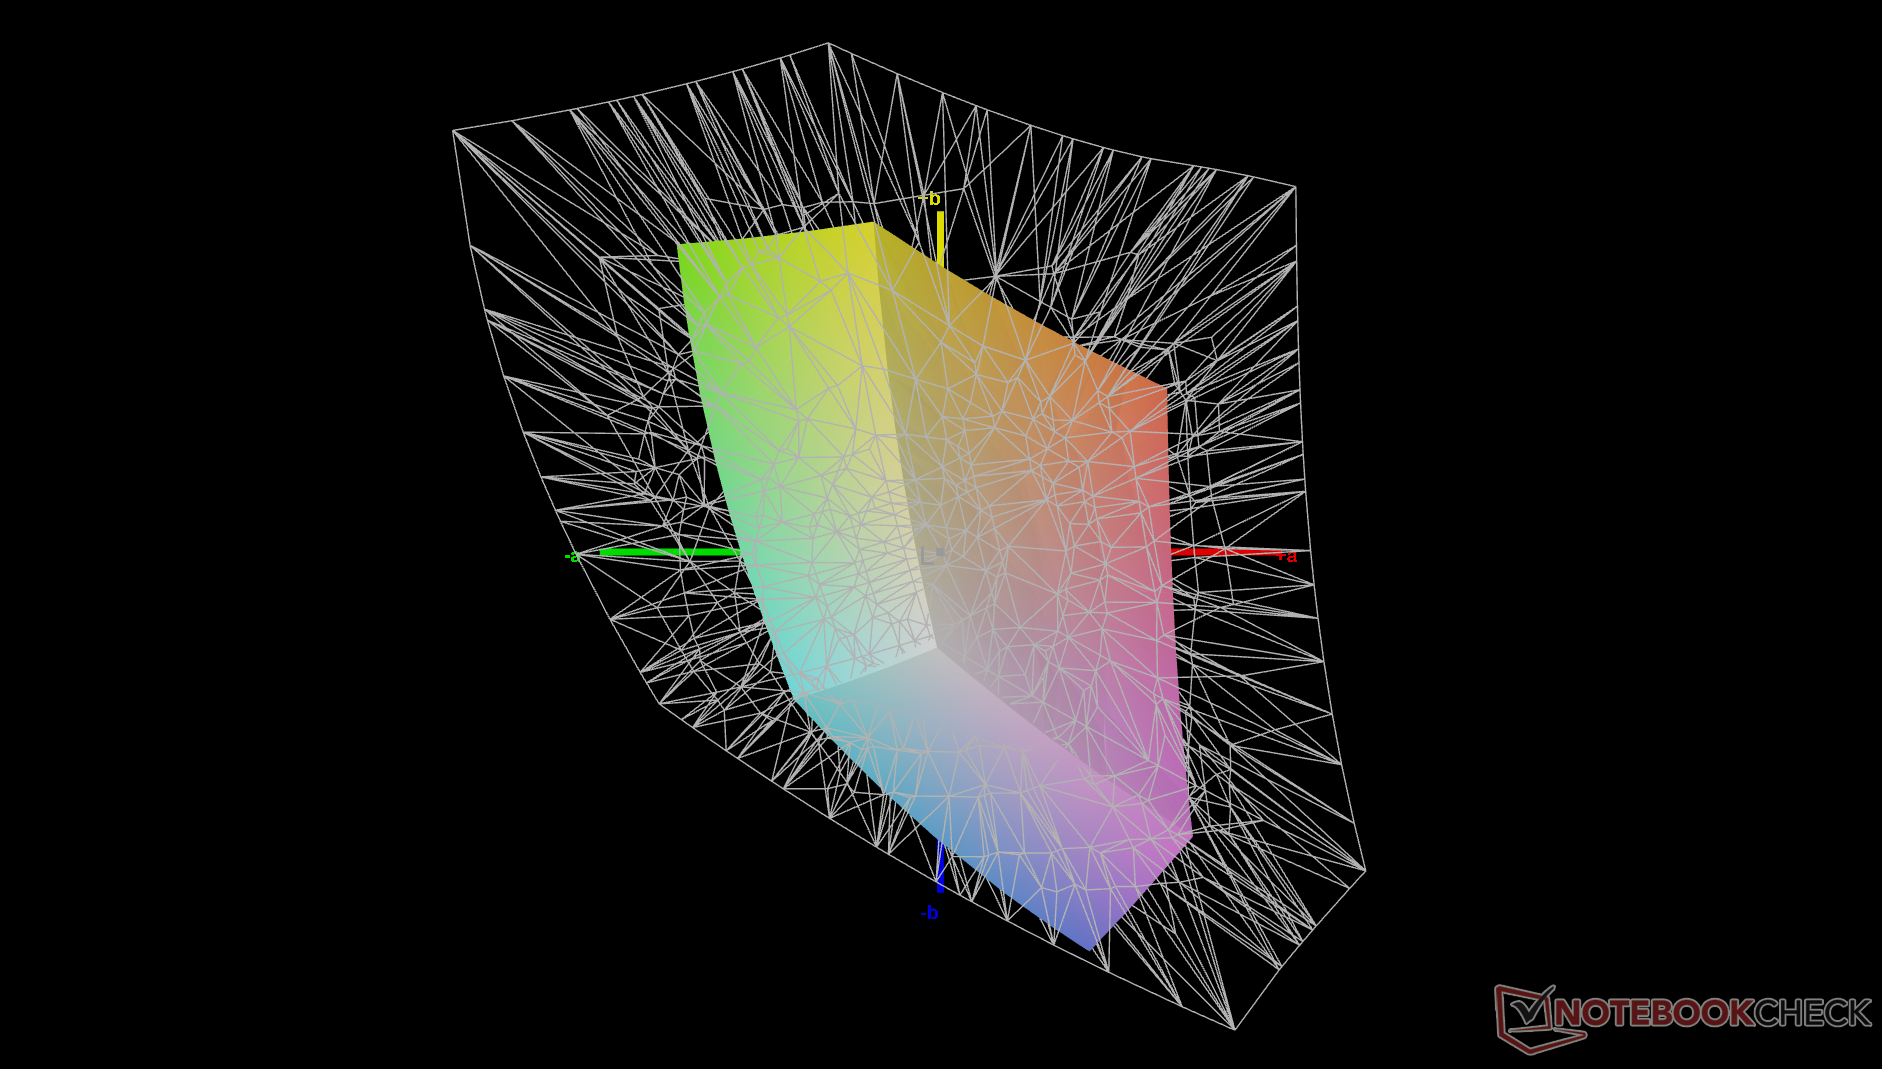
43.3% AdobeRGB 1998 (Argyll 3D)
62.6% sRGB (Argyll 3D)
42% Display P3 (Argyll 3D)
Gamma: 2.28
CCT: 6780 K
| Lenovo ThinkPad E16 G1 Core i5-1335U R160NW41 R2, IPS, 1920x1200, 16" | Lenovo ThinkPad E16 G1-21JUS08X00 MNG007DA1-C, IPS, 2560x1600, 16" | Dell Inspiron 16 7635 2-in-1 Chi Mei 160JCA, IPS, 1920x1200, 16" | Acer TravelMate P4 TMP416-51-55KN BOE BOE0A32, IPS, 1920x1200, 16" | Samsung Galaxy Book3 Pro 16 Samsung ATNA60CL03-0, AMOLED, 2880x1800, 16" | LG Gram 16Z90Q LG LP160WQ1-SPB2 (LGD06EB), IPS, 2560x1600, 16" | |
|---|---|---|---|---|---|---|
| Display | 58% | 59% | -7% | 107% | 95% | |
| Display P3 Coverage (%) | 42 | 67.6 61% | 67.4 60% | 38.9 -7% | 99.7 137% | 96.8 130% |
| sRGB Coverage (%) | 62.6 | 95.3 52% | 98.2 57% | 58.1 -7% | 100 60% | 99.9 60% |
| AdobeRGB 1998 Coverage (%) | 43.3 | 70 62% | 69.5 61% | 40.2 -7% | 97 124% | 84.6 95% |
| Response Times | 30% | 38% | 62% | 95% | 16% | |
| Response Time Grey 50% / Grey 80% * (ms) | 46.4 ? | 32.4 ? 30% | 27.6 ? 41% | 20 ? 57% | 2 ? 96% | 45.7 ? 2% |
| Response Time Black / White * (ms) | 27.6 ? | 19.6 ? 29% | 18.2 ? 34% | 9 ? 67% | 2 ? 93% | 19.7 ? 29% |
| PWM Frequency (Hz) | ||||||
| Screen | 30% | 12% | -20% | 295% | 13% | |
| Brightness middle (cd/m²) | 318.6 | 404 27% | 301.3 -5% | 269 -16% | 412 29% | 366 15% |
| Brightness (cd/m²) | 302 | 389 29% | 269 -11% | 265 -12% | 412 36% | 347 15% |
| Brightness Distribution (%) | 91 | 91 0% | 79 -13% | 94 3% | 98 8% | 89 -2% |
| Black Level * (cd/m²) | 0.29 | 0.24 17% | 0.28 3% | 0.305 -5% | 0.015 95% | 0.32 -10% |
| Contrast (:1) | 1099 | 1683 53% | 1076 -2% | 882 -20% | 27467 2399% | 1144 4% |
| Colorchecker dE 2000 * | 3.73 | 2.1 44% | 3.1 17% | 4.89 -31% | 2.34 37% | 2.82 24% |
| Colorchecker dE 2000 max. * | 16.51 | 4.2 75% | 5.5 67% | 8.81 47% | 3.34 80% | 4.65 72% |
| Colorchecker dE 2000 calibrated * | 2.03 | 1.4 31% | 0.49 76% | 5.12 -152% | 2.95 -45% | 2.69 -33% |
| Greyscale dE 2000 * | 3.2 | 3.3 -3% | 3.9 -22% | 2.91 9% | 2.78 13% | 2.3 28% |
| Gamma | 2.28 96% | 2.24 98% | 2.19 100% | 2.28 96% | 2.5 88% | 1.971 112% |
| CCT | 6780 96% | 7038 92% | 6186 105% | 6920 94% | 6879 94% | 6796 96% |
| Media totale (Programma / Settaggio) | 39% /
36% | 36% /
26% | 12% /
-5% | 166% /
226% | 41% /
31% |
* ... Meglio usare valori piccoli
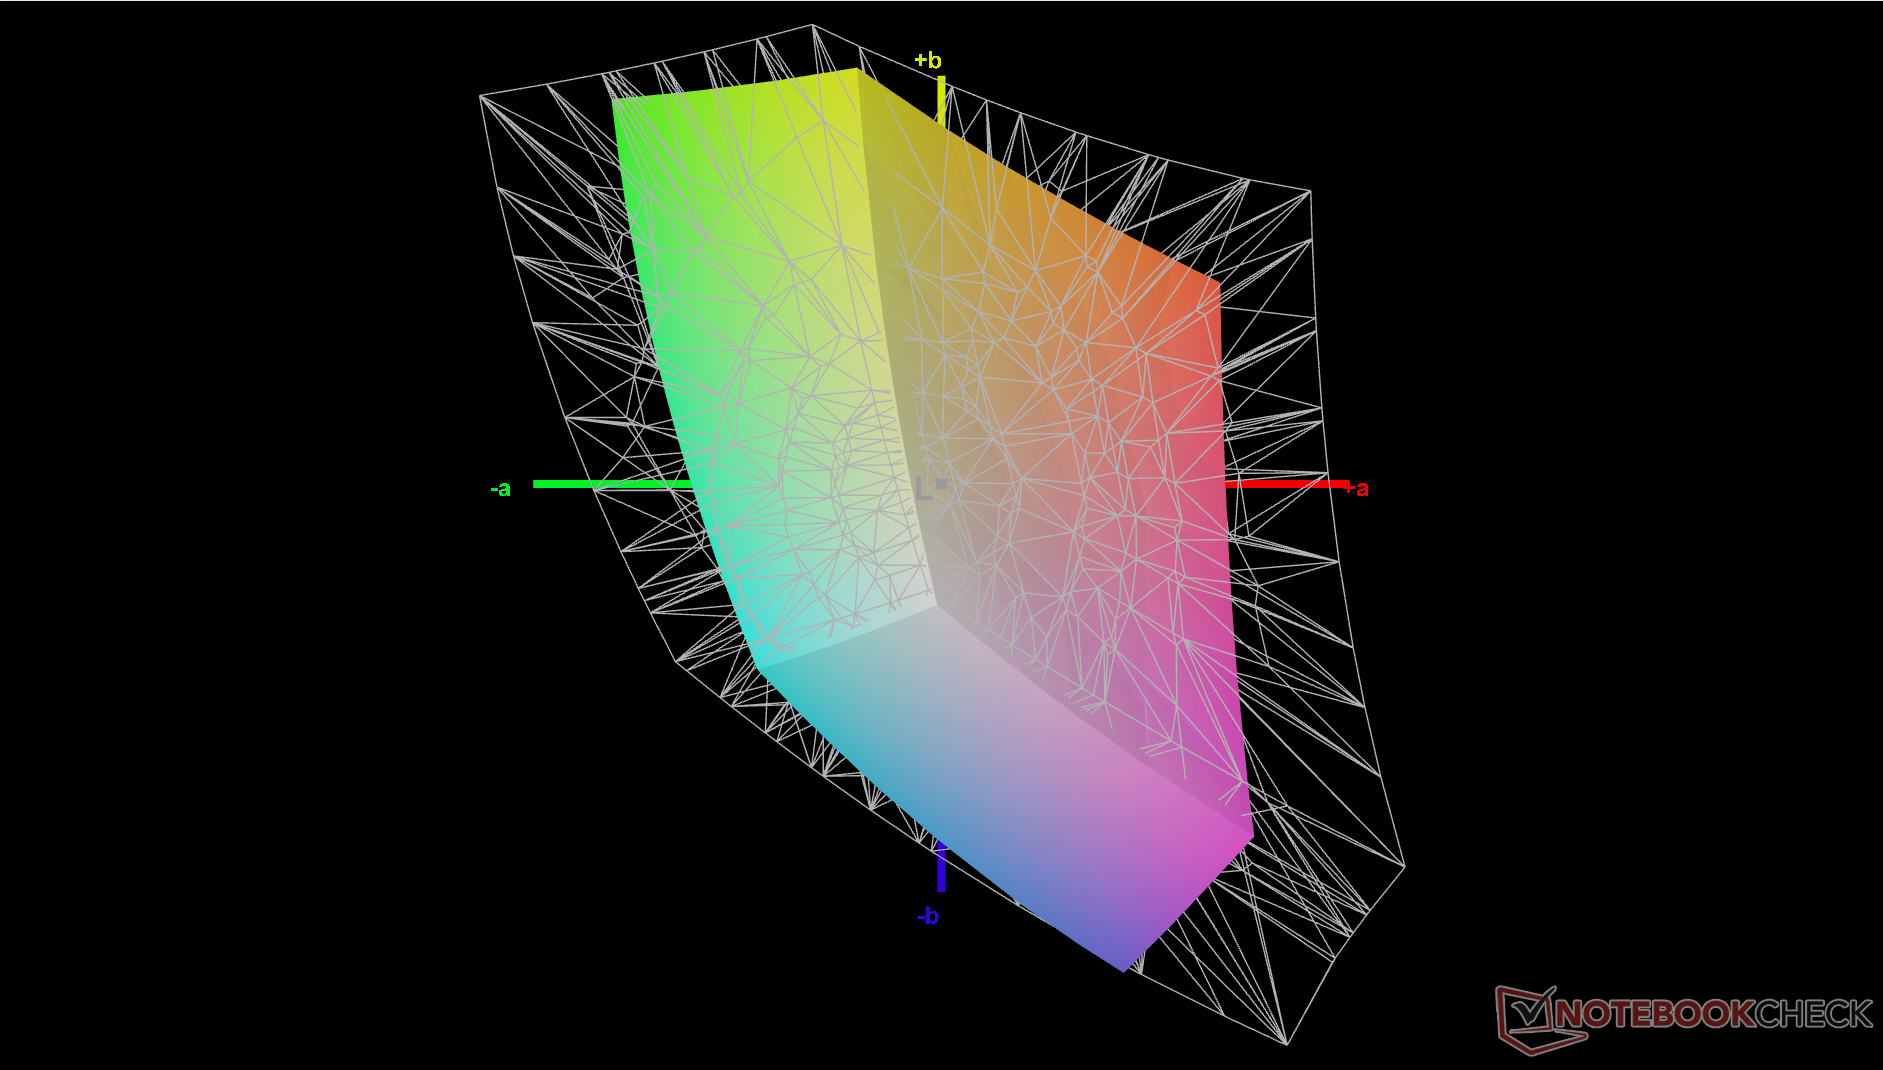
La calibrazione del display con un colorimetro X-Rite migliorerebbe leggermente i valori deltaE medi della scala di grigi e del colore, passando da 3,2 e 3,73 a 2,2 e 2,03, rispettivamente. Tuttavia, i colori continuano a diventare sempre più imprecisi a livelli di saturazione più elevati, a causa della stretta copertura del colore sRGB menzionata in precedenza.
Tempi di risposta del Display
| ↔ Tempi di risposta dal Nero al Bianco | ||
|---|---|---|
| 27.6 ms ... aumenta ↗ e diminuisce ↘ combinato | ↗ 12.9 ms Incremento | 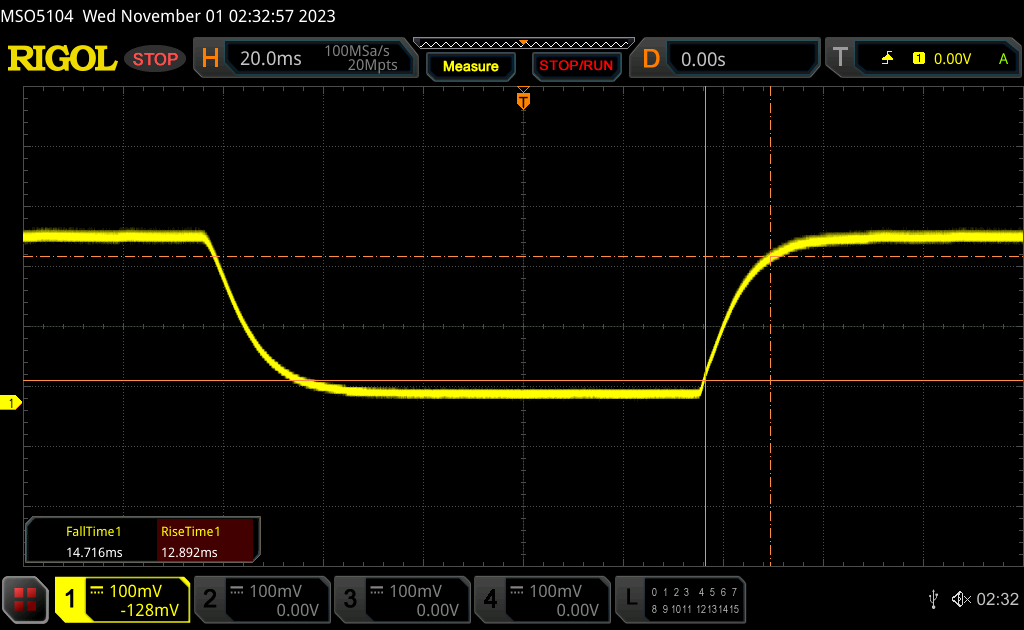 |
| ↘ 14.7 ms Calo | ||
| Lo schermo mostra tempi di risposta relativamente lenti nei nostri tests e potrebbe essere troppo lento per i gamers. In confronto, tutti i dispositivi di test variano da 0.1 (minimo) a 240 (massimo) ms. » 70 % di tutti i dispositivi è migliore. Questo significa che i tempi di risposta rilevati sono peggiori rispetto alla media di tutti i dispositivi testati (19.8 ms). | ||
| ↔ Tempo di risposta dal 50% Grigio all'80% Grigio | ||
| 46.4 ms ... aumenta ↗ e diminuisce ↘ combinato | ↗ 19.5 ms Incremento | 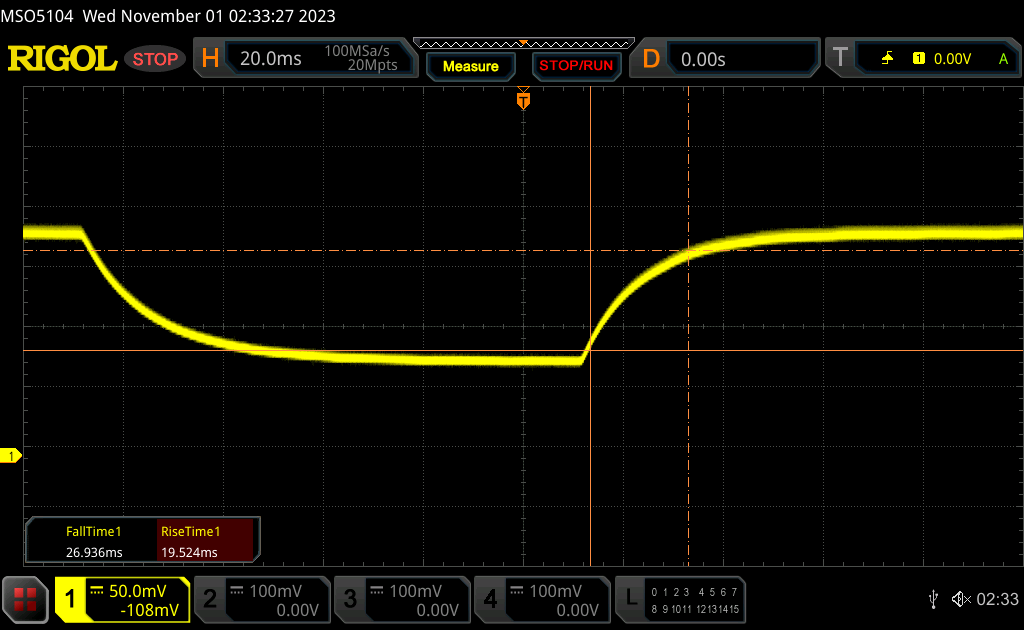 |
| ↘ 26.9 ms Calo | ||
| Lo schermo mostra tempi di risposta lenti nei nostri tests e sarà insoddisfacente per i gamers. In confronto, tutti i dispositivi di test variano da 0.165 (minimo) a 636 (massimo) ms. » 80 % di tutti i dispositivi è migliore. Questo significa che i tempi di risposta rilevati sono peggiori rispetto alla media di tutti i dispositivi testati (31 ms). | ||
Sfarfallio dello schermo / PWM (Pulse-Width Modulation)
| flickering dello schermo / PWM non rilevato |  | ||
In confronto: 52 % di tutti i dispositivi testati non utilizza PWM per ridurre la luminosita' del display. Se è rilevato PWM, una media di 7754 (minimo: 5 - massimo: 343500) Hz è stata rilevata. | |||
Prestazioni
Condizioni del test
Abbiamo impostato Windows in modalità Prestazioni prima di eseguire i benchmark qui sotto. Gli utenti dovrebbero familiarizzare con il software Vantage integrato, in quanto è l'hub centrale per le funzioni specifiche di Lenovo e gli aggiornamenti del BIOS.


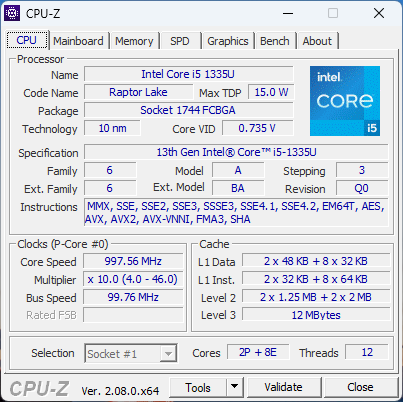
Processore
A differenza della maggior parte delle altre CPU Core i5 e Core i7, il Core i5-1335U si comporta in modo molto più simile al più costoso Core i7-1355U di quanto ci si possa aspettare inizialmente. I benchmark classificano il nostro Core i5-1335U solo dal 5 al 10% più lento del Core i7-1355U, il che significa che può risparmiare diverse centinaia di dollari optando per la configurazione Core i5, se non le dispiace il piccolo deficit di prestazioni della CPU. Il motivo principale per scegliere l'opzione Core i7 è invece legato alla sua grafica integrata, come dimostra la sezione Prestazioni della GPU qui sotto.
Rispetto al modello Ryzen 7 7730U la nostra versione Intel Core i5 è circa il 10-15% più lenta nelle prestazioni multi-thread, mentre il contrario è vero per quanto riguarda le prestazioni single-thread.
Cinebench R15 Multi Loop
Cinebench R23: Multi Core | Single Core
Cinebench R20: CPU (Multi Core) | CPU (Single Core)
Cinebench R15: CPU Multi 64Bit | CPU Single 64Bit
Blender: v2.79 BMW27 CPU
7-Zip 18.03: 7z b 4 | 7z b 4 -mmt1
Geekbench 5.5: Multi-Core | Single-Core
HWBOT x265 Benchmark v2.2: 4k Preset
LibreOffice : 20 Documents To PDF
R Benchmark 2.5: Overall mean
* ... Meglio usare valori piccoli
AIDA64: FP32 Ray-Trace | FPU Julia | CPU SHA3 | CPU Queen | FPU SinJulia | FPU Mandel | CPU AES | CPU ZLib | FP64 Ray-Trace | CPU PhotoWorxx
| Performance rating | |
| Lenovo ThinkPad E16 G1-21JUS08X00 | |
| Samsung Galaxy Book3 Pro 16 | |
| Dell Inspiron 16 7635 2-in-1 | |
| Acer TravelMate P4 TMP416-51-55KN | |
| Lenovo ThinkPad E16 G1 Core i5-1335U | |
| Media Intel Core i5-1335U | |
| LG Gram 16Z90Q | |
| AIDA64 / FP32 Ray-Trace | |
| Lenovo ThinkPad E16 G1-21JUS08X00 | |
| Dell Inspiron 16 7635 2-in-1 | |
| Acer TravelMate P4 TMP416-51-55KN | |
| Samsung Galaxy Book3 Pro 16 | |
| Lenovo ThinkPad E16 G1 Core i5-1335U | |
| Media Intel Core i5-1335U (5661 - 7809, n=11) | |
| LG Gram 16Z90Q | |
| AIDA64 / FPU SinJulia | |
| Lenovo ThinkPad E16 G1-21JUS08X00 | |
| Dell Inspiron 16 7635 2-in-1 | |
| Samsung Galaxy Book3 Pro 16 | |
| Acer TravelMate P4 TMP416-51-55KN | |
| Lenovo ThinkPad E16 G1 Core i5-1335U | |
| LG Gram 16Z90Q | |
| Media Intel Core i5-1335U (3873 - 5008, n=11) | |
| AIDA64 / FPU Mandel | |
| Lenovo ThinkPad E16 G1-21JUS08X00 | |
| Dell Inspiron 16 7635 2-in-1 | |
| Samsung Galaxy Book3 Pro 16 | |
| Acer TravelMate P4 TMP416-51-55KN | |
| Lenovo ThinkPad E16 G1 Core i5-1335U | |
| Media Intel Core i5-1335U (14376 - 20553, n=11) | |
| LG Gram 16Z90Q | |
| AIDA64 / FP64 Ray-Trace | |
| Lenovo ThinkPad E16 G1-21JUS08X00 | |
| Dell Inspiron 16 7635 2-in-1 | |
| Acer TravelMate P4 TMP416-51-55KN | |
| Samsung Galaxy Book3 Pro 16 | |
| Lenovo ThinkPad E16 G1 Core i5-1335U | |
| LG Gram 16Z90Q | |
| Media Intel Core i5-1335U (2878 - 4214, n=11) | |
| AIDA64 / CPU PhotoWorxx | |
| Samsung Galaxy Book3 Pro 16 | |
| LG Gram 16Z90Q | |
| Media Intel Core i5-1335U (13584 - 41123, n=11) | |
| Acer TravelMate P4 TMP416-51-55KN | |
| Lenovo ThinkPad E16 G1 Core i5-1335U | |
| Dell Inspiron 16 7635 2-in-1 | |
| Lenovo ThinkPad E16 G1-21JUS08X00 | |
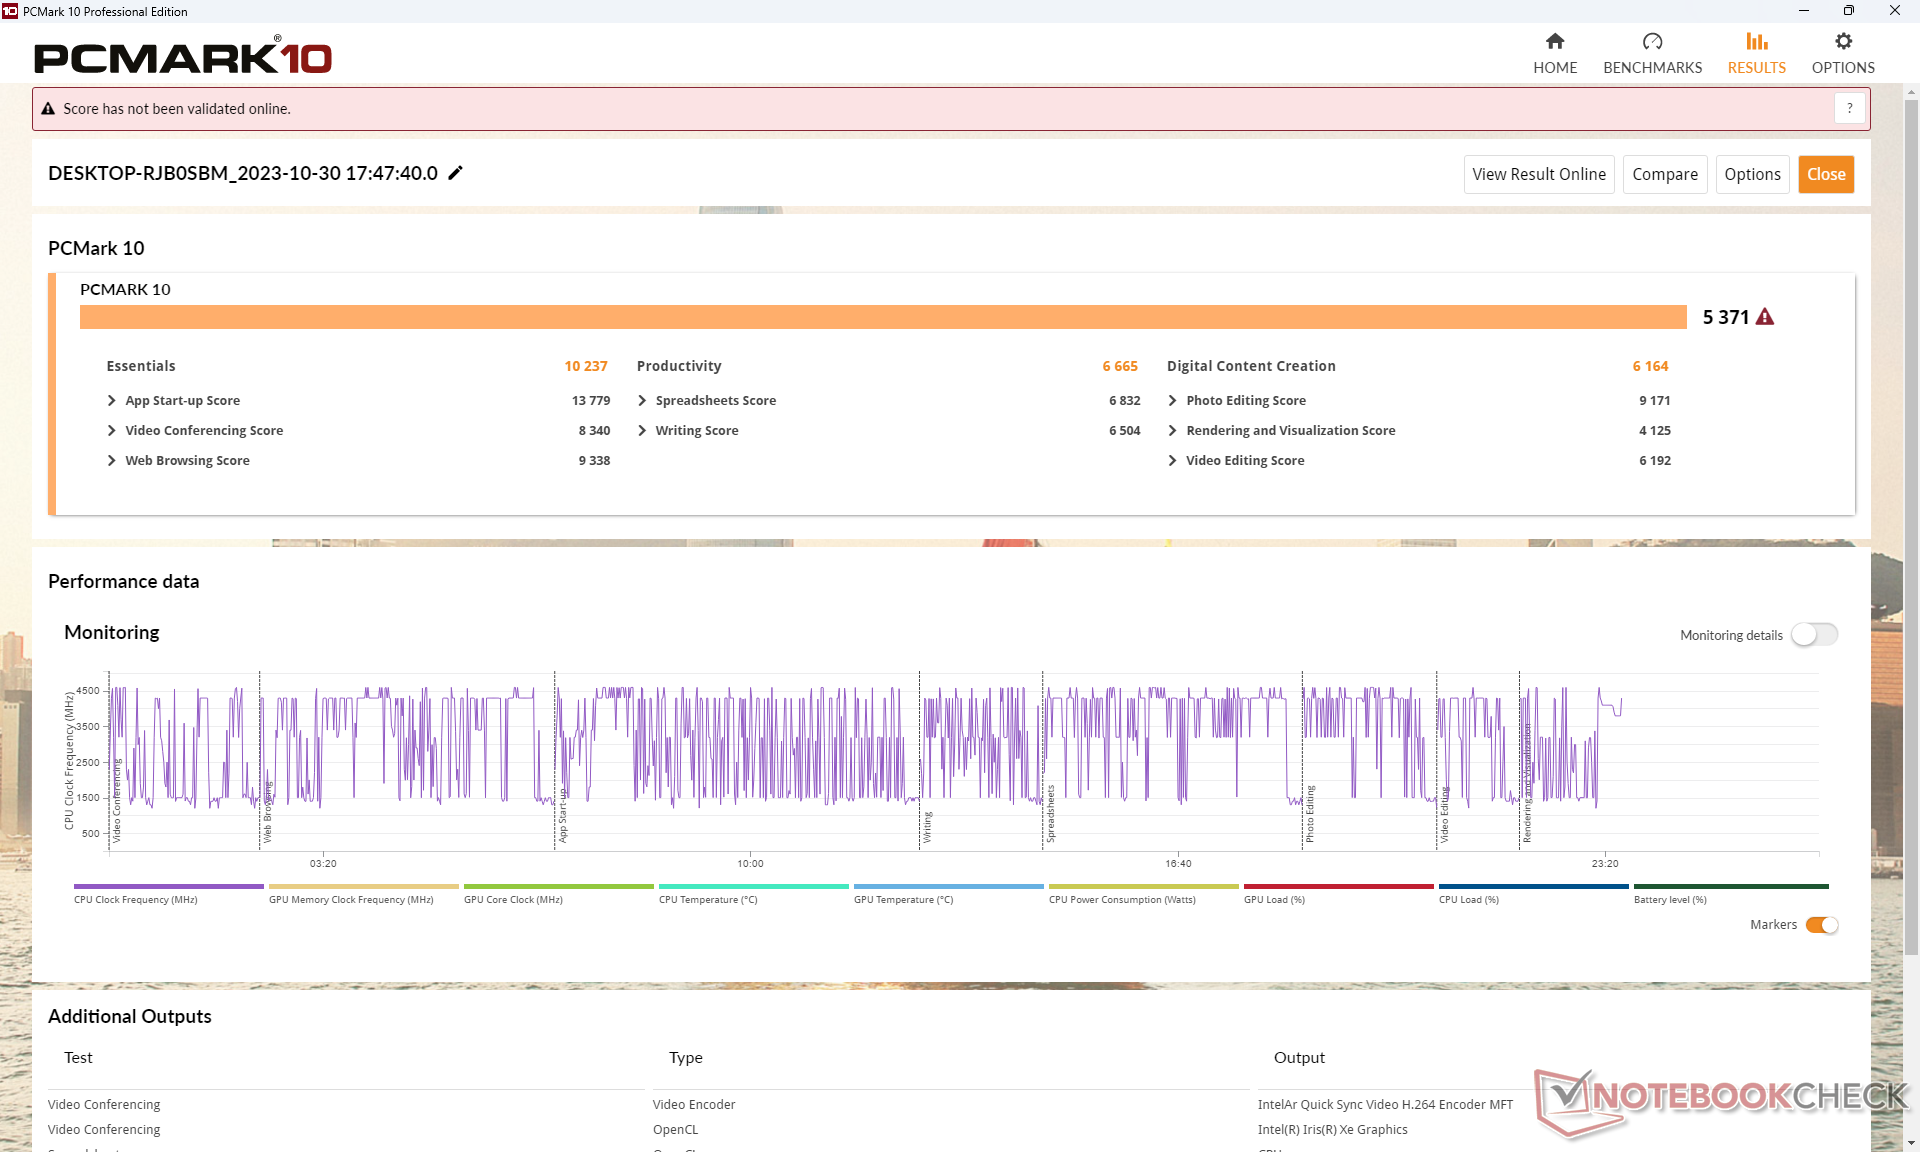
Prestazioni del sistema
I risultati di PCMark sono testa a testa con l'alternativa Ryzen 7 AMD, tranne che nel sottotest Produttività, grazie alle prestazioni multi-thread superiori di Ryzen 7 7730U rispetto al nostro Core i5-1335U.
CrossMark: Overall | Productivity | Creativity | Responsiveness
| PCMark 10 / Score | |
| Dell Inspiron 16 7635 2-in-1 | |
| Lenovo ThinkPad E16 G1-21JUS08X00 | |
| Samsung Galaxy Book3 Pro 16 | |
| Lenovo ThinkPad E16 G1 Core i5-1335U | |
| Media Intel Core i5-1335U, Intel Iris Xe Graphics G7 80EUs (5068 - 5600, n=11) | |
| Acer TravelMate P4 TMP416-51-55KN | |
| LG Gram 16Z90Q | |
| PCMark 10 / Essentials | |
| Dell Inspiron 16 7635 2-in-1 | |
| Samsung Galaxy Book3 Pro 16 | |
| Lenovo ThinkPad E16 G1-21JUS08X00 | |
| Media Intel Core i5-1335U, Intel Iris Xe Graphics G7 80EUs (9828 - 11912, n=11) | |
| Lenovo ThinkPad E16 G1 Core i5-1335U | |
| LG Gram 16Z90Q | |
| Acer TravelMate P4 TMP416-51-55KN | |
| PCMark 10 / Productivity | |
| Dell Inspiron 16 7635 2-in-1 | |
| Lenovo ThinkPad E16 G1-21JUS08X00 | |
| Media Intel Core i5-1335U, Intel Iris Xe Graphics G7 80EUs (6196 - 7261, n=11) | |
| Acer TravelMate P4 TMP416-51-55KN | |
| Samsung Galaxy Book3 Pro 16 | |
| Lenovo ThinkPad E16 G1 Core i5-1335U | |
| LG Gram 16Z90Q | |
| PCMark 10 / Digital Content Creation | |
| Samsung Galaxy Book3 Pro 16 | |
| Acer TravelMate P4 TMP416-51-55KN | |
| Lenovo ThinkPad E16 G1 Core i5-1335U | |
| Lenovo ThinkPad E16 G1-21JUS08X00 | |
| LG Gram 16Z90Q | |
| Dell Inspiron 16 7635 2-in-1 | |
| Media Intel Core i5-1335U, Intel Iris Xe Graphics G7 80EUs (5361 - 6164, n=11) | |
| CrossMark / Overall | |
| Samsung Galaxy Book3 Pro 16 | |
| Acer TravelMate P4 TMP416-51-55KN | |
| Media Intel Core i5-1335U, Intel Iris Xe Graphics G7 80EUs (1339 - 1599, n=11) | |
| Lenovo ThinkPad E16 G1 Core i5-1335U | |
| Lenovo ThinkPad E16 G1-21JUS08X00 | |
| Dell Inspiron 16 7635 2-in-1 | |
| CrossMark / Productivity | |
| Samsung Galaxy Book3 Pro 16 | |
| Acer TravelMate P4 TMP416-51-55KN | |
| Media Intel Core i5-1335U, Intel Iris Xe Graphics G7 80EUs (1337 - 1638, n=11) | |
| Lenovo ThinkPad E16 G1 Core i5-1335U | |
| Lenovo ThinkPad E16 G1-21JUS08X00 | |
| Dell Inspiron 16 7635 2-in-1 | |
| CrossMark / Creativity | |
| Samsung Galaxy Book3 Pro 16 | |
| Acer TravelMate P4 TMP416-51-55KN | |
| Media Intel Core i5-1335U, Intel Iris Xe Graphics G7 80EUs (1315 - 1620, n=11) | |
| Lenovo ThinkPad E16 G1 Core i5-1335U | |
| Lenovo ThinkPad E16 G1-21JUS08X00 | |
| Dell Inspiron 16 7635 2-in-1 | |
| CrossMark / Responsiveness | |
| Acer TravelMate P4 TMP416-51-55KN | |
| Samsung Galaxy Book3 Pro 16 | |
| Media Intel Core i5-1335U, Intel Iris Xe Graphics G7 80EUs (1023 - 1868, n=11) | |
| Lenovo ThinkPad E16 G1 Core i5-1335U | |
| Lenovo ThinkPad E16 G1-21JUS08X00 | |
| Dell Inspiron 16 7635 2-in-1 | |
| PCMark 10 Score | 5371 punti | |
Aiuto | ||
| AIDA64 / Memory Copy | |
| LG Gram 16Z90Q | |
| Samsung Galaxy Book3 Pro 16 | |
| Media Intel Core i5-1335U (22417 - 60884, n=11) | |
| Acer TravelMate P4 TMP416-51-55KN | |
| Dell Inspiron 16 7635 2-in-1 | |
| Lenovo ThinkPad E16 G1 Core i5-1335U | |
| Lenovo ThinkPad E16 G1-21JUS08X00 | |
| AIDA64 / Memory Read | |
| LG Gram 16Z90Q | |
| Samsung Galaxy Book3 Pro 16 | |
| Acer TravelMate P4 TMP416-51-55KN | |
| Media Intel Core i5-1335U (23104 - 61555, n=11) | |
| Dell Inspiron 16 7635 2-in-1 | |
| Lenovo ThinkPad E16 G1-21JUS08X00 | |
| Lenovo ThinkPad E16 G1 Core i5-1335U | |
| AIDA64 / Memory Write | |
| Samsung Galaxy Book3 Pro 16 | |
| LG Gram 16Z90Q | |
| Media Intel Core i5-1335U (22936 - 72584, n=11) | |
| Acer TravelMate P4 TMP416-51-55KN | |
| Lenovo ThinkPad E16 G1 Core i5-1335U | |
| Dell Inspiron 16 7635 2-in-1 | |
| Lenovo ThinkPad E16 G1-21JUS08X00 | |
| AIDA64 / Memory Latency | |
| Dell Inspiron 16 7635 2-in-1 | |
| LG Gram 16Z90Q | |
| Media Intel Core i5-1335U (78.6 - 112.8, n=11) | |
| Samsung Galaxy Book3 Pro 16 | |
| Lenovo ThinkPad E16 G1-21JUS08X00 | |
| Lenovo ThinkPad E16 G1 Core i5-1335U | |
| Acer TravelMate P4 TMP416-51-55KN | |
* ... Meglio usare valori piccoli
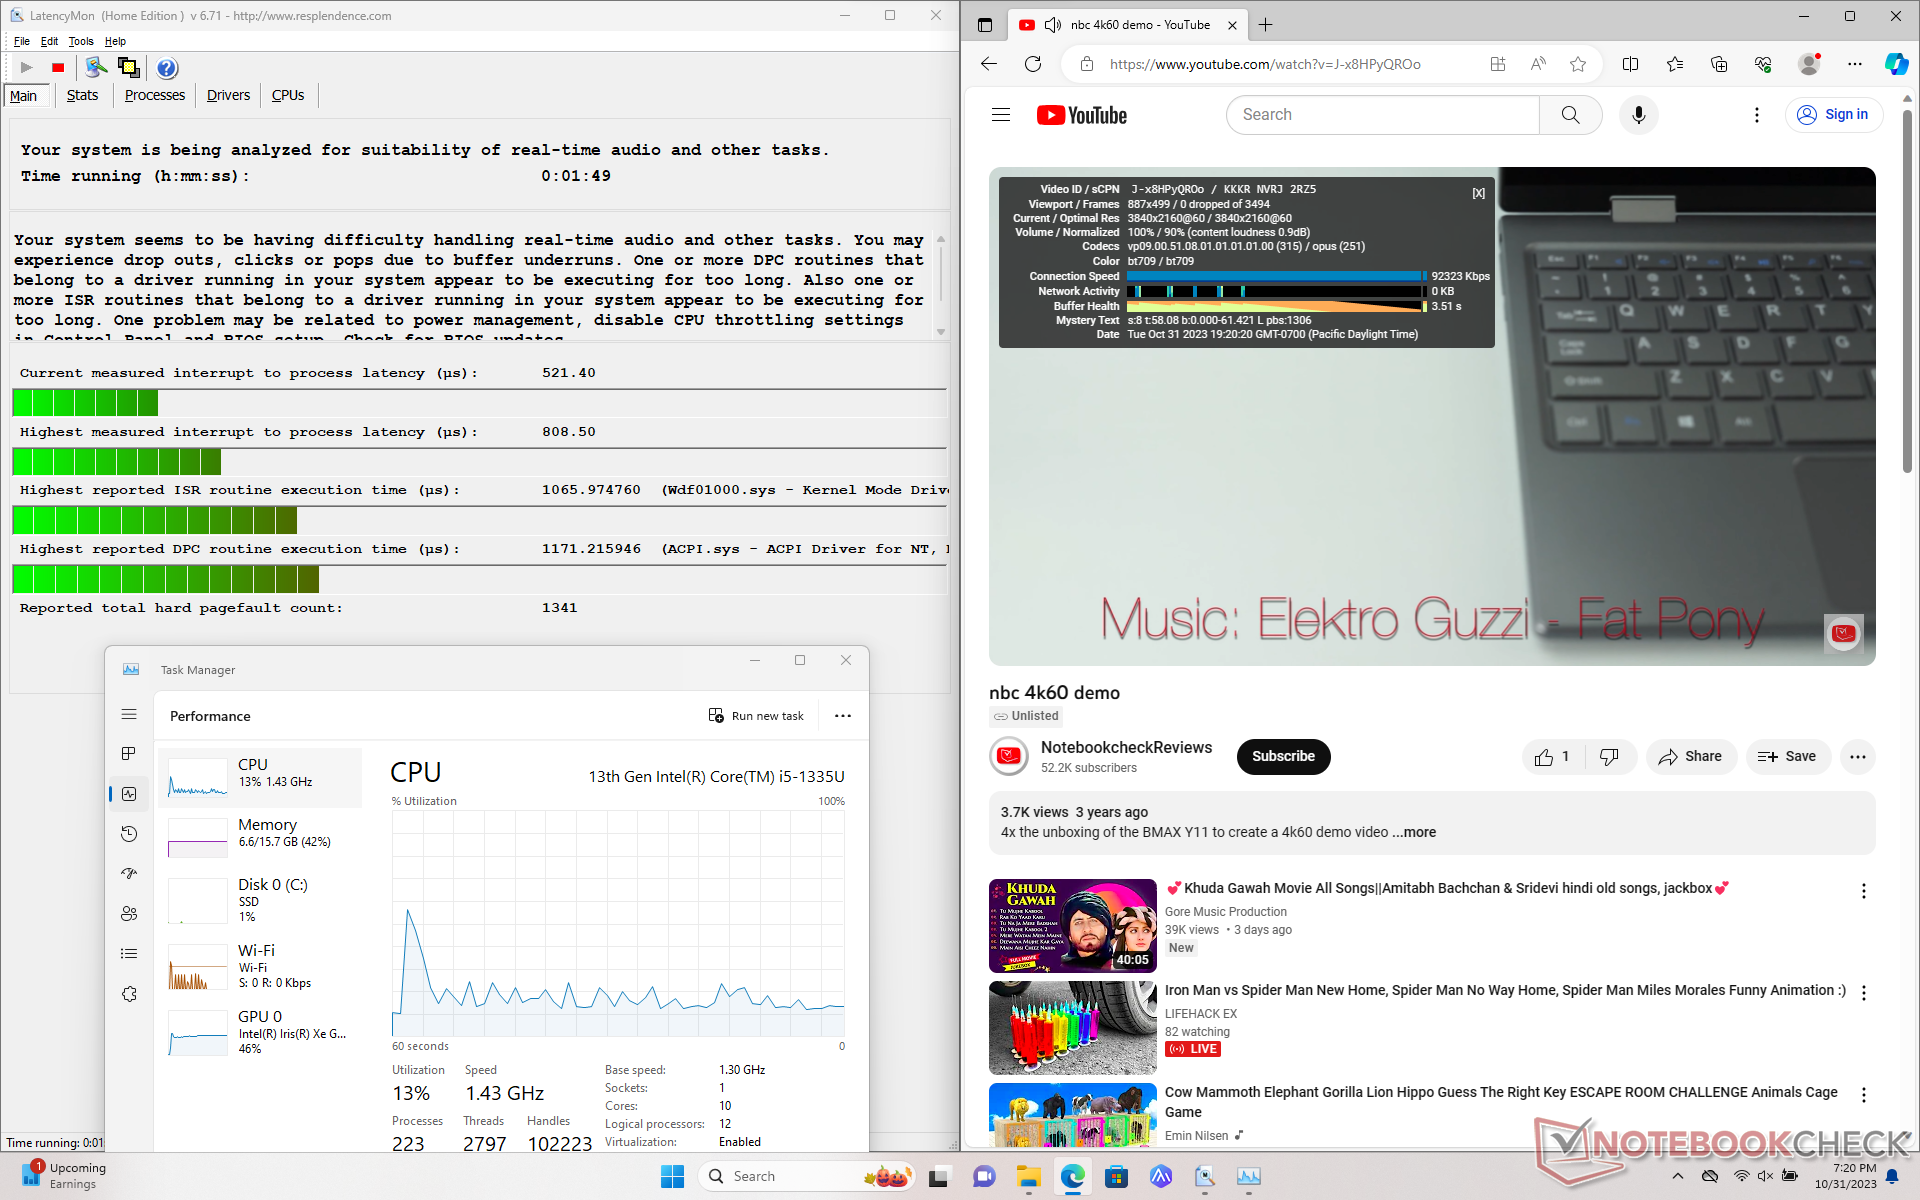
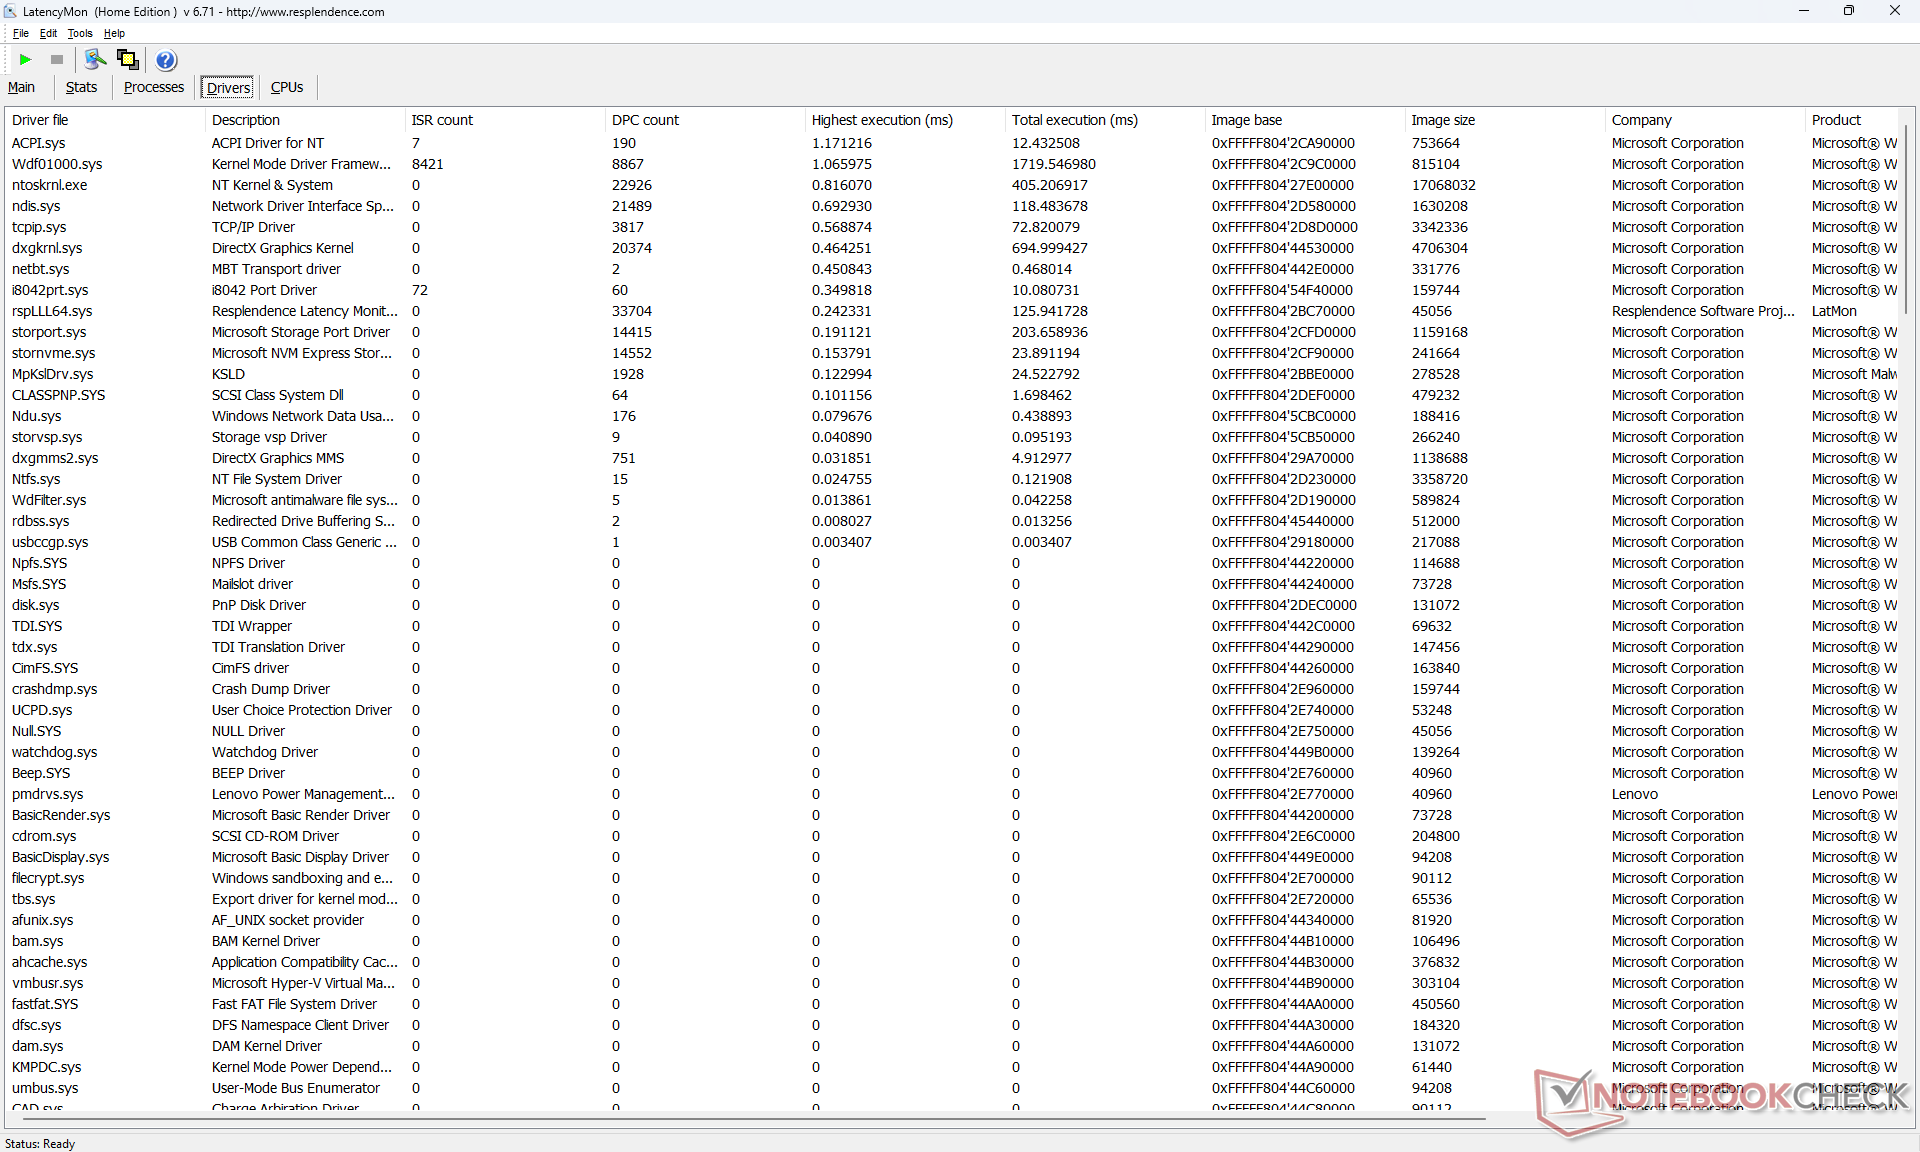
Latenza DPC
LatencyMon rivela solo lievi problemi di DPC quando si aprono più schede del browser della nostra homepage. la riproduzione di video 4K a 60 FPS è invece perfettamente fluida, senza alcuna perdita di fotogrammi.
| DPC Latencies / LatencyMon - interrupt to process latency (max), Web, Youtube, Prime95 | |
| Acer TravelMate P4 TMP416-51-55KN | |
| LG Gram 16Z90Q | |
| Lenovo ThinkPad E16 G1-21JUS08X00 | |
| Lenovo ThinkPad E16 G1 Core i5-1335U | |
| Dell Inspiron 16 7635 2-in-1 | |
| Samsung Galaxy Book3 Pro 16 | |
* ... Meglio usare valori piccoli
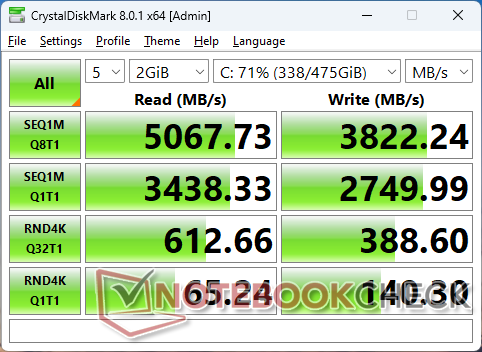
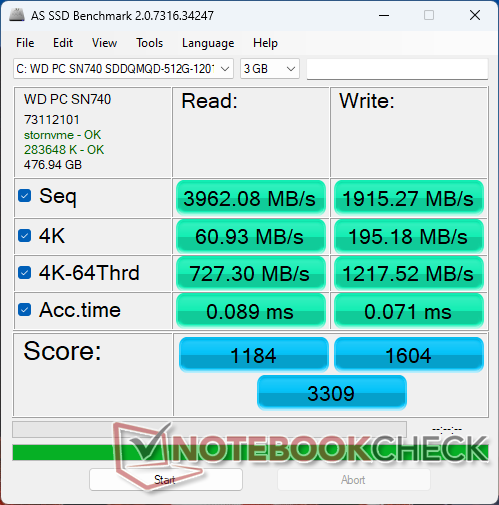
Dispositivi di archiviazione
La nostra unità di prova comprende il Western Digital SN740 che è un SSD PCIe4 x4 NVMe di fascia media che offre velocità di lettura e scrittura sequenziali reali fino a 5100 MB/s e 3900 MB/s, rispettivamente. L'unità 2242 non ha avuto problemi a mantenere queste velocità massime, nonostante la mancanza di pad termici o ausili per il raffreddamento.

* ... Meglio usare valori piccoli
Disk Throttling: DiskSpd Read Loop, Queue Depth 8
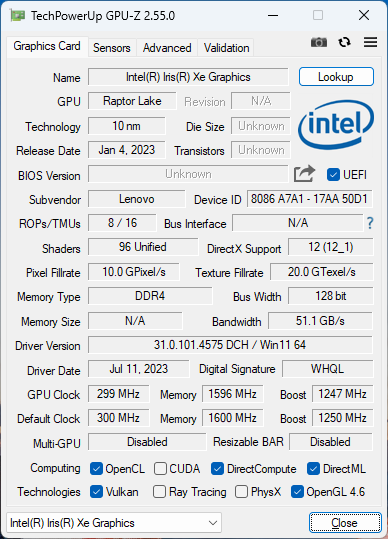
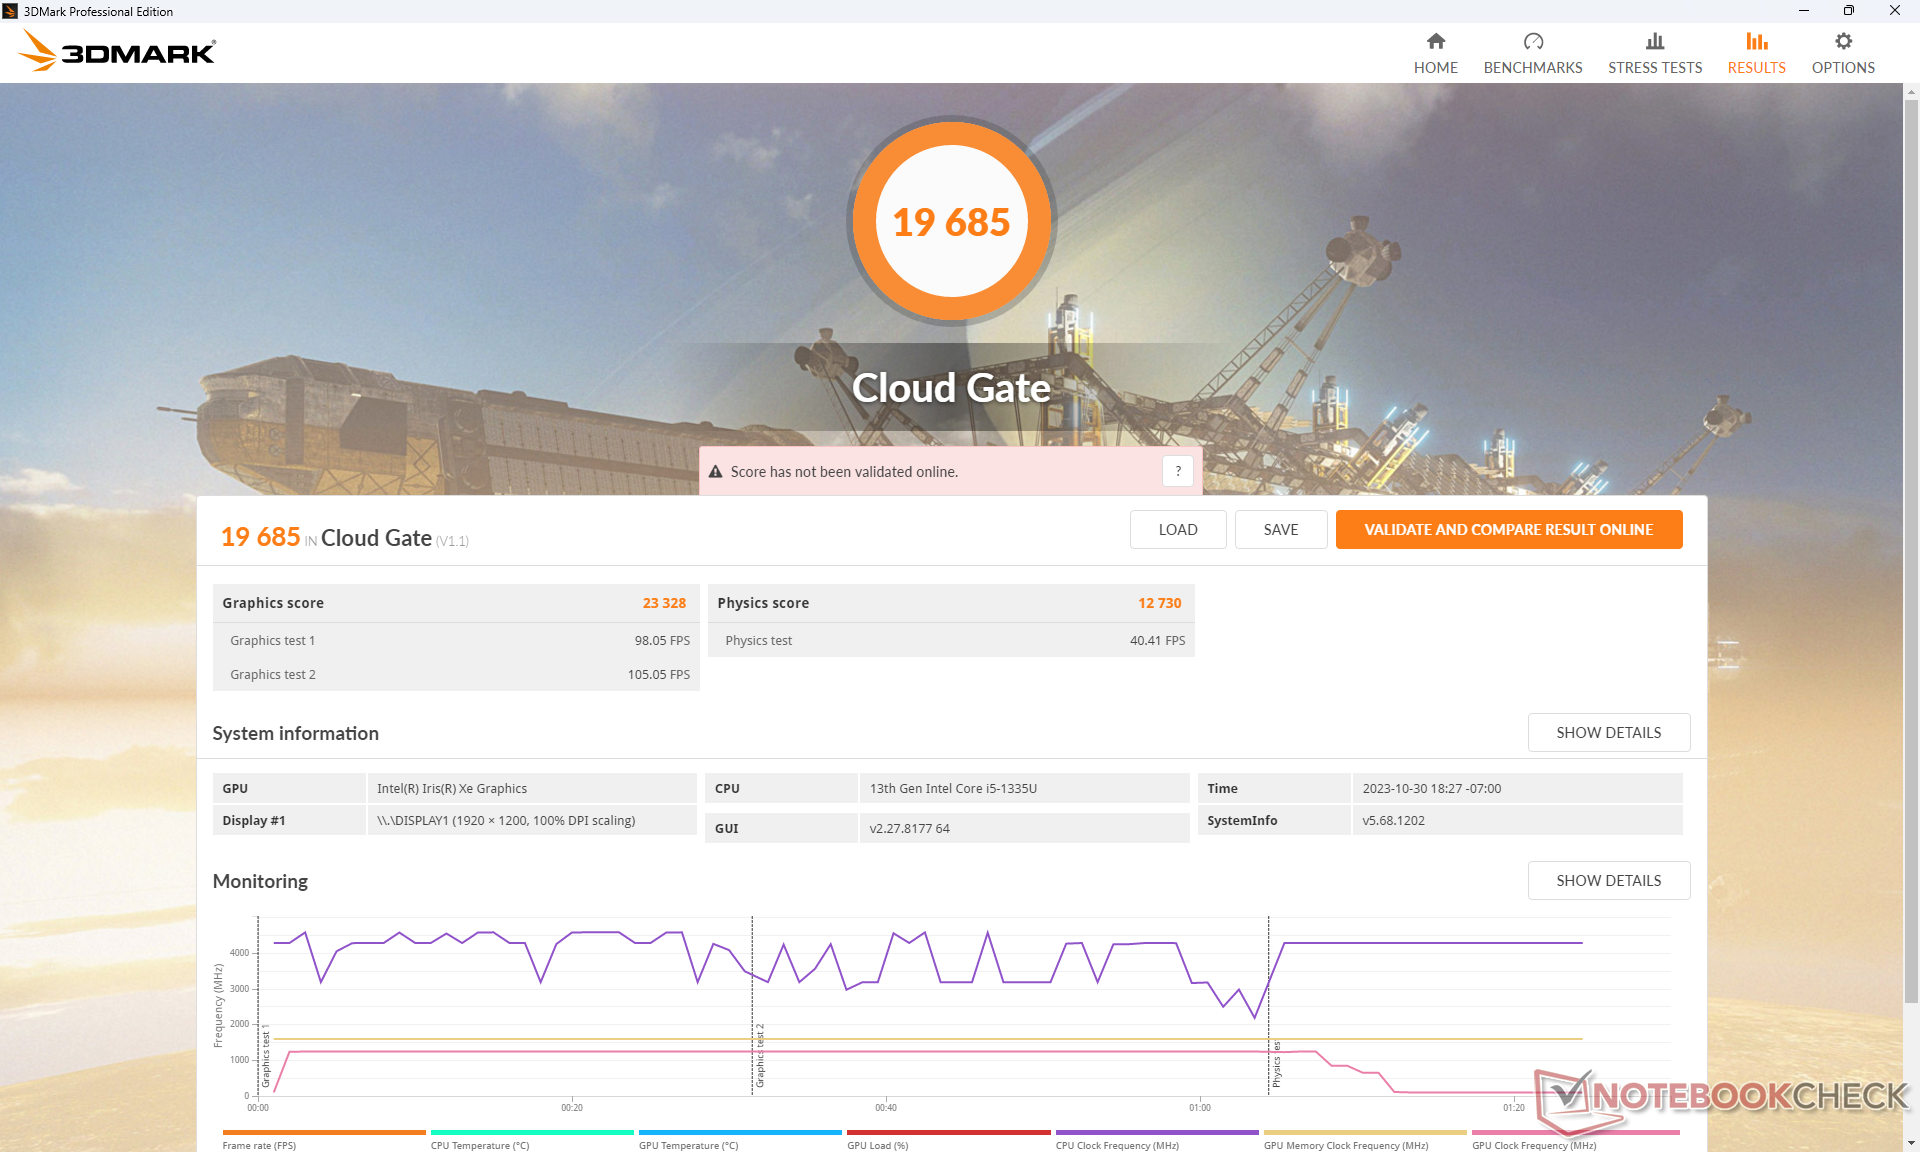
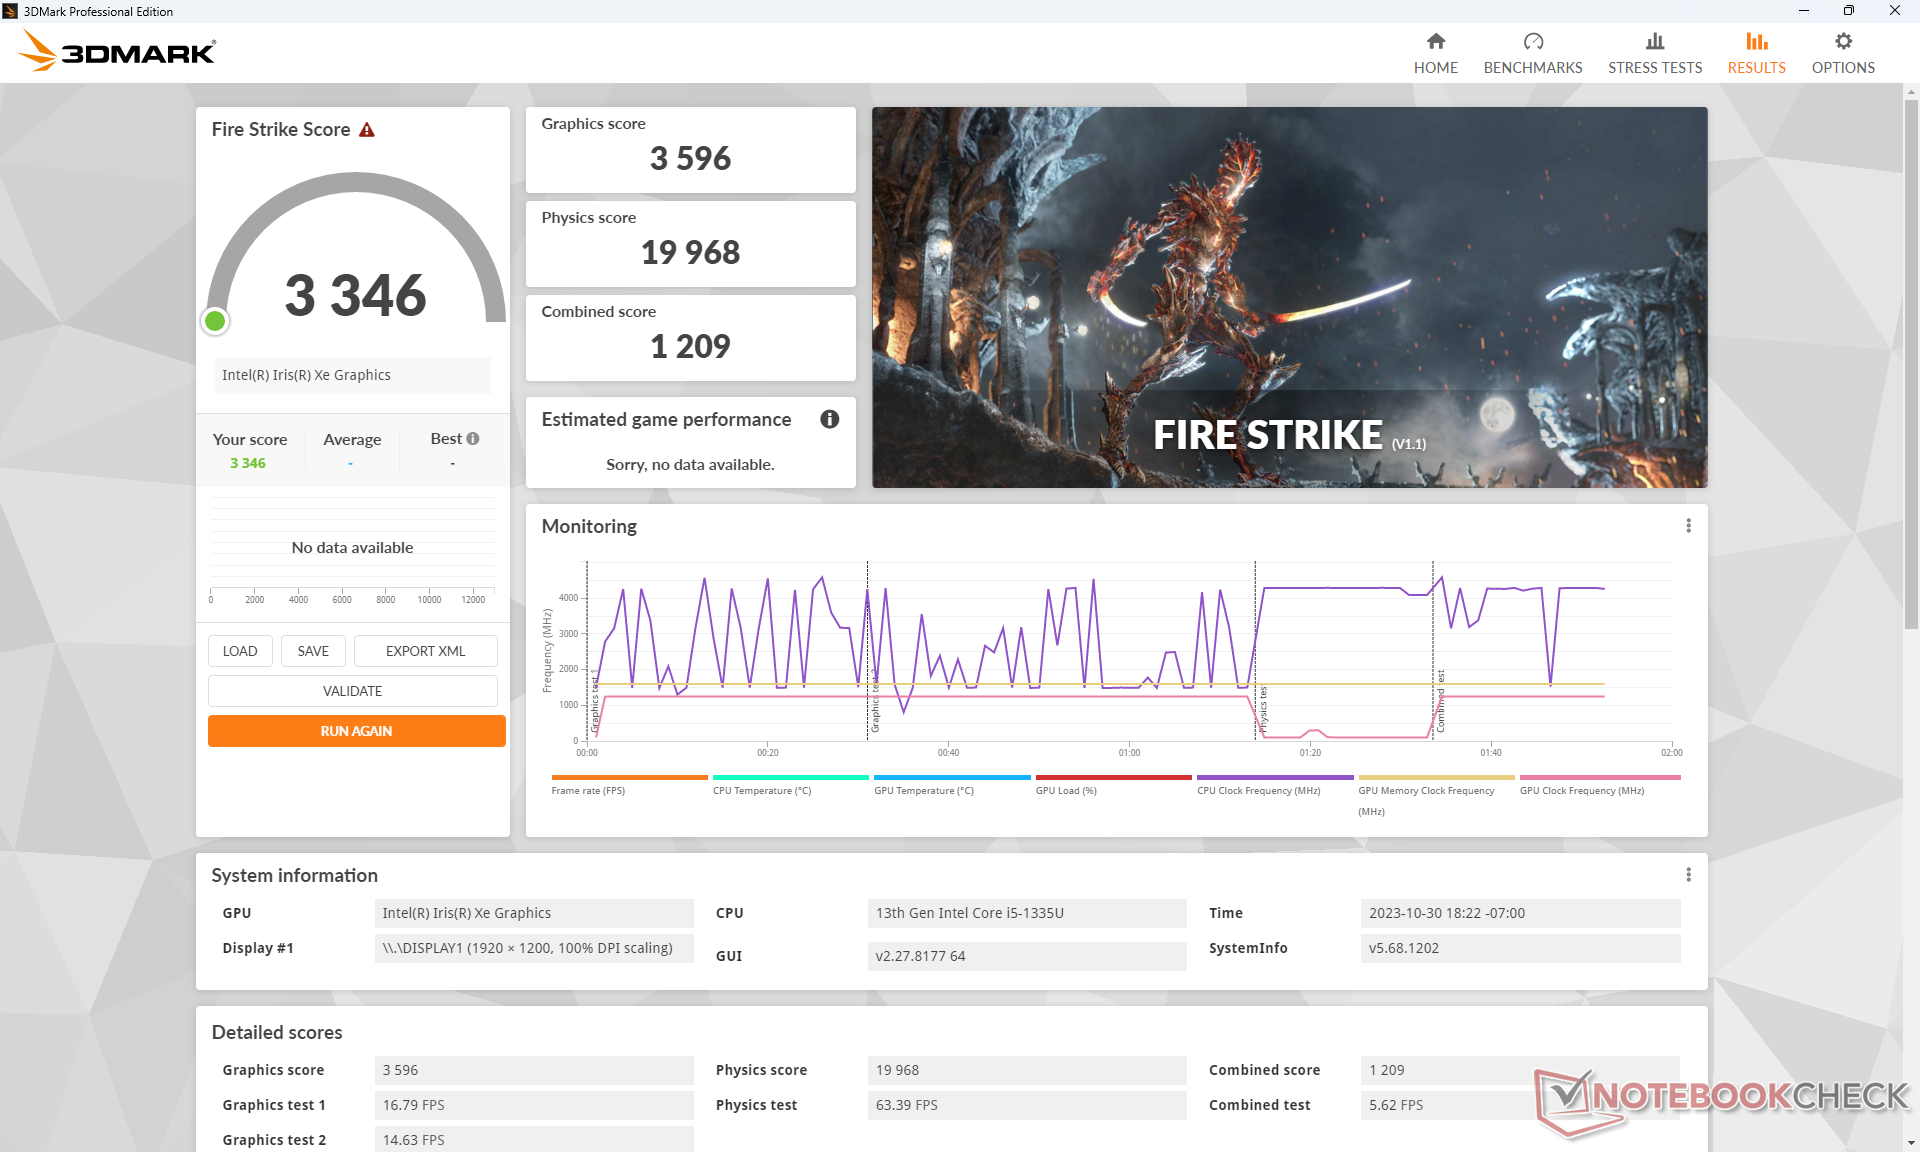
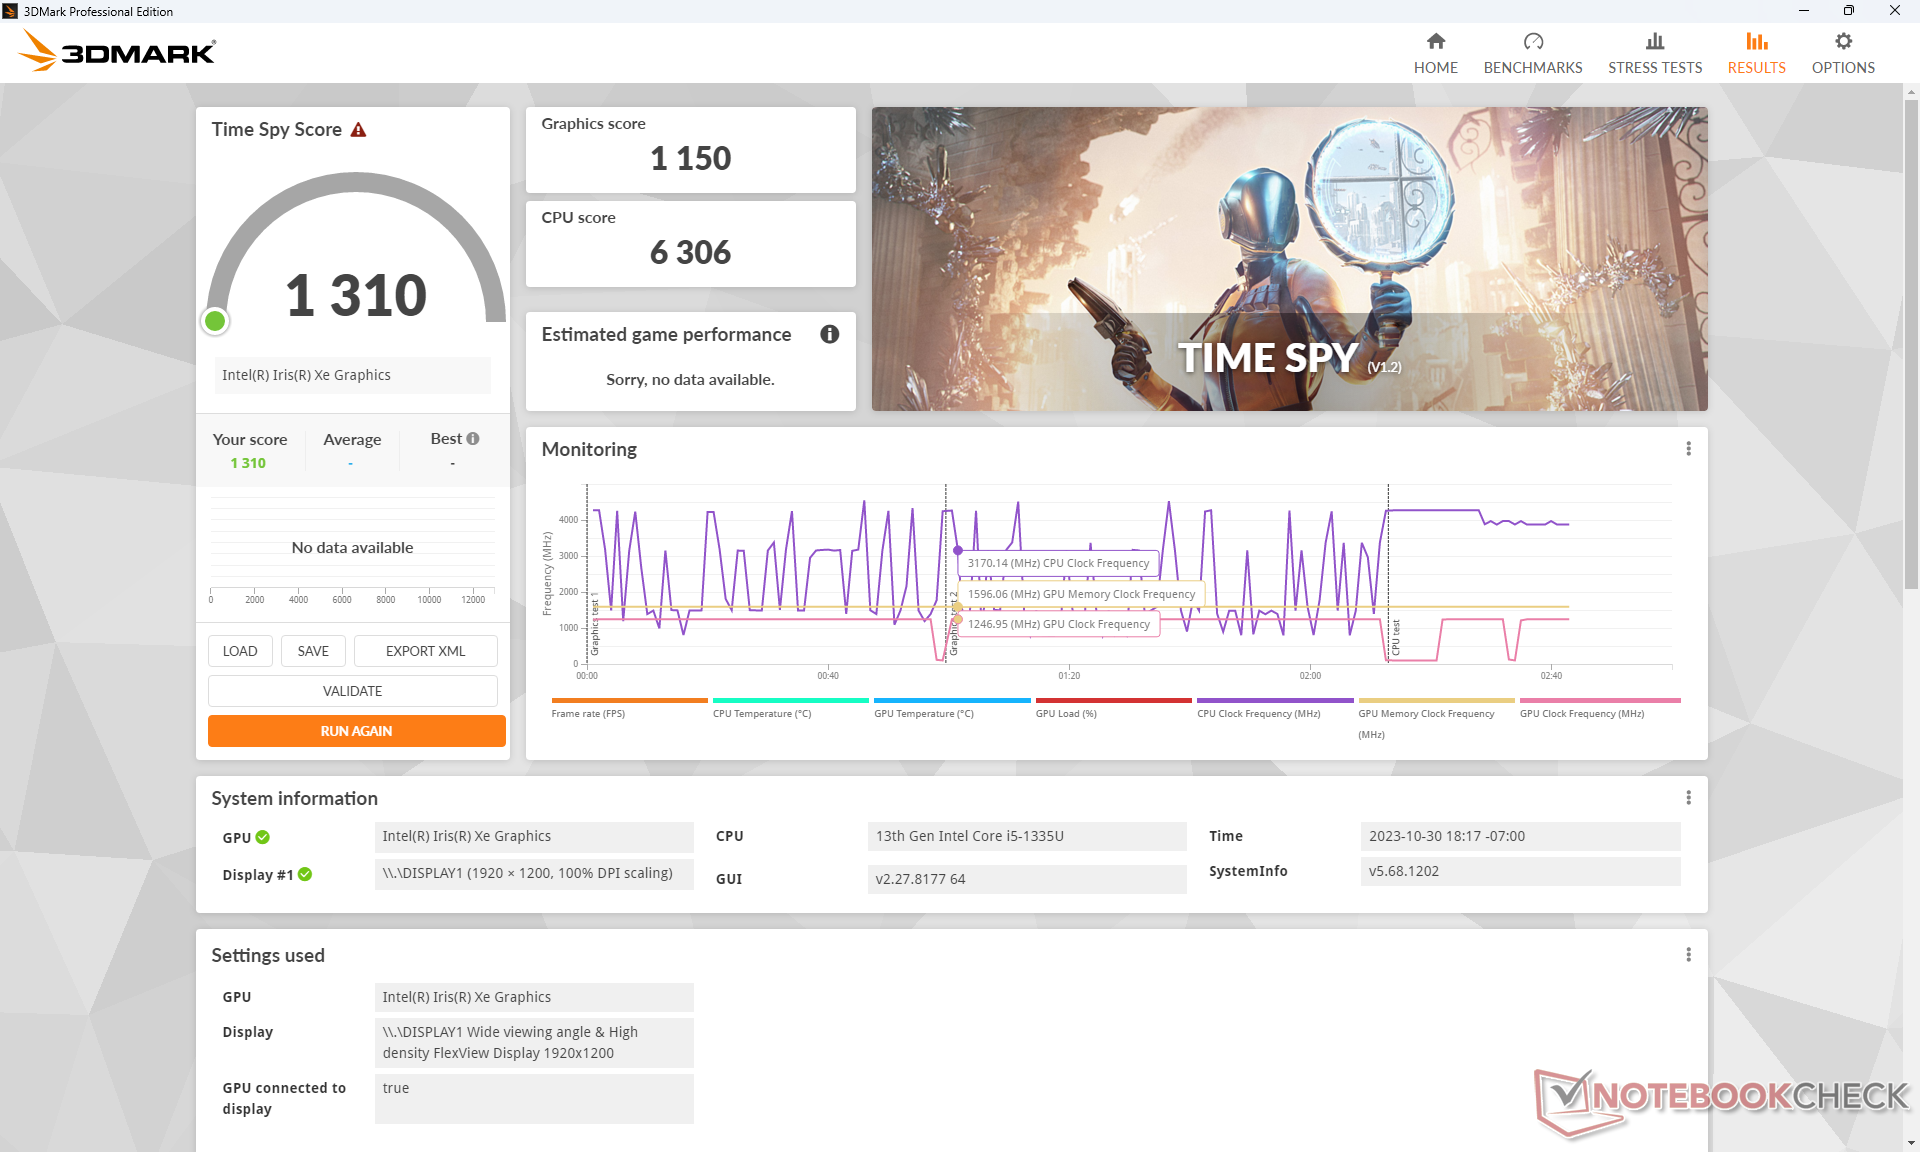
Prestazioni della GPU
Il nostro sistema integrato Iris Xe 80 EUs integrata si sta comportando come ci aspettiamo rispetto ad altri portatili con la stessa GPU, se non leggermente più lentamente. L'aggiornamento alla configurazione Core i7 con Iris Xe 96 EUs o GeForce MX550 aumenterebbe le prestazioni di circa il 25-30% o il 70-100%, rispettivamente.
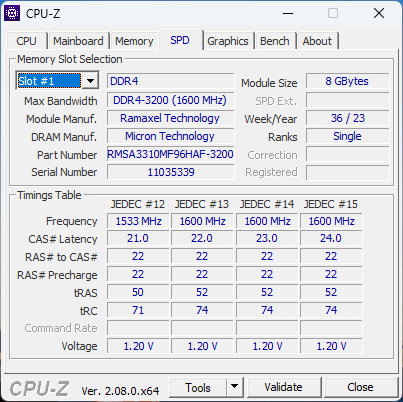
Si assicuri di configurare con RAM a doppio canale, altrimenti le prestazioni dell'iGPU ne risentiranno in modo significativo.
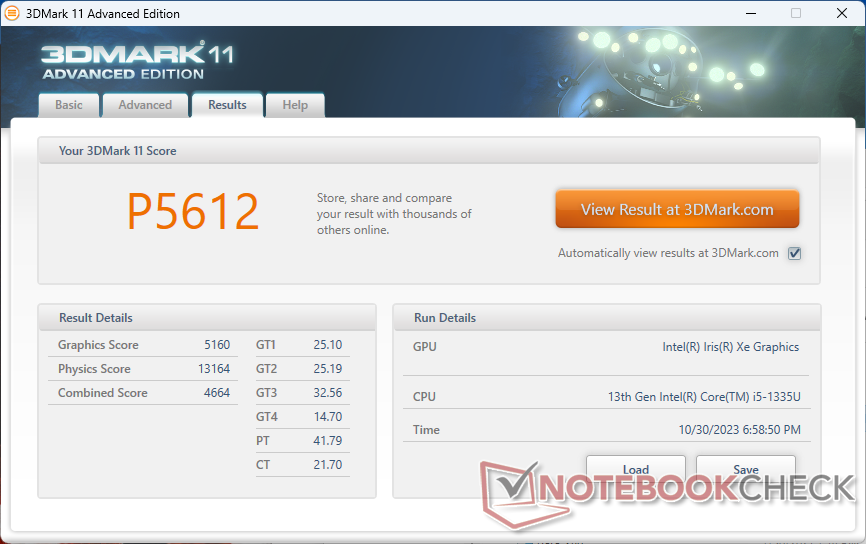
| 3DMark 11 Performance | 5612 punti | |
| 3DMark Cloud Gate Standard Score | 19685 punti | |
| 3DMark Fire Strike Score | 3346 punti | |
| 3DMark Time Spy Score | 1310 punti | |
Aiuto | ||
* ... Meglio usare valori piccoli
Le frequenze dei fotogrammi al minimo su Witcher 3 si sono ridotte notevolmente all'inizio del test, suggerendo l'interruzione di qualche attività di sottofondo. Fortunatamente, questo non si ripete durante il resto del test.
Witcher 3 FPS Chart
| basso | medio | alto | ultra | |
|---|---|---|---|---|
| GTA V (2015) | 84.5 | 68.8 | 13.2 | 5.41 |
| The Witcher 3 (2015) | 73.6 | 45.1 | 22.1 | 11.1 |
| Dota 2 Reborn (2015) | 100.7 | 75.2 | 49.2 | 45 |
| Final Fantasy XV Benchmark (2018) | 31 | 16.9 | 12.1 | |
| X-Plane 11.11 (2018) | 28.6 | 22.5 | 21 | |
| Far Cry 5 (2018) | 40 | 19 | 18 | 17 |
| Strange Brigade (2018) | 70.3 | 27.3 | 22.4 | 18.3 |
| Cyberpunk 2077 1.6 (2022) | 14.1 | |||
| Tiny Tina's Wonderlands (2022) | 20.6 | 15.3 | 10.4 | 8.1 |
| F1 22 (2022) | 32.8 | 29.1 | 21.3 | 16.5 |
Emissioni
Rumore del sistema
Il rumore della ventola è generalmente più forte di quello che abbiamo riscontrato sulla versione Ryzen 7, probabilmente a causa delle maggiori richieste di energia della nostra versione Intel. La versione AMD è in grado di rimanere più silenziosa per periodi più lunghi quando viene introdotto lo stress. Durante l'esecuzione di 3DMark 06, ad esempio, il rumore della ventola rimane relativamente silenzioso a poco meno di 25 dB(A) rispetto ai quasi 33 dB(A) della nostra versione Intel.
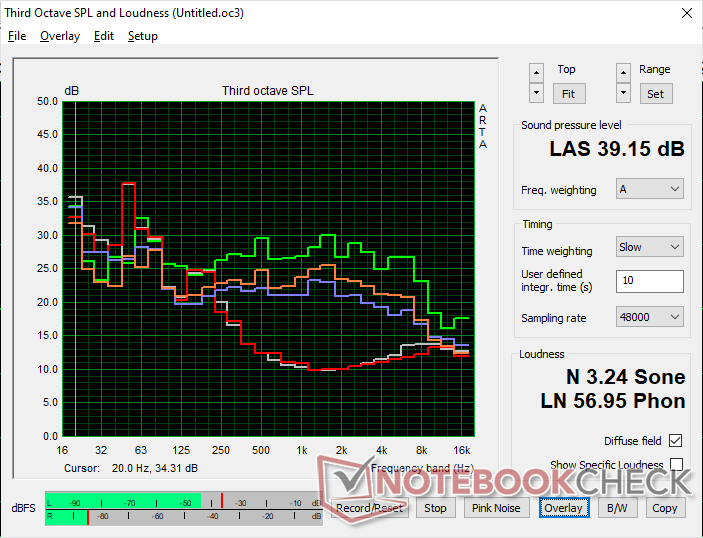
Rumorosità
| Idle |
| 24.6 / 24.6 / 24.6 dB(A) |
| Sotto carico |
| 32.7 / 39.2 dB(A) |
 | ||
30 dB silenzioso 40 dB(A) udibile 50 dB(A) rumoroso |
||
min: | ||
| Lenovo ThinkPad E16 G1 Core i5-1335U Iris Xe G7 80EUs, i5-1335U | Lenovo ThinkPad E16 G1-21JUS08X00 Vega 8, R7 7730U, WD PC SN740 SDDPNQD-1T00 | Dell Inspiron 16 7635 2-in-1 Vega 7, R5 7530U, Kioxia BG5 KBG50ZNS512G | Acer TravelMate P4 TMP416-51-55KN Iris Xe G7 80EUs, i5-1240P, Micron 2450 512GB MTFDKBA512TFK | Samsung Galaxy Book3 Pro 16 Iris Xe G7 80EUs, i5-1340P, WD PC SN740 256GB SDDPNQD-256G | LG Gram 16Z90Q Iris Xe G7 96EUs, i7-1260P, Samsung PM9A1 MZVL21T0HCLR | |
|---|---|---|---|---|---|---|
| Noise | 11% | -7% | -10% | -14% | -7% | |
| off /ambiente * (dB) | 24.6 | 22.4 9% | 23.6 4% | 25.4 -3% | 25.2 -2% | 25 -2% |
| Idle Minimum * (dB) | 24.6 | 22.4 9% | 23.6 4% | 25.4 -3% | 25.2 -2% | 26 -6% |
| Idle Average * (dB) | 24.6 | 22.4 9% | 23.6 4% | 25.4 -3% | 25.2 -2% | 27 -10% |
| Idle Maximum * (dB) | 24.6 | 23.7 4% | 23.6 4% | 25.4 -3% | 29.3 -19% | 28 -14% |
| Load Average * (dB) | 32.7 | 24.8 24% | 40.3 -23% | 43.9 -34% | 46.4 -42% | 38 -16% |
| Witcher 3 ultra * (dB) | 34.7 | 29.8 14% | 44.2 -27% | 37 -7% | ||
| Load Maximum * (dB) | 39.2 | 36.1 8% | 44.2 -13% | 43.7 -11% | 46.4 -18% | 38 3% |
* ... Meglio usare valori piccoli
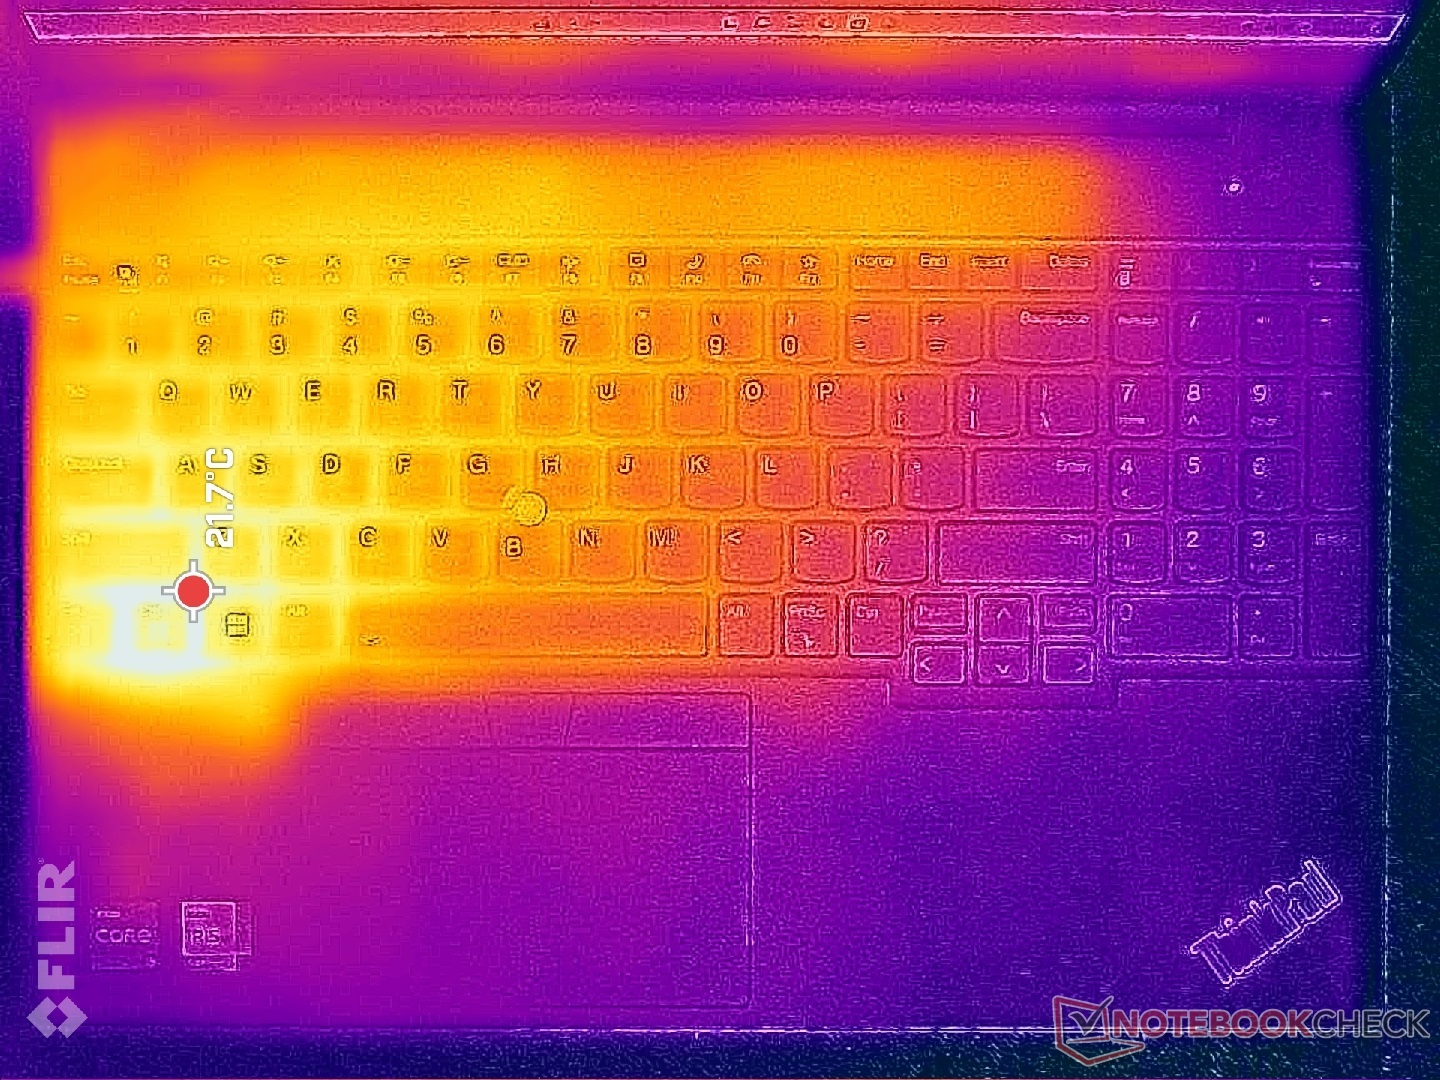
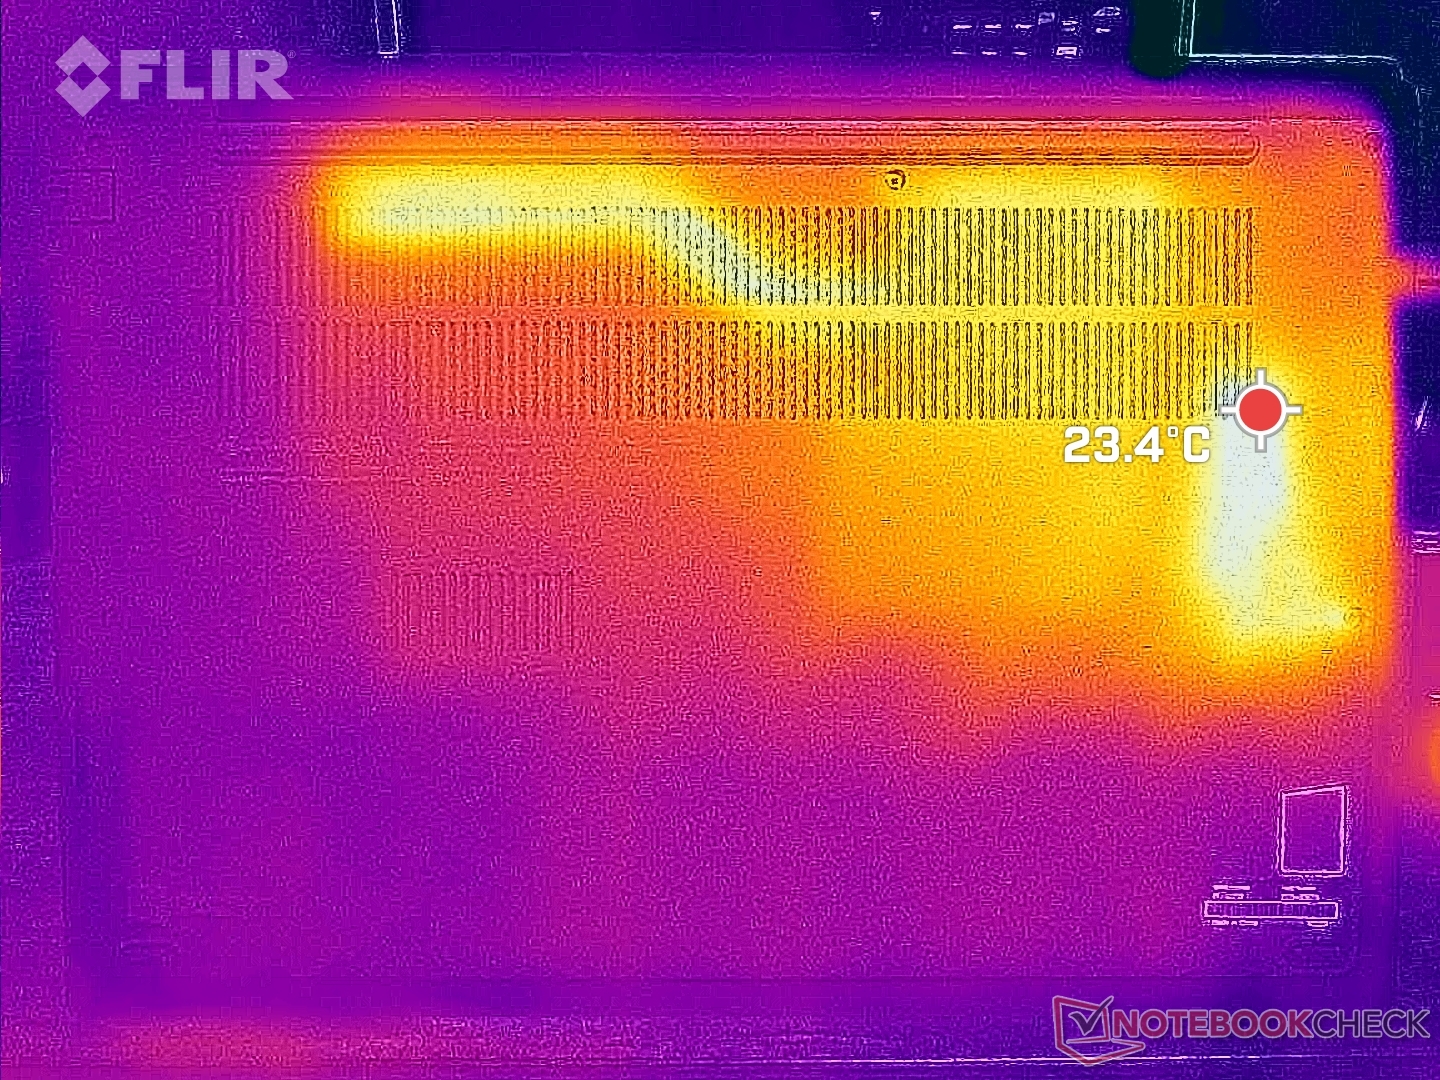
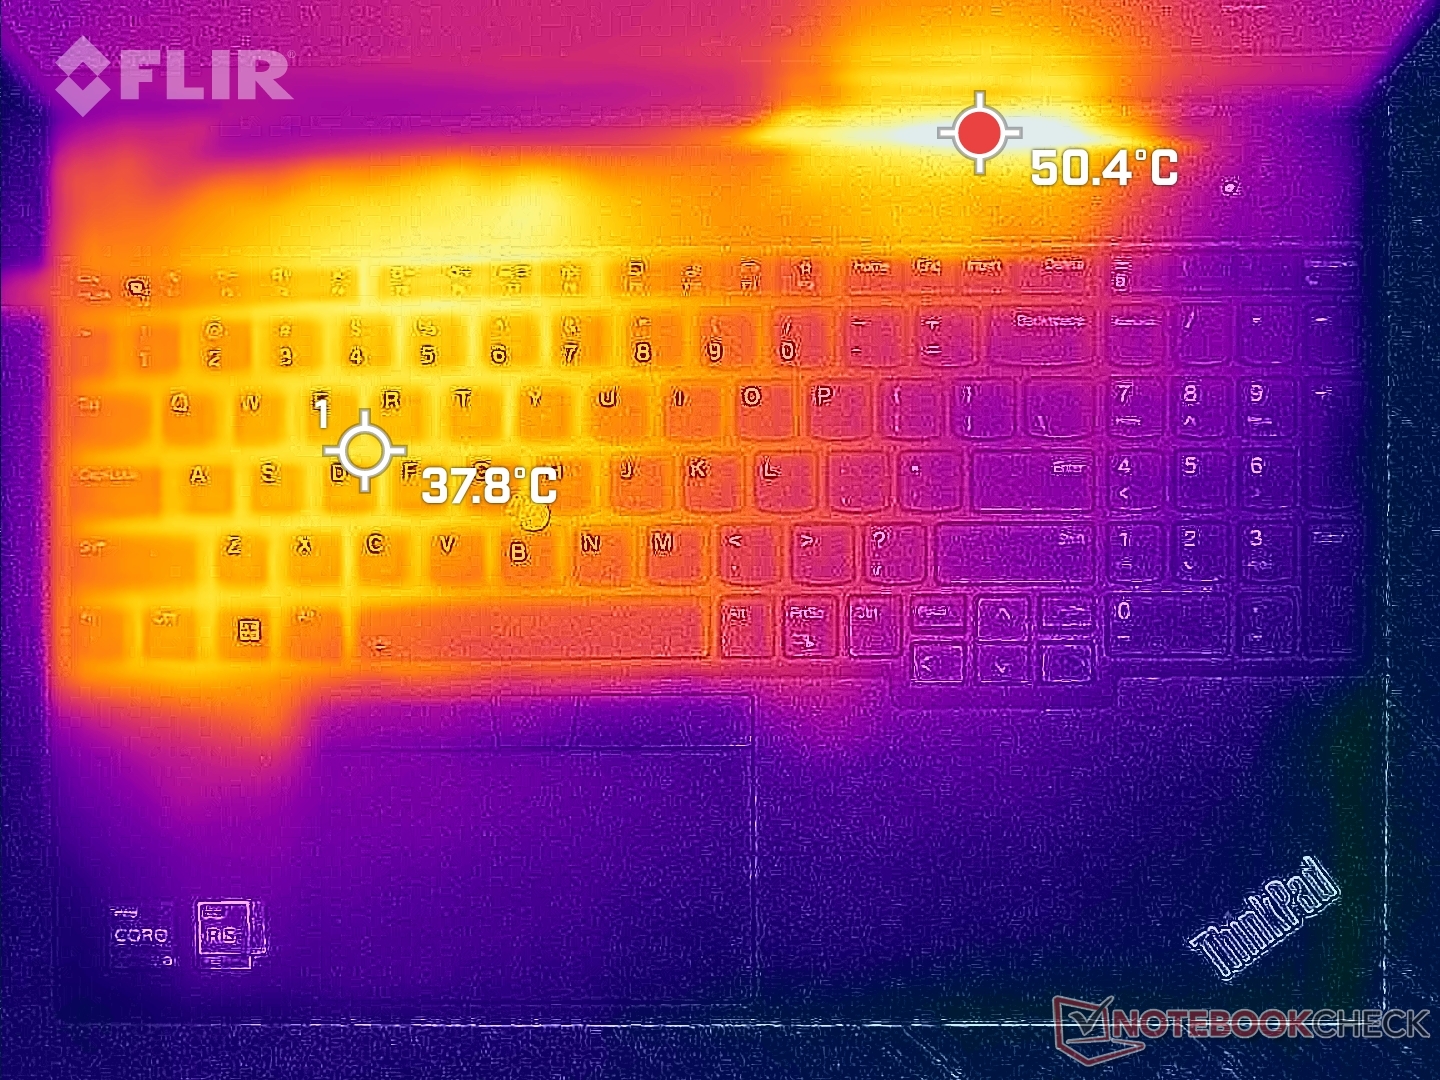
Temperatura
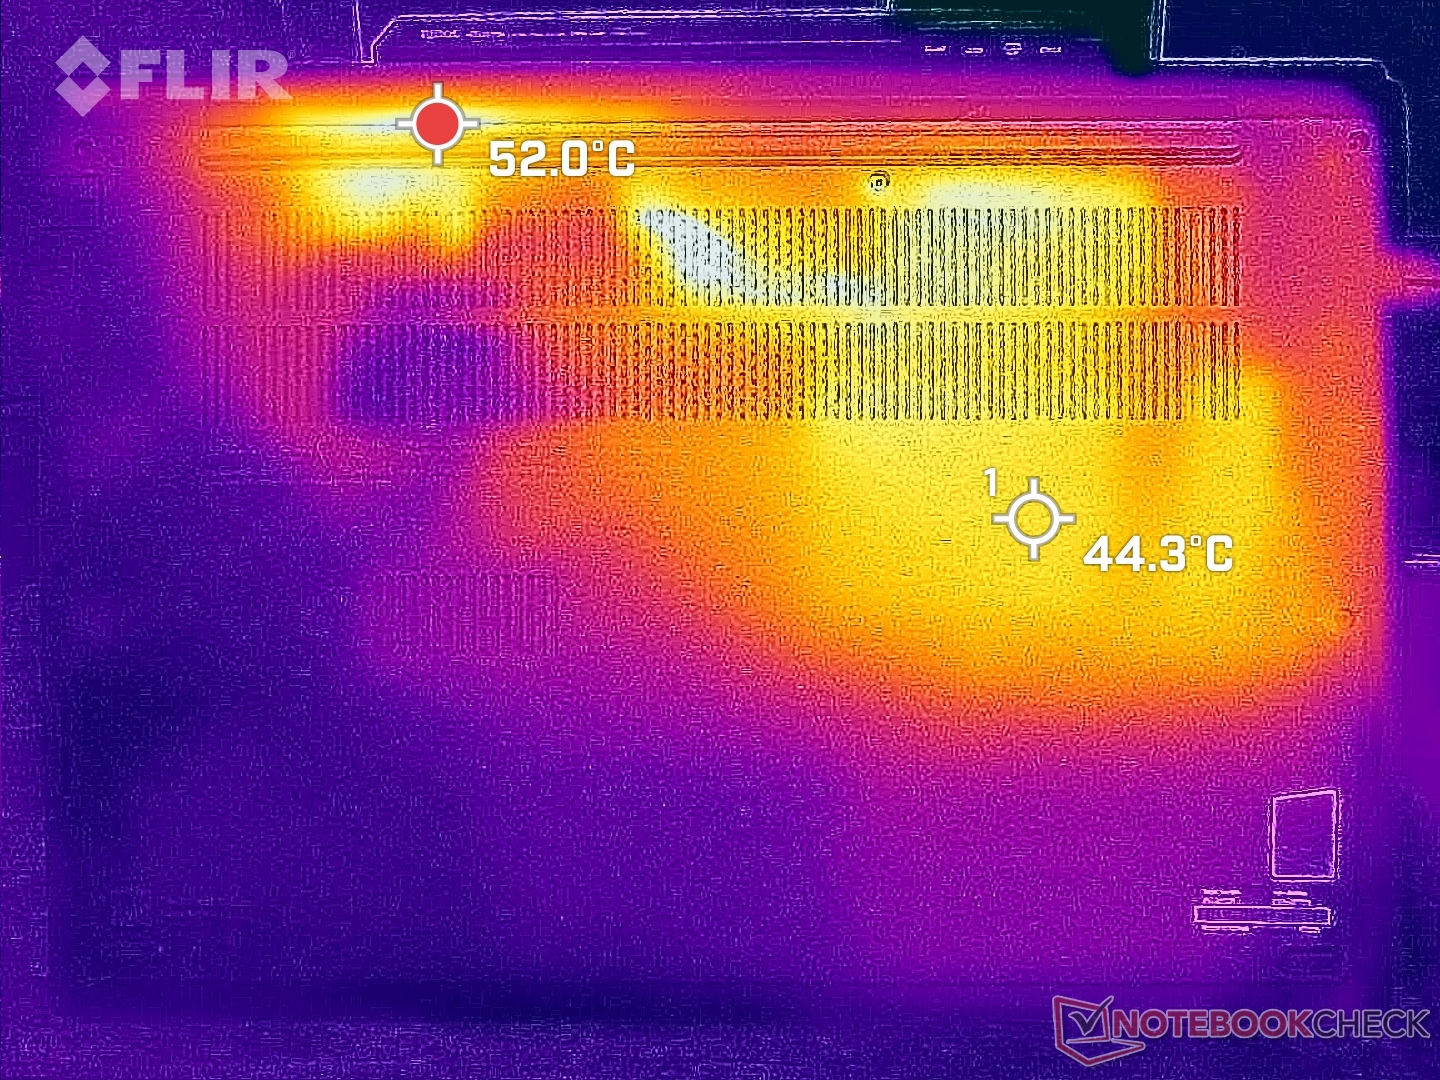
Le temperature di superficie sono più calde nella metà sinistra del portatile rispetto alla destra, semplicemente a causa del posizionamento del processore e della soluzione di raffreddamento all'interno. I punti caldi durante l'esecuzione di carichi impegnativi possono raggiungere i 38 C e i 45 C sui lati superiore e inferiore, rispettivamente, come mostrano le mappe di temperatura qui sotto. I risultati sono in realtà più freddi di qualche grado C rispetto a quanto abbiamo registrato sulla configurazione AMD, forse a causa della ventola più rumorosa menzionata in precedenza. Sebbene le differenze di temperatura tra i quadranti più caldi e quelli più freddi siano evidenti al tatto, non sono fastidiose o distraggono durante l'uso.
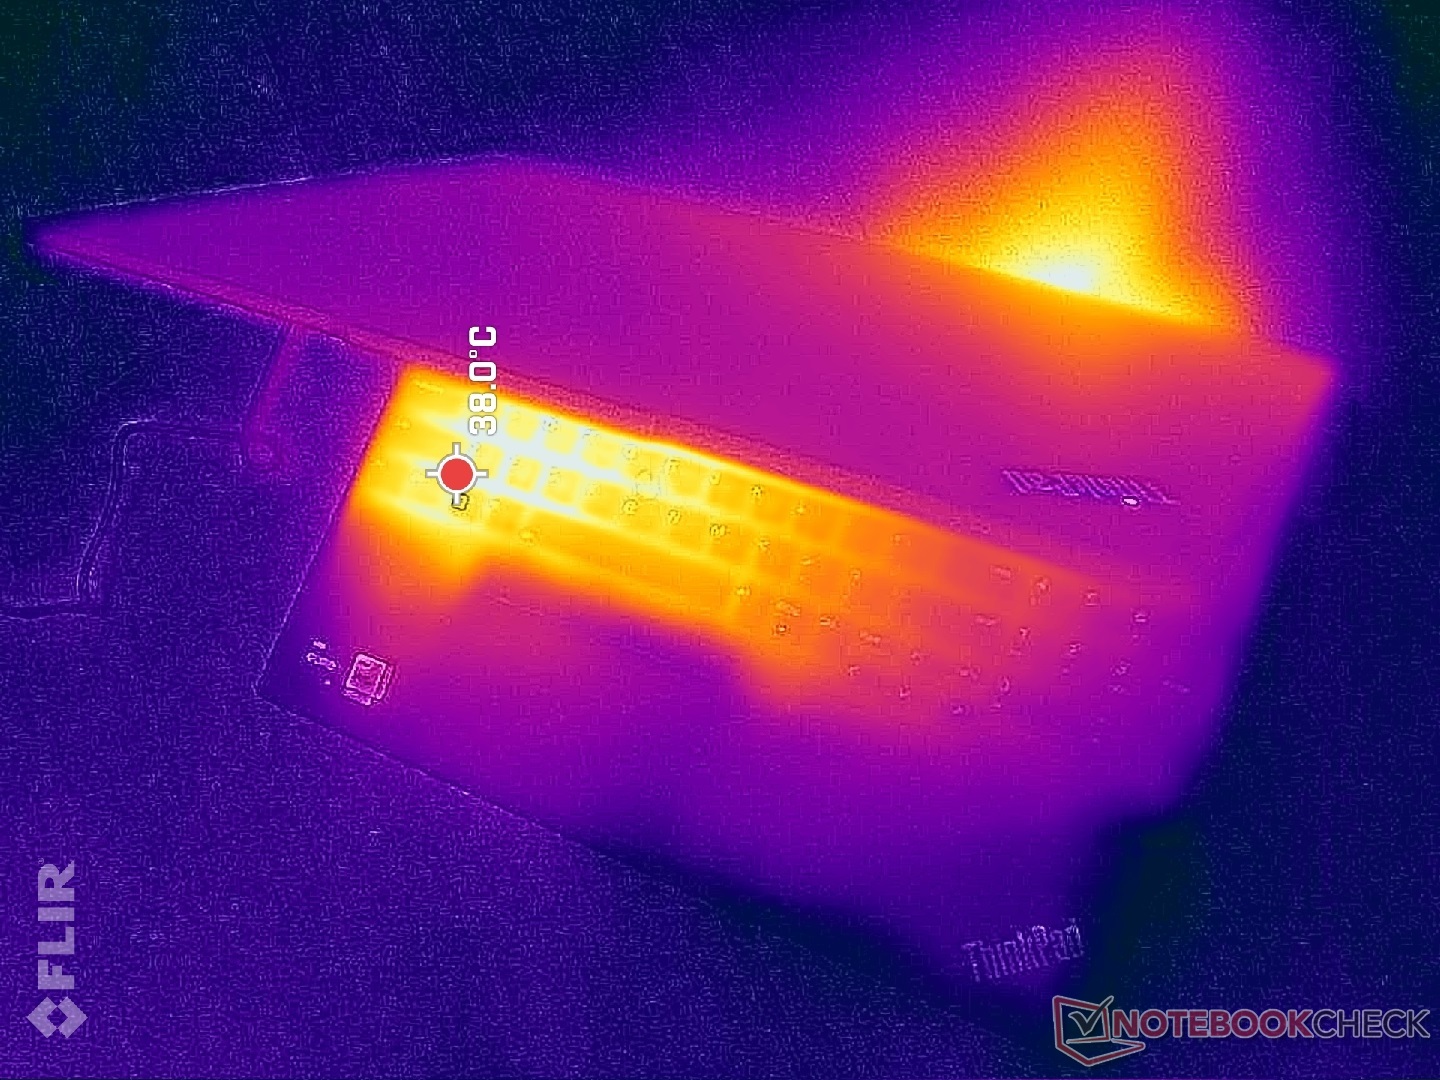
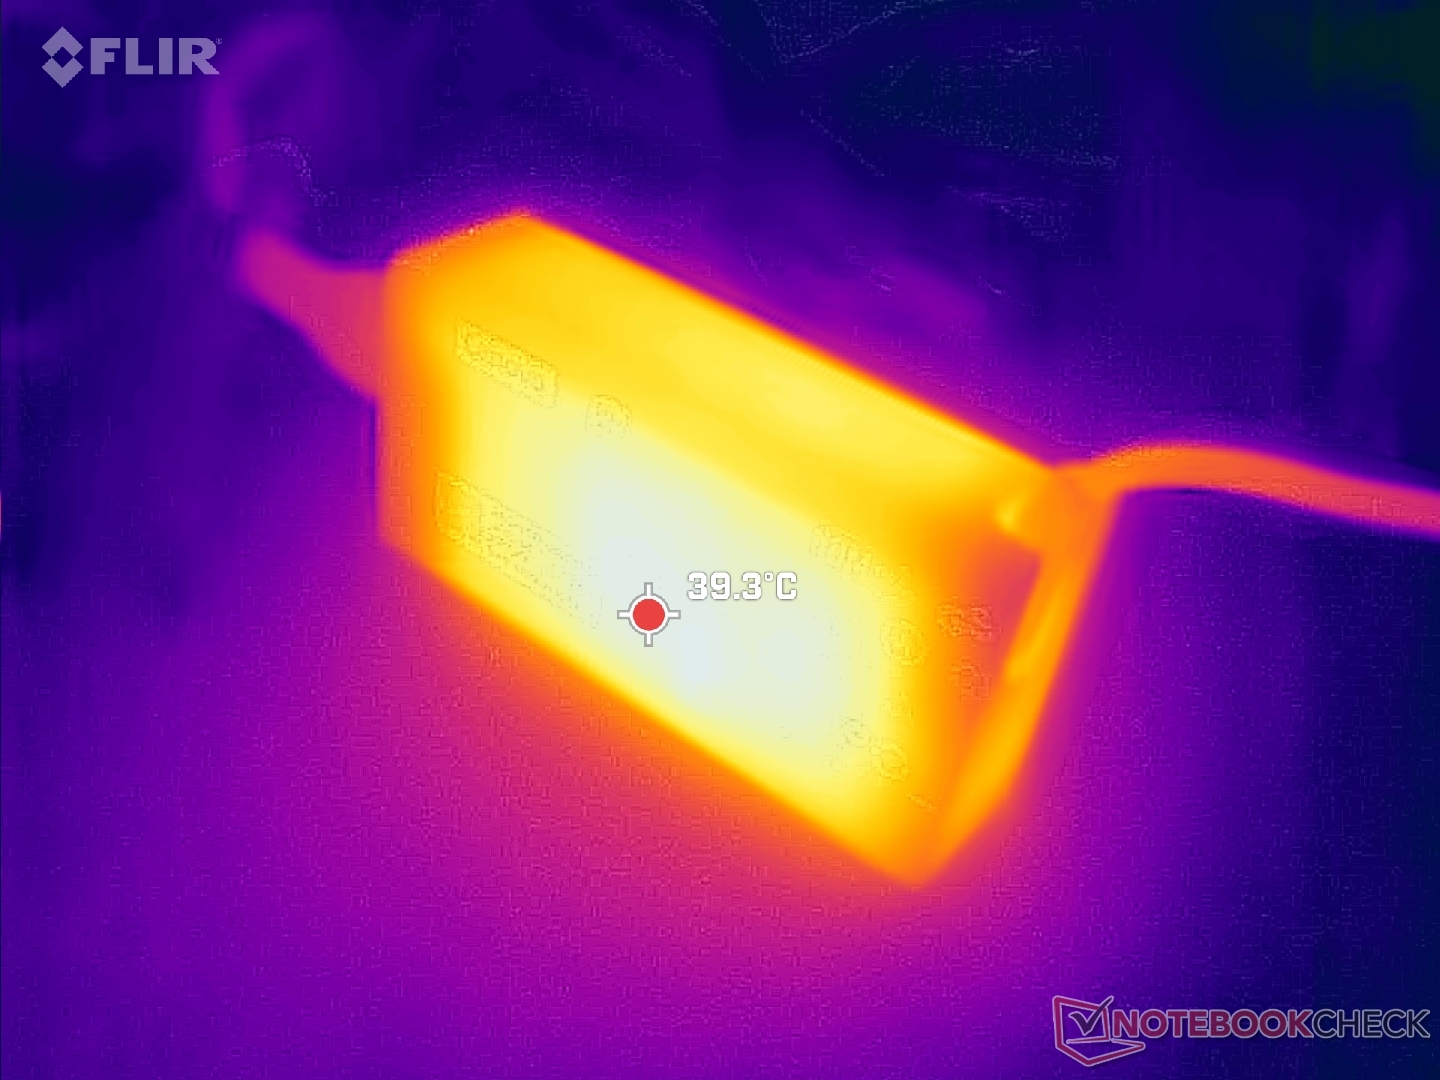
(±) La temperatura massima sul lato superiore è di 44 °C / 111 F, rispetto alla media di 34.3 °C / 94 F, che varia da 21.2 a 62.5 °C per questa classe Office.
(-) Il lato inferiore si riscalda fino ad un massimo di 50.4 °C / 123 F, rispetto alla media di 36.8 °C / 98 F
(+) In idle, la temperatura media del lato superiore è di 24.3 °C / 76 F, rispetto alla media deld ispositivo di 29.5 °C / 85 F.
(+) I poggiapolsi e il touchpad sono piu' freddi della temperatura della pelle con un massimo di 27 °C / 80.6 F e sono quindi freddi al tatto.
(±) La temperatura media della zona del palmo della mano di dispositivi simili e'stata di 27.5 °C / 81.5 F (+0.5 °C / 0.9 F).
| Lenovo ThinkPad E16 G1 Core i5-1335U Intel Core i5-1335U, Intel Iris Xe Graphics G7 80EUs | Lenovo ThinkPad E16 G1-21JUS08X00 AMD Ryzen 7 7730U, AMD Radeon RX Vega 8 (Ryzen 4000/5000) | Dell Inspiron 16 7635 2-in-1 AMD Ryzen 5 7530U, AMD Radeon RX Vega 7 | Acer TravelMate P4 TMP416-51-55KN Intel Core i5-1240P, Intel Iris Xe Graphics G7 80EUs | Samsung Galaxy Book3 Pro 16 Intel Core i5-1340P, Intel Iris Xe Graphics G7 80EUs | LG Gram 16Z90Q Intel Core i7-1260P, Intel Iris Xe Graphics G7 96EUs | |
|---|---|---|---|---|---|---|
| Heat | 0% | 4% | -1% | -5% | 6% | |
| Maximum Upper Side * (°C) | 44 | 46.1 -5% | 41.6 5% | 38.6 12% | 41.6 5% | 45 -2% |
| Maximum Bottom * (°C) | 50.4 | 52.2 -4% | 39 23% | 44.4 12% | 45 11% | 43 15% |
| Idle Upper Side * (°C) | 27.2 | 25.7 6% | 29.4 -8% | 28.9 -6% | 31 -14% | 26 4% |
| Idle Bottom * (°C) | 27.8 | 26.7 4% | 28.6 -3% | 34 -22% | 33.6 -21% | 26 6% |
* ... Meglio usare valori piccoli
Test da sforzo
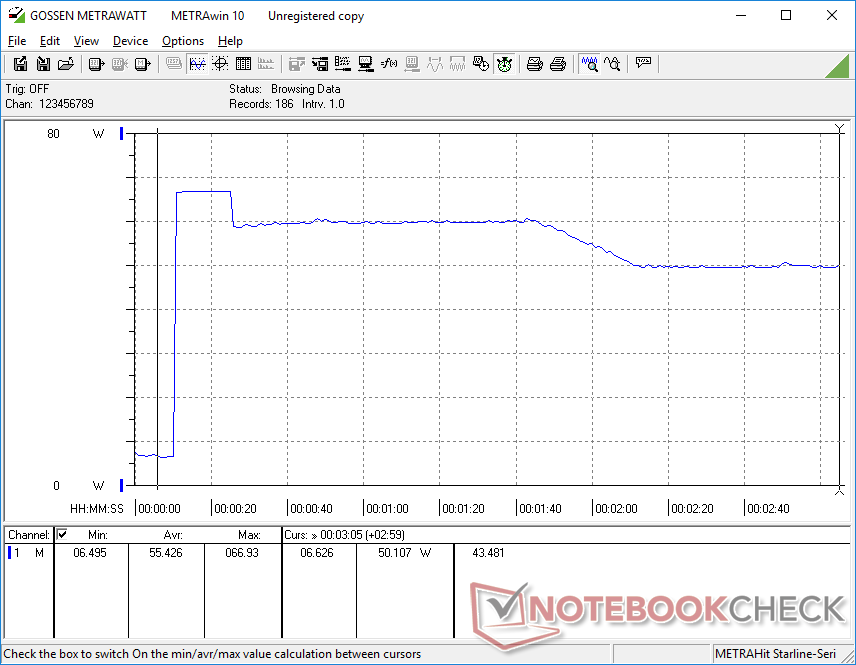
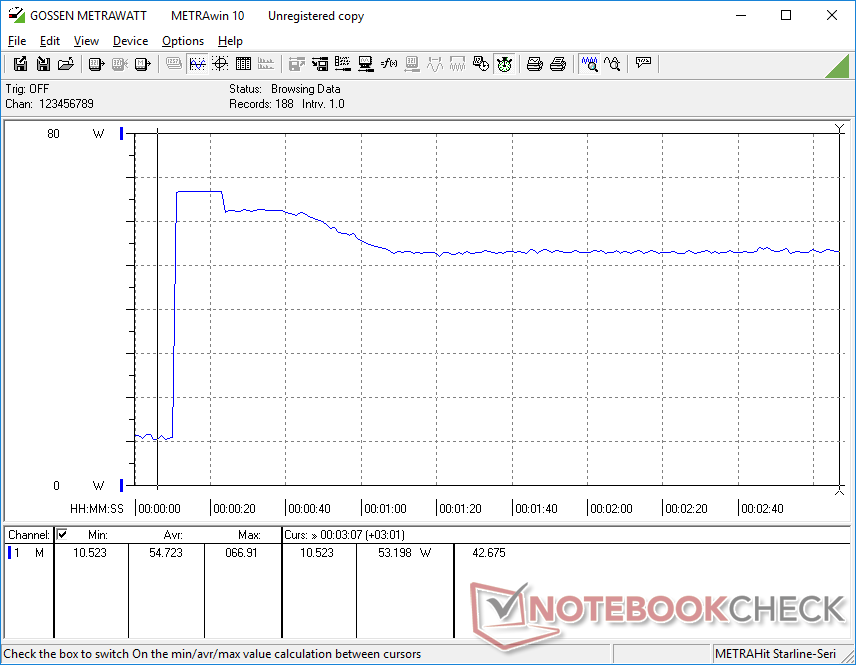
Durante l'esecuzione di Prime95, la CPU raggiungeva un picco di 4 GHz, 50 W e 94 C solo per i primi secondi, prima di scendere costantemente e stabilizzarsi a 2,4 GHz, 86 C e 28 W, poiché il picco di Turbo Boost non è sostenibile. La fascia alta di 80 C è piuttosto calda per un portatile Core serie U da 16 pollici. Eseguendo questo stesso test sull'Acer Swift Edge 16 con Ryzen 7 7840U, ad esempio, la CPU si stabilizzerebbe a soli 64 C in confronto.
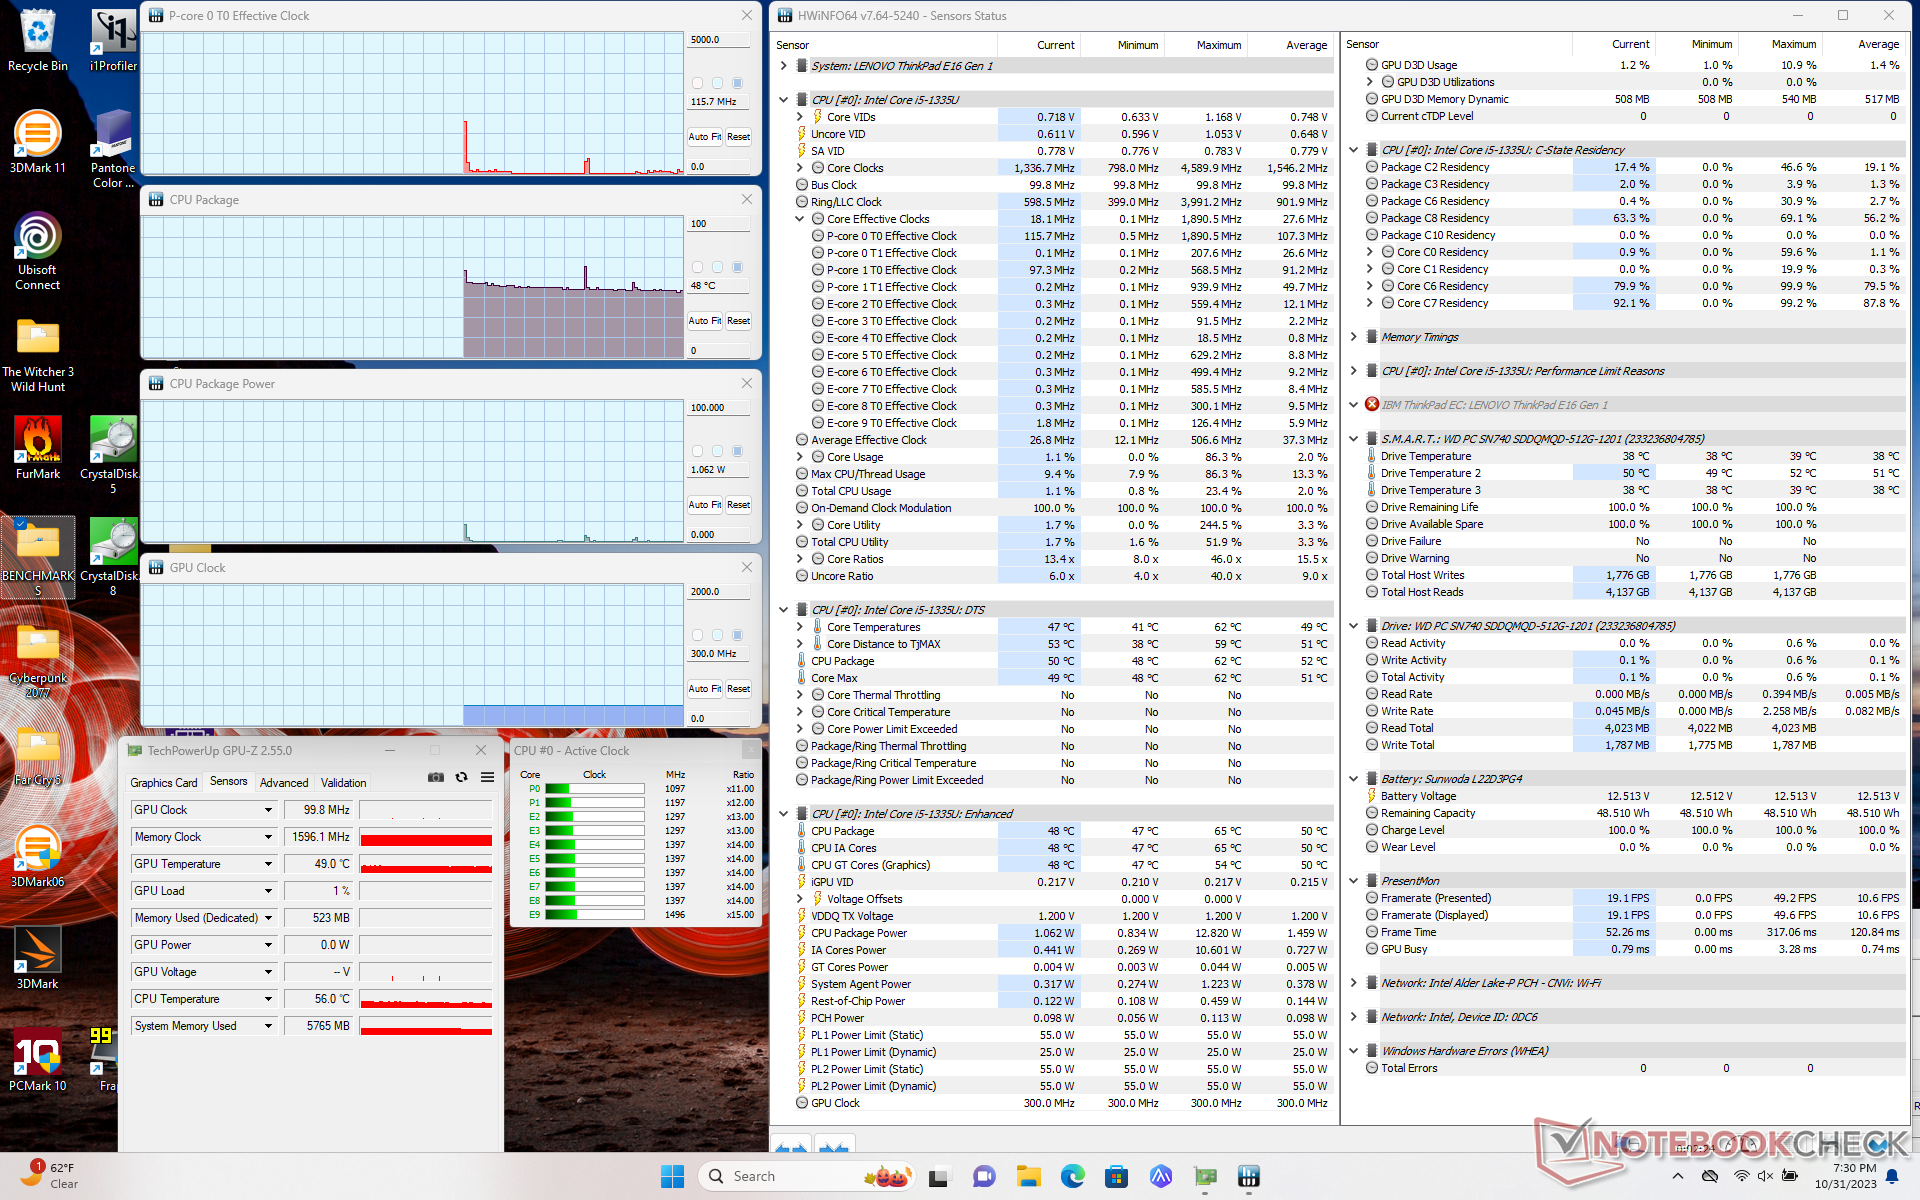
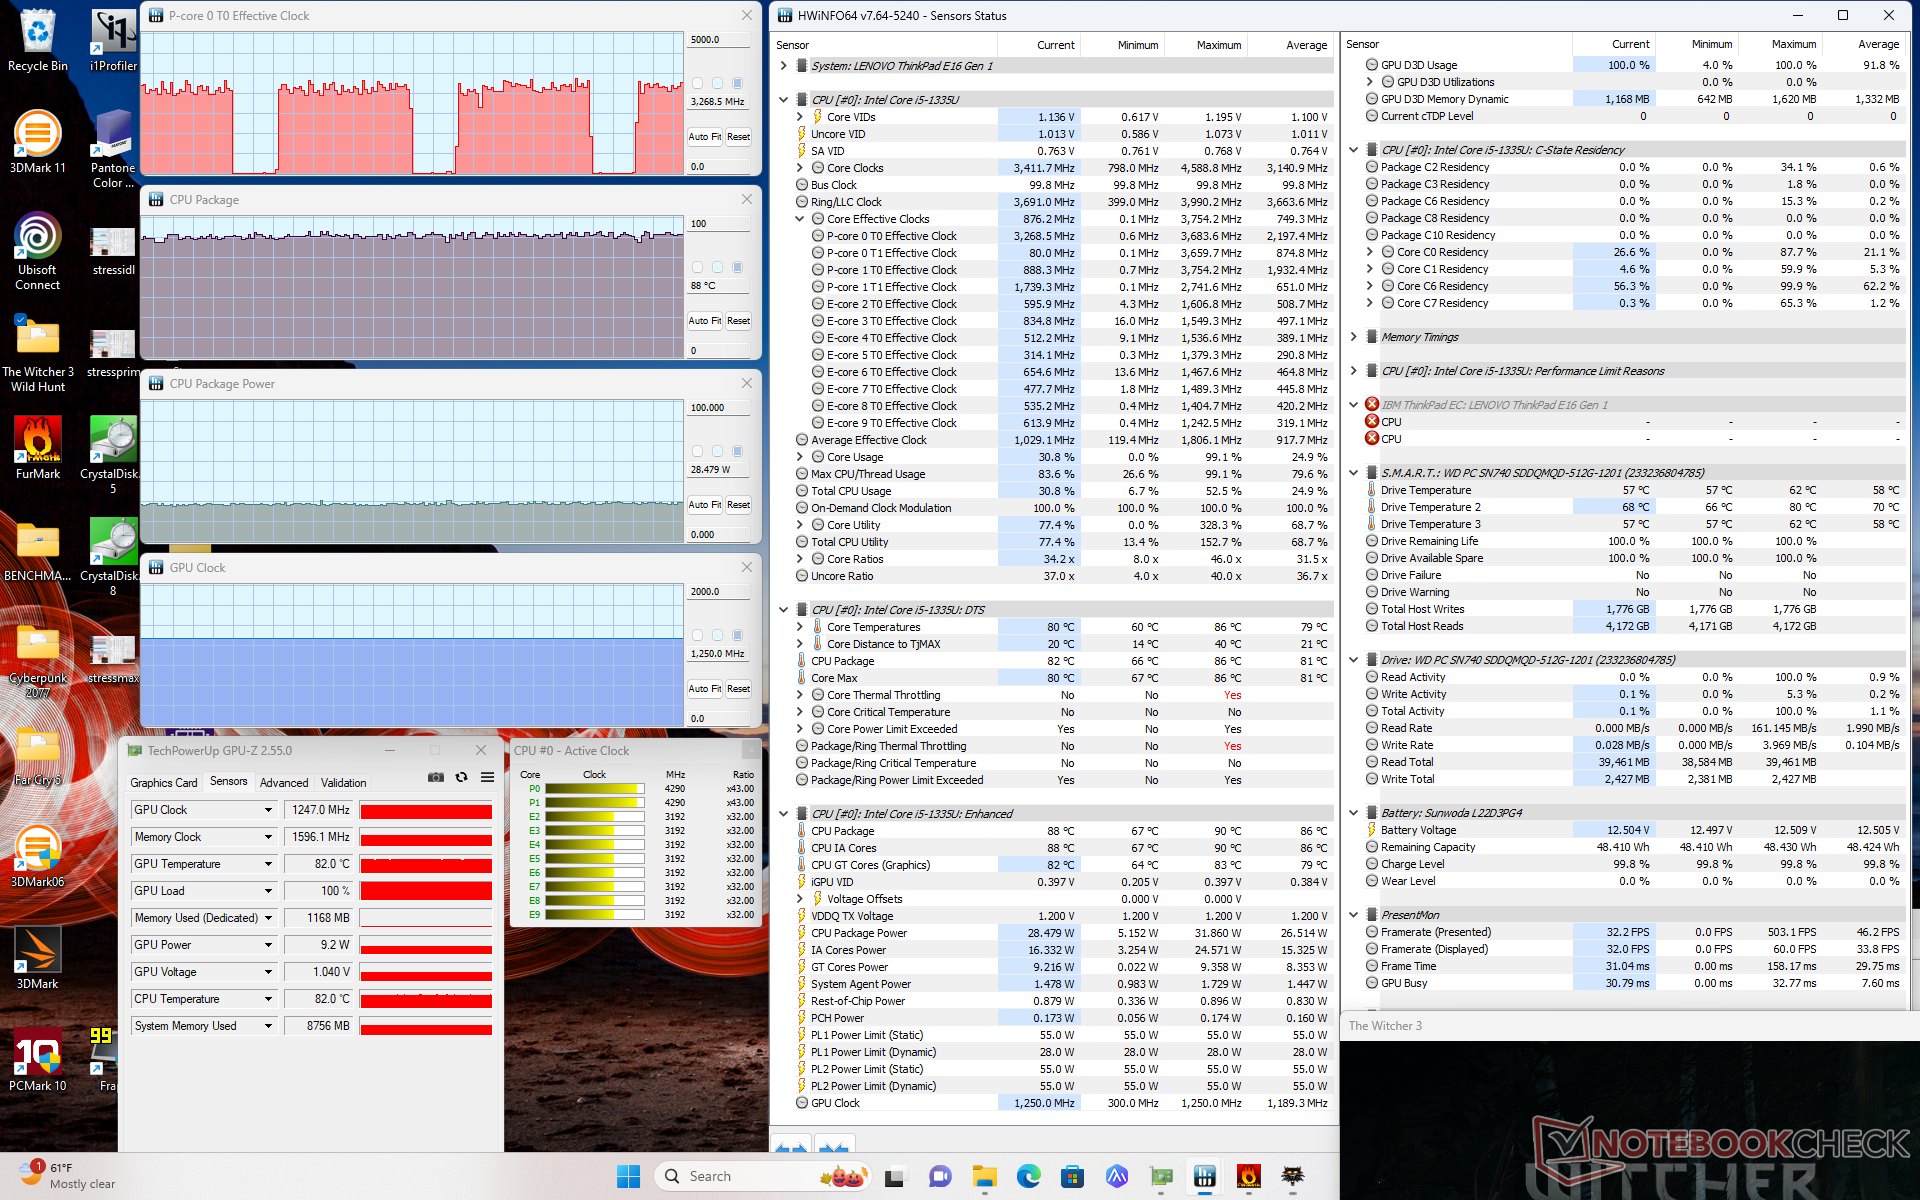
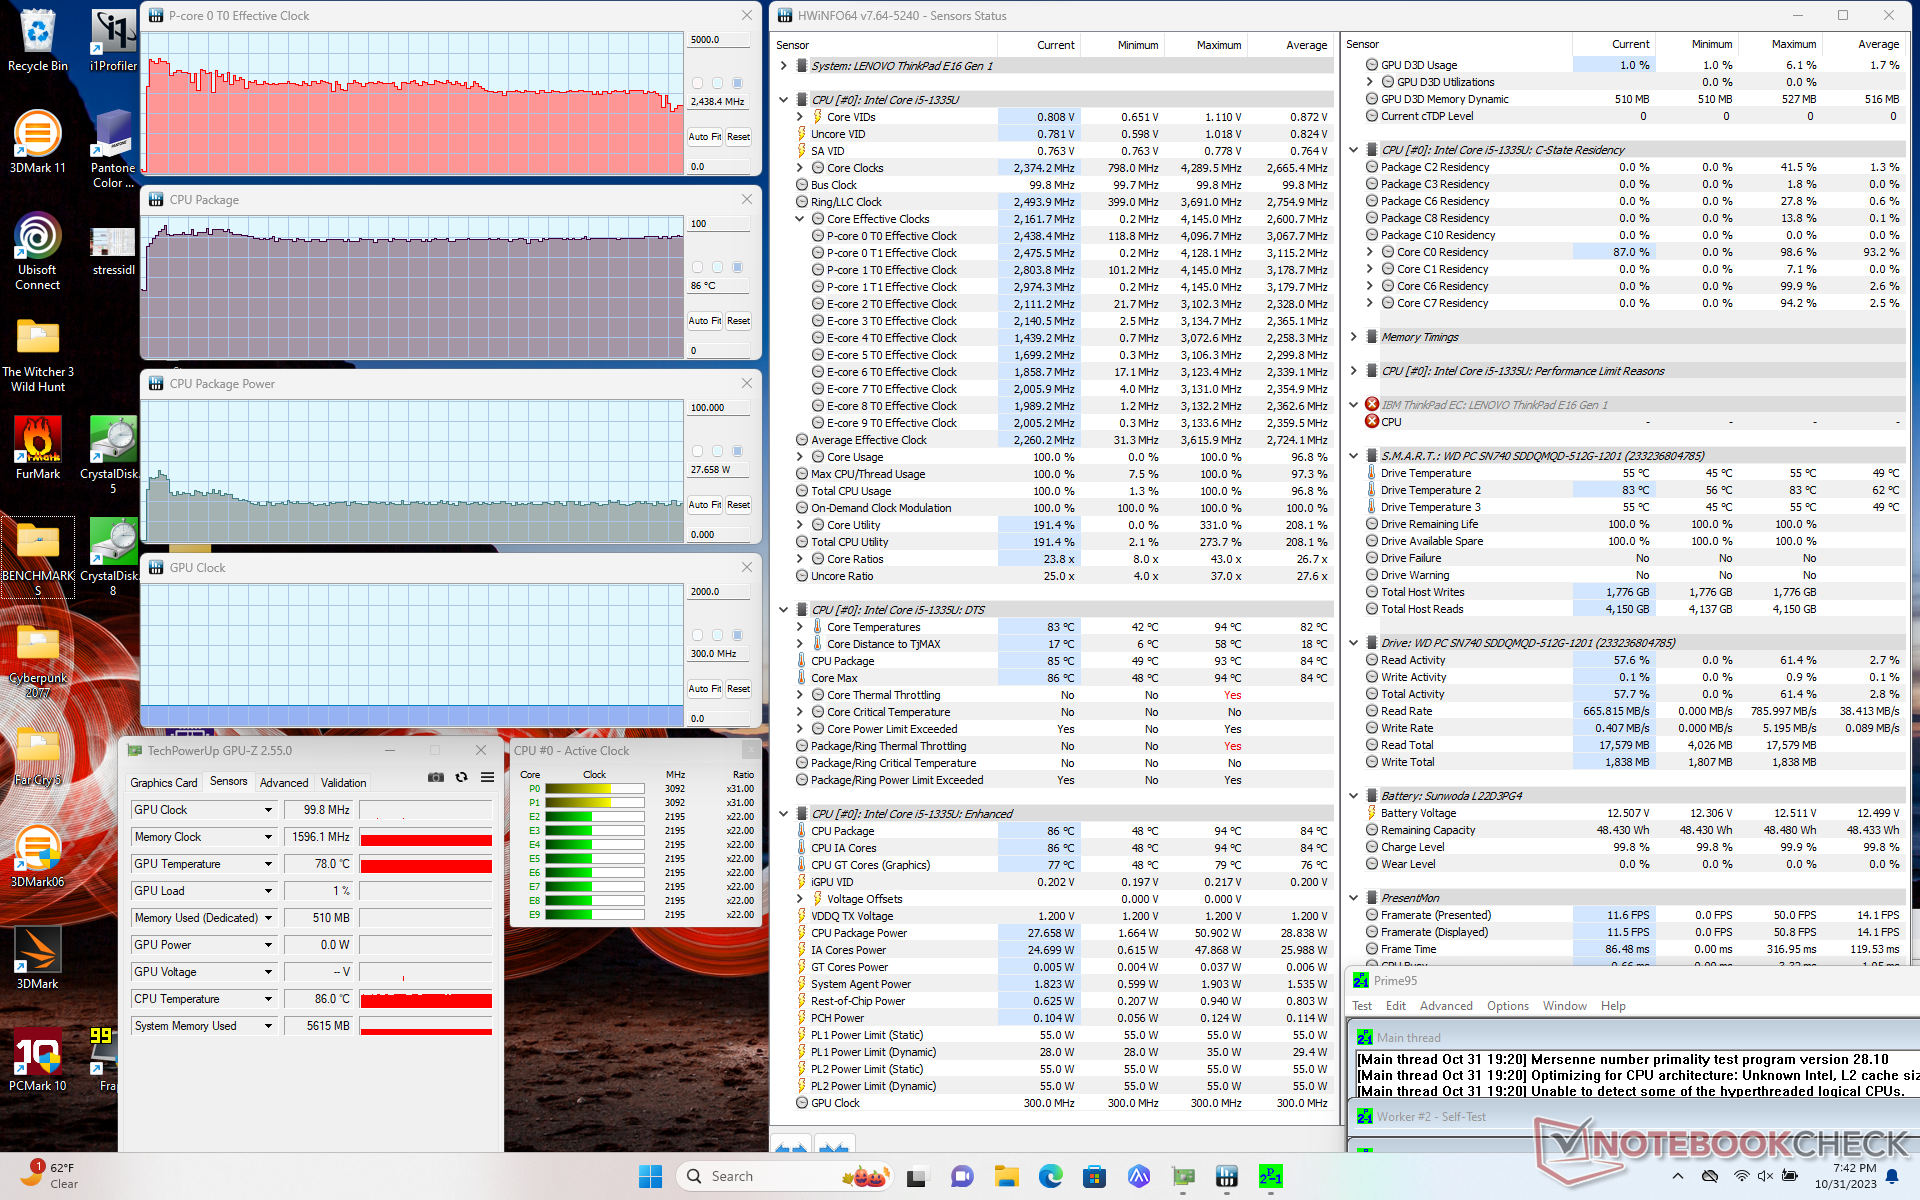
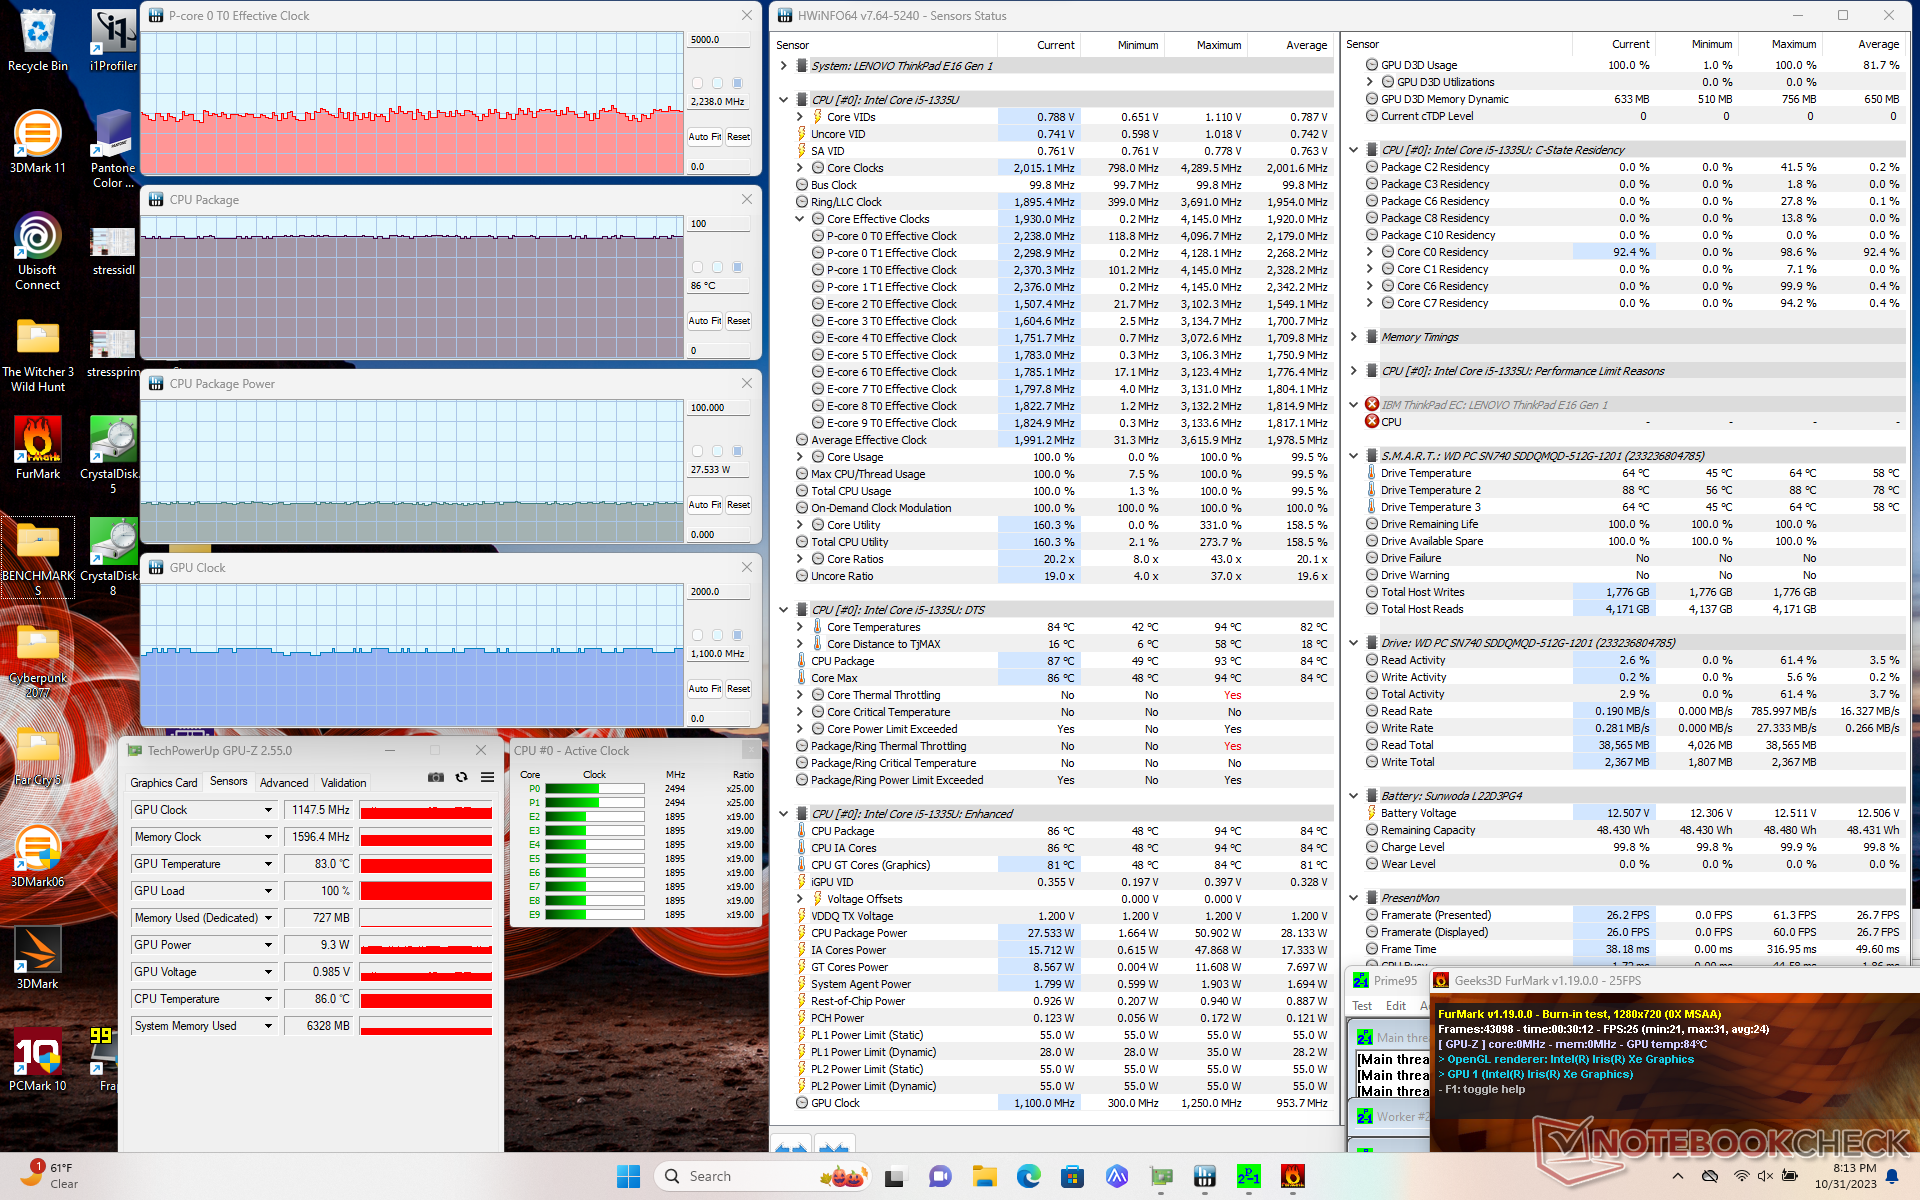
| Clock della CPU (GHz) | Clock della GPU (MHz) | Temperatura media della CPU (°C) | |
| Sistema inattivo | -- | -- | 48 |
| Stress Prime95 | 2,4 | -- | 86 |
| Prime95 + FurMark Stress | ~2,2 | 1100 | 86 |
| Witcher 3 Stress | ~3,2 | 1250 | 88 |
Altoparlanti
Lenovo ThinkPad E16 G1 Core i5-1335U analisi audio
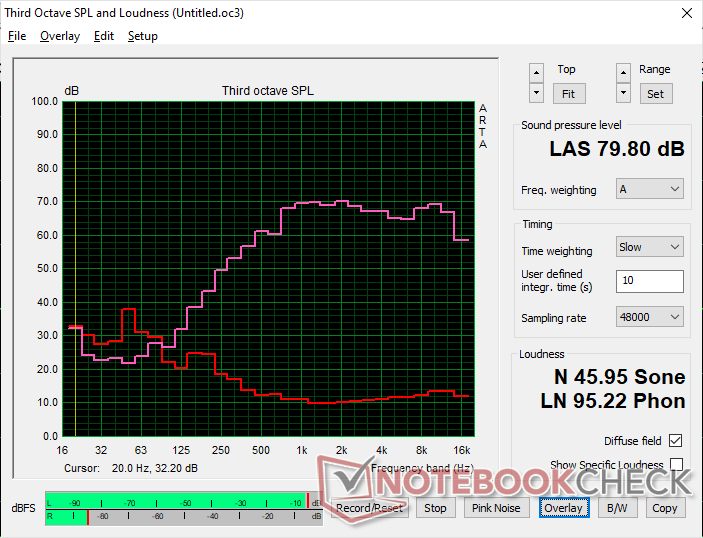
(±) | potenza degli altiparlanti media ma buona (79.8 dB)
Bassi 100 - 315 Hz
(-) | quasi nessun basso - in media 24.7% inferiori alla media
(±) | la linearità dei bassi è media (8.8% delta rispetto alla precedente frequenza)
Medi 400 - 2000 Hz
(+) | medi bilanciati - solo only 4.8% rispetto alla media
(+) | medi lineari (4.8% delta rispetto alla precedente frequenza)
Alti 2 - 16 kHz
(+) | Alti bilanciati - appena 2.1% dalla media
(+) | alti lineari (2.7% delta rispetto alla precedente frequenza)
Nel complesso 100 - 16.000 Hz
(±) | la linearità complessiva del suono è media (18.4% di differenza rispetto alla media
Rispetto alla stessa classe
» 33% di tutti i dispositivi testati in questa classe è stato migliore, 7% simile, 59% peggiore
» Il migliore ha avuto un delta di 7%, medio di 21%, peggiore di 53%
Rispetto a tutti i dispositivi testati
» 41% di tutti i dispositivi testati in questa classe è stato migliore, 8% similare, 51% peggiore
» Il migliore ha avuto un delta di 4%, medio di 23%, peggiore di 134%
Apple MacBook Pro 16 2021 M1 Pro analisi audio
(+) | gli altoparlanti sono relativamente potenti (84.7 dB)
Bassi 100 - 315 Hz
(+) | bassi buoni - solo 3.8% dalla media
(+) | bassi in lineaa (5.2% delta rispetto alla precedente frequenza)
Medi 400 - 2000 Hz
(+) | medi bilanciati - solo only 1.3% rispetto alla media
(+) | medi lineari (2.1% delta rispetto alla precedente frequenza)
Alti 2 - 16 kHz
(+) | Alti bilanciati - appena 1.9% dalla media
(+) | alti lineari (2.7% delta rispetto alla precedente frequenza)
Nel complesso 100 - 16.000 Hz
(+) | suono nel complesso lineare (4.6% differenza dalla media)
Rispetto alla stessa classe
» 0% di tutti i dispositivi testati in questa classe è stato migliore, 0% simile, 100% peggiore
» Il migliore ha avuto un delta di 5%, medio di 17%, peggiore di 45%
Rispetto a tutti i dispositivi testati
» 0% di tutti i dispositivi testati in questa classe è stato migliore, 0% similare, 100% peggiore
» Il migliore ha avuto un delta di 4%, medio di 23%, peggiore di 134%
Gestione dell'energia
Consumo di energia
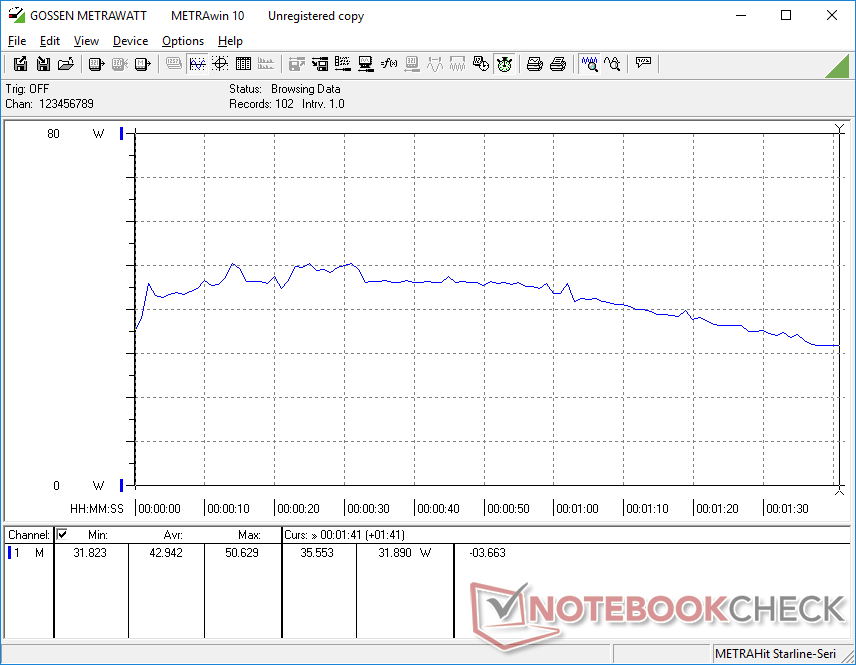
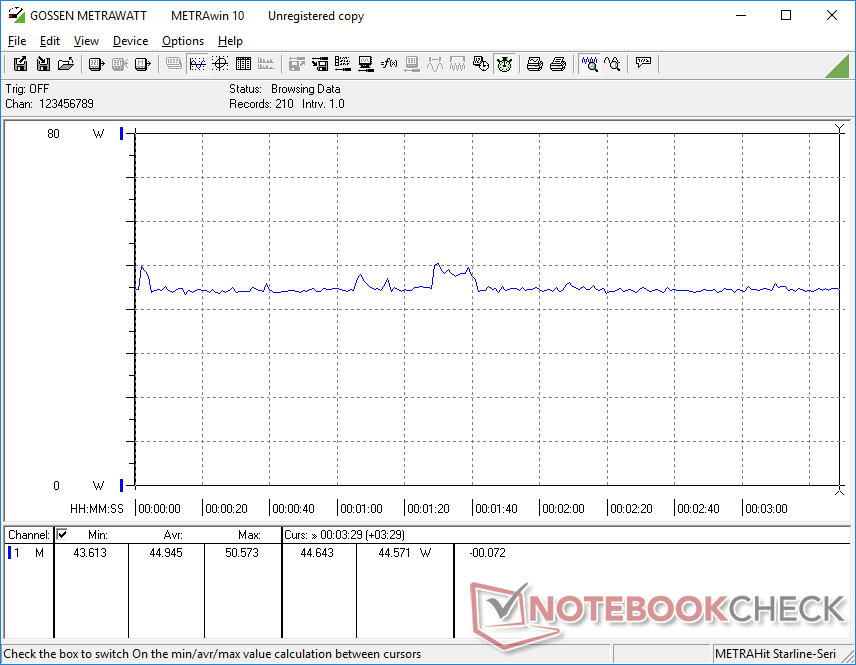
Il sistema Intel è generalmente più esigente della versione AMD quando si eseguono attività ad alta intensità di CPU, anche se il processore AMD è generalmente più veloce di Intel quando si tratta di carichi multi-thread. Quando si avvia CineBench R15 xT, ad esempio, il consumo raggiunge i 68 W sulla nostra unità Intel rispetto ai soli 45 W dell'unità AMD. Risultati simili si osservano anche quando si esegue Prime95. Il consumo complessivo quando è al minimo sul desktop o quando si eseguono attività ad alta intensità di GPU come Witcher 3 è altrimenti circa lo stesso tra le versioni Intel e AMD.
| Off / Standby | |
| Idle | |
| Sotto carico |
|
Leggenda:
min: | |
| Lenovo ThinkPad E16 G1 Core i5-1335U i5-1335U, Iris Xe G7 80EUs, , IPS, 1920x1200, 16" | Lenovo ThinkPad E16 G1-21JUS08X00 R7 7730U, Vega 8, WD PC SN740 SDDPNQD-1T00, IPS, 2560x1600, 16" | Dell Inspiron 16 7635 2-in-1 R5 7530U, Vega 7, Kioxia BG5 KBG50ZNS512G, IPS, 1920x1200, 16" | Acer TravelMate P4 TMP416-51-55KN i5-1240P, Iris Xe G7 80EUs, Micron 2450 512GB MTFDKBA512TFK, IPS, 1920x1200, 16" | Samsung Galaxy Book3 Pro 16 i5-1340P, Iris Xe G7 80EUs, WD PC SN740 256GB SDDPNQD-256G, AMOLED, 2880x1800, 16" | LG Gram 16Z90Q i7-1260P, Iris Xe G7 96EUs, Samsung PM9A1 MZVL21T0HCLR, IPS, 2560x1600, 16" | |
|---|---|---|---|---|---|---|
| Power Consumption | -3% | 2% | 1% | 9% | -7% | |
| Idle Minimum * (Watt) | 4.9 | 4.1 16% | 4.8 2% | 5.2 -6% | 3.9 20% | 5 -2% |
| Idle Average * (Watt) | 8.3 | 9.6 -16% | 7.6 8% | 7.1 14% | 4.8 42% | 8 4% |
| Idle Maximum * (Watt) | 8.6 | 10.2 -19% | 8.7 -1% | 9.6 -12% | 10 -16% | 14 -63% |
| Load Average * (Watt) | 42.9 | 47.3 -10% | 47.1 -10% | 47 -10% | 44 -3% | 47 -10% |
| Witcher 3 ultra * (Watt) | 44.9 | 46.7 -4% | 46.6 -4% | 43.3 4% | 42.3 6% | 37.8 16% |
| Load Maximum * (Watt) | 67 | 55.7 17% | 56.4 16% | 56 16% | 63 6% | 56 16% |
* ... Meglio usare valori piccoli
Power Consumption Witcher 3 / Stresstest
Power Consumption external Monitor
Durata della batteria
Il modello è disponibile con due opzioni di capacità della batteria: 47 Wh e 57 Wh. La nostra unità Intel viene fornita con l'opzione minore, mentre la nostra unità AMD viene fornita con quella più grande. La durata della batteria è solo la metà di quella della nostra unità AMD, per sole 5 ore di navigazione nel mondo reale. Per un portatile da 16 pollici, l'opzione da 47 Wh è molto più piccola di quanto ci si aspettasse e rappresenta un taglio netto.
La ricarica da vuoto a pieno regime è fortunatamente abbastanza veloce, con poco più di un'ora.
| Lenovo ThinkPad E16 G1 Core i5-1335U i5-1335U, Iris Xe G7 80EUs, 47 Wh | Lenovo ThinkPad E16 G1-21JUS08X00 R7 7730U, Vega 8, 57 Wh | Dell Inspiron 16 7635 2-in-1 R5 7530U, Vega 7, 64 Wh | Acer TravelMate P4 TMP416-51-55KN i5-1240P, Iris Xe G7 80EUs, 56 Wh | Samsung Galaxy Book3 Pro 16 i5-1340P, Iris Xe G7 80EUs, 76 Wh | LG Gram 16Z90Q i7-1260P, Iris Xe G7 96EUs, 80 Wh | |
|---|---|---|---|---|---|---|
| Autonomia della batteria | 117% | 179% | 81% | 96% | 94% | |
| WiFi v1.3 (h) | 5.2 | 11.3 117% | 14.5 179% | 9.4 81% | 10.2 96% | 10.1 94% |
| H.264 (h) | 11.7 | 14.4 | ||||
| Load (h) | 1.3 | 1.9 | 2 | 2.6 | ||
| Reader / Idle (h) | 26 | 30.4 | 18.1 |
Pro
Contro
Verdetto - AMD vince alla grande sulla durata della batteria
Optando per il ThinkPad E16 G1 di Intel invece che per AMD, otterrà il supporto Thunderbolt, prestazioni single-thread più veloci e prestazioni grafiche integrate più rapide, a patto di scegliere il Core i7-1355U. Tuttavia, questi vantaggi impallidiscono rispetto a ciò che offre la versione Versione AMD offre: una durata della batteria notevolmente superiore, prestazioni più elevate per watt, prestazioni multi-thread più veloci e supporto per le unità SSD M.2 2280. Pertanto, dovrà apprezzare davvero le capacità di docking superiori della versione Intel se decide di saltare le opzioni AMD.
Se non intende collegare monitor Thunderbolt o eGPU al suo ThinkPad E16 G1, le versioni AMD possono offrire una maggiore durata della batteria e prestazioni multi-thread più veloci rispetto alle opzioni Intel, a circa lo stesso prezzo.
Indipendentemente dalla versione preferita, gli utenti dovranno comunque prestare attenzione alle dimensioni del display e della batteria prima dell'acquisto. Purtroppo, non tutti i rivenditori elencano la copertura del colore o la capacità della batteria, per cui è facile acquistare per sbaglio una configurazione con un display di fascia bassa o una batteria più piccola da 47 Wh. Consigliamo di puntare alla copertura sRGB completa e alla batteria più grande da 57 Wh, se possibile, poiché si tratta di un salto significativo rispetto alla configurazione base.
Prezzo e disponibilità
Lenovo distribuisce ora il ThinkPad E16 G1 a partire da 638 dollari per la configurazione Core i3 o 724 dollari per la configurazione Core i5.
Lenovo ThinkPad E16 G1 Core i5-1335U
- 11/02/2023 v7 (old)
Allen Ngo
Transparency
La selezione dei dispositivi da recensire viene effettuata dalla nostra redazione. Il campione di prova è stato fornito all'autore come prestito dal produttore o dal rivenditore ai fini di questa recensione. L'istituto di credito non ha avuto alcuna influenza su questa recensione, né il produttore ne ha ricevuto una copia prima della pubblicazione. Non vi era alcun obbligo di pubblicare questa recensione. In quanto società mediatica indipendente, Notebookcheck non è soggetta all'autorità di produttori, rivenditori o editori.
Ecco come Notebookcheck esegue i test
Ogni anno, Notebookcheck esamina in modo indipendente centinaia di laptop e smartphone utilizzando procedure standardizzate per garantire che tutti i risultati siano comparabili. Da circa 20 anni sviluppiamo continuamente i nostri metodi di prova e nel frattempo stabiliamo gli standard di settore. Nei nostri laboratori di prova, tecnici ed editori esperti utilizzano apparecchiature di misurazione di alta qualità. Questi test comportano un processo di validazione in più fasi. Il nostro complesso sistema di valutazione si basa su centinaia di misurazioni e parametri di riferimento ben fondati, che mantengono l'obiettività.Price comparison

