Recensione del Lenovo ThinkPad T14 G3 - Il portatile business peggiora con Intel e Nvidia
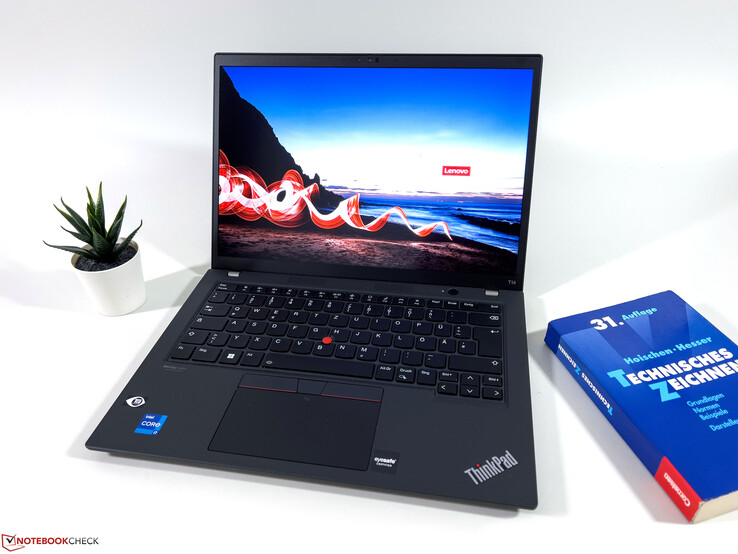
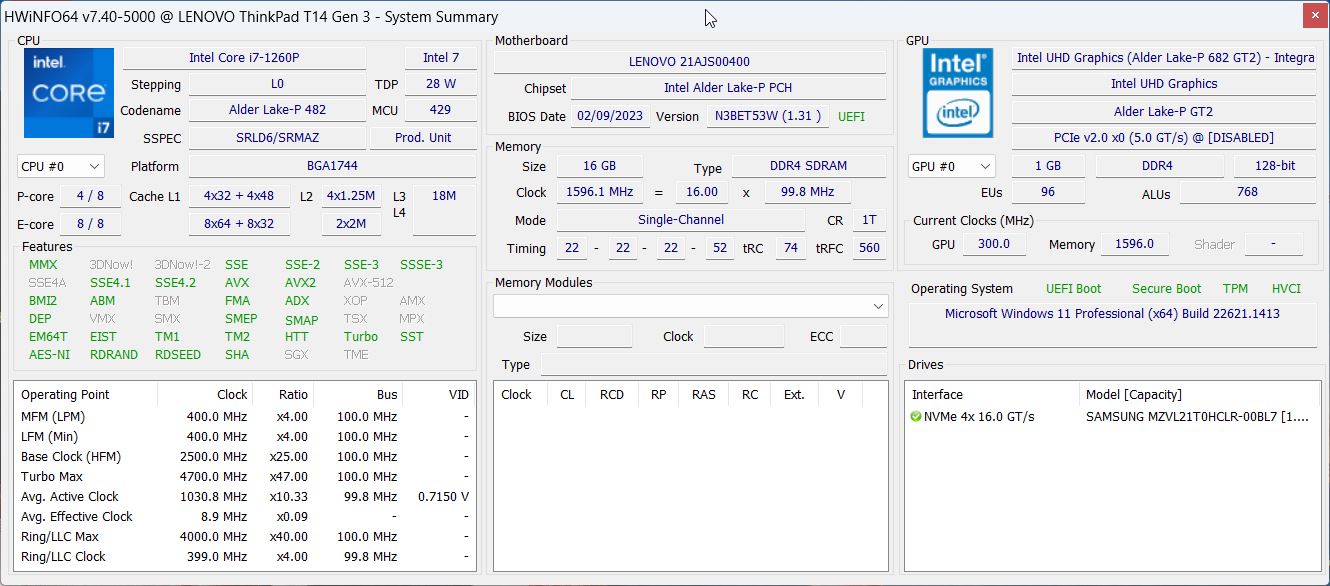
Abbiamo già testato la versioneThinkPad T14 G3 con il processore AMD Ryzen 7 Procon la veloce iGPU Radeon 680M, ma Lenovo continua a offrire anche il portatile business da 14 pollici con processori Intel e GPU Nvidia GeForce opzionale. Con il modello 21AJS00400, abbiamo ora un rappresentante di questo tipo che combina il processore Alder Lake Core i7-1260Pcon il processore GeForce MX550 sul nostro banco di prova. Possiamo trascurare il fatto che non sia ancora stato utilizzato un processore Raptor Lake, in quanto l'aumento delle prestazioni sarebbe minimo, come abbiamo già potuto constatare con l'MX550 già in grado di vedere.
Fondamentalmente, il modello AMD e quello Intel condividono lo stesso case e gli stessi dispositivi di input, webcam e altoparlanti. Nel test che segue, quindi, ci concentreremo principalmente sulla domanda su quale versione sia migliore e se la scheda grafica aggiuntiva valga davvero ancora la pena.
Potenziali concorrenti a confronto
Punteggio | Data | Modello | Peso | Altezza | Dimensione | Risoluzione | Prezzo |
|---|---|---|---|---|---|---|---|
| 86.4 % v7 (old) | 03/2023 | Lenovo ThinkPad T14 G3-21AJS00400 i7-1260P, GeForce MX550 | 1.5 kg | 17.9 mm | 14.00" | 1920x1200 | |
| 88.8 % v7 (old) | 09/2022 | Lenovo ThinkPad T14 G3-21CF004NGE R7 PRO 6850U, Radeon 680M | 1.4 kg | 17.9 mm | 14.00" | 1920x1200 | |
| 88.7 % v7 (old) | 12/2022 | HP EliteBook 840 G9 i7-1280P, Iris Xe G7 96EUs | 1.5 kg | 19 mm | 14.00" | 1920x1200 | |
| 88.8 % v7 (old) | 10/2022 | Schenker Vision 14 2022 RTX 3050 Ti i7-12700H, GeForce RTX 3050 Ti Laptop GPU | 1.3 kg | 16.6 mm | 14.00" | 2880x1800 | |
| 90.3 % v7 (old) | 09/2022 | Huawei MateBook X Pro 2022 i7-1260P, Iris Xe G7 96EUs | 1.3 kg | 15.6 mm | 14.20" | 3120x2080 |
Differenze rispetto al ThinkPad T14 G3 AMD
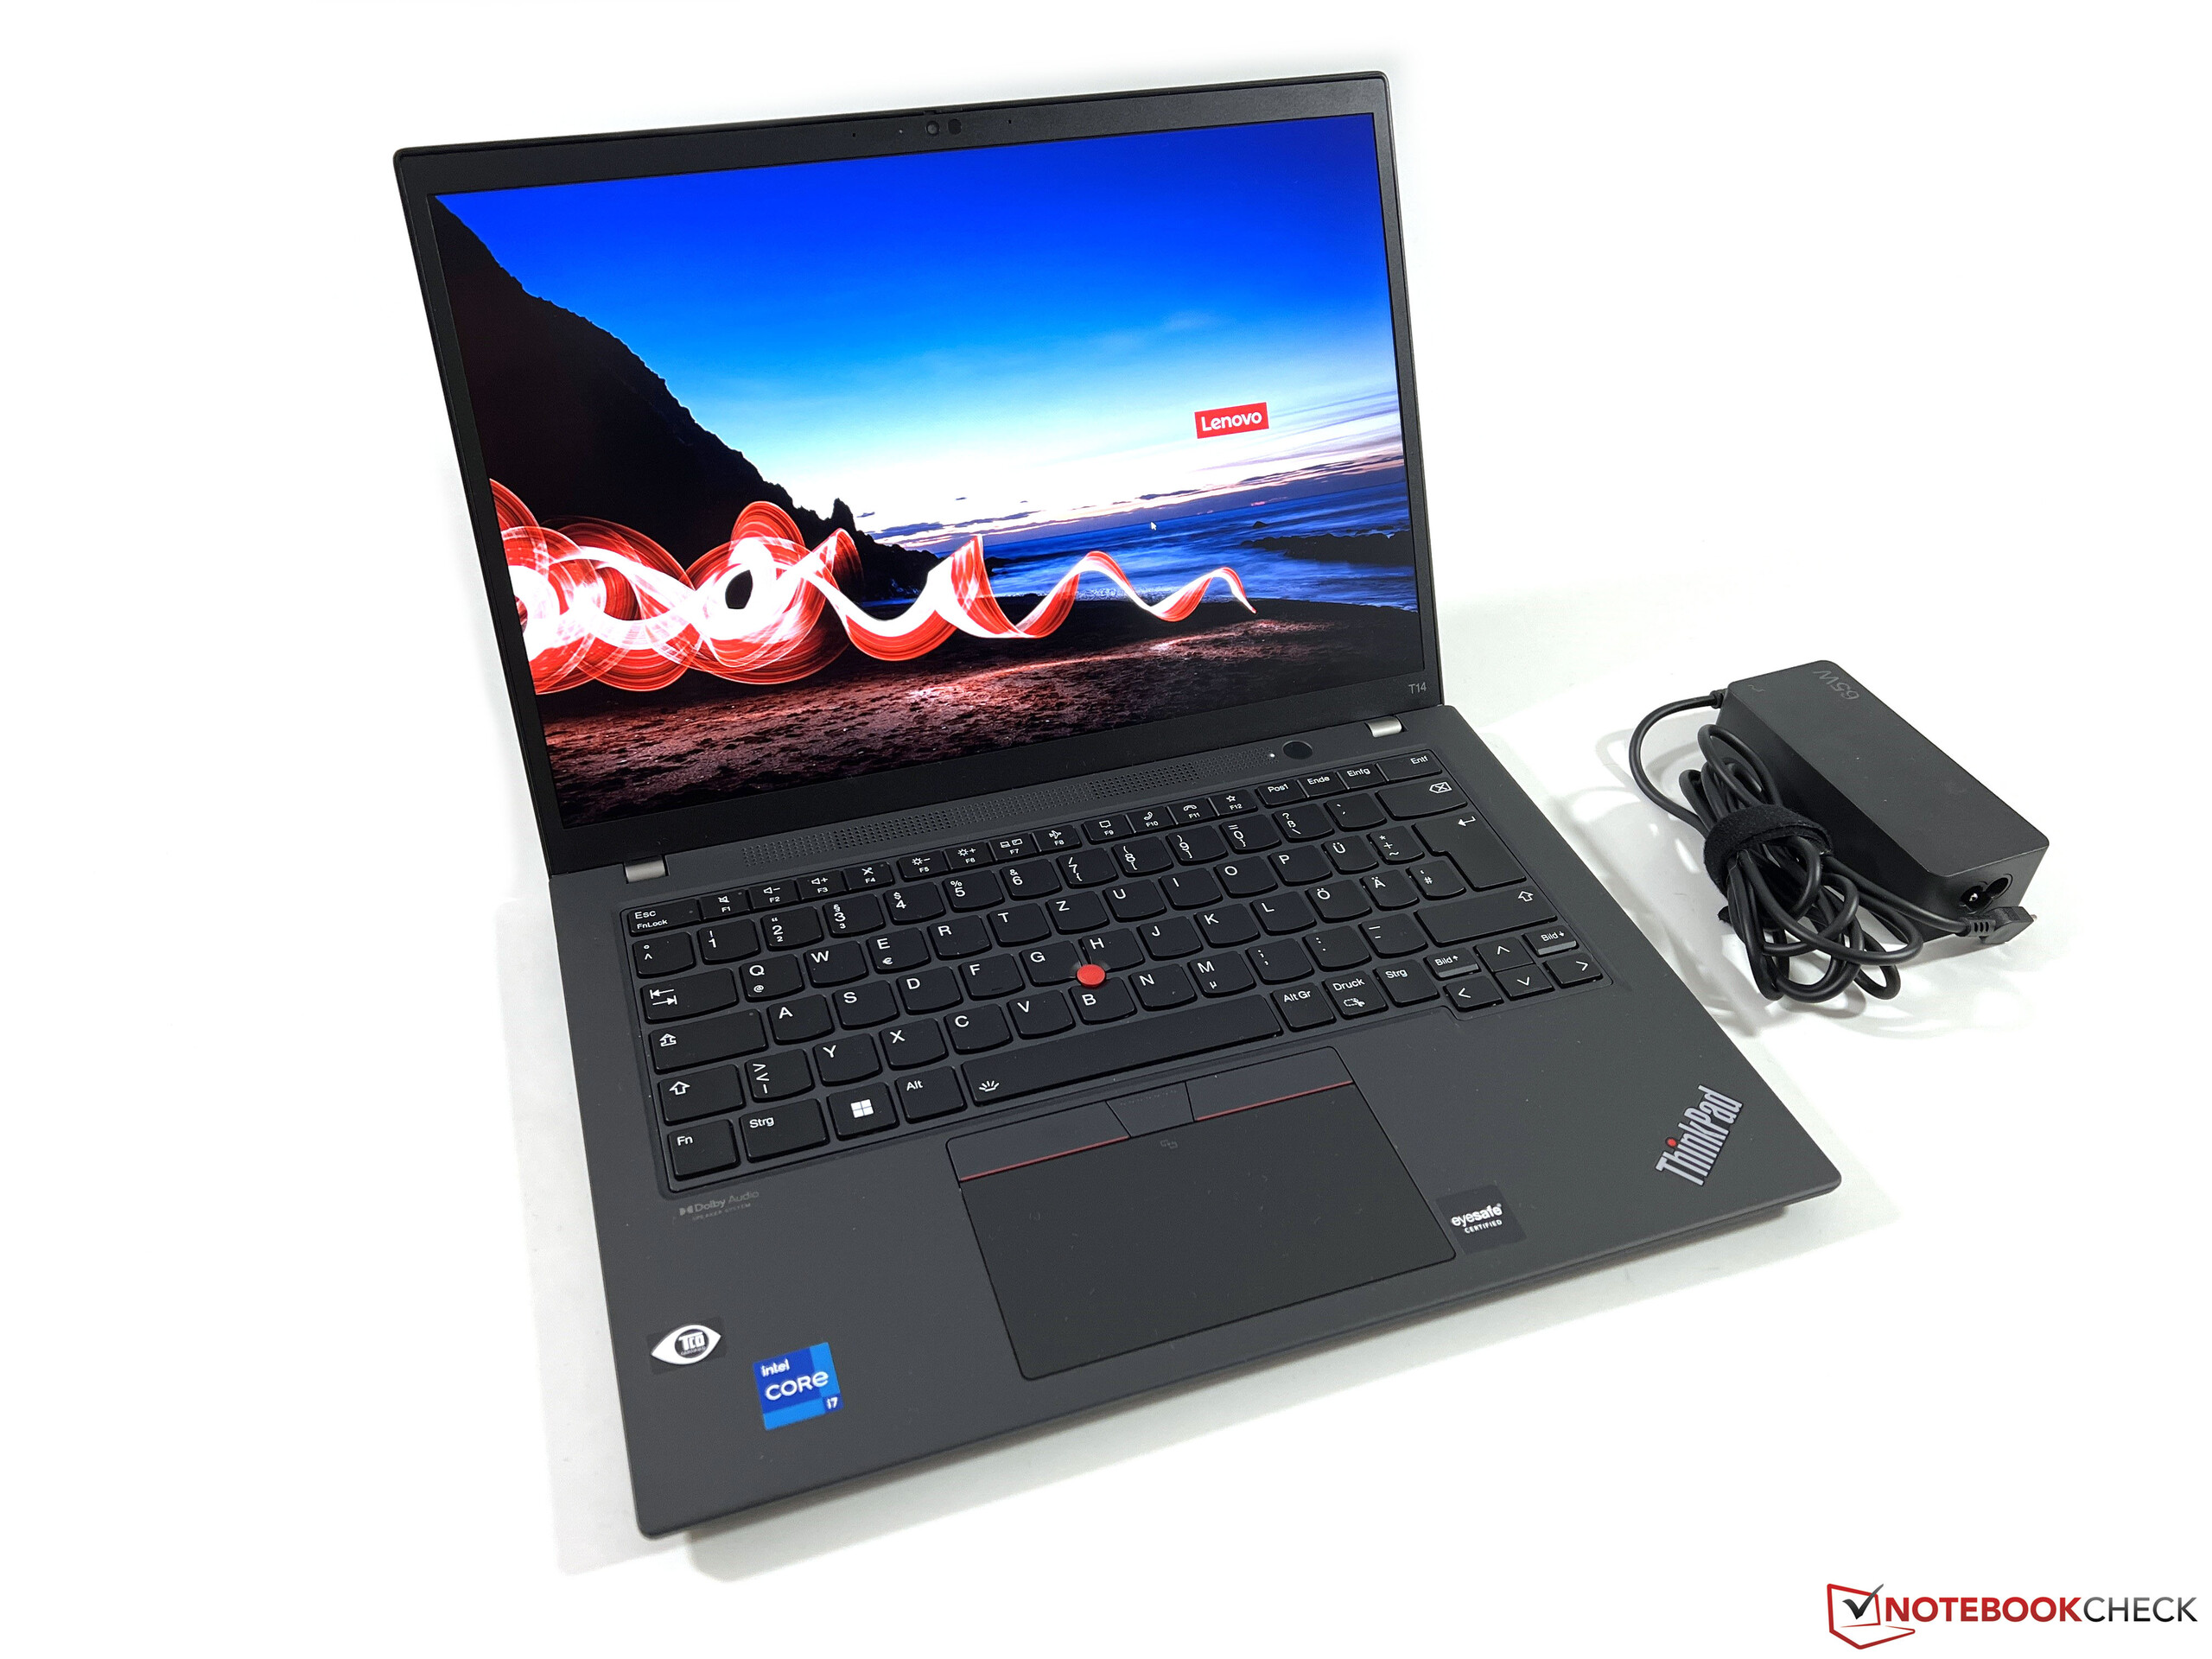
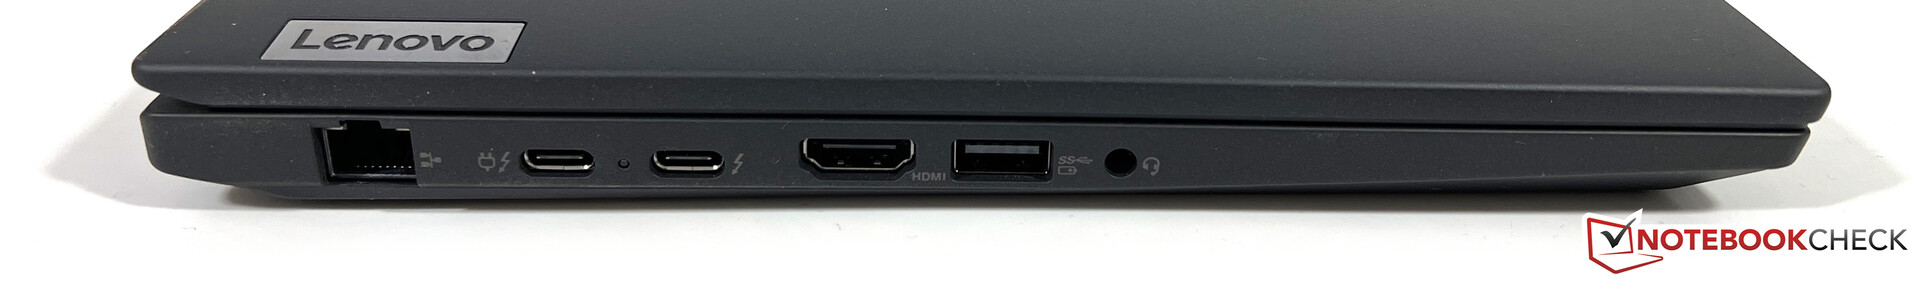
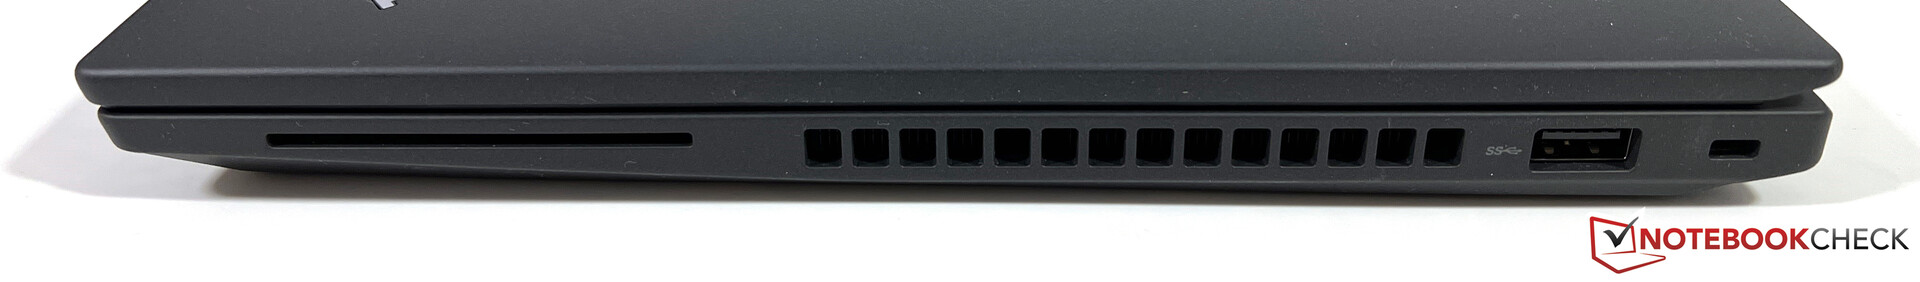
A parte i diversi adesivi sul poggiapolsi, non ci sono differenze nell'aspetto esteriore delle due versioni del ThinkPad T14, quindi vi rimandiamo al nostro test approfondito del modello AMDa questo proposito. Anche le connessioni di base sono le stesse, ma mentre Lenovo rinuncia all'USB 4.0 nel modello AMD, la versione Intel è dotata di due connessioni USB-C che supportano la Thunderbolt 4.
Con la scheda WLAN AX211, il modello Intel supporta anche la moderna rete a 6 GHz, ma durante il test non siamo riusciti a connetterci alla rete corrispondente utilizzando il nostro router di riferimento. Tuttavia, anche le prestazioni nella normale rete 5G sono state molto buone. La nostra unità di test è predisposta per la WWAN e lo slot Nano-SIM sul retro, così come le antenne necessarie per il modulo LTE, sono già presenti.
| Networking | |
| Lenovo ThinkPad T14 G3-21AJS00400 | |
| iperf3 receive AXE11000 | |
| iperf3 transmit AXE11000 | |
| Lenovo ThinkPad T14 G3-21CF004NGE | |
| iperf3 receive AXE11000 6GHz | |
| iperf3 transmit AXE11000 6GHz | |
| HP EliteBook 840 G9 | |
| iperf3 receive AXE11000 6GHz | |
| iperf3 receive AXE11000 | |
| iperf3 transmit AXE11000 6GHz | |
| iperf3 transmit AXE11000 | |
| Schenker Vision 14 2022 RTX 3050 Ti | |
| iperf3 receive AXE11000 | |
| iperf3 transmit AXE11000 | |
| Huawei MateBook X Pro 2022 | |
| iperf3 receive AXE11000 6GHz | |
| iperf3 transmit AXE11000 6GHz | |


Manutenzione
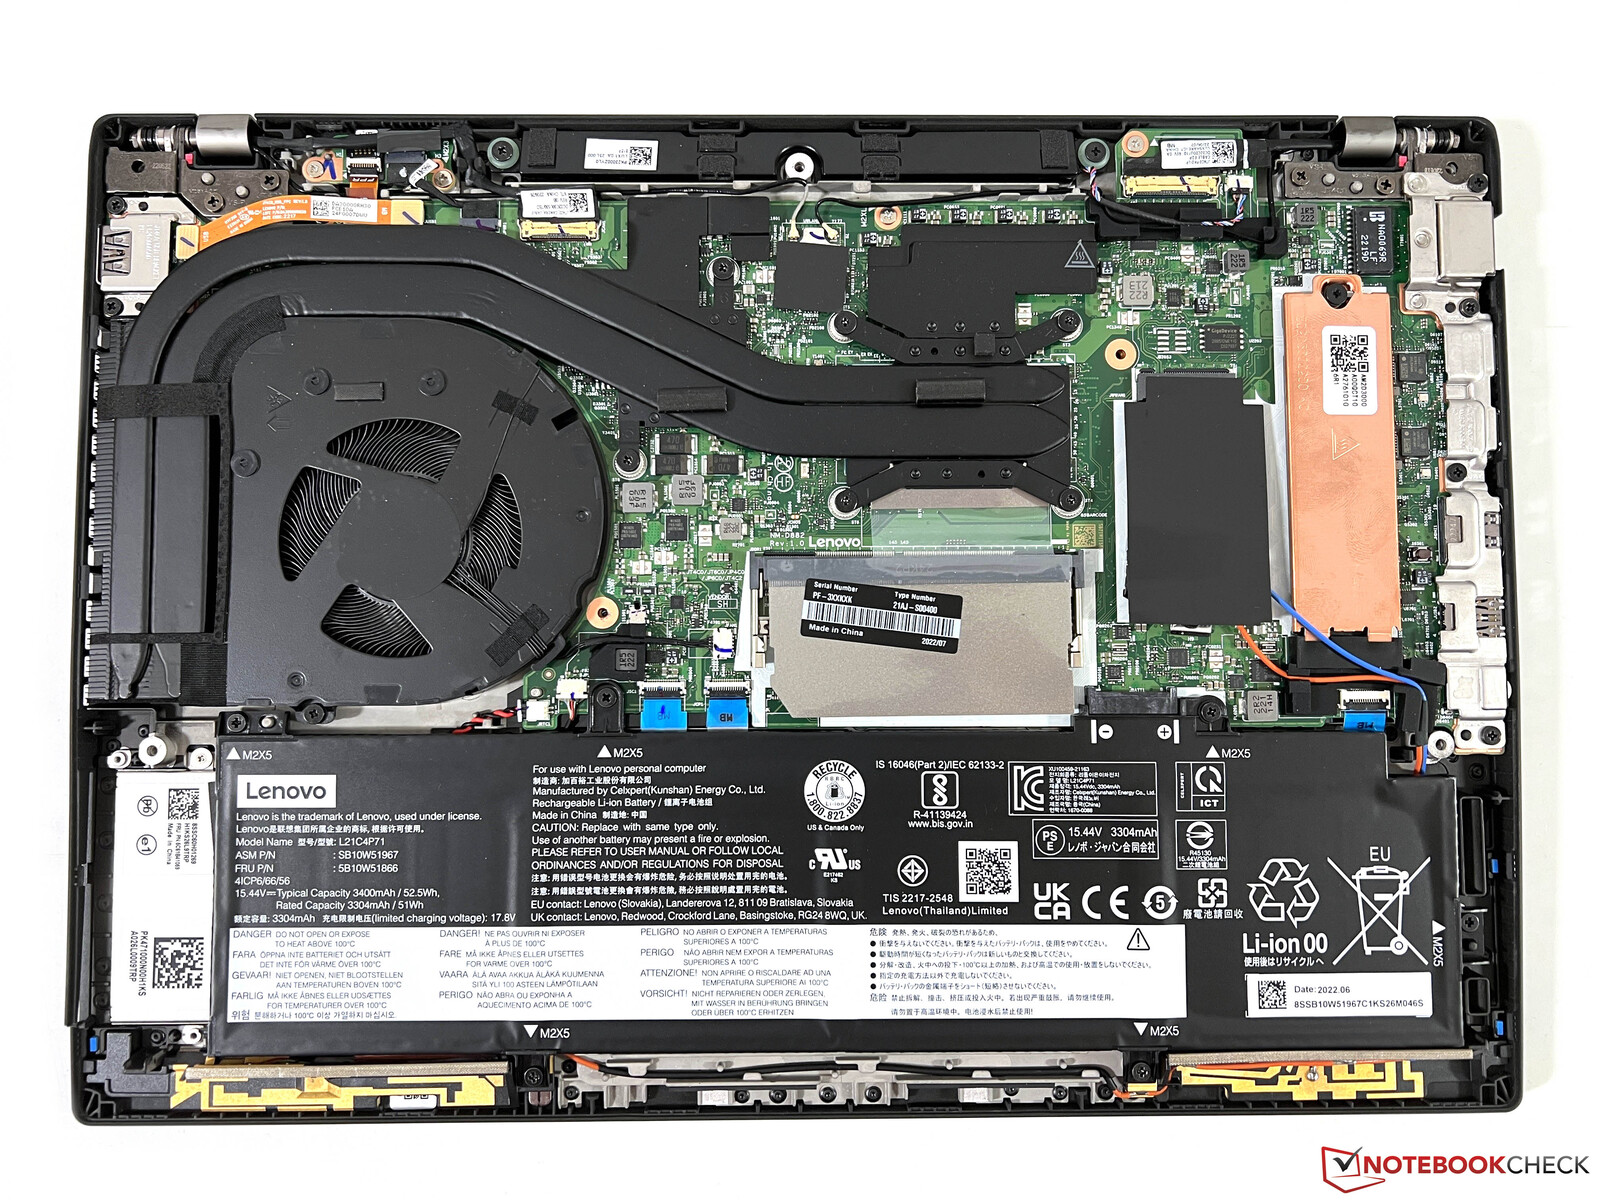
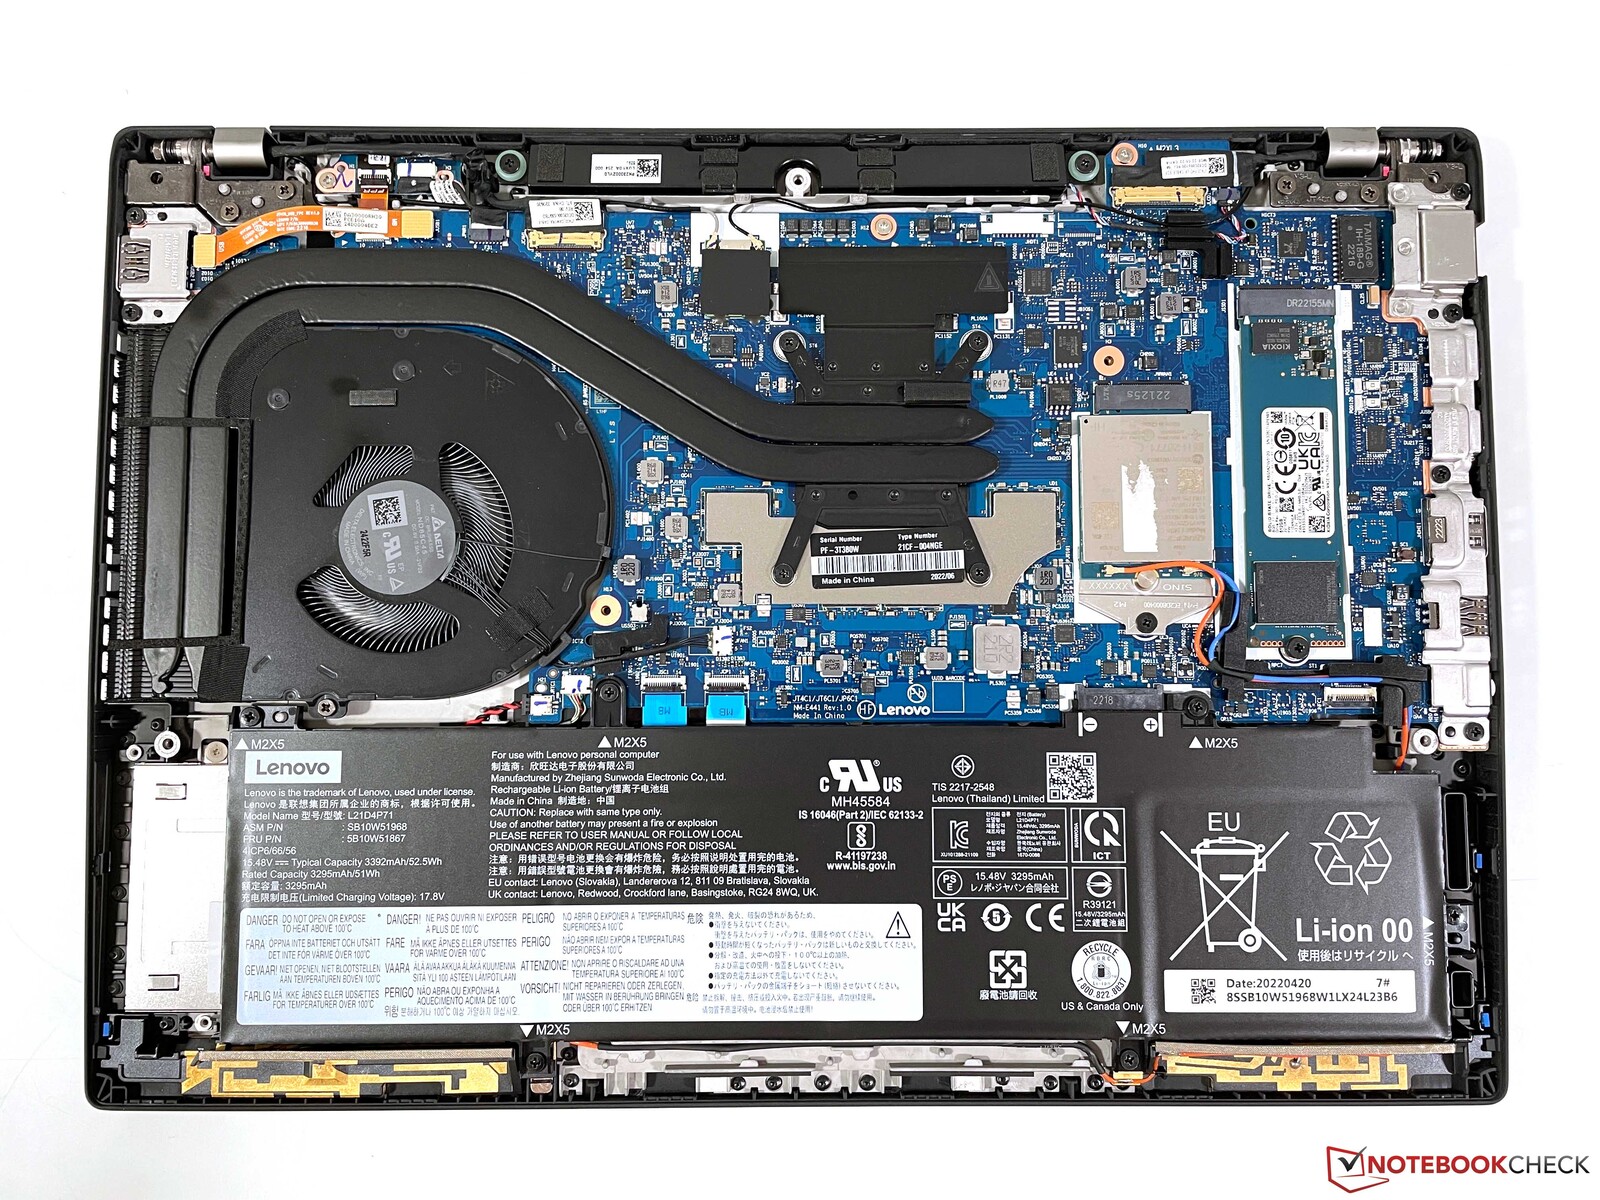
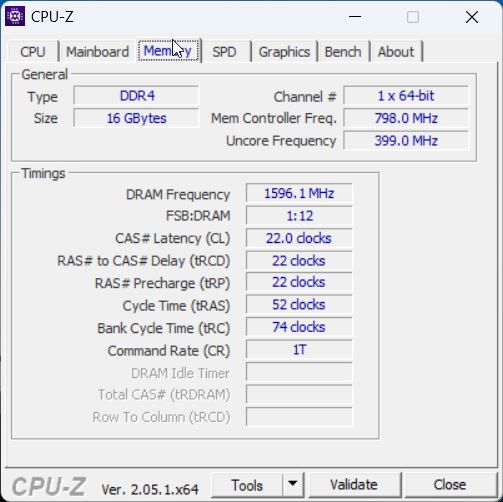
C'è anche una differenza nel layout interno. Mentre Lenovo fornisce il modello Modello AMDesclusivamente con RAM saldata senza offrire all'utente alcuna possibilità di espansione, la situazione è diversa per il modello Intel. Oltre a un modulo saldato (16 GB nel nostro caso), c'è anche uno slot SO-DIMM libero, che porta il totale possibile di RAM a 48 GB.
Display - La lotteria del pannello continua
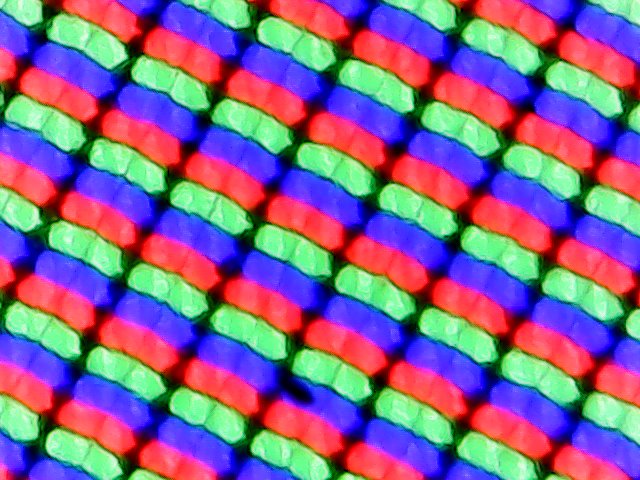
Come già nei precedenti modelli ThinkPad, anche per i modelli attuali Lenovo utilizza diversi produttori di pannelli. Sebbene entrambe le nostre unità di prova siano equipaggiate con il pannello LowPower Full-HD da 14 pollici, ci sono delle differenze, anche se vengono mantenute le specifiche tecniche di base di entrambe le versioni (o anche di più, visto che in passato ci sono state fino a 4 versioni). A differenza del pannelloPannello LG della nostra precedente unità di test AMD, la nostra attuale unità di test Intel utilizza un pannello di AUO, che soggettivamente non è del tutto convincente, poiché le aree luminose appaiono leggermente sgranate. Anche i tempi di risposta sono significativamente più lenti e ci sono alcuni effetti di ghosting visibili, ad esempio quando si sposta il puntatore del mouse. Tuttavia, anche in questo caso non viene utilizzato il PWM.
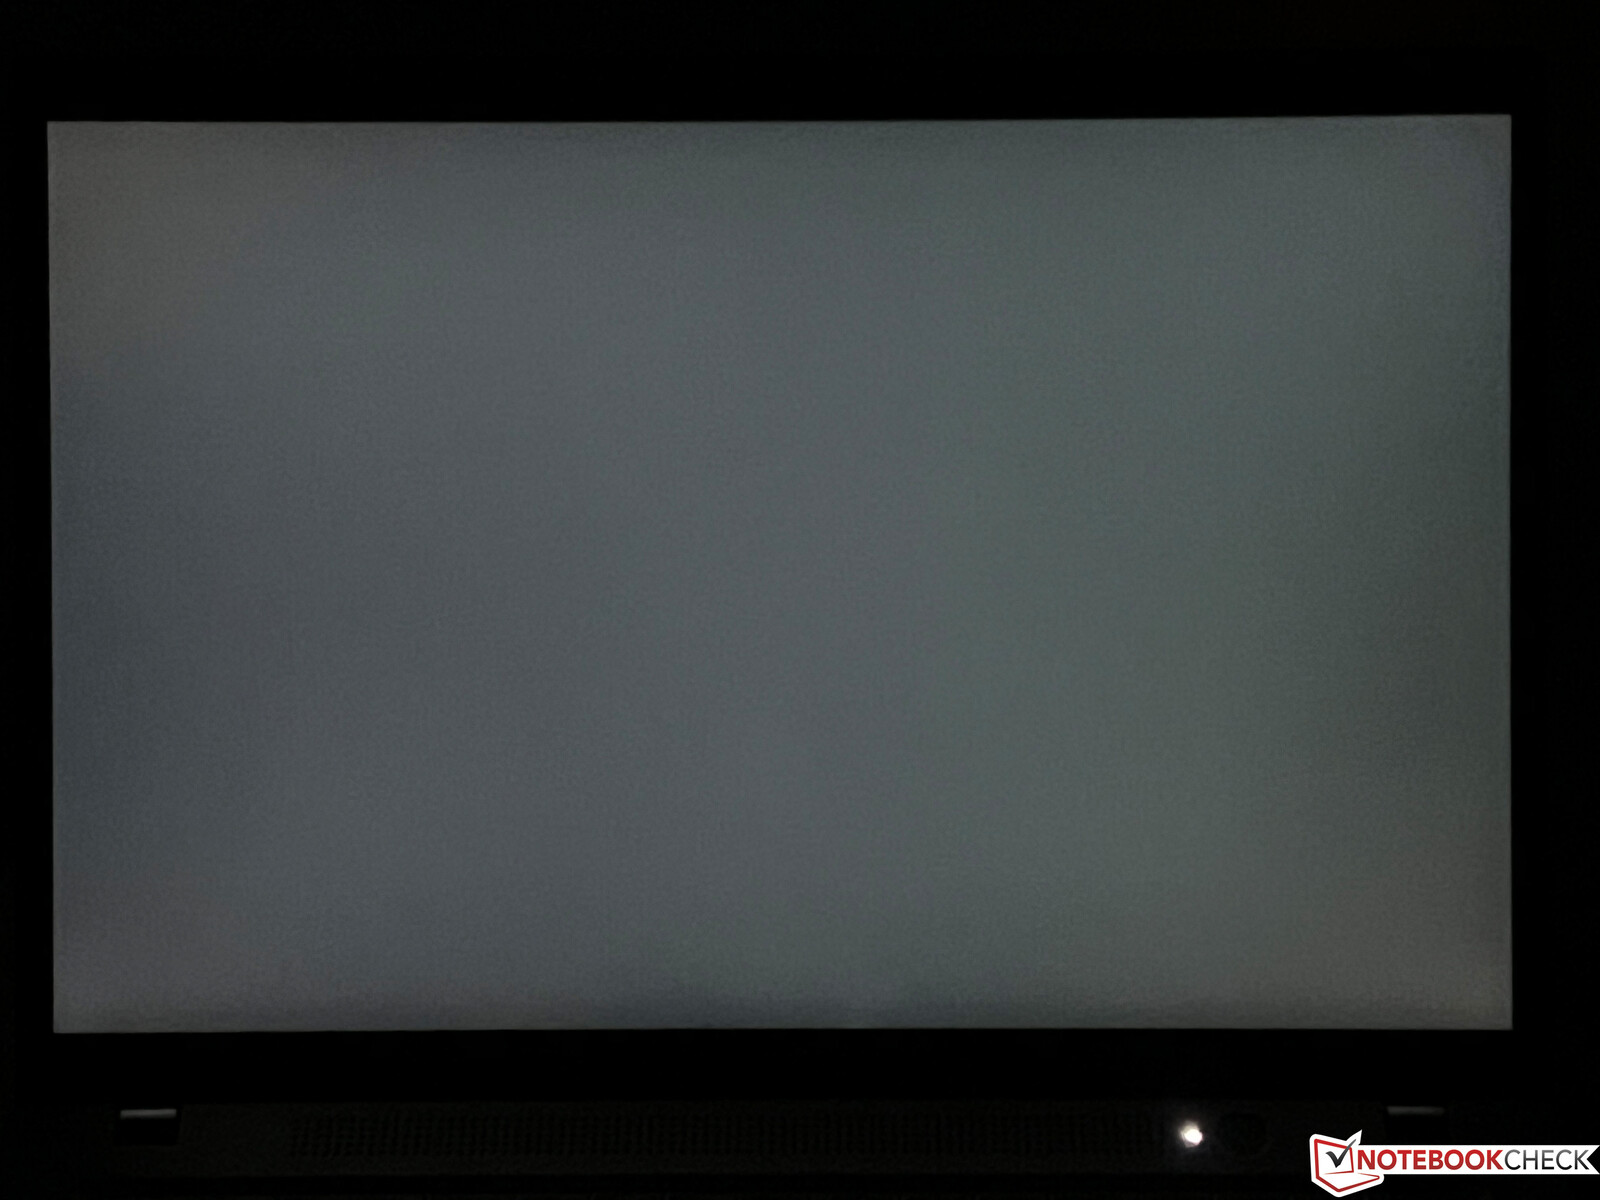
Lo stesso vale per la luminosità, che risulta inferiore a quella del modello LG. Tuttavia, raggiunge comunque i 400 cd/m² pubblicizzati. Grazie al basso valore del nero, il rapporto di contrasto non offre motivi di lamentela. La nostra unità di prova non ha avuto alcun problema di offuscamento o di perdita di colore dello schermo, nemmeno al massimo livello di luminosità.
| |||||||||||||||||||||||||
Distribuzione della luminosità: 91 %
Al centro con la batteria: 399 cd/m²
Contrasto: 2105:1 (Nero: 0.19 cd/m²)
ΔE ColorChecker Calman: 3.5 | ∀{0.5-29.43 Ø4.71}
calibrated: 1.6
ΔE Greyscale Calman: 4.8 | ∀{0.09-98 Ø4.96}
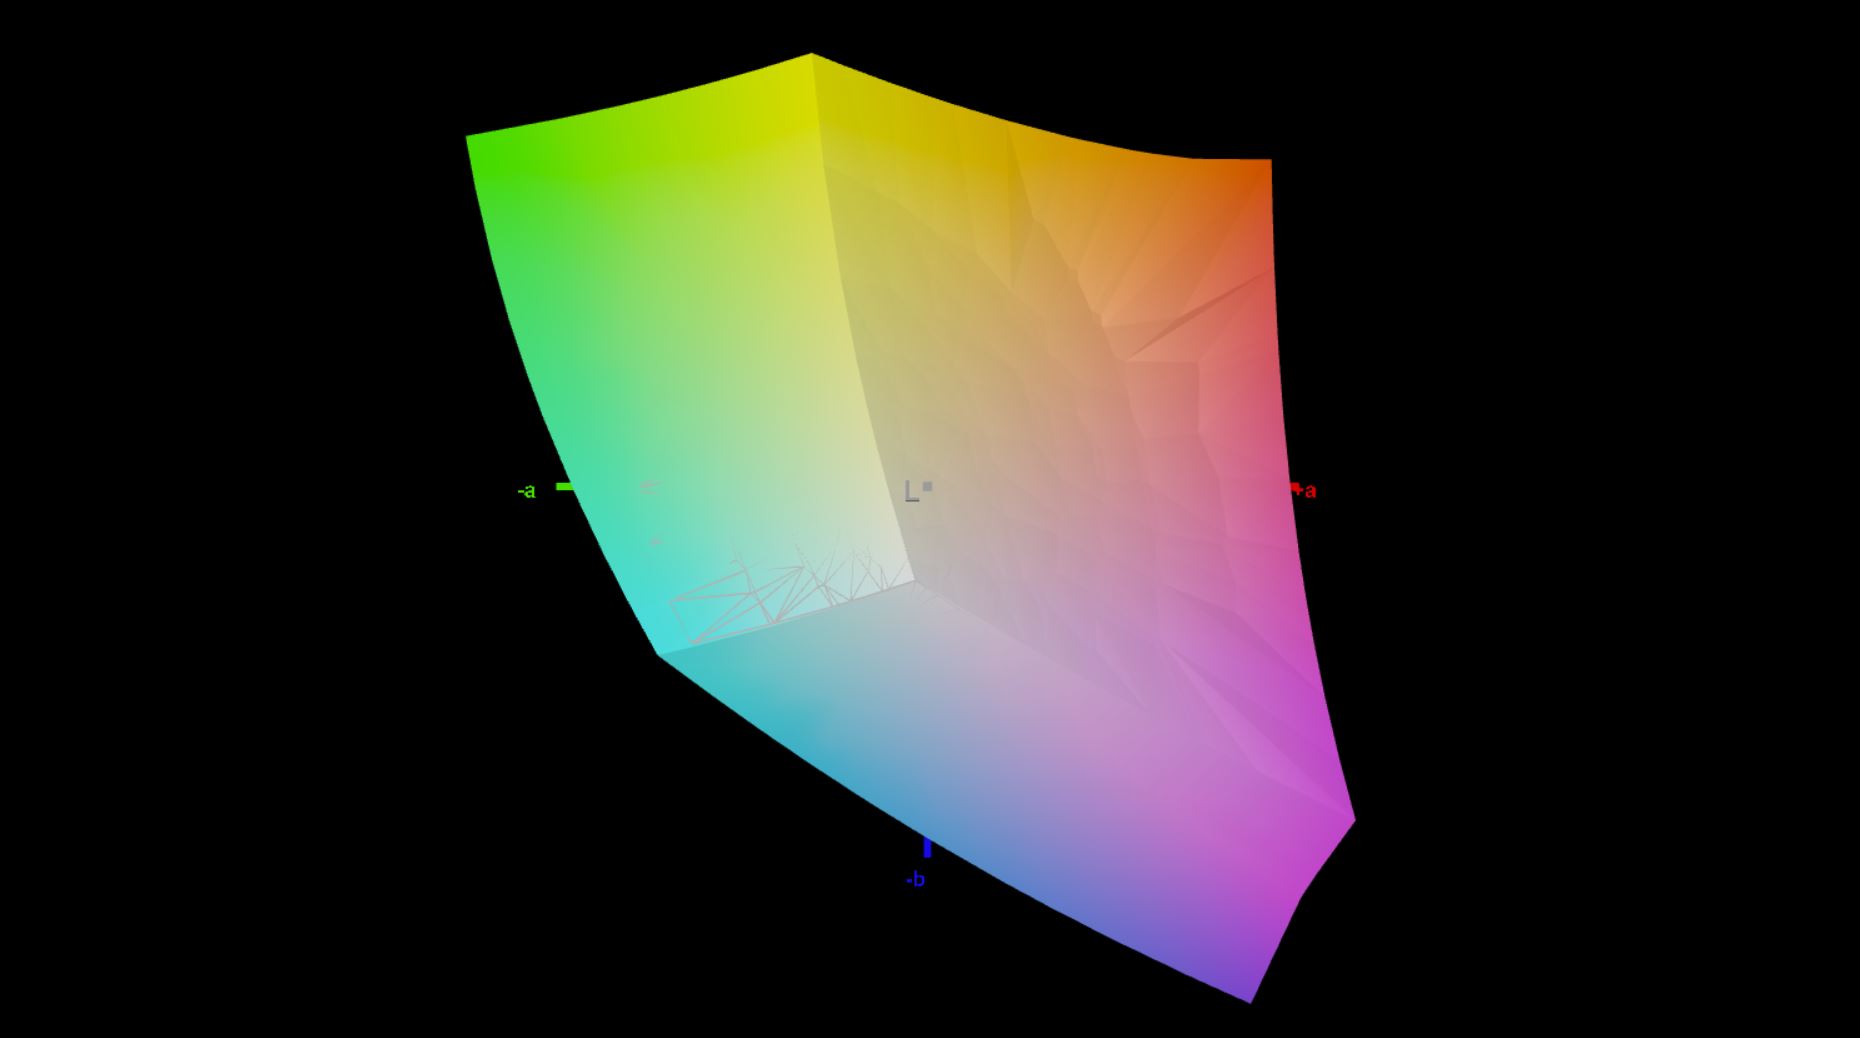
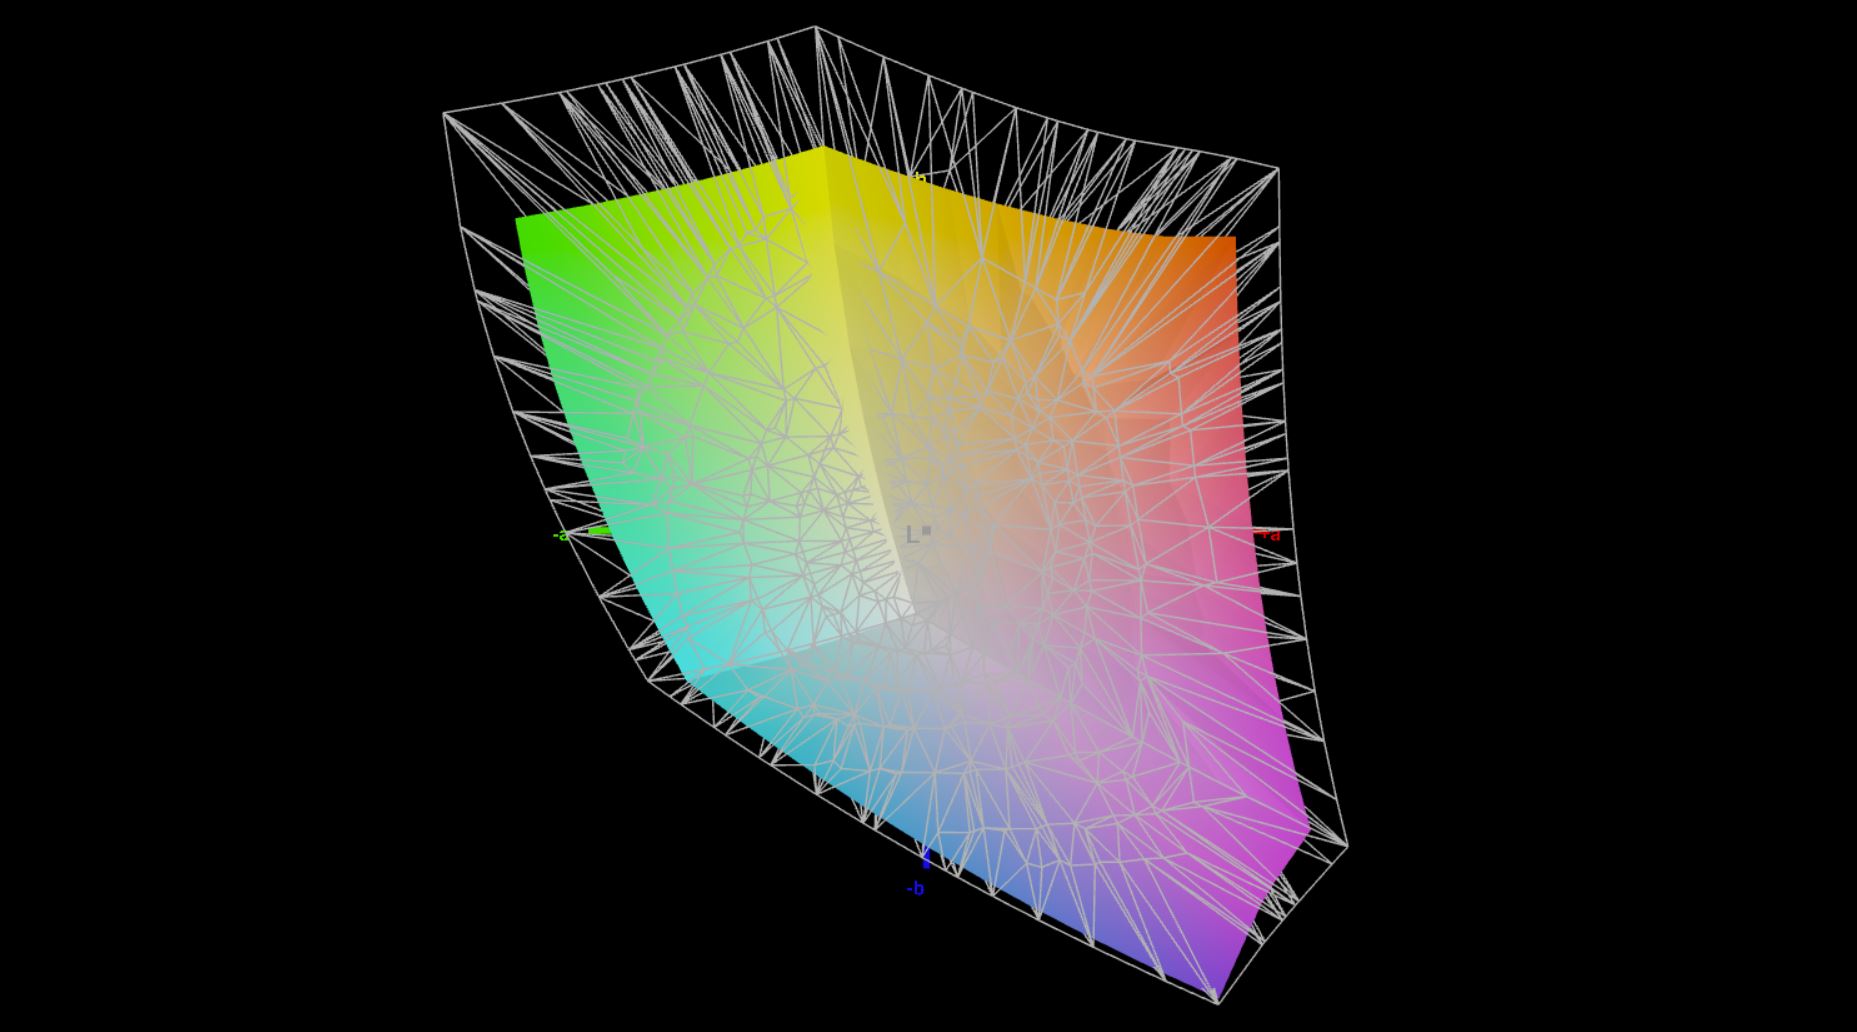
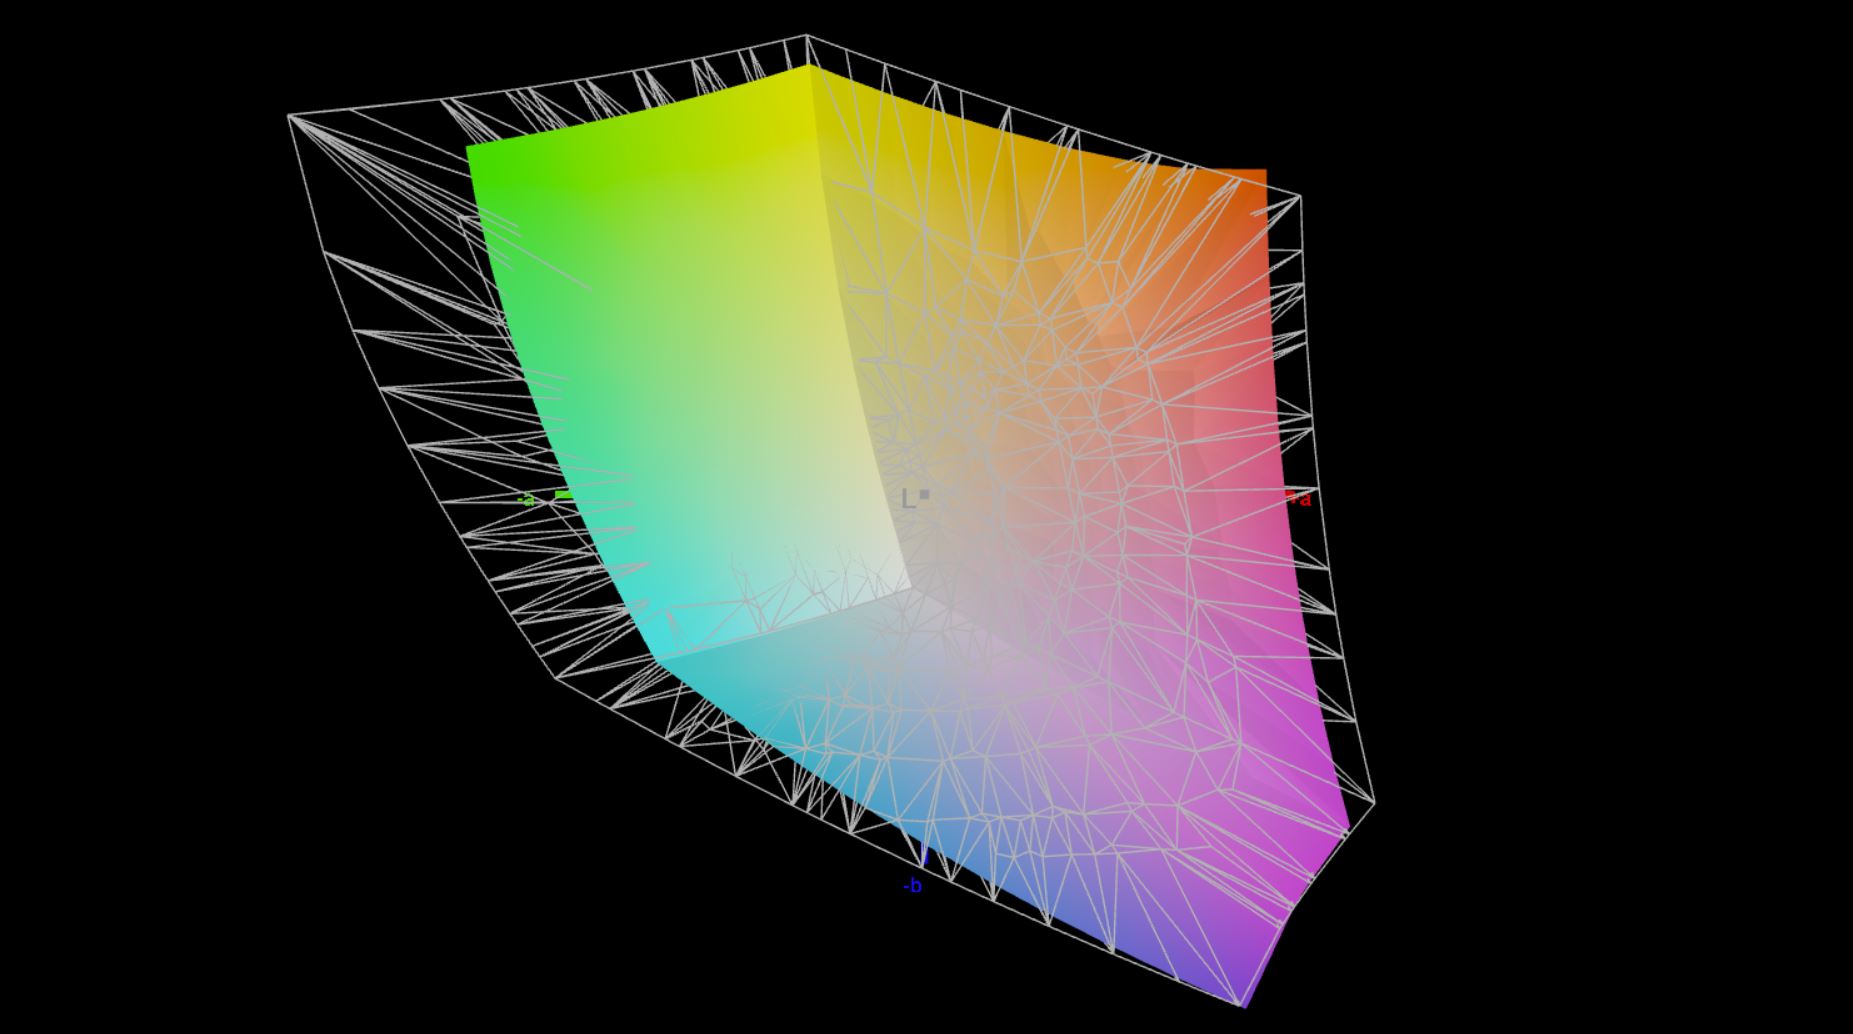
77.9% AdobeRGB 1998 (Argyll 3D)
100% sRGB (Argyll 3D)
76.3% Display P3 (Argyll 3D)
Gamma: 2.11
CCT: 6662 K
| Lenovo ThinkPad T14 G3-21AJS00400 B140UAN02.1, IPS, 1920x1200, 14" | Lenovo ThinkPad T14 G3-21CF004NGE LP140WU1-SPB2, IPS, 1920x1200, 14" | HP EliteBook 840 G9 Chi Mei CMN1435, IPS, 1920x1200, 14" | Schenker Vision 14 2022 RTX 3050 Ti MNE007ZA1-1, IPS, 2880x1800, 14" | Huawei MateBook X Pro 2022 TMX1422, IPS, 3120x2080, 14.2" | |
|---|---|---|---|---|---|
| Display | -7% | -8% | -3% | 12% | |
| Display P3 Coverage (%) | 76.3 | 69.2 -9% | 67.6 -11% | 74.1 -3% | 94.6 24% |
| sRGB Coverage (%) | 100 | 97.4 -3% | 98.7 -1% | 97.4 -3% | 99.5 0% |
| AdobeRGB 1998 Coverage (%) | 77.9 | 71.5 -8% | 69.7 -11% | 75.3 -3% | 86.5 11% |
| Response Times | 40% | -19% | 54% | 55% | |
| Response Time Grey 50% / Grey 80% * (ms) | 62.6 ? | 41.4 ? 34% | 66 ? -5% | 31.5 ? 50% | 25.4 ? 59% |
| Response Time Black / White * (ms) | 34.9 ? | 19.2 ? 45% | 46.4 ? -33% | 14.5 ? 58% | 17.1 ? 51% |
| PWM Frequency (Hz) | |||||
| Screen | 16% | 14% | -6% | 22% | |
| Brightness middle (cd/m²) | 400 | 451 13% | 391.3 -2% | 421 5% | 603 51% |
| Brightness (cd/m²) | 395 | 435 10% | 368 -7% | 416 5% | 586 48% |
| Brightness Distribution (%) | 91 | 94 3% | 86 -5% | 89 -2% | 91 0% |
| Black Level * (cd/m²) | 0.19 | 0.21 -11% | 0.32 -68% | 0.28 -47% | 0.39 -105% |
| Contrast (:1) | 2105 | 2148 2% | 1223 -42% | 1504 -29% | 1546 -27% |
| Colorchecker dE 2000 * | 3.5 | 2.4 31% | 1.49 57% | 3.2 9% | 1.1 69% |
| Colorchecker dE 2000 max. * | 7.2 | 4.1 43% | 3.29 54% | 5.5 24% | 2.2 69% |
| Colorchecker dE 2000 calibrated * | 1.6 | 1.3 19% | 0.44 73% | 2 -25% | 1.2 25% |
| Greyscale dE 2000 * | 4.8 | 3.3 31% | 1.7 65% | 4.4 8% | 1.5 69% |
| Gamma | 2.11 104% | 2.13 103% | 2.12 104% | 2.22 99% | 2.17 101% |
| CCT | 6662 98% | 6848 95% | 6488 100% | 6384 102% | 6549 99% |
| Media totale (Programma / Settaggio) | 16% /
14% | -4% /
5% | 15% /
3% | 30% /
25% |
* ... Meglio usare valori piccoli
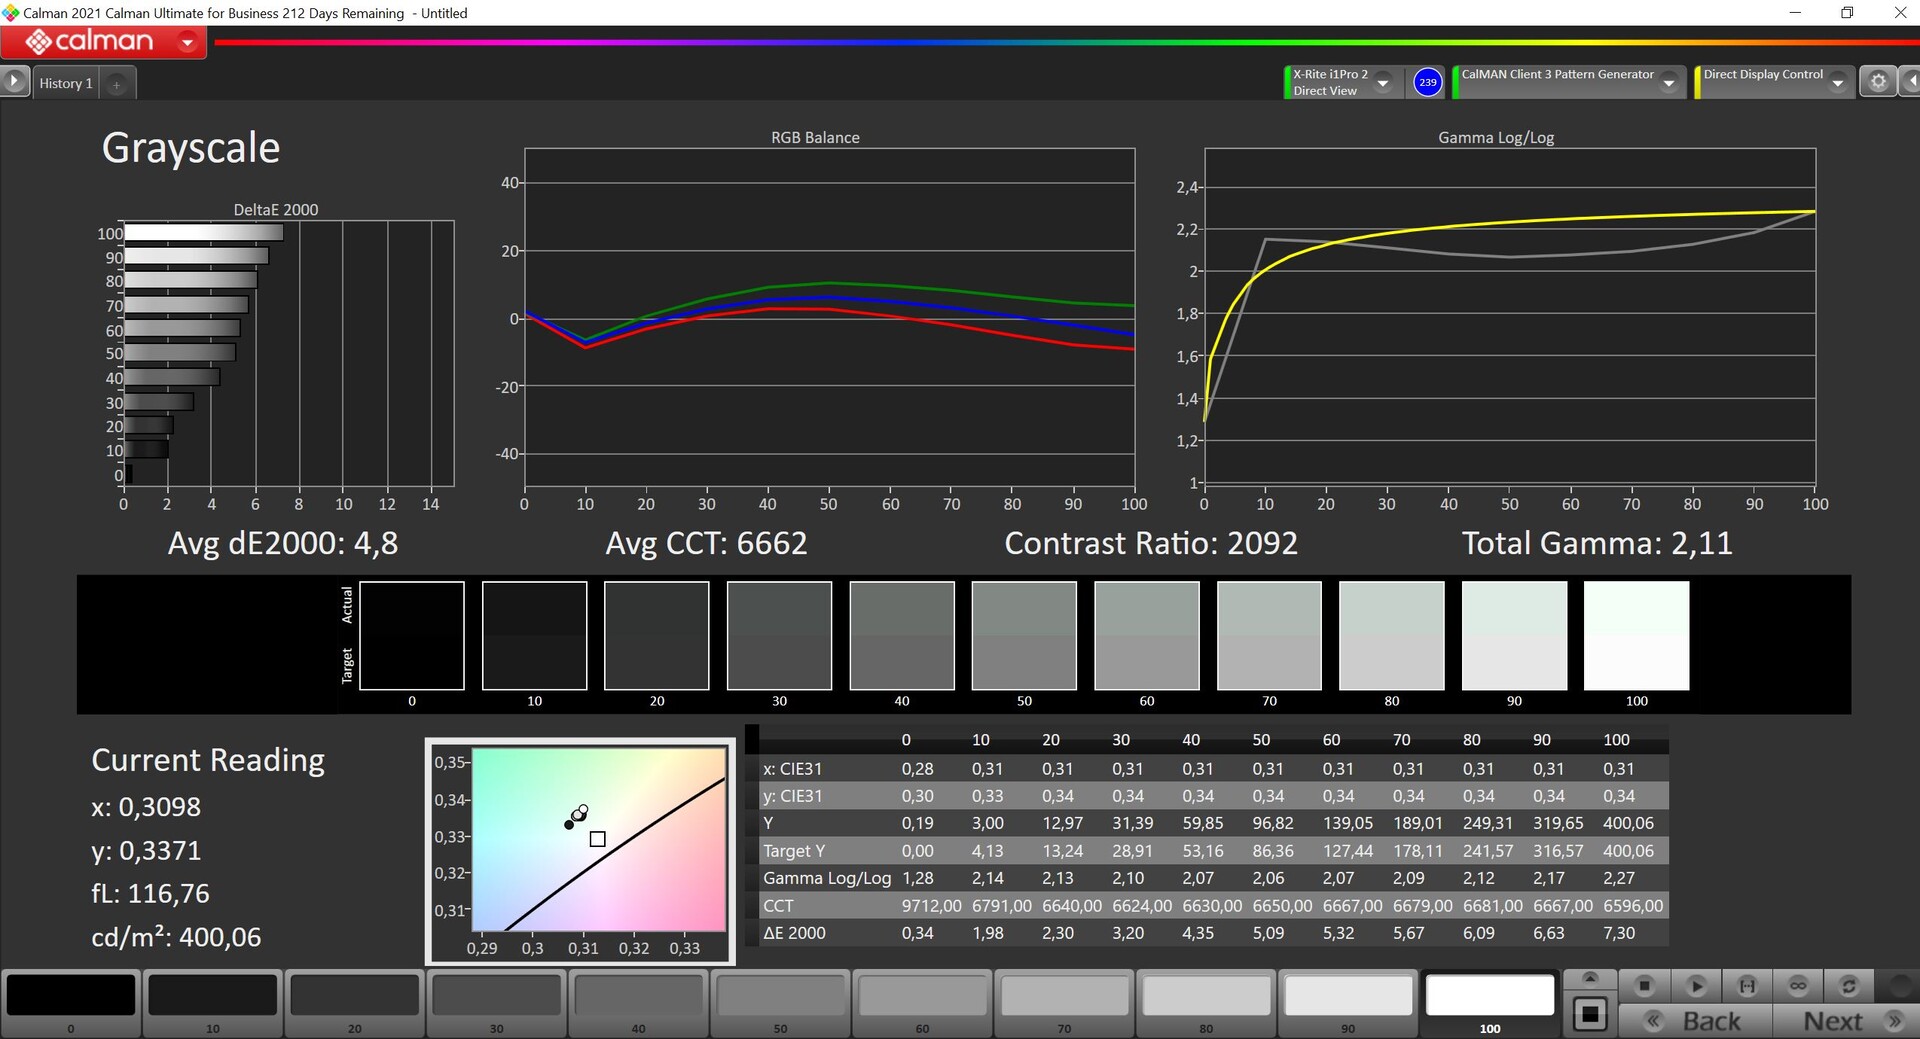
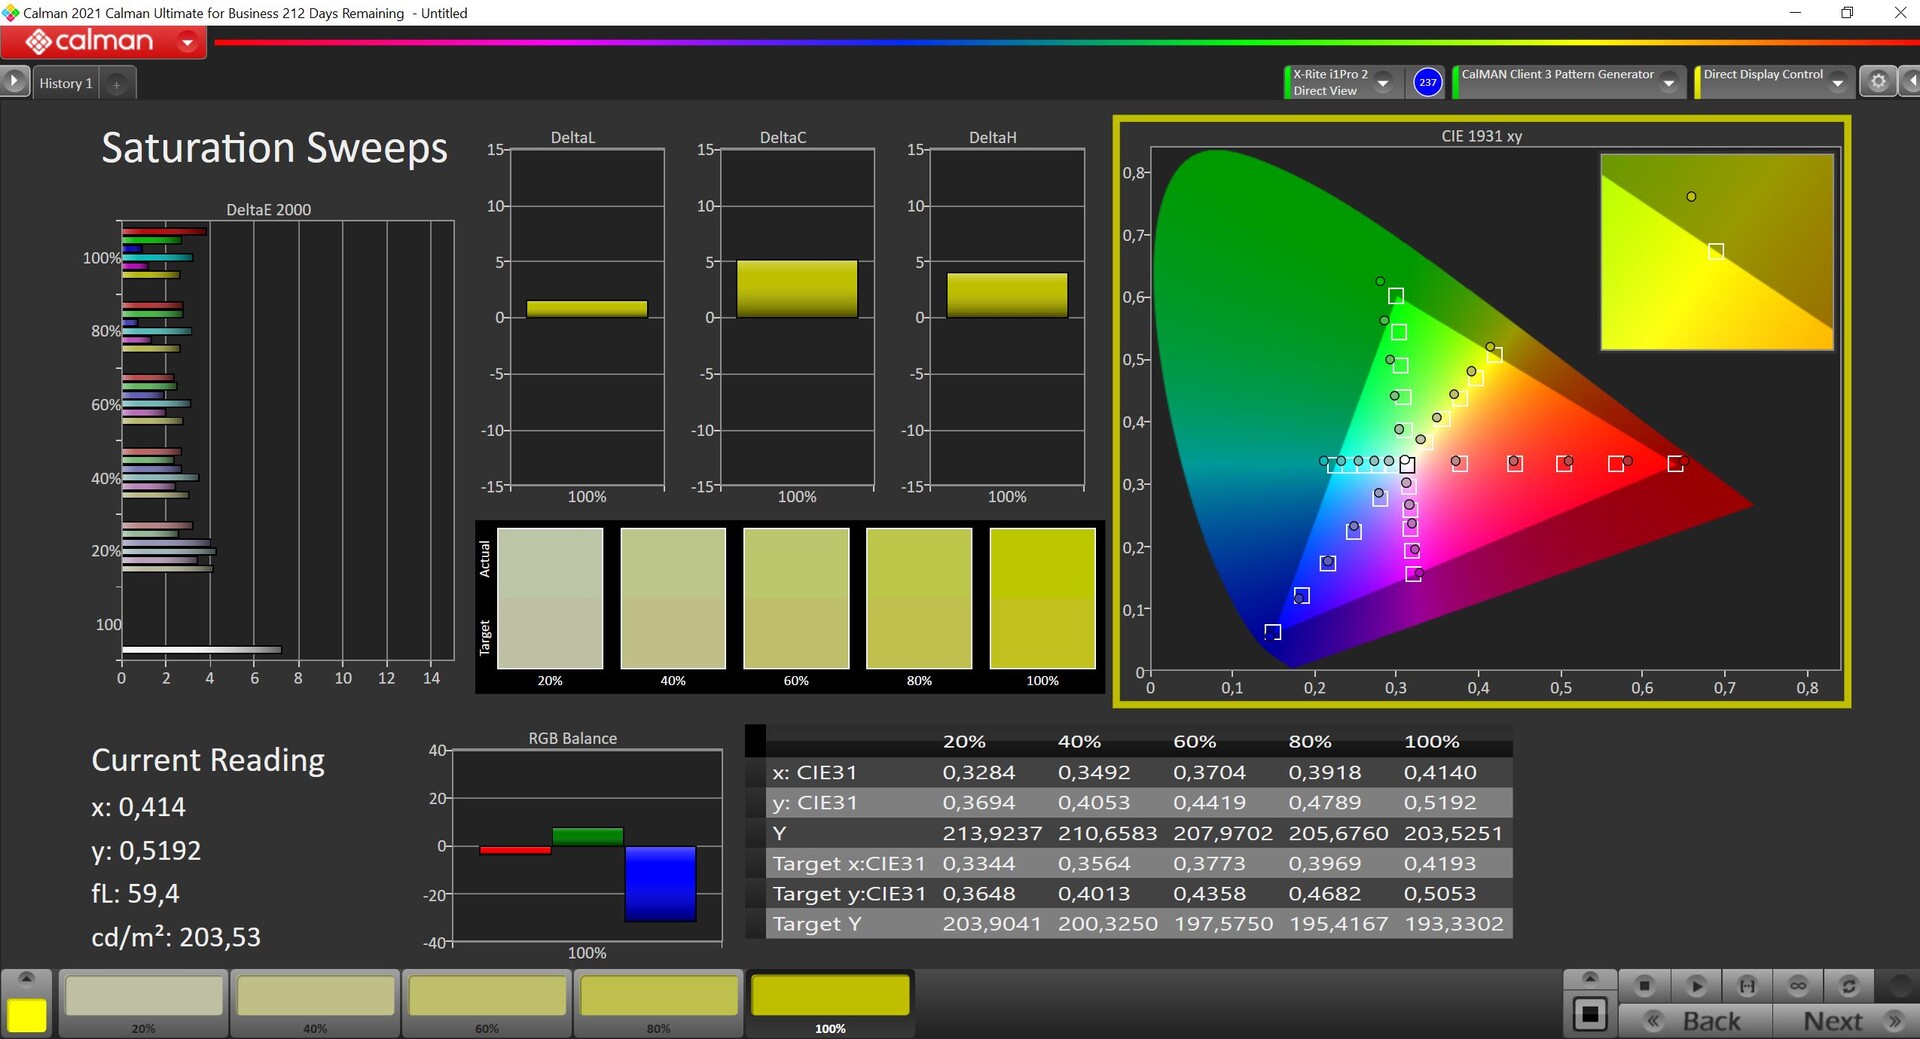
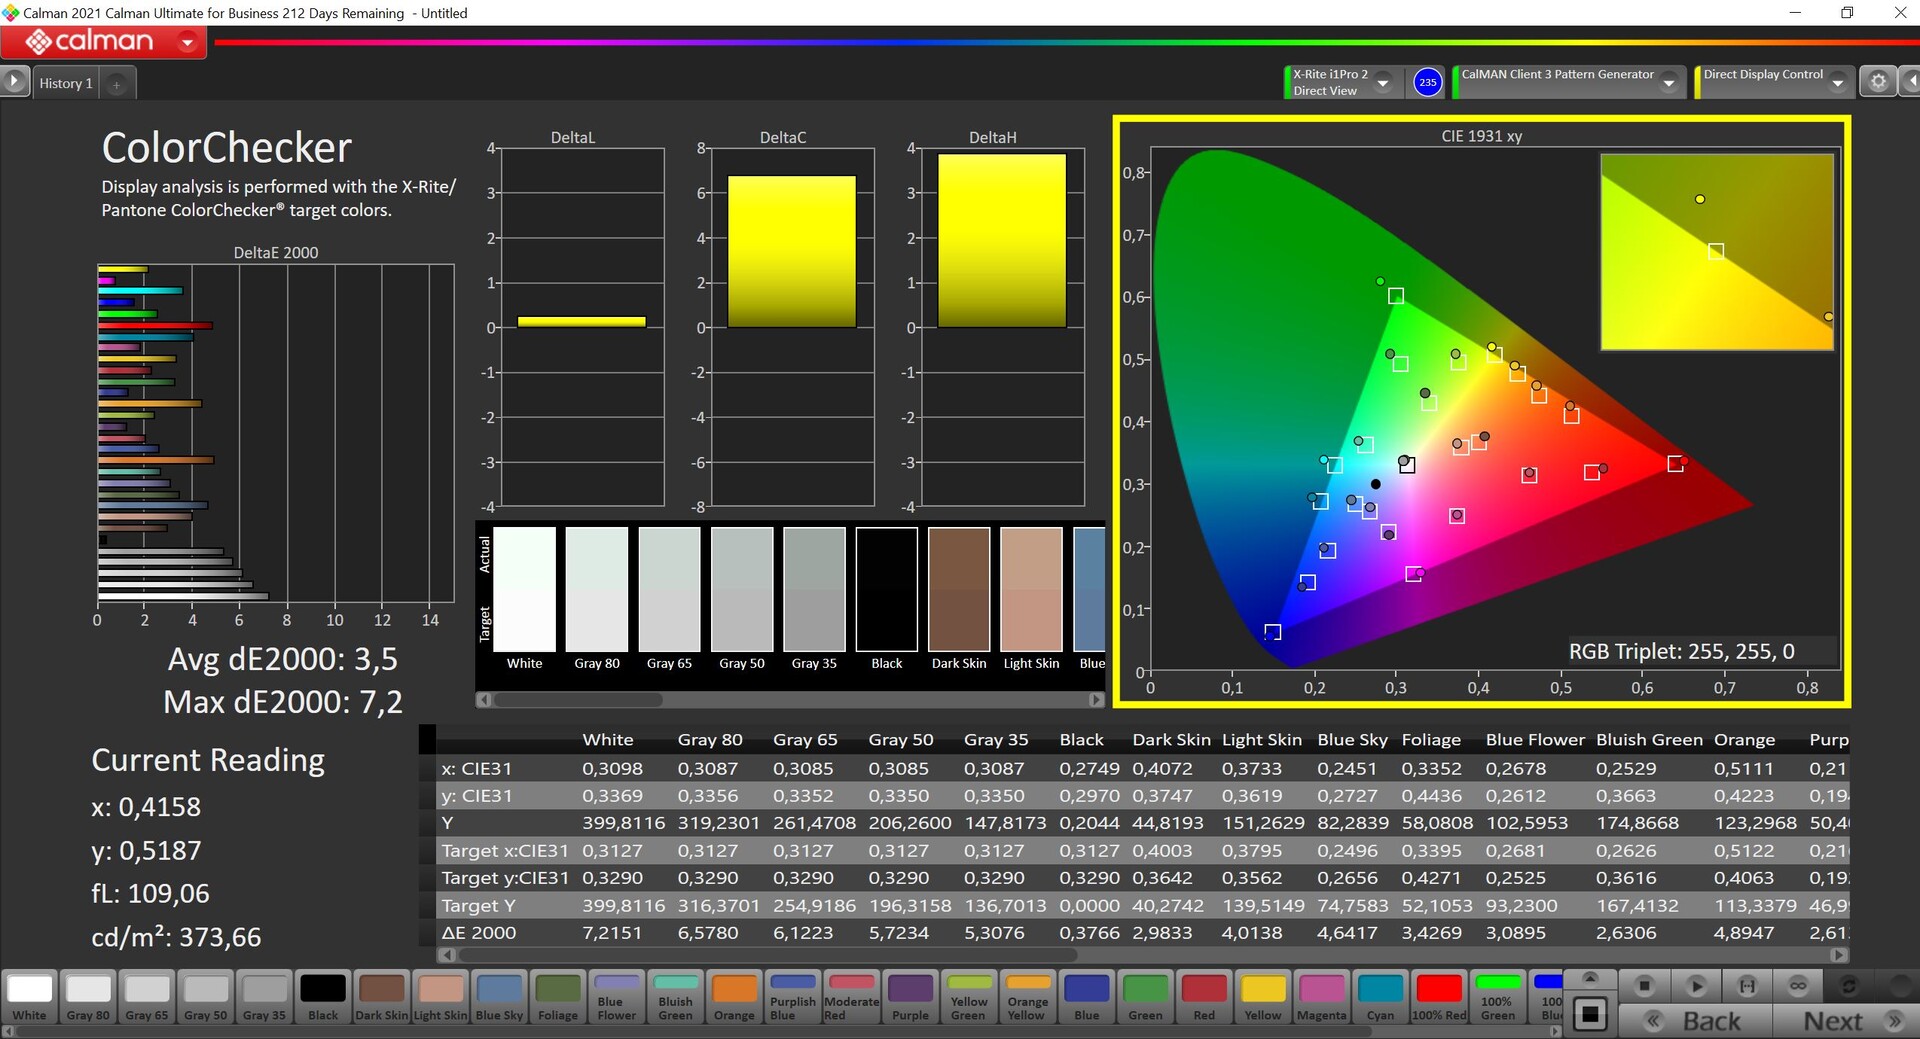
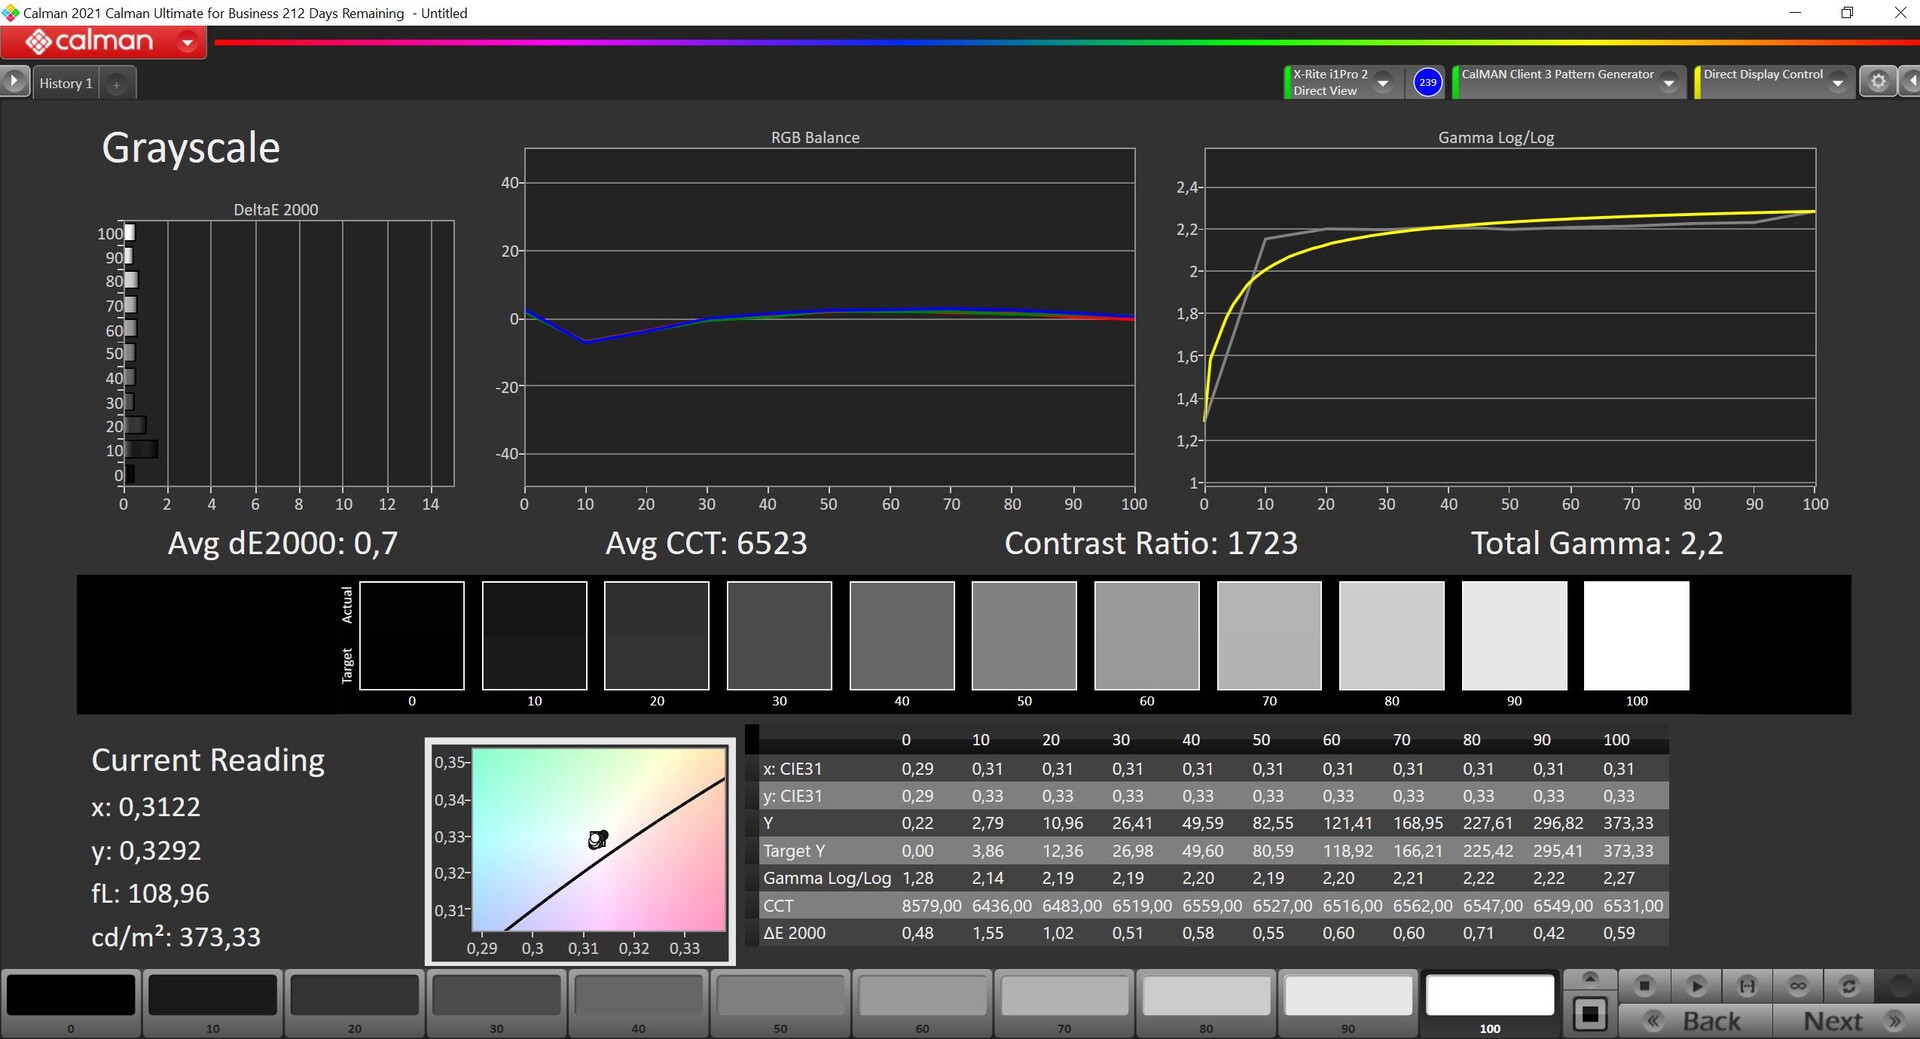
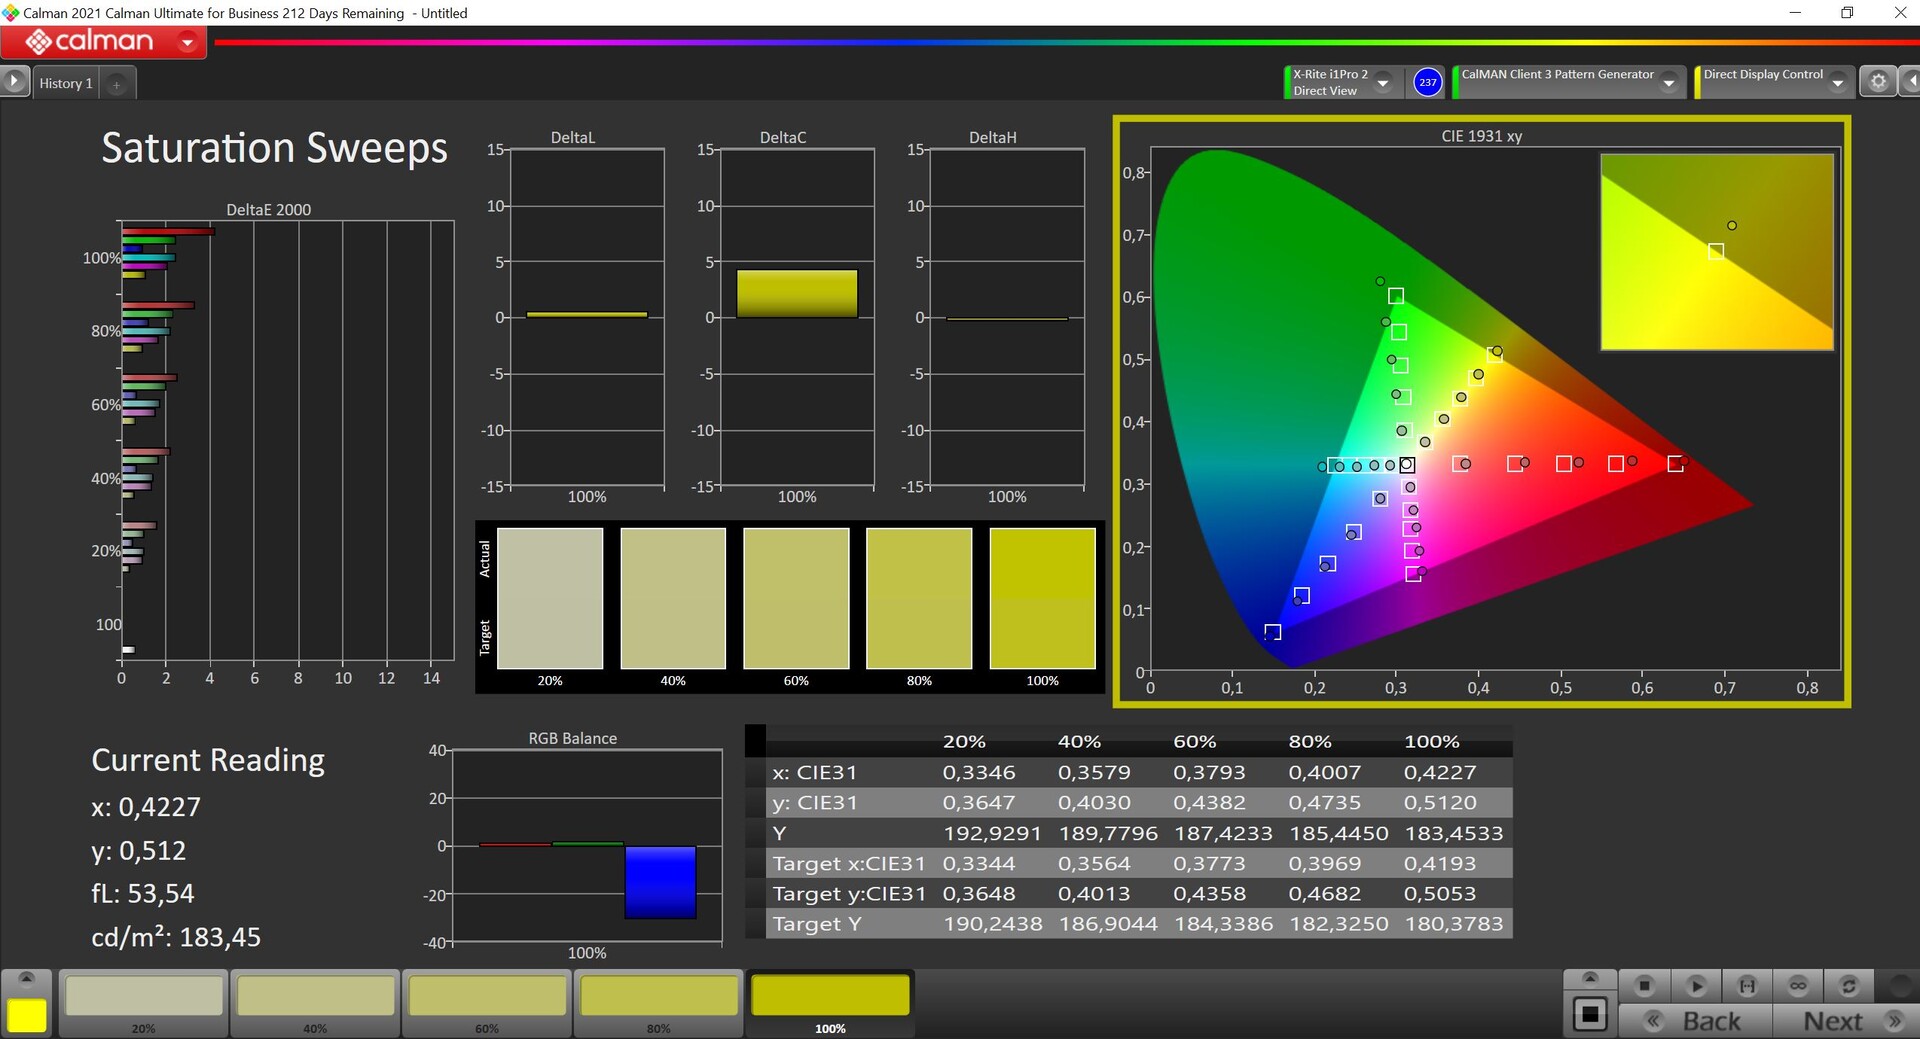
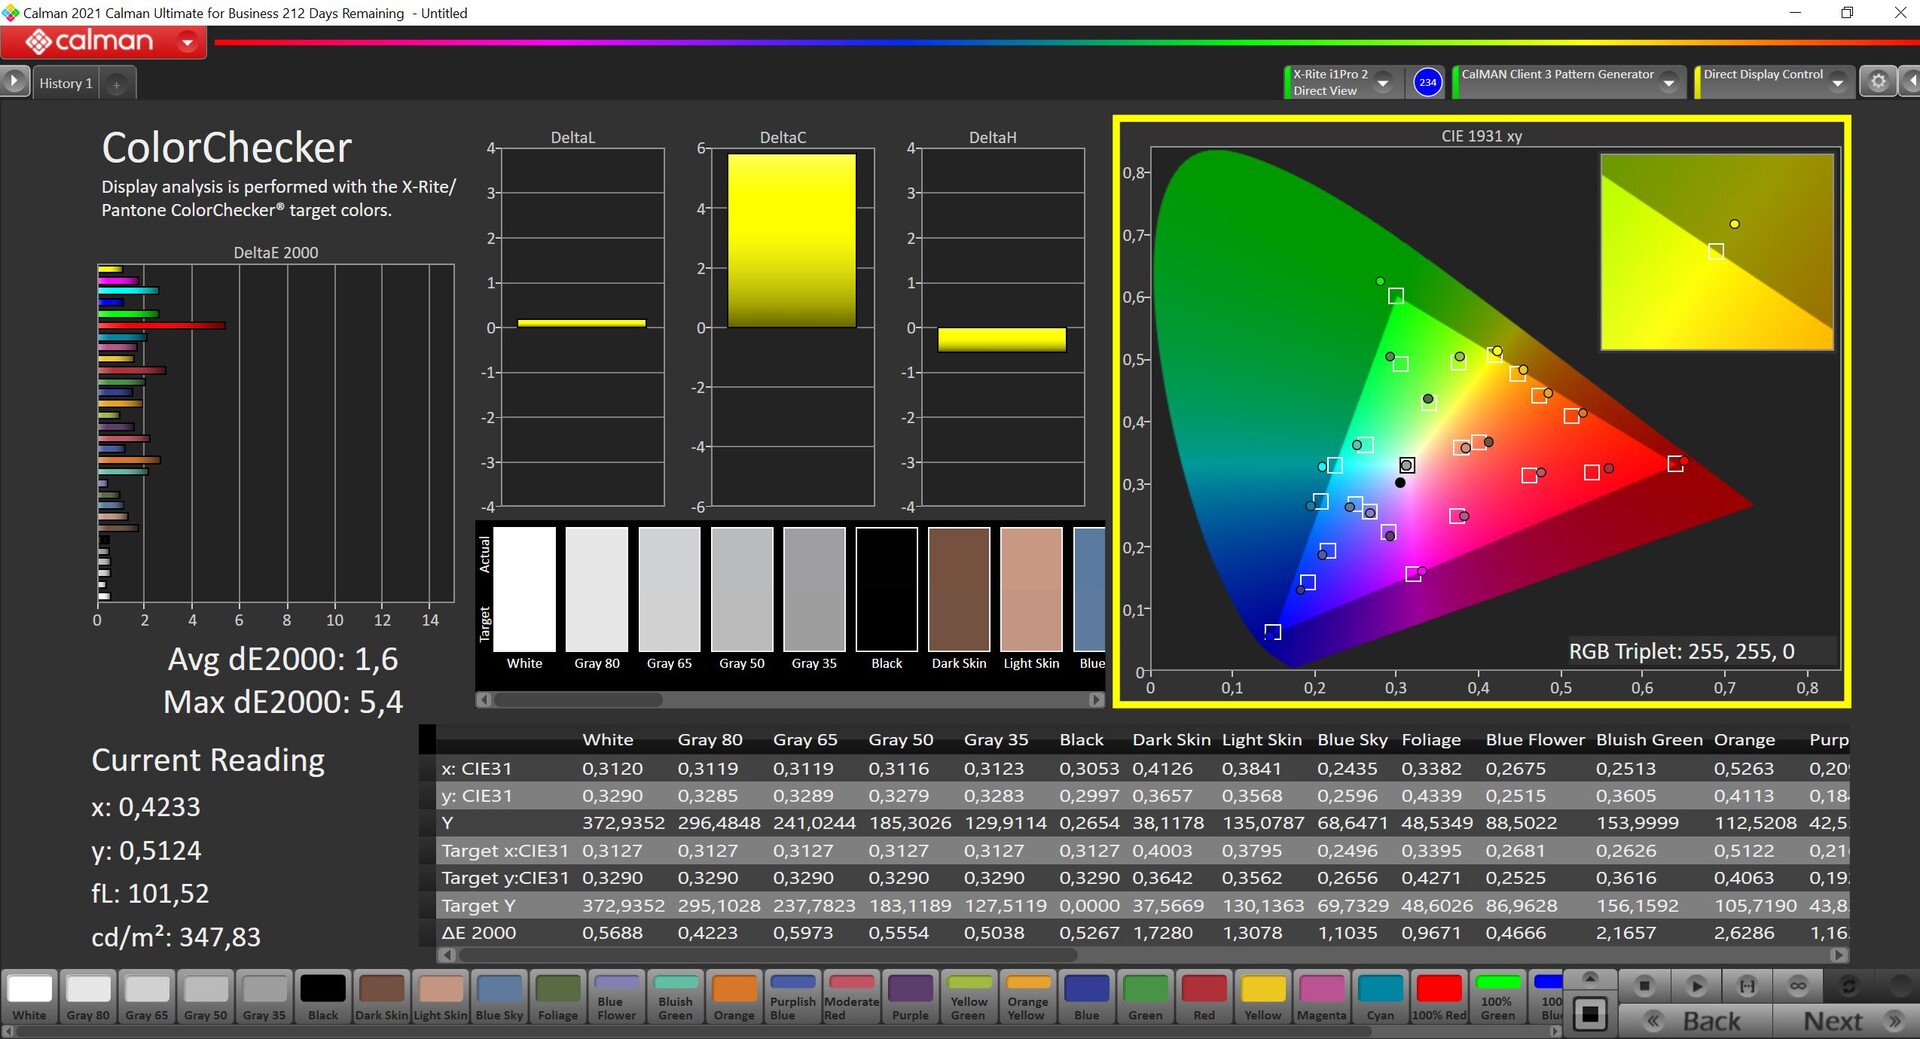
Abbiamo misurato il pannello con il software professionale CalMAN (X-Rite i1 Pro 2). Anche se in fase di consegna è presente una leggera sfumatura di colore verso il verde/blu, questa non è molto evidente nell'uso quotidiano e i risultati sono già decenti per un portatile aziendale. Con la nostra calibrazione (profilo colore scaricabile gratuitamente dal link sopra), siamo in grado di migliorare ulteriormente la riproduzione dei colori. In combinazione con la copertura completa dello spazio colore sRGB, il pannello è abbastanza adatto per l'elaborazione occasionale di immagini o video.
Tempi di risposta del Display
| ↔ Tempi di risposta dal Nero al Bianco | ||
|---|---|---|
| 34.9 ms ... aumenta ↗ e diminuisce ↘ combinato | ↗ 16.5 ms Incremento | 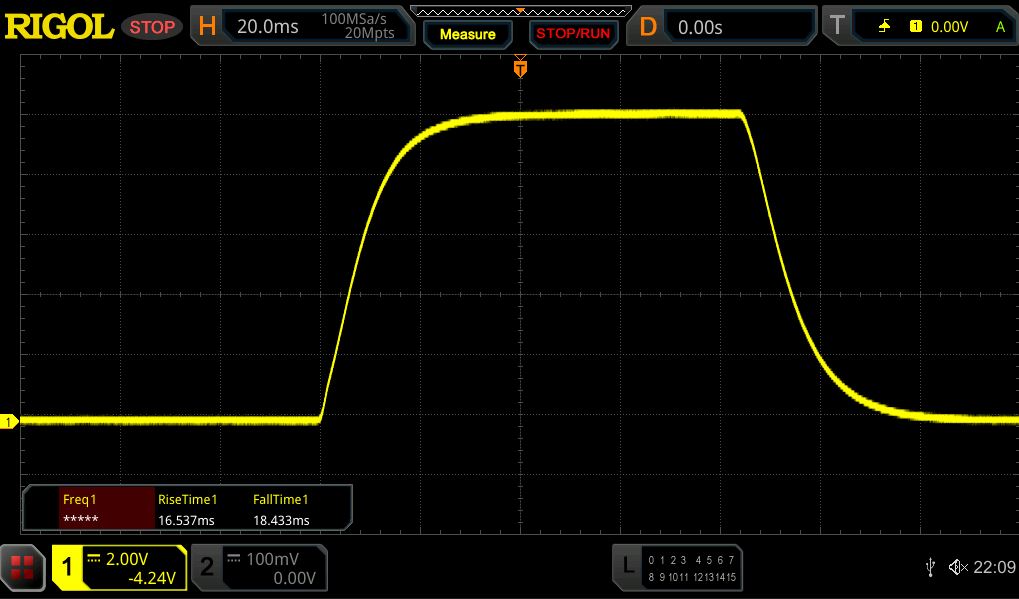 |
| ↘ 18.4 ms Calo | ||
| Lo schermo mostra tempi di risposta lenti nei nostri tests e sarà insoddisfacente per i gamers. In confronto, tutti i dispositivi di test variano da 0.1 (minimo) a 240 (massimo) ms. » 92 % di tutti i dispositivi è migliore. Questo significa che i tempi di risposta rilevati sono peggiori rispetto alla media di tutti i dispositivi testati (19.8 ms). | ||
| ↔ Tempo di risposta dal 50% Grigio all'80% Grigio | ||
| 62.6 ms ... aumenta ↗ e diminuisce ↘ combinato | ↗ 28.2 ms Incremento | 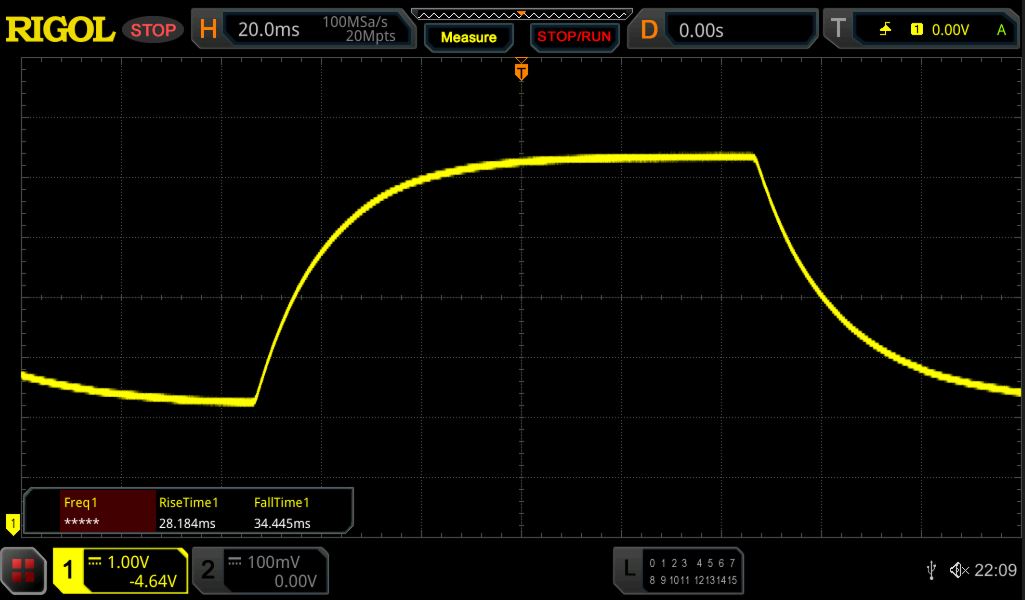 |
| ↘ 34.4 ms Calo | ||
| Lo schermo mostra tempi di risposta lenti nei nostri tests e sarà insoddisfacente per i gamers. In confronto, tutti i dispositivi di test variano da 0.165 (minimo) a 636 (massimo) ms. » 97 % di tutti i dispositivi è migliore. Questo significa che i tempi di risposta rilevati sono peggiori rispetto alla media di tutti i dispositivi testati (31 ms). | ||
Sfarfallio dello schermo / PWM (Pulse-Width Modulation)
| flickering dello schermo / PWM non rilevato | 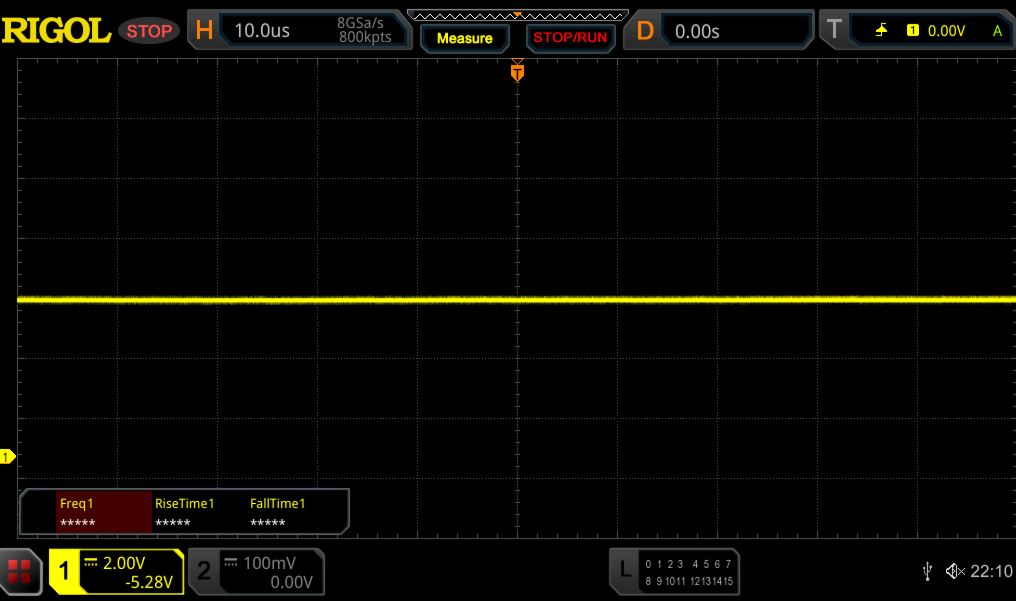 | ||
In confronto: 52 % di tutti i dispositivi testati non utilizza PWM per ridurre la luminosita' del display. Se è rilevato PWM, una media di 7747 (minimo: 5 - massimo: 343500) Hz è stata rilevata. | |||
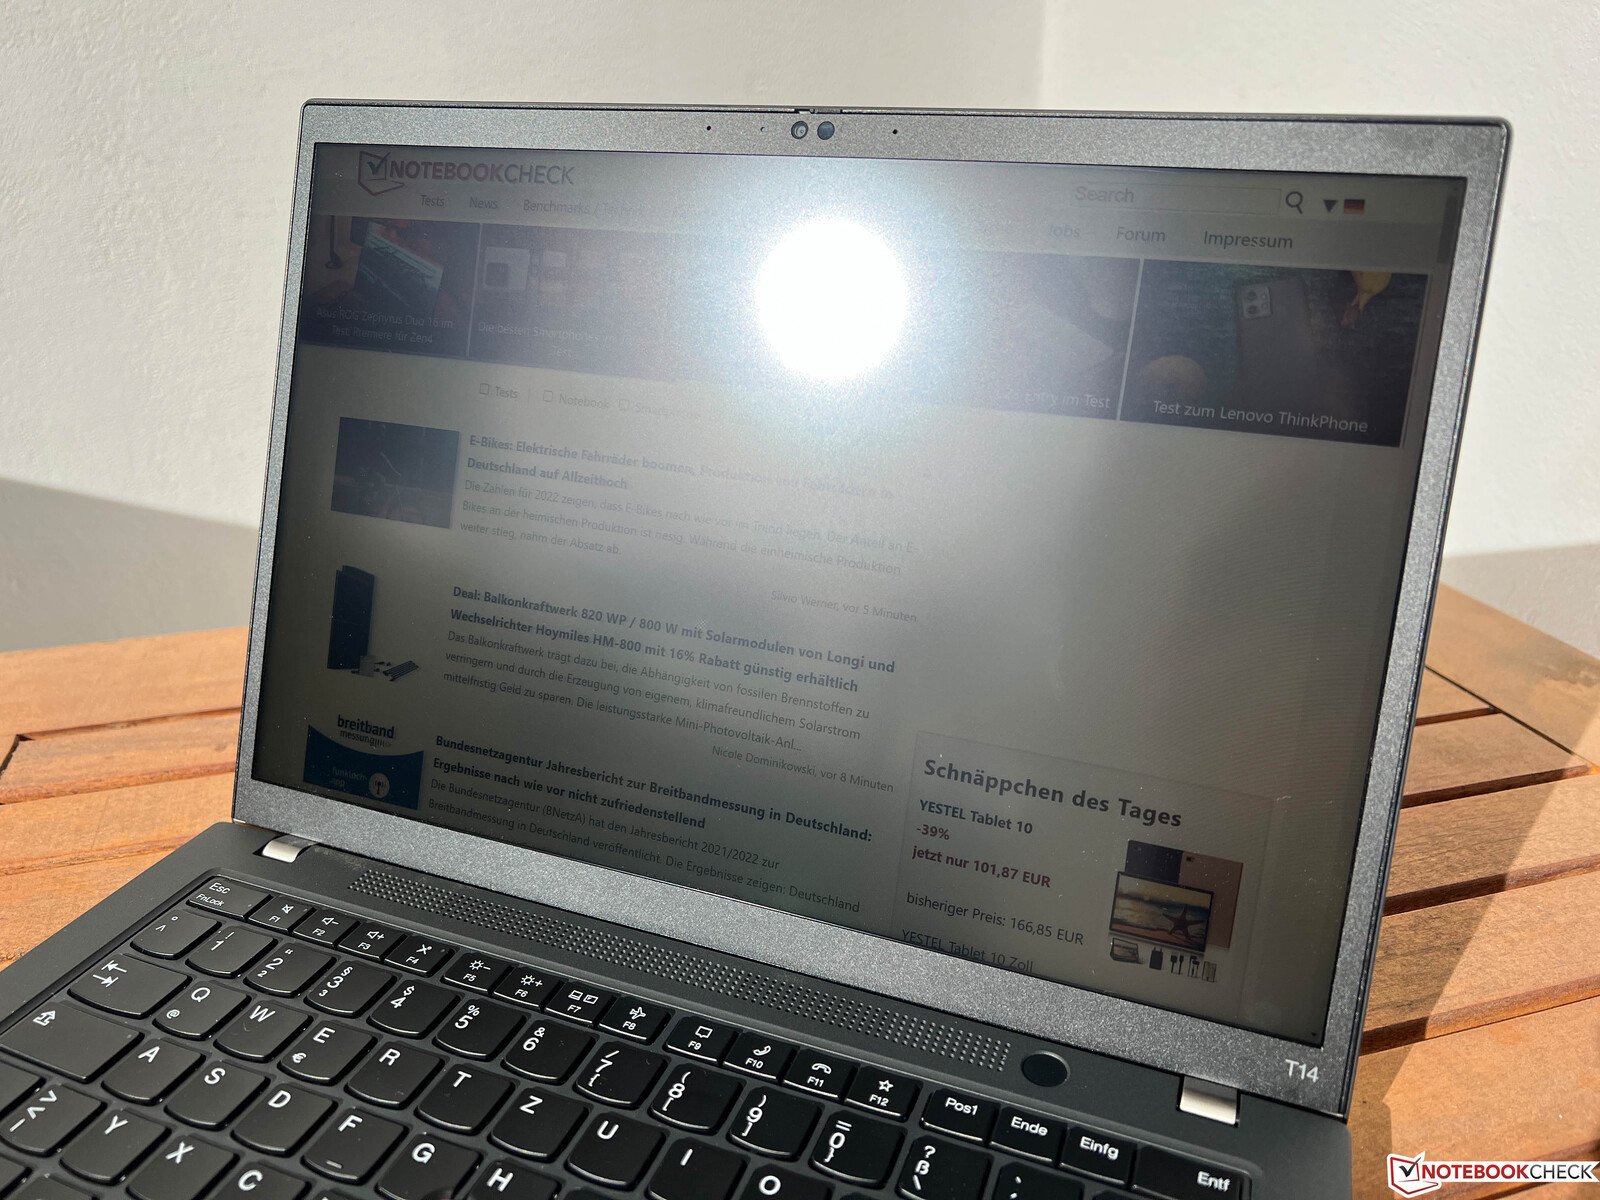
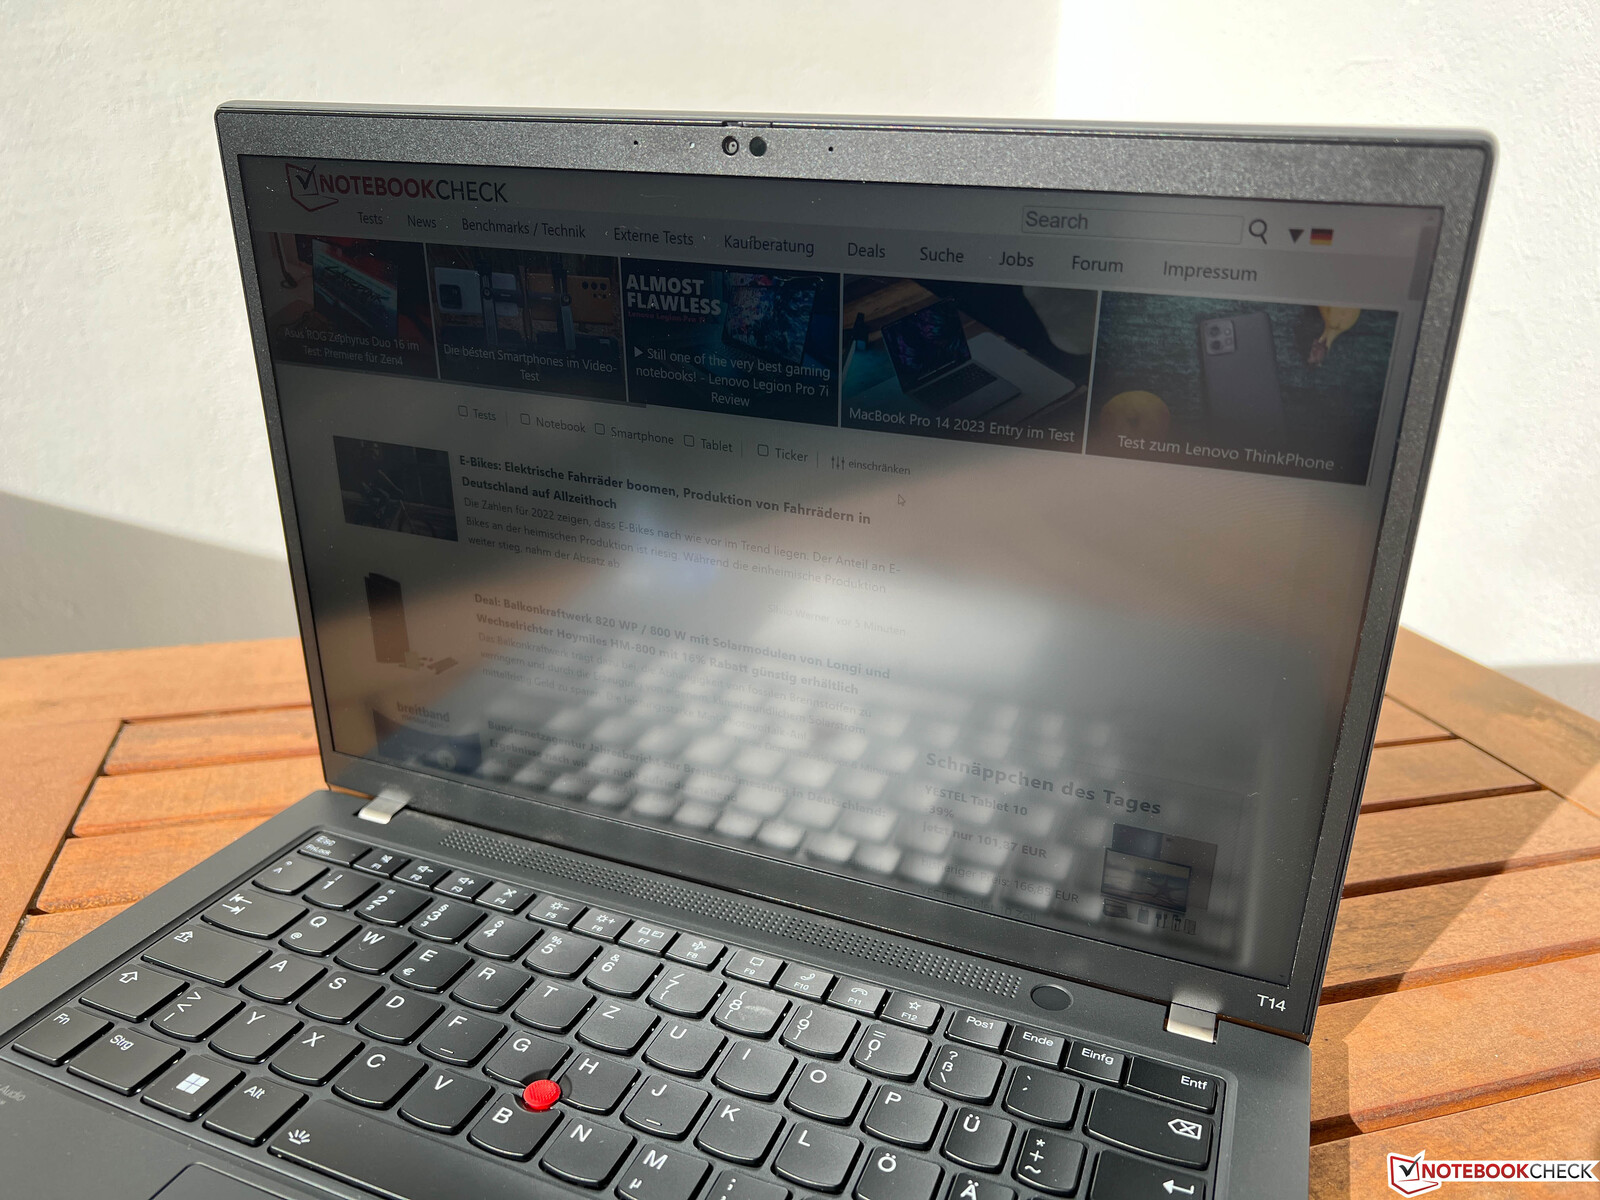
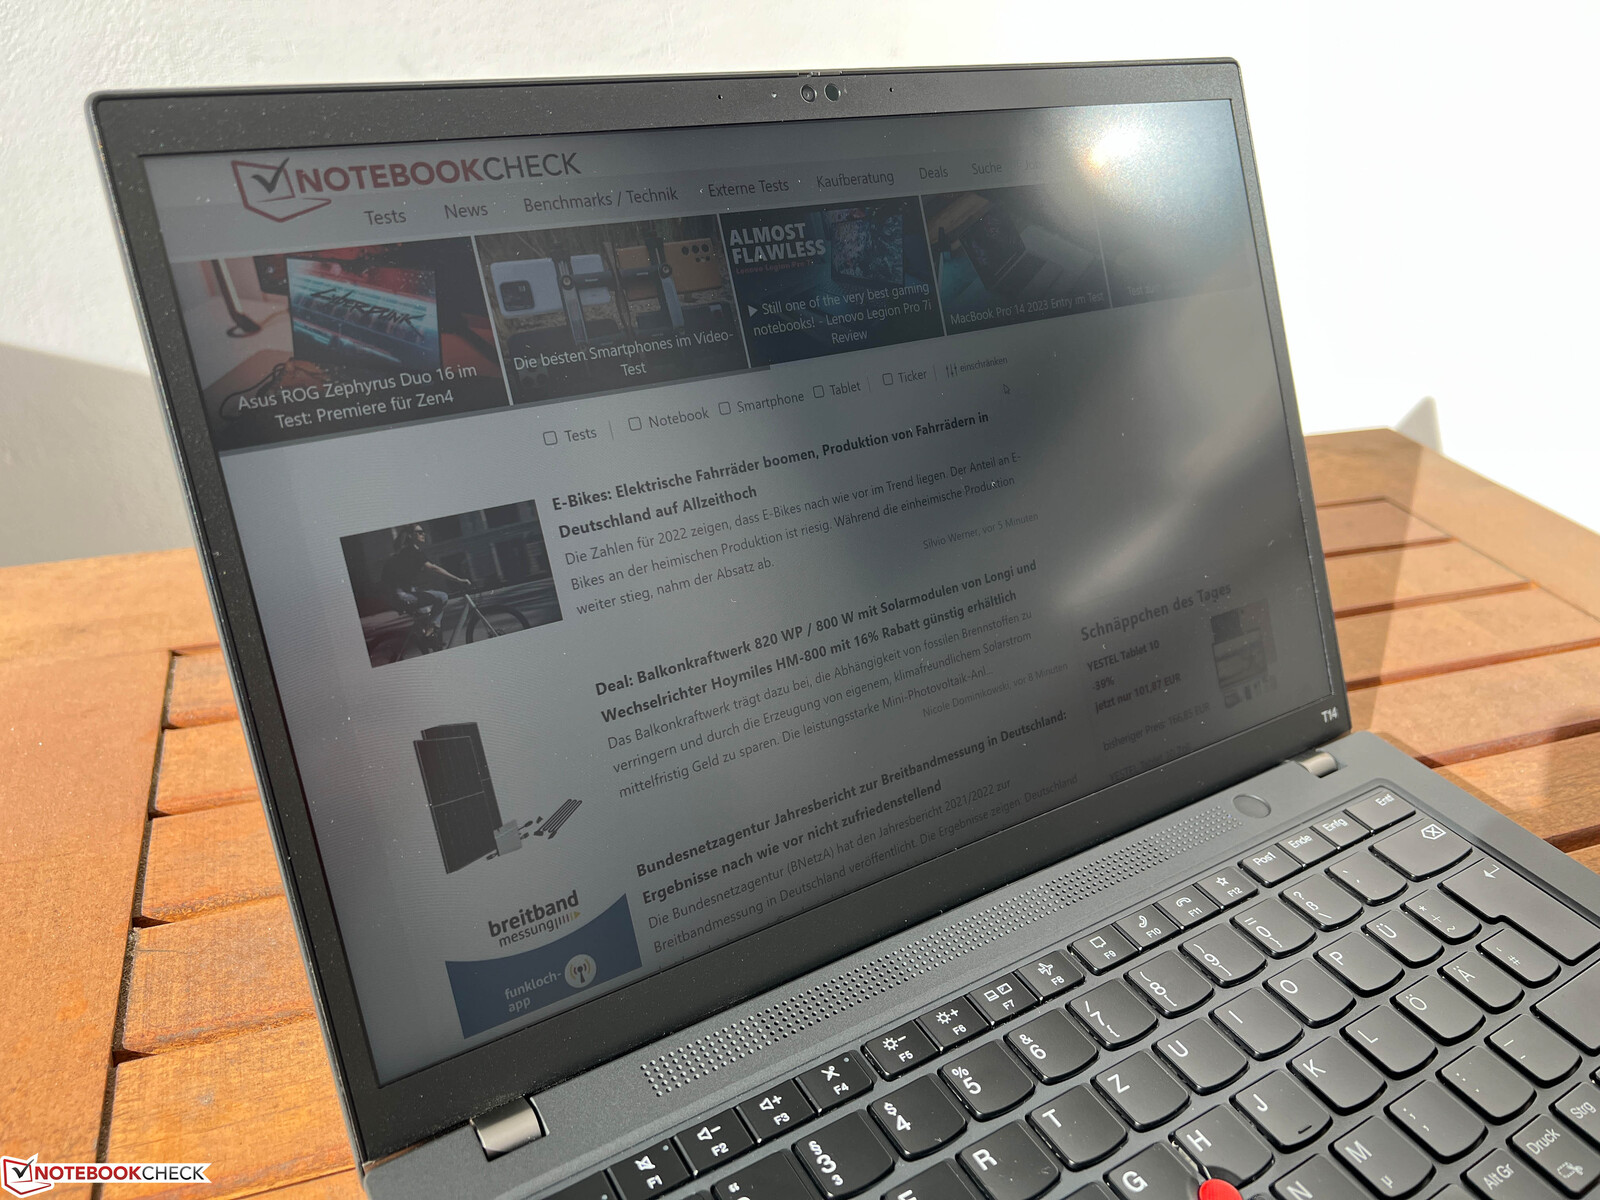
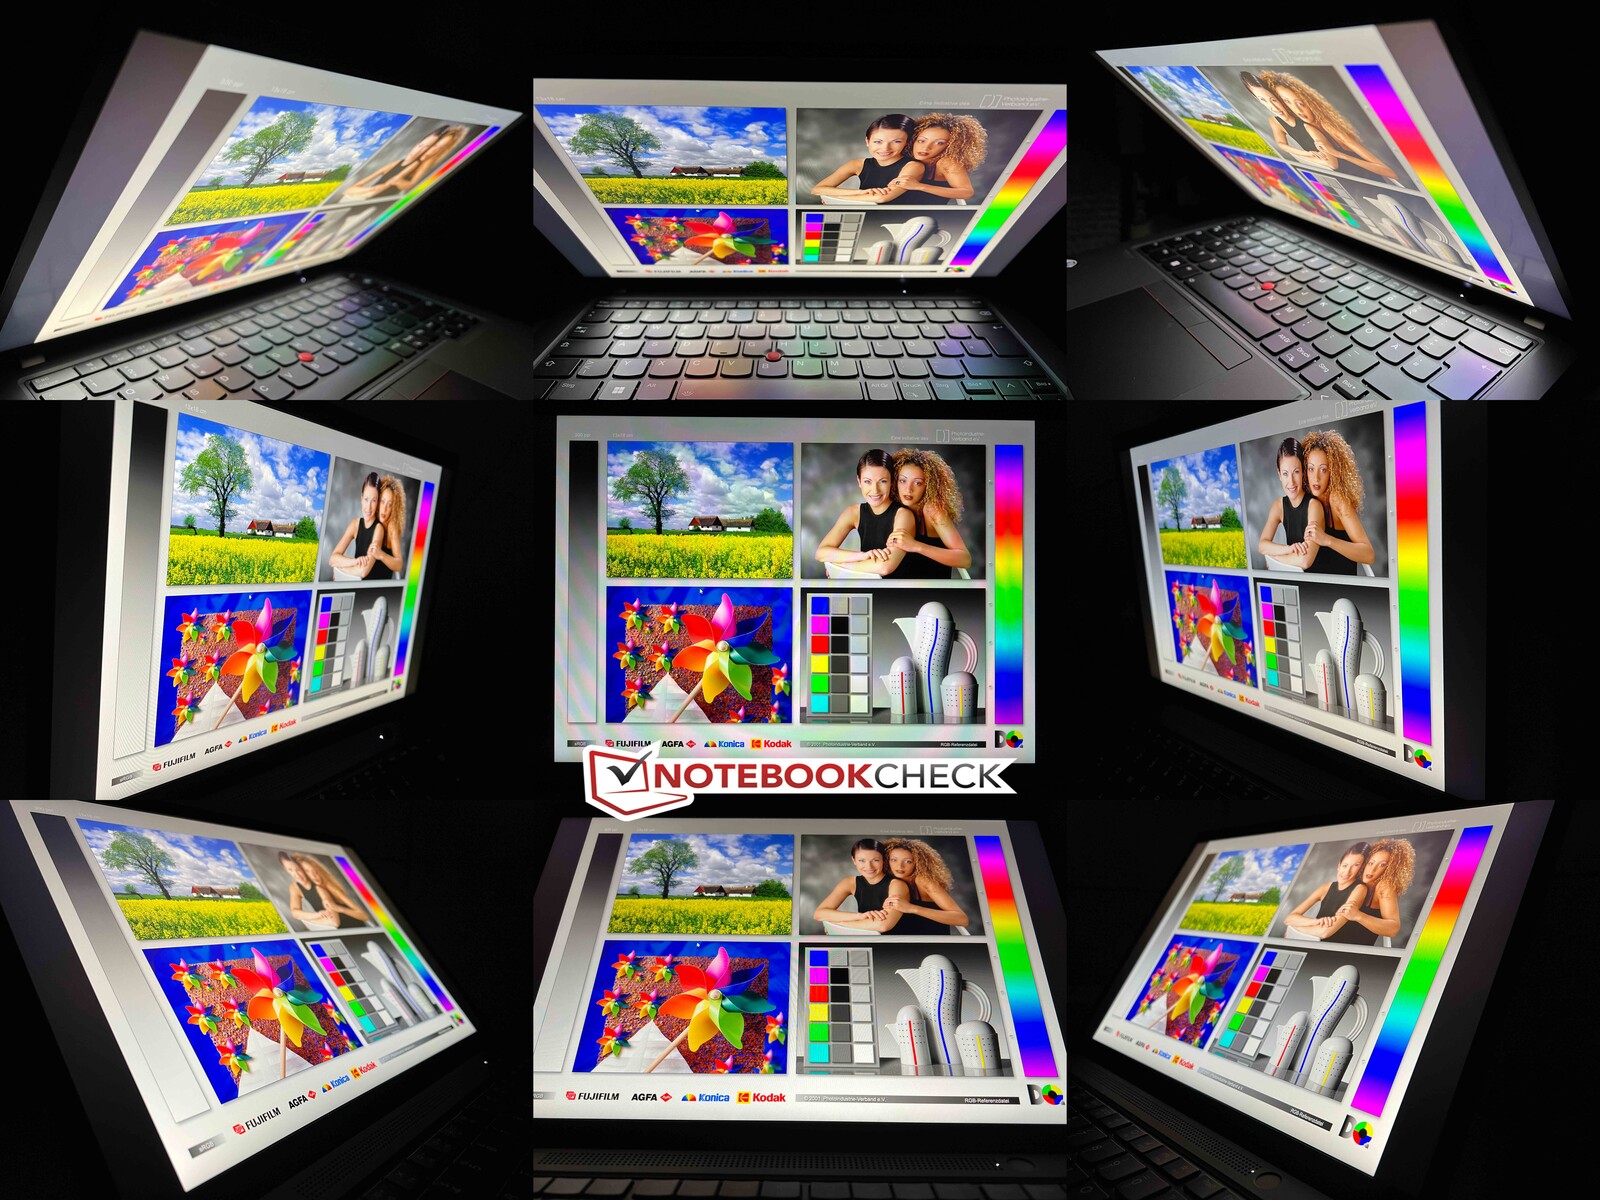
Il pannello si comporta bene all'aperto, ma bisogna comunque evitare i riflessi delle fonti di luce diretta. La stabilità dell'angolo di visione del pannello IPS è molto buona.
Prestazioni - Alder Lake e GeForce MX550
Condizioni di prova
L'applicazione Lenovo Vantage offre una modalità di "raffreddamento intelligente", ma nel nostro test ha avuto un effetto negativo sulle prestazioni dopo poco tempo. Abbiamo quindi disattivato questa modalità per i nostri benchmark e misurazioni (tramite l'app o la combinazione di tasti Fn+T).
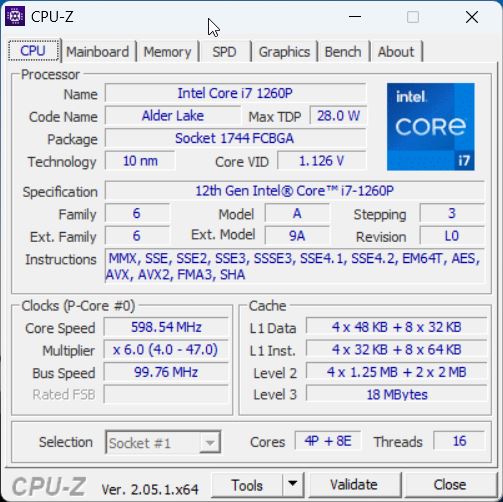
Processore - Core i7-1260P
Sappiamo già che ilCore i7-1260Pdella generazione Alder Lake, e con i suoi 4 core ad alte prestazioni e 8 core di efficienza, le prestazioni sono molto buone, ma il processore Intel consuma anche molta energia. Nel ThinkPad T14 G3, il processore può consumare fino a un massimo di 58 watt e 42 watt costanti. Le prestazioni single-core sono migliori di quelle del modello AMD, mentre le prestazioni multicore sono paragonabili.
Cinebench R15 Multi Constant Load Test
Le prestazioni complessive rimangono relativamente stabili nel ciclo Cinebench. Interessante è anche il confronto con il nuovo Raptor Lake Core i7-1360Pche ha un vantaggio nella prima fase, ma poi scende al livello dei vecchi processori Alder Lake. Solo le prestazioni single-core rimangono leggermente migliori, ma nel complesso si può scegliere anche il Core i7-1260P senza alcuna preoccupazione.
Nel funzionamento a batteria, il processore può consumare un massimo di 32 watt, con una riduzione delle prestazioni di circa il 30% nei test multicore. Potete trovare altri benchmark nella la nostra sezione tecnica.
Cinebench R23: Multi Core | Single Core
Cinebench R20: CPU (Multi Core) | CPU (Single Core)
Cinebench R15: CPU Multi 64Bit | CPU Single 64Bit
Blender: v2.79 BMW27 CPU
7-Zip 18.03: 7z b 4 | 7z b 4 -mmt1
Geekbench 5.5: Multi-Core | Single-Core
HWBOT x265 Benchmark v2.2: 4k Preset
LibreOffice : 20 Documents To PDF
R Benchmark 2.5: Overall mean
| CPU Performance rating | |
| Schenker Vision 14 2022 RTX 3050 Ti | |
| Lenovo Yoga 9 14IRP G8 | |
| HP EliteBook 840 G9 | |
| Lenovo ThinkPad T14 G3-21AJS00400 | |
| Huawei MateBook X Pro 2022 | |
| Media della classe Office | |
| Lenovo ThinkPad T14 G3-21CF004NGE | |
| Media Intel Core i7-1260P | |
| Cinebench R23 / Multi Core | |
| Schenker Vision 14 2022 RTX 3050 Ti | |
| Lenovo ThinkPad T14 G3-21AJS00400 | |
| Lenovo Yoga 9 14IRP G8 | |
| Media della classe Office (1673 - 22808, n=75, ultimi 2 anni) | |
| Lenovo ThinkPad T14 G3-21CF004NGE | |
| HP EliteBook 840 G9 | |
| Media Intel Core i7-1260P (3173 - 12150, n=27) | |
| Huawei MateBook X Pro 2022 | |
| Cinebench R23 / Single Core | |
| Lenovo Yoga 9 14IRP G8 | |
| Lenovo ThinkPad T14 G3-21AJS00400 | |
| HP EliteBook 840 G9 | |
| Media della classe Office (708 - 2130, n=75, ultimi 2 anni) | |
| Schenker Vision 14 2022 RTX 3050 Ti | |
| Media Intel Core i7-1260P (1155 - 1812, n=25) | |
| Huawei MateBook X Pro 2022 | |
| Lenovo ThinkPad T14 G3-21CF004NGE | |
| Cinebench R20 / CPU (Multi Core) | |
| Schenker Vision 14 2022 RTX 3050 Ti | |
| Lenovo ThinkPad T14 G3-21AJS00400 | |
| Media della classe Office (648 - 8840, n=74, ultimi 2 anni) | |
| Lenovo Yoga 9 14IRP G8 | |
| HP EliteBook 840 G9 | |
| Lenovo ThinkPad T14 G3-21CF004NGE | |
| Huawei MateBook X Pro 2022 | |
| Media Intel Core i7-1260P (1234 - 4748, n=25) | |
| Cinebench R20 / CPU (Single Core) | |
| Lenovo Yoga 9 14IRP G8 | |
| Schenker Vision 14 2022 RTX 3050 Ti | |
| Lenovo ThinkPad T14 G3-21AJS00400 | |
| Huawei MateBook X Pro 2022 | |
| Media della classe Office (345 - 816, n=74, ultimi 2 anni) | |
| Media Intel Core i7-1260P (448 - 698, n=25) | |
| HP EliteBook 840 G9 | |
| Lenovo ThinkPad T14 G3-21CF004NGE | |
| Cinebench R15 / CPU Multi 64Bit | |
| Schenker Vision 14 2022 RTX 3050 Ti | |
| Lenovo Yoga 9 14IRP G8 | |
| HP EliteBook 840 G9 | |
| Huawei MateBook X Pro 2022 | |
| Huawei MateBook X Pro 2022 | |
| Lenovo ThinkPad T14 G3-21AJS00400 | |
| Media della classe Office (250 - 3380, n=76, ultimi 2 anni) | |
| Lenovo ThinkPad T14 G3-21CF004NGE | |
| Media Intel Core i7-1260P (549 - 2034, n=29) | |
| Cinebench R15 / CPU Single 64Bit | |
| Lenovo Yoga 9 14IRP G8 | |
| Schenker Vision 14 2022 RTX 3050 Ti | |
| HP EliteBook 840 G9 | |
| Media della classe Office (99.5 - 316, n=76, ultimi 2 anni) | |
| Huawei MateBook X Pro 2022 | |
| Lenovo ThinkPad T14 G3-21AJS00400 | |
| Lenovo ThinkPad T14 G3-21CF004NGE | |
| Media Intel Core i7-1260P (165.4 - 260, n=27) | |
| Blender / v2.79 BMW27 CPU | |
| Media Intel Core i7-1260P (264 - 906, n=26) | |
| Media della classe Office (158 - 1940, n=75, ultimi 2 anni) | |
| Huawei MateBook X Pro 2022 | |
| Lenovo ThinkPad T14 G3-21AJS00400 | |
| Lenovo ThinkPad T14 G3-21CF004NGE | |
| Lenovo Yoga 9 14IRP G8 | |
| HP EliteBook 840 G9 | |
| Schenker Vision 14 2022 RTX 3050 Ti | |
| 7-Zip 18.03 / 7z b 4 | |
| Schenker Vision 14 2022 RTX 3050 Ti | |
| Lenovo ThinkPad T14 G3-21CF004NGE | |
| HP EliteBook 840 G9 | |
| Lenovo Yoga 9 14IRP G8 | |
| Media della classe Office (7098 - 76886, n=76, ultimi 2 anni) | |
| Huawei MateBook X Pro 2022 | |
| Lenovo ThinkPad T14 G3-21AJS00400 | |
| Media Intel Core i7-1260P (16146 - 47064, n=25) | |
| 7-Zip 18.03 / 7z b 4 -mmt1 | |
| HP EliteBook 840 G9 | |
| Lenovo Yoga 9 14IRP G8 | |
| Schenker Vision 14 2022 RTX 3050 Ti | |
| Lenovo ThinkPad T14 G3-21AJS00400 | |
| Media della classe Office (3387 - 6469, n=76, ultimi 2 anni) | |
| Huawei MateBook X Pro 2022 | |
| Lenovo ThinkPad T14 G3-21CF004NGE | |
| Media Intel Core i7-1260P (4064 - 5791, n=25) | |
| Geekbench 5.5 / Multi-Core | |
| HP EliteBook 840 G9 | |
| Schenker Vision 14 2022 RTX 3050 Ti | |
| Lenovo Yoga 9 14IRP G8 | |
| Huawei MateBook X Pro 2022 | |
| Media della classe Office (1483 - 16999, n=72, ultimi 2 anni) | |
| Media Intel Core i7-1260P (3866 - 10570, n=25) | |
| Lenovo ThinkPad T14 G3-21CF004NGE | |
| Lenovo ThinkPad T14 G3-21AJS00400 | |
| Geekbench 5.5 / Single-Core | |
| Media della classe Office (811 - 2175, n=72, ultimi 2 anni) | |
| Lenovo Yoga 9 14IRP G8 | |
| Schenker Vision 14 2022 RTX 3050 Ti | |
| HP EliteBook 840 G9 | |
| Huawei MateBook X Pro 2022 | |
| Media Intel Core i7-1260P (1436 - 1786, n=25) | |
| Lenovo ThinkPad T14 G3-21AJS00400 | |
| Lenovo ThinkPad T14 G3-21CF004NGE | |
| HWBOT x265 Benchmark v2.2 / 4k Preset | |
| Schenker Vision 14 2022 RTX 3050 Ti | |
| Lenovo ThinkPad T14 G3-21AJS00400 | |
| Media della classe Office (2.21 - 26, n=75, ultimi 2 anni) | |
| Lenovo ThinkPad T14 G3-21CF004NGE | |
| Lenovo Yoga 9 14IRP G8 | |
| HP EliteBook 840 G9 | |
| Huawei MateBook X Pro 2022 | |
| Media Intel Core i7-1260P (3.45 - 13.6, n=26) | |
| LibreOffice / 20 Documents To PDF | |
| Media della classe Office (39.9 - 102.3, n=75, ultimi 2 anni) | |
| Lenovo ThinkPad T14 G3-21CF004NGE | |
| Media Intel Core i7-1260P (40.2 - 65.7, n=25) | |
| Lenovo Yoga 9 14IRP G8 | |
| HP EliteBook 840 G9 | |
| Schenker Vision 14 2022 RTX 3050 Ti | |
| Lenovo ThinkPad T14 G3-21AJS00400 | |
| Huawei MateBook X Pro 2022 | |
| R Benchmark 2.5 / Overall mean | |
| Lenovo ThinkPad T14 G3-21CF004NGE | |
| Media della classe Office (0.393 - 0.888, n=75, ultimi 2 anni) | |
| Media Intel Core i7-1260P (0.4559 - 0.727, n=25) | |
| Huawei MateBook X Pro 2022 | |
| Lenovo ThinkPad T14 G3-21AJS00400 | |
| HP EliteBook 840 G9 | |
| Lenovo Yoga 9 14IRP G8 | |
| Schenker Vision 14 2022 RTX 3050 Ti | |
* ... Meglio usare valori piccoli
AIDA64: FP32 Ray-Trace | FPU Julia | CPU SHA3 | CPU Queen | FPU SinJulia | FPU Mandel | CPU AES | CPU ZLib | FP64 Ray-Trace | CPU PhotoWorxx
| Performance rating | |
| Schenker Vision 14 2022 RTX 3050 Ti | |
| Lenovo ThinkPad T14 G3-21CF004NGE | |
| Media della classe Office | |
| HP EliteBook 840 G9 | |
| Lenovo ThinkPad T14 G3-21AJS00400 | |
| Huawei MateBook X Pro 2022 | |
| Media Intel Core i7-1260P | |
| AIDA64 / FP32 Ray-Trace | |
| Media della classe Office (2083 - 31245, n=82, ultimi 2 anni) | |
| Schenker Vision 14 2022 RTX 3050 Ti | |
| Lenovo ThinkPad T14 G3-21CF004NGE | |
| Lenovo ThinkPad T14 G3-21AJS00400 | |
| HP EliteBook 840 G9 | |
| Media Intel Core i7-1260P (2176 - 10898, n=26) | |
| Huawei MateBook X Pro 2022 | |
| AIDA64 / FPU Julia | |
| Lenovo ThinkPad T14 G3-21CF004NGE | |
| Media della classe Office (8191 - 125394, n=82, ultimi 2 anni) | |
| Schenker Vision 14 2022 RTX 3050 Ti | |
| Lenovo ThinkPad T14 G3-21AJS00400 | |
| HP EliteBook 840 G9 | |
| Media Intel Core i7-1260P (11015 - 56906, n=26) | |
| Huawei MateBook X Pro 2022 | |
| AIDA64 / CPU SHA3 | |
| Media della classe Office (433 - 5755, n=82, ultimi 2 anni) | |
| Schenker Vision 14 2022 RTX 3050 Ti | |
| Lenovo ThinkPad T14 G3-21AJS00400 | |
| Lenovo ThinkPad T14 G3-21CF004NGE | |
| HP EliteBook 840 G9 | |
| Media Intel Core i7-1260P (669 - 2709, n=26) | |
| Huawei MateBook X Pro 2022 | |
| AIDA64 / CPU Queen | |
| HP EliteBook 840 G9 | |
| Schenker Vision 14 2022 RTX 3050 Ti | |
| Lenovo ThinkPad T14 G3-21CF004NGE | |
| Lenovo ThinkPad T14 G3-21AJS00400 | |
| Huawei MateBook X Pro 2022 | |
| Media Intel Core i7-1260P (42571 - 82493, n=26) | |
| Media della classe Office (22784 - 115197, n=67, ultimi 2 anni) | |
| AIDA64 / FPU SinJulia | |
| Lenovo ThinkPad T14 G3-21CF004NGE | |
| Schenker Vision 14 2022 RTX 3050 Ti | |
| Media della classe Office (1378 - 18321, n=82, ultimi 2 anni) | |
| HP EliteBook 840 G9 | |
| Lenovo ThinkPad T14 G3-21AJS00400 | |
| Huawei MateBook X Pro 2022 | |
| Media Intel Core i7-1260P (2901 - 6975, n=26) | |
| AIDA64 / FPU Mandel | |
| Lenovo ThinkPad T14 G3-21CF004NGE | |
| Media della classe Office (4601 - 66922, n=82, ultimi 2 anni) | |
| Schenker Vision 14 2022 RTX 3050 Ti | |
| Lenovo ThinkPad T14 G3-21AJS00400 | |
| HP EliteBook 840 G9 | |
| Media Intel Core i7-1260P (5950 - 26376, n=26) | |
| Huawei MateBook X Pro 2022 | |
| AIDA64 / CPU AES | |
| Schenker Vision 14 2022 RTX 3050 Ti | |
| Huawei MateBook X Pro 2022 | |
| Lenovo ThinkPad T14 G3-21AJS00400 | |
| Media della classe Office (4854 - 155900, n=82, ultimi 2 anni) | |
| HP EliteBook 840 G9 | |
| Lenovo ThinkPad T14 G3-21CF004NGE | |
| Media Intel Core i7-1260P (16041 - 92356, n=26) | |
| AIDA64 / CPU ZLib | |
| Schenker Vision 14 2022 RTX 3050 Ti | |
| Lenovo ThinkPad T14 G3-21AJS00400 | |
| Media della classe Office (114.6 - 1366, n=82, ultimi 2 anni) | |
| HP EliteBook 840 G9 | |
| Lenovo ThinkPad T14 G3-21CF004NGE | |
| Huawei MateBook X Pro 2022 | |
| Media Intel Core i7-1260P (259 - 771, n=26) | |
| AIDA64 / FP64 Ray-Trace | |
| Media della classe Office (1109 - 17834, n=82, ultimi 2 anni) | |
| Schenker Vision 14 2022 RTX 3050 Ti | |
| Lenovo ThinkPad T14 G3-21CF004NGE | |
| Lenovo ThinkPad T14 G3-21AJS00400 | |
| HP EliteBook 840 G9 | |
| Media Intel Core i7-1260P (1237 - 5858, n=26) | |
| Huawei MateBook X Pro 2022 | |
| AIDA64 / CPU PhotoWorxx | |
| Media della classe Office (11090 - 65229, n=82, ultimi 2 anni) | |
| Huawei MateBook X Pro 2022 | |
| HP EliteBook 840 G9 | |
| Media Intel Core i7-1260P (13261 - 43652, n=26) | |
| Schenker Vision 14 2022 RTX 3050 Ti | |
| Lenovo ThinkPad T14 G3-21CF004NGE | |
| Lenovo ThinkPad T14 G3-21AJS00400 | |
Prestazioni del sistema
In pratica, anche la versione Intel del ThinkPad T14 G3 è un portatile molto reattivo e non abbiamo riscontrato alcun problema. Tuttavia, la nostra unità di test mostra solo prestazioni medie nei benchmark sintetici. Ciò è dovuto principalmente alle cattive prestazioni dell'archiviazione, poiché la memoria di lavoro funziona solo in configurazione a canale singolo.
CrossMark: Overall | Productivity | Creativity | Responsiveness
| PCMark 10 / Score | |
| Schenker Vision 14 2022 RTX 3050 Ti | |
| Media della classe Office (2601 - 9298, n=67, ultimi 2 anni) | |
| Huawei MateBook X Pro 2022 | |
| Lenovo ThinkPad T14 G3-21CF004NGE | |
| Media Intel Core i7-1260P, NVIDIA GeForce MX550 (5870 - 6235, n=2) | |
| HP EliteBook 840 G9 | |
| Lenovo ThinkPad T14 G3-21AJS00400 | |
| PCMark 10 / Essentials | |
| HP EliteBook 840 G9 | |
| Huawei MateBook X Pro 2022 | |
| Schenker Vision 14 2022 RTX 3050 Ti | |
| Media della classe Office (3245 - 11594, n=67, ultimi 2 anni) | |
| Media Intel Core i7-1260P, NVIDIA GeForce MX550 (9729 - 10132, n=2) | |
| Lenovo ThinkPad T14 G3-21CF004NGE | |
| Lenovo ThinkPad T14 G3-21AJS00400 | |
| PCMark 10 / Productivity | |
| Media della classe Office (5336 - 17243, n=67, ultimi 2 anni) | |
| Media Intel Core i7-1260P, NVIDIA GeForce MX550 (8189 - 9245, n=2) | |
| Huawei MateBook X Pro 2022 | |
| Schenker Vision 14 2022 RTX 3050 Ti | |
| Lenovo ThinkPad T14 G3-21CF004NGE | |
| Lenovo ThinkPad T14 G3-21AJS00400 | |
| HP EliteBook 840 G9 | |
| PCMark 10 / Digital Content Creation | |
| Schenker Vision 14 2022 RTX 3050 Ti | |
| Media della classe Office (2049 - 13541, n=67, ultimi 2 anni) | |
| Lenovo ThinkPad T14 G3-21CF004NGE | |
| HP EliteBook 840 G9 | |
| Media Intel Core i7-1260P, NVIDIA GeForce MX550 (6891 - 7021, n=2) | |
| Lenovo ThinkPad T14 G3-21AJS00400 | |
| Huawei MateBook X Pro 2022 | |
| CrossMark / Overall | |
| Huawei MateBook X Pro 2022 | |
| HP EliteBook 840 G9 | |
| Schenker Vision 14 2022 RTX 3050 Ti | |
| Media della classe Office (381 - 2010, n=74, ultimi 2 anni) | |
| Lenovo ThinkPad T14 G3-21AJS00400 | |
| Media Intel Core i7-1260P, NVIDIA GeForce MX550 (n=1) | |
| Lenovo ThinkPad T14 G3-21CF004NGE | |
| CrossMark / Productivity | |
| Huawei MateBook X Pro 2022 | |
| HP EliteBook 840 G9 | |
| Schenker Vision 14 2022 RTX 3050 Ti | |
| Lenovo ThinkPad T14 G3-21AJS00400 | |
| Media Intel Core i7-1260P, NVIDIA GeForce MX550 (n=1) | |
| Media della classe Office (464 - 1880, n=74, ultimi 2 anni) | |
| Lenovo ThinkPad T14 G3-21CF004NGE | |
| CrossMark / Creativity | |
| Huawei MateBook X Pro 2022 | |
| HP EliteBook 840 G9 | |
| Schenker Vision 14 2022 RTX 3050 Ti | |
| Media della classe Office (319 - 2361, n=74, ultimi 2 anni) | |
| Lenovo ThinkPad T14 G3-21AJS00400 | |
| Media Intel Core i7-1260P, NVIDIA GeForce MX550 (n=1) | |
| Lenovo ThinkPad T14 G3-21CF004NGE | |
| CrossMark / Responsiveness | |
| Huawei MateBook X Pro 2022 | |
| HP EliteBook 840 G9 | |
| Schenker Vision 14 2022 RTX 3050 Ti | |
| Lenovo ThinkPad T14 G3-21AJS00400 | |
| Media Intel Core i7-1260P, NVIDIA GeForce MX550 (n=1) | |
| Media della classe Office (360 - 1820, n=74, ultimi 2 anni) | |
| Lenovo ThinkPad T14 G3-21CF004NGE | |
| PCMark 10 Score | 5870 punti | |
Aiuto | ||
| AIDA64 / Memory Copy | |
| Media della classe Office (20075 - 110930, n=79, ultimi 2 anni) | |
| Huawei MateBook X Pro 2022 | |
| HP EliteBook 840 G9 | |
| Media Intel Core i7-1260P (25125 - 71544, n=25) | |
| Lenovo ThinkPad T14 G3-21CF004NGE | |
| Schenker Vision 14 2022 RTX 3050 Ti | |
| Lenovo ThinkPad T14 G3-21AJS00400 | |
| AIDA64 / Memory Read | |
| Huawei MateBook X Pro 2022 | |
| Media della classe Office (10084 - 128030, n=80, ultimi 2 anni) | |
| HP EliteBook 840 G9 | |
| Media Intel Core i7-1260P (24983 - 72065, n=25) | |
| Lenovo ThinkPad T14 G3-21CF004NGE | |
| Schenker Vision 14 2022 RTX 3050 Ti | |
| Lenovo ThinkPad T14 G3-21AJS00400 | |
| AIDA64 / Memory Write | |
| Media della classe Office (20073 - 119858, n=80, ultimi 2 anni) | |
| Huawei MateBook X Pro 2022 | |
| HP EliteBook 840 G9 | |
| Media Intel Core i7-1260P (23512 - 66799, n=25) | |
| Lenovo ThinkPad T14 G3-21CF004NGE | |
| Schenker Vision 14 2022 RTX 3050 Ti | |
| Lenovo ThinkPad T14 G3-21AJS00400 | |
| AIDA64 / Memory Latency | |
| Lenovo ThinkPad T14 G3-21CF004NGE | |
| Huawei MateBook X Pro 2022 | |
| Media della classe Office (7.6 - 162.9, n=75, ultimi 2 anni) | |
| HP EliteBook 840 G9 | |
| Lenovo ThinkPad T14 G3-21AJS00400 | |
| Schenker Vision 14 2022 RTX 3050 Ti | |
| Media Intel Core i7-1260P (77.9 - 118.4, n=21) | |
* ... Meglio usare valori piccoli
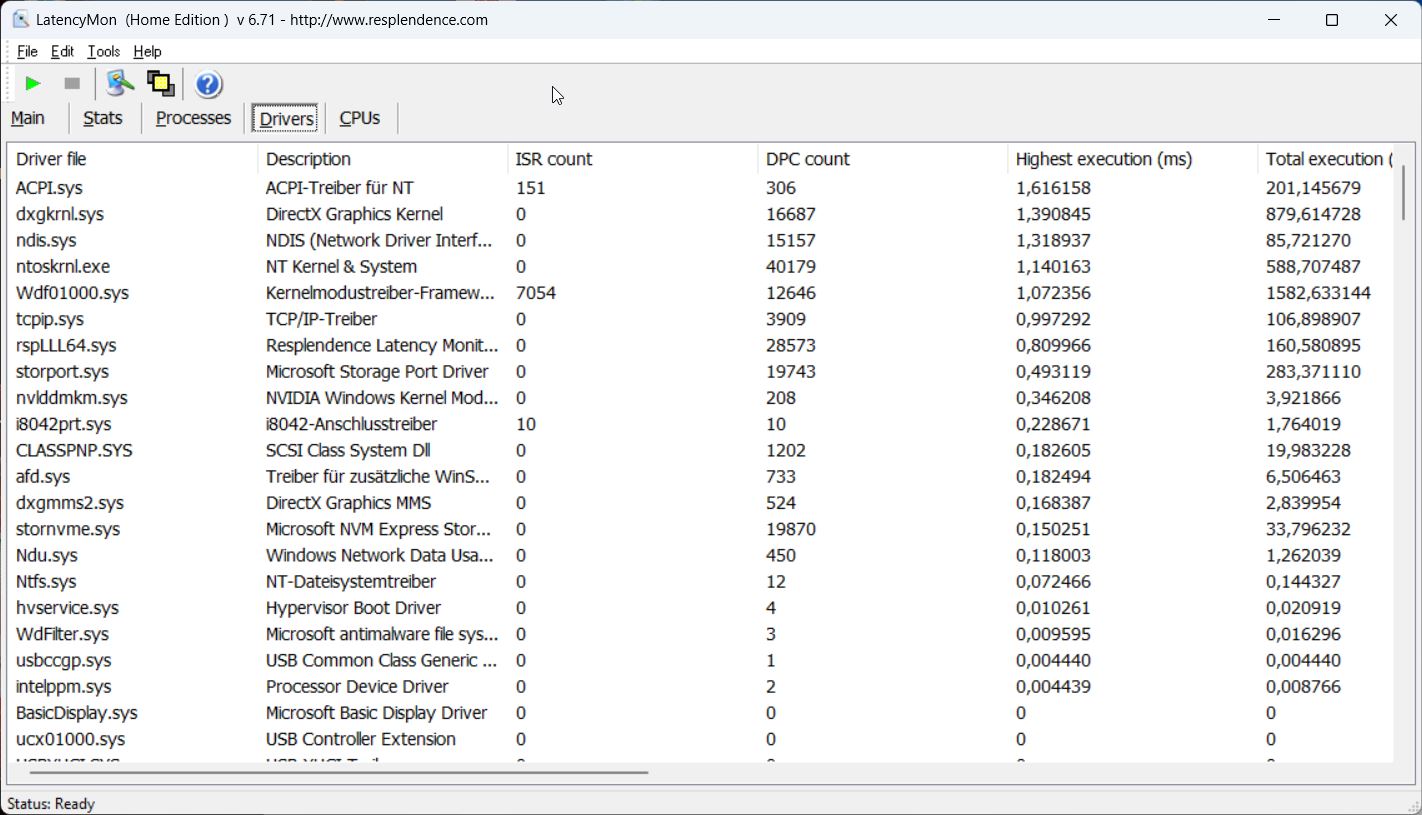
Latenze DPC
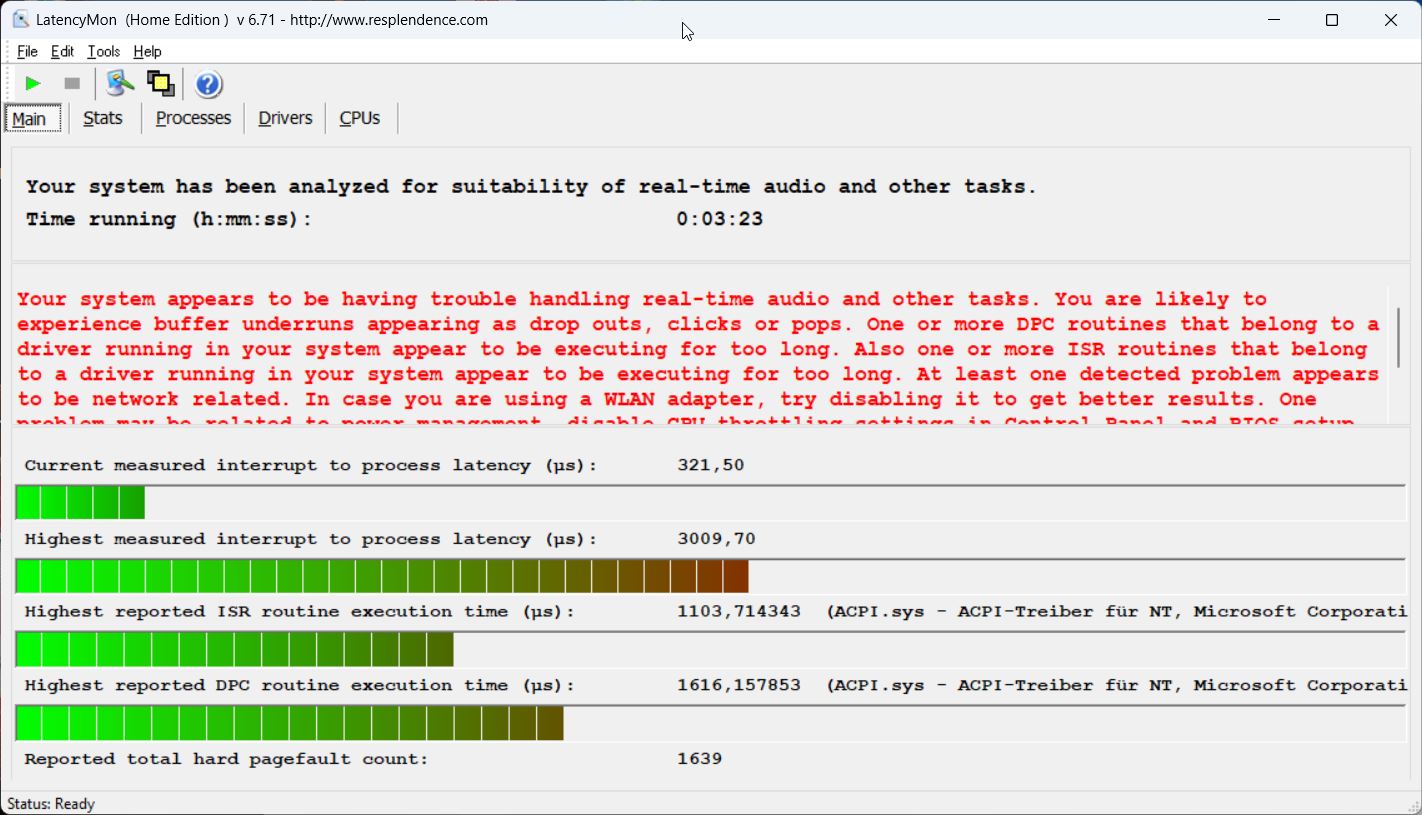
Nel nostro test di latenza standardizzato (navigazione in Internet, riproduzione di video YouTube 4K e carico della CPU), l'unità di test con l'attuale versione del BIOS mostra alcune limitazioni significative per l'utilizzo di applicazioni audio in tempo reale. Ma potrebbero esserci anche alcune limitazioni create dal driver Nvidia, dato che ci sono stati problemi in questo senso per diverse versioni del driver. Il modello Modello AMD del T14 G3non ha avuto alcun problema.
| DPC Latencies / LatencyMon - interrupt to process latency (max), Web, Youtube, Prime95 | |
| HP EliteBook 840 G9 | |
| Lenovo ThinkPad T14 G3-21AJS00400 | |
| Huawei MateBook X Pro 2022 | |
| Schenker Vision 14 2022 RTX 3050 Ti | |
| Lenovo ThinkPad T14 G3-21CF004NGE | |
* ... Meglio usare valori piccoli
Soluzione di stoccaggio
La nostra unità di test utilizza la versione da 1 TB del Samsung PM9A1, che è la variante OEM del 980 Pro. Sebbene l'unità SSD PCIe 4.0 offra ottime velocità di trasferimento, le velocità calano dopo qualche tempo sotto carico costante. Tuttavia, questo non ha alcun impatto sul funzionamento quotidiano dell'azienda. Dopo il primo avvio, l'utente ha a disposizione 904 GB di spazio di archiviazione. È possibile trovare altri benchmark dell'SSD qui.

* ... Meglio usare valori piccoli
Disk Throttling: DiskSpd Read Loop, Queue Depth 8
Scheda grafica
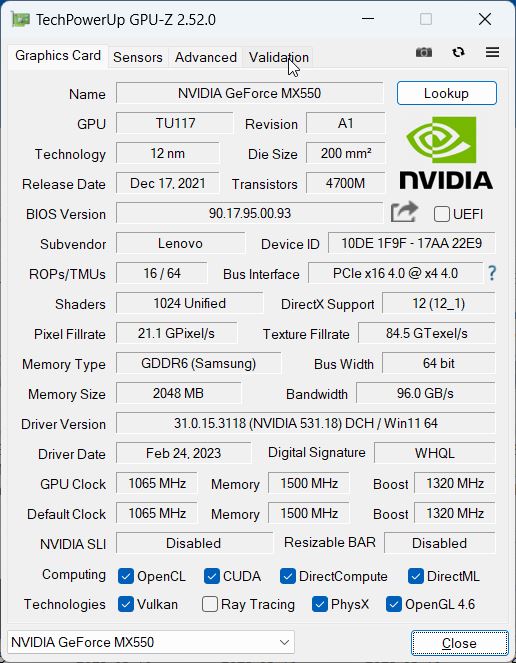
Oltre alla grafica integrata Grafica Iris Xe G7 integratadel processore, Lenovo ha dotato la nostra configurazione di prova anche di una grafica dedicata GeForce MX550di Nvidia con 2 GB di VRAM. La scheda grafica può consumare un massimo di 30 watt e offre un notevole vantaggio nei benchmark rispetto alla iGPU di Intel, leggermente obsoleta. Tuttavia, la scheda grafica integrata Radeon 680M integrata nel modello AMD si comporta allo stesso livello, almeno nei test sintetici. Quindi dobbiamo già porci la domanda sul perché sia necessaria una scheda grafica aggiuntiva.
D'altra parte, la GPU GeForce ha un leggero vantaggio rispetto alla Radeon 680M integrata nei benchmark di gioco reali, ma questo vantaggio non è davvero enorme. Coloro che amano giocare sul proprio portatile da lavoro dopo aver terminato il lavoro sono decisamente più avvantaggiati dallo Schenker Vision 14e der RTX 3050 Ti, ad esempio.
Sotto carico costante e in funzionamento a batteria, le prestazioni grafiche rimangono stabili. Ulteriori benchmark della GPU sono disponibili nella la nostra sezione tecnica.
| 3DMark 11 Performance | 10068 punti | |
| 3DMark Fire Strike Score | 5764 punti | |
| 3DMark Time Spy Score | 2695 punti | |
Aiuto | ||
| Blender / v3.3 Classroom OPTIX/RTX | |
| Lenovo ThinkPad T14 G3-21AJS00400 | |
| Media NVIDIA GeForce MX550 (n=1) | |
| Media della classe Office (29 - 242, n=2, ultimi 2 anni) | |
| Schenker Vision 14 2022 RTX 3050 Ti | |
| Blender / v3.3 Classroom CUDA | |
| Lenovo ThinkPad T14 G3-21AJS00400 | |
| Media NVIDIA GeForce MX550 (n=1) | |
| Media della classe Office (53 - 214, n=3, ultimi 2 anni) | |
| Schenker Vision 14 2022 RTX 3050 Ti | |
| Blender / v3.3 Classroom CPU | |
| HP EliteBook 840 G9 | |
| Lenovo ThinkPad T14 G3-21AJS00400 | |
| Media NVIDIA GeForce MX550 (n=1) | |
| Huawei MateBook X Pro 2022 | |
| Media della classe Office (245 - 3219, n=74, ultimi 2 anni) | |
| Lenovo ThinkPad T14 G3-21CF004NGE | |
| Schenker Vision 14 2022 RTX 3050 Ti | |
| Blender / v3.3 Classroom HIP/AMD | |
| Media della classe Office (296 - 507, n=5, ultimi 2 anni) | |
| Lenovo ThinkPad T14 G3-21CF004NGE | |
* ... Meglio usare valori piccoli
| The Witcher 3 - 1920x1080 Ultra Graphics & Postprocessing (HBAO+) | |
| Schenker Vision 14 2022 RTX 3050 Ti | |
| Lenovo ThinkPad T14 G3-21AJS00400 | |
| Lenovo ThinkPad T14 G3-21CF004NGE | |
| Media della classe Office (14.8 - 28.1, n=3, ultimi 2 anni) | |
| HP EliteBook 840 G9 | |
| Huawei MateBook X Pro 2022 | |
| GTA V - 1920x1080 Highest AA:4xMSAA + FX AF:16x | |
| Schenker Vision 14 2022 RTX 3050 Ti | |
| Lenovo ThinkPad T14 G3-21AJS00400 | |
| Lenovo ThinkPad T14 G3-21CF004NGE | |
| Media della classe Office (5.77 - 45.3, n=68, ultimi 2 anni) | |
| Huawei MateBook X Pro 2022 | |
| HP EliteBook 840 G9 | |
| Final Fantasy XV Benchmark - 1920x1080 High Quality | |
| Schenker Vision 14 2022 RTX 3050 Ti | |
| Lenovo ThinkPad T14 G3-21CF004NGE | |
| Media della classe Office (8.09 - 79.5, n=70, ultimi 2 anni) | |
| Lenovo ThinkPad T14 G3-21AJS00400 | |
| Huawei MateBook X Pro 2022 | |
| HP EliteBook 840 G9 | |
| Strange Brigade - 1920x1080 ultra AA:ultra AF:16 | |
| Schenker Vision 14 2022 RTX 3050 Ti | |
| Lenovo ThinkPad T14 G3-21AJS00400 | |
| Lenovo ThinkPad T14 G3-21CF004NGE | |
| Media della classe Office (12.9 - 142.1, n=52, ultimi 2 anni) | |
| Huawei MateBook X Pro 2022 | |
| HP EliteBook 840 G9 | |
| Dota 2 Reborn - 1920x1080 ultra (3/3) best looking | |
| Schenker Vision 14 2022 RTX 3050 Ti | |
| Lenovo ThinkPad T14 G3-21AJS00400 | |
| Lenovo ThinkPad T14 G3-21CF004NGE | |
| HP EliteBook 840 G9 | |
| Huawei MateBook X Pro 2022 | |
| Media della classe Office (14.6 - 135, n=76, ultimi 2 anni) | |
The Witcher 3 FPS Chart
| basso | medio | alto | ultra | 4K | |
|---|---|---|---|---|---|
| GTA V (2015) | 159.9 | 152.3 | 73.4 | 33.7 | |
| The Witcher 3 (2015) | 149 | 89 | 48 | 24 | |
| Dota 2 Reborn (2015) | 142.1 | 127 | 110.4 | 101.1 | |
| Final Fantasy XV Benchmark (2018) | 69.2 | 34.3 | 20.8 | ||
| X-Plane 11.11 (2018) | 109.9 | 95.2 | 73.4 | ||
| Far Cry 5 (2018) | 95 | 40 | 32 | 30 | |
| Strange Brigade (2018) | 147 | 59 | 51 | 45 | |
| F1 2021 (2021) | 152.7 | 53.5 | 47.4 | 25.7 | |
| F1 22 (2022) | 59.4 | 51.3 | 41.2 | 28.1 |
Emissioni e gestione dell'energia
Livelli di rumore
Il modello Intel del ThinkPad T14 G3 è un compagno molto silenzioso a basso carico, ma il numero di giri ad alta velocità della ventola è un po' fastidioso. Anche se la velocità viene ridotta rapidamente, la ventola inizialmente sale di giri in modo molto evidente. Sotto un carico maggiore, il dispositivo diventa leggermente più rumoroso rispetto alla versione AMD, e durante il gioco e lo stress test abbiamo misurato un massimo di quasi 40 dB(A). La nostra unità di prova non produce altri rumori elettronici.
Rumorosità
| Idle |
| 23.6 / 23.6 / 23.6 dB(A) |
| Sotto carico |
| 35.1 / 39.6 dB(A) |
 | ||
30 dB silenzioso 40 dB(A) udibile 50 dB(A) rumoroso |
||
min: | ||
| Lenovo ThinkPad T14 G3-21AJS00400 GeForce MX550, i7-1260P, Samsung PM9A1 MZVL21T0HCLR | Lenovo ThinkPad T14 G3-21CF004NGE Radeon 680M, R7 PRO 6850U, Kioxia BG5 KBG5AZNV512G | HP EliteBook 840 G9 Iris Xe G7 96EUs, i7-1280P, SK hynix PC801 HFS512GEJ9X101N BF | Schenker Vision 14 2022 RTX 3050 Ti GeForce RTX 3050 Ti Laptop GPU, i7-12700H, Samsung SSD 980 Pro 1TB MZ-V8P1T0BW | Huawei MateBook X Pro 2022 Iris Xe G7 96EUs, i7-1260P, Silicon Motion PCIe-8 SSD 1TB | |
|---|---|---|---|---|---|
| Noise | 1% | -3% | -14% | 0% | |
| off /ambiente * (dB) | 23.6 | 24.2 -3% | 24.3 -3% | 24.4 -3% | 23.5 -0% |
| Idle Minimum * (dB) | 23.6 | 24.2 -3% | 24.5 -4% | 24.4 -3% | 23.5 -0% |
| Idle Average * (dB) | 23.6 | 24.2 -3% | 24.5 -4% | 24.4 -3% | 23.5 -0% |
| Idle Maximum * (dB) | 23.6 | 25.8 -9% | 26 -10% | 27.8 -18% | 25.9 -10% |
| Load Average * (dB) | 35.1 | 32.2 8% | 32.3 8% | 43.3 -23% | 33.8 4% |
| Witcher 3 ultra * (dB) | 39.6 | 34.1 14% | 39 2% | 48.2 -22% | 35.4 11% |
| Load Maximum * (dB) | 39.6 | 38.8 2% | 44.7 -13% | 48.8 -23% | 40.6 -3% |
* ... Meglio usare valori piccoli
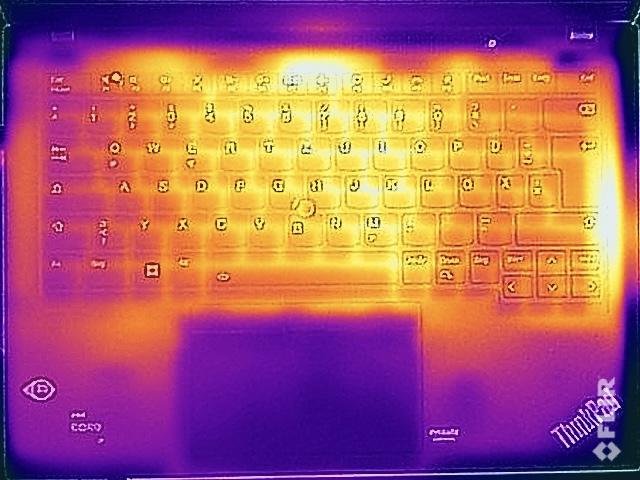
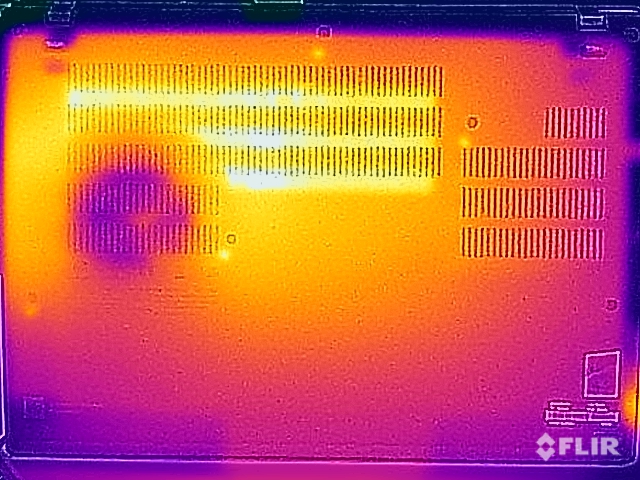
Temperature
Lenovo ha una buona padronanza delle temperature superficiali del ThinkPad T14 G3 nel complesso, ma sotto carico ridotto, il dispositivo purtroppo diventa già leggermente più caldo del modello AMD. In condizioni di carico più elevato, la temperatura massima misurata è leggermente superiore a 40 °C (104 °F), quindi non ci sono limitazioni e si può ancora scrivere comodamente e tenere il dispositivo sulle ginocchia.
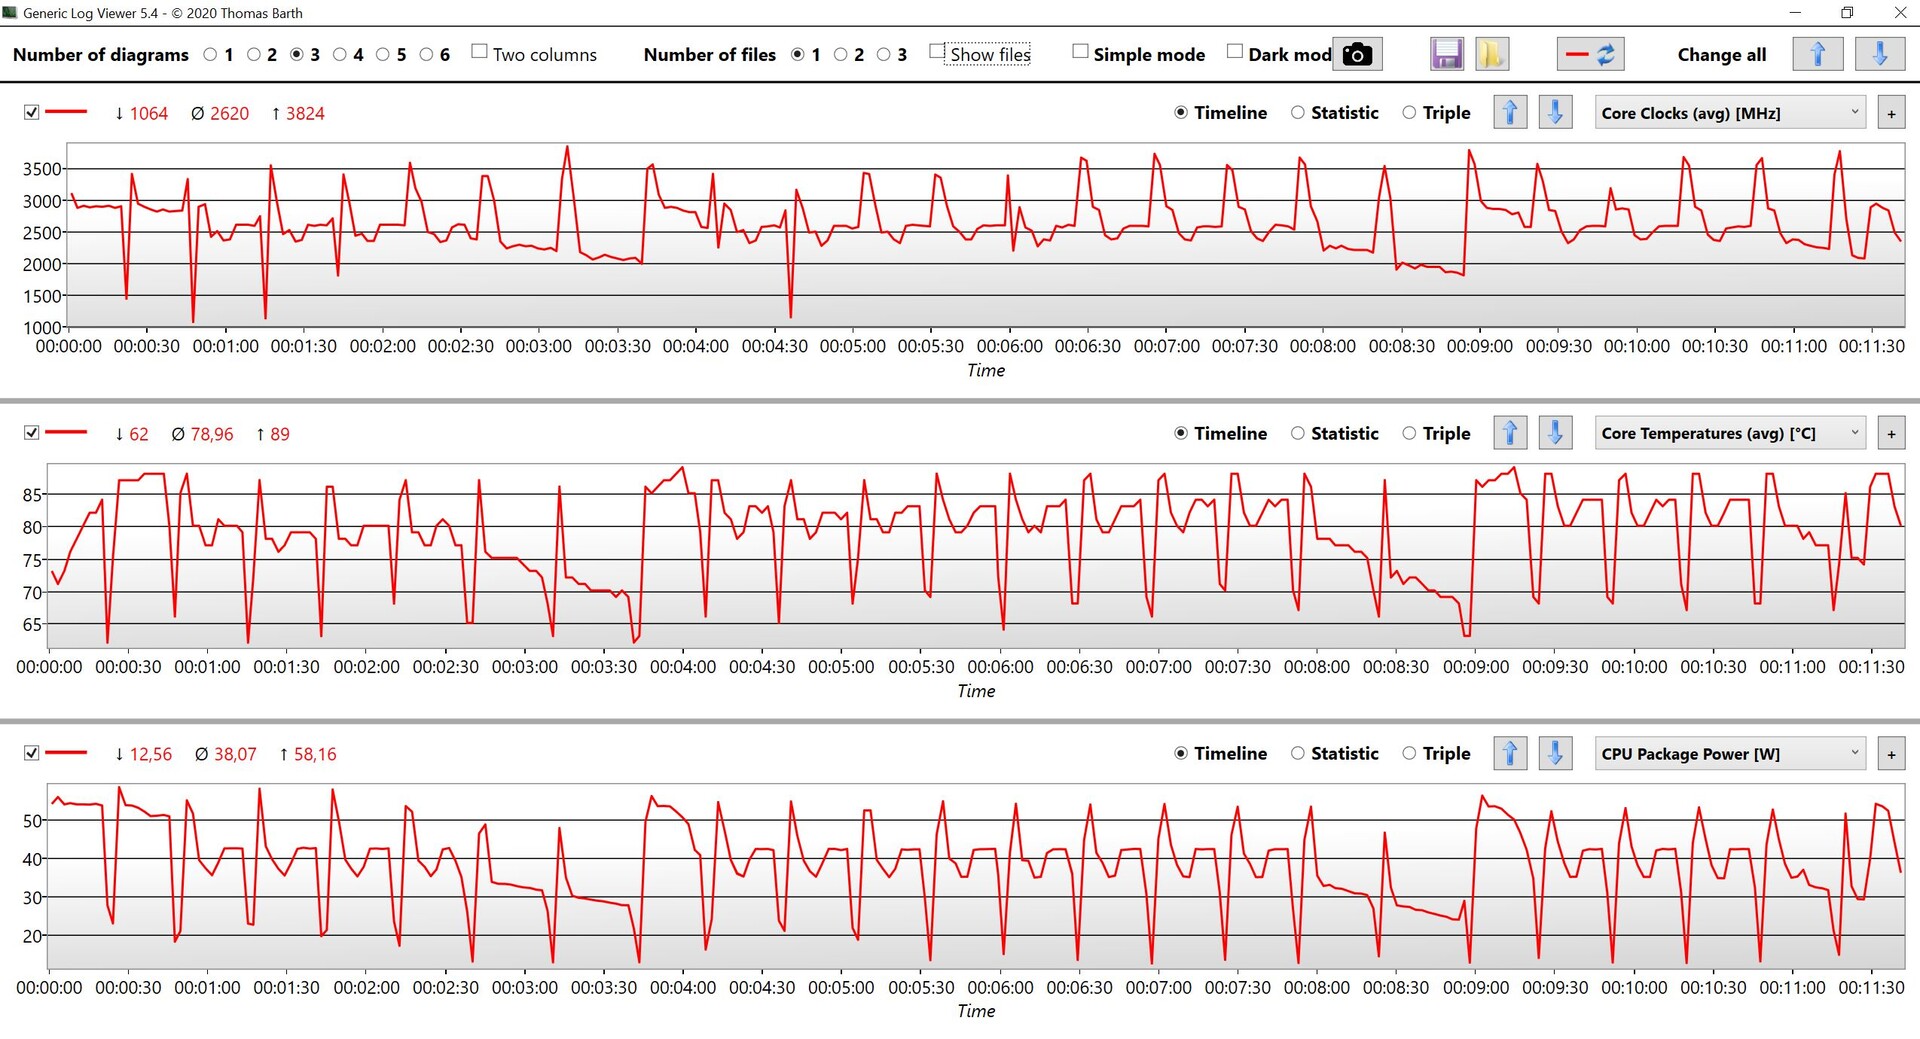
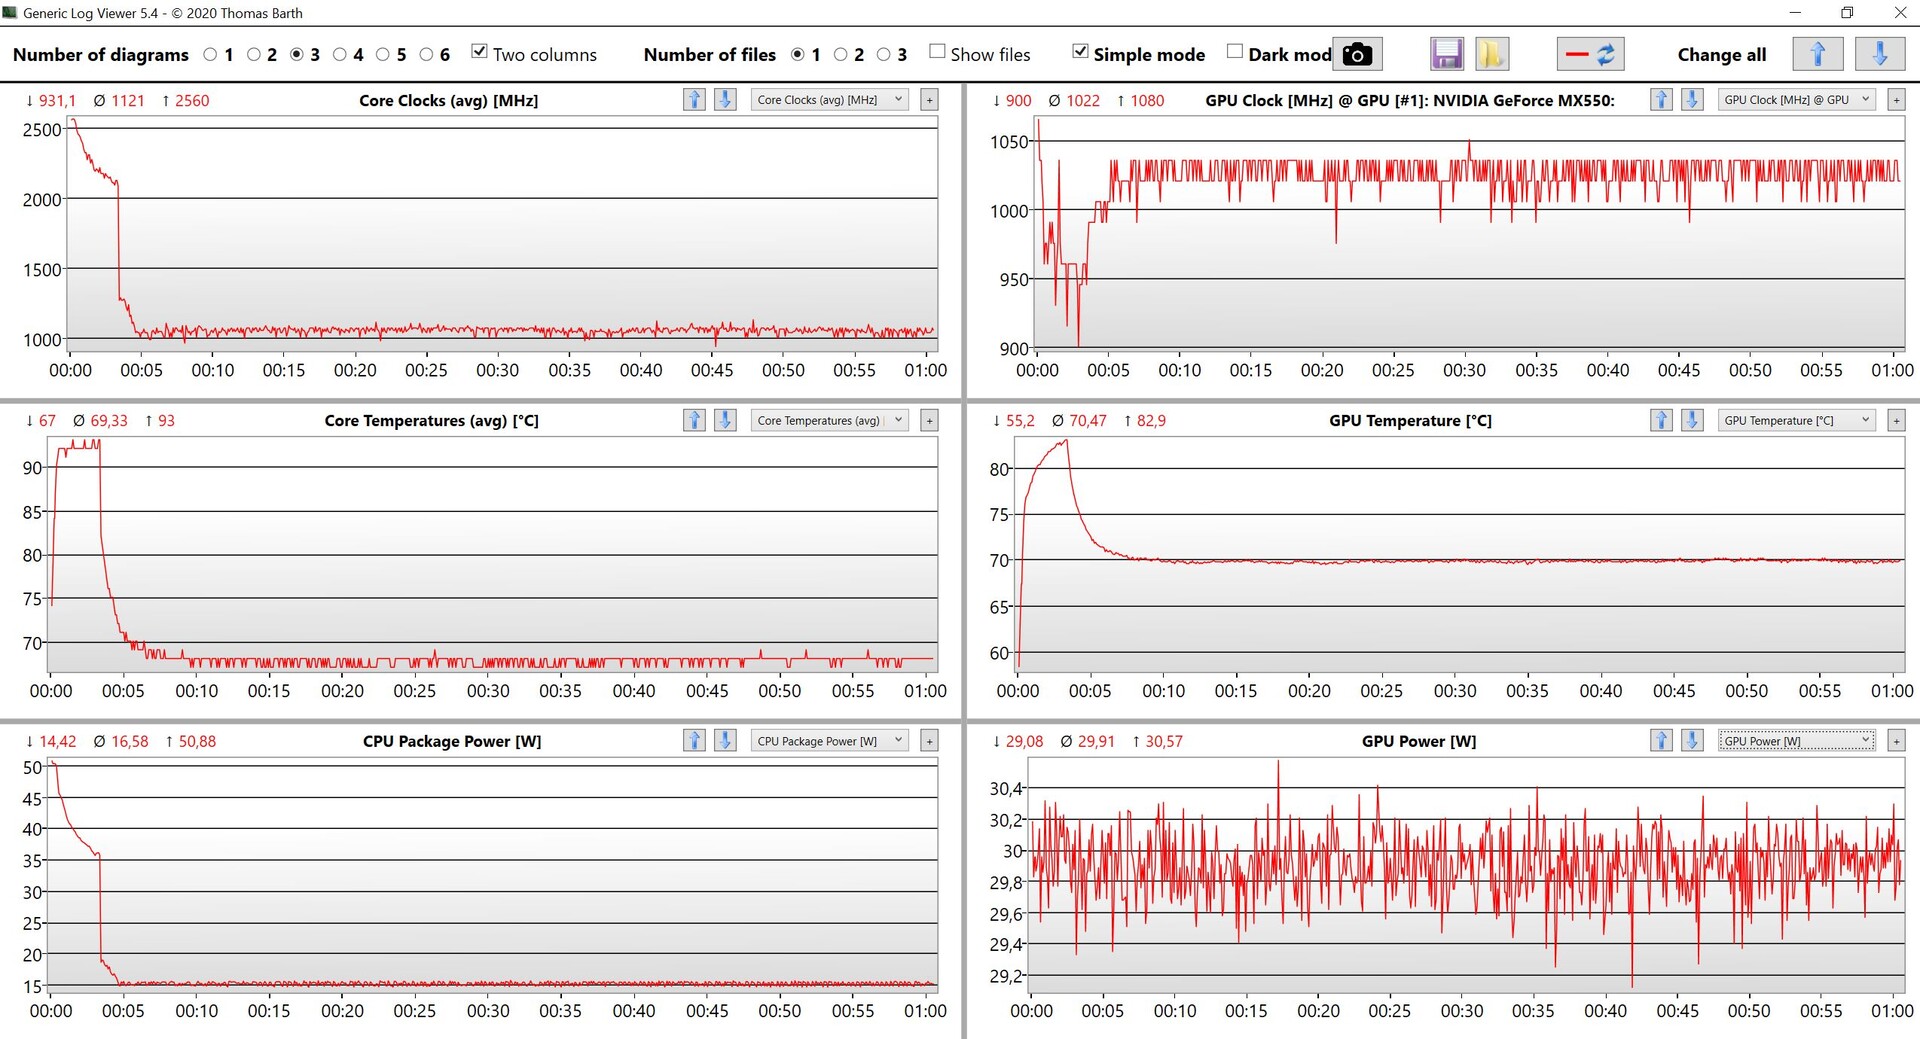
Durante lo stress test, le prestazioni della GPU rimangono stabili intorno ai 30 watt, ma il processore è costretto a ridurre le sue prestazioni in modo massiccio dopo pochi minuti, passando da un massimo di 50 watt a soli 15 watt. Se si osserva il consumo, si nota subito che l'alimentatore da 65 Watt non sarà mai in grado di fornire una potenza sufficiente, ma di questo parleremo più avanti.
(-) La temperatura massima sul lato superiore è di 46.4 °C / 116 F, rispetto alla media di 34.3 °C / 94 F, che varia da 21.2 a 62.5 °C per questa classe Office.
(±) Il lato inferiore si riscalda fino ad un massimo di 43.1 °C / 110 F, rispetto alla media di 36.8 °C / 98 F
(+) In idle, la temperatura media del lato superiore è di 29.9 °C / 86 F, rispetto alla media deld ispositivo di 29.5 °C / 85 F.
(±) Riproducendo The Witcher 3, la temperatura media per il lato superiore e' di 37.5 °C / 100 F, rispetto alla media del dispositivo di 29.5 °C / 85 F.
(+) I poggiapolsi e il touchpad raggiungono la temperatura massima della pelle (34.5 °C / 94.1 F) e quindi non sono caldi.
(-) La temperatura media della zona del palmo della mano di dispositivi simili e'stata di 27.5 °C / 81.5 F (-7 °C / -12.6 F).
| Lenovo ThinkPad T14 G3-21AJS00400 Intel Core i7-1260P, NVIDIA GeForce MX550 | Lenovo ThinkPad T14 G3-21CF004NGE AMD Ryzen 7 PRO 6850U, AMD Radeon 680M | HP EliteBook 840 G9 Intel Core i7-1280P, Intel Iris Xe Graphics G7 96EUs | Schenker Vision 14 2022 RTX 3050 Ti Intel Core i7-12700H, NVIDIA GeForce RTX 3050 Ti Laptop GPU | Huawei MateBook X Pro 2022 Intel Core i7-1260P, Intel Iris Xe Graphics G7 96EUs | |
|---|---|---|---|---|---|
| Heat | 6% | 27% | -3% | 7% | |
| Maximum Upper Side * (°C) | 46.4 | 48.2 -4% | 32.8 29% | 48.4 -4% | 43.1 7% |
| Maximum Bottom * (°C) | 43.1 | 52.8 -23% | 36.6 15% | 57.1 -32% | 42 3% |
| Idle Upper Side * (°C) | 33.9 | 24.4 28% | 21.6 36% | 28.1 17% | 29.4 13% |
| Idle Bottom * (°C) | 31.4 | 24.5 22% | 22.2 29% | 29 8% | 29.4 6% |
* ... Meglio usare valori piccoli
Altoparlanti
Lenovo ThinkPad T14 G3-21AJS00400 analisi audio
(±) | potenza degli altiparlanti media ma buona (77.8 dB)
Bassi 100 - 315 Hz
(-) | quasi nessun basso - in media 24.9% inferiori alla media
(±) | la linearità dei bassi è media (11.7% delta rispetto alla precedente frequenza)
Medi 400 - 2000 Hz
(+) | medi bilanciati - solo only 2.4% rispetto alla media
(+) | medi lineari (4% delta rispetto alla precedente frequenza)
Alti 2 - 16 kHz
(+) | Alti bilanciati - appena 2.5% dalla media
(+) | alti lineari (3.8% delta rispetto alla precedente frequenza)
Nel complesso 100 - 16.000 Hz
(±) | la linearità complessiva del suono è media (18% di differenza rispetto alla media
Rispetto alla stessa classe
» 30% di tutti i dispositivi testati in questa classe è stato migliore, 7% simile, 62% peggiore
» Il migliore ha avuto un delta di 7%, medio di 21%, peggiore di 53%
Rispetto a tutti i dispositivi testati
» 38% di tutti i dispositivi testati in questa classe è stato migliore, 8% similare, 54% peggiore
» Il migliore ha avuto un delta di 4%, medio di 23%, peggiore di 134%
Huawei MateBook X Pro 2022 analisi audio
(+) | gli altoparlanti sono relativamente potenti (85.5 dB)
Bassi 100 - 315 Hz
(±) | bassi ridotti - in media 5% inferiori alla media
(+) | bassi in lineaa (5.3% delta rispetto alla precedente frequenza)
Medi 400 - 2000 Hz
(+) | medi bilanciati - solo only 1.5% rispetto alla media
(+) | medi lineari (2.5% delta rispetto alla precedente frequenza)
Alti 2 - 16 kHz
(+) | Alti bilanciati - appena 2.1% dalla media
(+) | alti lineari (5.3% delta rispetto alla precedente frequenza)
Nel complesso 100 - 16.000 Hz
(+) | suono nel complesso lineare (5% differenza dalla media)
Rispetto alla stessa classe
» 0% di tutti i dispositivi testati in questa classe è stato migliore, 0% simile, 100% peggiore
» Il migliore ha avuto un delta di 5%, medio di 18%, peggiore di 53%
Rispetto a tutti i dispositivi testati
» 0% di tutti i dispositivi testati in questa classe è stato migliore, 0% similare, 100% peggiore
» Il migliore ha avuto un delta di 4%, medio di 23%, peggiore di 134%
Consumo di energia

Il modello Intel consuma più energia rispetto alla AMDin tutti gli scenari, anche durante il funzionamento inattivo (ma anche in questo caso il diverso pannello potrebbe giocare un ruolo). Inoltre, l'alimentatore da 65 Watt non è sufficientemente dimensionato sotto carico, poiché il dispositivo deve attingere energia dalla batteria nei primi tre minuti, con la capacità della batteria che scende a circa il 95%. Solo dopo che il processore si è stabilizzato a 15 watt (vedi sopra), l'alimentatore è in grado di fornire energia sufficiente durante lo stress test.
Dobbiamo dire che Lenovo limita chiaramente le prestazioni in questo scenario. Utilizzando un alimentatore da 100 watt, siamo riusciti a misurare un consumo massimo di 101 watt all'inizio dello stress test, prima di stabilizzarsi a circa 85 watt. In questo modo, le prestazioni della CPU sarebbero migliori, ma d'altra parte ciò avrebbe un effetto anche sul rumore della ventola e sulle temperature di superficie.
| Off / Standby | |
| Idle | |
| Sotto carico |
|
Leggenda:
min: | |
| Lenovo ThinkPad T14 G3-21AJS00400 GeForce MX550, i7-1260P, Samsung PM9A1 MZVL21T0HCLR | Lenovo ThinkPad T14 G3-21CF004NGE Radeon 680M, R7 PRO 6850U, Kioxia BG5 KBG5AZNV512G | HP EliteBook 840 G9 Iris Xe G7 96EUs, i7-1280P, SK hynix PC801 HFS512GEJ9X101N BF | Schenker Vision 14 2022 RTX 3050 Ti GeForce RTX 3050 Ti Laptop GPU, i7-12700H, Samsung SSD 980 Pro 1TB MZ-V8P1T0BW | Huawei MateBook X Pro 2022 Iris Xe G7 96EUs, i7-1260P, Silicon Motion PCIe-8 SSD 1TB | |
|---|---|---|---|---|---|
| Power Consumption | 26% | 10% | -63% | -55% | |
| Idle Minimum * (Watt) | 4.3 | 2.4 44% | 2.2 49% | 7.5 -74% | 6.5 -51% |
| Idle Average * (Watt) | 6.2 | 5.3 15% | 5.3 15% | 10.4 -68% | 13.7 -121% |
| Idle Maximum * (Watt) | 7 | 5.6 20% | 8.5 -21% | 11.4 -63% | 14.4 -106% |
| Load Average * (Watt) | 63.5 | 39.7 37% | 54.3 14% | 83.3 -31% | 64.6 -2% |
| Witcher 3 ultra * (Watt) | 52.5 | 42.8 18% | 51 3% | 92.7 -77% | 57.2 -9% |
| Load Maximum * (Watt) | 66.1 | 50.6 23% | 67.3 -2% | 110.3 -67% | 90.9 -38% |
* ... Meglio usare valori piccoli
Power Consumption The Witcher 3 / Stress Test
Power Consumption with External Monitor
Durata della batteria
Lo stesso comportamento continua nei test della batteria, e il modello Intel è chiaramente superato dalla versione AMD nei nostri due test WLAN (una volta alla massima luminosità e poi a 150 cd/m²). Abbiamo misurato tra le 7 e le 8 ore di navigazione, mentre il modello AMD è durato ~9,5-13 ore.
Pro
Contro
Verdetto - Il ThinkPad T14 G3 è migliore con AMD

Guardando il ThinkPad T14 G3 da solo, si tratta di un buon portatile business anche con la combinazione Intel/Nvidia con prestazioni grafiche leggermente superiori rispetto alla vecchia iGPU di Intel. Rispetto alla Versione AMDci sono un paio di vantaggi, come le prestazioni single-core più elevate del processore Intel e le prestazioni di gioco leggermente migliori dell'unità dedicata GeForce MX550. Inoltre, il modello Intel offre anche Thunderbolt 4 e uno slot SO-DIMM che consente di espandere la memoria di lavoro.
D'altra parte, ci sono anche degli svantaggi, come il consumo energetico significativamente più elevato sotto carico, con l'alimentatore da 65 Watt in dotazione che è troppo debole, con conseguente throttling artificiale delle prestazioni sotto carico combinato CPU/GPU. Inoltre, la ventola diventa più rumorosa e la durata della batteria si riduce. Allo stesso tempo, il processore AMD si comporta allo stesso livello nei test multicore, consumando meno energia.
A causa della scheda grafica aggiuntiva, il ThinkPad T14 G3 consuma anche più energia, mentre le prestazioni aggiuntive rispetto alla versione AMD sono molto ridotte. Quindi il modulo aggiuntivo non vale la pena, e chi può fare a meno di Thunderbolt 4 otterrà un portatile business migliore con una maggiore durata della batteria scegliendo la versione AMD del ThinkPad T14 G3.
Un altro problema è la situazione del pannello, ma questo vale per tutti i modelli del ThinkPad T14 G3. Ad esempio, il pannello LG ha lasciato un'impressione migliore nel test rispetto al modello di AU Optronics, anche se in entrambi i casi si trattava di un display LowPower da 14 pollici. Abbiamo già visto questa lotteria di pannelli nei modelli precedenti e purtroppo non si può mai sapere in anticipo quale pannello viene utilizzato.
Anche se il T14 G3 è già sul mercato da qualche tempo, le nuove CPU mobili Raptor Lake di Intel sono nel complesso un aggiornamento piuttosto deludente e, a questo punto, non sappiamo quando arriveranno i nuovi modelli AMD. O almeno, non ci aspettiamo un aggiornamento nei prossimi mesi.
Prezzo e disponibilità
La versione Intel del Lenovo ThinkPad T14 G3 è disponibile presso Lenovo a partire da 1012,32 dollari, mentre la configurazione Nvidia parte da 1067,52 dollari.
Lenovo ThinkPad T14 G3-21AJS00400
- 03/21/2023 v7 (old)
Andreas Osthoff
Transparency
La selezione dei dispositivi da recensire viene effettuata dalla nostra redazione. Il campione di prova è stato fornito all'autore come prestito dal produttore o dal rivenditore ai fini di questa recensione. L'istituto di credito non ha avuto alcuna influenza su questa recensione, né il produttore ne ha ricevuto una copia prima della pubblicazione. Non vi era alcun obbligo di pubblicare questa recensione. In quanto società mediatica indipendente, Notebookcheck non è soggetta all'autorità di produttori, rivenditori o editori.
Ecco come Notebookcheck esegue i test
Ogni anno, Notebookcheck esamina in modo indipendente centinaia di laptop e smartphone utilizzando procedure standardizzate per garantire che tutti i risultati siano comparabili. Da circa 20 anni sviluppiamo continuamente i nostri metodi di prova e nel frattempo stabiliamo gli standard di settore. Nei nostri laboratori di prova, tecnici ed editori esperti utilizzano apparecchiature di misurazione di alta qualità. Questi test comportano un processo di validazione in più fasi. Il nostro complesso sistema di valutazione si basa su centinaia di misurazioni e parametri di riferimento ben fondati, che mantengono l'obiettività.Price comparison

