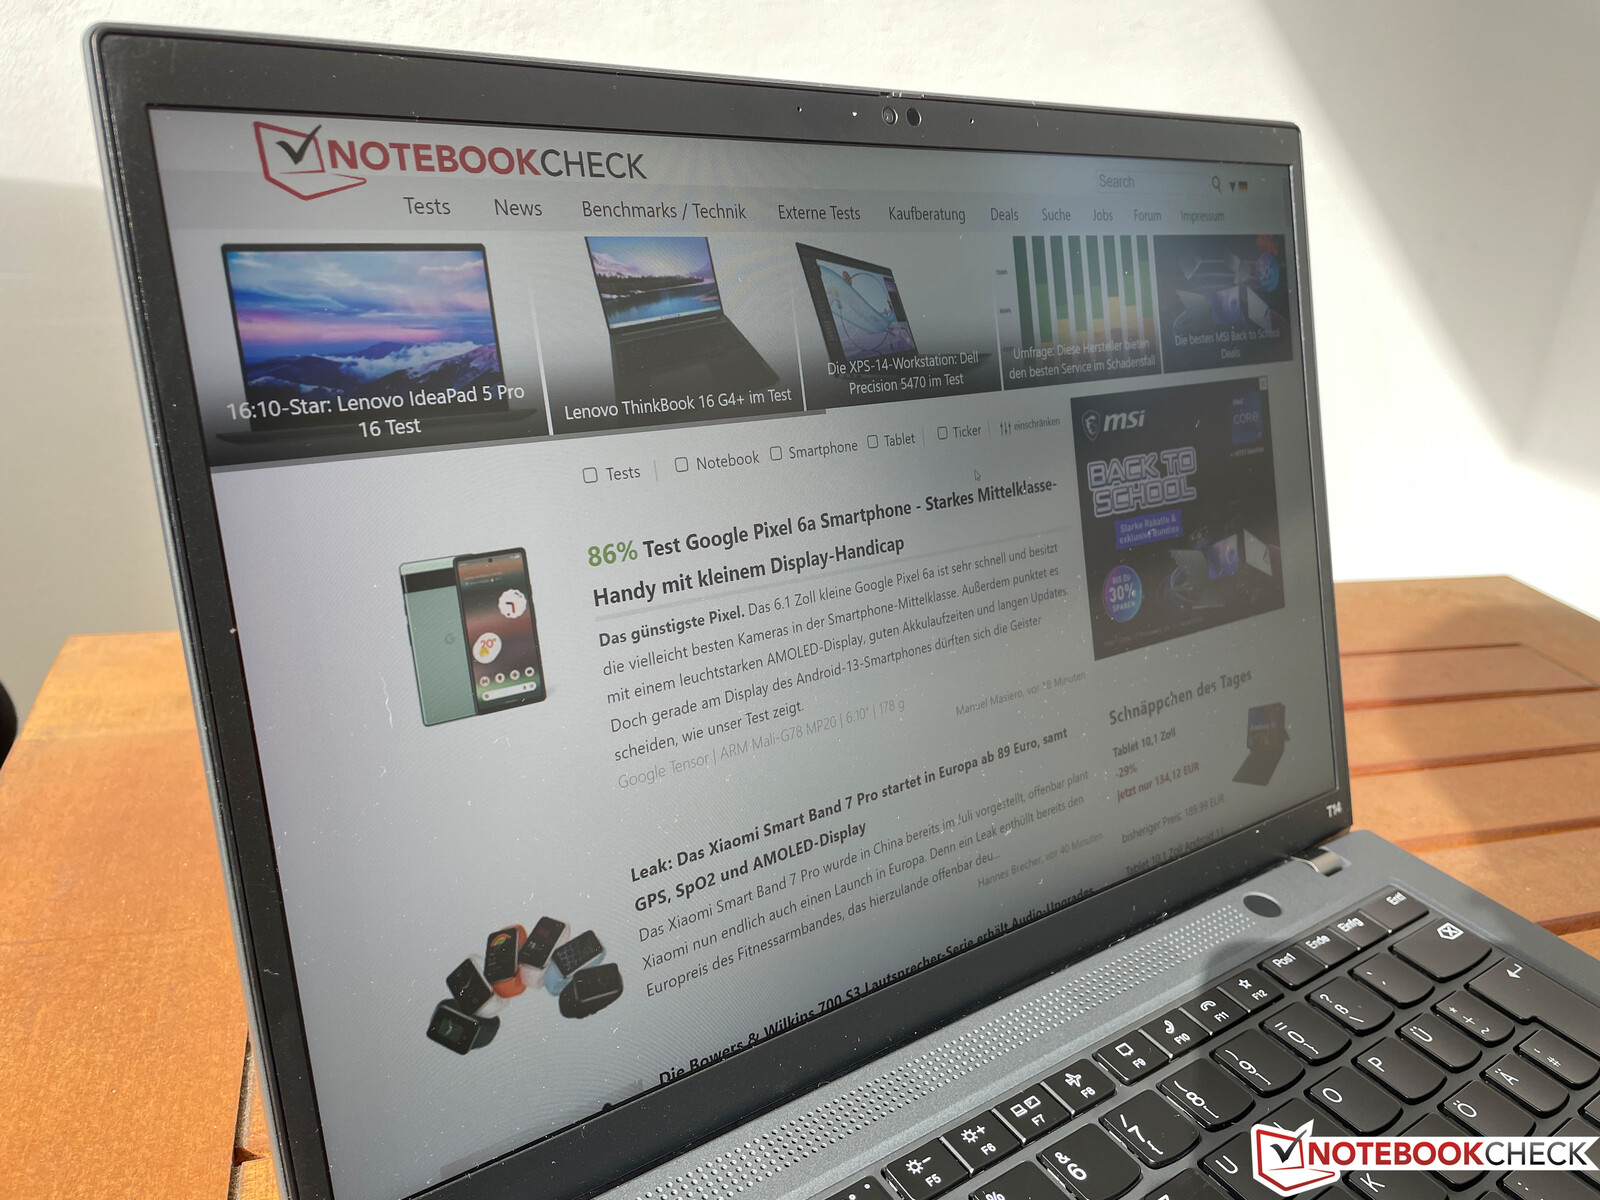
Recensione del Lenovo ThinkPad T14 G3: questo portatile business è migliore con AMD Ryzen Pro
Il ThinkPad T14 e i suoi predecessori sono stati per molti anni tra i più popolari e migliori portatili business da 14 pollici. Con il nuovo T14 G3, Lenovo presenta un'ampia riprogettazione, che comprende un nuovo case, ancora una volta dotato di un pannello 16:10. Il produttore continua a offrire modelli con CPU AMD e Intel, ma le differenze vanno oltre. Il produttore continua a offrire modelli con CPU AMD e Intel, ma le differenze vanno un po' oltre, i cui dettagli tecnici saranno svelati nel corso della nostra recensione.
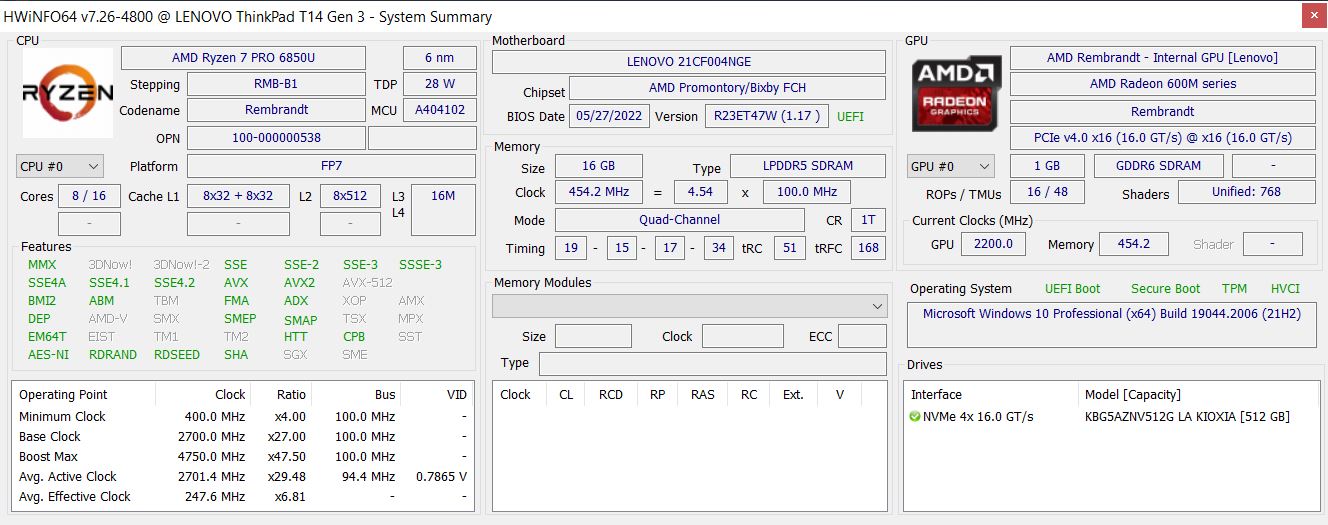
Il nostro esemplare in prova è il modello ThinkPad T14 G3-21CF004NGE con un processoreAMD Ryzen 7 Pro 6850Ue una scheda grafica integrata Radeon-680M-GPU16 GB di RAM LPDDR5-6400, un SSD PCIe 4.0 da 512 GB e un display da 14 pollici in formato 16:10 con una risoluzione di 1920x1200. Il prezzo di listino per questa configurazione è di 1.859 euro (~US$1.800), o di 1.649 euro (~US$1.596) per l'identico modello Campus.
I prezzi del modello base, ovvero il T14 G3 AMD con Ryzen 5 Pro 6650U, variano da Paese a Paese (per maggiori dettagli, vedere "Prezzo e disponibilità" alla fine di questa recensione). Negli Stati Uniti, ad esempio, il prezzo di partenza è di 1.038,95 dollari. Per la variante Intel con Core i5-1235U, il prezzo è di 1.054,50 dollari.
Potenziali concorrenti a confronto
Punteggio | Data | Modello | Peso | Altezza | Dimensione | Risoluzione | Prezzo |
|---|---|---|---|---|---|---|---|
| 88.8 % v7 (old) | 09/2022 | Lenovo ThinkPad T14 G3-21CF004NGE R7 PRO 6850U, Radeon 680M | 1.4 kg | 17.9 mm | 14.00" | 1920x1200 | |
| 90.1 % v7 (old) | 04/2022 | Dell Latitude 7420 JW6MH i5-1145G7, Iris Xe G7 80EUs | 1.3 kg | 17.3 mm | 14.00" | 1920x1080 | |
| 90.3 % v7 (old) | 09/2022 | Huawei MateBook X Pro 2022 i7-1260P, Iris Xe G7 96EUs | 1.3 kg | 15.6 mm | 14.20" | 3120x2080 | |
| 88.6 % v7 (old) | 07/2022 | HP EliteBook 845 G9 6F6H6EA R9 PRO 6950HS, Radeon 680M | 1.5 kg | 19.3 mm | 14.00" | 1920x1200 | |
| 88.1 % v7 (old) | 05/2021 | Lenovo ThinkPad T14 Gen2-20W1S00000 i7-1165G7, GeForce MX450 | 1.5 kg | 17.9 mm | 14.00" | 1920x1080 | |
| 90.1 % v7 (old) | 03/2022 | Lenovo ThinkPad T14s G2 20XGS01100 R7 PRO 5850U, Vega 8 | 1.3 kg | 16.14 mm | 14.00" | 1920x1080 |
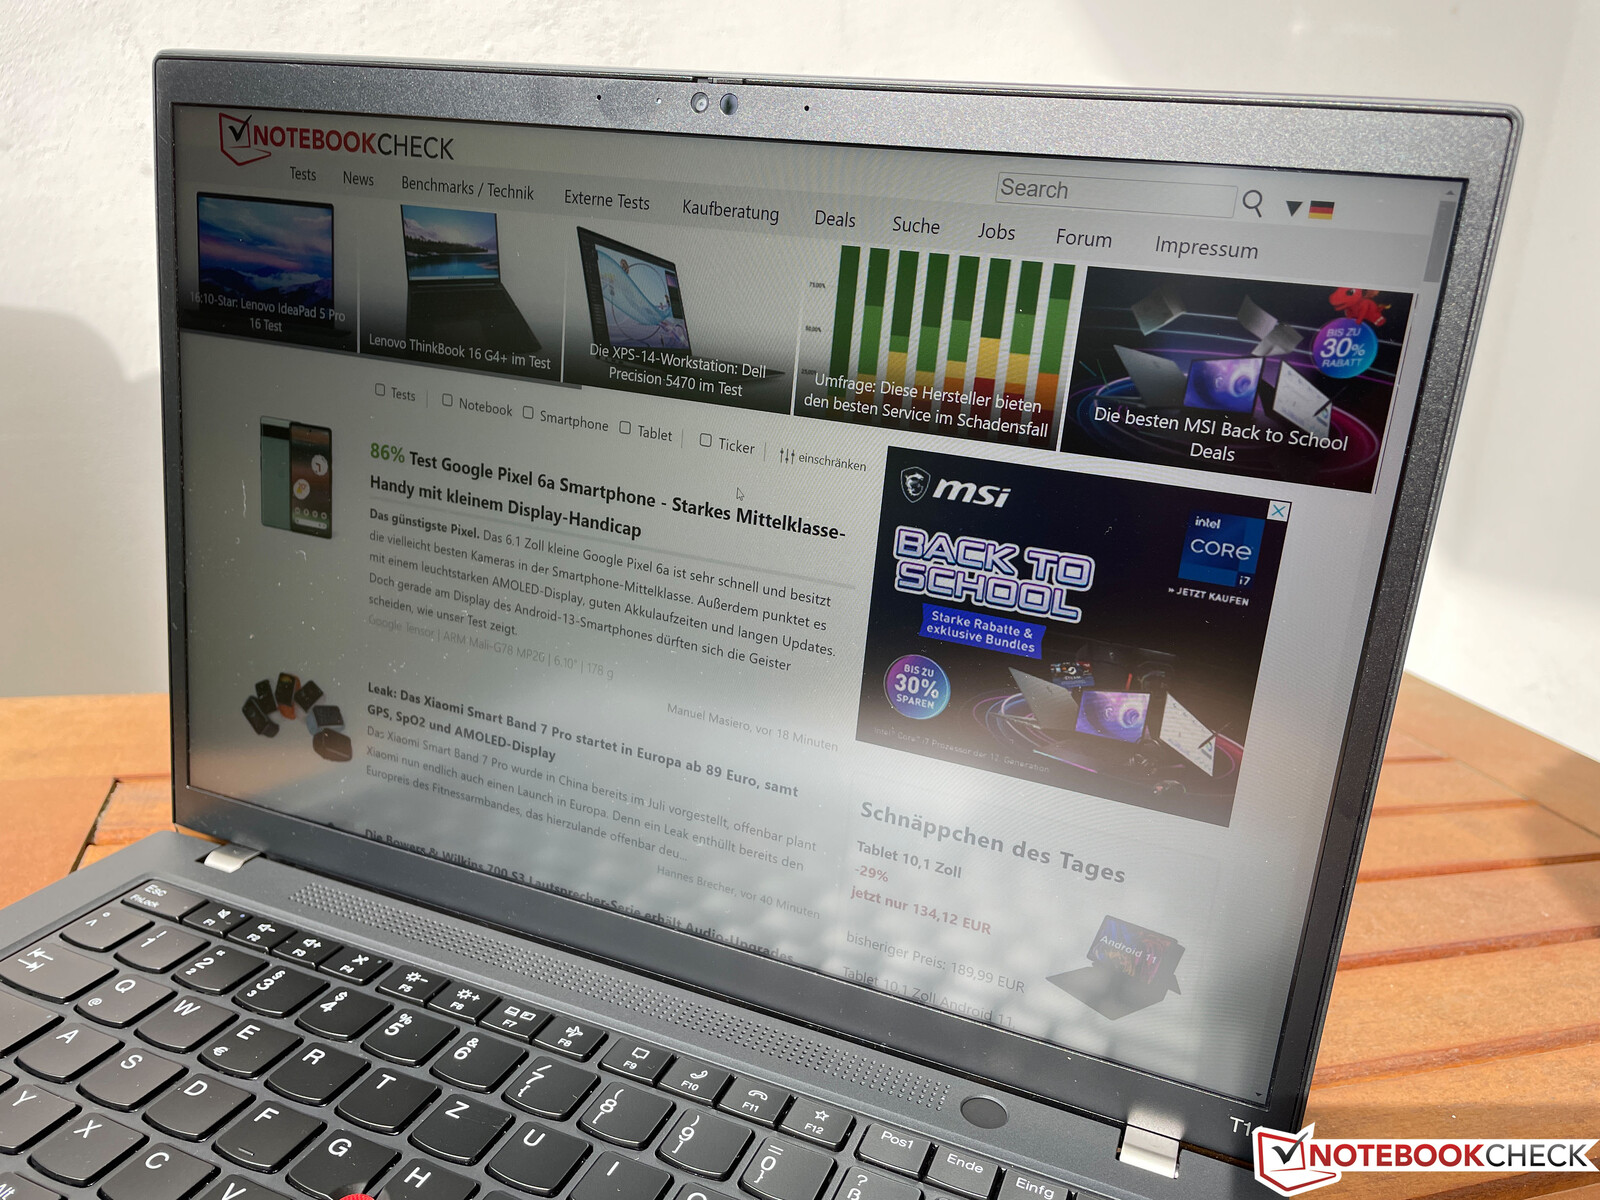
Custodia - ThinkPad con fibra di carbonio e magnesio
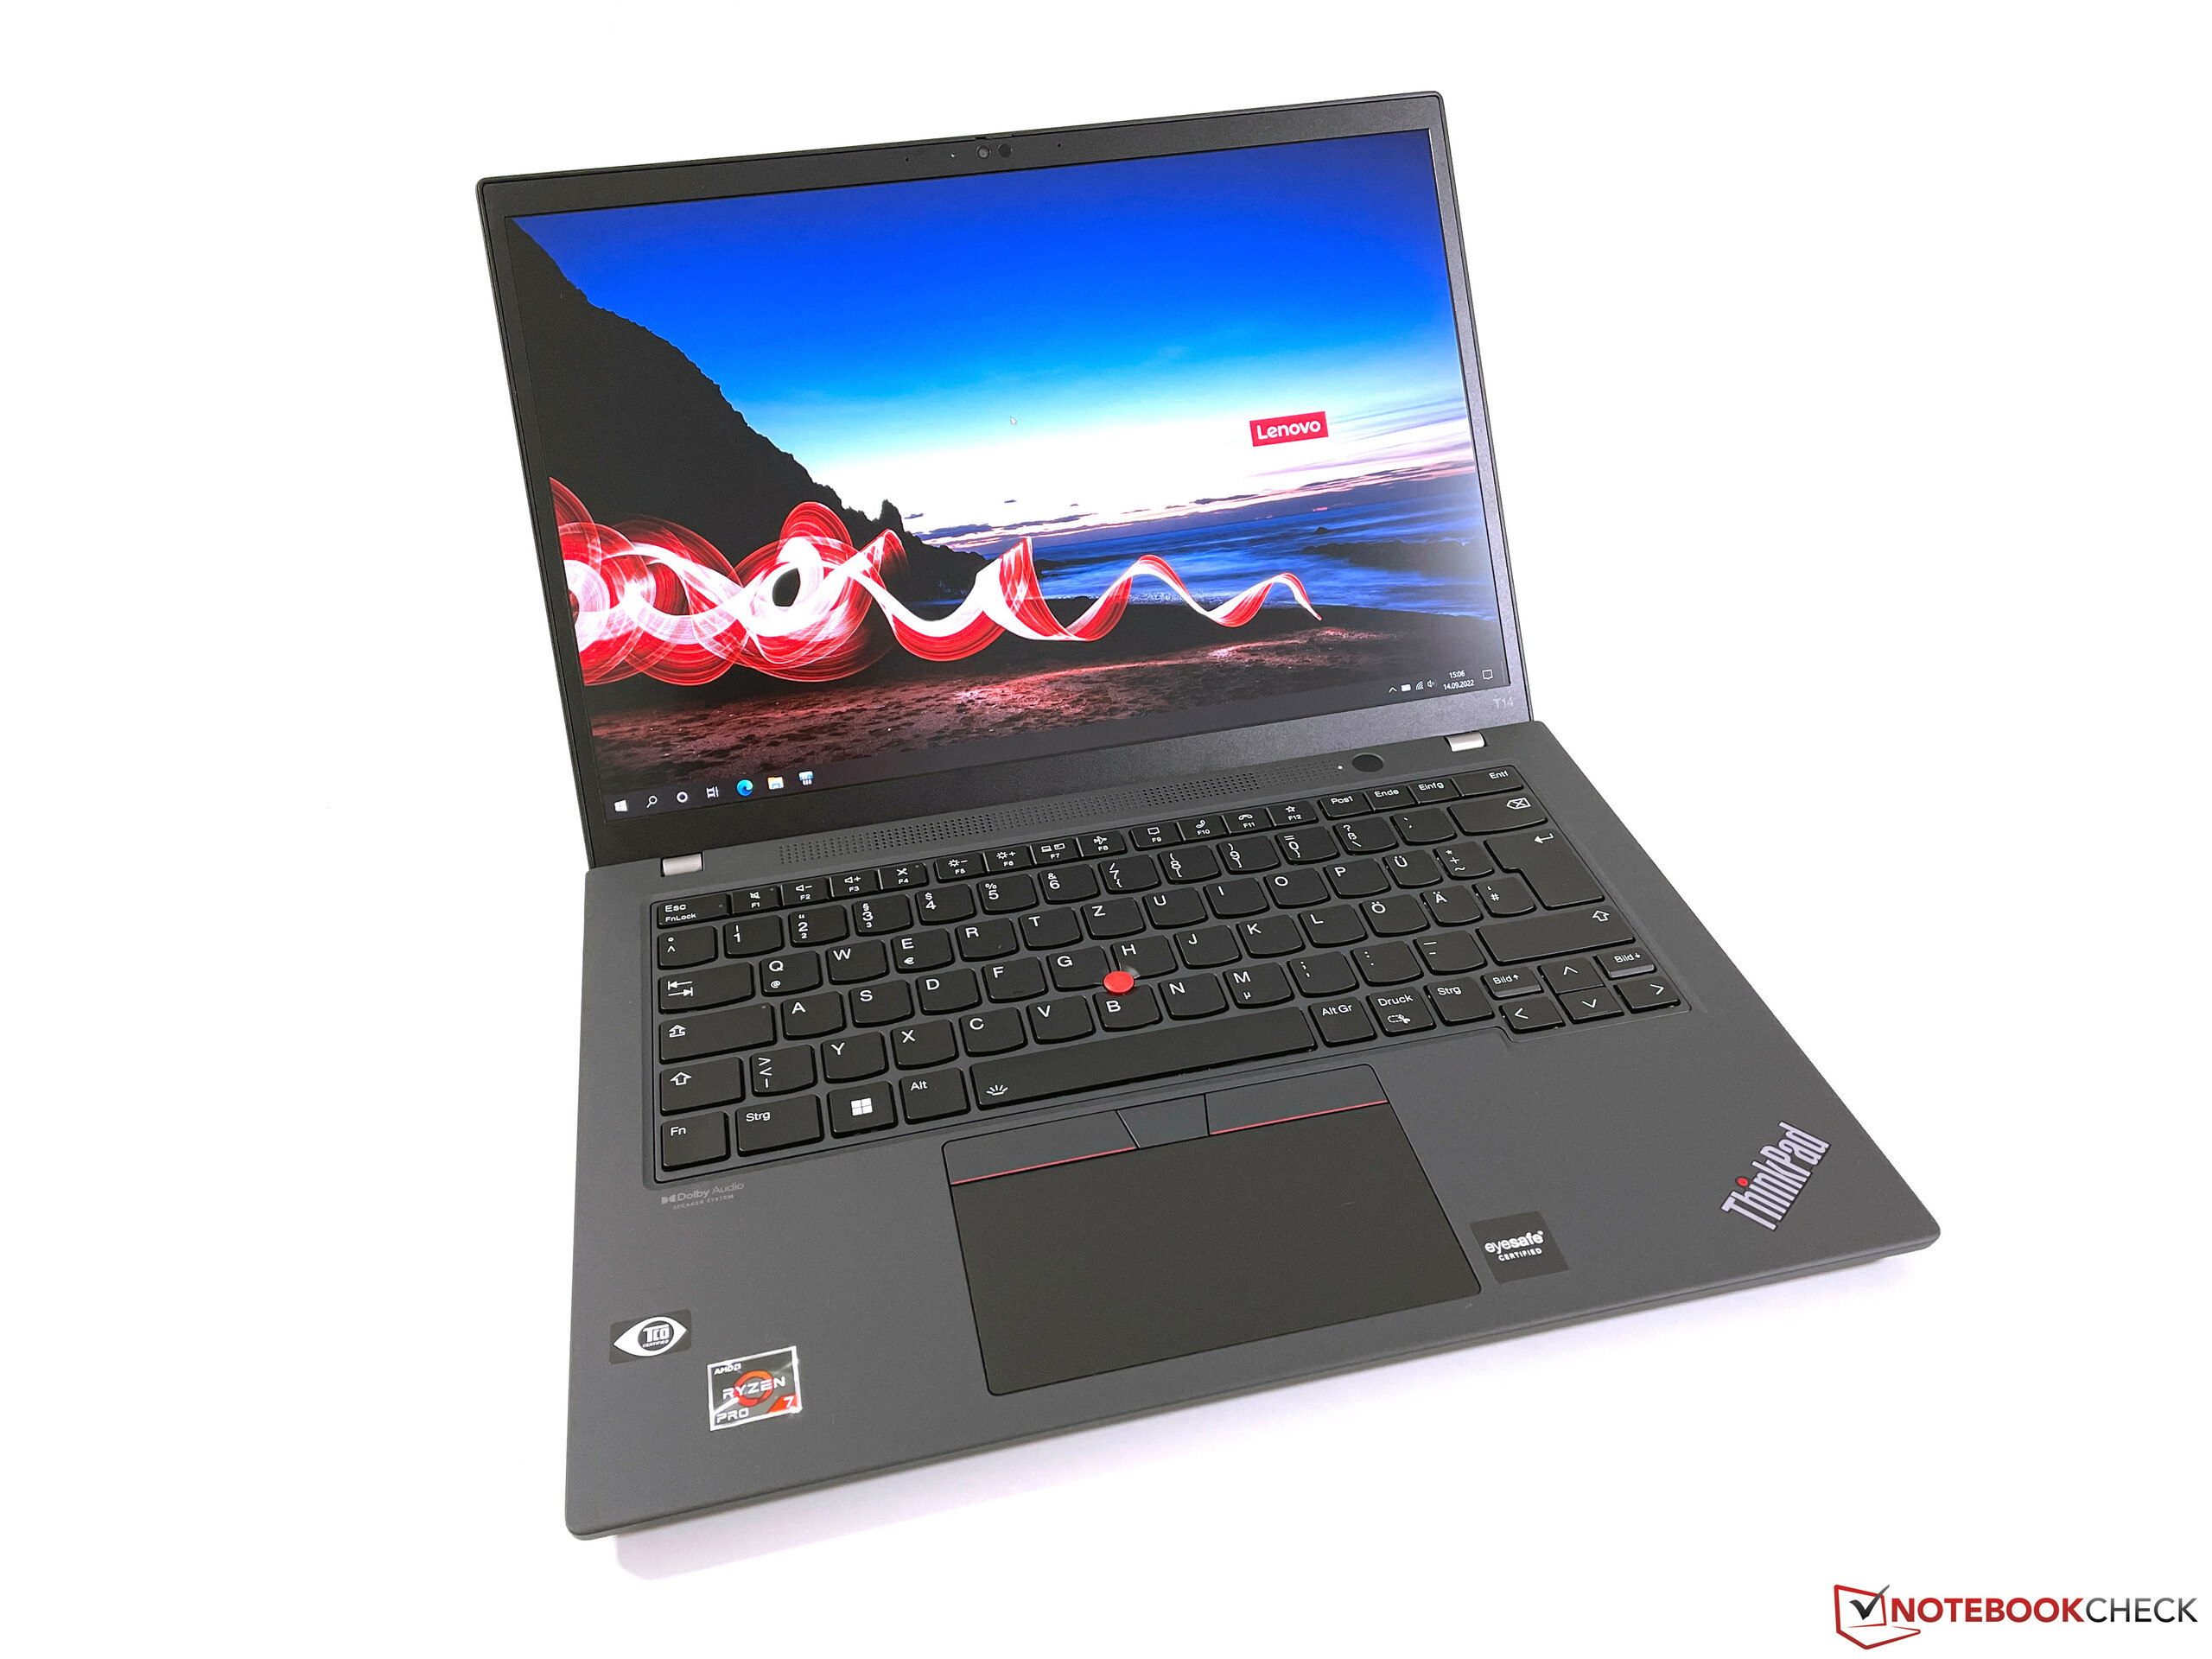
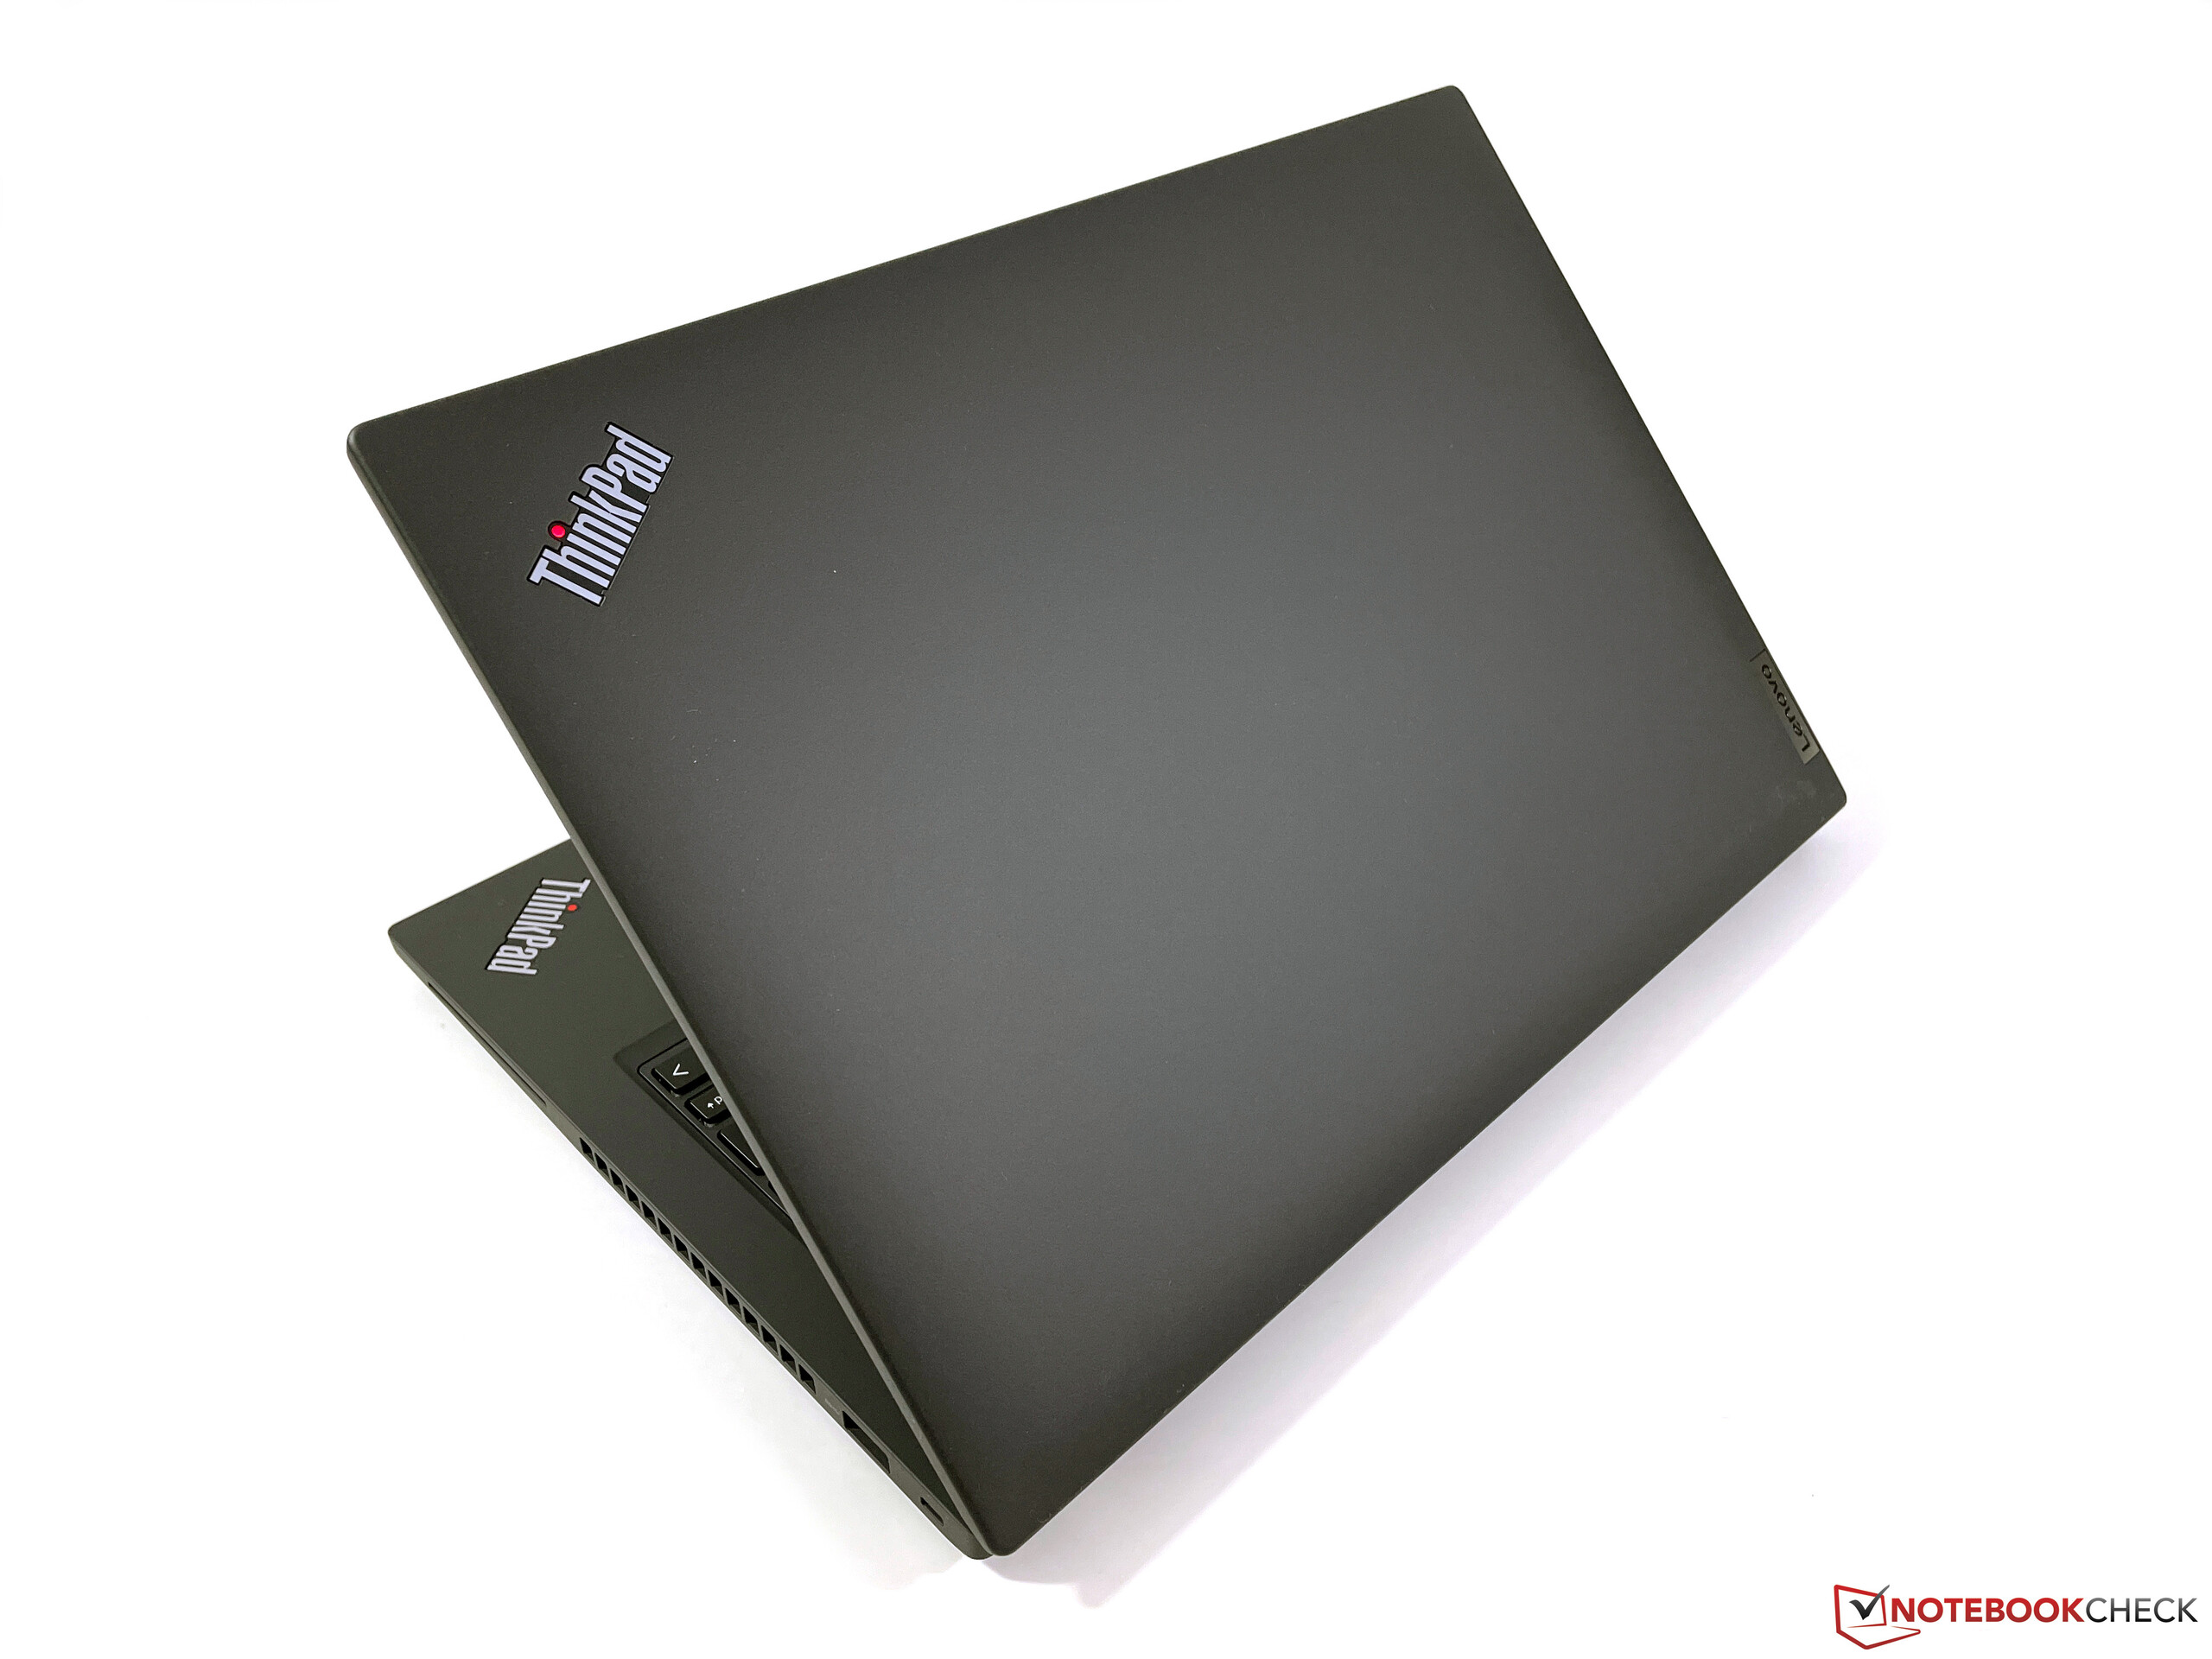
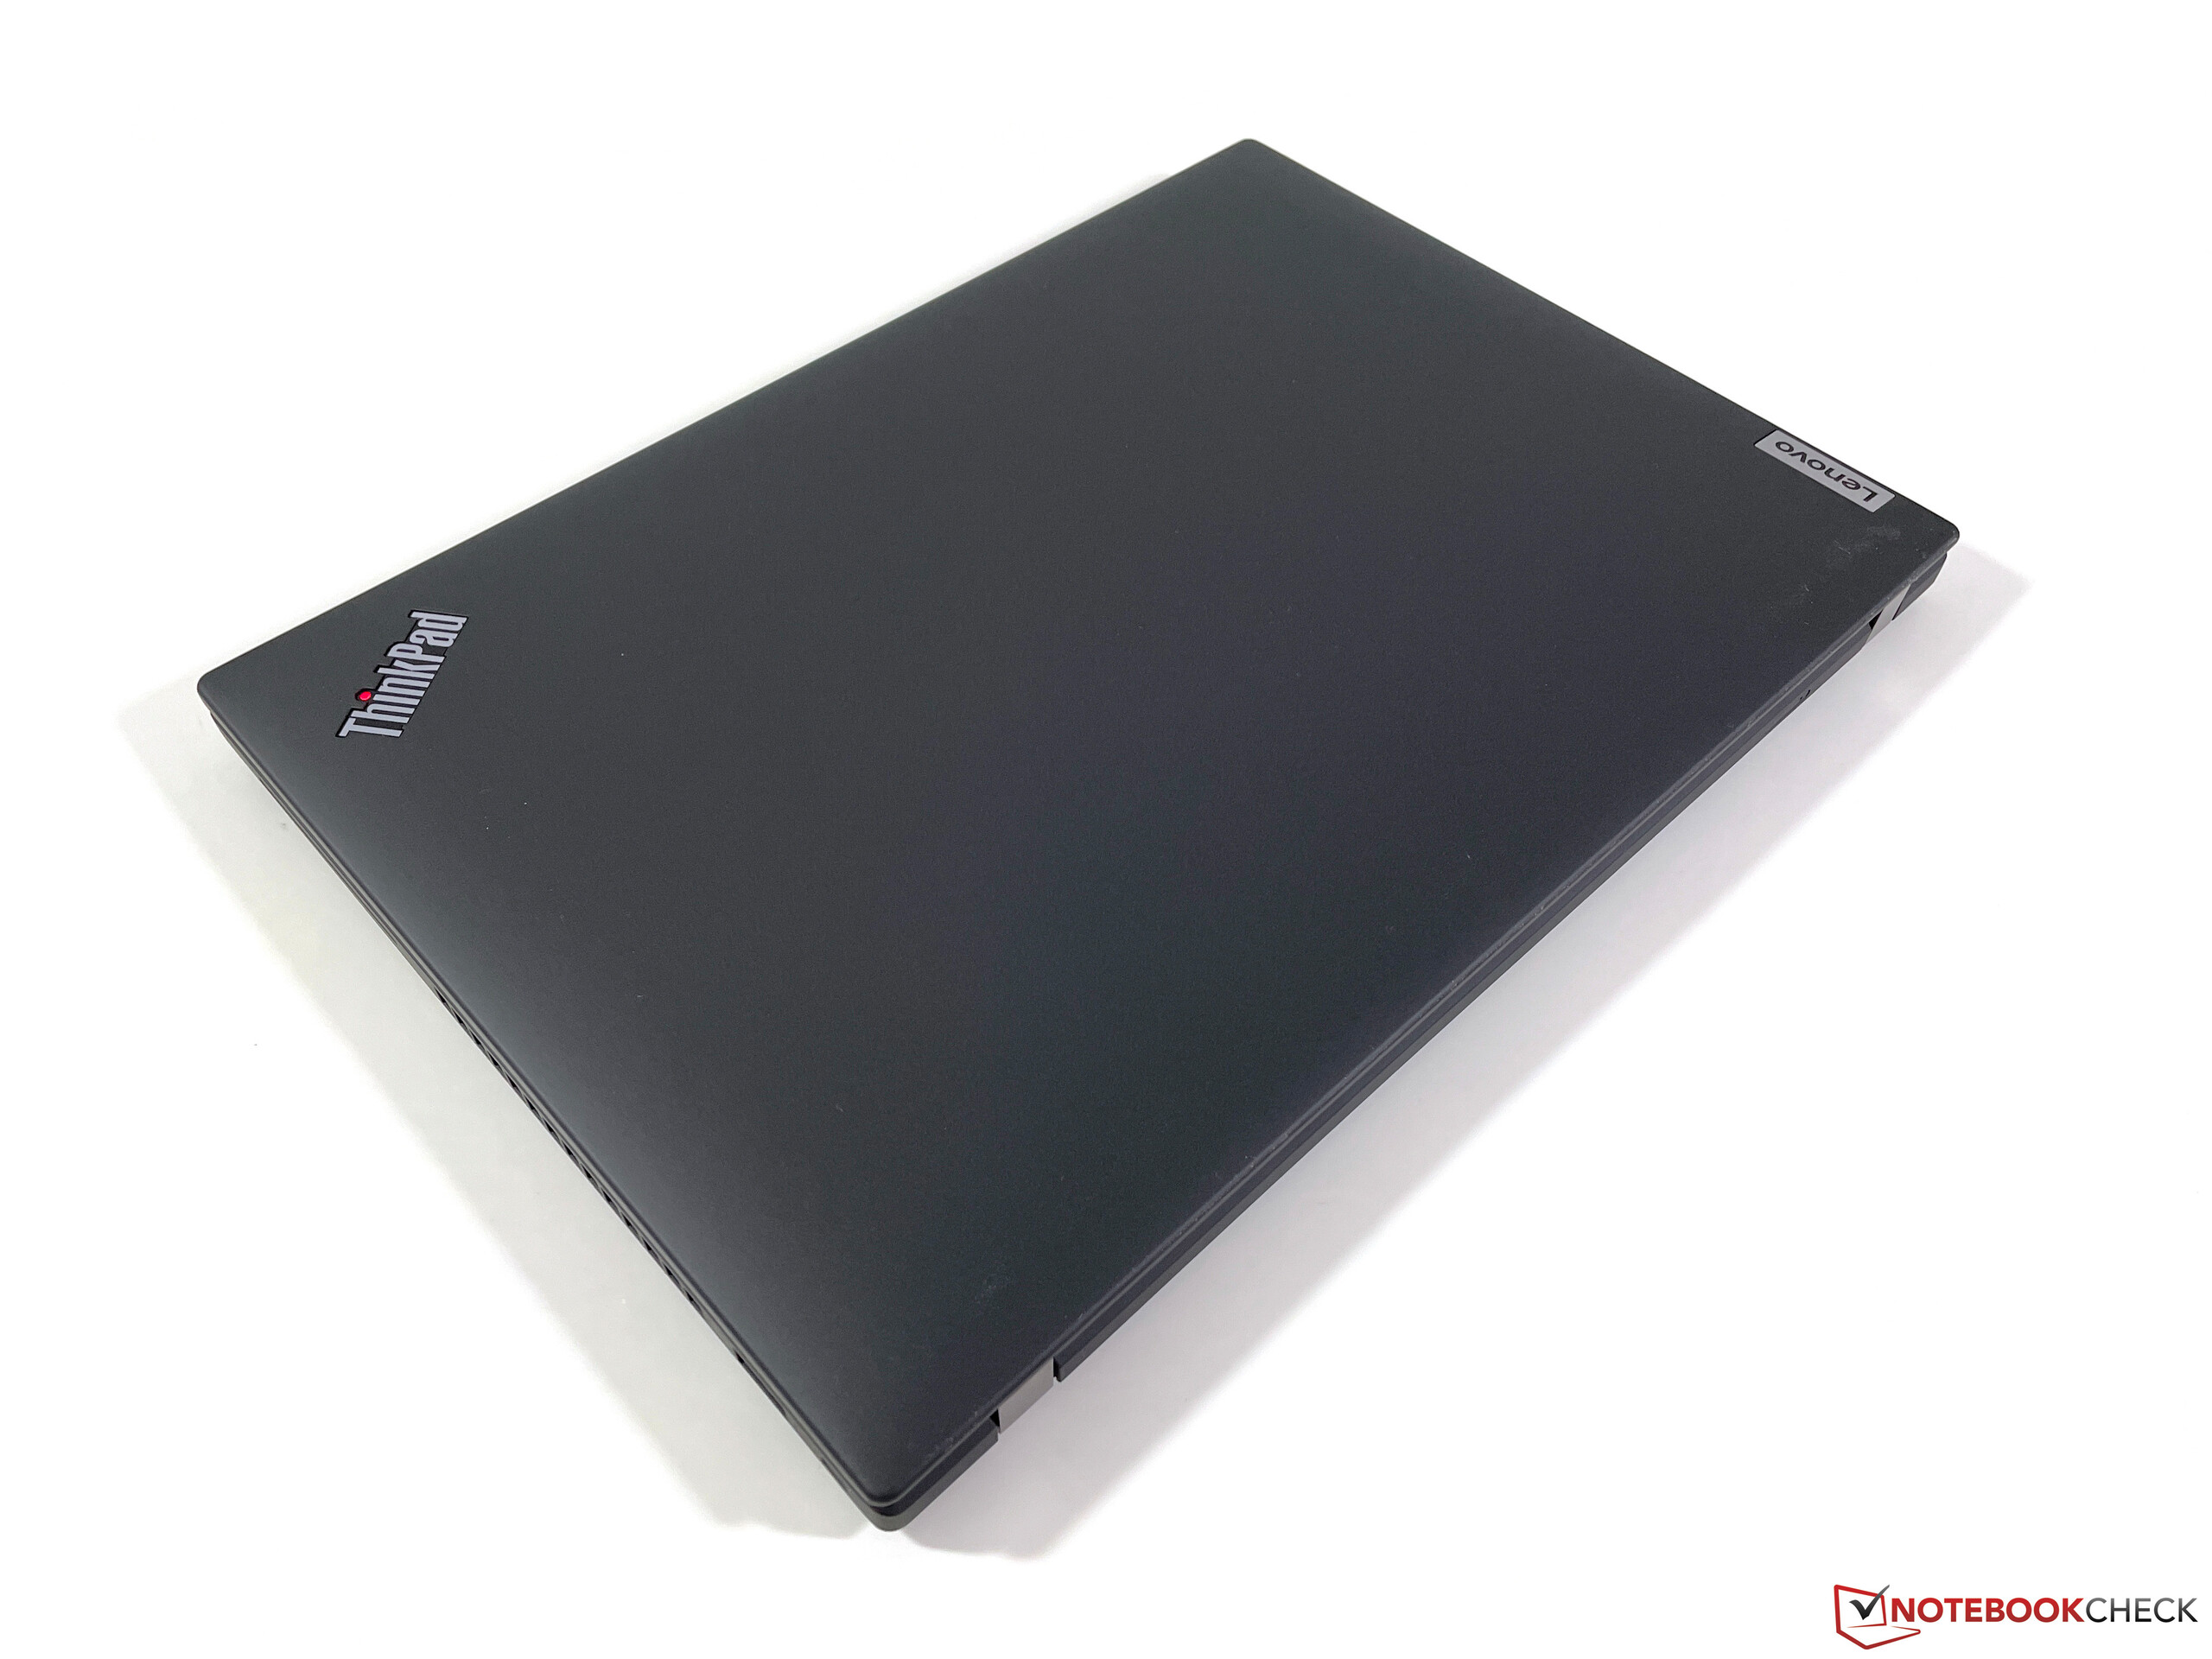
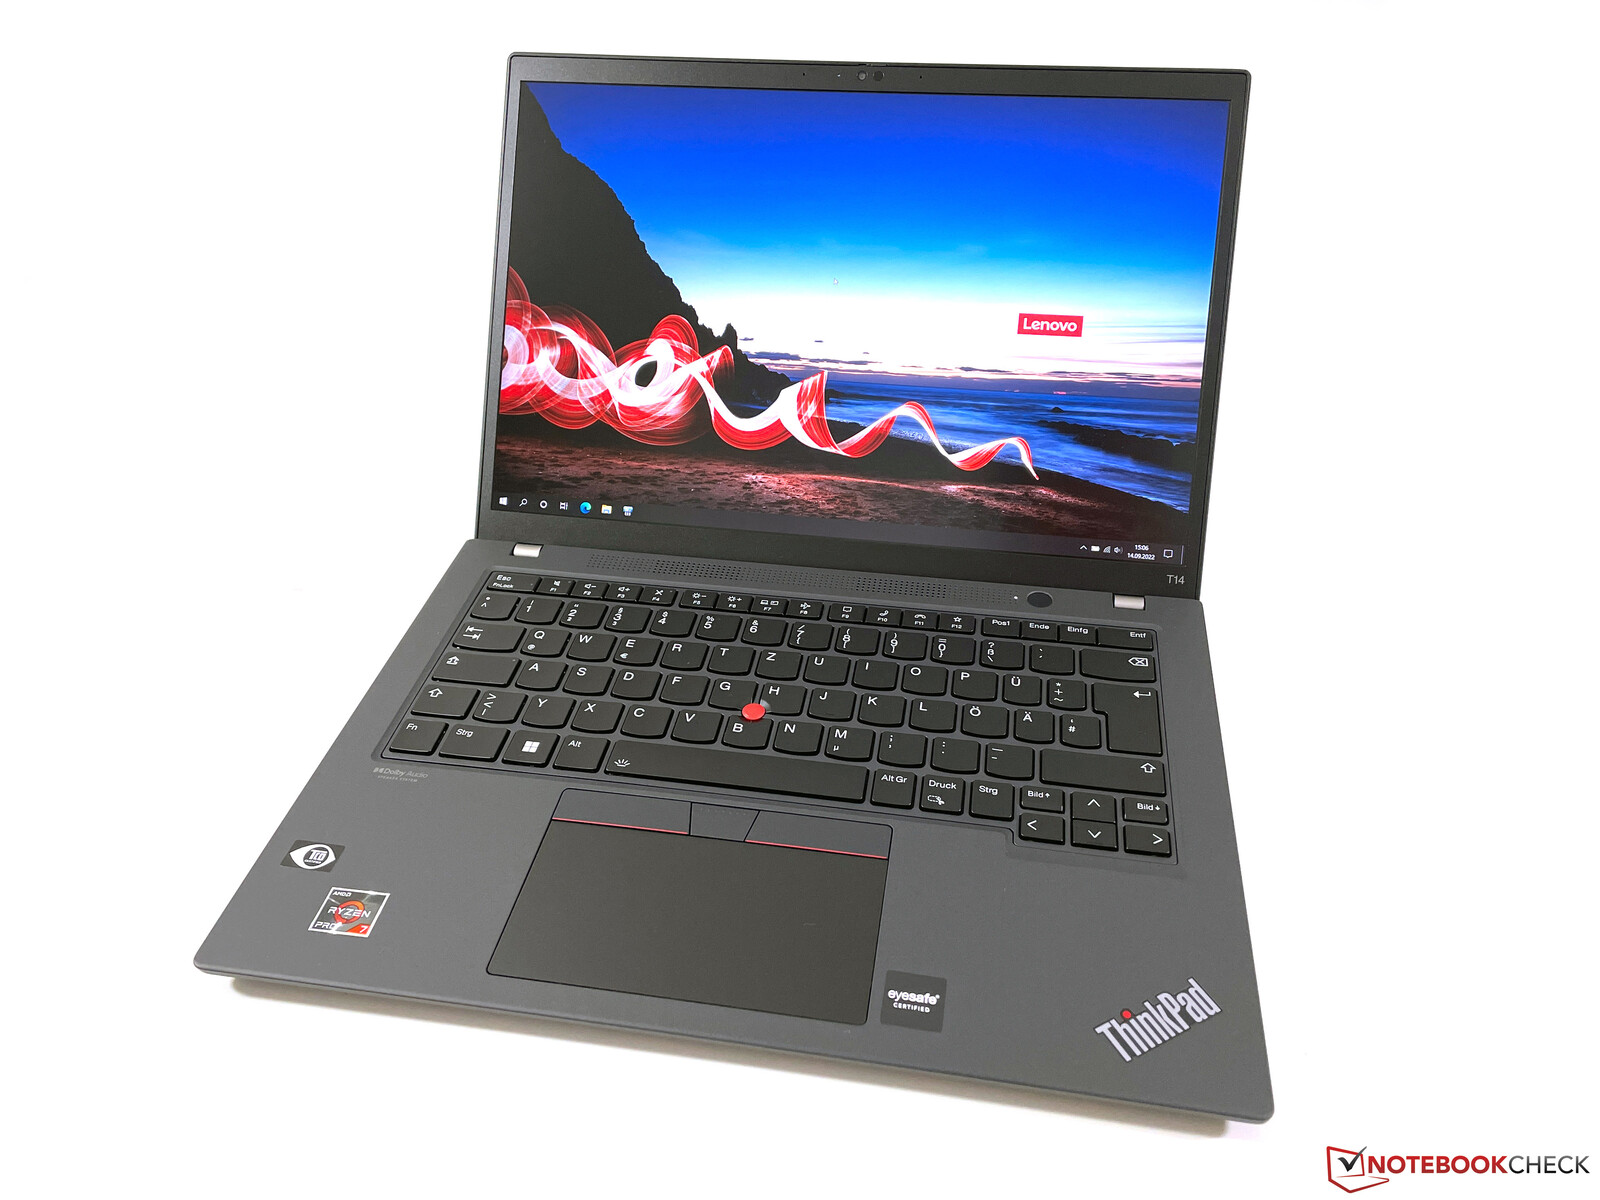
Pur trattandosi di un nuovo case, Lenovo non ha cambiato il design fondamentale e quindi il nuovo T14 G3 è immediatamente riconoscibile come un ThinkPad. Tuttavia, ci sono due grandi differenze rispetto al predecessore Recensione del portatile Lenovo ThinkPad T14 Gen 2: Beneficia dell'Intel Tiger Lake : Il case è ora più color antracite, cioè un po' più chiaro di prima, in modo da poter notare il contrasto con i dispositivi di input neri. Inoltre, i bordi dello schermo più sottili si notano immediatamente; in particolare, il bordo inferiore molto ampio appartiene ormai al passato. Rispetto ai laptop consumer contemporanei, i bordi sono ancora piuttosto ampi, 8 mm ai lati e 14 mm sopra e sotto il pannello, ma il dispositivo ha ora un aspetto molto più moderno nel complesso. Oltre alla variante di colore nero/antracite, Lenovo offre anche una variante argentata con dispositivi di input argentati.
Per il case sono stati utilizzati diversi materiali. Ad esempio, una combinazione di fibra di vetro/magnesio per la base e plastica rinforzata con fibra di vetro e carbonio per il coperchio. Le superfici risultano minimamente ruvide o vellutate, ma un aspetto positivo è che durante la nostra recensione abbiamo avuto molti meno problemi di impronte digitali rispetto a molti altri ThinkPad.
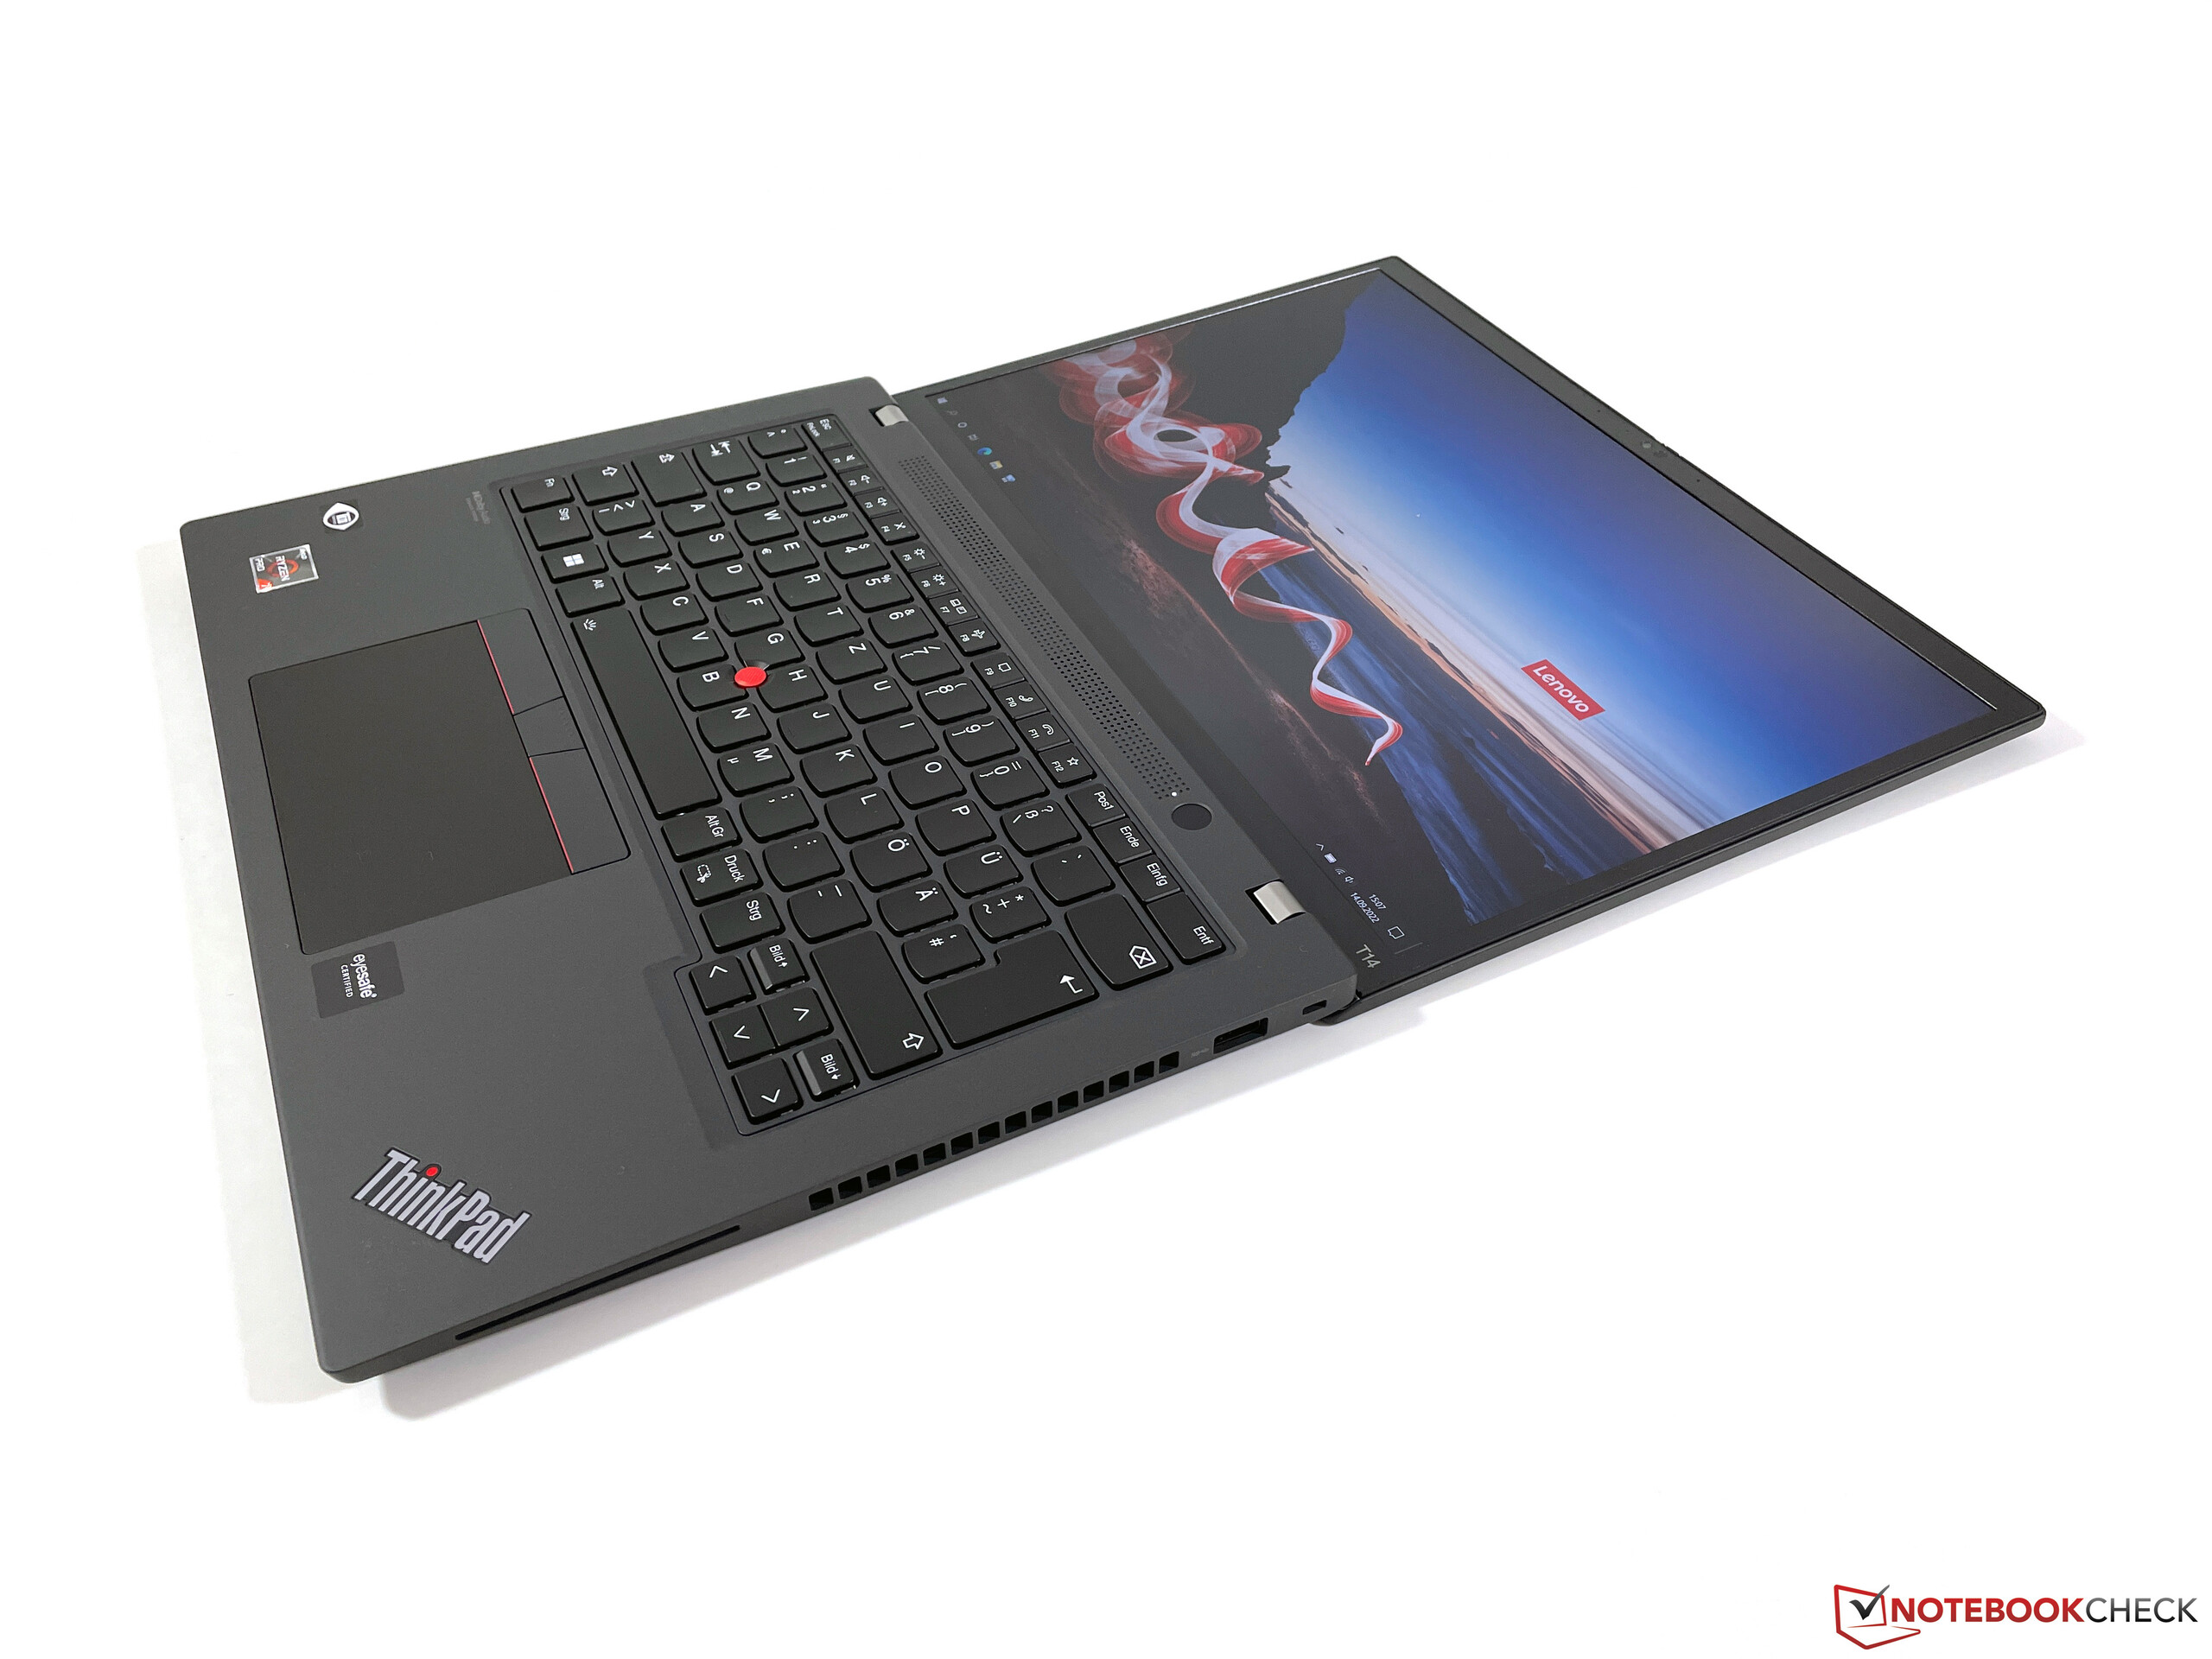
La stabilità dell'unità base è buona, ma non eccezionale. L'area centrale della tastiera può essere visibilmente premuta con un po' di forza, ma questo non si traduce in limitazioni nella pratica, anche per i dattilografi più energici. Sono stati avvertiti leggeri scricchiolii quando si è sottoposta l'unità base a sollecitazioni torsionali. Le due cerniere offrono un'ottima stabilità e impediscono efficacemente allo schermo di traballare, ma sono anche molto strette: cambiare l'angolo di apertura (massimo 180 gradi) con una sola mano è difficilmente possibile, per non parlare dell'apertura del coperchio con una sola mano. La stabilità del coperchio stesso è eccellente, perché difficilmente può essere piegato (non si sono registrati scricchiolii) e non siamo riusciti a ottenere alcun errore di immagine nemmeno applicando una pressione selettiva sul retro.
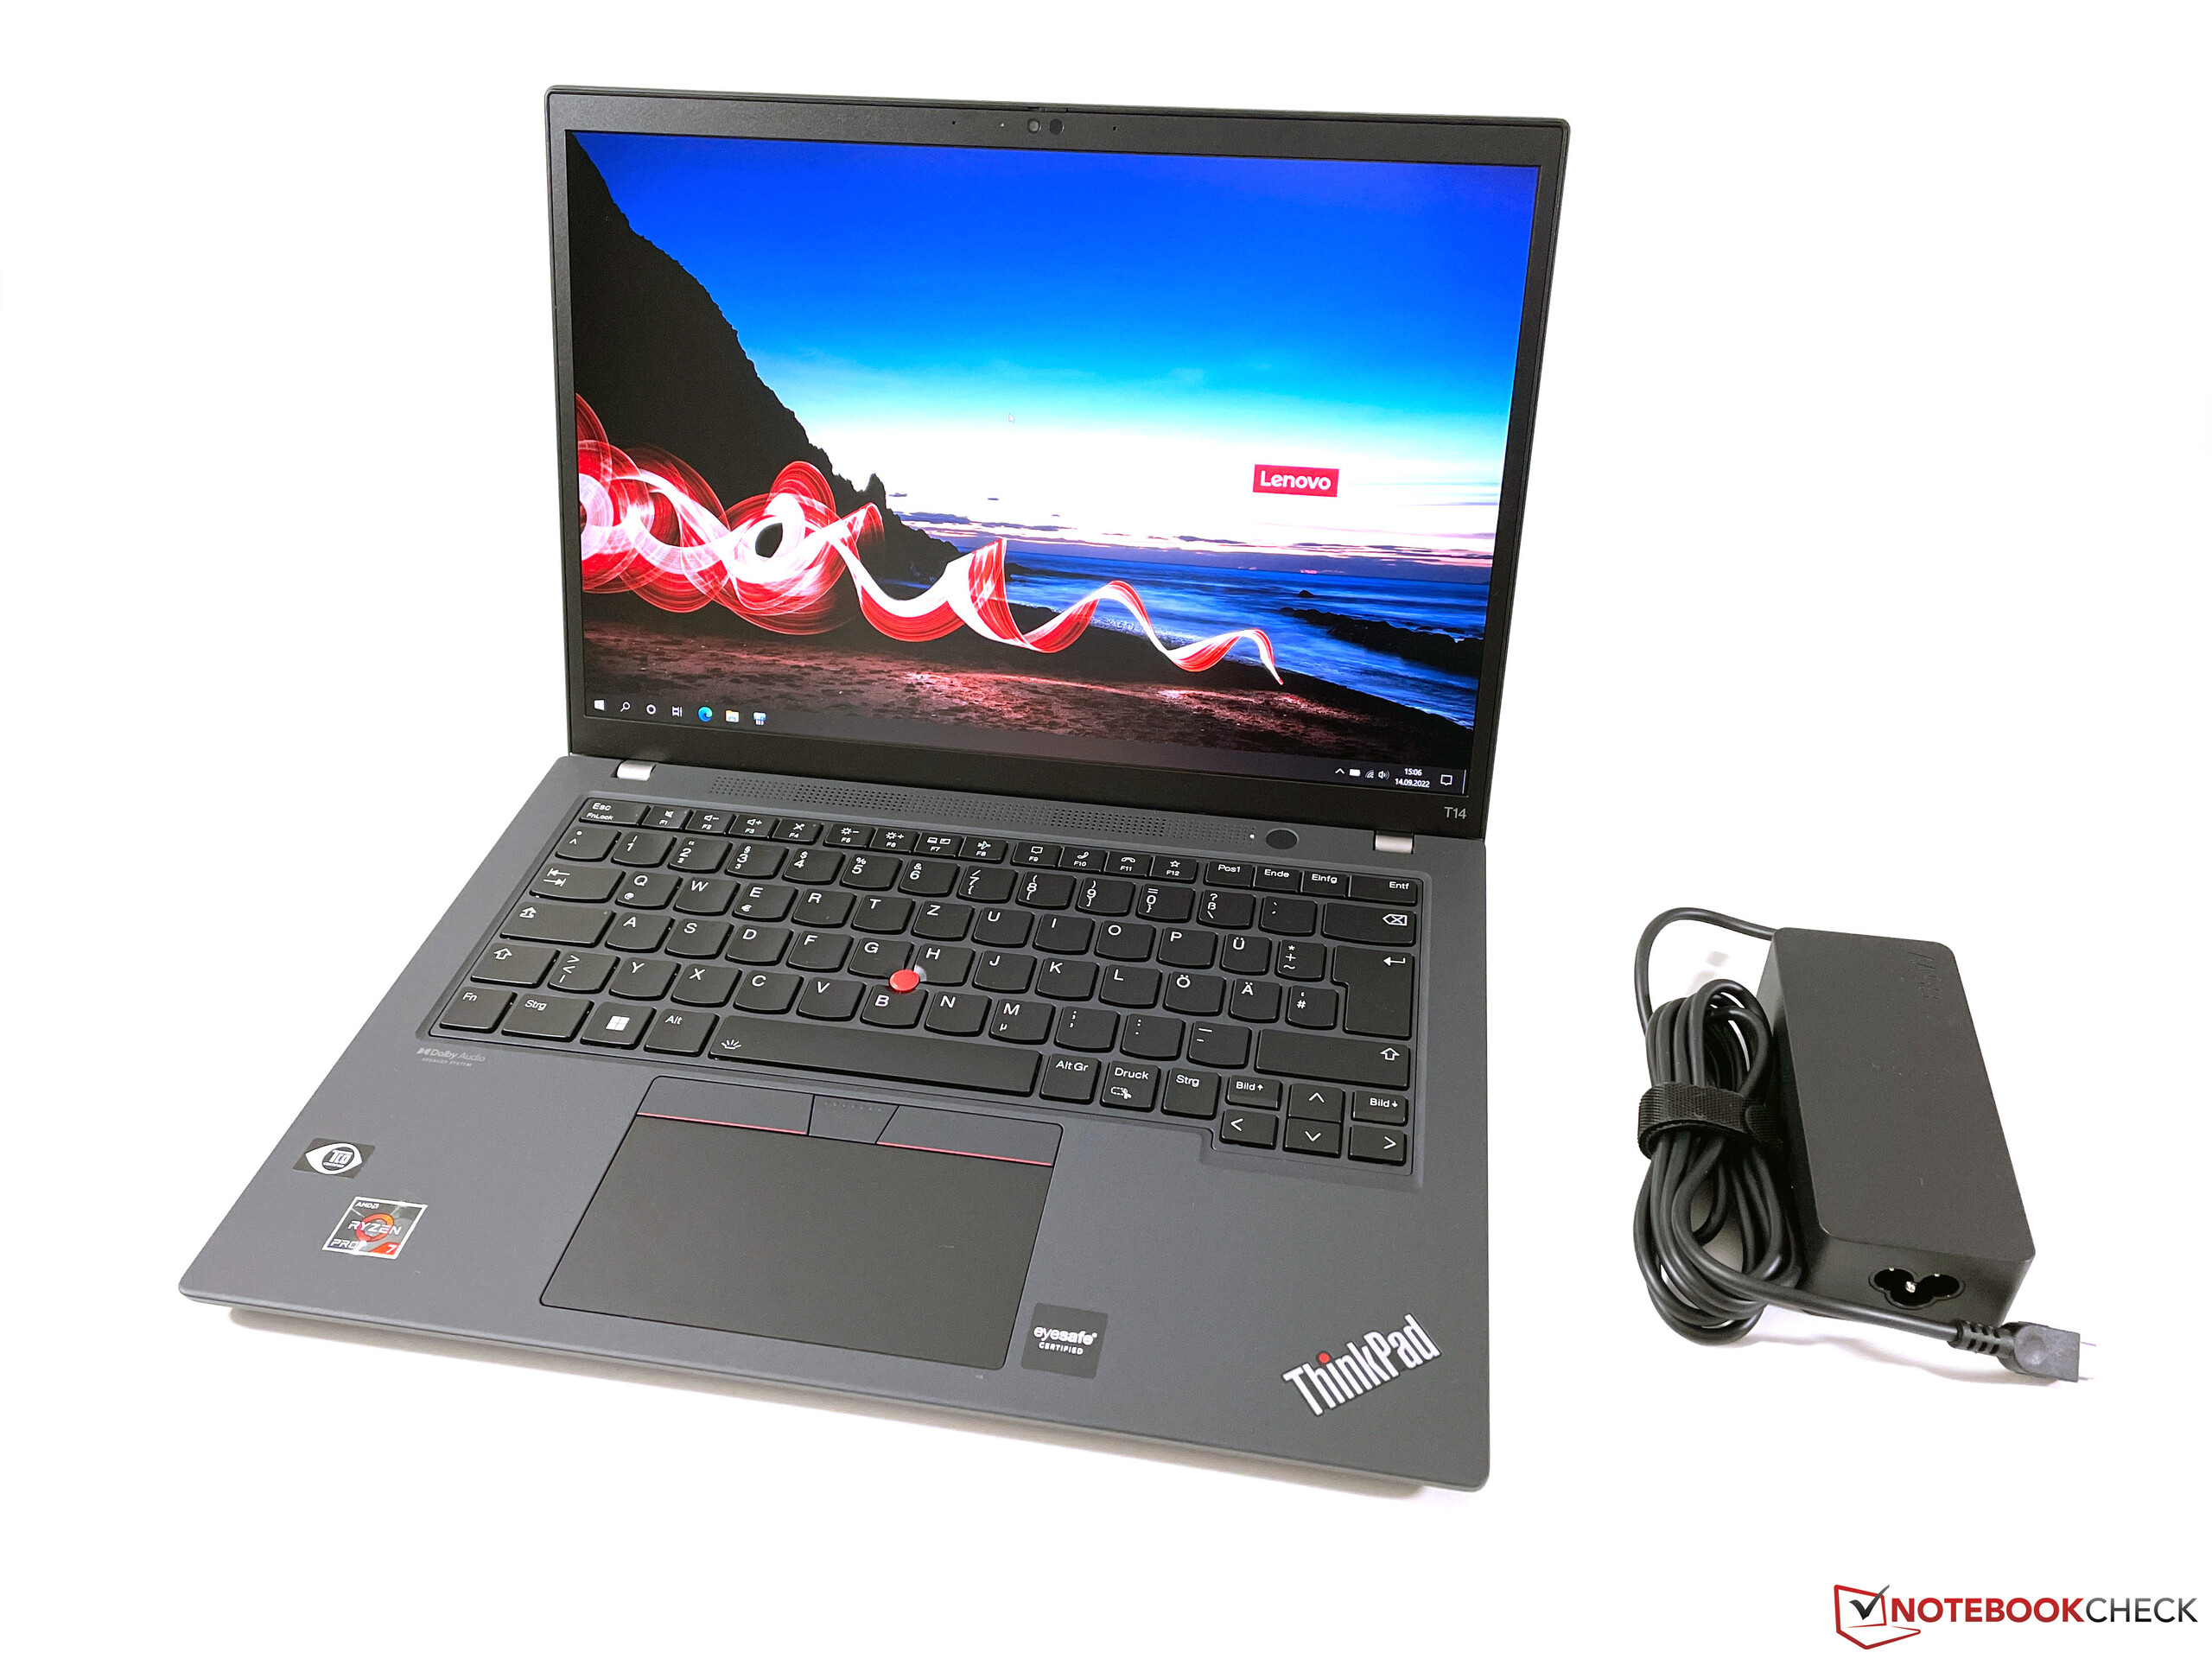
Rispetto al predecessoreil nuovo ThinkPad T14 G3 è diventato un po' più sottile, ma allo stesso tempo lo schermo 16:10 non ha comportato un case più profondo. Anche il peso è leggermente inferiore, poco più di 1,4 kg. È interessante notare che Lenovo offre anche una versione con una batteria a 3 celle più piccola, più leggera di circa 100 grammi. L'ormai noto alimentatore da 65 watt pesa circa 350 grammi e viene utilizzato anche per le versioni Intel, anche per il modello con la versione dedicata GeForce MX550che ci ha sorpreso non poco.
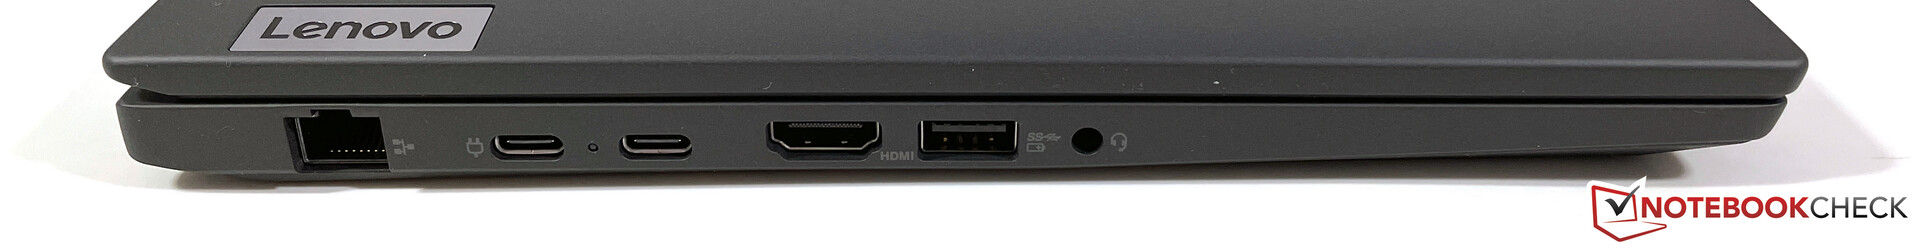
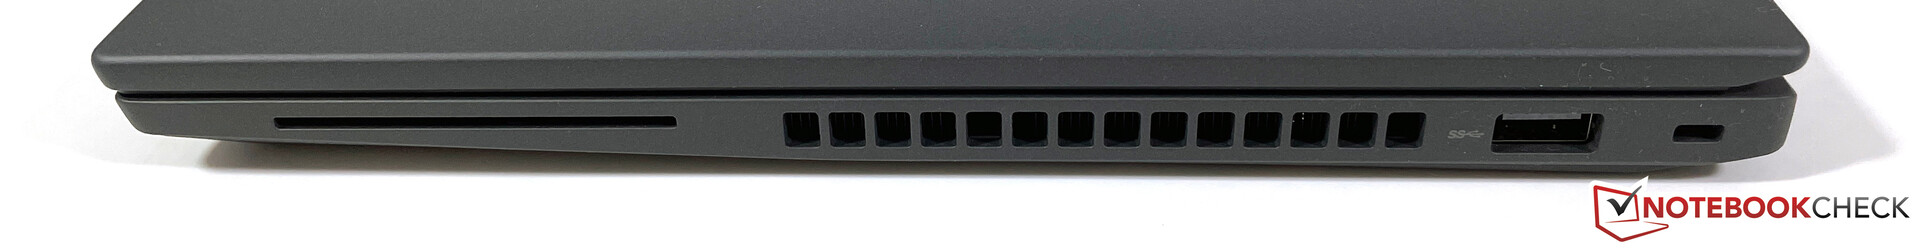
Apparecchiature - Lenovo omette l'USB 4
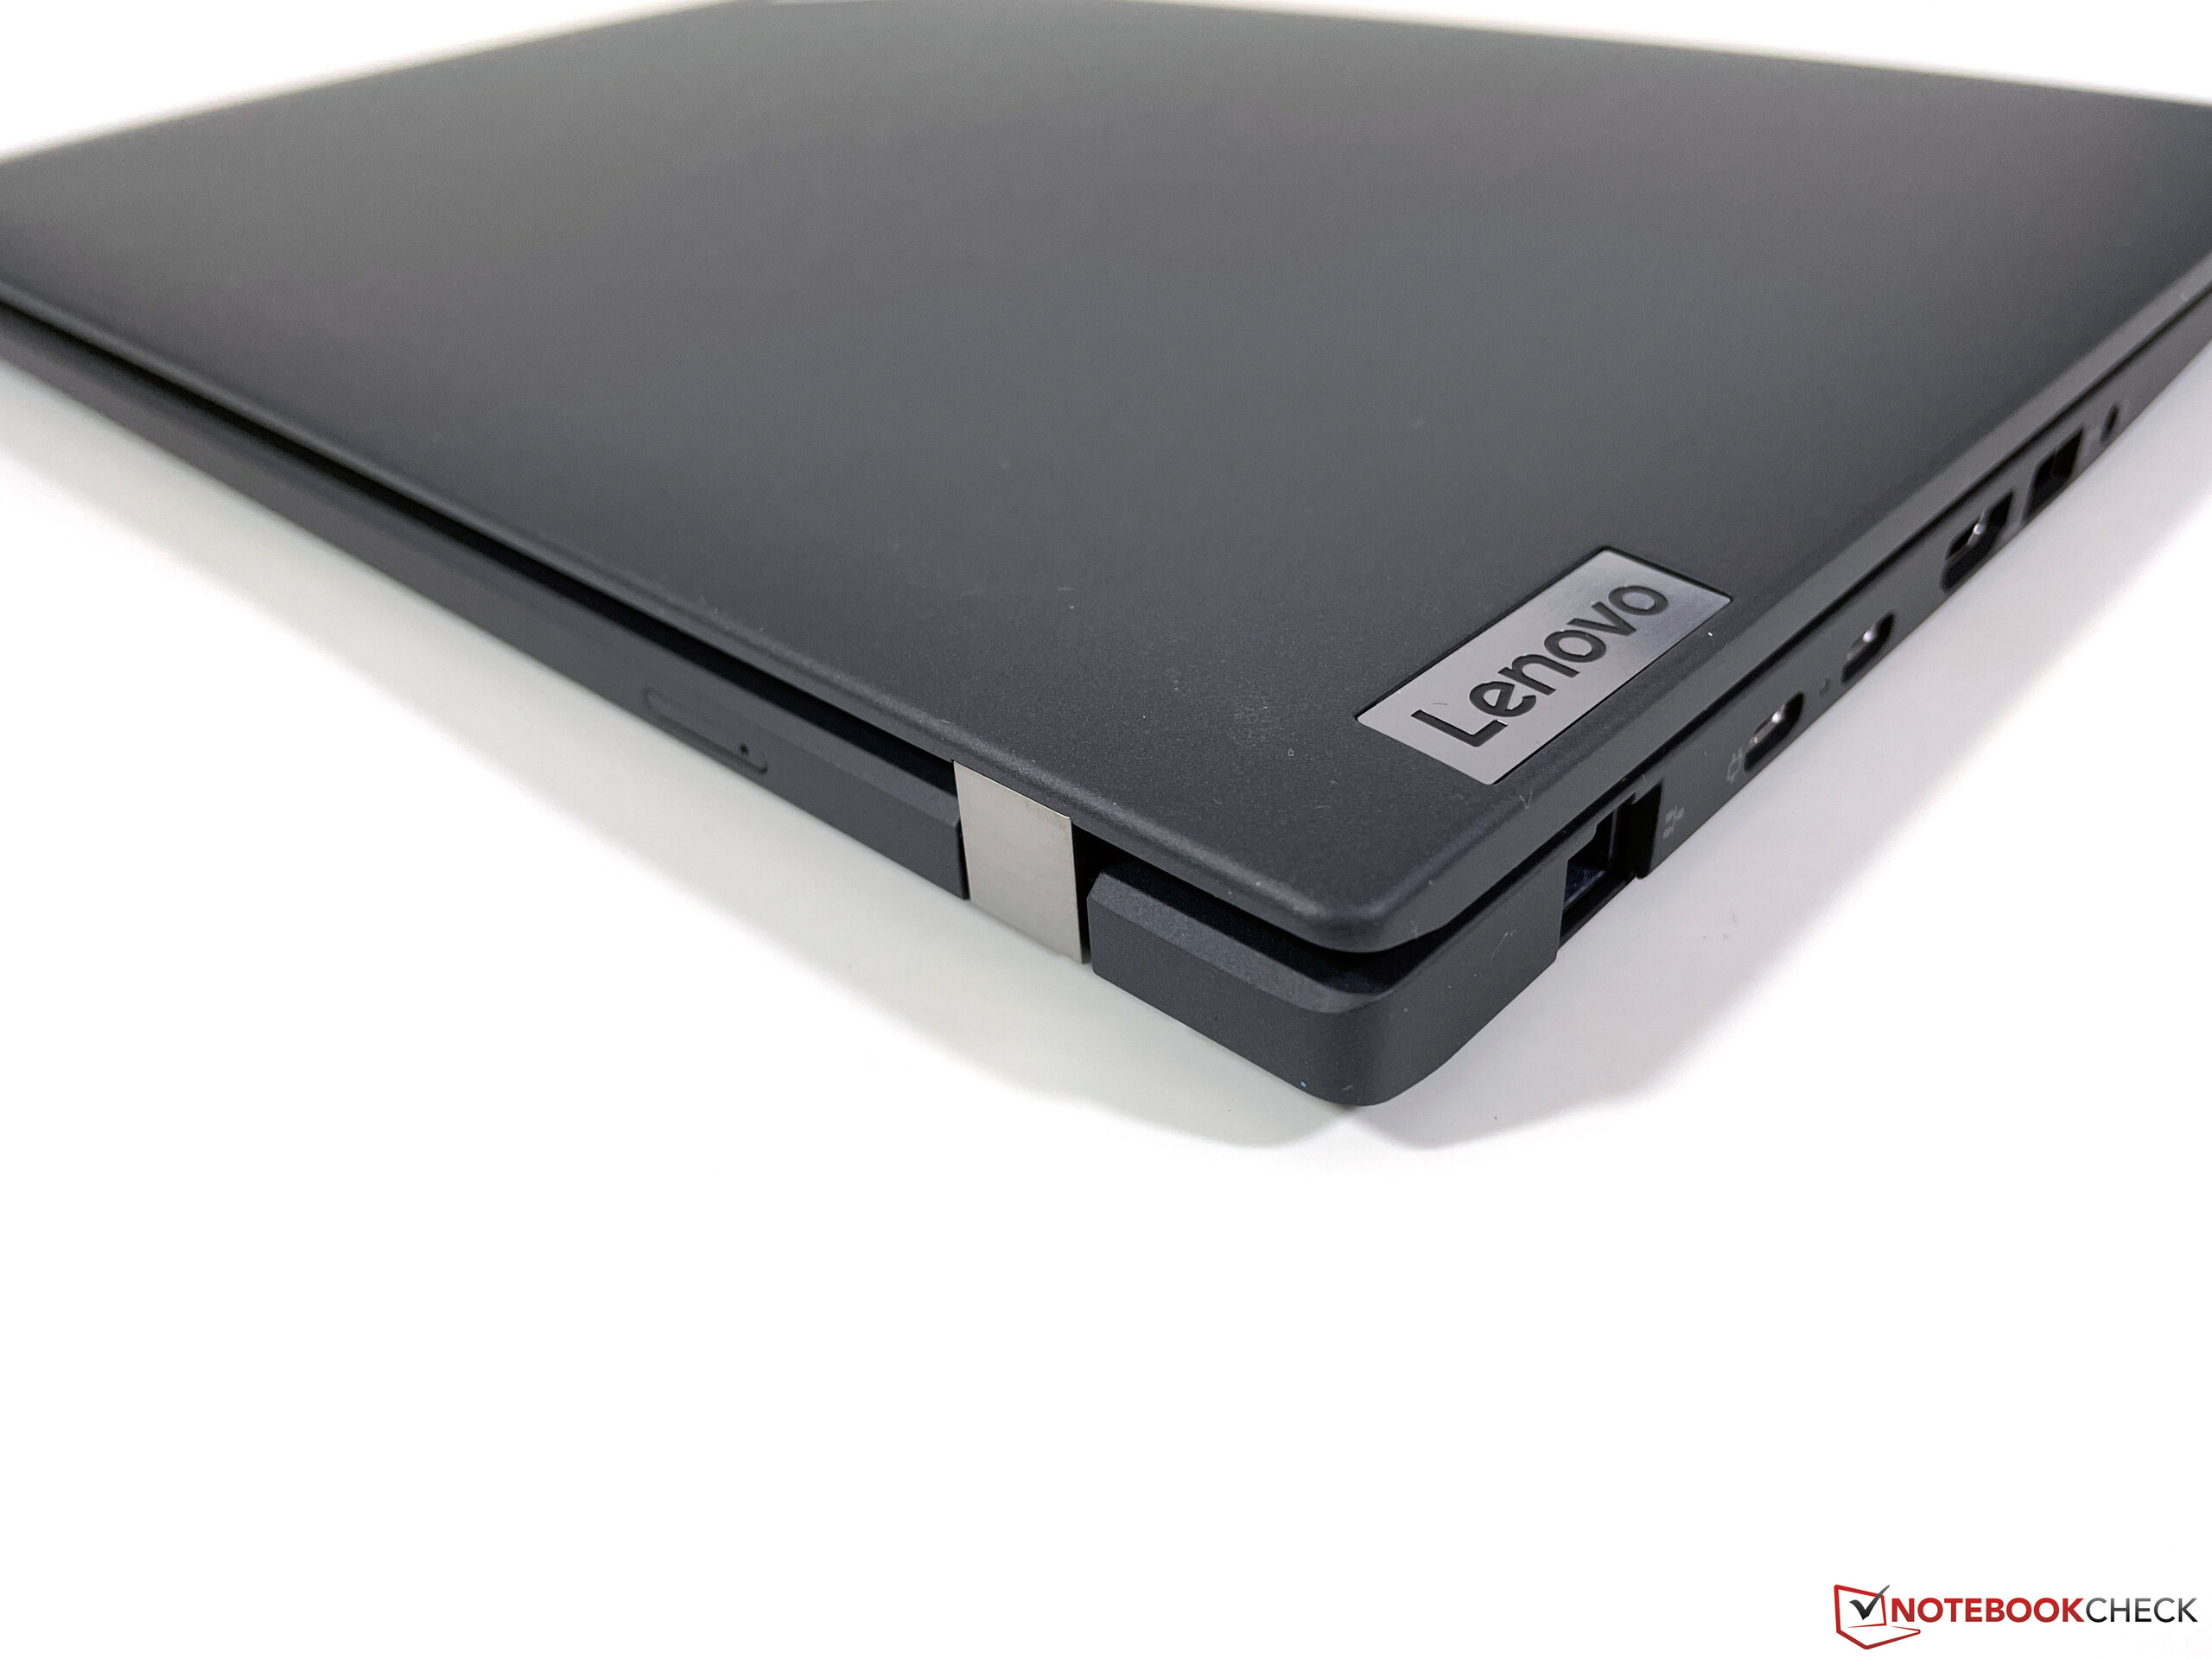
Il ThinkPad T14 G3 offre una varietà di porte, tra cui le normali porte USB-A, un'uscita HDMI e una porta Gigabit Ethernet. Tuttavia, l'omissione della porta USB 4 lascia perplessi, in quanto le due porte USB-C sulla sinistra supportano solo lo standard 3.2 Gen.2. Questo è incomprensibile e, a nostro avviso, una limitazione non necessaria, in quanto L'azienda ha deciso di non utilizzare la porta USB-C. Questo è incomprensibile e, a nostro avviso, una limitazione non necessaria, dato che Lenovo offre il supporto USB 4 nei modelli consumer con CPU AMD. È presente anche un lettore di SmartCard opzionale sulla parte anteriore destra. Anche voi dovrete fare a meno di un lettore di schede.
Comunicazione
In termini di moduli di comunicazione, avete a disposizione quasi l'intero spettro perché, oltre a una porta Gigabit Ethernet, viene utilizzato un moderno modulo Wi-Fi 6E di Qualcomm (NFA725A), che supporta anche il Bluetooth 5.2 insieme alle moderne reti a 6 GHz. La connessione alla rete a 6 GHz del nostro router di riferimento Asus ha funzionato senza problemi e sia la velocità di trasferimento che la qualità del segnale erano eccellenti. Non ci sono stati problemi nemmeno utilizzando un router Wi-Fi 5 (Fritz!Box 7590).
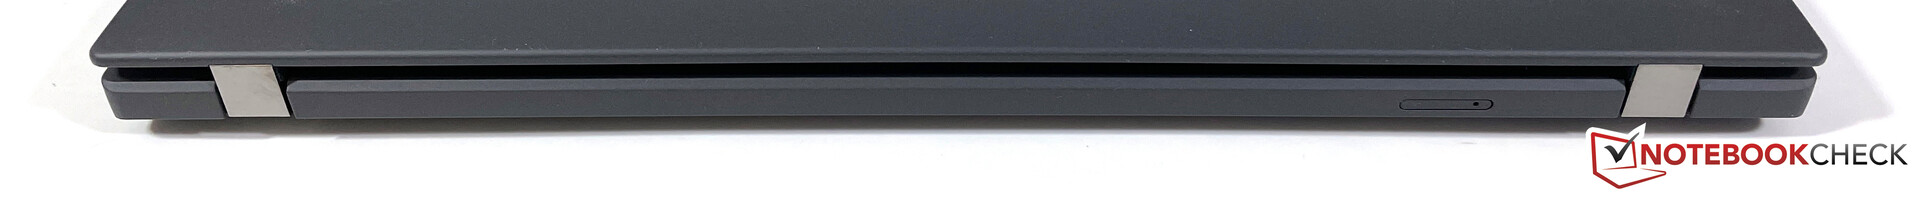
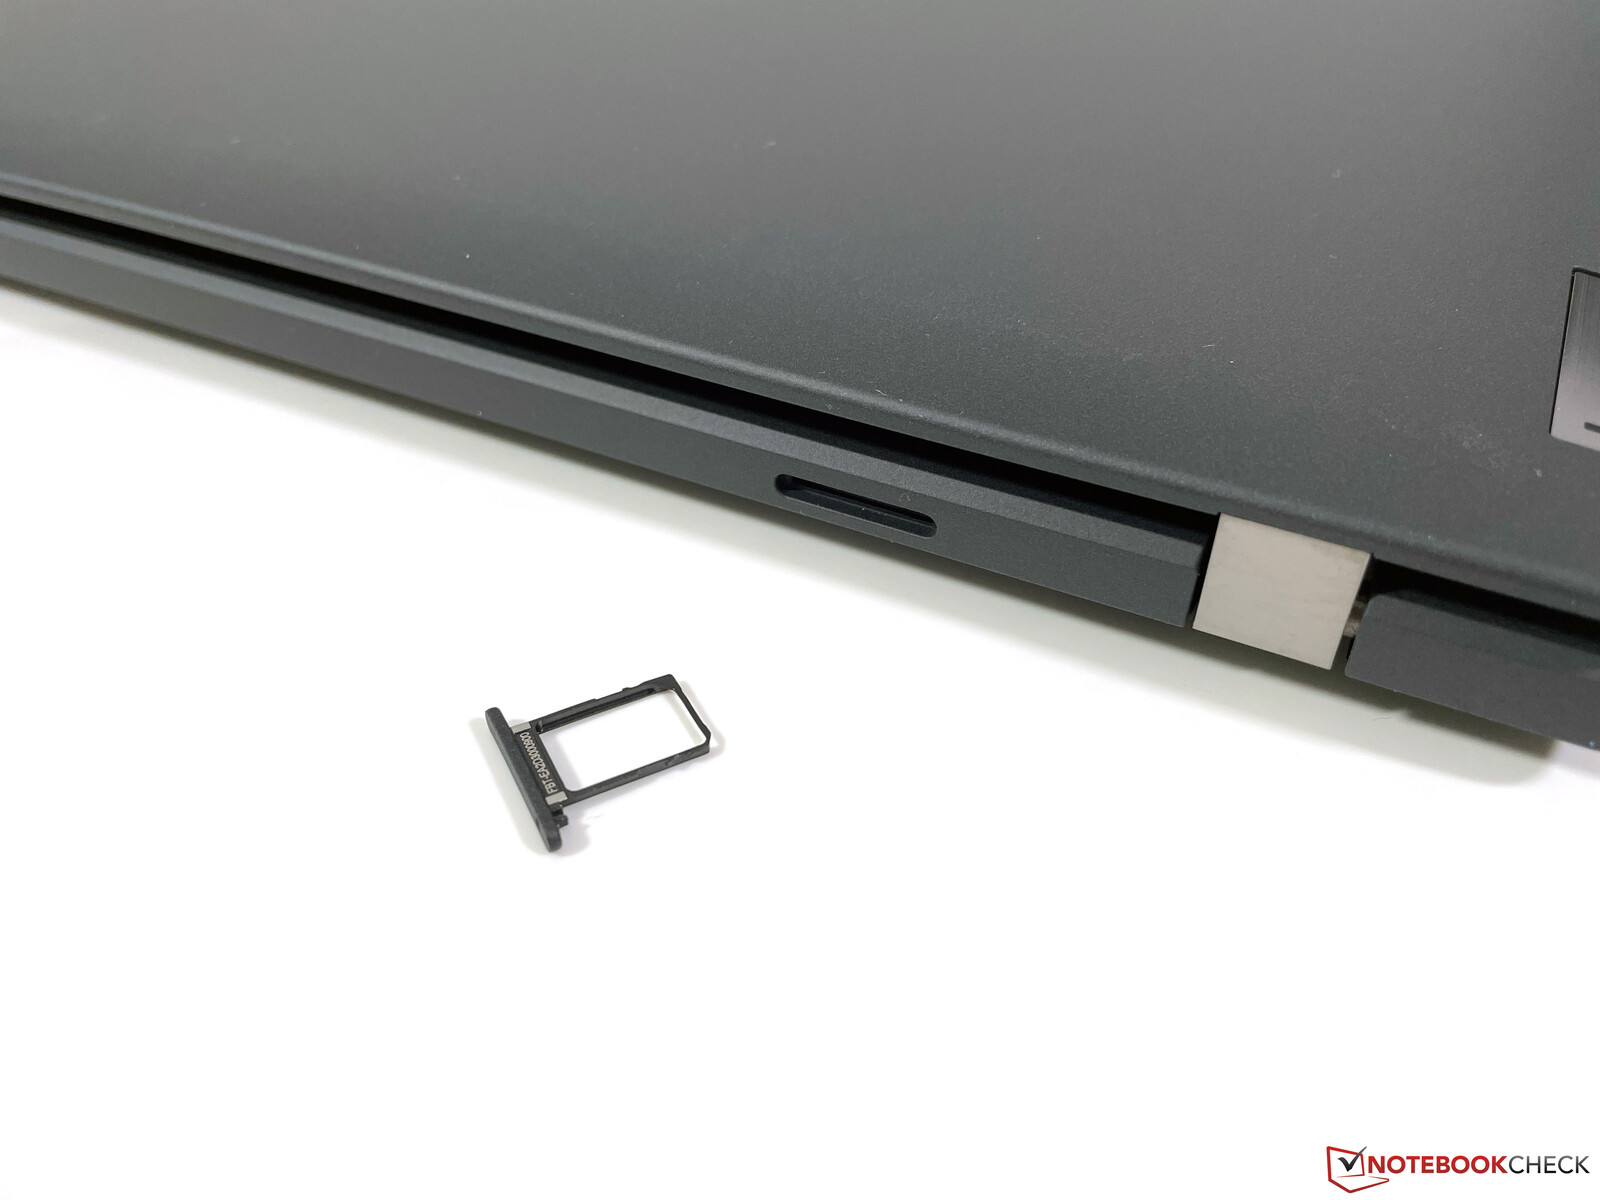
Chi dipende da Internet mobile ha la possibilità di configurare il T14 G3 con un modulo WWAN, ma in questo caso viene utilizzato "solo" un modulo 4G/LTE; i moduli 5G non sono disponibili. Tuttavia, bisogna fare attenzione quando si configura o si acquista il dispositivo, poiché la maggior parte delle configurazioni non sono predisposte per la WWAN, quindi non ci sono antenne e nemmeno uno slot nano-SIM sul retro. Questo è incomprensibile perché Lenovo offre un'opzione WWAN-ready nel configuratore senza costi aggiuntivi. In questo caso si potrebbero semplicemente fornire tutti i modelli con WWAN, come avveniva in passato.
Sia la versione AMD che quella Intel del T14 G3 sono disponibili come opzione con il modulo WWAN Quectel EM05-G (LTE Cat.4) e offrono una eSIM e uno slot nano-SIM. Durante i test abbiamo potuto utilizzare una scheda SIM Telekom senza alcun problema e abbiamo navigato sulla rete LTE senza problemi. La potenza del segnale era molto buona nelle aree urbane e migliore di quella di uno smartphone. Secondo la scheda tecnica ufficiale, dovrebbe essere presente anche un modulo Fibocom L860 GL-16 (Cat.16).
Webcam
Lenovo ha installato una webcam da 1080p con otturatore meccanico nella cornice superiore dello schermo, che offre una migliore qualità dell'immagine rispetto ai vecchi sensori da 720p. È stata installata anche una telecamera IR per il riconoscimento facciale tramite Windows Hello.


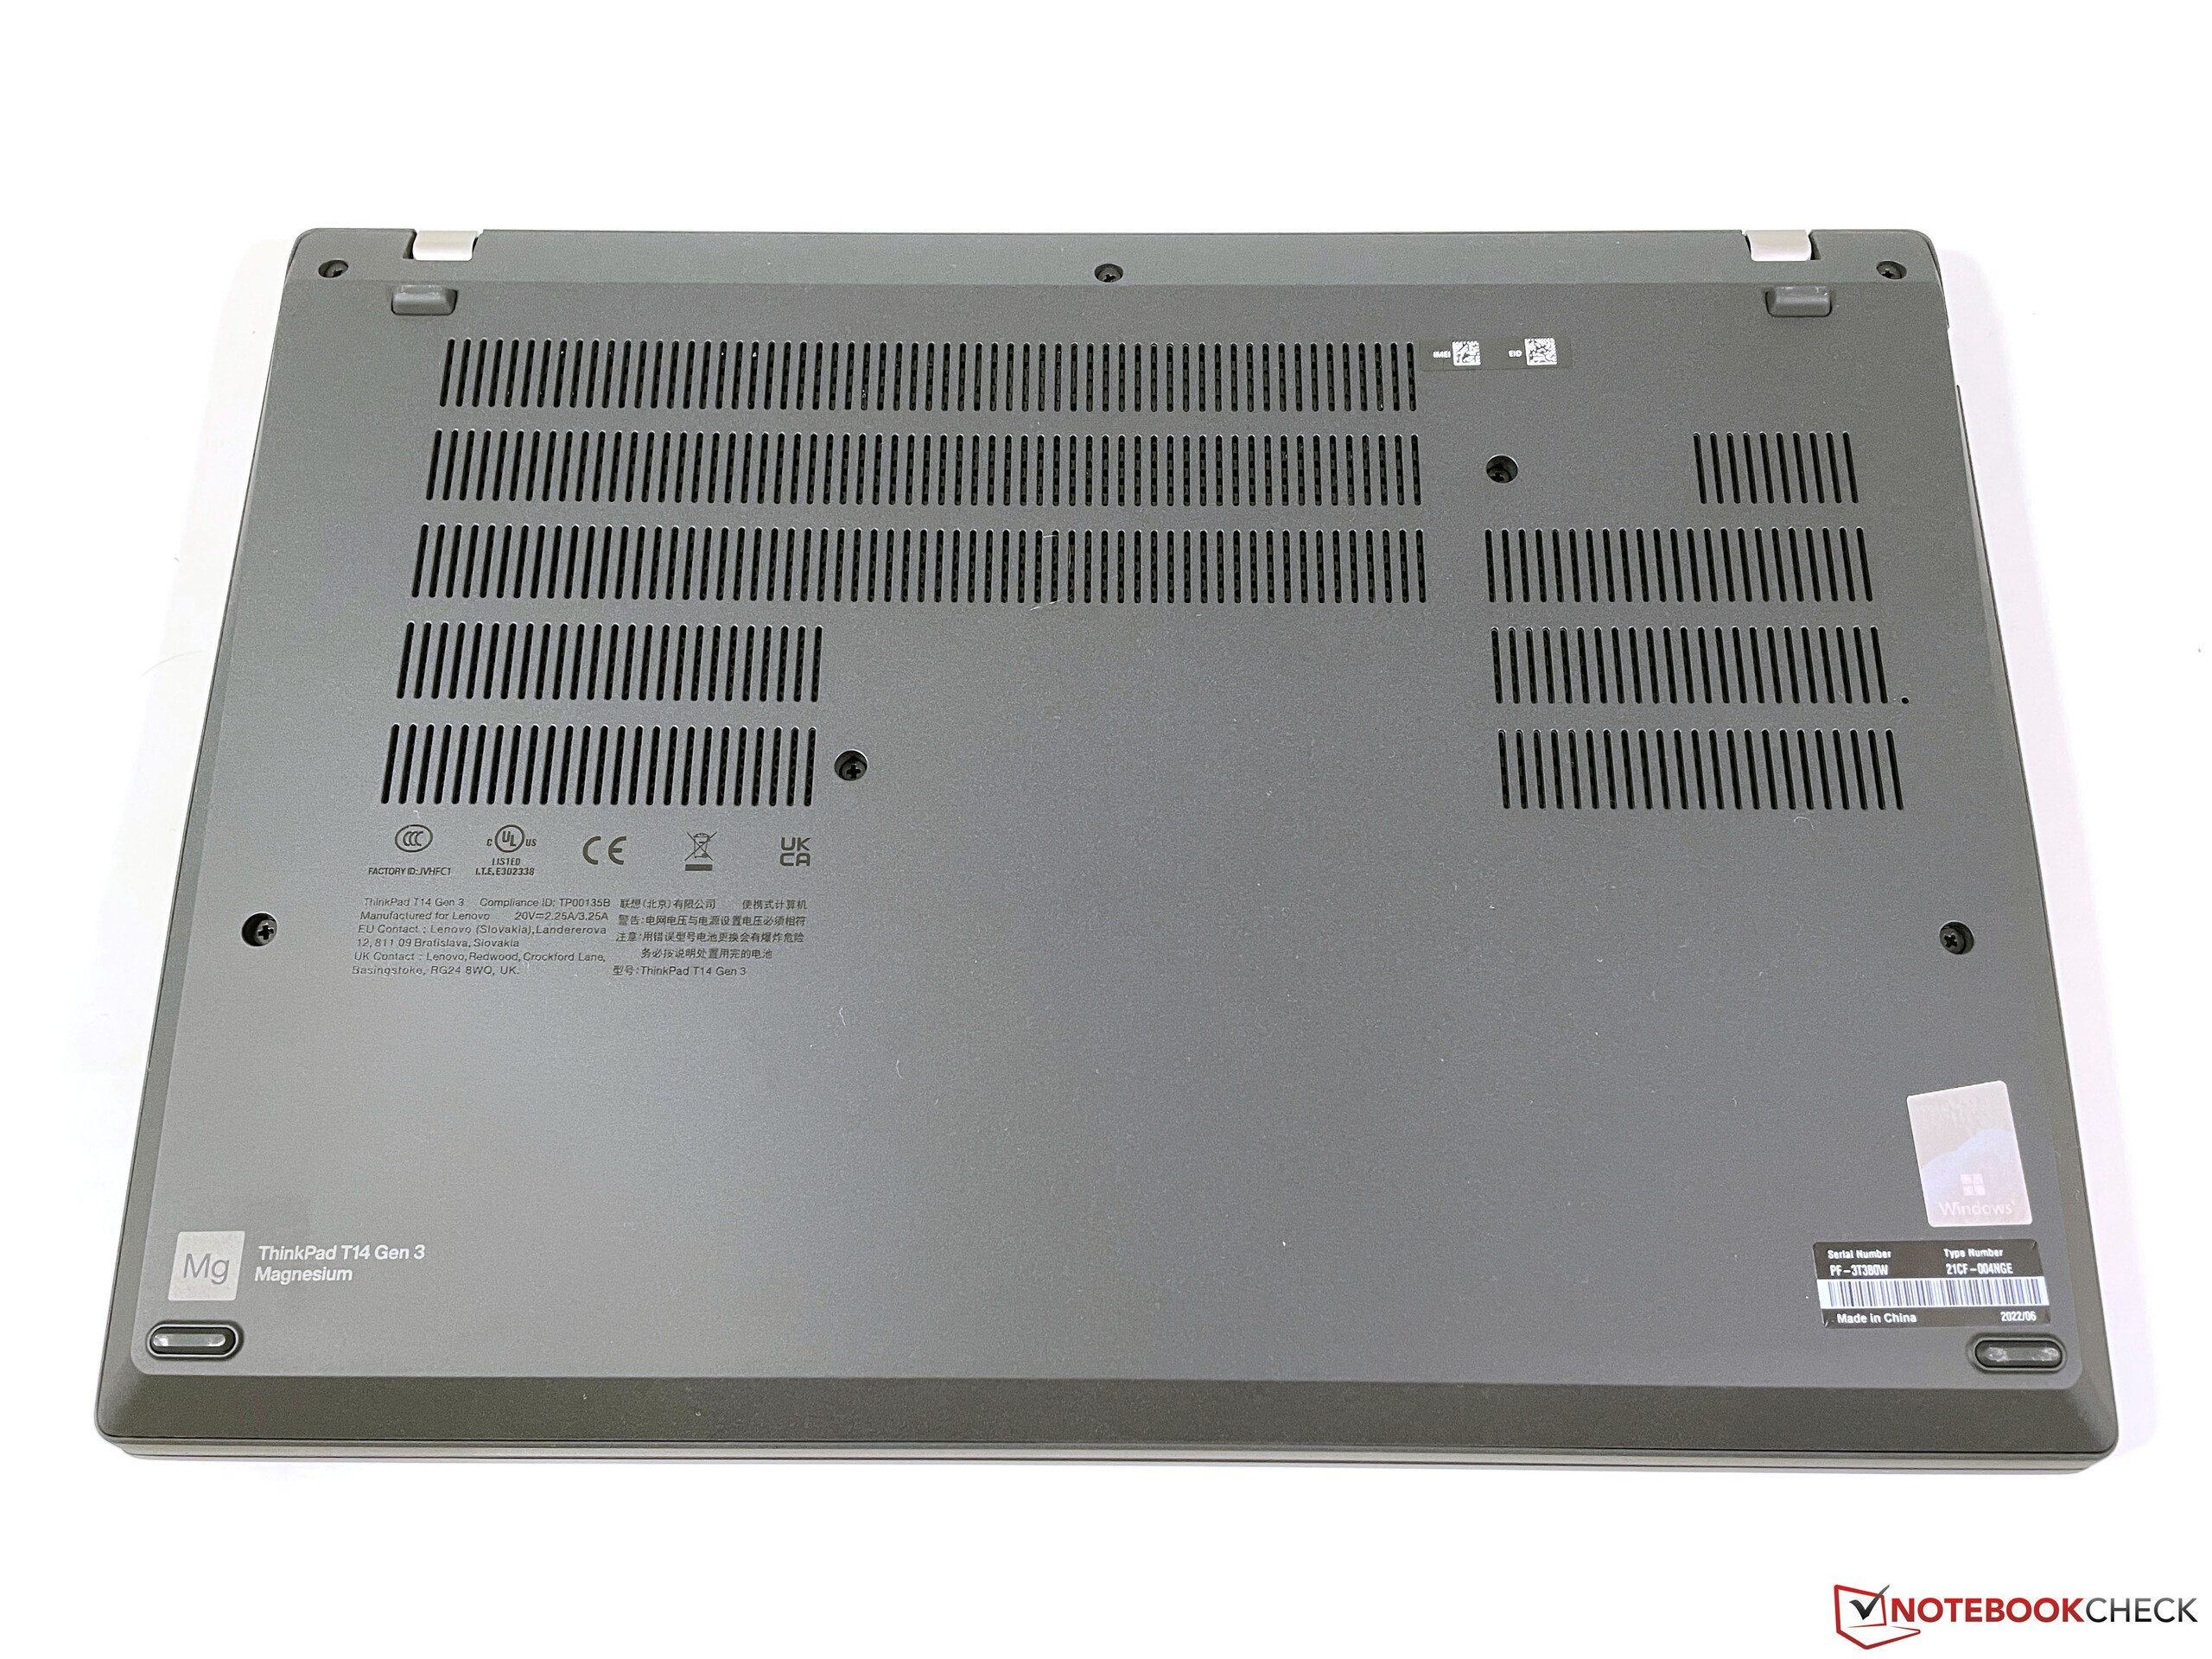
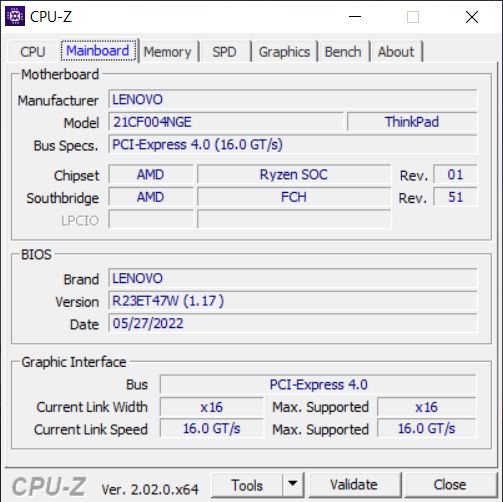
Manutenzione
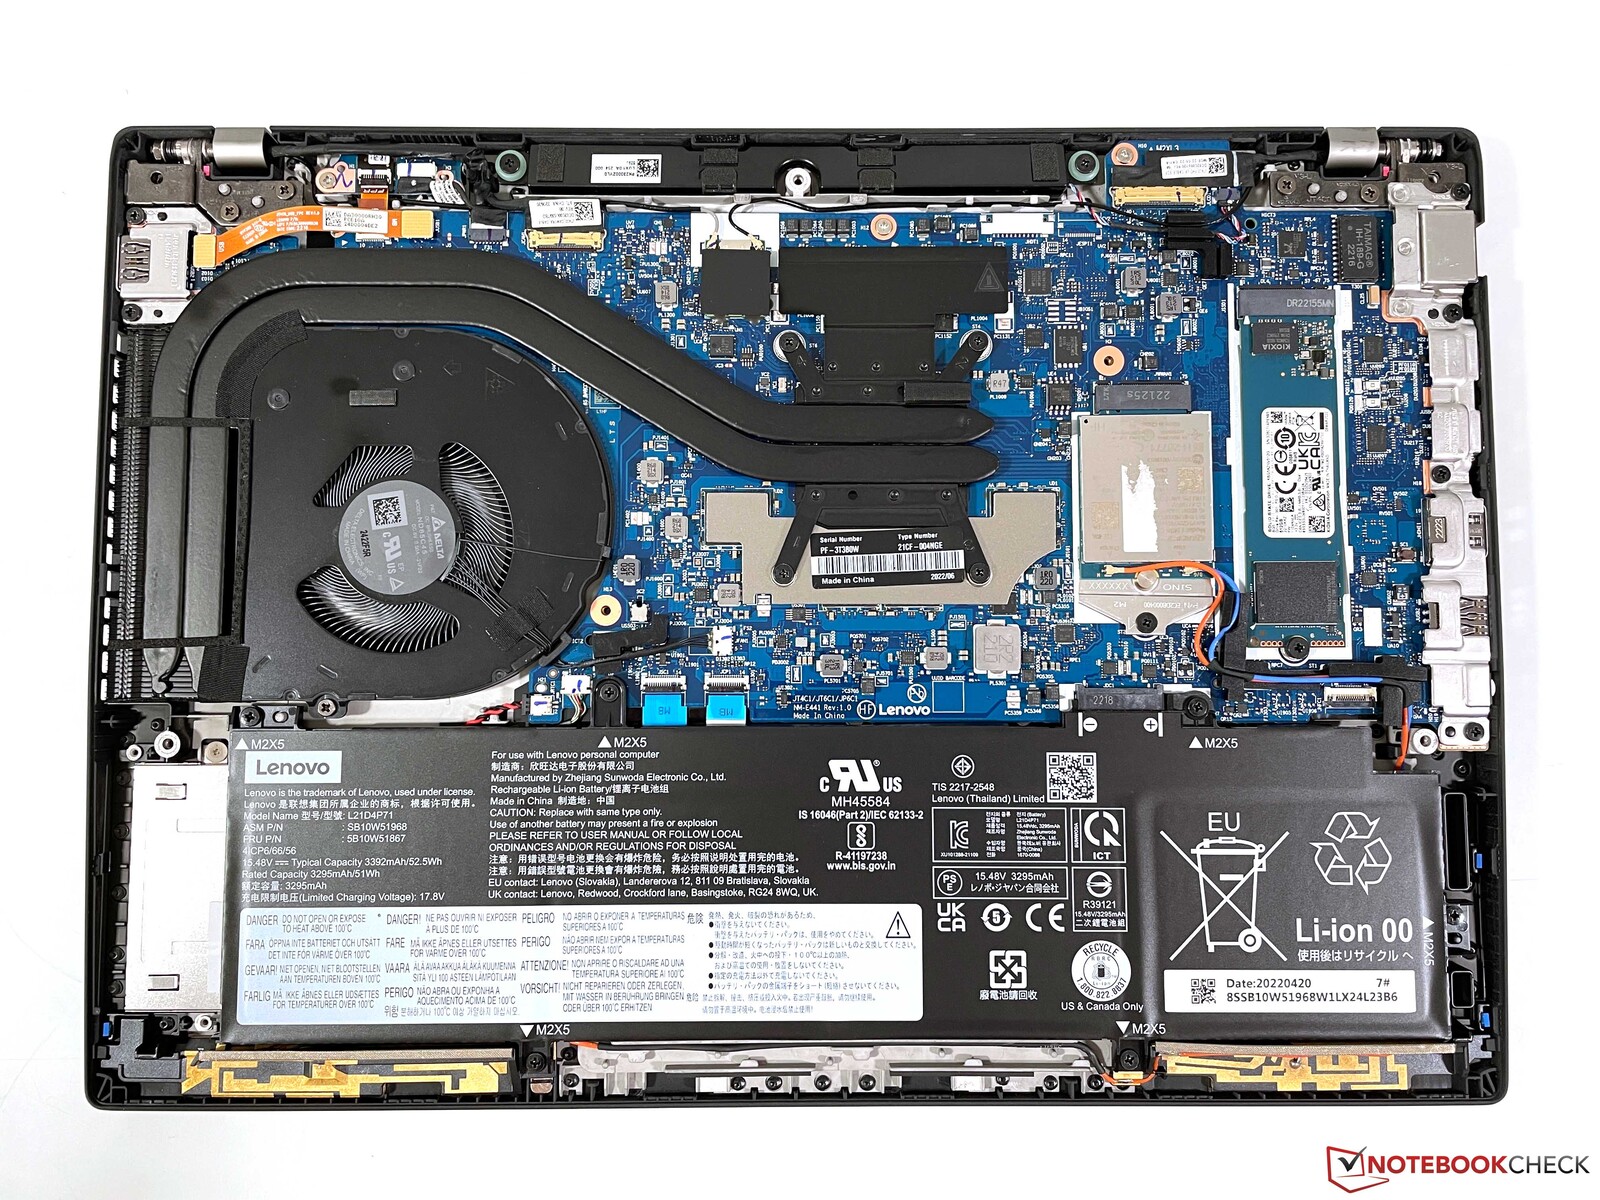
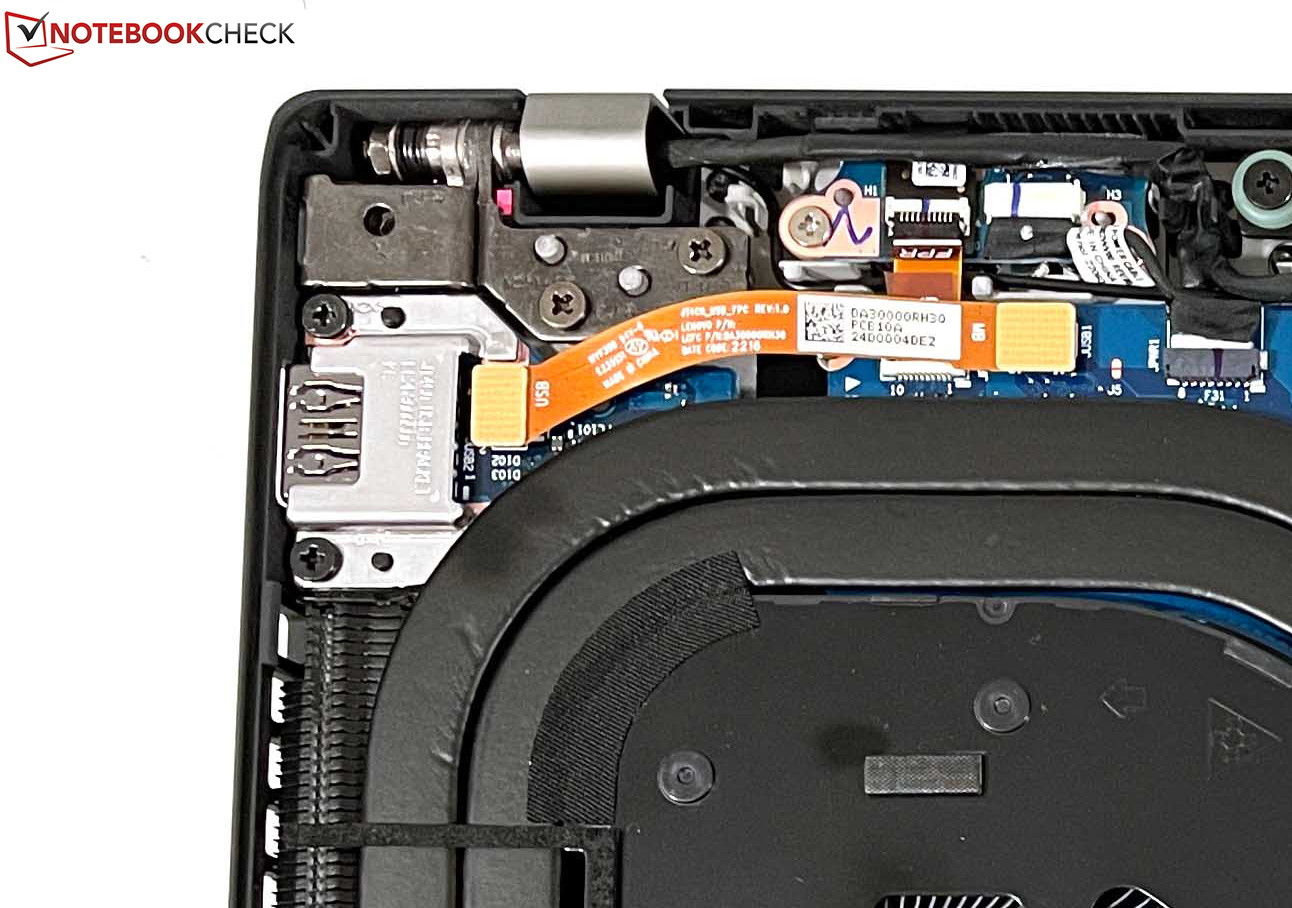
Lenovo ha semplificato l'accesso ai componenti perché ora non ci sono più tanti fermi di plastica. Dopo aver allentato le 7 normali viti Philips, il coperchio può essere rimosso molto facilmente. Qui si ha accesso alla ventola, all'SSD M.2-2280 e al modulo WWAN, ma il modulo WLAN non è sostituibile. Tuttavia, la RAM è saldata nel modello AMD (max. 32 GB LPDDR5-6400), mentre il modello Intel offre uno slot per la RAM insieme a un modulo saldato, per cui è possibile un massimo di 48 GB di RAM (DDR4-3200). La batteria è solo avvitata e può essere sostituita se necessario. Anche la tastiera può essere sostituita molto facilmente allentando due viti sul lato inferiore, quindi spingendo la tastiera leggermente in avanti e rimuovendola.
Dispositivi di input - ThinkPad T14 solo con caduta dei tasti da 1,5 mm
Tastiera
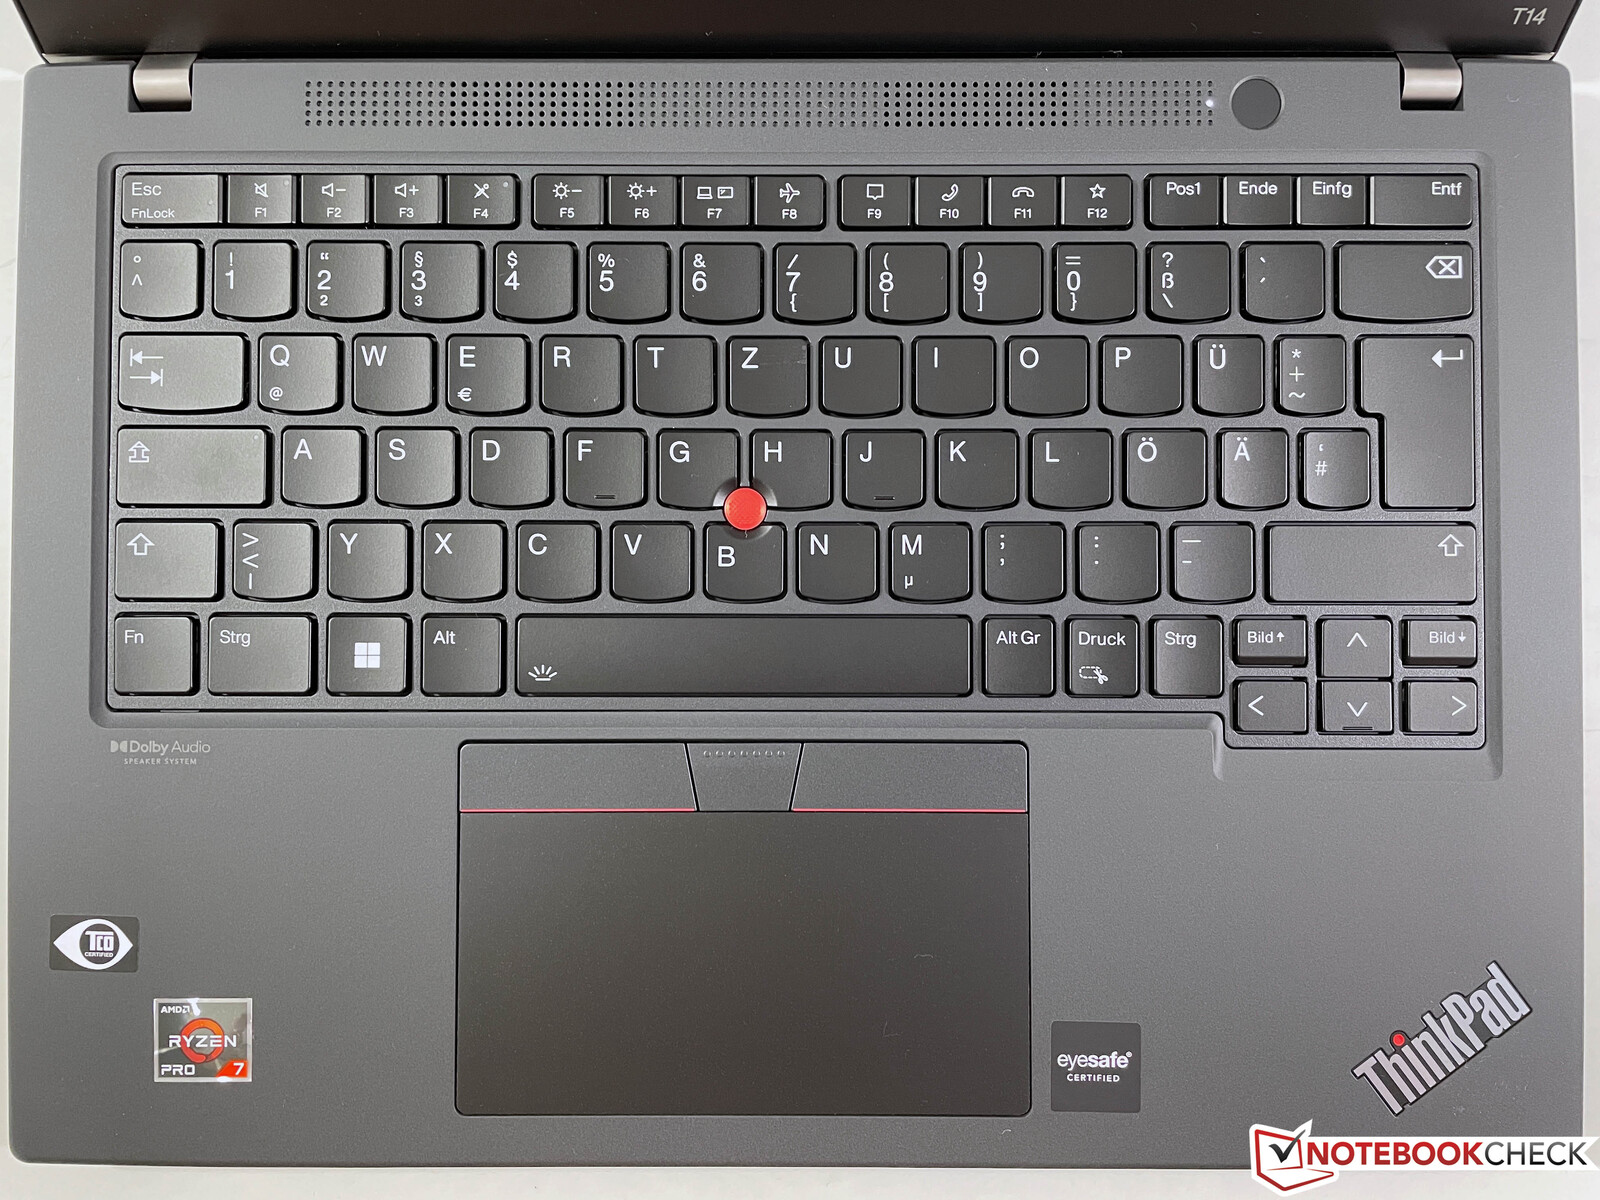
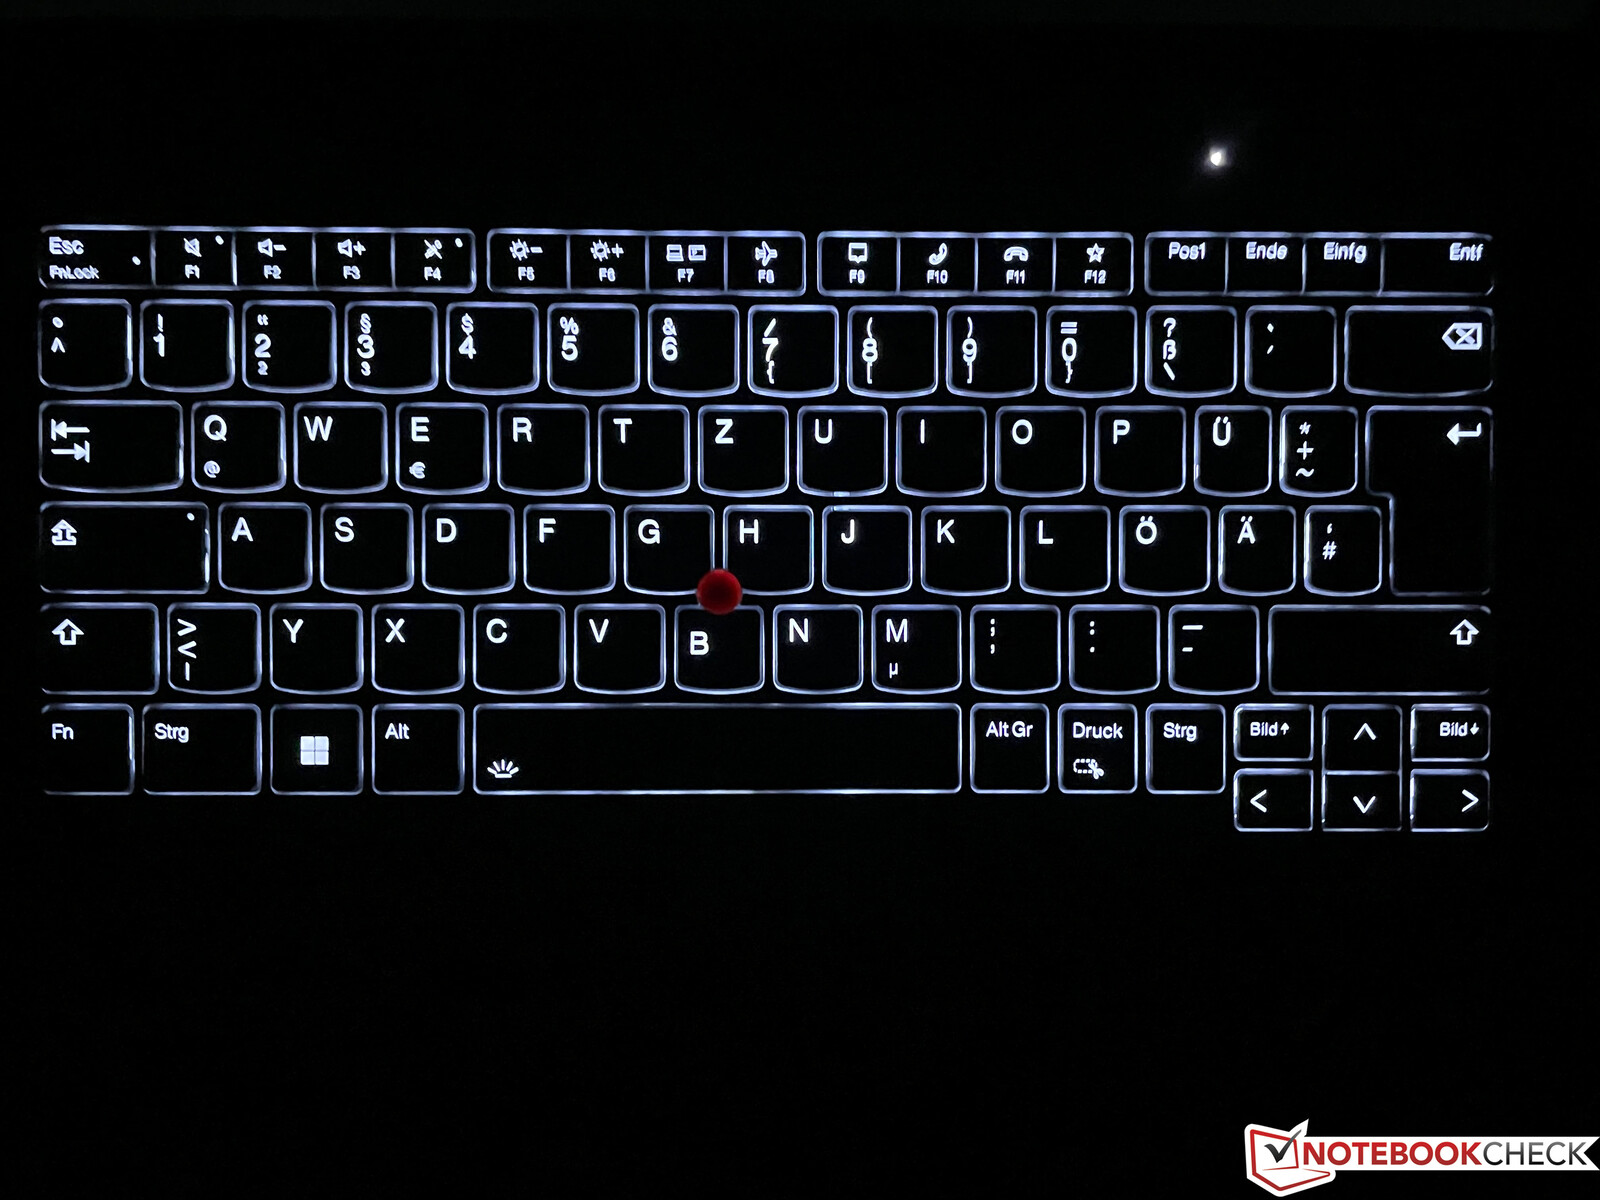
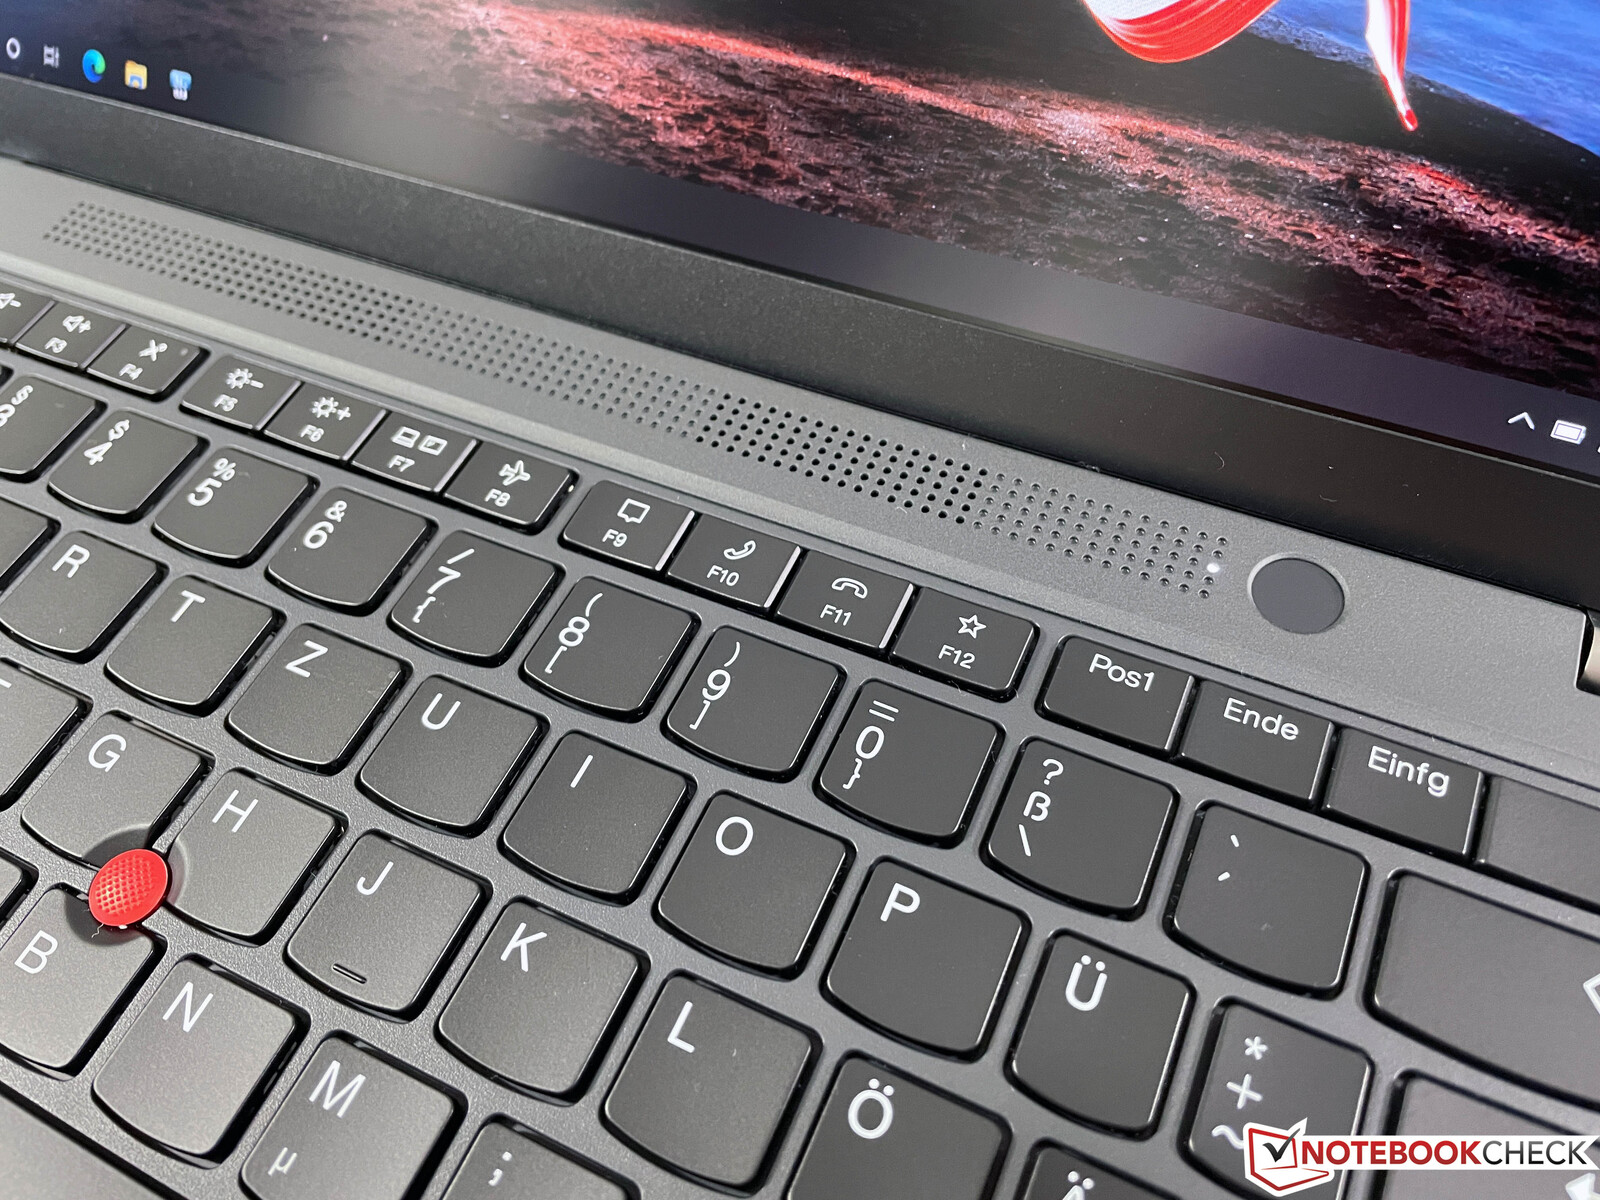
Come per altri ThinkPad, Lenovo ha ridotto la corsa dei tasti per il nuovo modello G3 del T14 da 1,8 a 1,5 mm, cosa che si nota nella pratica. Sebbene il feedback dei tasti sia ancora conciso e non si tratti di una cattiva tastiera, i vecchi modelli erano semplicemente migliori e più comodi. Rispetto ad altri portatili business, Lenovo non ha più un vantaggio e le tastiere di Dell e HP sono ora a un livello comparabile. La tastiera offre anche una retroilluminazione bianca a due livelli, ma non può essere attivata automaticamente tramite il sensore di luminosità. Il lettore di impronte digitali è stato integrato nel pulsante di accensione, situato sopra la tastiera.
Touchpad e TrackPoint
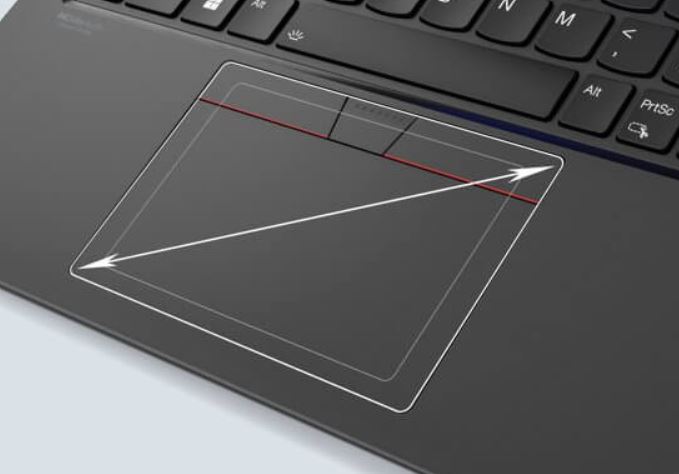
Il TouchPad è più grande rispetto alpredecessore e funziona molto bene nella pratica. Non abbiamo avuto problemi con il normale controllo del puntatore né con i gesti fino a quattro dita durante i test. L'area inferiore del pad può essere premuta, il che viene riconosciuto da un suono di scatto piuttosto attenuato.
Naturalmente, anche il TrackPoint al centro della tastiera è disponibile per i movimenti del puntatore e funziona molto bene. Siamo rimasti positivamente sorpresi dai nuovi tasti TrackPoint, che ora sono un po' più larghi, come il touchpad. Offrono una corsa leggermente maggiore e sono stati perfettamente implementati nel nostro esemplare in prova, per cui non presentano instabilità o oscillazioni. Inoltre, offrono un rumore di clic molto ricco e ovattato.
Display - T14 G3 ora con 16:10
Dopo aver equipaggiato nuovamente dispositivi di fascia alta come ilThinkPad X1 Carbon con pannelli 16:10 dalla scorsa generazione, anche i modelli ThinkPad T14 G3 e T14s G3 vengono ora convertiti. Lenovo offre un totale di 6 diversi pannelli da 14 pollici per il T14 G3 AMD (5 per l'Europa), che possono differire notevolmente in termini di qualità dell'immagine e luminosità:
- WUXGA (1.920 x 1.200), 300 nit, IPS, 700:1, 45% NTSC
- WUXGA (1.920 x 1.200), 400 Nits, IPS, 800:1, 100% sRGB, sovrapprezzo di circa US$ 110
- WUXGA (1.920 x 1.200), 300 Nits, IPS, Touch, 700:1, 45% NTSC, sovrapprezzo di circa US$ 100
- WUXGA (1.920 x 1.200), 500 Nits, IPS, Touch, Privacy Guard, 1000:1, 100% sRGB, sovrapprezzo di circa US$ 360
- 2.2K (2.240 x 1.400), 300 Nits, IPS, 1500:1, 100% sRGB
- WQUXGA (3.840 x 2.400), 500 Nits, 1500:1, 100% DCI-P3, DolbyVision HDR 400, sovrapprezzo di circa US$ 420
Il display 2.2K non è disponibile in Europa. Il nostro esemplare in prova ha il display non-touch da 400 nit, che probabilmente sarà la variante più popolare per l'uso produttivo e, in base all'esperienza, offre il miglior compromesso tra qualità dell'immagine ed efficienza. Come per i predecessori di Recensione del portatile Lenovo ThinkPad T14 Gen 2: Beneficia dell'Intel Tiger Lake , anche in questo caso ci saranno probabilmente diversi fornitori, quindi non si può escludere una certa lotteria di pannelli, motivo per cui le specifiche minime con un contrasto di 800:1 sono così basse
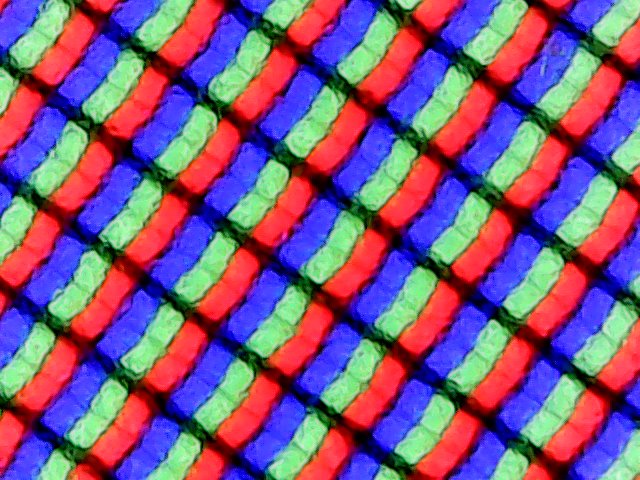
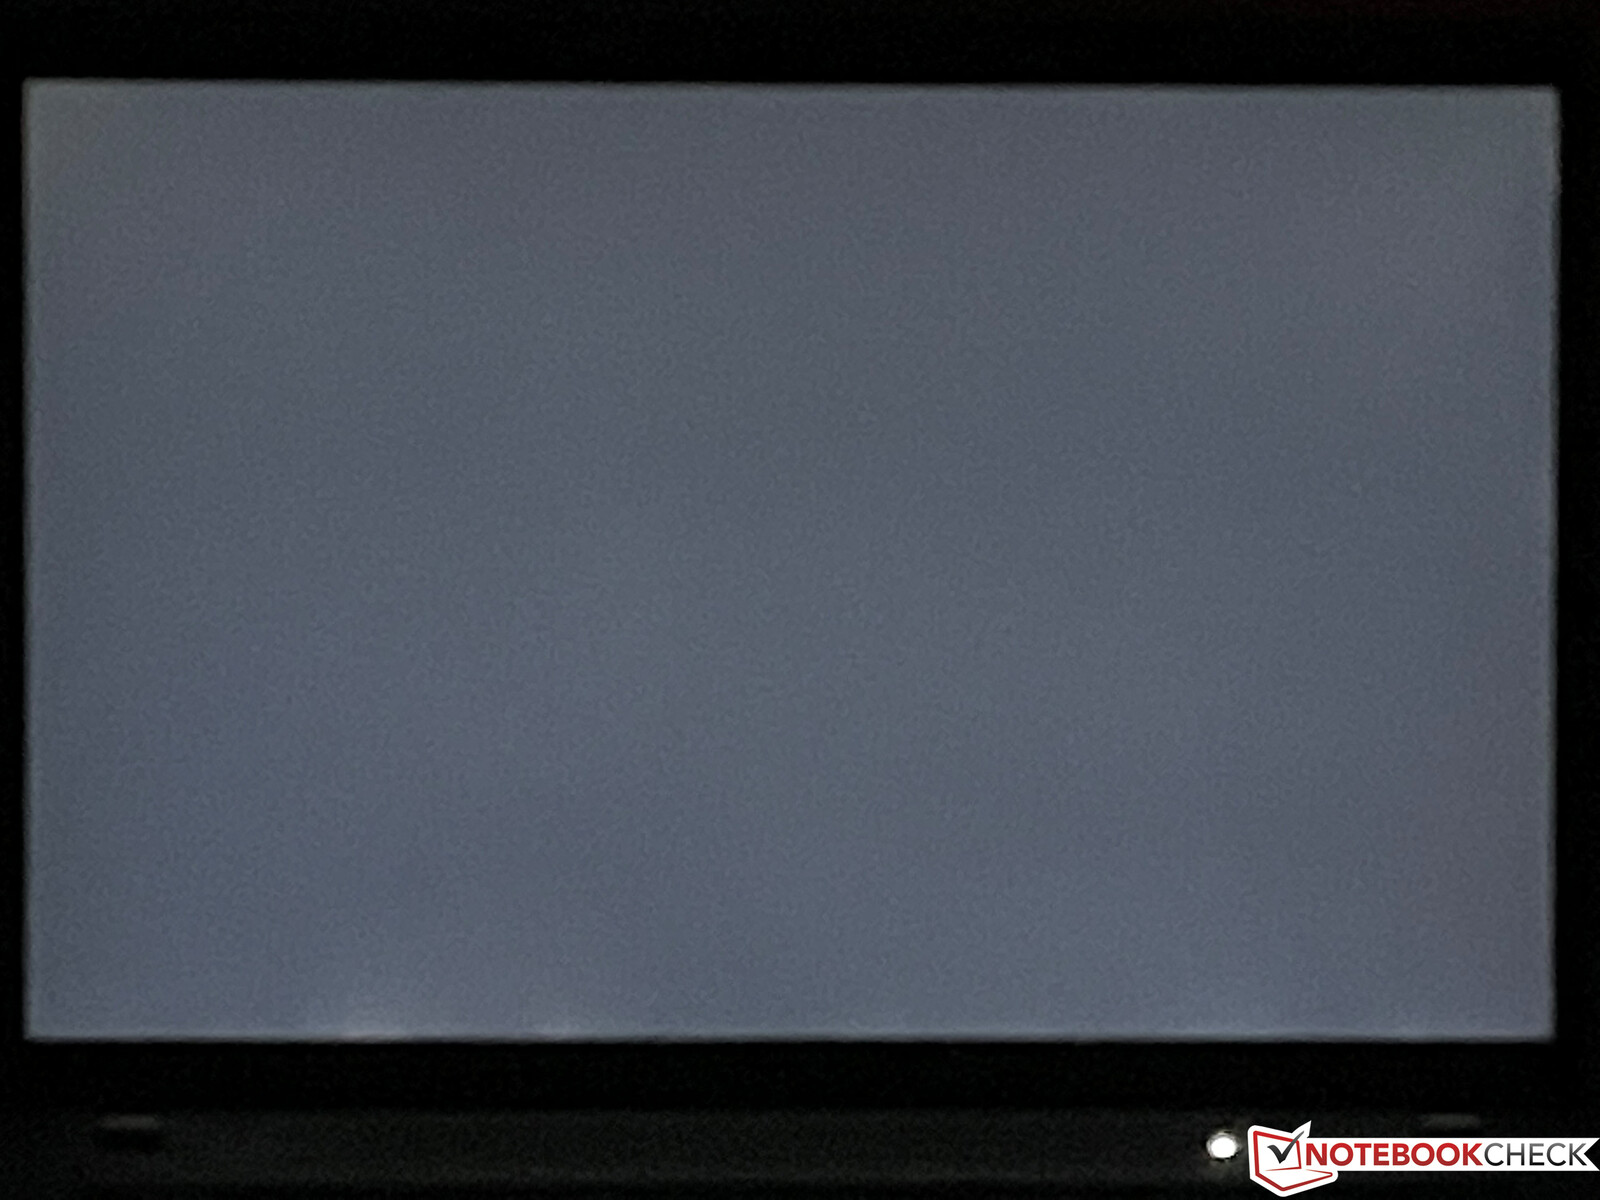
Il nostro pannello proviene da LG (LP140WU1-SPB2) e si comporta bene praticamente in tutte le aree, considerando l'uso previsto. Nonostante la superficie opaca, le superfici luminose non appaiono affatto sgranate, i contenuti sono sufficientemente nitidi nonostante la normale risoluzione FHD e anche i colori appaiono vividi. Un'occhiata ai valori misurati mostra anche il perché di questa situazione. Il rapporto di contrasto è superiore a 2100:1, un valore estremamente buono per un pannello IPS. Anche la luminosità specificata di 400 cd/m² viene superata dal nostro campione in esame con una media di 432 cd/m². Allo stesso tempo, il valore del nero di 0,21 è molto basso. Gli aloni sono minimi alla massima luminosità e non è stato rilevato alcuno sfarfallio PWM. Inoltre, la stabilità dell'angolo di visione dello schermo IPS è molto buona.
| |||||||||||||||||||||||||
Distribuzione della luminosità: 94 %
Al centro con la batteria: 451 cd/m²
Contrasto: 2148:1 (Nero: 0.21 cd/m²)
ΔE ColorChecker Calman: 2.4 | ∀{0.5-29.43 Ø4.71}
calibrated: 1.3
ΔE Greyscale Calman: 3.3 | ∀{0.09-98 Ø4.96}
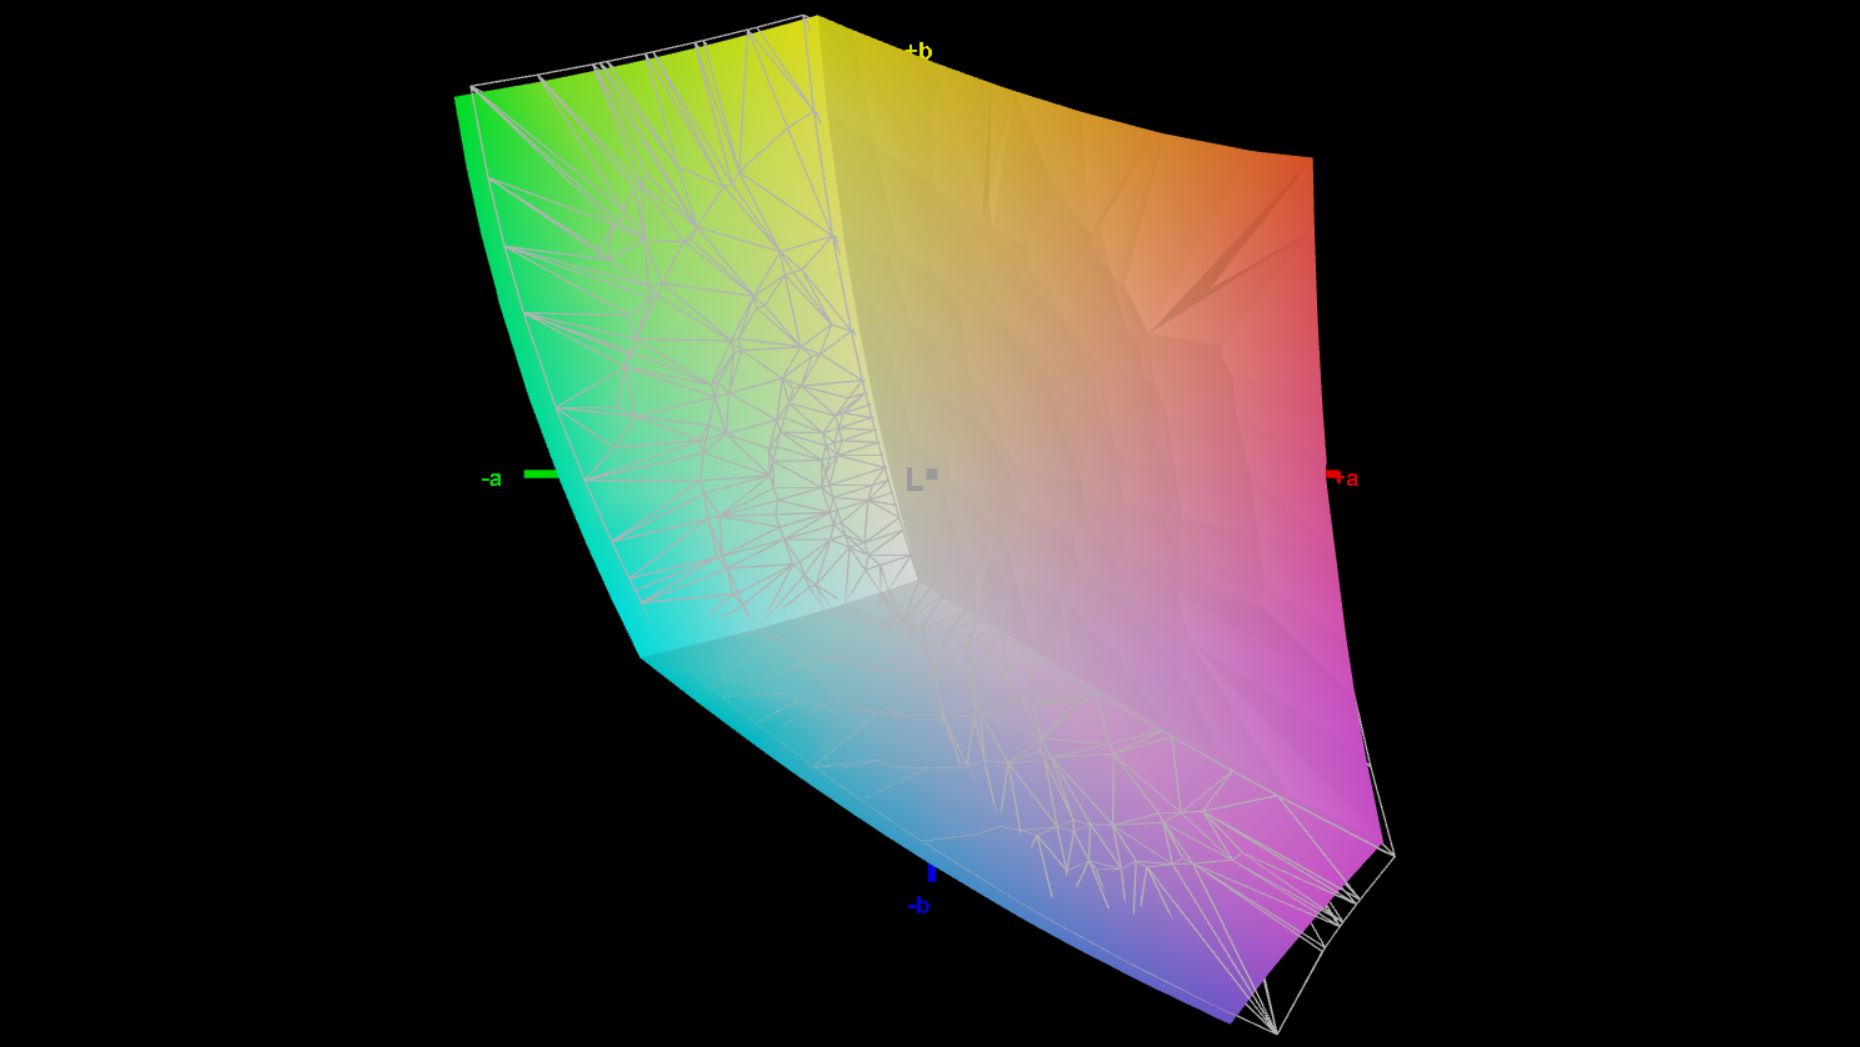
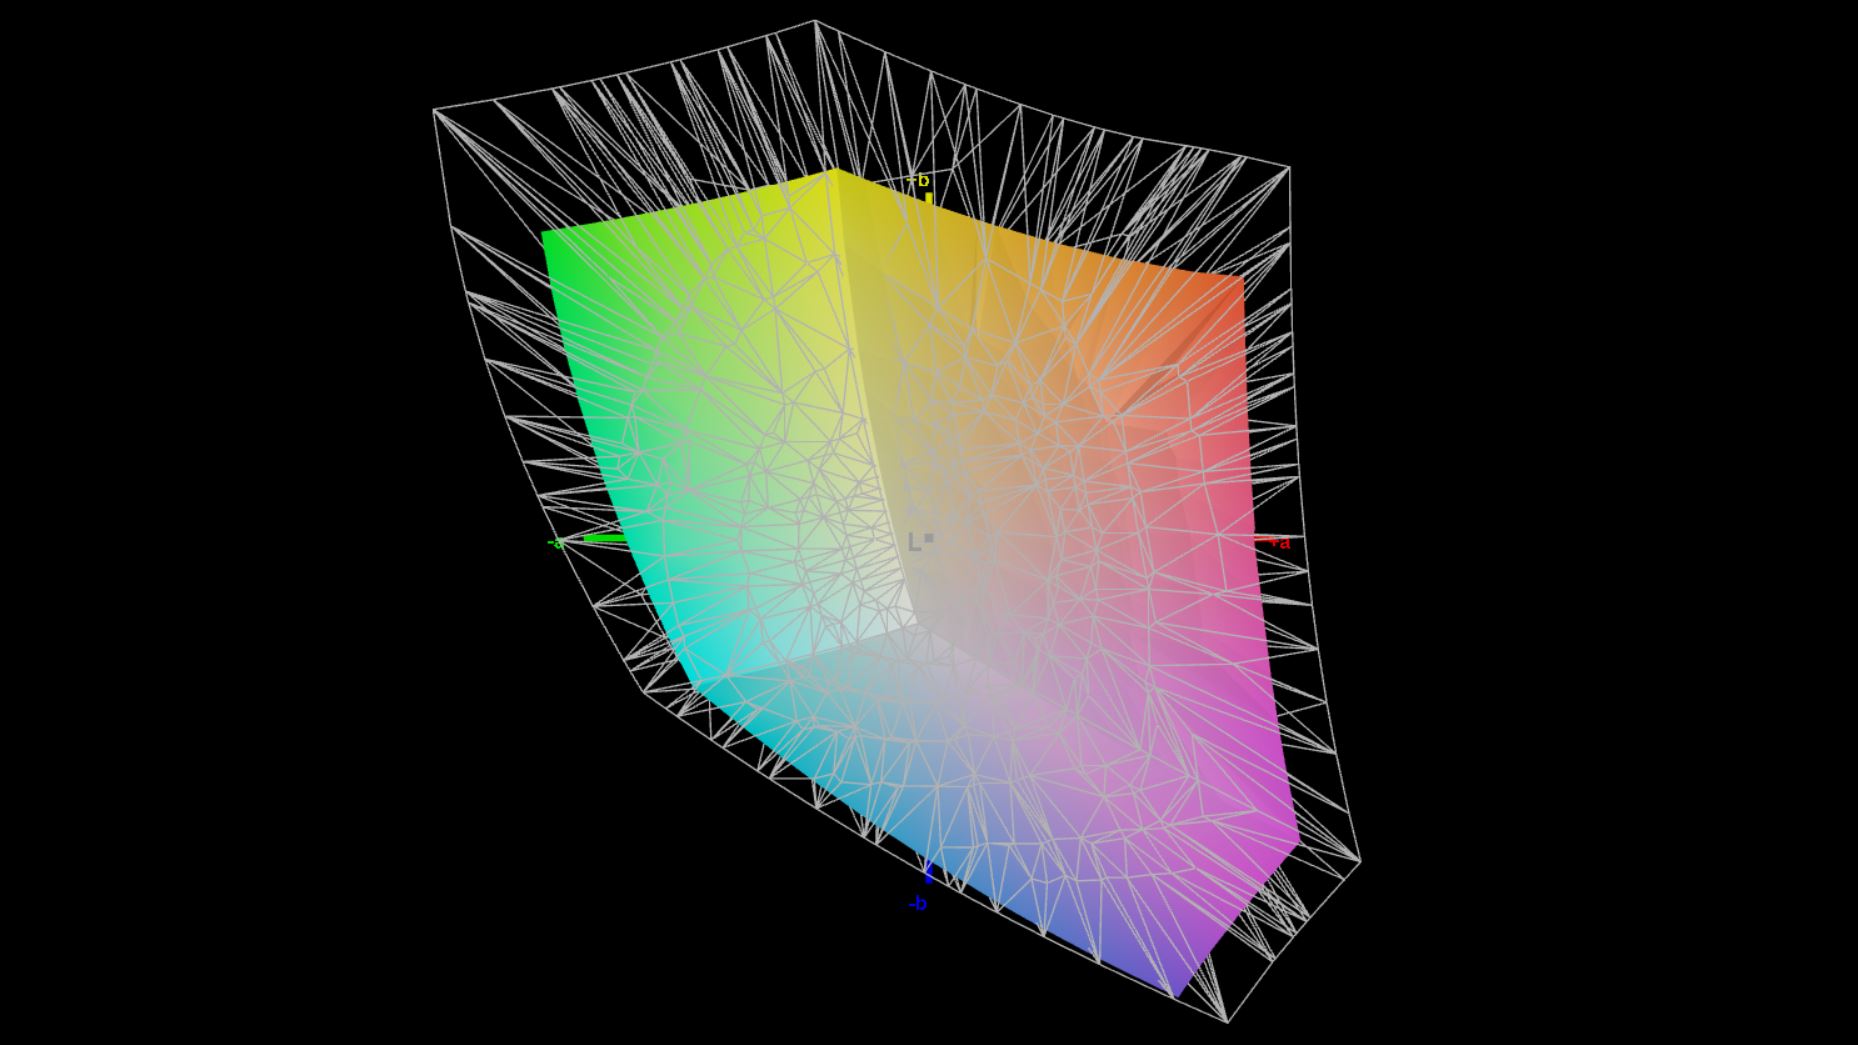
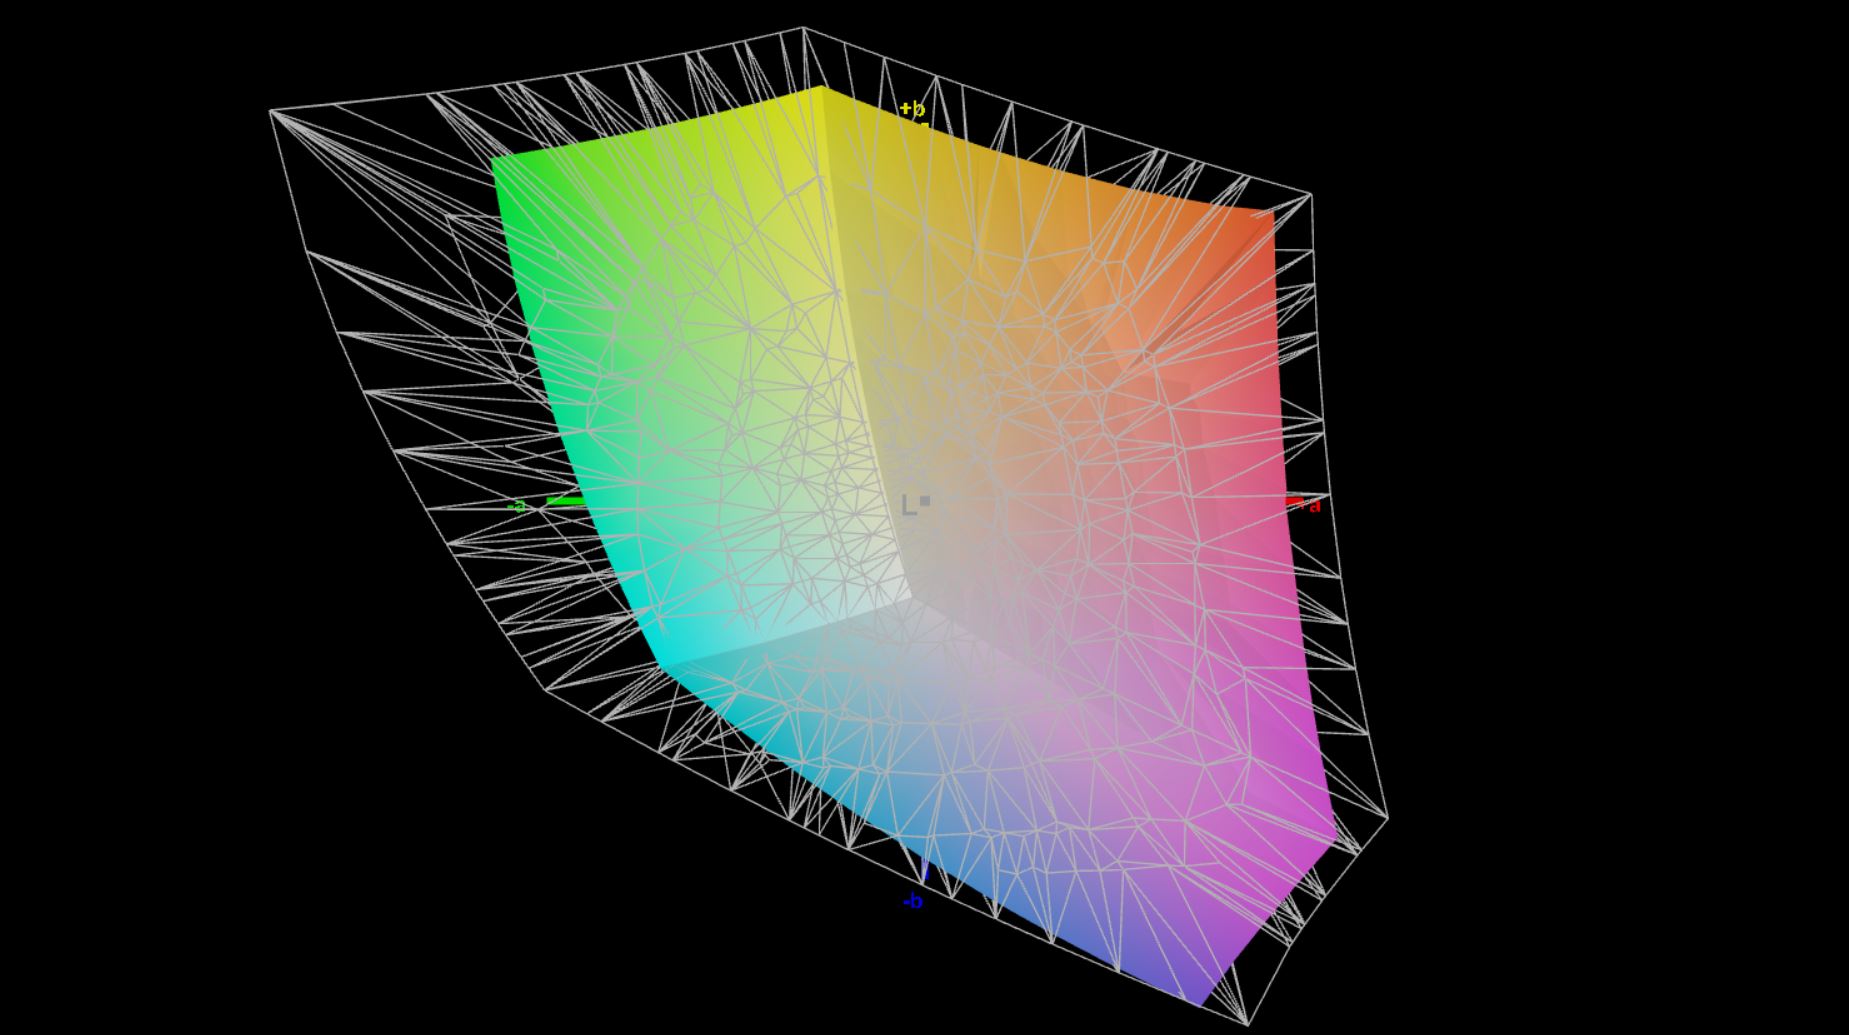
71.5% AdobeRGB 1998 (Argyll 3D)
97.4% sRGB (Argyll 3D)
69.2% Display P3 (Argyll 3D)
Gamma: 2.13
CCT: 6848 K
| Lenovo ThinkPad T14 G3-21CF004NGE LP140WU1-SPB2, IPS, 1920x1200, 14" | Dell Latitude 7420 JW6MH Chi Mei CMN1416 CHF07 140HCG, IPS, 1920x1080, 14" | Huawei MateBook X Pro 2022 TMX1422, IPS, 3120x2080, 14.2" | HP EliteBook 845 G9 6F6H6EA InfoVision X140NV4J, IPS, 1920x1200, 14" | Lenovo ThinkPad T14 Gen2-20W1S00000 LP140WF9-SPF2, IPS LED, 1920x1080, 14" | Lenovo ThinkPad T14s G2 20XGS01100 NE140FHM-N61, IPS LED, 1920x1080, 14" | |
|---|---|---|---|---|---|---|
| Display | -1% | 20% | 0% | -6% | -4% | |
| Display P3 Coverage (%) | 69.2 | 68 -2% | 94.6 37% | 69 0% | 64.3 -7% | 69.7 1% |
| sRGB Coverage (%) | 97.4 | 99 2% | 99.5 2% | 99 2% | 95.4 -2% | 91.8 -6% |
| AdobeRGB 1998 Coverage (%) | 71.5 | 70 -2% | 86.5 21% | 70 -2% | 65.5 -8% | 67.2 -6% |
| Response Times | -34% | 25% | 8% | -38% | -148% | |
| Response Time Grey 50% / Grey 80% * (ms) | 41.4 ? | 55 ? -33% | 25.4 ? 39% | 31 ? 25% | 57.2 ? -38% | 84 ? -103% |
| Response Time Black / White * (ms) | 19.2 ? | 26 ? -35% | 17.1 ? 11% | 21 ? -9% | 26.4 ? -38% | 56 ? -192% |
| PWM Frequency (Hz) | 2451 ? | |||||
| Screen | 9% | 13% | -13% | -20% | -71% | |
| Brightness middle (cd/m²) | 451 | 408 -10% | 603 34% | 678 50% | 382 -15% | 397 -12% |
| Brightness (cd/m²) | 435 | 378 -13% | 586 35% | 745 71% | 367 -16% | 386 -11% |
| Brightness Distribution (%) | 94 | 86 -9% | 91 -3% | 69 -27% | 88 -6% | 88 -6% |
| Black Level * (cd/m²) | 0.21 | 0.22 -5% | 0.39 -86% | 0.33 -57% | 0.14 33% | 0.28 -33% |
| Contrast (:1) | 2148 | 1855 -14% | 1546 -28% | 2055 -4% | 2729 27% | 1418 -34% |
| Colorchecker dE 2000 * | 2.4 | 1.54 36% | 1.1 54% | 3.56 -48% | 4.2 -75% | 5.8 -142% |
| Colorchecker dE 2000 max. * | 4.1 | 2.72 34% | 2.2 46% | 7.23 -76% | 7.9 -93% | 12.6 -207% |
| Colorchecker dE 2000 calibrated * | 1.3 | 1.08 17% | 1.2 8% | 1.05 19% | 0.9 31% | 1.9 -46% |
| Greyscale dE 2000 * | 3.3 | 1.95 41% | 1.5 55% | 4.93 -49% | 5.4 -64% | 8.3 -152% |
| Gamma | 2.13 103% | 2.33 94% | 2.17 101% | 2.63 84% | 2.31 95% | 2.07 106% |
| CCT | 6848 95% | 6806 96% | 6549 99% | 7114 91% | 7499 87% | 6867 95% |
| Color Space (Percent of AdobeRGB 1998) (%) | 60.6 | |||||
| Color Space (Percent of sRGB) (%) | 95.4 | |||||
| Media totale (Programma / Settaggio) | -9% /
1% | 19% /
16% | -2% /
-8% | -21% /
-19% | -74% /
-68% |
* ... Meglio usare valori piccoli
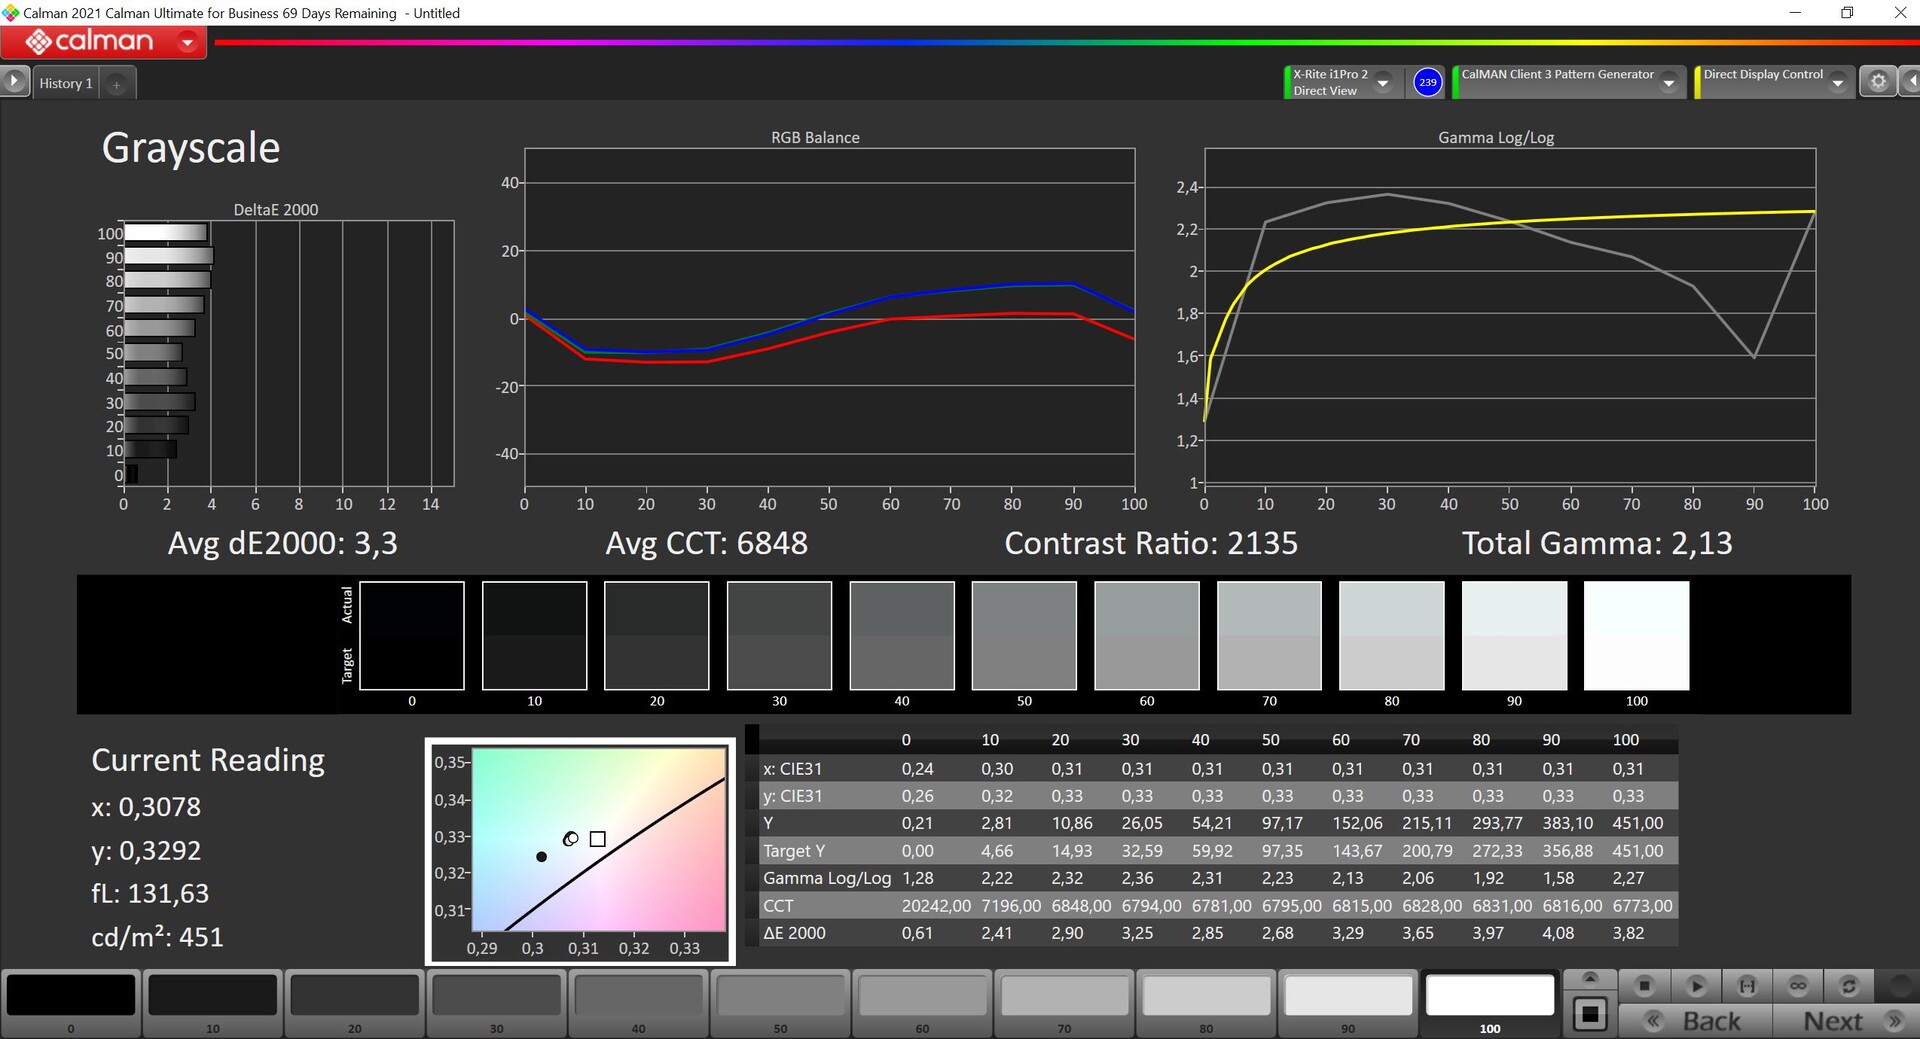
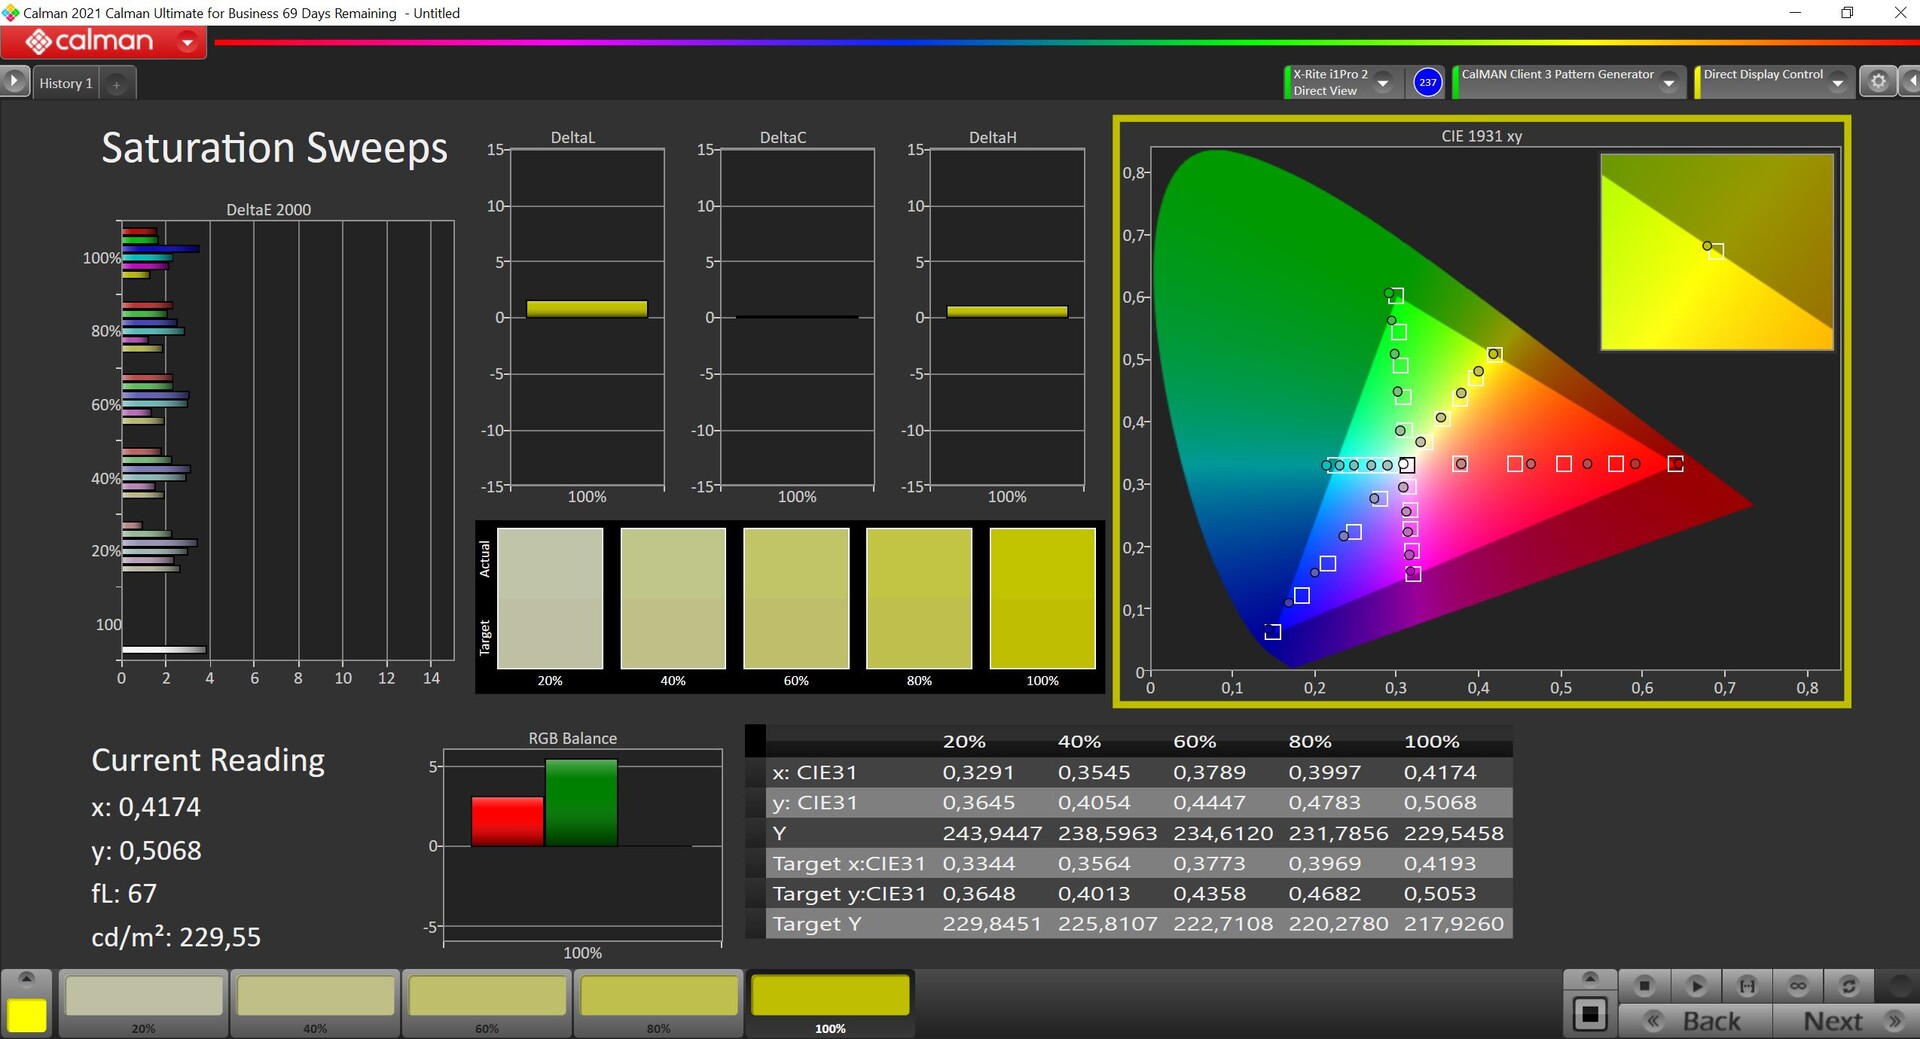
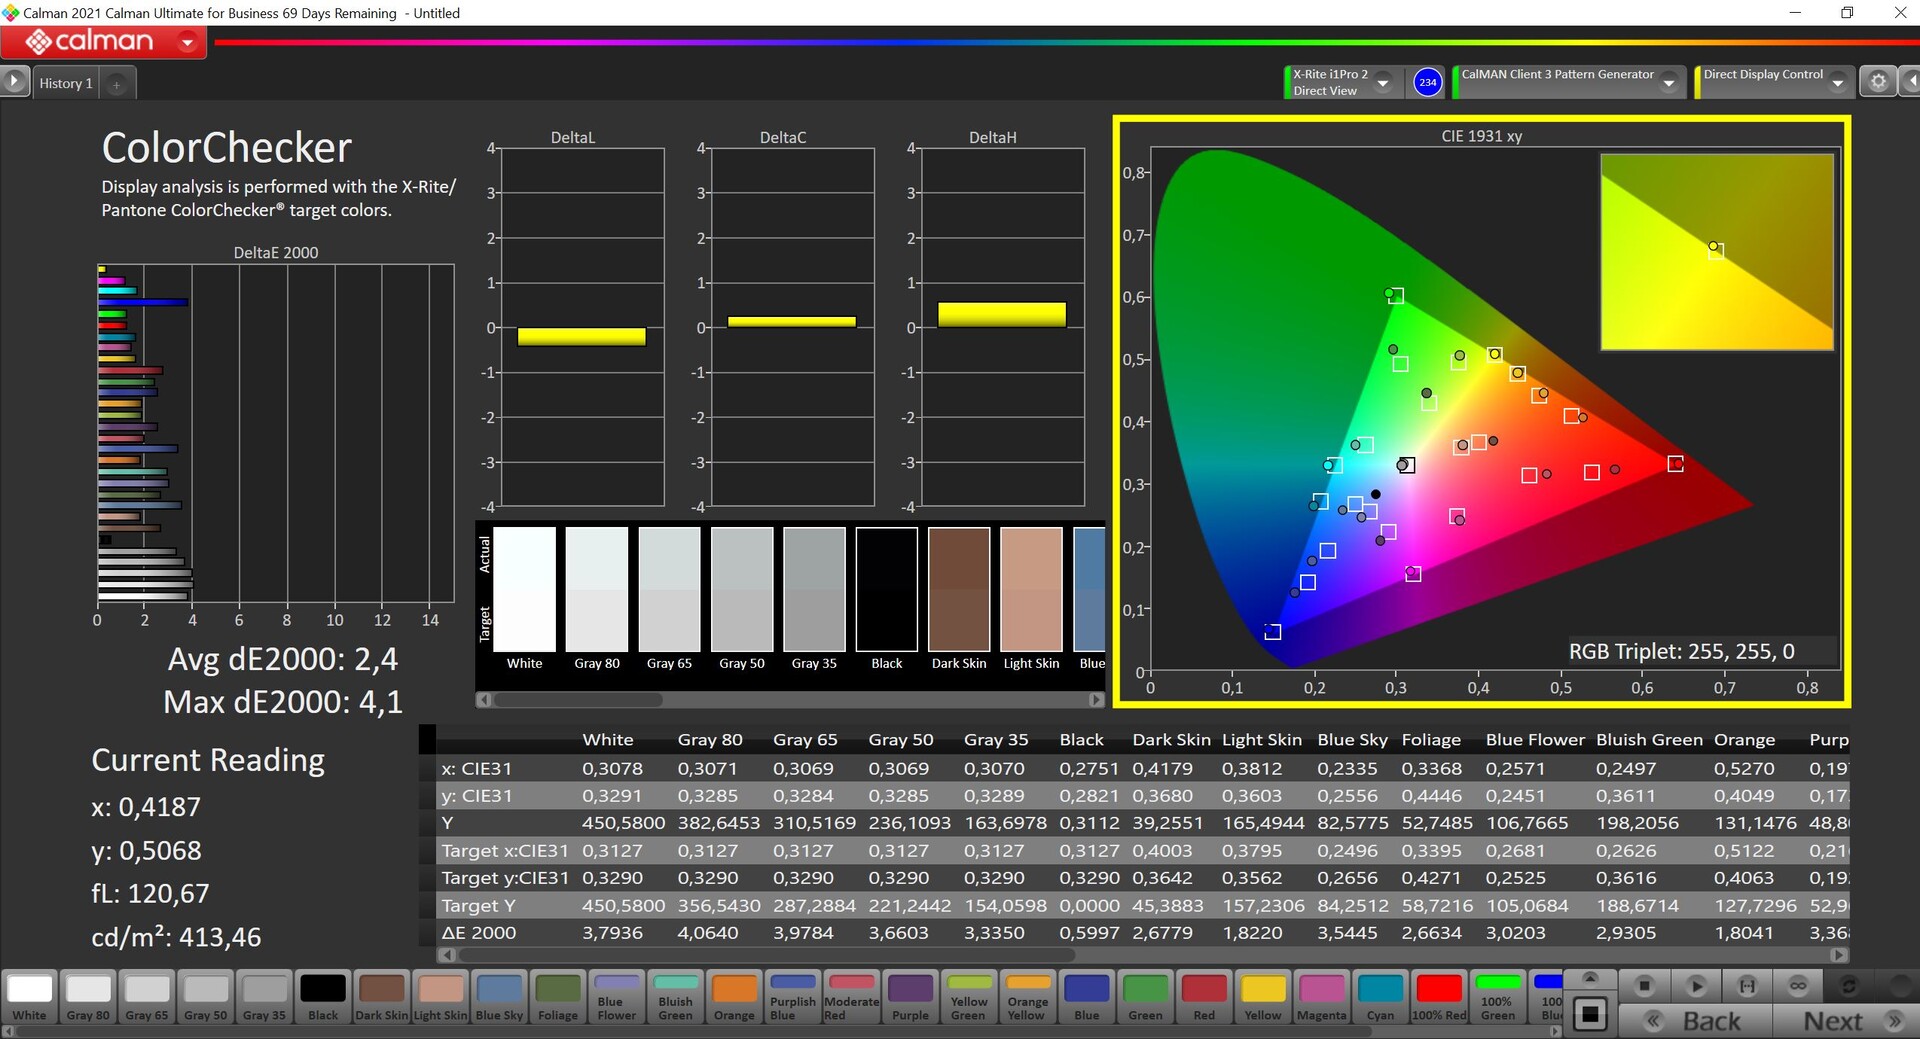

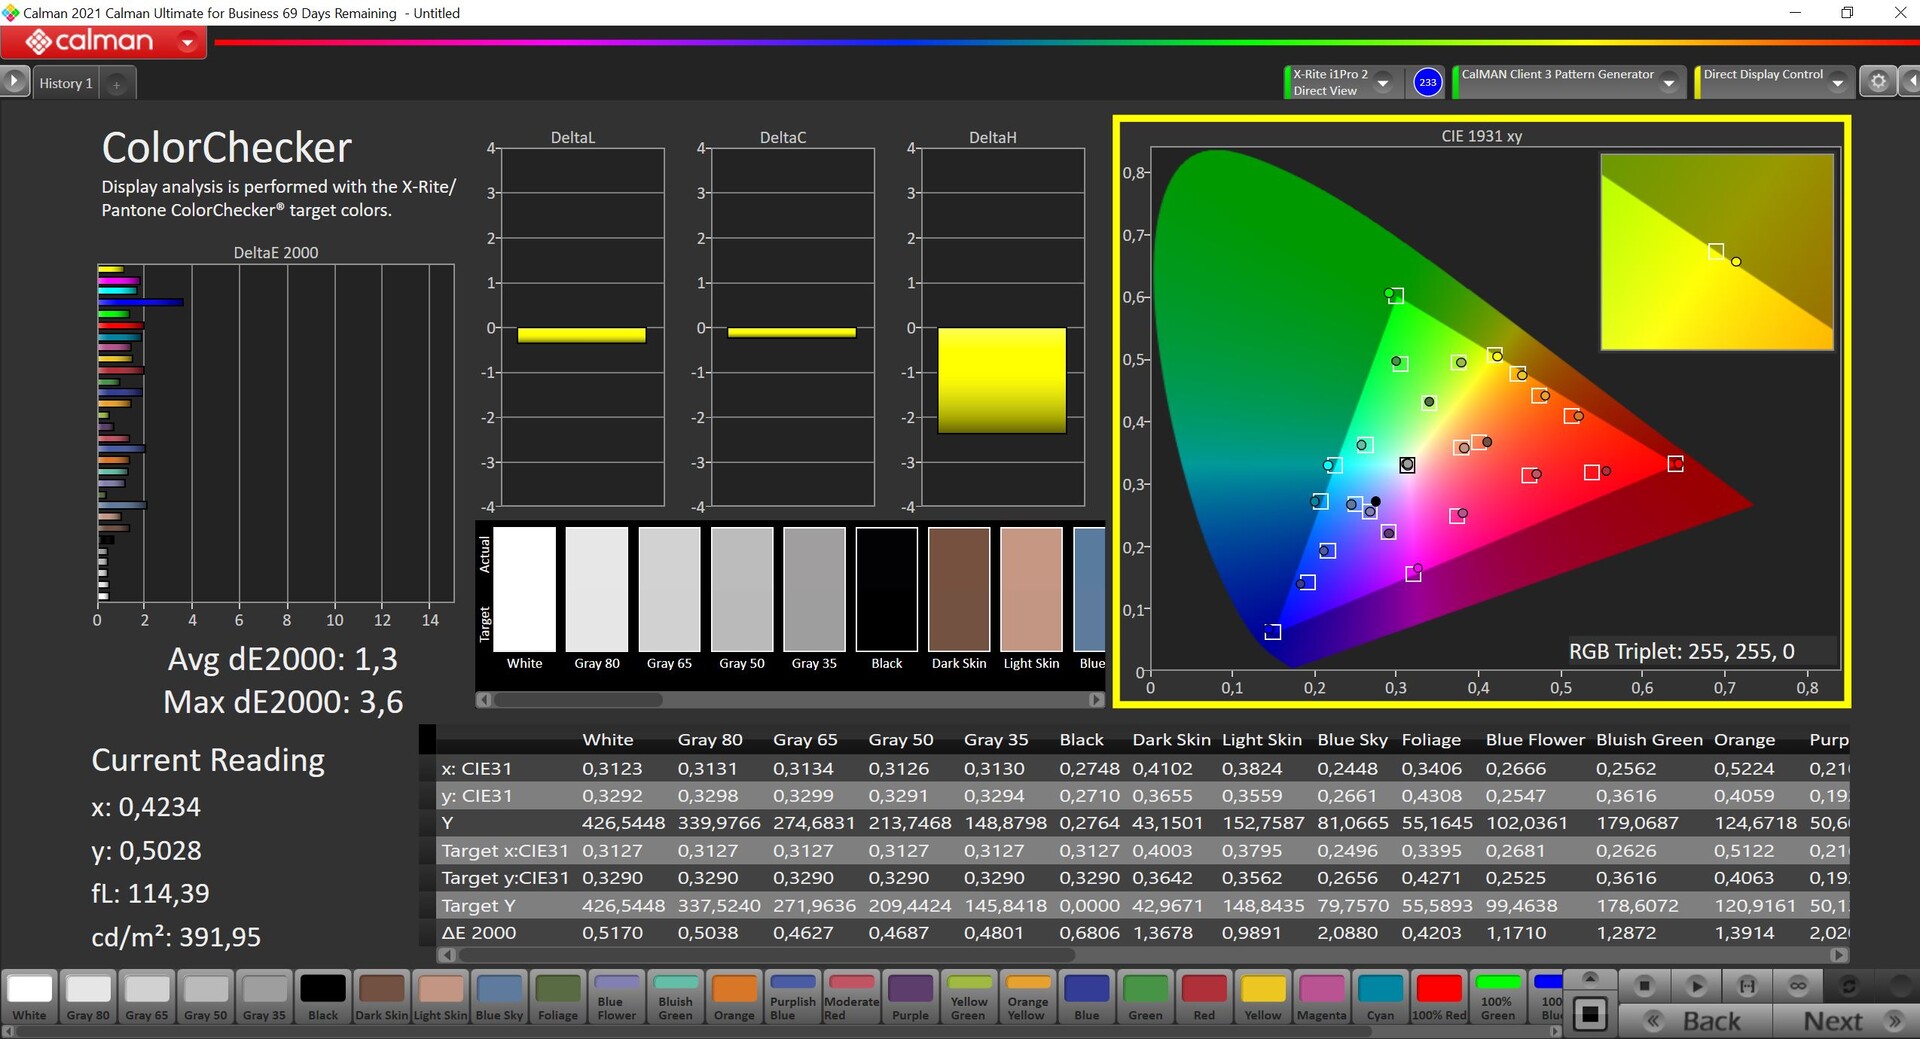
Utilizzando il portatile appena tolto dalla confezione, la nostra analisi con il software professionale CalMAN (X-Rite i1 Pro 2) rivela un leggero viraggio del colore verso il blu/verde insieme a una temperatura del colore leggermente troppo fredda. D'altra parte, non ci sono grandi deviazioni dallo spazio colore di riferimento sRGB in termini di scala di grigi o di colori, quindi il pannello non ha necessariamente bisogno di essere calibrato per il normale uso in ufficio.
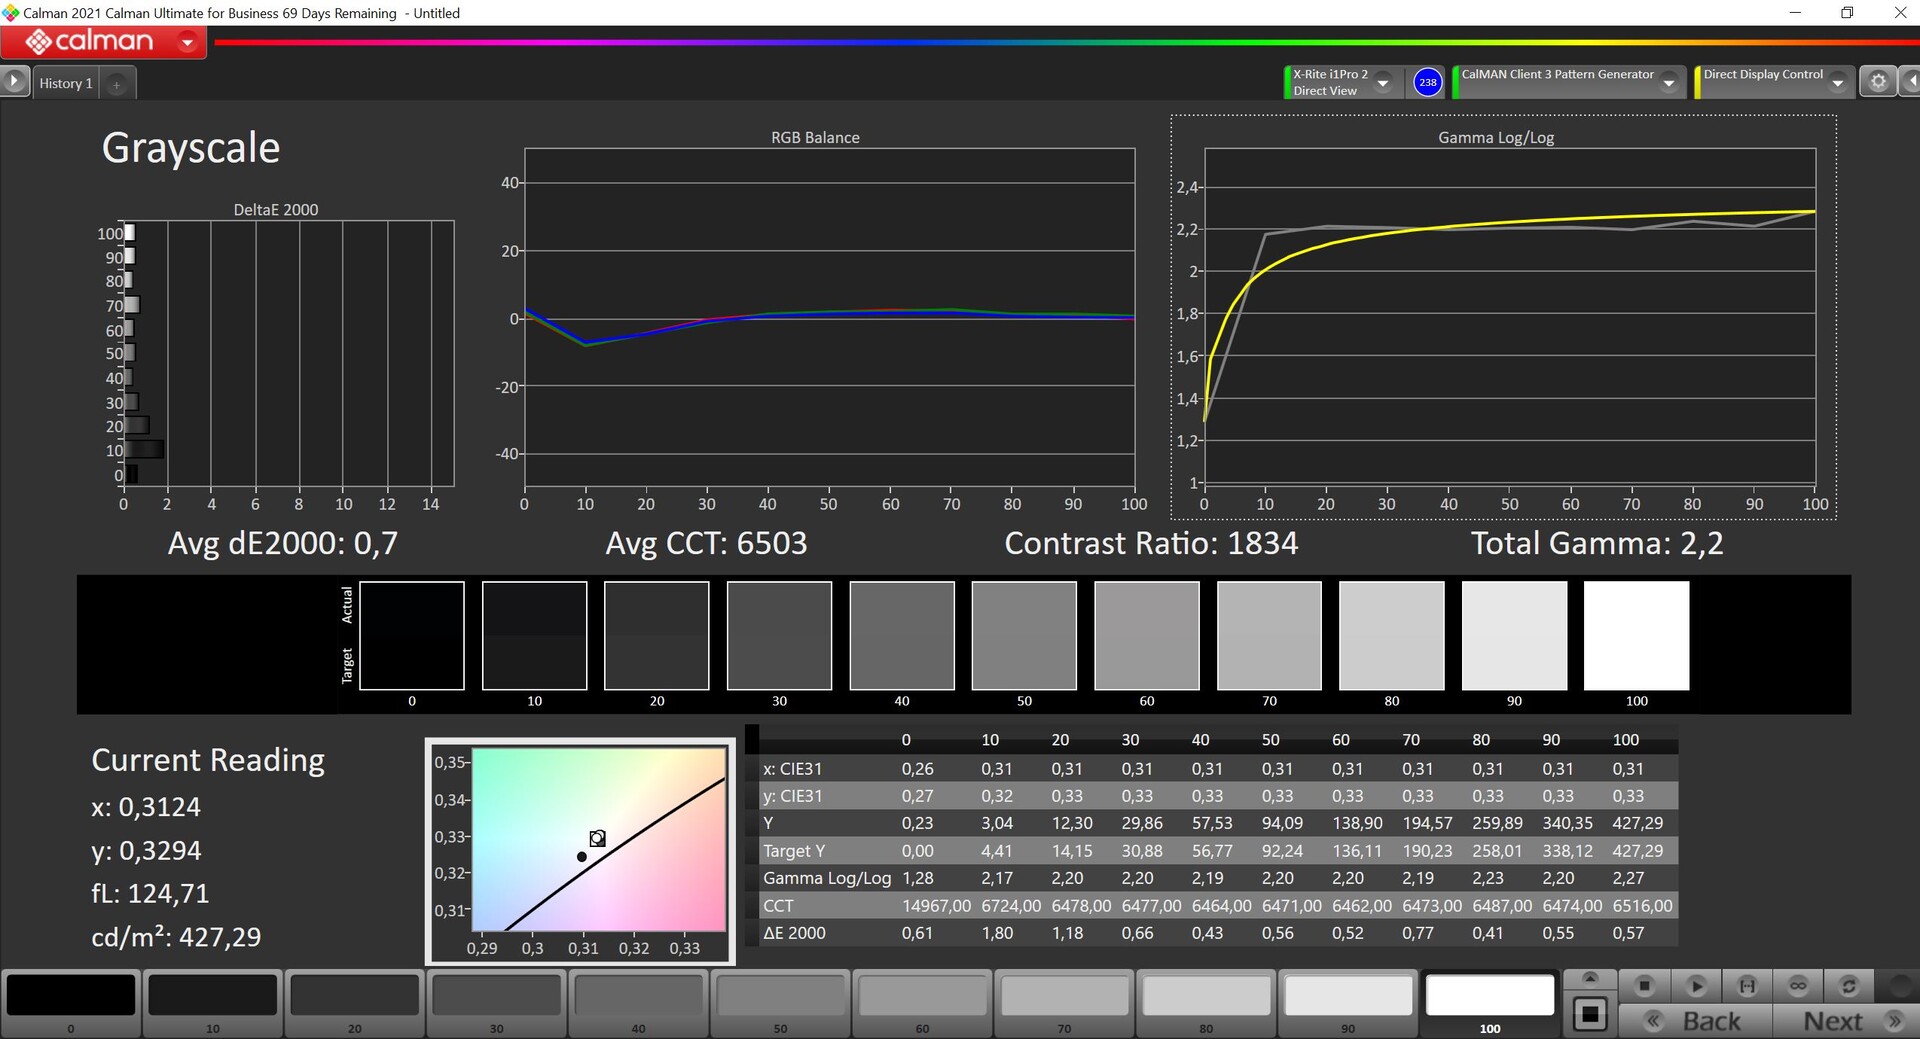
La nostra calibrazione (il profilo è scaricabile gratuitamente qui sopra) migliora la qualità del display e riduce ulteriormente le deviazioni del colore. Solo il 100% di blu è appena sopra il limite importante di 3. Insieme alla copertura sRGB quasi completa, il pannello è quindi molto adatto per l'editing di video/immagini nello spazio colore sRGB.
Tempi di risposta del Display
| ↔ Tempi di risposta dal Nero al Bianco | ||
|---|---|---|
| 19.2 ms ... aumenta ↗ e diminuisce ↘ combinato | ↗ 6.8 ms Incremento | 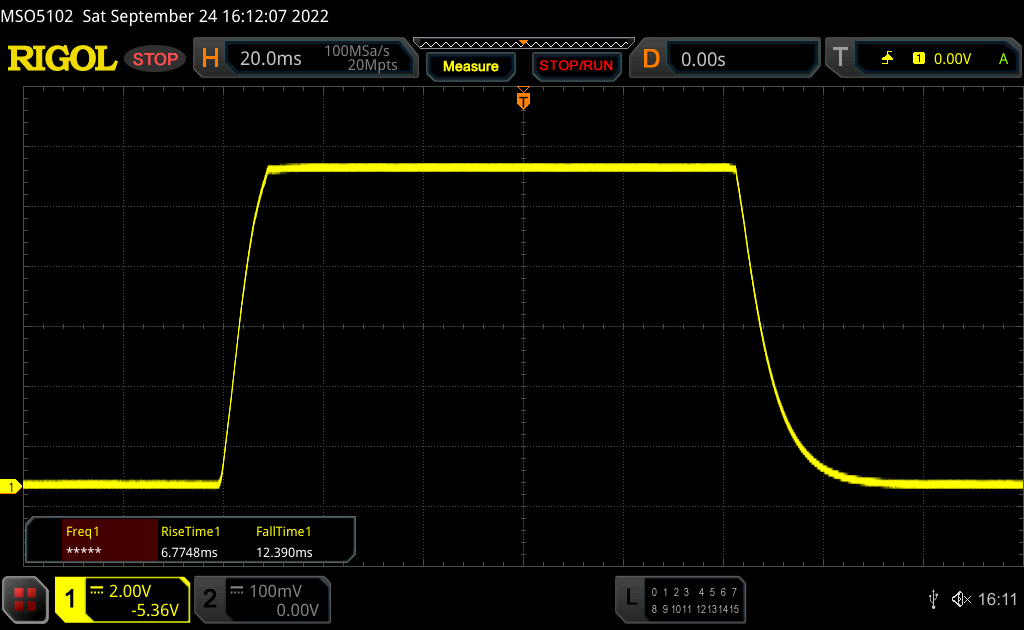 |
| ↘ 12.4 ms Calo | ||
| Lo schermo mostra buoni tempi di risposta durante i nostri tests, ma potrebbe essere troppo lento per i gamers competitivi. In confronto, tutti i dispositivi di test variano da 0.1 (minimo) a 240 (massimo) ms. » 43 % di tutti i dispositivi è migliore. Questo significa che i tempi di risposta rilevati sono simili alla media di tutti i dispositivi testati (19.8 ms). | ||
| ↔ Tempo di risposta dal 50% Grigio all'80% Grigio | ||
| 41.4 ms ... aumenta ↗ e diminuisce ↘ combinato | ↗ 18.8 ms Incremento | 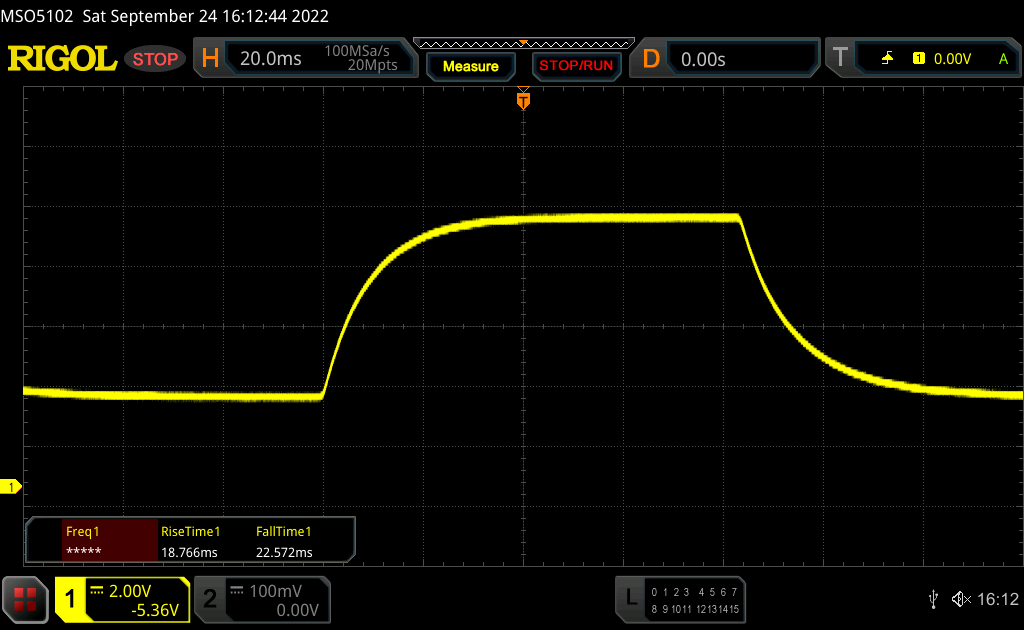 |
| ↘ 22.6 ms Calo | ||
| Lo schermo mostra tempi di risposta lenti nei nostri tests e sarà insoddisfacente per i gamers. In confronto, tutti i dispositivi di test variano da 0.165 (minimo) a 636 (massimo) ms. » 67 % di tutti i dispositivi è migliore. Questo significa che i tempi di risposta rilevati sono peggiori rispetto alla media di tutti i dispositivi testati (30.9 ms). | ||
Sfarfallio dello schermo / PWM (Pulse-Width Modulation)
| flickering dello schermo / PWM non rilevato | 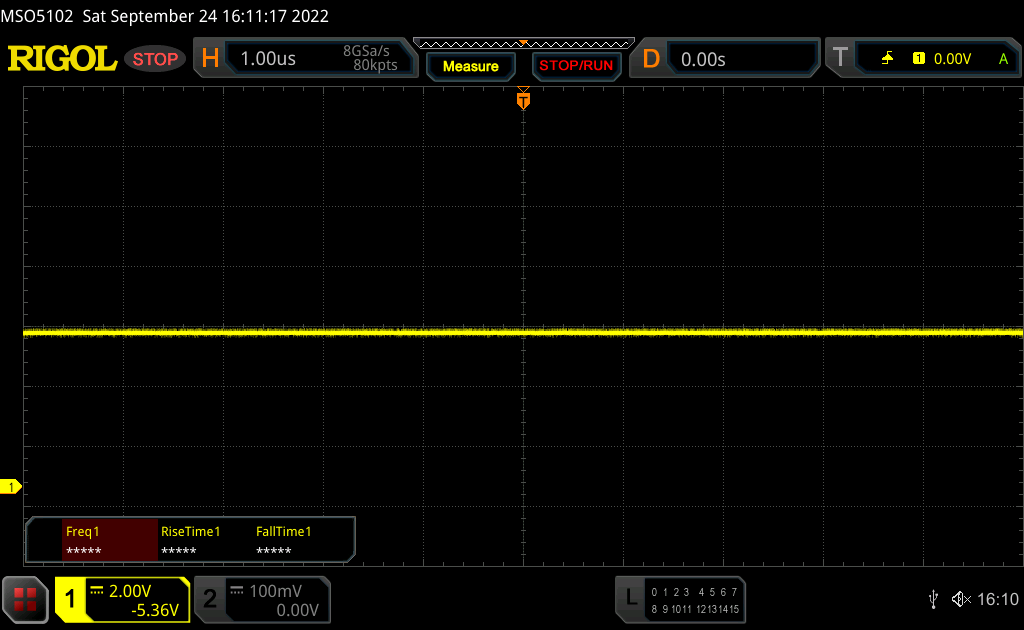 | ||
In confronto: 52 % di tutti i dispositivi testati non utilizza PWM per ridurre la luminosita' del display. Se è rilevato PWM, una media di 7741 (minimo: 5 - massimo: 343500) Hz è stata rilevata. | |||
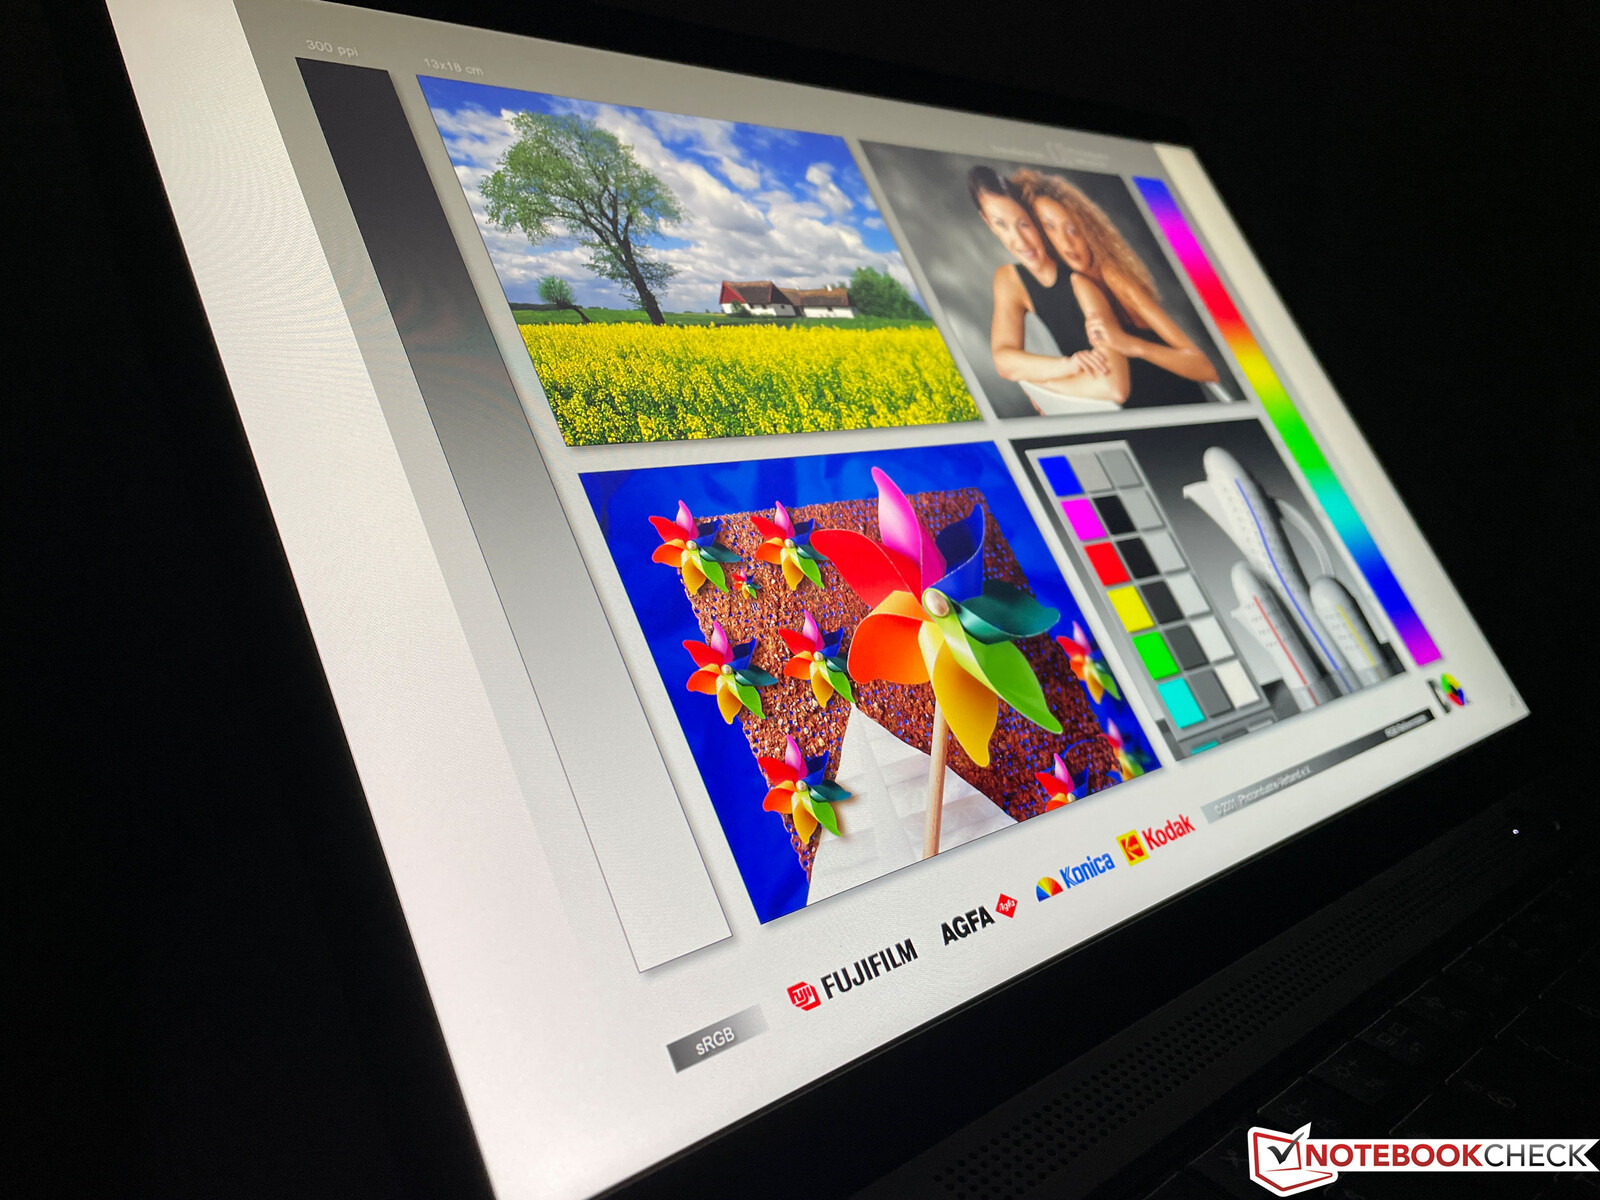
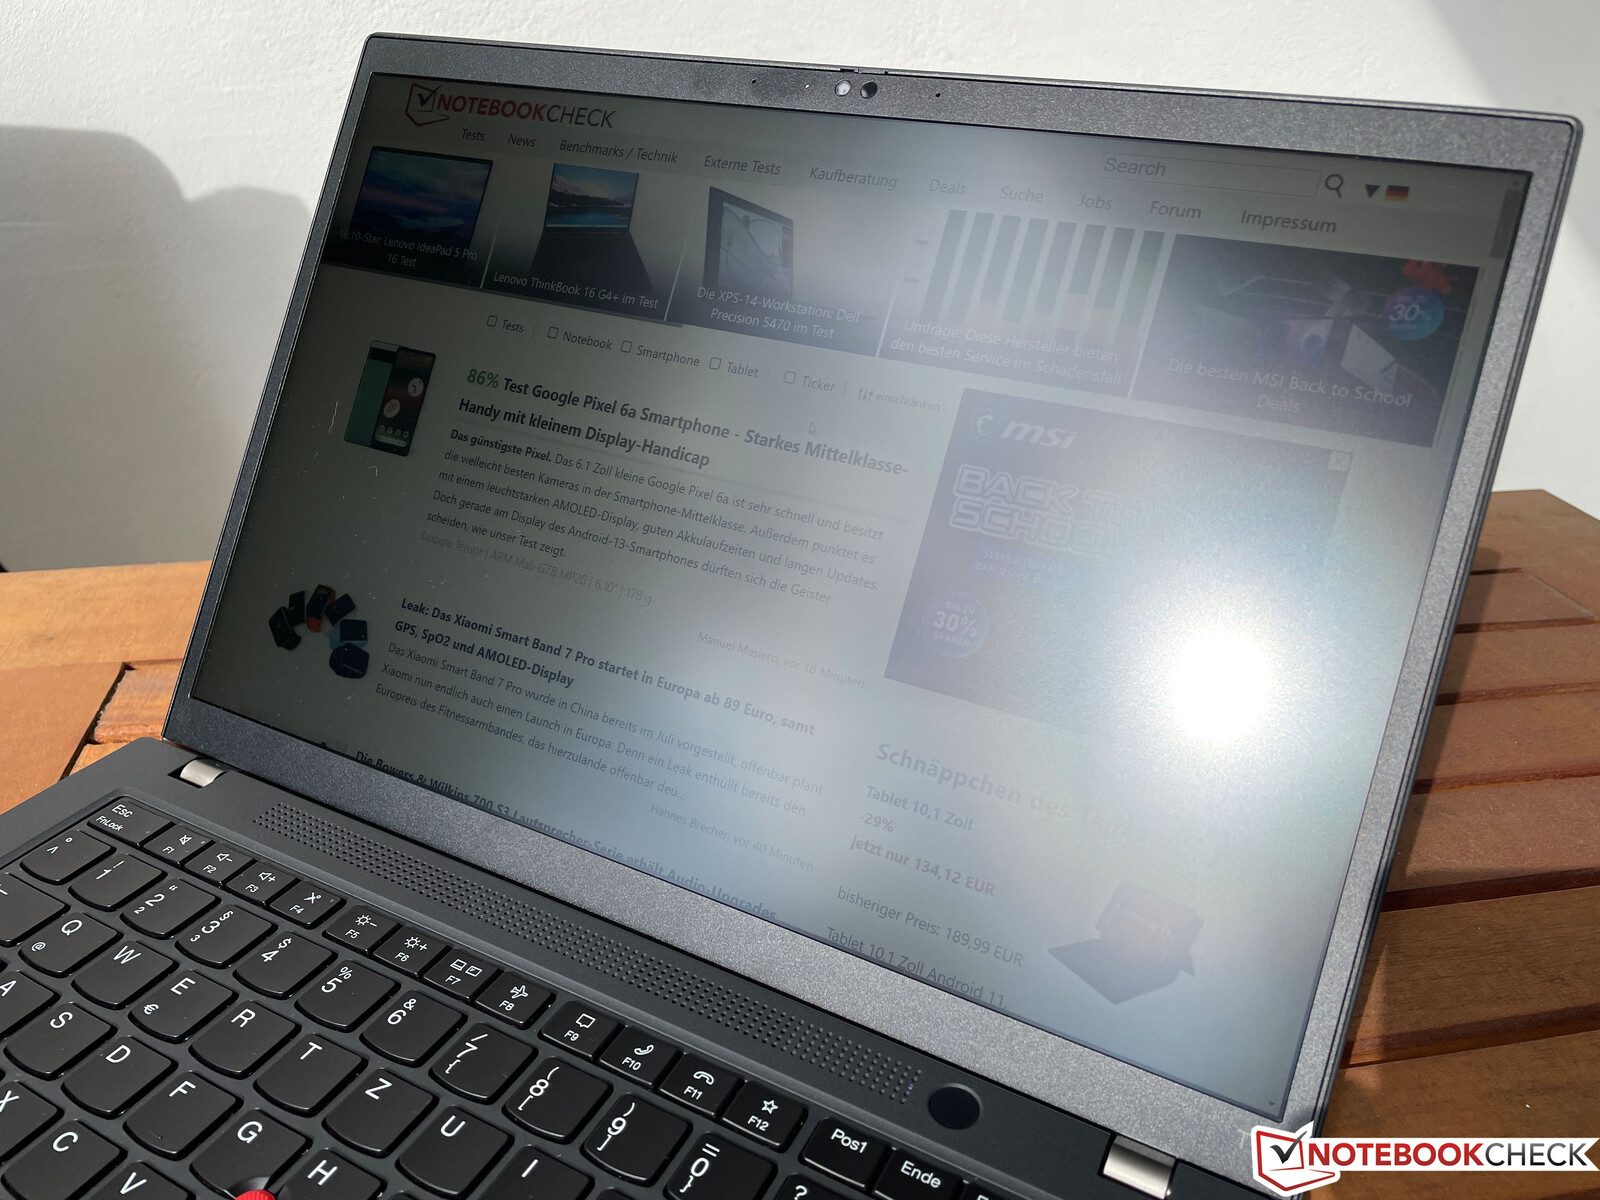
Gli utenti possono lavorare all'aperto con il ThinkPad T14 G3 senza problemi, purché si evitino i riflessi diretti delle fonti di luce. Anche nelle giornate di sole, i contenuti sono ben visibili sulla superficie opaca dello schermo alla massima luminosità. Tuttavia, questo potrebbe essere un po' più difficile nel caso del pannello standard con una luminosità di 300 cd/m².
Prestazioni - AMD Ryzen Pro e PCIe 4.0
In termini di configurazione, ci sono grandi differenze tra le versioni AMD e Intel del ThinkPad T14 G3. Mentre il modello AMD offre una scelta tra i due più recenti modelli Ryzen Pro con funzioni di sicurezza estese e iGPU veloci, la versione Intel è molto più complicata. Lenovo offre entrambi gli attuali processori Alder Lake U e P (solo vPro con un sovrapprezzo), sia con le rispettive iGPU sia con una iGPU dedicata.Nvidia GeForce MX550. Alcuni documenti tecnici riportano addirittura la GeForce RTX 2050ma non siamo riusciti a trovare alcuna configurazione corrispondente e, visto l'elevato rating TGP (a partire da 35 watt), una RTX 2050 nel T14 G3 ci sorprenderebbe.
| ThinkPad T14 G3 AMD | ThinkPad T14 G3 Intel | |
|---|---|---|
| CPU | AMD Ryzen 5 Pro 6650UAMD Ryzen 7 Pro 6850U |
Intel Alder Lake-U (i5-1235U, i5-1245U, i7-1255U, i7-1265U) Intel Alder Lake-P (i5-1240P, i5-1250P, i7-1260P, i7-1270P, i7-1280P) |
| GPU | AMD Radeon 660MAMD Radeon 680M |
Intel Iris Xe Graphics G7 (80 o 96 EUs) Nvidia GeForce MX550 2 GB |
| RAM | max. 32 GB di RAM LPDDR5-6400 onboard | max. 48 GB di RAM DDR4-3200, 8/16 GB onboard + 1 slot |
Condizioni di test
A differenza di altri portatili Lenovo, da qualche tempo le impostazioni di alimentazione dei modelli ThinkPad sono direttamente collegate alle normali impostazioni di alimentazione di Windows, il che si rivela molto comodo nell'uso quotidiano. Abbiamo eseguito i seguenti benchmark e misurazioni in modalità Best Performance, dove i valori TDP sono 30 watt per il carico a breve termine e 25 watt per il carico permanente. In modalità Better Performance, i valori sono di 26/22 watt e scendono ulteriormente a 14 watt con l'impostazione More Battery Efficiency attivata. Questi limiti sono significativamente più bassi rispetto alle attuali CPU Alder Lake, dove i chip della serie U possono facilmente consumare più di 50 watt durante i picchi di carico
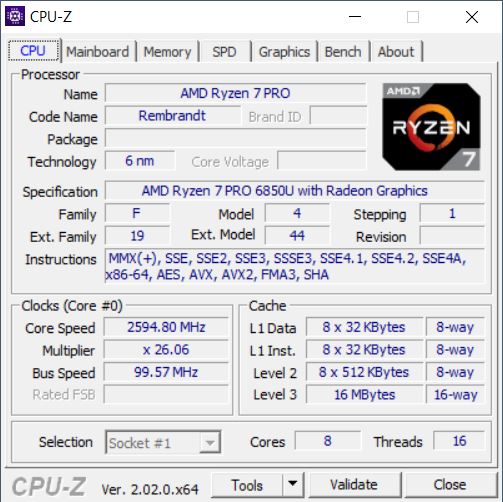
Processore - AMD Ryzen 7 Pro 6850U
Il AMD Ryzen 7 Pro 6850Uè principalmente uguale al noto Ryzen 7 6800U, ma la versione Pro offre ulteriori funzioni di gestione e sicurezza simili alle CPU vPro di Intel. Il Ryzen 7 Pro offre quindi 8 moderni core Zen3+, realizzati con un moderno processo a 6 nm. Il clock massimo degli 8 core (16 thread) è di 4,7 GHz. Abbiamo già analizzato in dettaglio il normale Ryzen 7 6800U e pertanto rimandiamo al nostro articolo speciale per ulteriori dettagli
In sostanza, possiamo dire che le attuali CPU Alder Lake di Intel offrono maggiori prestazioni single-core grazie alla loro architettura ibrida (vale sia per Alder Lake-U che per Alder Lake-P), ma anche il consumo energetico single-core è più elevato. In termini di efficienza single-core, i chip Alder Lake-U sono più o meno alla pari, a seconda dell'impostazione del TDP. Nei test multi-core, invece, i processori mobili di Intel sono davvero competitivi solo con consumi molto elevati (40 watt o più), ma a quel punto non sono più particolarmente efficienti.
| Power Consumption / Cinebench R23 Single Power Efficiency - external Monitor | |
| Apple M2 | |
| Intel Core i7-1255U | |
| AMD Ryzen 7 PRO 6850U | |
| AMD Ryzen 7 6800U | |
| Intel Core i7-1260P | |
| Intel Core i7-1260P | |
| Power Consumption / Cinebench R23 Multi Power Efficiency - external Monitor | |
| Apple M2 | |
| AMD Ryzen 7 PRO 6850U | |
| AMD Ryzen 7 6800U | |
| Intel Core i7-1260P | |
| Intel Core i7-1255U | |
| Intel Core i7-1260P | |
Con una configurazione TDP di 30/25 watt, il ThinkPad T14 G3 con Ryzen 7 Pro 6850U subisce un calo minimo delle prestazioni (stabile a ~1.650 punti) sotto carico sostenuto e nel nostro ciclo Cinebench R15, il Ryzen 7 Pro è battuto solo dal Ryzen 9 Pro 6950HS.Ryzen 9 Pro 6950HS nell'HP EliteBook 845 G9 HP EliteBook 845 G9anche se con un consumo superiore di 40 watt. I processori Intel Alder Lake P sono solitamente in grado di tenere il passo nei test multi-core sotto breve carico, come è evidente nel caso del Core i7-1260P del Huawei MateBook X Proil Core i7-1260P raggiunge circa 1.400 punti a 30 watt e poco più di 1.200 punti a 25 watt, che corrispondono al nostro campione di prova AMD. Pertanto, a parità di consumo energetico, il chip Alder Lake P è circa il 25% più lento quando tutti i core sono sotto carico. Il Core i7-1255Uraggiunge inoltre solo circa 1.150 punti con 23 watt. Il processore mobile più veloce di Intel, il Core i7-1280Pcon due core aggiuntivi per le prestazioni, è stato battuto a 23 watt nel ThinkPad X1 Nano Gen.2 ThinkPad X1 Nano Gen.2.
Cinebench R15 Multi Sustained Load
Se assumiamo valori TDP comparabili per le CPU Intel, i sovrapprezzi per i chip più veloci non valgono in realtà la pena, perché anche il Core i7-1280P a 23 watt non è più veloce del Core i7-1255U a 23 watt, nonostante i quattro core prestazionali aggiuntivi.
Nelle altre due modalità di prestazioni, il Ryzen 7 Pro 6850U è ancora molto competitivo con ~1.570 punti a 22 watt e ~1.220 punti a 14 watt ed è anche abbastanza veloce nell'uso quotidiano, beneficiando anche di una ventola molto più silenziosa.
Le prestazioni non si riducono in modalità batteria perché non ci sono limiti di potenza estremamente elevati rispetto alle CPU Intel. Altri benchmark della CPU sono disponibili nella nostra sezione tecnica.
Cinebench R23: Multi Core | Single Core
Cinebench R20: CPU (Multi Core) | CPU (Single Core)
Cinebench R15: CPU Multi 64Bit | CPU Single 64Bit
Blender: v2.79 BMW27 CPU
7-Zip 18.03: 7z b 4 | 7z b 4 -mmt1
Geekbench 5.5: Multi-Core | Single-Core
HWBOT x265 Benchmark v2.2: 4k Preset
LibreOffice : 20 Documents To PDF
R Benchmark 2.5: Overall mean
| CPU Performance rating | |
| Media della classe Office | |
| Huawei MateBook X Pro 2022 | |
| HP EliteBook 845 G9 6F6H6EA | |
| Media AMD Ryzen 7 PRO 6850U | |
| Lenovo ThinkPad T14 G3-21CF004NGE | |
| Lenovo ThinkPad T14s G2 20XGS01100 | |
| Dell Inspiron 14 7420 2-in-1 | |
| Lenovo ThinkPad Z13 21D2CTO1WW | |
| Lenovo ThinkPad T14 Gen2-20W1S00000 | |
| Dell Latitude 7420 JW6MH | |
| Cinebench R23 / Multi Core | |
| Media della classe Office (1673 - 22808, n=76, ultimi 2 anni) | |
| HP EliteBook 845 G9 6F6H6EA | |
| Media AMD Ryzen 7 PRO 6850U (9923 - 12945, n=7) | |
| Lenovo ThinkPad T14 G3-21CF004NGE | |
| Huawei MateBook X Pro 2022 | |
| Lenovo ThinkPad Z13 21D2CTO1WW | |
| Lenovo ThinkPad T14s G2 20XGS01100 | |
| Dell Inspiron 14 7420 2-in-1 | |
| Lenovo ThinkPad T14 Gen2-20W1S00000 | |
| Dell Latitude 7420 JW6MH | |
| Cinebench R23 / Single Core | |
| Dell Inspiron 14 7420 2-in-1 | |
| Media della classe Office (708 - 2130, n=76, ultimi 2 anni) | |
| Huawei MateBook X Pro 2022 | |
| HP EliteBook 845 G9 6F6H6EA | |
| Lenovo ThinkPad T14 Gen2-20W1S00000 | |
| Media AMD Ryzen 7 PRO 6850U (1409 - 1536, n=7) | |
| Lenovo ThinkPad T14 G3-21CF004NGE | |
| Lenovo ThinkPad Z13 21D2CTO1WW | |
| Lenovo ThinkPad T14s G2 20XGS01100 | |
| Dell Latitude 7420 JW6MH | |
| Cinebench R20 / CPU (Multi Core) | |
| HP EliteBook 845 G9 6F6H6EA | |
| Media della classe Office (648 - 8840, n=75, ultimi 2 anni) | |
| Media AMD Ryzen 7 PRO 6850U (3784 - 5022, n=7) | |
| Lenovo ThinkPad T14 G3-21CF004NGE | |
| Huawei MateBook X Pro 2022 | |
| Lenovo ThinkPad Z13 21D2CTO1WW | |
| Lenovo ThinkPad T14s G2 20XGS01100 | |
| Dell Inspiron 14 7420 2-in-1 | |
| Lenovo ThinkPad T14 Gen2-20W1S00000 | |
| Dell Latitude 7420 JW6MH | |
| Cinebench R20 / CPU (Single Core) | |
| Dell Inspiron 14 7420 2-in-1 | |
| Huawei MateBook X Pro 2022 | |
| Media della classe Office (345 - 816, n=75, ultimi 2 anni) | |
| HP EliteBook 845 G9 6F6H6EA | |
| Media AMD Ryzen 7 PRO 6850U (587 - 596, n=7) | |
| Lenovo ThinkPad T14 G3-21CF004NGE | |
| Lenovo ThinkPad T14 Gen2-20W1S00000 | |
| Lenovo ThinkPad Z13 21D2CTO1WW | |
| Lenovo ThinkPad T14s G2 20XGS01100 | |
| Dell Latitude 7420 JW6MH | |
| Cinebench R15 / CPU Multi 64Bit | |
| Huawei MateBook X Pro 2022 | |
| Huawei MateBook X Pro 2022 | |
| HP EliteBook 845 G9 6F6H6EA | |
| Media della classe Office (250 - 3380, n=77, ultimi 2 anni) | |
| Media AMD Ryzen 7 PRO 6850U (1652 - 2092, n=7) | |
| Lenovo ThinkPad T14 G3-21CF004NGE | |
| Lenovo ThinkPad Z13 21D2CTO1WW | |
| Lenovo ThinkPad T14s G2 20XGS01100 | |
| Dell Inspiron 14 7420 2-in-1 | |
| Lenovo ThinkPad T14 Gen2-20W1S00000 | |
| Dell Latitude 7420 JW6MH | |
| Cinebench R15 / CPU Single 64Bit | |
| Dell Inspiron 14 7420 2-in-1 | |
| Media della classe Office (99.5 - 316, n=77, ultimi 2 anni) | |
| Huawei MateBook X Pro 2022 | |
| HP EliteBook 845 G9 6F6H6EA | |
| Lenovo ThinkPad T14 G3-21CF004NGE | |
| Media AMD Ryzen 7 PRO 6850U (228 - 244, n=7) | |
| Lenovo ThinkPad Z13 21D2CTO1WW | |
| Lenovo ThinkPad T14s G2 20XGS01100 | |
| Lenovo ThinkPad T14 Gen2-20W1S00000 | |
| Dell Latitude 7420 JW6MH | |
| Blender / v2.79 BMW27 CPU | |
| Dell Latitude 7420 JW6MH | |
| Lenovo ThinkPad T14 Gen2-20W1S00000 | |
| Lenovo ThinkPad Z13 21D2CTO1WW | |
| Dell Inspiron 14 7420 2-in-1 | |
| Media della classe Office (158 - 1940, n=76, ultimi 2 anni) | |
| Lenovo ThinkPad T14s G2 20XGS01100 | |
| Huawei MateBook X Pro 2022 | |
| Lenovo ThinkPad T14 G3-21CF004NGE | |
| Media AMD Ryzen 7 PRO 6850U (241 - 307, n=7) | |
| HP EliteBook 845 G9 6F6H6EA | |
| 7-Zip 18.03 / 7z b 4 | |
| Lenovo ThinkPad T14 G3-21CF004NGE | |
| Media AMD Ryzen 7 PRO 6850U (44011 - 59045, n=7) | |
| HP EliteBook 845 G9 6F6H6EA | |
| Lenovo ThinkPad T14s G2 20XGS01100 | |
| Media della classe Office (7098 - 76886, n=77, ultimi 2 anni) | |
| Huawei MateBook X Pro 2022 | |
| Lenovo ThinkPad Z13 21D2CTO1WW | |
| Dell Inspiron 14 7420 2-in-1 | |
| Lenovo ThinkPad T14 Gen2-20W1S00000 | |
| Dell Latitude 7420 JW6MH | |
| 7-Zip 18.03 / 7z b 4 -mmt1 | |
| Dell Inspiron 14 7420 2-in-1 | |
| HP EliteBook 845 G9 6F6H6EA | |
| Media della classe Office (3387 - 6469, n=77, ultimi 2 anni) | |
| Media AMD Ryzen 7 PRO 6850U (5057 - 5662, n=7) | |
| Lenovo ThinkPad T14 Gen2-20W1S00000 | |
| Huawei MateBook X Pro 2022 | |
| Lenovo ThinkPad T14 G3-21CF004NGE | |
| Lenovo ThinkPad T14s G2 20XGS01100 | |
| Lenovo ThinkPad Z13 21D2CTO1WW | |
| Dell Latitude 7420 JW6MH | |
| Geekbench 5.5 / Multi-Core | |
| Huawei MateBook X Pro 2022 | |
| Media della classe Office (1483 - 16999, n=73, ultimi 2 anni) | |
| Media AMD Ryzen 7 PRO 6850U (7044 - 9241, n=7) | |
| Lenovo ThinkPad T14 G3-21CF004NGE | |
| HP EliteBook 845 G9 6F6H6EA | |
| Lenovo ThinkPad T14s G2 20XGS01100 | |
| Dell Inspiron 14 7420 2-in-1 | |
| Lenovo ThinkPad Z13 21D2CTO1WW | |
| Dell Latitude 7420 JW6MH | |
| Lenovo ThinkPad T14 Gen2-20W1S00000 | |
| Geekbench 5.5 / Single-Core | |
| Media della classe Office (811 - 2175, n=73, ultimi 2 anni) | |
| Huawei MateBook X Pro 2022 | |
| Dell Inspiron 14 7420 2-in-1 | |
| HP EliteBook 845 G9 6F6H6EA | |
| Lenovo ThinkPad T14 G3-21CF004NGE | |
| Media AMD Ryzen 7 PRO 6850U (1433 - 1533, n=7) | |
| Lenovo ThinkPad T14 Gen2-20W1S00000 | |
| Lenovo ThinkPad Z13 21D2CTO1WW | |
| Lenovo ThinkPad T14s G2 20XGS01100 | |
| Dell Latitude 7420 JW6MH | |
| HWBOT x265 Benchmark v2.2 / 4k Preset | |
| Media della classe Office (2.21 - 26, n=76, ultimi 2 anni) | |
| Lenovo ThinkPad T14 G3-21CF004NGE | |
| Media AMD Ryzen 7 PRO 6850U (11.7 - 16.3, n=7) | |
| HP EliteBook 845 G9 6F6H6EA | |
| Huawei MateBook X Pro 2022 | |
| Lenovo ThinkPad T14s G2 20XGS01100 | |
| Dell Inspiron 14 7420 2-in-1 | |
| Lenovo ThinkPad Z13 21D2CTO1WW | |
| Lenovo ThinkPad T14 Gen2-20W1S00000 | |
| Dell Latitude 7420 JW6MH | |
| LibreOffice / 20 Documents To PDF | |
| HP EliteBook 845 G9 6F6H6EA | |
| Media della classe Office (39.9 - 102.3, n=76, ultimi 2 anni) | |
| Lenovo ThinkPad Z13 21D2CTO1WW | |
| Media AMD Ryzen 7 PRO 6850U (46.3 - 74, n=7) | |
| Dell Latitude 7420 JW6MH | |
| Lenovo ThinkPad T14 G3-21CF004NGE | |
| Dell Inspiron 14 7420 2-in-1 | |
| Lenovo ThinkPad T14s G2 20XGS01100 | |
| Lenovo ThinkPad T14 Gen2-20W1S00000 | |
| Huawei MateBook X Pro 2022 | |
| R Benchmark 2.5 / Overall mean | |
| Dell Latitude 7420 JW6MH | |
| Lenovo ThinkPad T14 Gen2-20W1S00000 | |
| Lenovo ThinkPad Z13 21D2CTO1WW | |
| Lenovo ThinkPad T14s G2 20XGS01100 | |
| Lenovo ThinkPad T14 G3-21CF004NGE | |
| Media AMD Ryzen 7 PRO 6850U (0.4932 - 0.544, n=7) | |
| Media della classe Office (0.393 - 0.888, n=76, ultimi 2 anni) | |
| HP EliteBook 845 G9 6F6H6EA | |
| Huawei MateBook X Pro 2022 | |
| Dell Inspiron 14 7420 2-in-1 | |
* ... Meglio usare valori piccoli
AIDA64: FP32 Ray-Trace | FPU Julia | CPU SHA3 | CPU Queen | FPU SinJulia | FPU Mandel | CPU AES | CPU ZLib | FP64 Ray-Trace | CPU PhotoWorxx
| Performance rating | |
| HP EliteBook 845 G9 6F6H6EA | |
| Media AMD Ryzen 7 PRO 6850U | |
| Media della classe Office | |
| Lenovo ThinkPad T14 G3-21CF004NGE | |
| Lenovo ThinkPad T14s G2 20XGS01100 | |
| Huawei MateBook X Pro 2022 | |
| Dell Latitude 7420 JW6MH | |
| Lenovo ThinkPad T14 Gen2-20W1S00000 | |
| AIDA64 / FP32 Ray-Trace | |
| HP EliteBook 845 G9 6F6H6EA | |
| Media della classe Office (2083 - 31245, n=83, ultimi 2 anni) | |
| Media AMD Ryzen 7 PRO 6850U (11272 - 14704, n=8) | |
| Lenovo ThinkPad T14 G3-21CF004NGE | |
| Lenovo ThinkPad T14s G2 20XGS01100 | |
| Lenovo ThinkPad T14 Gen2-20W1S00000 | |
| Dell Latitude 7420 JW6MH | |
| Huawei MateBook X Pro 2022 | |
| AIDA64 / FPU Julia | |
| HP EliteBook 845 G9 6F6H6EA | |
| Media AMD Ryzen 7 PRO 6850U (72242 - 92957, n=8) | |
| Lenovo ThinkPad T14 G3-21CF004NGE | |
| Lenovo ThinkPad T14s G2 20XGS01100 | |
| Media della classe Office (8191 - 125394, n=83, ultimi 2 anni) | |
| Lenovo ThinkPad T14 Gen2-20W1S00000 | |
| Dell Latitude 7420 JW6MH | |
| Huawei MateBook X Pro 2022 | |
| AIDA64 / CPU SHA3 | |
| HP EliteBook 845 G9 6F6H6EA | |
| Media della classe Office (433 - 5755, n=83, ultimi 2 anni) | |
| Media AMD Ryzen 7 PRO 6850U (2419 - 3104, n=8) | |
| Lenovo ThinkPad T14 G3-21CF004NGE | |
| Lenovo ThinkPad T14s G2 20XGS01100 | |
| Lenovo ThinkPad T14 Gen2-20W1S00000 | |
| Dell Latitude 7420 JW6MH | |
| Huawei MateBook X Pro 2022 | |
| AIDA64 / CPU Queen | |
| HP EliteBook 845 G9 6F6H6EA | |
| Media AMD Ryzen 7 PRO 6850U (86644 - 96912, n=7) | |
| Lenovo ThinkPad T14 G3-21CF004NGE | |
| Lenovo ThinkPad T14s G2 20XGS01100 | |
| Huawei MateBook X Pro 2022 | |
| Media della classe Office (22784 - 115197, n=67, ultimi 2 anni) | |
| Lenovo ThinkPad T14 Gen2-20W1S00000 | |
| Dell Latitude 7420 JW6MH | |
| AIDA64 / FPU SinJulia | |
| HP EliteBook 845 G9 6F6H6EA | |
| Media AMD Ryzen 7 PRO 6850U (10917 - 12571, n=8) | |
| Lenovo ThinkPad T14 G3-21CF004NGE | |
| Lenovo ThinkPad T14s G2 20XGS01100 | |
| Media della classe Office (1378 - 18321, n=83, ultimi 2 anni) | |
| Huawei MateBook X Pro 2022 | |
| Lenovo ThinkPad T14 Gen2-20W1S00000 | |
| Dell Latitude 7420 JW6MH | |
| AIDA64 / FPU Mandel | |
| HP EliteBook 845 G9 6F6H6EA | |
| Media AMD Ryzen 7 PRO 6850U (39609 - 51296, n=8) | |
| Lenovo ThinkPad T14 G3-21CF004NGE | |
| Lenovo ThinkPad T14s G2 20XGS01100 | |
| Media della classe Office (4601 - 66922, n=83, ultimi 2 anni) | |
| Lenovo ThinkPad T14 Gen2-20W1S00000 | |
| Dell Latitude 7420 JW6MH | |
| Huawei MateBook X Pro 2022 | |
| AIDA64 / CPU AES | |
| Lenovo ThinkPad T14s G2 20XGS01100 | |
| Lenovo ThinkPad T14 Gen2-20W1S00000 | |
| Dell Latitude 7420 JW6MH | |
| Huawei MateBook X Pro 2022 | |
| HP EliteBook 845 G9 6F6H6EA | |
| Media della classe Office (4854 - 155900, n=83, ultimi 2 anni) | |
| Media AMD Ryzen 7 PRO 6850U (45568 - 60867, n=8) | |
| Lenovo ThinkPad T14 G3-21CF004NGE | |
| AIDA64 / CPU ZLib | |
| HP EliteBook 845 G9 6F6H6EA | |
| Media della classe Office (114.6 - 1366, n=83, ultimi 2 anni) | |
| Media AMD Ryzen 7 PRO 6850U (641 - 805, n=8) | |
| Lenovo ThinkPad T14 G3-21CF004NGE | |
| Huawei MateBook X Pro 2022 | |
| Lenovo ThinkPad T14s G2 20XGS01100 | |
| Lenovo ThinkPad T14 Gen2-20W1S00000 | |
| Dell Latitude 7420 JW6MH | |
| AIDA64 / FP64 Ray-Trace | |
| Media della classe Office (1109 - 17834, n=83, ultimi 2 anni) | |
| HP EliteBook 845 G9 6F6H6EA | |
| Media AMD Ryzen 7 PRO 6850U (5967 - 7821, n=8) | |
| Lenovo ThinkPad T14 G3-21CF004NGE | |
| Lenovo ThinkPad T14s G2 20XGS01100 | |
| Lenovo ThinkPad T14 Gen2-20W1S00000 | |
| Dell Latitude 7420 JW6MH | |
| Huawei MateBook X Pro 2022 | |
| AIDA64 / CPU PhotoWorxx | |
| Media della classe Office (11090 - 65229, n=83, ultimi 2 anni) | |
| Huawei MateBook X Pro 2022 | |
| Dell Latitude 7420 JW6MH | |
| Media AMD Ryzen 7 PRO 6850U (19707 - 27840, n=8) | |
| Lenovo ThinkPad T14 G3-21CF004NGE | |
| Lenovo ThinkPad T14s G2 20XGS01100 | |
| HP EliteBook 845 G9 6F6H6EA | |
| Lenovo ThinkPad T14 Gen2-20W1S00000 | |
Prestazioni del sistema
Il ThinkPad T14 G3 è un portatile molto reattivo e nei nostri test non abbiamo riscontrato scatti, blocchi o altri problemi. Ciò è ulteriormente confermato dai buoni risultati ottenuti nei benchmark sintetici. Il nostro dispositivo in prova è stato fornito con Windows 10 Professional, ma è possibile passare a Windows 11 Pro senza problemi.
CrossMark: Overall | Productivity | Creativity | Responsiveness
| PCMark 10 / Score | |
| Media della classe Office (2601 - 9298, n=69, ultimi 2 anni) | |
| Media AMD Ryzen 7 PRO 6850U, AMD Radeon 680M (5873 - 6311, n=7) | |
| Huawei MateBook X Pro 2022 | |
| Lenovo ThinkPad T14 G3-21CF004NGE | |
| Lenovo ThinkPad T14s G2 20XGS01100 | |
| HP EliteBook 845 G9 6F6H6EA | |
| Lenovo ThinkPad T14 Gen2-20W1S00000 | |
| Dell Inspiron 14 7420 2-in-1 | |
| Dell Latitude 7420 JW6MH | |
| PCMark 10 / Essentials | |
| Huawei MateBook X Pro 2022 | |
| Lenovo ThinkPad T14s G2 20XGS01100 | |
| Dell Inspiron 14 7420 2-in-1 | |
| Media della classe Office (3245 - 11594, n=69, ultimi 2 anni) | |
| Lenovo ThinkPad T14 Gen2-20W1S00000 | |
| Dell Latitude 7420 JW6MH | |
| Lenovo ThinkPad T14 G3-21CF004NGE | |
| Media AMD Ryzen 7 PRO 6850U, AMD Radeon 680M (9151 - 10263, n=7) | |
| HP EliteBook 845 G9 6F6H6EA | |
| PCMark 10 / Productivity | |
| Media della classe Office (5336 - 17243, n=69, ultimi 2 anni) | |
| Lenovo ThinkPad T14s G2 20XGS01100 | |
| Lenovo ThinkPad T14 Gen2-20W1S00000 | |
| Huawei MateBook X Pro 2022 | |
| Media AMD Ryzen 7 PRO 6850U, AMD Radeon 680M (8435 - 8891, n=7) | |
| Lenovo ThinkPad T14 G3-21CF004NGE | |
| HP EliteBook 845 G9 6F6H6EA | |
| Dell Latitude 7420 JW6MH | |
| Dell Inspiron 14 7420 2-in-1 | |
| PCMark 10 / Digital Content Creation | |
| Media della classe Office (2049 - 13541, n=69, ultimi 2 anni) | |
| Media AMD Ryzen 7 PRO 6850U, AMD Radeon 680M (6796 - 8422, n=7) | |
| HP EliteBook 845 G9 6F6H6EA | |
| Lenovo ThinkPad T14 G3-21CF004NGE | |
| Huawei MateBook X Pro 2022 | |
| Lenovo ThinkPad T14s G2 20XGS01100 | |
| Dell Inspiron 14 7420 2-in-1 | |
| Lenovo ThinkPad T14 Gen2-20W1S00000 | |
| Dell Latitude 7420 JW6MH | |
| CrossMark / Overall | |
| Huawei MateBook X Pro 2022 | |
| Media della classe Office (381 - 2010, n=75, ultimi 2 anni) | |
| Dell Inspiron 14 7420 2-in-1 | |
| Lenovo ThinkPad T14 G3-21CF004NGE | |
| Media AMD Ryzen 7 PRO 6850U, AMD Radeon 680M (1154 - 1442, n=7) | |
| Lenovo ThinkPad T14s G2 20XGS01100 | |
| HP EliteBook 845 G9 6F6H6EA | |
| Dell Latitude 7420 JW6MH | |
| CrossMark / Productivity | |
| Huawei MateBook X Pro 2022 | |
| Dell Inspiron 14 7420 2-in-1 | |
| Media della classe Office (464 - 1880, n=75, ultimi 2 anni) | |
| Lenovo ThinkPad T14 G3-21CF004NGE | |
| HP EliteBook 845 G9 6F6H6EA | |
| Media AMD Ryzen 7 PRO 6850U, AMD Radeon 680M (1188 - 1444, n=7) | |
| Lenovo ThinkPad T14s G2 20XGS01100 | |
| Dell Latitude 7420 JW6MH | |
| CrossMark / Creativity | |
| Huawei MateBook X Pro 2022 | |
| Media della classe Office (319 - 2361, n=75, ultimi 2 anni) | |
| Dell Inspiron 14 7420 2-in-1 | |
| Lenovo ThinkPad T14 G3-21CF004NGE | |
| Lenovo ThinkPad T14s G2 20XGS01100 | |
| Media AMD Ryzen 7 PRO 6850U, AMD Radeon 680M (1180 - 1523, n=7) | |
| HP EliteBook 845 G9 6F6H6EA | |
| Dell Latitude 7420 JW6MH | |
| CrossMark / Responsiveness | |
| Huawei MateBook X Pro 2022 | |
| Media della classe Office (360 - 1820, n=75, ultimi 2 anni) | |
| Dell Inspiron 14 7420 2-in-1 | |
| Dell Latitude 7420 JW6MH | |
| Lenovo ThinkPad T14 G3-21CF004NGE | |
| Media AMD Ryzen 7 PRO 6850U, AMD Radeon 680M (990 - 1282, n=7) | |
| HP EliteBook 845 G9 6F6H6EA | |
| Lenovo ThinkPad T14s G2 20XGS01100 | |
| PCMark 10 Score | 6060 punti | |
Aiuto | ||
| AIDA64 / Memory Copy | |
| Media della classe Office (20075 - 110930, n=80, ultimi 2 anni) | |
| Huawei MateBook X Pro 2022 | |
| Dell Latitude 7420 JW6MH | |
| Lenovo ThinkPad T14 G3-21CF004NGE | |
| Media AMD Ryzen 7 PRO 6850U (31003 - 48605, n=8) | |
| Lenovo ThinkPad T14s G2 20XGS01100 | |
| HP EliteBook 845 G9 6F6H6EA | |
| Lenovo ThinkPad T14 Gen2-20W1S00000 | |
| AIDA64 / Memory Read | |
| Huawei MateBook X Pro 2022 | |
| Media della classe Office (10084 - 128030, n=81, ultimi 2 anni) | |
| Dell Latitude 7420 JW6MH | |
| Media AMD Ryzen 7 PRO 6850U (34682 - 45912, n=8) | |
| Lenovo ThinkPad T14 G3-21CF004NGE | |
| Lenovo ThinkPad T14s G2 20XGS01100 | |
| HP EliteBook 845 G9 6F6H6EA | |
| Lenovo ThinkPad T14 Gen2-20W1S00000 | |
| AIDA64 / Memory Write | |
| Media della classe Office (20073 - 119858, n=81, ultimi 2 anni) | |
| Huawei MateBook X Pro 2022 | |
| Dell Latitude 7420 JW6MH | |
| Lenovo ThinkPad T14 G3-21CF004NGE | |
| Media AMD Ryzen 7 PRO 6850U (34532 - 51096, n=8) | |
| Lenovo ThinkPad T14s G2 20XGS01100 | |
| HP EliteBook 845 G9 6F6H6EA | |
| Lenovo ThinkPad T14 Gen2-20W1S00000 | |
| AIDA64 / Memory Latency | |
| Lenovo ThinkPad T14 G3-21CF004NGE | |
| Huawei MateBook X Pro 2022 | |
| Lenovo ThinkPad T14s G2 20XGS01100 | |
| Media AMD Ryzen 7 PRO 6850U (86.1 - 135.3, n=8) | |
| Media della classe Office (7.6 - 162.9, n=76, ultimi 2 anni) | |
| HP EliteBook 845 G9 6F6H6EA | |
| Dell Latitude 7420 JW6MH | |
| Lenovo ThinkPad T14 Gen2-20W1S00000 | |
* ... Meglio usare valori piccoli
Latenza DPC
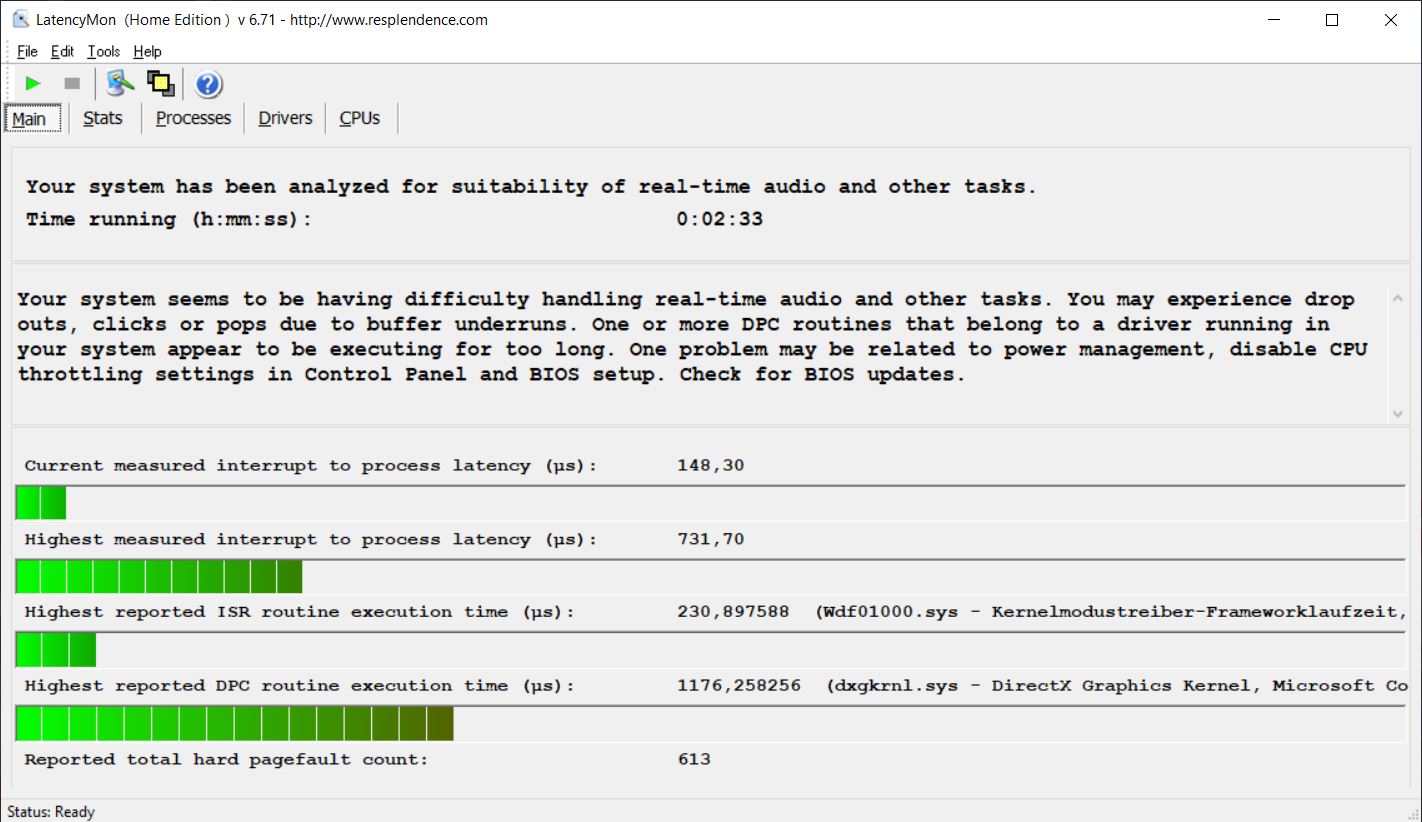
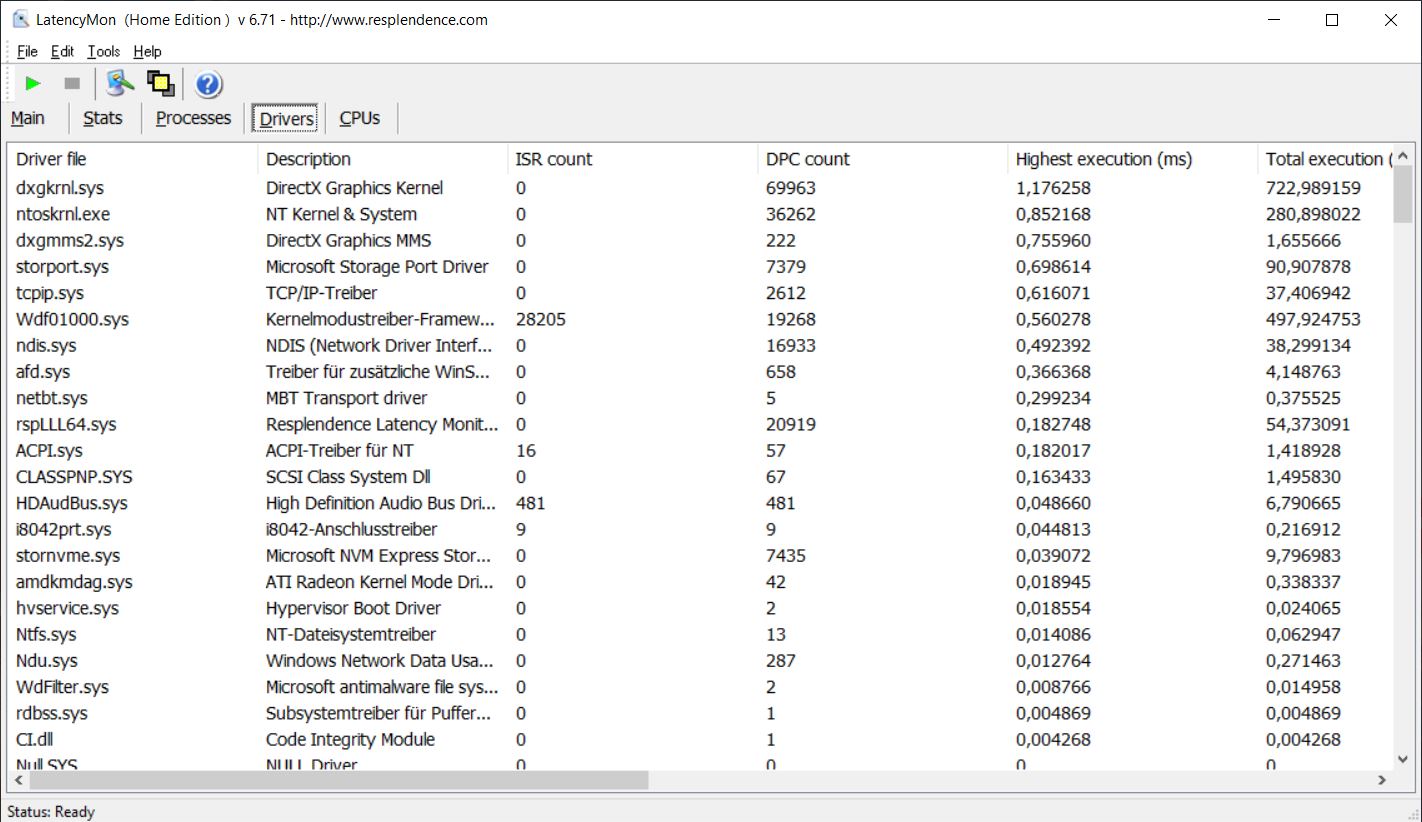
Nel nostro test di latenza standardizzato (navigazione web, riproduzione YouTube 4K, carico della CPU), il ThinkPad T14 G3 non ha mostrato limitazioni fondamentali con l'attuale versione del BIOS, ma un driver (DirectX Graphics Kernel) ha causato un leggero aumento della latenza. Ciononostante, il dispositivo oggetto della recensione ha ottenuto un ottimo punteggio nel campo del confronto.
| DPC Latencies / LatencyMon - interrupt to process latency (max), Web, Youtube, Prime95 | |
| Lenovo ThinkPad T14 Gen2-20W1S00000 | |
| Lenovo ThinkPad T14s G2 20XGS01100 | |
| HP EliteBook 845 G9 6F6H6EA | |
| Dell Latitude 7420 JW6MH | |
| Huawei MateBook X Pro 2022 | |
| Lenovo ThinkPad T14 G3-21CF004NGE | |
* ... Meglio usare valori piccoli
Dispositivi di archiviazione
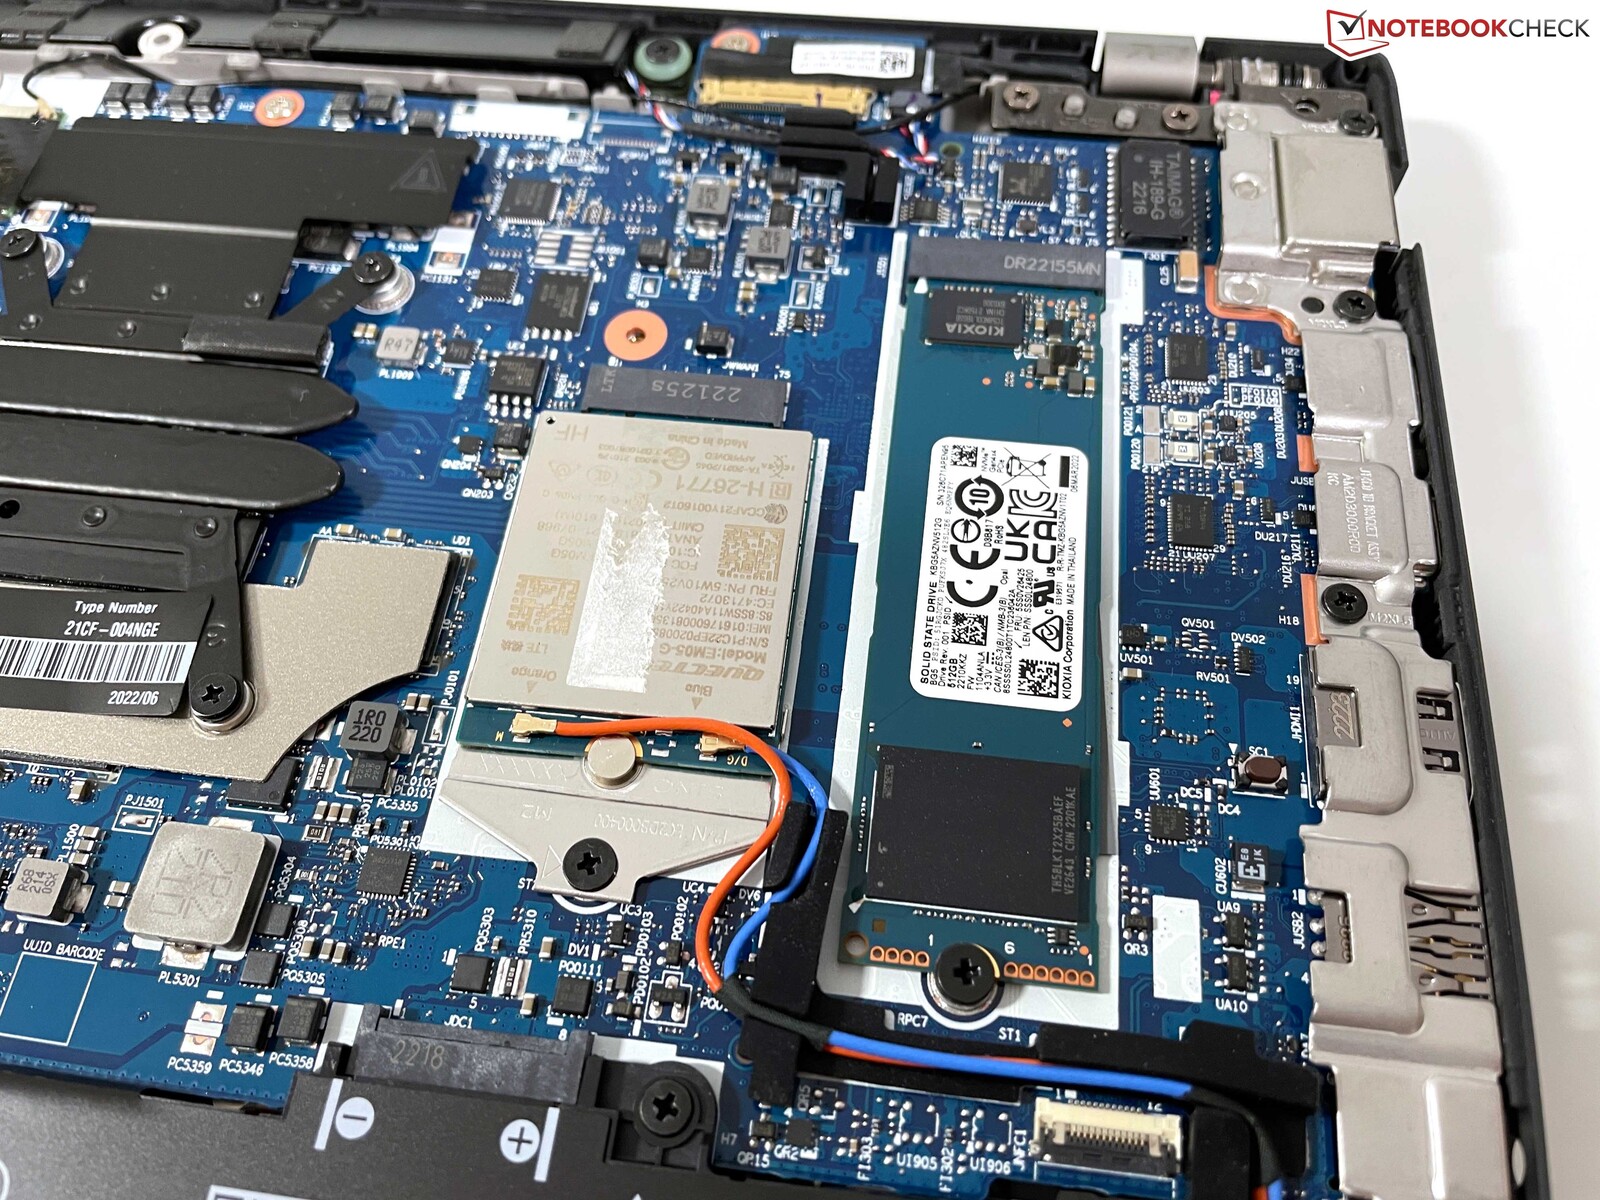
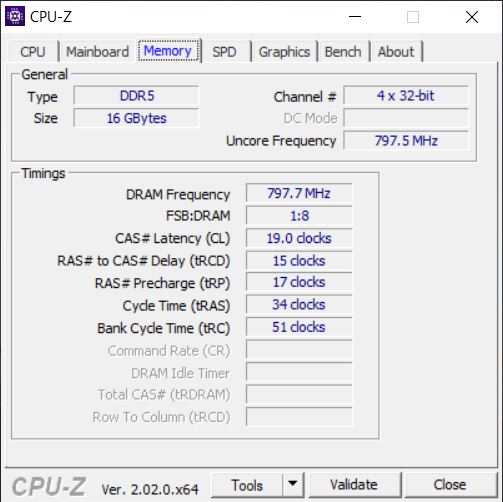
La versione AMD del ThinkPad T14 G3 offre uno slot PCIe 4.0 veloce per M.2-2280-SSD, che nell'esemplare da noi recensito è dotato di un Kioxia BG5. Si tratta di una moderna unità SSD PCIe 4.0, ma non è uno dei moduli più veloci ed è specificata con una velocità di trasferimento massima di 3,5 GB/s. Nei nostri benchmark, i risultati sono decenti con circa 3 GB/s, ma è possibile fare molto di più. Almeno le prestazioni rimangono abbastanza stabili in caso di carico prolungato e non calano a causa di problemi di temperatura. La nostra configurazione di prova offre 512 GB di spazio di archiviazione, di cui 434 GB sono disponibili dopo il primo avvio. Altri benchmark sulle SSD sono elencatiqui.

* ... Meglio usare valori piccoli
Sustained Read Performance: DiskSpd Read Loop, Queue Depth 8
Scheda grafica
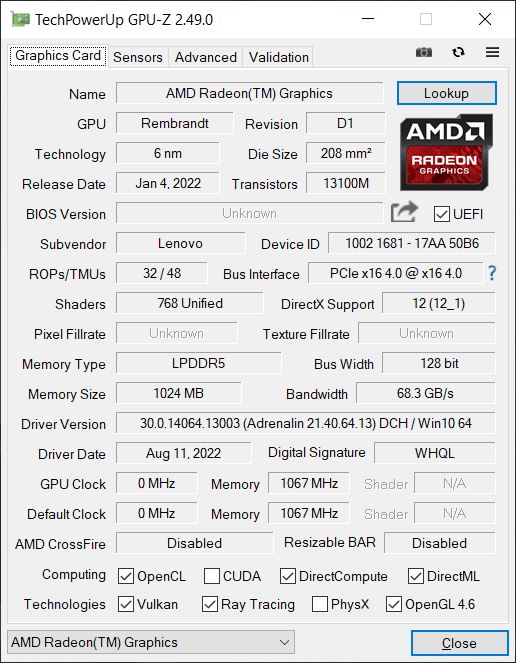
La Radeon 680Mè attualmente la scheda grafica integrata più veloce sul mercato ed è in grado di competere con schede grafiche entry-level come la GeForce MX450e non è nemmeno lontanamente paragonabile alla GeForce MX550che è disponibile come opzione per il modello Intel. Tuttavia, abbiamo solo risultati per la MX550 con un TGP molto elevato di 35 watt; ci aspettiamo 25 watt per il T14 G3. Quindi è possibile che l'MX550 nel ThinkPad T14 non offra prestazioni superiori a quelle del 680M. La grafica integrata Grafica Intel Xe G7è nettamente superiore ed è all'incirca alla pari con la più piccola Radeon 660M del ThinkPad T14 Radeon 660M nel Ryzen 5 Pro 6650U.
Oltre alle elevate prestazioni grafiche, che rimangono stabili anche in caso di carico prolungato e in modalità batteria, il decoder video integrato è anche estremamente efficiente. Ad esempio, nel nostro test sui video 4K di YouTube, il carico della GPU è solo dell'1-2%, rispetto al 43-44% della Iris Xe Graphics G7 degli attuali processori Alder Lake. Altri benchmark della GPU sono disponibiliqui.
| 3DMark 11 Performance | 10275 punti | |
| 3DMark Cloud Gate Standard Score | 32012 punti | |
| 3DMark Fire Strike Score | 6486 punti | |
| 3DMark Time Spy Score | 2555 punti | |
Aiuto | ||
Nel benchmark di Blender, la Radeon 680M presenta vantaggi anche rispetto alla Iris Xe Graphics G7. Poiché Blender non supporta più OpenCL dalla versione 3.0, AMD supporta nuovamente il rendering su GPU tramite HIP (Heterogeneous-computing Interface for Portability), che è un concorrente della tecnologia CUDA di Nvidia. Questo riduce il tempo di rendering nel benchmark Classroom da 525 secondi (CPU) a 335 secondi (HIP). Non abbiamo ancora molti risultati per le GPU CUDA, ma sia la RTX A1000 che la RTX 3050 sono almeno tre volte più veloci. Siamo quindi curiosi di vedere come si comporta l'MX550 di GeForce.
| Blender / v3.3 Classroom CPU | |
| Beelink SEi11 Pro | |
| Lenovo ThinkPad Z13 21D2CTO1WW | |
| Asus VivoBook Pro 16X OLED N7600PC-L2026X (3.3.0) | |
| Huawei MateBook X Pro 2022 | |
| Media della classe Office (245 - 3219, n=75, ultimi 2 anni) | |
| Lenovo ThinkPad T14 G3-21CF004NGE (3.2.0) | |
| HP Envy 16 h0112nr (3.2.0) | |
| Dell Precision 5000 5470 | |
| Blender / v3.3 Classroom HIP/AMD | |
| Lenovo ThinkPad Z13 21D2CTO1WW | |
| Media della classe Office (296 - 507, n=5, ultimi 2 anni) | |
| Lenovo ThinkPad T14 G3-21CF004NGE (3.2.0) | |
| Blender / v3.3 Classroom OPTIX/RTX | |
| Media della classe Office (29 - 242, n=2, ultimi 2 anni) | |
| Dell Precision 5000 5470 | |
| Asus VivoBook Pro 16X OLED N7600PC-L2026X (3.3.0) | |
| HP Envy 16 h0112nr (3.2.0) | |
| Blender / v3.3 Classroom CUDA | |
| Dell Precision 5000 5470 | |
| Asus VivoBook Pro 16X OLED N7600PC-L2026X (3.3.0) | |
| Media della classe Office (53 - 214, n=3, ultimi 2 anni) | |
| HP Envy 16 h0112nr (3.2.0) | |
* ... Meglio usare valori piccoli
Sebbene il ThinkPad T14 G3 non sia una workstation, la Radeon 680M si comporta comunque piuttosto bene nei benchmark professionali SPECviewperf. L'Intel Xe Graphics G7 è nettamente superiore in quasi tutti i test, mentre il confronto con la scheda dedicata GeForce MX550 dipende dallo scenario. Il 680M è più veloce in alcuni casi, il GeForce in altri. Per lo meno, i progetti più piccoli possono essere realizzati sul ThinkPad T14 G3 AMD.
Prestazioni di gioco
Il ThinkPad T14 G3 è prima di tutto un computer portatile per il business, ma grazie alla sua veloce GPU integrata, è possibile anche giocare. LaRadeon 680Mriesce spesso a garantire un gameplay fluido a dettagli medi e alti in risoluzione 1080p, a patto che i titoli non siano troppo impegnativi. Nei benchmark di gioco, la versione veloce da 35 watt dell' GeForce MX550 è spesso leggermente più veloce, ma la differenza con l'MX550 nel ThinkPad T14 G3 è appena degna di nota.
| F1 2021 | |
| 1920x1080 High Preset AA:T AF:16x | |
| Media AMD Radeon 680M (26.8 - 69, n=21) | |
| Lenovo ThinkPad T14 G3-21CF004NGE (874931) | |
| Lenovo IdeaCentre AIO 3 24IAP7 (874931) | |
| Huawei MateBook X Pro 2022 (874931) | |
| 1920x1080 Ultra High Preset + Raytracing AA:T AF:16x | |
| Lenovo IdeaCentre AIO 3 24IAP7 (874931) | |
| Huawei MateBook X Pro 2022 (874931) | |
| Media AMD Radeon 680M (16.1 - 29.1, n=18) | |
| Lenovo ThinkPad T14 G3-21CF004NGE (874931) | |
| Final Fantasy XV Benchmark | |
| 1920x1080 Standard Quality | |
| Lenovo IdeaCentre AIO 3 24IAP7 (1.3) | |
| Lenovo ThinkPad T14 G3-21CF004NGE (1.3) | |
| Media della classe Office (7.86 - 105.7, n=74, ultimi 2 anni) | |
| Media AMD Radeon 680M (18.3 - 36.9, n=40) | |
| Huawei MateBook X Pro 2022 (1.3) | |
| HP EliteBook 845 G9 6F6H6EA (1.3) | |
| Dell Latitude 7420 JW6MH (1.3) | |
| Dell Inspiron 14 7420 2-in-1 (1.3) | |
| 1920x1080 High Quality | |
| Lenovo IdeaCentre AIO 3 24IAP7 (1.3) | |
| Lenovo ThinkPad T14 G3-21CF004NGE (1.3) | |
| Media della classe Office (8.09 - 79.5, n=72, ultimi 2 anni) | |
| Media AMD Radeon 680M (12.9 - 26.2, n=40) | |
| Huawei MateBook X Pro 2022 (1.3) | |
| HP EliteBook 845 G9 6F6H6EA (1.3) | |
| Dell Inspiron 14 7420 2-in-1 (1.3) | |
| Strange Brigade | |
| 1920x1080 high AA:high AF:8 | |
| Lenovo IdeaCentre AIO 3 24IAP7 (1.47.22.14 D3D12) | |
| Lenovo ThinkPad T14 G3-21CF004NGE | |
| Media della classe Office (9.8 - 164.3, n=54, ultimi 2 anni) | |
| Media AMD Radeon 680M (25.3 - 53.1, n=38) | |
| Huawei MateBook X Pro 2022 (1.47.22.14 D3D12) | |
| Lenovo ThinkPad T14s G2 20XGS01100 (1.47.22.14 D3D12) | |
| HP EliteBook 845 G9 6F6H6EA (1.47.22.14 D3D12) | |
| Dell Inspiron 14 7420 2-in-1 (1.47.22.14 D3D12) | |
| Dell Latitude 7420 JW6MH (1.47.22.14 D3D12) | |
| 1920x1080 ultra AA:ultra AF:16 | |
| Lenovo ThinkPad T14 G3-21CF004NGE | |
| Media della classe Office (12.9 - 142.1, n=54, ultimi 2 anni) | |
| Lenovo IdeaCentre AIO 3 24IAP7 (1.47.22.14 D3D12) | |
| Media AMD Radeon 680M (22 - 46, n=38) | |
| Huawei MateBook X Pro 2022 (1.47.22.14 D3D12) | |
| Lenovo ThinkPad T14s G2 20XGS01100 (1.47.22.14 D3D12) | |
| HP EliteBook 845 G9 6F6H6EA (1.47.22.14 D3D12) | |
| Dell Inspiron 14 7420 2-in-1 (1.47.22.14 D3D12) | |
| Dell Latitude 7420 JW6MH (1.47.22.14 D3D12) | |
| Farming Simulator 22 | |
| 1920x1080 High Preset | |
| Lenovo IdeaCentre AIO 3 24IAP7 | |
| Media AMD Radeon 680M (30 - 72.5, n=4) | |
| Lenovo ThinkPad T14 G3-21CF004NGE | |
| Huawei MateBook X Pro 2022 | |
| 1920x1080 Very High Preset | |
| Lenovo ThinkPad T14 G3-21CF004NGE | |
| Lenovo IdeaCentre AIO 3 24IAP7 | |
| Media AMD Radeon 680M (27 - 53, n=4) | |
| Huawei MateBook X Pro 2022 | |
Le prestazioni di gioco rimangono stabili anche sotto carico prolungato, come ben illustrato dal nostro ciclo Witcher 3. Quando si valuta il consumo energetico su uno schermo esterno (per escludere i diversi pannelli interni dei dispositivi recensiti come fattori influenti), l'eccezionale efficienza rispetto all'MX550 e soprattutto all'Iris Xe Graphics G7 è ancora una volta evidente. In termini di prestazioni di gioco, tuttavia, è un peccato che Lenovo abbia omesso l'USB 4, in quanto ciò significa che non è possibile collegare una scheda grafica esterna, che altrimenti funzionerebbe molto bene grazie al potente processore. Le prestazioni rimangono stabili in modalità batteria. Altri benchmark di gioco sono disponibili qui.
Witcher 3 FPS-Diagramm
| Power Consumption - Witcher 3 ultra Efficiency (external Monitor) | |
| AMD Radeon 680M | |
| AMD Radeon 680M | |
| NVIDIA GeForce MX550 | |
| AMD Radeon RX Vega 8 (Ryzen 4000/5000) | |
| Intel Iris Xe Graphics G7 80EUs | |
| Intel Iris Xe Graphics G7 96EUs | |
| Intel Iris Xe Graphics G7 96EUs | |
| Intel Iris Xe Graphics G7 96EUs | |
| basso | medio | alto | ultra | |
|---|---|---|---|---|
| GTA V (2015) | 133.6 | 120.1 | 99.1 | 22.2 |
| The Witcher 3 (2015) | 117 | 79 | 41 | 23.9 |
| Dota 2 Reborn (2015) | 111.4 | 96 | 72.8 | 63.1 |
| Final Fantasy XV Benchmark (2018) | 62 | 32.4 | 23 | |
| X-Plane 11.11 (2018) | 48.9 | 39.5 | 33.5 | |
| Far Cry 5 (2018) | 58 | 36 | 34 | 32 |
| Strange Brigade (2018) | 139 | 58 | 48 | 41 |
| F1 2021 (2021) | 140.5 | 70.8 | 55.1 | 21.2 |
| Farming Simulator 22 (2021) | 121 | 61 | 49 | 43 |
| F1 22 (2022) | 66.5 | 60.3 | 42.3 | 9.16 |
Emissioni - Il ThinkPad AMD rimane piacevolmente silenzioso
Rumore
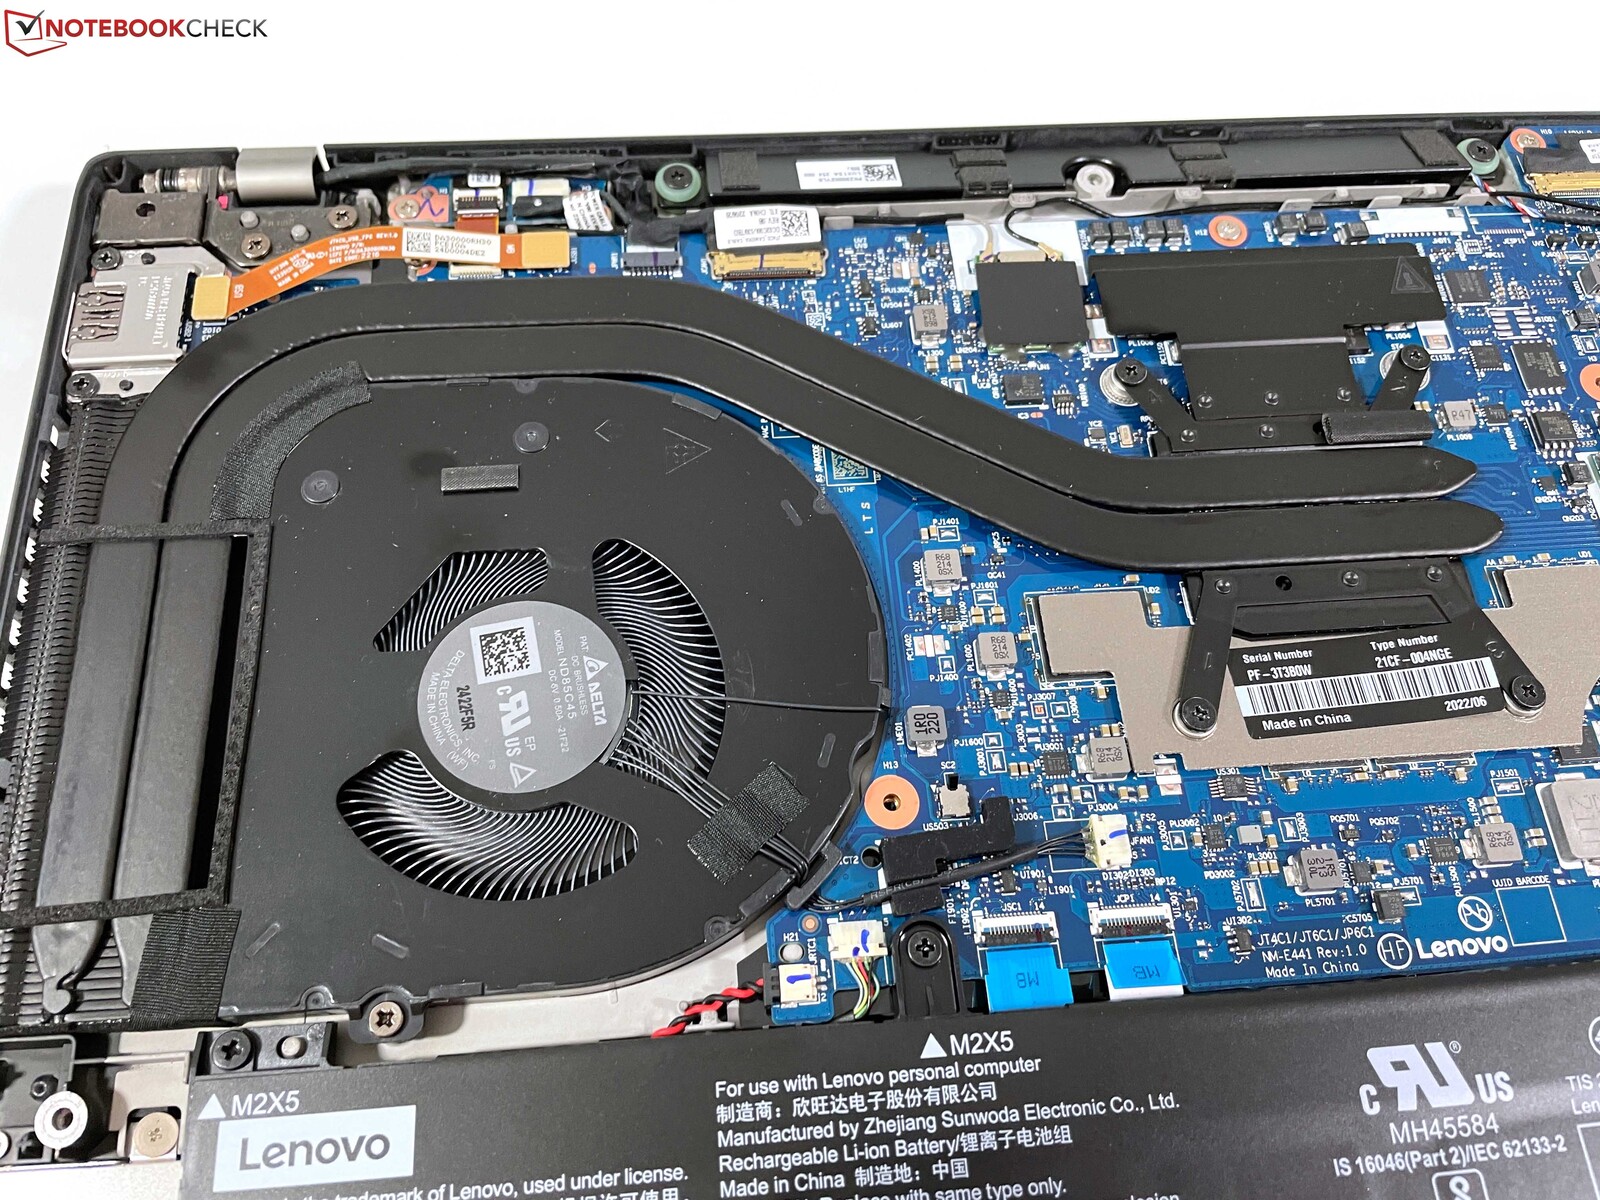
La ventola singola rimane piacevolmente silenziosa nell'uso quotidiano e spesso viene disattivata durante le attività più semplici, oppure si sente solo un rumore molto silenzioso, quasi impercettibile. Sotto carico, la ventola raggiunge un massimo di 38 dB(A), ma il rumore non è acuto o fastidioso. Non appena il TDP si stabilizza, il rumore della ventola scende nuovamente a circa 34 dB(A), che abbiamo misurato anche durante il gioco. Nel complesso, questo rende il ThinkPad T14 G3 uno dei dispositivi più silenziosi nel campo di confronto e, se si seleziona la modalità di alimentazione più efficiente, la ventola è appena udibile, anche sotto carico. Non sono stati rilevati altri rumori elettronici, come il fruscio della bobina.
Rumorosità
| Idle |
| 24.2 / 24.2 / 25.8 dB(A) |
| Sotto carico |
| 32.2 / 38.8 dB(A) |
 | ||
30 dB silenzioso 40 dB(A) udibile 50 dB(A) rumoroso |
||
min: | ||
| Lenovo ThinkPad T14 G3-21CF004NGE Radeon 680M, R7 PRO 6850U, Kioxia BG5 KBG5AZNV512G | Dell Latitude 7420 JW6MH Iris Xe G7 80EUs, i5-1145G7, SK Hynix BC711 HFM512GD3HX015N | Huawei MateBook X Pro 2022 Iris Xe G7 96EUs, i7-1260P, Silicon Motion PCIe-8 SSD 1TB | HP EliteBook 845 G9 6F6H6EA Radeon 680M, R9 PRO 6950HS, WDC PC SN810 1TB | Lenovo ThinkPad T14 Gen2-20W1S00000 GeForce MX450, i7-1165G7, Samsung PM981a MZVLB1T0HBLR | Lenovo ThinkPad T14s G2 20XGS01100 Vega 8, R7 PRO 5850U, Lenovo UMIS AM630 RPETJ1T24MGE2QDQ | |
|---|---|---|---|---|---|---|
| Noise | -11% | -1% | -8% | -4% | -3% | |
| off /ambiente * (dB) | 24.2 | 25.3 -5% | 23.5 3% | 25.5 -5% | 24.2 -0% | 26.81 -11% |
| Idle Minimum * (dB) | 24.2 | 25.3 -5% | 23.5 3% | 25.5 -5% | 24.2 -0% | 26.81 -11% |
| Idle Average * (dB) | 24.2 | 25.3 -5% | 23.5 3% | 25.5 -5% | 24.2 -0% | 26.81 -11% |
| Idle Maximum * (dB) | 25.8 | 25.3 2% | 25.9 -0% | 25.5 1% | 24.2 6% | 26.81 -4% |
| Load Average * (dB) | 32.2 | 44.9 -39% | 33.8 -5% | 38.1 -18% | 35.4 -10% | 30.16 6% |
| Witcher 3 ultra * (dB) | 34.1 | 35.4 -4% | 40.1 -18% | |||
| Load Maximum * (dB) | 38.8 | 44.9 -16% | 40.6 -5% | 44 -13% | 40.1 -3% | 33.98 12% |
* ... Meglio usare valori piccoli
Temperatura
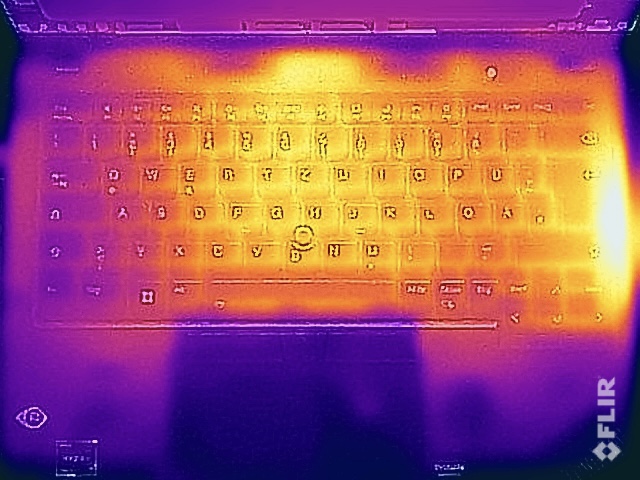
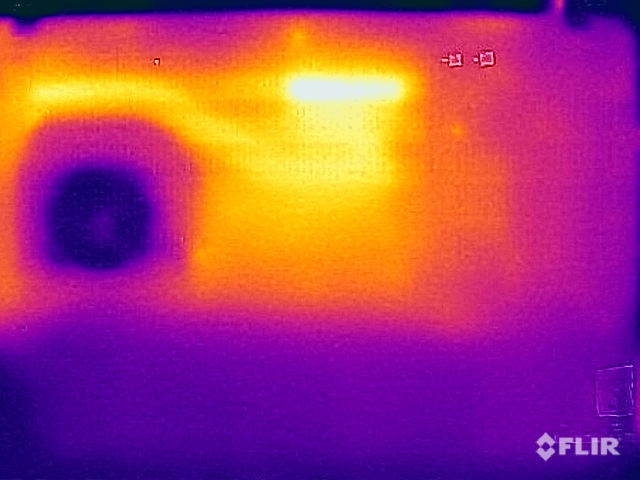
Il case del ThinkPad T14 G3 non si riscalda quasi per niente a basso carico, ma sotto carico la situazione è diversa. In particolare, l'area posteriore centrale sul lato inferiore e la copertura sopra l'uscita della ventola accanto alla tastiera si riscaldano molto. Conosciamo già le superfici calde vicino alla tastiera dei predecessori. Sotto carico, il ThinkPad T14 G3 non dovrebbe essere appoggiato sulle ginocchia, altrimenti si dovrebbe passare alla modalità di risparmio della batteria. Questo potrebbe essere problematico per le configurazioni del T14 G3 con GeForce MX550 dedicato, che sono naturalmente accompagnate da un maggiore carico termico.
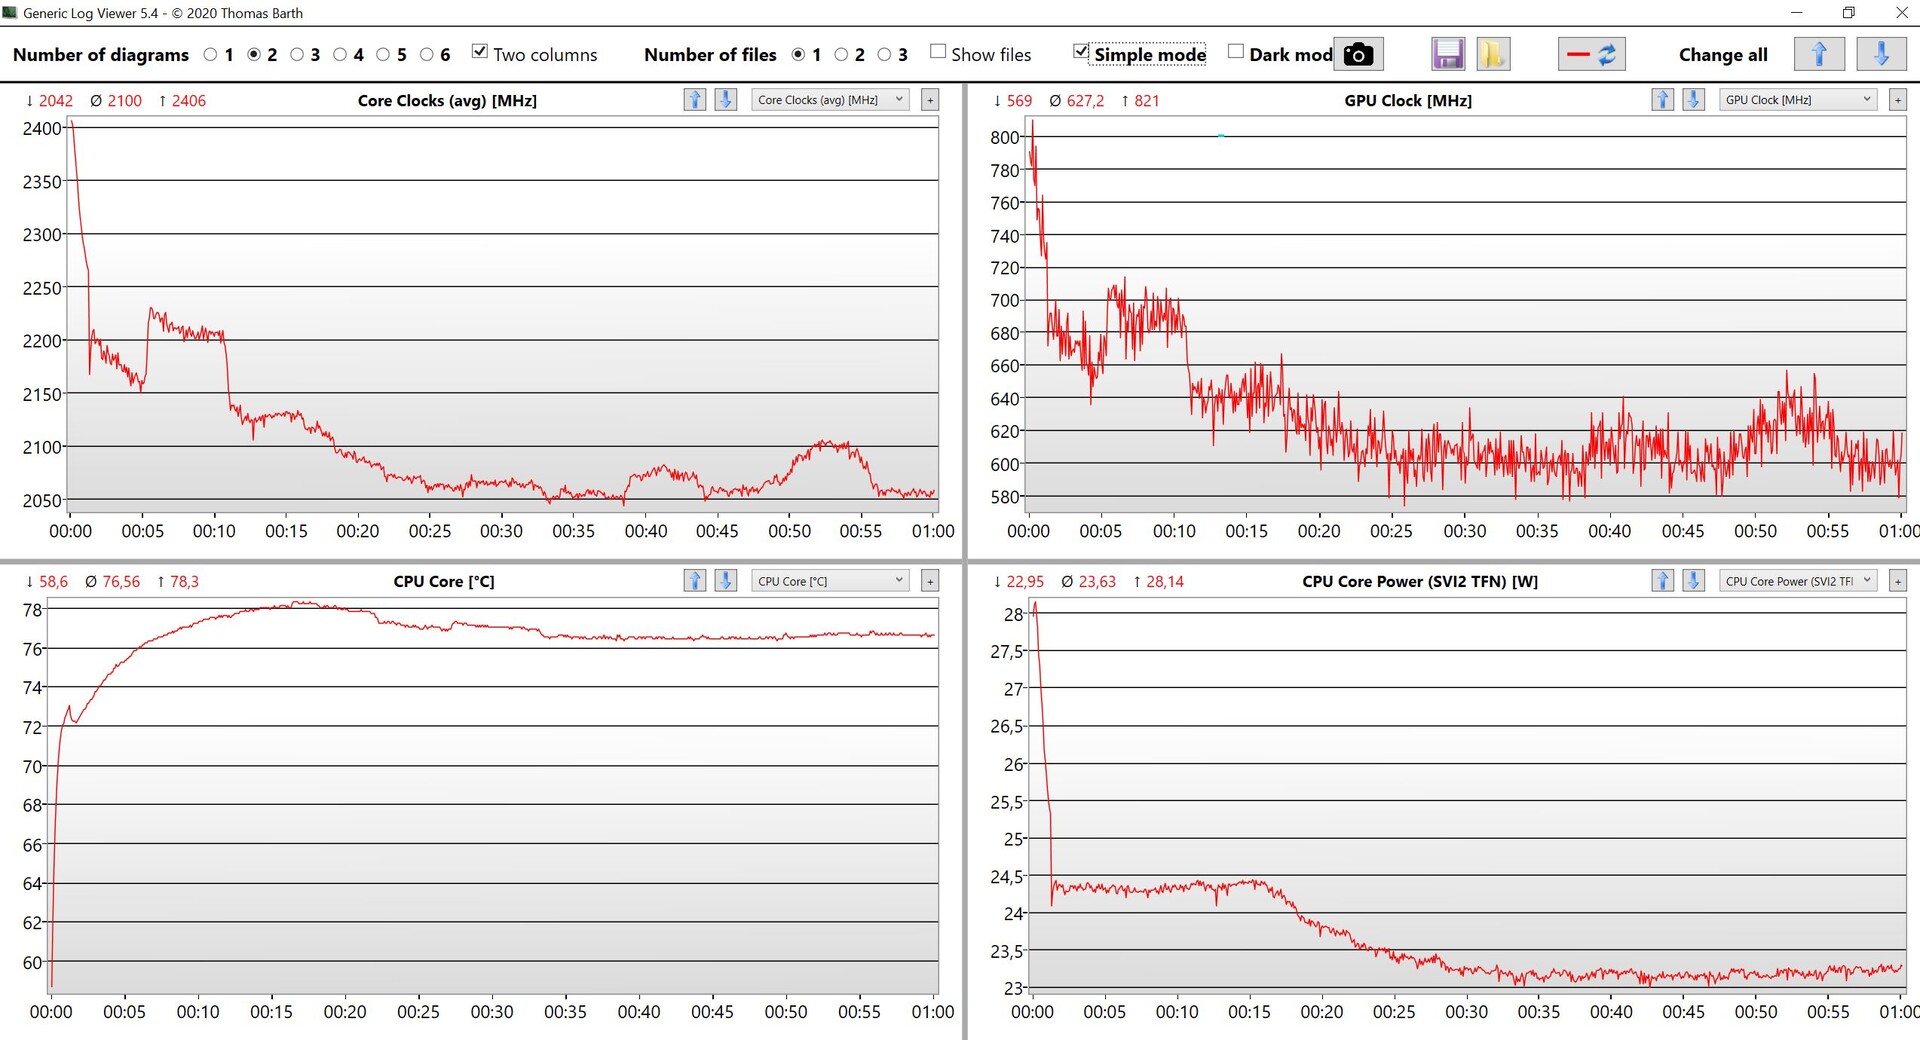
Nello stress test con carico combinato CPU/GPU, il consumo energetico del SoC oscilla intorno ai 25 watt per i primi 15 minuti prima di stabilizzarsi a 23 watt. Al termine dello stress test non è stato osservato alcun calo delle prestazioni
(-) La temperatura massima sul lato superiore è di 48.2 °C / 119 F, rispetto alla media di 34.3 °C / 94 F, che varia da 21.2 a 62.5 °C per questa classe Office.
(-) Il lato inferiore si riscalda fino ad un massimo di 52.8 °C / 127 F, rispetto alla media di 36.8 °C / 98 F
(+) In idle, la temperatura media del lato superiore è di 23.9 °C / 75 F, rispetto alla media deld ispositivo di 29.5 °C / 85 F.
(±) Riproducendo The Witcher 3, la temperatura media per il lato superiore e' di 37.8 °C / 100 F, rispetto alla media del dispositivo di 29.5 °C / 85 F.
(+) I poggiapolsi e il touchpad sono piu' freddi della temperatura della pelle con un massimo di 29.8 °C / 85.6 F e sono quindi freddi al tatto.
(-) La temperatura media della zona del palmo della mano di dispositivi simili e'stata di 27.6 °C / 81.7 F (-2.2 °C / -3.9 F).
| Lenovo ThinkPad T14 G3-21CF004NGE AMD Ryzen 7 PRO 6850U, AMD Radeon 680M | Dell Latitude 7420 JW6MH Intel Core i5-1145G7, Intel Iris Xe Graphics G7 80EUs | Huawei MateBook X Pro 2022 Intel Core i7-1260P, Intel Iris Xe Graphics G7 96EUs | HP EliteBook 845 G9 6F6H6EA AMD Ryzen 9 PRO 6950HS, AMD Radeon 680M | Lenovo ThinkPad T14 Gen2-20W1S00000 Intel Core i7-1165G7, NVIDIA GeForce MX450 | Lenovo ThinkPad T14s G2 20XGS01100 AMD Ryzen 7 PRO 5850U, AMD Radeon RX Vega 8 (Ryzen 4000/5000) | |
|---|---|---|---|---|---|---|
| Heat | 6% | -2% | -12% | -7% | 1% | |
| Maximum Upper Side * (°C) | 48.2 | 37.1 23% | 43.1 11% | 49.4 -2% | 47 2% | 44.2 8% |
| Maximum Bottom * (°C) | 52.8 | 38.7 27% | 42 20% | 48 9% | 58.4 -11% | 38.9 26% |
| Idle Upper Side * (°C) | 24.4 | 27.3 -12% | 29.4 -20% | 30.8 -26% | 25.3 -4% | 27.7 -14% |
| Idle Bottom * (°C) | 24.5 | 28.1 -15% | 29.4 -20% | 31.4 -28% | 27.7 -13% | 28.3 -16% |
* ... Meglio usare valori piccoli
Altoparlanti
I due altoparlanti stereo sono posizionati sopra la tastiera e dirigono il suono verso l'utente. Tuttavia, poiché i due moduli sono posizionati molto vicini l'uno all'altro, non c'è un effetto stereo e il suono complessivo è piuttosto sottile. Il punto di forza sono gli alti lineari, che favoriscono la riproduzione della voce durante le conferenze. Tuttavia, a parte un po' di musica di sottofondo o un video occasionale, sarebbe meglio utilizzare altoparlanti esterni o cuffie.
Lenovo ThinkPad T14 G3-21CF004NGE analisi audio
(±) | potenza degli altiparlanti media ma buona (77.2 dB)
Bassi 100 - 315 Hz
(-) | quasi nessun basso - in media 24.6% inferiori alla media
(±) | la linearità dei bassi è media (10.1% delta rispetto alla precedente frequenza)
Medi 400 - 2000 Hz
(+) | medi bilanciati - solo only 2.6% rispetto alla media
(+) | medi lineari (4.6% delta rispetto alla precedente frequenza)
Alti 2 - 16 kHz
(+) | Alti bilanciati - appena 3.3% dalla media
(+) | alti lineari (3.8% delta rispetto alla precedente frequenza)
Nel complesso 100 - 16.000 Hz
(±) | la linearità complessiva del suono è media (18.8% di differenza rispetto alla media
Rispetto alla stessa classe
» 35% di tutti i dispositivi testati in questa classe è stato migliore, 7% simile, 58% peggiore
» Il migliore ha avuto un delta di 7%, medio di 21%, peggiore di 53%
Rispetto a tutti i dispositivi testati
» 44% di tutti i dispositivi testati in questa classe è stato migliore, 8% similare, 49% peggiore
» Il migliore ha avuto un delta di 4%, medio di 23%, peggiore di 134%
Dell Latitude 7420 JW6MH analisi audio
(+) | gli altoparlanti sono relativamente potenti (82.7 dB)
Bassi 100 - 315 Hz
(-) | quasi nessun basso - in media 15.6% inferiori alla media
(±) | la linearità dei bassi è media (12.8% delta rispetto alla precedente frequenza)
Medi 400 - 2000 Hz
(+) | medi bilanciati - solo only 2.9% rispetto alla media
(+) | medi lineari (4% delta rispetto alla precedente frequenza)
Alti 2 - 16 kHz
(+) | Alti bilanciati - appena 2.5% dalla media
(+) | alti lineari (4.3% delta rispetto alla precedente frequenza)
Nel complesso 100 - 16.000 Hz
(+) | suono nel complesso lineare (12.5% differenza dalla media)
Rispetto alla stessa classe
» 5% di tutti i dispositivi testati in questa classe è stato migliore, 2% simile, 93% peggiore
» Il migliore ha avuto un delta di 7%, medio di 21%, peggiore di 53%
Rispetto a tutti i dispositivi testati
» 11% di tutti i dispositivi testati in questa classe è stato migliore, 2% similare, 86% peggiore
» Il migliore ha avuto un delta di 4%, medio di 23%, peggiore di 134%
Gestione dell'alimentazione - AMD ThinkPad è molto efficiente
Consumo di energia
Con un display da 400 nit e un processore AMD, il ThinkPad T14 G3 è estremamente efficiente dal punto di vista energetico. Anche con la massima luminosità, il consumo energetico in idle è inferiore a 6 watt. Sotto carico, si notano chiaramente le differenze rispetto agli attuali sistemi Intel, che spesso raggiungono il limite dell'alimentatore da 65 watt durante i picchi di carico e sono occasionalmente costretti ad attingere alla batteria. Il processore AMD, invece, assorbe solo un massimo di 50 watt sotto carico, quindi l'alimentatore da 65 watt è del tutto sufficiente.
| Off / Standby | |
| Idle | |
| Sotto carico |
|
Leggenda:
min: | |
| Lenovo ThinkPad T14 G3-21CF004NGE R7 PRO 6850U, Radeon 680M, Kioxia BG5 KBG5AZNV512G, IPS, 1920x1200, 14" | Dell Latitude 7420 JW6MH i5-1145G7, Iris Xe G7 80EUs, SK Hynix BC711 HFM512GD3HX015N, IPS, 1920x1080, 14" | Huawei MateBook X Pro 2022 i7-1260P, Iris Xe G7 96EUs, Silicon Motion PCIe-8 SSD 1TB, IPS, 3120x2080, 14.2" | HP EliteBook 845 G9 6F6H6EA R9 PRO 6950HS, Radeon 680M, WDC PC SN810 1TB, IPS, 1920x1200, 14" | Lenovo ThinkPad T14 Gen2-20W1S00000 i7-1165G7, GeForce MX450, Samsung PM981a MZVLB1T0HBLR, IPS LED, 1920x1080, 14" | Lenovo ThinkPad T14s G2 20XGS01100 R7 PRO 5850U, Vega 8, Lenovo UMIS AM630 RPETJ1T24MGE2QDQ, IPS LED, 1920x1080, 14" | Media AMD Radeon 680M | Media della classe Office | |
|---|---|---|---|---|---|---|---|---|
| Power Consumption | -10% | -111% | -111% | -47% | -4% | -84% | -41% | |
| Idle Minimum * (Watt) | 2.4 | 2.7 -13% | 6.5 -171% | 6.4 -167% | 3.8 -58% | 3.16 -32% | 6.93 ? -189% | 4.25 ? -77% |
| Idle Average * (Watt) | 5.3 | 6 -13% | 13.7 -158% | 12.4 -134% | 7.3 -38% | 5.6 -6% | 8.98 ? -69% | 7.3 ? -38% |
| Idle Maximum * (Watt) | 5.6 | 7.6 -36% | 14.4 -157% | 18 -221% | 11.2 -100% | 7.13 -27% | 10.5 ? -88% | 8.57 ? -53% |
| Load Average * (Watt) | 39.7 | 37 7% | 64.6 -63% | 63 -59% | 61.2 -54% | 30.86 22% | 53.5 ? -35% | 43.8 ? -10% |
| Witcher 3 ultra * (Watt) | 42.8 | 33.2 22% | 57.2 -34% | 63.6 -49% | 41.2 4% | 37 14% | ||
| Load Maximum * (Watt) | 50.6 | 65 -28% | 90.9 -80% | 68 -34% | 67.5 -33% | 46.55 8% | 70.5 ? -39% | 64.5 ? -27% |
* ... Meglio usare valori piccoli
Power consumption Witcher 3 / Stress test
Power consumption with an external monitor
Durata della batteria
La batteria da 52,5 Wh garantisce un'ottima autonomia. Con una luminosità regolata di 150 cd/m² (corrispondente al 65% della luminosità massima del nostro campione in esame), il nostro test video dura quasi 16,5 ore, a conferma dell'efficienza del decoder video. Il test WLAN dura quasi 13 ore, e quasi 10 ore alla massima luminosità. Abbiamo anche ripetuto il test WLAN (150 cd/m²) con una connessione LTE attiva e il risultato è stato di 10:18 minuti.
Grazie all'alimentatore da 65 watt, il ThinkPad supporta la tecnologia RapidCharge e una ricarica completa richiede poco meno di 100 minuti a dispositivo acceso; il 50% è disponibile dopo soli 30 minuti e l'80% dopo 53 minuti.
| Lenovo ThinkPad T14 G3-21CF004NGE R7 PRO 6850U, Radeon 680M, 52.5 Wh | Dell Latitude 7420 JW6MH i5-1145G7, Iris Xe G7 80EUs, 63 Wh | Huawei MateBook X Pro 2022 i7-1260P, Iris Xe G7 96EUs, 60 Wh | HP EliteBook 845 G9 6F6H6EA R9 PRO 6950HS, Radeon 680M, 51 Wh | Lenovo ThinkPad T14 Gen2-20W1S00000 i7-1165G7, GeForce MX450, 50 Wh | Lenovo ThinkPad T14s G2 20XGS01100 R7 PRO 5850U, Vega 8, 57 Wh | Media della classe Office | |
|---|---|---|---|---|---|---|---|
| Autonomia della batteria | 55% | -22% | -14% | -15% | 12% | 12% | |
| H.264 (h) | 16.4 | 7.6 -54% | 14 -15% | 14.9 -9% | 15.4 ? -6% | ||
| WiFi v1.3 (h) | 12.9 | 14.1 9% | 7.5 -42% | 9.3 -28% | 9 -30% | 14.6 13% | 13.2 ? 2% |
| Load (h) | 1.3 | 2.6 100% | 1.7 31% | 1.3 0% | 1.3 0% | 1.7 31% | 1.808 ? 39% |
Pro
Contro
Verdetto - Il ThinkPad T3 G3 è molto buono, ma presenta limitazioni non necessarie

Il ThinkPad T14 è un ottimo notebook business. Non è né il più sottile né il più leggero notebook da 14 pollici, e non cerca di esserlo, e questo approccio comporta dei vantaggi nell'uso quotidiano, come l'ampia connettività. Lenovo ha apportato un'ampia riprogettazione al nuovo T14 G3, che è anche un successo in molti settori. Lo schermo 16:10 si inserisce armoniosamente nel concetto generale e il bordo inferiore estremamente ampio dello schermo è finalmente scomparso. Anche il touchpad più grande è piacevole e i tasti TrackPoint sono tra i migliori che abbiamo mai provato in un ThinkPad, con i loro clic ricchi e silenziosi
Tuttavia, un aspetto negativo riguarda la tastiera. In questo caso, Lenovo segue l'approccio di altri ThinkPad come l'X1 Carbon X1 Carbonriducendo la caduta dei tasti da 1,8 a 1,5 mm, cosa non necessaria considerando lo spessore del case. E la differenza si nota durante la digitazione. È un vero peccato che Lenovo continui a sminuire ulteriormente quello che prima era un punto di forza, accontentandosi deliberatamente di una qualità inferiore. La tastiera del nuovo T14 G3 non è affatto male, ma non ha più un vantaggio rispetto ad altri concorrenti business come HP. Lenovo dovrebbe riconsiderare la sua strategia
Il nuovo ThinkPad T14 G3 è un ottimo portatile business, un dispositivo complessivamente completo grazie al veloce ed efficiente AMD Ryzen 7 Pro, che ha un vantaggio sulla variante Intel in molte aree.
Quando si sceglie tra il ThinkPad T14 G3 con CPU AMD o Intel, AMD è chiaramente il preferito perché, oltre alle elevate prestazioni nei test multi-core e alla GPU integrata, è particolarmente impressionante in termini di efficienza. La nostra esperienza con i precedenti portatili Alder Lake ha dimostrato che limiti di potenza molto elevati spesso portano a ventole molto reattive e a un consumo energetico più elevato nell'uso quotidiano, che di solito richiede adattatori di alimentazione più potenti. Il sistema AMD è piacevolmente silenzioso anche sotto carico e anche l'autonomia della batteria si dimostra molto buona. La versione Intel è disponibile con un alimentatore dedicato
GeForce MX550dedicato, ma è improbabile che sia più veloce della scheda integrata Radeon 680Mper non parlare del carico termico aggiuntivo. L'unico vero vantaggio della versione Intel è il supporto Thunderbolt, anche se bisogna chiedersi criticamente perché Lenovo abbia deciso di rinunciare all'implementazione dell'USB 4 quando questa è possibile in modelli consumer come lo Yoga 7 14. Inoltre, la RAM non può essere espansa nel modello AMD, ma in compenso viene utilizzata una memoria di lavoro più veloce (LPDDR5-6400 contro DDR4-3200)
La mancanza di USB 4 nella versione AMD è una limitazione inutile da parte di Lenovo, e raccomandiamo anche al produttore di riconsiderare la sua strategia per quanto riguarda la tastiera. Qui la qualità continua a diminuire e il precedente vantaggio di tastiere migliori non esiste più.
Gli acquirenti dovrebbero essere un po' cauti nella scelta del display, perché il pannello di base non è molto divertente. La nostra variante di recensione, con una luminosità di 400 cd/m², è il miglior compromesso tra qualità dell'immagine e consumo energetico, come accadeva anche nelle versioni precedenti. La luminosità è molto buona, il rapporto di contrasto è estremamente elevato e anche la nitidezza dell'immagine è perfettamente adeguata: si tratta semplicemente di un ottimo display per uso aziendale. Inoltre, è estremamente efficiente e garantisce un'ottima autonomia della batteria. Il pannello 4K opzionale con copertura DCI-P3 offrirà una migliore qualità dell'immagine, ma richiederà anche una potenza significativamente maggiore
Il concorrente più forte del ThinkPad T14 G3 è probabilmente l'EliteBook 845 G9, che utilizza l'ancora più potente AMD Ryzen 9 Pro 6950HS, ma dovrebbe evitare il pannello Sure View. Il Dell Latitude 7420, invece, offre prestazioni nettamente inferiori ed è notevolmente più rumoroso con il suo processore Tiger Lake. Nelle prossime settimane verranno recensiti altri portatili business attuali, tra cui il nuovo ThinkPad T14s G3 e la variante Intel/Nvidia del ThinkPad T14 G3.
Prezzo e disponibilità
Gli acquirenti interessati sono invitati a verificare direttamente la disponibilità sul sito ufficiale di Lenovo. Sia la variante AMD che quella Intel del Lenovo ThinkPad T14 G3 sembrano essere ampiamente disponibili, con la configurazione esatta (e quindi il prezzo) che dipende dal paese di acquisto. Ad esempio, abbiamo trovato la variante AMD elencata in USA (1.038,95 dollari), Canada (CAD$1.319,45), Regno Unito (£896,00), Francia (1.616,00€), Italia (1.359,00€), India (₹98.952) Singapore (SG$1.602,55), Australia (AU$2.289,00), Emirati Arabi Uniti e Sudafrica. Questo elenco non è esaustivo e questi prezzi rappresentano solo i prezzi di partenza, che aumentano invariabilmente con la scelta di componenti più potenti.
I prezzi sono aggiornati al 26.09 e sono soggetti a variazioni
Lenovo ThinkPad T14 G3-21CF004NGE
- 09/23/2022 v7 (old)
Andreas Osthoff
Price comparison

