Recensione del convertibile Intel Lenovo ThinkPad L13 Yoga G4: Durata della batteria inferiore a quella della versione AMD
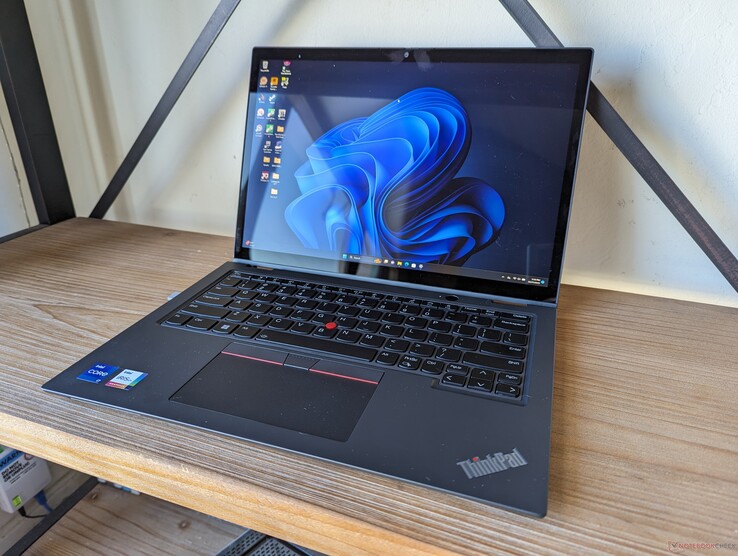
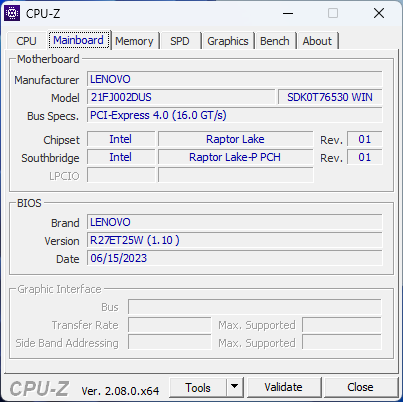
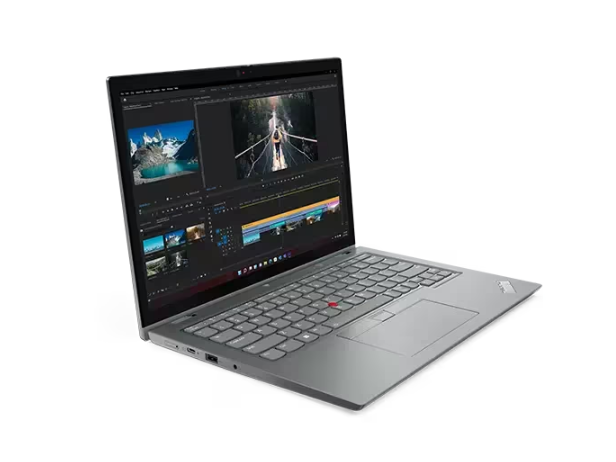
Il ThinkPad L13 Yoga Gen 4 è disponibile sia in versione Intel che AMD, per attirare gli utenti da entrambi i lati della barricata. Questa pagina di recensione si concentrerà sulla versione Intel, in quanto abbiamo recentemente recensito la versione AMD ad agosto Versione AMD nel mese di agosto. Tutti i nostri commenti sulle caratteristiche fisiche della versione AMD valgono anche in questo caso, poiché le due versioni sono visivamente identiche.
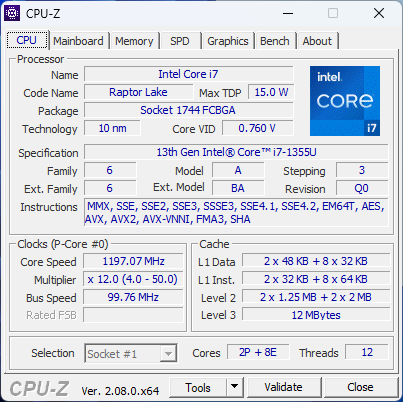
La nostra unità di recensione Intel è una configurazione di fascia alta con CPU Raptor Lake-U Core i7-1355U di 13a generazione, 16 GB di RAM e schermo touchscreen IPS da 1200p per un prezzo al dettaglio di circa 1400-600 dollari. Altre configurazioni vanno dal Core i3-1315U fino al Core i7-1365U con vPro, ma tutte le opzioni sono altrimenti limitate alla grafica integrata e a un display da 1200p.
Le alternative al ThinkPad L13 Yoga G4 includono altri convertibili incentrati sul business, come il modello MSI Summit E13 Flip Evo,HP Elite Dragonfly Folio 13.5o il Dell Latitude 7330 2-in-1.
Altre recensioni di Lenovo:
Potenziali concorrenti a confronto
Punteggio | Data | Modello | Peso | Altezza | Dimensione | Risoluzione | Prezzo |
|---|---|---|---|---|---|---|---|
| 88.1 % v7 (old) | 11/2023 | Lenovo ThinkPad L13 Yoga G4 i7-1355U i7-1355U, Iris Xe G7 96EUs | 1.4 kg | 17.1 mm | 13.30" | 1920x1200 | |
| 88.7 % v7 (old) | 08/2023 | Lenovo ThinkPad L13 Yoga G4 21FSS00100 R5 7530U, Vega 7 | 1.4 kg | 17.1 mm | 13.30" | 1920x1200 | |
| 90.3 % v7 (old) | 12/2022 | HP Elite Dragonfly Folio 13.5 G3 i7-1265U, Iris Xe G7 96EUs | 1.4 kg | 17.8 mm | 13.50" | 1920x1280 | |
| 89 % v7 (old) | 11/2022 | Dell Latitude 9330 i7-1260U, Iris Xe G7 96EUs | 1.2 kg | 14.1 mm | 13.30" | 2560x1600 | |
| 86.9 % v7 (old) | 04/2021 | MSI Summit E13 Flip Evo A11MT i7-1185G7, Iris Xe G7 96EUs | 1.4 kg | 14.9 mm | 13.40" | 1920x1200 | |
| 87.5 % v7 (old) | 10/2023 | Framework Laptop 13.5 Ryzen 7 7840U R7 7840U, Radeon 780M | 1.3 kg | 15.85 mm | 13.50" | 2256x1504 |
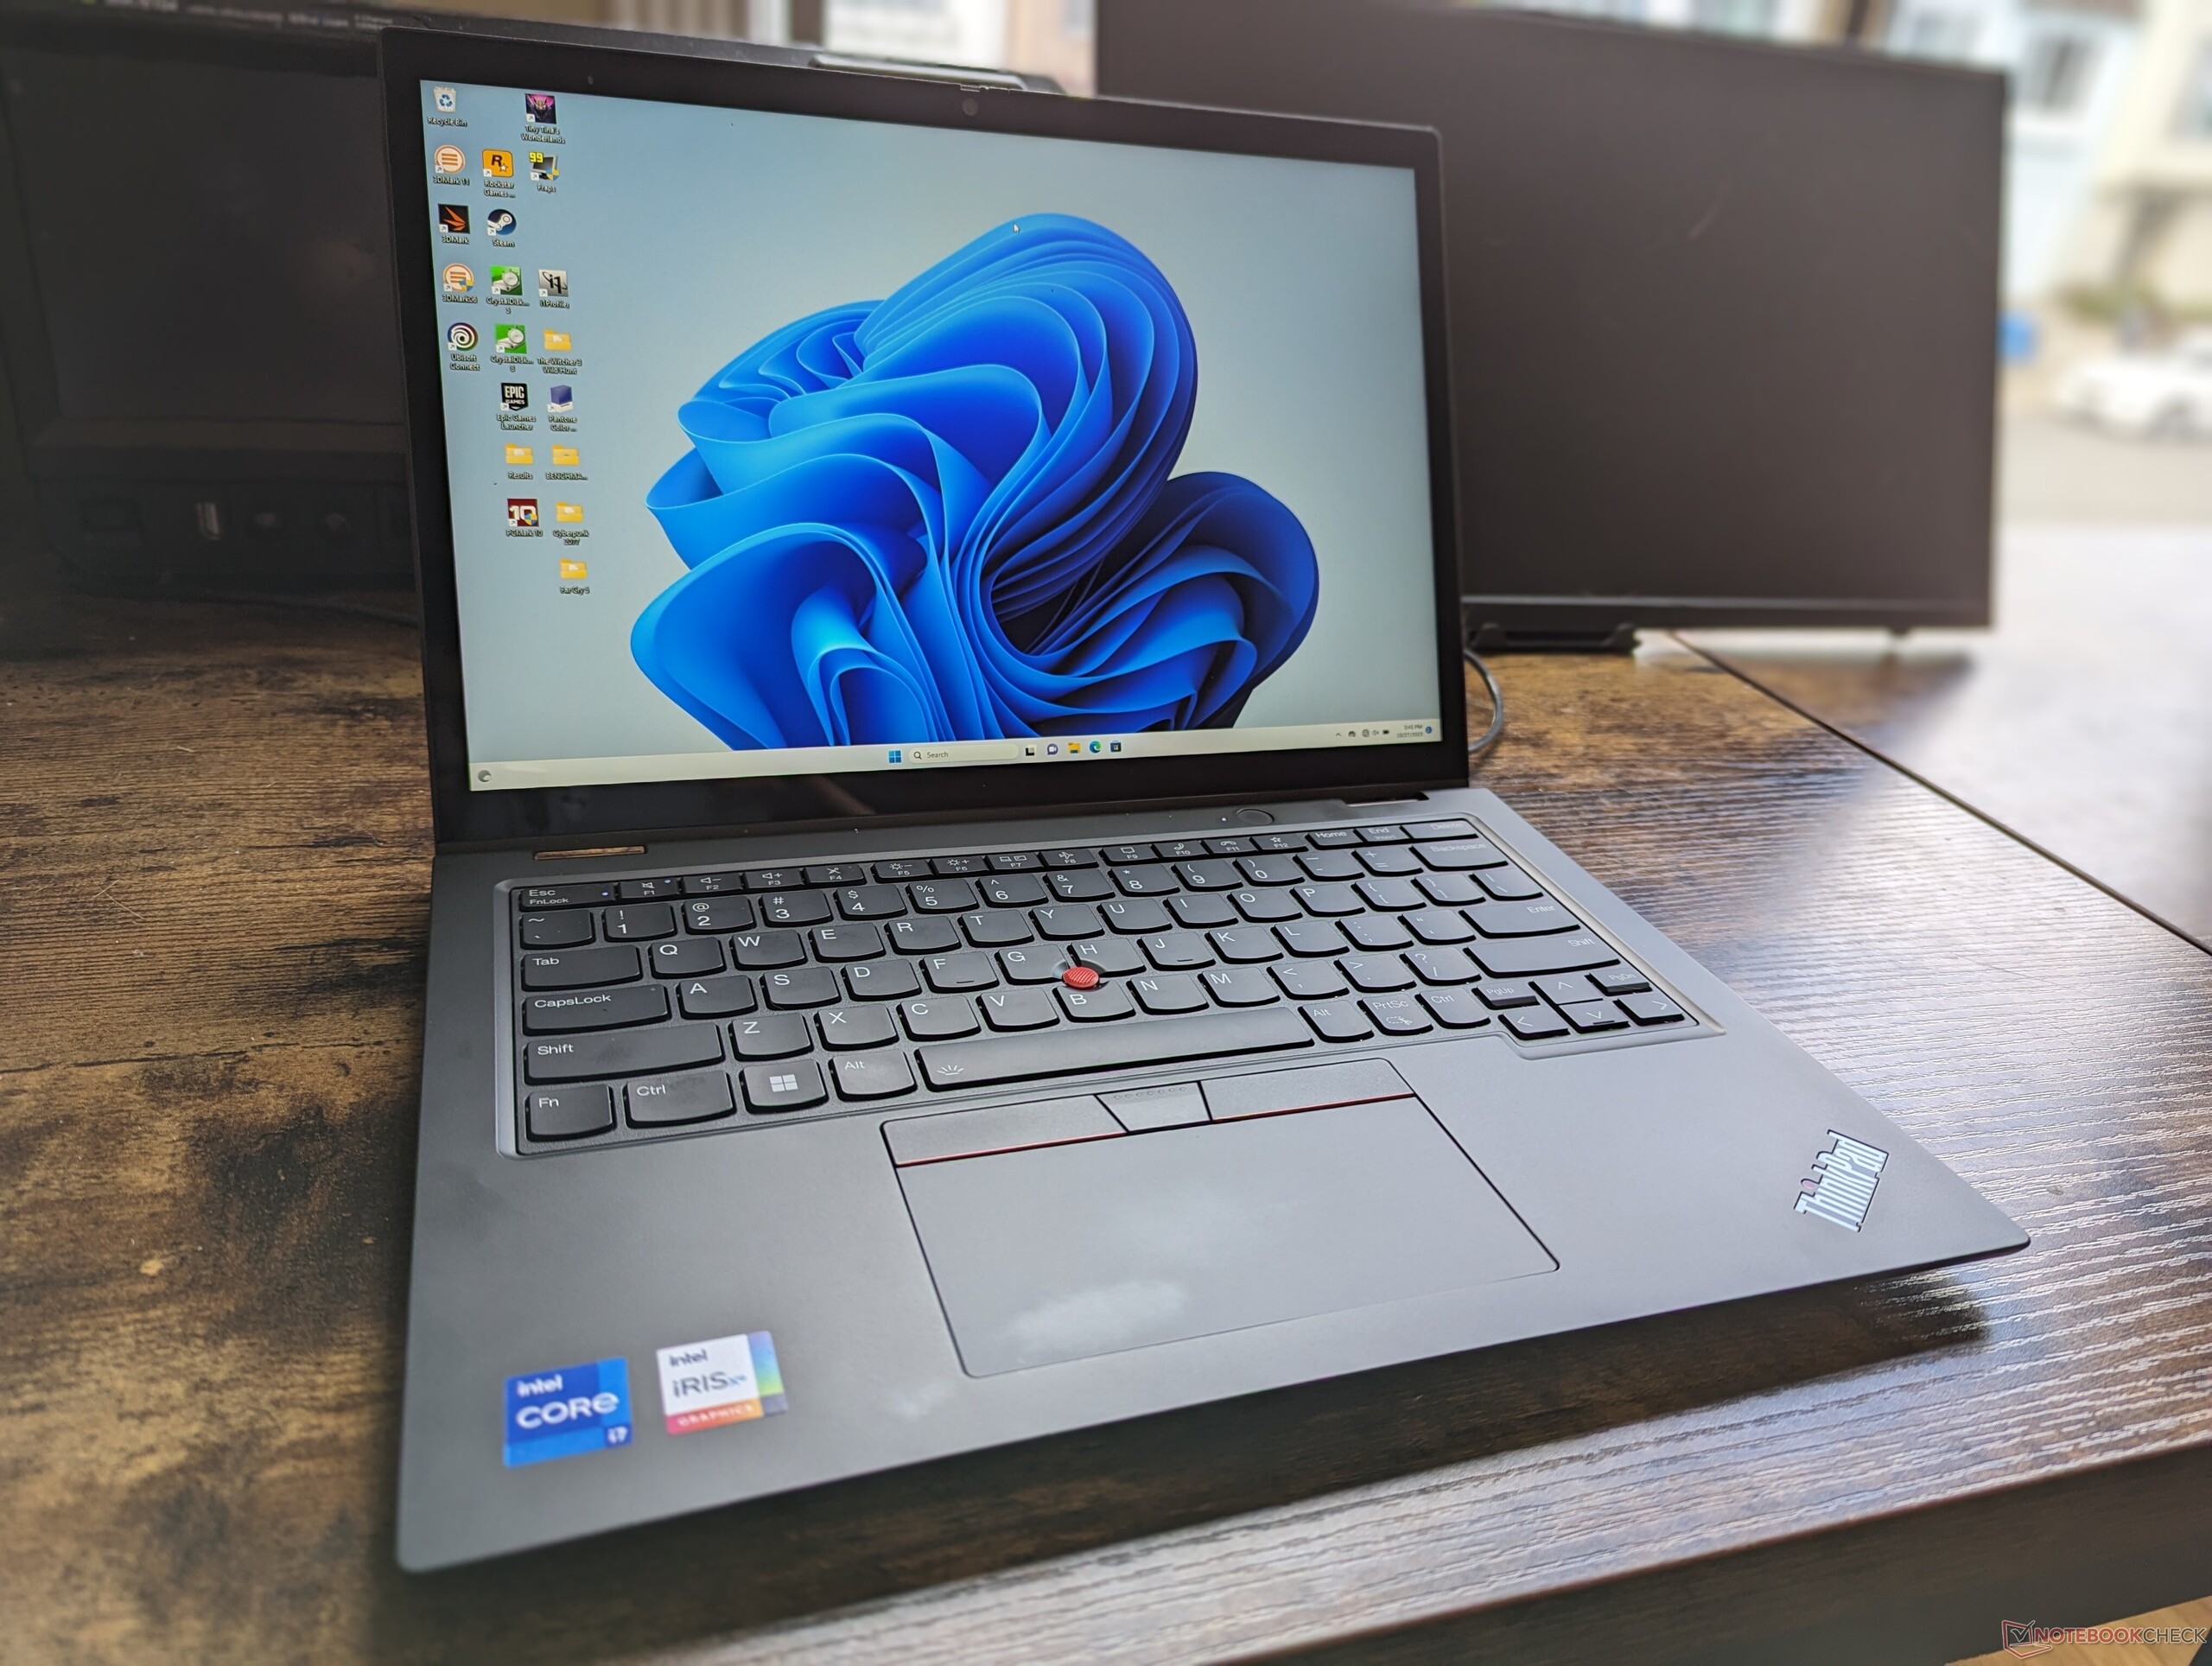
Caso
Come nel recente ThinkPad E14 G5, il modo più rapido per identificare la versione Intel da quella AMD è cercare il logo Thunderbolt lungo il bordo sinistro, in quanto le opzioni AMD mancano di questa funzione. Si noti che, sebbene il modello sia dotato di due porte USB-C, solo la porta sinistra è compatibile con i dispositivi Thunderbolt come le eGPU.
Comunicazione
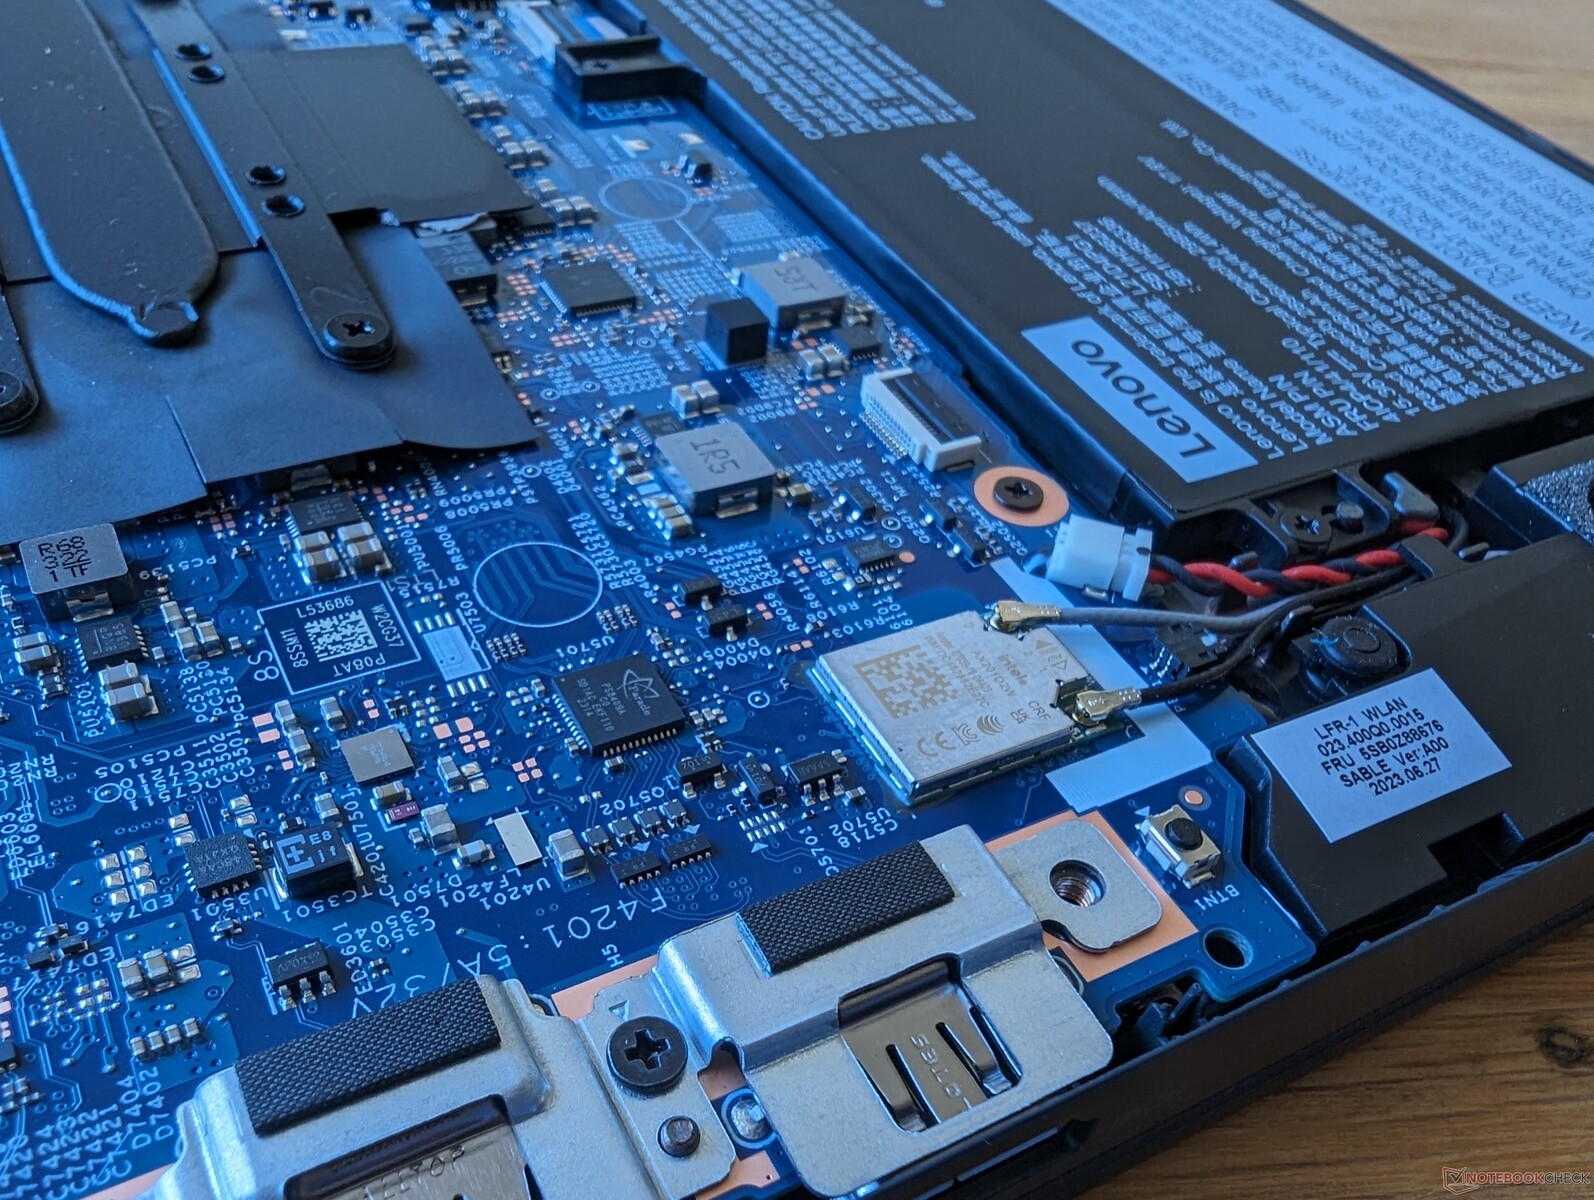
L'Intel AX201 è standard per il supporto Wi-Fi 6 e Bluetooth 5.1, mentre l'Intel AX211 con Wi-Fi 6E è opzionale.
| Networking | |
| iperf3 transmit AX12 | |
| MSI Summit E13 Flip Evo A11MT | |
| iperf3 receive AX12 | |
| MSI Summit E13 Flip Evo A11MT | |
| iperf3 transmit AXE11000 | |
| Framework Laptop 13.5 Ryzen 7 7840U | |
| Lenovo ThinkPad L13 Yoga G4 i7-1355U | |
| HP Elite Dragonfly Folio 13.5 G3 | |
| Dell Latitude 9330 | |
| Lenovo ThinkPad L13 Yoga G4 21FSS00100 | |
| iperf3 receive AXE11000 | |
| Lenovo ThinkPad L13 Yoga G4 21FSS00100 | |
| Framework Laptop 13.5 Ryzen 7 7840U | |
| Lenovo ThinkPad L13 Yoga G4 i7-1355U | |
| HP Elite Dragonfly Folio 13.5 G3 | |
| Dell Latitude 9330 | |
| iperf3 transmit AXE11000 6GHz | |
| Framework Laptop 13.5 Ryzen 7 7840U | |
| HP Elite Dragonfly Folio 13.5 G3 | |
| Dell Latitude 9330 | |
| Lenovo ThinkPad L13 Yoga G4 21FSS00100 | |
| iperf3 receive AXE11000 6GHz | |
| Lenovo ThinkPad L13 Yoga G4 21FSS00100 | |
| HP Elite Dragonfly Folio 13.5 G3 | |
| Framework Laptop 13.5 Ryzen 7 7840U | |
| Dell Latitude 9330 | |
Webcam
L'IR è opzionale, mentre l'otturatore per la privacy è standard. Le SKU di fascia bassa sono dotate solo di una webcam a 720p, mentre quelle di fascia più alta offrono una webcam a 1080p.


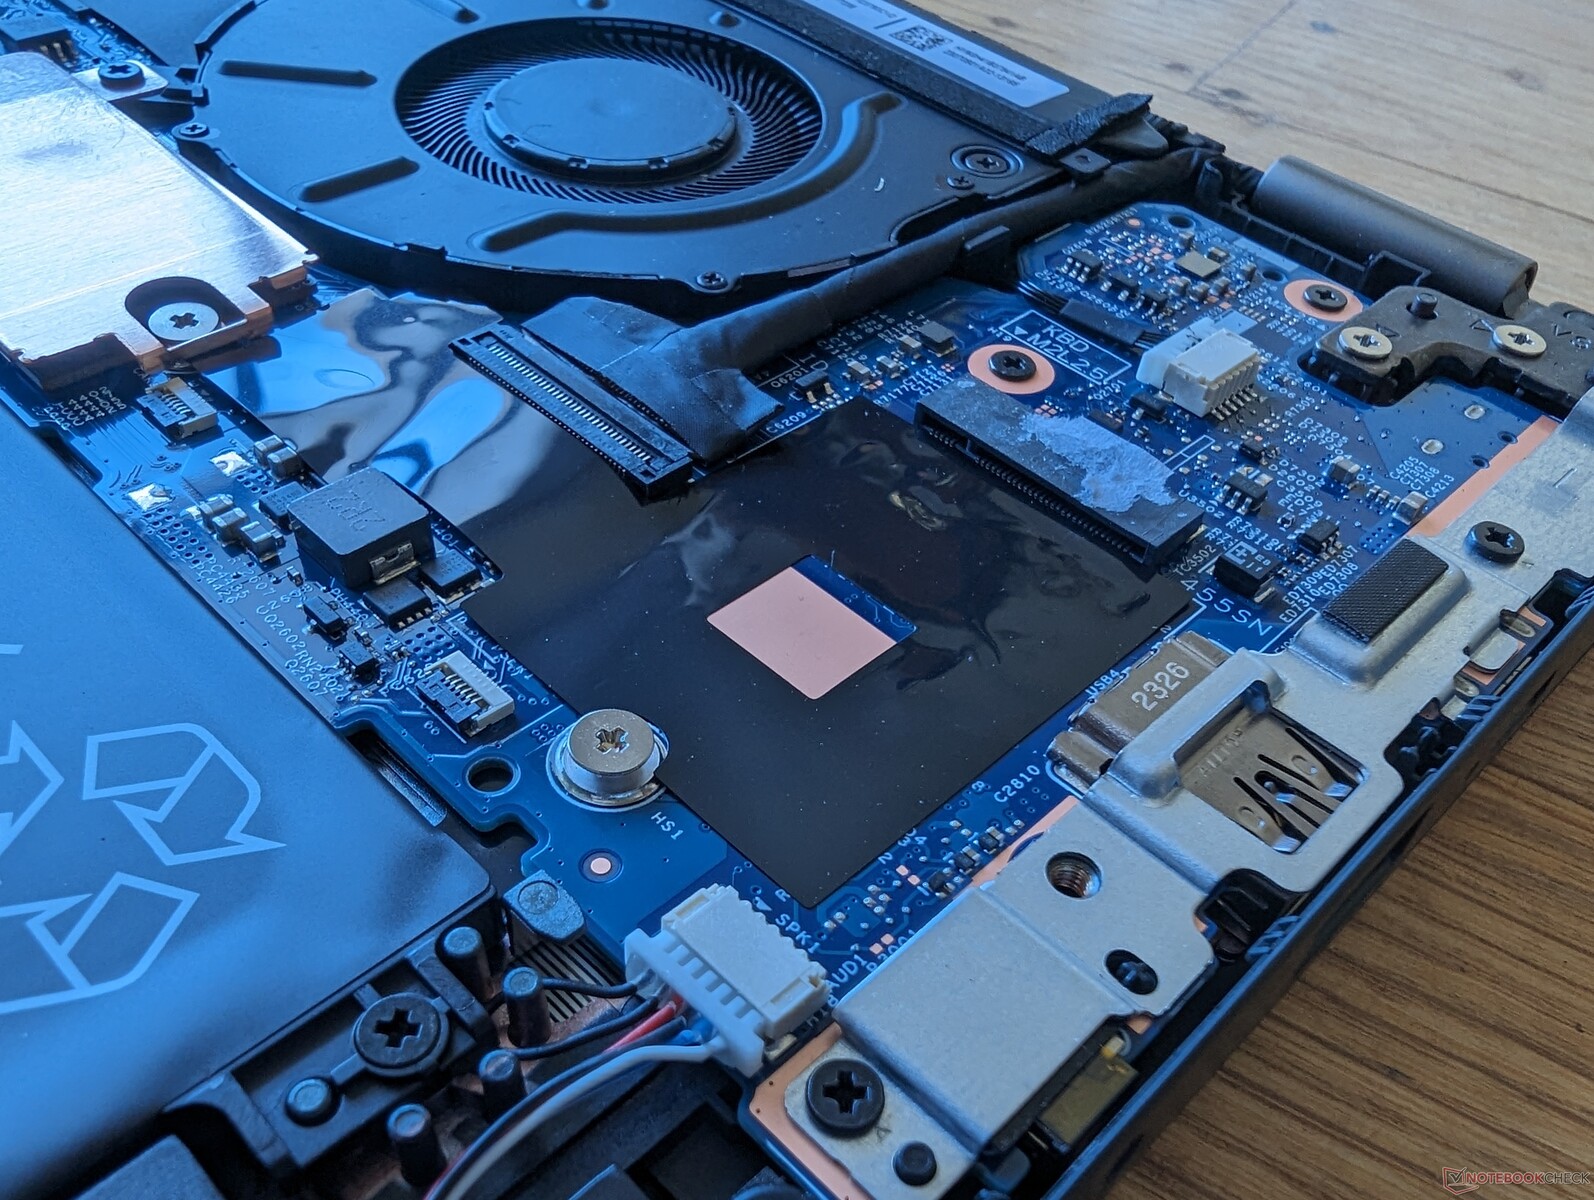
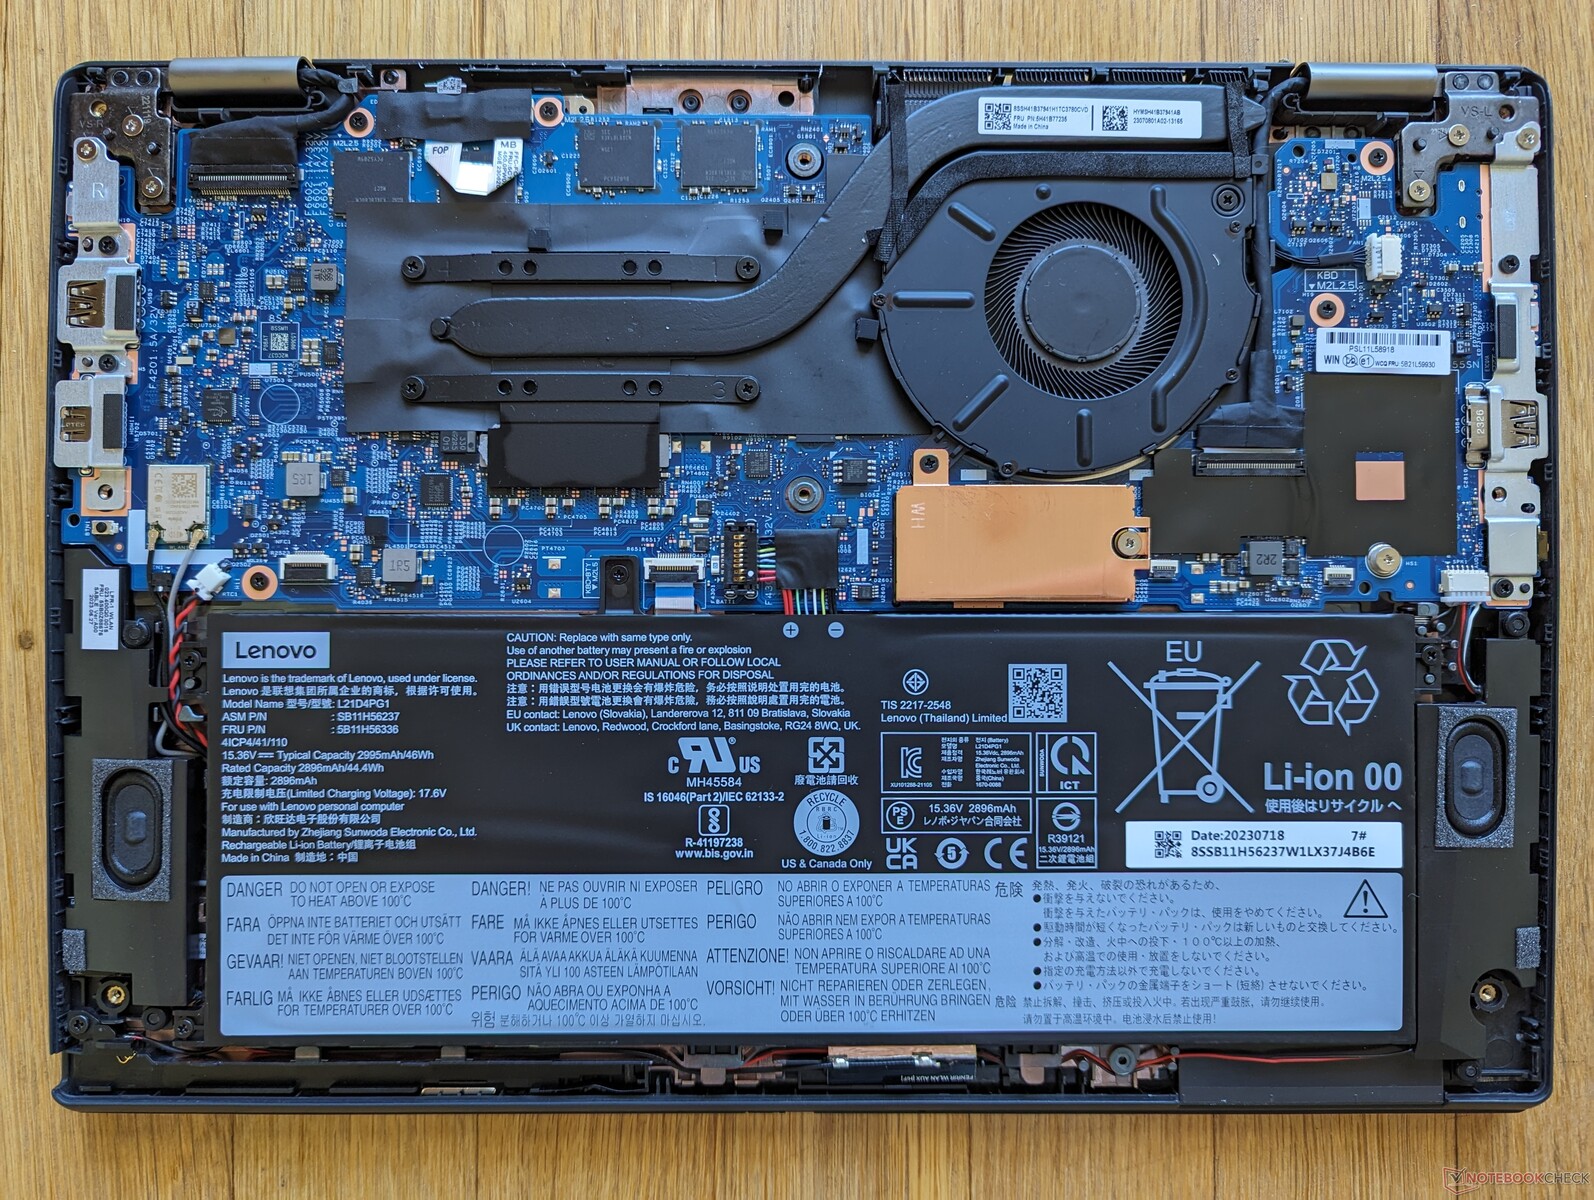
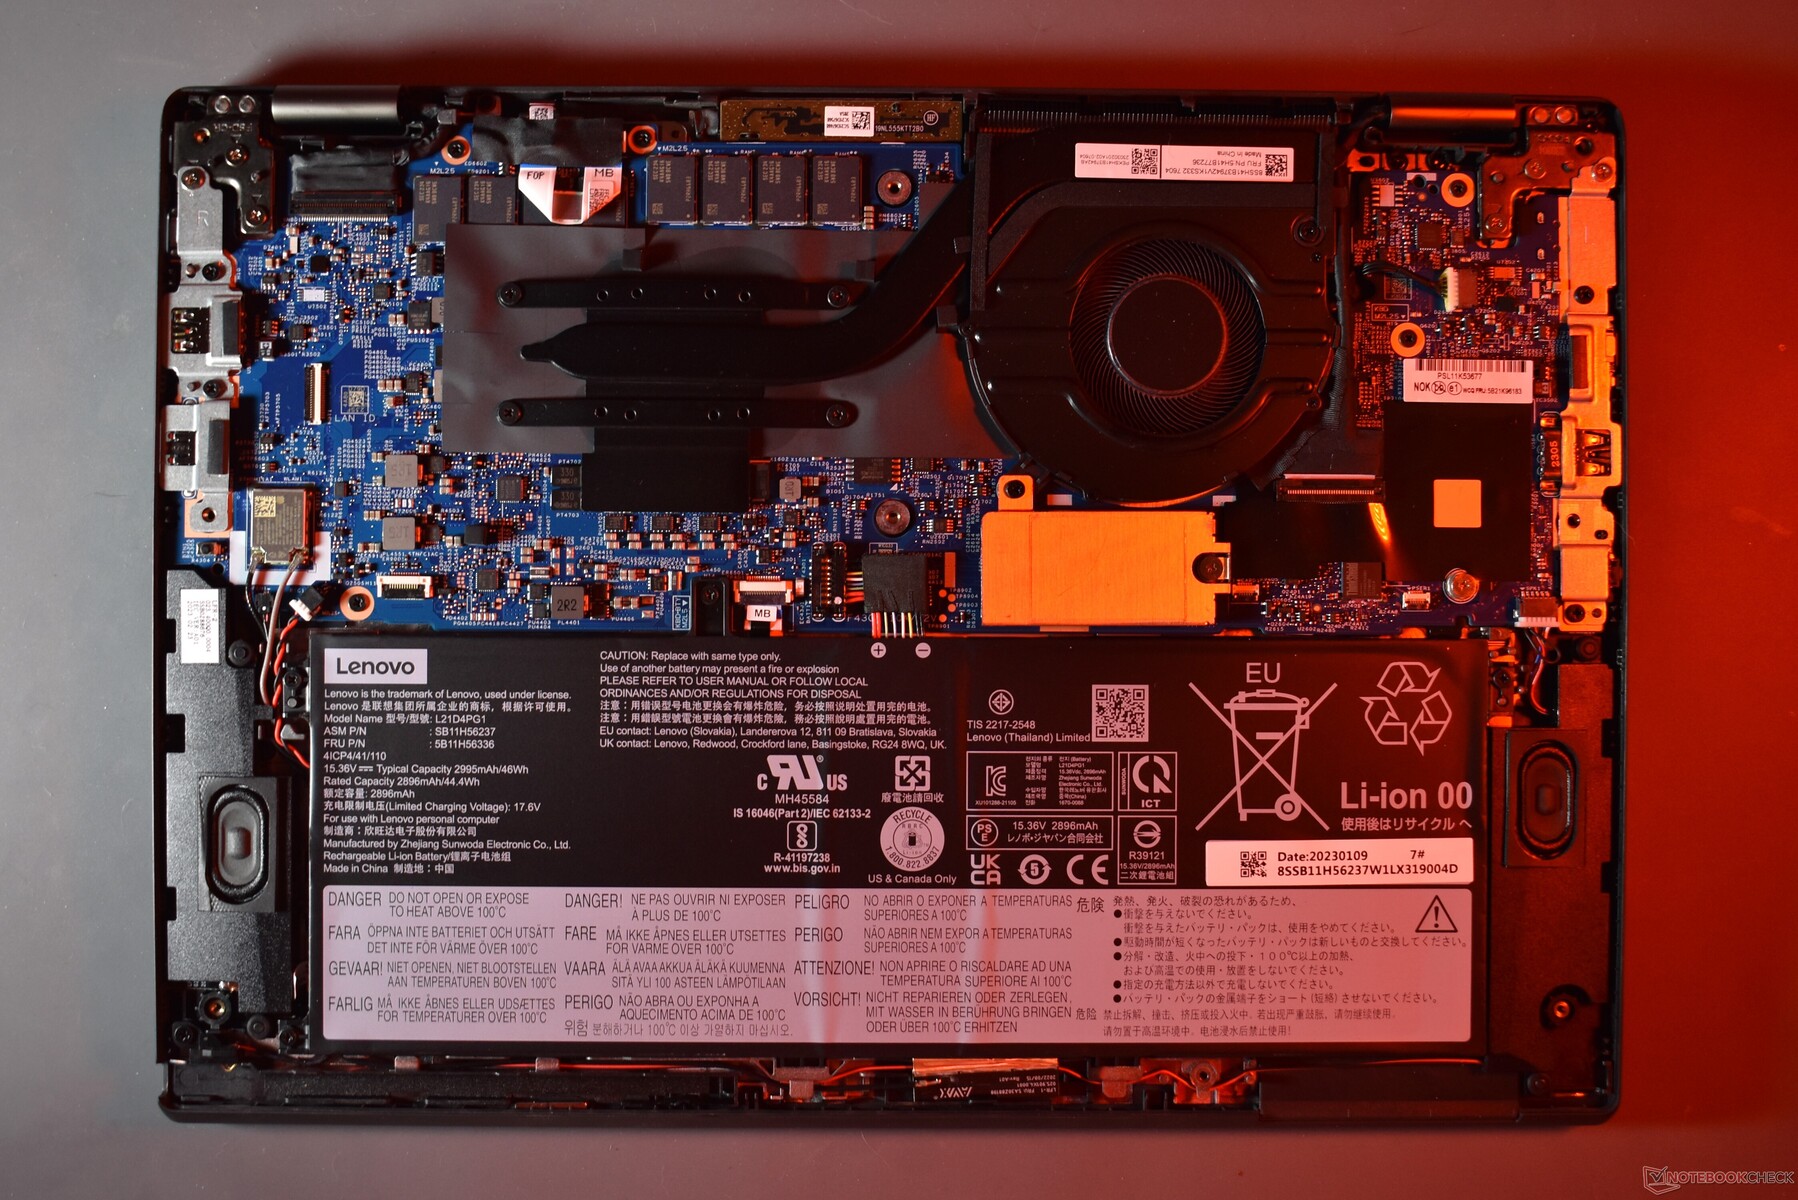
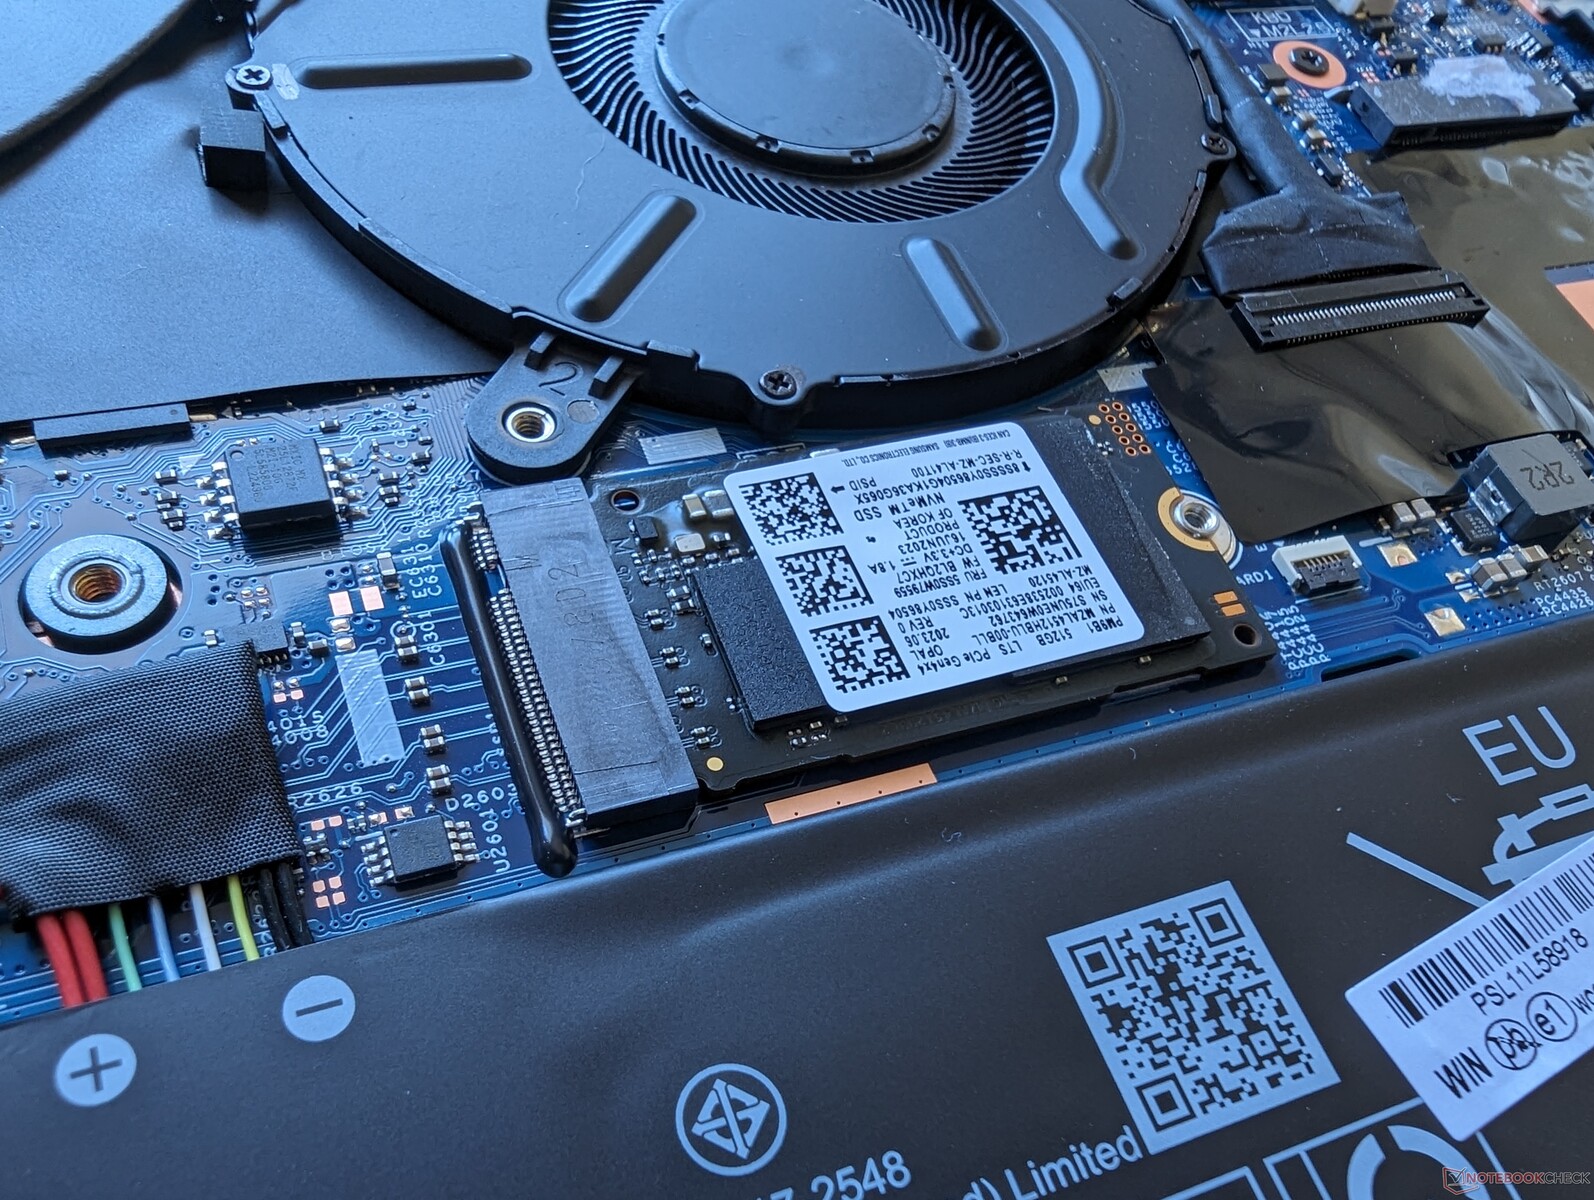
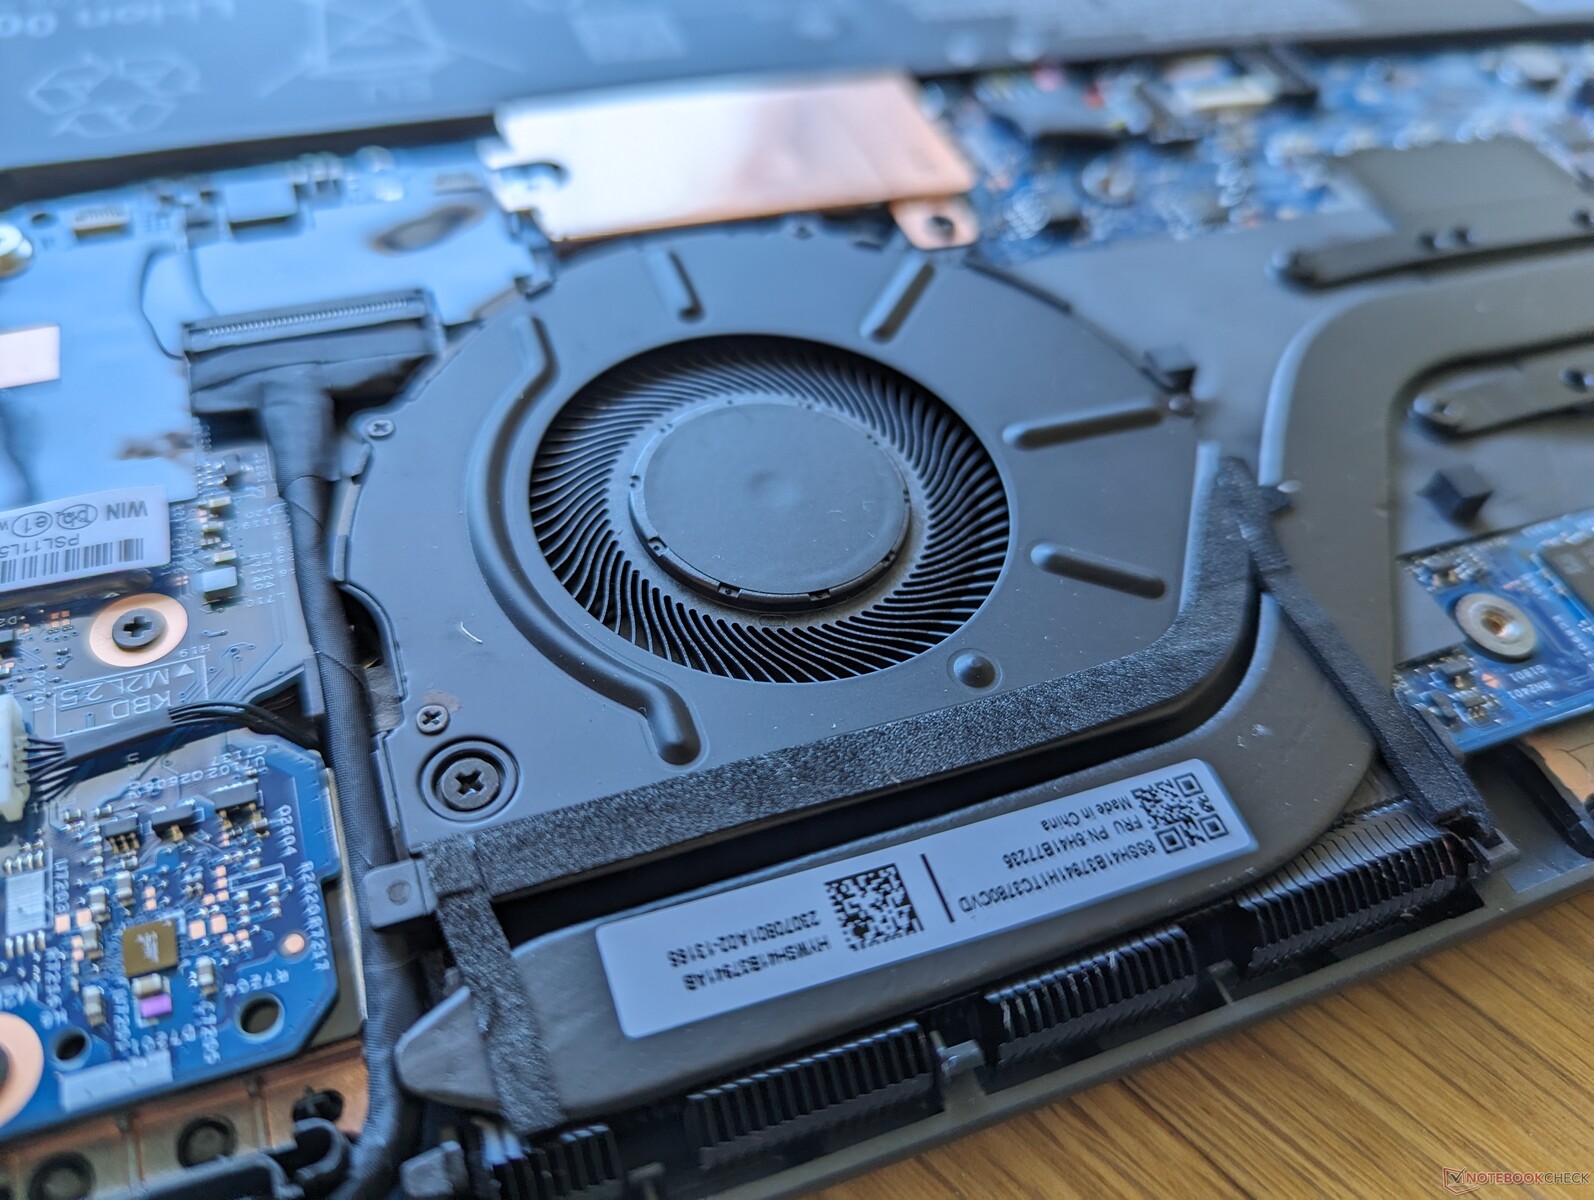
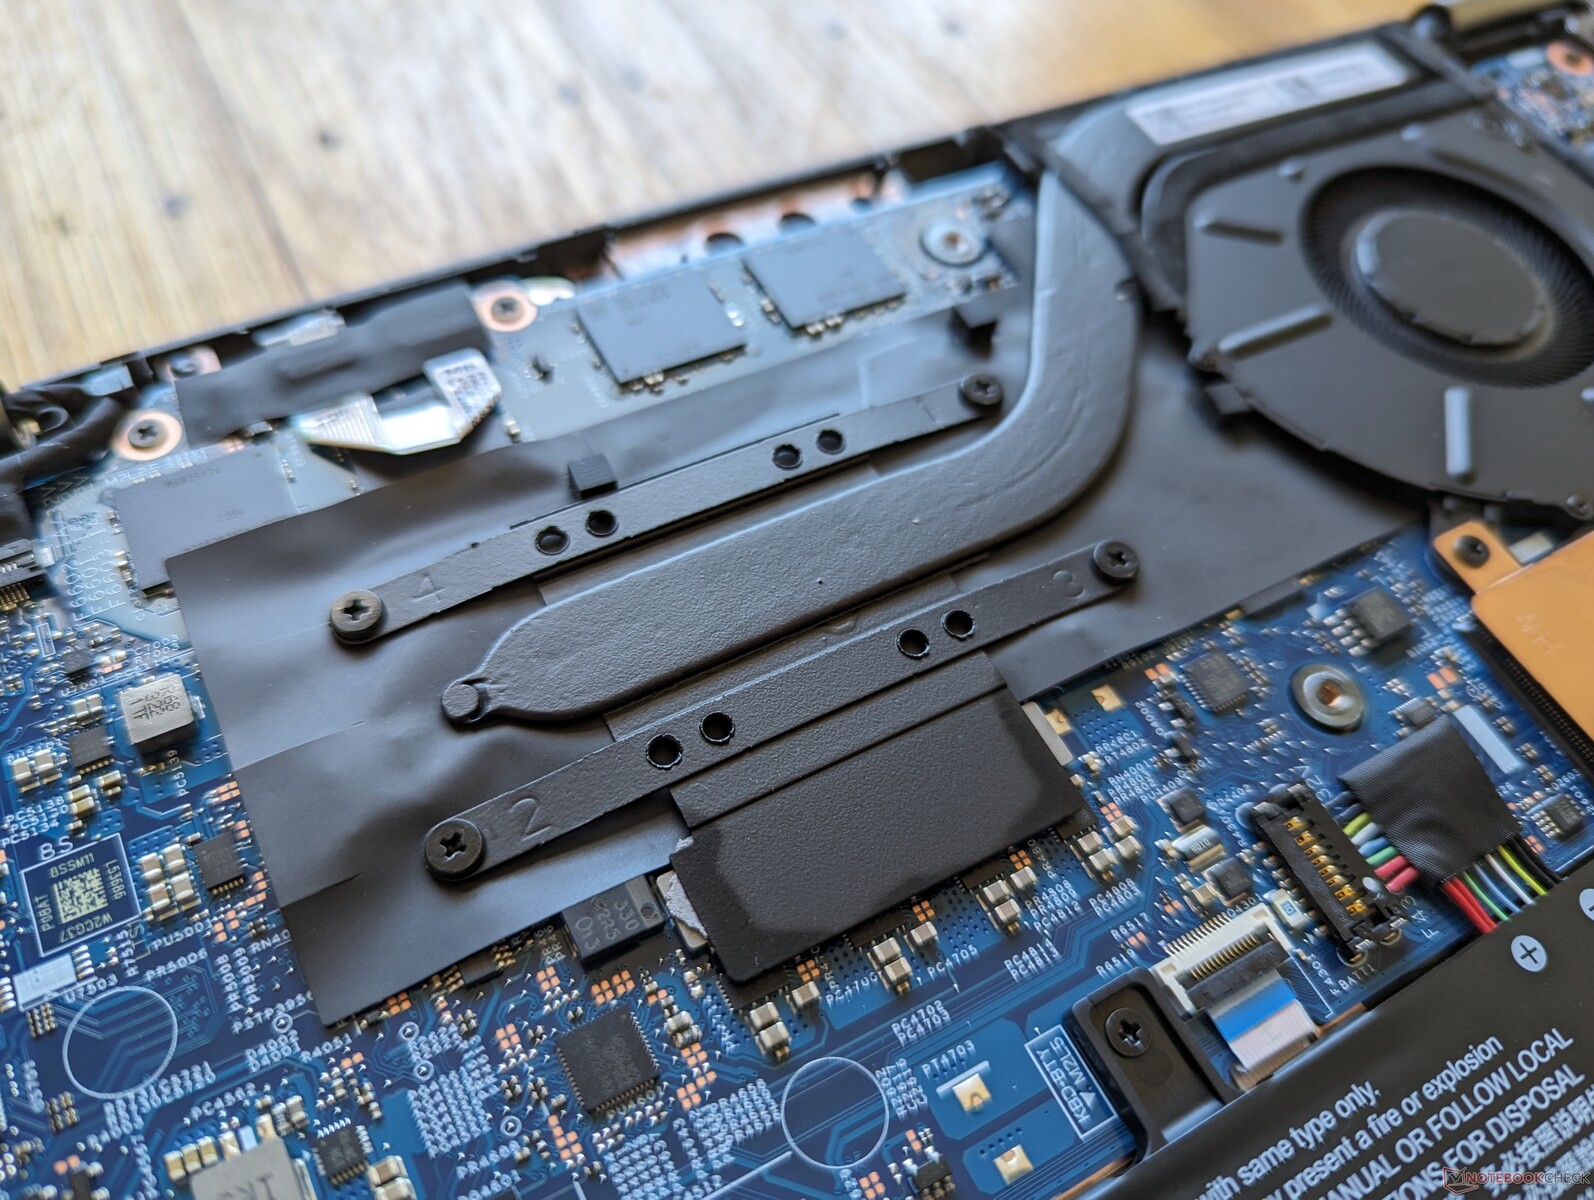
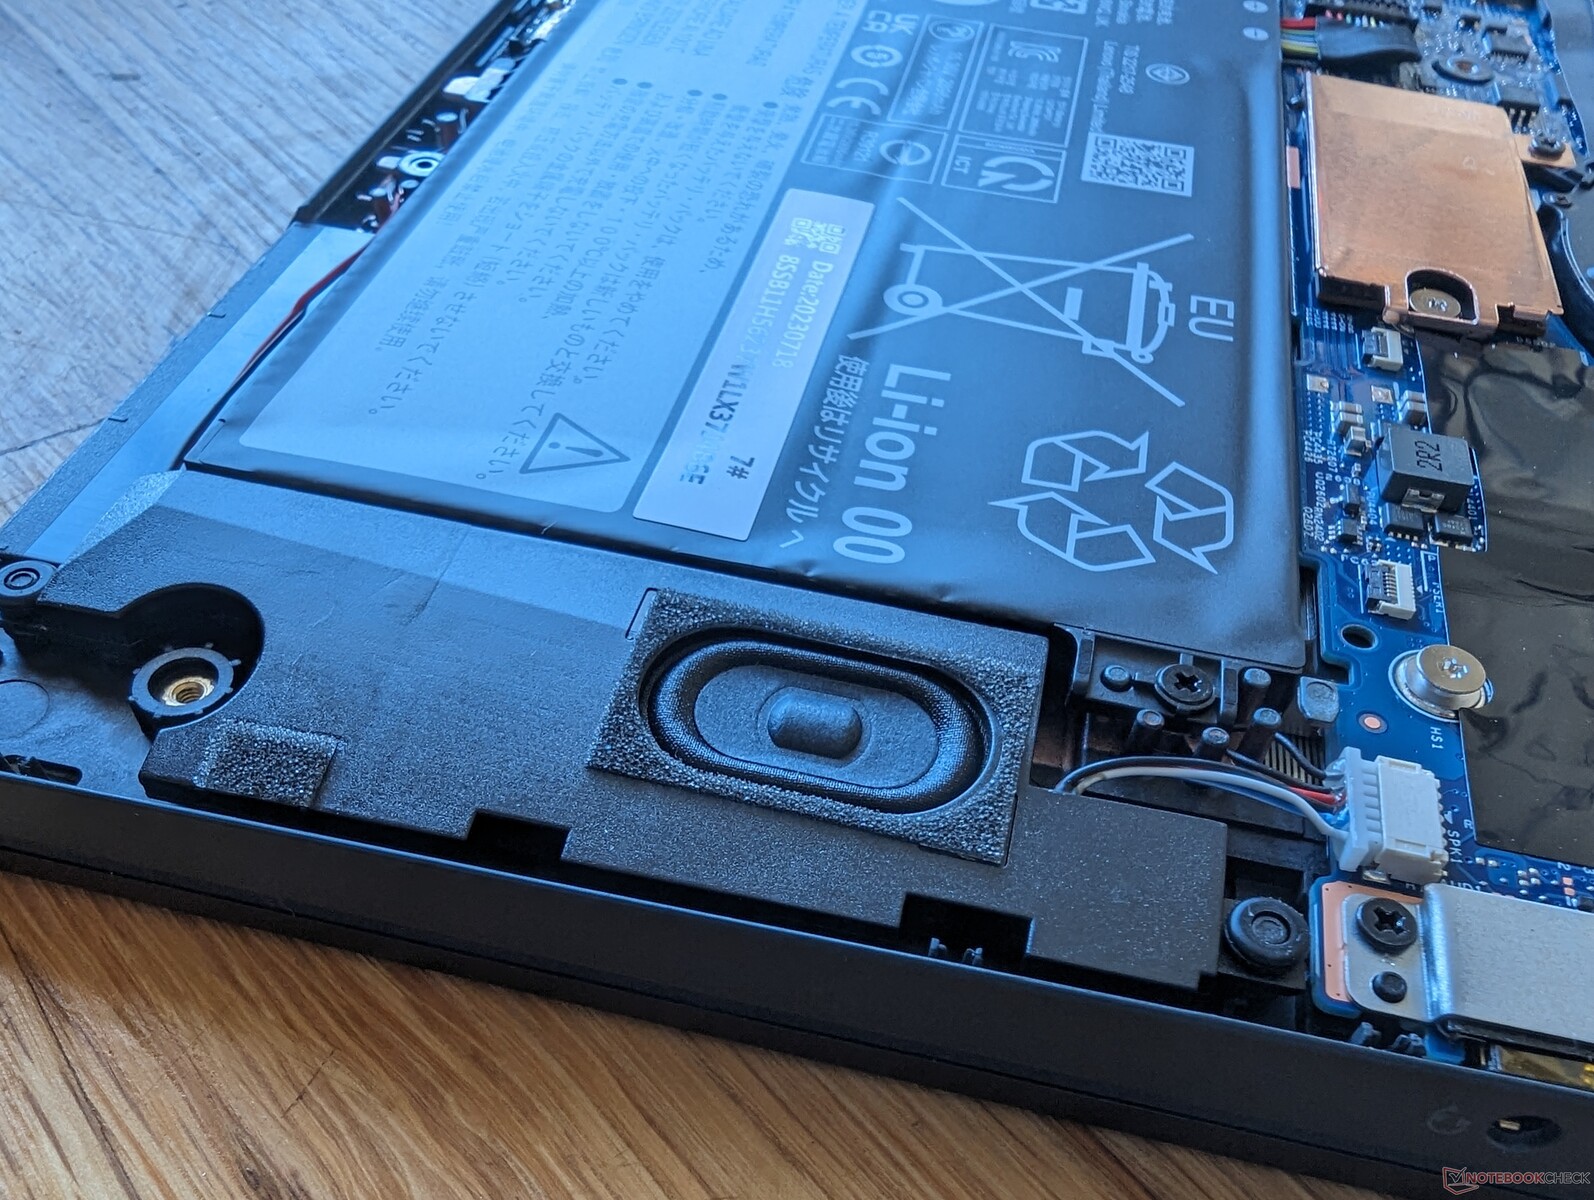
Manutenzione
Non ci sono grandi differenze interne in termini di aggiornabilità tra le versioni AMD e Intel, come mostrano le immagini di confronto qui sotto.
Accessori e garanzia
La confezione di vendita include un adattatore CA e una penna stilo attiva. La penna è alloggiata all'interno del portatile stesso, per comodità e per la ricarica.
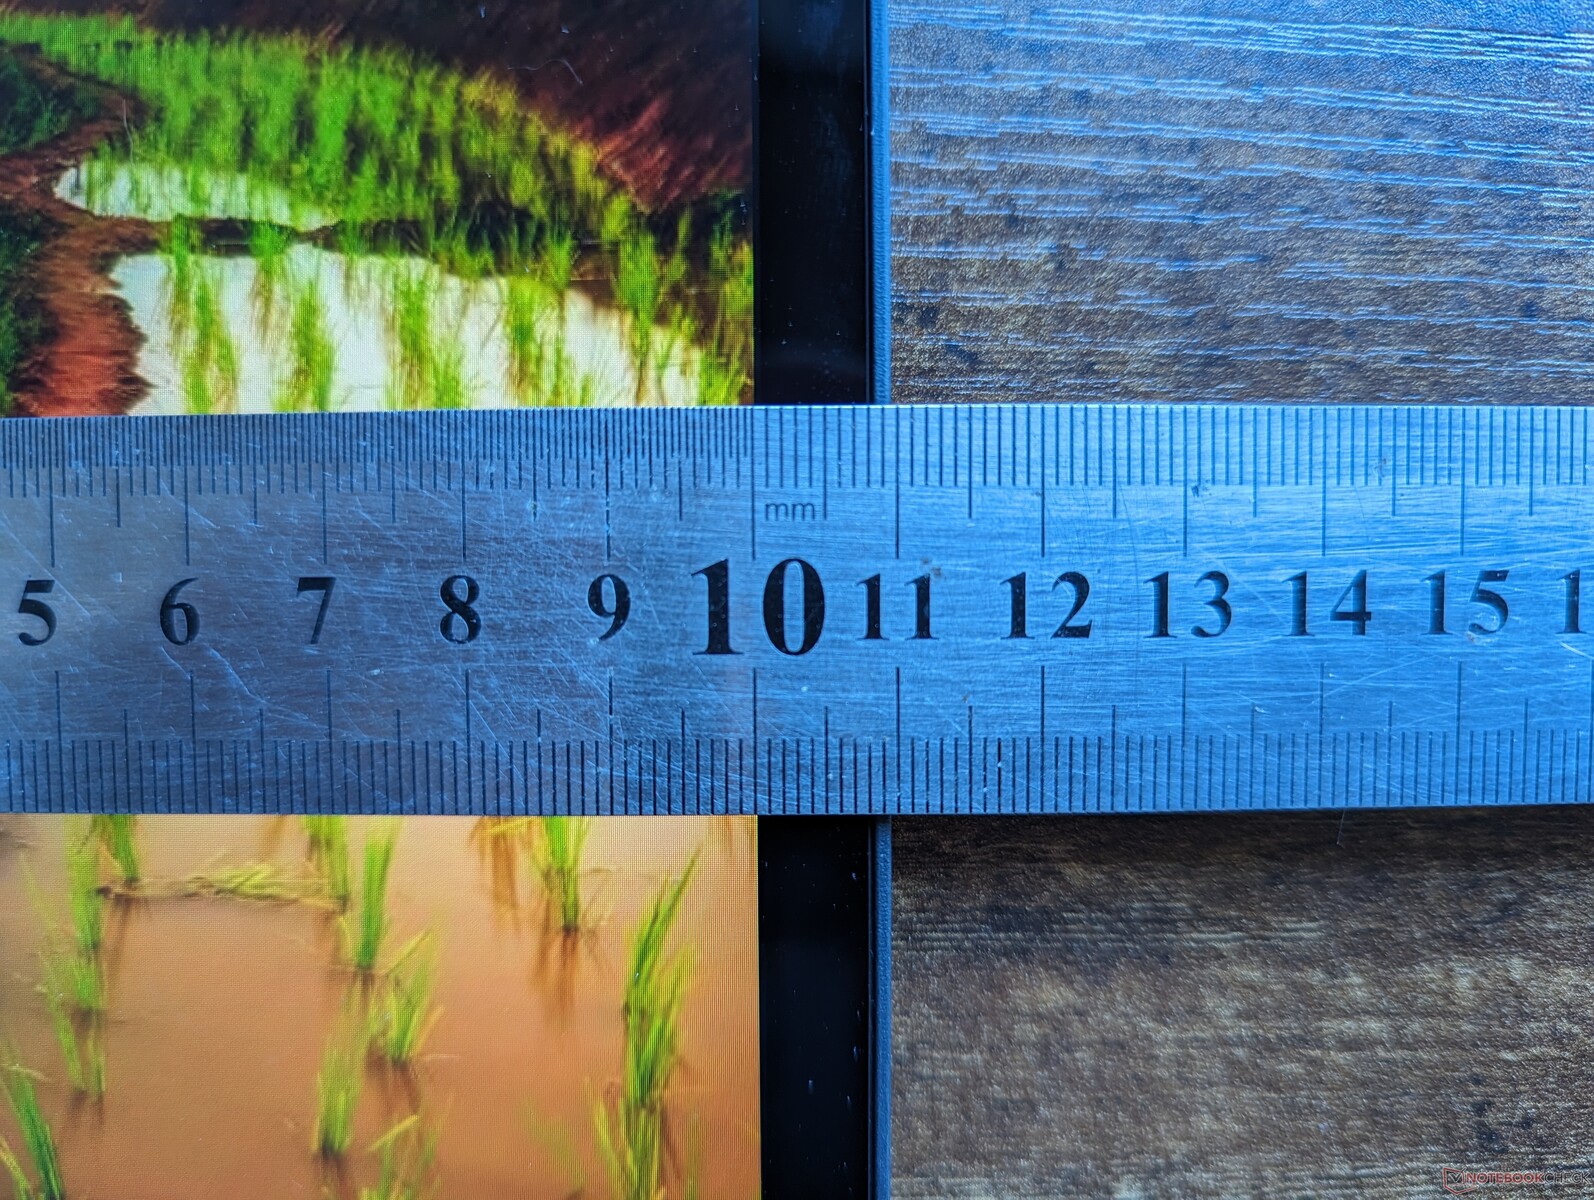
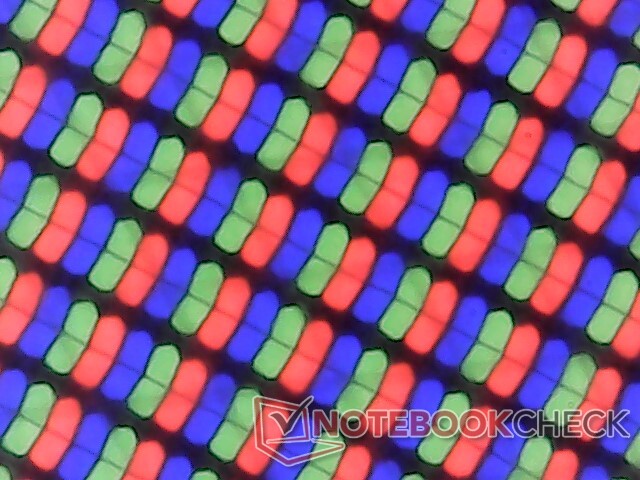
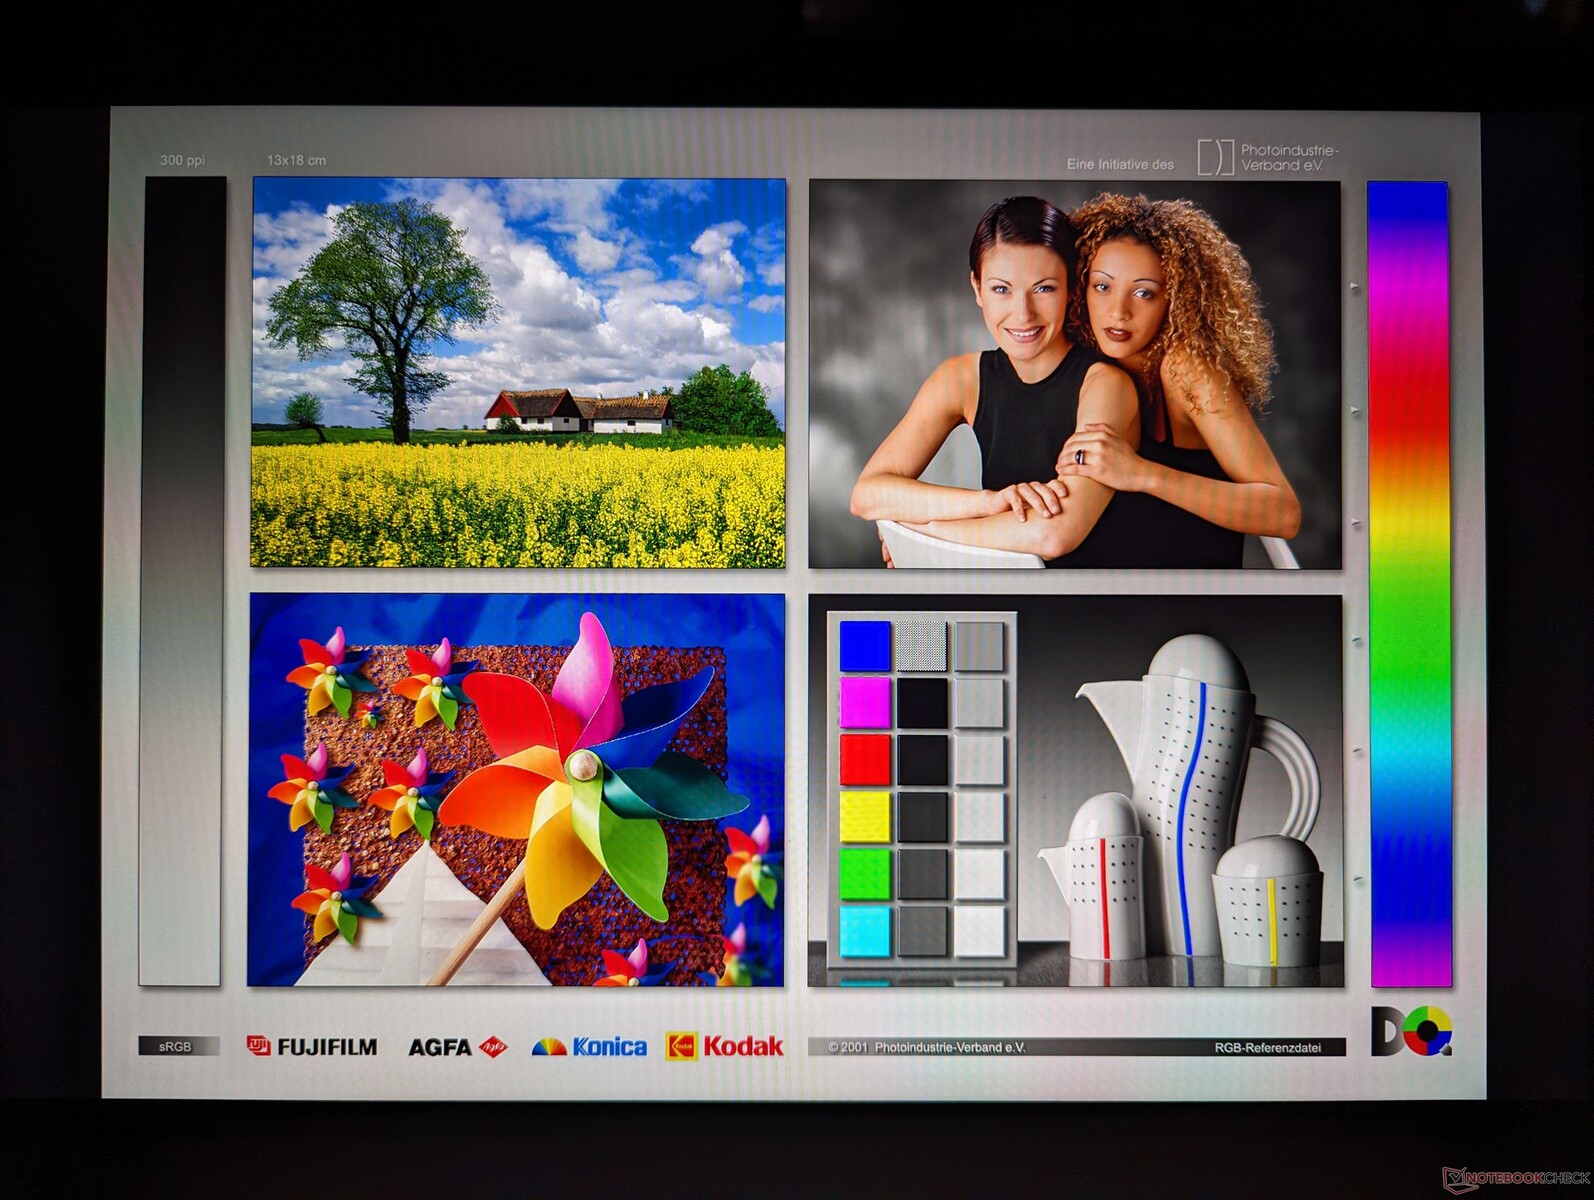
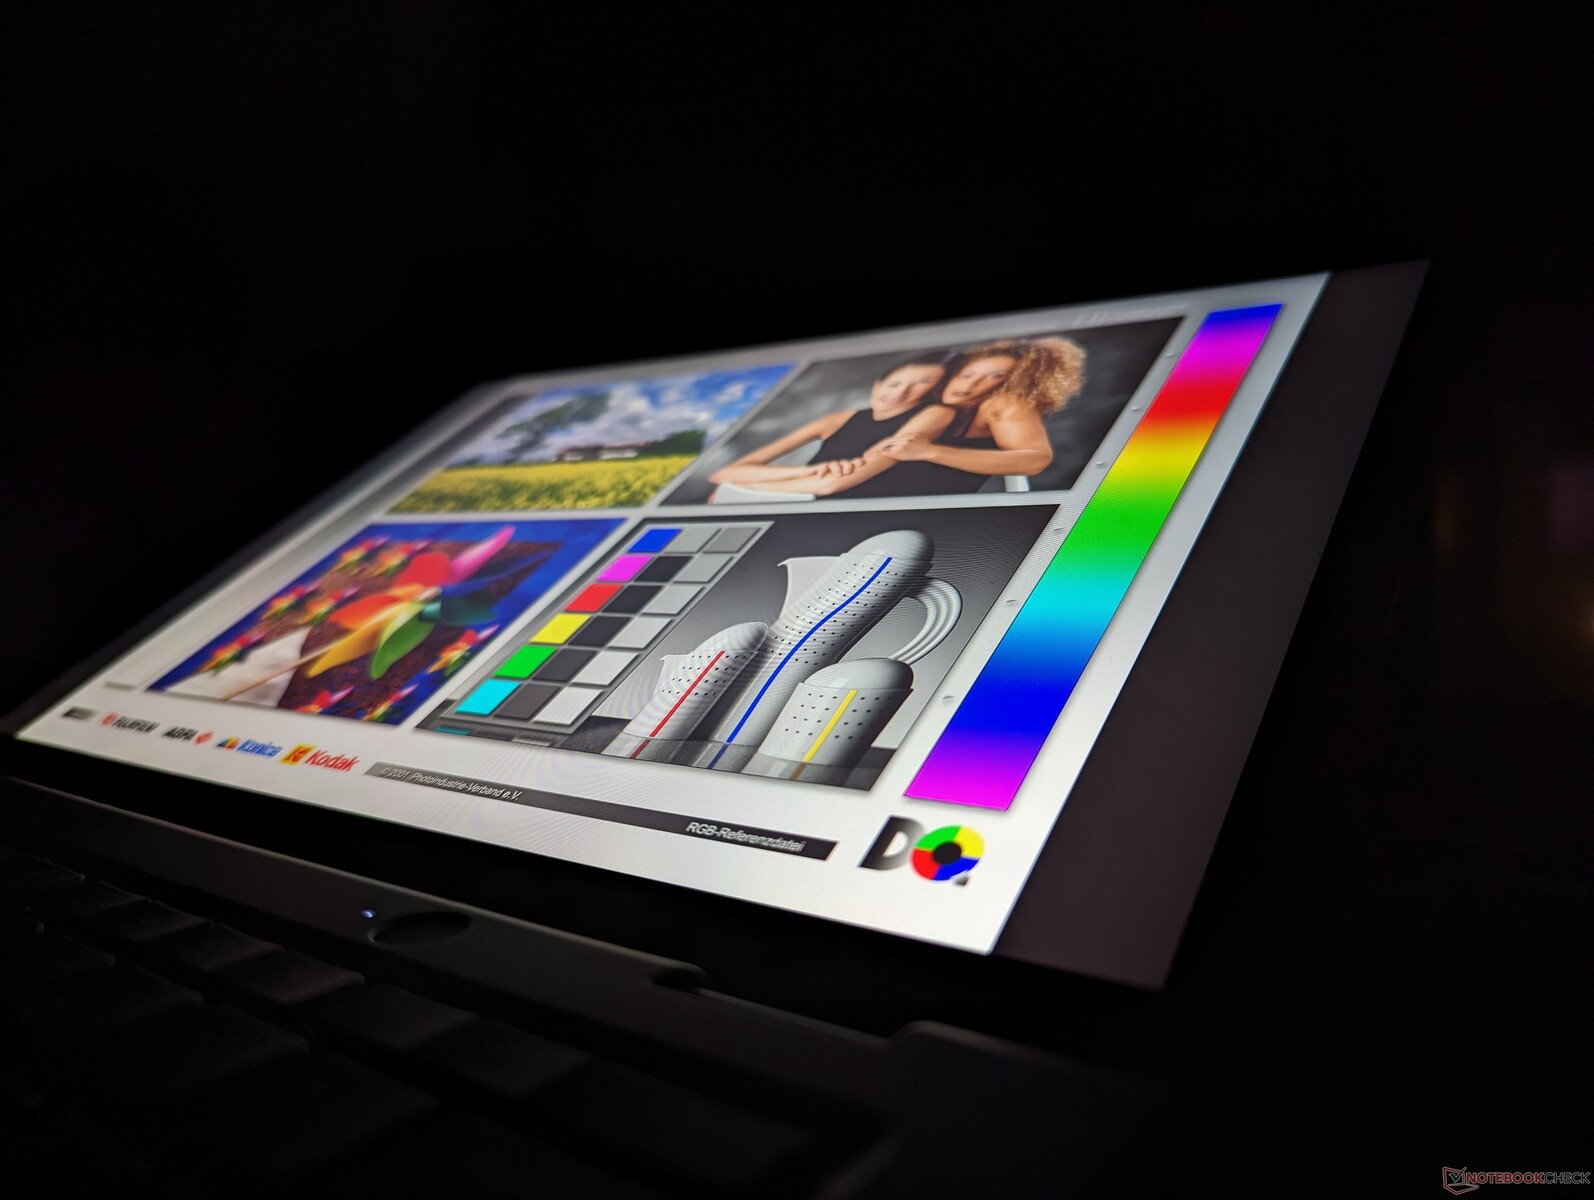
Display
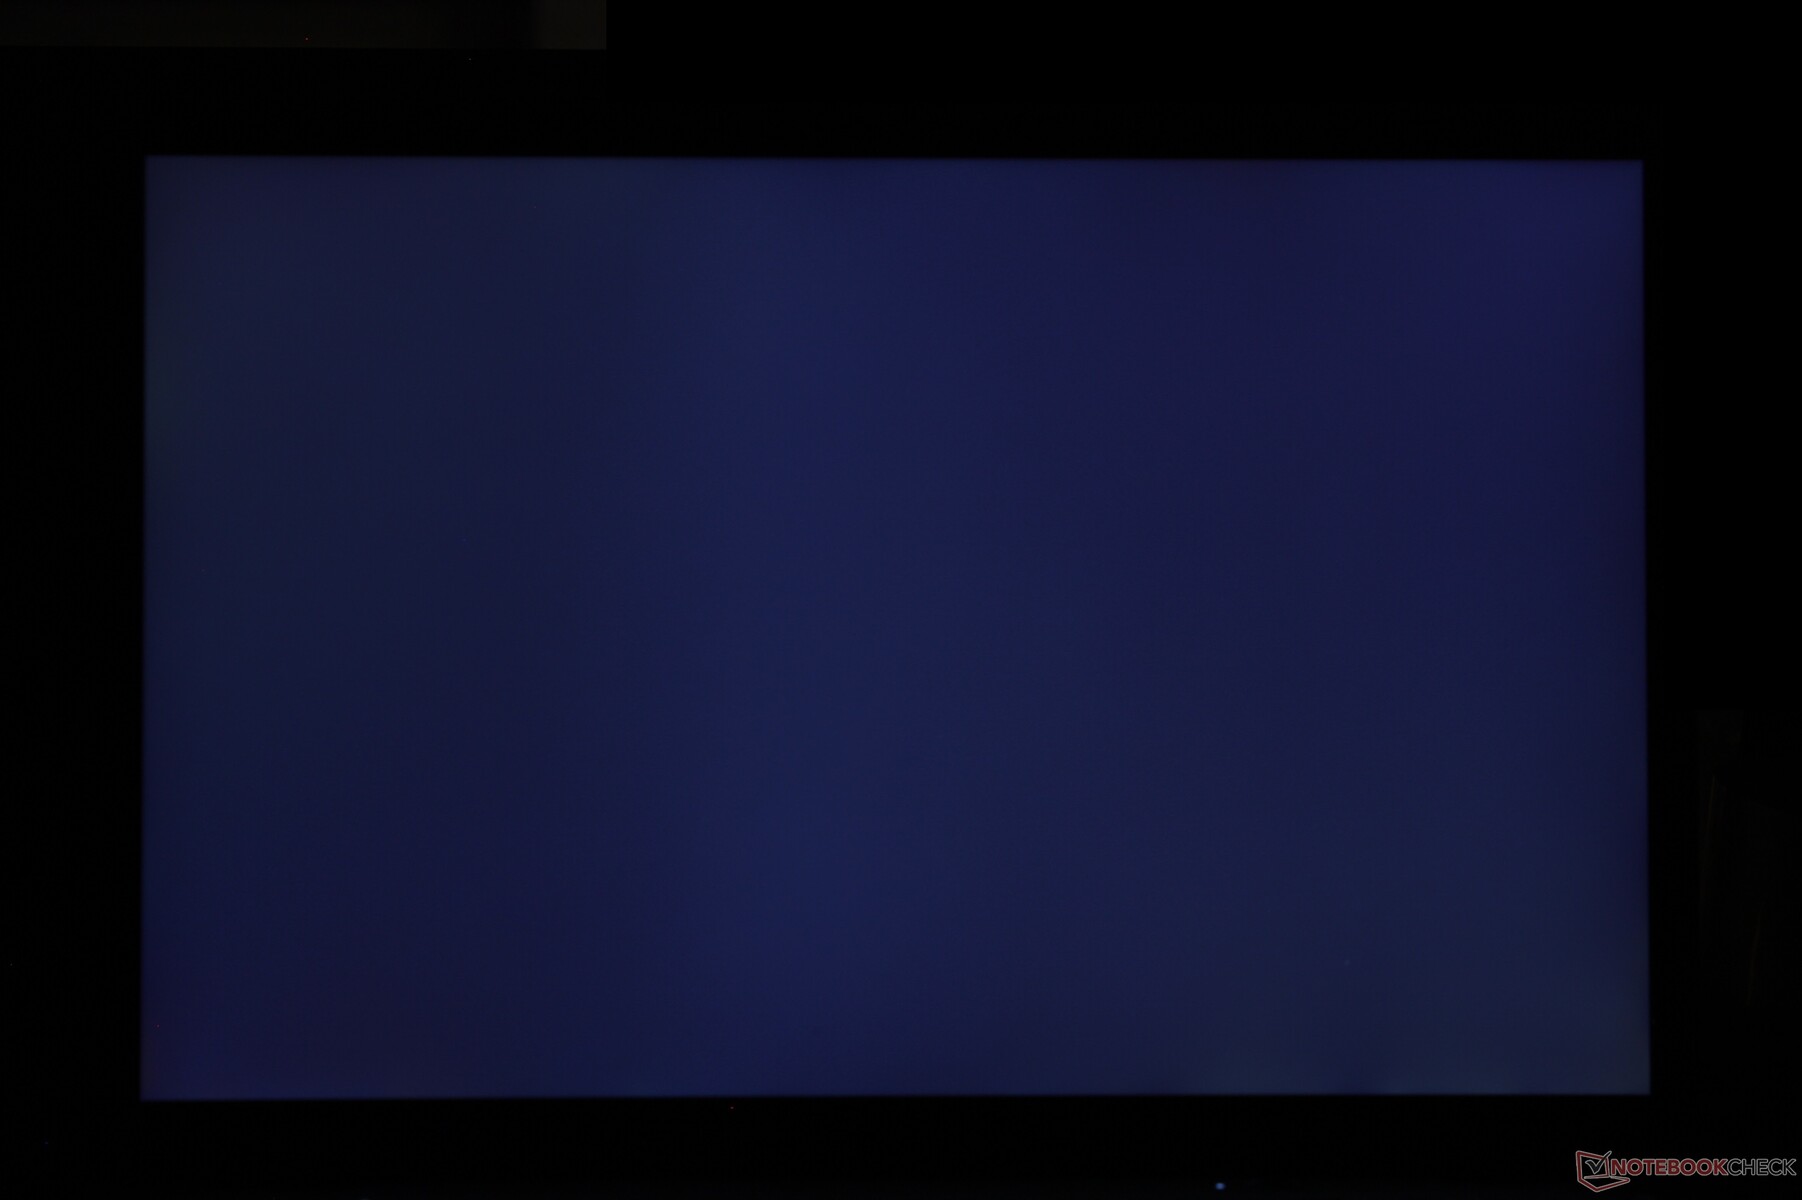
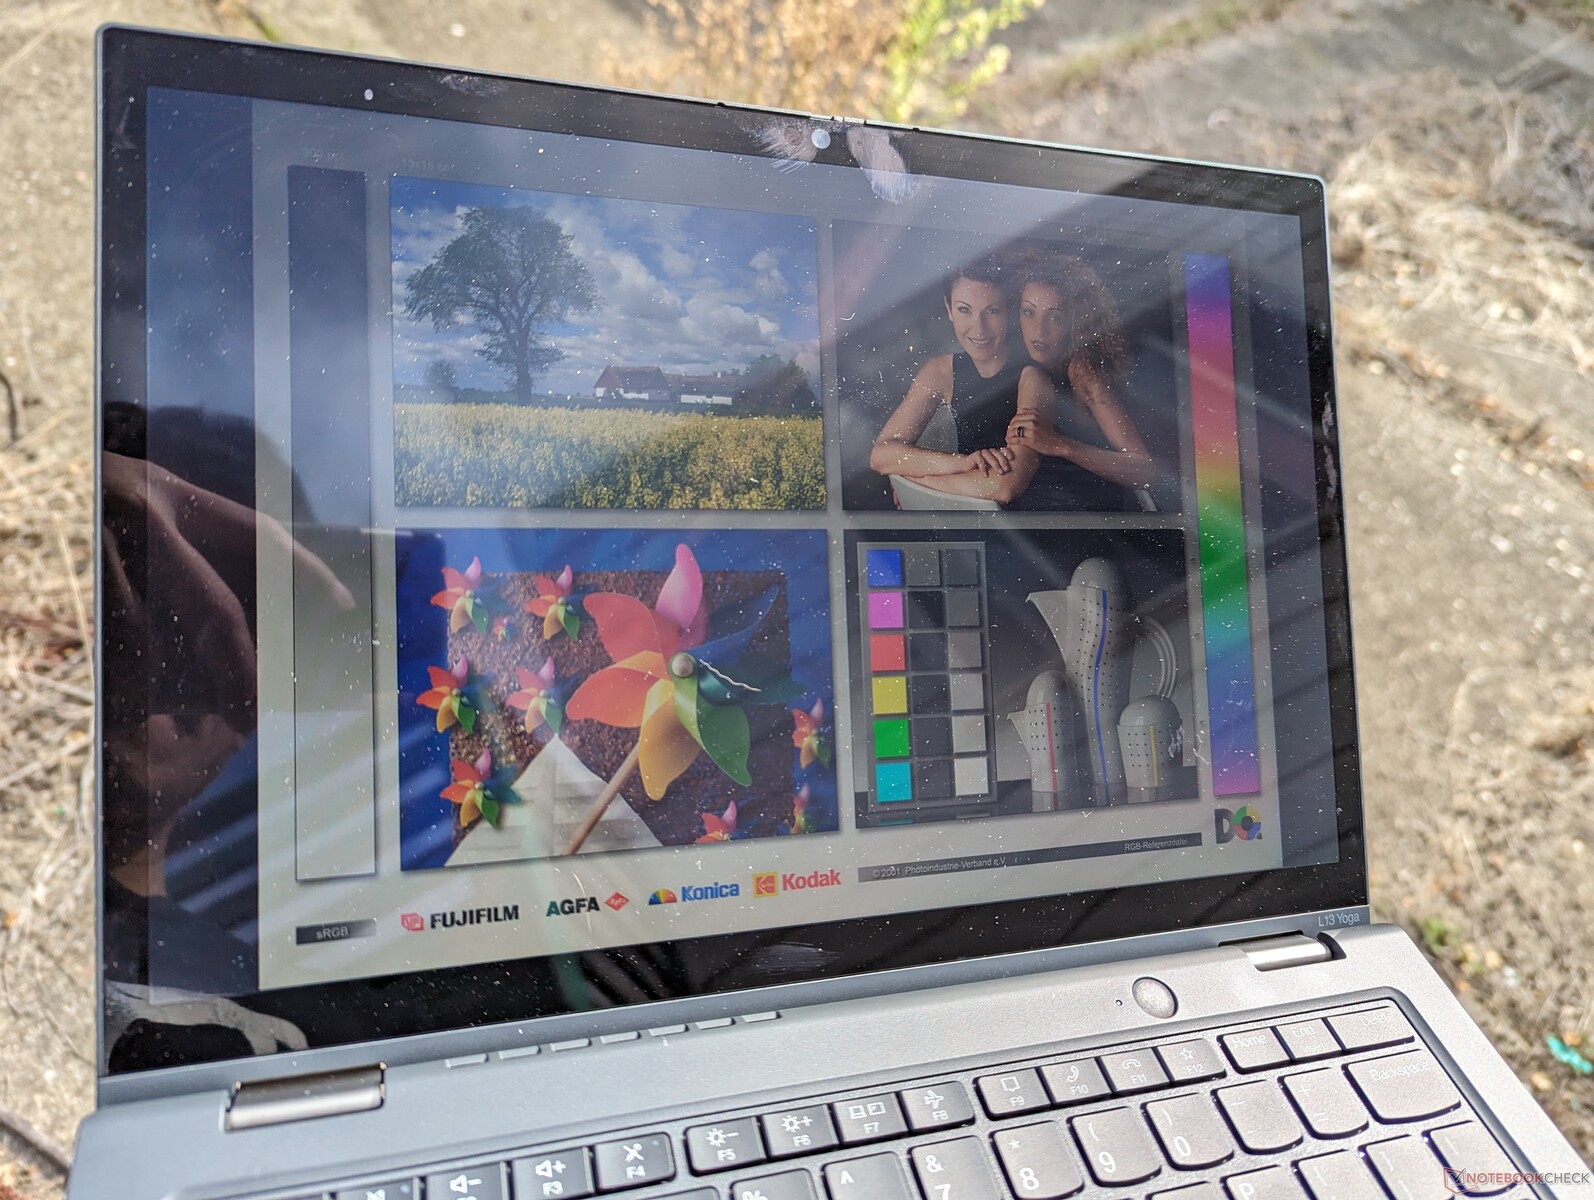
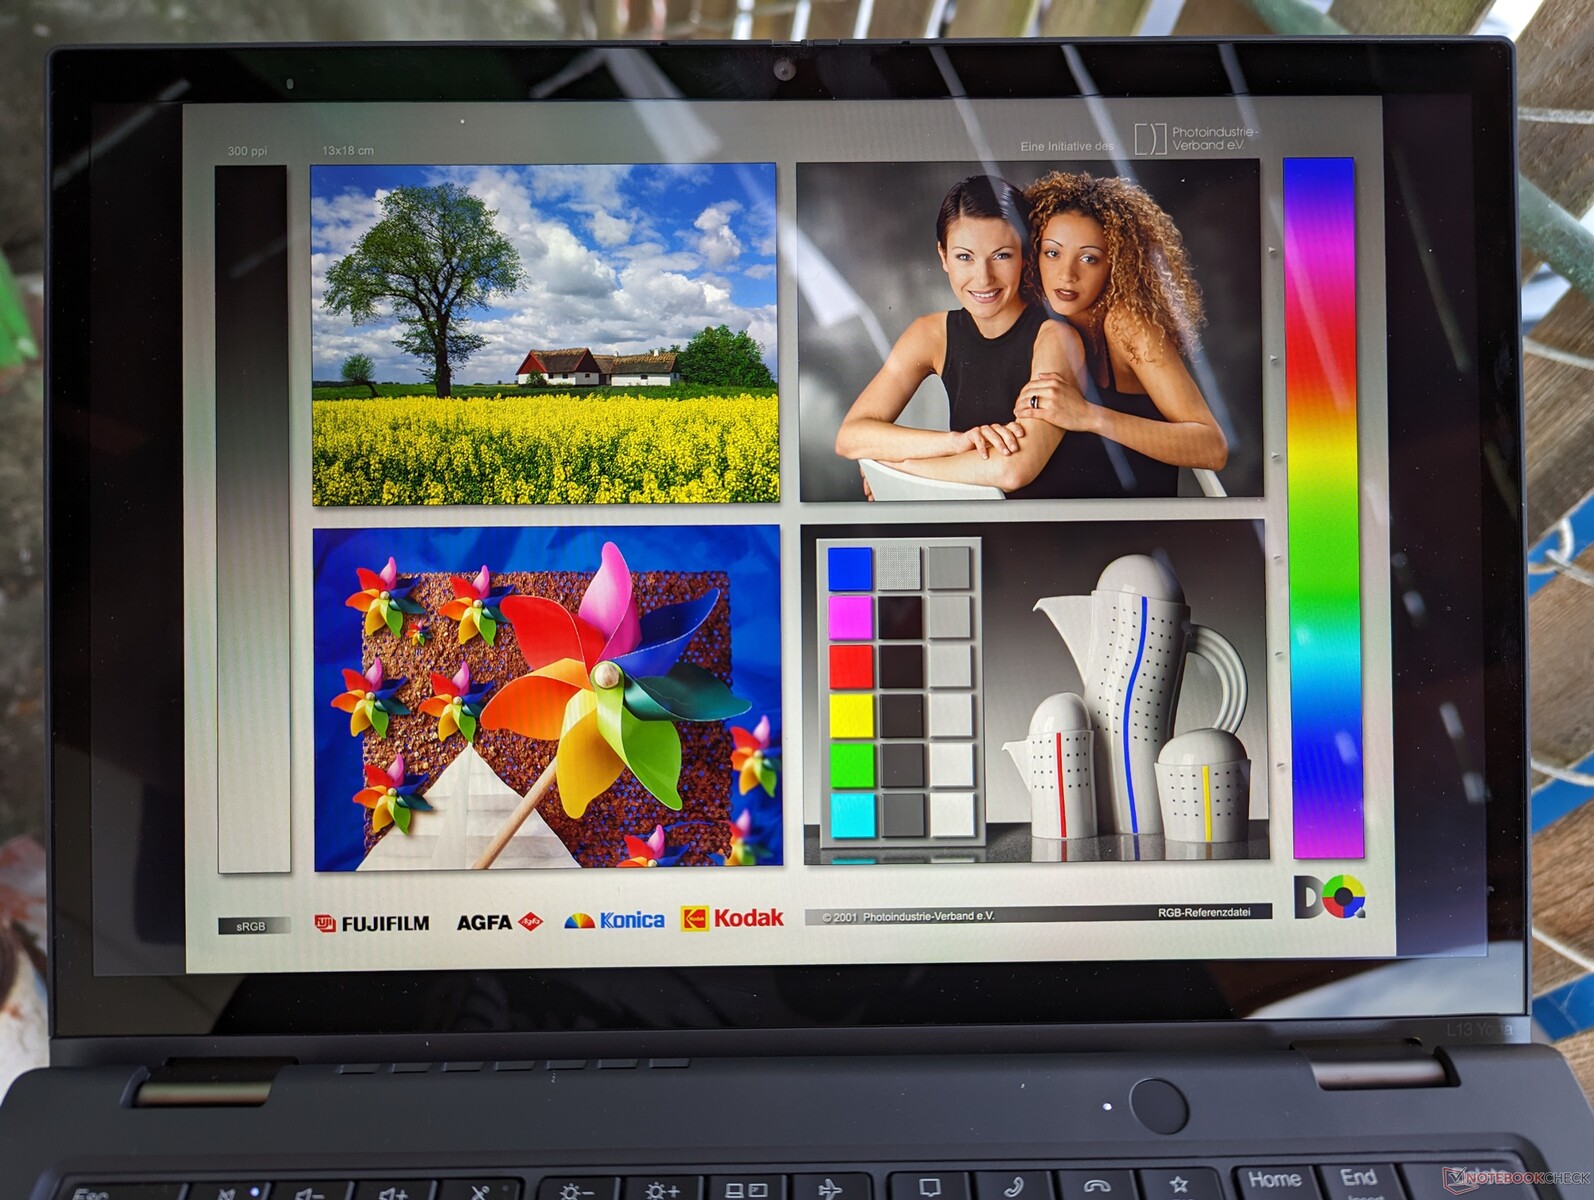
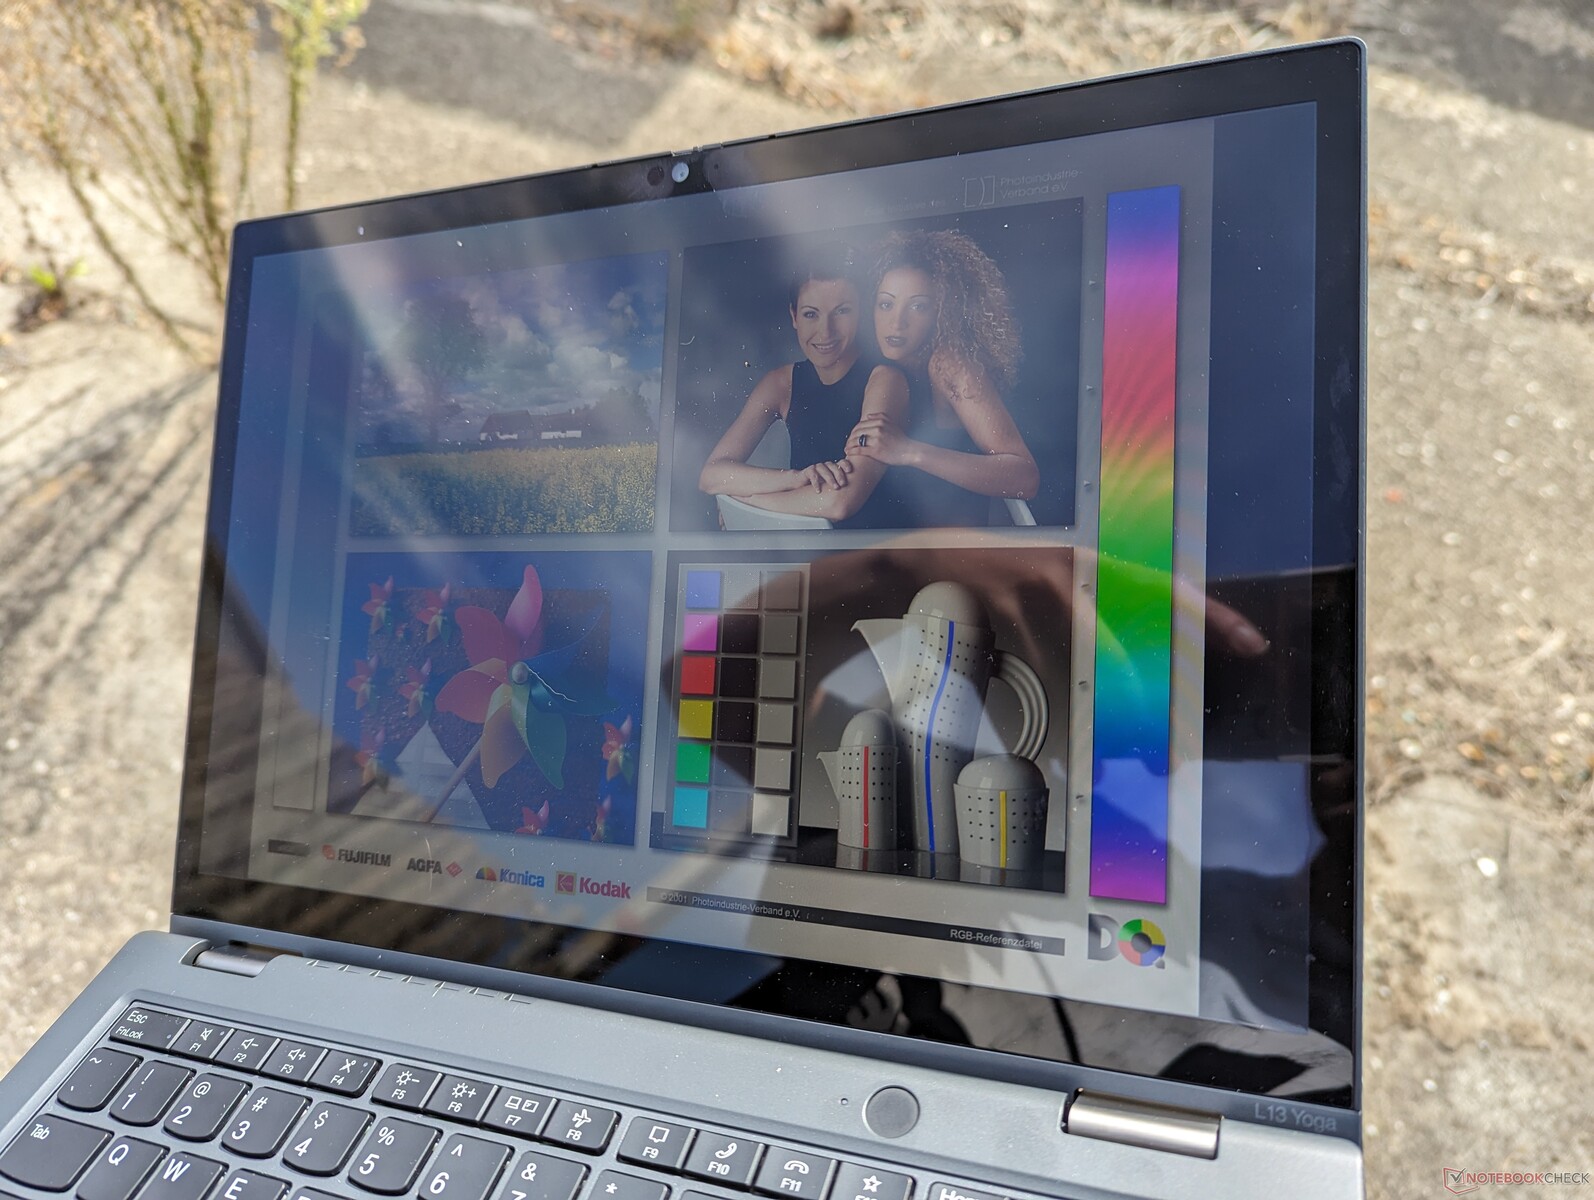
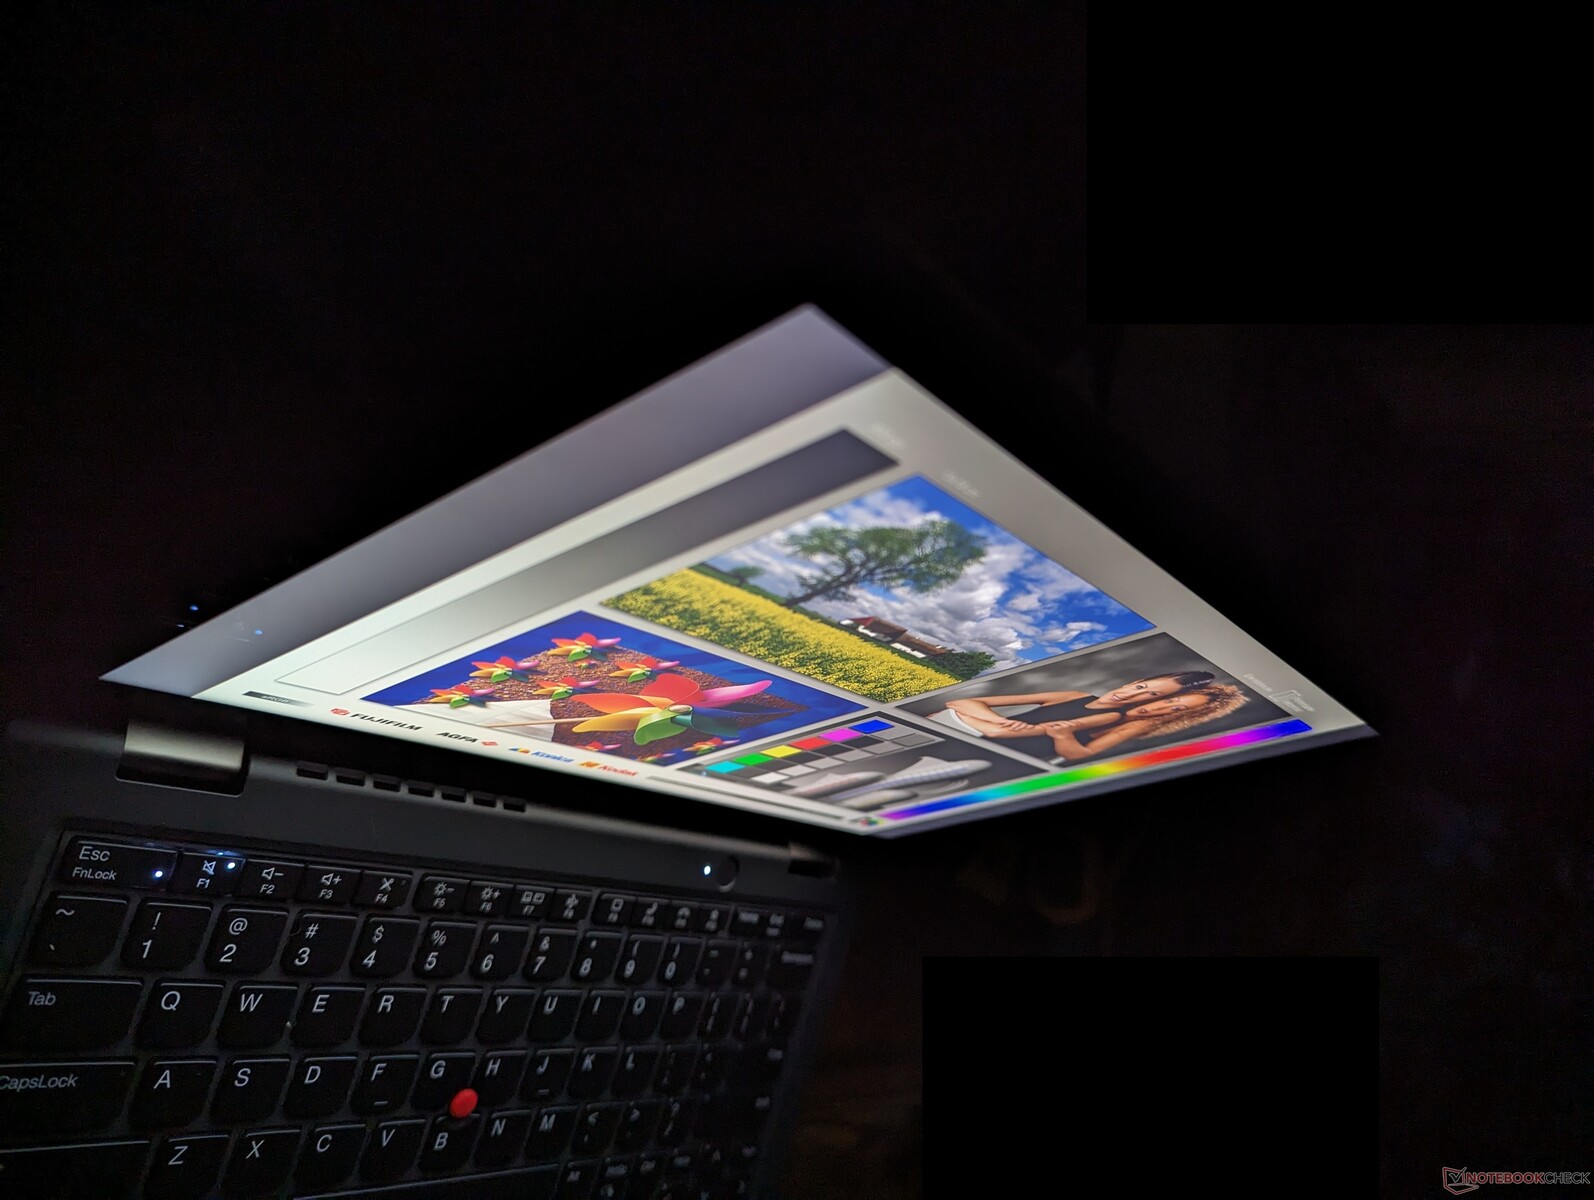
La nostra unità Intel è dotata di un pannello IPS da 1200p diverso da quello presente sulla nostra unità AMD (NV133WUM-N61 vs. B133UAN01.2). Questo particolare pannello sembra essere leggermente più debole di circa 50-60 nits, pur offrendo tempi di risposta più rapidi in bianco e nero e grigio-grigio per ridurre al minimo il ghosting. Il colore e la qualità dell'immagine sono molto simili tra i due modelli.
È un peccato che Lenovo non offra opzioni di frequenza di aggiornamento a 90 Hz o 120 Hz, considerando il prezzo di oltre 1500 dollari.

| |||||||||||||||||||||||||
Distribuzione della luminosità: 92 %
Al centro con la batteria: 278.1 cd/m²
Contrasto: 818:1 (Nero: 0.34 cd/m²)
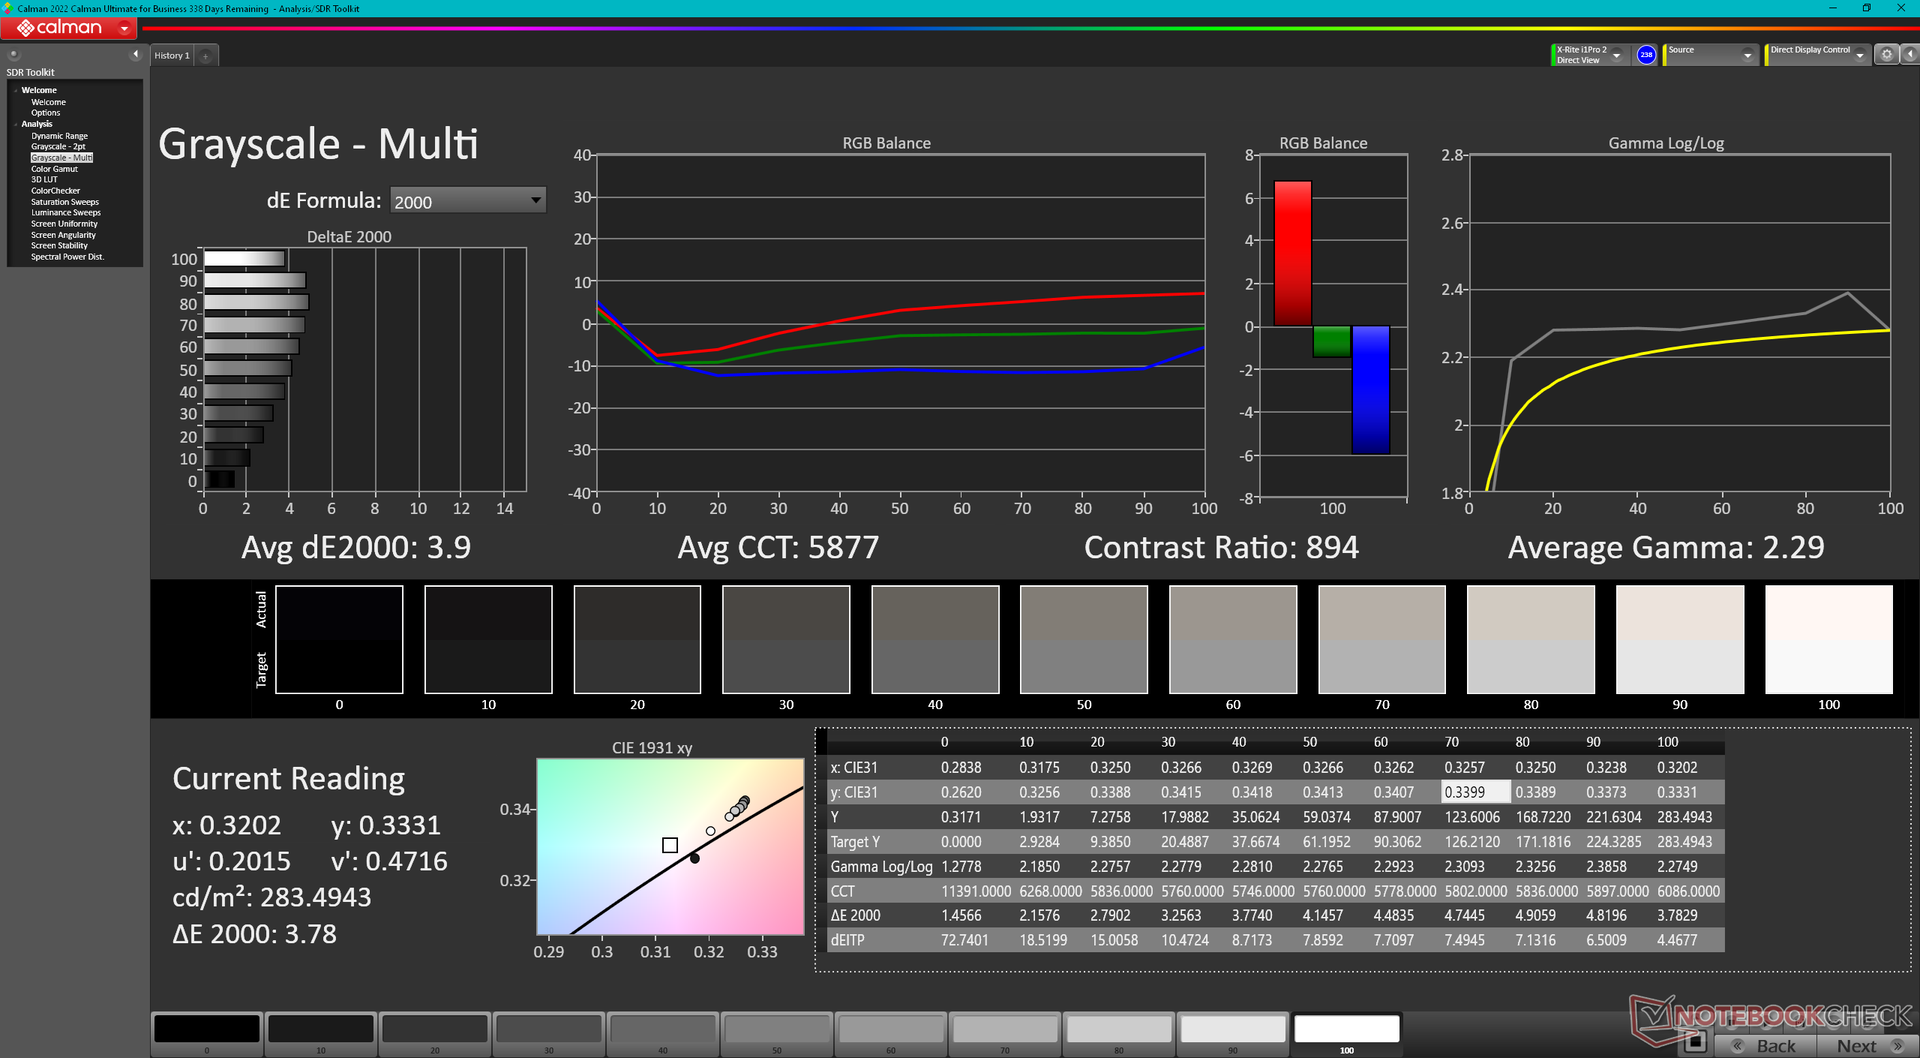
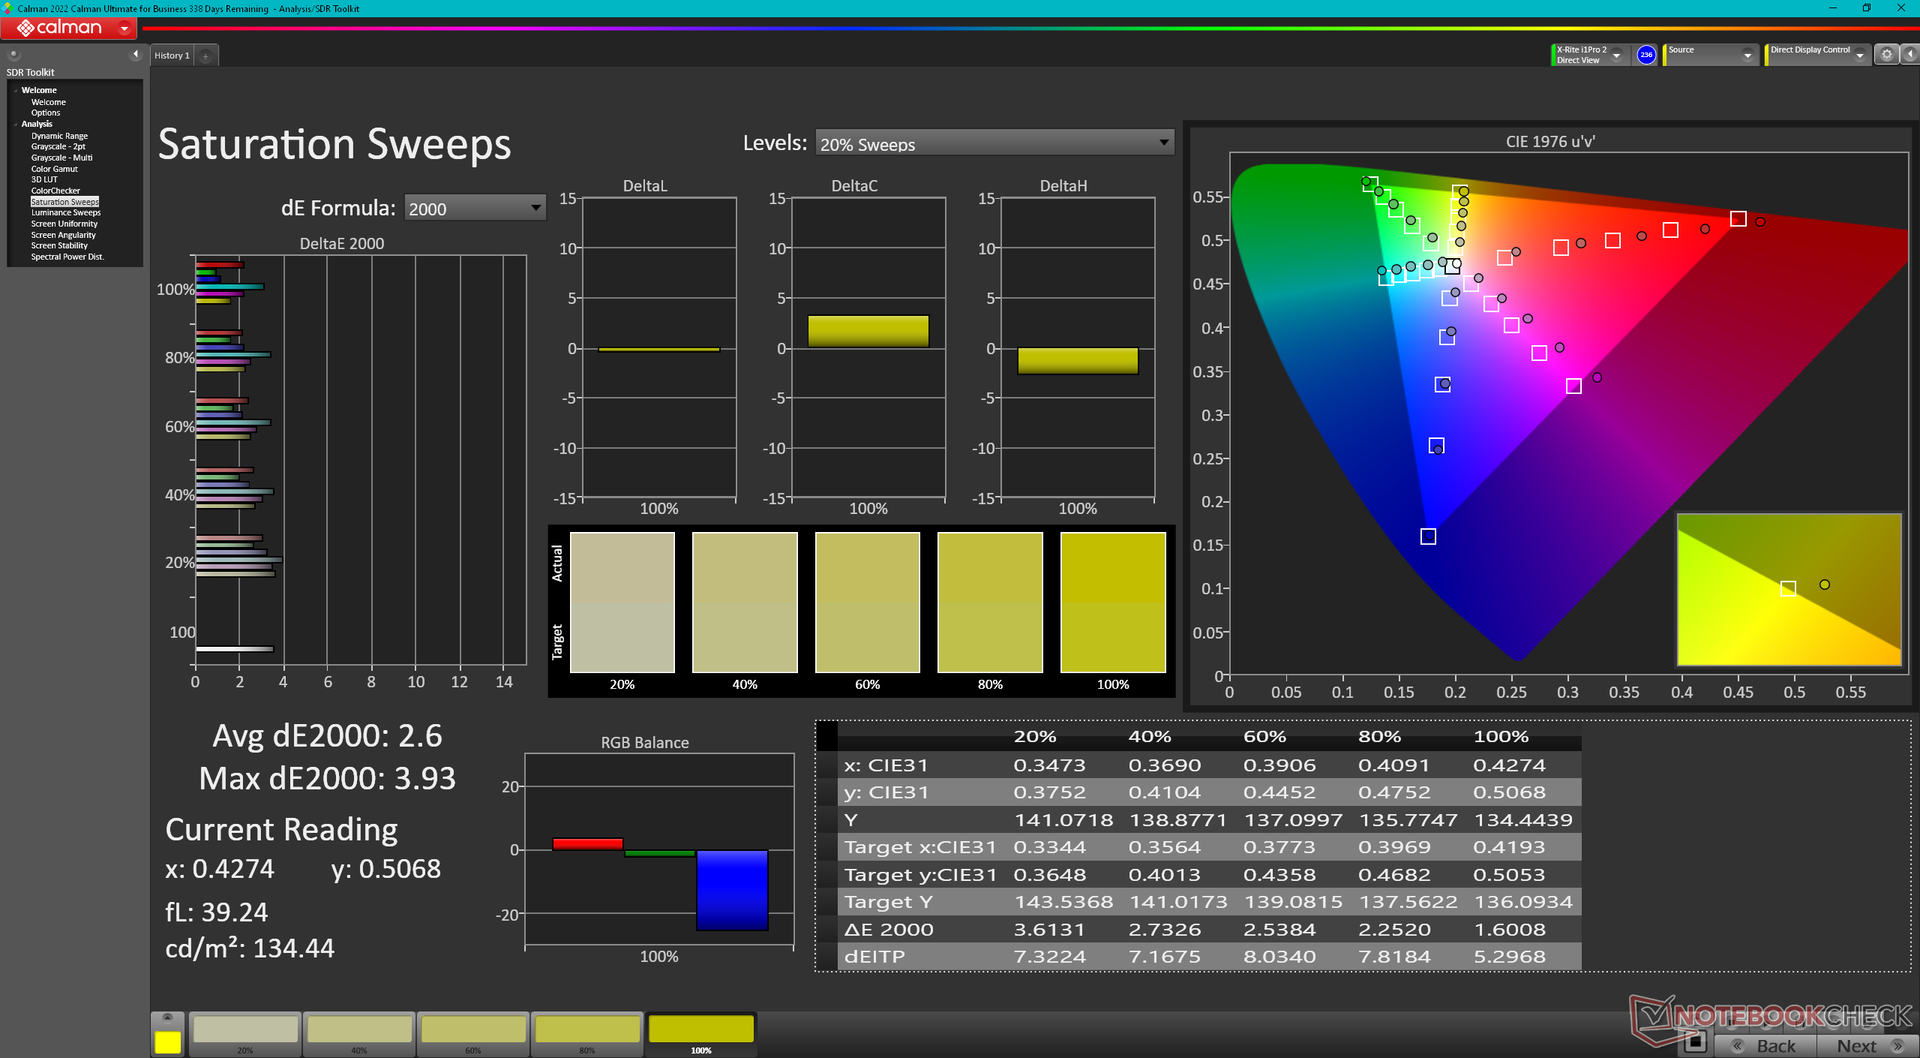
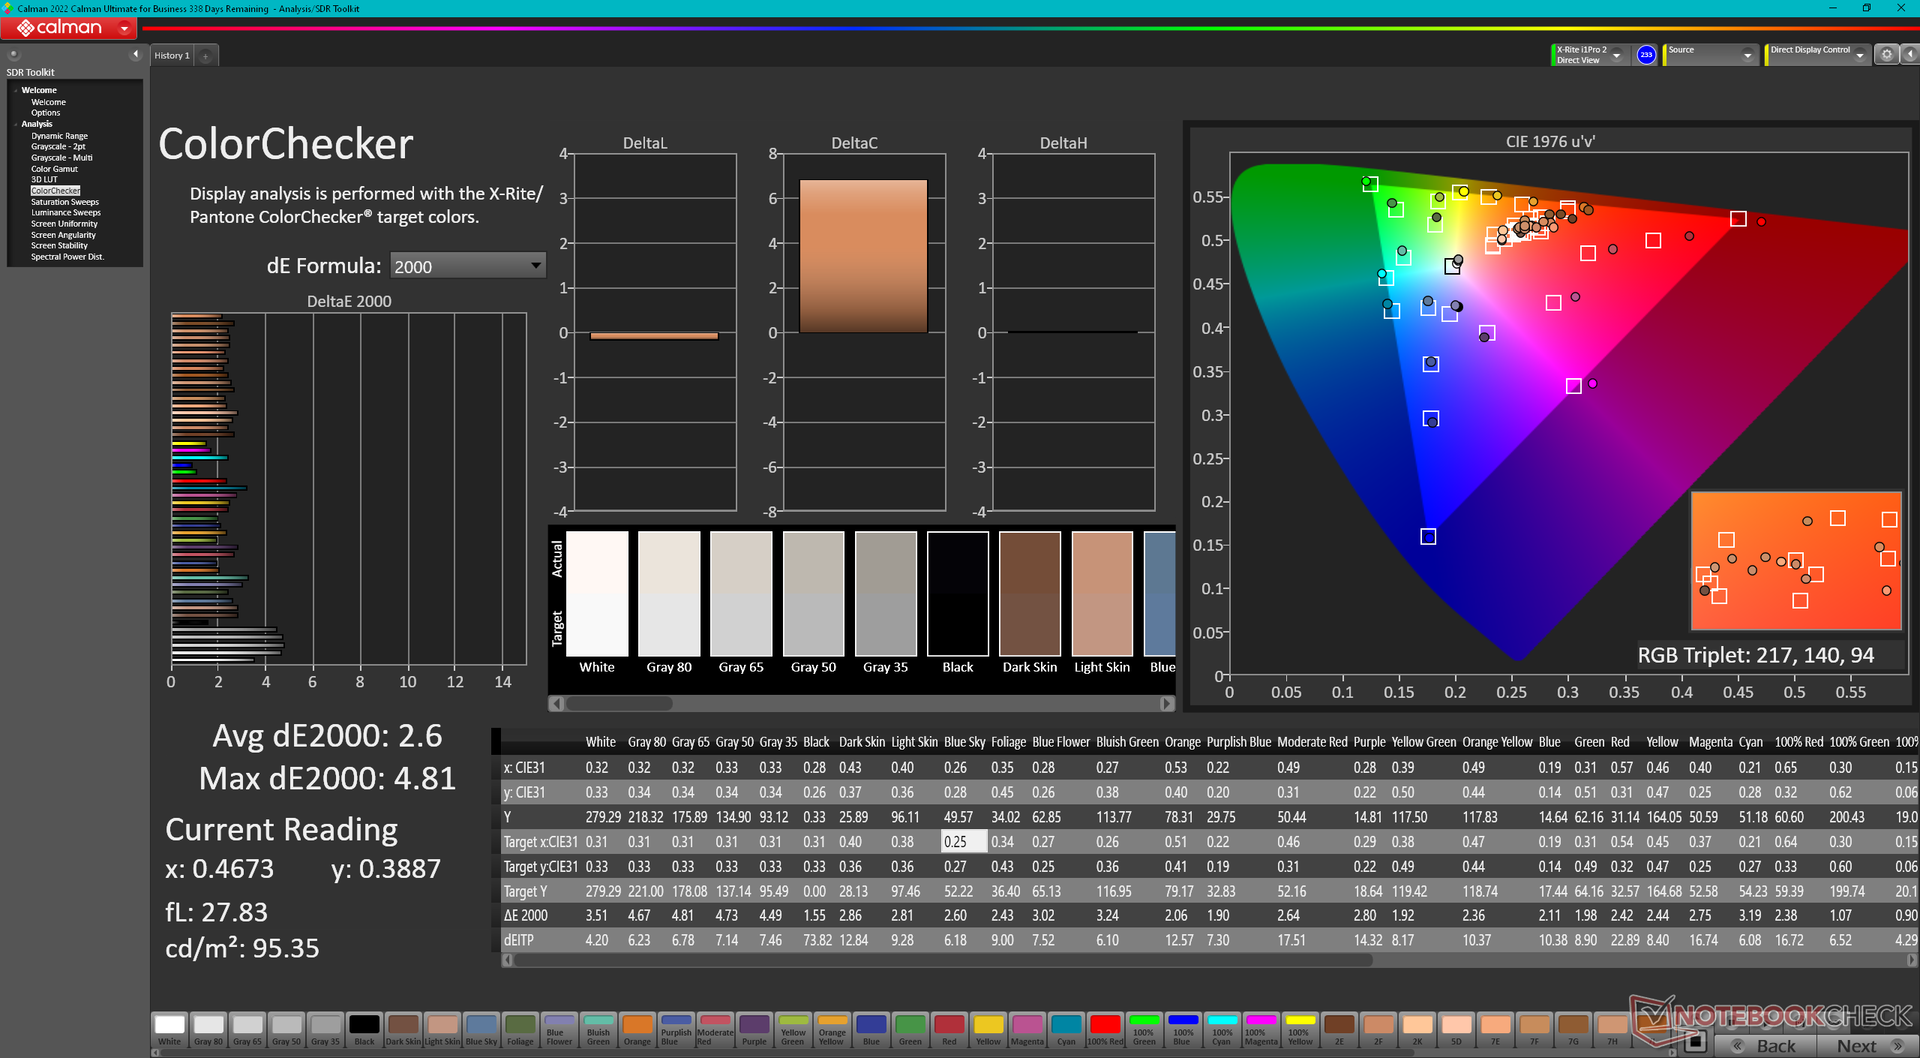
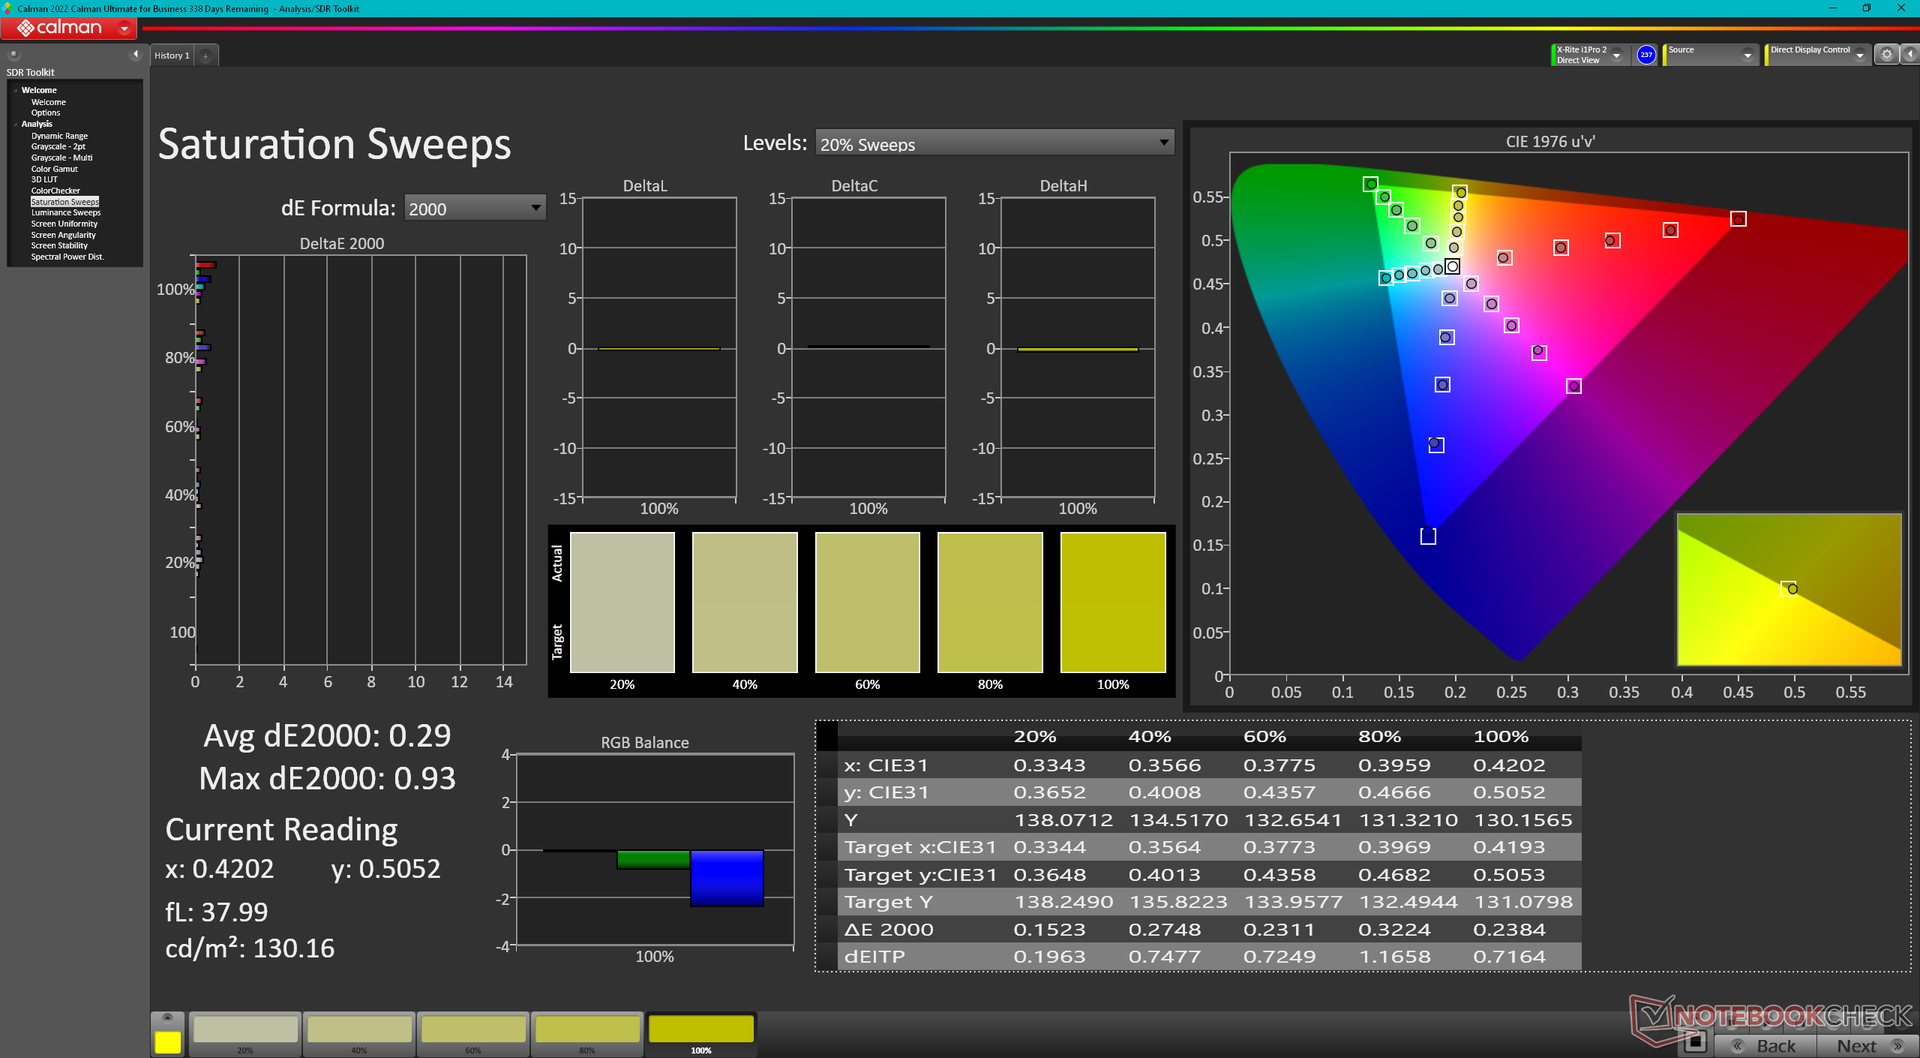
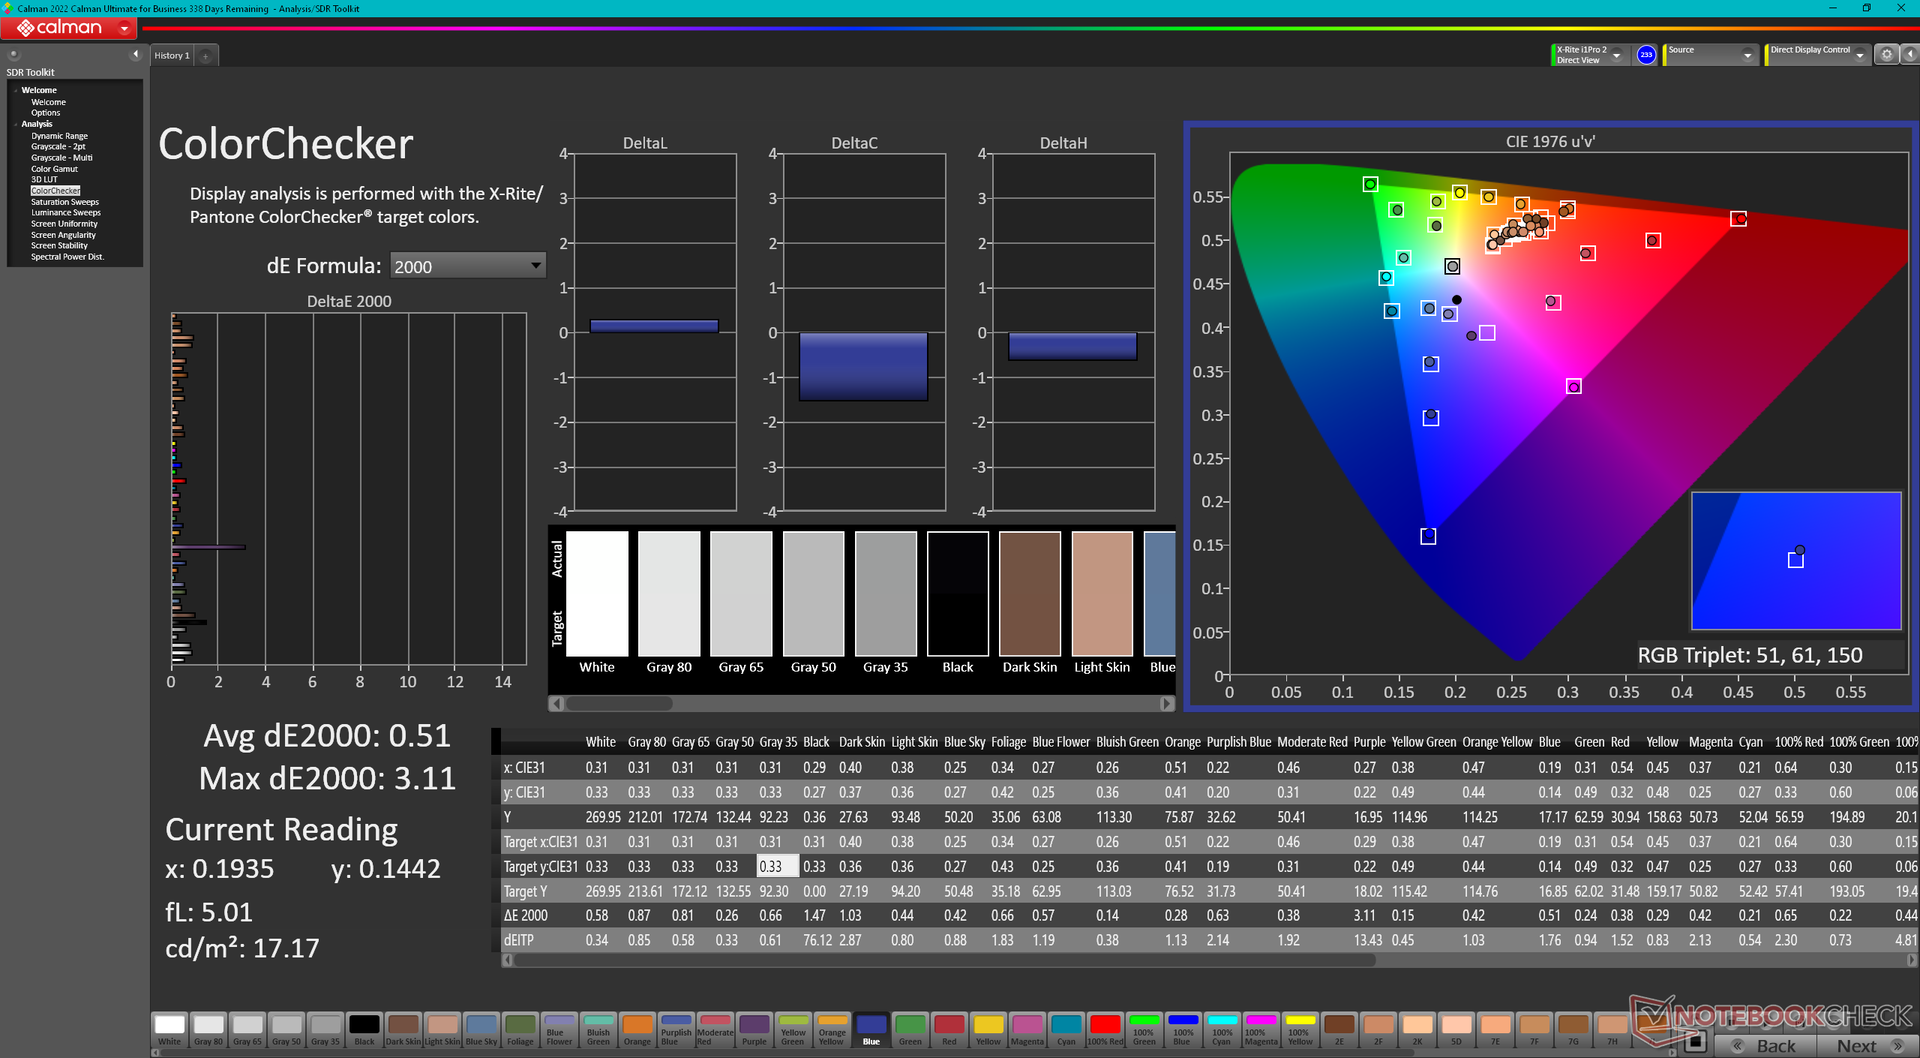
ΔE ColorChecker Calman: 2.6 | ∀{0.5-29.43 Ø4.71}
calibrated: 0.51
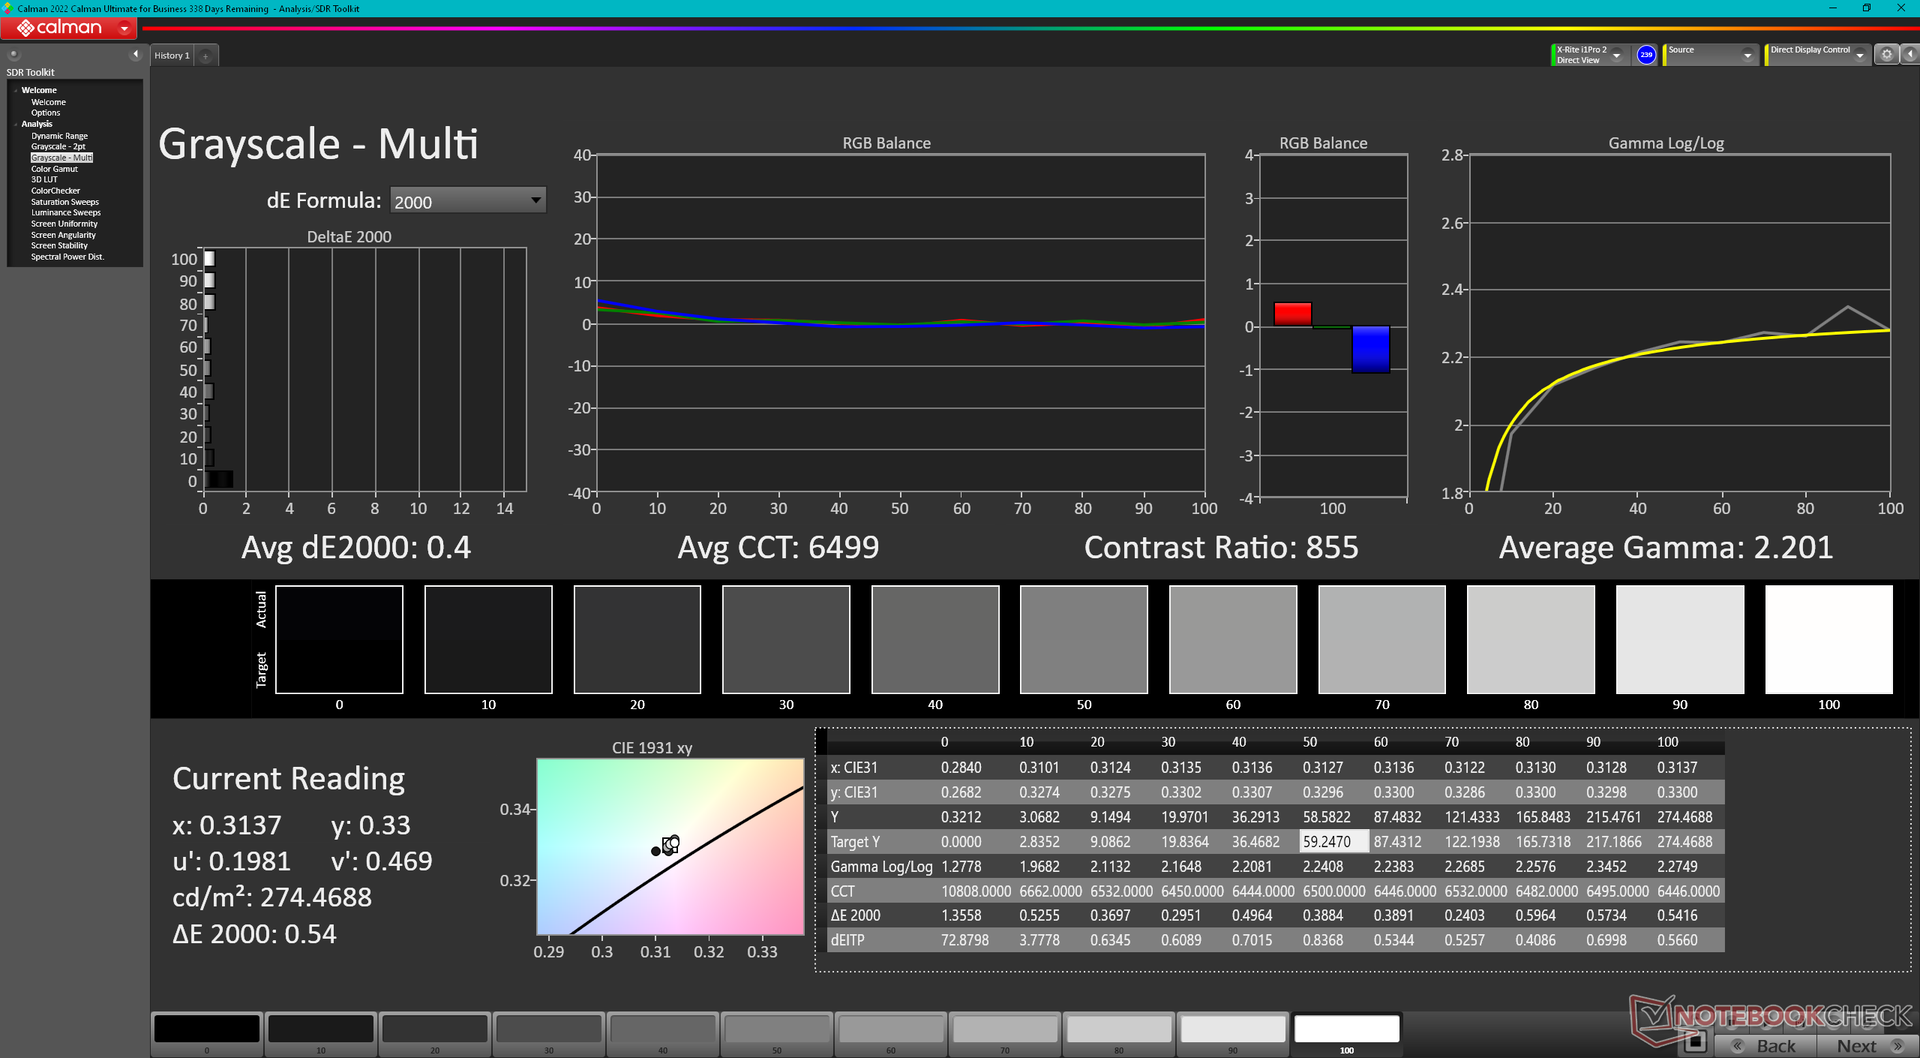
ΔE Greyscale Calman: 3.9 | ∀{0.09-98 Ø4.96}
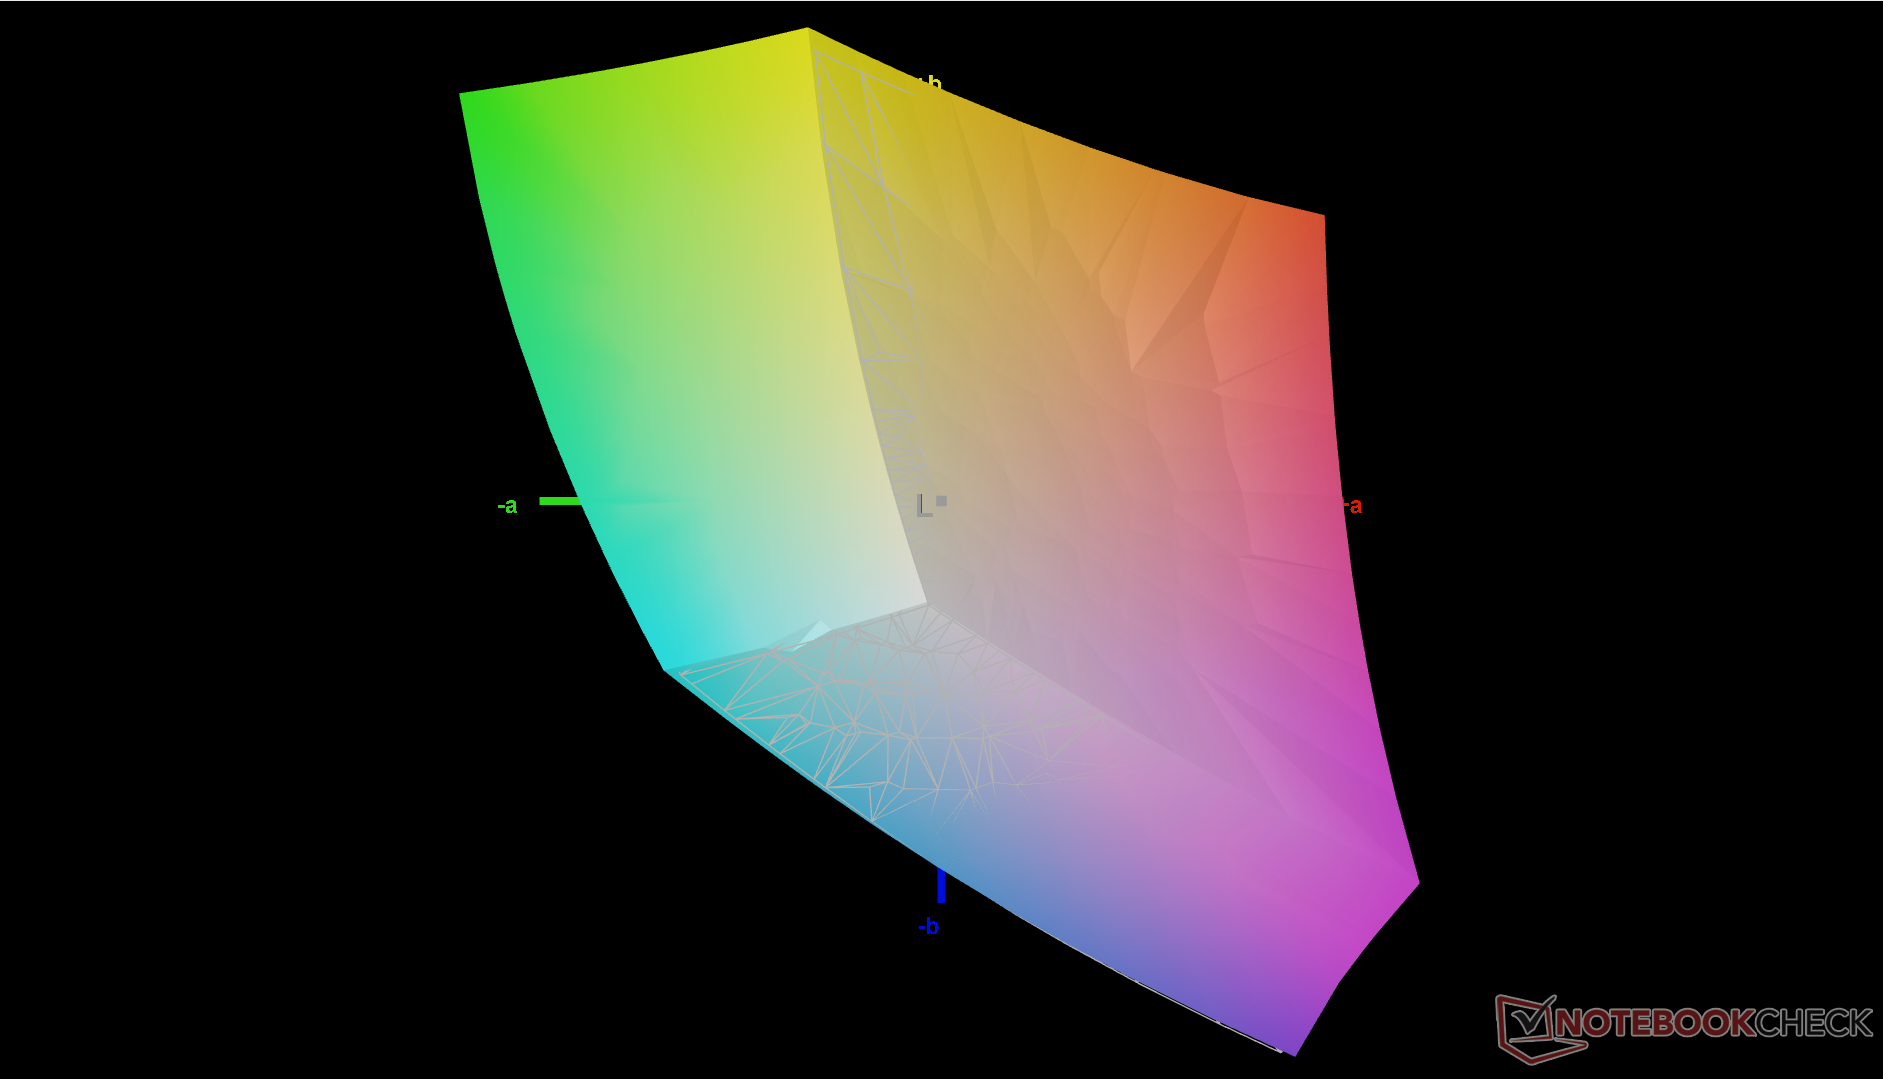
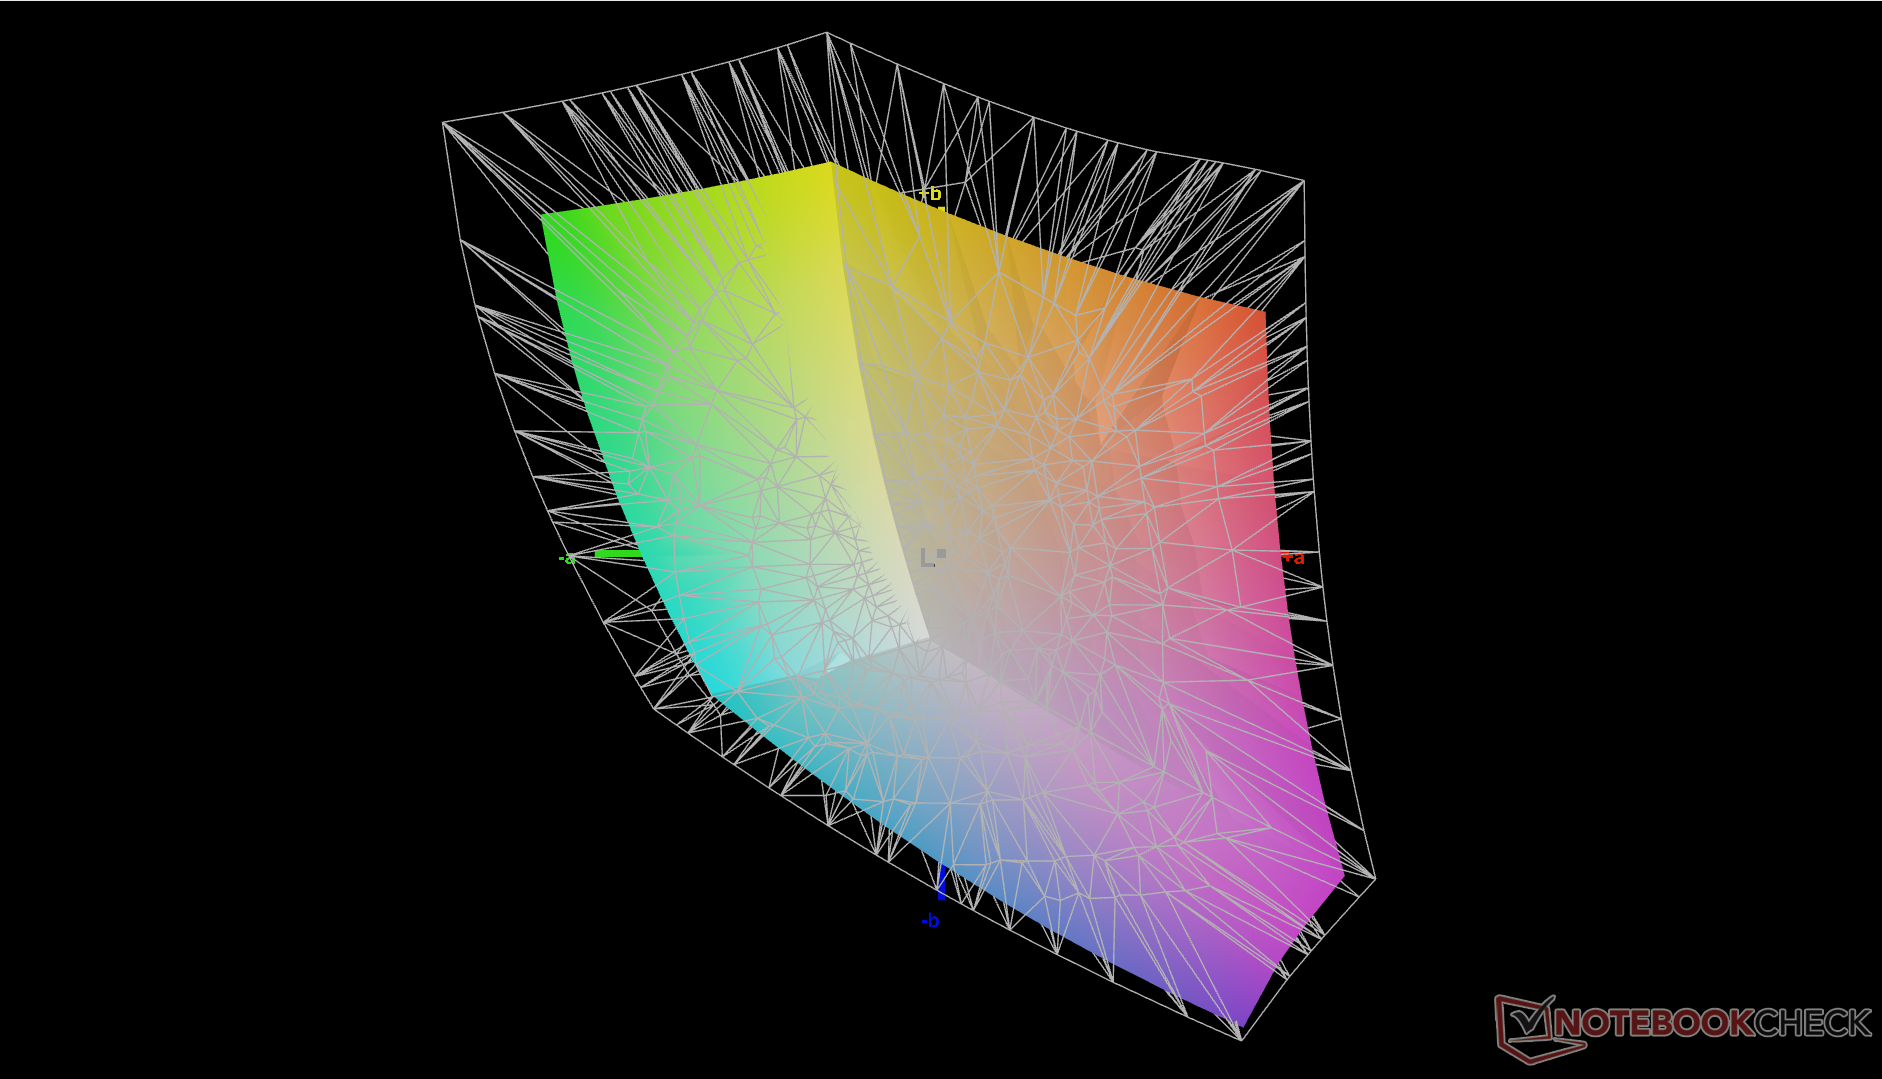
71.9% AdobeRGB 1998 (Argyll 3D)
99.8% sRGB (Argyll 3D)
71.6% Display P3 (Argyll 3D)
Gamma: 2.29
CCT: 5877 K
| Lenovo ThinkPad L13 Yoga G4 i7-1355U NV133WUM-N61, IPS, 1920x1200, 13.3" | Lenovo ThinkPad L13 Yoga G4 21FSS00100 B133UAN01.2 , IPS LED, 1920x1200, 13.3" | HP Elite Dragonfly Folio 13.5 G3 Chi Mei CMN13C0, IPS, 1920x1280, 13.5" | Dell Latitude 9330 AU Optronics B133QAA, IPS, 2560x1600, 13.3" | MSI Summit E13 Flip Evo A11MT Sharp LQ134N1JW53, IPS, 1920x1200, 13.4" | Framework Laptop 13.5 Ryzen 7 7840U BOE CQ NE135FBM-N41, IPS, 2256x1504, 13.5" | |
|---|---|---|---|---|---|---|
| Display | 2% | -3% | 6% | -2% | -2% | |
| Display P3 Coverage (%) | 71.6 | 74.1 3% | 68.3 -5% | 77.8 9% | 69.8 -3% | 69 -4% |
| sRGB Coverage (%) | 99.8 | 99.3 -1% | 98.6 -1% | 99.9 0% | 98.8 -1% | 99.1 -1% |
| AdobeRGB 1998 Coverage (%) | 71.9 | 74.5 4% | 70.2 -2% | 77.5 8% | 70.6 -2% | 71.1 -1% |
| Response Times | -58% | -147% | -165% | -140% | -81% | |
| Response Time Grey 50% / Grey 80% * (ms) | 27.3 ? | 43.3 ? -59% | 66.8 ? -145% | 67.6 ? -148% | 64 ? -134% | 50.4 ? -85% |
| Response Time Black / White * (ms) | 17.9 ? | 28 ? -56% | 44.4 ? -148% | 50.4 ? -182% | 44 ? -146% | 31.5 ? -76% |
| PWM Frequency (Hz) | ||||||
| Screen | -8% | 22% | 19% | 19% | 24% | |
| Brightness middle (cd/m²) | 278.1 | 336 21% | 369.5 33% | 542.3 95% | 551.3 98% | 436 57% |
| Brightness (cd/m²) | 280 | 321 15% | 350 25% | 516 84% | 517 85% | 416 49% |
| Brightness Distribution (%) | 92 | 88 -4% | 87 -5% | 85 -8% | 91 -1% | 89 -3% |
| Black Level * (cd/m²) | 0.34 | 0.22 35% | 0.24 29% | 0.38 -12% | 0.37 -9% | 0.36 -6% |
| Contrast (:1) | 818 | 1527 87% | 1540 88% | 1427 74% | 1490 82% | 1211 48% |
| Colorchecker dE 2000 * | 2.6 | 2.8 -8% | 2.3 12% | 3.18 -22% | 1.45 44% | 1.81 30% |
| Colorchecker dE 2000 max. * | 4.81 | 6.9 -43% | 4.34 10% | 6.05 -26% | 2.86 41% | 4.73 2% |
| Colorchecker dE 2000 calibrated * | 0.51 | 1.4 -175% | 0.6 -18% | 0.67 -31% | 1.7 -233% | 0.45 12% |
| Greyscale dE 2000 * | 3.9 | 3.8 3% | 3.1 21% | 3.1 21% | 1.3 67% | 2.9 26% |
| Gamma | 2.29 96% | 2.15 102% | 2.1 105% | 2.08 106% | 2.14 103% | 2.27 97% |
| CCT | 5877 111% | 6664 98% | 6248 104% | 6140 106% | 6580 99% | 6784 96% |
| Color Space (Percent of AdobeRGB 1998) (%) | 65 | |||||
| Color Space (Percent of sRGB) (%) | 99 | |||||
| Media totale (Programma / Settaggio) | -21% /
-13% | -43% /
-8% | -47% /
-10% | -41% /
-8% | -20% /
3% |
* ... Meglio usare valori piccoli
Calibrando noi stessi il pannello con un colorimetro X-Rite, i valori DeltaE medi della scala di grigi e del colore sarebbero migliorati da 3,9 e 2,6 a soli 0,4 e 0,51, rispettivamente. Il nostro profilo ICM calibrato è disponibile qui sopra per essere scaricato gratuitamente.
Tempi di risposta del Display
| ↔ Tempi di risposta dal Nero al Bianco | ||
|---|---|---|
| 17.9 ms ... aumenta ↗ e diminuisce ↘ combinato | ↗ 9 ms Incremento | 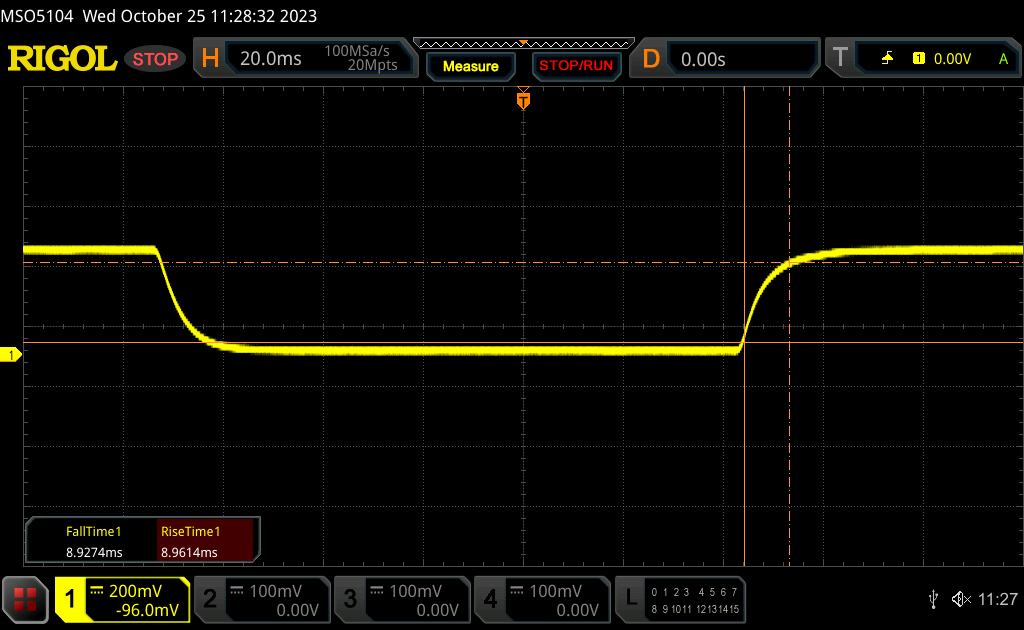 |
| ↘ 8.9 ms Calo | ||
| Lo schermo mostra buoni tempi di risposta durante i nostri tests, ma potrebbe essere troppo lento per i gamers competitivi. In confronto, tutti i dispositivi di test variano da 0.1 (minimo) a 240 (massimo) ms. » 40 % di tutti i dispositivi è migliore. Questo significa che i tempi di risposta rilevati sono simili alla media di tutti i dispositivi testati (19.8 ms). | ||
| ↔ Tempo di risposta dal 50% Grigio all'80% Grigio | ||
| 27.3 ms ... aumenta ↗ e diminuisce ↘ combinato | ↗ 12.7 ms Incremento | 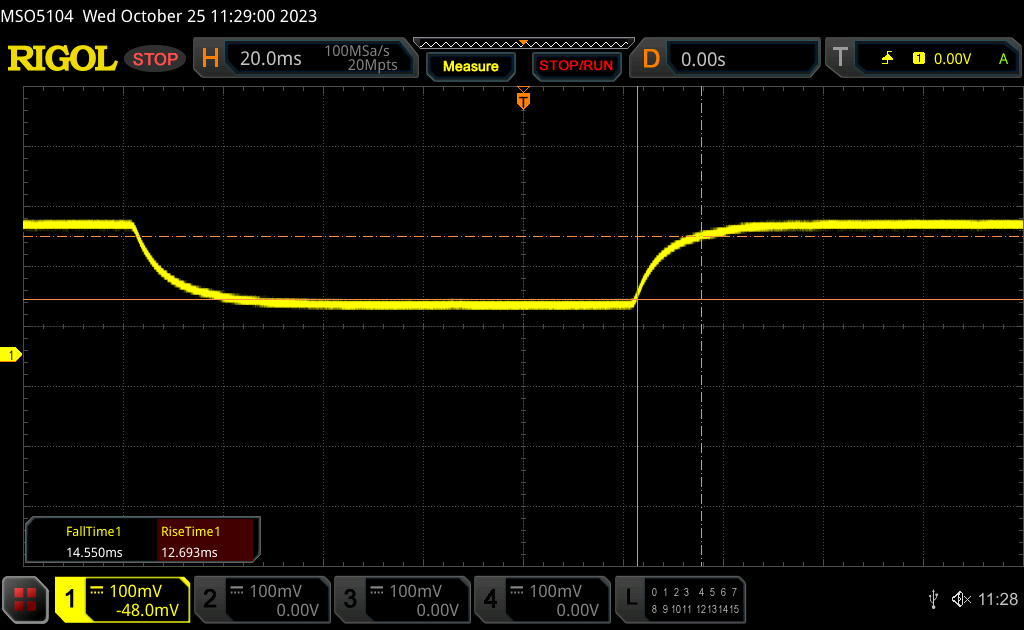 |
| ↘ 14.6 ms Calo | ||
| Lo schermo mostra tempi di risposta relativamente lenti nei nostri tests e potrebbe essere troppo lento per i gamers. In confronto, tutti i dispositivi di test variano da 0.165 (minimo) a 636 (massimo) ms. » 37 % di tutti i dispositivi è migliore. Questo significa che i tempi di risposta rilevati sono migliori rispettto alla media di tutti i dispositivi testati (31 ms). | ||
Sfarfallio dello schermo / PWM (Pulse-Width Modulation)
| flickering dello schermo / PWM non rilevato | 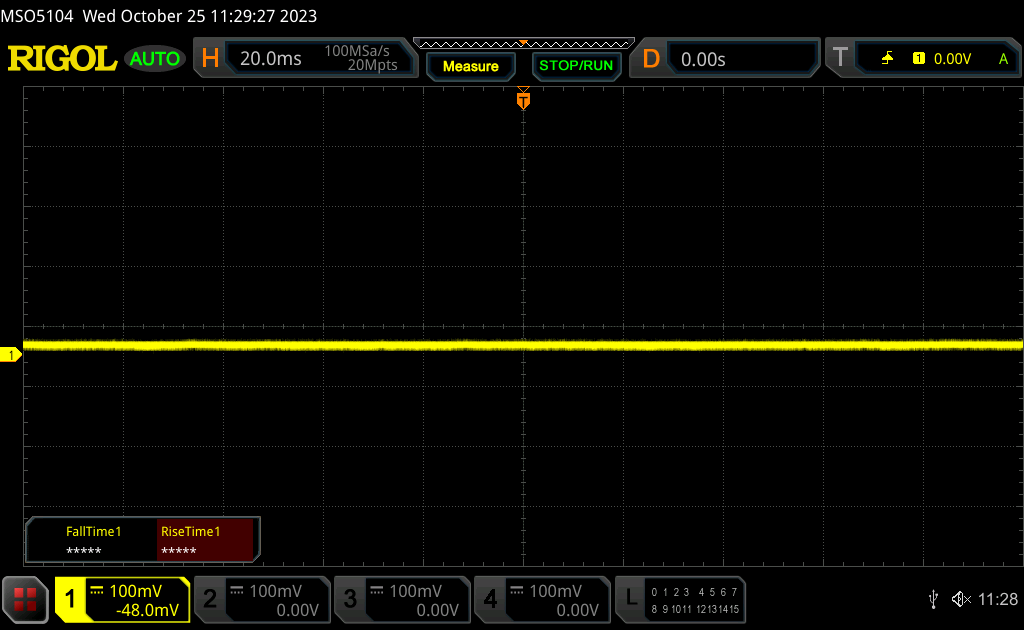 | ||
In confronto: 52 % di tutti i dispositivi testati non utilizza PWM per ridurre la luminosita' del display. Se è rilevato PWM, una media di 7757 (minimo: 5 - massimo: 343500) Hz è stata rilevata. | |||
Prestazioni
Condizioni del test
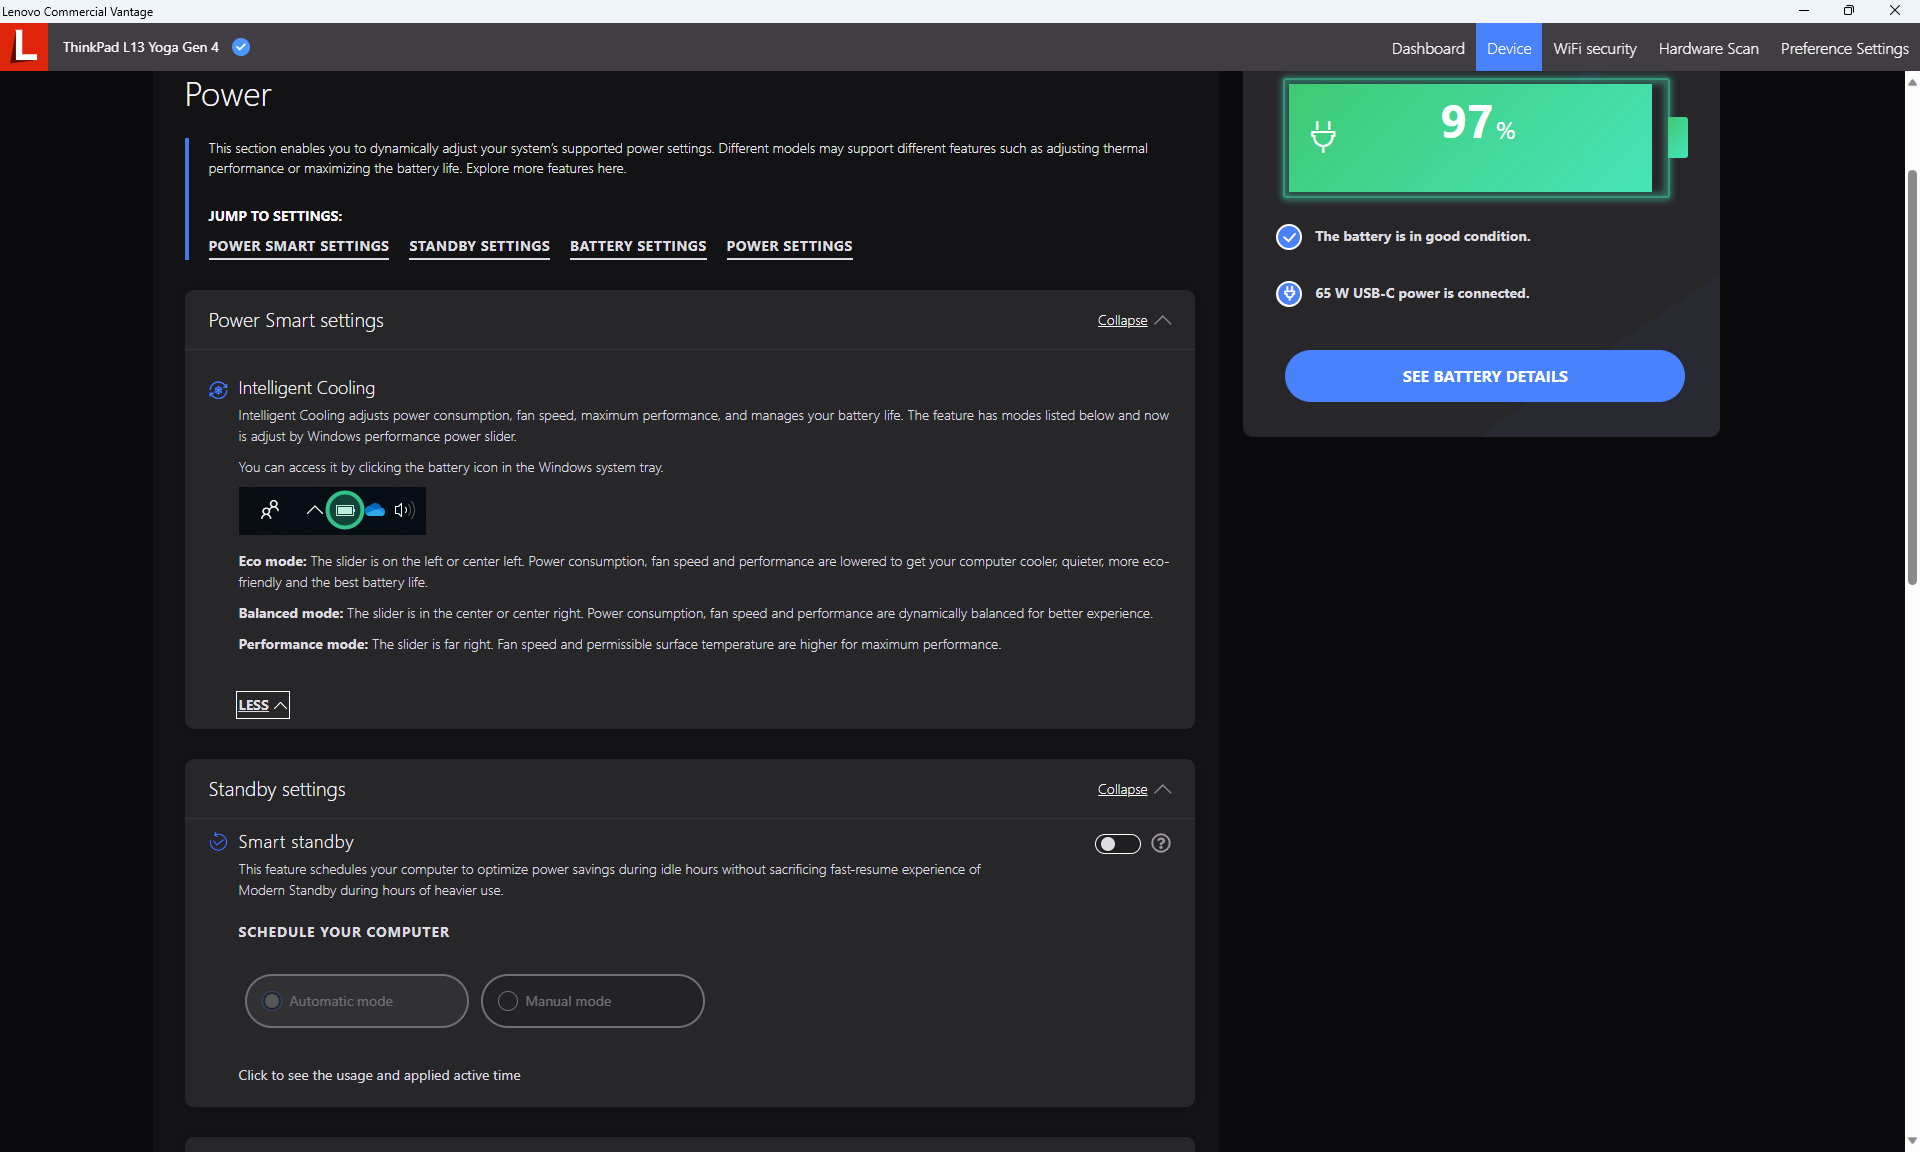
Abbiamo impostato Windows in modalità Prestazioni prima di eseguire i benchmark qui sotto. Non ci sono altri profili energetici oltre a quelli standard di Windows (Risparmio energetico, Bilanciato e Prestazioni).
Processore
Le prestazioni della CPU sono leggermente più lente rispetto alla maggior parte degli altri computer portatili con lo stesso Core i7-1355U a causa del throttling. Quando si esegue CineBench R15 xT in loop, ad esempio, il punteggio iniziale di 1274 punti diminuisce fino al 35% nel tempo, come mostra il grafico sottostante. Le prestazioni multi-thread sono quindi solo leggermente migliori rispetto al concorrente Ryzen 5 7530U dopo aver tenuto conto del throttling più elevato sulla versione Intel.
Il vantaggio principale per Intel continua ad essere nelle prestazioni single-thread, dove il nostro Core i7 ha un vantaggio del 20-25% rispetto al Ryzen 5 7530U.
Cinebench R15 Multi Loop
Cinebench R23: Multi Core | Single Core
Cinebench R20: CPU (Multi Core) | CPU (Single Core)
Cinebench R15: CPU Multi 64Bit | CPU Single 64Bit
Blender: v2.79 BMW27 CPU
7-Zip 18.03: 7z b 4 | 7z b 4 -mmt1
Geekbench 5.5: Multi-Core | Single-Core
HWBOT x265 Benchmark v2.2: 4k Preset
LibreOffice : 20 Documents To PDF
R Benchmark 2.5: Overall mean
| CPU Performance rating | |
| Framework Laptop 13.5 Ryzen 7 7840U | |
| Dell XPS 13 Plus 9320 Core i7-1360P | |
| Media Intel Core i7-1355U | |
| Lenovo ThinkPad L13 Yoga G4 i7-1355U | |
| HP Elite Dragonfly Folio 13.5 G3 | |
| Lenovo ThinkBook 13s G3 20YA0005GE | |
| Lenovo Yoga 6 13 83B2001SGE | |
| Dell Latitude 9330 | |
| Lenovo ThinkPad L13 Yoga G4 21FSS00100 | |
| Lenovo Yoga 6 13ALC6 -2! | |
| MSI Summit E13 Flip Evo A11MT | |
| Cinebench R23 / Multi Core | |
| Framework Laptop 13.5 Ryzen 7 7840U | |
| Dell XPS 13 Plus 9320 Core i7-1360P | |
| Media Intel Core i7-1355U (6936 - 10252, n=18) | |
| Lenovo ThinkPad L13 Yoga G4 i7-1355U | |
| Lenovo ThinkBook 13s G3 20YA0005GE | |
| HP Elite Dragonfly Folio 13.5 G3 | |
| Lenovo Yoga 6 13ALC6 | |
| Dell Latitude 9330 | |
| Lenovo Yoga 6 13 83B2001SGE | |
| Lenovo ThinkPad L13 Yoga G4 21FSS00100 | |
| MSI Summit E13 Flip Evo A11MT | |
| Cinebench R23 / Single Core | |
| Dell XPS 13 Plus 9320 Core i7-1360P | |
| Media Intel Core i7-1355U (1687 - 1889, n=18) | |
| Lenovo ThinkPad L13 Yoga G4 i7-1355U | |
| HP Elite Dragonfly Folio 13.5 G3 | |
| Framework Laptop 13.5 Ryzen 7 7840U | |
| Dell Latitude 9330 | |
| MSI Summit E13 Flip Evo A11MT | |
| Lenovo ThinkBook 13s G3 20YA0005GE | |
| Lenovo ThinkPad L13 Yoga G4 21FSS00100 | |
| Lenovo Yoga 6 13 83B2001SGE | |
| Lenovo Yoga 6 13ALC6 | |
| Cinebench R20 / CPU (Multi Core) | |
| Framework Laptop 13.5 Ryzen 7 7840U | |
| Dell XPS 13 Plus 9320 Core i7-1360P | |
| Media Intel Core i7-1355U (2849 - 3907, n=18) | |
| Lenovo ThinkPad L13 Yoga G4 i7-1355U | |
| Lenovo ThinkBook 13s G3 20YA0005GE | |
| HP Elite Dragonfly Folio 13.5 G3 | |
| Lenovo Yoga 6 13ALC6 | |
| Lenovo Yoga 6 13 83B2001SGE | |
| Dell Latitude 9330 | |
| Lenovo ThinkPad L13 Yoga G4 21FSS00100 | |
| MSI Summit E13 Flip Evo A11MT | |
| Cinebench R20 / CPU (Single Core) | |
| Dell XPS 13 Plus 9320 Core i7-1360P | |
| Media Intel Core i7-1355U (654 - 725, n=18) | |
| Lenovo ThinkPad L13 Yoga G4 i7-1355U | |
| HP Elite Dragonfly Folio 13.5 G3 | |
| Framework Laptop 13.5 Ryzen 7 7840U | |
| Dell Latitude 9330 | |
| Lenovo ThinkBook 13s G3 20YA0005GE | |
| MSI Summit E13 Flip Evo A11MT | |
| Lenovo Yoga 6 13 83B2001SGE | |
| Lenovo ThinkPad L13 Yoga G4 21FSS00100 | |
| Lenovo Yoga 6 13ALC6 | |
| Cinebench R15 / CPU Multi 64Bit | |
| Framework Laptop 13.5 Ryzen 7 7840U | |
| Dell XPS 13 Plus 9320 Core i7-1360P | |
| Lenovo ThinkBook 13s G3 20YA0005GE | |
| Lenovo ThinkBook 13s G3 20YA0005GE | |
| Lenovo Yoga 6 13 83B2001SGE | |
| Media Intel Core i7-1355U (1206 - 1735, n=18) | |
| HP Elite Dragonfly Folio 13.5 G3 | |
| Lenovo ThinkPad L13 Yoga G4 21FSS00100 | |
| Lenovo ThinkPad L13 Yoga G4 i7-1355U | |
| Lenovo Yoga 6 13ALC6 | |
| Dell Latitude 9330 | |
| MSI Summit E13 Flip Evo A11MT | |
| Cinebench R15 / CPU Single 64Bit | |
| Dell XPS 13 Plus 9320 Core i7-1360P | |
| Media Intel Core i7-1355U (237 - 267, n=18) | |
| Framework Laptop 13.5 Ryzen 7 7840U | |
| HP Elite Dragonfly Folio 13.5 G3 | |
| Lenovo ThinkPad L13 Yoga G4 i7-1355U | |
| Lenovo ThinkBook 13s G3 20YA0005GE | |
| Dell Latitude 9330 | |
| Lenovo Yoga 6 13 83B2001SGE | |
| MSI Summit E13 Flip Evo A11MT | |
| Lenovo ThinkPad L13 Yoga G4 21FSS00100 | |
| Lenovo Yoga 6 13ALC6 | |
| Blender / v2.79 BMW27 CPU | |
| MSI Summit E13 Flip Evo A11MT | |
| Lenovo ThinkPad L13 Yoga G4 i7-1355U | |
| Lenovo ThinkPad L13 Yoga G4 21FSS00100 | |
| Dell Latitude 9330 | |
| HP Elite Dragonfly Folio 13.5 G3 | |
| Media Intel Core i7-1355U (328 - 503, n=18) | |
| Lenovo ThinkBook 13s G3 20YA0005GE | |
| Lenovo Yoga 6 13ALC6 | |
| Lenovo Yoga 6 13 83B2001SGE | |
| Dell XPS 13 Plus 9320 Core i7-1360P | |
| Framework Laptop 13.5 Ryzen 7 7840U | |
| 7-Zip 18.03 / 7z b 4 | |
| Framework Laptop 13.5 Ryzen 7 7840U | |
| Dell XPS 13 Plus 9320 Core i7-1360P | |
| Lenovo Yoga 6 13 83B2001SGE | |
| Lenovo ThinkBook 13s G3 20YA0005GE | |
| Lenovo Yoga 6 13ALC6 | |
| Media Intel Core i7-1355U (30255 - 42092, n=18) | |
| HP Elite Dragonfly Folio 13.5 G3 | |
| Lenovo ThinkPad L13 Yoga G4 i7-1355U | |
| Lenovo ThinkPad L13 Yoga G4 21FSS00100 | |
| Dell Latitude 9330 | |
| MSI Summit E13 Flip Evo A11MT | |
| 7-Zip 18.03 / 7z b 4 -mmt1 | |
| Framework Laptop 13.5 Ryzen 7 7840U | |
| Media Intel Core i7-1355U (5301 - 5911, n=18) | |
| Dell XPS 13 Plus 9320 Core i7-1360P | |
| Lenovo ThinkPad L13 Yoga G4 i7-1355U | |
| Lenovo ThinkBook 13s G3 20YA0005GE | |
| Lenovo Yoga 6 13 83B2001SGE | |
| HP Elite Dragonfly Folio 13.5 G3 | |
| MSI Summit E13 Flip Evo A11MT | |
| Lenovo ThinkPad L13 Yoga G4 21FSS00100 | |
| Dell Latitude 9330 | |
| Lenovo Yoga 6 13ALC6 | |
| Geekbench 5.5 / Multi-Core | |
| Dell XPS 13 Plus 9320 Core i7-1360P | |
| Framework Laptop 13.5 Ryzen 7 7840U | |
| HP Elite Dragonfly Folio 13.5 G3 | |
| Media Intel Core i7-1355U (7507 - 9328, n=18) | |
| Lenovo ThinkPad L13 Yoga G4 i7-1355U | |
| Lenovo Yoga 6 13 83B2001SGE | |
| Dell Latitude 9330 | |
| Lenovo ThinkBook 13s G3 20YA0005GE | |
| Lenovo ThinkPad L13 Yoga G4 21FSS00100 | |
| MSI Summit E13 Flip Evo A11MT | |
| Geekbench 5.5 / Single-Core | |
| Framework Laptop 13.5 Ryzen 7 7840U | |
| Lenovo ThinkPad L13 Yoga G4 i7-1355U | |
| Dell XPS 13 Plus 9320 Core i7-1360P | |
| Media Intel Core i7-1355U (1678 - 1872, n=18) | |
| HP Elite Dragonfly Folio 13.5 G3 | |
| Dell Latitude 9330 | |
| MSI Summit E13 Flip Evo A11MT | |
| Lenovo Yoga 6 13 83B2001SGE | |
| Lenovo ThinkBook 13s G3 20YA0005GE | |
| Lenovo ThinkPad L13 Yoga G4 21FSS00100 | |
| HWBOT x265 Benchmark v2.2 / 4k Preset | |
| Framework Laptop 13.5 Ryzen 7 7840U | |
| Dell XPS 13 Plus 9320 Core i7-1360P | |
| Lenovo Yoga 6 13 83B2001SGE | |
| Lenovo ThinkBook 13s G3 20YA0005GE | |
| Media Intel Core i7-1355U (7.83 - 11.4, n=18) | |
| Lenovo ThinkPad L13 Yoga G4 i7-1355U | |
| Lenovo Yoga 6 13ALC6 | |
| HP Elite Dragonfly Folio 13.5 G3 | |
| Dell Latitude 9330 | |
| Lenovo ThinkPad L13 Yoga G4 21FSS00100 | |
| MSI Summit E13 Flip Evo A11MT | |
| LibreOffice / 20 Documents To PDF | |
| Lenovo Yoga 6 13ALC6 | |
| Lenovo ThinkPad L13 Yoga G4 21FSS00100 | |
| Media Intel Core i7-1355U (41.1 - 108.6, n=18) | |
| Dell Latitude 9330 | |
| Lenovo ThinkBook 13s G3 20YA0005GE | |
| HP Elite Dragonfly Folio 13.5 G3 | |
| Lenovo Yoga 6 13 83B2001SGE | |
| Lenovo ThinkPad L13 Yoga G4 i7-1355U | |
| MSI Summit E13 Flip Evo A11MT | |
| Dell XPS 13 Plus 9320 Core i7-1360P | |
| Framework Laptop 13.5 Ryzen 7 7840U | |
| R Benchmark 2.5 / Overall mean | |
| MSI Summit E13 Flip Evo A11MT | |
| Lenovo Yoga 6 13ALC6 | |
| Lenovo ThinkPad L13 Yoga G4 21FSS00100 | |
| Lenovo ThinkBook 13s G3 20YA0005GE | |
| Lenovo Yoga 6 13 83B2001SGE | |
| Dell Latitude 9330 | |
| Media Intel Core i7-1355U (0.4481 - 0.832, n=18) | |
| HP Elite Dragonfly Folio 13.5 G3 | |
| Lenovo ThinkPad L13 Yoga G4 i7-1355U | |
| Dell XPS 13 Plus 9320 Core i7-1360P | |
| Framework Laptop 13.5 Ryzen 7 7840U | |
* ... Meglio usare valori piccoli
AIDA64: FP32 Ray-Trace | FPU Julia | CPU SHA3 | CPU Queen | FPU SinJulia | FPU Mandel | CPU AES | CPU ZLib | FP64 Ray-Trace | CPU PhotoWorxx
| AIDA64 / FP32 Ray-Trace | |
| Framework Laptop 13.5 Ryzen 7 7840U | |
| Lenovo ThinkPad L13 Yoga G4 21FSS00100 | |
| Media Intel Core i7-1355U (5673 - 8424, n=18) | |
| MSI Summit E13 Flip Evo A11MT | |
| Dell Latitude 9330 | |
| HP Elite Dragonfly Folio 13.5 G3 | |
| Lenovo ThinkPad L13 Yoga G4 i7-1355U | |
| AIDA64 / FP64 Ray-Trace | |
| Framework Laptop 13.5 Ryzen 7 7840U | |
| Lenovo ThinkPad L13 Yoga G4 21FSS00100 | |
| MSI Summit E13 Flip Evo A11MT | |
| Media Intel Core i7-1355U (2991 - 4453, n=18) | |
| Dell Latitude 9330 | |
| HP Elite Dragonfly Folio 13.5 G3 | |
| Lenovo ThinkPad L13 Yoga G4 i7-1355U | |
| AIDA64 / CPU PhotoWorxx | |
| HP Elite Dragonfly Folio 13.5 G3 | |
| MSI Summit E13 Flip Evo A11MT | |
| Dell Latitude 9330 | |
| Lenovo ThinkPad L13 Yoga G4 i7-1355U | |
| Media Intel Core i7-1355U (21800 - 46154, n=18) | |
| Framework Laptop 13.5 Ryzen 7 7840U | |
| Lenovo ThinkPad L13 Yoga G4 21FSS00100 | |
Prestazioni del sistema
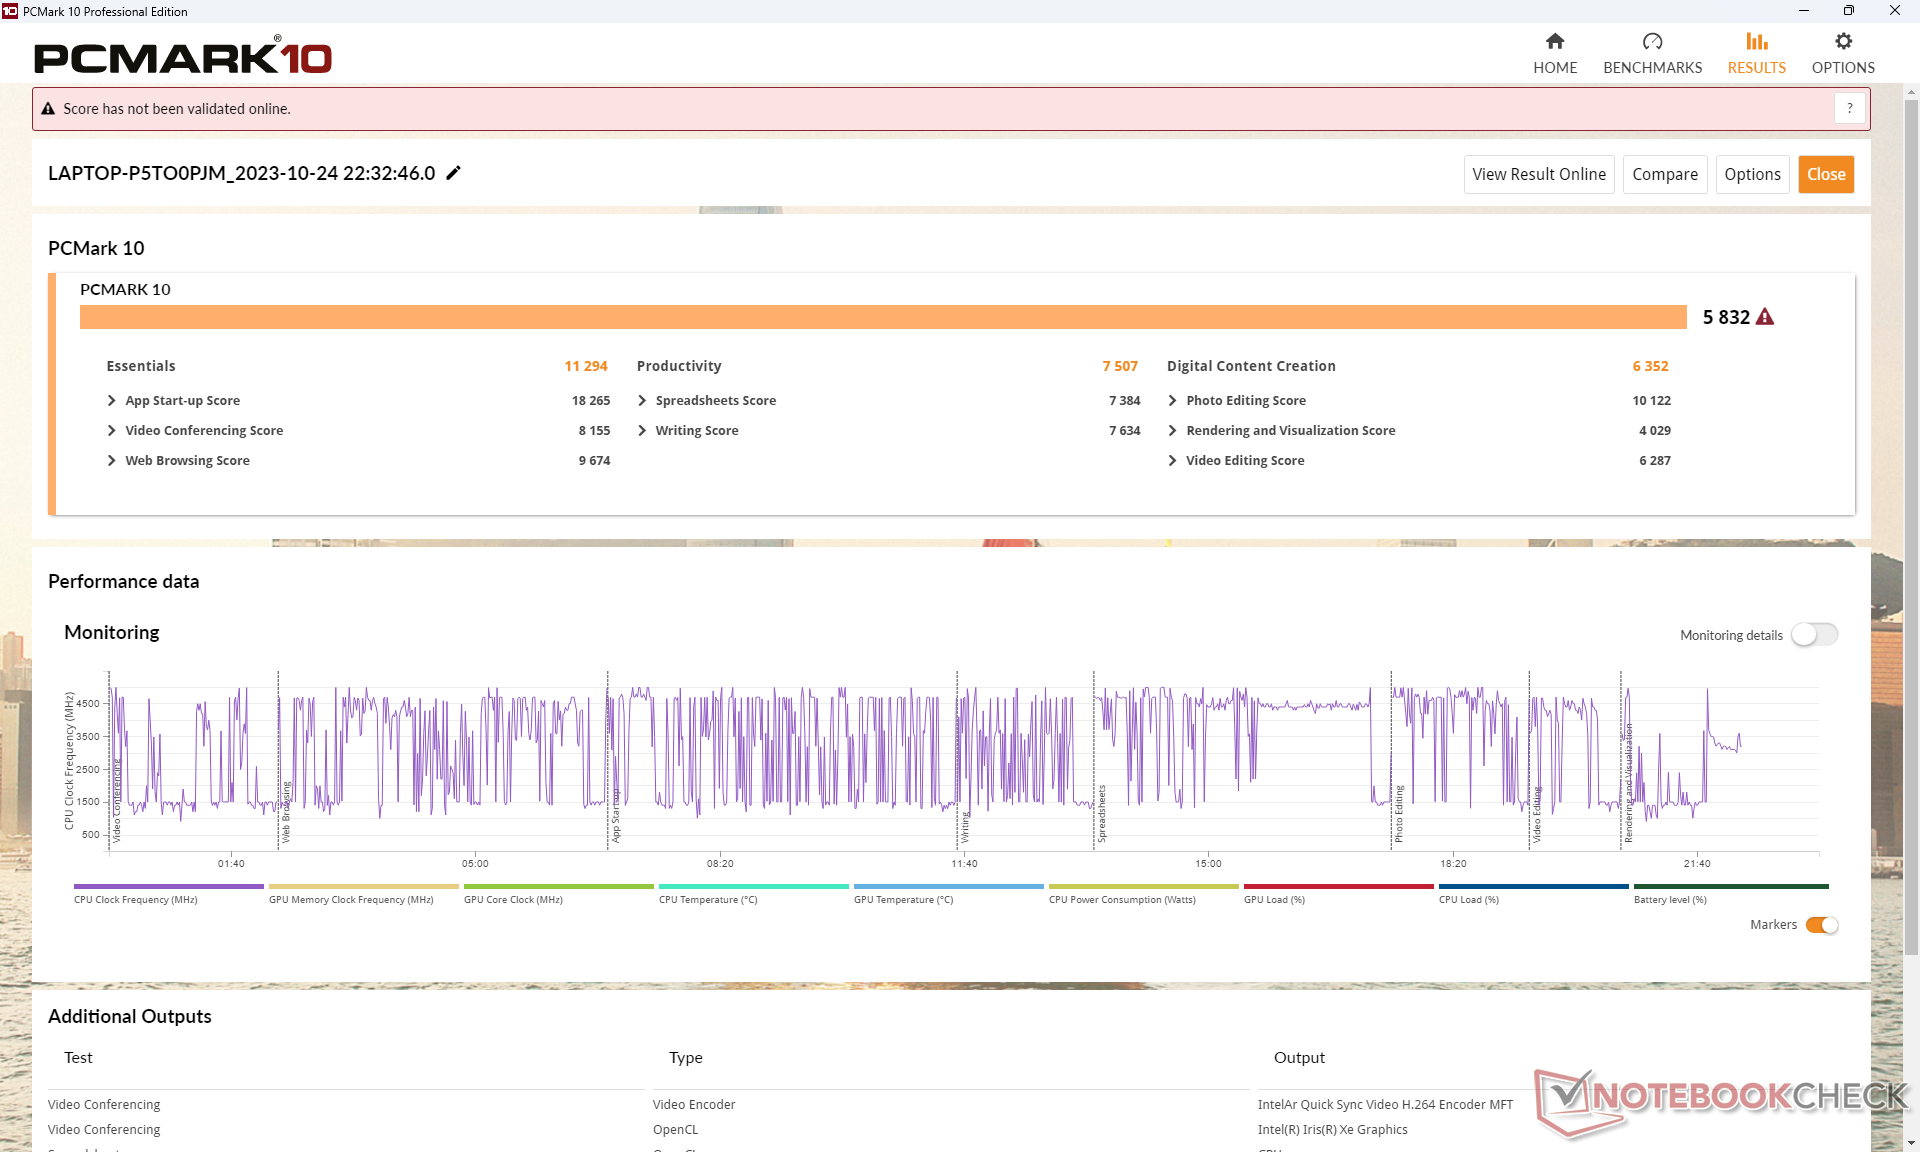
I punteggi di PCMark sono più alti nel sottotest Creazione di contenuti digitali, che è molto impegnativo per la GPU, mentre il test Produttività, che è molto impegnativo per la CPU, favorisce la versione AMD. Questo suggerisce che la nostra versione Intel offre migliori prestazioni grafiche integrate ma prestazioni multi-thread della CPU più lente rispetto alla versione AMD.
CrossMark: Overall | Productivity | Creativity | Responsiveness
| PCMark 10 / Score | |
| Framework Laptop 13.5 Ryzen 7 7840U | |
| Lenovo ThinkPad L13 Yoga G4 i7-1355U | |
| HP Elite Dragonfly Folio 13.5 G3 | |
| Media Intel Core i7-1355U, Intel Iris Xe Graphics G7 96EUs (5455 - 5933, n=15) | |
| Lenovo ThinkPad L13 Yoga G4 21FSS00100 | |
| Dell Latitude 9330 | |
| MSI Summit E13 Flip Evo A11MT | |
| PCMark 10 / Essentials | |
| HP Elite Dragonfly Folio 13.5 G3 | |
| Lenovo ThinkPad L13 Yoga G4 i7-1355U | |
| Lenovo ThinkPad L13 Yoga G4 21FSS00100 | |
| Framework Laptop 13.5 Ryzen 7 7840U | |
| Media Intel Core i7-1355U, Intel Iris Xe Graphics G7 96EUs (10203 - 11822, n=15) | |
| Dell Latitude 9330 | |
| MSI Summit E13 Flip Evo A11MT | |
| PCMark 10 / Productivity | |
| Framework Laptop 13.5 Ryzen 7 7840U | |
| Lenovo ThinkPad L13 Yoga G4 21FSS00100 | |
| Lenovo ThinkPad L13 Yoga G4 i7-1355U | |
| HP Elite Dragonfly Folio 13.5 G3 | |
| Media Intel Core i7-1355U, Intel Iris Xe Graphics G7 96EUs (6763 - 7536, n=15) | |
| Dell Latitude 9330 | |
| MSI Summit E13 Flip Evo A11MT | |
| PCMark 10 / Digital Content Creation | |
| Framework Laptop 13.5 Ryzen 7 7840U | |
| Lenovo ThinkPad L13 Yoga G4 i7-1355U | |
| Media Intel Core i7-1355U, Intel Iris Xe Graphics G7 96EUs (5723 - 6712, n=15) | |
| HP Elite Dragonfly Folio 13.5 G3 | |
| Dell Latitude 9330 | |
| MSI Summit E13 Flip Evo A11MT | |
| Lenovo ThinkPad L13 Yoga G4 21FSS00100 | |
| CrossMark / Overall | |
| Framework Laptop 13.5 Ryzen 7 7840U | |
| HP Elite Dragonfly Folio 13.5 G3 | |
| Media Intel Core i7-1355U, Intel Iris Xe Graphics G7 96EUs (1478 - 1643, n=15) | |
| Lenovo ThinkPad L13 Yoga G4 i7-1355U | |
| Lenovo ThinkPad L13 Yoga G4 21FSS00100 | |
| CrossMark / Productivity | |
| Framework Laptop 13.5 Ryzen 7 7840U | |
| HP Elite Dragonfly Folio 13.5 G3 | |
| Media Intel Core i7-1355U, Intel Iris Xe Graphics G7 96EUs (1444 - 1665, n=15) | |
| Lenovo ThinkPad L13 Yoga G4 i7-1355U | |
| Lenovo ThinkPad L13 Yoga G4 21FSS00100 | |
| CrossMark / Creativity | |
| Framework Laptop 13.5 Ryzen 7 7840U | |
| HP Elite Dragonfly Folio 13.5 G3 | |
| Lenovo ThinkPad L13 Yoga G4 i7-1355U | |
| Media Intel Core i7-1355U, Intel Iris Xe Graphics G7 96EUs (1563 - 1732, n=15) | |
| Lenovo ThinkPad L13 Yoga G4 21FSS00100 | |
| CrossMark / Responsiveness | |
| HP Elite Dragonfly Folio 13.5 G3 | |
| Framework Laptop 13.5 Ryzen 7 7840U | |
| Media Intel Core i7-1355U, Intel Iris Xe Graphics G7 96EUs (1217 - 1681, n=15) | |
| Lenovo ThinkPad L13 Yoga G4 i7-1355U | |
| Lenovo ThinkPad L13 Yoga G4 21FSS00100 | |
| PCMark 10 Score | 5823 punti | |
Aiuto | ||
| AIDA64 / Memory Latency | |
| HP Elite Dragonfly Folio 13.5 G3 | |
| Lenovo ThinkPad L13 Yoga G4 21FSS00100 | |
| Media Intel Core i7-1355U (72.2 - 346, n=18) | |
| Dell Latitude 9330 | |
| Lenovo ThinkPad L13 Yoga G4 i7-1355U | |
| MSI Summit E13 Flip Evo A11MT | |
| Framework Laptop 13.5 Ryzen 7 7840U | |
* ... Meglio usare valori piccoli
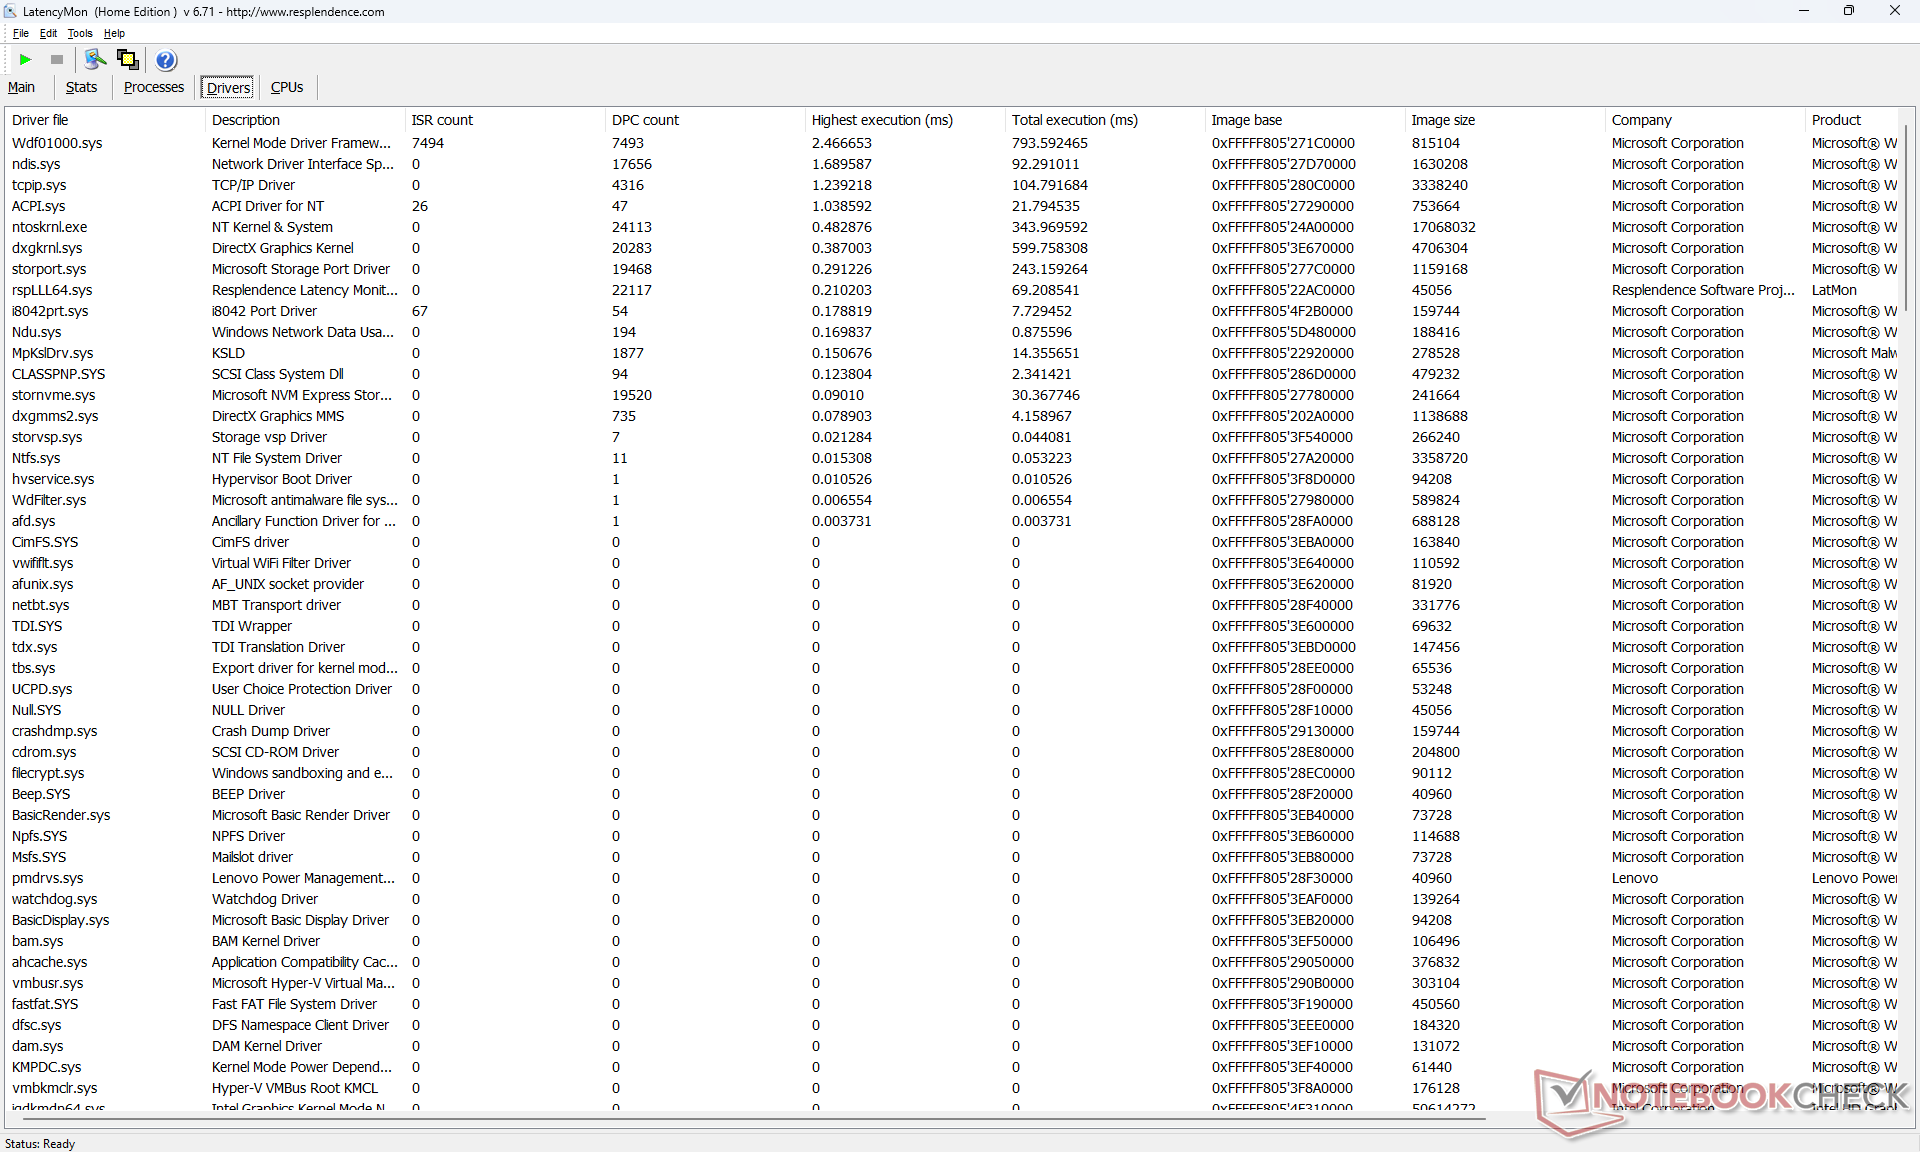
Latenza DPC
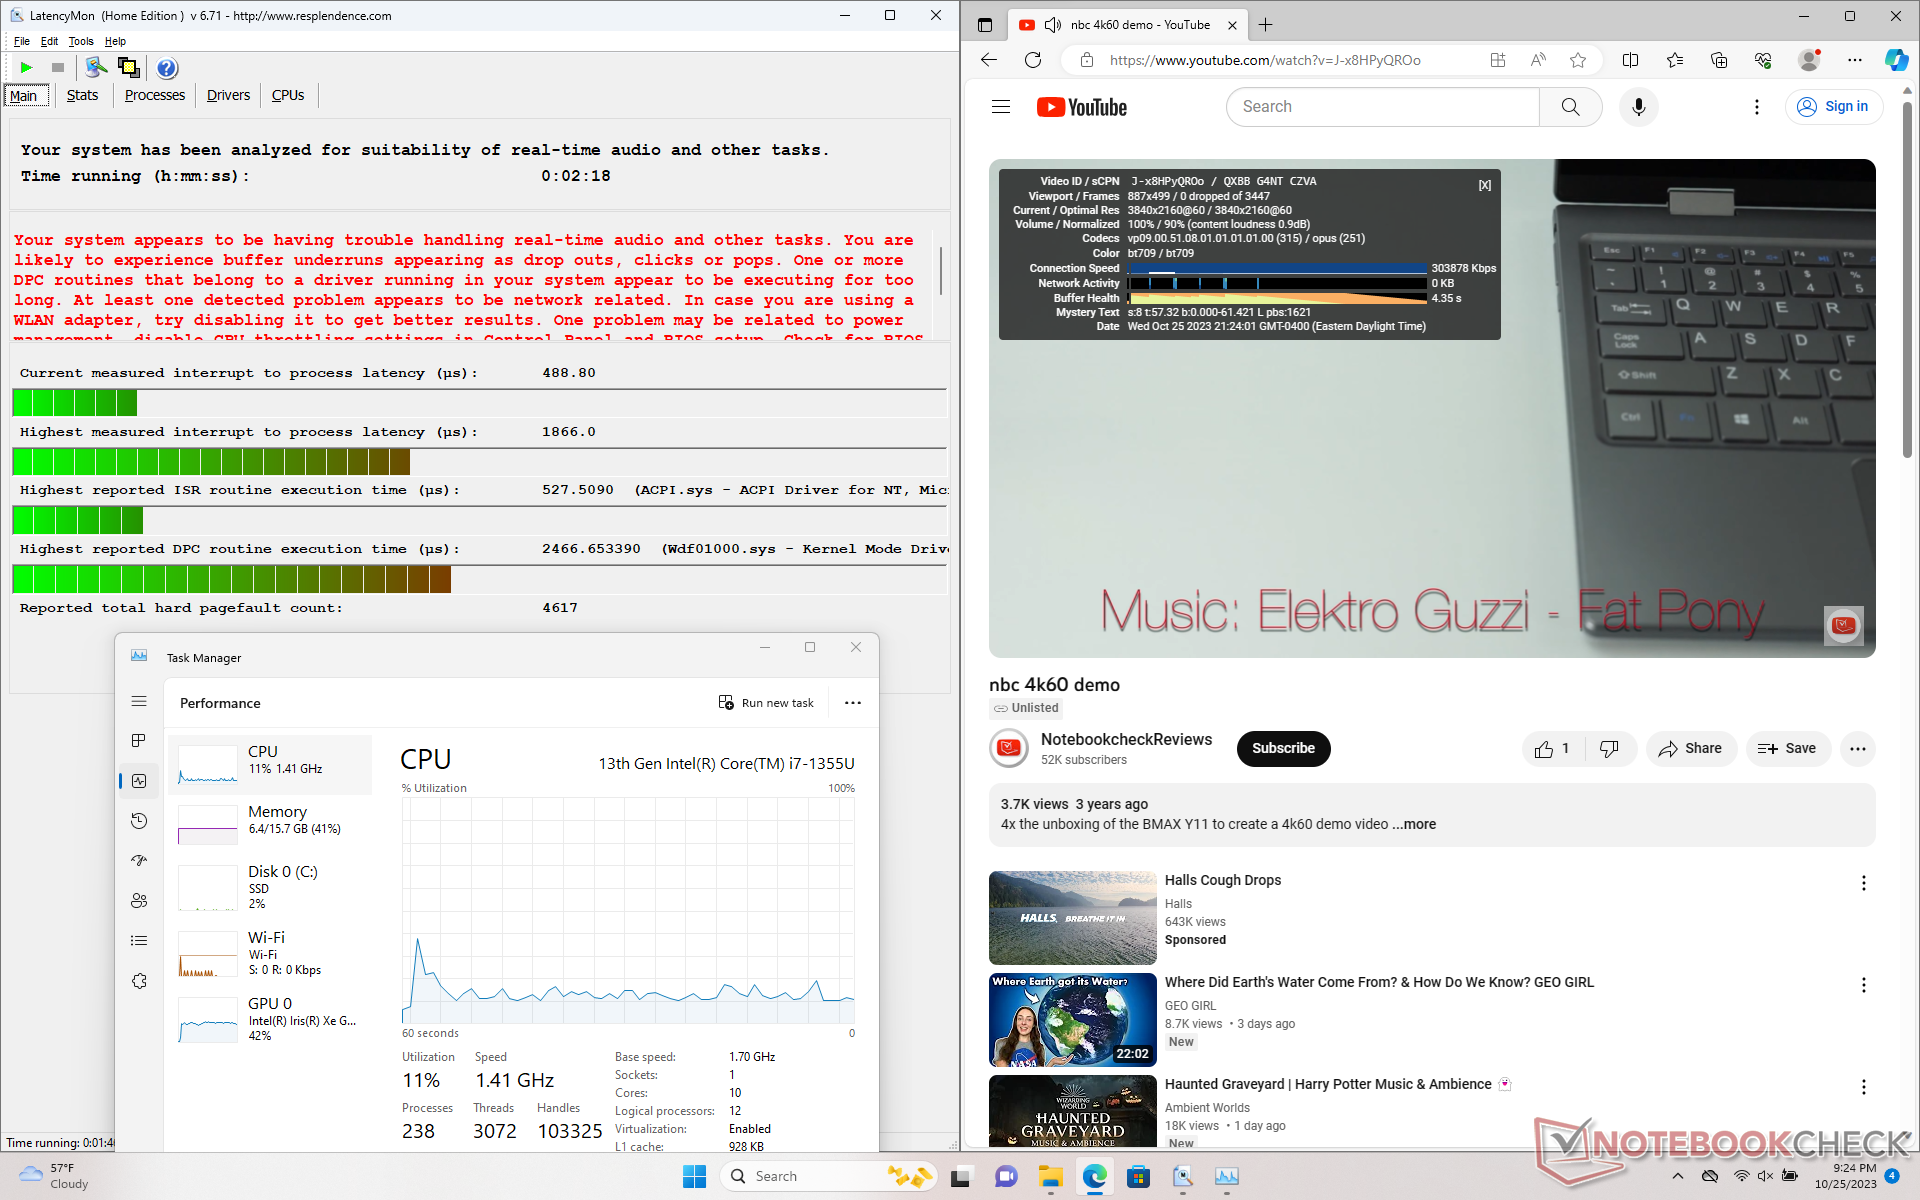
LatencyMon rivela lievi problemi di DPC quando si aprono più schede del browser della nostra homepage. la riproduzione di video 4K a 60 FPS è invece fluida e senza cadute di fotogrammi.
| DPC Latencies / LatencyMon - interrupt to process latency (max), Web, Youtube, Prime95 | |
| Dell Latitude 9330 | |
| HP Elite Dragonfly Folio 13.5 G3 | |
| MSI Summit E13 Flip Evo A11MT | |
| Lenovo ThinkPad L13 Yoga G4 i7-1355U | |
| Framework Laptop 13.5 Ryzen 7 7840U | |
| Lenovo ThinkPad L13 Yoga G4 21FSS00100 | |
* ... Meglio usare valori piccoli
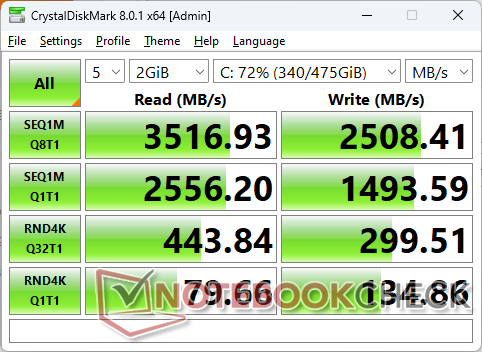
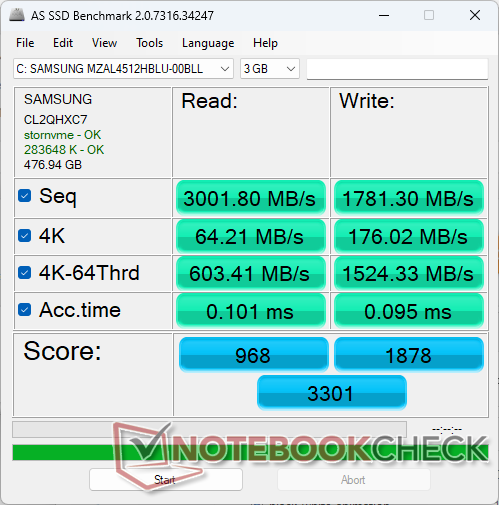
Dispositivi di archiviazione
La nostra unità viene fornita con un modello di fascia media da 512 GBSamsung PM9B1 al posto del Kioxia BG5, presente nella nostra versione AMD. Le velocità di trasferimento raggiungono un massimo di circa 3600 MB/s, prima che il throttling entri in gioco dopo alcuni minuti di stress, nel qual caso le velocità di trasferimento possono scendere fino a 2200 MB/s.

| Drive Performance rating - Percent | |
| HP Elite Dragonfly Folio 13.5 G3 -11! | |
| MSI Summit E13 Flip Evo A11MT | |
| Framework Laptop 13.5 Ryzen 7 7840U -11! | |
| Dell Latitude 9330 | |
| Lenovo ThinkPad L13 Yoga G4 21FSS00100 | |
| Lenovo ThinkPad L13 Yoga G4 i7-1355U | |
* ... Meglio usare valori piccoli
Disk Throttling: DiskSpd Read Loop, Queue Depth 8
Prestazioni della GPU
Il nostro Iris Xe 96 EUs ha un chiaro vantaggio rispetto allaRadeon RX Vega 7 nel Ryzen 5 7530U nelle applicazioni DX11 e DX12. i risultati di 3DMark Fire Strike e Time Spy, ad esempio, sono più veloci del 50-60% con la nostra configurazione Intel.
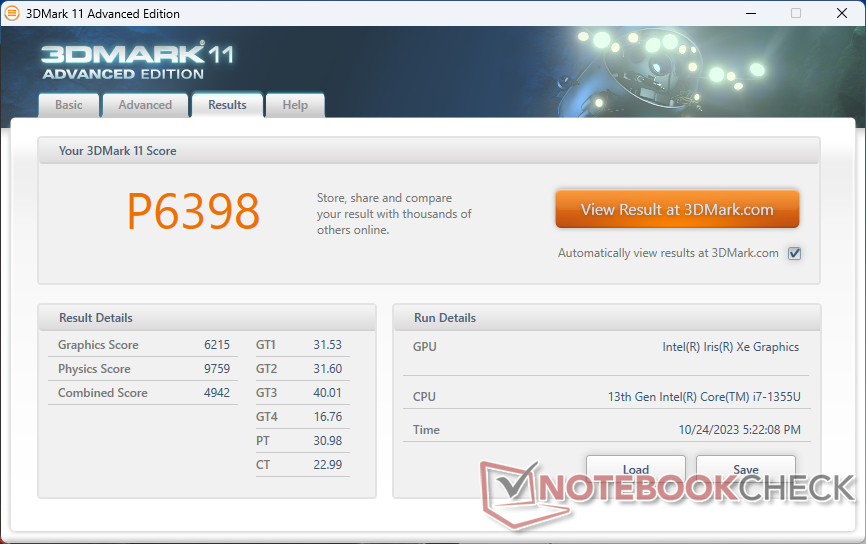
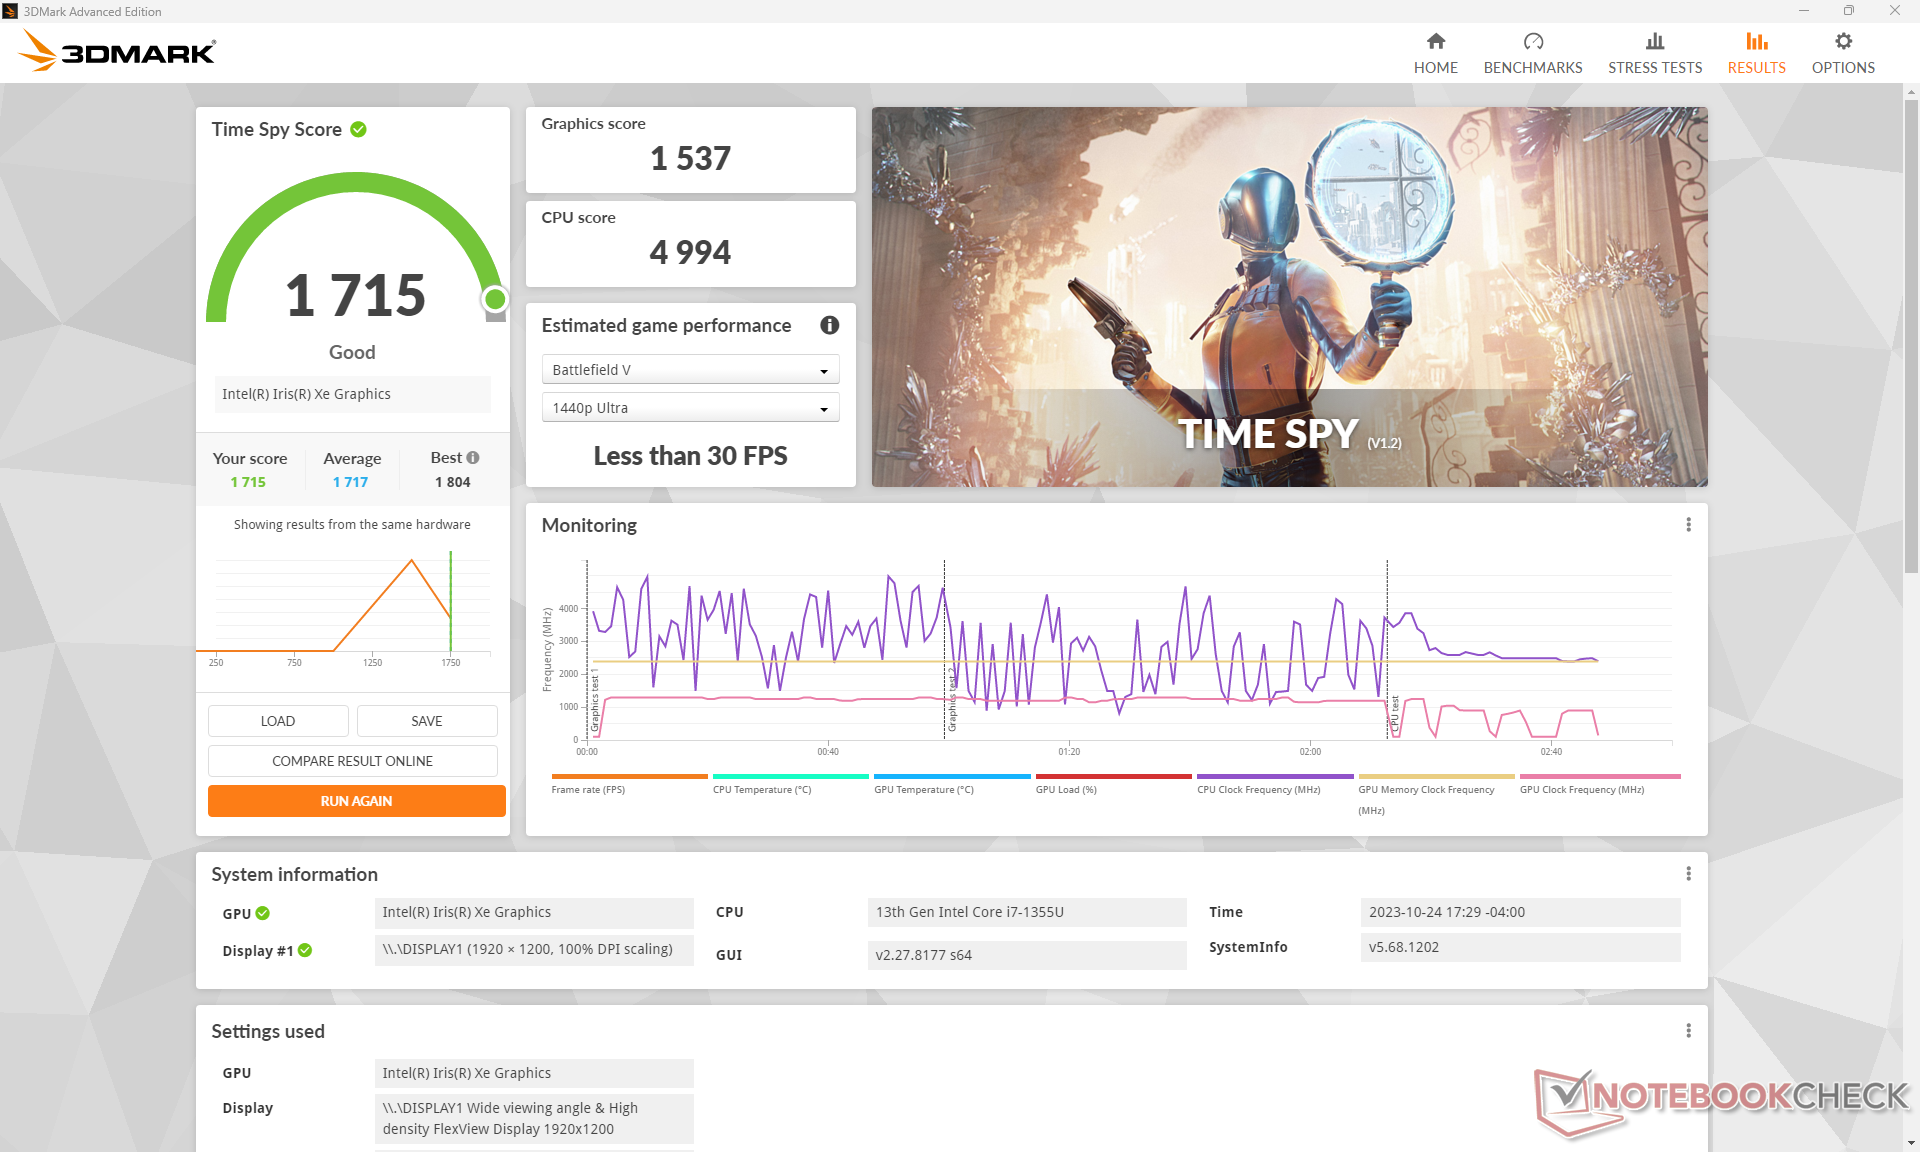
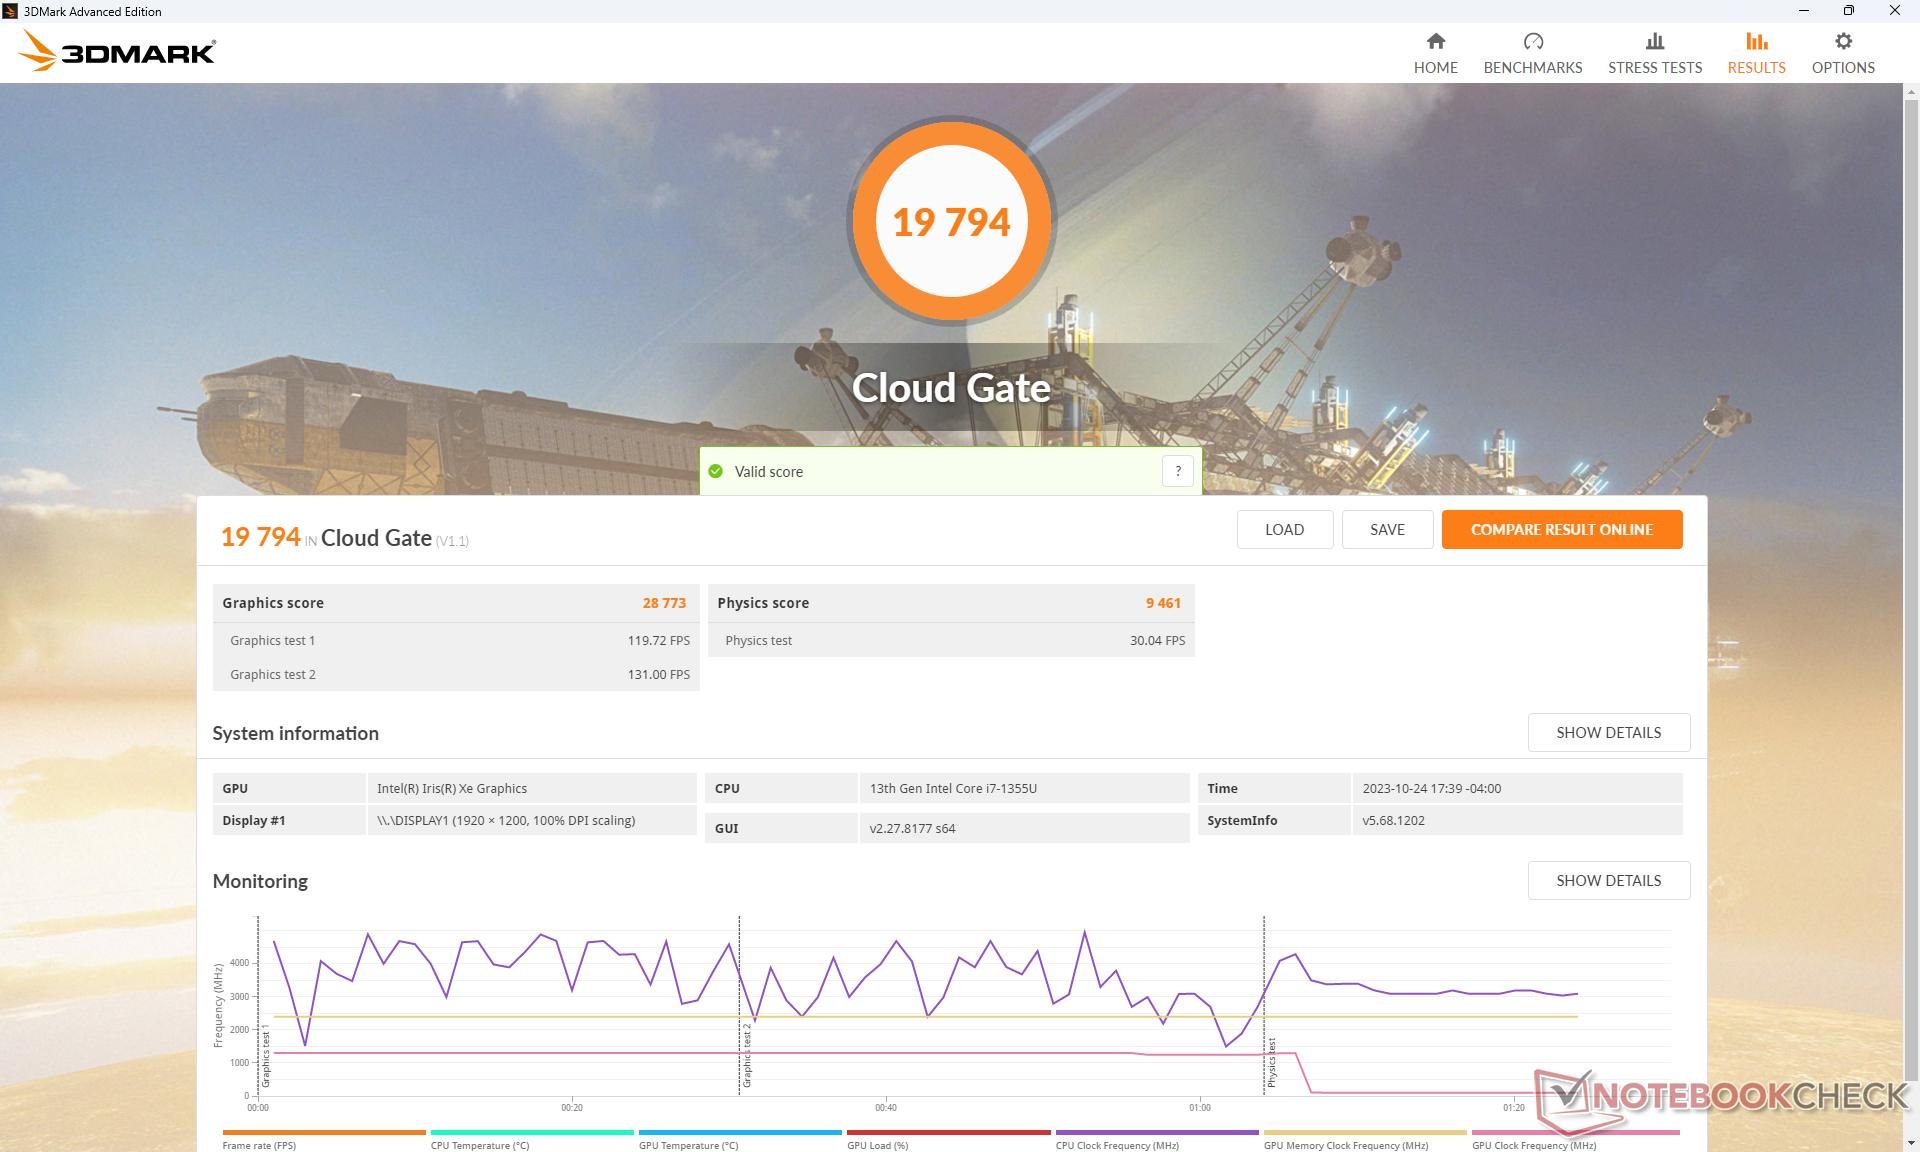
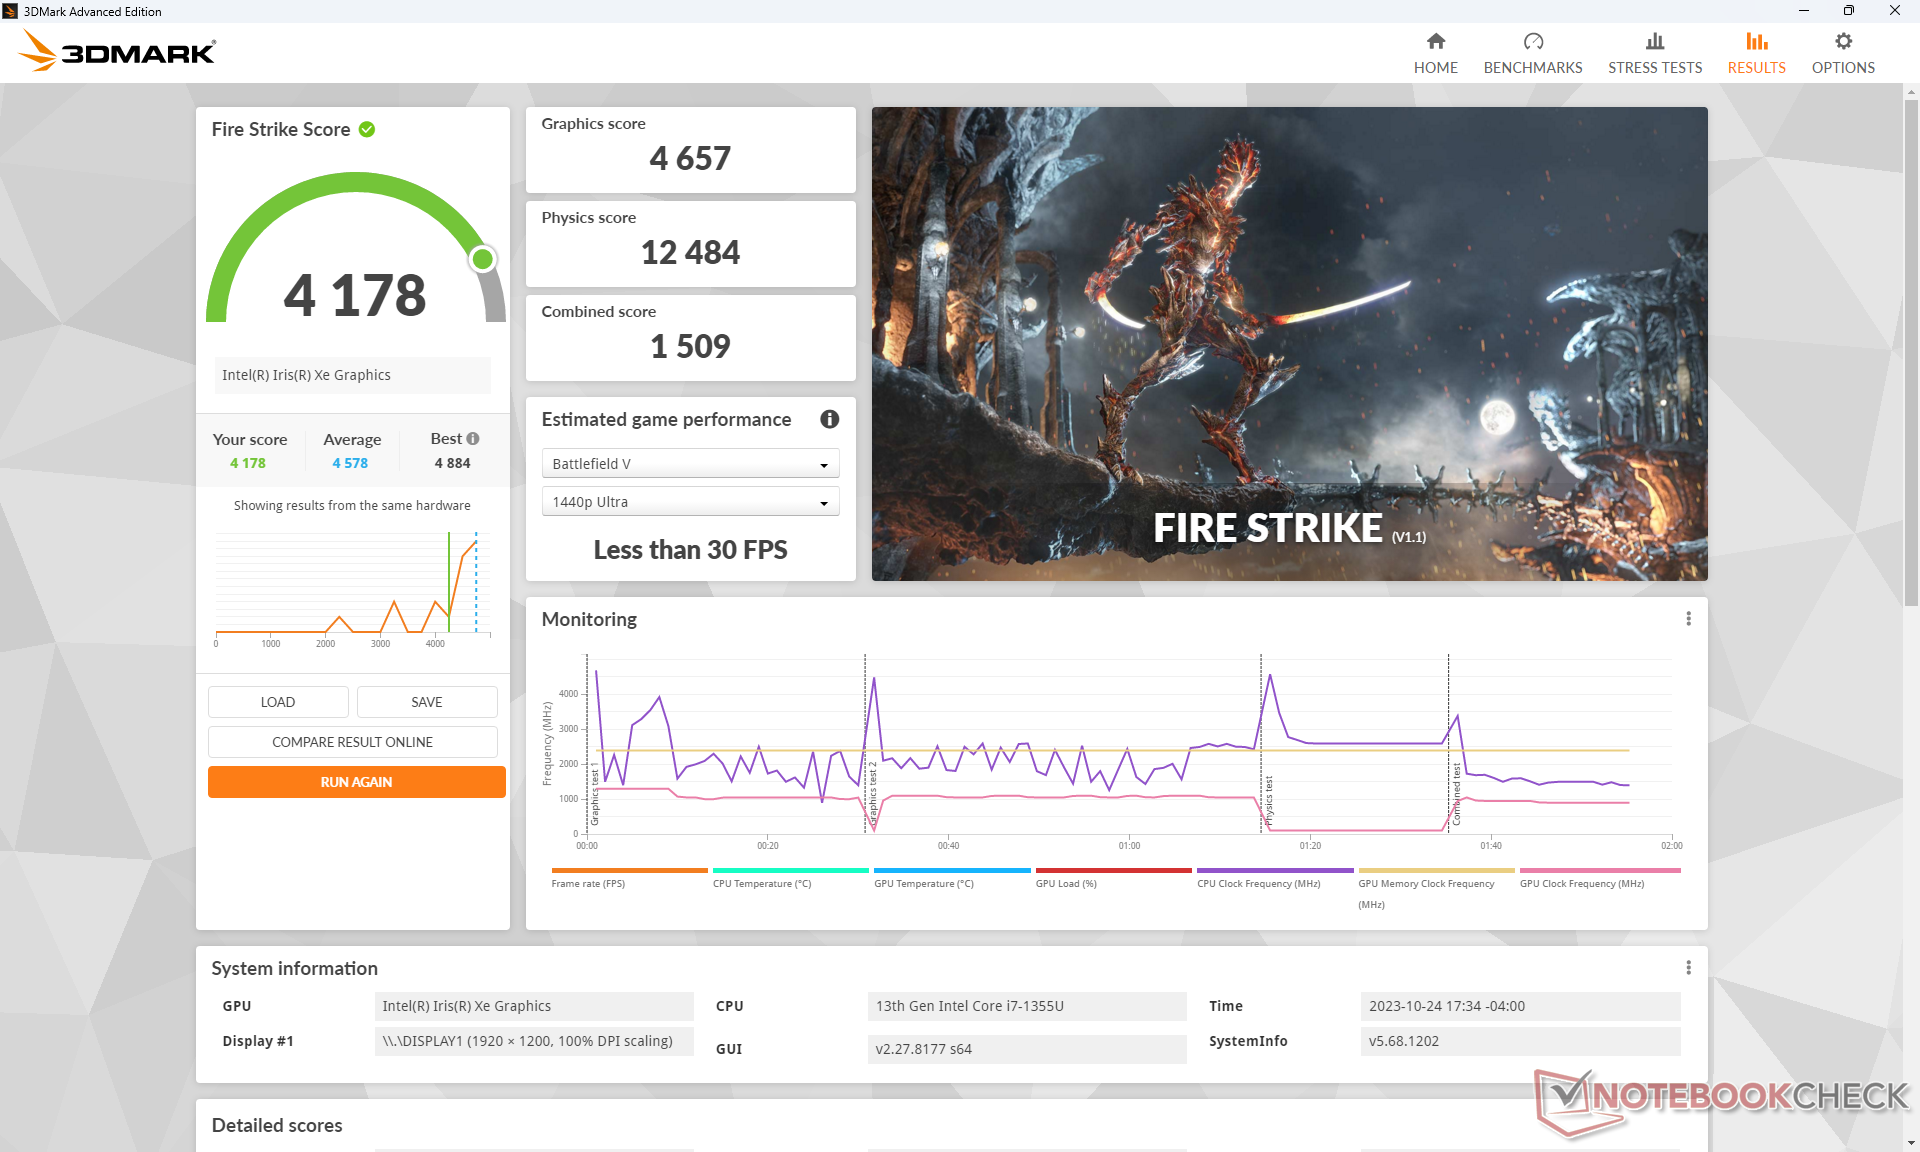
| 3DMark 11 Performance | 6398 punti | |
| 3DMark Cloud Gate Standard Score | 19794 punti | |
| 3DMark Fire Strike Score | 4178 punti | |
| 3DMark Time Spy Score | 1715 punti | |
Aiuto | ||
* ... Meglio usare valori piccoli
La stabilità del frame rate durante il gioco è purtroppo instabile. Quando è al minimo su Witcher 3 su impostazioni basse, ad esempio, i frame rate fluttuano tra 70 e 85 FPS, come mostra il grafico sottostante, che suggerisce la fluttuazione dei clock rate nel tempo. Fortunatamente, il ThinkPad L13 non è un computer portatile da gioco e quindi questo svantaggio specifico non dovrebbe essere un problema per il pubblico di riferimento. Le applicazioni di streaming continuano a funzionare senza problemi sulla macchina.
Witcher 3 FPS Chart
| basso | medio | alto | ultra | |
|---|---|---|---|---|
| GTA V (2015) | 106.7 | 84.1 | 9.99 | |
| The Witcher 3 (2015) | 92.8 | 56.7 | 31 | 13.8 |
| Dota 2 Reborn (2015) | 94.3 | 65.3 | 52.4 | 46.2 |
| Final Fantasy XV Benchmark (2018) | 36.6 | 20.1 | 15 | |
| X-Plane 11.11 (2018) | 39.8 | 27.3 | 25.1 | |
| Far Cry 5 (2018) | 45 | 24 | 22 | 21 |
| Strange Brigade (2018) | 87.2 | 38.1 | 30.5 | 23 |
| Cyberpunk 2077 1.6 (2022) | 17.8 | |||
| Tiny Tina's Wonderlands (2022) | 23.3 | 17.7 | 10.9 | 8.6 |
| F1 22 (2022) | 45 | 41.1 | 29.8 | 22.6 |
Emissioni
Rumore del sistema
Il rumore della ventola può essere più forte sulla versione Intel rispetto alla versione AMD quando si eseguono carichi impegnativi come 3DMark, il che può essere attribuito alle prestazioni grafiche più veloci e al consumo energetico complessivo della versione Intel. Per il resto, il rumore della ventola si aggira in genere intorno ai 30 dB(A) durante la navigazione web o lo streaming, per essere facilmente ignorabile nella maggior parte degli uffici o delle conferenze.
Rumorosità
| Idle |
| 23.4 / 23.4 / 23.4 dB(A) |
| Sotto carico |
| 33.9 / 36.9 dB(A) |
 | ||
30 dB silenzioso 40 dB(A) udibile 50 dB(A) rumoroso |
||
min: | ||
| Lenovo ThinkPad L13 Yoga G4 i7-1355U Iris Xe G7 96EUs, i7-1355U, Samsung PM9B1 512GB MZAL4512HBLU | Lenovo ThinkPad L13 Yoga G4 21FSS00100 Vega 7, R5 7530U, Kioxia BG5 KBG5AZNT512G | HP Elite Dragonfly Folio 13.5 G3 Iris Xe G7 96EUs, i7-1265U, Samsung PM9A1 MZVL2512HCJQ | Dell Latitude 9330 Iris Xe G7 96EUs, i7-1260U | MSI Summit E13 Flip Evo A11MT Iris Xe G7 96EUs, i7-1185G7, Phison 1TB SM2801T24GKBB4S-E162 | Framework Laptop 13.5 Ryzen 7 7840U Radeon 780M, R7 7840U, WD PC SN740 512GB SDDPNQD-512G | |
|---|---|---|---|---|---|---|
| Noise | 9% | 2% | -4% | -12% | -9% | |
| off /ambiente * (dB) | 23.1 | 23.4 -1% | 24.6 -6% | 23 -0% | 24.5 -6% | 22.6 2% |
| Idle Minimum * (dB) | 23.4 | 23.4 -0% | 24.6 -5% | 23 2% | 24.7 -6% | 22.6 3% |
| Idle Average * (dB) | 23.4 | 23.4 -0% | 24.6 -5% | 23.1 1% | 24.7 -6% | 22.6 3% |
| Idle Maximum * (dB) | 23.4 | 23.4 -0% | 24.6 -5% | 23.1 1% | 26.4 -13% | 24.2 -3% |
| Load Average * (dB) | 33.9 | 24 29% | 27.8 18% | 37.1 -9% | 37.8 -12% | 35.8 -6% |
| Witcher 3 ultra * (dB) | 36.9 | 30.8 17% | 33.4 9% | 40.6 -10% | 41.4 -12% | 46.5 -26% |
| Load Maximum * (dB) | 36.9 | 30.1 18% | 33.4 9% | 40.5 -10% | 48.8 -32% | 48.9 -33% |
* ... Meglio usare valori piccoli
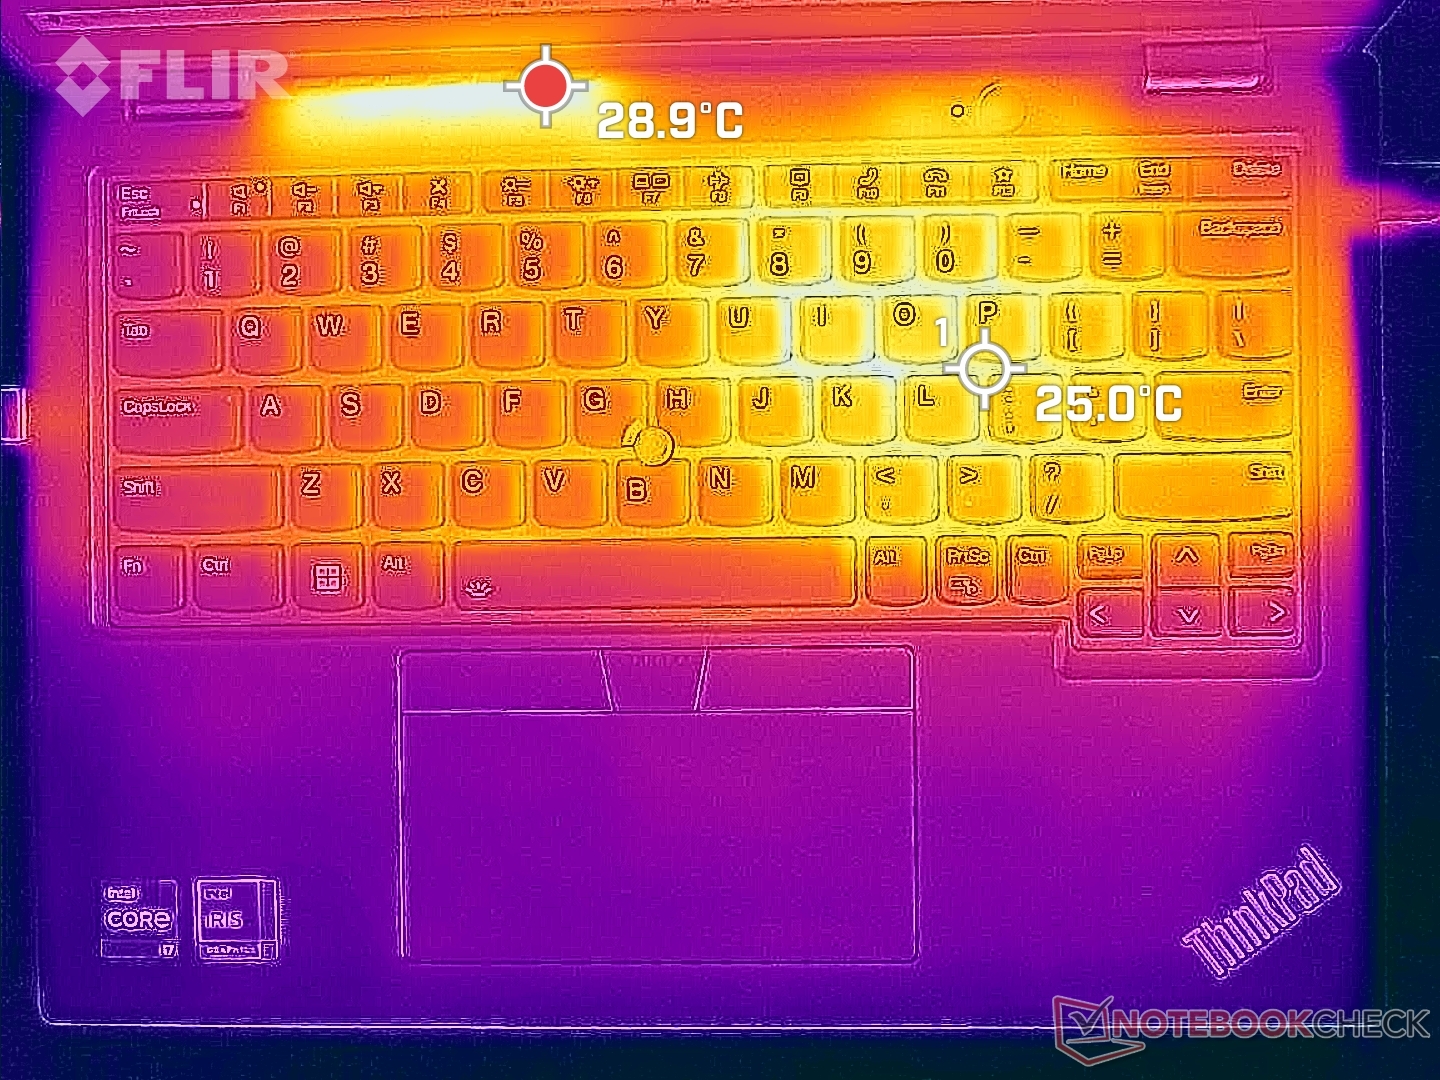
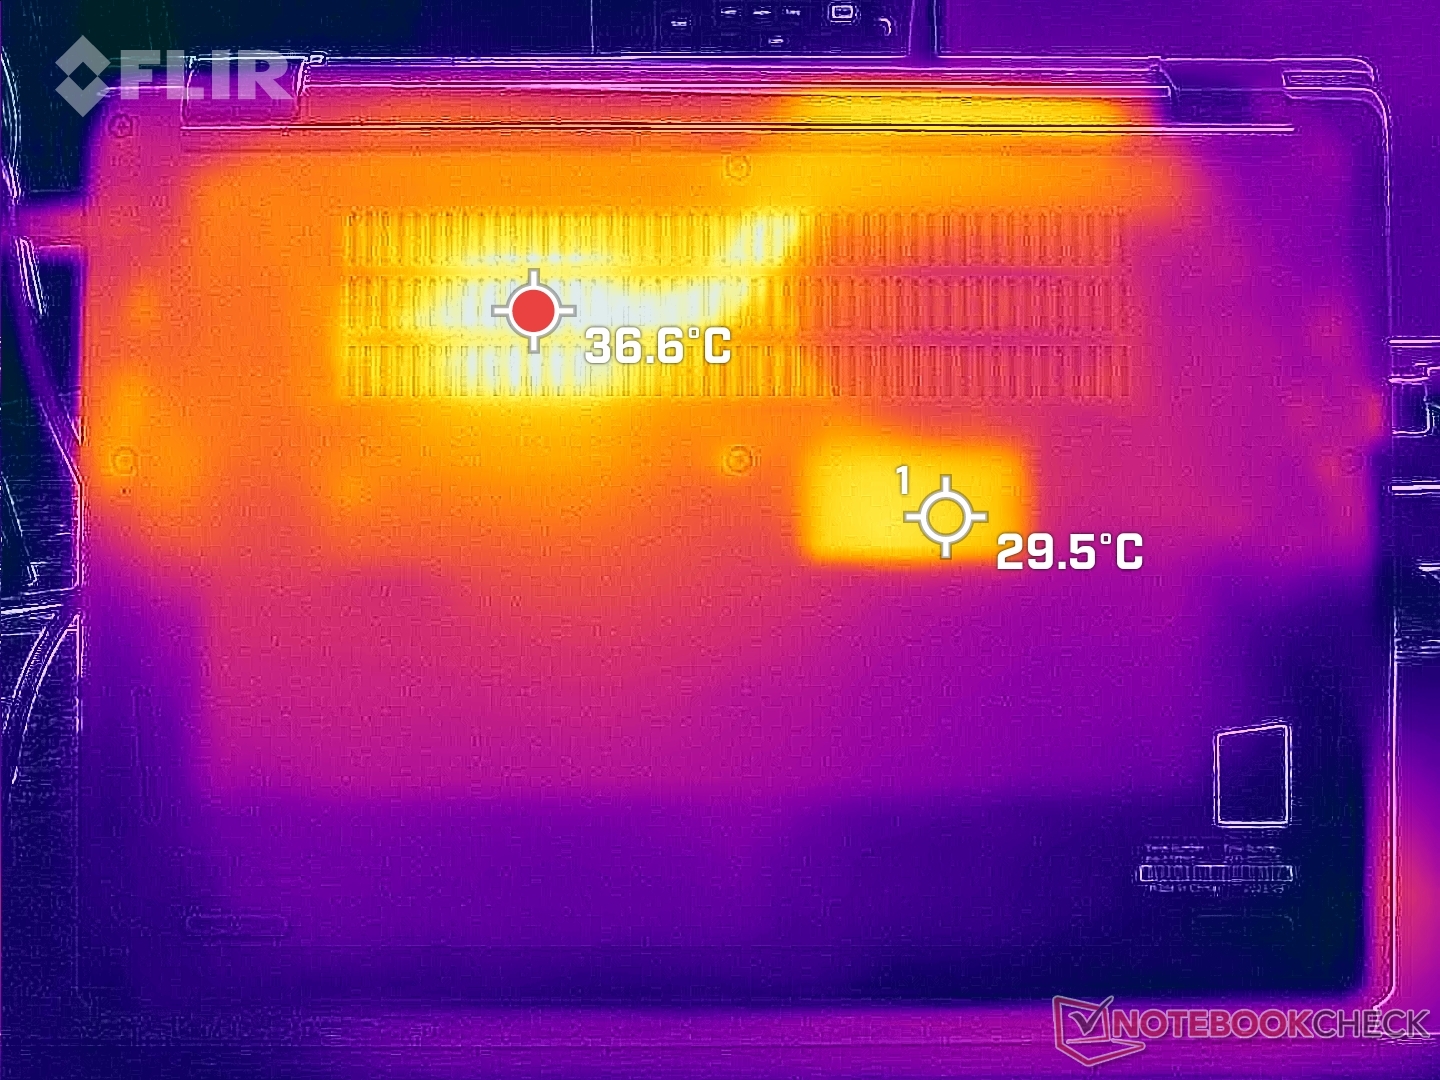
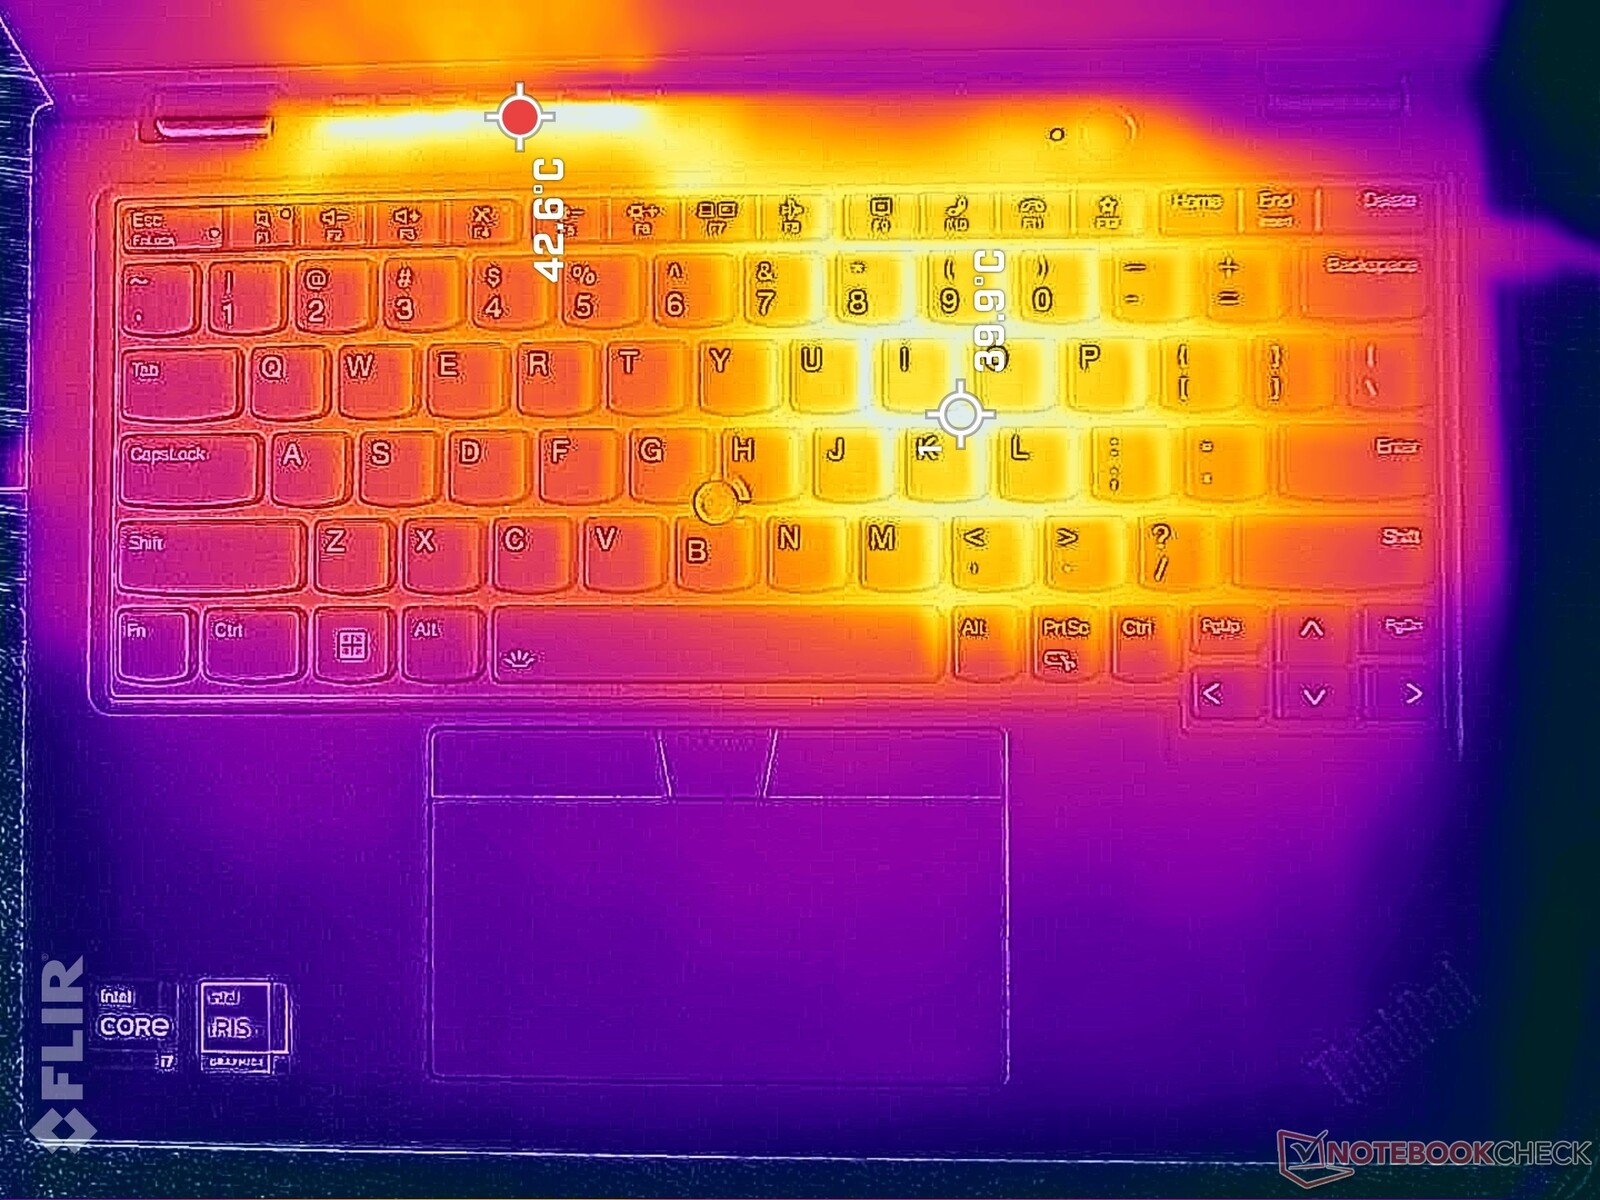
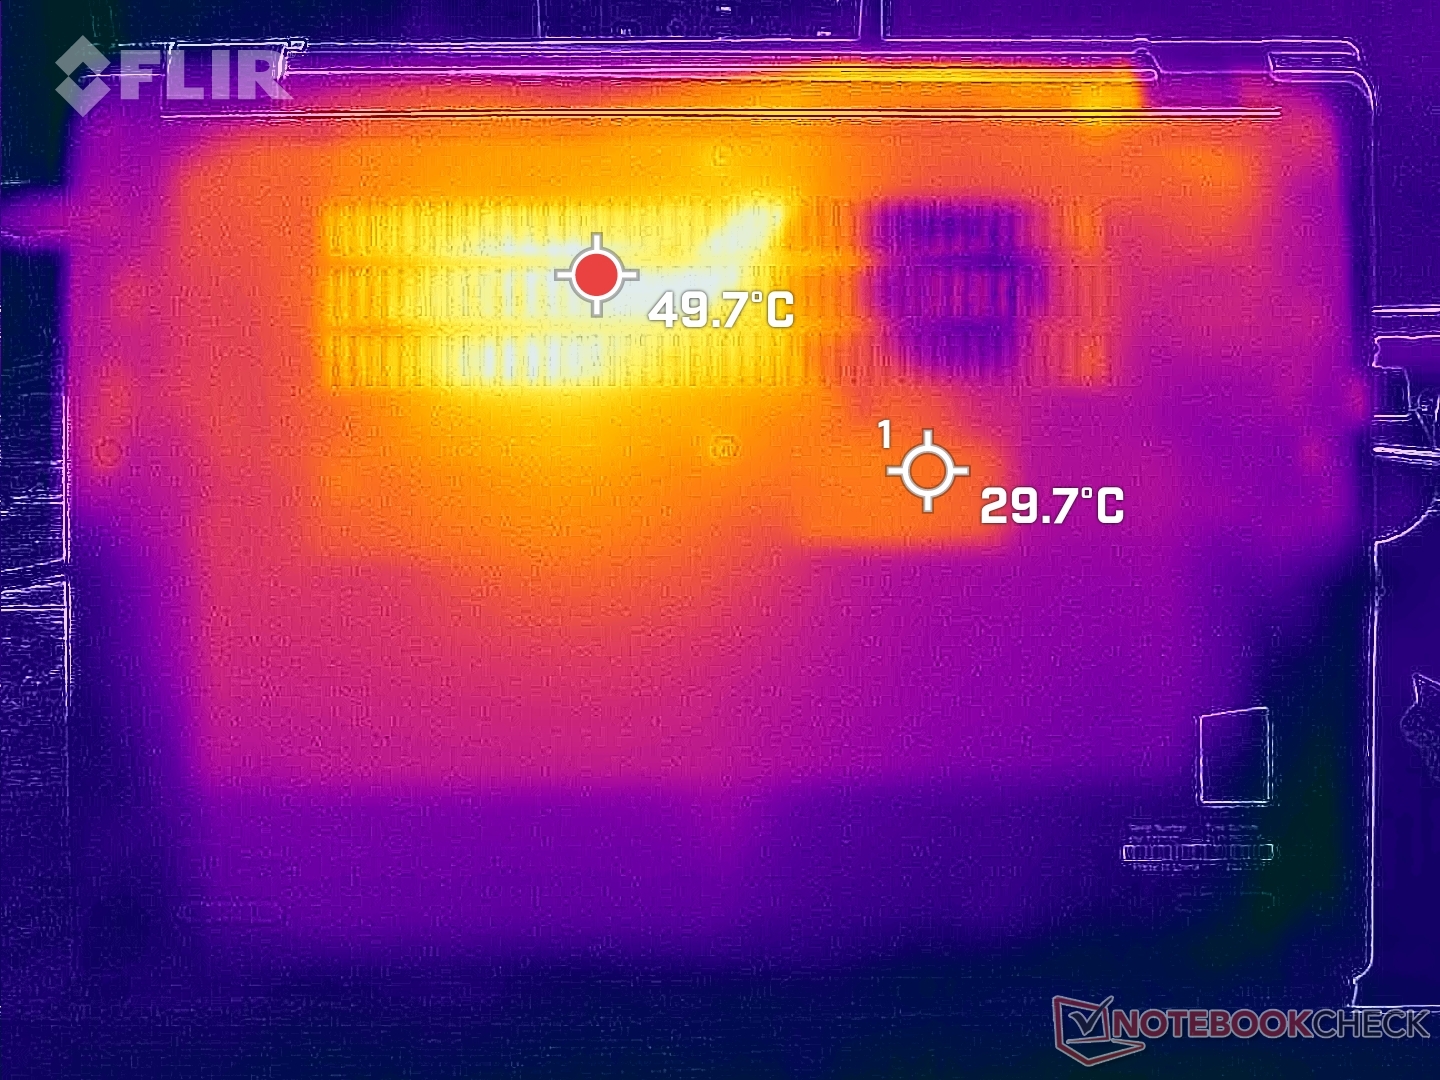
Temperatura
I punti caldi possono raggiungere i 40 C sul lato destro della tastiera, in modo simile a quanto abbiamo registrato sulla configurazione AMD. Quindi, l'unità Intel non funziona in modo significativamente più freddo o più caldo, nonostante le differenze di prestazioni.
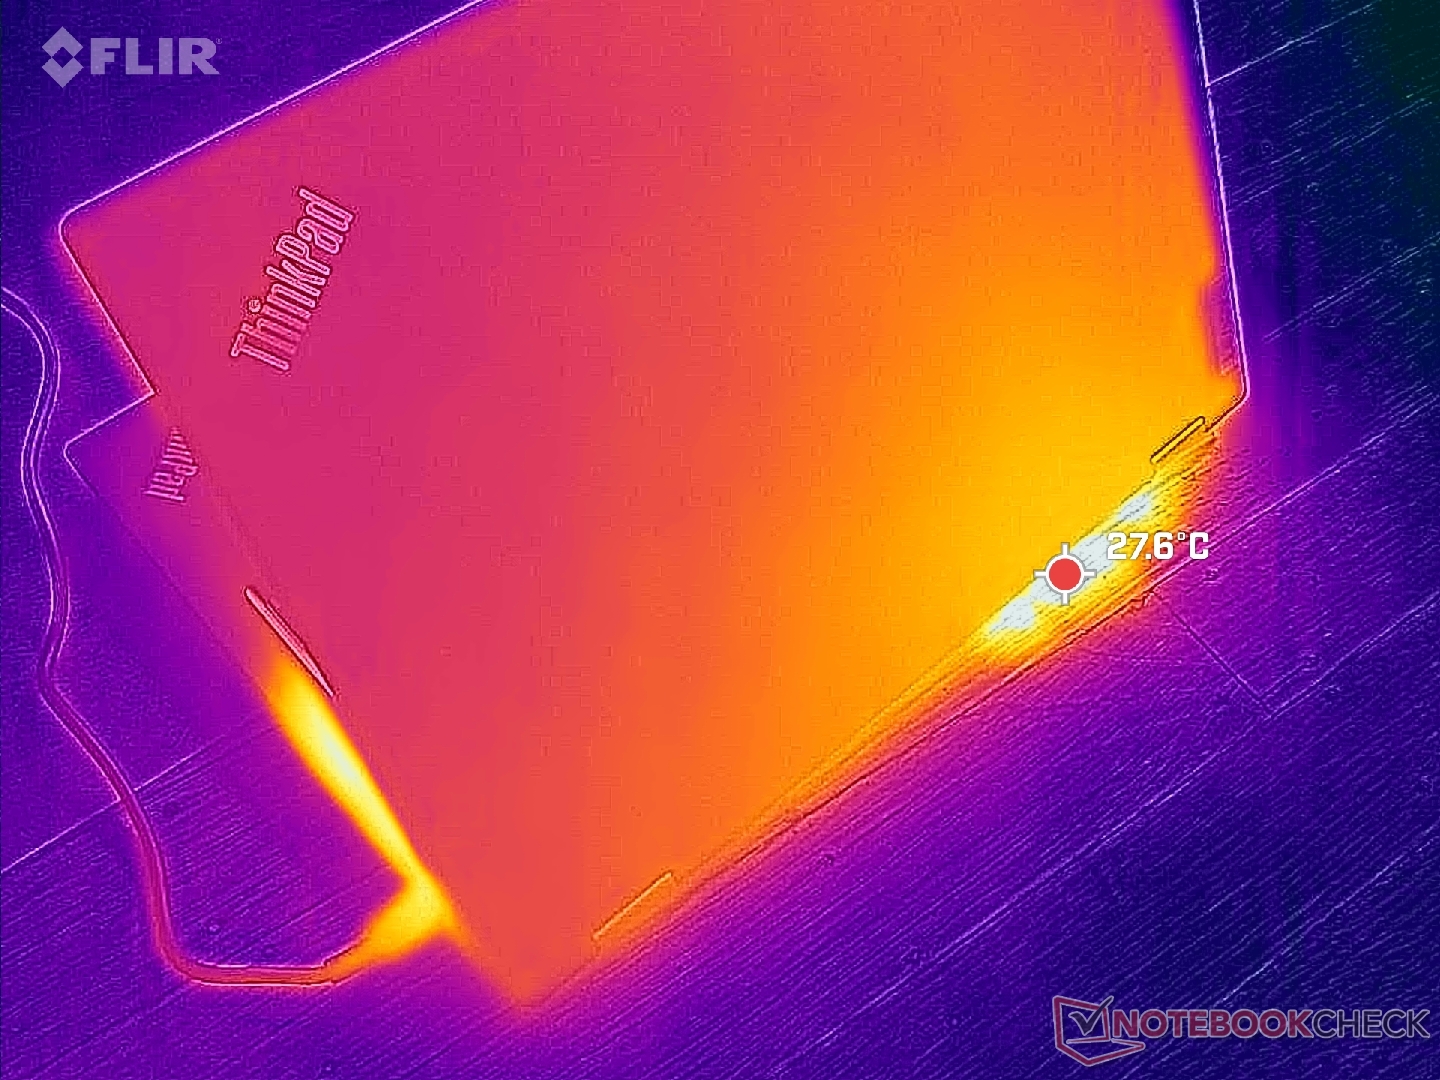
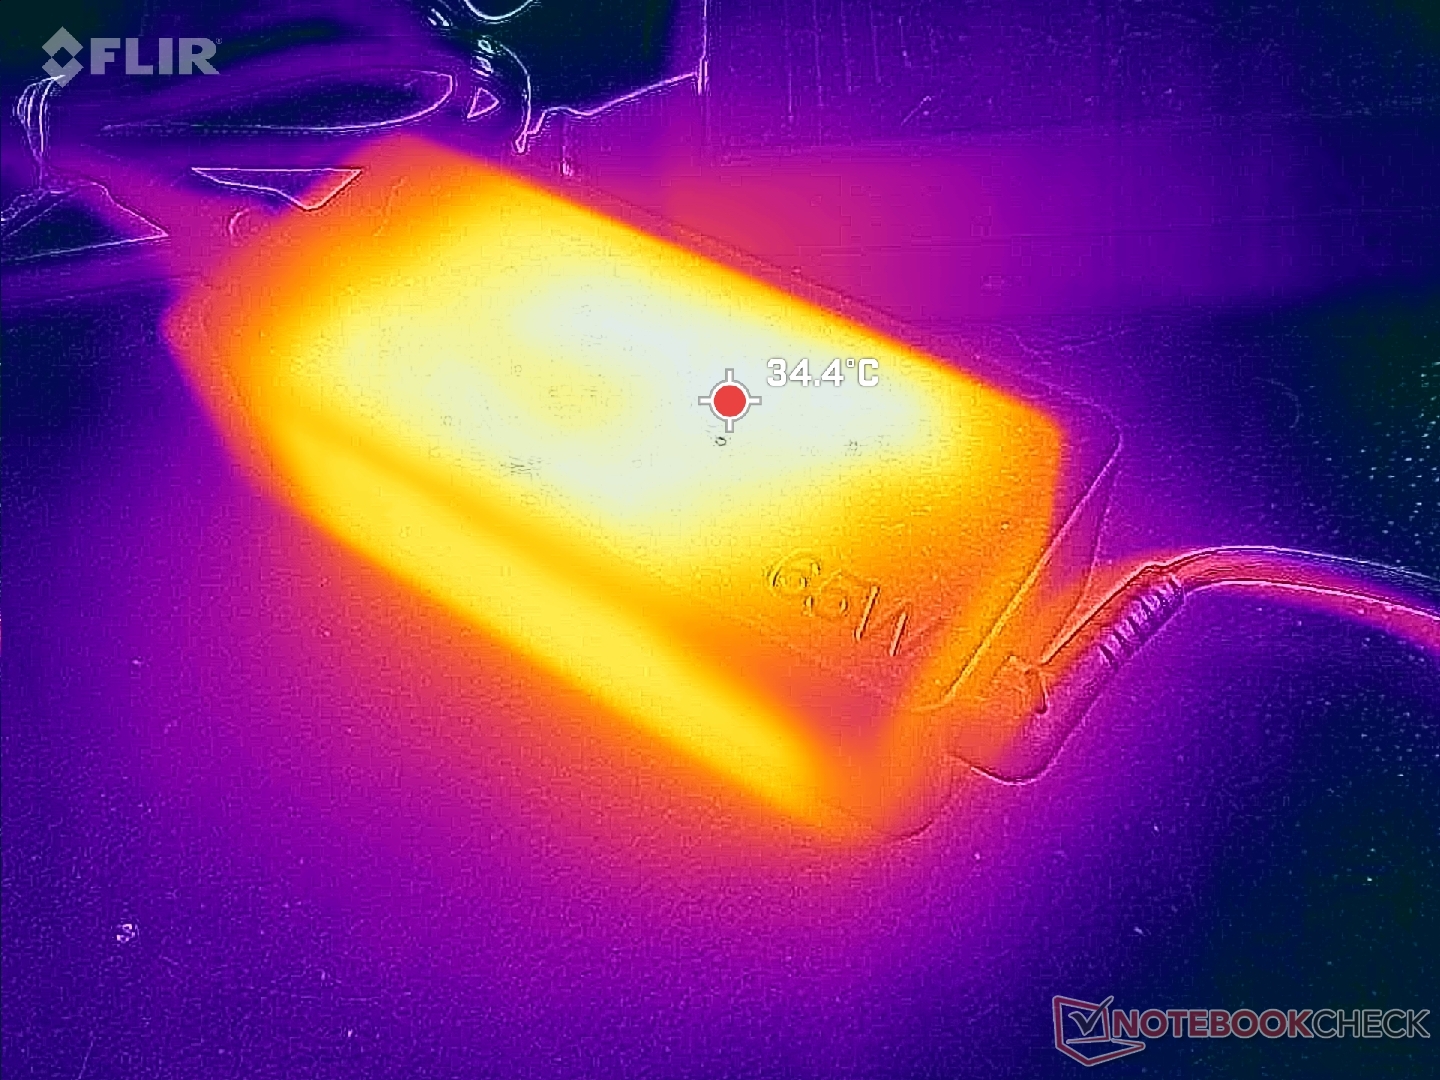
(+) La temperatura massima sul lato superiore è di 38.4 °C / 101 F, rispetto alla media di 35.4 °C / 96 F, che varia da 19.6 a 60 °C per questa classe Convertible.
(-) Il lato inferiore si riscalda fino ad un massimo di 46 °C / 115 F, rispetto alla media di 36.9 °C / 98 F
(+) In idle, la temperatura media del lato superiore è di 27.2 °C / 81 F, rispetto alla media deld ispositivo di 30.3 °C / 87 F.
(+) I poggiapolsi e il touchpad sono piu' freddi della temperatura della pelle con un massimo di 23.6 °C / 74.5 F e sono quindi freddi al tatto.
(+) La temperatura media della zona del palmo della mano di dispositivi simili e'stata di 28 °C / 82.4 F (+4.4 °C / 7.9 F).
| Lenovo ThinkPad L13 Yoga G4 i7-1355U Intel Core i7-1355U, Intel Iris Xe Graphics G7 96EUs | Lenovo ThinkPad L13 Yoga G4 21FSS00100 AMD Ryzen 5 7530U, AMD Radeon RX Vega 7 | HP Elite Dragonfly Folio 13.5 G3 Intel Core i7-1265U, Intel Iris Xe Graphics G7 96EUs | Dell Latitude 9330 Intel Core i7-1260U, Intel Iris Xe Graphics G7 96EUs | MSI Summit E13 Flip Evo A11MT Intel Core i7-1185G7, Intel Iris Xe Graphics G7 96EUs | Framework Laptop 13.5 Ryzen 7 7840U AMD Ryzen 7 7840U, AMD Radeon 780M | |
|---|---|---|---|---|---|---|
| Heat | -3% | 23% | 7% | -14% | 3% | |
| Maximum Upper Side * (°C) | 38.4 | 43.3 -13% | 32.8 15% | 40.6 -6% | 52 -35% | 42 -9% |
| Maximum Bottom * (°C) | 46 | 46.5 -1% | 33.4 27% | 50.2 -9% | 57.4 -25% | 47.4 -3% |
| Idle Upper Side * (°C) | 31.2 | 31.9 -2% | 24.6 21% | 25 20% | 30.4 3% | 28.8 8% |
| Idle Bottom * (°C) | 34.8 | 33.1 5% | 24.6 29% | 27.6 21% | 34.2 2% | 29.6 15% |
* ... Meglio usare valori piccoli
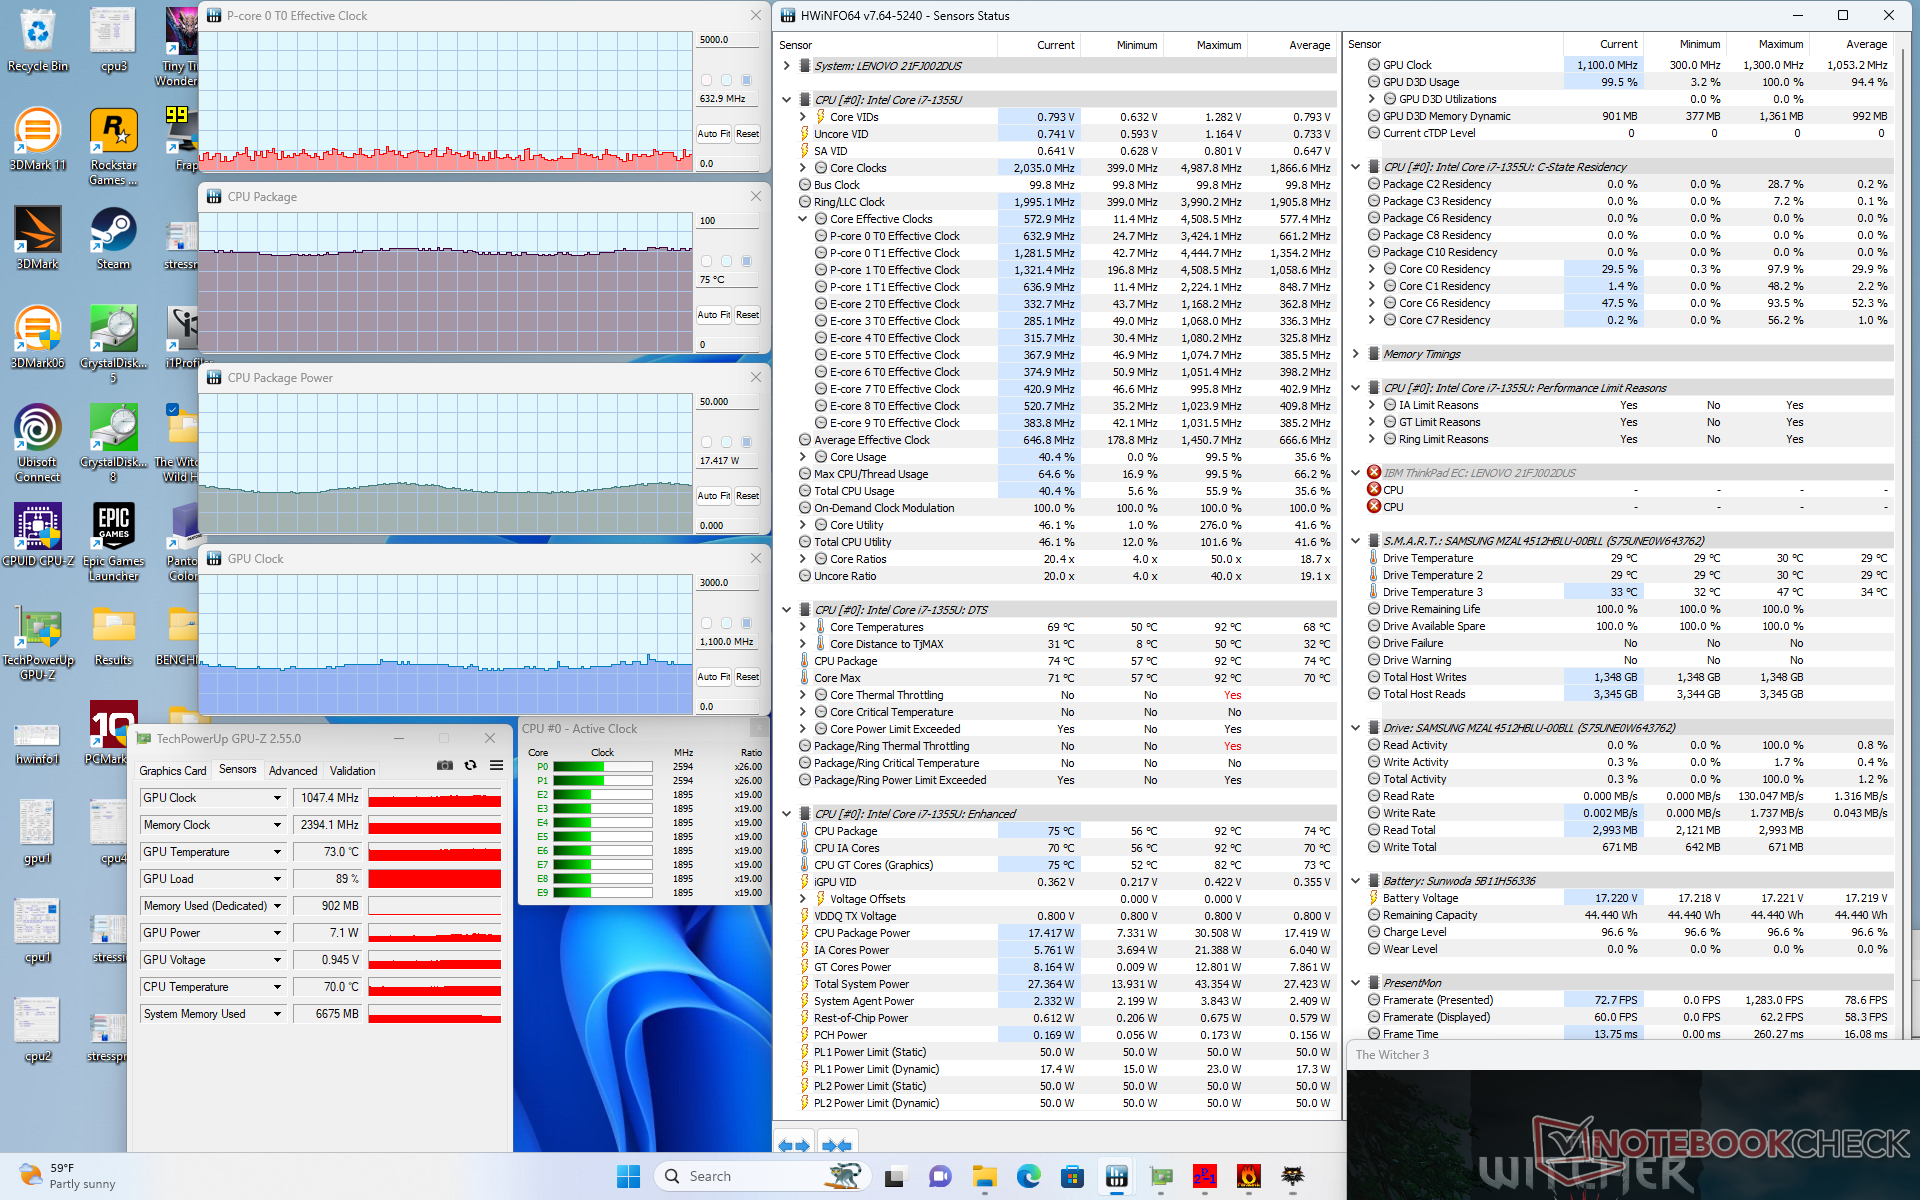
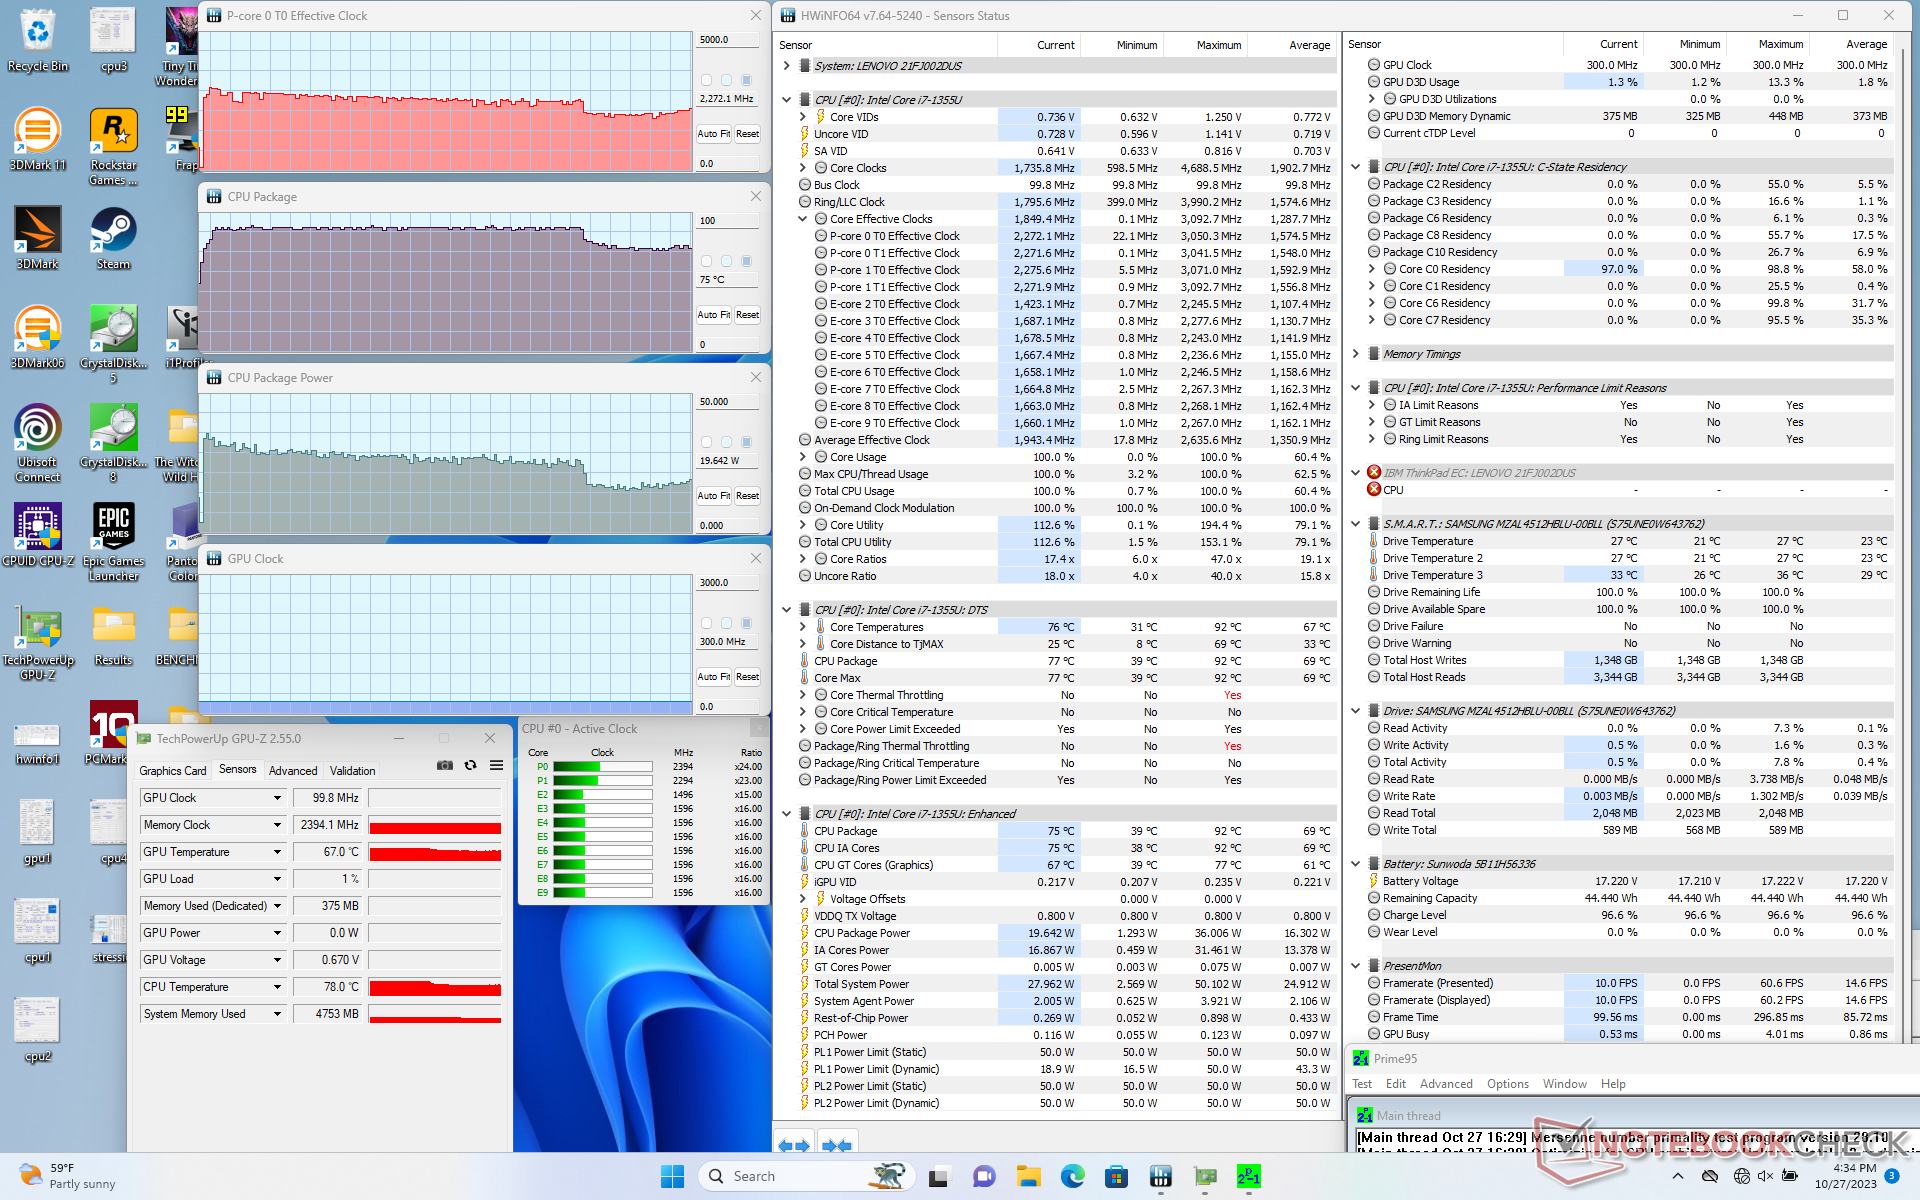
Test da sforzo
Quando si avvia lo stress Prime95, la CPU sale a 3 GHz, 89 C e 35 W solo per i primi secondi, prima di scendere costantemente e stabilizzarsi a 2,2 GHz, 75 C e 19 W. Questo comportamento è in linea con le osservazioni di CineBench R15 xT di cui sopra, in cui le prestazioni erano massime all'inizio del test prima di scendere.
Le velocità di clock della GPU in esecuzione Witcher 3 si muovevano tra 950 e 1150 MHz, il che contribuisce ai tassi di frame ciclici menzionati in precedenza.
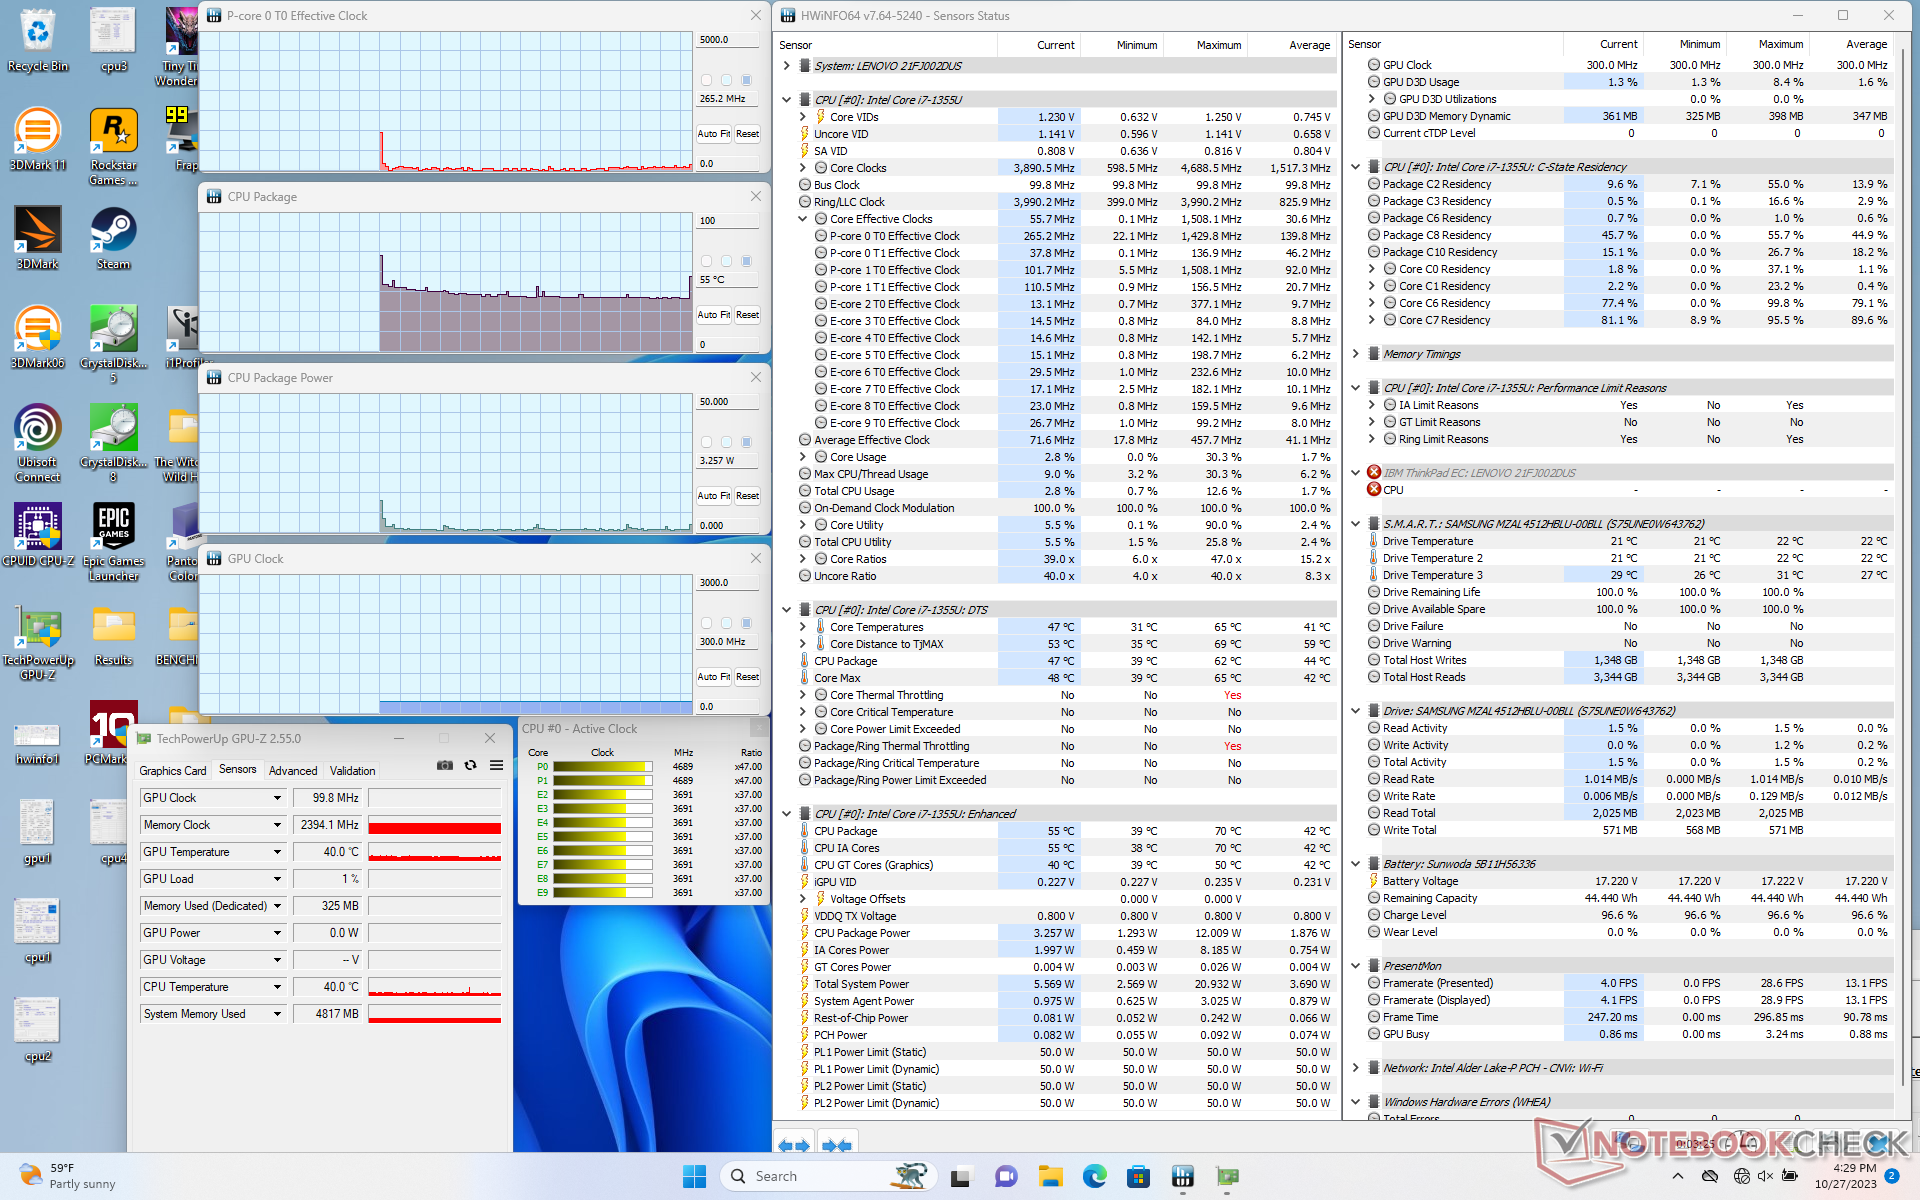
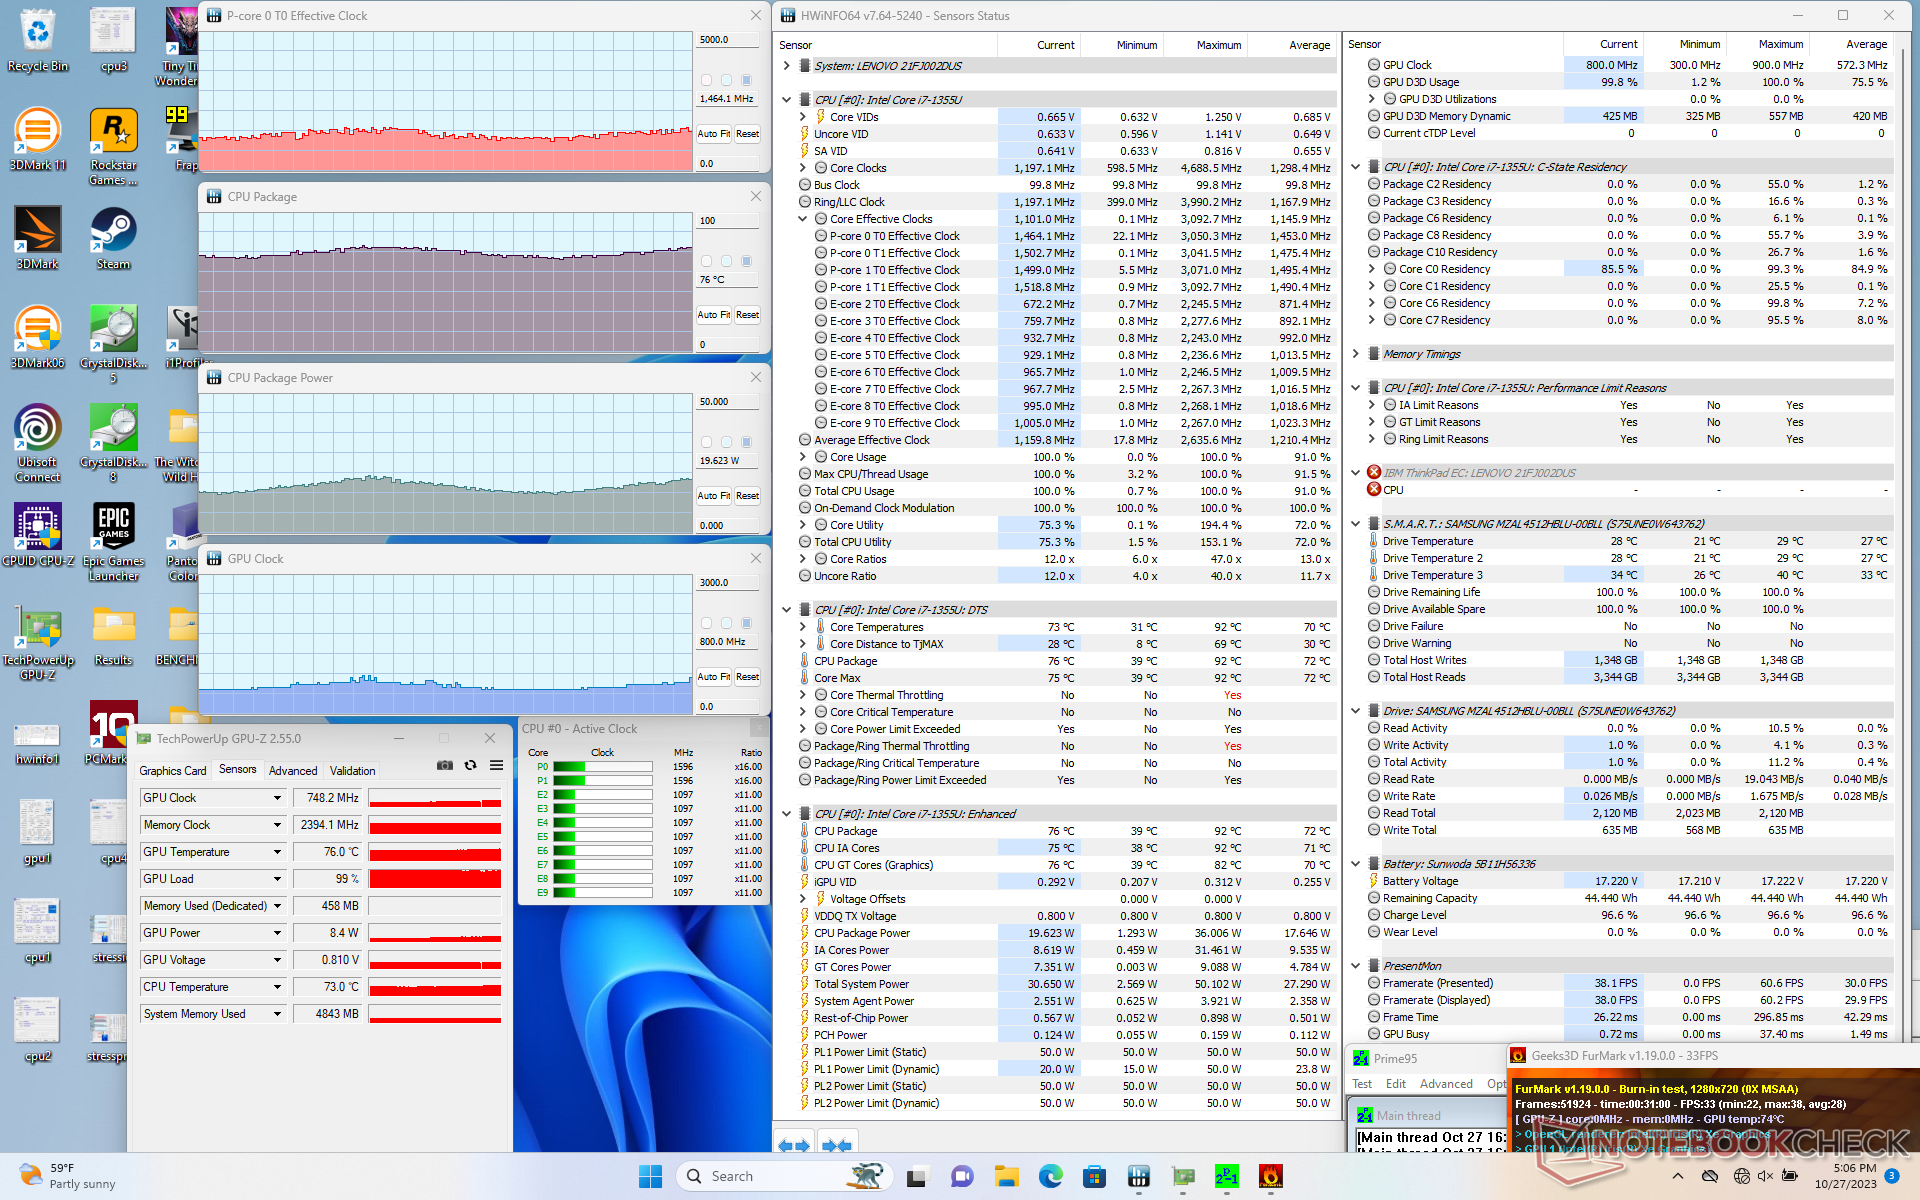
| Clock della CPU (GHz) | Clock della GPU (MHz) | Temperatura media della CPU (°C) | |
| Sistema inattivo | -- | -- | 36 |
| Stress Prime95 | 2,2 | -- | 75 |
| Prime95 + FurMark Stress | 1,0 - 1,5 | 550 - 850 | 68 - 79 |
| Witcher 3 Stress | ~0,6 | 950 - 1150 | 75 |
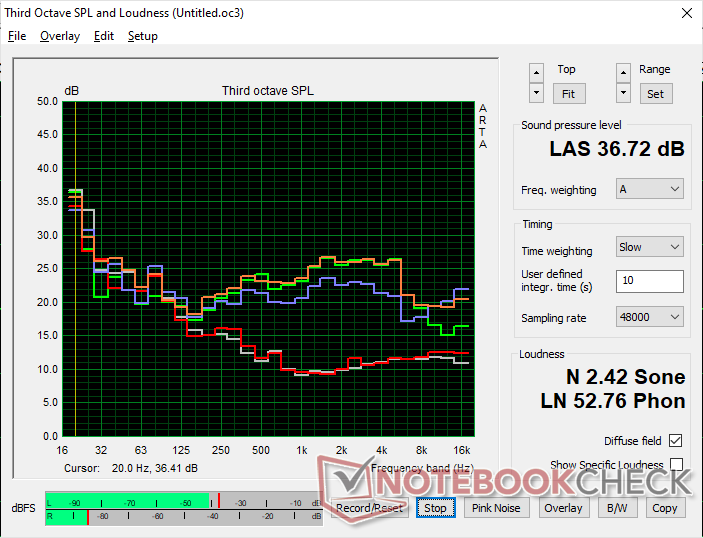
Altoparlanti
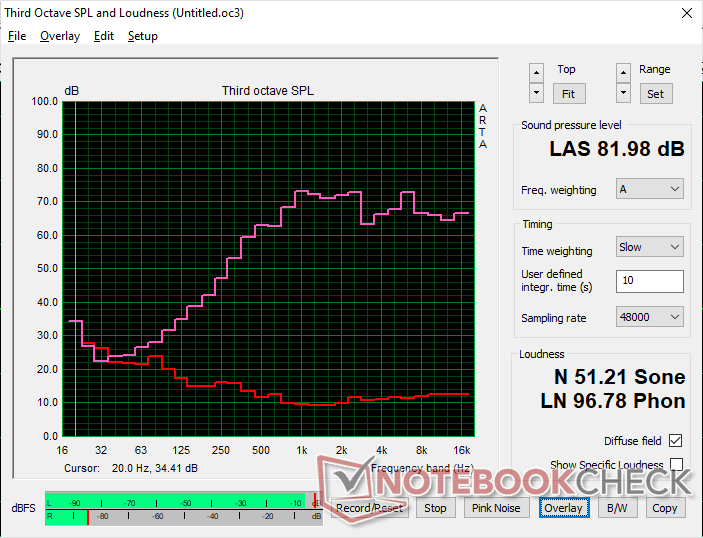
Lenovo ThinkPad L13 Yoga G4 i7-1355U analisi audio
(+) | gli altoparlanti sono relativamente potenti (82 dB)
Bassi 100 - 315 Hz
(-) | quasi nessun basso - in media 24.7% inferiori alla media
(±) | la linearità dei bassi è media (7.7% delta rispetto alla precedente frequenza)
Medi 400 - 2000 Hz
(+) | medi bilanciati - solo only 4.9% rispetto alla media
(+) | medi lineari (5.4% delta rispetto alla precedente frequenza)
Alti 2 - 16 kHz
(+) | Alti bilanciati - appena 2.7% dalla media
(±) | la linearità degli alti è media (7% delta rispetto alla precedente frequenza)
Nel complesso 100 - 16.000 Hz
(±) | la linearità complessiva del suono è media (17.7% di differenza rispetto alla media
Rispetto alla stessa classe
» 35% di tutti i dispositivi testati in questa classe è stato migliore, 9% simile, 55% peggiore
» Il migliore ha avuto un delta di 6%, medio di 20%, peggiore di 57%
Rispetto a tutti i dispositivi testati
» 35% di tutti i dispositivi testati in questa classe è stato migliore, 8% similare, 57% peggiore
» Il migliore ha avuto un delta di 4%, medio di 23%, peggiore di 134%
Apple MacBook Pro 16 2021 M1 Pro analisi audio
(+) | gli altoparlanti sono relativamente potenti (84.7 dB)
Bassi 100 - 315 Hz
(+) | bassi buoni - solo 3.8% dalla media
(+) | bassi in lineaa (5.2% delta rispetto alla precedente frequenza)
Medi 400 - 2000 Hz
(+) | medi bilanciati - solo only 1.3% rispetto alla media
(+) | medi lineari (2.1% delta rispetto alla precedente frequenza)
Alti 2 - 16 kHz
(+) | Alti bilanciati - appena 1.9% dalla media
(+) | alti lineari (2.7% delta rispetto alla precedente frequenza)
Nel complesso 100 - 16.000 Hz
(+) | suono nel complesso lineare (4.6% differenza dalla media)
Rispetto alla stessa classe
» 0% di tutti i dispositivi testati in questa classe è stato migliore, 0% simile, 100% peggiore
» Il migliore ha avuto un delta di 5%, medio di 17%, peggiore di 45%
Rispetto a tutti i dispositivi testati
» 0% di tutti i dispositivi testati in questa classe è stato migliore, 0% similare, 100% peggiore
» Il migliore ha avuto un delta di 4%, medio di 23%, peggiore di 134%
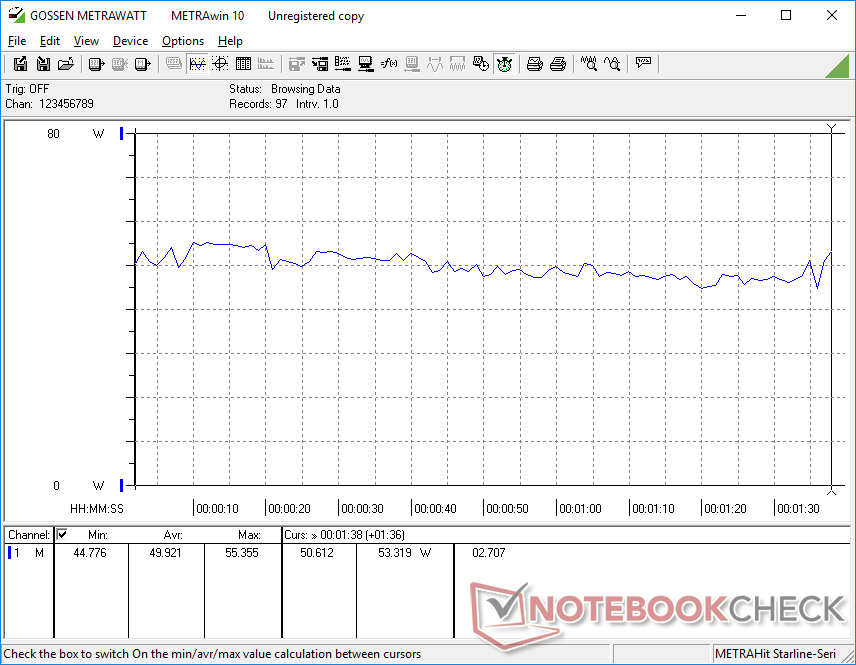
Gestione dell'energia
Consumo di energia
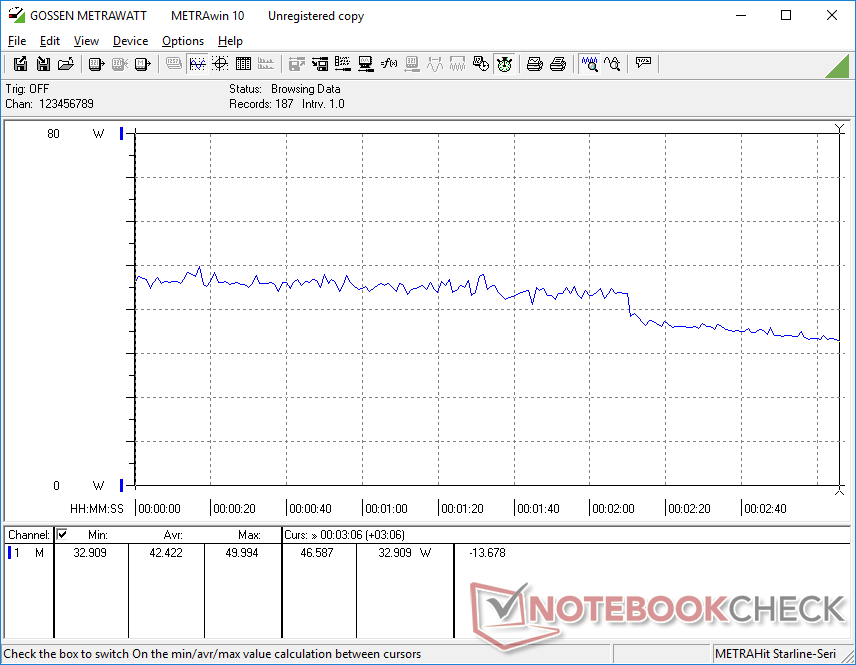
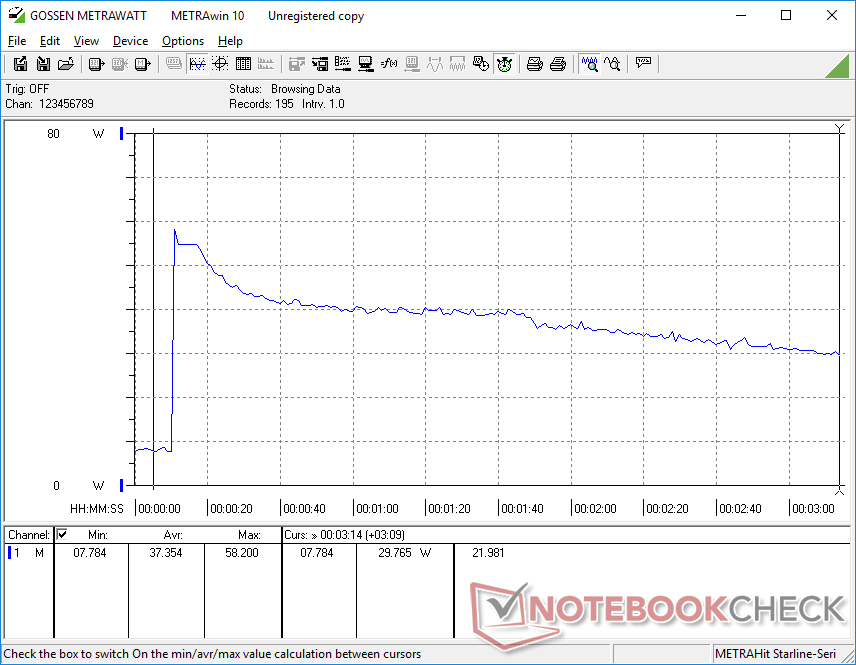
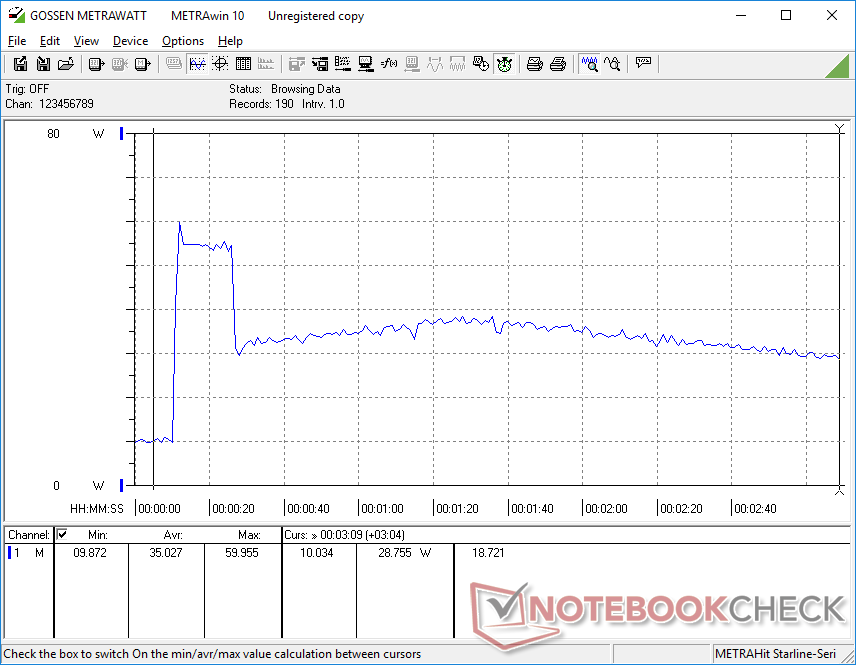
Il consumo energetico è più elevato su tutta la linea nella configurazione Intel rispetto a quella AMD, in particolare quando si eseguono carichi più elevati. Queste differenze potrebbero essere dovute sia al potenziale Turbo Boost iniziale più elevato della CPU Core i7 rispetto a Ryzen 5, sia alle prestazioni grafiche integrate più rapide rispetto alla Radeon RX Vega 7. L'esecuzione di un'unità Intel, ad esempio, consumerebbe circa il 30% in più di energia sulla nostra unità Intel Witcher 3ad esempio, consumerebbe circa il 30% in più di energia sulla nostra unità Intel.
| Off / Standby | |
| Idle | |
| Sotto carico |
|
Leggenda:
min: | |
| Lenovo ThinkPad L13 Yoga G4 i7-1355U i7-1355U, Iris Xe G7 96EUs, Samsung PM9B1 512GB MZAL4512HBLU, IPS, 1920x1200, 13.3" | Lenovo ThinkPad L13 Yoga G4 21FSS00100 R5 7530U, Vega 7, Kioxia BG5 KBG5AZNT512G, IPS LED, 1920x1200, 13.3" | HP Elite Dragonfly Folio 13.5 G3 i7-1265U, Iris Xe G7 96EUs, Samsung PM9A1 MZVL2512HCJQ, IPS, 1920x1280, 13.5" | Dell Latitude 9330 i7-1260U, Iris Xe G7 96EUs, , IPS, 2560x1600, 13.3" | MSI Summit E13 Flip Evo A11MT i7-1185G7, Iris Xe G7 96EUs, Phison 1TB SM2801T24GKBB4S-E162, IPS, 1920x1200, 13.4" | Framework Laptop 13.5 Ryzen 7 7840U R7 7840U, Radeon 780M, WD PC SN740 512GB SDDPNQD-512G, IPS, 2256x1504, 13.5" | |
|---|---|---|---|---|---|---|
| Power Consumption | 24% | 16% | 16% | -2% | 11% | |
| Idle Minimum * (Watt) | 5.5 | 4.4 20% | 3.4 38% | 4.7 15% | 4.8 13% | 4 27% |
| Idle Average * (Watt) | 8.3 | 7.2 13% | 4.9 41% | 8.2 1% | 8.4 -1% | 6.5 22% |
| Idle Maximum * (Watt) | 9.1 | 8.3 9% | 9.3 -2% | 8.4 8% | 8.6 5% | 6.8 25% |
| Load Average * (Watt) | 49.9 | 21.6 57% | 41.9 16% | 36.8 26% | 47.1 6% | 48 4% |
| Witcher 3 ultra * (Watt) | 42.4 | 32.1 24% | 36.4 14% | 30.4 28% | 51.6 -22% | 52.3 -23% |
| Load Maximum * (Watt) | 60 | 49.3 18% | 67.5 -13% | 49.9 17% | 65.9 -10% | 55.2 8% |
* ... Meglio usare valori piccoli
Power Consumption Witcher 3 / Stresstest
Power Consumption external Monitor
Durata della batteria
Il consumo energetico generalmente più elevato di cui sopra si ripercuote sulla durata della batteria. La navigazione web sulla nostra unità Intel dura poco più di 6 ore, rispetto alle 7,5 ore dell'unità AMD, quando entrambi sono sullo stesso profilo energetico bilanciato. Anche la ricarica è più lenta del previsto, circa 2 ore, anche quando si attiva la carica rapida di Lenovo.
| Lenovo ThinkPad L13 Yoga G4 i7-1355U i7-1355U, Iris Xe G7 96EUs, 46 Wh | Lenovo ThinkPad L13 Yoga G4 21FSS00100 R5 7530U, Vega 7, 46 Wh | HP Elite Dragonfly Folio 13.5 G3 i7-1265U, Iris Xe G7 96EUs, 53 Wh | Dell Latitude 9330 i7-1260U, Iris Xe G7 96EUs, 50 Wh | MSI Summit E13 Flip Evo A11MT i7-1185G7, Iris Xe G7 96EUs, 70 Wh | Framework Laptop 13.5 Ryzen 7 7840U R7 7840U, Radeon 780M, 61 Wh | |
|---|---|---|---|---|---|---|
| Autonomia della batteria | 24% | 52% | 52% | 81% | 95% | |
| WiFi v1.3 (h) | 6.2 | 7.7 24% | 9.4 52% | 9.4 52% | 11.2 81% | 12.1 95% |
| Load (h) | 1.5 | 2.6 | 2.3 | 1.8 | ||
| Reader / Idle (h) | 27.3 | 15.4 | 21.1 |
Pro
Contro
Verdetto - Scambio tra durata della batteria e ventole più silenziose per Thunderbolt e grafica più veloce
Forse la scoperta più sorprendente della versione Intel del ThinkPad L13 Yoga G4 è il throttling delle prestazioni della CPU, più forte del previsto. Sebbene non ci aspettiamo mai che un processore Core U mantenga elevate velocità di clock Turbo Boost per periodi prolungati, il Core i7 di questo particolare modello Lenovo subisce un throttling maggiore rispetto alla maggior parte degli altri computer portatili con la stessa CPU. Questo deficit di prestazioni attenua un punto di vantaggio chiave per Intel rispetto ad AMD, soprattutto perché il problema del throttling non è così grave nella configurazione AMD.
Un altro aspetto degno di nota è il consumo energetico più elevato della versione Intel, che porta a tempi di esecuzione più brevi, da 1 a 2 ore. Gli utenti che apprezzano una maggiore durata della batteria potrebbero quindi scegliere la versione AMD del ThinkPad L13 Yoga G4.
A meno che non abbia davvero bisogno delle prestazioni grafiche extra e del supporto Thunderbolt di Intel, la versione AMD del ThinkPad L13 Yoga G4 dovrebbe essere sufficiente per la maggior parte degli utenti interessati.
I motivi principali per scegliere la versione Intel del modello rispetto a quella AMD sono vPro (invece di AMD PRO), il supporto Thunderbolt, le prestazioni grafiche più veloci e le prestazioni della CPU a thread singolo. Per il resto, le SKU AMD hanno la meglio quando si tratta di prestazioni CPU multi-thread, durata della batteria e prezzo.
Prezzo e disponibilità
Al momento della pubblicazione, Lenovo non sta ancora spedendo il ThinkPad L13 Yoga Gen 4. Tuttavia, CDW sta attualmente spedendo la nostra configurazione Core i7 a 1419 dollari.
Lenovo ThinkPad L13 Yoga G4 i7-1355U
- 10/30/2023 v7 (old)
Allen Ngo
Transparency
La selezione dei dispositivi da recensire viene effettuata dalla nostra redazione. Il campione di prova è stato fornito all'autore come prestito dal produttore o dal rivenditore ai fini di questa recensione. L'istituto di credito non ha avuto alcuna influenza su questa recensione, né il produttore ne ha ricevuto una copia prima della pubblicazione. Non vi era alcun obbligo di pubblicare questa recensione. In quanto società mediatica indipendente, Notebookcheck non è soggetta all'autorità di produttori, rivenditori o editori.
Ecco come Notebookcheck esegue i test
Ogni anno, Notebookcheck esamina in modo indipendente centinaia di laptop e smartphone utilizzando procedure standardizzate per garantire che tutti i risultati siano comparabili. Da circa 20 anni sviluppiamo continuamente i nostri metodi di prova e nel frattempo stabiliamo gli standard di settore. Nei nostri laboratori di prova, tecnici ed editori esperti utilizzano apparecchiature di misurazione di alta qualità. Questi test comportano un processo di validazione in più fasi. Il nostro complesso sistema di valutazione si basa su centinaia di misurazioni e parametri di riferimento ben fondati, che mantengono l'obiettività.Price comparison

