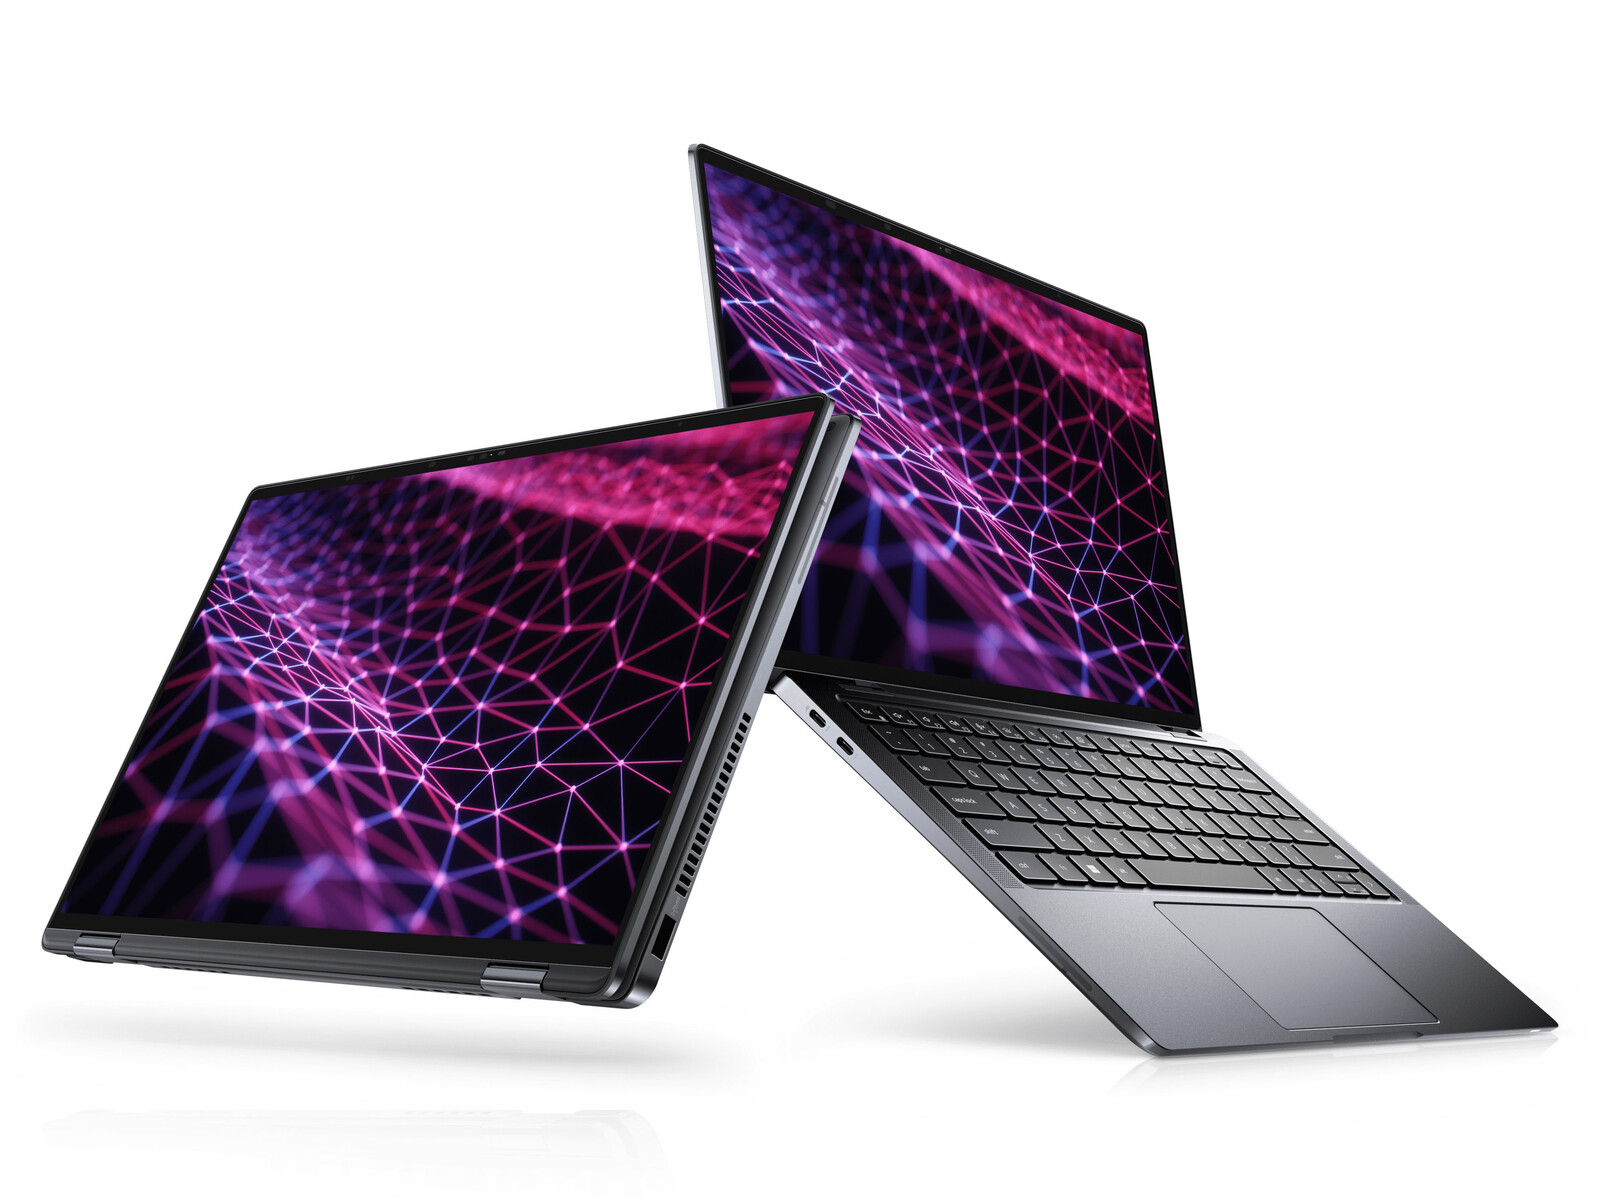
Recensione del convertibile 2-in-1 Dell Latitude 13 9330: debutto del Core i7-1260U
La serie Latitude 9000 ospita i portatili business di punta di Dell, in contrapposizione alla fascia media superiore Latitude 7000 serie 7000, di fascia media Latitude 5000 serie 7000, la serie 5000 di fascia media e la serie Latitude 3000 serie 3000. Il nostro modello in prova è il Latitude 9330, il primo convertibile da 13,3 pollici della famiglia Latitude 9000
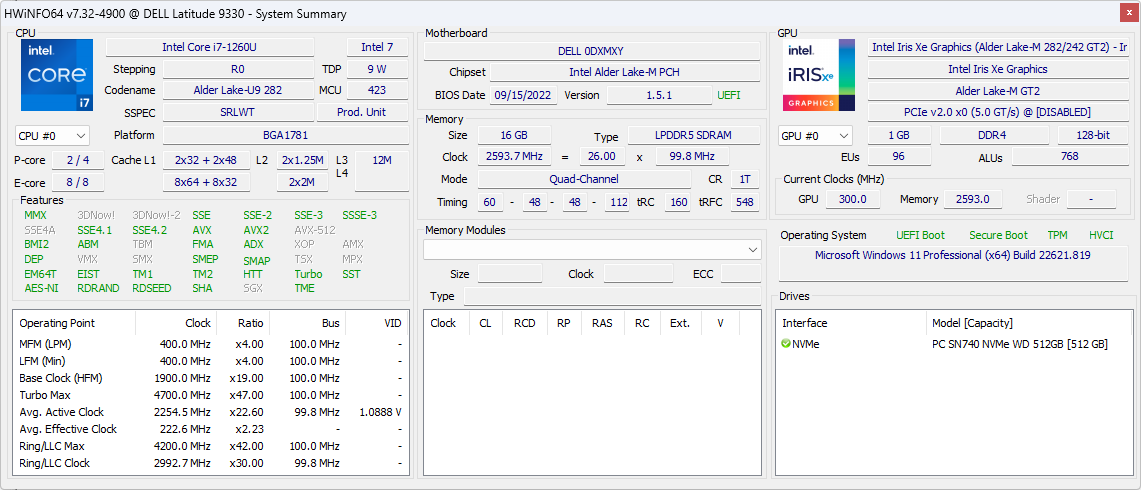
La nostra configurazione specifica è la SKU di fascia più alta con CPU Core i7-1260U di 12a generazione, 32 GB di RAM LPDDR5 e 512 GB di SSD NVMe per circa 2.700 dollari. Sono disponibili anche altre SKU con la CPU Core i5-1240U più lenta e metà della RAM e dello spazio di archiviazione, a partire da 2.000 dollari, ma tutte le opzioni sono dotate solo di grafica integrata e dello stesso schermo touchscreen IPS con risoluzione di 2560 x 1600
Tra i concorrenti del Latitude 9330 ci sono altri convertibili di fascia alta da 13 pollici incentrati sul business, come il Lenovo ThinkPad X1 Yoga G1, MSI Summit E13 Flipo HP Elite Dragonfly Max.
Altre recensioni Dell
Potenziali concorrenti a confronto
Punteggio | Data | Modello | Peso | Altezza | Dimensione | Risoluzione | Prezzo |
|---|---|---|---|---|---|---|---|
| 89 % v7 (old) | 11/2022 | Dell Latitude 9330 i7-1260U, Iris Xe G7 96EUs | 1.2 kg | 14.1 mm | 13.30" | 2560x1600 | |
| 88.5 % v7 (old) | Lenovo ThinkPad X1 Titanium Yoga G1 20QB0016GE i5-1140G7, Iris Xe G7 80EUs | 1.2 kg | 11.5 mm | 13.50" | 2256x1504 | ||
| 86.9 % v7 (old) | 04/2021 | MSI Summit E13 Flip Evo A11MT i7-1185G7, Iris Xe G7 96EUs | 1.4 kg | 14.9 mm | 13.40" | 1920x1200 | |
| 90 % v7 (old) | 11/2020 | HP EliteBook x360 1030 G7 i7-10810U, UHD Graphics 620 | 1.2 kg | 16 mm | 13.30" | 1920x1080 | |
| 90.8 % v7 (old) | 06/2021 | HP Elite Dragonfly Max i7-1185G7, Iris Xe G7 96EUs | 1.2 kg | 16 mm | 13.30" | 1920x1080 | |
| 87.2 % v7 (old) | 12/2020 | Dell Latitude 5310-23VP6 i5-10310U, UHD Graphics 620 | 1.3 kg | 19.7 mm | 13.30" | 1920x1080 |
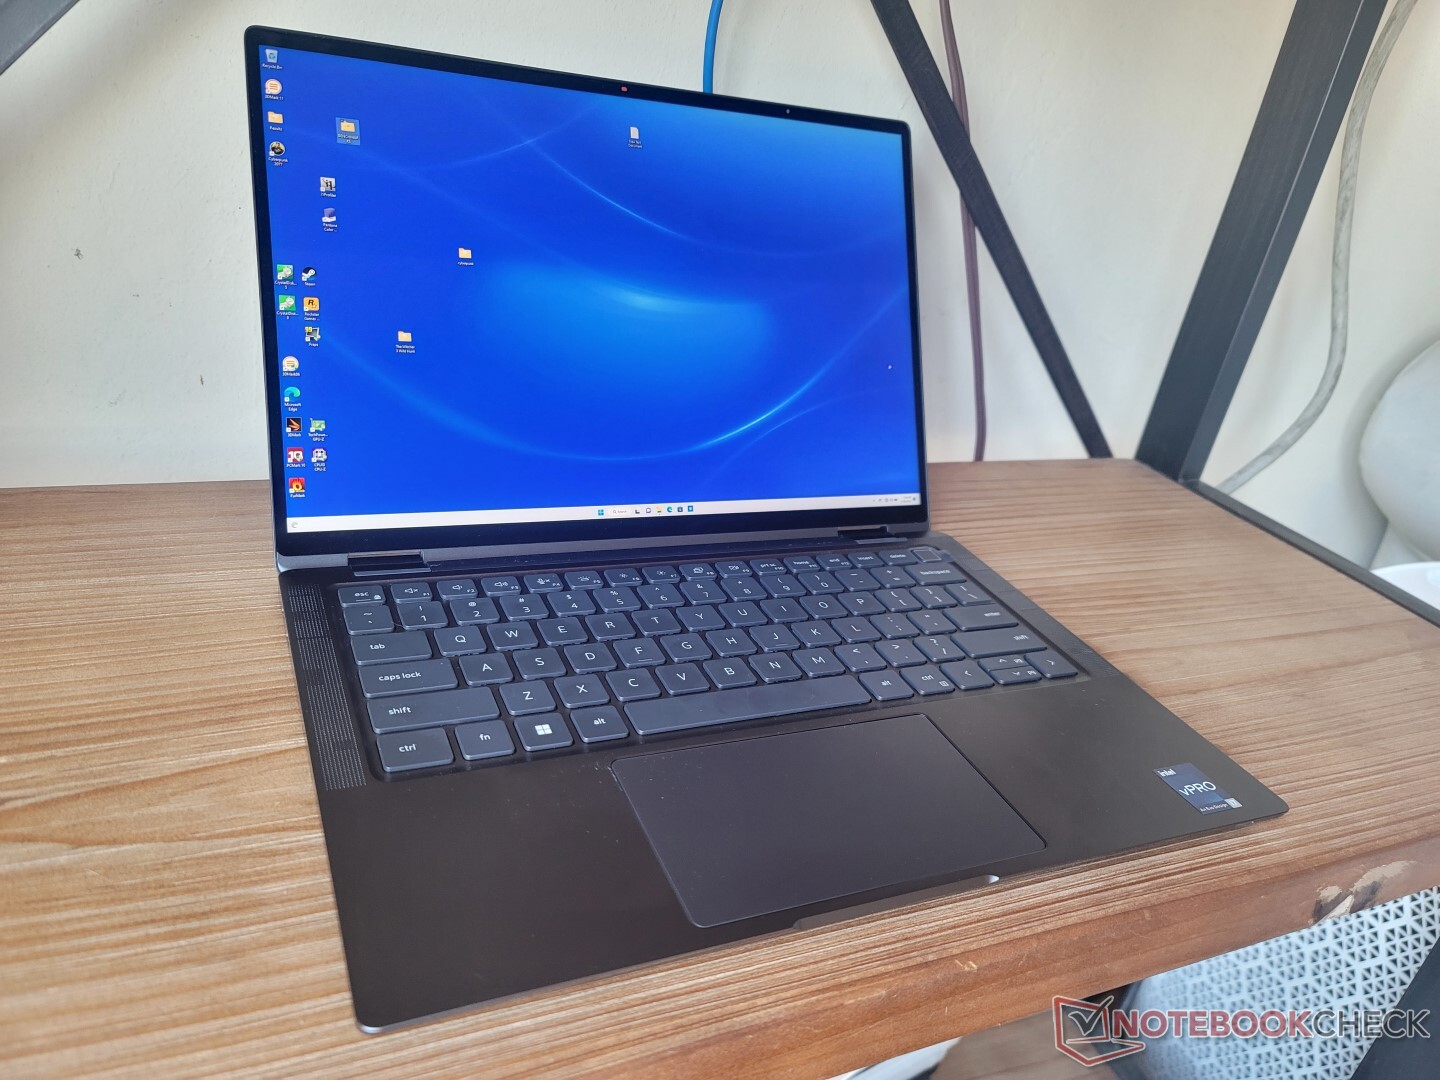
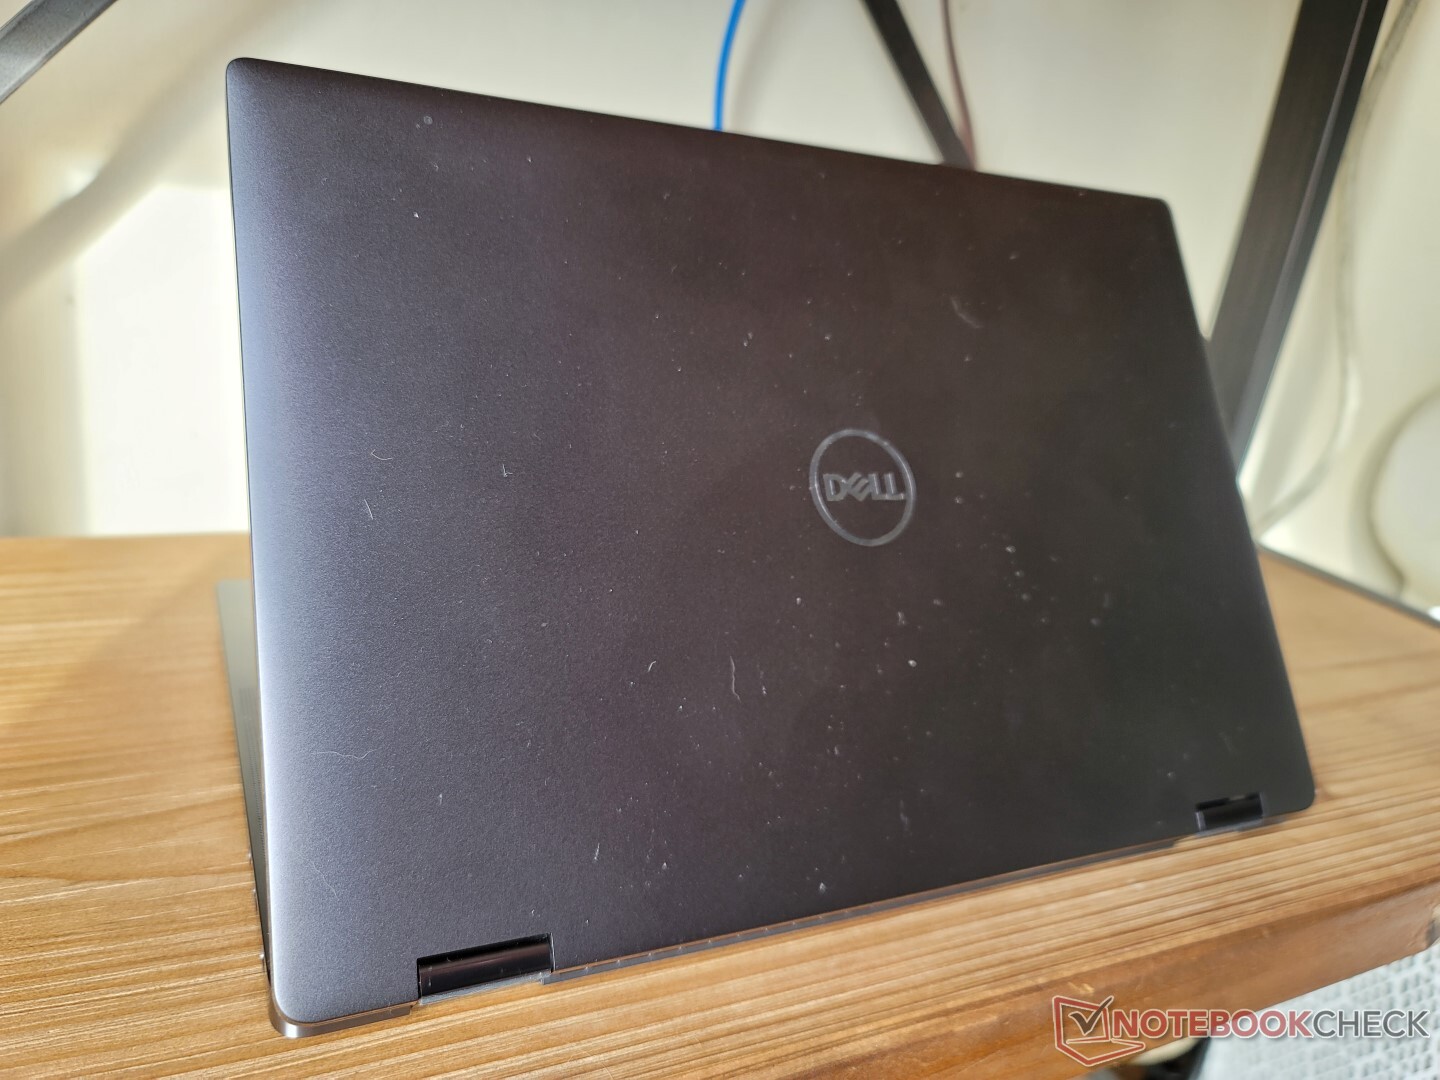
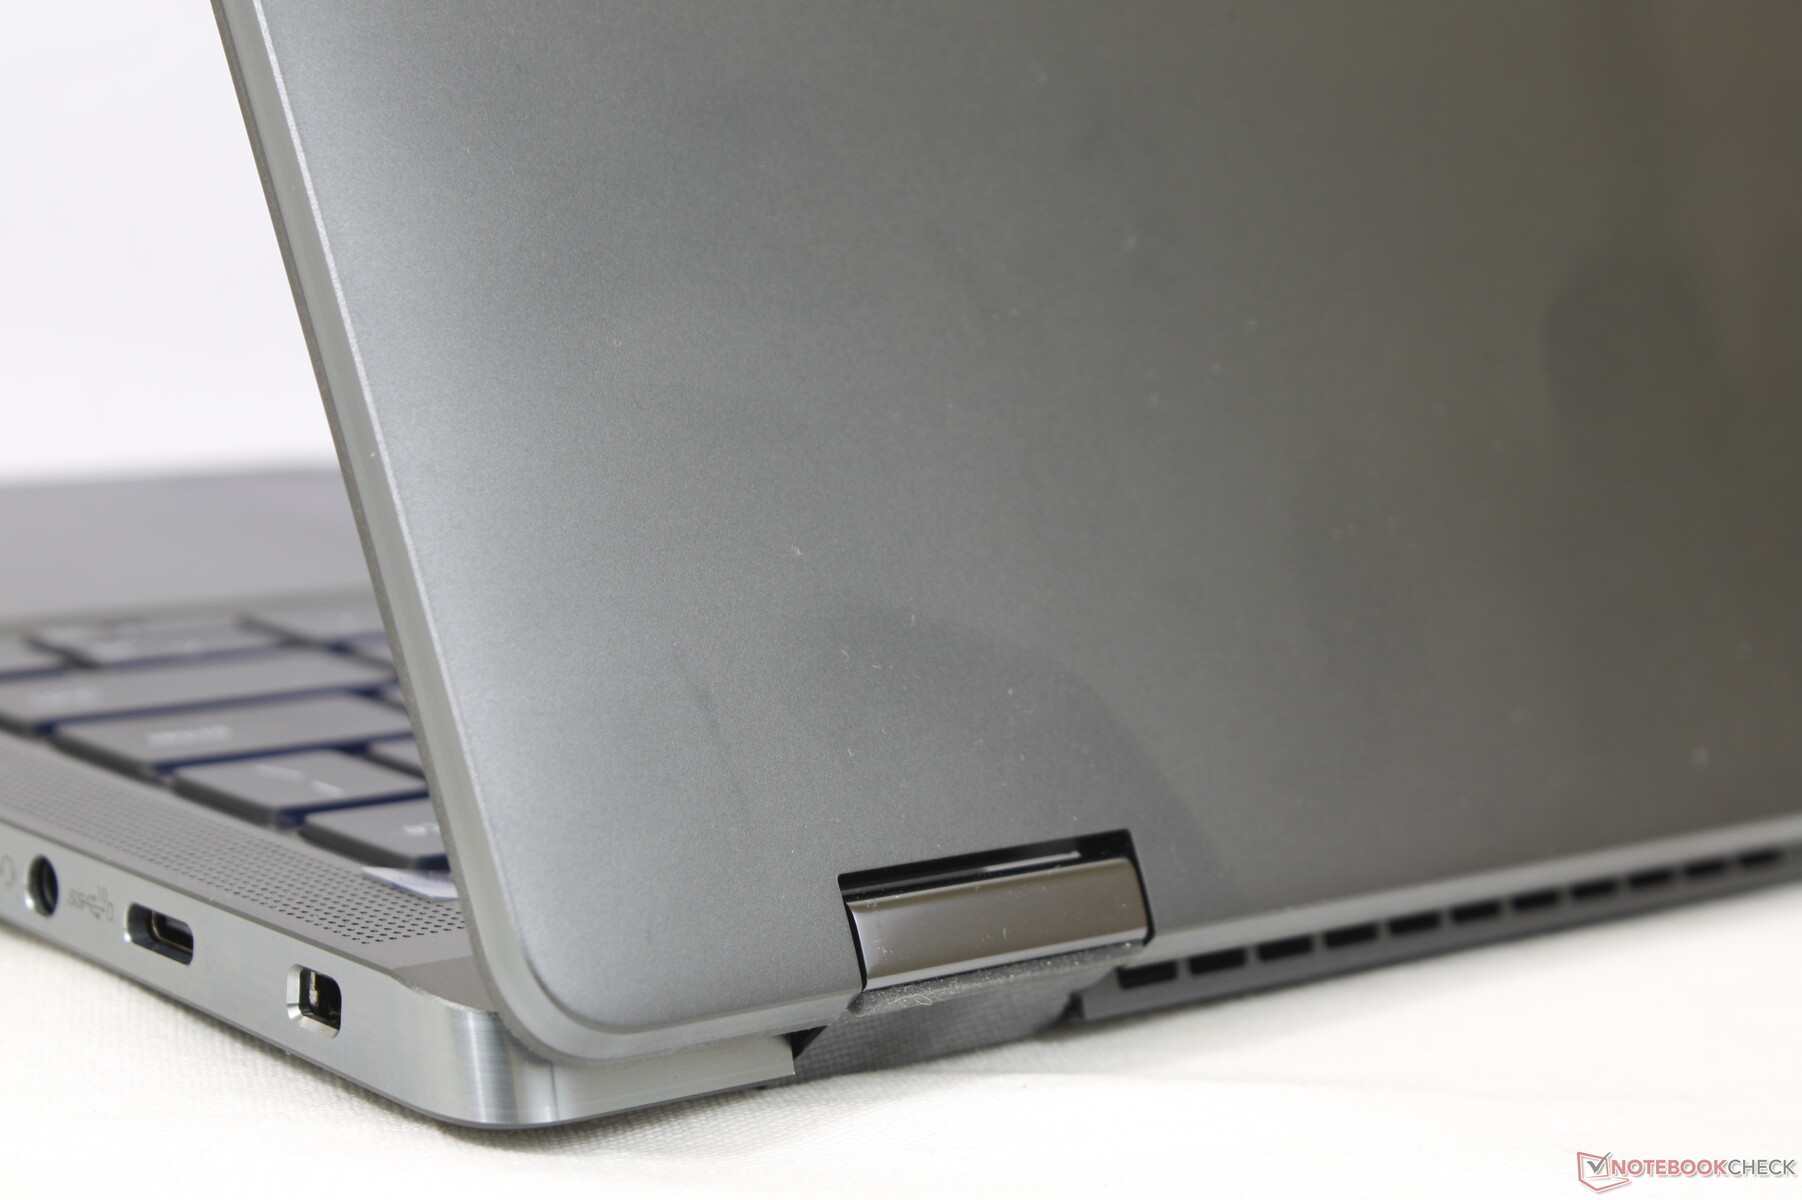
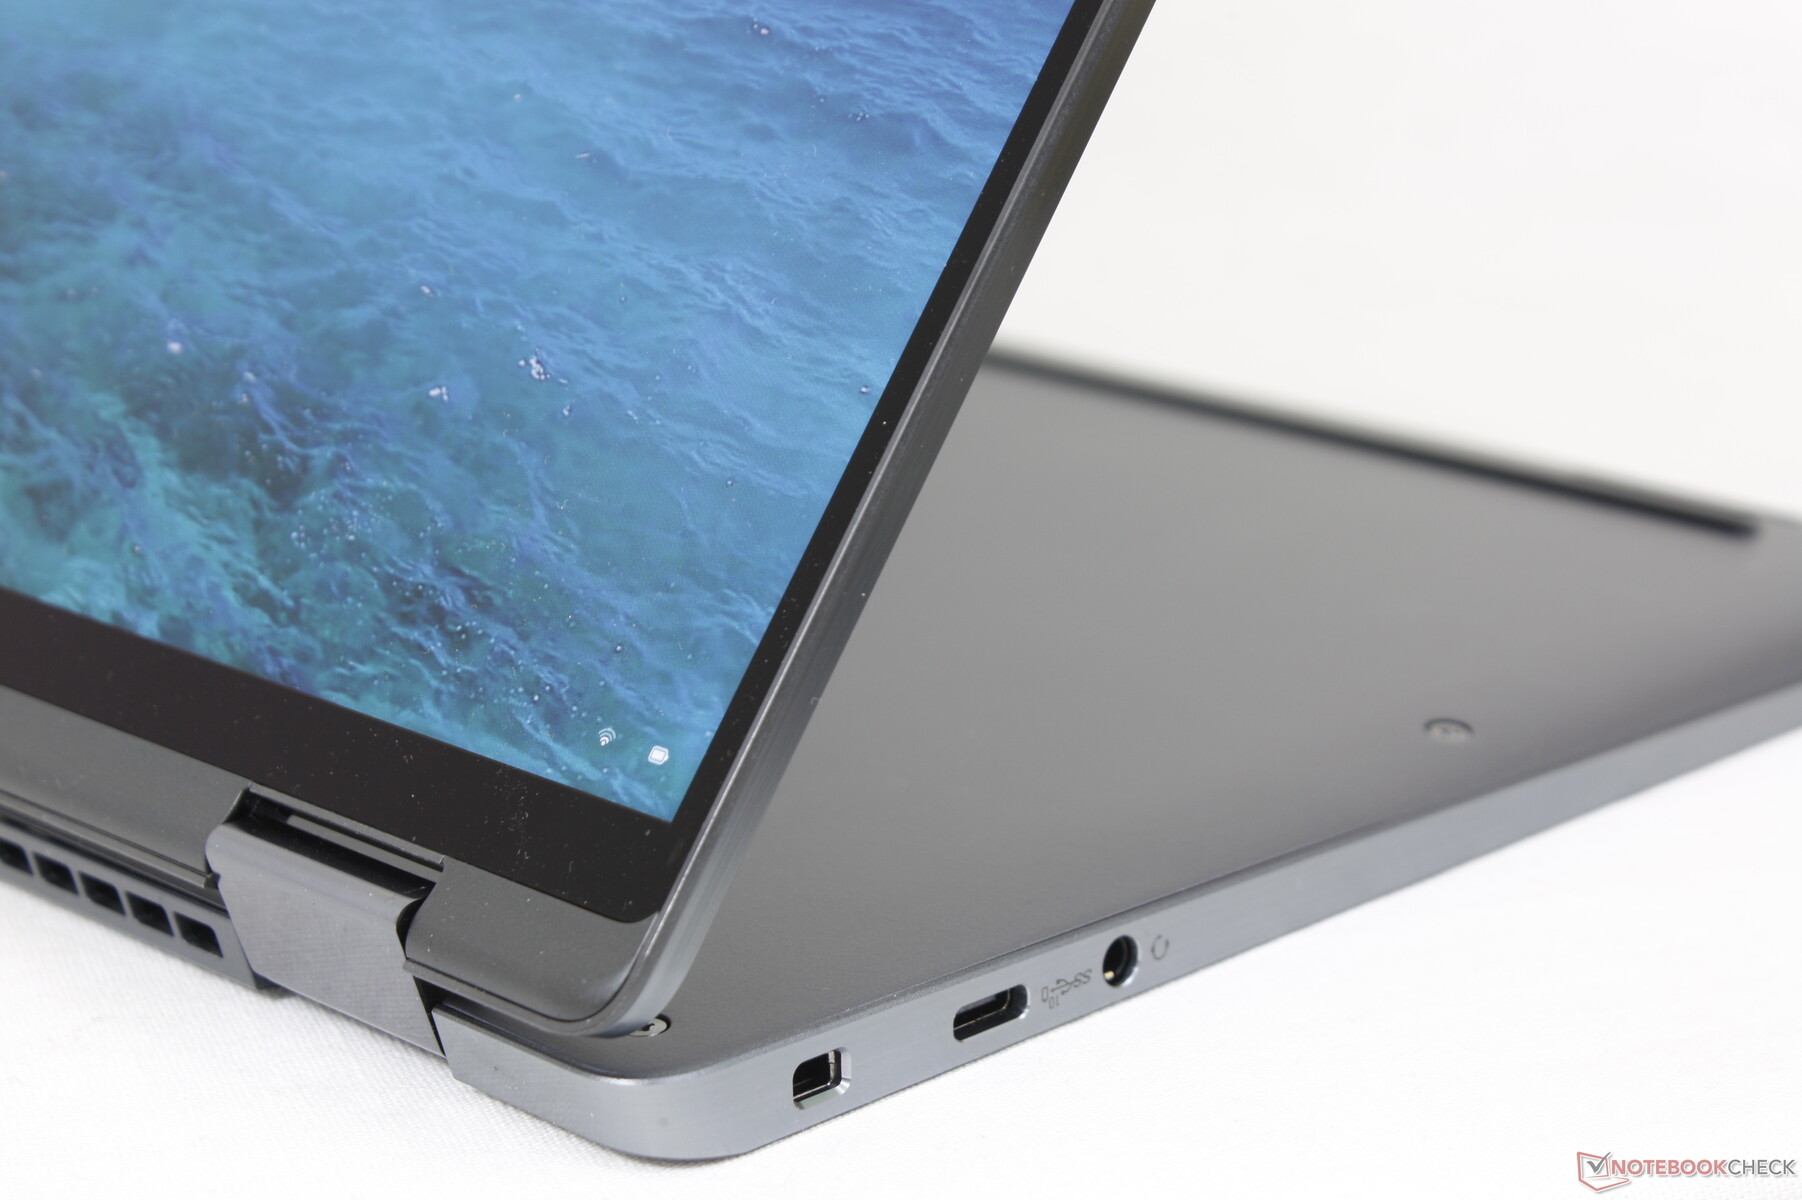
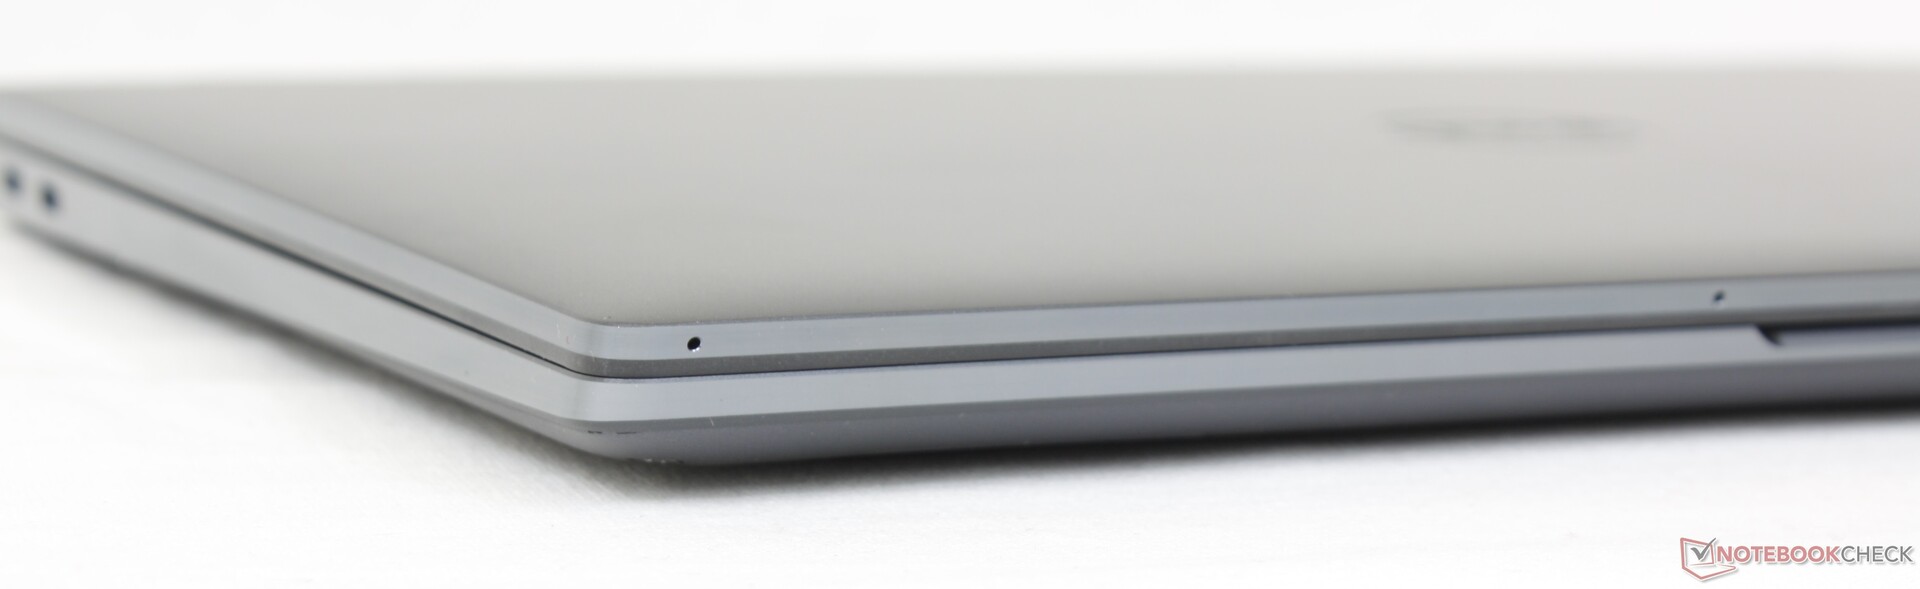
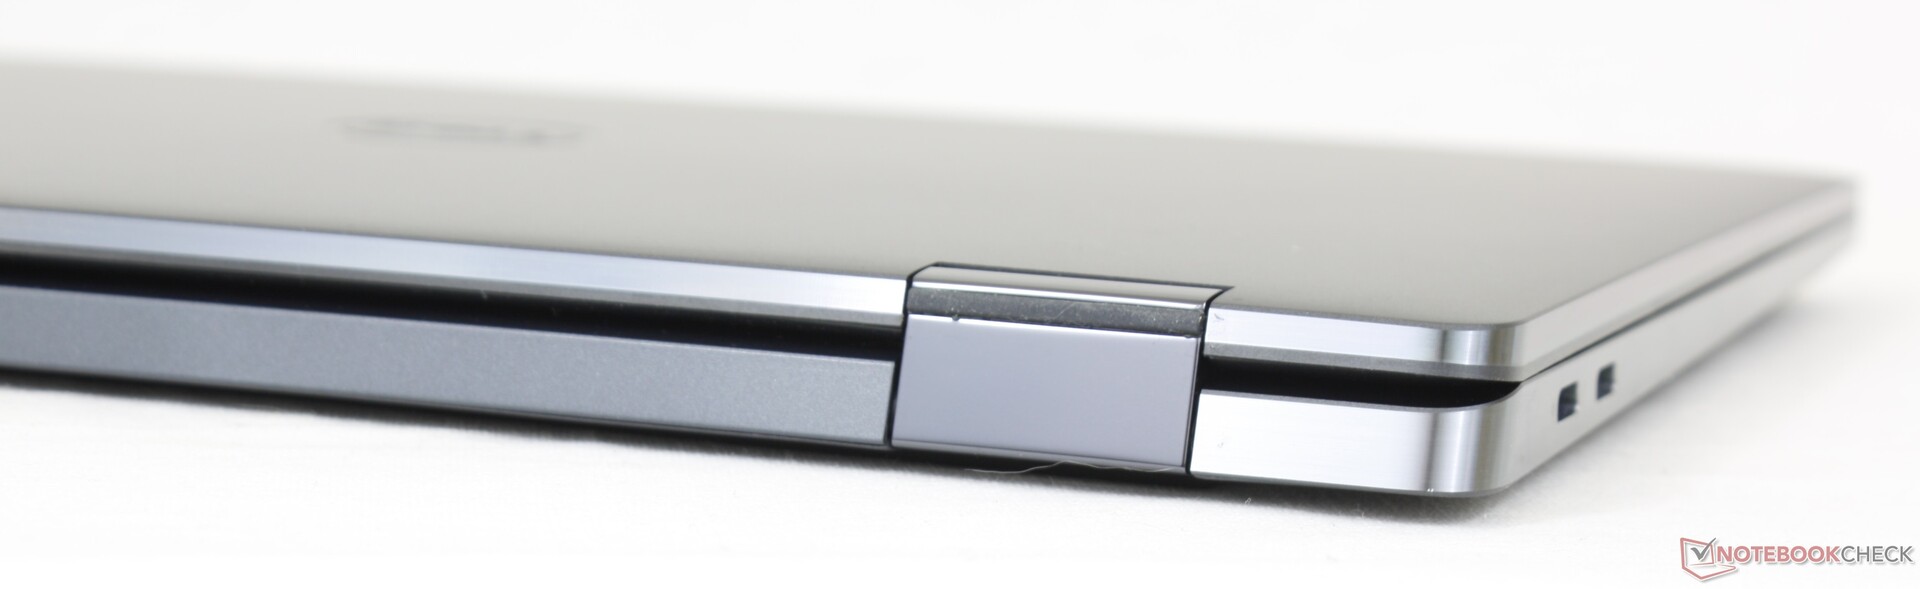
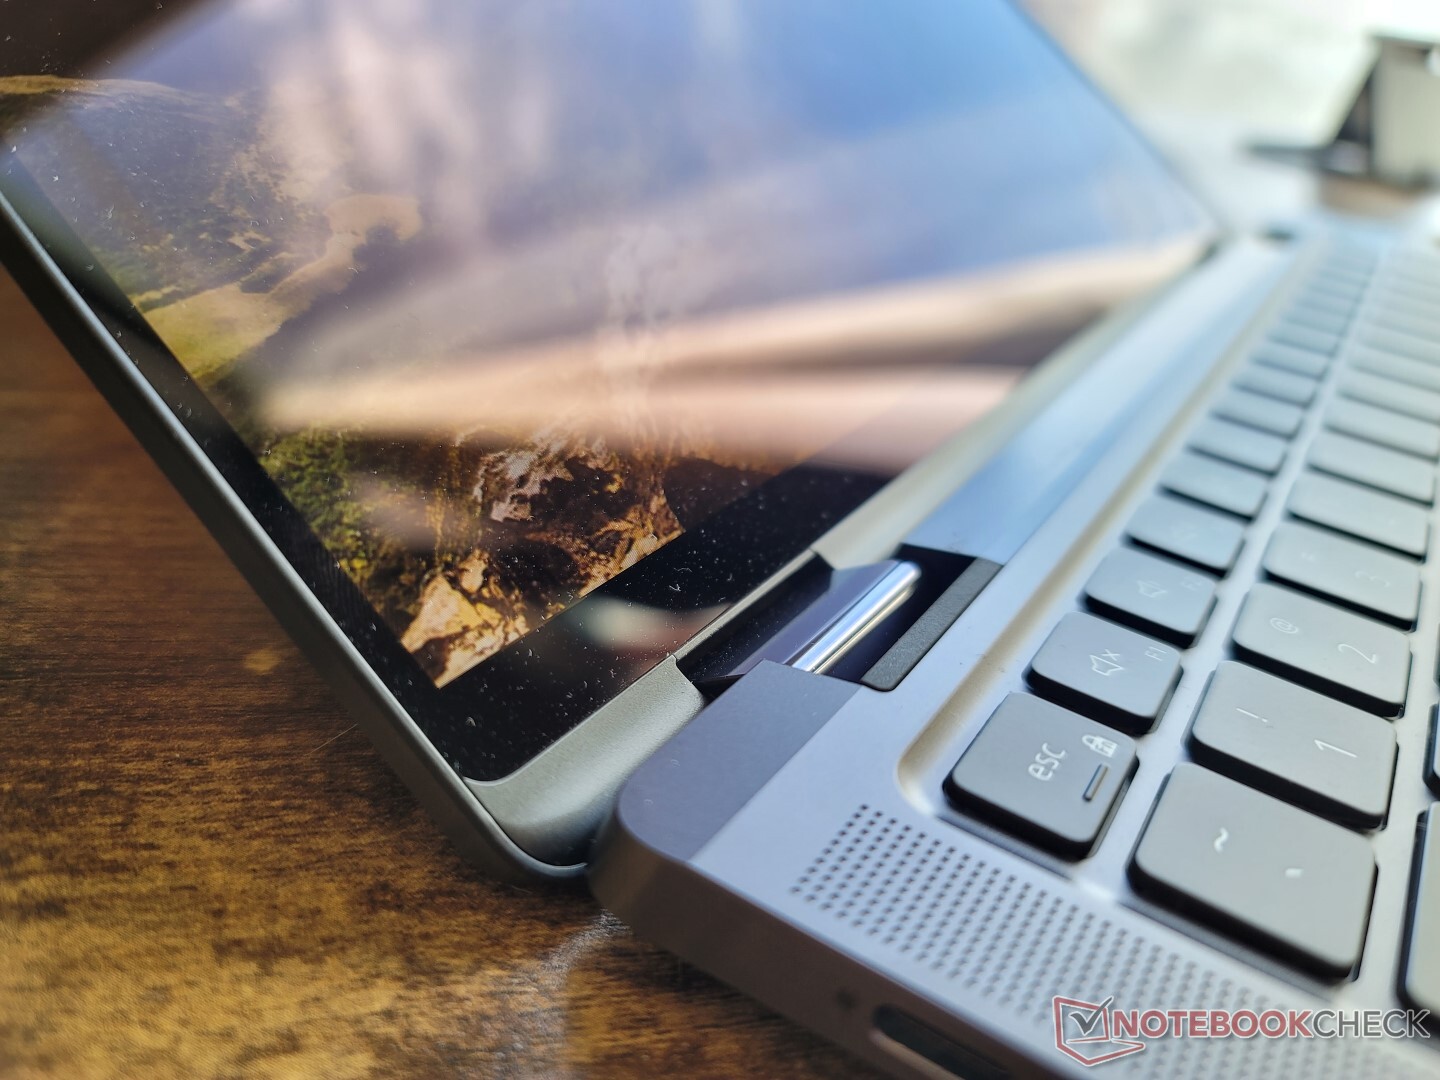
Custodia - Aspetto noioso, design robusto
Lo scheletro metallico grigio potrebbe non sembrare granché, soprattutto se paragonato ai vistosi design dorati dell'MSI Summit E13 Flip o dell'HP Spectre HP Spectre ma è altrettanto resistente, se non di più. Se si tenta di torcere la base dai lati o dal centro della tastiera, la deformazione è minima e la prima impressione è eccellente. Anche il display è resistente alla torsione o alla piegatura. La rigidità complessiva è una delle migliori che abbiamo visto su qualsiasi subnotebook convertibile ultrasottile.
Dimensioni e peso sono simili a quelli dell'Elite Dragonfly Max. Il modello Dell è leggermente più lungo a causa del rapporto di aspetto 16:10 più alto rispetto al 16:9 di HP, ma il design Dell compensa con cornici laterali più strette e un profilo più sottile. Nel frattempo, il Summit E13 Flip è un convertibile da 13 pollici ancora più grande e pesante.
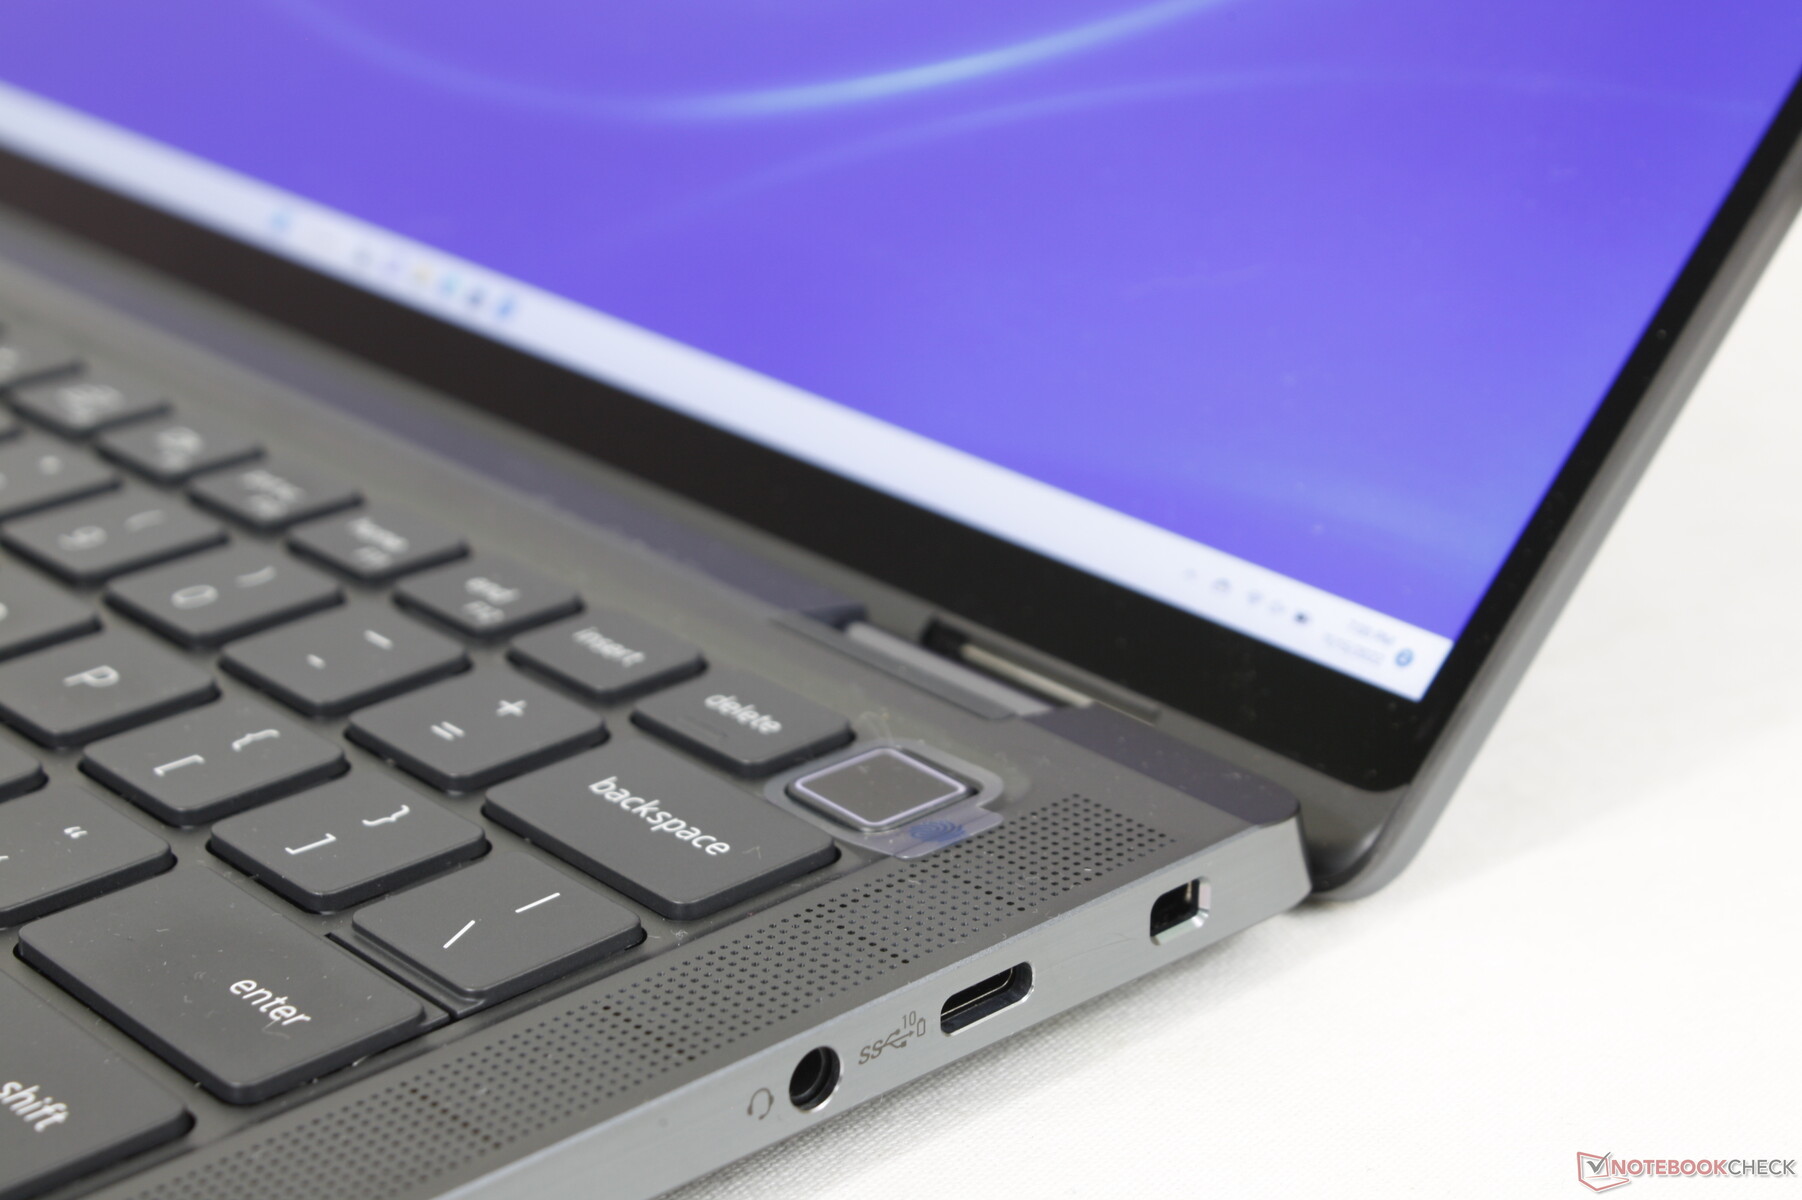
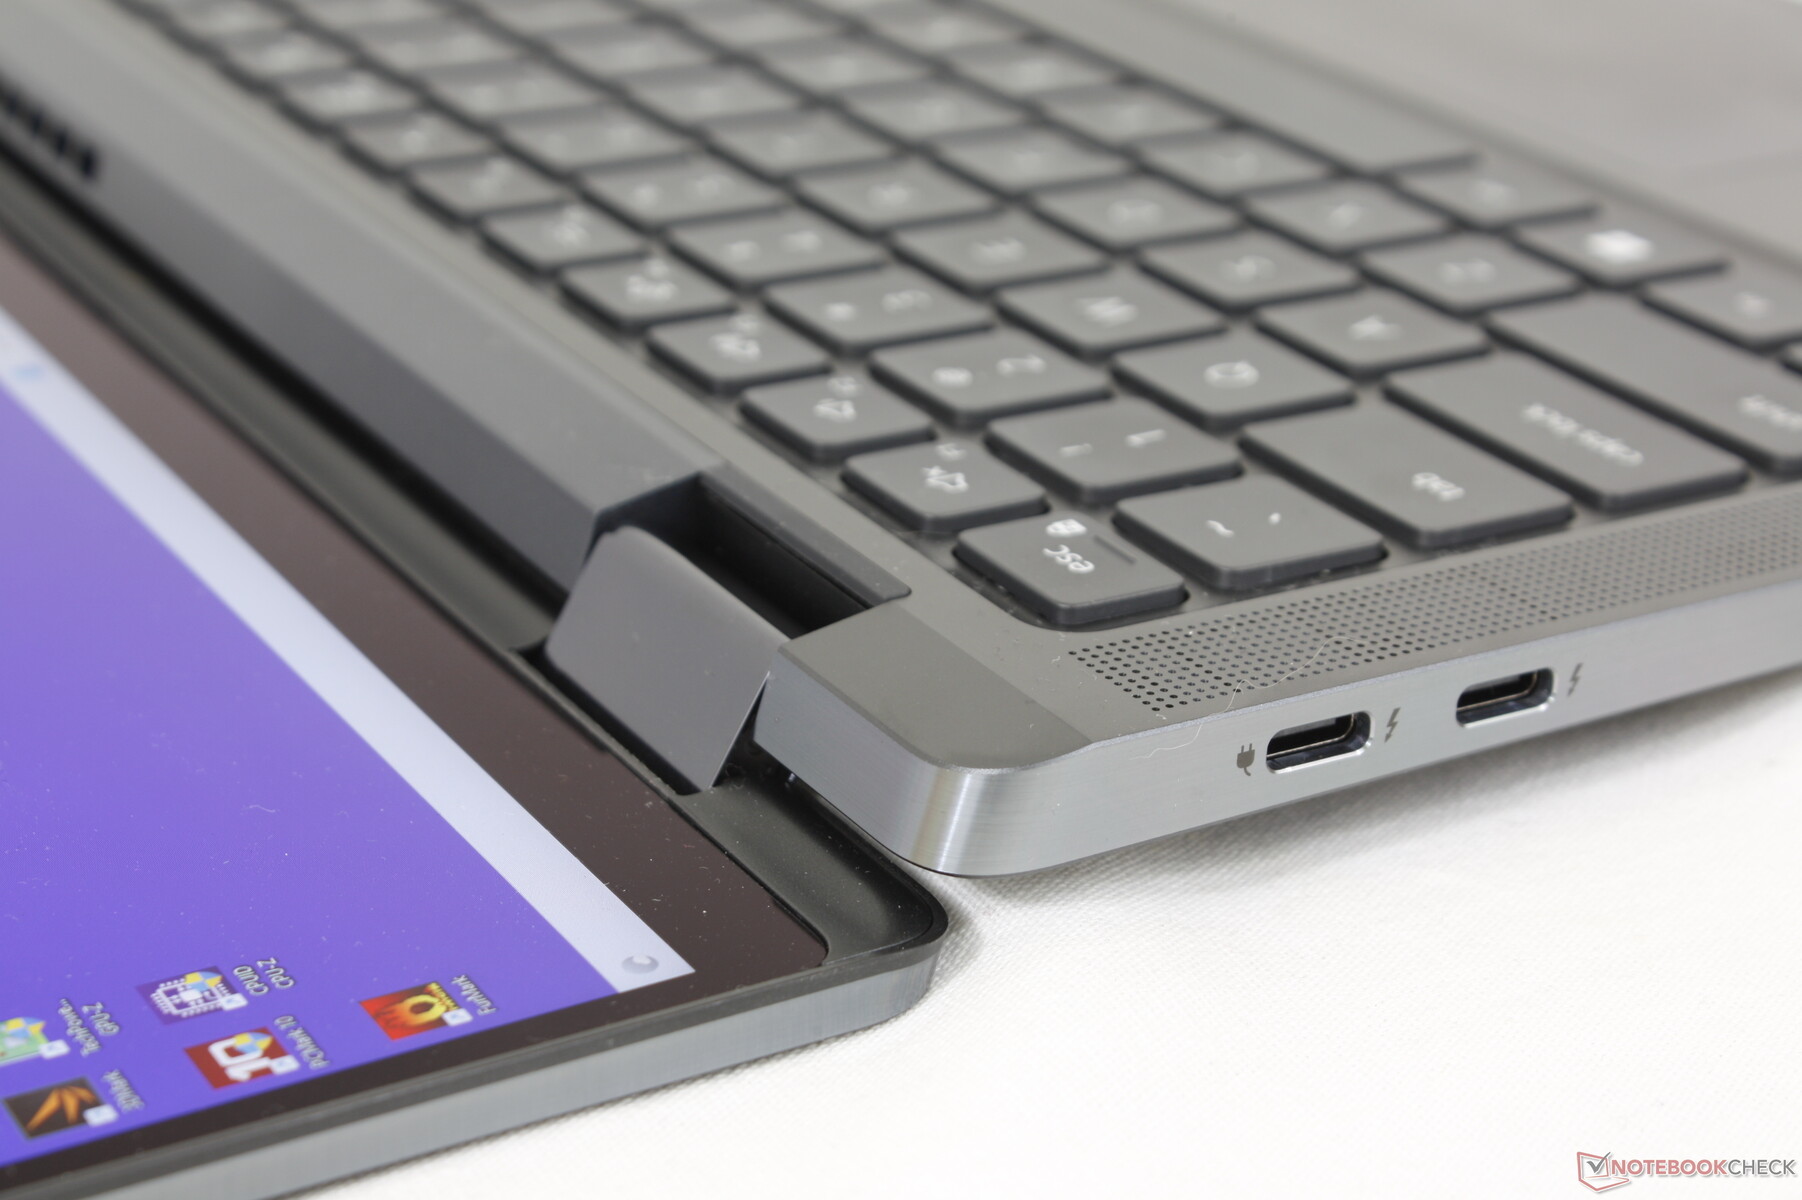
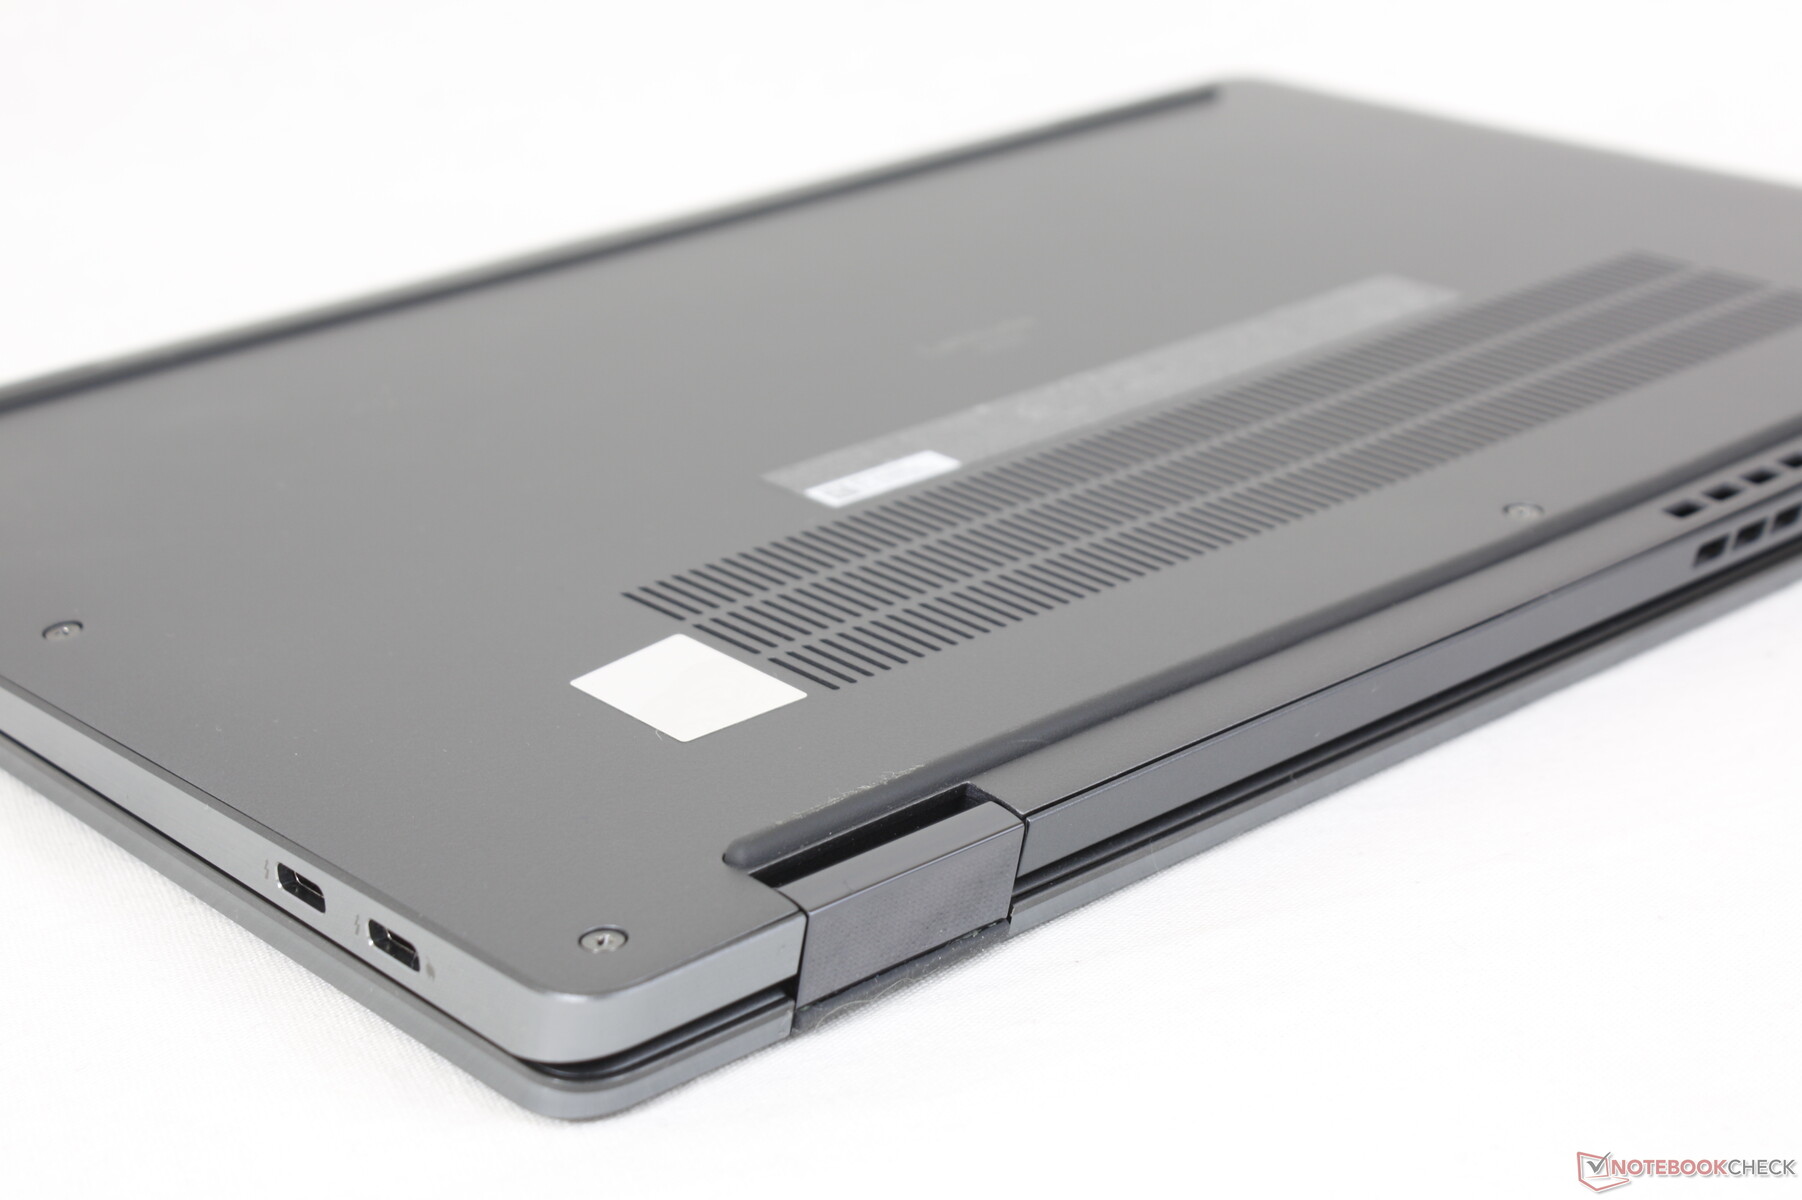
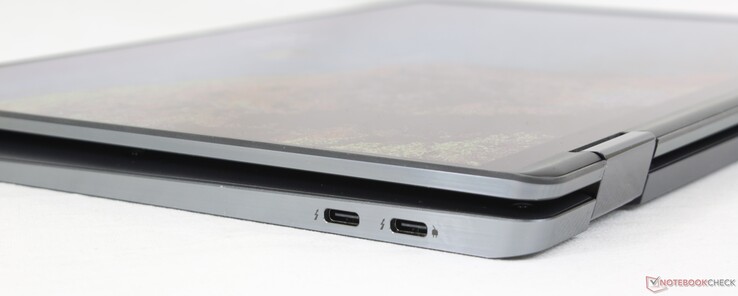
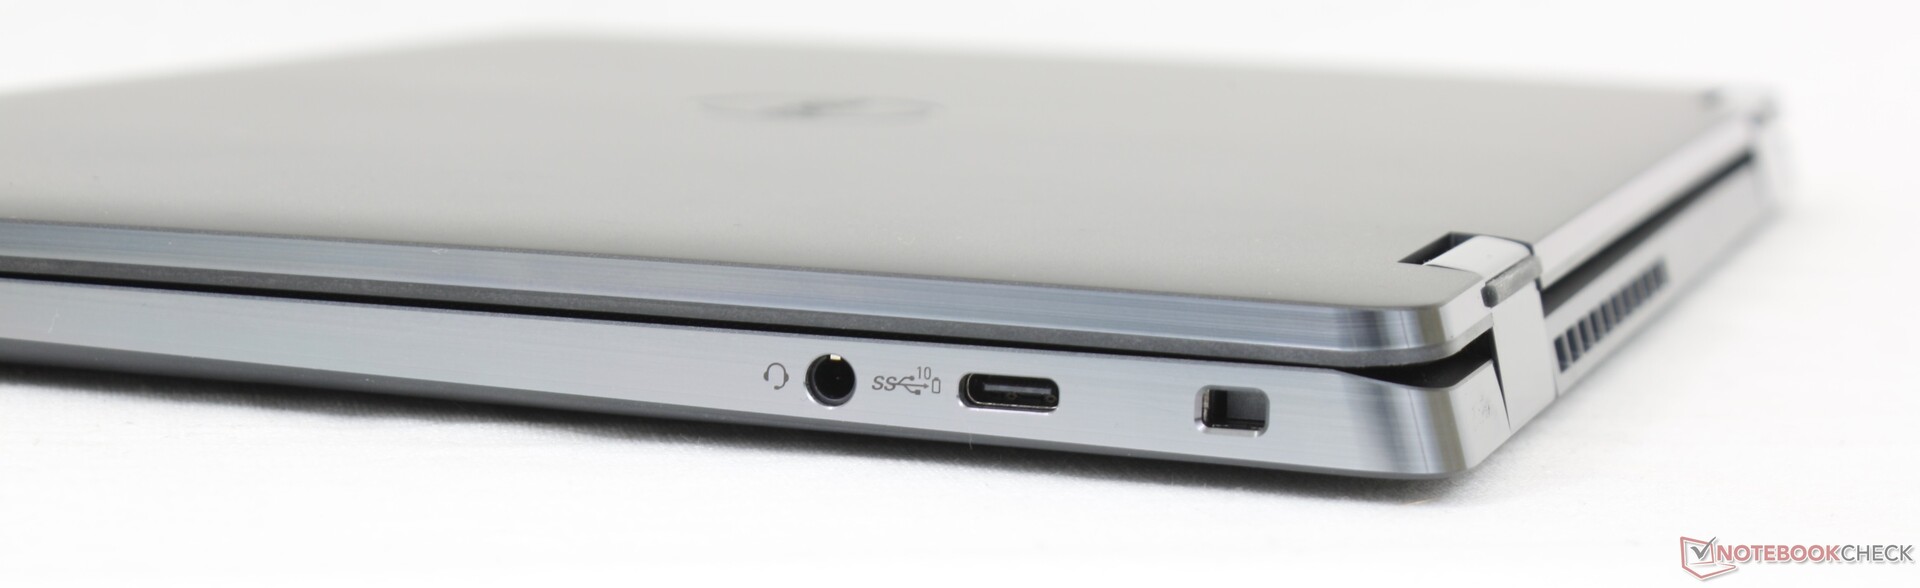
Connettività - Solo USB-C
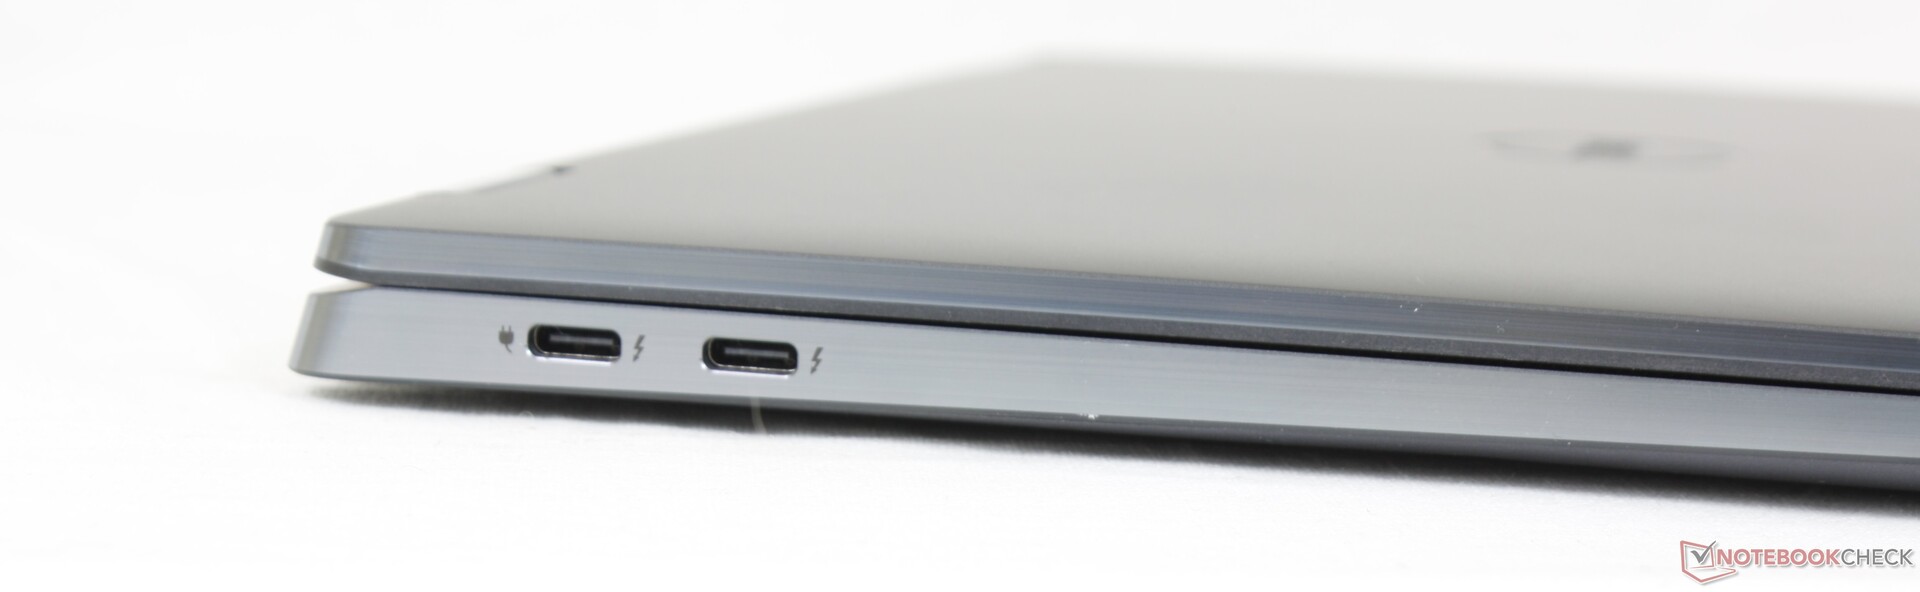
Preparatevi a portare con voi adattatori USB-C ovunque andiate, poiché il modello non integra porte USB-A o HDMI. Se tali porte sono necessarie, potreste prendere in considerazione il Dragonfly Max o anche il Summit E13 Flip.
Tenere presente che solo le due porte USB-C di sinistra supportano i dispositivi Thunderbolt 4. Le tre porte USB-C possono essere utilizzate per monitor esterni e per la ricarica.
È un po' deludente che il modello non integri un lettore di schede SD, considerando che il più economicoLatitude 5310 2-in-1 ne include uno.
Comunicazione
La connettività Wi-Fi 6E e Bluetooth 5.2 è affidata a un Intel AX211. La velocità di trasferimento è leggermente superiore con 6 GHz rispetto a 5 GHz, ma la differenza non è così ampia come ci si aspetterebbe
Lo Snapdragon X20 LTE-A o l'Intel 5000 5G sono opzionali per la connettività WWAN su uSIM. Purtroppo non è possibile acquistare una SKU non WAN per poi aggiungere un modulo WAN in un secondo momento, poiché l'antenna non è inclusa nelle configurazioni non WAN.
| Networking | |
| iperf3 transmit AX12 | |
| Dell Latitude 5310-23VP6 | |
| HP Elite Dragonfly Max | |
| HP EliteBook x360 1030 G7 | |
| MSI Summit E13 Flip Evo A11MT | |
| iperf3 receive AX12 | |
| HP EliteBook x360 1030 G7 | |
| HP Elite Dragonfly Max | |
| MSI Summit E13 Flip Evo A11MT | |
| Dell Latitude 5310-23VP6 | |
| iperf3 receive AXE11000 6GHz | |
| Dell Latitude 9330 | |
| iperf3 receive AXE11000 | |
| Dell Latitude 9330 | |
| iperf3 transmit AXE11000 | |
| Dell Latitude 9330 | |
| iperf3 transmit AXE11000 6GHz | |
| Dell Latitude 9330 | |
Webcam
La webcam da 2 MP con IR è di serie per il supporto di Windows Hello. In confronto, i portatili HP Elite e Spectre sono dotati di sensori da 5 MP per una qualità delle immagini più nitida. Tutte le webcam dei portatili Dell Latitude e Lenovo ThinkPad continuano a essere limitate a 2 MP.


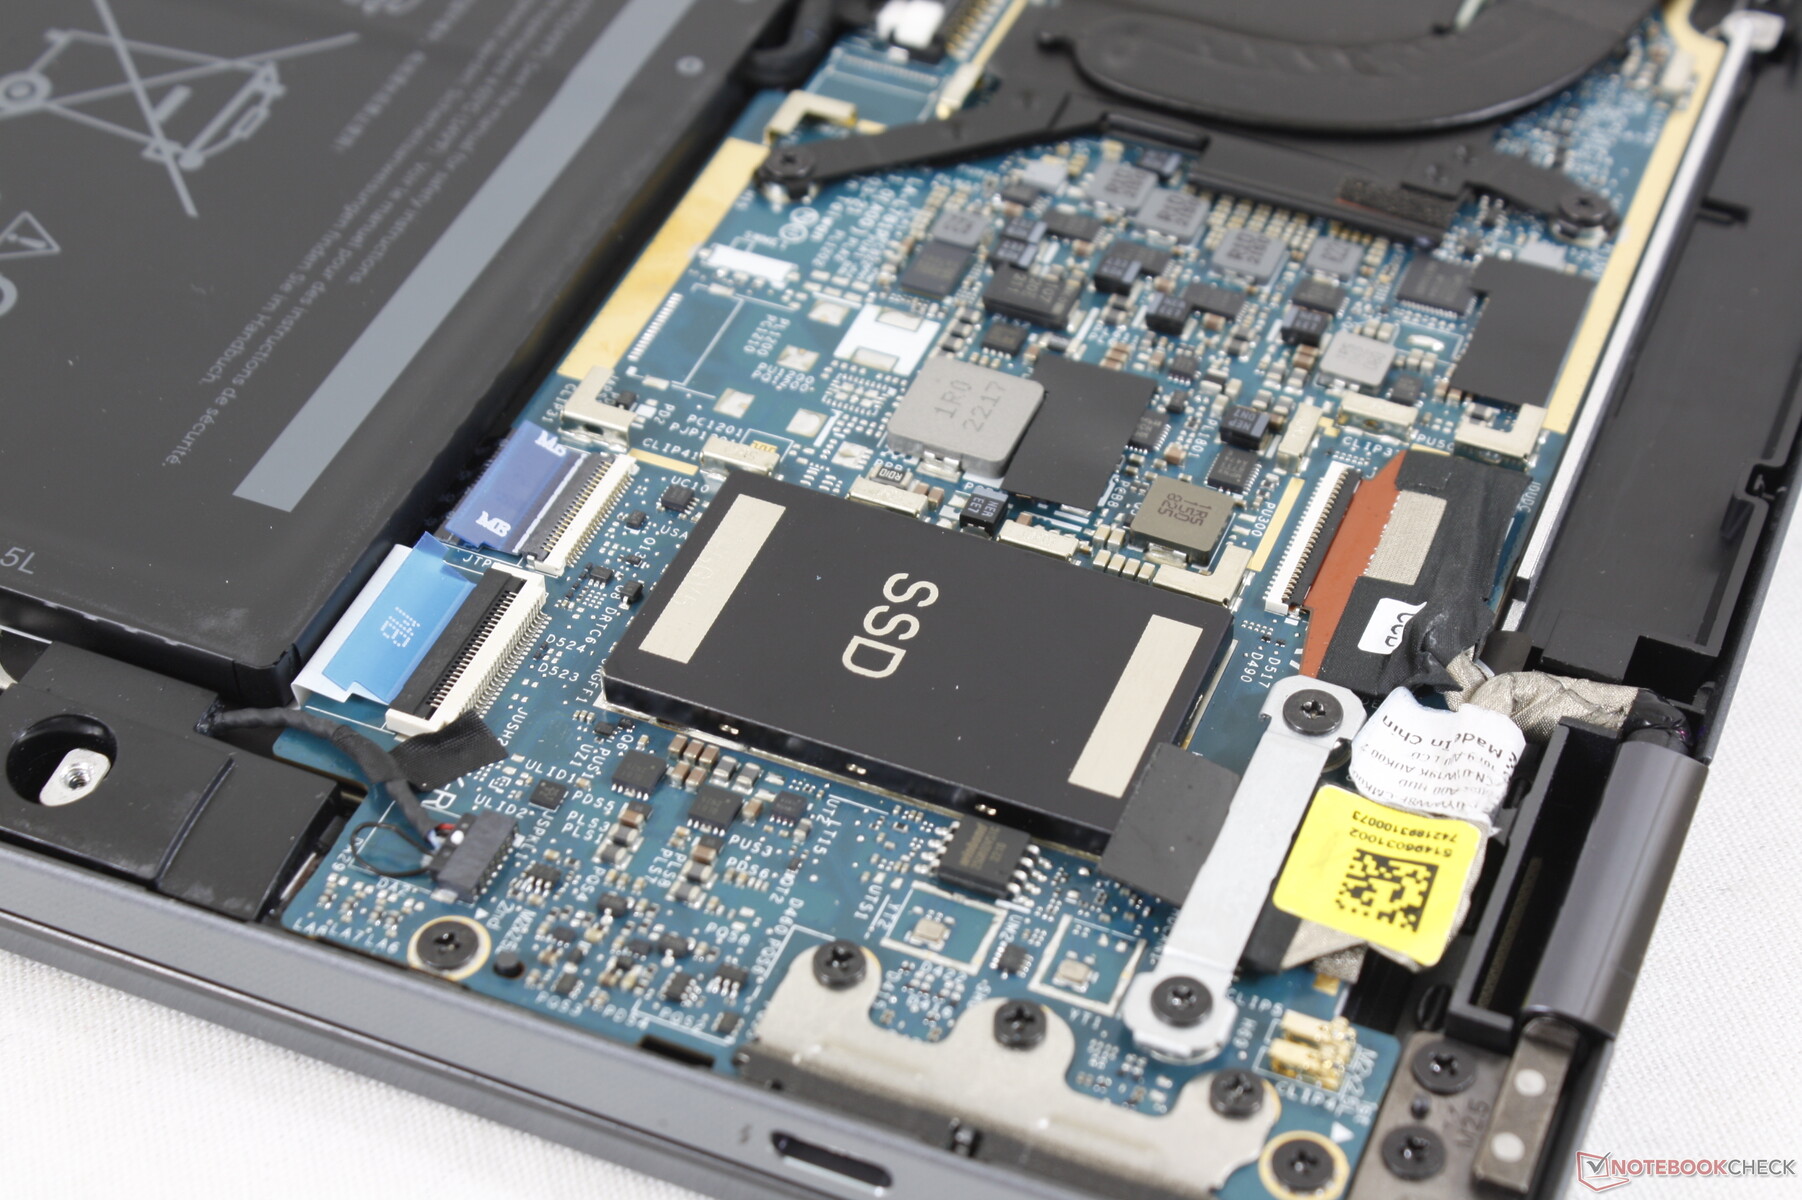
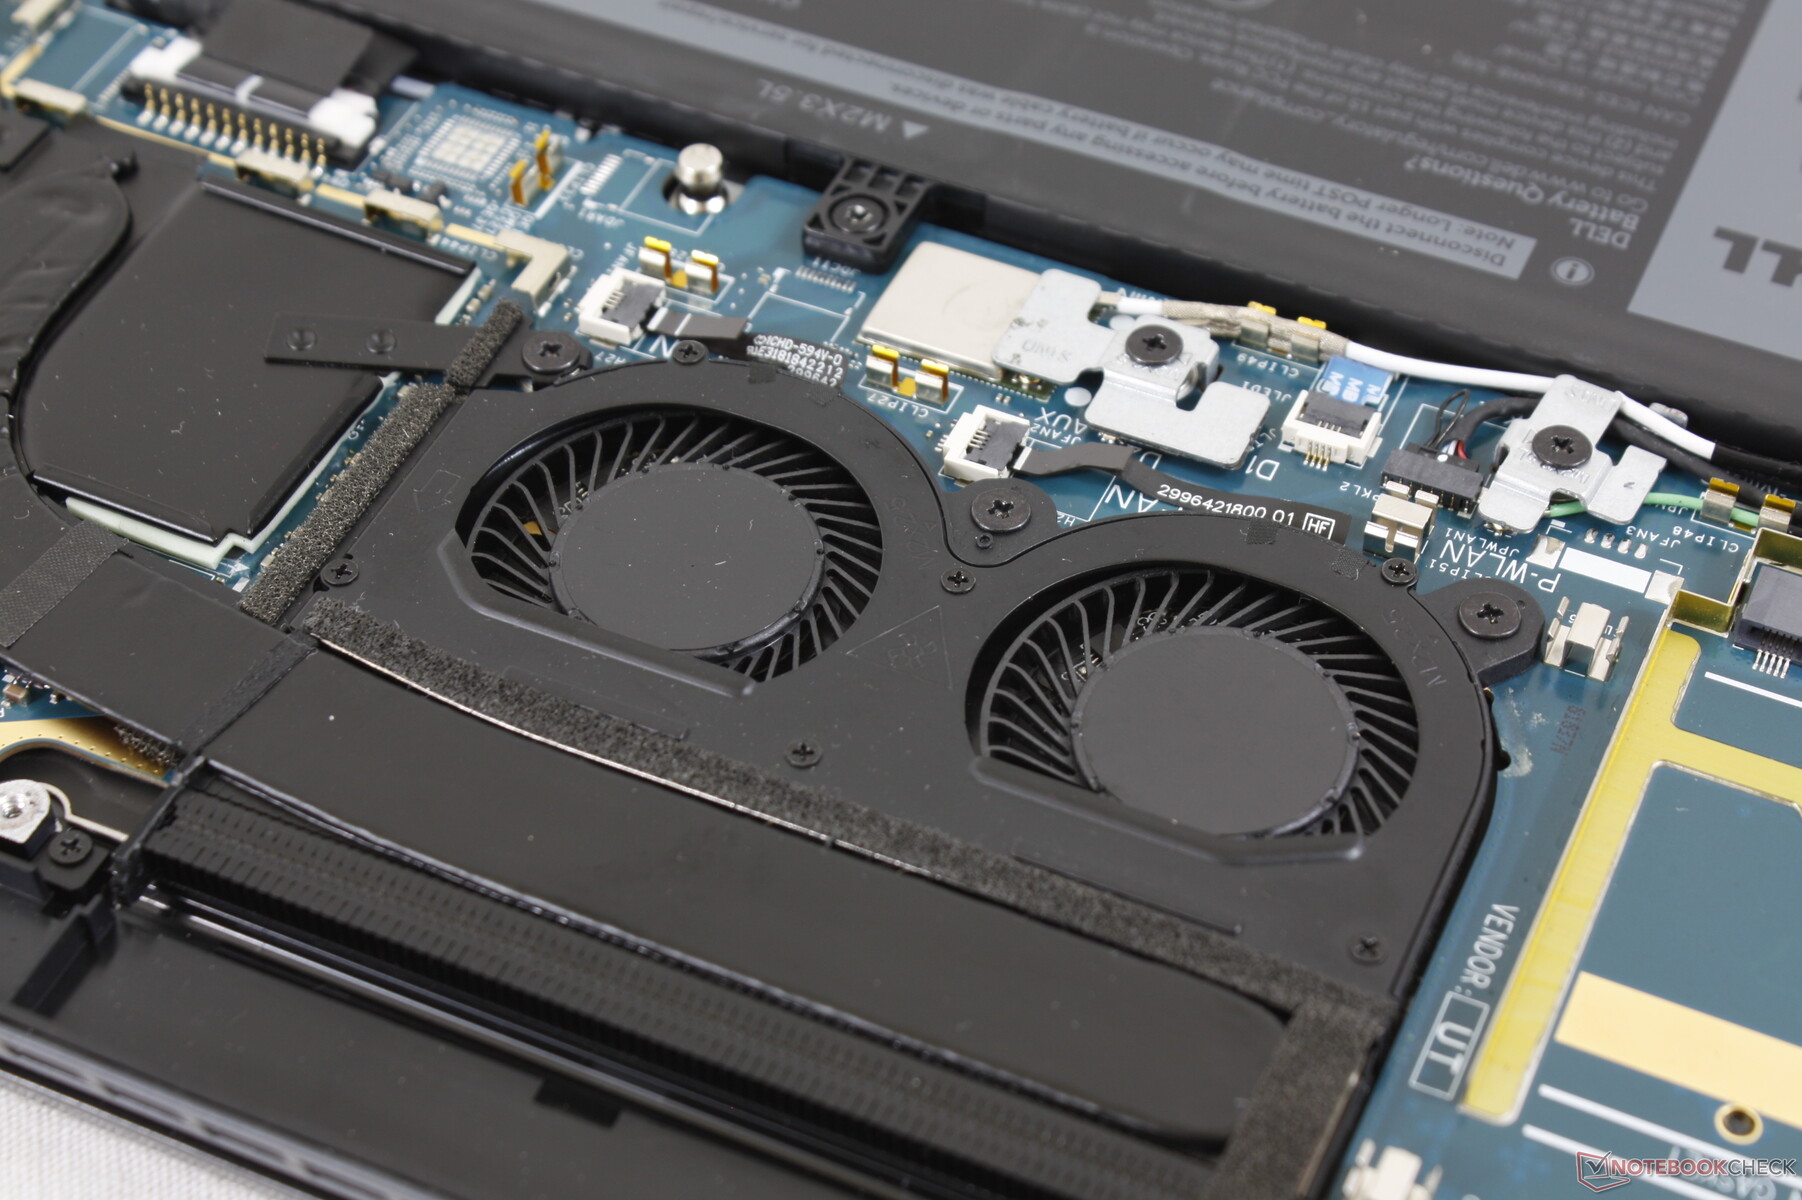
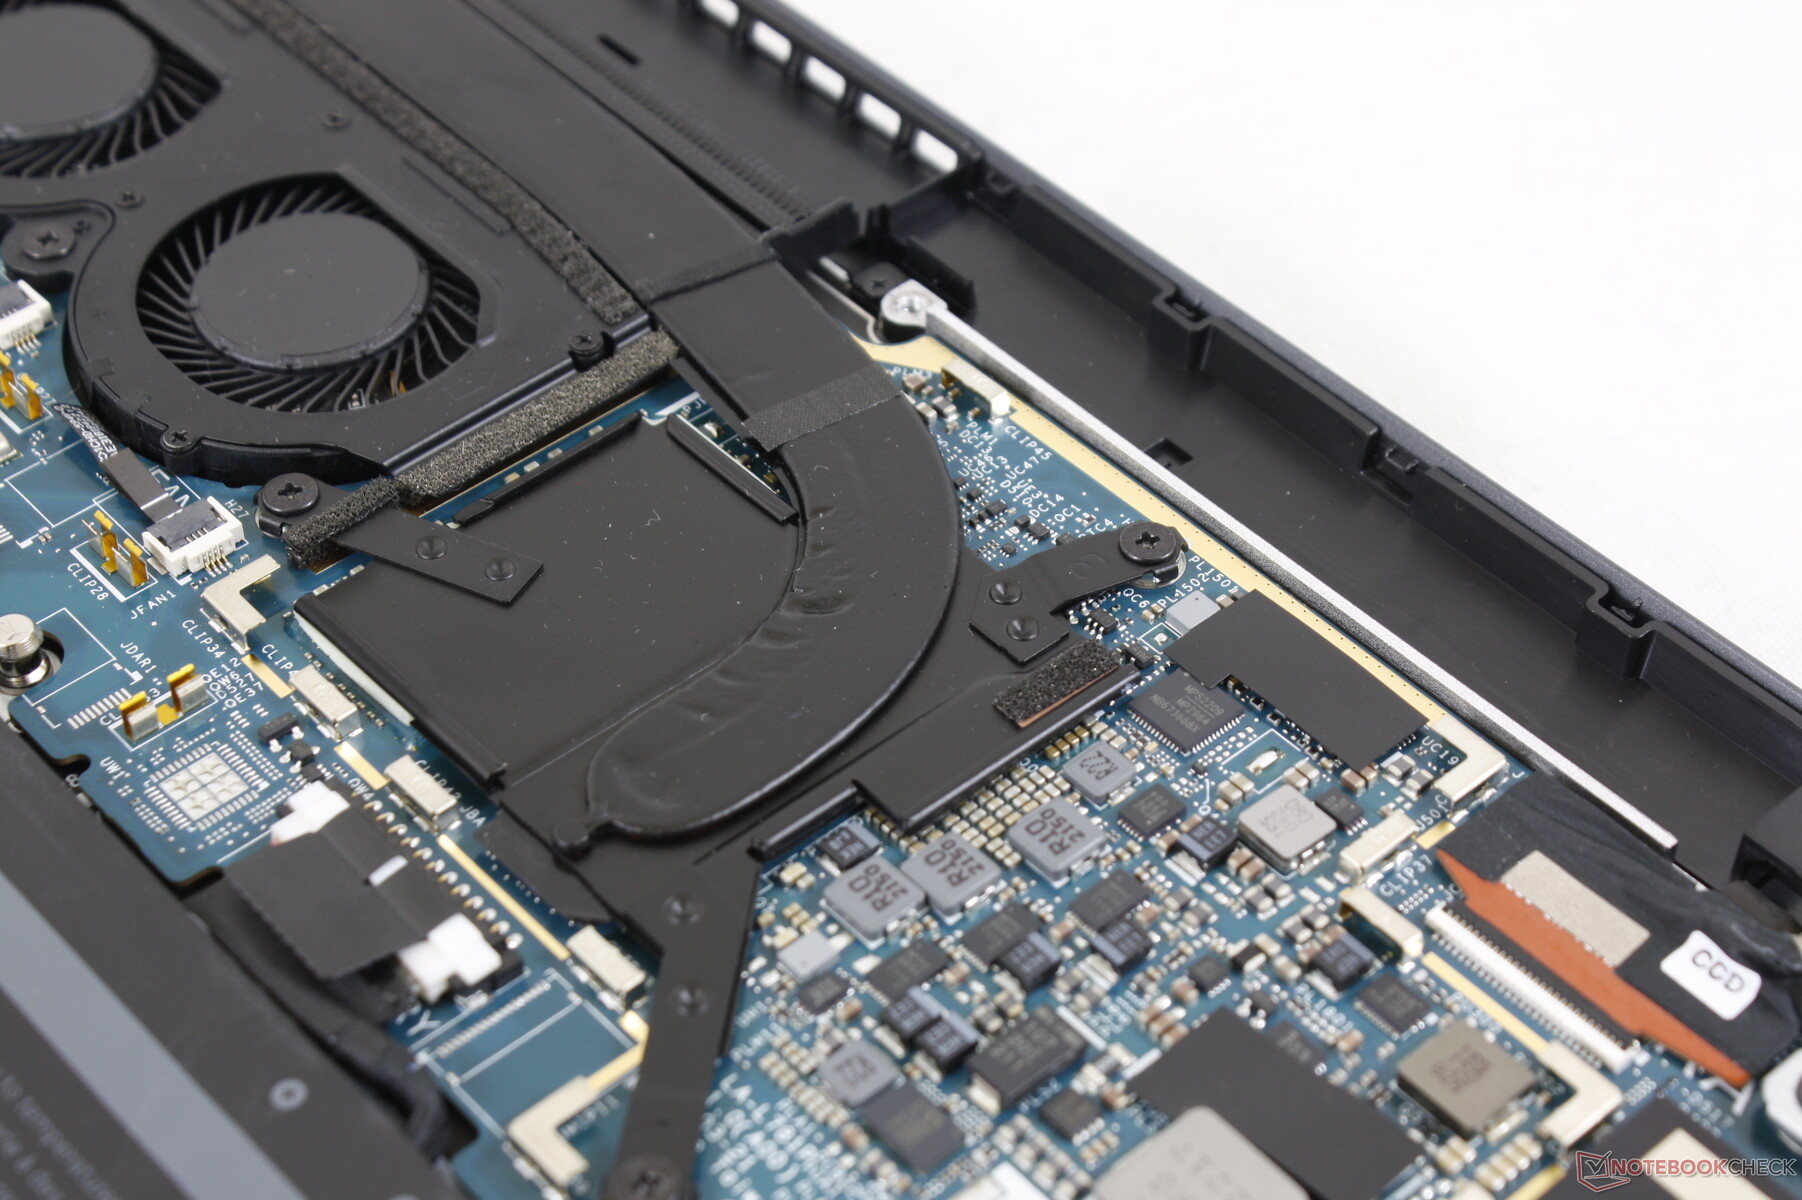
Manutenzione
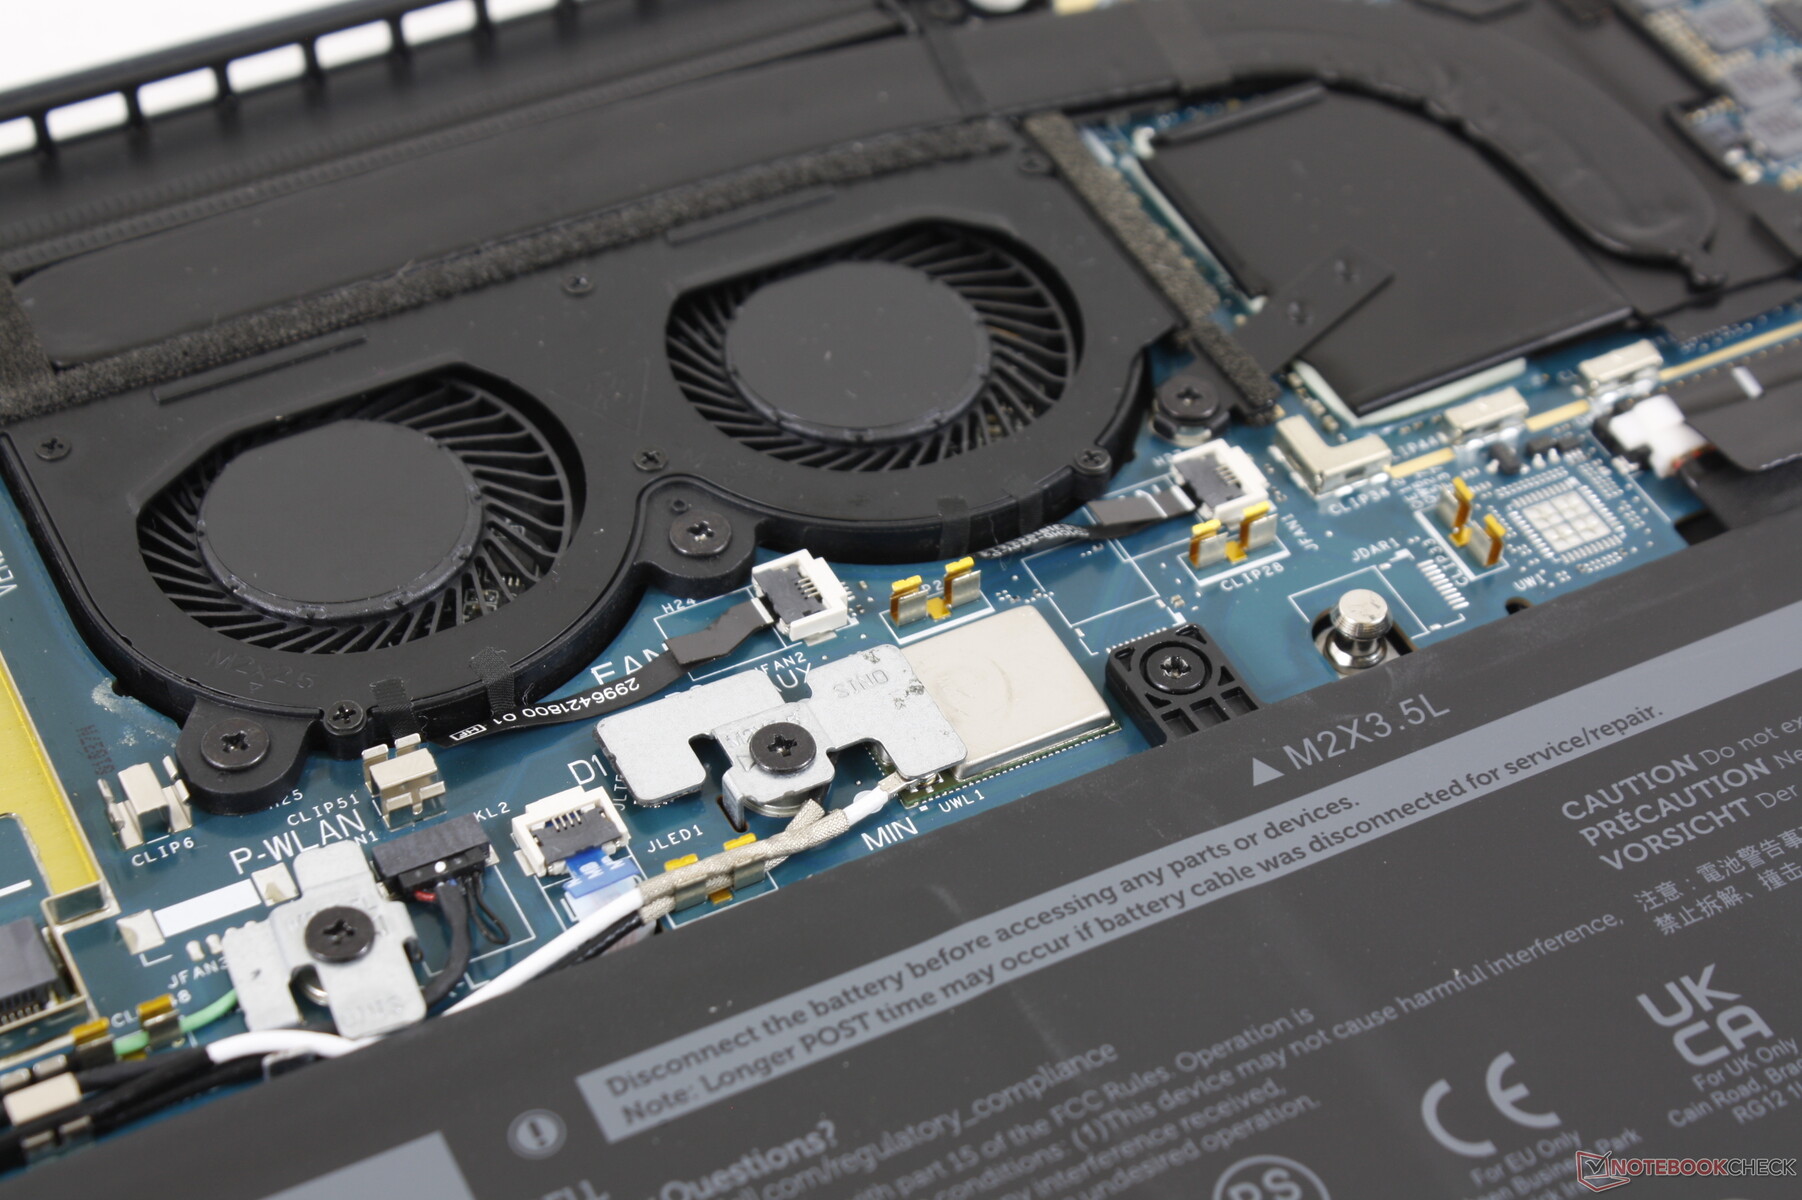
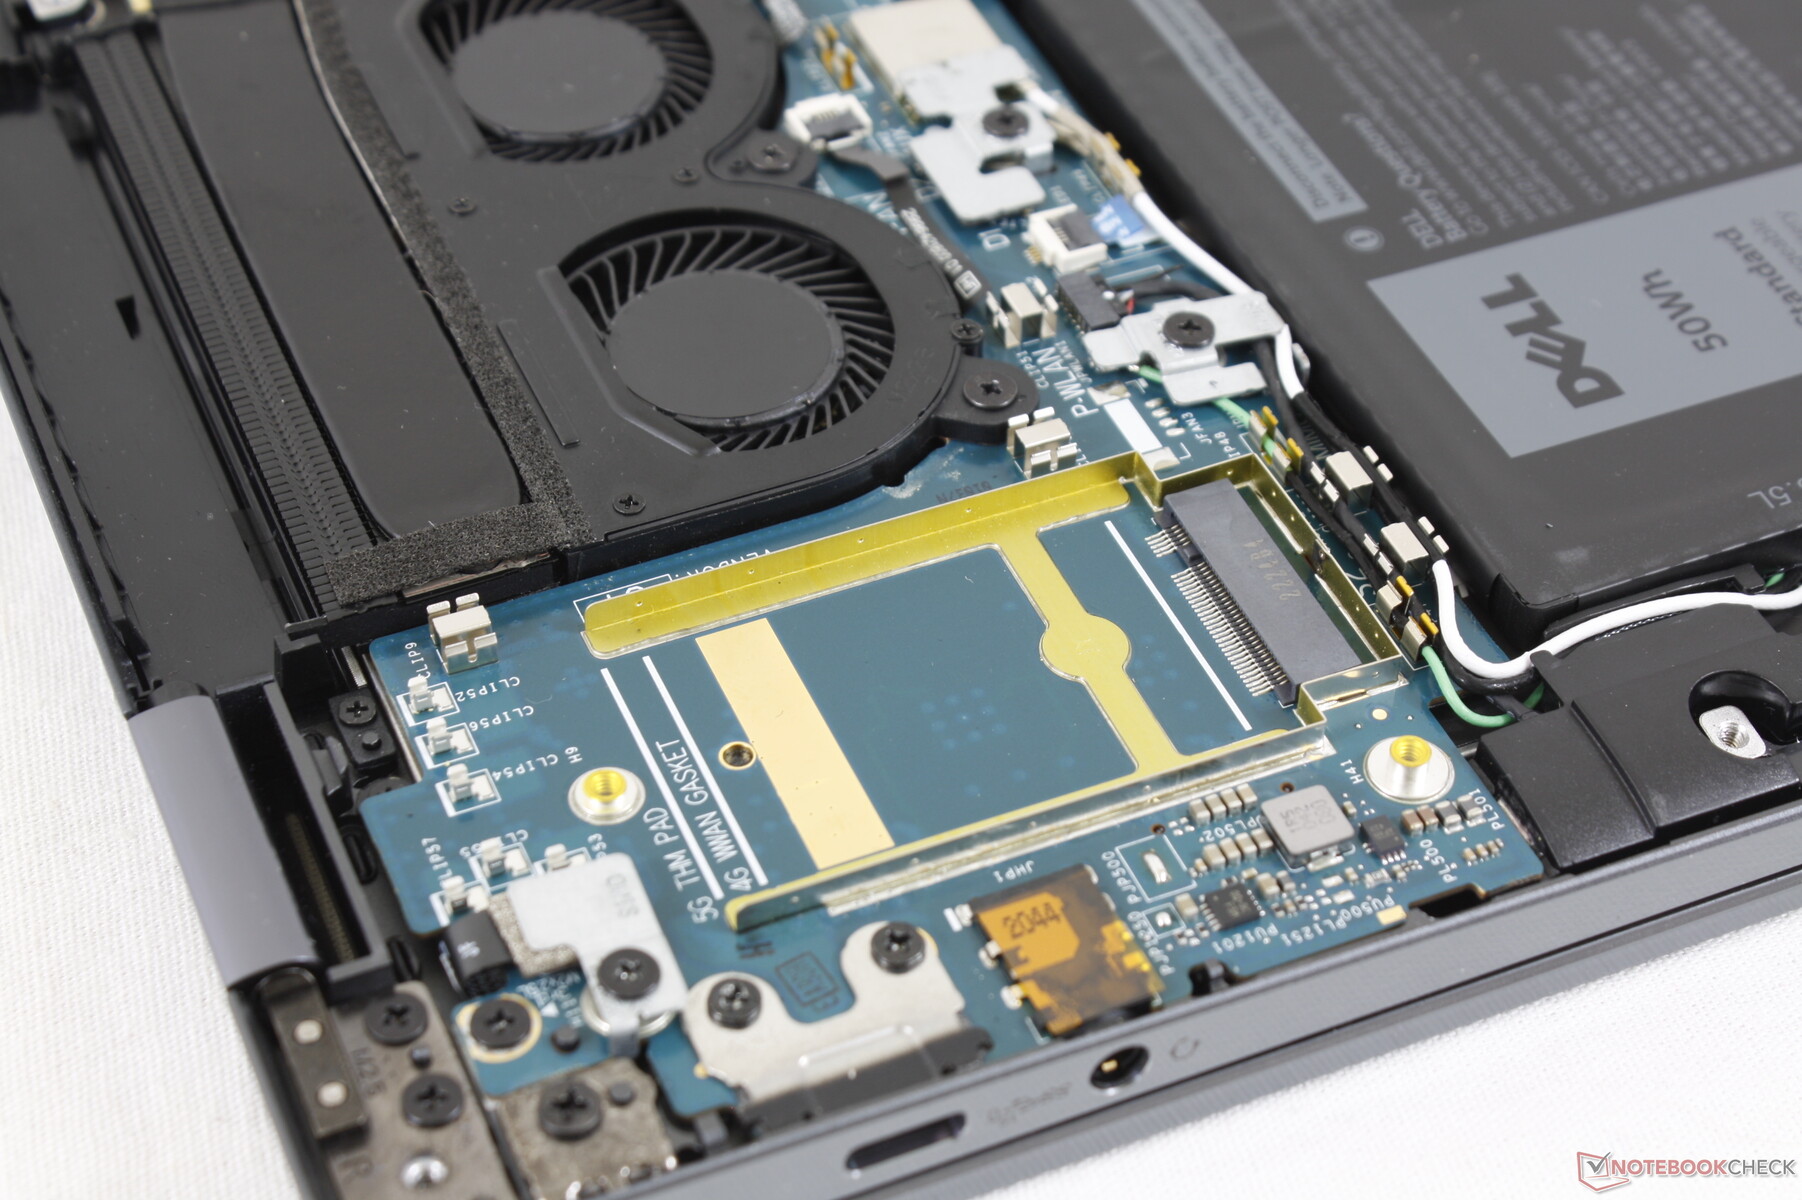
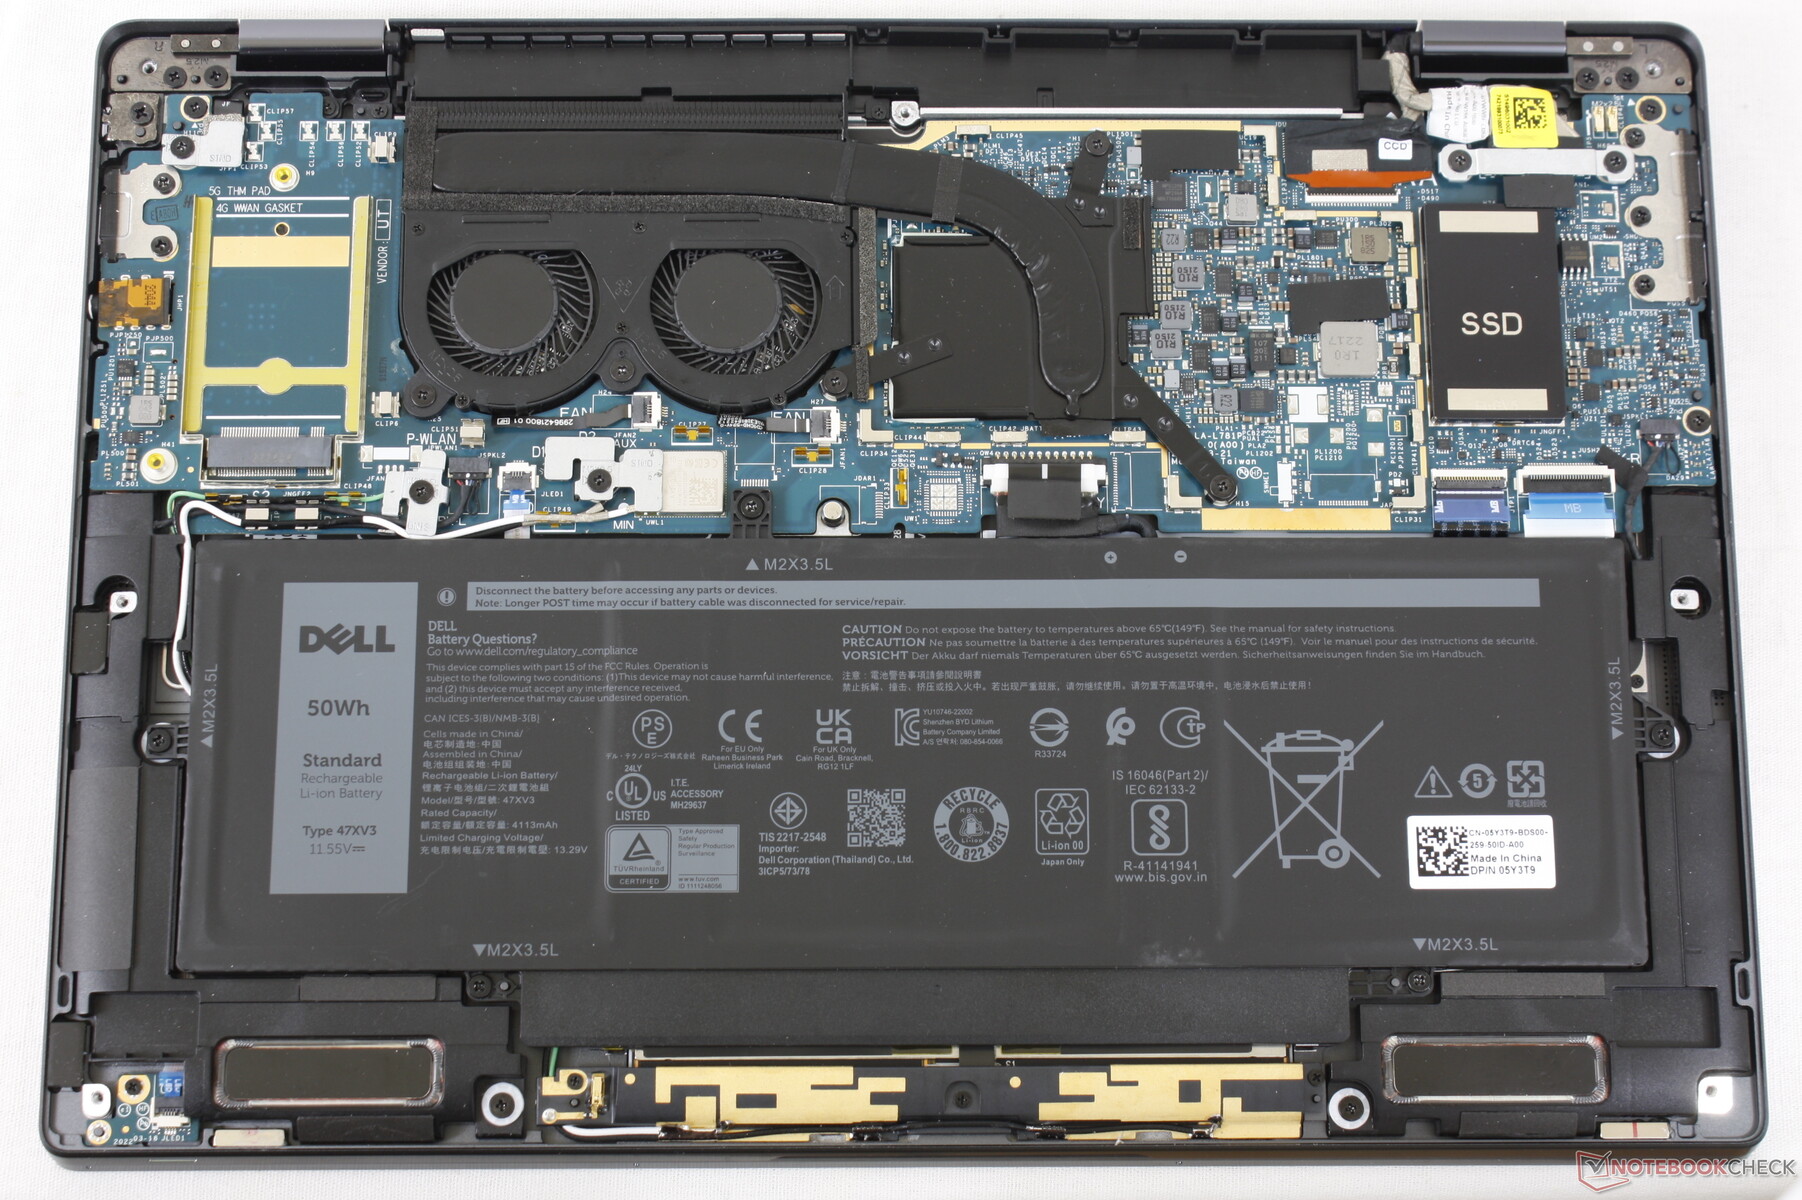
Il pannello inferiore è fissato con sole 6 viti Philips per facilitare la manutenzione. Gli utenti possono rimuovere la batteria, i moduli WAN e SSD mentre i moduli WLAN e RAM sono saldati. La WLAN e la RAM non aggiornabili sono comuni nei subnotebook da 13 pollici.
Accessori e garanzia
La confezione di vendita include un adattatore da USB-C a USB-A per ovviare al fatto che Latitude 9330 non integra alcuna porta USB-A. La garanzia limitata di tre anni del produttore è di serie, una prassi comune per i PC aziendali di fascia alta di Dell o HP.
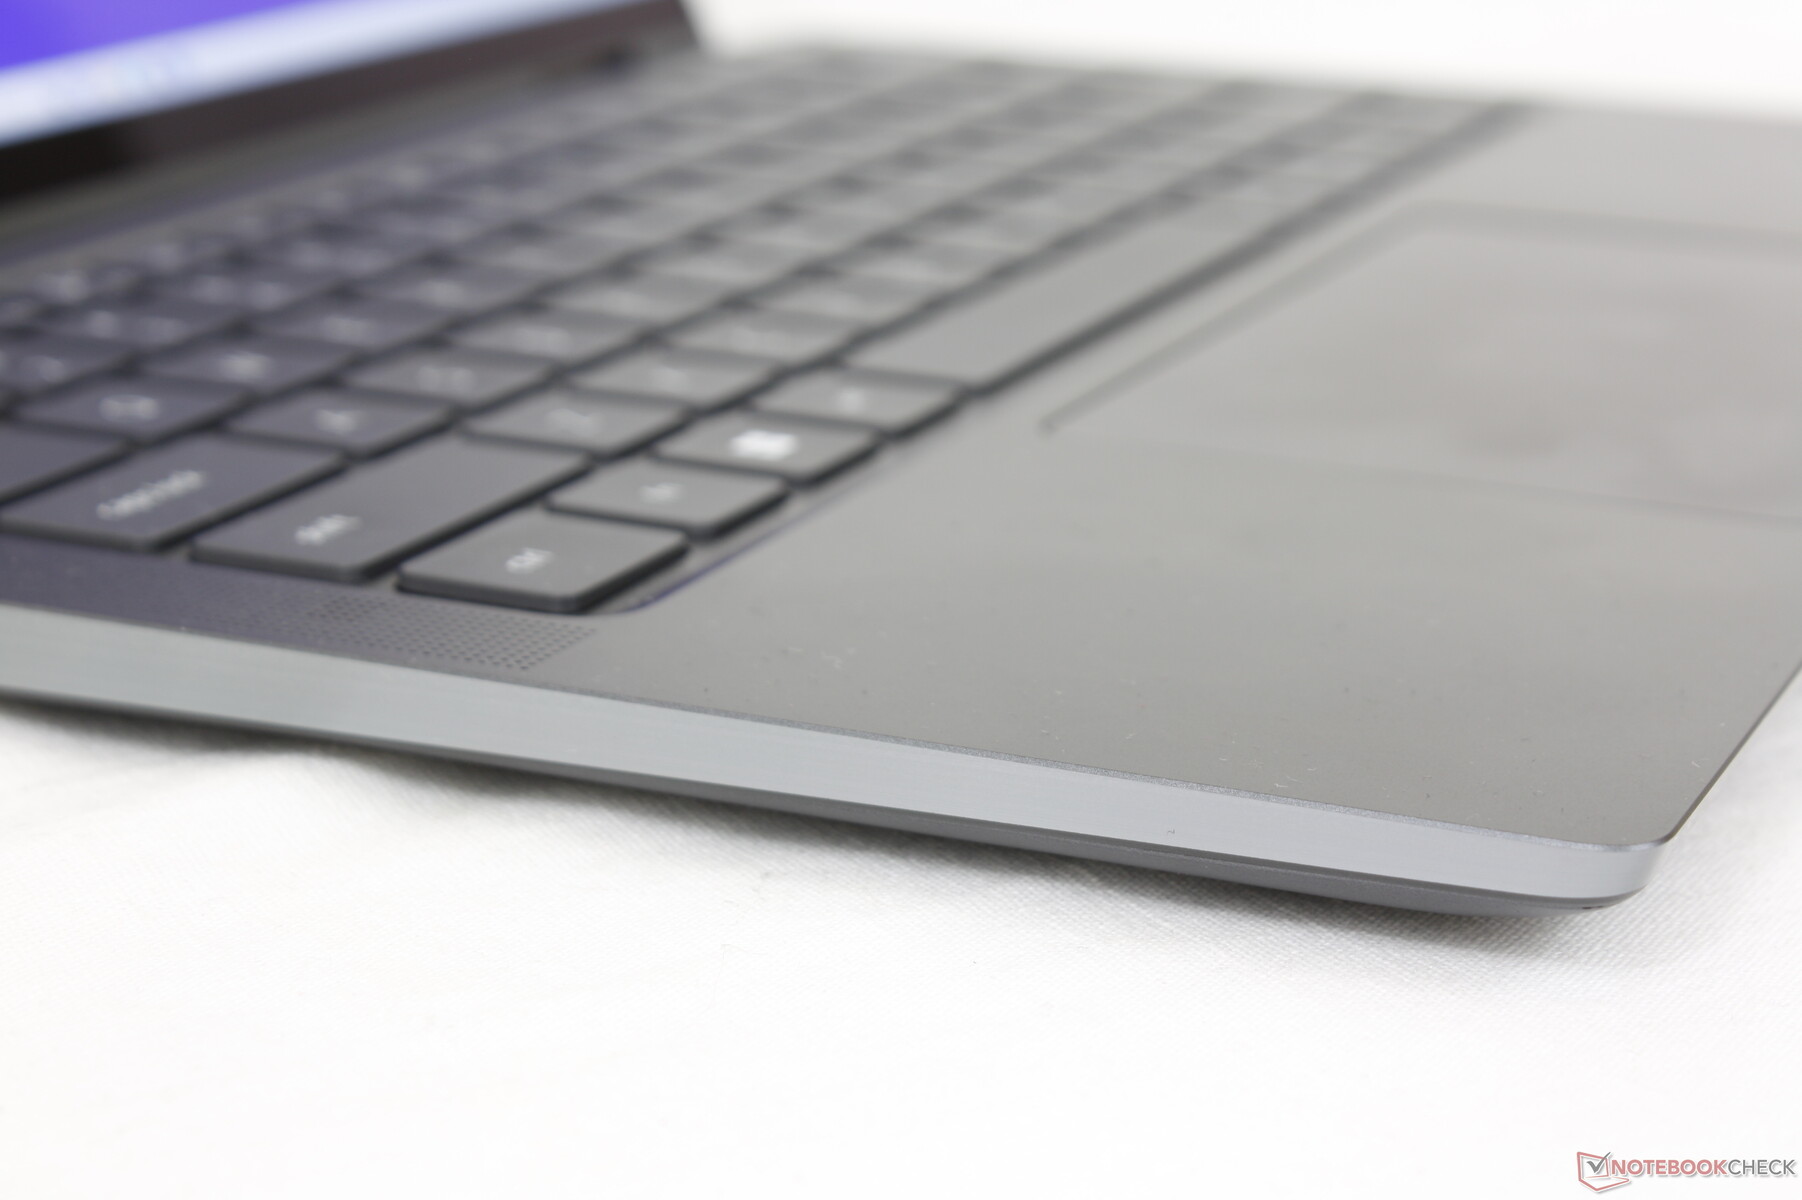
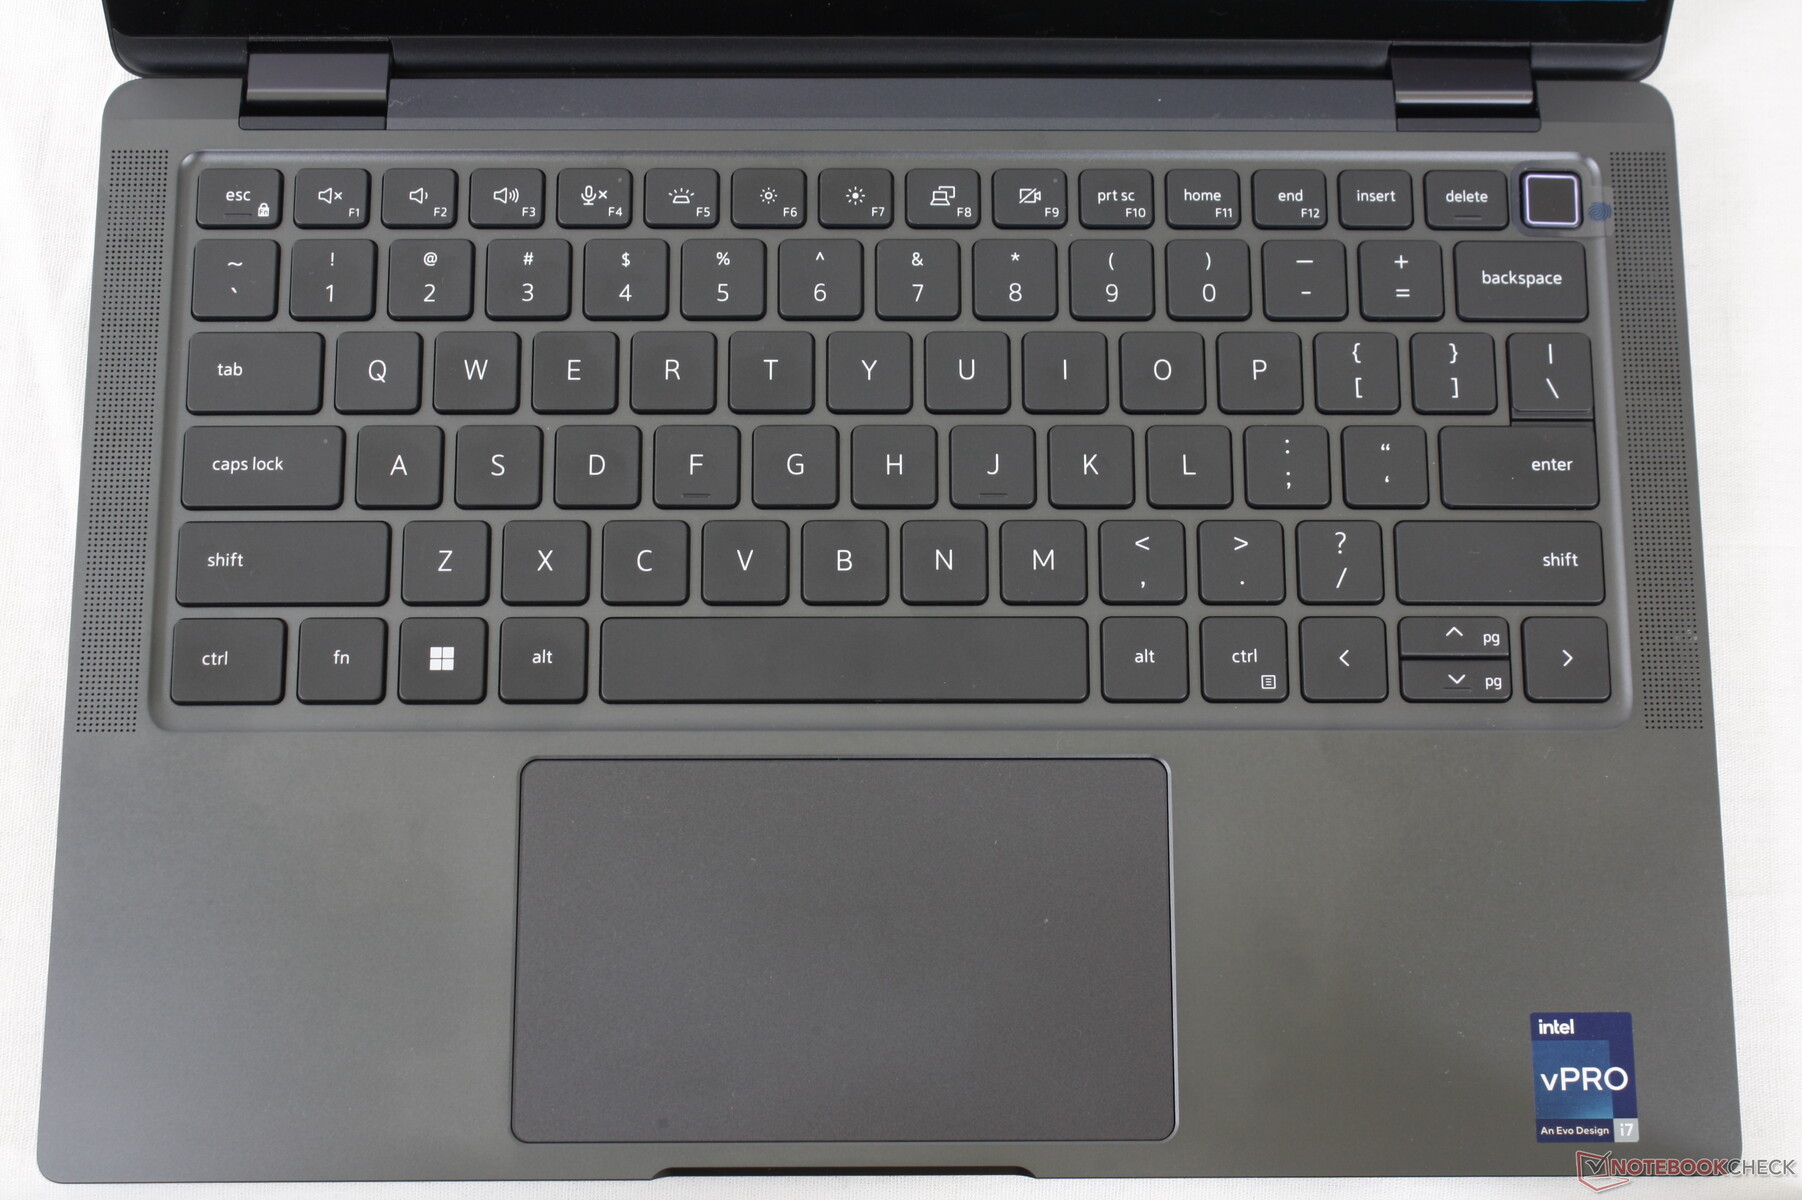
Dispositivi di input - Tastiera confortevole e clickpad spugnoso
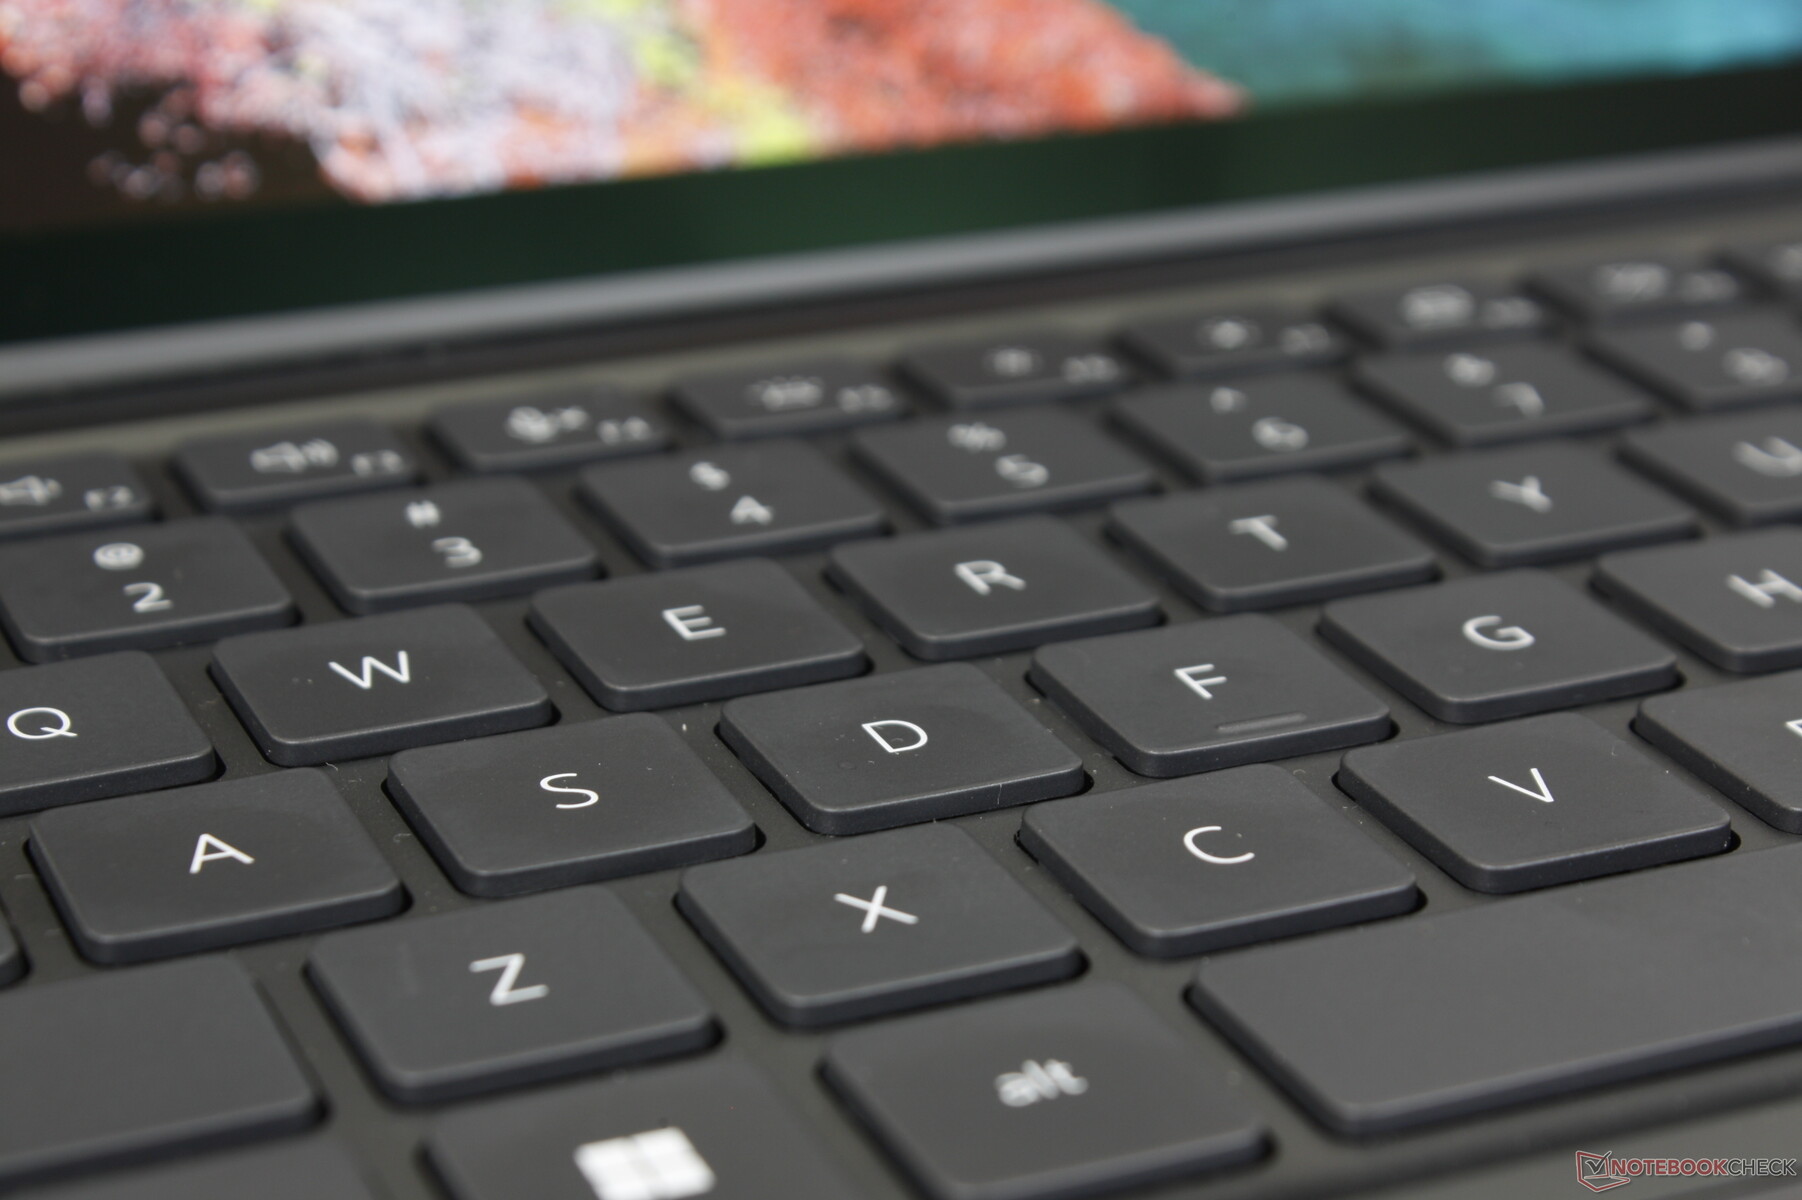
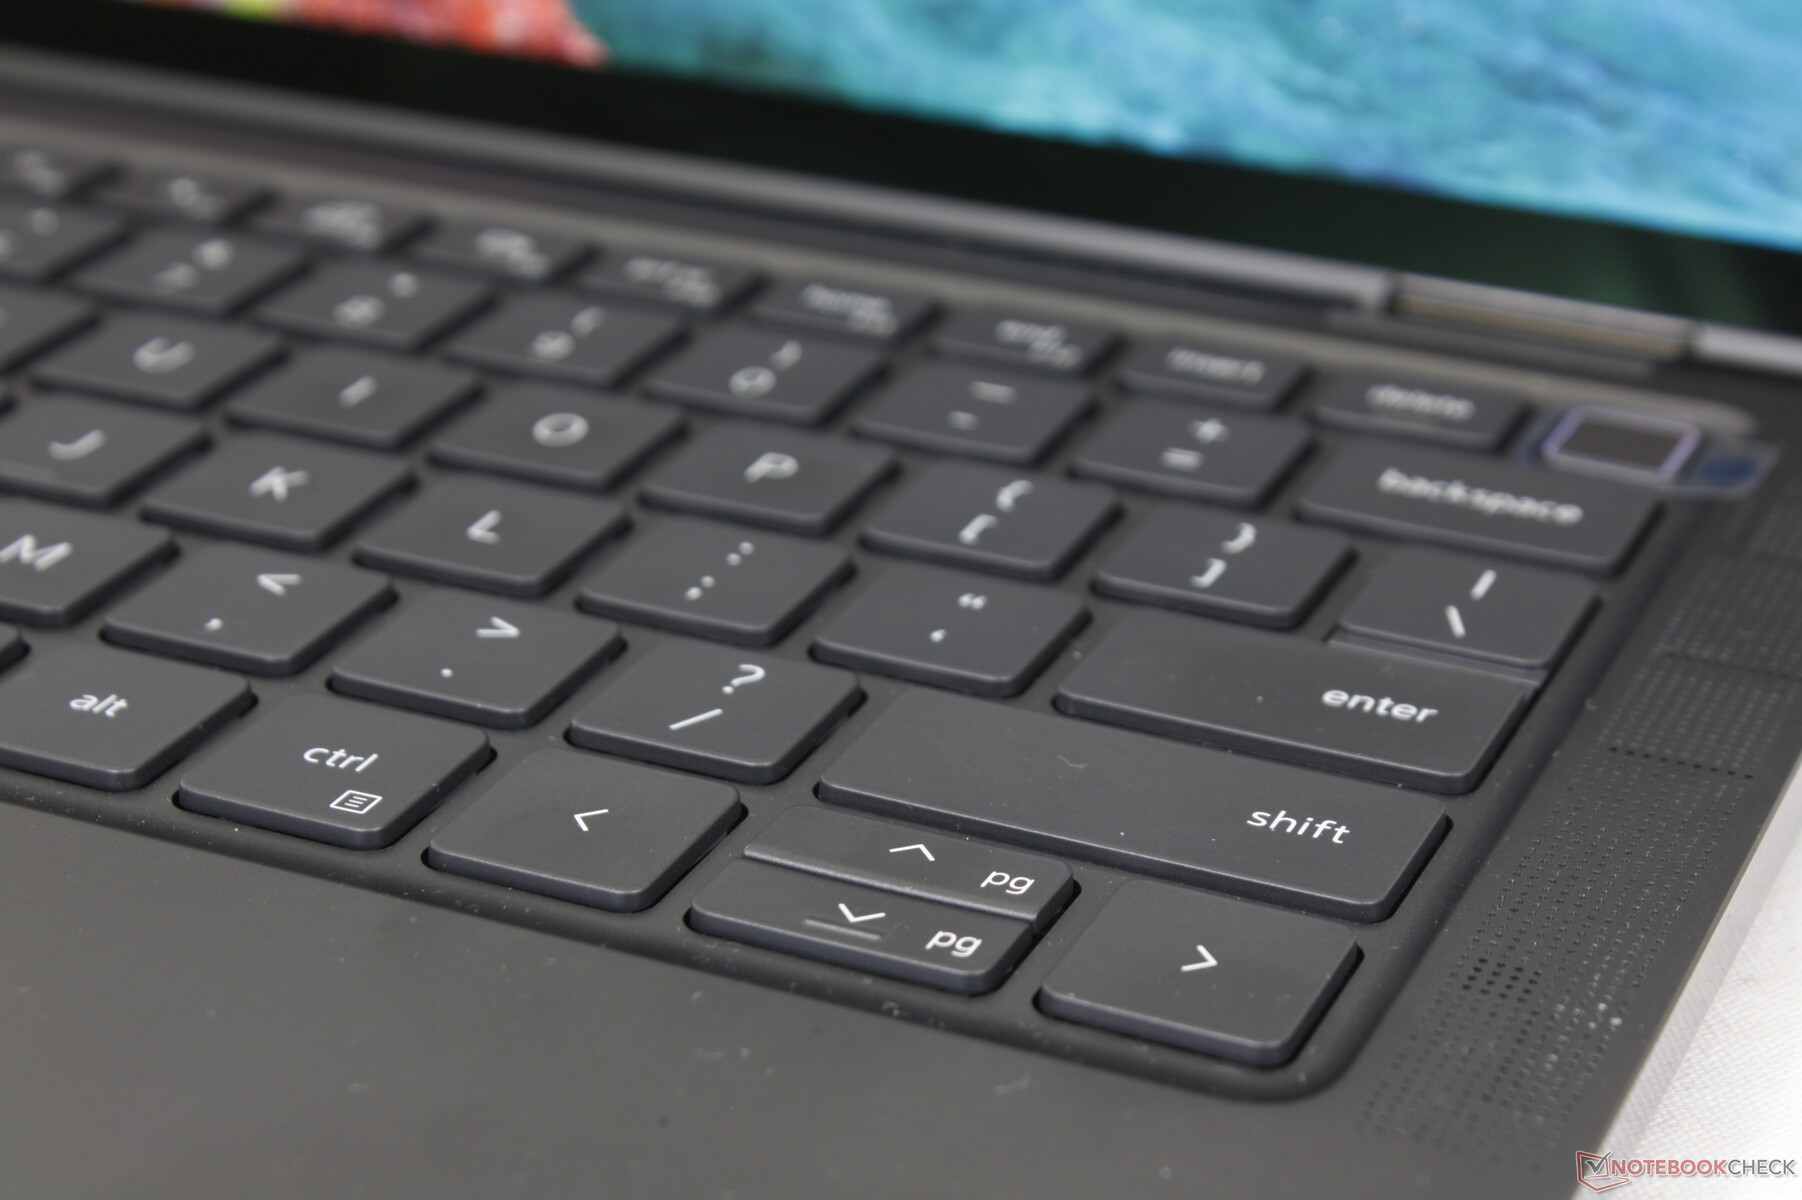
Tastiera
I tasti di Latitude 9330 sono più solidi e con un feedback più forte rispetto ai tasti della serie XPS 13 9315 XPS 13 serie 9315 per un'esperienza di digitazione più confortevole. Sono più paragonabili ai tasti della serie Spectre o EliteBook rispetto a quelli dei subnotebook consumer più economici. Tuttavia, il ticchettio è moderatamente forte, conseguenza del feedback più nitido.
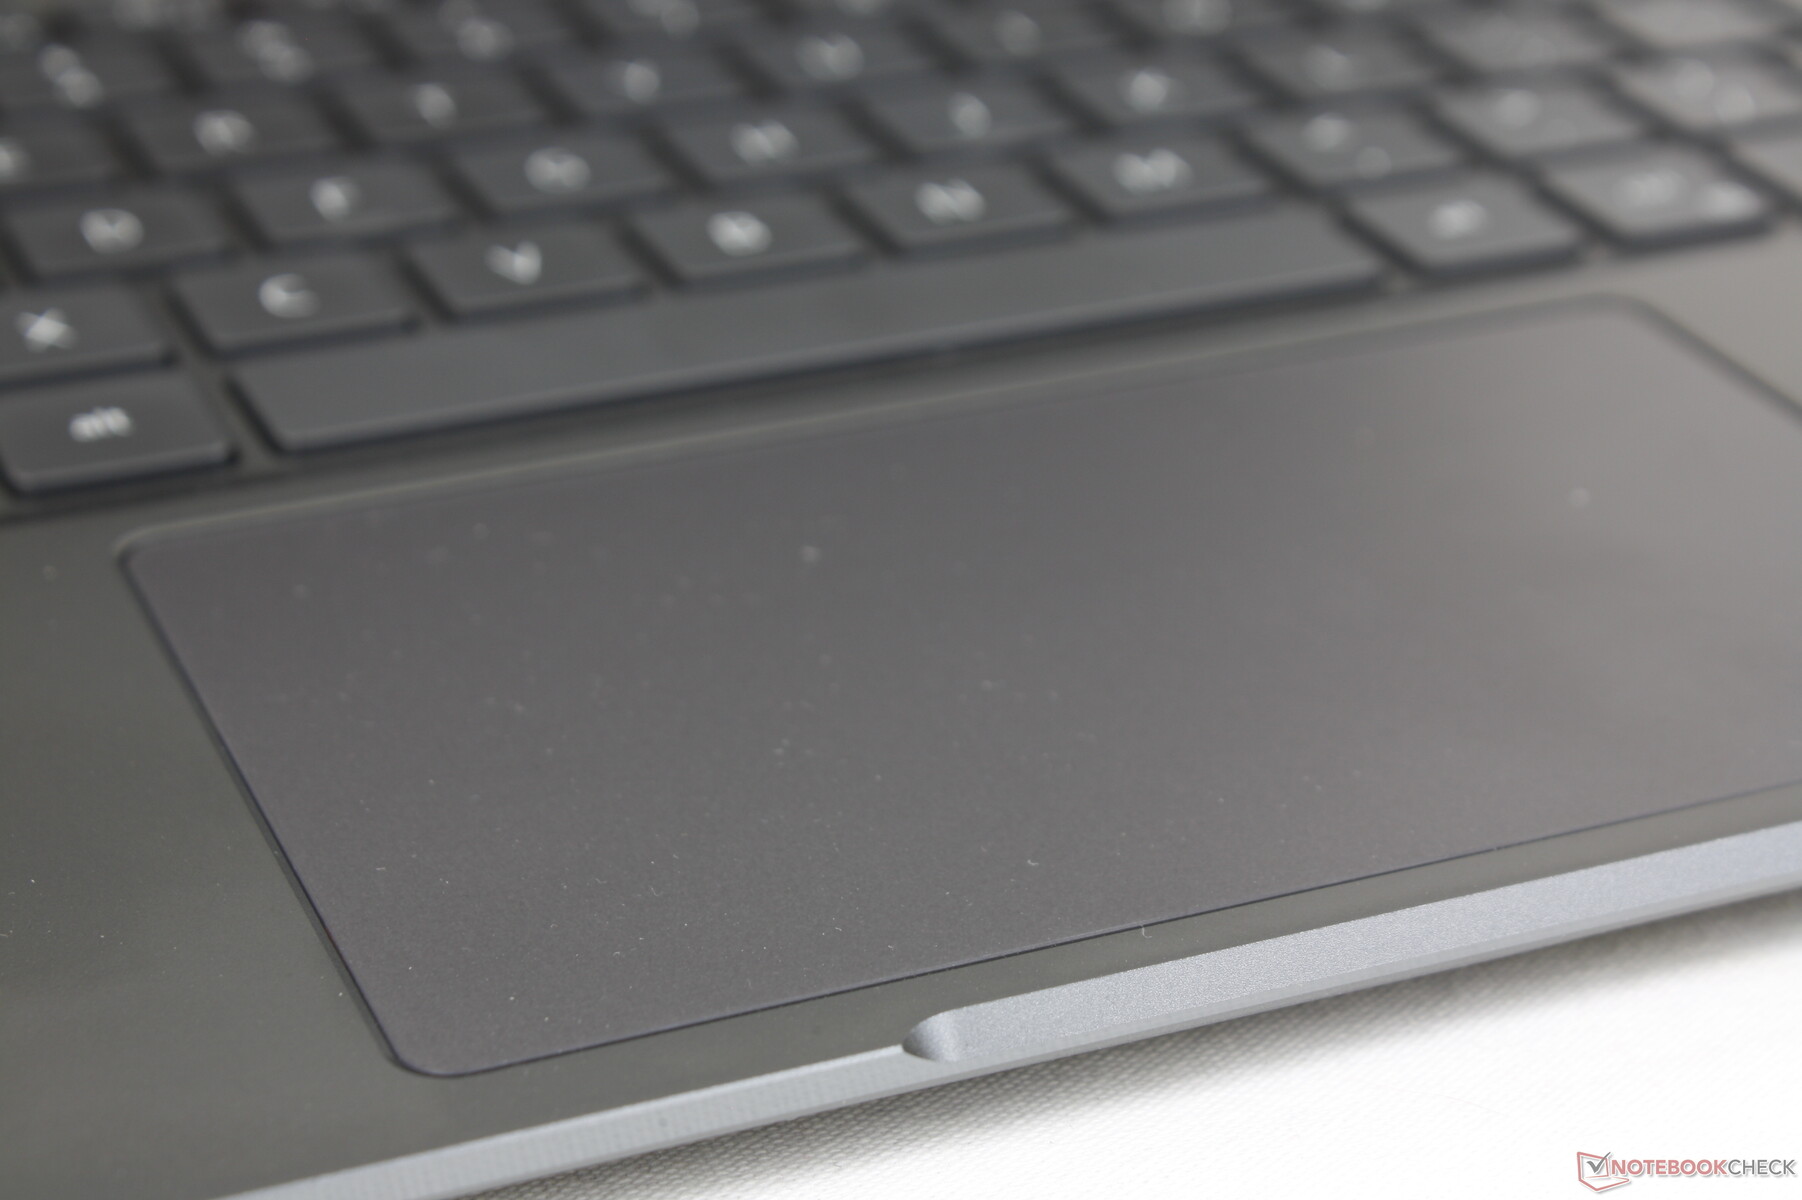
Touchpad
Il clickpad è più grande di quello del ThinkPad X1 Titanium Yoga (11,5 x 6,8 cm contro 9 x 6,5 cm) per facilitare gli input multi-touch nonostante il piccolo formato da 13 pollici. D'altra parte, non ci sono pulsanti dedicati per il mouse e quindi le azioni di trascinamento sono più difficili da eseguire. La superficie del mouse è completamente liscia, con solo un po' di aderenza alle velocità più basse per un clic più preciso.
Il feedback quando si fa clic sul clickpad è più morbido e silenzioso rispetto alla maggior parte degli altri portatili. Sebbene alcuni apprezzino l'assenza di un forte "clic" quando si preme, il feedback spugnoso non è molto soddisfacente.
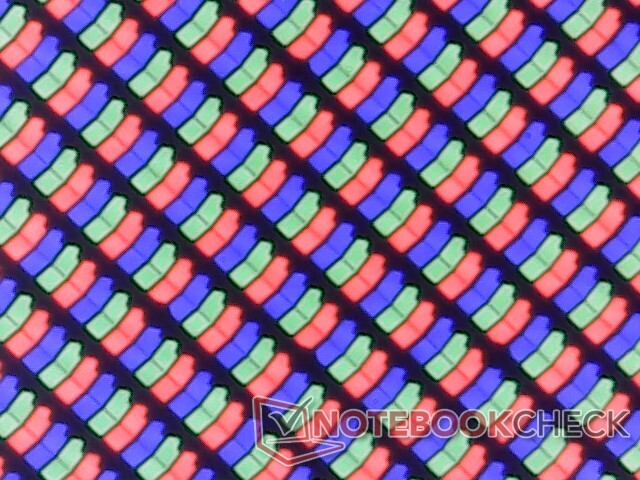
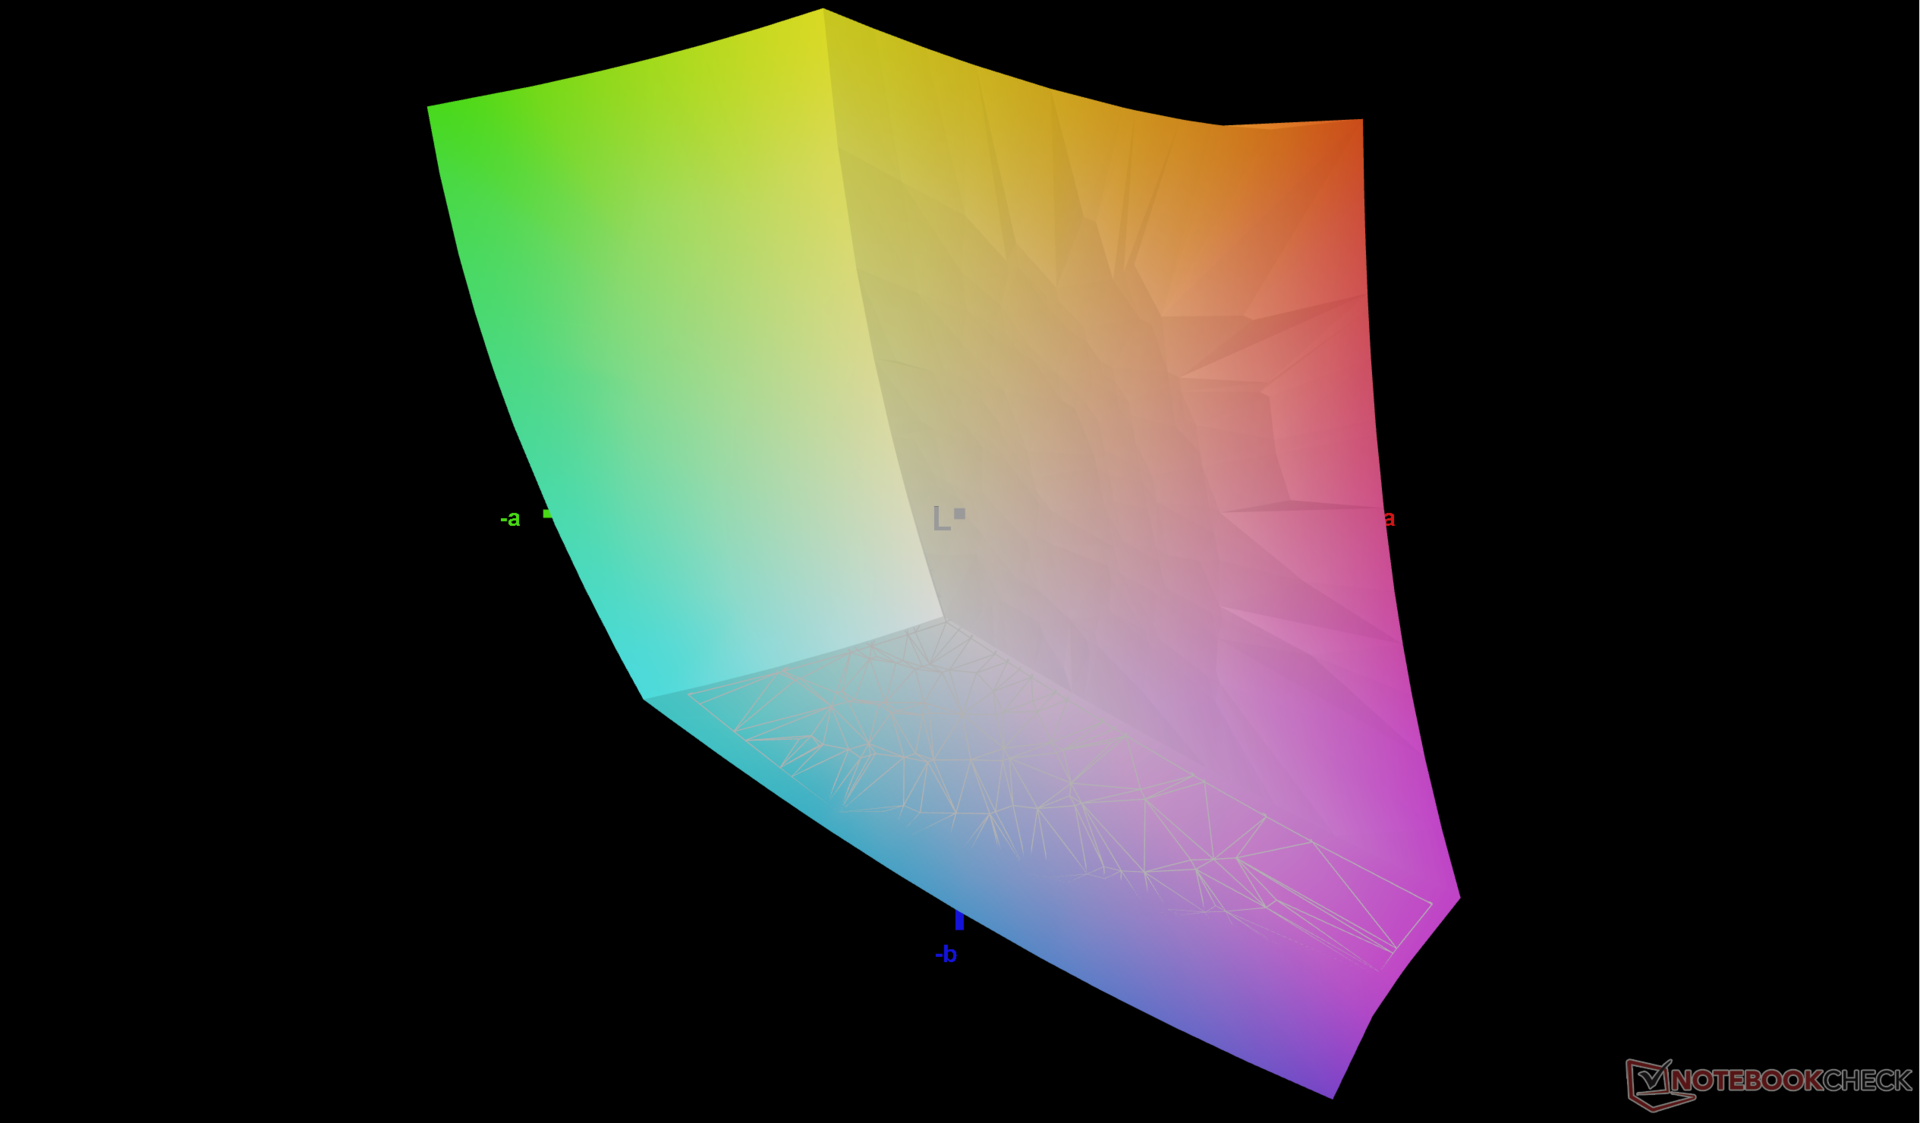
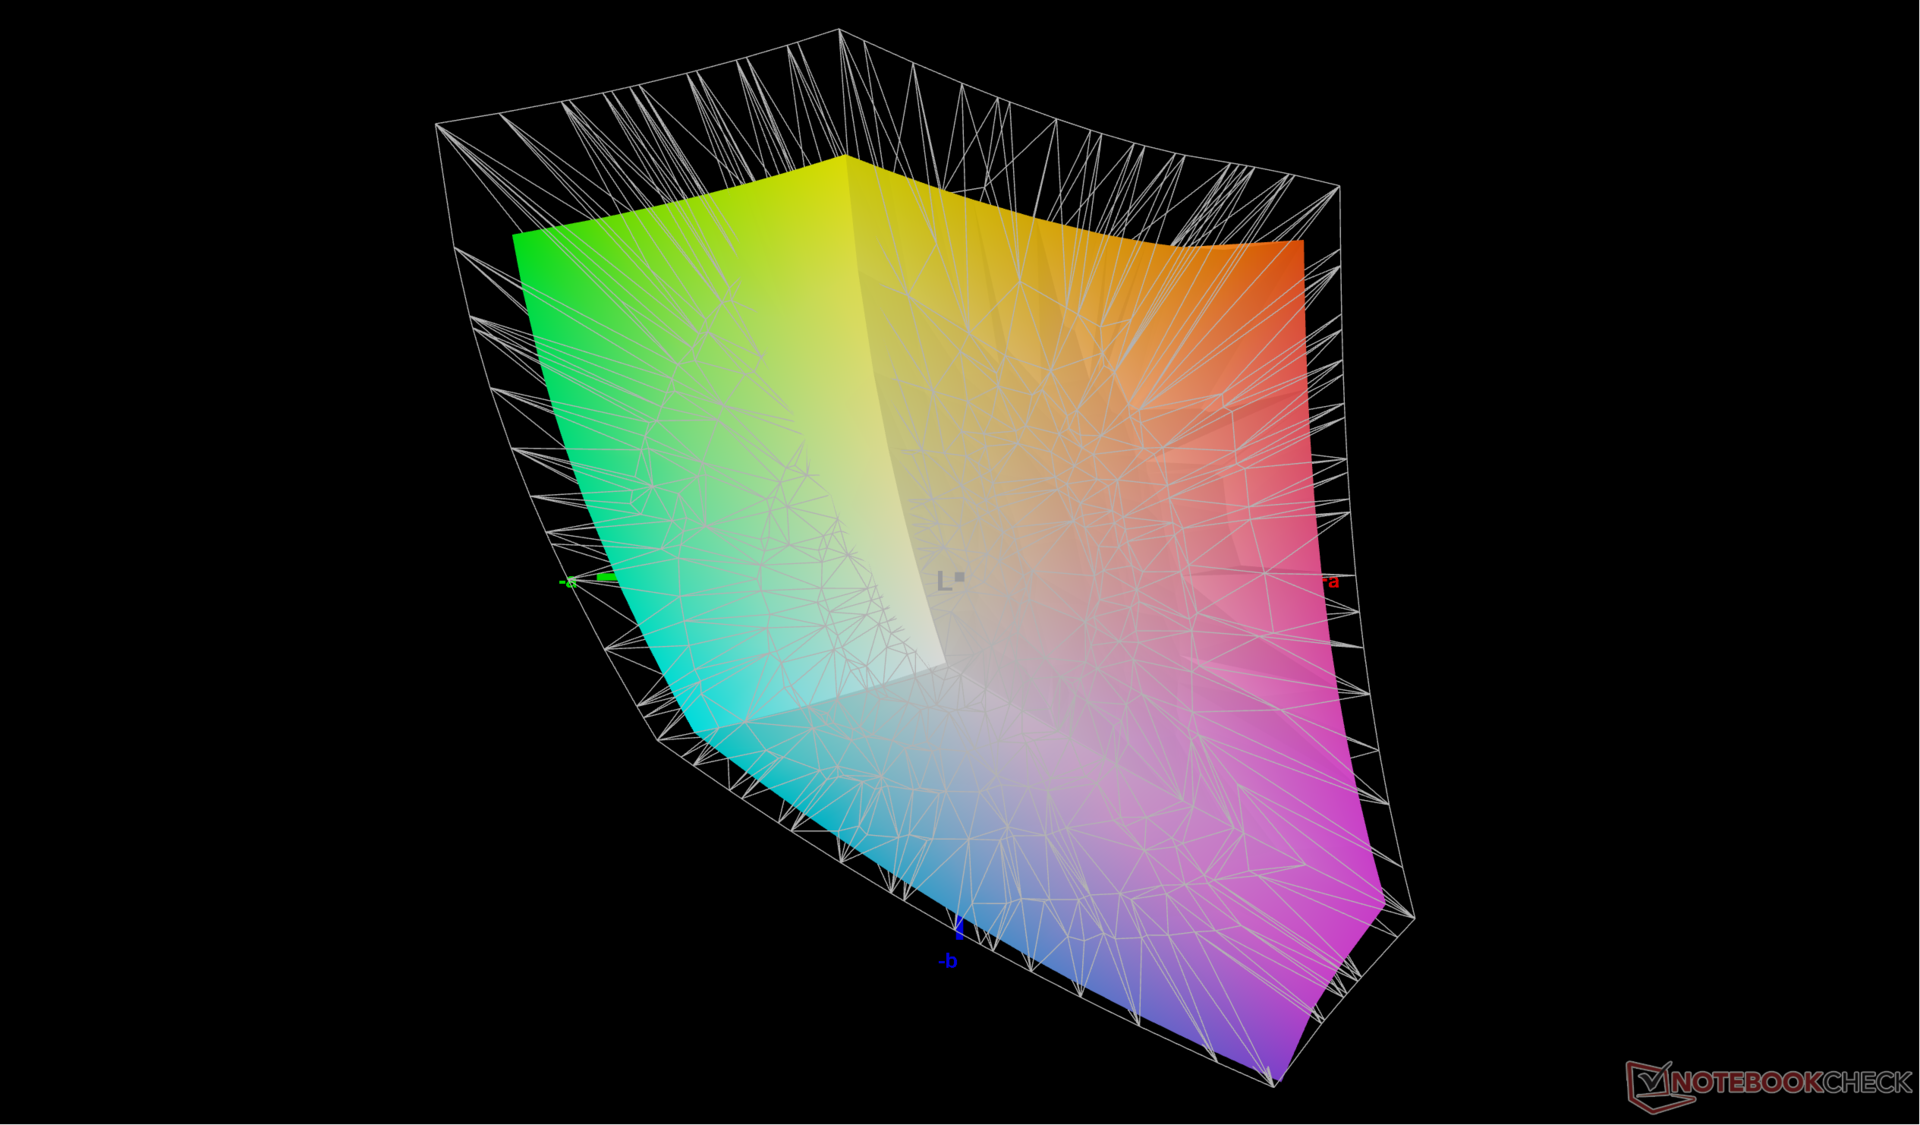
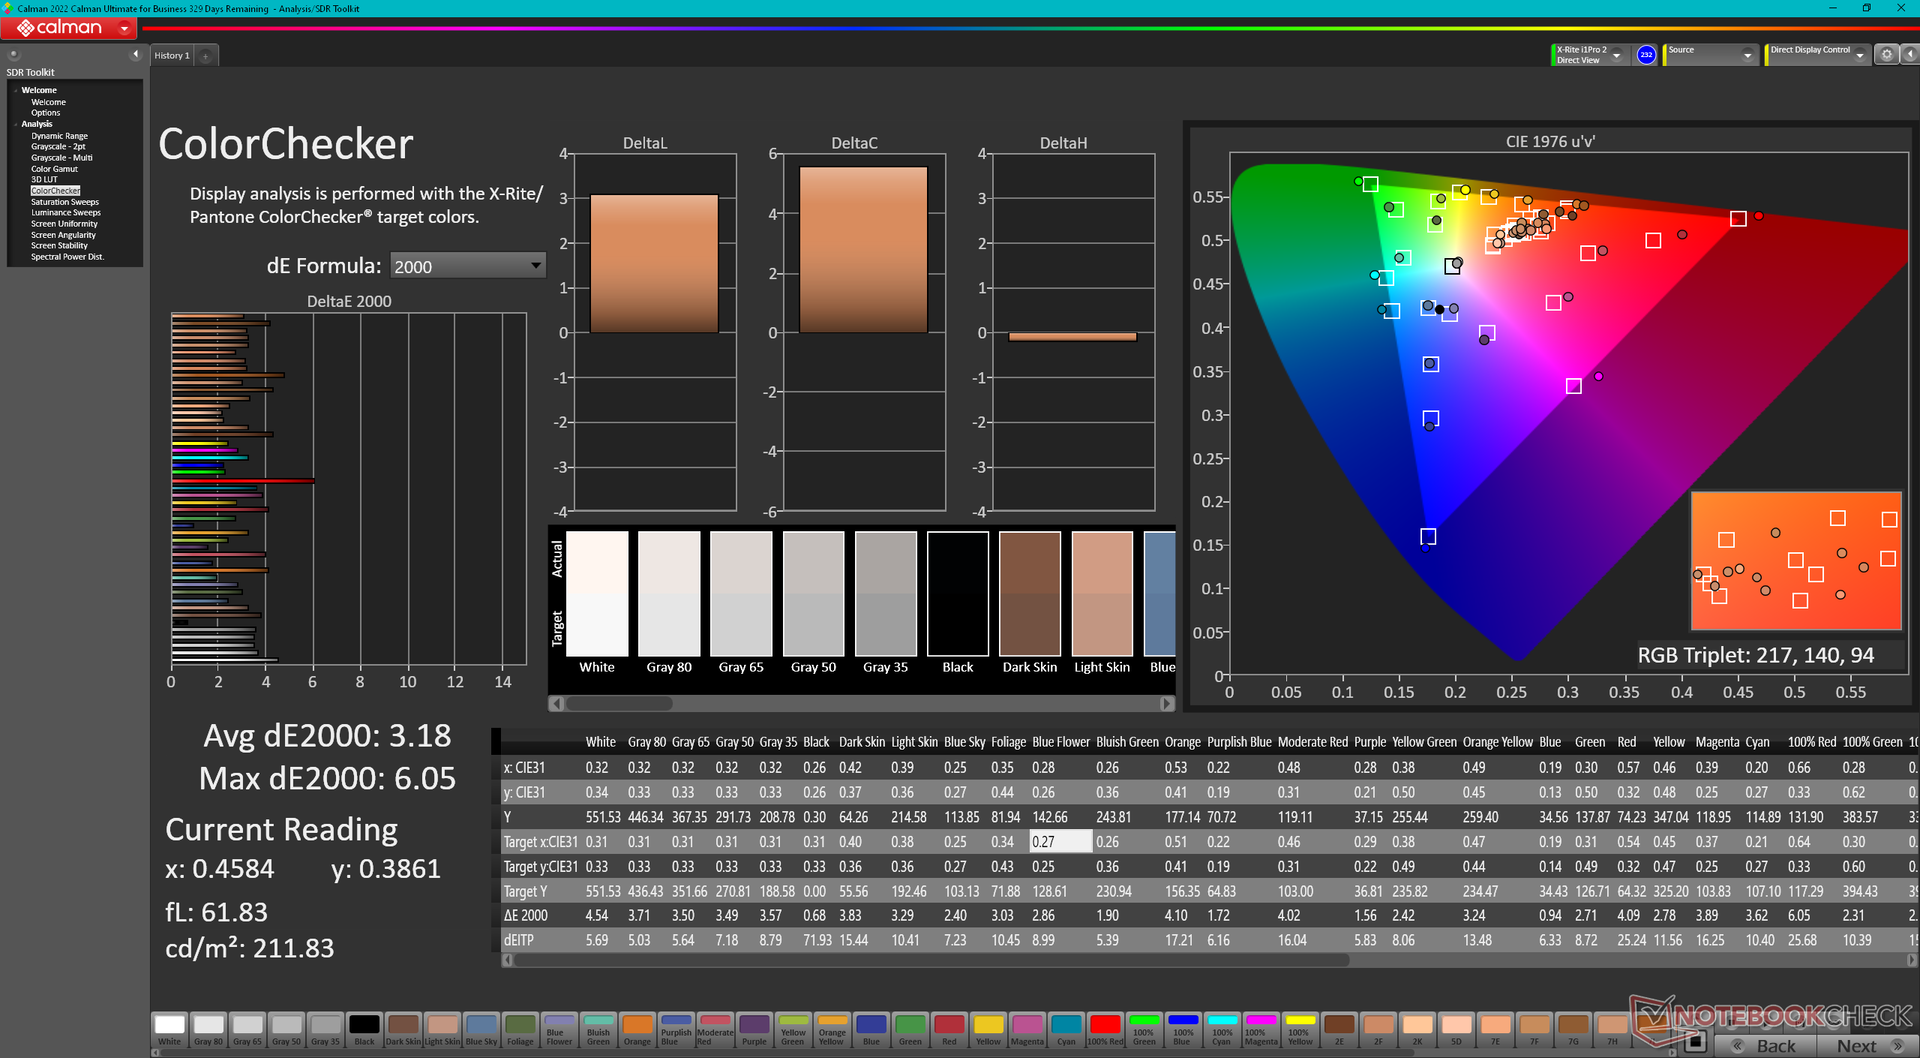
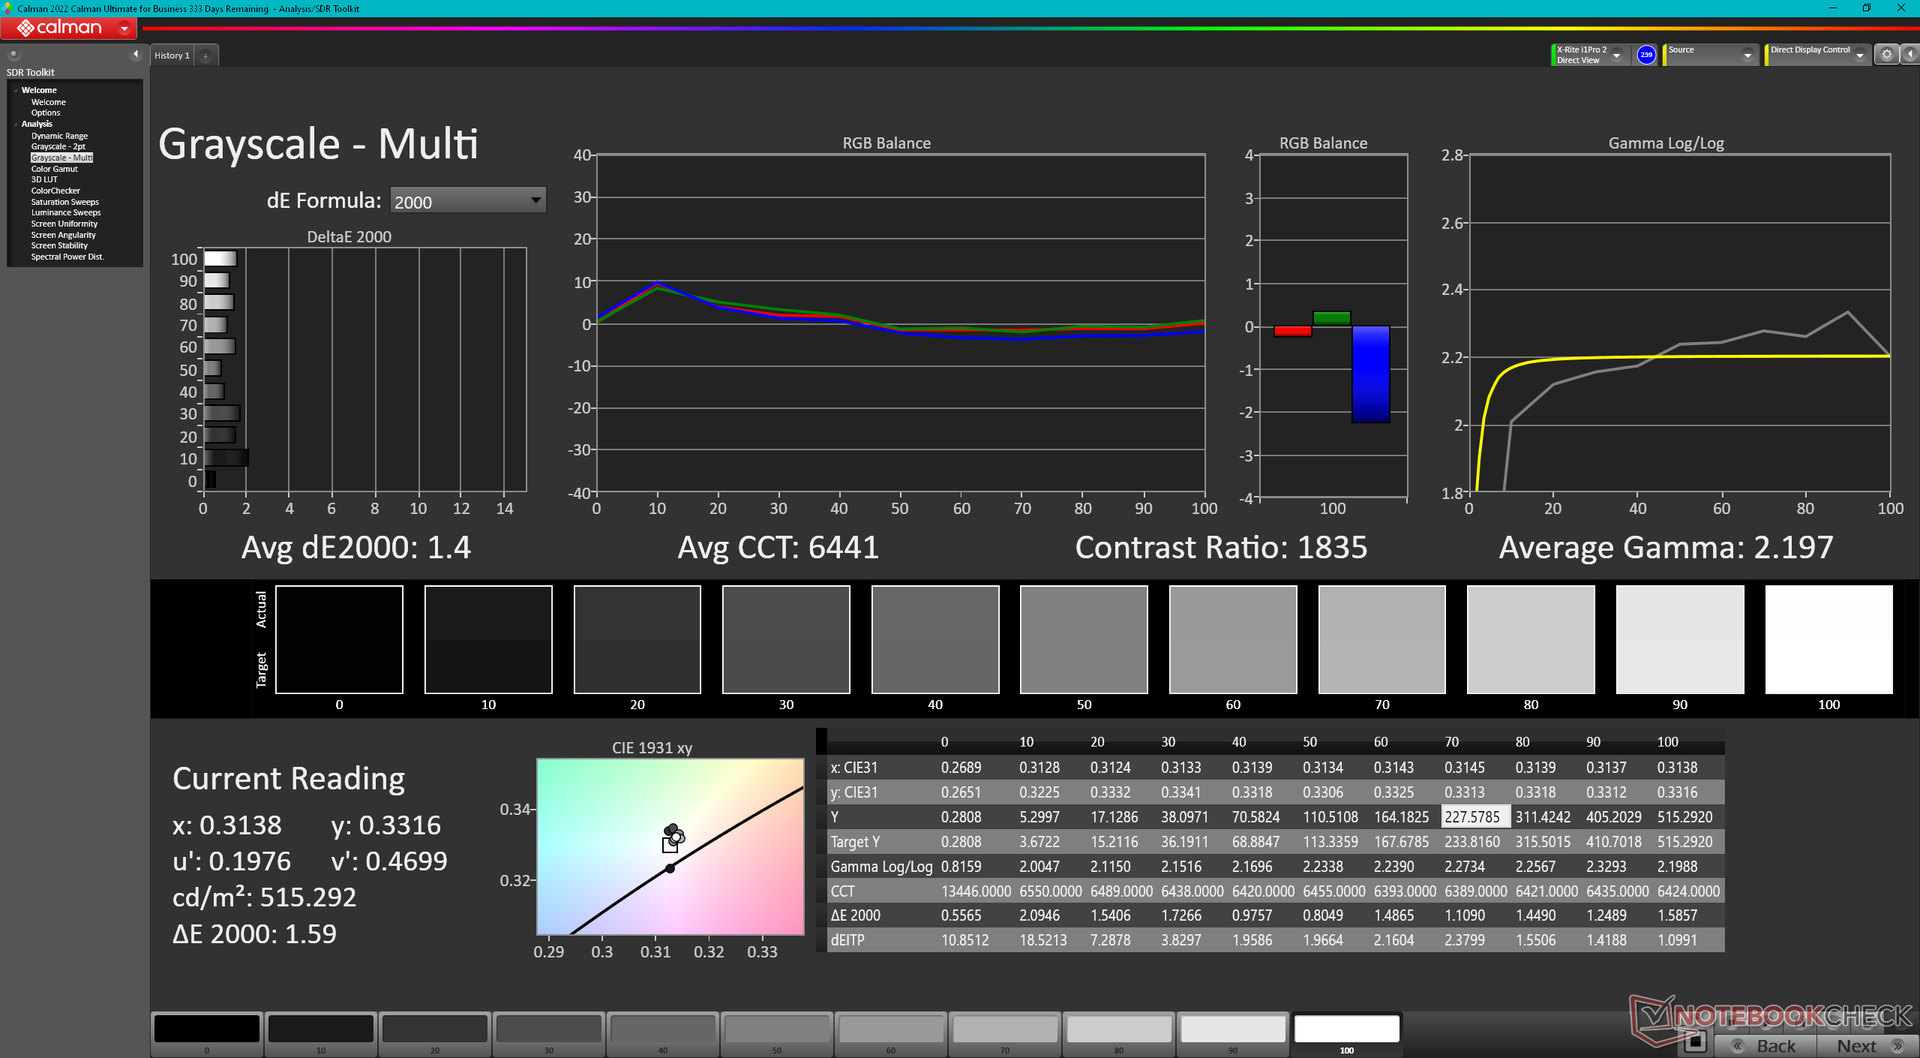
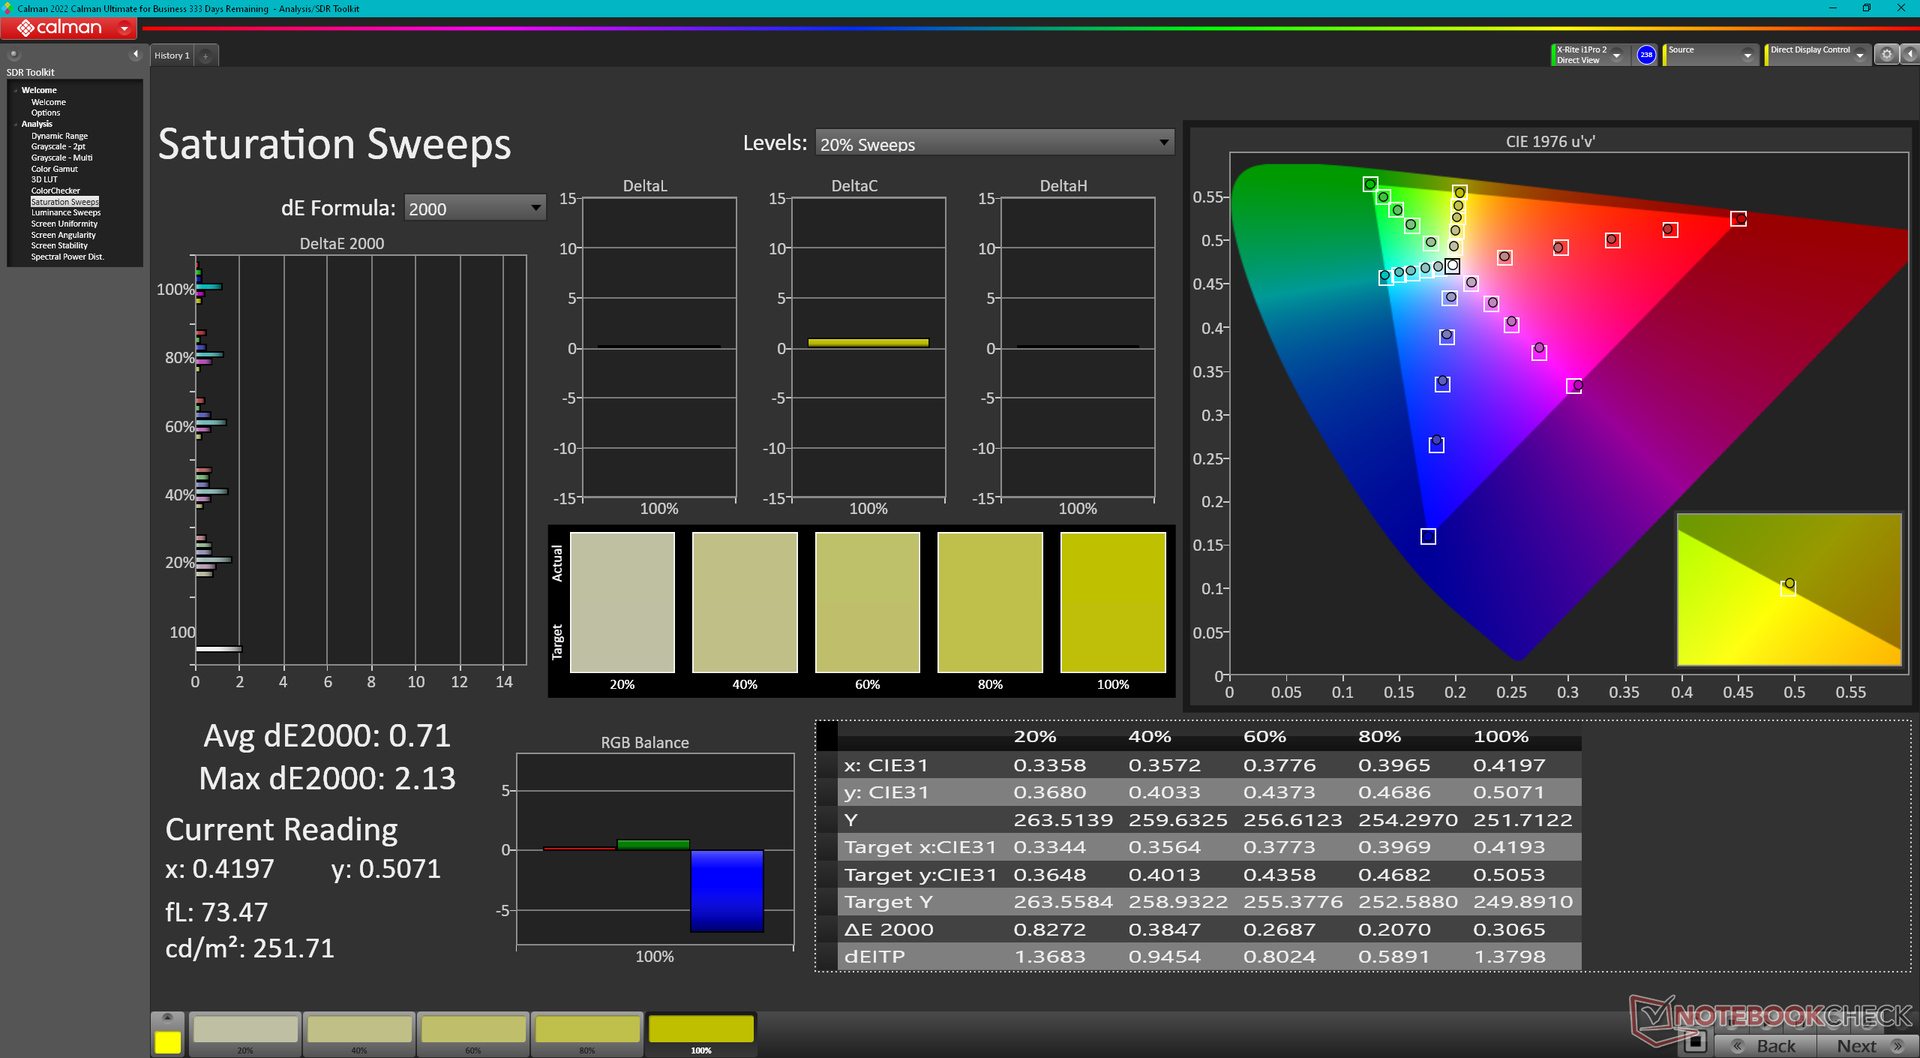
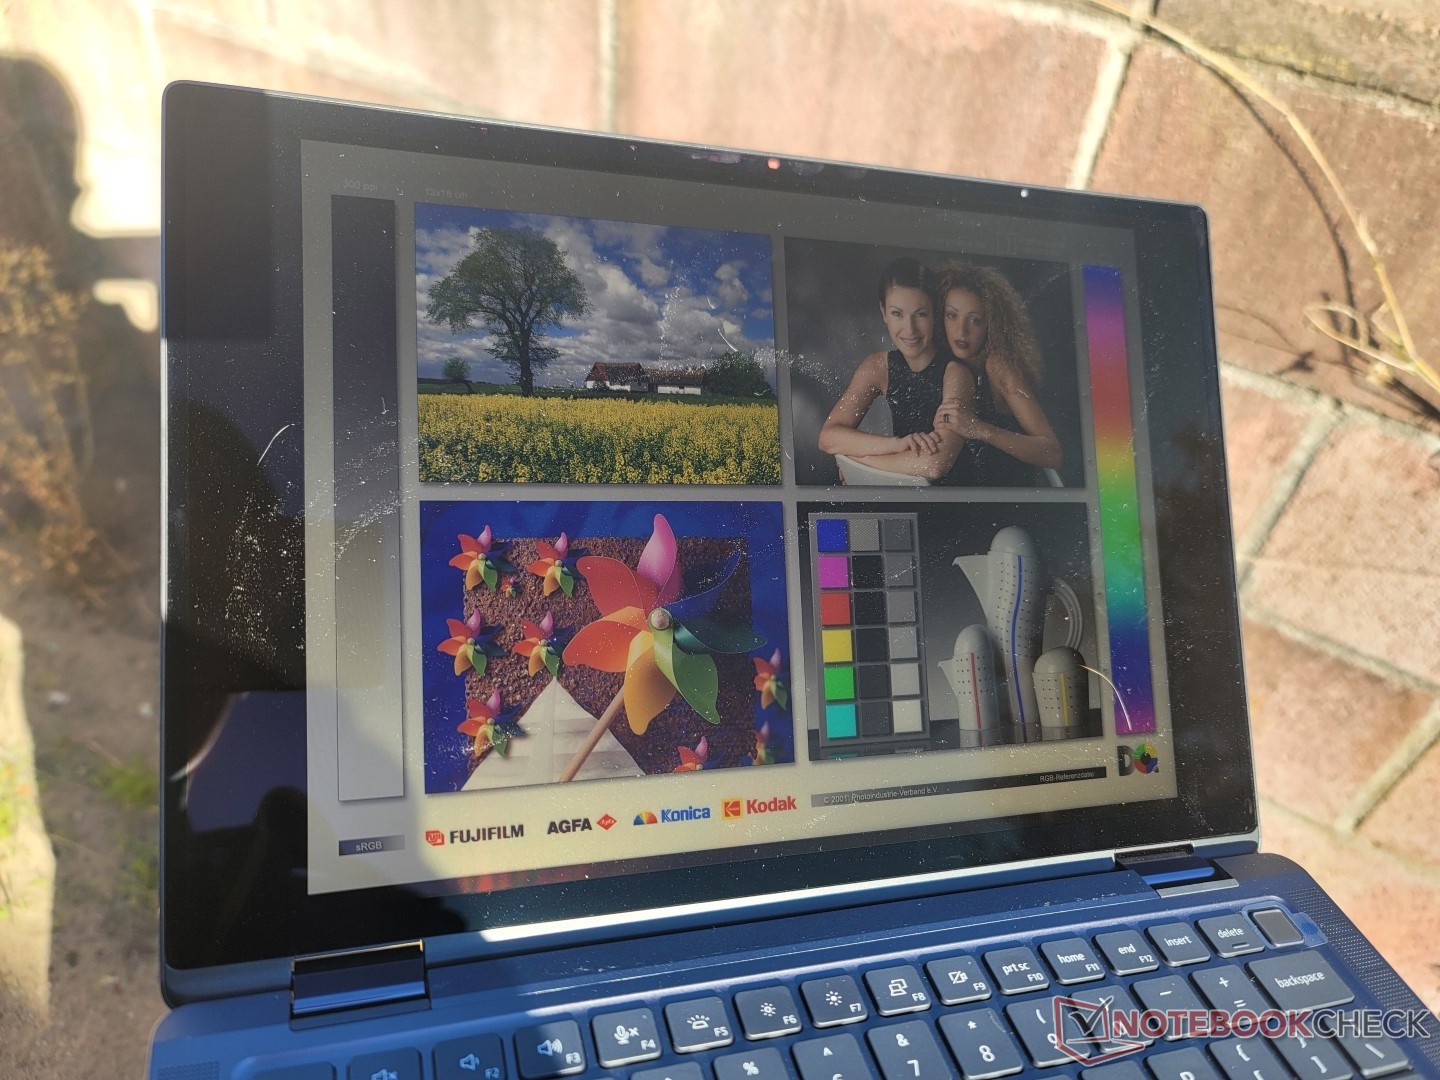
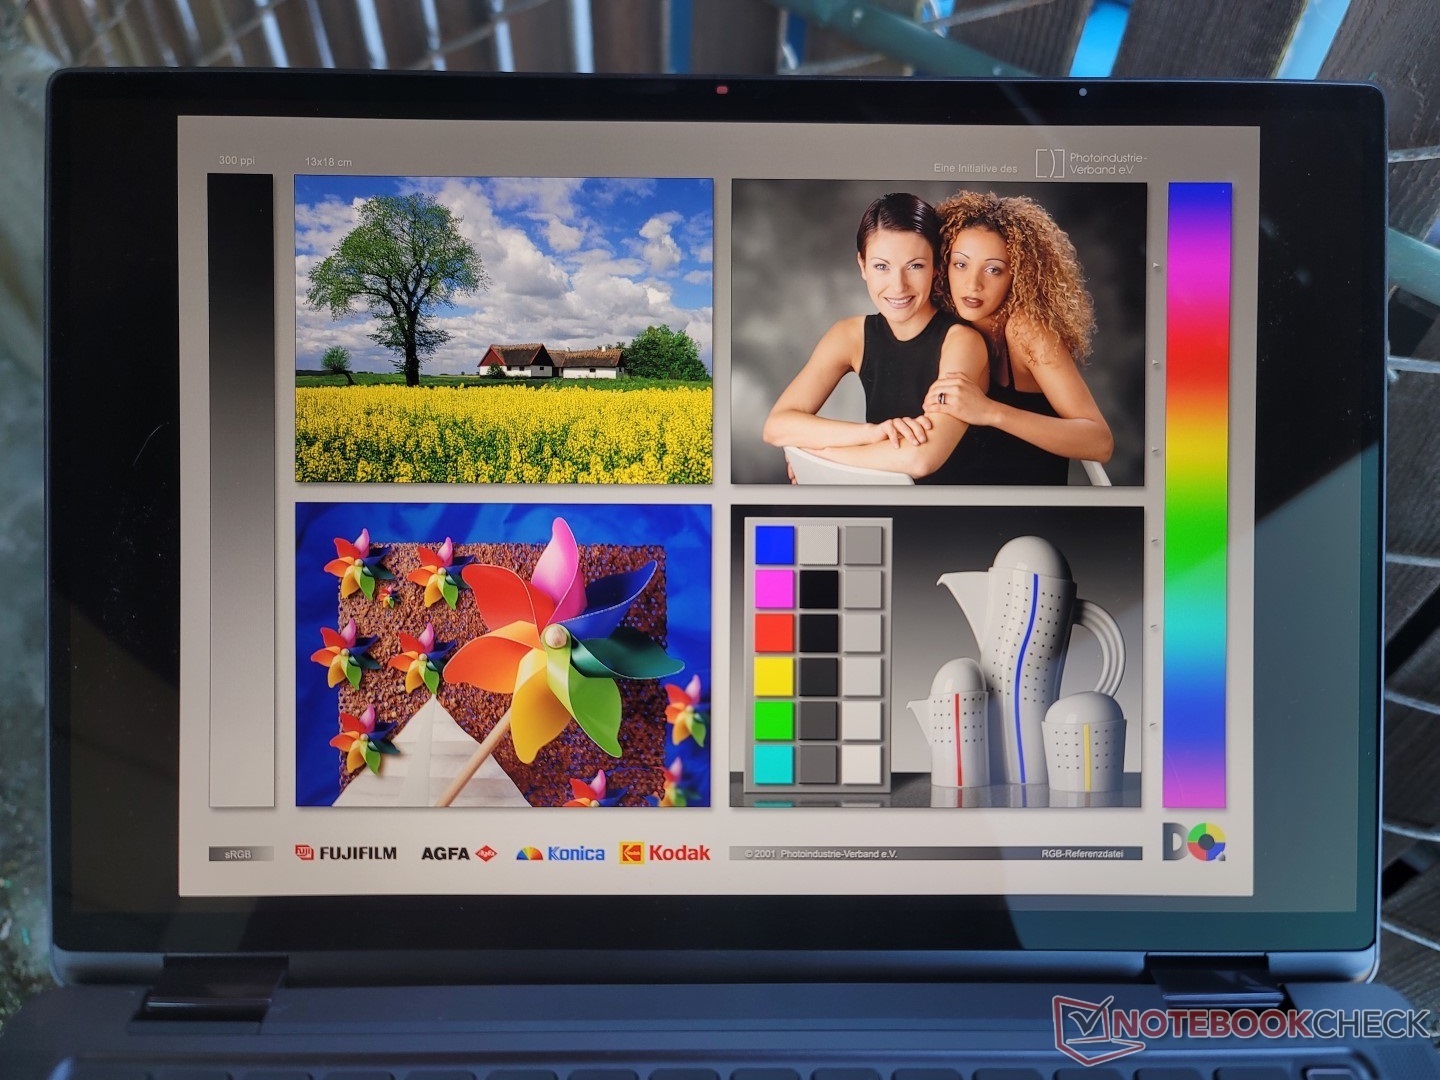
Display - 100% sRGB, schermo touchscreen IPS da 500 nit
Dell pubblicizza un touchscreen da 500 nit con copertura sRGB completa, che possiamo confermare con le nostre misurazioni indipendenti. Si tratta di un display di fascia alta con livelli di luminosità e contrasto simili a quelli del display dell'MSI Summit E13 Flip.
I due maggiori svantaggi del display sono i tempi di risposta in bianco e nero molto lenti e la frequenza di aggiornamento limitata a 60 Hz. Sebbene non si tratti di una macchina da gioco, il ghosting è difficile da ignorare anche durante la navigazione web, mentre la frequenza di aggiornamento di 60 Hz inizia a mostrare la sua età. Una frequenza di aggiornamento più elevata avrebbe migliorato anche la reattività del touchscreen.
Non c'è la possibilità di scegliere qualcosa di più luminoso o con colori P3 più ampi, dato che al momento tutte le SKU di Latitude 9330 sono dotate dello stesso identico pannello AU Optronics.
| |||||||||||||||||||||||||
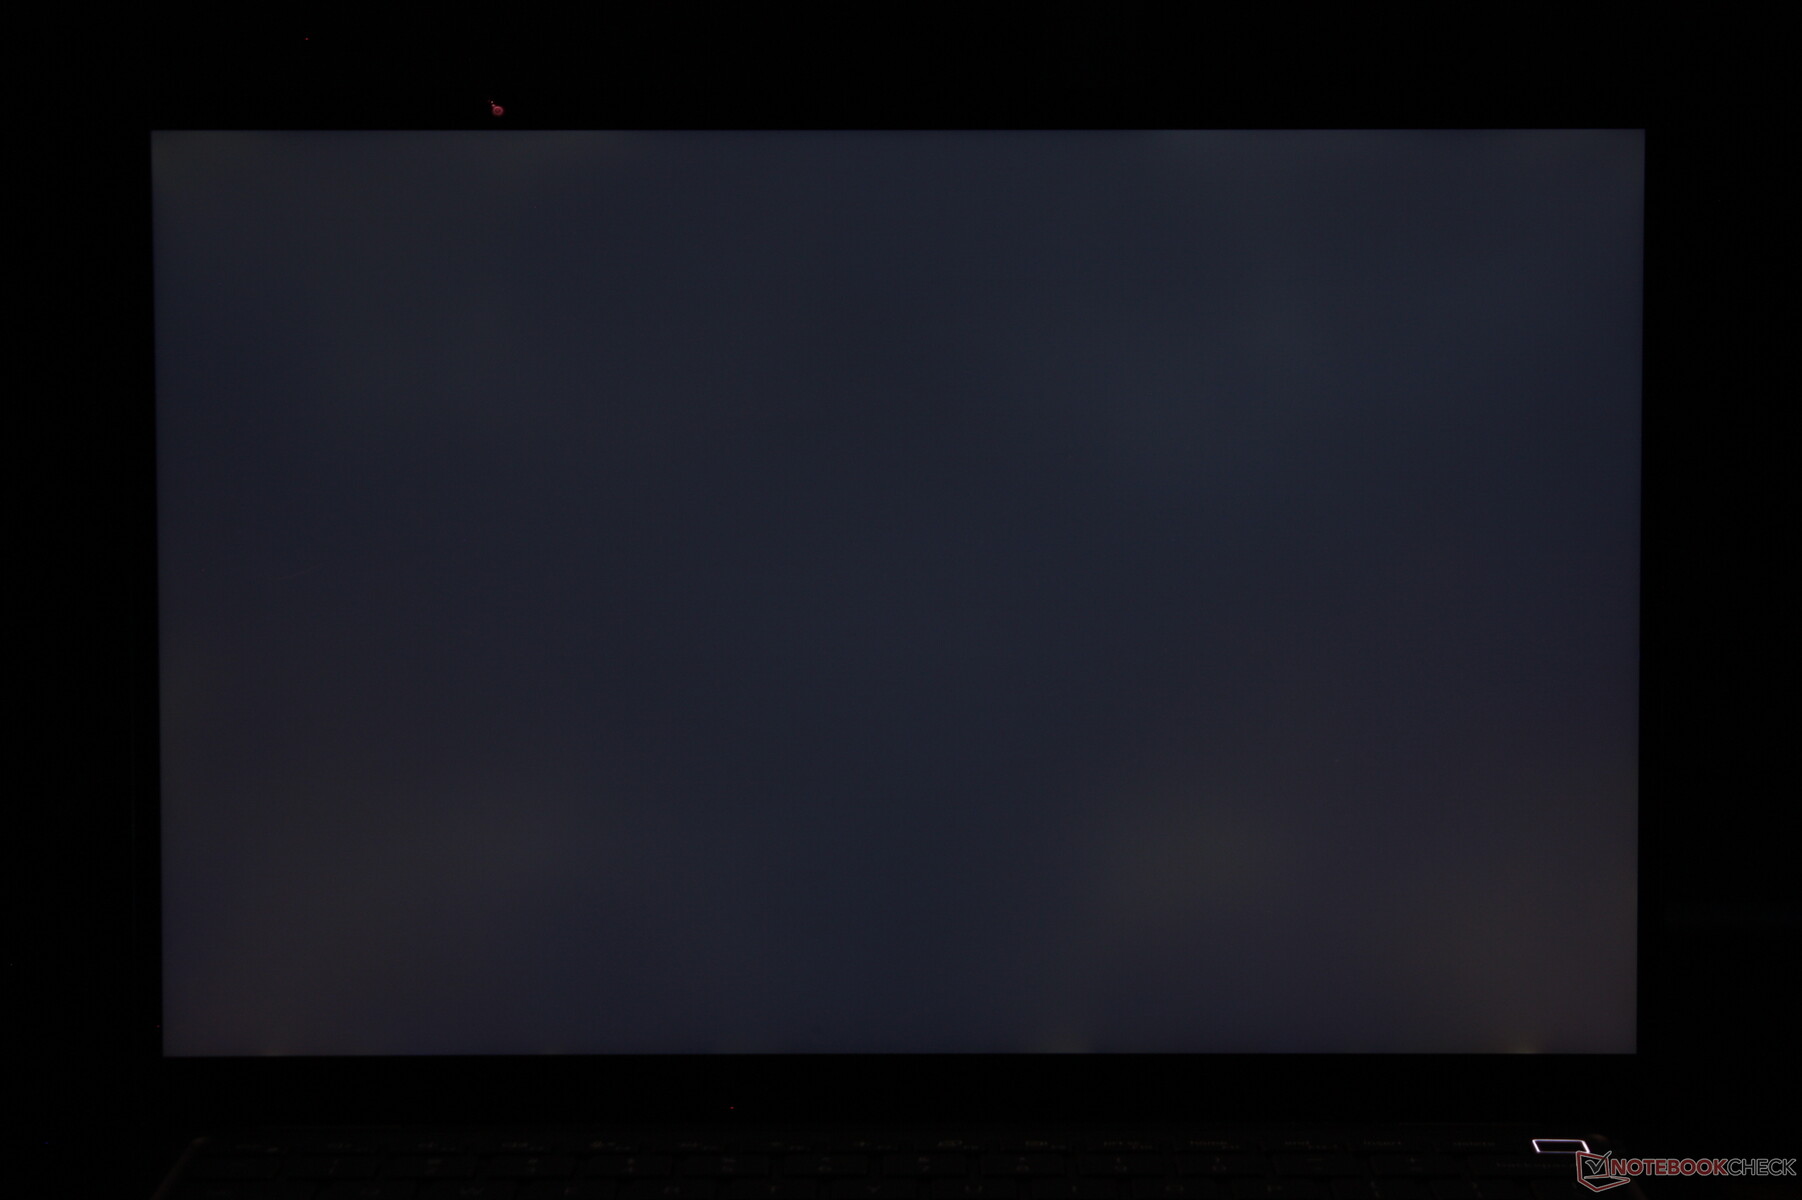
Distribuzione della luminosità: 85 %
Al centro con la batteria: 542.3 cd/m²
Contrasto: 1427:1 (Nero: 0.38 cd/m²)
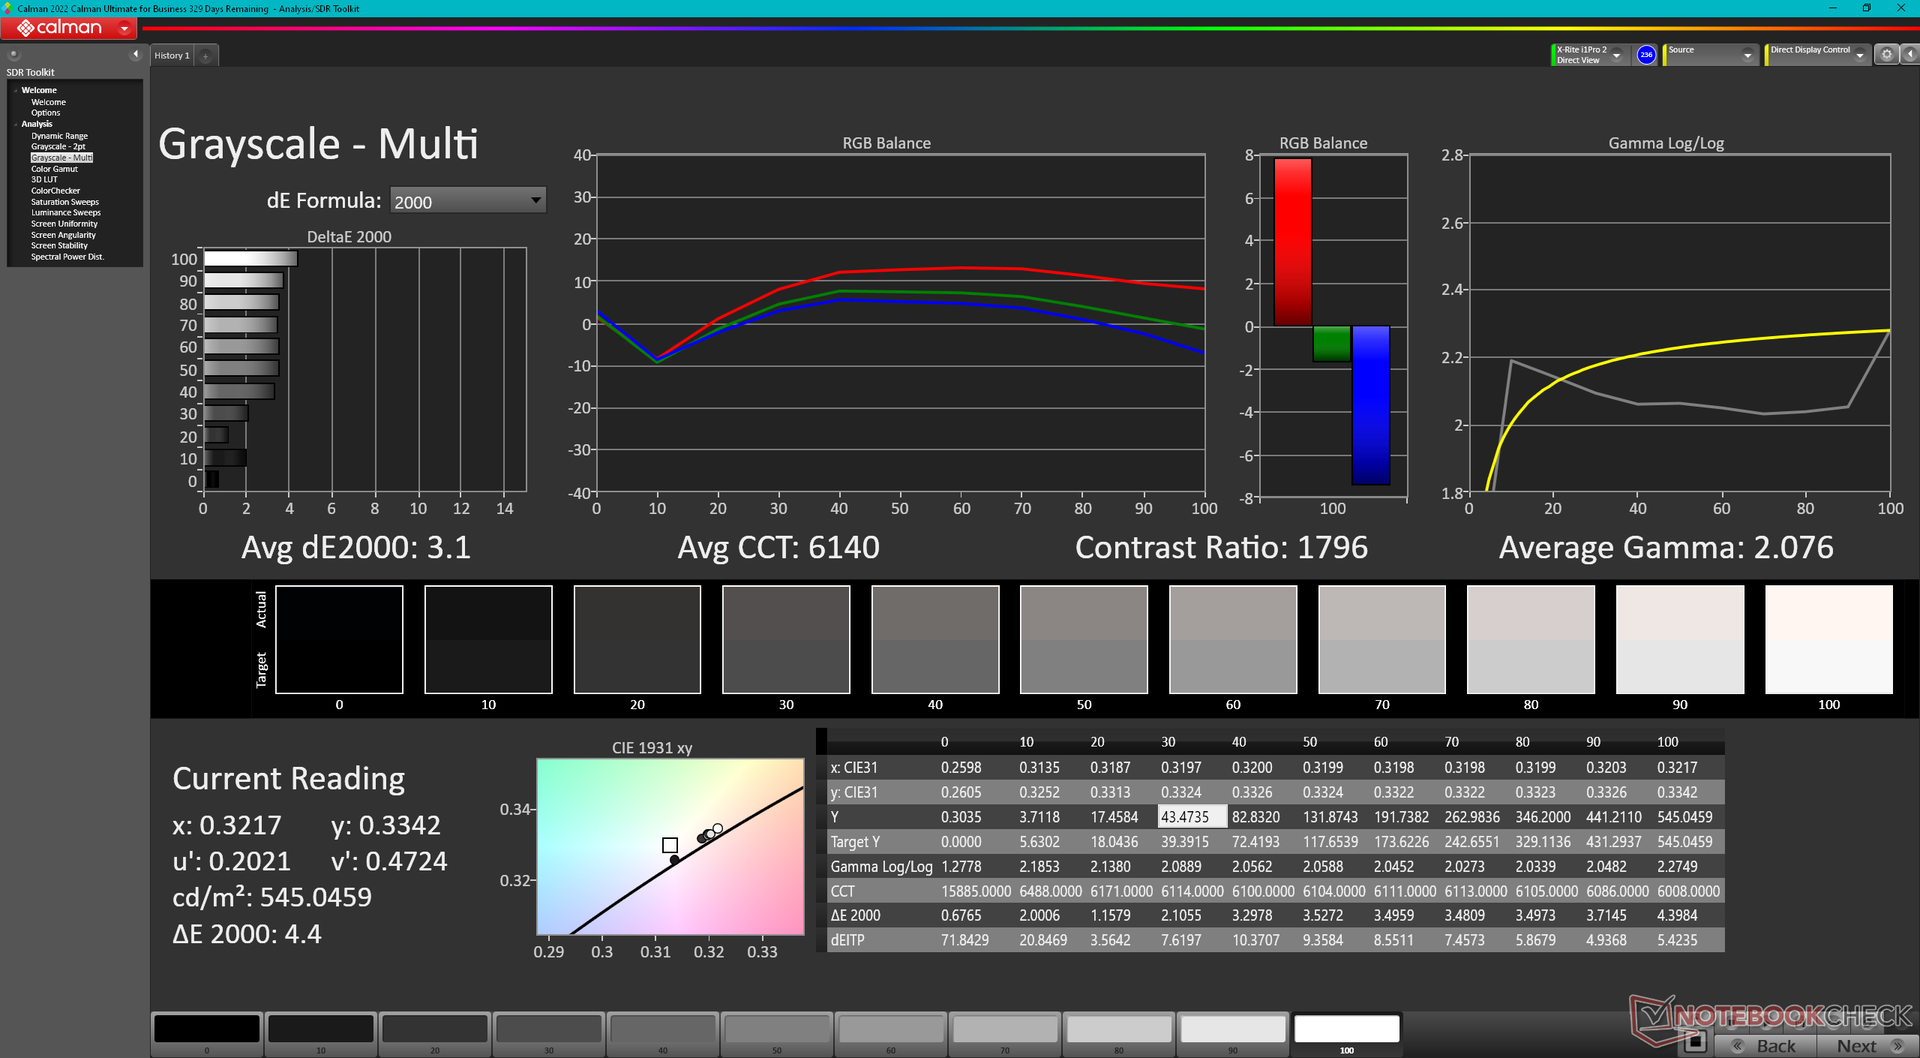
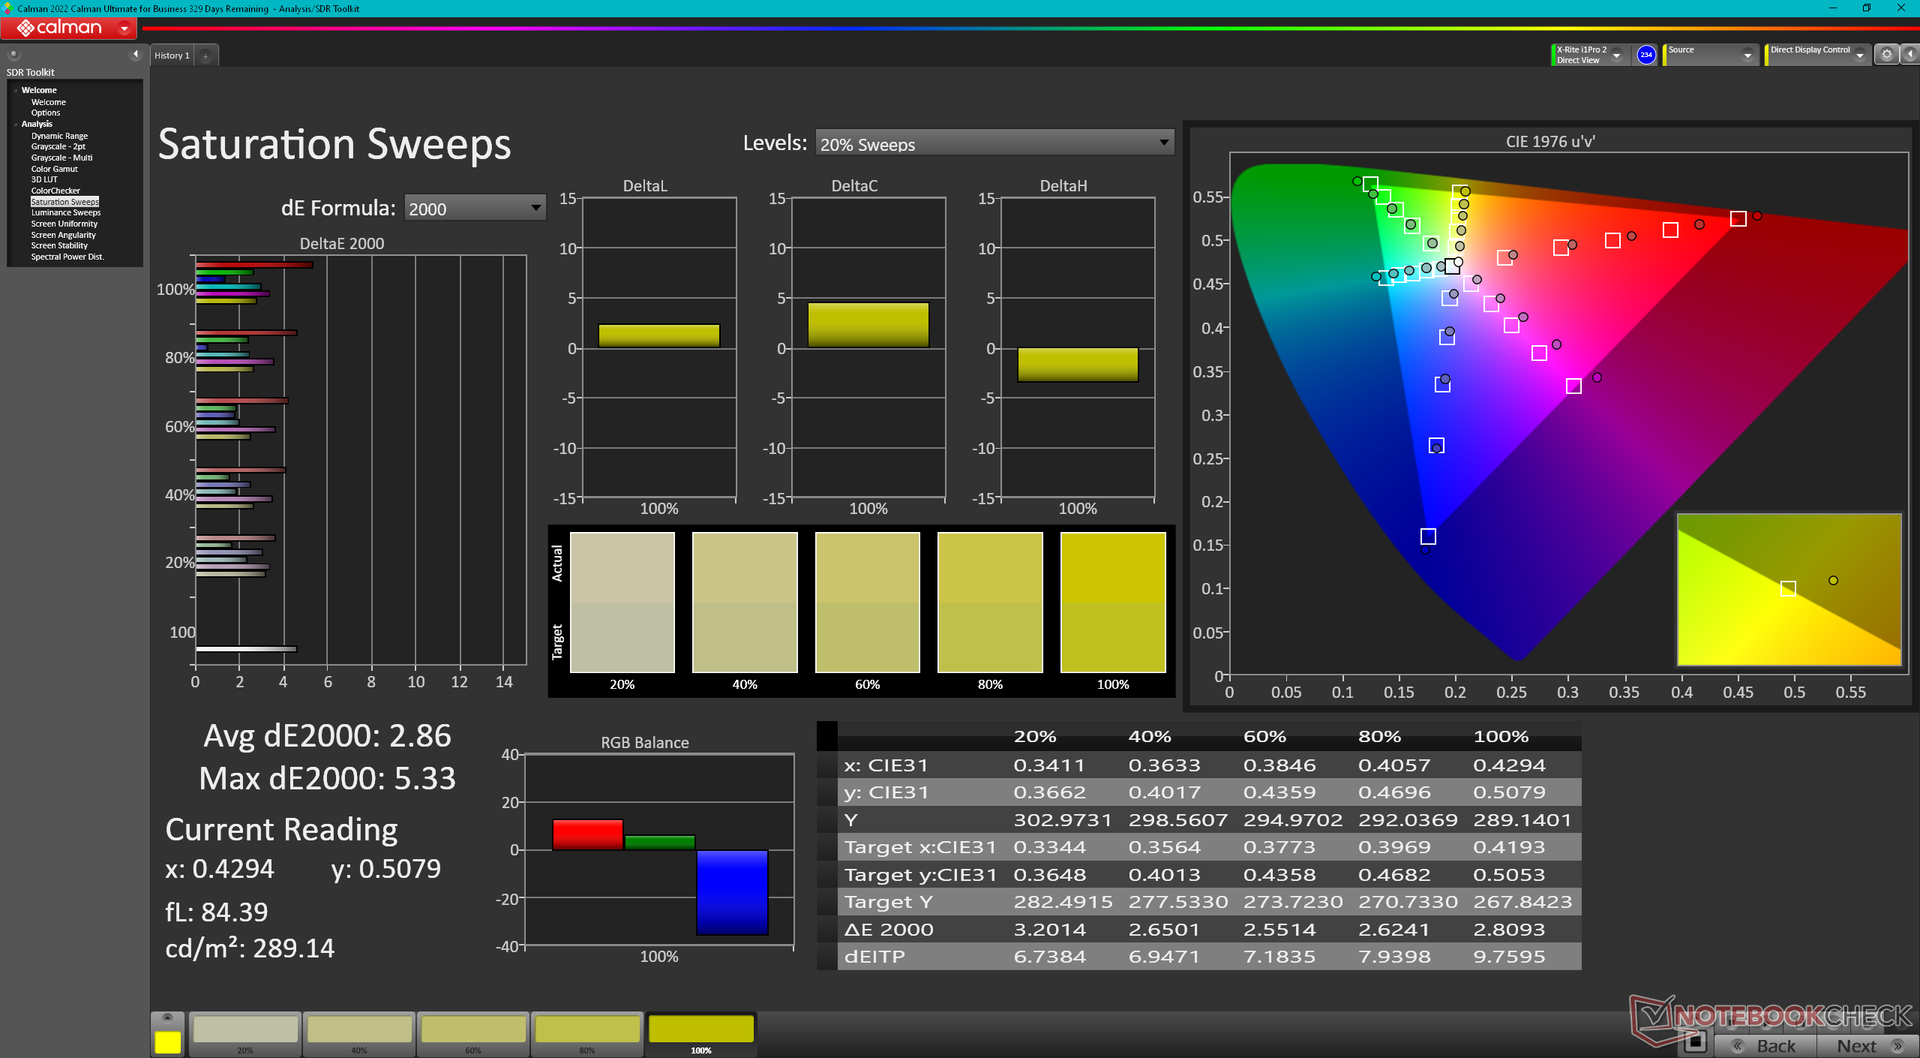
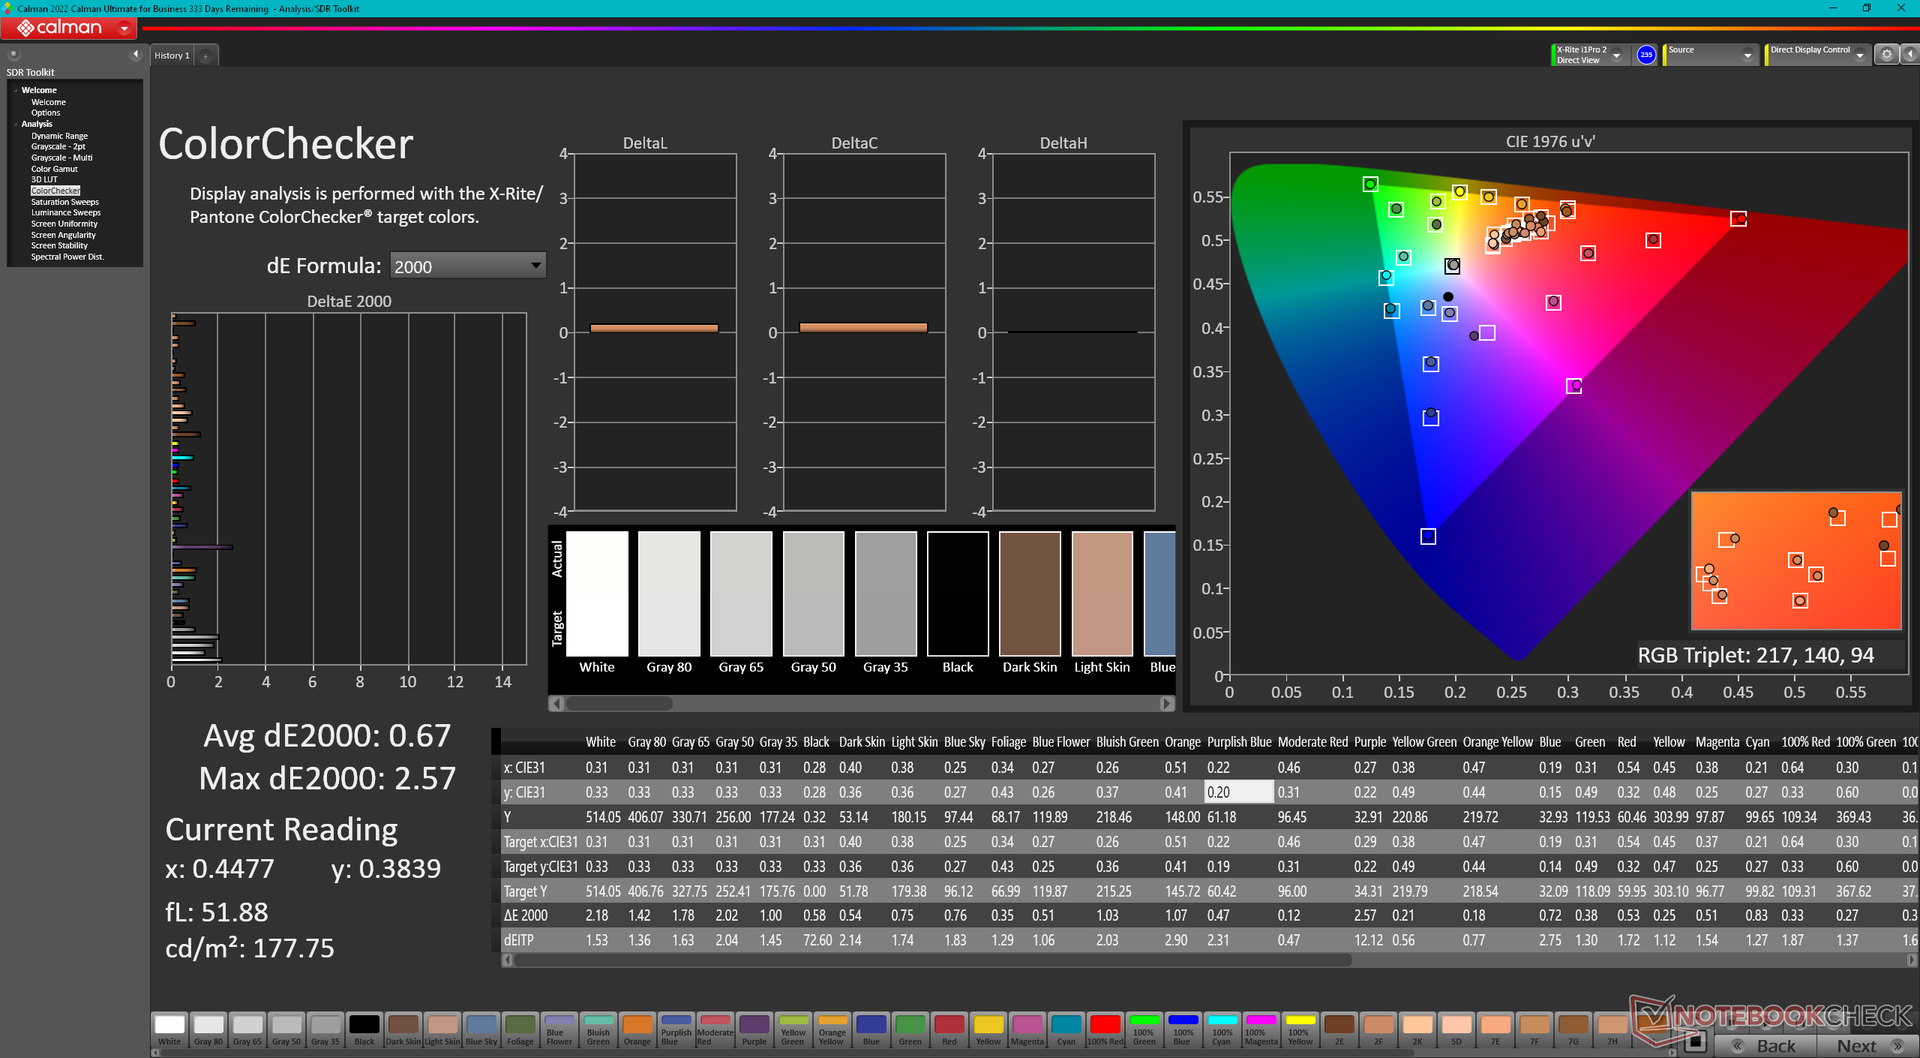
ΔE ColorChecker Calman: 3.18 | ∀{0.5-29.43 Ø4.72}
calibrated: 0.67
ΔE Greyscale Calman: 3.1 | ∀{0.09-98 Ø4.97}
77.5% AdobeRGB 1998 (Argyll 3D)
99.9% sRGB (Argyll 3D)
77.8% Display P3 (Argyll 3D)
Gamma: 2.08
CCT: 6140 K
| Dell Latitude 9330 AU Optronics B133QAA, IPS, 2560x1600, 13.3" | Lenovo ThinkPad X1 Titanium Yoga G1 20QB0016GE LPM135M467, IPS LED, 2256x1504, 13.5" | MSI Summit E13 Flip Evo A11MT Sharp LQ134N1JW53, IPS, 1920x1200, 13.4" | HP EliteBook x360 1030 G7 Chi Mei CMN13A9, IPS, 1920x1080, 13.3" | HP Elite Dragonfly Max InfoVision X133NVFL R0, IPS, 1920x1080, 13.3" | Dell Latitude 5310-23VP6 Chi Mei CMN1382, IPS, 1920x1080, 13.3" | |
|---|---|---|---|---|---|---|
| Display | -9% | -7% | -10% | -8% | ||
| Display P3 Coverage (%) | 77.8 | 66.8 -14% | 69.8 -10% | 66.1 -15% | 67.5 -13% | |
| sRGB Coverage (%) | 99.9 | 98 -2% | 98.8 -1% | 97 -3% | 99 -1% | |
| AdobeRGB 1998 Coverage (%) | 77.5 | 68.6 -11% | 70.6 -9% | 67.7 -13% | 69.2 -11% | |
| Response Times | 9% | 9% | 25% | 36% | 50% | |
| Response Time Grey 50% / Grey 80% * (ms) | 67.6 ? | 64 ? 5% | 64 ? 5% | 56.4 ? 17% | 44.8 ? 34% | 36 ? 47% |
| Response Time Black / White * (ms) | 50.4 ? | 44 ? 13% | 44 ? 13% | 34.4 ? 32% | 32 ? 37% | 24 ? 52% |
| PWM Frequency (Hz) | 26040 ? | 2500 ? | ||||
| Screen | 9% | 3% | -25% | 10% | 2% | |
| Brightness middle (cd/m²) | 542.3 | 465 -14% | 551.3 2% | 425.4 -22% | 777.5 43% | 383 -29% |
| Brightness (cd/m²) | 516 | 451 -13% | 517 0% | 407 -21% | 727 41% | 364 -29% |
| Brightness Distribution (%) | 85 | 92 8% | 91 7% | 89 5% | 75 -12% | 84 -1% |
| Black Level * (cd/m²) | 0.38 | 0.28 26% | 0.37 3% | 0.28 26% | 0.44 -16% | 0.34 11% |
| Contrast (:1) | 1427 | 1661 16% | 1490 4% | 1519 6% | 1767 24% | 1126 -21% |
| Colorchecker dE 2000 * | 3.18 | 2 37% | 1.45 54% | 4.39 -38% | 1.62 49% | 2.24 30% |
| Colorchecker dE 2000 max. * | 6.05 | 4.7 22% | 2.86 53% | 6.73 -11% | 5.26 13% | 3.32 45% |
| Colorchecker dE 2000 calibrated * | 0.67 | 0.7 -4% | 1.7 -154% | 1.65 -146% | 1.32 -97% | 0.72 -7% |
| Greyscale dE 2000 * | 3.1 | 2.9 6% | 1.3 58% | 3.9 -26% | 1.6 48% | 2.42 22% |
| Gamma | 2.08 106% | 2.09 105% | 2.14 103% | 1.87 118% | 2.2 100% | 2.65 83% |
| CCT | 6140 106% | 6181 105% | 6580 99% | 6758 96% | 6538 99% | 6776 96% |
| Color Space (Percent of AdobeRGB 1998) (%) | 65 | 61.7 | 72.3 | 56 | ||
| Color Space (Percent of sRGB) (%) | 99 | 96.6 | 94.8 | 99 | ||
| Media totale (Programma / Settaggio) | 3% /
5% | 2% /
2% | -3% /
-15% | 23% /
15% | 15% /
7% |
* ... Meglio usare valori piccoli
Il display non viene fornito pre-calibrato, il che è deludente per un portatile con un prezzo di vendita superiore ai 2000 dollari. Calibrando noi stessi il pannello con un colorimetro X-Rite, i valori medi del DeltaE della scala di grigi e del colore passerebbero rispettivamente da 3,1 e 3,18 a 1,4 e 0,67. Gli utenti possono applicare il profilo ICM di cui sopra per sfruttare al meglio i colori sRGB del display.
Tempi di risposta del Display
| ↔ Tempi di risposta dal Nero al Bianco | ||
|---|---|---|
| 50.4 ms ... aumenta ↗ e diminuisce ↘ combinato | ↗ 26.8 ms Incremento | 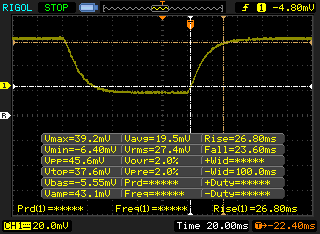 |
| ↘ 23.6 ms Calo | ||
| Lo schermo mostra tempi di risposta lenti nei nostri tests e sarà insoddisfacente per i gamers. In confronto, tutti i dispositivi di test variano da 0.1 (minimo) a 240 (massimo) ms. » 99 % di tutti i dispositivi è migliore. Questo significa che i tempi di risposta rilevati sono peggiori rispetto alla media di tutti i dispositivi testati (19.8 ms). | ||
| ↔ Tempo di risposta dal 50% Grigio all'80% Grigio | ||
| 67.6 ms ... aumenta ↗ e diminuisce ↘ combinato | ↗ 34.8 ms Incremento | 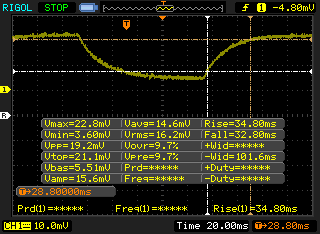 |
| ↘ 32.8 ms Calo | ||
| Lo schermo mostra tempi di risposta lenti nei nostri tests e sarà insoddisfacente per i gamers. In confronto, tutti i dispositivi di test variano da 0.165 (minimo) a 636 (massimo) ms. » 98 % di tutti i dispositivi è migliore. Questo significa che i tempi di risposta rilevati sono peggiori rispetto alla media di tutti i dispositivi testati (31 ms). | ||
Sfarfallio dello schermo / PWM (Pulse-Width Modulation)
| flickering dello schermo / PWM non rilevato | 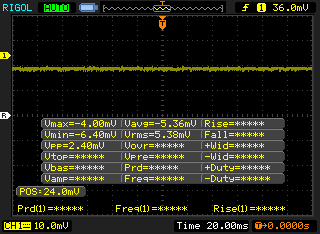 | ||
In confronto: 52 % di tutti i dispositivi testati non utilizza PWM per ridurre la luminosita' del display. Se è rilevato PWM, una media di 7781 (minimo: 5 - massimo: 343500) Hz è stata rilevata. | |||
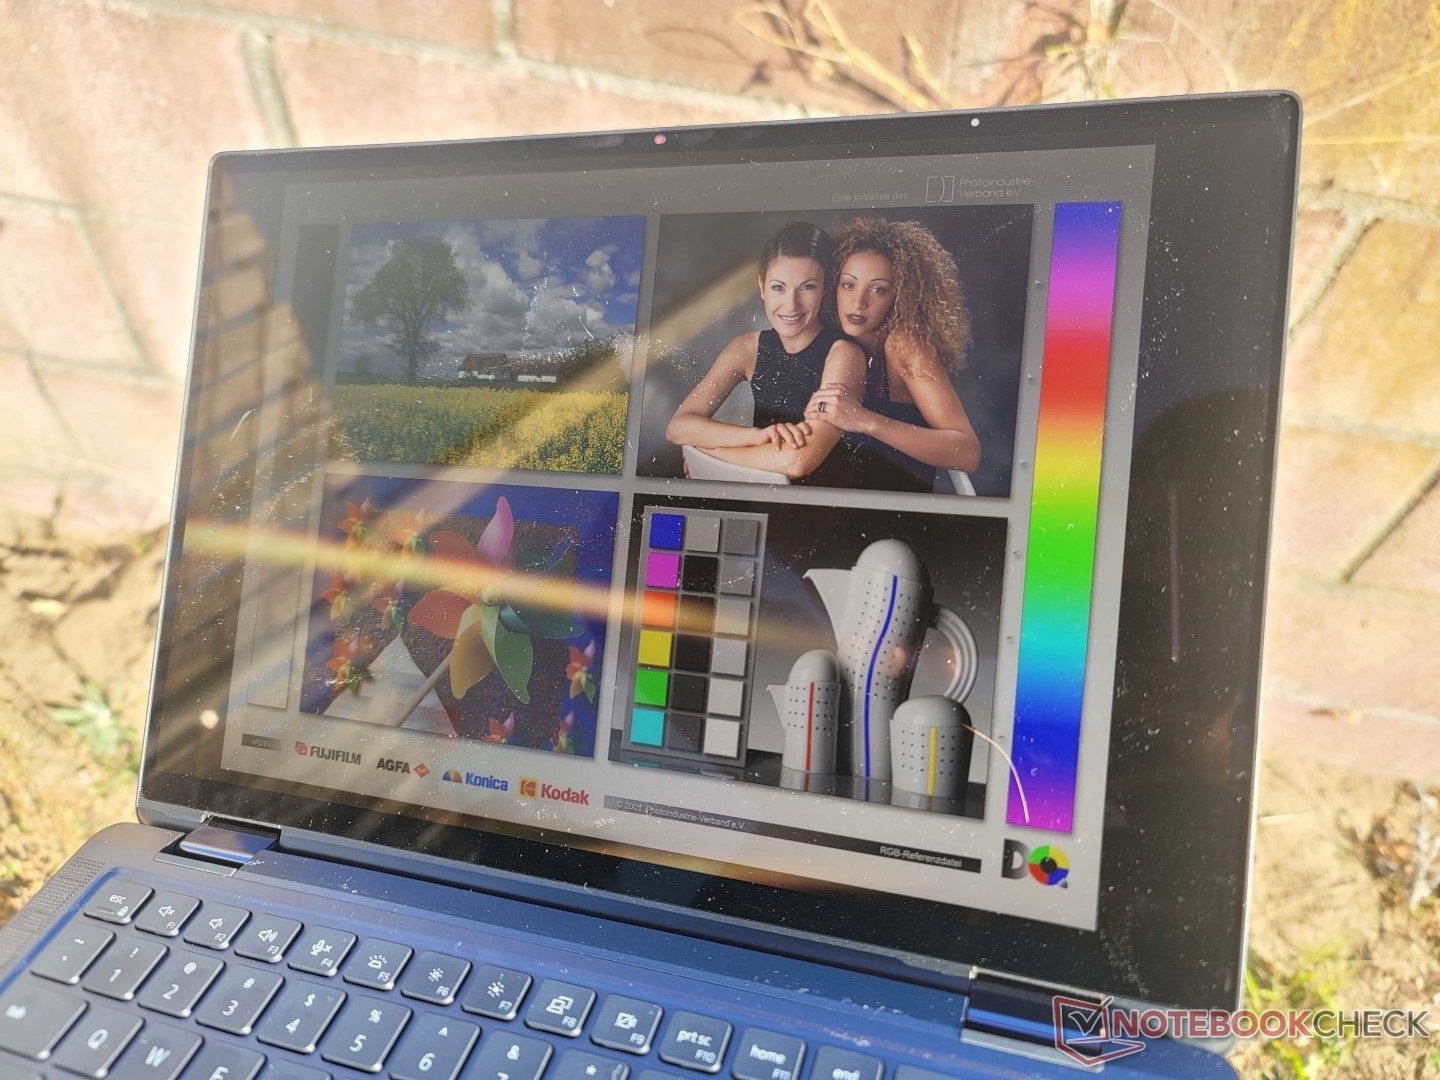
La visibilità all'aperto è buona quando si è all'ombra, poiché il display è sufficientemente luminoso da superare un abbagliamento lieve o moderato. Tuttavia, per ottimizzare l'esperienza visiva, è opportuno evitare la luce diretta del sole quando possibile. Il concorrente Dragonfly Max offre opzioni di visualizzazione ancora più luminose rispetto al Latitude 9330 per una visione più confortevole all'aperto.
Prestazioni - 12a generazione Alder Lake-U
Condizioni di test
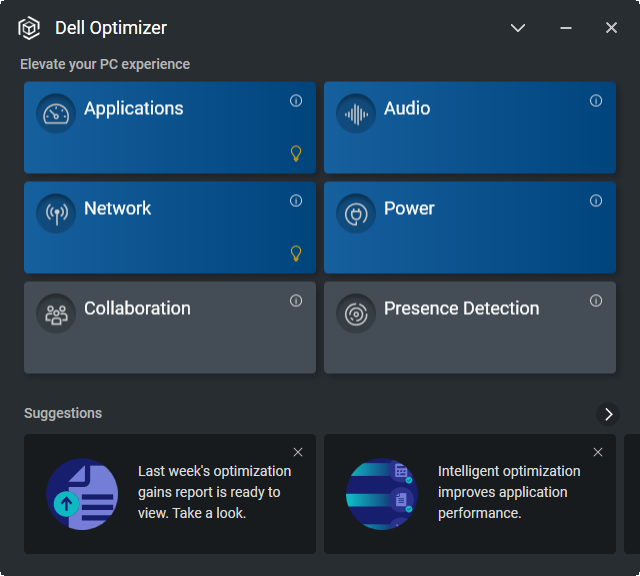
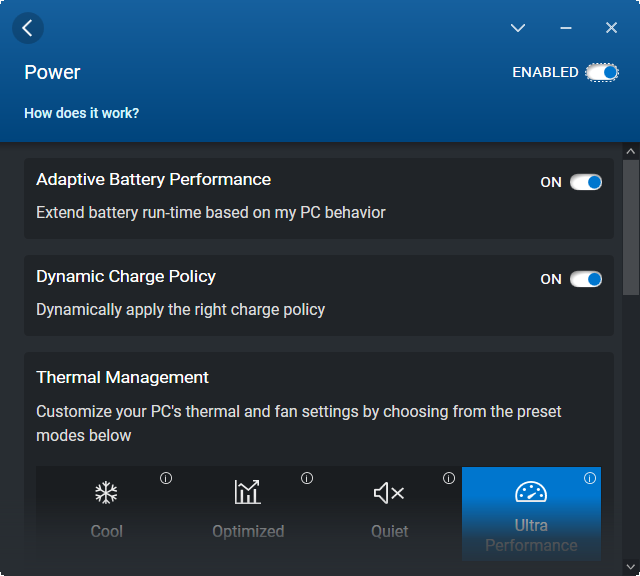
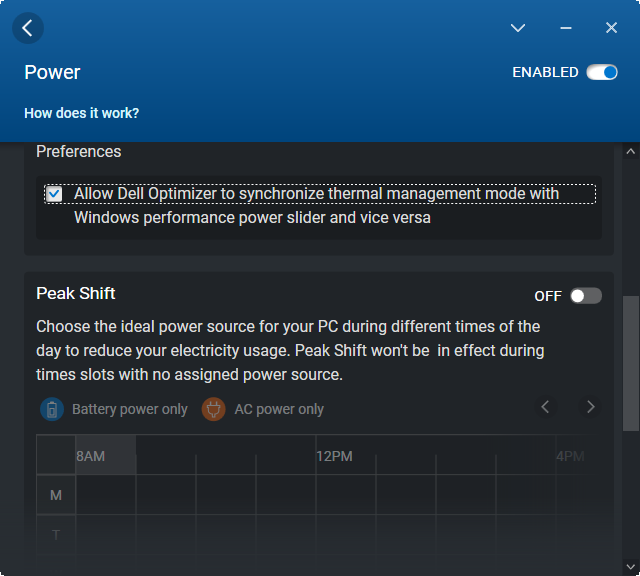
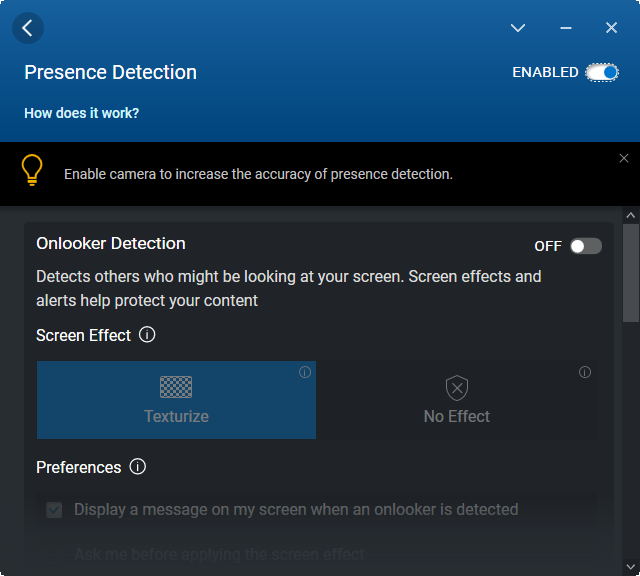
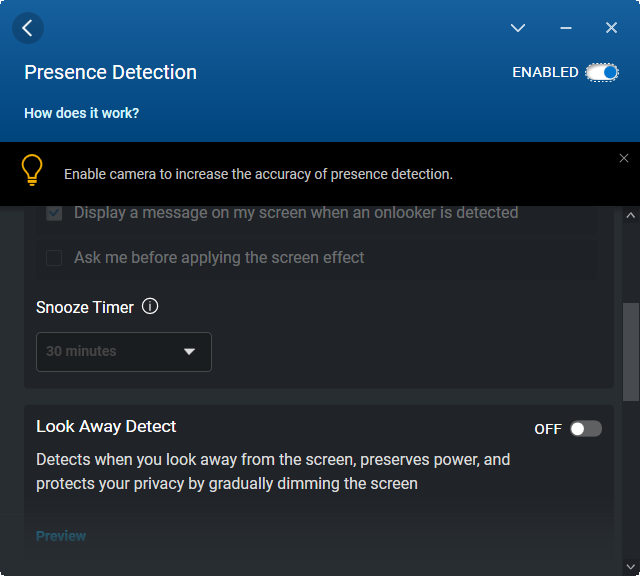
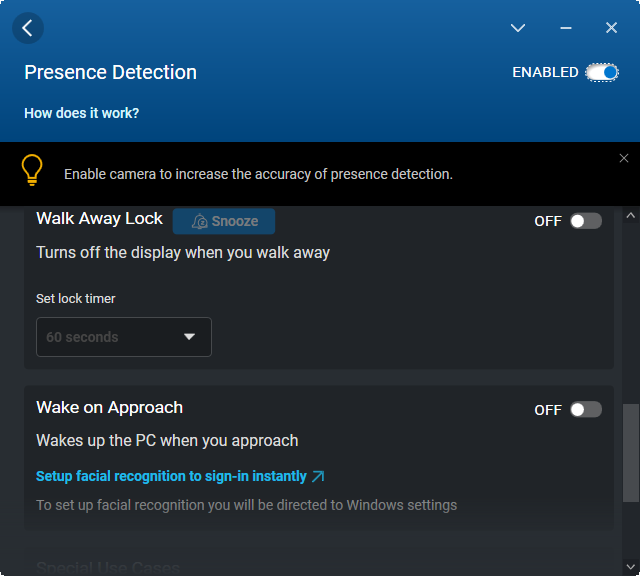
La nostra unità è stata impostata in modalità Ultra Performance sia tramite Windows che tramite il software Dell Optimizer. Si consiglia vivamente ai possessori di familiarizzare con Optimizer, in quanto è l'hub per attivare funzioni specifiche di Latitude, come Presence Detection per il login a mani libere o l'abilitazione di pulsanti aggiuntivi sensibili al tocco del clickpad. Anche i profili delle prestazioni sono disponibili attraverso il software, come mostrano le schermate seguenti.
Processore
Le prestazioni della CPU sono complessivamente eccellenti, ma non fanno abbastanza per differenziarsi dal Core i5-1235U. Ad esempio, i risultati dei benchmark sono tutti entro il 5-10% del più economico Core i5-1235U nell'IdeaPad Flex 5i IdeaPad Flex 5i. Nel frattempo, il Core i7-1255U è più veloce di circa il 10-15% grazie al TDP più elevato rispetto al nostro Core i7-1260U Core i7-1260U. Il vantaggio in termini di prestazioni multi-thread rispetto al precedente Core i7-1165G7 di 11a gen Core i7-1165G7 è ancora significativo, pari a circa il 35%, nonostante le minori differenze tra l'i5-1235U e l'i7-1255U di 12a generazione
La sostenibilità delle prestazioni è buona e molto migliore di quella osservata sul concorrente ThinkPad X1 Nano Gen 2 come mostra il grafico di confronto qui sotto. Il sistema Dell è in grado di ottenere questo risultato grazie a temperature del core molto elevate, come illustrato nella sezione Stress Test.
Cinebench R15 Multi Loop
Cinebench R23: Multi Core | Single Core
Cinebench R15: CPU Multi 64Bit | CPU Single 64Bit
Blender: v2.79 BMW27 CPU
7-Zip 18.03: 7z b 4 | 7z b 4 -mmt1
Geekbench 5.5: Multi-Core | Single-Core
HWBOT x265 Benchmark v2.2: 4k Preset
LibreOffice : 20 Documents To PDF
R Benchmark 2.5: Overall mean
| Cinebench R20 / CPU (Multi Core) | |
| Asus Zenbook S 13 OLED | |
| Lenovo ThinkPad X1 Nano Gen 2 Core i7-1280P | |
| HP Spectre x360 13.5 14t-ef000 | |
| Media Intel Core i7-1260U (2838 - 3165, n=2) | |
| Lenovo ThinkBook 13s G3 20YA0005GE | |
| Lenovo Yoga 6 13ALC6 | |
| Dell Latitude 9330 | |
| Lenovo IdeaPad Flex 5i 14IAU7 | |
| Samsung Galaxy Book2 Pro 13 NP930XED-KA1DE | |
| Framework Laptop 13.5 | |
| MSI Summit E13 Flip Evo A11MT | |
| HP EliteBook x360 1030 G7 | |
| HP Elite Dragonfly Max | |
| Dell Latitude 5310-23VP6 | |
| Lenovo ThinkPad X1 Titanium Yoga G1 20QB0016GE | |
| Cinebench R20 / CPU (Single Core) | |
| HP Spectre x360 13.5 14t-ef000 | |
| Lenovo IdeaPad Flex 5i 14IAU7 | |
| Lenovo ThinkPad X1 Nano Gen 2 Core i7-1280P | |
| Dell Latitude 9330 | |
| Framework Laptop 13.5 | |
| Media Intel Core i7-1260U (566 - 588, n=2) | |
| Asus Zenbook S 13 OLED | |
| Lenovo ThinkBook 13s G3 20YA0005GE | |
| MSI Summit E13 Flip Evo A11MT | |
| HP Elite Dragonfly Max | |
| Lenovo Yoga 6 13ALC6 | |
| HP EliteBook x360 1030 G7 | |
| Lenovo ThinkPad X1 Titanium Yoga G1 20QB0016GE | |
| Dell Latitude 5310-23VP6 | |
| Samsung Galaxy Book2 Pro 13 NP930XED-KA1DE | |
| Cinebench R23 / Multi Core | |
| Asus Zenbook S 13 OLED | |
| Lenovo ThinkPad X1 Nano Gen 2 Core i7-1280P | |
| HP Spectre x360 13.5 14t-ef000 | |
| Lenovo IdeaPad Flex 5i 14IAU7 | |
| Lenovo ThinkBook 13s G3 20YA0005GE | |
| Media Intel Core i7-1260U (7444 - 8381, n=2) | |
| Lenovo Yoga 6 13ALC6 | |
| Dell Latitude 9330 | |
| Samsung Galaxy Book2 Pro 13 NP930XED-KA1DE | |
| MSI Summit E13 Flip Evo A11MT | |
| Framework Laptop 13.5 | |
| HP Elite Dragonfly Max | |
| Lenovo ThinkPad X1 Titanium Yoga G1 20QB0016GE | |
| Cinebench R23 / Single Core | |
| HP Spectre x360 13.5 14t-ef000 | |
| Lenovo ThinkPad X1 Nano Gen 2 Core i7-1280P | |
| Lenovo IdeaPad Flex 5i 14IAU7 | |
| Media Intel Core i7-1260U (1538 - 1664, n=2) | |
| Dell Latitude 9330 | |
| Framework Laptop 13.5 | |
| Asus Zenbook S 13 OLED | |
| MSI Summit E13 Flip Evo A11MT | |
| Lenovo ThinkBook 13s G3 20YA0005GE | |
| HP Elite Dragonfly Max | |
| Lenovo Yoga 6 13ALC6 | |
| Lenovo ThinkPad X1 Titanium Yoga G1 20QB0016GE | |
| Samsung Galaxy Book2 Pro 13 NP930XED-KA1DE | |
| Cinebench R15 / CPU Multi 64Bit | |
| Lenovo ThinkPad X1 Nano Gen 2 Core i7-1280P | |
| Lenovo ThinkBook 13s G3 20YA0005GE | |
| Lenovo ThinkBook 13s G3 20YA0005GE | |
| Asus Zenbook S 13 OLED | |
| HP Spectre x360 13.5 14t-ef000 | |
| Lenovo IdeaPad Flex 5i 14IAU7 | |
| Media Intel Core i7-1260U (1117 - 1289, n=2) | |
| Lenovo Yoga 6 13ALC6 | |
| Dell Latitude 9330 | |
| Samsung Galaxy Book2 Pro 13 NP930XED-KA1DE | |
| MSI Summit E13 Flip Evo A11MT | |
| Framework Laptop 13.5 | |
| HP EliteBook x360 1030 G7 | |
| Lenovo ThinkPad X1 Titanium Yoga G1 20QB0016GE | |
| HP Elite Dragonfly Max | |
| Dell Latitude 5310-23VP6 | |
| Cinebench R15 / CPU Single 64Bit | |
| HP Spectre x360 13.5 14t-ef000 | |
| Lenovo IdeaPad Flex 5i 14IAU7 | |
| Lenovo ThinkPad X1 Nano Gen 2 Core i7-1280P | |
| Asus Zenbook S 13 OLED | |
| Lenovo ThinkBook 13s G3 20YA0005GE | |
| Framework Laptop 13.5 | |
| Dell Latitude 9330 | |
| Media Intel Core i7-1260U (217 - 222, n=2) | |
| MSI Summit E13 Flip Evo A11MT | |
| Lenovo Yoga 6 13ALC6 | |
| HP EliteBook x360 1030 G7 | |
| Lenovo ThinkPad X1 Titanium Yoga G1 20QB0016GE | |
| HP Elite Dragonfly Max | |
| Dell Latitude 5310-23VP6 | |
| Samsung Galaxy Book2 Pro 13 NP930XED-KA1DE | |
| Blender / v2.79 BMW27 CPU | |
| Lenovo ThinkPad X1 Titanium Yoga G1 20QB0016GE | |
| Dell Latitude 5310-23VP6 | |
| HP Elite Dragonfly Max | |
| HP EliteBook x360 1030 G7 | |
| Samsung Galaxy Book2 Pro 13 NP930XED-KA1DE | |
| MSI Summit E13 Flip Evo A11MT | |
| Framework Laptop 13.5 | |
| Dell Latitude 9330 | |
| Media Intel Core i7-1260U (393 - 431, n=2) | |
| Lenovo IdeaPad Flex 5i 14IAU7 | |
| Lenovo ThinkBook 13s G3 20YA0005GE | |
| HP Spectre x360 13.5 14t-ef000 | |
| Lenovo Yoga 6 13ALC6 | |
| Asus Zenbook S 13 OLED | |
| Lenovo ThinkPad X1 Nano Gen 2 Core i7-1280P | |
| 7-Zip 18.03 / 7z b 4 | |
| Asus Zenbook S 13 OLED | |
| Lenovo ThinkPad X1 Nano Gen 2 Core i7-1280P | |
| Lenovo ThinkBook 13s G3 20YA0005GE | |
| Lenovo Yoga 6 13ALC6 | |
| HP Spectre x360 13.5 14t-ef000 | |
| Media Intel Core i7-1260U (32008 - 36480, n=2) | |
| Dell Latitude 9330 | |
| Lenovo IdeaPad Flex 5i 14IAU7 | |
| MSI Summit E13 Flip Evo A11MT | |
| Framework Laptop 13.5 | |
| Samsung Galaxy Book2 Pro 13 NP930XED-KA1DE | |
| HP EliteBook x360 1030 G7 | |
| HP Elite Dragonfly Max | |
| Dell Latitude 5310-23VP6 | |
| Lenovo ThinkPad X1 Titanium Yoga G1 20QB0016GE | |
| 7-Zip 18.03 / 7z b 4 -mmt1 | |
| Lenovo ThinkPad X1 Nano Gen 2 Core i7-1280P | |
| HP Spectre x360 13.5 14t-ef000 | |
| Asus Zenbook S 13 OLED | |
| Framework Laptop 13.5 | |
| Lenovo ThinkBook 13s G3 20YA0005GE | |
| MSI Summit E13 Flip Evo A11MT | |
| HP Elite Dragonfly Max | |
| Lenovo IdeaPad Flex 5i 14IAU7 | |
| Media Intel Core i7-1260U (4746 - 5047, n=2) | |
| Dell Latitude 9330 | |
| Lenovo Yoga 6 13ALC6 | |
| HP EliteBook x360 1030 G7 | |
| Dell Latitude 5310-23VP6 | |
| Lenovo ThinkPad X1 Titanium Yoga G1 20QB0016GE | |
| Samsung Galaxy Book2 Pro 13 NP930XED-KA1DE | |
| Geekbench 5.5 / Multi-Core | |
| Lenovo ThinkPad X1 Nano Gen 2 Core i7-1280P | |
| Lenovo IdeaPad Flex 5i 14IAU7 | |
| HP Spectre x360 13.5 14t-ef000 | |
| Asus Zenbook S 13 OLED | |
| Media Intel Core i7-1260U (7072 - 7444, n=2) | |
| Dell Latitude 9330 | |
| Lenovo ThinkBook 13s G3 20YA0005GE | |
| MSI Summit E13 Flip Evo A11MT | |
| HP Elite Dragonfly Max | |
| HP EliteBook x360 1030 G7 | |
| Samsung Galaxy Book2 Pro 13 NP930XED-KA1DE | |
| Lenovo ThinkPad X1 Titanium Yoga G1 20QB0016GE | |
| Dell Latitude 5310-23VP6 | |
| Geekbench 5.5 / Single-Core | |
| Lenovo ThinkPad X1 Nano Gen 2 Core i7-1280P | |
| HP Spectre x360 13.5 14t-ef000 | |
| Lenovo IdeaPad Flex 5i 14IAU7 | |
| Media Intel Core i7-1260U (1560 - 1662, n=2) | |
| Dell Latitude 9330 | |
| HP Elite Dragonfly Max | |
| Asus Zenbook S 13 OLED | |
| MSI Summit E13 Flip Evo A11MT | |
| Lenovo ThinkBook 13s G3 20YA0005GE | |
| Lenovo ThinkPad X1 Titanium Yoga G1 20QB0016GE | |
| HP EliteBook x360 1030 G7 | |
| Dell Latitude 5310-23VP6 | |
| Samsung Galaxy Book2 Pro 13 NP930XED-KA1DE | |
| HWBOT x265 Benchmark v2.2 / 4k Preset | |
| Asus Zenbook S 13 OLED | |
| HP Spectre x360 13.5 14t-ef000 | |
| Lenovo ThinkBook 13s G3 20YA0005GE | |
| Lenovo ThinkPad X1 Nano Gen 2 Core i7-1280P | |
| Lenovo IdeaPad Flex 5i 14IAU7 | |
| Lenovo Yoga 6 13ALC6 | |
| Media Intel Core i7-1260U (8.54 - 9.58, n=2) | |
| Dell Latitude 9330 | |
| MSI Summit E13 Flip Evo A11MT | |
| Framework Laptop 13.5 | |
| Samsung Galaxy Book2 Pro 13 NP930XED-KA1DE | |
| HP EliteBook x360 1030 G7 | |
| HP Elite Dragonfly Max | |
| Dell Latitude 5310-23VP6 | |
| Lenovo ThinkPad X1 Titanium Yoga G1 20QB0016GE | |
| LibreOffice / 20 Documents To PDF | |
| Samsung Galaxy Book2 Pro 13 NP930XED-KA1DE | |
| HP EliteBook x360 1030 G7 | |
| Dell Latitude 5310-23VP6 | |
| Lenovo Yoga 6 13ALC6 | |
| Asus Zenbook S 13 OLED | |
| Dell Latitude 9330 | |
| Lenovo ThinkPad X1 Titanium Yoga G1 20QB0016GE | |
| Lenovo ThinkBook 13s G3 20YA0005GE | |
| Lenovo IdeaPad Flex 5i 14IAU7 | |
| Media Intel Core i7-1260U (45.9 - 51.4, n=2) | |
| MSI Summit E13 Flip Evo A11MT | |
| HP Elite Dragonfly Max | |
| Lenovo ThinkPad X1 Nano Gen 2 Core i7-1280P | |
| Framework Laptop 13.5 | |
| HP Spectre x360 13.5 14t-ef000 | |
| R Benchmark 2.5 / Overall mean | |
| Samsung Galaxy Book2 Pro 13 NP930XED-KA1DE | |
| Lenovo ThinkPad X1 Titanium Yoga G1 20QB0016GE | |
| Dell Latitude 5310-23VP6 | |
| HP EliteBook x360 1030 G7 | |
| HP Elite Dragonfly Max | |
| MSI Summit E13 Flip Evo A11MT | |
| Lenovo Yoga 6 13ALC6 | |
| Framework Laptop 13.5 | |
| Lenovo ThinkBook 13s G3 20YA0005GE | |
| Dell Latitude 9330 | |
| Asus Zenbook S 13 OLED | |
| Media Intel Core i7-1260U (0.494 - 0.53, n=2) | |
| Lenovo IdeaPad Flex 5i 14IAU7 | |
| HP Spectre x360 13.5 14t-ef000 | |
| Lenovo ThinkPad X1 Nano Gen 2 Core i7-1280P | |
Cinebench R23: Multi Core | Single Core
Cinebench R15: CPU Multi 64Bit | CPU Single 64Bit
Blender: v2.79 BMW27 CPU
7-Zip 18.03: 7z b 4 | 7z b 4 -mmt1
Geekbench 5.5: Multi-Core | Single-Core
HWBOT x265 Benchmark v2.2: 4k Preset
LibreOffice : 20 Documents To PDF
R Benchmark 2.5: Overall mean
* ... Meglio usare valori piccoli
AIDA64: FP32 Ray-Trace | FPU Julia | CPU SHA3 | CPU Queen | FPU SinJulia | FPU Mandel | CPU AES | CPU ZLib | FP64 Ray-Trace | CPU PhotoWorxx
| Performance rating | |
| MSI Summit E13 Flip Evo A11MT | |
| Media Intel Core i7-1260U | |
| Dell Latitude 9330 | |
| HP Elite Dragonfly Max | |
| Lenovo ThinkPad X1 Titanium Yoga G1 20QB0016GE | |
| Dell Latitude 5310-23VP6 | |
| AIDA64 / FP32 Ray-Trace | |
| MSI Summit E13 Flip Evo A11MT | |
| Media Intel Core i7-1260U (6694 - 7261, n=2) | |
| Dell Latitude 9330 | |
| HP Elite Dragonfly Max | |
| Dell Latitude 5310-23VP6 | |
| Lenovo ThinkPad X1 Titanium Yoga G1 20QB0016GE | |
| AIDA64 / FPU Julia | |
| Media Intel Core i7-1260U (33823 - 37371, n=2) | |
| Dell Latitude 9330 | |
| MSI Summit E13 Flip Evo A11MT | |
| Dell Latitude 5310-23VP6 | |
| HP Elite Dragonfly Max | |
| Lenovo ThinkPad X1 Titanium Yoga G1 20QB0016GE | |
| AIDA64 / CPU SHA3 | |
| MSI Summit E13 Flip Evo A11MT | |
| Media Intel Core i7-1260U (1816 - 1949, n=2) | |
| Dell Latitude 9330 | |
| HP Elite Dragonfly Max | |
| Lenovo ThinkPad X1 Titanium Yoga G1 20QB0016GE | |
| Dell Latitude 5310-23VP6 | |
| AIDA64 / CPU Queen | |
| MSI Summit E13 Flip Evo A11MT | |
| Media Intel Core i7-1260U (50854 - 53090, n=2) | |
| Dell Latitude 9330 | |
| HP Elite Dragonfly Max | |
| Dell Latitude 5310-23VP6 | |
| Lenovo ThinkPad X1 Titanium Yoga G1 20QB0016GE | |
| AIDA64 / FPU SinJulia | |
| MSI Summit E13 Flip Evo A11MT | |
| Dell Latitude 5310-23VP6 | |
| Media Intel Core i7-1260U (4067 - 4155, n=2) | |
| Dell Latitude 9330 | |
| HP Elite Dragonfly Max | |
| Lenovo ThinkPad X1 Titanium Yoga G1 20QB0016GE | |
| AIDA64 / FPU Mandel | |
| MSI Summit E13 Flip Evo A11MT | |
| Media Intel Core i7-1260U (16988 - 17918, n=2) | |
| Dell Latitude 9330 | |
| HP Elite Dragonfly Max | |
| Dell Latitude 5310-23VP6 | |
| Lenovo ThinkPad X1 Titanium Yoga G1 20QB0016GE | |
| AIDA64 / CPU AES | |
| MSI Summit E13 Flip Evo A11MT | |
| HP Elite Dragonfly Max | |
| Lenovo ThinkPad X1 Titanium Yoga G1 20QB0016GE | |
| Media Intel Core i7-1260U (33289 - 35061, n=2) | |
| Dell Latitude 9330 | |
| Dell Latitude 5310-23VP6 | |
| AIDA64 / CPU ZLib | |
| Media Intel Core i7-1260U (506 - 586, n=2) | |
| Dell Latitude 9330 | |
| MSI Summit E13 Flip Evo A11MT | |
| Dell Latitude 5310-23VP6 | |
| HP Elite Dragonfly Max | |
| Lenovo ThinkPad X1 Titanium Yoga G1 20QB0016GE | |
| AIDA64 / FP64 Ray-Trace | |
| MSI Summit E13 Flip Evo A11MT | |
| Media Intel Core i7-1260U (3666 - 3854, n=2) | |
| Dell Latitude 9330 | |
| HP Elite Dragonfly Max | |
| Dell Latitude 5310-23VP6 | |
| Lenovo ThinkPad X1 Titanium Yoga G1 20QB0016GE | |
| AIDA64 / CPU PhotoWorxx | |
| MSI Summit E13 Flip Evo A11MT | |
| HP Elite Dragonfly Max | |
| Media Intel Core i7-1260U (37448 - 37790, n=2) | |
| Dell Latitude 9330 | |
| Lenovo ThinkPad X1 Titanium Yoga G1 20QB0016GE | |
| Dell Latitude 5310-23VP6 | |
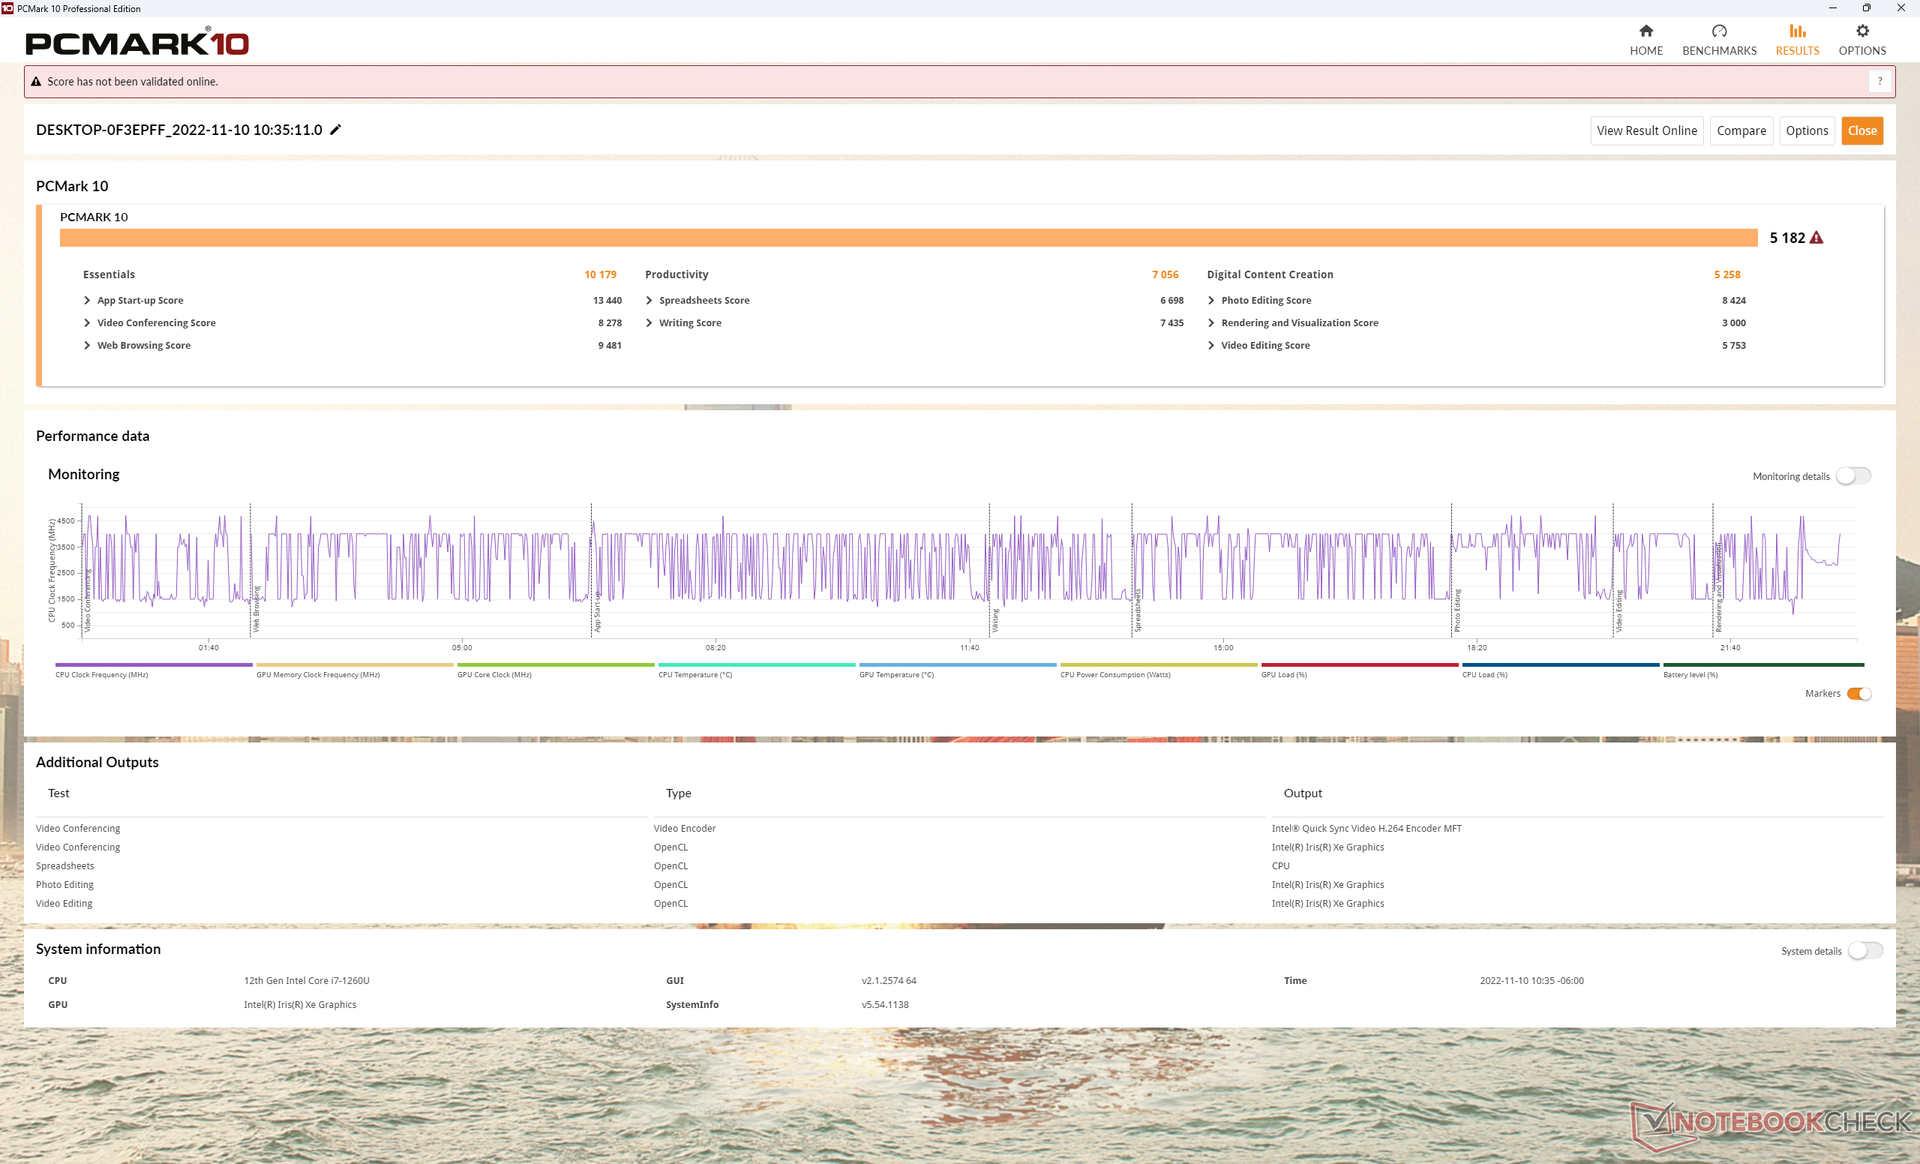
Prestazioni del sistema
I risultati di PCMark 10 sono superiori a quelli della maggior parte dei subnotebook da 13 pollici e sono tra i più veloci della categoria. Molti modelli di questa classe di dimensioni tendono a utilizzare CPU con TDP inferiore, come il ThinkPad X1 Yoga G1 per ottenere prestazioni più basse.
| PCMark 10 / Score | |
| Media Intel Core i7-1260U, Intel Iris Xe Graphics G7 96EUs (5182 - 5300, n=2) | |
| Dell Latitude 9330 | |
| HP Elite Dragonfly Max | |
| MSI Summit E13 Flip Evo A11MT | |
| Lenovo ThinkPad X1 Titanium Yoga G1 20QB0016GE | |
| HP EliteBook x360 1030 G7 | |
| Dell Latitude 5310-23VP6 | |
| PCMark 10 / Essentials | |
| HP Elite Dragonfly Max | |
| Dell Latitude 9330 | |
| Media Intel Core i7-1260U, Intel Iris Xe Graphics G7 96EUs (9929 - 10179, n=2) | |
| Lenovo ThinkPad X1 Titanium Yoga G1 20QB0016GE | |
| HP EliteBook x360 1030 G7 | |
| Dell Latitude 5310-23VP6 | |
| MSI Summit E13 Flip Evo A11MT | |
| PCMark 10 / Productivity | |
| Media Intel Core i7-1260U, Intel Iris Xe Graphics G7 96EUs (7056 - 7287, n=2) | |
| Dell Latitude 9330 | |
| MSI Summit E13 Flip Evo A11MT | |
| HP Elite Dragonfly Max | |
| Dell Latitude 5310-23VP6 | |
| HP EliteBook x360 1030 G7 | |
| Lenovo ThinkPad X1 Titanium Yoga G1 20QB0016GE | |
| PCMark 10 / Digital Content Creation | |
| Media Intel Core i7-1260U, Intel Iris Xe Graphics G7 96EUs (5258 - 5584, n=2) | |
| Dell Latitude 9330 | |
| MSI Summit E13 Flip Evo A11MT | |
| HP Elite Dragonfly Max | |
| Lenovo ThinkPad X1 Titanium Yoga G1 20QB0016GE | |
| HP EliteBook x360 1030 G7 | |
| Dell Latitude 5310-23VP6 | |
| PCMark 10 Score | 5182 punti | |
Aiuto | ||
| AIDA64 / Memory Copy | |
| Dell Latitude 9330 | |
| Media Intel Core i7-1260U (68849 - 69994, n=2) | |
| HP Elite Dragonfly Max | |
| MSI Summit E13 Flip Evo A11MT | |
| Lenovo ThinkPad X1 Titanium Yoga G1 20QB0016GE | |
| Dell Latitude 5310-23VP6 | |
| AIDA64 / Memory Read | |
| HP Elite Dragonfly Max | |
| Dell Latitude 9330 | |
| Media Intel Core i7-1260U (59219 - 60804, n=2) | |
| MSI Summit E13 Flip Evo A11MT | |
| Lenovo ThinkPad X1 Titanium Yoga G1 20QB0016GE | |
| Dell Latitude 5310-23VP6 | |
| AIDA64 / Memory Write | |
| HP Elite Dragonfly Max | |
| Dell Latitude 9330 | |
| Media Intel Core i7-1260U (62367 - 63786, n=2) | |
| Lenovo ThinkPad X1 Titanium Yoga G1 20QB0016GE | |
| MSI Summit E13 Flip Evo A11MT | |
| Dell Latitude 5310-23VP6 | |
| AIDA64 / Memory Latency | |
| Dell Latitude 9330 | |
| Media Intel Core i7-1260U (107.2 - 107.7, n=2) | |
| HP Elite Dragonfly Max | |
| Dell Latitude 5310-23VP6 | |
| MSI Summit E13 Flip Evo A11MT | |
| Lenovo ThinkPad X1 Titanium Yoga G1 20QB0016GE | |
* ... Meglio usare valori piccoli
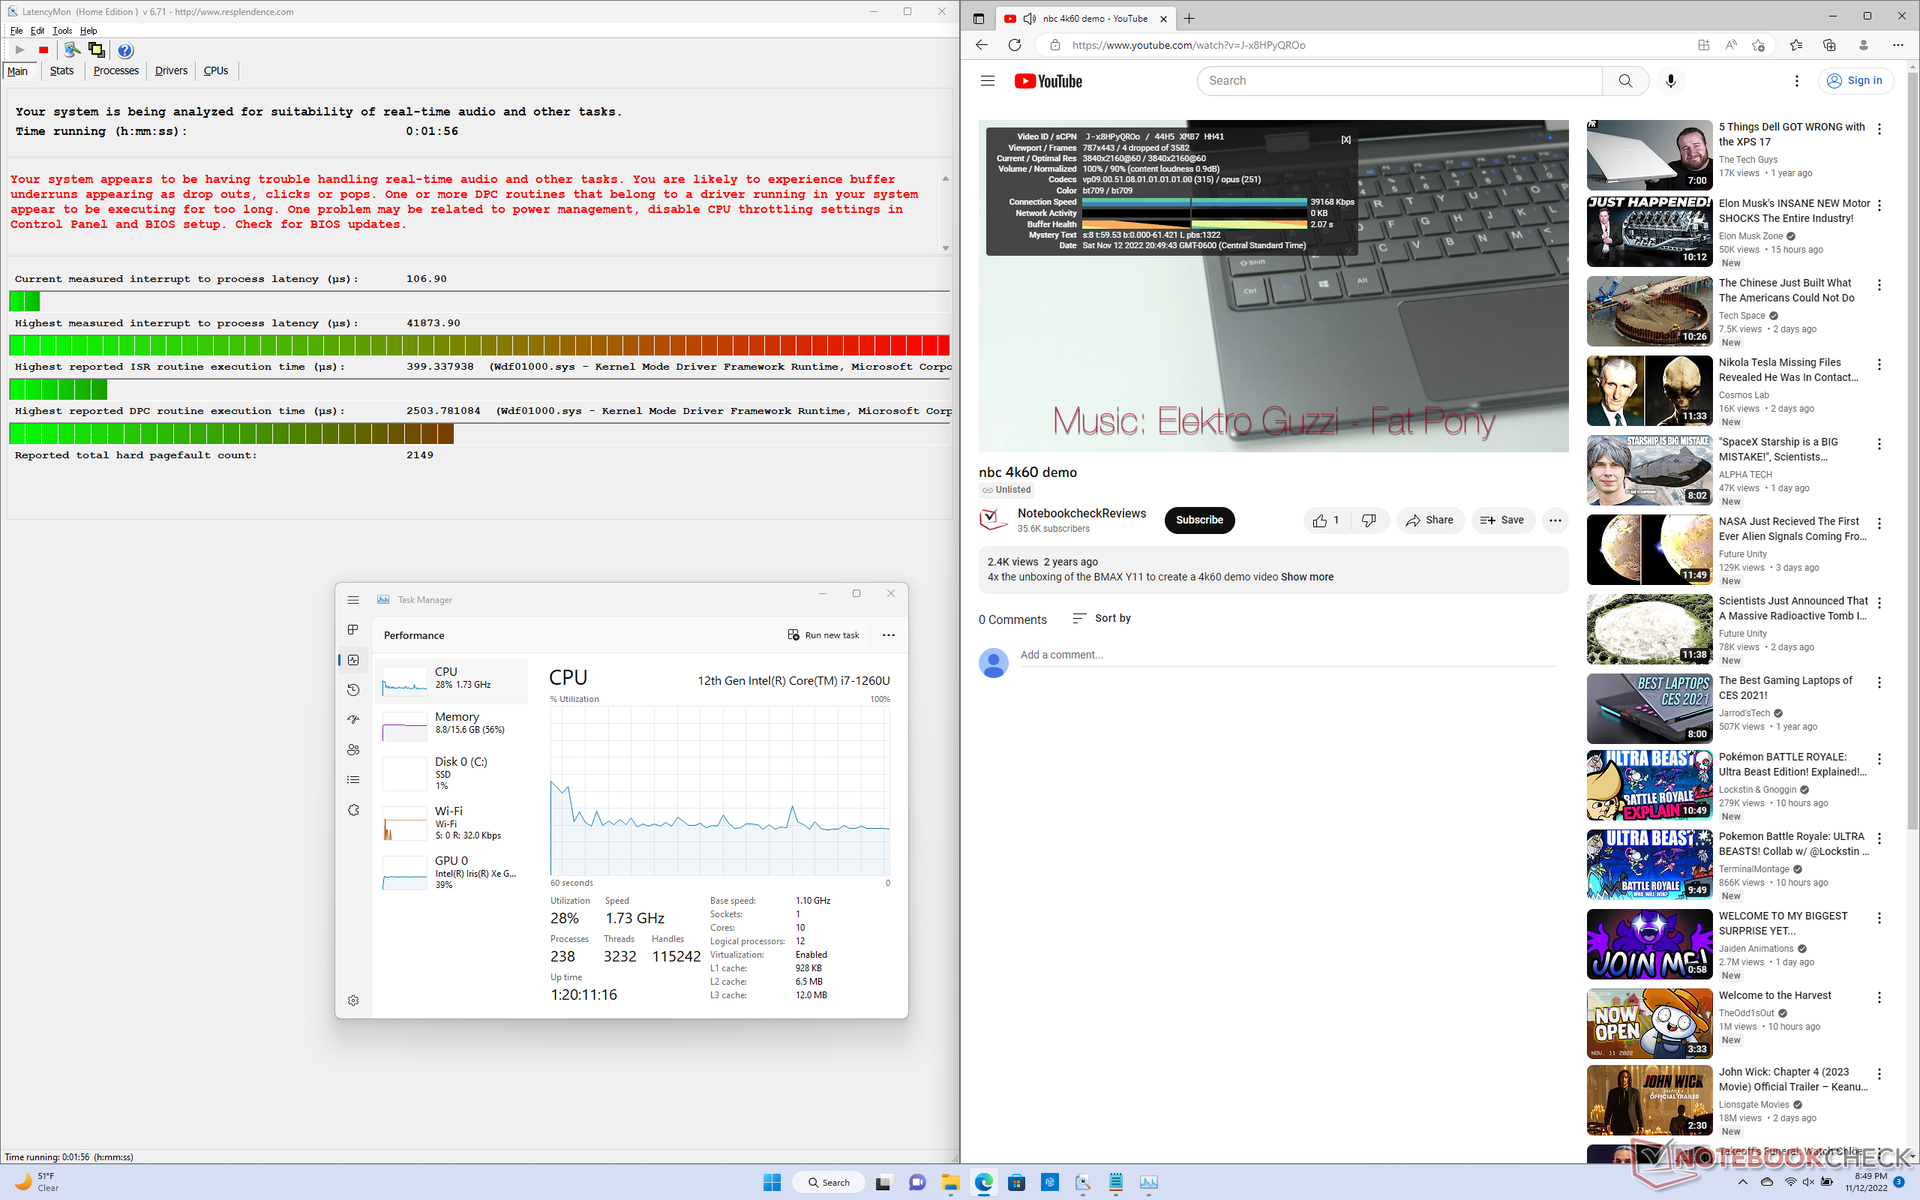
Latenza DPC
L'unità ha mostrato gravi problemi di DPC all'apertura di più schede del browser della nostra homepage, anche dopo vari test. anche la riproduzione di video in 4K a 60 FPS è imperfetta, con 4 fotogrammi caduti durante il minuto di test. I risultati sono deludenti per un portatile business di fascia alta in cui la costanza delle prestazioni è importante.
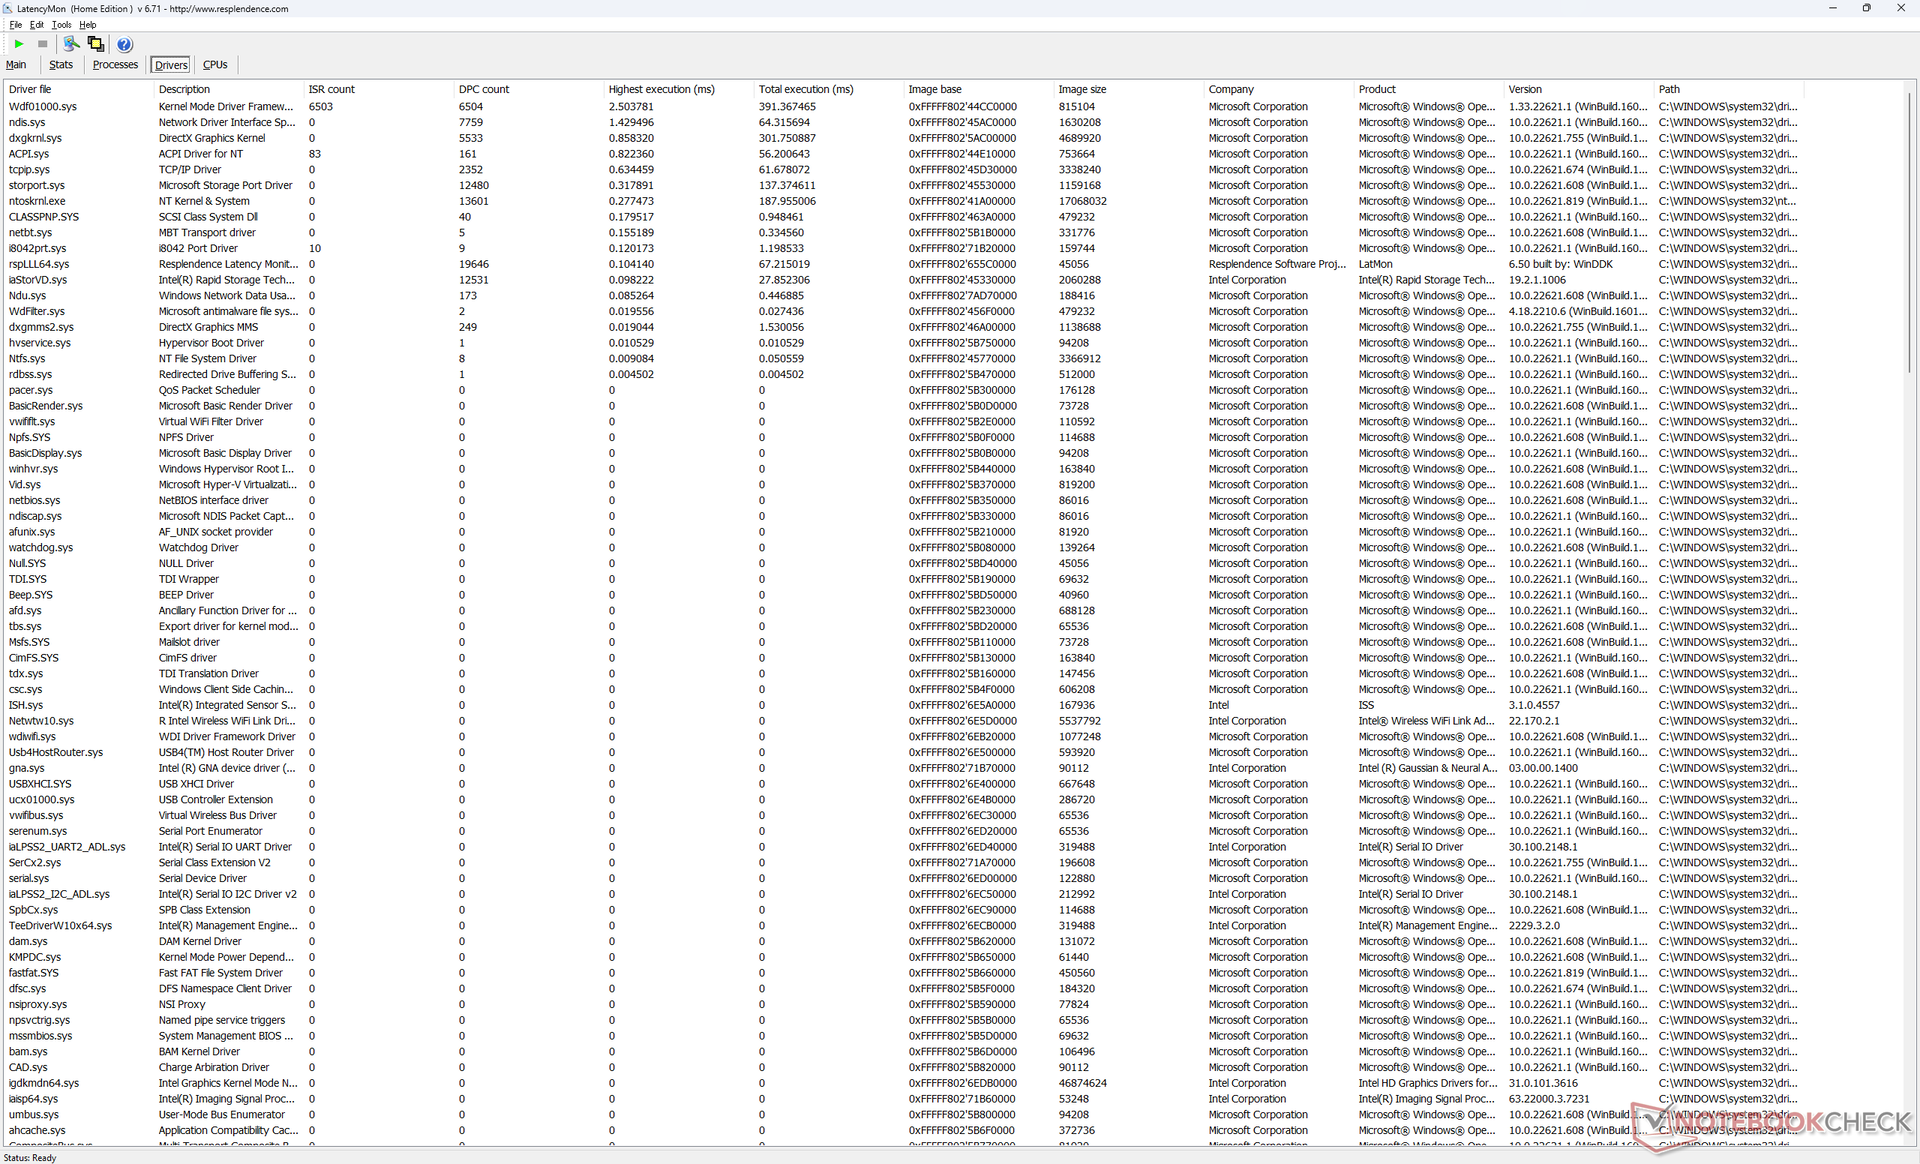
| DPC Latencies / LatencyMon - interrupt to process latency (max), Web, Youtube, Prime95 | |
| Dell Latitude 9330 | |
| HP EliteBook x360 1030 G7 | |
| HP Elite Dragonfly Max | |
| MSI Summit E13 Flip Evo A11MT | |
| Lenovo ThinkPad X1 Titanium Yoga G1 20QB0016GE | |
| Dell Latitude 5310-23VP6 | |
* ... Meglio usare valori piccoli
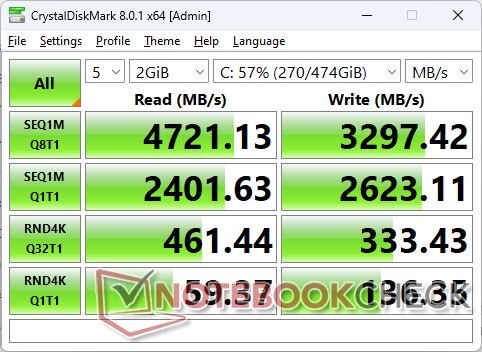
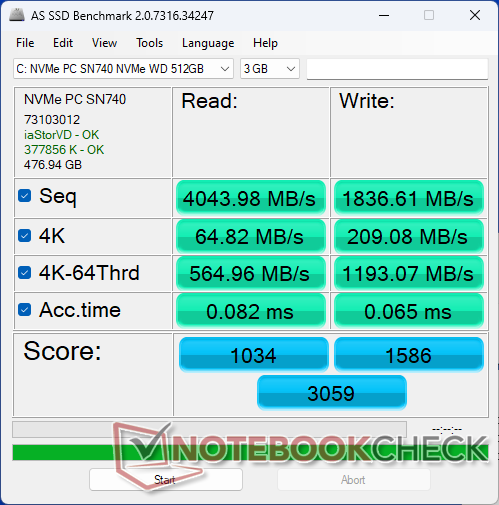
Dispositivi di archiviazione - Solo PCIe4 x4 2230
La nostra unità di prova viene fornita con un disco da 512 GB WD SN740 SSD PCIe4 x4 NVMe che offre velocità di lettura e scrittura sequenziali costanti, rispettivamente fino a 4700 MB/s e 3300 MB/s. Si tratta di un'unità di fascia media, considerando che le più recenti unità PCIe4 x4 di Samsung possono raggiungere oltre 7000 MB/s. Il sistema può supportare una sola unità interna, senza opzioni secondarie.

| Drive Performance rating - Percent | |
| MSI Summit E13 Flip Evo A11MT | |
| Dell Latitude 9330 | |
| HP EliteBook x360 1030 G7 | |
| HP Elite Dragonfly Max | |
| Lenovo ThinkPad X1 Titanium Yoga G1 20QB0016GE | |
| Dell Latitude 5310-23VP6 | |
* ... Meglio usare valori piccoli
Disk Throttling: DiskSpd Read Loop, Queue Depth 8
Prestazioni della GPU: buone ma non eccezionali
Le prestazioni grafiche sono del 15% più lente rispetto alla media dei laptop del nostro database con lo stesso sistema integrato Iris Xe 96 EUs Nonostante gli ampi 32 GB di RAM LPDDR5-5200. La serie Latitude non è progettata per il gioco e quindi questo deficit non è un grosso problema. Le prestazioni complessive sono più vicine a quelle della Iris Xe 80 EU che si trovano su molte CPU Core i5
La maggior parte dei giochi è ancora giocabile su Latitude 9330, anche se solo a basse impostazioni.

| 3DMark 11 - 1280x720 Performance GPU | |
| Asus Zenbook S 13 OLED | |
| MSI Summit E13 Flip Evo A11MT | |
| Lenovo ThinkPad X1 Nano Gen 2 Core i7-1280P | |
| Media Intel Iris Xe Graphics G7 96EUs (2867 - 7676, n=209) | |
| HP Spectre x360 13.5 14t-ef000 | |
| Lenovo ThinkBook 13s G3 20YA0005GE | |
| Lenovo Yoga 6 13ALC6 | |
| Lenovo IdeaPad Flex 5i 14IAU7 | |
| Samsung Galaxy Book2 Pro 13 NP930XED-KA1DE | |
| HP Elite Dragonfly Max | |
| Dell Latitude 9330 | |
| Lenovo ThinkPad X1 Titanium Yoga G1 20QB0016GE | |
| HP EliteBook x360 1030 G7 | |
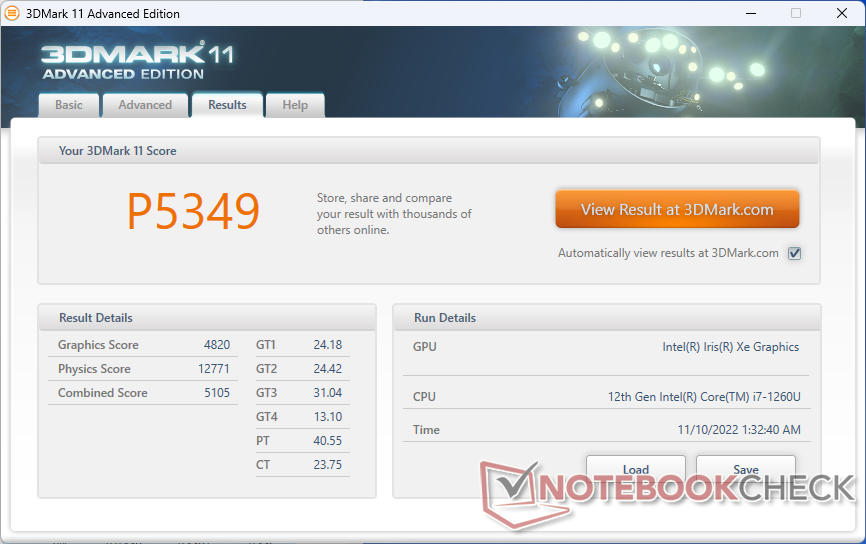
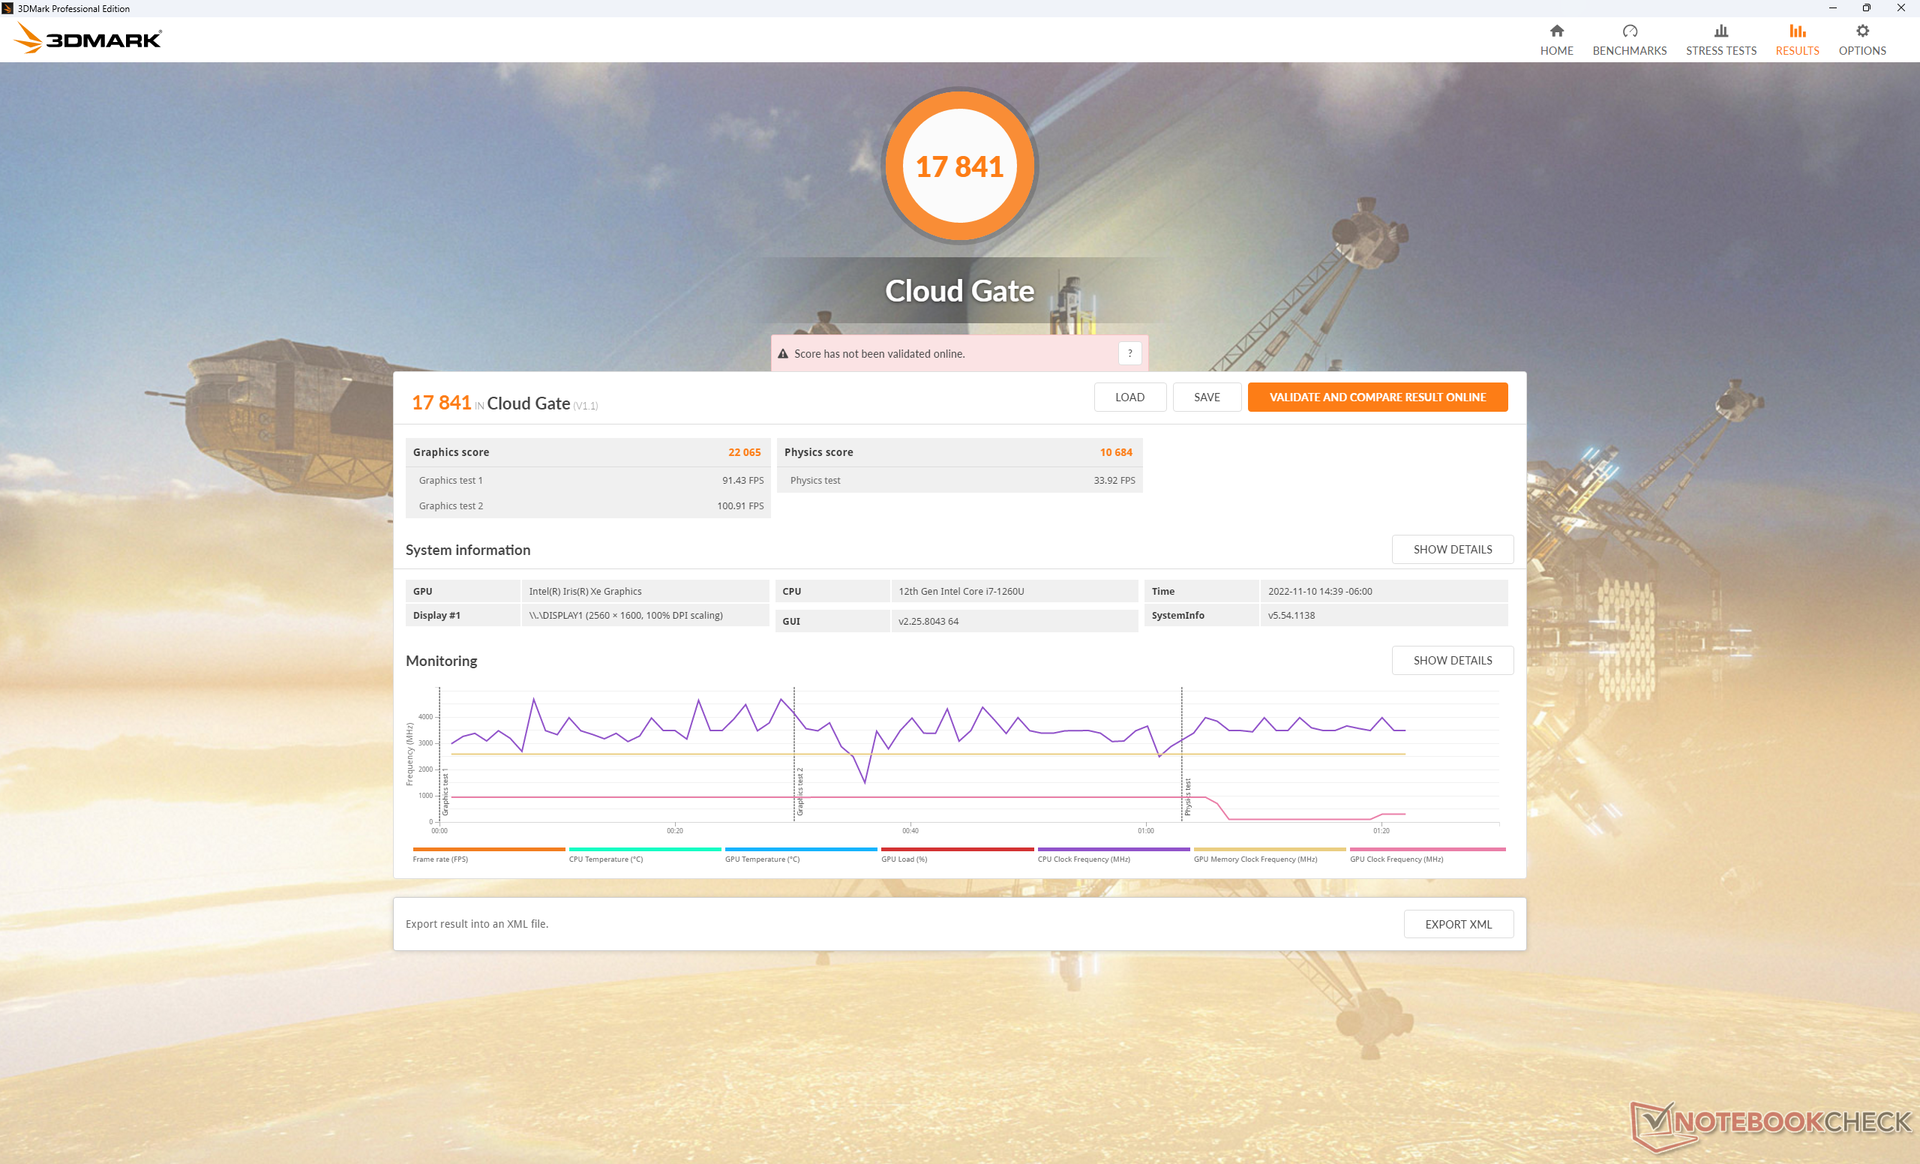
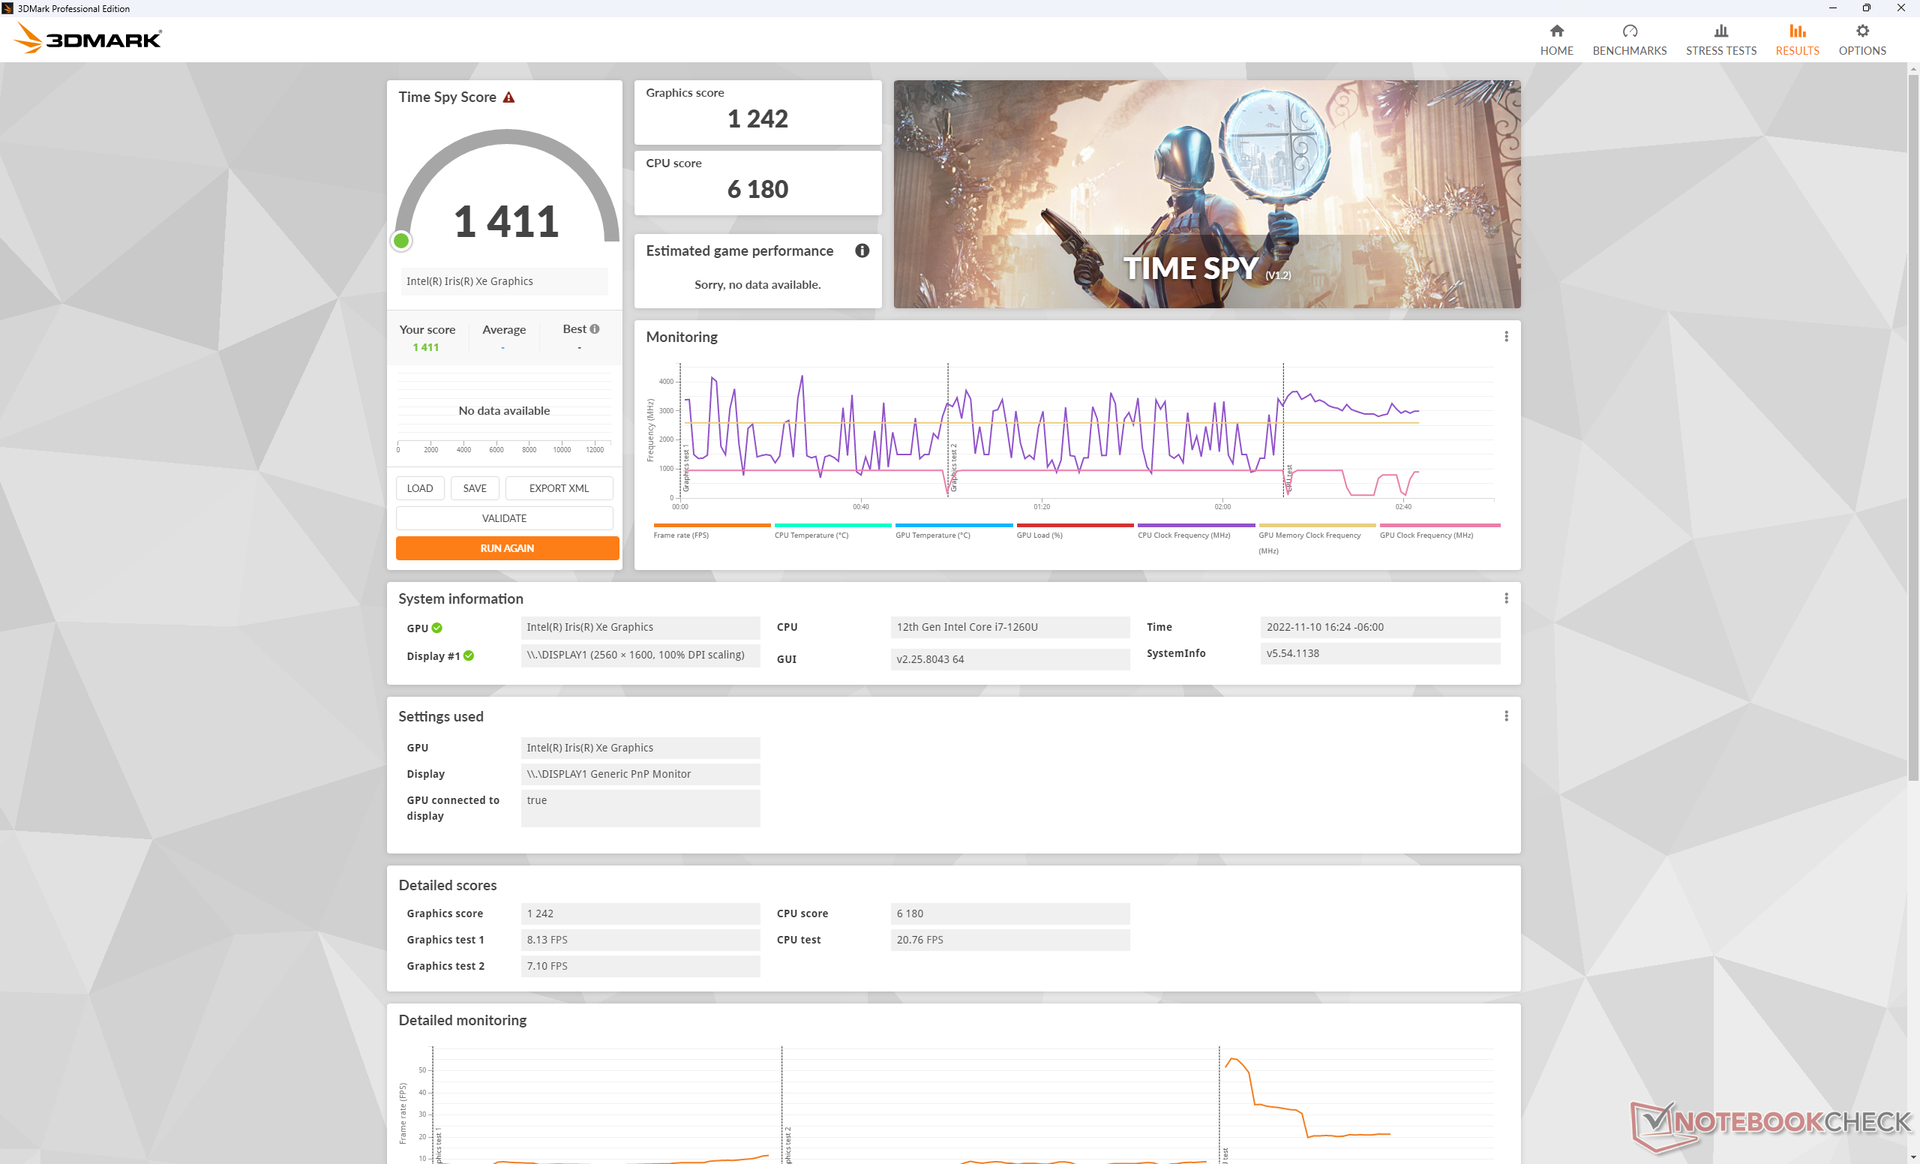
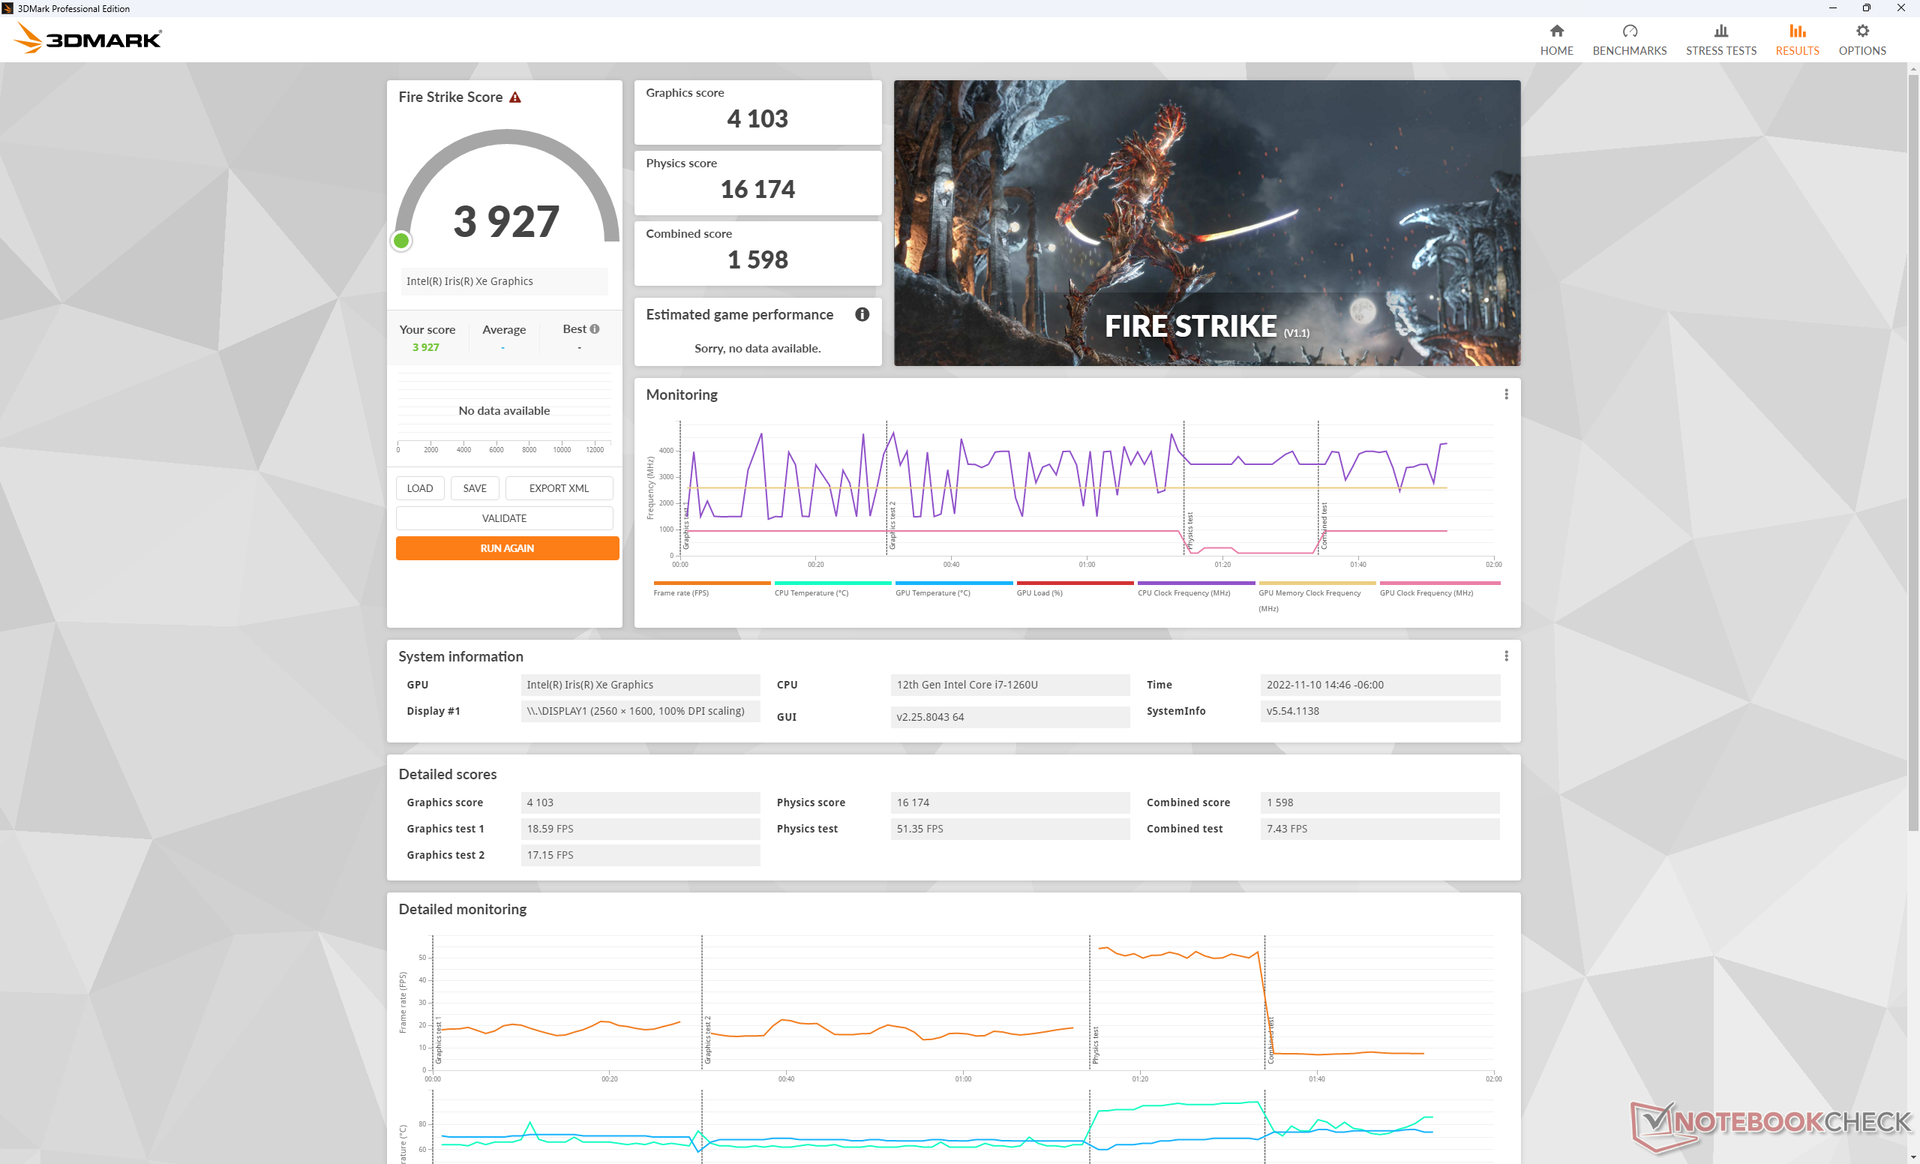
| 3DMark 11 Performance | 5349 punti | |
| 3DMark Cloud Gate Standard Score | 17841 punti | |
| 3DMark Fire Strike Score | 3927 punti | |
| 3DMark Time Spy Score | 1411 punti | |
Aiuto | ||
| Blender - v3.3 Classroom CPU | |
| Dell Latitude 9330 | |
| Media Intel Iris Xe Graphics G7 96EUs (336 - 1259, n=109) | |
* ... Meglio usare valori piccoli
| Performance rating - Percent | |
| MSI Summit E13 Flip Evo A11MT | |
| Dell Latitude 9330 | |
| HP Elite Dragonfly Max -1! | |
| Lenovo ThinkPad X1 Titanium Yoga G1 20QB0016GE -3! | |
| HP EliteBook x360 1030 G7 -3! | |
| Dell Latitude 5310-23VP6 -4! | |
| The Witcher 3 - 1920x1080 Ultra Graphics & Postprocessing (HBAO+) | |
| MSI Summit E13 Flip Evo A11MT | |
| HP Elite Dragonfly Max | |
| Dell Latitude 9330 | |
| Lenovo ThinkPad X1 Titanium Yoga G1 20QB0016GE | |
| GTA V - 1920x1080 Highest AA:4xMSAA + FX AF:16x | |
| MSI Summit E13 Flip Evo A11MT | |
| Dell Latitude 9330 | |
| Final Fantasy XV Benchmark - 1920x1080 High Quality | |
| MSI Summit E13 Flip Evo A11MT | |
| Dell Latitude 9330 | |
| HP Elite Dragonfly Max | |
| HP EliteBook x360 1030 G7 | |
| Strange Brigade - 1920x1080 ultra AA:ultra AF:16 | |
| MSI Summit E13 Flip Evo A11MT | |
| Dell Latitude 9330 | |
| HP Elite Dragonfly Max | |
| Dota 2 Reborn - 1920x1080 ultra (3/3) best looking | |
| Dell Latitude 9330 | |
| MSI Summit E13 Flip Evo A11MT | |
| Lenovo ThinkPad X1 Titanium Yoga G1 20QB0016GE | |
| HP Elite Dragonfly Max | |
| HP EliteBook x360 1030 G7 | |
| Dell Latitude 5310-23VP6 | |
| X-Plane 11.11 - 1920x1080 high (fps_test=3) | |
| MSI Summit E13 Flip Evo A11MT | |
| Dell Latitude 9330 | |
| HP Elite Dragonfly Max | |
| Lenovo ThinkPad X1 Titanium Yoga G1 20QB0016GE | |
| HP EliteBook x360 1030 G7 | |
| Dell Latitude 5310-23VP6 | |
Witcher 3 FPS Chart
| basso | medio | alto | ultra | |
|---|---|---|---|---|
| GTA V (2015) | 102.1 | 91.1 | 21.7 | 8.94 |
| The Witcher 3 (2015) | 75.8 | 47.2 | 25.9 | 11.4 |
| Dota 2 Reborn (2015) | 100.3 | 80.1 | 58.6 | 53.4 |
| Final Fantasy XV Benchmark (2018) | 37.3 | 21 | 14.6 | |
| X-Plane 11.11 (2018) | 37.1 | 34.4 | 30.8 | |
| Strange Brigade (2018) | 69.1 | 32.4 | 25 | 20.4 |
| Cyberpunk 2077 1.6 (2022) | 17.5 | 14.5 | 11.2 | 8.9 |
Emissioni
Rumore del sistema - Ventilatori ad alta frequenza
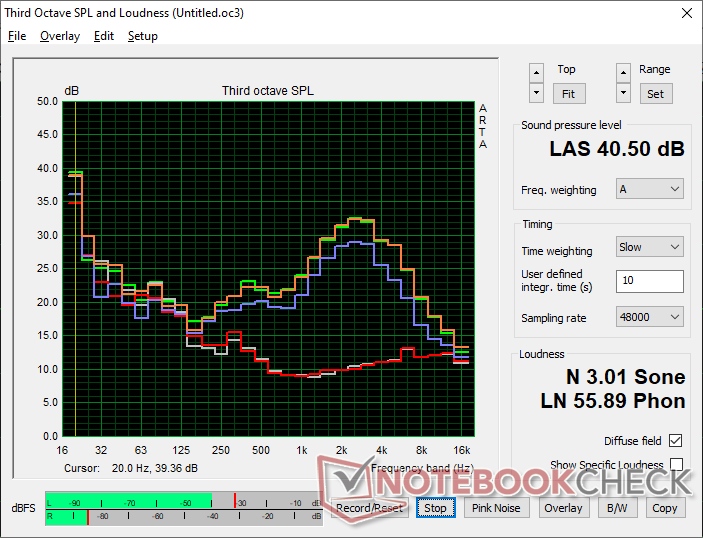
Le due ventole interne sono piuttosto piccole, con un diametro di soli 30 mm ciascuna, rispetto ai 40 mm o più della maggior parte dei portatili. Lo svantaggio principale delle ventole più piccole è che in genere hanno un tono più alto rispetto a quelle più grandi e quindi sono più evidenti quando sono attive. Le misurazioni del nostro microfono qui sotto confermano il rumore più acuto, con un picco relativamente netto di circa 3k Hz rispetto ai picchi più ampi di altri subnotebook da 13 pollici come l'XPS 13 Plus 9320 XPS 13 Plus 9320. In altre parole, è più probabile che le ventole di Latitude 9330 siano fonte di distrazione durante la navigazione in rete o lo streaming di video.
Durante l'esecuzione di 3DMark 06, il rumore della ventola aumentava bruscamente da silenzioso a 37 dB(A) circa a metà della prima scena del benchmark. Il Dell è molto più rumoroso di quello che abbiamo registrato con l'HP Dragonfly Max.HP Dragonfly Max mentre è alla pari con il Summit E13 Flip. Si consiglia di utilizzare il sistema in modalità silenziosa o bilanciata per ridurre al minimo le pulsazioni della ventola.
Rumorosità
| Idle |
| 23 / 23.1 / 23.1 dB(A) |
| Sotto carico |
| 37.1 / 40.5 dB(A) |
 | ||
30 dB silenzioso 40 dB(A) udibile 50 dB(A) rumoroso |
||
min: | ||
| Dell Latitude 9330 Iris Xe G7 96EUs, i7-1260U | Lenovo ThinkPad X1 Titanium Yoga G1 20QB0016GE Iris Xe G7 80EUs, i5-1140G7, Lenovo UMIS RPJTJ256MEE1OWX | MSI Summit E13 Flip Evo A11MT Iris Xe G7 96EUs, i7-1185G7, Phison 1TB SM2801T24GKBB4S-E162 | HP EliteBook x360 1030 G7 UHD Graphics 620, i7-10810U, Samsung SSD PM981a MZVLB512HBJQ | HP Elite Dragonfly Max Iris Xe G7 96EUs, i7-1185G7, Toshiba XG6 KXG60ZNV512G | Dell Latitude 5310-23VP6 UHD Graphics 620, i5-10310U, SK hynix BC511 HFM512GDHTNI-87A0B | |
|---|---|---|---|---|---|---|
| Noise | -9% | -8% | -13% | 5% | 1% | |
| off /ambiente * (dB) | 23 | 25.61 -11% | 24.5 -7% | 28.1 -22% | 24.9 -8% | 24.9 -8% |
| Idle Minimum * (dB) | 23 | 25.61 -11% | 24.7 -7% | 28.1 -22% | 24.9 -8% | 24.9 -8% |
| Idle Average * (dB) | 23.1 | 25.61 -11% | 24.7 -7% | 28.1 -22% | 24.9 -8% | 24.9 -8% |
| Idle Maximum * (dB) | 23.1 | 25.61 -11% | 26.4 -14% | 28.1 -22% | 24.9 -8% | 24.9 -8% |
| Load Average * (dB) | 37.1 | 40.14 -8% | 37.8 -2% | 35.1 5% | 29.7 20% | 30 19% |
| Witcher 3 ultra * (dB) | 40.6 | 41.4 -2% | 31.3 23% | 36 11% | ||
| Load Maximum * (dB) | 40.5 | 40.14 1% | 48.8 -20% | 37.6 7% | 31.3 23% | 36.3 10% |
* ... Meglio usare valori piccoli
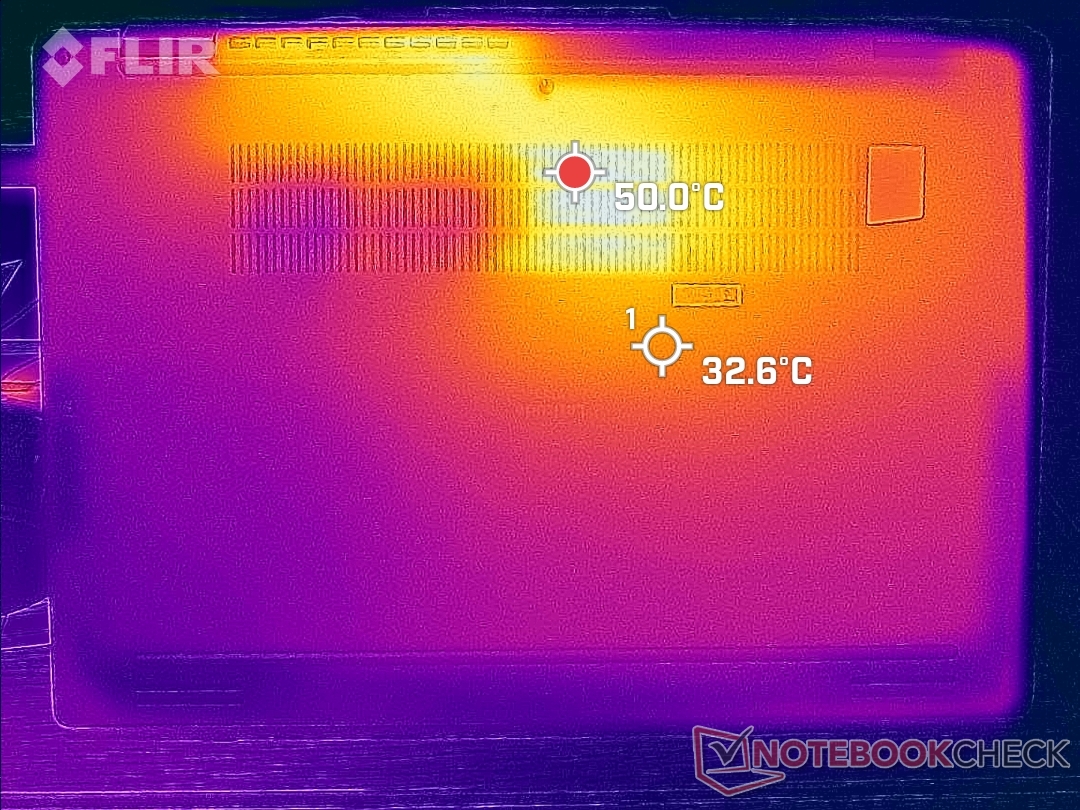
Temperatura
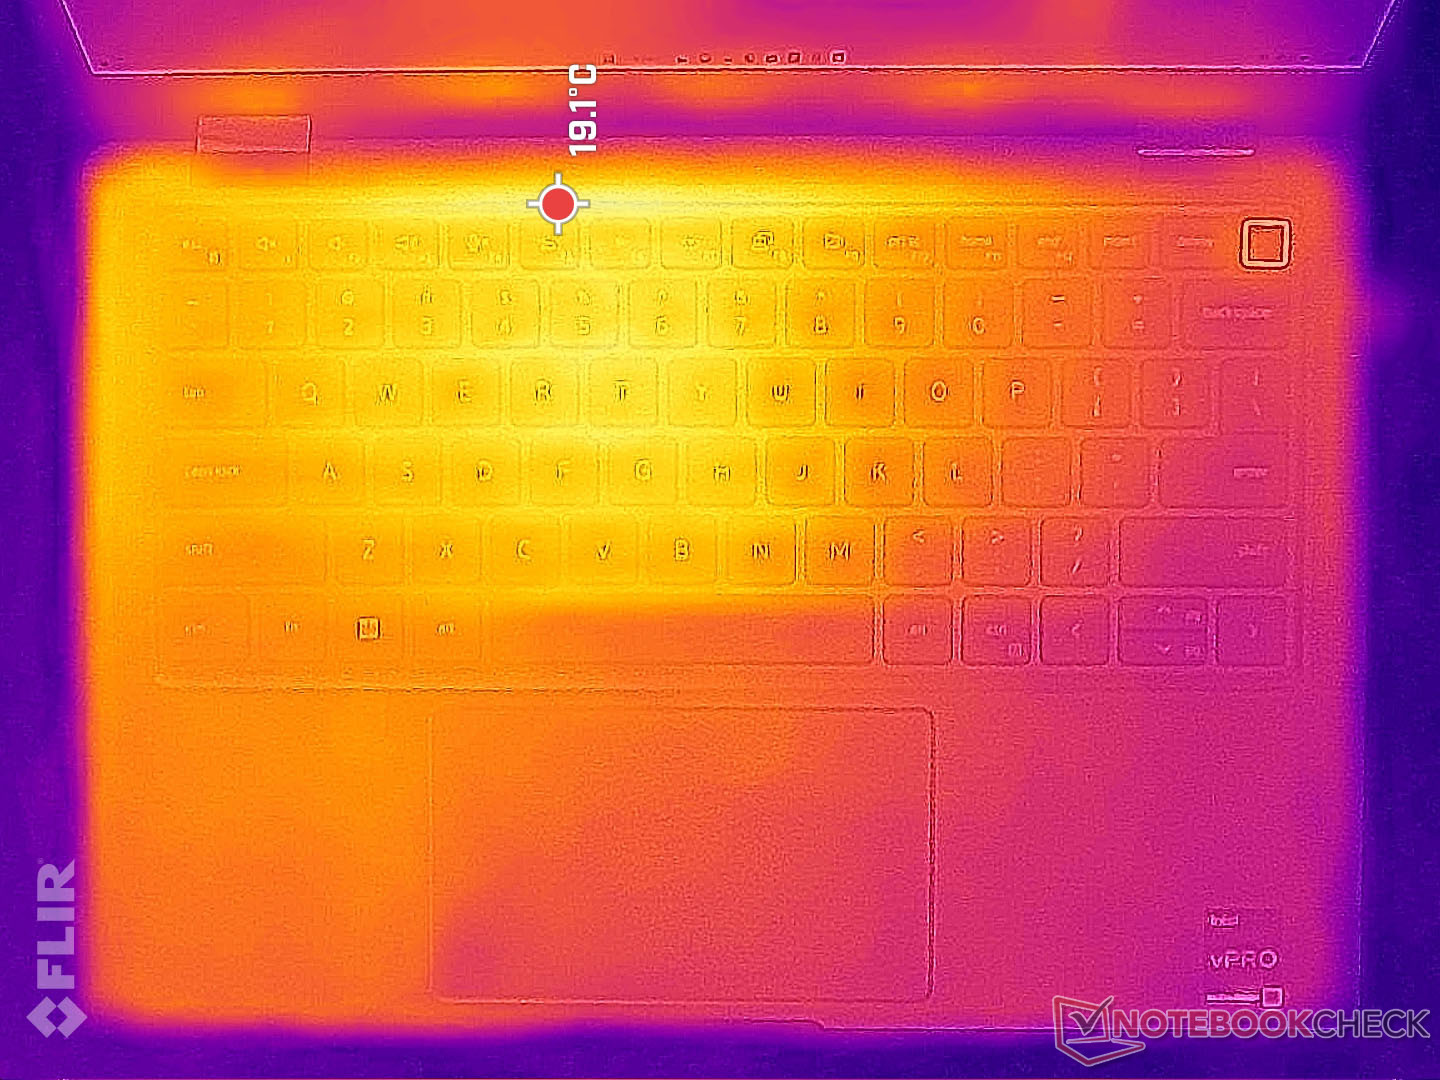
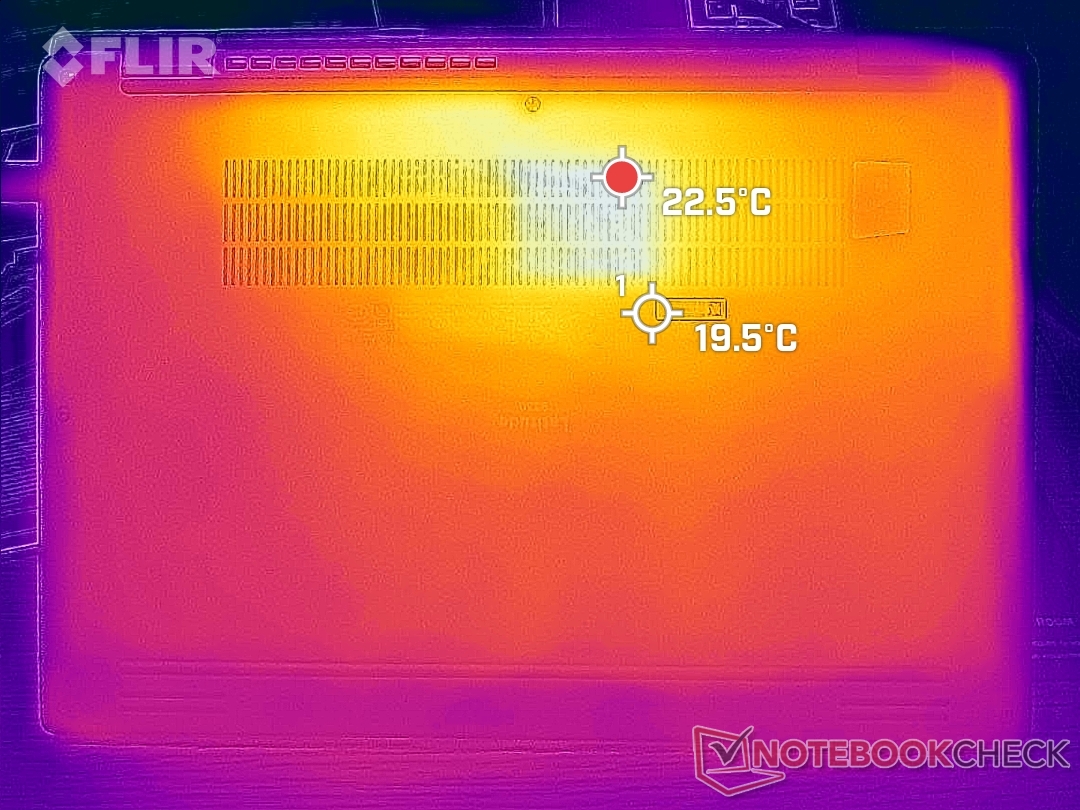
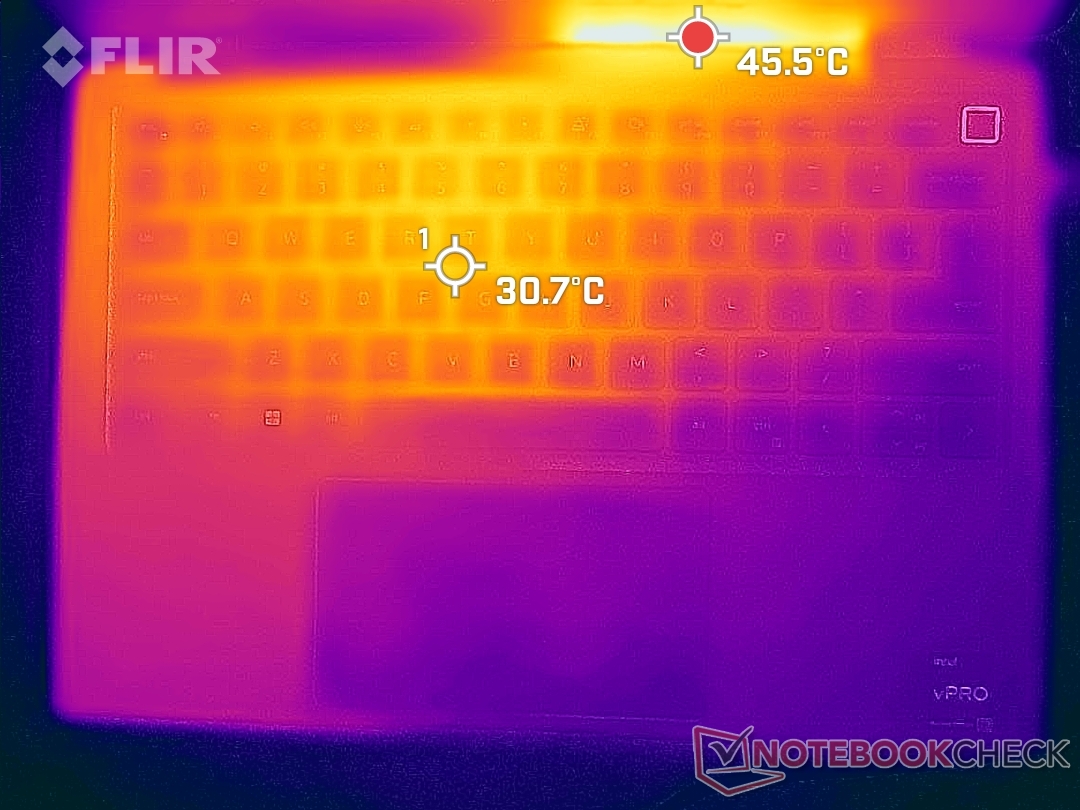
Le temperature superficiali sono molto basse durante i bassi carichi, poiché la maggior parte dello chassis è in metallo. Se sottoposto a carichi più elevati, tuttavia, i punti caldi possono raggiungere i 41 C e i 50 C rispettivamente sulla parte superiore e inferiore. I punti caldi sono verso la parte posteriore dello chassis e quindi la tastiera e i poggiapolsi rimangono più freschi per una digitazione confortevole. Il concorrente Dragonfly Max raggiunge valori massimi simili, mentre il Summit E13 Flip può diventare ancora più caldo, fino a 57°C.
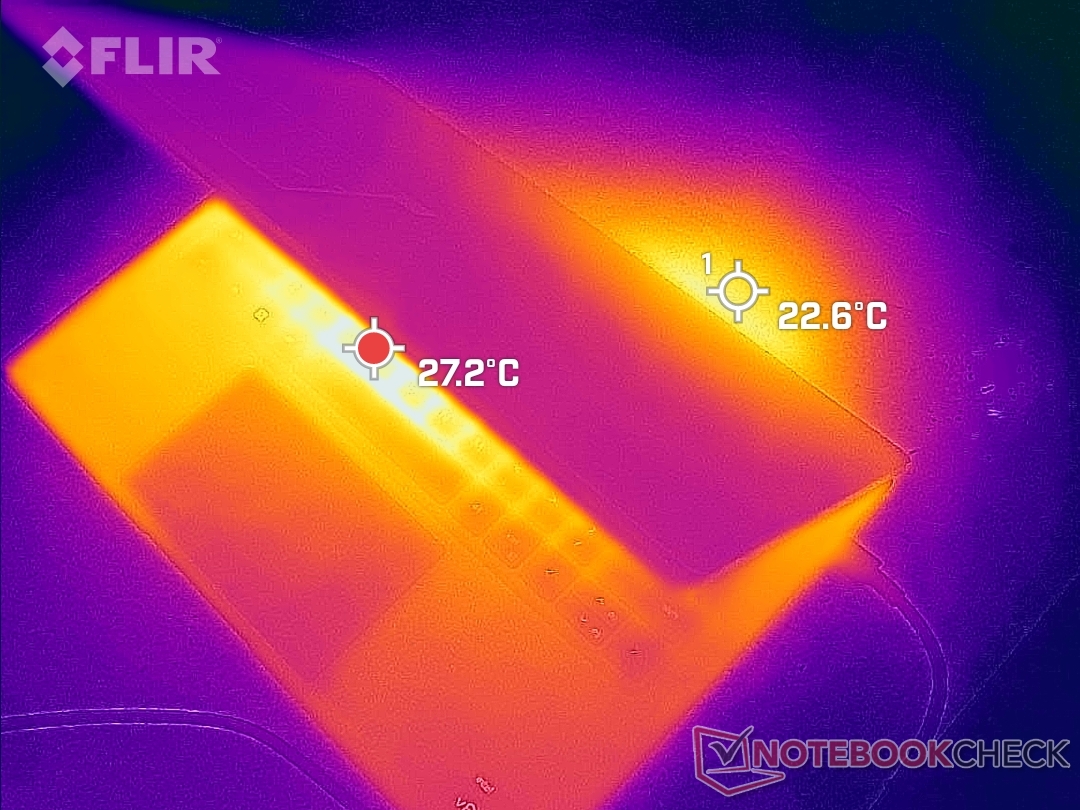
(±) La temperatura massima sul lato superiore è di 40.6 °C / 105 F, rispetto alla media di 35.4 °C / 96 F, che varia da 19.6 a 60 °C per questa classe Convertible.
(-) Il lato inferiore si riscalda fino ad un massimo di 50.2 °C / 122 F, rispetto alla media di 36.9 °C / 98 F
(+) In idle, la temperatura media del lato superiore è di 23.5 °C / 74 F, rispetto alla media deld ispositivo di 30.3 °C / 87 F.
(+) I poggiapolsi e il touchpad sono piu' freddi della temperatura della pelle con un massimo di 28 °C / 82.4 F e sono quindi freddi al tatto.
(±) La temperatura media della zona del palmo della mano di dispositivi simili e'stata di 28 °C / 82.4 F (0 °C / 0 F).
| Dell Latitude 9330 Intel Core i7-1260U, Intel Iris Xe Graphics G7 96EUs | Lenovo ThinkPad X1 Titanium Yoga G1 20QB0016GE Intel Core i5-1140G7, Intel Iris Xe Graphics G7 80EUs | MSI Summit E13 Flip Evo A11MT Intel Core i7-1185G7, Intel Iris Xe Graphics G7 96EUs | HP EliteBook x360 1030 G7 Intel Core i7-10810U, Intel UHD Graphics 620 | HP Elite Dragonfly Max Intel Core i7-1185G7, Intel Iris Xe Graphics G7 96EUs | Dell Latitude 5310-23VP6 Intel Core i5-10310U, Intel UHD Graphics 620 | |
|---|---|---|---|---|---|---|
| Heat | -3% | -22% | -2% | -11% | 6% | |
| Maximum Upper Side * (°C) | 40.6 | 46.3 -14% | 52 -28% | 37 9% | 39.4 3% | 39 4% |
| Maximum Bottom * (°C) | 50.2 | 43.3 14% | 57.4 -14% | 47.2 6% | 50 -0% | 44.8 11% |
| Idle Upper Side * (°C) | 25 | 26.8 -7% | 30.4 -22% | 25.8 -3% | 31.6 -26% | 24.3 3% |
| Idle Bottom * (°C) | 27.6 | 28.3 -3% | 34.2 -24% | 32.6 -18% | 33.4 -21% | 25.6 7% |
* ... Meglio usare valori piccoli
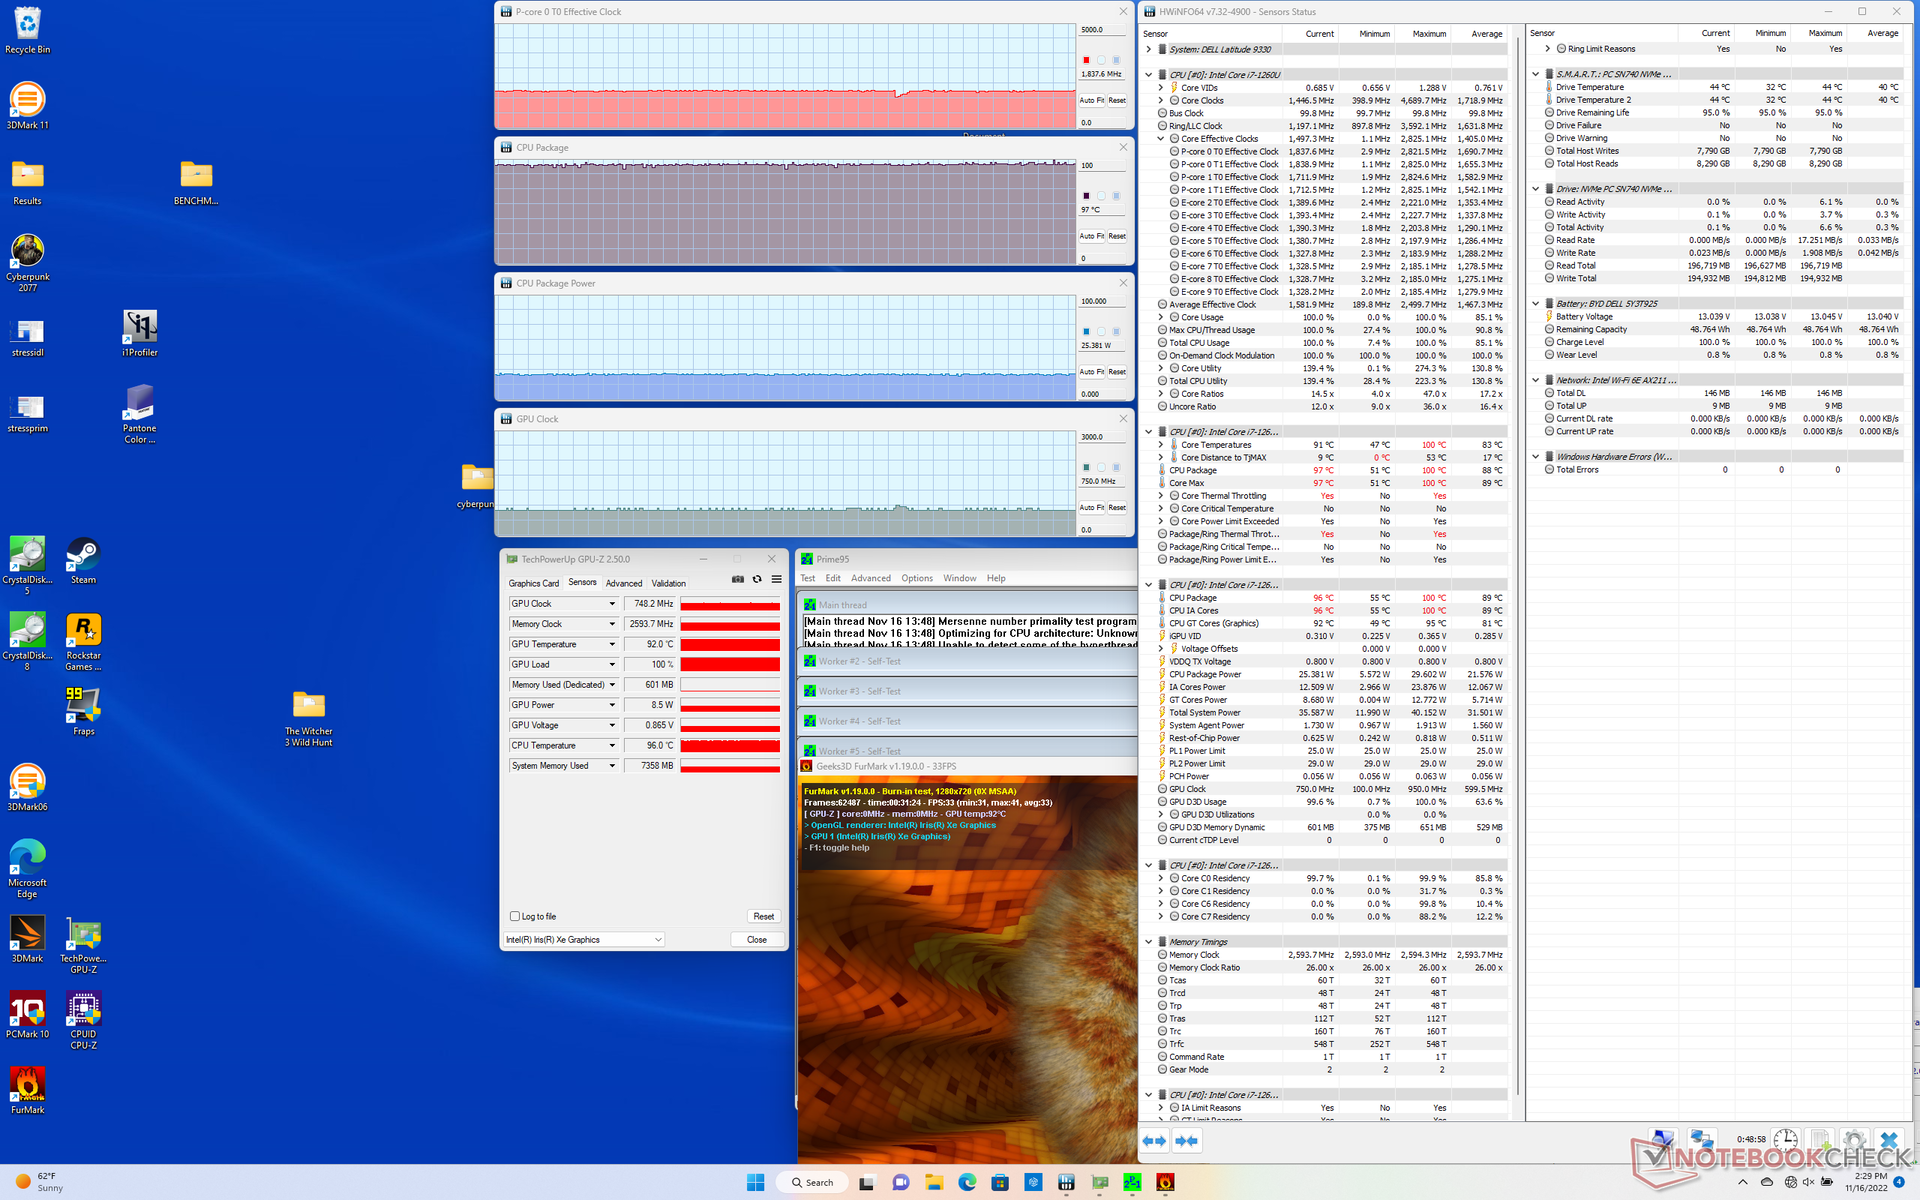
Stress test
La temperatura della CPU raggiunge regolarmente i 90 C o più quando si eseguono carichi impegnativi. Quando si esegue Prime95, ad esempio, la CPU sale quasi istantaneamente a 99 C, 2,8 GHz e 29 W, prima di scendere rapidamente e stabilizzarsi a 2,4 GHz e 25 W per mantenere una temperatura del nucleo di ~98 C. Eseguendo lo stesso test sul Dragonfly Max con il Core i7-1185G7 si otterrebbe una frequenza di clock molto più lenta e una temperatura del nucleo più fredda, rispettivamente di soli 1,5 GHz e 71 C. Dell non ha paura di far funzionare il processore a temperature più elevate rispetto alla maggior parte degli altri modelli per offrire prestazioni più veloci.
La frequenza di clock e la temperatura della GPU, quando Witcher 3 per rappresentare un carico grafico impegnativo si stabilizzerebbero rispettivamente a 948 MHz e 91 C, rispetto ai soli 700 MHz e 61 C del già citato HP.
Il funzionamento a batteria limita le prestazioni. Un test 3DMark 11 a batteria restituirebbe punteggi di Fisica e Grafica rispettivamente di 7531 e 4193 punti, rispetto a 12771 e 4820 punti con alimentazione a rete.
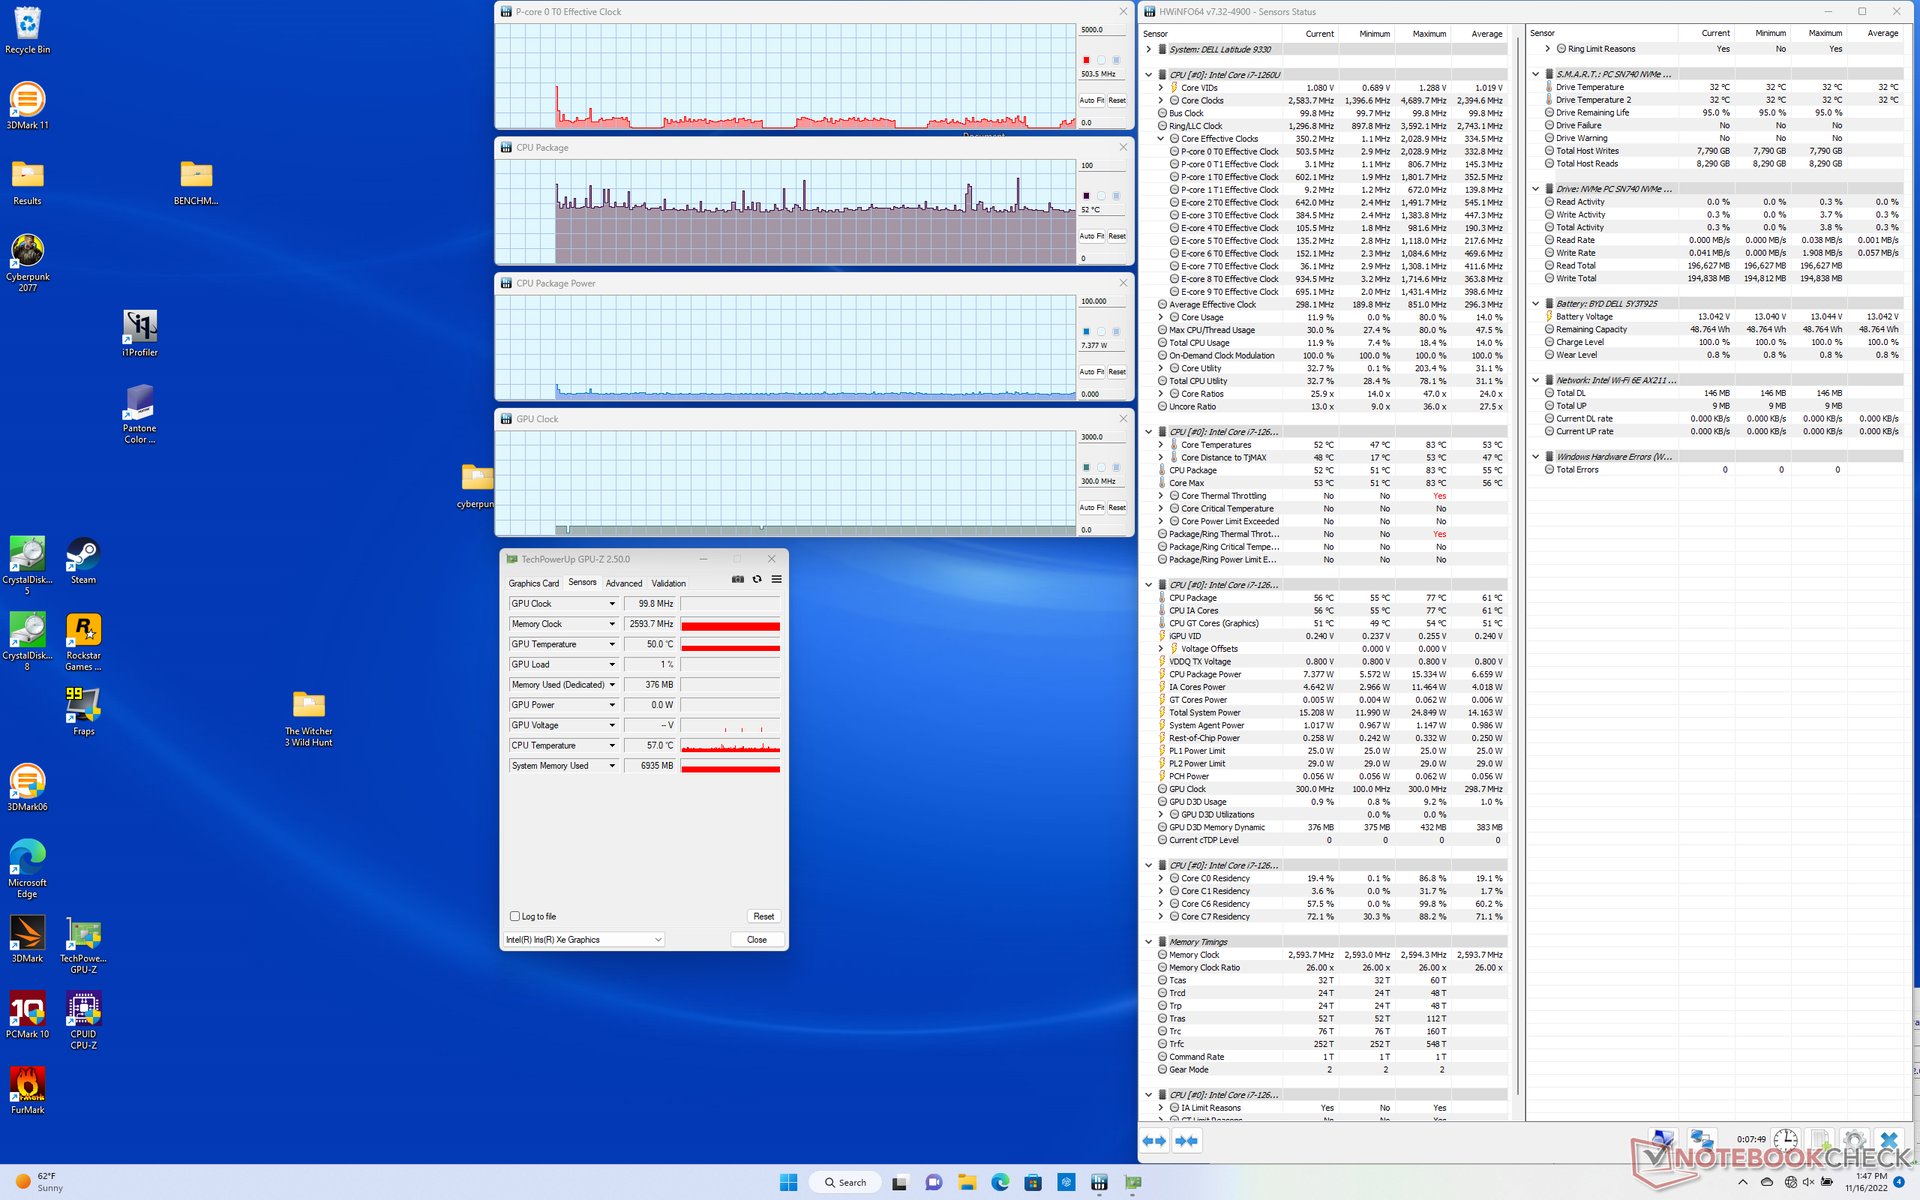
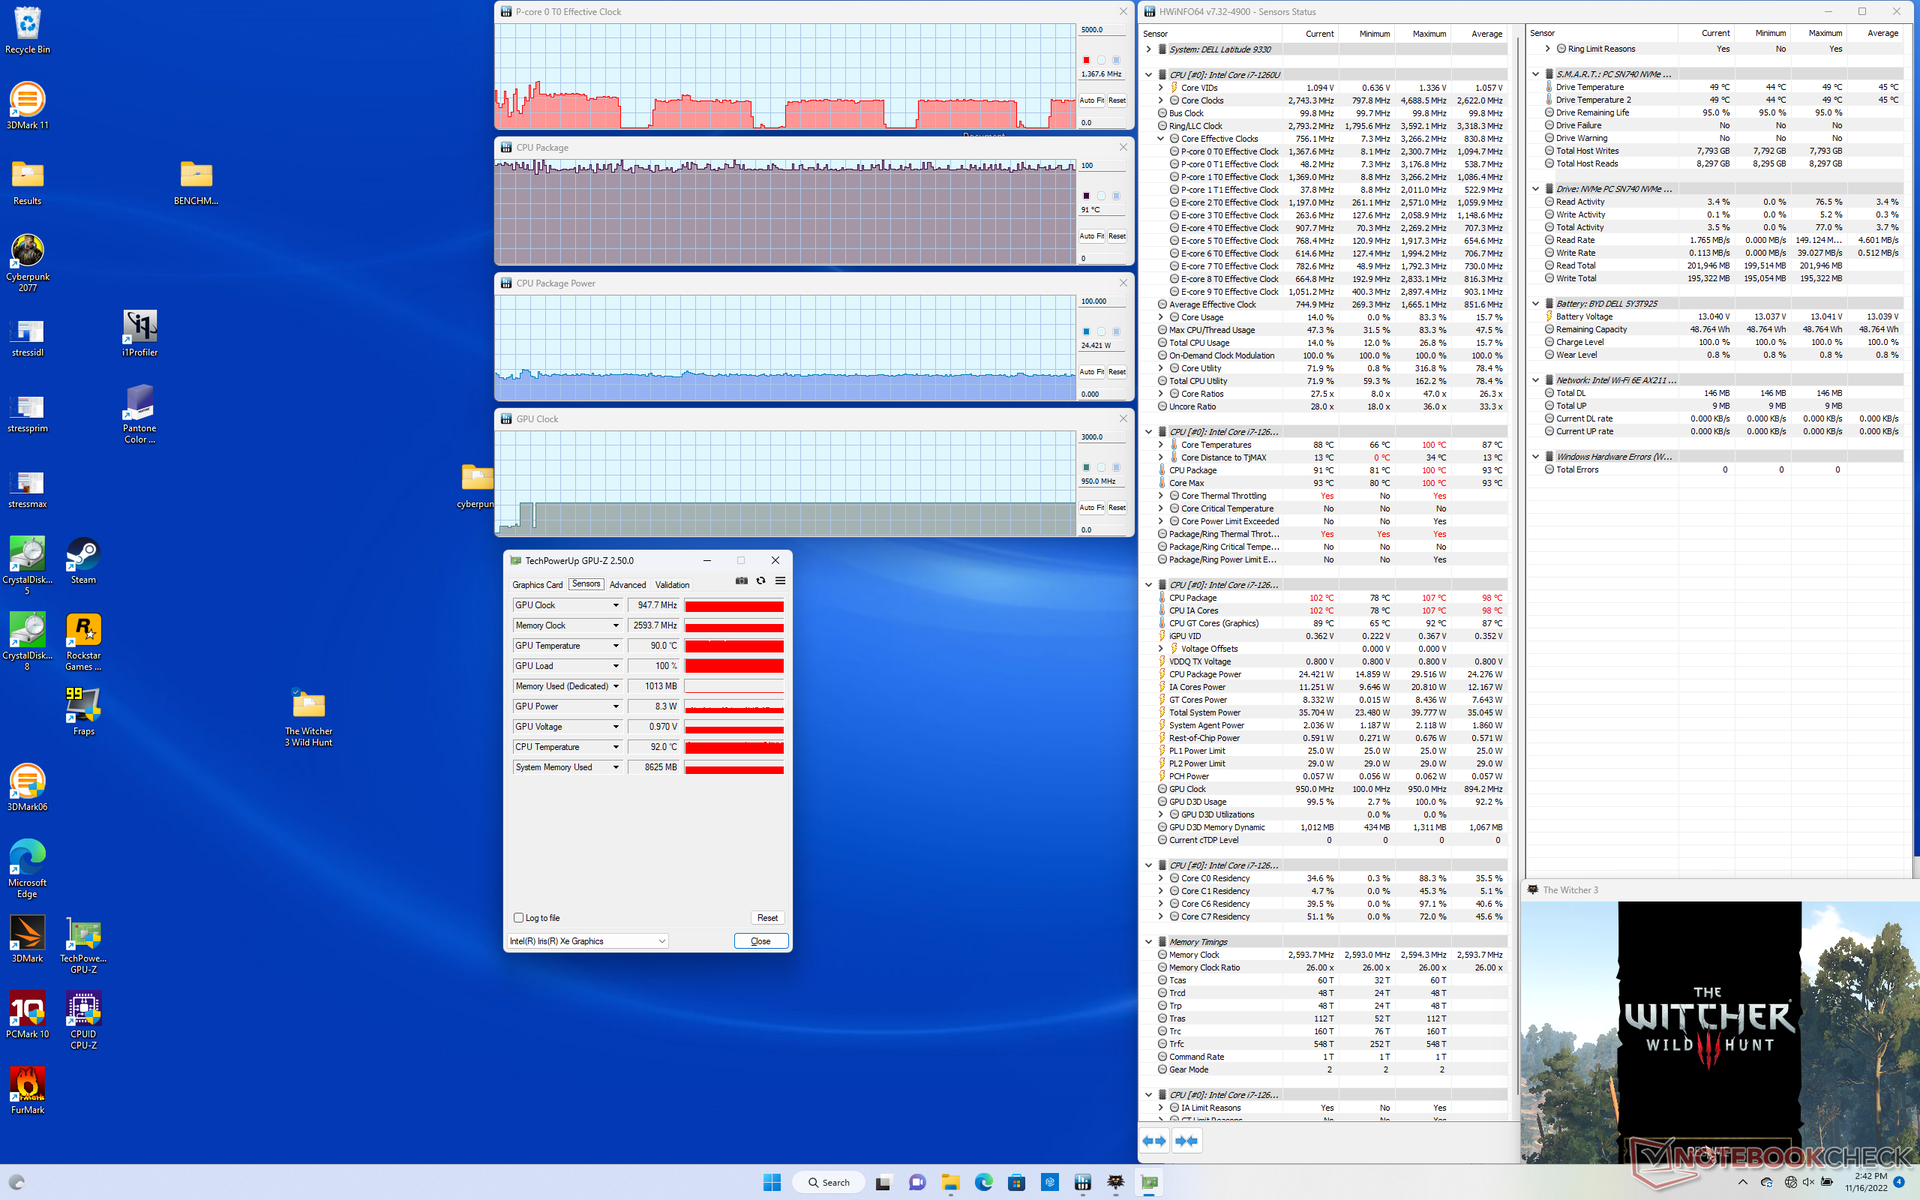
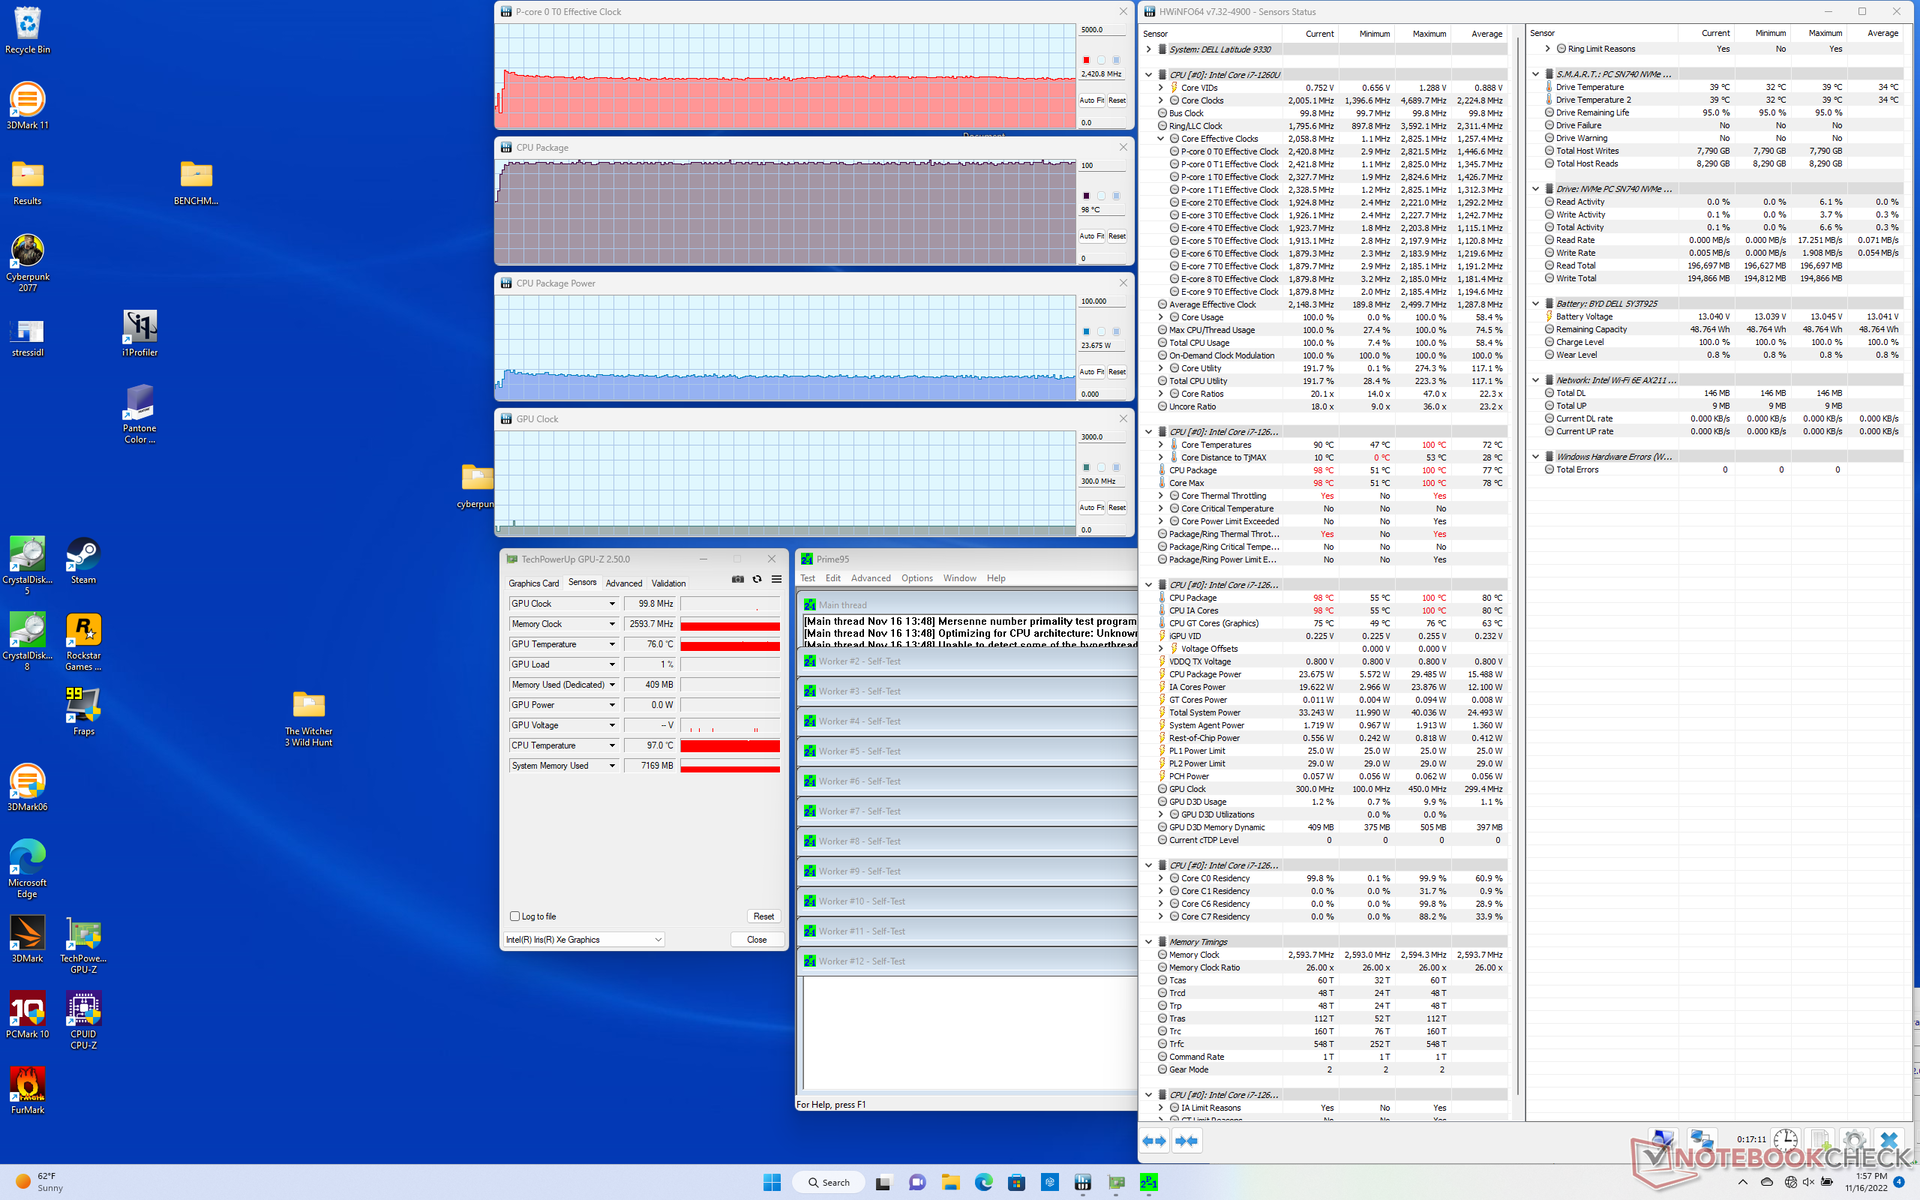
| Clock della CPU (GHz) | Clock della GPU (MHz) | Temperatura media della CPU (°C) | |
| Sistema inattivo | -- | -- | 52 |
| Stress Prime95 | 2,4 | -- | 98 |
| Prime95 + FurMark Stress | 1,8 | 748 | 97 |
| Witcher 3 Stress | 1,4 | 948 | 91 |
Altoparlanti
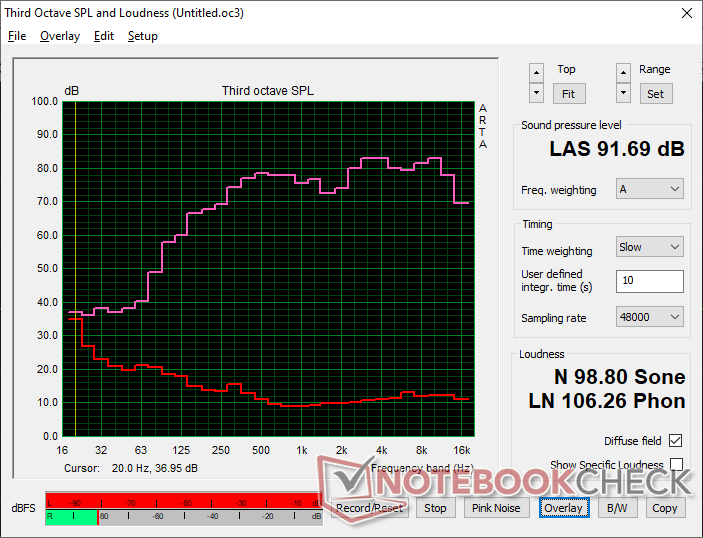
Dell è riuscita a inserire quattro altoparlanti singoli con un'eccellente riproduzione audio nonostante il piccolo formato. Il volume massimo è alto e chiaro, senza alcuna statica percepibile. È evidente che gli altoparlanti interni sono stati ottimizzati per conferenze audio o video.
Dell Latitude 9330 analisi audio
(+) | gli altoparlanti sono relativamente potenti (91.7 dB)
Bassi 100 - 315 Hz
(±) | bassi ridotti - in media 11.9% inferiori alla media
(+) | bassi in lineaa (6.3% delta rispetto alla precedente frequenza)
Medi 400 - 2000 Hz
(+) | medi bilanciati - solo only 1.9% rispetto alla media
(+) | medi lineari (2.7% delta rispetto alla precedente frequenza)
Alti 2 - 16 kHz
(+) | Alti bilanciati - appena 3.4% dalla media
(+) | alti lineari (3.5% delta rispetto alla precedente frequenza)
Nel complesso 100 - 16.000 Hz
(+) | suono nel complesso lineare (9.2% differenza dalla media)
Rispetto alla stessa classe
» 4% di tutti i dispositivi testati in questa classe è stato migliore, 1% simile, 95% peggiore
» Il migliore ha avuto un delta di 6%, medio di 20%, peggiore di 57%
Rispetto a tutti i dispositivi testati
» 3% di tutti i dispositivi testati in questa classe è stato migliore, 1% similare, 96% peggiore
» Il migliore ha avuto un delta di 4%, medio di 24%, peggiore di 134%
Apple MacBook Pro 16 2021 M1 Pro analisi audio
(+) | gli altoparlanti sono relativamente potenti (84.7 dB)
Bassi 100 - 315 Hz
(+) | bassi buoni - solo 3.8% dalla media
(+) | bassi in lineaa (5.2% delta rispetto alla precedente frequenza)
Medi 400 - 2000 Hz
(+) | medi bilanciati - solo only 1.3% rispetto alla media
(+) | medi lineari (2.1% delta rispetto alla precedente frequenza)
Alti 2 - 16 kHz
(+) | Alti bilanciati - appena 1.9% dalla media
(+) | alti lineari (2.7% delta rispetto alla precedente frequenza)
Nel complesso 100 - 16.000 Hz
(+) | suono nel complesso lineare (4.6% differenza dalla media)
Rispetto alla stessa classe
» 0% di tutti i dispositivi testati in questa classe è stato migliore, 0% simile, 100% peggiore
» Il migliore ha avuto un delta di 5%, medio di 17%, peggiore di 45%
Rispetto a tutti i dispositivi testati
» 0% di tutti i dispositivi testati in questa classe è stato migliore, 0% similare, 100% peggiore
» Il migliore ha avuto un delta di 4%, medio di 24%, peggiore di 134%
Gestione dell'energia
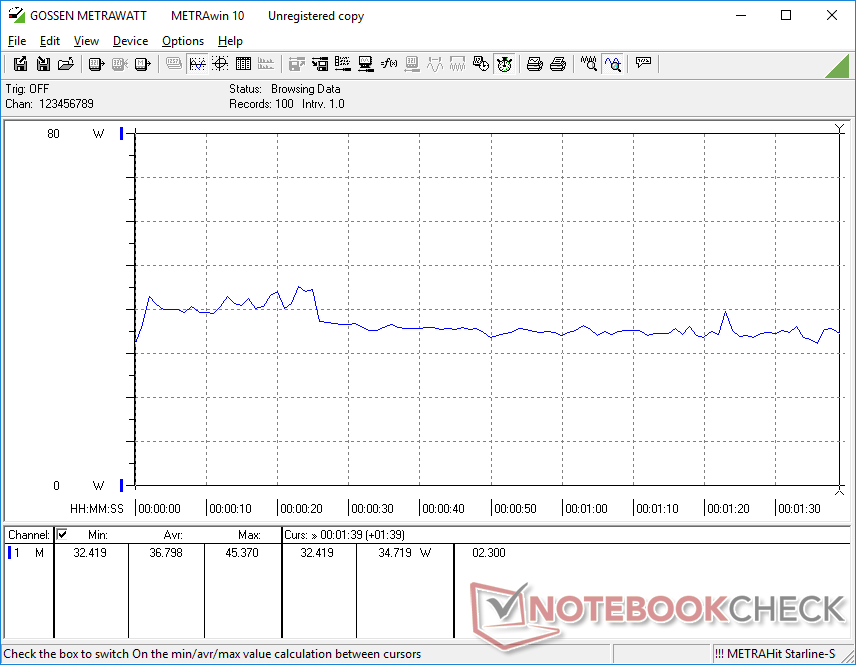
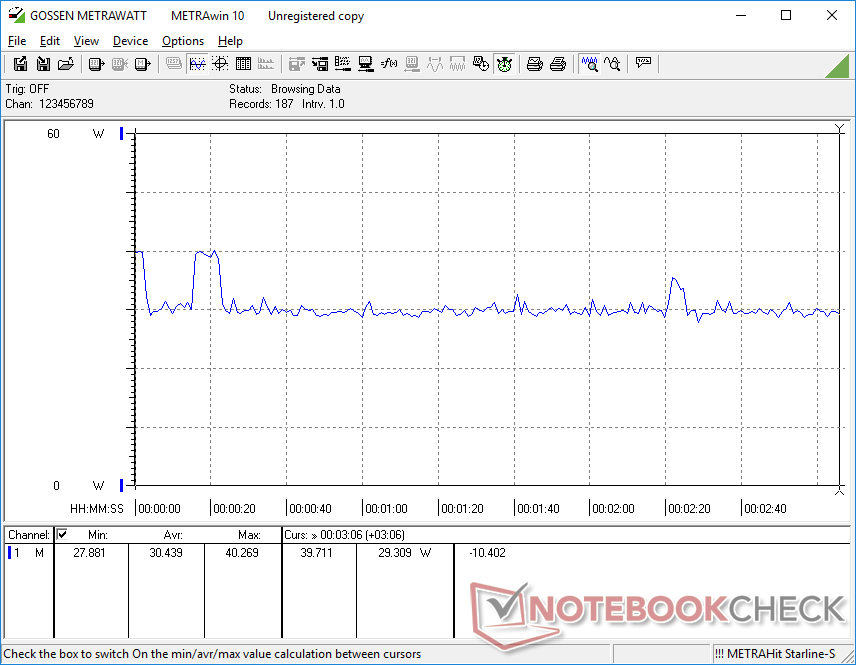
Consumo di energia - Prestazioni elevate per Watt
Il sistema è molto efficiente dal punto di vista energetico, come ci si aspetterebbe da un computer portatile con CPU Core serie U. Il dato più significativo è che il nostro Latitude 9330 consuma circa il 23% in meno di energia rispetto al più vecchioLatitude 5310 quando si eseguono applicazioni ad alta intensità di GPU, pur offrendo prestazioni grafiche da 2 a 3 volte superiori. Gli utenti che passano da CPU Intel di 10a generazione o più vecchie vedranno un significativo guadagno in termini di prestazioni per watt.
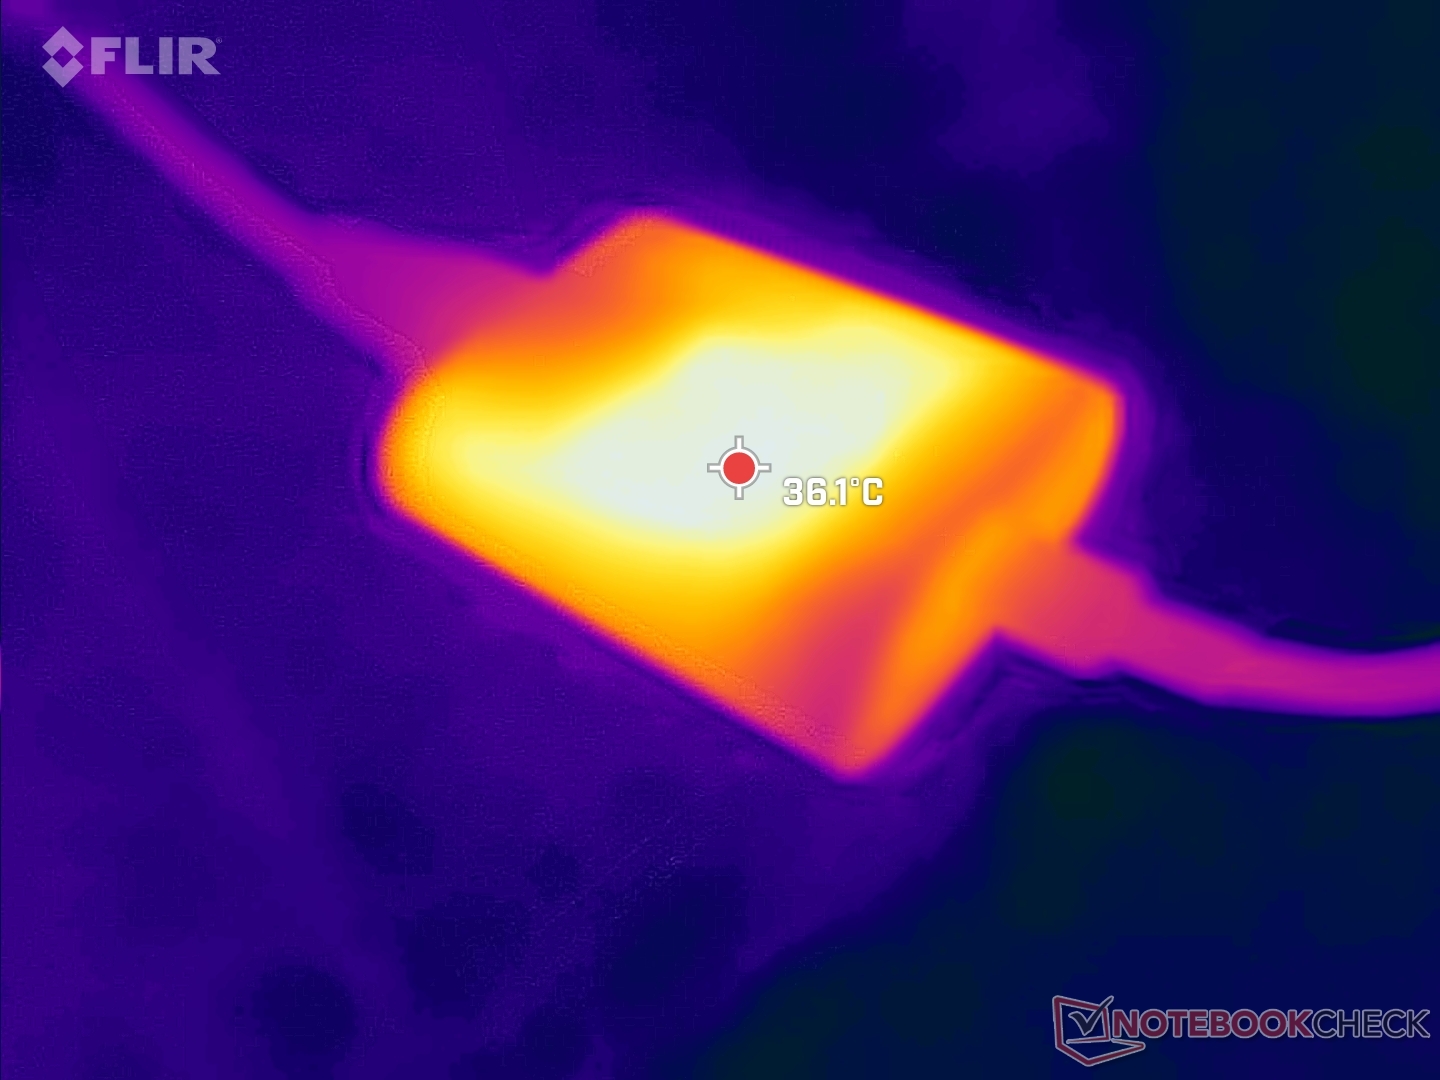
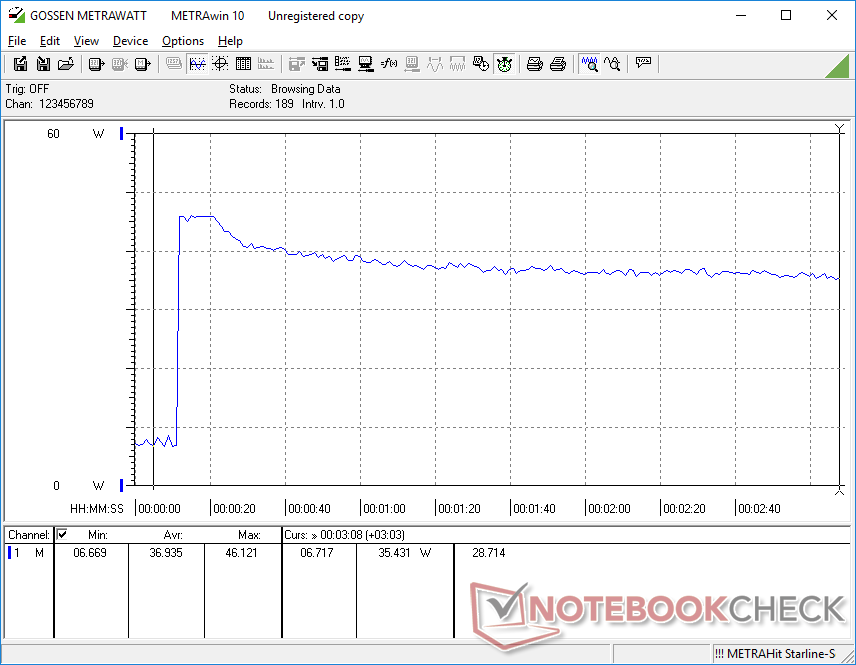
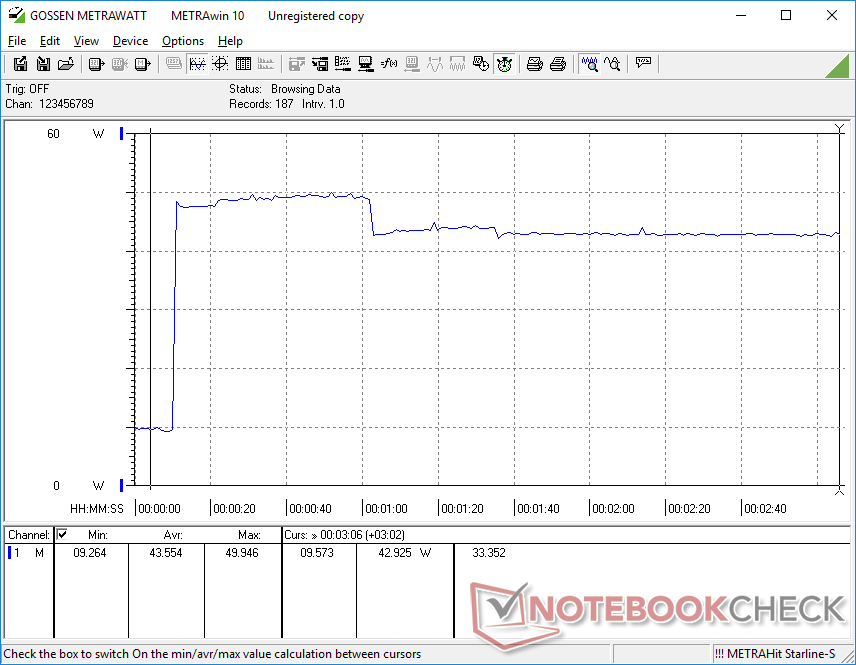
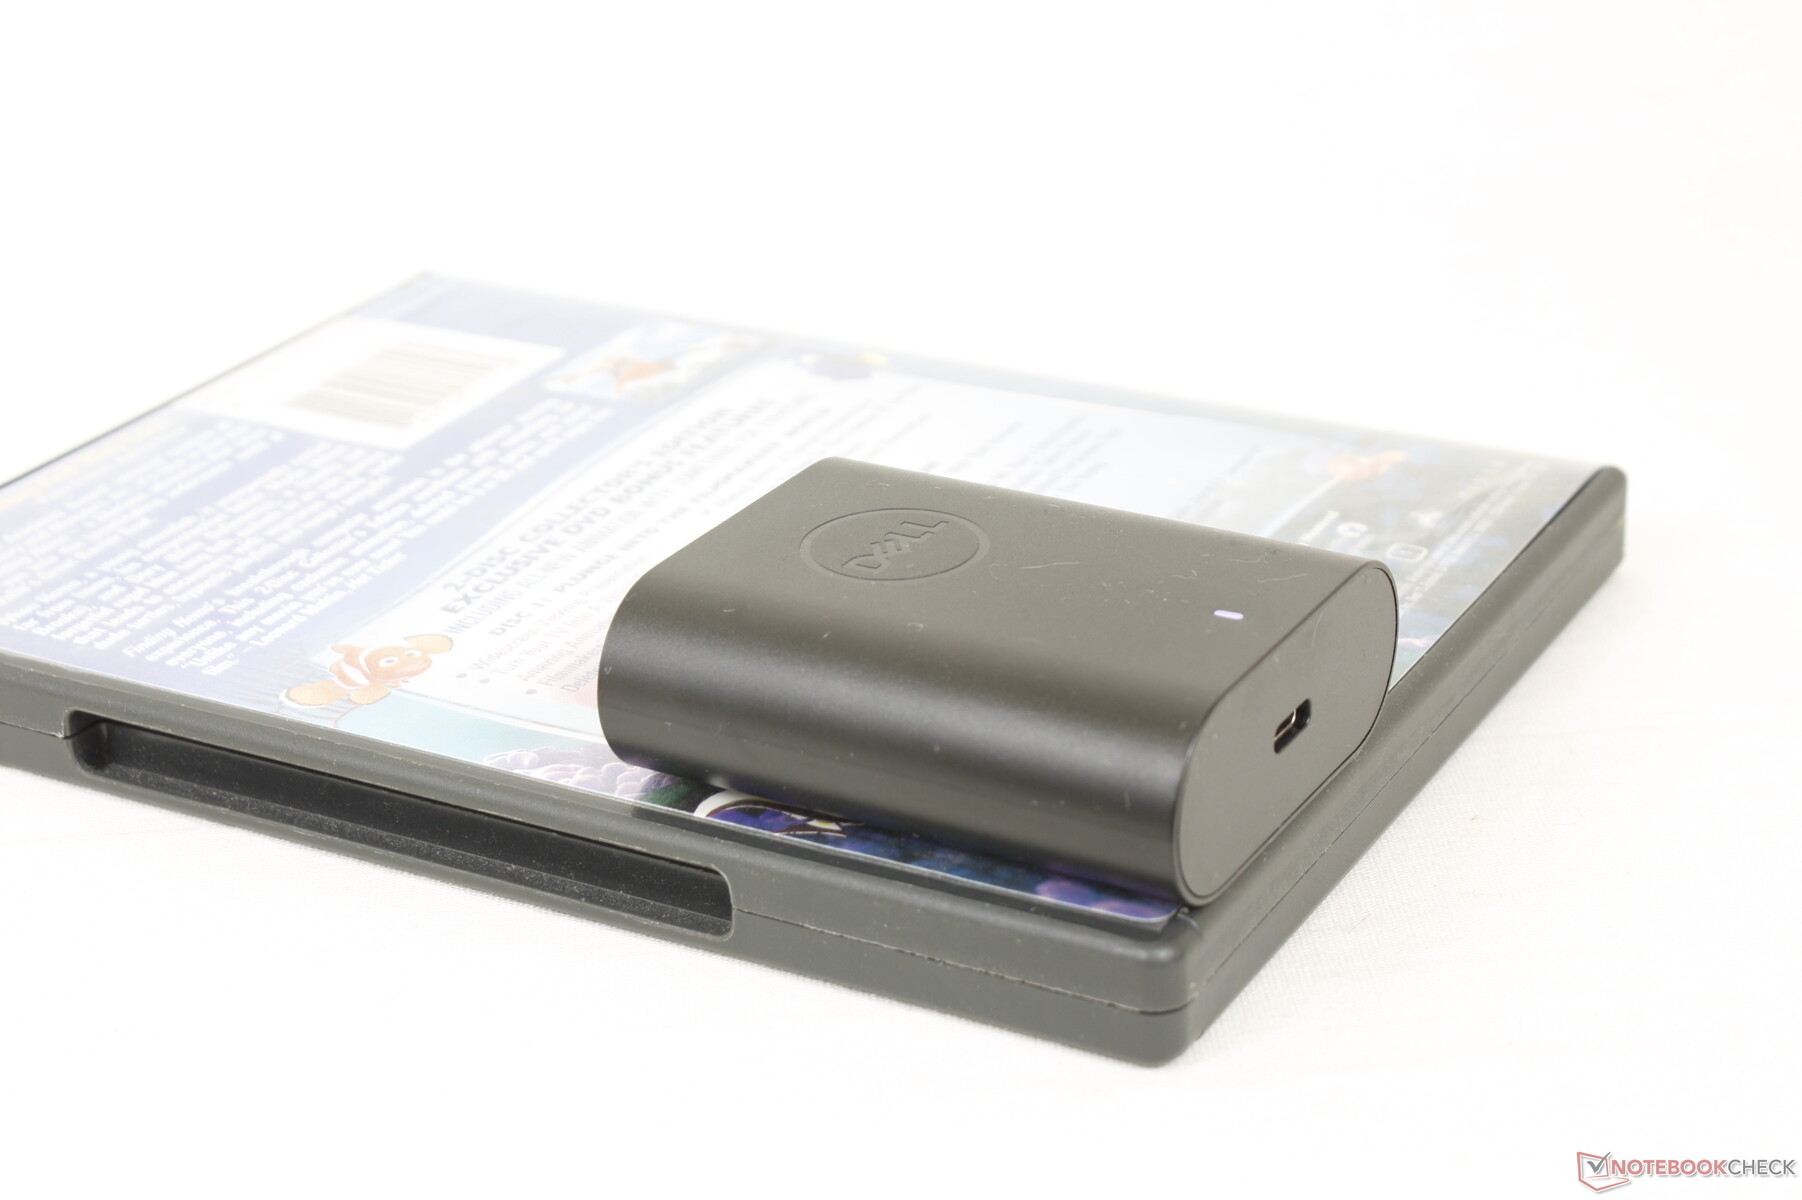
Il consumo energetico è inferiore di circa il 27% rispetto al Core i7-1255U Spectre x360 13.5 durante lo stress Prime95. Siamo riusciti a misurare un consumo massimo temporaneo di 50 W dal piccolo (~6,7 x 5,3 x 2,3 cm) adattatore CA USB-C da 60 W quando la CPU è al 100% di utilizzo. Il consumo di energia diminuisce nel tempo, come mostrano i grafici sottostanti, poiché le prestazioni massime del Turbo Boost non sono indefinite.
| Off / Standby | |
| Idle | |
| Sotto carico |
|
Leggenda:
min: | |
| Dell Latitude 9330 i7-1260U, Iris Xe G7 96EUs, , IPS, 2560x1600, 13.3" | Lenovo ThinkPad X1 Titanium Yoga G1 20QB0016GE i5-1140G7, Iris Xe G7 80EUs, Lenovo UMIS RPJTJ256MEE1OWX, IPS LED, 2256x1504, 13.5" | MSI Summit E13 Flip Evo A11MT i7-1185G7, Iris Xe G7 96EUs, Phison 1TB SM2801T24GKBB4S-E162, IPS, 1920x1200, 13.4" | HP Elite Dragonfly Max i7-1185G7, Iris Xe G7 96EUs, Toshiba XG6 KXG60ZNV512G, IPS, 1920x1080, 13.3" | Dell Latitude 5310-23VP6 i5-10310U, UHD Graphics 620, SK hynix BC511 HFM512GDHTNI-87A0B, IPS, 1920x1080, 13.3" | Lenovo Yoga Slim 9 14IAP7 i7-1280P, Iris Xe G7 96EUs, Samsung PM9B1 1024GB MZAL41T0HBLB, OLED, 2880x1800, 14" | |
|---|---|---|---|---|---|---|
| Power Consumption | 11% | -23% | -5% | 5% | -98% | |
| Idle Minimum * (Watt) | 4.7 | 3.75 20% | 4.8 -2% | 2.9 38% | 2.9 38% | 11.8 -151% |
| Idle Average * (Watt) | 8.2 | 7.75 5% | 8.4 -2% | 9.9 -21% | 5.9 28% | 17.4 -112% |
| Idle Maximum * (Watt) | 8.4 | 8.69 -3% | 8.6 -2% | 10.4 -24% | 6.7 20% | 22.4 -167% |
| Load Average * (Watt) | 36.8 | 33.12 10% | 47.1 -28% | 37.1 -1% | 42 -14% | 53 -44% |
| Witcher 3 ultra * (Watt) | 30.4 | 28.7 6% | 51.6 -70% | 31.5 -4% | 43 -41% | 52.6 -73% |
| Load Maximum * (Watt) | 49.9 | 35.19 29% | 65.9 -32% | 58.8 -18% | 50 -0% | 71 -42% |
* ... Meglio usare valori piccoli
Power Consumption Witcher 3 / Stresstest
Power Consumption external Monitor
Durata della batteria: buona per una giornata di lavoro
La capacità della batteria è nella media per un subnotebook, con 50 Wh. L'autonomia è comunque buona, con quasi 9,5 ore di utilizzo reale della WLAN, solo leggermente inferiore a quella dell'HP Dragonfly Max o dell'MSI Summit E13 Flip.
La ricarica da vuoto a pieno regime richiede circa 90 minuti.
| Dell Latitude 9330 i7-1260U, Iris Xe G7 96EUs, 50 Wh | Lenovo ThinkPad X1 Titanium Yoga G1 20QA001RGE i7-1160G7, Iris Xe G7 96EUs, 44.5 Wh | MSI Summit E13 Flip Evo A11MT i7-1185G7, Iris Xe G7 96EUs, 70 Wh | HP EliteBook x360 1030 G7 i7-10810U, UHD Graphics 620, 54 Wh | HP Elite Dragonfly Max i7-1185G7, Iris Xe G7 96EUs, 56 Wh | Dell Latitude 5310-23VP6 i5-10310U, UHD Graphics 620, 60 Wh | |
|---|---|---|---|---|---|---|
| Autonomia della batteria | -14% | 11% | 37% | 43% | 18% | |
| Reader / Idle (h) | 15.4 | 21.1 37% | 30.9 101% | 28.7 86% | ||
| WiFi v1.3 (h) | 9.4 | 8.4 -11% | 11.2 19% | 10.3 10% | 11 17% | 11.1 18% |
| Load (h) | 2.3 | 1.9 -17% | 1.8 -22% | 2.3 0% | 2.9 26% | |
| H.264 (h) | 11.4 |
Pro
Contro
Verdetto - Eccellere dove è importante
Latitude 9330 2-in-1 è altamente ottimizzato per gli ambienti d'ufficio, con funzioni non disponibili sulla maggior parte dei modelli consumer-centrici, tra cui l'XPS 13. La qualità costruttiva e la rigidità sono tra le migliori che abbiamo visto per un convertibile ultrasottile da 13 pollici e ci danno maggiore fiducia nella longevità e nell'affidabilità del modello. Se decidete di investire nel Latitude 9330, è più che probabile che vi duri per diversi anni.
Sebbene il sistema Dell sia da buono a eccellente nella maggior parte delle aree, sta iniziando a rimanere indietro in alcune altre I modelli concorrenti di HP hanno display da 1000 nit e webcam da 5 MP, mentre il Latitude 9330 è fermo a 500 nit e 2 MP. Anche la mancanza di porte USB-A e HDMI potrebbe irritare molti utenti. Preparatevi anche a un rumore della ventola sensibilmente più alto se intendete eseguire carichi impegnativi sul Dell.
A parte alcune specifiche medie, il Dell Latitude 9330 2-in-1 è il nostro miglior convertibile business da consigliare se si vuole qualcosa che duri per diversi anni.
Altri svantaggi, come le prestazioni grafiche inferiori, le temperature più calde dei core e l'assenza di supporto per le unità SSD M.2 2280, sono relativamente minori se si considera il target di utenti business o aziendali. Ci piacerebbe molto vedere in futuro opzioni di visualizzazione con una frequenza di aggiornamento più elevata e tempi di risposta in bianco e nero più rapidi, poiché una frequenza di fotogrammi più fluida migliorerebbe notevolmente l'esperienza d'uso del touchscreen.
Prezzo e disponibilità
Dellil modello Latitude 9330 2-in-1 è ora in vendita a partire da 2065 dollari, fino a oltre 2.700 dollari se completamente configurato.
Dell Latitude 9330
- 11/18/2022 v7 (old)
Allen Ngo
Price comparison

