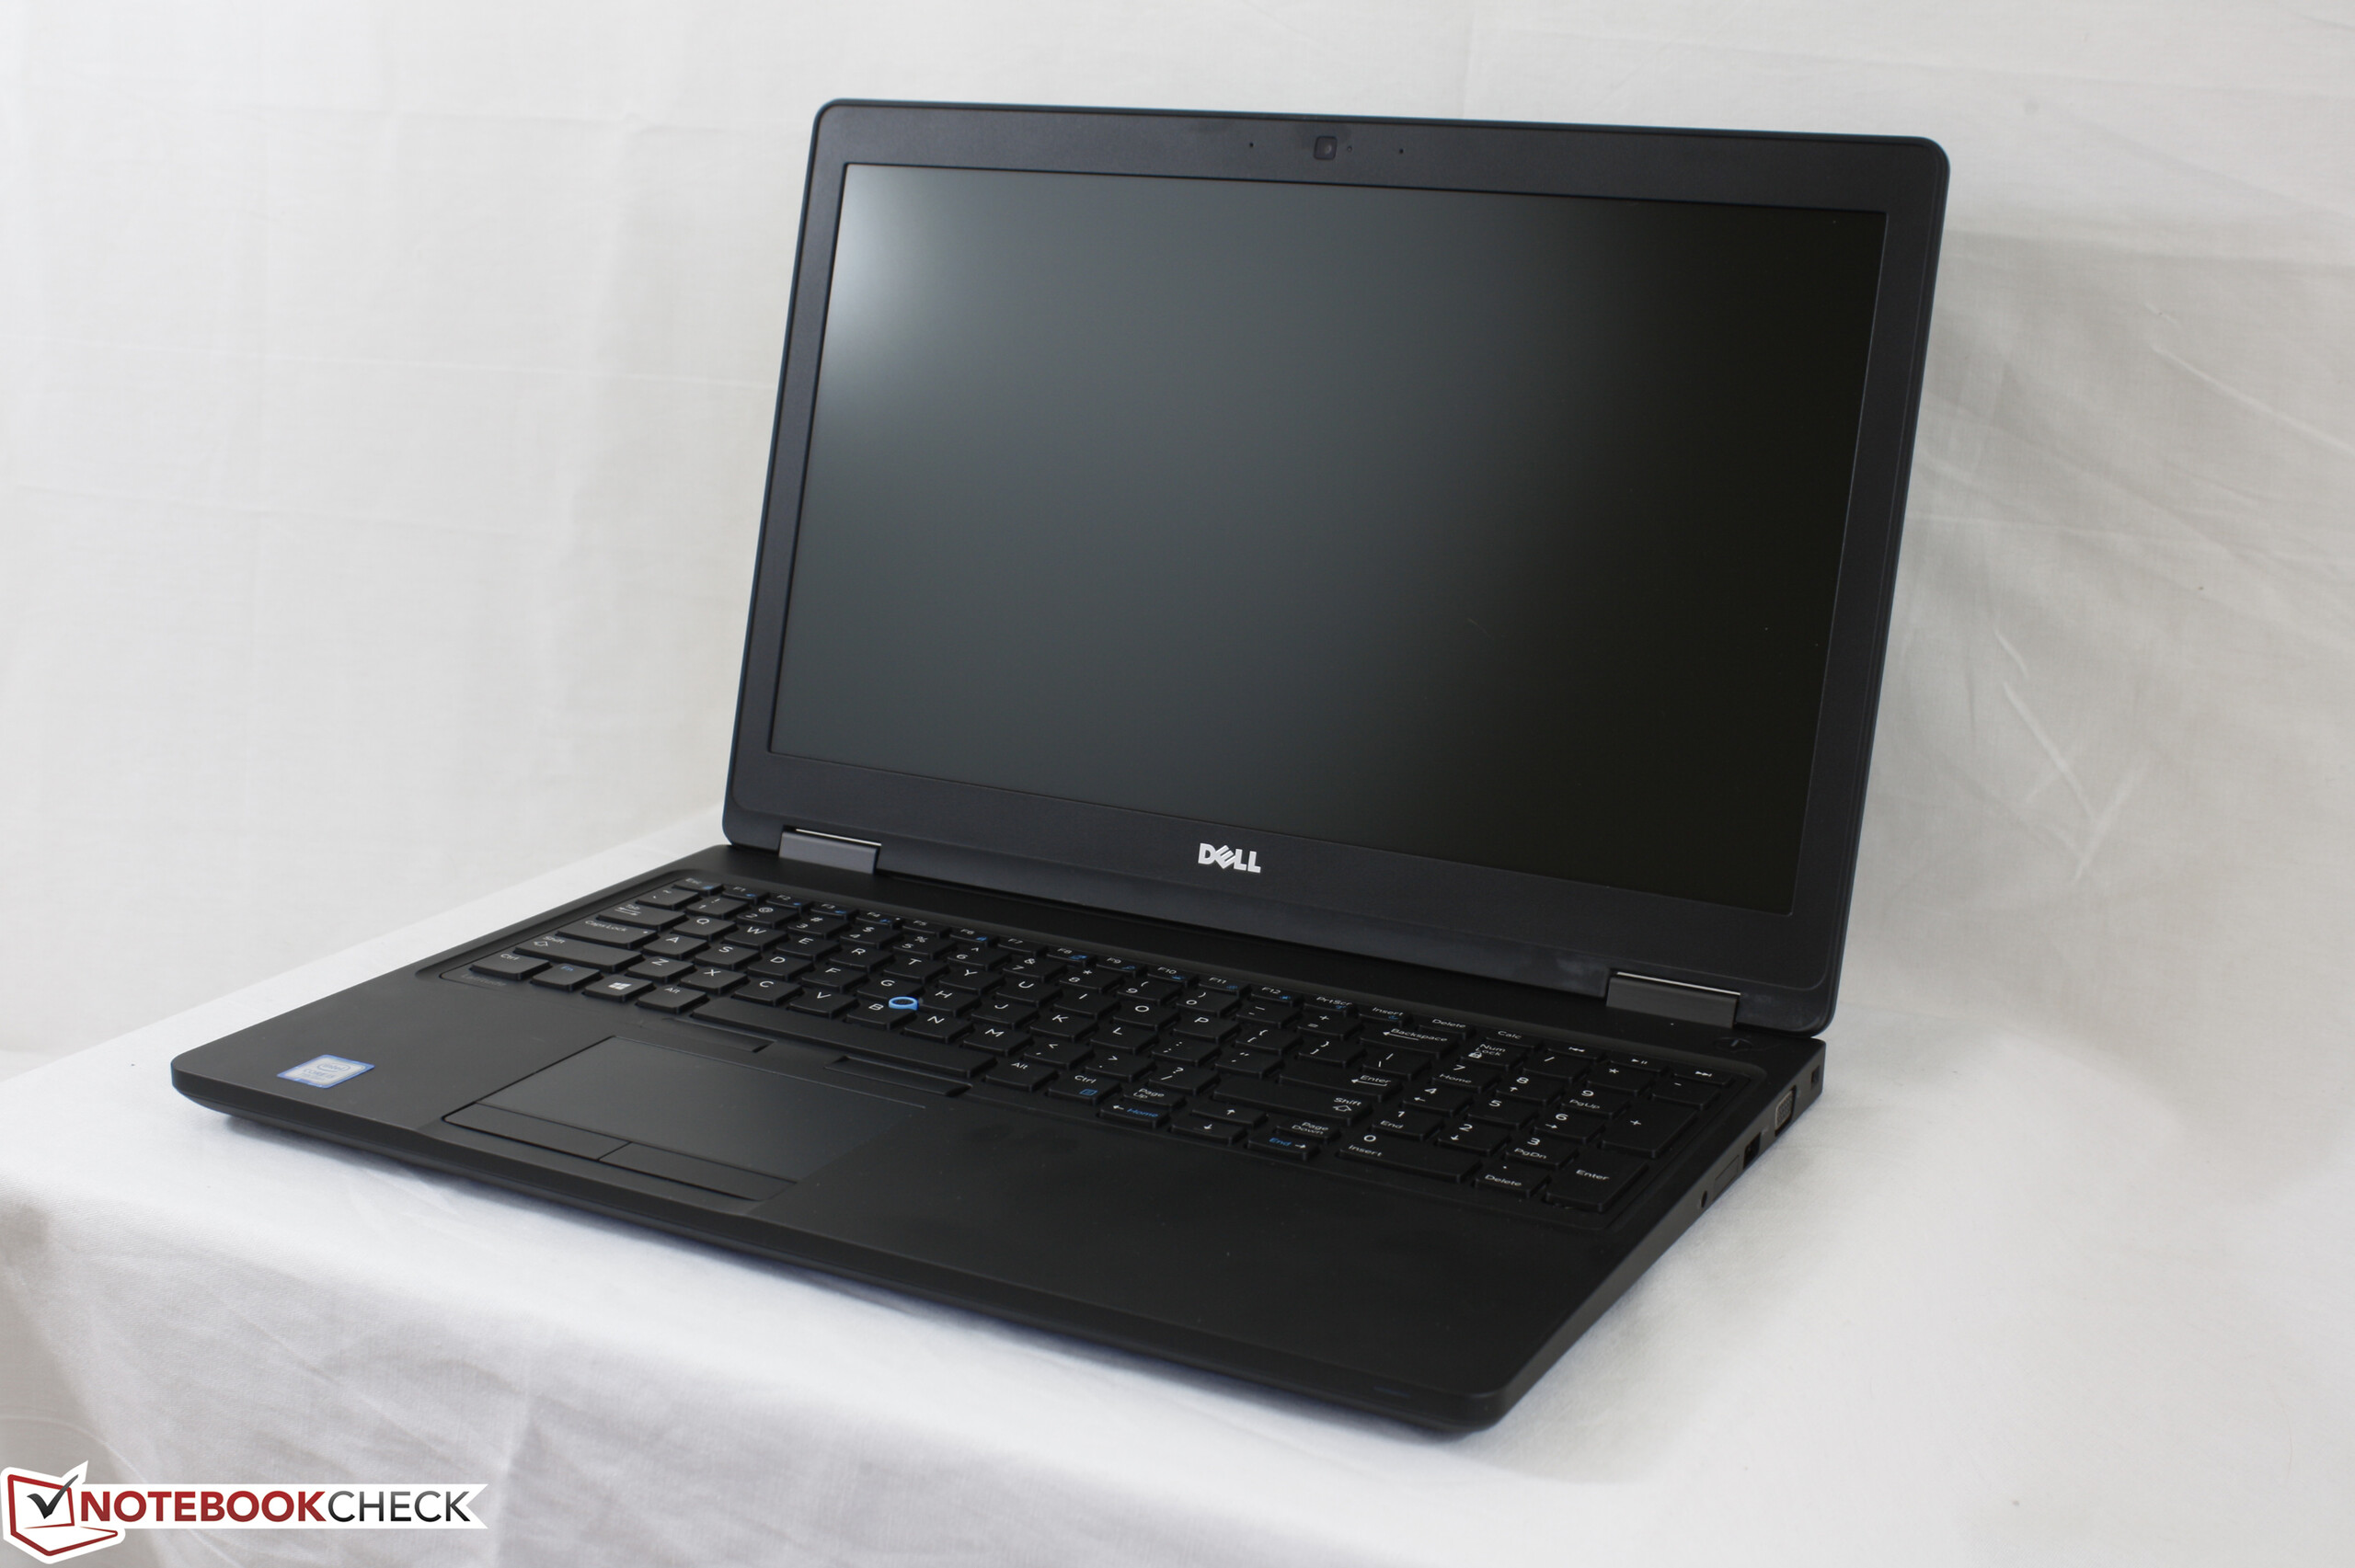
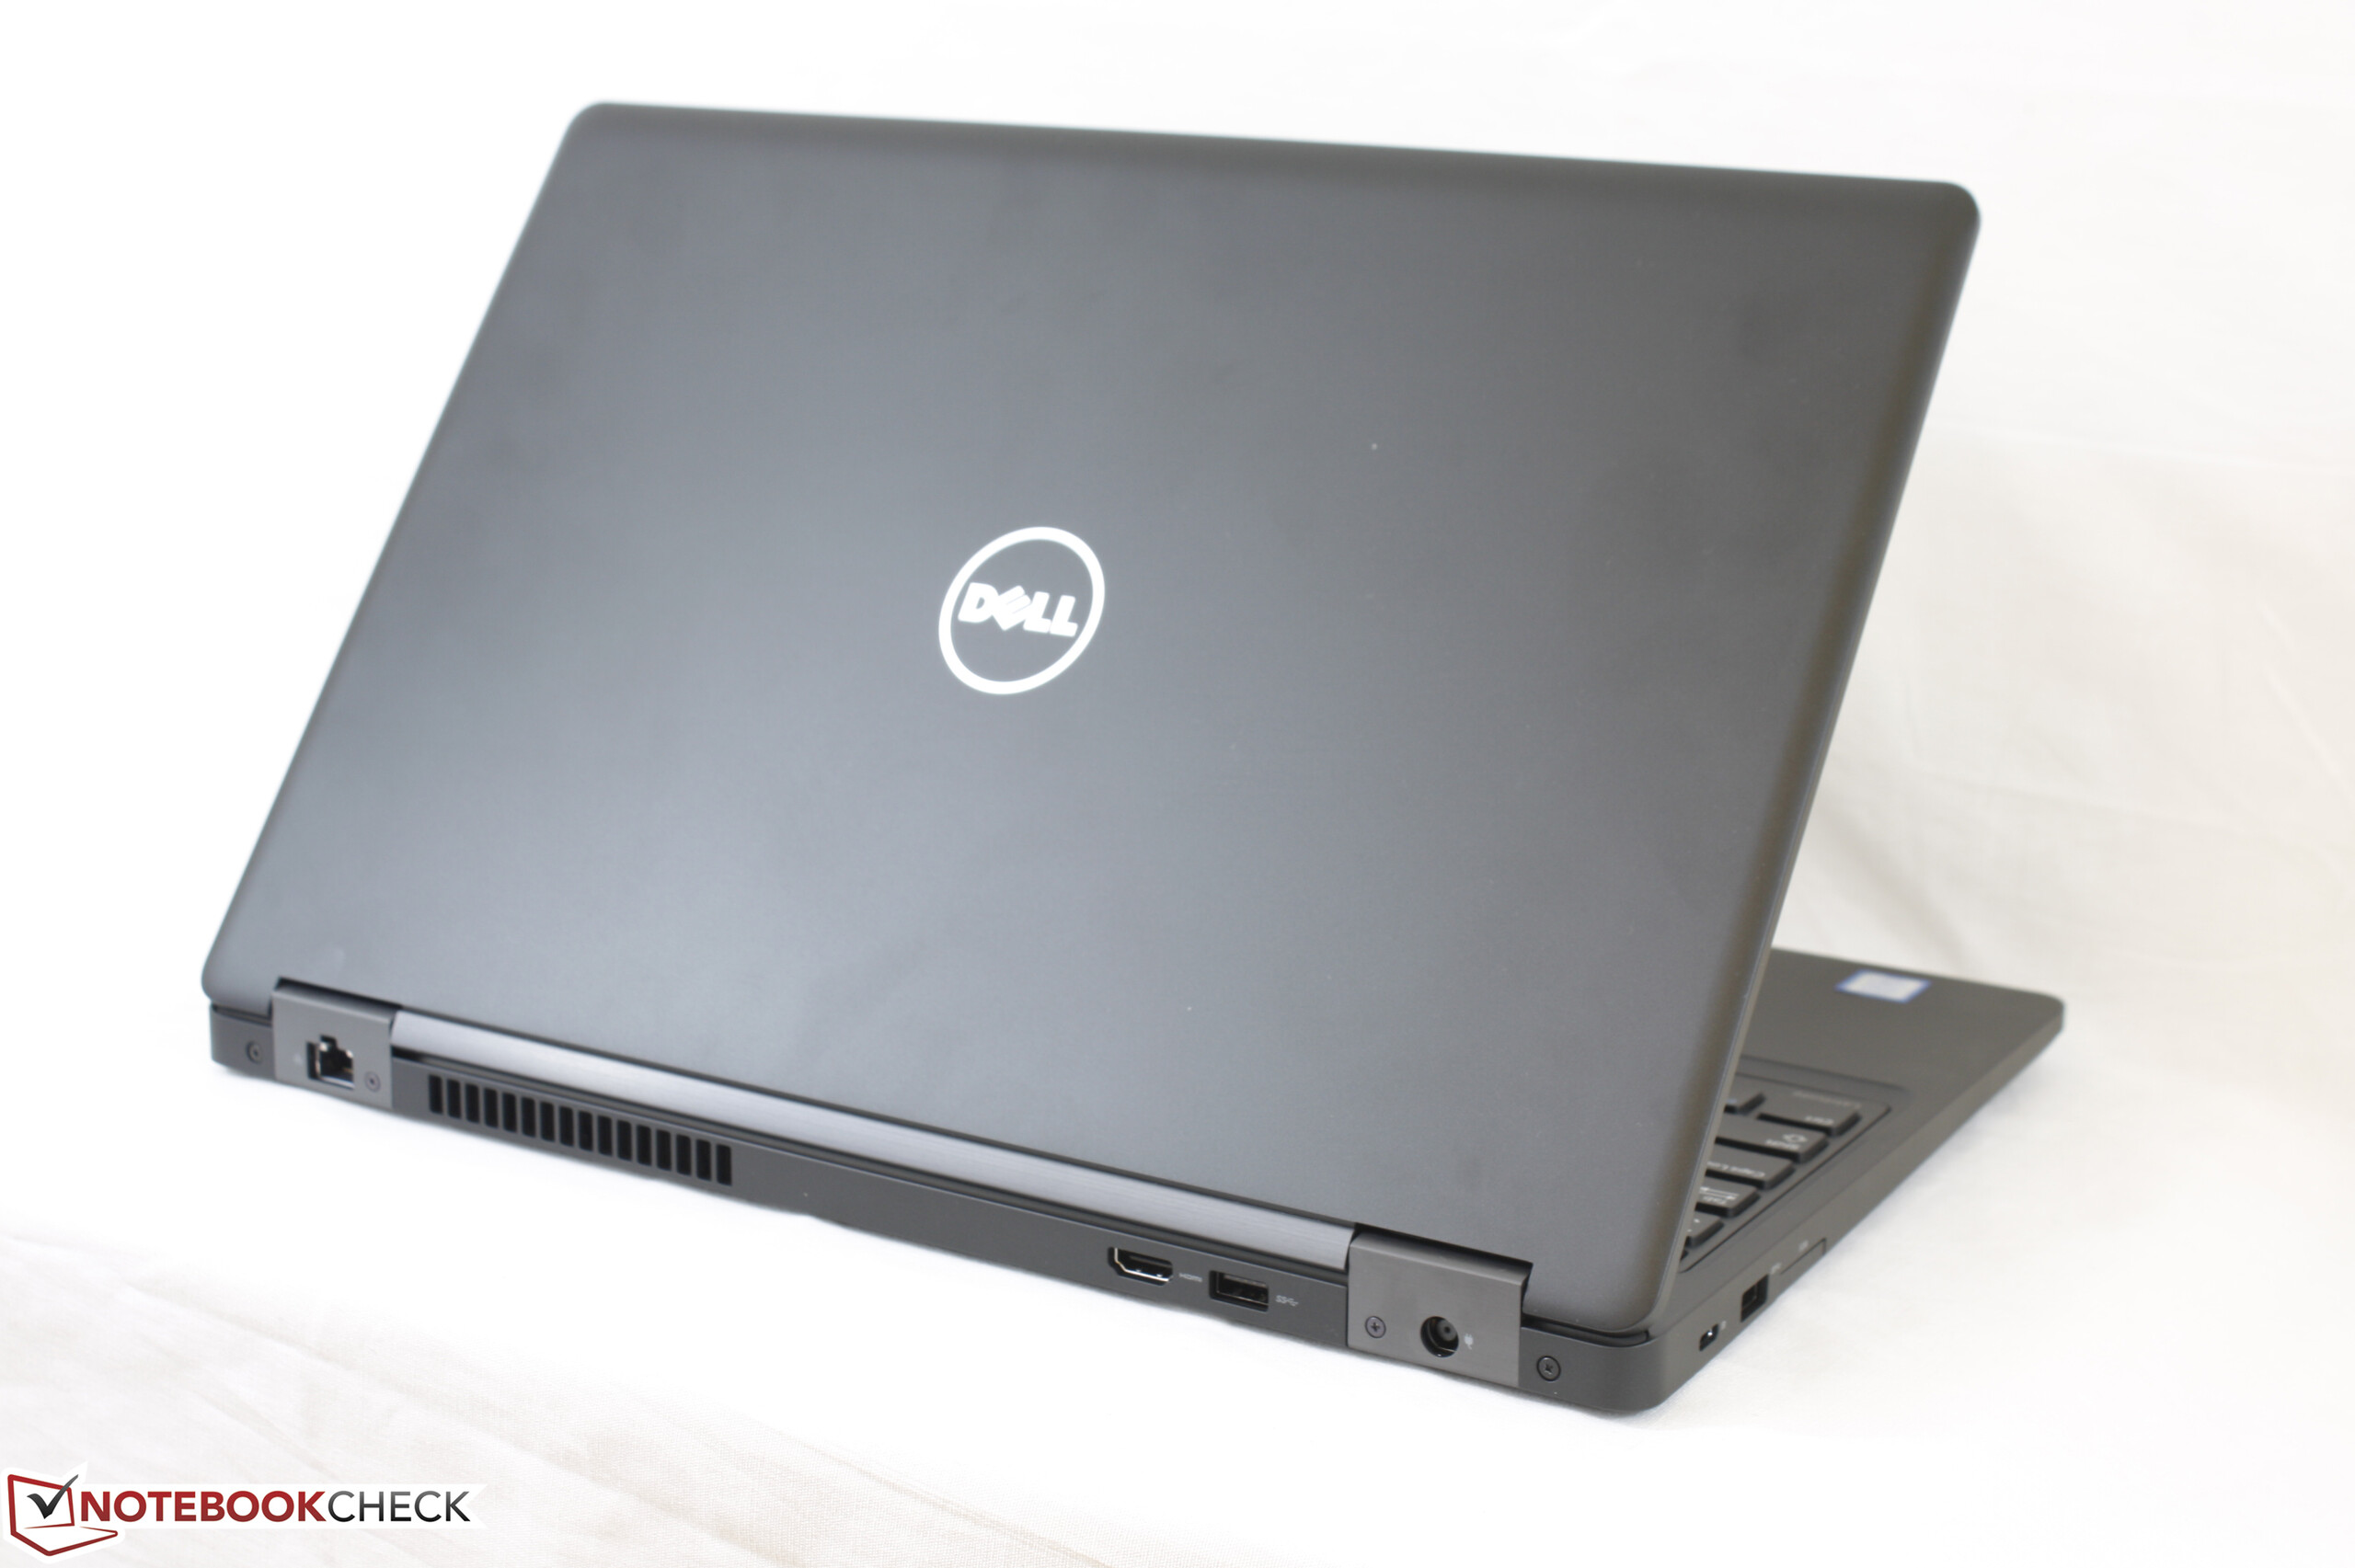
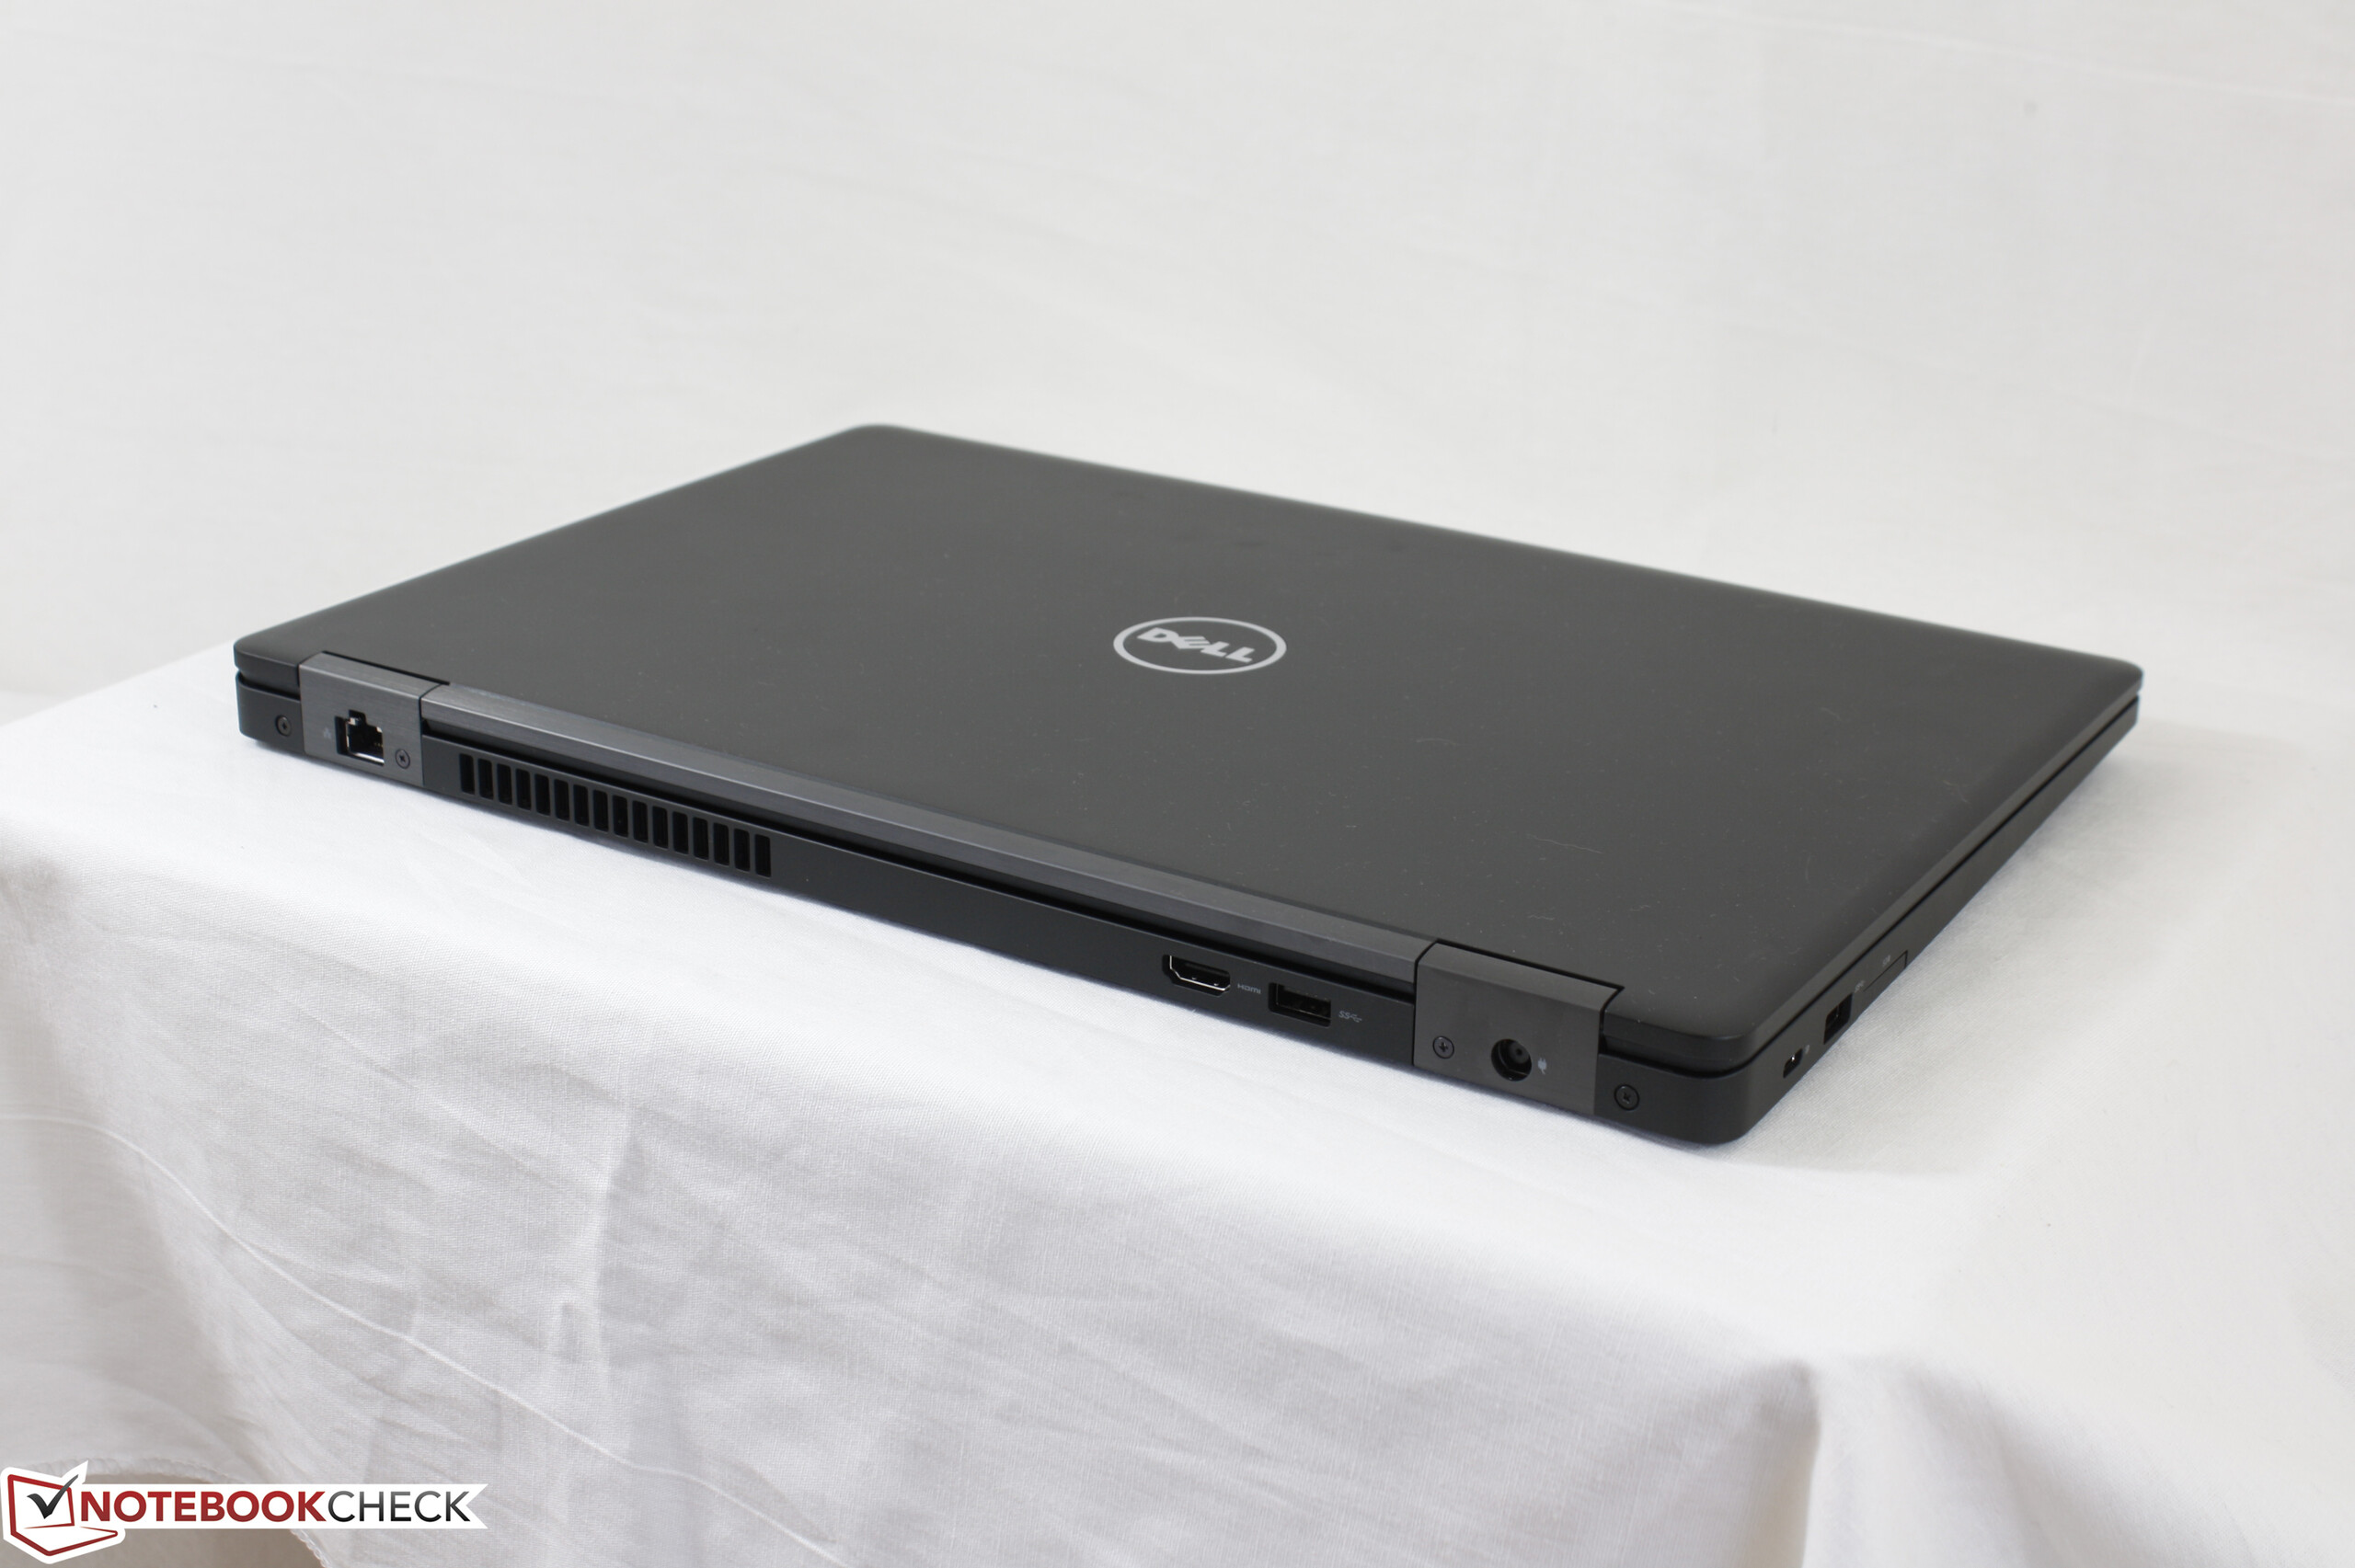
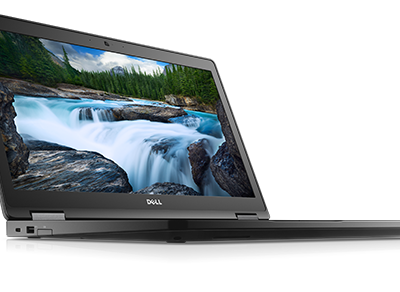
Recensione breve del Portatile Dell Latitude 5580 (i5-7200U, HD)
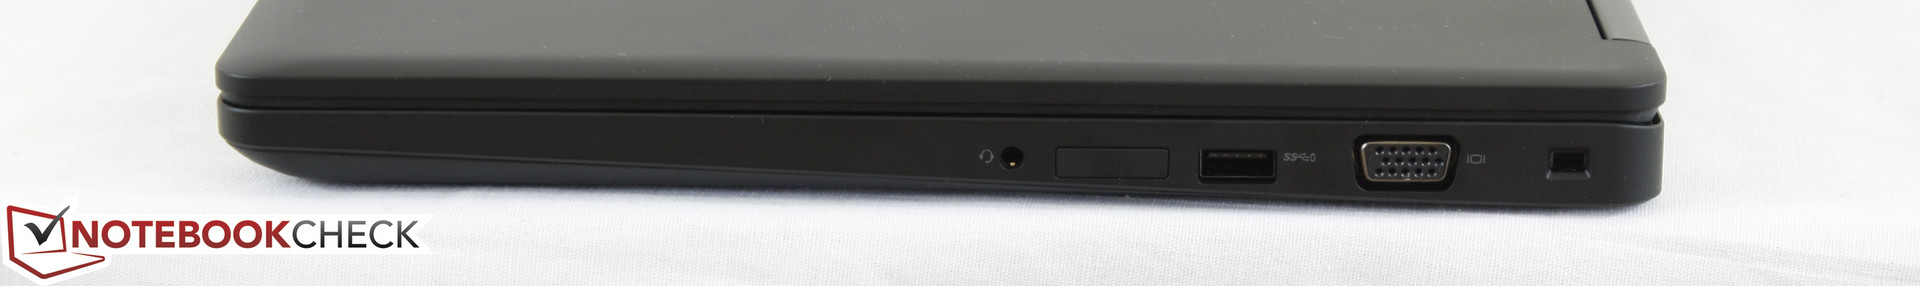
| SD Card Reader | |
| average JPG Copy Test (av. of 3 runs) | |
| Dell XPS 15 9560 (i7-7700HQ, UHD) | |
| Dell Latitude 5580 | |
| Lenovo ThinkPad T570-20H90002GE | |
| maximum AS SSD Seq Read Test (1GB) | |
| Dell Latitude 5580 | |
| Dell XPS 15 9560 (i7-7700HQ, UHD) | |
| Lenovo ThinkPad T570-20H90002GE | |
| Networking | |
| iperf3 transmit AX12 | |
| Asus AsusPro P4540UQ-FY0056R | |
| Lenovo ThinkPad T570-20H90002GE | |
| Dell Latitude 5580 | |
| iperf3 receive AX12 | |
| Dell Latitude 5580 | |
| Lenovo ThinkPad T570-20H90002GE | |
| Asus AsusPro P4540UQ-FY0056R | |
| |||||||||||||||||||||||||
Distribuzione della luminosità: 83 %
Al centro con la batteria: 238 cd/m²
Contrasto: 449:1 (Nero: 0.53 cd/m²)
ΔE ColorChecker Calman: 10.8 | ∀{0.5-29.43 Ø4.71}
ΔE Greyscale Calman: 12.1 | ∀{0.09-98 Ø4.96}
59.9% sRGB (Argyll 1.6.3 3D)
38.3% AdobeRGB 1998 (Argyll 1.6.3 3D)
41.5% AdobeRGB 1998 (Argyll 3D)
60% sRGB (Argyll 3D)
40.13% Display P3 (Argyll 3D)
Gamma: 2.25
CCT: 14344 K
| Dell Latitude 5580 TN LED, 15.6", 1366x768 | Lenovo ThinkPad T570-20H90002GE N156HCA-EAA, IPS, 15.6", 1920x1080 | Asus AsusPro P4540UQ-FY0056R LG Philips LP156WF6-SPB6, IPS, 15.6", 1920x1080 | Toshiba Satellite Pro R50-C-16V Toshiba, TN LED, 15.6", 1366x768 | HP Probook 650 G3 Z2W44ET AU Optronics, TN LED, 15.6", 1920x1080 | |
|---|---|---|---|---|---|
| Display | 10% | 48% | 1% | 37% | |
| Display P3 Coverage (%) | 40.13 | 44.08 10% | 63.3 58% | 40.6 1% | 55.2 38% |
| sRGB Coverage (%) | 60 | 65.6 9% | 83.6 39% | 61.2 2% | 81.1 35% |
| AdobeRGB 1998 Coverage (%) | 41.5 | 45.66 10% | 61.1 47% | 41.95 1% | 57 37% |
| Response Times | -5% | -13% | -58% | -9% | |
| Response Time Grey 50% / Grey 80% * (ms) | 30 ? | 41.6 ? -39% | 38 ? -27% | 68 ? -127% | 38 ? -27% |
| Response Time Black / White * (ms) | 29.6 ? | 20.8 ? 30% | 29 ? 2% | 26 ? 12% | 27 ? 9% |
| PWM Frequency (Hz) | 201.6 ? | 26040 ? | 21000 ? | 217 ? | 200 ? |
| Screen | 44% | 52% | 5% | 22% | |
| Brightness middle (cd/m²) | 238 | 262 10% | 276 16% | 226 -5% | 351 47% |
| Brightness (cd/m²) | 216 | 245 13% | 283 31% | 217 0% | 345 60% |
| Brightness Distribution (%) | 83 | 89 7% | 85 2% | 91 10% | 95 14% |
| Black Level * (cd/m²) | 0.53 | 0.24 55% | 0.27 49% | 0.58 -9% | 0.65 -23% |
| Contrast (:1) | 449 | 1092 143% | 1022 128% | 390 -13% | 540 20% |
| Colorchecker dE 2000 * | 10.8 | 4.5 58% | 3.92 64% | 9.84 9% | 11.02 -2% |
| Colorchecker dE 2000 max. * | 29.3 | 10.5 64% | 9.13 69% | 16.77 43% | 17.68 40% |
| Greyscale dE 2000 * | 12.1 | 3.5 71% | 2.6 79% | 11.1 8% | 13.14 -9% |
| Gamma | 2.25 98% | 2.32 95% | 2.53 87% | 2.35 94% | 2.7 81% |
| CCT | 14344 45% | 6524 100% | 6561 99% | 11979 54% | 16626 39% |
| Color Space (Percent of AdobeRGB 1998) (%) | 38.3 | 42.04 10% | 54.5 42% | 39 2% | 52 36% |
| Color Space (Percent of sRGB) (%) | 59.9 | 65.4 9% | 83.7 40% | 61 2% | 81 35% |
| Media totale (Programma / Settaggio) | 16% /
31% | 29% /
43% | -17% /
-4% | 17% /
21% |
* ... Meglio usare valori piccoli
Tempi di risposta del Display
| ↔ Tempi di risposta dal Nero al Bianco | ||
|---|---|---|
| 29.6 ms ... aumenta ↗ e diminuisce ↘ combinato | ↗ 21.2 ms Incremento | 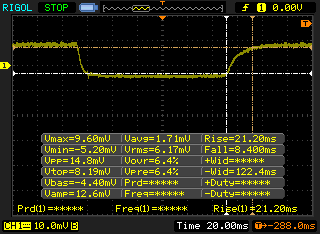 |
| ↘ 8.4 ms Calo | ||
| Lo schermo mostra tempi di risposta relativamente lenti nei nostri tests e potrebbe essere troppo lento per i gamers. In confronto, tutti i dispositivi di test variano da 0.1 (minimo) a 240 (massimo) ms. » 79 % di tutti i dispositivi è migliore. Questo significa che i tempi di risposta rilevati sono peggiori rispetto alla media di tutti i dispositivi testati (19.8 ms). | ||
| ↔ Tempo di risposta dal 50% Grigio all'80% Grigio | ||
| 30 ms ... aumenta ↗ e diminuisce ↘ combinato | ↗ 19.2 ms Incremento | 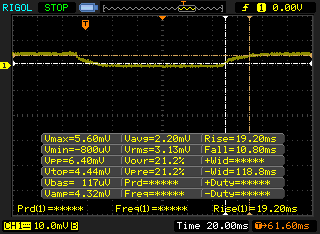 |
| ↘ 10.8 ms Calo | ||
| Lo schermo mostra tempi di risposta lenti nei nostri tests e sarà insoddisfacente per i gamers. In confronto, tutti i dispositivi di test variano da 0.165 (minimo) a 636 (massimo) ms. » 40 % di tutti i dispositivi è migliore. Questo significa che i tempi di risposta rilevati sono simili alla media di tutti i dispositivi testati (30.9 ms). | ||
Sfarfallio dello schermo / PWM (Pulse-Width Modulation)
| flickering dello schermo / PWM rilevato | 201.6 Hz | ≤ 99 % settaggio luminosita' | 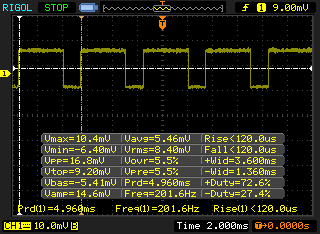 |
Il display sfarfalla a 201.6 Hz (Probabilmente a causa dell'uso di PWM) Flickering rilevato ad una luminosita' di 99 % o inferiore. Non dovrebbe verificarsi flickering o PWM sopra questo valore di luminosita'. La frequenza di 201.6 Hz è relativamente bassa, quindi gli utenti sensibili potrebbero notare il flickering ed accusare stanchezza agli occhi a questo livello di luminosità e a livelli inferiori. In confronto: 52 % di tutti i dispositivi testati non utilizza PWM per ridurre la luminosita' del display. Se è rilevato PWM, una media di 7741 (minimo: 5 - massimo: 343500) Hz è stata rilevata. | |||
| wPrime 2.10 - 1024m | |
| Lenovo Thinkpad 13-20J1001BUS | |
| Dell Latitude 7480 | |
| Dell Latitude 5580 | |
| Lenovo ThinkPad T470s-20HF0012US | |
| Apple MacBook Pro 15 2016 (2.7 GHz, 455) | |
* ... Meglio usare valori piccoli
| PCMark 8 Home Score Accelerated v2 | 3345 punti | |
| PCMark 8 Creative Score Accelerated v2 | 3942 punti | |
| PCMark 8 Work Score Accelerated v2 | 4390 punti | |
Aiuto | ||
| Dell Latitude 5580 Seagate ST500LM021-1KJ15 | Lenovo ThinkPad T570-20H90002GE Samsung PM961 MZVLW256HEHP | Asus AsusPro P4540UQ-FY0056R SK Hynix HFS256G39TND-N210A | Toshiba Satellite Pro R50-C-16V TOSHIBA MQ01ABD075 | HP ProBook 650 G3 Z2N47EA Samsung SSD 850 EVO 250GB | |
|---|---|---|---|---|---|
| CrystalDiskMark 3.0 | 16541% | 10100% | -30% | 7088% | |
| Read Seq (MB/s) | 132.3 | 1318 896% | 498.4 277% | 96.5 -27% | 506 282% |
| Write Seq (MB/s) | 131.1 | 1166 789% | 257.1 96% | 77.9 -41% | 475.2 262% |
| Read 512 (MB/s) | 27.04 | 933 3350% | 309.3 1044% | 20.82 -23% | 435.9 1512% |
| Write 512 (MB/s) | 56.6 | 860 1419% | 264.2 367% | 19.83 -65% | 367.2 549% |
| Read 4k (MB/s) | 0.459 | 56.6 12231% | 30.6 6567% | 0.342 -25% | 41.78 9002% |
| Write 4k (MB/s) | 0.812 | 130.6 15984% | 77.3 9420% | 0.836 3% | 86.1 10503% |
| Read 4k QD32 (MB/s) | 1.1 | 510 46264% | 357.4 32391% | 0.595 -46% | 263.2 23827% |
| Write 4k QD32 (MB/s) | 0.828 | 426.4 51398% | 254.5 30637% | 0.706 -15% | 90 10770% |

| 3DMark 11 | |
| 1280x720 Performance GPU | |
| Dell Latitude 12 5285 2-in-1 | |
| Lenovo ThinkPad T470s-20HF0012US | |
| Dell Latitude 5480 N005L548014EMEA | |
| Lenovo Miix 510 Pro 80U10006GE | |
| Dell Latitude 5580 | |
| Toshiba Portege Z20t-C-121 | |
| Asus Vivobook F556UQ-XO626D | |
| Asus PU551LA-XO359G | |
| Acer Aspire One Cloudbook 14 AO1-431-C6QM | |
| 1280x720 Performance Combined | |
| Dell Latitude 5480 N005L548014EMEA | |
| Lenovo ThinkPad T470s-20HF0012US | |
| Dell Latitude 12 5285 2-in-1 | |
| Lenovo Miix 510 Pro 80U10006GE | |
| Asus Vivobook F556UQ-XO626D | |
| Dell Latitude 5580 | |
| Asus PU551LA-XO359G | |
| Toshiba Portege Z20t-C-121 | |
| Acer Aspire One Cloudbook 14 AO1-431-C6QM | |
| 3DMark | |
| 1280x720 Cloud Gate Standard Graphics | |
| Dell Latitude 12 5285 2-in-1 | |
| Dell Latitude 5480 N005L548014EMEA | |
| Lenovo ThinkPad T470s-20HF0012US | |
| Lenovo Miix 510 Pro 80U10006GE | |
| Dell Latitude 5580 | |
| Asus Vivobook F556UQ-XO626D | |
| Acer Aspire One Cloudbook 14 AO1-431-C6QM | |
| 1920x1080 Fire Strike Graphics | |
| Dell Latitude 12 5285 2-in-1 | |
| Dell Latitude 5480 N005L548014EMEA | |
| Lenovo ThinkPad T470s-20HF0012US | |
| Dell Latitude 5580 | |
| Asus PU551LA-XO359G | |
| Asus Vivobook F556UQ-XO626D | |
| Acer Aspire One Cloudbook 14 AO1-431-C6QM | |
| 1280x720 Ice Storm Standard Graphics | |
| Dell Latitude 5480 N005L548014EMEA | |
| Lenovo ThinkPad T470s-20HF0012US | |
| Asus Vivobook F556UQ-XO626D | |
| Asus PU551LA-XO359G | |
| Dell Latitude 5580 | |
| Acer Aspire One Cloudbook 14 AO1-431-C6QM | |
| Dell Latitude 12 5285 2-in-1 | |
| 1920x1080 Ice Storm Extreme Graphics | |
| Dell Latitude 5480 N005L548014EMEA | |
| Dell Latitude 12 5285 2-in-1 | |
| Dell Latitude 5580 | |
| Asus PU551LA-XO359G | |
| Asus Vivobook F556UQ-XO626D | |
| 3DMark 11 Performance | 1354 punti | |
| 3DMark Ice Storm Standard Score | 47545 punti | |
| 3DMark Cloud Gate Standard Score | 5273 punti | |
| 3DMark Fire Strike Score | 621 punti | |
Aiuto | ||
| basso | medio | alto | ultra | |
|---|---|---|---|---|
| BioShock Infinite (2013) | 52 | 29 | ||
| Rise of the Tomb Raider (2016) | 19.1 | 11.2 |
Rumorosità
| Idle |
| 32.6 / 32.6 / 32.8 dB(A) |
| HDD |
| 33.2 dB(A) |
| Sotto carico |
| 33.5 / 34.7 dB(A) |
 | ||
30 dB silenzioso 40 dB(A) udibile 50 dB(A) rumoroso |
||
min: | ||
| Dell Latitude 5580 HD Graphics 620, i5-7200U, Seagate ST500LM021-1KJ15 | Lenovo ThinkPad T570-20H90002GE HD Graphics 620, i5-7200U, Samsung PM961 MZVLW256HEHP | Asus AsusPro P4540UQ-FY0056R GeForce 940MX, i5-7200U, SK Hynix HFS256G39TND-N210A | Toshiba Satellite Pro R50-C-16V HD Graphics 520, 6006U, TOSHIBA MQ01ABD075 | HP ProBook 650 G3 Z2N47EA HD Graphics 620, i5-7200U, Samsung SSD 850 EVO 250GB | |
|---|---|---|---|---|---|
| Noise | 1% | 0% | 2% | -7% | |
| off /ambiente * (dB) | 28.2 | 29.3 -4% | 30.3 -7% | 30.4 -8% | |
| Idle Minimum * (dB) | 32.6 | 29.3 10% | 30.3 7% | 31.8 2% | 32.5 -0% |
| Idle Average * (dB) | 32.6 | 29.3 10% | 30.3 7% | 31.8 2% | 33.1 -2% |
| Idle Maximum * (dB) | 32.8 | 31.2 5% | 30.3 8% | 31.8 3% | 33.7 -3% |
| Load Average * (dB) | 33.5 | 35.1 -5% | 35.4 -6% | 31.9 5% | 37 -10% |
| Load Maximum * (dB) | 34.7 | 38.7 -12% | 37.2 -7% | 31.8 8% | 42.5 -22% |
* ... Meglio usare valori piccoli
(+) La temperatura massima sul lato superiore è di 36.2 °C / 97 F, rispetto alla media di 34.3 °C / 94 F, che varia da 21.2 a 62.5 °C per questa classe Office.
(-) Il lato inferiore si riscalda fino ad un massimo di 45.6 °C / 114 F, rispetto alla media di 36.8 °C / 98 F
(+) In idle, la temperatura media del lato superiore è di 25 °C / 77 F, rispetto alla media deld ispositivo di 29.5 °C / 85 F.
(+) I poggiapolsi e il touchpad sono piu' freddi della temperatura della pelle con un massimo di 27.2 °C / 81 F e sono quindi freddi al tatto.
(±) La temperatura media della zona del palmo della mano di dispositivi simili e'stata di 27.6 °C / 81.7 F (+0.4 °C / 0.7 F).
Dell Latitude 5580 analisi audio
(-) | altoparlanti non molto potenti (70.2 dB)
Bassi 100 - 315 Hz
(±) | bassi ridotti - in media 12.5% inferiori alla media
(±) | la linearità dei bassi è media (10.4% delta rispetto alla precedente frequenza)
Medi 400 - 2000 Hz
(+) | medi bilanciati - solo only 4.6% rispetto alla media
(±) | linearità dei medi adeguata (8.9% delta rispetto alla precedente frequenza)
Alti 2 - 16 kHz
(±) | alti elevati - circa 5.1% superiori alla media
(±) | la linearità degli alti è media (9.9% delta rispetto alla precedente frequenza)
Nel complesso 100 - 16.000 Hz
(±) | la linearità complessiva del suono è media (24.6% di differenza rispetto alla media
Rispetto alla stessa classe
» 73% di tutti i dispositivi testati in questa classe è stato migliore, 7% simile, 20% peggiore
» Il migliore ha avuto un delta di 7%, medio di 21%, peggiore di 53%
Rispetto a tutti i dispositivi testati
» 75% di tutti i dispositivi testati in questa classe è stato migliore, 5% similare, 20% peggiore
» Il migliore ha avuto un delta di 4%, medio di 23%, peggiore di 134%
Apple MacBook 12 (Early 2016) 1.1 GHz analisi audio
(+) | gli altoparlanti sono relativamente potenti (83.6 dB)
Bassi 100 - 315 Hz
(±) | bassi ridotti - in media 11.3% inferiori alla media
(±) | la linearità dei bassi è media (14.2% delta rispetto alla precedente frequenza)
Medi 400 - 2000 Hz
(+) | medi bilanciati - solo only 2.4% rispetto alla media
(+) | medi lineari (5.5% delta rispetto alla precedente frequenza)
Alti 2 - 16 kHz
(+) | Alti bilanciati - appena 2% dalla media
(+) | alti lineari (4.5% delta rispetto alla precedente frequenza)
Nel complesso 100 - 16.000 Hz
(+) | suono nel complesso lineare (10.2% differenza dalla media)
Rispetto alla stessa classe
» 7% di tutti i dispositivi testati in questa classe è stato migliore, 2% simile, 90% peggiore
» Il migliore ha avuto un delta di 5%, medio di 18%, peggiore di 53%
Rispetto a tutti i dispositivi testati
» 5% di tutti i dispositivi testati in questa classe è stato migliore, 1% similare, 94% peggiore
» Il migliore ha avuto un delta di 4%, medio di 23%, peggiore di 134%
| Off / Standby | |
| Idle | |
| Sotto carico |
|
Leggenda:
min: | |
| Dell Latitude 5580 i5-7200U, HD Graphics 620, Seagate ST500LM021-1KJ15, TN LED, 1366x768, 15.6" | Lenovo ThinkPad T570-20H90002GE i5-7200U, HD Graphics 620, Samsung PM961 MZVLW256HEHP, IPS, 1920x1080, 15.6" | Asus AsusPro P4540UQ-FY0056R i5-7200U, GeForce 940MX, SK Hynix HFS256G39TND-N210A, IPS, 1920x1080, 15.6" | Toshiba Satellite Pro R50-C-16V 6006U, HD Graphics 520, TOSHIBA MQ01ABD075, TN LED, 1366x768, 15.6" | HP ProBook 650 G3 Z2N47EA i5-7200U, HD Graphics 620, Samsung SSD 850 EVO 250GB, podświetlanie diodami LED, 1920x1080, 15.6" | |
|---|---|---|---|---|---|
| Power Consumption | -18% | -54% | -16% | -40% | |
| Idle Minimum * (Watt) | 3.5 | 3.6 -3% | 4.9 -40% | 6 -71% | 7 -100% |
| Idle Average * (Watt) | 6 | 7.7 -28% | 8.1 -35% | 8.7 -45% | 9.2 -53% |
| Idle Maximum * (Watt) | 7.3 | 8.2 -12% | 9.4 -29% | 9.2 -26% | 10.3 -41% |
| Load Average * (Watt) | 30.8 | 30.8 -0% | 50 -62% | 18.6 40% | 25.8 16% |
| Load Maximum * (Watt) | 31 | 46.1 -49% | 63.7 -105% | 23.8 23% | 37.5 -21% |
* ... Meglio usare valori piccoli
| Dell Latitude 5580 i5-7200U, HD Graphics 620, 68 Wh | Lenovo ThinkPad T570-20H90002GE i5-7200U, HD Graphics 620, 56 Wh | Asus AsusPro P4540UQ-FY0056R i5-7200U, GeForce 940MX, 72 Wh | Toshiba Satellite Pro R50-C-16V 6006U, HD Graphics 520, 44 Wh | HP Probook 650 G3 Z2W44ET i5-7200U, HD Graphics 620, 48 Wh | |
|---|---|---|---|---|---|
| Autonomia della batteria | 9% | -1% | -49% | -9% | |
| Reader / Idle (h) | 18.4 | 19.5 6% | 12.8 -30% | ||
| WiFi v1.3 (h) | 11.6 | 7.6 -34% | 11.5 -1% | 5.9 -49% | 7.8 -33% |
| Load (h) | 2.2 | 3.4 55% | 3 36% |
Pro
Contro
Non c'è niente di speciale sul Latitude 5580 che non sia stato detto sulle nostre pagine E5550/E5570. La sua ampia autonomia, la facile manutenzione, le numerose opzioni, la certificazione Linux, e la comoda tastiera lo rendono attraente e molto versatile come portatile business.
Il prezzo è un discorso a parte per il 5580. Mentre le configurazioni entry-level come la nostra partono da $700 USD, le features business come Smart Card, Thunderbolt 3, WWAN, NFC, e lettore di impronte fanno salire il prezzo ben oltre i $1000 USD. Inoltre, raccomandiamo di evitare l'orribile display HD e scegliere l'FHD, ma la SKU FHD da sola parte da $1100 USD. Le configurazioni con CPU più veloce HQ-class partono da $1000 USD ed includono solo 4 GB di RAM, ed il citato display HD, e nemmeno un SSD. Preparatevi a sborsare molto di più rispetto alla SKU entry-level per avere maggiori prestazioni dal Latitude 5580.
Probabilmente proveremo altre SKU superiori del Latitude 5580 a breve per avere una migliore panoramica della famiglia. Una CPU HQ-class ha il doppio di TDP di una CPU U-class ed il pannello FHD sicuramente offre un'esperienza migliore. Come impattano questi componenti più esigenti sulla batteria, e sulla rumorosità della ventola, oltre che sulle prestazioni lo vedremo da vicino.
Evitate le SKUs di base in quanto hanno un display HD sotto la media e non hanno features. Thunderbolt 3 e pannello FHD sono vitali per una migliore esperienza e per ovviare all'assenza della E-port.
Nota: si tratta di una recensione breve, con alcune sezioni non tradotte, per la versione integrale in inglese guardate qui.
Dell Latitude 5580
- 05/11/2017 v6 (old)
Allen Ngo
Price comparison
