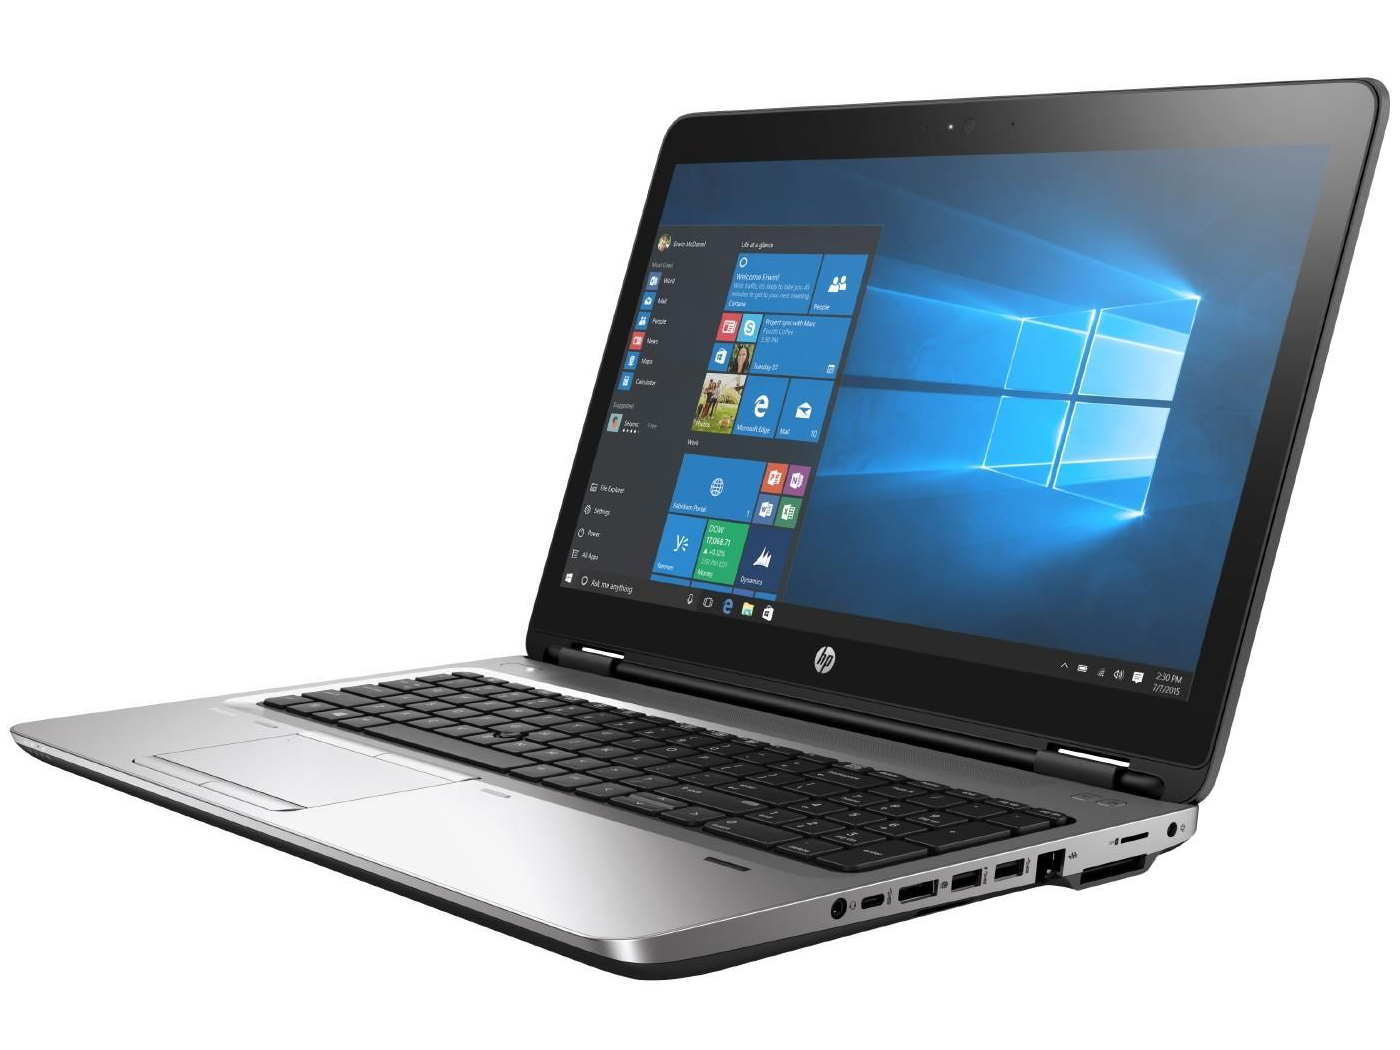
Recensione breve del Portatile HP ProBook 650 G3 Z2W44ET
| SD Card Reader | |
| average JPG Copy Test (av. of 3 runs) | |
| Dell Latitude 15 E5570 | |
| Lenovo ThinkPad L560-20F10026GE | |
| Acer TravelMate P658-M-537B | |
| HP Probook 650 G3 Z2W44ET | |
| HP ProBook 650 G2 V1A44ET | |
| HP ProBook 655 G2 T9X09ET | |
| maximum AS SSD Seq Read Test (1GB) | |
| HP Probook 650 G3 Z2W44ET | |
| Lenovo ThinkPad L560-20F10026GE | |
| Networking | |
| iperf3 transmit AX12 | |
| Apple MacBook Pro 15 2016 (2.6 GHz, 450) (Klaus I211) | |
| HP Probook 650 G3 Z2W44ET (jseb) | |
| iperf3 receive AX12 | |
| Apple MacBook Pro 15 2016 (2.6 GHz, 450) (Klaus I211) | |
| HP Probook 650 G3 Z2W44ET (jseb) | |
| iperf Client (transmit) TCP 1 m | |
| HP ProBook 650 G2 V1A44ET (jseb) | |
| Dell Latitude 15 E5570 | |
| HP ProBook 655 G2 T9X09ET (jseb) | |
| iperf Server (receive) TCP 1 m | |
| HP ProBook 650 G2 V1A44ET (jseb) | |
| HP ProBook 655 G2 T9X09ET (jseb) | |
| Dell Latitude 15 E5570 | |
| |||||||||||||||||||||||||
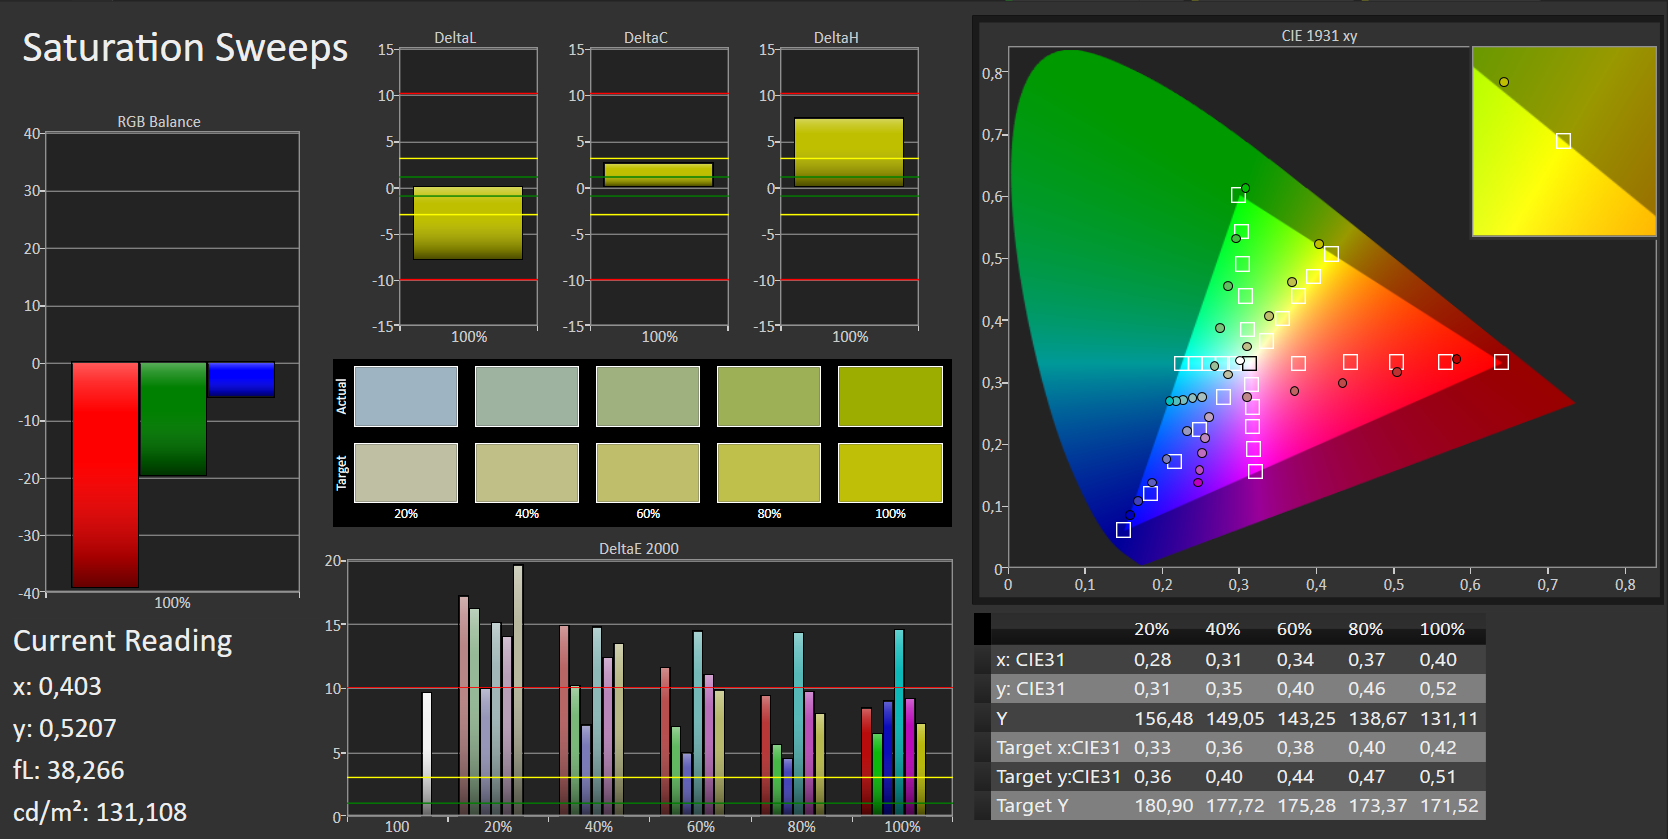
Distribuzione della luminosità: 95 %
Al centro con la batteria: 355 cd/m²
Contrasto: 540:1 (Nero: 0.65 cd/m²)
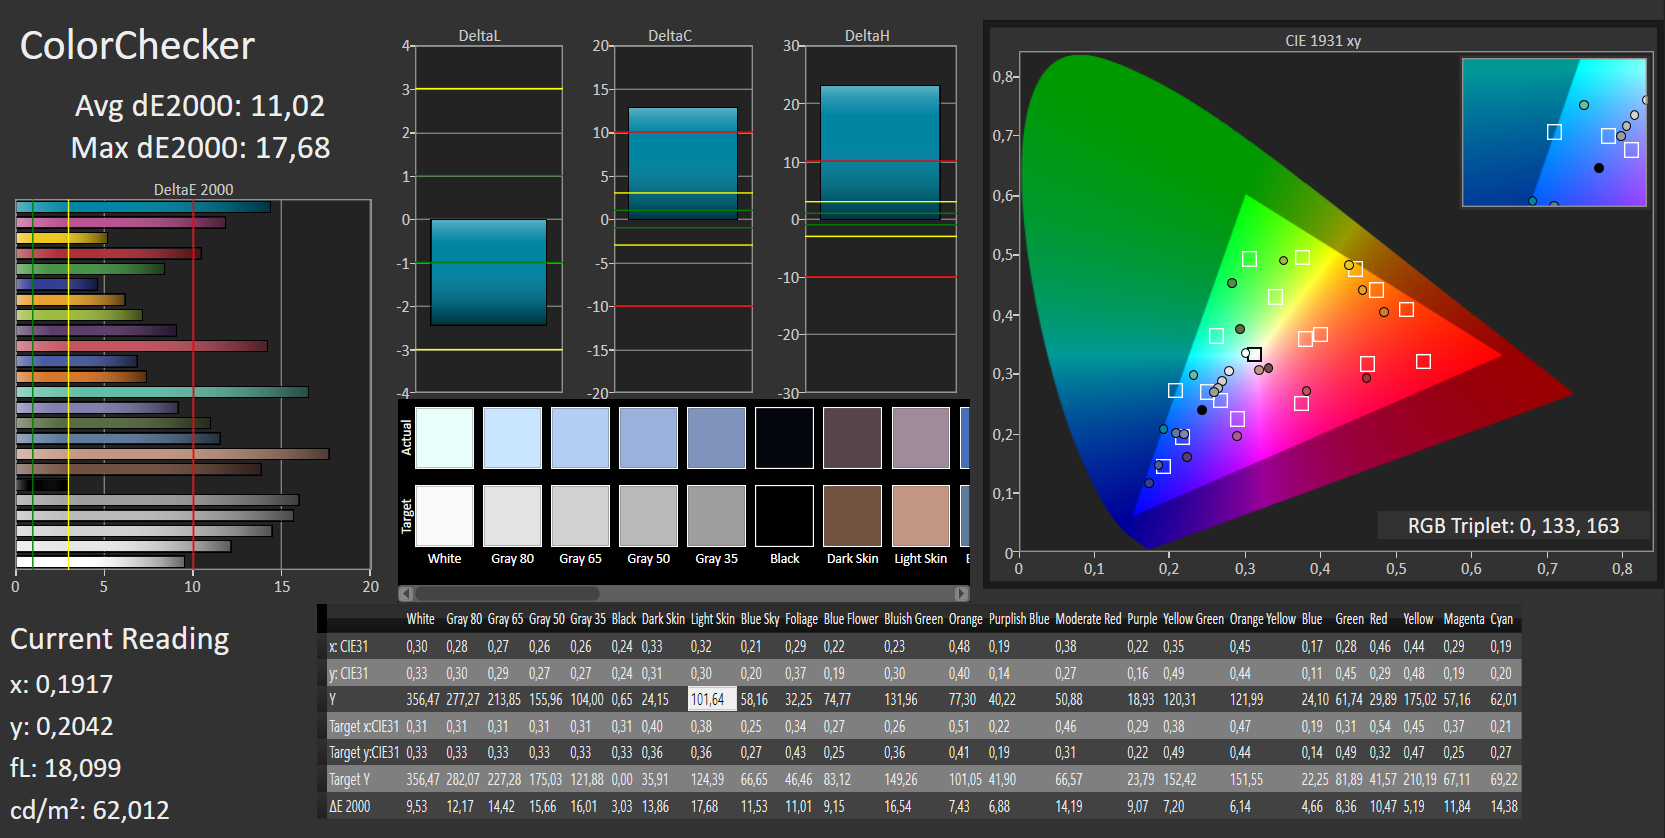
ΔE ColorChecker Calman: 11.02 | ∀{0.5-29.43 Ø4.73}
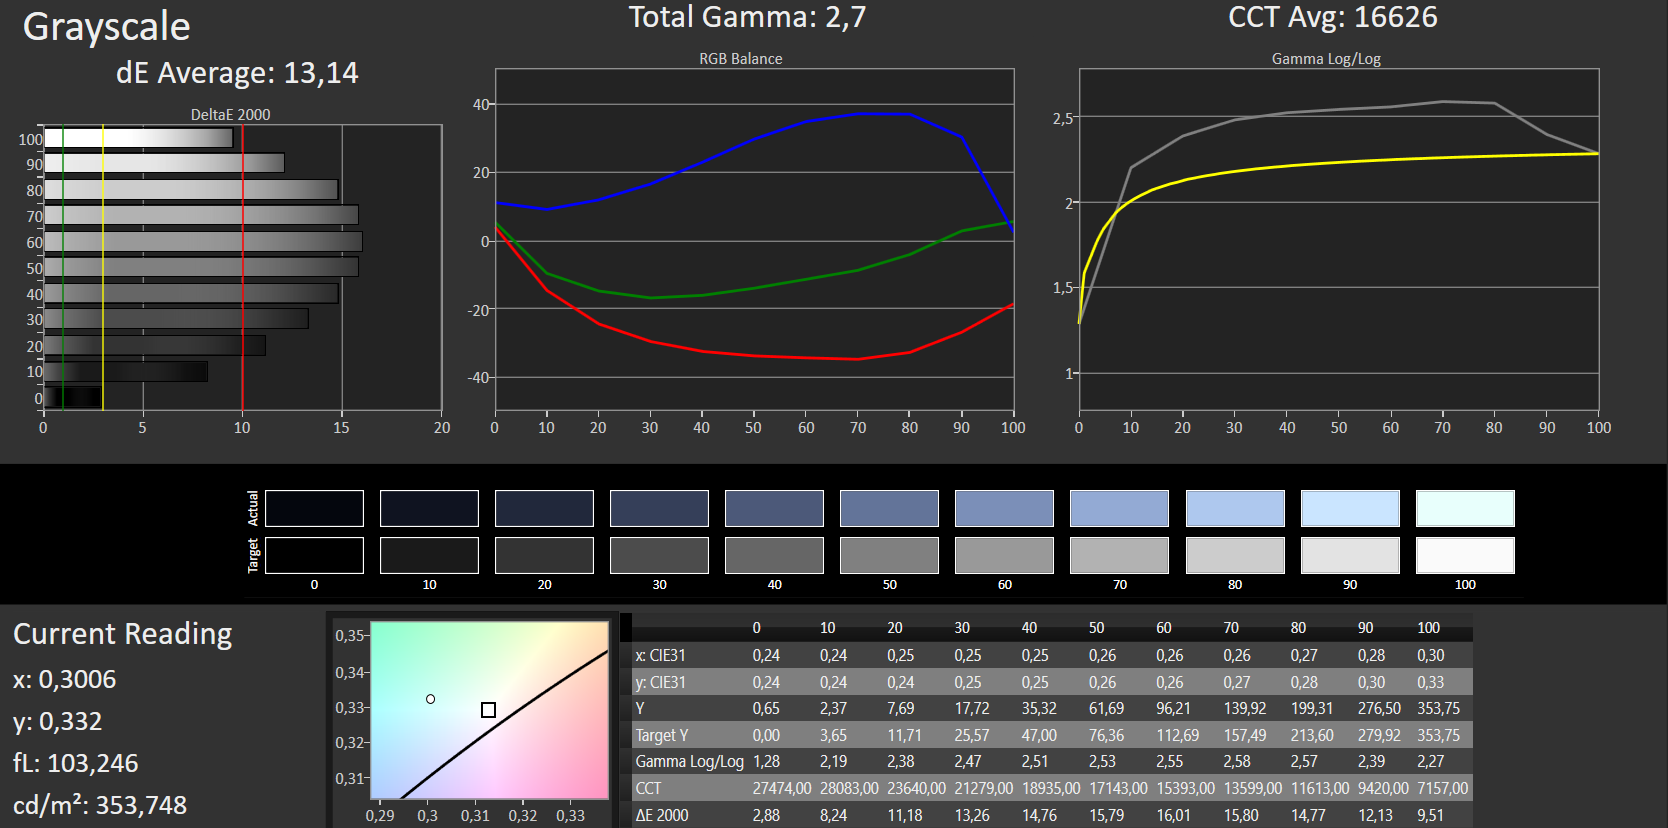
ΔE Greyscale Calman: 13.14 | ∀{0.09-98 Ø4.97}
81% sRGB (Argyll 1.6.3 3D)
52% AdobeRGB 1998 (Argyll 1.6.3 3D)
57% AdobeRGB 1998 (Argyll 3D)
81.1% sRGB (Argyll 3D)
55.2% Display P3 (Argyll 3D)
Gamma: 2.7
CCT: 16626 K
| HP Probook 650 G3 Z2W44ET TN LED, 1920x1080, 15.6" | HP ProBook 650 G2 V1A44ET TN LED, 1920x1080, 15.6" | HP ProBook 655 G2 T9X09ET TN LED, 1366x768, 15.6" | Acer TravelMate P658-M-537B IPS, 1920x1080, 15.6" | Dell Latitude 15 E5570 TN LED, 1366x768, 15.6" | Lenovo ThinkPad L560-20F10026GE AH-IPS, 1920x1080, 15.6" | Apple MacBook Pro 15 2016 (2.6 GHz, 450) IPS, 2880x1800, 15.4" | |
|---|---|---|---|---|---|---|---|
| Display | -5% | -19% | 12% | -26% | -29% | ||
| Display P3 Coverage (%) | 55.2 | 52.1 -6% | 44.49 -19% | 66.6 21% | 40.48 -27% | 39 -29% | |
| sRGB Coverage (%) | 81.1 | 78.3 -3% | 66.9 -18% | 85.7 6% | 60.9 -25% | 58.3 -28% | |
| AdobeRGB 1998 Coverage (%) | 57 | 53.7 -6% | 45.97 -19% | 62.8 10% | 41.82 -27% | 40.33 -29% | |
| Response Times | -4% | -12% | 4% | -12% | -4% | -20% | |
| Response Time Grey 50% / Grey 80% * (ms) | 38 ? | 41 ? -8% | 44 ? -16% | 38 ? -0% | 47 ? -24% | 39.2 ? -3% | 47.3 ? -24% |
| Response Time Black / White * (ms) | 27 ? | 27 ? -0% | 29 ? -7% | 25 ? 7% | 27 ? -0% | 28 ? -4% | 31.2 ? -16% |
| PWM Frequency (Hz) | 200 ? | 200 ? | 200 ? | 117000 ? | |||
| Screen | -6% | -6% | 15% | -10% | 7% | 69% | |
| Brightness middle (cd/m²) | 351 | 313 -11% | 248 -29% | 308 -12% | 228 -35% | 262 -25% | 483 38% |
| Brightness (cd/m²) | 345 | 296 -14% | 230 -33% | 319 -8% | 236 -32% | 250 -28% | 465 35% |
| Brightness Distribution (%) | 95 | 90 -5% | 88 -7% | 71 -25% | 90 -5% | 92 -3% | 92 -3% |
| Black Level * (cd/m²) | 0.65 | 0.59 9% | 0.56 14% | 0.61 6% | 0.56 14% | 0.29 55% | 0.33 49% |
| Contrast (:1) | 540 | 531 -2% | 443 -18% | 505 -6% | 407 -25% | 903 67% | 1464 171% |
| Colorchecker dE 2000 * | 11.02 | 11.89 -8% | 8.7 21% | 4.51 59% | 10.02 9% | 8.49 23% | 1.4 87% |
| Colorchecker dE 2000 max. * | 17.68 | 20.81 -18% | 14.96 15% | 10.19 42% | 15.93 10% | 17.99 -2% | 3 83% |
| Greyscale dE 2000 * | 13.14 | 12.95 1% | 11.48 13% | 2.91 78% | 10.66 19% | 8.11 38% | 1.5 89% |
| Gamma | 2.7 81% | 2.4 92% | 2.38 92% | 2.4 92% | 2.48 89% | 2.37 93% | 2.34 94% |
| CCT | 16626 39% | 15063 43% | 11179 58% | 6740 96% | 11800 55% | 6300 103% | 6650 98% |
| Color Space (Percent of AdobeRGB 1998) (%) | 52 | 50 -4% | 42 -19% | 56 8% | 39 -25% | 37.07 -29% | |
| Color Space (Percent of sRGB) (%) | 81 | 78 -4% | 67 -17% | 86 6% | 61 -25% | 57.94 -28% | |
| Media totale (Programma / Settaggio) | -5% /
-5% | -12% /
-9% | 10% /
13% | -16% /
-13% | -9% /
-2% | 25% /
51% |
* ... Meglio usare valori piccoli
Sfarfallio dello schermo / PWM (Pulse-Width Modulation)
| flickering dello schermo / PWM rilevato | 200 Hz | ≤ 50 % settaggio luminosita' | 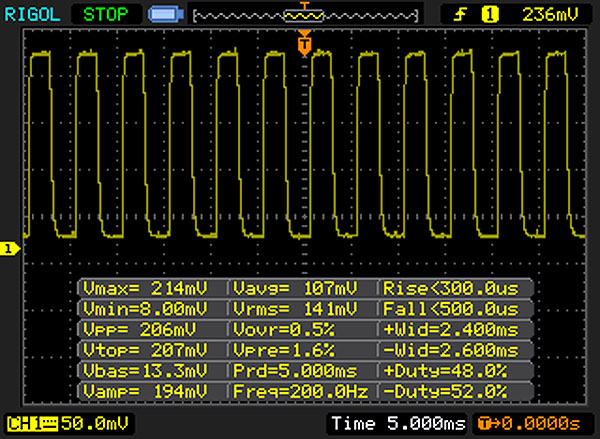 |
Il display sfarfalla a 200 Hz (Probabilmente a causa dell'uso di PWM) Flickering rilevato ad una luminosita' di 50 % o inferiore. Non dovrebbe verificarsi flickering o PWM sopra questo valore di luminosita'. La frequenza di 200 Hz è relativamente bassa, quindi gli utenti sensibili potrebbero notare il flickering ed accusare stanchezza agli occhi a questo livello di luminosità e a livelli inferiori. In confronto: 52 % di tutti i dispositivi testati non utilizza PWM per ridurre la luminosita' del display. Se è rilevato PWM, una media di 7794 (minimo: 5 - massimo: 343500) Hz è stata rilevata. | |||
Tempi di risposta del Display
| ↔ Tempi di risposta dal Nero al Bianco | ||
|---|---|---|
| 27 ms ... aumenta ↗ e diminuisce ↘ combinato | ↗ 9 ms Incremento | 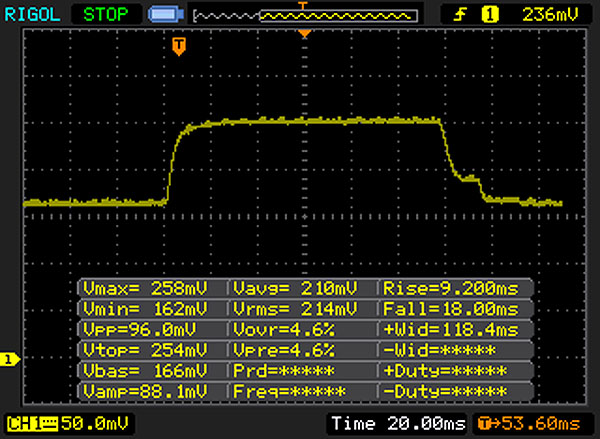 |
| ↘ 18 ms Calo | ||
| Lo schermo mostra tempi di risposta relativamente lenti nei nostri tests e potrebbe essere troppo lento per i gamers. In confronto, tutti i dispositivi di test variano da 0.1 (minimo) a 240 (massimo) ms. » 67 % di tutti i dispositivi è migliore. Questo significa che i tempi di risposta rilevati sono peggiori rispetto alla media di tutti i dispositivi testati (19.9 ms). | ||
| ↔ Tempo di risposta dal 50% Grigio all'80% Grigio | ||
| 38 ms ... aumenta ↗ e diminuisce ↘ combinato | ↗ 16 ms Incremento | 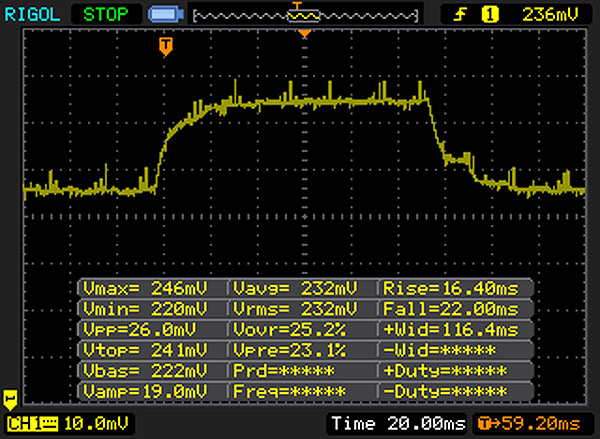 |
| ↘ 22 ms Calo | ||
| Lo schermo mostra tempi di risposta lenti nei nostri tests e sarà insoddisfacente per i gamers. In confronto, tutti i dispositivi di test variano da 0.165 (minimo) a 636 (massimo) ms. » 55 % di tutti i dispositivi è migliore. Questo significa che i tempi di risposta rilevati sono peggiori rispetto alla media di tutti i dispositivi testati (31.1 ms). | ||
| Cinebench R15 | |
| CPU Single 64Bit | |
| Apple MacBook Pro 15 2016 (2.6 GHz, 450) | |
| Dell Latitude 15 E5570 | |
| HP Probook 650 G3 Z2W44ET | |
| Lenovo ThinkPad L560-20F10026GE | |
| HP ProBook 650 G2 V1A44ET | |
| Acer TravelMate P658-M-537B | |
| HP ProBook 655 G2 T9X09ET | |
| CPU Multi 64Bit | |
| Apple MacBook Pro 15 2016 (2.6 GHz, 450) | |
| HP Probook 650 G3 Z2W44ET | |
| Dell Latitude 15 E5570 | |
| HP ProBook 650 G2 V1A44ET | |
| Lenovo ThinkPad L560-20F10026GE | |
| Acer TravelMate P658-M-537B | |
| HP ProBook 655 G2 T9X09ET | |
| Cinebench R10 | |
| Rendering Multiple CPUs 32Bit | |
| HP Probook 650 G3 Z2W44ET | |
| Dell Latitude 15 E5570 | |
| Lenovo ThinkPad L560-20F10026GE | |
| HP ProBook 650 G2 V1A44ET | |
| HP ProBook 655 G2 T9X09ET | |
| Rendering Single 32Bit | |
| HP Probook 650 G3 Z2W44ET | |
| Dell Latitude 15 E5570 | |
| Lenovo ThinkPad L560-20F10026GE | |
| HP ProBook 650 G2 V1A44ET | |
| HP ProBook 655 G2 T9X09ET | |
| Geekbench 3 | |
| 32 Bit Single-Core Score | |
| Dell Latitude 15 E5570 | |
| HP Probook 650 G3 Z2W44ET | |
| HP ProBook 650 G2 V1A44ET | |
| HP ProBook 655 G2 T9X09ET | |
| 32 Bit Multi-Core Score | |
| HP Probook 650 G3 Z2W44ET | |
| Dell Latitude 15 E5570 | |
| HP ProBook 650 G2 V1A44ET | |
| HP ProBook 655 G2 T9X09ET | |
| Geekbench 4.0 | |
| 64 Bit Single-Core Score | |
| Apple MacBook Pro 15 2016 (2.6 GHz, 450) | |
| HP Probook 650 G3 Z2W44ET | |
| HP ProBook 655 G2 T9X09ET | |
| 64 Bit Multi-Core Score | |
| Apple MacBook Pro 15 2016 (2.6 GHz, 450) | |
| HP Probook 650 G3 Z2W44ET | |
| HP ProBook 655 G2 T9X09ET | |
| JetStream 1.1 - 1.1 Total | |
| Apple MacBook Pro 15 2016 (2.6 GHz, 450) | |
| HP Probook 650 G3 Z2W44ET | |
| Dell Latitude 15 E5570 | |
| HP ProBook 650 G2 V1A44ET | |
| Lenovo ThinkPad L560-20F10026GE | |
| HP ProBook 655 G2 T9X09ET | |
| PCMark 7 Score | 3124 punti | |
| PCMark 8 Home Score Accelerated v2 | 3149 punti | |
| PCMark 8 Creative Score Accelerated v2 | 3741 punti | |
| PCMark 8 Work Score Accelerated v2 | 4118 punti | |
Aiuto | ||
| PCMark 8 | |
| Home Score Accelerated v2 | |
| Apple MacBook Pro 15 2016 (2.6 GHz, 450) | |
| Acer TravelMate P658-M-537B | |
| Dell Latitude 15 E5570 | |
| HP ProBook 650 G2 V1A44ET | |
| HP Probook 650 G3 Z2W44ET | |
| Lenovo ThinkPad L560-20F10026GE | |
| HP ProBook 655 G2 T9X09ET | |
| Work Score Accelerated v2 | |
| Acer TravelMate P658-M-537B | |
| Apple MacBook Pro 15 2016 (2.6 GHz, 450) | |
| Dell Latitude 15 E5570 | |
| HP Probook 650 G3 Z2W44ET | |
| Lenovo ThinkPad L560-20F10026GE | |
| HP ProBook 655 G2 T9X09ET | |

| HP Probook 650 G3 Z2W44ET Hitachi Travelstar Z7K500 HTS725050A7E630 | HP ProBook 655 G2 T9X09ET Seagate ST500LM021-1KJ15 | Acer TravelMate P658-M-537B Kingston RBU-SNS8152S3256GG2 | Dell Latitude 15 E5570 Samsung SSD PM871 MZ7LN128HCHP | Lenovo ThinkPad L560-20F10026GE WDC Slim WD10SPCX-21KHST0 | |
|---|---|---|---|---|---|
| CrystalDiskMark 3.0 | 12% | 8793% | 10223% | 42% | |
| Read Seq (MB/s) | 109.4 | 122.1 12% | 479.1 338% | 474.7 334% | 113.6 4% |
| Write Seq (MB/s) | 99.9 | 110.7 11% | 333.1 233% | 155 55% | 111.7 12% |
| Read 512 (MB/s) | 16.34 | 33.53 105% | 418 2458% | 393.6 2309% | 39.65 143% |
| Write 512 (MB/s) | 43.45 | 51.3 18% | 320.5 638% | 119.7 175% | 55.3 27% |
| Read 4k (MB/s) | 0.337 | 0.357 6% | 25.66 7514% | 34 9989% | 0.488 45% |
| Write 4k (MB/s) | 0.866 | 0.641 -26% | 64.7 7371% | 96.6 11055% | 1.022 18% |
| Read 4k QD32 (MB/s) | 0.826 | 0.778 -6% | 226.2 27285% | 383.3 46304% | 1.367 65% |
| Write 4k QD32 (MB/s) | 0.859 | 0.672 -22% | 211.4 24510% | 100.2 11565% | 1.036 21% |
| 3DMark 06 Standard Score | 6656 punti | |
| 3DMark 11 Performance | 1359 punti | |
| 3DMark Ice Storm Standard Score | 46690 punti | |
| 3DMark Cloud Gate Standard Score | 5064 punti | |
| 3DMark Fire Strike Score | 600 punti | |
Aiuto | ||
| 3DMark 11 - 1280x720 Performance GPU | |
| Apple MacBook Pro 15 2016 (2.6 GHz, 450) | |
| HP ProBook 655 G2 T9X09ET | |
| Acer TravelMate P658-M-537B | |
| HP Probook 650 G3 Z2W44ET | |
| Dell Latitude 15 E5570 | |
| Lenovo ThinkPad L560-20F10026GE | |
| HP ProBook 650 G2 V1A44ET | |
| 3DMark | |
| 1280x720 Cloud Gate Standard Graphics | |
| Apple MacBook Pro 15 2016 (2.6 GHz, 450) | |
| Acer TravelMate P658-M-537B | |
| Dell Latitude 15 E5570 | |
| Lenovo ThinkPad L560-20F10026GE | |
| HP Probook 650 G3 Z2W44ET | |
| 1920x1080 Fire Strike Graphics | |
| Apple MacBook Pro 15 2016 (2.6 GHz, 450) | |
| Dell Latitude 15 E5570 | |
| Lenovo ThinkPad L560-20F10026GE | |
| HP Probook 650 G3 Z2W44ET | |
| basso | medio | alto | ultra | |
|---|---|---|---|---|
| Tomb Raider (2013) | 52.1 | 26.2 | 14.4 | 9.6 |
| BioShock Infinite (2013) | 32.9 | 20.1 | 16.1 | 6.9 |
| Battlefield 4 (2013) | 24.4 | 19.3 | 12.2 | 6.1 |
Rumorosità
| Idle |
| 31.5 / 31.5 / 31.5 dB(A) |
| HDD |
| 32 dB(A) |
| DVD |
| 36.7 / dB(A) |
| Sotto carico |
| 34.6 / 33.3 dB(A) |
 | ||
30 dB silenzioso 40 dB(A) udibile 50 dB(A) rumoroso |
||
min: | ||
| HP Probook 650 G3 Z2W44ET i5-7200U, HD Graphics 620 | HP ProBook 650 G2 V1A44ET 6200U, HD Graphics 520 | HP ProBook 655 G2 T9X09ET Pro A8-8600B, Radeon R6 (Carrizo) | Acer TravelMate P658-M-537B 6200U, HD Graphics 520 | Dell Latitude 15 E5570 6300U, HD Graphics 520 | Lenovo ThinkPad L560-20F10026GE 6200U, HD Graphics 520 | Apple MacBook Pro 15 2016 (2.6 GHz, 450) 6700HQ, Radeon Pro 450 | |
|---|---|---|---|---|---|---|---|
| Noise | -0% | -0% | -9% | -4% | 3% | -5% | |
| off /ambiente * (dB) | 30.7 | 30.5 1% | 31.5 -3% | 31.2 -2% | 31.2 -2% | 29.4 4% | 30.4 1% |
| Idle Minimum * (dB) | 31.5 | 30.5 3% | 31.6 -0% | 32.5 -3% | 31.2 1% | 30.1 4% | 30.6 3% |
| Idle Average * (dB) | 31.5 | 31.6 -0% | 31.6 -0% | 32.5 -3% | 33.2 -5% | 30.1 4% | 30.6 3% |
| Idle Maximum * (dB) | 31.5 | 31.9 -1% | 31.6 -0% | 35 -11% | 34.3 -9% | 30.1 4% | 30.6 3% |
| Load Average * (dB) | 34.6 | 34.7 -0% | 33.5 3% | 42 -21% | 36.6 -6% | 33.4 3% | 34.7 -0% |
| Load Maximum * (dB) | 33.3 | 34.5 -4% | 33.5 -1% | 37.5 -13% | 34.7 -4% | 34.7 -4% | 46.3 -39% |
* ... Meglio usare valori piccoli
(+) La temperatura massima sul lato superiore è di 31.9 °C / 89 F, rispetto alla media di 34.3 °C / 94 F, che varia da 21.2 a 62.5 °C per questa classe Office.
(+) Il lato inferiore si riscalda fino ad un massimo di 32.1 °C / 90 F, rispetto alla media di 36.8 °C / 98 F
(+) In idle, la temperatura media del lato superiore è di 22.1 °C / 72 F, rispetto alla media deld ispositivo di 29.5 °C / 85 F.
(+) I poggiapolsi e il touchpad sono piu' freddi della temperatura della pelle con un massimo di 25.6 °C / 78.1 F e sono quindi freddi al tatto.
(±) La temperatura media della zona del palmo della mano di dispositivi simili e'stata di 27.5 °C / 81.5 F (+1.9 °C / 3.4 F).
| HP Probook 650 G3 Z2W44ET i5-7200U, HD Graphics 620 | HP ProBook 650 G2 V1A44ET 6200U, HD Graphics 520 | HP ProBook 655 G2 T9X09ET Pro A8-8600B, Radeon R6 (Carrizo) | Acer TravelMate P658-M-537B 6200U, HD Graphics 520 | Dell Latitude 15 E5570 6300U, HD Graphics 520 | Lenovo ThinkPad L560-20F10026GE 6200U, HD Graphics 520 | Apple MacBook Pro 15 2016 (2.6 GHz, 450) 6700HQ, Radeon Pro 450 | |
|---|---|---|---|---|---|---|---|
| Heat | -26% | -26% | -17% | -36% | -23% | -18% | |
| Maximum Upper Side * (°C) | 31.9 | 39.6 -24% | 35.8 -12% | 35.2 -10% | 37.3 -17% | 37.2 -17% | 43 -35% |
| Maximum Bottom * (°C) | 32.1 | 41.8 -30% | 37.6 -17% | 38 -18% | 41.5 -29% | 36 -12% | 40 -25% |
| Idle Upper Side * (°C) | 23.5 | 31.6 -34% | 33.4 -42% | 29.5 -26% | 34.2 -46% | 30.7 -31% | 26 -11% |
| Idle Bottom * (°C) | 25.3 | 29.7 -17% | 33.2 -31% | 29 -15% | 38.8 -53% | 32.8 -30% | 25 1% |
* ... Meglio usare valori piccoli
HP Probook 650 G3 Z2W44ET analisi audio
(-) | altoparlanti non molto potenti (68 dB)
Bassi 100 - 315 Hz
(±) | bassi ridotti - in media 14.6% inferiori alla media
(±) | la linearità dei bassi è media (7.3% delta rispetto alla precedente frequenza)
Medi 400 - 2000 Hz
(+) | medi bilanciati - solo only 3% rispetto alla media
(+) | medi lineari (4.5% delta rispetto alla precedente frequenza)
Alti 2 - 16 kHz
(±) | alti elevati - circa 8.5% superiori alla media
(±) | la linearità degli alti è media (7.6% delta rispetto alla precedente frequenza)
Nel complesso 100 - 16.000 Hz
(±) | la linearità complessiva del suono è media (21% di differenza rispetto alla media
Rispetto alla stessa classe
» 49% di tutti i dispositivi testati in questa classe è stato migliore, 10% simile, 41% peggiore
» Il migliore ha avuto un delta di 7%, medio di 21%, peggiore di 53%
Rispetto a tutti i dispositivi testati
» 57% di tutti i dispositivi testati in questa classe è stato migliore, 7% similare, 35% peggiore
» Il migliore ha avuto un delta di 4%, medio di 24%, peggiore di 134%
Apple MacBook 12 (Early 2016) 1.1 GHz analisi audio
(+) | gli altoparlanti sono relativamente potenti (83.6 dB)
Bassi 100 - 315 Hz
(±) | bassi ridotti - in media 11.3% inferiori alla media
(±) | la linearità dei bassi è media (14.2% delta rispetto alla precedente frequenza)
Medi 400 - 2000 Hz
(+) | medi bilanciati - solo only 2.4% rispetto alla media
(+) | medi lineari (5.5% delta rispetto alla precedente frequenza)
Alti 2 - 16 kHz
(+) | Alti bilanciati - appena 2% dalla media
(+) | alti lineari (4.5% delta rispetto alla precedente frequenza)
Nel complesso 100 - 16.000 Hz
(+) | suono nel complesso lineare (10.2% differenza dalla media)
Rispetto alla stessa classe
» 7% di tutti i dispositivi testati in questa classe è stato migliore, 2% simile, 91% peggiore
» Il migliore ha avuto un delta di 5%, medio di 18%, peggiore di 53%
Rispetto a tutti i dispositivi testati
» 5% di tutti i dispositivi testati in questa classe è stato migliore, 1% similare, 94% peggiore
» Il migliore ha avuto un delta di 4%, medio di 24%, peggiore di 134%
| Off / Standby | |
| Idle | |
| Sotto carico |
|
Leggenda:
min: | |
| HP Probook 650 G3 Z2W44ET i5-7200U, HD Graphics 620 | HP ProBook 650 G2 V1A44ET 6200U, HD Graphics 520 | HP ProBook 655 G2 T9X09ET Pro A8-8600B, Radeon R6 (Carrizo) | Acer TravelMate P658-M-537B 6200U, HD Graphics 520 | Dell Latitude 15 E5570 6300U, HD Graphics 520 | Lenovo ThinkPad L560-20F10026GE 6200U, HD Graphics 520 | Apple MacBook Pro 15 2016 (2.6 GHz, 450) 6700HQ, Radeon Pro 450 | |
|---|---|---|---|---|---|---|---|
| Power Consumption | 2% | -16% | -46% | -7% | -13% | -77% | |
| Idle Minimum * (Watt) | 4 | 3.4 15% | 5.8 -45% | 6.6 -65% | 4.5 -13% | 5 -25% | 2.9 27% |
| Idle Average * (Watt) | 6.9 | 7.5 -9% | 7.5 -9% | 10.4 -51% | 7.6 -10% | 7.9 -14% | 9.7 -41% |
| Idle Maximum * (Watt) | 7.6 | 7.6 -0% | 8.6 -13% | 12.7 -67% | 8.7 -14% | 8.6 -13% | 10.1 -33% |
| Load Average * (Watt) | 29 | 28.4 2% | 31 -7% | 36 -24% | 28.5 2% | 27.5 5% | 65 -124% |
| Load Maximum * (Watt) | 28.7 | 28.4 1% | 30.5 -6% | 35 -22% | 29.2 -2% | 33.7 -17% | 89.5 -212% |
* ... Meglio usare valori piccoli
| HP Probook 650 G3 Z2W44ET i5-7200U, HD Graphics 620, 48 Wh | HP ProBook 650 G2-T9X61ET 6200U, HD Graphics 520, 48 Wh | HP ProBook 650 G2 V1A44ET 6200U, HD Graphics 520, 48 Wh | HP ProBook 655 G2 T9X09ET Pro A8-8600B, Radeon R6 (Carrizo), 48 Wh | Acer TravelMate P658-M-537B 6200U, HD Graphics 520, 55 Wh | Dell Latitude 15 E5570 6300U, HD Graphics 520, 62 Wh | Lenovo ThinkPad L560-20F10026GE 6200U, HD Graphics 520, 48 Wh | Apple MacBook Pro 15 2016 (2.6 GHz, 450) 6700HQ, Radeon Pro 450, 76 Wh | |
|---|---|---|---|---|---|---|---|---|
| Autonomia della batteria | -9% | -9% | -53% | -4% | 30% | -23% | -5% | |
| Reader / Idle (h) | 12.8 | 11.5 -10% | 14 9% | 20.5 60% | 11.6 -9% | |||
| H.264 (h) | 6.7 | 6.4 -4% | 9.5 42% | 4.6 -31% | 8.6 28% | |||
| WiFi v1.3 (h) | 7.8 | 6.8 -13% | 7.1 -9% | 3.7 -53% | 8.5 9% | 10.5 35% | 6.8 -13% | 10 28% |
| Load (h) | 3 | 2.7 -10% | 2.1 -30% | 2.5 -17% | 1.8 -40% | 0.9 -70% |
Pro
Contro
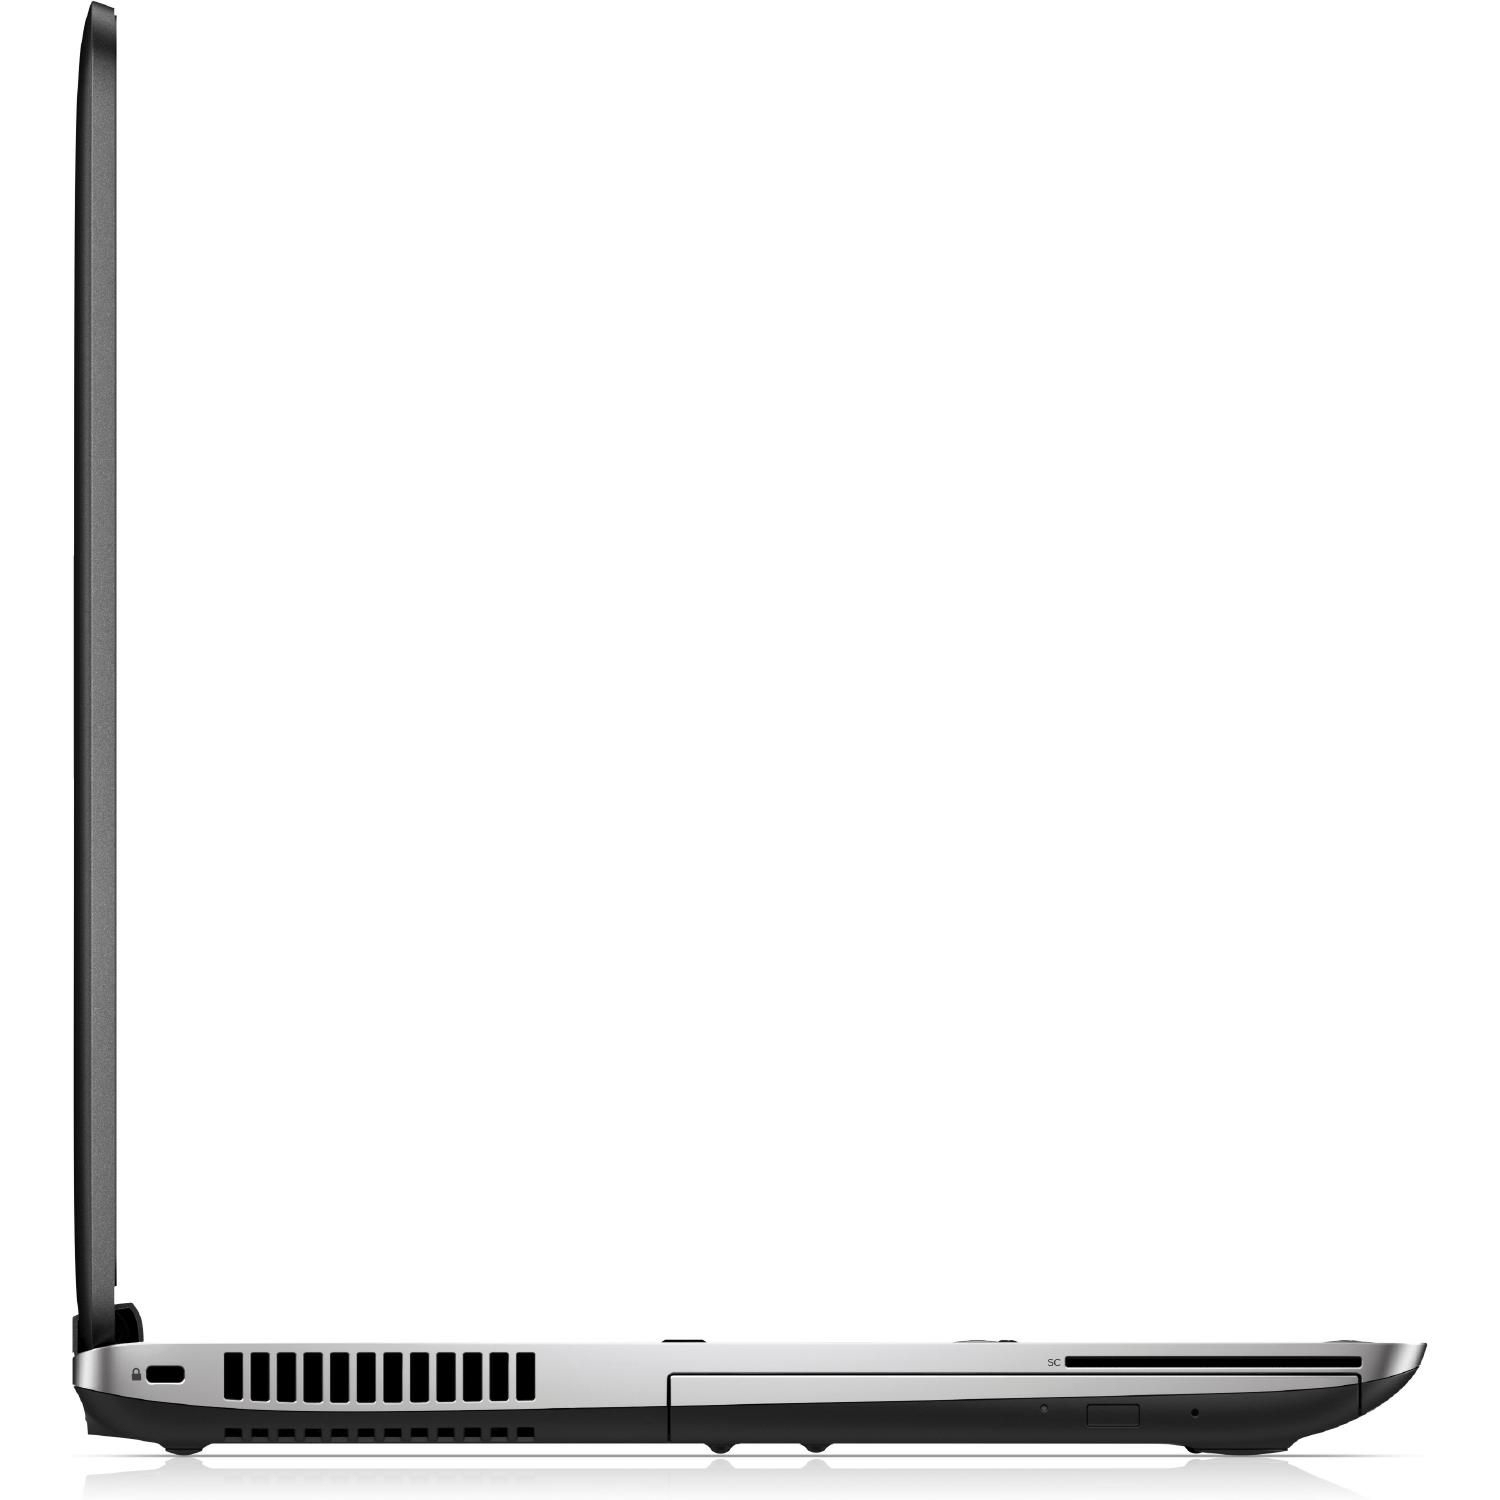
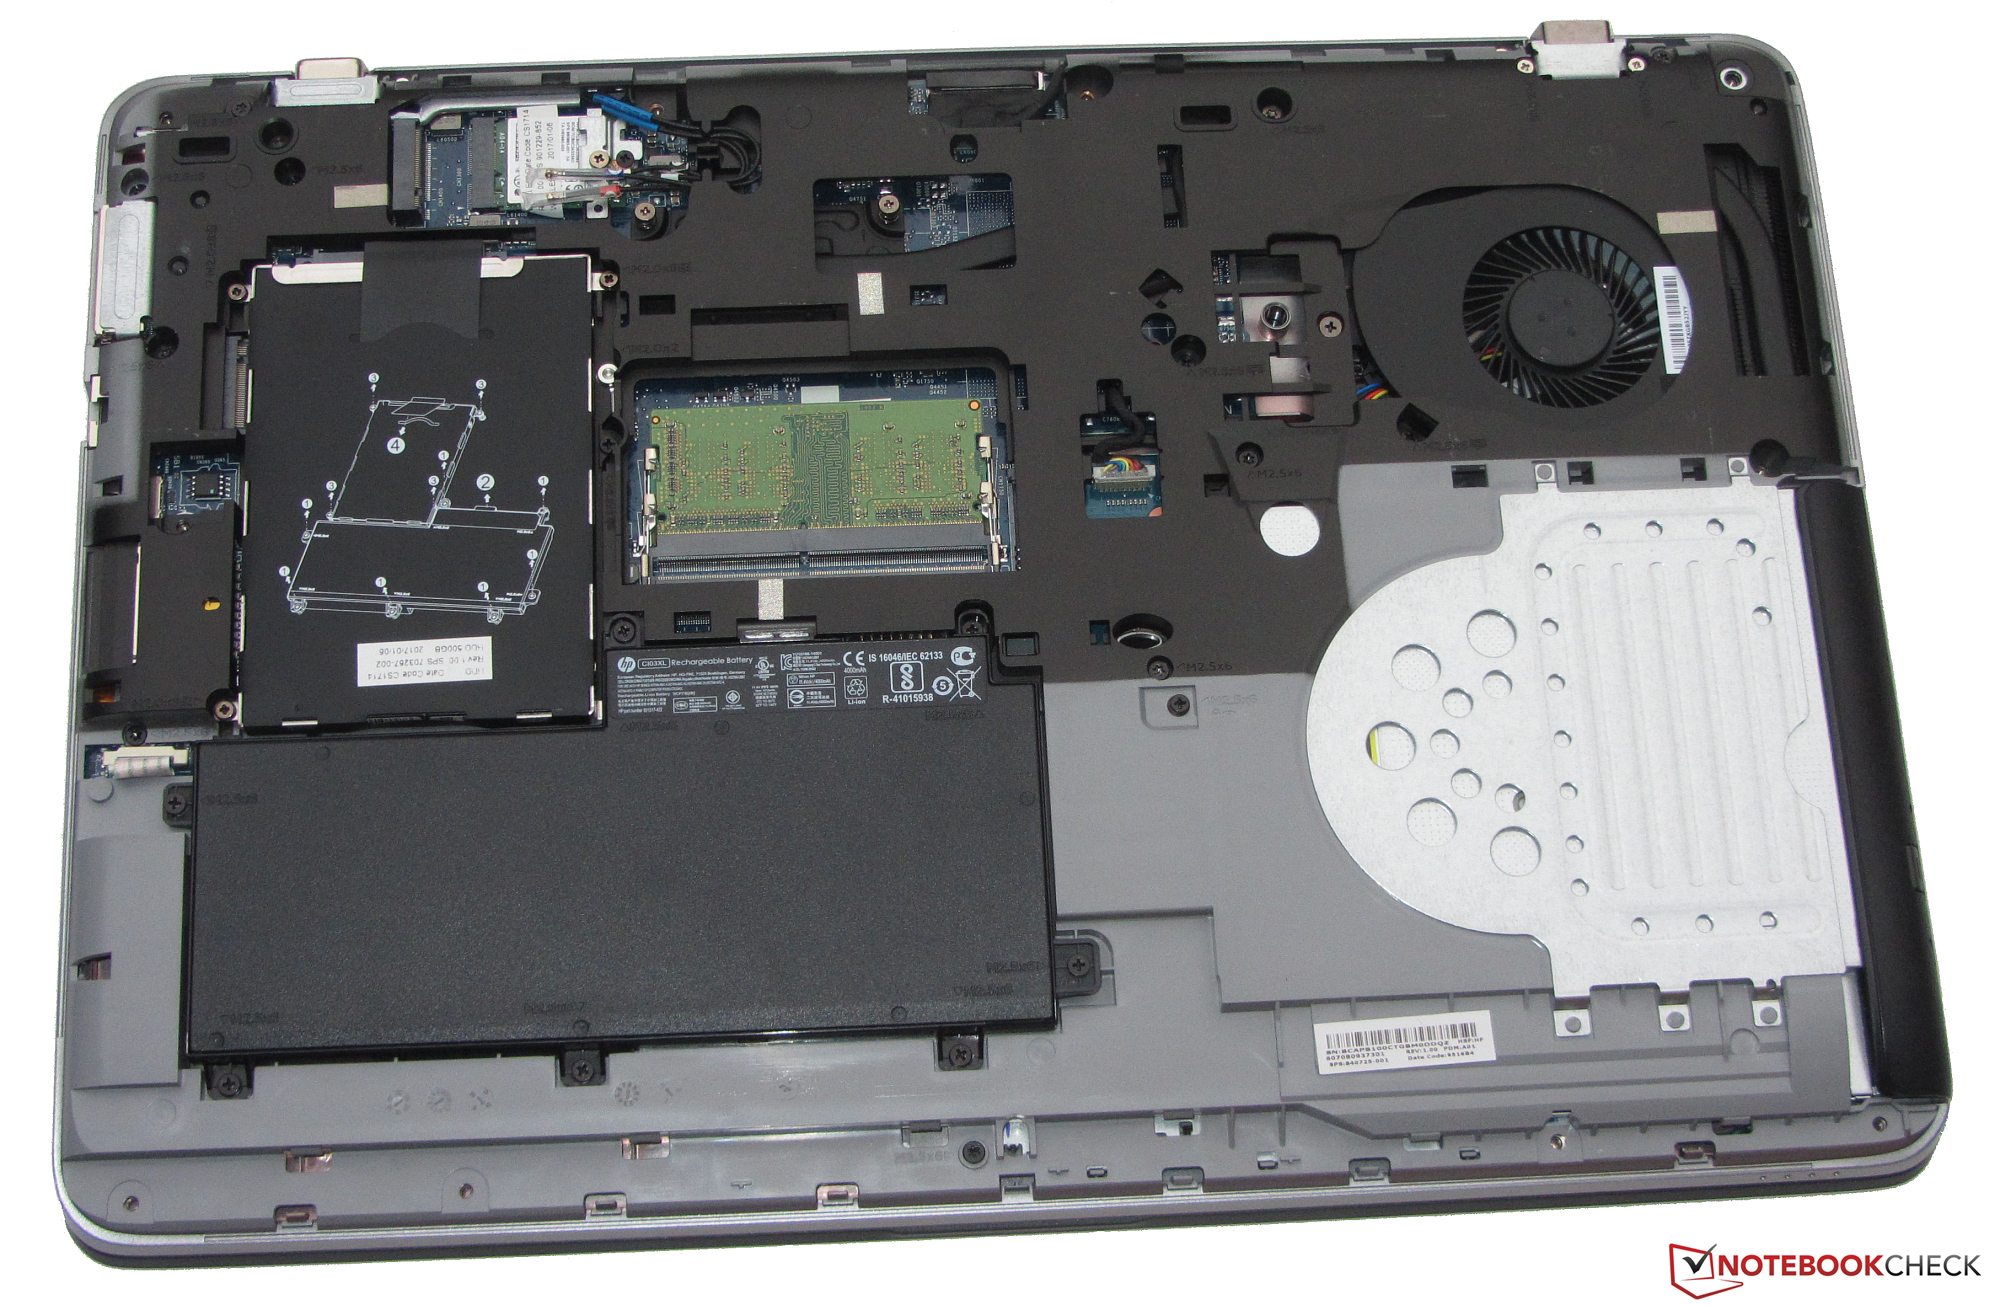
Il notebook HP mid-range business ha performance un tantino migliori grazie ai nuovi processori Kaby Lake. Tuttavia, questo sarà difficilmente visibile durante le attività quotidiane. I nuovi processori migliorano l'autonomia della batteria. Il laptop può superare i già buoni risultati dei predecessori. Il computer funziona silenziosamente e si salda poco indipendentemente dal carico di lavoro. Con un hard disk da 500 GB, non sarà molto veloce. È possibile sostituire l'HDD con una SSD. Ciò richiede la rimozione della parte inferiore - che viene fatta abbastanza facilmente.
In generale, HP realizza un notebook business solido con il ProBook 650 G3. Tuttavia, il modello di test è meno attraente di quanto potrebbe essere poichè il prezzo è troppo elevato per le caratteristiche fornite.
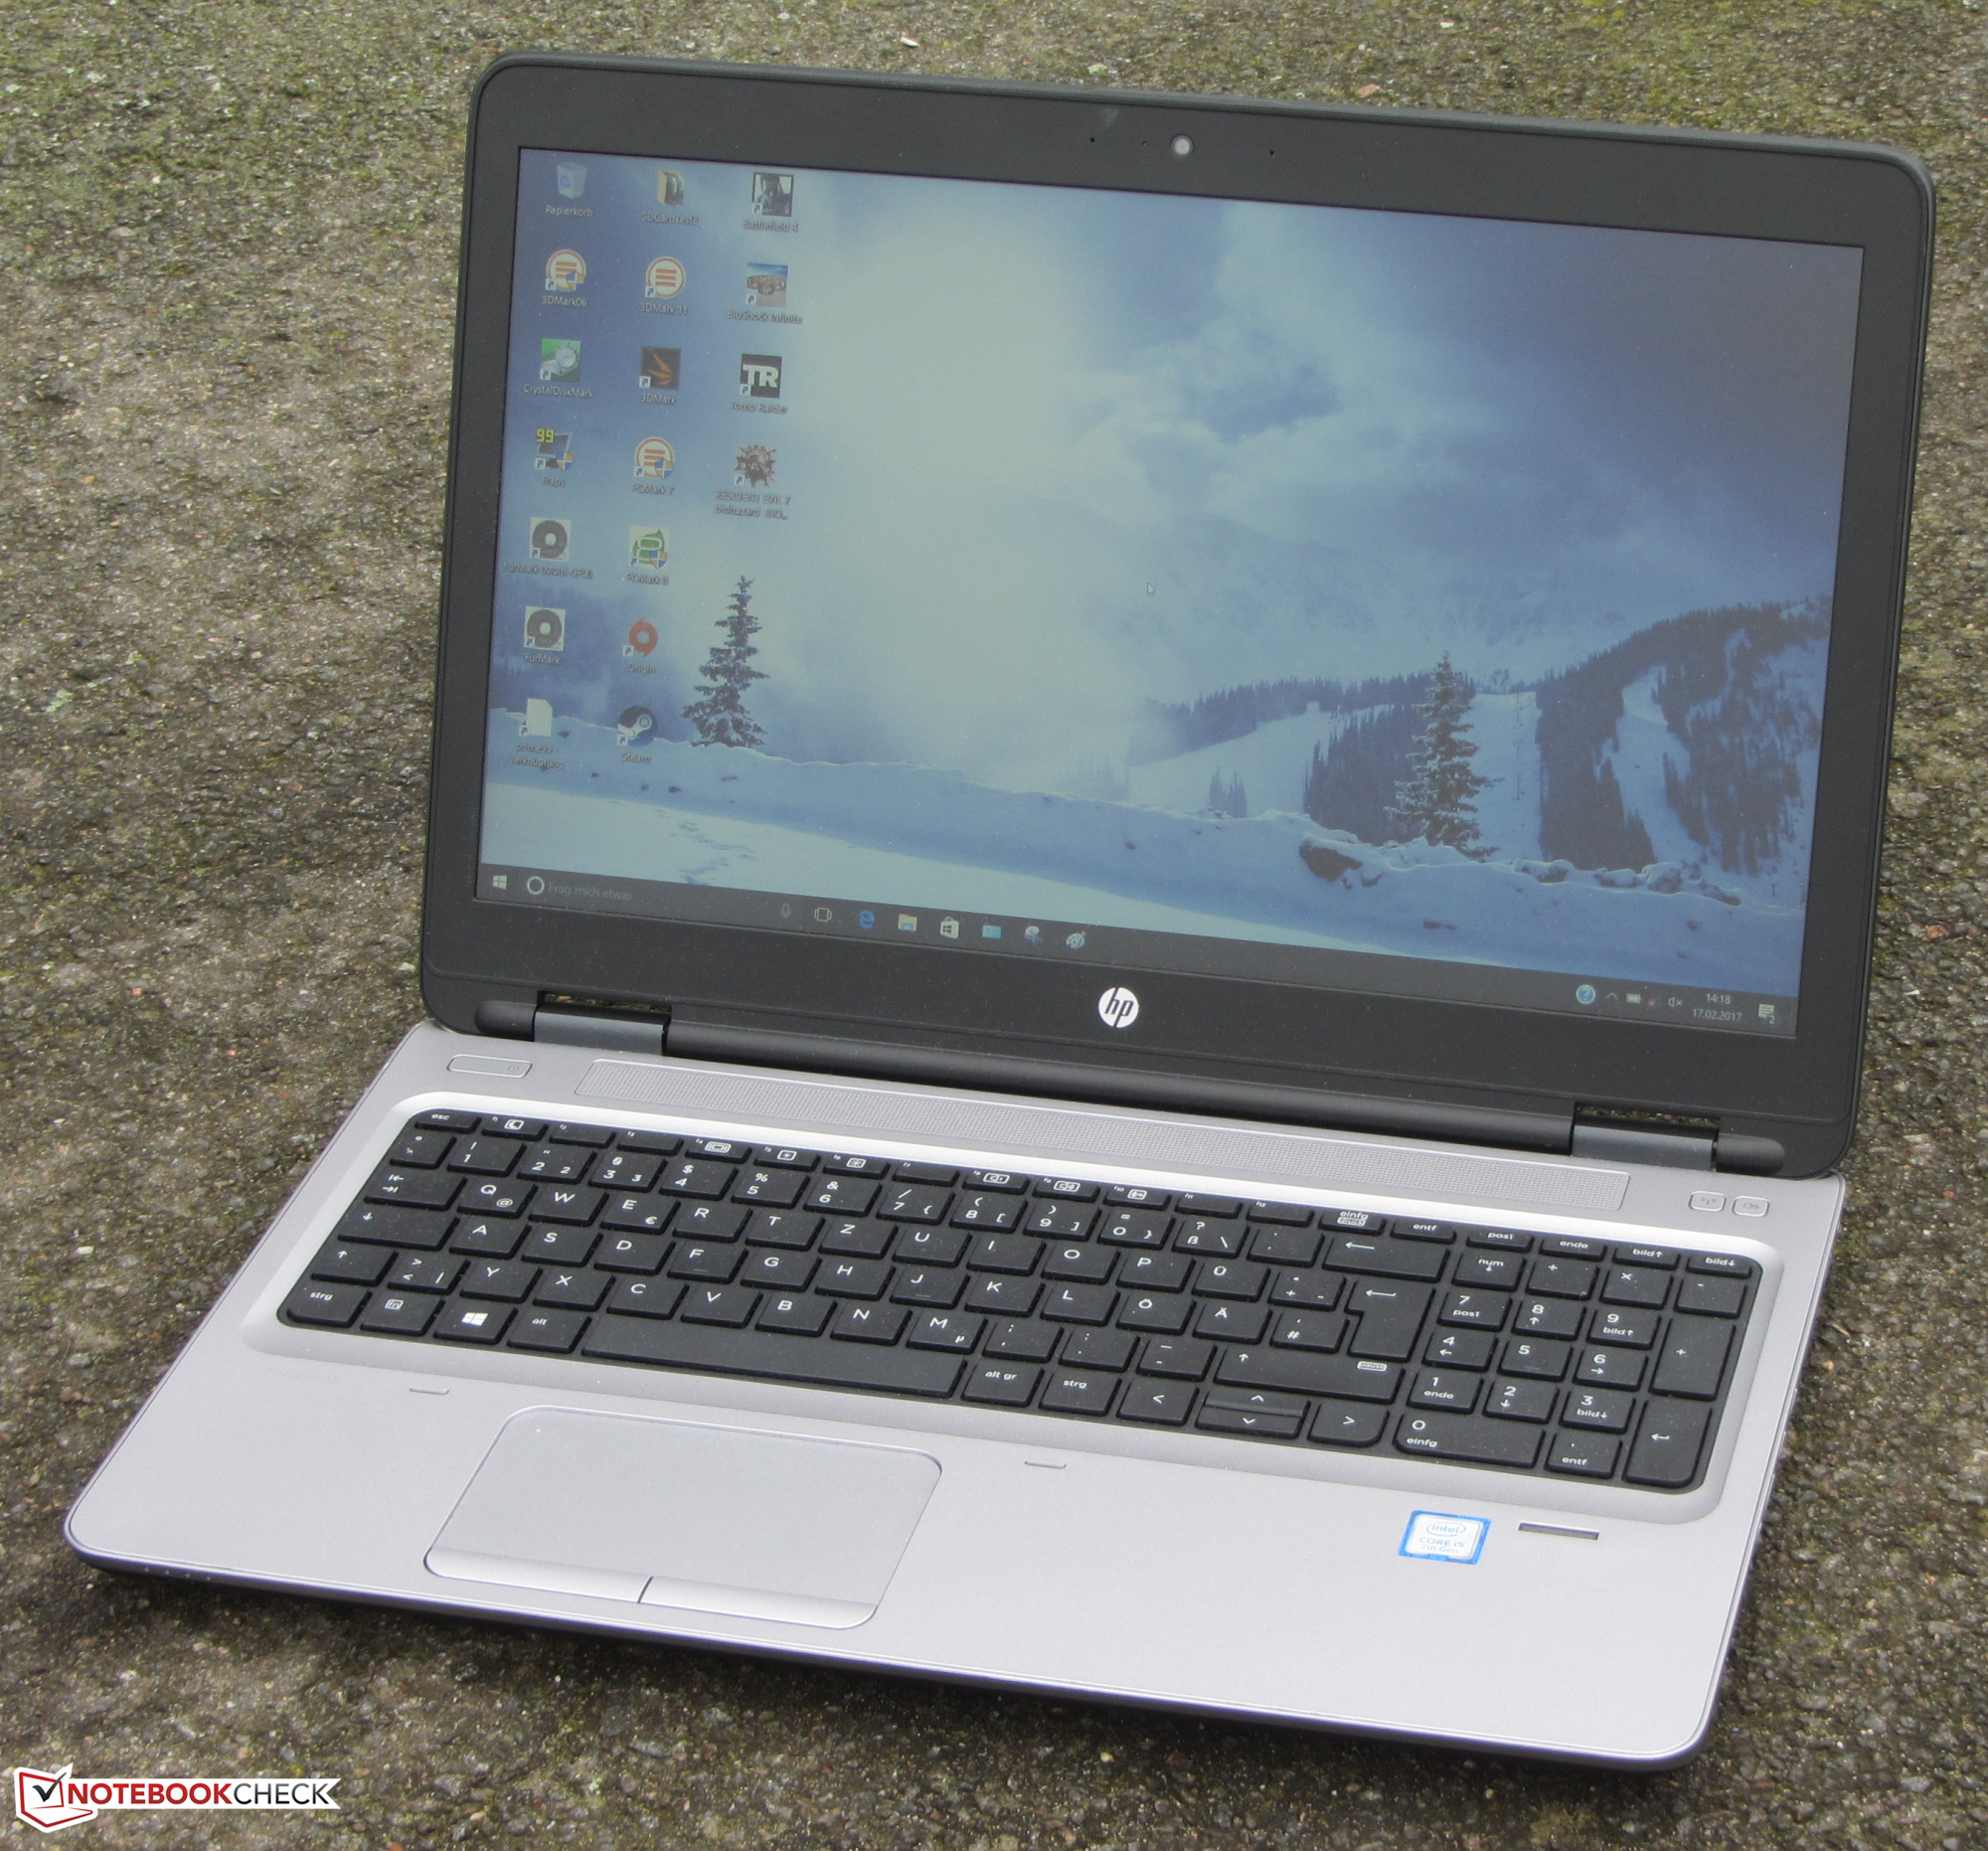
Parlando dell'SSD: HP offre in effetti per 1.050-Euro (~ $ 1111) un notebook con una HDD al posto di un SSD. Questo è certamente un evidente punto debole. La tastiera sembra buona ed è fatta per chi scrive molto. Tuttavia, manca una retroilluminazione. Questa dovrebbe essere una caratteristica standard considerando il prezzo del computer. Inoltre, il display è davvero deludente. Il produttore include un modello TN a basso contrasto con angoli di visione limitati. Questo display è considerato assolutamente fuori luogo in un notebook di questa fascia di prezzo. Ci aspettiamo un modello IPS.
Nota: si tratta di una recensione breve, con alcune sezioni non tradotte, per la versione integrale in inglese guardate qui.
HP Probook 650 G3 Z2W44ET
- 02/21/2017 v6 (old)
Sascha Mölck