Recensione breve del notebook Dell Latitude 15 E5570
| SD Card Reader | |
| average JPG Copy Test (av. of 3 runs) | |
| Dell Latitude 15 E5570 | |
| Lenovo ThinkPad L560-20F10026GE | |
| HP EliteBook 850 G3 | |
| Toshiba Tecra A50-C-1G0 | |
| maximum AS SSD Seq Read Test (1GB) | |
| HP EliteBook 850 G3 | |
| Lenovo ThinkPad L560-20F10026GE | |
| Toshiba Tecra A50-C-1G0 | |
| |||||||||||||||||||||||||
Distribuzione della luminosità: 90 %
Al centro con la batteria: 228 cd/m²
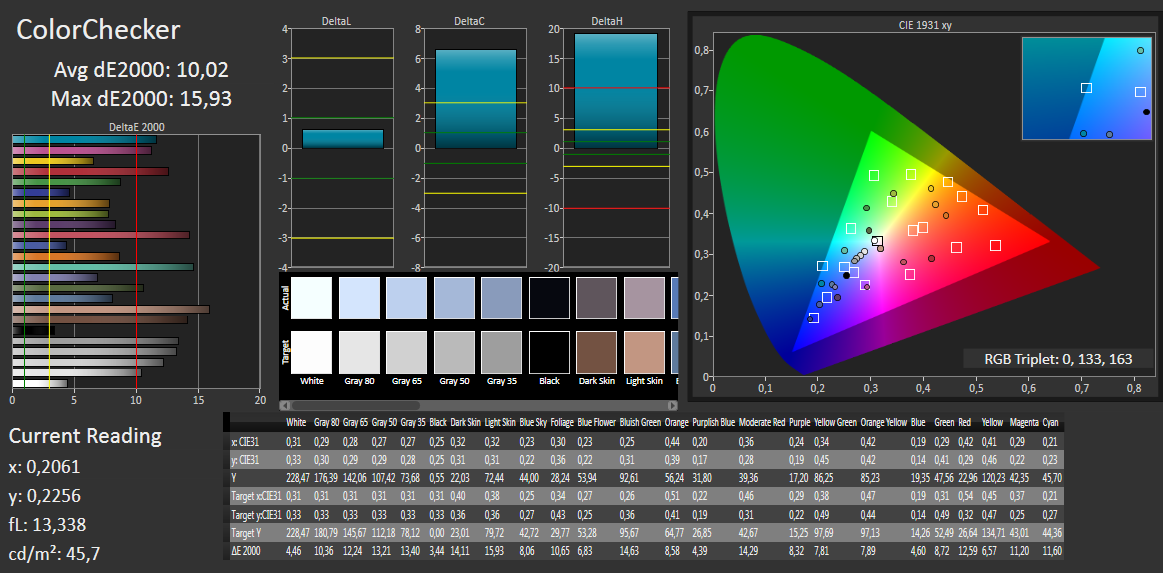
Contrasto: 407:1 (Nero: 0.56 cd/m²)
ΔE ColorChecker Calman: 10.02 | ∀{0.5-29.43 Ø4.72}
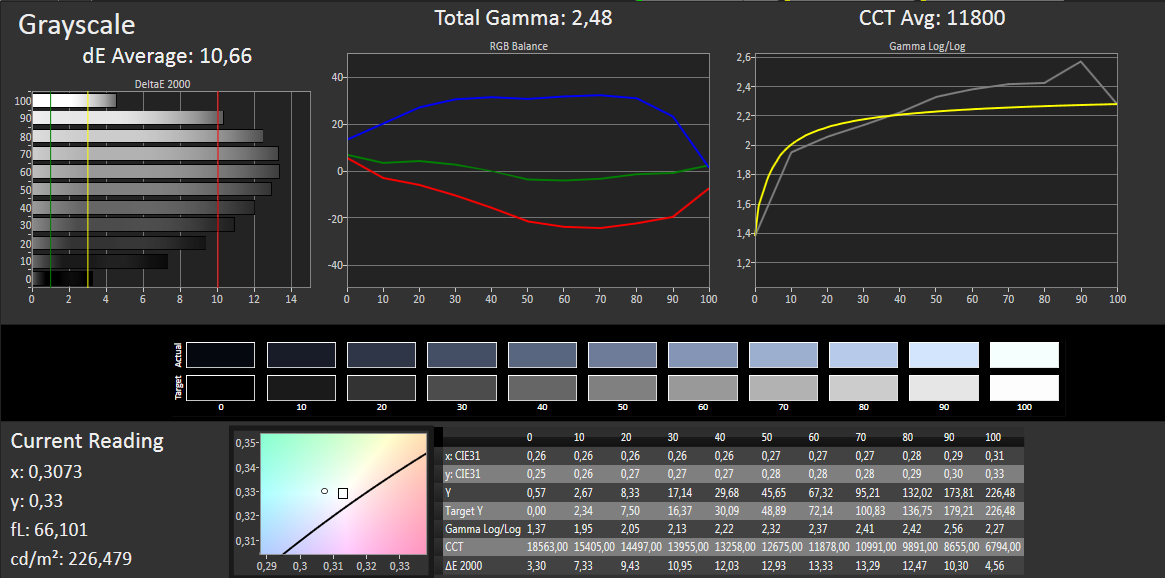
ΔE Greyscale Calman: 10.66 | ∀{0.09-98 Ø4.97}
61% sRGB (Argyll 1.6.3 3D)
39% AdobeRGB 1998 (Argyll 1.6.3 3D)
41.82% AdobeRGB 1998 (Argyll 3D)
60.9% sRGB (Argyll 3D)
40.48% Display P3 (Argyll 3D)
Gamma: 2.48
CCT: 11800 K
Sfarfallio dello schermo / PWM (Pulse-Width Modulation)
| flickering dello schermo / PWM non rilevato | ||
In confronto: 52 % di tutti i dispositivi testati non utilizza PWM per ridurre la luminosita' del display. Se è rilevato PWM, una media di 7781 (minimo: 5 - massimo: 343500) Hz è stata rilevata. | ||
Tempi di risposta del Display
| ↔ Tempi di risposta dal Nero al Bianco | ||
|---|---|---|
| 27 ms ... aumenta ↗ e diminuisce ↘ combinato | ↗ 10 ms Incremento | 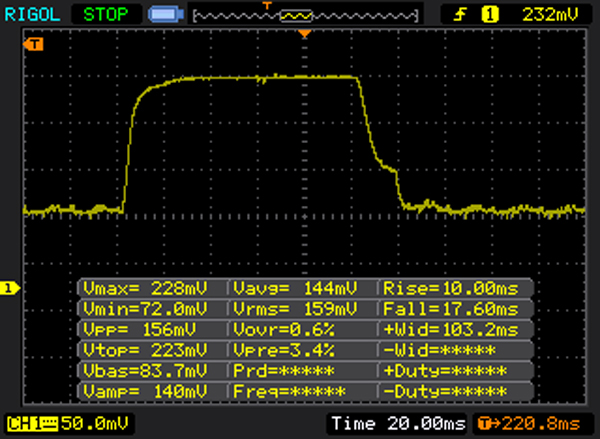 |
| ↘ 17 ms Calo | ||
| Lo schermo mostra tempi di risposta relativamente lenti nei nostri tests e potrebbe essere troppo lento per i gamers. In confronto, tutti i dispositivi di test variano da 0.1 (minimo) a 240 (massimo) ms. » 67 % di tutti i dispositivi è migliore. Questo significa che i tempi di risposta rilevati sono peggiori rispetto alla media di tutti i dispositivi testati (19.8 ms). | ||
| ↔ Tempo di risposta dal 50% Grigio all'80% Grigio | ||
| 47 ms ... aumenta ↗ e diminuisce ↘ combinato | ↗ 22 ms Incremento |  |
| ↘ 25 ms Calo | ||
| Lo schermo mostra tempi di risposta lenti nei nostri tests e sarà insoddisfacente per i gamers. In confronto, tutti i dispositivi di test variano da 0.165 (minimo) a 636 (massimo) ms. » 81 % di tutti i dispositivi è migliore. Questo significa che i tempi di risposta rilevati sono peggiori rispetto alla media di tutti i dispositivi testati (31 ms). | ||
| Dell Latitude 15 E5570 TN LED, 1366x768 | Dell Latitude E5550 Broadwell IPS, 1920x1080 | HP EliteBook 850 G3 TN LED, 1920x1080 | Lenovo ThinkPad L560-20F10026GE AH-IPS, 1920x1080 | Toshiba Tecra A50-C-1G0 IPS, 1920x1080 | |
|---|---|---|---|---|---|
| Display | 60% | 33% | -4% | 49% | |
| Display P3 Coverage (%) | 40.48 | 65.6 62% | 54.2 34% | 39 -4% | 65.6 62% |
| sRGB Coverage (%) | 60.9 | 95.3 56% | 79.3 30% | 58.3 -4% | 84 38% |
| AdobeRGB 1998 Coverage (%) | 41.82 | 67.6 62% | 56 34% | 40.33 -4% | 61.5 47% |
| Response Times | 0% | 7% | 18% | ||
| Response Time Grey 50% / Grey 80% * (ms) | 47 ? | 46.4 ? 1% | 39.2 ? 17% | 27 ? 43% | |
| Response Time Black / White * (ms) | 27 ? | 27.2 ? -1% | 28 ? -4% | 29 ? -7% | |
| PWM Frequency (Hz) | 200 ? | 50 ? | |||
| Screen | 33% | 15% | 21% | 50% | |
| Brightness middle (cd/m²) | 228 | 312 37% | 290 27% | 262 15% | 345 51% |
| Brightness (cd/m²) | 236 | 295 25% | 287 22% | 250 6% | 318 35% |
| Brightness Distribution (%) | 90 | 77 -14% | 85 -6% | 92 2% | 81 -10% |
| Black Level * (cd/m²) | 0.56 | 0.53 5% | 0.54 4% | 0.29 48% | 0.35 38% |
| Contrast (:1) | 407 | 589 45% | 537 32% | 903 122% | 986 142% |
| Colorchecker dE 2000 * | 10.02 | 4.32 57% | 9.7 3% | 8.49 15% | 4.04 60% |
| Colorchecker dE 2000 max. * | 15.93 | 14.39 10% | 17.99 -13% | 10.35 35% | |
| Greyscale dE 2000 * | 10.66 | 5.34 50% | 10.83 -2% | 8.11 24% | 3.18 70% |
| Gamma | 2.48 89% | 2.71 81% | 2.91 76% | 2.37 93% | 2.45 90% |
| CCT | 11800 55% | 6998 93% | 12761 51% | 6300 103% | 6206 105% |
| Color Space (Percent of AdobeRGB 1998) (%) | 39 | 62 59% | 51.15 31% | 37.07 -5% | 55 41% |
| Color Space (Percent of sRGB) (%) | 61 | 78.96 29% | 57.94 -5% | 84 38% | |
| Media totale (Programma / Settaggio) | 47% /
40% | 16% /
17% | 8% /
14% | 39% /
46% |
* ... Meglio usare valori piccoli
| Cinebench R15 | |
| CPU Single 64Bit | |
| Dell Latitude E5570 N026LE557015EMEA | |
| HP EliteBook 850 G3 | |
| Dell Latitude 15 E5570 | |
| Dell Latitude E5550 Broadwell | |
| Lenovo ThinkPad L560-20F10026GE | |
| Toshiba Tecra A50-C-1G0 | |
| CPU Multi 64Bit | |
| Dell Latitude E5570 N026LE557015EMEA | |
| HP EliteBook 850 G3 | |
| Dell Latitude 15 E5570 | |
| Lenovo ThinkPad L560-20F10026GE | |
| Toshiba Tecra A50-C-1G0 | |
| Dell Latitude E5550 Broadwell | |
| Cinebench R11.5 | |
| CPU Multi 64Bit | |
| Dell Latitude E5570 N026LE557015EMEA | |
| HP EliteBook 850 G3 | |
| Dell Latitude 15 E5570 | |
| Lenovo ThinkPad L560-20F10026GE | |
| Dell Latitude E5550 Broadwell | |
| Toshiba Tecra A50-C-1G0 | |
| CPU Single 64Bit | |
| Dell Latitude E5570 N026LE557015EMEA | |
| HP EliteBook 850 G3 | |
| Dell Latitude 15 E5570 | |
| Dell Latitude E5550 Broadwell | |
| Lenovo ThinkPad L560-20F10026GE | |
| Toshiba Tecra A50-C-1G0 | |
| Cinebench R10 | |
| Rendering Multiple CPUs 32Bit | |
| Dell Latitude E5570 N026LE557015EMEA | |
| HP EliteBook 850 G3 | |
| Dell Latitude 15 E5570 | |
| Lenovo ThinkPad L560-20F10026GE | |
| Dell Latitude E5550 Broadwell | |
| Rendering Single 32Bit | |
| Dell Latitude E5570 N026LE557015EMEA | |
| HP EliteBook 850 G3 | |
| Dell Latitude 15 E5570 | |
| Dell Latitude E5550 Broadwell | |
| Lenovo ThinkPad L560-20F10026GE | |
| Geekbench 3 | |
| 32 Bit Single-Core Score | |
| HP EliteBook 850 G3 | |
| Dell Latitude 15 E5570 | |
| Dell Latitude E5550 Broadwell | |
| 32 Bit Multi-Core Score | |
| HP EliteBook 850 G3 | |
| Dell Latitude 15 E5570 | |
| Dell Latitude E5550 Broadwell | |
| JetStream 1.1 - 1.1 Total | |
| HP EliteBook 850 G3 | |
| Dell Latitude 15 E5570 | |
| Lenovo ThinkPad L560-20F10026GE | |
| Mozilla Kraken 1.1 - Total | |
| Lenovo ThinkPad L560-20F10026GE | |
| Dell Latitude E5550 Broadwell | |
| Dell Latitude 15 E5570 | |
| HP EliteBook 850 G3 | |
| Octane V2 - Total Score | |
| HP EliteBook 850 G3 | |
| Dell Latitude 15 E5570 | |
| Lenovo ThinkPad L560-20F10026GE | |
| Dell Latitude E5550 Broadwell | |
| Peacekeeper - --- | |
| HP EliteBook 850 G3 | |
| Dell Latitude 15 E5570 | |
| Dell Latitude E5550 Broadwell | |
* ... Meglio usare valori piccoli
| PCMark 7 Score | 4566 punti | |
| PCMark 8 Home Score Accelerated v2 | 3282 punti | |
| PCMark 8 Creative Score Accelerated v2 | 3591 punti | |
| PCMark 8 Work Score Accelerated v2 | 4301 punti | |
Aiuto | ||
| PCMark 8 - Home Score Accelerated v2 | |
| Dell Latitude 15 E5570 | |
| HP EliteBook 850 G3 | |
| Lenovo ThinkPad T460p | |
| Lenovo ThinkPad L560-20F10026GE | |
| Dell Latitude E5550 Broadwell | |
| PCMark 7 - Score | |
| HP EliteBook 850 G3 | |
| Dell Latitude E5550 Broadwell | |
| Dell Latitude 15 E5570 | |
| Toshiba Tecra A50-C-1G0 | |
| Lenovo ThinkPad T460p | |
| Lenovo ThinkPad L560-20F10026GE | |
| Dell Latitude 15 E5570 HD Graphics 520, 6300U, Samsung SSD PM871 MZ7LN128HCHP | Dell Latitude E5550 Broadwell HD Graphics 5500, 5300U, Samsung SSD PM851 128 GB MZ7TE128HMGR | HP EliteBook 850 G3 HD Graphics 520, 6500U, Sandisk X300 SD7SN6S-256G-1006 | Lenovo ThinkPad L560-20F10026GE HD Graphics 520, 6200U, WDC Slim WD10SPCX-21KHST0 | Dell Latitude E5570 N026LE557015EMEA Radeon R7 M370, 6440HQ, Samsung SSD 850 EVO 250GB | |
|---|---|---|---|---|---|
| CrystalDiskMark 3.0 | 7% | 38% | -81% | 56% | |
| Read Seq (MB/s) | 474.7 | 524 10% | 466.3 -2% | 113.6 -76% | 525 11% |
| Write Seq (MB/s) | 155 | 139.7 -10% | 426.1 175% | 111.7 -28% | 507 227% |
| Read 512 (MB/s) | 393.6 | 426.6 8% | 295.3 -25% | 39.65 -90% | 477.7 21% |
| Write 512 (MB/s) | 119.7 | 139.5 17% | 282.1 136% | 55.3 -54% | 375.6 214% |
| Read 4k (MB/s) | 34 | 28.32 -17% | 30.42 -11% | 0.488 -99% | 45.85 35% |
| Write 4k (MB/s) | 96.6 | 105.3 9% | 80.1 -17% | 1.022 -99% | 86.4 -11% |
| Read 4k QD32 (MB/s) | 383.3 | 376.7 -2% | 326.1 -15% | 1.367 -100% | 253.2 -34% |
| Write 4k QD32 (MB/s) | 100.2 | 139.7 39% | 162.1 62% | 1.036 -99% | 84.8 -15% |

| 3DMark 11 Performance | 1438 punti | |
| 3DMark Ice Storm Standard Score | 51106 punti | |
| 3DMark Cloud Gate Standard Score | 5456 punti | |
| 3DMark Fire Strike Score | 720 punti | |
Aiuto | ||
| 3DMark 11 - 1280x720 Performance | |
| Dell Latitude E5570 N026LE557015EMEA | |
| HP EliteBook 850 G3 | |
| Dell Latitude 15 E5570 | |
| Lenovo ThinkPad L560-20F10026GE | |
| Toshiba Tecra A50-C-1G0 | |
| Dell Latitude E5550 Broadwell | |
| basso | medio | alto | ultra | |
|---|---|---|---|---|
| Tomb Raider (2013) | 67.1 | 35.3 | 21.5 | |
| BioShock Infinite (2013) | 44.1 | 24.3 | 20 | |
| Rise of the Tomb Raider (2016) | 14.5 | 9.4 |
Rumorosità
| Idle |
| 31.2 / 33.2 / 34.3 dB(A) |
| Sotto carico |
| 36.6 / 34.7 dB(A) |
 | ||
30 dB silenzioso 40 dB(A) udibile 50 dB(A) rumoroso |
||
min: | ||
| Dell Latitude 15 E5570 6300U, HD Graphics 520 | Dell Latitude E5550 Broadwell 5300U, HD Graphics 5500 | HP EliteBook 850 G3 6500U, HD Graphics 520 | Lenovo ThinkPad L560-20F10026GE 6200U, HD Graphics 520 | Toshiba Tecra A50-C-1G0 5200U, HD Graphics 520 | Dell Latitude E5570 N026LE557015EMEA 6440HQ, Radeon R7 M370 | |
|---|---|---|---|---|---|---|
| Noise | -2% | 9% | 7% | 3% | -9% | |
| off /ambiente * (dB) | 31.2 | 29 7% | 29.4 6% | 31.3 -0% | ||
| Idle Minimum * (dB) | 31.2 | 29.6 5% | 29 7% | 30.1 4% | 32 -3% | 30.3 3% |
| Idle Average * (dB) | 33.2 | 29.6 11% | 29 13% | 30.1 9% | 32 4% | 30.3 9% |
| Idle Maximum * (dB) | 34.3 | 29.6 14% | 29 15% | 30.1 12% | 32 7% | 30.3 12% |
| Load Average * (dB) | 36.6 | 38.1 -4% | 32.6 11% | 33.4 9% | 33.8 8% | 47.8 -31% |
| Load Maximum * (dB) | 34.7 | 46.4 -34% | 34.6 -0% | 34.7 -0% | 33.8 3% | 48.5 -40% |
* ... Meglio usare valori piccoli
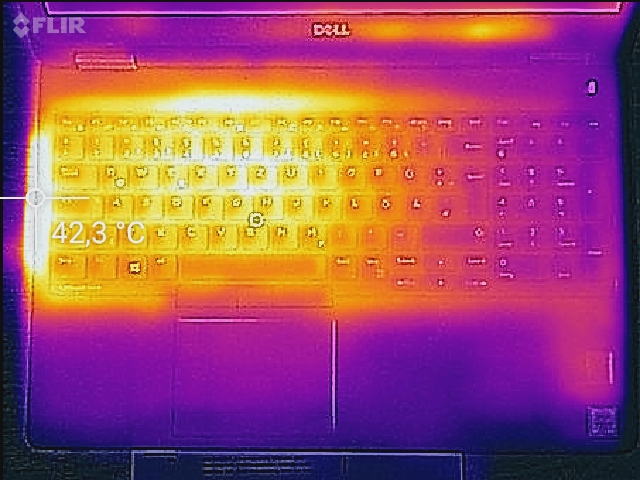
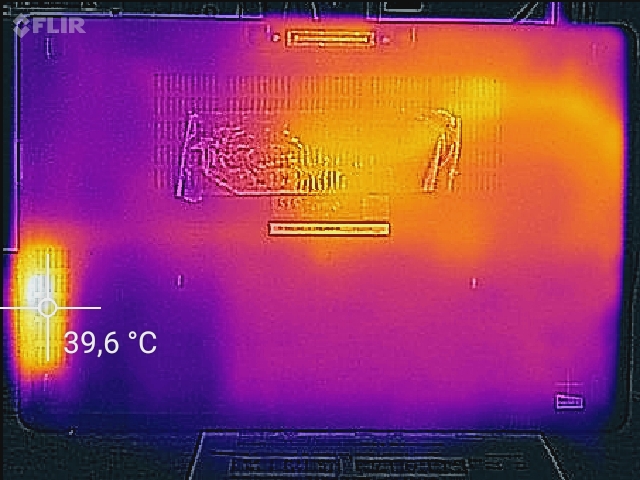
(+) La temperatura massima sul lato superiore è di 37.3 °C / 99 F, rispetto alla media di 34.3 °C / 94 F, che varia da 21.2 a 62.5 °C per questa classe Office.
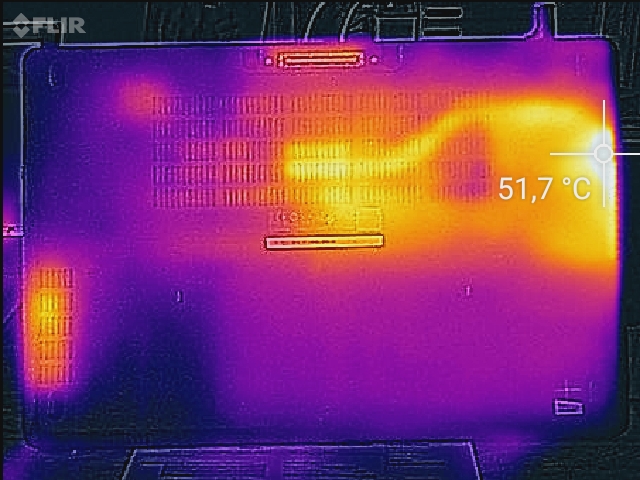
(±) Il lato inferiore si riscalda fino ad un massimo di 41.5 °C / 107 F, rispetto alla media di 36.8 °C / 98 F
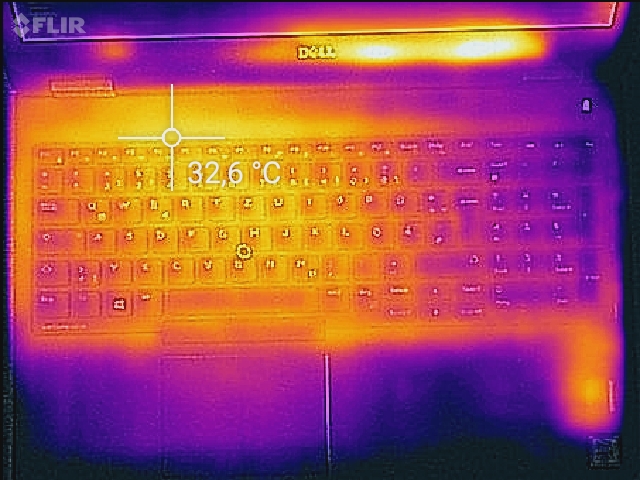
(+) In idle, la temperatura media del lato superiore è di 29.3 °C / 85 F, rispetto alla media deld ispositivo di 29.5 °C / 85 F.
(+) I poggiapolsi e il touchpad sono piu' freddi della temperatura della pelle con un massimo di 27.5 °C / 81.5 F e sono quindi freddi al tatto.
(±) La temperatura media della zona del palmo della mano di dispositivi simili e'stata di 27.5 °C / 81.5 F (0 °C / 0 F).
| Dell Latitude 15 E5570 6300U, HD Graphics 520 | Dell Latitude E5550 Broadwell 5300U, HD Graphics 5500 | HP EliteBook 850 G3 6500U, HD Graphics 520 | Lenovo ThinkPad L560-20F10026GE 6200U, HD Graphics 520 | Toshiba Tecra A50-C-1G0 5200U, HD Graphics 520 | Dell Latitude E5570 N026LE557015EMEA 6440HQ, Radeon R7 M370 | |
|---|---|---|---|---|---|---|
| Heat | -3% | 13% | 10% | 8% | -11% | |
| Maximum Upper Side * (°C) | 37.3 | 42.3 -13% | 33.4 10% | 37.2 -0% | 37.4 -0% | 58.9 -58% |
| Maximum Bottom * (°C) | 41.5 | 48 -16% | 36.4 12% | 36 13% | 50.2 -21% | 57.4 -38% |
| Idle Upper Side * (°C) | 34.2 | 33.5 2% | 31.4 8% | 30.7 10% | 26.4 23% | 26.4 23% |
| Idle Bottom * (°C) | 38.8 | 33.1 15% | 30.2 22% | 32.8 15% | 27 30% | 27.8 28% |
* ... Meglio usare valori piccoli
| Off / Standby | |
| Idle | |
| Sotto carico |
|
Leggenda:
min: | |
| Dell Latitude 15 E5570 6300U, HD Graphics 520 | Dell Latitude E5550 Broadwell 5300U, HD Graphics 5500 | HP EliteBook 850 G3 6500U, HD Graphics 520 | Lenovo ThinkPad L560-20F10026GE 6200U, HD Graphics 520 | Toshiba Tecra A50-C-1G0 5200U, HD Graphics 520 | Dell Latitude E5570 N026LE557015EMEA 6440HQ, Radeon R7 M370 | |
|---|---|---|---|---|---|---|
| Power Consumption | -23% | -12% | -5% | -8% | -138% | |
| Idle Minimum * (Watt) | 4.5 | 4.7 -4% | 5 -11% | 5 -11% | 4.9 -9% | 4.6 -2% |
| Idle Average * (Watt) | 7.6 | 8 -5% | 7.8 -3% | 7.9 -4% | 8.7 -14% | 12.5 -64% |
| Idle Maximum * (Watt) | 8.7 | 10.3 -18% | 8.4 3% | 8.6 1% | 9 -3% | 17.7 -103% |
| Load Average * (Watt) | 28.5 | 40.3 -41% | 28.8 -1% | 27.5 4% | 30.4 -7% | 99.3 -248% |
| Load Maximum * (Watt) | 29.2 | 43.5 -49% | 43 -47% | 33.7 -15% | 31 -6% | 108.7 -272% |
* ... Meglio usare valori piccoli
| Dell Latitude 15 E5570 62 Wh | Dell Latitude E5550 Broadwell 51 Wh | HP EliteBook 850 G3 46 Wh | Lenovo ThinkPad L560-20F10026GE 48 Wh | Toshiba Tecra A50-C-1G0 45 Wh | Dell Latitude E5570 N026LE557015EMEA 62 Wh | |
|---|---|---|---|---|---|---|
| Autonomia della batteria | -43% | -22% | -40% | -67% | -35% | |
| Reader / Idle (h) | 20.5 | 12 -41% | 15.3 -25% | 11.6 -43% | 13.3 -35% | |
| H.264 (h) | 9.5 | 6.5 -32% | 7.2 -24% | 4.6 -52% | ||
| WiFi v1.3 (h) | 10.5 | 7 -33% | 6.8 -35% | 3.5 -67% | ||
| Load (h) | 2.5 | 1.1 -56% | 2.4 -4% | 1.8 -28% | ||
| WiFi (h) | 6.4 | 5 |
Pro
Contro
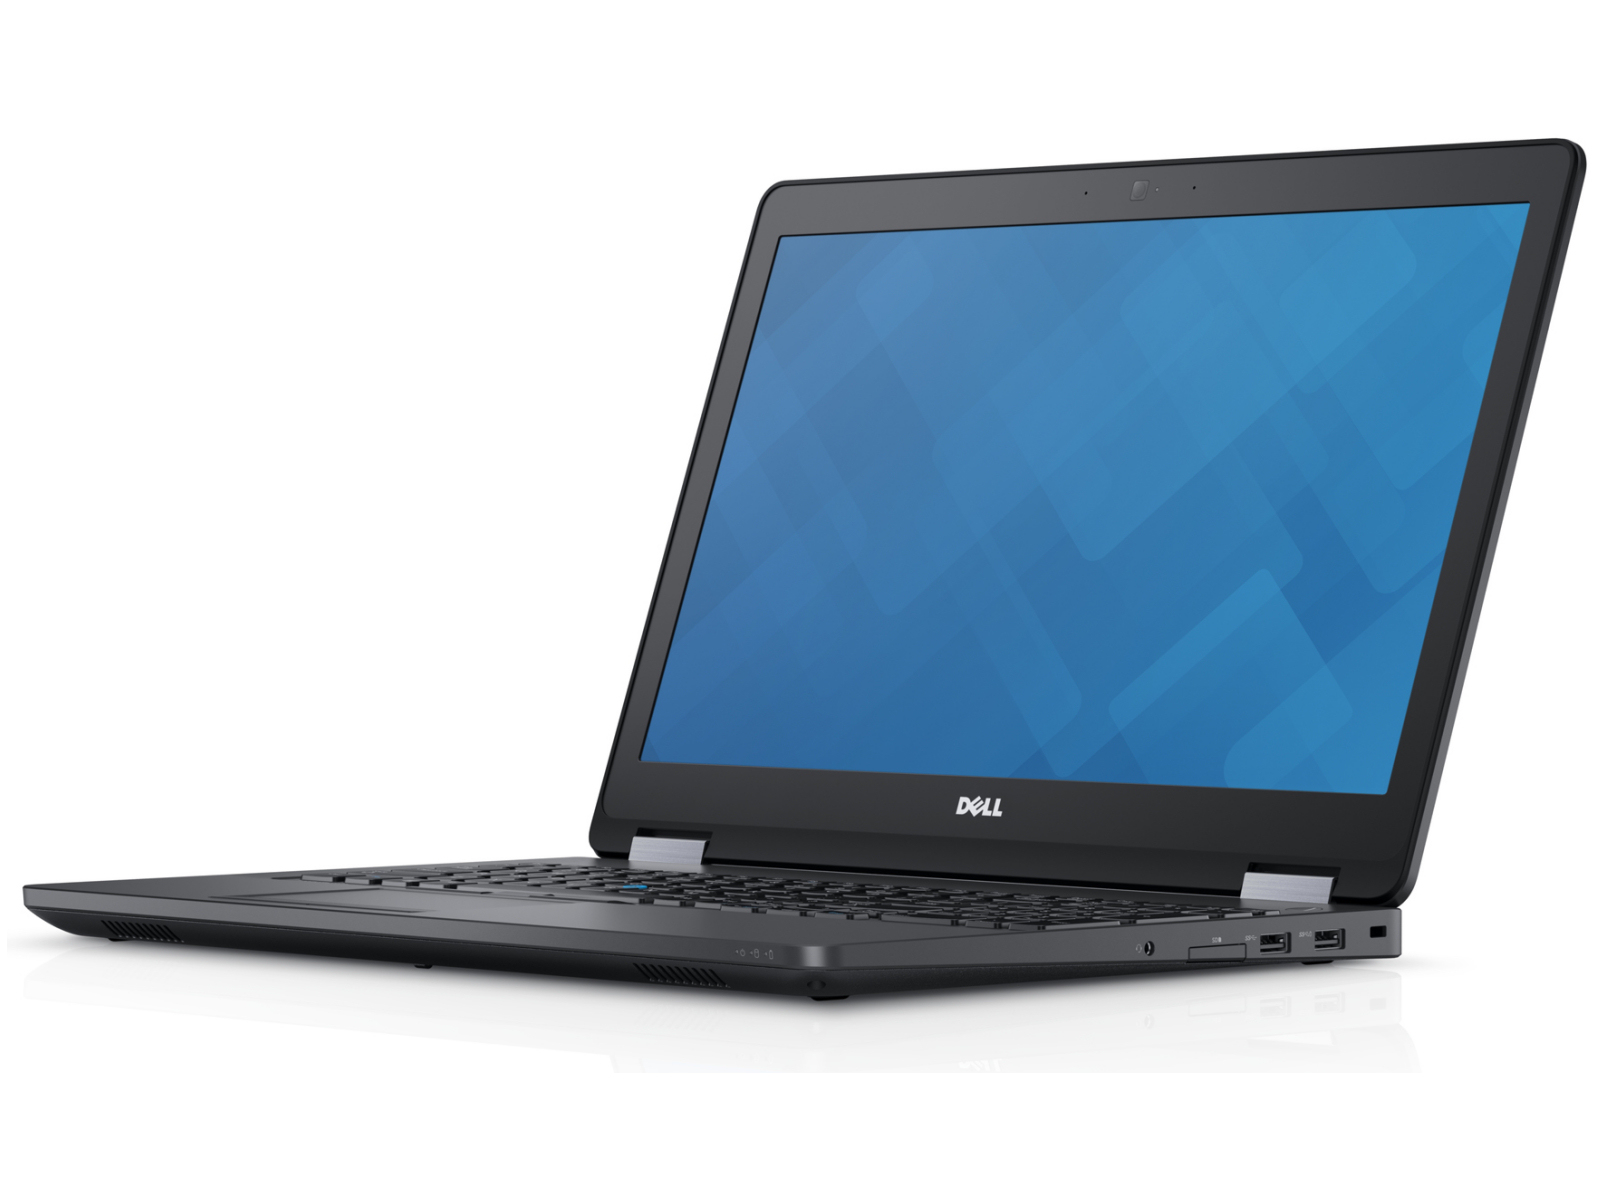
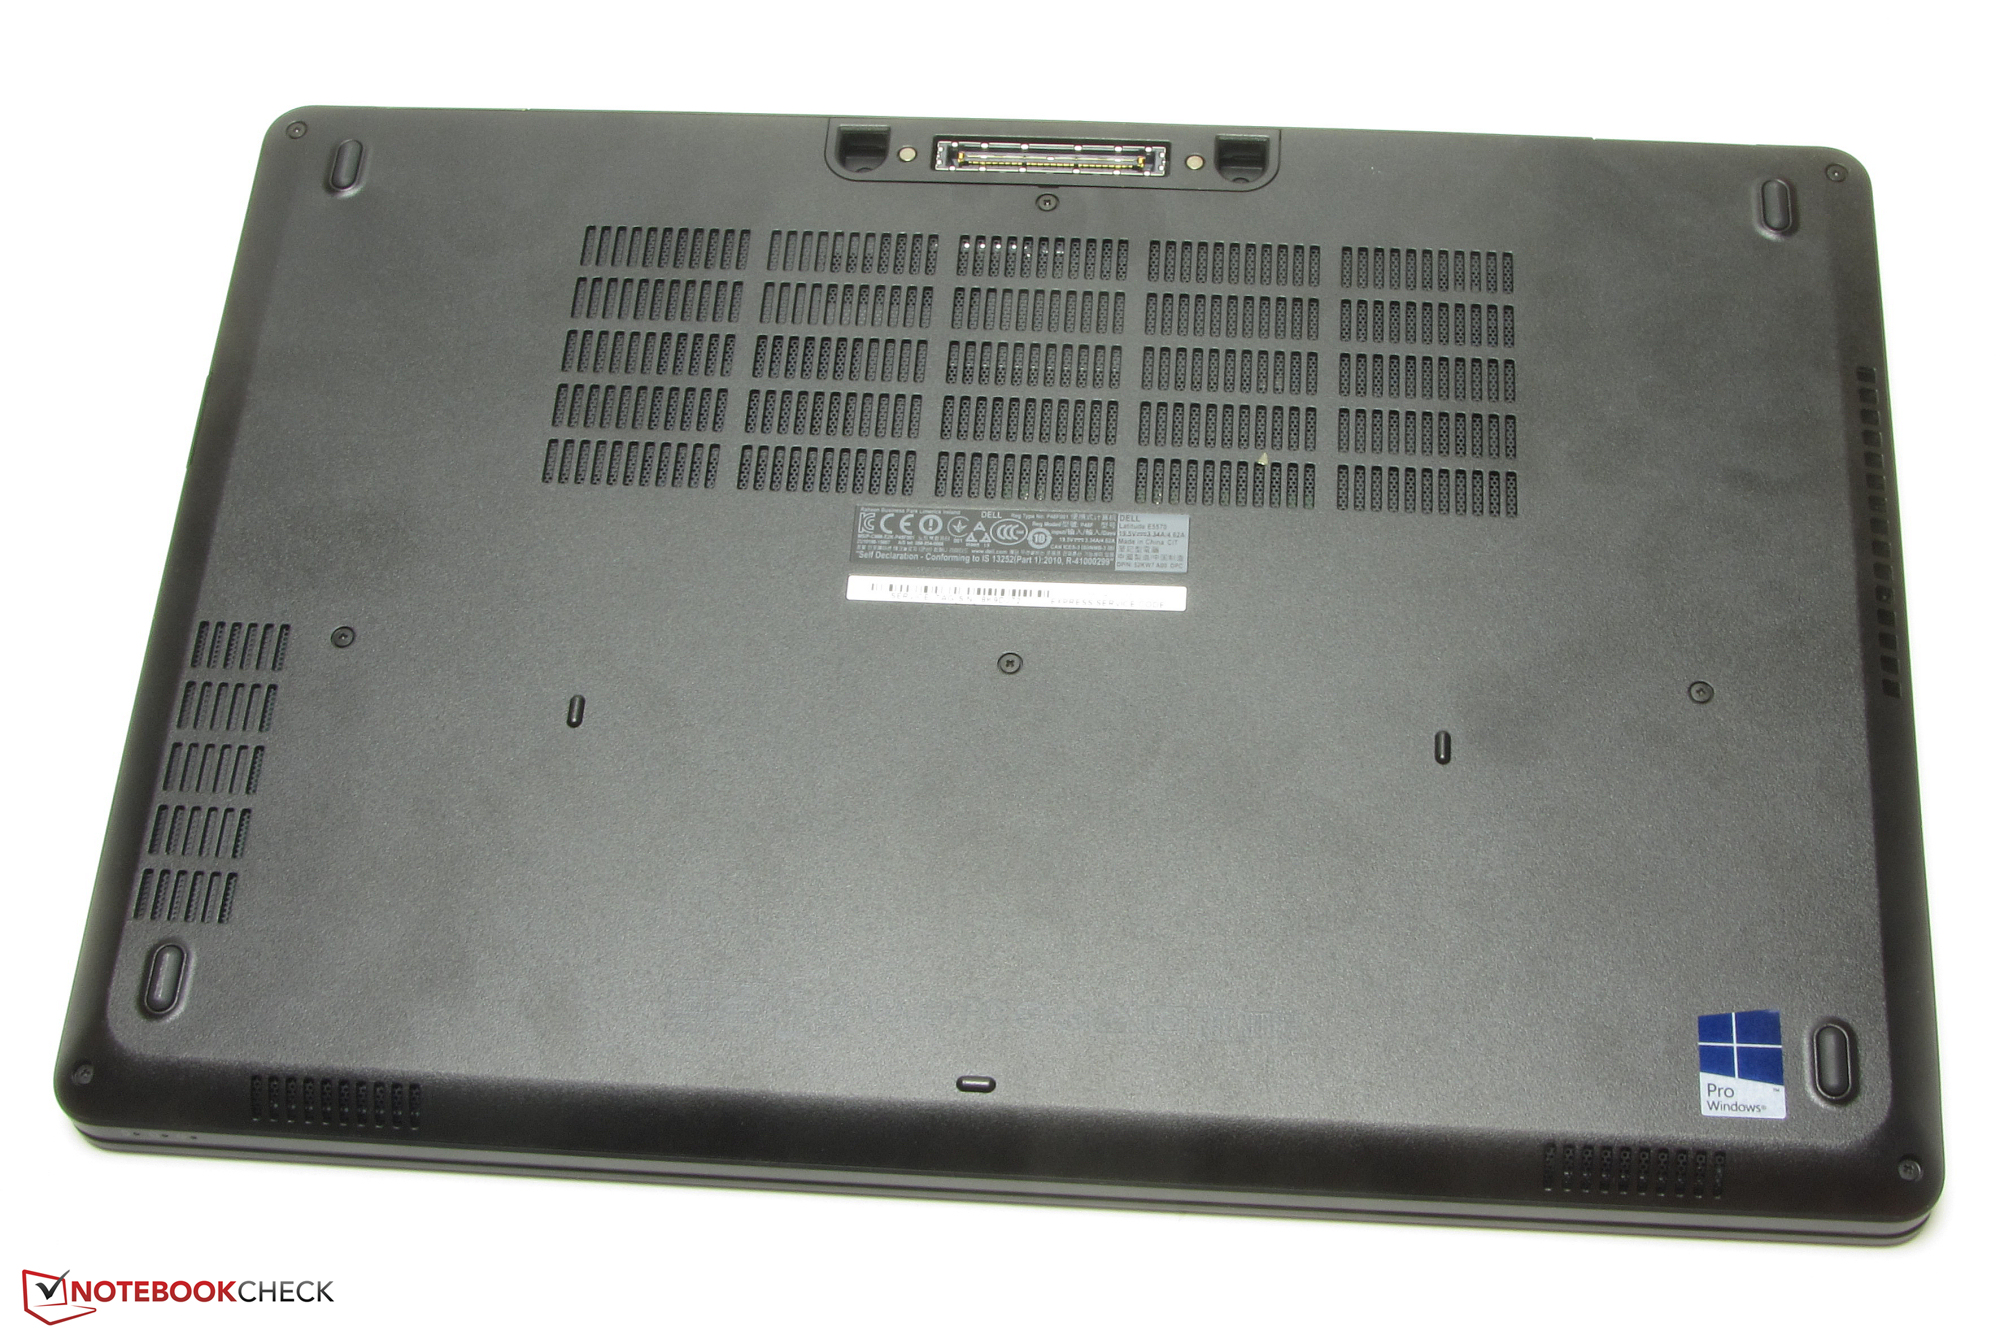
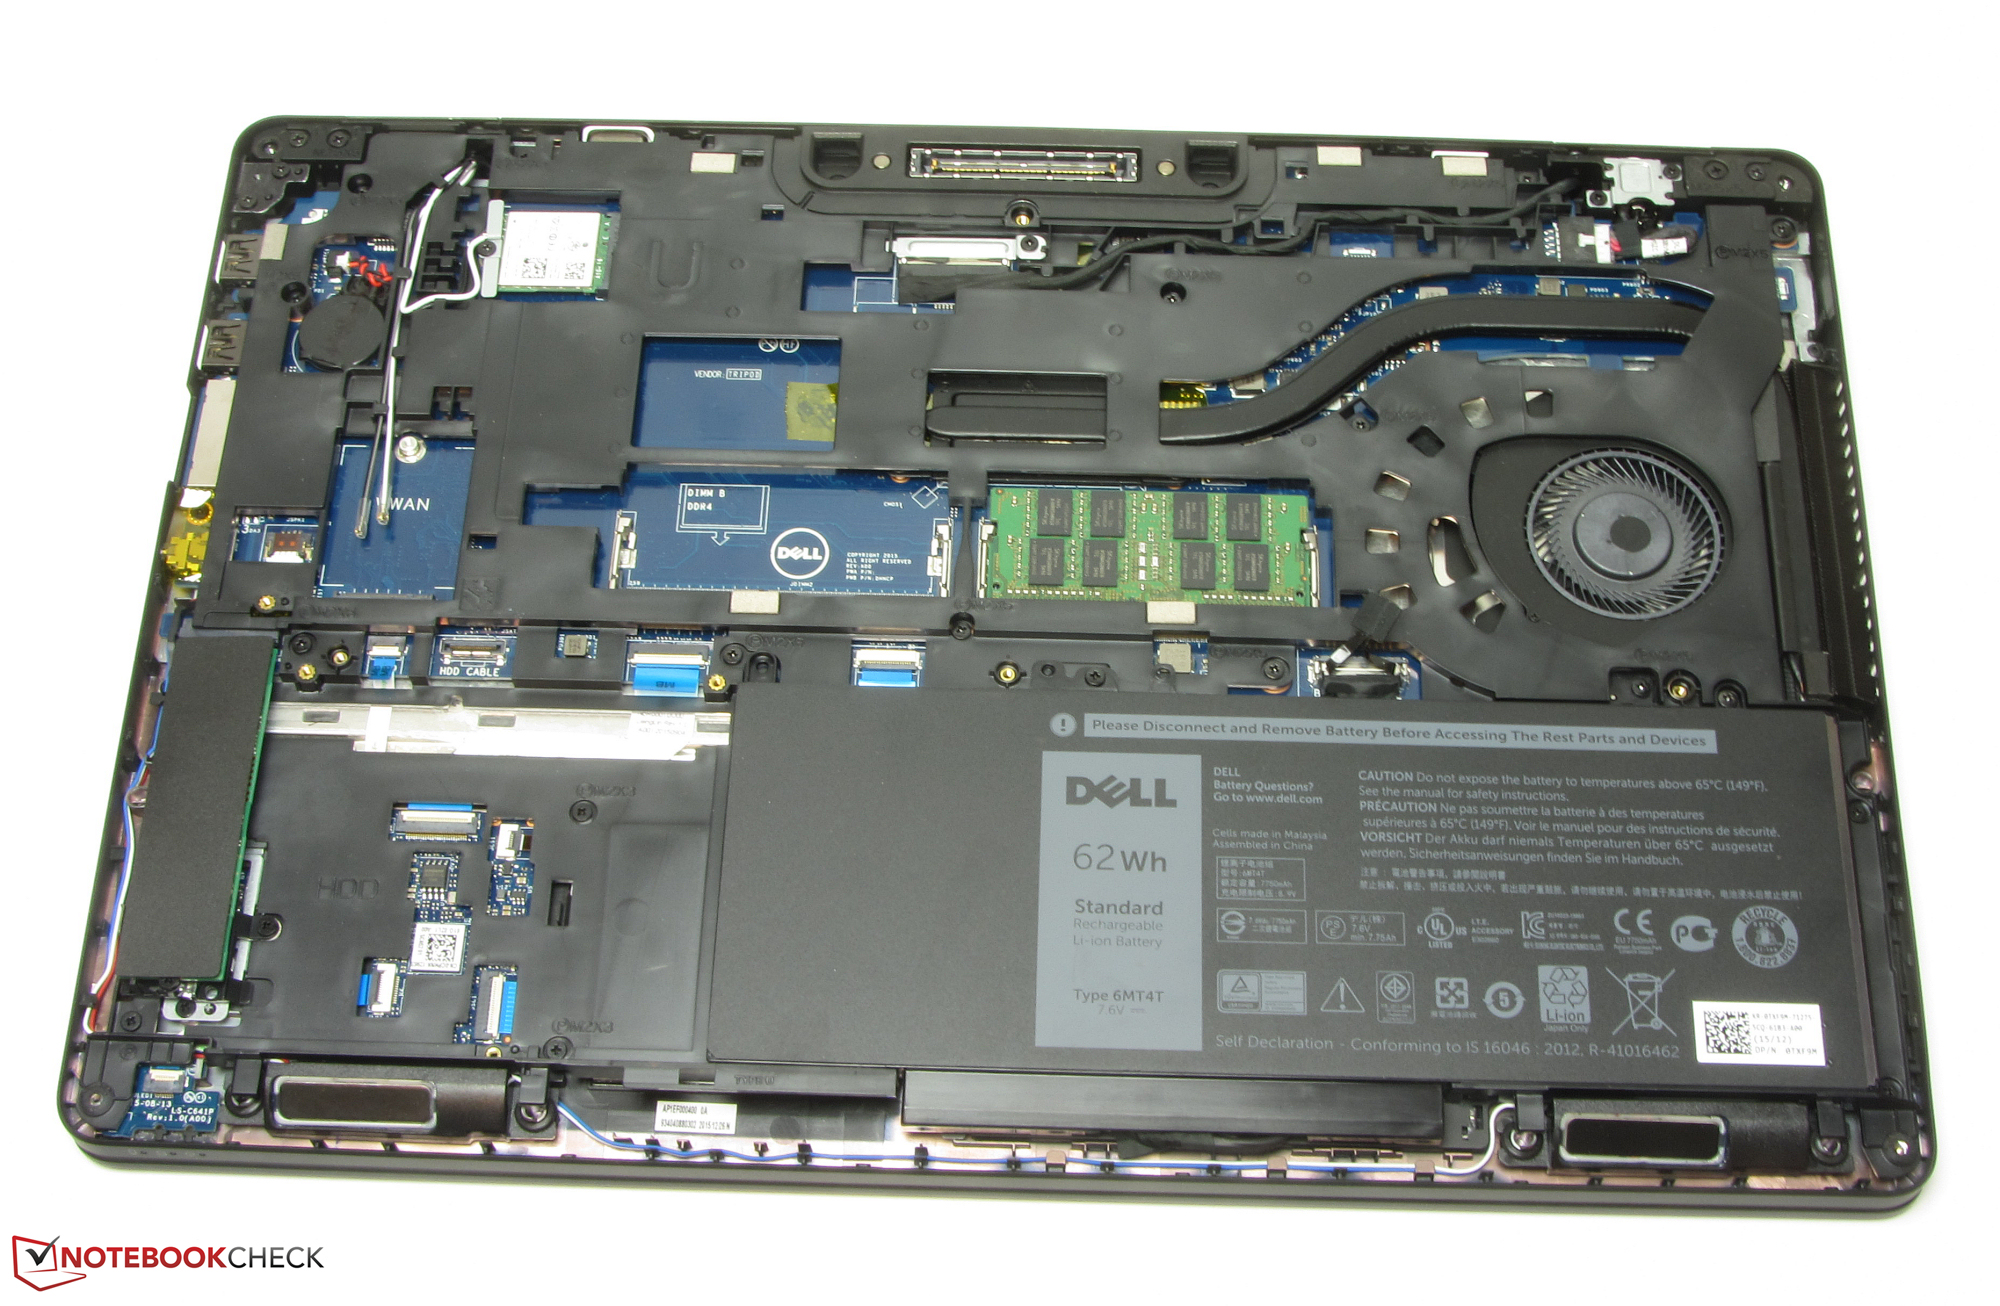
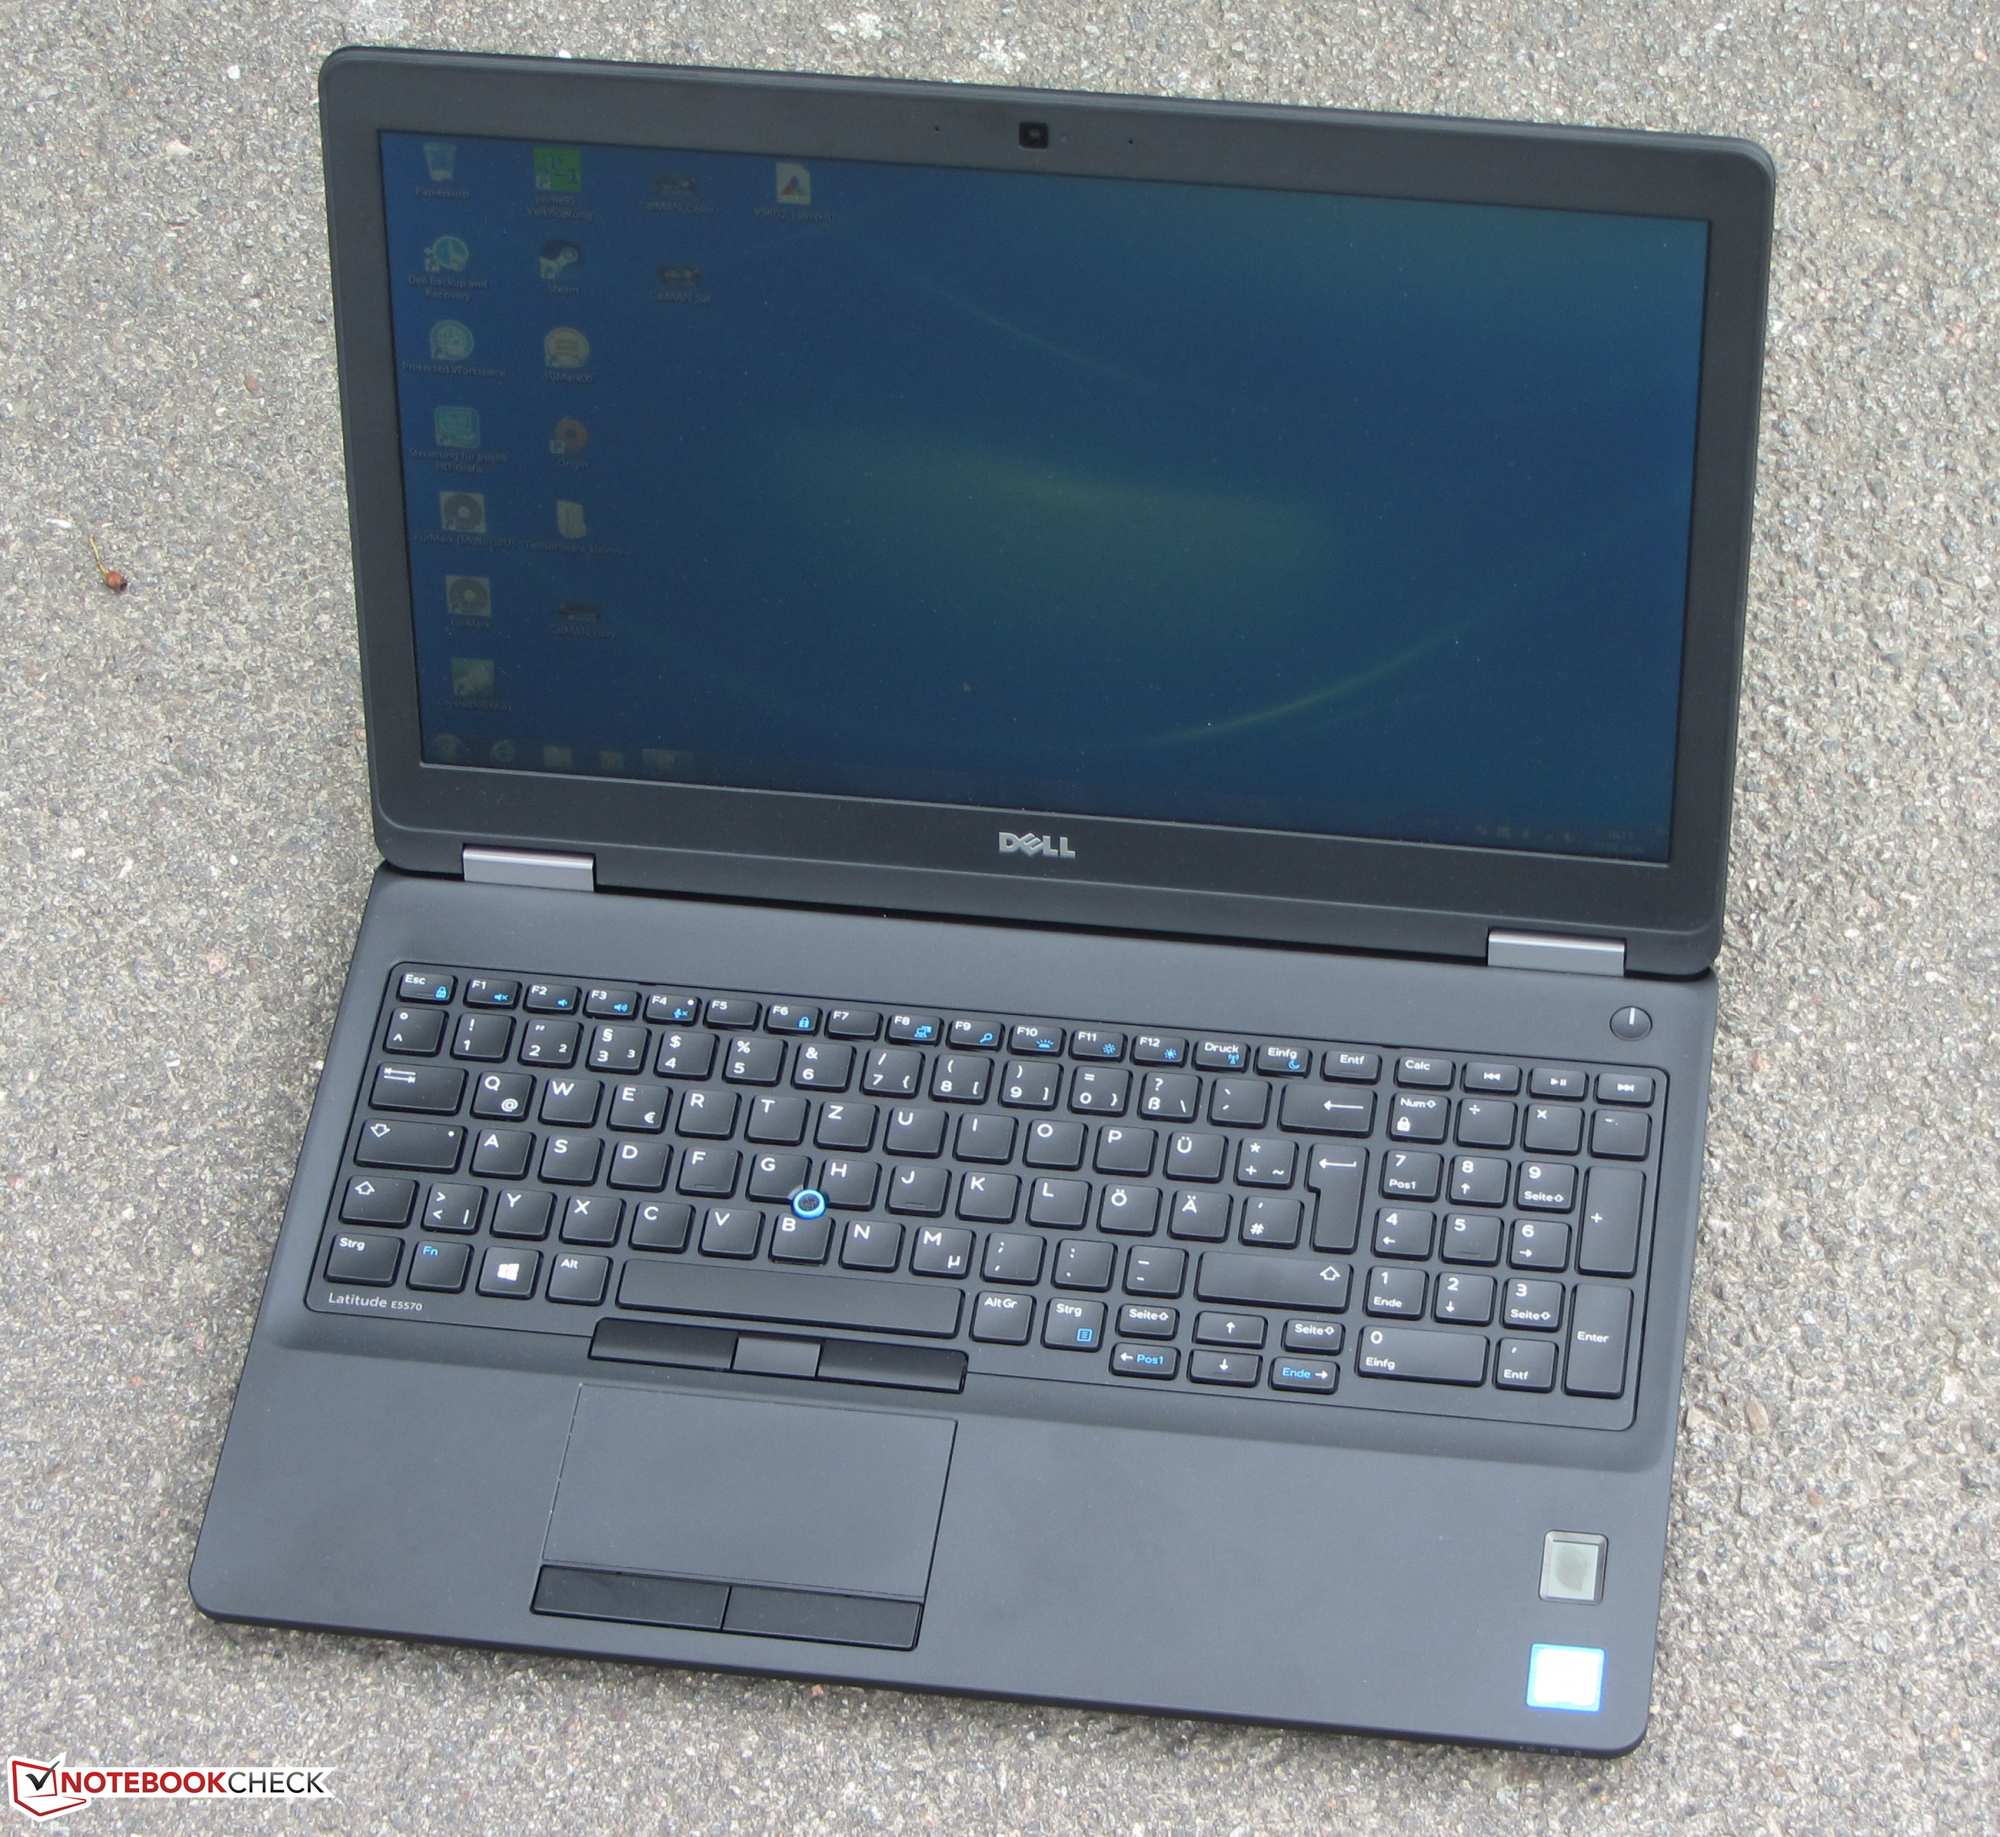
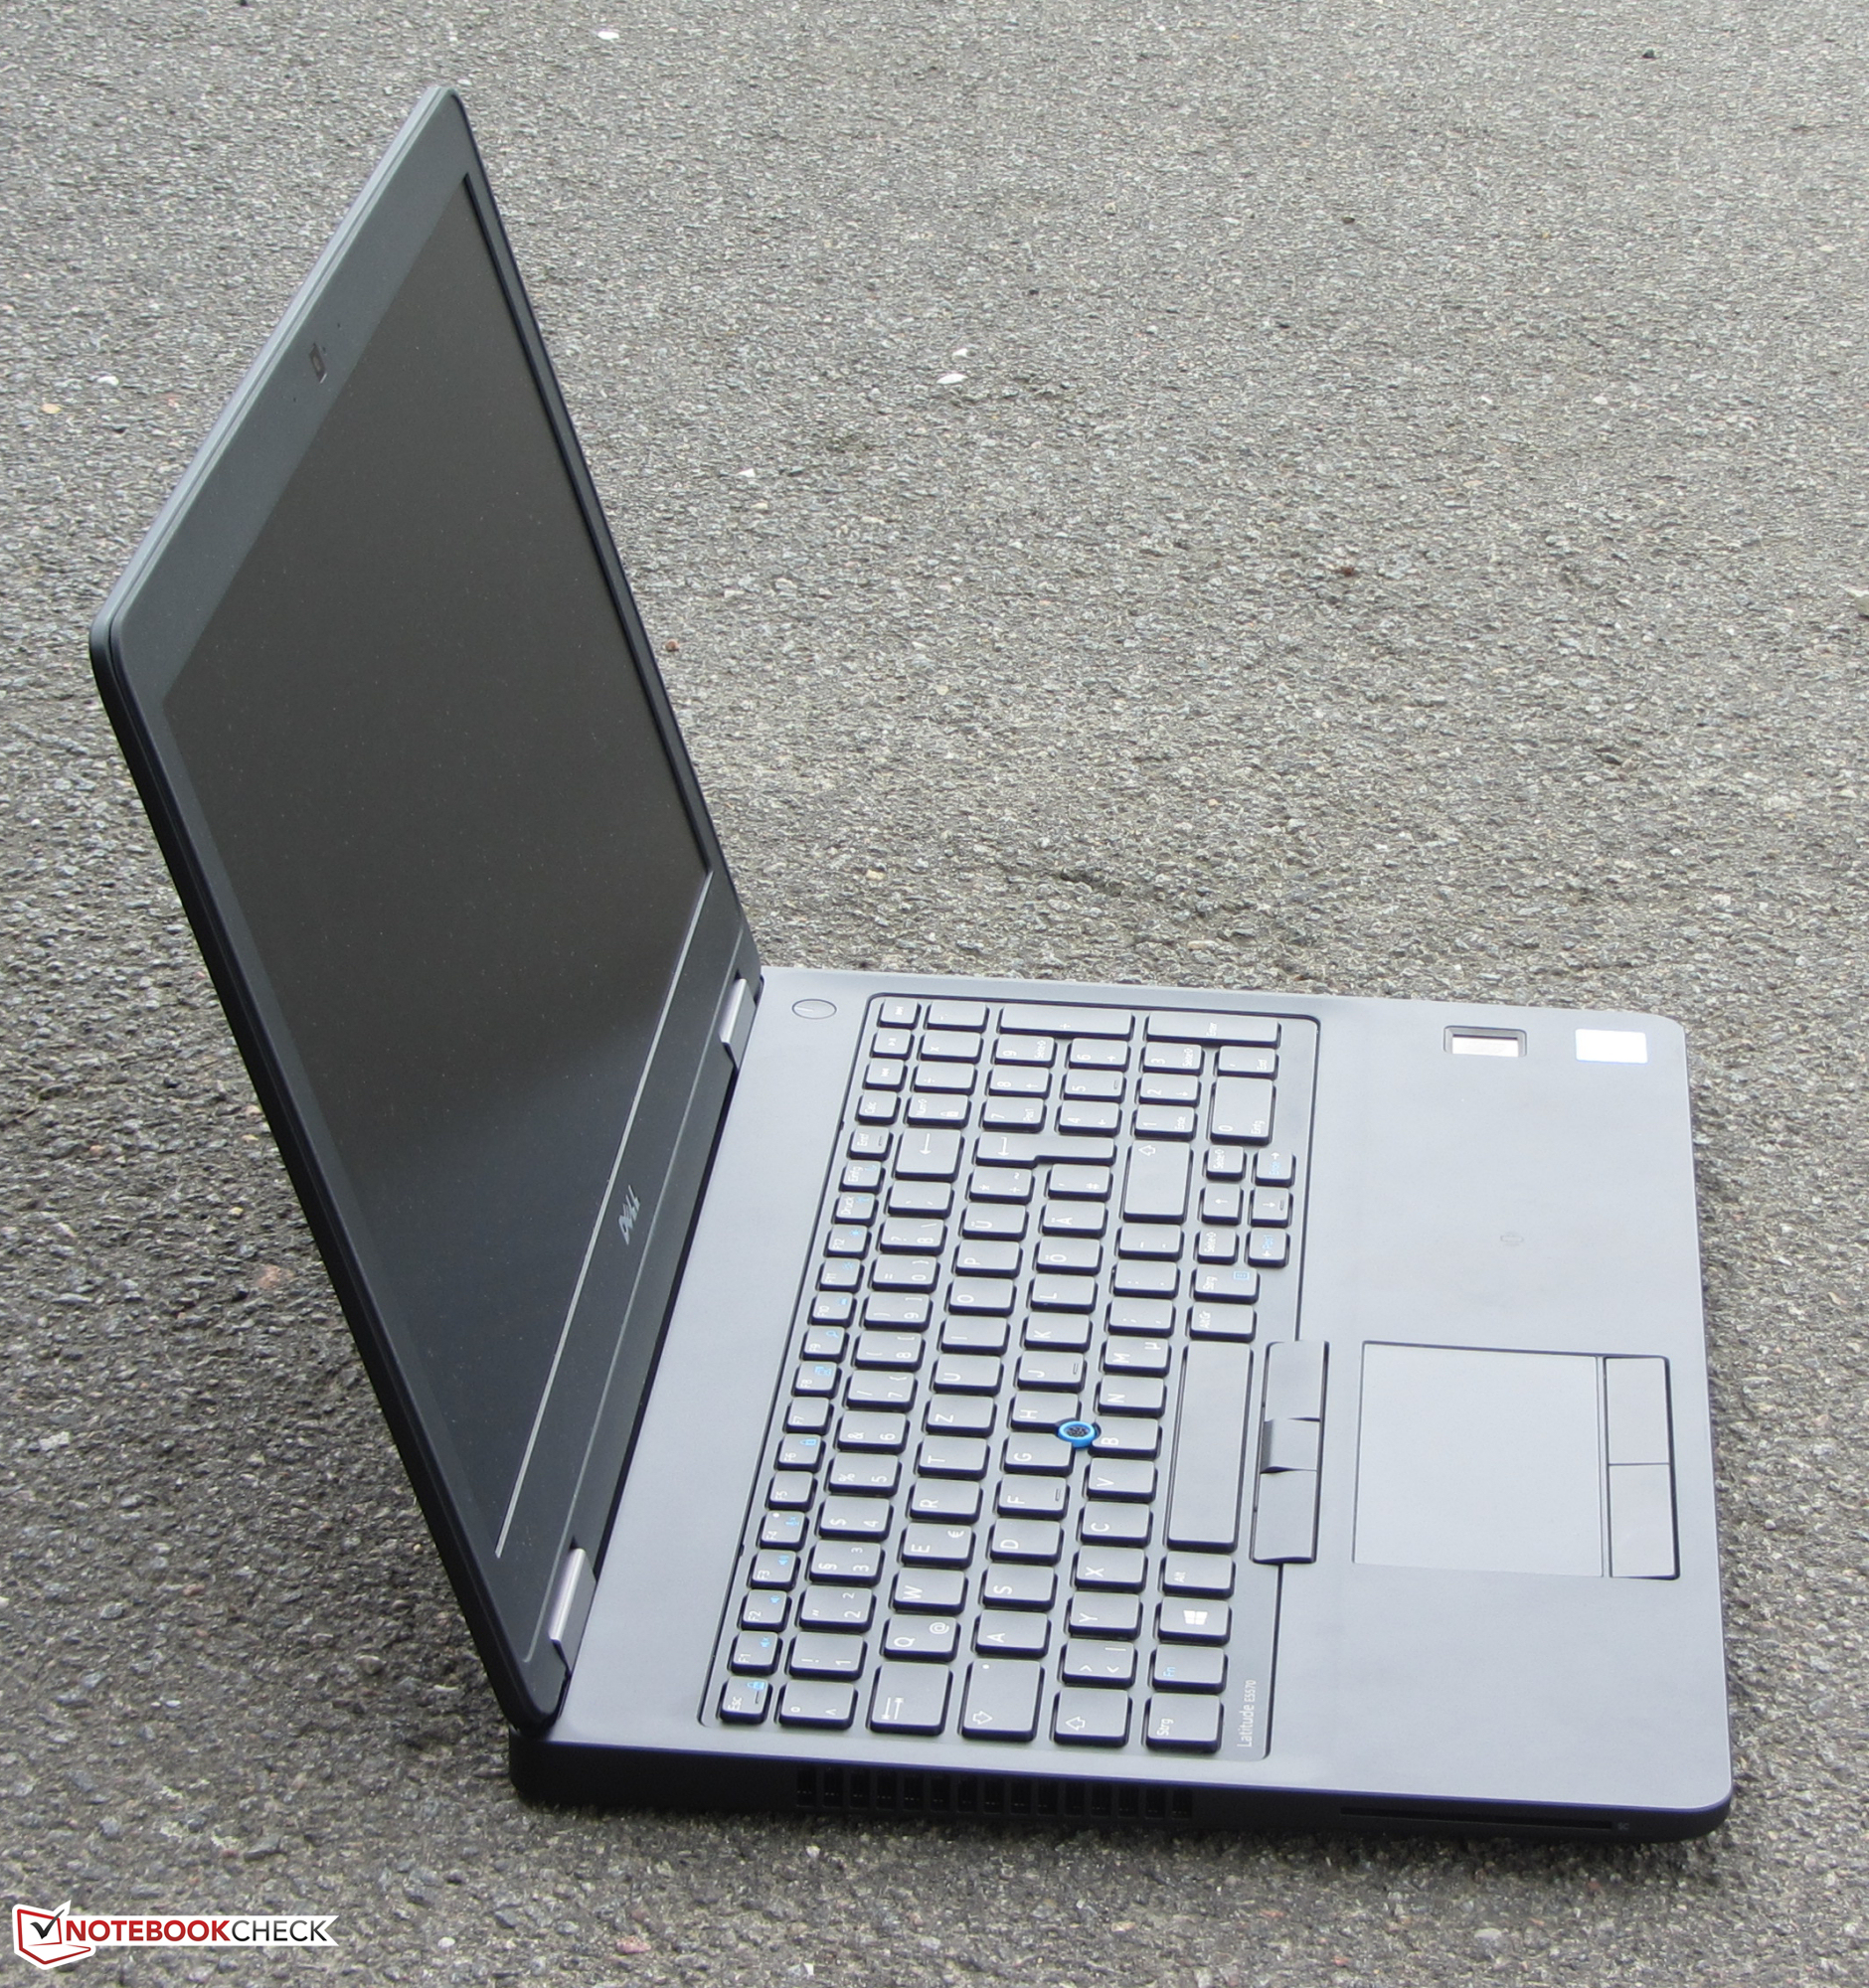
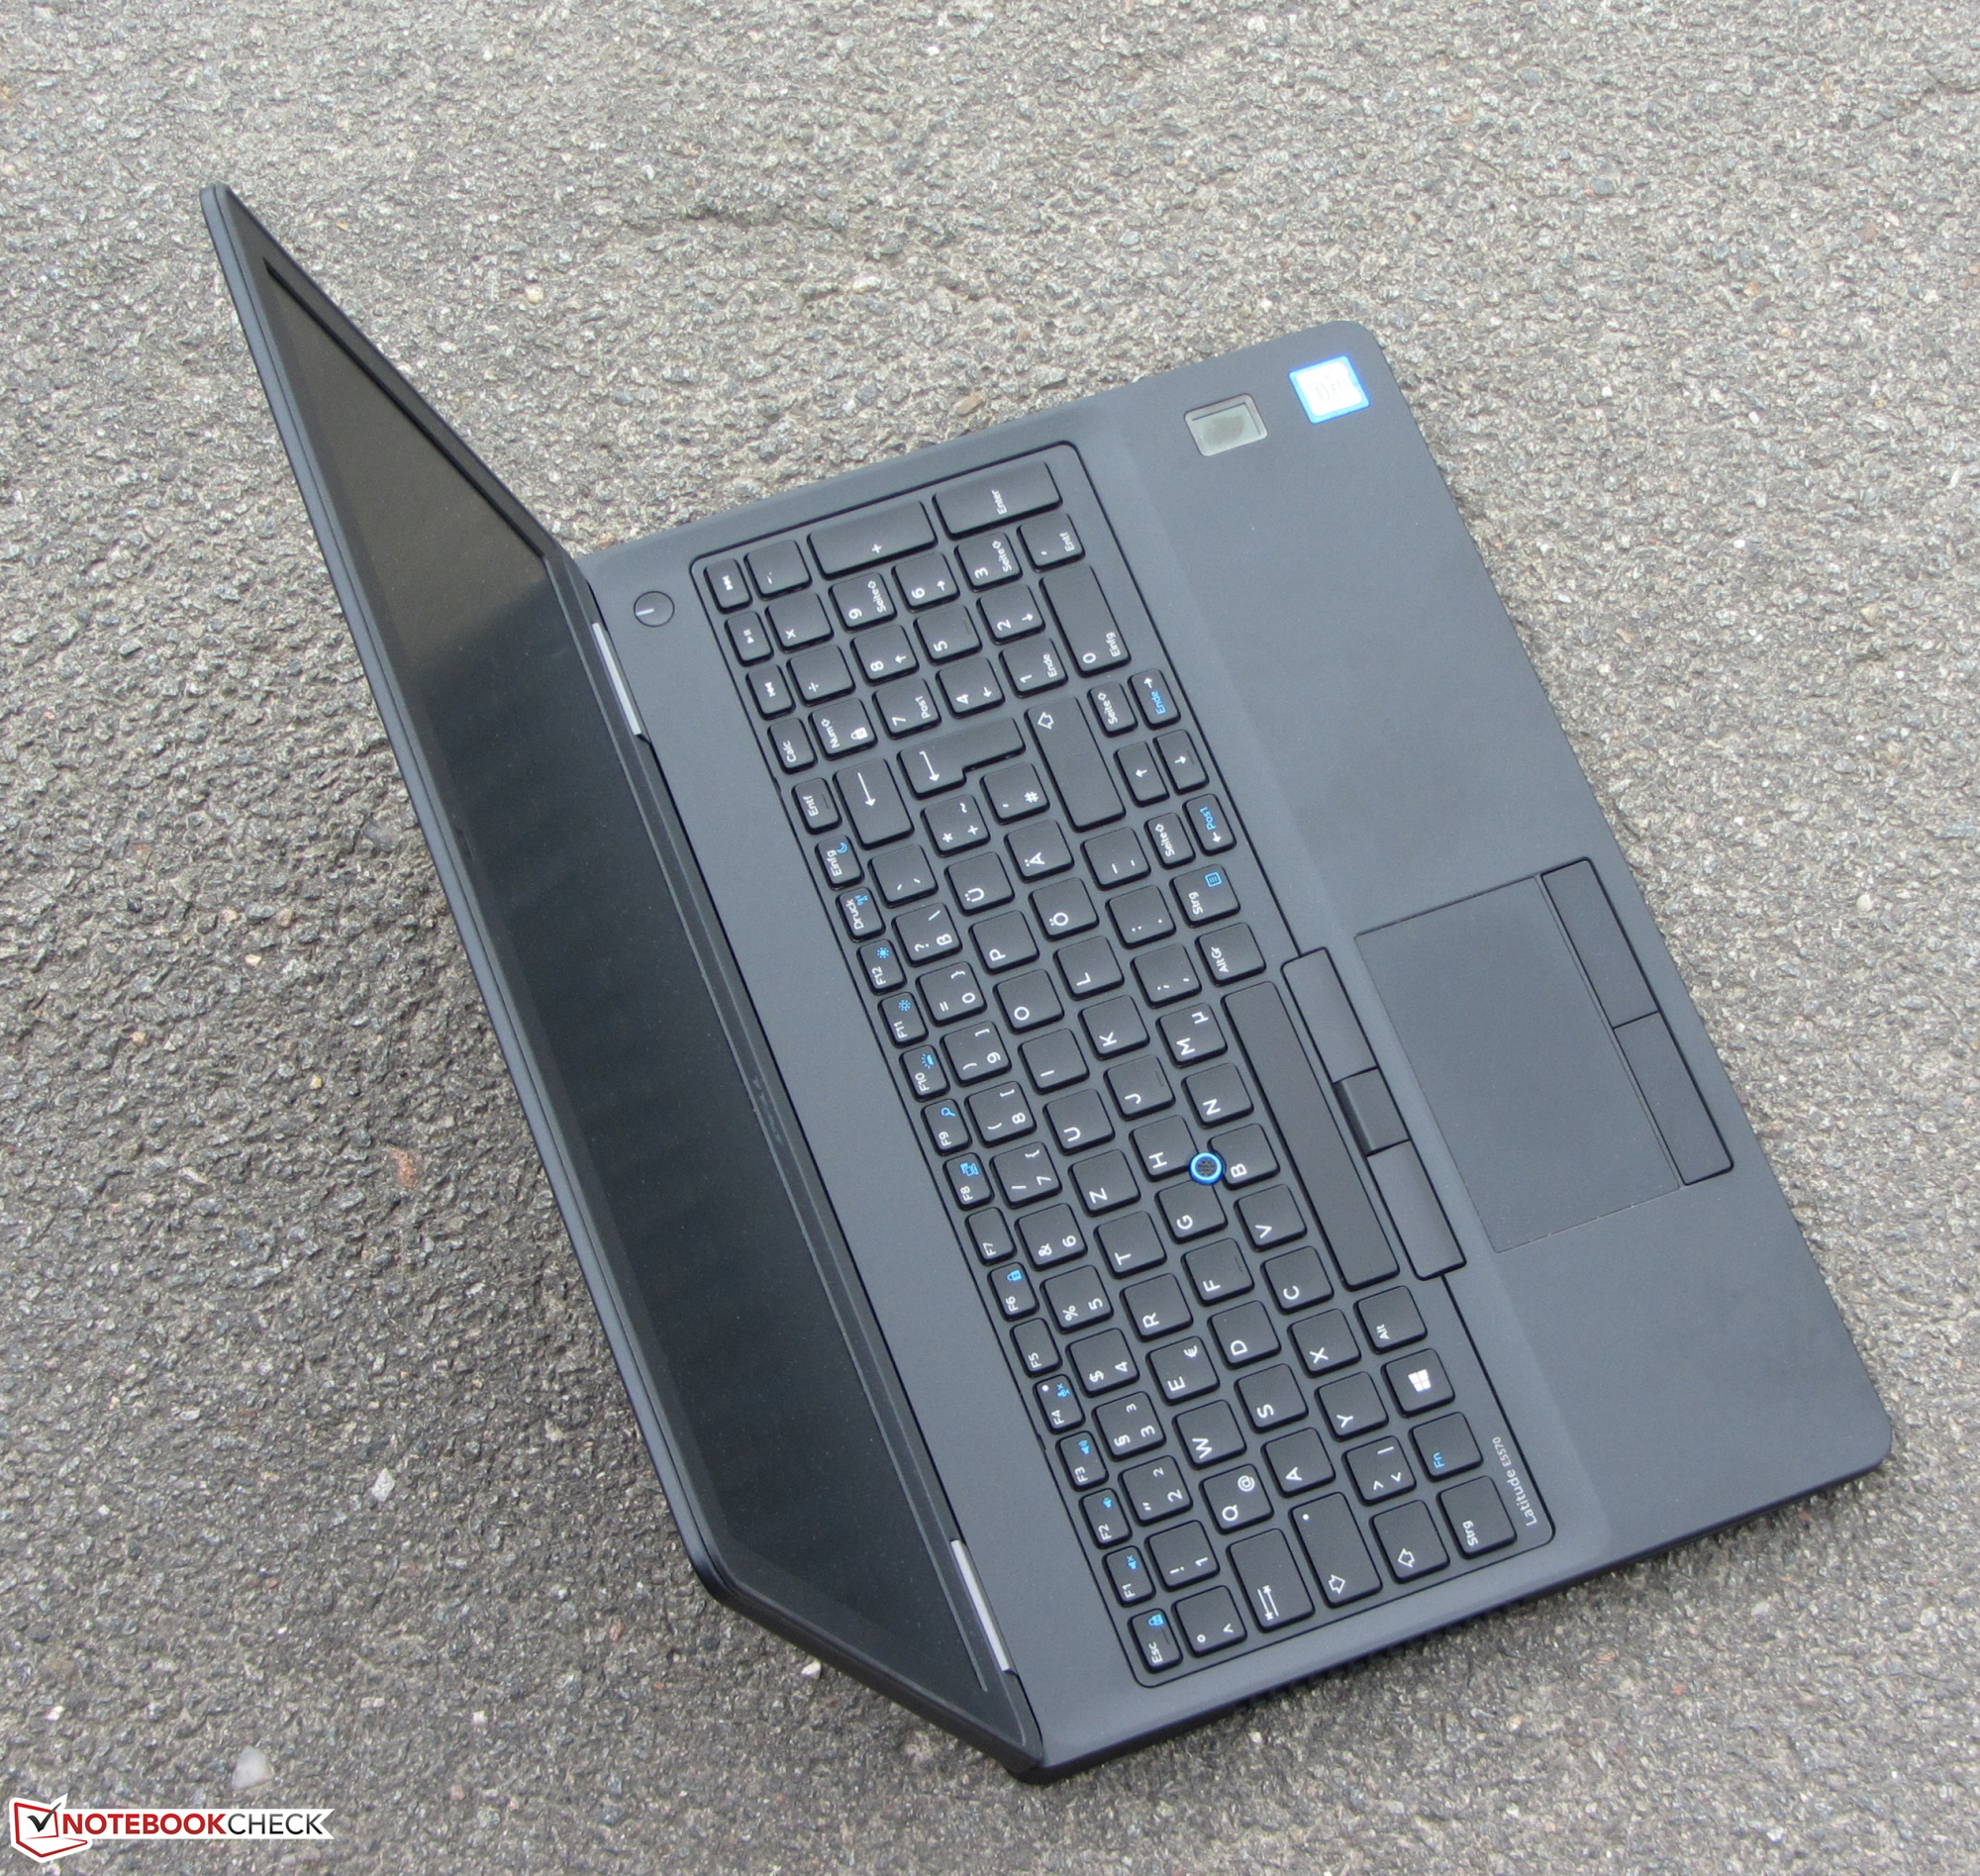
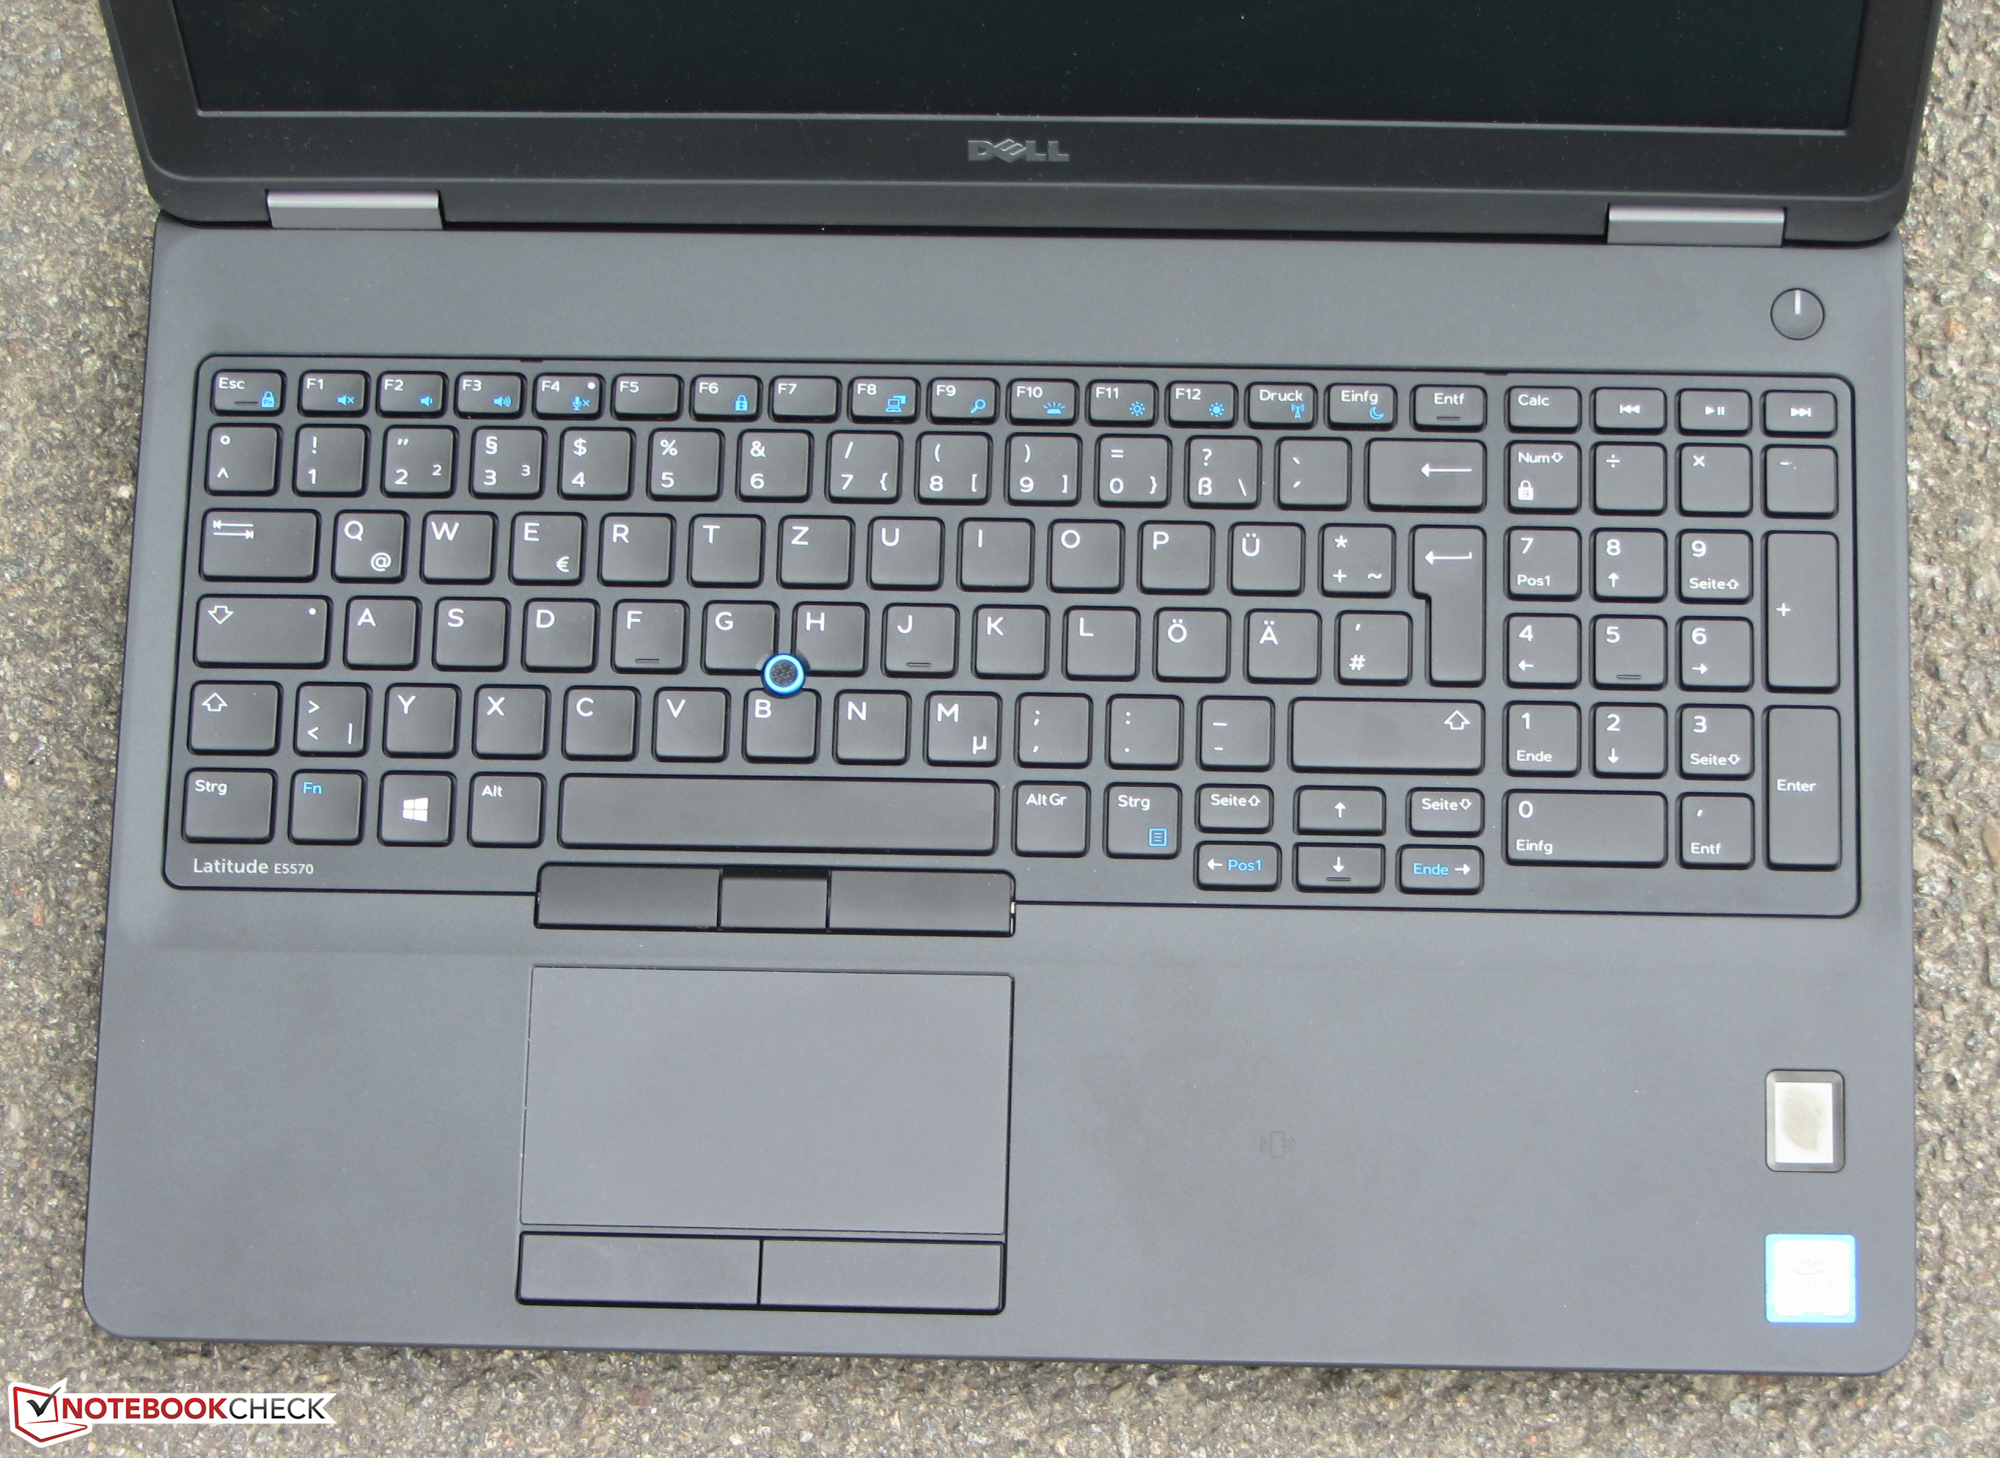
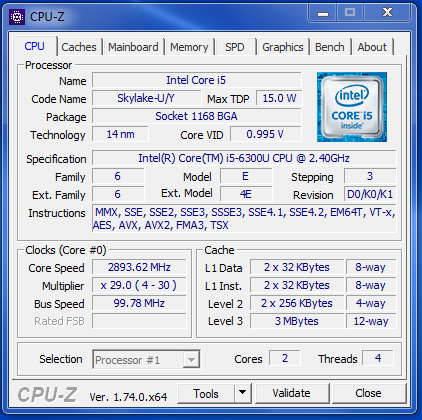
Il Dell Latitude 15 E5570 è un notebook business con schermo da 15.6 pollici. Il design non cambia molto rispetto al modello precedente, ma le modifiche sotto il cofano sono sostanziose. IIl processore ULV della generazione Skylake offre ottime prestazioni per tutti i compiti più comuni. Se sono necessarie prestazioni superiori, occorre rivolgersi alla configurazione con processore quad-core Core i5. Il dispositivo è solitamente silenzioso e non scalda molto. L'SSD assicura una buona reattività ed è possibile sostituirlo. Ciò richiede la rimozione del pannello inferiore, e non è un problema. La tastiera è ottima come al solito, e l'autonomia della batteria è davvero valida.
Il Latitude di Dell è un buon notebook per molti aspetti, ma non è privo di difetti.
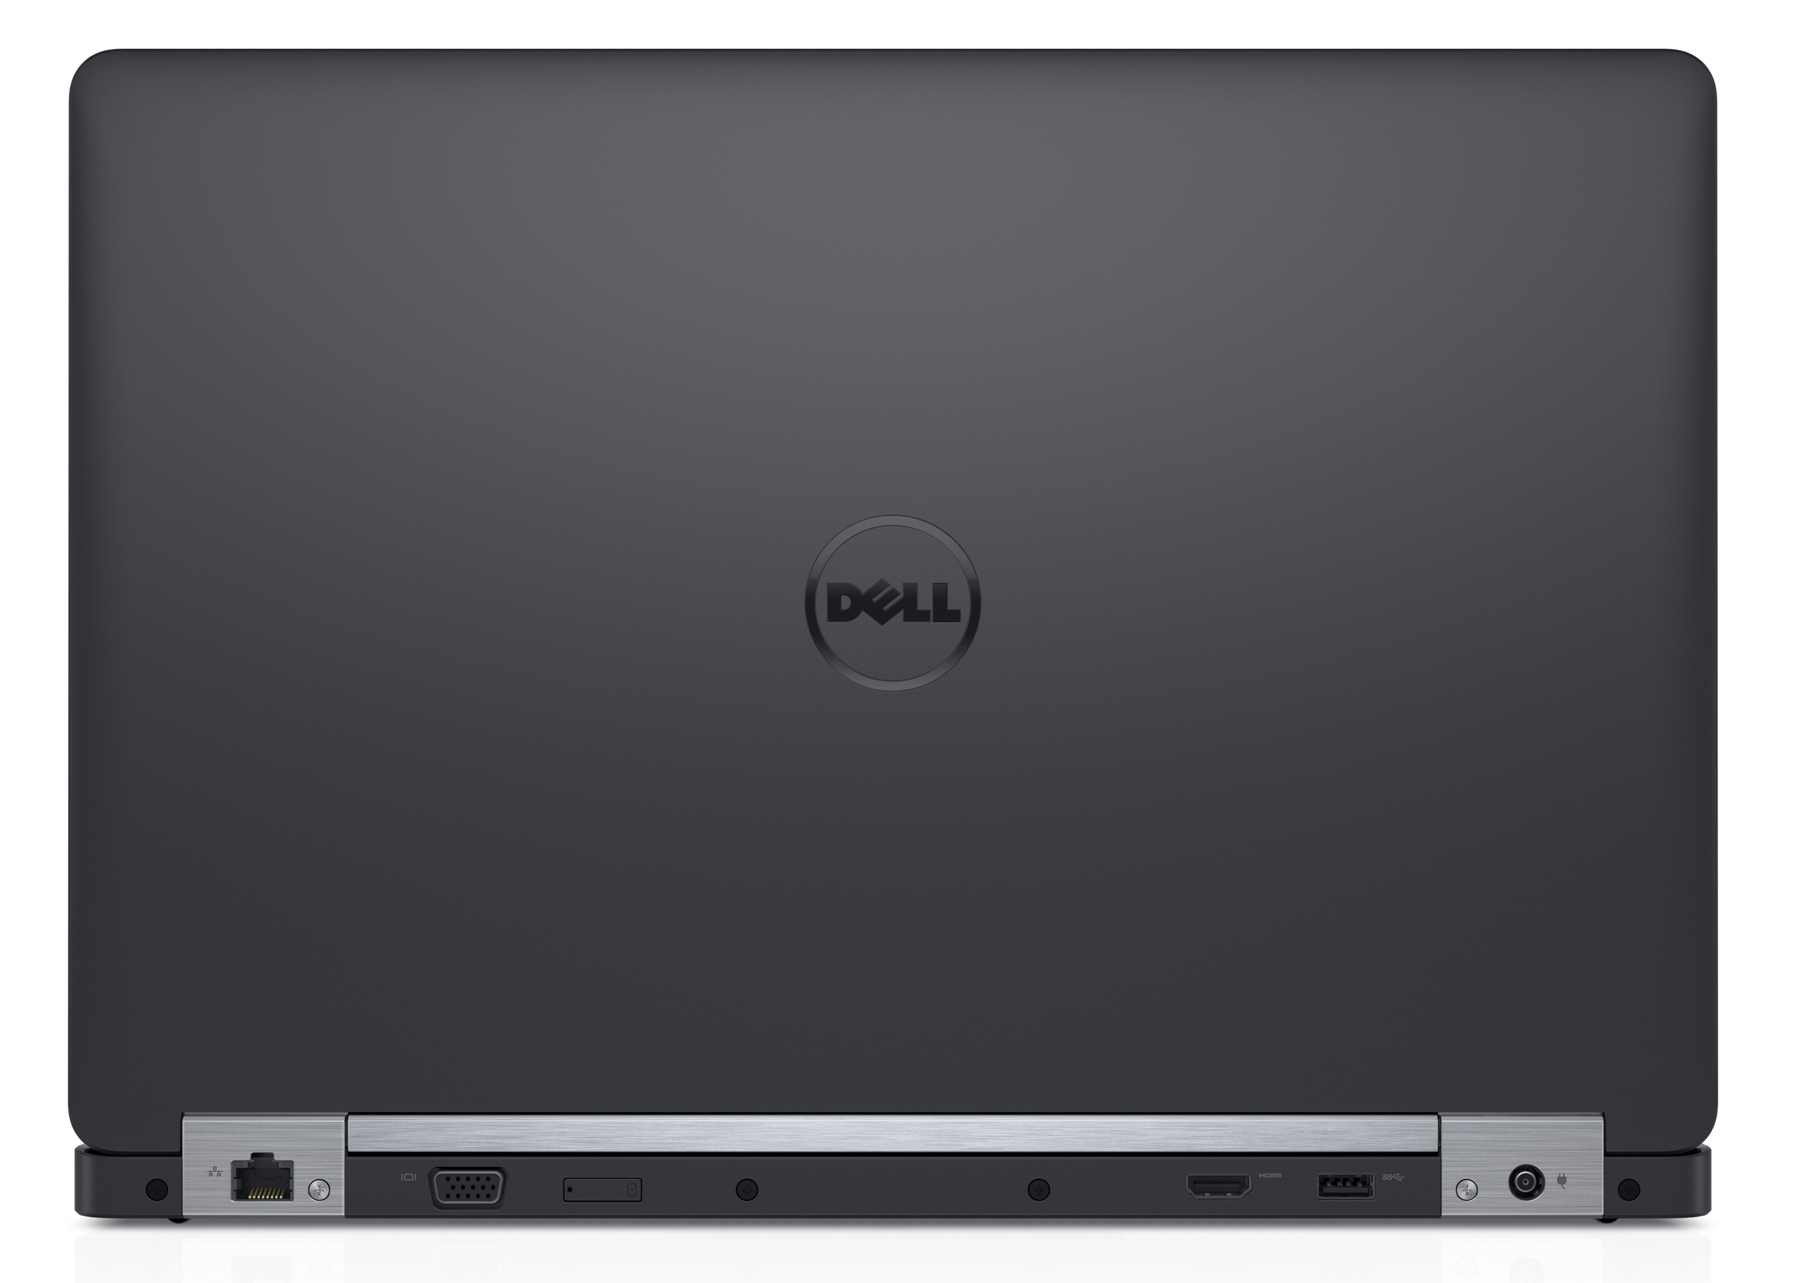
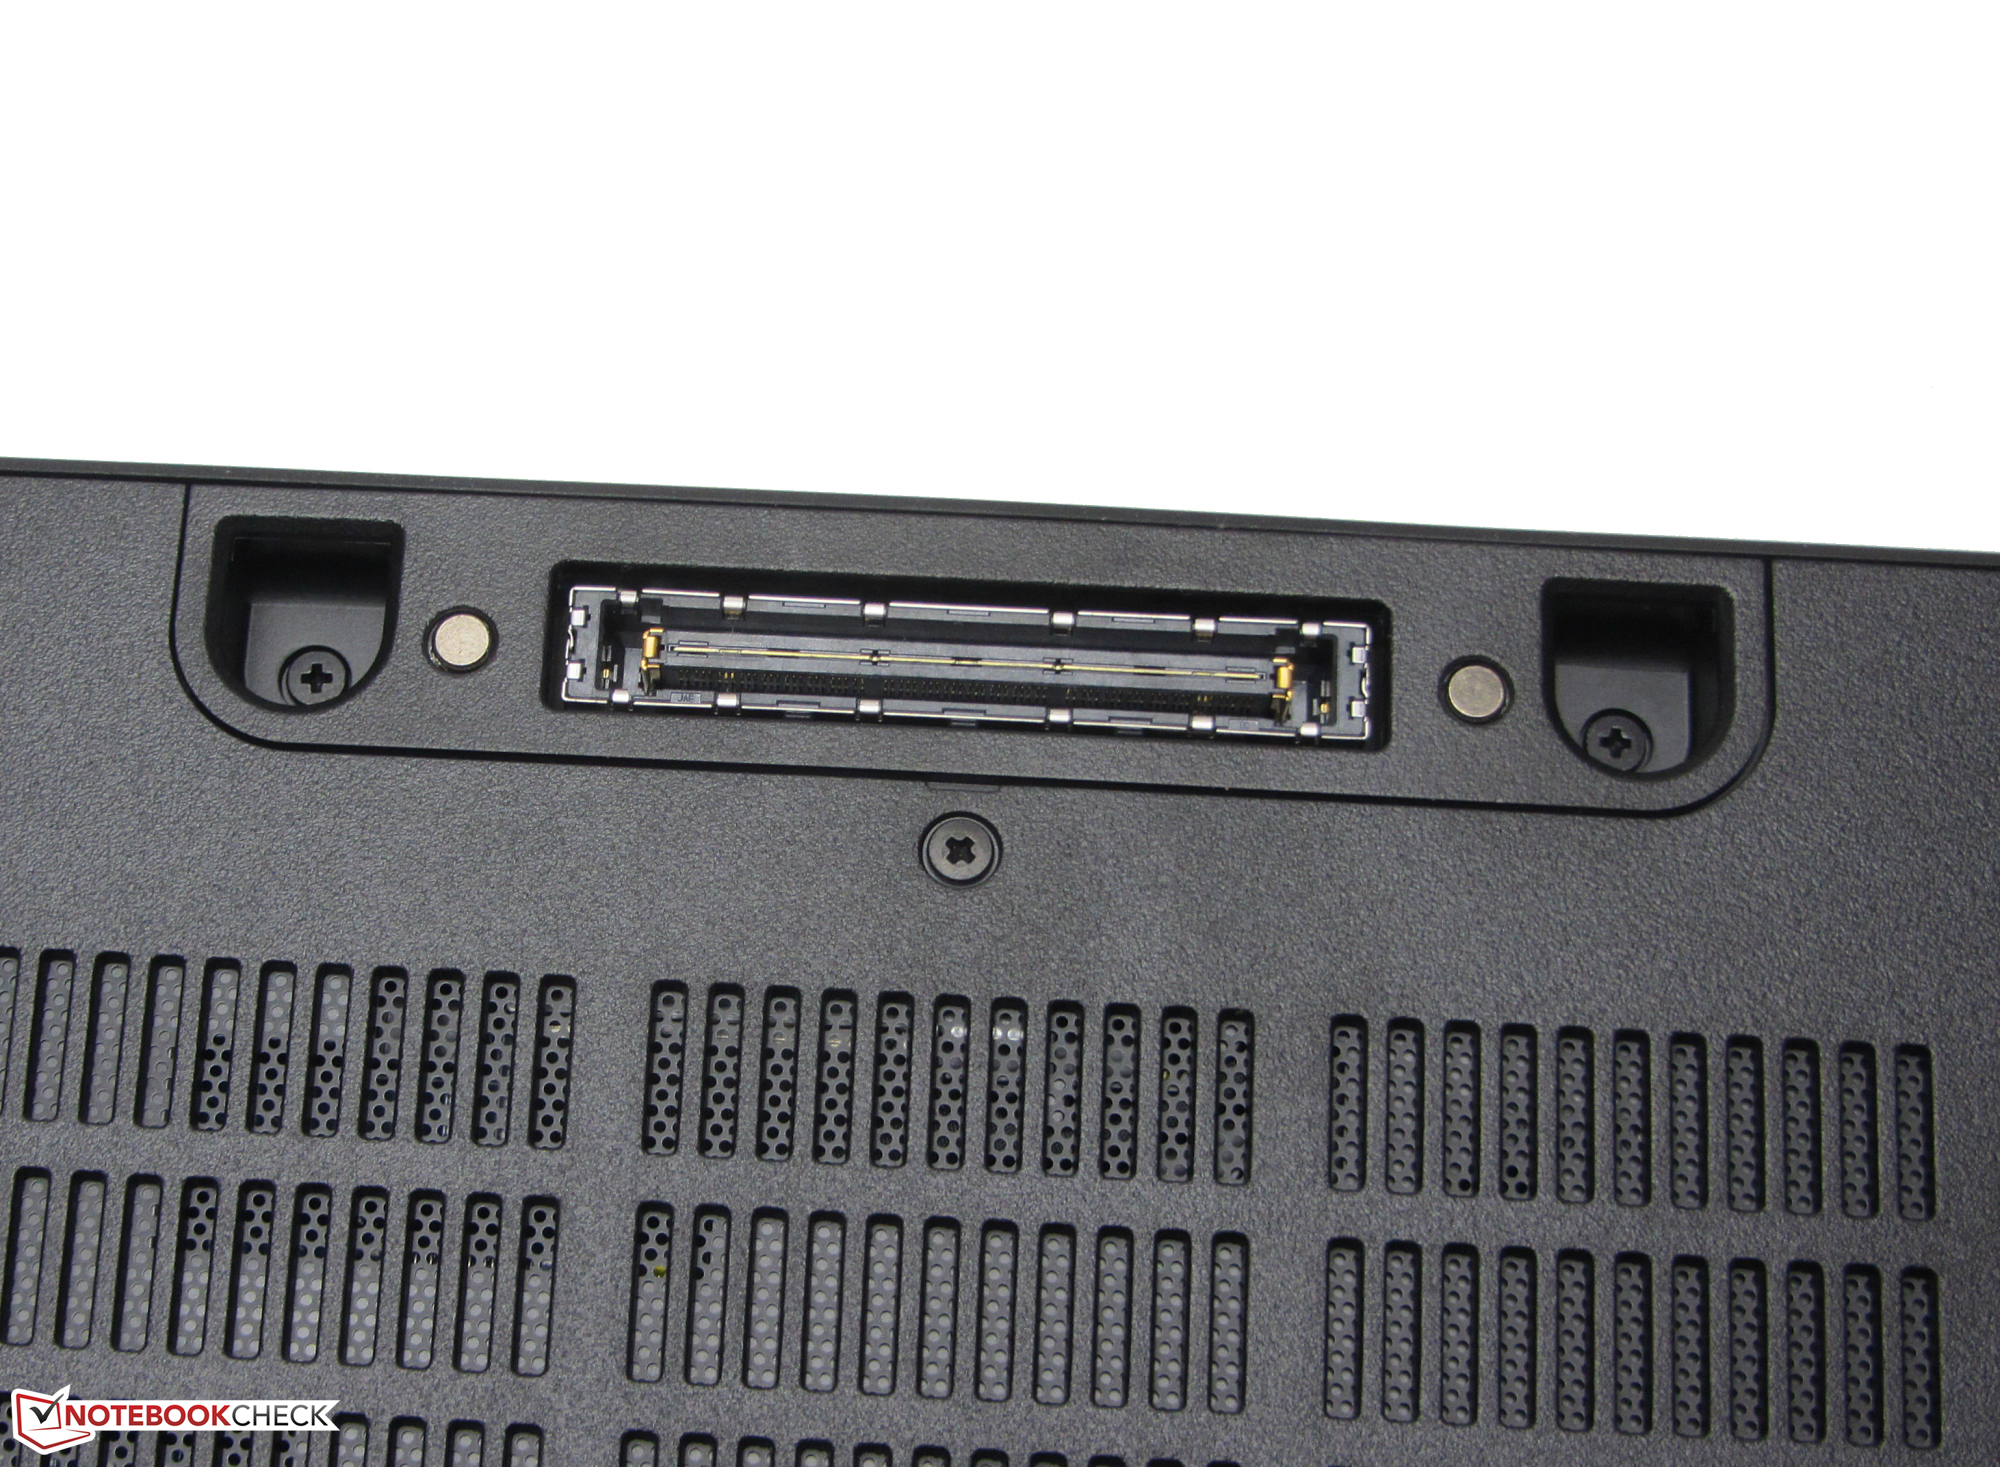
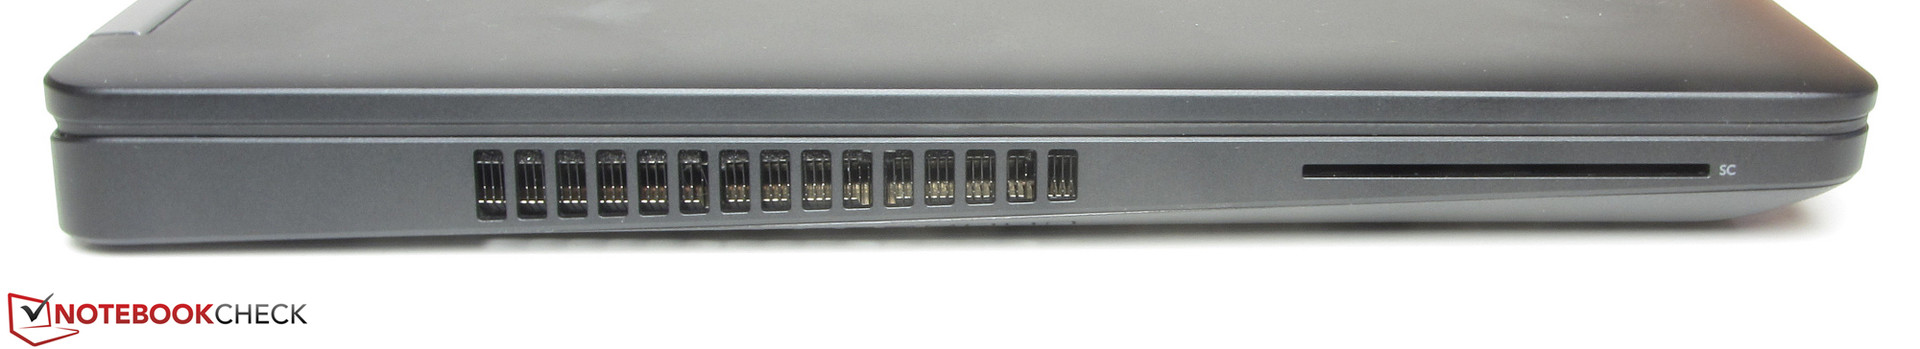
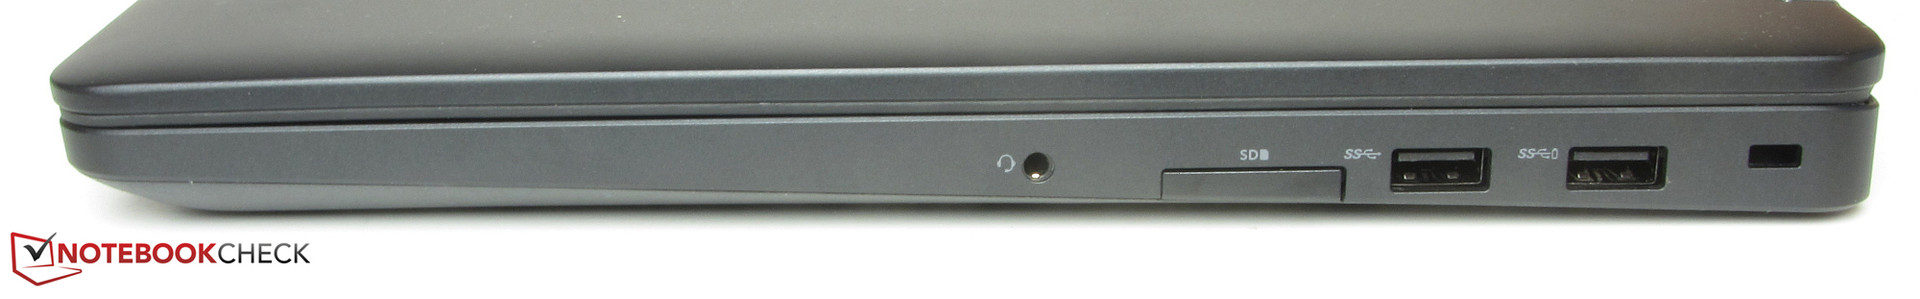
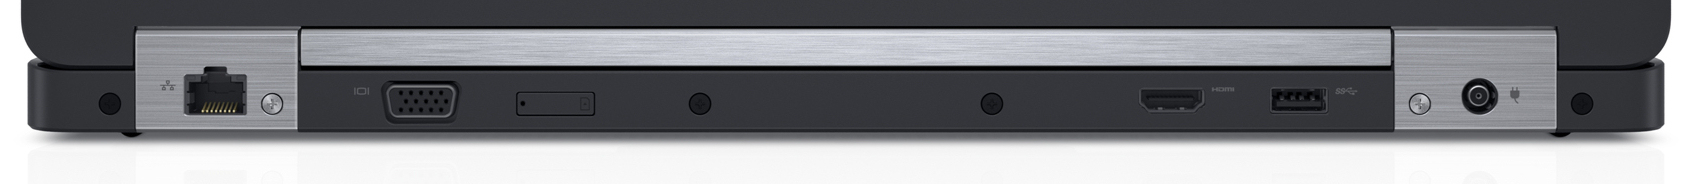
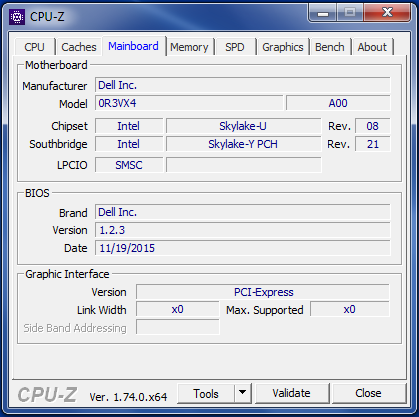
Il dispositivo offre le solite funzionalità business come scanner di impronte digitali, porta per docking station, lettore di SmartCard (opzionale), ma Dell ha eliminato TPM preferendo implementare la tecnologia proprietaria ControlVault. Il display purtroppo non è un punto di forza, a causa dell'utilizzo di un pannello scuro e con scarso contrasto con angoli di visualizzazione limitati. Ci aspettavamo di più da un dispositivo con un prezzo di 1.000 Euro (~$1112). Un dispositivo come il Latitude, inoltre, dovrebbe essere dotato di porta USB Type-C.
Nota: è una recensione breve. Per la recensione originale in inglese leggete qui.
Dell Latitude 15 E5570
- 07/05/2016 v5.1 (old)
Sascha Mölck
Price comparison
