Dell Latitude 15 9520 2-in-1 vs. Latitude 9510 2-in-1: più nuovo non è sempre meglio
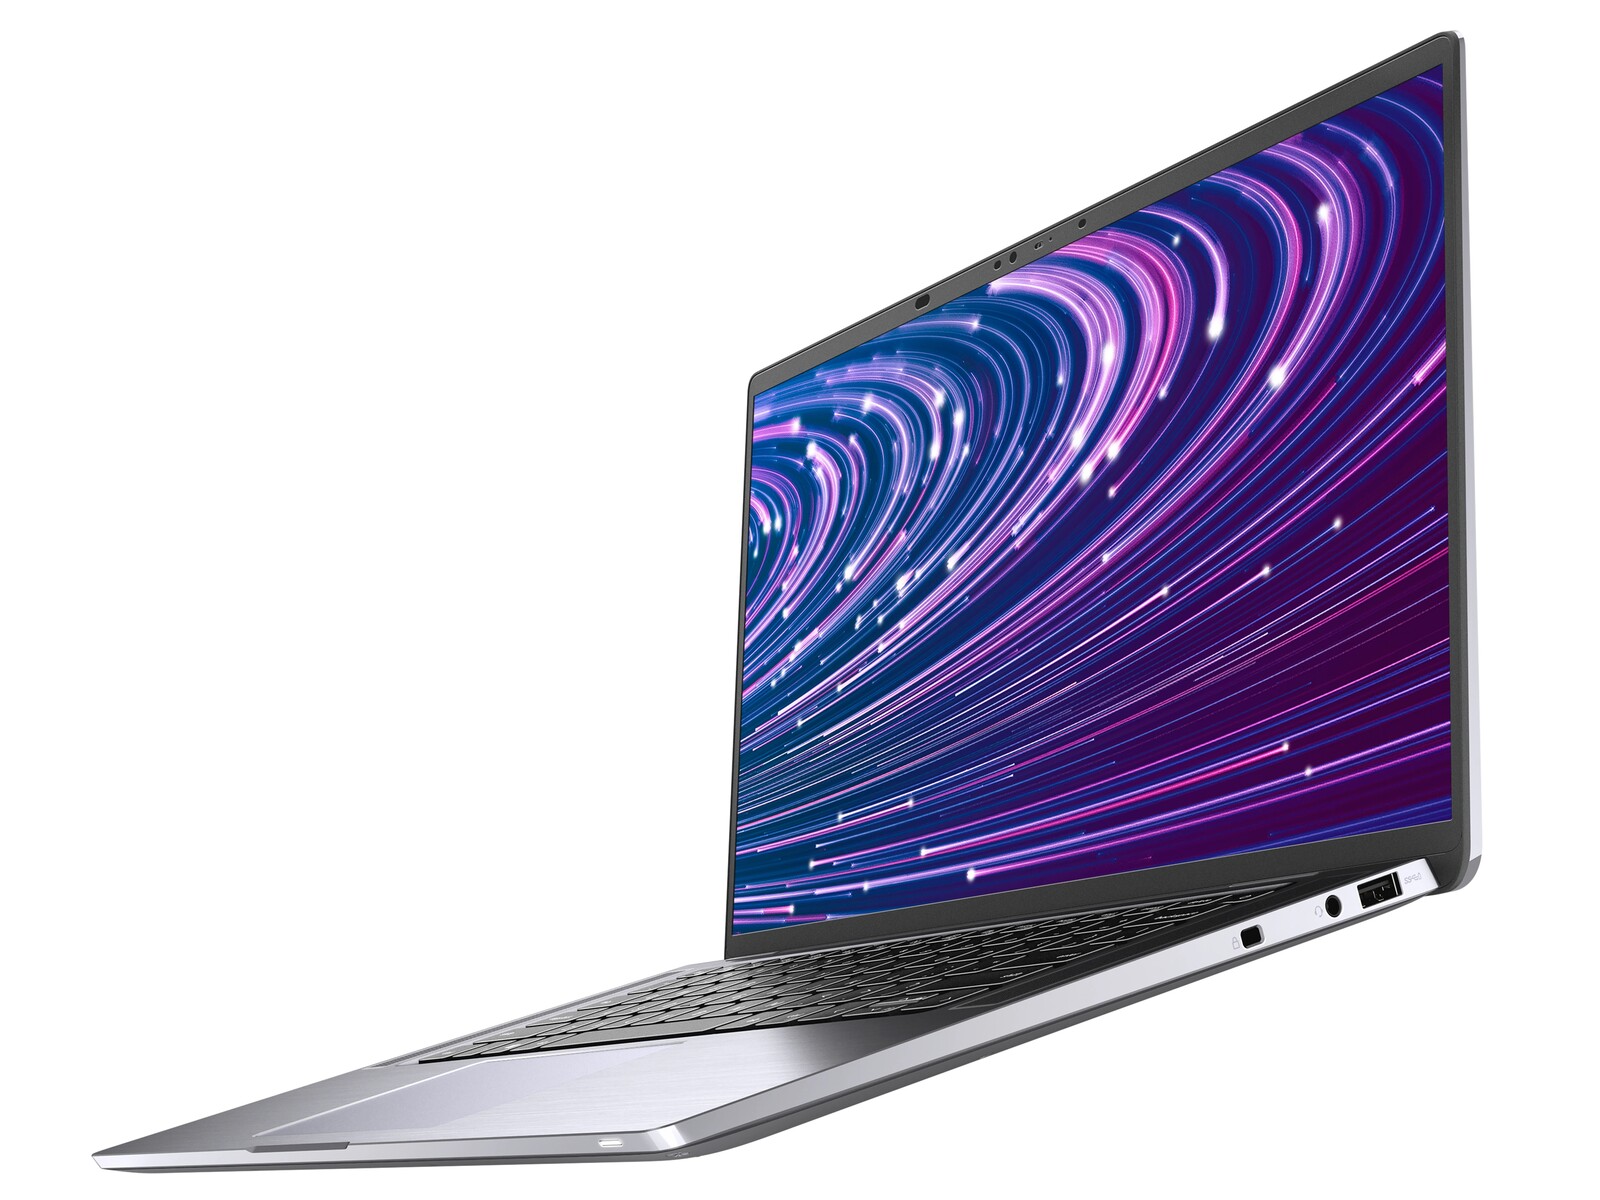
Il Latitude 9520 2-in-1 sostituisce la CPU Intel di decima generazione del Latitude 9510 2-in-1 con opzioni più recenti di undicesima generazione, mantenendo lo chassis identico. Quindi, vi raccomandiamo di controllare la nostra recensione esistente sul Latitude 9510 2-in-1 per saperne di più sui nostri pensieri sullo chassis, la tastiera e altre caratteristiche fisiche del sistema. Questa recensione si concentrerà sulle differenze tra i due modelli, compreso ciò che gli utenti possono aspettarsi in termini di prestazioni.
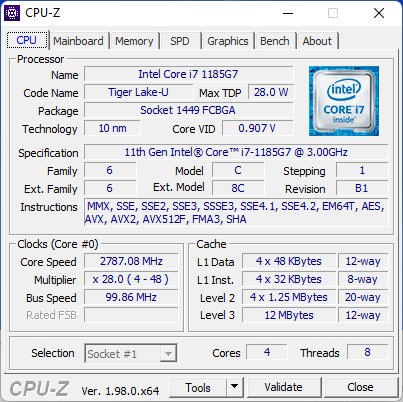
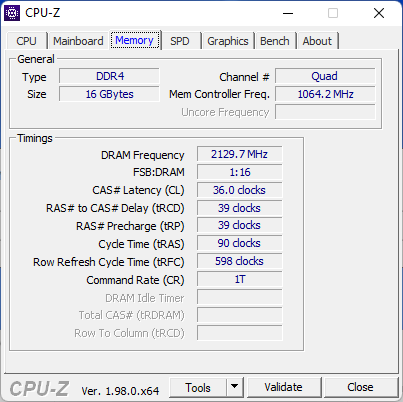
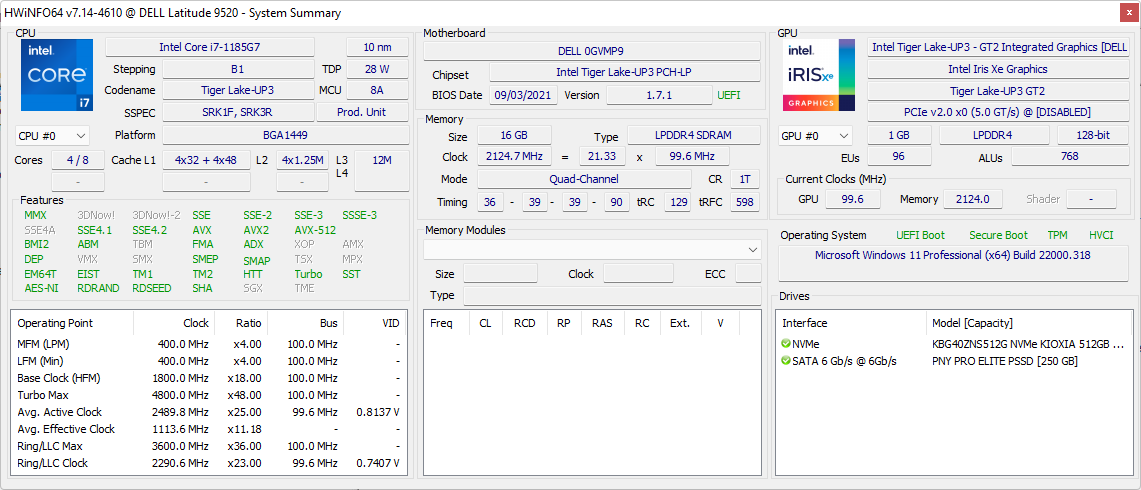
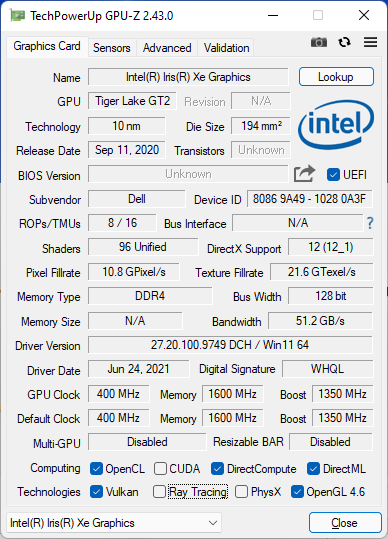
La nostra unità di test è una configurazione di fascia alta con CPU Core i7-1185G7 vPro, GPU Iris Xe 96 EUs, 16 GB di RAM e 512 GB di SSD NVMe per circa $2800 USD. SKU inferiori con la CPU Core i5-1145G7 e metà della capacità di archiviazione sono disponibili per circa 2300 dollari. Si noti che tutte le SKU 2-in-1 sono dotate dello stesso pannello FHD da 15 pollici con sensore di prossimità e otturatore elettronico. In alternativa, gli utenti possono anche acquistare il Latitude 9520 clamshell se il fattore di forma 2-in-1 è indesiderabile.
Il Latitude 9520 2-in-1 compete con altri convertibili di fascia alta come il MSI Summit E13 Flip, Microsoft Surface Book, HP EliteBook x360 1040 G7, o il Lenovo ThinkPad x13 Yoga.
Altre recensioni di Dell:
Potential Competitors in Comparison
Punteggio | Data | Modello | Peso | Altezza | Dimensione | Risoluzione | Prezzo |
|---|---|---|---|---|---|---|---|
| 89.2 % v7 (old) | 11/2021 | Dell Latitude 15 9520 2-in-1 i7-1185G7, Iris Xe G7 96EUs | 1.7 kg | 13.99 mm | 15.00" | 1920x1080 | |
| 88.6 % v7 (old) | 07/2020 | Dell Latitude 9510 2-in-1 i7-10810U, UHD Graphics 620 | 1.7 kg | 13.99 mm | 15.00" | 1920x1080 | |
| 86.1 % v7 (old) | 08/2021 | HP EliteBook 850 G8 3C7Z8EA i7-1165G7, Iris Xe G7 96EUs | 1.8 kg | 19 mm | 15.60" | 1920x1080 | |
| 85.1 % v7 (old) | 07/2021 | Lenovo ThinkPad L15 G2 AMD R5 5600U, Vega 7 | 1.9 kg | 21 mm | 15.60" | 1920x1080 | |
| 81.2 % v7 (old) | 05/2021 | MSI Summit B15 A11M i7-1165G7, Iris Xe G7 96EUs | 1.5 kg | 16.9 mm | 15.60" | 1920x1080 | |
| 84.9 % v7 (old) | 04/2021 | Microsoft Surface Laptop 4 15 AMD TFF_00028 R7 4980U, Vega 8 | 1.6 kg | 14.7 mm | 15.00" | 2496x1664 |
Caso
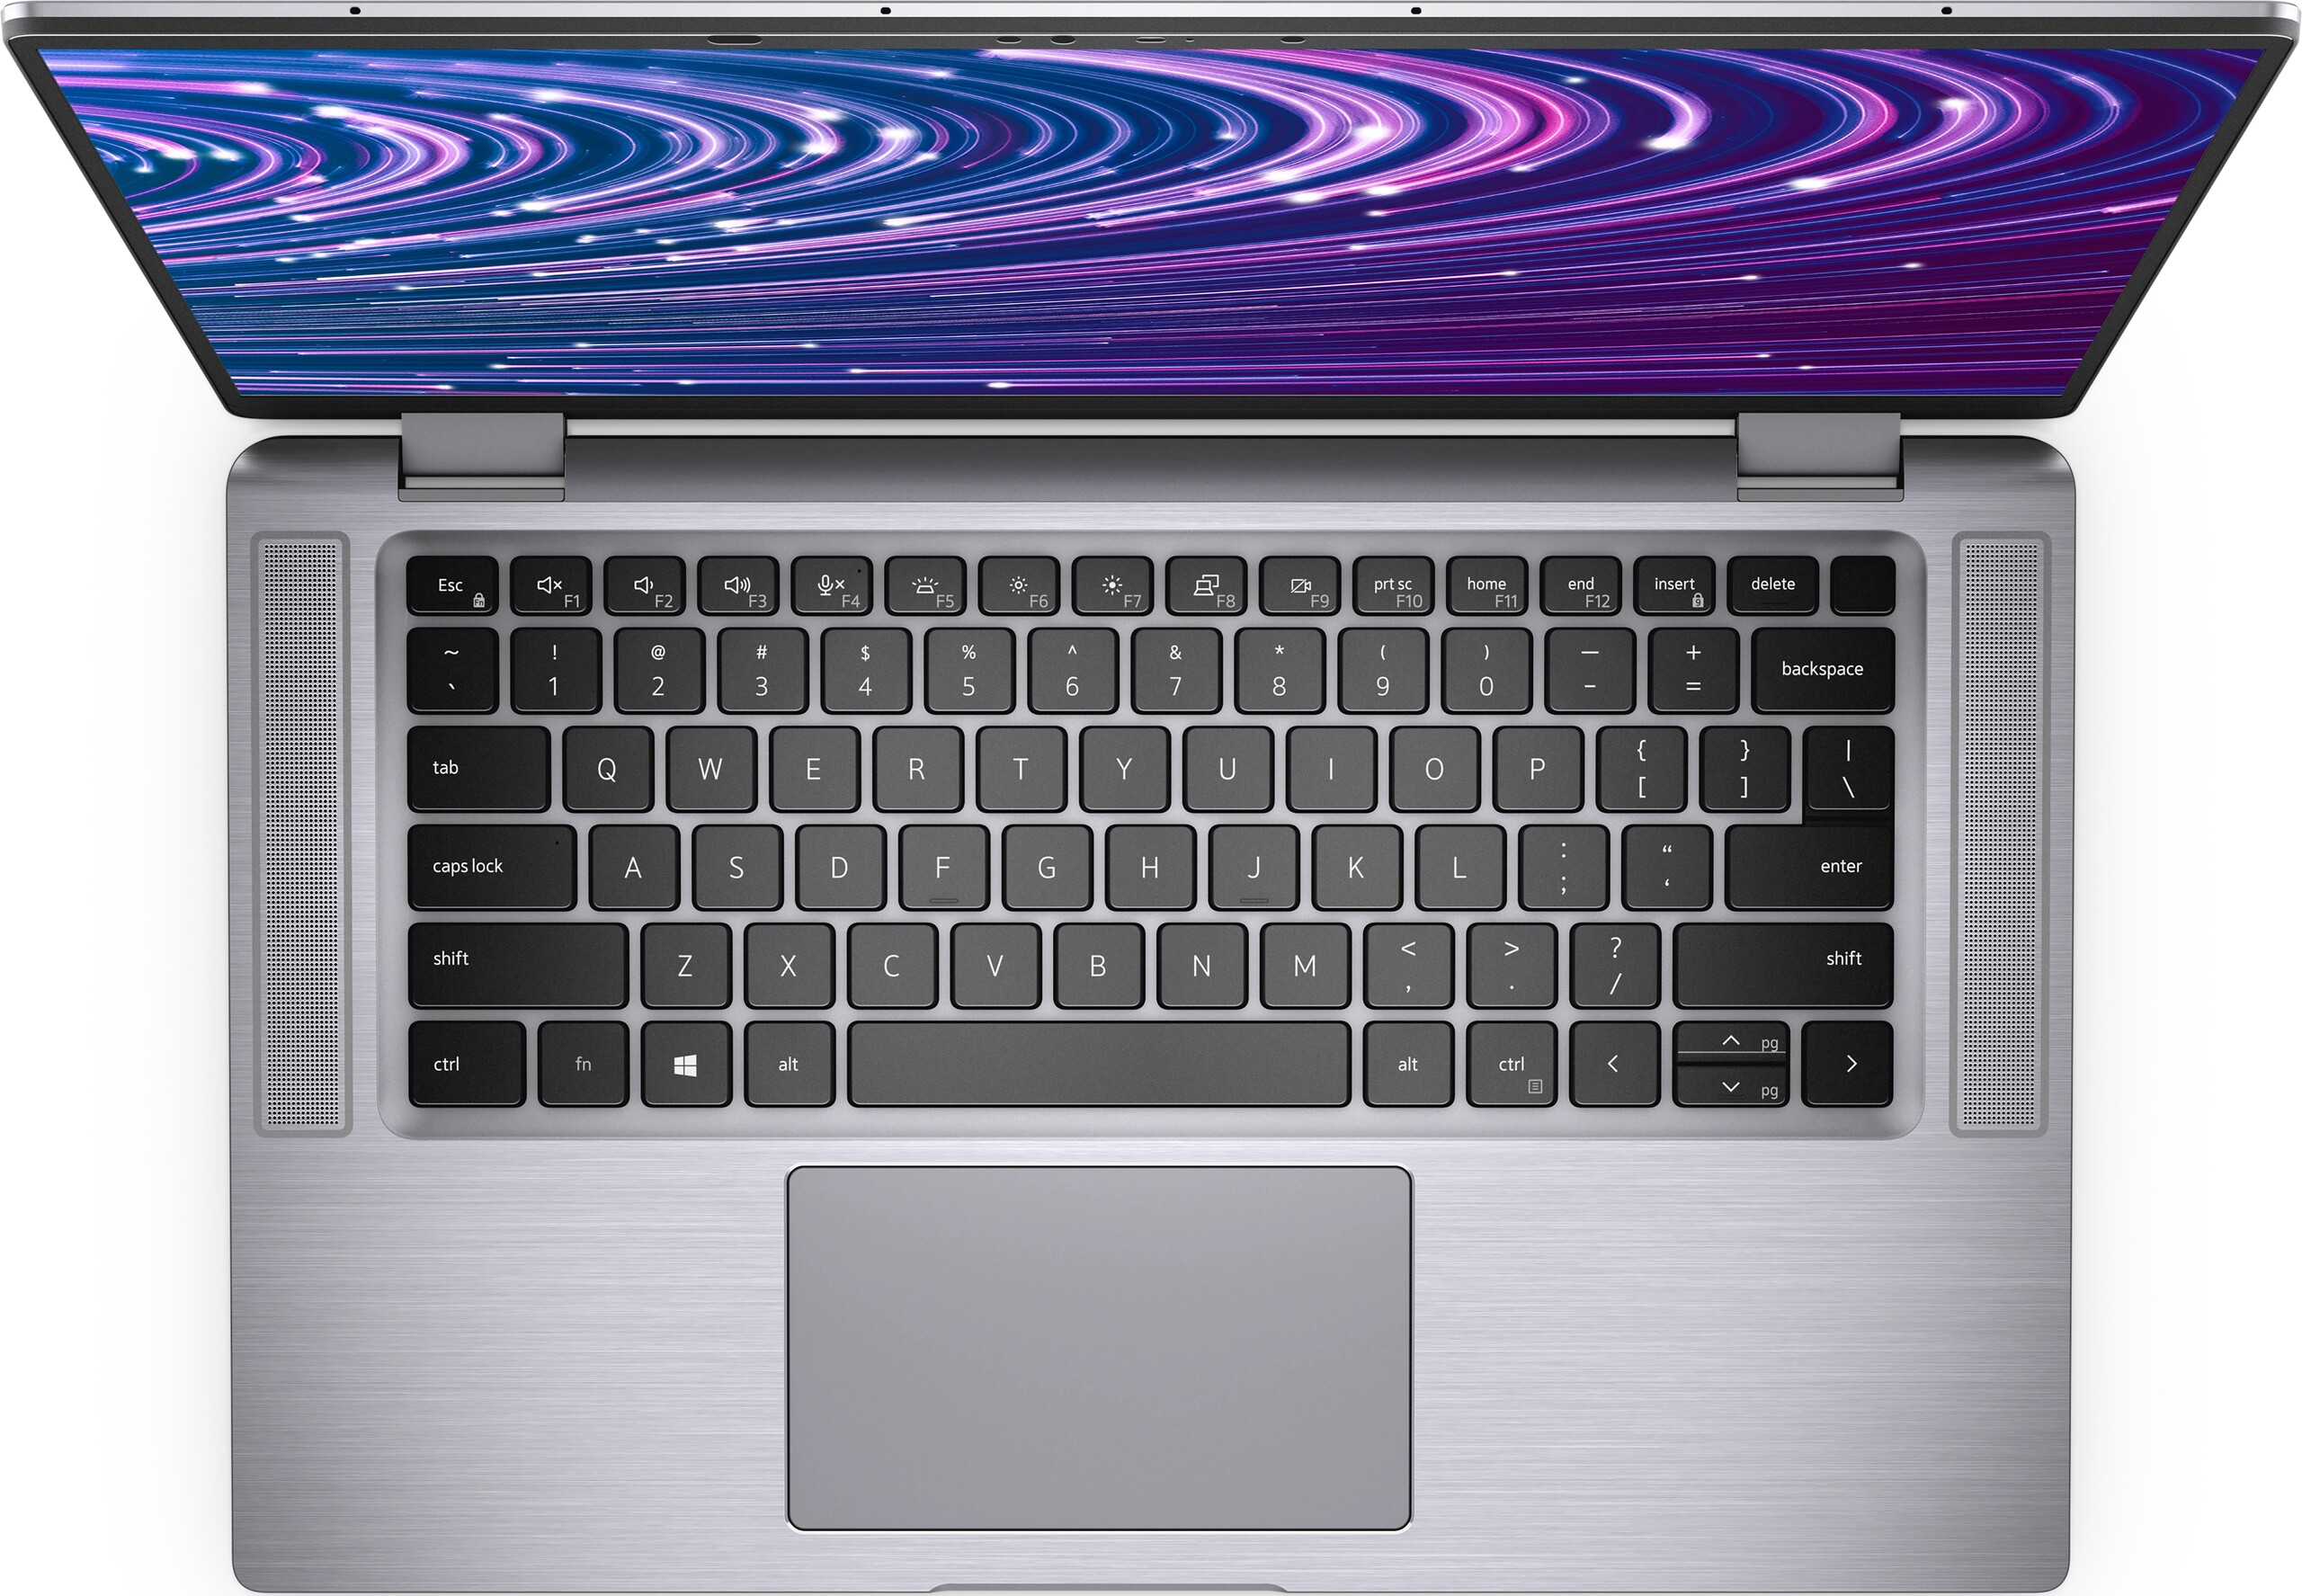
Anche se il telaio è identico al modello dell'anno scorso, le cerniere della nostra unità di test Latitude 9520 2-in-1 si sentivano più deboli ad angoli compresi tra 60 e 90 gradi. Idealmente, la rigidità delle cerniere dovrebbe essere uniforme in tutti gli angoli. Raccomandiamo di controllare le cerniere dopo l'acquisto per qualsiasi anomalia.

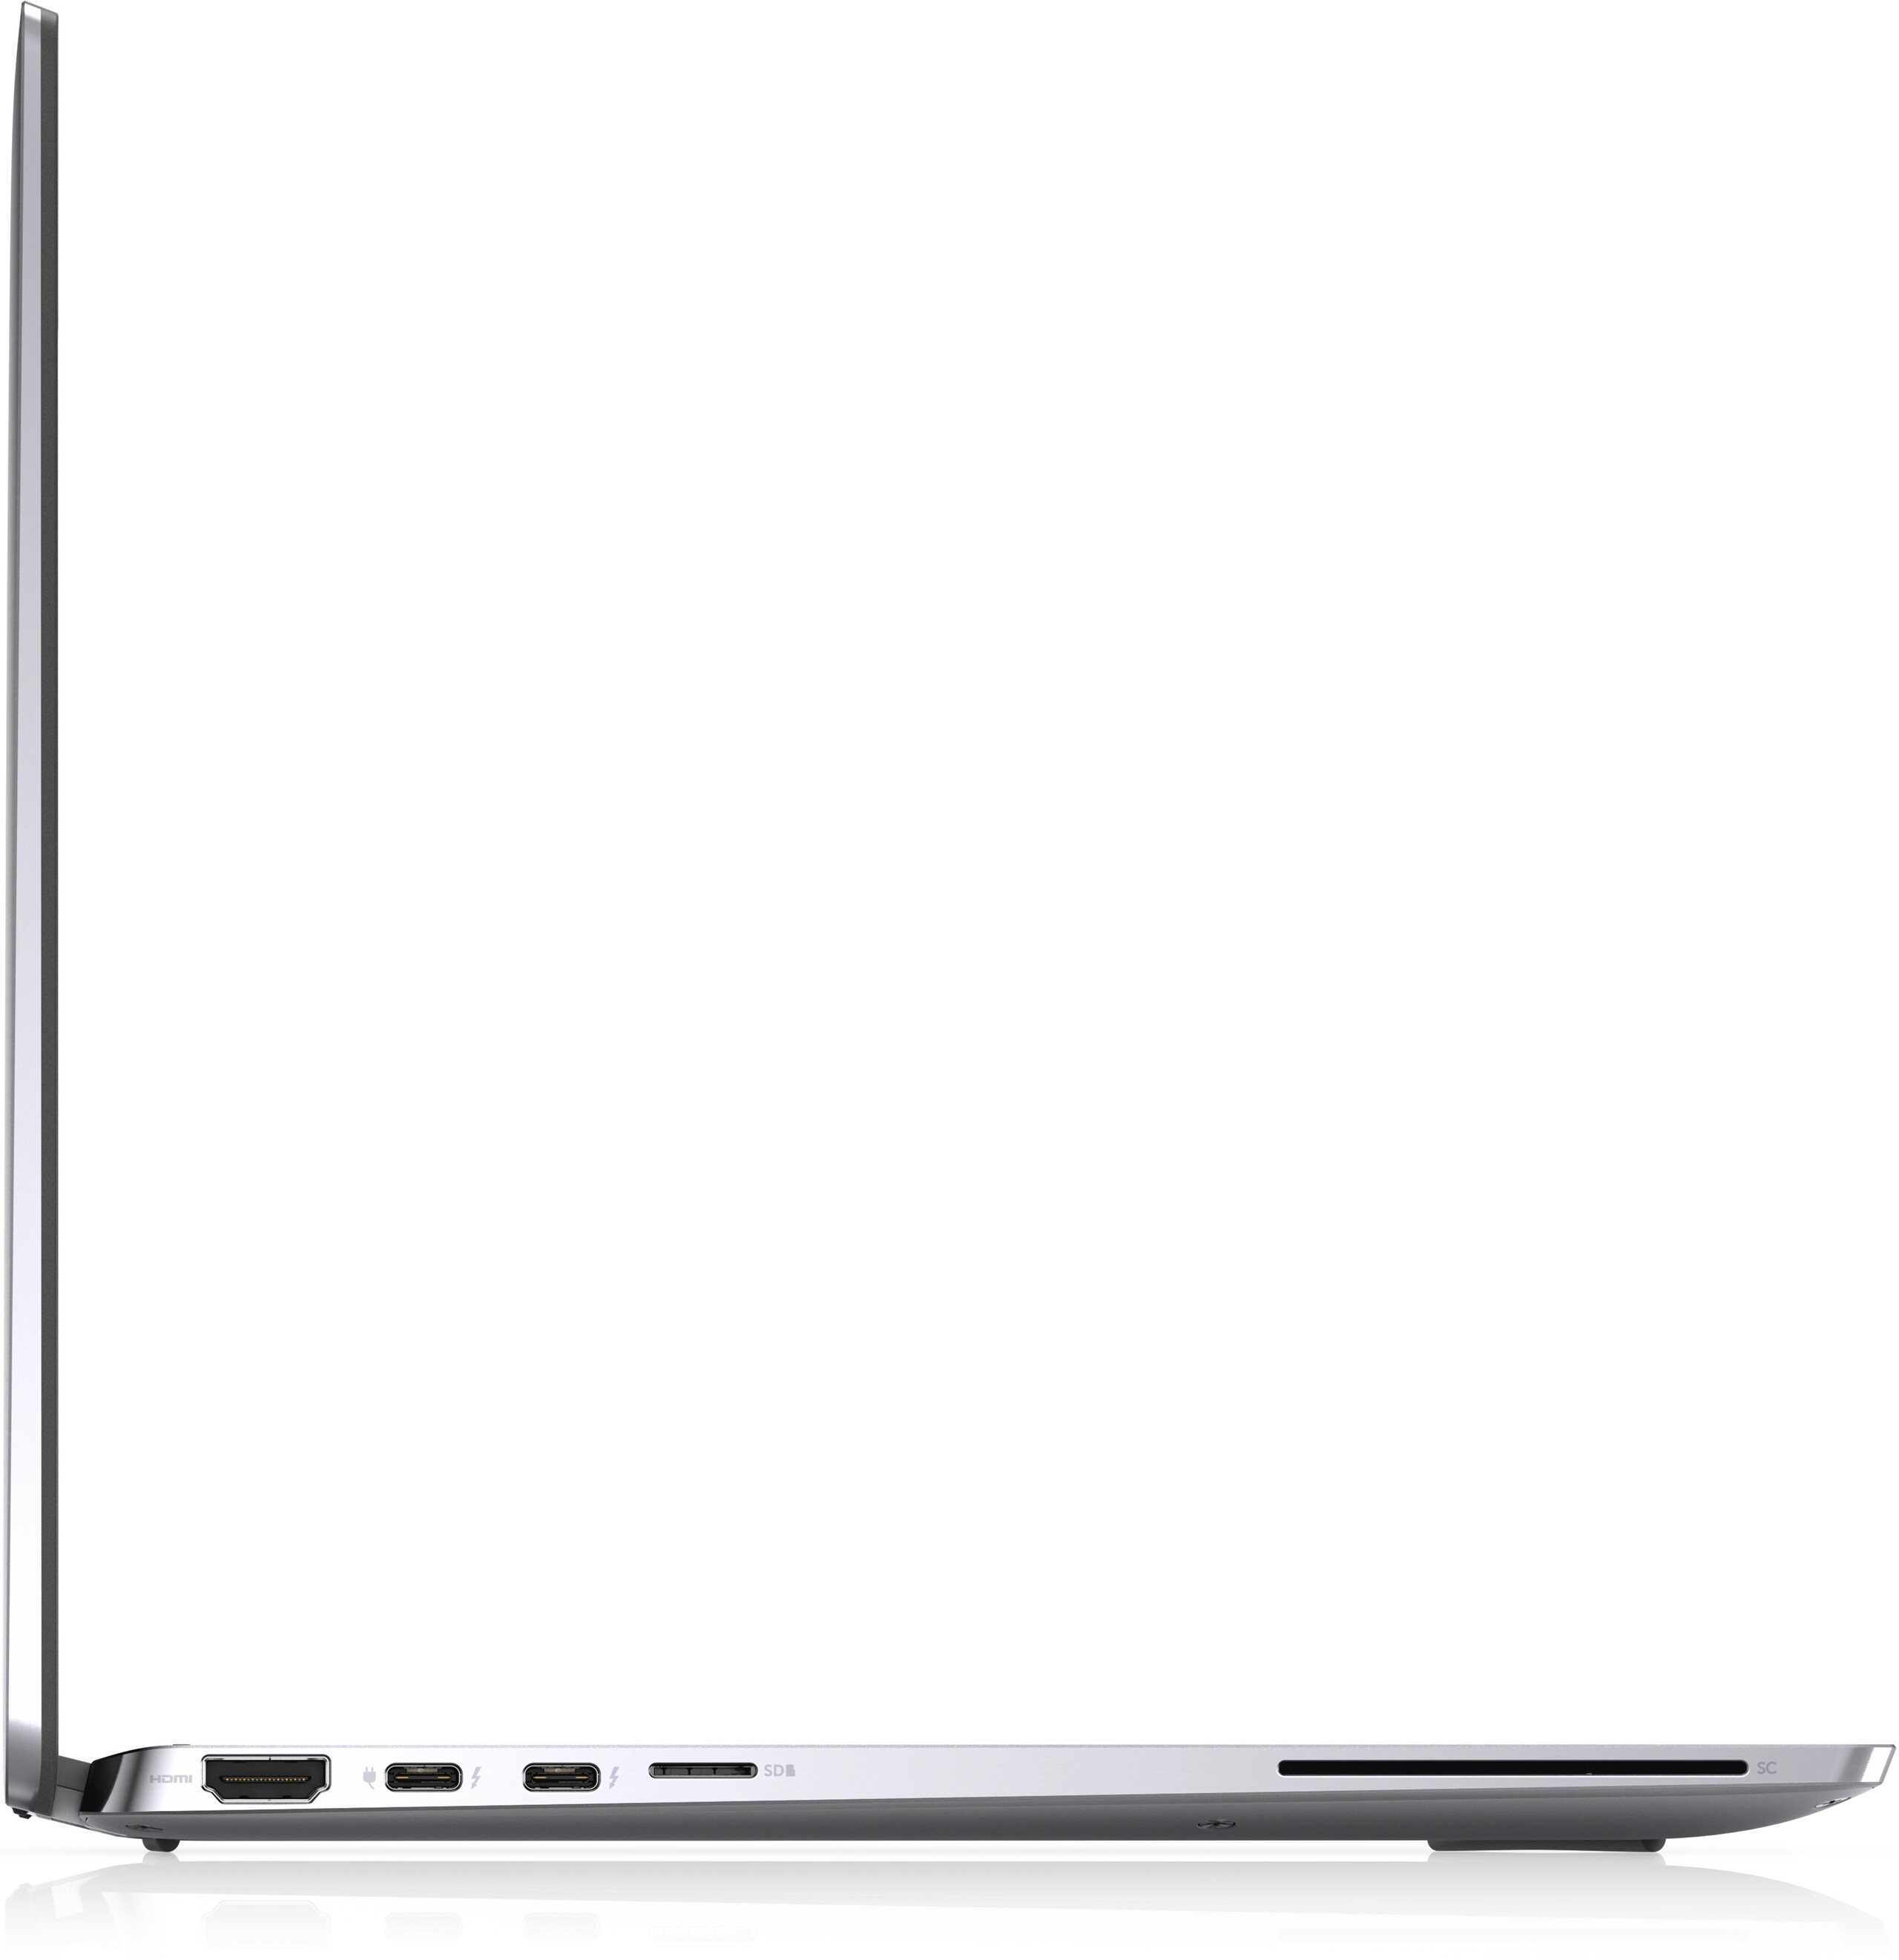
Connettività
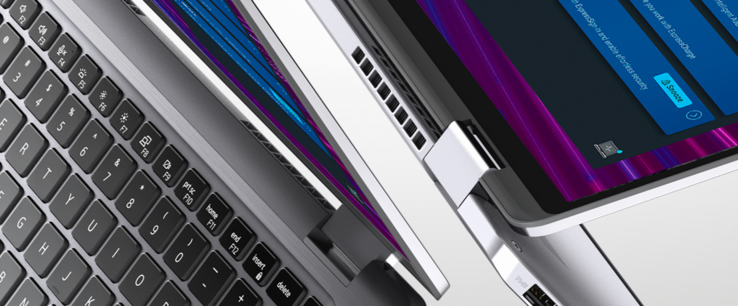
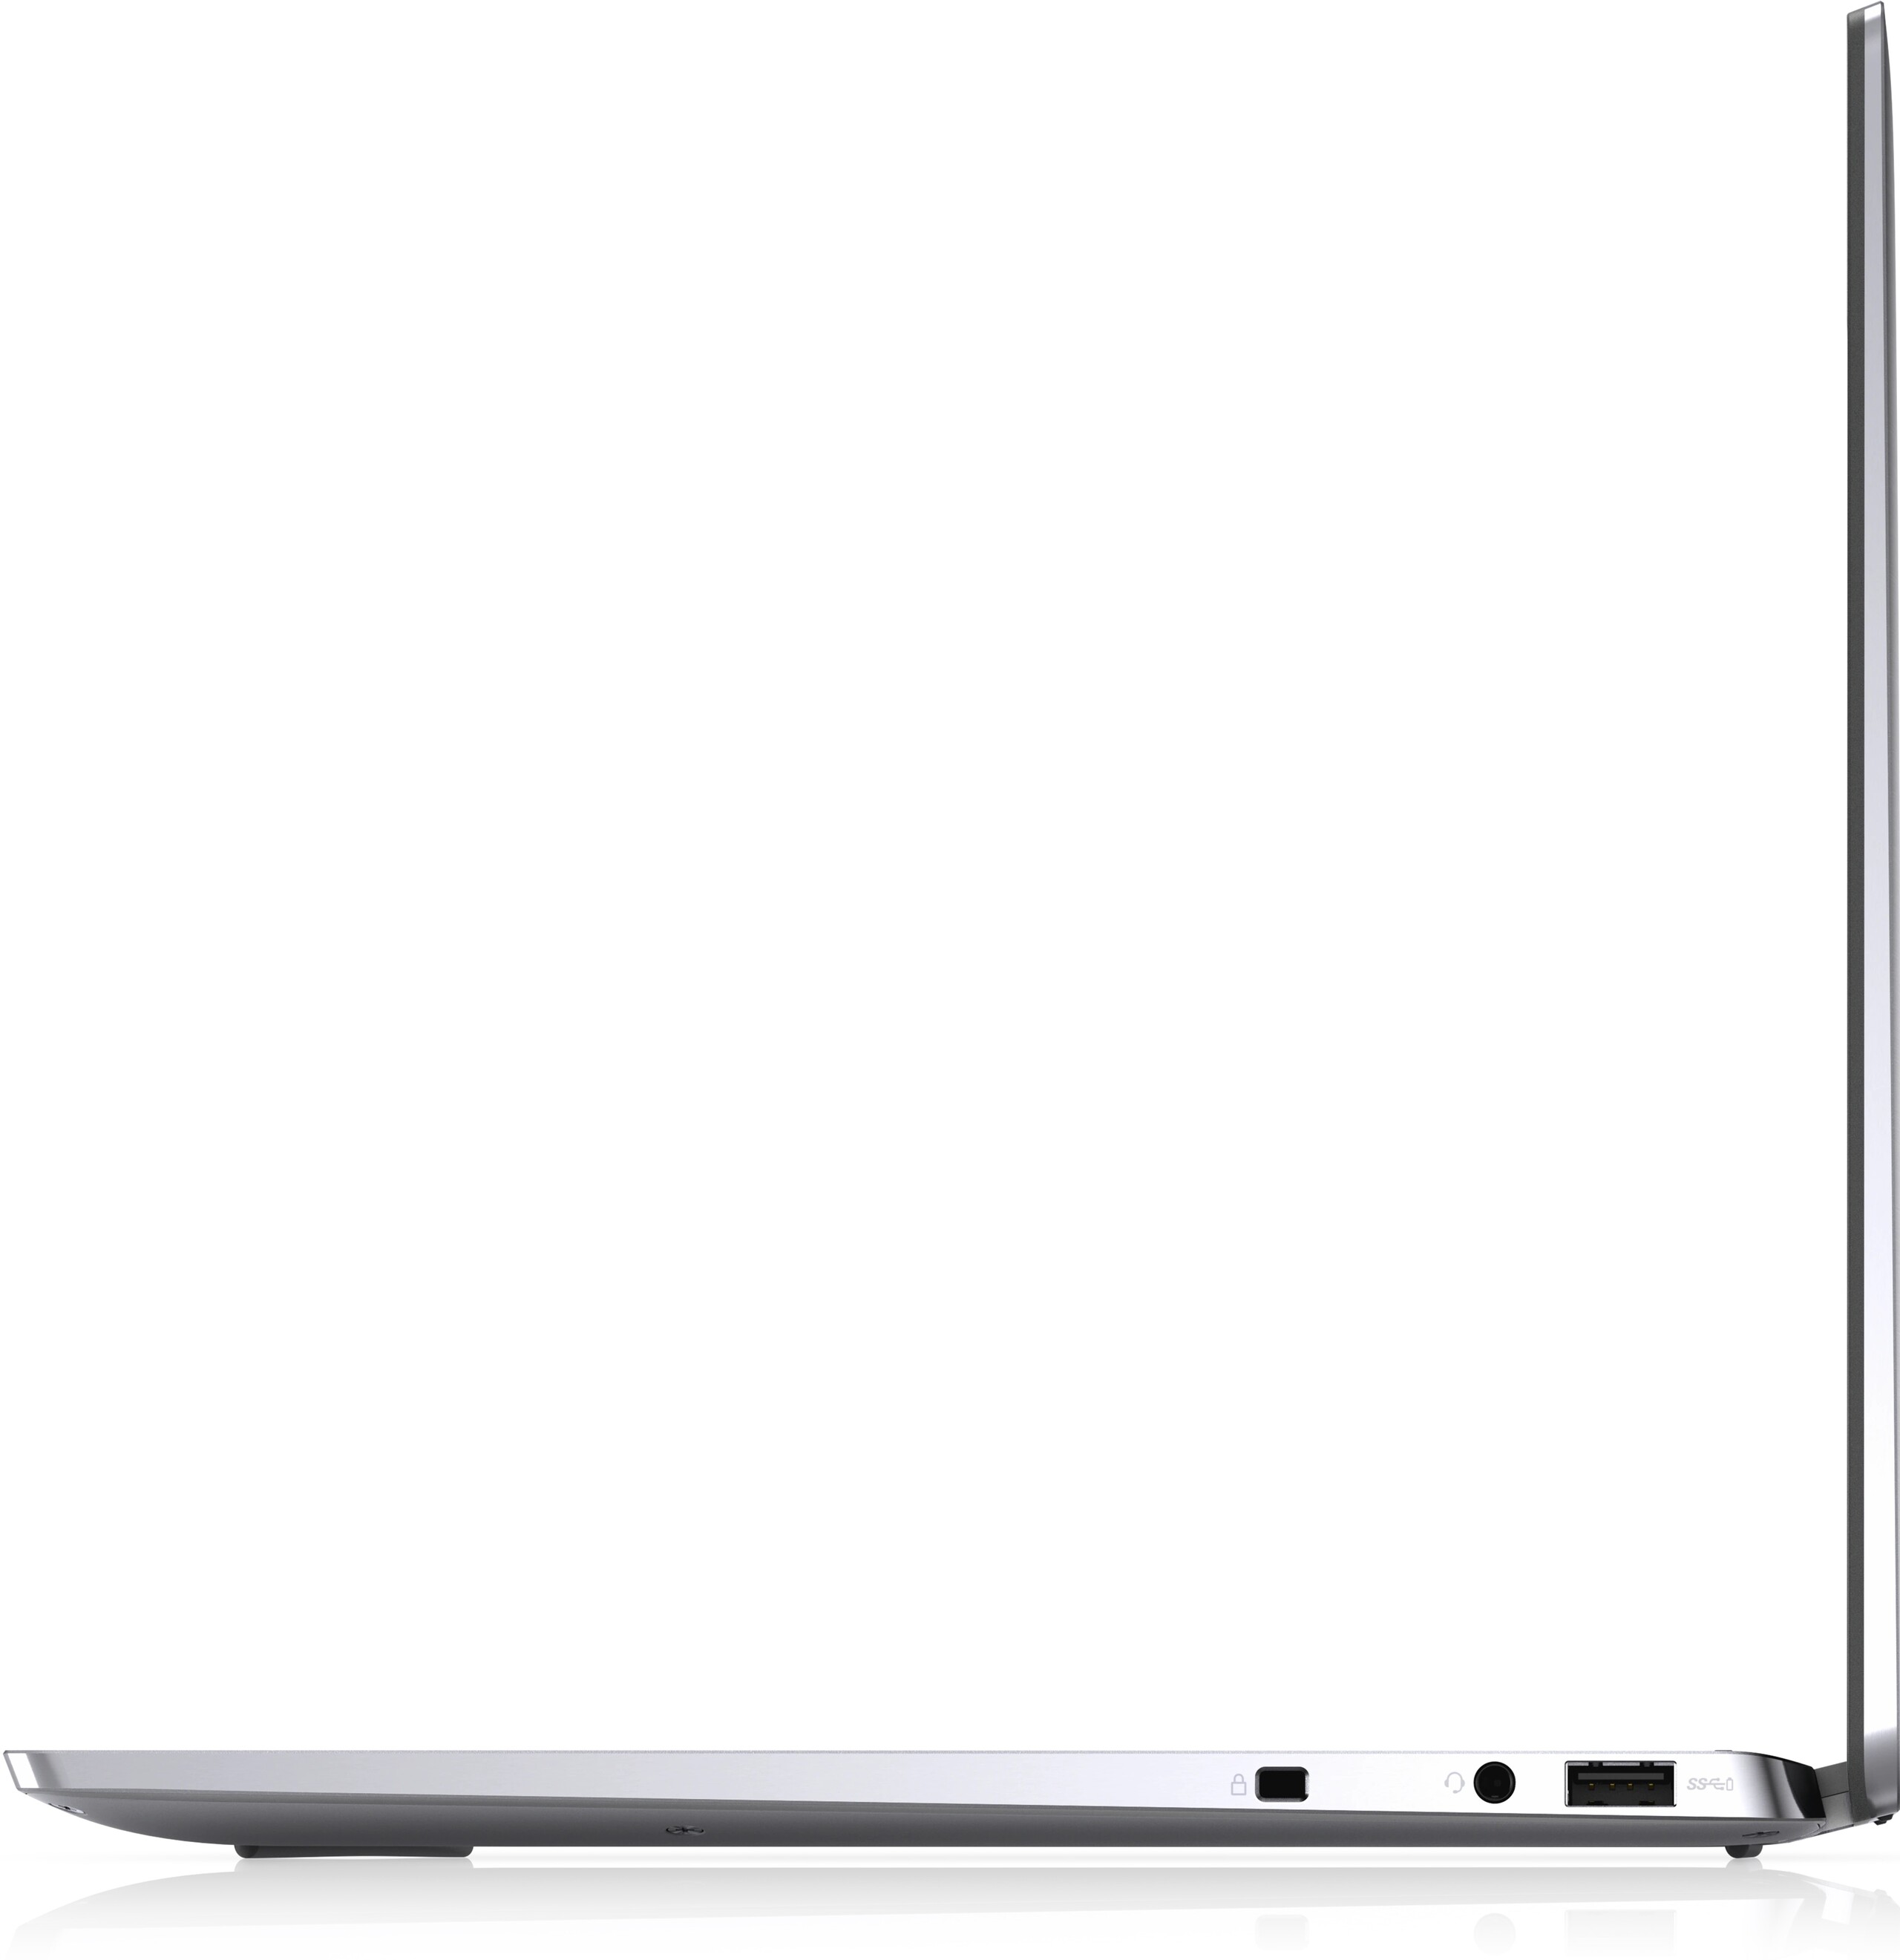
Le porte Thunderbolt 3 sul Latitude 9510 sono state aggiornate a Thunderbolt 4 sul nostro Latitude 9520. Per la maggior parte degli utenti, tuttavia, l'aggiornamento non avrà essenzialmente alcun significato, a meno che non abbiate intenzione di utilizzare GPU esterne. Tutte le altre porte sono altrimenti identiche tra i due modelli.
Lettore di schede SD
| SD Card Reader | |
| average JPG Copy Test (av. of 3 runs) | |
| Dell Latitude 9510 2-in-1 (Toshiba Exceria Pro M501 64 GB UHS-II) | |
| Dell Latitude 15 9520 2-in-1 (AV Pro V60) | |
| MSI Summit B15 A11M (AV PRO microSD 128 GB V60) | |
| Lenovo ThinkPad L15 G2 AMD (AV Pro V60) | |
| maximum AS SSD Seq Read Test (1GB) | |
| MSI Summit B15 A11M (AV PRO microSD 128 GB V60) | |
| Dell Latitude 9510 2-in-1 (Toshiba Exceria Pro M501 64 GB UHS-II) | |
| Dell Latitude 15 9520 2-in-1 (AV Pro V60) | |
| Lenovo ThinkPad L15 G2 AMD (AV Pro V60) | |
Comunicazione
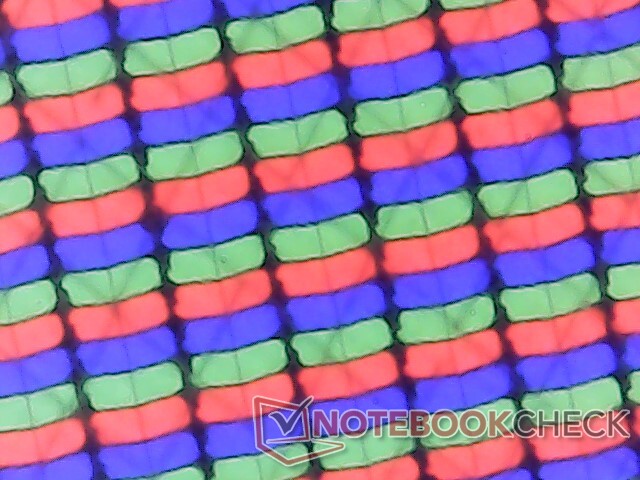
Webcam


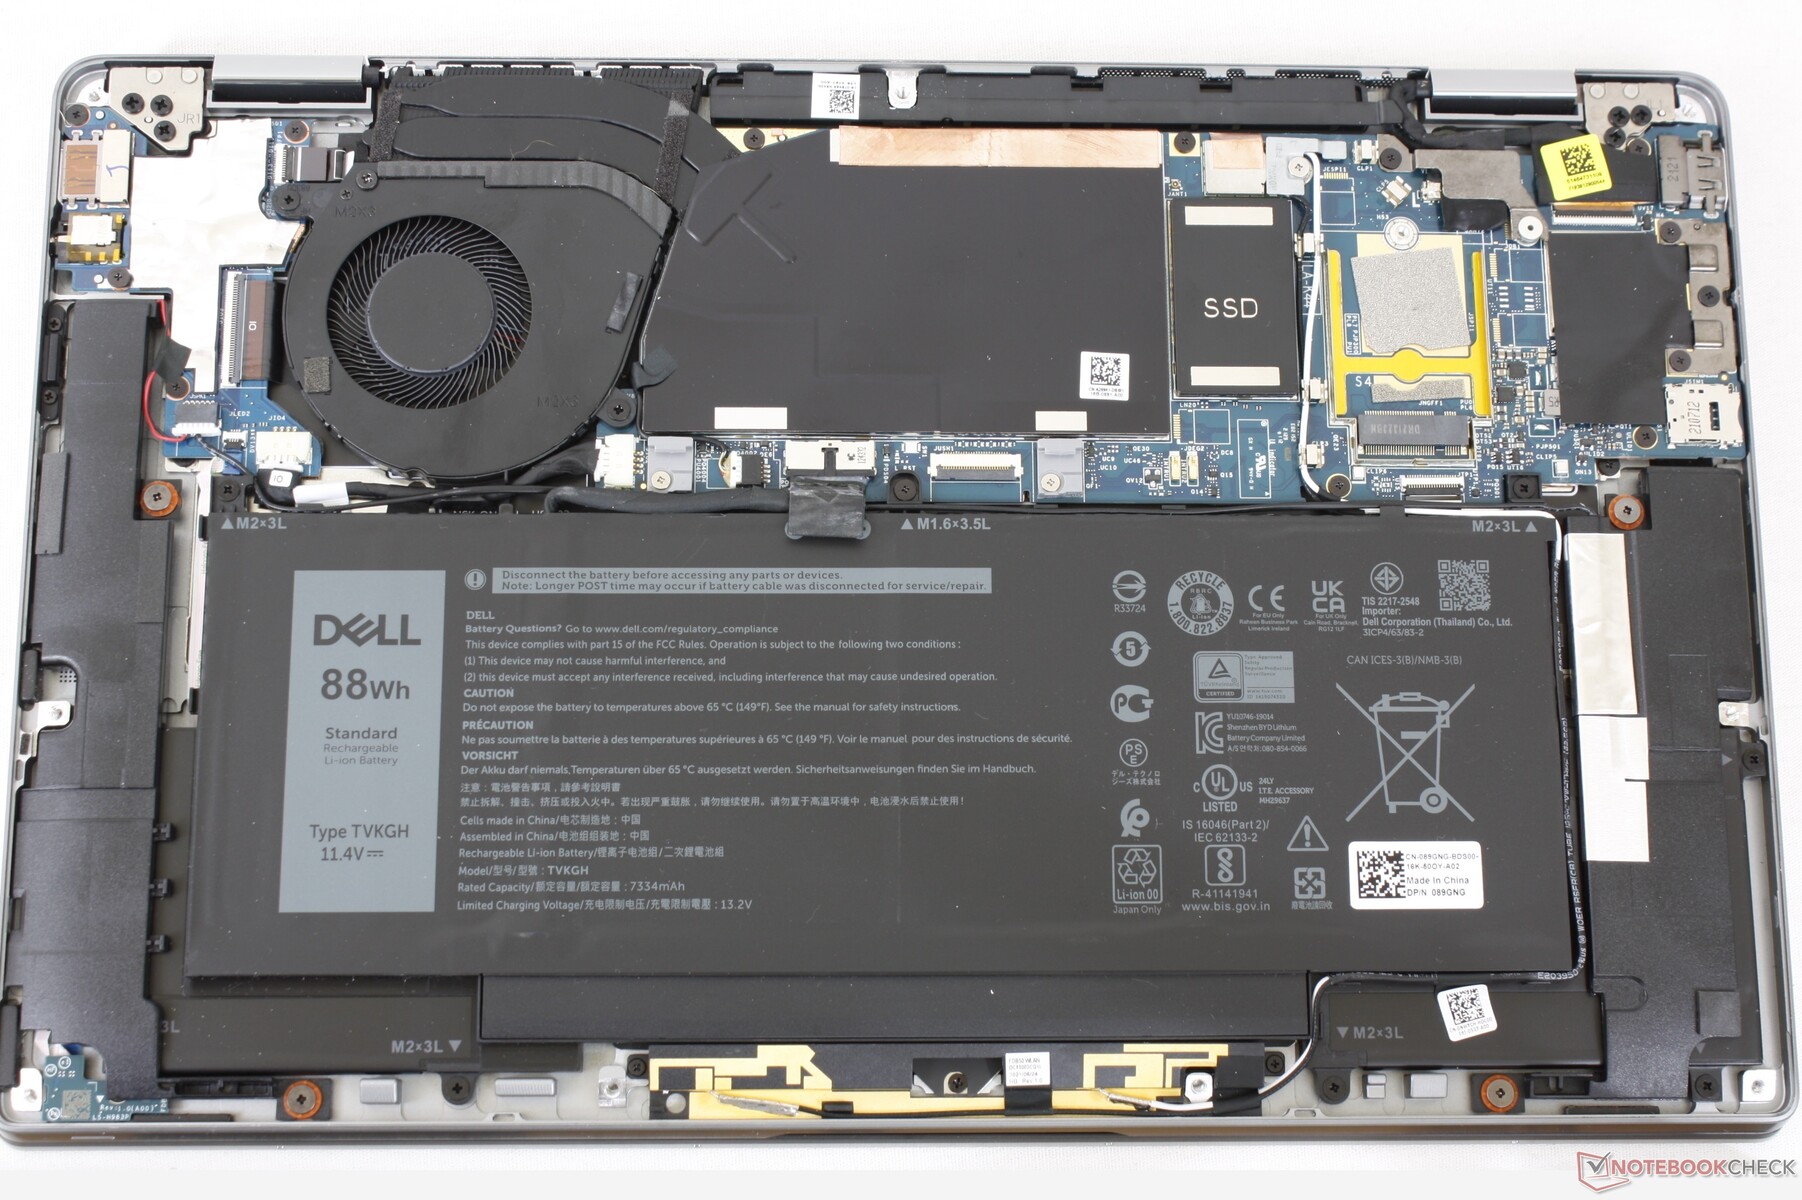
Manutenzione
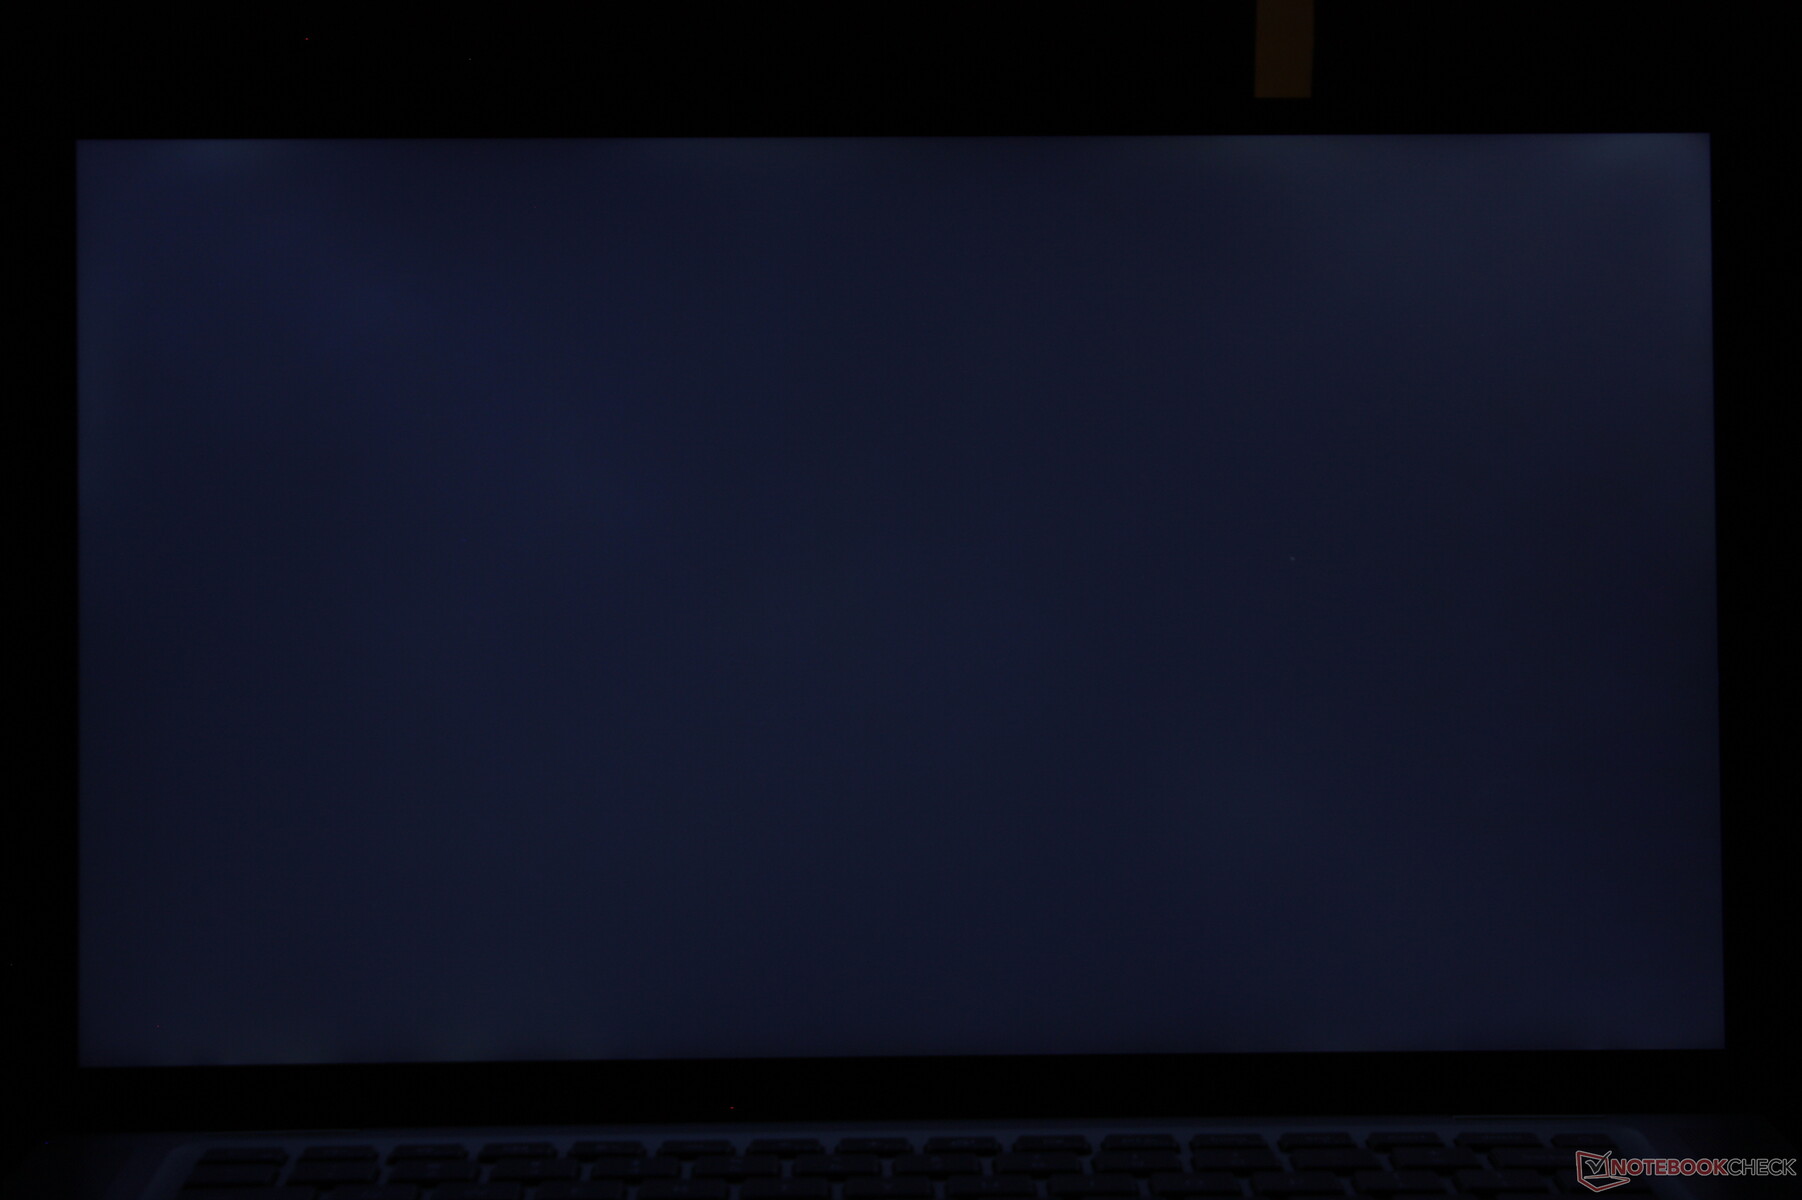
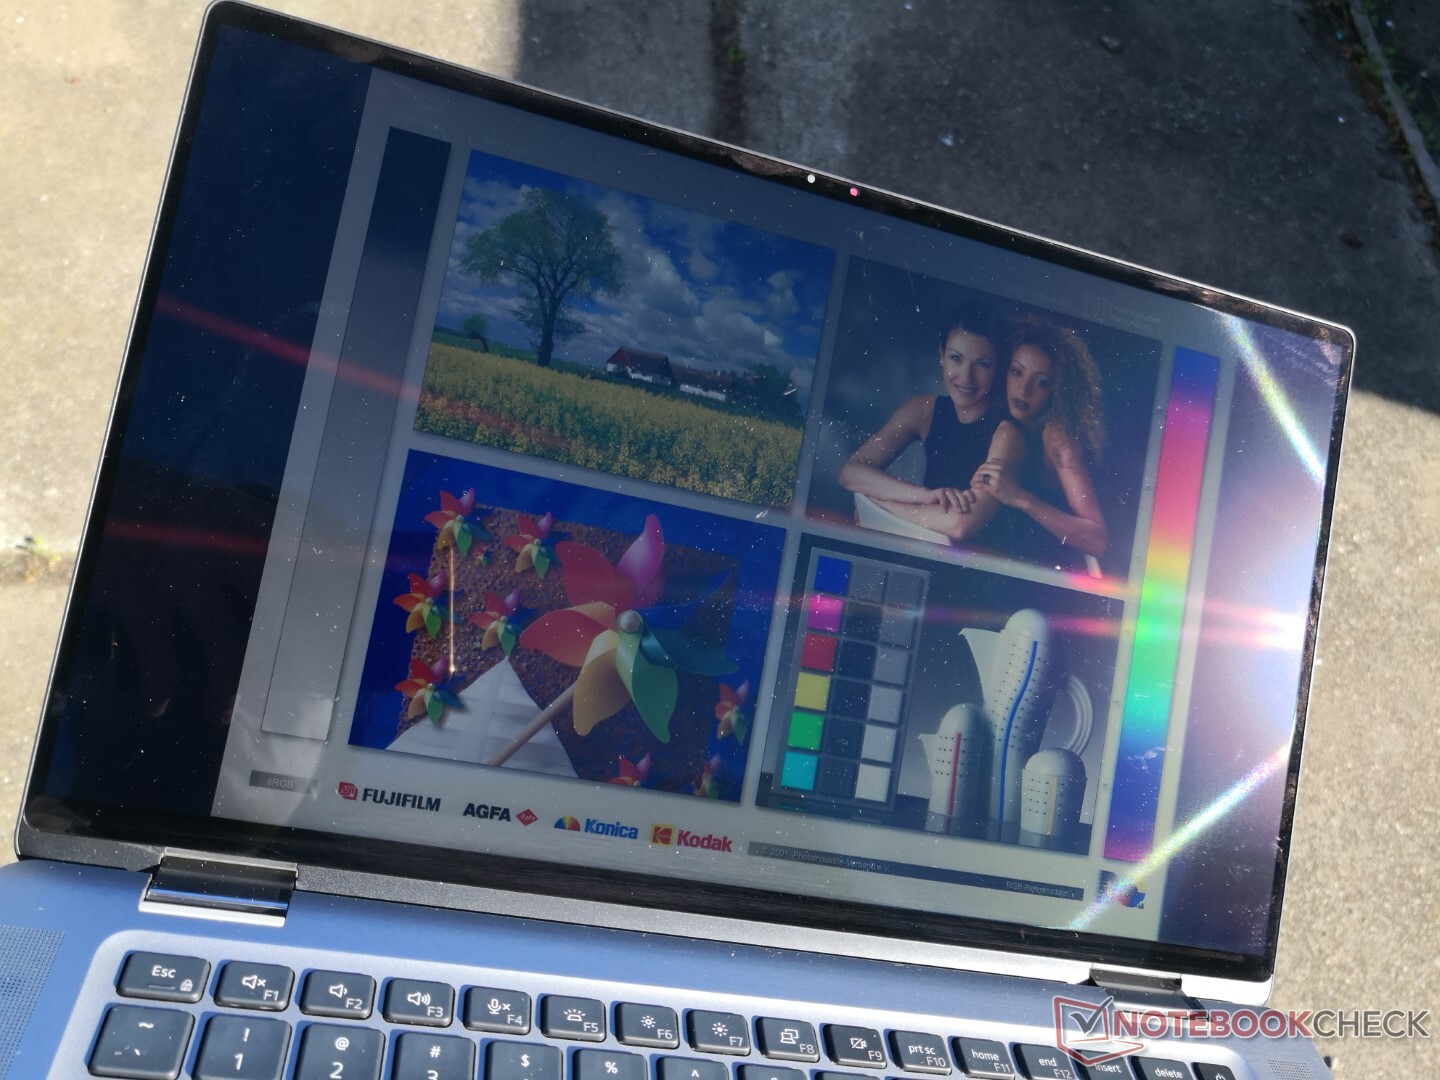
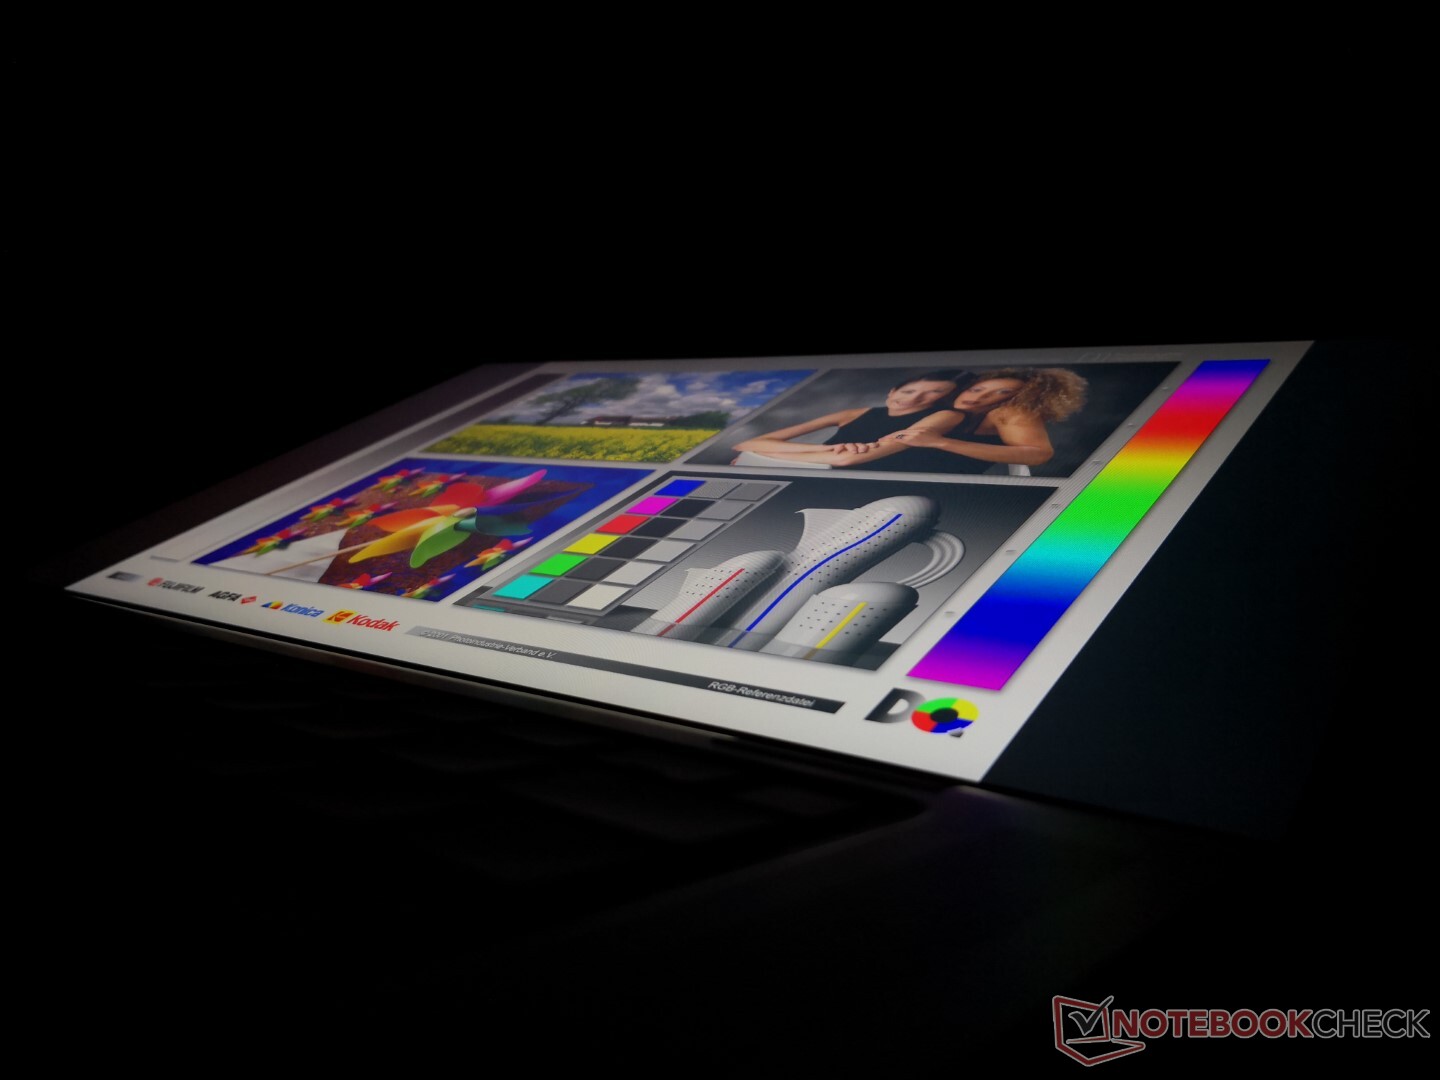
Visualizza
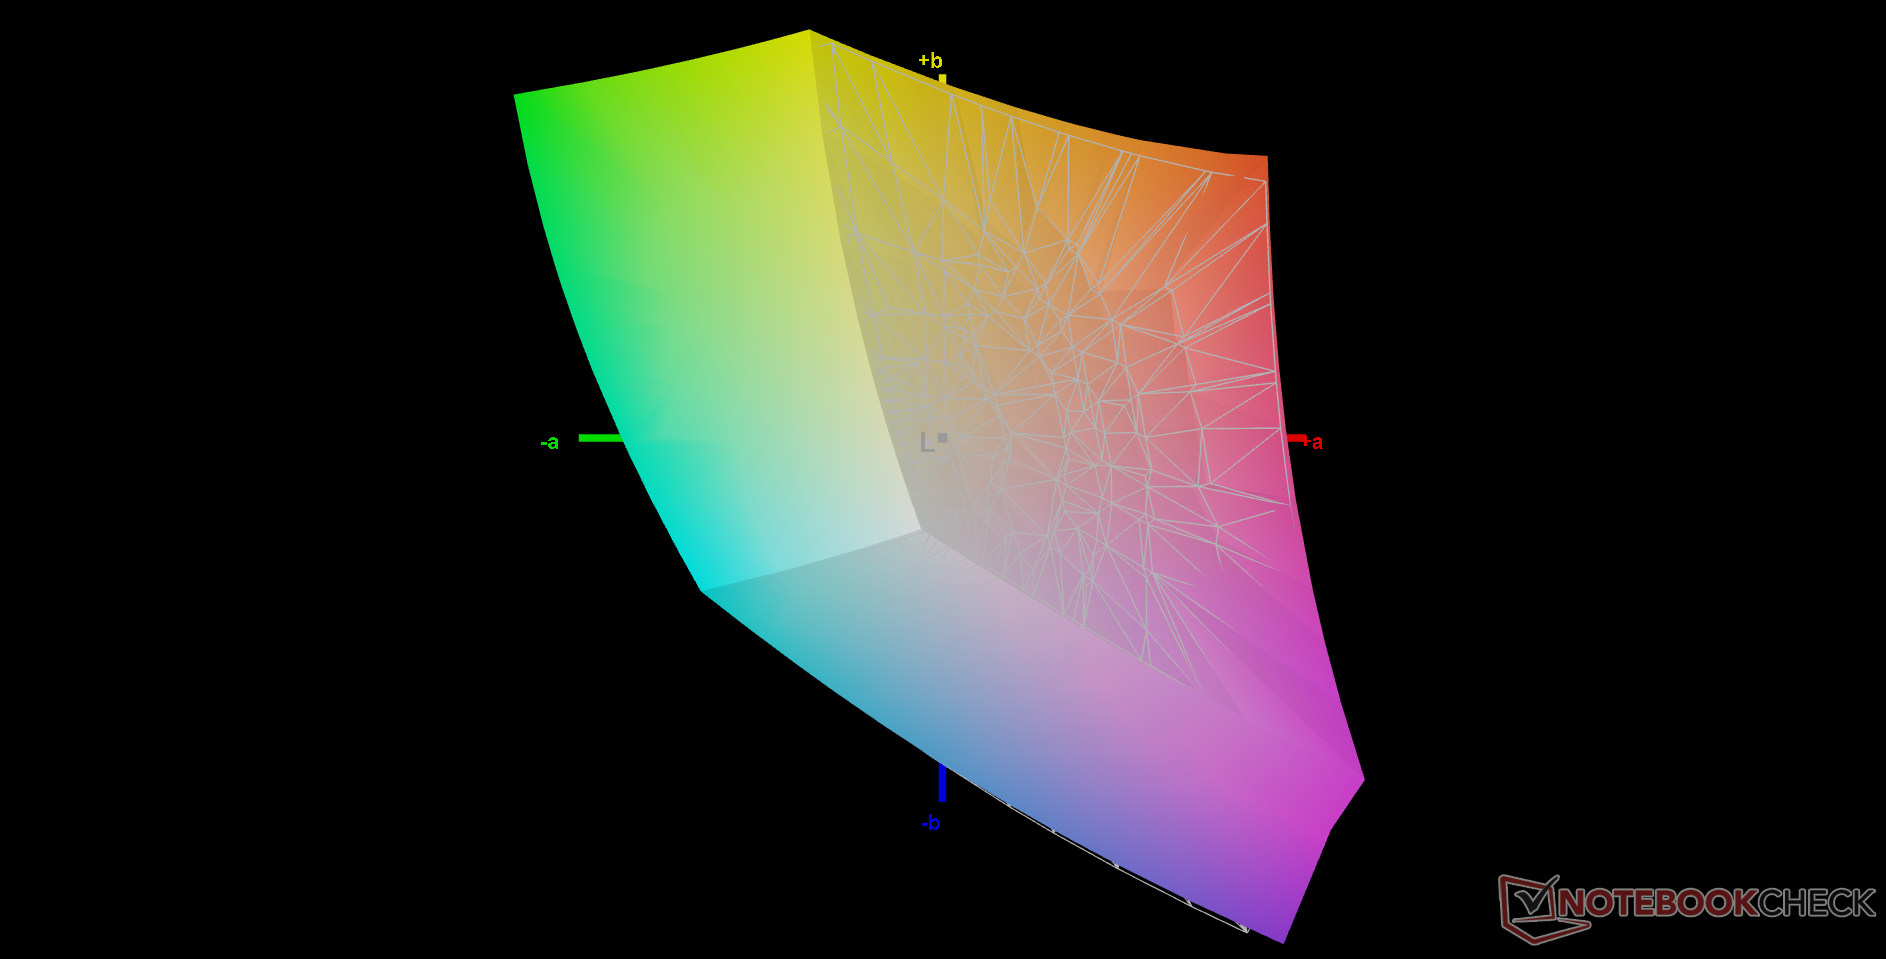
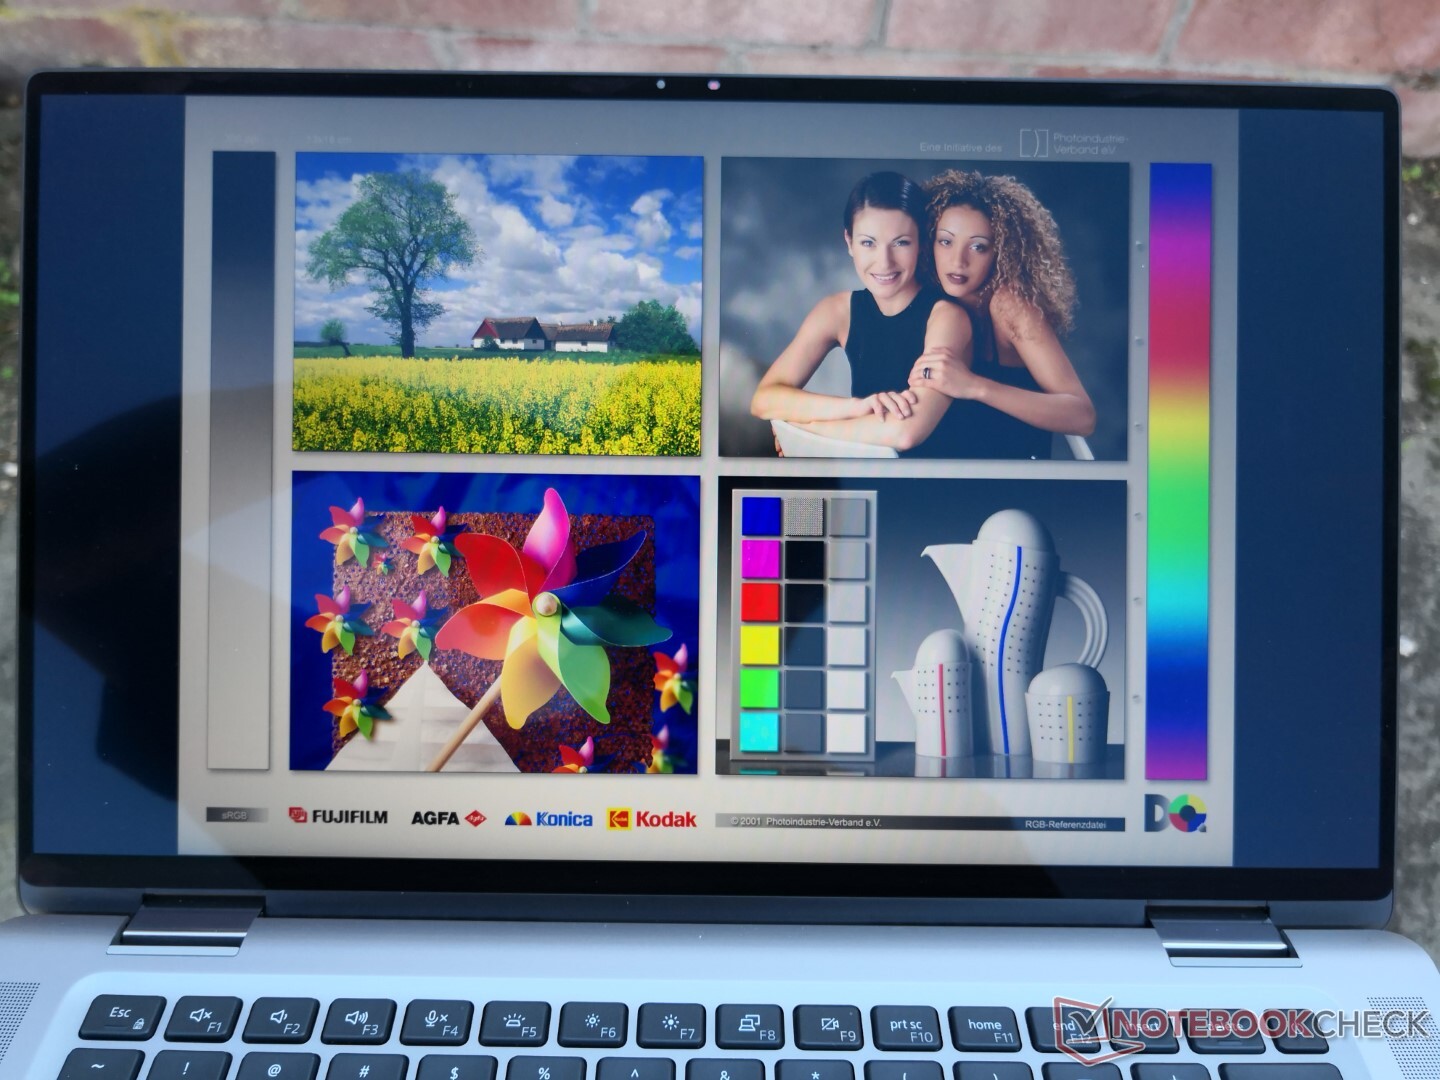
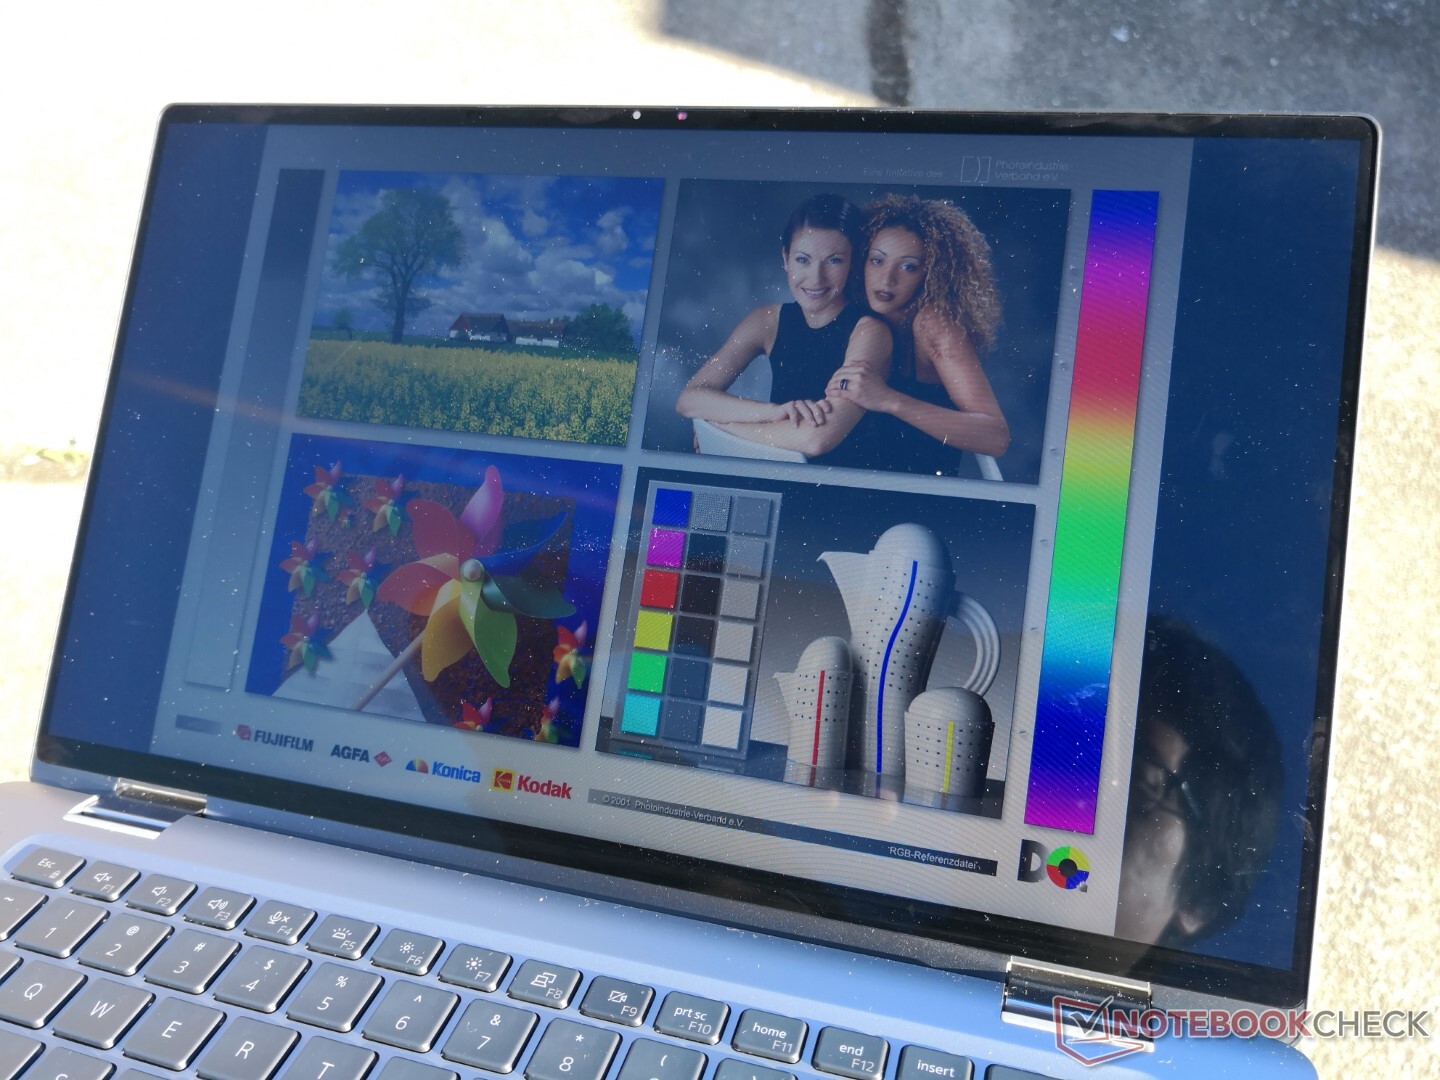
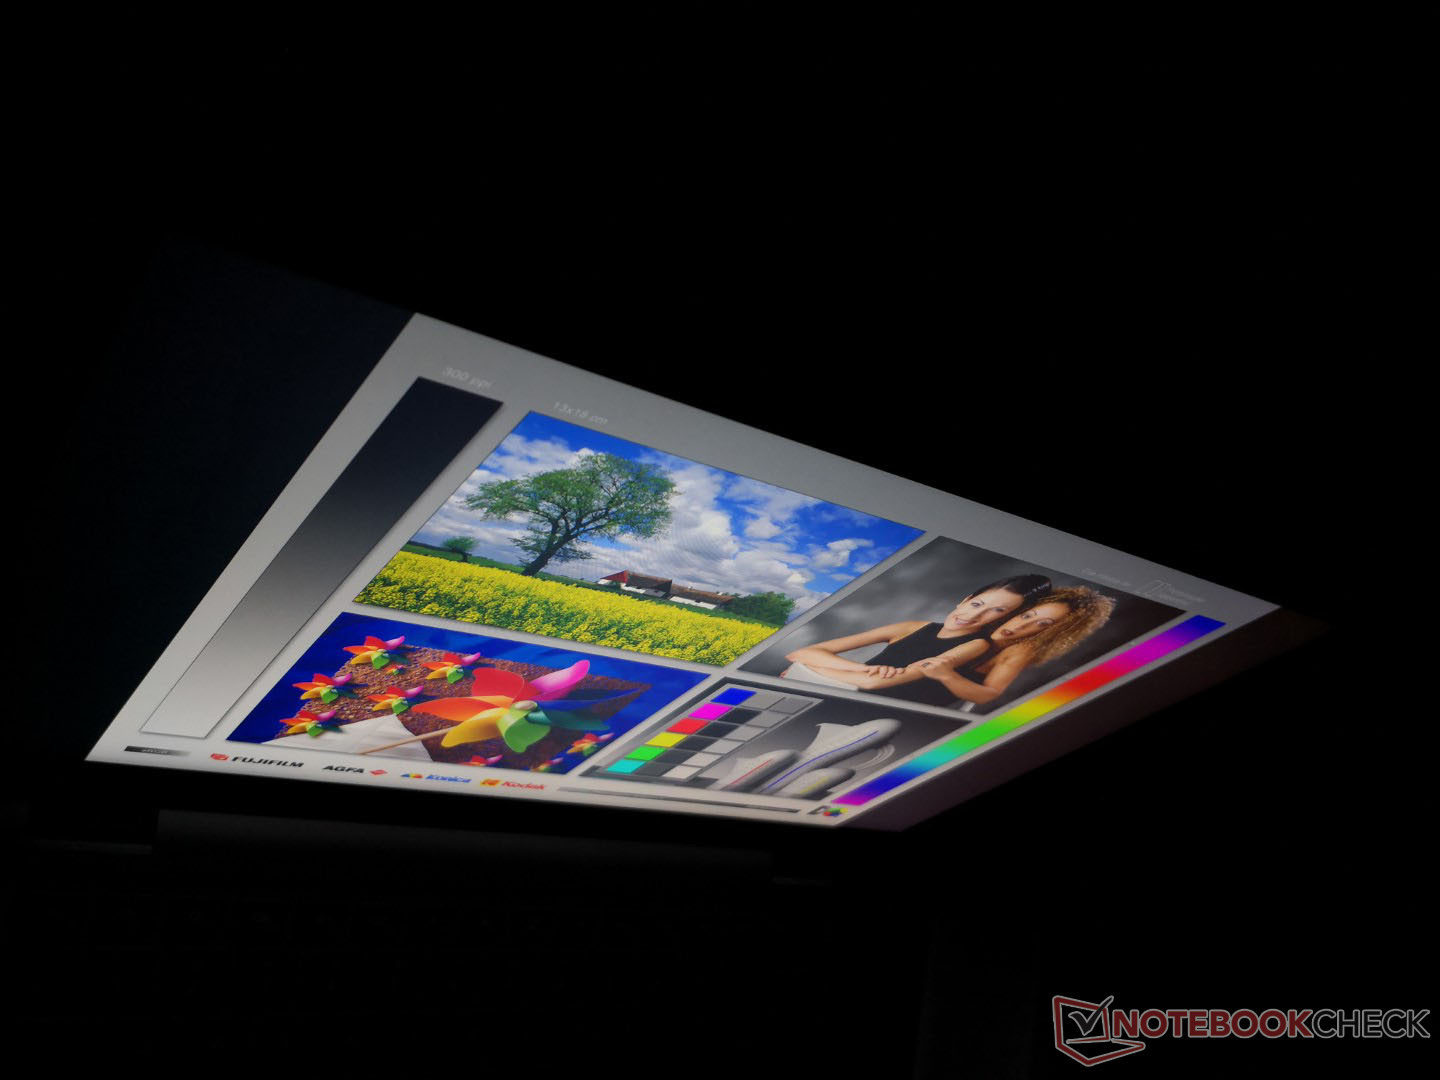
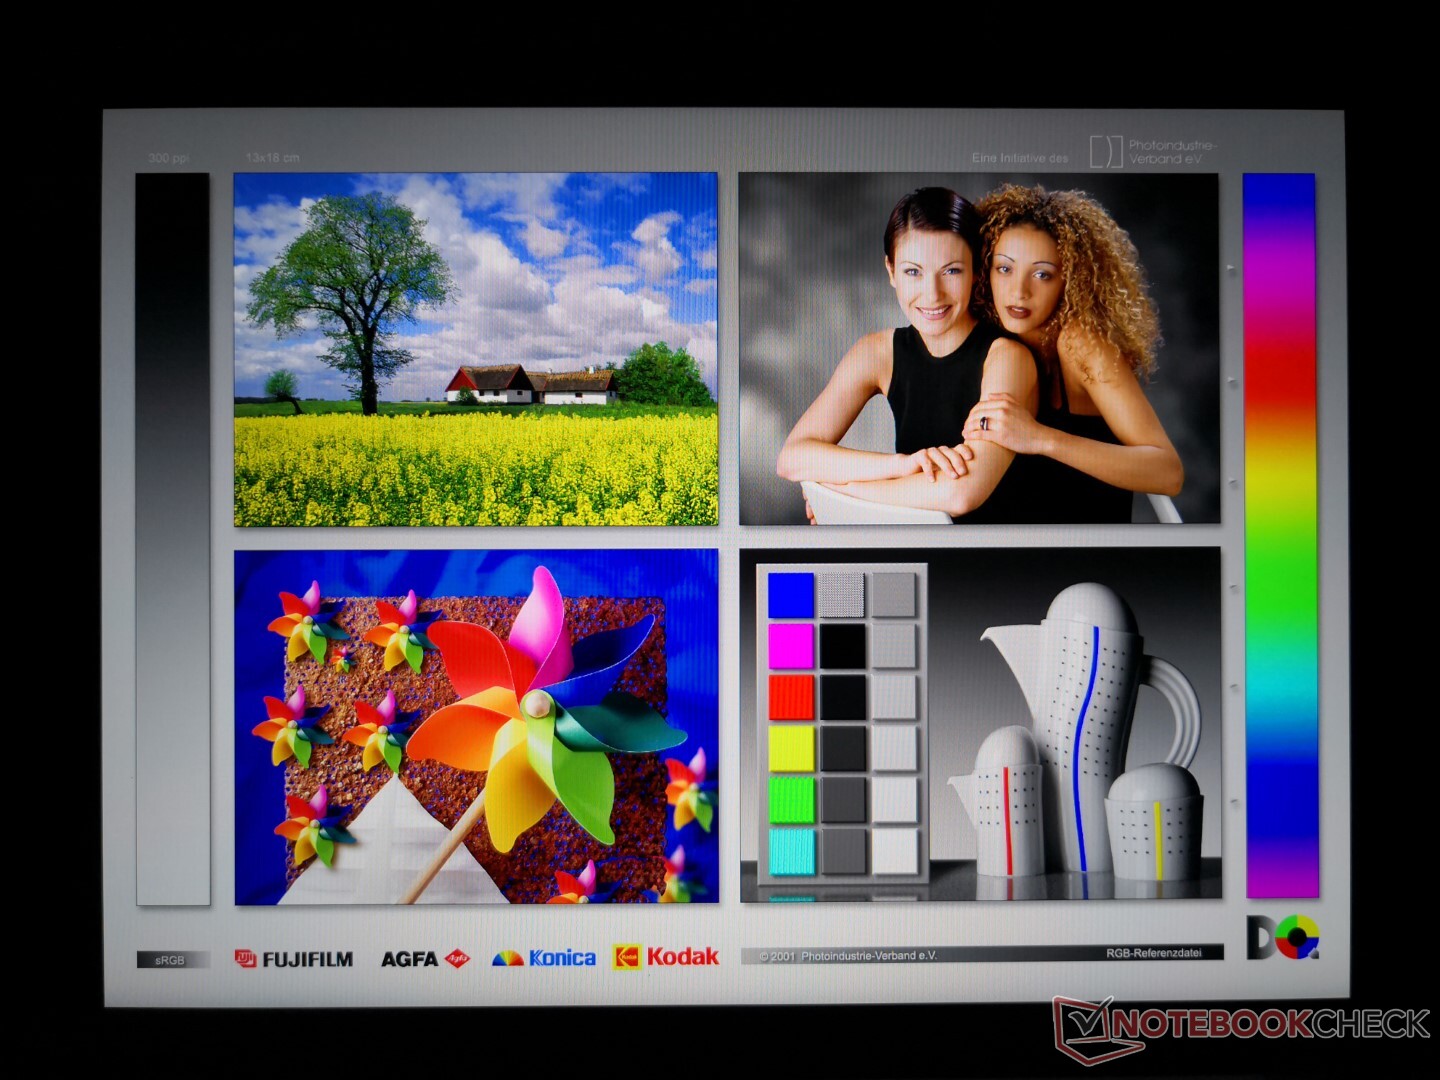
Dell usa lo stesso pannello AU Optronics B150HAN IPS tra entrambi i Latitude 9510 2-in-1 e 9520 2-in-1 per un'esperienza visiva simile tra loro. Purtroppo non ci sono nuove opzioni di pannello per il 9520 2-in-1. Opzioni 4K o OLED sarebbero fantastiche da vedere sulle future revisioni del Latitude 2-in-1.
| |||||||||||||||||||||||||
Distribuzione della luminosità: 84 %
Al centro con la batteria: 403.6 cd/m²
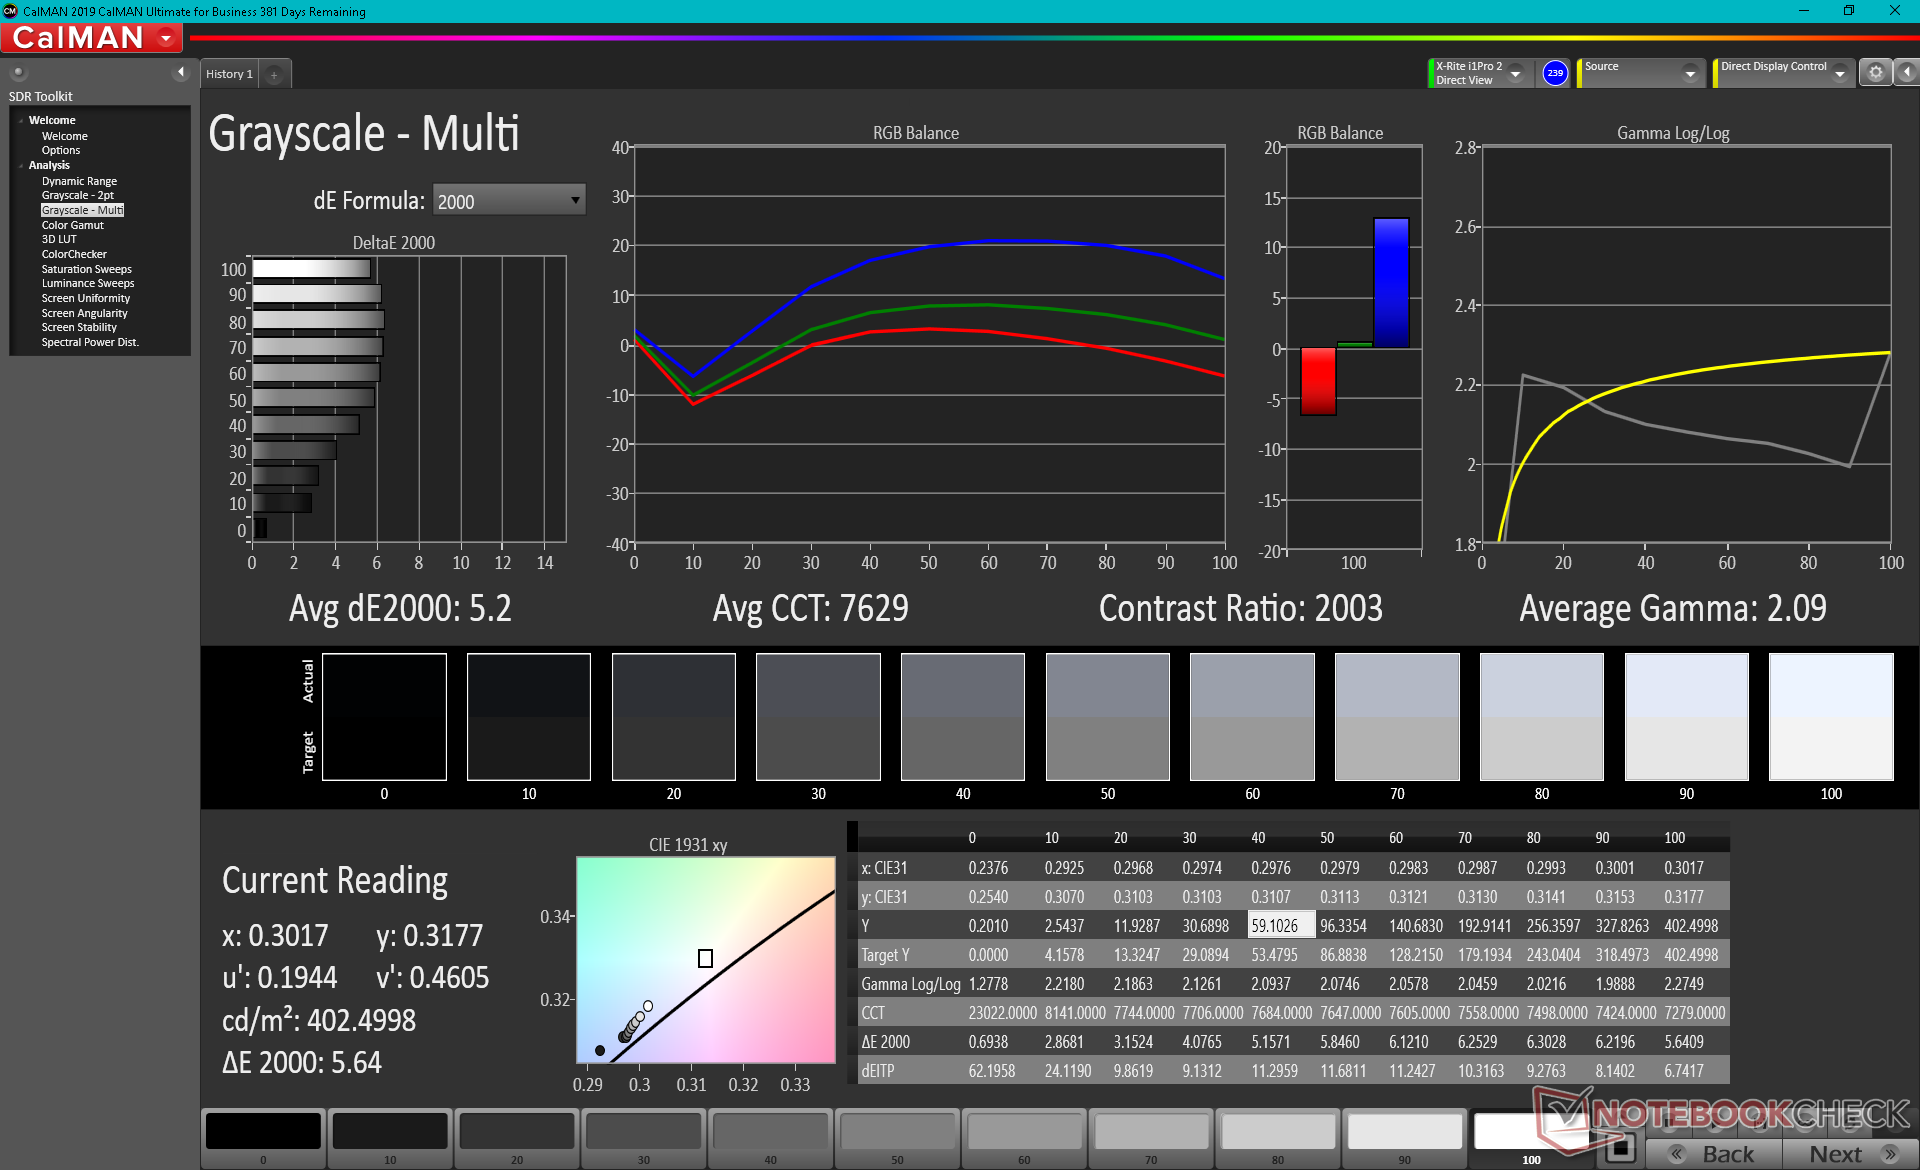
Contrasto: 1835:1 (Nero: 0.22 cd/m²)
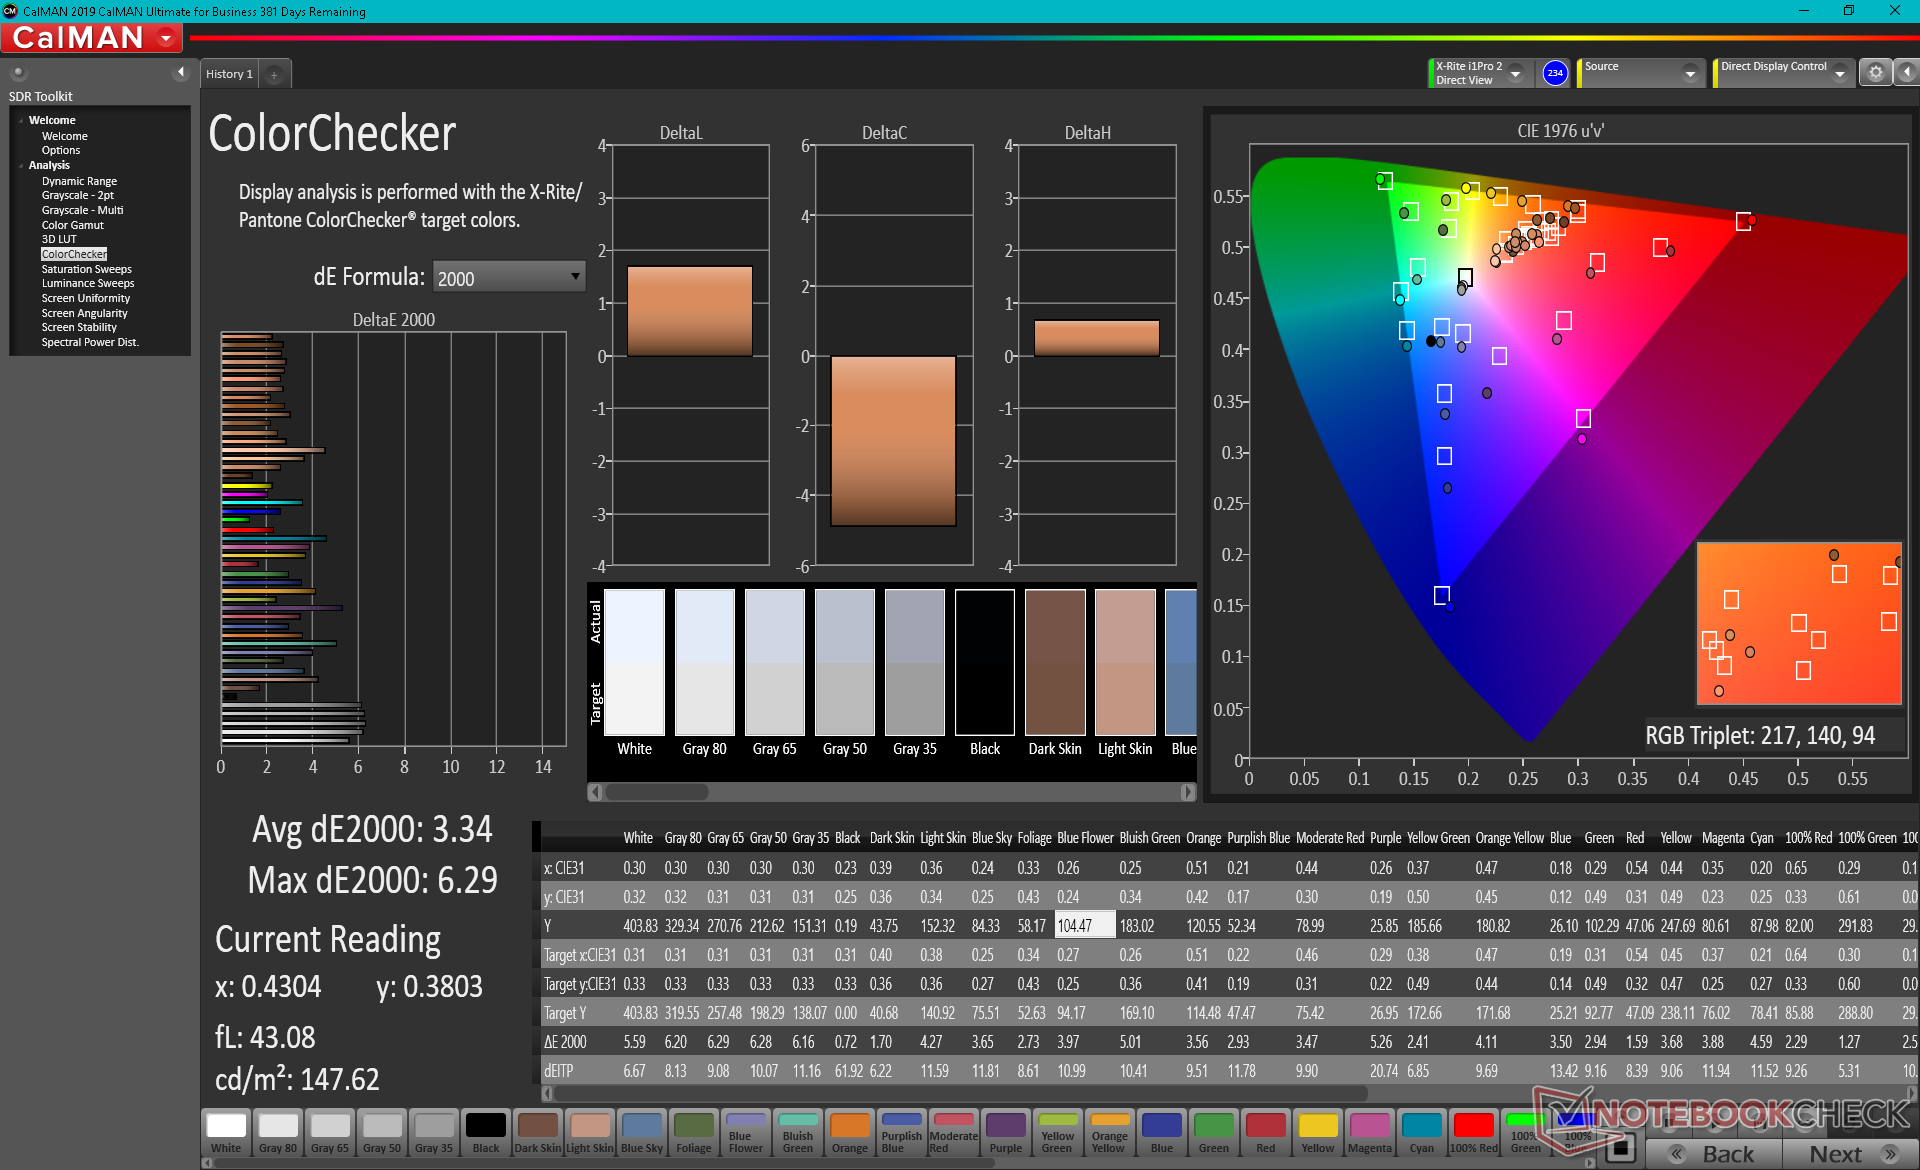
ΔE ColorChecker Calman: 3.34 | ∀{0.5-29.43 Ø4.72}
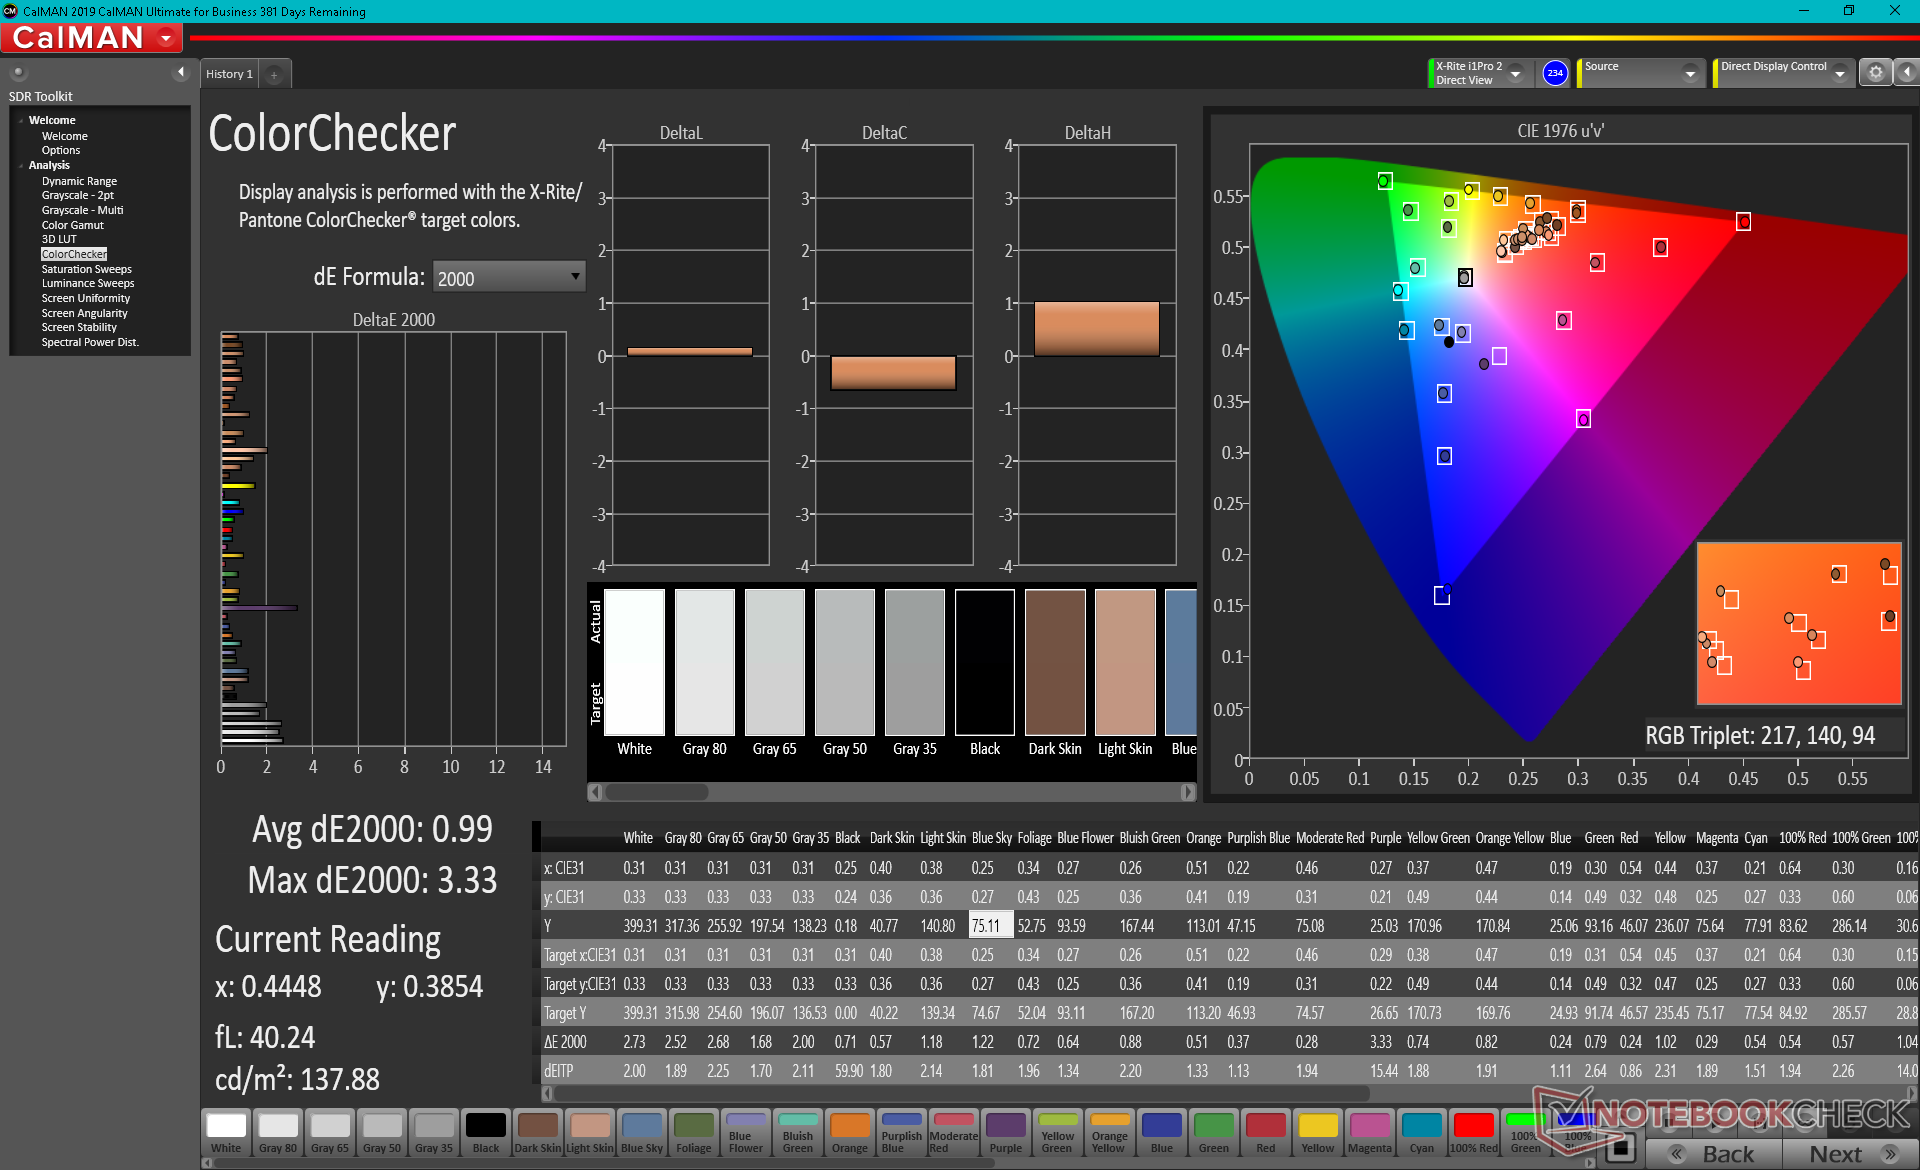
calibrated: 0.99
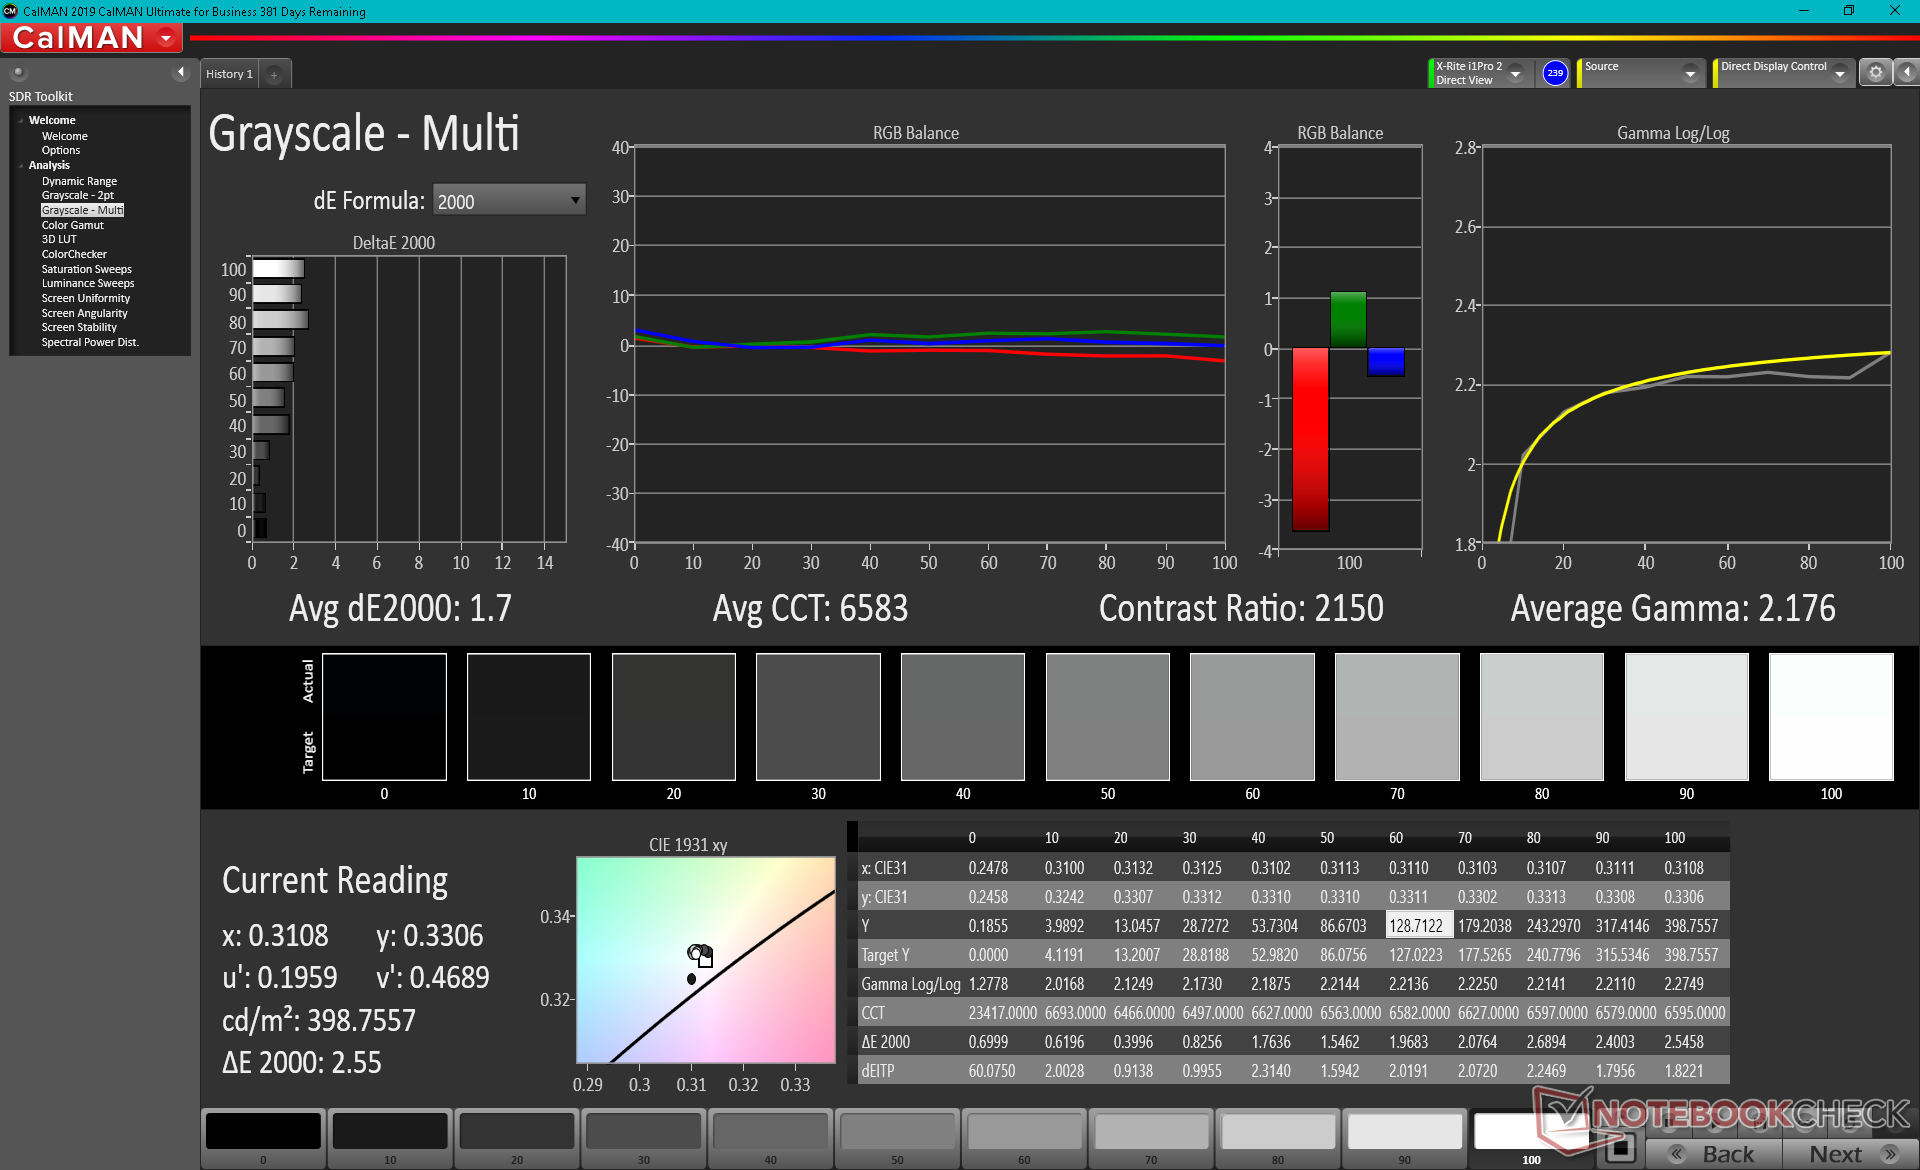
ΔE Greyscale Calman: 5.2 | ∀{0.09-98 Ø4.97}
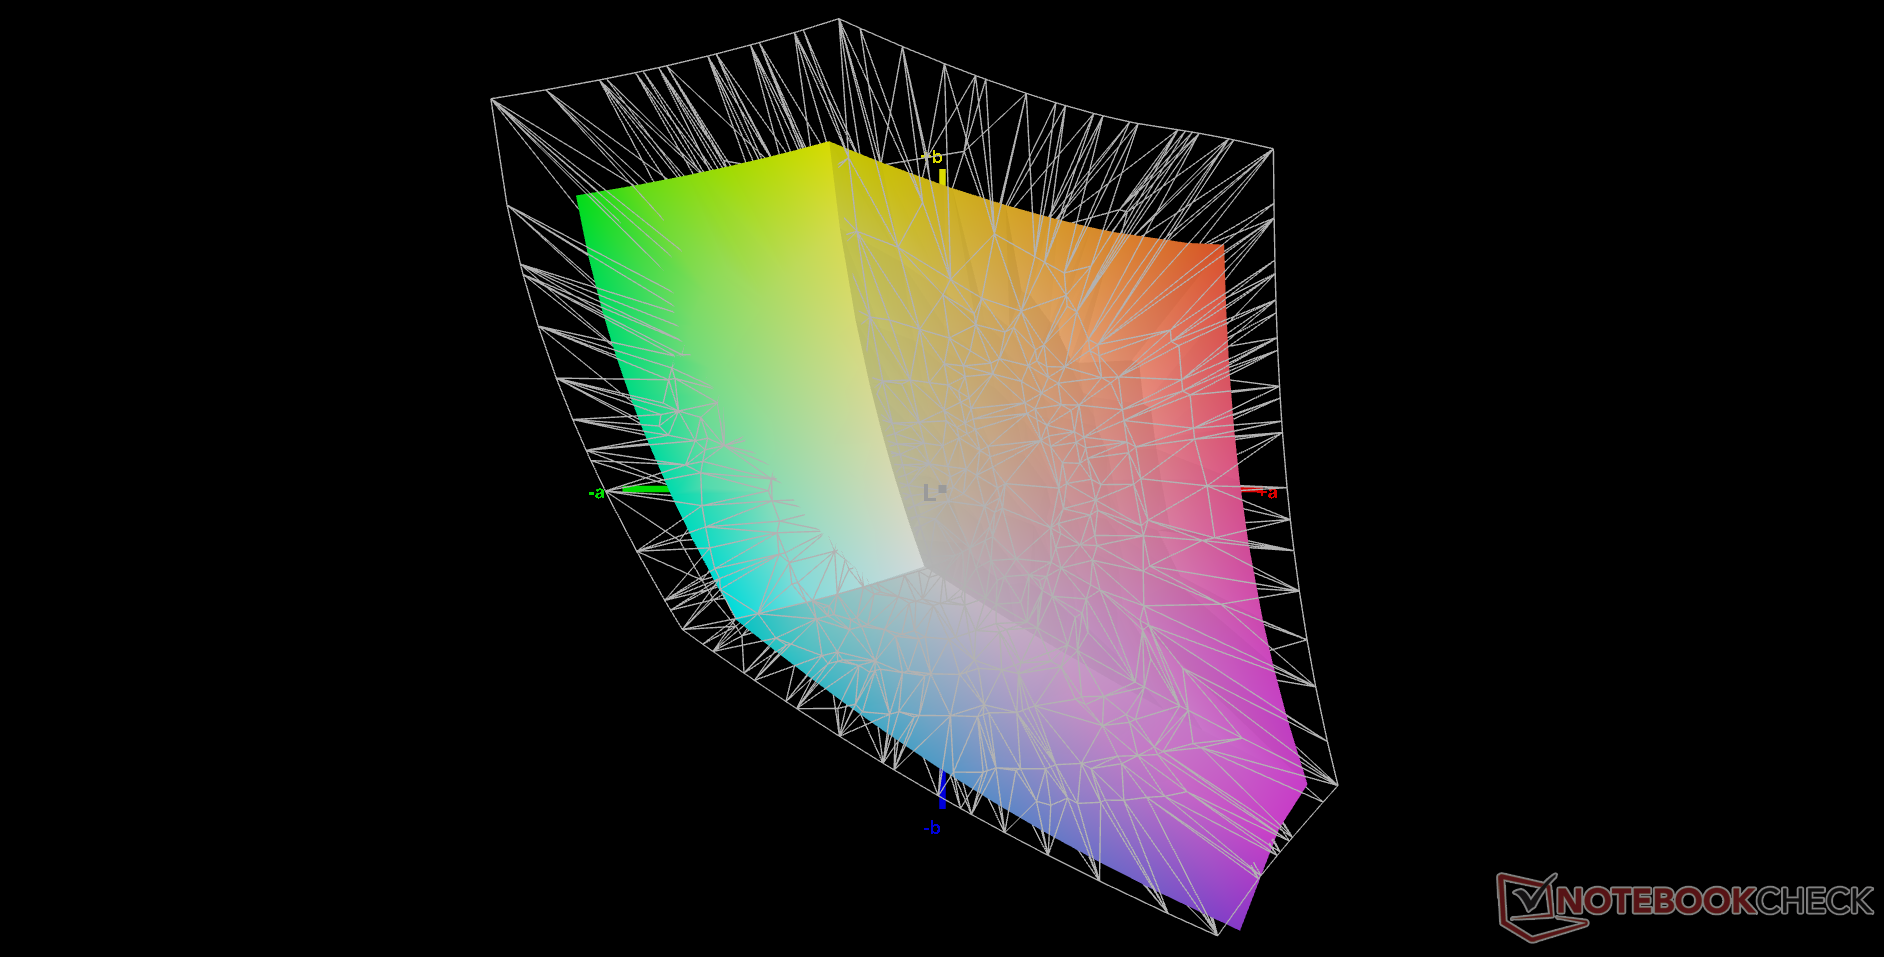
70.4% AdobeRGB 1998 (Argyll 3D)
98.7% sRGB (Argyll 3D)
69.9% Display P3 (Argyll 3D)
Gamma: 2.09
CCT: 7629 K
| Dell Latitude 15 9520 2-in-1 AU Optronics B150HAN, IPS, 1920x1080, 15" | Dell Latitude 9510 2-in-1 AU Optronics B150HAN, IPS, 1920x1080, 15" | HP EliteBook 850 G8 3C7Z8EA InfoVision X156NVF8 R1, I, 1920x1080, 15.6" | Lenovo ThinkPad L15 G2 AMD N156HCA-EAB, IPS LED, 1920x1080, 15.6" | MSI Summit B15 A11M Chi Mei N156HCE-EN1, IPS, 1920x1080, 15.6" | Microsoft Surface Laptop 4 15 AMD TFF_00028 SHP14B4, IPS, 2496x1664, 15" | |
|---|---|---|---|---|---|---|
| Display | 1% | -6% | -35% | -7% | -4% | |
| Display P3 Coverage (%) | 69.9 | 71.2 2% | 43.8 -37% | 65.7 -6% | 65.2 -7% | |
| sRGB Coverage (%) | 98.7 | 99.3 1% | 95 -4% | 65.7 -33% | 90.6 -8% | 97.7 -1% |
| AdobeRGB 1998 Coverage (%) | 70.4 | 71.3 1% | 65 -8% | 45.3 -36% | 66 -6% | 67.3 -4% |
| Response Times | -27% | -19% | -6% | -11% | -32% | |
| Response Time Grey 50% / Grey 80% * (ms) | 39.2 ? | 52.8 ? -35% | 47 ? -20% | 40 -2% | 40.4 ? -3% | 58.4 ? -49% |
| Response Time Black / White * (ms) | 27.2 ? | 32 ? -18% | 32 ? -18% | 30 -10% | 32.4 ? -19% | 31.2 ? -15% |
| PWM Frequency (Hz) | 312 ? | 25510 ? | 21550 ? | |||
| Screen | -27% | 7% | -49% | -71% | 6% | |
| Brightness middle (cd/m²) | 403.6 | 426.7 6% | 802 99% | 298 -26% | 341.3 -15% | 405 0% |
| Brightness (cd/m²) | 368 | 394 7% | 702 91% | 276 -25% | 310 -16% | 379 3% |
| Brightness Distribution (%) | 84 | 87 4% | 77 -8% | 86 2% | 81 -4% | 79 -6% |
| Black Level * (cd/m²) | 0.22 | 0.3 -36% | 0.245 -11% | 0.26 -18% | 0.45 -105% | 0.26 -18% |
| Contrast (:1) | 1835 | 1422 -23% | 3273 78% | 1146 -38% | 758 -59% | 1558 -15% |
| Colorchecker dE 2000 * | 3.34 | 4.28 -28% | 6.22 -86% | 3.7 -11% | 6.17 -85% | 2.6 22% |
| Colorchecker dE 2000 max. * | 6.29 | 10.43 -66% | 9.92 -58% | 15 -138% | 11.75 -87% | 6.6 -5% |
| Colorchecker dE 2000 calibrated * | 0.99 | 1.46 -47% | 3.5 -254% | 3.3 -233% | 0.9 9% | |
| Greyscale dE 2000 * | 5.2 | 8.1 -56% | 7.69 -48% | 1.7 67% | 7.1 -37% | 1.9 63% |
| Gamma | 2.09 105% | 2.26 97% | 2.75 80% | 2.21 100% | 2.2 100% | 2.11 104% |
| CCT | 7629 85% | 7993 81% | 6135 106% | 6588 99% | 6842 95% | 6825 95% |
| Color Space (Percent of AdobeRGB 1998) (%) | 65.2 | 65 | 58.7 | 62 | ||
| Color Space (Percent of sRGB) (%) | 99.2 | 95 | 90.1 | 97.7 | ||
| Media totale (Programma / Settaggio) | -18% /
-21% | -6% /
1% | -30% /
-40% | -30% /
-49% | -10% /
-2% |
* ... Meglio usare valori piccoli
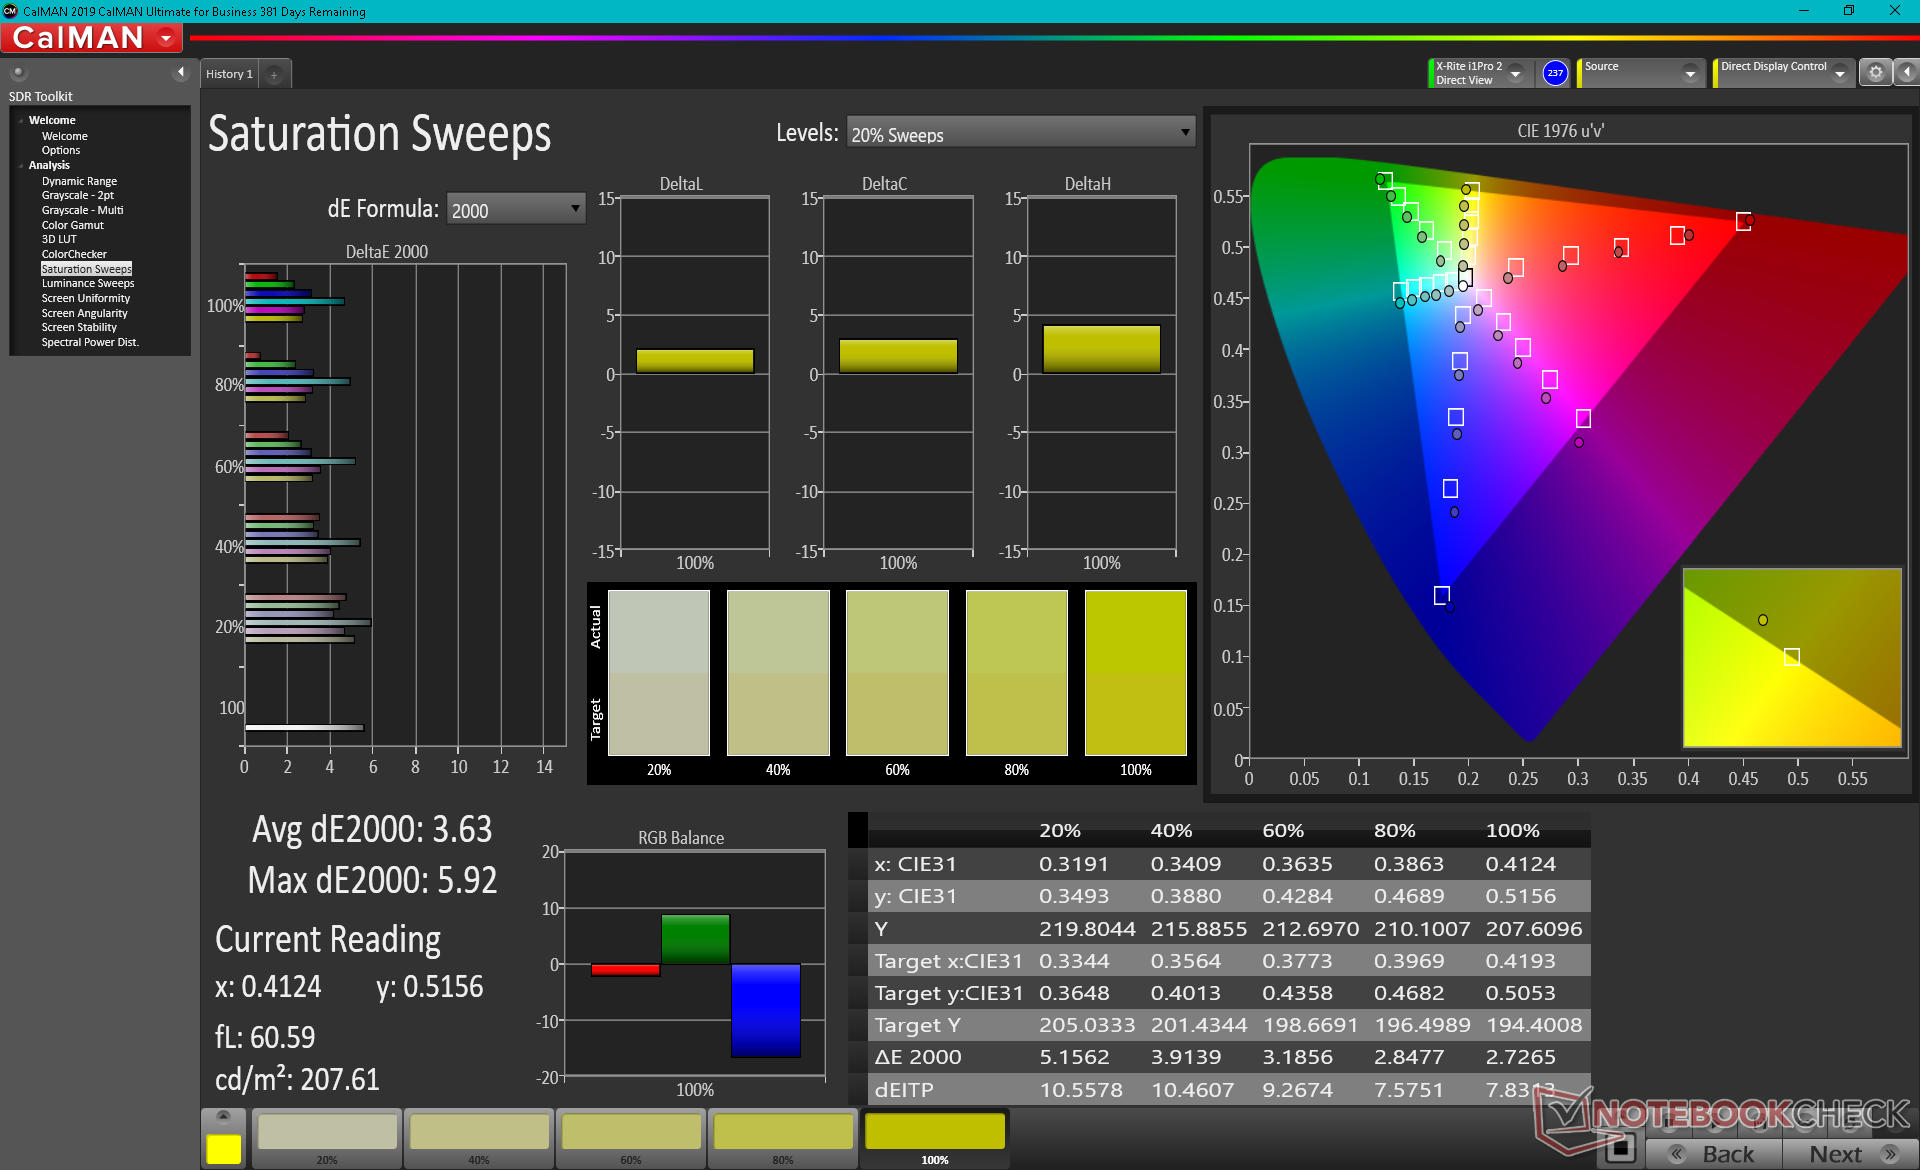
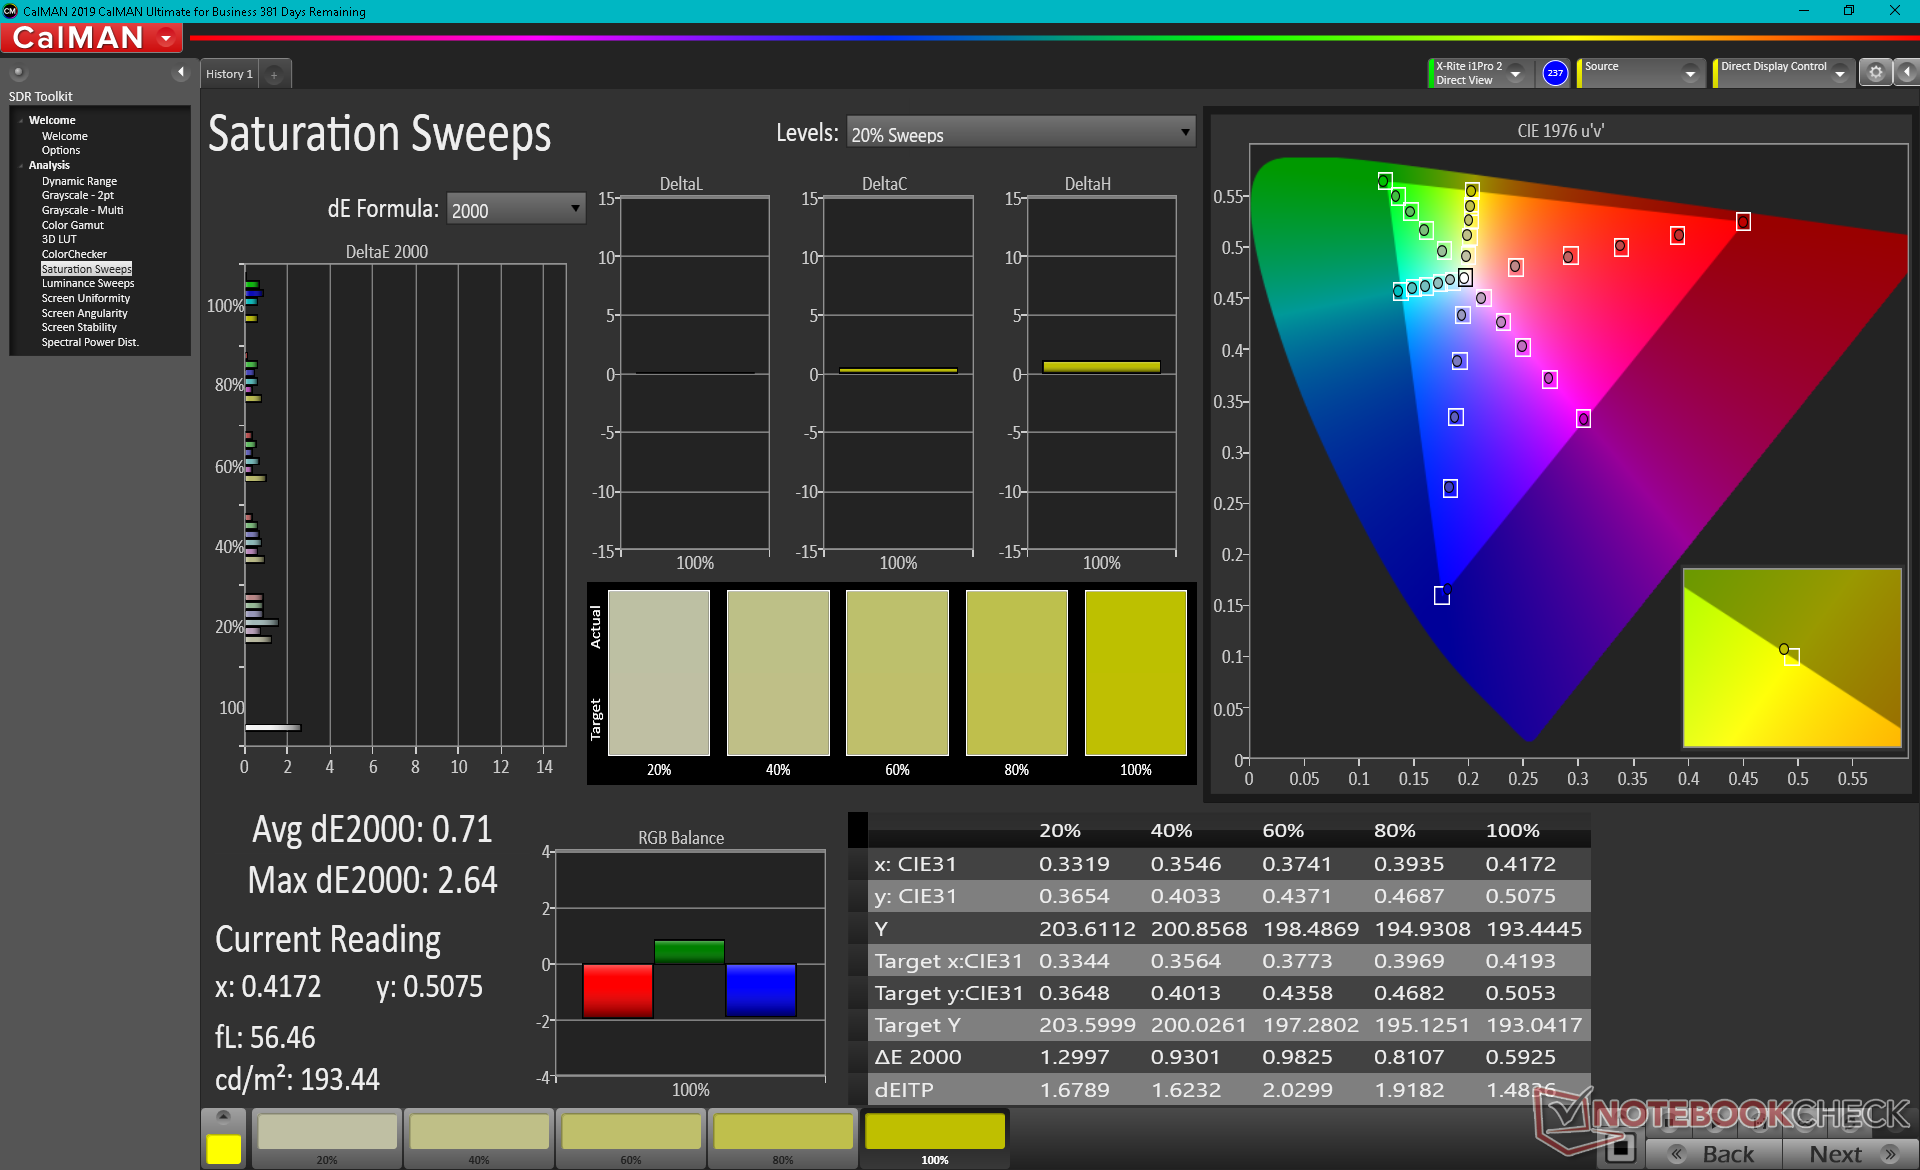
Il display è calibrato decentemente fuori dalla scatola con valori medi di deltaE in scala di grigi e colore di solo 5,2 e 3,34, rispettivamente. Una corretta calibrazione dell'utente finale può ridurre questi valori a ben meno di <2 ciascuno, come mostrato dai nostri screenshot CalMAN qui sotto.
Tempi di risposta del Display
| ↔ Tempi di risposta dal Nero al Bianco | ||
|---|---|---|
| 27.2 ms ... aumenta ↗ e diminuisce ↘ combinato | ↗ 14 ms Incremento | 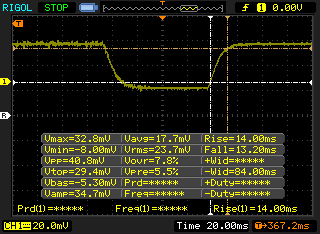 |
| ↘ 13.2 ms Calo | ||
| Lo schermo mostra tempi di risposta relativamente lenti nei nostri tests e potrebbe essere troppo lento per i gamers. In confronto, tutti i dispositivi di test variano da 0.1 (minimo) a 240 (massimo) ms. » 69 % di tutti i dispositivi è migliore. Questo significa che i tempi di risposta rilevati sono peggiori rispetto alla media di tutti i dispositivi testati (19.8 ms). | ||
| ↔ Tempo di risposta dal 50% Grigio all'80% Grigio | ||
| 39.2 ms ... aumenta ↗ e diminuisce ↘ combinato | ↗ 19.2 ms Incremento | 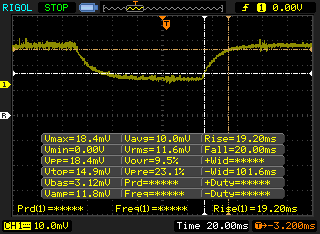 |
| ↘ 20 ms Calo | ||
| Lo schermo mostra tempi di risposta lenti nei nostri tests e sarà insoddisfacente per i gamers. In confronto, tutti i dispositivi di test variano da 0.165 (minimo) a 636 (massimo) ms. » 60 % di tutti i dispositivi è migliore. Questo significa che i tempi di risposta rilevati sono peggiori rispetto alla media di tutti i dispositivi testati (31 ms). | ||
Sfarfallio dello schermo / PWM (Pulse-Width Modulation)
| flickering dello schermo / PWM non rilevato | 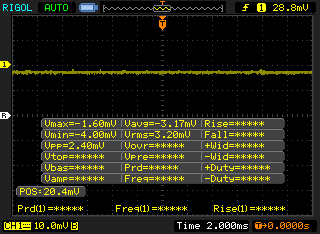 | ||
In confronto: 52 % di tutti i dispositivi testati non utilizza PWM per ridurre la luminosita' del display. Se è rilevato PWM, una media di 7775 (minimo: 5 - massimo: 343500) Hz è stata rilevata. | |||
Performance
Condizioni di test
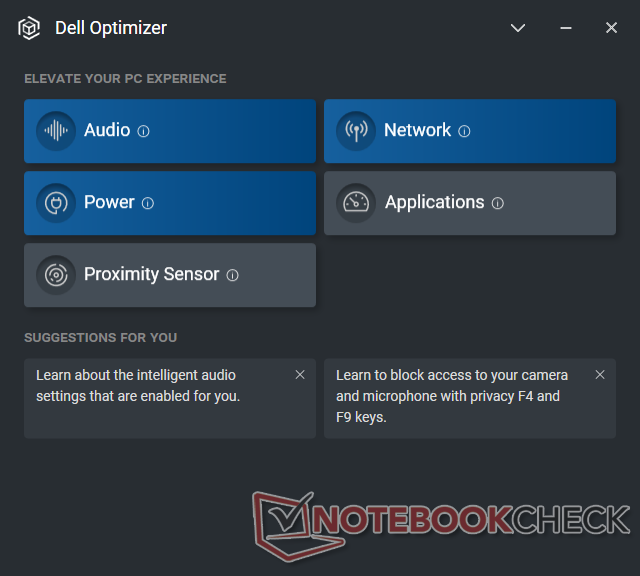
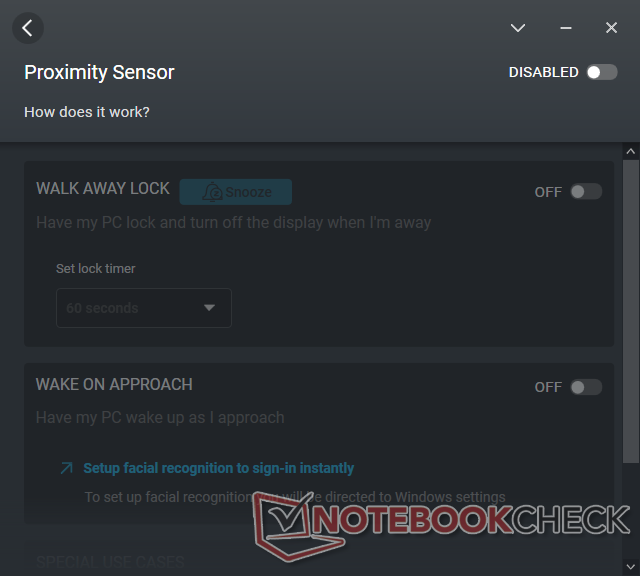
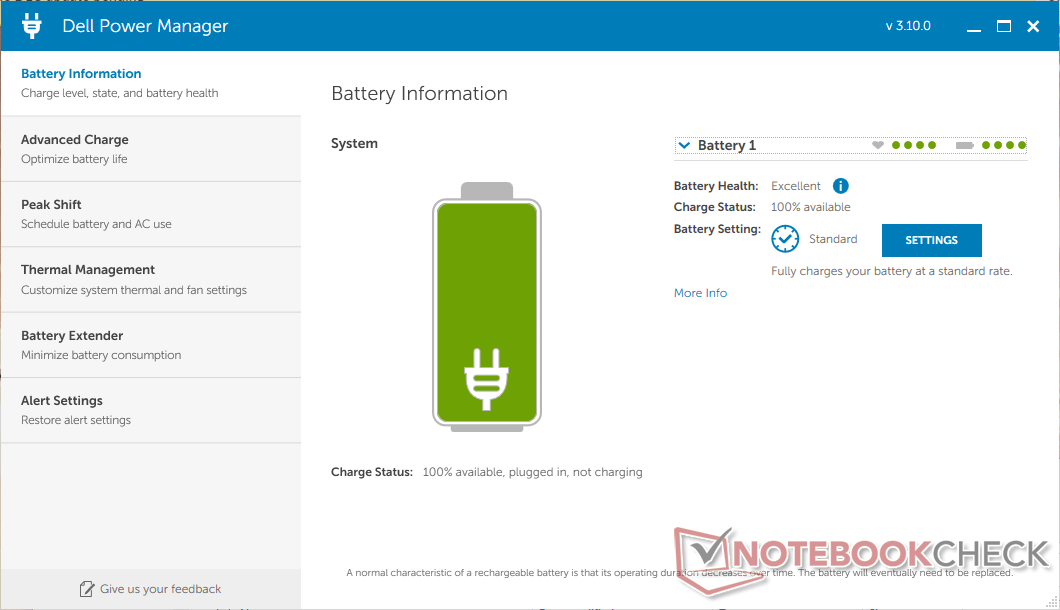
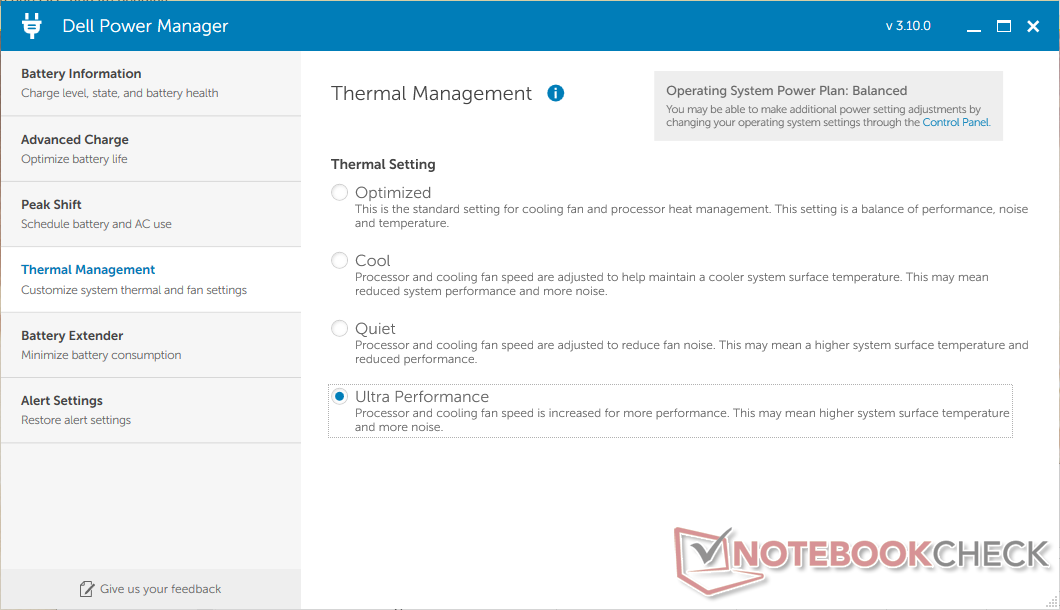
Il nostro sistema è stato impostato in modalità 'Best Performance' di Windows e con Dell Power Manager impostato su Ultra Performance prima di eseguire qualsiasi benchmark qui sotto per ottenere i punteggi più alti possibili. Gli utenti dovrebbero anche familiarizzare con il software Dell Optimizer preinstallato che include impostazioni aggiuntive per l'audio, la rete e il sensore di prossimità per il login a mani libere.
Processore
Le prestazioni della CPU multi-thread sono un mix, dato che il Core i7-1185G7 ha due core in meno rispetto al Core i7-10810U per un downgrade di circa il 25-35%. Il delta è più ampio del previsto dato che l'i7-1185G7 nel nostro Latitude 9520 2-in-1 si comporta almeno dal 15 al 20 per cento più lentamente della maggior parte degli altri portatili che utilizzano la stessa CPU. La CPU Core i7-1185G7 nel MSI Stealth 15Mper esempio, può offrire fino al 50% di prestazioni multi-thread più veloci del nostro Dell
Le prestazioni single-thread sono fortunatamente dove dovrebbero essere rispetto alla media del Core i7-1185G7. Gli utenti possono aspettarsi circa il 30 per cento di prestazioni più veloci rispetto al Core i7-10810U in questo senso.
Cinebench R15 Multi Loop
Cinebench R23: Multi Core | Single Core
Cinebench R20: CPU (Multi Core) | CPU (Single Core)
Cinebench R15: CPU Multi 64Bit | CPU Single 64Bit
Blender: v2.79 BMW27 CPU
7-Zip 18.03: 7z b 4 | 7z b 4 -mmt1
Geekbench 5.5: Multi-Core | Single-Core
HWBOT x265 Benchmark v2.2: 4k Preset
LibreOffice : 20 Documents To PDF
R Benchmark 2.5: Overall mean
* ... Meglio usare valori piccoli
AIDA64: FP32 Ray-Trace | FPU Julia | CPU SHA3 | CPU Queen | FPU SinJulia | FPU Mandel | CPU AES | CPU ZLib | FP64 Ray-Trace | CPU PhotoWorxx
| Performance rating | |
| Microsoft Surface Laptop 4 15 AMD TFF_00028 | |
| Lenovo ThinkPad L15 G2 AMD | |
| MSI Summit B15 A11M | |
| Media Intel Core i7-1185G7 | |
| HP EliteBook 850 G8 3C7Z8EA | |
| Dell Latitude 15 9520 2-in-1 | |
| Dell Latitude 9510 2-in-1 | |
| AIDA64 / FP32 Ray-Trace | |
| Microsoft Surface Laptop 4 15 AMD TFF_00028 | |
| Lenovo ThinkPad L15 G2 AMD | |
| MSI Summit B15 A11M | |
| Media Intel Core i7-1185G7 (5621 - 7453, n=20) | |
| HP EliteBook 850 G8 3C7Z8EA | |
| Dell Latitude 15 9520 2-in-1 | |
| Dell Latitude 9510 2-in-1 | |
| AIDA64 / FPU Julia | |
| Microsoft Surface Laptop 4 15 AMD TFF_00028 | |
| Lenovo ThinkPad L15 G2 AMD | |
| Dell Latitude 9510 2-in-1 | |
| MSI Summit B15 A11M | |
| Media Intel Core i7-1185G7 (23248 - 32614, n=20) | |
| HP EliteBook 850 G8 3C7Z8EA | |
| Dell Latitude 15 9520 2-in-1 | |
| AIDA64 / CPU SHA3 | |
| Microsoft Surface Laptop 4 15 AMD TFF_00028 | |
| MSI Summit B15 A11M | |
| Lenovo ThinkPad L15 G2 AMD | |
| Media Intel Core i7-1185G7 (1530 - 2209, n=20) | |
| HP EliteBook 850 G8 3C7Z8EA | |
| Dell Latitude 15 9520 2-in-1 | |
| Dell Latitude 9510 2-in-1 | |
| AIDA64 / CPU Queen | |
| Microsoft Surface Laptop 4 15 AMD TFF_00028 | |
| Lenovo ThinkPad L15 G2 AMD | |
| Dell Latitude 9510 2-in-1 | |
| HP EliteBook 850 G8 3C7Z8EA | |
| Media Intel Core i7-1185G7 (44677 - 52815, n=20) | |
| Dell Latitude 15 9520 2-in-1 | |
| MSI Summit B15 A11M | |
| AIDA64 / FPU SinJulia | |
| Microsoft Surface Laptop 4 15 AMD TFF_00028 | |
| Lenovo ThinkPad L15 G2 AMD | |
| Dell Latitude 9510 2-in-1 | |
| MSI Summit B15 A11M | |
| Media Intel Core i7-1185G7 (3870 - 5027, n=20) | |
| HP EliteBook 850 G8 3C7Z8EA | |
| Dell Latitude 15 9520 2-in-1 | |
| AIDA64 / FPU Mandel | |
| Microsoft Surface Laptop 4 15 AMD TFF_00028 | |
| Lenovo ThinkPad L15 G2 AMD | |
| MSI Summit B15 A11M | |
| Media Intel Core i7-1185G7 (14584 - 19594, n=20) | |
| HP EliteBook 850 G8 3C7Z8EA | |
| Dell Latitude 15 9520 2-in-1 | |
| Dell Latitude 9510 2-in-1 | |
| AIDA64 / CPU ZLib | |
| Microsoft Surface Laptop 4 15 AMD TFF_00028 | |
| Lenovo ThinkPad L15 G2 AMD | |
| Dell Latitude 9510 2-in-1 | |
| MSI Summit B15 A11M | |
| HP EliteBook 850 G8 3C7Z8EA | |
| Media Intel Core i7-1185G7 (258 - 412, n=22) | |
| Dell Latitude 15 9520 2-in-1 | |
| AIDA64 / FP64 Ray-Trace | |
| Microsoft Surface Laptop 4 15 AMD TFF_00028 | |
| Lenovo ThinkPad L15 G2 AMD | |
| MSI Summit B15 A11M | |
| Media Intel Core i7-1185G7 (2821 - 4094, n=20) | |
| HP EliteBook 850 G8 3C7Z8EA | |
| Dell Latitude 15 9520 2-in-1 | |
| Dell Latitude 9510 2-in-1 | |
| AIDA64 / CPU PhotoWorxx | |
| Dell Latitude 15 9520 2-in-1 | |
| Media Intel Core i7-1185G7 (22349 - 43701, n=20) | |
| MSI Summit B15 A11M | |
| HP EliteBook 850 G8 3C7Z8EA | |
| Microsoft Surface Laptop 4 15 AMD TFF_00028 | |
| Dell Latitude 9510 2-in-1 | |
| Lenovo ThinkPad L15 G2 AMD | |
Prestazioni del sistema
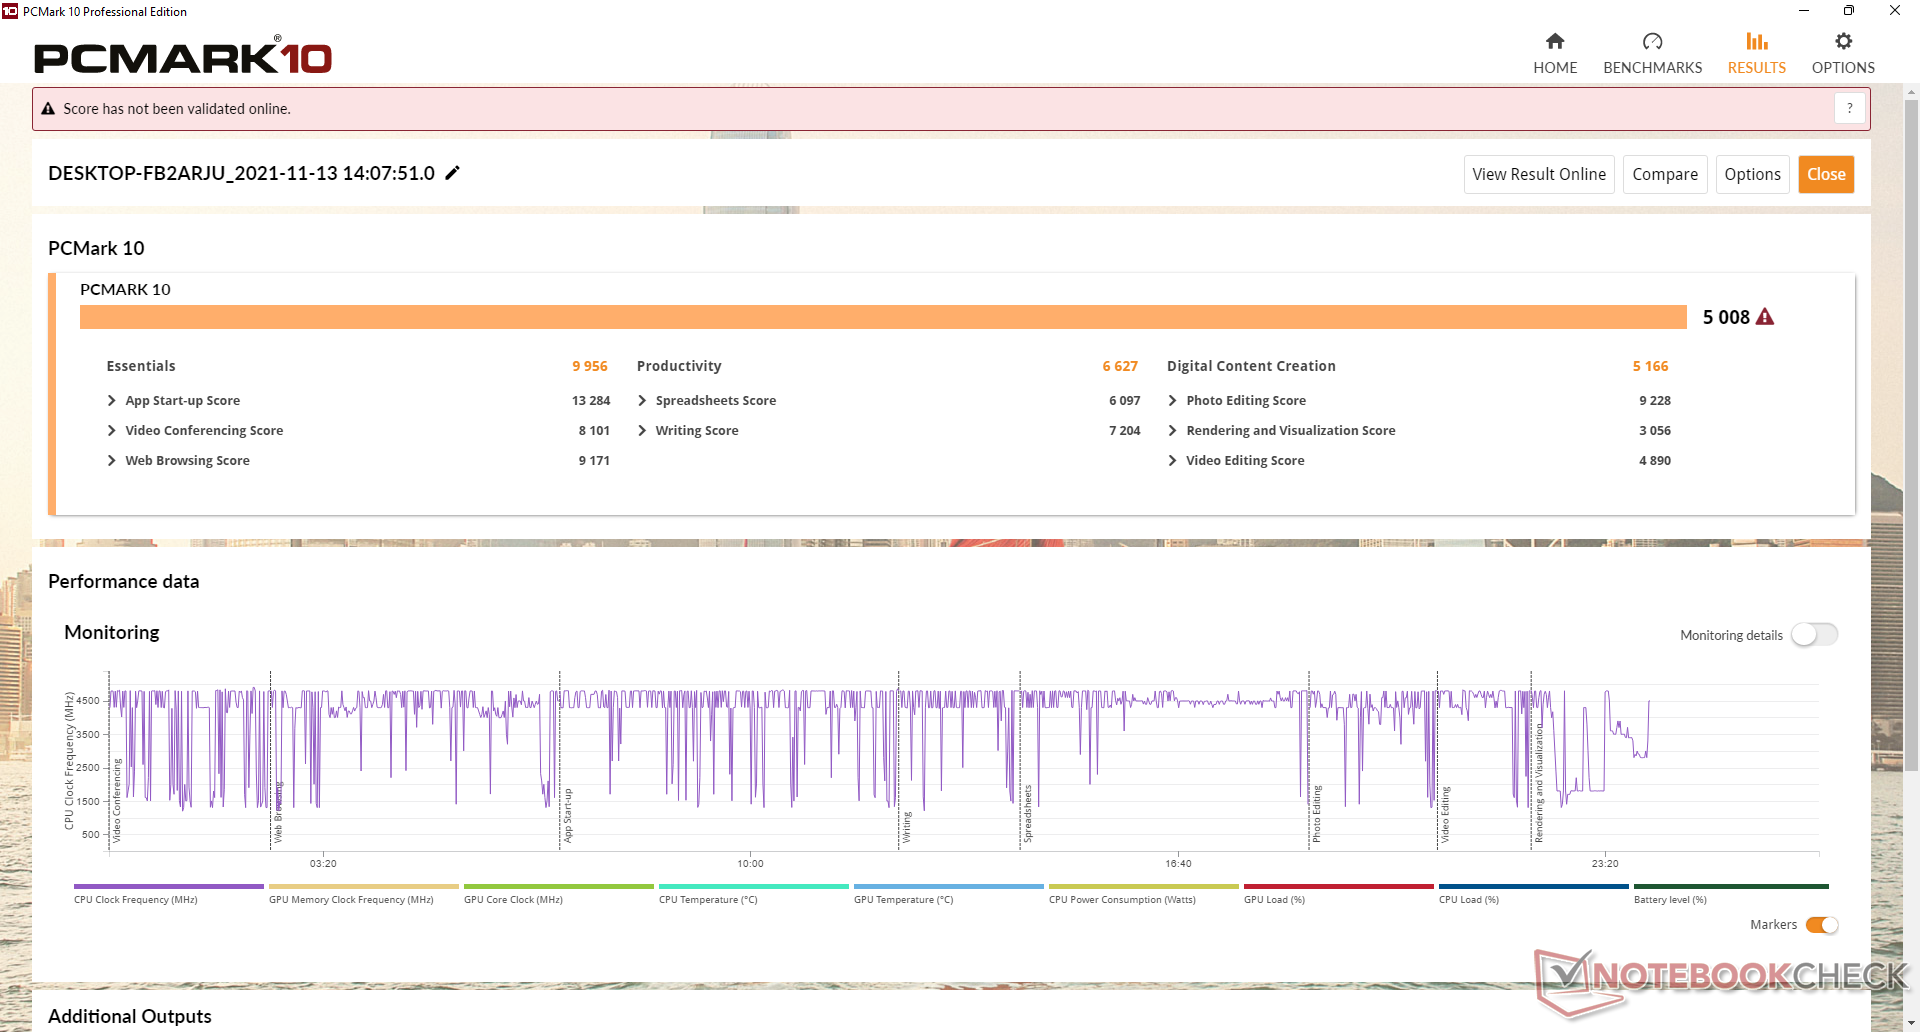
I punteggi PCMark 10 sono generalmente più alti di quelli che abbiamo registrato sul Latitude 9510 2-in-1 specialmente nella Creazione di contenuti digitali dove la grafica conta di più. Il vecchio modello ha un punteggio di produttività più alto, probabilmente a causa delle sue prestazioni multi-thread superiori.
| PCMark 10 / Score | |
| Lenovo ThinkPad L15 G2 AMD | |
| Microsoft Surface Laptop 4 15 AMD TFF_00028 | |
| Dell Latitude 15 9520 2-in-1 | |
| Media Intel Core i7-1185G7, Intel Iris Xe Graphics G7 96EUs (4746 - 5561, n=20) | |
| HP EliteBook 850 G8 3C7Z8EA | |
| MSI Summit B15 A11M | |
| Dell Latitude 9510 2-in-1 | |
| PCMark 10 / Essentials | |
| Lenovo ThinkPad L15 G2 AMD | |
| Dell Latitude 15 9520 2-in-1 | |
| Media Intel Core i7-1185G7, Intel Iris Xe Graphics G7 96EUs (8279 - 10664, n=20) | |
| Dell Latitude 9510 2-in-1 | |
| MSI Summit B15 A11M | |
| HP EliteBook 850 G8 3C7Z8EA | |
| Microsoft Surface Laptop 4 15 AMD TFF_00028 | |
| PCMark 10 / Productivity | |
| Lenovo ThinkPad L15 G2 AMD | |
| Microsoft Surface Laptop 4 15 AMD TFF_00028 | |
| Dell Latitude 9510 2-in-1 | |
| HP EliteBook 850 G8 3C7Z8EA | |
| Media Intel Core i7-1185G7, Intel Iris Xe Graphics G7 96EUs (5799 - 8770, n=20) | |
| Dell Latitude 15 9520 2-in-1 | |
| MSI Summit B15 A11M | |
| PCMark 10 / Digital Content Creation | |
| Microsoft Surface Laptop 4 15 AMD TFF_00028 | |
| Dell Latitude 15 9520 2-in-1 | |
| Media Intel Core i7-1185G7, Intel Iris Xe Graphics G7 96EUs (4424 - 5684, n=20) | |
| HP EliteBook 850 G8 3C7Z8EA | |
| Lenovo ThinkPad L15 G2 AMD | |
| MSI Summit B15 A11M | |
| Dell Latitude 9510 2-in-1 | |
| PCMark 10 Score | 5008 punti | |
Aiuto | ||
| AIDA64 / Memory Copy | |
| Dell Latitude 15 9520 2-in-1 | |
| Media Intel Core i7-1185G7 (36515 - 68450, n=20) | |
| HP EliteBook 850 G8 3C7Z8EA | |
| Microsoft Surface Laptop 4 15 AMD TFF_00028 | |
| MSI Summit B15 A11M | |
| Dell Latitude 9510 2-in-1 | |
| Lenovo ThinkPad L15 G2 AMD | |
| AIDA64 / Memory Read | |
| Dell Latitude 15 9520 2-in-1 | |
| Media Intel Core i7-1185G7 (38394 - 64291, n=20) | |
| HP EliteBook 850 G8 3C7Z8EA | |
| Microsoft Surface Laptop 4 15 AMD TFF_00028 | |
| MSI Summit B15 A11M | |
| Dell Latitude 9510 2-in-1 | |
| Lenovo ThinkPad L15 G2 AMD | |
| AIDA64 / Memory Write | |
| Dell Latitude 15 9520 2-in-1 | |
| Media Intel Core i7-1185G7 (37684 - 66873, n=20) | |
| HP EliteBook 850 G8 3C7Z8EA | |
| MSI Summit B15 A11M | |
| Microsoft Surface Laptop 4 15 AMD TFF_00028 | |
| Dell Latitude 9510 2-in-1 | |
| Lenovo ThinkPad L15 G2 AMD | |
| AIDA64 / Memory Latency | |
| Microsoft Surface Laptop 4 15 AMD TFF_00028 | |
| Dell Latitude 15 9520 2-in-1 | |
| Dell Latitude 9510 2-in-1 | |
| Lenovo ThinkPad L15 G2 AMD | |
| Media Intel Core i7-1185G7 (78.3 - 117, n=22) | |
| MSI Summit B15 A11M | |
| HP EliteBook 850 G8 3C7Z8EA | |
* ... Meglio usare valori piccoli
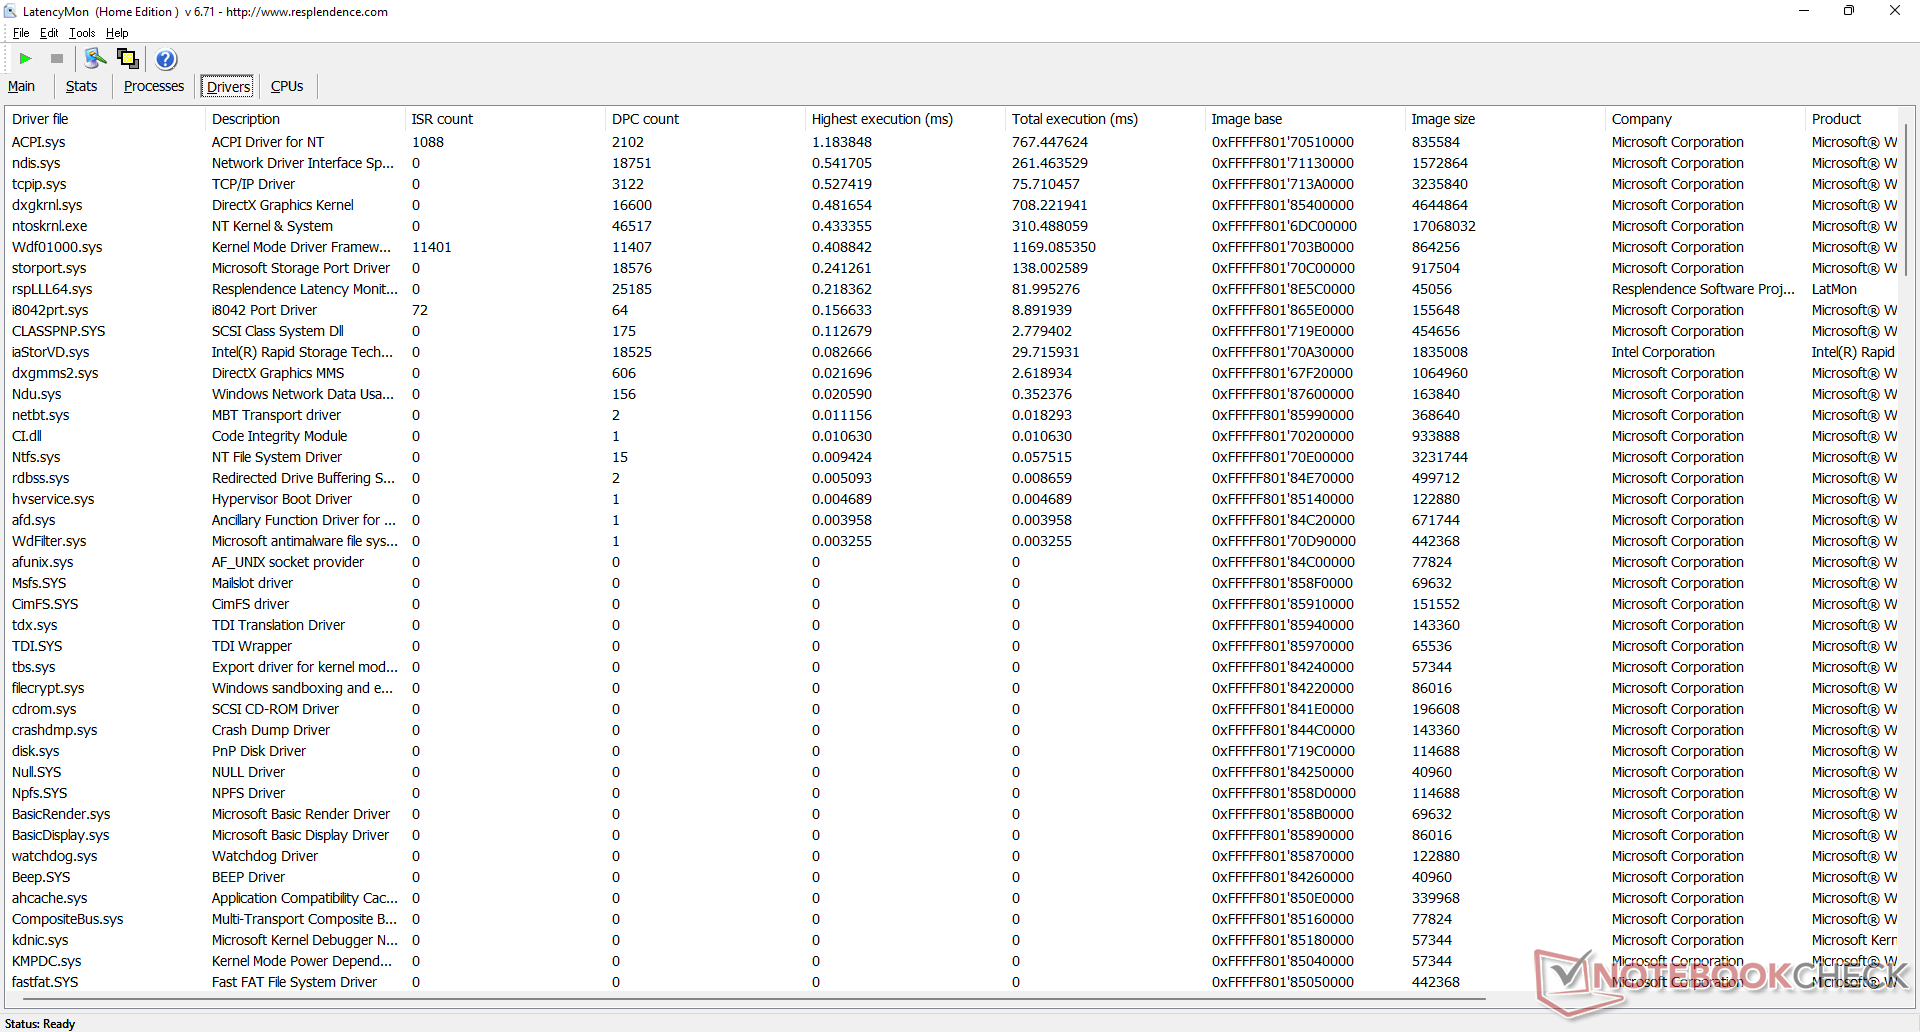
Latenza DPC
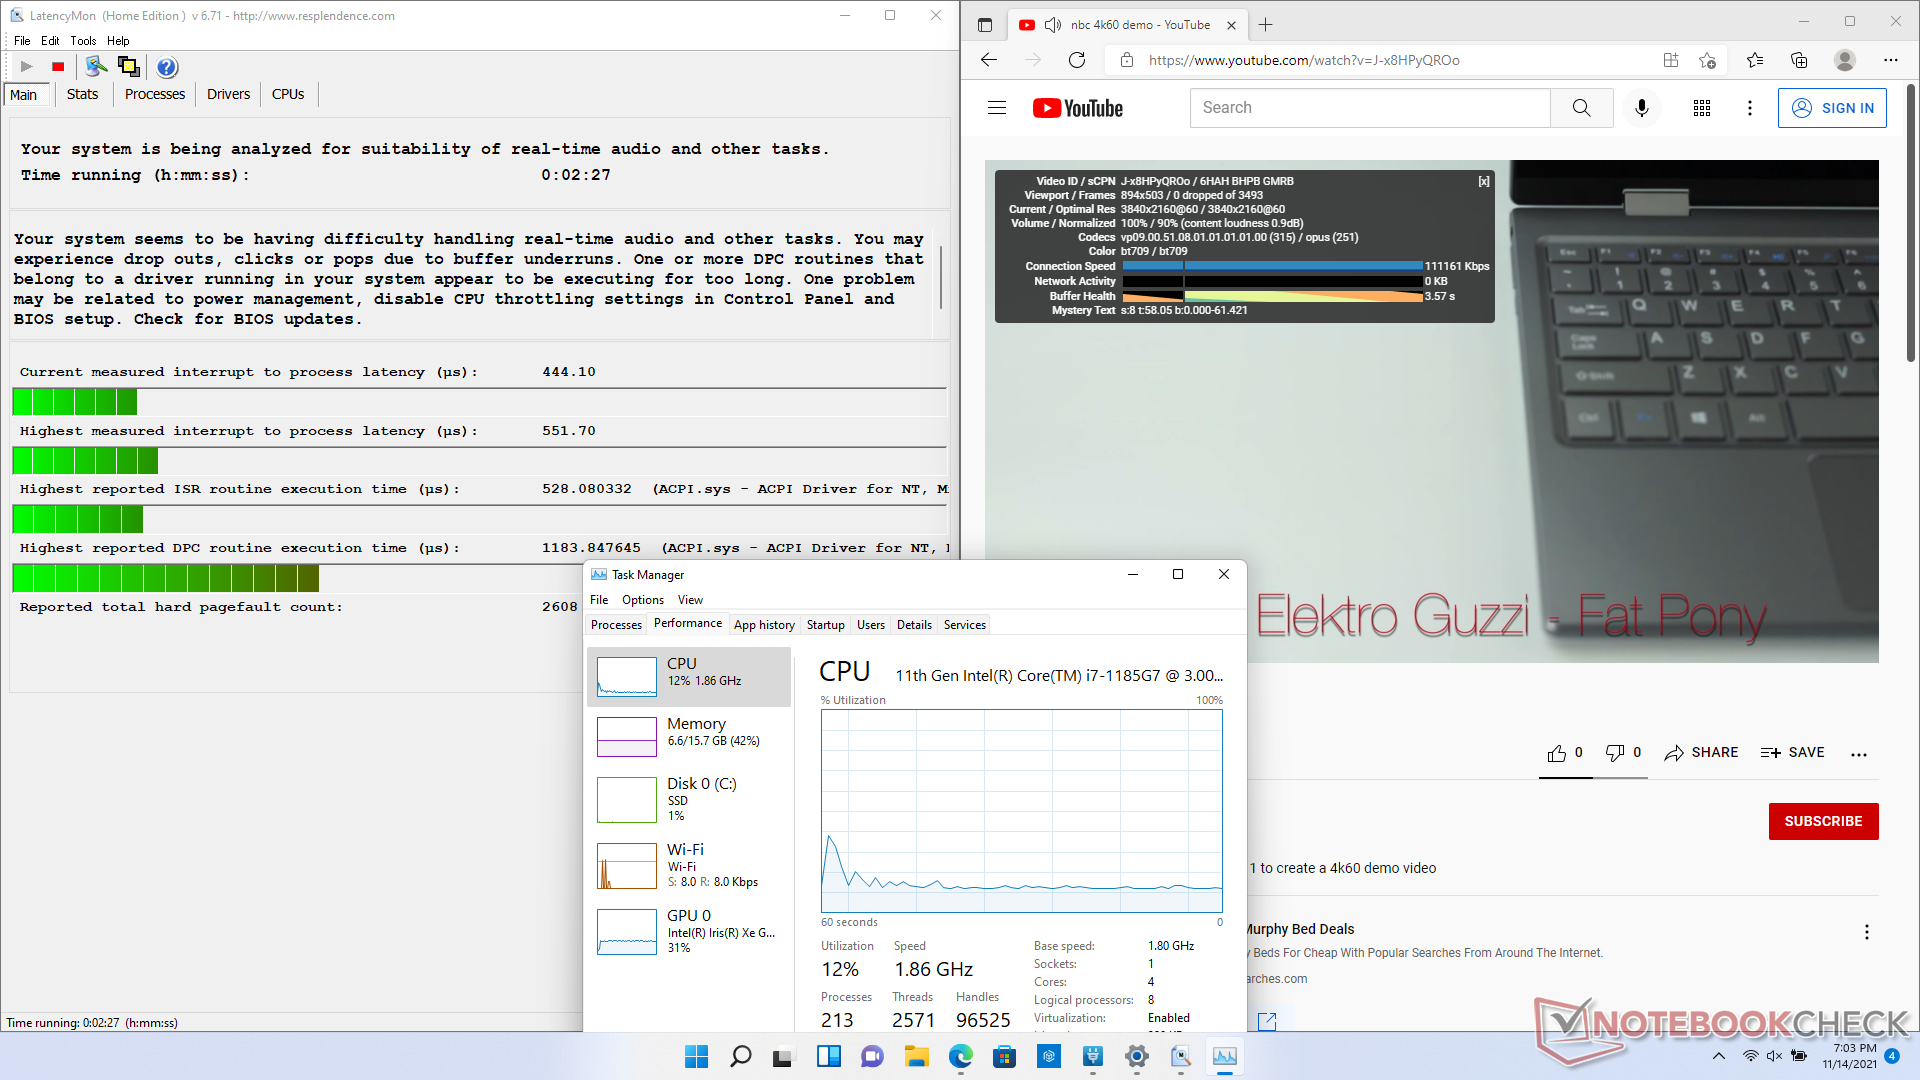
LatencyMon mostra piccoli problemi di latenza DPC relativi ad ACPI.sys quando si aprono più schede del browser della nostra homepage. Tuttavia, è ancora un miglioramento rispetto a quanto osservato sul modello dell'anno scorso
La riproduzione di video 4K a 60 FPS rimane perfetta senza perdita di frame e con un utilizzo della GPU più efficiente rispetto al modello UHD Graphics 620.
| DPC Latencies / LatencyMon - interrupt to process latency (max), Web, Youtube, Prime95 | |
| Dell Latitude 9510 2-in-1 | |
| Lenovo ThinkPad L15 G2 AMD | |
| HP EliteBook 850 G8 3C7Z8EA | |
| MSI Summit B15 A11M | |
| Microsoft Surface Laptop 4 15 AMD TFF_00028 | |
| Dell Latitude 15 9520 2-in-1 | |
* ... Meglio usare valori piccoli
Dispositivi di archiviazione
La nostra unità di test utilizza lo stesso PCIe3 x4 Toshiba KBG40ZNS512G NVMe M.2 2230 SSD che si trova sul Latitude 9510 2-in-1. Dell attualmente non offre opzioni PCIe4 anche se il chipset Intel dovrebbe teoricamente essere in grado di supportare tali SSD. La mancanza di un diffusore di calore, tuttavia, significherà che qualsiasi SSD PCIe4 probabilmente si strozzerà dopo un breve periodo, comunque.

* ... Meglio usare valori piccoli
Disk Throttling: DiskSpd Read Loop, Queue Depth 8
Prestazioni della GPU
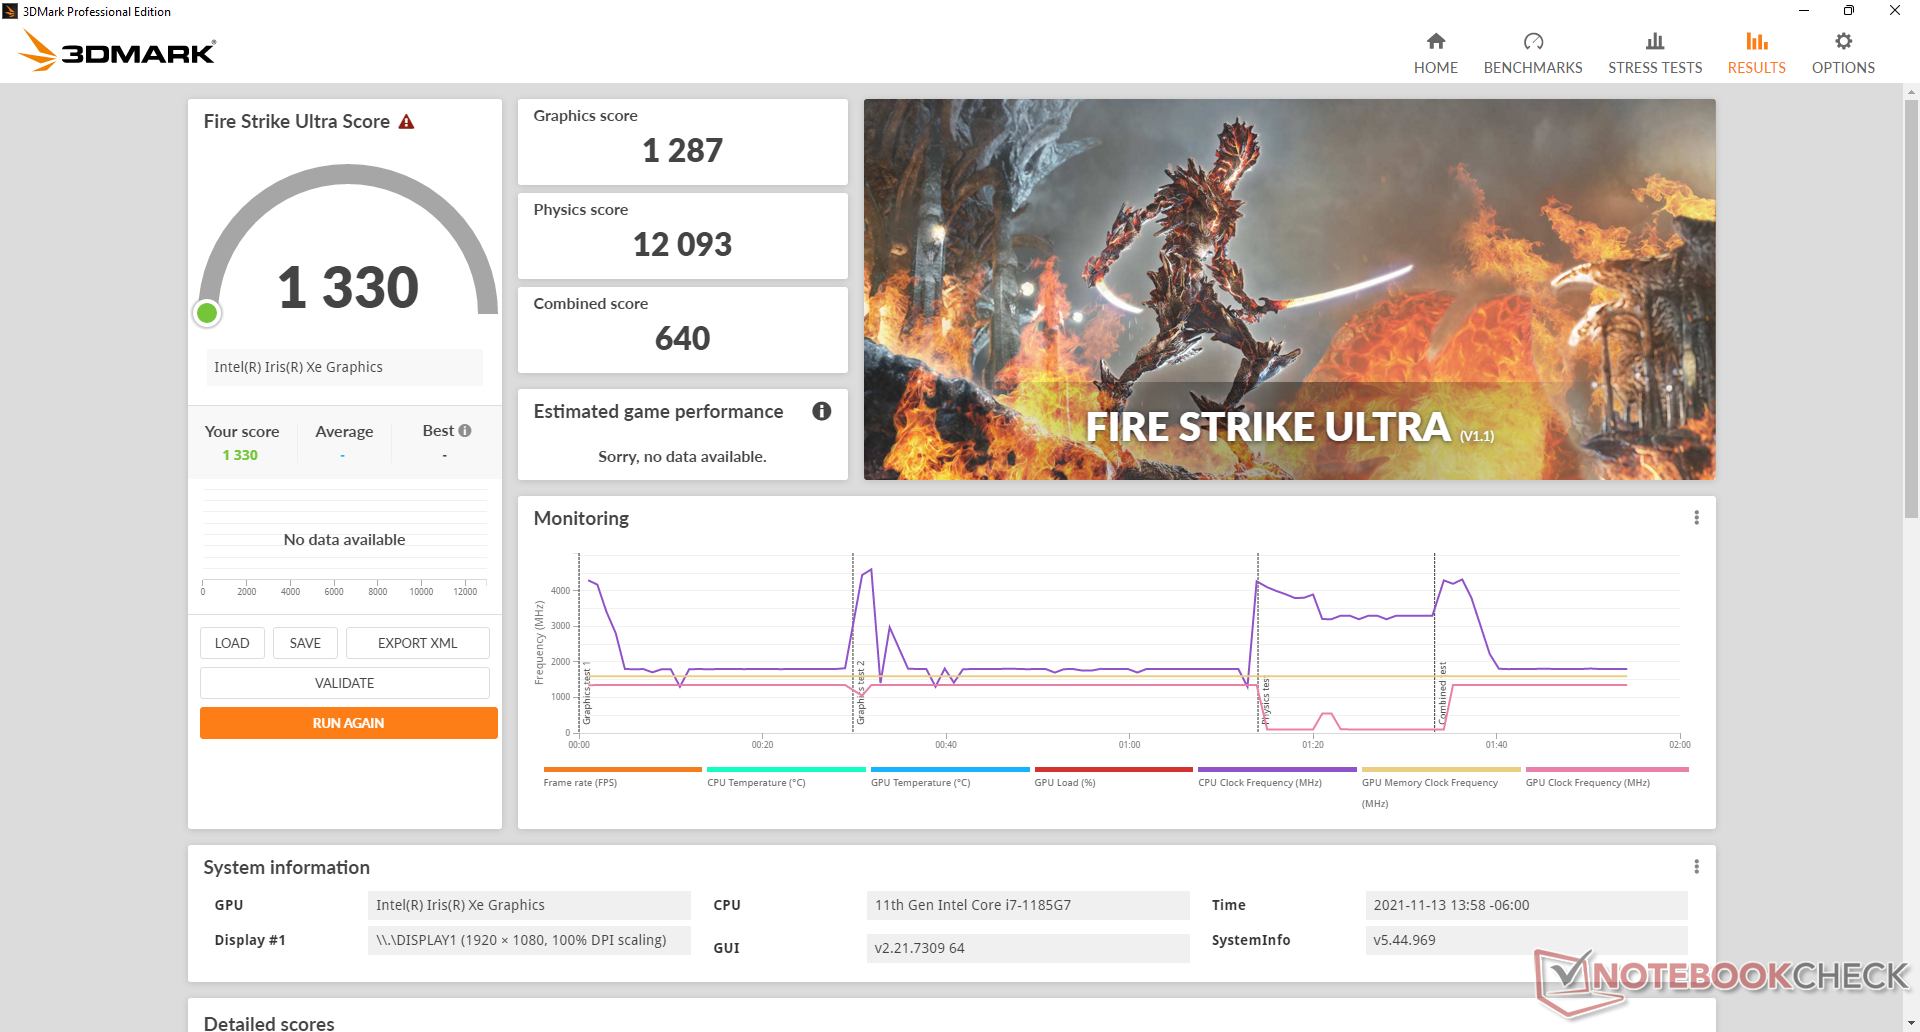
I punteggi di 3DMark mostrano la Iris Xe 96 EU nel nostro Latitude 9520 2-in-1 con buone prestazioni rispetto ad altri portatili Iris Xe nel nostro database. Il diavolo è nei dettagli, tuttavia, poiché le prestazioni di gioco nel mondo reale sono scarse a causa dei frame rate fluttuanti insolitamente ampi. Per esempio, il frame rate salta costantemente tra i 40 FPS e i 90 FPS quando è semplicemente al minimo Witcher 3 alle impostazioni più basse, mentre l'Iris Xe-powered MSI Summit B15 funzionerebbe in modo molto più stabile senza alcuno di questi bruschi cali di FPS. Così, mentre il nostro Latitude 9520 2-in-1 Iris Xe è indubbiamente più veloce del UHD Graphics 620 sul Latitude 9510 2-in-1 dell'anno scorso, avrebbe potuto sicuramente essere più stabile in termini di prestazioni nel tempo.
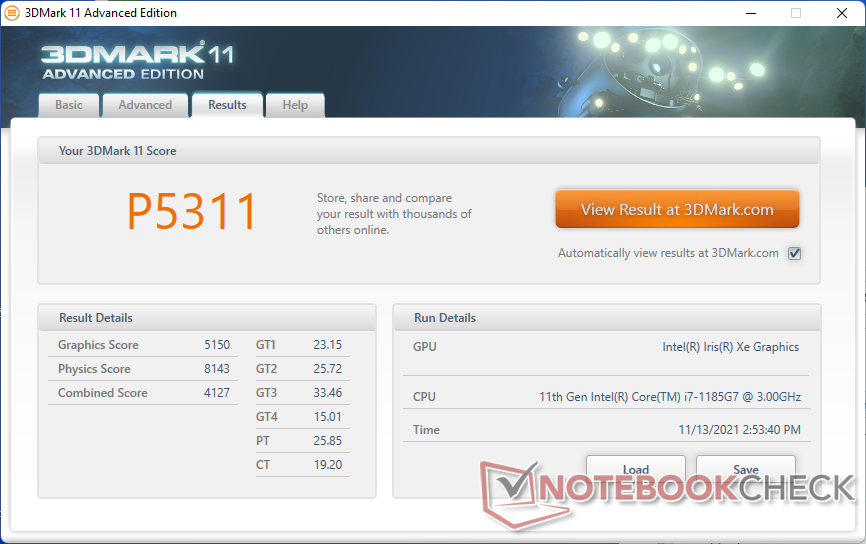
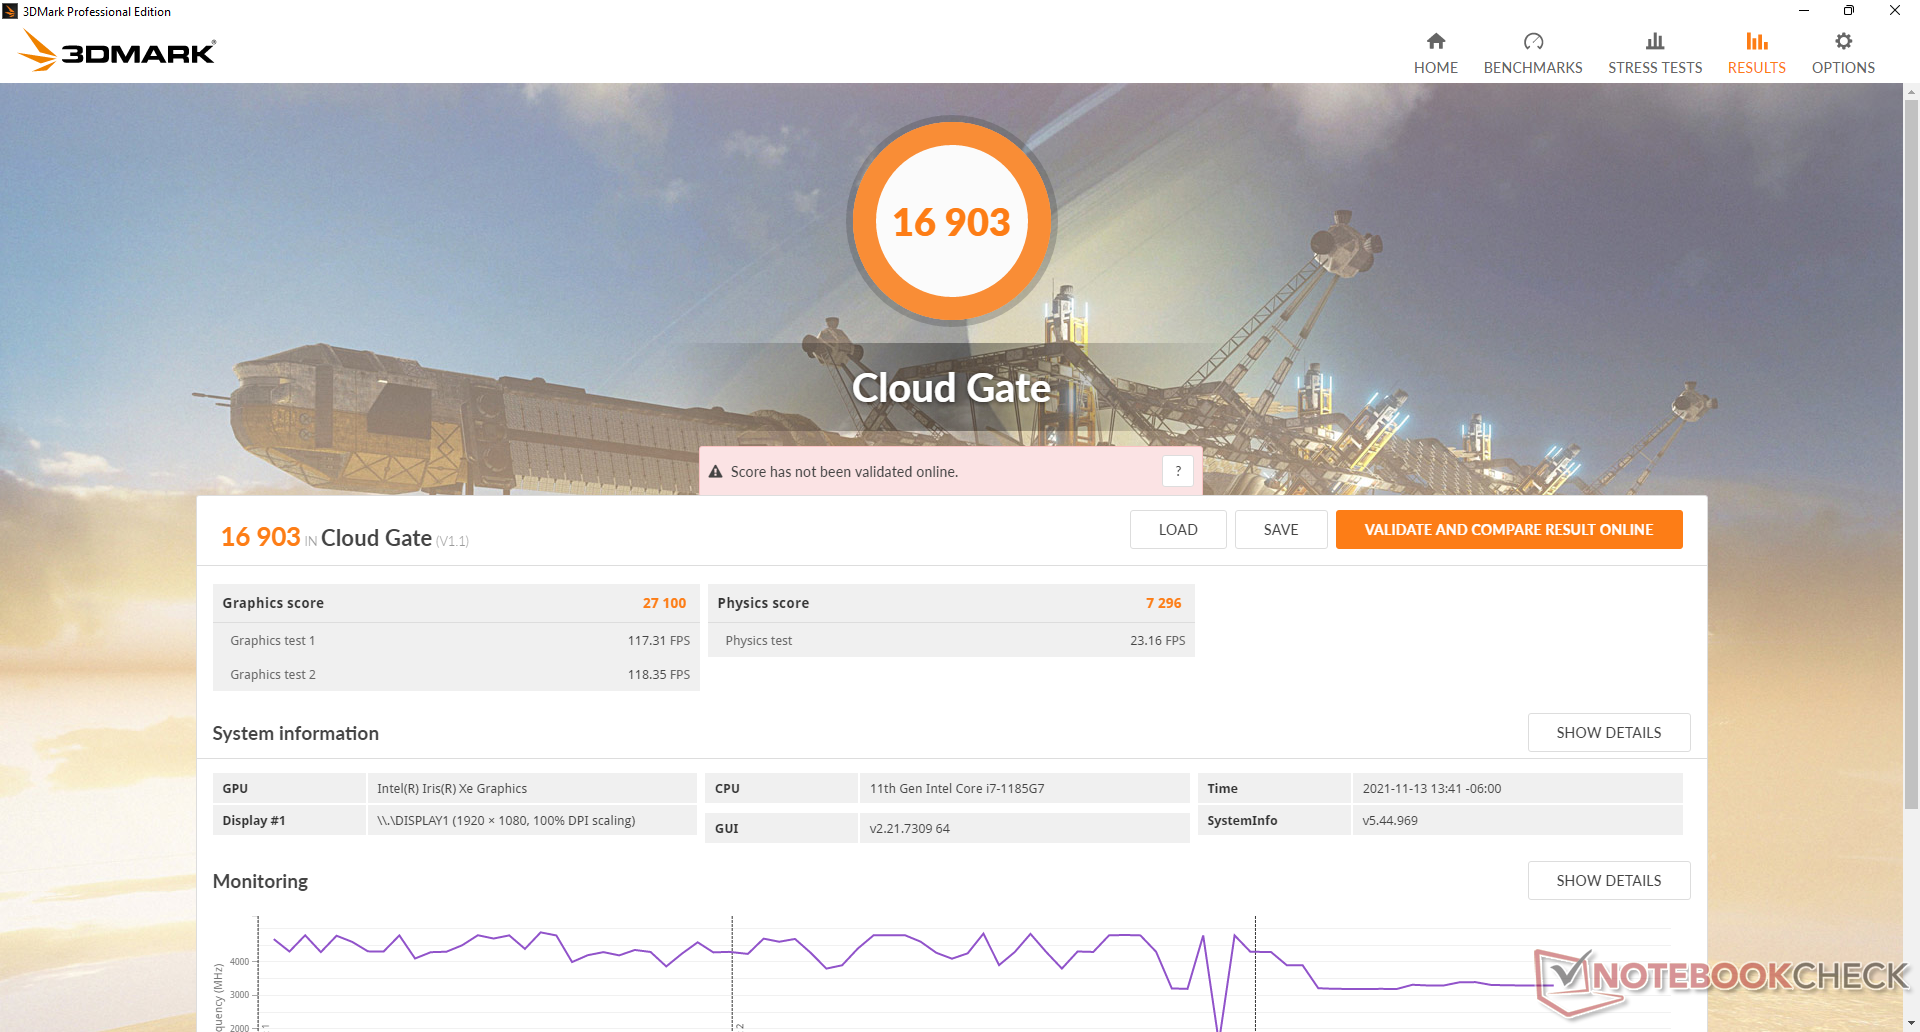
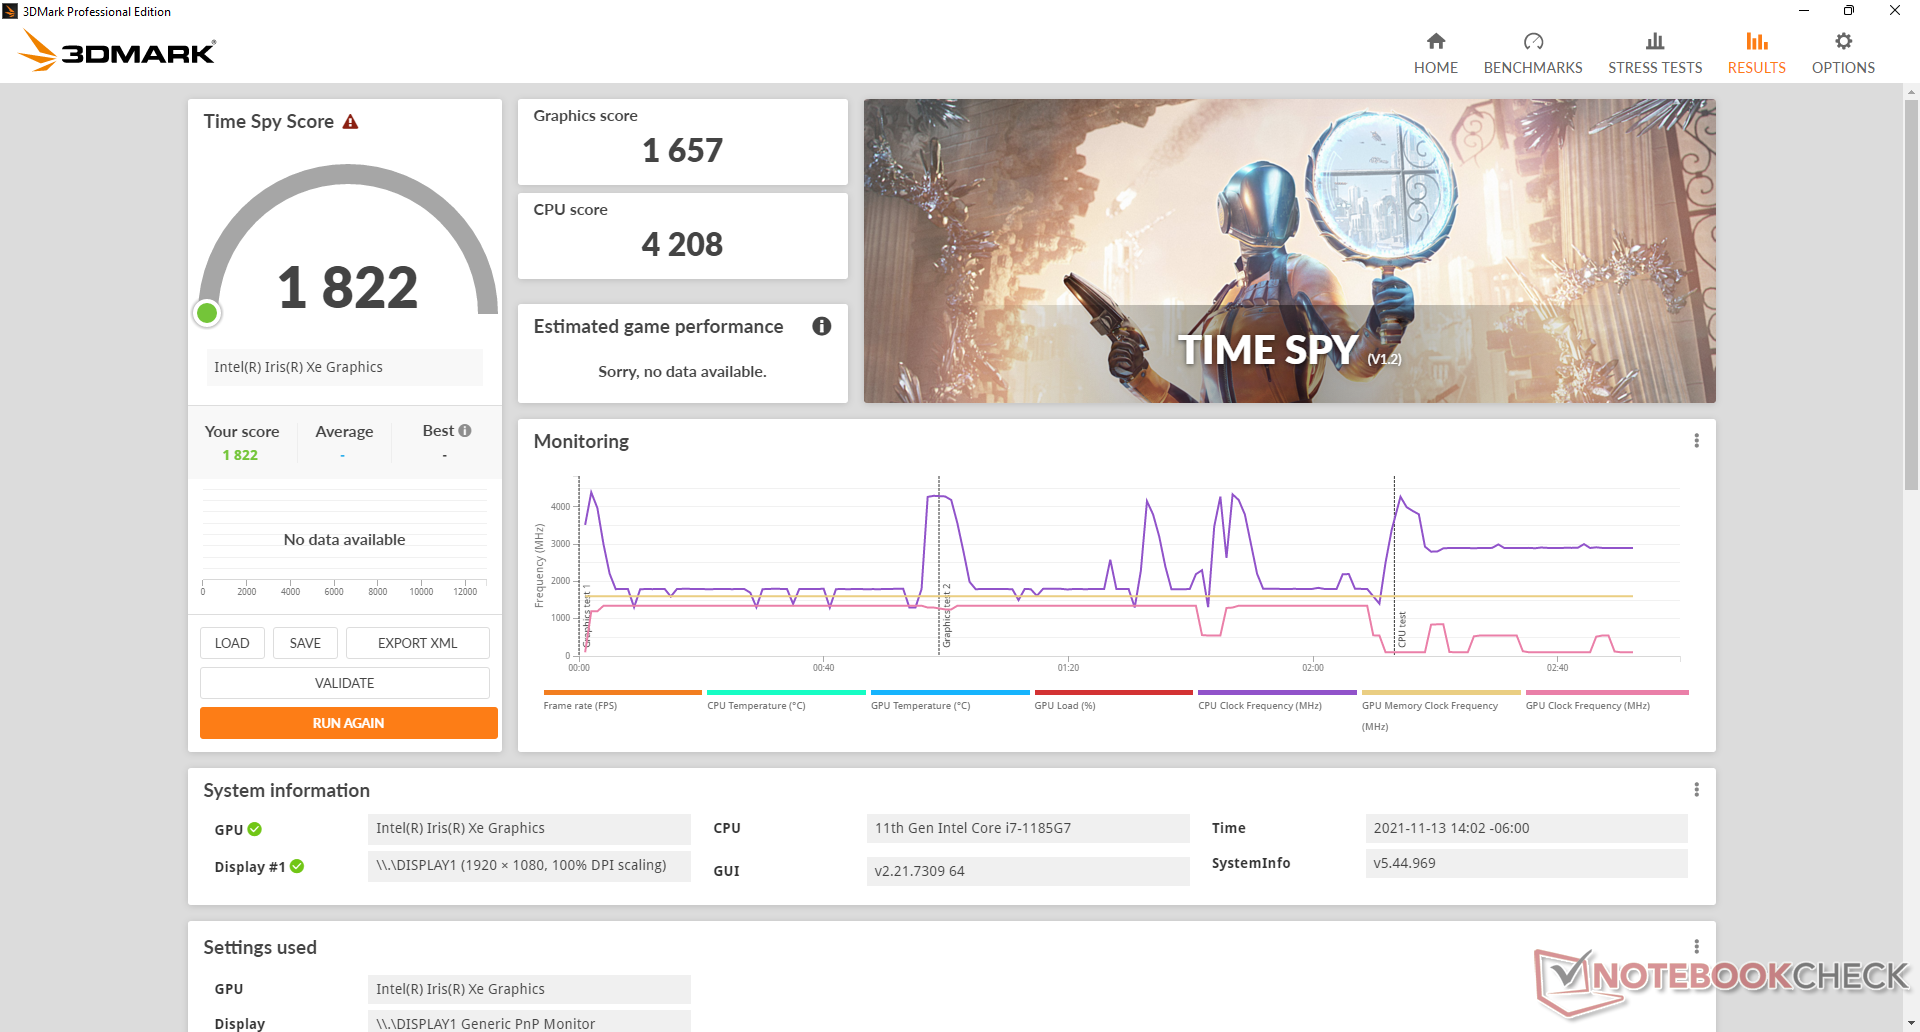
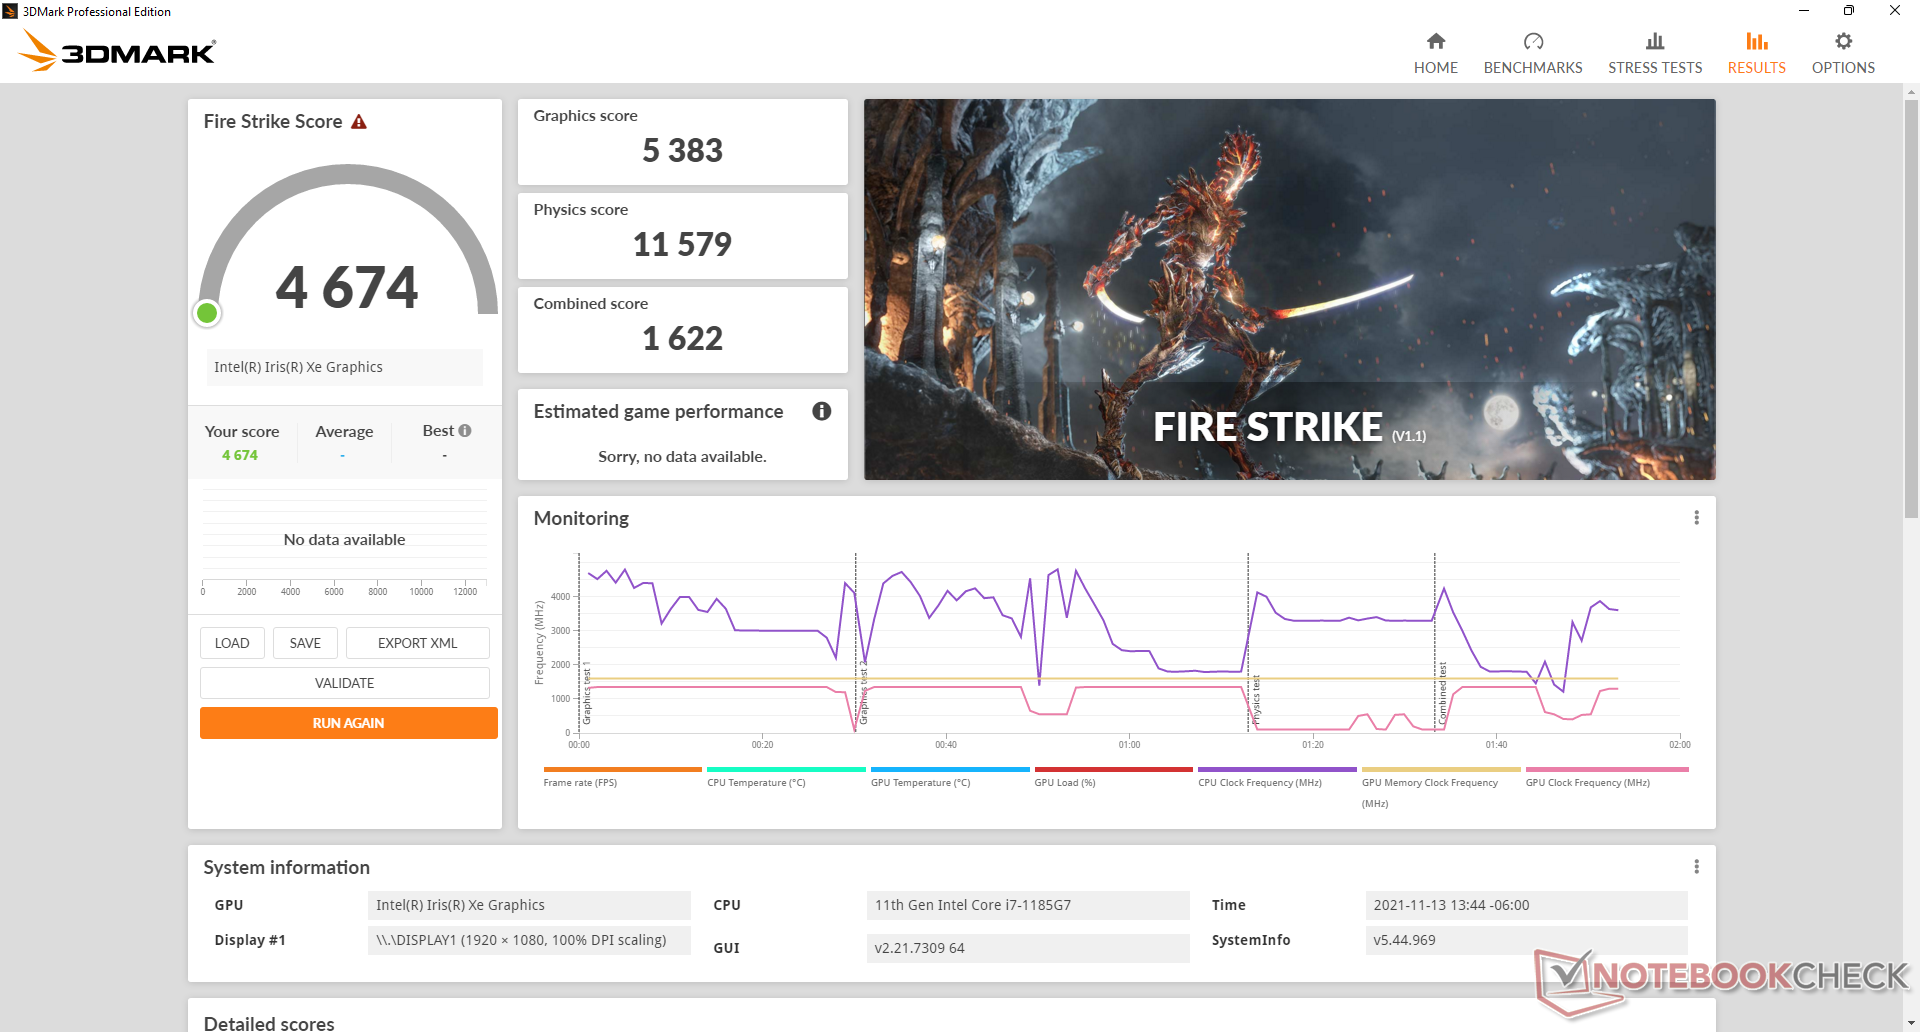
| 3DMark 11 Performance | 5311 punti | |
| 3DMark Cloud Gate Standard Score | 16903 punti | |
| 3DMark Fire Strike Score | 4674 punti | |
| 3DMark Time Spy Score | 1822 punti | |
Aiuto | ||
Witcher 3 FPS Chart
| basso | medio | alto | ultra | |
|---|---|---|---|---|
| GTA V (2015) | 81 | 70.5 | 27.2 | 10.6 |
| The Witcher 3 (2015) | 86.8 | 59.4 | 33.5 | 14.3 |
| Dota 2 Reborn (2015) | 103 | 61.7 | 39.8 | 39.8 |
| Final Fantasy XV Benchmark (2018) | 35 | 20 | 14.6 | |
| X-Plane 11.11 (2018) | 36 | 34.4 | 27.5 | |
| Strange Brigade (2018) | 82.8 | 32.7 | 26.3 | 23.2 |
Emissioni
Rumore di sistema
La ventola interna è silenziosa a 24,1 dN(A) quando è al minimo o si naviga sul web in modalità bilanciata o ottimizzata o inferiore. Può occasionalmente saltare a 25.8 dB(A), ma questo sarà impercettibile nella maggior parte degli ambienti. Gli utenti possono raggiungere il rumore massimo della ventola di poco meno di 40 dB(A) quando si eseguono carichi più elevati come i giochi.
Il rumore della ventola pulserà più frequentemente se impostato sulla modalità High Performance durante la navigazione o lo streaming video. Quindi, assicuratevi di impostare il profilo di alimentazione in modo appropriato se il rumore della ventola è una preoccupazione.
Rumorosità
| Idle |
| 24.1 / 24.1 / 25.8 dB(A) |
| Sotto carico |
| 34.2 / 39.6 dB(A) |
 | ||
30 dB silenzioso 40 dB(A) udibile 50 dB(A) rumoroso |
||
min: | ||
| Dell Latitude 15 9520 2-in-1 Iris Xe G7 96EUs, i7-1185G7, Toshiba KBG40ZNS512G NVMe | Dell Latitude 9510 2-in-1 UHD Graphics 620, i7-10810U, Toshiba KBG40ZNS512G NVMe | HP EliteBook 850 G8 3C7Z8EA Iris Xe G7 96EUs, i7-1165G7, Samsung PM981a MZVLB1T0HBLR | Lenovo ThinkPad L15 G2 AMD Vega 7, R5 5600U, SK Hynix HFS512 GDE9X081N | MSI Summit B15 A11M Iris Xe G7 96EUs, i7-1165G7, Kingston OM8PCP31024F | Microsoft Surface Laptop 4 15 AMD TFF_00028 Vega 8, R7 4980U, SK Hynix BC511 HFM512GDJTNI | |
|---|---|---|---|---|---|---|
| Noise | -7% | 0% | 6% | -1% | -2% | |
| off /ambiente * (dB) | 24 | 27.2 -13% | 26 -8% | 24.22 -1% | 25.2 -5% | 24.2 -1% |
| Idle Minimum * (dB) | 24.1 | 27.2 -13% | 26 -8% | 24.22 -0% | 26.4 -10% | 24.2 -0% |
| Idle Average * (dB) | 24.1 | 27.2 -13% | 26 -8% | 24.22 -0% | 26.4 -10% | 24.2 -0% |
| Idle Maximum * (dB) | 25.8 | 27.2 -5% | 26.2 -2% | 24.22 6% | 26.4 -2% | 24.2 6% |
| Load Average * (dB) | 34.2 | 33.4 2% | 29.5 14% | 25.84 24% | 26.8 22% | 39.9 -17% |
| Witcher 3 ultra * (dB) | 39.6 | 28 29% | 39.9 -1% | |||
| Load Maximum * (dB) | 39.6 | 39.5 -0% | 34 14% | 36.02 9% | 52.6 -33% | 39.9 -1% |
* ... Meglio usare valori piccoli
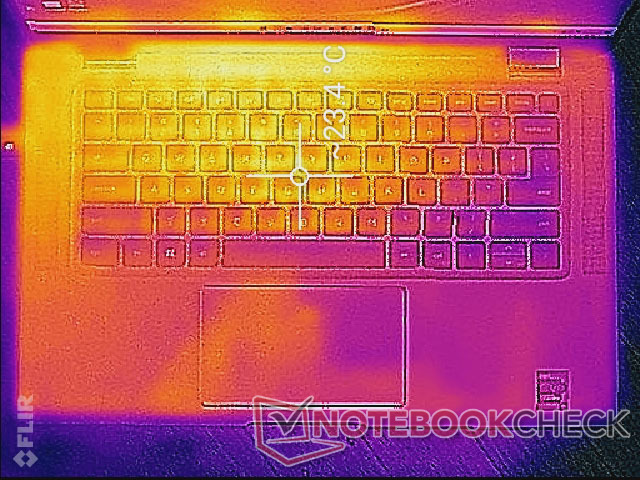
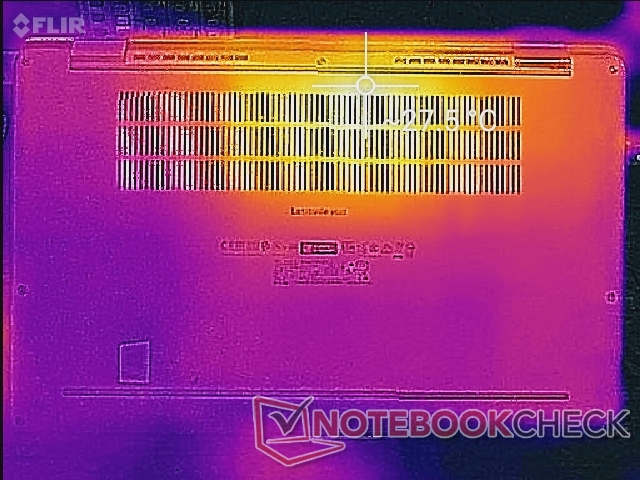
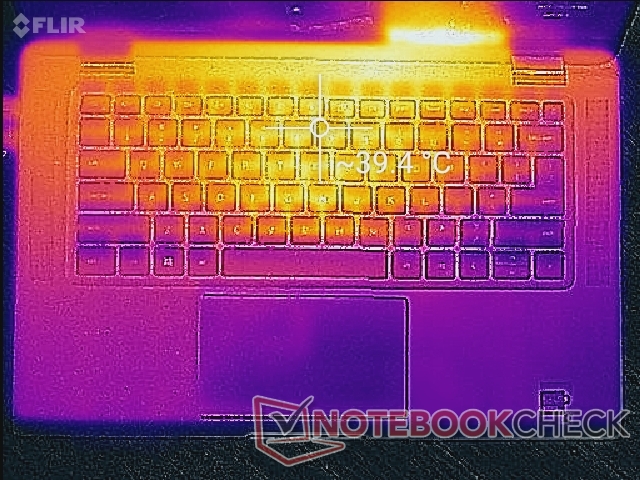
Temperatura
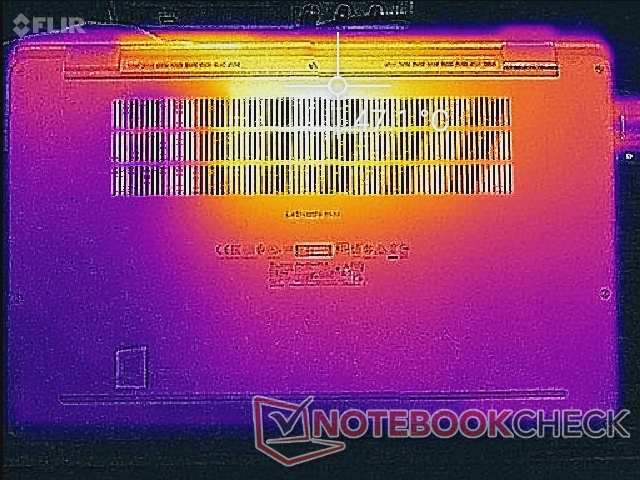
Le temperature di superficie sono simili a quelle del Latitude 9510 2-in-1 quando si utilizzano carichi medio-bassi. Se si eseguono carichi più elevati come i giochi, tuttavia, il punto caldo inferiore del Latitude 9520 2-in-1 può essere qualche grado più caldo rispetto al vecchio modello.
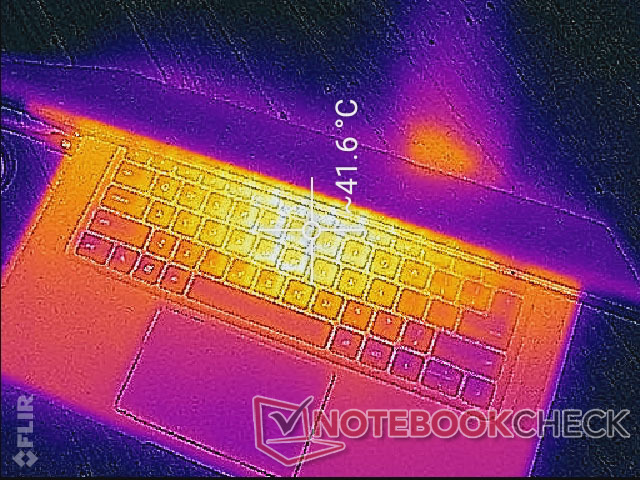
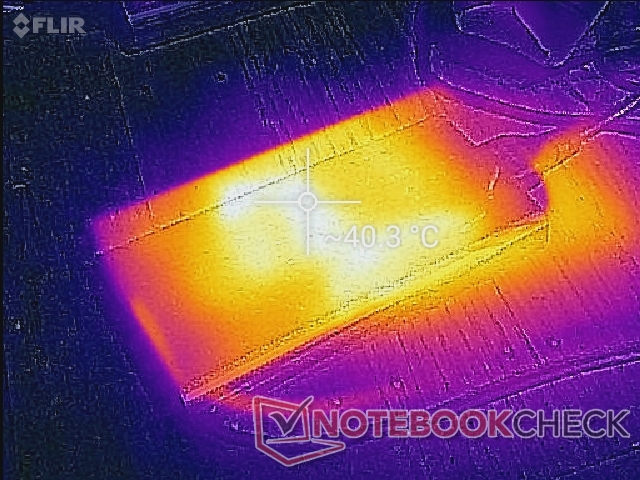
(±) La temperatura massima sul lato superiore è di 40 °C / 104 F, rispetto alla media di 34.3 °C / 94 F, che varia da 21.2 a 62.5 °C per questa classe Office.
(-) Il lato inferiore si riscalda fino ad un massimo di 47.2 °C / 117 F, rispetto alla media di 36.8 °C / 98 F
(+) In idle, la temperatura media del lato superiore è di 22.5 °C / 73 F, rispetto alla media deld ispositivo di 29.5 °C / 85 F.
(+) I poggiapolsi e il touchpad sono piu' freddi della temperatura della pelle con un massimo di 28.6 °C / 83.5 F e sono quindi freddi al tatto.
(±) La temperatura media della zona del palmo della mano di dispositivi simili e'stata di 27.5 °C / 81.5 F (-1.1 °C / -2 F).
| Dell Latitude 15 9520 2-in-1 Intel Core i7-1185G7, Intel Iris Xe Graphics G7 96EUs | Dell Latitude 9510 2-in-1 Intel Core i7-10810U, Intel UHD Graphics 620 | HP EliteBook 850 G8 3C7Z8EA Intel Core i7-1165G7, Intel Iris Xe Graphics G7 96EUs | Lenovo ThinkPad L15 G2 AMD AMD Ryzen 5 5600U, AMD Radeon RX Vega 7 | MSI Summit B15 A11M Intel Core i7-1165G7, Intel Iris Xe Graphics G7 96EUs | Microsoft Surface Laptop 4 15 AMD TFF_00028 AMD Ryzen 7 4980U, AMD Radeon RX Vega 8 (Ryzen 4000/5000) | |
|---|---|---|---|---|---|---|
| Heat | -9% | -3% | -8% | -8% | 4% | |
| Maximum Upper Side * (°C) | 40 | 42.8 -7% | 37.9 5% | 42.8 -7% | 42.8 -7% | 41.8 -5% |
| Maximum Bottom * (°C) | 47.2 | 41.8 11% | 39 17% | 46 3% | 52.2 -11% | 44.8 5% |
| Idle Upper Side * (°C) | 23.4 | 29.2 -25% | 31 -32% | 26.9 -15% | 26 -11% | 23 2% |
| Idle Bottom * (°C) | 27.4 | 31 -13% | 27.8 -1% | 31.1 -14% | 28.2 -3% | 23.6 14% |
* ... Meglio usare valori piccoli
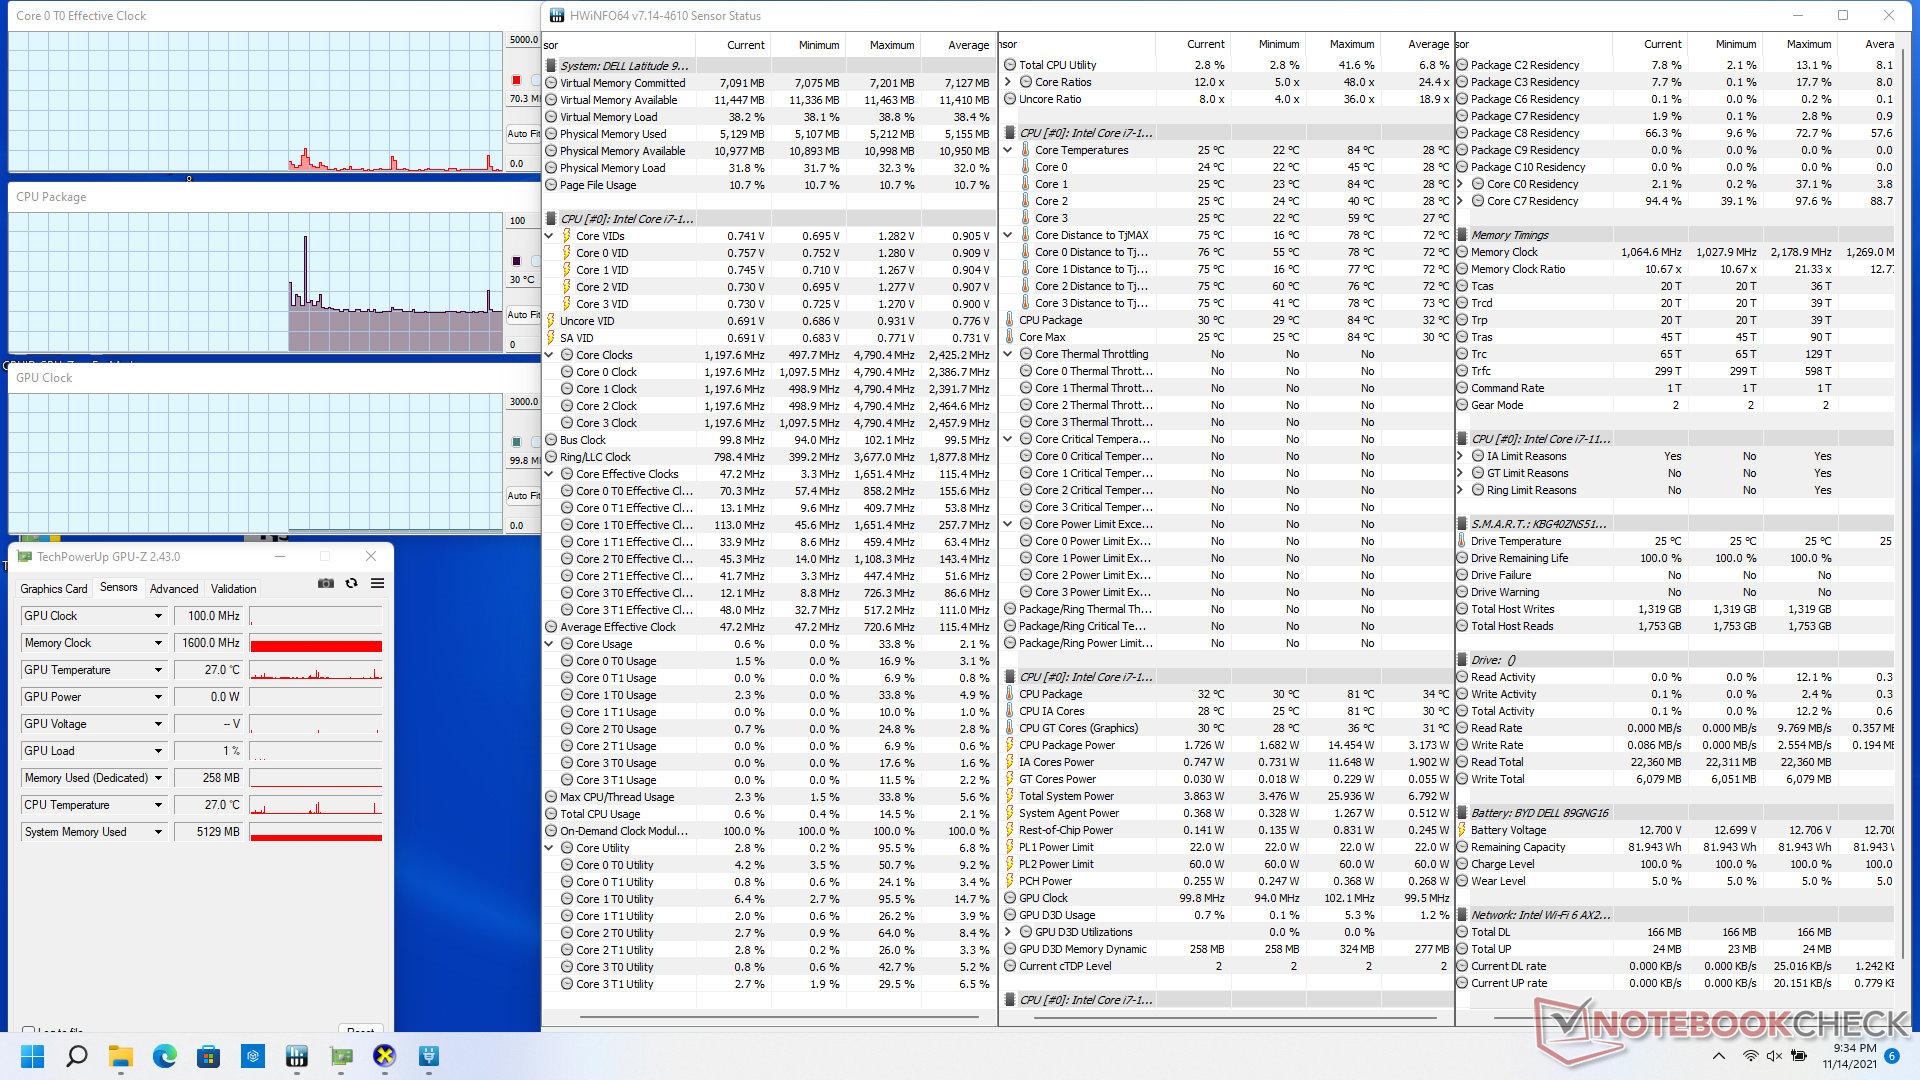
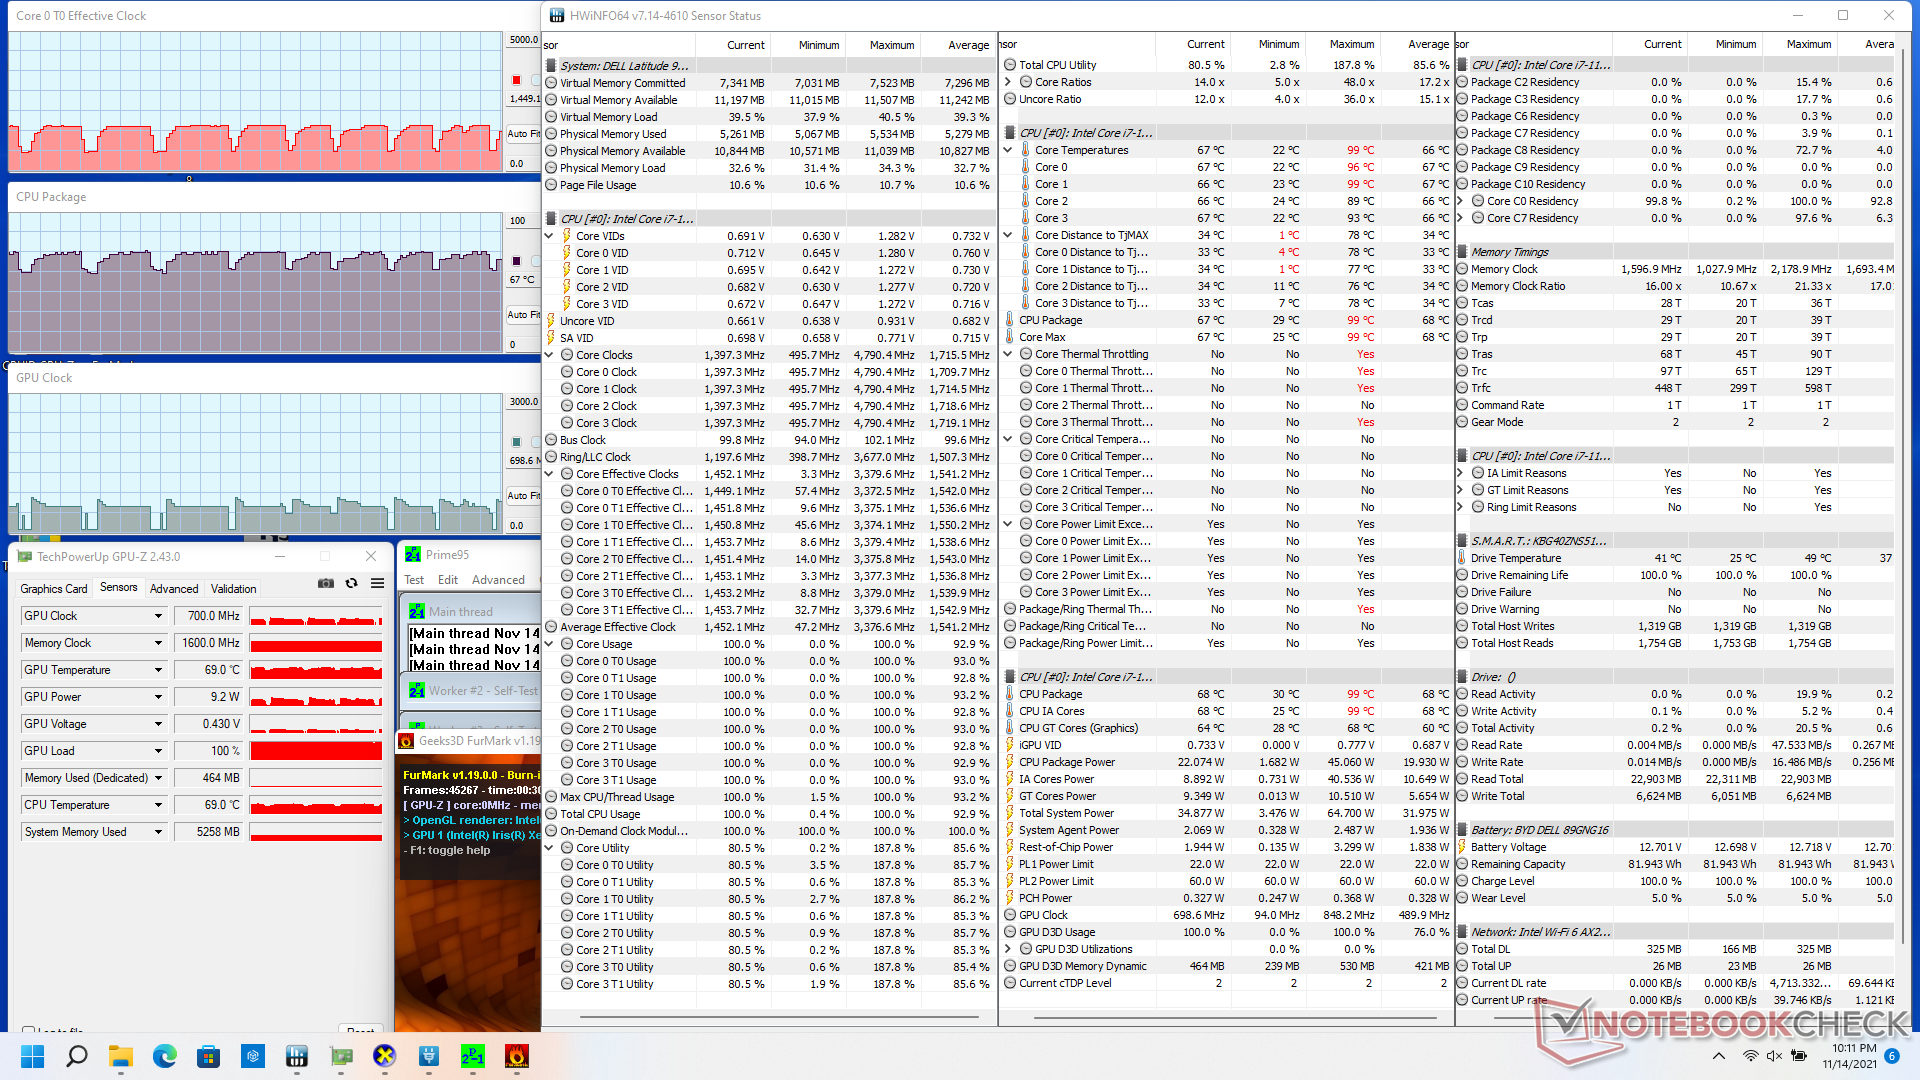
Test di stress
Le prestazioni instabili durante l'esecuzione Witcher 3 come menzionato sopra può essere attribuito alle frequenze di clock instabili quando la CPU e la GPU sono sotto carico simultaneo. Le frequenze di clock della GPU oscillano tra 500 MHz e 1200 MHz durante l'esecuzione del gioco, mentre la maggior parte degli altri portatili Iris Xe rimangono stabili a frequenze di clock fisse per prestazioni più stabili. Il MSI Summit B15per esempio, avrebbe un clock rate della GPU costante di 1300 MHz nelle stesse condizioni di gioco del nostro Dell. Questo comportamento indesiderato della GPU rende il Latitude 9520 2-in-1 una scelta relativamente povera per compiti grafici intensi.
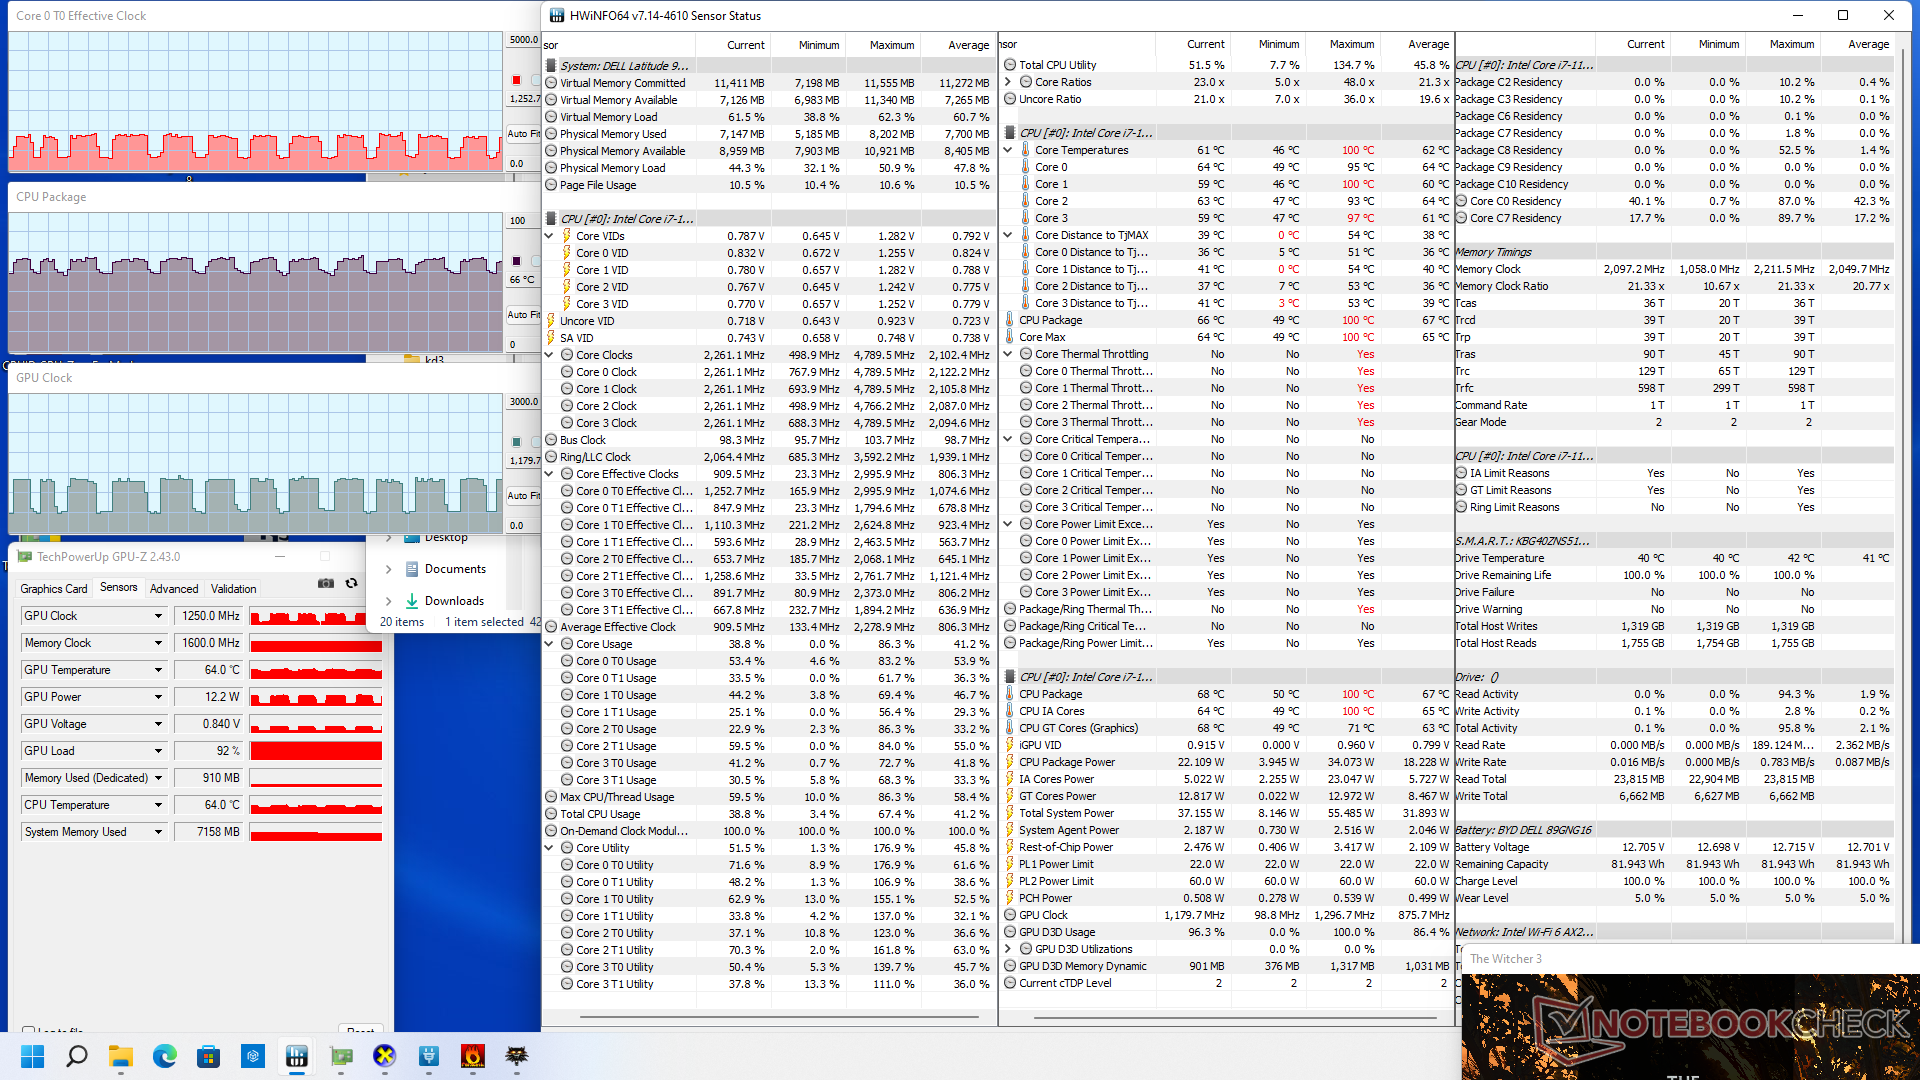
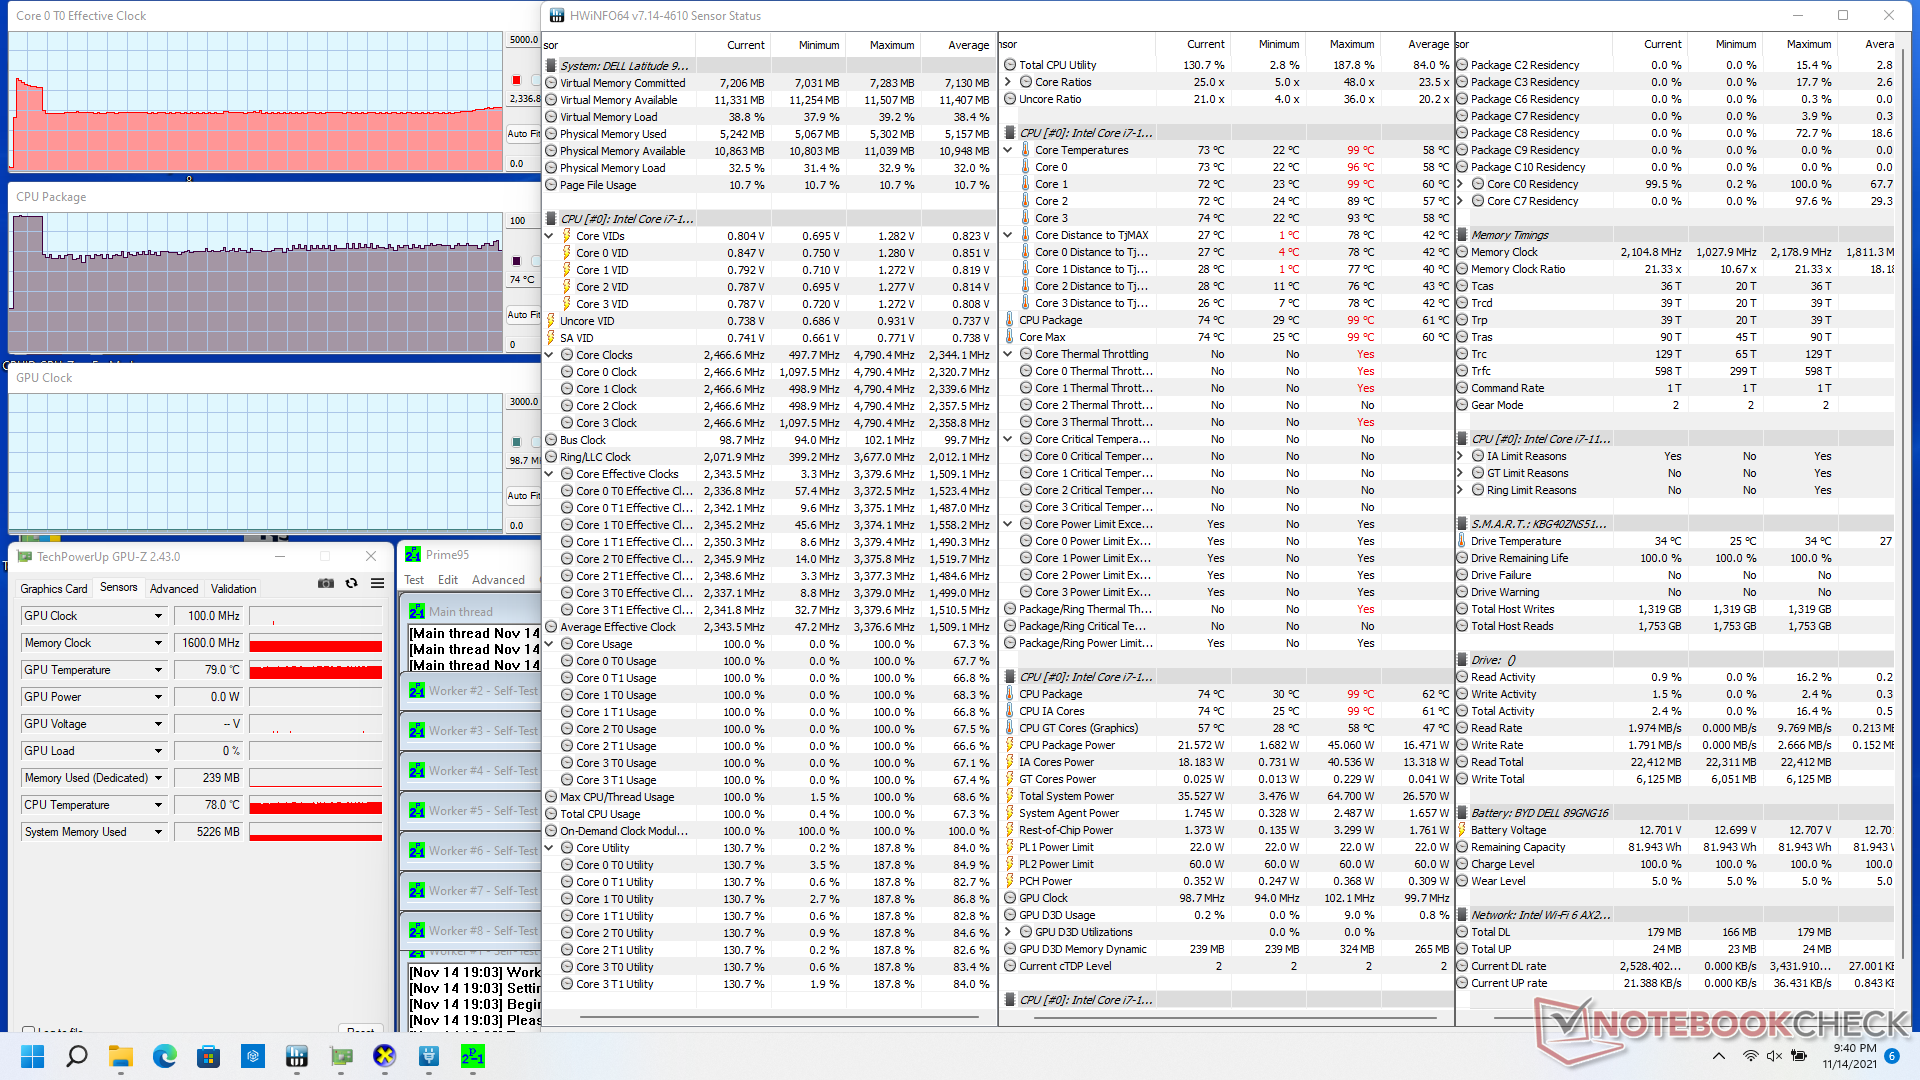
Se si stressa solo la CPU tramite Prime95, le frequenze di clock aumentano fino a 3,2 GHz solo per i primi secondi a una temperatura del core di 98 C. In seguito, le frequenze di clock scendono fino a 2 GHz per mantenere una temperatura del core più fredda di circa 75 C. I limiti di potenza PL1 a lungo termine e PL2 a breve termine dei multi-thread sono rispettivamente di 22 W e 45 W, quando il sistema è in modalità High Performance.
L'alimentazione a batteria non limita le prestazioni, dato che i punteggi di 3DMark 11 sono quasi identici tra rete e batterie.
| Clock della CPU (GHz)Clock della GPU(MHz)Temperaturamedia dellaCPU (°C) |
| Sistema inattivo |
| Stress Prime95 |
| Prime95 + FurMark Stress |
| Witcher 3 Stress |
Altoparlanti
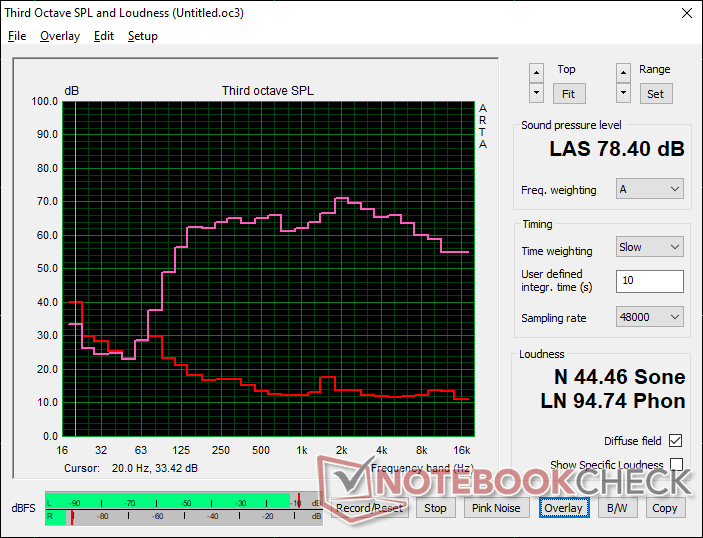
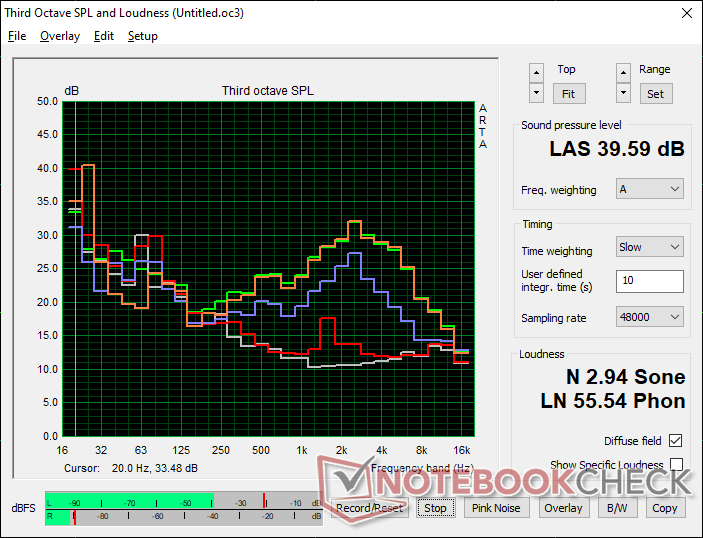
Dell Latitude 15 9520 2-in-1 analisi audio
(±) | potenza degli altiparlanti media ma buona (78.4 dB)
Bassi 100 - 315 Hz
(+) | bassi buoni - solo 4.4% dalla media
(±) | la linearità dei bassi è media (9.4% delta rispetto alla precedente frequenza)
Medi 400 - 2000 Hz
(+) | medi bilanciati - solo only 2.3% rispetto alla media
(+) | medi lineari (4.5% delta rispetto alla precedente frequenza)
Alti 2 - 16 kHz
(+) | Alti bilanciati - appena 3.3% dalla media
(+) | alti lineari (3.9% delta rispetto alla precedente frequenza)
Nel complesso 100 - 16.000 Hz
(+) | suono nel complesso lineare (9.5% differenza dalla media)
Rispetto alla stessa classe
» 1% di tutti i dispositivi testati in questa classe è stato migliore, 0% simile, 99% peggiore
» Il migliore ha avuto un delta di 7%, medio di 21%, peggiore di 53%
Rispetto a tutti i dispositivi testati
» 4% di tutti i dispositivi testati in questa classe è stato migliore, 1% similare, 95% peggiore
» Il migliore ha avuto un delta di 4%, medio di 24%, peggiore di 134%
Apple MacBook 12 (Early 2016) 1.1 GHz analisi audio
(+) | gli altoparlanti sono relativamente potenti (83.6 dB)
Bassi 100 - 315 Hz
(±) | bassi ridotti - in media 11.3% inferiori alla media
(±) | la linearità dei bassi è media (14.2% delta rispetto alla precedente frequenza)
Medi 400 - 2000 Hz
(+) | medi bilanciati - solo only 2.4% rispetto alla media
(+) | medi lineari (5.5% delta rispetto alla precedente frequenza)
Alti 2 - 16 kHz
(+) | Alti bilanciati - appena 2% dalla media
(+) | alti lineari (4.5% delta rispetto alla precedente frequenza)
Nel complesso 100 - 16.000 Hz
(+) | suono nel complesso lineare (10.2% differenza dalla media)
Rispetto alla stessa classe
» 7% di tutti i dispositivi testati in questa classe è stato migliore, 2% simile, 91% peggiore
» Il migliore ha avuto un delta di 5%, medio di 18%, peggiore di 53%
Rispetto a tutti i dispositivi testati
» 5% di tutti i dispositivi testati in questa classe è stato migliore, 1% similare, 94% peggiore
» Il migliore ha avuto un delta di 4%, medio di 24%, peggiore di 134%
Gestione dell'energia
Consumo di energia
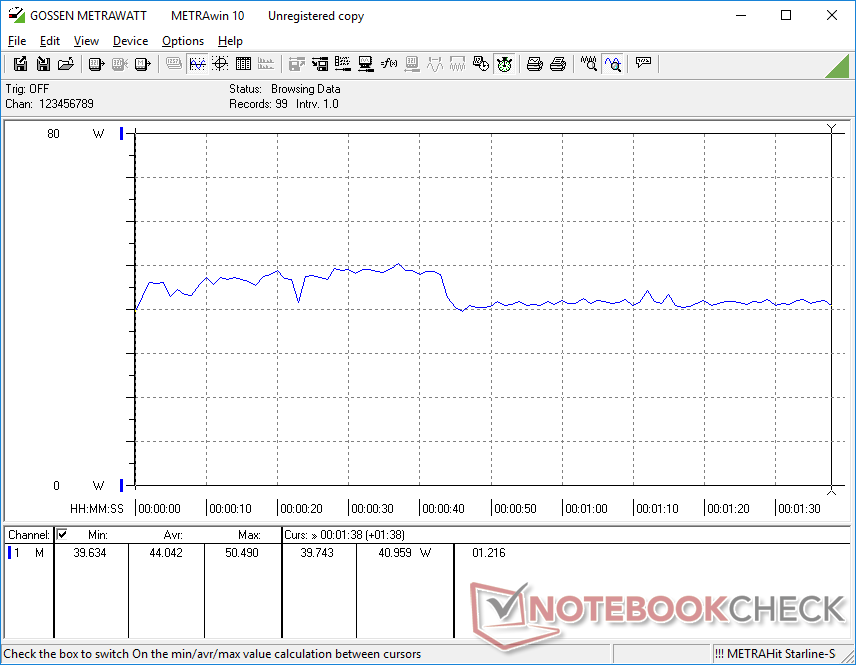
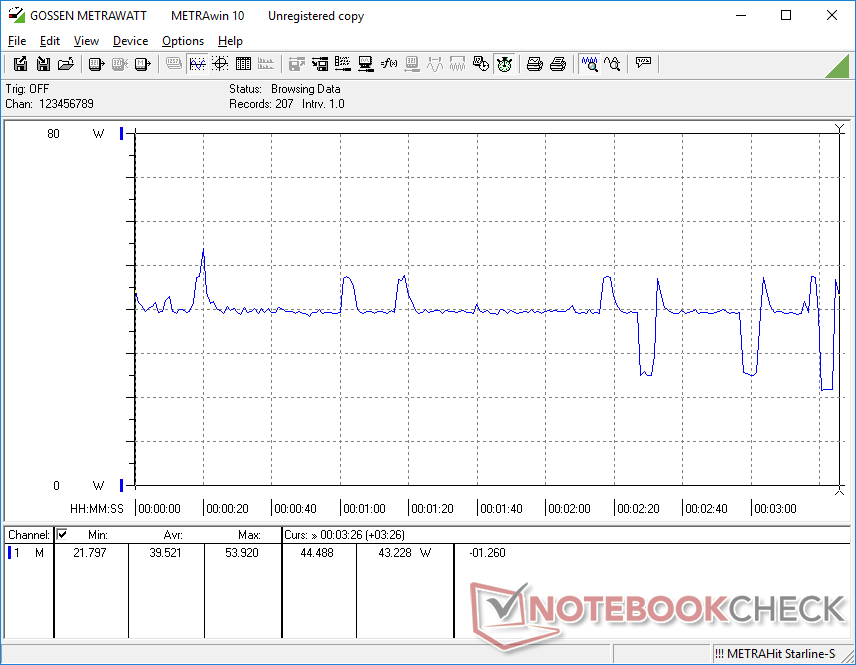
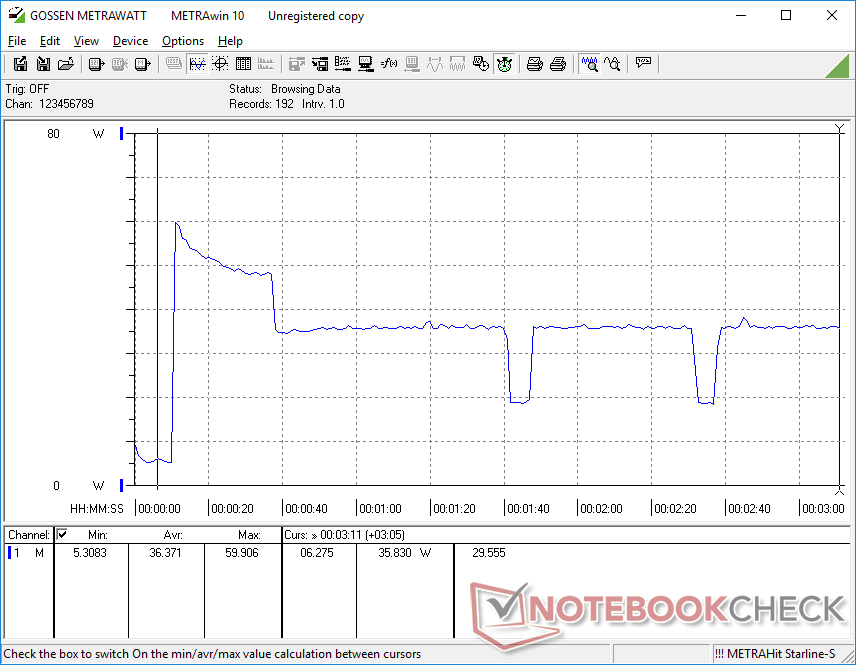
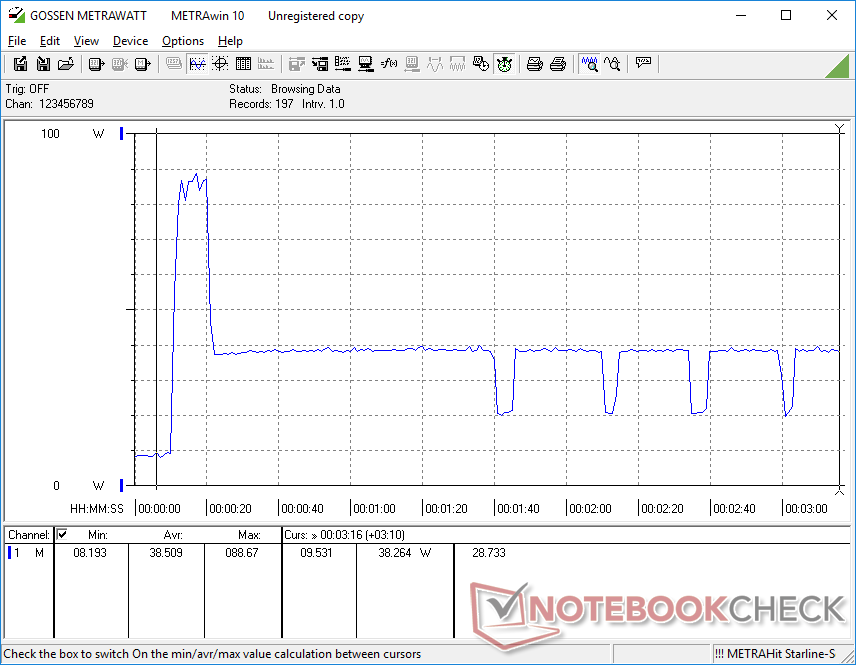
L'esecuzione di 3DMark 06 consumerebbe solo 44 W sul nostro Latitude 9520 2-in-1 rispetto ai 46 W sul Latitude 9510 2-in-1 nonostante il massiccio aumento delle prestazioni grafiche sul modello più recente. Quindi, i proprietari stanno ottenendo un aumento medio di 3 volte nelle prestazioni della GPU a parità di potenza. L'aumento delle prestazioni per watt su base annua non può essere sottovalutato.
Sfortunatamente, le prestazioni instabili della GPU di cui sopra si riflettono nei tassi di consumo energetico instabili come mostrato dai nostri grafici qui sotto. Quando si esegue Witcher 3 per rappresentare i carichi di gioco, il consumo varia da 21 W a 40 W, mentre rimane costante a soli 34 W sul HP EliteBook 850 G8 equipaggiato con la simile CPU Core i7-1165G7.
Siamo in grado di registrare un consumo massimo di 88,7 W dal piccolo (~13 x 6,6 x 2,3 cm) adattatore AC da 90 W. Il sistema non è in grado di mantenere questo tasso per più di pochi secondi a causa delle limitazioni termiche.
| Off / Standby | |
| Idle | |
| Sotto carico |
|
Leggenda:
min: | |
| Dell Latitude 15 9520 2-in-1 i7-1185G7, Iris Xe G7 96EUs, Toshiba KBG40ZNS512G NVMe, IPS, 1920x1080, 15" | Dell Latitude 9510 2-in-1 i7-10810U, UHD Graphics 620, Toshiba KBG40ZNS512G NVMe, IPS, 1920x1080, 15" | HP EliteBook 850 G8 3C7Z8EA i7-1165G7, Iris Xe G7 96EUs, Samsung PM981a MZVLB1T0HBLR, I, 1920x1080, 15.6" | Lenovo ThinkPad L15 G2 AMD R5 5600U, Vega 7, SK Hynix HFS512 GDE9X081N, IPS LED, 1920x1080, 15.6" | MSI Summit B15 A11M i7-1165G7, Iris Xe G7 96EUs, Kingston OM8PCP31024F, IPS, 1920x1080, 15.6" | Microsoft Surface Laptop 4 15 AMD TFF_00028 R7 4980U, Vega 8, SK Hynix BC511 HFM512GDJTNI, IPS, 2496x1664, 15" | |
|---|---|---|---|---|---|---|
| Power Consumption | 8% | -27% | -14% | -15% | -14% | |
| Idle Minimum * (Watt) | 2.6 | 2.1 19% | 5.8 -123% | 4.57 -76% | 4.2 -62% | 3.6 -38% |
| Idle Average * (Watt) | 5 | 4.6 8% | 8.4 -68% | 8.2 -64% | 7.7 -54% | 6.5 -30% |
| Idle Maximum * (Watt) | 7.1 | 5.3 25% | 9.9 -39% | 9.3 -31% | 8.4 -18% | 8.9 -25% |
| Load Average * (Watt) | 44 | 45.8 -4% | 33 25% | 31.9 27% | 37.8 14% | 46.5 -6% |
| Witcher 3 ultra * (Watt) | 39.5 | 34.3 13% | 34.5 13% | 36.6 7% | 43.4 -10% | |
| Load Maximum * (Watt) | 88.7 | 96.3 -9% | 60 32% | 47.4 47% | 67.5 24% | 64.9 27% |
* ... Meglio usare valori piccoli
Power Consumption Witcher 3 / Stresstest
Durata della batteria
I tempi di esecuzione sono un paio di ore più brevi di quelli che abbiamo registrato sul modello dell'anno scorso, nonostante le identiche batterie da 88 Wh tra di loro. Anche così, 14+ ore di utilizzo WLAN nel mondo reale non è ancora nulla di cui vergognarsi e ben al di sopra della media per la categoria di dimensioni
Dell offre SKU con batterie più piccole da 46 Wh per gli utenti che non si preoccupano di sacrificare la durata della batteria per un'unità più leggera
| Dell Latitude 15 9520 2-in-1 i7-1185G7, Iris Xe G7 96EUs, 88 Wh | Dell Latitude 9510 2-in-1 i7-10810U, UHD Graphics 620, 88 Wh | HP EliteBook 850 G8 3C7Z8EA i7-1165G7, Iris Xe G7 96EUs, 56 Wh | Lenovo ThinkPad L15 G2 AMD R5 5600U, Vega 7, 45 Wh | MSI Summit B15 A11M i7-1165G7, Iris Xe G7 96EUs, 52 Wh | Microsoft Surface Laptop 4 15 AMD TFF_00028 R7 4980U, Vega 8, 47.4 Wh | |
|---|---|---|---|---|---|---|
| Autonomia della batteria | 26% | -43% | -47% | -55% | -30% | |
| WiFi v1.3 (h) | 14.8 | 18.7 26% | 8.5 -43% | 7.8 -47% | 6.6 -55% | 10.4 -30% |
| Reader / Idle (h) | 59 | 18.4 | ||||
| Load (h) | 4 | 2.3 | 1 | 2.5 | ||
| H.264 (h) | 6.6 | 14.8 |
Pro
Contro
Verdetto
Il Latitude 9520 2-in-1 offre significativi vantaggi di performance rispetto al Latitude 9510 2-in-1 sulla carta. Il vecchio UHD Graphics 620 è stato reso obsoleto ora che Iris Xe sta diventando più comune. In pratica, tuttavia, ci sono dei caveat che i potenziali acquirenti non dovrebbero ignorare.
In primo luogo, la GPU Iris Xe nel nuovo Latitude funziona a tassi di clock ciclici con conseguenti frame rate ciclici quando si gioca o prestazioni instabili quando si eseguono attività ad alta intensità di GPU. I frame rate si muovono in modo così ciclico che alcune applicazioni in cui i frame rate costanti sono vitali diventerebbero quasi ingiocabili. Raccomandiamo di guardare altri Tiger Lake-U laptop come MSI Summit E13 Flip oHP EliteBook 840 Aero G8 se si desiderano prestazioni della GPU più costanti e affidabili.
Il principale punto di forza del Latitude 9520 2-in-1 rispetto al 9510 2-in-1 è la sua performance grafica integrata significativamente più veloce. Tuttavia, le prestazioni grafiche insolitamente instabili sul modello più recente possono essere un punto debole per molti acquirenti interessati.
In secondo luogo, le prestazioni della CPU multi-thread del nostro Core i7-1185G7 sono più lente rispetto al vecchio Core i7-10810U sul Latitude 9510 2-in-1. Anche se questo svantaggio non è unico per i PC Dell, l'i7-1185G7 nel Latitude 9520 2-in-1 è più lento che su molti altri portatili con lo stesso processore. Così, il deficit di prestazioni multi-thread è amplificato sul Dell.
Le ragioni per scegliere il Latitude 9520 2-in-1 rispetto al 9510 2-in-1 sono minori di quanto vorremmo, soprattutto perché il nuovo modello non offre nulla di nuovo in termini di qualità del display, qualità della webcam, o durata della batteria. Speriamo che le prestazioni irregolari della GPU possano essere affrontate con un futuro aggiornamento.
Prezzo e disponibilità
La maggior parte dei grandi rivenditori come Amazon, Walmart, e Newegg hanno il Latitude 9520 2-in-1 in magazzino in varie configurazioni. Gli utenti possono anche acquistare direttamente da Dell a partire da $2800 USD per la versione Core i5.
Dell Latitude 15 9520 2-in-1
- 11/22/2021 v7 (old)
Allen Ngo
Price comparison

